Recenzja laptopa Dell Inspiron 14 Plus 7420: Dla użytkowników mocy w budżecie
Dell wprowadził na rynek w 2022 roku trzy oddzielne 14-calowe modele Inspiron 14 7420: standardowy Inspiron 14 7420, Inspiron 14 7420 2-in-1 i Inspiron 14 7420 Plus. Niniejsza recenzja skupia się na modelu Plus, który niesie ze sobą znacznie szybsze procesory Core serii H i dyskretną grafikę Nvidia GeForce RTX przeznaczoną dla użytkowników mocy niezadowolonych ze zwykłych ultrabooków z serii Core-U
.Nasz konkretny egzemplarz recenzencki jest wyposażony w procesor Alder Lake-H Core i7-12700H i układ graficzny GeForce RTX 3050 w cenie około 1400 USD w sprzedaży detalicznej. Planowane są inne jednostki SKU z procesorem Core i5-12500H, RTX 3050 Ti lub zintegrowaną grafiką i mniejszym akumulatorem 54 Wh, ale wszystkie konfiguracje są wyposażone w ten sam panel o rozdzielczości 2,2K 2240 x 1400.
Wśród konkurentów są inne wydajne 14-calowe laptopy, jak Asus VivoBook Pro 14, HP Pavilion 14 Plus, Schenker Vision 14, HP Envy 14, czy Lenovo IdeaPad 5 Pro 14. Za alternatywę można uznać również Razer Blade 14 oraz Asus Zephyrus G14, ale są one znacznie droższe.
Więcej recenzji Della:
Potencjalni konkurenci w porównaniu
Ocena | Data | Model | Waga | Wysokość | Rozmiar | Rezolucja | Cena |
|---|---|---|---|---|---|---|---|
| 87.2 % v7 (old) | 09/2022 | Dell Inspiron 14 Plus 7420 i7-12700H, GeForce RTX 3050 4GB Laptop GPU | 1.7 kg | 18.87 mm | 14.00" | 2240x1400 | |
| 86.3 % v7 (old) | Asus Vivobook Pro 14 M3401QC-KM007T R5 5600H, GeForce RTX 3050 4GB Laptop GPU | 1.5 kg | 19 mm | 14.00" | 2880x1800 | ||
| 83.7 % v7 (old) | Dell Inspiron 14 7420 2-in-1 i7-1255U, Iris Xe G7 96EUs | 1.6 kg | 17.86 mm | 14.00" | 1920x1200 | ||
| 87.7 % v7 (old) | Schenker Vision 14 i7-11370H, GeForce RTX 3050 Ti Laptop GPU | 1.1 kg | 15.6 mm | 14.00" | 2880x1800 | ||
v (old) | Asus Zenbook 14X UX5400E i7-1165G7, GeForce MX450 | 1.4 kg | 16.9 mm | 14.00" | 2880x1800 | ||
| 82.3 % v7 (old) | MSI Summit E14 A11SCS i7-1185G7, GeForce GTX 1650 Ti Max-Q | 1.3 kg | 16 mm | 14.00" | 3840x2160 | ||
| 86.5 % v7 (old) | HP Envy 14-eb0010nr i5-1135G7, GeForce GTX 1650 Ti Max-Q | 1.6 kg | 17.9 mm | 14.00" | 1920x1200 |
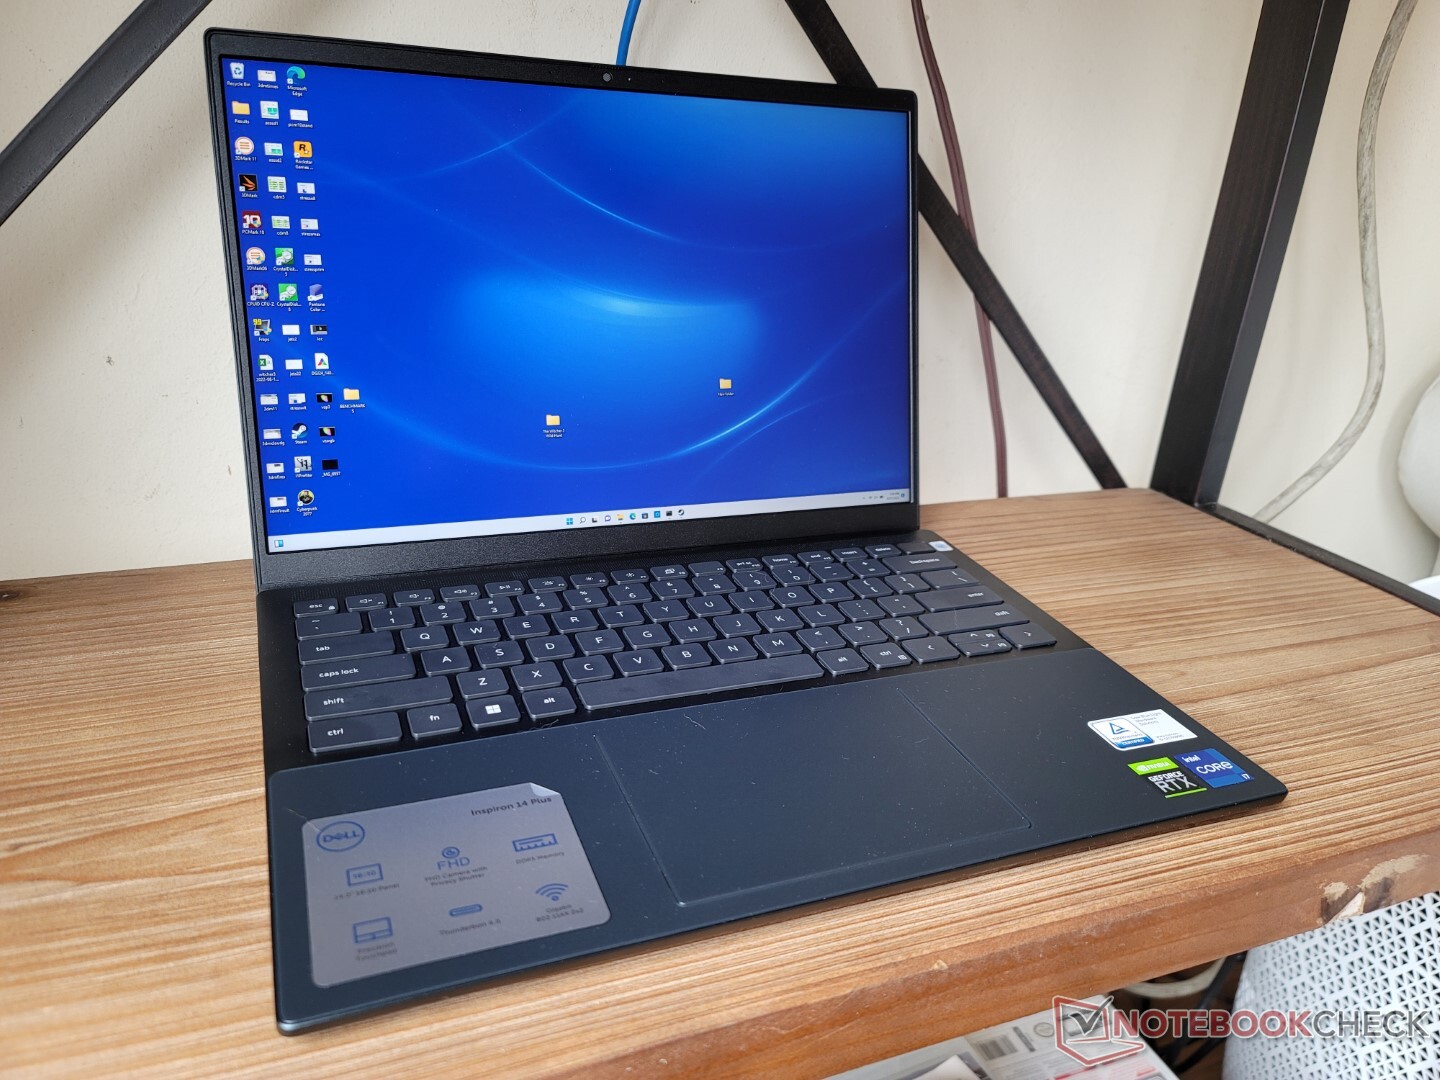
Obudowa - miniaturowy Inspiron 16 7620
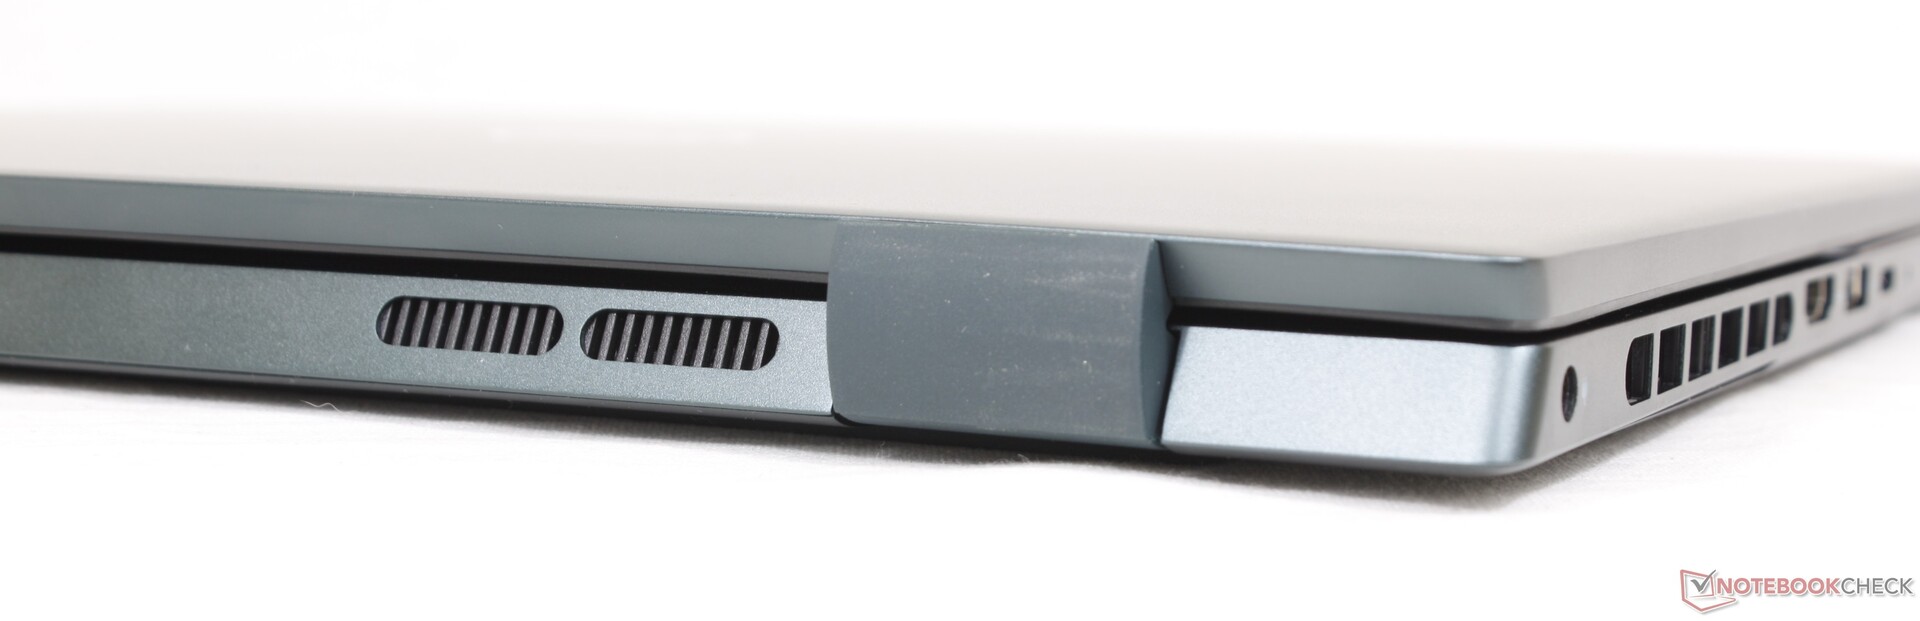
Obudowa może być najlepiej opisana jako mniejsza wersja Inspiron 16 7620 Plus ponieważ oba mają ten sam wizualny język projektowania. Materiały użyte do wykonania metalowej obudowy i warstwy Mylaru nad gładzikiem i podpórkami pod dłonie są podobne jak w większym Inspironie. Gładka, matowa obudowa od góry do dołu niemal naśladuje gładką, metalową pokrywę w modelu XPS 15
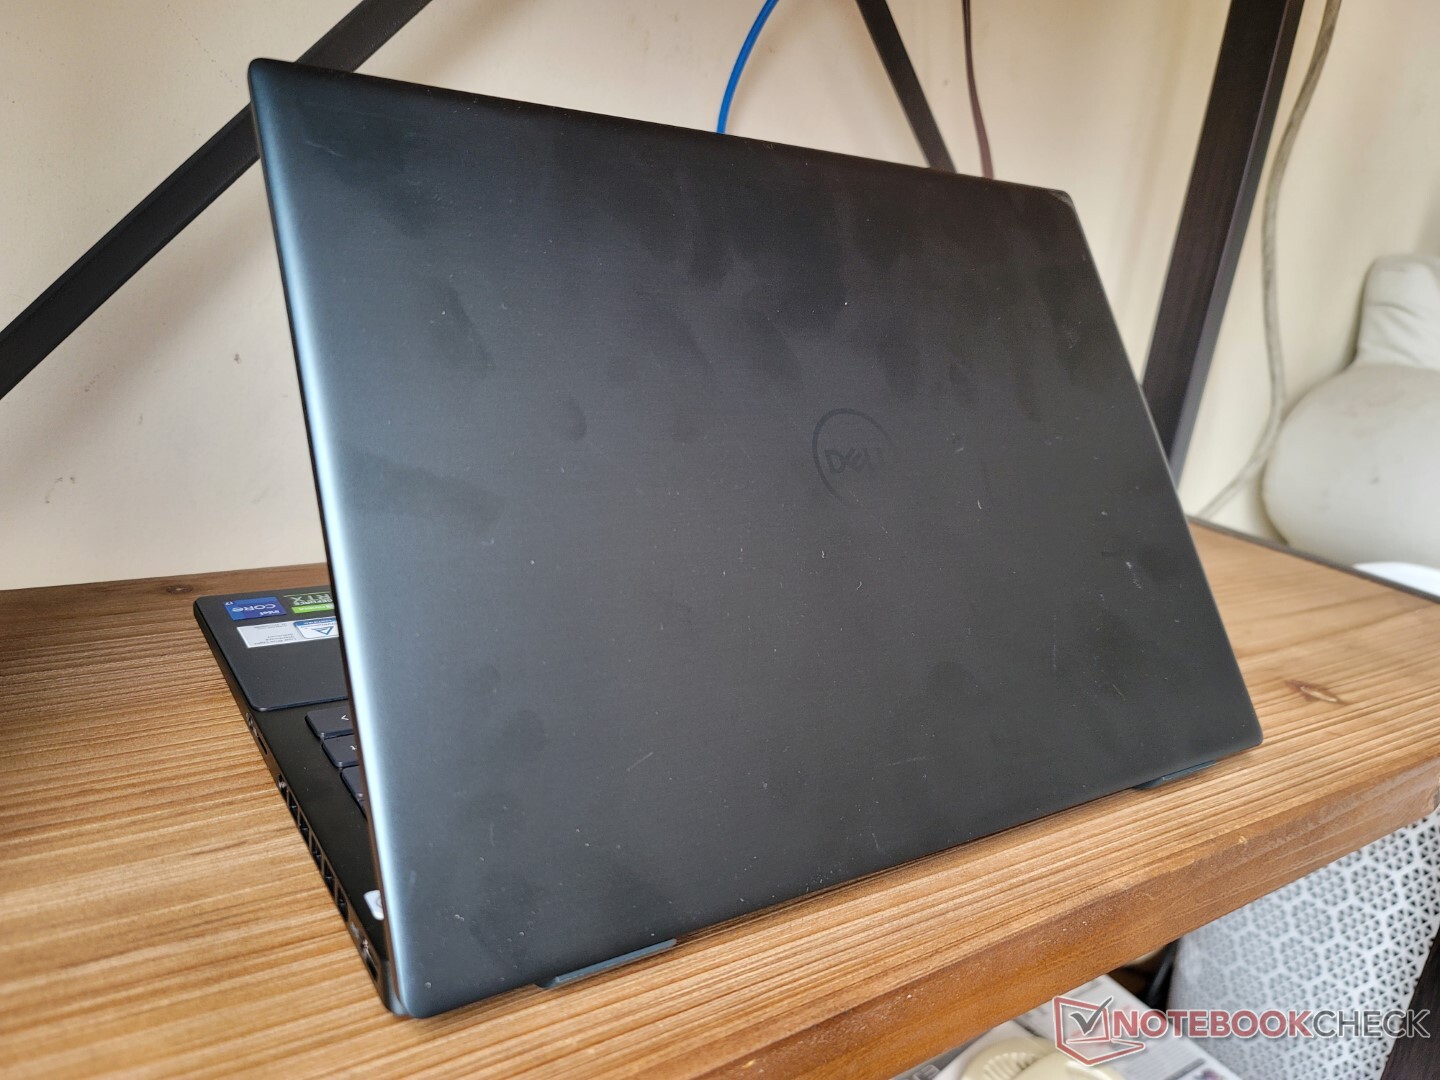
Najsłabszym aspektem szkieletu jest chyba wieko, gdyż dość łatwo się wykręca. Podczas obracania podstawy słychać drobne skrzypienie, a nacisk na środek klawiatury powoduje lekkie odkształcenie jej powierzchni. Choć model ten kosztuje prawie tyle samo, co Dell XPS 15, nie spodziewajcie się, że będzie zbudowany tak mocno jak on.
Można by się spodziewać, że Inspiron 14 Plus 7620 będzie większy i cięższy od Inspiron 14 7620 2-w-1, ale tak nie jest. Jego wymiary są identyczne jak w przypadku wersji 2-w-1, a mimo znacznie wydajniejszego sprzętu w środku jest tylko odrobinę grubszy i cięższy. Mimo to nadal jest cięższy i większy od większości innych 14-calowych laptopów, takich jak HP Envy 14,Asus Zenbook 14Xczy Schenker Vision 14, które również posiadają dyskretną grafikę Nvidii.
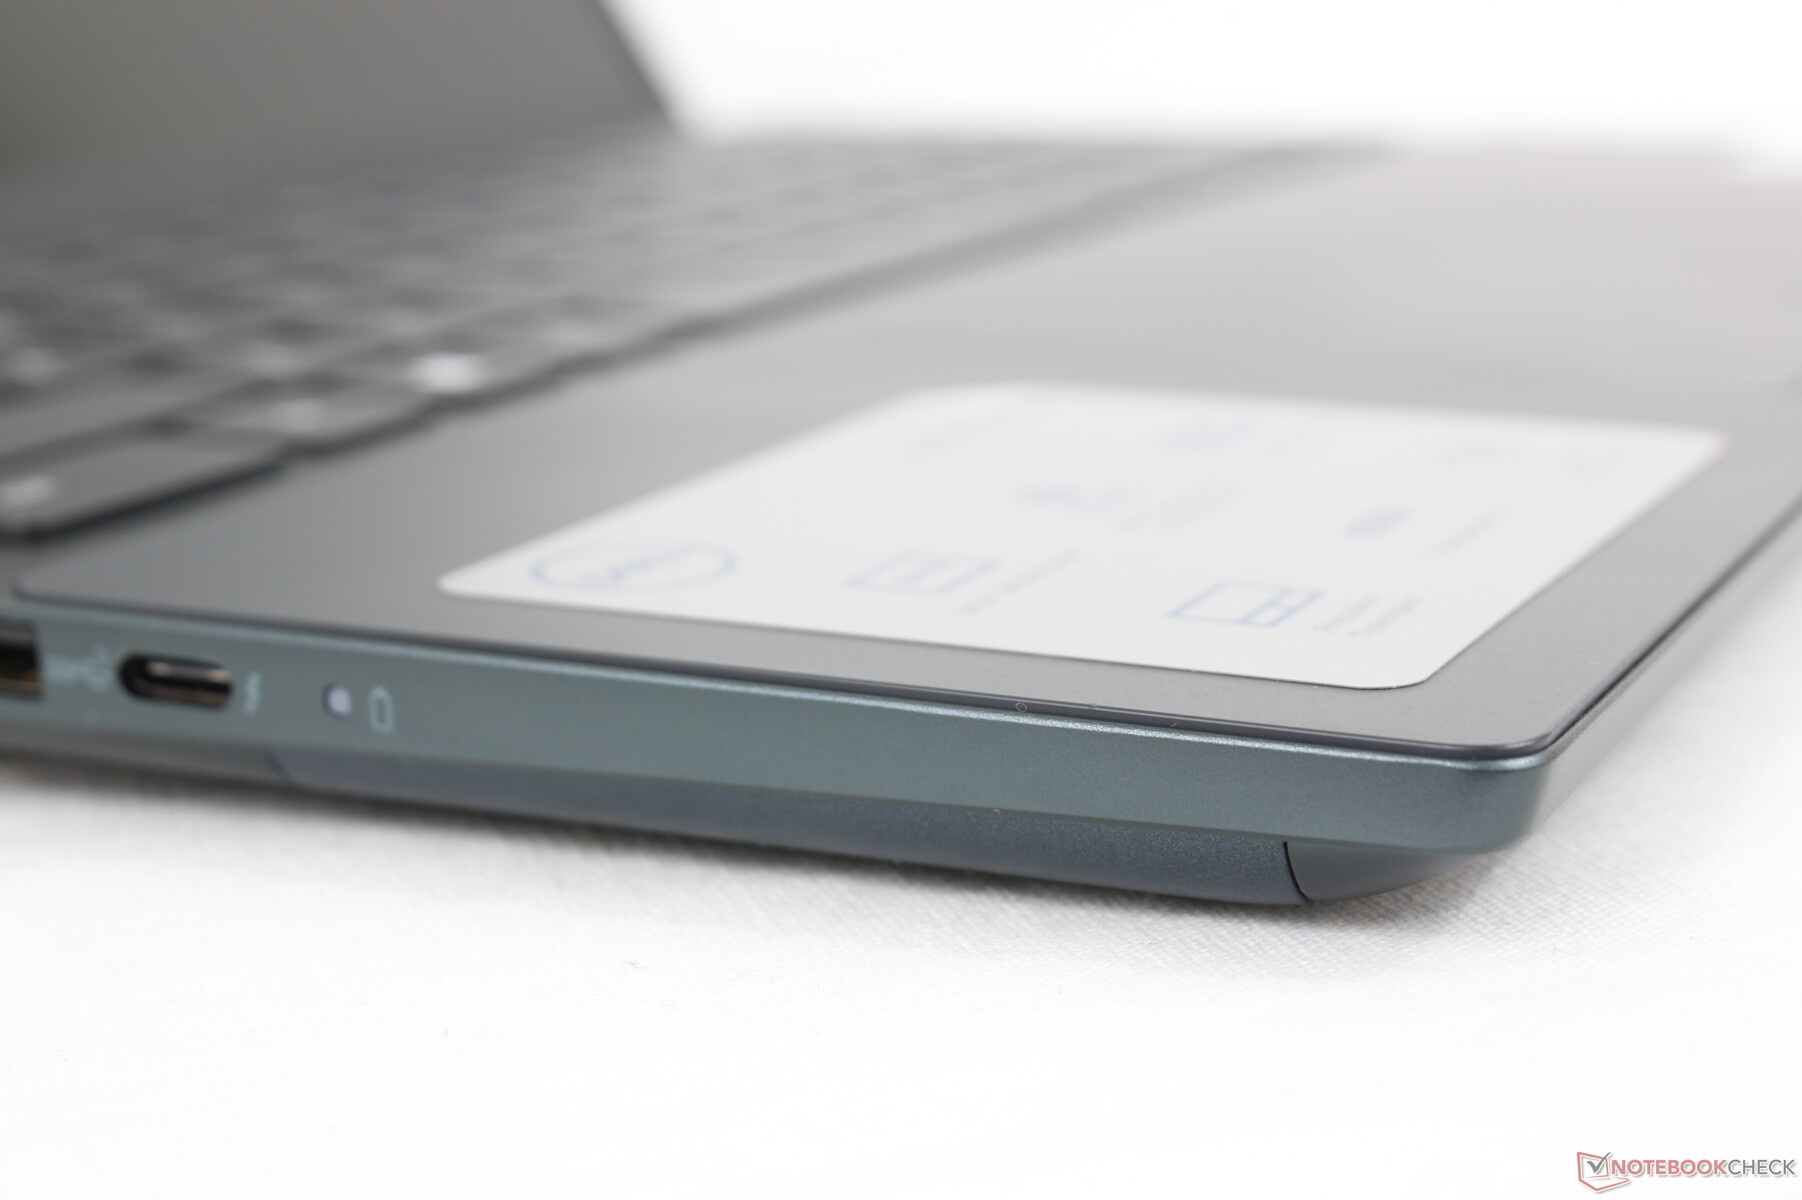
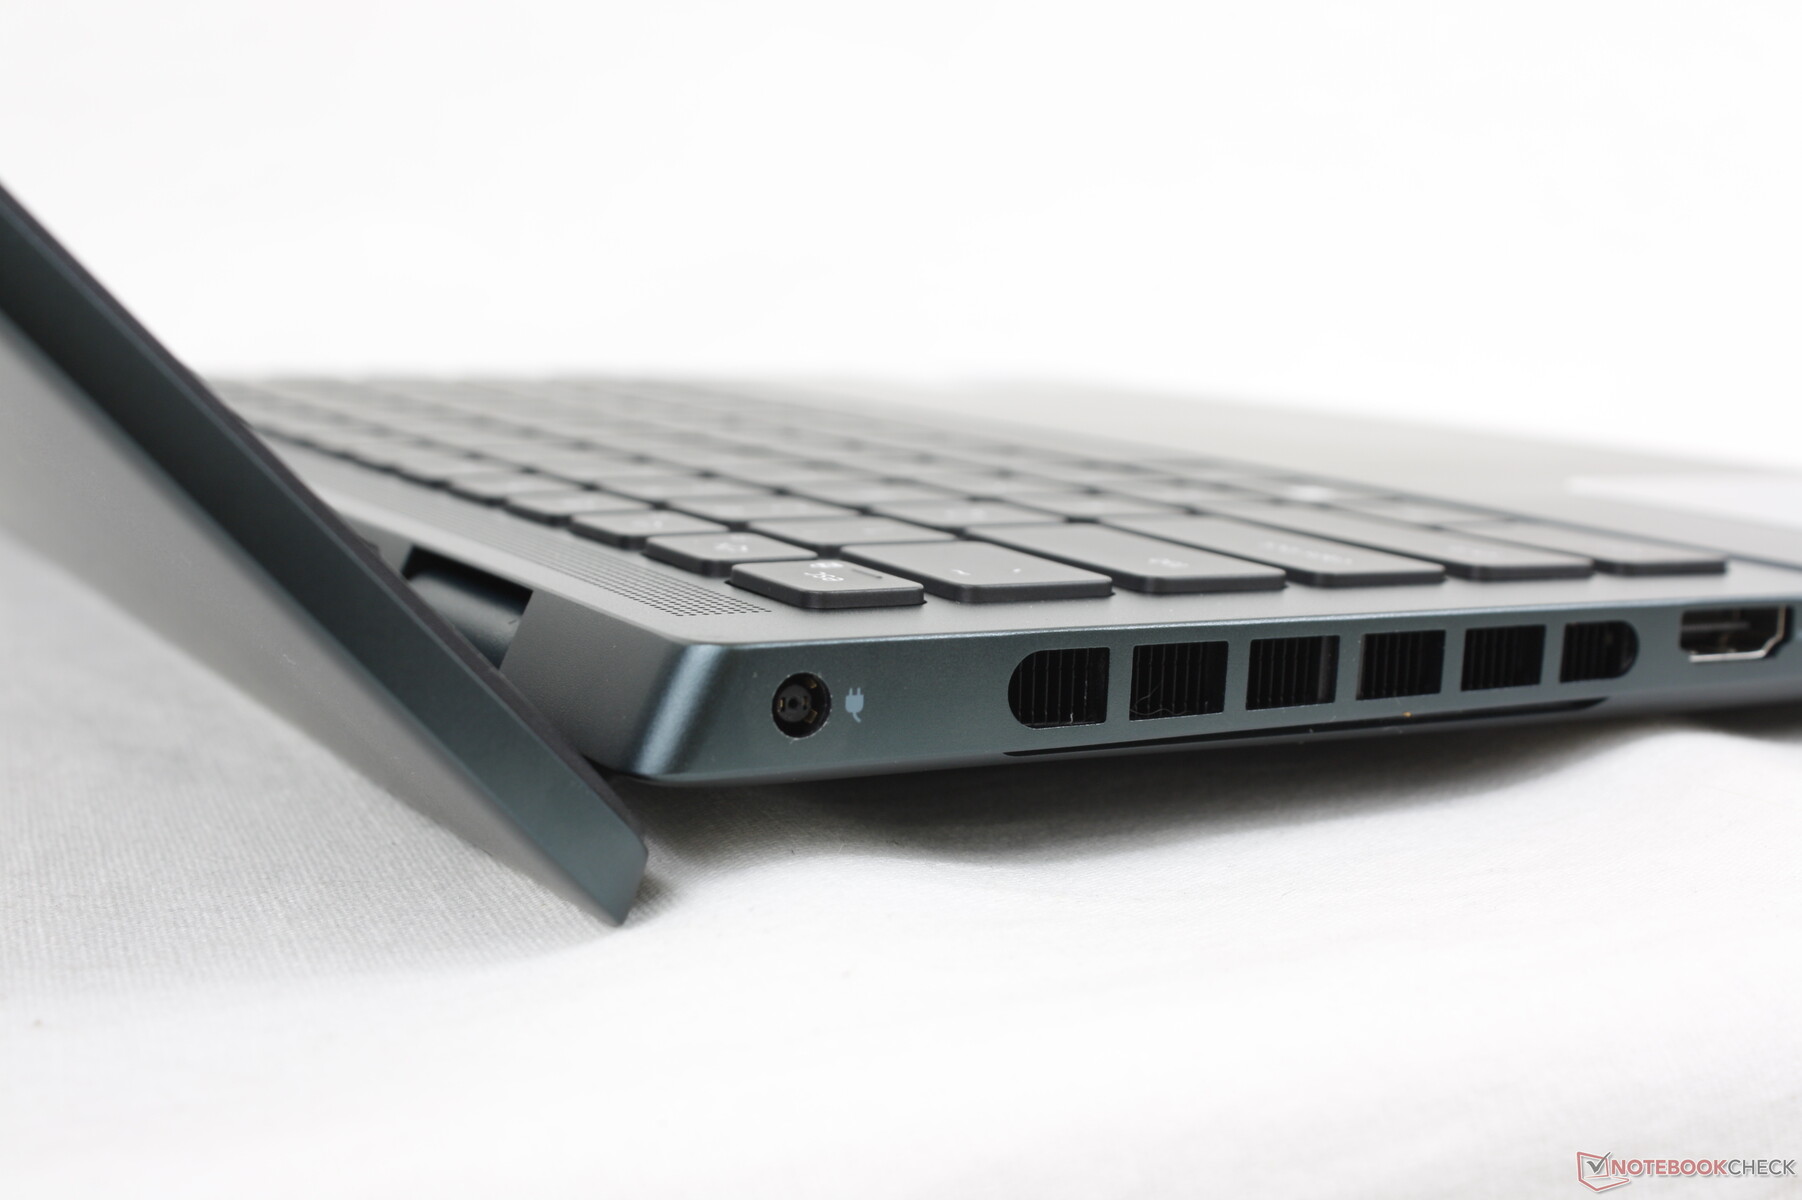
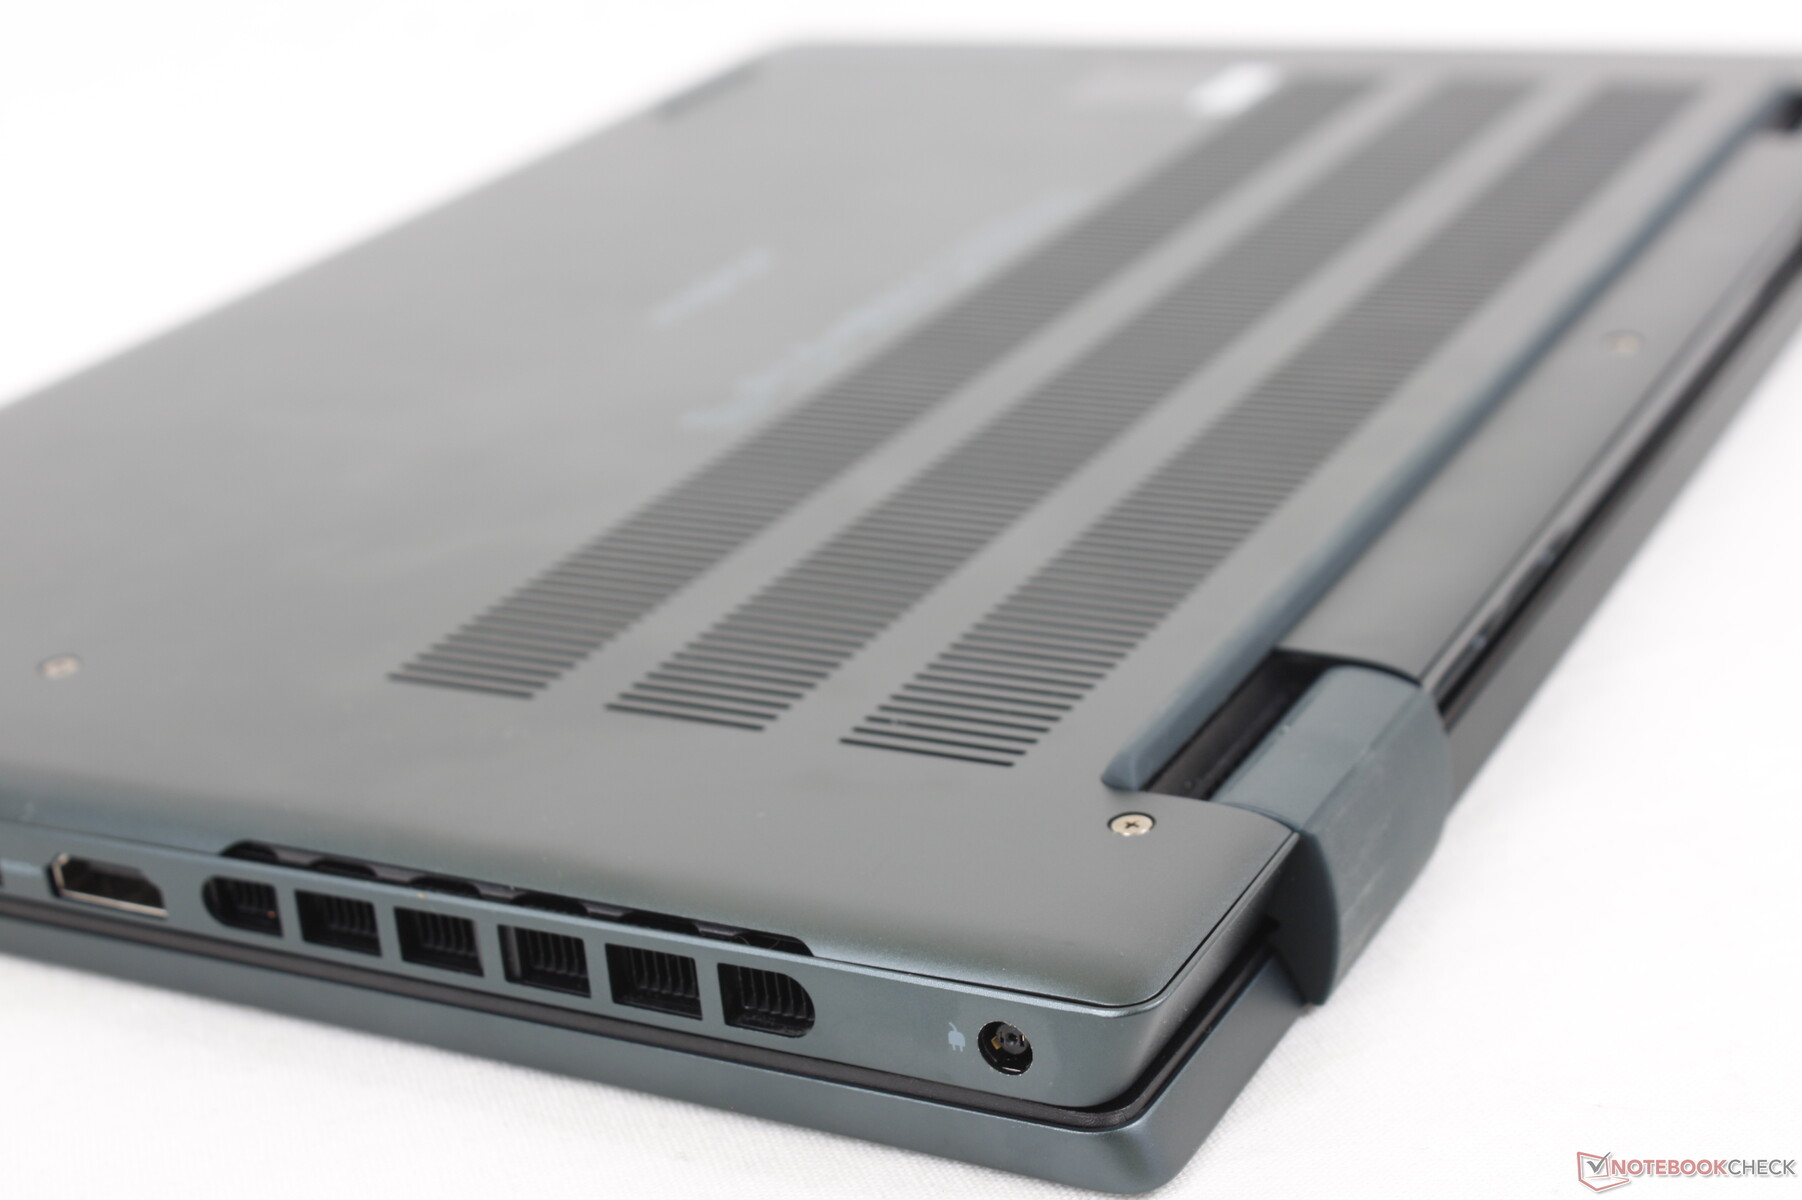
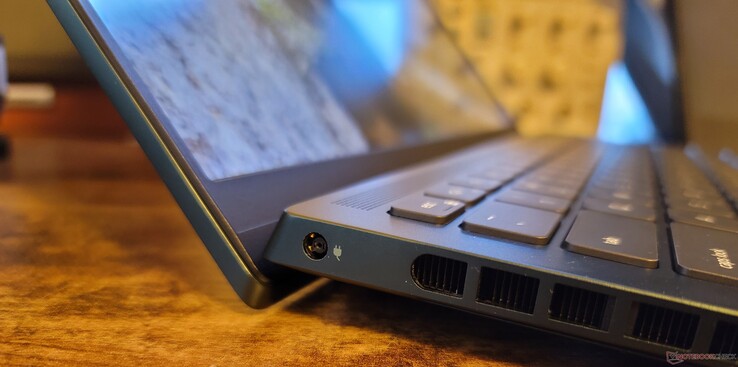
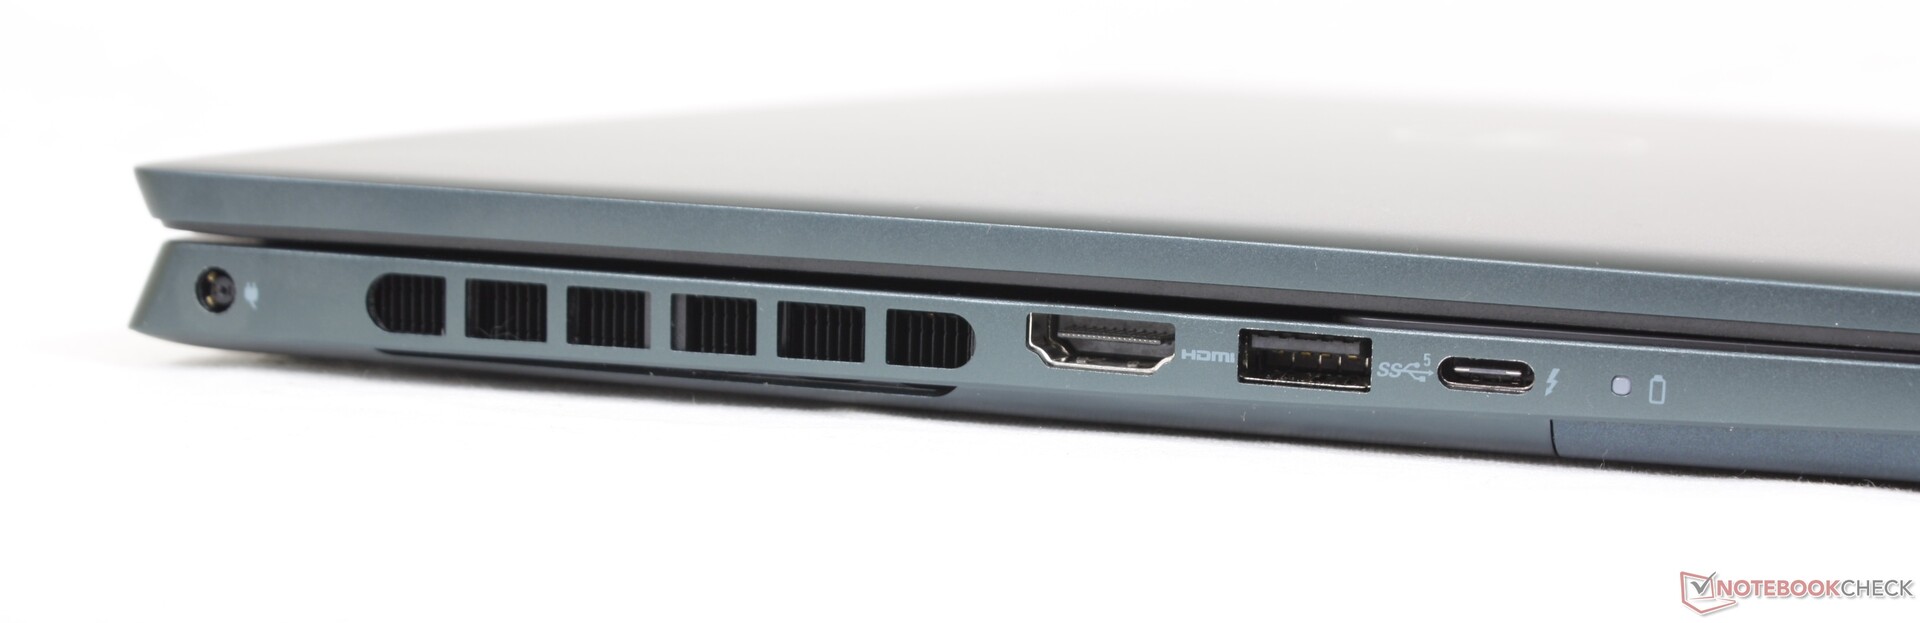
Łączność - Obsługa Thunderbolt 4
Opcje portów są identyczne jak w Inspironie 16 Plus 7620, choć pełnowymiarowy czytnik SD został zamieniony na mniejszy microSD. Doceniamy wsparcie dla Thunderbolt 4, ponieważ ani konkurencyjny HP Pavilion Plus 14 ani Asus Vivobook Pro 14 OLED nie obsługują Thunderbolt, mimo że mają porty USB-C.
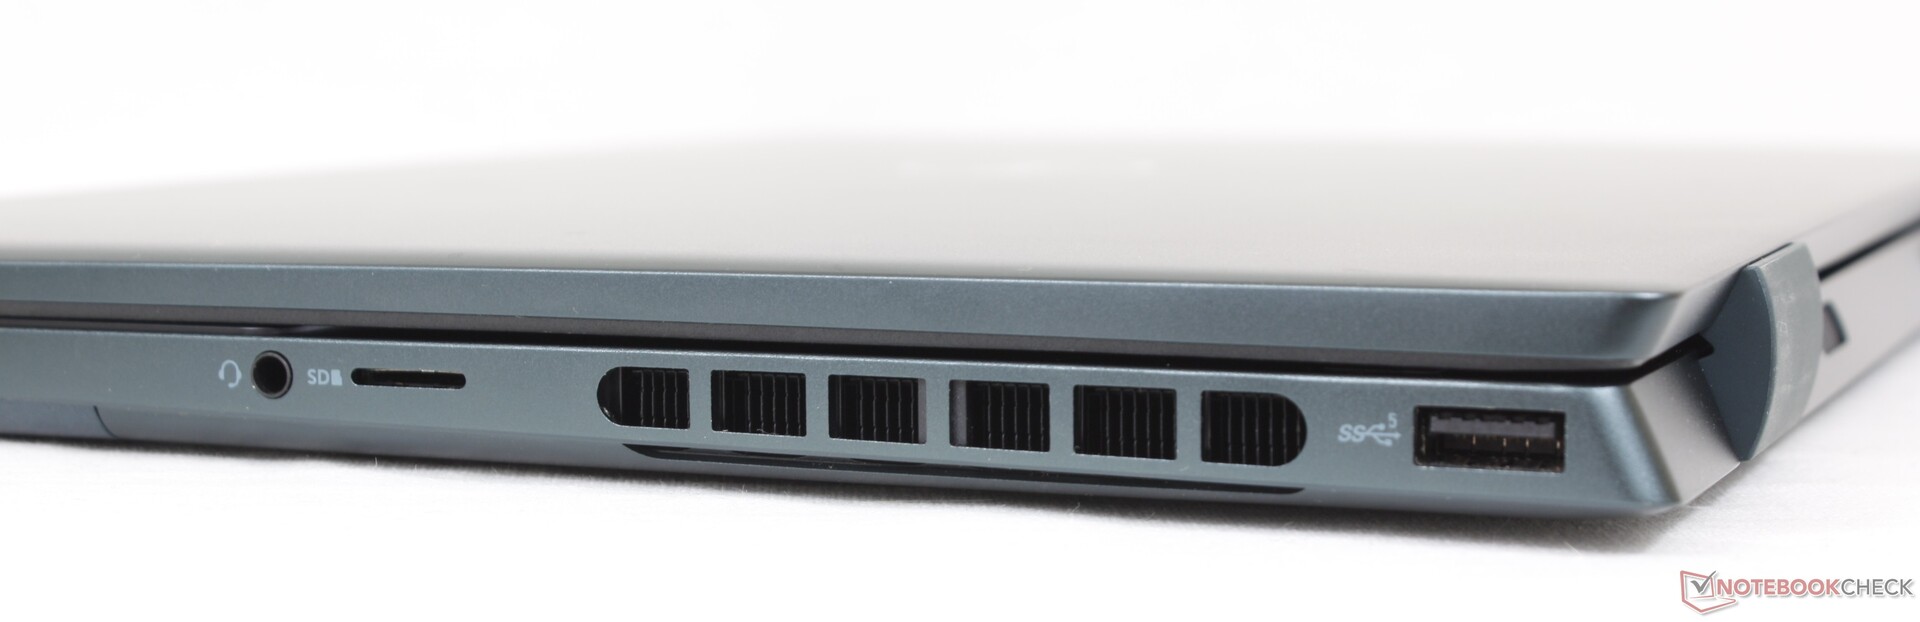
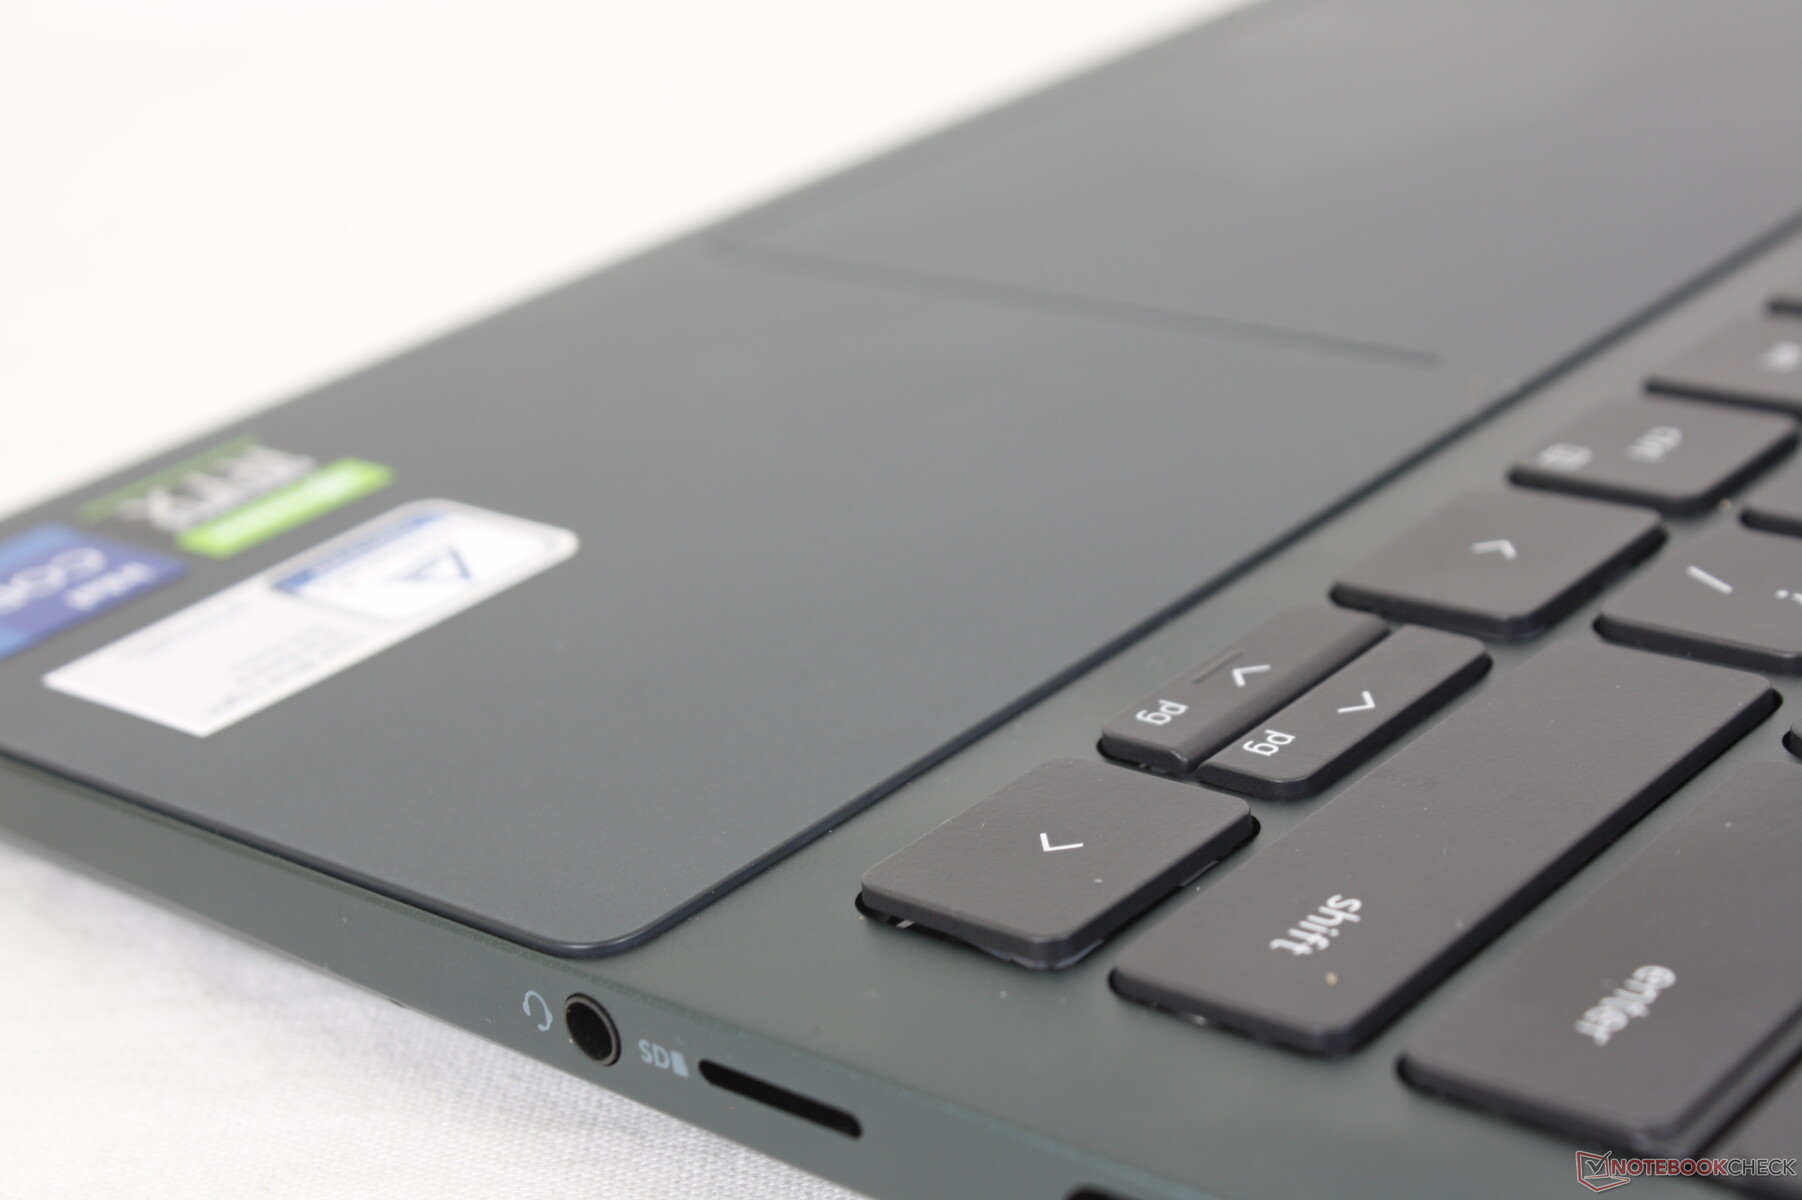
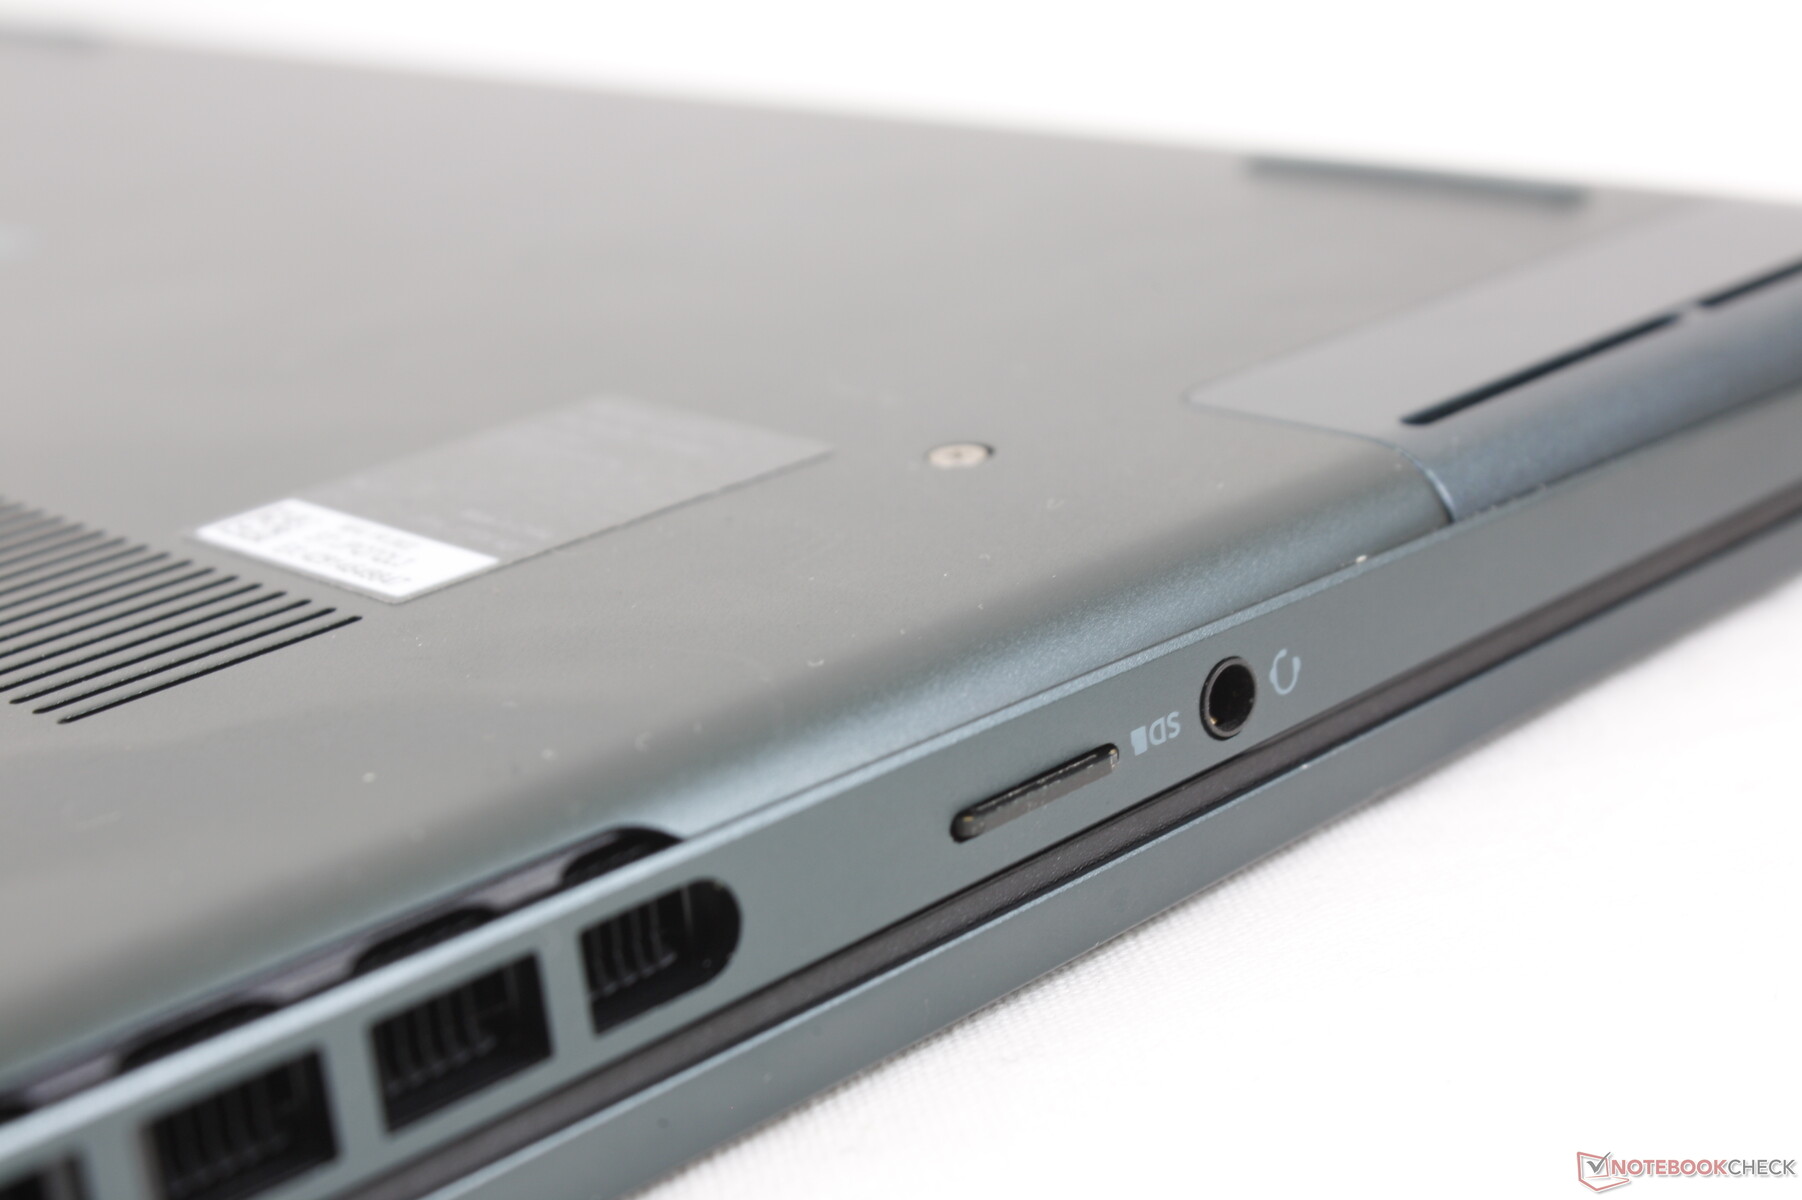
Czytnik kart SD
Szybkość transferu ze zintegrowanego, sprężynującego czytnika MicroSD jest powolna, podobnie jak to, co zaobserwowaliśmy w modelu Inspiron 14 7420 2-in-1. Przeniesienie 1 GB zdjęć z naszej karty testowej UHS-II na pulpit trwa około 45 sekund.
| SD Card Reader | |
| average JPG Copy Test (av. of 3 runs) | |
| MSI Summit E14 A11SCS (AV Pro V60) | |
| Schenker Vision 14 (Angelbird AV Pro V60) | |
| HP Envy 14-eb0010nr (Toshiba Exceria Pro M501 microSDXC 32GB) | |
| Asus Zenbook 14X UX5400E (AV Pro SD microSD 128 GB V60) | |
| Asus Vivobook Pro 14 M3401QC-KM007T (AV Pro SD microSD 128 GB V60) | |
| Dell Inspiron 14 Plus 7420 (AV PRO microSD 128 GB V60) | |
| Dell Inspiron 14 7420 2-in-1 (Toshiba Exceria Pro SDXC 64 GB UHS-II) | |
| maximum AS SSD Seq Read Test (1GB) | |
| MSI Summit E14 A11SCS (AV Pro V60) | |
| Schenker Vision 14 (Angelbird AV Pro V60) | |
| HP Envy 14-eb0010nr (Toshiba Exceria Pro M501 microSDXC 32GB) | |
| Asus Zenbook 14X UX5400E (AV Pro SD microSD 128 GB V60) | |
| Asus Vivobook Pro 14 M3401QC-KM007T (AV Pro SD microSD 128 GB V60) | |
| Dell Inspiron 14 Plus 7420 (AV PRO microSD 128 GB V60) | |
| Dell Inspiron 14 7420 2-in-1 (Toshiba Exceria Pro SDXC 64 GB UHS-II) | |
Komunikacja
Standardem dla łączności Wi-Fi 6E i Bluetooth 5.2 jest układ Intel AX211. Chociaż nie doświadczyliśmy żadnych problemów podczas sparowania z naszą siecią 6 GHz, szybkość transmisji była nieco bardziej niestabilna niż szybkość odbioru, co pokazuje poniższy wykres.
| Networking | |
| iperf3 transmit AX12 | |
| Schenker Vision 14 | |
| HP Envy 14-eb0010nr | |
| MSI Summit E14 A11SCS | |
| Asus Zenbook 14X UX5400E | |
| iperf3 receive AX12 | |
| Schenker Vision 14 | |
| MSI Summit E14 A11SCS | |
| HP Envy 14-eb0010nr | |
| Asus Zenbook 14X UX5400E | |
| iperf3 receive AXE11000 6GHz | |
| Dell Inspiron 14 Plus 7420 | |
| Dell Inspiron 14 7420 2-in-1 | |
| Asus Vivobook Pro 14 M3401QC-KM007T | |
| iperf3 transmit AXE11000 6GHz | |
| Dell Inspiron 14 Plus 7420 | |
| Dell Inspiron 14 7420 2-in-1 | |
| Asus Vivobook Pro 14 M3401QC-KM007T | |
Kamera internetowa
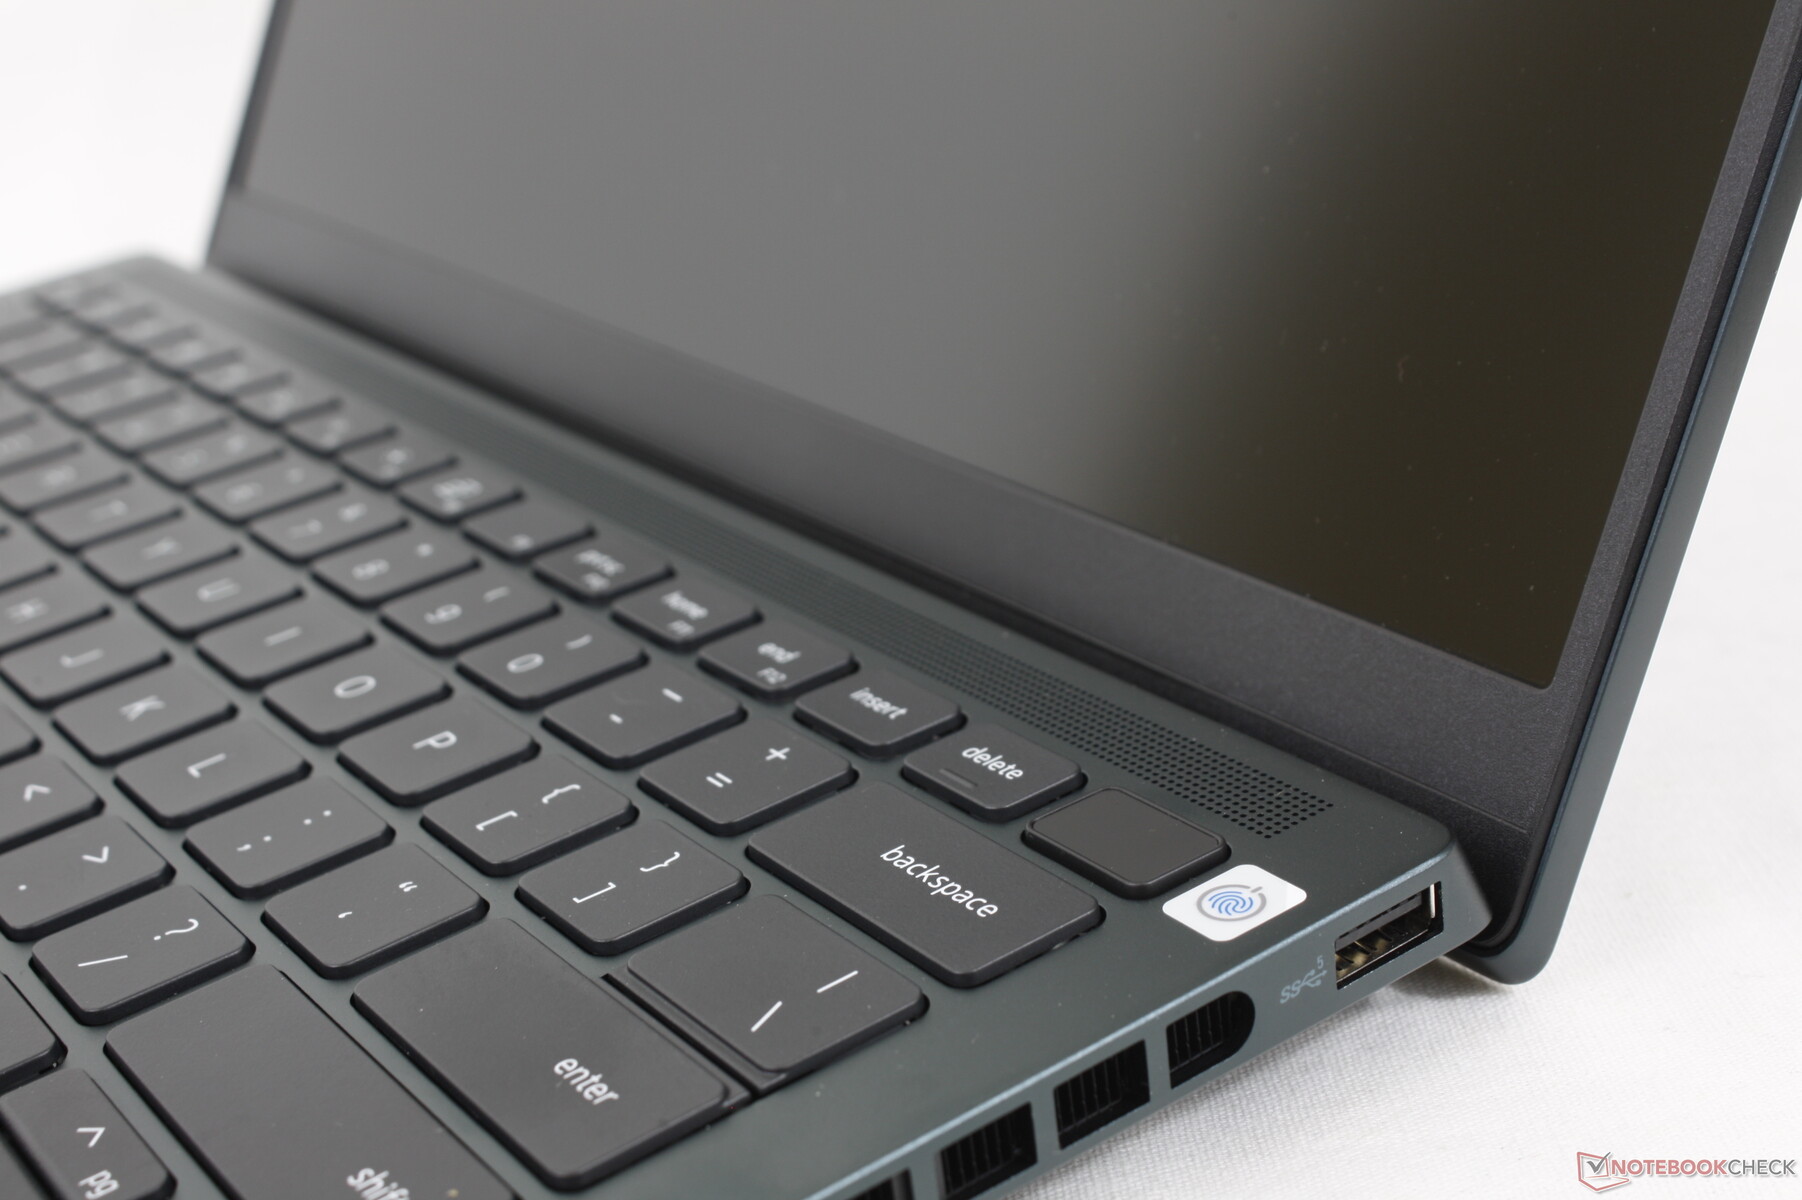
kamera internetowa 2 MP oferuje podobną jakość obrazu jak kamera internetowa 2 MP w standardowym modelu Inspiron 14 7420 2-in-1. Fizyczna migawka prywatności jest standardem, natomiast Windows Hello i IR nie są obsługiwane.


Konserwacja
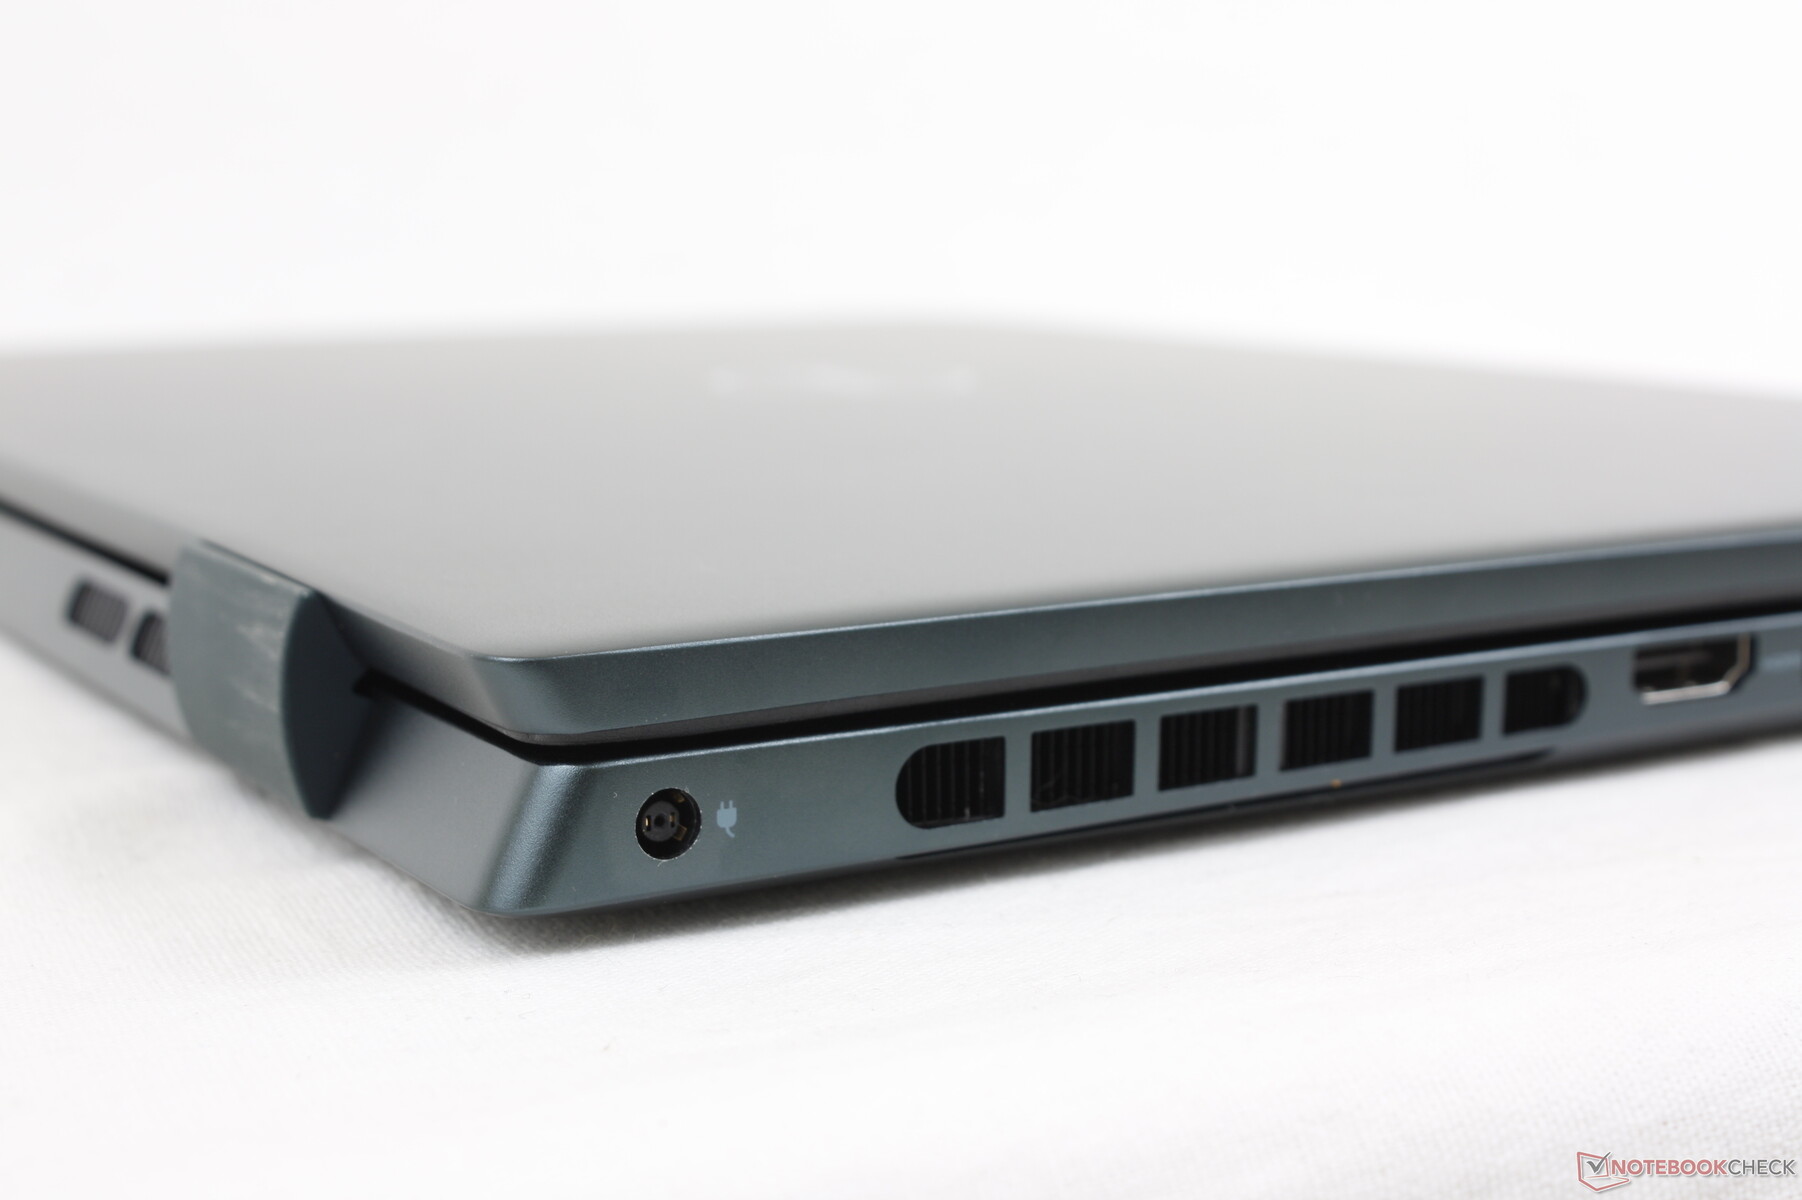
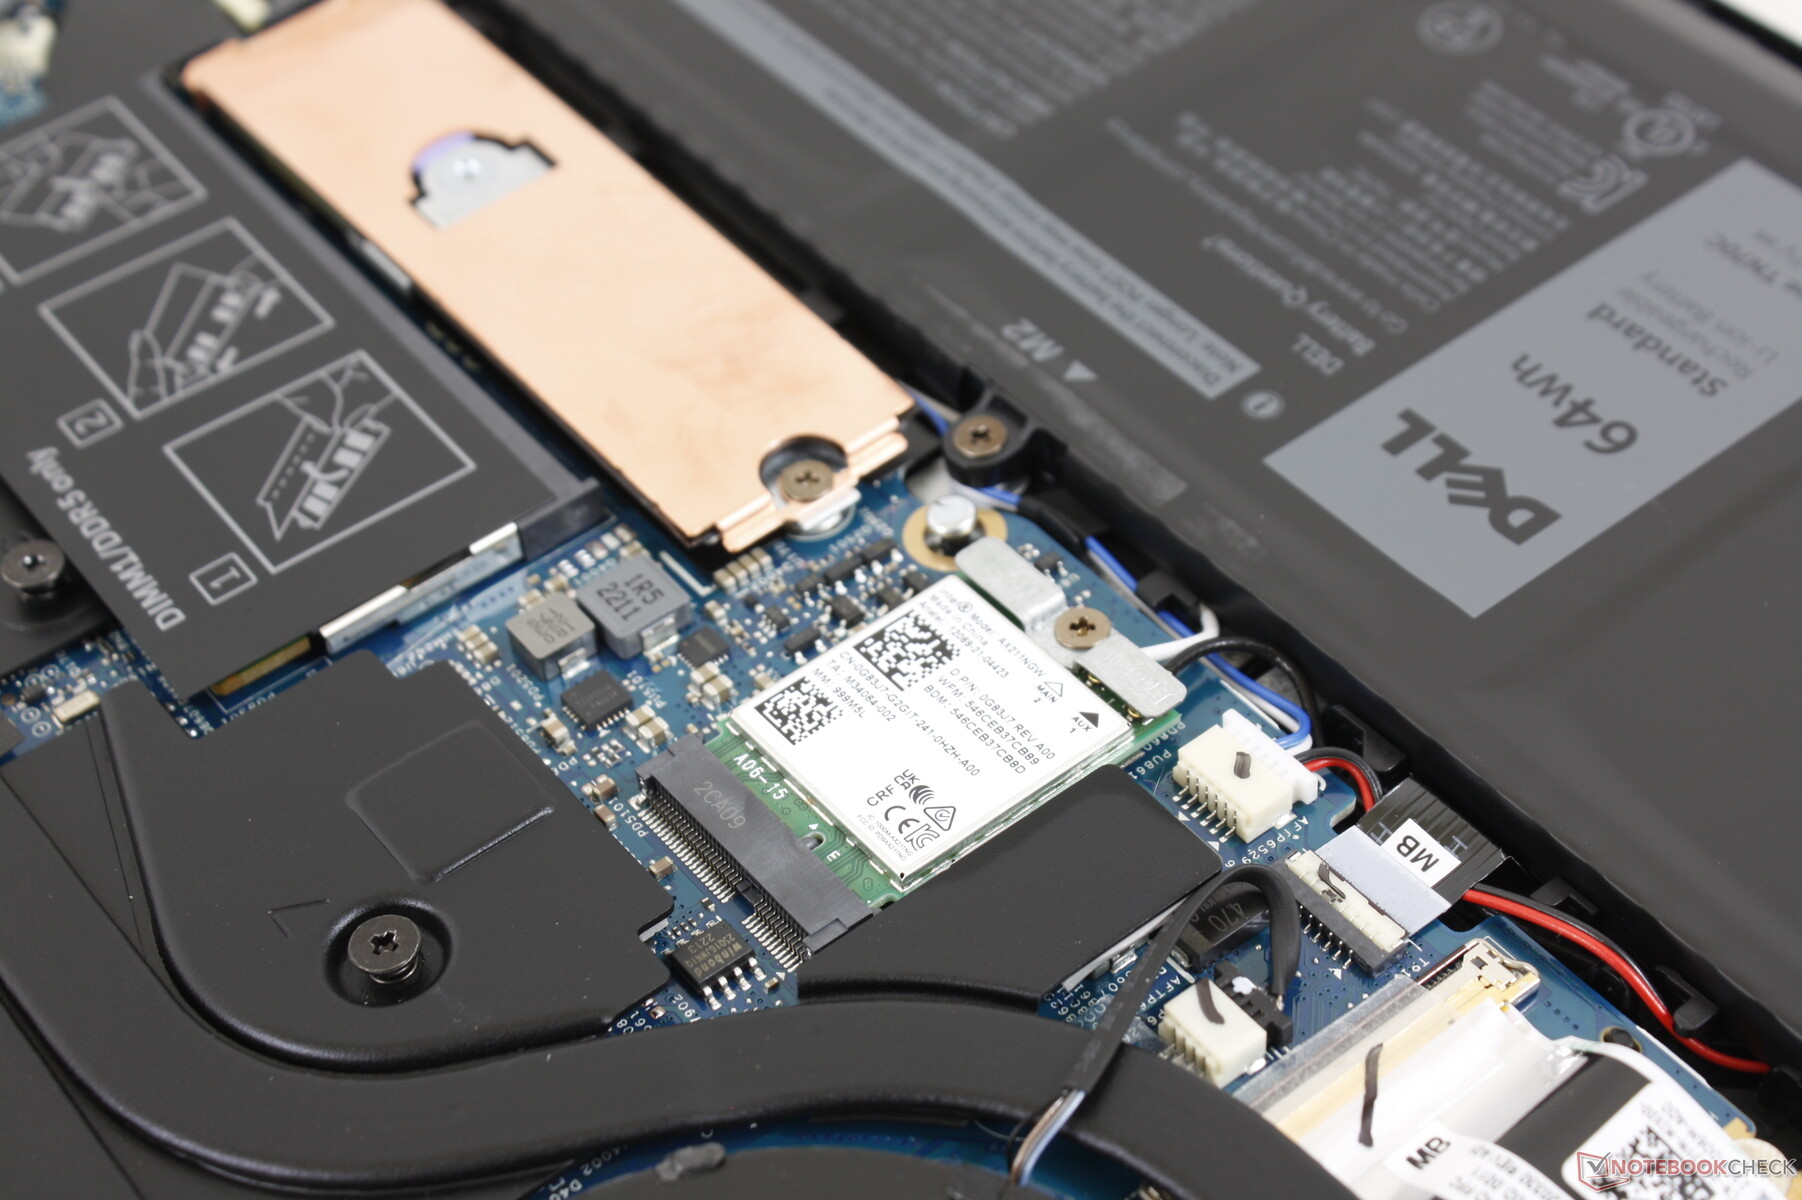
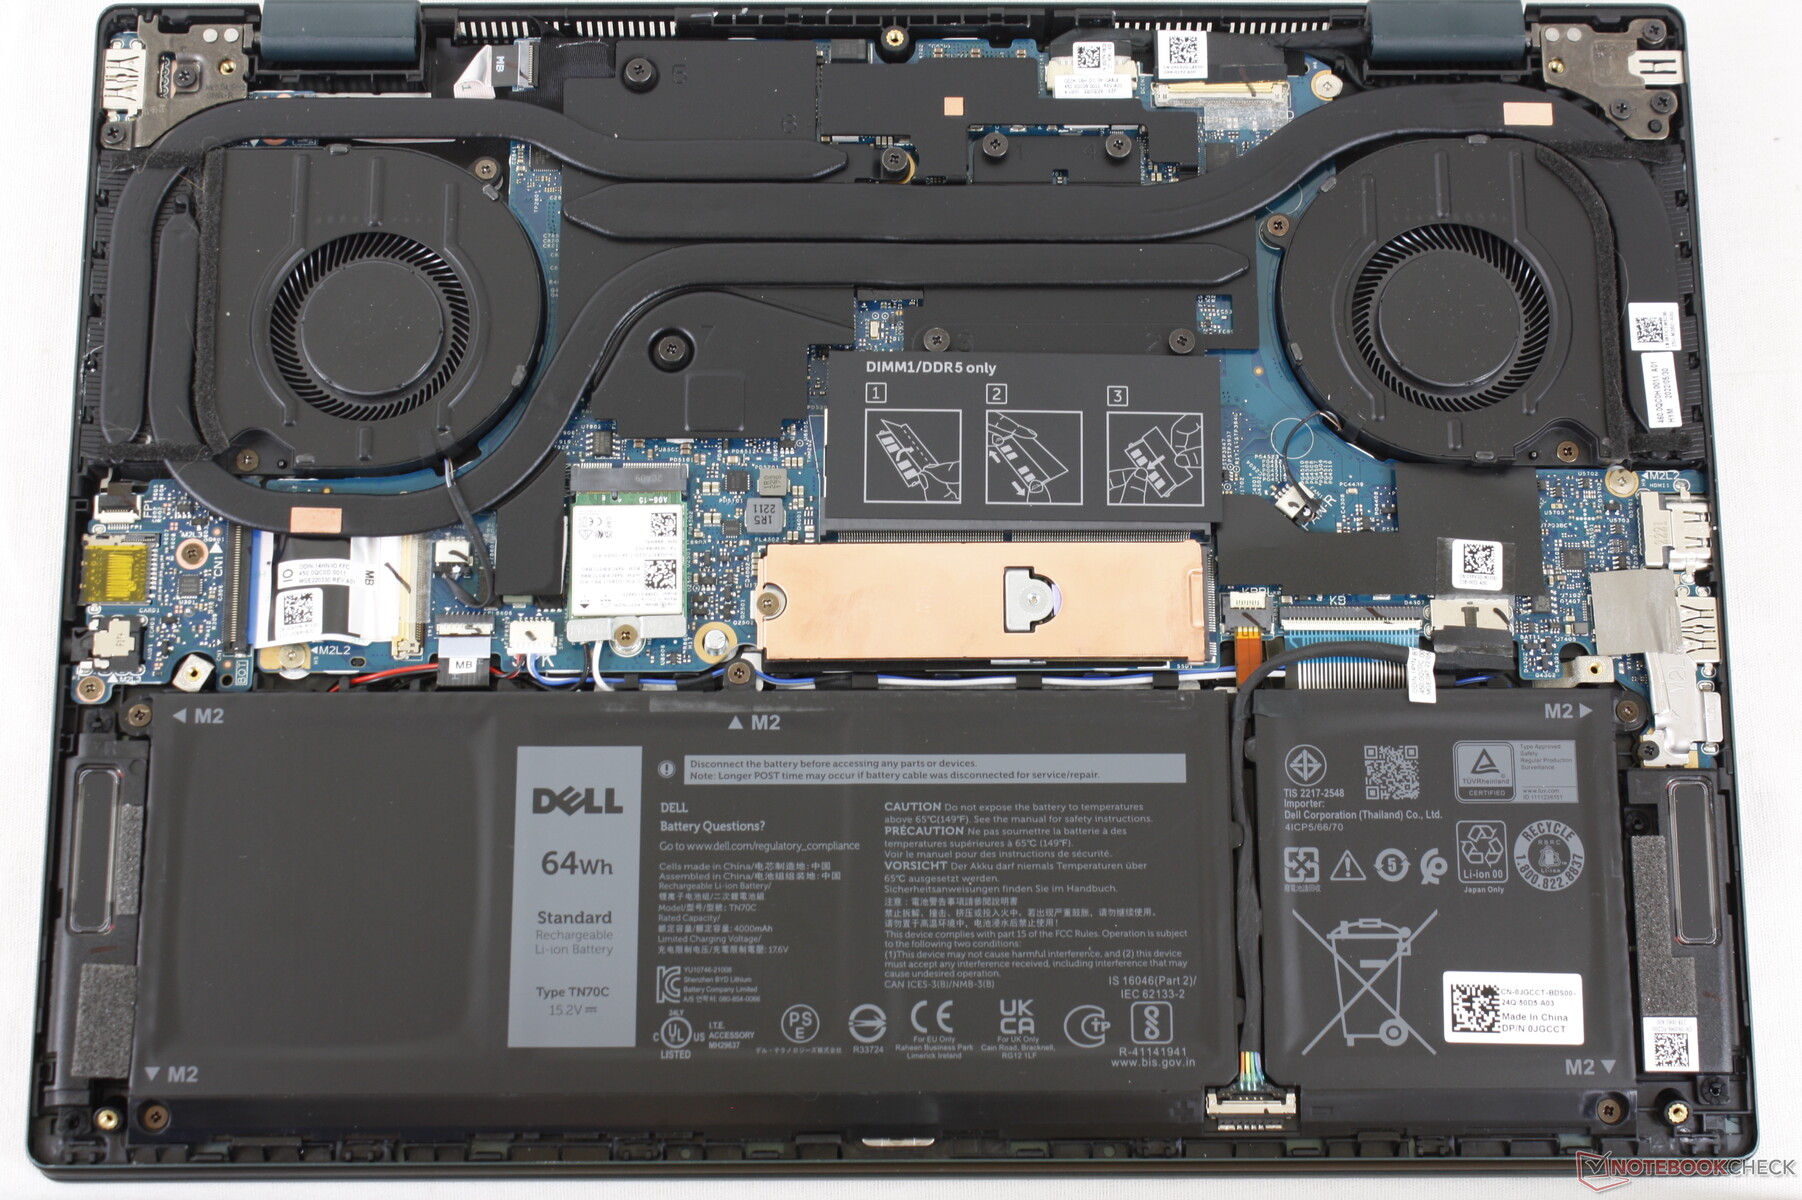
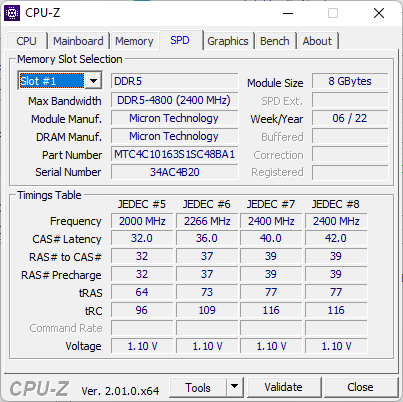
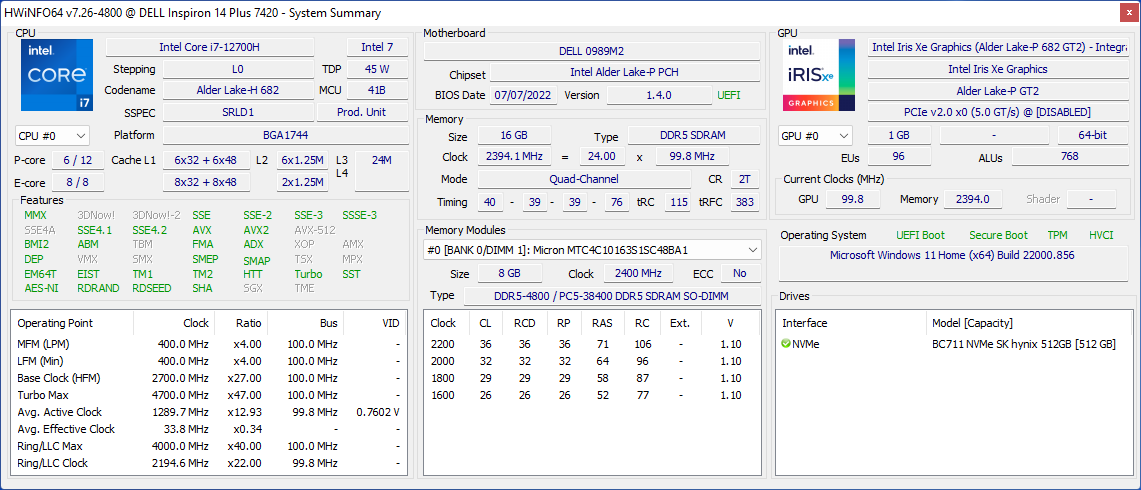
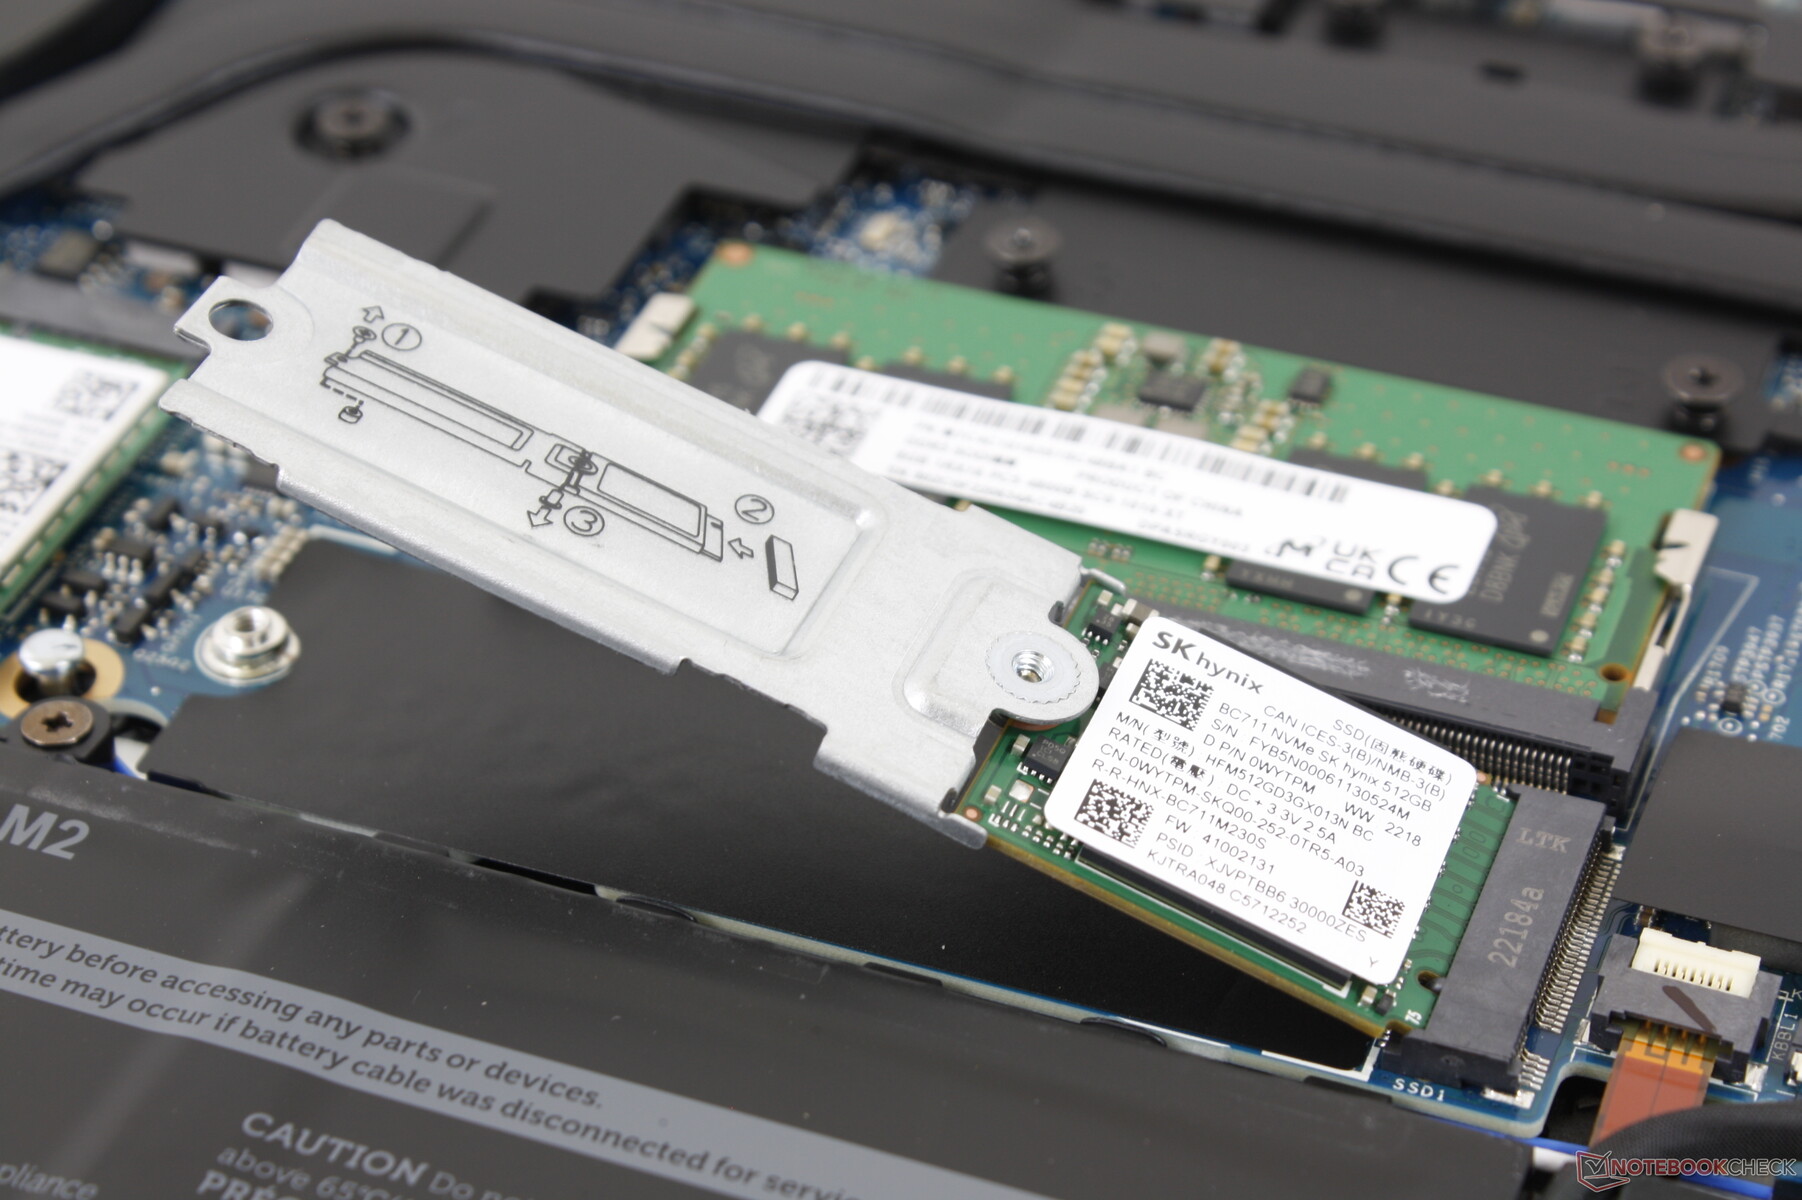
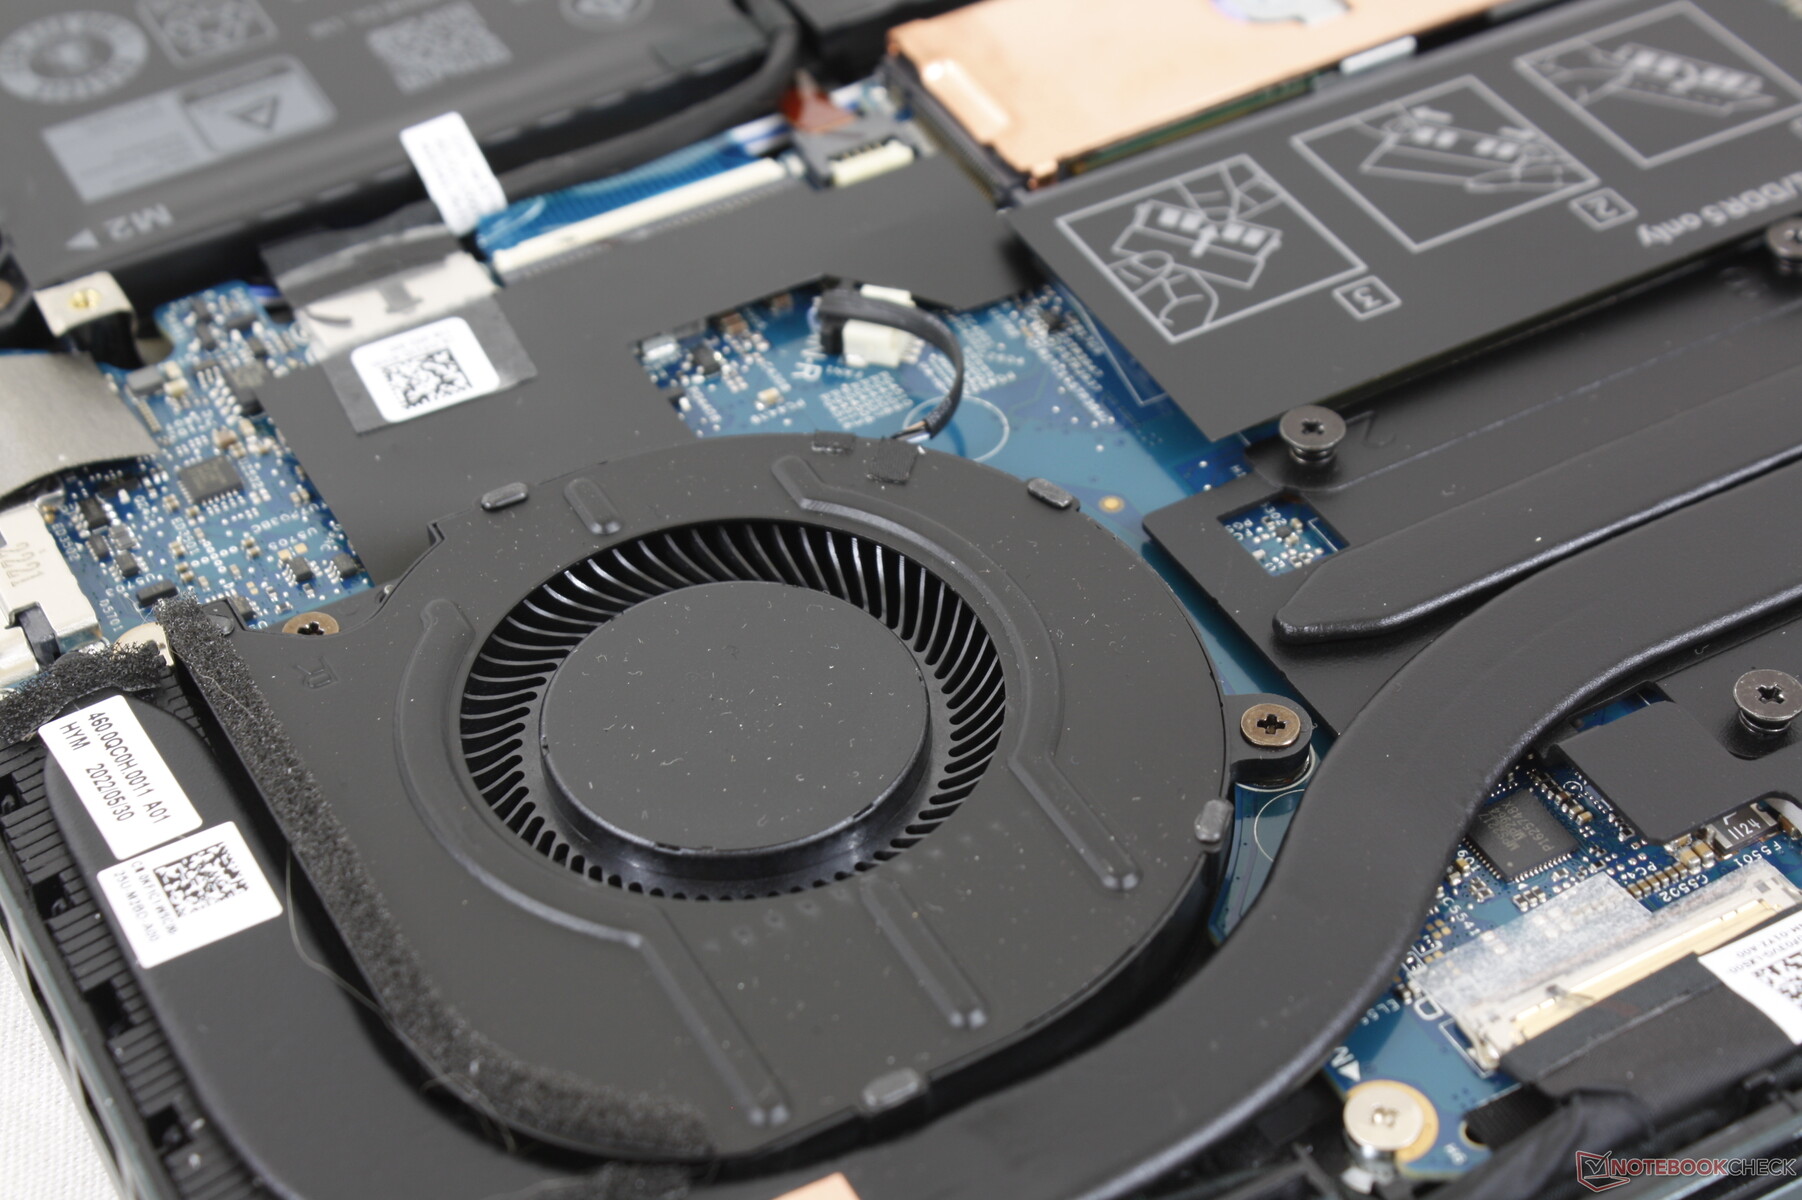
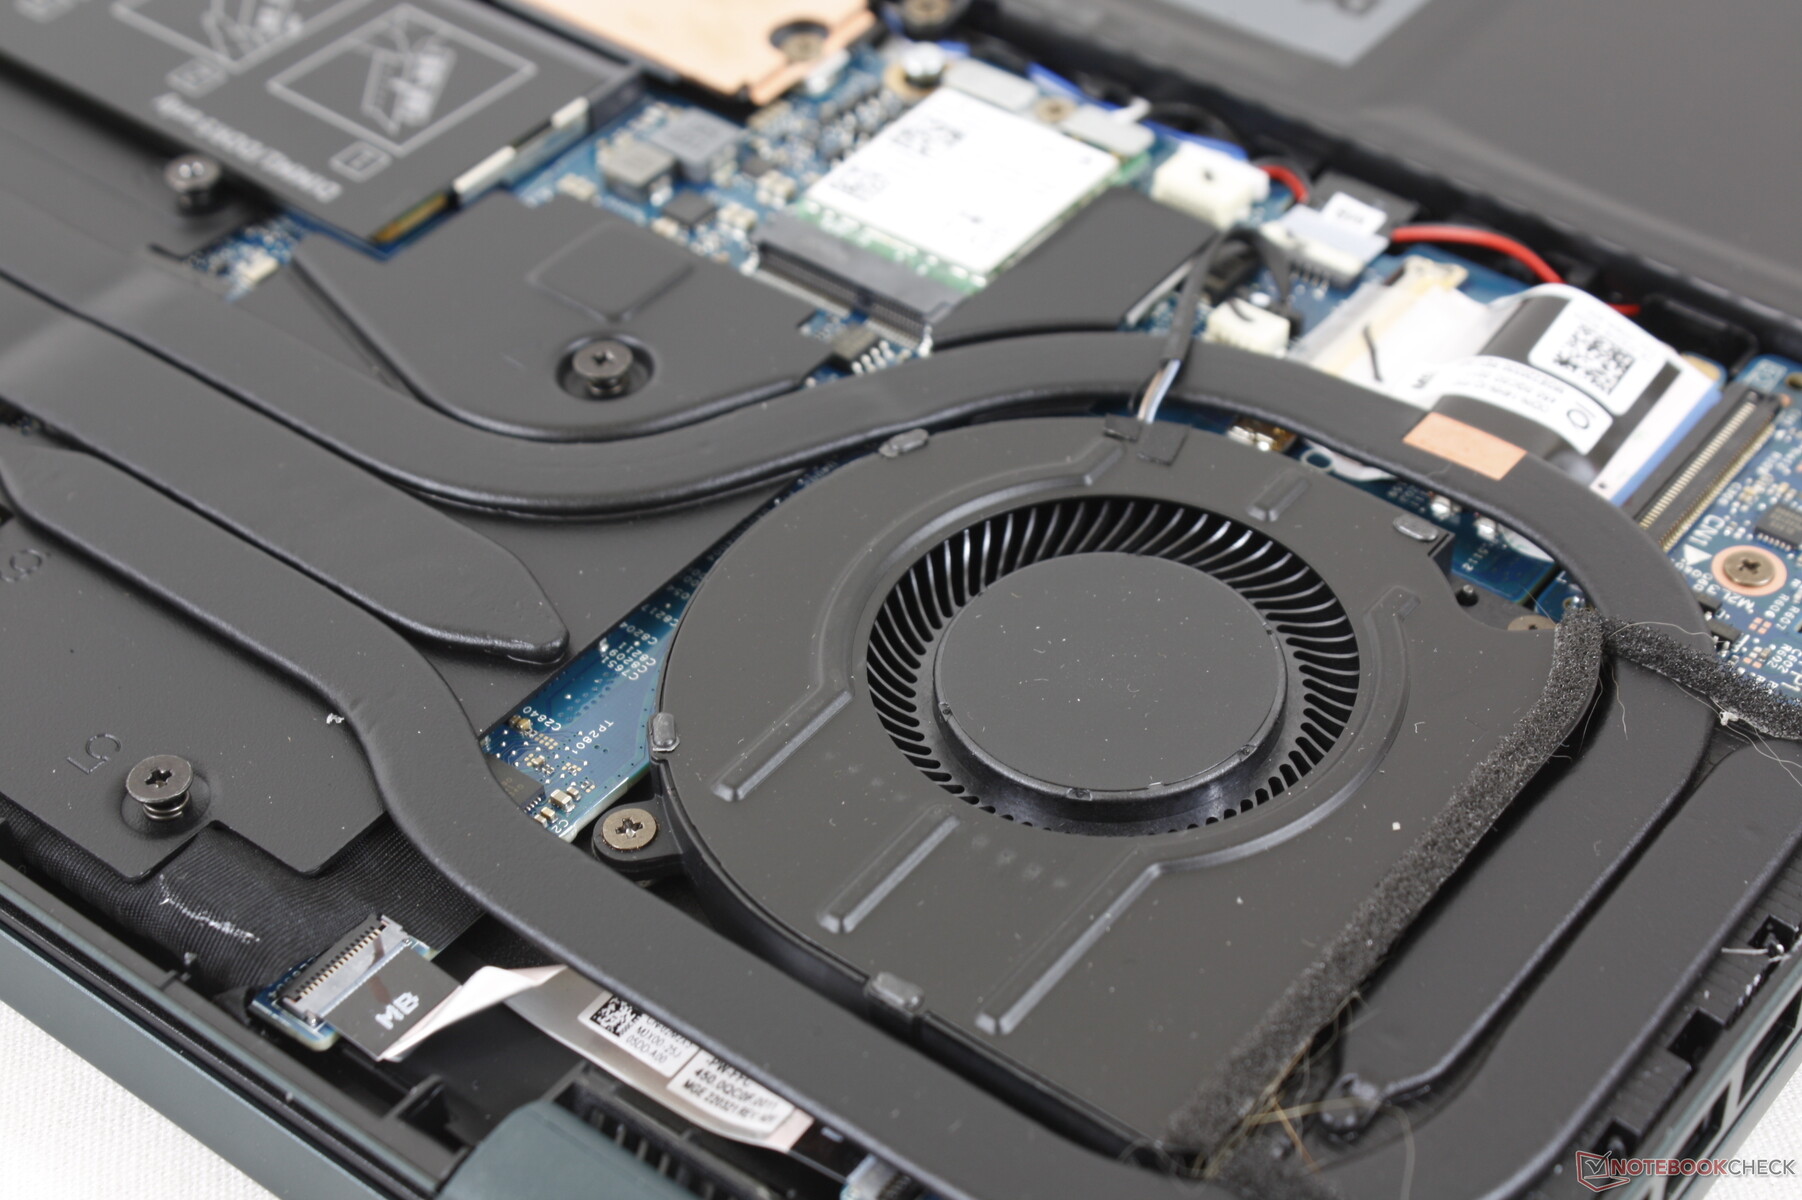
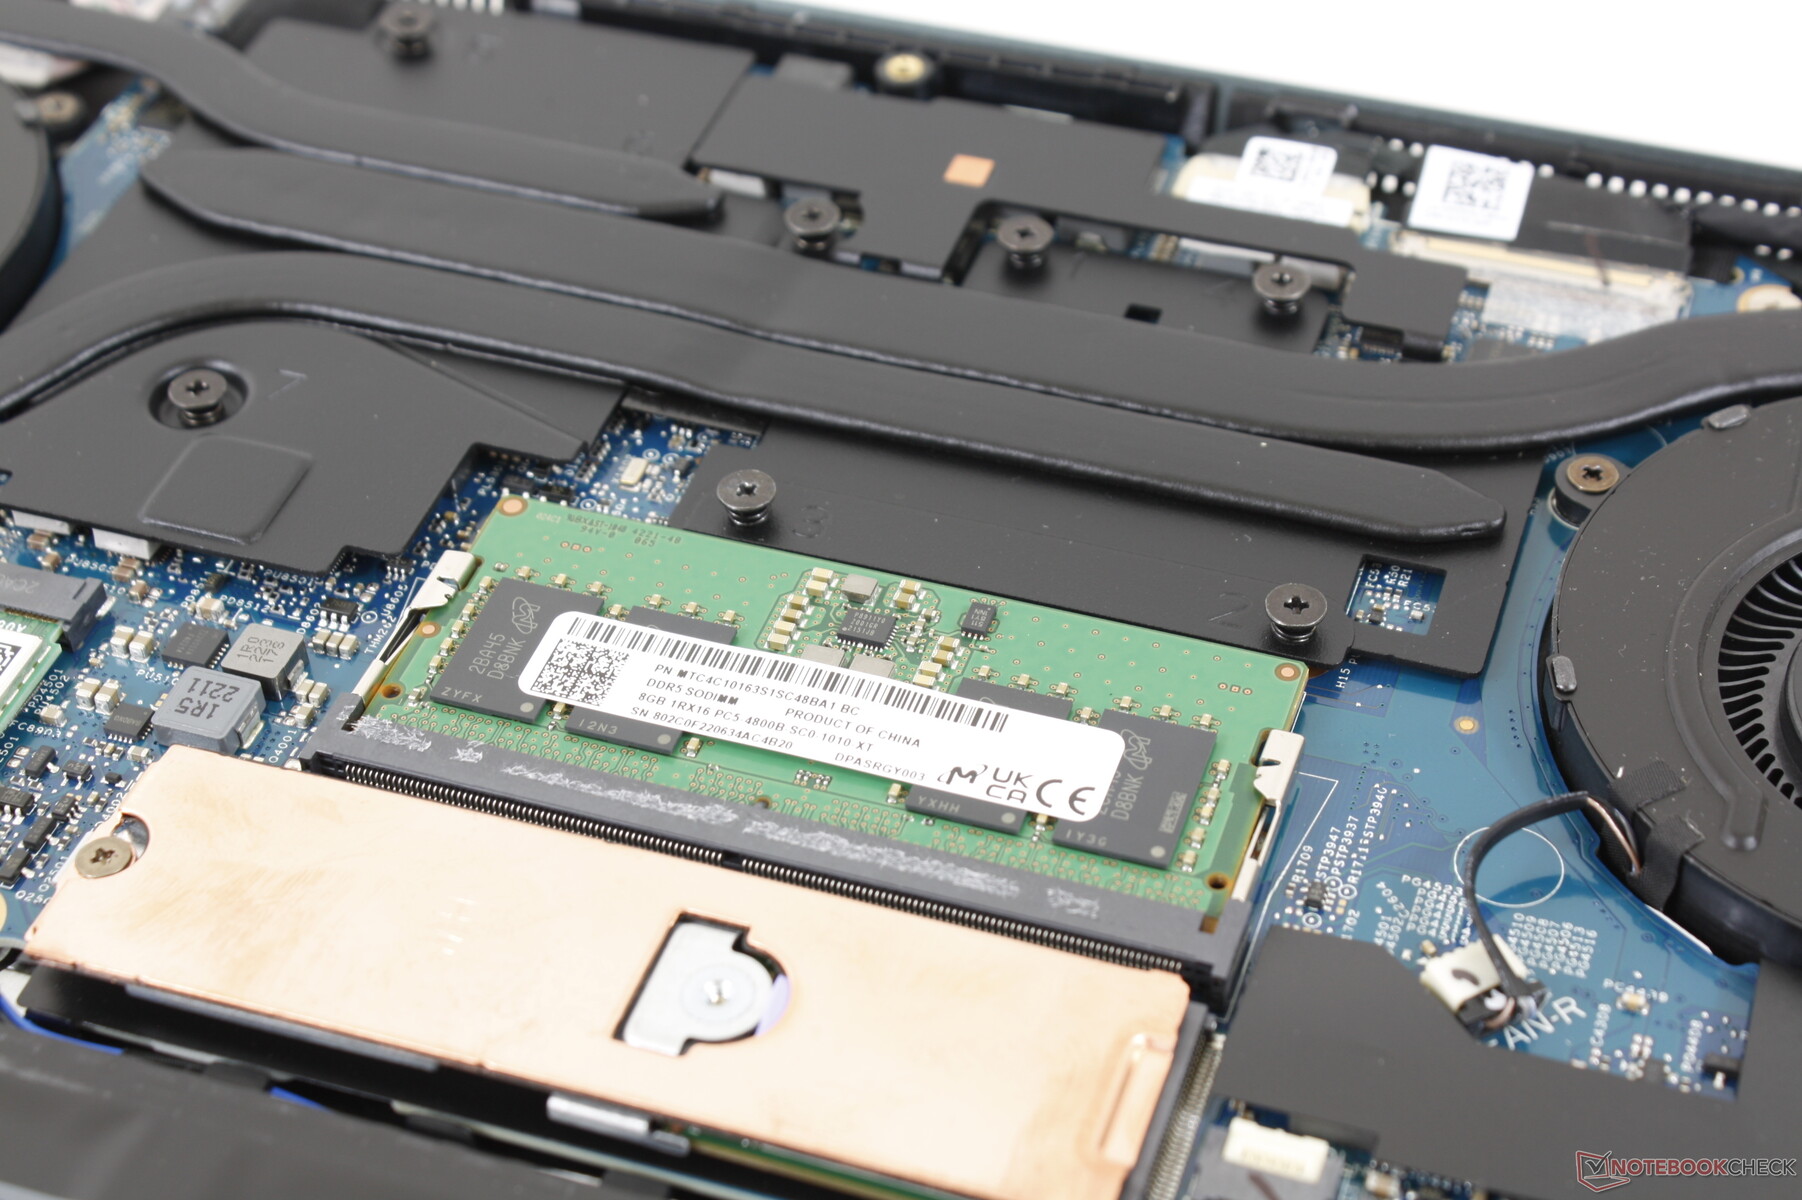
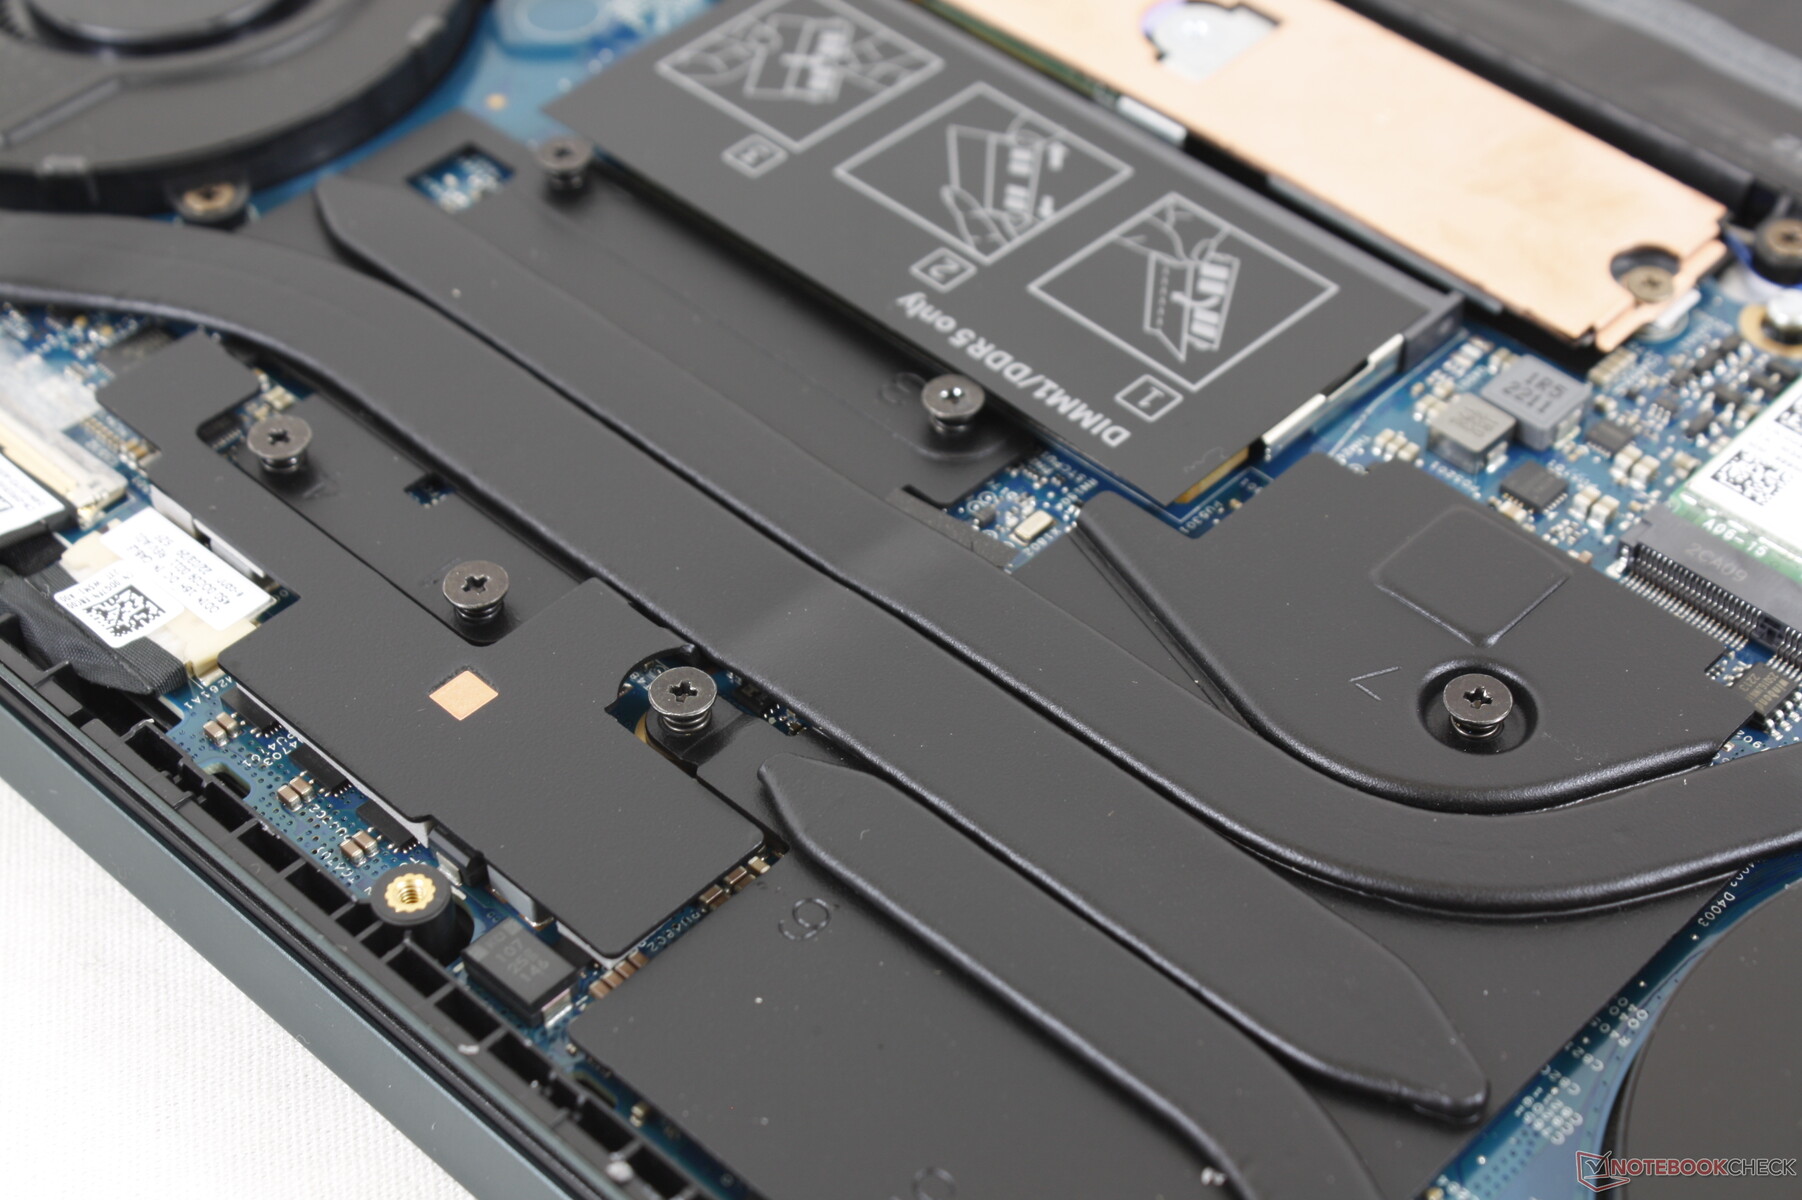
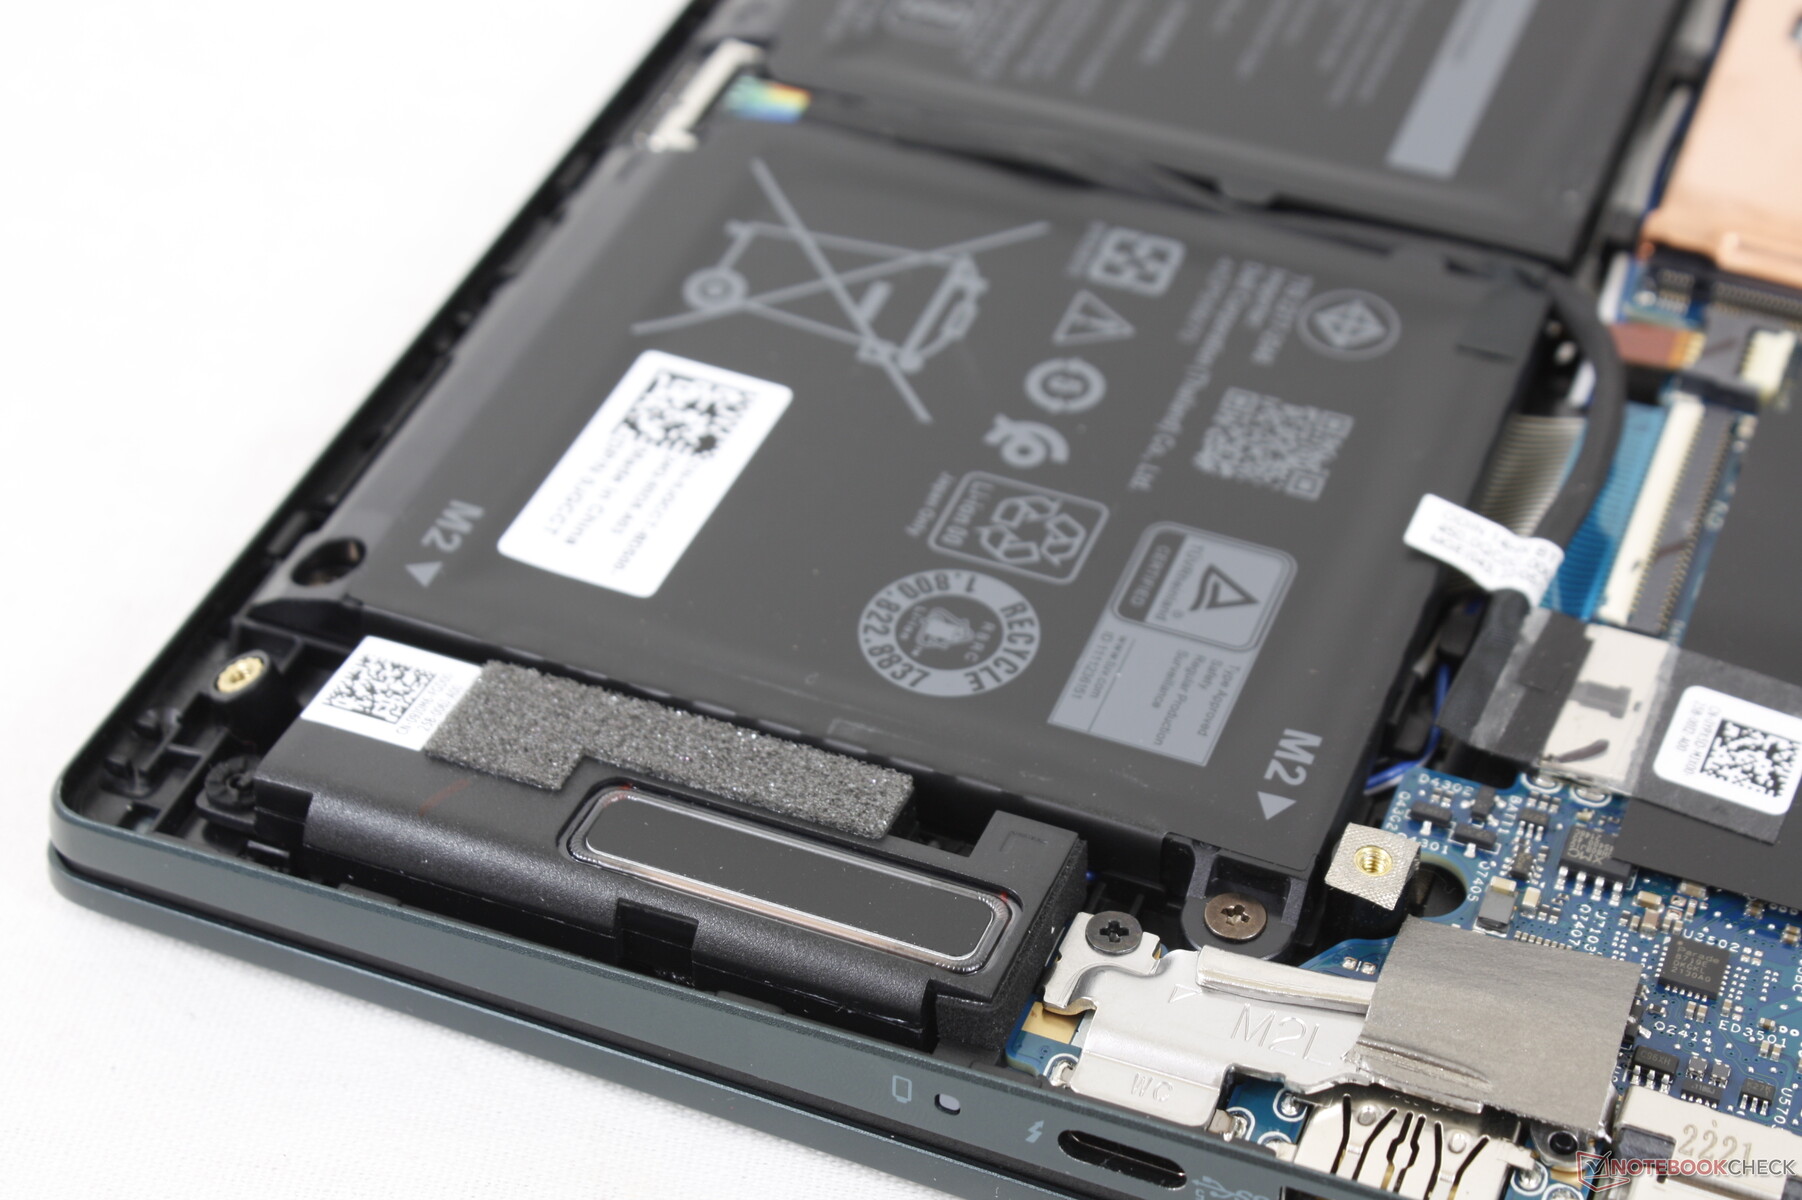
Dolny panel można dość łatwo zdjąć za pomocą śrubokręta Philips i ostrej plastikowej krawędzi. W środku znajduje się bateria, 1x slot M.2 2280, 1x slot DDR5 SODIMM oraz moduł M.2 WLAN. Należy pamiętać, że 8 GB pamięci RAM jest wlutowane we wszystkich jednostkach SKU, co oznacza, że użytkownicy mogą dodać tylko jeden moduł, aby uzyskać maksymalną pojemność pamięci RAM 40 GB.
Akcesoria i gwarancja
W pudełku nie ma żadnych dodatków poza zasilaczem sieciowym i dokumentacją. W przypadku zakupu w USA obowiązuje zwykła roczna ograniczona gwarancja.
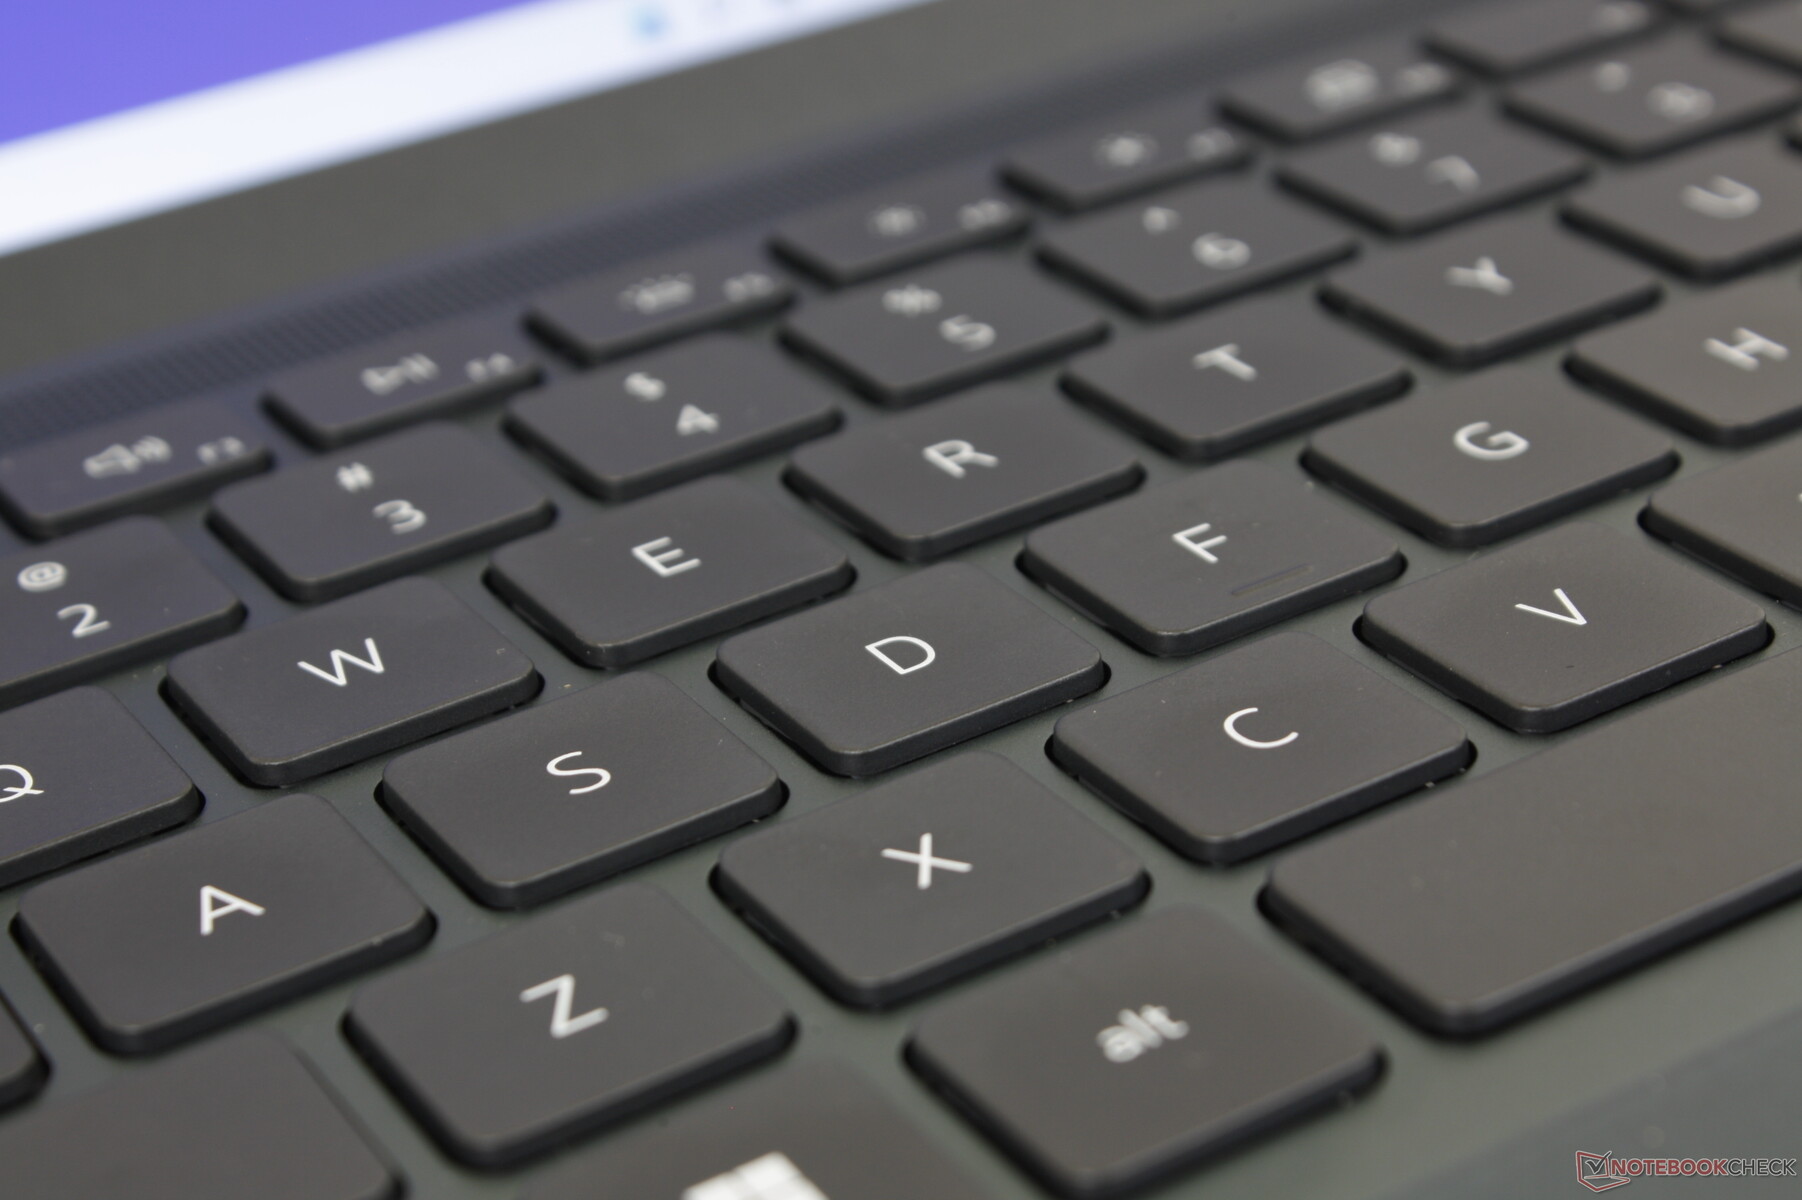
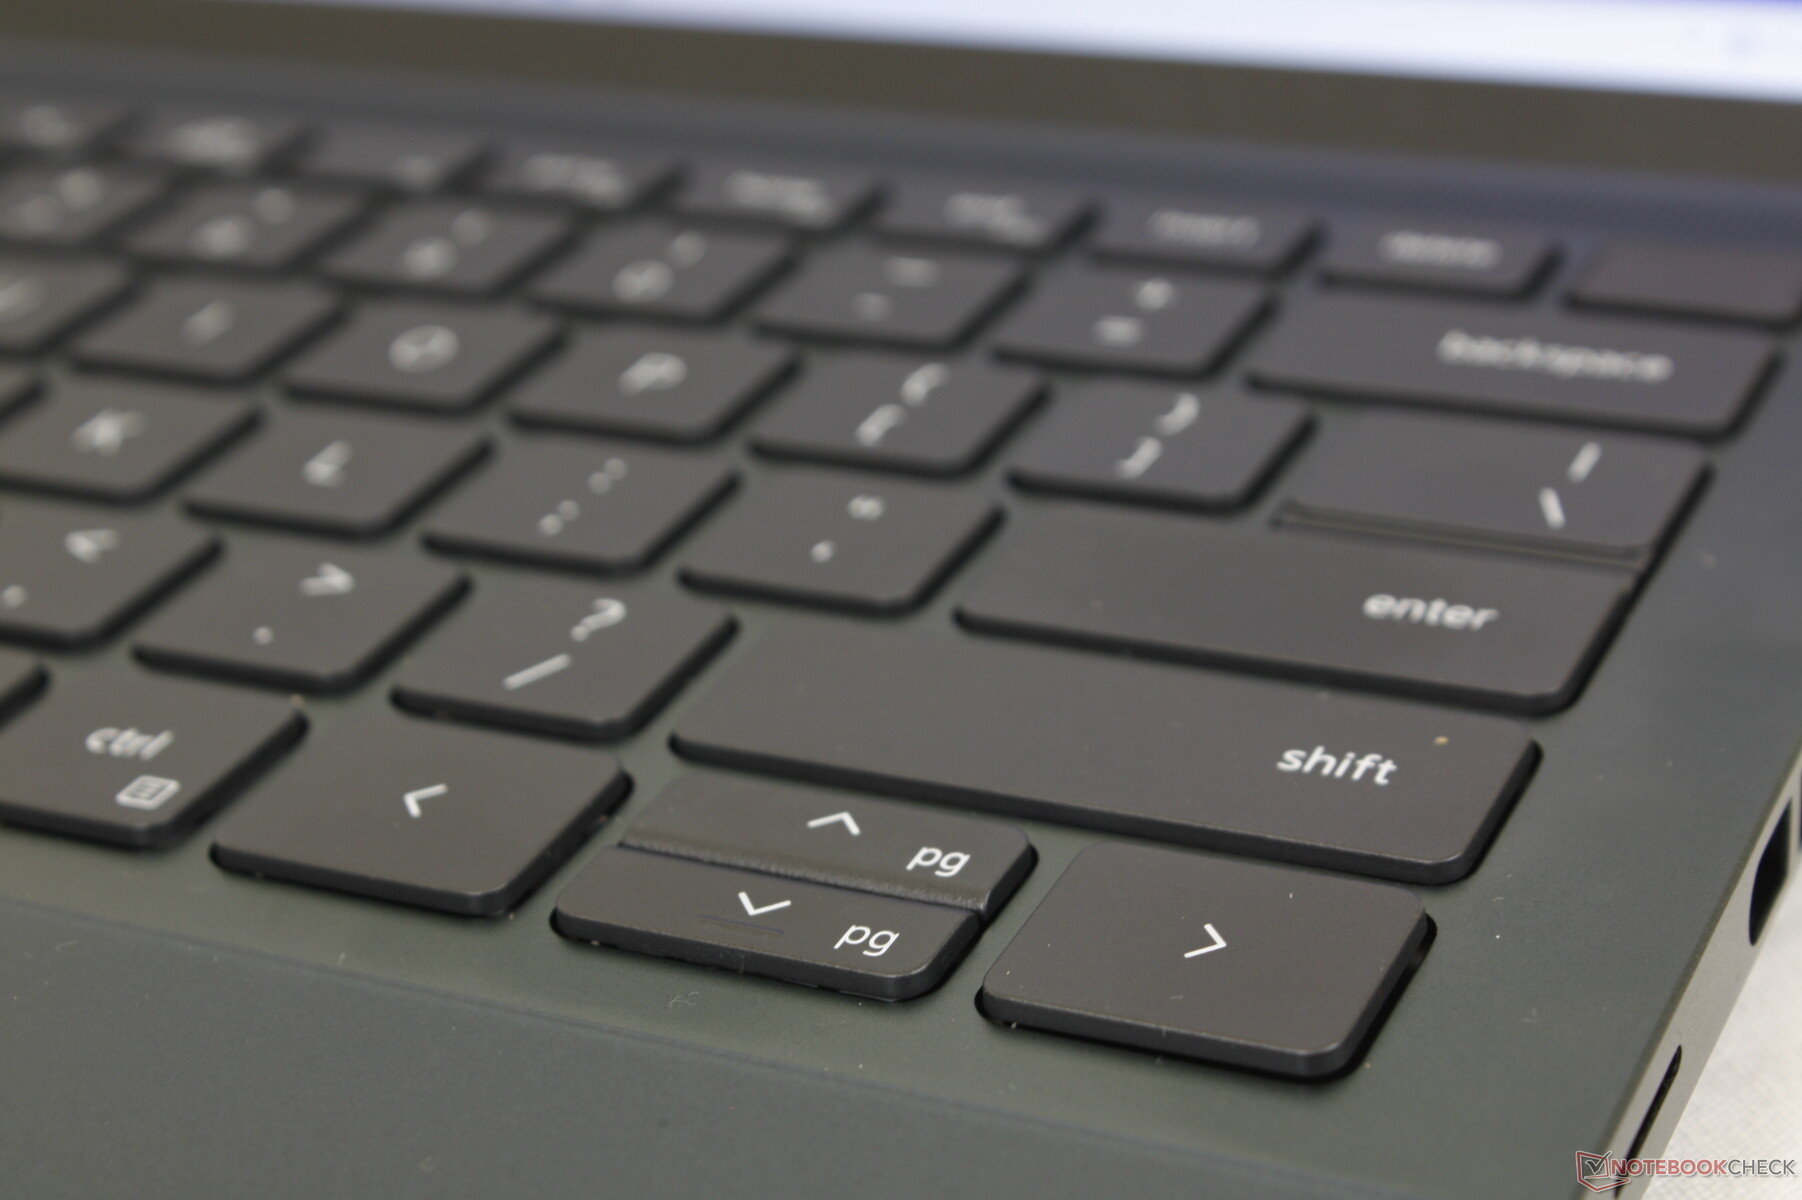
Urządzenia wejściowe - Been Here, Seen That
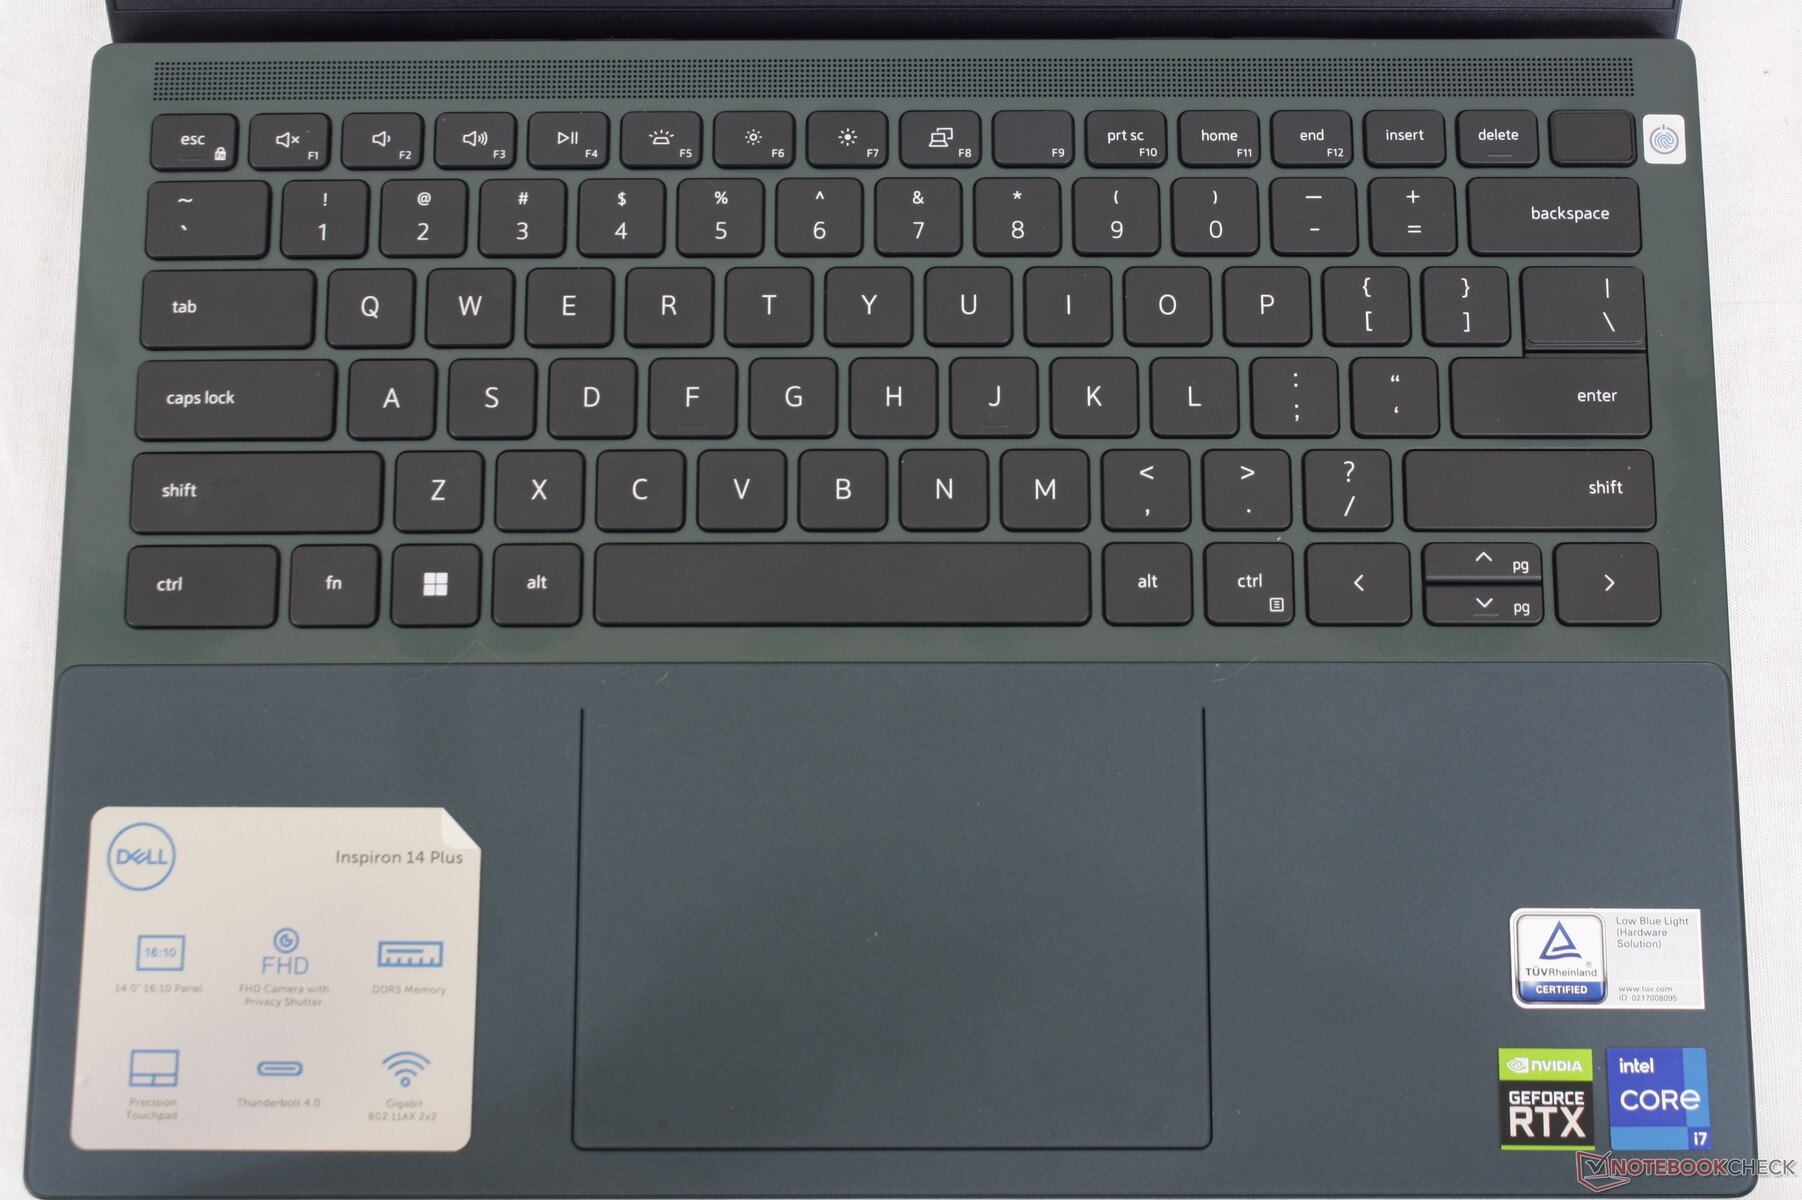
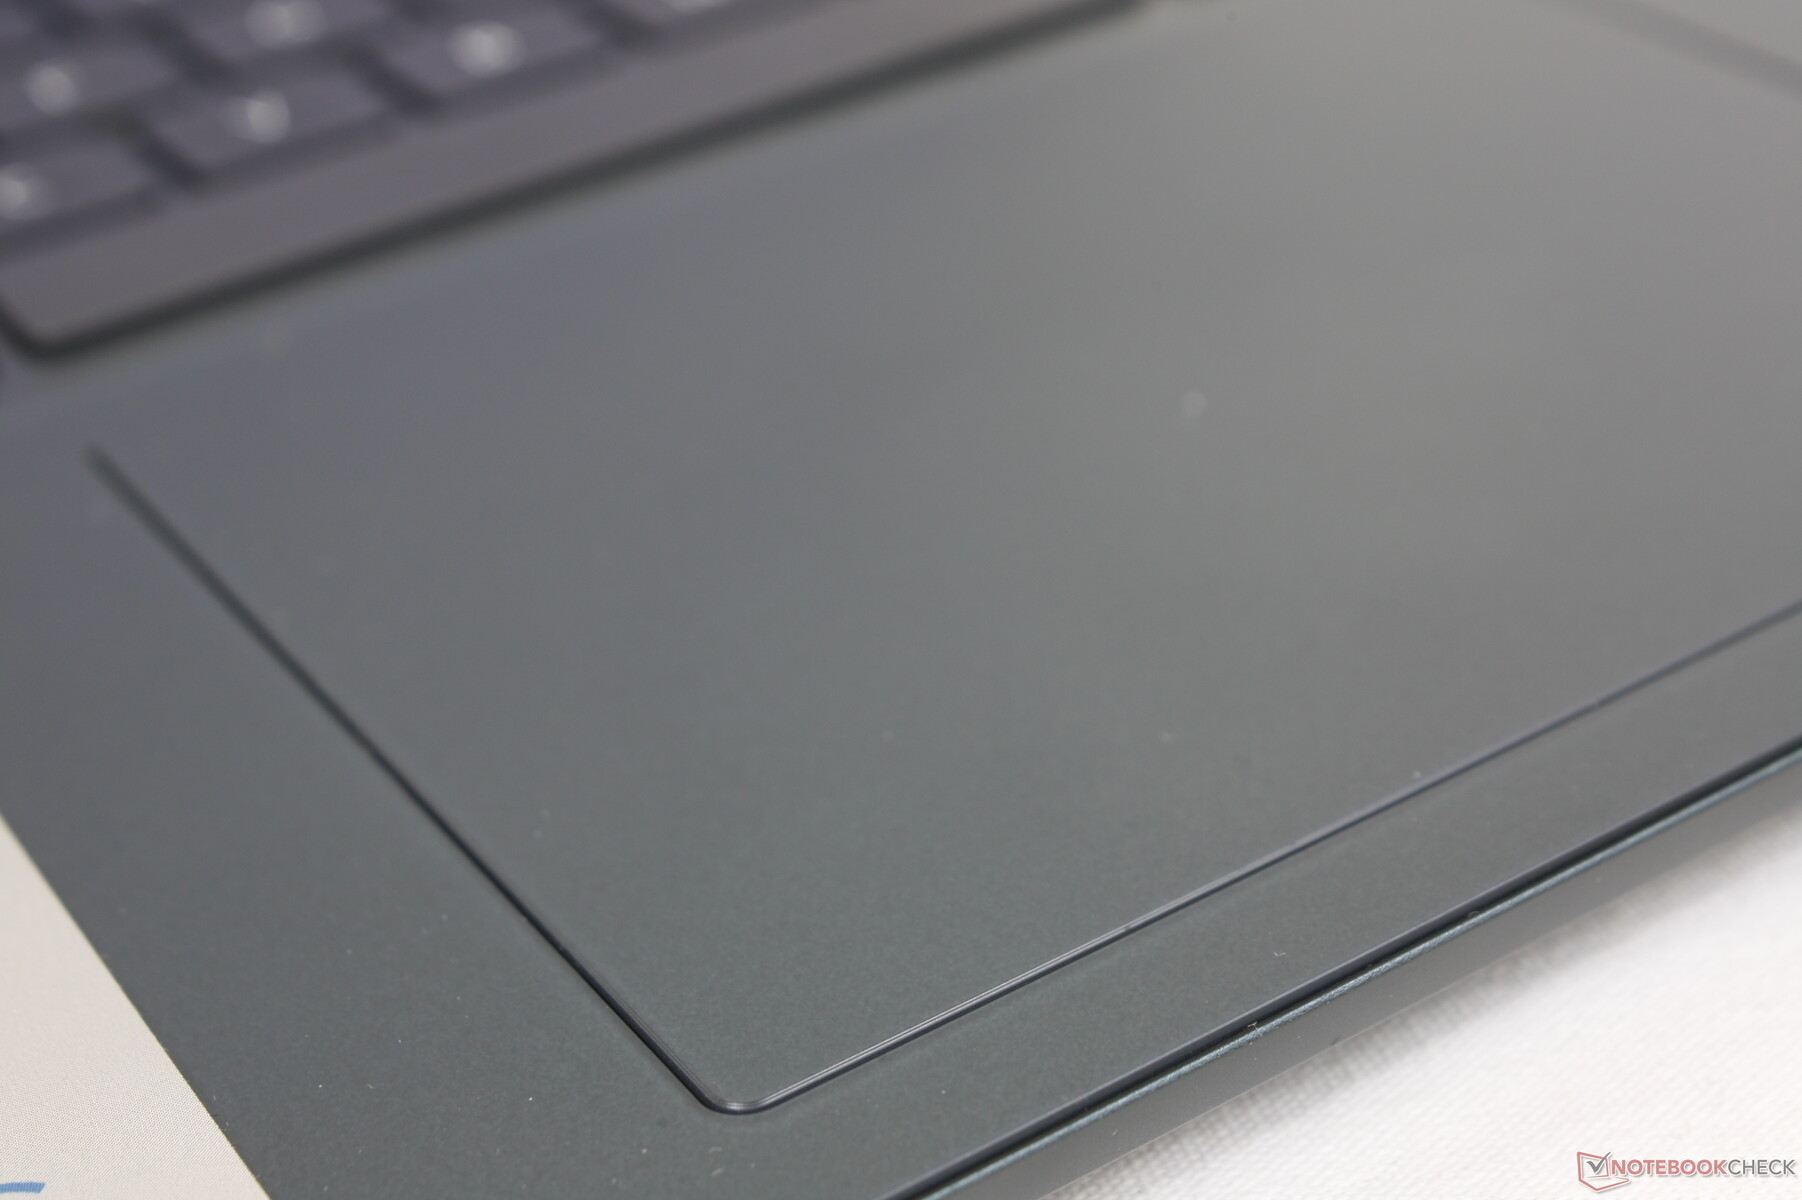
Klawiatura i Touchpad
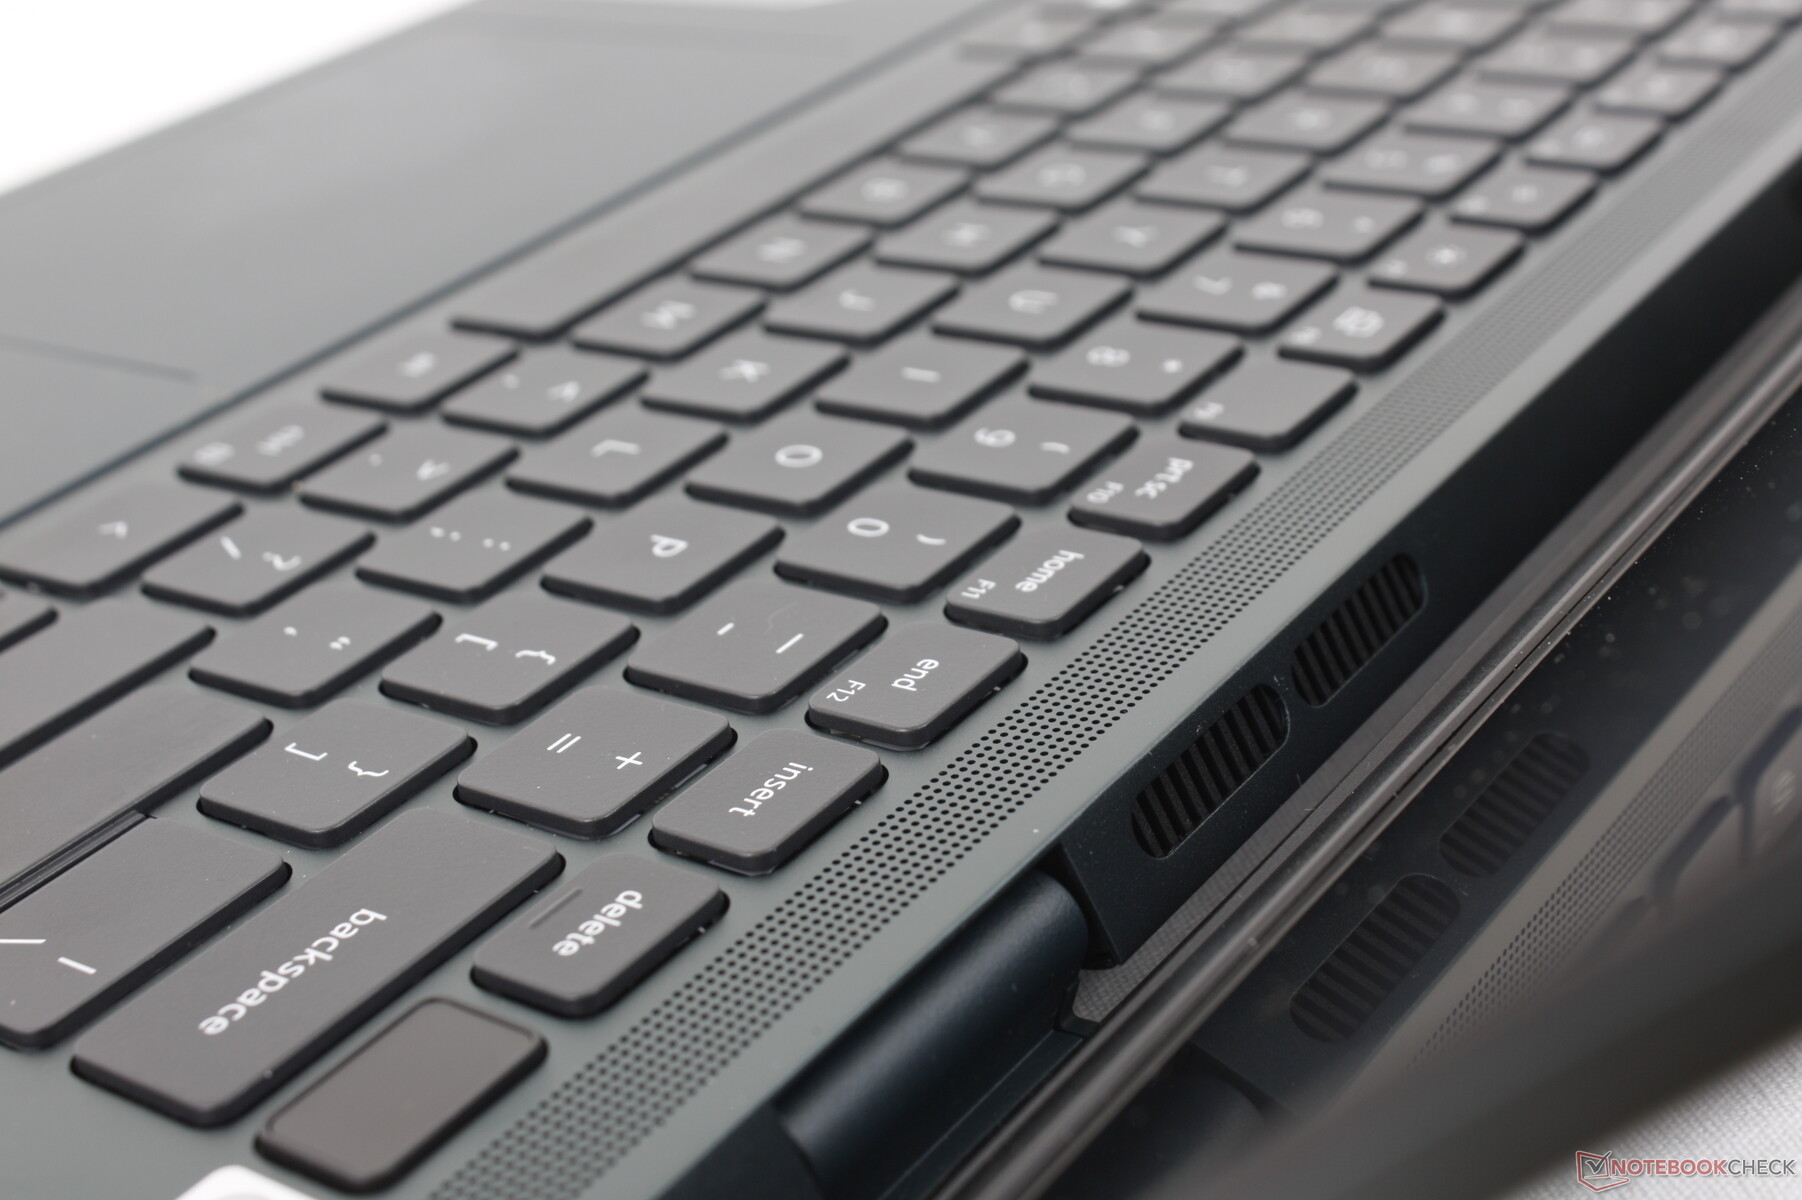
Sposób pisania jest taki sam jak w przypadku Inspiron 16 Plus 7620,Inspiron 16 7620 2-in-1lub Inspiron 14 7420 2-in-1 ponieważ wszystkie cztery modele mają takie same klawisze klawiatury i płytkę Mylar. Nawet symbole klawiszy głównych i drugorzędnych oraz rozmiar gładzika (11,5 x 8 cm) są identyczne pomiędzy modelami, niezależnie od różnic w wielkości ekranu. W skrócie, klawisze mają odpowiednie sprzężenie zwrotne i umiarkowany klekot, z wyjątkiem klawisza spacji, który wydaje się nieco zbyt płytki. Podobnie powierzchnia gładzika działa niezawodnie przy standardowym sterowaniu kursorem, natomiast zintegrowane z nim klawisze są zbyt miękkie i gąbczaste przy przeciąganiu i upuszczaniu.
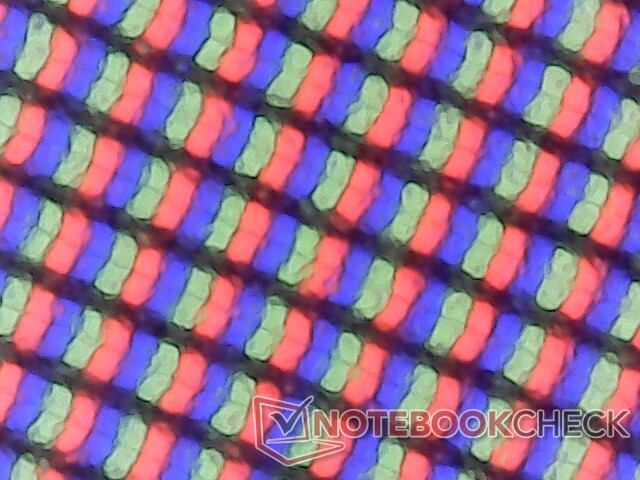
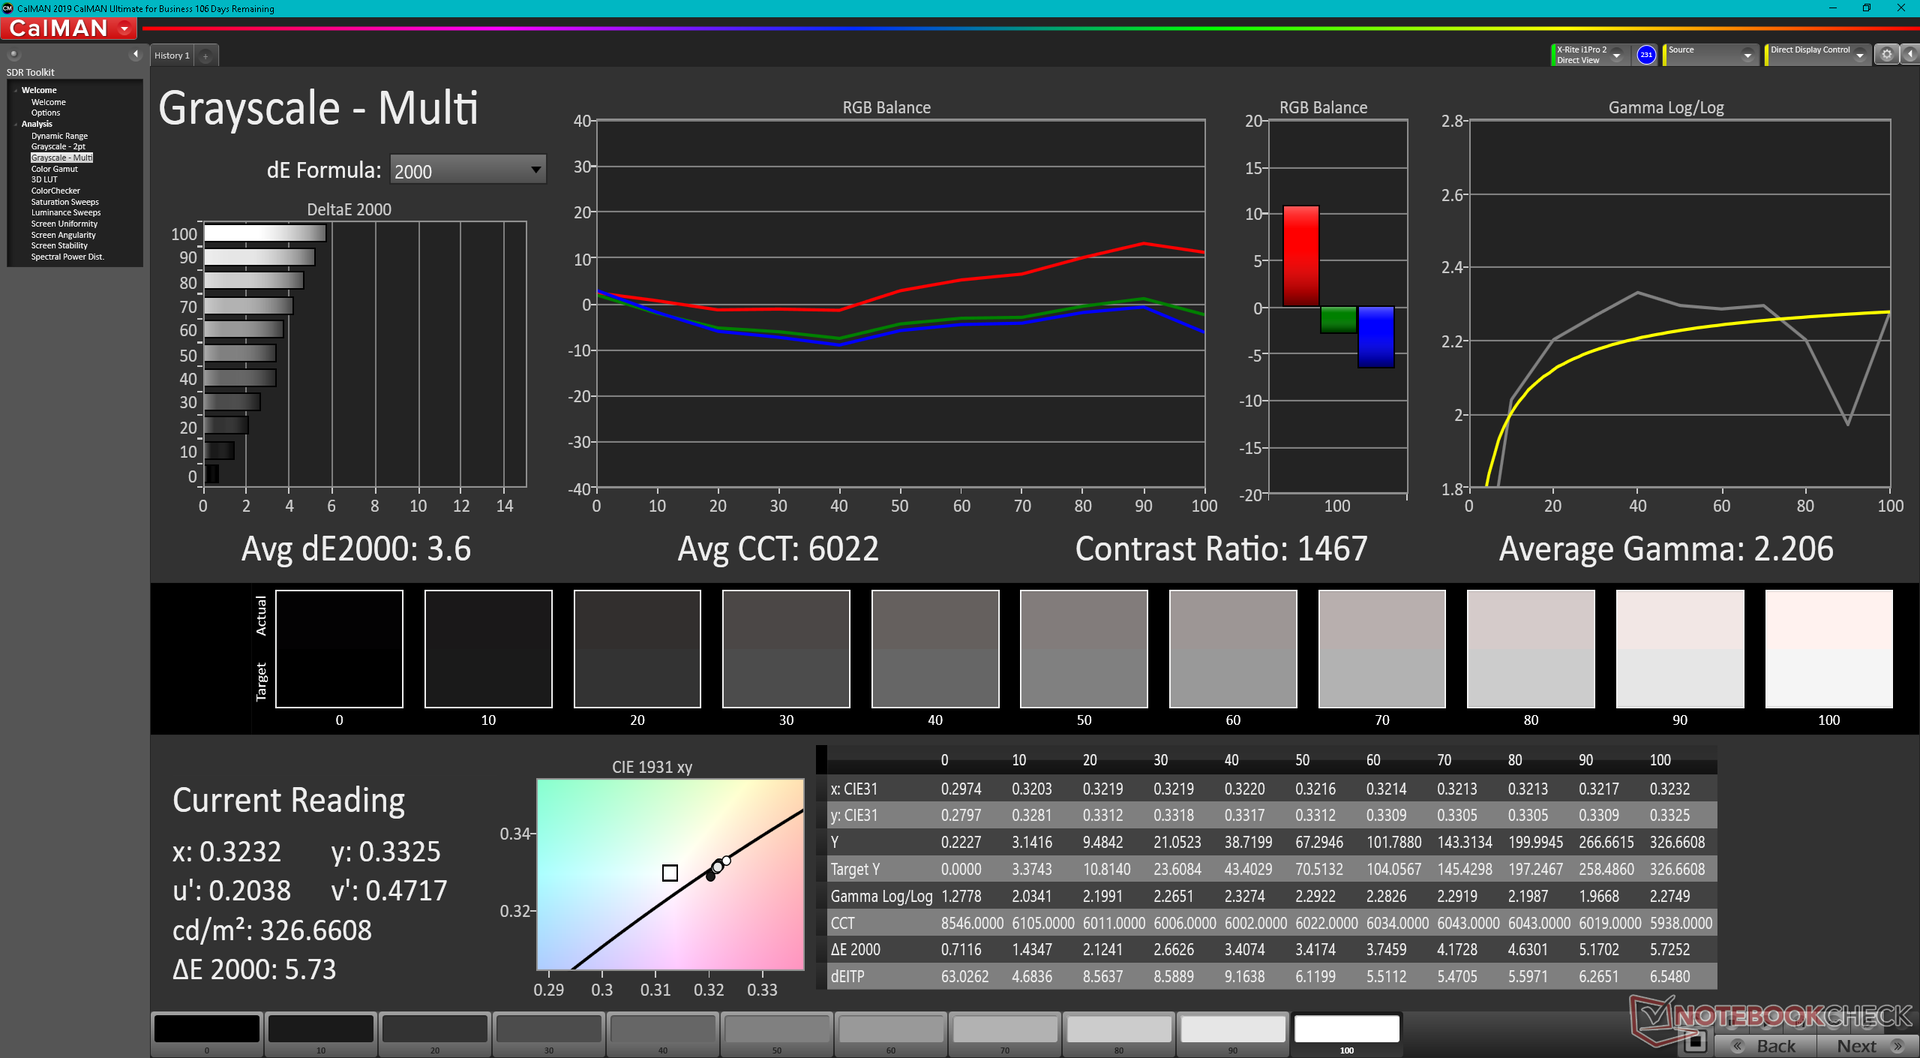
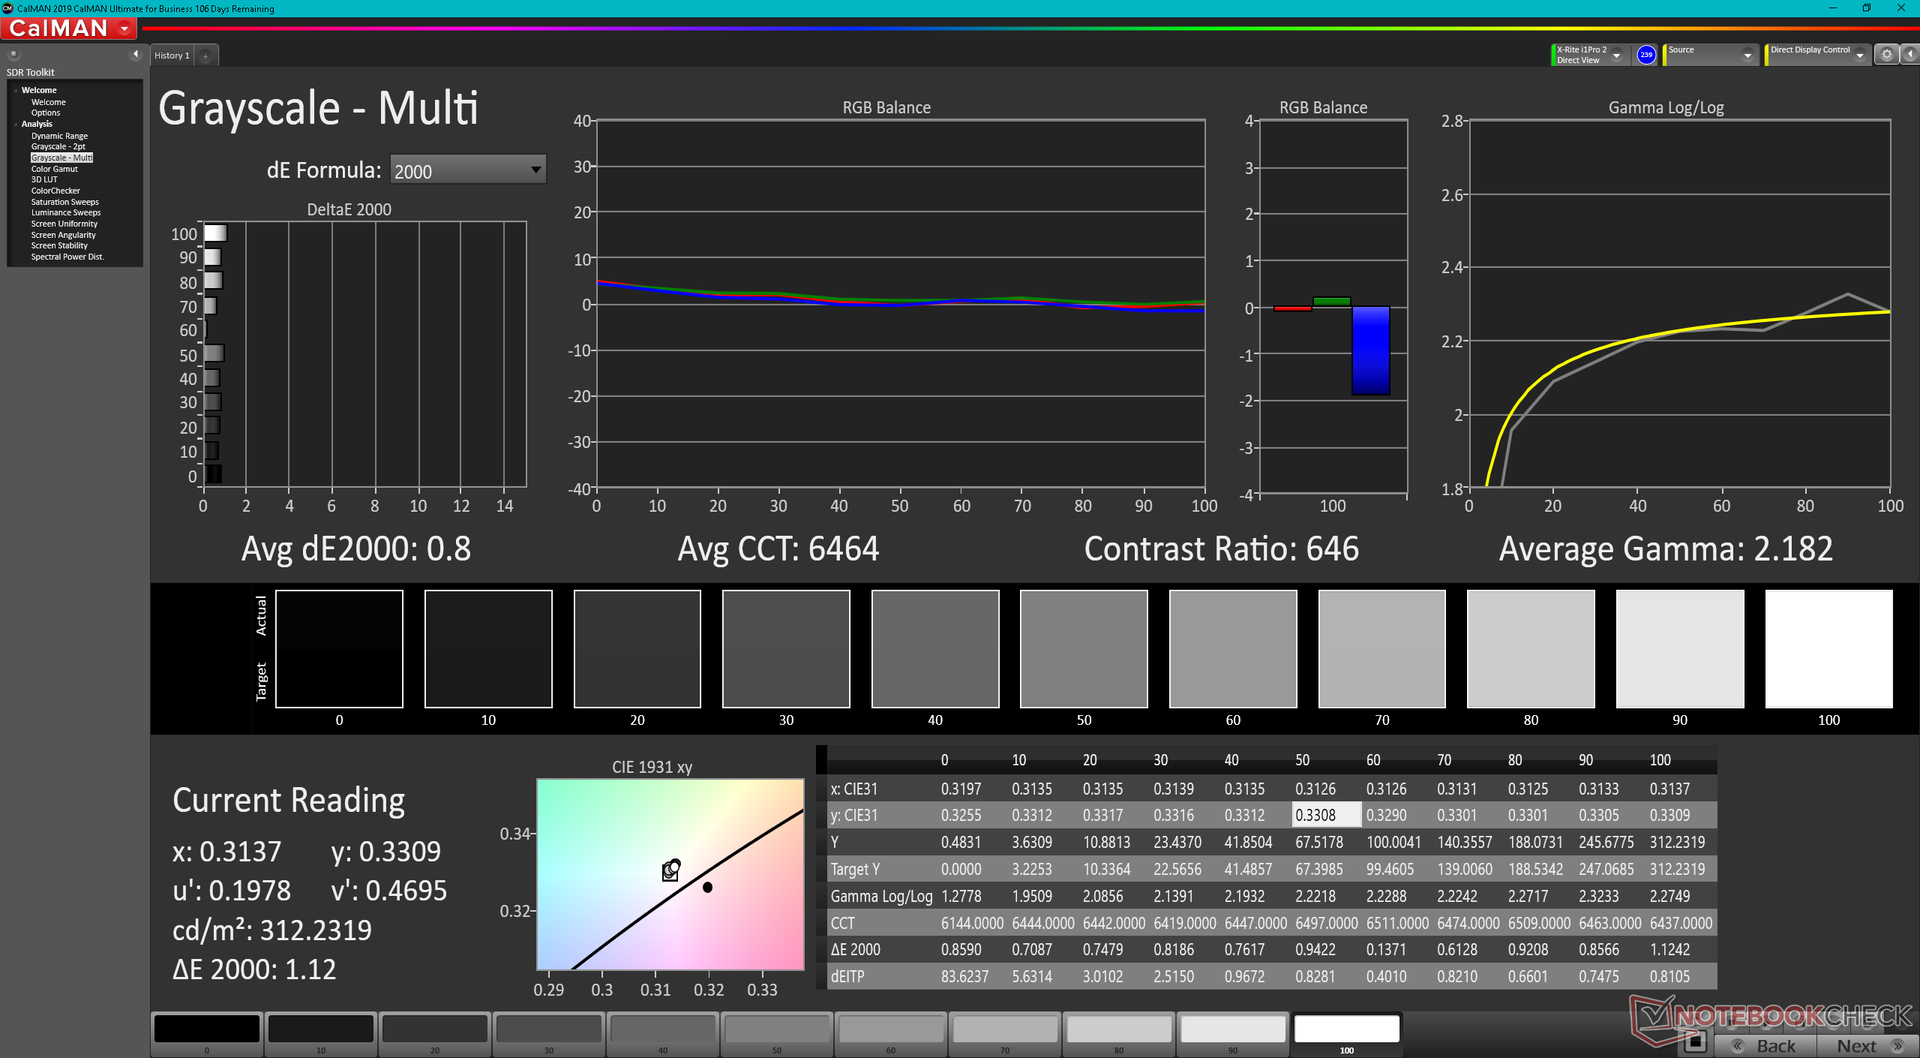
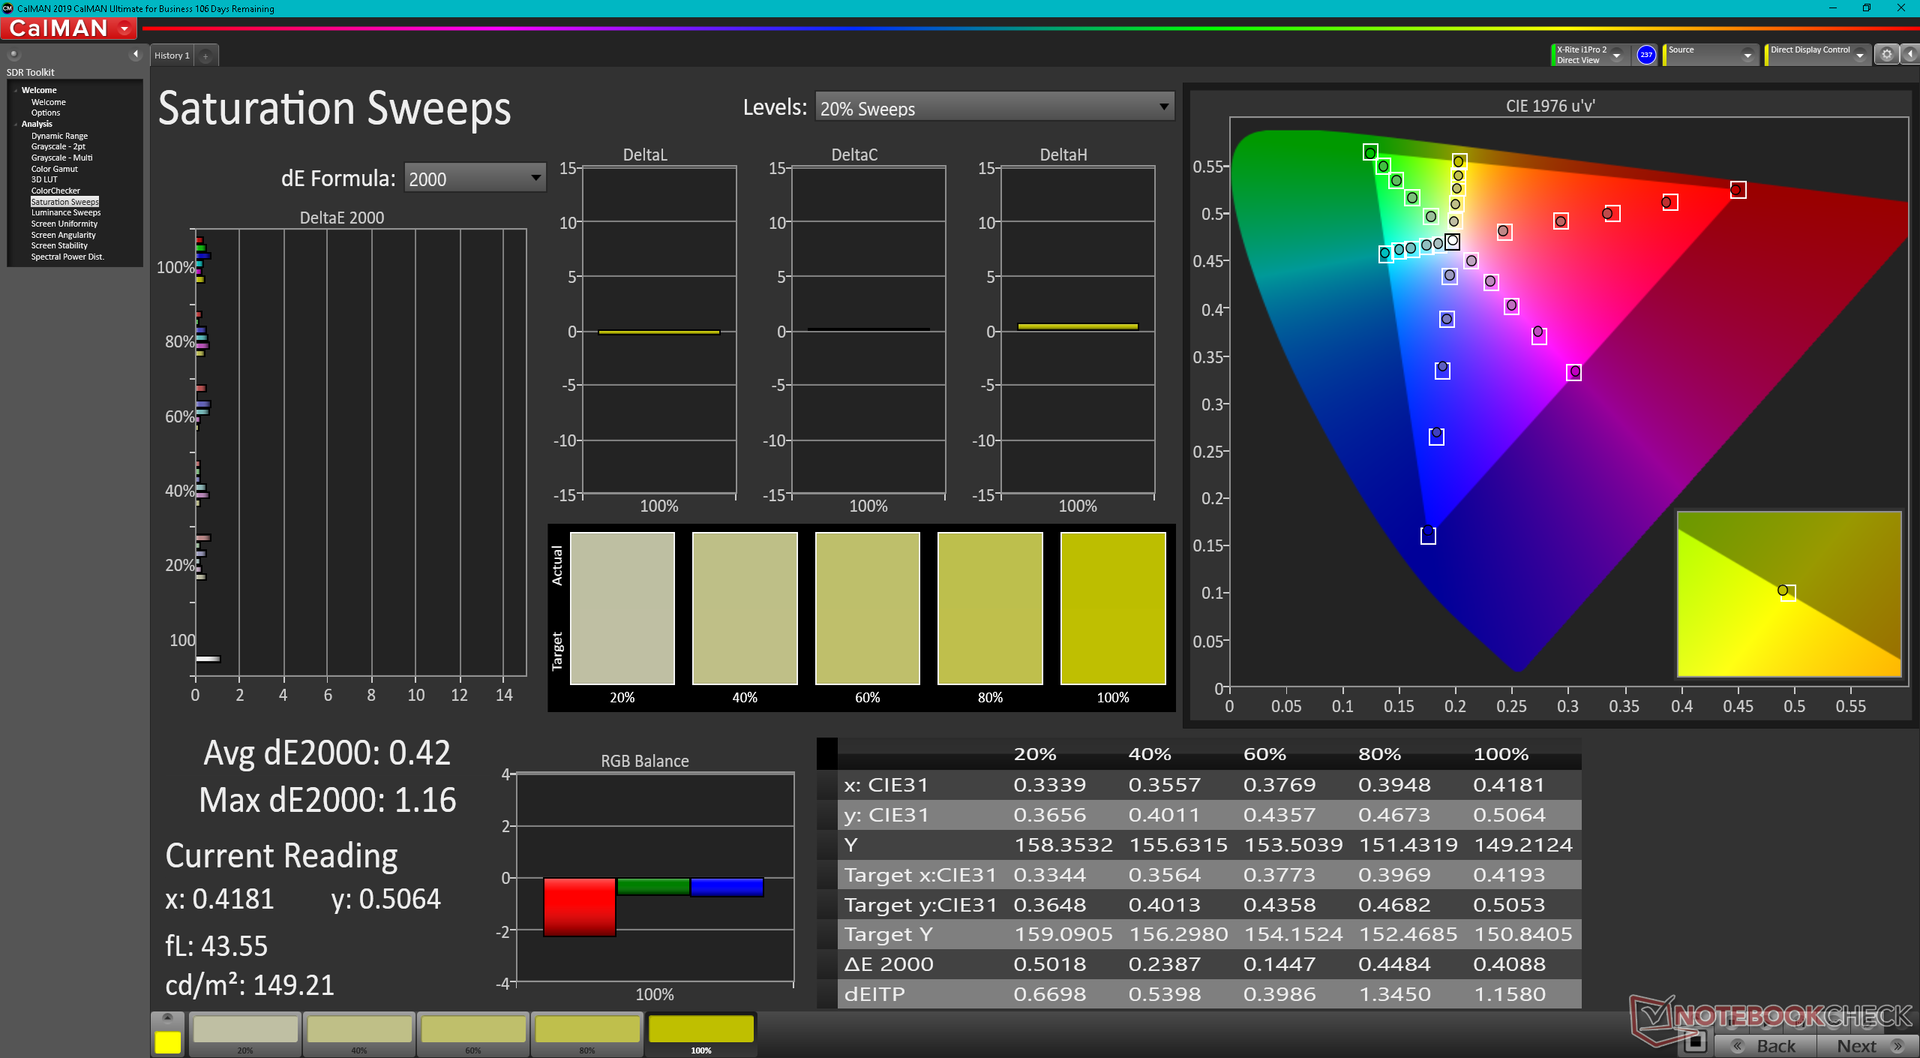
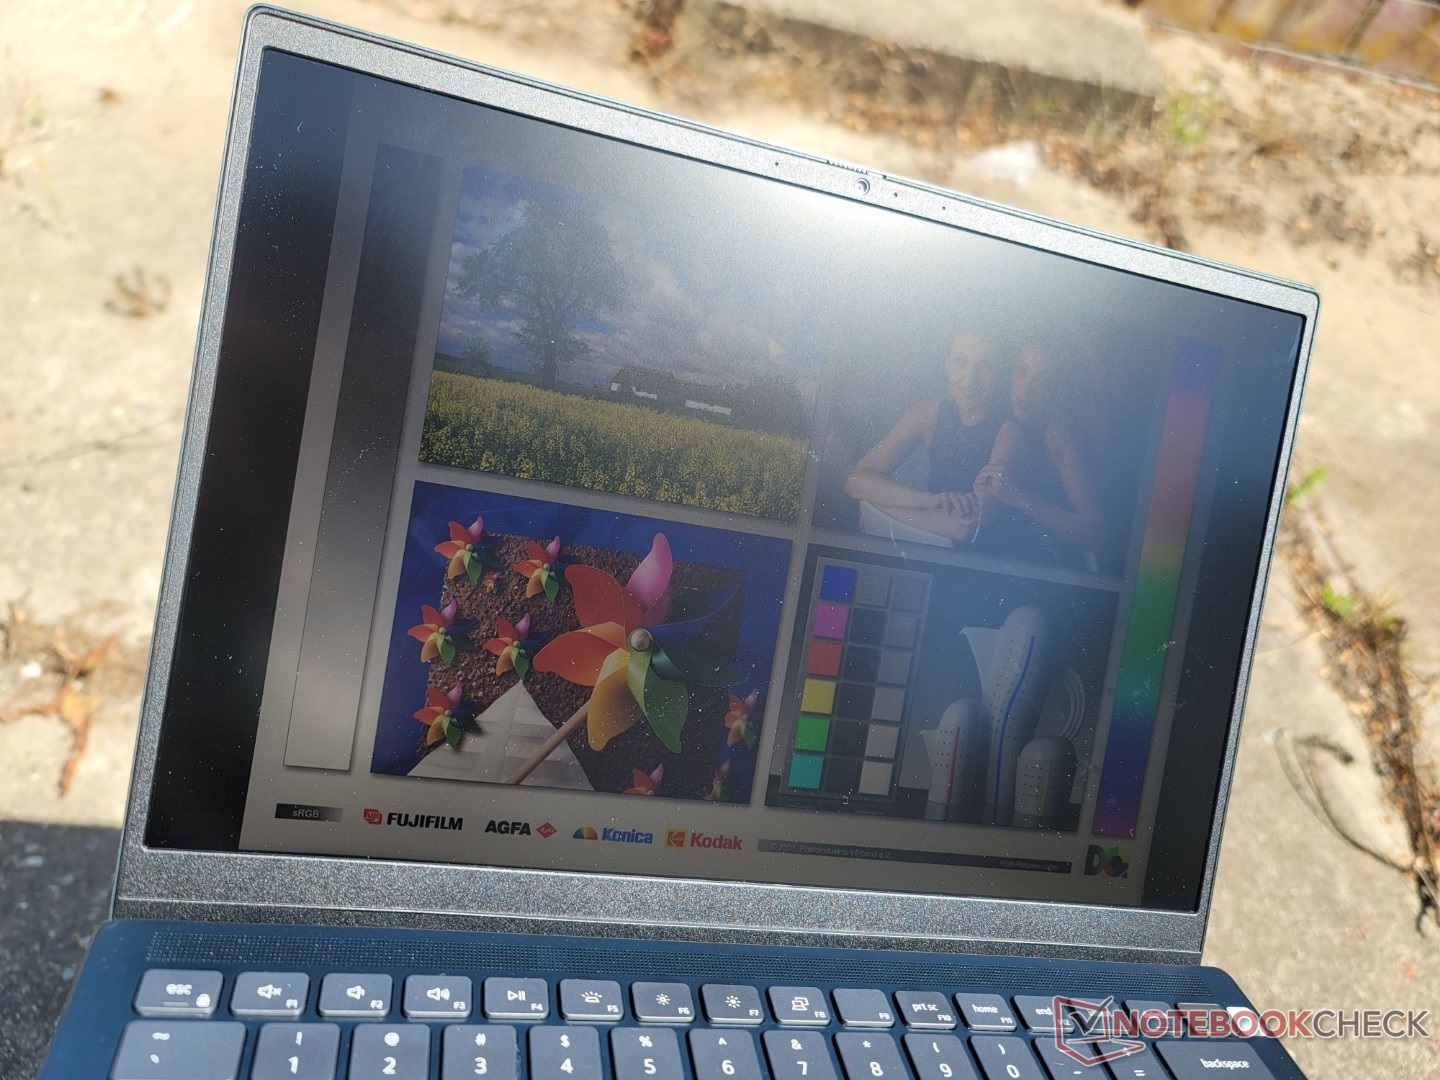
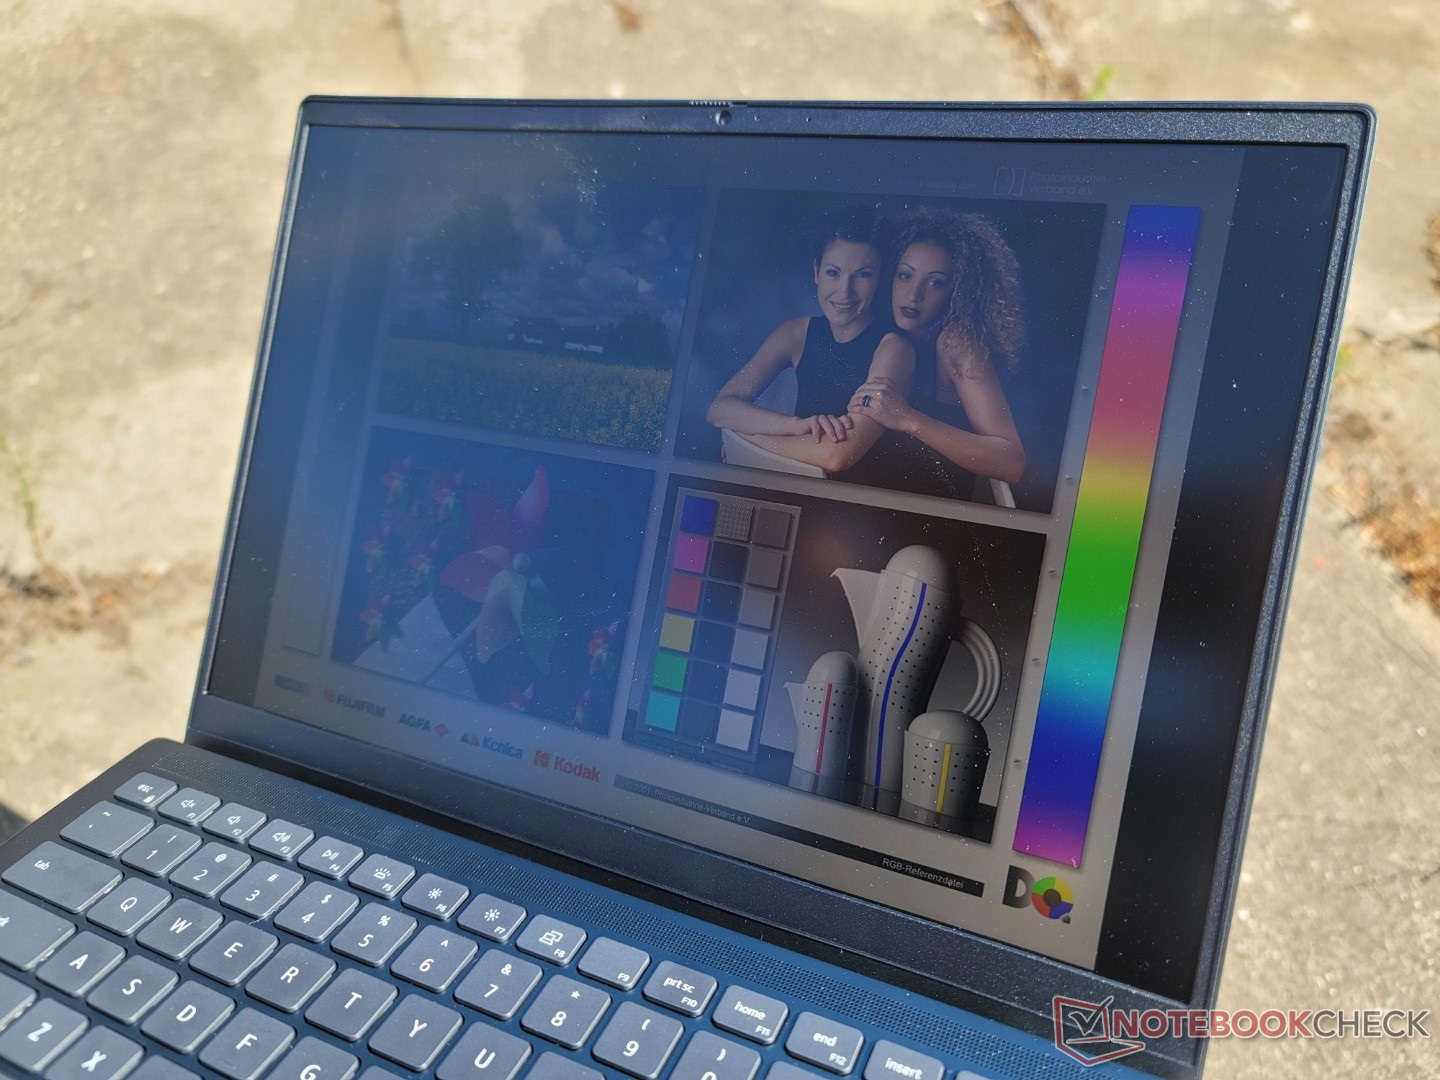
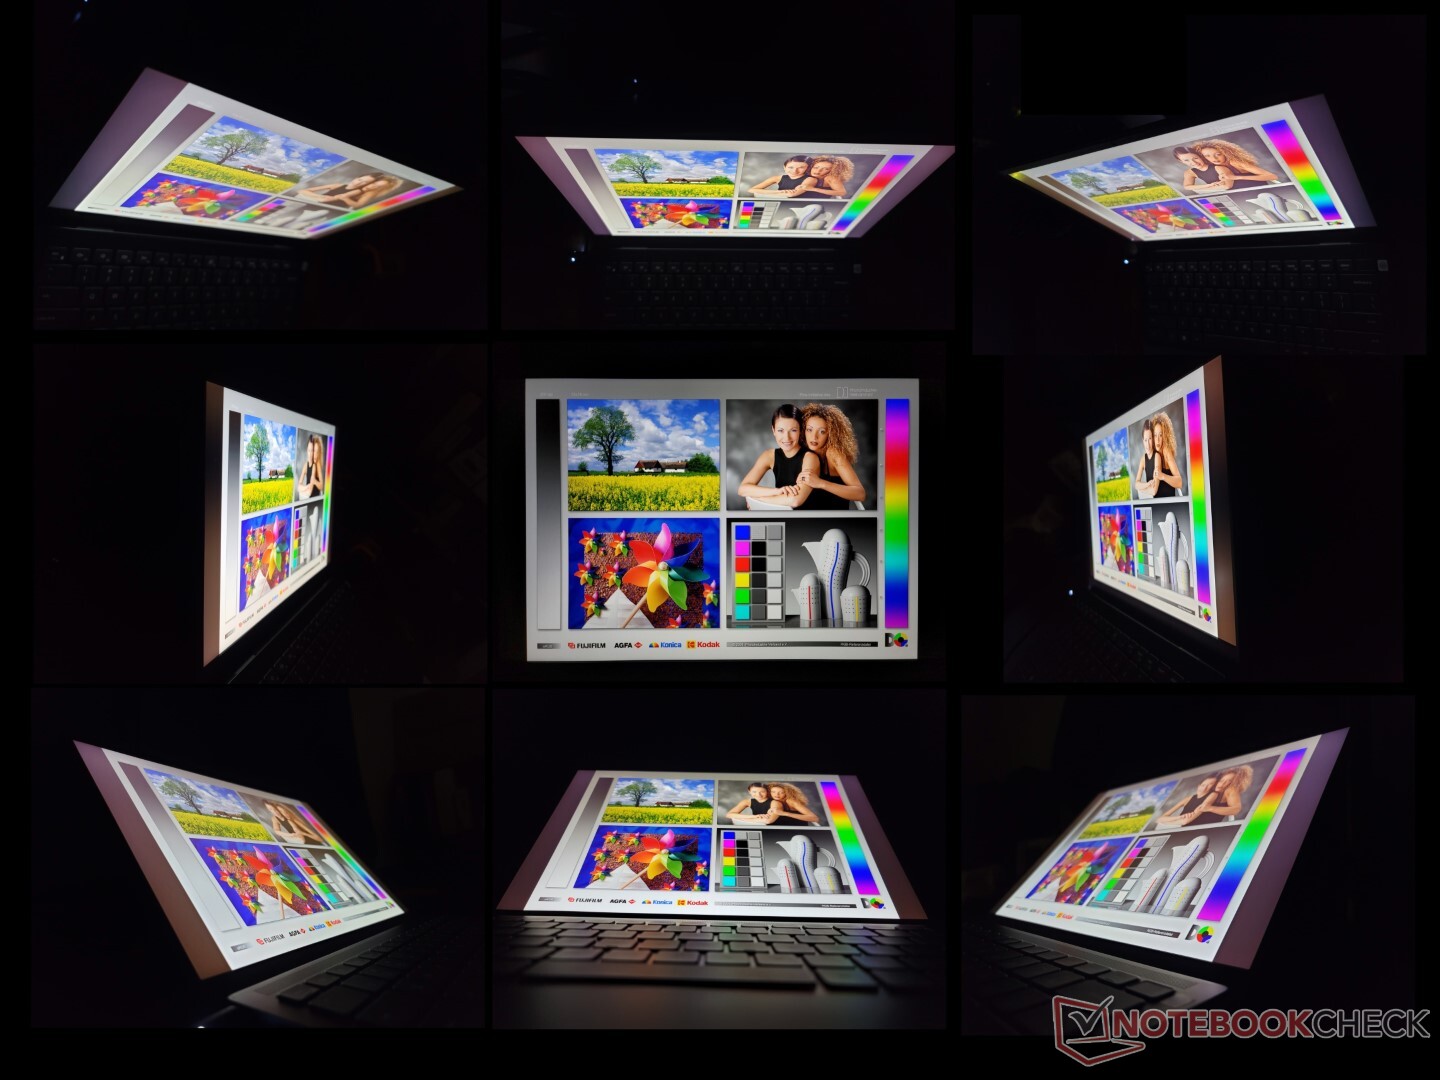
Wyświetlacz - pełne pokrycie sRGB i 60 Hz
Podczas gdy inne 14-calowe laptopy zazwyczaj celują w rozdzielczości 1200p, 1800p lub 2160p, Inspiron 14 Plus 7420 jest standardowo wyposażony w stosunkowo rzadki panel 2,2K lub 2240 x 1400. Główne atrybuty są inaczej solidne, w tym pełne pokrycie sRGB, ~1000:1 współczynnik kontrastu i przyzwoite czasy reakcji dla swojej klasy wielkości. Szkoda, że nie ma opcji OLED lub błyszczących, by jeszcze bardziej podbić kolory lub ostrość.
| |||||||||||||||||||||||||
rozświetlenie: 85 %
na akumulatorze: 331.1 cd/m²
kontrast: 1142:1 (czerń: 0.29 cd/m²)
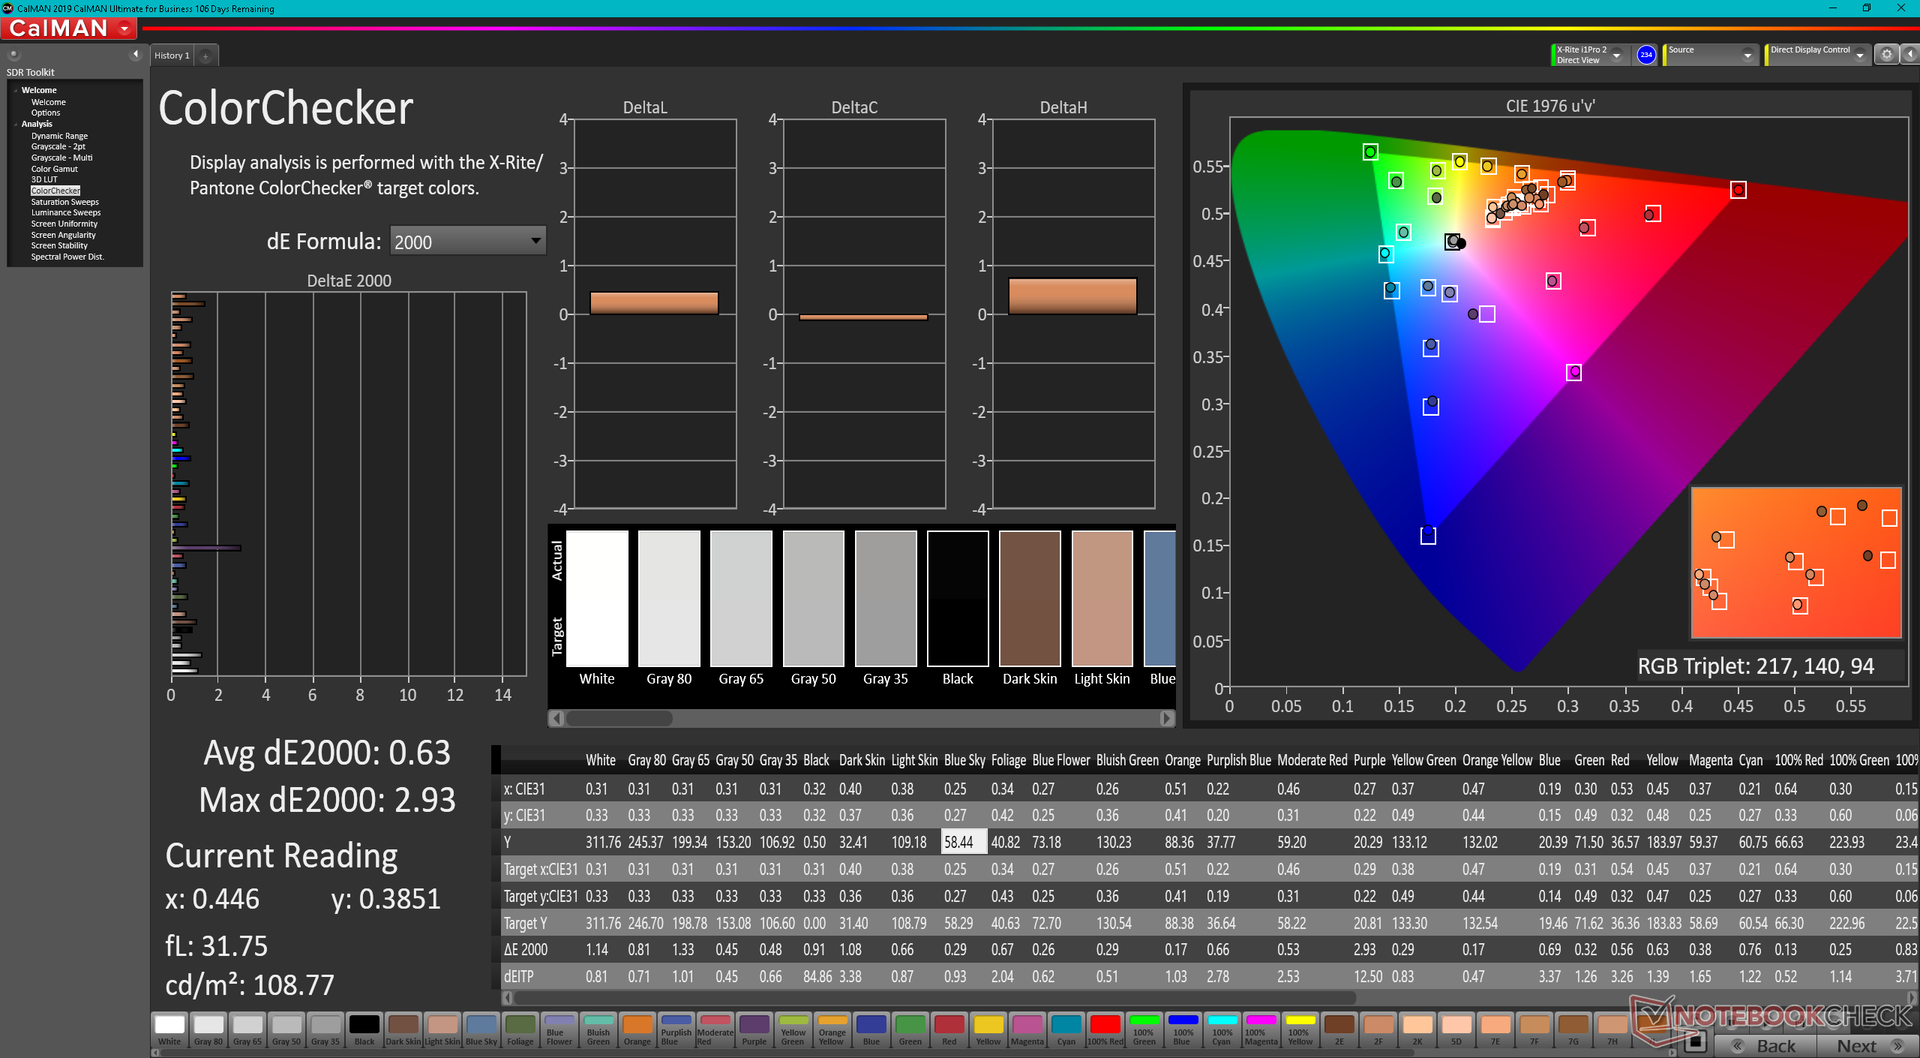
ΔE ColorChecker Calman: 2.23 | ∀{0.5-29.43 Ø4.72}
calibrated: 0.63
ΔE Greyscale Calman: 3.6 | ∀{0.09-98 Ø4.97}
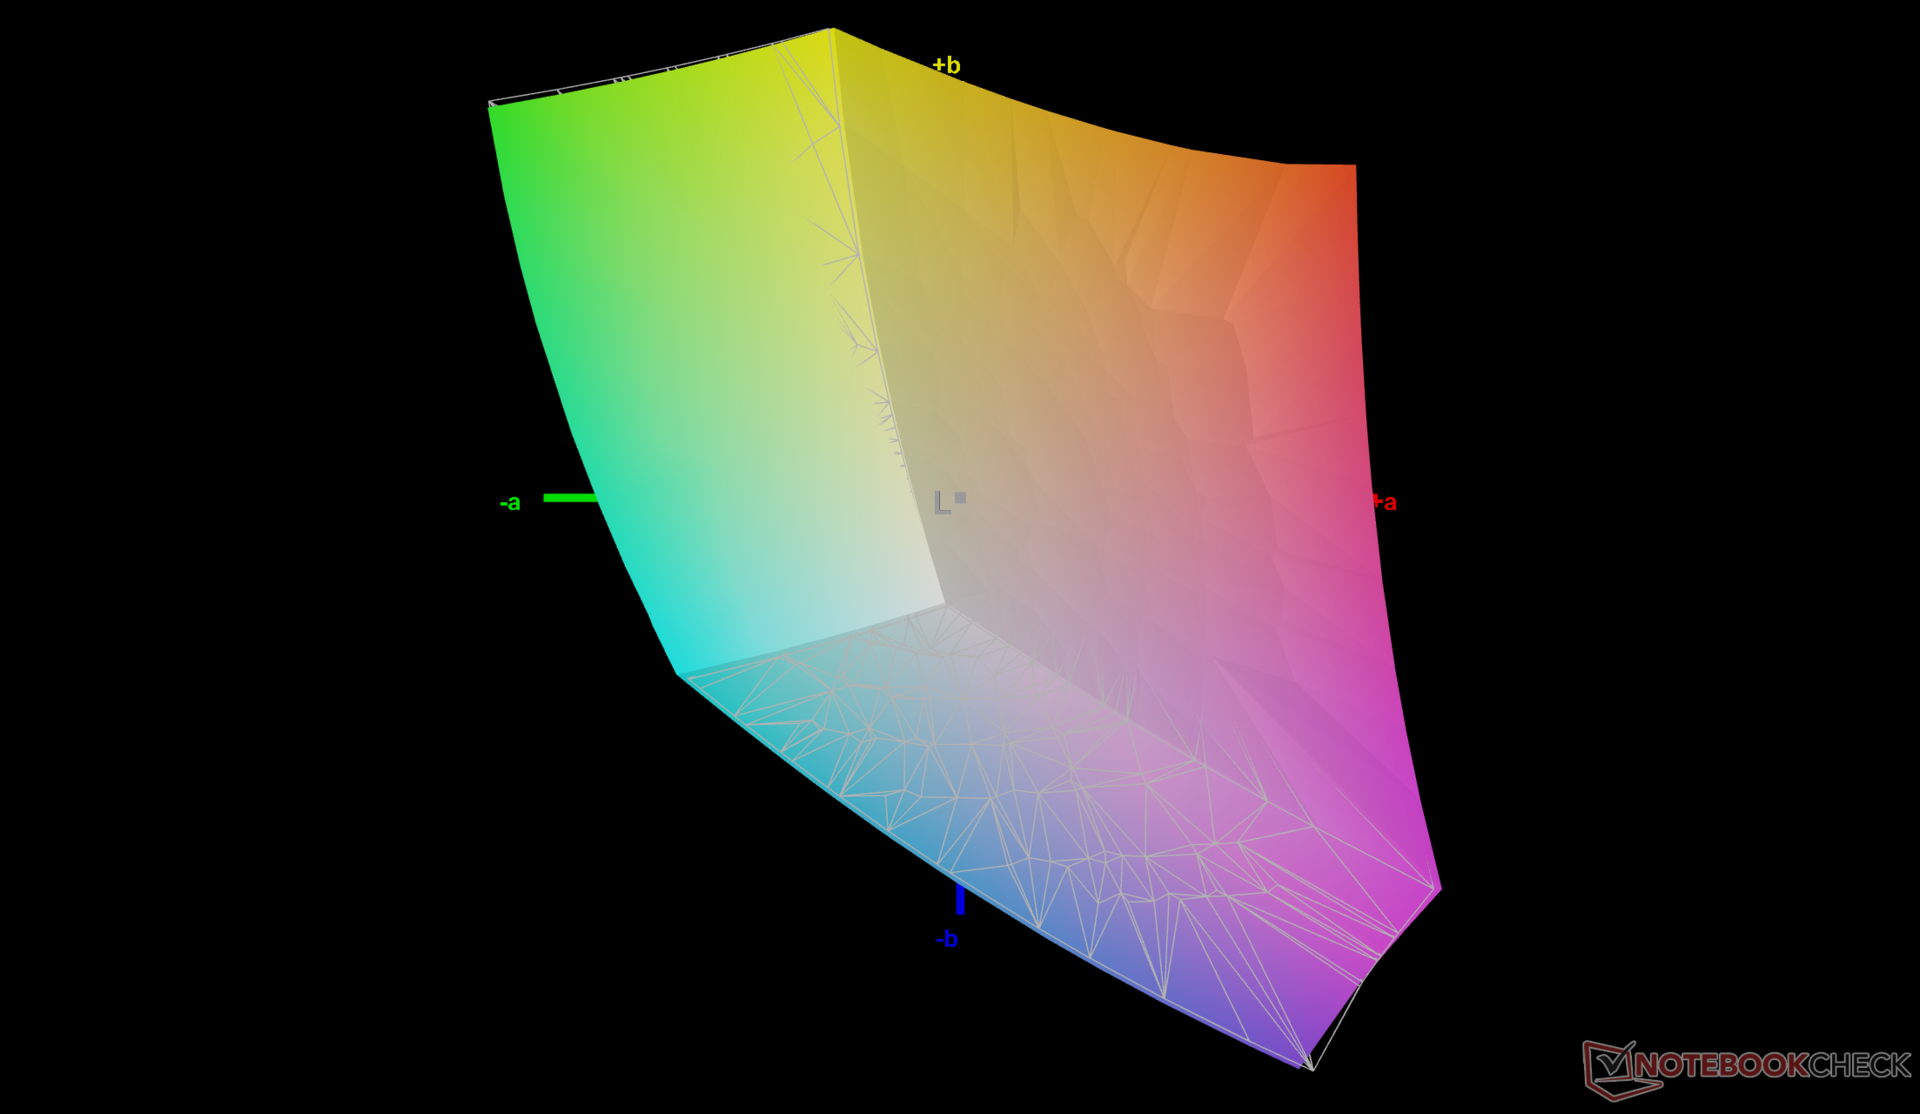
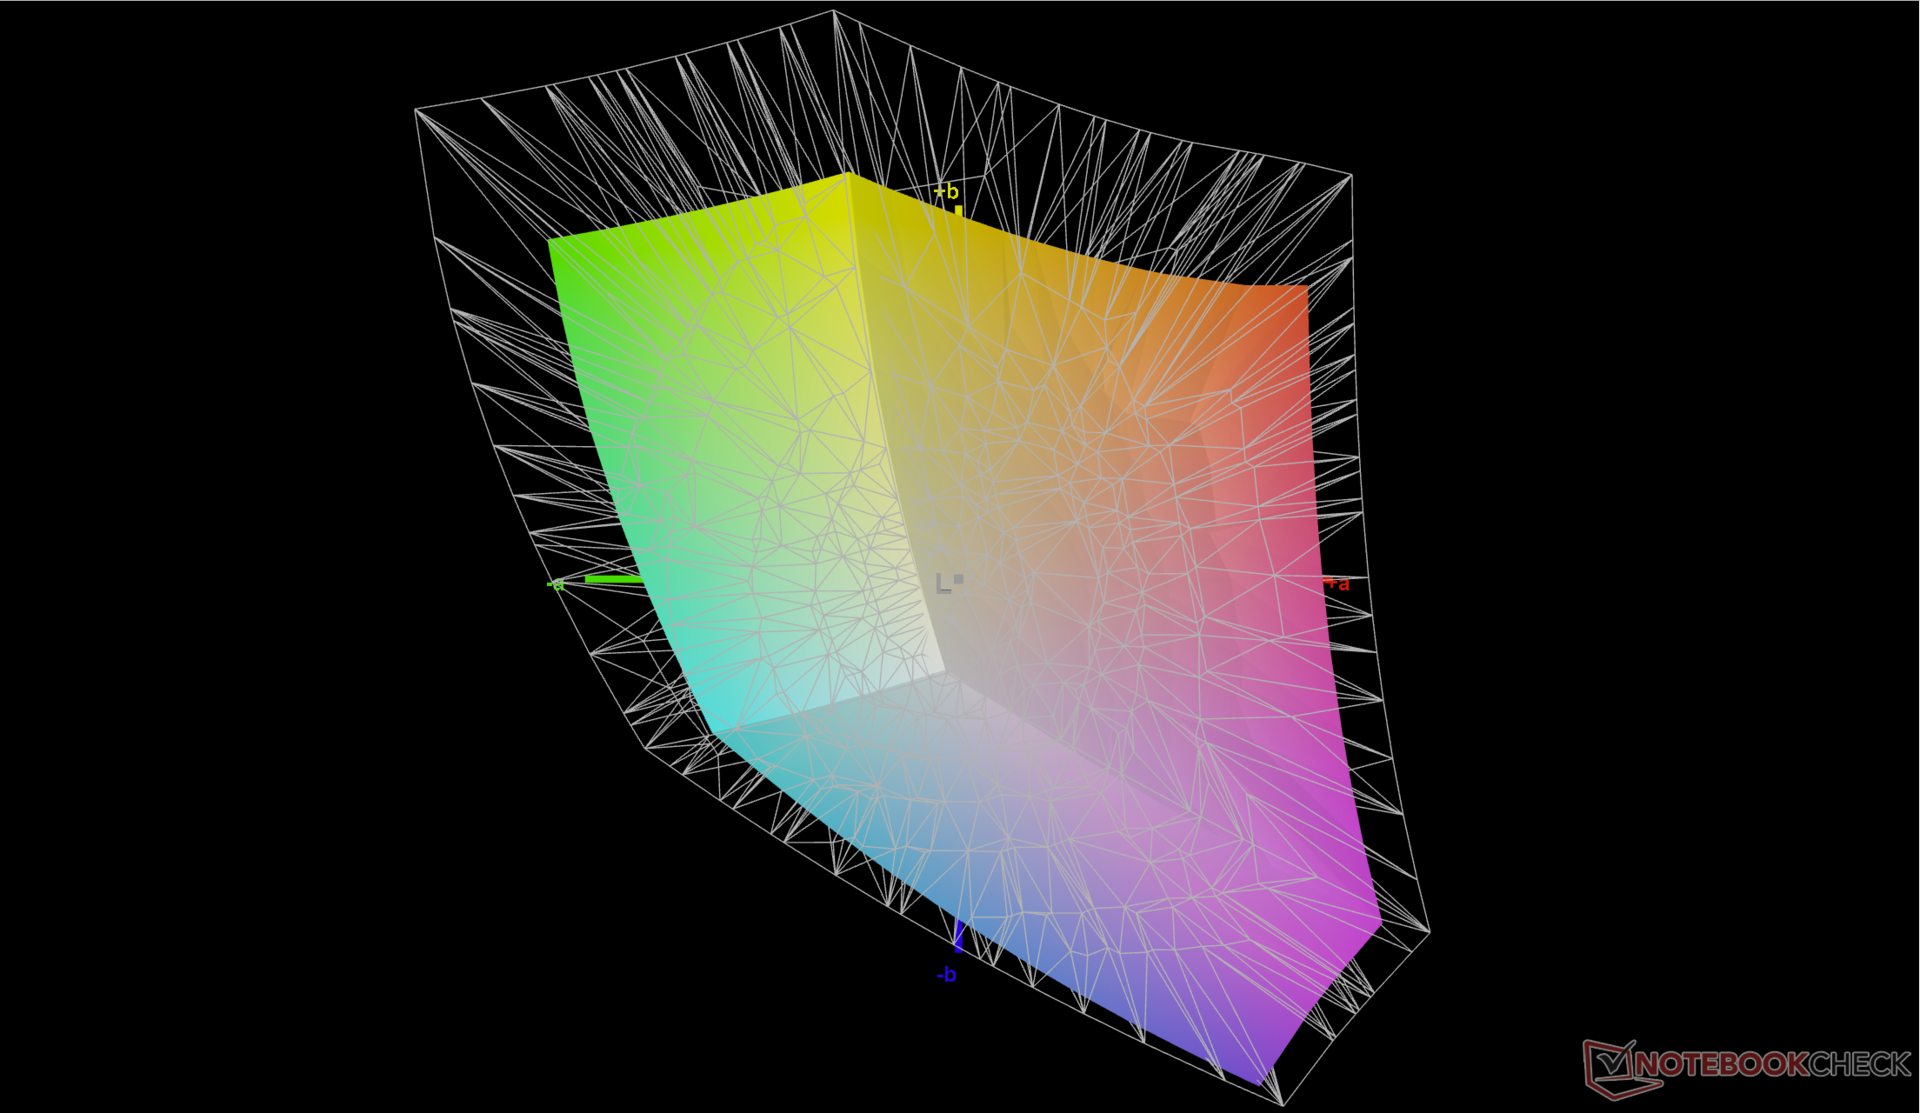
69.5% AdobeRGB 1998 (Argyll 3D)
99.3% sRGB (Argyll 3D)
68.8% Display P3 (Argyll 3D)
Gamma: 2.21
CCT: 6022 K
| Dell Inspiron 14 Plus 7420 InfoVision 140NWHE, IPS, 2240x1400, 14" | Asus Vivobook Pro 14 M3401QC-KM007T SAMSUNG: SDC4171, OLED, 2880x1800, 14" | Dell Inspiron 14 7420 2-in-1 BOE NV14N42, IPS, 1920x1200, 14" | Schenker Vision 14 MNE007ZA1, IPS, 2880x1800, 14" | Asus Zenbook 14X UX5400E Samsung SDC4154, OLED, 2880x1800, 14" | MSI Summit E14 A11SCS AU Optronics AUO123B, IPS, 3840x2160, 14" | HP Envy 14-eb0010nr AU Optronics AUOF392, IPS, 1920x1200, 14" | |
|---|---|---|---|---|---|---|---|
| Display | 27% | -43% | 5% | 28% | 24% | 8% | |
| Display P3 Coverage (%) | 68.8 | 99.41 44% | 38.6 -44% | 74.3 8% | 100 45% | 87.5 27% | 77.1 12% |
| sRGB Coverage (%) | 99.3 | 99.94 1% | 56.2 -43% | 97.6 -2% | 100 1% | 100 1% | 99.8 1% |
| AdobeRGB 1998 Coverage (%) | 69.5 | 94.79 36% | 39.9 -43% | 75.7 9% | 96 38% | 99.4 43% | 76.7 10% |
| Response Times | 89% | 13% | -2% | 93% | -47% | -95% | |
| Response Time Grey 50% / Grey 80% * (ms) | 32.8 ? | 3 ? 91% | 27.2 ? 17% | 40.4 ? -23% | 2 ? 94% | 52 ? -59% | 61.2 ? -87% |
| Response Time Black / White * (ms) | 22.8 ? | 3 ? 87% | 20.8 ? 9% | 18.4 ? 19% | 2 ? 91% | 30.8 ? -35% | 46 ? -102% |
| PWM Frequency (Hz) | 360 | ||||||
| Screen | 41% | -113% | -8% | 13% | -70% | -8% | |
| Brightness middle (cd/m²) | 331.1 | 384 16% | 269.4 -19% | 407 23% | 379 14% | 593.3 79% | 412 24% |
| Brightness (cd/m²) | 326 | 385 18% | 260 -20% | 407 25% | 381 17% | 571 75% | 392 20% |
| Brightness Distribution (%) | 85 | 98 15% | 89 5% | 94 11% | 93 9% | 87 2% | 81 -5% |
| Black Level * (cd/m²) | 0.29 | 0.07 76% | 0.41 -41% | 0.25 14% | 0.1 66% | 0.53 -83% | 0.32 -10% |
| Contrast (:1) | 1142 | 5486 380% | 657 -42% | 1628 43% | 3790 232% | 1119 -2% | 1288 13% |
| Colorchecker dE 2000 * | 2.23 | 1.75 22% | 6.53 -193% | 2.6 -17% | 2.3 -3% | 4.42 -98% | 1.88 16% |
| Colorchecker dE 2000 max. * | 5.44 | 3.41 37% | 19.76 -263% | 4.4 19% | 4.16 24% | 7.16 -32% | 3.06 44% |
| Colorchecker dE 2000 calibrated * | 0.63 | 2.32 -268% | 3.13 -397% | 2 -217% | 2.42 -284% | 4.3 -583% | 1.96 -211% |
| Greyscale dE 2000 * | 3.6 | 1.06 71% | 5.4 -50% | 2.7 25% | 2.12 41% | 3.2 11% | 2.2 39% |
| Gamma | 2.21 100% | 2.39 92% | 2.05 107% | 2.18 101% | 2.42 91% | 2.04 108% | 2.1 105% |
| CCT | 6022 108% | 6440 101% | 6007 108% | 6316 103% | 6737 96% | 6650 98% | |
| Color Space (Percent of AdobeRGB 1998) (%) | 68.7 | ||||||
| Color Space (Percent of sRGB) (%) | 99.8 | ||||||
| Całkowita średnia (program / ustawienia) | 52% /
45% | -48% /
-80% | -2% /
-5% | 45% /
28% | -31% /
-47% | -32% /
-17% |
* ... im mniej tym lepiej
Wyświetlacz nie jest skalibrowany fabrycznie, więc jego kolory nie są tak dokładne, jak mogłyby być. Szczególnie temperatura kolorów jest zbyt ciepła i wynosi około 6000 w porównaniu z docelową wartością 6500 według standardu sRGB. Po prawidłowej kalibracji przy użyciu naszego kolorymetru X-Rite, średnie wartości DeltaE w skali szarości i kolorze poprawiłyby się z 3,6 i 2,23 do zaledwie 0,8 i 0,63, odpowiednio. Zalecamy przeprowadzenie kalibracji przez użytkownika końcowego, aby w pełni wykorzystać 100-procentowe pokrycie sRGB przez panel.
Wyświetl czasy reakcji
| ↔ Czas reakcji od czerni do bieli | ||
|---|---|---|
| 22.8 ms ... wzrost ↗ i spadek ↘ łącznie | ↗ 12 ms wzrost | 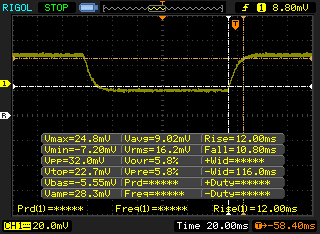 |
| ↘ 10.8 ms upadek | ||
| W naszych testach ekran wykazuje dobry współczynnik reakcji, ale może być zbyt wolny dla graczy rywalizujących ze sobą. Dla porównania, wszystkie testowane urządzenia wahają się od 0.1 (minimum) do 240 (maksimum) ms. » 51 % wszystkich urządzeń jest lepszych. Oznacza to, że zmierzony czas reakcji jest gorszy od średniej wszystkich testowanych urządzeń (19.9 ms). | ||
| ↔ Czas reakcji 50% szarości do 80% szarości | ||
| 32.8 ms ... wzrost ↗ i spadek ↘ łącznie | ↗ 16 ms wzrost | 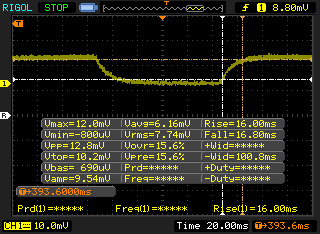 |
| ↘ 16.8 ms upadek | ||
| W naszych testach ekran wykazuje powolne tempo reakcji, co będzie niezadowalające dla graczy. Dla porównania, wszystkie testowane urządzenia wahają się od 0.165 (minimum) do 636 (maksimum) ms. » 44 % wszystkich urządzeń jest lepszych. Oznacza to, że zmierzony czas reakcji jest zbliżony do średniej wszystkich testowanych urządzeń (31.1 ms). | ||
Migotanie ekranu / PWM (modulacja szerokości impulsu)
| Migotanie ekranu/nie wykryto PWM | 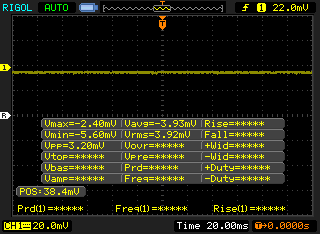 | ||
Dla porównania: 52 % wszystkich testowanych urządzeń nie używa PWM do przyciemniania wyświetlacza. Jeśli wykryto PWM, zmierzono średnio 7784 (minimum: 5 - maksimum: 343500) Hz. | |||
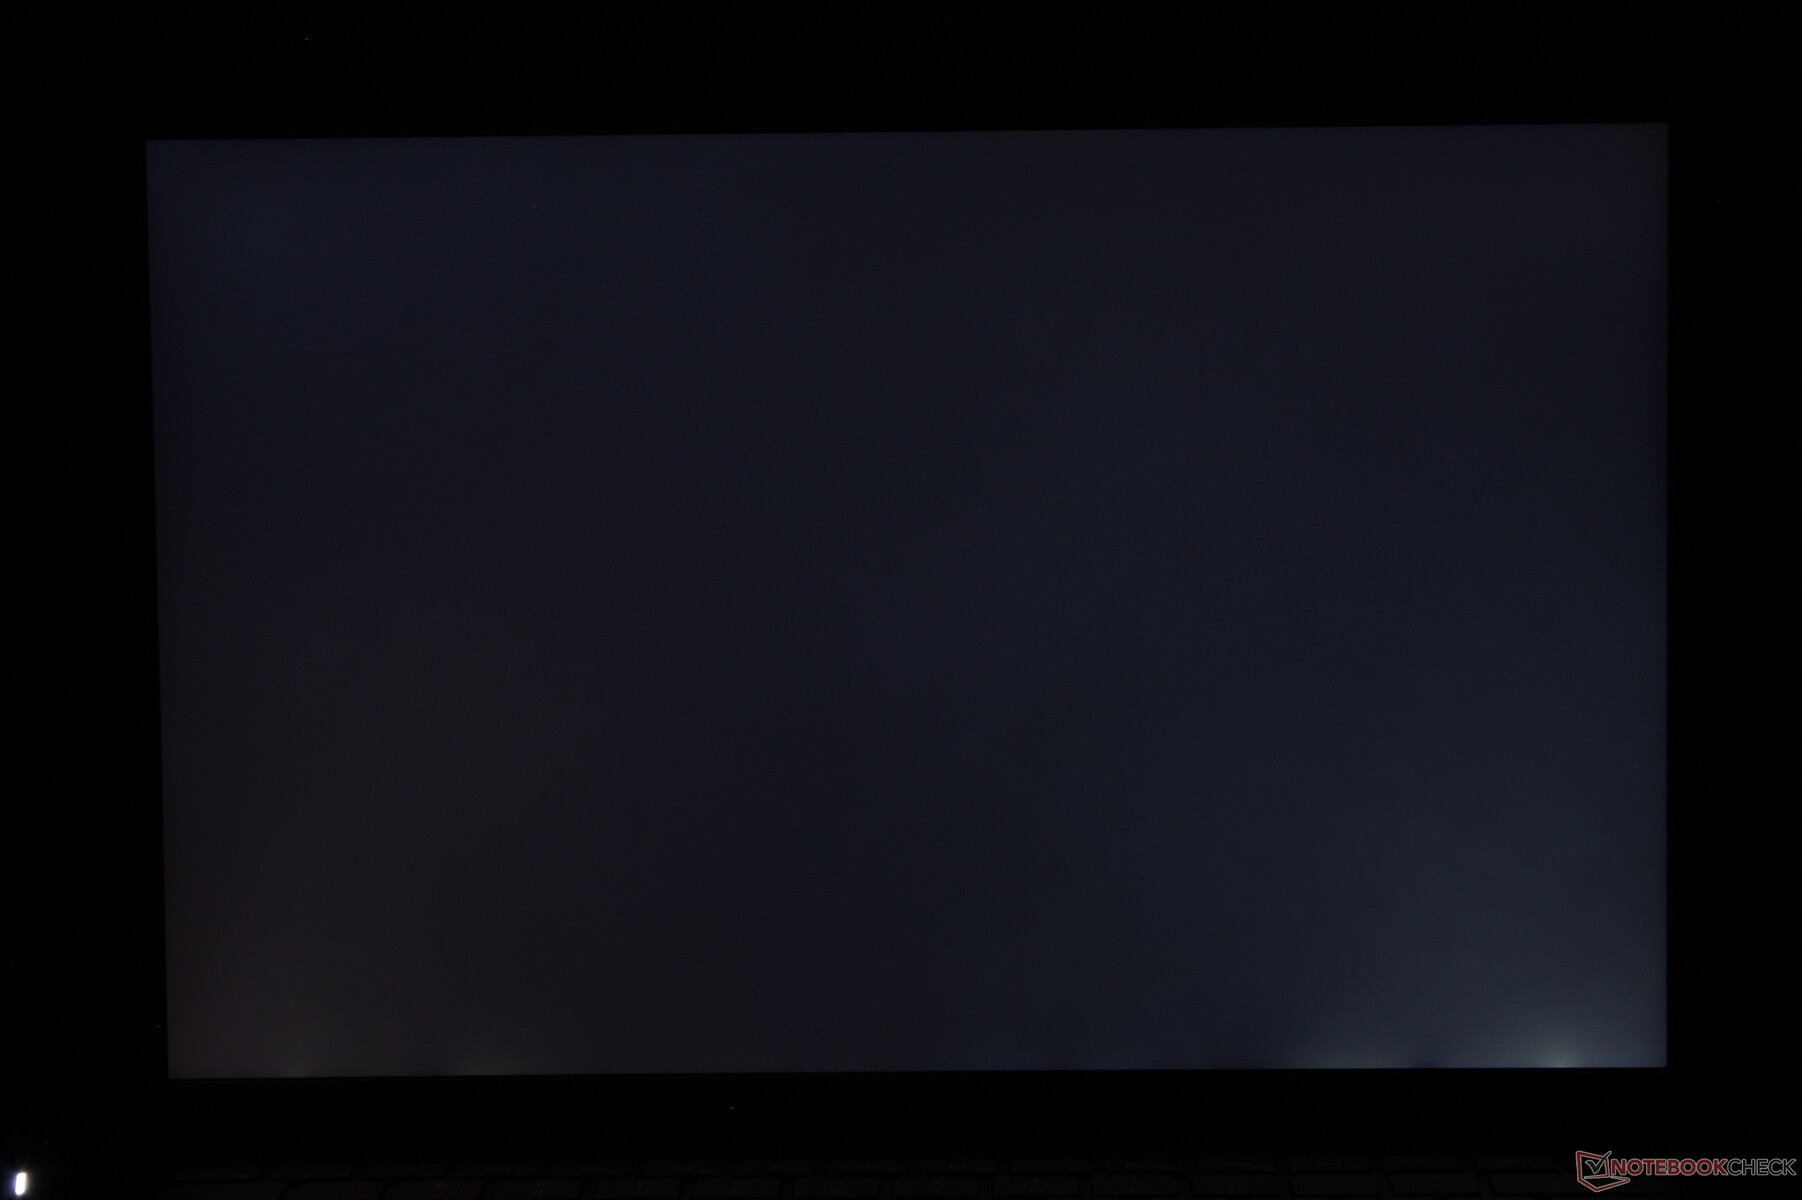
Widoczność na zewnątrz jest niezadowalająca, gdyż wyświetlacz ma średnio tylko 300 nitów przy maksymalnym ustawieniu. W miarę możliwości warto pracować w cieniu, bo w jasnym oświetleniu ekran staje się wyprany. StronaMSI Summit E14 posiada znacznie jaśniejszy ekran, a jednocześnie oferuje dyskretne opcje GPU.
Osiągi - Supercharged 14-incher
Warunki badania
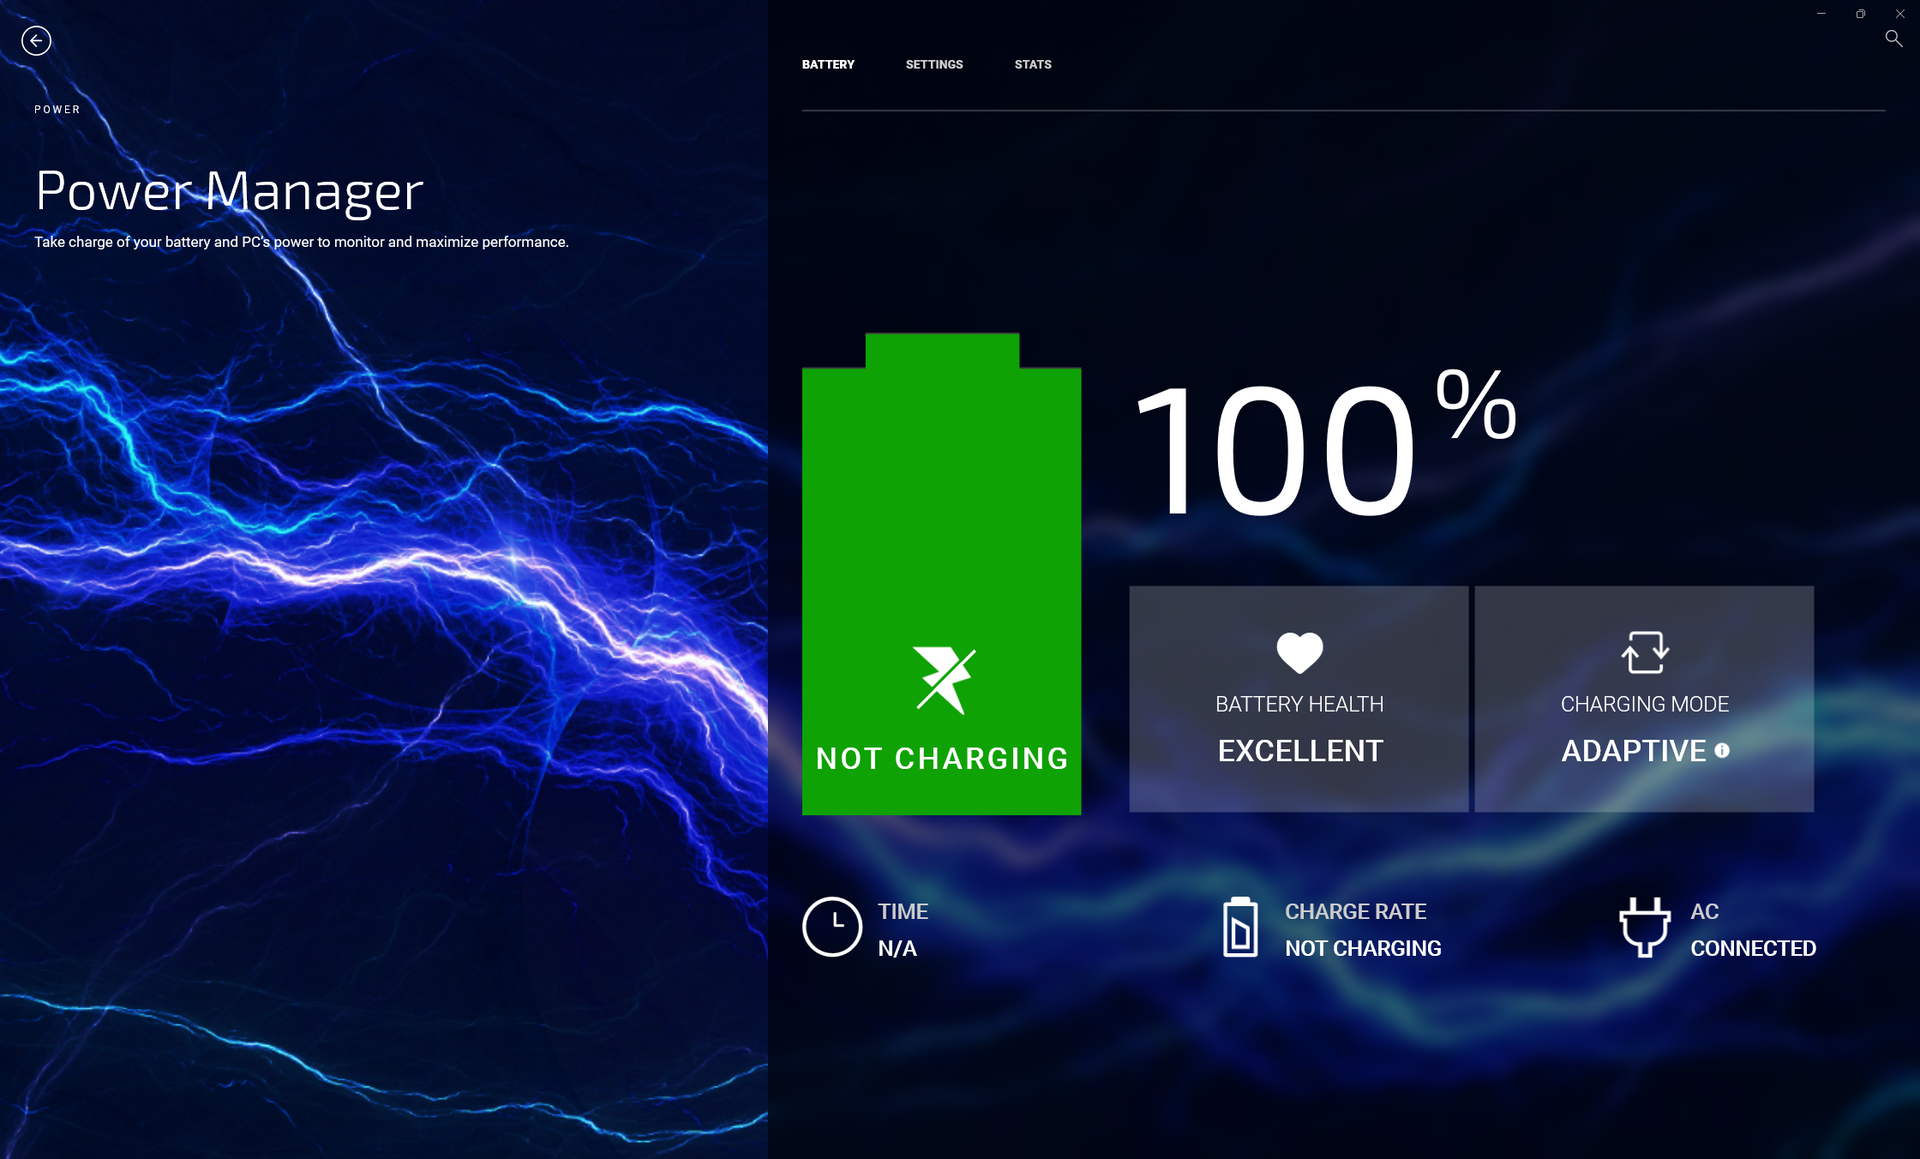
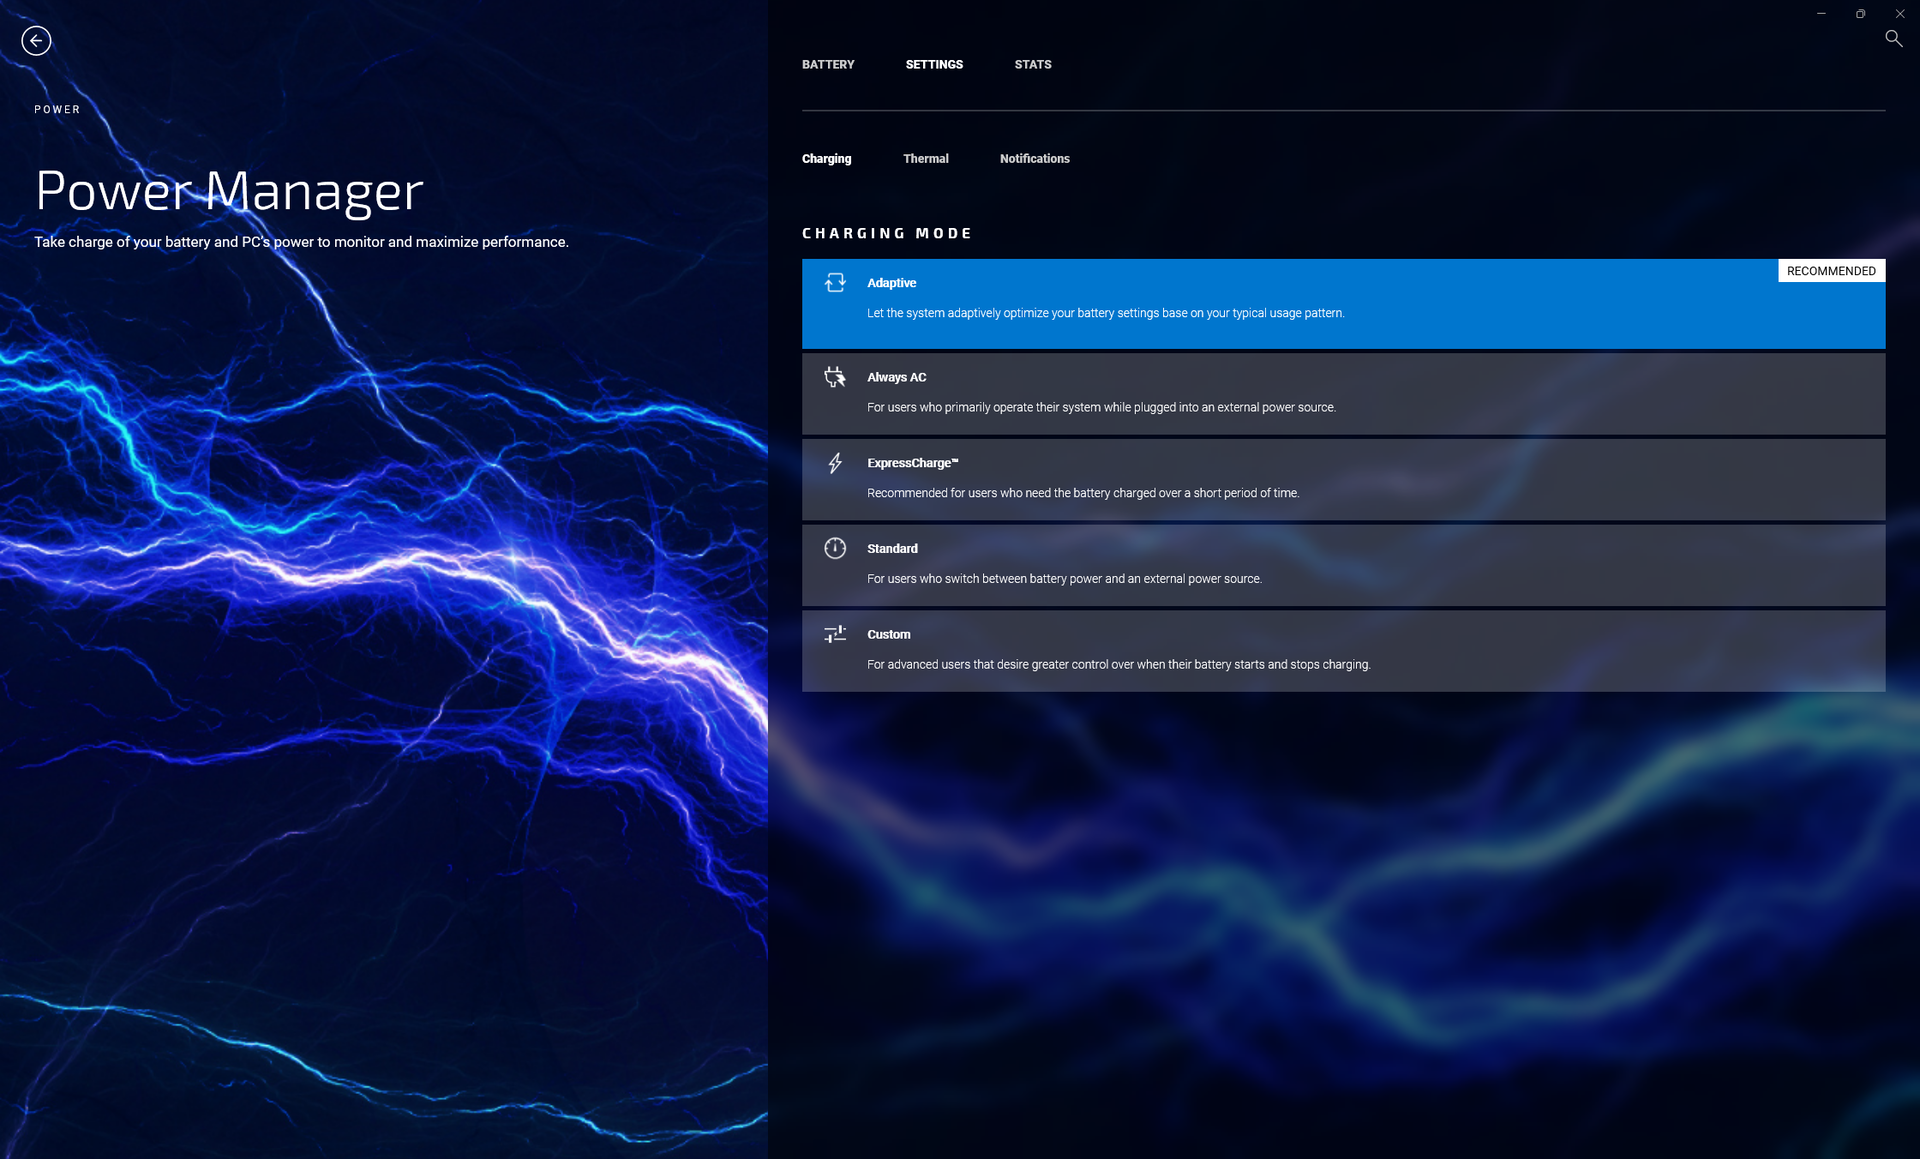
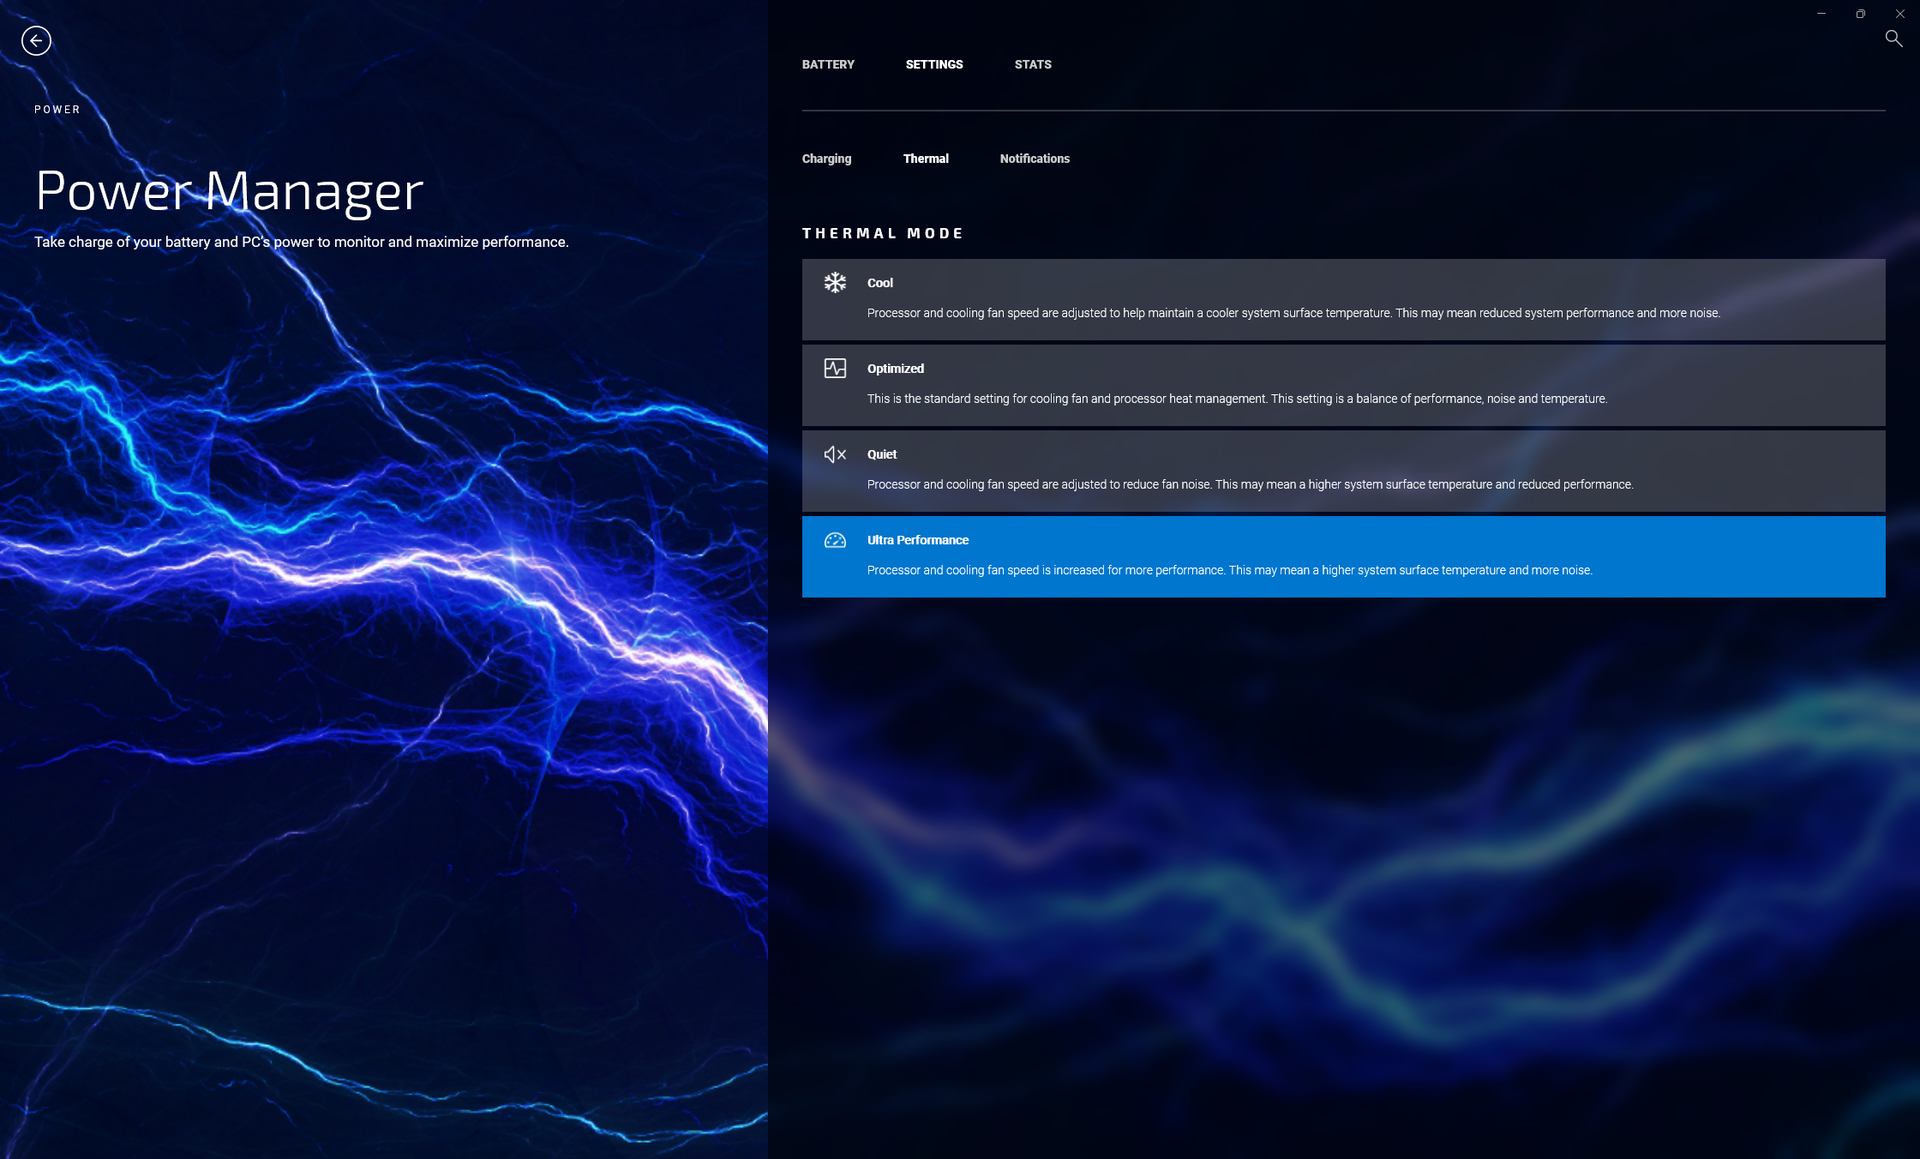
Przed przeprowadzeniem poniższych benchmarków ustawiliśmy nasze urządzenie w trybie Ultra Performance za pomocą oprogramowania My Dell. Zaleca się, by właściciele zapoznali się z oprogramowaniem My Dell, ponieważ służy ono jako portal do obsługi gwarancyjnej, zachowania podczas ładowania baterii, wydajności systemu i innych informacji, co widać na poniższych zrzutach ekranu
Standardowy Optimus służy do przełączania między zintegrowanym i dyskretnym układem graficznym GeForce RTX 3050. Zaawansowany Optimus, MUX i tryb WhisperMode nie są obsługiwane.
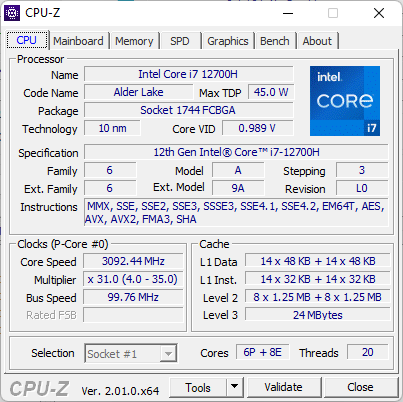
Procesor
Wydajność procesora można analizować z perspektywy szklanki do połowy pełnej lub szklanki do połowy pustej. Z pesymistycznego punktu widzenia, 45 W Core i7-12700H w Dellu jest nieco rozczarowujący, gdyż jego wydajność wielowątkowa jest o około 10 procent wolniejsza od innych laptopów wyposażonych w ten sam procesor. Z optymistycznego punktu widzenia Dell jest znacznie szybszy od większości innych 14-calowych laptopów, w których częściej spotyka się procesory 15 W, 25 W czy 35 W. Jest to jeden z mniejszych laptopów, które można dostać z Core i7-12700H, ale klapka jest taka, że jego wydajność Turbo Boost jest następnie bardziej ograniczona w porównaniu z większymi laptopami z tą samą opcją procesora. W końcu Core i7-12700H jest często spotykany także w pełnoprawnych laptopach do gier. Na przykład 16-calowy Lenovo Legion Slim 7 z tym samym procesorem oferuje o 30 procent szybszą wydajność niż nasz Inspiron 14 Plus
Ograniczoną wydajność Turbo Boost naszego procesora można zademonstrować uruchamiając w pętli program CineBench R15 xT. Jak widać na poniższym wykresie, nasz początkowy wynik 2410 punktów spadłby o 21% w trzeciej lub czwartej pętli, co oznacza znaczny spadek wydajności.
Cinebench R15 Multi Loop
Cinebench R23: Multi Core | Single Core
Cinebench R15: CPU Multi 64Bit | CPU Single 64Bit
Blender: v2.79 BMW27 CPU
7-Zip 18.03: 7z b 4 | 7z b 4 -mmt1
Geekbench 5.5: Multi-Core | Single-Core
HWBOT x265 Benchmark v2.2: 4k Preset
LibreOffice : 20 Documents To PDF
R Benchmark 2.5: Overall mean
| Cinebench R20 / CPU (Multi Core) | |
| Przeciętny Intel Core i7-12700H (1576 - 7407, n=64) | |
| Razer Blade 15 2022 | |
| Asus ROG Flow Z13 GZ301ZE | |
| Dell Inspiron 14 Plus 7420 | |
| Lenovo Yoga Slim 7 Pro 14 OLED Ryzen 9 | |
| Asus ZenBook 14X UM5401QA-KN162 | |
| Asus Vivobook Pro 14 M3401QC-KM007T | |
| Dell Inspiron 14 7420 2-in-1 | |
| Asus Zenbook 14X UX5400E | |
| HP Envy 14-eb0010nr | |
| Schenker Vision 14 | |
| MSI Summit E14 A11SCS | |
| Cinebench R20 / CPU (Single Core) | |
| Asus ROG Flow Z13 GZ301ZE | |
| Razer Blade 15 2022 | |
| Dell Inspiron 14 7420 2-in-1 | |
| Dell Inspiron 14 Plus 7420 | |
| Przeciętny Intel Core i7-12700H (300 - 704, n=64) | |
| Schenker Vision 14 | |
| MSI Summit E14 A11SCS | |
| Lenovo Yoga Slim 7 Pro 14 OLED Ryzen 9 | |
| Asus Zenbook 14X UX5400E | |
| Asus ZenBook 14X UM5401QA-KN162 | |
| Asus Vivobook Pro 14 M3401QC-KM007T | |
| HP Envy 14-eb0010nr | |
| Cinebench R23 / Multi Core | |
| Przeciętny Intel Core i7-12700H (4032 - 19330, n=64) | |
| Asus ROG Flow Z13 GZ301ZE | |
| Razer Blade 15 2022 | |
| Dell Inspiron 14 Plus 7420 | |
| Lenovo Yoga Slim 7 Pro 14 OLED Ryzen 9 | |
| Asus ZenBook 14X UM5401QA-KN162 | |
| Asus Vivobook Pro 14 M3401QC-KM007T | |
| Dell Inspiron 14 7420 2-in-1 | |
| HP Envy 14-eb0010nr | |
| Schenker Vision 14 | |
| Asus Zenbook 14X UX5400E | |
| MSI Summit E14 A11SCS | |
| Cinebench R23 / Single Core | |
| Asus ROG Flow Z13 GZ301ZE | |
| Razer Blade 15 2022 | |
| Dell Inspiron 14 7420 2-in-1 | |
| Dell Inspiron 14 Plus 7420 | |
| Przeciętny Intel Core i7-12700H (778 - 1826, n=63) | |
| MSI Summit E14 A11SCS | |
| Asus Zenbook 14X UX5400E | |
| Lenovo Yoga Slim 7 Pro 14 OLED Ryzen 9 | |
| Schenker Vision 14 | |
| Asus ZenBook 14X UM5401QA-KN162 | |
| HP Envy 14-eb0010nr | |
| Asus Vivobook Pro 14 M3401QC-KM007T | |
| Cinebench R15 / CPU Multi 64Bit | |
| Asus ROG Flow Z13 GZ301ZE | |
| Przeciętny Intel Core i7-12700H (1379 - 2916, n=70) | |
| Dell Inspiron 14 Plus 7420 | |
| Razer Blade 15 2022 | |
| Lenovo Yoga Slim 7 Pro 14 OLED Ryzen 9 | |
| Asus ZenBook 14X UM5401QA-KN162 | |
| Asus Vivobook Pro 14 M3401QC-KM007T | |
| Dell Inspiron 14 7420 2-in-1 | |
| Schenker Vision 14 | |
| Schenker Vision 14 | |
| Asus Zenbook 14X UX5400E | |
| HP Envy 14-eb0010nr | |
| MSI Summit E14 A11SCS | |
| Cinebench R15 / CPU Single 64Bit | |
| Asus ROG Flow Z13 GZ301ZE | |
| Razer Blade 15 2022 | |
| Dell Inspiron 14 Plus 7420 | |
| Przeciętny Intel Core i7-12700H (113 - 263, n=65) | |
| Dell Inspiron 14 7420 2-in-1 | |
| Lenovo Yoga Slim 7 Pro 14 OLED Ryzen 9 | |
| Schenker Vision 14 | |
| MSI Summit E14 A11SCS | |
| Asus ZenBook 14X UM5401QA-KN162 | |
| Asus Vivobook Pro 14 M3401QC-KM007T | |
| HP Envy 14-eb0010nr | |
| Asus Zenbook 14X UX5400E | |
| Blender / v2.79 BMW27 CPU | |
| Asus Zenbook 14X UX5400E | |
| MSI Summit E14 A11SCS | |
| HP Envy 14-eb0010nr | |
| Schenker Vision 14 | |
| Dell Inspiron 14 7420 2-in-1 | |
| Asus Vivobook Pro 14 M3401QC-KM007T | |
| Lenovo Yoga Slim 7 Pro 14 OLED Ryzen 9 | |
| Asus ZenBook 14X UM5401QA-KN162 | |
| Dell Inspiron 14 Plus 7420 | |
| Razer Blade 15 2022 | |
| Przeciętny Intel Core i7-12700H (168 - 732, n=63) | |
| Asus ROG Flow Z13 GZ301ZE | |
| 7-Zip 18.03 / 7z b 4 | |
| Asus ROG Flow Z13 GZ301ZE | |
| Razer Blade 15 2022 | |
| Przeciętny Intel Core i7-12700H (22844 - 73067, n=63) | |
| Dell Inspiron 14 Plus 7420 | |
| Asus ZenBook 14X UM5401QA-KN162 | |
| Lenovo Yoga Slim 7 Pro 14 OLED Ryzen 9 | |
| Asus Vivobook Pro 14 M3401QC-KM007T | |
| Dell Inspiron 14 7420 2-in-1 | |
| Schenker Vision 14 | |
| MSI Summit E14 A11SCS | |
| HP Envy 14-eb0010nr | |
| Asus Zenbook 14X UX5400E | |
| 7-Zip 18.03 / 7z b 4 -mmt1 | |
| Asus ROG Flow Z13 GZ301ZE | |
| Razer Blade 15 2022 | |
| Przeciętny Intel Core i7-12700H (2743 - 5972, n=63) | |
| Dell Inspiron 14 Plus 7420 | |
| Schenker Vision 14 | |
| Lenovo Yoga Slim 7 Pro 14 OLED Ryzen 9 | |
| Dell Inspiron 14 7420 2-in-1 | |
| Asus ZenBook 14X UM5401QA-KN162 | |
| Asus Vivobook Pro 14 M3401QC-KM007T | |
| MSI Summit E14 A11SCS | |
| HP Envy 14-eb0010nr | |
| Asus Zenbook 14X UX5400E | |
| Geekbench 5.5 / Multi-Core | |
| Asus ROG Flow Z13 GZ301ZE | |
| Razer Blade 15 2022 | |
| Dell Inspiron 14 Plus 7420 | |
| Przeciętny Intel Core i7-12700H (5144 - 13745, n=64) | |
| Asus ZenBook 14X UM5401QA-KN162 | |
| Lenovo Yoga Slim 7 Pro 14 OLED Ryzen 9 | |
| Dell Inspiron 14 7420 2-in-1 | |
| Asus Vivobook Pro 14 M3401QC-KM007T | |
| Schenker Vision 14 | |
| Asus Zenbook 14X UX5400E | |
| HP Envy 14-eb0010nr | |
| Geekbench 5.5 / Single-Core | |
| Asus ROG Flow Z13 GZ301ZE | |
| Razer Blade 15 2022 | |
| Przeciętny Intel Core i7-12700H (803 - 1851, n=64) | |
| Dell Inspiron 14 Plus 7420 | |
| Dell Inspiron 14 7420 2-in-1 | |
| Schenker Vision 14 | |
| Asus Zenbook 14X UX5400E | |
| Lenovo Yoga Slim 7 Pro 14 OLED Ryzen 9 | |
| Asus ZenBook 14X UM5401QA-KN162 | |
| HP Envy 14-eb0010nr | |
| Asus Vivobook Pro 14 M3401QC-KM007T | |
| HWBOT x265 Benchmark v2.2 / 4k Preset | |
| Asus ROG Flow Z13 GZ301ZE | |
| Razer Blade 15 2022 | |
| Przeciętny Intel Core i7-12700H (4.67 - 21.8, n=64) | |
| Dell Inspiron 14 Plus 7420 | |
| Asus ZenBook 14X UM5401QA-KN162 | |
| Lenovo Yoga Slim 7 Pro 14 OLED Ryzen 9 | |
| Asus Vivobook Pro 14 M3401QC-KM007T | |
| Schenker Vision 14 | |
| Dell Inspiron 14 7420 2-in-1 | |
| HP Envy 14-eb0010nr | |
| Asus Zenbook 14X UX5400E | |
| MSI Summit E14 A11SCS | |
| LibreOffice / 20 Documents To PDF | |
| Asus Vivobook Pro 14 M3401QC-KM007T | |
| MSI Summit E14 A11SCS | |
| Asus ZenBook 14X UM5401QA-KN162 | |
| Razer Blade 15 2022 | |
| Asus Zenbook 14X UX5400E | |
| Lenovo Yoga Slim 7 Pro 14 OLED Ryzen 9 | |
| HP Envy 14-eb0010nr | |
| Dell Inspiron 14 7420 2-in-1 | |
| Dell Inspiron 14 Plus 7420 | |
| Schenker Vision 14 | |
| Przeciętny Intel Core i7-12700H (34.2 - 95.3, n=63) | |
| Asus ROG Flow Z13 GZ301ZE | |
| R Benchmark 2.5 / Overall mean | |
| HP Envy 14-eb0010nr | |
| Asus Zenbook 14X UX5400E | |
| Asus Vivobook Pro 14 M3401QC-KM007T | |
| MSI Summit E14 A11SCS | |
| Schenker Vision 14 | |
| Asus ZenBook 14X UM5401QA-KN162 | |
| Lenovo Yoga Slim 7 Pro 14 OLED Ryzen 9 | |
| Dell Inspiron 14 Plus 7420 | |
| Przeciętny Intel Core i7-12700H (0.4441 - 1.052, n=63) | |
| Razer Blade 15 2022 | |
| Dell Inspiron 14 7420 2-in-1 | |
| Asus ROG Flow Z13 GZ301ZE | |
* ... im mniej tym lepiej
AIDA64: FP32 Ray-Trace | FPU Julia | CPU SHA3 | CPU Queen | FPU SinJulia | FPU Mandel | CPU AES | CPU ZLib | FP64 Ray-Trace | CPU PhotoWorxx
| Performance rating | |
| Przeciętny Intel Core i7-12700H | |
| Dell Inspiron 14 Plus 7420 | |
| Asus Vivobook Pro 14 M3401QC-KM007T | |
| Schenker Vision 14 | |
| Asus Zenbook 14X UX5400E | |
| MSI Summit E14 A11SCS | |
| Dell Inspiron 14 7420 2-in-1 | |
| AIDA64 / FP32 Ray-Trace | |
| Dell Inspiron 14 Plus 7420 | |
| Przeciętny Intel Core i7-12700H (2585 - 17957, n=64) | |
| Asus Vivobook Pro 14 M3401QC-KM007T | |
| Schenker Vision 14 | |
| Asus Zenbook 14X UX5400E | |
| MSI Summit E14 A11SCS | |
| Dell Inspiron 14 7420 2-in-1 | |
| AIDA64 / FPU Julia | |
| Asus Vivobook Pro 14 M3401QC-KM007T | |
| Dell Inspiron 14 Plus 7420 | |
| Przeciętny Intel Core i7-12700H (12439 - 90760, n=64) | |
| Schenker Vision 14 | |
| Asus Zenbook 14X UX5400E | |
| MSI Summit E14 A11SCS | |
| Dell Inspiron 14 7420 2-in-1 | |
| AIDA64 / CPU SHA3 | |
| Przeciętny Intel Core i7-12700H (833 - 4242, n=64) | |
| Dell Inspiron 14 Plus 7420 | |
| Schenker Vision 14 | |
| Asus Vivobook Pro 14 M3401QC-KM007T | |
| Asus Zenbook 14X UX5400E | |
| MSI Summit E14 A11SCS | |
| Dell Inspiron 14 7420 2-in-1 | |
| AIDA64 / CPU Queen | |
| Przeciętny Intel Core i7-12700H (57923 - 103202, n=63) | |
| Dell Inspiron 14 Plus 7420 | |
| Asus Vivobook Pro 14 M3401QC-KM007T | |
| Dell Inspiron 14 7420 2-in-1 | |
| Schenker Vision 14 | |
| Asus Zenbook 14X UX5400E | |
| MSI Summit E14 A11SCS | |
| AIDA64 / FPU SinJulia | |
| Przeciętny Intel Core i7-12700H (3249 - 9939, n=64) | |
| Asus Vivobook Pro 14 M3401QC-KM007T | |
| Dell Inspiron 14 Plus 7420 | |
| Schenker Vision 14 | |
| Asus Zenbook 14X UX5400E | |
| MSI Summit E14 A11SCS | |
| Dell Inspiron 14 7420 2-in-1 | |
| AIDA64 / FPU Mandel | |
| Asus Vivobook Pro 14 M3401QC-KM007T | |
| Dell Inspiron 14 Plus 7420 | |
| Przeciętny Intel Core i7-12700H (7135 - 44760, n=64) | |
| Schenker Vision 14 | |
| MSI Summit E14 A11SCS | |
| Asus Zenbook 14X UX5400E | |
| Dell Inspiron 14 7420 2-in-1 | |
| AIDA64 / CPU AES | |
| Asus Vivobook Pro 14 M3401QC-KM007T | |
| Przeciętny Intel Core i7-12700H (31839 - 144360, n=64) | |
| Schenker Vision 14 | |
| Asus Zenbook 14X UX5400E | |
| Dell Inspiron 14 Plus 7420 | |
| MSI Summit E14 A11SCS | |
| Dell Inspiron 14 7420 2-in-1 | |
| AIDA64 / CPU ZLib | |
| Przeciętny Intel Core i7-12700H (305 - 1171, n=64) | |
| Dell Inspiron 14 Plus 7420 | |
| Asus Vivobook Pro 14 M3401QC-KM007T | |
| Dell Inspiron 14 7420 2-in-1 | |
| Schenker Vision 14 | |
| Asus Zenbook 14X UX5400E | |
| MSI Summit E14 A11SCS | |
| AIDA64 / FP64 Ray-Trace | |
| Dell Inspiron 14 Plus 7420 | |
| Przeciętny Intel Core i7-12700H (1437 - 9692, n=64) | |
| Asus Vivobook Pro 14 M3401QC-KM007T | |
| Schenker Vision 14 | |
| Asus Zenbook 14X UX5400E | |
| MSI Summit E14 A11SCS | |
| Dell Inspiron 14 7420 2-in-1 | |
| AIDA64 / CPU PhotoWorxx | |
| MSI Summit E14 A11SCS | |
| Dell Inspiron 14 Plus 7420 | |
| Przeciętny Intel Core i7-12700H (12863 - 52207, n=64) | |
| Asus Zenbook 14X UX5400E | |
| Schenker Vision 14 | |
| Dell Inspiron 14 7420 2-in-1 | |
| Asus Vivobook Pro 14 M3401QC-KM007T | |
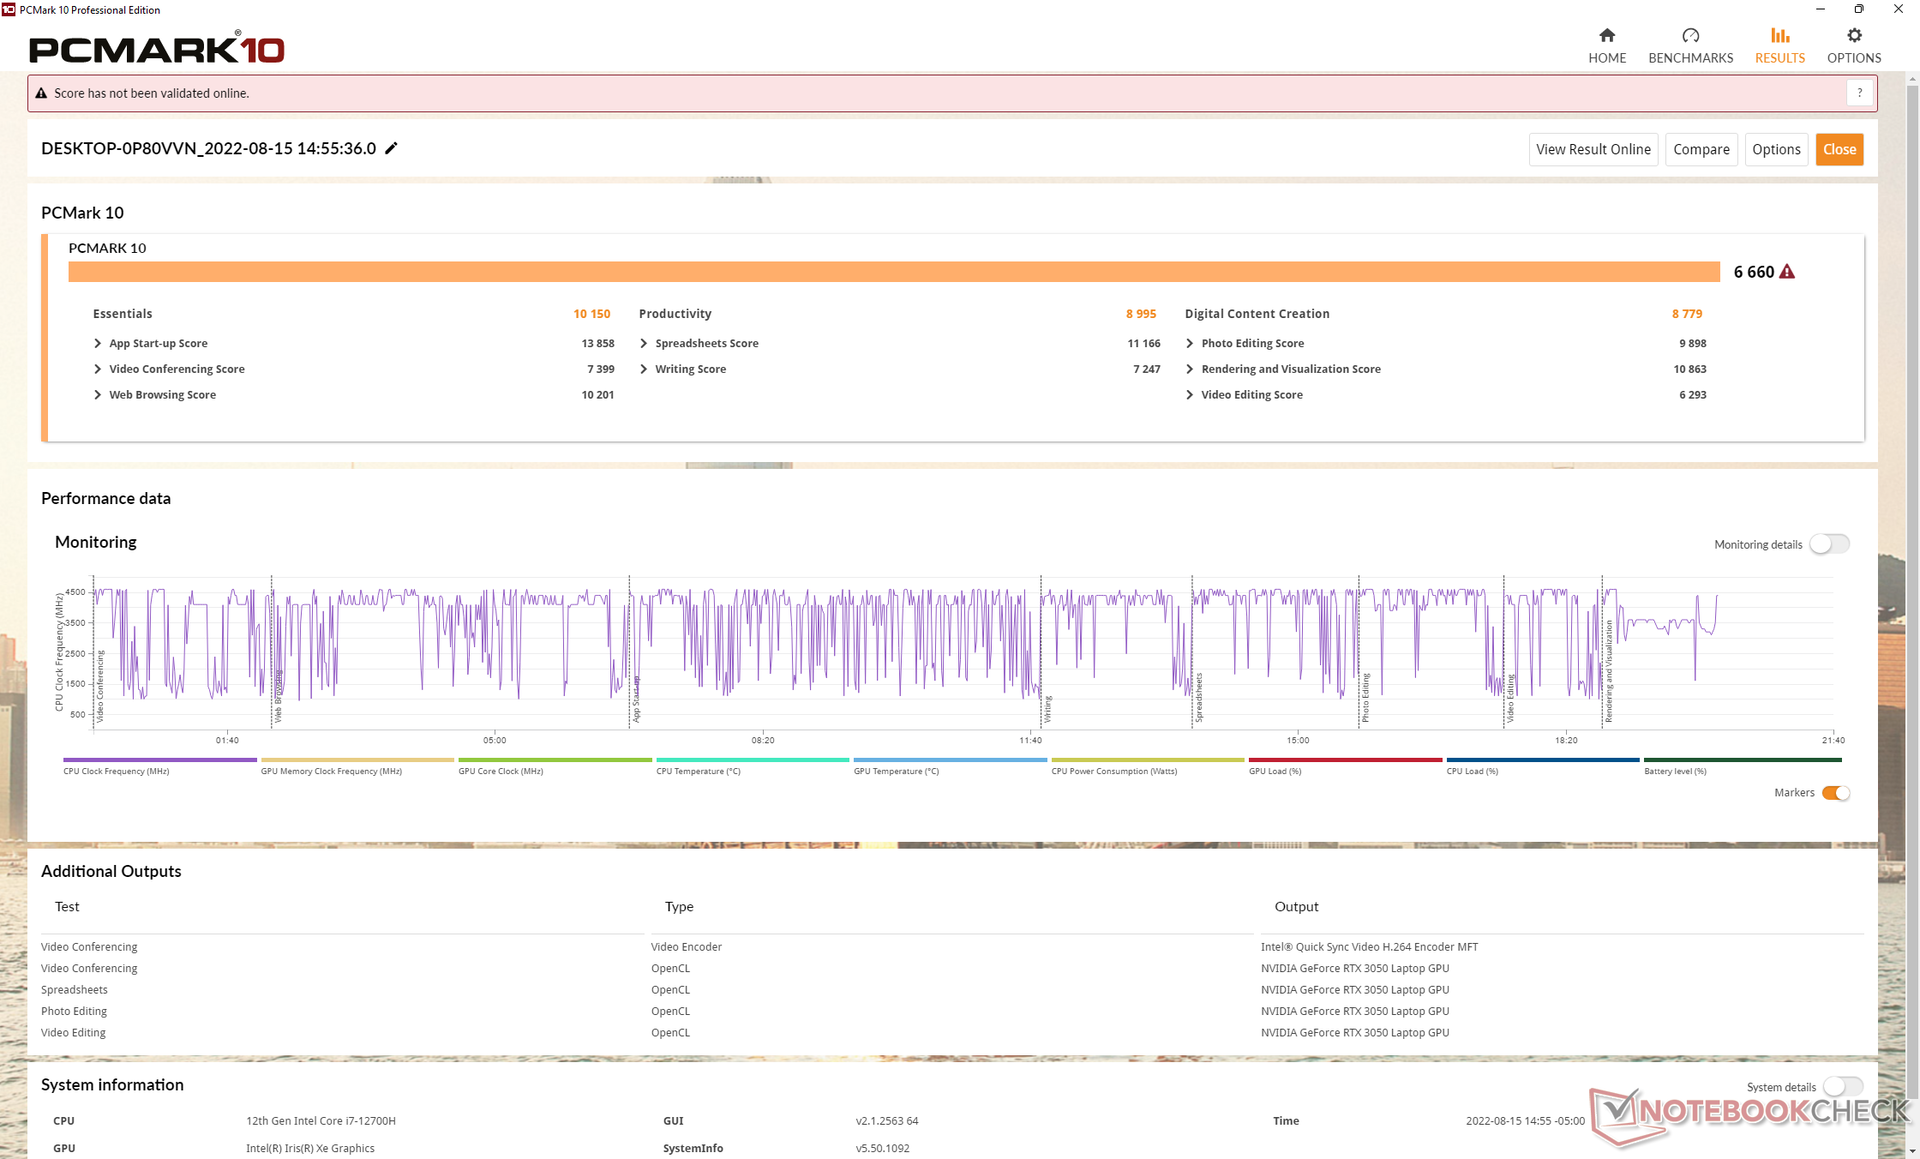
Wydajność systemu
Wyniki PCMark 10 są doskonałe i wyższe nawet od takich konkurentów jak Schenker Vision 14 z szybszą grafiką RTX 3050 Ti czy.Asus Vivobook Pro 14 z procesorem AMD Ryzen 5600H. Nie ma wątpliwości, że Core i7-12700H odgrywa ogromną rolę w zwiększeniu ogólnej wydajności Inspirona 14 Plus 7420 w stosunku do większości innych 14-calowych laptopów multimedialnych.
CrossMark: Overall | Productivity | Creativity | Responsiveness
| PCMark 10 / Score | |
| Przeciętny Intel Core i7-12700H, NVIDIA GeForce RTX 3050 4GB Laptop GPU (6660 - 6879, n=3) | |
| Dell Inspiron 14 Plus 7420 | |
| Schenker Vision 14 | |
| Asus Vivobook Pro 14 M3401QC-KM007T | |
| HP Envy 14-eb0010nr | |
| MSI Summit E14 A11SCS | |
| Dell Inspiron 14 7420 2-in-1 | |
| Asus Zenbook 14X UX5400E | |
| PCMark 10 / Essentials | |
| Przeciętny Intel Core i7-12700H, NVIDIA GeForce RTX 3050 4GB Laptop GPU (10150 - 10369, n=3) | |
| Dell Inspiron 14 7420 2-in-1 | |
| Dell Inspiron 14 Plus 7420 | |
| Asus Vivobook Pro 14 M3401QC-KM007T | |
| Schenker Vision 14 | |
| HP Envy 14-eb0010nr | |
| MSI Summit E14 A11SCS | |
| Asus Zenbook 14X UX5400E | |
| PCMark 10 / Productivity | |
| Przeciętny Intel Core i7-12700H, NVIDIA GeForce RTX 3050 4GB Laptop GPU (8995 - 9397, n=3) | |
| Dell Inspiron 14 Plus 7420 | |
| Schenker Vision 14 | |
| Asus Zenbook 14X UX5400E | |
| HP Envy 14-eb0010nr | |
| MSI Summit E14 A11SCS | |
| Asus Vivobook Pro 14 M3401QC-KM007T | |
| Dell Inspiron 14 7420 2-in-1 | |
| PCMark 10 / Digital Content Creation | |
| Przeciętny Intel Core i7-12700H, NVIDIA GeForce RTX 3050 4GB Laptop GPU (8779 - 9203, n=3) | |
| Dell Inspiron 14 Plus 7420 | |
| Asus Vivobook Pro 14 M3401QC-KM007T | |
| Schenker Vision 14 | |
| Dell Inspiron 14 7420 2-in-1 | |
| HP Envy 14-eb0010nr | |
| MSI Summit E14 A11SCS | |
| Asus Zenbook 14X UX5400E | |
| CrossMark / Overall | |
| Przeciętny Intel Core i7-12700H, NVIDIA GeForce RTX 3050 4GB Laptop GPU (1717 - 1857, n=3) | |
| Dell Inspiron 14 Plus 7420 | |
| Schenker Vision 14 | |
| Dell Inspiron 14 7420 2-in-1 | |
| Asus Vivobook Pro 14 M3401QC-KM007T | |
| CrossMark / Productivity | |
| Przeciętny Intel Core i7-12700H, NVIDIA GeForce RTX 3050 4GB Laptop GPU (1620 - 1735, n=3) | |
| Dell Inspiron 14 Plus 7420 | |
| Schenker Vision 14 | |
| Dell Inspiron 14 7420 2-in-1 | |
| Asus Vivobook Pro 14 M3401QC-KM007T | |
| CrossMark / Creativity | |
| Przeciętny Intel Core i7-12700H, NVIDIA GeForce RTX 3050 4GB Laptop GPU (1911 - 2067, n=3) | |
| Dell Inspiron 14 Plus 7420 | |
| Dell Inspiron 14 7420 2-in-1 | |
| Schenker Vision 14 | |
| Asus Vivobook Pro 14 M3401QC-KM007T | |
| CrossMark / Responsiveness | |
| Przeciętny Intel Core i7-12700H, NVIDIA GeForce RTX 3050 4GB Laptop GPU (1481 - 1651, n=3) | |
| Schenker Vision 14 | |
| Dell Inspiron 14 Plus 7420 | |
| Dell Inspiron 14 7420 2-in-1 | |
| Asus Vivobook Pro 14 M3401QC-KM007T | |
| PCMark 10 Score | 6660 pkt. | |
Pomoc | ||
| AIDA64 / Memory Copy | |
| MSI Summit E14 A11SCS | |
| Asus Zenbook 14X UX5400E | |
| Dell Inspiron 14 Plus 7420 | |
| Przeciętny Intel Core i7-12700H (25615 - 80511, n=64) | |
| Schenker Vision 14 | |
| Dell Inspiron 14 7420 2-in-1 | |
| Asus Vivobook Pro 14 M3401QC-KM007T | |
| AIDA64 / Memory Read | |
| Dell Inspiron 14 Plus 7420 | |
| MSI Summit E14 A11SCS | |
| Asus Zenbook 14X UX5400E | |
| Przeciętny Intel Core i7-12700H (25586 - 79442, n=64) | |
| Schenker Vision 14 | |
| Asus Vivobook Pro 14 M3401QC-KM007T | |
| Dell Inspiron 14 7420 2-in-1 | |
| AIDA64 / Memory Write | |
| Asus Zenbook 14X UX5400E | |
| MSI Summit E14 A11SCS | |
| Dell Inspiron 14 Plus 7420 | |
| Przeciętny Intel Core i7-12700H (23679 - 88660, n=64) | |
| Schenker Vision 14 | |
| Dell Inspiron 14 7420 2-in-1 | |
| Asus Vivobook Pro 14 M3401QC-KM007T | |
| AIDA64 / Memory Latency | |
| Dell Inspiron 14 Plus 7420 | |
| Asus Zenbook 14X UX5400E | |
| MSI Summit E14 A11SCS | |
| Asus Vivobook Pro 14 M3401QC-KM007T | |
| Przeciętny Intel Core i7-12700H (76.2 - 133.9, n=62) | |
| Schenker Vision 14 | |
| Dell Inspiron 14 7420 2-in-1 | |
* ... im mniej tym lepiej
Opóźnienie DPC
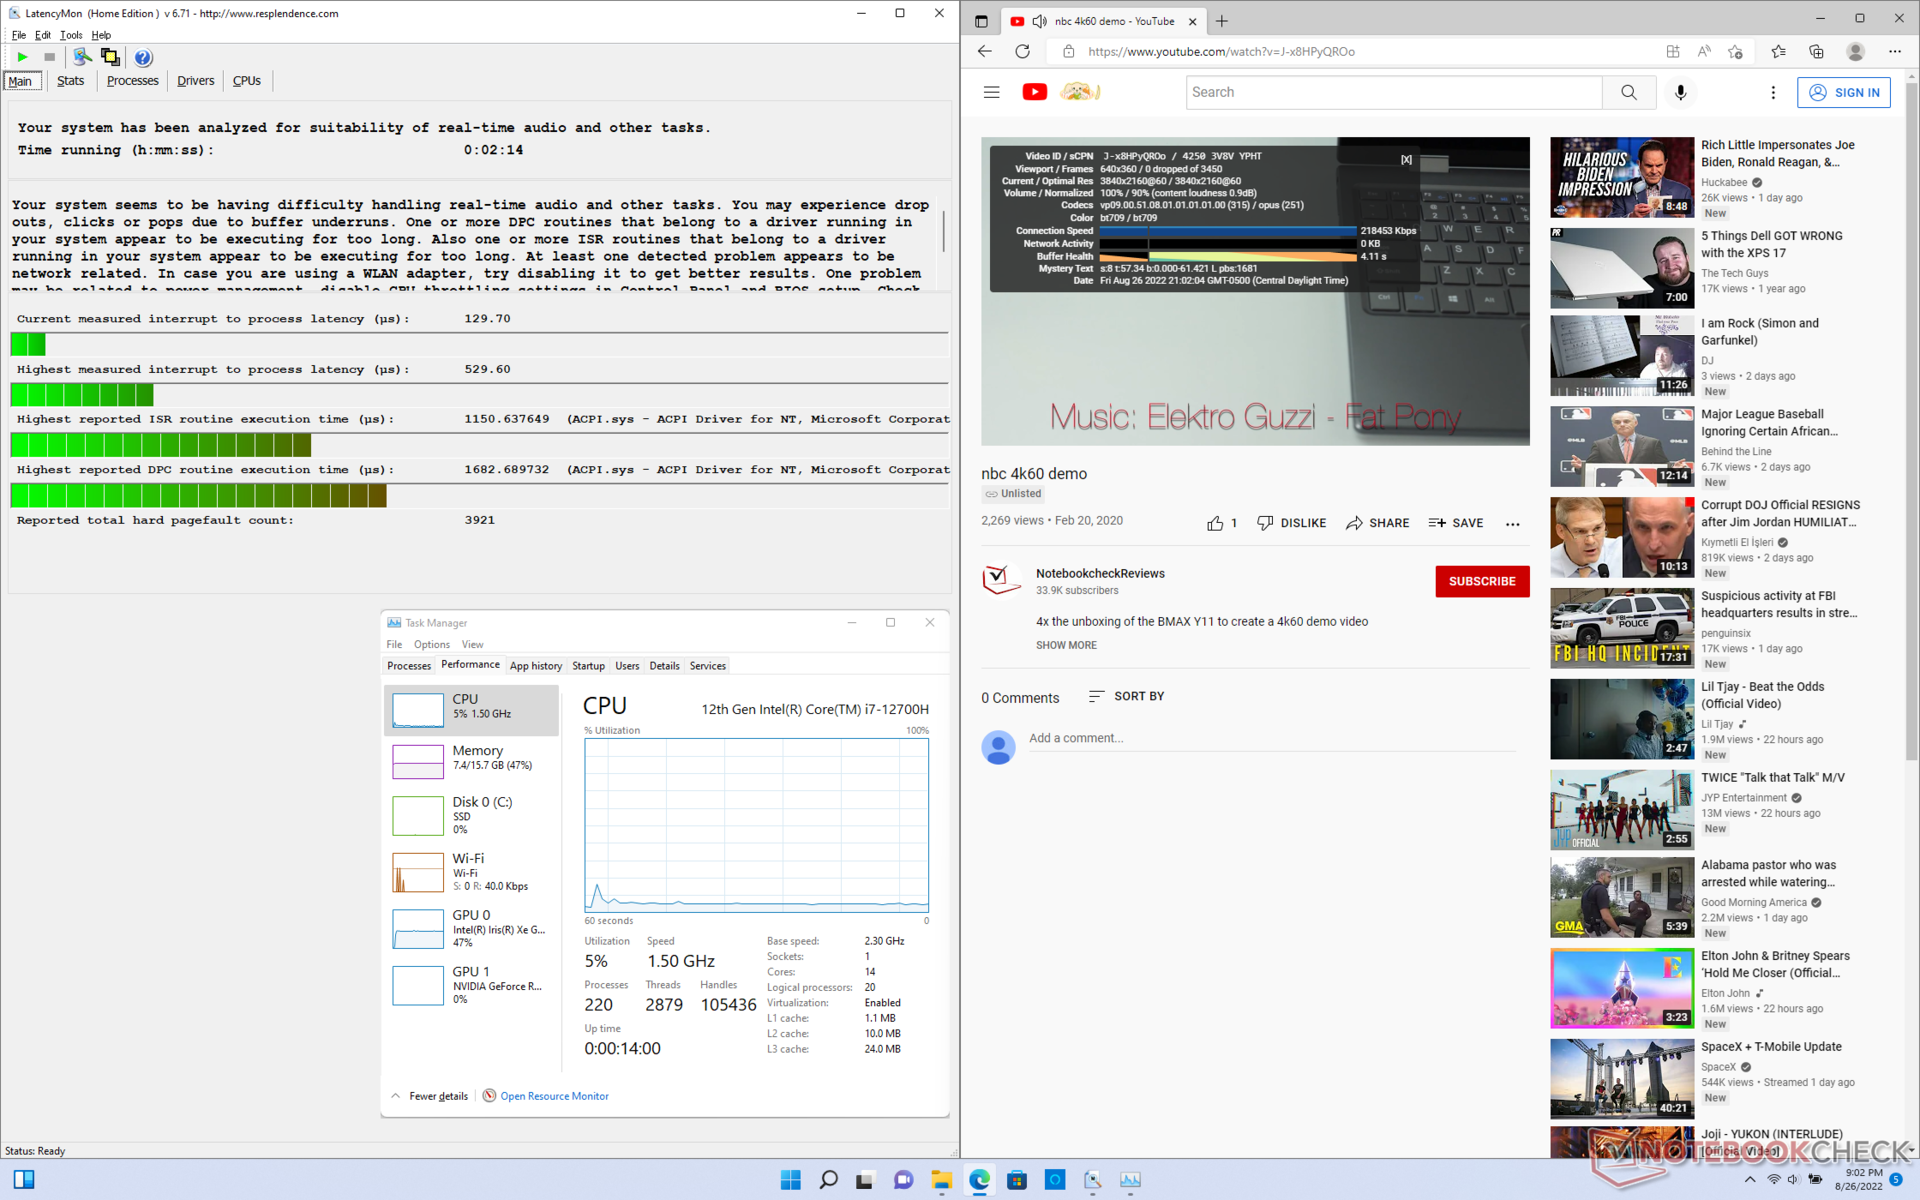
LatencyMon wykazuje niewielkie problemy z DPC podczas otwierania wielu kart przeglądarki na naszej stronie głównej. odtwarzanie wideo w rozdzielczości 4K przy 60 FPS jest poza tym płynne i bez żadnych spadków klatek.
| DPC Latencies / LatencyMon - interrupt to process latency (max), Web, Youtube, Prime95 | |
| HP Envy 14-eb0010nr | |
| Schenker Vision 14 | |
| MSI Summit E14 A11SCS | |
| Asus Vivobook Pro 14 M3401QC-KM007T | |
| Asus Zenbook 14X UX5400E | |
| Dell Inspiron 14 7420 2-in-1 | |
| Dell Inspiron 14 Plus 7420 | |
* ... im mniej tym lepiej
Urządzenia do przechowywania - rozpraszacz ciepła w zestawie
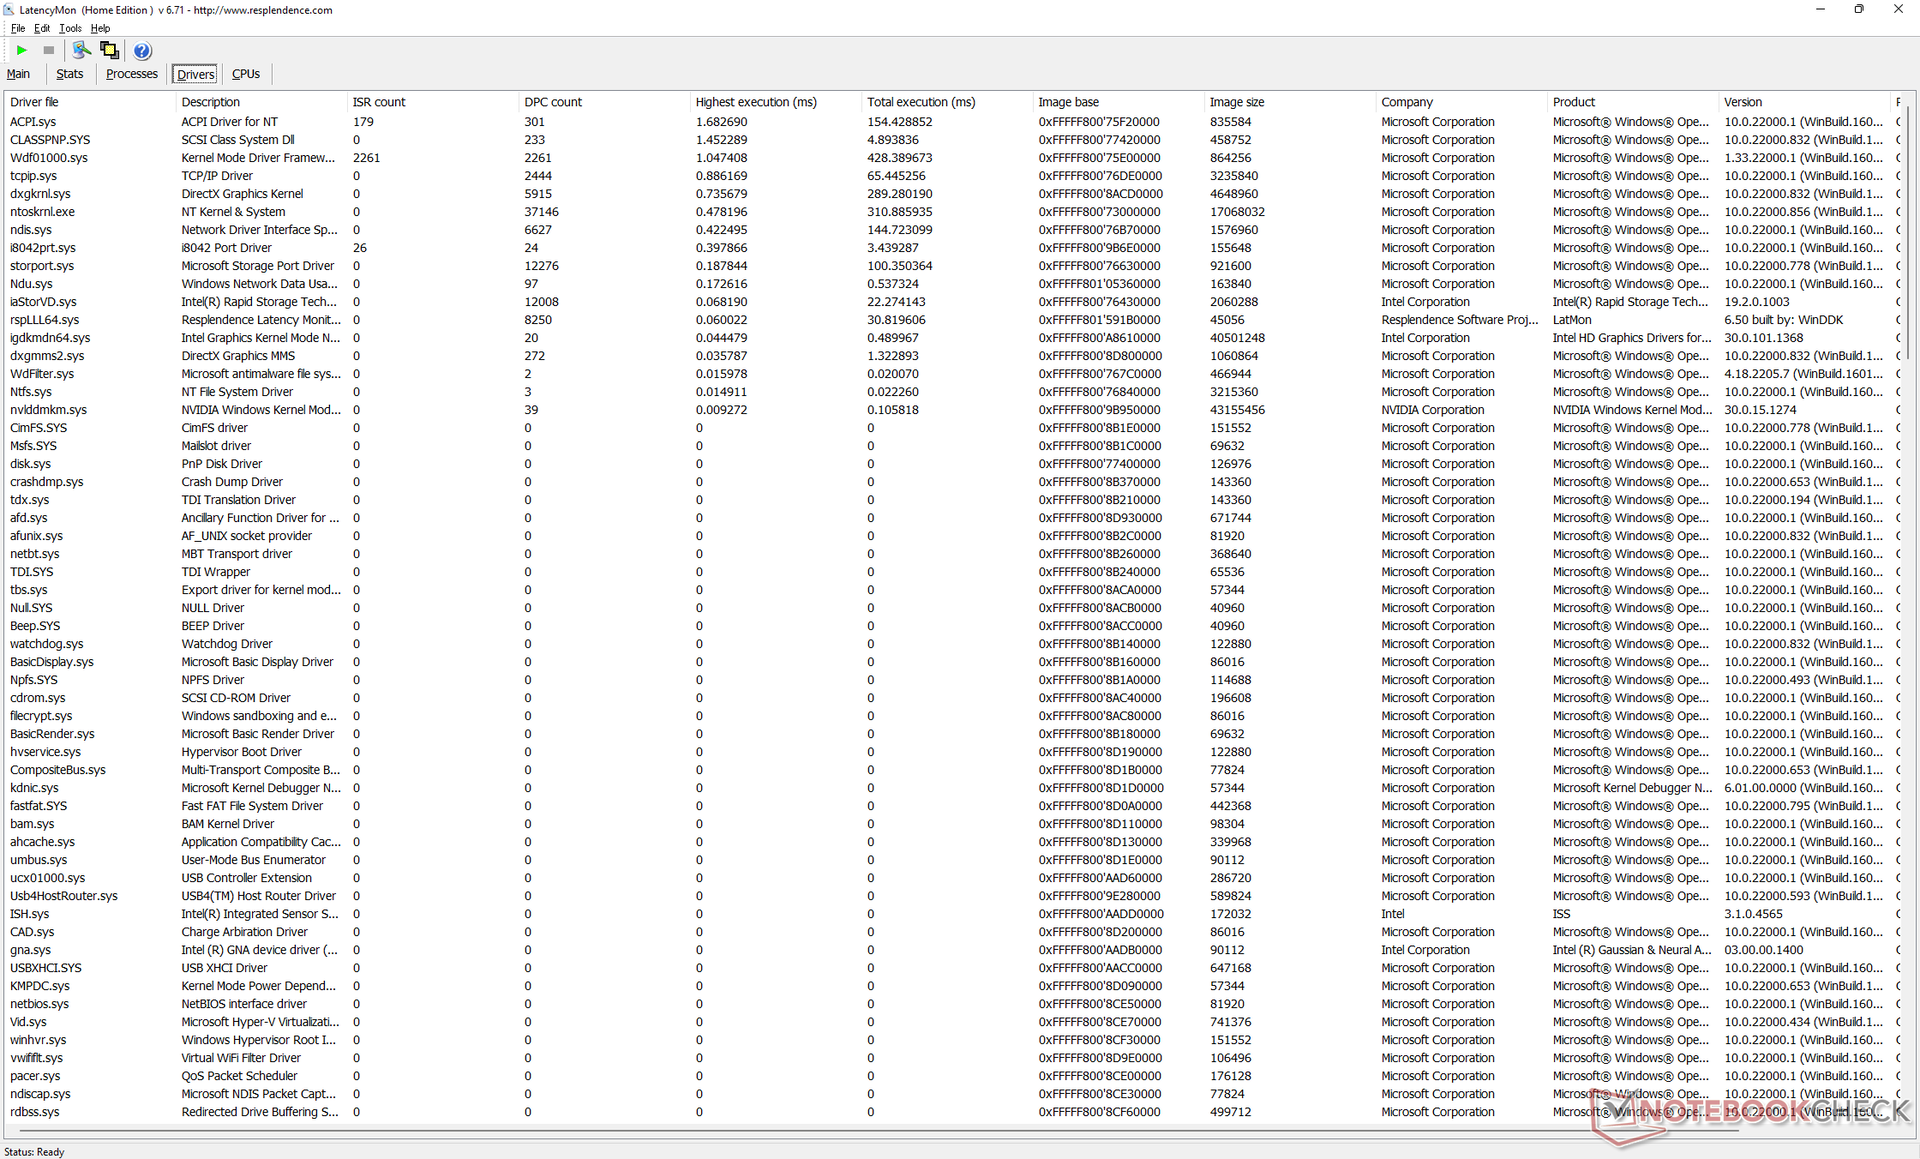
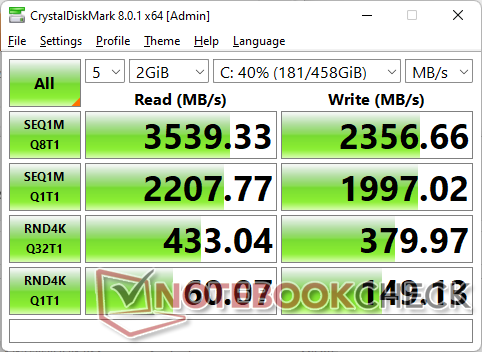
Nasze urządzenie jest dostarczane z dyskiem 512 GB SK Hynix BC711 PCIe3 NVMe SSD oferujący szybkość odczytu sekwencyjnego do 3600 MB/s. Dysk nie wykazuje żadnych problemów z wydajnością podczas pracy w pętli DiskSpd, ponieważ posiada fabrycznie zainstalowany rozpraszacz ciepła. Dla porównania, większość innych producentów OEM nie dołącza go do swoich budżetowych lub nawet średniej klasy laptopów. Miło byłoby jednak zobaczyć szybsze opcje PCIe4 w Inspironie 14 Plus 7420.

| Drive Performance rating - Percent | |
| Schenker Vision 14 | |
| MSI Summit E14 A11SCS | |
| Dell Inspiron 14 Plus 7420 | |
| Asus Zenbook 14X UX5400E | |
| HP Envy 14-eb0010nr | |
| Asus Vivobook Pro 14 M3401QC-KM007T | |
| Dell Inspiron 14 7420 2-in-1 | |
| DiskSpd | |
| seq read | |
| Schenker Vision 14 | |
| MSI Summit E14 A11SCS | |
| Dell Inspiron 14 Plus 7420 | |
| Asus Vivobook Pro 14 M3401QC-KM007T | |
| Asus Zenbook 14X UX5400E | |
| HP Envy 14-eb0010nr | |
| Dell Inspiron 14 7420 2-in-1 | |
| seq write | |
| Schenker Vision 14 | |
| MSI Summit E14 A11SCS | |
| Asus Zenbook 14X UX5400E | |
| Dell Inspiron 14 Plus 7420 | |
| HP Envy 14-eb0010nr | |
| Asus Vivobook Pro 14 M3401QC-KM007T | |
| Dell Inspiron 14 7420 2-in-1 | |
| seq q8 t1 read | |
| Schenker Vision 14 | |
| MSI Summit E14 A11SCS | |
| Dell Inspiron 14 Plus 7420 | |
| Asus Zenbook 14X UX5400E | |
| HP Envy 14-eb0010nr | |
| Asus Vivobook Pro 14 M3401QC-KM007T | |
| Dell Inspiron 14 7420 2-in-1 | |
| seq q8 t1 write | |
| Schenker Vision 14 | |
| Asus Zenbook 14X UX5400E | |
| Dell Inspiron 14 Plus 7420 | |
| MSI Summit E14 A11SCS | |
| HP Envy 14-eb0010nr | |
| Asus Vivobook Pro 14 M3401QC-KM007T | |
| Dell Inspiron 14 7420 2-in-1 | |
| 4k q1 t1 read | |
| Schenker Vision 14 | |
| Dell Inspiron 14 Plus 7420 | |
| Asus Zenbook 14X UX5400E | |
| Asus Vivobook Pro 14 M3401QC-KM007T | |
| MSI Summit E14 A11SCS | |
| Dell Inspiron 14 7420 2-in-1 | |
| HP Envy 14-eb0010nr | |
| 4k q1 t1 write | |
| MSI Summit E14 A11SCS | |
| Schenker Vision 14 | |
| Dell Inspiron 14 Plus 7420 | |
| Dell Inspiron 14 7420 2-in-1 | |
| Asus Zenbook 14X UX5400E | |
| Asus Vivobook Pro 14 M3401QC-KM007T | |
| HP Envy 14-eb0010nr | |
| 4k q32 t16 read | |
| Schenker Vision 14 | |
| MSI Summit E14 A11SCS | |
| Asus Zenbook 14X UX5400E | |
| Dell Inspiron 14 Plus 7420 | |
| HP Envy 14-eb0010nr | |
| Dell Inspiron 14 7420 2-in-1 | |
| Asus Vivobook Pro 14 M3401QC-KM007T | |
| 4k q32 t16 write | |
| MSI Summit E14 A11SCS | |
| Schenker Vision 14 | |
| Asus Vivobook Pro 14 M3401QC-KM007T | |
| Asus Zenbook 14X UX5400E | |
| Dell Inspiron 14 Plus 7420 | |
| HP Envy 14-eb0010nr | |
| Dell Inspiron 14 7420 2-in-1 | |
| AS SSD | |
| Score Total | |
| Schenker Vision 14 | |
| MSI Summit E14 A11SCS | |
| Dell Inspiron 14 Plus 7420 | |
| HP Envy 14-eb0010nr | |
| Asus Zenbook 14X UX5400E | |
| Asus Vivobook Pro 14 M3401QC-KM007T | |
| Dell Inspiron 14 7420 2-in-1 | |
| Score Read | |
| Schenker Vision 14 | |
| MSI Summit E14 A11SCS | |
| Asus Zenbook 14X UX5400E | |
| HP Envy 14-eb0010nr | |
| Dell Inspiron 14 Plus 7420 | |
| Dell Inspiron 14 7420 2-in-1 | |
| Asus Vivobook Pro 14 M3401QC-KM007T | |
| Score Write | |
| MSI Summit E14 A11SCS | |
| Dell Inspiron 14 Plus 7420 | |
| HP Envy 14-eb0010nr | |
| Asus Zenbook 14X UX5400E | |
| Asus Vivobook Pro 14 M3401QC-KM007T | |
| Schenker Vision 14 | |
| Dell Inspiron 14 7420 2-in-1 | |
| Seq Read | |
| Schenker Vision 14 | |
| MSI Summit E14 A11SCS | |
| Dell Inspiron 14 Plus 7420 | |
| Asus Zenbook 14X UX5400E | |
| Asus Vivobook Pro 14 M3401QC-KM007T | |
| Dell Inspiron 14 7420 2-in-1 | |
| HP Envy 14-eb0010nr | |
| Seq Write | |
| Schenker Vision 14 | |
| MSI Summit E14 A11SCS | |
| Dell Inspiron 14 Plus 7420 | |
| HP Envy 14-eb0010nr | |
| Dell Inspiron 14 7420 2-in-1 | |
| Asus Zenbook 14X UX5400E | |
| Asus Vivobook Pro 14 M3401QC-KM007T | |
| 4K Read | |
| Schenker Vision 14 | |
| Dell Inspiron 14 Plus 7420 | |
| Asus Vivobook Pro 14 M3401QC-KM007T | |
| Asus Zenbook 14X UX5400E | |
| MSI Summit E14 A11SCS | |
| HP Envy 14-eb0010nr | |
| Dell Inspiron 14 7420 2-in-1 | |
| 4K Write | |
| Dell Inspiron 14 7420 2-in-1 | |
| Schenker Vision 14 | |
| Dell Inspiron 14 Plus 7420 | |
| Asus Vivobook Pro 14 M3401QC-KM007T | |
| Asus Zenbook 14X UX5400E | |
| HP Envy 14-eb0010nr | |
| MSI Summit E14 A11SCS | |
| 4K-64 Read | |
| Schenker Vision 14 | |
| MSI Summit E14 A11SCS | |
| Asus Zenbook 14X UX5400E | |
| HP Envy 14-eb0010nr | |
| Dell Inspiron 14 Plus 7420 | |
| Dell Inspiron 14 7420 2-in-1 | |
| Asus Vivobook Pro 14 M3401QC-KM007T | |
| 4K-64 Write | |
| MSI Summit E14 A11SCS | |
| Dell Inspiron 14 Plus 7420 | |
| HP Envy 14-eb0010nr | |
| Asus Zenbook 14X UX5400E | |
| Asus Vivobook Pro 14 M3401QC-KM007T | |
| Schenker Vision 14 | |
| Dell Inspiron 14 7420 2-in-1 | |
| Access Time Read | |
| Asus Vivobook Pro 14 M3401QC-KM007T | |
| Dell Inspiron 14 7420 2-in-1 | |
| HP Envy 14-eb0010nr | |
| MSI Summit E14 A11SCS | |
| Dell Inspiron 14 Plus 7420 | |
| Asus Zenbook 14X UX5400E | |
| Schenker Vision 14 | |
| Access Time Write | |
| Dell Inspiron 14 7420 2-in-1 | |
| HP Envy 14-eb0010nr | |
| Dell Inspiron 14 Plus 7420 | |
| Asus Vivobook Pro 14 M3401QC-KM007T | |
| MSI Summit E14 A11SCS | |
| Asus Zenbook 14X UX5400E | |
| Schenker Vision 14 | |
* ... im mniej tym lepiej
Disk Throttling: DiskSpd Read Loop, Queue Depth 8
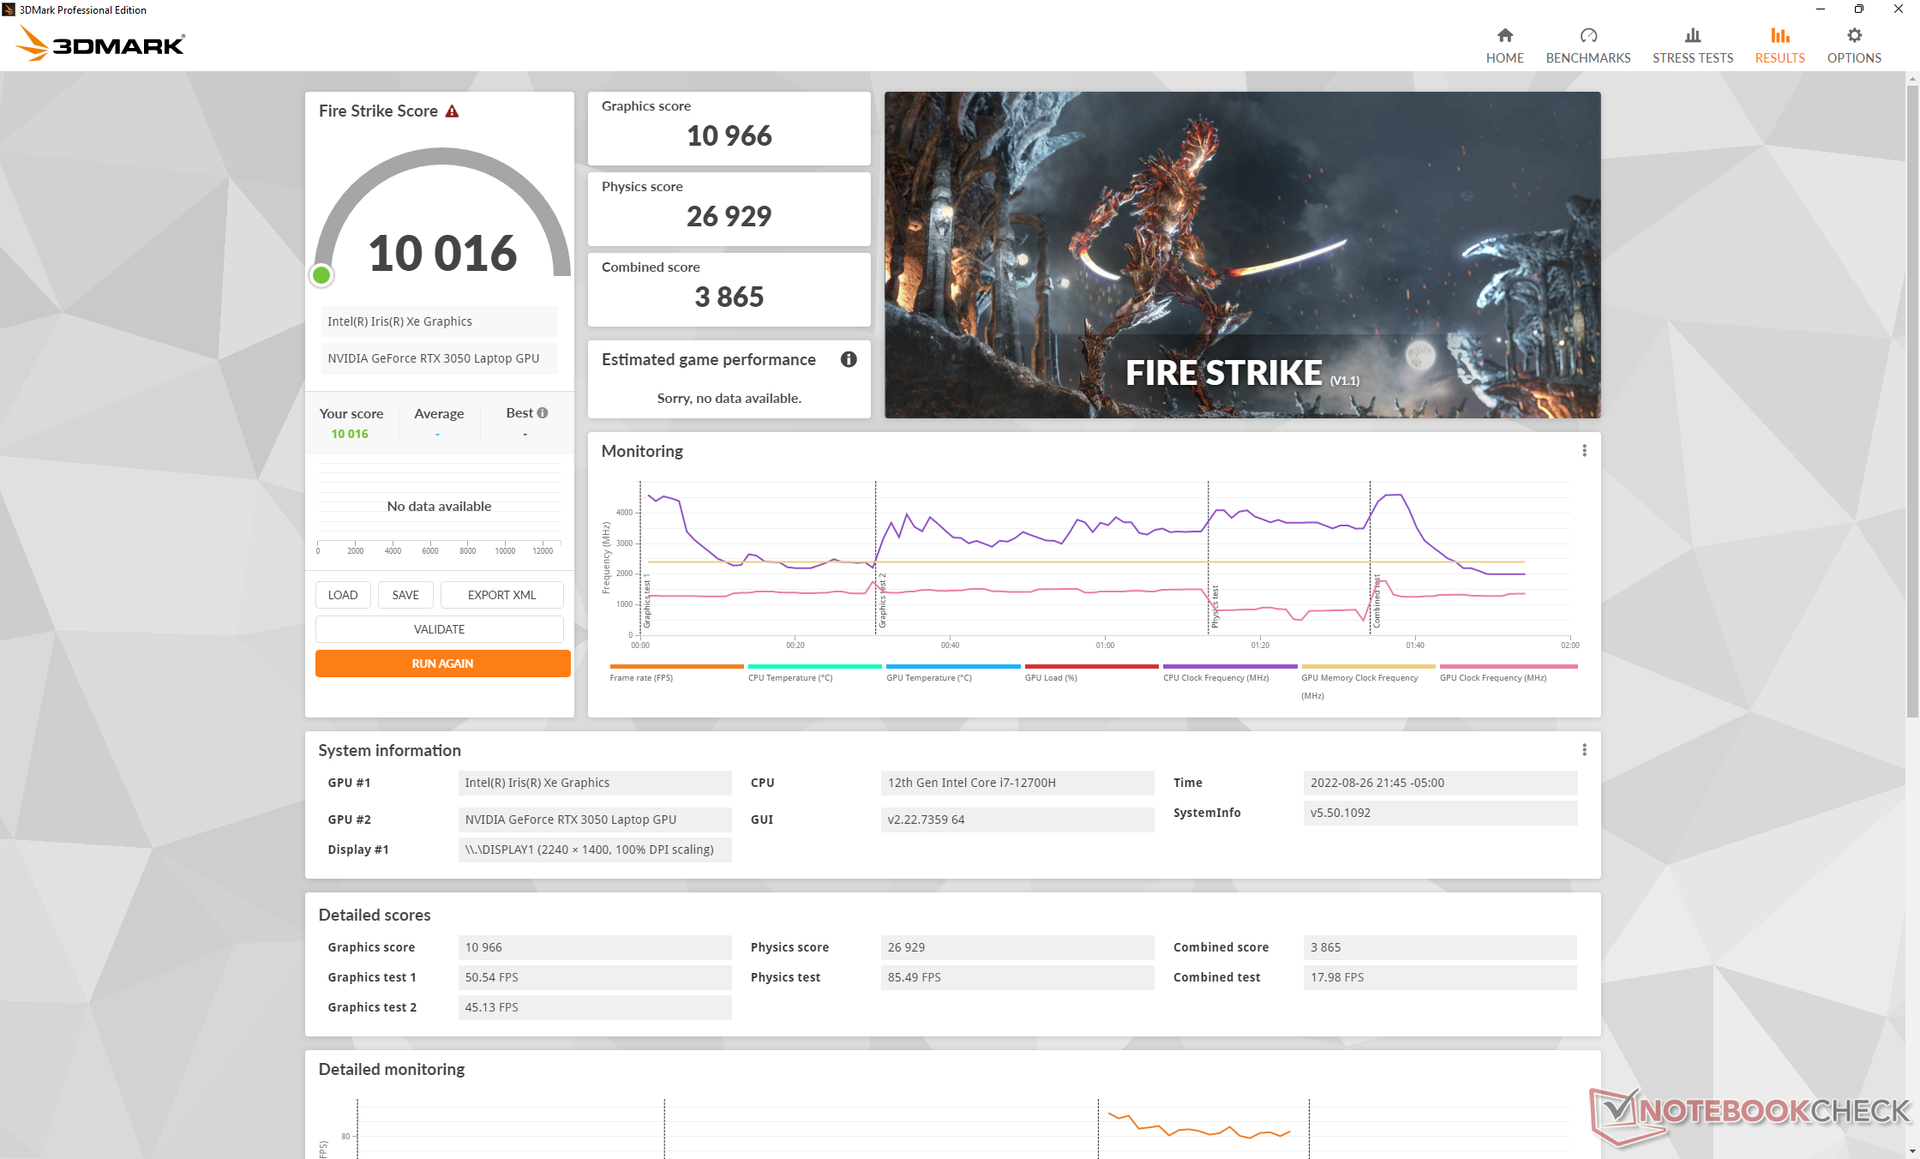
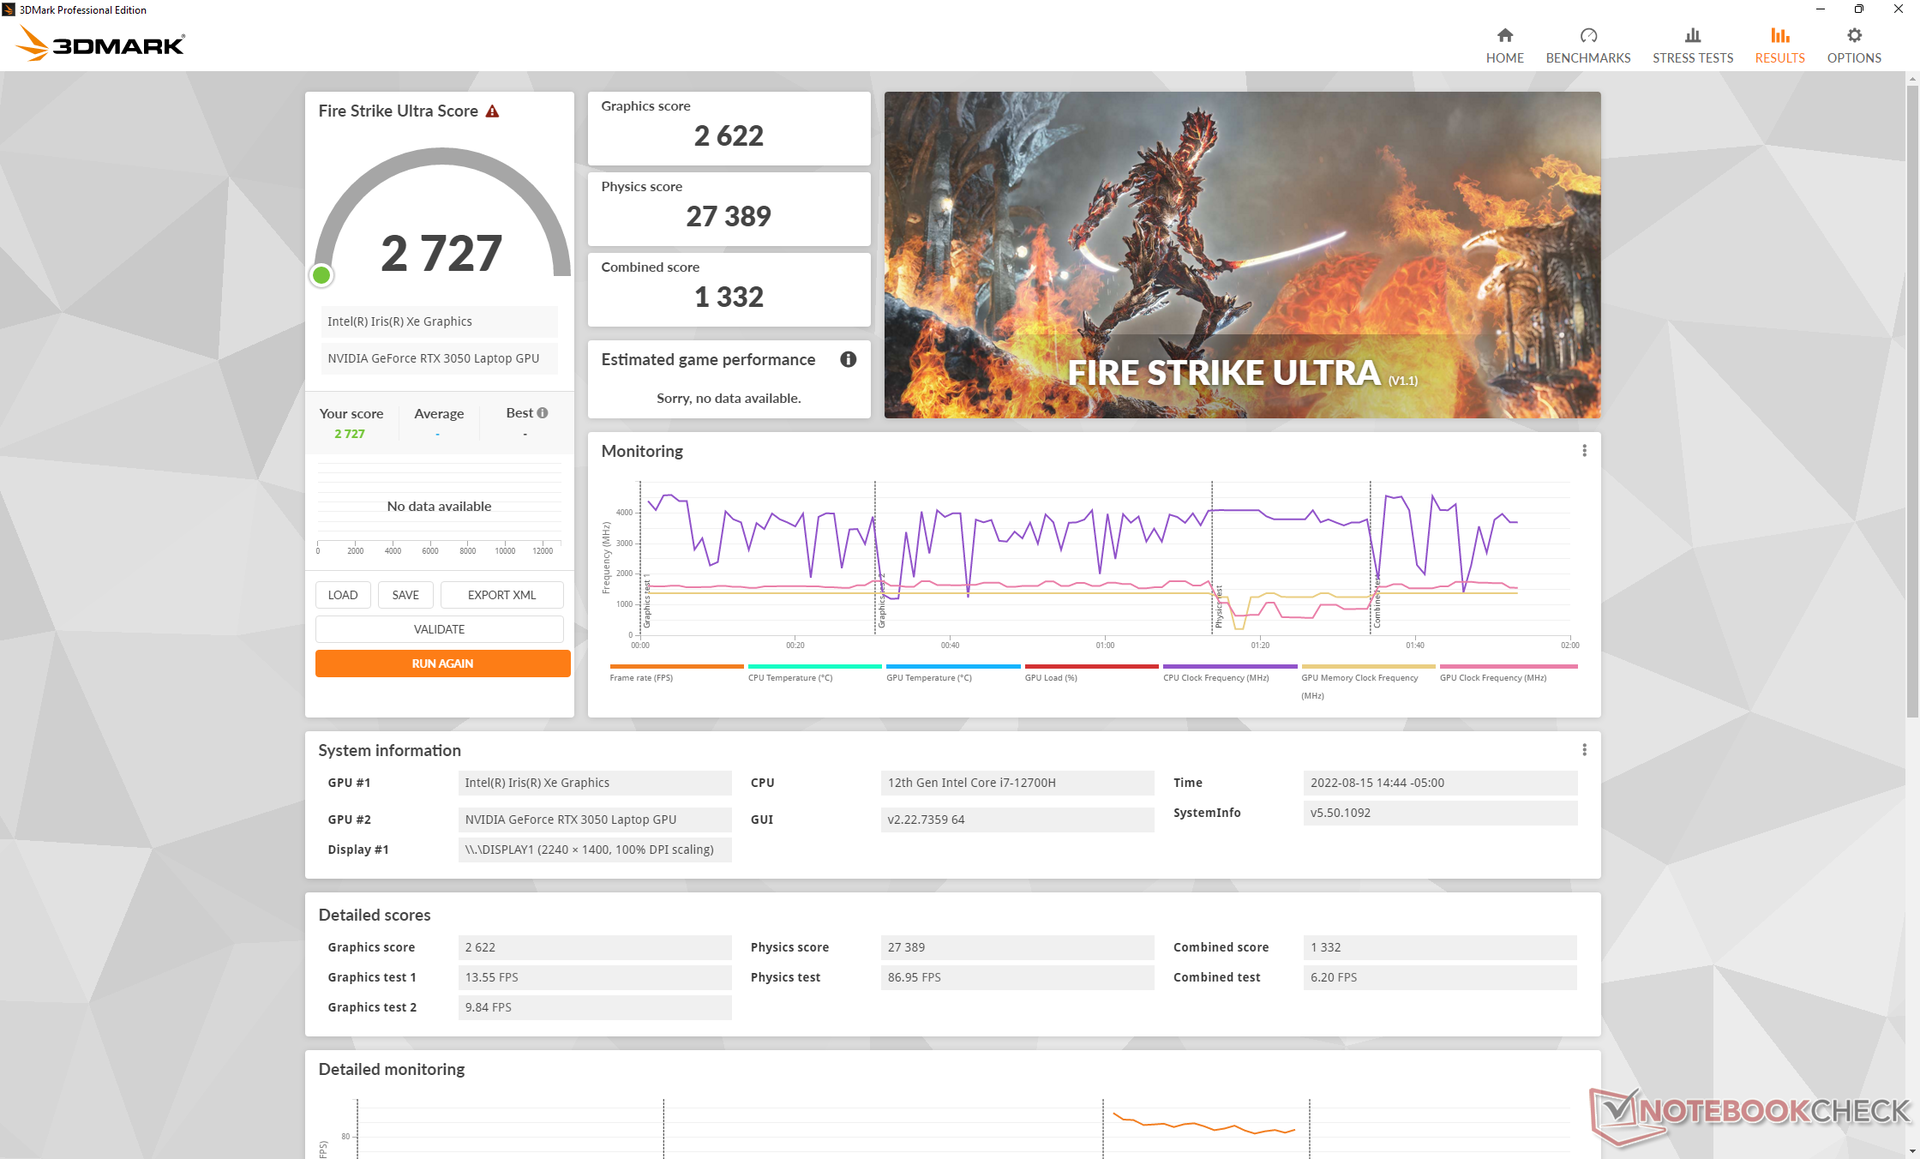
Wydajność układu GPU - szybko jak na rozmiar i cenę
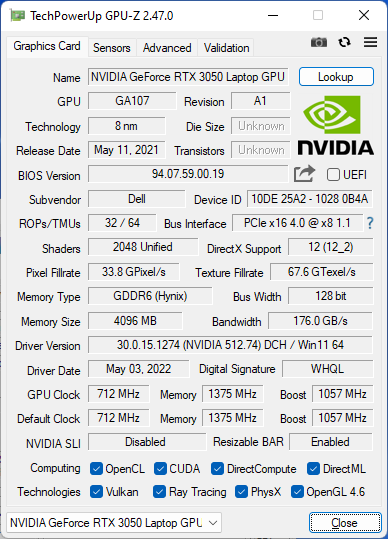
Wydajność graficzna jest na poziomie, którego oczekujemy od innych laptopów z tym samym GeForce RTX 3050 GPU. W rzeczywistości wyniki są dość zbliżone do RTX 3050 Ti z Schenker Vision 14 lubAsus ROG Flow Z13. Dell może w niedalekiej przyszłości wprowadzić jednostki z RTX 3050 Ti, ale nie polecamy ich, gdyż prawdopodobnie będą one w najlepszym wypadku marginalnie szybsze od naszej bazowej jednostki z RTX 3050.
Użytkownicy modernizujący ze znacznie starszego GTX 1650 Ti Max-Q zobaczą znaczącą poprawę o około 50 procent.
Należy pamiętać, że wydajność grafiki spada w przypadku uruchomienia trybu Dell Optimized zamiast trybu Dell Ultra Performance. Test Fire Strike w trybie Optimized zwróciłby wynik 10966 punktów w porównaniu do 12125 punktów w trybie Ultra Performance.

| 3DMark | |
| 1920x1080 Fire Strike Graphics | |
| Asus Zephyrus G14 GA401QM | |
| Dell Inspiron 14 Plus 7420 | |
| Przeciętny NVIDIA GeForce RTX 3050 4GB Laptop GPU (9138 - 14157, n=22) | |
| Asus Vivobook Pro 14 M3401QC-KM007T | |
| Schenker Vision 14 | |
| Asus ROG Flow Z13 GZ301ZE | |
| HP Envy 14-eb0010nr | |
| MSI Summit E14 A11SCS | |
| Lenovo Yoga Slim 7 Pro 14 OLED Ryzen 9 | |
| Asus Zenbook 14X UX5400E | |
| Dell Inspiron 14 7420 2-in-1 | |
| Asus ZenBook 14X UM5401QA-KN162 | |
| 2560x1440 Time Spy Graphics | |
| Asus Zephyrus G14 GA401QM | |
| Schenker Vision 14 | |
| Dell Inspiron 14 Plus 7420 | |
| Asus Vivobook Pro 14 M3401QC-KM007T | |
| Przeciętny NVIDIA GeForce RTX 3050 4GB Laptop GPU (3281 - 5295, n=23) | |
| Asus ROG Flow Z13 GZ301ZE | |
| HP Envy 14-eb0010nr | |
| MSI Summit E14 A11SCS | |
| Lenovo Yoga Slim 7 Pro 14 OLED Ryzen 9 | |
| Asus Zenbook 14X UX5400E | |
| Dell Inspiron 14 7420 2-in-1 | |
| Asus ZenBook 14X UM5401QA-KN162 | |
| 2560x1440 Time Spy Score | |
| Asus Zephyrus G14 GA401QM | |
| Dell Inspiron 14 Plus 7420 | |
| Schenker Vision 14 | |
| Asus Vivobook Pro 14 M3401QC-KM007T | |
| Przeciętny NVIDIA GeForce RTX 3050 4GB Laptop GPU (3500 - 5506, n=22) | |
| Asus ROG Flow Z13 GZ301ZE | |
| HP Envy 14-eb0010nr | |
| MSI Summit E14 A11SCS | |
| Lenovo Yoga Slim 7 Pro 14 OLED Ryzen 9 | |
| Asus Zenbook 14X UX5400E | |
| Dell Inspiron 14 7420 2-in-1 | |
| Asus ZenBook 14X UM5401QA-KN162 | |
| 3DMark 11 - 1280x720 Performance GPU | |
| Asus Zephyrus G14 GA401QM | |
| Schenker Vision 14 | |
| Dell Inspiron 14 Plus 7420 | |
| Przeciętny NVIDIA GeForce RTX 3050 4GB Laptop GPU (11980 - 18557, n=23) | |
| Asus Vivobook Pro 14 M3401QC-KM007T | |
| Asus ROG Flow Z13 GZ301ZE | |
| MSI Summit E14 A11SCS | |
| HP Envy 14-eb0010nr | |
| Lenovo Yoga Slim 7 Pro 14 OLED Ryzen 9 | |
| Asus ZenBook 14X UM5401QA-KN162 | |
| Dell Inspiron 14 7420 2-in-1 | |
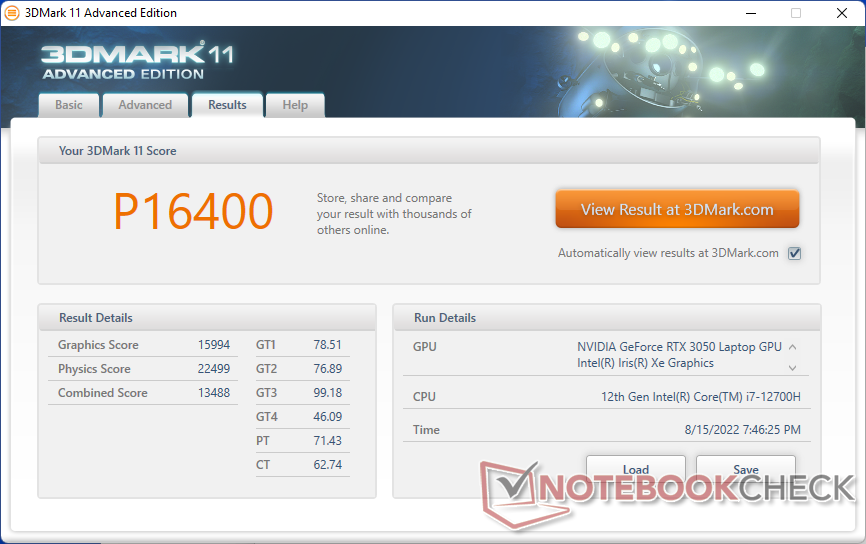
| 3DMark 11 Performance | 16400 pkt. | |
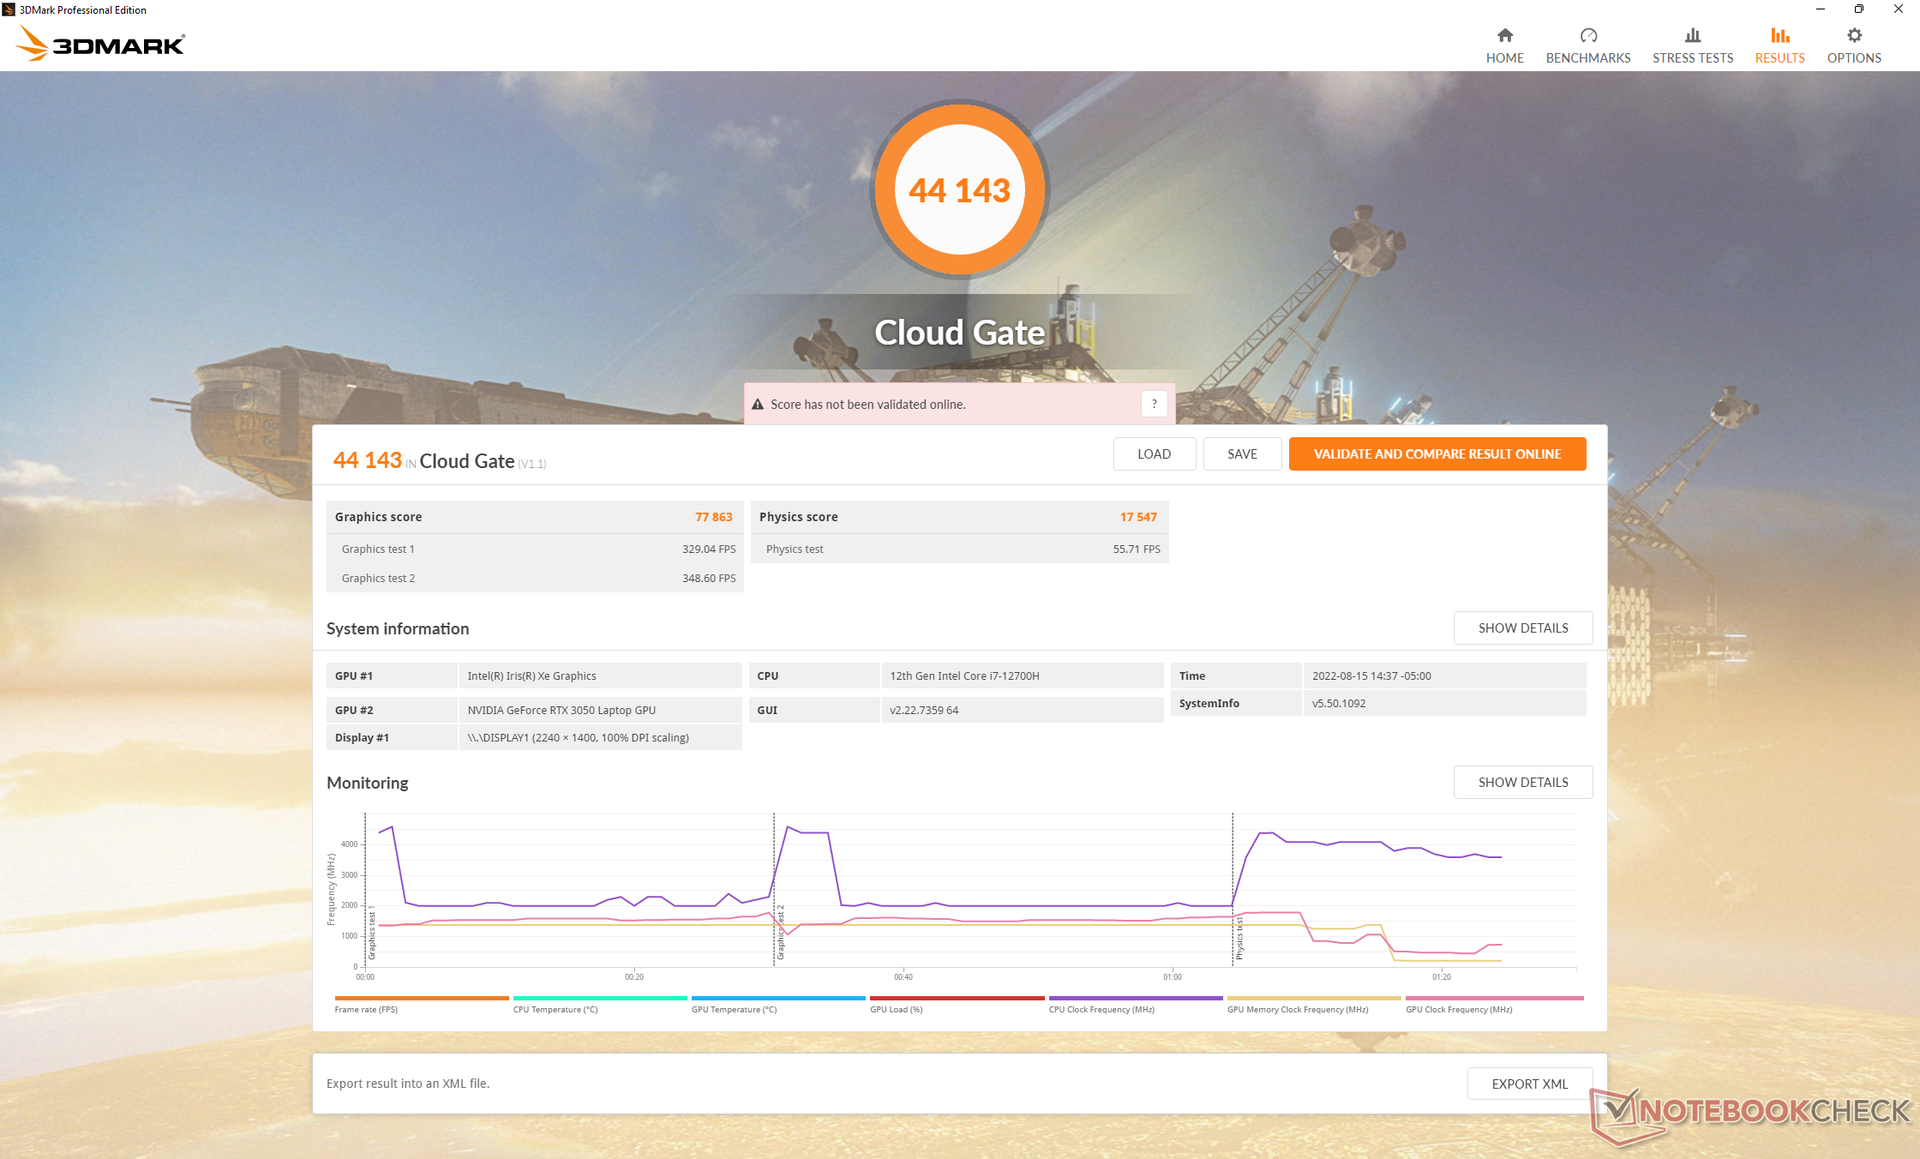
| 3DMark Cloud Gate Standard Score | 44143 pkt. | |
| 3DMark Fire Strike Score | 11060 pkt. | |
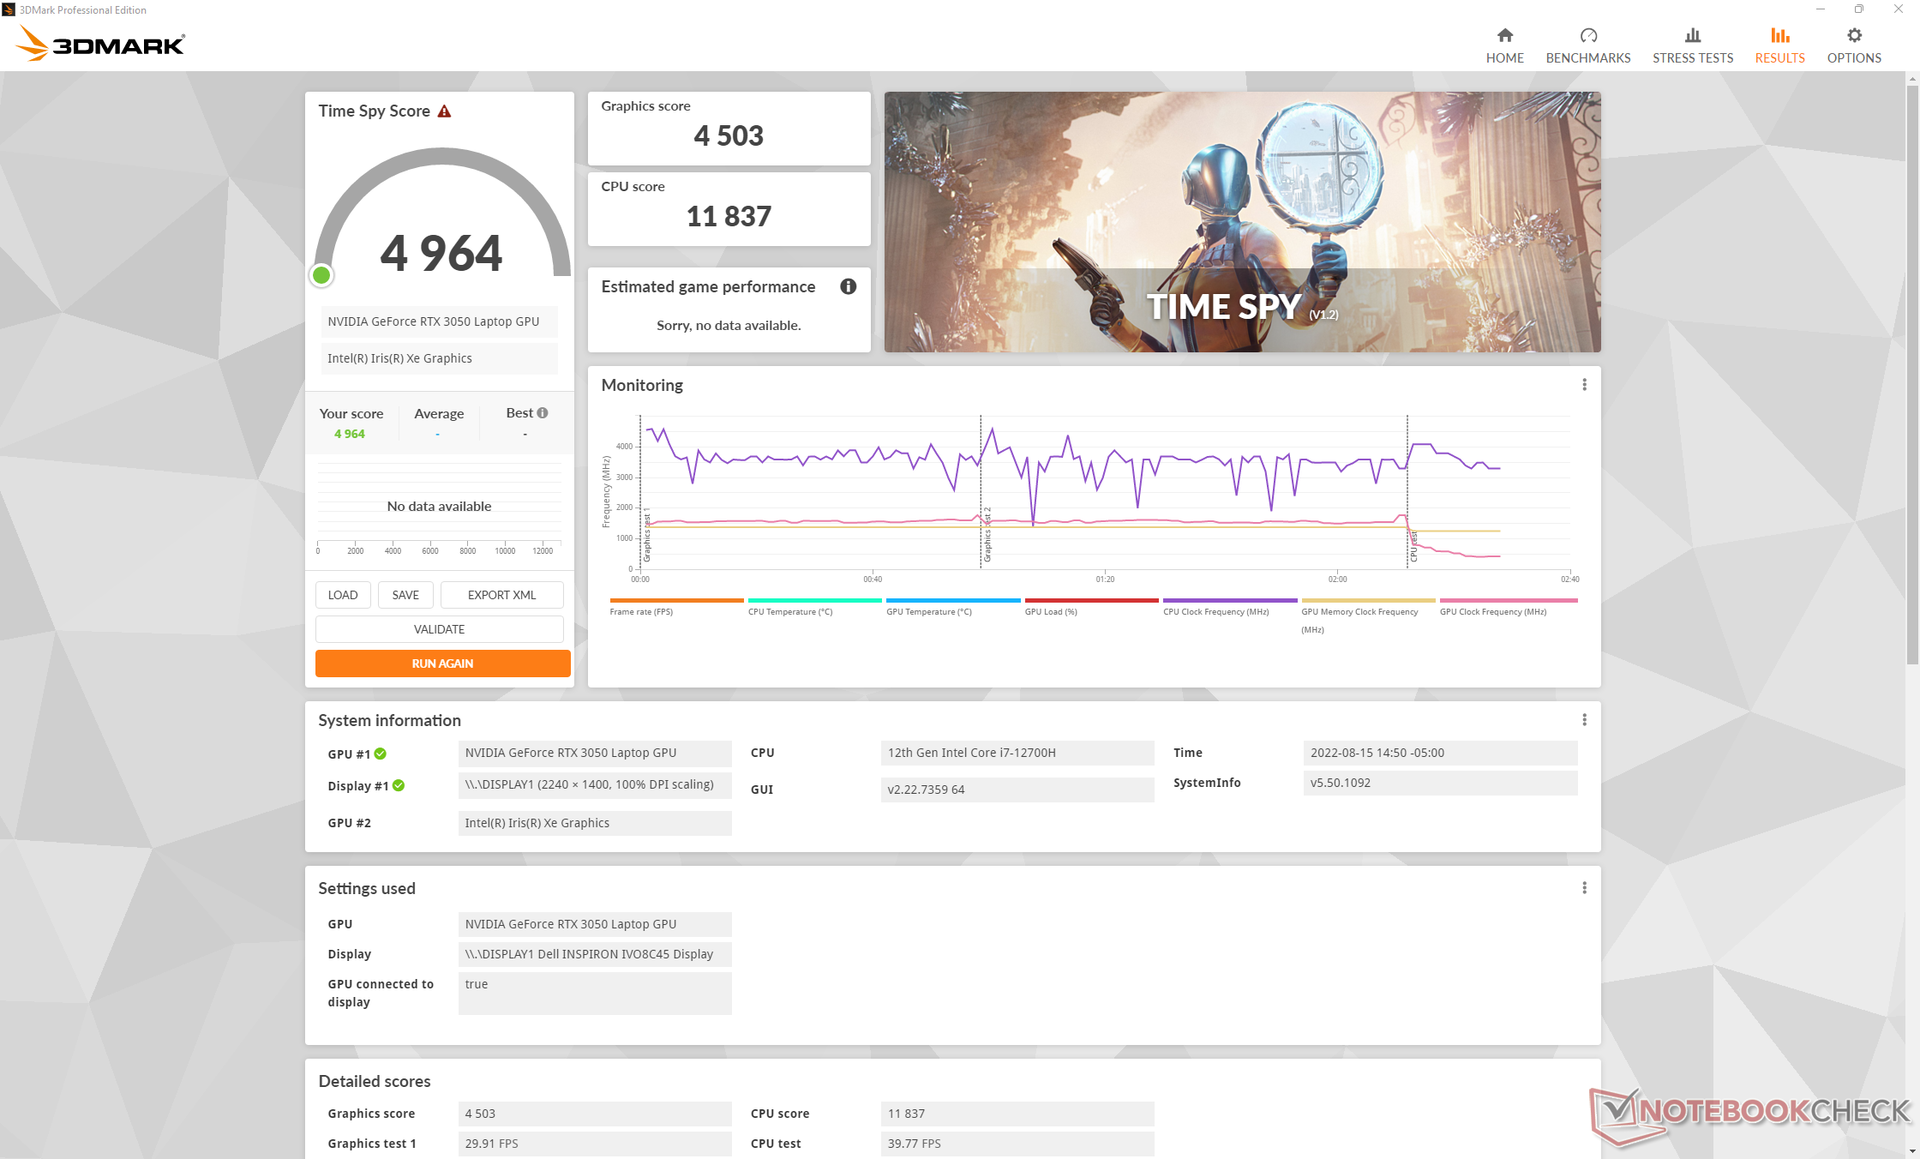
| 3DMark Time Spy Score | 4964 pkt. | |
Pomoc | ||
| Final Fantasy XV Benchmark | |
| 1280x720 Lite Quality | |
| Asus Zephyrus G14 GA401QM | |
| Dell Inspiron 14 Plus 7420 | |
| Schenker Vision 14 | |
| Przeciętny NVIDIA GeForce RTX 3050 4GB Laptop GPU (62 - 143.4, n=15) | |
| HP Envy 14-eb0010nr | |
| MSI Summit E14 A11SCS | |
| Lenovo Yoga Slim 7 Pro 14 OLED Ryzen 9 | |
| Asus ZenBook 14X UM5401QA-KN162 | |
| Dell Inspiron 14 7420 2-in-1 | |
| 1920x1080 Standard Quality | |
| Asus Zephyrus G14 GA401QM | |
| Dell Inspiron 14 Plus 7420 | |
| Przeciętny NVIDIA GeForce RTX 3050 4GB Laptop GPU (47 - 74, n=20) | |
| Schenker Vision 14 | |
| HP Envy 14-eb0010nr | |
| MSI Summit E14 A11SCS | |
| Lenovo Yoga Slim 7 Pro 14 OLED Ryzen 9 | |
| Asus ZenBook 14X UM5401QA-KN162 | |
| Dell Inspiron 14 7420 2-in-1 | |
| 1920x1080 High Quality | |
| Asus Zephyrus G14 GA401QM | |
| Dell Inspiron 14 Plus 7420 | |
| Przeciętny NVIDIA GeForce RTX 3050 4GB Laptop GPU (35.9 - 53.5, n=21) | |
| Schenker Vision 14 | |
| HP Envy 14-eb0010nr | |
| MSI Summit E14 A11SCS | |
| Lenovo Yoga Slim 7 Pro 14 OLED Ryzen 9 | |
| Dell Inspiron 14 7420 2-in-1 | |
| The Witcher 3 | |
| 1024x768 Low Graphics & Postprocessing | |
| Asus Zephyrus G14 GA401QM | |
| Dell Inspiron 14 Plus 7420 | |
| Przeciętny NVIDIA GeForce RTX 3050 4GB Laptop GPU (60 - 283, n=13) | |
| Schenker Vision 14 | |
| HP Envy 14-eb0010nr | |
| MSI Summit E14 A11SCS | |
| Lenovo Yoga Slim 7 Pro 14 OLED Ryzen 9 | |
| Dell Inspiron 14 7420 2-in-1 | |
| Asus ZenBook 14X UM5401QA-KN162 | |
| 1366x768 Medium Graphics & Postprocessing | |
| Dell Inspiron 14 Plus 7420 | |
| Przeciętny NVIDIA GeForce RTX 3050 4GB Laptop GPU (68.8 - 179, n=15) | |
| Schenker Vision 14 | |
| HP Envy 14-eb0010nr | |
| MSI Summit E14 A11SCS | |
| Dell Inspiron 14 7420 2-in-1 | |
| Asus ZenBook 14X UM5401QA-KN162 | |
| 1920x1080 High Graphics & Postprocessing (Nvidia HairWorks Off) | |
| Asus Zephyrus G14 GA401QM | |
| Dell Inspiron 14 Plus 7420 | |
| Przeciętny NVIDIA GeForce RTX 3050 4GB Laptop GPU (53.5 - 105.1, n=17) | |
| Schenker Vision 14 | |
| Asus Vivobook Pro 14 M3401QC-KM007T | |
| HP Envy 14-eb0010nr | |
| MSI Summit E14 A11SCS | |
| Lenovo Yoga Slim 7 Pro 14 OLED Ryzen 9 | |
| Asus Zenbook 14X UX5400E | |
| Dell Inspiron 14 7420 2-in-1 | |
| Asus ZenBook 14X UM5401QA-KN162 | |
| 1920x1080 Ultra Graphics & Postprocessing (HBAO+) | |
| Asus Zephyrus G14 GA401QM | |
| Asus Vivobook Pro 14 M3401QC-KM007T | |
| Dell Inspiron 14 Plus 7420 | |
| Przeciętny NVIDIA GeForce RTX 3050 4GB Laptop GPU (31.5 - 55.8, n=21) | |
| Schenker Vision 14 | |
| HP Envy 14-eb0010nr | |
| MSI Summit E14 A11SCS | |
| Lenovo Yoga Slim 7 Pro 14 OLED Ryzen 9 | |
| Asus Zenbook 14X UX5400E | |
| Asus ZenBook 14X UM5401QA-KN162 | |
| Dell Inspiron 14 7420 2-in-1 | |
| Dota 2 Reborn | |
| 1280x720 min (0/3) fastest | |
| Dell Inspiron 14 Plus 7420 | |
| Schenker Vision 14 | |
| MSI Summit E14 A11SCS | |
| Przeciętny NVIDIA GeForce RTX 3050 4GB Laptop GPU (91.1 - 187, n=22) | |
| Lenovo Yoga Slim 7 Pro 14 OLED Ryzen 9 | |
| Asus Zephyrus G14 GA401QM | |
| Asus Vivobook Pro 14 M3401QC-KM007T | |
| HP Envy 14-eb0010nr | |
| Asus ZenBook 14X UM5401QA-KN162 | |
| Dell Inspiron 14 7420 2-in-1 | |
| Asus Zenbook 14X UX5400E | |
| 1366x768 med (1/3) | |
| Dell Inspiron 14 Plus 7420 | |
| Lenovo Yoga Slim 7 Pro 14 OLED Ryzen 9 | |
| Asus Zephyrus G14 GA401QM | |
| Schenker Vision 14 | |
| Przeciętny NVIDIA GeForce RTX 3050 4GB Laptop GPU (90.3 - 170.8, n=22) | |
| Asus Vivobook Pro 14 M3401QC-KM007T | |
| MSI Summit E14 A11SCS | |
| HP Envy 14-eb0010nr | |
| Asus ZenBook 14X UM5401QA-KN162 | |
| Dell Inspiron 14 7420 2-in-1 | |
| Asus Zenbook 14X UX5400E | |
| 1920x1080 high (2/3) | |
| Dell Inspiron 14 Plus 7420 | |
| Przeciętny NVIDIA GeForce RTX 3050 4GB Laptop GPU (84 - 160.3, n=22) | |
| Schenker Vision 14 | |
| Asus Zephyrus G14 GA401QM | |
| MSI Summit E14 A11SCS | |
| Asus Vivobook Pro 14 M3401QC-KM007T | |
| HP Envy 14-eb0010nr | |
| Lenovo Yoga Slim 7 Pro 14 OLED Ryzen 9 | |
| Asus ZenBook 14X UM5401QA-KN162 | |
| Dell Inspiron 14 7420 2-in-1 | |
| Asus Zenbook 14X UX5400E | |
| 1920x1080 ultra (3/3) best looking | |
| Dell Inspiron 14 Plus 7420 | |
| Schenker Vision 14 | |
| Przeciętny NVIDIA GeForce RTX 3050 4GB Laptop GPU (82.8 - 147.7, n=22) | |
| Asus Zephyrus G14 GA401QM | |
| Asus Vivobook Pro 14 M3401QC-KM007T | |
| HP Envy 14-eb0010nr | |
| MSI Summit E14 A11SCS | |
| Lenovo Yoga Slim 7 Pro 14 OLED Ryzen 9 | |
| Asus ZenBook 14X UM5401QA-KN162 | |
| Dell Inspiron 14 7420 2-in-1 | |
| Asus Zenbook 14X UX5400E | |
| X-Plane 11.11 | |
| 1280x720 low (fps_test=1) | |
| Dell Inspiron 14 Plus 7420 | |
| Przeciętny NVIDIA GeForce RTX 3050 4GB Laptop GPU (76.2 - 148.1, n=22) | |
| Lenovo Yoga Slim 7 Pro 14 OLED Ryzen 9 | |
| Schenker Vision 14 | |
| Asus Zephyrus G14 GA401QM | |
| MSI Summit E14 A11SCS | |
| Asus Vivobook Pro 14 M3401QC-KM007T | |
| HP Envy 14-eb0010nr | |
| Asus Zenbook 14X UX5400E | |
| Dell Inspiron 14 7420 2-in-1 | |
| Asus ZenBook 14X UM5401QA-KN162 | |
| 1920x1080 med (fps_test=2) | |
| Dell Inspiron 14 Plus 7420 | |
| Przeciętny NVIDIA GeForce RTX 3050 4GB Laptop GPU (63.5 - 129.9, n=22) | |
| Schenker Vision 14 | |
| Lenovo Yoga Slim 7 Pro 14 OLED Ryzen 9 | |
| Asus Zephyrus G14 GA401QM | |
| MSI Summit E14 A11SCS | |
| Asus Vivobook Pro 14 M3401QC-KM007T | |
| HP Envy 14-eb0010nr | |
| Asus Zenbook 14X UX5400E | |
| Asus ZenBook 14X UM5401QA-KN162 | |
| Dell Inspiron 14 7420 2-in-1 | |
| 1920x1080 high (fps_test=3) | |
| Dell Inspiron 14 Plus 7420 | |
| Schenker Vision 14 | |
| Przeciętny NVIDIA GeForce RTX 3050 4GB Laptop GPU (51.6 - 103.1, n=22) | |
| Lenovo Yoga Slim 7 Pro 14 OLED Ryzen 9 | |
| MSI Summit E14 A11SCS | |
| Asus Vivobook Pro 14 M3401QC-KM007T | |
| HP Envy 14-eb0010nr | |
| Asus Zephyrus G14 GA401QM | |
| Asus Zenbook 14X UX5400E | |
| Dell Inspiron 14 7420 2-in-1 | |
| Asus ZenBook 14X UM5401QA-KN162 | |
| Cyberpunk 2077 1.6 | |
| 1920x1080 Low Preset | |
| Dell Inspiron 14 Plus 7420 | |
| Przeciętny NVIDIA GeForce RTX 3050 4GB Laptop GPU (51.7 - 77.9, n=6) | |
| Lenovo Yoga Slim 7 Pro 14 OLED Ryzen 9 | |
| Dell Inspiron 14 7420 2-in-1 | |
| 1920x1080 Medium Preset | |
| Dell Inspiron 14 Plus 7420 | |
| Przeciętny NVIDIA GeForce RTX 3050 4GB Laptop GPU (38.2 - 62.4, n=7) | |
| Lenovo Yoga Slim 7 Pro 14 OLED Ryzen 9 | |
| Dell Inspiron 14 7420 2-in-1 | |
| 1920x1080 High Preset | |
| Dell Inspiron 14 Plus 7420 | |
| Przeciętny NVIDIA GeForce RTX 3050 4GB Laptop GPU (28.4 - 45.5, n=7) | |
| Lenovo Yoga Slim 7 Pro 14 OLED Ryzen 9 | |
| Dell Inspiron 14 7420 2-in-1 | |
| 1920x1080 Ultra Preset | |
| Dell Inspiron 14 Plus 7420 | |
| Przeciętny NVIDIA GeForce RTX 3050 4GB Laptop GPU (25.3 - 36.5, n=7) | |
| Dell Inspiron 14 7420 2-in-1 | |
| GTA V | |
| 1024x768 Lowest Settings possible | |
| Dell Inspiron 14 Plus 7420 | |
| Asus Zephyrus G14 GA401QM | |
| Lenovo Yoga Slim 7 Pro 14 OLED Ryzen 9 | |
| Asus Vivobook Pro 14 M3401QC-KM007T | |
| Przeciętny NVIDIA GeForce RTX 3050 4GB Laptop GPU (128.7 - 186.8, n=16) | |
| MSI Summit E14 A11SCS | |
| Schenker Vision 14 | |
| HP Envy 14-eb0010nr | |
| Asus ZenBook 14X UM5401QA-KN162 | |
| Dell Inspiron 14 7420 2-in-1 | |
| 1920x1080 Lowest Settings possible | |
| Dell Inspiron 14 Plus 7420 | |
| Asus Vivobook Pro 14 M3401QC-KM007T | |
| Asus Zephyrus G14 GA401QM | |
| Przeciętny NVIDIA GeForce RTX 3050 4GB Laptop GPU (129.2 - 179, n=11) | |
| MSI Summit E14 A11SCS | |
| HP Envy 14-eb0010nr | |
| Dell Inspiron 14 7420 2-in-1 | |
| 1366x768 Normal/Off AF:4x | |
| Dell Inspiron 14 Plus 7420 | |
| Przeciętny NVIDIA GeForce RTX 3050 4GB Laptop GPU (117.3 - 180.2, n=17) | |
| Lenovo Yoga Slim 7 Pro 14 OLED Ryzen 9 | |
| MSI Summit E14 A11SCS | |
| Schenker Vision 14 | |
| HP Envy 14-eb0010nr | |
| Dell Inspiron 14 7420 2-in-1 | |
| Asus ZenBook 14X UM5401QA-KN162 | |
| 1920x1080 Normal/Off AF:4x | |
| Dell Inspiron 14 Plus 7420 | |
| Asus Zephyrus G14 GA401QM | |
| Przeciętny NVIDIA GeForce RTX 3050 4GB Laptop GPU (97.9 - 175.7, n=14) | |
| MSI Summit E14 A11SCS | |
| HP Envy 14-eb0010nr | |
| Dell Inspiron 14 7420 2-in-1 | |
| 1920x1080 High/On (Advanced Graphics Off) AA:2xMSAA + FX AF:8x | |
| Asus Zephyrus G14 GA401QM | |
| Asus Vivobook Pro 14 M3401QC-KM007T | |
| Przeciętny NVIDIA GeForce RTX 3050 4GB Laptop GPU (89.9 - 148.2, n=19) | |
| Dell Inspiron 14 Plus 7420 | |
| Schenker Vision 14 | |
| HP Envy 14-eb0010nr | |
| MSI Summit E14 A11SCS | |
| Lenovo Yoga Slim 7 Pro 14 OLED Ryzen 9 | |
| Asus Zenbook 14X UX5400E | |
| Dell Inspiron 14 7420 2-in-1 | |
| 1920x1080 Highest AA:4xMSAA + FX AF:16x | |
| Asus Zephyrus G14 GA401QM | |
| Dell Inspiron 14 Plus 7420 | |
| Przeciętny NVIDIA GeForce RTX 3050 4GB Laptop GPU (48 - 72.5, n=21) | |
| Asus Vivobook Pro 14 M3401QC-KM007T | |
| Schenker Vision 14 | |
| HP Envy 14-eb0010nr | |
| MSI Summit E14 A11SCS | |
| Lenovo Yoga Slim 7 Pro 14 OLED Ryzen 9 | |
| Asus Zenbook 14X UX5400E | |
| Dell Inspiron 14 7420 2-in-1 | |
| Strange Brigade | |
| 1280x720 lowest AF:1 | |
| Asus Zephyrus G14 GA401QM | |
| Dell Inspiron 14 Plus 7420 | |
| Przeciętny NVIDIA GeForce RTX 3050 4GB Laptop GPU (179.7 - 320, n=16) | |
| Asus Vivobook Pro 14 M3401QC-KM007T | |
| Schenker Vision 14 | |
| HP Envy 14-eb0010nr | |
| MSI Summit E14 A11SCS | |
| Lenovo Yoga Slim 7 Pro 14 OLED Ryzen 9 | |
| Asus ZenBook 14X UM5401QA-KN162 | |
| Dell Inspiron 14 7420 2-in-1 | |
| 1920x1080 medium AA:medium AF:4 | |
| Asus Zephyrus G14 GA401QM | |
| Dell Inspiron 14 Plus 7420 | |
| Asus Vivobook Pro 14 M3401QC-KM007T | |
| Przeciętny NVIDIA GeForce RTX 3050 4GB Laptop GPU (78.6 - 135.8, n=19) | |
| Schenker Vision 14 | |
| HP Envy 14-eb0010nr | |
| MSI Summit E14 A11SCS | |
| Lenovo Yoga Slim 7 Pro 14 OLED Ryzen 9 | |
| Asus ZenBook 14X UM5401QA-KN162 | |
| Dell Inspiron 14 7420 2-in-1 | |
| 1920x1080 high AA:high AF:8 | |
| Asus Zephyrus G14 GA401QM | |
| Dell Inspiron 14 Plus 7420 | |
| Asus Vivobook Pro 14 M3401QC-KM007T | |
| Przeciętny NVIDIA GeForce RTX 3050 4GB Laptop GPU (65.2 - 109.1, n=19) | |
| Schenker Vision 14 | |
| HP Envy 14-eb0010nr | |
| MSI Summit E14 A11SCS | |
| Lenovo Yoga Slim 7 Pro 14 OLED Ryzen 9 | |
| Asus Zenbook 14X UX5400E | |
| Asus ZenBook 14X UM5401QA-KN162 | |
| Dell Inspiron 14 7420 2-in-1 | |
| 1920x1080 ultra AA:ultra AF:16 | |
| Asus Zephyrus G14 GA401QM | |
| Dell Inspiron 14 Plus 7420 | |
| Asus Vivobook Pro 14 M3401QC-KM007T | |
| Przeciętny NVIDIA GeForce RTX 3050 4GB Laptop GPU (57.9 - 95.1, n=21) | |
| Schenker Vision 14 | |
| HP Envy 14-eb0010nr | |
| MSI Summit E14 A11SCS | |
| Asus Zenbook 14X UX5400E | |
| Lenovo Yoga Slim 7 Pro 14 OLED Ryzen 9 | |
| Asus ZenBook 14X UM5401QA-KN162 | |
| Dell Inspiron 14 7420 2-in-1 | |
Witcher 3 FPS Chart
| low | med. | high | ultra | |
|---|---|---|---|---|
| GTA V (2015) | 181.8 | 161.4 | 111.5 | 61.8 |
| The Witcher 3 (2015) | 222.2 | 150.4 | 83.5 | 46 |
| Dota 2 Reborn (2015) | 174.4 | 158.7 | 145 | 134.4 |
| Final Fantasy XV Benchmark (2018) | 113.5 | 66.1 | 47.4 | |
| X-Plane 11.11 (2018) | 137.8 | 117.2 | 94.4 | |
| Strange Brigade (2018) | 263 | 118.2 | 94.7 | 82.4 |
| Cyberpunk 2077 1.6 (2022) | 68.6 | 55 | 41 | 33.8 |
Emissions - Loud Like A Gamer
Szum systemu
Podwójne wentylatory w systemie są wrażliwe na duże obciążenie. Na przykład podczas uruchamiania programu 3DMark 06 szum wentylatorów szybko się nasilał, by pod koniec pierwszej sceny benchmarku ustabilizować się na poziomie około 47 dB(A), w porównaniu z 43 dB(A) w Schenkerze Vision 14 lub 35 dB(A) w HP Envy 14 HP Envy 14 każdy z nich posiada dyskretną grafikę GeForce
Uruchomienie gier w trybie Ultra Performance skutkowałoby hałasem wentylatora na poziomie prawie 52 dB(A), co jest porównywalne z wieloma dedykowanymi laptopami do gier z szybszą grafiką. W trybie Optimized hałas wentylatora spadłby do 48 dB(A), ale wiąże się to z niewielkim spadkiem wydajności grafiki, jak wspomniano powyżej. Użytkownicy muszą więc wytrzymać maksymalne obroty wentylatorów, jeśli chcą wycisnąć pełne 50 W mocy z GPU GeForce
Na szczęście wentylatory są dość ciche (26,5 dB(A)) na tle 23,2 dB(A) podczas bardziej przyziemnych zadań, takich jak przeglądanie stron internetowych czy strumieniowanie wideo. Dopiero przy większych obciążeniach zaczynają się one bardzo szybko rozpędzać.
Hałas
| luz |
| 23.2 / 23.2 / 23.2 dB |
| obciążenie |
| 47.5 / 51.7 dB |
 | ||
30 dB cichy 40 dB(A) słyszalny 50 dB(A) irytujący |
||
min: | ||
| Dell Inspiron 14 Plus 7420 GeForce RTX 3050 4GB Laptop GPU, i7-12700H, SK Hynix BC711 512GB HFM512GD3GX013N | Asus Vivobook Pro 14 M3401QC-KM007T GeForce RTX 3050 4GB Laptop GPU, R5 5600H, Intel SSD 670p SSDPEKNU512GZ | Dell Inspiron 14 7420 2-in-1 Iris Xe G7 96EUs, i7-1255U, WDC PC SN530 SDBPMPZ-512G | Schenker Vision 14 GeForce RTX 3050 Ti Laptop GPU, i7-11370H, Samsung SSD 980 Pro 1TB MZ-V8P1T0BW | Asus Zenbook 14X UX5400E GeForce MX450, i7-1165G7, SK Hynix HFM001TD3JX013N | HP Envy 14-eb0010nr GeForce GTX 1650 Ti Max-Q, i5-1135G7, Samsung SSD PM981a MZVLB256HBHQ | |
|---|---|---|---|---|---|---|
| Noise | -14% | 7% | 0% | -0% | 3% | |
| wyłączone / środowisko * (dB) | 23.2 | 25.4 -9% | 23.1 -0% | 24.3 -5% | 26 -12% | 25.9 -12% |
| Idle Minimum * (dB) | 23.2 | 25.4 -9% | 24.7 -6% | 24.3 -5% | 26 -12% | 26 -12% |
| Idle Average * (dB) | 23.2 | 25.4 -9% | 24.7 -6% | 24.3 -5% | 26 -12% | 26 -12% |
| Idle Maximum * (dB) | 23.2 | 30.9 -33% | 24.7 -6% | 25.9 -12% | 26.3 -13% | 26 -12% |
| Load Average * (dB) | 47.5 | 56 -18% | 27.7 42% | 43.3 9% | 37.1 22% | 34.9 27% |
| Witcher 3 ultra * (dB) | 51.7 | 45.1 13% | 44.6 14% | 34.5 33% | ||
| Load Maximum * (dB) | 51.7 | 56 -8% | 45.1 13% | 49.5 4% | 38 26% | 48.7 6% |
* ... im mniej tym lepiej
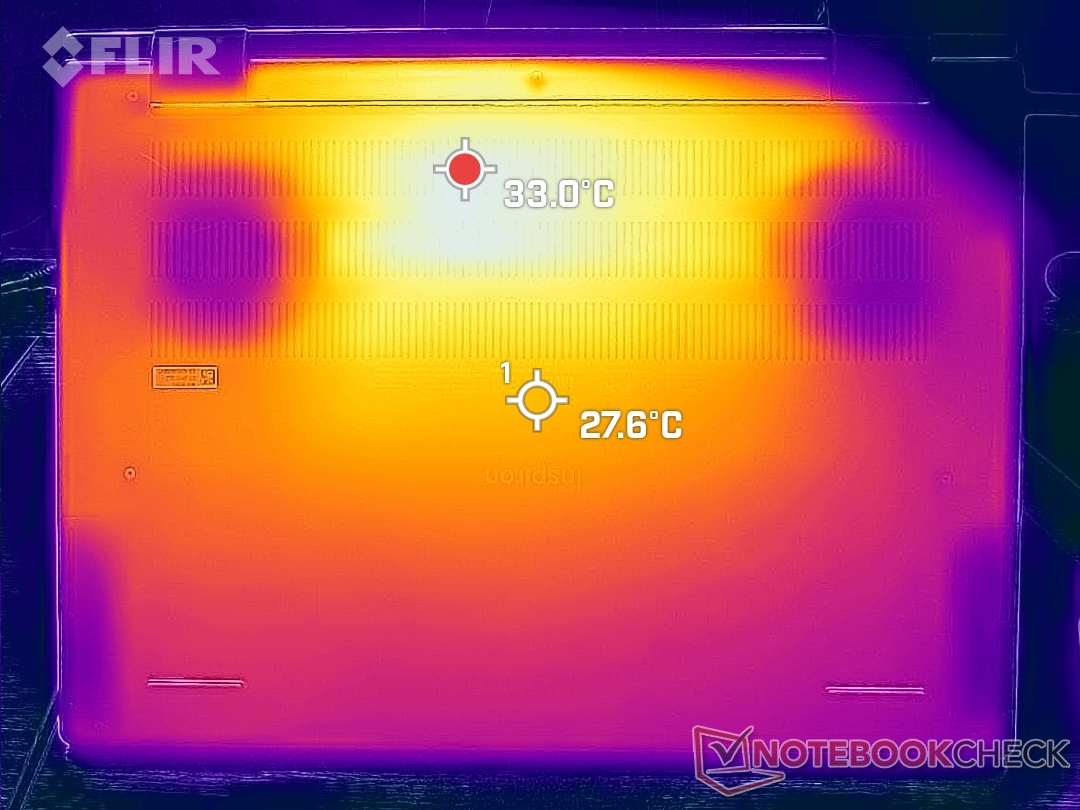
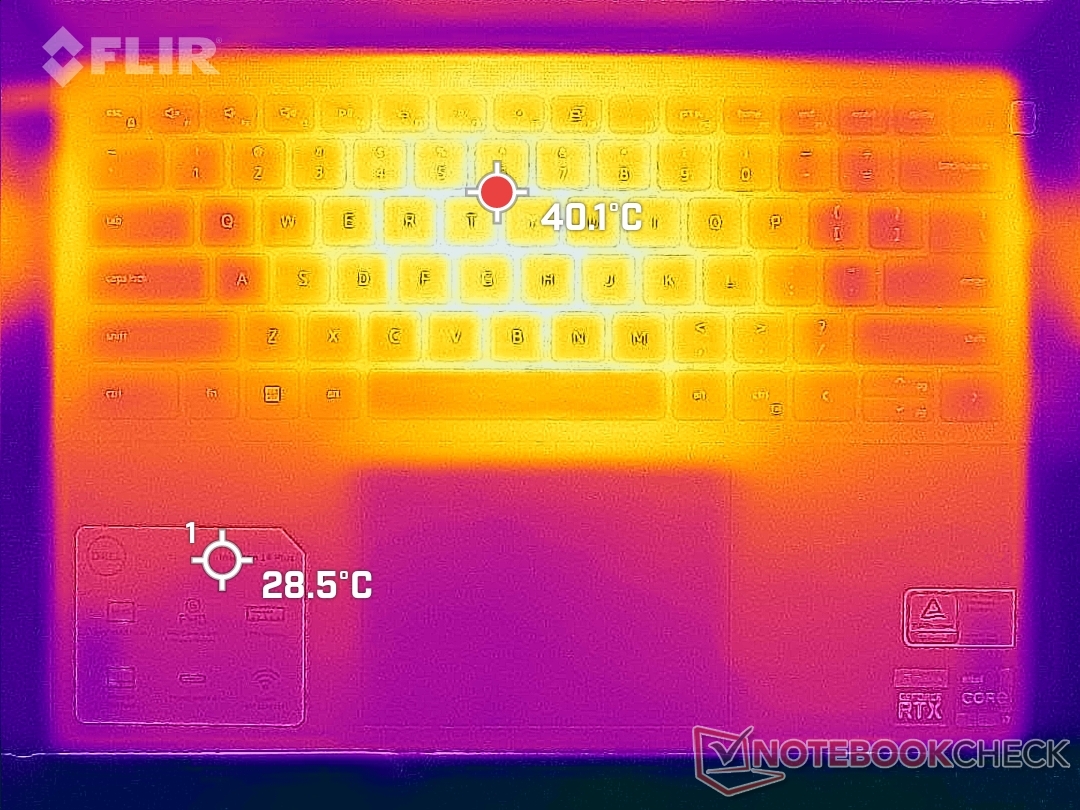
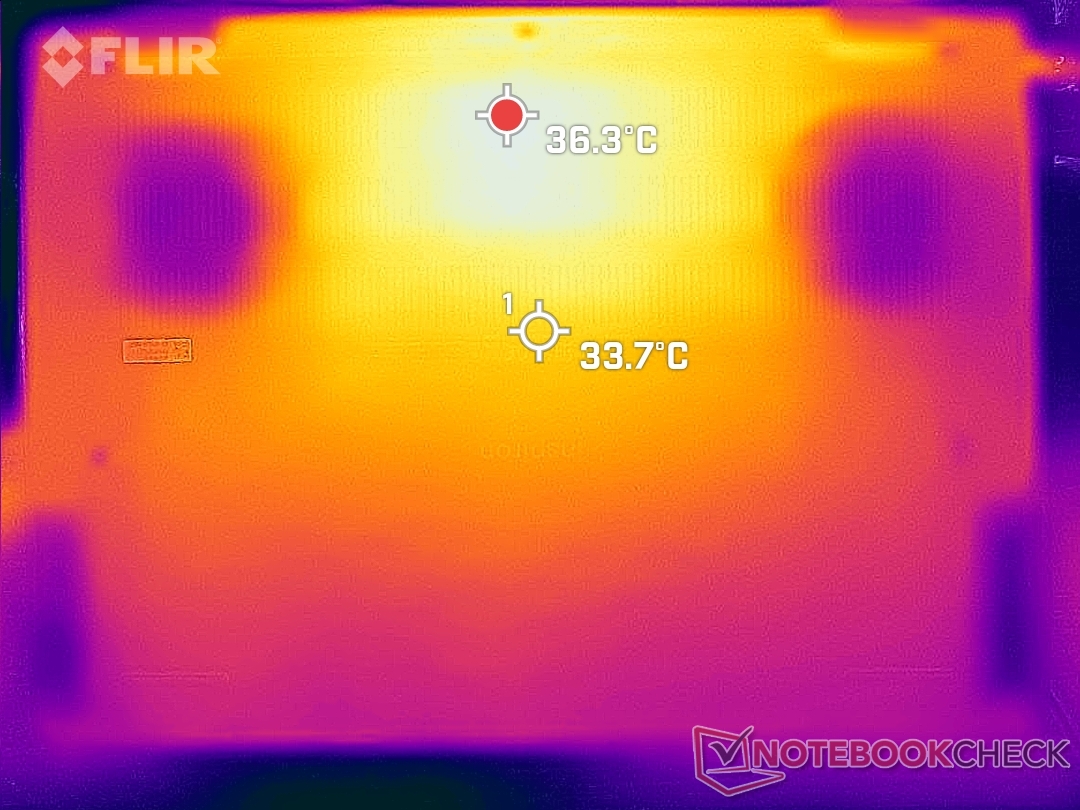
Temperatura
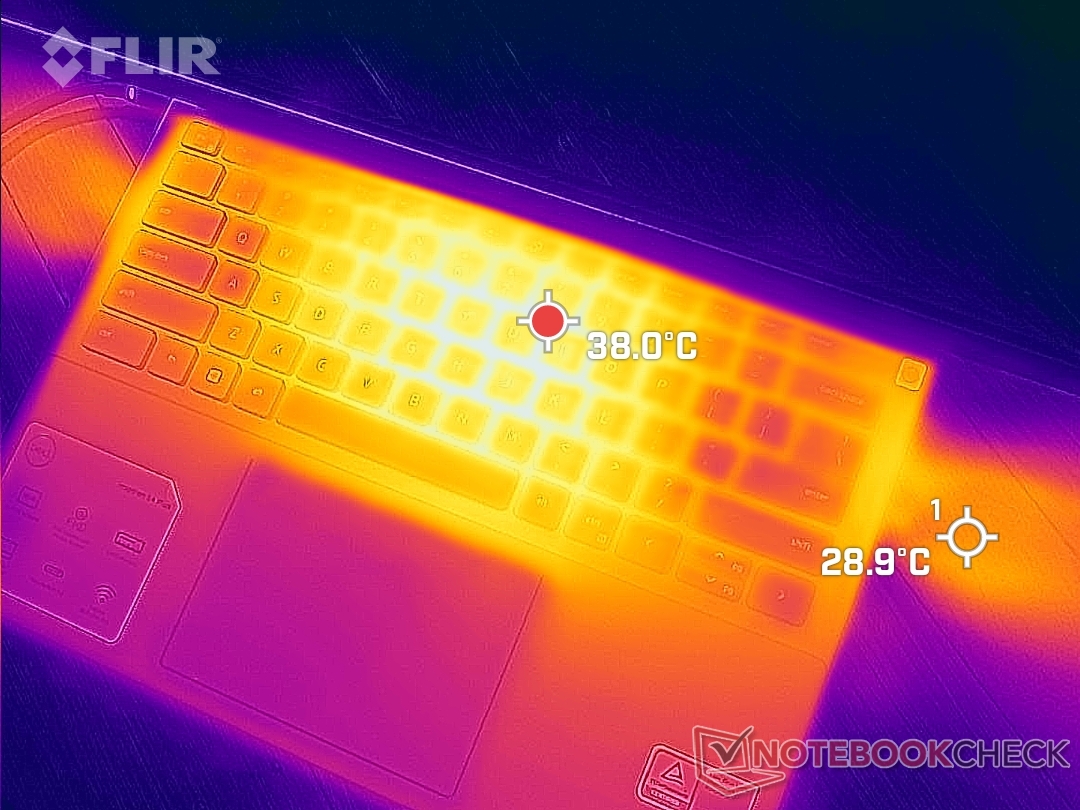
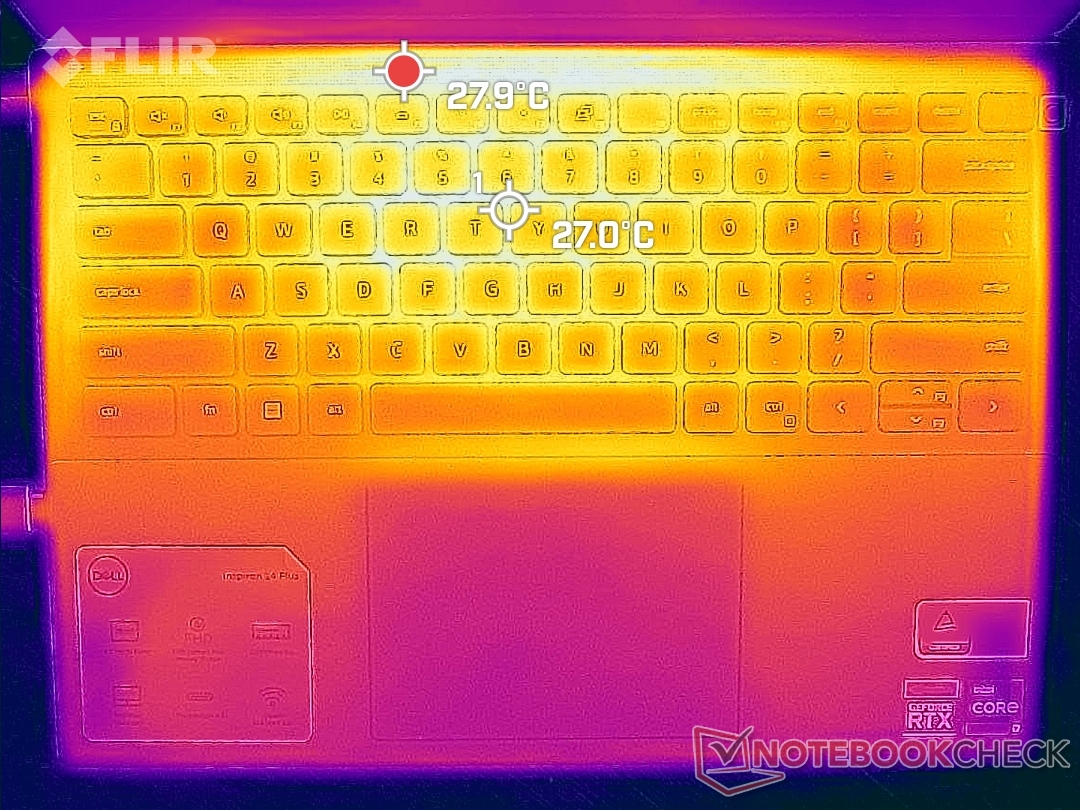
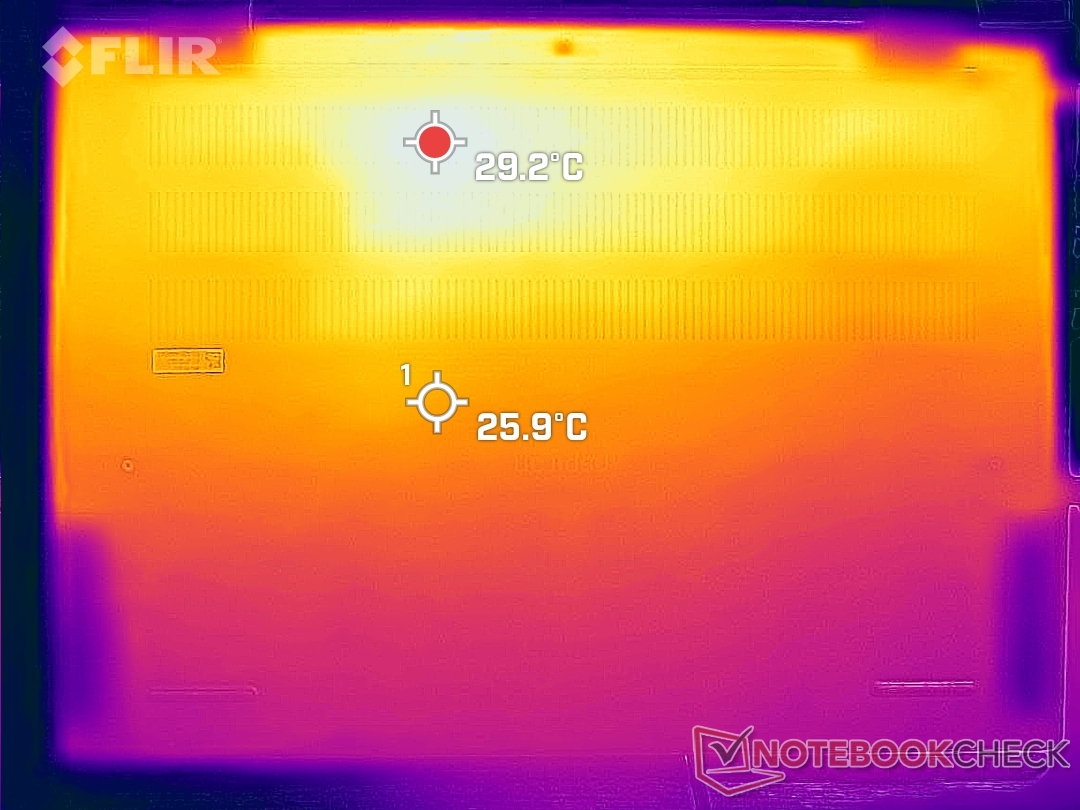
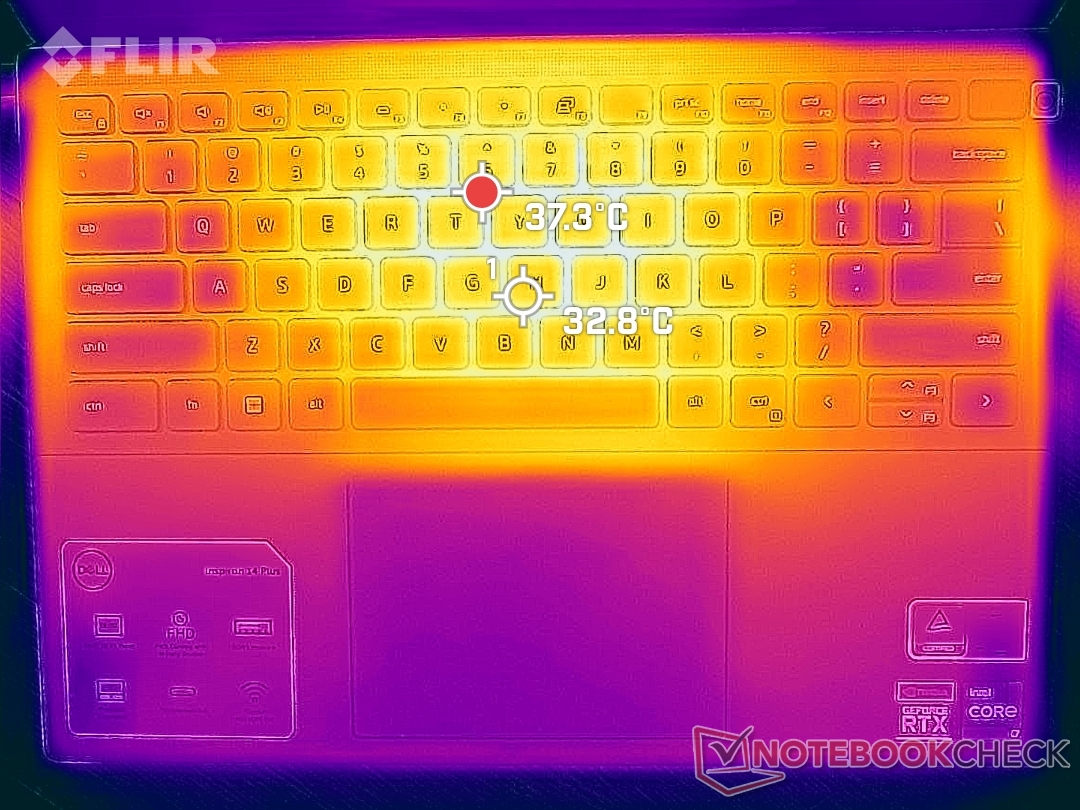
Temperatury powierzchni w stanie spoczynku są ciepłe i wynoszą około 28 C zarówno na górze, jak i na dole, co jest podobne do innych cienkich laptopów multimedialnych z grafiką dyskretną, jak np.Asus Vivobook Pro 14 czy Schenker Vision 14. Podczas grania punkty gorąca osiągają nieco ponad 40 C w okolicach środka klawiatury i z tyłu obudowy, podczas gdy podpórki pozostają bardziej komfortowe w zakresie poniżej 30 C. Miejsca nagrzewania są tu generalnie chłodniejsze, niż we wspomnianych Asusie czy Schenkerze, które mogą osiągać od 45 do 55 C.
(±) Maksymalna temperatura w górnej części wynosi 40 °C / 104 F, w porównaniu do średniej 36.8 °C / 98 F , począwszy od 21 do 71 °C dla klasy Multimedia.
(+) Dno nagrzewa się maksymalnie do 36.4 °C / 98 F, w porównaniu do średniej 39.1 °C / 102 F
(+) W stanie bezczynności średnia temperatura górnej części wynosi 24.2 °C / 76 F, w porównaniu ze średnią temperaturą urządzenia wynoszącą 31.3 °C / ### class_avg_f### F.
(+) Podczas gry w Wiedźmina 3 średnia temperatura górnej części wynosi 28.6 °C / 83 F, w porównaniu do średniej temperatury urządzenia wynoszącej 31.3 °C / ## #class_avg_f### F.
(+) Podpórki pod nadgarstki i touchpad są chłodniejsze niż temperatura skóry i maksymalnie 29.4 °C / 84.9 F i dlatego są chłodne w dotyku.
(±) Średnia temperatura obszaru podparcia dłoni w podobnych urządzeniach wynosiła 28.7 °C / 83.7 F (-0.7 °C / -1.2 F).
| Dell Inspiron 14 Plus 7420 Intel Core i7-12700H, NVIDIA GeForce RTX 3050 4GB Laptop GPU | Asus Vivobook Pro 14 M3401QC-KM007T AMD Ryzen 5 5600H, NVIDIA GeForce RTX 3050 4GB Laptop GPU | Dell Inspiron 14 7420 2-in-1 Intel Core i7-1255U, Intel Iris Xe Graphics G7 96EUs | Schenker Vision 14 Intel Core i7-11370H, NVIDIA GeForce RTX 3050 Ti Laptop GPU | Asus Zenbook 14X UX5400E Intel Core i7-1165G7, NVIDIA GeForce MX450 | MSI Summit E14 A11SCS Intel Core i7-1185G7, NVIDIA GeForce GTX 1650 Ti Max-Q | HP Envy 14-eb0010nr Intel Core i5-1135G7, NVIDIA GeForce GTX 1650 Ti Max-Q | |
|---|---|---|---|---|---|---|---|
| Heat | -25% | -5% | -23% | -17% | -33% | -19% | |
| Maximum Upper Side * (°C) | 40 | 42.3 -6% | 38.2 4% | 49.7 -24% | 42.4 -6% | 49.4 -23% | 41.2 -3% |
| Maximum Bottom * (°C) | 36.4 | 49.6 -36% | 45.6 -25% | 56 -54% | 47.7 -31% | 60.6 -66% | 45.6 -25% |
| Idle Upper Side * (°C) | 27 | 34.2 -27% | 27.4 -1% | 28.8 -7% | 32.3 -20% | 30.6 -13% | 31.8 -18% |
| Idle Bottom * (°C) | 29.2 | 37.9 -30% | 28.4 3% | 30.6 -5% | 31.9 -9% | 37.4 -28% | 37.8 -29% |
* ... im mniej tym lepiej
Stress Test
Uruchomienie Prime95 w celu zestresowania procesora spowodowałoby wzrost częstotliwości taktowania, temperatury i poboru mocy do 3,5 GHz, 100 C i 80 W, odpowiednio przez około 10 sekund. Następnie częstotliwość taktowania, temperatura i pobór mocy na płycie systematycznie spadały, zanim ustabilizowały się na poziomie 1,9 GHz, 80 C i 38 W, odpowiednio, aby utrzymać temperaturę w ryzach. Spadek wydajności jest stosunkowo gwałtowny, ponieważ HP Pavilion Plus 14 z tym samym procesorem jest w stanie utrzymać szybsze tempo pracy w zakresie od 2,2 do 2,9 GHz podczas tego samego testu.
Uruchomienie strony Witcher 3 pokazuje stabilizację GPU GeForce przy 1590 MHz, 74 C i 50 W. Dla porównania, RTX 3050 Ti w większym Inspironie 16 Plus ustabilizowałby się przy 1627 MHz, 84 C i 63 W. Temperatury rdzenia są bezsprzecznie wysokie, ponieważ jest to jeden z niewielu 14-calowych laptopów wyposażonych zarówno w procesor Core serii H, jak i GPU GeForce RTX. Zmiana profilu zasilania z Ultra Performance na Optimized obniży pobór mocy GPU do około 45 W lub mniej.
Praca na zasilaniu akumulatorowym ogranicza wydajność. Test Fire Strike na zasilaniu akumulatorowym przyniósłby wyniki w zakresie fizyki i grafiki na poziomie odpowiednio 9493 i 7637 punktów, w porównaniu do 26940 i 12125 punktów na zasilaniu sieciowym.
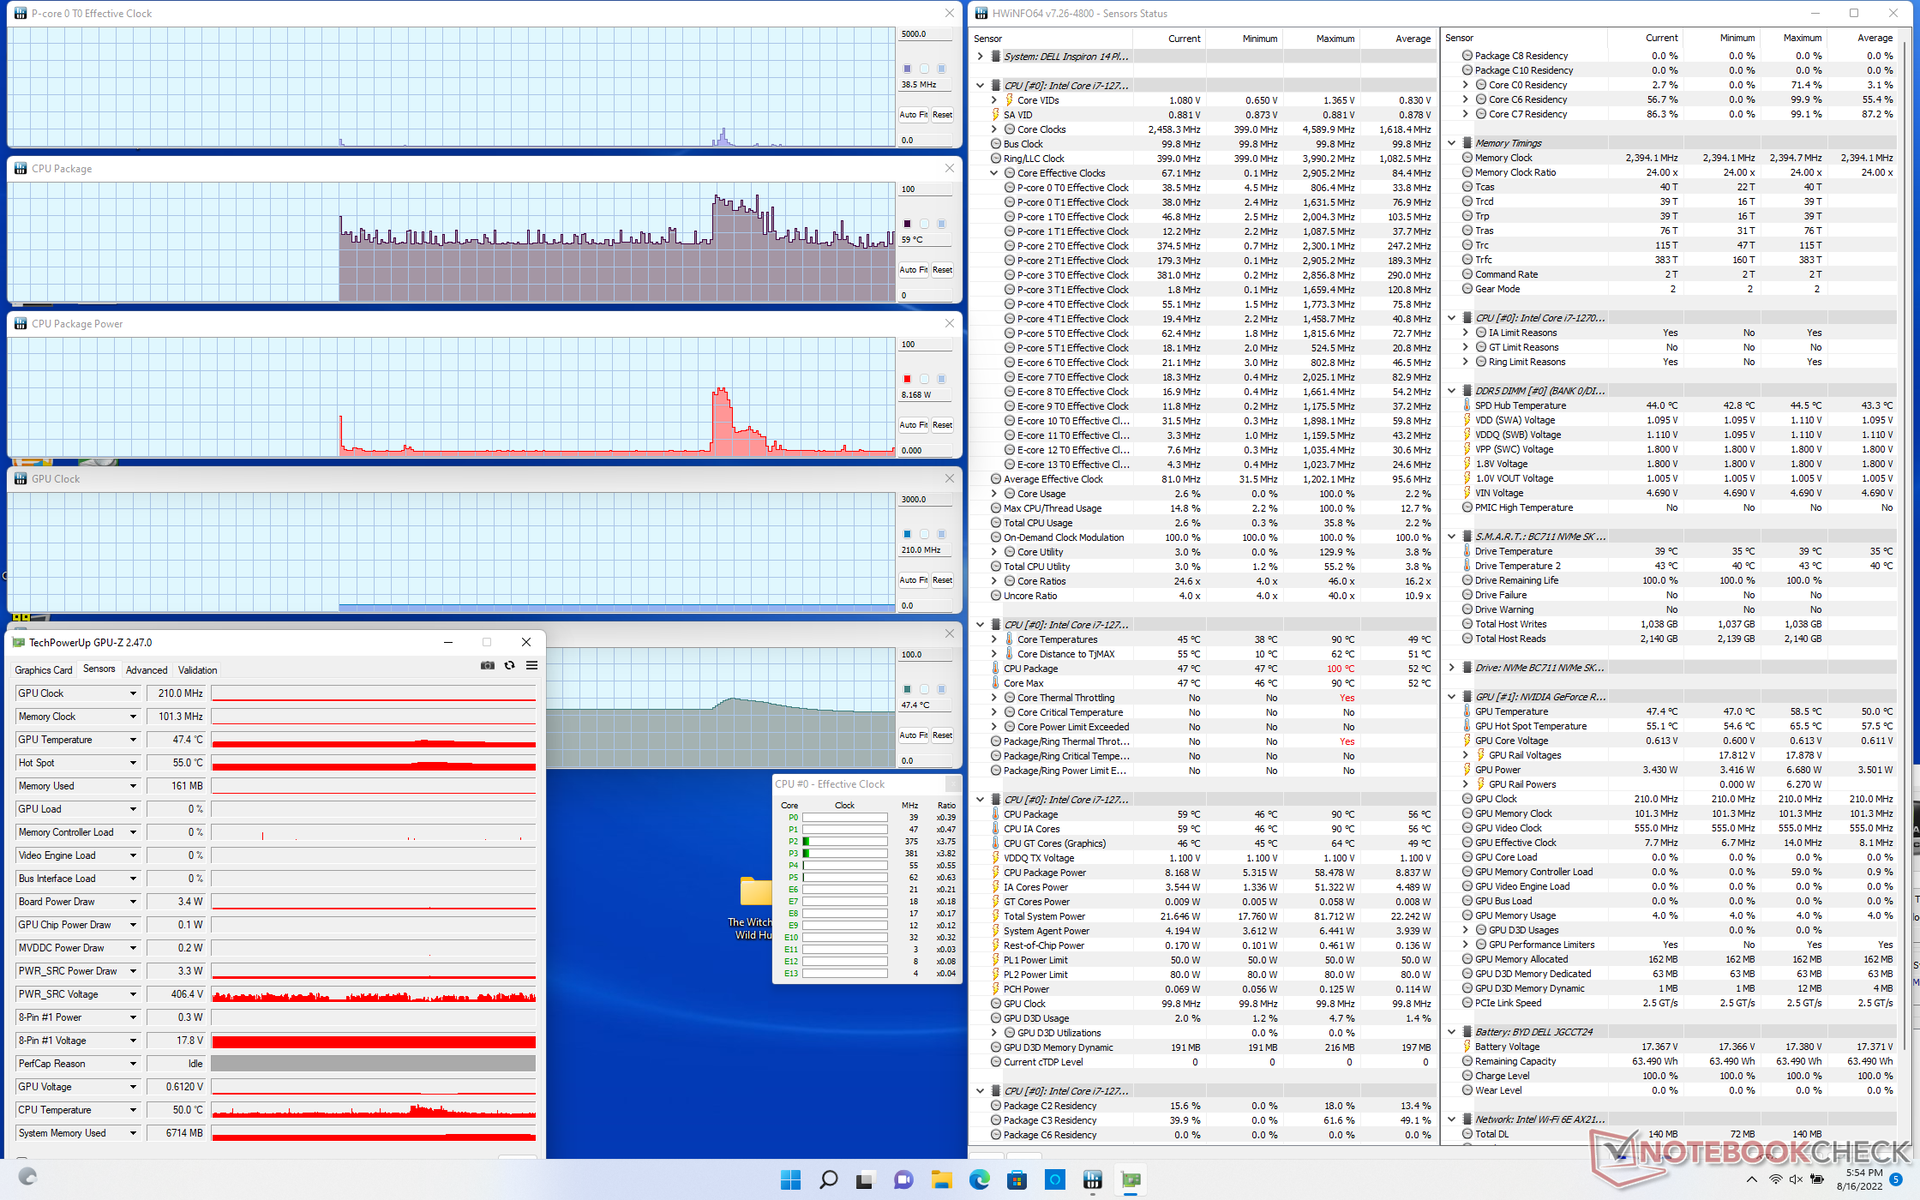
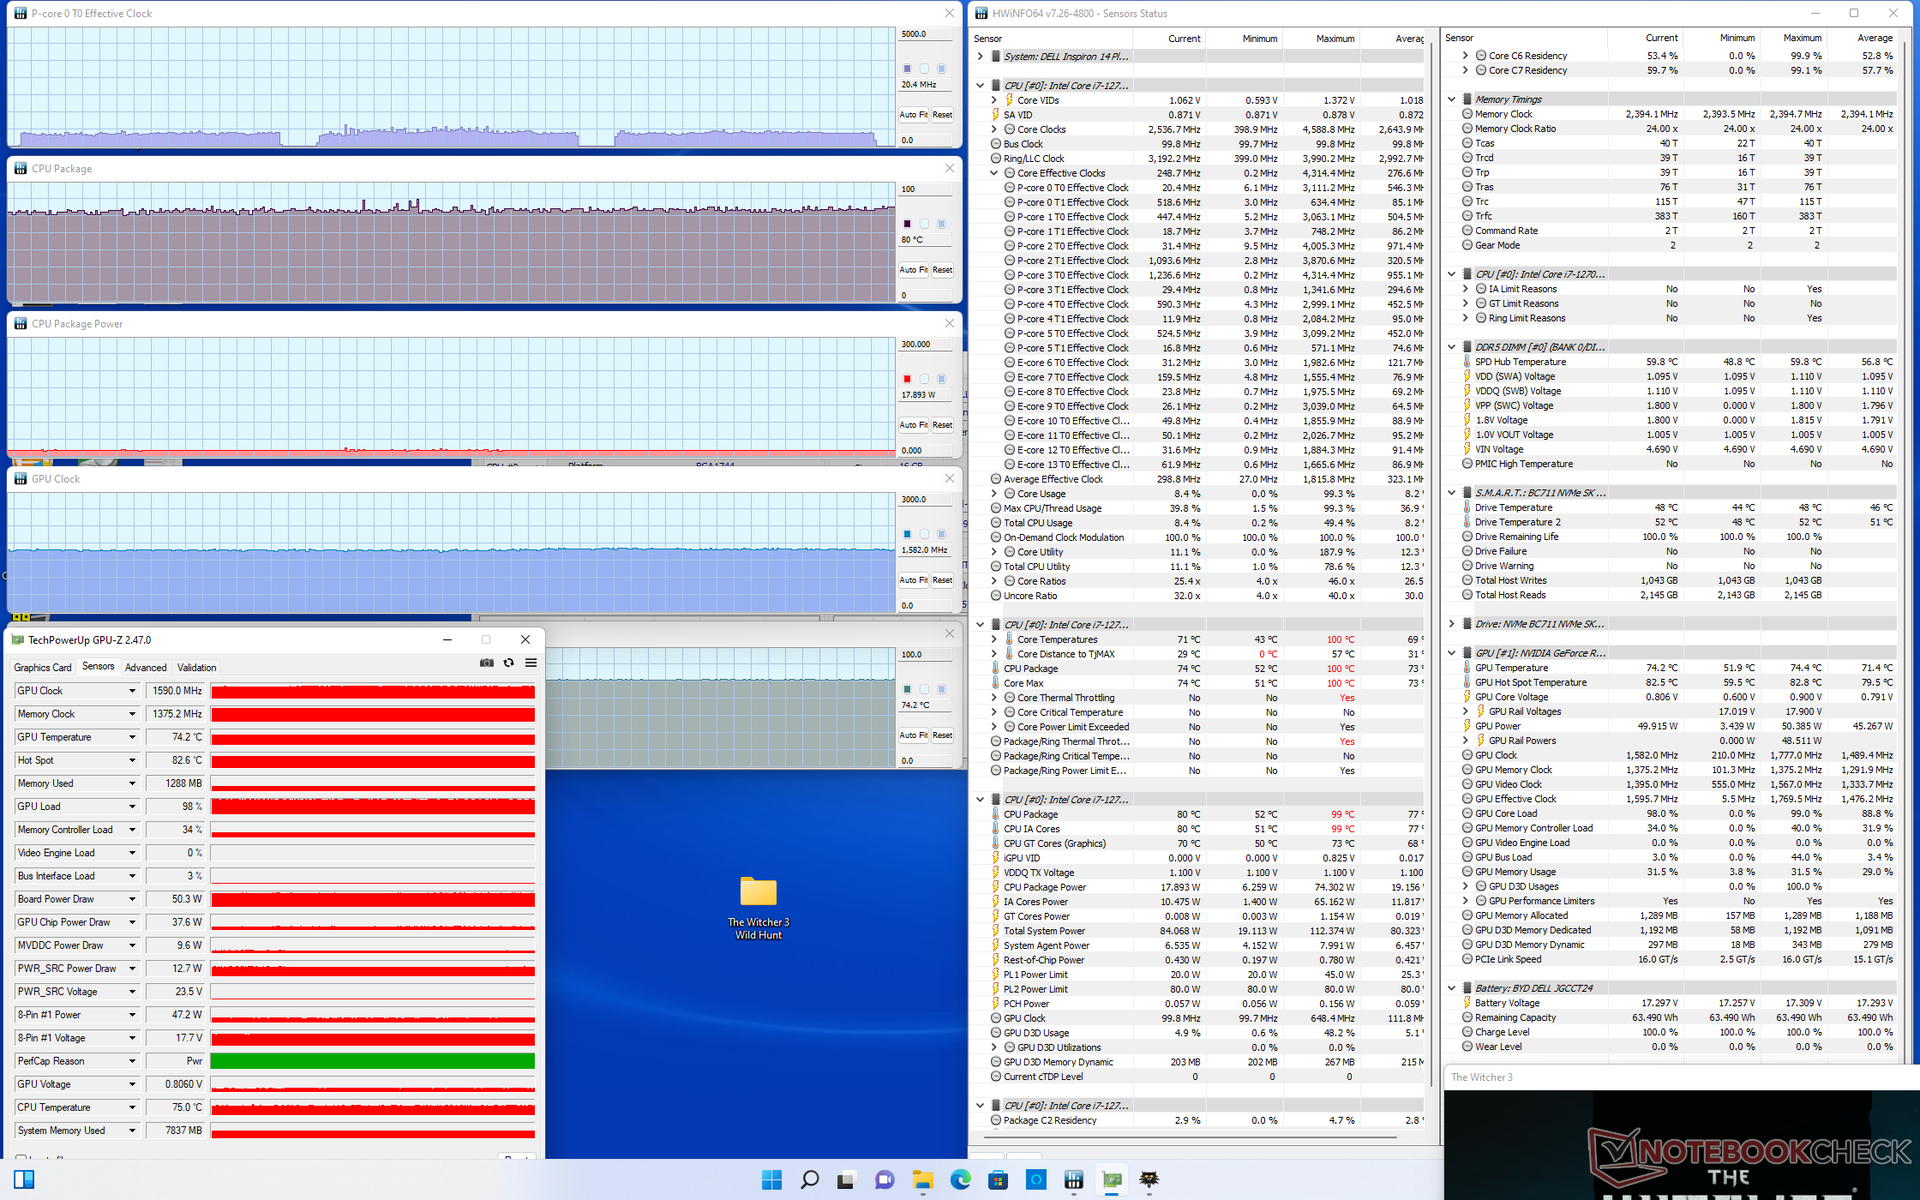
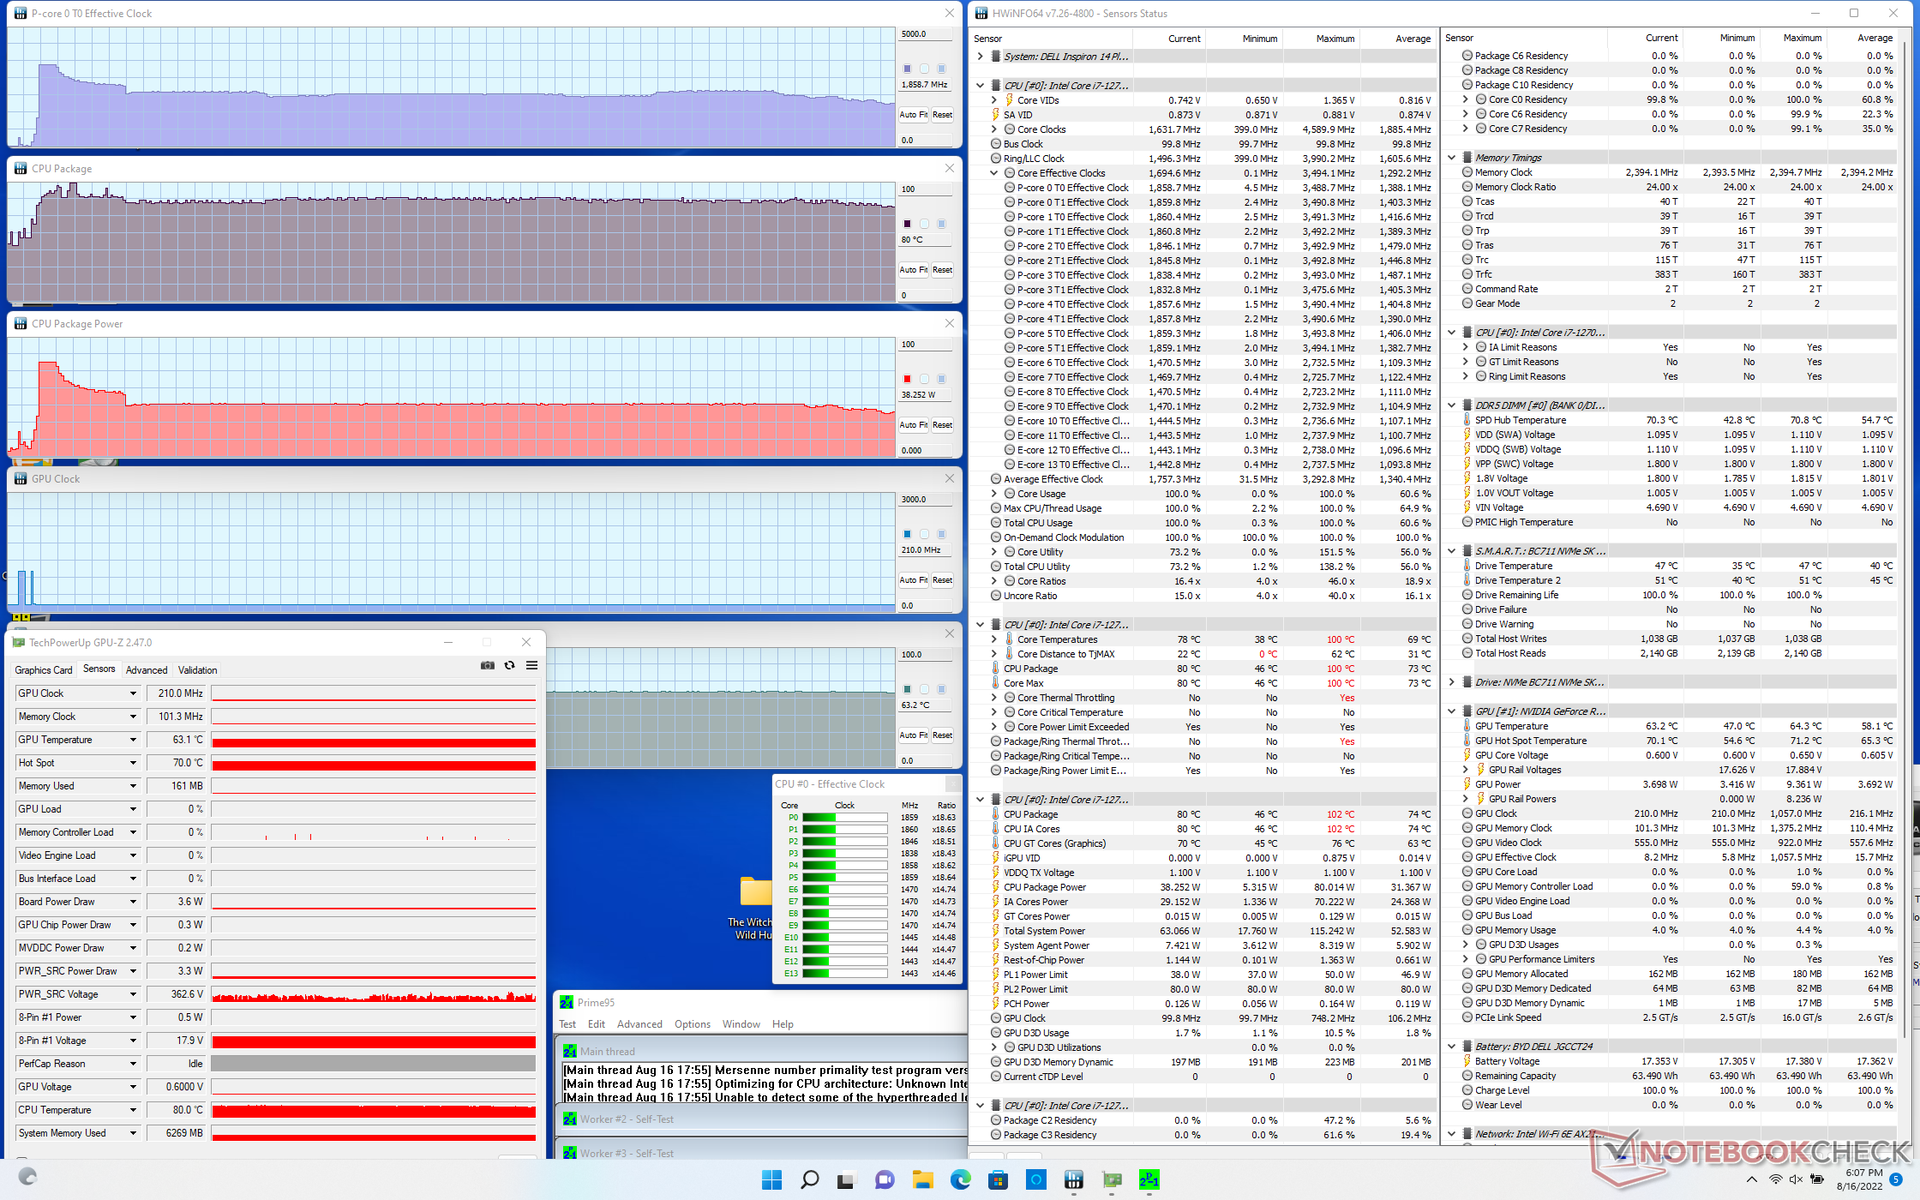
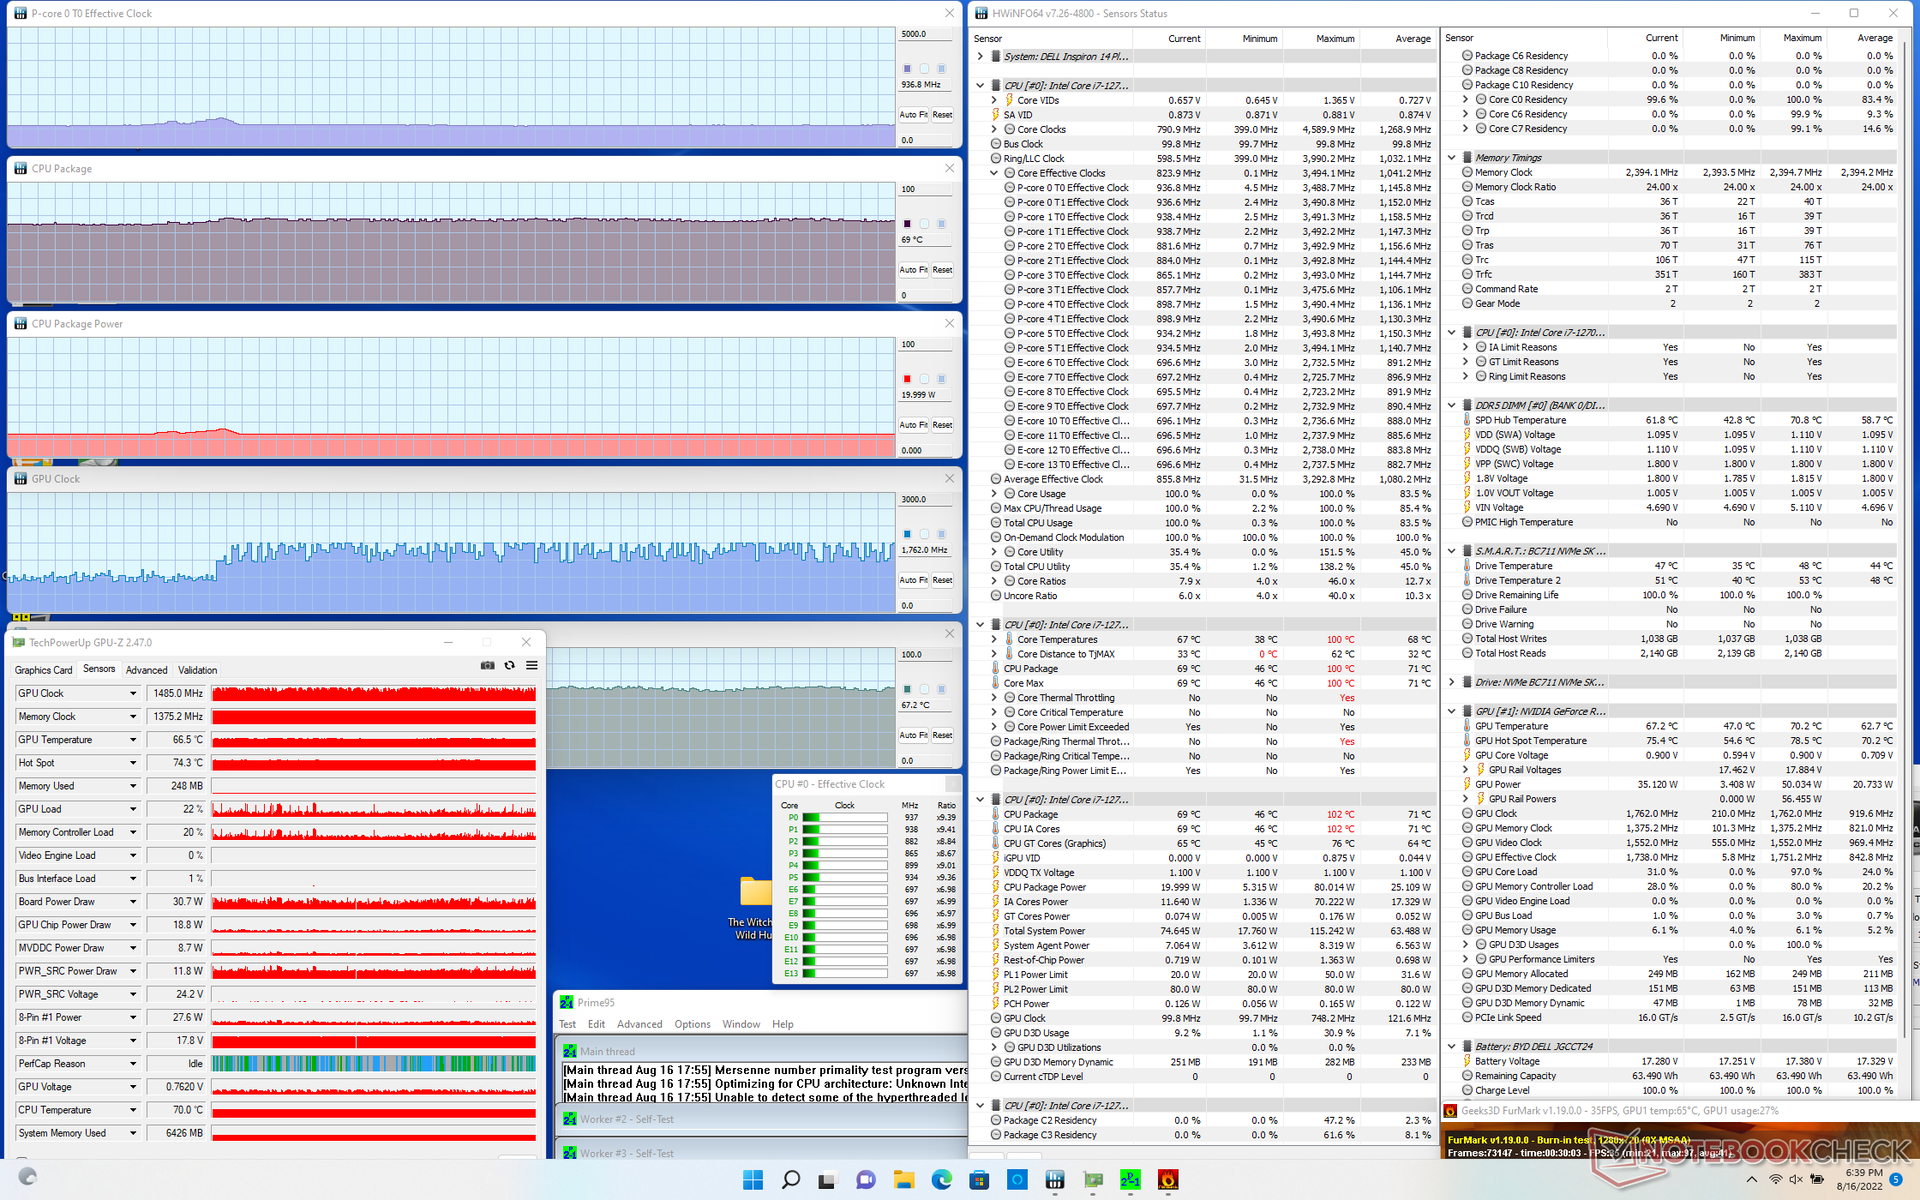
| ZegarCPU (GHz) | Zegar GPU (MHz) | Średnia temperatura CPU (°C) | Średnia temperatura GPU (°C) | |
| System w stanie bezczynności | -- | -- | 59 | 47 |
| Prime95 Stress | 1.9 | -- | 80 | 63 |
| Prime95 + FurMark Stress | 0,9 | ~1485 | 69 | 67 |
| Witcher 3 Stress | ~1.1 | 1590 | 80 | 74 |
Mówcy
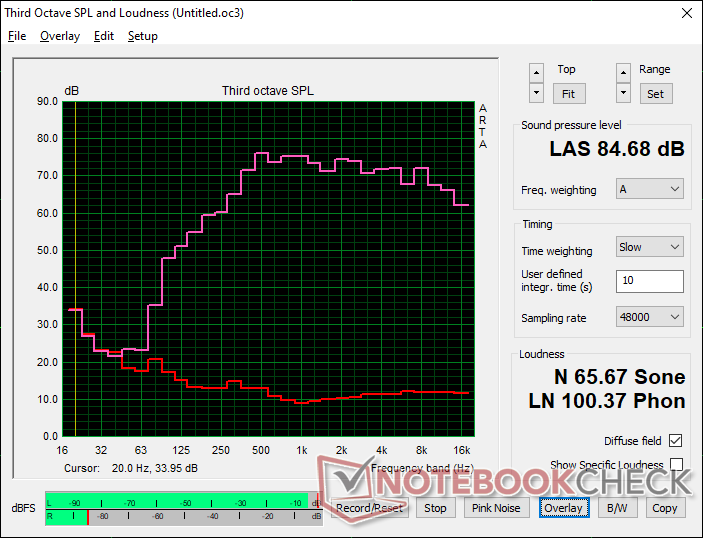
Dell Inspiron 14 Plus 7420 analiza dźwięku
(+) | głośniki mogą odtwarzać stosunkowo głośno (84.7 dB)
Bas 100 - 315 Hz
(±) | zredukowany bas - średnio 14.7% niższy od mediany
(±) | liniowość basu jest średnia (8.3% delta do poprzedniej częstotliwości)
Średnie 400 - 2000 Hz
(+) | zbalansowane środki średnie - tylko 2.6% od mediany
(+) | średnie są liniowe (4.8% delta do poprzedniej częstotliwości)
Wysokie 2–16 kHz
(+) | zrównoważone maksima - tylko 1.8% od mediany
(+) | wzloty są liniowe (4.4% delta do poprzedniej częstotliwości)
Ogólnie 100 - 16.000 Hz
(+) | ogólny dźwięk jest liniowy (10.4% różnicy w stosunku do mediany)
W porównaniu do tej samej klasy
» 15% wszystkich testowanych urządzeń w tej klasie było lepszych, 1% podobnych, 84% gorszych
» Najlepszy miał deltę 5%, średnia wynosiła ###średnia###%, najgorsza wynosiła 45%
W porównaniu do wszystkich testowanych urządzeń
» 5% wszystkich testowanych urządzeń było lepszych, 1% podobnych, 93% gorszych
» Najlepszy miał deltę 4%, średnia wynosiła ###średnia###%, najgorsza wynosiła 134%
Apple MacBook Pro 16 2021 M1 Pro analiza dźwięku
(+) | głośniki mogą odtwarzać stosunkowo głośno (84.7 dB)
Bas 100 - 315 Hz
(+) | dobry bas - tylko 3.8% od mediany
(+) | bas jest liniowy (5.2% delta do poprzedniej częstotliwości)
Średnie 400 - 2000 Hz
(+) | zbalansowane środki średnie - tylko 1.3% od mediany
(+) | średnie są liniowe (2.1% delta do poprzedniej częstotliwości)
Wysokie 2–16 kHz
(+) | zrównoważone maksima - tylko 1.9% od mediany
(+) | wzloty są liniowe (2.7% delta do poprzedniej częstotliwości)
Ogólnie 100 - 16.000 Hz
(+) | ogólny dźwięk jest liniowy (4.6% różnicy w stosunku do mediany)
W porównaniu do tej samej klasy
» 0% wszystkich testowanych urządzeń w tej klasie było lepszych, 0% podobnych, 100% gorszych
» Najlepszy miał deltę 5%, średnia wynosiła ###średnia###%, najgorsza wynosiła 45%
W porównaniu do wszystkich testowanych urządzeń
» 0% wszystkich testowanych urządzeń było lepszych, 0% podobnych, 100% gorszych
» Najlepszy miał deltę 4%, średnia wynosiła ###średnia###%, najgorsza wynosiła 134%
Zarządzanie energią - wymagająca mała maszyna
Pobór mocy
Pobór mocy w trybie Power Saver wynosi od 6 W przy ustawieniu minimalnej jasności do 10 W przy ustawieniu maksymalnej. Zmiana profilu zasilania na tryb Ultra Performance z aktywnym procesorem graficznym Nvidii zwiększa pobór mocy na biegu jałowym do 20 W, czyli około dwukrotnie więcej, niż w przypadku większości wolniejszych 14-calowych laptopów z procesorami z serii U
Gry wymagają od 96 do 106 W w porównaniu z zaledwie 40 lub 50 W w tradycyjnych alternatywach napędzanych procesorami z serii U. Intel 12. generacji serii H jest znany z tego, że jest bardzo wymagający w połączeniu z już wymagającym dyskretnym GPU. Nic więc dziwnego, że Inspiron 14 Plus działa zarówno głośniej, jak i cieplej niż przeciętny 14-calowy laptop
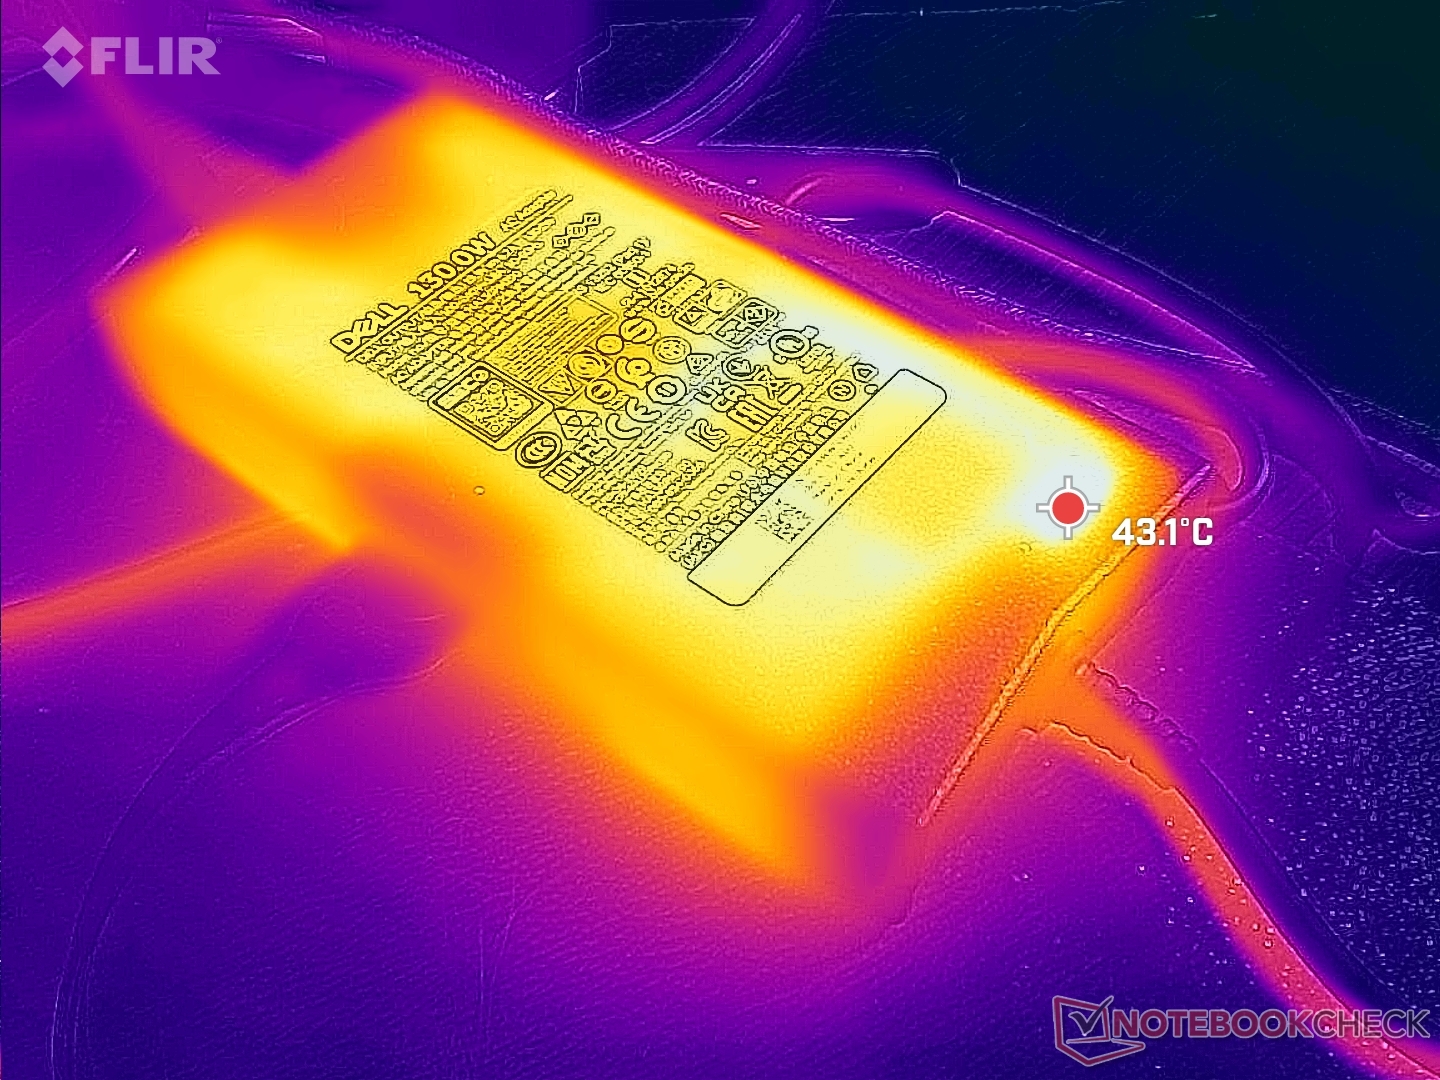
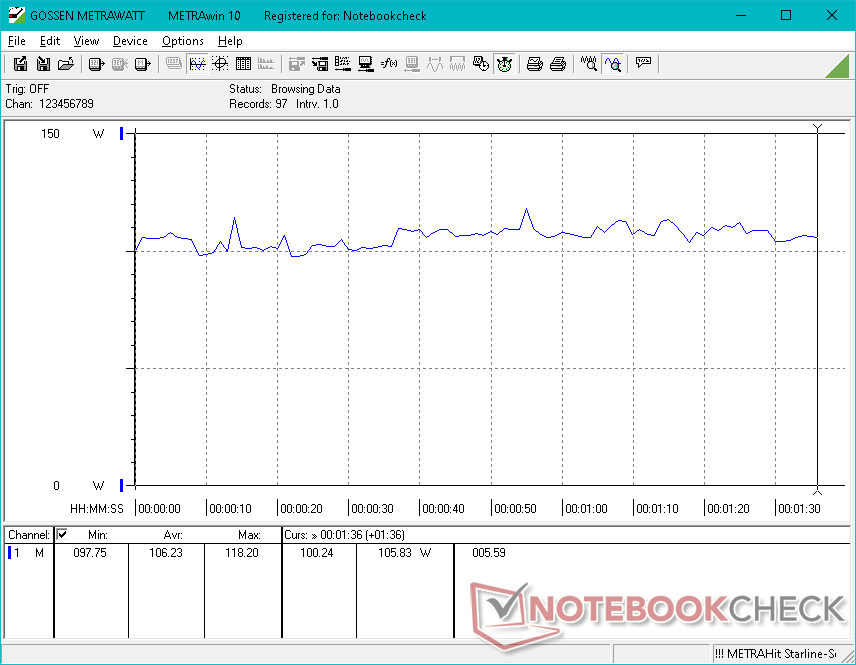
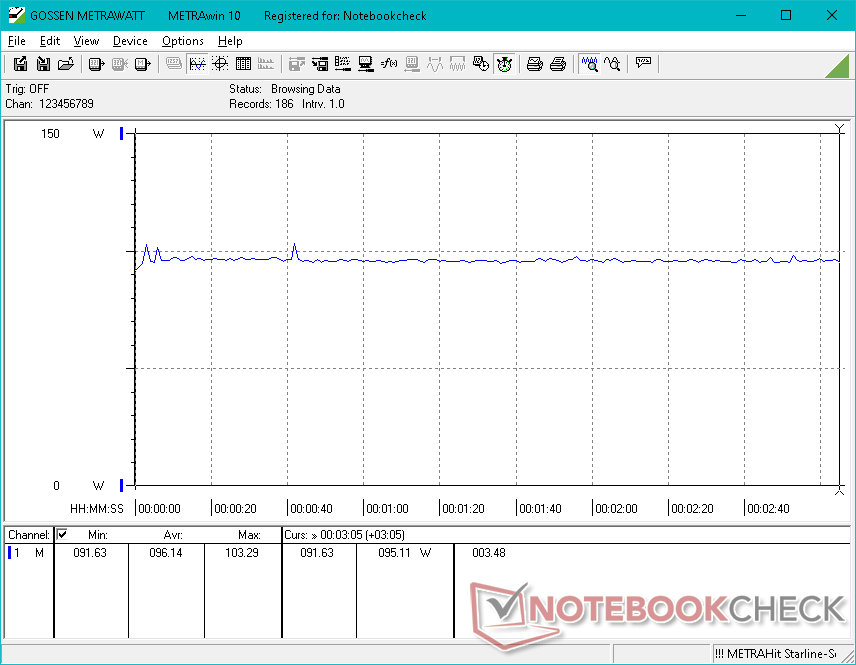
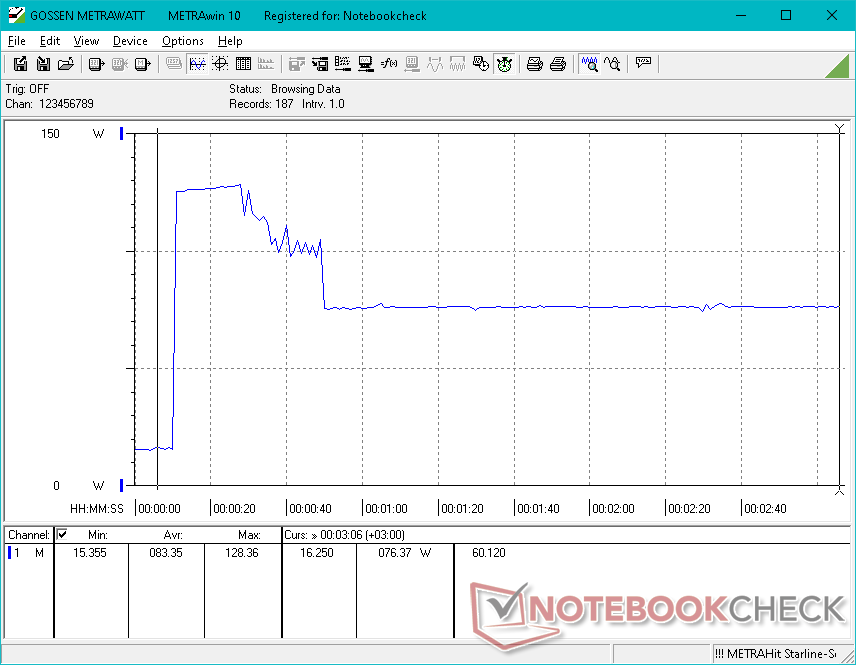
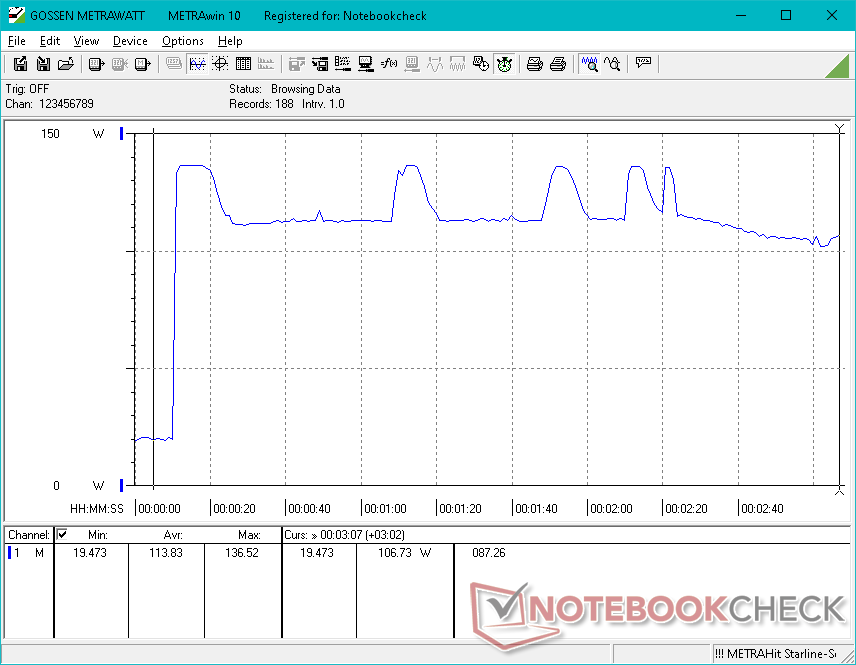
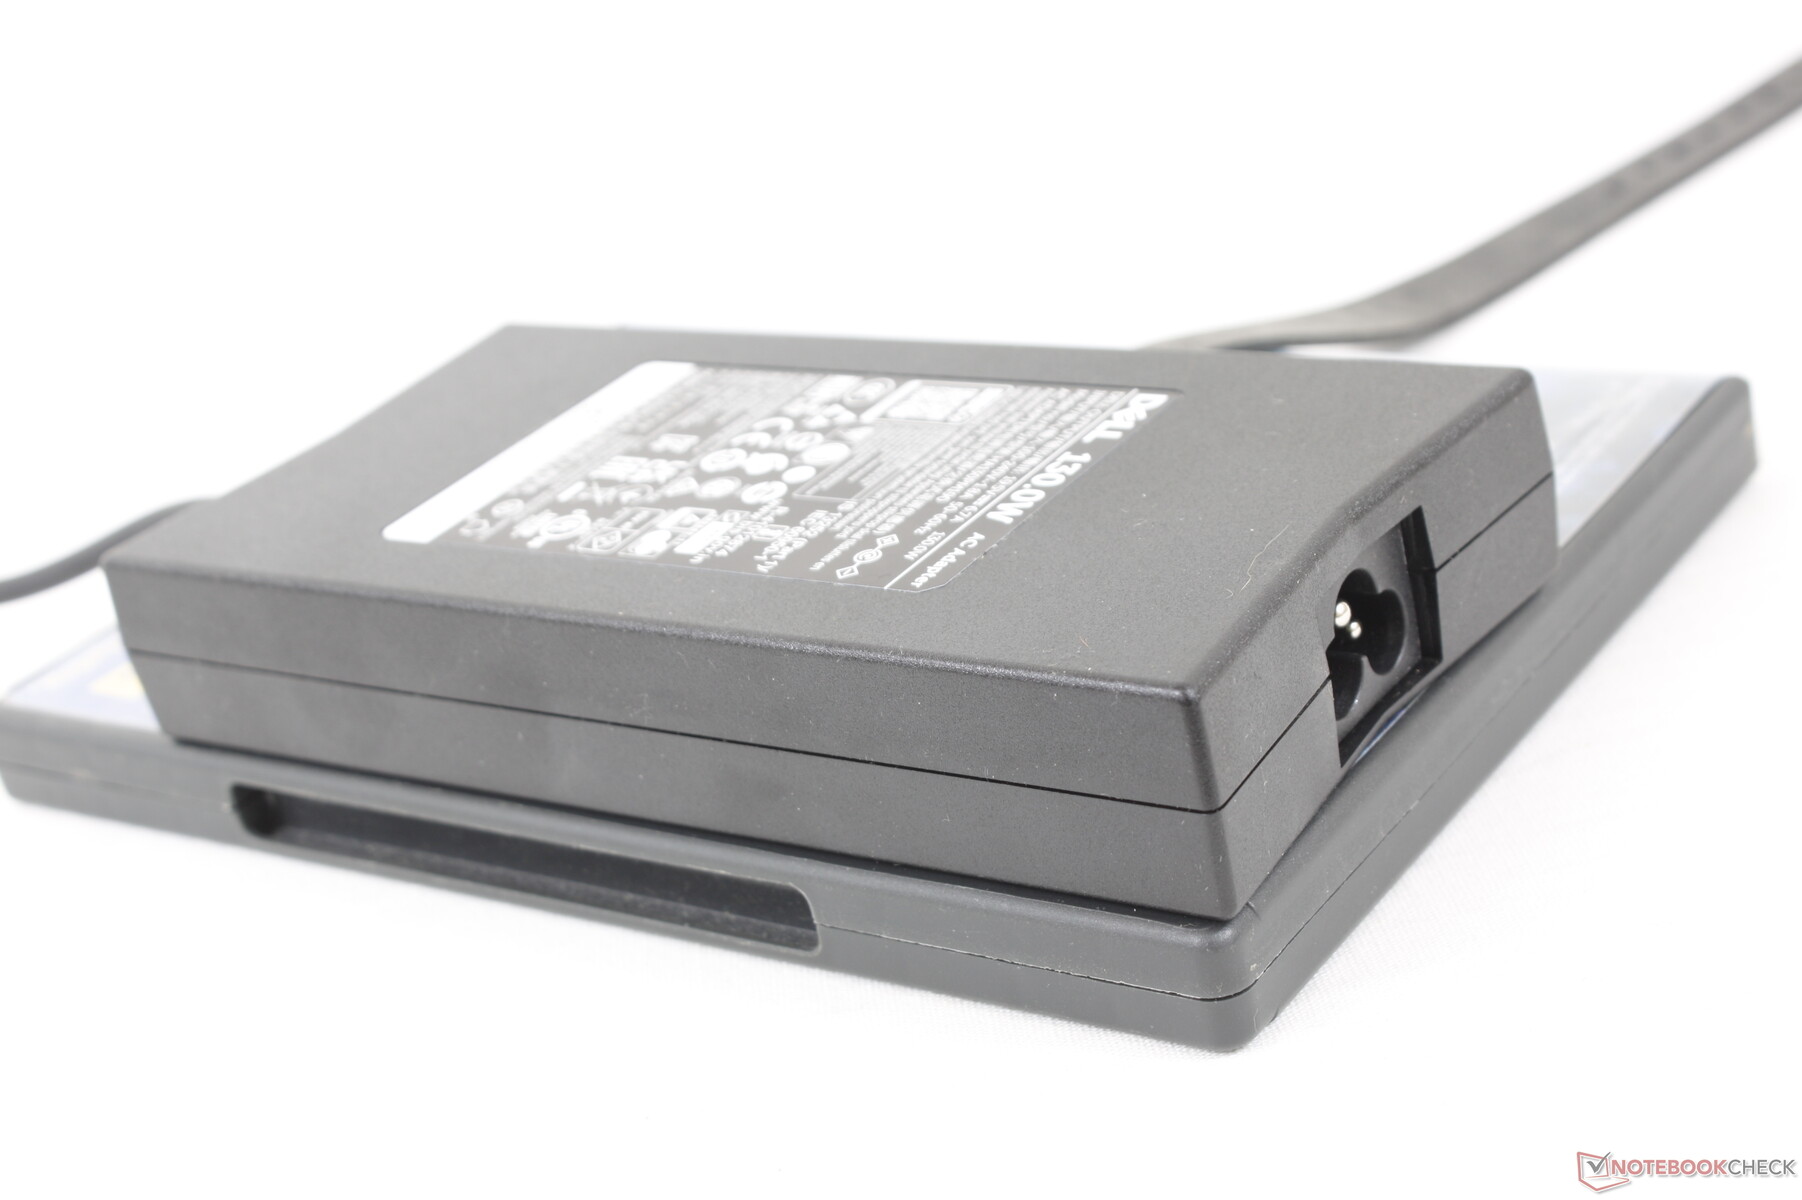
Przy jednoczesnym uruchomieniu Prime95 i FurMark udało nam się zarejestrować maksymalny pobór 137 W ze średniej wielkości (~15,3 x 7,5 x 2,6 cm) zasilacza 130 W. Zużycie ma tendencję do cyklicznych między 110 W i 137 W, jak pokazano na naszym zrzucie ekranu poniżej. Spodziewaj się wolniejszego tempa ładowania przy tak wymagających obciążeniach.
| wyłączony / stan wstrzymania | |
| luz | |
| obciążenie |
|
Legenda:
min: | |
| Dell Inspiron 14 Plus 7420 i7-12700H, GeForce RTX 3050 4GB Laptop GPU, SK Hynix BC711 512GB HFM512GD3GX013N, IPS, 2240x1400, 14" | Asus Vivobook Pro 14 M3401QC-KM007T R5 5600H, GeForce RTX 3050 4GB Laptop GPU, Intel SSD 670p SSDPEKNU512GZ, OLED, 2880x1800, 14" | Dell Inspiron 14 7420 2-in-1 i7-1255U, Iris Xe G7 96EUs, WDC PC SN530 SDBPMPZ-512G, IPS, 1920x1200, 14" | Schenker Vision 14 i7-11370H, GeForce RTX 3050 Ti Laptop GPU, Samsung SSD 980 Pro 1TB MZ-V8P1T0BW, IPS, 2880x1800, 14" | Asus Zenbook 14X UX5400E i7-1165G7, GeForce MX450, SK Hynix HFM001TD3JX013N, OLED, 2880x1800, 14" | MSI Summit E14 A11SCS i7-1185G7, GeForce GTX 1650 Ti Max-Q, Phison 1TB SM2801T24GKBB4S-E162, IPS, 3840x2160, 14" | HP Envy 14-eb0010nr i5-1135G7, GeForce GTX 1650 Ti Max-Q, Samsung SSD PM981a MZVLB256HBHQ, IPS, 1920x1200, 14" | |
|---|---|---|---|---|---|---|---|
| Power Consumption | 22% | 44% | 8% | 24% | -10% | 5% | |
| Idle Minimum * (Watt) | 6.3 | 6.6 -5% | 5.2 17% | 6.7 -6% | 7.2 -14% | 9.9 -57% | 4.2 33% |
| Idle Average * (Watt) | 10.3 | 9.6 7% | 8.2 20% | 12.6 -22% | 10.4 -1% | 17.4 -69% | 18.3 -78% |
| Idle Maximum * (Watt) | 20 | 7.3 63% | 9.9 50% | 15.4 23% | 11 45% | 22.5 -13% | 19.2 4% |
| Load Average * (Watt) | 106.2 | 73 31% | 44.4 58% | 85.7 19% | 61.7 42% | 85.6 19% | 72.9 31% |
| Witcher 3 ultra * (Watt) | 96.1 | 74.4 23% | 35 64% | 83 14% | 53.6 44% | 70.9 26% | 61.5 36% |
| Load Maximum * (Watt) | 136.5 | 119 13% | 62.5 54% | 110.9 19% | 96 30% | 91.1 33% | 127.8 6% |
* ... im mniej tym lepiej
Power Consumption Witcher 3 / Stresstest
Power Consumption external Monitor
Czas pracy na baterii
Czasy pracy są lepsze od oczekiwanych i wynoszą ponad 7 godzin rzeczywistego użytkowania sieci WLAN, co jest bardzo zbliżone do tego, co odnotowaliśmy w wolniejszym modelu Inspiron 14 7420 2-w-1 bez dedykowanej grafiki. Należy jednak pamiętać, że nasze wyniki odzwierciedlają tylko konfigurację 64 Wh, a nie mniejszą konfigurację 54 Wh, która powinna mieć nieco krótszy czas pracy na baterii.
Ładowanie od pustej do pełnej pojemności za pomocą dołączonego adaptera AC z beczką trwa około 2 godzin. Ładowanie przez adaptery AC USB-C innych firm jest obsługiwane.
| Dell Inspiron 14 Plus 7420 i7-12700H, GeForce RTX 3050 4GB Laptop GPU, 64 Wh | Asus Vivobook Pro 14 M3401QC-KM007T R5 5600H, GeForce RTX 3050 4GB Laptop GPU, 63 Wh | Dell Inspiron 14 7420 2-in-1 i7-1255U, Iris Xe G7 96EUs, 54 Wh | Schenker Vision 14 i7-11370H, GeForce RTX 3050 Ti Laptop GPU, 53 Wh | Asus Zenbook 14X UX5400E i7-1165G7, GeForce MX450, 63 Wh | MSI Summit E14 A11SCS i7-1185G7, GeForce GTX 1650 Ti Max-Q, 52 Wh | HP Envy 14-eb0010nr i5-1135G7, GeForce GTX 1650 Ti Max-Q, 63.3 Wh | |
|---|---|---|---|---|---|---|---|
| Czasy pracy | 47% | 58% | 16% | 65% | -24% | 83% | |
| Reader / Idle (h) | 11.9 | 11.5 -3% | 15.9 34% | 34 186% | 6.6 -45% | 27.7 133% | |
| WiFi v1.3 (h) | 7.2 | 9.5 32% | 7.6 6% | 5.5 -24% | 5.4 -25% | 4.5 -37% | 10.8 50% |
| Load (h) | 0.9 | 1.9 111% | 2.1 133% | 1.4 56% | 1.2 33% | 1 11% | 1.5 67% |
| H.264 (h) | 6.8 |
Za
Przeciw
Werdykt - Plus-size Performance, Plus-size Weight
Jeśli zależy Ci na maksymalnej wydajności CPU i GPU w kolejnym 14-calowym laptopie, rozważ droższy model Razer Blade 14 lub Asus Zephyrus G14. Jeśli szukasz cienkiego i lekkiego 14-calowego ultrabooka, to Asus Zenbook 14 lub LG Gram 14 mogą być lepszymi opcjami. Jeśli jednak szukasz najlepszego z obu światów, to Dell Inspiron 14 Plus 7420 trzyma się cienkiej granicy między ekstremalną wydajnością i przenośnością, a jednocześnie utrzymuje cenę na rozsądnym poziomie. Osoby często podróżujące, które oczekują wydajności wykraczającej poza to, co może zaoferować seria Core U i zintegrowana grafika, znajdą w Dellu solidne rozwiązanie.
Pakowanie tak dużej mocy do 14-calowej obudowy wiąże się z typowymi wadami: cieplejszymi temperaturami, głośniejszym działaniem wentylatorów, większą wagą i wyższym zużyciem energii niż w przypadku większości innych laptopów w kategorii 14 cali. Uważamy, że spośród tych czterech wad najbardziej można poprawić wagę, gdyż konkurencyjneAsus Vivobook Pro 14 wyposażony jest w procesory AMD serii H i ten sam układ graficzny GeForce RTX 3050, a przy tym waży o kilkaset gramów mniej. Wentylatory są co najmniej doskonałe w zachowywaniu ciszy podczas mniejszych obciążeń procesowych, a więc są głośne tylko podczas uruchamiania wymagających aplikacji.
Inspiron 14 Plus 7420 może być ciężki, ale wykona swoją pracę szybciej niż typowy Ultrabook.
Inne wady to gąbczasty gładzik i elastyczna pokrywa. W przypadku tak ciężkiego 14-calowego laptopa przydałaby się sztywniejsza pokrywa. Przewaga wydajnościowa nad większością 14-calowych laptopów w tym przedziale cenowym jest poza tym główną atrakcją systemu.
Cena i dostępność
Inspiron 14 Plus 7420 clamshell jest już w sprzedaży na Amazon oraz Newegg W cenie odpowiednio 1300 i 1400 USD. Konfiguracje są jednak obecnie ograniczone tylko do zintegrowanej grafiki. Zalecamy zakup bezpośrednio od firmy Dell jeśli chcesz GeForce RTX 3050 SKU.
Dell Inspiron 14 Plus 7420
- 30/08/2022 v7 (old)
Allen Ngo
Price comparison

