Recenzja laptopa MSI Katana 17 B13V: Nvidia GeForce RTX 4060 debiutuje

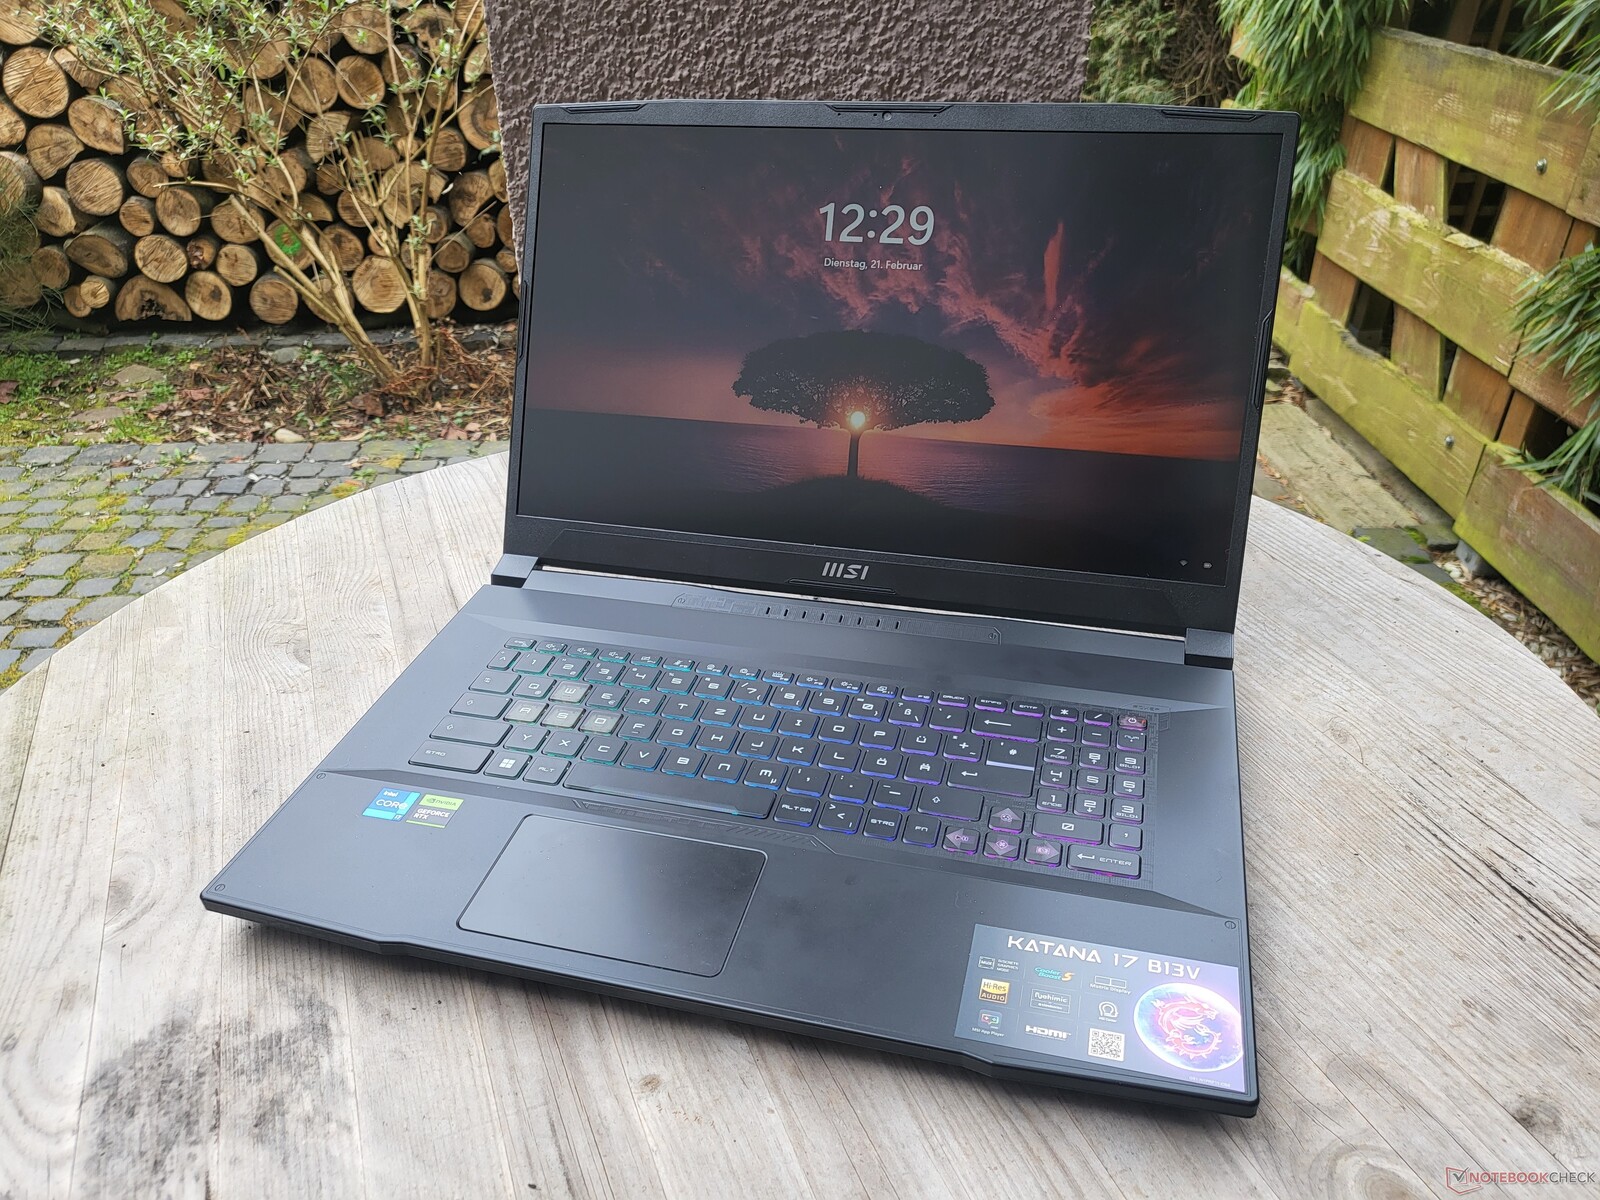
5499 dolarów. Tyle właśnie potencjalni nabywcy muszą wyłożyć na MSI Titan GT77. Z jednej strony otrzymujemy najwyższą moc, ale niewiele osób będzie skłonnych wydać tyle na laptopa. Dzięki kilku ściętym rogom, MSI Katana 17 B13VFK pokazuje, że tańsze też może działać: Z procesorem Raptor Lake i Nvidia GeForce RTX 4060, ten laptop do gier (obecnie niedostępny na Amazon i Best Buy) można mieć w Niemczech za około 1999 euro. Nadal są to duże pieniądze, ale około dwie trzecie taniej. W naszej obszernej recenzji ujawniamy, czy wydajność również bierze podobny hit.
Potencjalni konkurenci w porównaniu
Ocena | Data | Model | Waga | Wysokość | Rozmiar | Rezolucja | Cena |
|---|---|---|---|---|---|---|---|
| 82.1 % v7 (old) | 02/2023 | MSI Katana 17 B13VFK i7-13620H, GeForce RTX 4060 Laptop GPU | 2.8 kg | 25.2 mm | 17.30" | 1920x1080 | |
| 89 % v7 (old) | 02/2023 | MSI Titan GT77 HX 13VI i9-13950HX, GeForce RTX 4090 Laptop GPU | 3.5 kg | 23 mm | 17.30" | 3840x2160 | |
| 83.2 % v7 (old) | 01/2023 | MSI Pulse GL76 12UGK i7-12700H, GeForce RTX 3070 Laptop GPU | 2.6 kg | 24.2 mm | 17.30" | 1920x1080 | |
| 83.3 % v7 (old) | 01/2023 | Gigabyte G7 KE i5-12500H, GeForce RTX 3060 Laptop GPU | 2.6 kg | 25 mm | 17.30" | 1920x1080 | |
| 86.9 % v7 (old) | 11/2022 | Asus ROG Strix Scar 17 SE G733CX-LL014W i9-12950HX, GeForce RTX 3080 Ti Laptop GPU | 2.9 kg | 28.3 mm | 17.30" | 2560x1440 | |
| 86.5 % v7 (old) | 11/2022 | Acer Predator Helios 300 (i7-12700H, RTX 3070 Ti) i7-12700H, GeForce RTX 3070 Ti Laptop GPU | 3 kg | 27.65 mm | 17.30" | 2560x1440 |
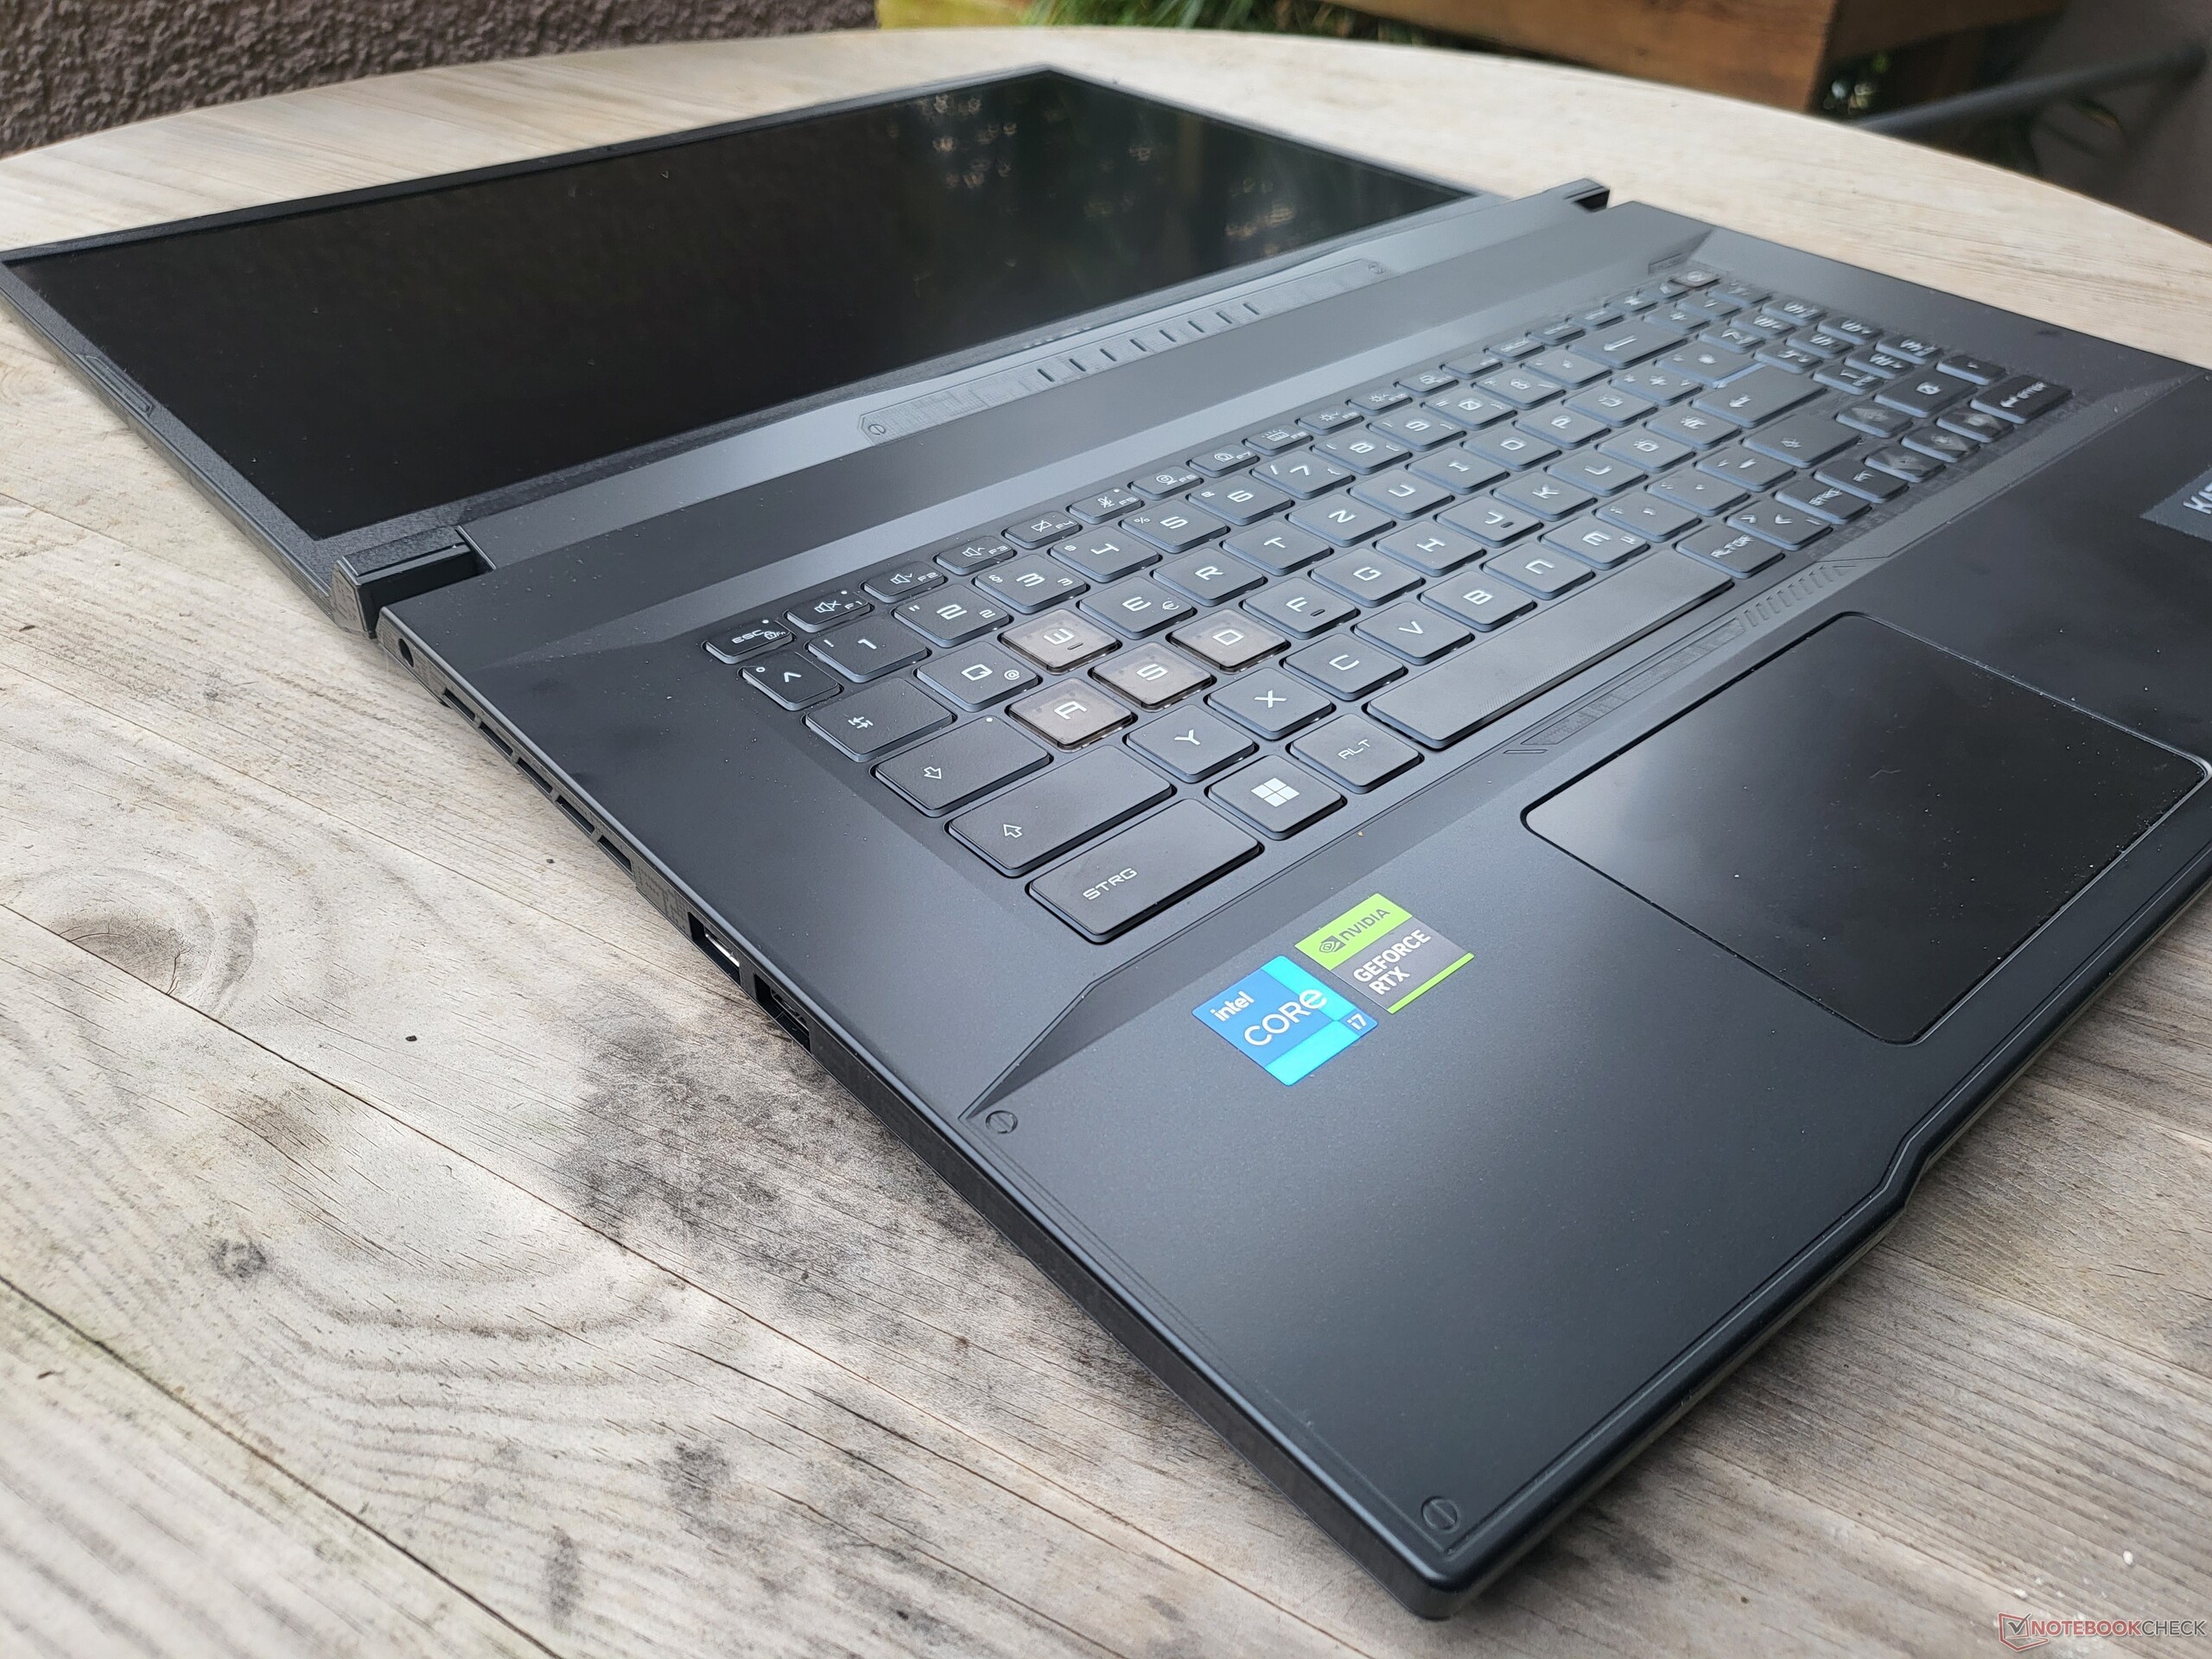
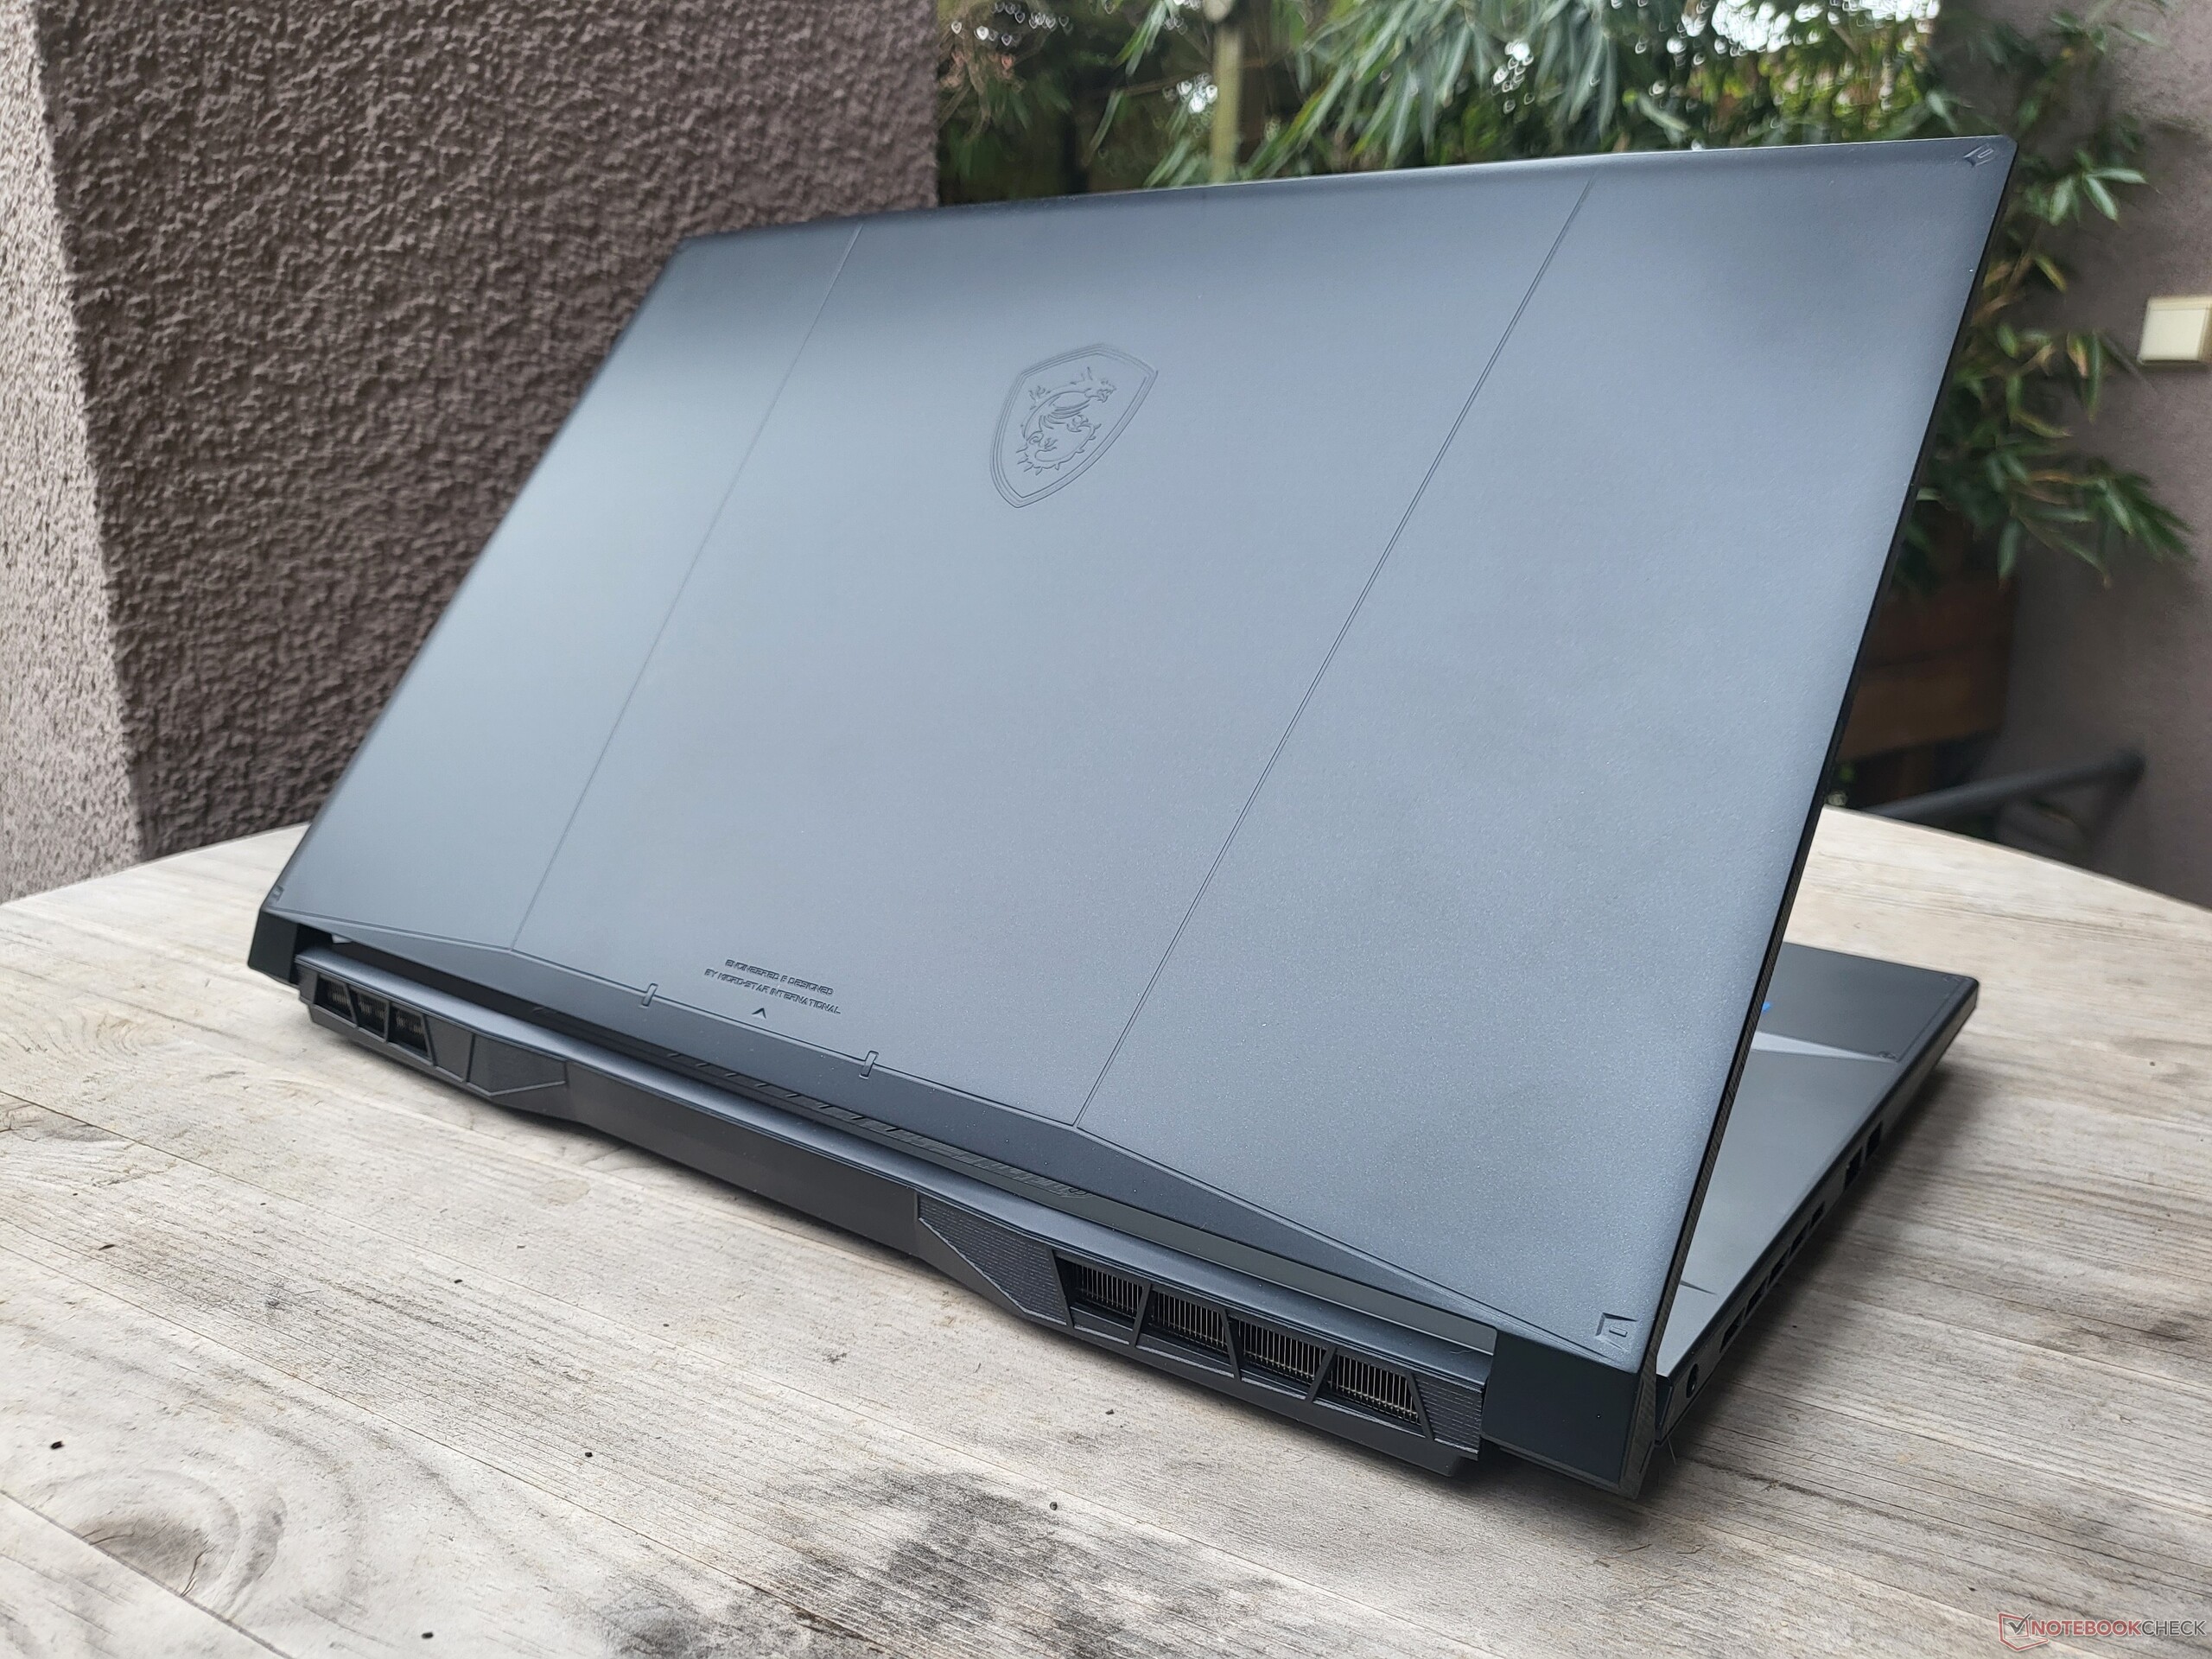
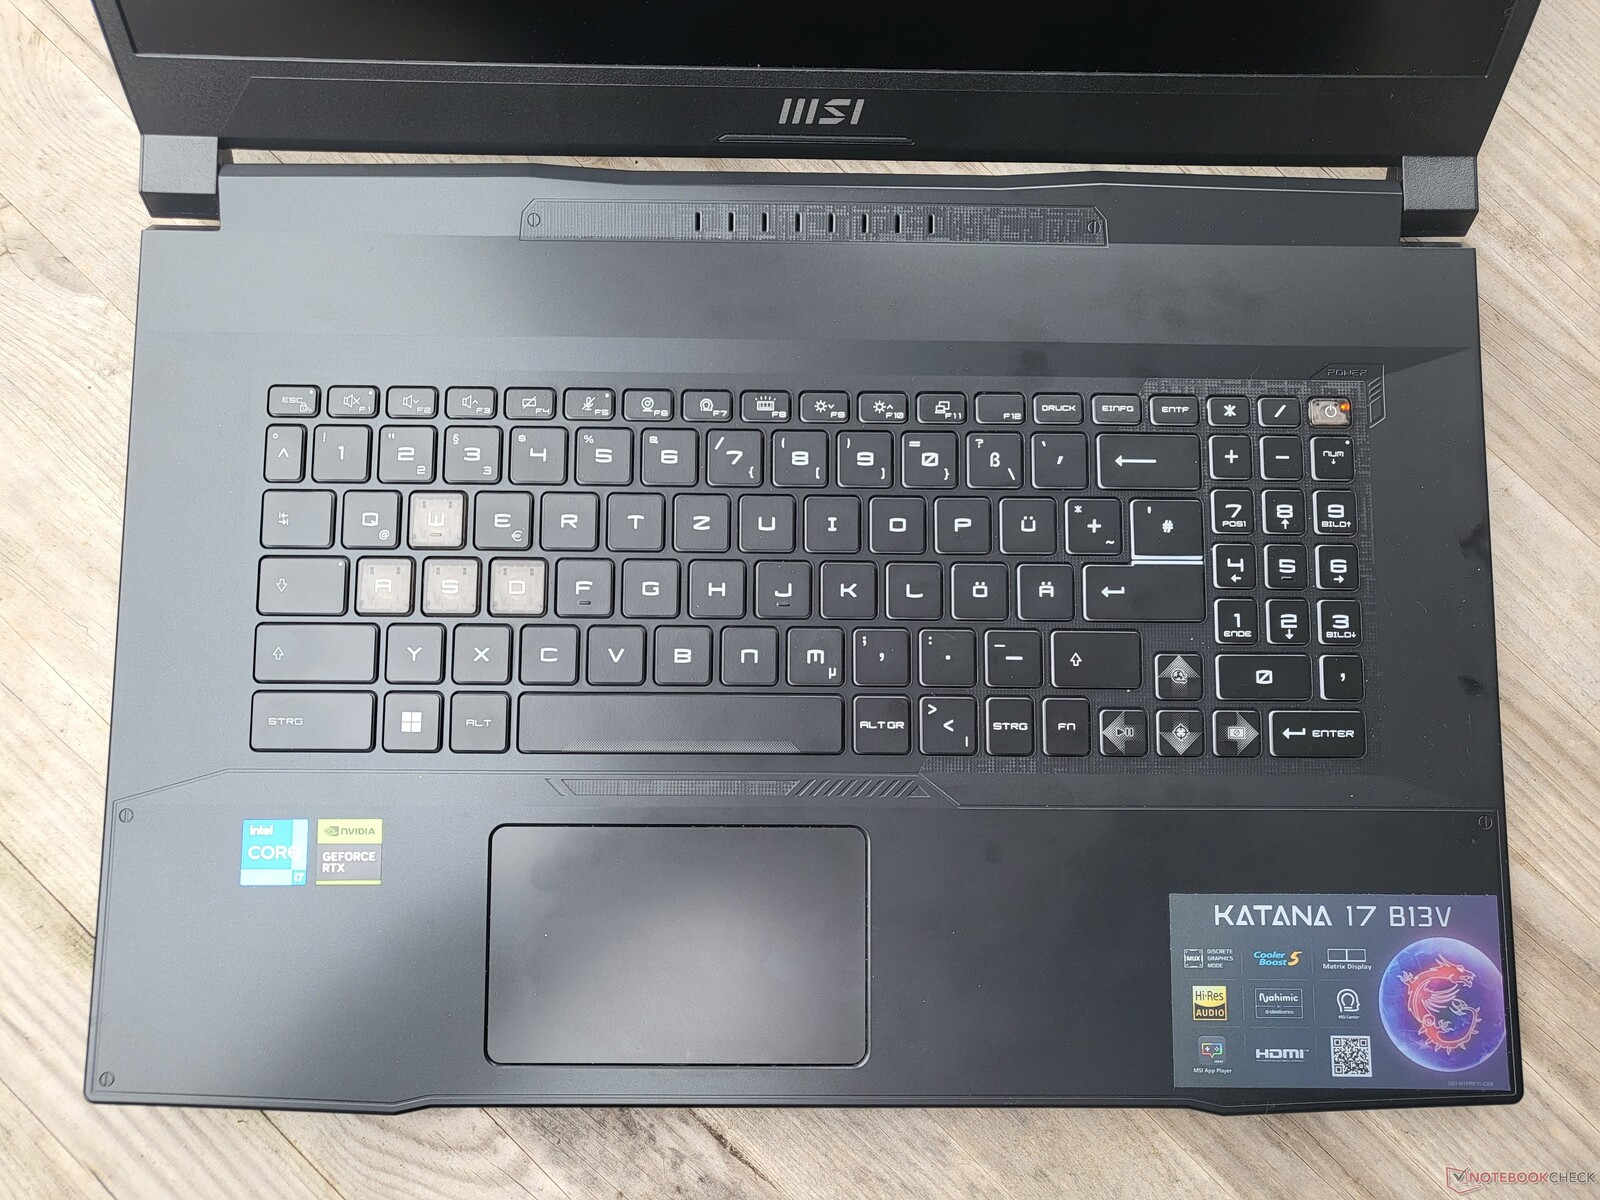
Obudowa: Matowa szara rakieta MSI
MSI nadało Katanie 17 typowo gamingowy wygląd. Język projektowy trudno określić jako prosty, ale to coś, co nie dotyczy koloru laptopa: MSI jest na całej powierzchni ciemnoszary. Chociaż tak jest tylko wtedy, gdy urządzenie jest wyłączone. Z włączoną kolorową, podświetlaną klawiaturą, MSI pod względem kolorystycznym również wygląda jak laptop dla graczy.
Zewnętrznie, przynajmniej, laptop jest wykonany z tworzywa sztucznego. Podpórka pod dłonie i wieko są gładkie w dotyku, natomiast spód urządzenia jest nieco bardziej szorstki. Niekoniecznie jest to materiał najwyższej jakości, ale mimo to spełnia swoją rolę. Przy lekkim nacisku oparcie dłoni jest twarde, ale przy dodatkowym nacisku ugina się trochę na środku. Pokrywę wyświetlacza można lekko wykręcić, w przeciwieństwie do podstawy, której nie da się w ogóle wykręcić. W przypadku laptopa, który powinien spędzać większość czasu na biurku, nie powinno to stanowić problemu.
Duże zawiasy pozwalają otworzyć urządzenie do kąta 180 stopni, a pokrywę wyświetlacza można otworzyć jedną ręką.
Pod względem wagi, MSI Katana 17 plasuje się w środku stawki w porównaniu do swoich rówieśników. W zamian za to może pochwalić się stosunkowo kompaktowymi wymiarami.
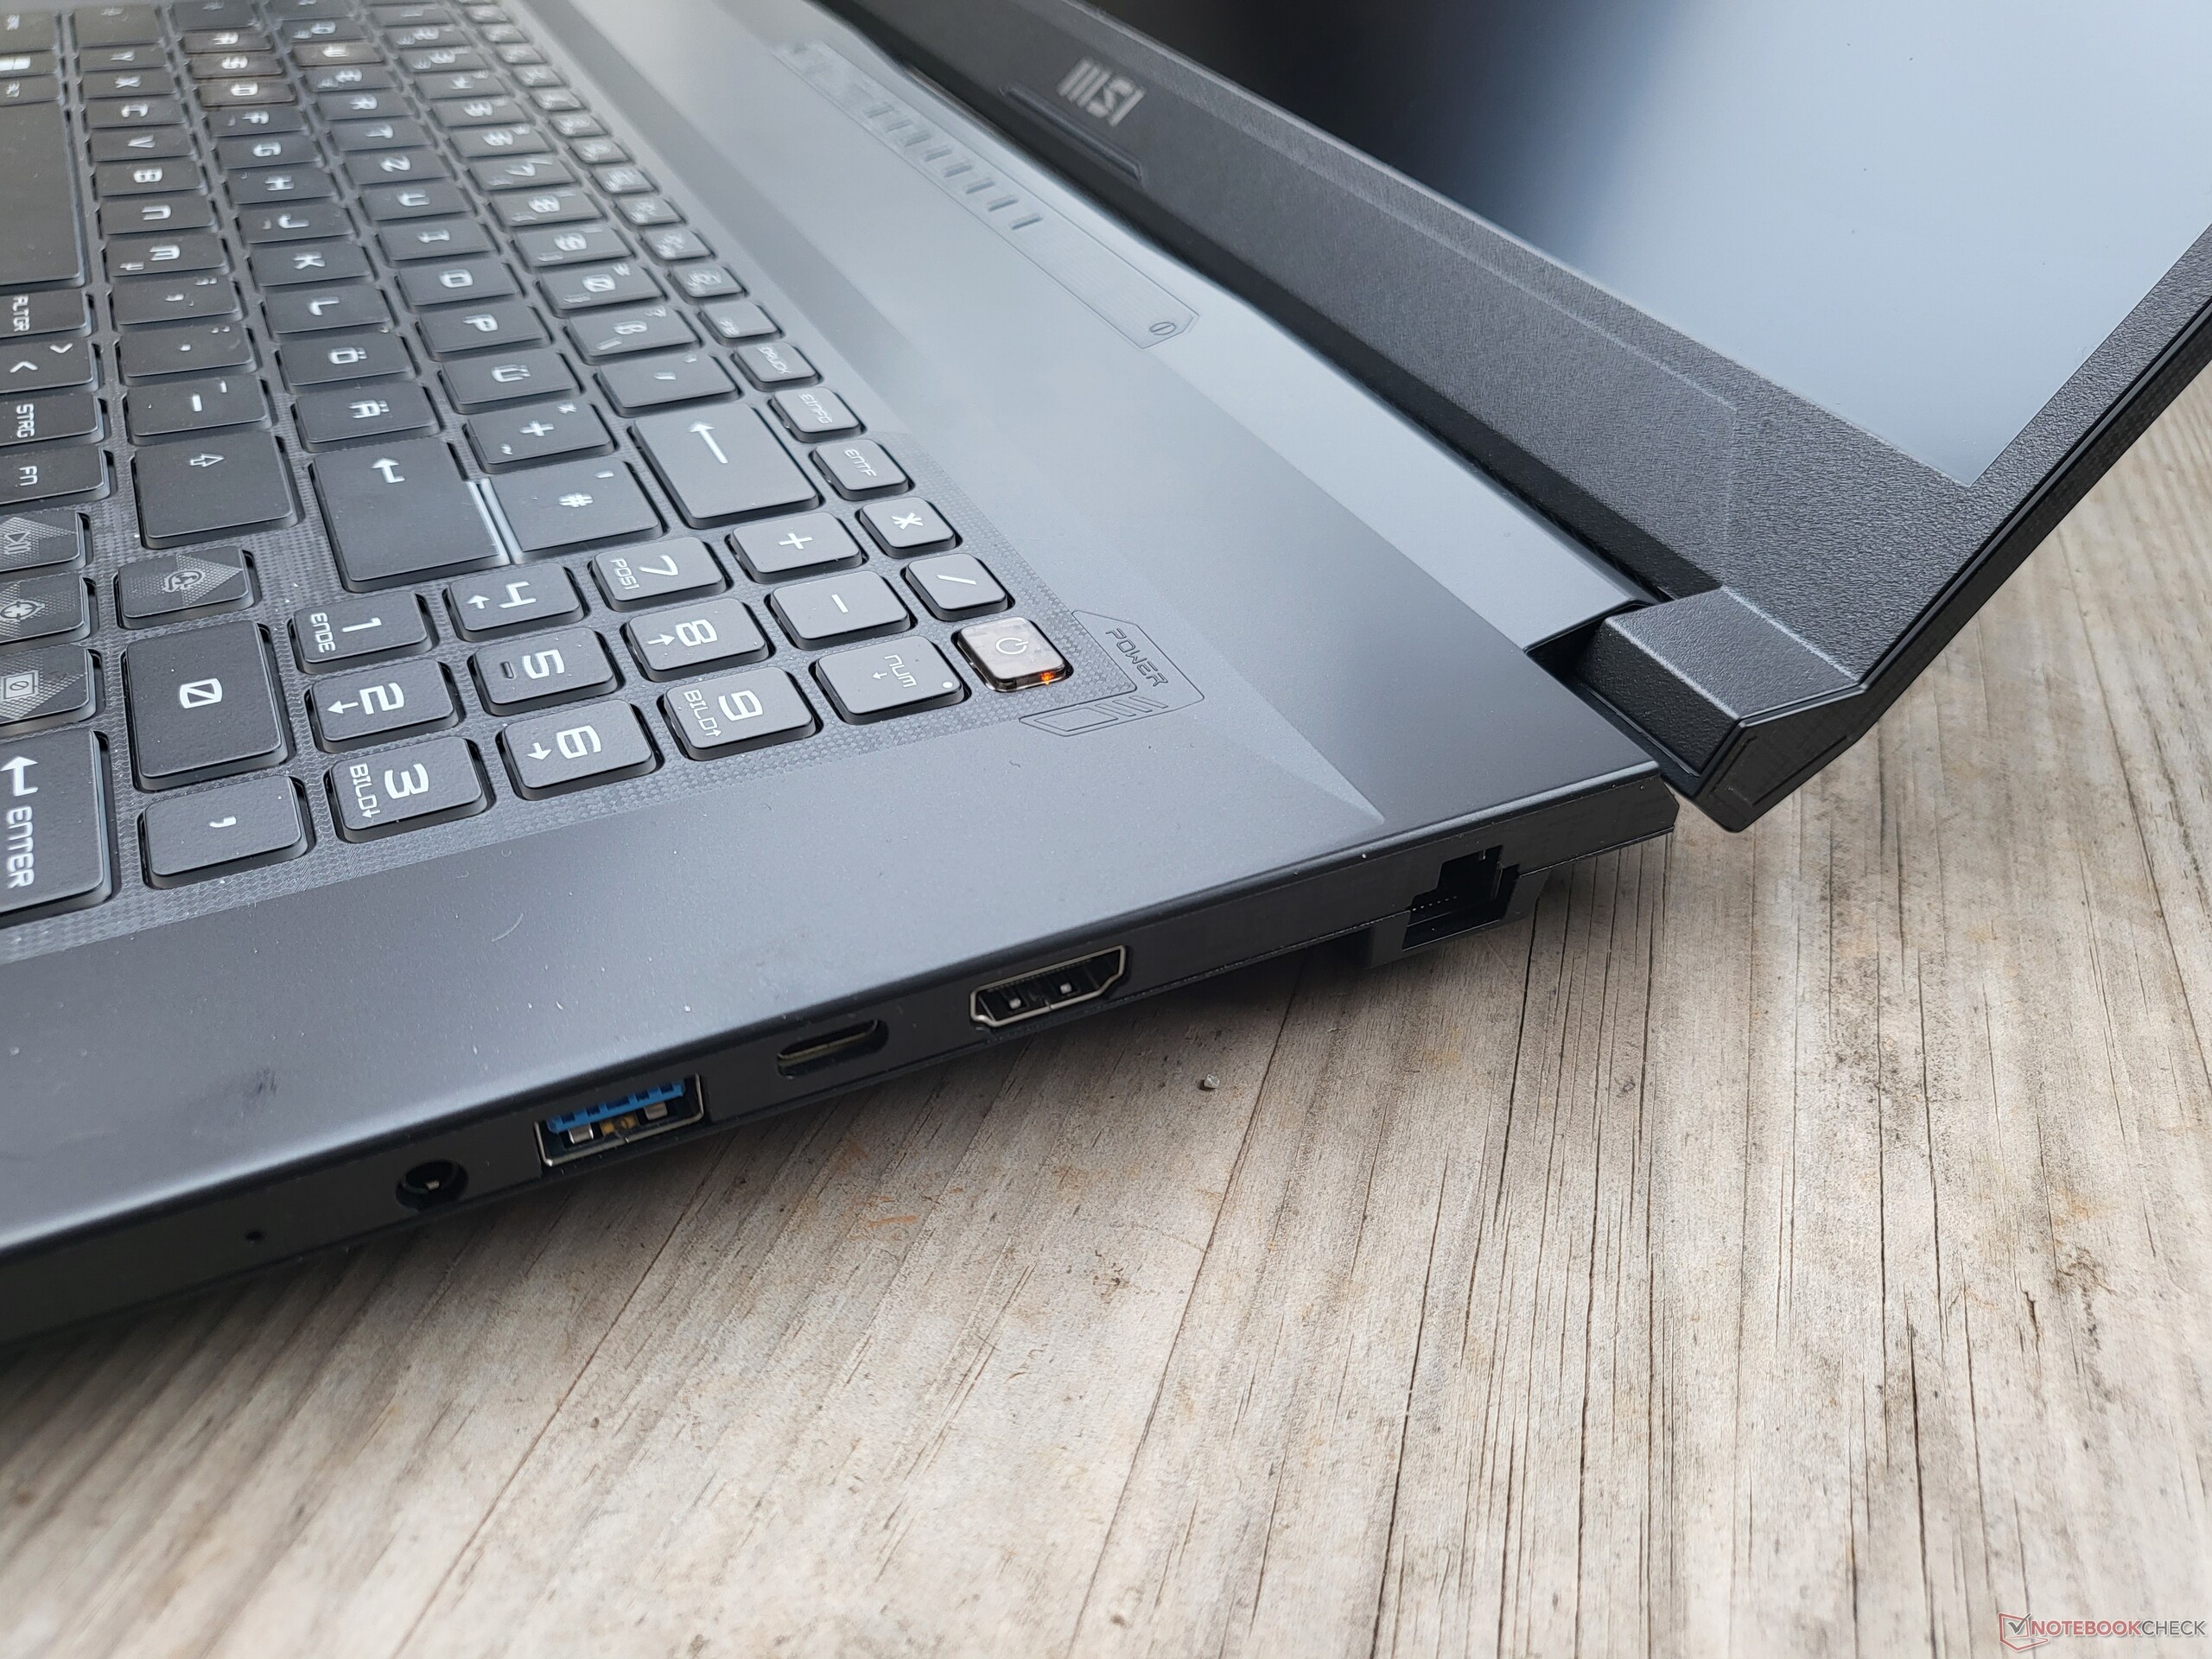
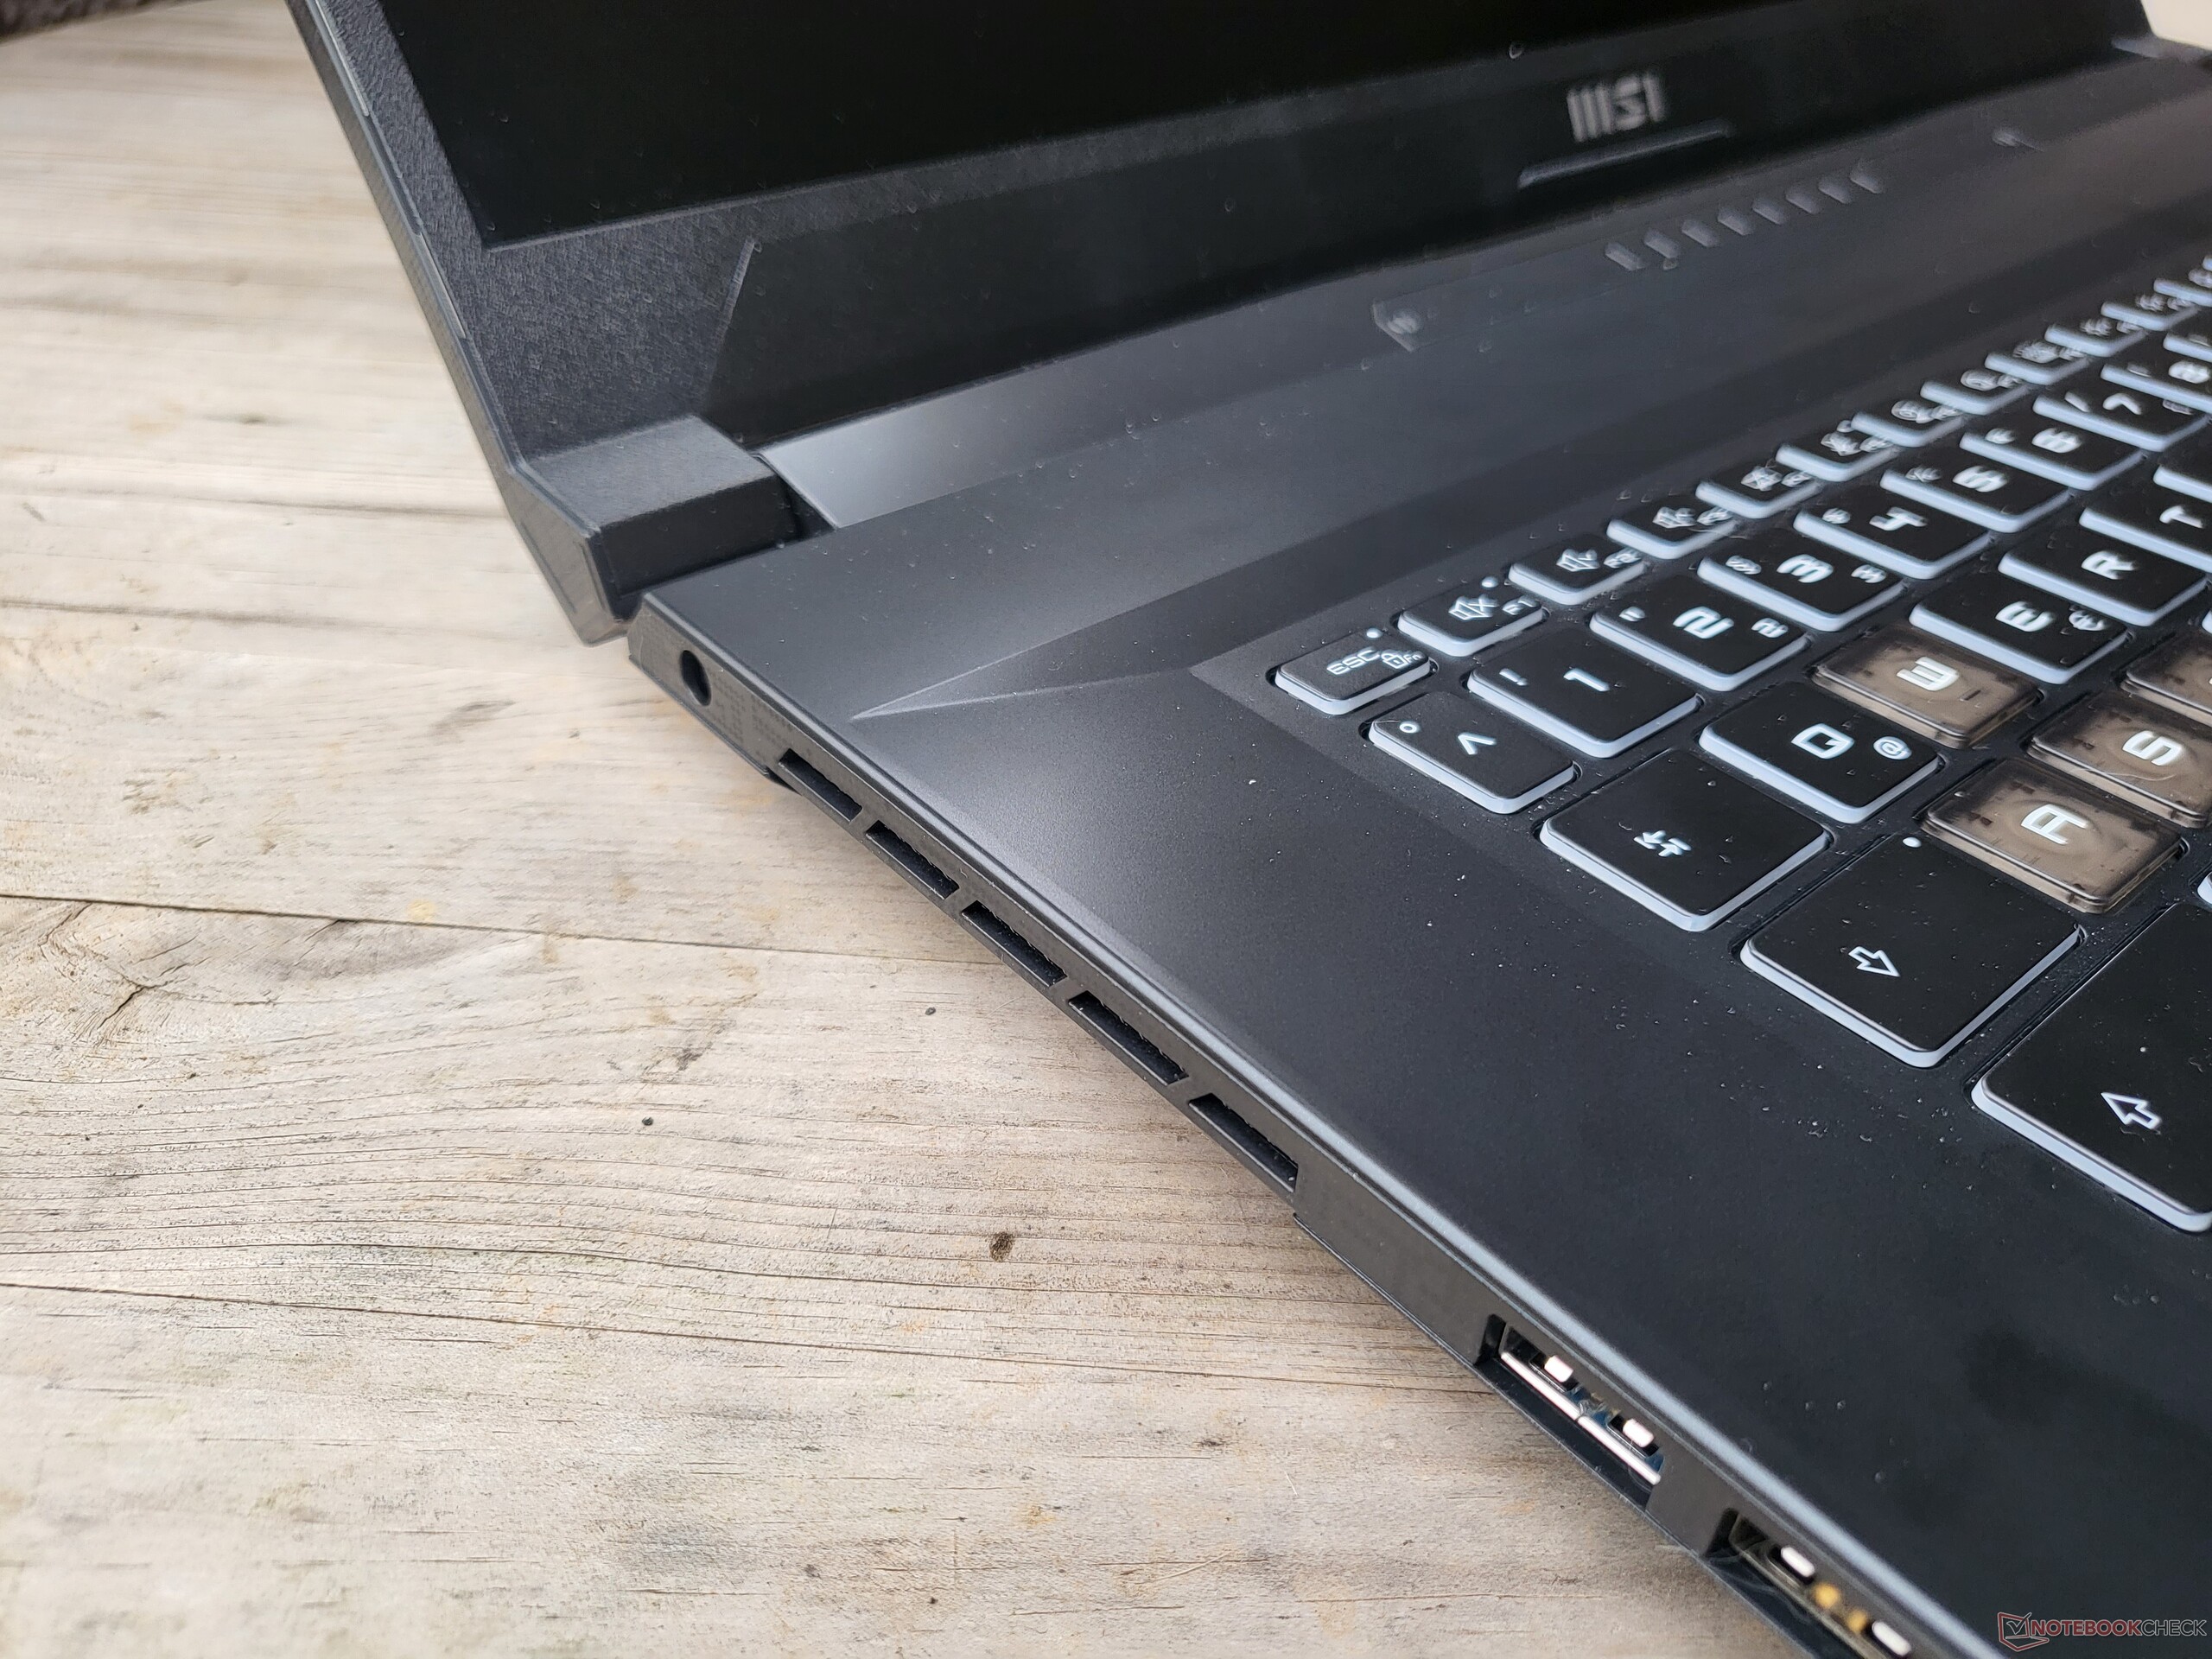
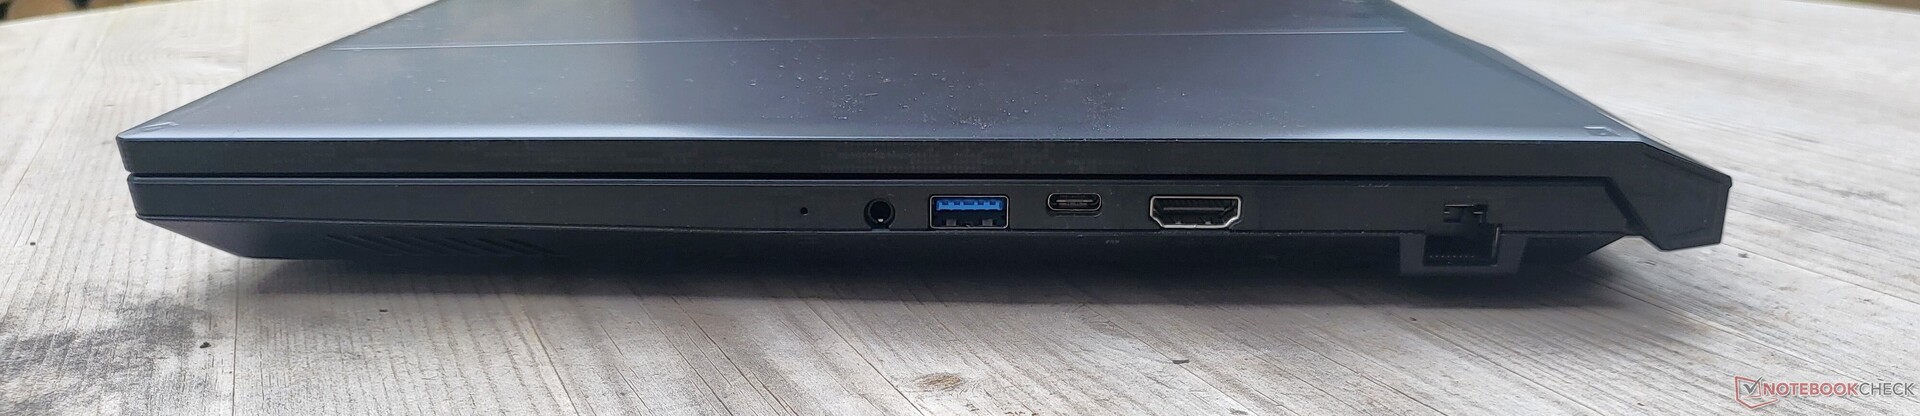
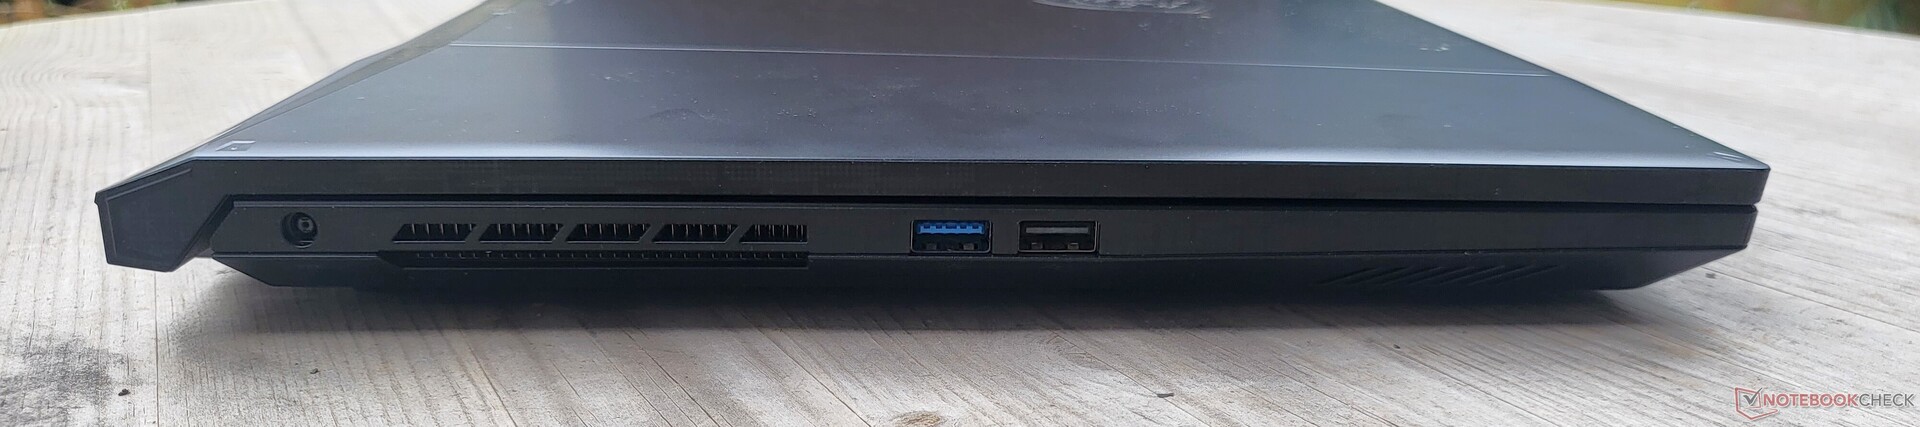
Cechy: USB 2.0 zamiast Thunderbolt
Zakres portów pozostawia wiele do życzenia: USB 2.0 nie ma miejsca w 2022 roku, a Thunderbolt jest również nieobecny w MSI Katana 17. Dodatkowo brakuje nam czytnika kart SD, ale przynajmniej MSI nie poskąpiło na port den RJ45.
Komunikacja
W Katanie 17 B13V MSI postawiło na rozwiązanie WiFi od Intela, choć nie jest to rozwiązanie z najnowszą technologią. Intel AX201 zapewnia wysoki, stabilny transfer, choć musi się obejść bez nowszego standardu WiFI 6E.
Kamera internetowa
Kamerka internetowa 720p dostarcza obraz typowy dla laptopów: głośny, wyprany i pozbawiony ostrości.


Akcesoria
Po wyjęciu z pudełka, MSI Katana 17 B13V posiada 240-watowy zasilacz firmy Chicony, który korzysta z autorskiego złącza.
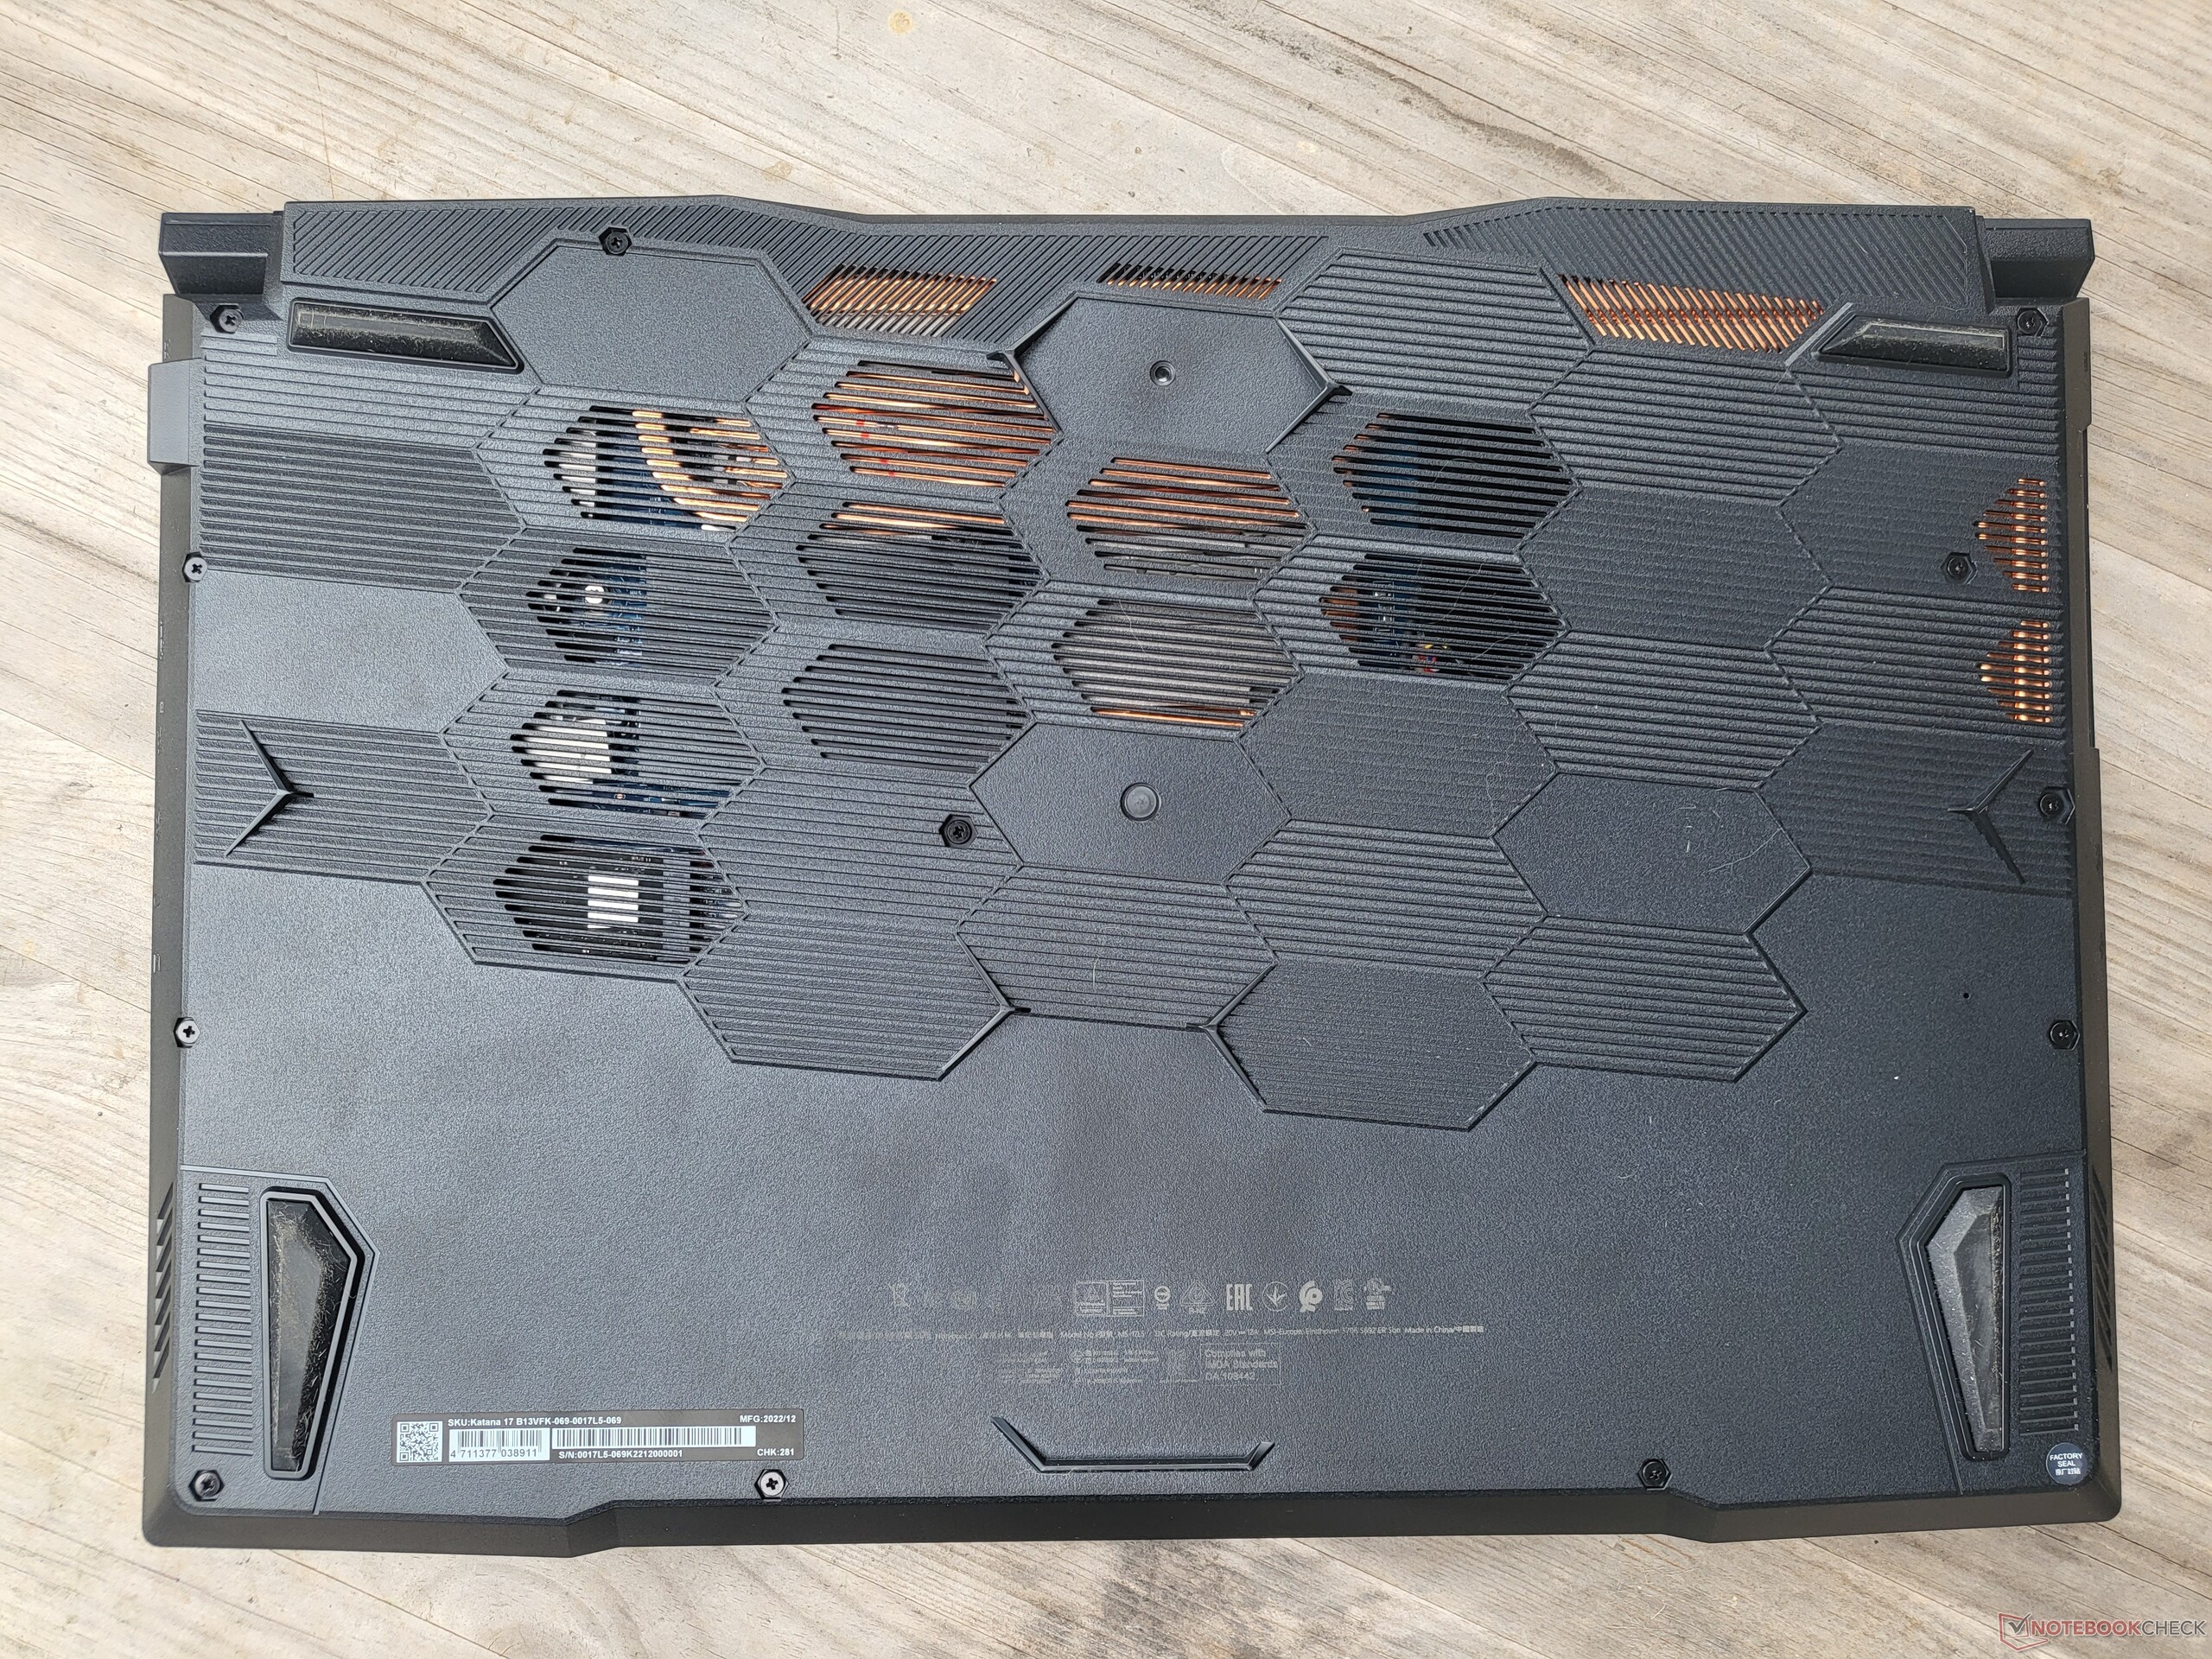
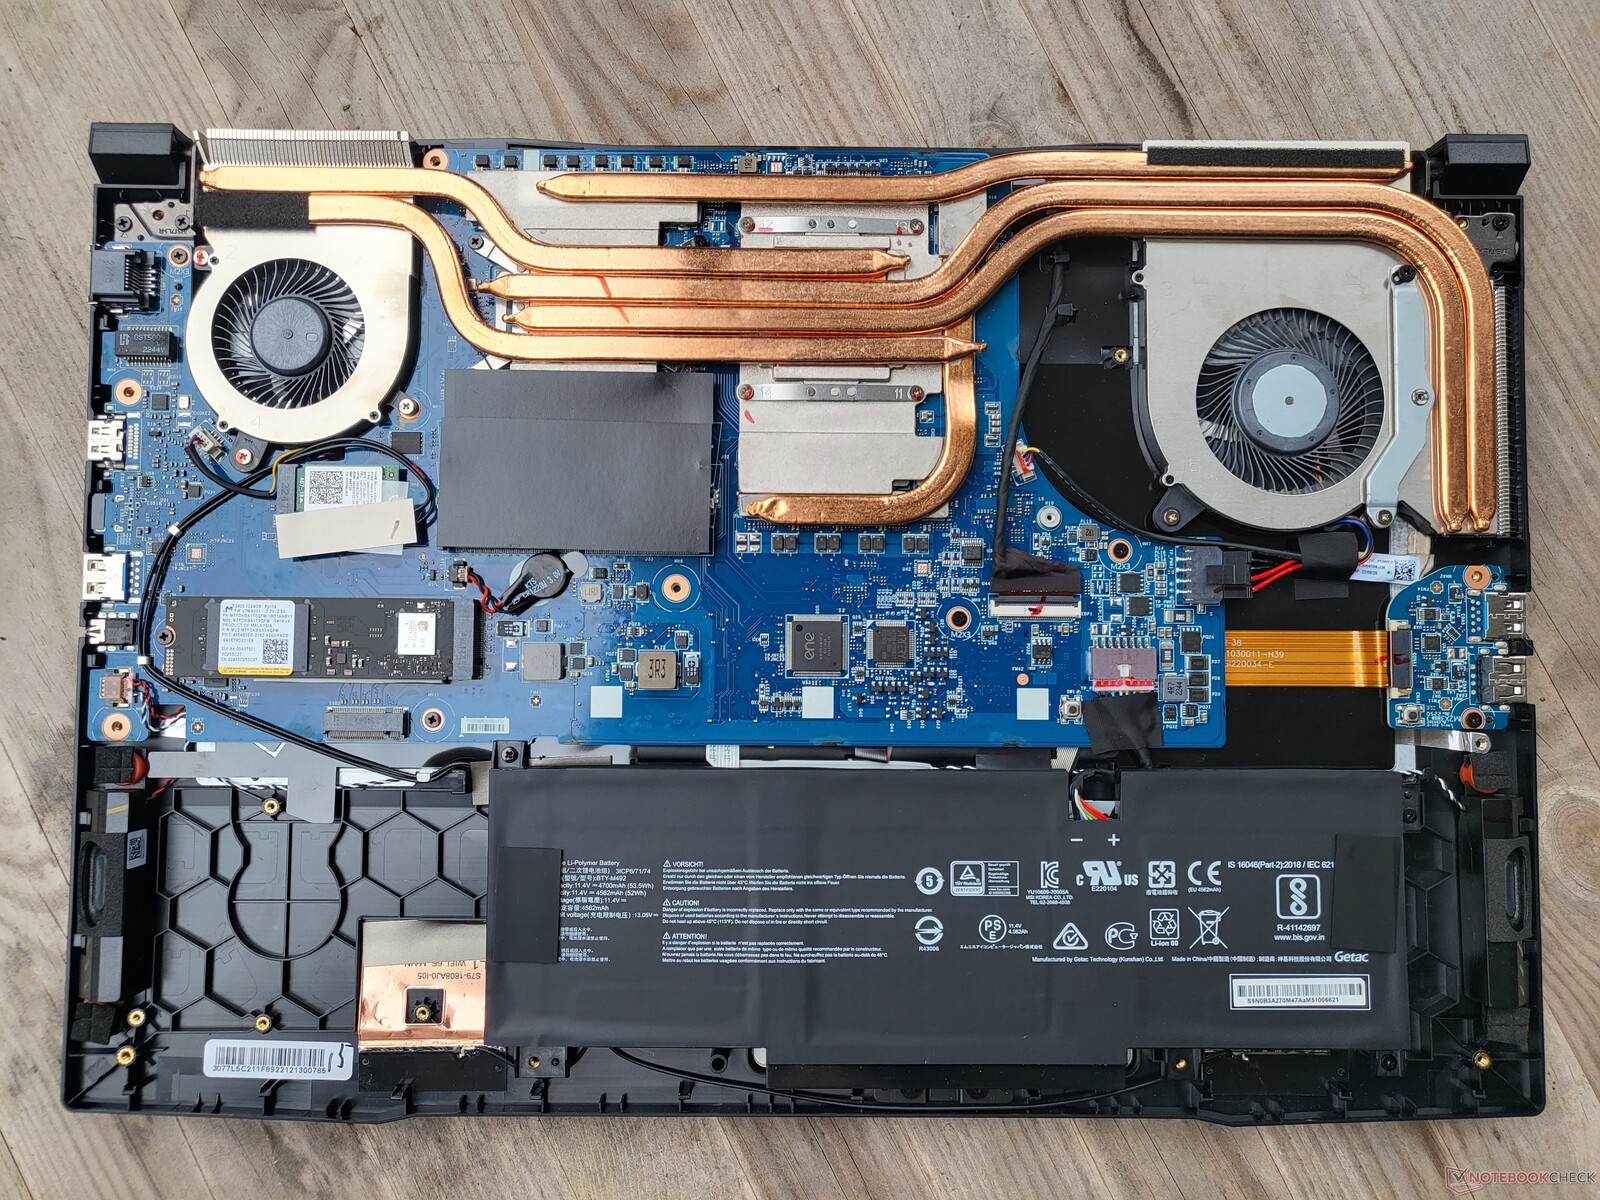
Konserwacja
Na drodze do uzyskania dostępu do wnętrza Katany stoi trzynaście śrubek i kilka klipsów. Moduł WiFi, dysk SSD M.2 2280, a także oba moduły pamięci RAM można rozbudować. Dodatkowo można uzyskać dostęp do dużego, dwuwentylatorowego systemu chłodzenia, a także do baterii, która jest raczej niewielka jak na urządzenie tej wielkości. Obok baterii jest sporo wolnego miejsca, co pokazuje, że można było zastosować większy akumulator. Co ciekawe, na płycie bazowej znajduje się ciężar, który sprawia, że laptop MSI wydaje się cięższy - być może ze względu na dużą, wolną przestrzeń.
Gwarancja
Laptop MSI objęty jest 2-letnią gwarancją od daty zakupu, która obejmuje usługę Pick-Up & Return. Gwarancja producenta obowiązuje jednak tylko na terenie Niemiec.
Urządzenia wejściowe: Dobra klawiatura, dziwny układ
Klawiatura
Po pierwsze pozytywy: Klawiatura typu chiclet jest w komplecie z wielopoziomowym podświetleniem RGB (cztery strefy, konfigurowalne) i oferuje, jak na dzisiejsze standardy, bardzo obfity skok klawiszy - 1,7 mm. MSI wybrało bardzo dobrą klawiaturę do Katany 17 B13V. Wrażenia z pisania są wspaniałe, a podświetlenie klawiszy WASD dobrze wpisuje się w gamingowy design - podobnie jak stosunkowo duże klawisze strzałek.
Trudno jednak zrozumieć, dlaczego MSI nie zdecydowało się na klawiaturę o pełnej szerokości. Niektóre klawisze są wyraźnie mniejsze niż normalnie, a w szczególności klawiatura numeryczna jest malutka. Ogólnie rzecz biorąc, mamy do czynienia z bardzo nietypowym i niewygodnym układem klawiatury. Klawisz FN jest w absurdalnej pozycji, prawy klawisz Shift jest znacznie mniejszy, a na domiar złego jest to układ ANSI z wąskim klawiszem Enter, co oznacza, że klawisz # jest przesunięty. Nie jest to problem dla rynku światowego, ale bardzo nietypowy tutaj w Niemczech.
Touchpad
Touchpad MSI Katana 17 ma wymiary 10,5 x 6,5 cm - zbyt małe jak na dzisiejsze standardy, a także w stosunku do rozmiarów urządzenia. Jak na nasze gusta, plastikowa powierzchnia mogłaby być nieco gładsza, a poza tym nie sprawia wrażenia zbyt wysokiej klasy. Nie dotyczy to przynajmniej mechanizmu klikania: Podkładka do klikania zapewnia równomierny klik i wysokiej jakości odczucie. Pod względem implementacji oprogramowania nie ma się na co skarżyć, a pod tym względem jest to typowy touchpad spotykany w nowoczesnych laptopach z systemem Windows.
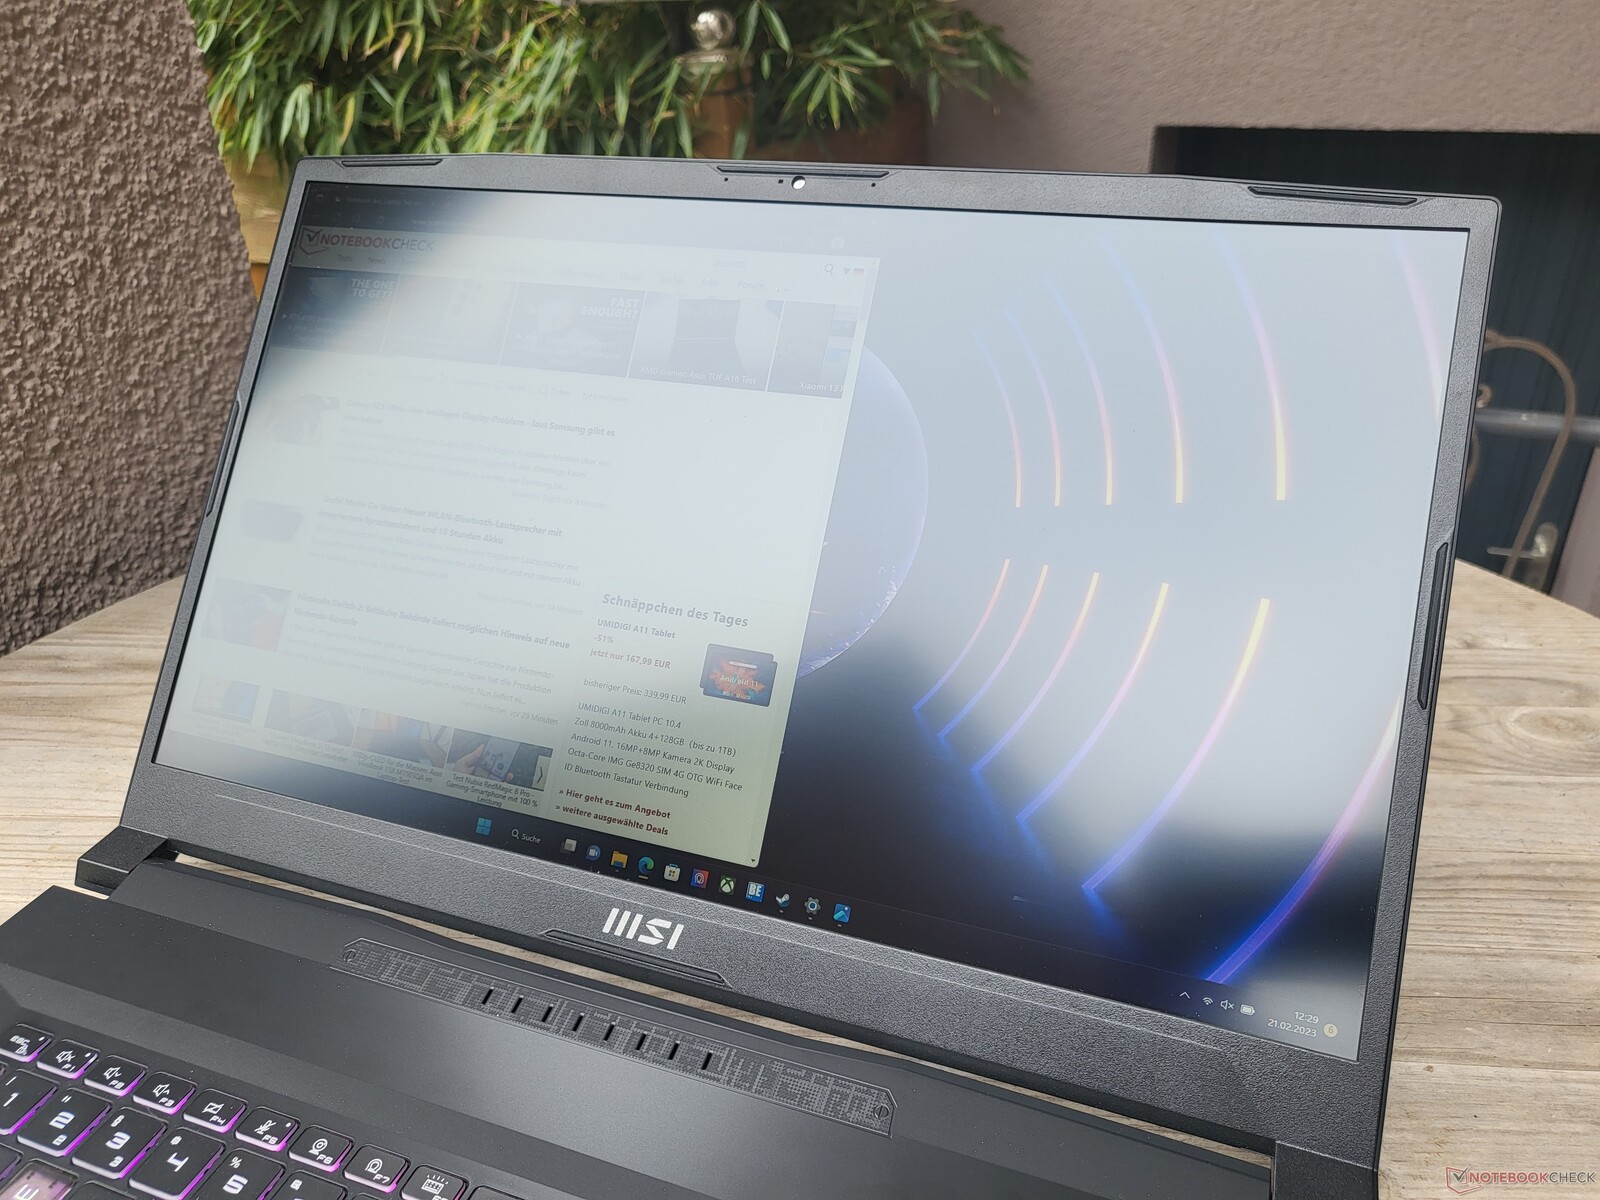
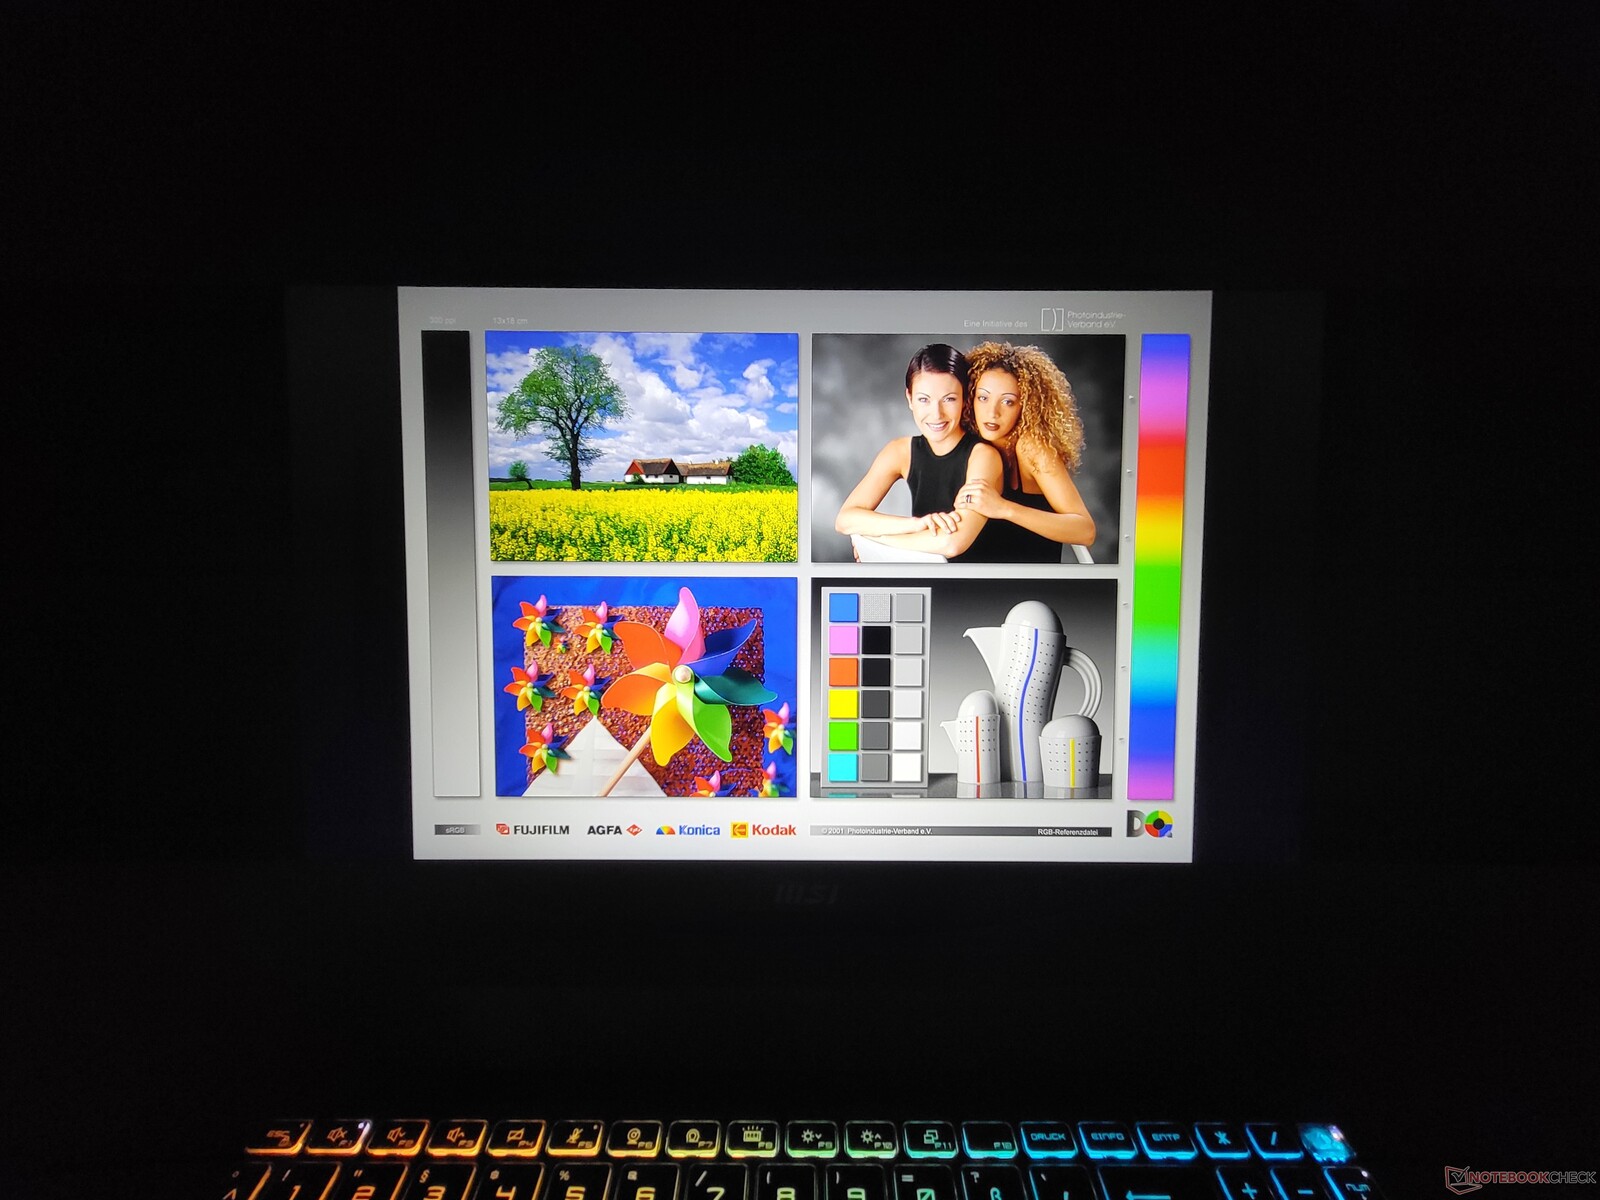
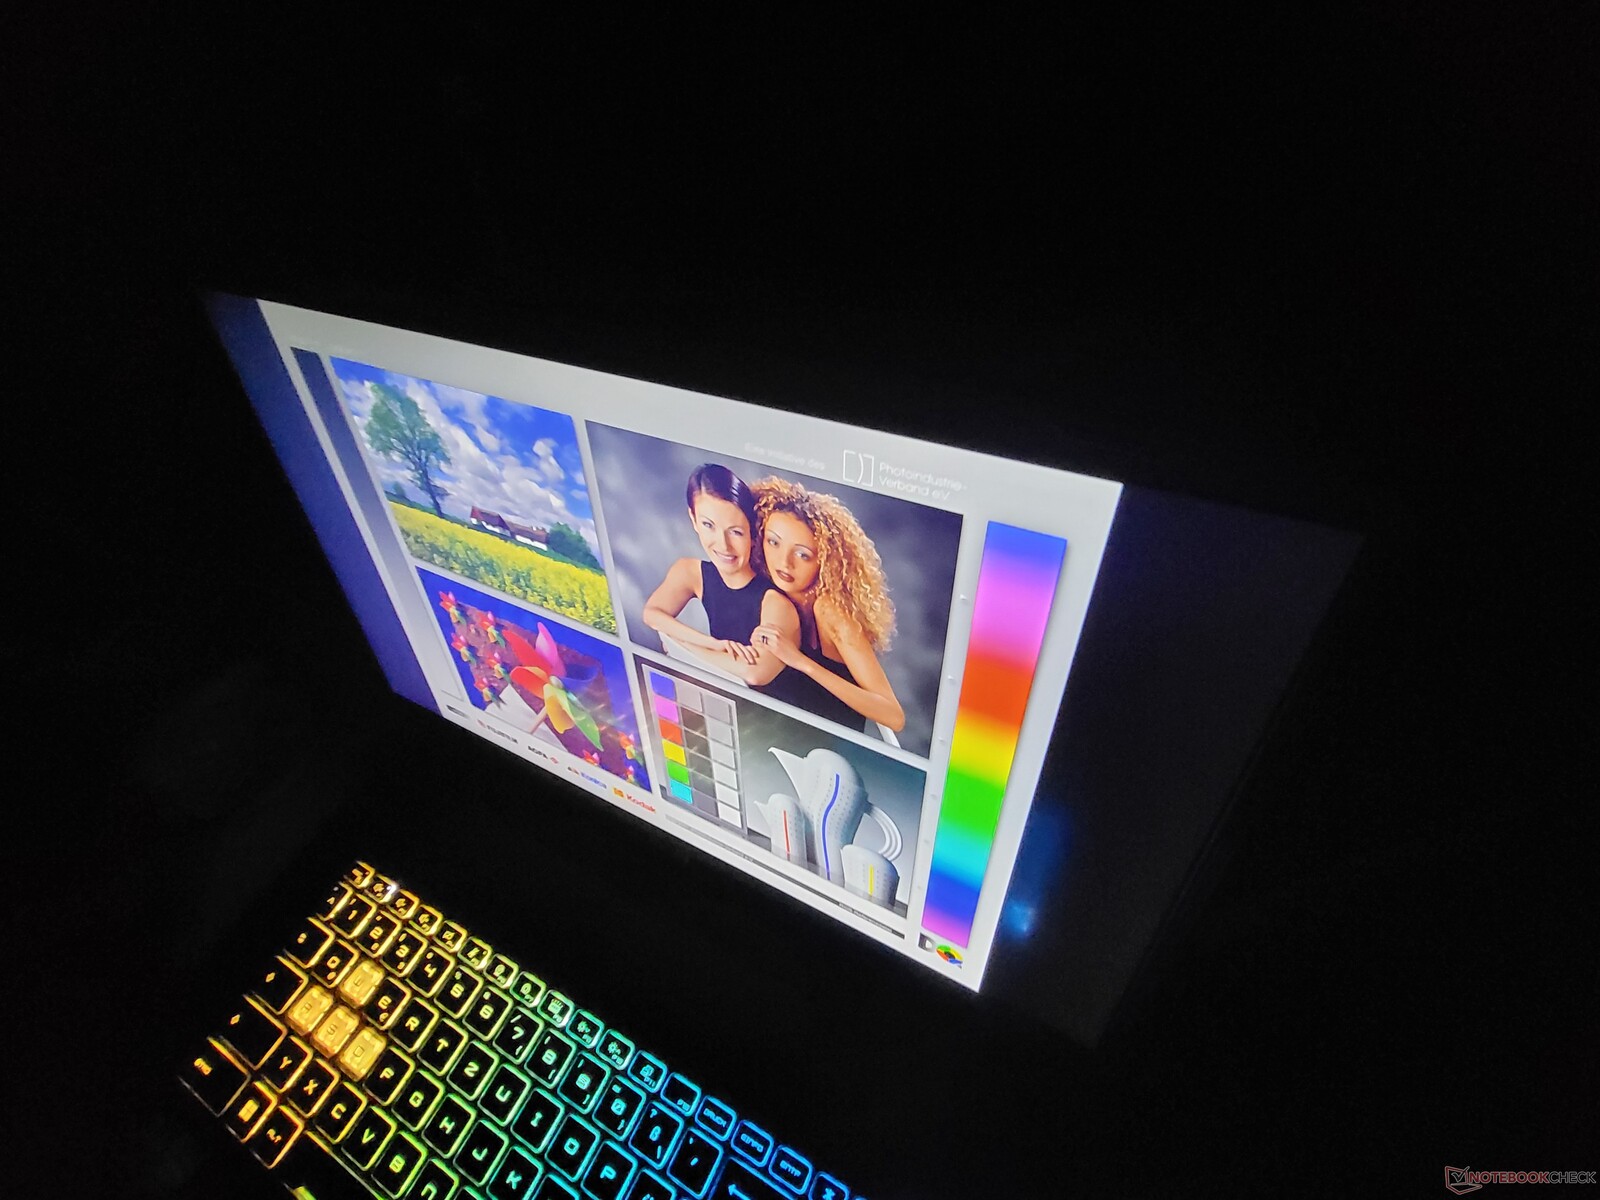
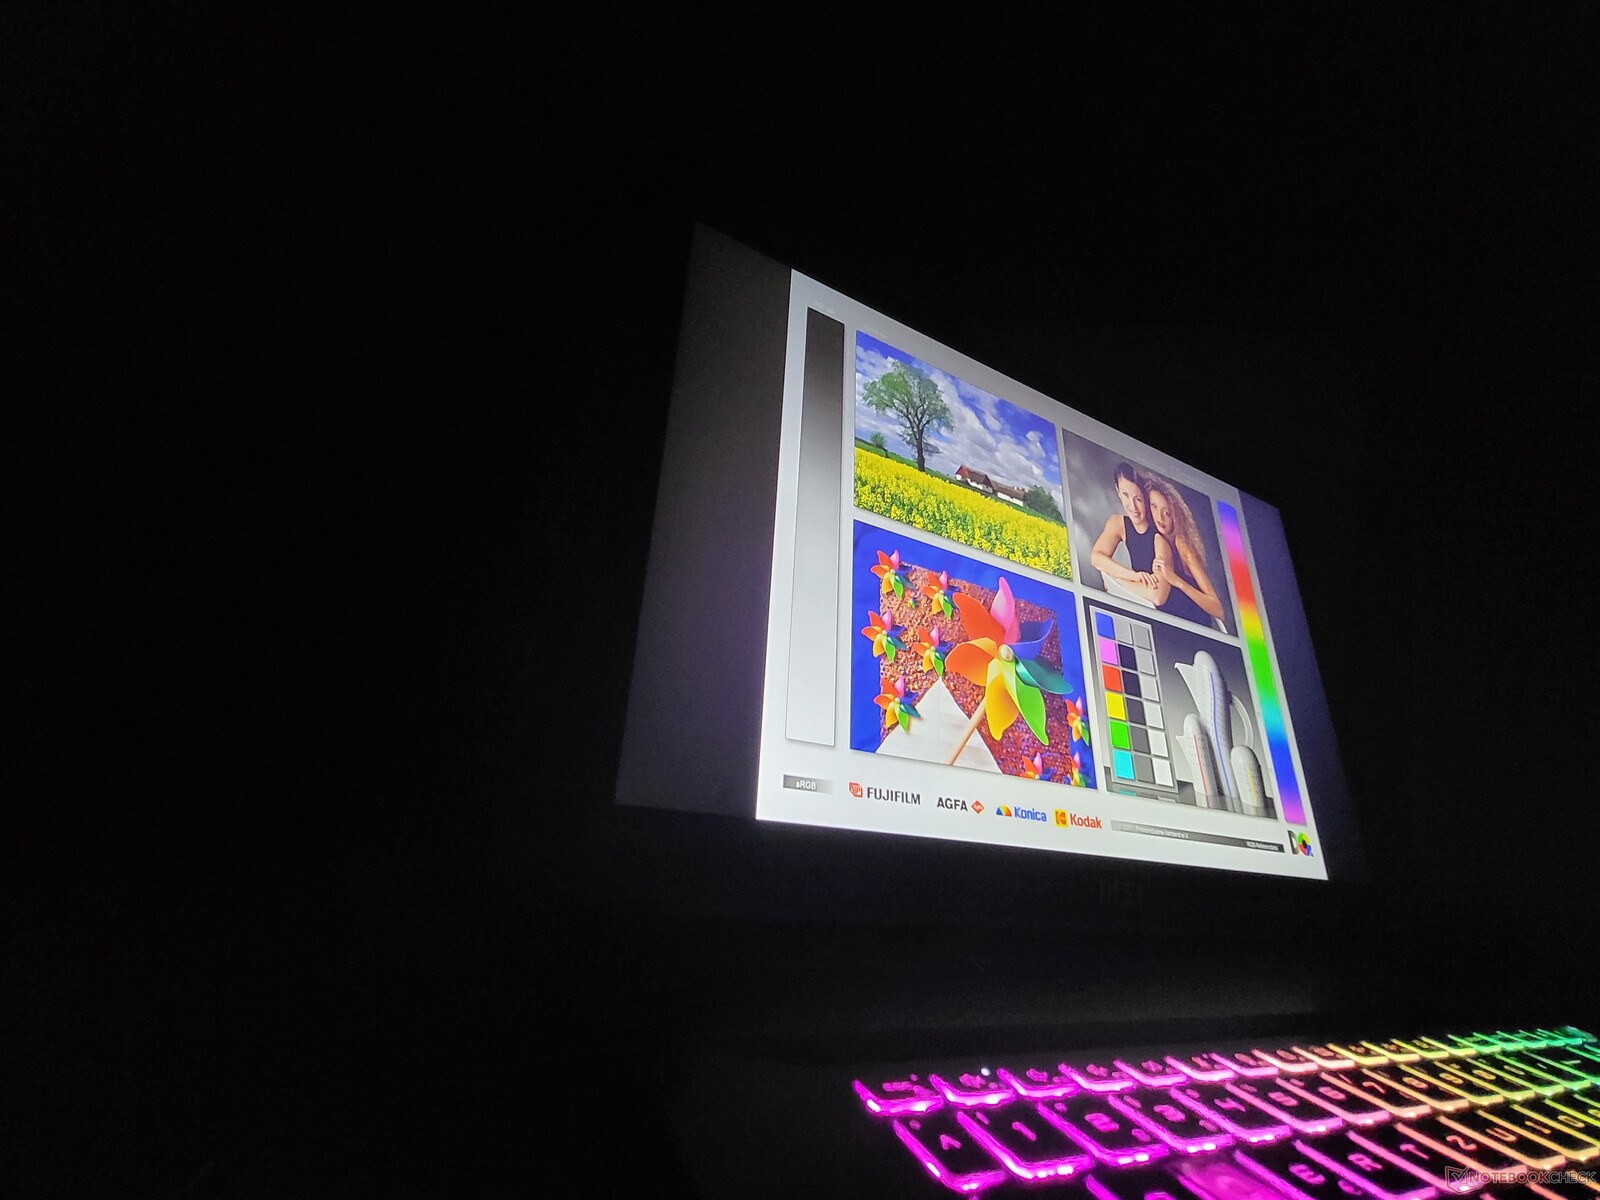
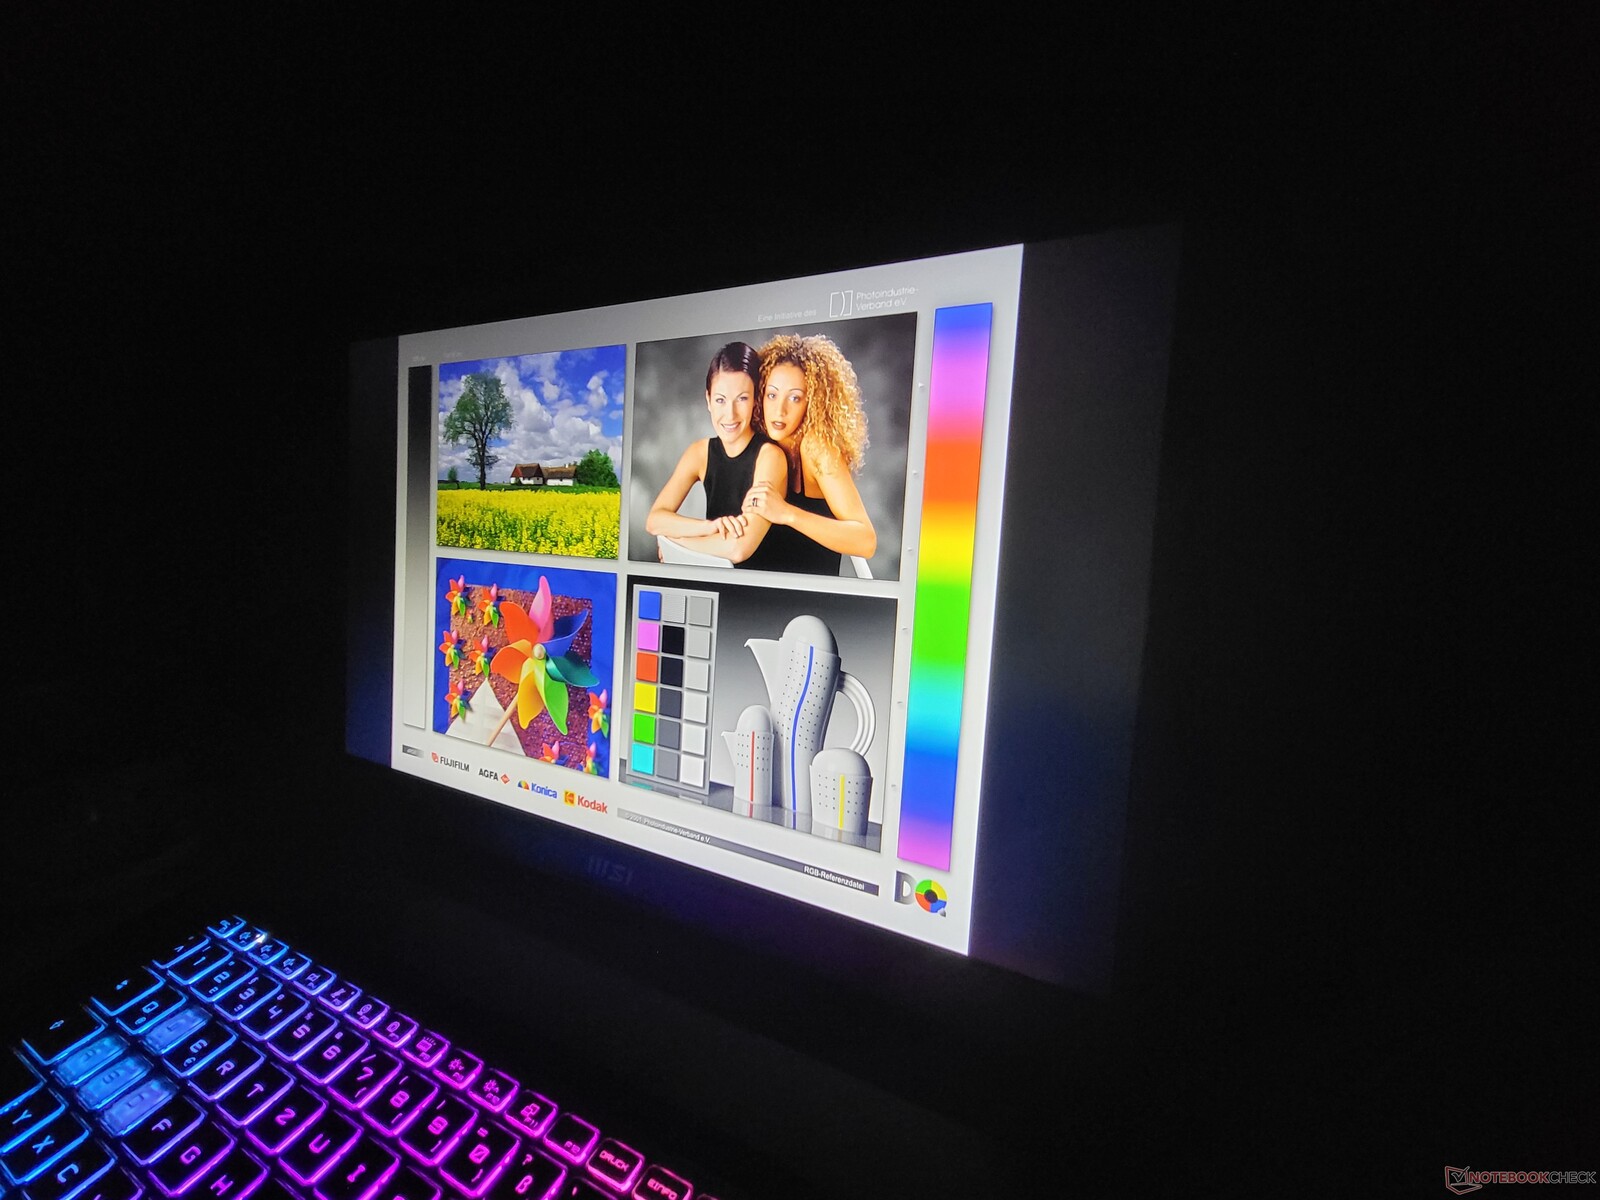
Wyświetlacz MSI Katana 17 to jego najsłabsze ogniwo

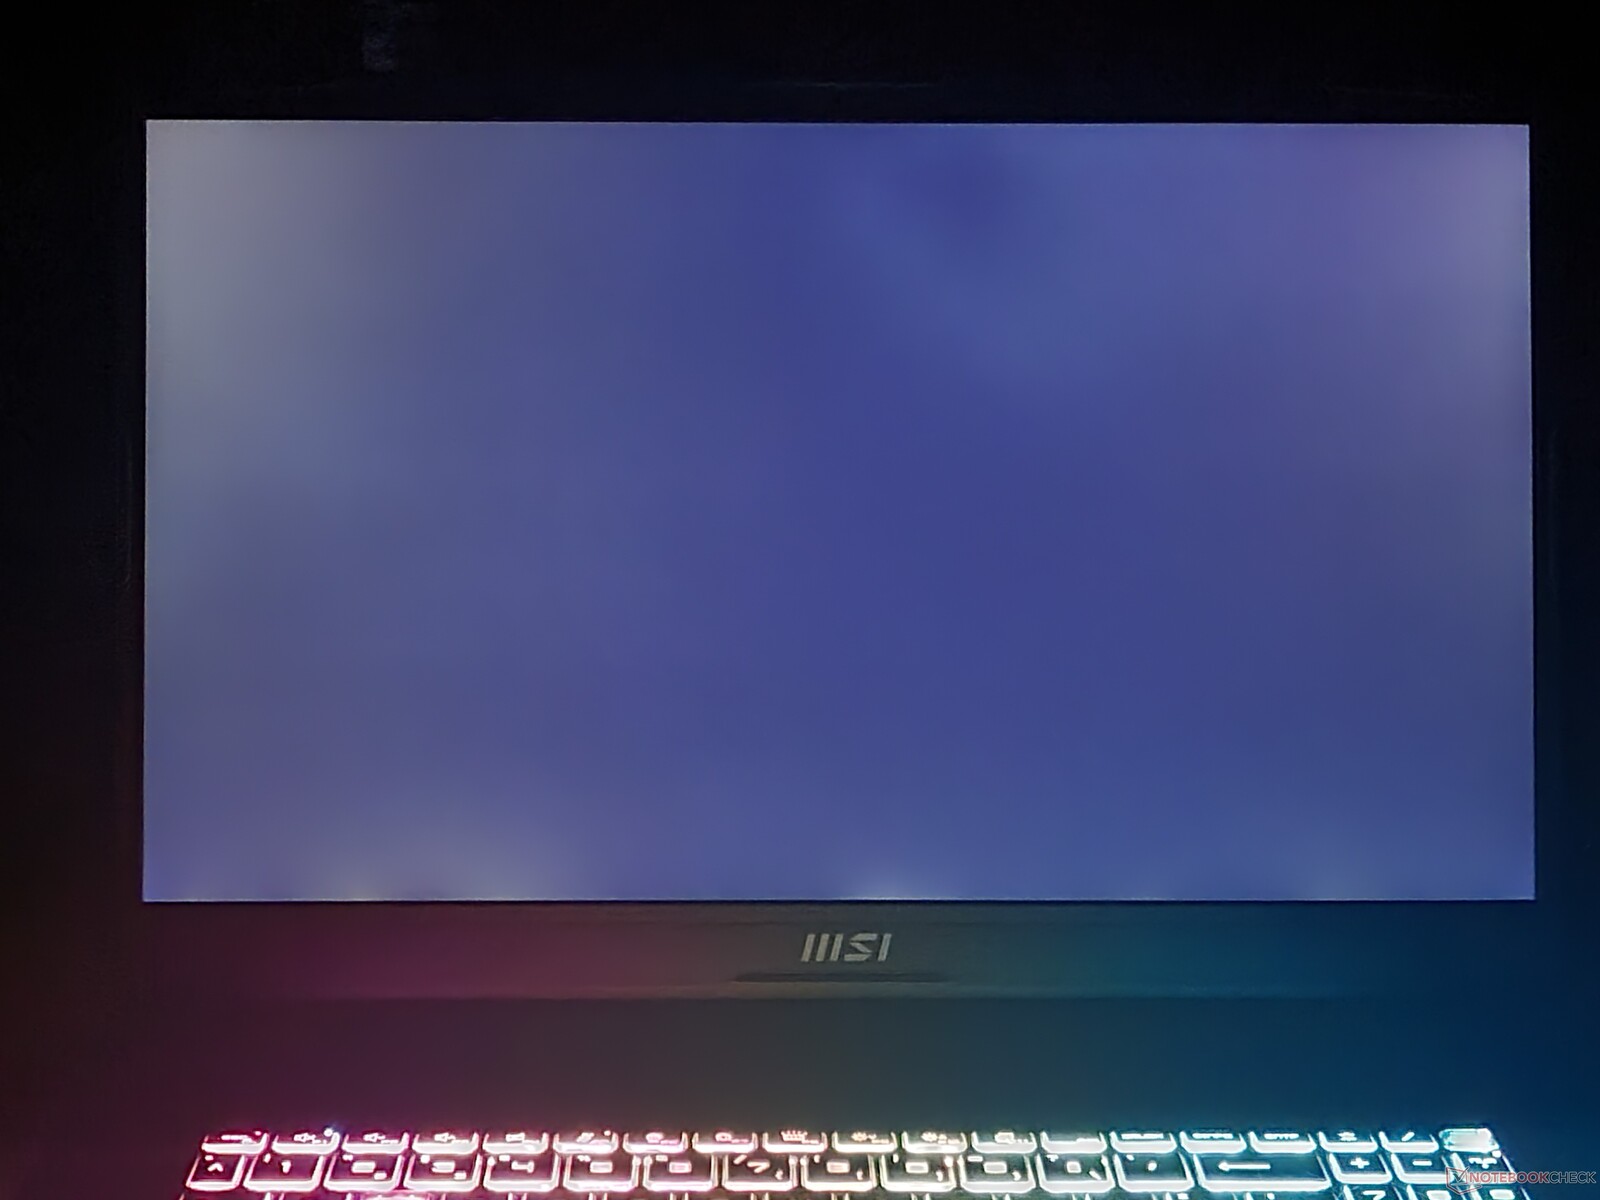
W przypadku Katana 17 B13V, MSI oferuje tylko jeden wariant wyświetlacza i jest to 17,3-calowy, matowy, w formacie 16:9, IPS LCD. Jedyna dostępna rozdzielczość to 1920 x 1080, czyli innymi słowy FullHD. To stosunkowo niska rozdzielczość jak na monitor tej wielkości - choć przynajmniej jest to wyświetlacz o częstotliwości 144 Hz.
Niestety, jakość panelu AUO pozostawia wiele do życzenia. Przy około 256 cd/m² jasność wyświetlacza pozostaje w tyle za konkurencją. Czasy reakcji również są słabe jak na laptop do gier.
| |||||||||||||||||||||||||
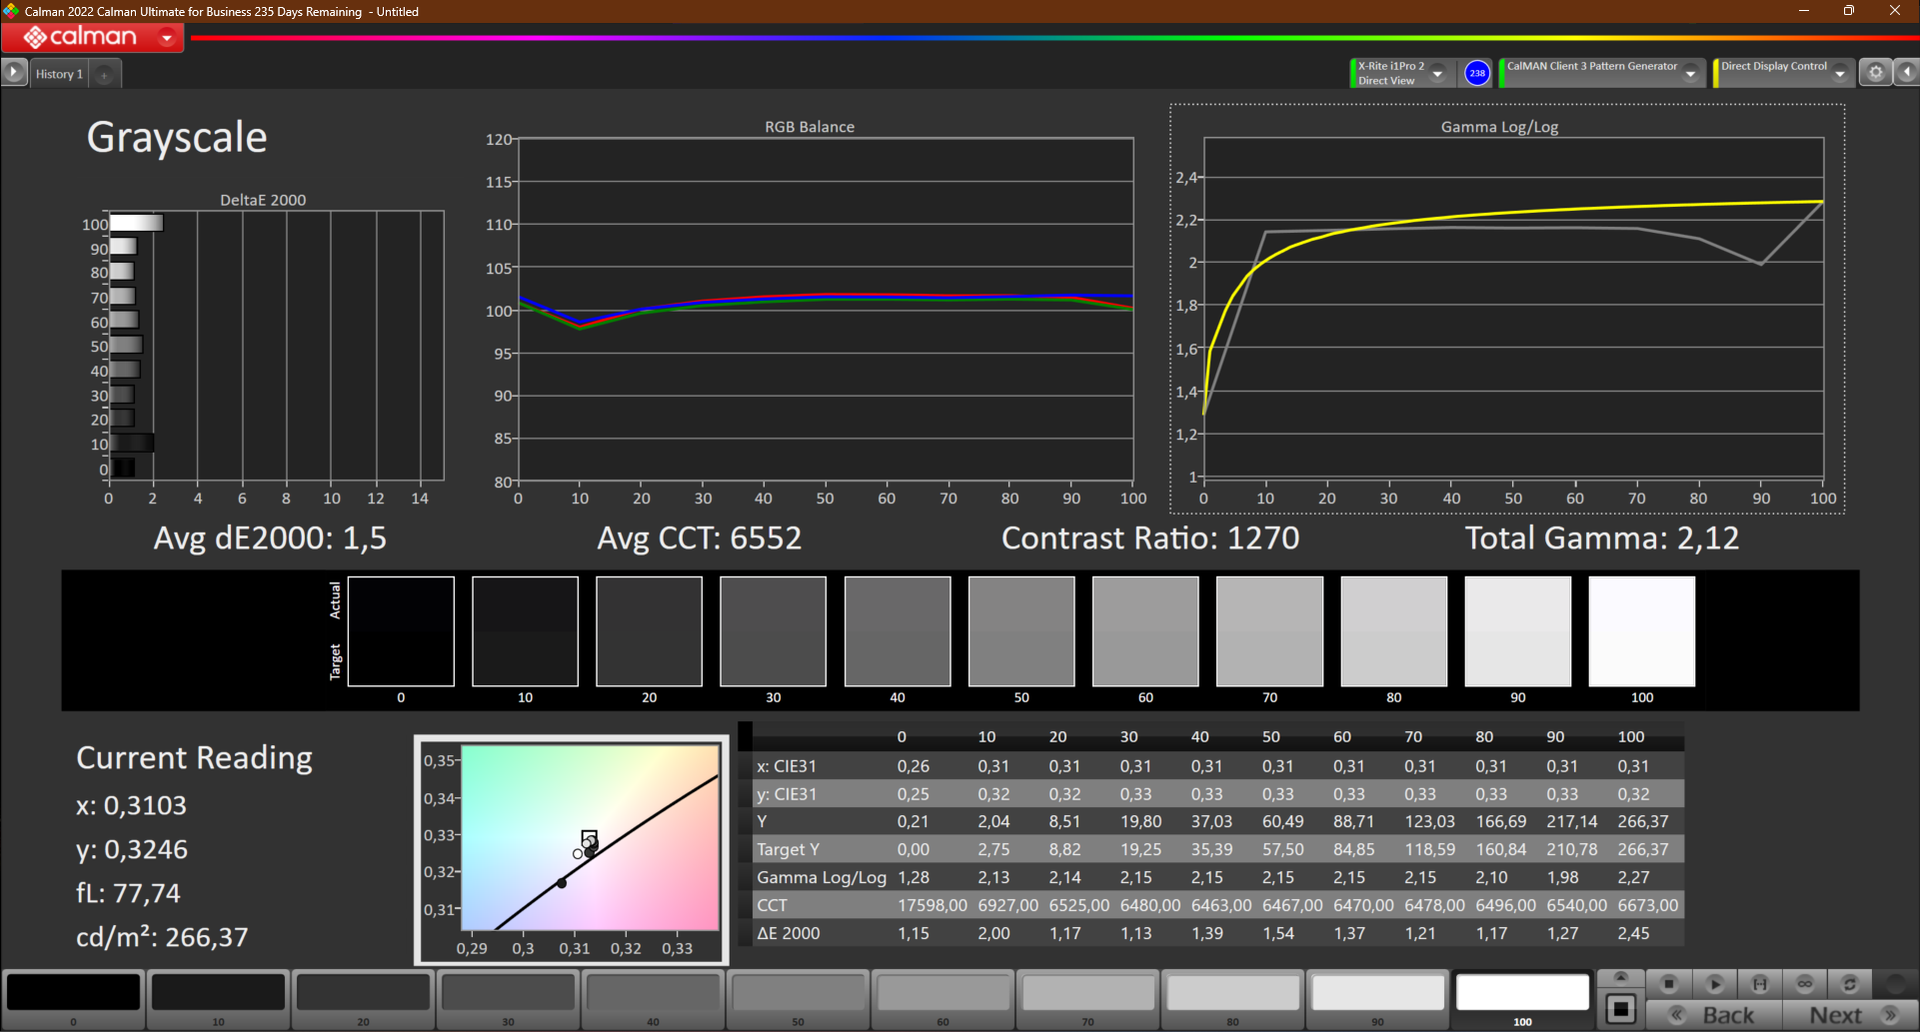
rozświetlenie: 93 %
na akumulatorze: 267 cd/m²
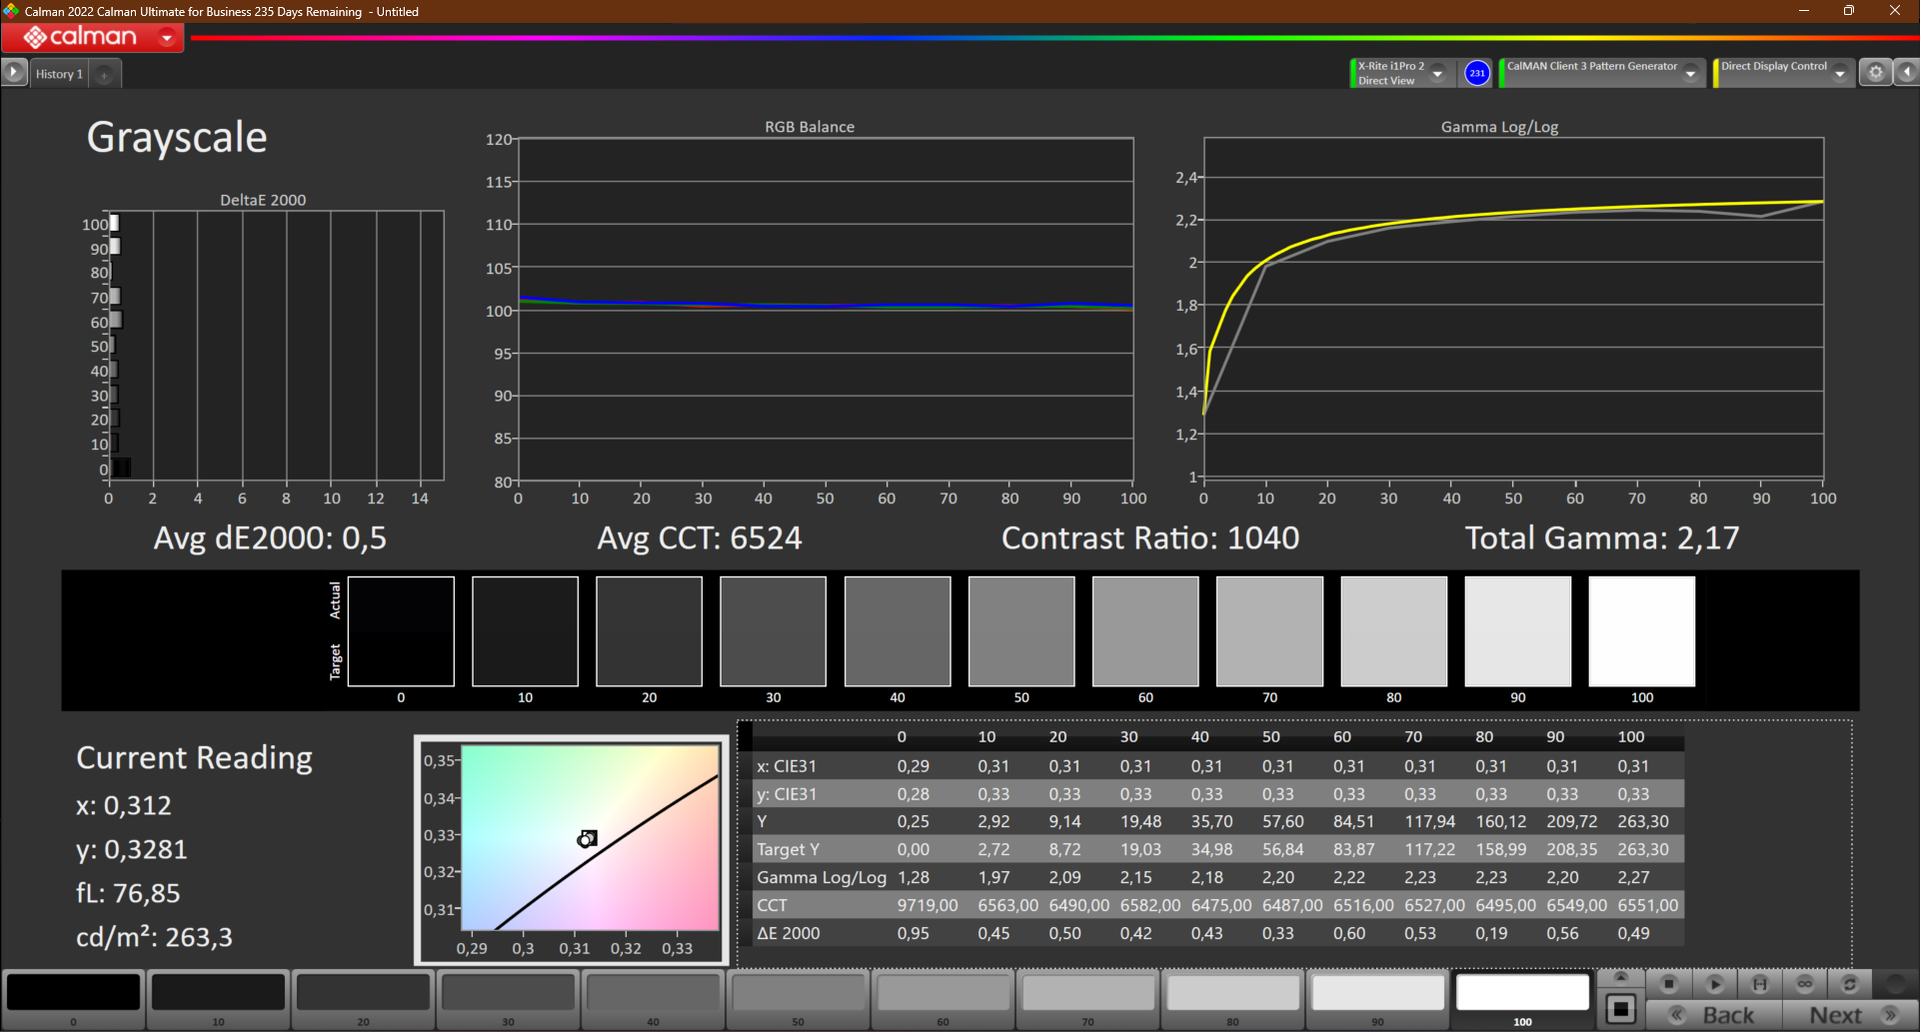
kontrast: 1271:1 (czerń: 0.21 cd/m²)
ΔE ColorChecker Calman: 4.7 | ∀{0.5-29.43 Ø4.73}
calibrated: 4.5
ΔE Greyscale Calman: 1.5 | ∀{0.09-98 Ø4.97}
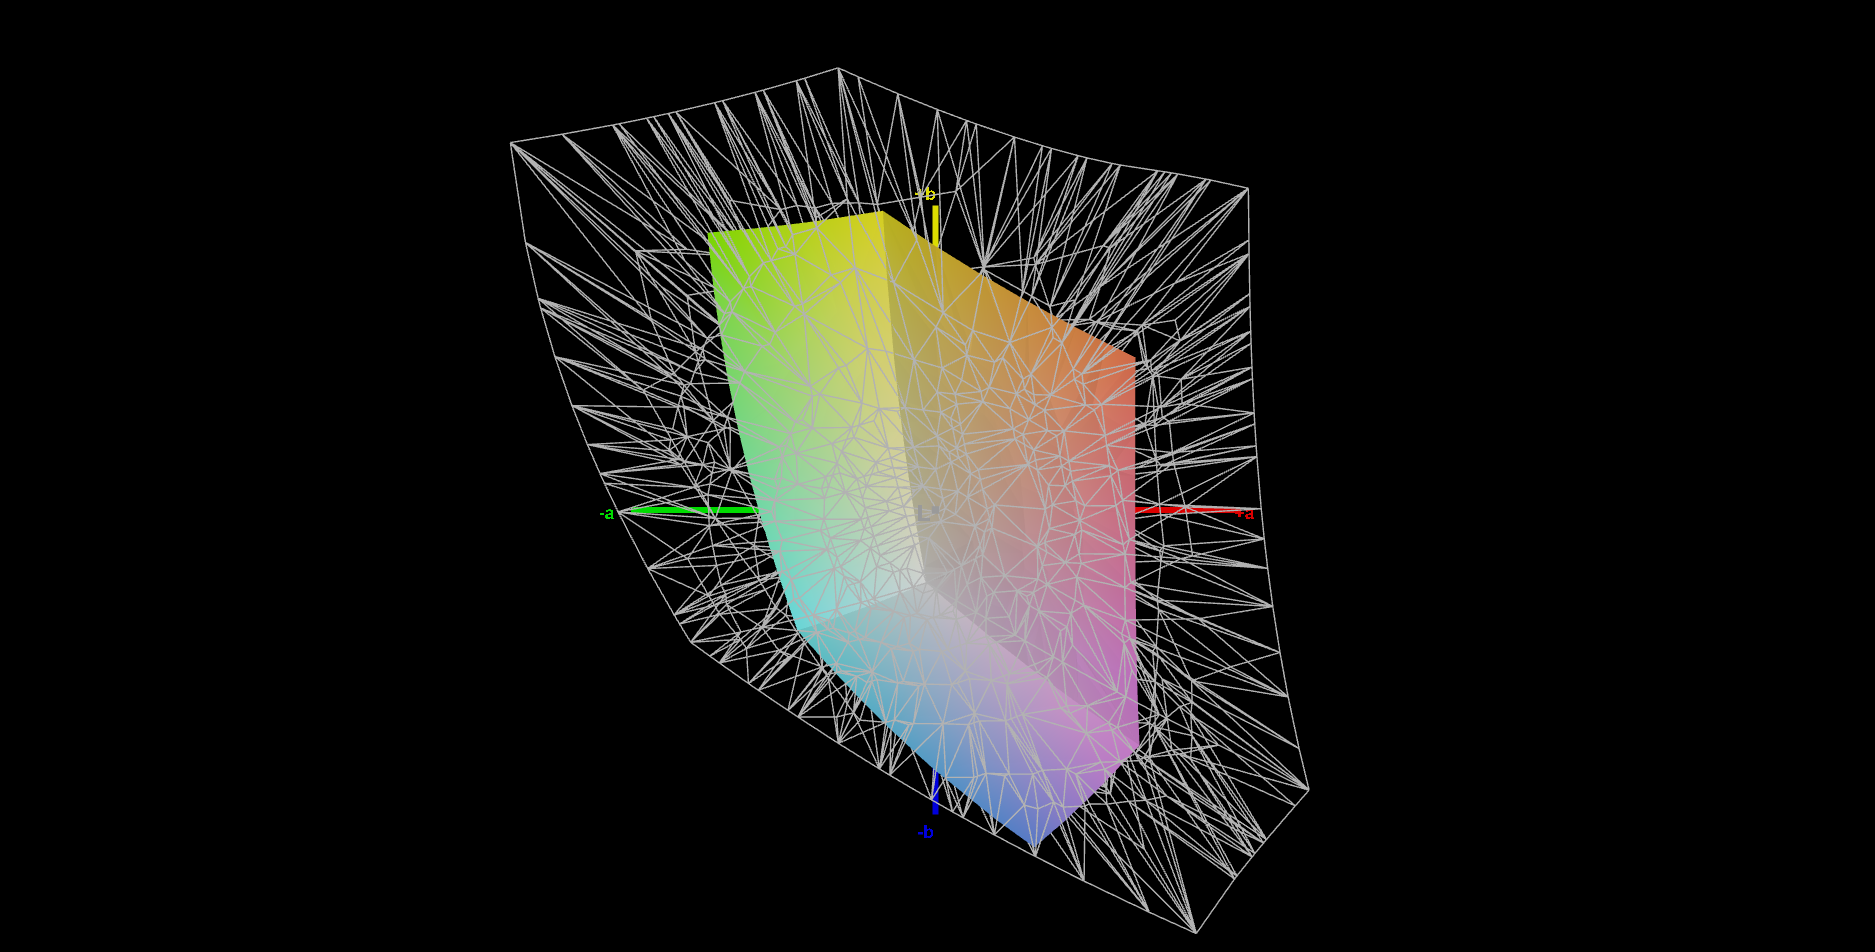
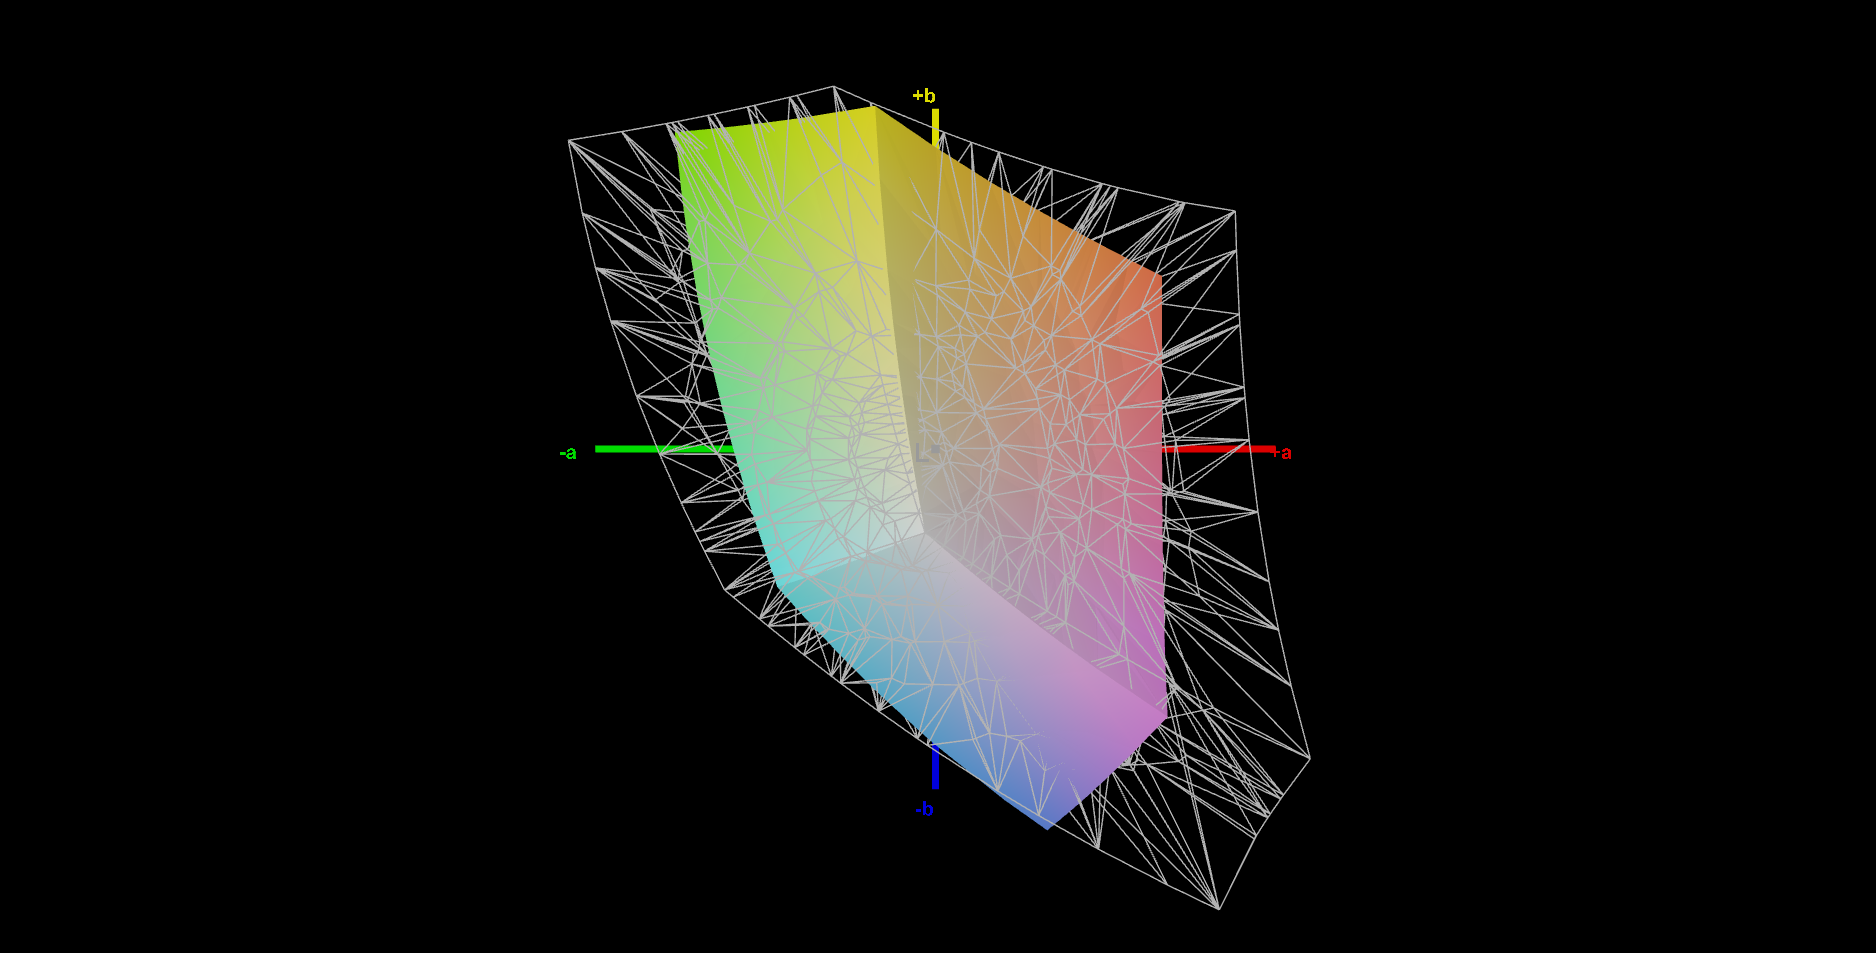
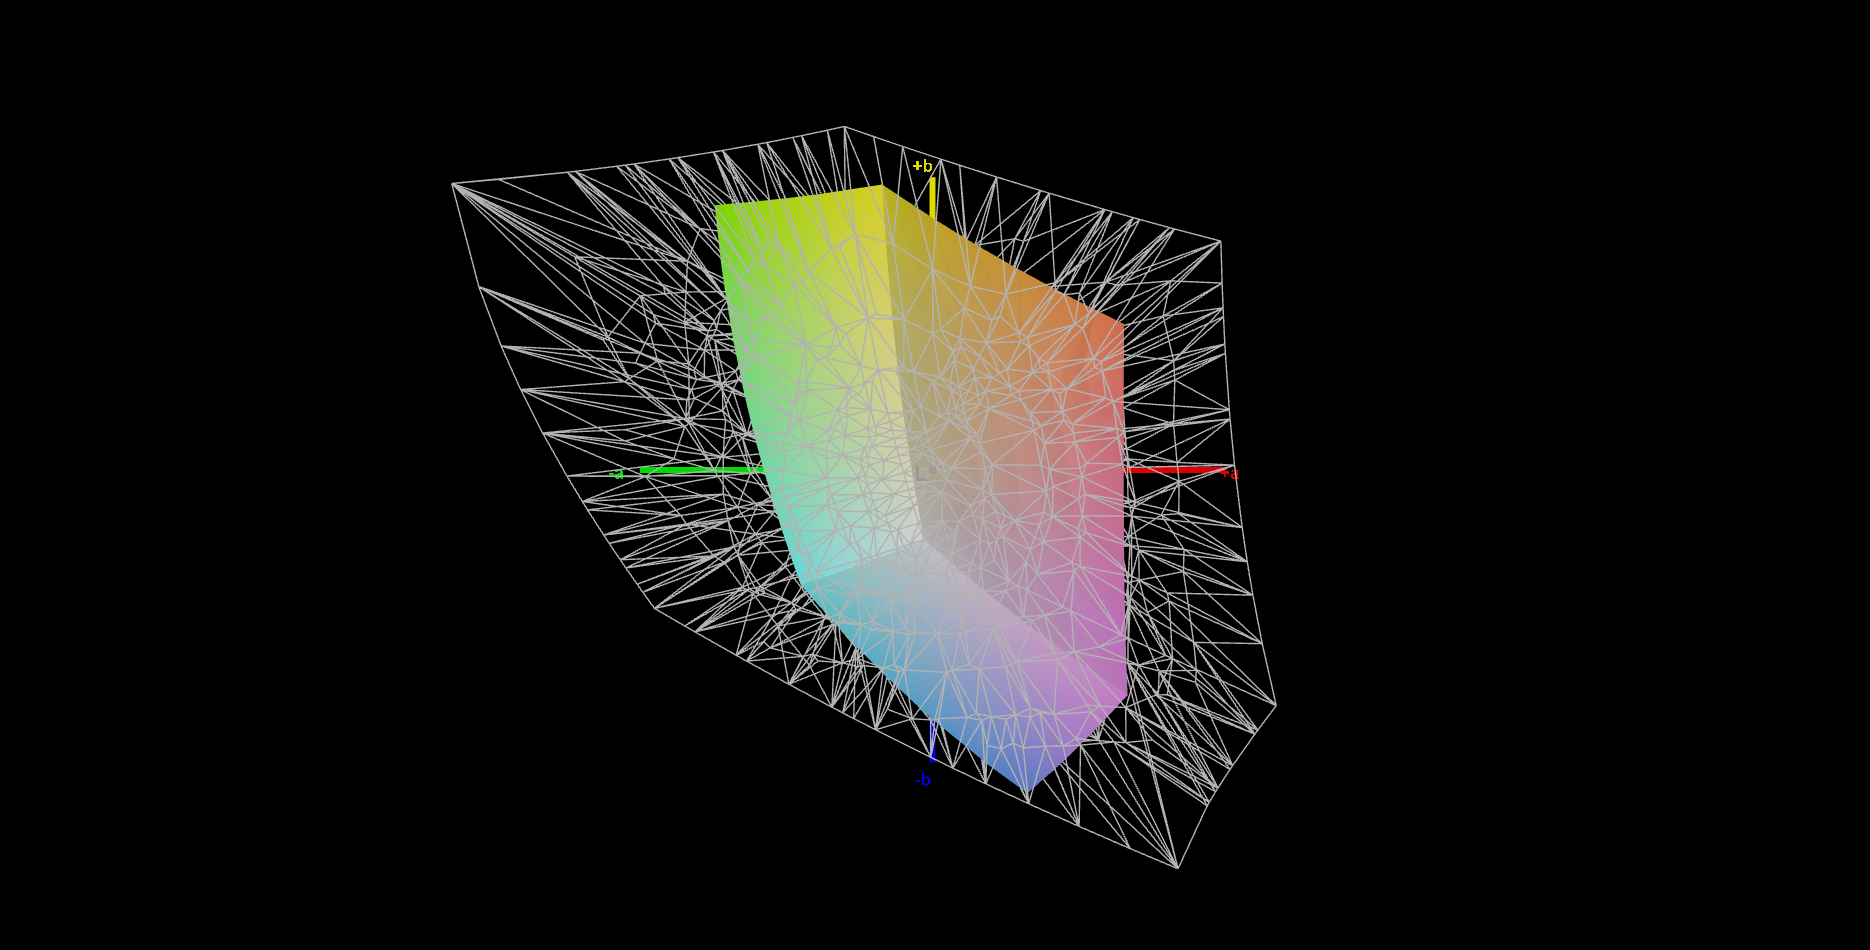
42.2% AdobeRGB 1998 (Argyll 3D)
61% sRGB (Argyll 3D)
40.8% Display P3 (Argyll 3D)
Gamma: 2.12
CCT: 6552 K
| MSI Katana 17 B13VFK B173HAN04.9, IPS LED, 1920x1080, 17.3" | MSI Titan GT77 HX 13VI B173ZAN06.C, Mini-LED, 3840x2160, 17.3" | MSI Pulse GL76 12UGK Sharp LQ173M1JW08, IPS, 1920x1080, 17.3" | Gigabyte G7 KE AU Optronics B173HAN05.1, IPS, 1920x1080, 17.3" | Asus ROG Strix Scar 17 SE G733CX-LL014W NE173QHM-NZ2, IPS, 2560x1440, 17.3" | Acer Predator Helios 300 (i7-12700H, RTX 3070 Ti) BOE0A1A, IPS, 2560x1440, 17.3" | |
|---|---|---|---|---|---|---|
| Display | 105% | 72% | 69% | 101% | 101% | |
| Display P3 Coverage (%) | 40.8 | 94.9 133% | 71.9 76% | 70.4 73% | 97.1 138% | 96.8 137% |
| sRGB Coverage (%) | 61 | 99.9 64% | 99.9 64% | 99.8 64% | 99.9 64% | 99.9 64% |
| AdobeRGB 1998 Coverage (%) | 42.2 | 92.4 119% | 73.7 75% | 71.7 70% | 84.8 101% | 84.8 101% |
| Response Times | -9% | 72% | 77% | 72% | 54% | |
| Response Time Grey 50% / Grey 80% * (ms) | 33 ? | 38.4 ? -16% | 4.6 ? 86% | 5 ? 85% | 5.7 ? 83% | 16.4 ? 50% |
| Response Time Black / White * (ms) | 26 ? | 26.6 ? -2% | 11.2 ? 57% | 8.3 ? 68% | 10.1 ? 61% | 11.2 ? 57% |
| PWM Frequency (Hz) | 2380 ? | |||||
| Screen | 52982% | -21% | 27% | 21% | 4% | |
| Brightness middle (cd/m²) | 267 | 606 127% | 337.7 26% | 307 15% | 320 20% | 366 37% |
| Brightness (cd/m²) | 256 | 602 135% | 331 29% | 301 18% | 303 18% | 340 33% |
| Brightness Distribution (%) | 93 | 93 0% | 82 -12% | 93 0% | 87 -6% | 85 -9% |
| Black Level * (cd/m²) | 0.21 | 0.0001 100% | 0.31 -48% | 0.2 5% | 0.3 -43% | 0.31 -48% |
| Contrast (:1) | 1271 | 6060000 476690% | 1089 -14% | 1535 21% | 1067 -16% | 1181 -7% |
| Colorchecker dE 2000 * | 4.7 | 4.8 -2% | 4.12 12% | 1.32 72% | 1.1 77% | 3.56 24% |
| Colorchecker dE 2000 max. * | 20.4 | 8.2 60% | 8.89 56% | 4.6 77% | 2.7 87% | 5.66 72% |
| Colorchecker dE 2000 calibrated * | 4.5 | 1.8 60% | 0.98 78% | 1.03 77% | 3.31 26% | |
| Greyscale dE 2000 * | 1.5 | 6.5 -333% | 6.3 -320% | 2.1 -40% | 1.1 27% | 2.84 -89% |
| Gamma | 2.12 104% | 2.63 84% | 2.48 89% | 2.247 98% | 2.13 103% | 2.29 96% |
| CCT | 6552 99% | 6596 99% | 6542 99% | 6815 95% | 6599 98% | 6835 95% |
| Całkowita średnia (program / ustawienia) | 17693% /
34081% | 41% /
12% | 58% /
43% | 65% /
47% | 53% /
32% |
* ... im mniej tym lepiej
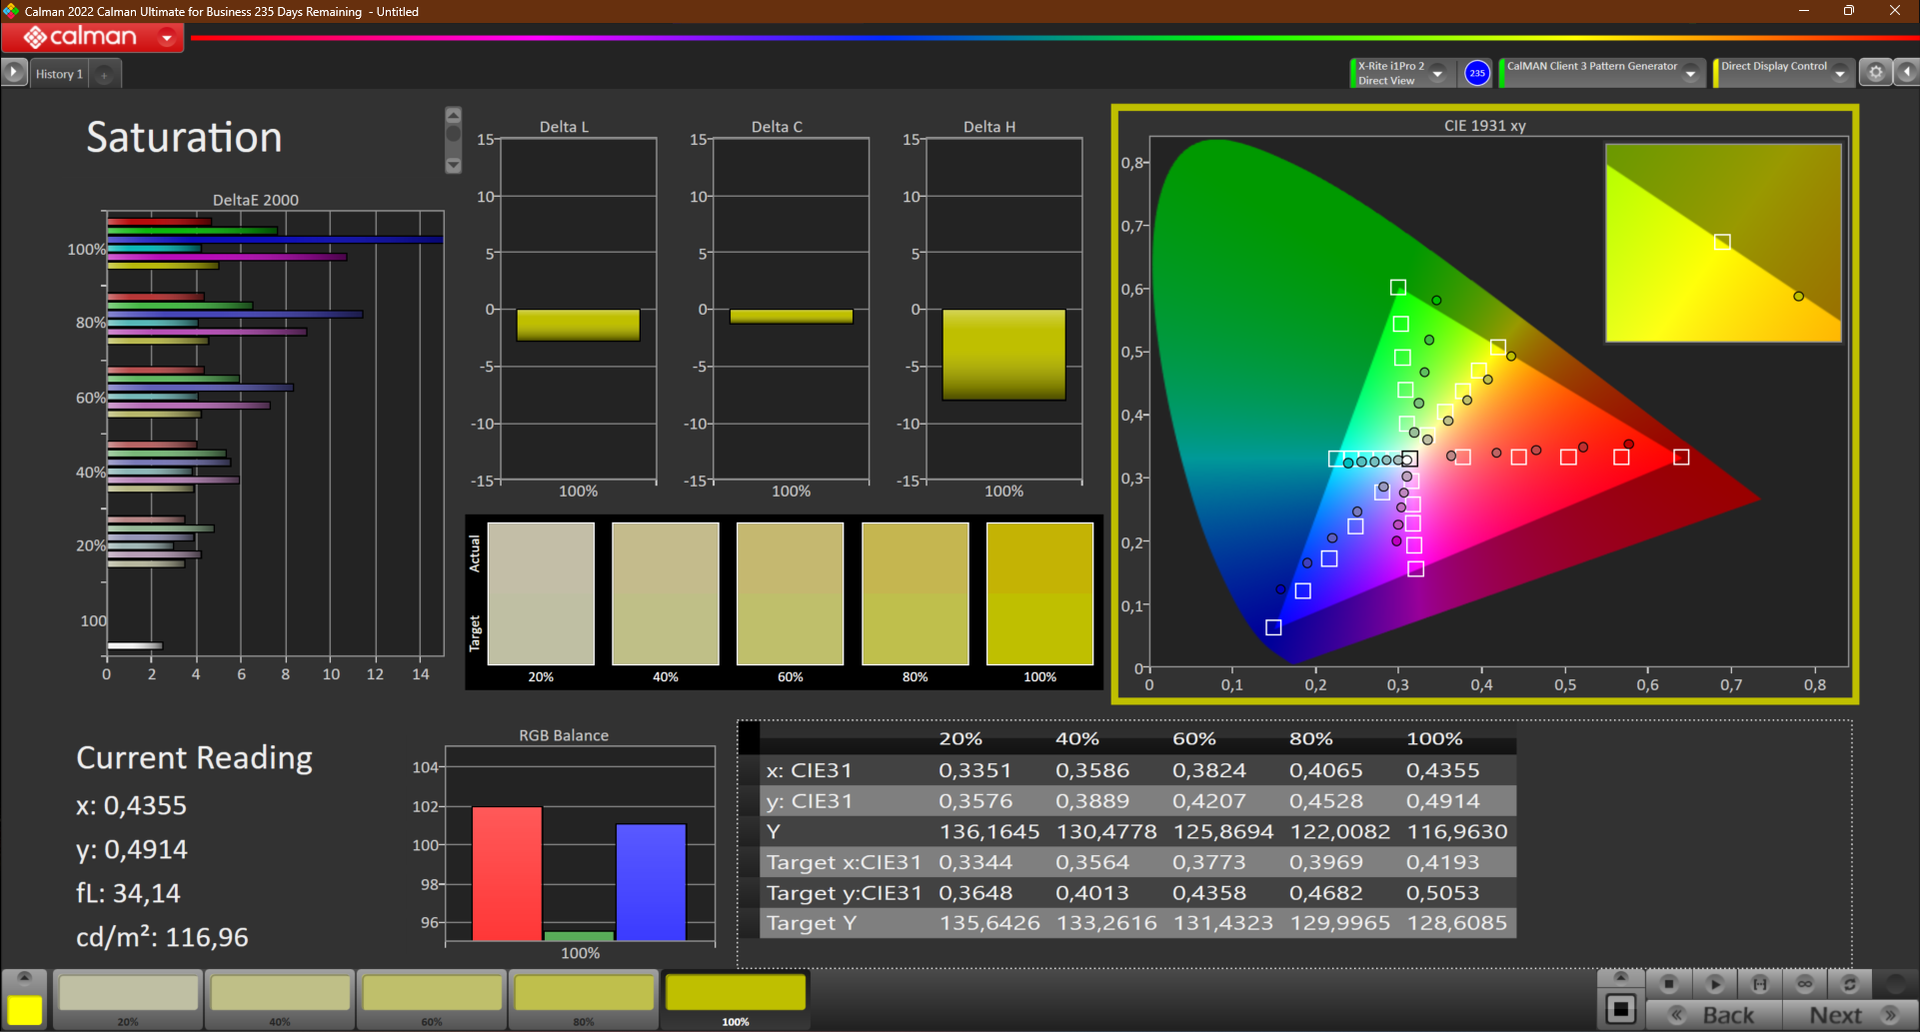
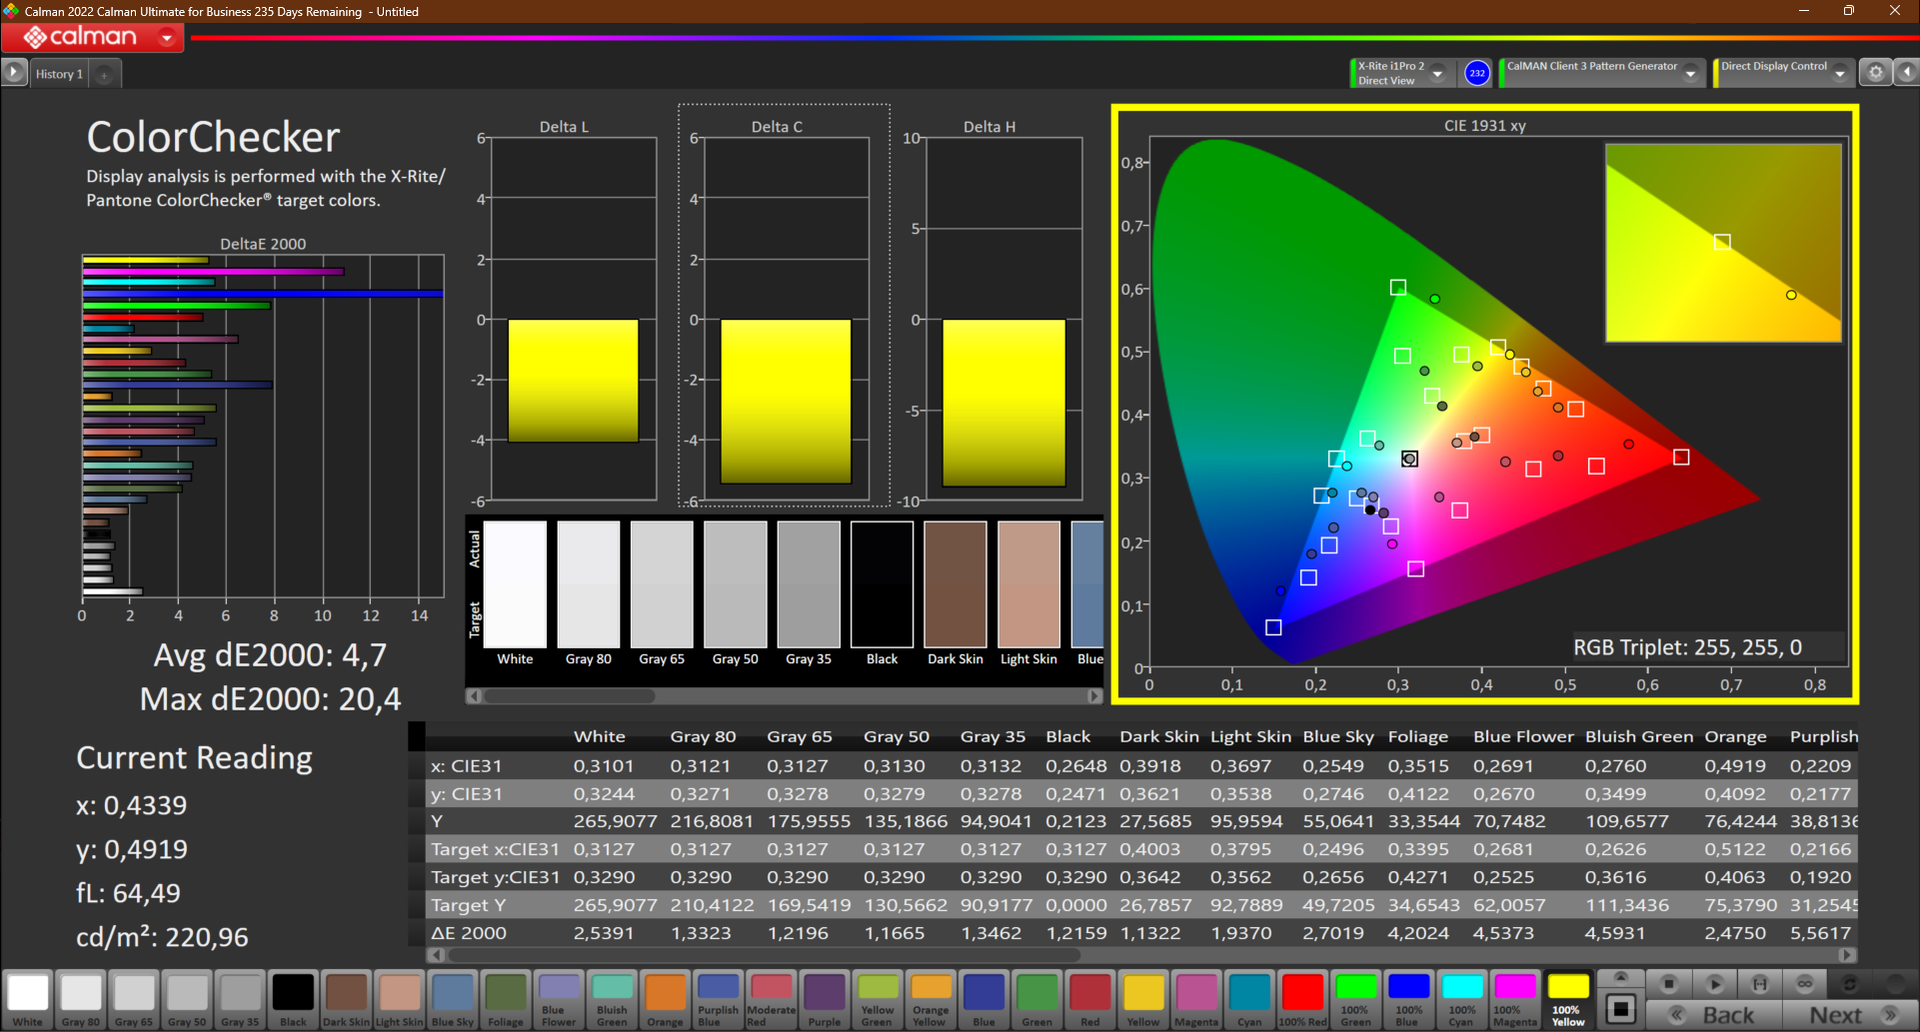
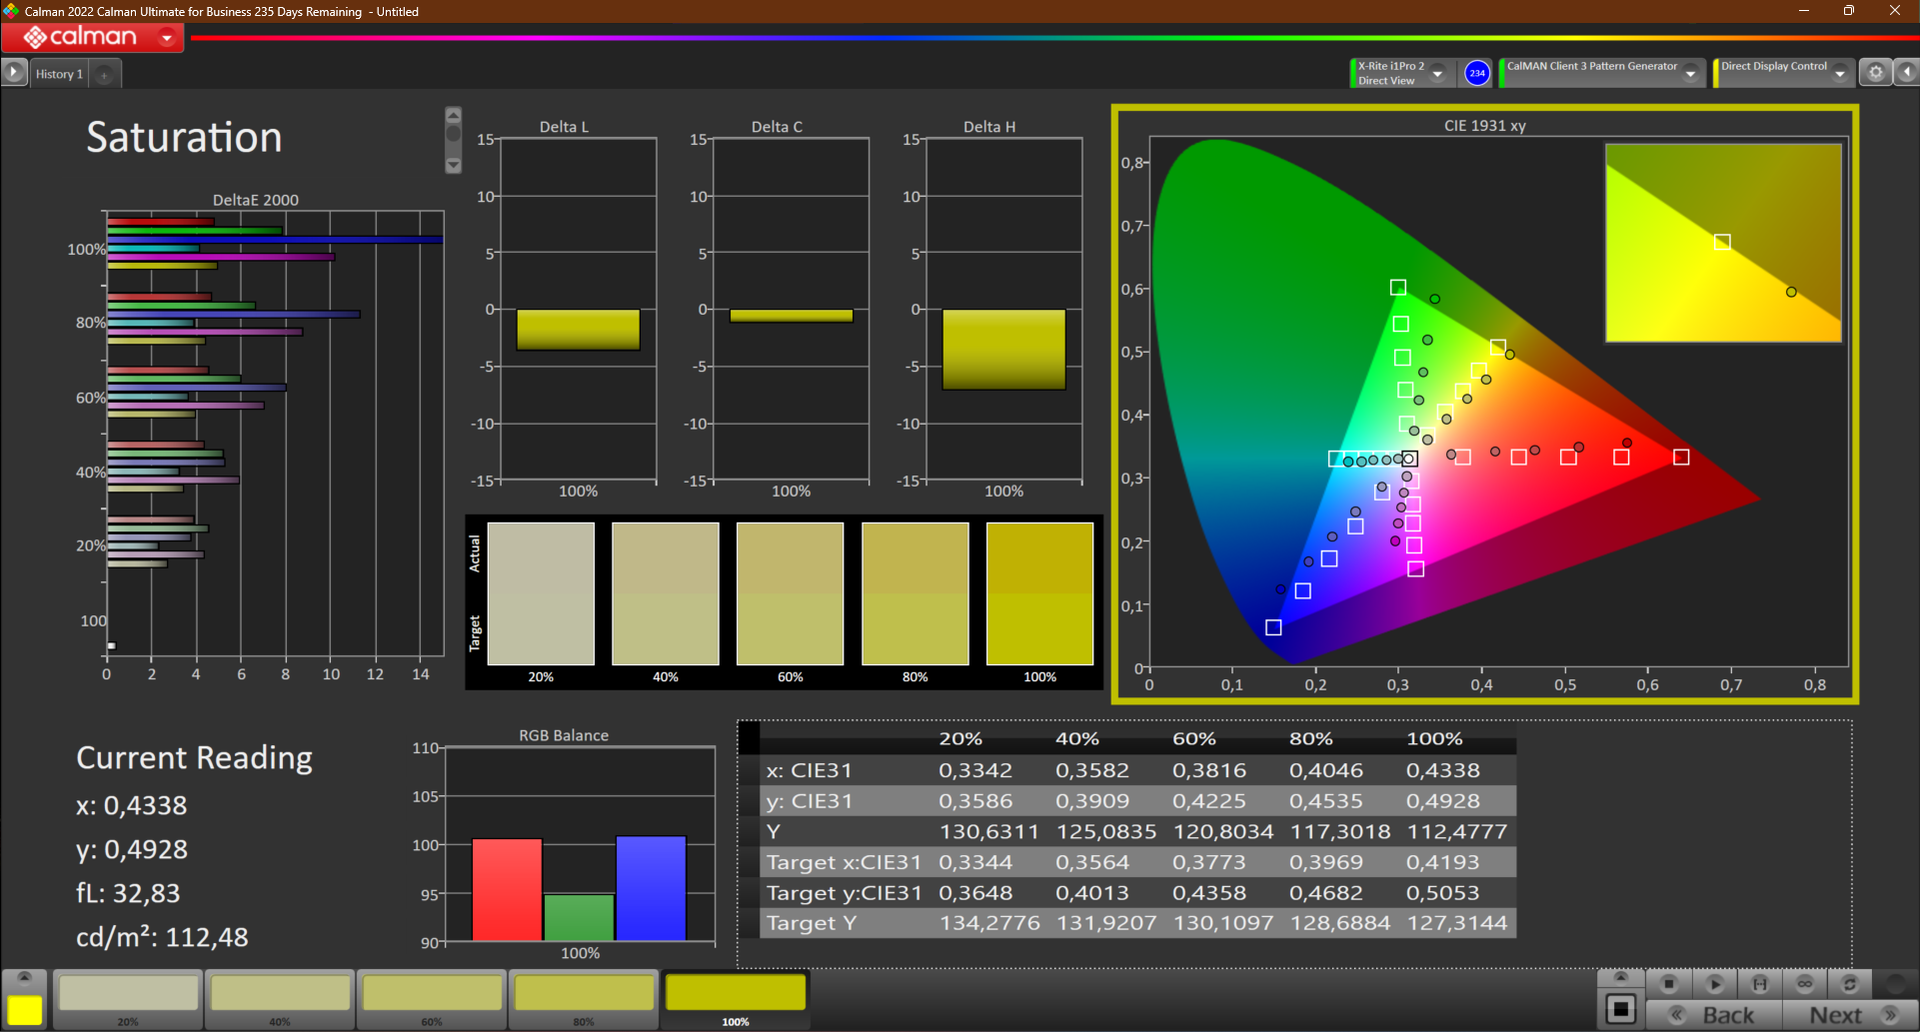
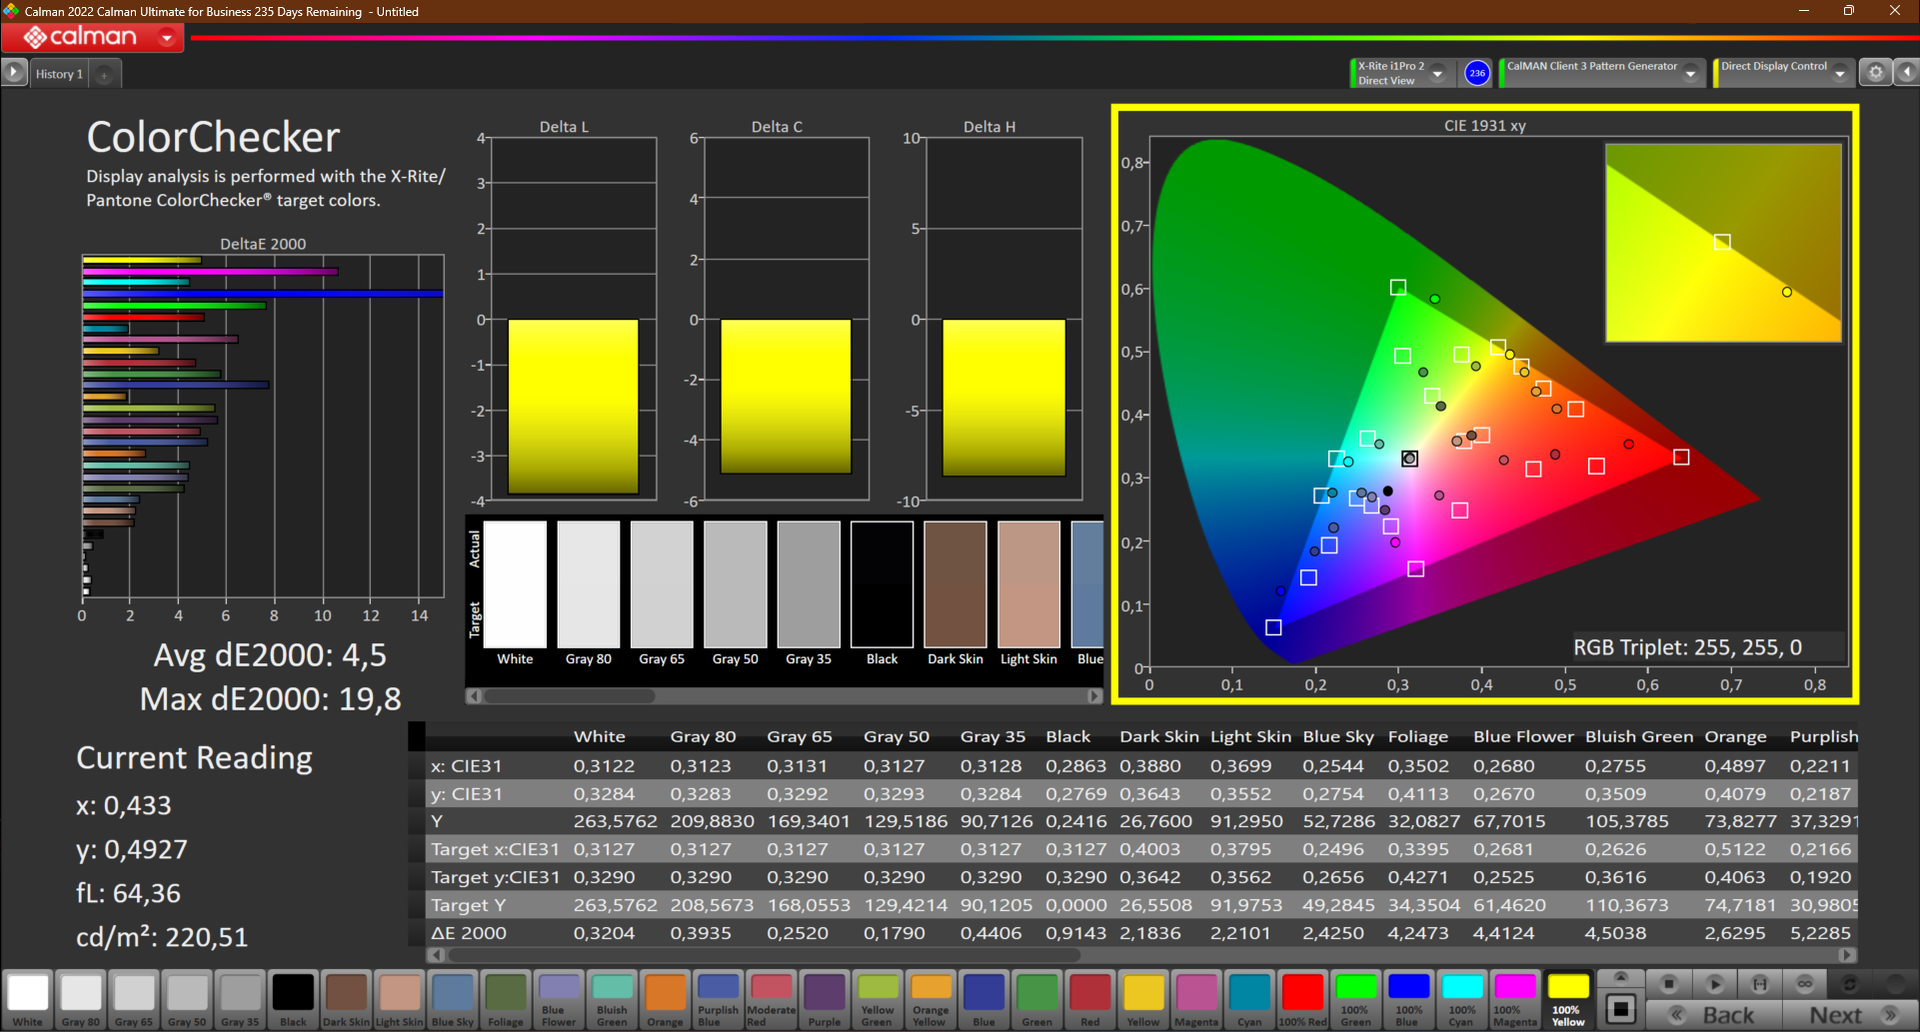
W dziedzinie odwzorowania kolorów, mniej pozytywne wrażenie wyświetlacza trwa nadal. Nawet po kalibracji panelowi daleko do wyświetlania wiernych kolorów. Po skalibrowaniu go za pomocą i1Profiler oraz X-Rite i1Pro 2, DeltaE-Wert spadła tylko minimalnie z 4,7 do 4,5.
Przyczyną takiego stanu rzeczy może być brak pokrycia przestrzeni barwnej. W dzisiejszych czasach tylko 61% przestrzeni barw sRGB to niezadowalający wynik - zwłaszcza w przypadku laptopa nastawionego na konsumpcję multimediów.
Na zewnątrz wyświetlacz MSI Katana 17 jest po prostu użyteczny, o ile urządzenie jest używane w cieniu.
Wyświetl czasy reakcji
| ↔ Czas reakcji od czerni do bieli | ||
|---|---|---|
| 26 ms ... wzrost ↗ i spadek ↘ łącznie | ↗ 13 ms wzrost | 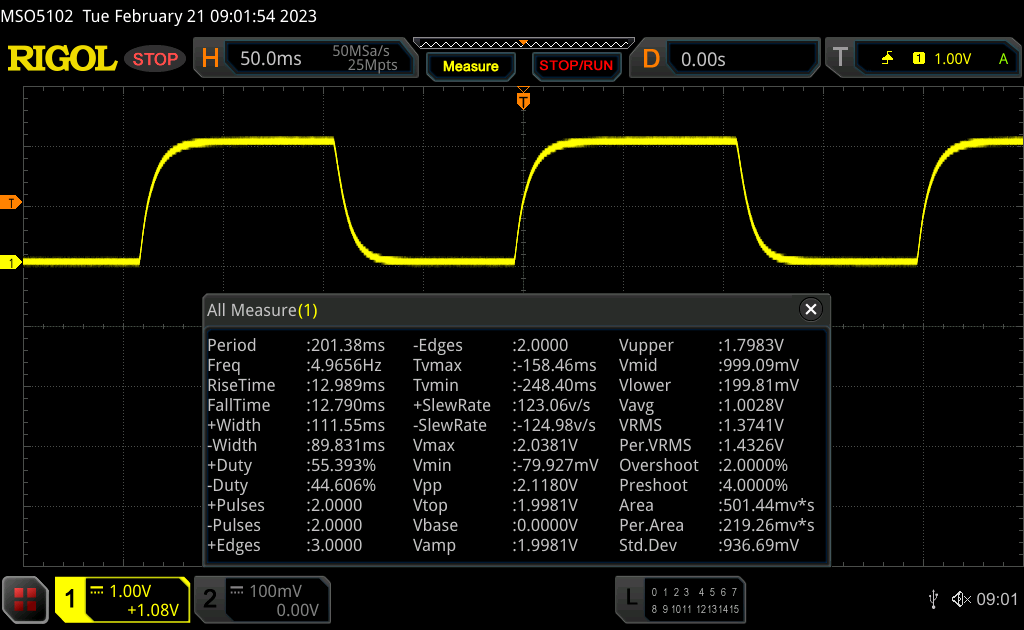 |
| ↘ 13 ms upadek | ||
| W naszych testach ekran wykazuje stosunkowo powolne tempo reakcji i może być zbyt wolny dla graczy. Dla porównania, wszystkie testowane urządzenia wahają się od 0.1 (minimum) do 240 (maksimum) ms. » 62 % wszystkich urządzeń jest lepszych. Oznacza to, że zmierzony czas reakcji jest gorszy od średniej wszystkich testowanych urządzeń (19.9 ms). | ||
| ↔ Czas reakcji 50% szarości do 80% szarości | ||
| 33 ms ... wzrost ↗ i spadek ↘ łącznie | ↗ 16 ms wzrost | 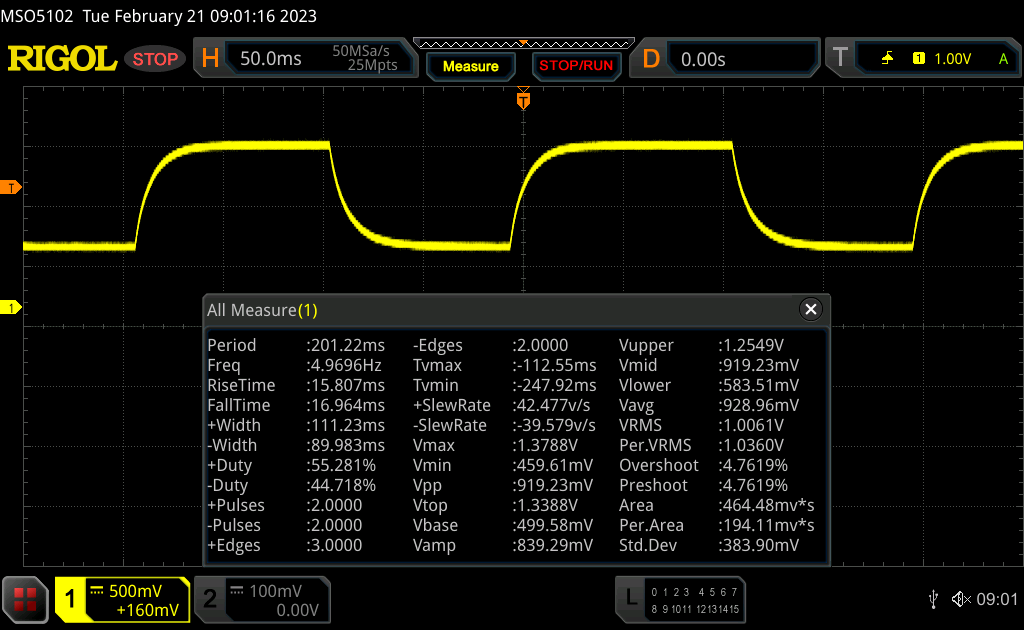 |
| ↘ 17 ms upadek | ||
| W naszych testach ekran wykazuje powolne tempo reakcji, co będzie niezadowalające dla graczy. Dla porównania, wszystkie testowane urządzenia wahają się od 0.165 (minimum) do 636 (maksimum) ms. » 45 % wszystkich urządzeń jest lepszych. Oznacza to, że zmierzony czas reakcji jest zbliżony do średniej wszystkich testowanych urządzeń (31.1 ms). | ||
Migotanie ekranu / PWM (modulacja szerokości impulsu)
| Migotanie ekranu/nie wykryto PWM | 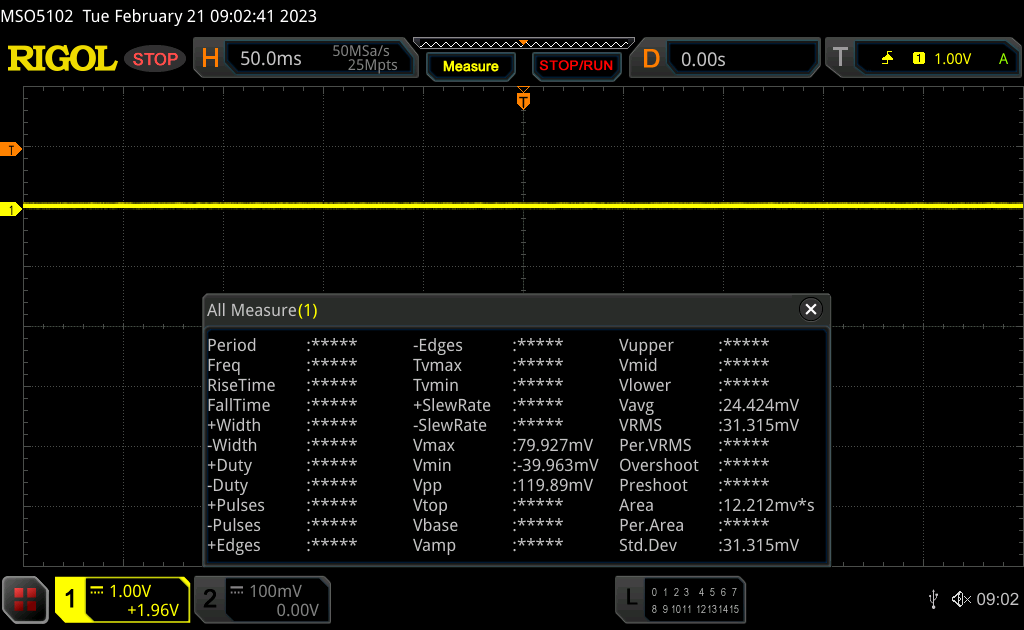 | ||
Dla porównania: 52 % wszystkich testowanych urządzeń nie używa PWM do przyciemniania wyświetlacza. Jeśli wykryto PWM, zmierzono średnio 7784 (minimum: 5 - maksimum: 343500) Hz. | |||
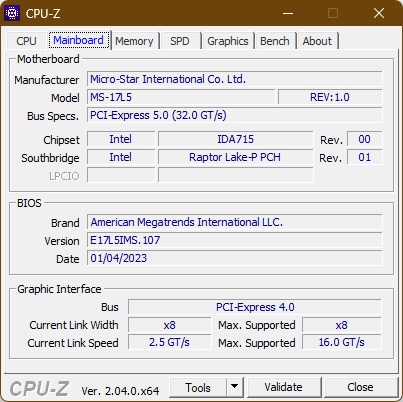
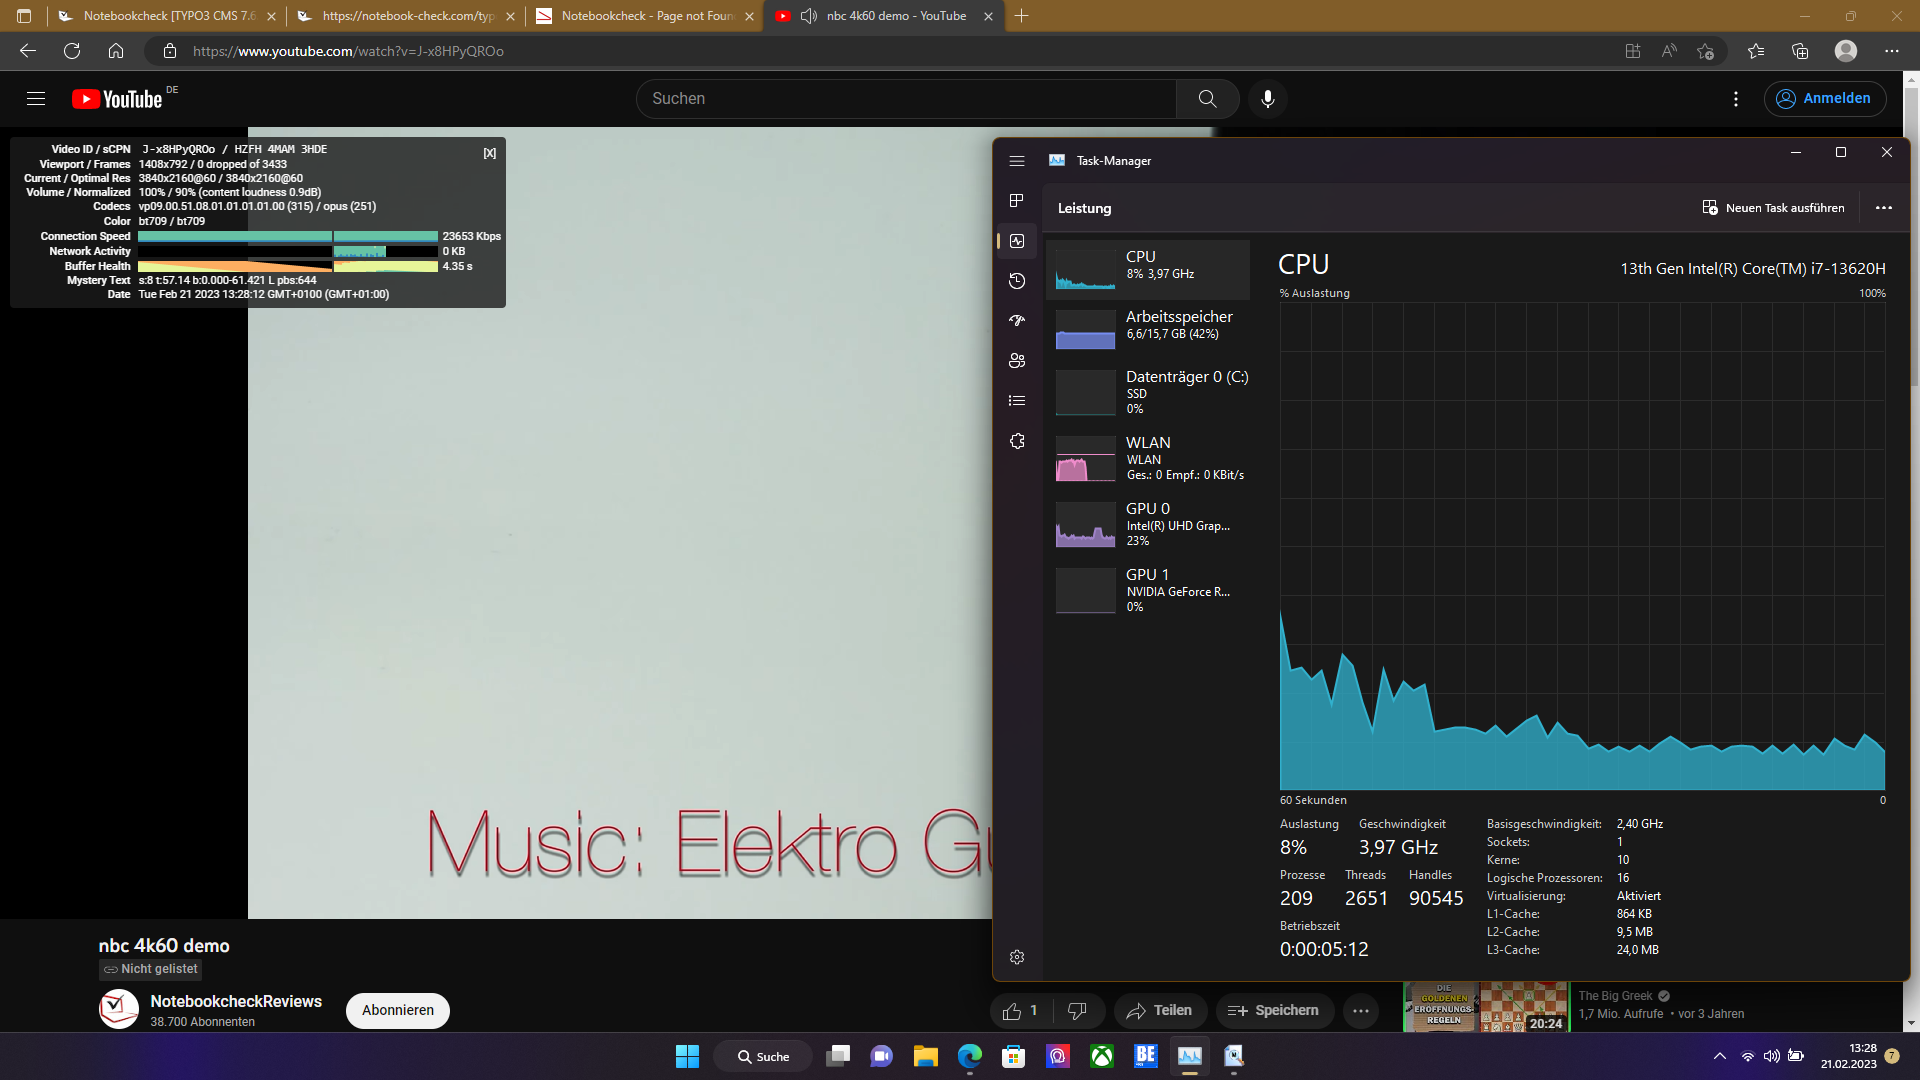
Wydajność: Debiut Nvidii GeForce RTX 4060
W Niemczech MSI sprzedaje Katanę 17 B13V w dwóch konfiguracjach. Oba urządzenia łączy Intel Core i7-13620H, Nvidia GeForce RTX 4060, a także 16 GB pamięci RAM DDR5 5200. Jedyne różnice to: Jeden model posiada dysk SSD o pojemności 512 GB, a drugi - 1 TB.

Warunki badania
W oprogramowaniu MSI "MSI Center" dostępne są cztery tryby wydajności: Max Performance, Balanced, tryb Silent, a także Super Battery. Oprócz tego dostępny jest również tryb Auto. Wszystkie nasze testy przeprowadziliśmy przy użyciu trybu Max Performance, w którym zużycie procesora wahało się między 70 a 80 watów. Rezerwy wydajności są podobne w trybie Balanced, który został wykorzystany do testu akumulatora. W trybach Silent i Super Battery procesor jest ograniczony odpowiednio do 30 i 15 watów.
Dzięki Optimus Advanced możliwe jest przełączenie układu graficznego na pracę wyłącznie w trybie Nvidii i wyłączenie GPU Intela. Przetestowaliśmy urządzenie korzystając z normalnego trybu Optimus.
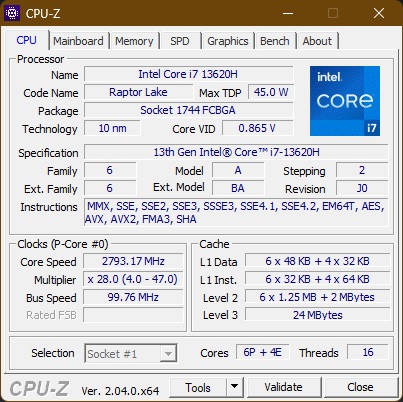
Procesor
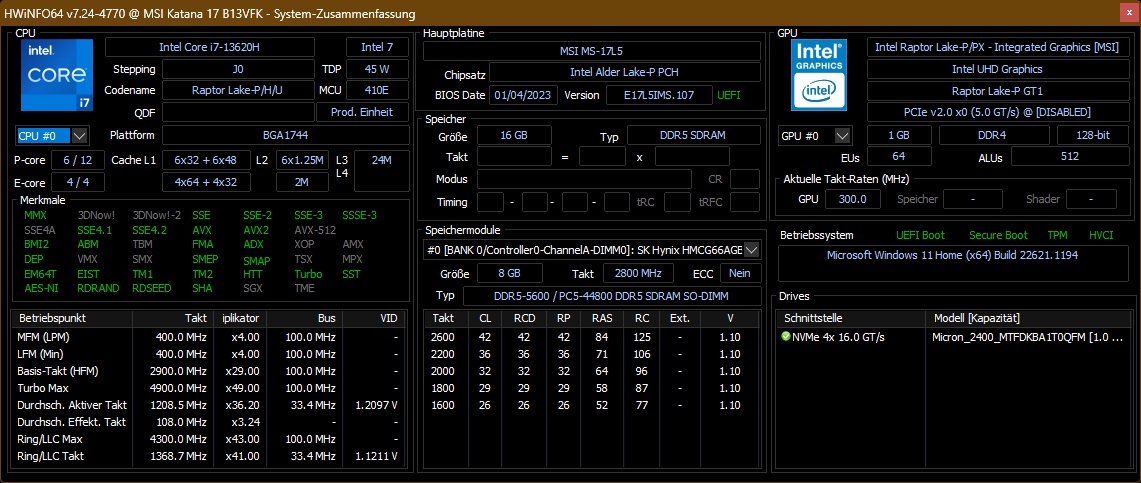
Na stronie .Intel Core i7-13620Hto podstawowy model i7 z serii Raptor Lake H. Posiada wszystkie z sześciu rdzeni wydajnościowych, ale tylko cztery z mniejszych rdzeni E. Jako procesor H ma typowe TDP na poziomie 45 W, choć w zależności od laptopa może się to znacznie różnić. Wszystkie dziesięć rdzeni (16 wątków) ma częstotliwość taktowania od 1,8 do 4,9 GHz. Dodatkowe porównania z innymi procesorami można znaleźć w naszym Lista procesorów.
MSI przyznało procesorowi maksymalnie 80 watów. Uzyskana wydajność plasuje się pomiędzy i7-12700HwMSI Pulse GL76ai5-12500Hznajdujący się wGigabyte G7 KE. Biorąc pod uwagę specyfikację i niewielkie różnice między Alder Lake a Raptor Lake i tak należało się spodziewać takich wyników. Ze swoimi ośmioma rdzeniami P i 16 rdzeniami E, tj Intel Core i9-13950HXjest wyraźnie do przodu.
W trybie bateryjnym wydajność procesora jest mocno ograniczona. Przy łącznej liczbie 1399 punktów wynik Cinebench R15 był o około 40 procent niższy.
Cinebench R15 Multi Continuous Test
Cinebench R23: Multi Core | Single Core
Cinebench R20: CPU (Multi Core) | CPU (Single Core)
Cinebench R15: CPU Multi 64Bit | CPU Single 64Bit
Blender: v2.79 BMW27 CPU
7-Zip 18.03: 7z b 4 | 7z b 4 -mmt1
Geekbench 5.5: Multi-Core | Single-Core
HWBOT x265 Benchmark v2.2: 4k Preset
LibreOffice : 20 Documents To PDF
R Benchmark 2.5: Overall mean
| CPU Performance rating | |
| MSI Titan GT77 HX 13VI | |
| Średnia w klasie Gaming | |
| Asus ROG Strix Scar 17 SE G733CX-LL014W | |
| MSI Pulse GL76 12UGK | |
| MSI Katana 17 B13VFK | |
| Acer Predator Helios 300 (i7-12700H, RTX 3070 Ti) | |
| Przeciętny Intel Core i7-13620H | |
| Gigabyte G7 KE | |
| Cinebench R23 / Multi Core | |
| MSI Titan GT77 HX 13VI | |
| Średnia w klasie Gaming (10488 - 40970, n=110, ostatnie 2 lata) | |
| Asus ROG Strix Scar 17 SE G733CX-LL014W | |
| Acer Predator Helios 300 (i7-12700H, RTX 3070 Ti) | |
| MSI Pulse GL76 12UGK | |
| MSI Katana 17 B13VFK | |
| Gigabyte G7 KE | |
| Przeciętny Intel Core i7-13620H (10819 - 15496, n=7) | |
| Cinebench R23 / Single Core | |
| MSI Titan GT77 HX 13VI | |
| Średnia w klasie Gaming (1166 - 2356, n=110, ostatnie 2 lata) | |
| Asus ROG Strix Scar 17 SE G733CX-LL014W | |
| Przeciętny Intel Core i7-13620H (1716 - 1871, n=7) | |
| MSI Katana 17 B13VFK | |
| Acer Predator Helios 300 (i7-12700H, RTX 3070 Ti) | |
| MSI Pulse GL76 12UGK | |
| Gigabyte G7 KE | |
| Cinebench R20 / CPU (Multi Core) | |
| MSI Titan GT77 HX 13VI | |
| Średnia w klasie Gaming (4029 - 16108, n=109, ostatnie 2 lata) | |
| Asus ROG Strix Scar 17 SE G733CX-LL014W | |
| MSI Pulse GL76 12UGK | |
| MSI Katana 17 B13VFK | |
| Acer Predator Helios 300 (i7-12700H, RTX 3070 Ti) | |
| Przeciętny Intel Core i7-13620H (4214 - 5905, n=7) | |
| Gigabyte G7 KE | |
| Cinebench R20 / CPU (Single Core) | |
| MSI Titan GT77 HX 13VI | |
| Średnia w klasie Gaming (442 - 895, n=109, ostatnie 2 lata) | |
| Asus ROG Strix Scar 17 SE G733CX-LL014W | |
| Acer Predator Helios 300 (i7-12700H, RTX 3070 Ti) | |
| Przeciętny Intel Core i7-13620H (657 - 719, n=7) | |
| MSI Katana 17 B13VFK | |
| MSI Pulse GL76 12UGK | |
| Gigabyte G7 KE | |
| Cinebench R15 / CPU Multi 64Bit | |
| MSI Titan GT77 HX 13VI | |
| Średnia w klasie Gaming (1578 - 6271, n=109, ostatnie 2 lata) | |
| Asus ROG Strix Scar 17 SE G733CX-LL014W | |
| Acer Predator Helios 300 (i7-12700H, RTX 3070 Ti) | |
| MSI Pulse GL76 12UGK | |
| MSI Katana 17 B13VFK | |
| Gigabyte G7 KE | |
| Przeciętny Intel Core i7-13620H (1681 - 2492, n=7) | |
| Cinebench R15 / CPU Single 64Bit | |
| MSI Titan GT77 HX 13VI | |
| Średnia w klasie Gaming (188.8 - 343, n=109, ostatnie 2 lata) | |
| Asus ROG Strix Scar 17 SE G733CX-LL014W | |
| Przeciętny Intel Core i7-13620H (250 - 269, n=7) | |
| MSI Katana 17 B13VFK | |
| MSI Pulse GL76 12UGK | |
| Acer Predator Helios 300 (i7-12700H, RTX 3070 Ti) | |
| Gigabyte G7 KE | |
| Blender / v2.79 BMW27 CPU | |
| Przeciętny Intel Core i7-13620H (215 - 297, n=7) | |
| Gigabyte G7 KE | |
| MSI Katana 17 B13VFK | |
| Acer Predator Helios 300 (i7-12700H, RTX 3070 Ti) | |
| MSI Pulse GL76 12UGK | |
| Asus ROG Strix Scar 17 SE G733CX-LL014W | |
| Średnia w klasie Gaming (80 - 330, n=107, ostatnie 2 lata) | |
| MSI Titan GT77 HX 13VI | |
| 7-Zip 18.03 / 7z b 4 | |
| MSI Titan GT77 HX 13VI | |
| Średnia w klasie Gaming (33491 - 148086, n=108, ostatnie 2 lata) | |
| Asus ROG Strix Scar 17 SE G733CX-LL014W | |
| Acer Predator Helios 300 (i7-12700H, RTX 3070 Ti) | |
| MSI Pulse GL76 12UGK | |
| MSI Katana 17 B13VFK | |
| Przeciętny Intel Core i7-13620H (45092 - 62324, n=7) | |
| Gigabyte G7 KE | |
| 7-Zip 18.03 / 7z b 4 -mmt1 | |
| MSI Titan GT77 HX 13VI | |
| Średnia w klasie Gaming (4199 - 7436, n=108, ostatnie 2 lata) | |
| Asus ROG Strix Scar 17 SE G733CX-LL014W | |
| Przeciętny Intel Core i7-13620H (5648 - 6326, n=7) | |
| Acer Predator Helios 300 (i7-12700H, RTX 3070 Ti) | |
| MSI Katana 17 B13VFK | |
| MSI Pulse GL76 12UGK | |
| Gigabyte G7 KE | |
| Geekbench 5.5 / Multi-Core | |
| MSI Titan GT77 HX 13VI | |
| Średnia w klasie Gaming (6460 - 27010, n=108, ostatnie 2 lata) | |
| Asus ROG Strix Scar 17 SE G733CX-LL014W | |
| Acer Predator Helios 300 (i7-12700H, RTX 3070 Ti) | |
| MSI Pulse GL76 12UGK | |
| MSI Katana 17 B13VFK | |
| Przeciętny Intel Core i7-13620H (8112 - 12223, n=7) | |
| Gigabyte G7 KE | |
| Geekbench 5.5 / Single-Core | |
| Średnia w klasie Gaming (986 - 2474, n=108, ostatnie 2 lata) | |
| MSI Titan GT77 HX 13VI | |
| Asus ROG Strix Scar 17 SE G733CX-LL014W | |
| Przeciętny Intel Core i7-13620H (1703 - 1865, n=7) | |
| MSI Katana 17 B13VFK | |
| Acer Predator Helios 300 (i7-12700H, RTX 3070 Ti) | |
| Gigabyte G7 KE | |
| MSI Pulse GL76 12UGK | |
| HWBOT x265 Benchmark v2.2 / 4k Preset | |
| MSI Titan GT77 HX 13VI | |
| Średnia w klasie Gaming (11.5 - 44.3, n=108, ostatnie 2 lata) | |
| Asus ROG Strix Scar 17 SE G733CX-LL014W | |
| MSI Pulse GL76 12UGK | |
| MSI Katana 17 B13VFK | |
| Gigabyte G7 KE | |
| Acer Predator Helios 300 (i7-12700H, RTX 3070 Ti) | |
| Przeciętny Intel Core i7-13620H (12.2 - 17.7, n=7) | |
| LibreOffice / 20 Documents To PDF | |
| Acer Predator Helios 300 (i7-12700H, RTX 3070 Ti) | |
| MSI Katana 17 B13VFK | |
| Przeciętny Intel Core i7-13620H (41.5 - 78.9, n=7) | |
| Średnia w klasie Gaming (19 - 88.8, n=108, ostatnie 2 lata) | |
| MSI Titan GT77 HX 13VI | |
| MSI Pulse GL76 12UGK | |
| Gigabyte G7 KE | |
| Asus ROG Strix Scar 17 SE G733CX-LL014W | |
| R Benchmark 2.5 / Overall mean | |
| Gigabyte G7 KE | |
| MSI Pulse GL76 12UGK | |
| Acer Predator Helios 300 (i7-12700H, RTX 3070 Ti) | |
| Przeciętny Intel Core i7-13620H (0.4438 - 0.4762, n=7) | |
| MSI Katana 17 B13VFK | |
| Średnia w klasie Gaming (0.3439 - 0.759, n=109, ostatnie 2 lata) | |
| Asus ROG Strix Scar 17 SE G733CX-LL014W | |
| MSI Titan GT77 HX 13VI | |
* ... im mniej tym lepiej
AIDA64: FP32 Ray-Trace | FPU Julia | CPU SHA3 | CPU Queen | FPU SinJulia | FPU Mandel | CPU AES | CPU ZLib | FP64 Ray-Trace | CPU PhotoWorxx
| Performance rating | |
| MSI Titan GT77 HX 13VI | |
| Średnia w klasie Gaming | |
| Asus ROG Strix Scar 17 SE G733CX-LL014W | |
| Acer Predator Helios 300 (i7-12700H, RTX 3070 Ti) | |
| MSI Pulse GL76 12UGK | |
| Gigabyte G7 KE | |
| MSI Katana 17 B13VFK | |
| Przeciętny Intel Core i7-13620H | |
| AIDA64 / FP32 Ray-Trace | |
| Średnia w klasie Gaming (10227 - 85542, n=107, ostatnie 2 lata) | |
| MSI Titan GT77 HX 13VI | |
| Asus ROG Strix Scar 17 SE G733CX-LL014W | |
| Acer Predator Helios 300 (i7-12700H, RTX 3070 Ti) | |
| MSI Pulse GL76 12UGK | |
| MSI Katana 17 B13VFK | |
| Gigabyte G7 KE | |
| Przeciętny Intel Core i7-13620H (10779 - 13601, n=7) | |
| AIDA64 / FPU Julia | |
| MSI Titan GT77 HX 13VI | |
| Średnia w klasie Gaming (51376 - 238426, n=107, ostatnie 2 lata) | |
| Acer Predator Helios 300 (i7-12700H, RTX 3070 Ti) | |
| Asus ROG Strix Scar 17 SE G733CX-LL014W | |
| MSI Pulse GL76 12UGK | |
| MSI Katana 17 B13VFK | |
| Gigabyte G7 KE | |
| Przeciętny Intel Core i7-13620H (54287 - 67187, n=7) | |
| AIDA64 / CPU SHA3 | |
| MSI Titan GT77 HX 13VI | |
| Średnia w klasie Gaming (2180 - 9817, n=107, ostatnie 2 lata) | |
| Asus ROG Strix Scar 17 SE G733CX-LL014W | |
| Acer Predator Helios 300 (i7-12700H, RTX 3070 Ti) | |
| MSI Pulse GL76 12UGK | |
| Gigabyte G7 KE | |
| MSI Katana 17 B13VFK | |
| Przeciętny Intel Core i7-13620H (2327 - 2773, n=7) | |
| AIDA64 / CPU Queen | |
| MSI Titan GT77 HX 13VI | |
| Średnia w klasie Gaming (49785 - 173351, n=98, ostatnie 2 lata) | |
| Asus ROG Strix Scar 17 SE G733CX-LL014W | |
| MSI Pulse GL76 12UGK | |
| Acer Predator Helios 300 (i7-12700H, RTX 3070 Ti) | |
| Gigabyte G7 KE | |
| MSI Katana 17 B13VFK | |
| Przeciętny Intel Core i7-13620H (66885 - 78867, n=7) | |
| AIDA64 / FPU SinJulia | |
| MSI Titan GT77 HX 13VI | |
| Średnia w klasie Gaming (4424 - 33636, n=107, ostatnie 2 lata) | |
| Asus ROG Strix Scar 17 SE G733CX-LL014W | |
| Acer Predator Helios 300 (i7-12700H, RTX 3070 Ti) | |
| MSI Pulse GL76 12UGK | |
| MSI Katana 17 B13VFK | |
| Przeciętny Intel Core i7-13620H (6737 - 8421, n=7) | |
| Gigabyte G7 KE | |
| AIDA64 / FPU Mandel | |
| Średnia w klasie Gaming (25115 - 128721, n=107, ostatnie 2 lata) | |
| MSI Titan GT77 HX 13VI | |
| Acer Predator Helios 300 (i7-12700H, RTX 3070 Ti) | |
| Asus ROG Strix Scar 17 SE G733CX-LL014W | |
| MSI Pulse GL76 12UGK | |
| MSI Katana 17 B13VFK | |
| Gigabyte G7 KE | |
| Przeciętny Intel Core i7-13620H (27242 - 32787, n=7) | |
| AIDA64 / CPU AES | |
| Asus ROG Strix Scar 17 SE G733CX-LL014W | |
| MSI Pulse GL76 12UGK | |
| MSI Titan GT77 HX 13VI | |
| Gigabyte G7 KE | |
| Średnia w klasie Gaming (39258 - 247074, n=107, ostatnie 2 lata) | |
| Acer Predator Helios 300 (i7-12700H, RTX 3070 Ti) | |
| Przeciętny Intel Core i7-13620H (48646 - 85895, n=7) | |
| MSI Katana 17 B13VFK | |
| AIDA64 / CPU ZLib | |
| MSI Titan GT77 HX 13VI | |
| Średnia w klasie Gaming (574 - 2531, n=107, ostatnie 2 lata) | |
| Asus ROG Strix Scar 17 SE G733CX-LL014W | |
| Acer Predator Helios 300 (i7-12700H, RTX 3070 Ti) | |
| MSI Pulse GL76 12UGK | |
| Gigabyte G7 KE | |
| MSI Katana 17 B13VFK | |
| Przeciętny Intel Core i7-13620H (688 - 835, n=7) | |
| AIDA64 / FP64 Ray-Trace | |
| Średnia w klasie Gaming (5509 - 45446, n=107, ostatnie 2 lata) | |
| MSI Titan GT77 HX 13VI | |
| Acer Predator Helios 300 (i7-12700H, RTX 3070 Ti) | |
| Asus ROG Strix Scar 17 SE G733CX-LL014W | |
| MSI Pulse GL76 12UGK | |
| MSI Katana 17 B13VFK | |
| Gigabyte G7 KE | |
| Przeciętny Intel Core i7-13620H (5919 - 7364, n=7) | |
| AIDA64 / CPU PhotoWorxx | |
| Średnia w klasie Gaming (12271 - 89891, n=107, ostatnie 2 lata) | |
| Asus ROG Strix Scar 17 SE G733CX-LL014W | |
| MSI Titan GT77 HX 13VI | |
| Acer Predator Helios 300 (i7-12700H, RTX 3070 Ti) | |
| MSI Katana 17 B13VFK | |
| Gigabyte G7 KE | |
| Przeciętny Intel Core i7-13620H (19421 - 34544, n=7) | |
| MSI Pulse GL76 12UGK | |
Wydajność systemu
Szybki dysk SSD w połączeniu z wydajnym układem graficznym Katany 17 skutkuje bardzo dobrą wydajnością systemu, która oczywiście w syntetycznych benchmarkach pozostaje nieco w tyle za lepiej skonfigurowaną konkurencją.
CrossMark: Overall | Productivity | Creativity | Responsiveness
| PCMark 10 / Score | |
| MSI Titan GT77 HX 13VI | |
| Średnia w klasie Gaming (5828 - 11574, n=94, ostatnie 2 lata) | |
| Acer Predator Helios 300 (i7-12700H, RTX 3070 Ti) | |
| MSI Pulse GL76 12UGK | |
| Asus ROG Strix Scar 17 SE G733CX-LL014W | |
| MSI Katana 17 B13VFK | |
| Przeciętny Intel Core i7-13620H, NVIDIA GeForce RTX 4060 Laptop GPU (6678 - 7256, n=3) | |
| Gigabyte G7 KE | |
| PCMark 10 / Essentials | |
| MSI Titan GT77 HX 13VI | |
| MSI Pulse GL76 12UGK | |
| MSI Katana 17 B13VFK | |
| Acer Predator Helios 300 (i7-12700H, RTX 3070 Ti) | |
| Średnia w klasie Gaming (8810 - 12600, n=98, ostatnie 2 lata) | |
| Przeciętny Intel Core i7-13620H, NVIDIA GeForce RTX 4060 Laptop GPU (9909 - 10809, n=3) | |
| Asus ROG Strix Scar 17 SE G733CX-LL014W | |
| Gigabyte G7 KE | |
| PCMark 10 / Productivity | |
| Średnia w klasie Gaming (6845 - 18766, n=96, ostatnie 2 lata) | |
| Acer Predator Helios 300 (i7-12700H, RTX 3070 Ti) | |
| MSI Pulse GL76 12UGK | |
| Asus ROG Strix Scar 17 SE G733CX-LL014W | |
| MSI Titan GT77 HX 13VI | |
| MSI Katana 17 B13VFK | |
| Przeciętny Intel Core i7-13620H, NVIDIA GeForce RTX 4060 Laptop GPU (8642 - 9781, n=3) | |
| Gigabyte G7 KE | |
| PCMark 10 / Digital Content Creation | |
| MSI Titan GT77 HX 13VI | |
| Średnia w klasie Gaming (7602 - 19657, n=96, ostatnie 2 lata) | |
| Acer Predator Helios 300 (i7-12700H, RTX 3070 Ti) | |
| MSI Pulse GL76 12UGK | |
| Asus ROG Strix Scar 17 SE G733CX-LL014W | |
| MSI Katana 17 B13VFK | |
| Przeciętny Intel Core i7-13620H, NVIDIA GeForce RTX 4060 Laptop GPU (9437 - 10204, n=3) | |
| Gigabyte G7 KE | |
| CrossMark / Overall | |
| MSI Titan GT77 HX 13VI | |
| Asus ROG Strix Scar 17 SE G733CX-LL014W | |
| Średnia w klasie Gaming (1366 - 2409, n=96, ostatnie 2 lata) | |
| Przeciętny Intel Core i7-13620H, NVIDIA GeForce RTX 4060 Laptop GPU (1857 - 1986, n=3) | |
| Acer Predator Helios 300 (i7-12700H, RTX 3070 Ti) | |
| MSI Katana 17 B13VFK | |
| MSI Pulse GL76 12UGK | |
| Gigabyte G7 KE | |
| CrossMark / Productivity | |
| MSI Titan GT77 HX 13VI | |
| Asus ROG Strix Scar 17 SE G733CX-LL014W | |
| Średnia w klasie Gaming (1386 - 2254, n=96, ostatnie 2 lata) | |
| Przeciętny Intel Core i7-13620H, NVIDIA GeForce RTX 4060 Laptop GPU (1765 - 1908, n=3) | |
| Gigabyte G7 KE | |
| MSI Pulse GL76 12UGK | |
| Acer Predator Helios 300 (i7-12700H, RTX 3070 Ti) | |
| MSI Katana 17 B13VFK | |
| CrossMark / Creativity | |
| MSI Titan GT77 HX 13VI | |
| Asus ROG Strix Scar 17 SE G733CX-LL014W | |
| Średnia w klasie Gaming (1343 - 2729, n=96, ostatnie 2 lata) | |
| Acer Predator Helios 300 (i7-12700H, RTX 3070 Ti) | |
| Przeciętny Intel Core i7-13620H, NVIDIA GeForce RTX 4060 Laptop GPU (2013 - 2067, n=3) | |
| MSI Katana 17 B13VFK | |
| MSI Pulse GL76 12UGK | |
| Gigabyte G7 KE | |
| CrossMark / Responsiveness | |
| Gigabyte G7 KE | |
| Asus ROG Strix Scar 17 SE G733CX-LL014W | |
| Przeciętny Intel Core i7-13620H, NVIDIA GeForce RTX 4060 Laptop GPU (1734 - 1989, n=3) | |
| MSI Titan GT77 HX 13VI | |
| MSI Pulse GL76 12UGK | |
| MSI Katana 17 B13VFK | |
| Acer Predator Helios 300 (i7-12700H, RTX 3070 Ti) | |
| Średnia w klasie Gaming (1226 - 2334, n=96, ostatnie 2 lata) | |
| PCMark 10 Score | 7160 pkt. | |
Pomoc | ||
| AIDA64 / Memory Copy | |
| Średnia w klasie Gaming (21750 - 129946, n=107, ostatnie 2 lata) | |
| MSI Titan GT77 HX 13VI | |
| Asus ROG Strix Scar 17 SE G733CX-LL014W | |
| Acer Predator Helios 300 (i7-12700H, RTX 3070 Ti) | |
| MSI Katana 17 B13VFK | |
| MSI Pulse GL76 12UGK | |
| Przeciętny Intel Core i7-13620H (31629 - 53927, n=7) | |
| Gigabyte G7 KE | |
| AIDA64 / Memory Read | |
| Średnia w klasie Gaming (22956 - 118858, n=107, ostatnie 2 lata) | |
| Asus ROG Strix Scar 17 SE G733CX-LL014W | |
| MSI Titan GT77 HX 13VI | |
| MSI Katana 17 B13VFK | |
| Acer Predator Helios 300 (i7-12700H, RTX 3070 Ti) | |
| Przeciętny Intel Core i7-13620H (35115 - 61853, n=7) | |
| MSI Pulse GL76 12UGK | |
| Gigabyte G7 KE | |
| AIDA64 / Memory Write | |
| Średnia w klasie Gaming (22297 - 135096, n=107, ostatnie 2 lata) | |
| Asus ROG Strix Scar 17 SE G733CX-LL014W | |
| MSI Titan GT77 HX 13VI | |
| Acer Predator Helios 300 (i7-12700H, RTX 3070 Ti) | |
| MSI Katana 17 B13VFK | |
| Gigabyte G7 KE | |
| MSI Pulse GL76 12UGK | |
| Przeciętny Intel Core i7-13620H (30611 - 54111, n=7) | |
| AIDA64 / Memory Latency | |
| Średnia w klasie Gaming (75.3 - 259, n=107, ostatnie 2 lata) | |
| MSI Katana 17 B13VFK | |
| Przeciętny Intel Core i7-13620H (75.9 - 108.2, n=7) | |
| MSI Pulse GL76 12UGK | |
| MSI Titan GT77 HX 13VI | |
| Acer Predator Helios 300 (i7-12700H, RTX 3070 Ti) | |
| Gigabyte G7 KE | |
| Asus ROG Strix Scar 17 SE G733CX-LL014W | |
* ... im mniej tym lepiej
Opóźnienia DPC
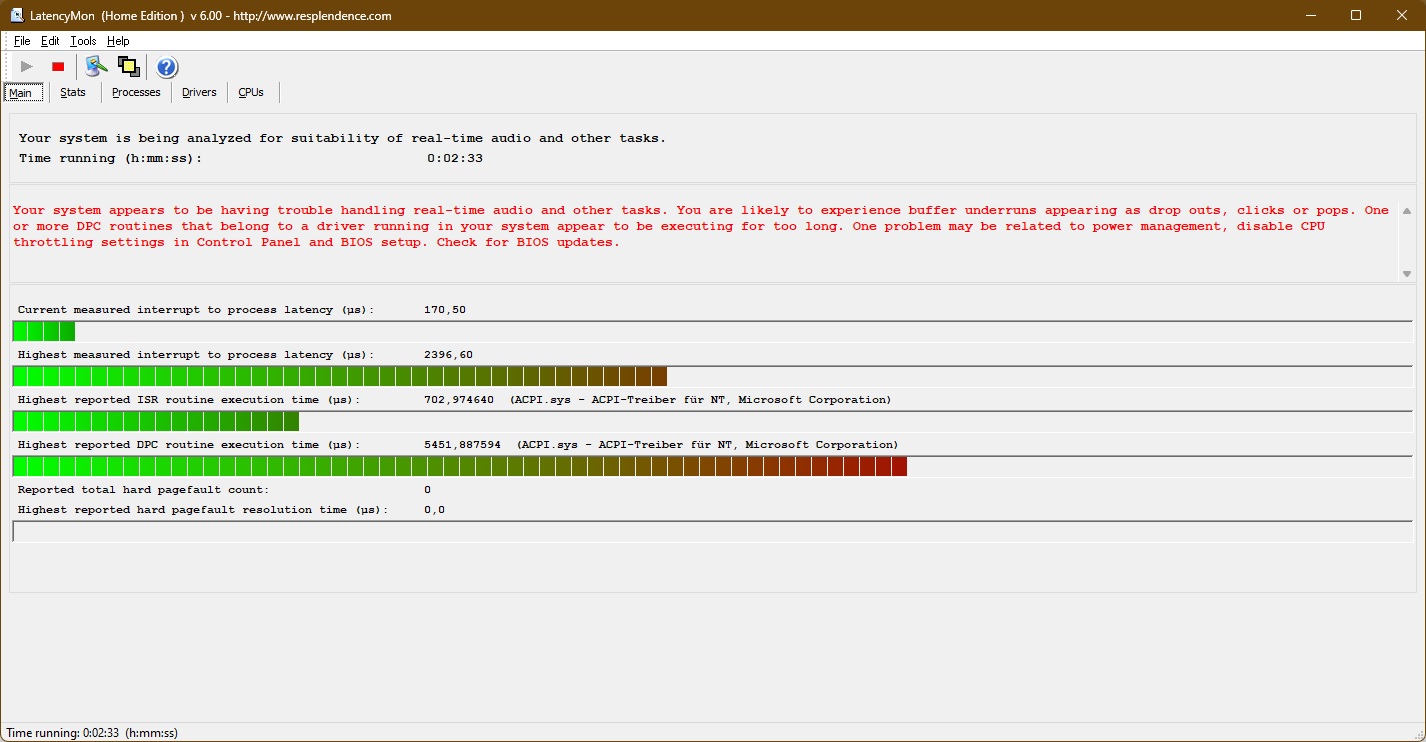
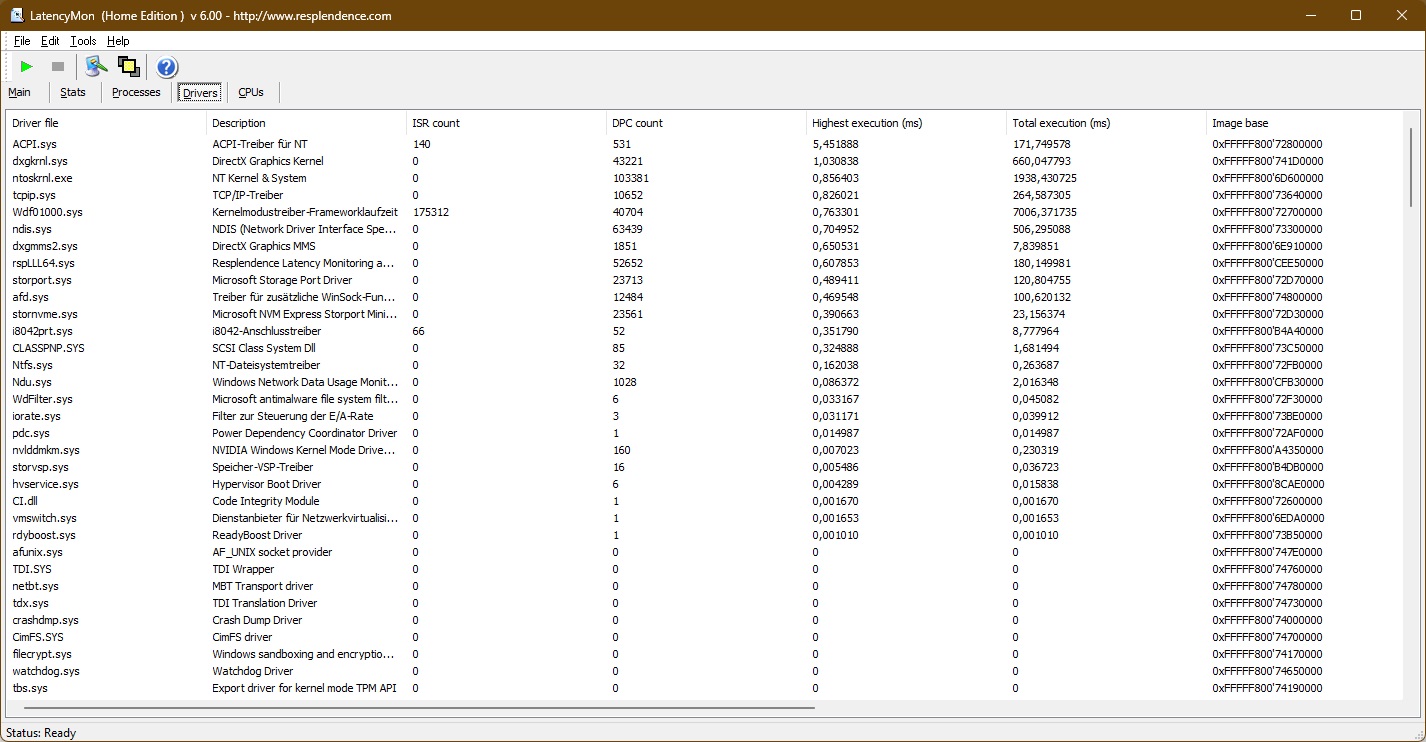
| DPC Latencies / LatencyMon - interrupt to process latency (max), Web, Youtube, Prime95 | |
| MSI Titan GT77 HX 13VI | |
| Asus ROG Strix Scar 17 SE G733CX-LL014W | |
| MSI Katana 17 B13VFK | |
| Gigabyte G7 KE | |
| Acer Predator Helios 300 (i7-12700H, RTX 3070 Ti) | |
| MSI Pulse GL76 12UGK | |
* ... im mniej tym lepiej
Pamięć masowa
Micron 2400 o pojemności jednego terabajta sam w sobie jest szybkim dyskiem SSD NVMe PCIe 4.0, wydajnościowo nie jest w stanie dotrzymać kroku konkurencji. W codziennym użytkowaniu nie powinno to być jednak zauważalne.

* ... im mniej tym lepiej
Continuous Performance Read: DiskSpd Read Loop, Queue Depth 8
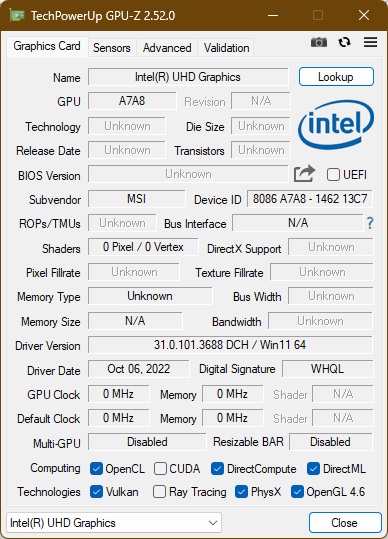
Karta graficzna
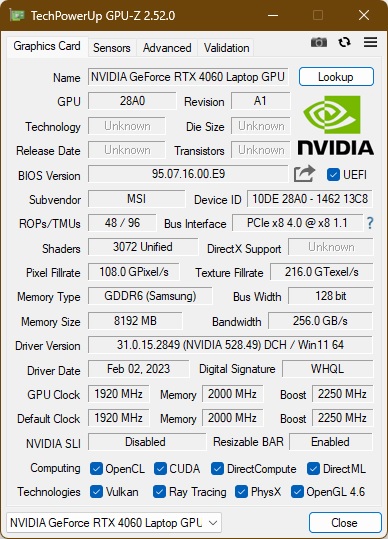
Na stronieNvidia GeForce RTX 4060 to średniej klasy GPU od Nvidii z generacji "Ada Lovelace". 3072 jednostki cieniujące są taktowane maksymalnym zegarem 2,25 GHz, a zainstalowane tu GPU ma do dyspozycji osiem gigabajtów pamięci RAM GDDR6. Dodatkowe porównania z innymi układami graficznymi znajdziecie w naszym Lista benchmarków GPU.
W testach 3DMark nowy procesor graficzny ma nosa przed ostatnią generacją Nvidia GeForce RTX 3070- ale tylko nieznacznie. Dla porównania.RTX 3070 Tijest marginalnie szybszy. W porównaniu do.Nvidia GeForce RTX 3060, RTX 4060 - który może tu zużywać swoje maksymalne 105 watów - jest o około 23% szybszy. Przy 115 watach Gigabyte G7 KE znaleziony w 3060 zużywał nieco więcej niż 4060. RTX 4060 jest wyraźnie zdeklasowany przezGeForce RTX 4090i było to do przewidzenia. W benchmarkach 3DMark układ z wyższej półki działa dwa razy szybciej. Wyniki benchmarku Blender potwierdzają wyniki testów 3DMark.
Podobnie jak w przypadku procesora, karta grafiki ma ograniczenie wydajności w trybie akumulatorowym. Bez zasilacza można uzyskać tylko 50 % wydajności GPU.
| 3DMark 06 Standard Score | 50607 pkt. | |
| 3DMark Vantage P Result | 90275 pkt. | |
| 3DMark 11 Performance | 30831 pkt. | |
| 3DMark Ice Storm Standard Score | 185655 pkt. | |
| 3DMark Cloud Gate Standard Score | 59494 pkt. | |
| 3DMark Fire Strike Score | 22497 pkt. | |
| 3DMark Time Spy Score | 10345 pkt. | |
Pomoc | ||
* ... im mniej tym lepiej
Wydajność w grach
W testach gier Nvidia GeForce RTX 4060 radzi sobie lepiej niż w benchmarkach syntetycznych. Pod tym względem marginalnie pokonuje GeForce RTX 3070 Ti. Jednak podobnie jak RTX 4090, RTX 3080 Ti pozostaje bezkonkurencyjny. Niemniej jednak, jeśli chodzi o gry, różnica w stosunku do flagowca nie jest tak duża - 4090 nadal jest o około 33% szybszy.
RTX 4060 może bez problemu grać w starsze tytuły w 4K UHD. Z nowymi grami jest to jednak trudniejsze, przynajmniej bez implementacji DLSS. Tak czy inaczej, granie w 2,5K jest możliwe.
| The Witcher 3 - 1920x1080 Ultra Graphics & Postprocessing (HBAO+) | |
| MSI Titan GT77 HX 13VI | |
| Średnia w klasie Gaming (95 - 240, n=8, ostatnie 2 lata) | |
| Acer Predator Helios 300 (i7-12700H, RTX 3070 Ti) | |
| Asus ROG Strix Scar 17 SE G733CX-LL014W | |
| MSI Katana 17 B13VFK | |
| MSI Pulse GL76 12UGK | |
| Gigabyte G7 KE | |
| Final Fantasy XV Benchmark - 1920x1080 High Quality | |
| MSI Titan GT77 HX 13VI | |
| Średnia w klasie Gaming (41 - 215, n=101, ostatnie 2 lata) | |
| Asus ROG Strix Scar 17 SE G733CX-LL014W | |
| Acer Predator Helios 300 (i7-12700H, RTX 3070 Ti) | |
| MSI Katana 17 B13VFK | |
| MSI Pulse GL76 12UGK | |
| Gigabyte G7 KE | |
Witcher 3 frame rate diagram
| low | med. | high | ultra | QHD | 4K DLSS | 4K | |
|---|---|---|---|---|---|---|---|
| GTA V (2015) | 186.1 | 184.7 | 180.2 | 112.1 | 83 | 82.1 | |
| The Witcher 3 (2015) | 435 | 322 | 206 | 104.7 | 62.6 | ||
| Dota 2 Reborn (2015) | 184.6 | 171 | 164.1 | 156.3 | 126 | ||
| Final Fantasy XV Benchmark (2018) | 204 | 135.1 | 96.1 | 70.1 | 40.2 | ||
| X-Plane 11.11 (2018) | 178.6 | 154.9 | 118.9 | 98.9 | |||
| Far Cry 5 (2018) | 134 | 99 | 51 | ||||
| Strange Brigade (2018) | 508 | 270 | 216 | 185.1 | 126.4 | 67.2 | |
| Shadow of the Tomb Raider (2018) | 155.6 | 120.7 | 67.2 | ||||
| Metro Exodus (2019) | 74.3 | 59 | 36.8 | ||||
| Control (2019) | 238 | 119 | 89 | ||||
| Borderlands 3 (2019) | 171.3 | 144.6 | 106.5 | 83.9 | |||
| Death Stranding (2020) | 200 | 158.9 | 150.3 | 146.7 | |||
| Horizon Zero Dawn (2020) | 108.3 | 85.9 | 46.5 | ||||
| Flight Simulator 2020 (2020) | 96.9 | 69.4 | 52.5 | ||||
| Crysis Remastered (2020) | 312 | 224 | 85.9 | 72.5 | |||
| Watch Dogs Legion (2020) | 65 | 44 | 25 | ||||
| Dirt 5 (2020) | 218 | 147.2 | 116.1 | 89.5 | |||
| Assassin´s Creed Valhalla (2020) | 135 | 111 | 96 | ||||
| Yakuza Like a Dragon (2020) | 131.7 | 123.2 | 117.4 | 109.6 | |||
| Hitman 3 (2021) | 267.5 | 197.7 | 172.7 | 163.5 | |||
| Days Gone (2021) | 148 | 131.4 | 100.2 | ||||
| F1 2021 (2021) | 389 | 312 | 244 | 128.9 | 93 | 50.2 | |
| Alan Wake Remastered (2021) | 149.8 | 144.9 | |||||
| Far Cry 6 (2021) | 97.2 | 32.6 | 3.38 | ||||
| Back 4 Blood (2021) | 245 | 197.5 | 188.2 | ||||
| Guardians of the Galaxy (2021) | 134 | 135 | 133 | ||||
| Riders Republic (2021) | 177 | 145 | 122 | 112 | |||
| Forza Horizon 5 (2021) | 137 | 125 | 84 | ||||
| Battlefield 2042 (2021) | 145.6 | 123 | 106.1 | ||||
| Halo Infinite (2021) | 144.9 | 123.6 | 114.2 | ||||
| God of War (2022) | 67.5 | 55.6 | 34.7 | ||||
| Rainbow Six Extraction (2022) | 149.1 | 106 | 52.4 | ||||
| Dying Light 2 (2022) | 64.7 | 43.8 | 23 | ||||
| GRID Legends (2022) | 126.4 | 102.2 | 63.9 | ||||
| Elden Ring (2022) | 59.5 | ||||||
| Cyberpunk 2077 1.6 (2022) | 73.81 | 45.9 | 21.1 | ||||
| Elex 2 (2022) | 115.4 | 115.4 | 113.5 | 96 | |||
| Ghostwire Tokyo (2022) | 68.6 | 65.9 | 36.8 | 29.6 | |||
| Tiny Tina's Wonderlands (2022) | 198.6 | 164.9 | 110 | 85.2 | |||
| Vampire Bloodhunt (2022) | 220 | 201 | 185.7 | ||||
| F1 22 (2022) | 247 | 240 | 179.2 | 65.4 | 41 | 19.7 | |
| The Quarry (2022) | 154.8 | 121.3 | 100.5 | 77.9 | |||
| A Plague Tale Requiem (2022) | 100.7 | 84.9 | 73 | 63.3 | |||
| Uncharted Legacy of Thieves Collection (2022) | 87.9 | 85.1 | 79.1 | 76.9 | |||
| Call of Duty Modern Warfare 2 2022 (2022) | 87 | 59 | 55 | 34 | |||
| Spider-Man Miles Morales (2022) | 77.3 | 59.7 | 35.3 | ||||
| The Callisto Protocol (2022) | 68.9 | 48.6 | 27 | ||||
| Need for Speed Unbound (2022) | 127.4 | 117.2 | 98.9 | 98.6 | |||
| High On Life (2023) | 220 | 165.8 | 125.6 | 99.9 | |||
| The Witcher 3 v4 (2023) | 66.3 | 40.5 | 21.4 | ||||
| Dead Space Remake (2023) | 67 | 43.4 | 20.6 | ||||
| Hogwarts Legacy (2023) | 150 | 126.7 | 107.7 | 91.6 | |||
| Returnal (2023) | |||||||
| Atomic Heart (2023) | 167.3 | 129.2 | 81.6 | 66.8 | |||
| Company of Heroes 3 (2023) | 202.7 | 182.1 | 133.3 | 131.3 | |||
| Sons of the Forest (2023) | 82 | 79.1 | 73.3 | 71.8 |
Emisje: Głośne wentylatory, chłodna obudowa
Emisja hałasu
Podczas wykonywania niewymagających zadań MSI Laptop Katana 17 pracuje przeważnie bezgłośnie - ale nie zawsze. Gdy trwa chłodzenie, przy około 40 dB(A) urządzenie pracuje stosunkowo głośno. Pod obciążeniem wzrasta to do maksymalnie 59 dB(A), co jest bardzo głośne dla wrażliwych uszu, ale normalne dla gier.
Nie wykryliśmy żadnego wycieku cewki.
Hałas
| luz |
| 24.5 / 24.5 / 40 dB |
| obciążenie |
| 48.3 / 59.1 dB |
 | ||
30 dB cichy 40 dB(A) słyszalny 50 dB(A) irytujący |
||
min: | ||
| MSI Katana 17 B13VFK GeForce RTX 4060 Laptop GPU, i7-13620H, Micron 2400 MTFDKBA1T0QFM | MSI Titan GT77 HX 13VI GeForce RTX 4090 Laptop GPU, i9-13950HX, Samsung PM9A1 MZVL22T0HBLB | MSI Pulse GL76 12UGK GeForce RTX 3070 Laptop GPU, i7-12700H, Micron 3400 1TB MTFDKBA1T0TFH | Gigabyte G7 KE GeForce RTX 3060 Laptop GPU, i5-12500H, Gigabyte AG470S1TB-SI B10 | Asus ROG Strix Scar 17 SE G733CX-LL014W GeForce RTX 3080 Ti Laptop GPU, i9-12950HX, Samsung PM9A1 MZVL22T0HBLB | Acer Predator Helios 300 (i7-12700H, RTX 3070 Ti) GeForce RTX 3070 Ti Laptop GPU, i7-12700H, Samsung PM9A1 MZVL21T0HCLR | |
|---|---|---|---|---|---|---|
| Noise | -2% | 6% | -9% | 16% | -0% | |
| wyłączone / środowisko * (dB) | 24.5 | 24.6 -0% | 24.1 2% | 27 -10% | 23.9 2% | 23 6% |
| Idle Minimum * (dB) | 24.5 | 29.2 -19% | 26.9 -10% | 27 -10% | 23.9 2% | 23 6% |
| Idle Average * (dB) | 24.5 | 29.2 -19% | 26.9 -10% | 35 -43% | 23.9 2% | 25.92 -6% |
| Idle Maximum * (dB) | 40 | 29.2 27% | 27 32% | 38 5% | 23.9 40% | 40.67 -2% |
| Load Average * (dB) | 48.3 | 50.7 -5% | 43.8 9% | 52 -8% | 34.3 29% | 42.7 12% |
| Witcher 3 ultra * (dB) | 56 | 53.3 5% | 44.7 20% | 56 -0% | 62.48 -12% | |
| Load Maximum * (dB) | 59.1 | 61 -3% | 58.3 1% | 59 -0% | 45.9 22% | 62.67 -6% |
* ... im mniej tym lepiej
Temperatura
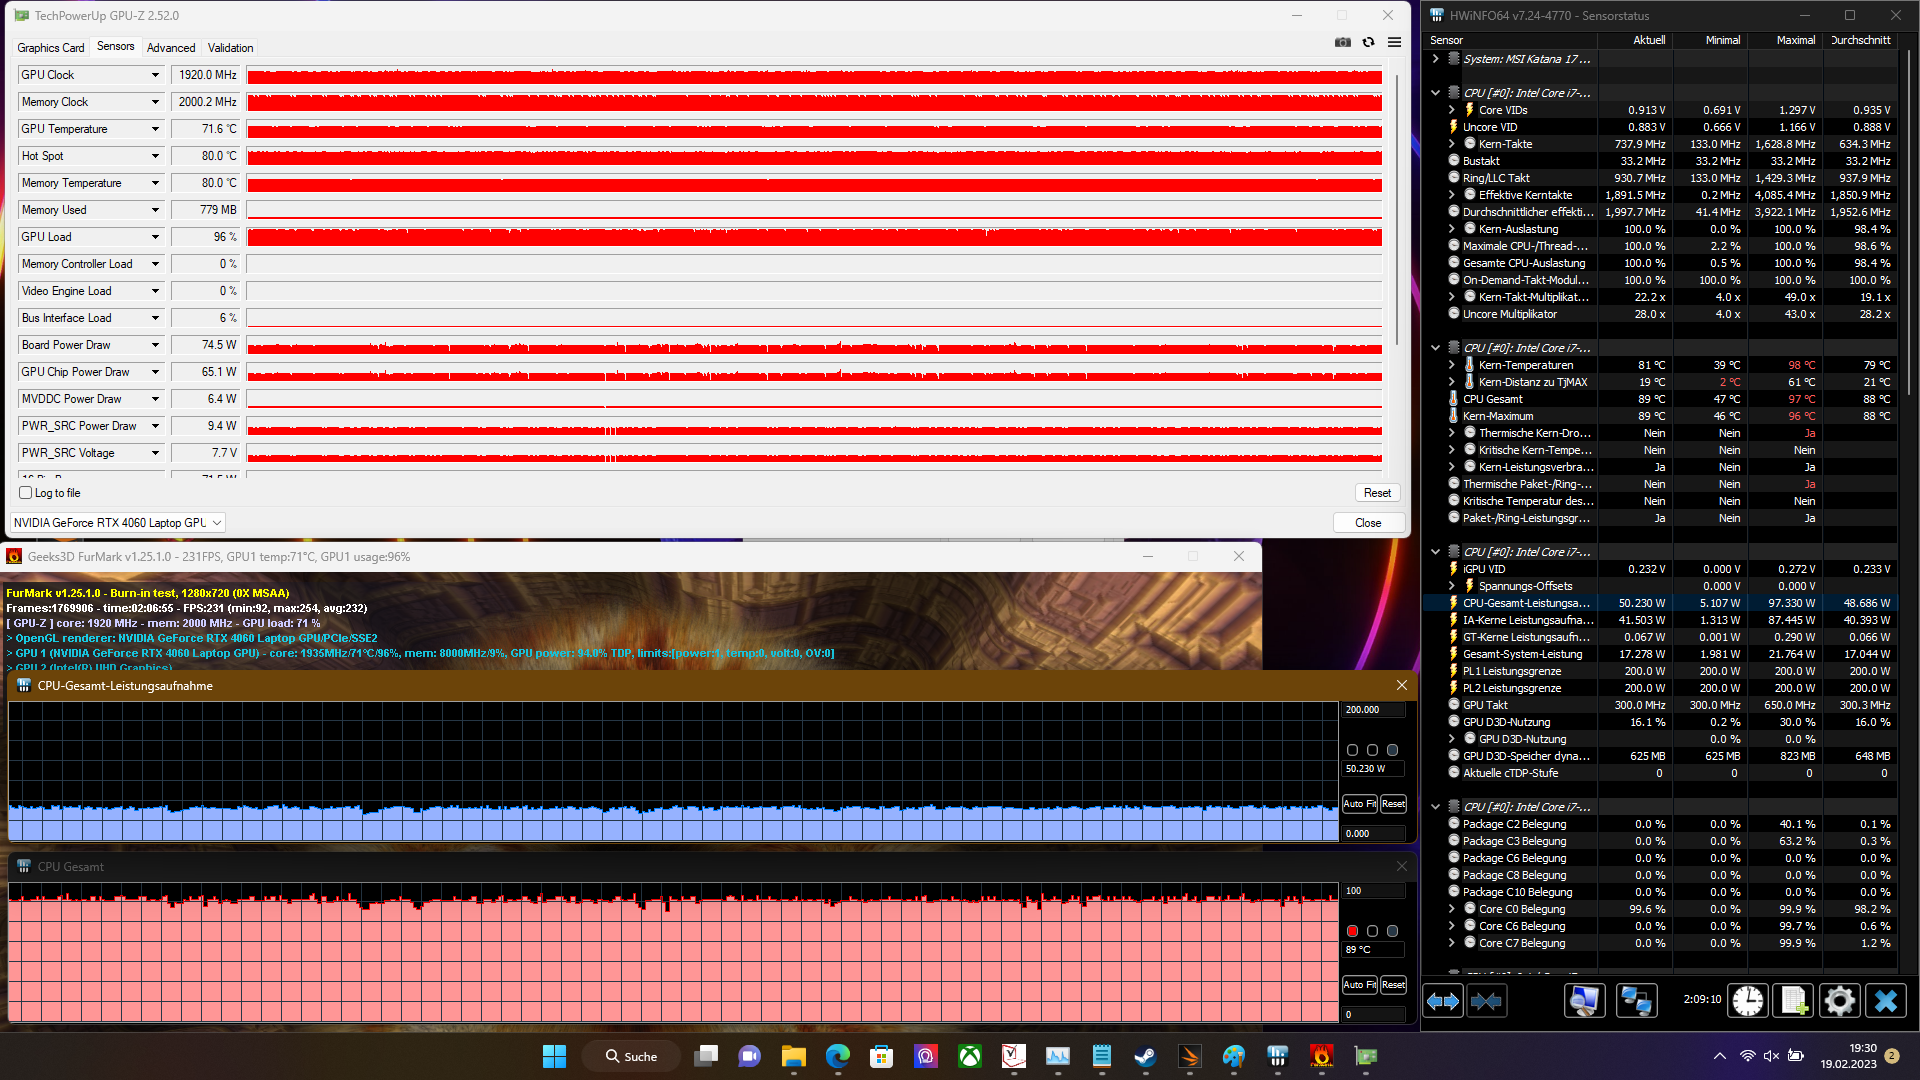
Dobra wiadomość: Nie należy się martwić o spocone dłonie podczas korzystania z Katany 17, gdyż obszar oparcia dłoni pozostaje chłodny nawet w testach obciążeniowych. Maksymalna temperatura 45,5 stopnia Celsjusza w teścieWitcher 3 również nie jest powodem do niepokoju.
W testach obciążeniowych MSI Katana 17 B13V nie wykryliśmy żadnego throttlingu.
(±) Maksymalna temperatura w górnej części wynosi 41.6 °C / 107 F, w porównaniu do średniej 40.4 °C / 105 F , począwszy od 21.2 do 68.8 °C dla klasy Gaming.
(±) Dno nagrzewa się maksymalnie do 43.1 °C / 110 F, w porównaniu do średniej 43.2 °C / 110 F
(+) W stanie bezczynności średnia temperatura górnej części wynosi 27.8 °C / 82 F, w porównaniu ze średnią temperaturą urządzenia wynoszącą 33.9 °C / ### class_avg_f### F.
(+) Podczas gry w Wiedźmina 3 średnia temperatura górnej części wynosi 31.8 °C / 89 F, w porównaniu do średniej temperatury urządzenia wynoszącej 33.9 °C / ## #class_avg_f### F.
(+) Podpórki pod nadgarstki i touchpad są chłodniejsze niż temperatura skóry i maksymalnie 24.2 °C / 75.6 F i dlatego są chłodne w dotyku.
(+) Średnia temperatura obszaru podparcia dłoni w podobnych urządzeniach wynosiła 28.8 °C / 83.8 F (+4.6 °C / 8.2 F).
| MSI Katana 17 B13VFK Intel Core i7-13620H, NVIDIA GeForce RTX 4060 Laptop GPU | MSI Titan GT77 HX 13VI Intel Core i9-13950HX, NVIDIA GeForce RTX 4090 Laptop GPU | MSI Pulse GL76 12UGK Intel Core i7-12700H, NVIDIA GeForce RTX 3070 Laptop GPU | Gigabyte G7 KE Intel Core i5-12500H, NVIDIA GeForce RTX 3060 Laptop GPU | Asus ROG Strix Scar 17 SE G733CX-LL014W Intel Core i9-12950HX, NVIDIA GeForce RTX 3080 Ti Laptop GPU | Acer Predator Helios 300 (i7-12700H, RTX 3070 Ti) Intel Core i7-12700H, NVIDIA GeForce RTX 3070 Ti Laptop GPU | |
|---|---|---|---|---|---|---|
| Heat | 10% | -5% | -7% | -7% | 2% | |
| Maximum Upper Side * (°C) | 41.6 | 40.6 2% | 44.2 -6% | 52 -25% | 48.8 -17% | 35 16% |
| Maximum Bottom * (°C) | 43.1 | 41.1 5% | 45.2 -5% | 54 -25% | 52.4 -22% | 53 -23% |
| Idle Upper Side * (°C) | 32 | 26.2 18% | 35.4 -11% | 28 12% | 30.4 5% | 29 9% |
| Idle Bottom * (°C) | 35.8 | 30.3 15% | 35 2% | 32 11% | 34.1 5% | 34 5% |
* ... im mniej tym lepiej
Mówcy
Głośniki MSI Katana 17 są stosunkowo głośne, ale brakuje im basów. Zamiast tego gracze powinni sięgnąć po dobry zestaw słuchawkowy, dzięki któremu szum wentylatorów będzie niesłyszalny.
MSI Katana 17 B13VFK analiza dźwięku
(±) | głośność głośnika jest średnia, ale dobra (78.5 dB)
Bas 100 - 315 Hz
(-) | prawie brak basu - średnio 17.7% niższa od mediany
(±) | liniowość basu jest średnia (11.7% delta do poprzedniej częstotliwości)
Średnie 400 - 2000 Hz
(±) | wyższe średnie - średnio 6.8% wyższe niż mediana
(+) | średnie są liniowe (6.7% delta do poprzedniej częstotliwości)
Wysokie 2–16 kHz
(+) | zrównoważone maksima - tylko 3.2% od mediany
(±) | liniowość wysokich wartości jest średnia (7.2% delta do poprzedniej częstotliwości)
Ogólnie 100 - 16.000 Hz
(±) | liniowość ogólnego dźwięku jest średnia (19.4% różnicy w stosunku do mediany)
W porównaniu do tej samej klasy
» 67% wszystkich testowanych urządzeń w tej klasie było lepszych, 7% podobnych, 26% gorszych
» Najlepszy miał deltę 6%, średnia wynosiła ###średnia###%, najgorsza wynosiła 132%
W porównaniu do wszystkich testowanych urządzeń
» 48% wszystkich testowanych urządzeń było lepszych, 7% podobnych, 45% gorszych
» Najlepszy miał deltę 4%, średnia wynosiła ###średnia###%, najgorsza wynosiła 134%
Acer Predator Helios 300 (i7-12700H, RTX 3070 Ti) analiza dźwięku
(±) | głośność głośnika jest średnia, ale dobra (73.83 dB)
Bas 100 - 315 Hz
(±) | zredukowany bas - średnio 12.7% niższy od mediany
(±) | liniowość basu jest średnia (11.2% delta do poprzedniej częstotliwości)
Średnie 400 - 2000 Hz
(±) | wyższe średnie - średnio 5.5% wyższe niż mediana
(±) | liniowość środka jest średnia (7.9% delta do poprzedniej częstotliwości)
Wysokie 2–16 kHz
(+) | zrównoważone maksima - tylko 2.1% od mediany
(+) | wzloty są liniowe (3.5% delta do poprzedniej częstotliwości)
Ogólnie 100 - 16.000 Hz
(±) | liniowość ogólnego dźwięku jest średnia (15.8% różnicy w stosunku do mediany)
W porównaniu do tej samej klasy
» 37% wszystkich testowanych urządzeń w tej klasie było lepszych, 7% podobnych, 56% gorszych
» Najlepszy miał deltę 6%, średnia wynosiła ###średnia###%, najgorsza wynosiła 132%
W porównaniu do wszystkich testowanych urządzeń
» 24% wszystkich testowanych urządzeń było lepszych, 5% podobnych, 71% gorszych
» Najlepszy miał deltę 4%, średnia wynosiła ###średnia###%, najgorsza wynosiła 134%
Zarządzanie energią: Głodna energii maszyna MSI dla graczy
Pobór mocy
Minimalne zużycie około 12,2 W jest stosunkowo wysokie, ale typowe dla systemu do gier. W porównaniu do konkurencji zużycie jest jednak nadal stosunkowo niskie.
Zasilacz o mocy 240 W jest wystarczająco duży, aby poradzić sobie z maksymalnym poborem mocy na poziomie 212 W.
| wyłączony / stan wstrzymania | |
| luz | |
| obciążenie |
|
Legenda:
min: | |
| MSI Katana 17 B13VFK i7-13620H, GeForce RTX 4060 Laptop GPU, Micron 2400 MTFDKBA1T0QFM, IPS LED, 1920x1080, 17.3" | MSI Titan GT77 HX 13VI i9-13950HX, GeForce RTX 4090 Laptop GPU, Samsung PM9A1 MZVL22T0HBLB, Mini-LED, 3840x2160, 17.3" | MSI Pulse GL76 12UGK i7-12700H, GeForce RTX 3070 Laptop GPU, Micron 3400 1TB MTFDKBA1T0TFH, IPS, 1920x1080, 17.3" | Gigabyte G7 KE i5-12500H, GeForce RTX 3060 Laptop GPU, Gigabyte AG470S1TB-SI B10, IPS, 1920x1080, 17.3" | Asus ROG Strix Scar 17 SE G733CX-LL014W i9-12950HX, GeForce RTX 3080 Ti Laptop GPU, Samsung PM9A1 MZVL22T0HBLB, IPS, 2560x1440, 17.3" | Acer Predator Helios 300 (i7-12700H, RTX 3070 Ti) i7-12700H, GeForce RTX 3070 Ti Laptop GPU, Samsung PM9A1 MZVL21T0HCLR, IPS, 2560x1440, 17.3" | Przeciętny NVIDIA GeForce RTX 4060 Laptop GPU | Średnia w klasie Gaming | |
|---|---|---|---|---|---|---|---|---|
| Power Consumption | -55% | -14% | -22% | -61% | -41% | -7% | -27% | |
| Idle Minimum * (Watt) | 12.2 | 14 -15% | 12.4 -2% | 15 -23% | 19.3 -58% | 15 -23% | 11.5 ? 6% | 13.2 ? -8% |
| Idle Average * (Watt) | 14.9 | 21.6 -45% | 13.1 12% | 17 -14% | 26.5 -78% | 20 -34% | 16 ? -7% | 18.9 ? -27% |
| Idle Maximum * (Watt) | 15.8 | 24.8 -57% | 25.3 -60% | 24 -52% | 27.1 -72% | 22.3 -41% | 20.3 ? -28% | 24.3 ? -54% |
| Load Average * (Watt) | 85.22 | 122.5 -44% | 105.4 -24% | 111 -30% | 141 -65% | 133 -56% | 92.9 ? -9% | 108.3 ? -27% |
| Witcher 3 ultra * (Watt) | 151.1 | 265 -75% | 150 1% | 174.1 -15% | 225 -49% | 231 -53% | ||
| Load Maximum * (Watt) | 212.8 | 418 -96% | 240.5 -13% | 208 2% | 307.9 -45% | 290 -36% | 210 ? 1% | 254 ? -19% |
* ... im mniej tym lepiej
Power consumption Witcher 3 / stress test
Power consumption with an external monitor
Żywotność baterii
Niewielki akumulator MSI Katana 17 ma tylko pojemność 53,5 watogodzin. Nie należy więc oczekiwać dobrych czasów pracy na akumulatorze w przypadku tak mocnego systemu. W testach WiFi bateria wytrzymała skromne trzy godziny, co oznacza, że laptop MSI nie nadaje się do zastosowań mobilnych.
| MSI Katana 17 B13VFK i7-13620H, GeForce RTX 4060 Laptop GPU, 53.5 Wh | MSI Titan GT77 HX 13VI i9-13950HX, GeForce RTX 4090 Laptop GPU, 99.9 Wh | MSI Pulse GL76 12UGK i7-12700H, GeForce RTX 3070 Laptop GPU, 90 Wh | Gigabyte G7 KE i5-12500H, GeForce RTX 3060 Laptop GPU, 54 Wh | Asus ROG Strix Scar 17 SE G733CX-LL014W i9-12950HX, GeForce RTX 3080 Ti Laptop GPU, 90 Wh | Acer Predator Helios 300 (i7-12700H, RTX 3070 Ti) i7-12700H, GeForce RTX 3070 Ti Laptop GPU, 90 Wh | Średnia w klasie Gaming | |
|---|---|---|---|---|---|---|---|
| Czasy pracy | 62% | 107% | 57% | 45% | 94% | 95% | |
| WiFi v1.3 (h) | 2.9 | 5.3 83% | 5.9 103% | 5.3 83% | 4.2 45% | 6 107% | 7.04 ? 143% |
| Load (h) | 1 | 1.4 40% | 2.1 110% | 1.3 30% | 1.8 80% | 1.47 ? 47% | |
| H.264 (h) | 6 | 2.2 | 5.9 | 8.26 ? | |||
| Reader / Idle (h) | 7.3 | 7.1 | 8.71 ? |
Za
Przeciw
Werdykt: MSI Katana 17 B13V to dobry system do gier
Laptop MSI Katana 17 B13V zaimponował nam w swoim głównym obszarze kompetencji - grach. Na stronieNvidia GeForce RTX 4060zapewnia wysoki poziom wydajności, który może konkurować z RTX 3070 Ti poprzedniej generacji. Oprócz szybkiego GPU, MSI jest wyposażony w wyświetlacz 144 Hz, a także klawiaturę RGB i zapewnia bardzo dobre wrażenia podczas pisania. Pomimo posiadanej mocy, laptop pozostaje stosunkowo chłodny.
Przede wszystkim głównym punktem krytyki jest wyświetlacz: Jest on niezbyt jasny i ma słabe pokrycie przestrzeni kolorów, a także wysokie czasy reakcji. Również port USB-2.0 to coś, bez czego 2023 naprawdę może się obejść. Ponadto, uznaliśmy, że układ klawiatury jest kiepsko wykonany, gdyż klawisze takie jak FN zostały przeniesione w dość nietypowe miejsca. Słaby czas pracy na baterii jest do przewidzenia po laptopie do gier, ale mimo wszystko jest godny krytyki.
GeForce RTX 4060: Atrakcyjność MSI 17 Katana B13V stoi lub upada wraz z GPU.
Ogólnie rzecz biorąc, MSI Katana 17 zasłużyła na dobrą ocenę, a dzięki RTX 4060 jest zdecydowanie ciekawym wyborem dla graczy. W czasach inflacji dotyczy to jednak również urządzeń poprzedniej generacji, jak np.Gigabyte G7 KEz RTX 3060. Świadomi cenowo klienci mogą sporo zaoszczędzić na jednym z modeli last-gena.
Cena i dostępność
W chwili publikacji tej recenzji MSI Katana 17 B14V jest obecnie niedostępna na Amazon i Best Buy. Jednak model poprzedniej generacji (3070Ti) można obecnie mieć na Amazon za około 1499 dolarów.
MSI Katana 17 B13VFK
- 21/02/2023 v7 (old)
Benjamin Herzig
Przezroczystość
Wyboru urządzeń do recenzji dokonuje nasza redakcja. Próbka testowa została udostępniona autorowi jako pożyczka od producenta lub sprzedawcy detalicznego na potrzeby tej recenzji. Pożyczkodawca nie miał wpływu na tę recenzję, producent nie otrzymał też kopii tej recenzji przed publikacją. Nie było obowiązku publikowania tej recenzji. Jako niezależna firma medialna, Notebookcheck nie podlega władzy producentów, sprzedawców detalicznych ani wydawców.
Tak testuje Notebookcheck
Każdego roku Notebookcheck niezależnie sprawdza setki laptopów i smartfonów, stosując standardowe procedury, aby zapewnić porównywalność wszystkich wyników. Od około 20 lat stale rozwijamy nasze metody badawcze, ustanawiając przy tym standardy branżowe. W naszych laboratoriach testowych doświadczeni technicy i redaktorzy korzystają z wysokiej jakości sprzętu pomiarowego. Testy te obejmują wieloetapowy proces walidacji. Nasz kompleksowy system ocen opiera się na setkach uzasadnionych pomiarów i benchmarków, co pozwala zachować obiektywizm.Price comparison

