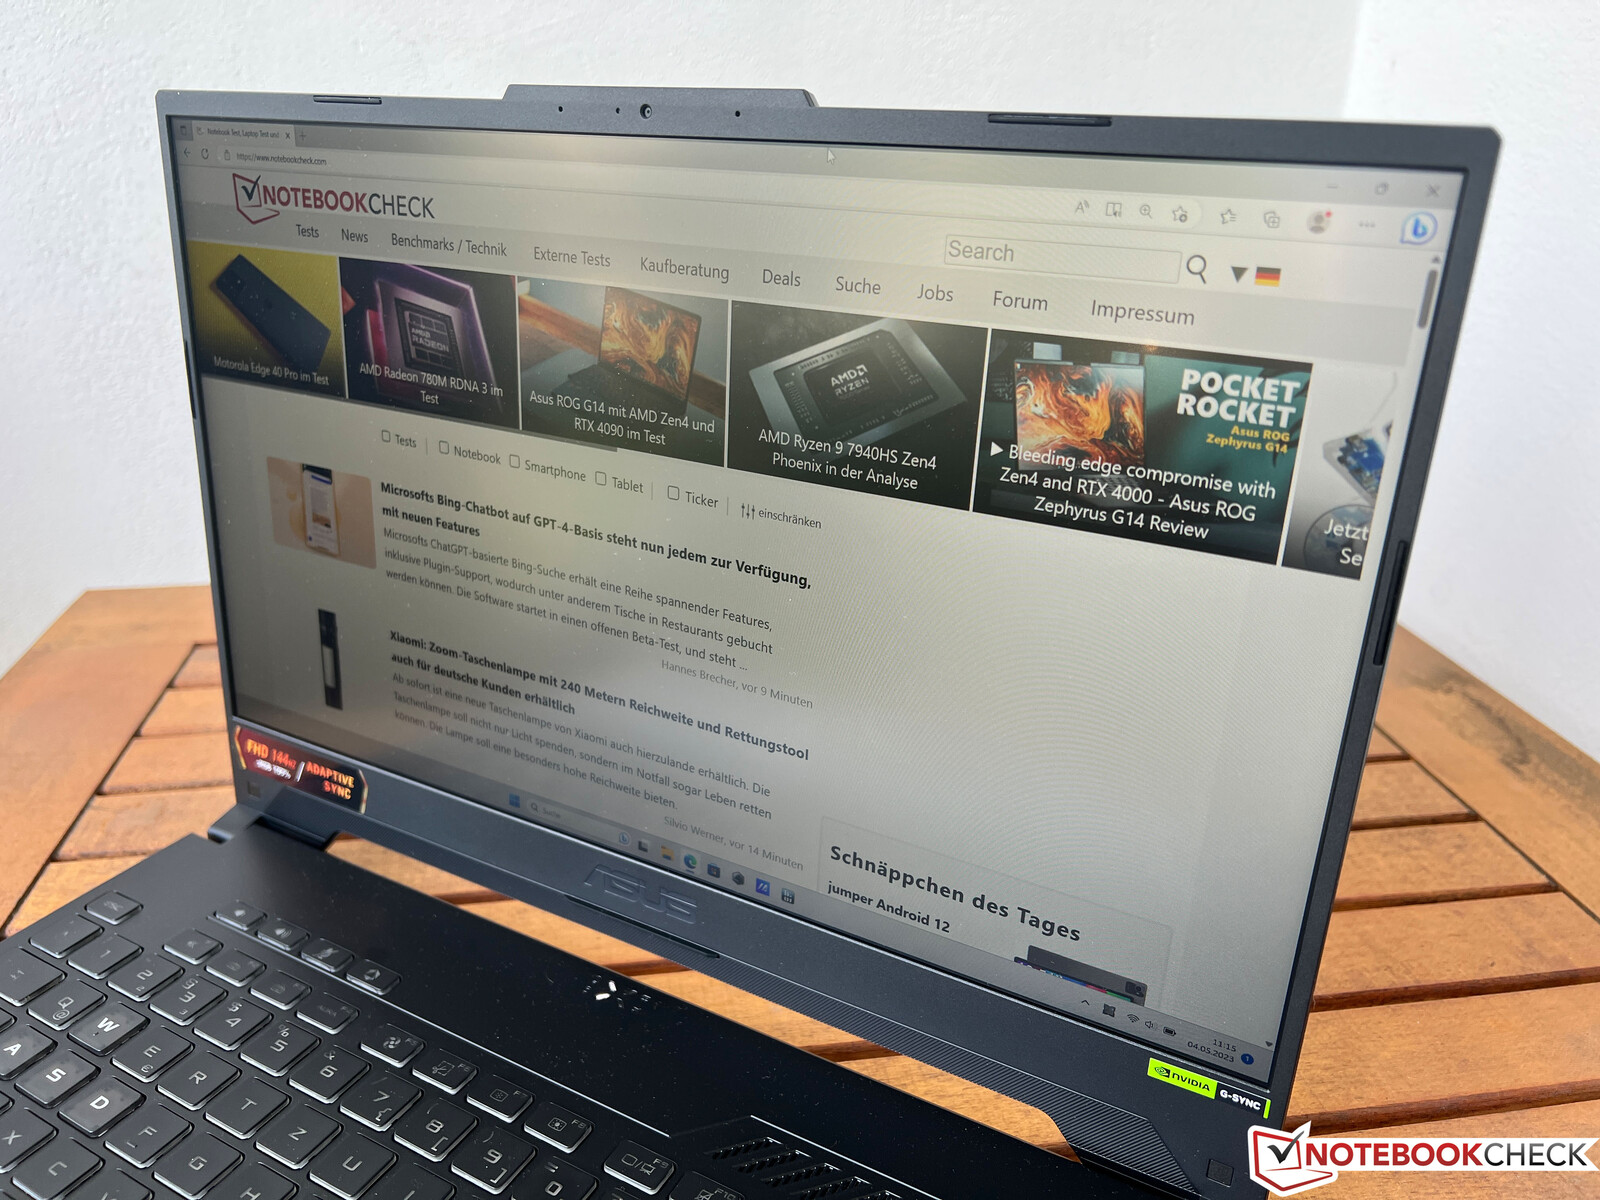
Recenzja laptopa Asus TUF Gaming A15 - budżetowy gracz z RTX 4050 i ekranem 144 Hz
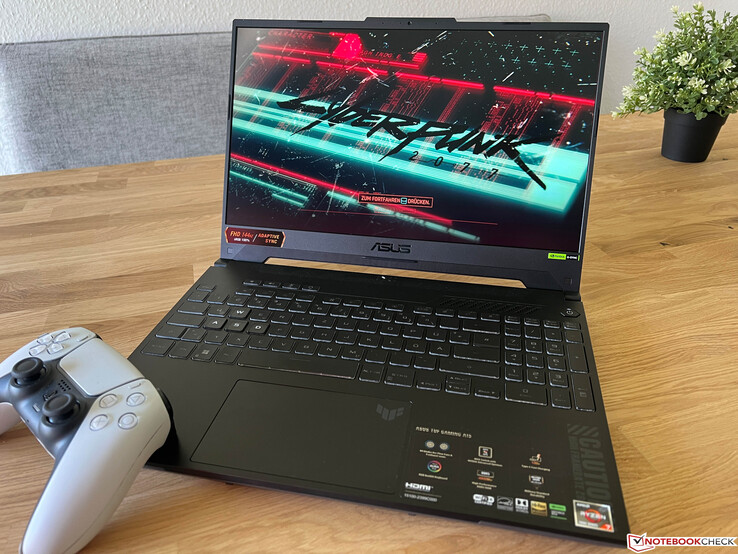
Znajdująca się poniżej serii ROG, seria Asus TUF Gaming ma na celu zapewnienie tańszej opcji laptopa dla graczy. Niedawno przetestowaliśmy16-calowy model ze sprzętem AMDa teraz nadszedł czas, aby przyjrzeć się wersji 15-calowej: TUF Gaming A15 z procesorem AMD (Ryzen 7 7735HS) i aktualną kartą graficzną Nvidii (GeForce RTX 4050 Laptop). Jego MRSP wynosi około 1300 USD, a obecnie można go znaleźć w Internecie za 1169 USD. Ponadto urządzenie posiada matowy panel IPS z częstotliwością odświeżania 144 Hz, 16 GB pamięci RAM i 512 GB NVMe SSD. Wersja detaliczna FA507NU-LP031 jest dostarczana bez systemu operacyjnego, ale nasz miał już zainstalowany system Windows 11 Home, gdy go otrzymaliśmy.
Potencjalni konkurenci w porównaniu
Ocena | Data | Model | Waga | Wysokość | Rozmiar | Rezolucja | Cena |
|---|---|---|---|---|---|---|---|
| 86.3 % v7 (old) | 06/2023 | Asus TUF A15 FA507 R7 7735HS, GeForce RTX 4050 Laptop GPU | 2.2 kg | 24.9 mm | 15.60" | 1920x1080 | |
| 81.8 % v7 (old) | 04/2023 | Gigabyte G5 KE i5-12500H, GeForce RTX 3060 Laptop GPU | 2 kg | 23.9 mm | 15.60" | 1920x1080 | |
| 87.9 % v7 (old) | 01/2023 | Schenker XMG Core 15 (M22) R7 6800H, GeForce RTX 3060 Laptop GPU | 2.1 kg | 23 mm | 15.60" | 2560x1440 | |
| 82.9 % v7 (old) | 03/2023 | MSI Katana 15 B12VEK i7-12650H, GeForce RTX 4050 Laptop GPU | 2.3 kg | 24.9 mm | 15.60" | 1920x1080 | |
| 81 % v7 (old) | 01/2023 | HP Victus 15 fa0020nr i7-12700H, GeForce RTX 3050 Ti Laptop GPU | 2.3 kg | 23.6 mm | 15.60" | 1920x1080 | |
| 82.8 % v7 (old) | 10/2022 | Lenovo IdeaPad Gaming 3 15IAH7 i5-12500H, GeForce RTX 3050 Ti Laptop GPU | 2.4 kg | 26 mm | 15.60" | 1920x1080 | |
| 87.2 % v7 (old) | Asus TUF Gaming F15 FX507ZM i7-12700H, GeForce RTX 3060 Laptop GPU | 2.1 kg | 24.95 mm | 15.60" | 1920x1080 |
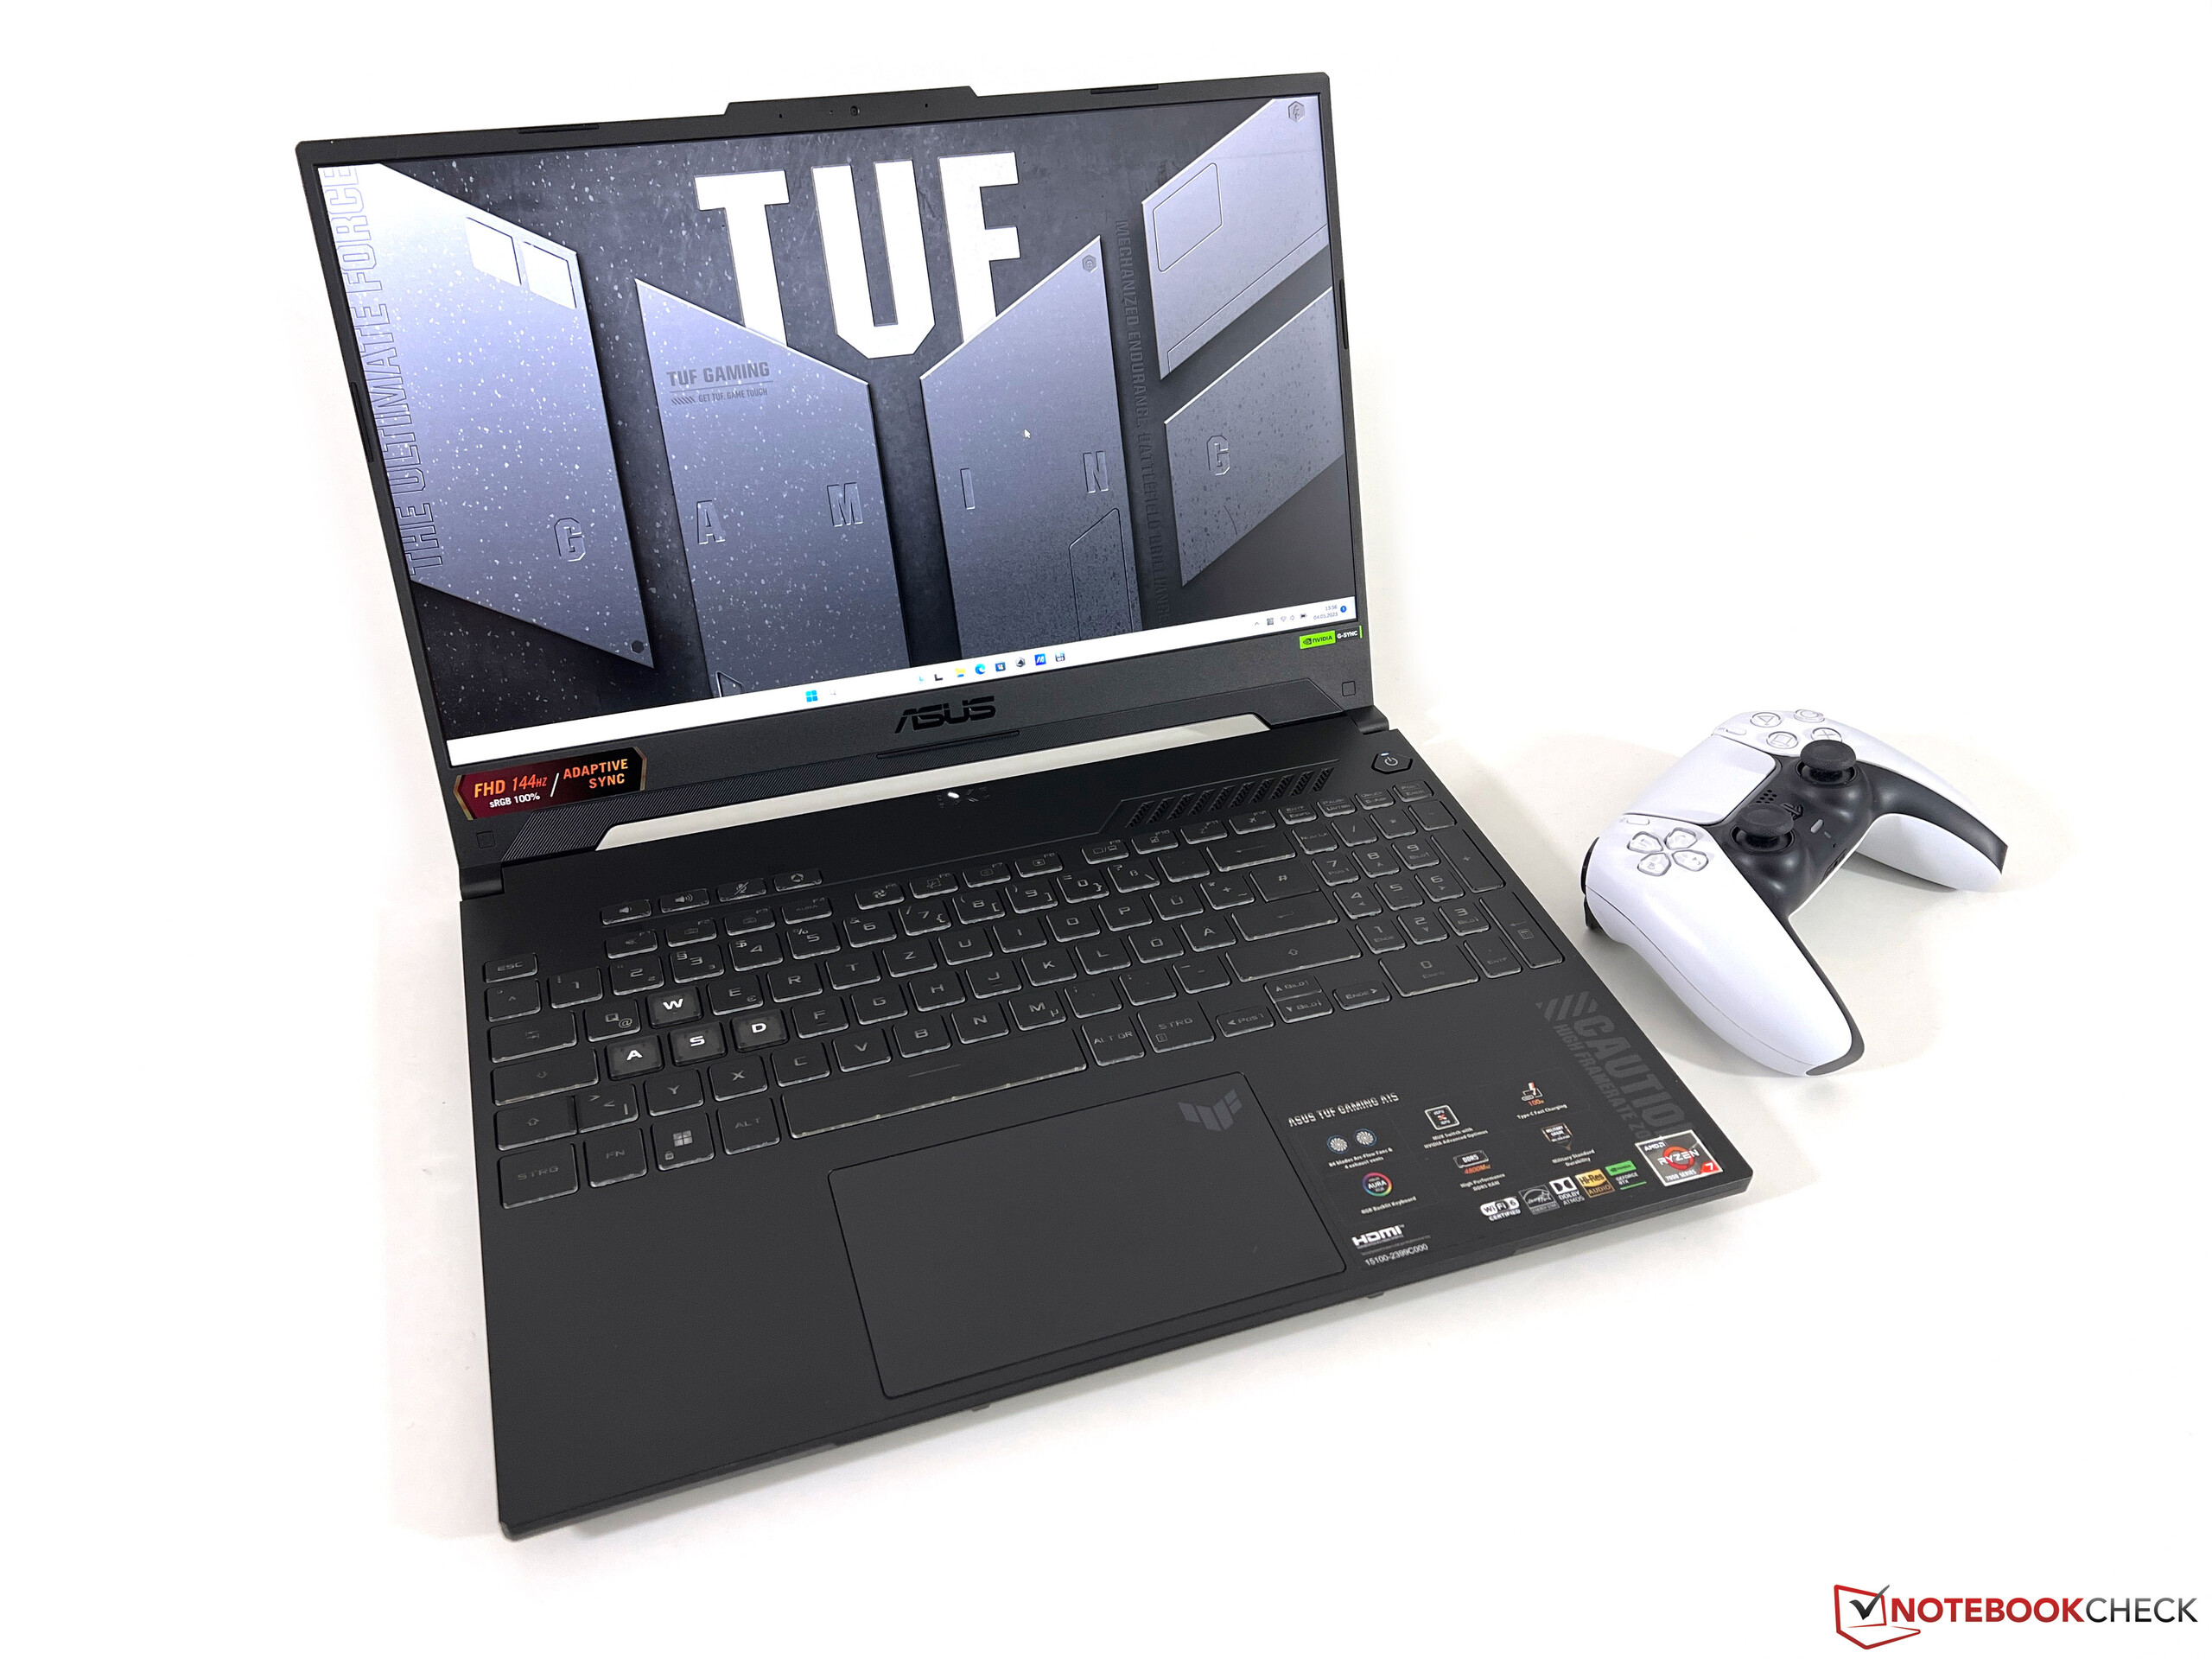
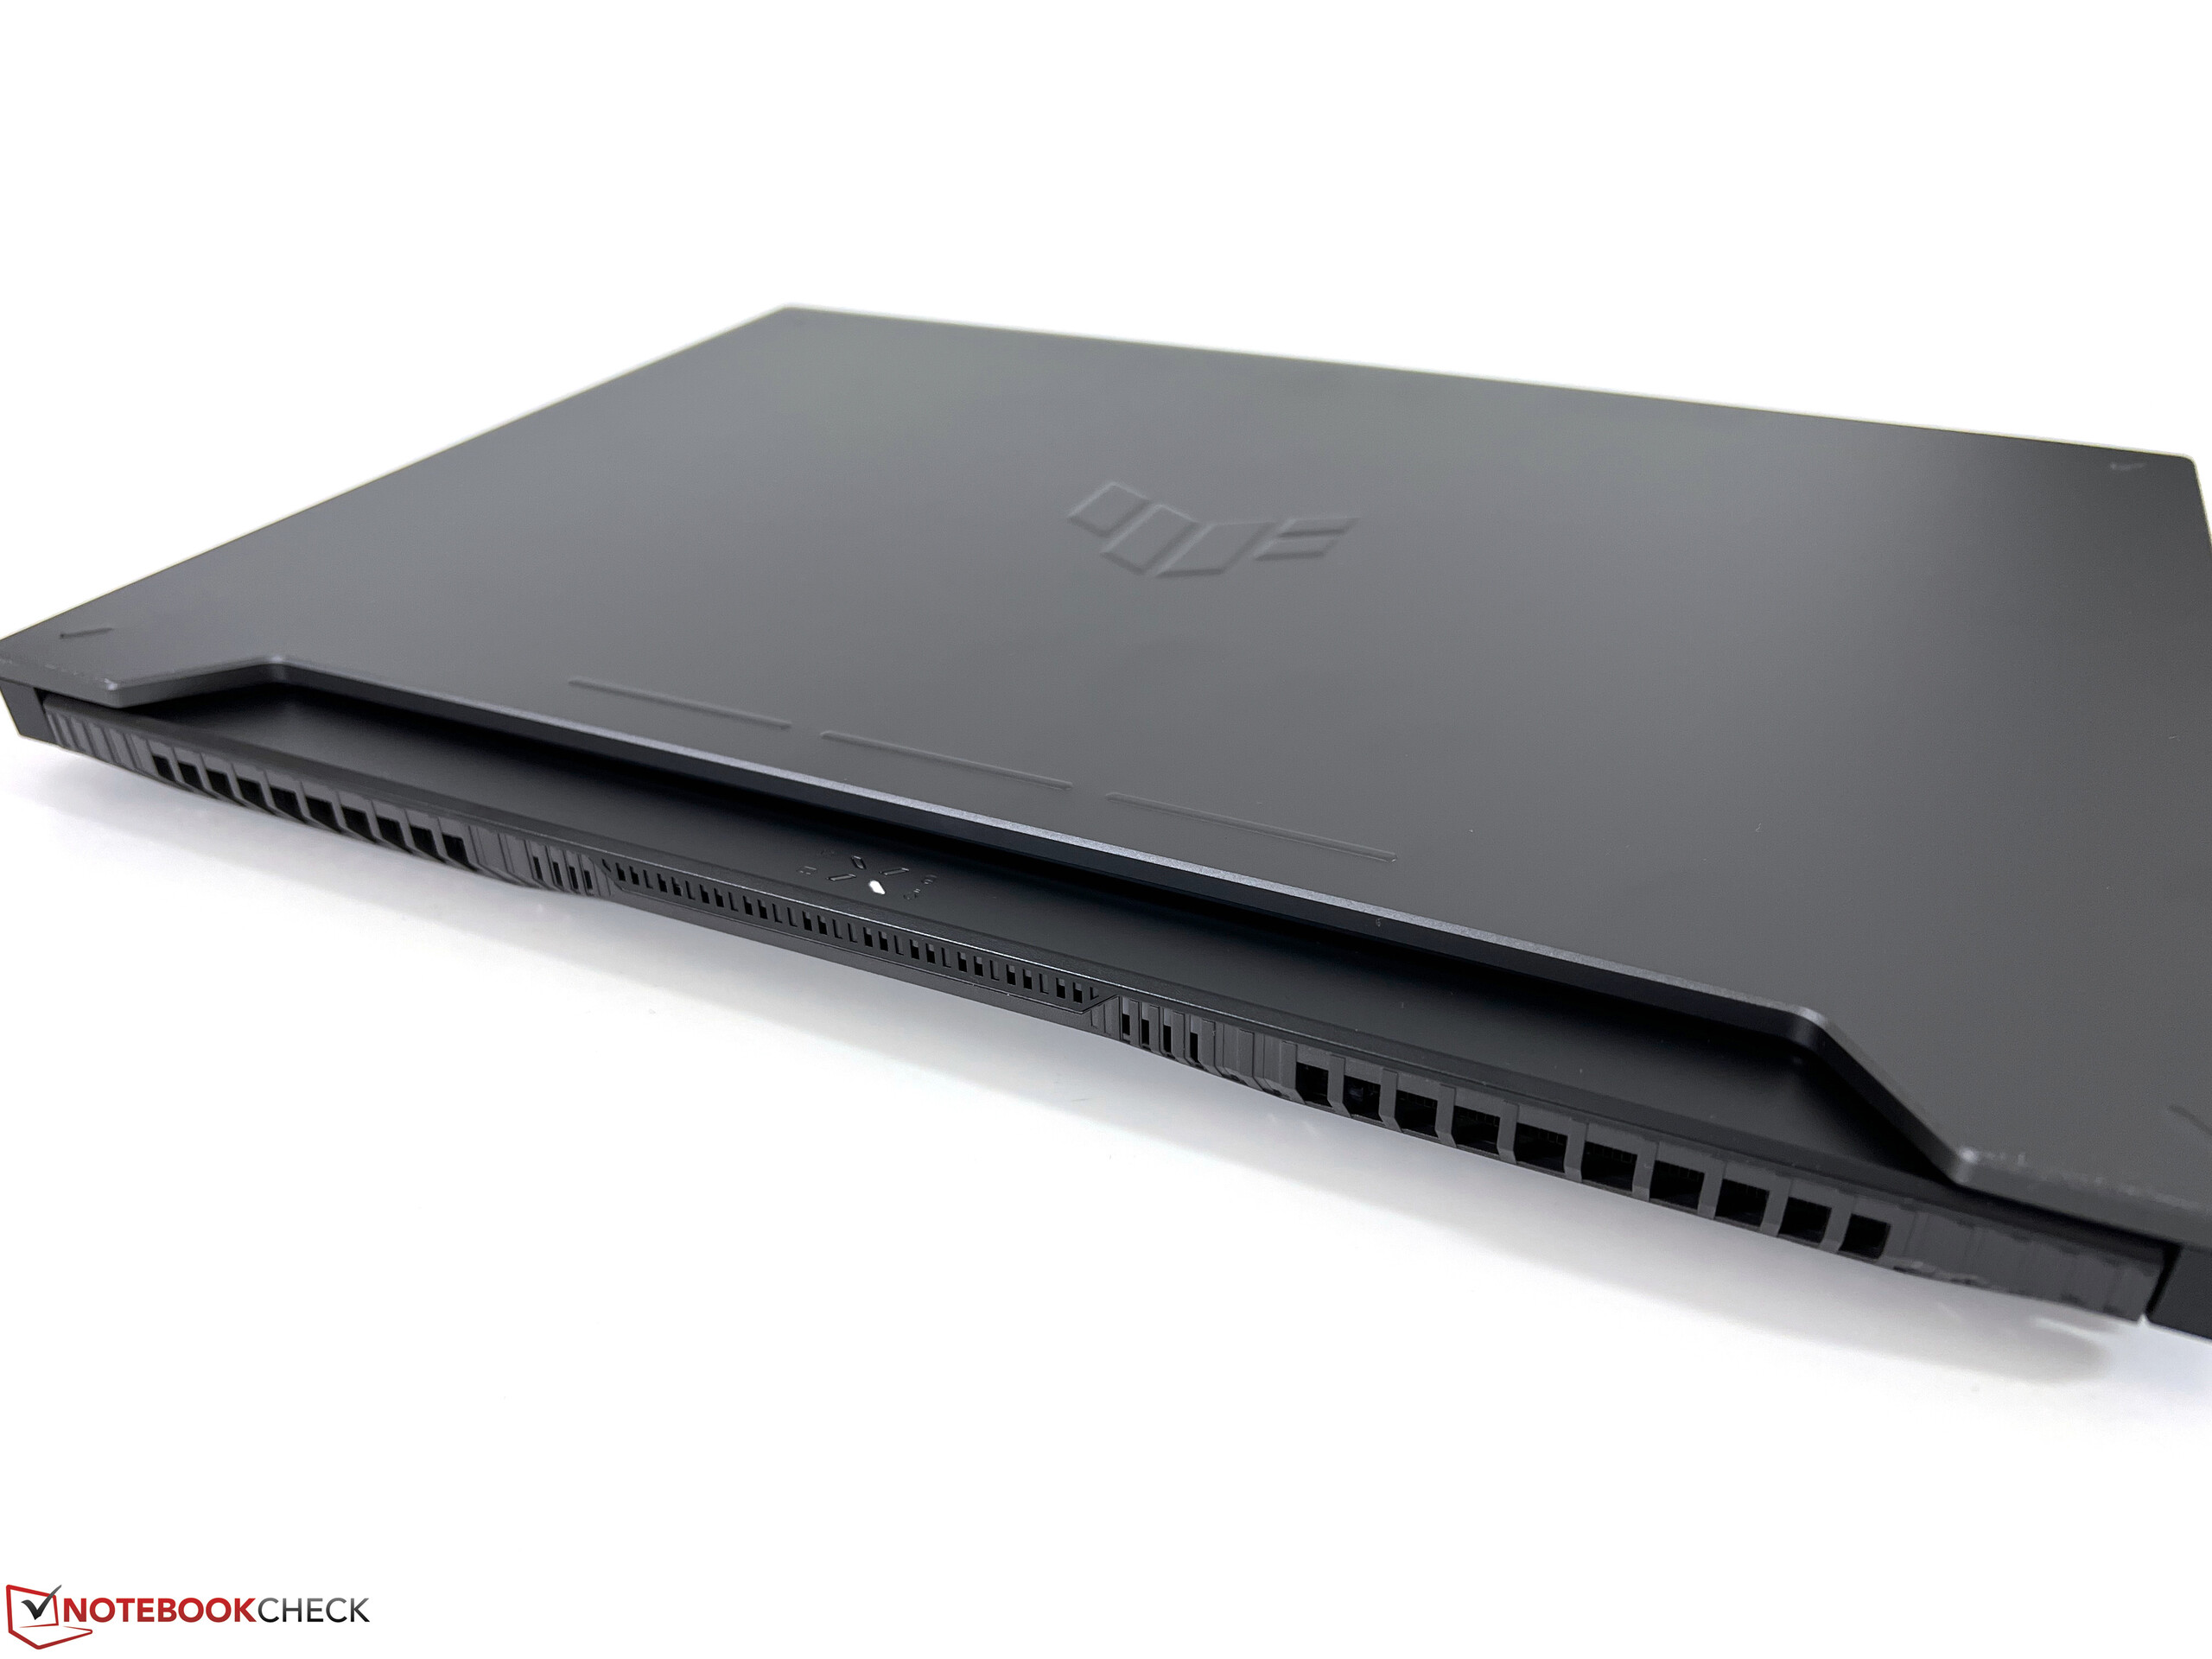
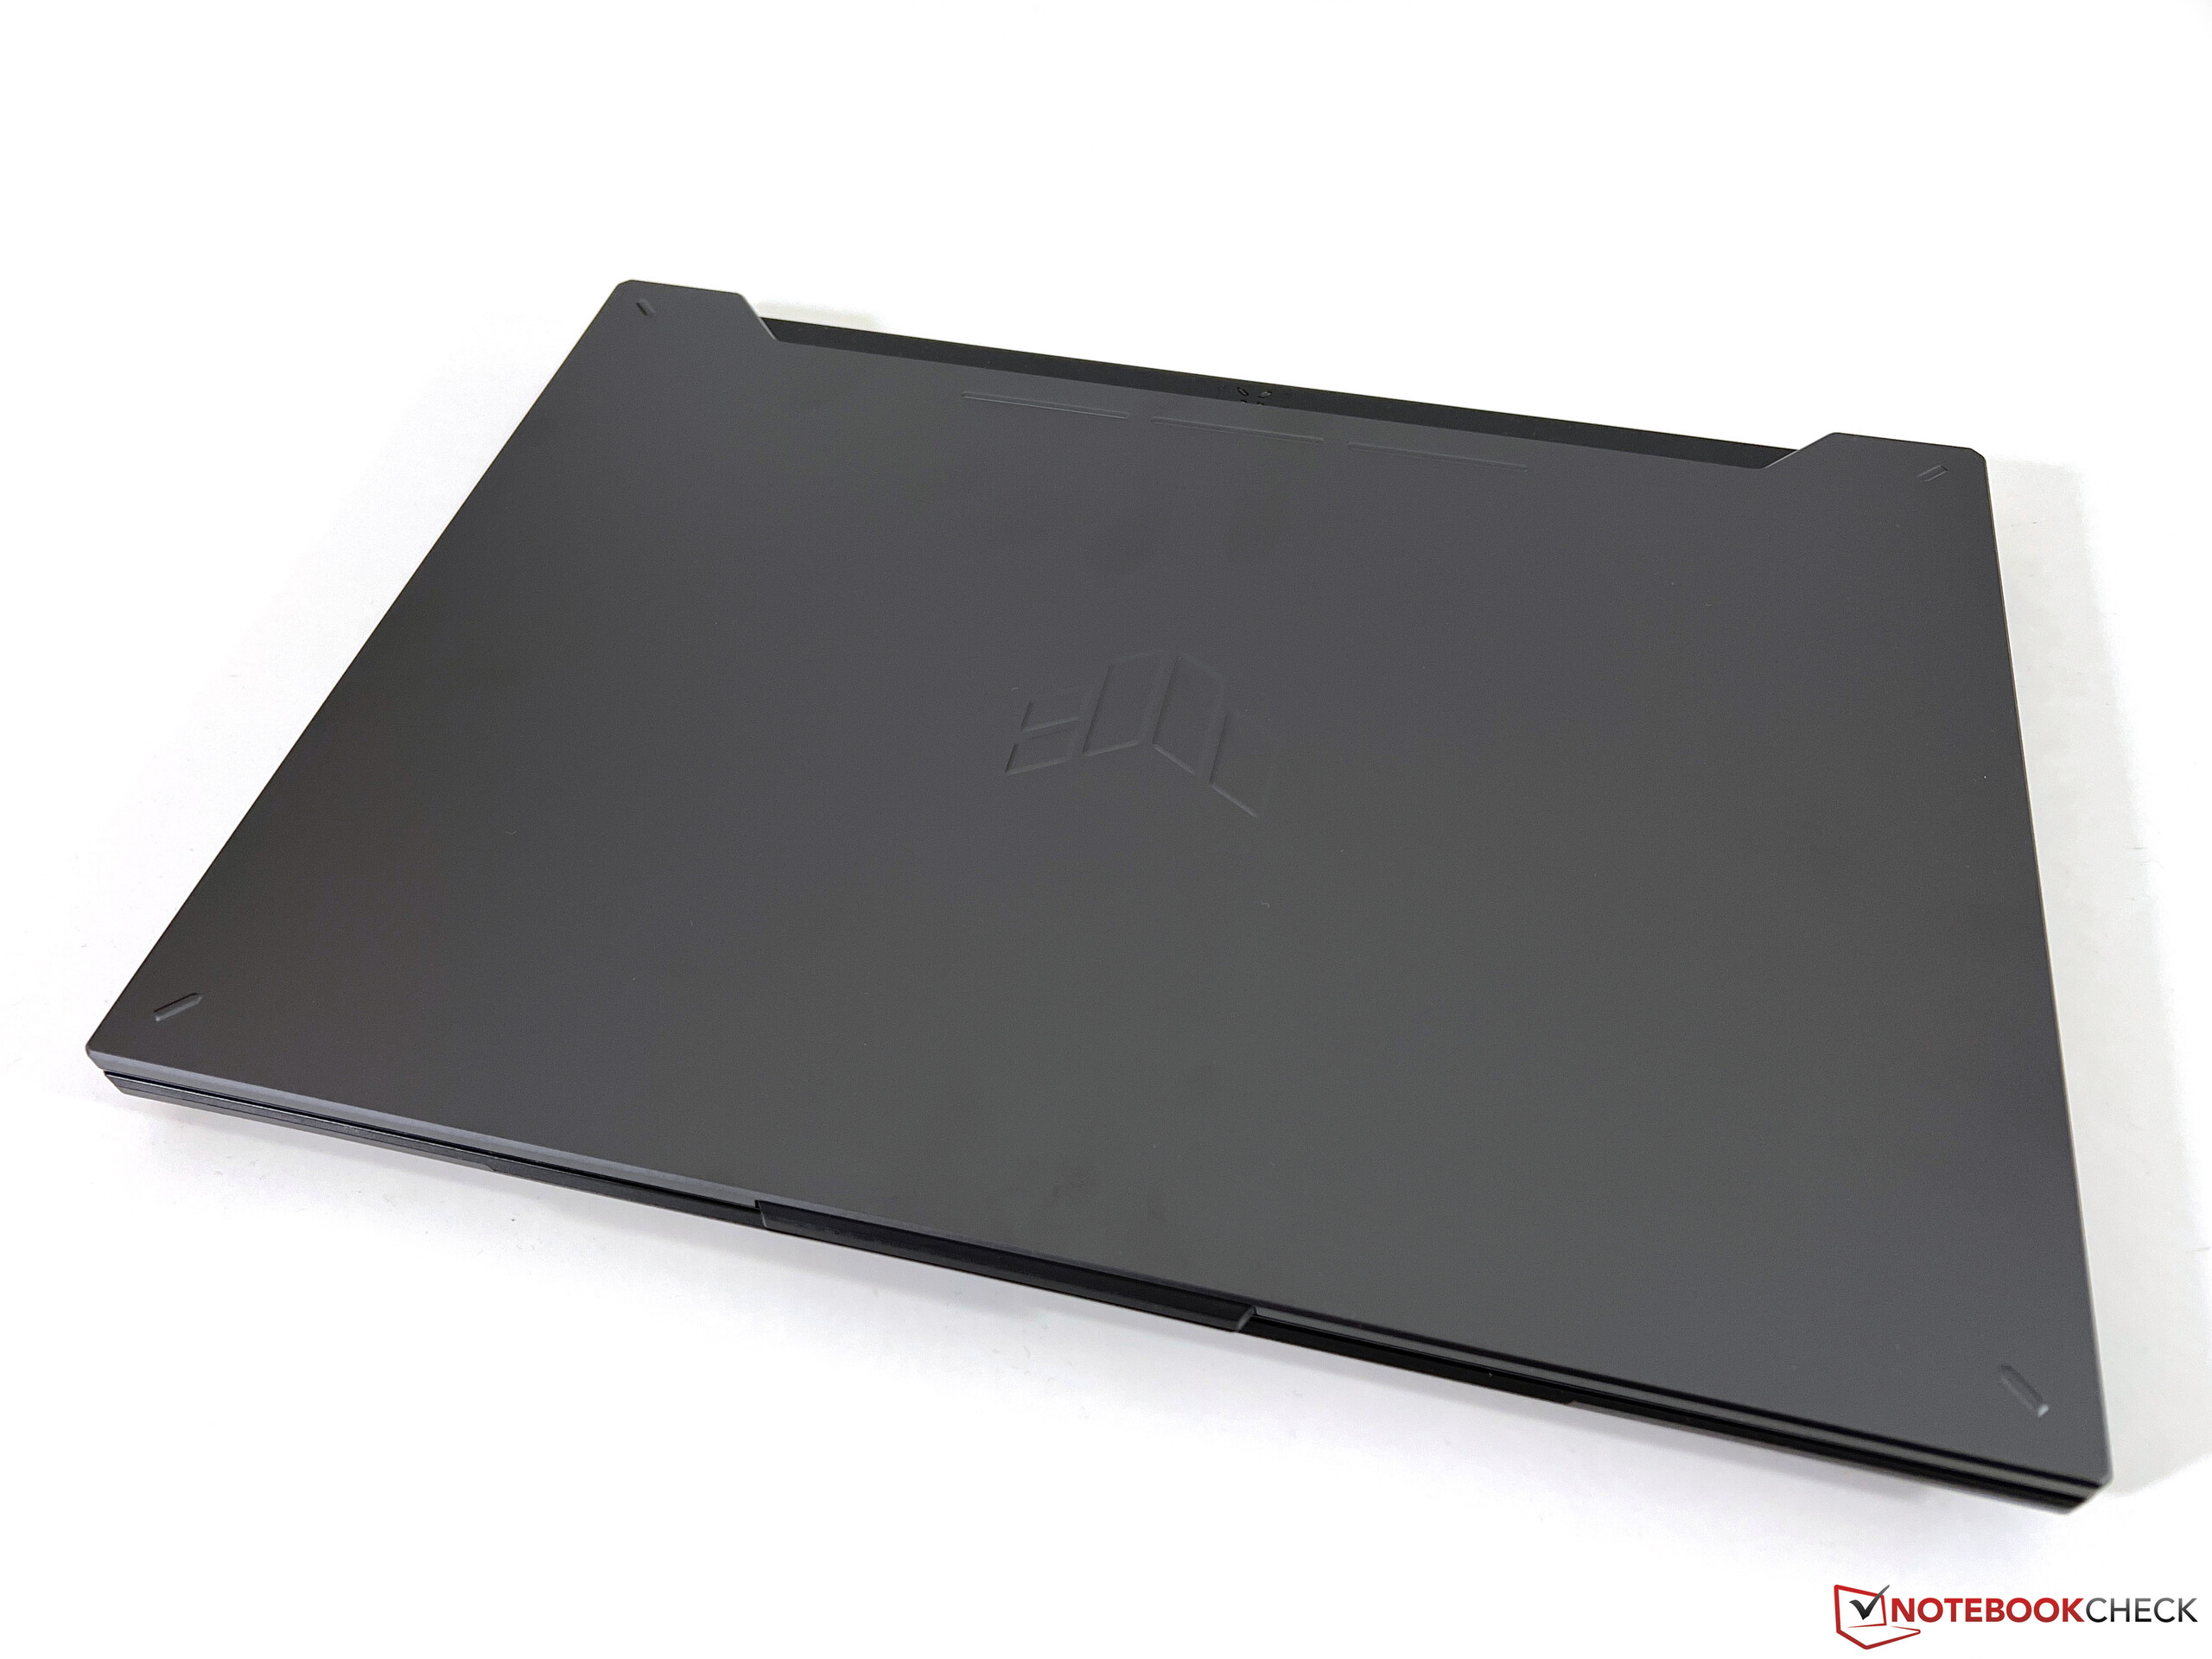
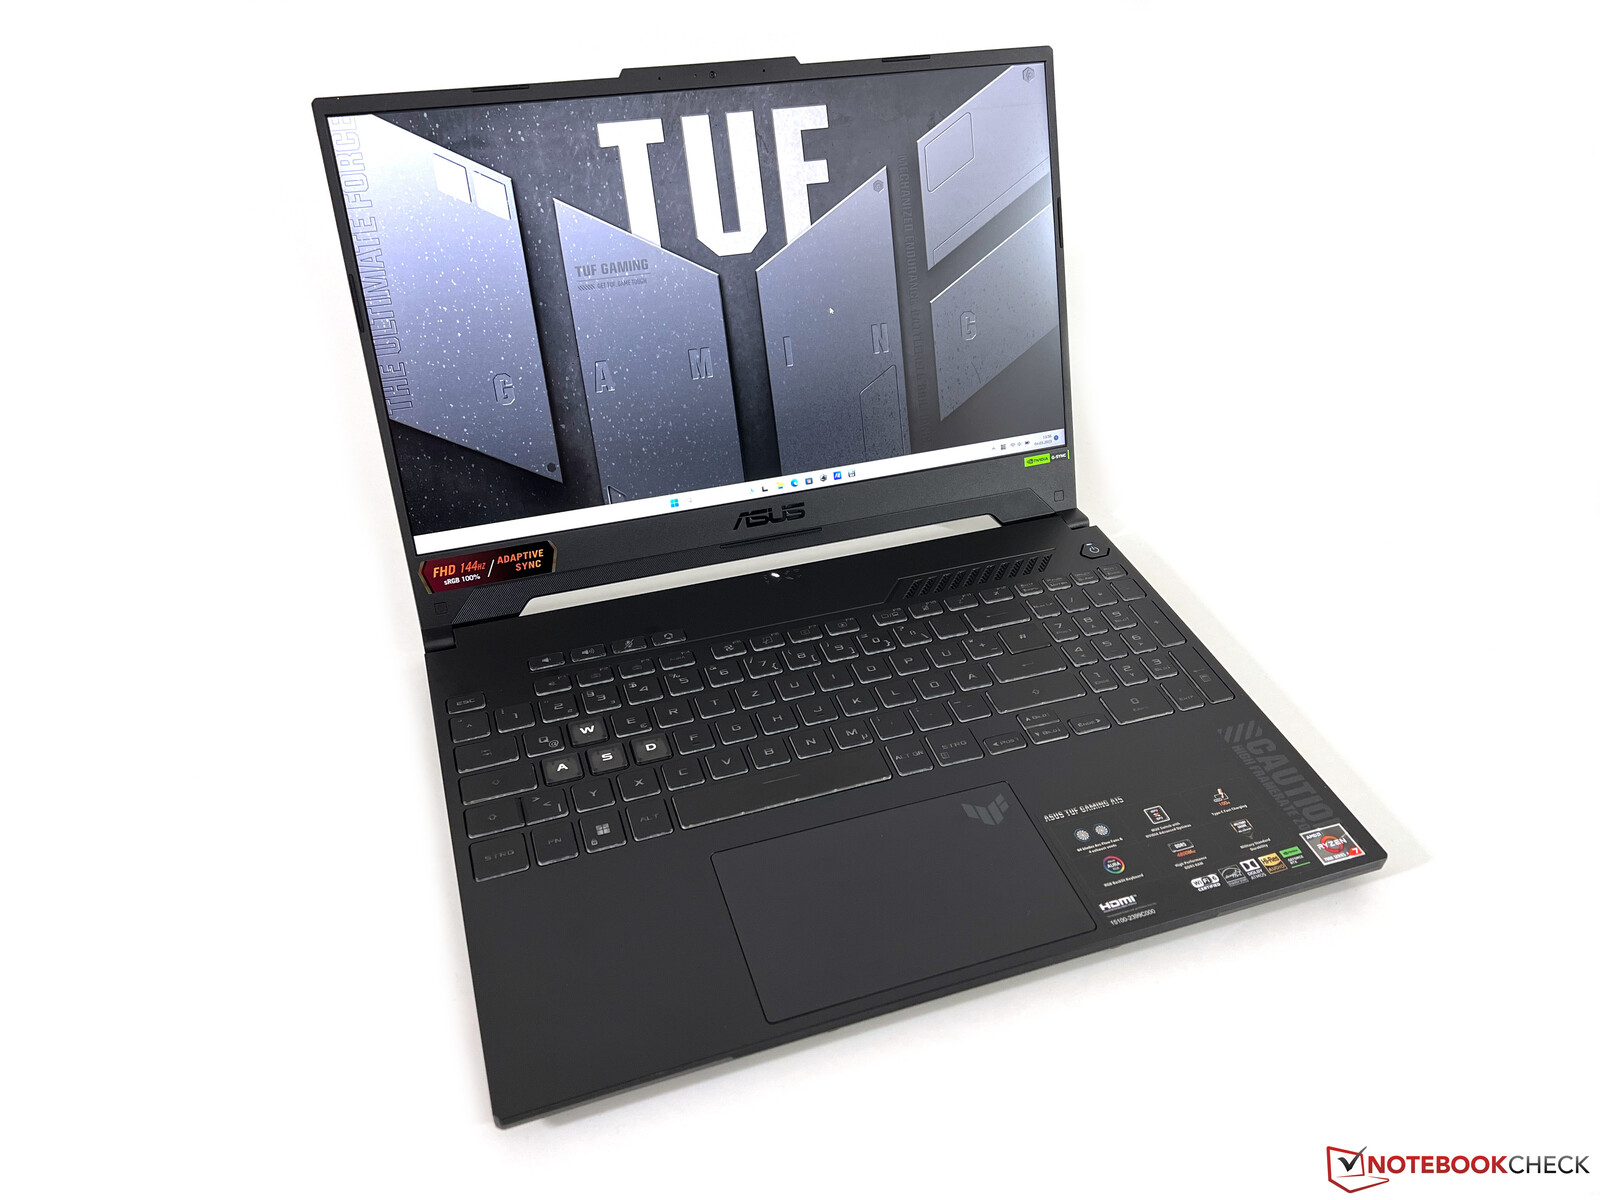
Obudowa - dyskretny laptop do gier bez podświetlenia
W porównaniu do swojego poprzednika z procesorem IntelTUF Gaming F15konstrukcja obudowy tego laptopa pozostaje praktycznie niezmieniona. Istnieją tylko niewielkie różnice, takie jak klawisze WASD nie są już białe, a cztery rogi pokrywy mają teraz małe paski zamiast okręgów. Obecny model nadal nie posiada żadnych wymyślnych funkcji podświetlenia i ogólnie laptop nabrał dość stonowanego wyglądu dzięki ciemnoszaremu kolorowi. Szczególnie dolna krawędź wzdłuż ekranu jest dość duża, ponieważ laptop nadal wykorzystuje proporcje 16:9. Prawdopodobnie będziesz musiał dość często czyścić jego ciemne powierzchnie, ponieważ są one podatne na zbieranie odcisków palców.
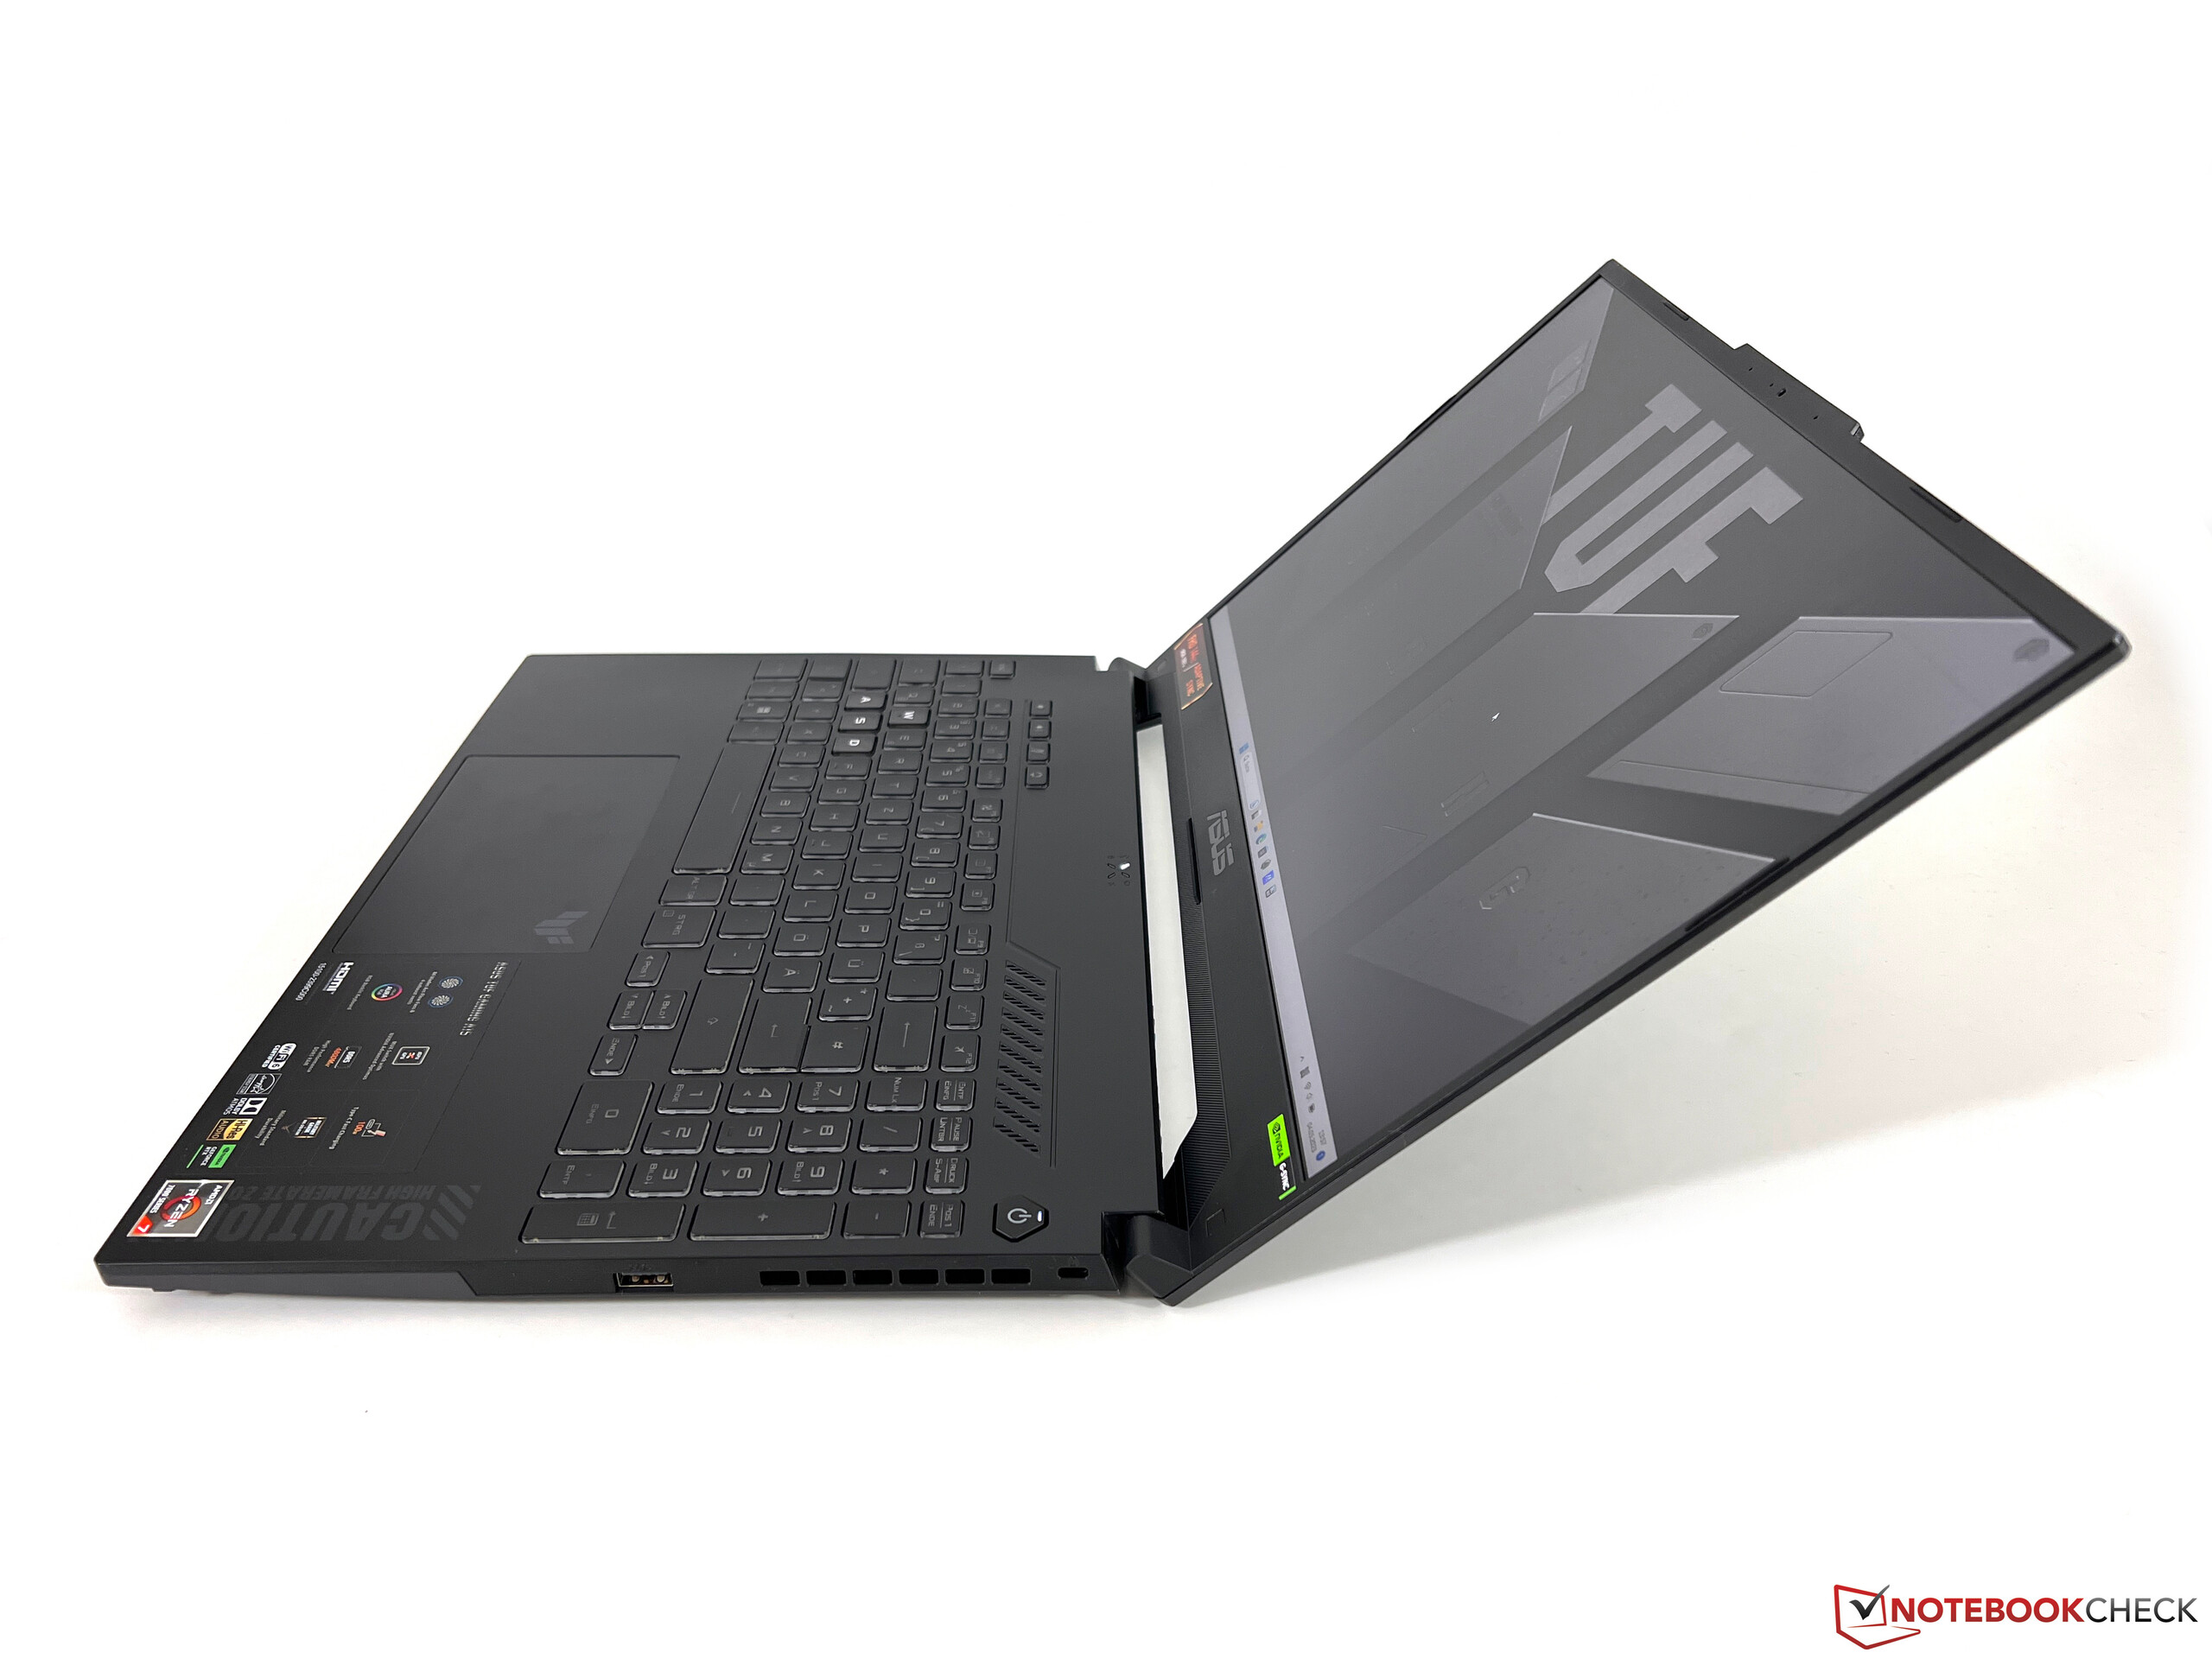
Pokrywa laptopa wykonana jest z metalu, a reszta obudowy z tworzywa sztucznego. Podstawa jest wystarczająco stabilna, ale można dość łatwo wcisnąć środek klawiatury. Chociaż nie wydaje żadnych skrzypiących dźwięków, gdy próbujesz skręcić i zgiąć urządzenie. Jego cienka pokrywa nie jest najlepsza, ponieważ ekran zaczyna już wykazywać zakłócenia, gdy naciskasz go z niewielkim naciskiem lub próbujesz zmienić kąt otwarcia (maksymalnie ~ 135 stopni).
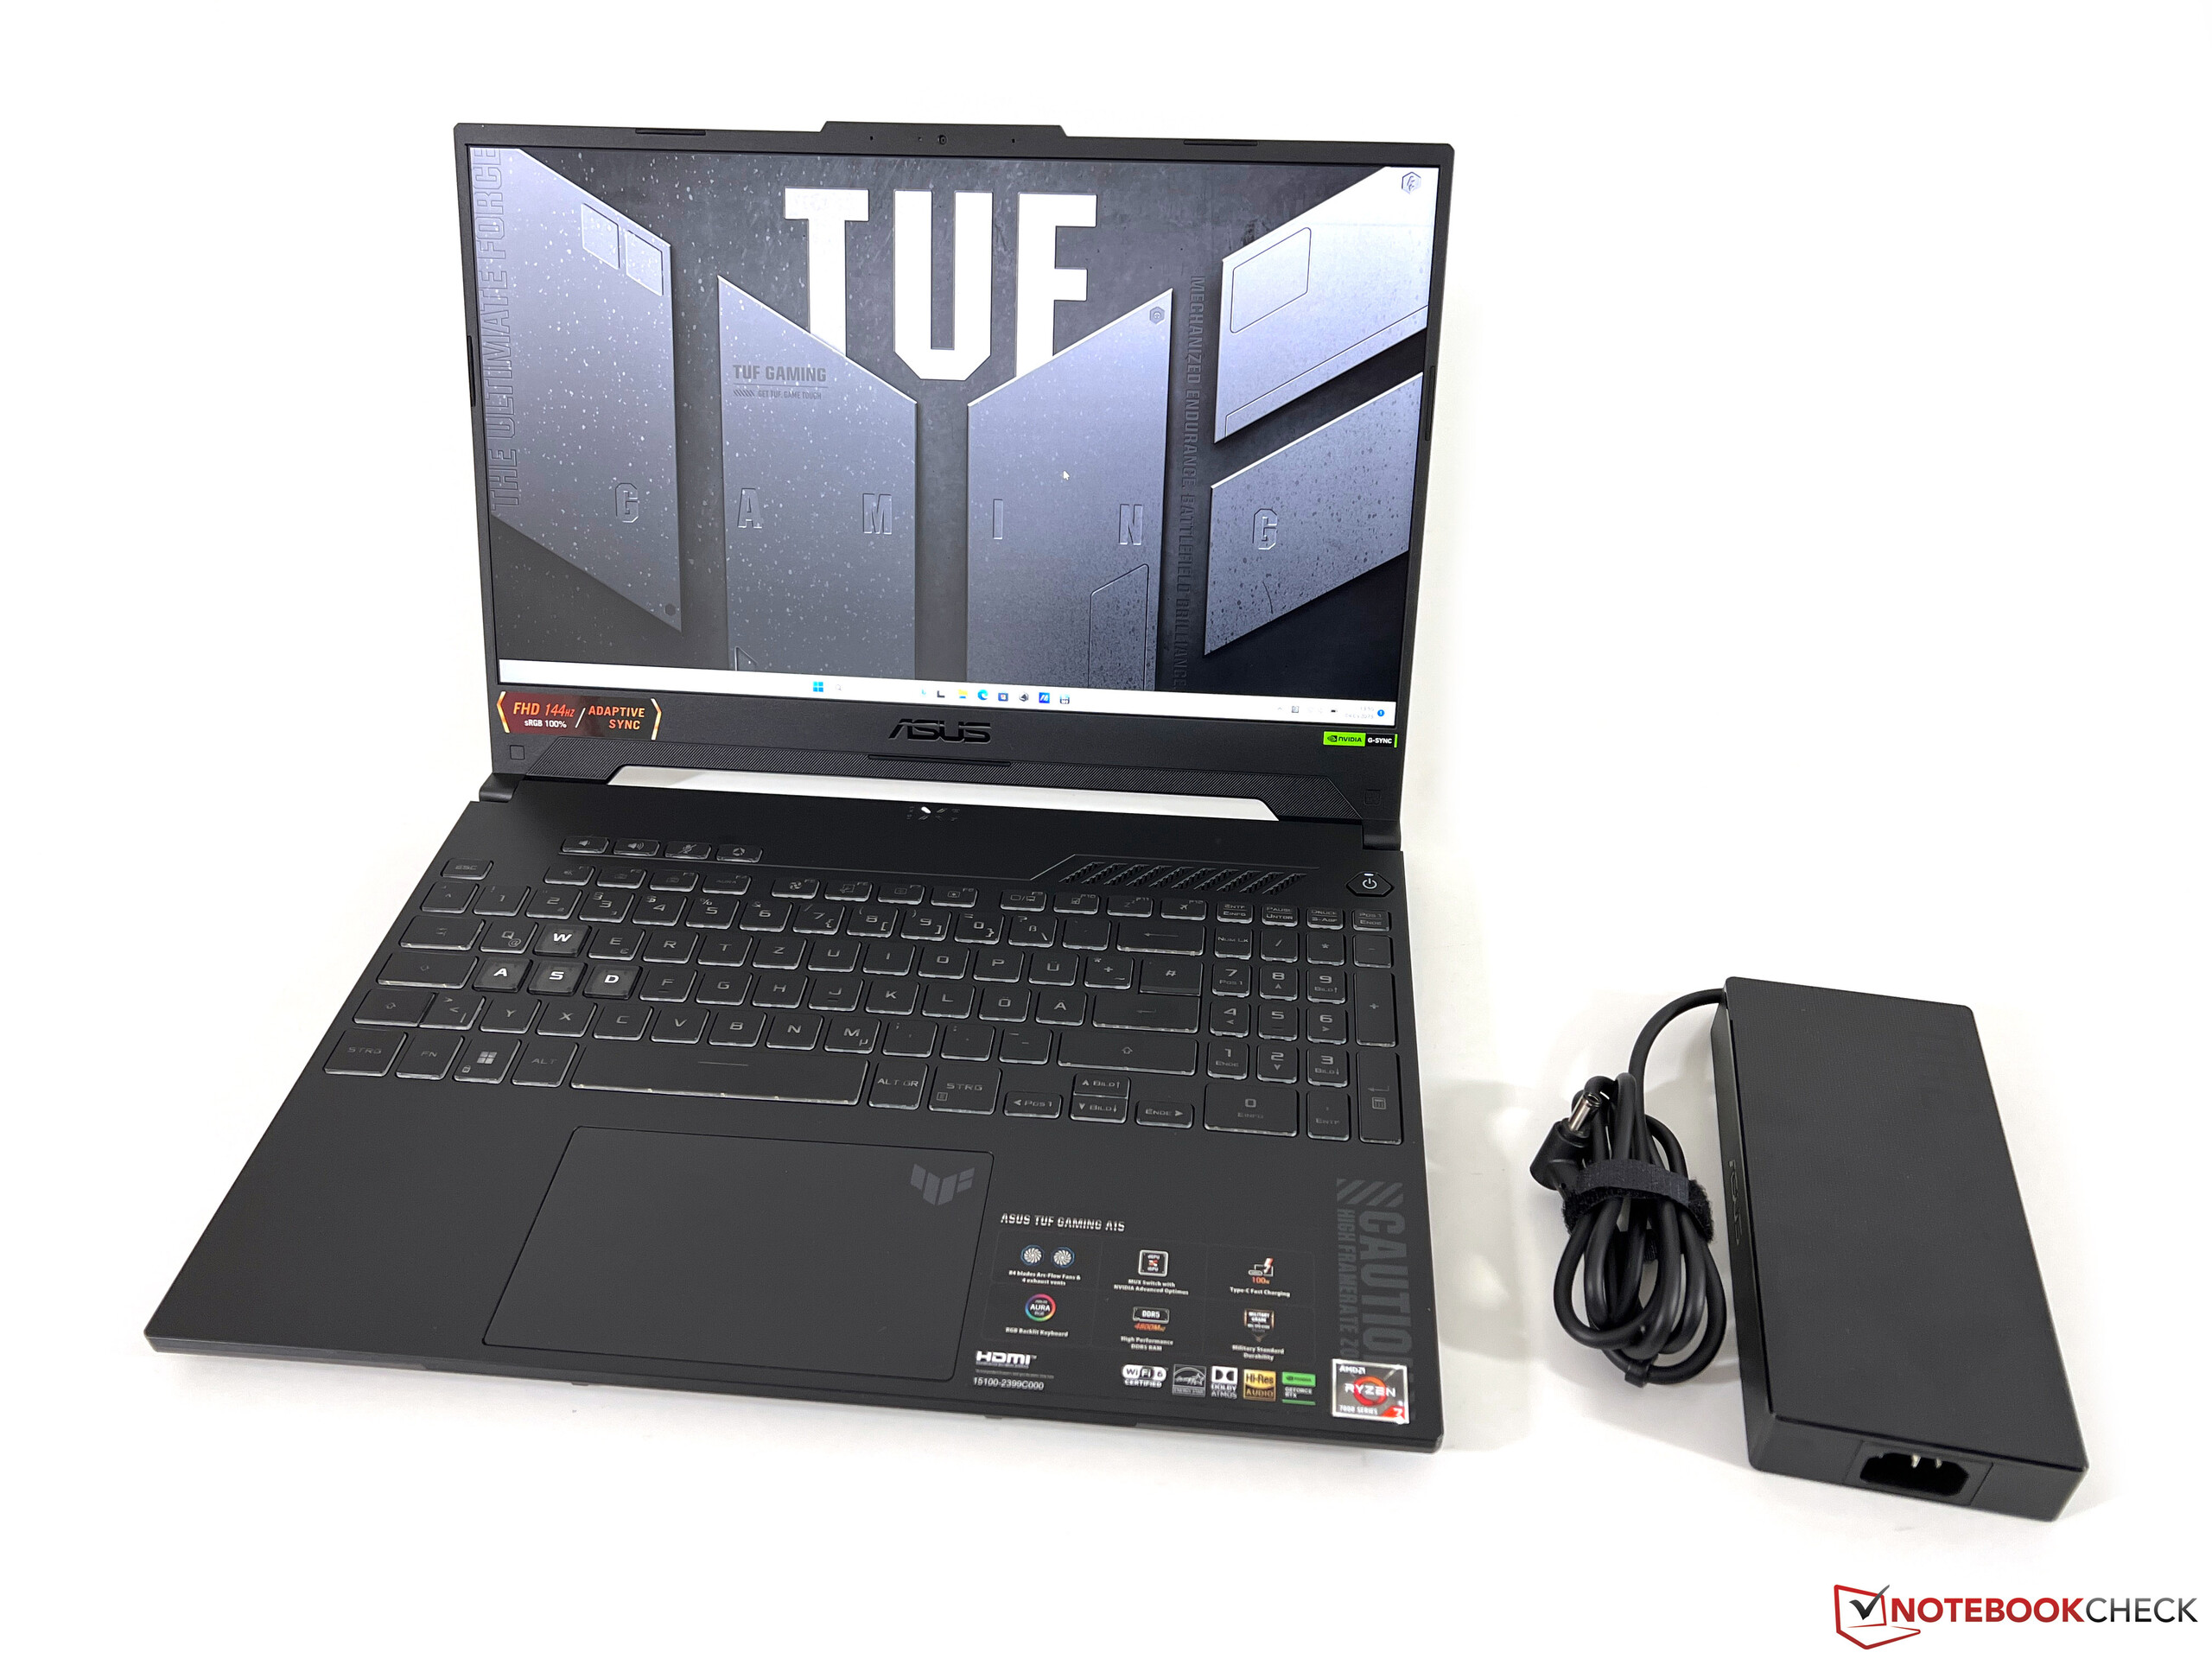
Pod względem rozmiaru wszyscy konkurenci są dość podobni - ale TUF Gaming A15 ma najmniejszy projekt. Waży nieco ponad 2,1 kg, dzięki czemu laptop jest stosunkowo przenośny i najprawdopodobniej będzie można go zmieścić w większości plecaków lub toreb. Dołączony 240-watowy zasilacz waży dodatkowe 735 gramów.
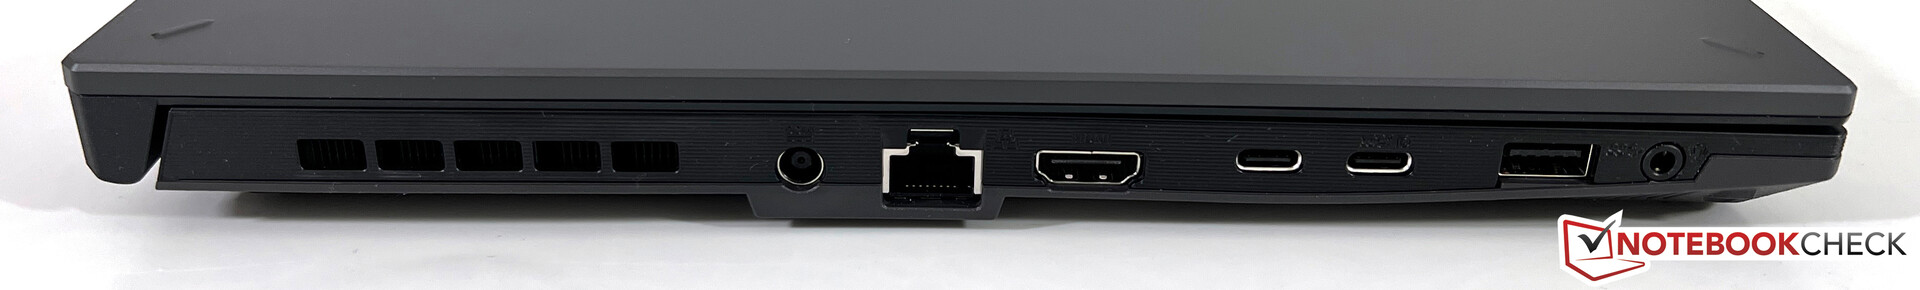
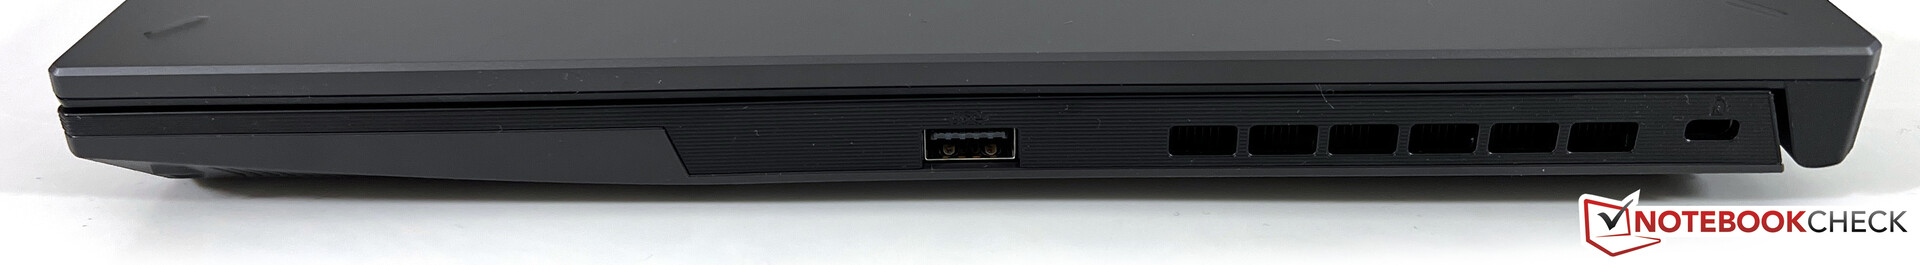
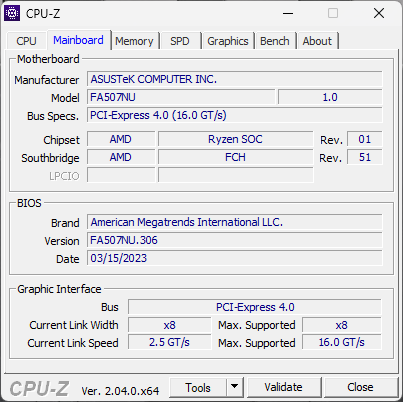
Łączność - Asus dołączył USB 4
Tylna część jednostki bazowej jest zajęta przez jednostkę chłodzącą, a prawie wszystkie porty znajdują się po lewej stronie urządzenia. Tylko jeden port USB znajduje się po prawej stronie. Jeśli korzystasz ze wszystkich portów, może być trochę ciasno. Istnieją dwa porty USB-C, z których jeden obsługuje USB 4.0, a drugi obsługuje G-Sync, jeśli podłączysz odpowiedni monitor.
Komunikacja
Oprócz portu Gigabit Ethernet, laptop wykorzystuje również moduł WLAN MediaTek MT7921, który obsługuje połączenia Wi-Fi 6 i pasmo 160 MHz. Jednak jego maksymalne prędkości transferu wynoszą 1200 bit/s. W naszym teście z wykorzystaniem referencyjnego routera od Asusa, prędkości te zostały potwierdzone i choć są przyzwoite, to na rynku są zdecydowanie szybsze moduły WLAN. Koniec końców, nie powinno to powodować żadnych problemów w codziennym użytkowaniu (np. podczas pobierania treści).
| Networking | |
| Asus TUF A15 FA507 | |
| iperf3 transmit AXE11000 | |
| iperf3 receive AXE11000 | |
| Gigabyte G5 KE | |
| iperf3 transmit AXE11000 | |
| iperf3 receive AXE11000 | |
| Schenker XMG Core 15 (M22) | |
| iperf3 transmit AXE11000 | |
| iperf3 receive AXE11000 | |
| iperf3 transmit AXE11000 6GHz | |
| iperf3 receive AXE11000 6GHz | |
| MSI Katana 15 B12VEK | |
| iperf3 transmit AXE11000 | |
| iperf3 receive AXE11000 | |
| HP Victus 15 fa0020nr | |
| iperf3 transmit AXE11000 | |
| iperf3 receive AXE11000 | |
| Lenovo IdeaPad Gaming 3 15IAH7 | |
| iperf3 receive AXE11000 | |
| Asus TUF Gaming F15 FX507ZM | |
| iperf3 transmit AX12 | |
| iperf3 receive AX12 | |
Kamera internetowa
Pomimo tego, że kamera w TUF Gaming A15 ma wybrzuszenie, jest w stanie wyświetlać tylko 720p, co utrudnia robienie przyzwoitych zdjęć nawet w dobrych warunkach oświetleniowych. Ostrość jest minimalna, a kolory nie są zbyt dokładnie odwzorowane.


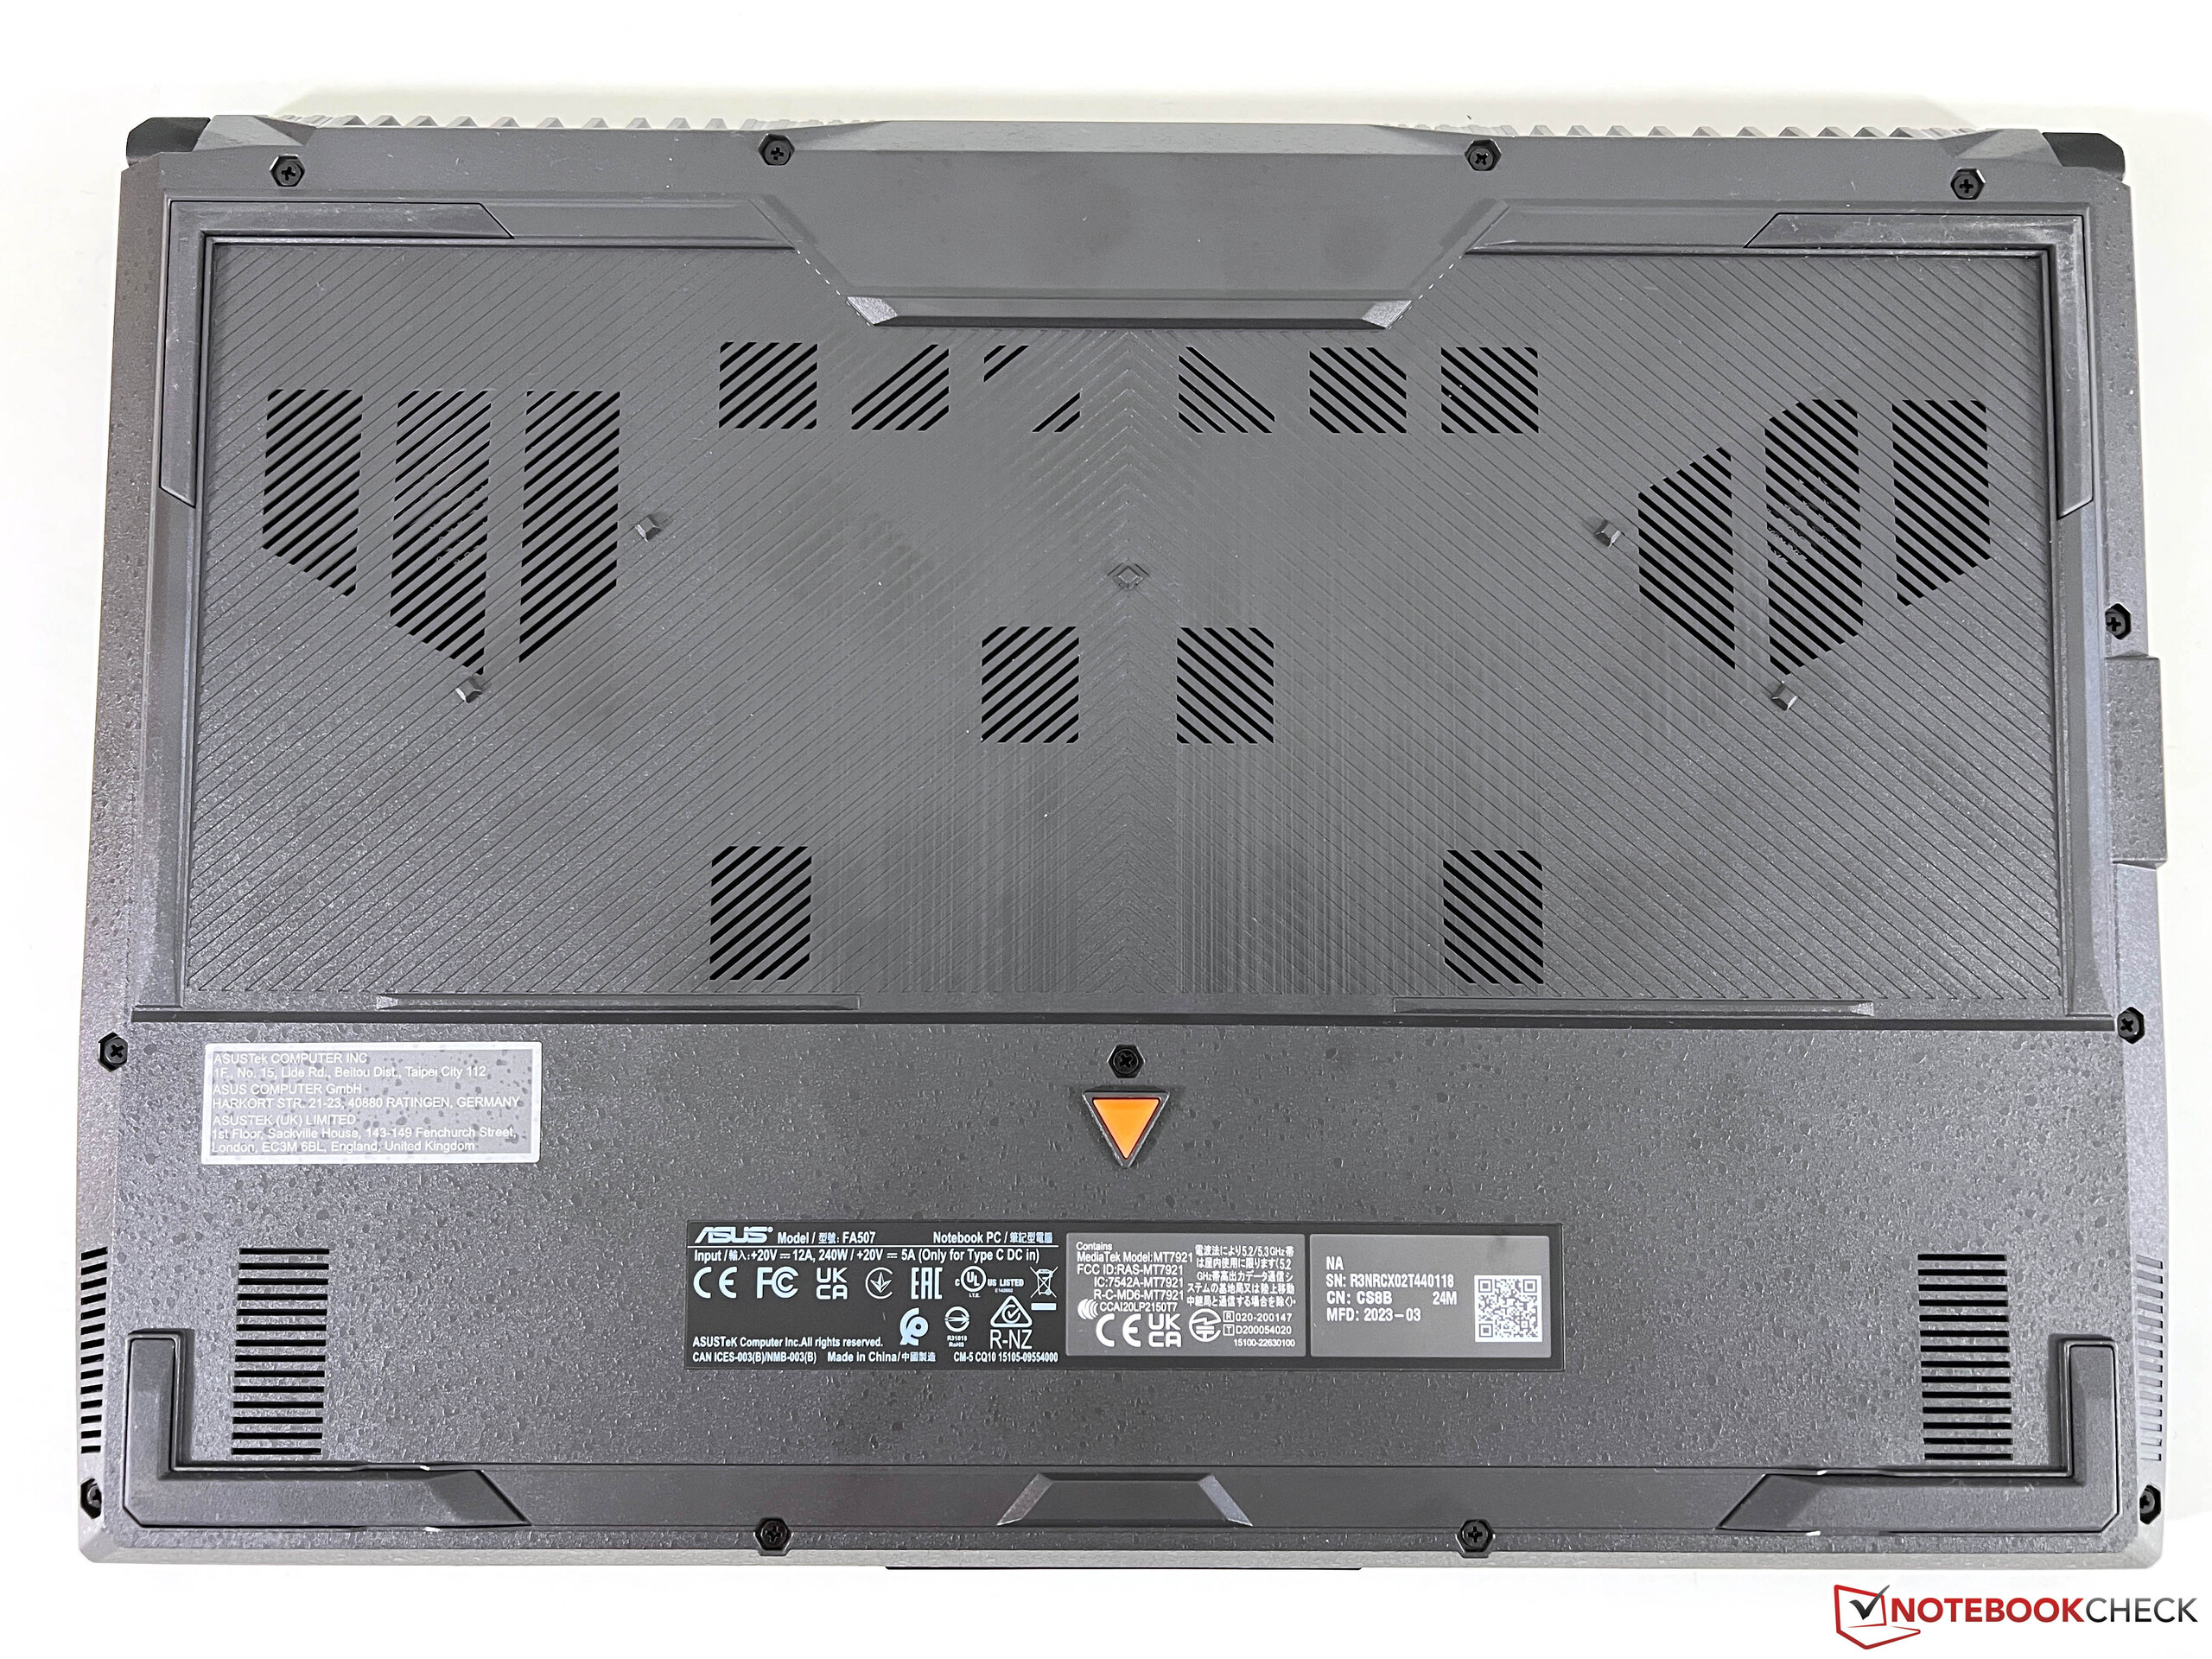
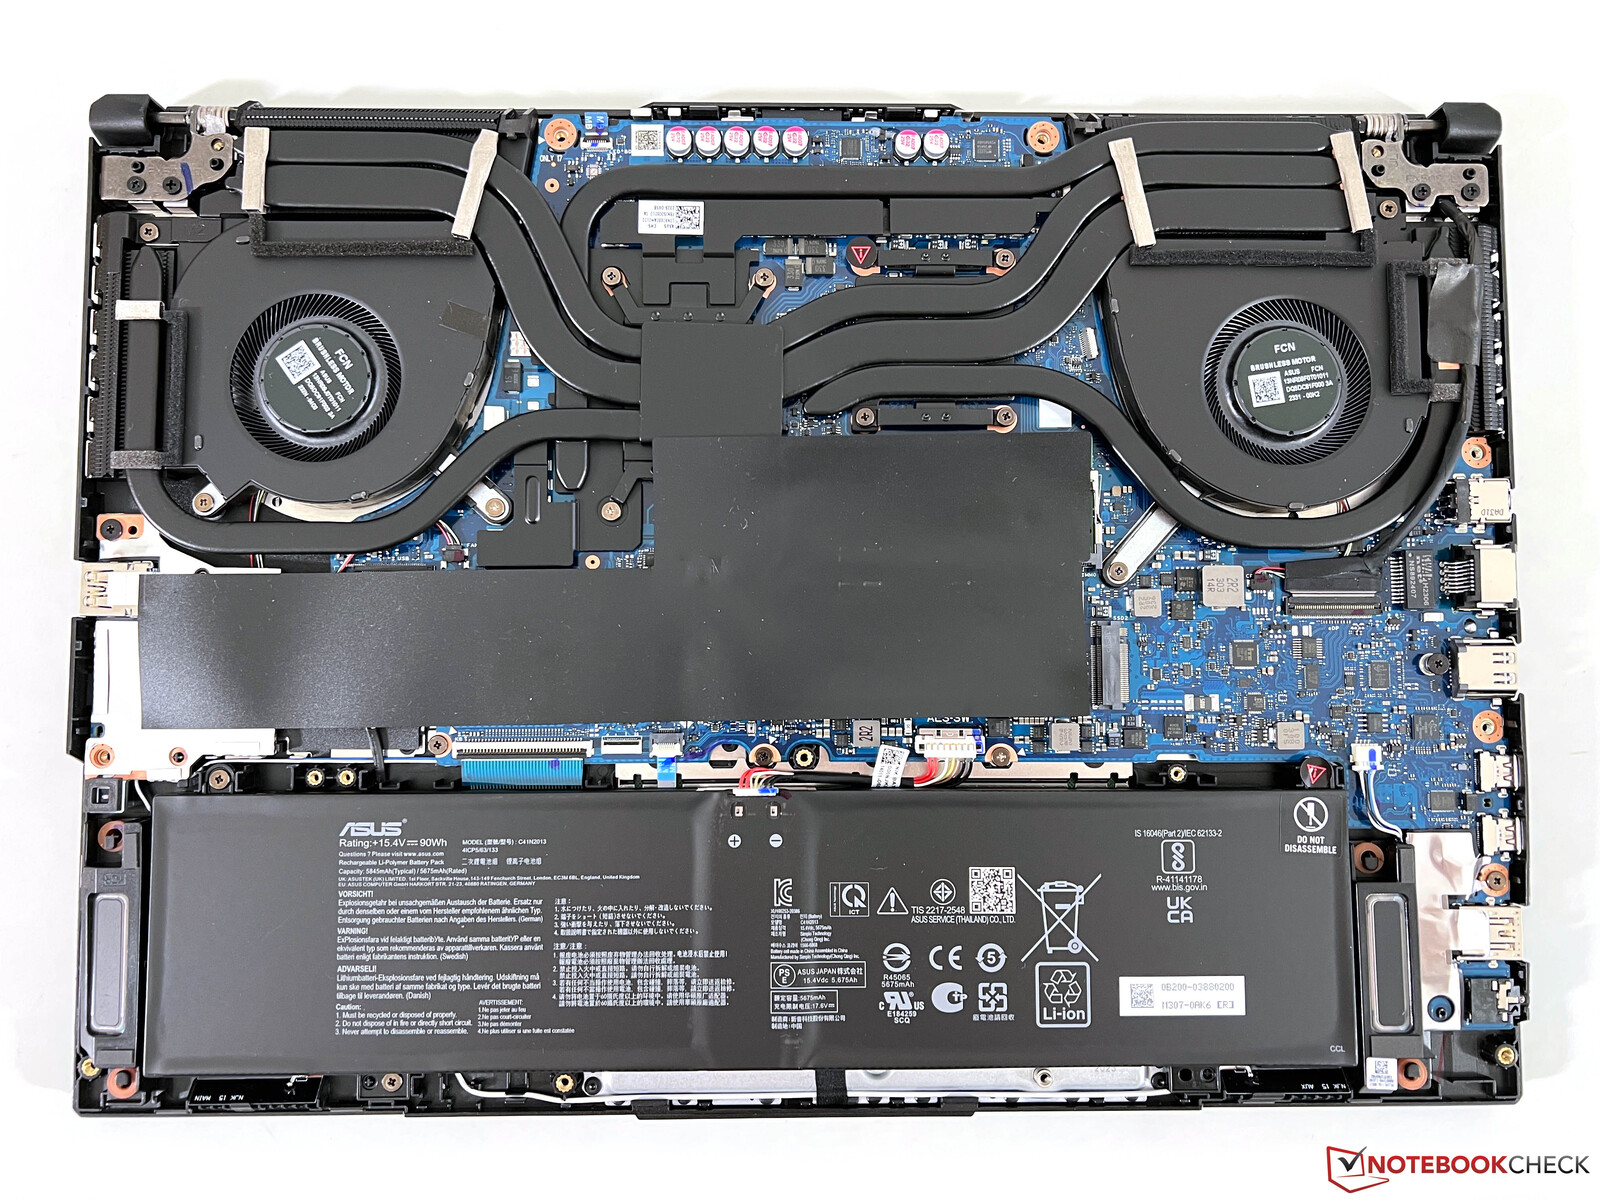
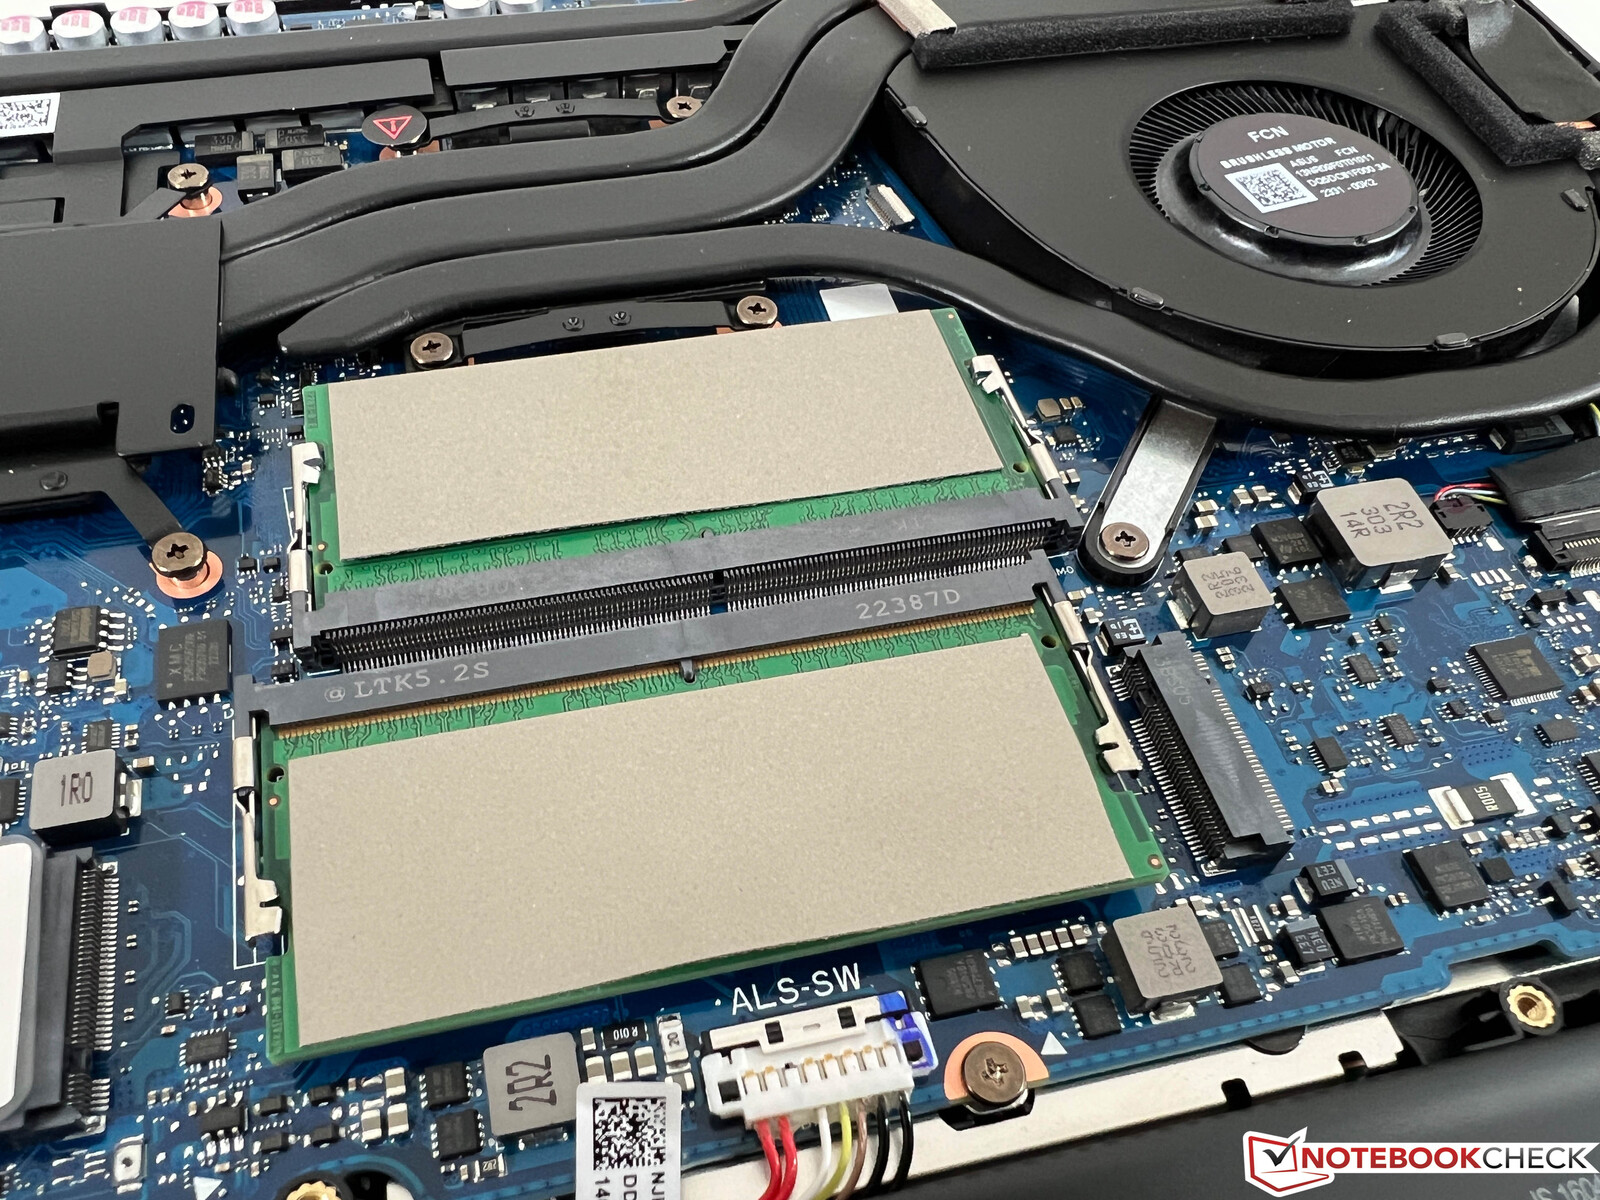
Konserwacja
Dolna pokrywa obudowy jest dość mocno przytwierdzona do reszty urządzenia - nawet po odkręceniu śrub. Zdejmowanie tej części obudowy okazuje się nieco kłopotliwe. Gdy już to zrobisz, możesz uzyskać dostęp do obu gniazd pamięci RAM, baterii, wentylatorów i dysku SSD M.2 2280.
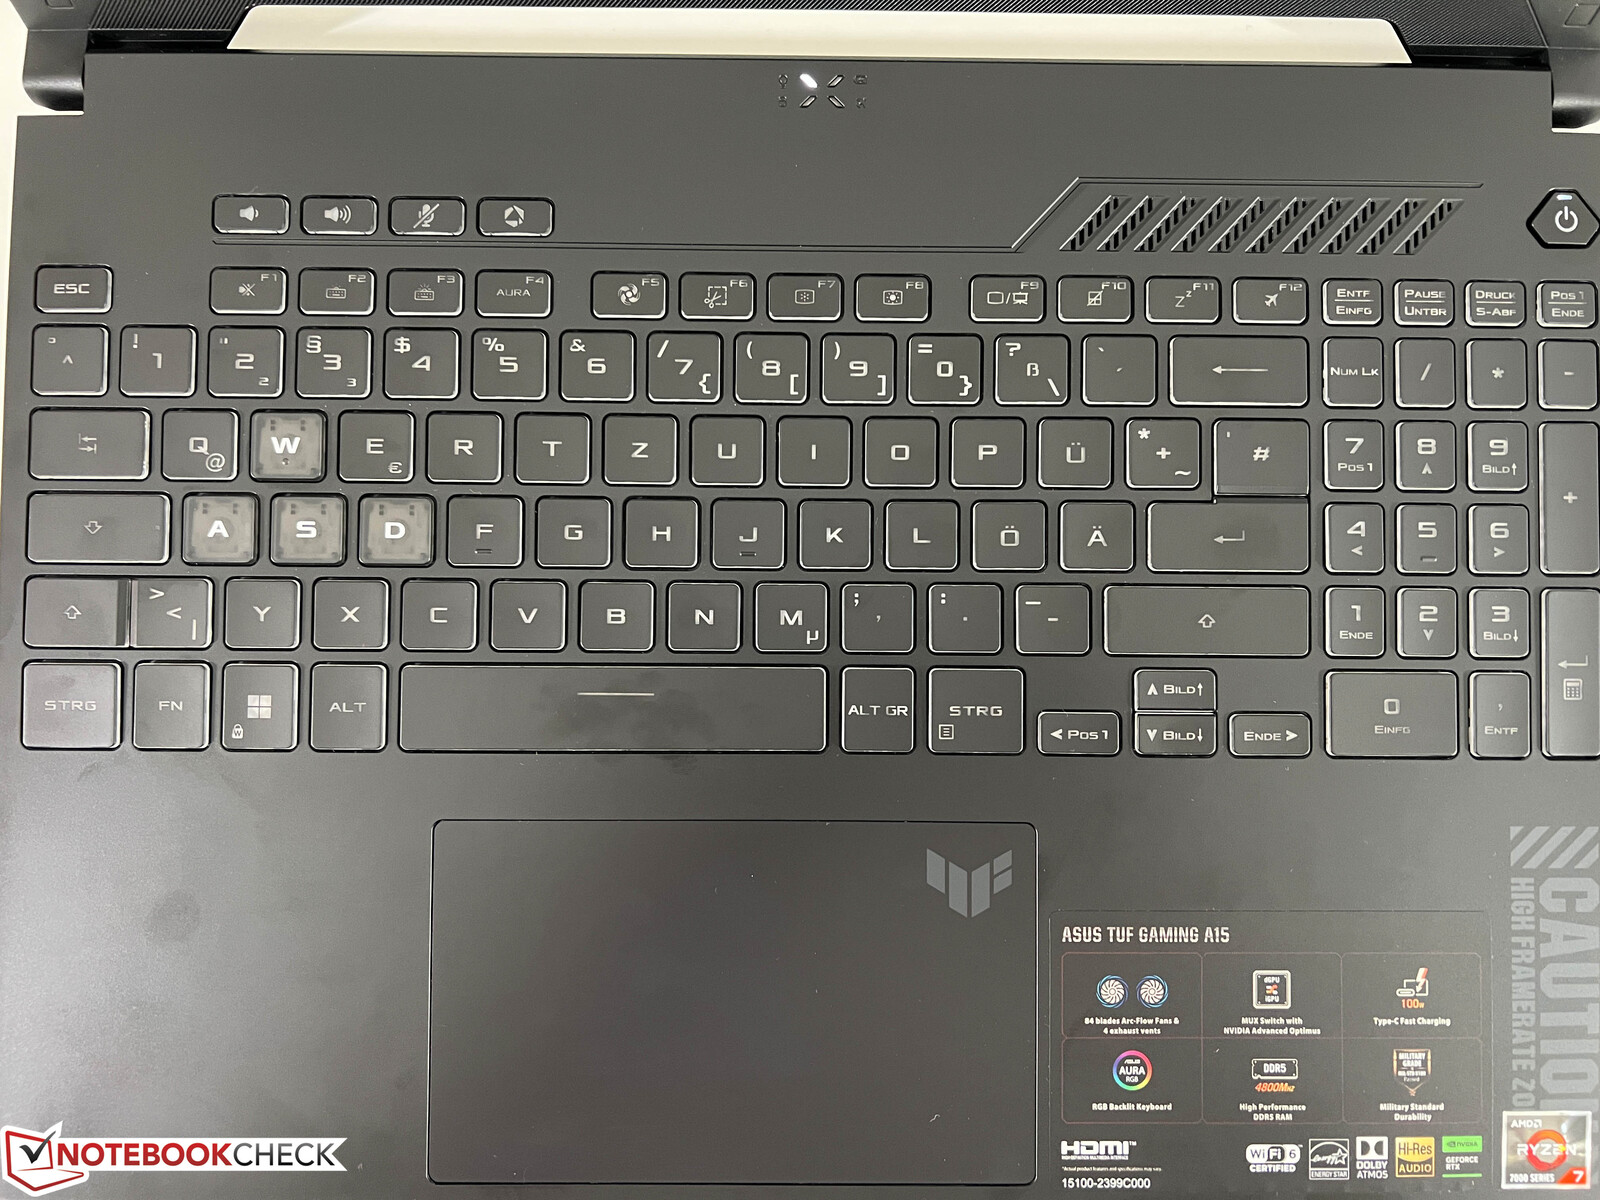
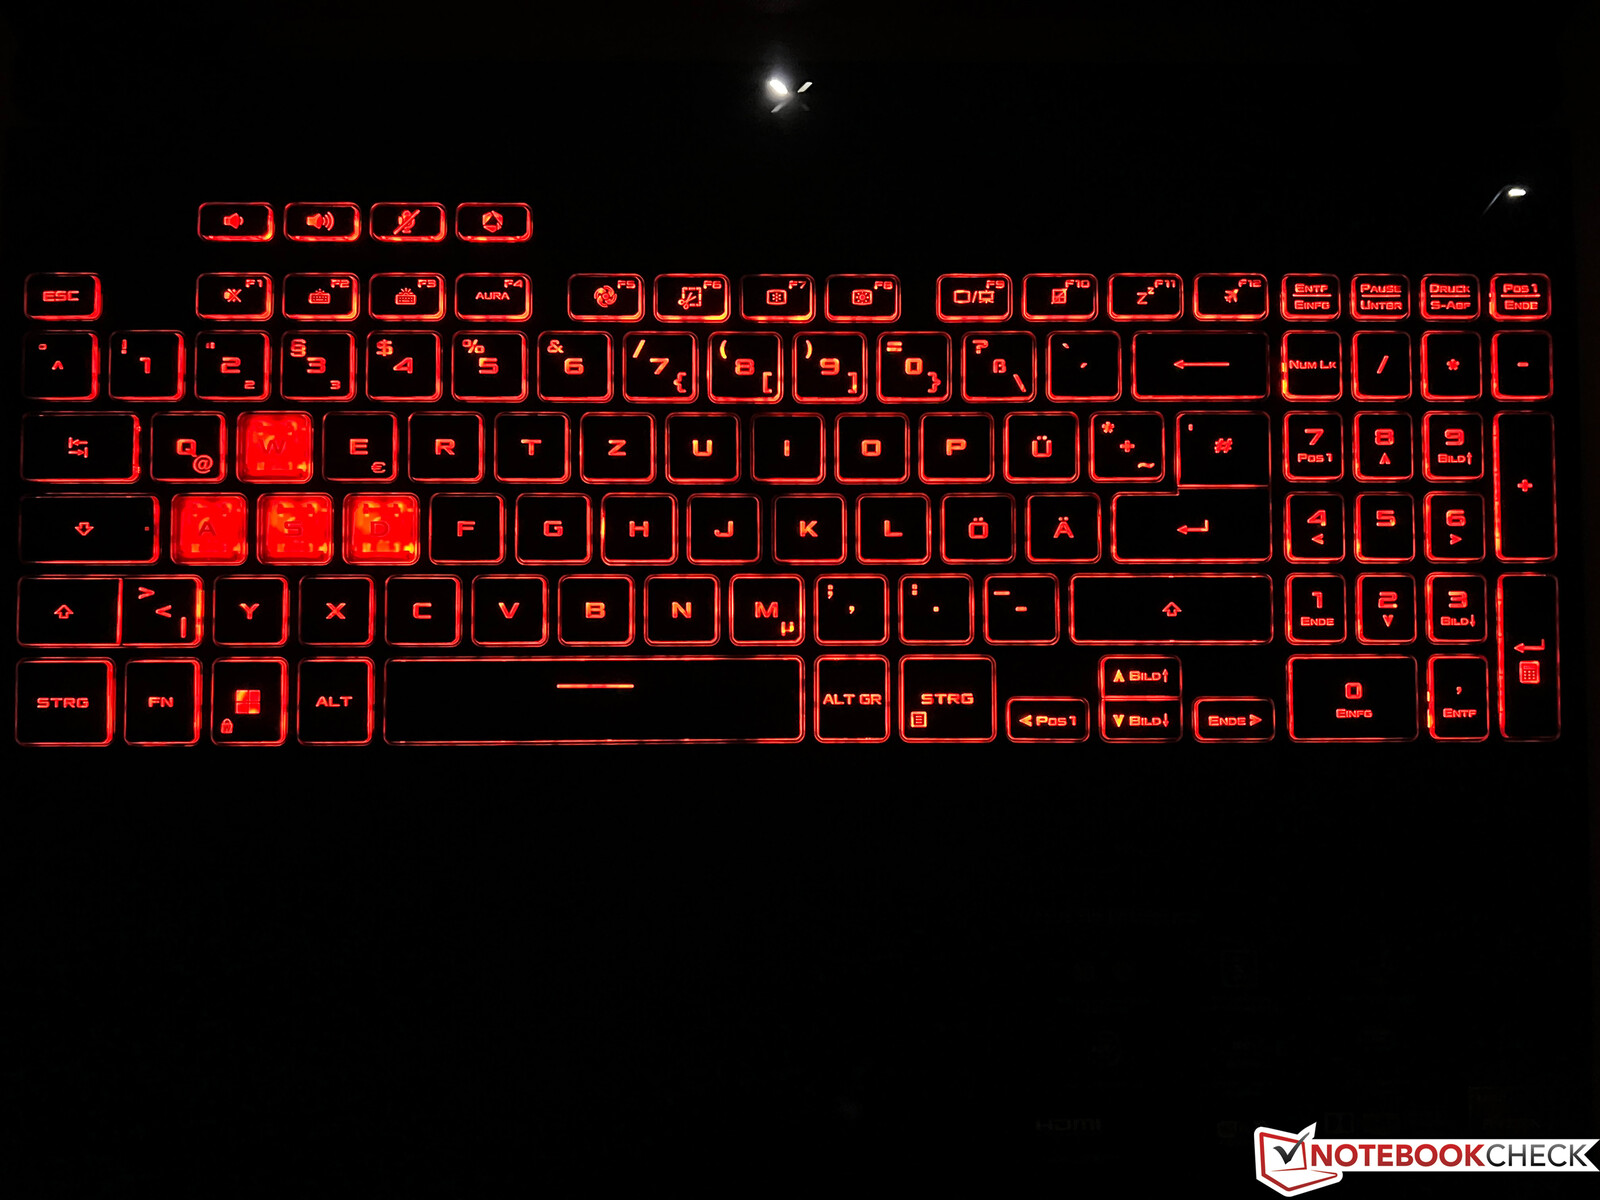
Urządzenia wejściowe - Duża klawiatura z klawiaturą numeryczną
Klawiatura posiada dedykowaną klawiaturę numeryczną i wygodnie się na niej pisze. Problem leży jednak w oznaczeniach klawiatury. Oprócz klawiszy WASD, które są białe, wszystkie inne klawisze mają przezroczyste oznaczenia. Dlatego nawet w przyzwoitych warunkach oświetleniowych często wygodniej jest po prostu aktywować podświetlenie. Dostępne są trzy poziomy podświetlenia, można też wybrać własny kolor - w obrębie jednej strefy. Jej układ jest w porządku, ale trzeba przyzwyczaić się do jednorzędowego klawisza Enter. Nad zwykłą klawiaturą znajdują się również cztery klawisze specjalne: Trzy służą do sterowania głośnością, a jeden można przypisać osobiście. Trzeba przyznać, że klawisze strzałek są wyjątkowo małe jak na laptop do gier.
Touchpad działa dobrze - zwykłe ruchy palca są wprowadzane płynnie, a jego powierzchnia jest przyjemna w dotyku. Odgłos kliknięcia jest przyjemny i cichy. Ogólnie rzecz biorąc, solidna wydajność i oczywiście większość użytkowników i tak skorzysta z zewnętrznej myszy lub kontrolera.
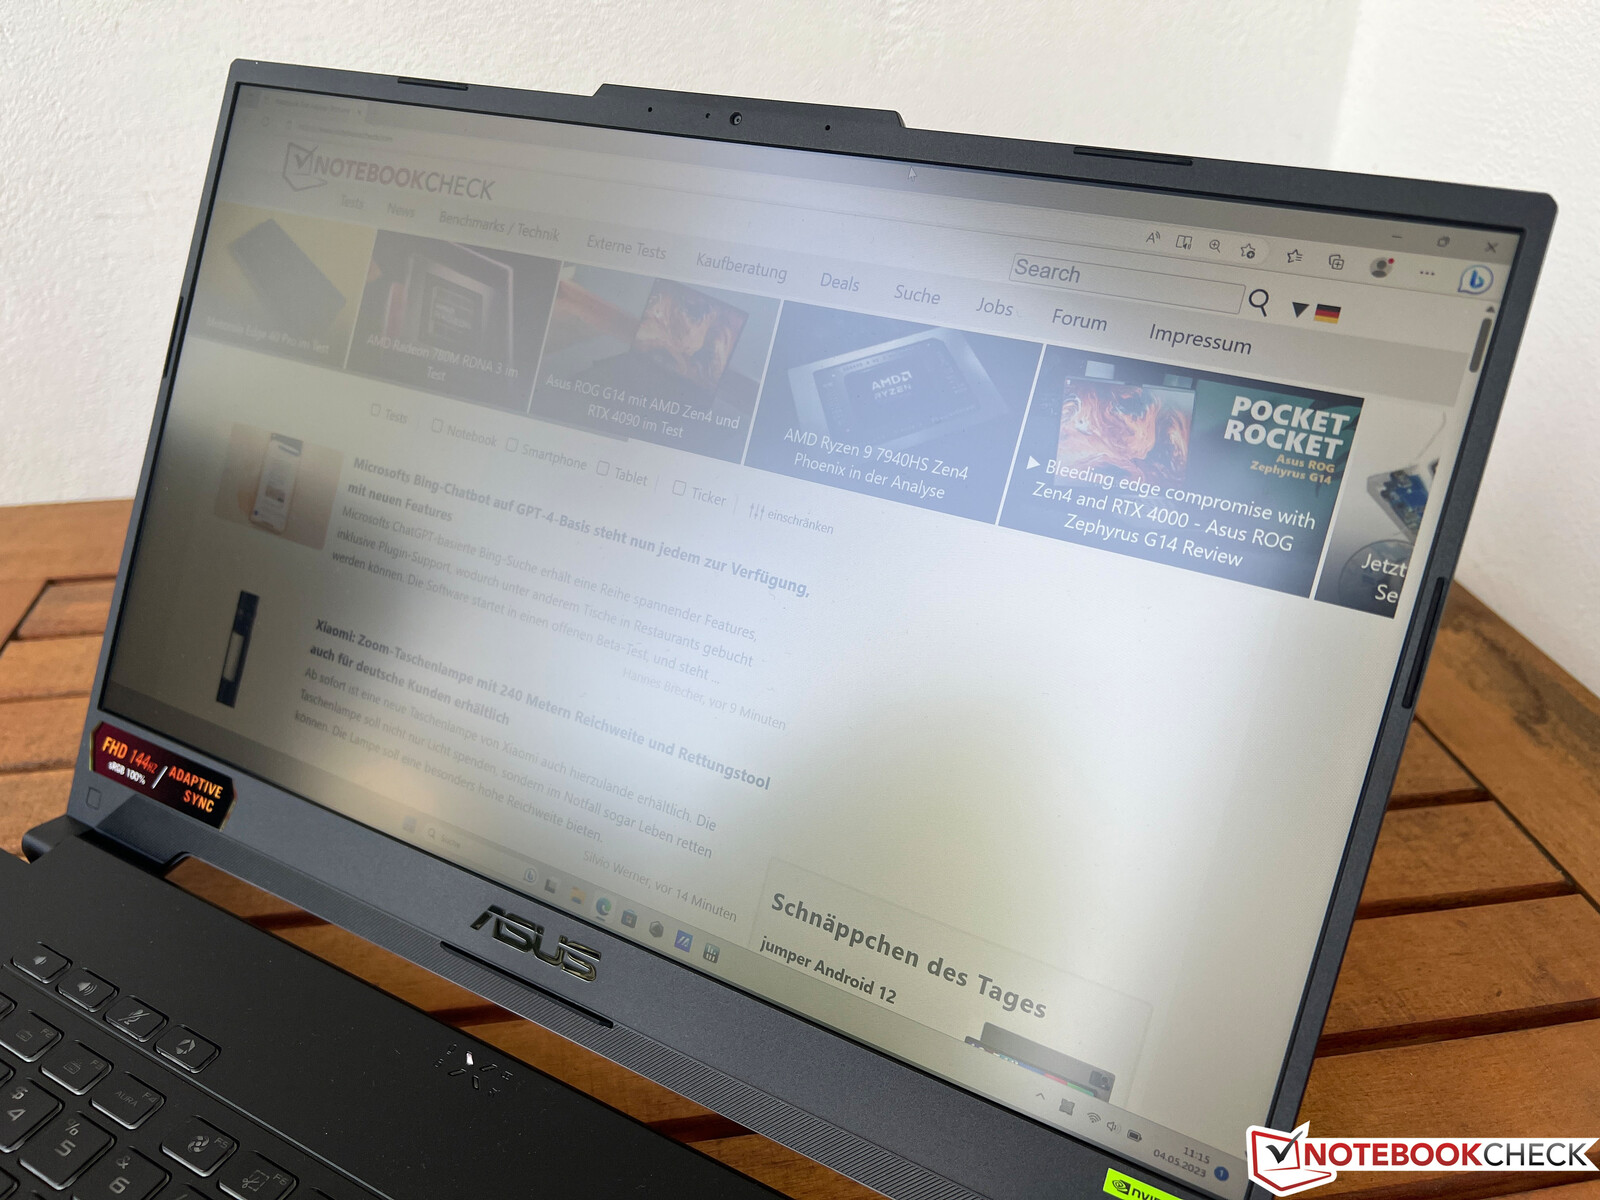
Wyświetlacz - panel IPS 144 Hz
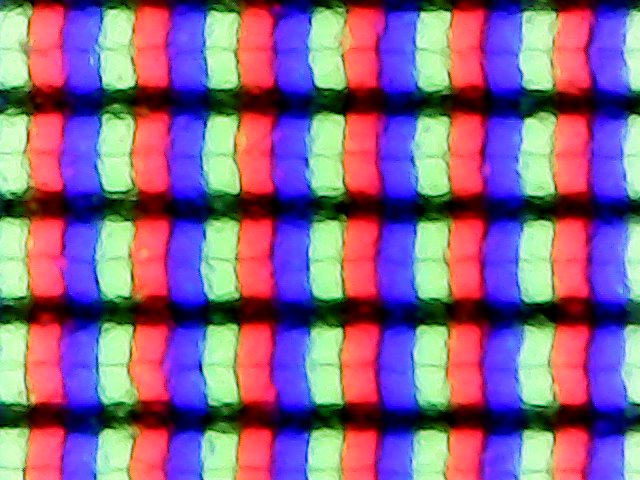

Laptop posiada stosunkowo prosty, matowy panel IPS o rozdzielczości Full HD (1920 x 1080 pikseli) i formacie 16:9. Subiektywnie, pozostawił na nas całkiem dobre wrażenie - treści były przedstawione wystarczająco ostro, a jaśniejsze obszary nie wyglądały na ziarniste. Częstotliwość odświeżania 144 Hz pomaga przy szybkich ruchach i nie ma migotania PWM, ale w sumie ekran nie ma się czym zbytnio chwalić.
Reklamowana jasność ekranu wynosi 250 cd/m², ale my zmierzyliśmy 270 cd/m² (średnio). Oczywiście nie jest to najlepszy wynik, ale wystarczający do użytku w pomieszczeniach i na zewnątrz, jeśli nie jest zbyt słonecznie. Z kolei wartość czerni jest przeciętna, co oznacza, że poziom kontrastu wynosi w najlepszym przypadku ~1.700:1. Szybkość reakcji urządzenia jest nieco wolna jak na laptopa do gier, a gdy ekran jest całkowicie ciemny, można zauważyć widoczne krwawienie podświetlenia. W codziennym użytkowaniu nie powinno to być zbyt dużą irytacją.
| |||||||||||||||||||||||||
rozświetlenie: 91 %
na akumulatorze: 288 cd/m²
kontrast: 1694:1 (czerń: 0.17 cd/m²)
ΔE ColorChecker Calman: 1.9 | ∀{0.5-29.43 Ø4.71}
calibrated: 0.9
ΔE Greyscale Calman: 2.7 | ∀{0.09-98 Ø4.96}
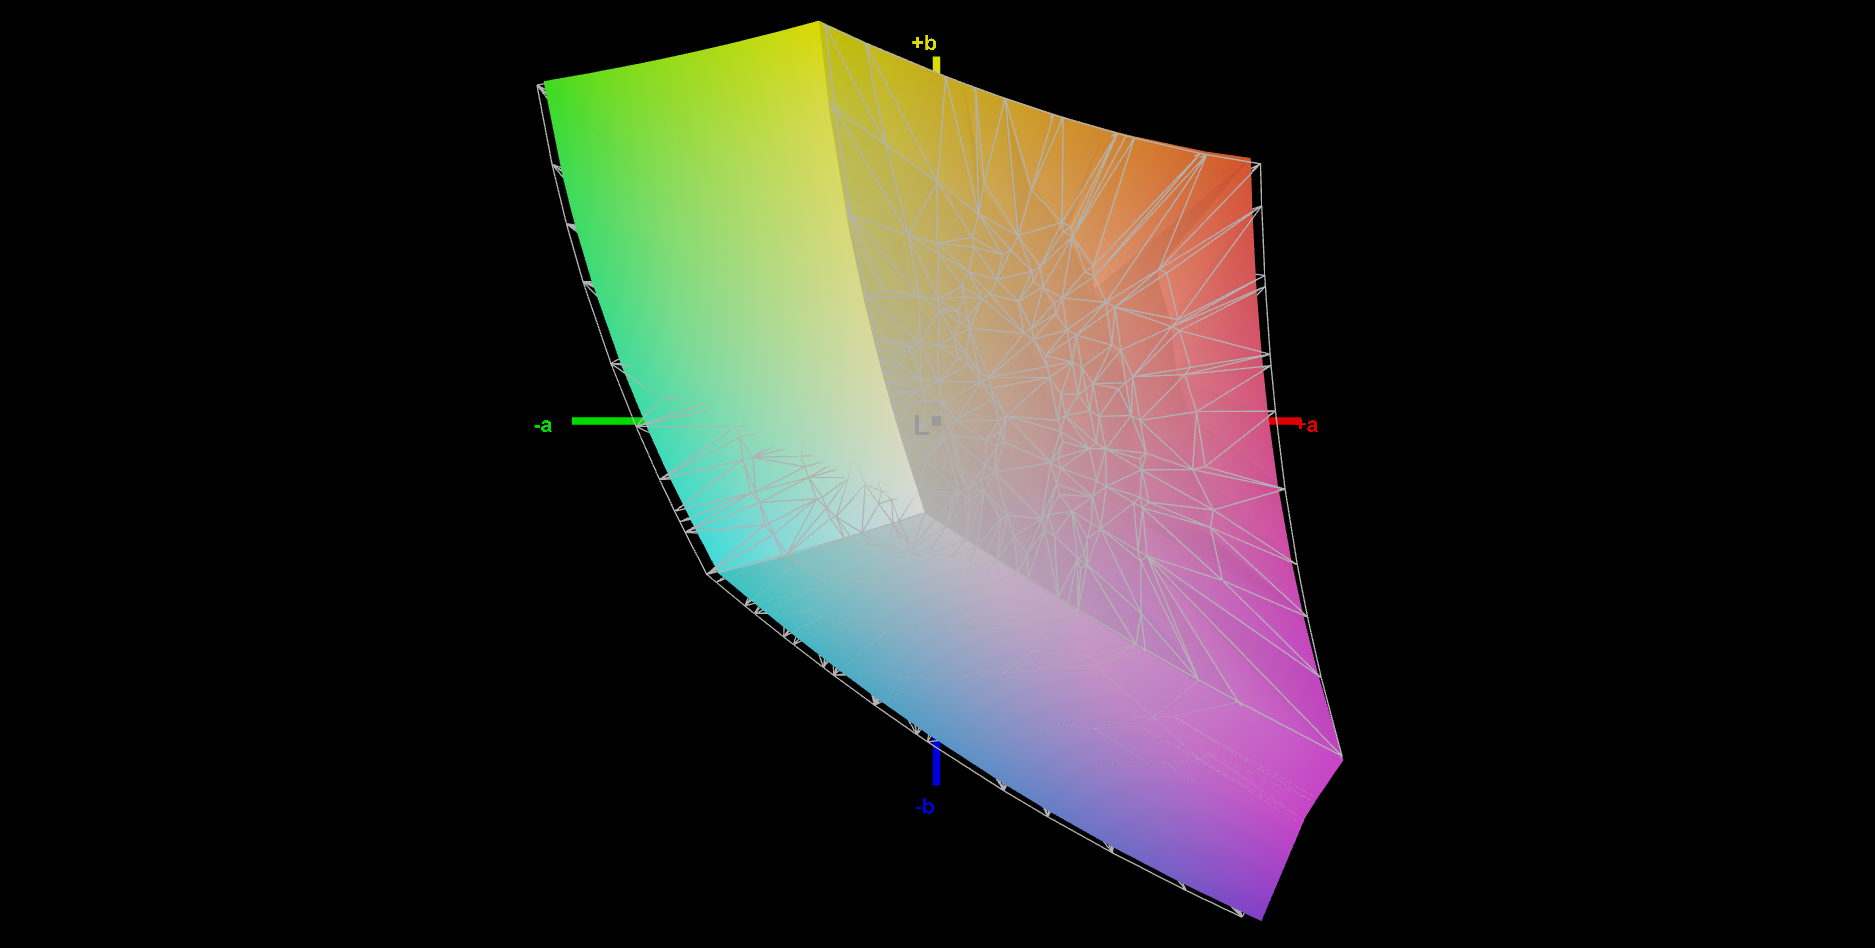
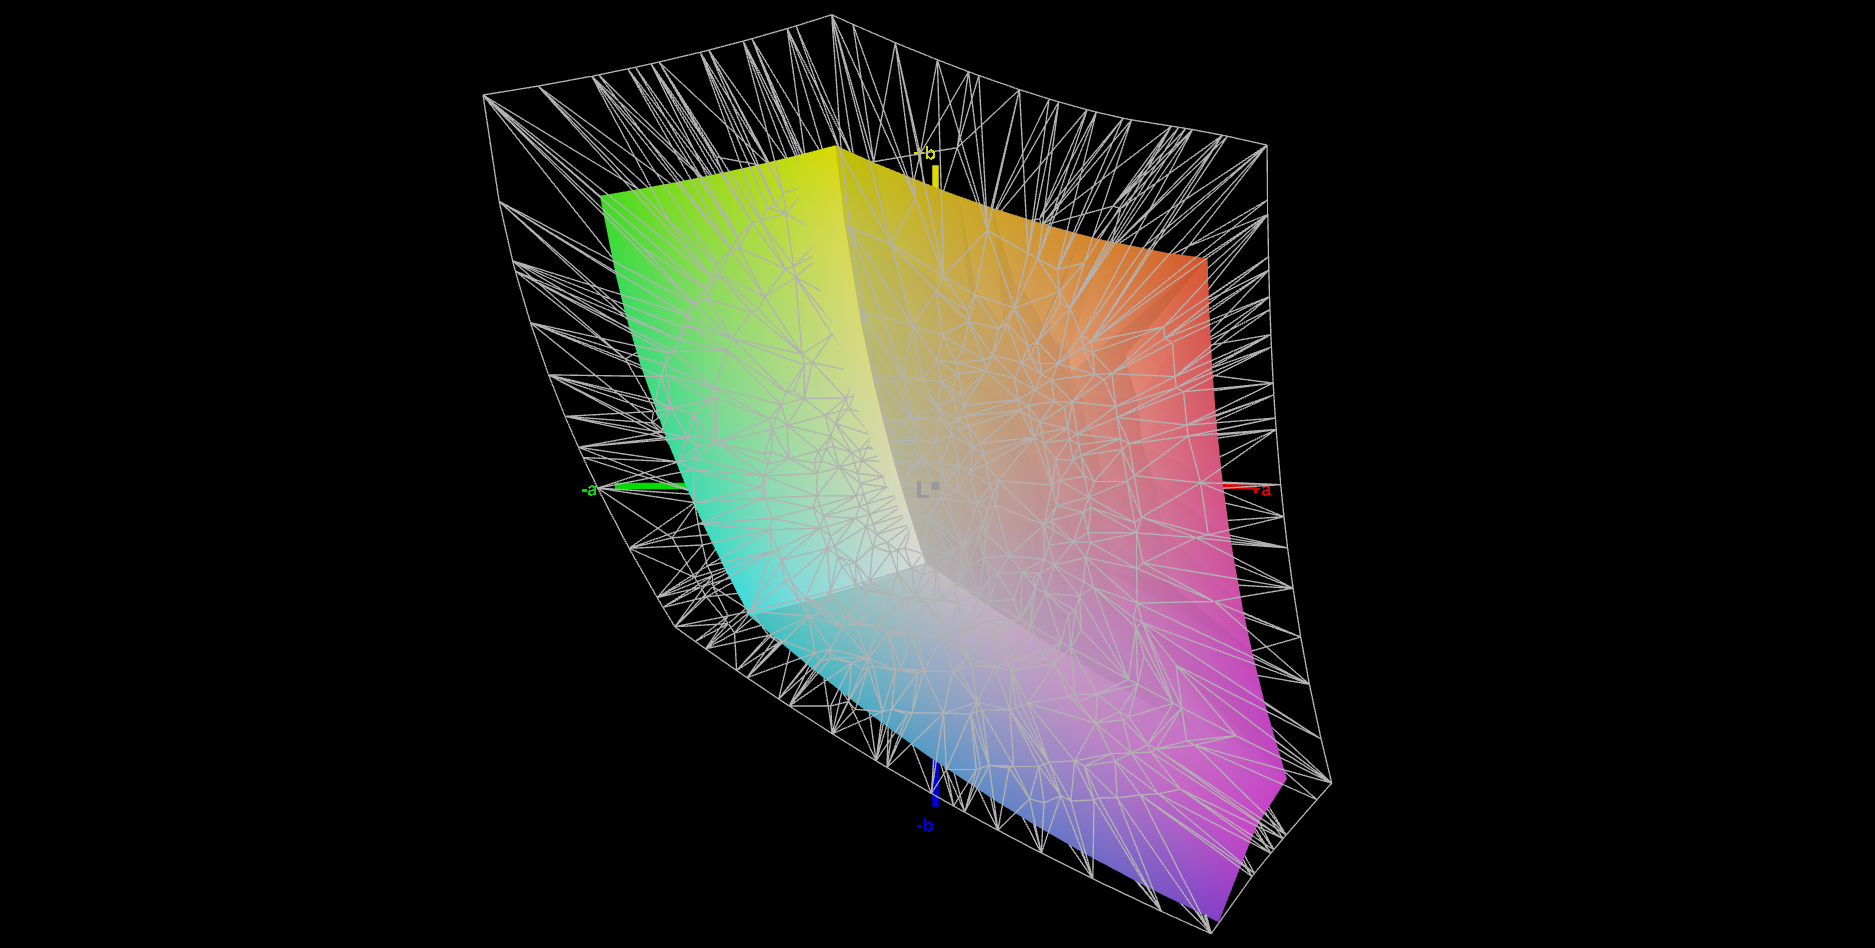
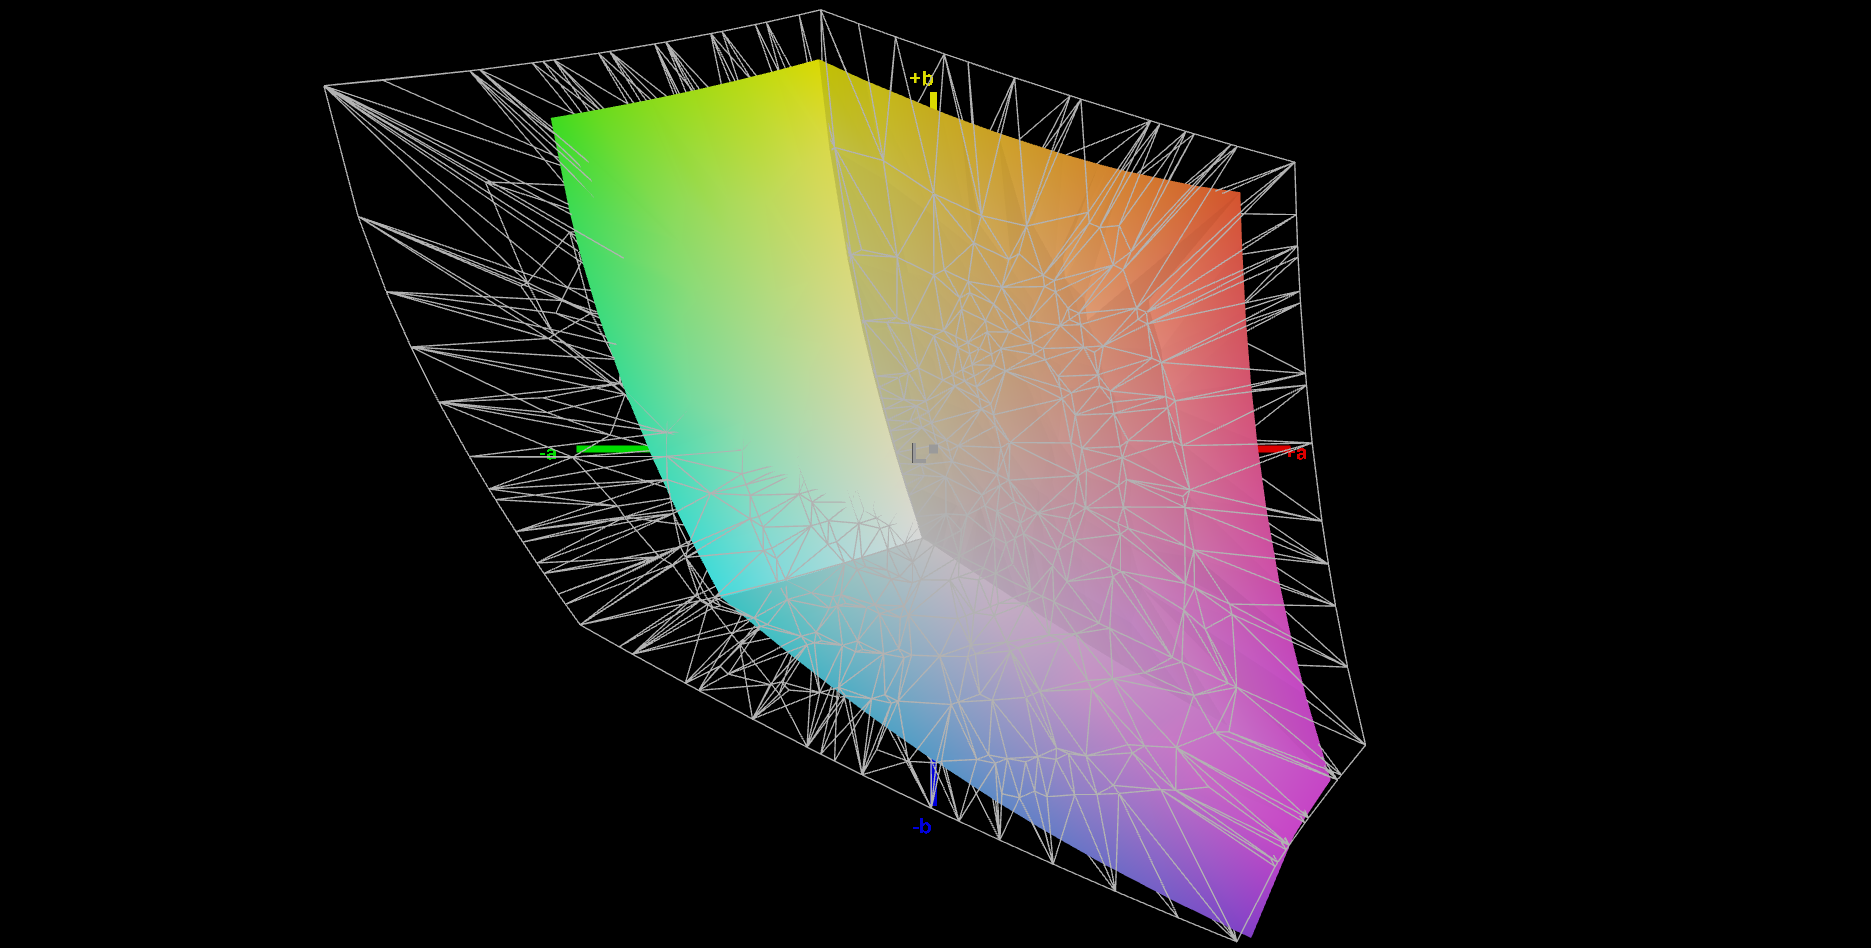
66.6% AdobeRGB 1998 (Argyll 3D)
96.5% sRGB (Argyll 3D)
64.9% Display P3 (Argyll 3D)
Gamma: 2.32
CCT: 6535 K
| Asus TUF A15 FA507 N156HMA-GA1, IPS, 1920x1080, 15.6" | Gigabyte G5 KE Chi Mei N156HRA-EA1, IPS, 1920x1080, 15.6" | Schenker XMG Core 15 (M22) CSOT MNF601CA1-1, IPS, 2560x1440, 15.6" | MSI Katana 15 B12VEK AUOAF90 (B156HAN08.4), IPS, 1920x1080, 15.6" | HP Victus 15 fa0020nr CMN1521, IPS, 1920x1080, 15.6" | Lenovo IdeaPad Gaming 3 15IAH7 Lenovo LEN156FHD, IPS, 1920x1080, 15.6" | Asus TUF Gaming F15 FX507ZM TL156VDXP0101, IPS, 1920x1080, 15.6" | |
|---|---|---|---|---|---|---|---|
| Display | -37% | 5% | -41% | -35% | 5% | 2% | |
| Display P3 Coverage (%) | 64.9 | 40.7 -37% | 68.8 6% | 38.1 -41% | 42 -35% | 69.1 6% | 66.4 2% |
| sRGB Coverage (%) | 96.5 | 61 -37% | 99.3 3% | 56.8 -41% | 62.7 -35% | 99.2 3% | 97 1% |
| AdobeRGB 1998 Coverage (%) | 66.6 | 42.1 -37% | 69.9 5% | 39.3 -41% | 43.4 -35% | 69.9 5% | 68.5 3% |
| Response Times | 11% | 55% | -29% | -24% | 59% | 60% | |
| Response Time Grey 50% / Grey 80% * (ms) | 30.4 ? | 26.64 ? 12% | 16 ? 47% | 38.8 ? -28% | 35.2 ? -16% | 13 ? 57% | 5.6 ? 82% |
| Response Time Black / White * (ms) | 20.8 ? | 18.65 ? 10% | 7.6 ? 63% | 26.8 ? -29% | 27.2 ? -31% | 8.4 ? 60% | 12.8 ? 38% |
| PWM Frequency (Hz) | |||||||
| Screen | -129% | -48% | -133% | -82% | -45% | -3% | |
| Brightness middle (cd/m²) | 288 | 269 -7% | 378 31% | 261 -9% | 284.3 -1% | 338 17% | 353.7 23% |
| Brightness (cd/m²) | 271 | 248 -8% | 371 37% | 258 -5% | 262 -3% | 329 21% | 340 25% |
| Brightness Distribution (%) | 91 | 85 -7% | 93 2% | 92 1% | 87 -4% | 92 1% | 89 -2% |
| Black Level * (cd/m²) | 0.17 | 0.5 -194% | 0.33 -94% | 0.19 -12% | 0.17 -0% | 0.27 -59% | 0.34 -100% |
| Contrast (:1) | 1694 | 538 -68% | 1145 -32% | 1374 -19% | 1672 -1% | 1252 -26% | 1040 -39% |
| Colorchecker dE 2000 * | 1.9 | 4.54 -139% | 2.84 -49% | 5.57 -193% | 4.52 -138% | 2.88 -52% | 1.74 8% |
| Colorchecker dE 2000 max. * | 3.3 | 17.28 -424% | 5.51 -67% | 20.6 -524% | 18.67 -466% | 9.35 -183% | 3.63 -10% |
| Colorchecker dE 2000 calibrated * | 0.9 | 3.34 -271% | 2.75 -206% | 4.63 -414% | 1.55 -72% | 1.22 -36% | 0.5 44% |
| Greyscale dE 2000 * | 2.7 | 3.8 -41% | 4.08 -51% | 3.19 -18% | 4.1 -52% | 5 -85% | 2.1 22% |
| Gamma | 2.32 95% | 2.17 101% | 2.4 92% | 2.45 90% | 2.3 96% | 2.162 102% | 2.3 96% |
| CCT | 6535 99% | 7408 88% | 5841 111% | 6146 106% | 6529 100% | 7497 87% | 6257 104% |
| Całkowita średnia (program / ustawienia) | -52% /
-89% | 4% /
-22% | -68% /
-98% | -47% /
-64% | 6% /
-19% | 20% /
7% |
* ... im mniej tym lepiej
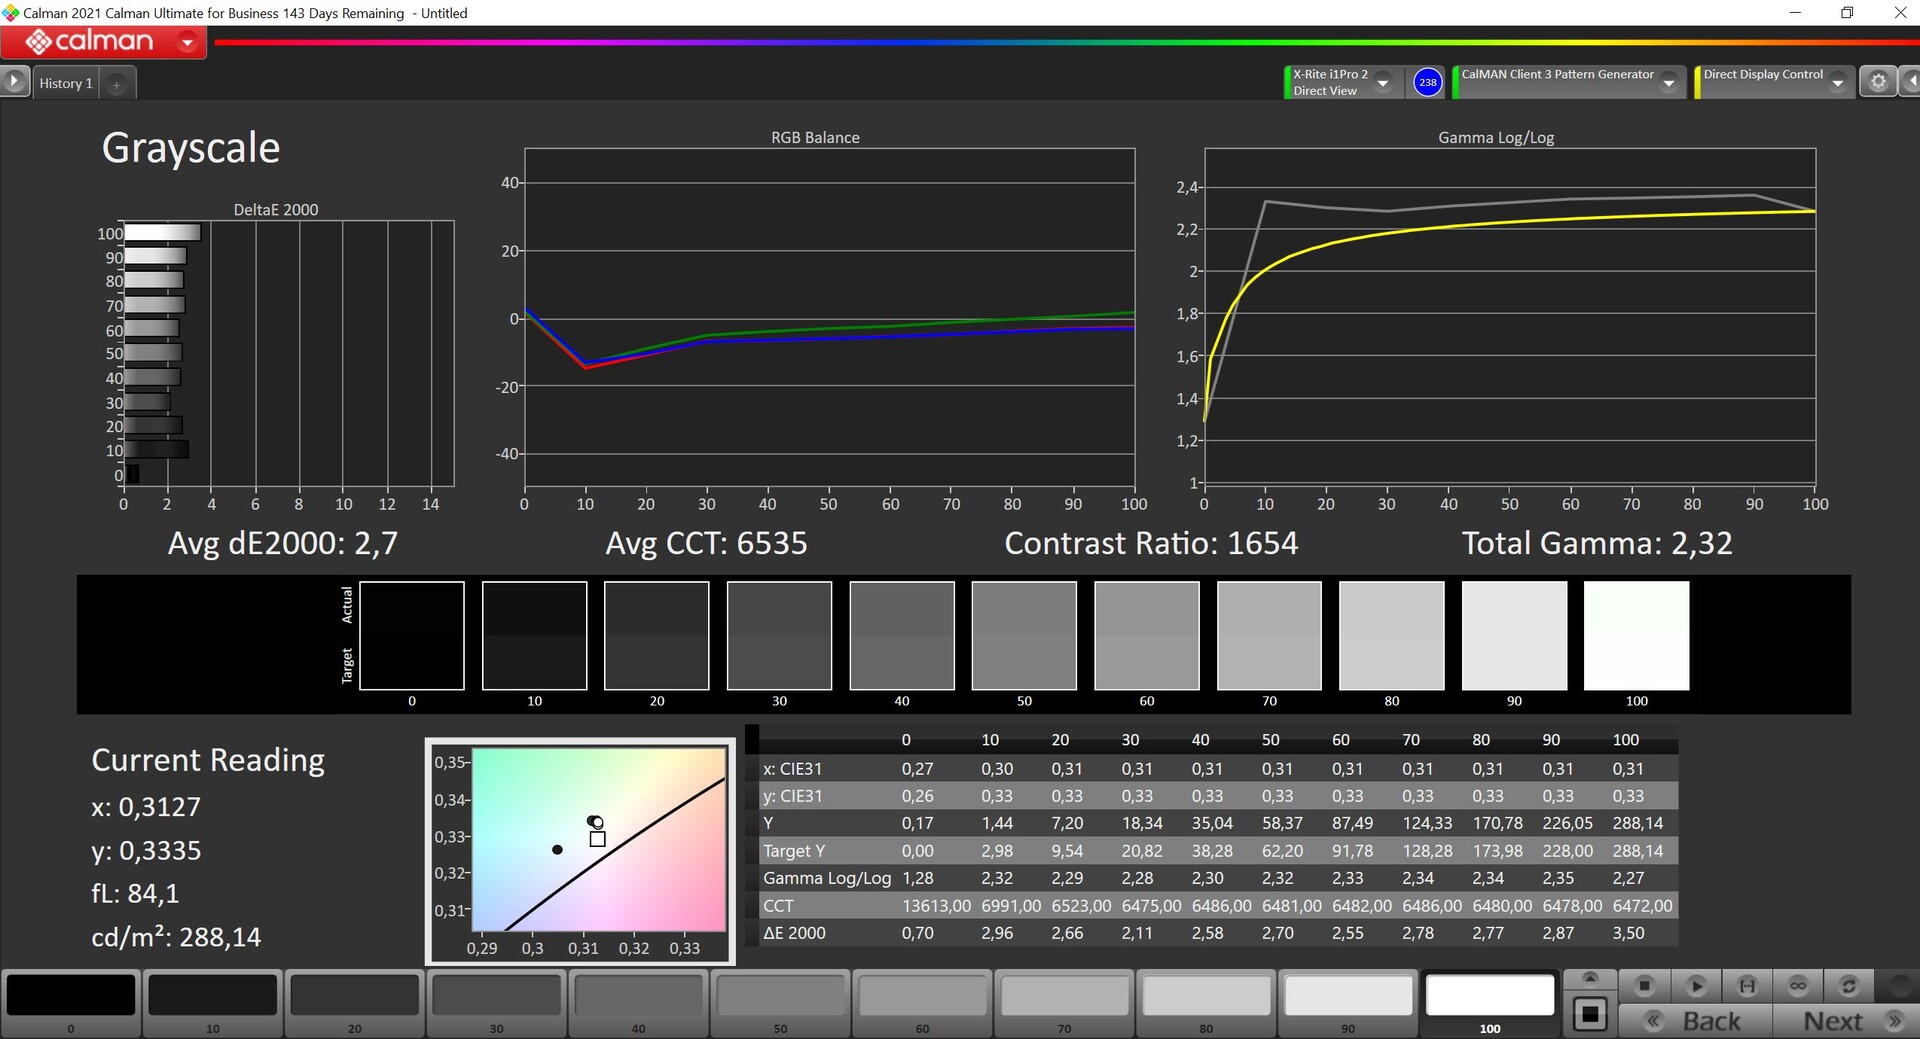

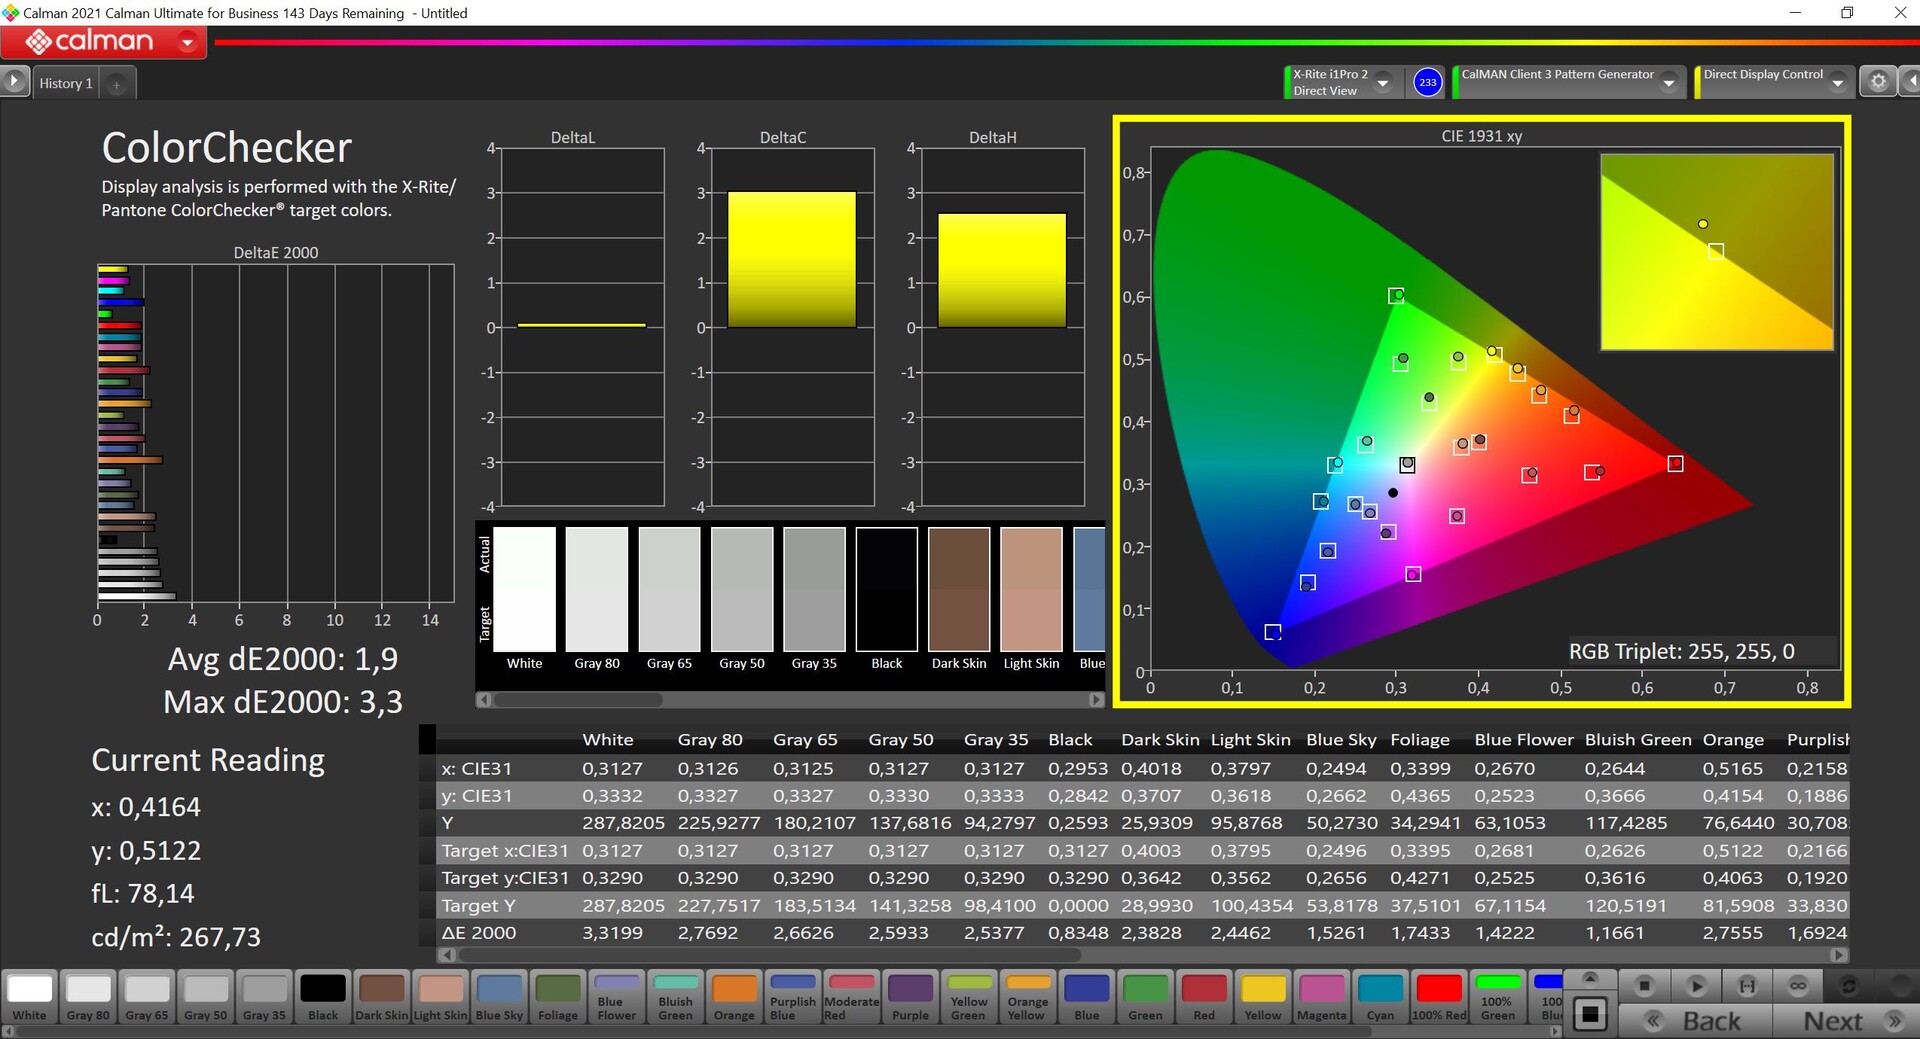
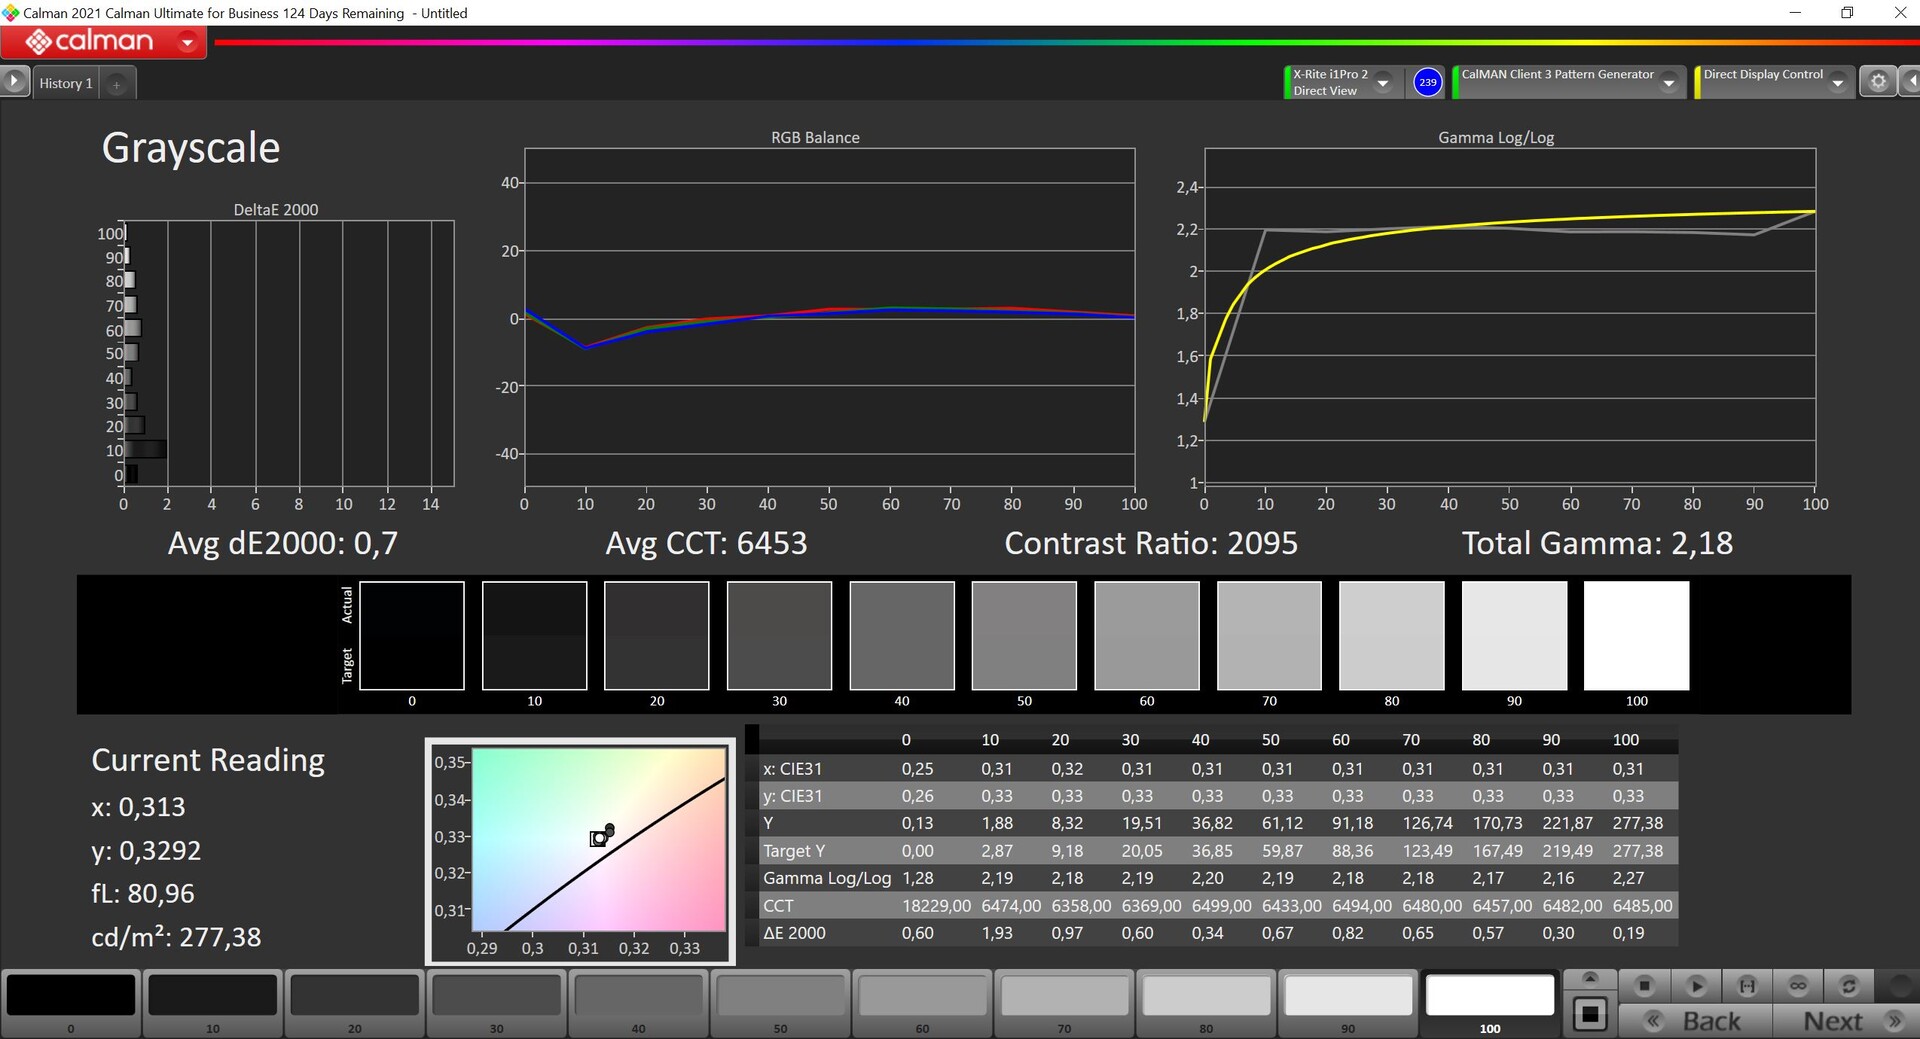
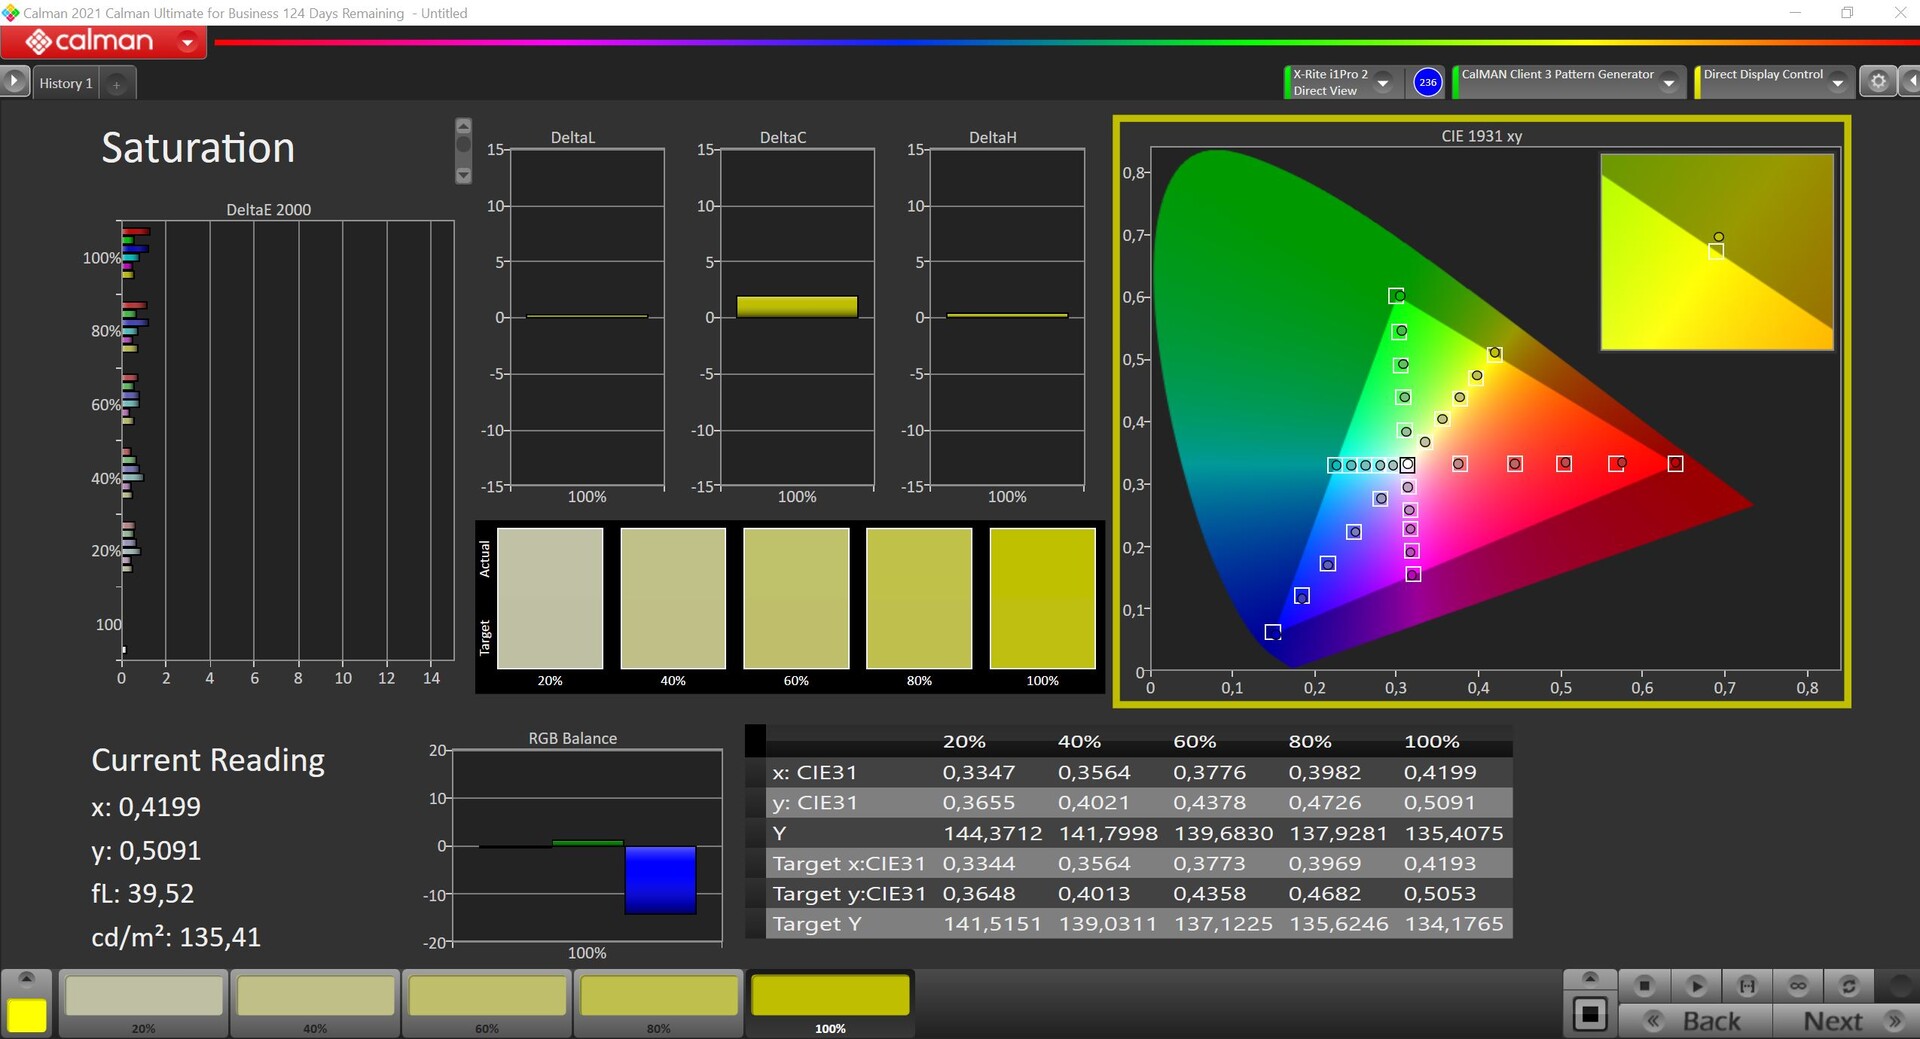
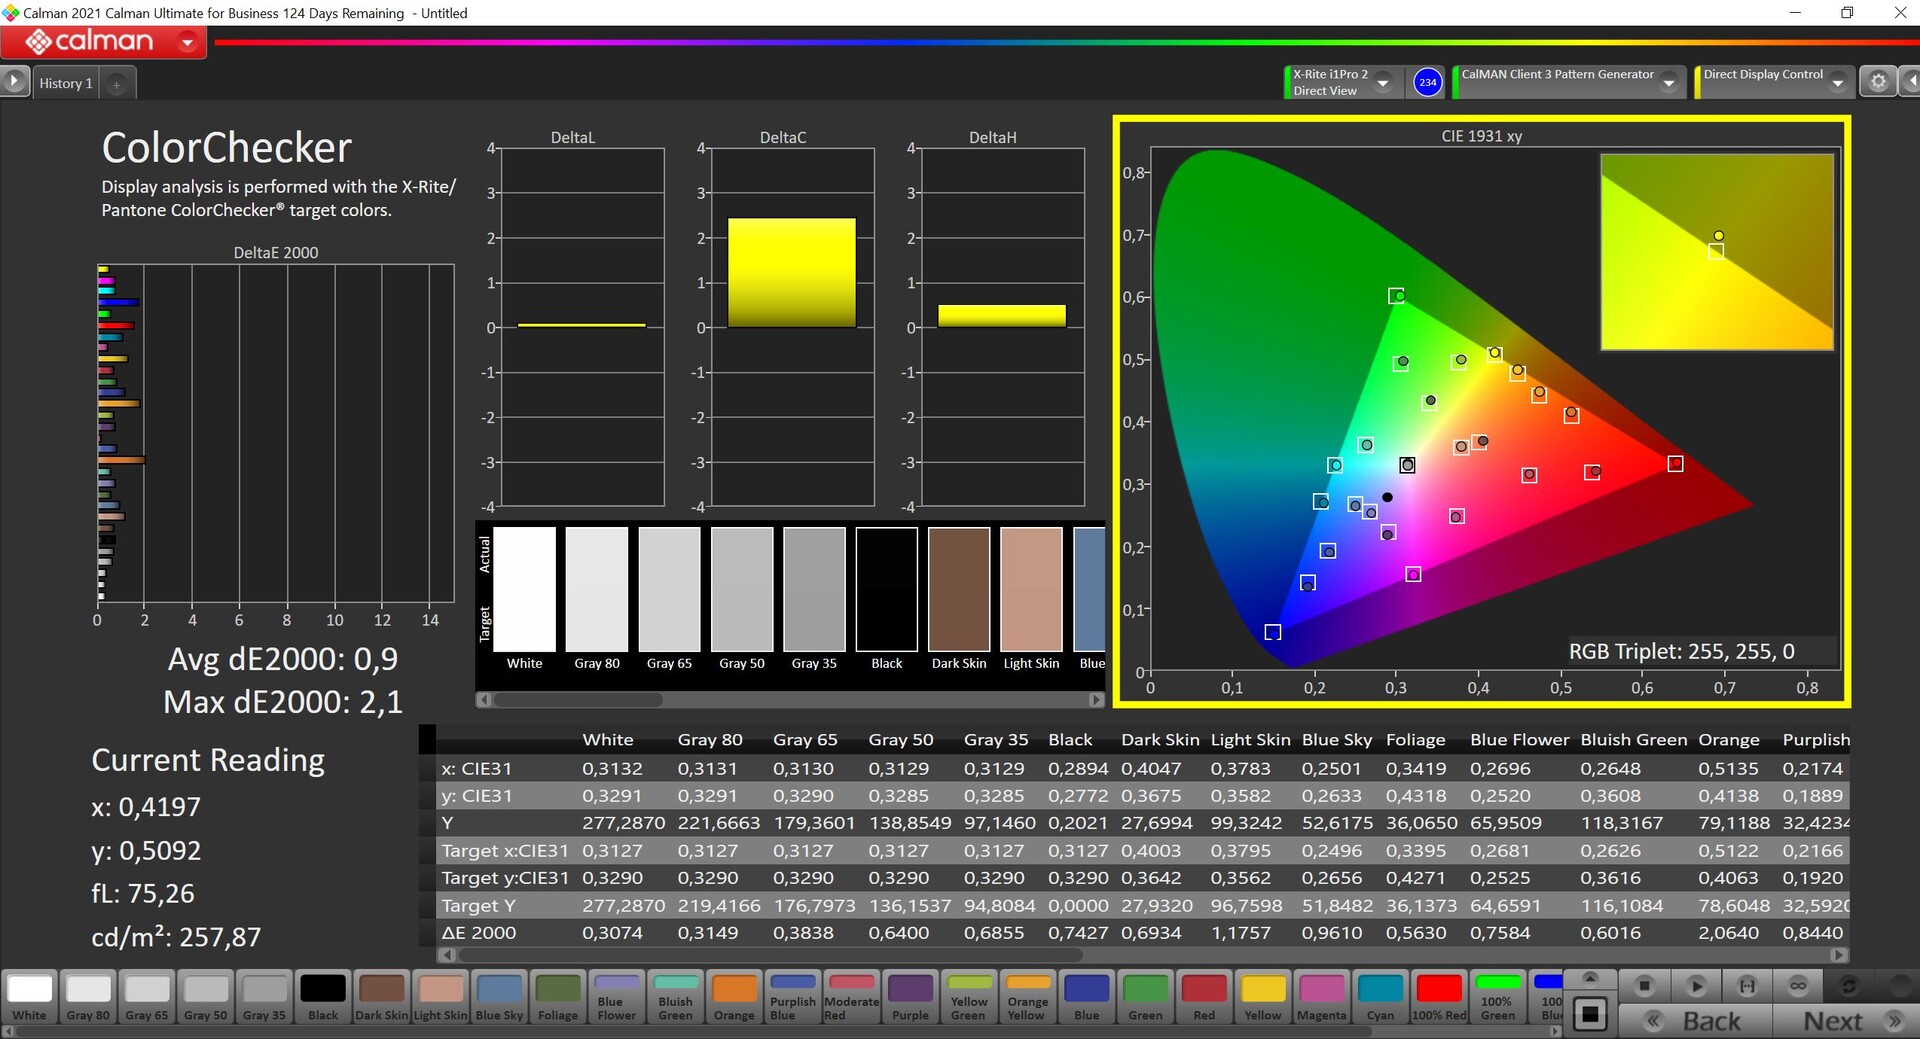
Korzystając z profesjonalnego oprogramowania CalMAN (X-Rite i1 Pro 2), zmierzyliśmy panel i jego wydajność była świetna od razu po wyjęciu z pudełka. Nie było żadnych odcieni kolorów, a odwzorowanie kolorów było już bardzo dokładne, co oznacza, że można od razu przystąpić do edycji obrazu (przynajmniej w mniejszej przestrzeni kolorów sRGB). Po naszej własnej kalibracji (możesz pobrać ten profil powyżej za darmo), byliśmy w stanie nieznacznie to poprawić, ale nie jest to naprawdę konieczne - szczególnie w grach.
Wyświetl czasy reakcji
| ↔ Czas reakcji od czerni do bieli | ||
|---|---|---|
| 20.8 ms ... wzrost ↗ i spadek ↘ łącznie | ↗ 11.7 ms wzrost | 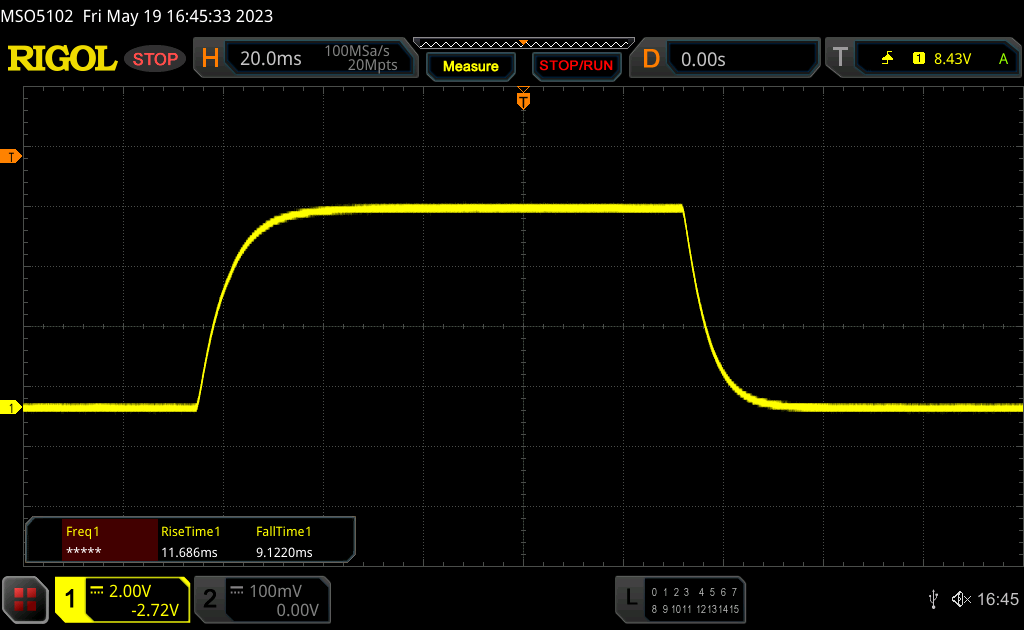 |
| ↘ 9.1 ms upadek | ||
| W naszych testach ekran wykazuje dobry współczynnik reakcji, ale może być zbyt wolny dla graczy rywalizujących ze sobą. Dla porównania, wszystkie testowane urządzenia wahają się od 0.1 (minimum) do 240 (maksimum) ms. » 46 % wszystkich urządzeń jest lepszych. Oznacza to, że zmierzony czas reakcji jest zbliżony do średniej wszystkich testowanych urządzeń (19.8 ms). | ||
| ↔ Czas reakcji 50% szarości do 80% szarości | ||
| 30.4 ms ... wzrost ↗ i spadek ↘ łącznie | ↗ 14.8 ms wzrost | 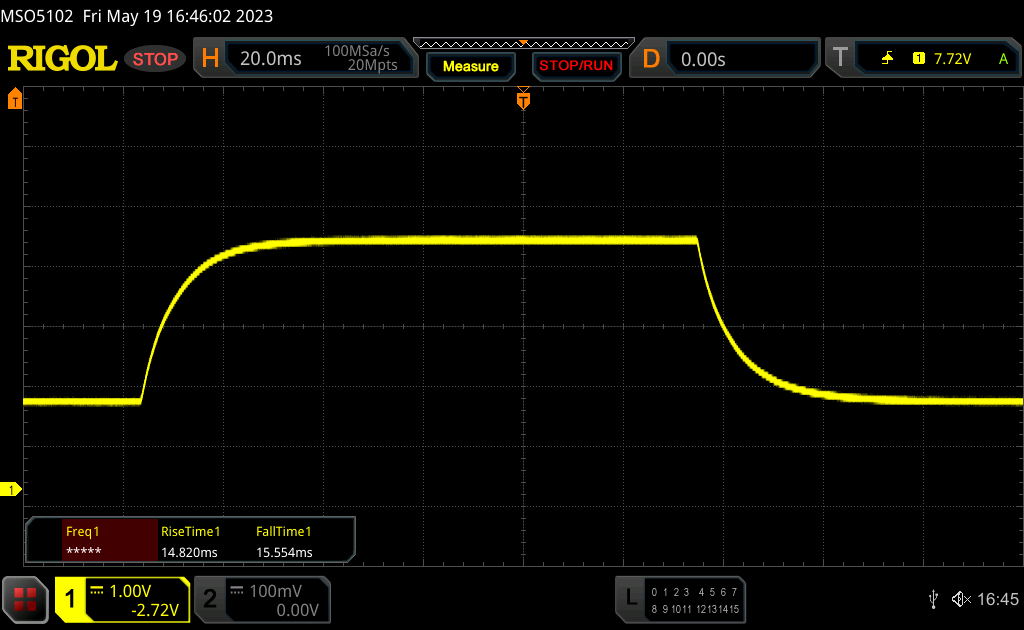 |
| ↘ 15.6 ms upadek | ||
| W naszych testach ekran wykazuje powolne tempo reakcji, co będzie niezadowalające dla graczy. Dla porównania, wszystkie testowane urządzenia wahają się od 0.165 (minimum) do 636 (maksimum) ms. » 41 % wszystkich urządzeń jest lepszych. Oznacza to, że zmierzony czas reakcji jest zbliżony do średniej wszystkich testowanych urządzeń (31 ms). | ||
Migotanie ekranu / PWM (modulacja szerokości impulsu)
| Migotanie ekranu/nie wykryto PWM | 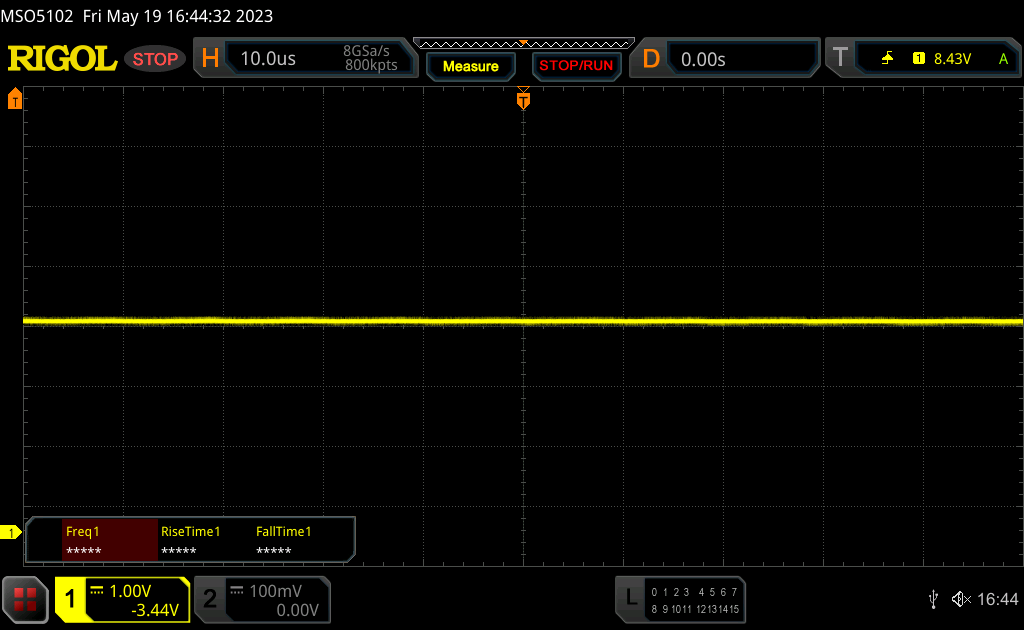 | ||
Dla porównania: 52 % wszystkich testowanych urządzeń nie używa PWM do przyciemniania wyświetlacza. Jeśli wykryto PWM, zmierzono średnio 7757 (minimum: 5 - maksimum: 343500) Hz. | |||

Na zewnątrz zdecydowanie zyskujesz na tym, że ekran jest matowy, ale jeśli jest zbyt jasno, nadal będziesz miał trudności z zobaczeniem treści na ekranie. Jasność ekranu mogłaby być wyższa. Stabilność kąta widzenia panelu IPS jest w porządku - jednak pod pewnymi kątami ekran czasami wydaje się zbyt rozjaśniony (szczególnie z góry i z boku).

Wydajność - TUF Gaming łączy w sobie procesor Ryzen 7 z kartą graficzną RTX 4050
Nasza konfiguracja testowa to najsłabszy model z tej serii - opcjonalnie Asus TUF Gaming A15 może zostać wyposażony w nowszy procesorRyzen 9 7940HSi kartęGeForce RTX 4070 Laptopw najlepszym przypadku. Oczywiście w takiej konfiguracji laptop będzie kosztował znacznie więcej.
Warunki testowania
Asus korzysta z oprogramowania Armoury Crate dla swoich laptopów do gier, w którym dostępne są również różne profile energetyczne. Opcjonalny tryb Turbo nie prowadzi jednak do wzrostu wydajności w naszej konfiguracji, dlatego też wszystkie pomiary i benchmarki przeprowadziliśmy w trybie Performance. Dodatkowo aktywny był Advanced Optimus, który jednak prowadzi do lekkich zacięć podczas przełączania grafiki (na przykład podczas uruchamiania gier). Jeśli nie chcesz tego, możesz dezaktywować iGPU na stałe lub użyć normalnej funkcji Optimus.
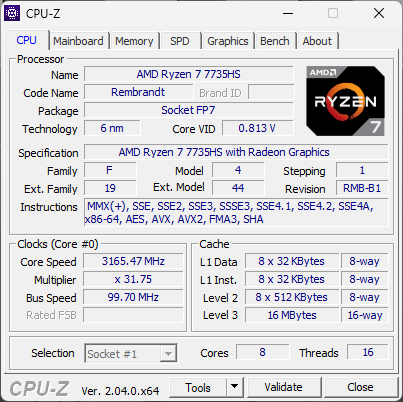
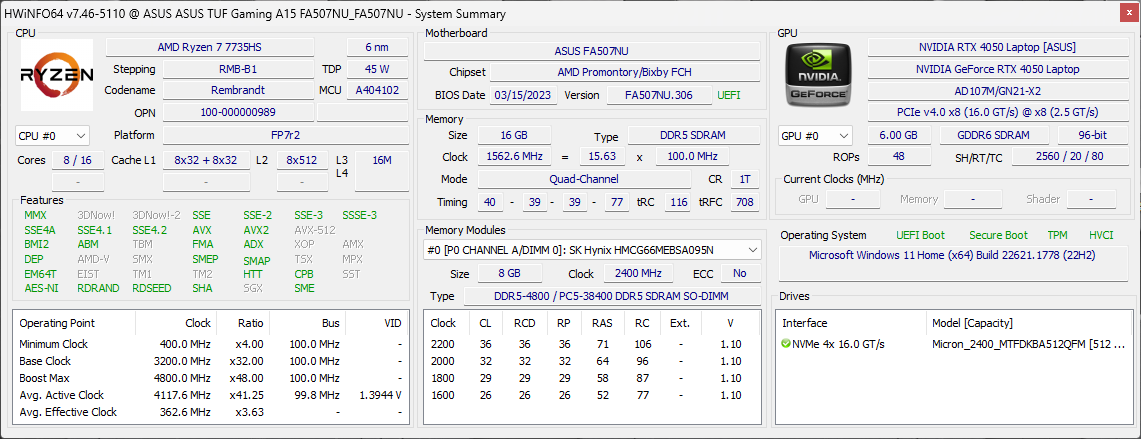
Procesor - Ryzen 7 7735HS
Ryzen 7 7735HSAMD Ryzen 7 7735HS jest używany jako procesor laptopa, który jest w zasadzie starymRyzen 7 6800HS ale z maksymalnym taktowaniem wyższym o 50 MHz. Układ Zen3+ ma 8 rdzeni i może przetwarzać 16 wątków jednocześnie. Limity mocy TUF Gaming A15 wynoszą 80/65 W, co pozwala na przyzwoitą wydajność wielordzeniową, która często wyprzedza konkurentów z procesorami Alder Lake. W testach pojedynczego rdzenia układy Intela z wydajnymi rdzeniami miały jednak wyraźną przewagę. Nic dziwnego, że 7735HS jest na równi zSchenker XMG Core 15'sRyzen 7 6800H. Ogólnie rzecz biorąc, procesor jest przyzwoitym wyborem dla budżetowego laptopa do gier. Na zasilaniu bateryjnym procesor na krótko zużywa 45 watów, a następnie spada do 32 watów, dlatego wydajność wielordzeniowa spada o 20%. Więcej testów porównawczych procesora jest dostępnych tutaj.
Cinebench R15 Multi continuous test
Cinebench R23: Multi Core | Single Core
Cinebench R20: CPU (Multi Core) | CPU (Single Core)
Cinebench R15: CPU Multi 64Bit | CPU Single 64Bit
Blender: v2.79 BMW27 CPU
7-Zip 18.03: 7z b 4 | 7z b 4 -mmt1
Geekbench 5.5: Multi-Core | Single-Core
HWBOT x265 Benchmark v2.2: 4k Preset
LibreOffice : 20 Documents To PDF
R Benchmark 2.5: Overall mean
| CPU Performance rating | |
| Średnia w klasie Gaming | |
| Asus TUF Gaming F15 FX507ZM | |
| HP Victus 15 fa0020nr | |
| MSI Katana 15 B12VEK | |
| Asus TUF A15 FA507 | |
| Schenker XMG Core 15 (M22) | |
| Lenovo IdeaPad Gaming 3 15IAH7 | |
| Gigabyte G5 KE | |
| Przeciętny AMD Ryzen 7 7735HS | |
| Cinebench R23 / Multi Core | |
| Średnia w klasie Gaming (10488 - 42661, n=107, ostatnie 2 lata) | |
| Asus TUF Gaming F15 FX507ZM | |
| MSI Katana 15 B12VEK | |
| HP Victus 15 fa0020nr | |
| Lenovo IdeaPad Gaming 3 15IAH7 | |
| Schenker XMG Core 15 (M22) | |
| Asus TUF A15 FA507 | |
| Gigabyte G5 KE | |
| Przeciętny AMD Ryzen 7 7735HS (10283 - 14131, n=15) | |
| Cinebench R23 / Single Core | |
| Średnia w klasie Gaming (1166 - 2415, n=107, ostatnie 2 lata) | |
| Asus TUF Gaming F15 FX507ZM | |
| HP Victus 15 fa0020nr | |
| MSI Katana 15 B12VEK | |
| Lenovo IdeaPad Gaming 3 15IAH7 | |
| Gigabyte G5 KE | |
| Schenker XMG Core 15 (M22) | |
| Asus TUF A15 FA507 | |
| Przeciętny AMD Ryzen 7 7735HS (1288 - 1570, n=15) | |
| Cinebench R20 / CPU (Multi Core) | |
| Średnia w klasie Gaming (4029 - 16433, n=106, ostatnie 2 lata) | |
| Asus TUF Gaming F15 FX507ZM | |
| MSI Katana 15 B12VEK | |
| HP Victus 15 fa0020nr | |
| Lenovo IdeaPad Gaming 3 15IAH7 | |
| Schenker XMG Core 15 (M22) | |
| Asus TUF A15 FA507 | |
| Gigabyte G5 KE | |
| Przeciętny AMD Ryzen 7 7735HS (3968 - 5502, n=15) | |
| Cinebench R20 / CPU (Single Core) | |
| Średnia w klasie Gaming (442 - 913, n=106, ostatnie 2 lata) | |
| HP Victus 15 fa0020nr | |
| Asus TUF Gaming F15 FX507ZM | |
| Lenovo IdeaPad Gaming 3 15IAH7 | |
| MSI Katana 15 B12VEK | |
| Gigabyte G5 KE | |
| Schenker XMG Core 15 (M22) | |
| Asus TUF A15 FA507 | |
| Przeciętny AMD Ryzen 7 7735HS (502 - 613, n=15) | |
| Cinebench R15 / CPU Multi 64Bit | |
| Średnia w klasie Gaming (1578 - 6330, n=105, ostatnie 2 lata) | |
| Asus TUF Gaming F15 FX507ZM | |
| HP Victus 15 fa0020nr | |
| Schenker XMG Core 15 (M22) | |
| Asus TUF A15 FA507 | |
| Lenovo IdeaPad Gaming 3 15IAH7 | |
| MSI Katana 15 B12VEK | |
| Przeciętny AMD Ryzen 7 7735HS (1758 - 2355, n=17) | |
| Gigabyte G5 KE | |
| Cinebench R15 / CPU Single 64Bit | |
| Średnia w klasie Gaming (188.8 - 350, n=106, ostatnie 2 lata) | |
| HP Victus 15 fa0020nr | |
| Asus TUF Gaming F15 FX507ZM | |
| Schenker XMG Core 15 (M22) | |
| Asus TUF A15 FA507 | |
| Lenovo IdeaPad Gaming 3 15IAH7 | |
| MSI Katana 15 B12VEK | |
| Przeciętny AMD Ryzen 7 7735HS (206 - 255, n=16) | |
| Gigabyte G5 KE | |
| Blender / v2.79 BMW27 CPU | |
| Przeciętny AMD Ryzen 7 7735HS (214 - 351, n=15) | |
| HP Victus 15 fa0020nr | |
| MSI Katana 15 B12VEK | |
| Gigabyte G5 KE | |
| Lenovo IdeaPad Gaming 3 15IAH7 | |
| Asus TUF A15 FA507 | |
| Schenker XMG Core 15 (M22) | |
| Asus TUF Gaming F15 FX507ZM | |
| Średnia w klasie Gaming (79 - 330, n=104, ostatnie 2 lata) | |
| 7-Zip 18.03 / 7z b 4 | |
| Średnia w klasie Gaming (33491 - 148086, n=105, ostatnie 2 lata) | |
| Asus TUF Gaming F15 FX507ZM | |
| Schenker XMG Core 15 (M22) | |
| Asus TUF A15 FA507 | |
| MSI Katana 15 B12VEK | |
| Przeciętny AMD Ryzen 7 7735HS (43455 - 63698, n=15) | |
| Gigabyte G5 KE | |
| HP Victus 15 fa0020nr | |
| Lenovo IdeaPad Gaming 3 15IAH7 | |
| 7-Zip 18.03 / 7z b 4 -mmt1 | |
| Średnia w klasie Gaming (4199 - 7436, n=105, ostatnie 2 lata) | |
| HP Victus 15 fa0020nr | |
| Asus TUF A15 FA507 | |
| Schenker XMG Core 15 (M22) | |
| Przeciętny AMD Ryzen 7 7735HS (4779 - 5849, n=15) | |
| MSI Katana 15 B12VEK | |
| Lenovo IdeaPad Gaming 3 15IAH7 | |
| Gigabyte G5 KE | |
| Asus TUF Gaming F15 FX507ZM | |
| Geekbench 5.5 / Multi-Core | |
| Średnia w klasie Gaming (6460 - 28263, n=105, ostatnie 2 lata) | |
| Asus TUF Gaming F15 FX507ZM | |
| MSI Katana 15 B12VEK | |
| HP Victus 15 fa0020nr | |
| Gigabyte G5 KE | |
| Schenker XMG Core 15 (M22) | |
| Asus TUF A15 FA507 | |
| Przeciętny AMD Ryzen 7 7735HS (7151 - 10258, n=15) | |
| Lenovo IdeaPad Gaming 3 15IAH7 | |
| Geekbench 5.5 / Single-Core | |
| Średnia w klasie Gaming (986 - 2474, n=105, ostatnie 2 lata) | |
| HP Victus 15 fa0020nr | |
| Asus TUF Gaming F15 FX507ZM | |
| MSI Katana 15 B12VEK | |
| Gigabyte G5 KE | |
| Lenovo IdeaPad Gaming 3 15IAH7 | |
| Schenker XMG Core 15 (M22) | |
| Przeciętny AMD Ryzen 7 7735HS (1327 - 1615, n=15) | |
| Asus TUF A15 FA507 | |
| HWBOT x265 Benchmark v2.2 / 4k Preset | |
| Średnia w klasie Gaming (11.5 - 44.4, n=105, ostatnie 2 lata) | |
| Asus TUF Gaming F15 FX507ZM | |
| Schenker XMG Core 15 (M22) | |
| MSI Katana 15 B12VEK | |
| Asus TUF A15 FA507 | |
| Gigabyte G5 KE | |
| HP Victus 15 fa0020nr | |
| Lenovo IdeaPad Gaming 3 15IAH7 | |
| Przeciętny AMD Ryzen 7 7735HS (10.8 - 17.9, n=15) | |
| LibreOffice / 20 Documents To PDF | |
| Schenker XMG Core 15 (M22) | |
| Gigabyte G5 KE | |
| Przeciętny AMD Ryzen 7 7735HS (44.3 - 63.9, n=15) | |
| Asus TUF A15 FA507 | |
| Asus TUF Gaming F15 FX507ZM | |
| Średnia w klasie Gaming (33.2 - 88.8, n=105, ostatnie 2 lata) | |
| HP Victus 15 fa0020nr | |
| Lenovo IdeaPad Gaming 3 15IAH7 | |
| MSI Katana 15 B12VEK | |
| R Benchmark 2.5 / Overall mean | |
| Lenovo IdeaPad Gaming 3 15IAH7 | |
| Przeciętny AMD Ryzen 7 7735HS (0.4822 - 0.585, n=15) | |
| Asus TUF A15 FA507 | |
| MSI Katana 15 B12VEK | |
| Gigabyte G5 KE | |
| Schenker XMG Core 15 (M22) | |
| HP Victus 15 fa0020nr | |
| Asus TUF Gaming F15 FX507ZM | |
| Średnia w klasie Gaming (0.3439 - 0.759, n=106, ostatnie 2 lata) | |
* ... im mniej tym lepiej
AIDA64: FP32 Ray-Trace | FPU Julia | CPU SHA3 | CPU Queen | FPU SinJulia | FPU Mandel | CPU AES | CPU ZLib | FP64 Ray-Trace | CPU PhotoWorxx
| Performance rating | |
| Średnia w klasie Gaming | |
| Schenker XMG Core 15 (M22) | |
| Asus TUF A15 FA507 | |
| Przeciętny AMD Ryzen 7 7735HS | |
| MSI Katana 15 B12VEK | |
| Gigabyte G5 KE | |
| Asus TUF Gaming F15 FX507ZM | |
| Lenovo IdeaPad Gaming 3 15IAH7 | |
| HP Victus 15 fa0020nr | |
| AIDA64 / FP32 Ray-Trace | |
| Średnia w klasie Gaming (10227 - 85542, n=105, ostatnie 2 lata) | |
| Schenker XMG Core 15 (M22) | |
| Asus TUF A15 FA507 | |
| MSI Katana 15 B12VEK | |
| Przeciętny AMD Ryzen 7 7735HS (11831 - 17161, n=16) | |
| Lenovo IdeaPad Gaming 3 15IAH7 | |
| HP Victus 15 fa0020nr | |
| Gigabyte G5 KE | |
| Asus TUF Gaming F15 FX507ZM | |
| AIDA64 / FPU Julia | |
| Średnia w klasie Gaming (51376 - 238426, n=105, ostatnie 2 lata) | |
| Schenker XMG Core 15 (M22) | |
| Asus TUF A15 FA507 | |
| Przeciętny AMD Ryzen 7 7735HS (75370 - 105483, n=16) | |
| MSI Katana 15 B12VEK | |
| Lenovo IdeaPad Gaming 3 15IAH7 | |
| Gigabyte G5 KE | |
| HP Victus 15 fa0020nr | |
| Asus TUF Gaming F15 FX507ZM | |
| AIDA64 / CPU SHA3 | |
| Średnia w klasie Gaming (2180 - 10115, n=105, ostatnie 2 lata) | |
| Schenker XMG Core 15 (M22) | |
| Asus TUF A15 FA507 | |
| Lenovo IdeaPad Gaming 3 15IAH7 | |
| Asus TUF Gaming F15 FX507ZM | |
| MSI Katana 15 B12VEK | |
| Gigabyte G5 KE | |
| Przeciętny AMD Ryzen 7 7735HS (2499 - 3494, n=16) | |
| HP Victus 15 fa0020nr | |
| AIDA64 / CPU Queen | |
| Średnia w klasie Gaming (49785 - 173351, n=90, ostatnie 2 lata) | |
| Asus TUF A15 FA507 | |
| HP Victus 15 fa0020nr | |
| Przeciętny AMD Ryzen 7 7735HS (87486 - 108729, n=15) | |
| Asus TUF Gaming F15 FX507ZM | |
| Schenker XMG Core 15 (M22) | |
| MSI Katana 15 B12VEK | |
| Lenovo IdeaPad Gaming 3 15IAH7 | |
| Gigabyte G5 KE | |
| AIDA64 / FPU SinJulia | |
| Średnia w klasie Gaming (4424 - 33636, n=105, ostatnie 2 lata) | |
| Schenker XMG Core 15 (M22) | |
| Asus TUF A15 FA507 | |
| Przeciętny AMD Ryzen 7 7735HS (11233 - 13097, n=16) | |
| Asus TUF Gaming F15 FX507ZM | |
| MSI Katana 15 B12VEK | |
| HP Victus 15 fa0020nr | |
| Gigabyte G5 KE | |
| Lenovo IdeaPad Gaming 3 15IAH7 | |
| AIDA64 / FPU Mandel | |
| Średnia w klasie Gaming (25115 - 128721, n=105, ostatnie 2 lata) | |
| Schenker XMG Core 15 (M22) | |
| Asus TUF A15 FA507 | |
| Przeciętny AMD Ryzen 7 7735HS (41400 - 58232, n=16) | |
| MSI Katana 15 B12VEK | |
| Lenovo IdeaPad Gaming 3 15IAH7 | |
| Gigabyte G5 KE | |
| HP Victus 15 fa0020nr | |
| Asus TUF Gaming F15 FX507ZM | |
| AIDA64 / CPU AES | |
| Lenovo IdeaPad Gaming 3 15IAH7 | |
| Gigabyte G5 KE | |
| Średnia w klasie Gaming (39258 - 247074, n=105, ostatnie 2 lata) | |
| Przeciętny AMD Ryzen 7 7735HS (44013 - 137629, n=16) | |
| Schenker XMG Core 15 (M22) | |
| MSI Katana 15 B12VEK | |
| Asus TUF Gaming F15 FX507ZM | |
| Asus TUF A15 FA507 | |
| HP Victus 15 fa0020nr | |
| AIDA64 / CPU ZLib | |
| Średnia w klasie Gaming (574 - 2531, n=105, ostatnie 2 lata) | |
| Asus TUF Gaming F15 FX507ZM | |
| Gigabyte G5 KE | |
| Lenovo IdeaPad Gaming 3 15IAH7 | |
| Schenker XMG Core 15 (M22) | |
| MSI Katana 15 B12VEK | |
| HP Victus 15 fa0020nr | |
| Przeciętny AMD Ryzen 7 7735HS (651 - 906, n=16) | |
| Asus TUF A15 FA507 | |
| AIDA64 / FP64 Ray-Trace | |
| Średnia w klasie Gaming (5509 - 45446, n=105, ostatnie 2 lata) | |
| Schenker XMG Core 15 (M22) | |
| Asus TUF A15 FA507 | |
| MSI Katana 15 B12VEK | |
| Przeciętny AMD Ryzen 7 7735HS (1459 - 9094, n=16) | |
| Lenovo IdeaPad Gaming 3 15IAH7 | |
| Gigabyte G5 KE | |
| HP Victus 15 fa0020nr | |
| Asus TUF Gaming F15 FX507ZM | |
| AIDA64 / CPU PhotoWorxx | |
| Średnia w klasie Gaming (12271 - 89891, n=105, ostatnie 2 lata) | |
| MSI Katana 15 B12VEK | |
| Asus TUF Gaming F15 FX507ZM | |
| Schenker XMG Core 15 (M22) | |
| Gigabyte G5 KE | |
| Asus TUF A15 FA507 | |
| Przeciętny AMD Ryzen 7 7735HS (17524 - 30542, n=16) | |
| HP Victus 15 fa0020nr | |
| Lenovo IdeaPad Gaming 3 15IAH7 | |
Wydajność systemu
TUF Gaming A15 osiągnął dobre wyniki w syntetycznych testach porównawczych systemu i był w stanie uplasować się w górnej połowie stawki w teście PCMark 10. Ogólnie rzecz biorąc, nie było tak wiele między pretendentami i subiektywnie, wszystkie pozostawiły na nas dobre wrażenie, jeśli chodzi o wydajność. Poza wspomnianymi wcześniej lekkimi zacięciami podczas przełączania GPU (które są normalne), system zawsze działał płynnie w teście.
CrossMark: Overall | Productivity | Creativity | Responsiveness
| PCMark 10 / Score | |
| Średnia w klasie Gaming (5828 - 12414, n=93, ostatnie 2 lata) | |
| Asus TUF Gaming F15 FX507ZM | |
| Schenker XMG Core 15 (M22) | |
| Asus TUF A15 FA507 | |
| Przeciętny AMD Ryzen 7 7735HS, NVIDIA GeForce RTX 4050 Laptop GPU (n=1) | |
| Gigabyte G5 KE | |
| HP Victus 15 fa0020nr | |
| MSI Katana 15 B12VEK | |
| Lenovo IdeaPad Gaming 3 15IAH7 | |
| PCMark 10 / Essentials | |
| Gigabyte G5 KE | |
| Schenker XMG Core 15 (M22) | |
| Średnia w klasie Gaming (8810 - 11935, n=97, ostatnie 2 lata) | |
| Asus TUF A15 FA507 | |
| Przeciętny AMD Ryzen 7 7735HS, NVIDIA GeForce RTX 4050 Laptop GPU (n=1) | |
| Asus TUF Gaming F15 FX507ZM | |
| HP Victus 15 fa0020nr | |
| MSI Katana 15 B12VEK | |
| Lenovo IdeaPad Gaming 3 15IAH7 | |
| PCMark 10 / Productivity | |
| Średnia w klasie Gaming (6845 - 25323, n=95, ostatnie 2 lata) | |
| MSI Katana 15 B12VEK | |
| Schenker XMG Core 15 (M22) | |
| Lenovo IdeaPad Gaming 3 15IAH7 | |
| Gigabyte G5 KE | |
| Asus TUF A15 FA507 | |
| Przeciętny AMD Ryzen 7 7735HS, NVIDIA GeForce RTX 4050 Laptop GPU (n=1) | |
| Asus TUF Gaming F15 FX507ZM | |
| HP Victus 15 fa0020nr | |
| PCMark 10 / Digital Content Creation | |
| Średnia w klasie Gaming (7602 - 19954, n=95, ostatnie 2 lata) | |
| Asus TUF Gaming F15 FX507ZM | |
| Asus TUF A15 FA507 | |
| Przeciętny AMD Ryzen 7 7735HS, NVIDIA GeForce RTX 4050 Laptop GPU (n=1) | |
| Schenker XMG Core 15 (M22) | |
| Gigabyte G5 KE | |
| HP Victus 15 fa0020nr | |
| MSI Katana 15 B12VEK | |
| Lenovo IdeaPad Gaming 3 15IAH7 | |
| CrossMark / Overall | |
| Średnia w klasie Gaming (1366 - 2409, n=94, ostatnie 2 lata) | |
| Gigabyte G5 KE | |
| MSI Katana 15 B12VEK | |
| HP Victus 15 fa0020nr | |
| Schenker XMG Core 15 (M22) | |
| Asus TUF A15 FA507 | |
| Przeciętny AMD Ryzen 7 7735HS, NVIDIA GeForce RTX 4050 Laptop GPU (n=1) | |
| CrossMark / Productivity | |
| Średnia w klasie Gaming (1386 - 2254, n=94, ostatnie 2 lata) | |
| Gigabyte G5 KE | |
| MSI Katana 15 B12VEK | |
| HP Victus 15 fa0020nr | |
| Schenker XMG Core 15 (M22) | |
| Asus TUF A15 FA507 | |
| Przeciętny AMD Ryzen 7 7735HS, NVIDIA GeForce RTX 4050 Laptop GPU (n=1) | |
| CrossMark / Creativity | |
| Średnia w klasie Gaming (1343 - 2786, n=94, ostatnie 2 lata) | |
| MSI Katana 15 B12VEK | |
| HP Victus 15 fa0020nr | |
| Gigabyte G5 KE | |
| Schenker XMG Core 15 (M22) | |
| Asus TUF A15 FA507 | |
| Przeciętny AMD Ryzen 7 7735HS, NVIDIA GeForce RTX 4050 Laptop GPU (n=1) | |
| CrossMark / Responsiveness | |
| Gigabyte G5 KE | |
| Średnia w klasie Gaming (1226 - 2334, n=94, ostatnie 2 lata) | |
| MSI Katana 15 B12VEK | |
| HP Victus 15 fa0020nr | |
| Schenker XMG Core 15 (M22) | |
| Asus TUF A15 FA507 | |
| Przeciętny AMD Ryzen 7 7735HS, NVIDIA GeForce RTX 4050 Laptop GPU (n=1) | |
| PCMark 10 Score | 7210 pkt. | |
Pomoc | ||
| AIDA64 / Memory Copy | |
| Średnia w klasie Gaming (21750 - 129946, n=105, ostatnie 2 lata) | |
| MSI Katana 15 B12VEK | |
| Asus TUF Gaming F15 FX507ZM | |
| Schenker XMG Core 15 (M22) | |
| Asus TUF A15 FA507 | |
| Przeciętny AMD Ryzen 7 7735HS (30324 - 52012, n=16) | |
| Gigabyte G5 KE | |
| HP Victus 15 fa0020nr | |
| Lenovo IdeaPad Gaming 3 15IAH7 | |
| AIDA64 / Memory Read | |
| Średnia w klasie Gaming (22956 - 118858, n=105, ostatnie 2 lata) | |
| MSI Katana 15 B12VEK | |
| Asus TUF Gaming F15 FX507ZM | |
| Schenker XMG Core 15 (M22) | |
| Asus TUF A15 FA507 | |
| Gigabyte G5 KE | |
| HP Victus 15 fa0020nr | |
| Przeciętny AMD Ryzen 7 7735HS (33938 - 51856, n=16) | |
| Lenovo IdeaPad Gaming 3 15IAH7 | |
| AIDA64 / Memory Write | |
| Średnia w klasie Gaming (22297 - 135096, n=105, ostatnie 2 lata) | |
| Asus TUF Gaming F15 FX507ZM | |
| MSI Katana 15 B12VEK | |
| Schenker XMG Core 15 (M22) | |
| Asus TUF A15 FA507 | |
| Przeciętny AMD Ryzen 7 7735HS (33175 - 55284, n=16) | |
| Gigabyte G5 KE | |
| HP Victus 15 fa0020nr | |
| Lenovo IdeaPad Gaming 3 15IAH7 | |
| AIDA64 / Memory Latency | |
| Średnia w klasie Gaming (75.3 - 259, n=105, ostatnie 2 lata) | |
| Gigabyte G5 KE | |
| MSI Katana 15 B12VEK | |
| Lenovo IdeaPad Gaming 3 15IAH7 | |
| Przeciętny AMD Ryzen 7 7735HS (78.2 - 109.8, n=16) | |
| Schenker XMG Core 15 (M22) | |
| Asus TUF A15 FA507 | |
| HP Victus 15 fa0020nr | |
| Asus TUF Gaming F15 FX507ZM | |
* ... im mniej tym lepiej
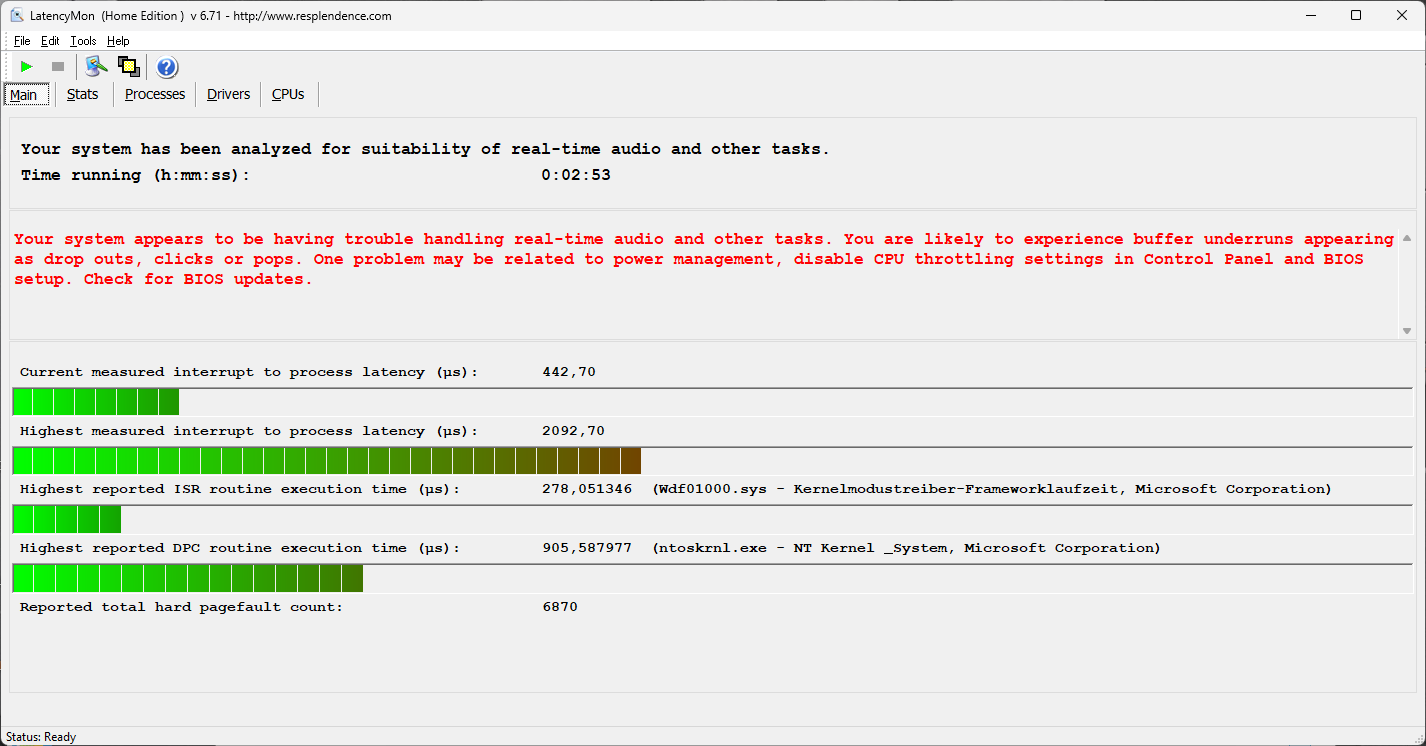
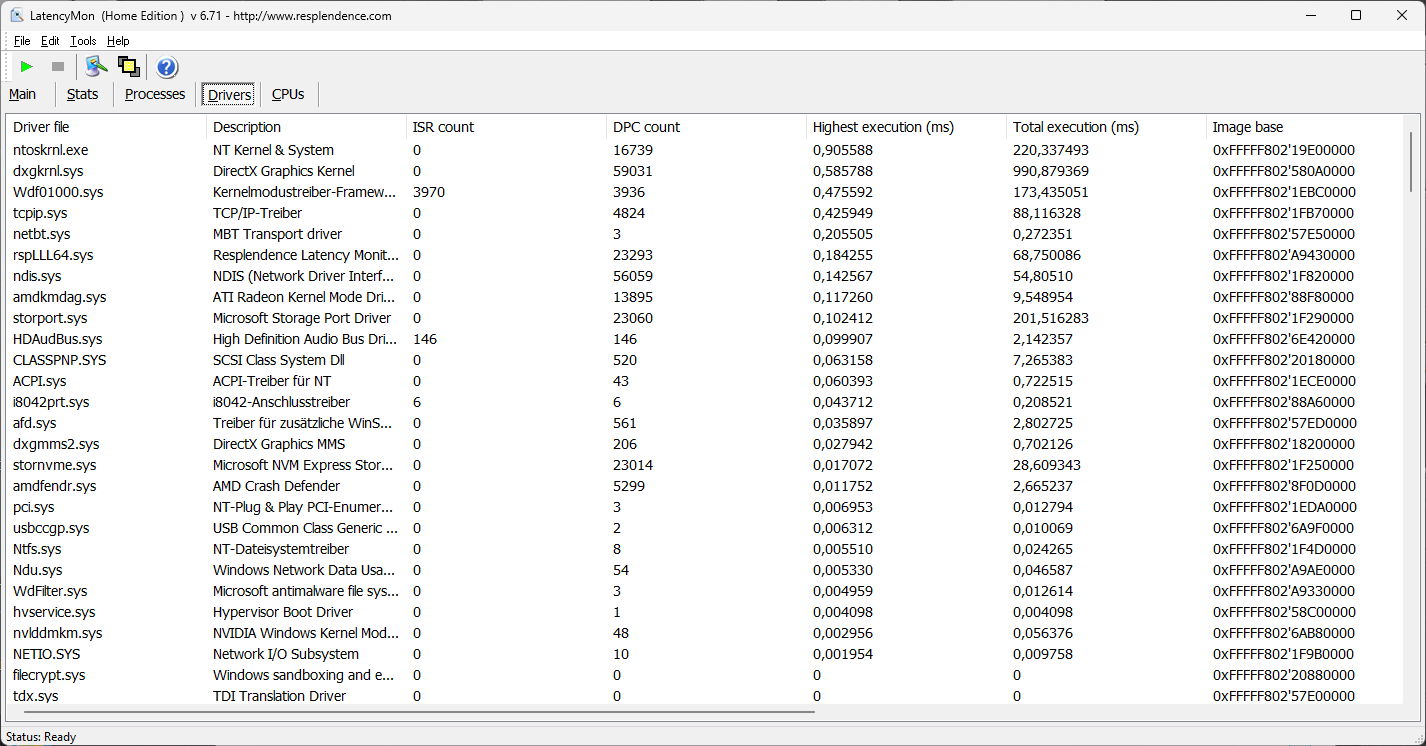
Opóźnienie DPC
W naszym standardowym teście opóźnień (przeglądanie stron internetowych, odtwarzanie YouTube 4K, obciążenie procesora) urządzenie testowe wykazało pewne ograniczenia z obecną wersją BIOS-u i dlatego nie nadaje się do nieograniczonego oprogramowania audio w czasie rzeczywistym.
| DPC Latencies / LatencyMon - interrupt to process latency (max), Web, Youtube, Prime95 | |
| MSI Katana 15 B12VEK | |
| Schenker XMG Core 15 (M22) | |
| HP Victus 15 fa0020nr | |
| Lenovo IdeaPad Gaming 3 15IAH7 | |
| Gigabyte G5 KE | |
| Asus TUF Gaming F15 FX507ZM | |
* ... im mniej tym lepiej
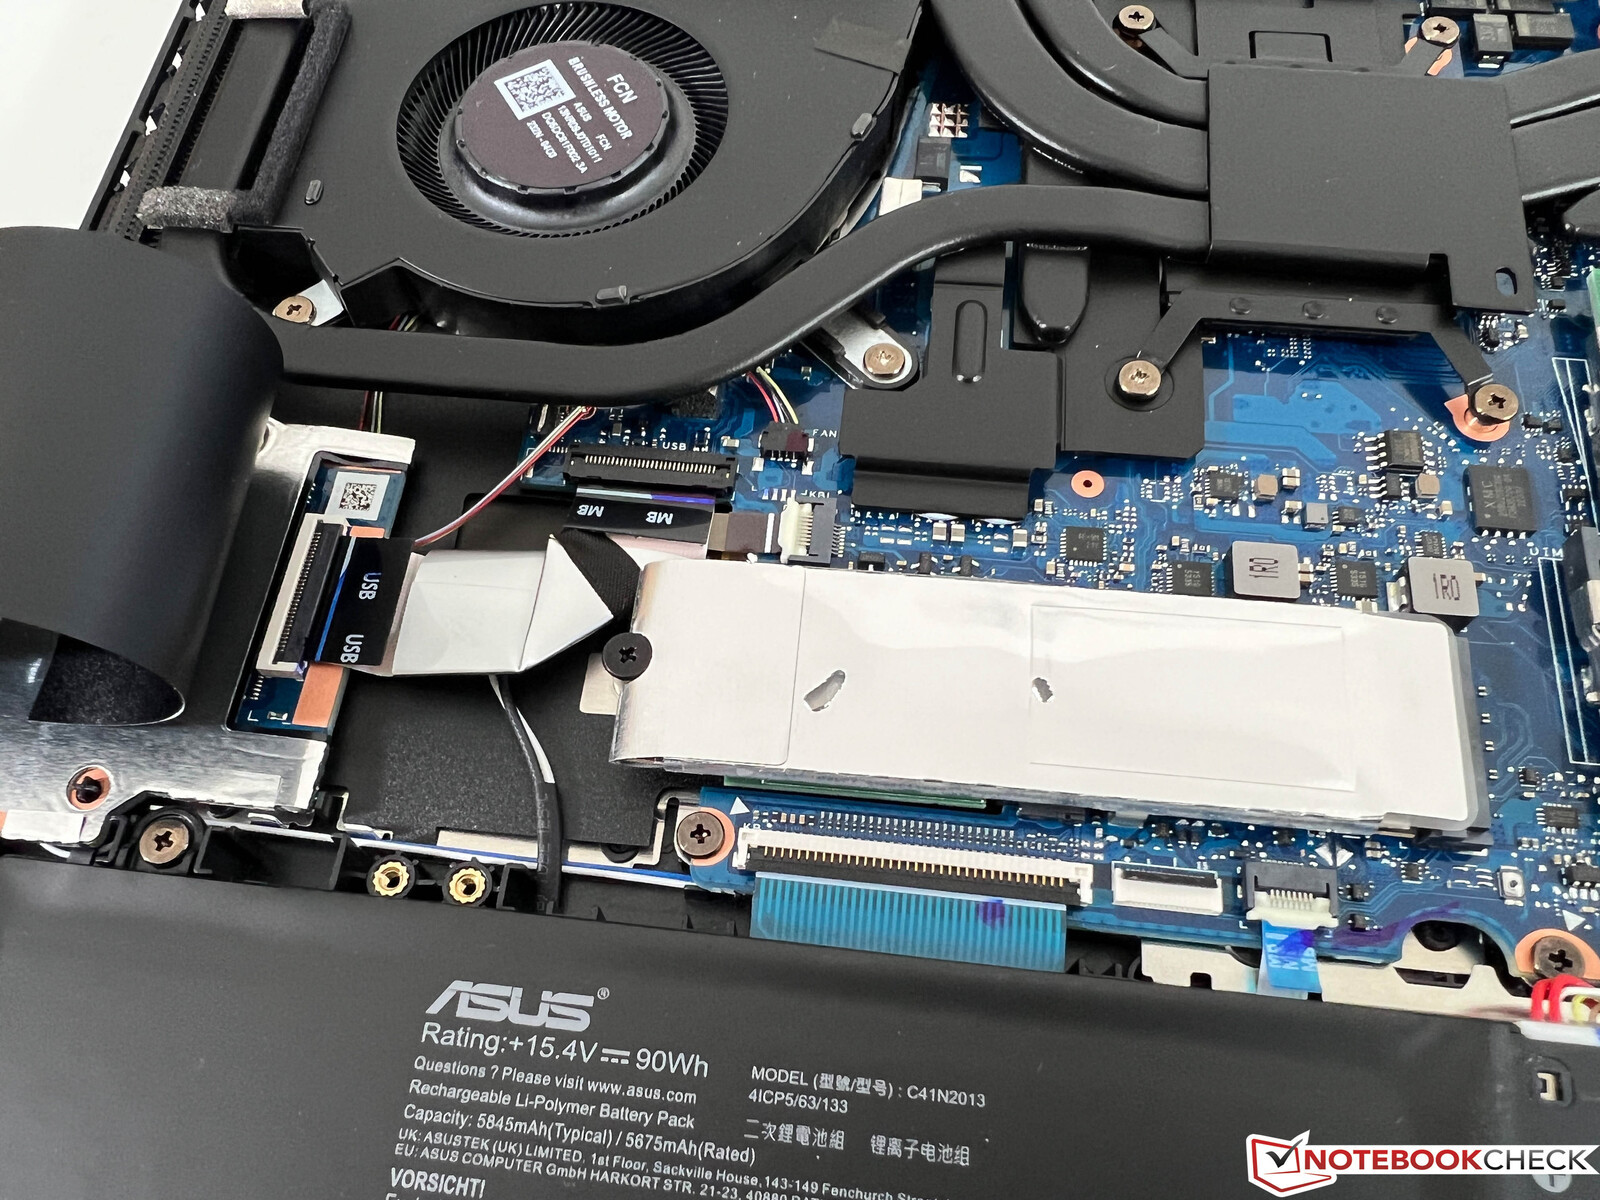
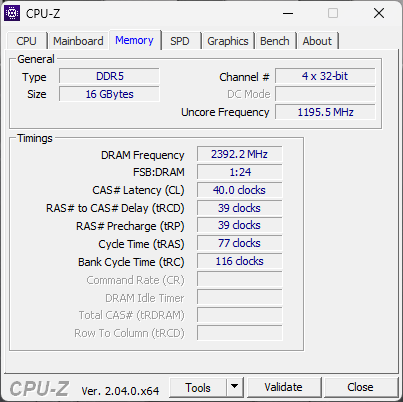
Urządzenia pamięci masowej
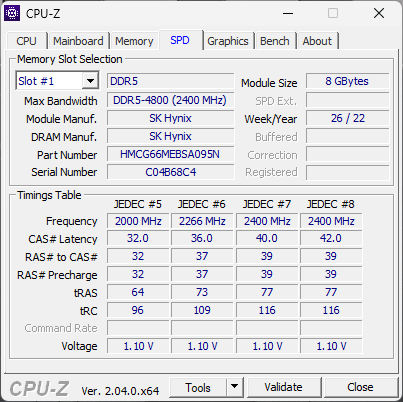
Zainstalowany dysk SSD to dysk PCIe 4.0 firmy Micron (2400). Dysk M.2 2280 ma pojemność 512 GB, z 420 GB dostępnymi po pierwszym uruchomieniu. Maksymalna szybkość transferu QLC-SSD wynosi 4200 MB/s, co odpowiada również szybkości w naszych testach porównawczych. Ogólnie rzecz biorąc, jego wydajność jest dobra i stabilna nawet przy dłuższym obciążeniu. Więcej testów porównawczych dysków SSD można znaleźć tutaj.

| Drive Performance rating - Percent | |
| Średnia w klasie Gaming | |
| Asus TUF Gaming F15 FX507ZM | |
| Gigabyte G5 KE | |
| Schenker XMG Core 15 (M22) | |
| HP Victus 15 fa0020nr | |
| MSI Katana 15 B12VEK | |
| Lenovo IdeaPad Gaming 3 15IAH7 | |
| Asus TUF A15 FA507 | |
| Przeciętny Micron 2400 MTFDKBA512QFM | |
* ... im mniej tym lepiej
reading continuous performance: DiskSpd Read Loop, Queue Depth 8
Karta graficzna - GeForce RTX 4050 Laptop
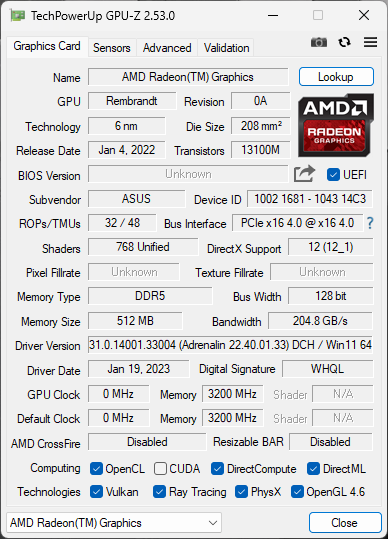
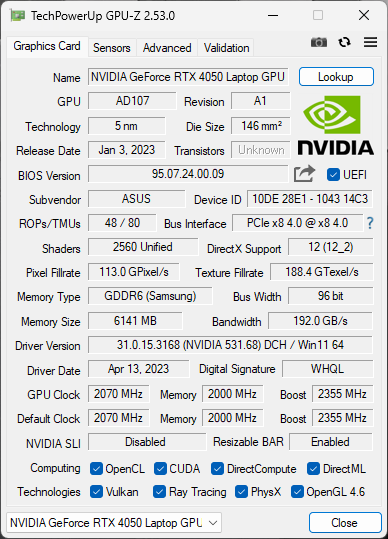
W codziennym użytkowaniu za obliczenia graficzne odpowiada zintegrowana karta graficznaAMD Radeon 680M- w przypadku większego wysiłku automatycznie przełącza się na dedykowaną kartę graficznąNvidia GeForce RTX 4050 Laptop. Ten ostatni ma 6 GB RAM i według sterownika jest to wersja 140-watowa. Jednak ta specyfikacja jest nieco myląca, ponieważ nowe GPU i tak zużywa maksymalnie ~95 watów podczas grania. Jest to więc najszybsza wersja laptopa z RTX 4050. Znajduje to również odzwierciedlenie w testach porównawczych, w których TUF Gaming A15 działał średnio o około 10% szybciej niż średnie wartości, które mamy dla tego GPU w naszej bazie danych.
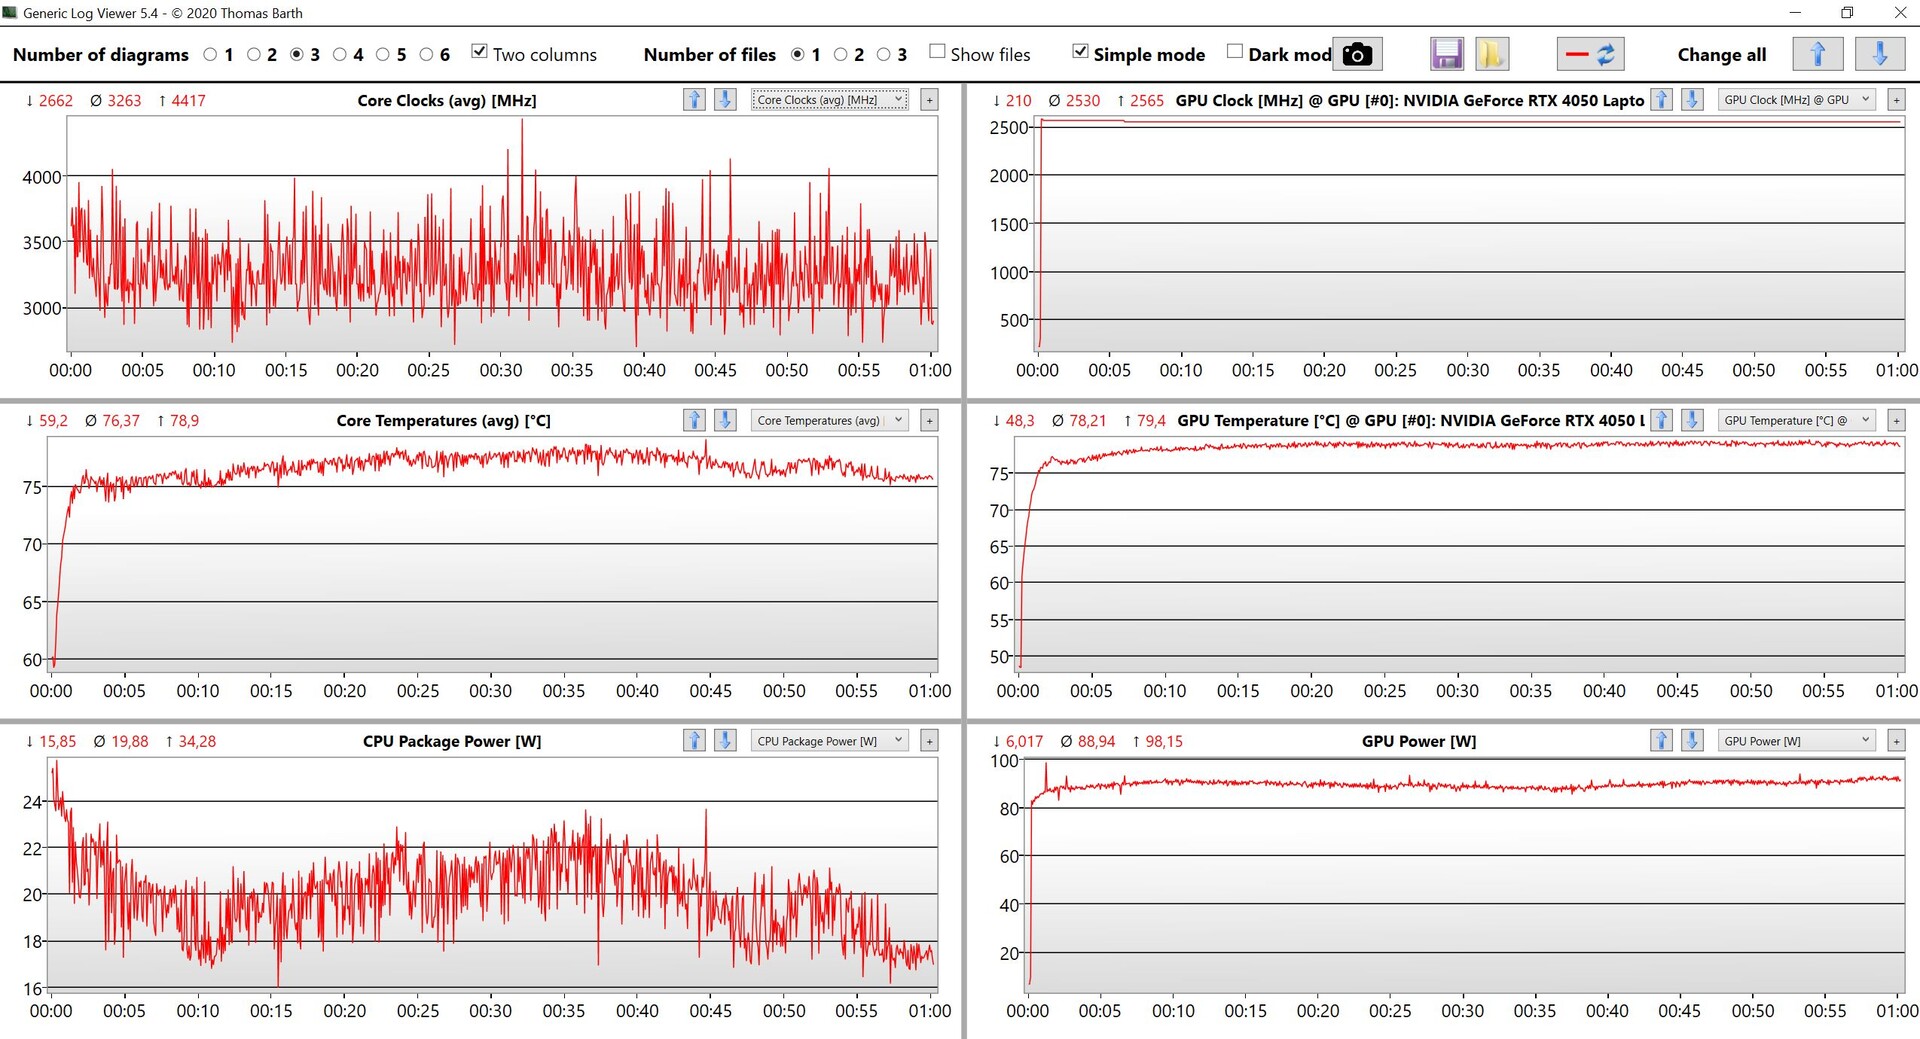
Oznacza to, że laptop RTX 4050 jest również bardzo zbliżony do starej wersji RTX 3060który również zużywa znacznie więcej energii w porównywanych urządzeniach (między 115 a 140 watów TGP). Ogólnie rzecz biorąc, jego wydajność jest bardzo dobra i nie odnotowano spadku wydajności nawet przy stałym obciążeniu - test obciążeniowy Time Spy został przeprowadzony bez żadnych problemów z wynikiem 99,3%. W trybie bateryjnym zużycie energii przez GPU jest ograniczone do około 50 watów, dlatego wydajność grafiki spada o około 30%. WięcejTestów porównawczych GPU znajduje się w naszej sekcji technologicznej.
| 3DMark Performance rating - Percent | |
| Średnia w klasie Gaming | |
| Asus TUF Gaming F15 FX507ZM -4! | |
| MSI Katana 15 B12VEK -3! | |
| Gigabyte G5 KE -3! | |
| Asus TUF A15 FA507 | |
| Schenker XMG Core 15 (M22) -1! | |
| Przeciętny NVIDIA GeForce RTX 4050 Laptop GPU | |
| Lenovo IdeaPad Gaming 3 15IAH7 -3! | |
| HP Victus 15 fa0020nr -2! | |
| 3DMark 11 - 1280x720 Performance GPU | |
| Średnia w klasie Gaming (21841 - 80022, n=104, ostatnie 2 lata) | |
| Asus TUF A15 FA507 | |
| MSI Katana 15 B12VEK | |
| Asus TUF Gaming F15 FX507ZM | |
| Gigabyte G5 KE | |
| Schenker XMG Core 15 (M22) | |
| Przeciętny NVIDIA GeForce RTX 4050 Laptop GPU (13339 - 32642, n=41) | |
| Lenovo IdeaPad Gaming 3 15IAH7 | |
| HP Victus 15 fa0020nr | |
| 3DMark | |
| 1920x1080 Fire Strike Graphics | |
| Średnia w klasie Gaming (12242 - 62849, n=115, ostatnie 2 lata) | |
| MSI Katana 15 B12VEK | |
| Asus TUF Gaming F15 FX507ZM | |
| Asus TUF A15 FA507 | |
| Gigabyte G5 KE | |
| Schenker XMG Core 15 (M22) | |
| Przeciętny NVIDIA GeForce RTX 4050 Laptop GPU (13591 - 24007, n=41) | |
| Lenovo IdeaPad Gaming 3 15IAH7 | |
| HP Victus 15 fa0020nr | |
| 2560x1440 Time Spy Graphics | |
| Średnia w klasie Gaming (5012 - 26212, n=115, ostatnie 2 lata) | |
| Asus TUF Gaming F15 FX507ZM | |
| Schenker XMG Core 15 (M22) | |
| Asus TUF A15 FA507 | |
| Gigabyte G5 KE | |
| MSI Katana 15 B12VEK | |
| Przeciętny NVIDIA GeForce RTX 4050 Laptop GPU (5107 - 9040, n=41) | |
| Lenovo IdeaPad Gaming 3 15IAH7 | |
| HP Victus 15 fa0020nr | |
| Geekbench 6.0 - GPU OpenCL 6.0 | |
| Średnia w klasie Gaming (155885 - 241981, n=3, ostatnie 2 lata) | |
| Asus TUF A15 FA507 | |
| Przeciętny NVIDIA GeForce RTX 4050 Laptop GPU (66574 - 84452, n=13) | |
| 3DMark 11 Performance | 26692 pkt. | |
| 3DMark Fire Strike Score | 20183 pkt. | |
| 3DMark Time Spy Score | 8902 pkt. | |
Pomoc | ||
| Blender / v3.3 Classroom HIP/AMD | |
| Schenker XMG Core 15 (M22) | |
| Asus TUF A15 FA507 | |
| Asus TUF A15 FA507 | |
| Przeciętny NVIDIA GeForce RTX 4050 Laptop GPU (345 - 345, n=2) | |
| Blender / v3.3 Classroom OPTIX/RTX | |
| Lenovo IdeaPad Gaming 3 15IAH7 | |
| HP Victus 15 fa0020nr | |
| Schenker XMG Core 15 (M22) | |
| Gigabyte G5 KE | |
| Przeciętny NVIDIA GeForce RTX 4050 Laptop GPU (25 - 37, n=40) | |
| MSI Katana 15 B12VEK | |
| Asus TUF A15 FA507 | |
| Asus TUF A15 FA507 | |
| Średnia w klasie Gaming (9 - 32, n=106, ostatnie 2 lata) | |
| Blender / v3.3 Classroom CUDA | |
| Lenovo IdeaPad Gaming 3 15IAH7 | |
| HP Victus 15 fa0020nr | |
| Przeciętny NVIDIA GeForce RTX 4050 Laptop GPU (47 - 68, n=39) | |
| Schenker XMG Core 15 (M22) | |
| MSI Katana 15 B12VEK | |
| Gigabyte G5 KE | |
| Asus TUF A15 FA507 | |
| Asus TUF A15 FA507 | |
| Średnia w klasie Gaming (15 - 228, n=106, ostatnie 2 lata) | |
| Blender / v3.3 Classroom CPU | |
| MSI Katana 15 B12VEK | |
| Gigabyte G5 KE | |
| HP Victus 15 fa0020nr | |
| Przeciętny NVIDIA GeForce RTX 4050 Laptop GPU (243 - 907, n=40) | |
| Lenovo IdeaPad Gaming 3 15IAH7 | |
| Asus TUF A15 FA507 | |
| Asus TUF A15 FA507 | |
| Schenker XMG Core 15 (M22) | |
| Średnia w klasie Gaming (122 - 565, n=102, ostatnie 2 lata) | |
* ... im mniej tym lepiej
Wydajność w grach
Nasz podstawowy wariant TUF Gaming A15 pod względem wydajności w grach był bardzo dobry - więcej niż wystarczający dla natywnej rozdzielczości 1080p, nawet podczas grania w nowoczesne gry, takie jak Hogwarts Legacy lub Cyberpunk 2077 z maksymalnymi ustawieniami detali. Jeśli jednak chcesz korzystać z ray tracingu, musisz użyć skalowania DLSS. Dla przykładu, Cyberpunk 2077 działał tylko przy 24 FPS w 1080p z ray tracingiem na Ultra, podczas gdy działał przy 74 FPS z DLSS. Różnica może być jednak mniejsza w przypadku innych gier. Zasadniczo wszystkie współczesne gry są w stanie działać, a 6 GB VRAM jest obecnie całkowicie wystarczające dla 1080p. Test Witcher 3 test pokazuje również, że wydajność w grach pozostaje stabilna nawet podczas dłuższych sesji.
| Performance rating - Percent | |
| Średnia w klasie Gaming | |
| Asus TUF Gaming F15 FX507ZM | |
| Gigabyte G5 KE | |
| MSI Katana 15 B12VEK | |
| Schenker XMG Core 15 (M22) | |
| Asus TUF A15 FA507 | |
| HP Victus 15 fa0020nr | |
| Lenovo IdeaPad Gaming 3 15IAH7 | |
| The Witcher 3 - 1920x1080 Ultra Graphics & Postprocessing (HBAO+) | |
| Średnia w klasie Gaming (104.7 - 240, n=7, ostatnie 2 lata) | |
| Asus TUF Gaming F15 FX507ZM | |
| Gigabyte G5 KE | |
| MSI Katana 15 B12VEK | |
| Asus TUF A15 FA507 | |
| Schenker XMG Core 15 (M22) | |
| Lenovo IdeaPad Gaming 3 15IAH7 | |
| HP Victus 15 fa0020nr | |
| GTA V - 1920x1080 Highest AA:4xMSAA + FX AF:16x | |
| Średnia w klasie Gaming (48.3 - 186.9, n=94, ostatnie 2 lata) | |
| Gigabyte G5 KE | |
| Asus TUF Gaming F15 FX507ZM | |
| Schenker XMG Core 15 (M22) | |
| MSI Katana 15 B12VEK | |
| Asus TUF A15 FA507 | |
| Lenovo IdeaPad Gaming 3 15IAH7 | |
| HP Victus 15 fa0020nr | |
| Final Fantasy XV Benchmark - 1920x1080 High Quality | |
| Średnia w klasie Gaming (41 - 215, n=95, ostatnie 2 lata) | |
| Asus TUF Gaming F15 FX507ZM | |
| Schenker XMG Core 15 (M22) | |
| Gigabyte G5 KE | |
| MSI Katana 15 B12VEK | |
| Asus TUF A15 FA507 | |
| Lenovo IdeaPad Gaming 3 15IAH7 | |
| HP Victus 15 fa0020nr | |
| Strange Brigade - 1920x1080 ultra AA:ultra AF:16 | |
| Średnia w klasie Gaming (76.3 - 458, n=87, ostatnie 2 lata) | |
| Asus TUF Gaming F15 FX507ZM | |
| Gigabyte G5 KE | |
| Schenker XMG Core 15 (M22) | |
| MSI Katana 15 B12VEK | |
| Asus TUF A15 FA507 | |
| Lenovo IdeaPad Gaming 3 15IAH7 | |
| HP Victus 15 fa0020nr | |
| Dota 2 Reborn - 1920x1080 ultra (3/3) best looking | |
| Średnia w klasie Gaming (84.8 - 248, n=107, ostatnie 2 lata) | |
| Asus TUF Gaming F15 FX507ZM | |
| MSI Katana 15 B12VEK | |
| Gigabyte G5 KE | |
| HP Victus 15 fa0020nr | |
| Asus TUF A15 FA507 | |
| Schenker XMG Core 15 (M22) | |
| Lenovo IdeaPad Gaming 3 15IAH7 | |
| X-Plane 11.11 - 1920x1080 high (fps_test=3) | |
| Asus TUF Gaming F15 FX507ZM | |
| Średnia w klasie Gaming (55.5 - 143.5, n=109, ostatnie 2 lata) | |
| MSI Katana 15 B12VEK | |
| HP Victus 15 fa0020nr | |
| Gigabyte G5 KE | |
| Lenovo IdeaPad Gaming 3 15IAH7 | |
| Asus TUF A15 FA507 | |
| Schenker XMG Core 15 (M22) | |
| The Witcher 3 - 1920x1080 Ultra Graphics & Postprocessing (HBAO+) | |
| Średnia w klasie Gaming (104.7 - 240, n=7, ostatnie 2 lata) | |
| Asus TUF Gaming F15 FX507ZM | |
| Gigabyte G5 KE | |
| MSI Katana 15 B12VEK | |
| Asus TUF A15 FA507 | |
| Schenker XMG Core 15 (M22) | |
| Przeciętny NVIDIA GeForce RTX 4050 Laptop GPU (18.5 - 94.7, n=40) | |
| Lenovo IdeaPad Gaming 3 15IAH7 | |
| HP Victus 15 fa0020nr | |
| Far Cry 5 - 1920x1080 Ultra Preset AA:T | |
| MSI Katana 15 B12VEK | |
| Gigabyte G5 KE | |
| Średnia w klasie Gaming (70 - 151, n=6, ostatnie 2 lata) | |
| Asus TUF Gaming F15 FX507ZM | |
| Schenker XMG Core 15 (M22) | |
| Przeciętny NVIDIA GeForce RTX 4050 Laptop GPU (50 - 127, n=24) | |
| Asus TUF A15 FA507 | |
| Cyberpunk 2077 1.6 | |
| 1920x1080 High Preset | |
| Gigabyte G5 KE | |
| Asus TUF A15 FA507 | |
| Przeciętny NVIDIA GeForce RTX 4050 Laptop GPU (48 - 91.3, n=14) | |
| HP Victus 15 fa0020nr | |
| 1920x1080 Ultra Preset | |
| Gigabyte G5 KE | |
| Asus TUF A15 FA507 | |
| Przeciętny NVIDIA GeForce RTX 4050 Laptop GPU (44.4 - 79.4, n=14) | |
| HP Victus 15 fa0020nr | |
| Hogwarts Legacy | |
| 1920x1080 High Preset AA:High T | |
| Asus TUF A15 FA507 | |
| Przeciętny NVIDIA GeForce RTX 4050 Laptop GPU (44.8 - 93.6, n=8) | |
| 1920x1080 Ultra Preset AA:High T | |
| Średnia w klasie Gaming (n=1ostatnie 2 lata) | |
| Przeciętny NVIDIA GeForce RTX 4050 Laptop GPU (39 - 77.3, n=8) | |
| Asus TUF A15 FA507 | |
Witcher 3 FPS diagram
| low | med. | high | ultra | |
|---|---|---|---|---|
| GTA V (2015) | 168.6 | 153.1 | 83.5 | |
| The Witcher 3 (2015) | 171 | 82.2 | ||
| Dota 2 Reborn (2015) | 137.4 | 127.2 | 115.8 | |
| Final Fantasy XV Benchmark (2018) | 178.9 | 115.5 | 81.5 | |
| X-Plane 11.11 (2018) | 103.5 | 97 | 77.8 | |
| Far Cry 5 (2018) | 111 | 105 | 99 | |
| Strange Brigade (2018) | 211 | 171 | 147 | |
| F1 2021 (2021) | 283 | 260 | 209 | 110.3 |
| Cyberpunk 2077 1.6 (2022) | 103 | 82 | 71 | 66 |
| F1 22 (2022) | 192.7 | 191.4 | 161.2 | 56.4 |
| Hogwarts Legacy (2023) | 122 | 109 | 89 | 49 |
Emissions - laptop do gier z fajną klawiaturą
Emisja hałasu
Jak na laptop do gier, nasze urządzenie testowe było stosunkowo ciche. Podczas prostych zadań cooler często był całkowicie bezgłośny, a nawet pod obciążeniem byliśmy pozytywnie zaskoczeni: Podczas testu obciążeniowego wentylatory osiągnęły maksymalny poziom hałasu 43 dB(A). Podczas grania zmierzyliśmy między 40-43 dB(A), co oznacza, że TUF Gaming A15 jest nadal cichszy niż jego konkurenci. Zakładamy, że mocniejsze konfiguracje będą miały nieco głośniejsze wentylatory. Nie odnotowaliśmy żadnych innych odgłosów elektronicznych.
Hałas
| luz |
| 23.3 / 23.3 / 23.3 dB |
| obciążenie |
| 29.6 / 43 dB |
 | ||
30 dB cichy 40 dB(A) słyszalny 50 dB(A) irytujący |
||
min: | ||
| Asus TUF A15 FA507 GeForce RTX 4050 Laptop GPU, R7 7735HS, Micron 2400 MTFDKBA512QFM | Gigabyte G5 KE GeForce RTX 3060 Laptop GPU, i5-12500H, Gigabyte AG4512G-SI B10 | Schenker XMG Core 15 (M22) GeForce RTX 3060 Laptop GPU, R7 6800H, Samsung SSD 980 Pro 1TB MZ-V8P1T0BW | MSI Katana 15 B12VEK GeForce RTX 4050 Laptop GPU, i7-12650H, Micron 2400 MTFDKBA1T0QFM | HP Victus 15 fa0020nr GeForce RTX 3050 Ti Laptop GPU, i7-12700H, Samsung PM9A1 MZVL2512HCJQ | Lenovo IdeaPad Gaming 3 15IAH7 GeForce RTX 3050 Ti Laptop GPU, i5-12500H, Intel SSD 660p SSDPEKNW512G8 | Asus TUF Gaming F15 FX507ZM GeForce RTX 3060 Laptop GPU, i7-12700H, SK Hynix HFM001TD3JX013N | |
|---|---|---|---|---|---|---|---|
| Noise | -33% | -13% | -10% | -10% | -25% | -14% | |
| wyłączone / środowisko * (dB) | 23.3 | 19.52 16% | 23 1% | 24 -3% | 24.8 -6% | 25 -7% | 23.2 -0% |
| Idle Minimum * (dB) | 23.3 | 31.05 -33% | 23 1% | 24 -3% | 26.2 -12% | 29 -24% | 23.6 -1% |
| Idle Average * (dB) | 23.3 | 31.05 -33% | 23 1% | 24 -3% | 29.2 -25% | 30 -29% | 23.6 -1% |
| Idle Maximum * (dB) | 23.3 | 31.05 -33% | 23 1% | 24 -3% | 29.4 -26% | 32 -37% | 25.4 -9% |
| Load Average * (dB) | 29.6 | 55.66 -88% | 42.41 -43% | 37.71 -27% | 29.9 -1% | 42 -42% | 38 -28% |
| Witcher 3 ultra * (dB) | 43 | 55.7 -30% | 54.71 -27% | 45.75 -6% | 41.1 4% | 46 -7% | 54.1 -26% |
| Load Maximum * (dB) | 43 | 55.51 -29% | 55.05 -28% | 54.55 -27% | 45.5 -6% | 54 -26% | 57.2 -33% |
* ... im mniej tym lepiej
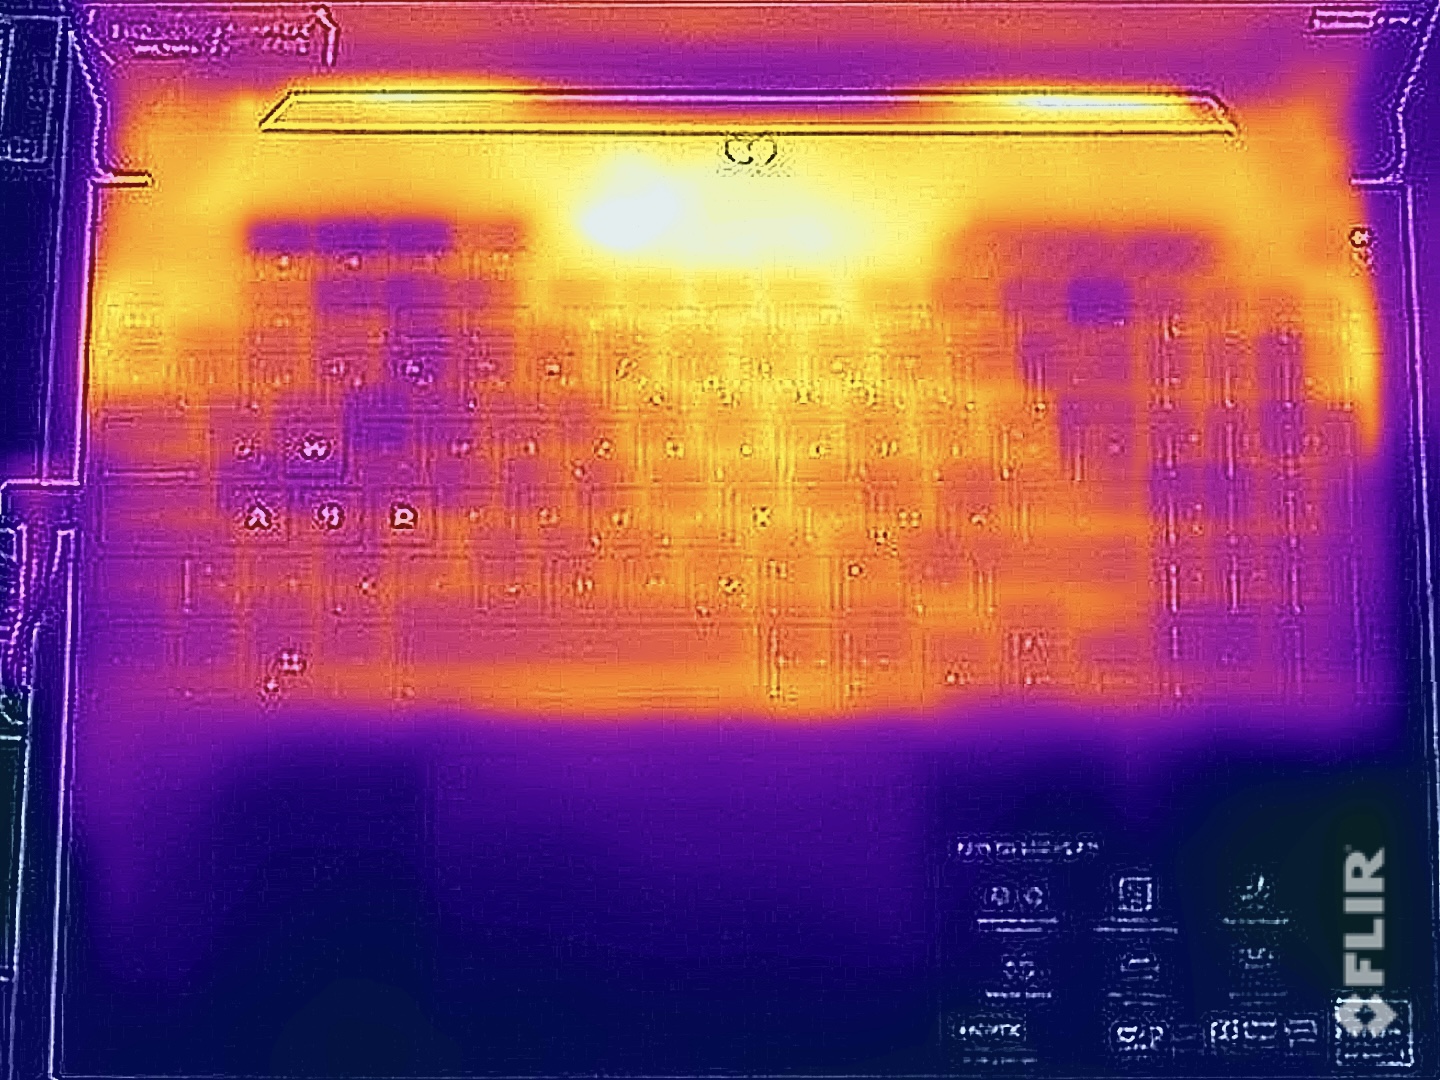
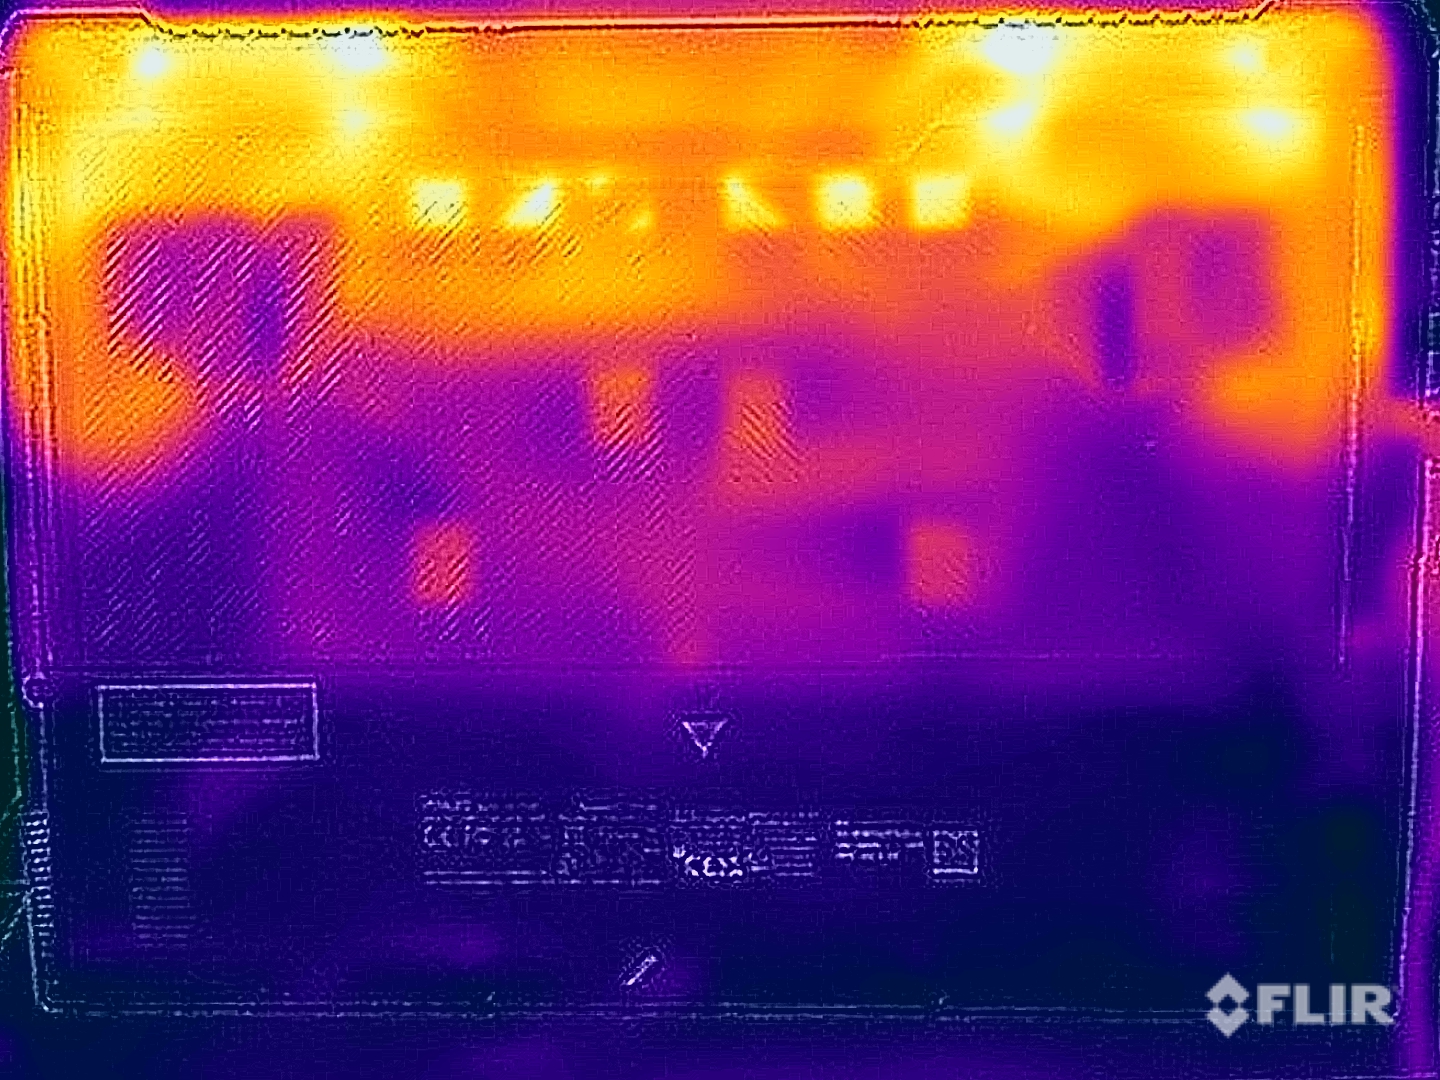
Temperatura
Nie było żadnych problemów z temperaturami podczas codziennych zadań, a nawet pod obciążeniem laptop Asusa dobrze kontrolował temperatury powierzchni. Górny, środkowy obszar jednostki zasadniczej nagrzał się do prawie 50 °C, ale ten hotspot znajduje się nad klawiaturą, a zwłaszcza obszar klawiszy WASD pozostał bardzo chłodny, co jest ważne podczas grania. Od spodu, w tylnej części zmierzyliśmy maksymalnie 44 °C i można nawet bez problemu położyć laptopa na udach.
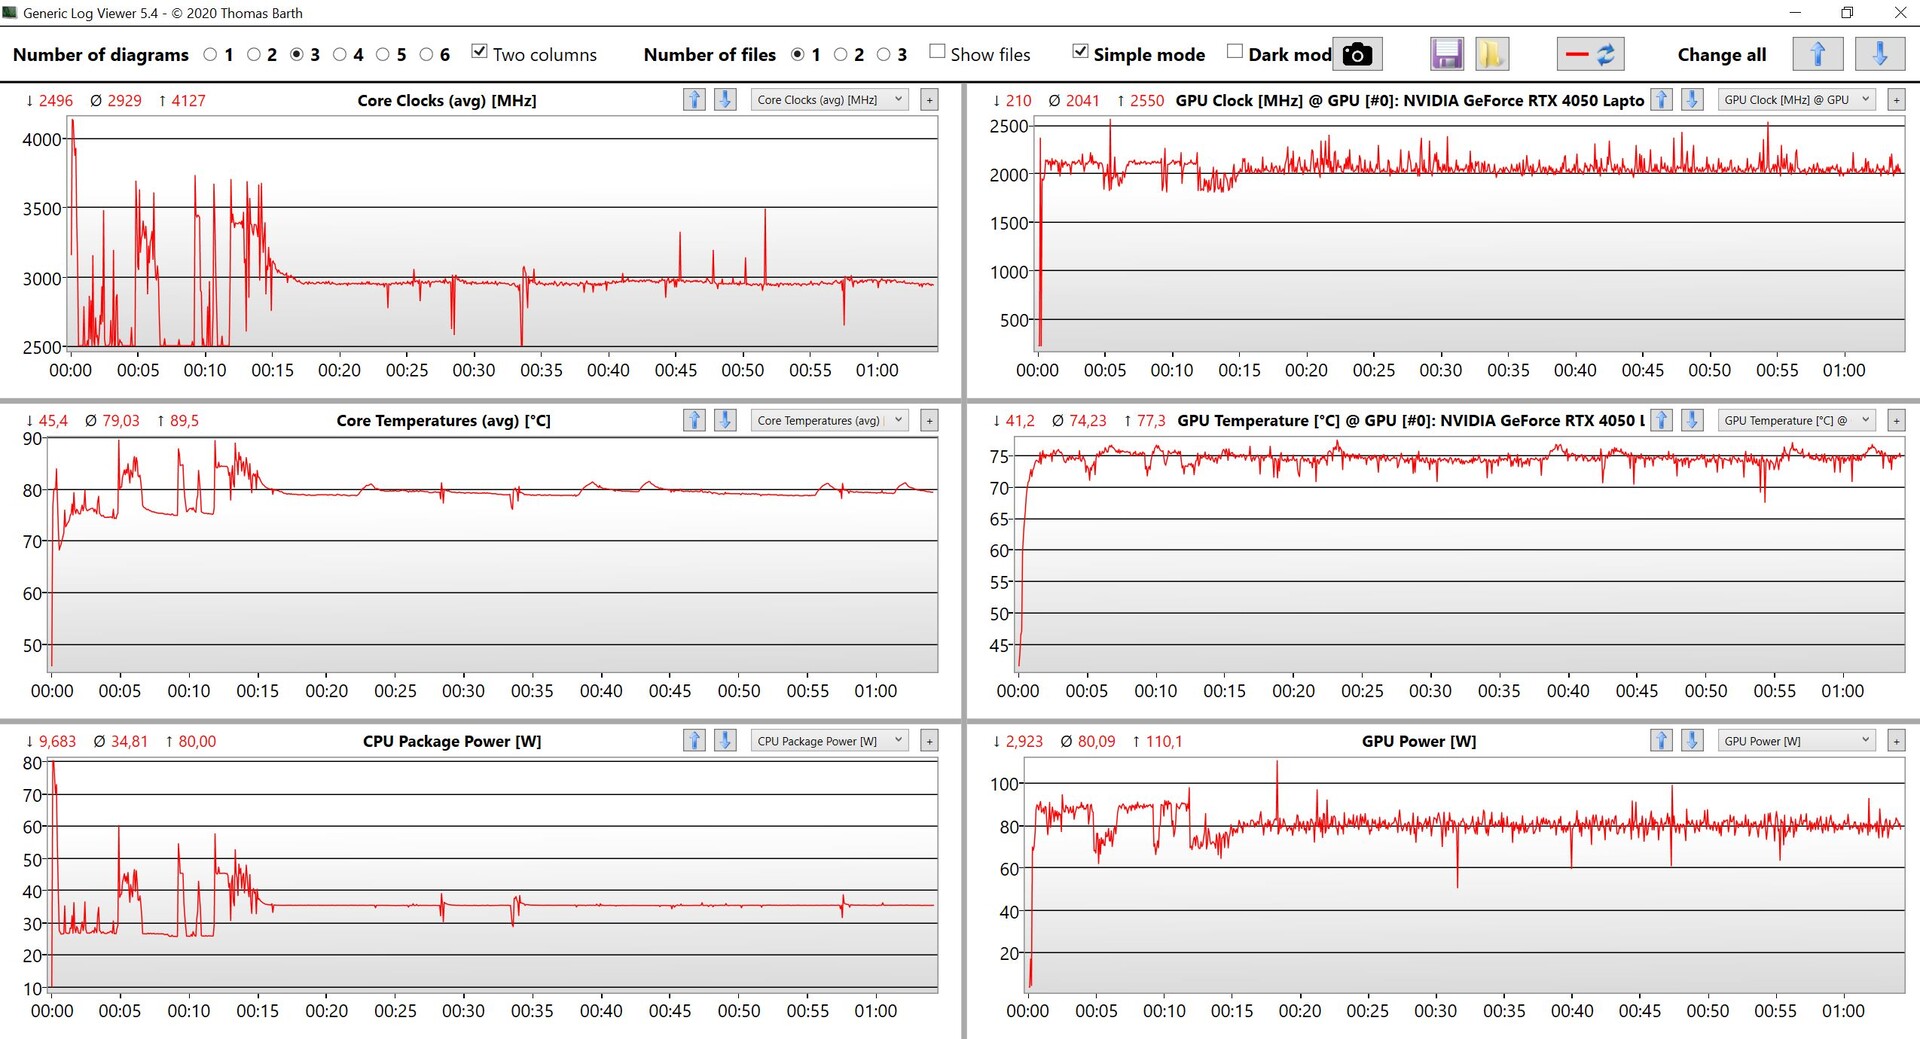
Zgodnie z oczekiwaniami, dGPU było faworyzowane podczas testu obciążeniowego. Przez pierwsze 15 minut występowały niewielkie wahania, zanim procesor i karta graficzna ustabilizowały się na stabilnym poziomie odpowiednio 35 i 80 watów.
(-) Maksymalna temperatura w górnej części wynosi 48.9 °C / 120 F, w porównaniu do średniej 40.4 °C / 105 F , począwszy od 21.2 do 68.8 °C dla klasy Gaming.
(±) Dno nagrzewa się maksymalnie do 44.6 °C / 112 F, w porównaniu do średniej 43.2 °C / 110 F
(+) W stanie bezczynności średnia temperatura górnej części wynosi 26.2 °C / 79 F, w porównaniu ze średnią temperaturą urządzenia wynoszącą 33.9 °C / ### class_avg_f### F.
(±) Podczas gry w Wiedźmina 3 średnia temperatura górnej części wynosi 36.9 °C / 98 F, w porównaniu do średniej temperatury urządzenia wynoszącej 33.9 °C / ## #class_avg_f### F.
(+) Podpórki pod nadgarstki i touchpad są chłodniejsze niż temperatura skóry i maksymalnie 30.6 °C / 87.1 F i dlatego są chłodne w dotyku.
(±) Średnia temperatura obszaru podparcia dłoni w podobnych urządzeniach wynosiła 28.8 °C / 83.8 F (-1.8 °C / -3.3 F).
| Asus TUF A15 FA507 AMD Ryzen 7 7735HS, NVIDIA GeForce RTX 4050 Laptop GPU | Gigabyte G5 KE Intel Core i5-12500H, NVIDIA GeForce RTX 3060 Laptop GPU | Schenker XMG Core 15 (M22) AMD Ryzen 7 6800H, NVIDIA GeForce RTX 3060 Laptop GPU | MSI Katana 15 B12VEK Intel Core i7-12650H, NVIDIA GeForce RTX 4050 Laptop GPU | HP Victus 15 fa0020nr Intel Core i7-12700H, NVIDIA GeForce RTX 3050 Ti Laptop GPU | Lenovo IdeaPad Gaming 3 15IAH7 Intel Core i5-12500H, NVIDIA GeForce RTX 3050 Ti Laptop GPU | Asus TUF Gaming F15 FX507ZM Intel Core i7-12700H, NVIDIA GeForce RTX 3060 Laptop GPU | |
|---|---|---|---|---|---|---|---|
| Heat | -25% | -9% | -18% | 20% | 2% | -21% | |
| Maximum Upper Side * (°C) | 48.9 | 52.6 -8% | 48 2% | 47 4% | 37.2 24% | 47 4% | 44.4 9% |
| Maximum Bottom * (°C) | 44.6 | 62.4 -40% | 51 -14% | 48 -8% | 35.4 21% | 52 -17% | 48.8 -9% |
| Idle Upper Side * (°C) | 27.1 | 33.6 -24% | 28 -3% | 35 -29% | 22.4 17% | 25 8% | 37.8 -39% |
| Idle Bottom * (°C) | 27.5 | 34.8 -27% | 33 -20% | 38 -38% | 22.6 18% | 24 13% | 39.6 -44% |
* ... im mniej tym lepiej
Głośniki
TUF Gaming A15 z pewnością nie może pochwalić się niesamowitym dźwiękiem, a dwa głośniki stereo są dość przeciętne - ale tak jest często w przypadku niedrogich laptopów do gier. Muzyka i filmy nie są zbyt przyjemne do słuchania i oglądania - i tak zalecamy korzystanie z zestawu słuchawkowego podczas grania, ponieważ wentylatory mogą być irytujące.
Asus TUF A15 FA507 analiza dźwięku
(±) | głośność głośnika jest średnia, ale dobra (79.3 dB)
Bas 100 - 315 Hz
(±) | zredukowany bas - średnio 13.7% niższy od mediany
(+) | bas jest liniowy (6.2% delta do poprzedniej częstotliwości)
Średnie 400 - 2000 Hz
(±) | wyższe średnie - średnio 7.6% wyższe niż mediana
(±) | liniowość środka jest średnia (7.3% delta do poprzedniej częstotliwości)
Wysokie 2–16 kHz
(+) | zrównoważone maksima - tylko 2.1% od mediany
(±) | liniowość wysokich wartości jest średnia (7.5% delta do poprzedniej częstotliwości)
Ogólnie 100 - 16.000 Hz
(±) | liniowość ogólnego dźwięku jest średnia (17.2% różnicy w stosunku do mediany)
W porównaniu do tej samej klasy
» 47% wszystkich testowanych urządzeń w tej klasie było lepszych, 11% podobnych, 42% gorszych
» Najlepszy miał deltę 6%, średnia wynosiła ###średnia###%, najgorsza wynosiła 132%
W porównaniu do wszystkich testowanych urządzeń
» 32% wszystkich testowanych urządzeń było lepszych, 8% podobnych, 60% gorszych
» Najlepszy miał deltę 4%, średnia wynosiła ###średnia###%, najgorsza wynosiła 134%
Schenker XMG Core 15 (M22) analiza dźwięku
(±) | głośność głośnika jest średnia, ale dobra (81.28 dB)
Bas 100 - 315 Hz
(-) | prawie brak basu - średnio 19.8% niższa od mediany
(+) | bas jest liniowy (6.4% delta do poprzedniej częstotliwości)
Średnie 400 - 2000 Hz
(±) | wyższe średnie - średnio 6.2% wyższe niż mediana
(±) | liniowość środka jest średnia (7.9% delta do poprzedniej częstotliwości)
Wysokie 2–16 kHz
(+) | zrównoważone maksima - tylko 1.8% od mediany
(+) | wzloty są liniowe (4.8% delta do poprzedniej częstotliwości)
Ogólnie 100 - 16.000 Hz
(±) | liniowość ogólnego dźwięku jest średnia (17.1% różnicy w stosunku do mediany)
W porównaniu do tej samej klasy
» 46% wszystkich testowanych urządzeń w tej klasie było lepszych, 12% podobnych, 43% gorszych
» Najlepszy miał deltę 6%, średnia wynosiła ###średnia###%, najgorsza wynosiła 132%
W porównaniu do wszystkich testowanych urządzeń
» 31% wszystkich testowanych urządzeń było lepszych, 8% podobnych, 61% gorszych
» Najlepszy miał deltę 4%, średnia wynosiła ###średnia###%, najgorsza wynosiła 134%
Zarządzanie energią - długi czas pracy dzięki dużej baterii
Zużycie energii
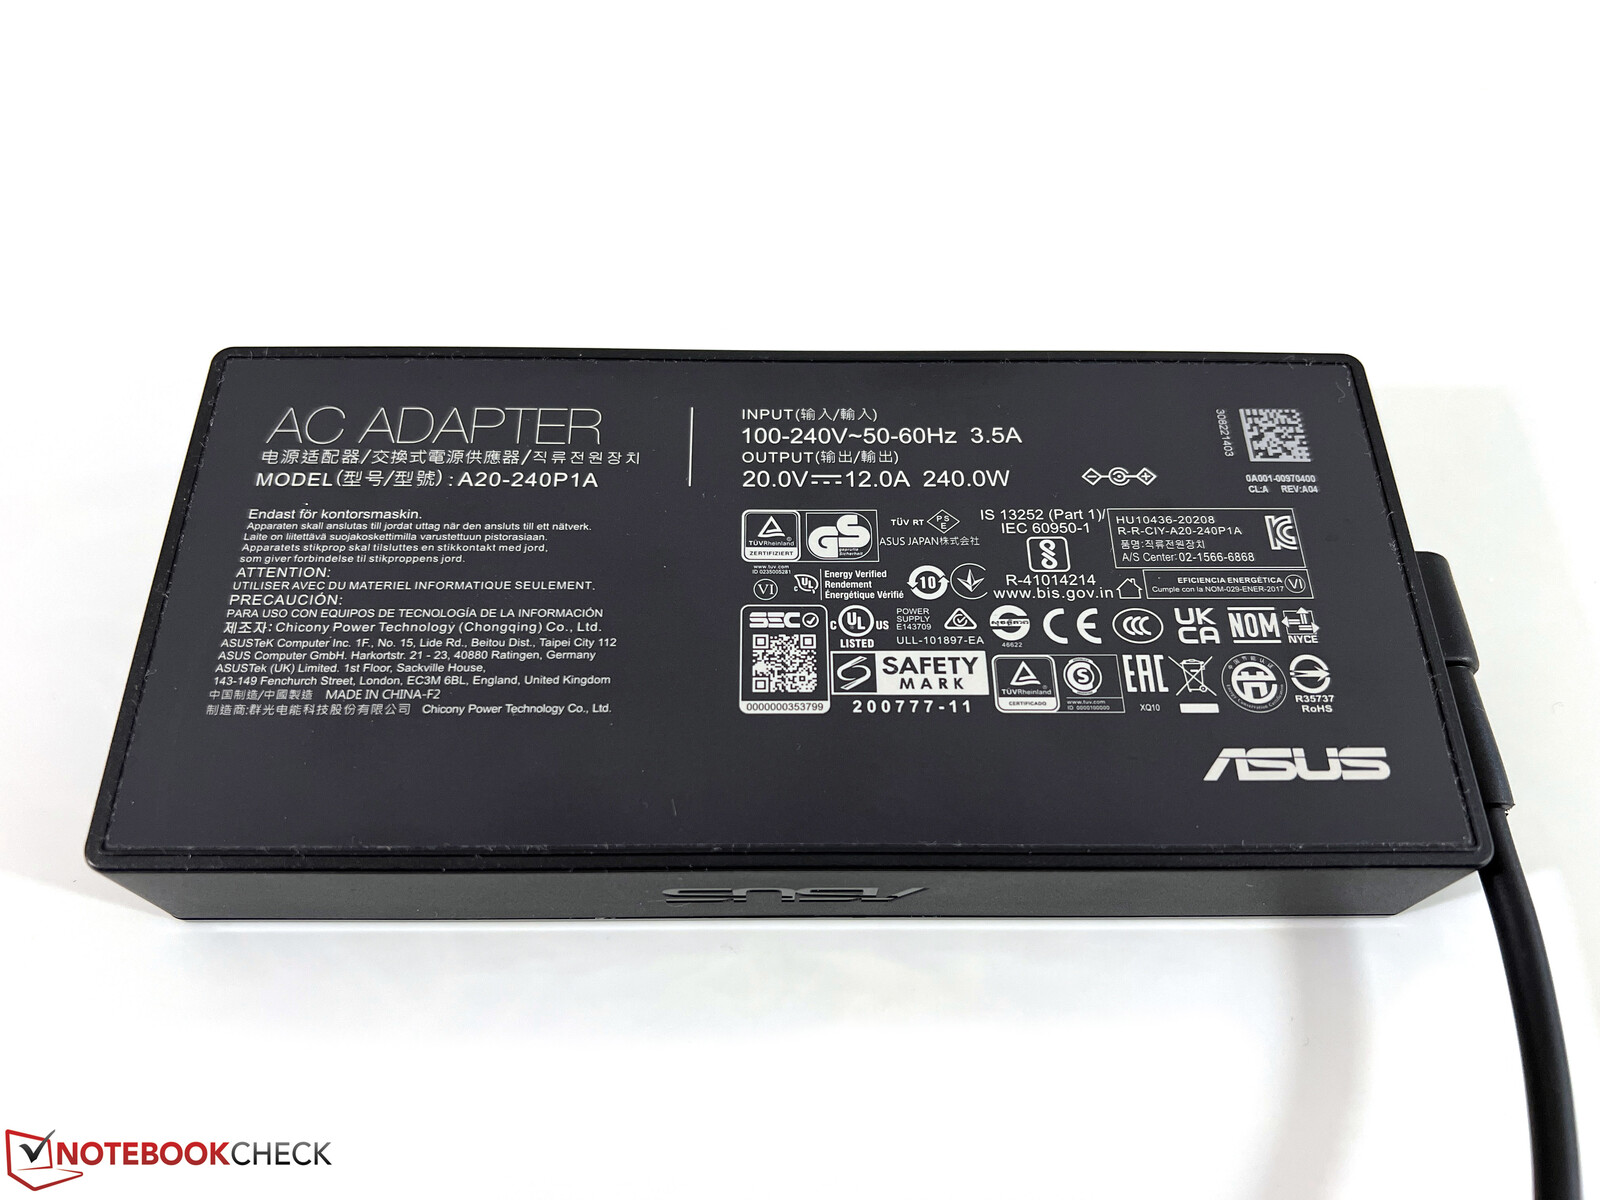
W naszych pomiarach zużycia energii próbka testowa pozostała bardzo oszczędna i nawet podczas grania A15 pozostała znacznie bardziej wydajna niż laptopy RTX-3060, które również nie oferują znacznie większej mocy. W teście obciążeniowym ustaliliśmy maksymalną wartość 185 watów, która następnie szybko ustabilizowała się na poziomie około 155 watów. Biorąc pod uwagę te wskaźniki, dołączony 240-watowy zasilacz jest prawie przewymiarowany dla wariantu podstawowego i bardziej kompaktowego 200-watowego modułu obecnegoZenbook Pro 14 byłby w zupełności wystarczający.
| wyłączony / stan wstrzymania | |
| luz | |
| obciążenie |
|
Legenda:
min: | |
| Asus TUF A15 FA507 R7 7735HS, GeForce RTX 4050 Laptop GPU, Micron 2400 MTFDKBA512QFM, IPS, 1920x1080, 15.6" | Gigabyte G5 KE i5-12500H, GeForce RTX 3060 Laptop GPU, Gigabyte AG4512G-SI B10, IPS, 1920x1080, 15.6" | Schenker XMG Core 15 (M22) R7 6800H, GeForce RTX 3060 Laptop GPU, Samsung SSD 980 Pro 1TB MZ-V8P1T0BW, IPS, 2560x1440, 15.6" | MSI Katana 15 B12VEK i7-12650H, GeForce RTX 4050 Laptop GPU, Micron 2400 MTFDKBA1T0QFM, IPS, 1920x1080, 15.6" | HP Victus 15 fa0020nr i7-12700H, GeForce RTX 3050 Ti Laptop GPU, Samsung PM9A1 MZVL2512HCJQ, IPS, 1920x1080, 15.6" | Lenovo IdeaPad Gaming 3 15IAH7 i5-12500H, GeForce RTX 3050 Ti Laptop GPU, Intel SSD 660p SSDPEKNW512G8, IPS, 1920x1080, 15.6" | Asus TUF Gaming F15 FX507ZM i7-12700H, GeForce RTX 3060 Laptop GPU, SK Hynix HFM001TD3JX013N, IPS, 1920x1080, 15.6" | Przeciętny NVIDIA GeForce RTX 4050 Laptop GPU | Średnia w klasie Gaming | |
|---|---|---|---|---|---|---|---|---|---|
| Power Consumption | -19% | -31% | 2% | -11% | -7% | -30% | -26% | -60% | |
| Idle Minimum * (Watt) | 8 | 7.66 4% | 11.8 -48% | 8.5 -6% | 5.1 36% | 8 -0% | 6.3 21% | 9.95 ? -24% | 13 ? -63% |
| Idle Average * (Watt) | 12.1 | 10.3 15% | 14.7 -21% | 10.2 16% | 15.1 -25% | 10 17% | 9.8 19% | 15.8 ? -31% | 18.7 ? -55% |
| Idle Maximum * (Watt) | 12.5 | 16.05 -28% | 15 -20% | 11.3 10% | 18.9 -51% | 16 -28% | 26.5 -112% | 20.1 ? -61% | 24.3 ? -94% |
| Load Average * (Watt) | 74.9 | 115.8 -55% | 100 -34% | 84 -12% | 114.5 -53% | 99 -32% | 103.8 -39% | 88 ? -17% | 110.2 ? -47% |
| Witcher 3 ultra * (Watt) | 136.6 | 168.7 -23% | 184 -35% | 128 6% | 113.9 17% | 144.6 -6% | 189 -38% | ||
| Load Maximum * (Watt) | 185 | 234.6 -27% | 237 -28% | 189 -2% | 165.8 10% | 168 9% | 241.9 -31% | 176.3 ? 5% | 258 ? -39% |
* ... im mniej tym lepiej
power consumption Witcher 3 / stress test
power consumption with external monitor
Czas trwania
Bateria laptopa o pojemności 90 Wh zapewnia bardzo dobre czasy pracy na baterii. Z wyjątkiem kilku minut, w naszych testach nie było różnicy, czy wyświetlacz był w trybie 60 Hz czy 144 Hz. W teście WLAN przy 150 cd/m² (co odpowiada 73% maksymalnej jasności) odnotowaliśmy nieco ponad 11,5 godziny, a przy pełnej jasności jeszcze nieco ponad 9,5 godziny. W teście wideo przy 150 cd/m² zmierzyliśmy ponad 12,5 godziny. Pełny proces ładowania trwa 106 minut, gdy urządzenie jest włączone. Krzywa ładowania wyrównuje się dopiero przy 70%, co ma miejsce po ~44 minutach.
| Asus TUF A15 FA507 R7 7735HS, GeForce RTX 4050 Laptop GPU, 90 Wh | Gigabyte G5 KE i5-12500H, GeForce RTX 3060 Laptop GPU, 54 Wh | Schenker XMG Core 15 (M22) R7 6800H, GeForce RTX 3060 Laptop GPU, 62 Wh | MSI Katana 15 B12VEK i7-12650H, GeForce RTX 4050 Laptop GPU, 53.5 Wh | HP Victus 15 fa0020nr i7-12700H, GeForce RTX 3050 Ti Laptop GPU, 70 Wh | Lenovo IdeaPad Gaming 3 15IAH7 i5-12500H, GeForce RTX 3050 Ti Laptop GPU, 60 Wh | Asus TUF Gaming F15 FX507ZM i7-12700H, GeForce RTX 3060 Laptop GPU, 90 Wh | Średnia w klasie Gaming | |
|---|---|---|---|---|---|---|---|---|
| Czasy pracy | -44% | -12% | -26% | -36% | -50% | -25% | -7% | |
| H.264 (h) | 12.5 | 2.2 -82% | 4.4 -65% | 8.32 ? -33% | ||||
| WiFi v1.3 (h) | 11.7 | 5.7 -51% | 7.8 -33% | 4.3 -63% | 2.1 -82% | 5.9 -50% | 4.8 -59% | 7.11 ? -39% |
| Load (h) | 1 | 1 0% | 1.1 10% | 1.5 50% | 1.1 10% | 1.1 10% | 1.502 ? 50% | |
| Witcher 3 ultra (h) | 1.3 | |||||||
| Reader / Idle (h) | 2.6 | 15.8 | 8.16 ? |
Za
Przeciw
Werdykt - Dobry laptop do gier w rozdzielczości 1080p
Wraz z premierą TUF Gaming A15, Asos skoncentrował się na tym, co najważniejsze: wydajności w grach. Nasza podstawowa wersja, którą można mieć za około 1169 USD, zapewniała już wystarczającą moc, aby płynnie grać w obecne gry w natywnej rozdzielczości 1080p i przy maksymalnych szczegółach - dzięki nowejNvidia GeForce RTX 4050 Laptop. Jeśli wykorzystasz upscaling, możesz nawet uruchomić ray tracing. Jego procesor Zen3+ to stary znajomy, ale nawet mimo to udaje mu się zaoferować solidną wydajność. Pamięć RAM i dysk SSD można rozszerzyć - chociaż 16 GB i 512 GB powinny wystarczyć na początek.
Jakość obudowy laptopa jest w porządku; nie ma żadnego wymyślnego podświetlenia (co niekoniecznie musi być złą rzeczą). Etykiety na klawiaturze mają nieco niski kontrast i często trzeba polegać na podświetleniu, aby móc je wyraźnie zobaczyć. Ale klawiatura pozostaje przyjemna i chłodna podczas grania, a wentylatory nie są zbyt głośne.
Podstawowa wersja nowego Asusa TUF Gaming A15 to dobry laptop do gier, a jego RTX 4050 Laptop zapewnia wystarczającą wydajność dla wyświetlacza 1080p.
Ekran robi to, co powinien. Jego matowy panel IPS o proporcjach 16:9 ma częstotliwość odświeżania 144 Hz i dobrą dokładność kolorów, ale jego czasy reakcji i jasność mogłyby być nieco lepsze. Zmierzyliśmy 300 cd/m² dla tego ostatniego. Opcje łączności obejmują nawet USB 4.0 i można podłączyć monitor G-Sync. Jedynym problemem jest fakt, że prawie wszystkie porty laptopa znajdują się z przodu po lewej stronie i na środku urządzenia.
Laptop nie wykazał żadnych słabych punktów, ale należy pamiętać, że podstawowa wersja jest dostarczana bez zainstalowanego systemu operacyjnego. W wielu obszarach urządzenie zapewnia standardowe funkcje (WLAN, głośniki, kamera internetowa) - ale we wszystkich podstawowych obszarach jego wydajność jest zadowalająca. Jego cena wynosząca około 1 169 USD jest również dość konkurencyjna.
Cena i dostępność
Testowane przez nas urządzenie można znaleźć za około 1 169 USD na Amazon.
Asus TUF A15 FA507
- 13/06/2023 v7 (old)
Andreas Osthoff
Przezroczystość
Wyboru urządzeń do recenzji dokonuje nasza redakcja. Próbka testowa została udostępniona autorowi jako pożyczka od producenta lub sprzedawcy detalicznego na potrzeby tej recenzji. Pożyczkodawca nie miał wpływu na tę recenzję, producent nie otrzymał też kopii tej recenzji przed publikacją. Nie było obowiązku publikowania tej recenzji. Jako niezależna firma medialna, Notebookcheck nie podlega władzy producentów, sprzedawców detalicznych ani wydawców.
Tak testuje Notebookcheck
Każdego roku Notebookcheck niezależnie sprawdza setki laptopów i smartfonów, stosując standardowe procedury, aby zapewnić porównywalność wszystkich wyników. Od około 20 lat stale rozwijamy nasze metody badawcze, ustanawiając przy tym standardy branżowe. W naszych laboratoriach testowych doświadczeni technicy i redaktorzy korzystają z wysokiej jakości sprzętu pomiarowego. Testy te obejmują wieloetapowy proces walidacji. Nasz kompleksowy system ocen opiera się na setkach uzasadnionych pomiarów i benchmarków, co pozwala zachować obiektywizm.Price comparison

