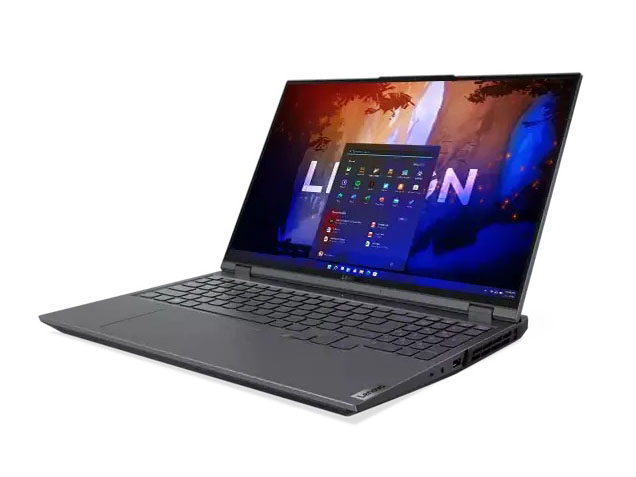
Recenzja laptopa Lenovo Legion 5 Pro Gen 7: Ryzen 7 6800H czy Ryzen 9 6900HX?
Legion 5 Pro Gen 7 to laptop do gier z wyższej półki, plasujący się tuż pod jeszcze droższą Legion seria 7 16. Dołącza on do coraz częściej spotykanej linii 16-calowych laptopów do gier, takich jak np HP Omen 16, , Asus ROG Zephyrus M16, Dell G16, czy też Gigabyte Aero 16 wszystkie one są alternatywą dla recenzowanego modelu Lenovo.
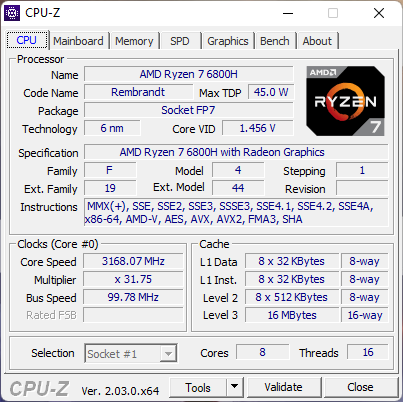
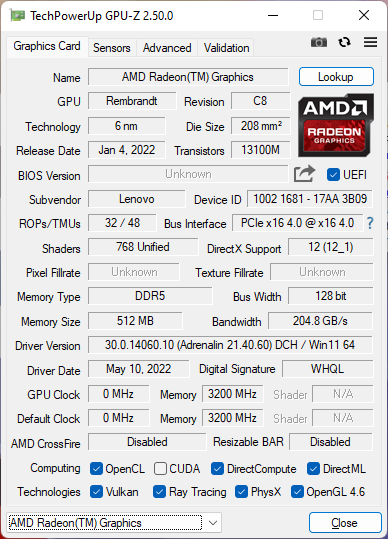
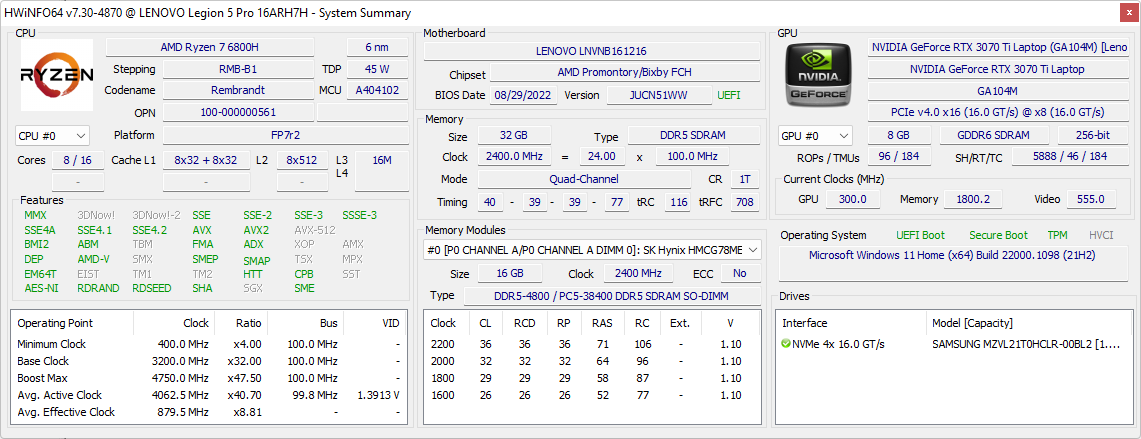
Nasz testowy egzemplarz jest dostarczany z procesorem AMD Zen 3+ Ryzen 7 6800H z grafiką 150 W TGP GeForce RTX 3070 Ti za około 1900 USD. Inne jednostki SKU są dostępne z procesorami Ryzen 9 6900HX, RTX 3070, RTX 3060 lub RTX 3050 Ti, ale wszystkie opcje mają ten sam wyświetlacz IPS 16:10 2560 x 1600 z obsługą G-Sync.
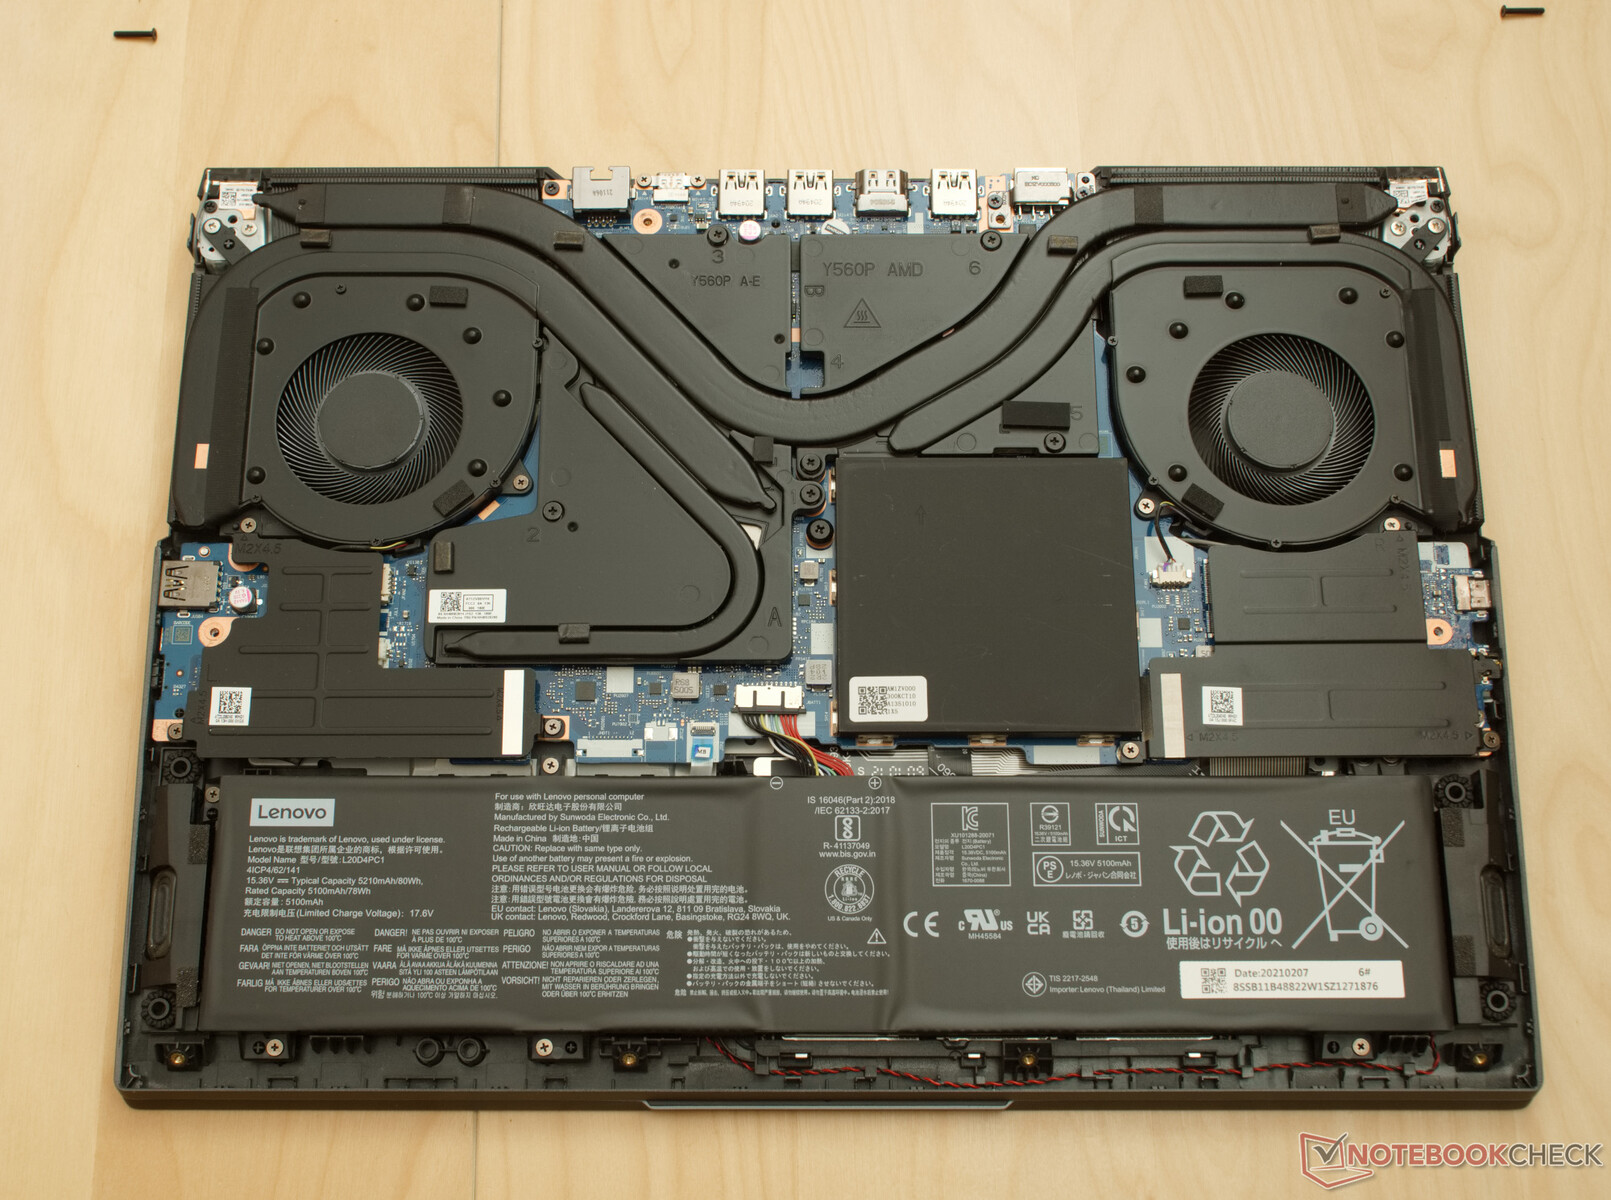
Model 2022 Legion 5 Pro Gen 7 posiada tę samą konstrukcję obudowy, co zeszłoroczny model, dlatego polecamy sprawdzić naszą istniejącą recenzję modelu 2021 aby uzyskać więcej informacji na temat fizycznych cech urządzenia. W starszej wersji wykorzystano wolniejsze procesory Zen 3 Ryzen 7 5800H i 140 W TGP GeForce RTX 3070 dla porównania
Więcej recenzji Lenovo:
Potencjalni konkurenci w porównaniu
Ocena | Data | Model | Waga | Wysokość | Rozmiar | Rezolucja | Cena |
|---|---|---|---|---|---|---|---|
| 87.7 % v7 (old) | 10/2022 | Lenovo Legion 5 Pro 16ARH7H RTX 3070 Ti R7 6800H, GeForce RTX 3070 Ti Laptop GPU | 2.6 kg | 26.6 mm | 16.00" | 2560x1600 | |
| 86.6 % v7 (old) | 08/2025 | Lenovo Legion 5 Pro 16IAH7H i7-12700H, GeForce RTX 3060 Laptop GPU | 2.6 kg | 27 mm | 16.00" | 2560x1600 | |
| 85.6 % v7 (old) | Asus ROG Zephyrus M16 GU603H i9-11900H, GeForce RTX 3070 Laptop GPU | 2 kg | 20 mm | 16.00" | 2560x1600 | ||
| 90.8 % v7 (old) | 10/2022 | Lenovo Legion 7 16ARHA7 R9 6900HX, Radeon RX 6850M XT | 2.6 kg | 19.4 mm | 16.00" | 2560x1600 | |
| 82.3 % v7 (old) | 03/2025 | HP Victus 16-e0145ng R5 5600H, GeForce RTX 3050 Ti Laptop GPU | 2.4 kg | 23.5 mm | 16.10" | 1920x1080 | |
| 86.1 % v7 (old) | 10/2022 | Dell G16 7620 i7-12700H, GeForce RTX 3060 Laptop GPU | 2.6 kg | 26.9 mm | 16.00" | 2560x1600 |
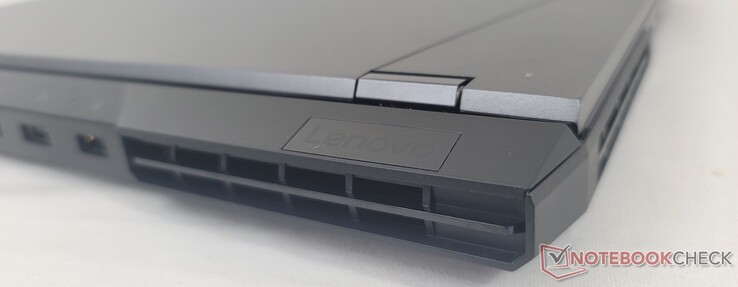
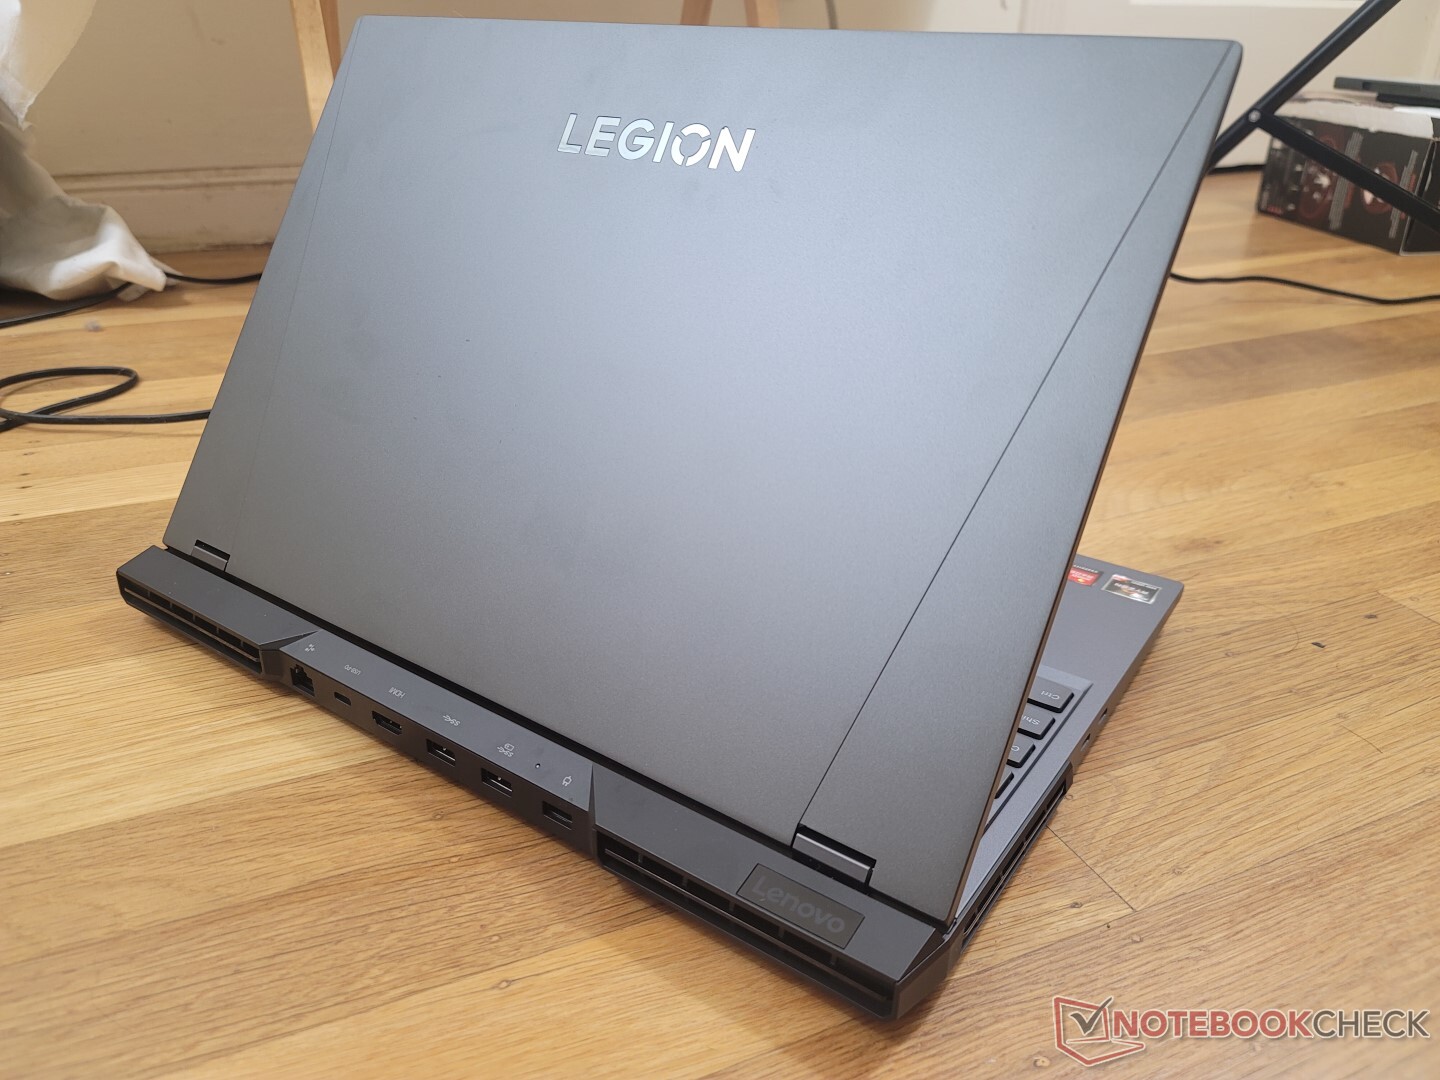
Walizka - aluminiowa zewnętrzna pokrywa i dolna podstawa
Jest jeden prosty sposób, aby odróżnić 2022 Legion 5 Pro 16 od 2021 Legion 5 Pro 16. Model 2022 ma jeszcze jeden port USB-C wzdłuż lewej krawędzi dla trzech łącznie, podczas gdy model 2021 ma tylko dwa. Tymczasem liczba portów USB-A spadła z czterech do trzech. Oba modele są poza tym wizualnie identyczne.
Komunikacja
| Networking | |
| iperf3 transmit AX12 | |
| Asus ROG Zephyrus M16 GU603H | |
| iperf3 receive AX12 | |
| Asus ROG Zephyrus M16 GU603H | |
| iperf3 receive AXE11000 6GHz | |
| Lenovo Legion 5 Pro 16ARH7H RTX 3070 Ti | |
| Lenovo Legion 7 16ARHA7 | |
| iperf3 receive AXE11000 | |
| Dell G16 7620 | |
| HP Victus 16-e0145ng | |
| iperf3 transmit AXE11000 6GHz | |
| Lenovo Legion 7 16ARHA7 | |
| Lenovo Legion 5 Pro 16ARH7H RTX 3070 Ti | |
| iperf3 transmit AXE11000 | |
| Dell G16 7620 | |
| HP Victus 16-e0145ng | |
Kamera internetowa
Kamera internetowa nadal jest tylko 720p bez podczerwieni.


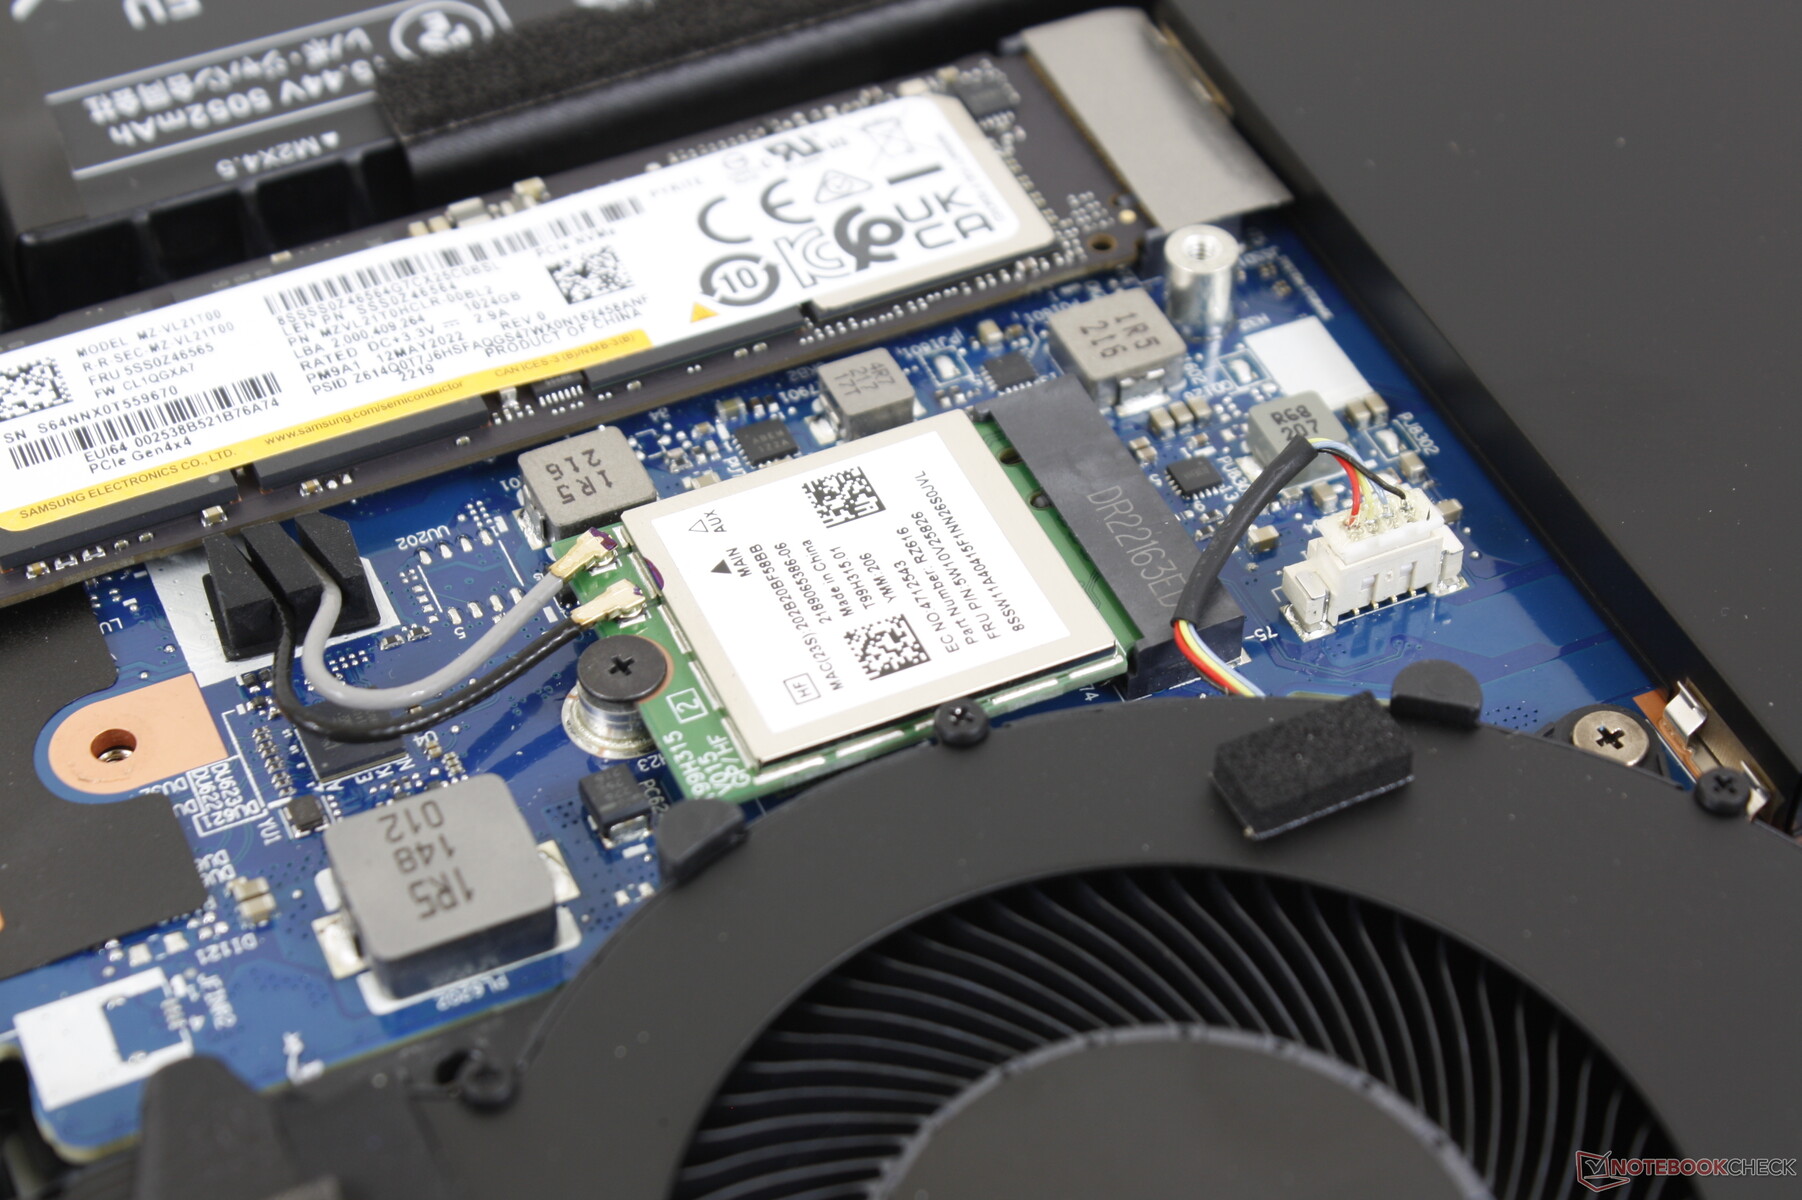
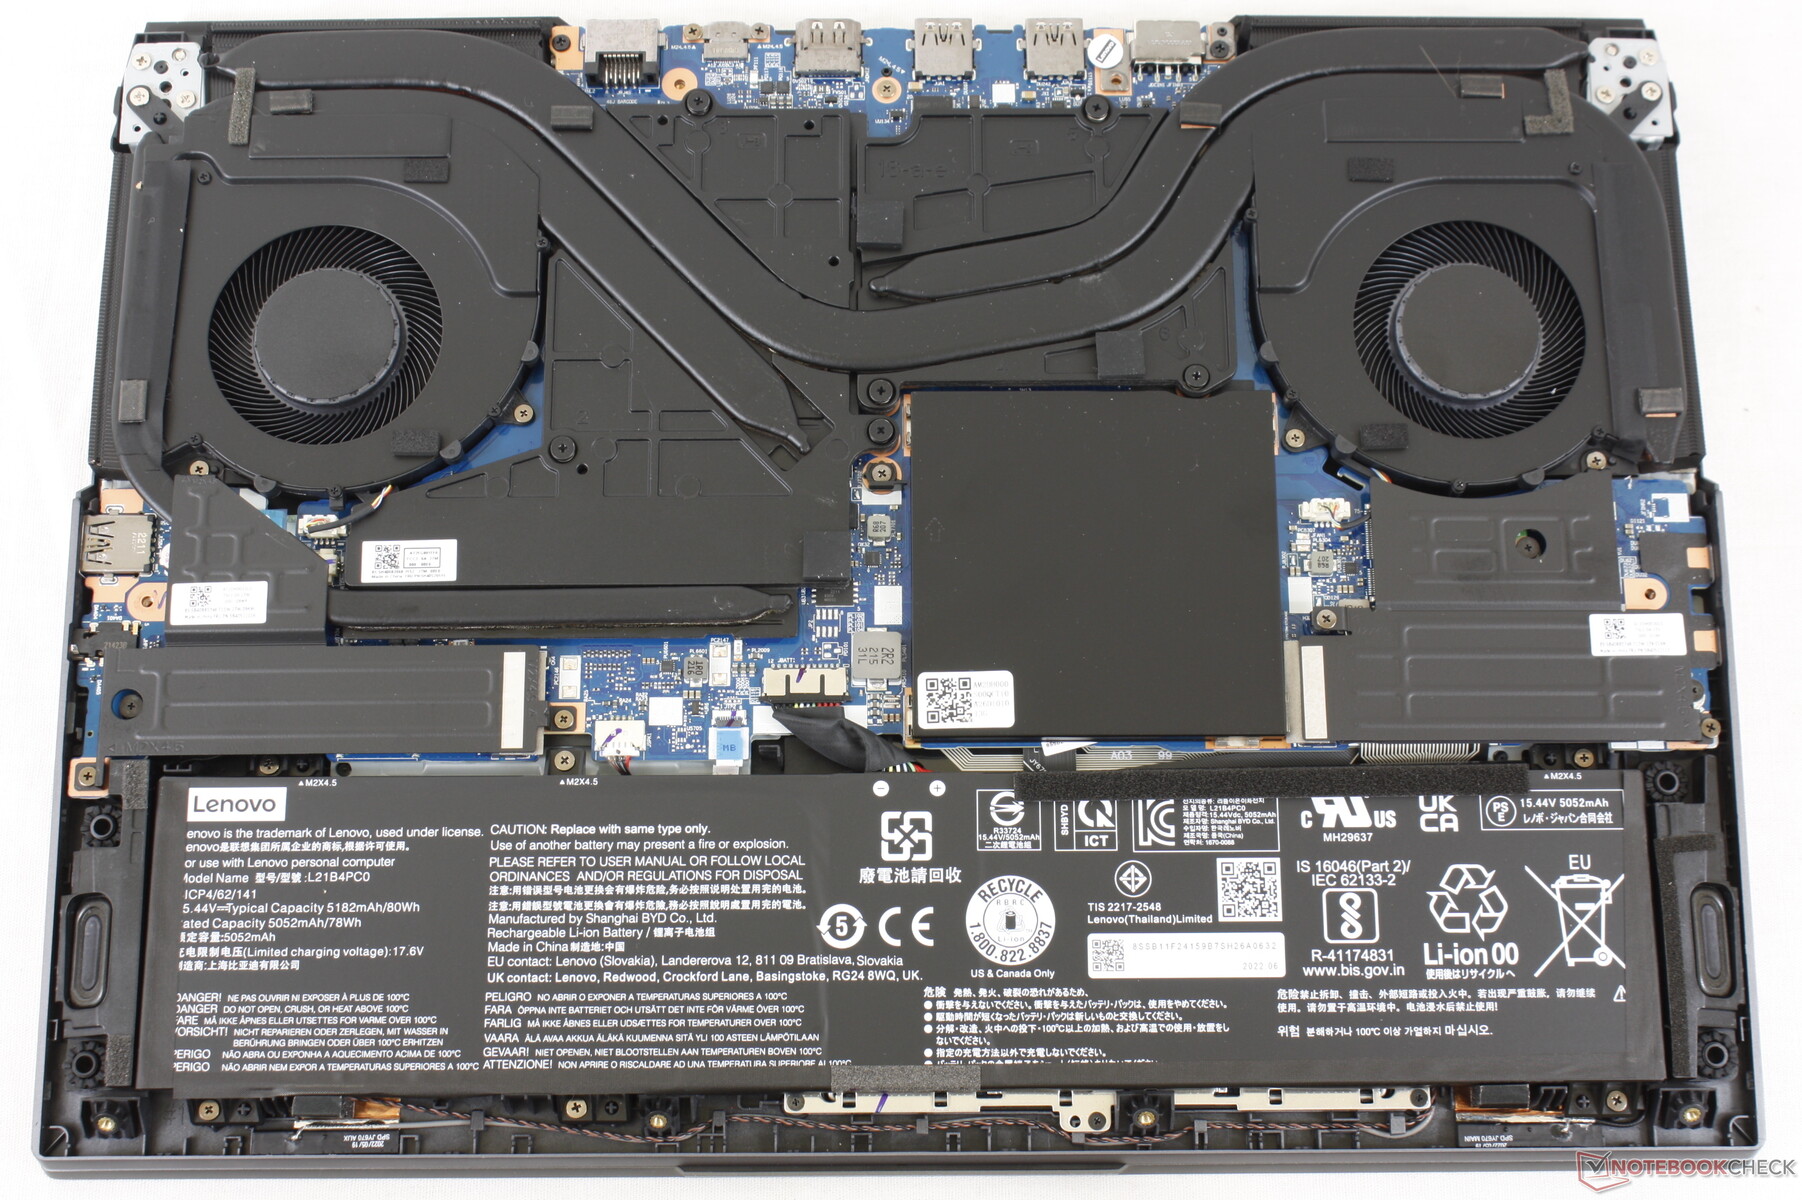
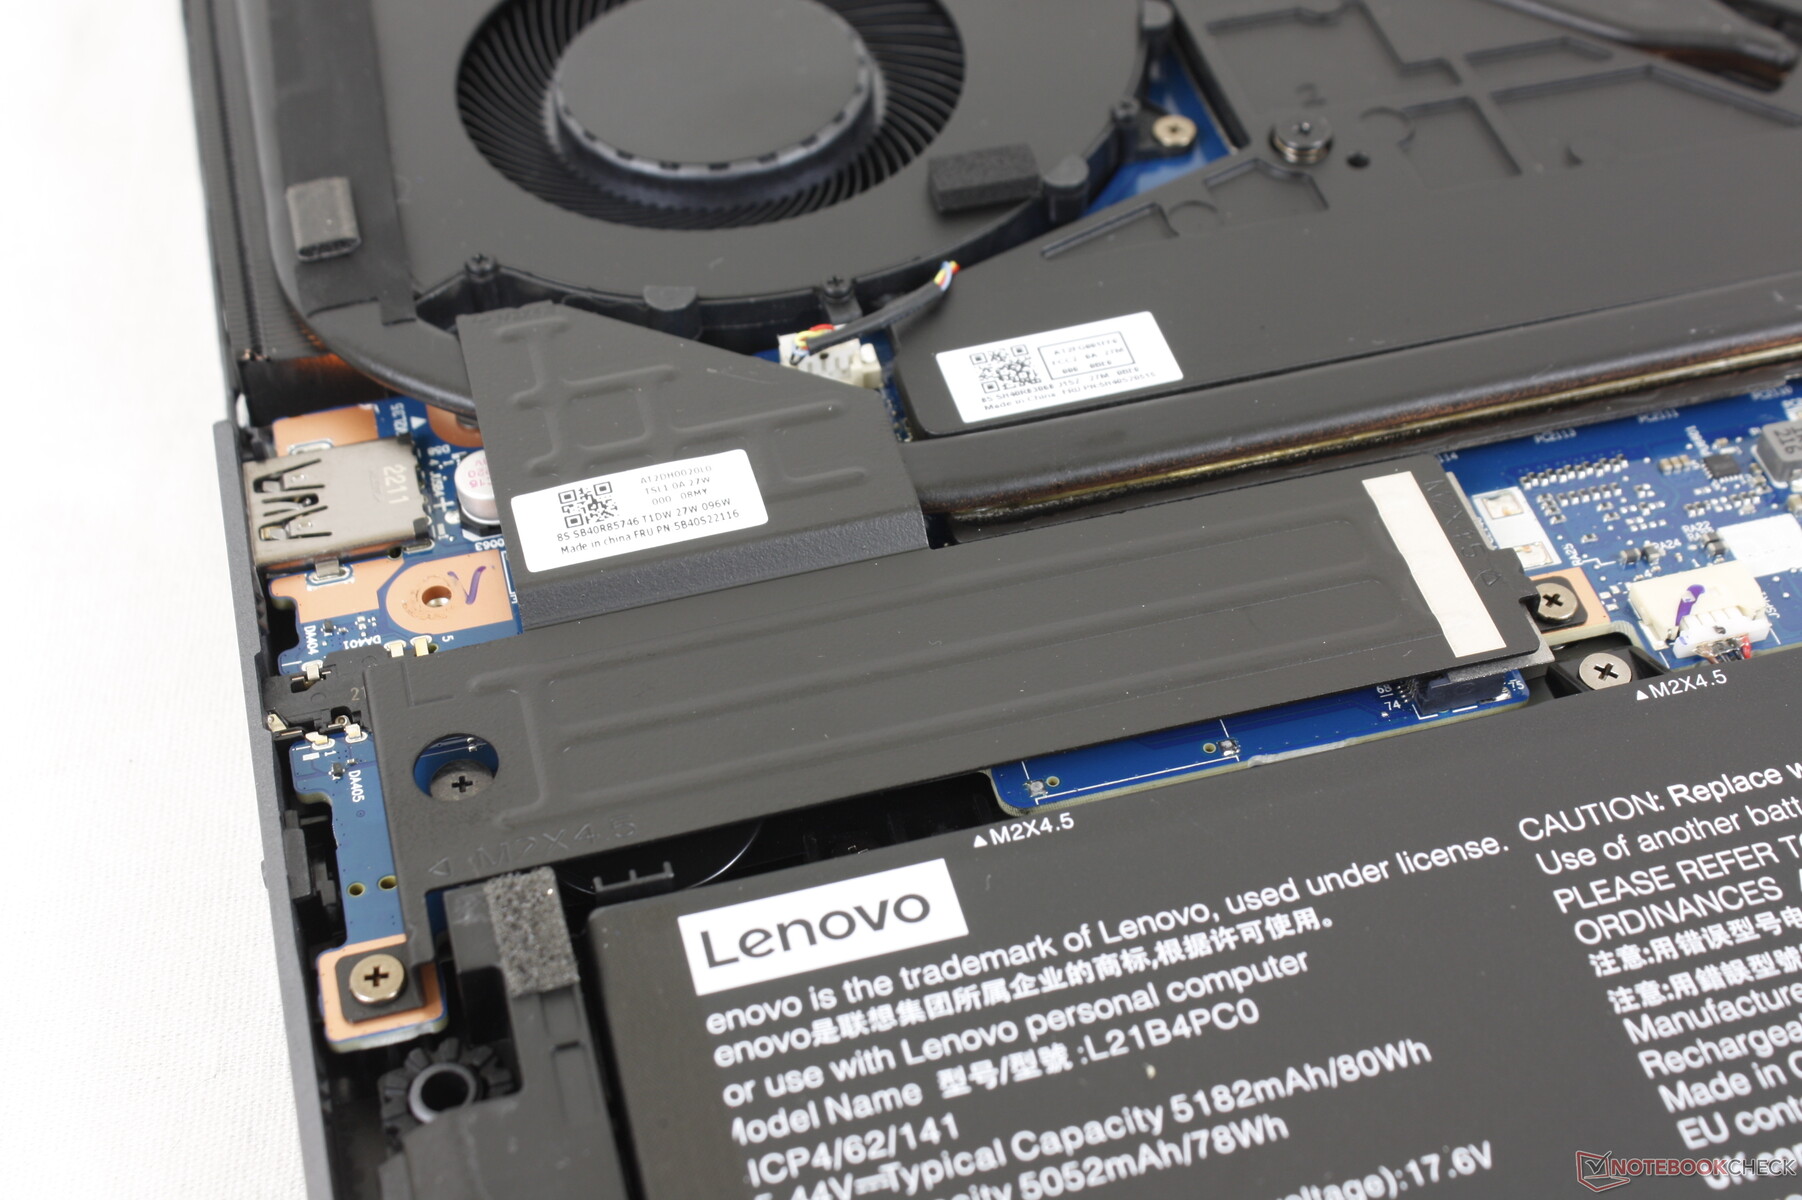
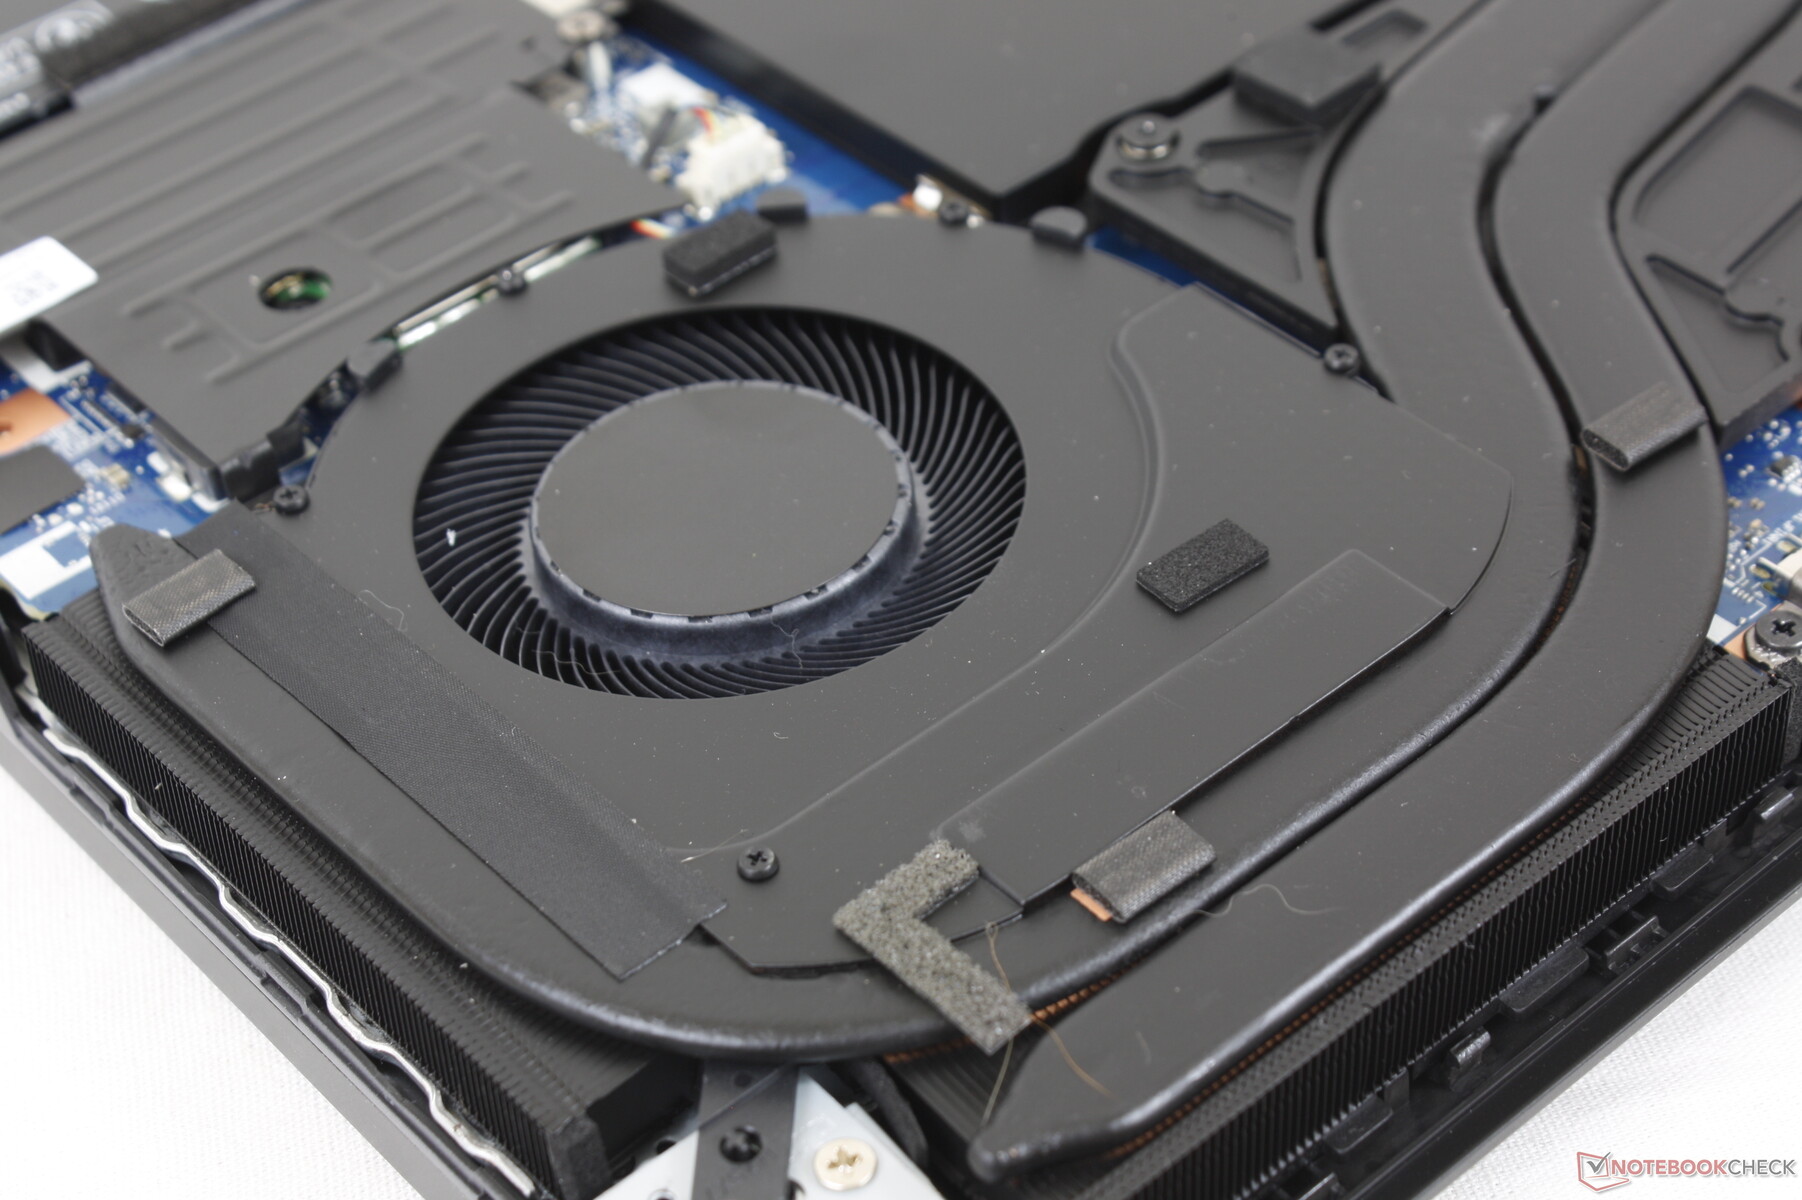
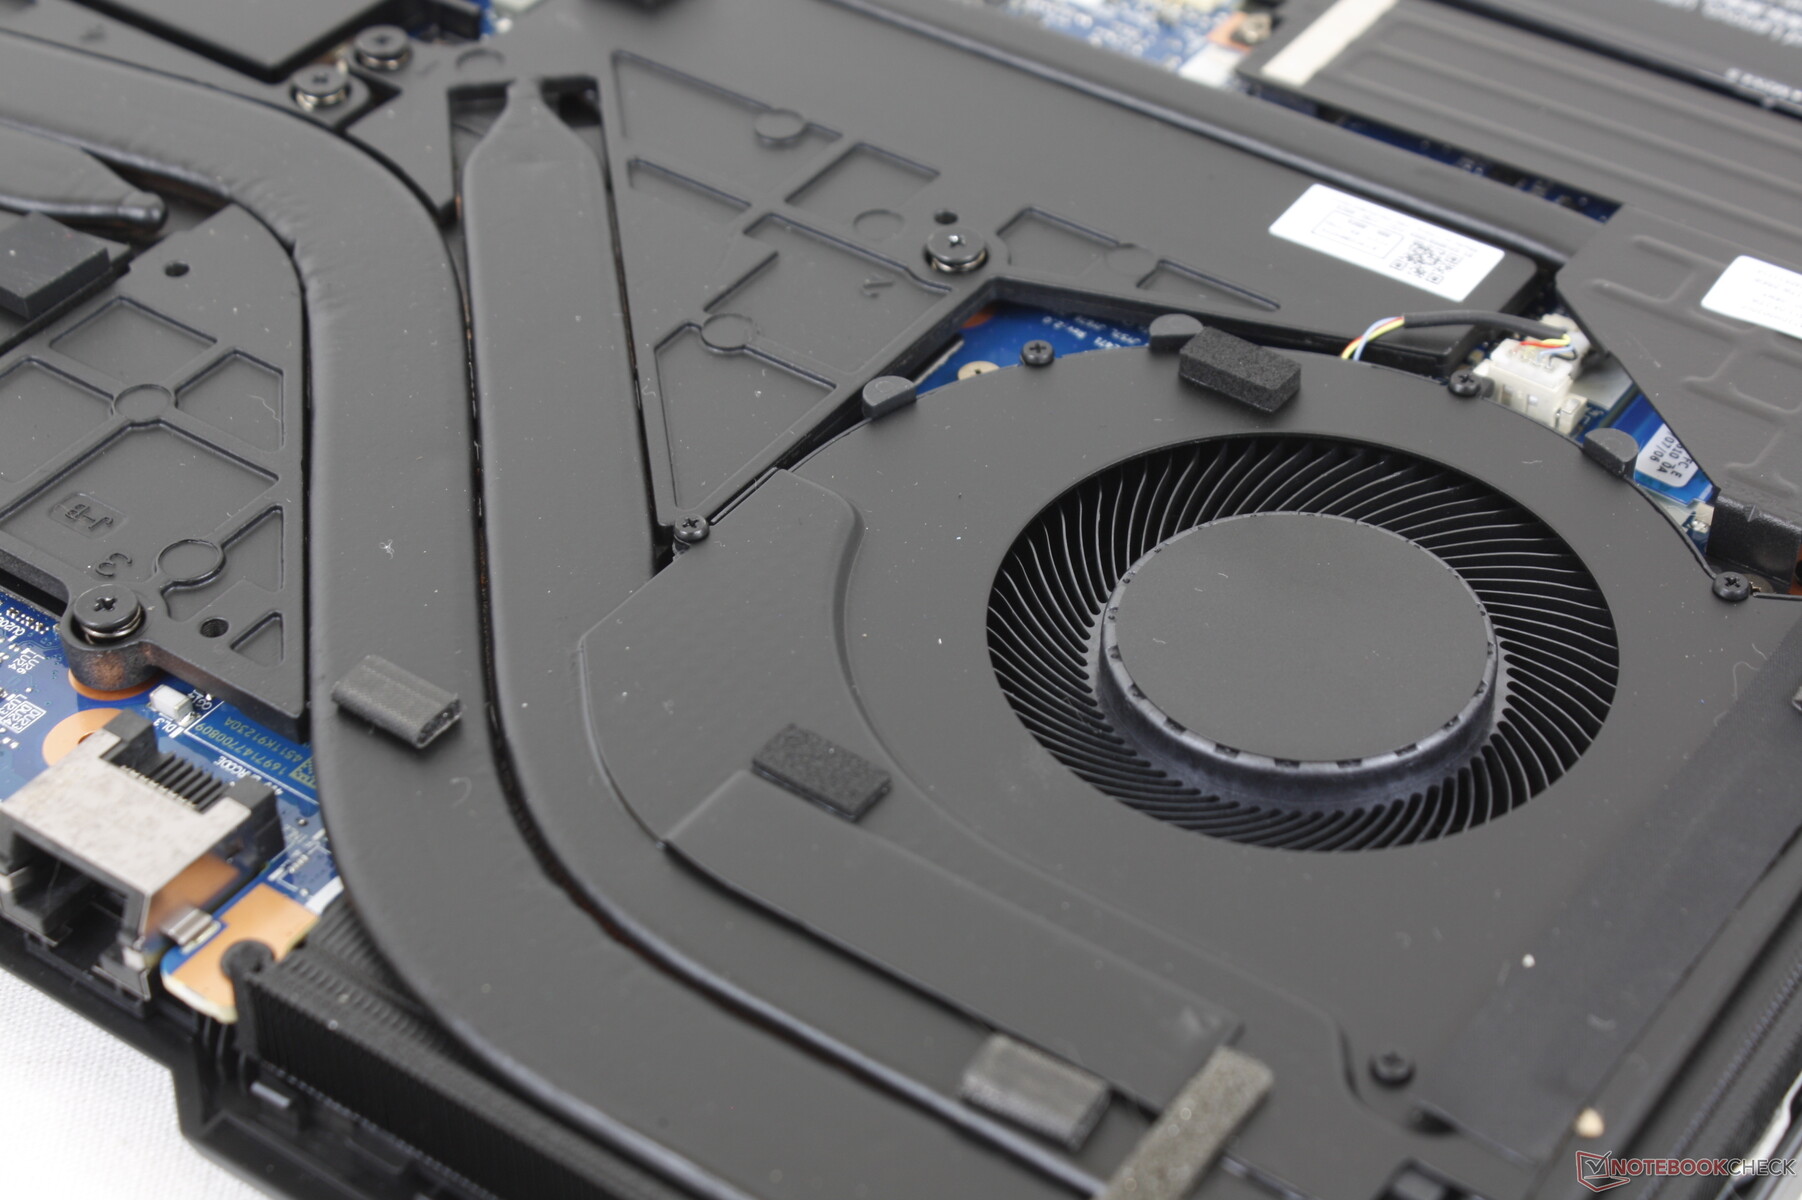
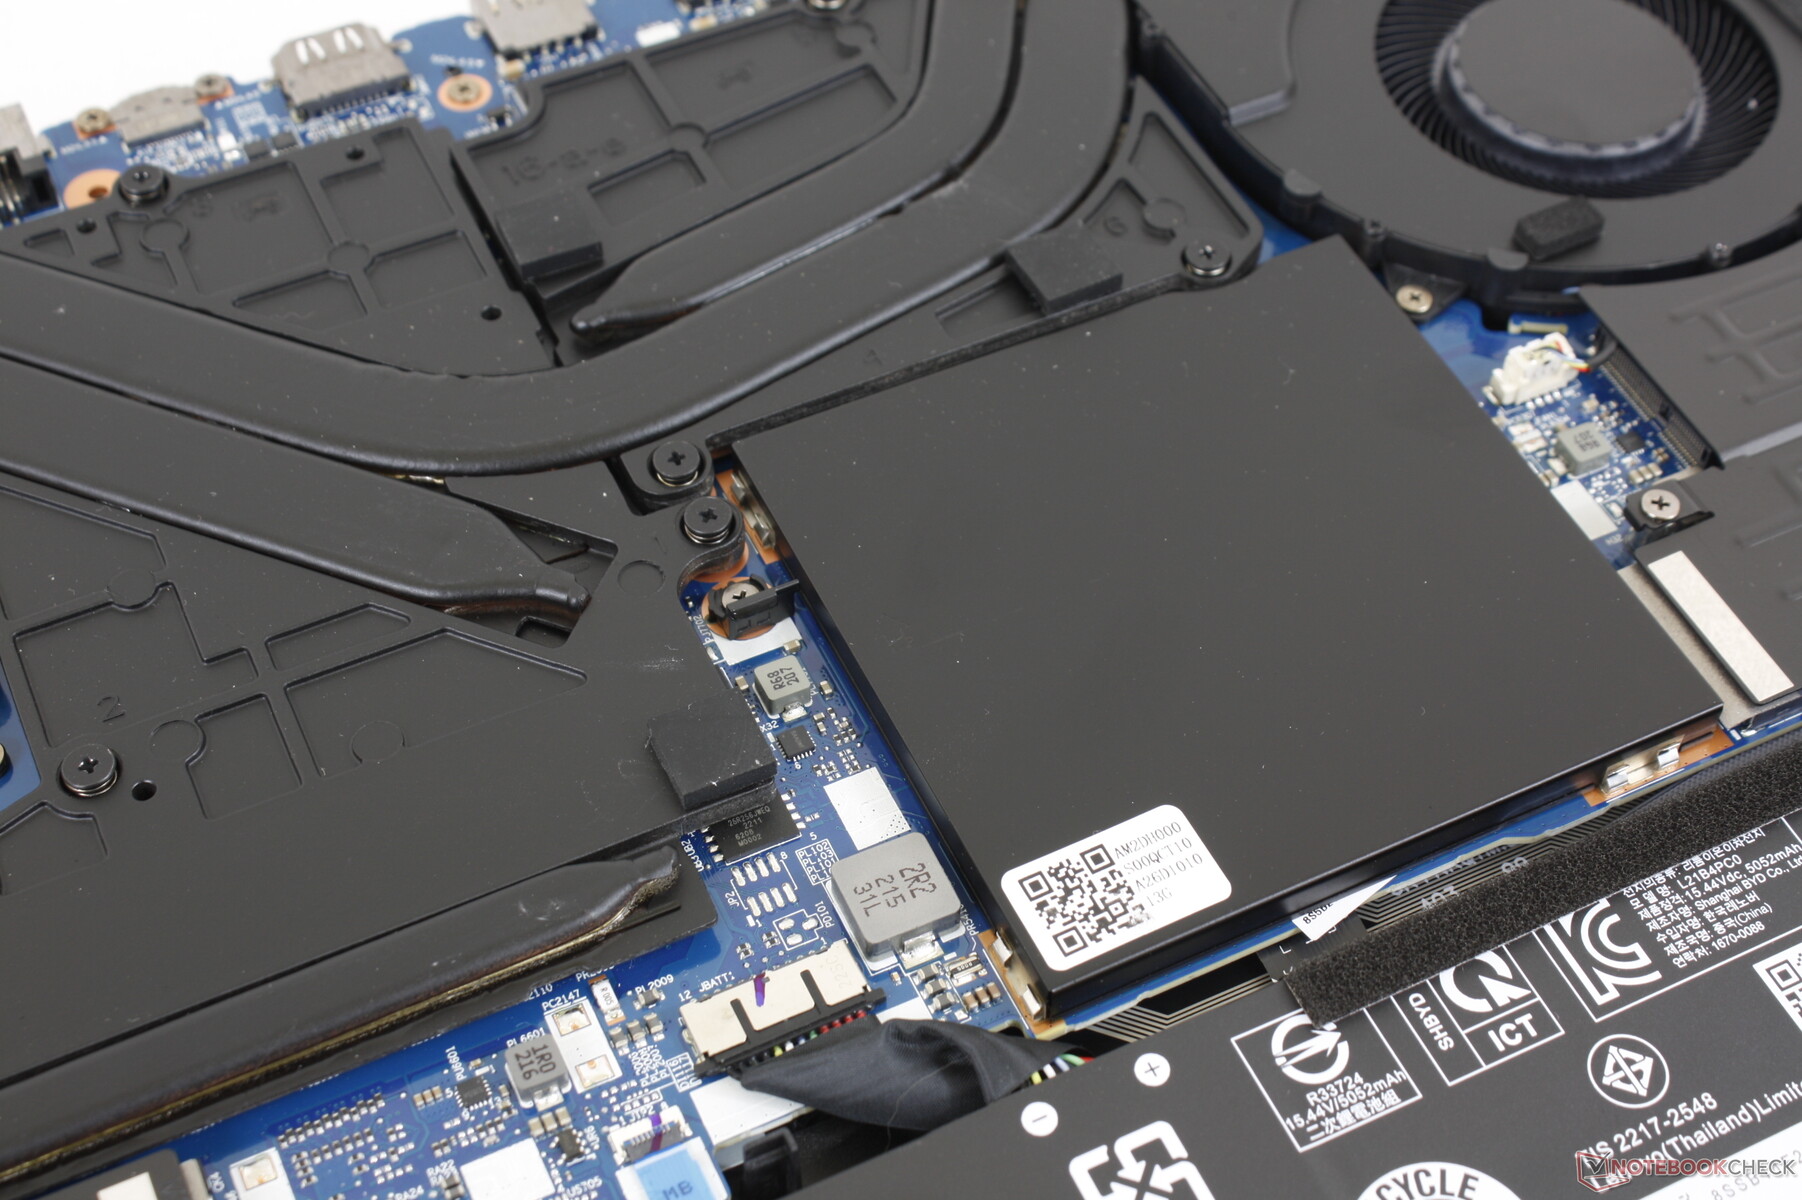
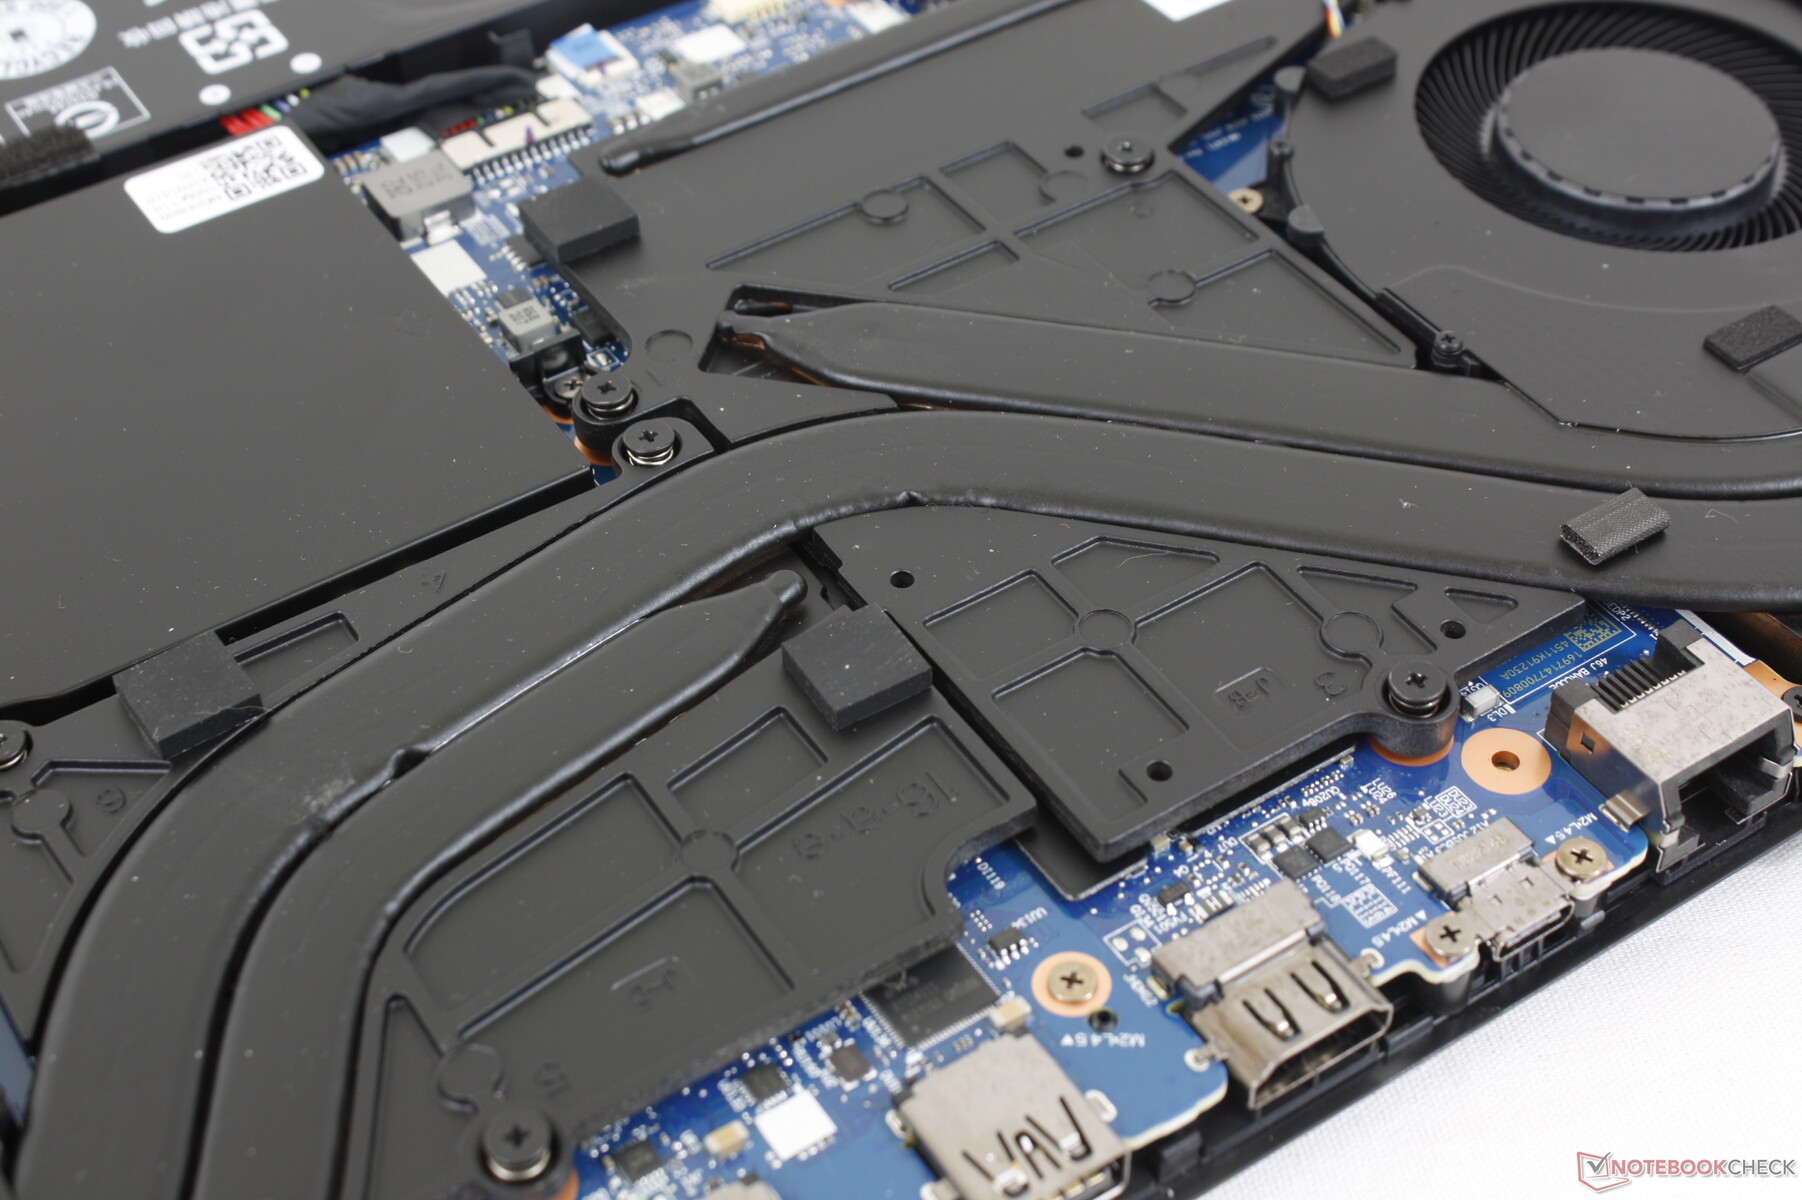
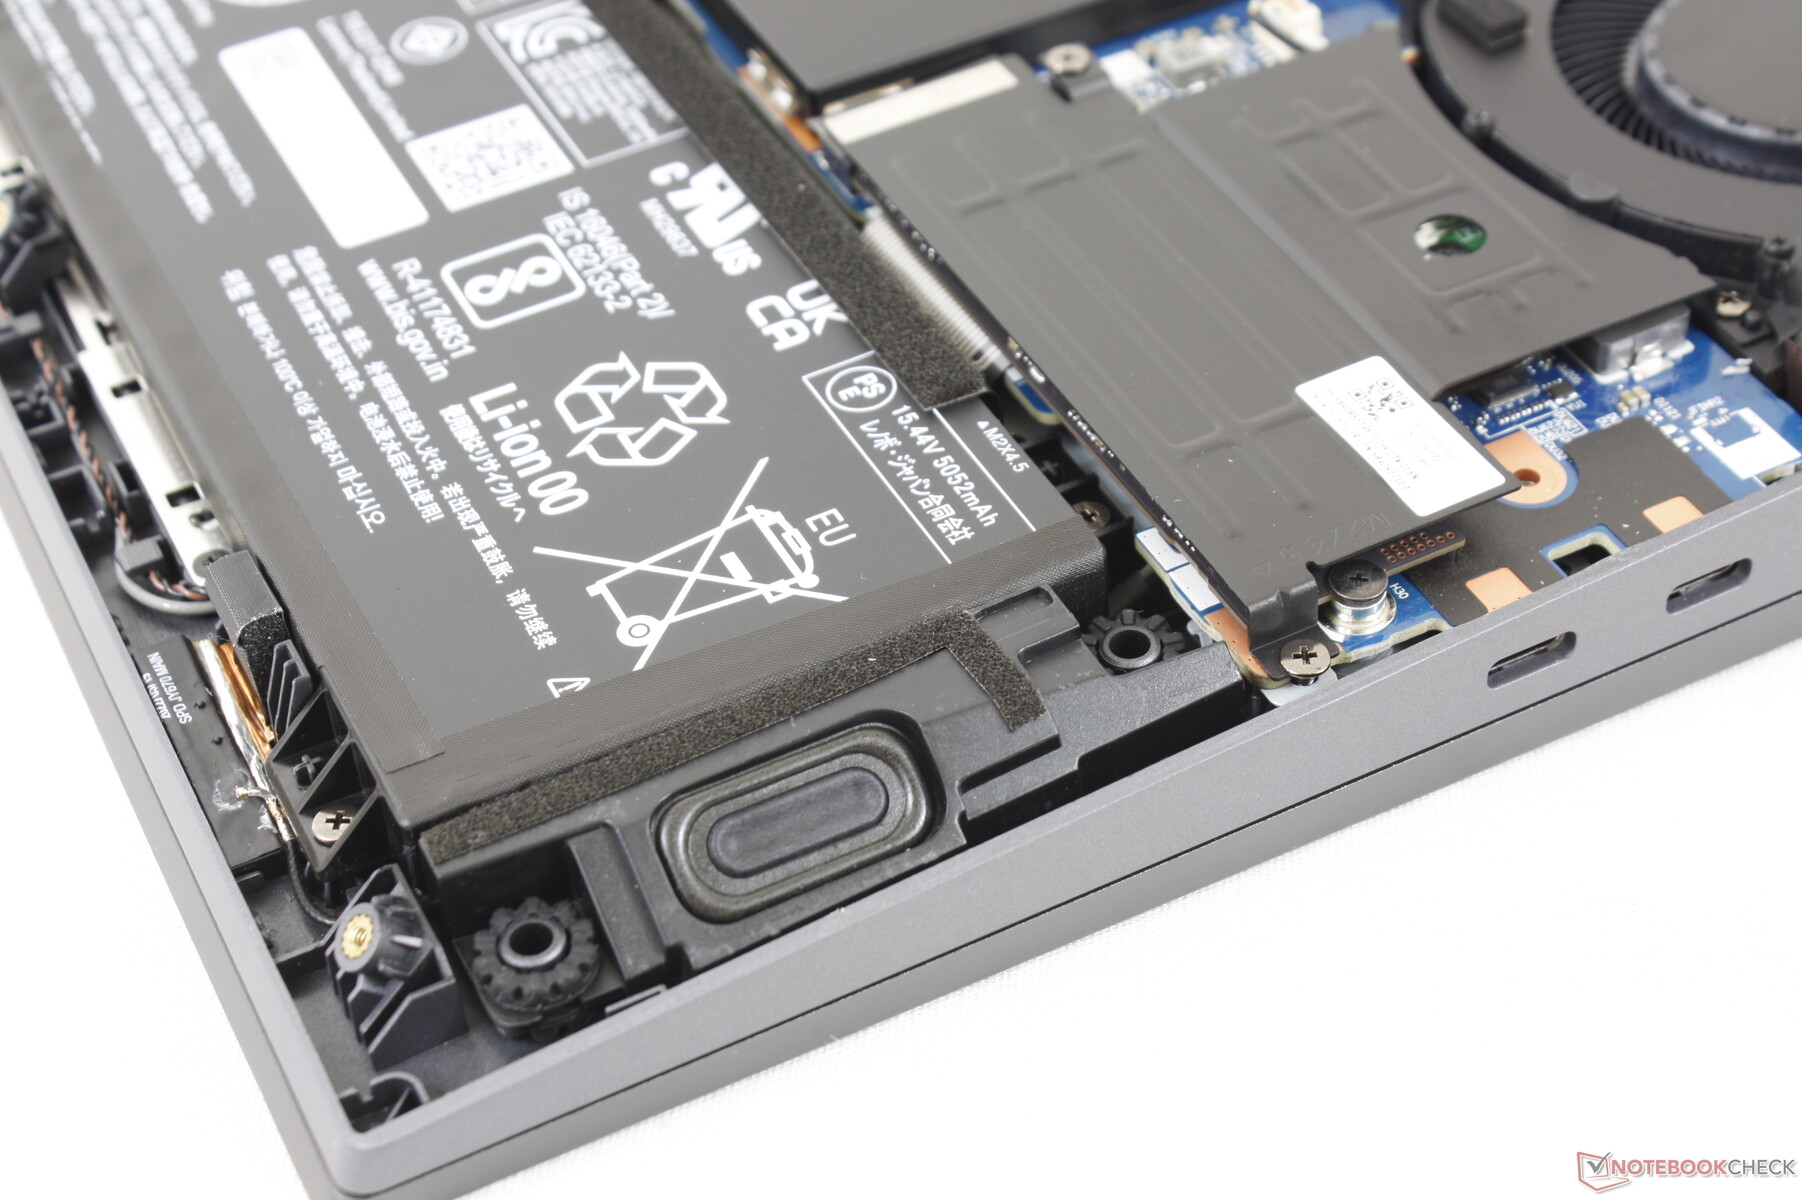
Konserwacja
Akcesoria i gwarancja
W pudełku nie ma żadnych dodatków poza zasilaczem sieciowym i papierami. W przypadku zakupu w USA obowiązuje standardowa roczna ograniczona gwarancja producenta.
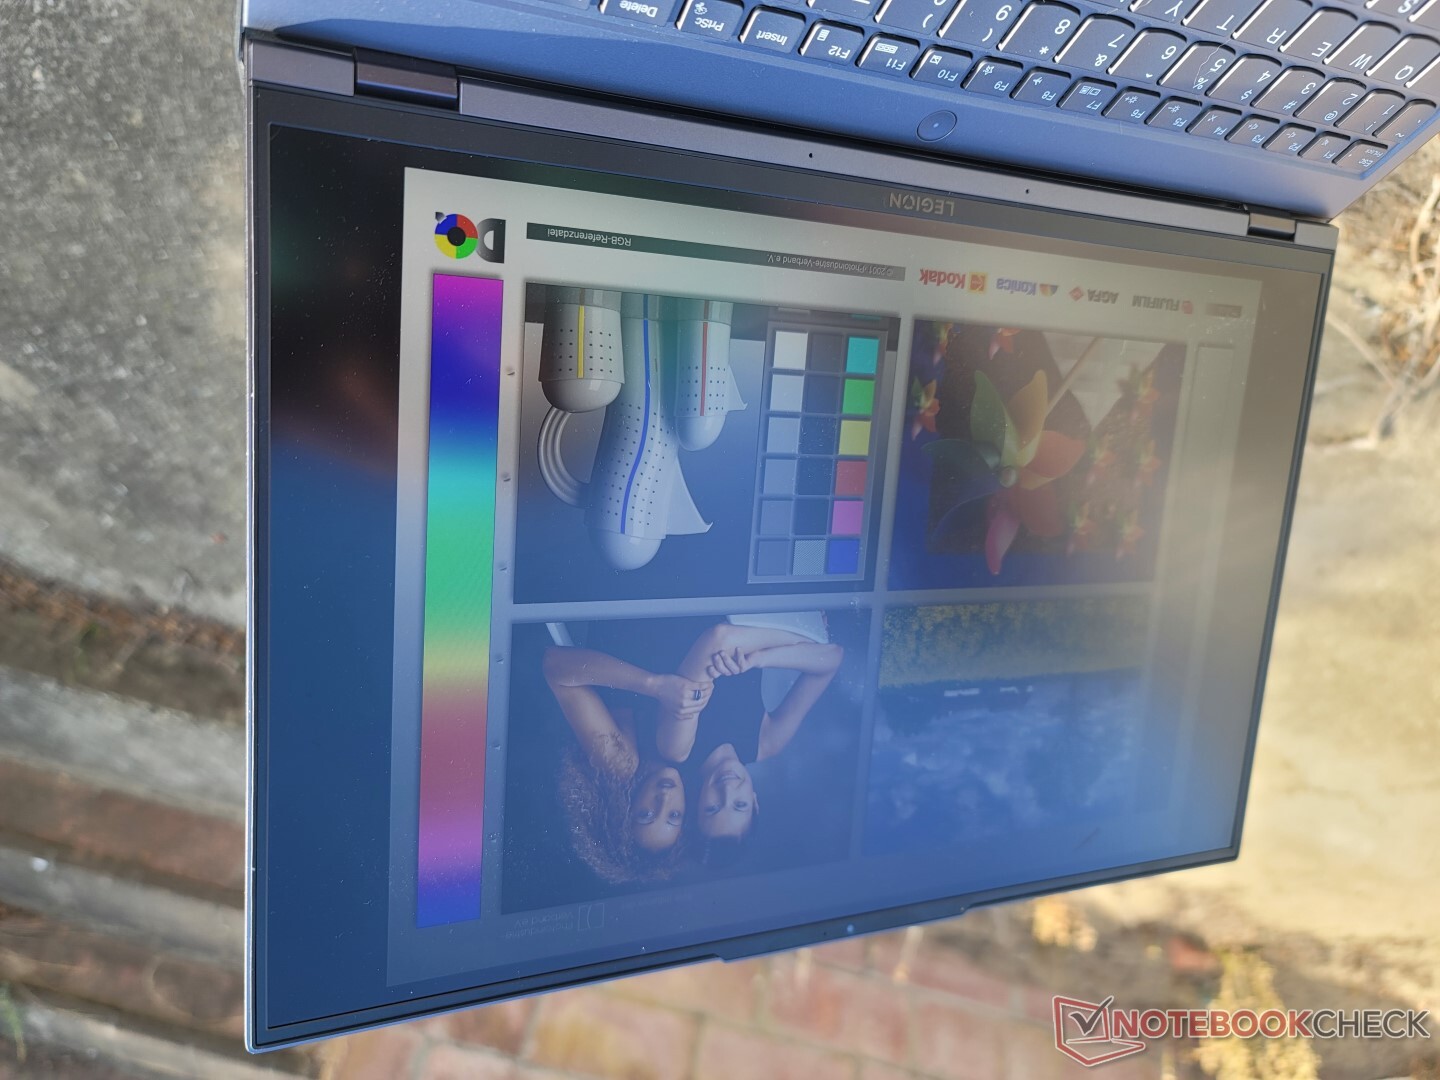
Wyświetlacz - tylko jedna opcja
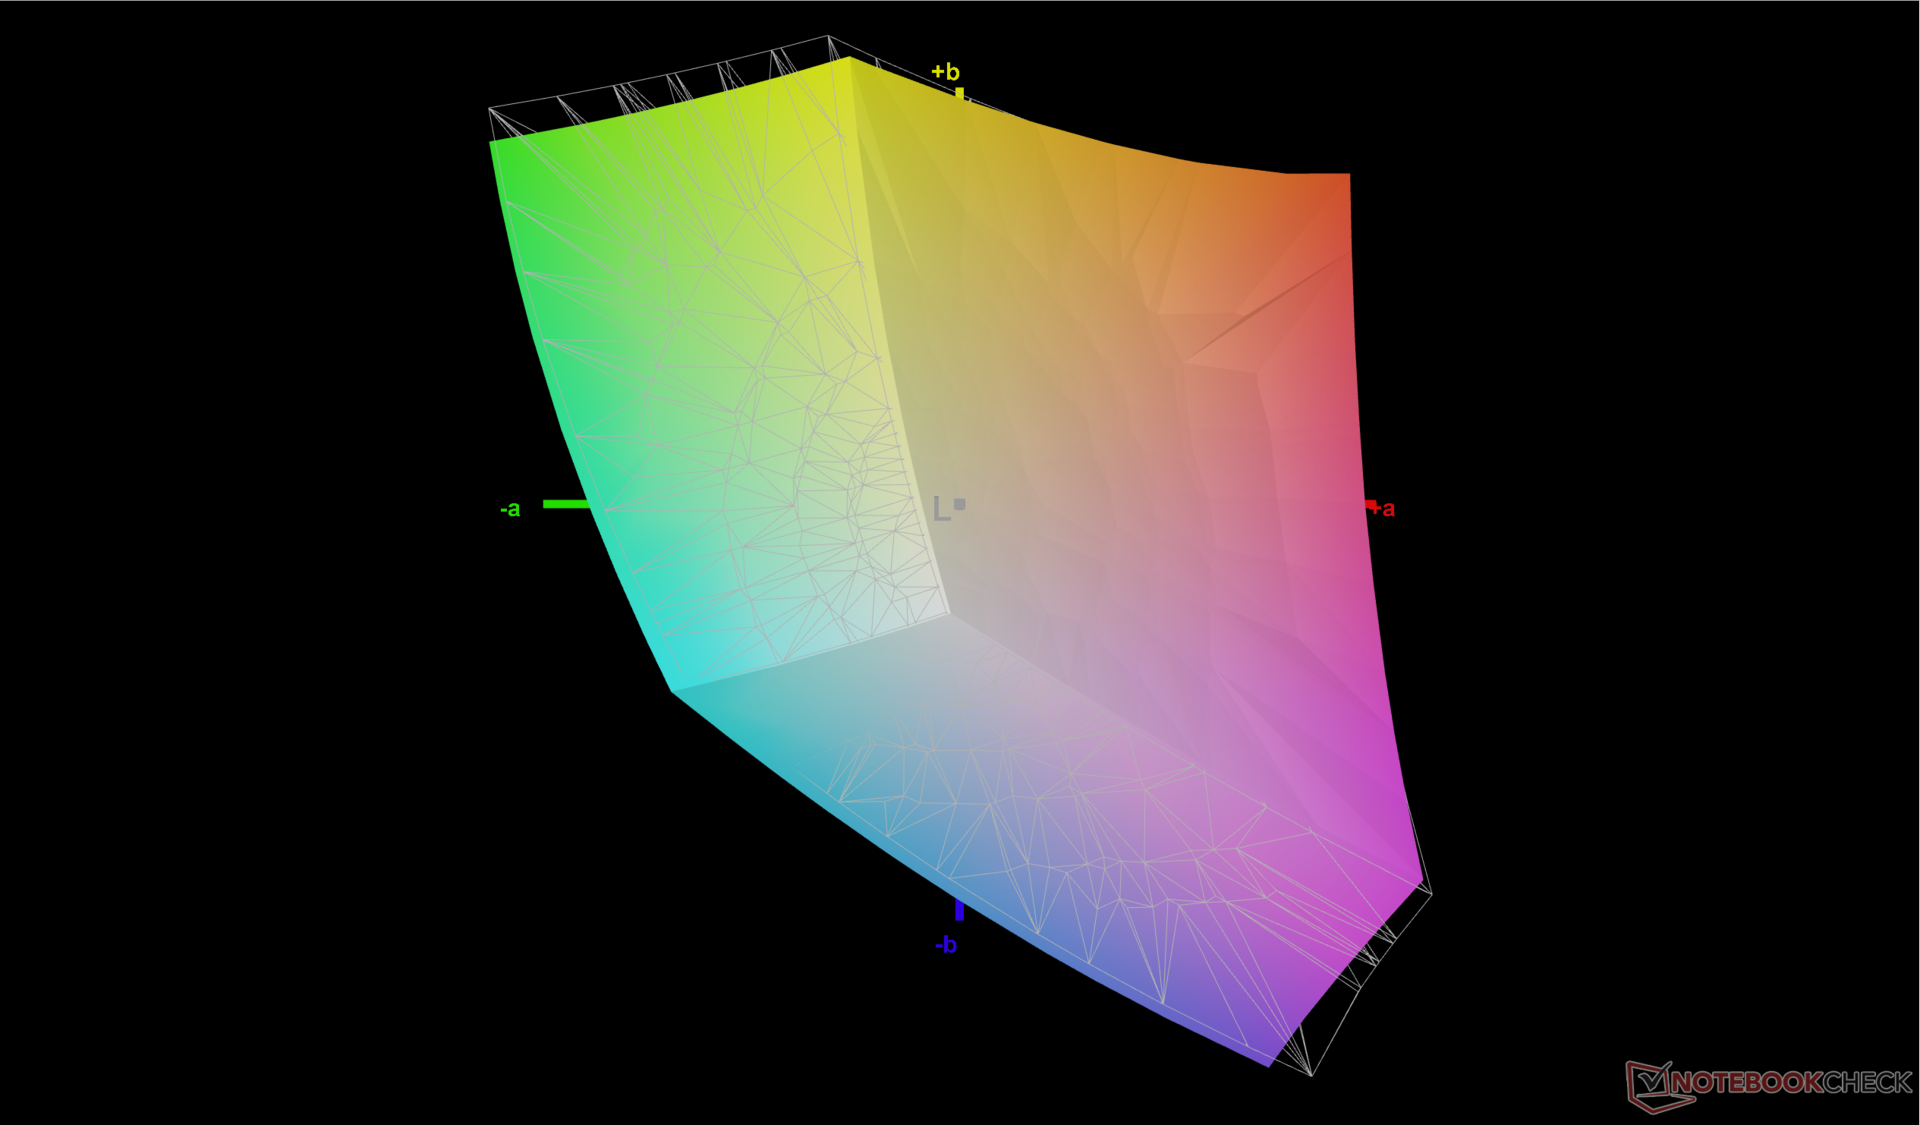
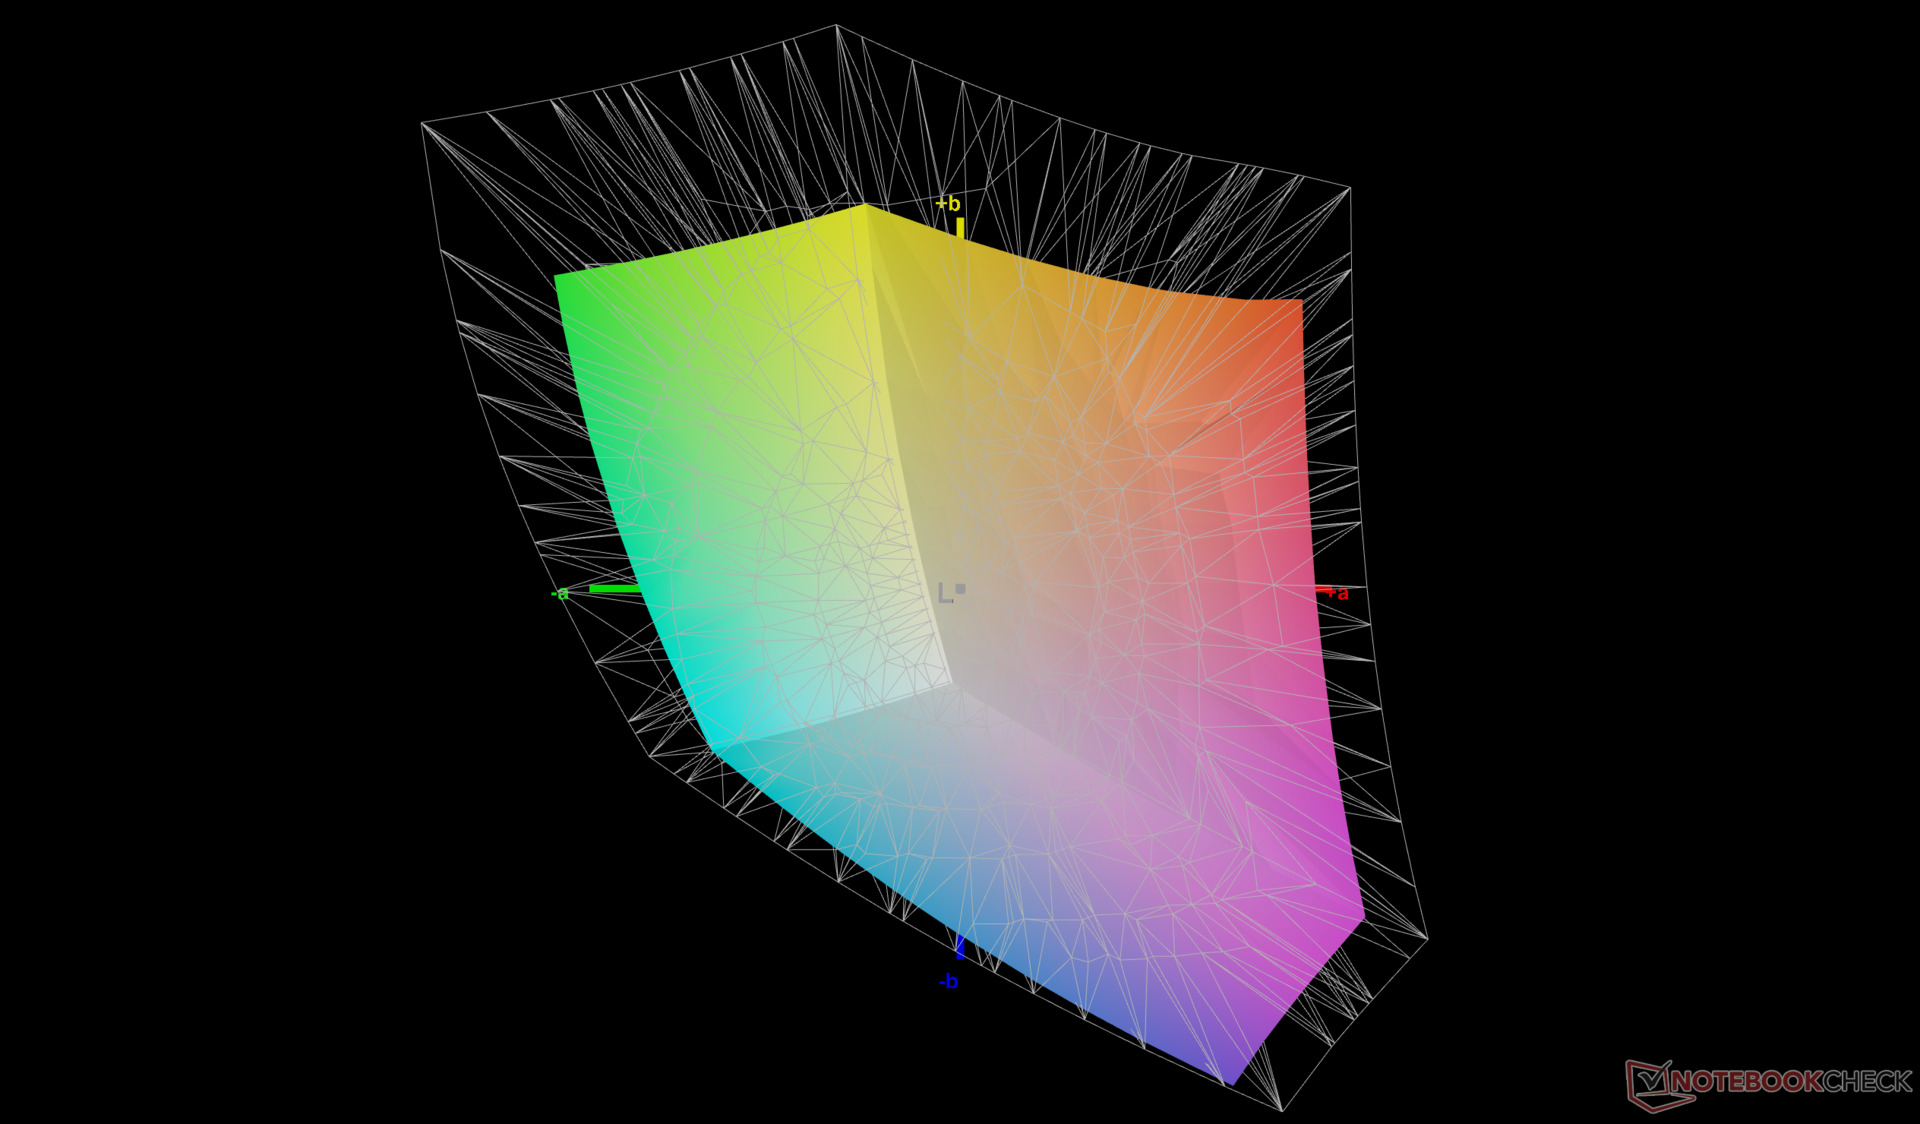
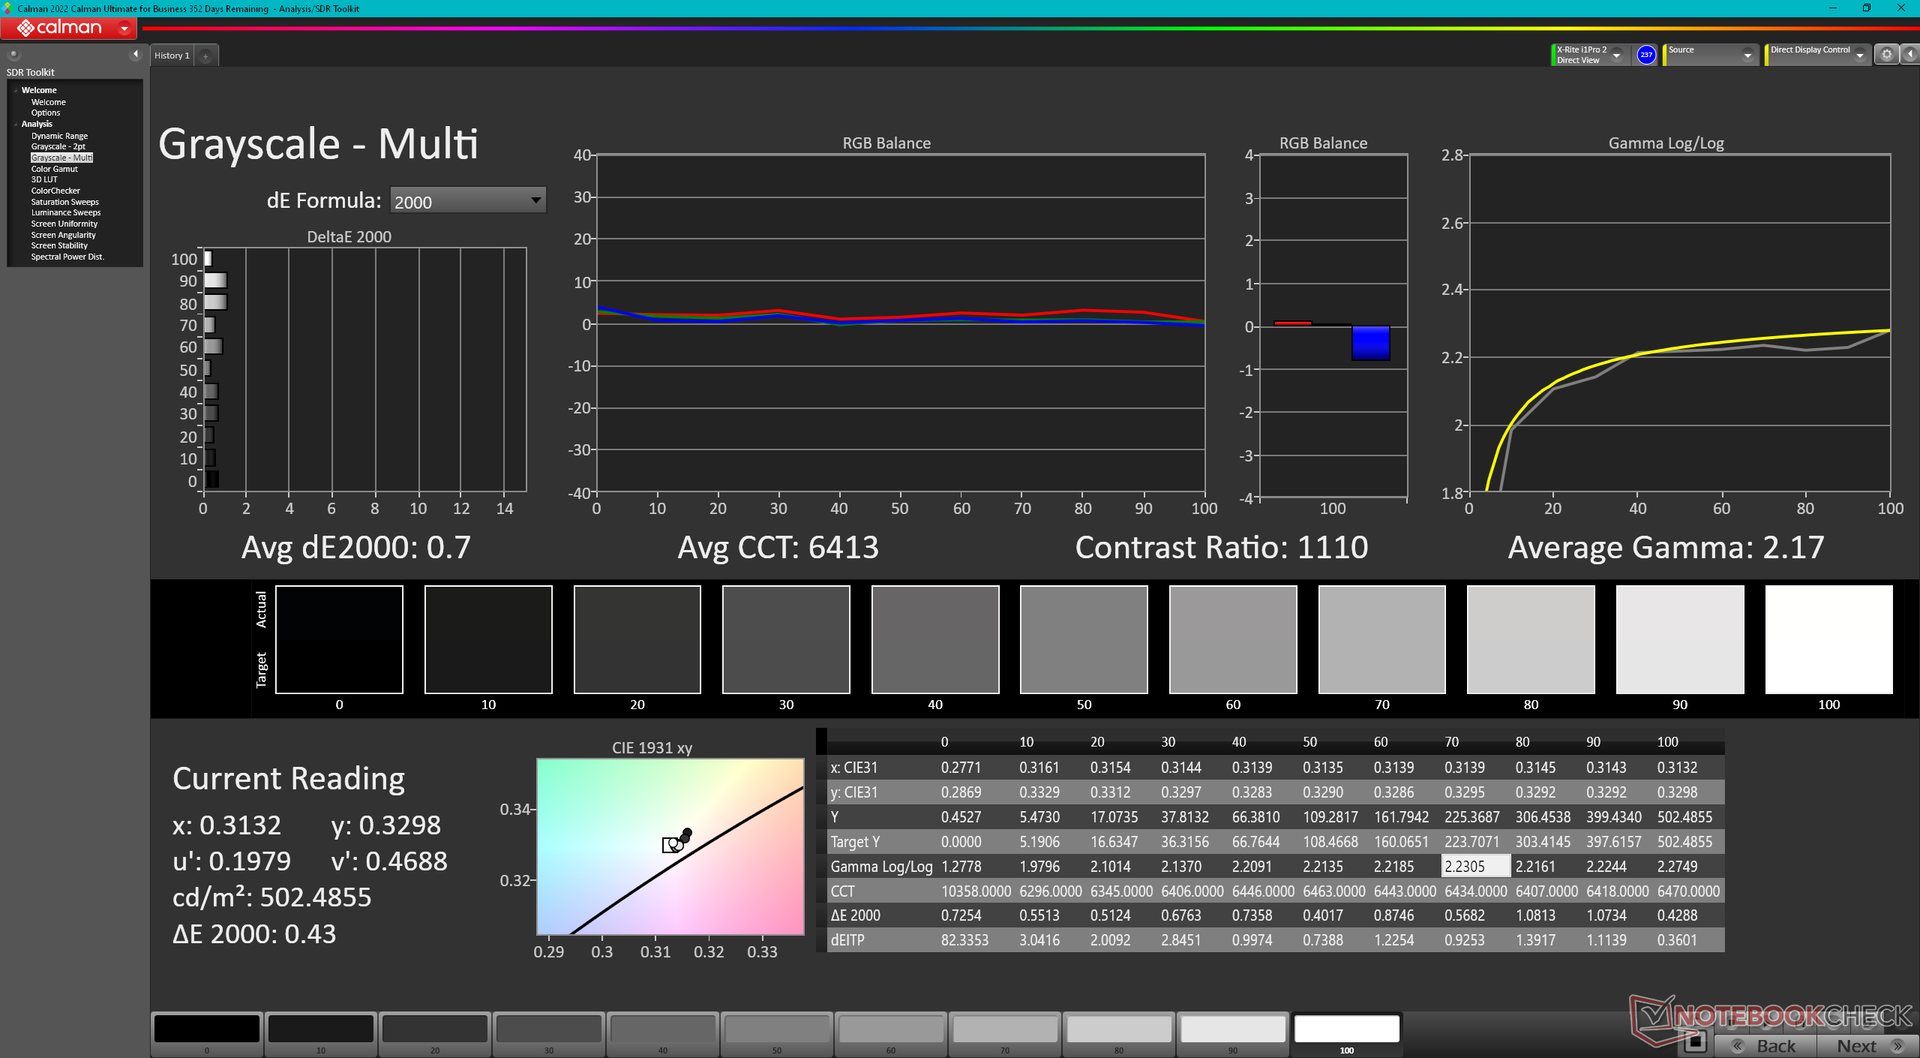
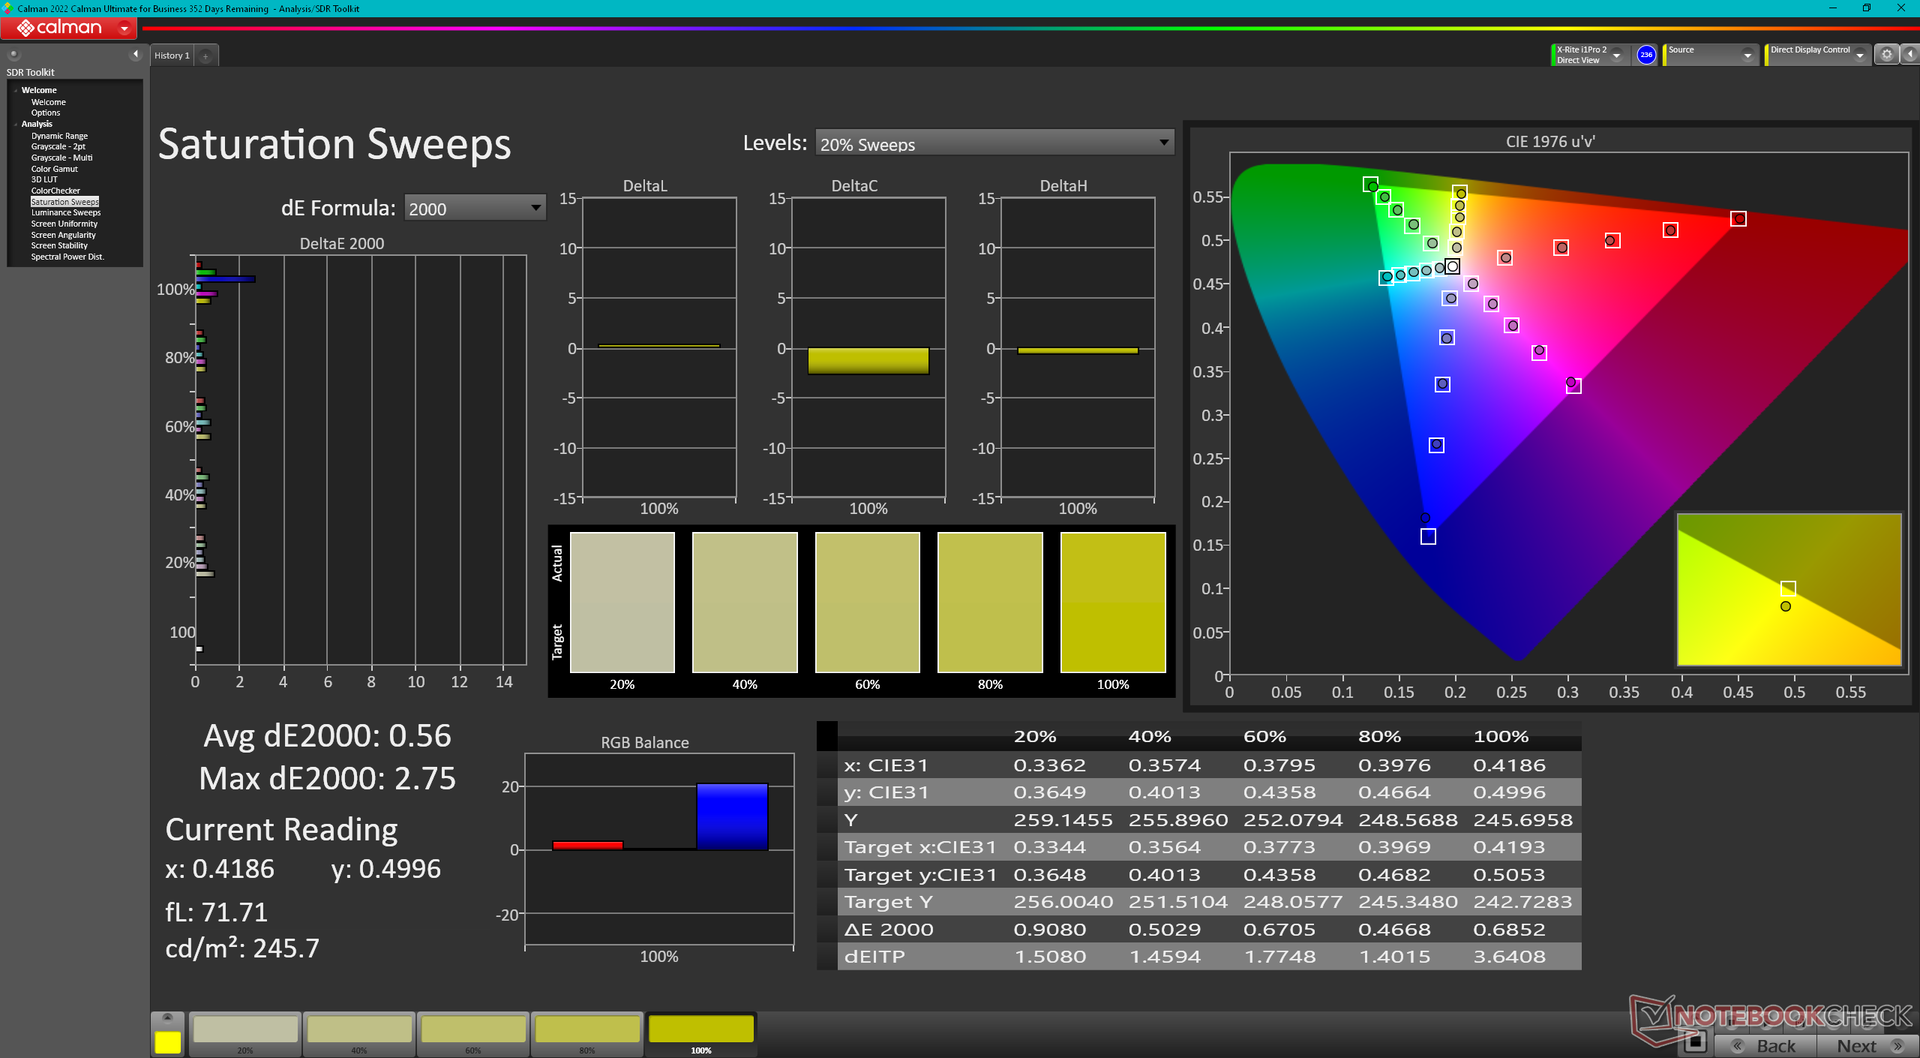
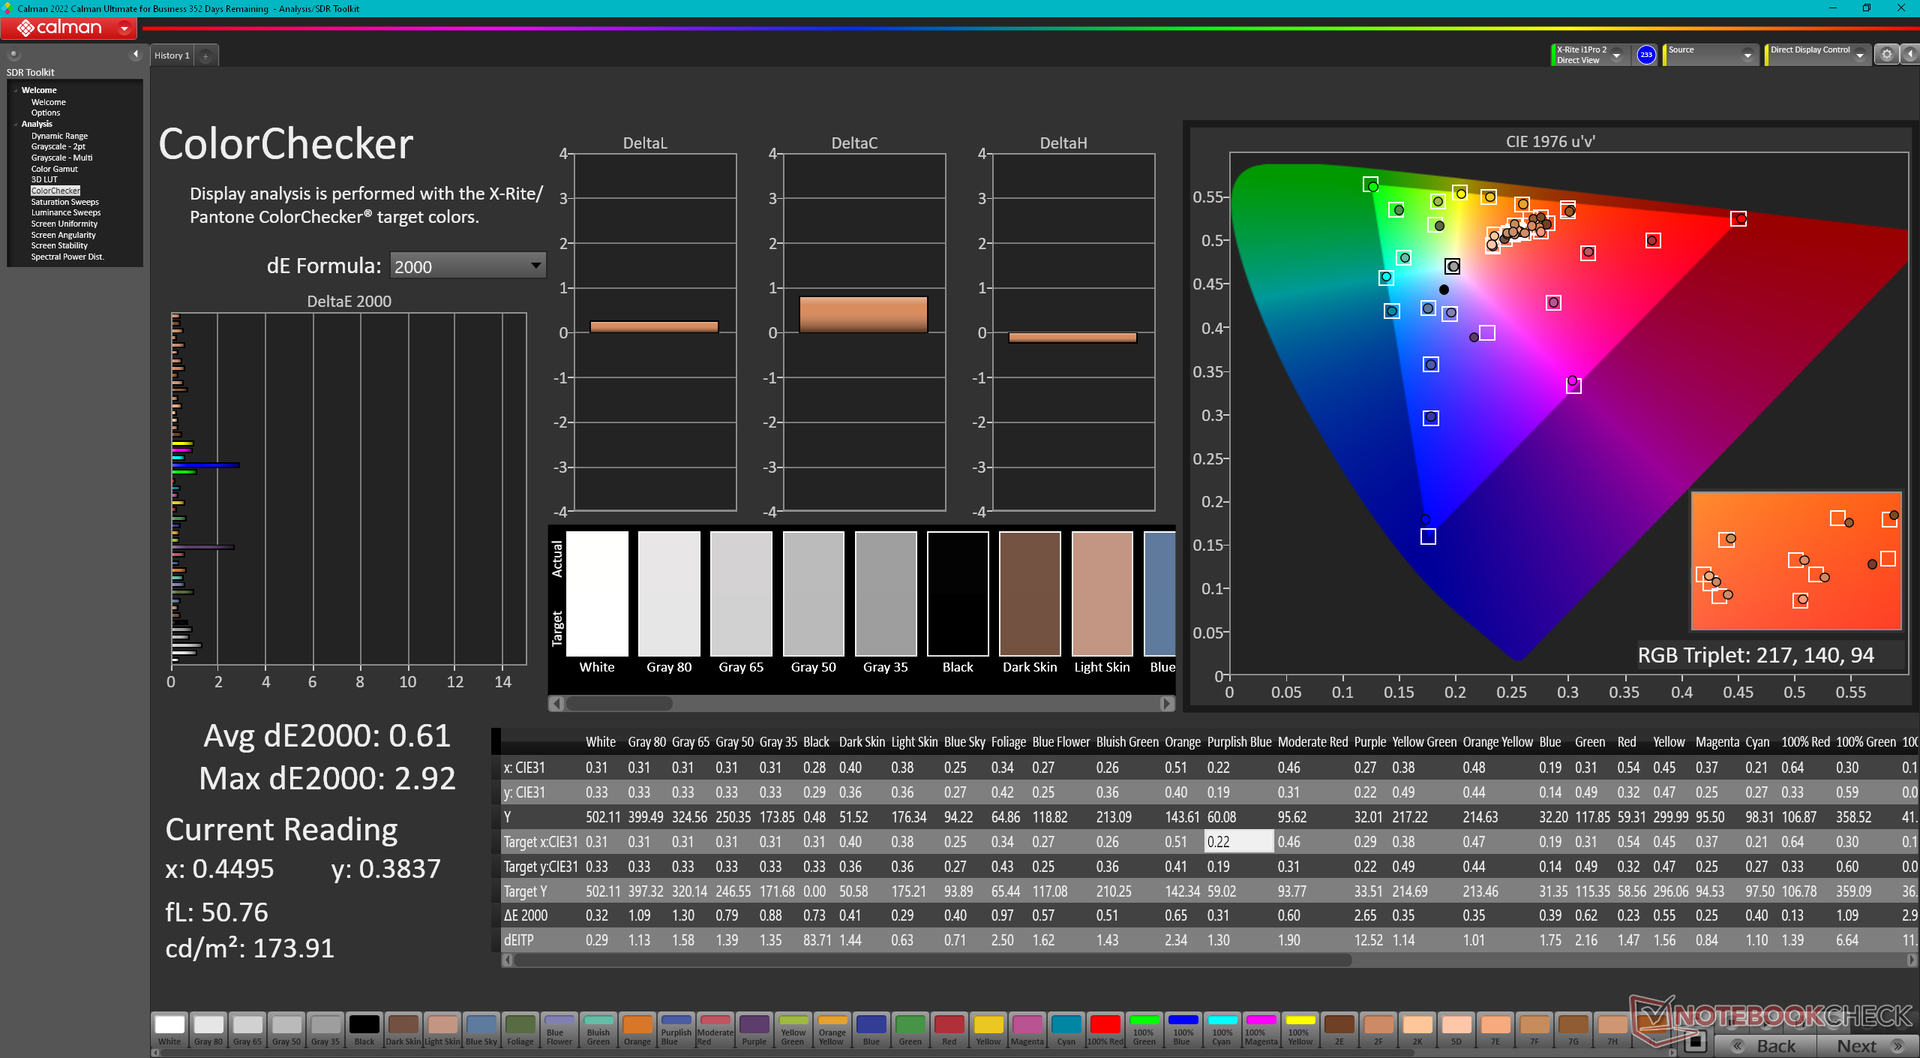
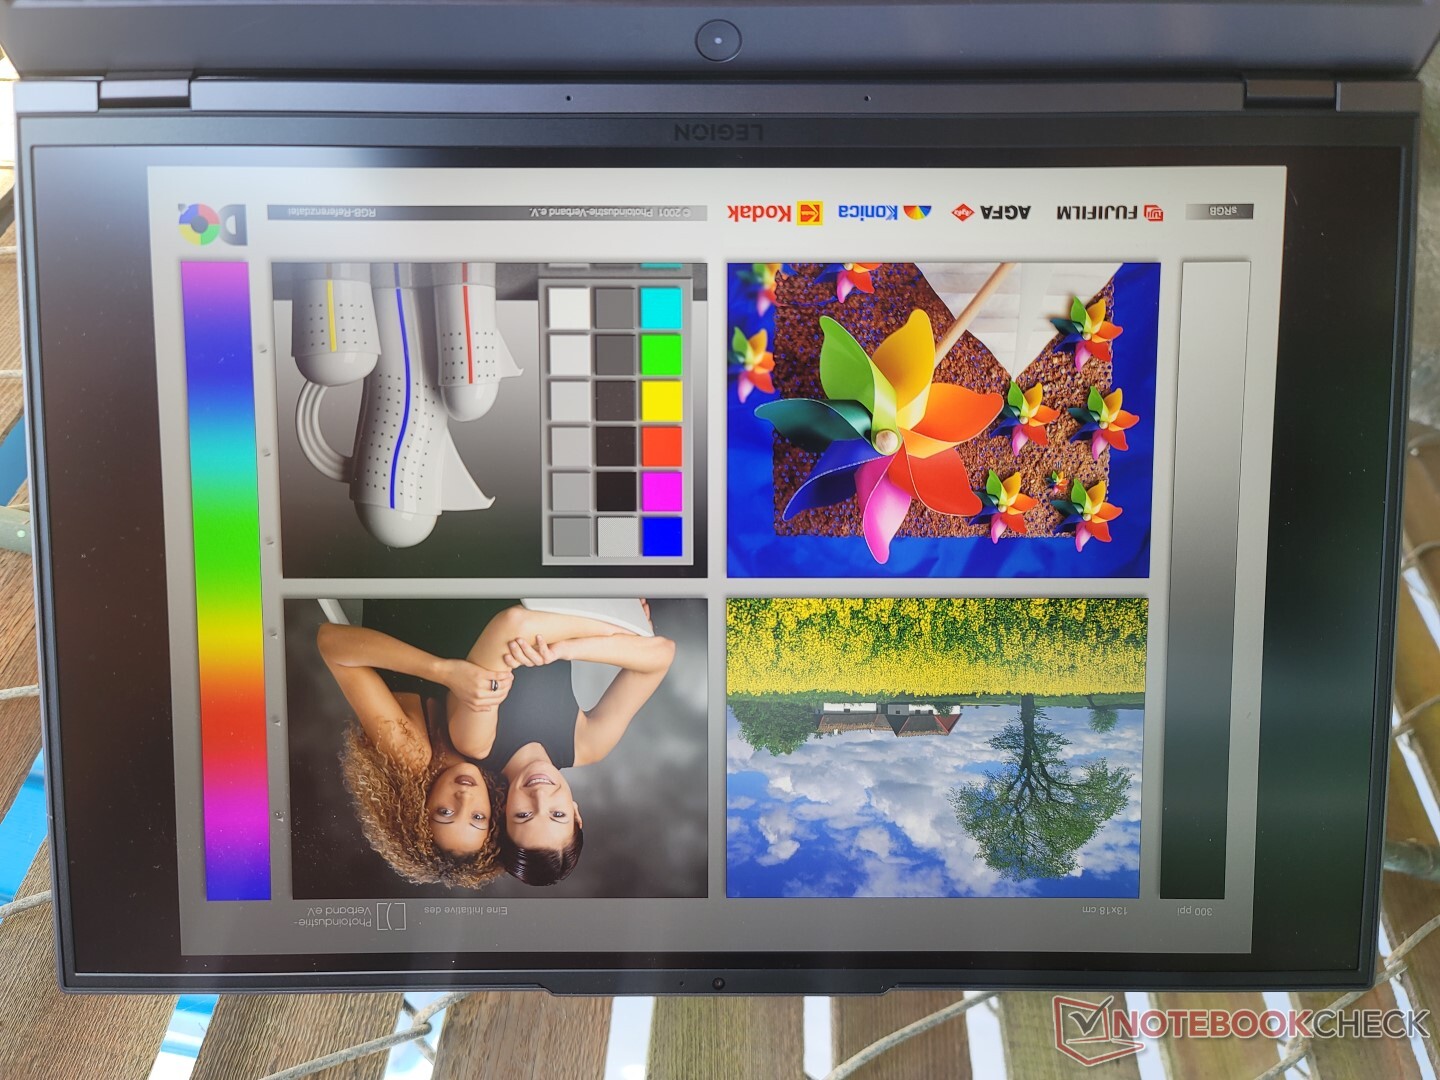
Lenovo nie zmieniło nic w panelu BOE CQ NE160QDM-NY1 IPS z zeszłorocznego modelu Legion 5 Pro 16. Nasze pomiary poniżej pokazują podobne atrybuty na całej planszy, w tym pełne pokrycie sRGB, szybkie czasy reakcji czerni i bieli, współczynnik kontrastu ~1000:1 i jasne 500-nitowe podświetlenie.
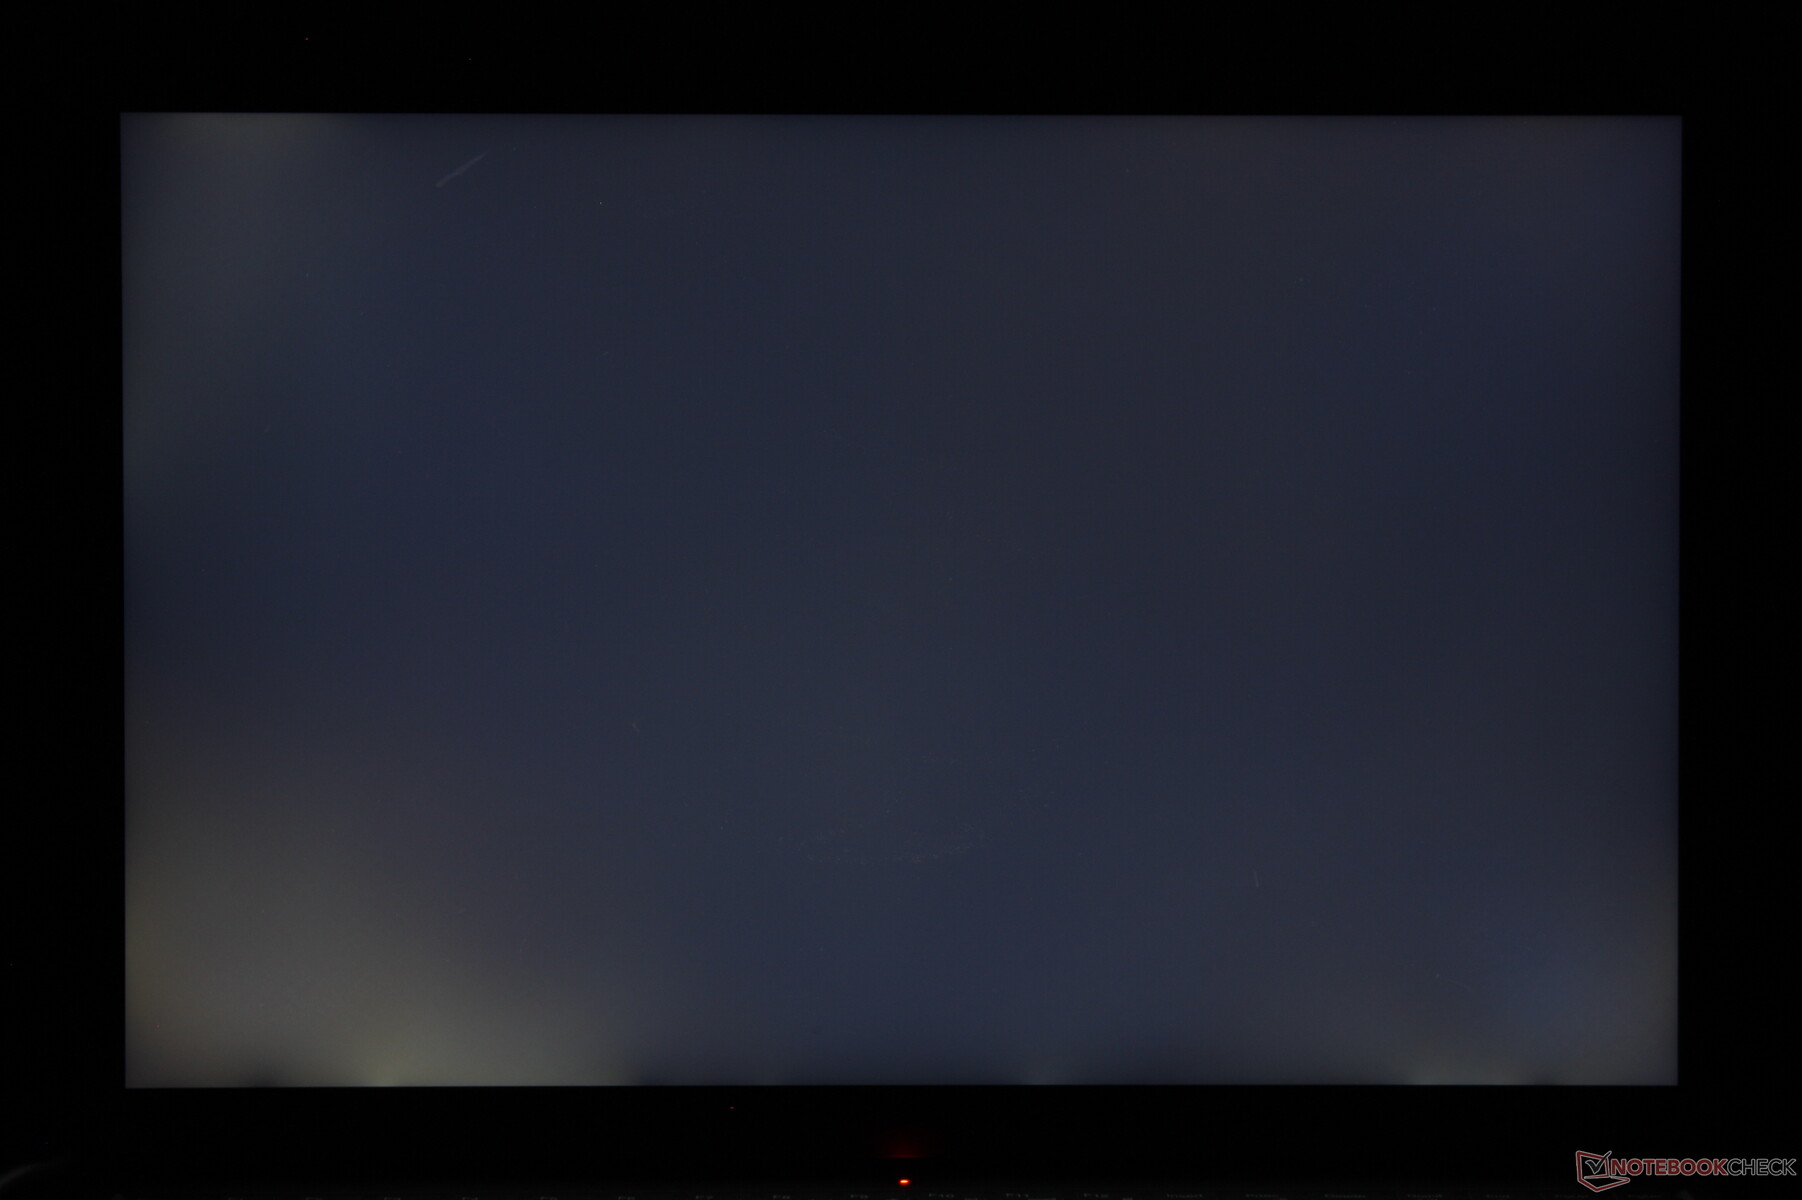
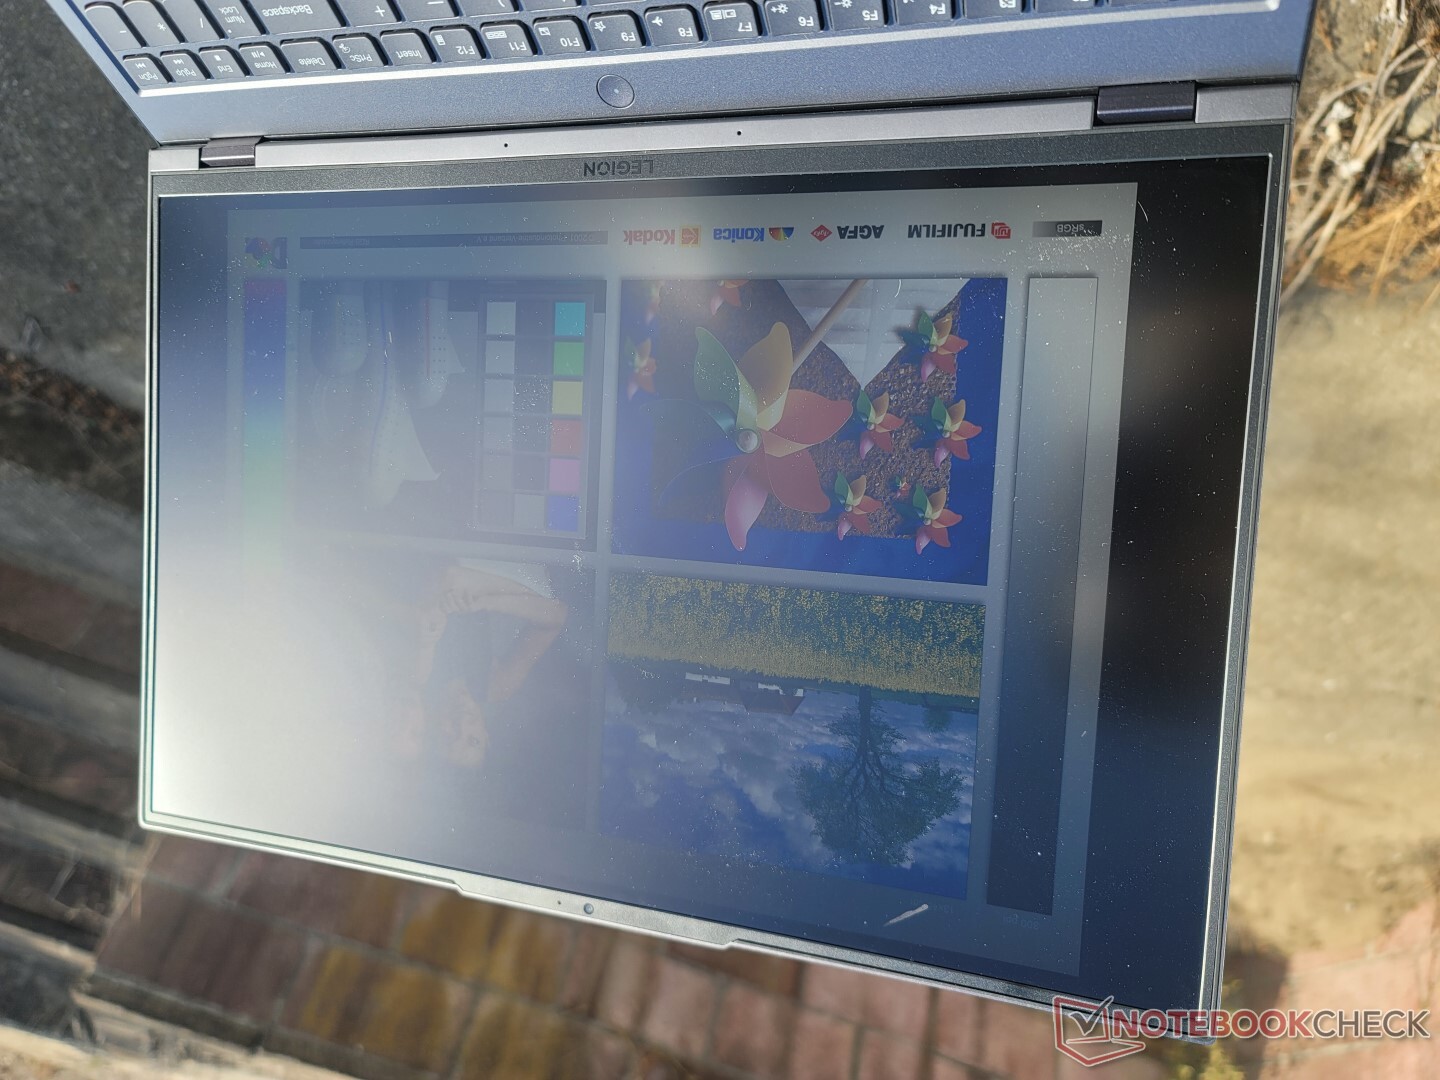
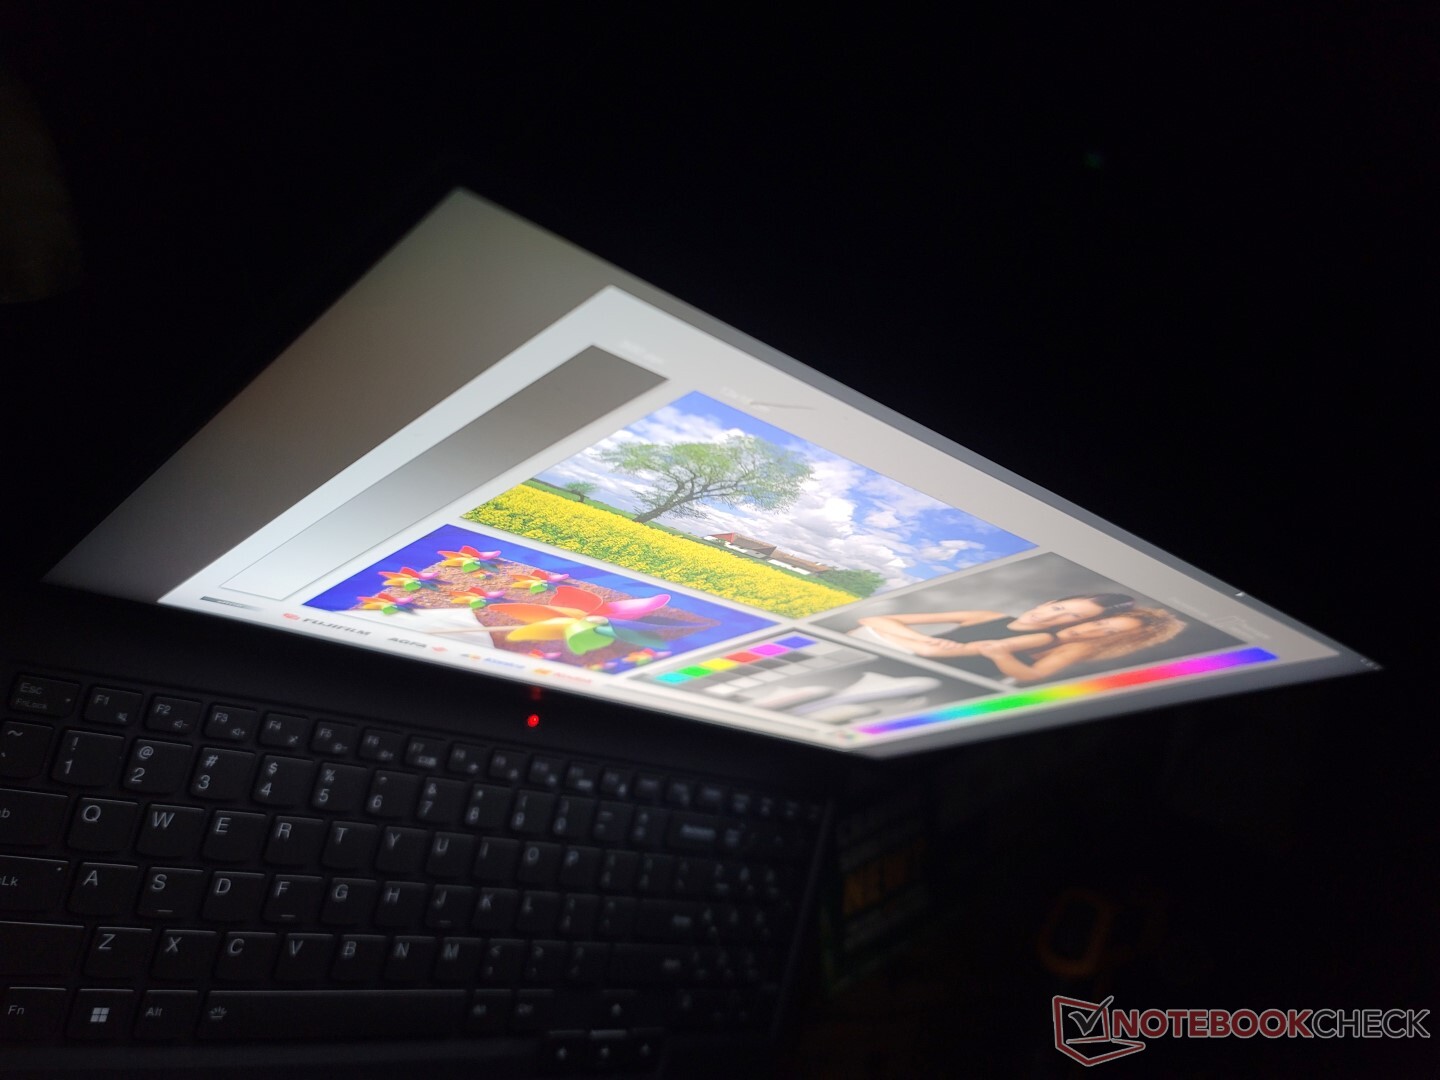
Niemniej jednak, nasz konkretny egzemplarz cierpi na umiarkowane i silne krwawienie podświetlenia, co widać na poniższym zdjęciu. Niektóre nierównomierne krwawienie światła jest oczekiwane od większości paneli IPS, ale ta intensywność jest szczególnie denerwująca w przypadku wyższej klasy maszyny do gier, takiej jak Legion 5 Pro 16.

| |||||||||||||||||||||||||
rozświetlenie: 84 %
na akumulatorze: 522.8 cd/m²
kontrast: 1275:1 (czerń: 0.41 cd/m²)
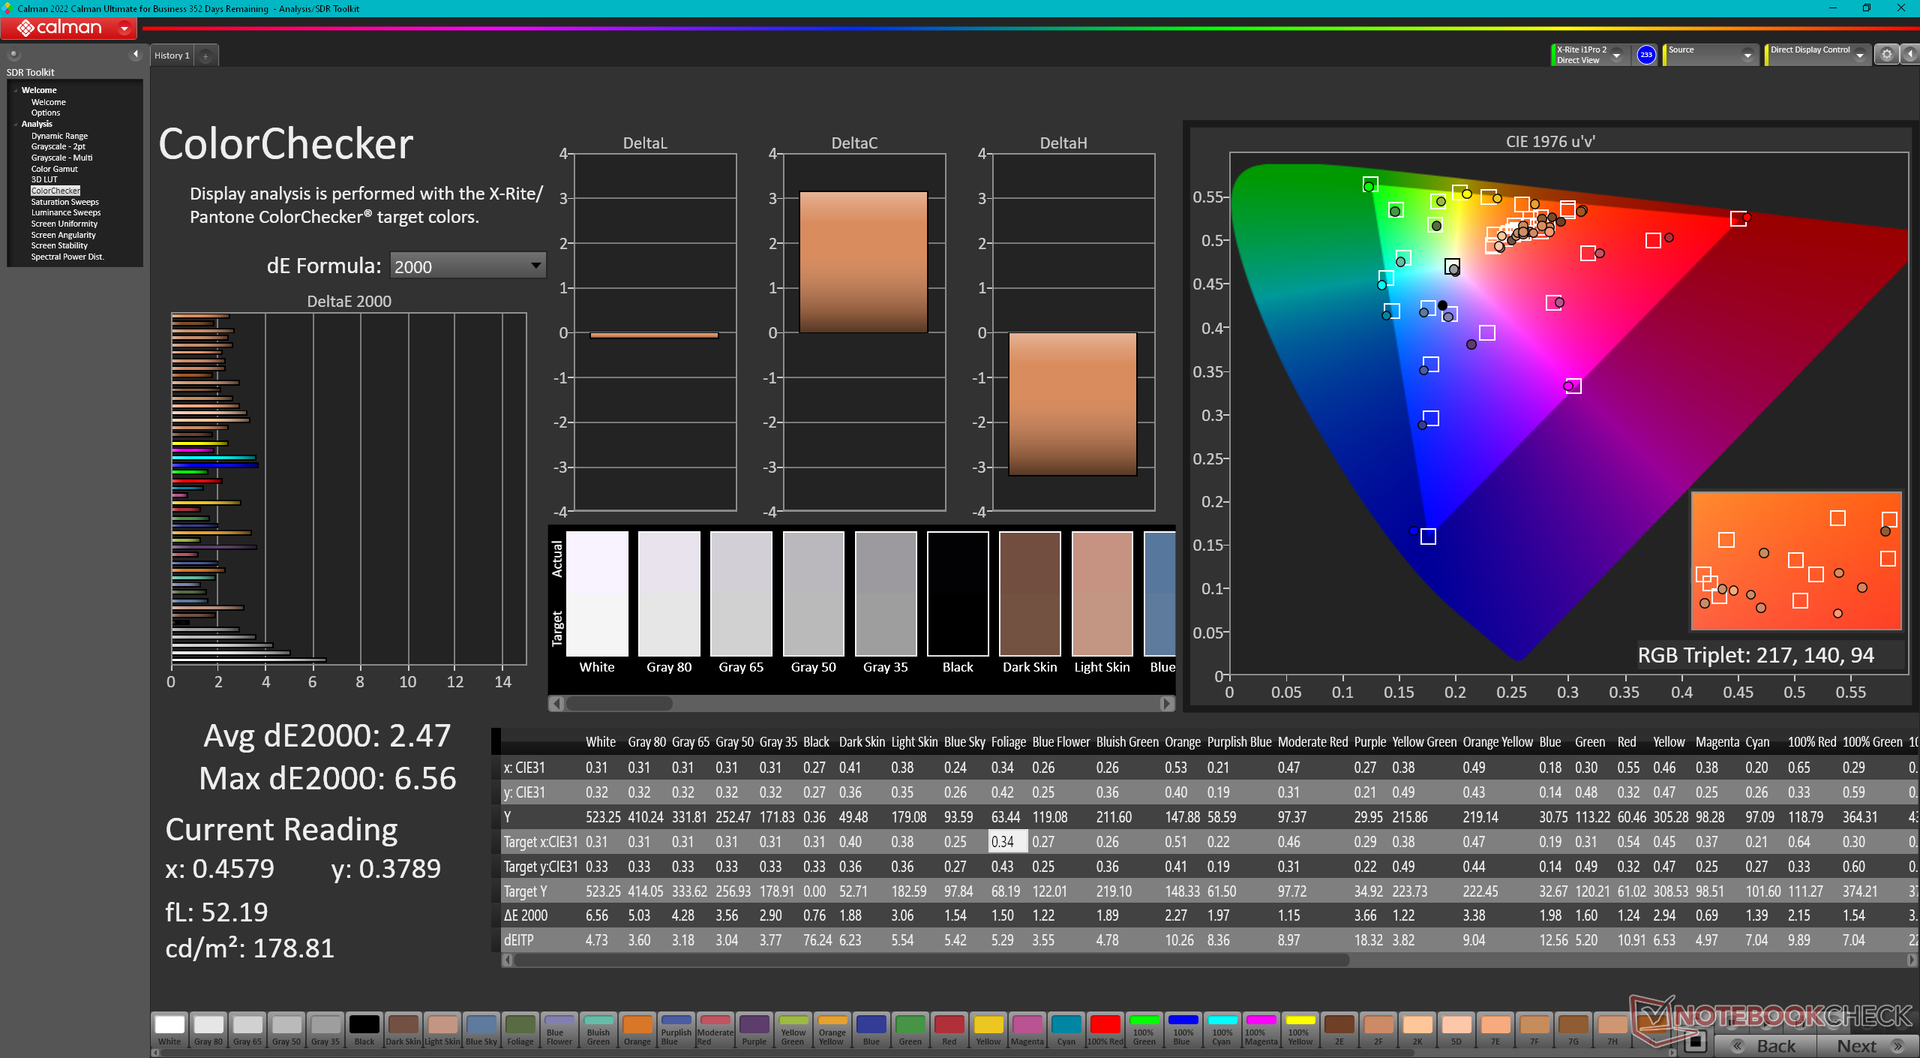
ΔE ColorChecker Calman: 2.47 | ∀{0.5-29.43 Ø4.73}
calibrated: 0.61
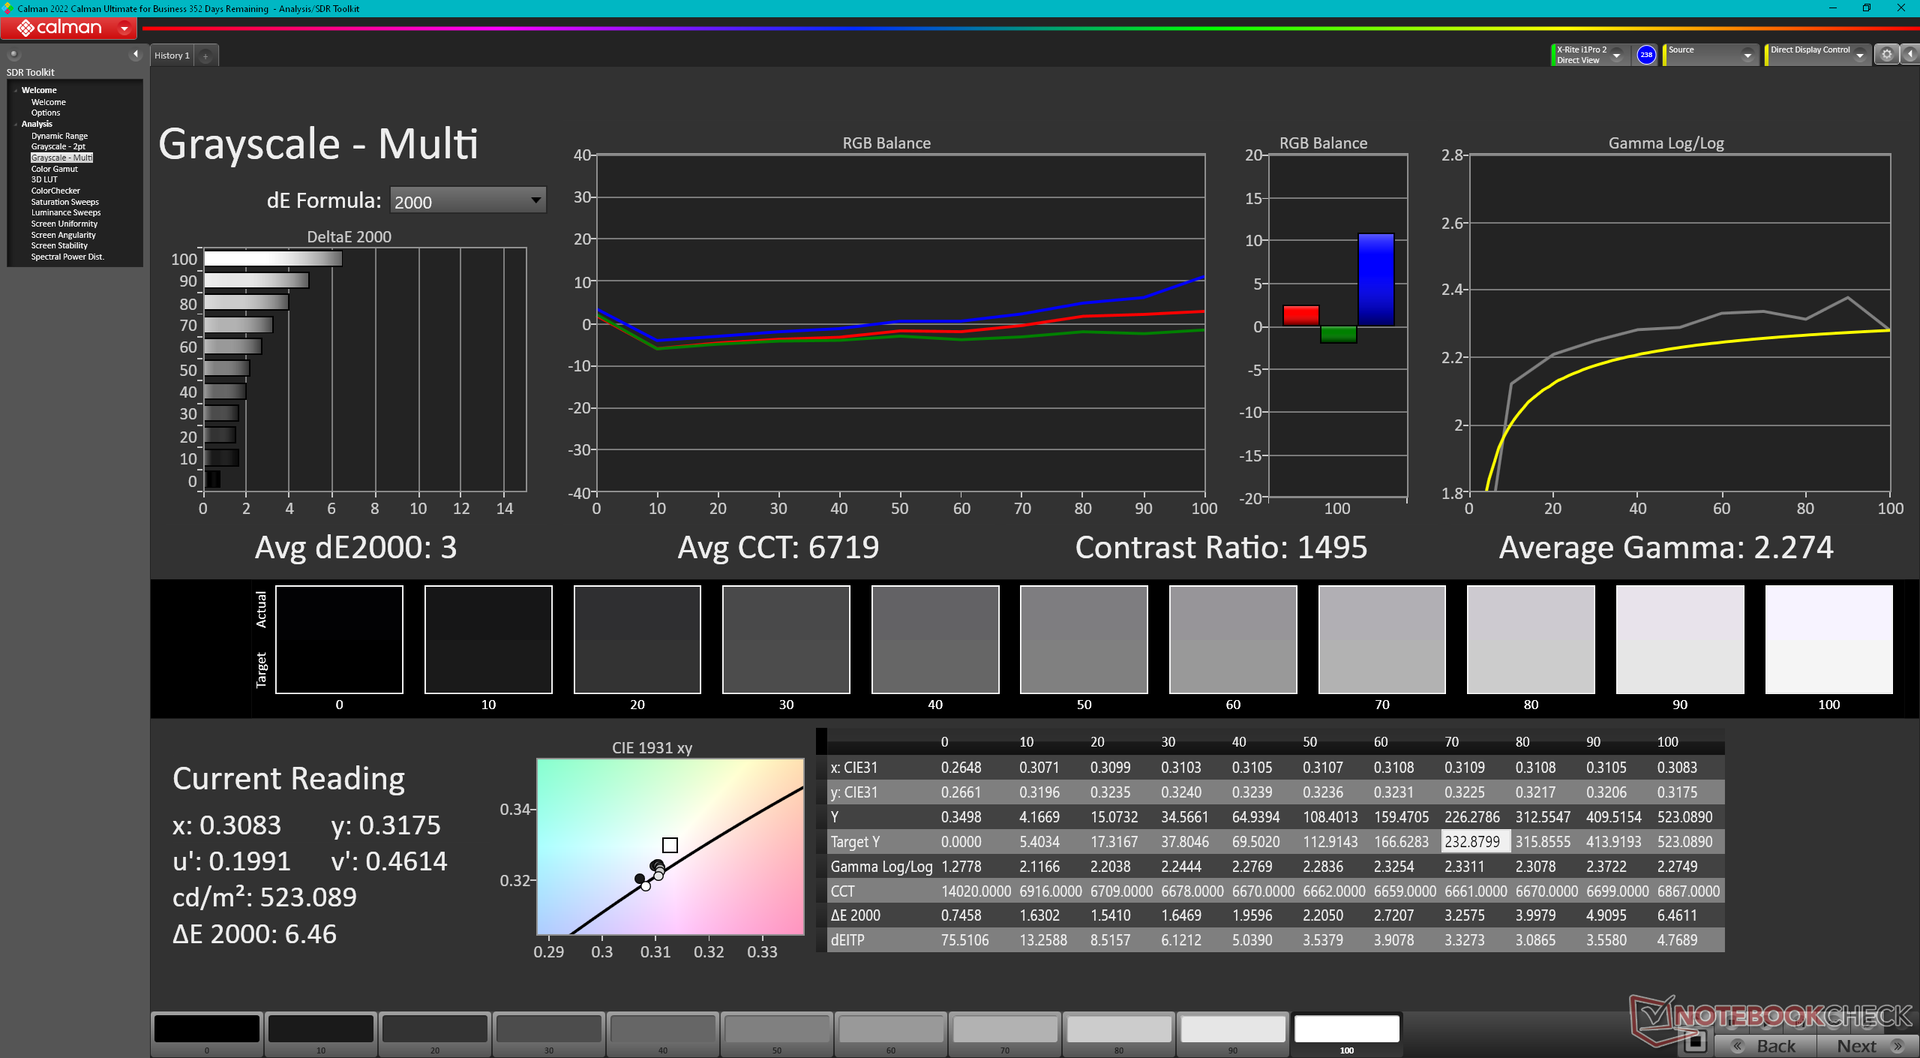
ΔE Greyscale Calman: 3 | ∀{0.09-98 Ø4.97}
69.5% AdobeRGB 1998 (Argyll 3D)
96.1% sRGB (Argyll 3D)
67.3% Display P3 (Argyll 3D)
Gamma: 2.27
CCT: 6719 K
| Lenovo Legion 5 Pro 16ARH7H RTX 3070 Ti BOE CQ NE160QDM-NY1, IPS, 2560x1600, 16" | Lenovo Legion 5 Pro 16IAH7H BOE CCQ_NE160QDM_NY1, IPS, 2560x1600, 16" | Asus ROG Zephyrus M16 GU603H AU Optronics AUOC199, IPS, 2560x1600, 16" | Lenovo Legion 7 16ARHA7 BOE CQ NE160QDM-NY1, IPS, 2560x1600, 16" | HP Victus 16-e0145ng CMN1609, IPS, 1920x1080, 16.1" | Dell G16 7620 BOE NE16QDM, IPS, 2560x1600, 16" | |
|---|---|---|---|---|---|---|
| Display | 2% | -4% | -37% | 1% | ||
| Display P3 Coverage (%) | 67.3 | 68.53 2% | 63.7 -5% | 41.6 -38% | 68.3 1% | |
| sRGB Coverage (%) | 96.1 | 98.38 2% | 95.3 -1% | 61.9 -36% | 98 2% | |
| AdobeRGB 1998 Coverage (%) | 69.5 | 70.45 1% | 65.7 -5% | 43 -38% | 70.5 1% | |
| Response Times | 25% | 57% | 25% | -90% | 24% | |
| Response Time Grey 50% / Grey 80% * (ms) | 14.4 ? | 14 ? 3% | 4.8 ? 67% | 9.2 ? 36% | 29.6 ? -106% | 8.6 ? 40% |
| Response Time Black / White * (ms) | 11.2 ? | 6 ? 46% | 6 ? 46% | 9.6 ? 14% | 19.4 ? -73% | 10.4 ? 7% |
| PWM Frequency (Hz) | ||||||
| Screen | -7% | -51% | -19% | -127% | -10% | |
| Brightness middle (cd/m²) | 522.8 | 515 -1% | 448 -14% | 478.8 -8% | 257 -51% | 369.4 -29% |
| Brightness (cd/m²) | 503 | 475 -6% | 446 -11% | 477 -5% | 239 -52% | 348 -31% |
| Brightness Distribution (%) | 84 | 85 1% | 86 2% | 90 7% | 88 5% | 83 -1% |
| Black Level * (cd/m²) | 0.41 | 0.45 -10% | 0.48 -17% | 0.43 -5% | 0.25 39% | 0.32 22% |
| Contrast (:1) | 1275 | 1144 -10% | 933 -27% | 1113 -13% | 1028 -19% | 1154 -9% |
| Colorchecker dE 2000 * | 2.47 | 2.38 4% | 2.76 -12% | 2.24 9% | 6.91 -180% | 1.78 28% |
| Colorchecker dE 2000 max. * | 6.56 | 4.37 33% | 7.09 -8% | 4.49 32% | 22.27 -239% | 4.41 33% |
| Colorchecker dE 2000 calibrated * | 0.61 | 1.1 -80% | 2.86 -369% | 1.89 -210% | 3.61 -492% | 1.22 -100% |
| Greyscale dE 2000 * | 3 | 2.71 10% | 3.1 -3% | 2.3 23% | 7.5 -150% | 3.2 -7% |
| Gamma | 2.27 97% | 2.49 88% | 2.153 102% | 2.25 98% | 2.125 104% | 2.2 100% |
| CCT | 6719 97% | 6117 106% | 6826 95% | 6955 93% | 6025 108% | 6750 96% |
| Color Space (Percent of AdobeRGB 1998) (%) | 87 | |||||
| Color Space (Percent of sRGB) (%) | 100 | |||||
| Całkowita średnia (program / ustawienia) | 7% /
-0% | 3% /
-31% | 1% /
-9% | -85% /
-102% | 5% /
-3% |
* ... im mniej tym lepiej
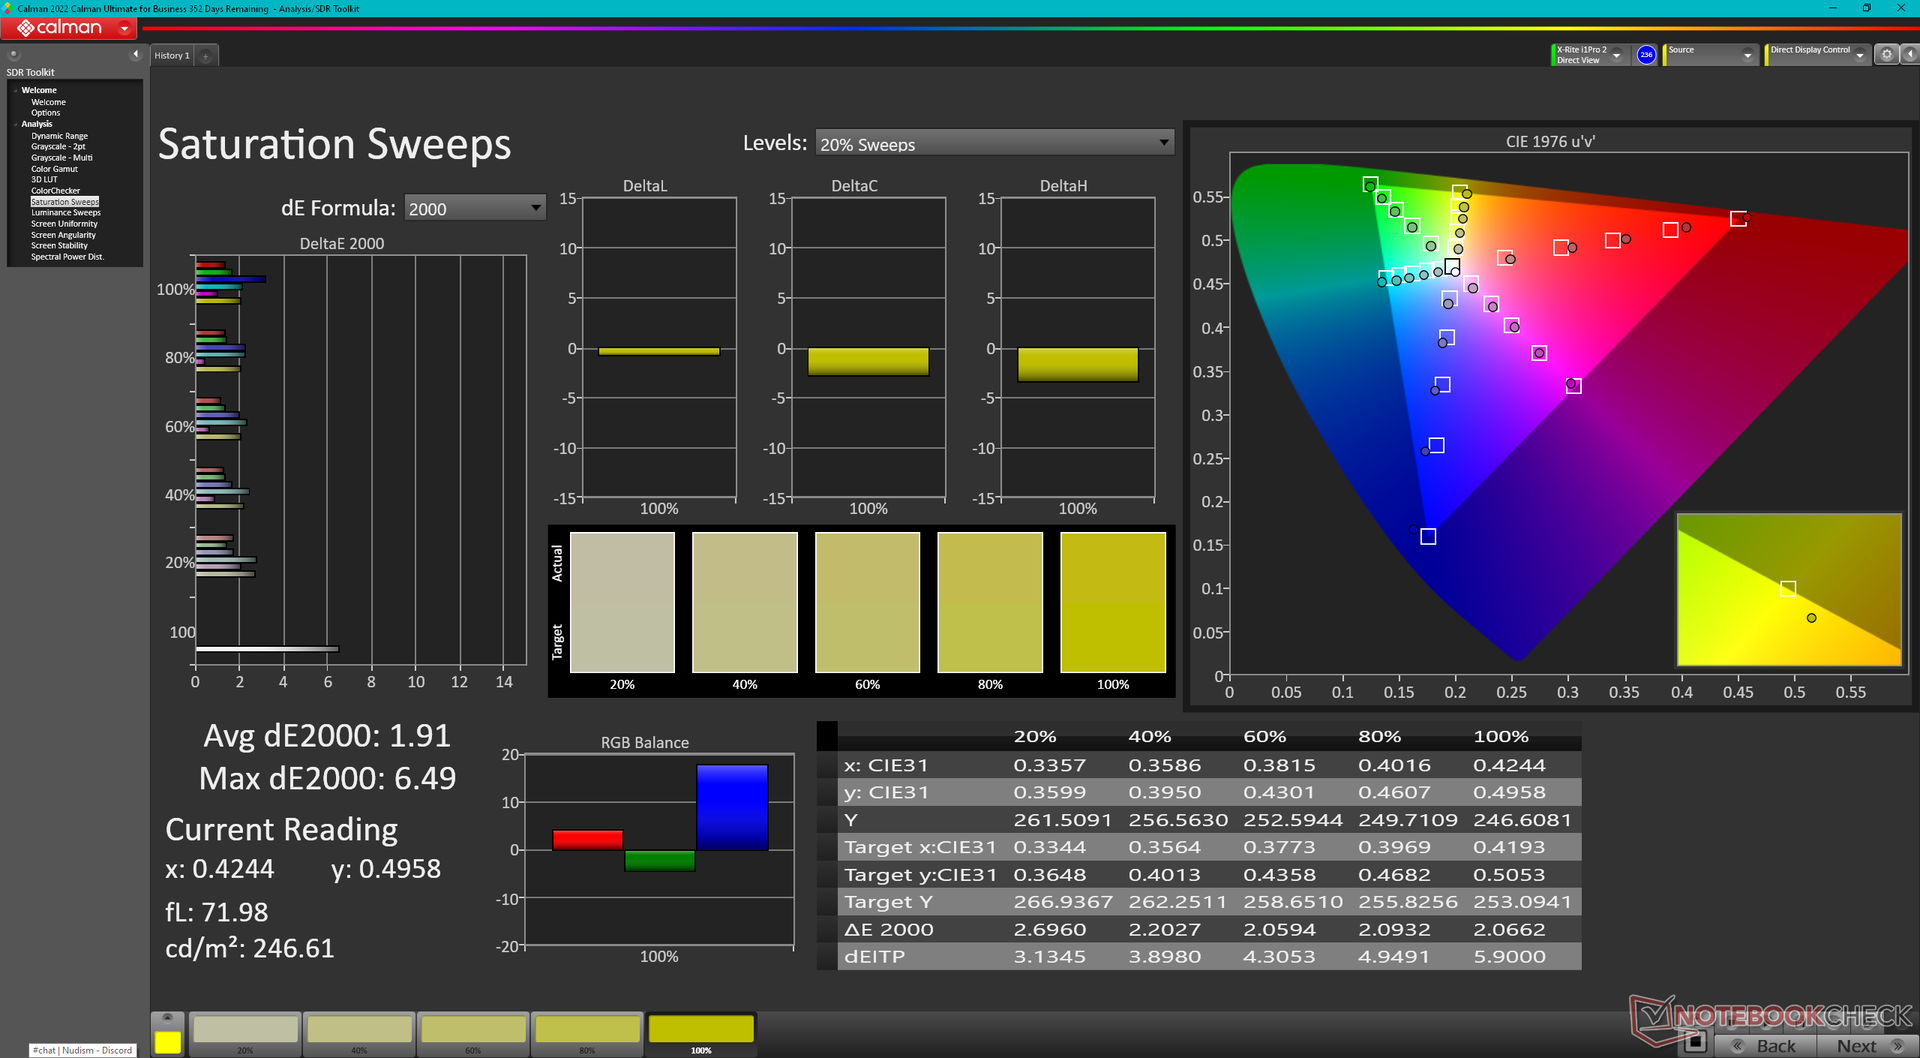
Wyświetlacz jest fabrycznie skalibrowany, a średnie wartości deltaE w skali szarości i kolorze wynoszą odpowiednio 3 i 2,47 w naszym konkretnym egzemplarzu. Samodzielna kalibracja panelu za pomocą kolorymetru X-Rite poprawiłaby wartości deltaE jeszcze bardziej, do zaledwie 0,7 i 0,6. Zalecamy zastosowanie naszego skalibrowanego profilu ICM powyżej, aby lepiej wykorzystać pełne pokrycie sRGB wyświetlacza.
Wyświetl czasy reakcji
| ↔ Czas reakcji od czerni do bieli | ||
|---|---|---|
| 11.2 ms ... wzrost ↗ i spadek ↘ łącznie | ↗ 6 ms wzrost | 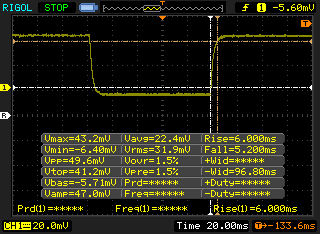 |
| ↘ 5.2 ms upadek | ||
| W naszych testach ekran wykazuje dobry współczynnik reakcji, ale może być zbyt wolny dla graczy rywalizujących ze sobą. Dla porównania, wszystkie testowane urządzenia wahają się od 0.1 (minimum) do 240 (maksimum) ms. » 30 % wszystkich urządzeń jest lepszych. Oznacza to, że zmierzony czas reakcji jest lepszy od średniej wszystkich testowanych urządzeń (19.9 ms). | ||
| ↔ Czas reakcji 50% szarości do 80% szarości | ||
| 14.4 ms ... wzrost ↗ i spadek ↘ łącznie | ↗ 7.6 ms wzrost | 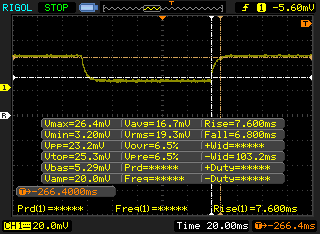 |
| ↘ 6.8 ms upadek | ||
| W naszych testach ekran wykazuje dobry współczynnik reakcji, ale może być zbyt wolny dla graczy rywalizujących ze sobą. Dla porównania, wszystkie testowane urządzenia wahają się od 0.165 (minimum) do 636 (maksimum) ms. » 28 % wszystkich urządzeń jest lepszych. Oznacza to, że zmierzony czas reakcji jest lepszy od średniej wszystkich testowanych urządzeń (31.1 ms). | ||
Migotanie ekranu / PWM (modulacja szerokości impulsu)
| Migotanie ekranu/nie wykryto PWM | 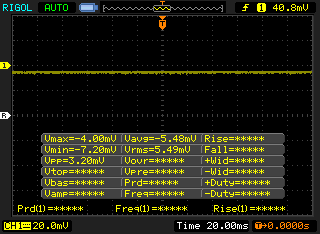 | ||
Dla porównania: 52 % wszystkich testowanych urządzeń nie używa PWM do przyciemniania wyświetlacza. Jeśli wykryto PWM, zmierzono średnio 7801 (minimum: 5 - maksimum: 343500) Hz. | |||

Wydajność - trochę szybciej
Warunki badania
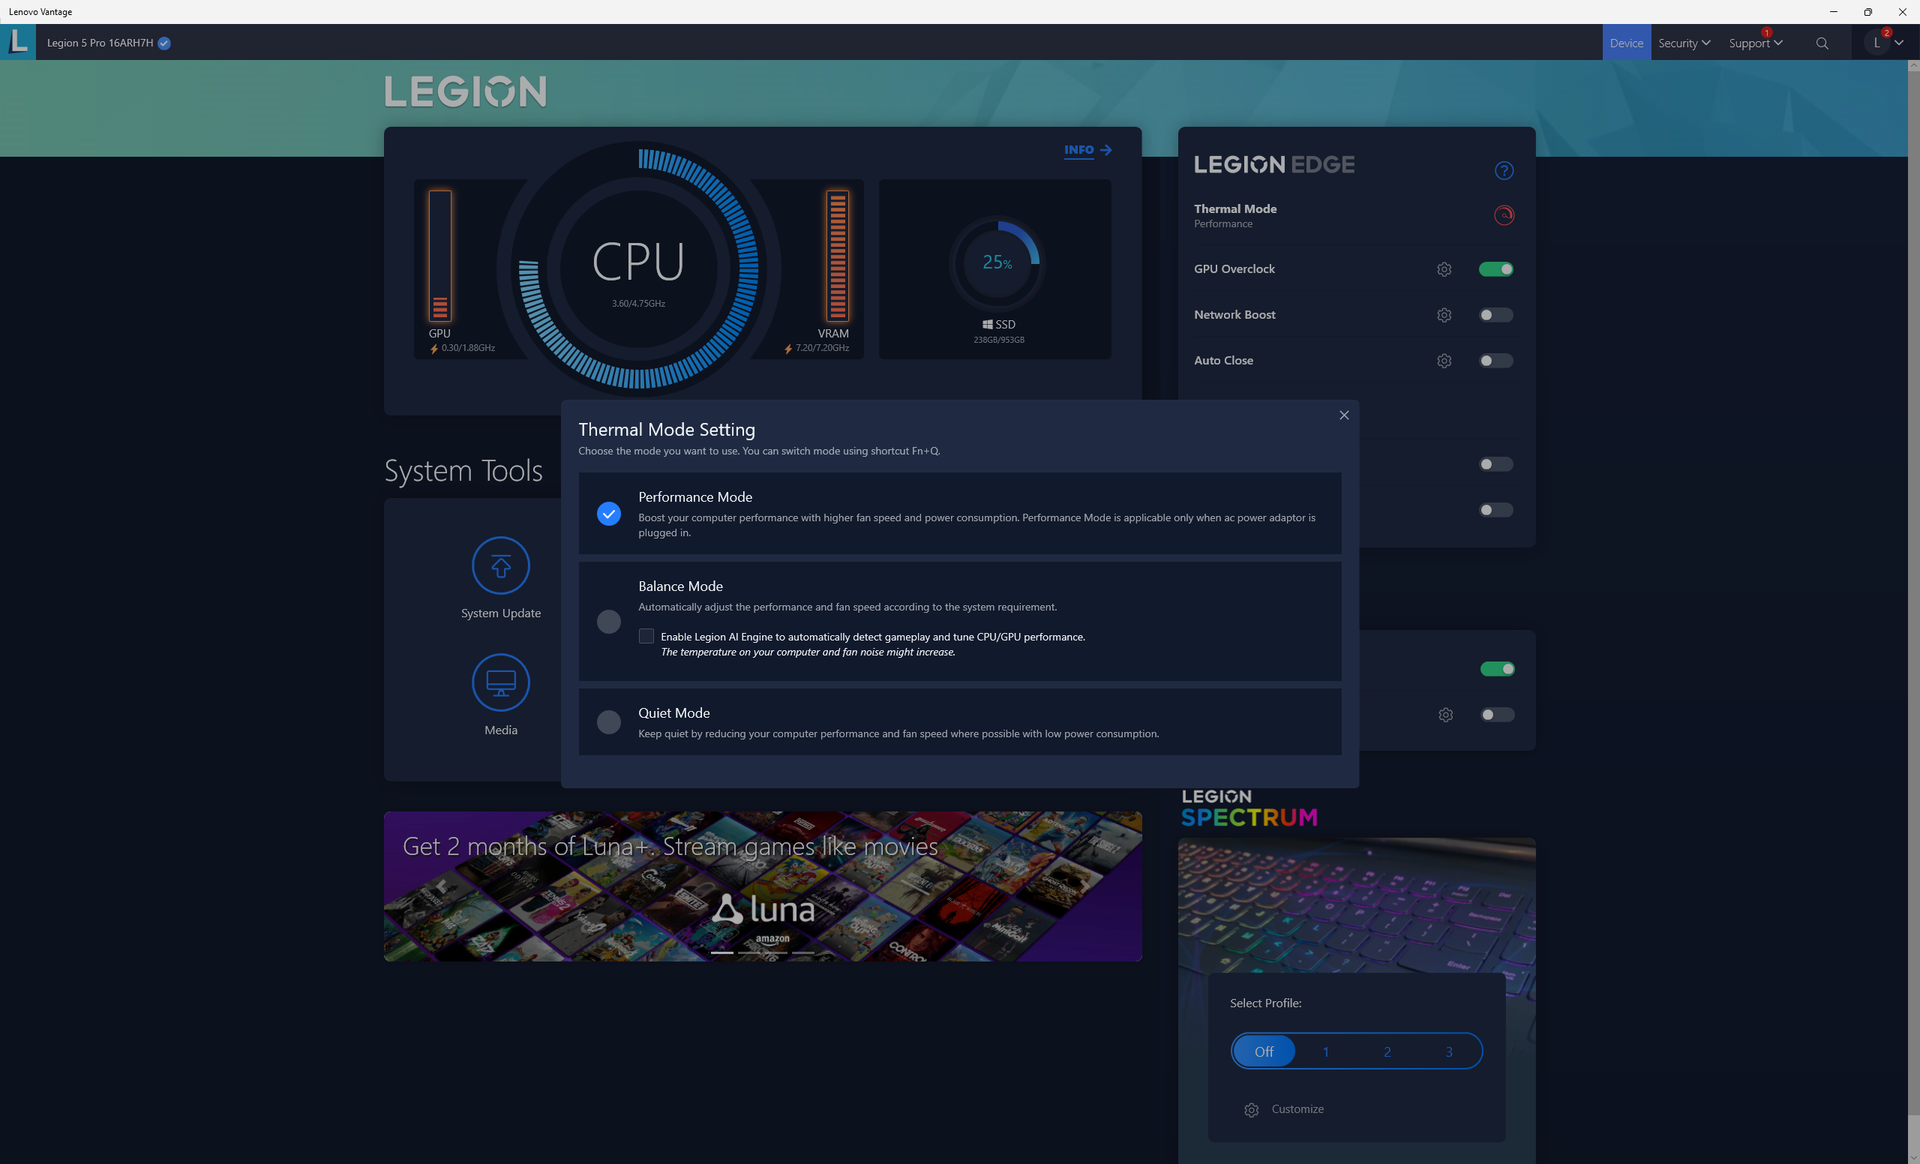
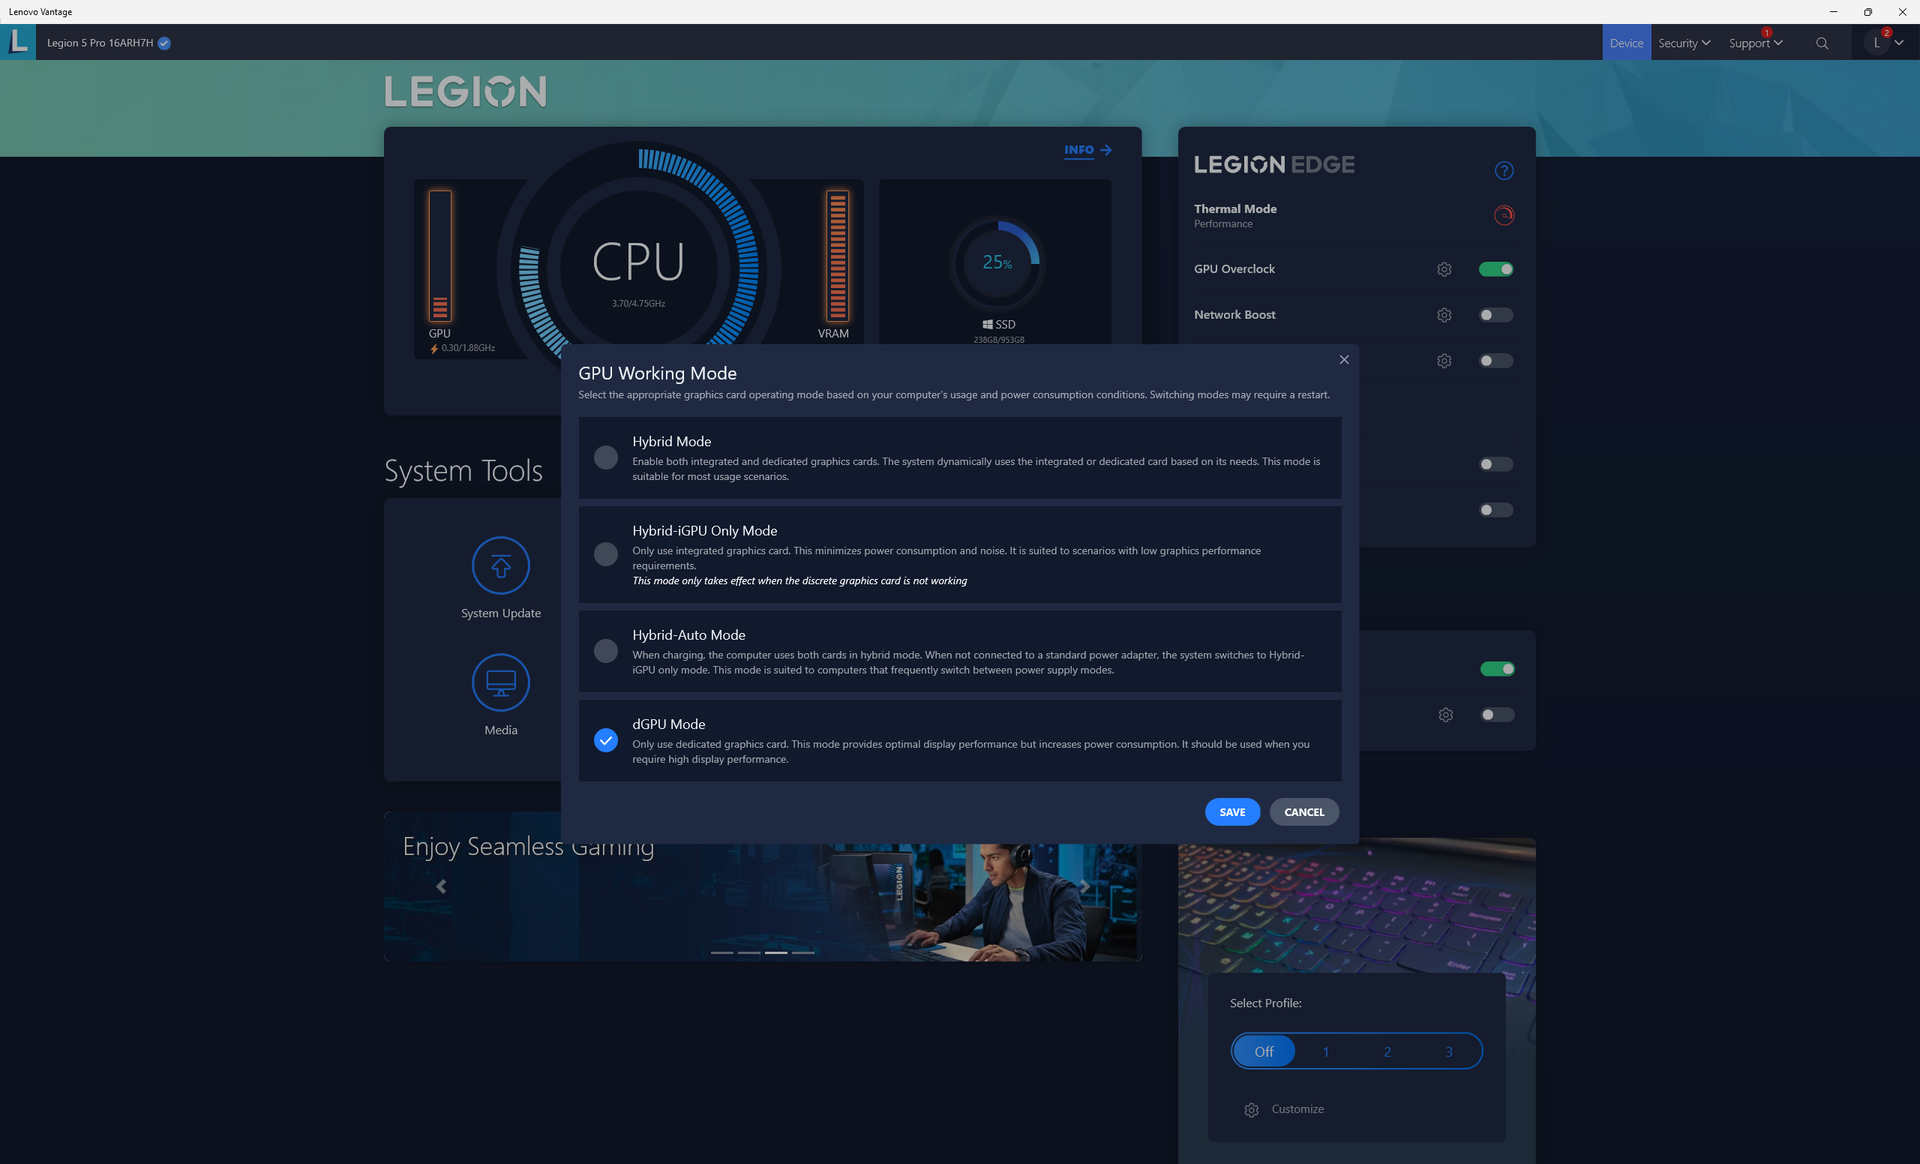
Przed uruchomieniem poniższych benchmarków ustawiliśmy nasz sprzęt w trybie Performance zarówno przez system Windows, jak i oprogramowanie Lenovo Vantage. Upewniliśmy się także, że włączyliśmy Overclock GPU i tryb pracy GPU na "dGPU only", aby uzyskać maksymalną wydajność. Właściciele powinni koniecznie zapoznać się z oprogramowaniem Vantage i jego różnymi ustawieniami, czego przykładem są poniższe zrzuty ekranu.

Procesor
Wydajność jednowątkowa i wielowątkowa jest o około 10 procent i 20 procent szybsza niż w przypadku ostatniej generacji Ryzen 7 5800Hna podstawie naszego czasu spędzonego z HP Omen 16 i Lenovo Legion 5 Pro 16 z 2021 roku. Choć nie jest to bez znaczenia, wzrost wydajności w skali roku nie jest tak duży, jak skok z 11. do 12. generacji Intela. Na stronie Core i7-12700Hjest wciąż o 15-30% szybszy od naszego Ryzena 7 6800H
Aktualizacja do Ryzen 9 6900HX z naszego Ryzen 7 6800H jak pokazują poniższe wykresy porównawcze, przyniesie w najlepszym wypadku marginalne korzyści. Dlatego też osoby dbające o budżet mogą rozważyć tańszy model Ryzen 7 6800H.
Cinebench R15 Multi Loop
Cinebench R23: Multi Core | Single Core
Cinebench R15: CPU Multi 64Bit | CPU Single 64Bit
Blender: v2.79 BMW27 CPU
7-Zip 18.03: 7z b 4 | 7z b 4 -mmt1
Geekbench 5.5: Multi-Core | Single-Core
HWBOT x265 Benchmark v2.2: 4k Preset
LibreOffice : 20 Documents To PDF
R Benchmark 2.5: Overall mean
| Cinebench R20 / CPU (Multi Core) | |
| Lenovo Legion 5 Pro 16IAH7H | |
| Alienware x15 R2 P111F | |
| Dell G16 7620 | |
| Lenovo Legion 5 Pro 16ARH7H RTX 3070 Ti | |
| Lenovo Legion 7 16ARHA7 | |
| Gigabyte A5 X1 | |
| Asus ROG Zephyrus M16 GU603H | |
| Przeciętny AMD Ryzen 7 6800H (4460 - 5661, n=9) | |
| HP Omen 16-c0077ng | |
| HP Victus 16-e0145ng | |
| Lenovo Legion C7 15IMH05 82EH0030GE | |
| Cinebench R20 / CPU (Single Core) | |
| Alienware x15 R2 P111F | |
| Lenovo Legion 5 Pro 16IAH7H | |
| Dell G16 7620 | |
| Lenovo Legion 7 16ARHA7 | |
| Asus ROG Zephyrus M16 GU603H | |
| Lenovo Legion 5 Pro 16ARH7H RTX 3070 Ti | |
| Przeciętny AMD Ryzen 7 6800H (580 - 605, n=9) | |
| Gigabyte A5 X1 | |
| HP Omen 16-c0077ng | |
| HP Victus 16-e0145ng | |
| Lenovo Legion C7 15IMH05 82EH0030GE | |
| Cinebench R23 / Multi Core | |
| Lenovo Legion 5 Pro 16IAH7H | |
| Dell G16 7620 | |
| Alienware x15 R2 P111F | |
| Lenovo Legion 5 Pro 16ARH7H RTX 3070 Ti | |
| Lenovo Legion 7 16ARHA7 | |
| Gigabyte A5 X1 | |
| Przeciętny AMD Ryzen 7 6800H (11481 - 14660, n=11) | |
| HP Omen 16-c0077ng | |
| HP Victus 16-e0145ng | |
| Lenovo Legion C7 15IMH05 82EH0030GE | |
| Cinebench R23 / Single Core | |
| Alienware x15 R2 P111F | |
| Lenovo Legion 5 Pro 16IAH7H | |
| Dell G16 7620 | |
| Lenovo Legion 7 16ARHA7 | |
| Lenovo Legion 5 Pro 16ARH7H RTX 3070 Ti | |
| Przeciętny AMD Ryzen 7 6800H (1500 - 1552, n=9) | |
| Gigabyte A5 X1 | |
| HP Omen 16-c0077ng | |
| HP Victus 16-e0145ng | |
| Lenovo Legion C7 15IMH05 82EH0030GE | |
| Cinebench R15 / CPU Multi 64Bit | |
| Lenovo Legion 5 Pro 16IAH7H | |
| Alienware x15 R2 P111F | |
| Dell G16 7620 | |
| Lenovo Legion 5 Pro 16ARH7H RTX 3070 Ti | |
| Lenovo Legion 7 16ARHA7 | |
| Asus ROG Zephyrus M16 GU603H | |
| Gigabyte A5 X1 | |
| Przeciętny AMD Ryzen 7 6800H (1585 - 2366, n=10) | |
| HP Omen 16-c0077ng | |
| Lenovo Legion C7 15IMH05 82EH0030GE | |
| HP Victus 16-e0145ng | |
| Cinebench R15 / CPU Single 64Bit | |
| Alienware x15 R2 P111F | |
| Lenovo Legion 7 16ARHA7 | |
| Lenovo Legion 5 Pro 16IAH7H | |
| Lenovo Legion 5 Pro 16ARH7H RTX 3070 Ti | |
| Dell G16 7620 | |
| Gigabyte A5 X1 | |
| Asus ROG Zephyrus M16 GU603H | |
| Przeciętny AMD Ryzen 7 6800H (182.7 - 250, n=10) | |
| HP Omen 16-c0077ng | |
| HP Victus 16-e0145ng | |
| Lenovo Legion C7 15IMH05 82EH0030GE | |
| Blender / v2.79 BMW27 CPU | |
| Lenovo Legion C7 15IMH05 82EH0030GE | |
| HP Victus 16-e0145ng | |
| HP Omen 16-c0077ng | |
| Asus ROG Zephyrus M16 GU603H | |
| Przeciętny AMD Ryzen 7 6800H (213 - 268, n=8) | |
| Gigabyte A5 X1 | |
| Lenovo Legion 7 16ARHA7 | |
| Lenovo Legion 5 Pro 16ARH7H RTX 3070 Ti | |
| Alienware x15 R2 P111F | |
| Dell G16 7620 | |
| Lenovo Legion 5 Pro 16IAH7H | |
| 7-Zip 18.03 / 7z b 4 | |
| Alienware x15 R2 P111F | |
| Lenovo Legion 5 Pro 16IAH7H | |
| Dell G16 7620 | |
| Lenovo Legion 5 Pro 16ARH7H RTX 3070 Ti | |
| Lenovo Legion 7 16ARHA7 | |
| Gigabyte A5 X1 | |
| Przeciętny AMD Ryzen 7 6800H (55067 - 64817, n=8) | |
| Asus ROG Zephyrus M16 GU603H | |
| HP Victus 16-e0145ng | |
| Lenovo Legion C7 15IMH05 82EH0030GE | |
| 7-Zip 18.03 / 7z b 4 -mmt1 | |
| Alienware x15 R2 P111F | |
| Lenovo Legion 5 Pro 16ARH7H RTX 3070 Ti | |
| Przeciętny AMD Ryzen 7 6800H (5521 - 5803, n=8) | |
| Gigabyte A5 X1 | |
| Lenovo Legion 7 16ARHA7 | |
| Asus ROG Zephyrus M16 GU603H | |
| Lenovo Legion 5 Pro 16IAH7H | |
| HP Omen 16-c0077ng | |
| Lenovo Legion C7 15IMH05 82EH0030GE | |
| HP Victus 16-e0145ng | |
| Dell G16 7620 | |
| Geekbench 5.5 / Multi-Core | |
| Alienware x15 R2 P111F | |
| Lenovo Legion 5 Pro 16IAH7H | |
| Dell G16 7620 | |
| Lenovo Legion 5 Pro 16ARH7H RTX 3070 Ti | |
| Lenovo Legion 7 16ARHA7 | |
| Asus ROG Zephyrus M16 GU603H | |
| Przeciętny AMD Ryzen 7 6800H (8898 - 10355, n=10) | |
| Gigabyte A5 X1 | |
| Lenovo Legion C7 15IMH05 82EH0030GE | |
| HP Omen 16-c0077ng | |
| HP Victus 16-e0145ng | |
| Geekbench 5.5 / Single-Core | |
| Alienware x15 R2 P111F | |
| Lenovo Legion 5 Pro 16IAH7H | |
| Dell G16 7620 | |
| Asus ROG Zephyrus M16 GU603H | |
| Lenovo Legion 7 16ARHA7 | |
| Lenovo Legion 5 Pro 16ARH7H RTX 3070 Ti | |
| Przeciętny AMD Ryzen 7 6800H (1518 - 1568, n=10) | |
| Gigabyte A5 X1 | |
| HP Victus 16-e0145ng | |
| HP Omen 16-c0077ng | |
| Lenovo Legion C7 15IMH05 82EH0030GE | |
| HWBOT x265 Benchmark v2.2 / 4k Preset | |
| Lenovo Legion 5 Pro 16IAH7H | |
| Alienware x15 R2 P111F | |
| Dell G16 7620 | |
| Lenovo Legion 5 Pro 16ARH7H RTX 3070 Ti | |
| Lenovo Legion 7 16ARHA7 | |
| Gigabyte A5 X1 | |
| Przeciętny AMD Ryzen 7 6800H (14.9 - 18.5, n=9) | |
| HP Omen 16-c0077ng | |
| Asus ROG Zephyrus M16 GU603H | |
| HP Victus 16-e0145ng | |
| Lenovo Legion C7 15IMH05 82EH0030GE | |
| LibreOffice / 20 Documents To PDF | |
| HP Omen 16-c0077ng | |
| Gigabyte A5 X1 | |
| HP Victus 16-e0145ng | |
| Lenovo Legion C7 15IMH05 82EH0030GE | |
| Przeciętny AMD Ryzen 7 6800H (48.7 - 79.5, n=8) | |
| Lenovo Legion 7 16ARHA7 | |
| Dell G16 7620 | |
| Lenovo Legion 5 Pro 16ARH7H RTX 3070 Ti | |
| Alienware x15 R2 P111F | |
| Asus ROG Zephyrus M16 GU603H | |
| Lenovo Legion 5 Pro 16IAH7H | |
| R Benchmark 2.5 / Overall mean | |
| Lenovo Legion C7 15IMH05 82EH0030GE | |
| Asus ROG Zephyrus M16 GU603H | |
| HP Victus 16-e0145ng | |
| HP Omen 16-c0077ng | |
| Dell G16 7620 | |
| Gigabyte A5 X1 | |
| Przeciętny AMD Ryzen 7 6800H (0.4783 - 0.515, n=8) | |
| Lenovo Legion 7 16ARHA7 | |
| Lenovo Legion 5 Pro 16ARH7H RTX 3070 Ti | |
| Lenovo Legion 5 Pro 16IAH7H | |
| Alienware x15 R2 P111F | |
* ... im mniej tym lepiej
AIDA64: FP32 Ray-Trace | FPU Julia | CPU SHA3 | CPU Queen | FPU SinJulia | FPU Mandel | CPU AES | CPU ZLib | FP64 Ray-Trace | CPU PhotoWorxx
| Performance rating | |
| Lenovo Legion 7 16ARHA7 | |
| Lenovo Legion 5 Pro 16ARH7H RTX 3070 Ti | |
| Przeciętny AMD Ryzen 7 6800H | |
| Dell G16 7620 | |
| Lenovo Legion 5 Pro 16IAH7H | |
| HP Victus 16-e0145ng | |
| Asus ROG Zephyrus M16 GU603H -9! | |
| AIDA64 / FP32 Ray-Trace | |
| Lenovo Legion 7 16ARHA7 | |
| Lenovo Legion 5 Pro 16ARH7H RTX 3070 Ti | |
| Przeciętny AMD Ryzen 7 6800H (12876 - 17031, n=8) | |
| Dell G16 7620 | |
| Lenovo Legion 5 Pro 16IAH7H | |
| Lenovo Legion 5 Pro 16IAH7H | |
| HP Victus 16-e0145ng | |
| AIDA64 / FPU Julia | |
| Lenovo Legion 7 16ARHA7 | |
| Lenovo Legion 5 Pro 16ARH7H RTX 3070 Ti | |
| Przeciętny AMD Ryzen 7 6800H (82673 - 105987, n=8) | |
| Dell G16 7620 | |
| Lenovo Legion 5 Pro 16IAH7H | |
| Lenovo Legion 5 Pro 16IAH7H | |
| HP Victus 16-e0145ng | |
| AIDA64 / CPU SHA3 | |
| Dell G16 7620 | |
| Lenovo Legion 7 16ARHA7 | |
| Lenovo Legion 5 Pro 16ARH7H RTX 3070 Ti | |
| Lenovo Legion 5 Pro 16IAH7H | |
| Lenovo Legion 5 Pro 16IAH7H | |
| Przeciętny AMD Ryzen 7 6800H (2886 - 3634, n=8) | |
| HP Victus 16-e0145ng | |
| AIDA64 / CPU Queen | |
| Lenovo Legion 5 Pro 16ARH7H RTX 3070 Ti | |
| Lenovo Legion 7 16ARHA7 | |
| Dell G16 7620 | |
| Lenovo Legion 5 Pro 16IAH7H | |
| Przeciętny AMD Ryzen 7 6800H (75117 - 106322, n=8) | |
| HP Victus 16-e0145ng | |
| AIDA64 / FPU SinJulia | |
| Lenovo Legion 7 16ARHA7 | |
| Lenovo Legion 5 Pro 16ARH7H RTX 3070 Ti | |
| Przeciętny AMD Ryzen 7 6800H (11771 - 13120, n=8) | |
| Lenovo Legion 5 Pro 16IAH7H | |
| Lenovo Legion 5 Pro 16IAH7H | |
| Dell G16 7620 | |
| HP Victus 16-e0145ng | |
| AIDA64 / FPU Mandel | |
| Lenovo Legion 7 16ARHA7 | |
| Lenovo Legion 5 Pro 16ARH7H RTX 3070 Ti | |
| Przeciętny AMD Ryzen 7 6800H (45287 - 58327, n=8) | |
| HP Victus 16-e0145ng | |
| Lenovo Legion 5 Pro 16IAH7H | |
| Lenovo Legion 5 Pro 16IAH7H | |
| Dell G16 7620 | |
| AIDA64 / CPU AES | |
| Lenovo Legion 7 16ARHA7 | |
| Lenovo Legion 5 Pro 16ARH7H RTX 3070 Ti | |
| Lenovo Legion 5 Pro 16IAH7H | |
| Lenovo Legion 5 Pro 16IAH7H | |
| Przeciętny AMD Ryzen 7 6800H (67816 - 137383, n=8) | |
| Dell G16 7620 | |
| HP Victus 16-e0145ng | |
| AIDA64 / CPU ZLib | |
| Lenovo Legion 5 Pro 16IAH7H | |
| Lenovo Legion 5 Pro 16IAH7H | |
| Dell G16 7620 | |
| Lenovo Legion 7 16ARHA7 | |
| Lenovo Legion 5 Pro 16ARH7H RTX 3070 Ti | |
| Przeciętny AMD Ryzen 7 6800H (732 - 901, n=8) | |
| HP Victus 16-e0145ng | |
| Asus ROG Zephyrus M16 GU603H | |
| AIDA64 / FP64 Ray-Trace | |
| Lenovo Legion 7 16ARHA7 | |
| Lenovo Legion 5 Pro 16ARH7H RTX 3070 Ti | |
| Przeciętny AMD Ryzen 7 6800H (6917 - 8980, n=8) | |
| Dell G16 7620 | |
| Lenovo Legion 5 Pro 16IAH7H | |
| Lenovo Legion 5 Pro 16IAH7H | |
| HP Victus 16-e0145ng | |
| AIDA64 / CPU PhotoWorxx | |
| Dell G16 7620 | |
| Lenovo Legion 5 Pro 16IAH7H | |
| Lenovo Legion 5 Pro 16IAH7H | |
| Lenovo Legion 7 16ARHA7 | |
| Lenovo Legion 5 Pro 16ARH7H RTX 3070 Ti | |
| Przeciętny AMD Ryzen 7 6800H (26496 - 30360, n=8) | |
| HP Victus 16-e0145ng | |
Wydajność systemu
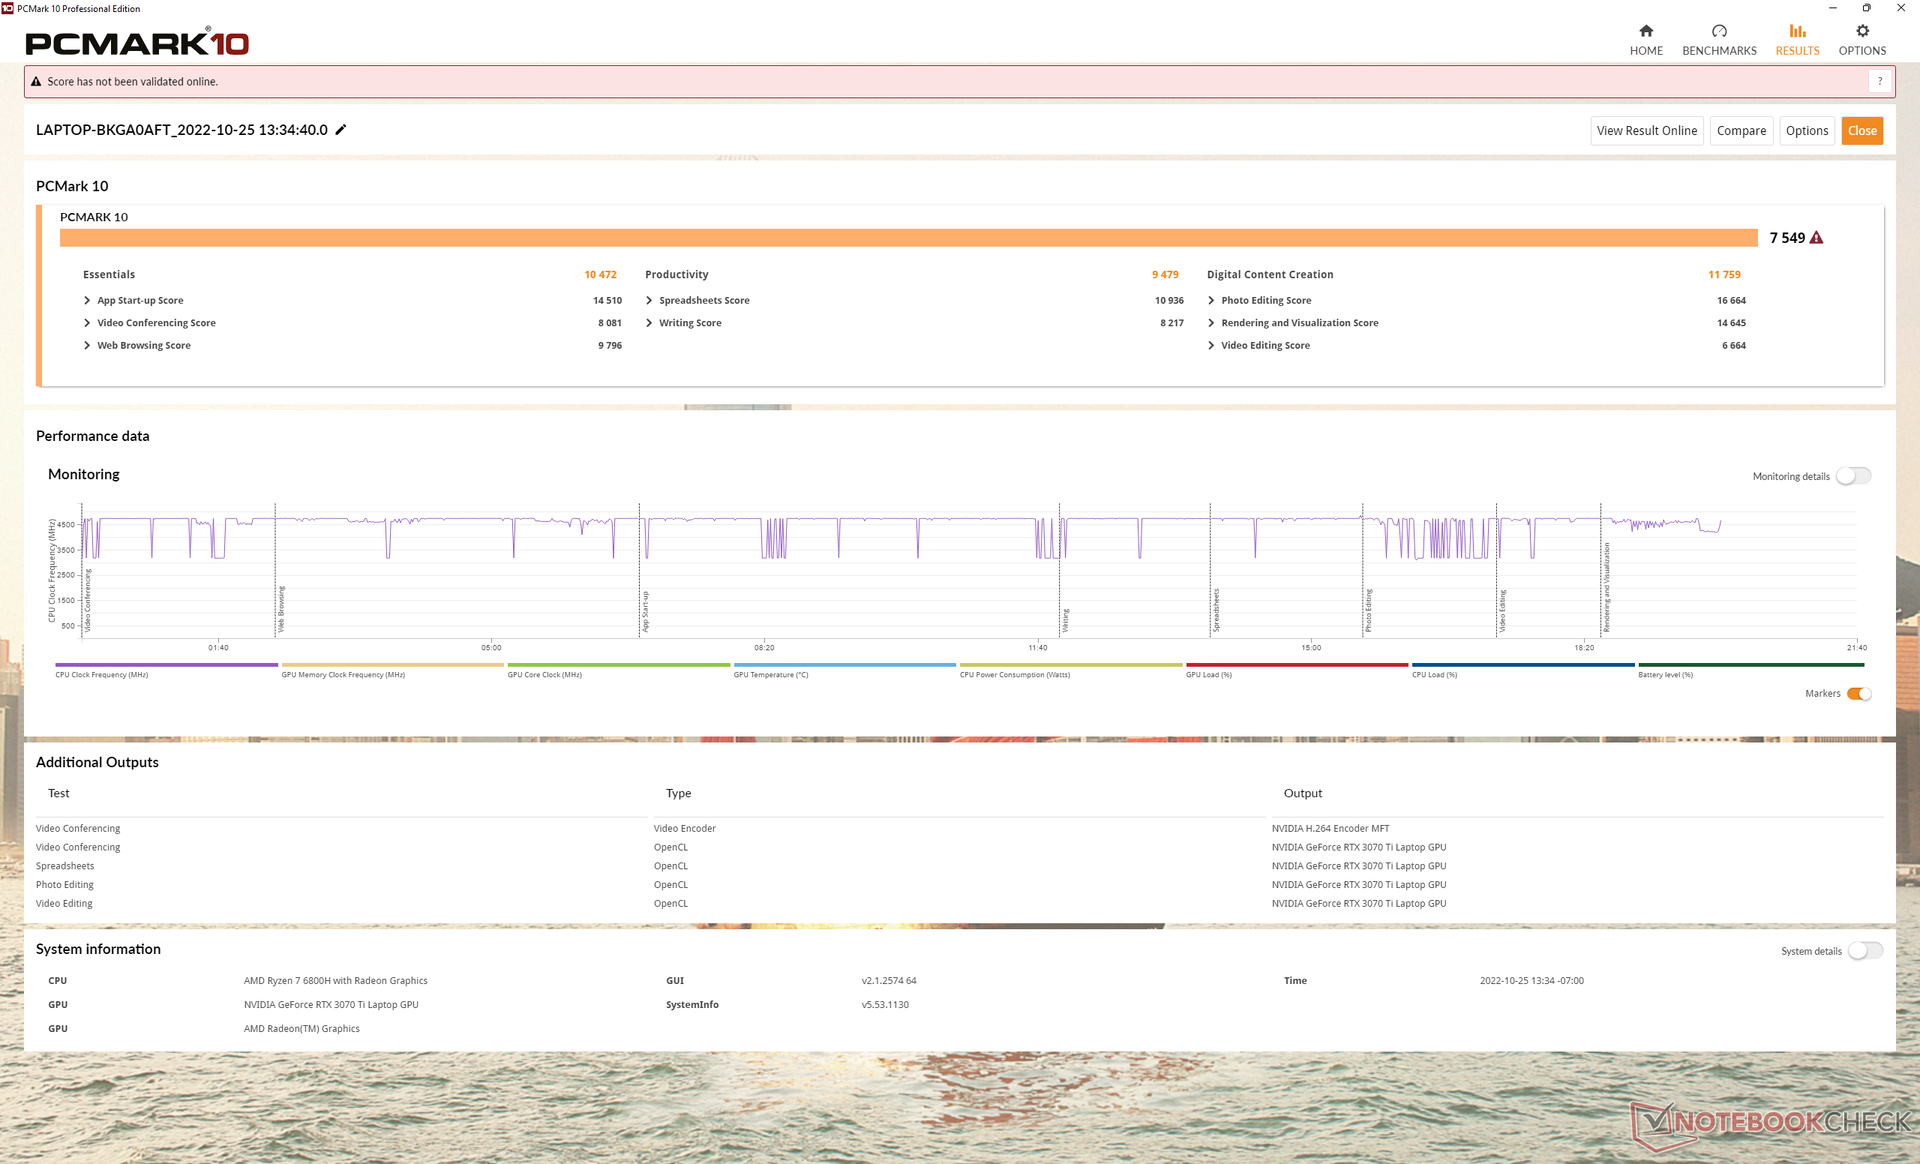
Wyniki PCMark mieszczą się w granicach jednocyfrowych punktów procentowych w stosunku do innych laptopów do gier z wyższej półki opartych na procesorze Intel, jak np.Dell G16 7620 nawet jeśli Ryzen 7 6800H nie nadąża za najnowszymi procesorami Core 12. generacji.
CrossMark: Overall | Productivity | Creativity | Responsiveness
| PCMark 10 / Score | |
| Lenovo Legion 5 Pro 16ARH7H RTX 3070 Ti | |
| Lenovo Legion 5 Pro 16IAH7H | |
| Lenovo Legion 7 16ARHA7 | |
| Dell G16 7620 | |
| Przeciętny AMD Ryzen 7 6800H, NVIDIA GeForce RTX 3070 Ti Laptop GPU (6783 - 7549, n=2) | |
| Asus ROG Zephyrus M16 GU603H | |
| HP Victus 16-e0145ng | |
| PCMark 10 / Essentials | |
| Lenovo Legion 5 Pro 16IAH7H | |
| Asus ROG Zephyrus M16 GU603H | |
| Lenovo Legion 7 16ARHA7 | |
| Lenovo Legion 5 Pro 16ARH7H RTX 3070 Ti | |
| Przeciętny AMD Ryzen 7 6800H, NVIDIA GeForce RTX 3070 Ti Laptop GPU (10343 - 10472, n=2) | |
| Dell G16 7620 | |
| HP Victus 16-e0145ng | |
| PCMark 10 / Productivity | |
| Lenovo Legion 5 Pro 16ARH7H RTX 3070 Ti | |
| Lenovo Legion 5 Pro 16IAH7H | |
| Przeciętny AMD Ryzen 7 6800H, NVIDIA GeForce RTX 3070 Ti Laptop GPU (8991 - 9479, n=2) | |
| Asus ROG Zephyrus M16 GU603H | |
| Lenovo Legion 7 16ARHA7 | |
| Dell G16 7620 | |
| HP Victus 16-e0145ng | |
| PCMark 10 / Digital Content Creation | |
| Lenovo Legion 5 Pro 16ARH7H RTX 3070 Ti | |
| Lenovo Legion 7 16ARHA7 | |
| Lenovo Legion 5 Pro 16IAH7H | |
| Dell G16 7620 | |
| Przeciętny AMD Ryzen 7 6800H, NVIDIA GeForce RTX 3070 Ti Laptop GPU (9108 - 11759, n=2) | |
| Asus ROG Zephyrus M16 GU603H | |
| HP Victus 16-e0145ng | |
| CrossMark / Overall | |
| Dell G16 7620 | |
| Lenovo Legion 5 Pro 16IAH7H | |
| Lenovo Legion 5 Pro 16ARH7H RTX 3070 Ti | |
| Lenovo Legion 7 16ARHA7 | |
| Przeciętny AMD Ryzen 7 6800H, NVIDIA GeForce RTX 3070 Ti Laptop GPU (1522 - 1643, n=2) | |
| CrossMark / Productivity | |
| Lenovo Legion 5 Pro 16IAH7H | |
| Dell G16 7620 | |
| Lenovo Legion 5 Pro 16ARH7H RTX 3070 Ti | |
| Przeciętny AMD Ryzen 7 6800H, NVIDIA GeForce RTX 3070 Ti Laptop GPU (1530 - 1600, n=2) | |
| Lenovo Legion 7 16ARHA7 | |
| CrossMark / Creativity | |
| Dell G16 7620 | |
| Lenovo Legion 5 Pro 16IAH7H | |
| Lenovo Legion 7 16ARHA7 | |
| Lenovo Legion 5 Pro 16ARH7H RTX 3070 Ti | |
| Przeciętny AMD Ryzen 7 6800H, NVIDIA GeForce RTX 3070 Ti Laptop GPU (1589 - 1746, n=2) | |
| CrossMark / Responsiveness | |
| Lenovo Legion 5 Pro 16IAH7H | |
| Dell G16 7620 | |
| Lenovo Legion 5 Pro 16ARH7H RTX 3070 Ti | |
| Przeciętny AMD Ryzen 7 6800H, NVIDIA GeForce RTX 3070 Ti Laptop GPU (1316 - 1481, n=2) | |
| Lenovo Legion 7 16ARHA7 | |
| PCMark 10 Score | 7549 pkt. | |
Pomoc | ||
| AIDA64 / Memory Copy | |
| Lenovo Legion 5 Pro 16IAH7H | |
| Lenovo Legion 5 Pro 16IAH7H | |
| Dell G16 7620 | |
| Lenovo Legion 5 Pro 16ARH7H RTX 3070 Ti | |
| Lenovo Legion 7 16ARHA7 | |
| Przeciętny AMD Ryzen 7 6800H (48209 - 51186, n=8) | |
| HP Victus 16-e0145ng | |
| AIDA64 / Memory Read | |
| Dell G16 7620 | |
| Lenovo Legion 5 Pro 16IAH7H | |
| Lenovo Legion 5 Pro 16IAH7H | |
| Lenovo Legion 7 16ARHA7 | |
| Lenovo Legion 5 Pro 16ARH7H RTX 3070 Ti | |
| Przeciętny AMD Ryzen 7 6800H (43828 - 51778, n=8) | |
| HP Victus 16-e0145ng | |
| AIDA64 / Memory Write | |
| Lenovo Legion 5 Pro 16IAH7H | |
| Lenovo Legion 5 Pro 16IAH7H | |
| Dell G16 7620 | |
| Lenovo Legion 5 Pro 16ARH7H RTX 3070 Ti | |
| Lenovo Legion 7 16ARHA7 | |
| Przeciętny AMD Ryzen 7 6800H (51116 - 55307, n=8) | |
| HP Victus 16-e0145ng | |
| AIDA64 / Memory Latency | |
| Lenovo Legion 5 Pro 16IAH7H | |
| Lenovo Legion 5 Pro 16IAH7H | |
| Dell G16 7620 | |
| Przeciętny AMD Ryzen 7 6800H (83.1 - 104.1, n=8) | |
| Lenovo Legion 5 Pro 16ARH7H RTX 3070 Ti | |
| Lenovo Legion 7 16ARHA7 | |
| HP Victus 16-e0145ng | |
| Asus ROG Zephyrus M16 GU603H | |
* ... im mniej tym lepiej
Opóźnienie DPC
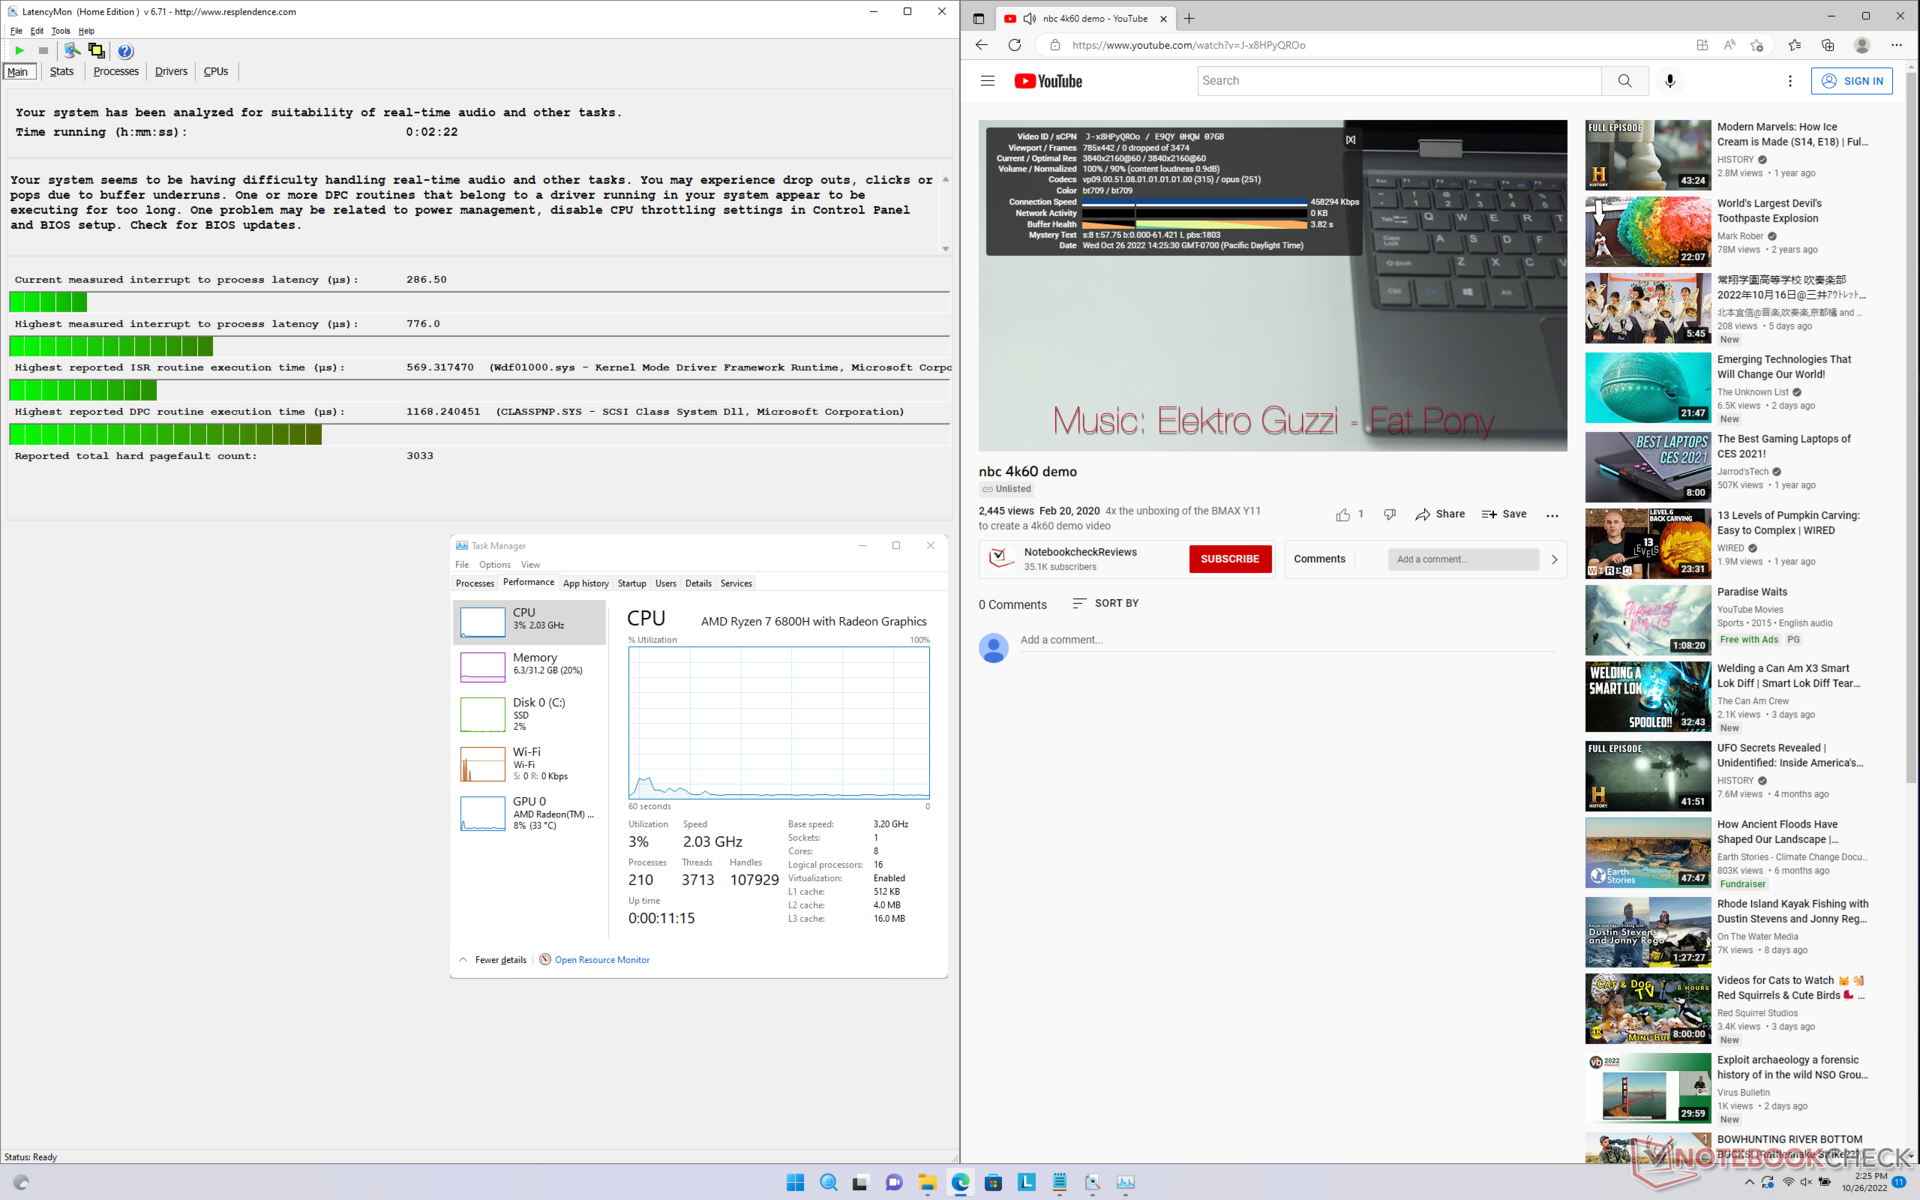
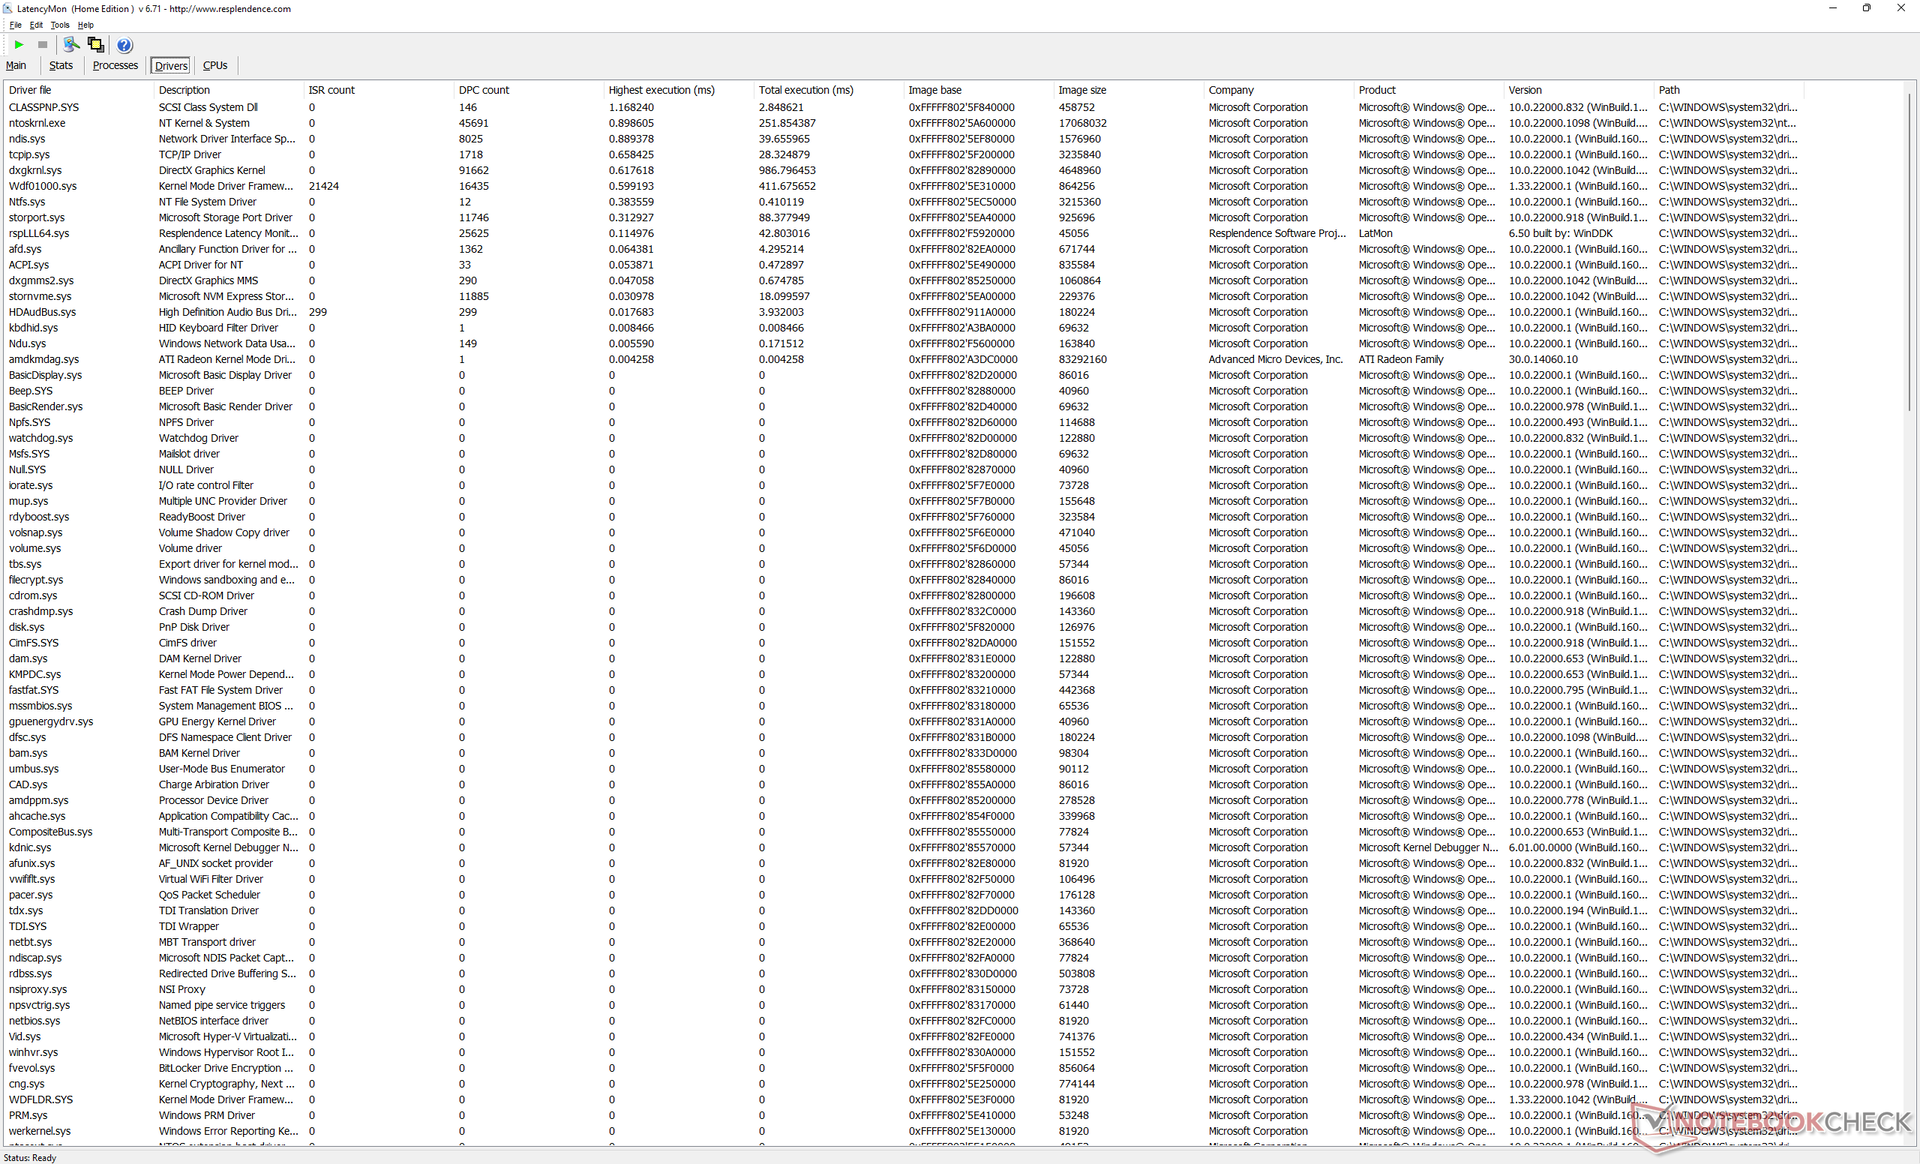
LatencyMon ujawnia drobne problemy z DPC podczas otwierania wielu kart przeglądarki na naszej stronie głównej. odtwarzanie wideo 4K przy 60 FPS jest poza tym perfekcyjne i nie ma żadnych zrzuconych klatek.
| DPC Latencies / LatencyMon - interrupt to process latency (max), Web, Youtube, Prime95 | |
| Lenovo Legion 7 16ARHA7 | |
| Asus ROG Zephyrus M16 GU603H | |
| Dell G16 7620 | |
| HP Victus 16-e0145ng | |
| Lenovo Legion 5 Pro 16ARH7H RTX 3070 Ti | |
| Lenovo Legion 5 Pro 16IAH7H | |
* ... im mniej tym lepiej
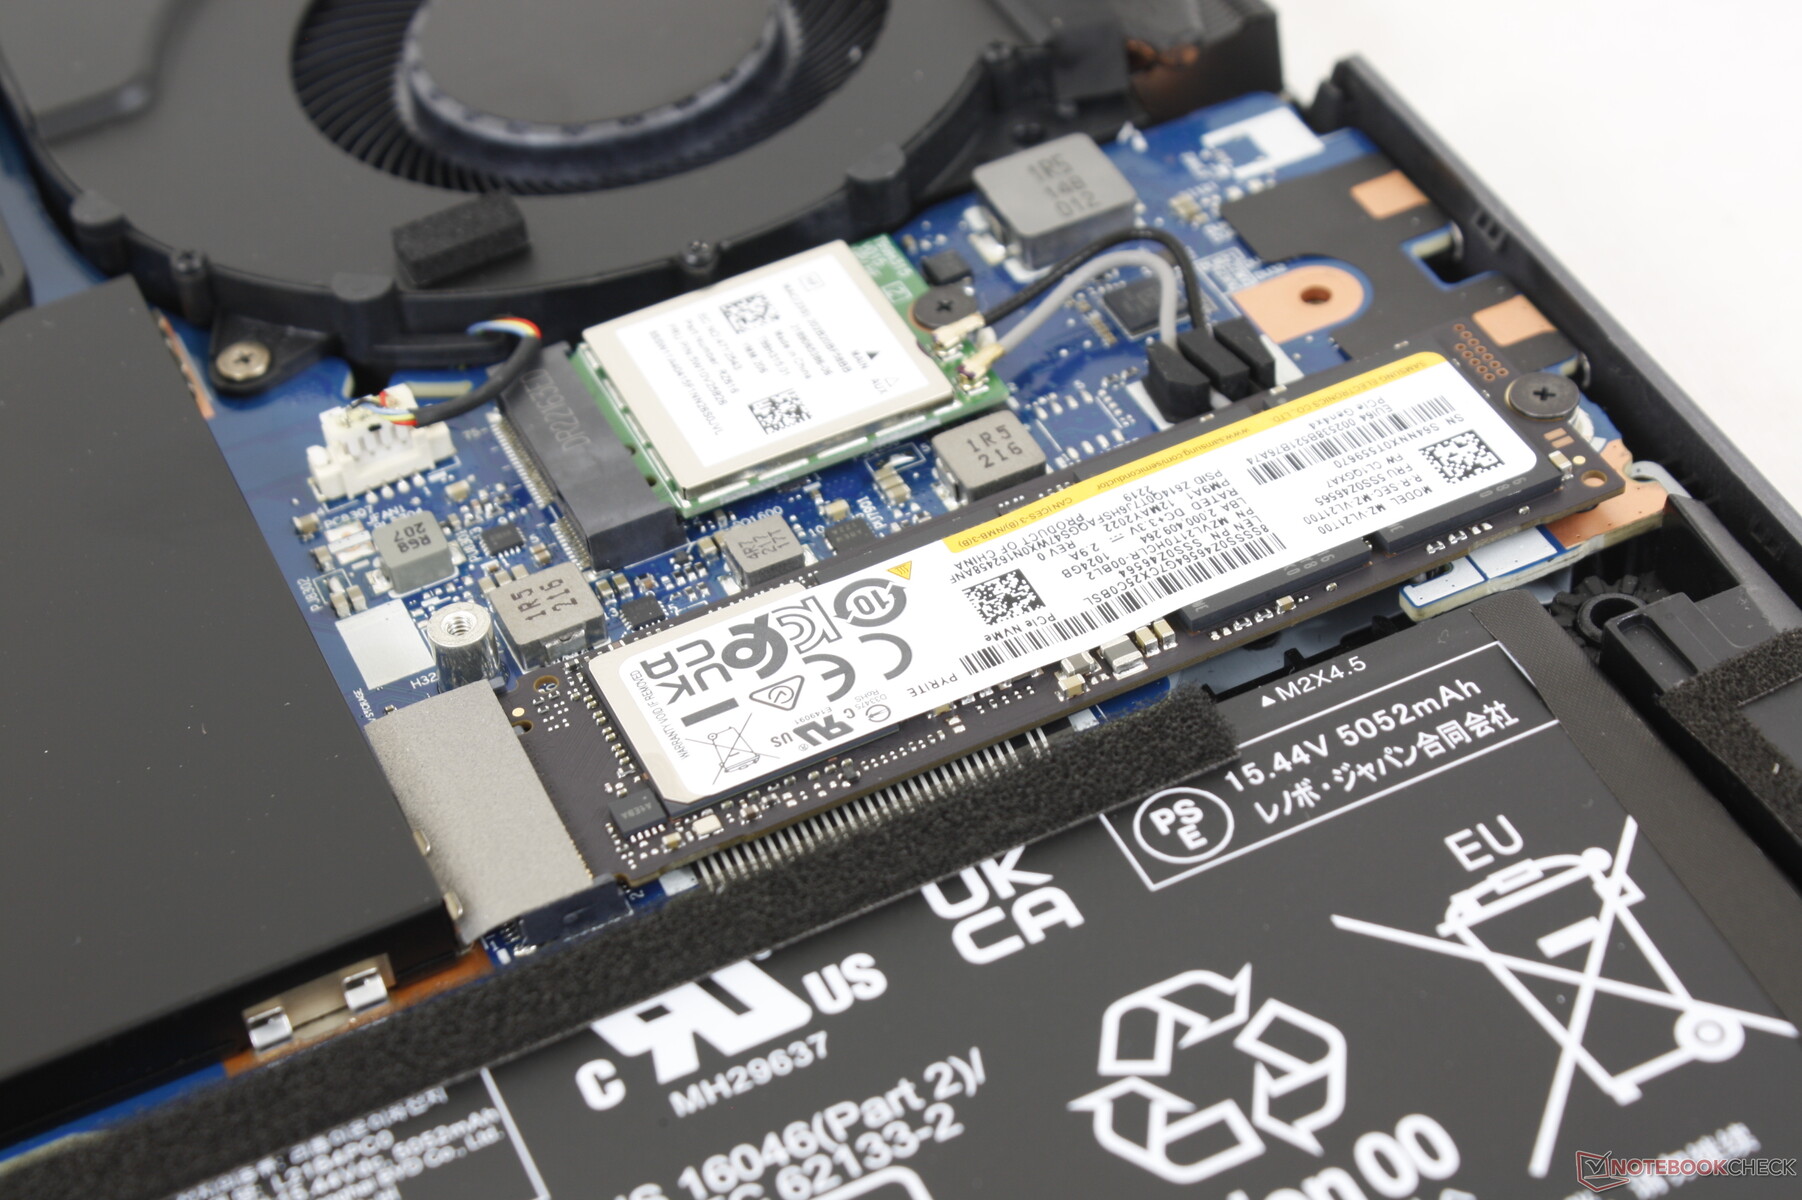
Urządzenia pamięci masowej - do dwóch dysków SSD PCIe4 NVMe
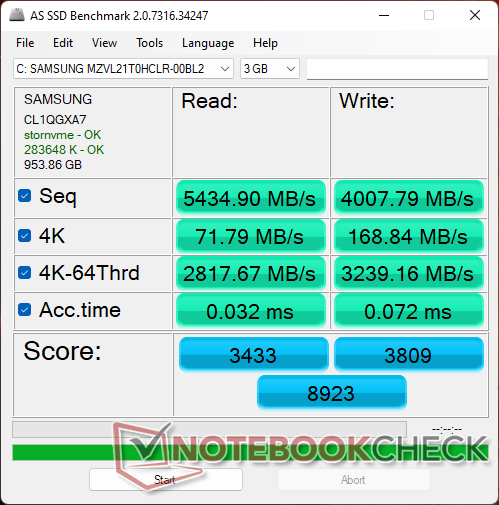
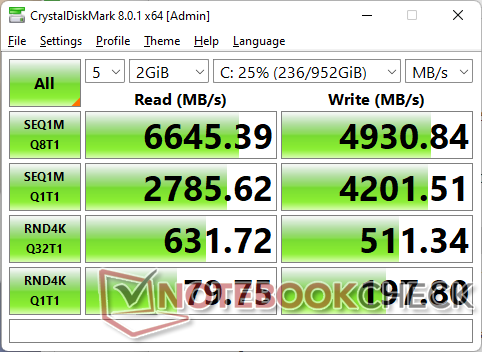

| Drive Performance rating - Percent | |
| Lenovo Legion 5 Pro 16IAH7H | |
| Lenovo Legion 5 Pro 16ARH7H RTX 3070 Ti | |
| Asus ROG Zephyrus M16 GU603H | |
| Dell G16 7620 | |
| Lenovo Legion 7 16ARHA7 | |
| HP Victus 16-e0145ng | |
* ... im mniej tym lepiej
Disk Throttling: DiskSpd Read Loop, Queue Depth 8
Wydajność układu graficznego - 150 W
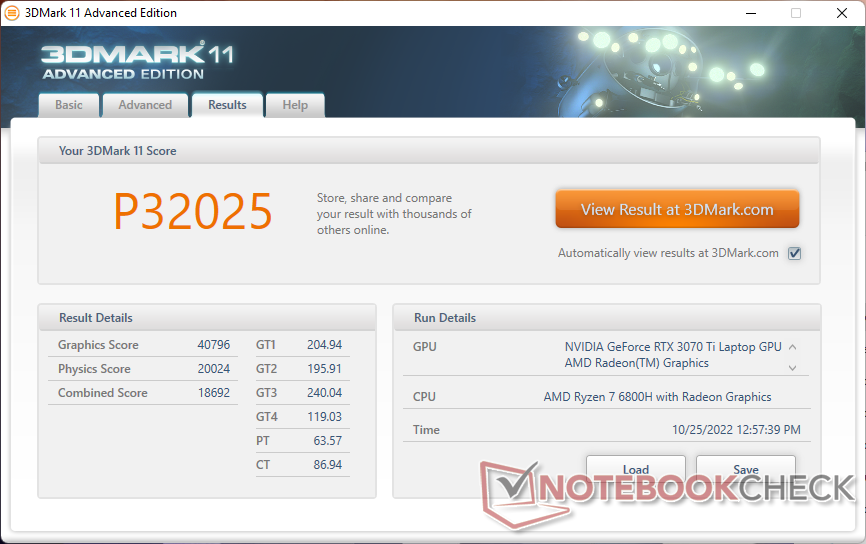
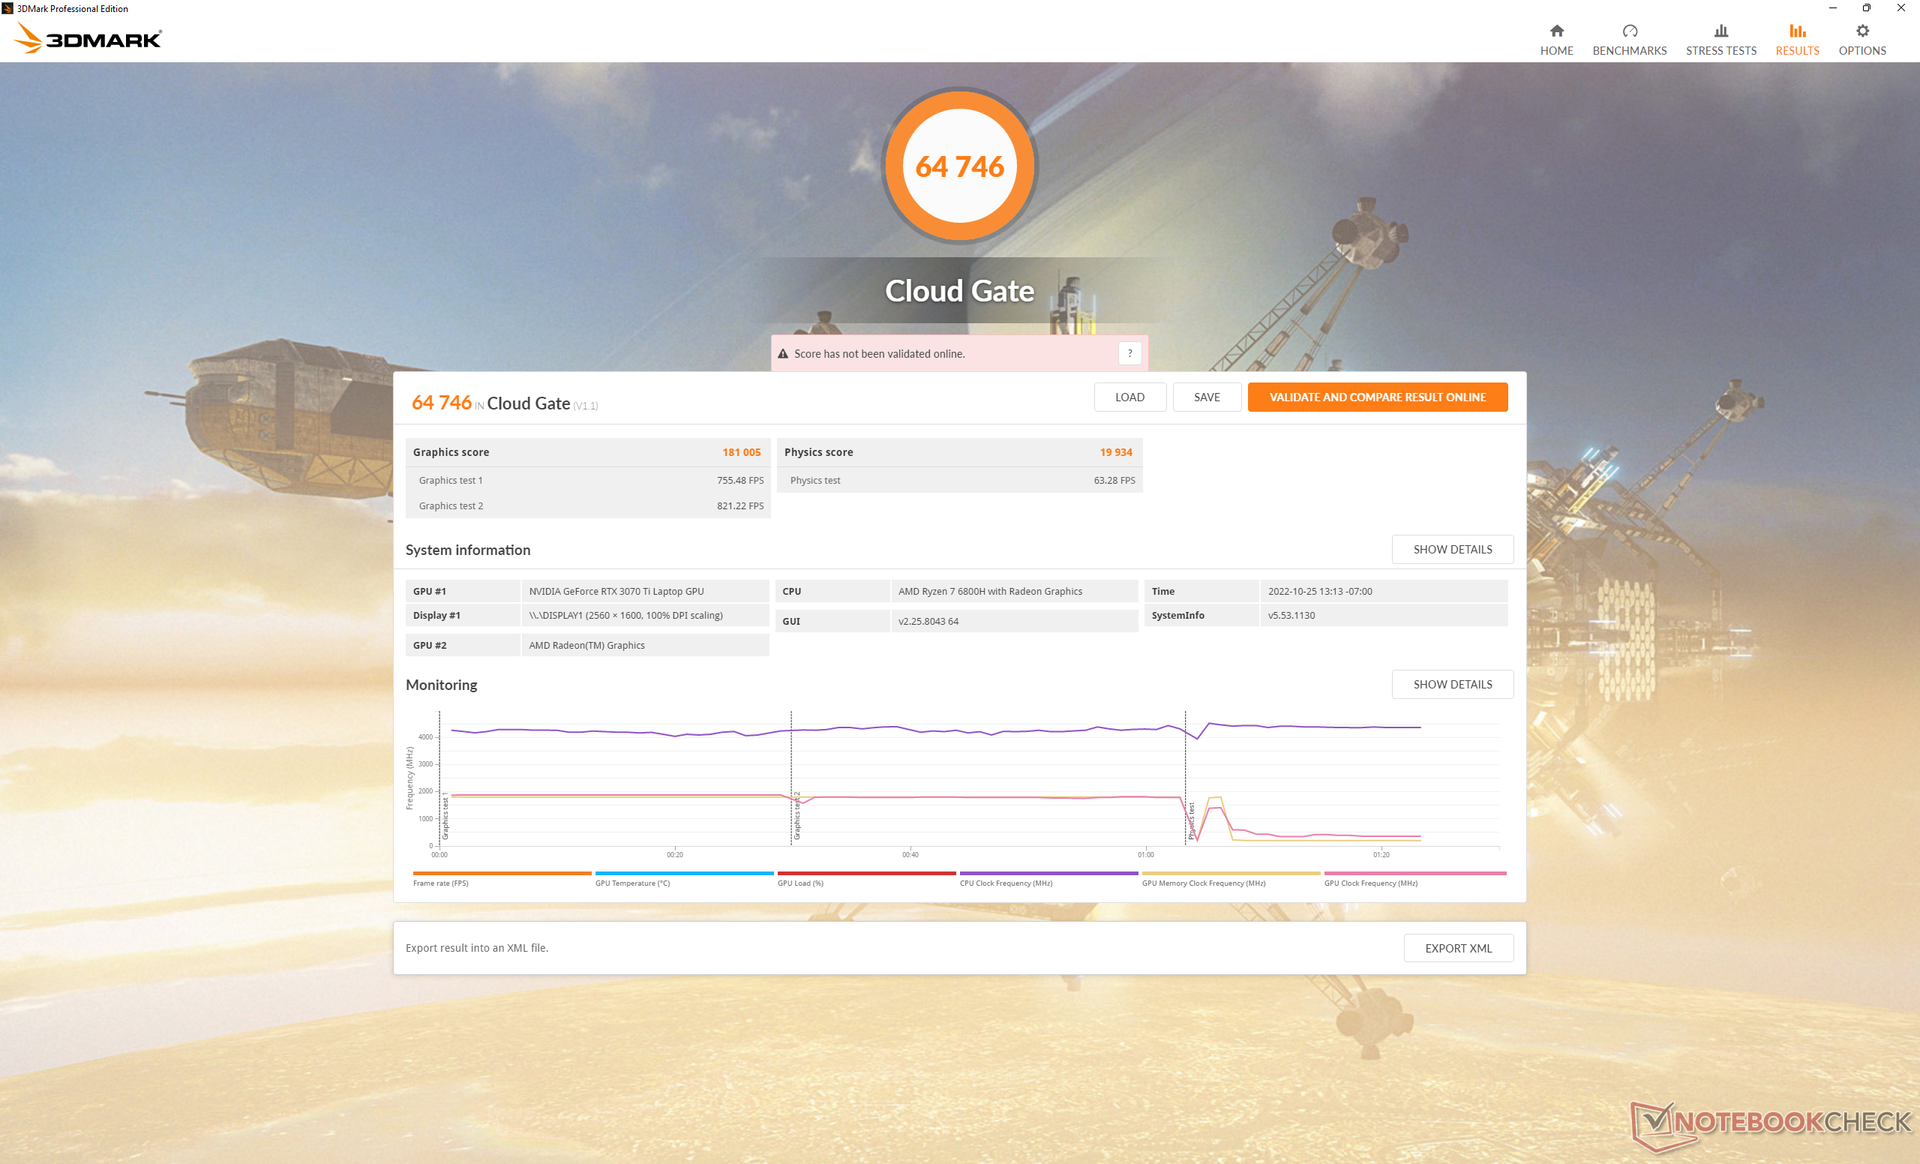
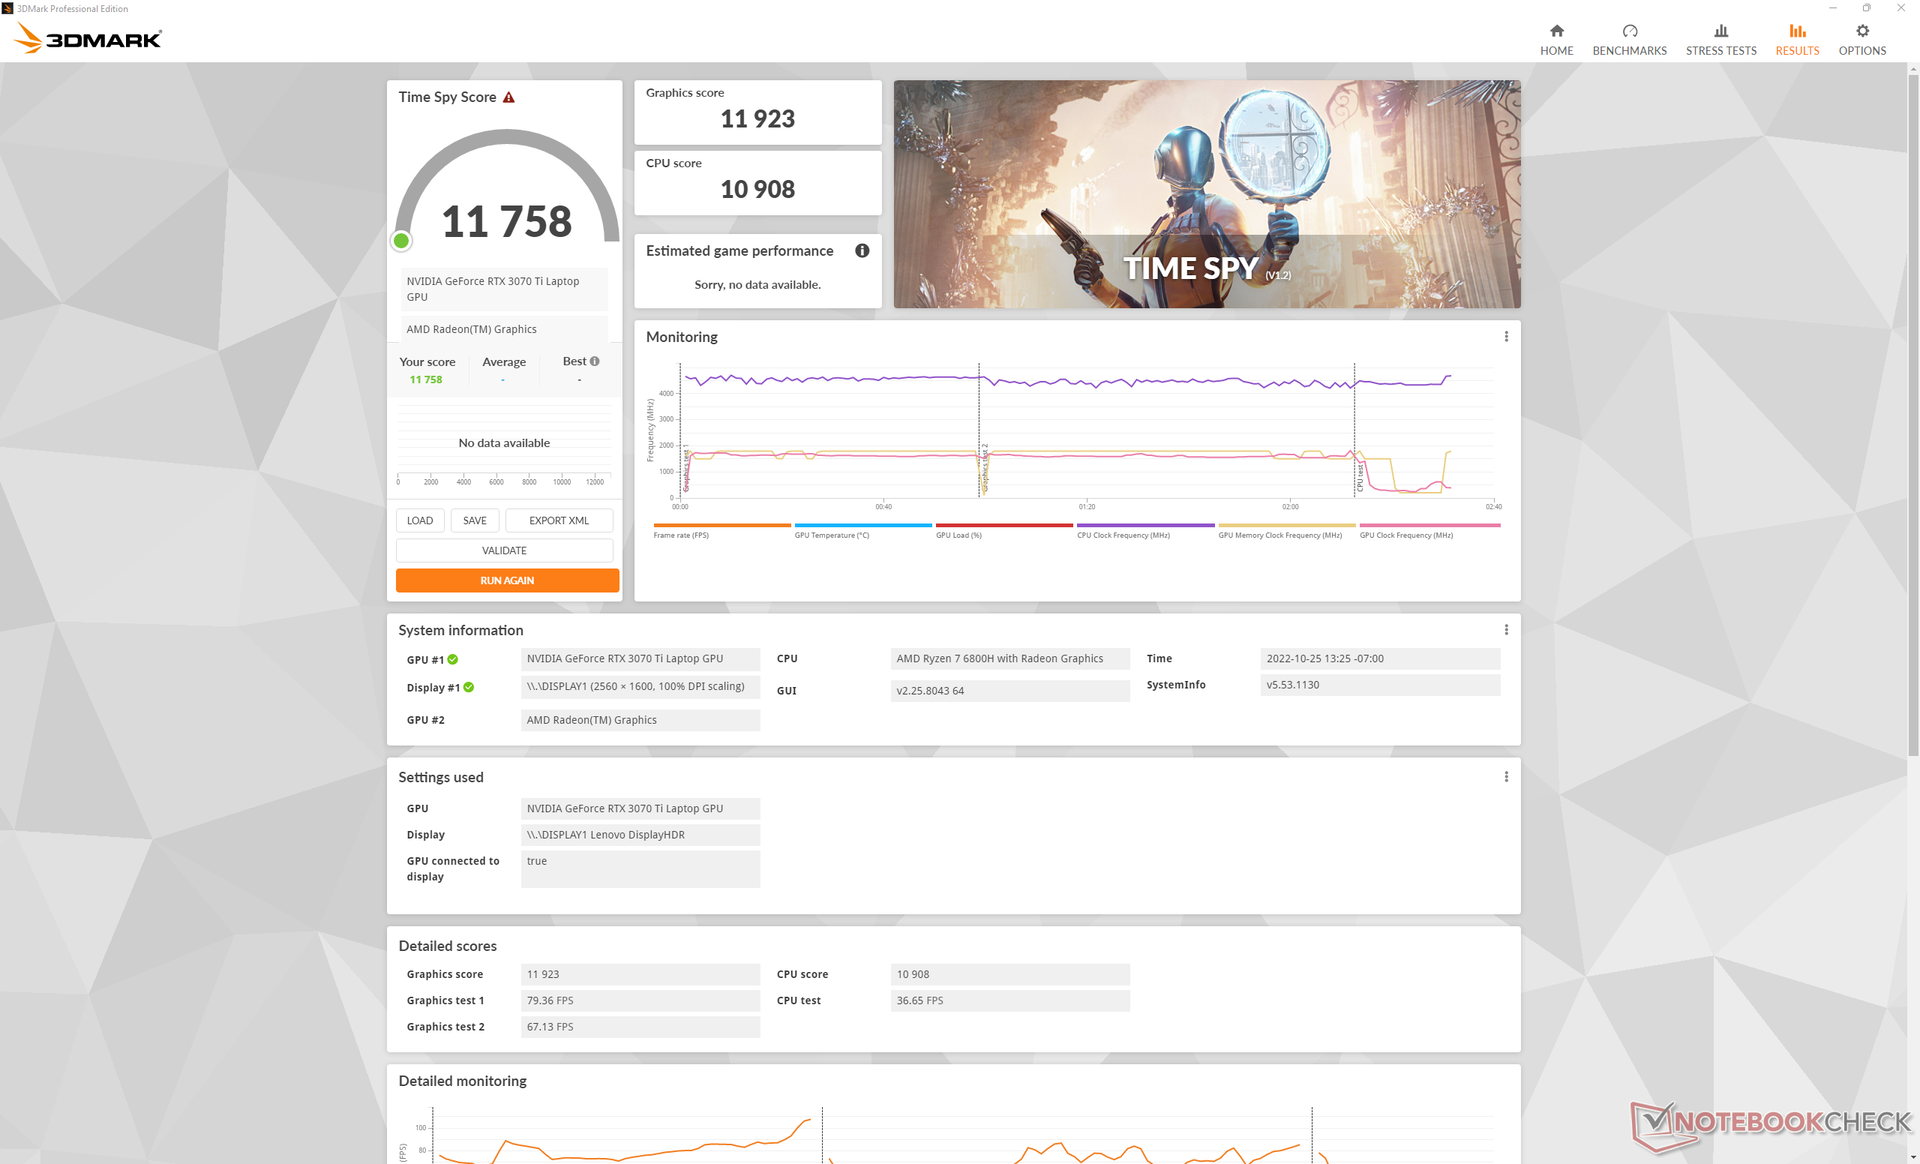
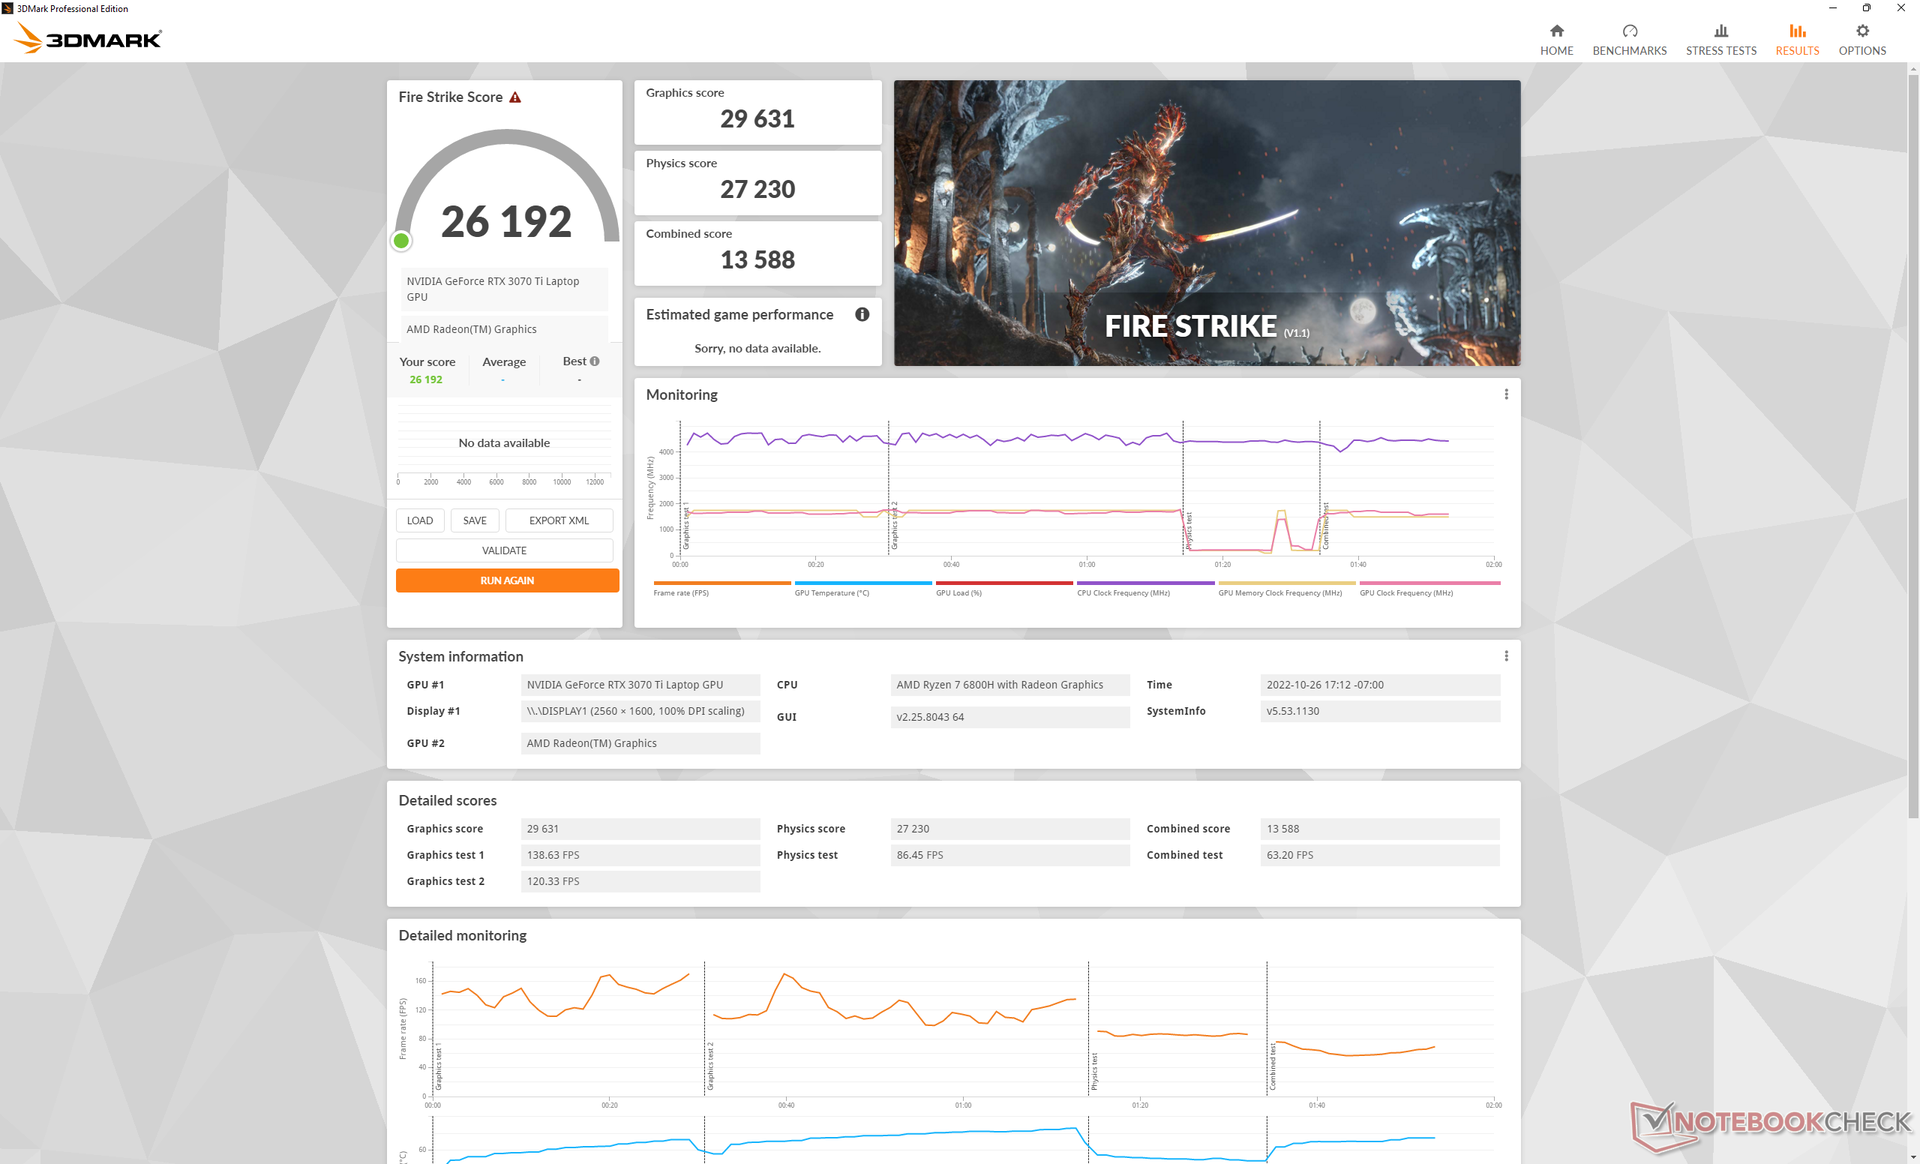
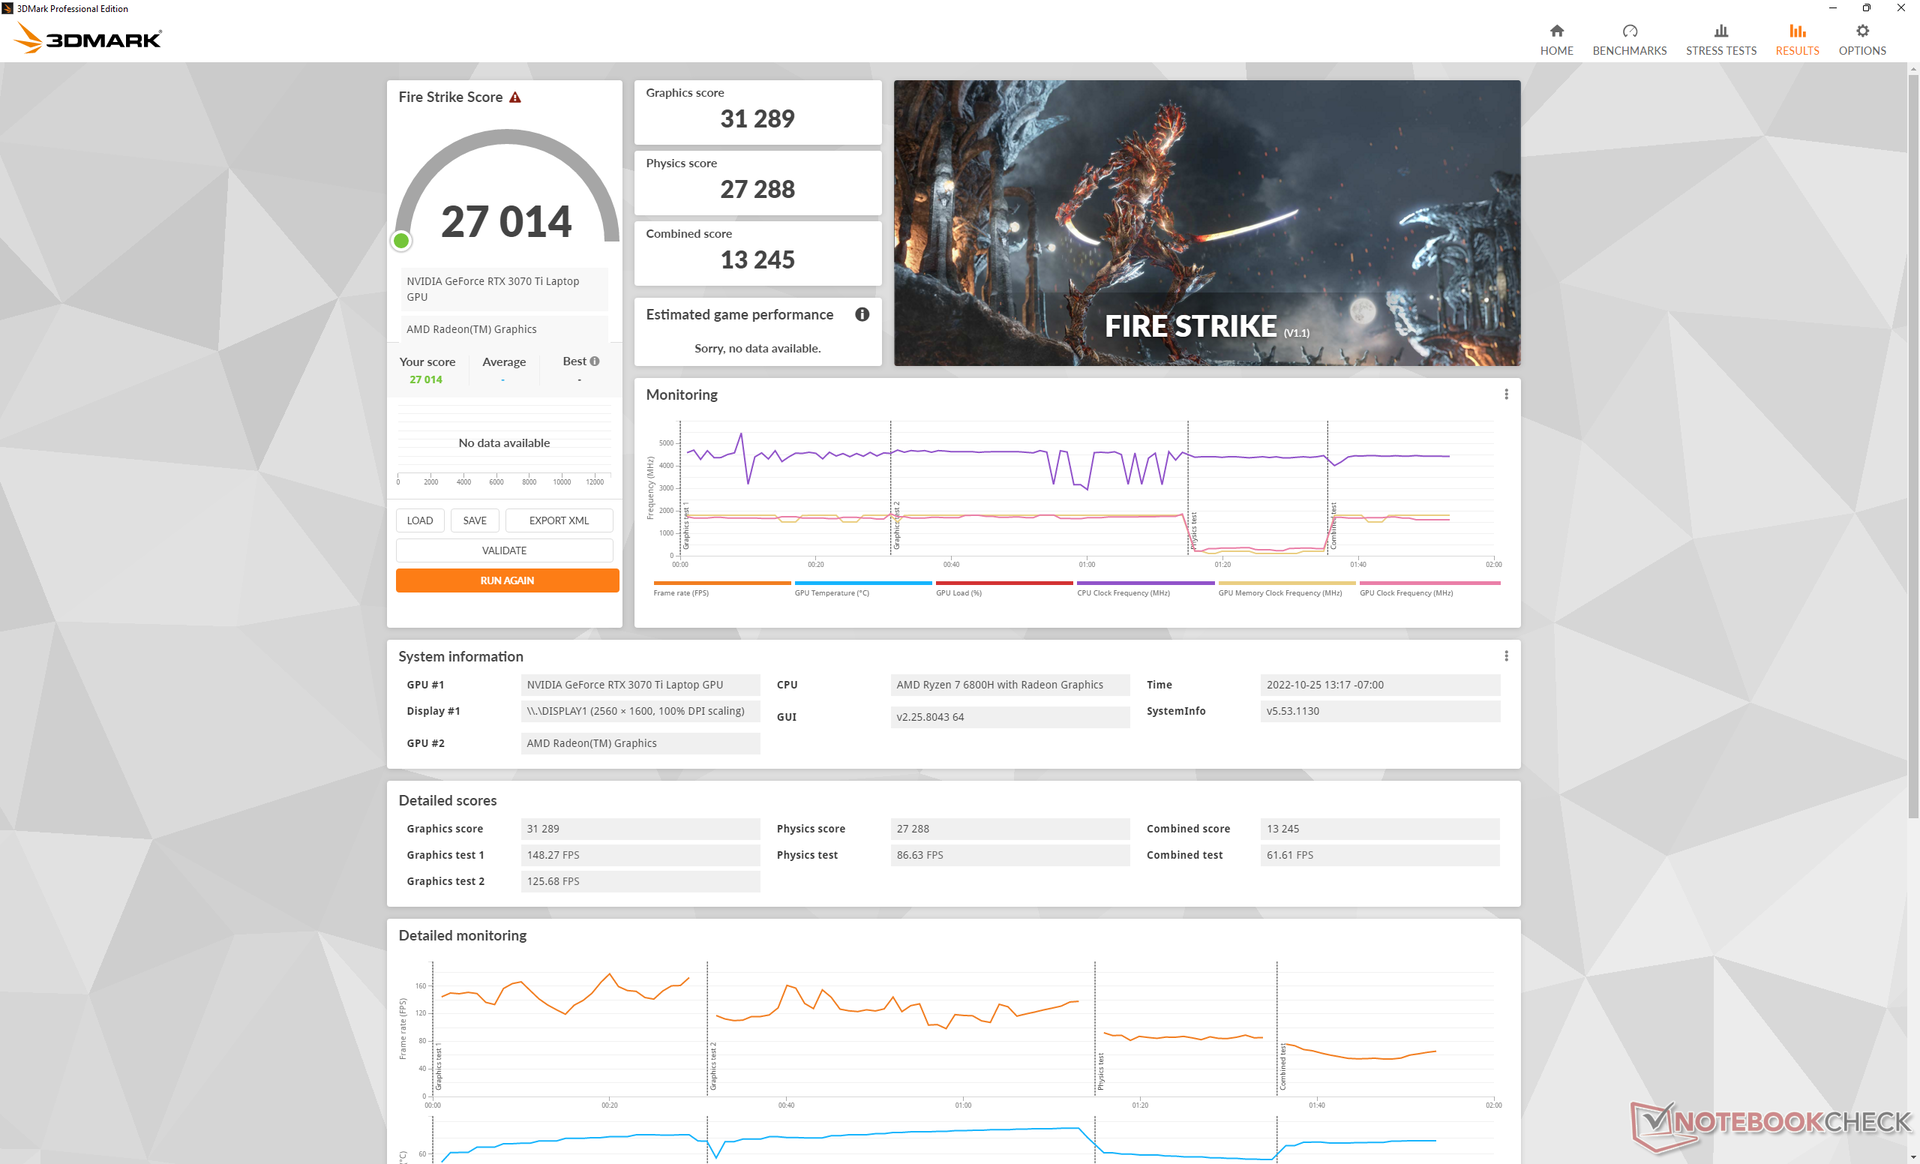
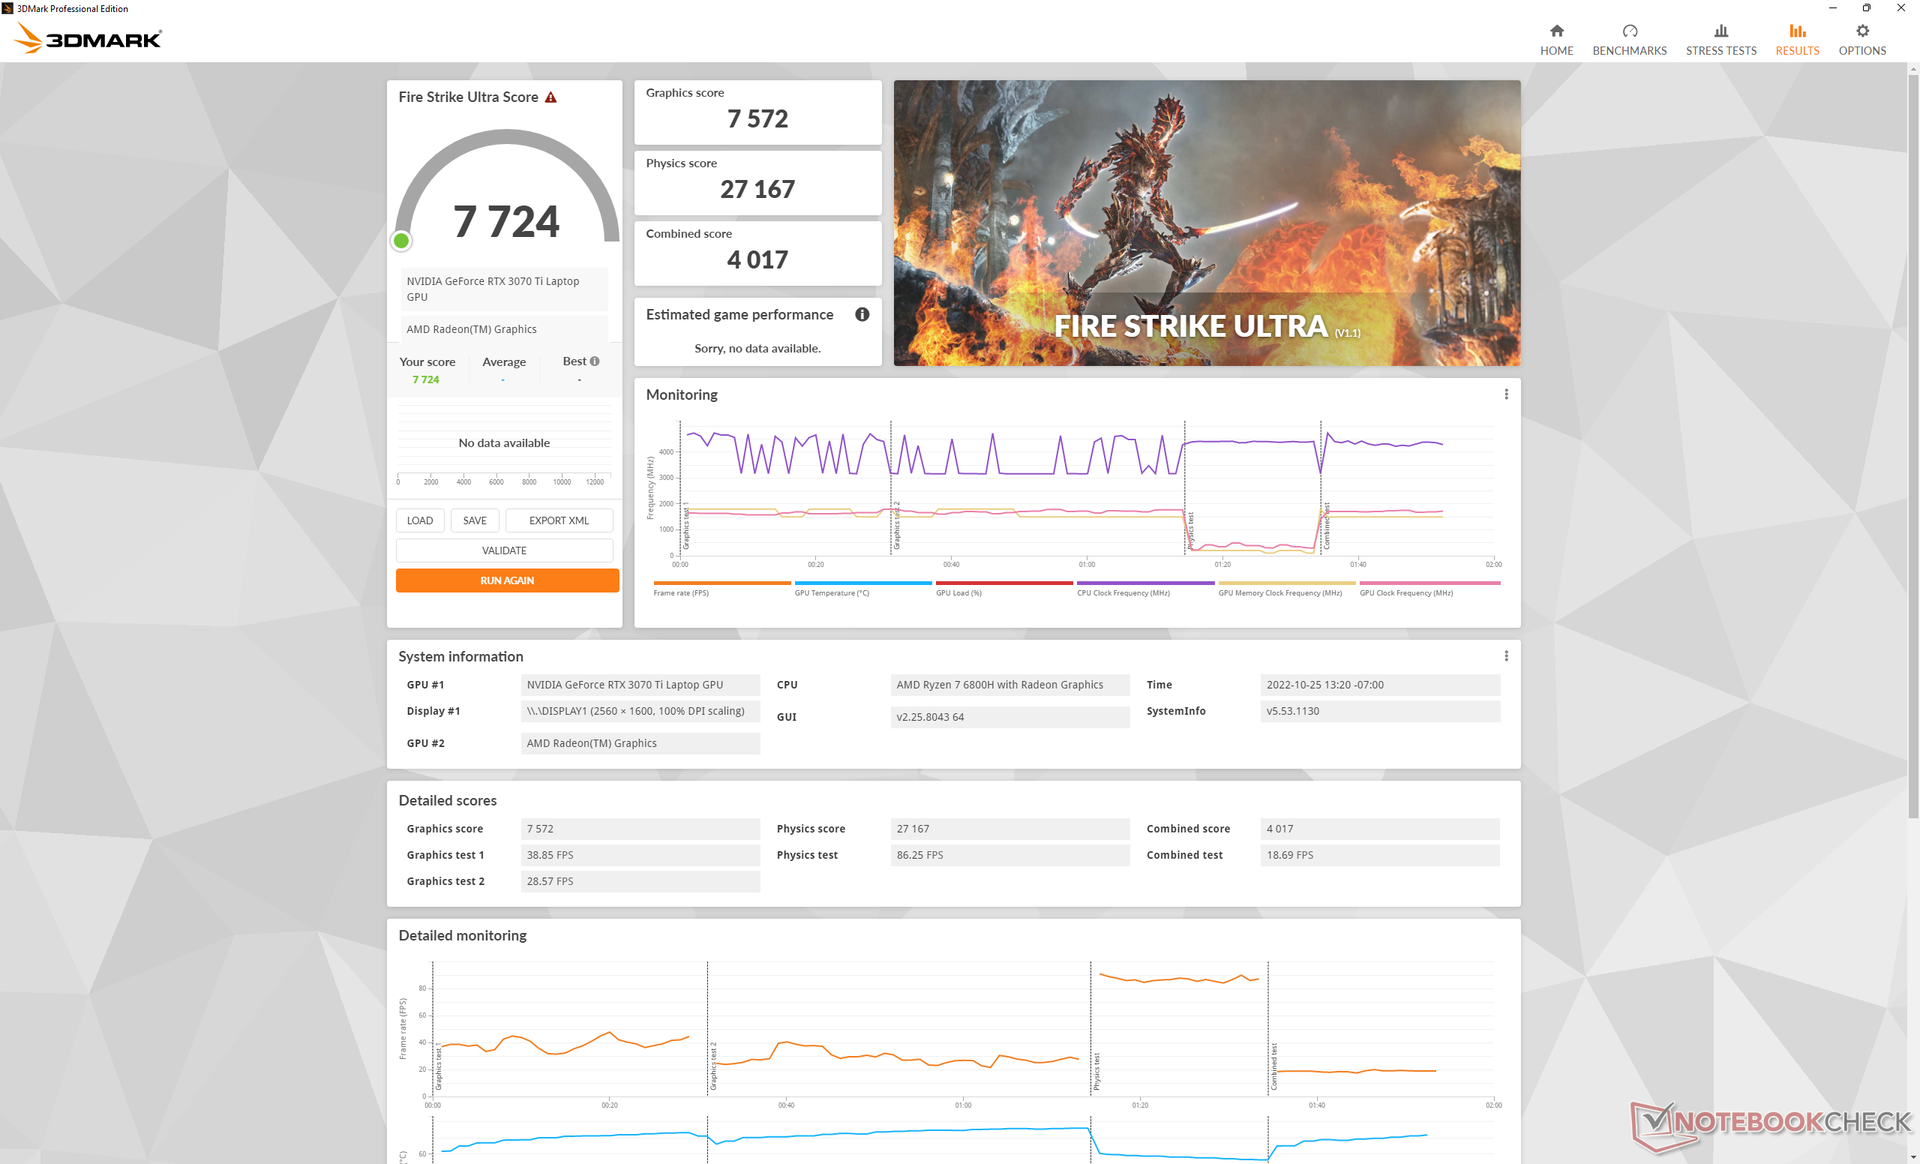
Wydajność graficzna jest doskonała - wyniki w 3DMarku są o prawie 15 procent szybsze niż w przypadku przeciętnego laptopa z naszej bazy danych z tym samym GeForce RTX 3070 Ti GPU. W rzeczywistości ustępuje on nawet RTX 3080 Ti w Alienware x15 R2.
Wydajność spada o około 5 procent tylko wtedy, gdy tryb Turbo jest wyłączony. Użytkownicy muszą więc pamiętać o włączeniu trybu Turbo za pośrednictwem Lenovo Vantage, jeśli chcą uruchomić laptop w jego najszybszym wydaniu.
Zmniejszenie wydajności do niższej klasy RTX 3070 lub RTX 3060 Spowoduje spadek wydajności odpowiednio o około 10 i 30 procent - wynika z naszych doświadczeń z wieloma laptopami z RTX 3070 lub 3060.
| 3DMark 11 - 1280x720 Performance GPU | |
| Lenovo Legion 7 16ARHA7 | |
| Lenovo Legion 5 Pro 16ARH7H RTX 3070 Ti | |
| Alienware x15 R2 P111F | |
| Przeciętny NVIDIA GeForce RTX 3070 Ti Laptop GPU (13799 - 42569, n=36) | |
| Gigabyte A5 X1 | |
| HP Omen 16-c0077ng | |
| Lenovo Legion 5 Pro 16IAH7H | |
| Lenovo Legion C7 15IMH05 82EH0030GE | |
| Acer Predator Triton 300 PT315-52-79LP | |
| HP Victus 16-e0145ng | |
| 3DMark 11 Performance | 32025 pkt. | |
| 3DMark Cloud Gate Standard Score | 64746 pkt. | |
| 3DMark Fire Strike Score | 27014 pkt. | |
| 3DMark Time Spy Score | 11758 pkt. | |
Pomoc | ||
* ... im mniej tym lepiej
| Final Fantasy XV Benchmark | |
| 1280x720 Lite Quality | |
| Alienware x15 R2 P111F | |
| Lenovo Legion 5 Pro 16IAH7H | |
| Lenovo Legion 5 Pro 16ARH7H RTX 3070 Ti | |
| Przeciętny NVIDIA GeForce RTX 3070 Ti Laptop GPU (141.1 - 211, n=20) | |
| Lenovo Legion 7 16ARHA7 | |
| Gigabyte A5 X1 | |
| 1920x1080 Standard Quality | |
| Alienware x15 R2 P111F | |
| Lenovo Legion 5 Pro 16ARH7H RTX 3070 Ti | |
| Lenovo Legion 7 16ARHA7 | |
| Przeciętny NVIDIA GeForce RTX 3070 Ti Laptop GPU (113.9 - 162.6, n=24) | |
| Gigabyte A5 X1 | |
| Lenovo Legion 5 Pro 16IAH7H | |
| HP Victus 16-e0145ng | |
| 1920x1080 High Quality | |
| Alienware x15 R2 P111F | |
| Lenovo Legion 5 Pro 16ARH7H RTX 3070 Ti | |
| Lenovo Legion 7 16ARHA7 | |
| Przeciętny NVIDIA GeForce RTX 3070 Ti Laptop GPU (49.5 - 122.4, n=35) | |
| Gigabyte A5 X1 | |
| Lenovo Legion 5 Pro 16IAH7H | |
| HP Omen 16-c0077ng | |
| HP Victus 16-e0145ng | |
| Acer Predator Triton 300 PT315-52-79LP | |
| 2560x1440 High Quality | |
| Lenovo Legion 5 Pro 16ARH7H RTX 3070 Ti | |
| Lenovo Legion 7 16ARHA7 | |
| Przeciętny NVIDIA GeForce RTX 3070 Ti Laptop GPU (57.9 - 93, n=24) | |
| Lenovo Legion 5 Pro 16IAH7H | |
| HP Omen 16-c0077ng | |
| X-Plane 11.11 | |
| 1280x720 low (fps_test=1) | |
| Lenovo Legion 5 Pro 16IAH7H | |
| Alienware x15 R2 P111F | |
| Przeciętny NVIDIA GeForce RTX 3070 Ti Laptop GPU (68.8 - 166.8, n=36) | |
| Lenovo Legion 5 Pro 16ARH7H RTX 3070 Ti | |
| Lenovo Legion C7 15IMH05 82EH0030GE | |
| Acer Predator Triton 300 PT315-52-79LP | |
| Gigabyte A5 X1 | |
| HP Victus 16-e0145ng | |
| Lenovo Legion 7 16ARHA7 | |
| 1920x1080 med (fps_test=2) | |
| Lenovo Legion 5 Pro 16IAH7H | |
| Alienware x15 R2 P111F | |
| Przeciętny NVIDIA GeForce RTX 3070 Ti Laptop GPU (57.3 - 145.7, n=36) | |
| Lenovo Legion 5 Pro 16ARH7H RTX 3070 Ti | |
| Lenovo Legion C7 15IMH05 82EH0030GE | |
| HP Victus 16-e0145ng | |
| Gigabyte A5 X1 | |
| Acer Predator Triton 300 PT315-52-79LP | |
| Lenovo Legion 7 16ARHA7 | |
| 1920x1080 high (fps_test=3) | |
| Lenovo Legion 5 Pro 16IAH7H | |
| Alienware x15 R2 P111F | |
| Przeciętny NVIDIA GeForce RTX 3070 Ti Laptop GPU (51.6 - 116.9, n=37) | |
| Lenovo Legion C7 15IMH05 82EH0030GE | |
| Lenovo Legion 5 Pro 16ARH7H RTX 3070 Ti | |
| Acer Predator Triton 300 PT315-52-79LP | |
| Gigabyte A5 X1 | |
| HP Victus 16-e0145ng | |
| HP Omen 16-c0077ng | |
| Lenovo Legion 7 16ARHA7 | |
Witcher 3 FPS Chart
| low | med. | high | ultra | QHD | |
|---|---|---|---|---|---|
| GTA V (2015) | 181.5 | 176.5 | 167.6 | 104 | 98.8 |
| The Witcher 3 (2015) | 370.5 | 308.8 | 226 | 117 | |
| Dota 2 Reborn (2015) | 150.4 | 138 | 132.2 | 126.6 | |
| Final Fantasy XV Benchmark (2018) | 187.2 | 156 | 115.6 | 90.4 | |
| X-Plane 11.11 (2018) | 119.6 | 103.6 | 83.9 | ||
| Strange Brigade (2018) | 383 | 298 | 248 | 217 | 160.5 |
| Cyberpunk 2077 1.6 (2022) | 148.9 | 130.2 | 102.1 | 86 | 54.4 |
Emisje - dość głośne
Szum systemu
Zachowanie wentylatora jest związane z ustawieniem profilu zasilania. Na przykład w trybie oszczędzania energii z wyłączonym dyskretnym procesorem graficznym system zachowuje się cicho, osiągając 23,7 dB(A) na tle 23,5 dB(A). Niestety, wystarczy lekka praca wielozadaniowa lub strumieniowanie wideo, aby hałas wzrósł do bardziej słyszalnych 32 dB(A), podobnie jak w przypadku zeszłorocznego modelu
W grach komputerowych szum wentylatora wynosi prawie 55 dB(A), nawet jeśli tryb Turbo jest wyłączony. Równie dobrze można więc włączyć tryb Turbo podczas grania, gdyż nie wydaje się, aby system był głośniejszy lub cichszy. Zakres średnich 50 dB(A) jest głośniejszy od tego, co zarejestrowaliśmy w modelu HP Victus 16 czy Dellu G16 w podobnych warunkach.
Hałas
| luz |
| 23.7 / 31.1 / 32.2 dB |
| obciążenie |
| 38.4 / 54.8 dB |
 | ||
30 dB cichy 40 dB(A) słyszalny 50 dB(A) irytujący |
||
min: | ||
| Lenovo Legion 5 Pro 16ARH7H RTX 3070 Ti GeForce RTX 3070 Ti Laptop GPU, R7 6800H, Samsung PM9A1 MZVL21T0HCLR | Lenovo Legion 5 Pro 16IAH7H GeForce RTX 3060 Laptop GPU, i7-12700H, 2x Samsung PM9A1 MZVL21T0HCLR (RAID 0) | Asus ROG Zephyrus M16 GU603H GeForce RTX 3070 Laptop GPU, i9-11900H, Samsung PM9A1 MZVL22T0HBLB | Lenovo Legion 7 16ARHA7 Radeon RX 6850M XT, R9 6900HX, Samsung PM9A1 MZVL22T0HBLB | HP Victus 16-e0145ng GeForce RTX 3050 Ti Laptop GPU, R5 5600H, Samsung SSD PM981a MZVLB512HBJQ | Dell G16 7620 GeForce RTX 3060 Laptop GPU, i7-12700H, WDC PC SN810 512GB | |
|---|---|---|---|---|---|---|
| Noise | -8% | -9% | 13% | -2% | 6% | |
| wyłączone / środowisko * (dB) | 23.5 | 24.6 -5% | 25 -6% | 22.8 3% | 26 -11% | 23.2 1% |
| Idle Minimum * (dB) | 23.7 | 28.7 -21% | 25 -5% | 23 3% | 26 -10% | 28.3 -19% |
| Idle Average * (dB) | 31.1 | 32 -3% | 31 -0% | 23 26% | 28 10% | 28.8 7% |
| Idle Maximum * (dB) | 32.2 | 32 1% | 42 -30% | 23 29% | 34 -6% | 28.9 10% |
| Load Average * (dB) | 38.4 | 45.2 -18% | 48 -25% | 26.8 30% | 44 -15% | 32.4 16% |
| Witcher 3 ultra * (dB) | 54.8 | 52 5% | 54.3 1% | 48 12% | 48.3 12% | |
| Load Maximum * (dB) | 54.8 | 54.4 1% | 56 -2% | 54.2 1% | 53 3% | 48.1 12% |
* ... im mniej tym lepiej
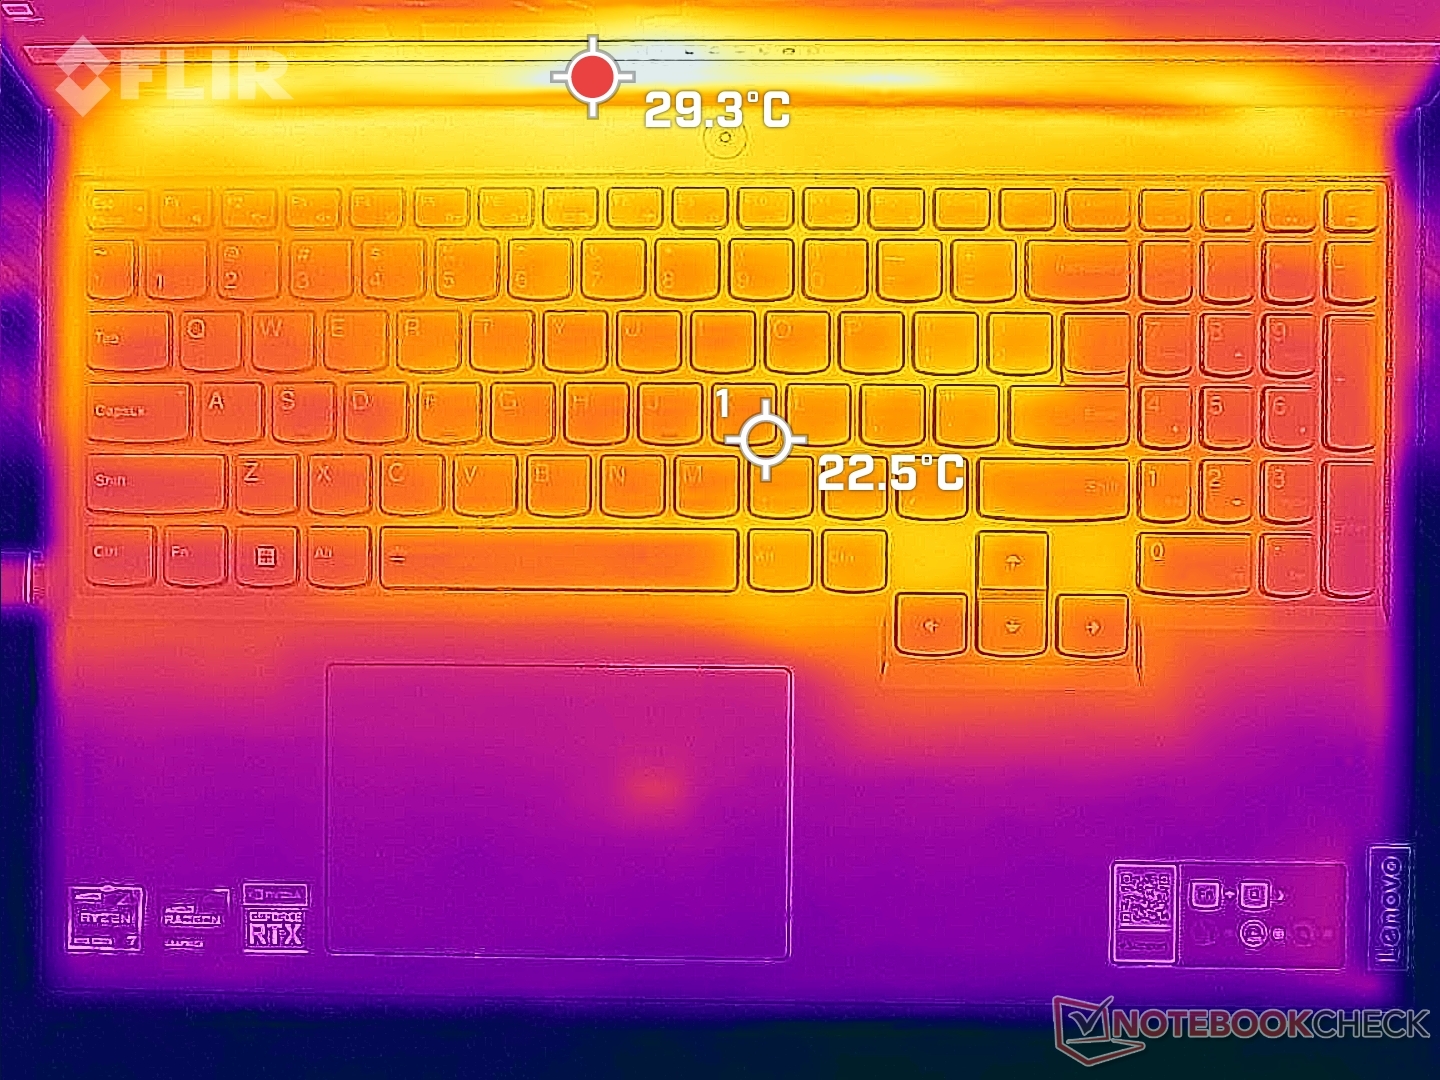
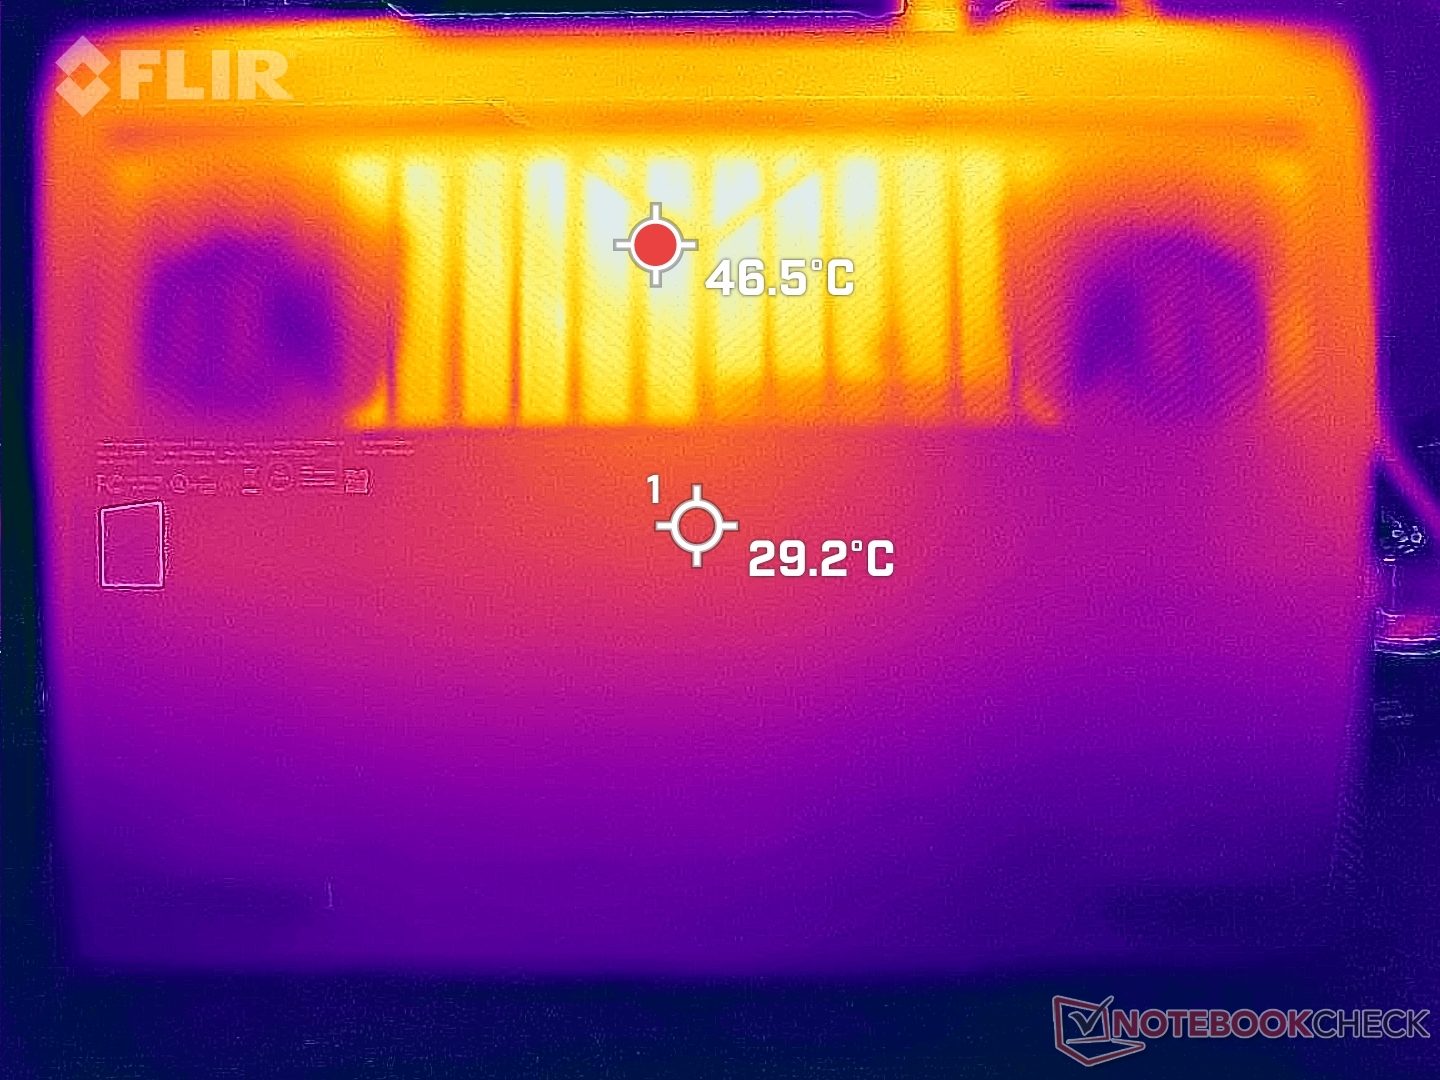
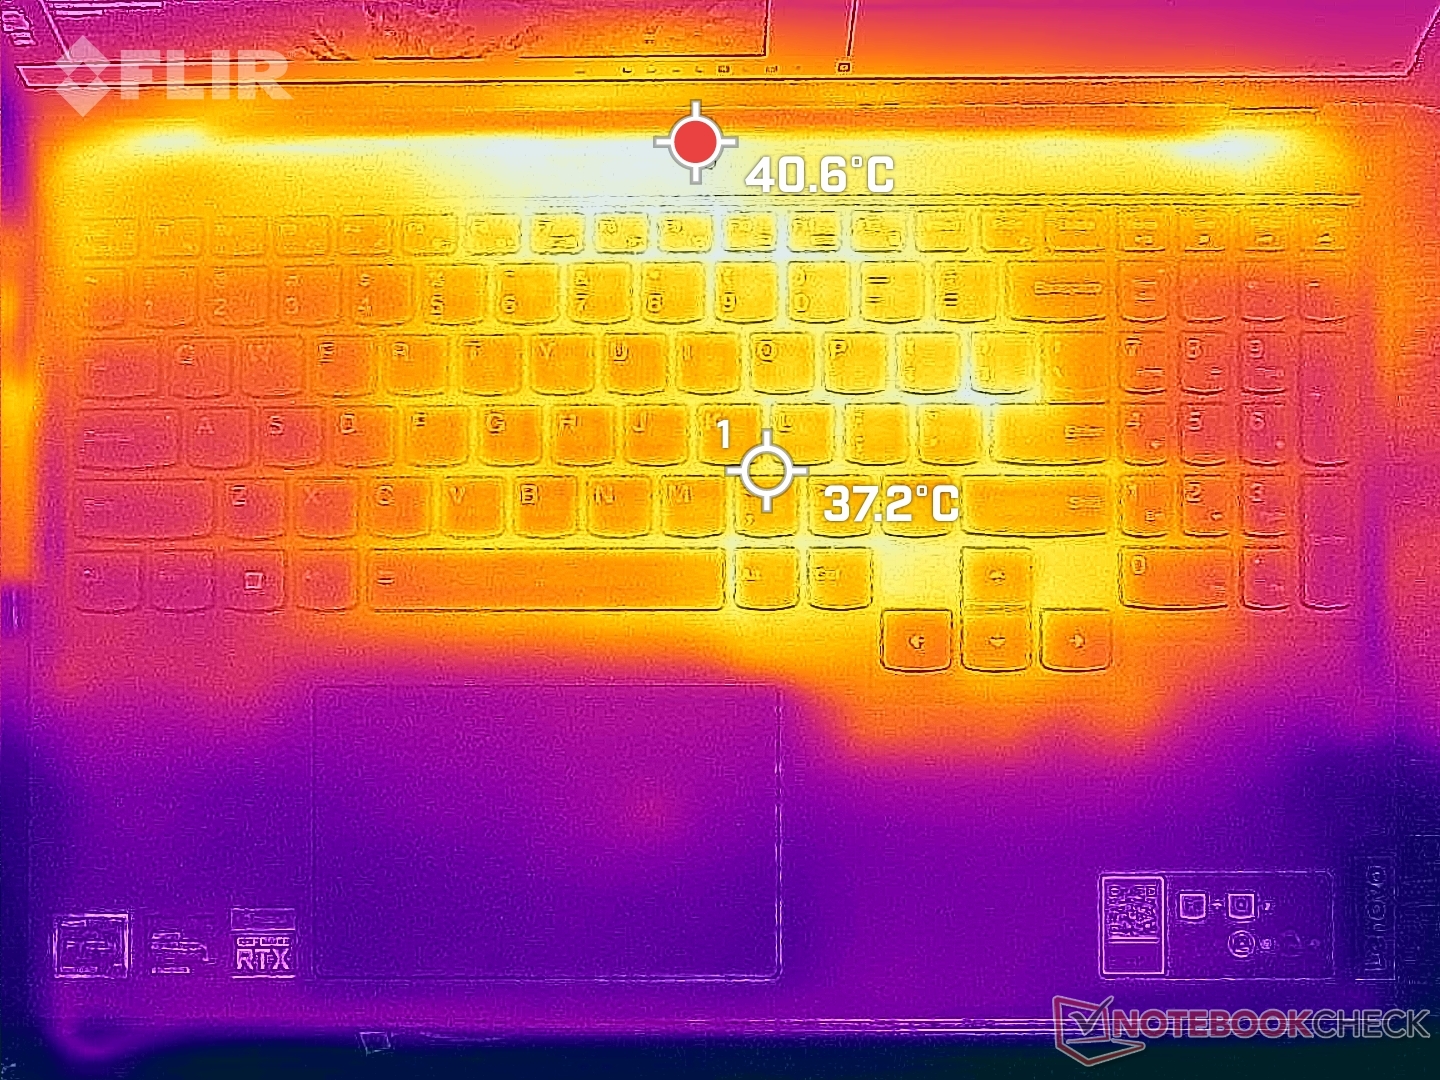
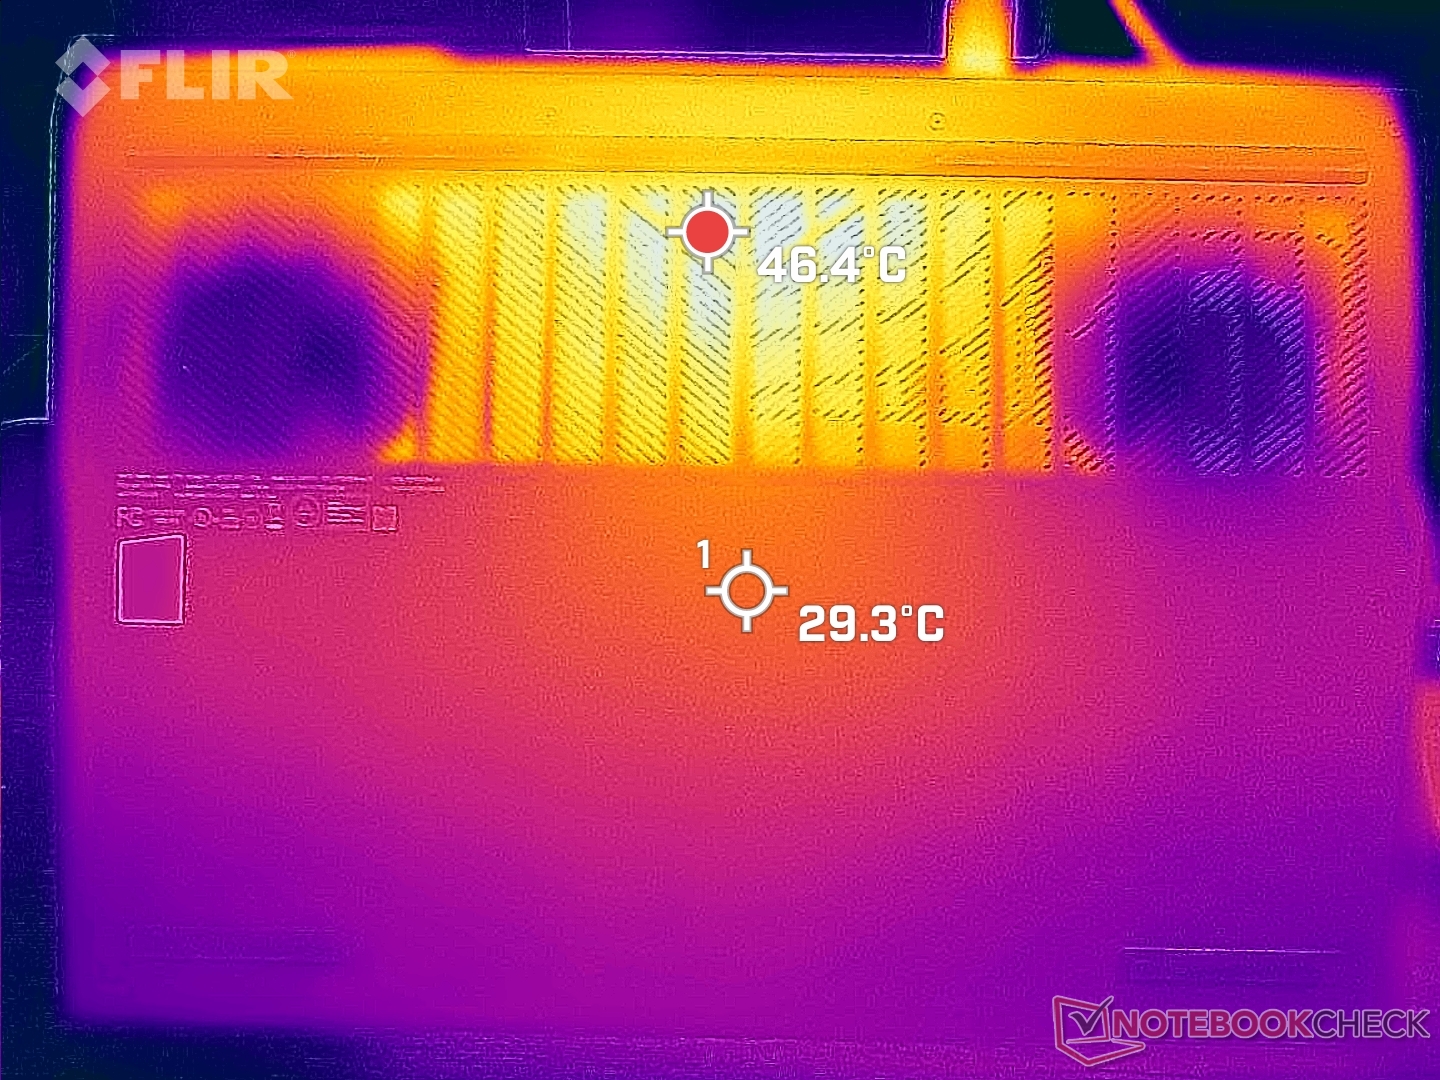
Temperatura
Średnie temperatury powierzchni są znacznie chłodniejsze niż w Asusie ROG Zephyrus M16, mimo że ich punkty gorące są podobne. Na przykład najgorętsze miejsca w Lenovo i Asusie mogą osiągnąć nawet po 53 C, ale oparcia dłoni i obszary klawiatury w Lenovo pozostają wyraźnie chłodniejsze, a tym samym bardziej komfortowe do gry.
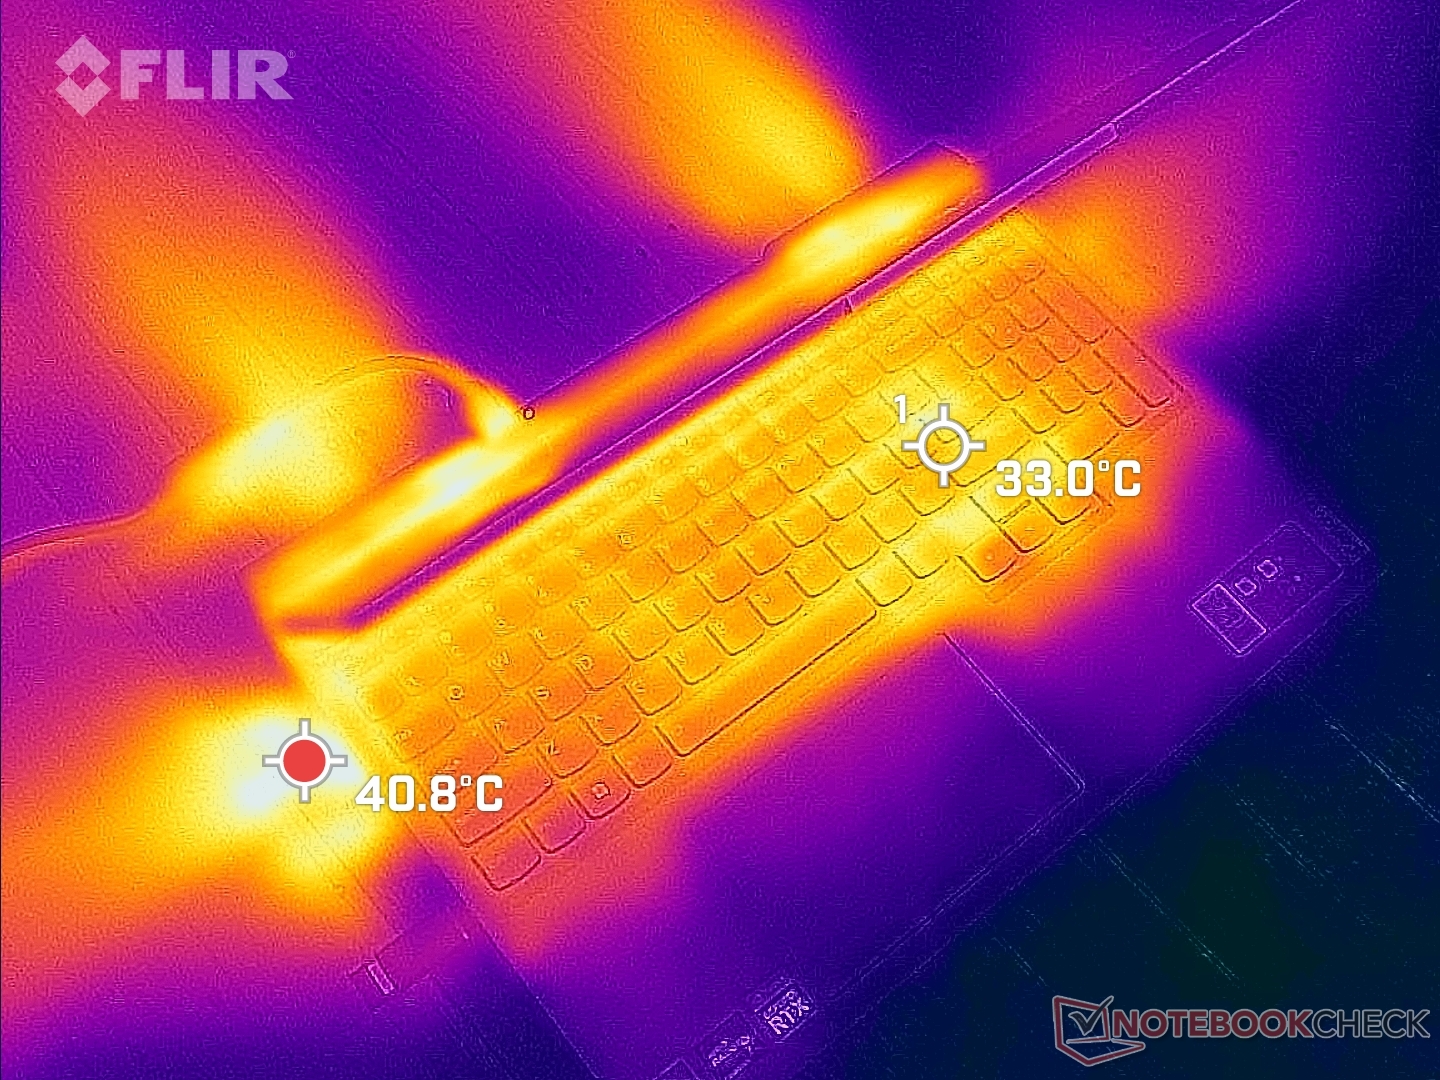
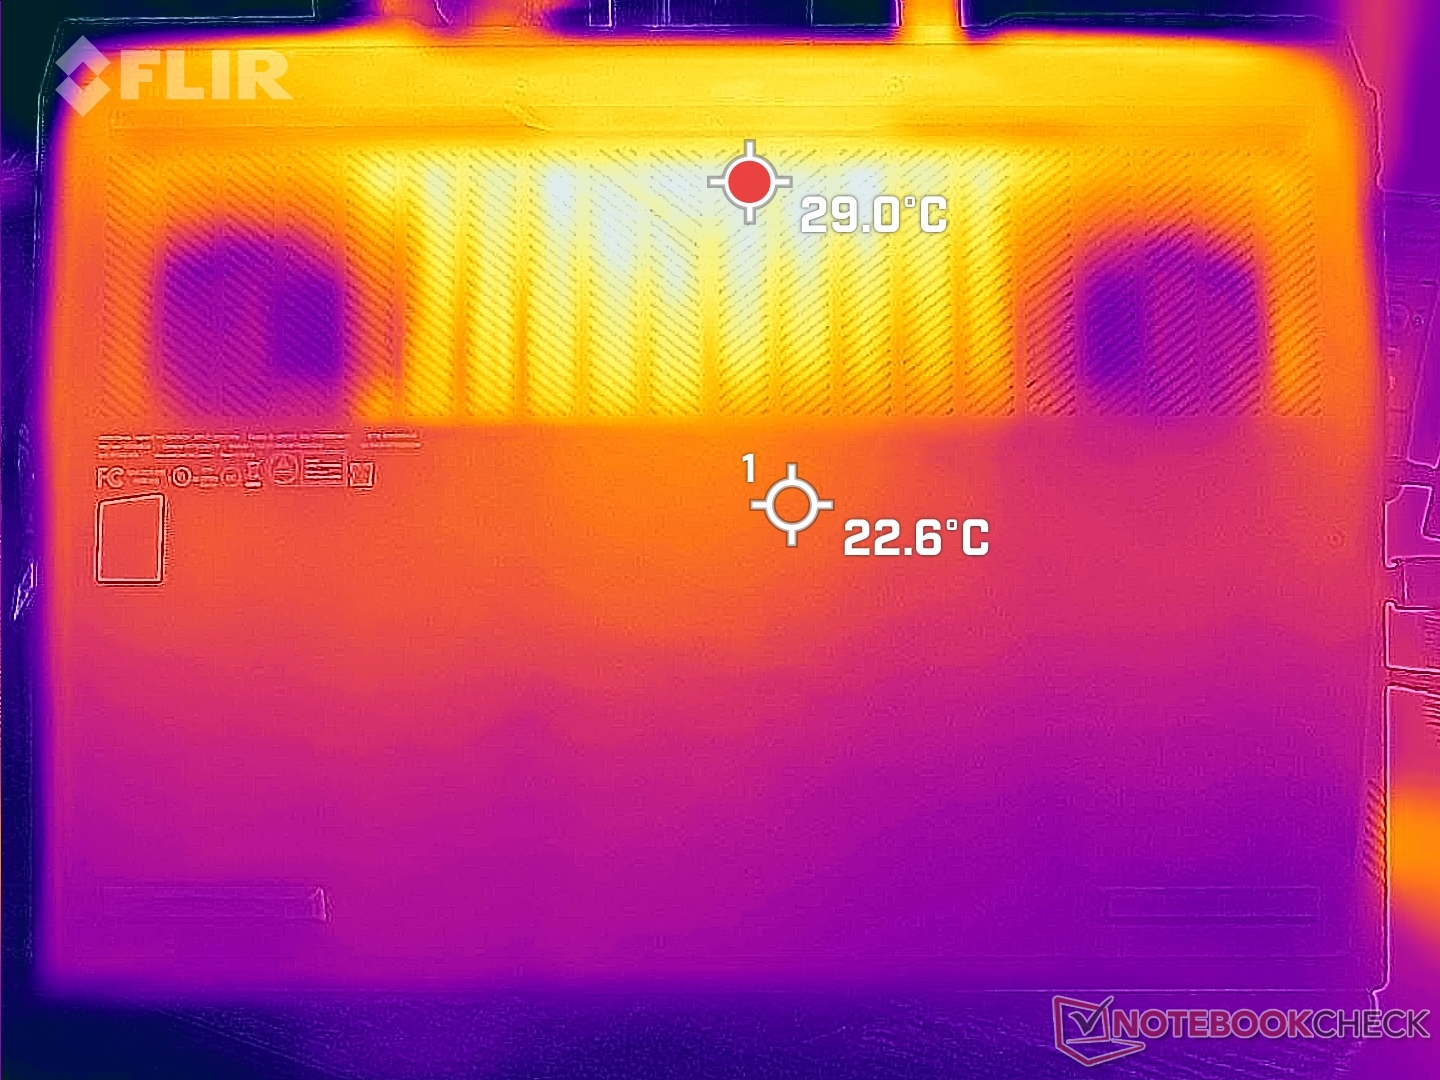
(±) Maksymalna temperatura w górnej części wynosi 43.8 °C / 111 F, w porównaniu do średniej 40.4 °C / 105 F , począwszy od 21.2 do 68.8 °C dla klasy Gaming.
(-) Dno nagrzewa się maksymalnie do 53 °C / 127 F, w porównaniu do średniej 43.2 °C / 110 F
(+) W stanie bezczynności średnia temperatura górnej części wynosi 27.4 °C / 81 F, w porównaniu ze średnią temperaturą urządzenia wynoszącą 33.9 °C / ### class_avg_f### F.
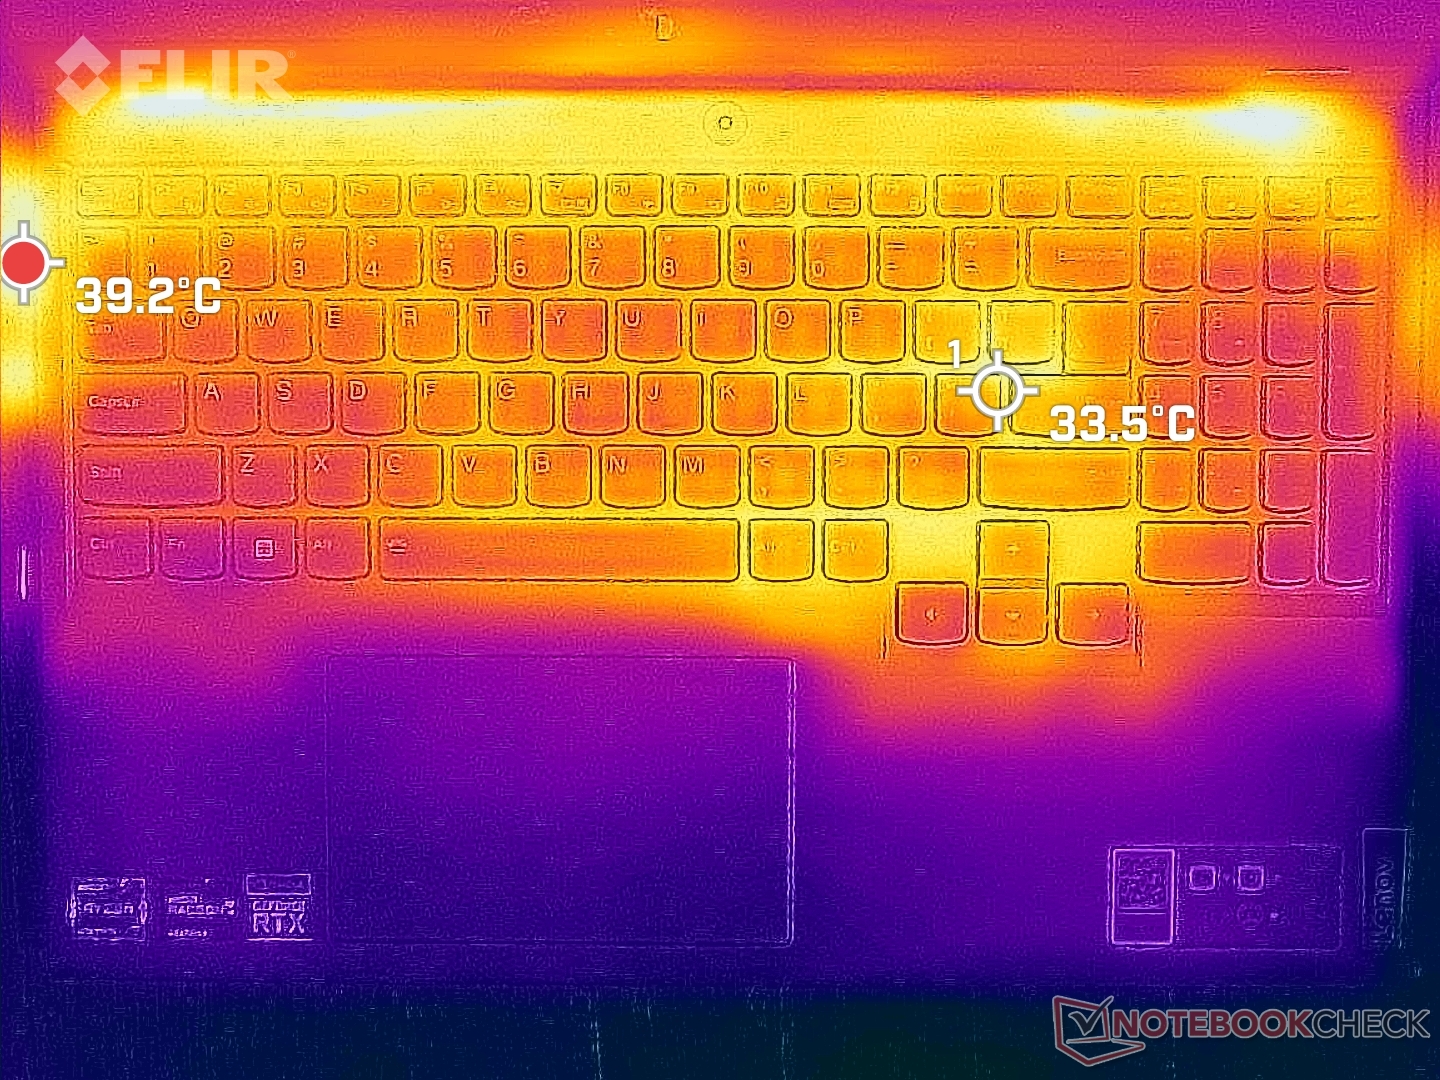
(±) Podczas gry w Wiedźmina 3 średnia temperatura górnej części wynosi 33.5 °C / 92 F, w porównaniu do średniej temperatury urządzenia wynoszącej 33.9 °C / ## #class_avg_f### F.
(+) Podpórki pod nadgarstki i touchpad są chłodniejsze niż temperatura skóry i maksymalnie 29.4 °C / 84.9 F i dlatego są chłodne w dotyku.
(±) Średnia temperatura obszaru podparcia dłoni w podobnych urządzeniach wynosiła 28.8 °C / 83.8 F (-0.6 °C / -1.1 F).
| Lenovo Legion 5 Pro 16ARH7H RTX 3070 Ti AMD Ryzen 7 6800H, NVIDIA GeForce RTX 3070 Ti Laptop GPU | Lenovo Legion 5 Pro 16IAH7H Intel Core i7-12700H, NVIDIA GeForce RTX 3060 Laptop GPU | Asus ROG Zephyrus M16 GU603H Intel Core i9-11900H, NVIDIA GeForce RTX 3070 Laptop GPU | Lenovo Legion 7 16ARHA7 AMD Ryzen 9 6900HX, AMD Radeon RX 6850M XT | HP Victus 16-e0145ng AMD Ryzen 5 5600H, NVIDIA GeForce RTX 3050 Ti Laptop GPU | Dell G16 7620 Intel Core i7-12700H, NVIDIA GeForce RTX 3060 Laptop GPU | |
|---|---|---|---|---|---|---|
| Heat | -7% | -19% | 5% | -12% | 9% | |
| Maximum Upper Side * (°C) | 43.8 | 45.8 -5% | 52 -19% | 37.2 15% | 54 -23% | 47.6 -9% |
| Maximum Bottom * (°C) | 53 | 66.3 -25% | 53 -0% | 43 19% | 47 11% | 54 -2% |
| Idle Upper Side * (°C) | 30 | 30.4 -1% | 38 -27% | 34 -13% | 41 -37% | 23 23% |
| Idle Bottom * (°C) | 31.8 | 30.4 4% | 41 -29% | 32.8 -3% | 31 3% | 24.6 23% |
* ... im mniej tym lepiej
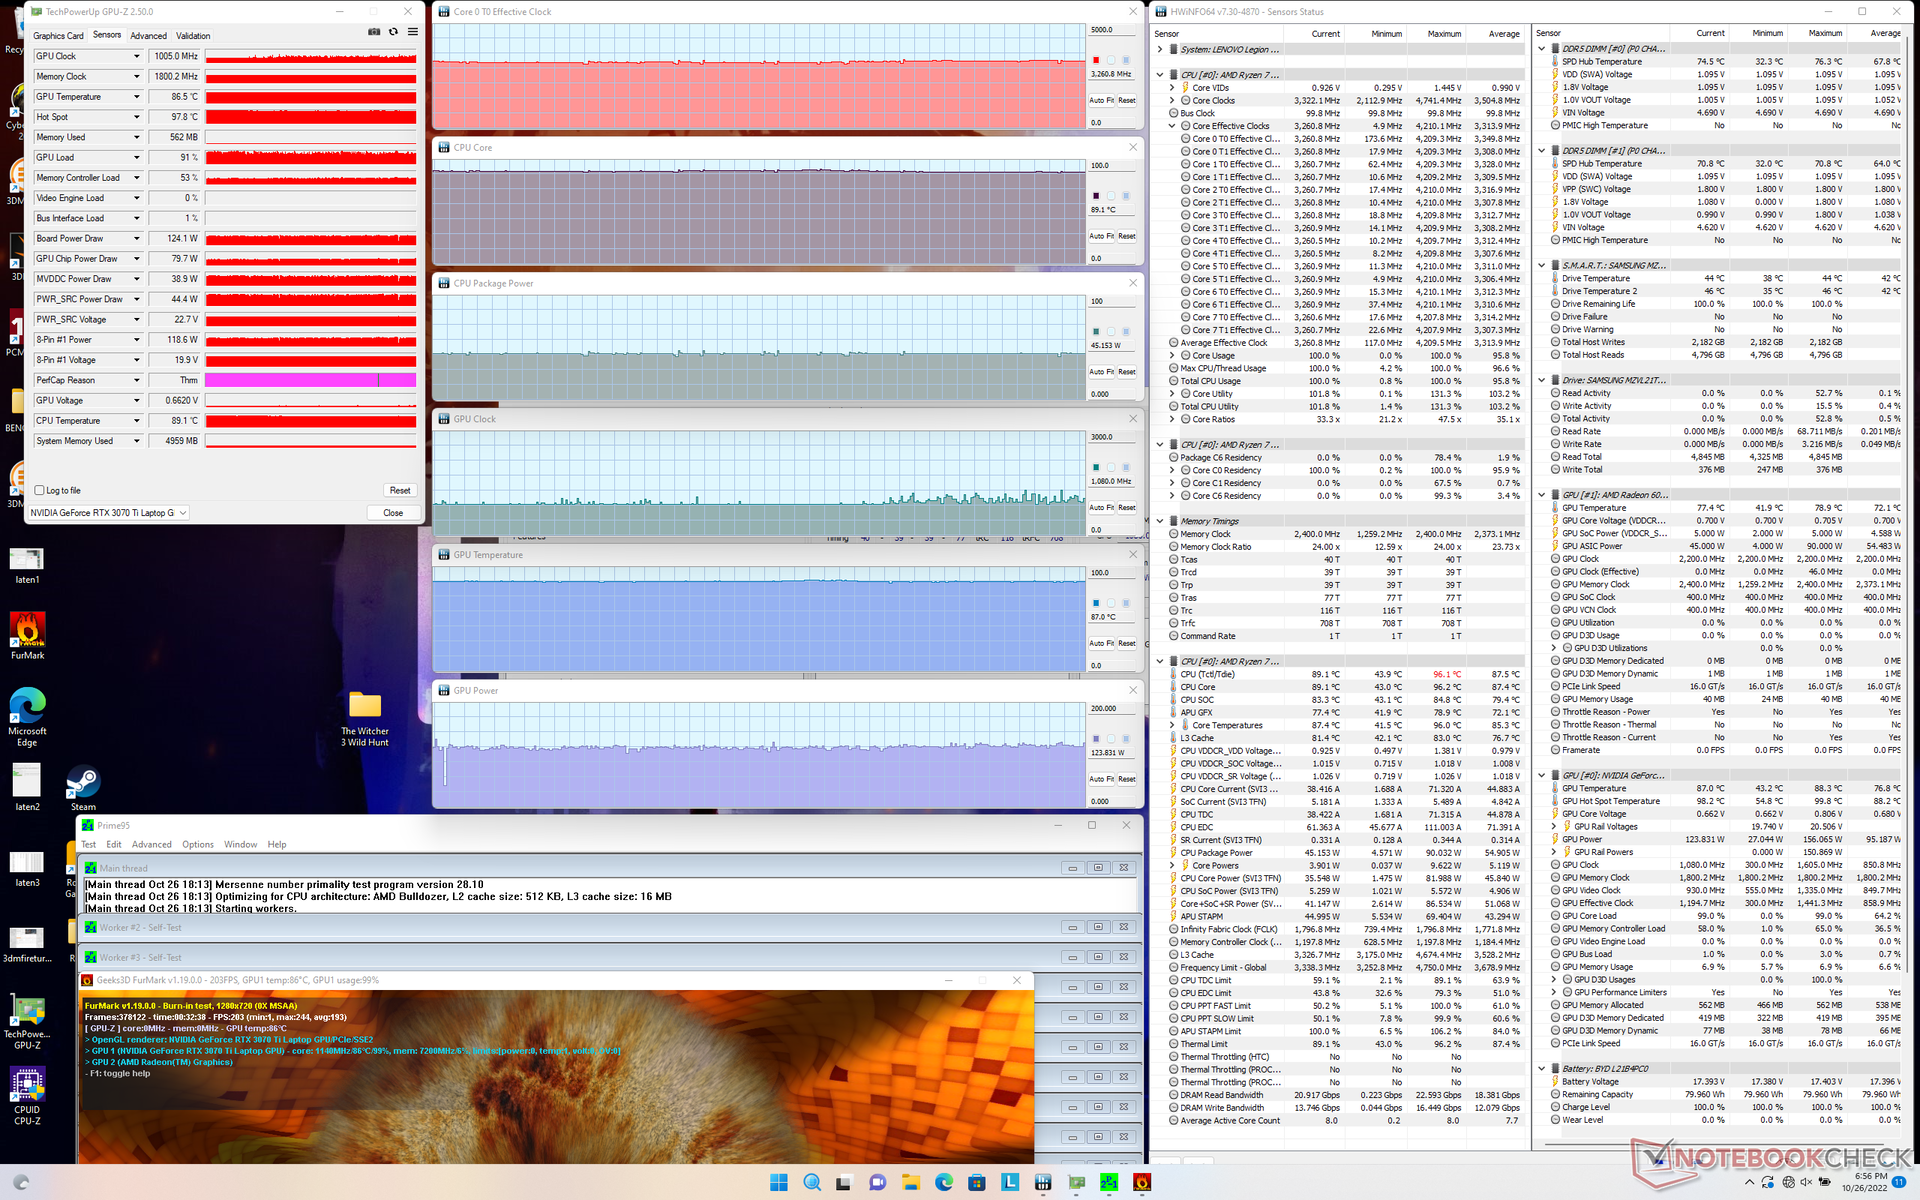
Stress Test
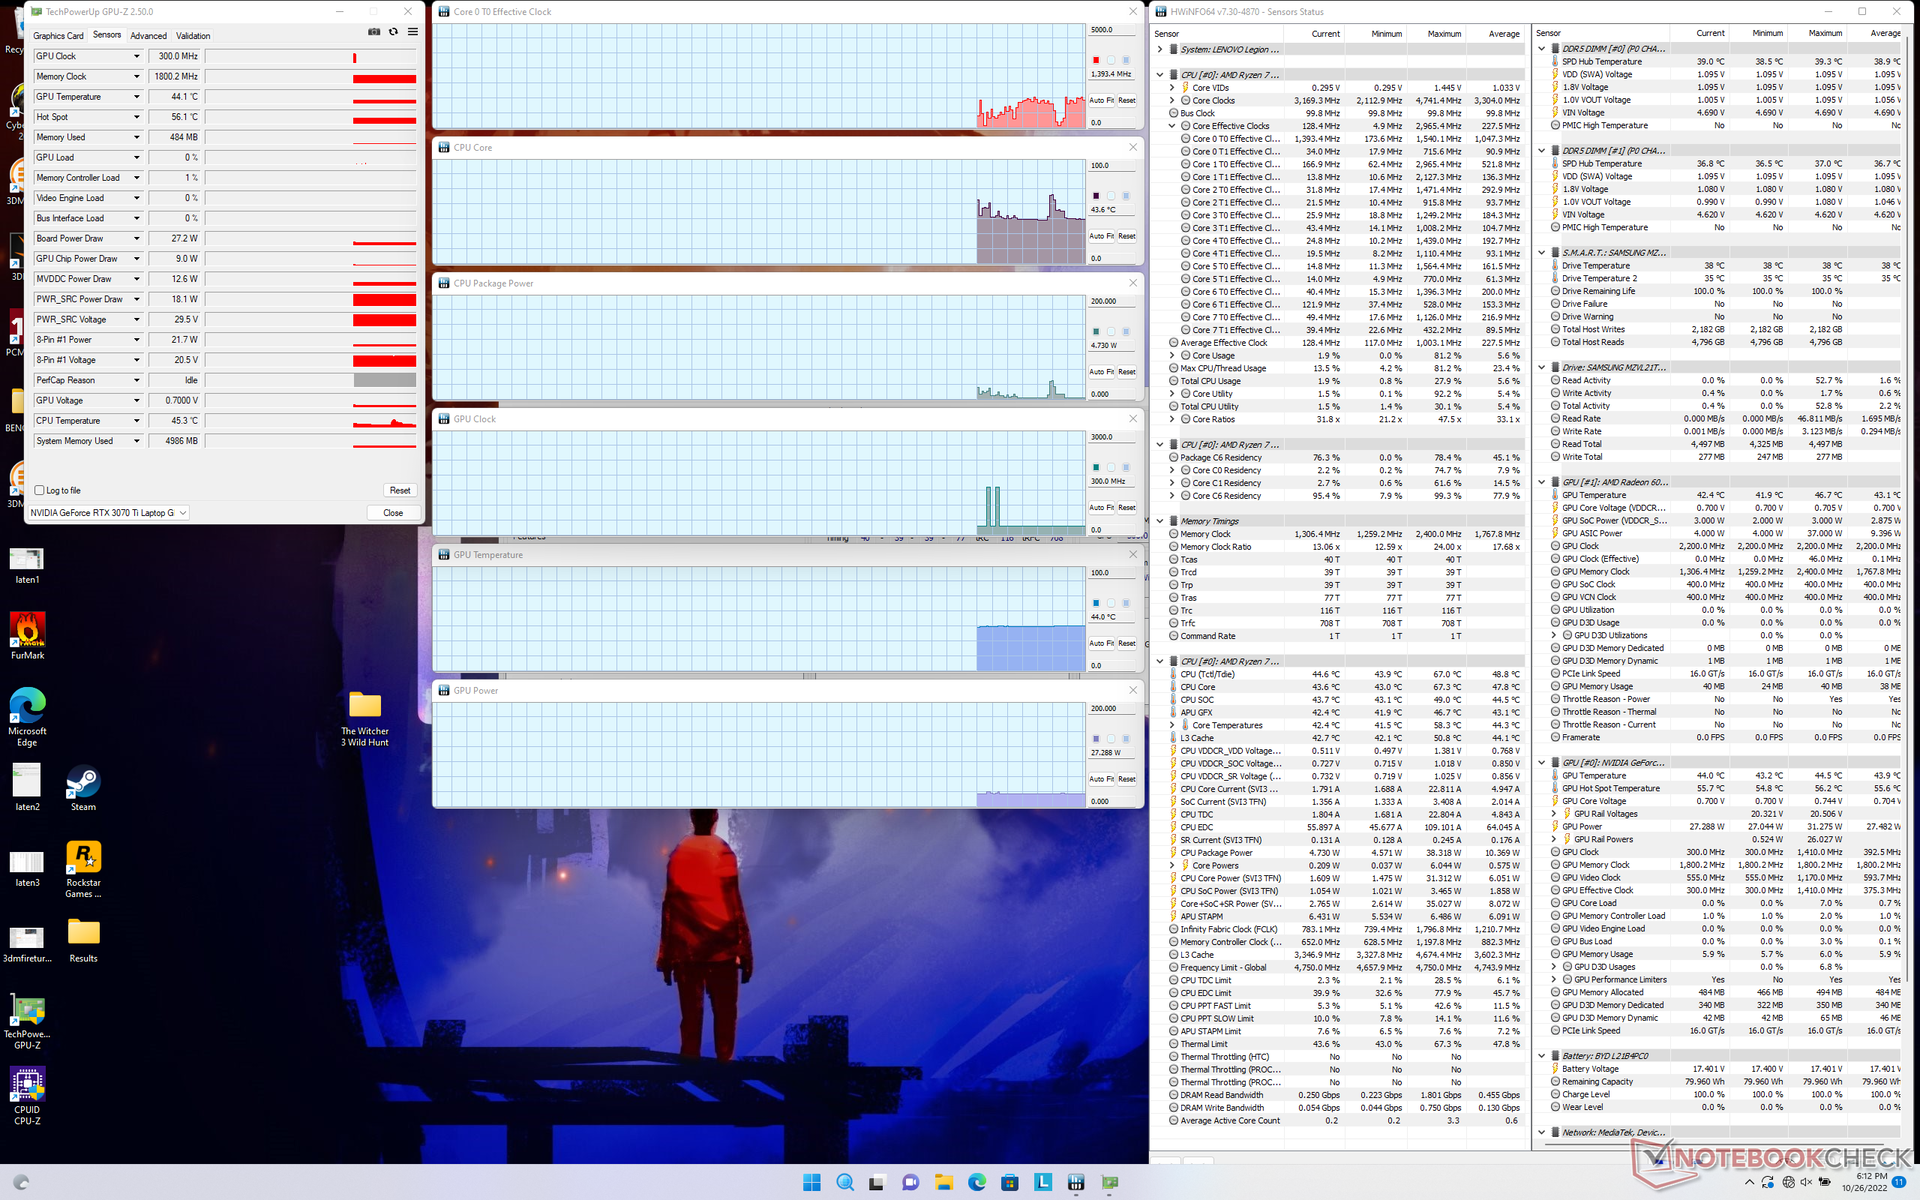
W warunkach stresu związanego z Prime95, procesor mógłby zwiększyć częstotliwość do 4,2 GHz i 90 W w nieskończoność, bez potrzeby dławienia. Niestety temperatury rdzenia stają się bardzo wysokie i wynoszą nieco poniżej 95 C, co jest cieplejsze niż w większości innych laptopów do gier.
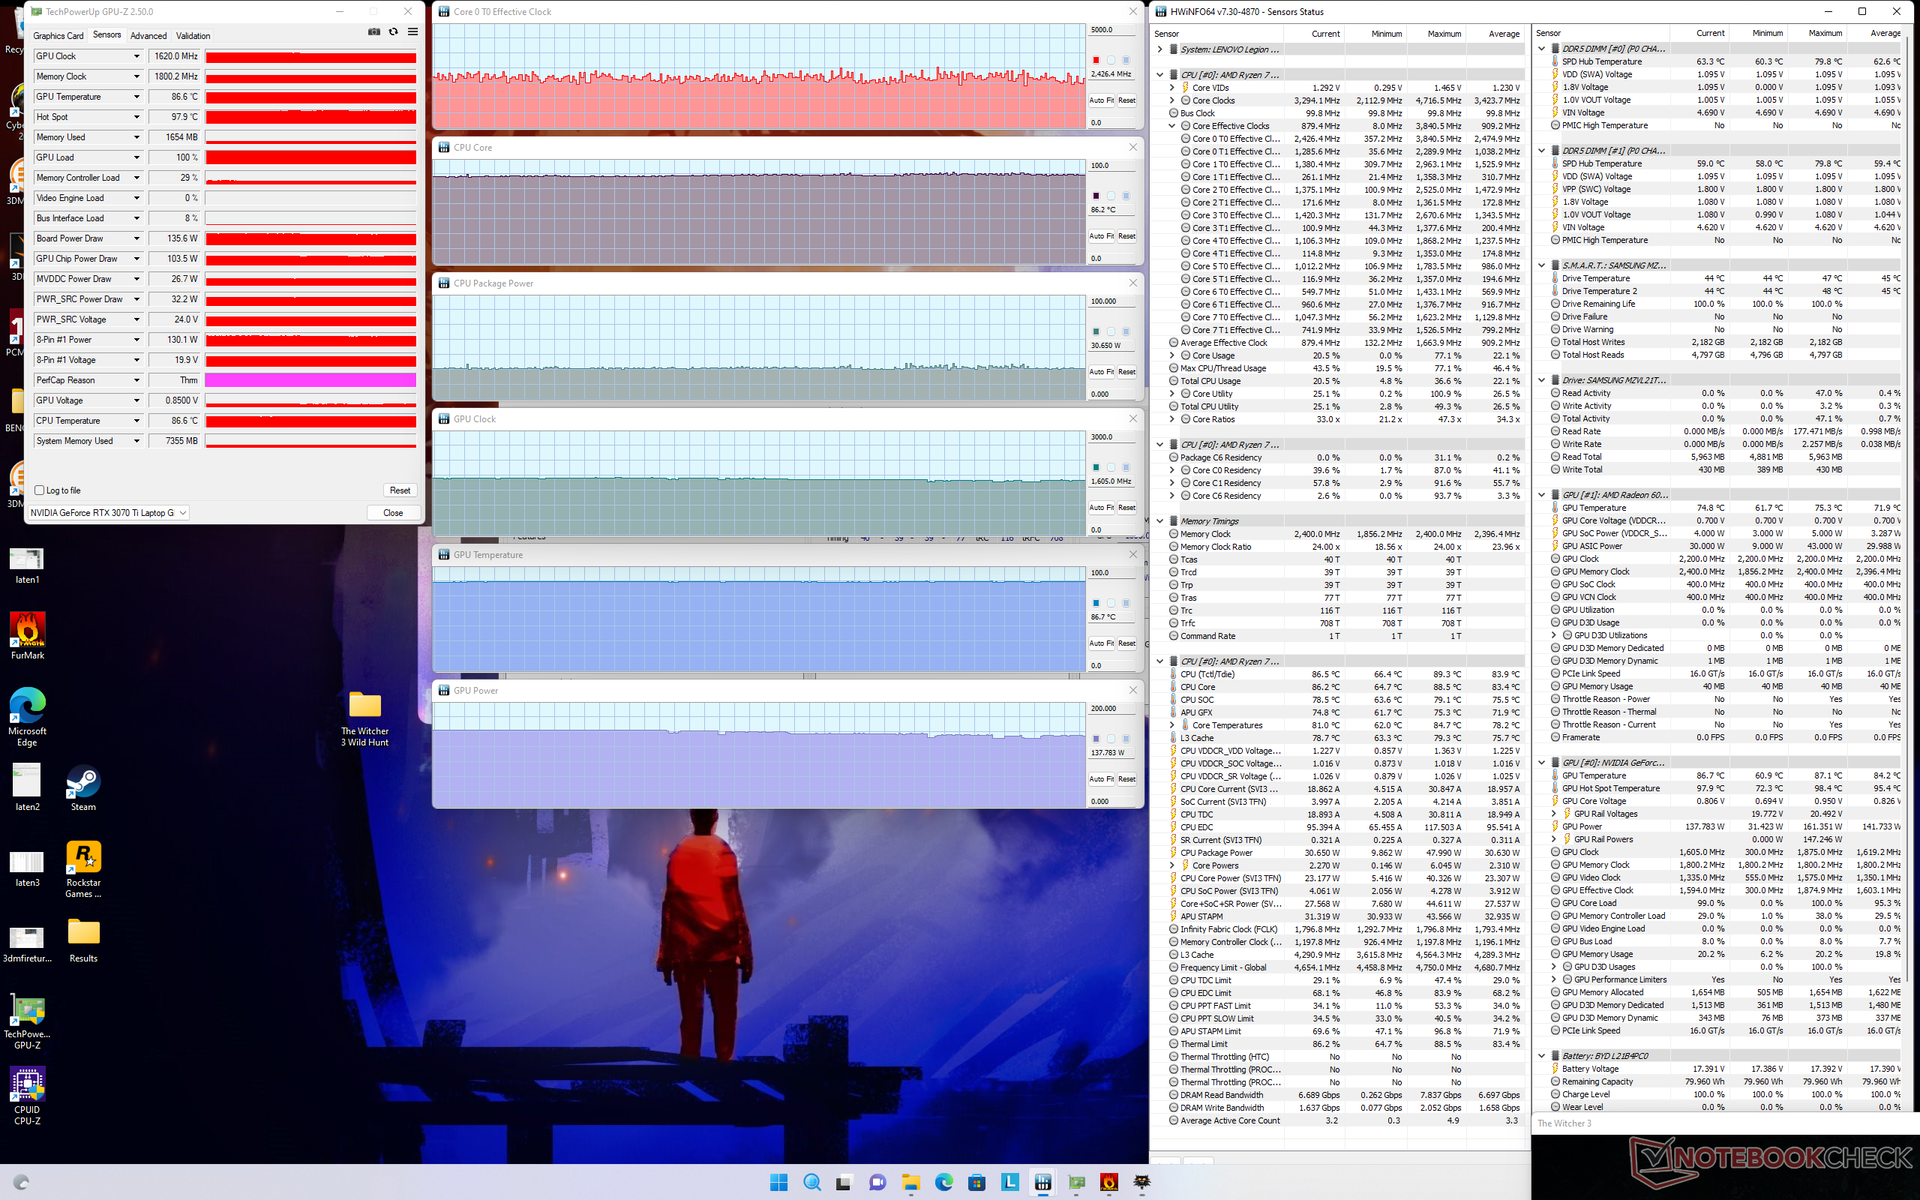
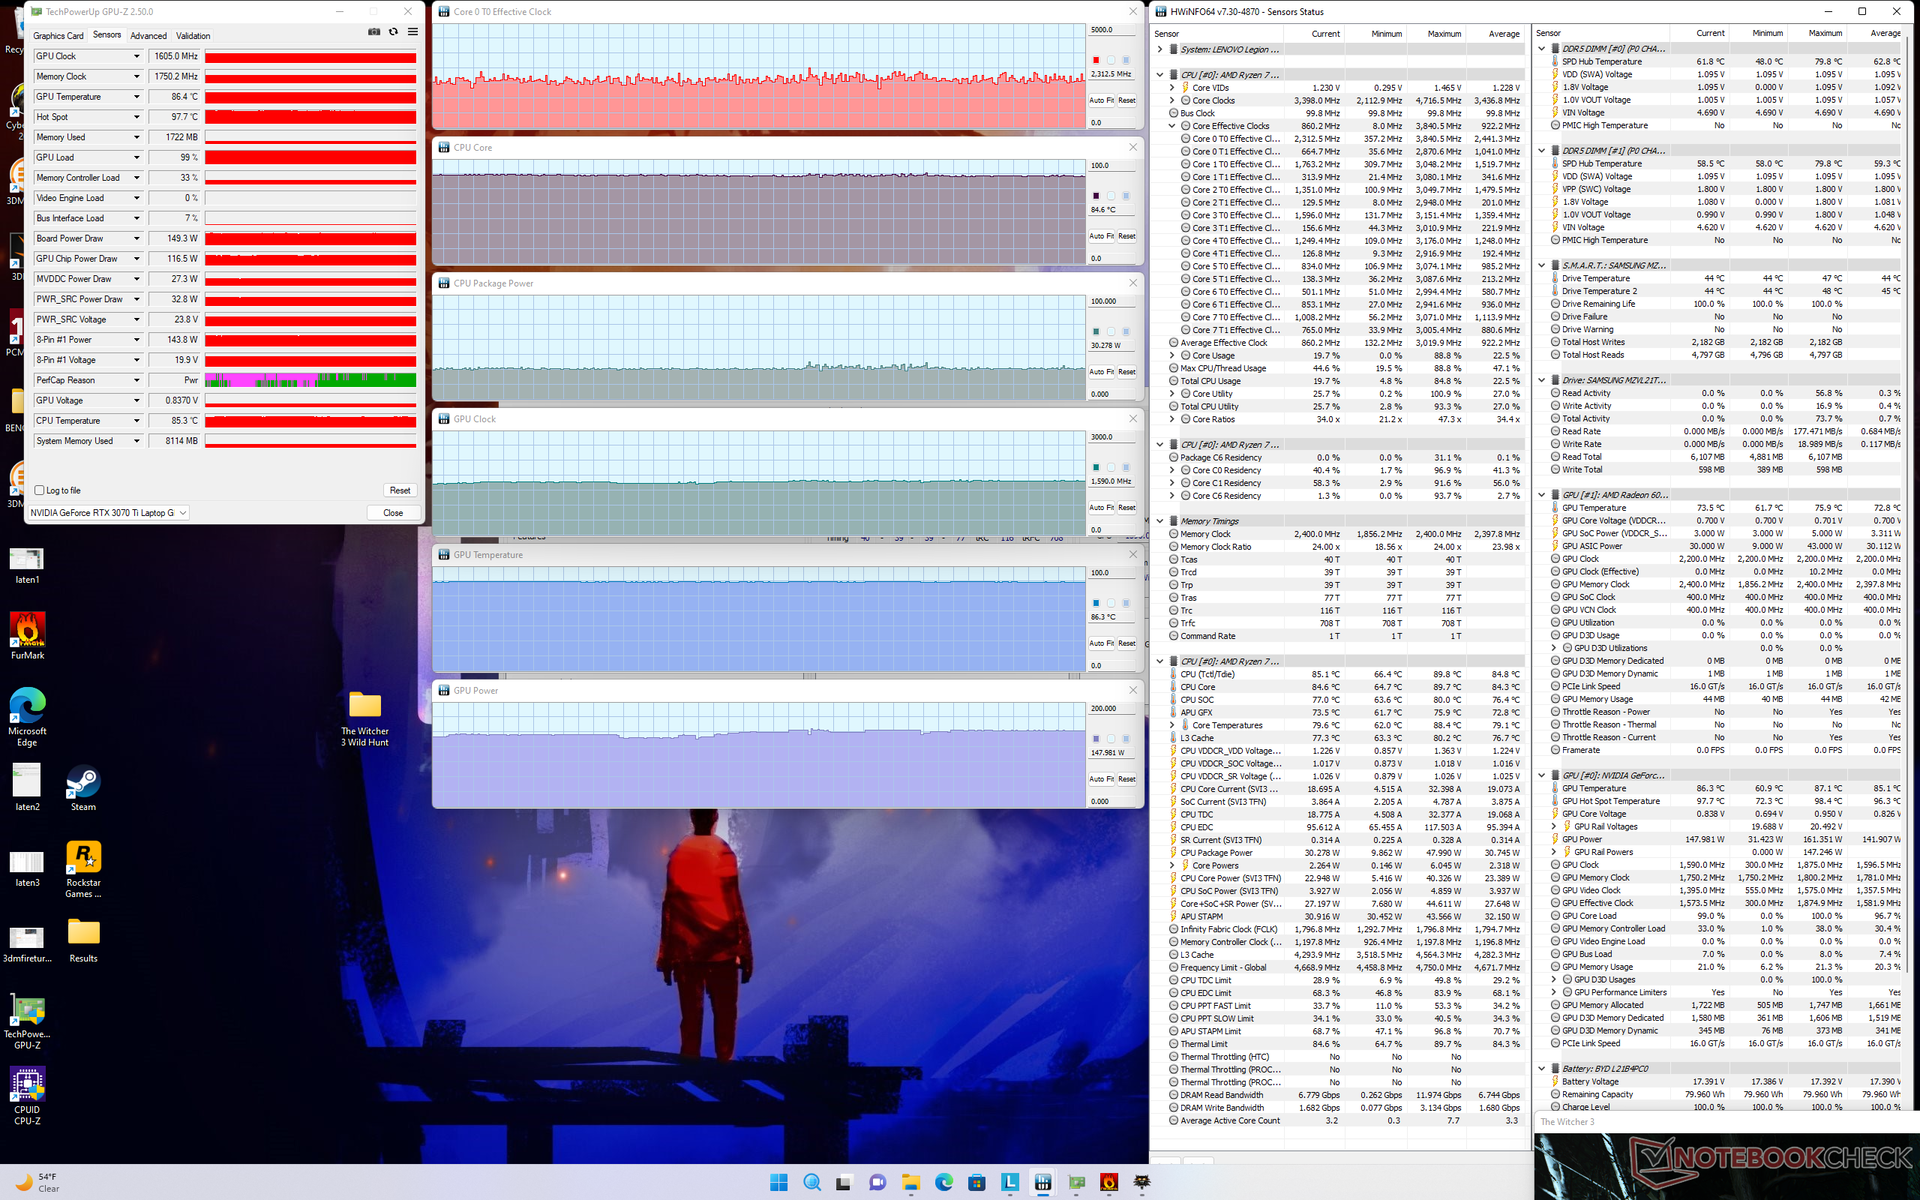
Podczas pracy Witcher 3 z aktywnym trybem Turbo, procesor graficzny Nvidii ustabilizował się na poziomie 1620 MHz dla rdzenia, 1800 MHz dla pamięci i 136 W poboru mocy. Co ciekawe, powtórzenie tego testu z wyłączonym trybem Turbo skutkowało wolniejszymi zegarami rdzenia i pamięci, odpowiednio 1605 MHz i 1750 MHz, ale wyższym poborem mocy na płycie głównej, wynoszącym 149 W. Mimo wszystko warto włączyć tryb Turbo, gdyż wydajność grafiki jest wciąż nieco wyższa, niż przy wyłączonym trybie Turbo.
Praca na zasilaniu akumulatorowym ogranicza wydajność. W teście Fire Strike na akumulatorze wyniki fizyki i grafiki wyniosły odpowiednio 20957 i 13153 pkt. w porównaniu z 27288 i 31289 pkt. na zasilaniu sieciowym.
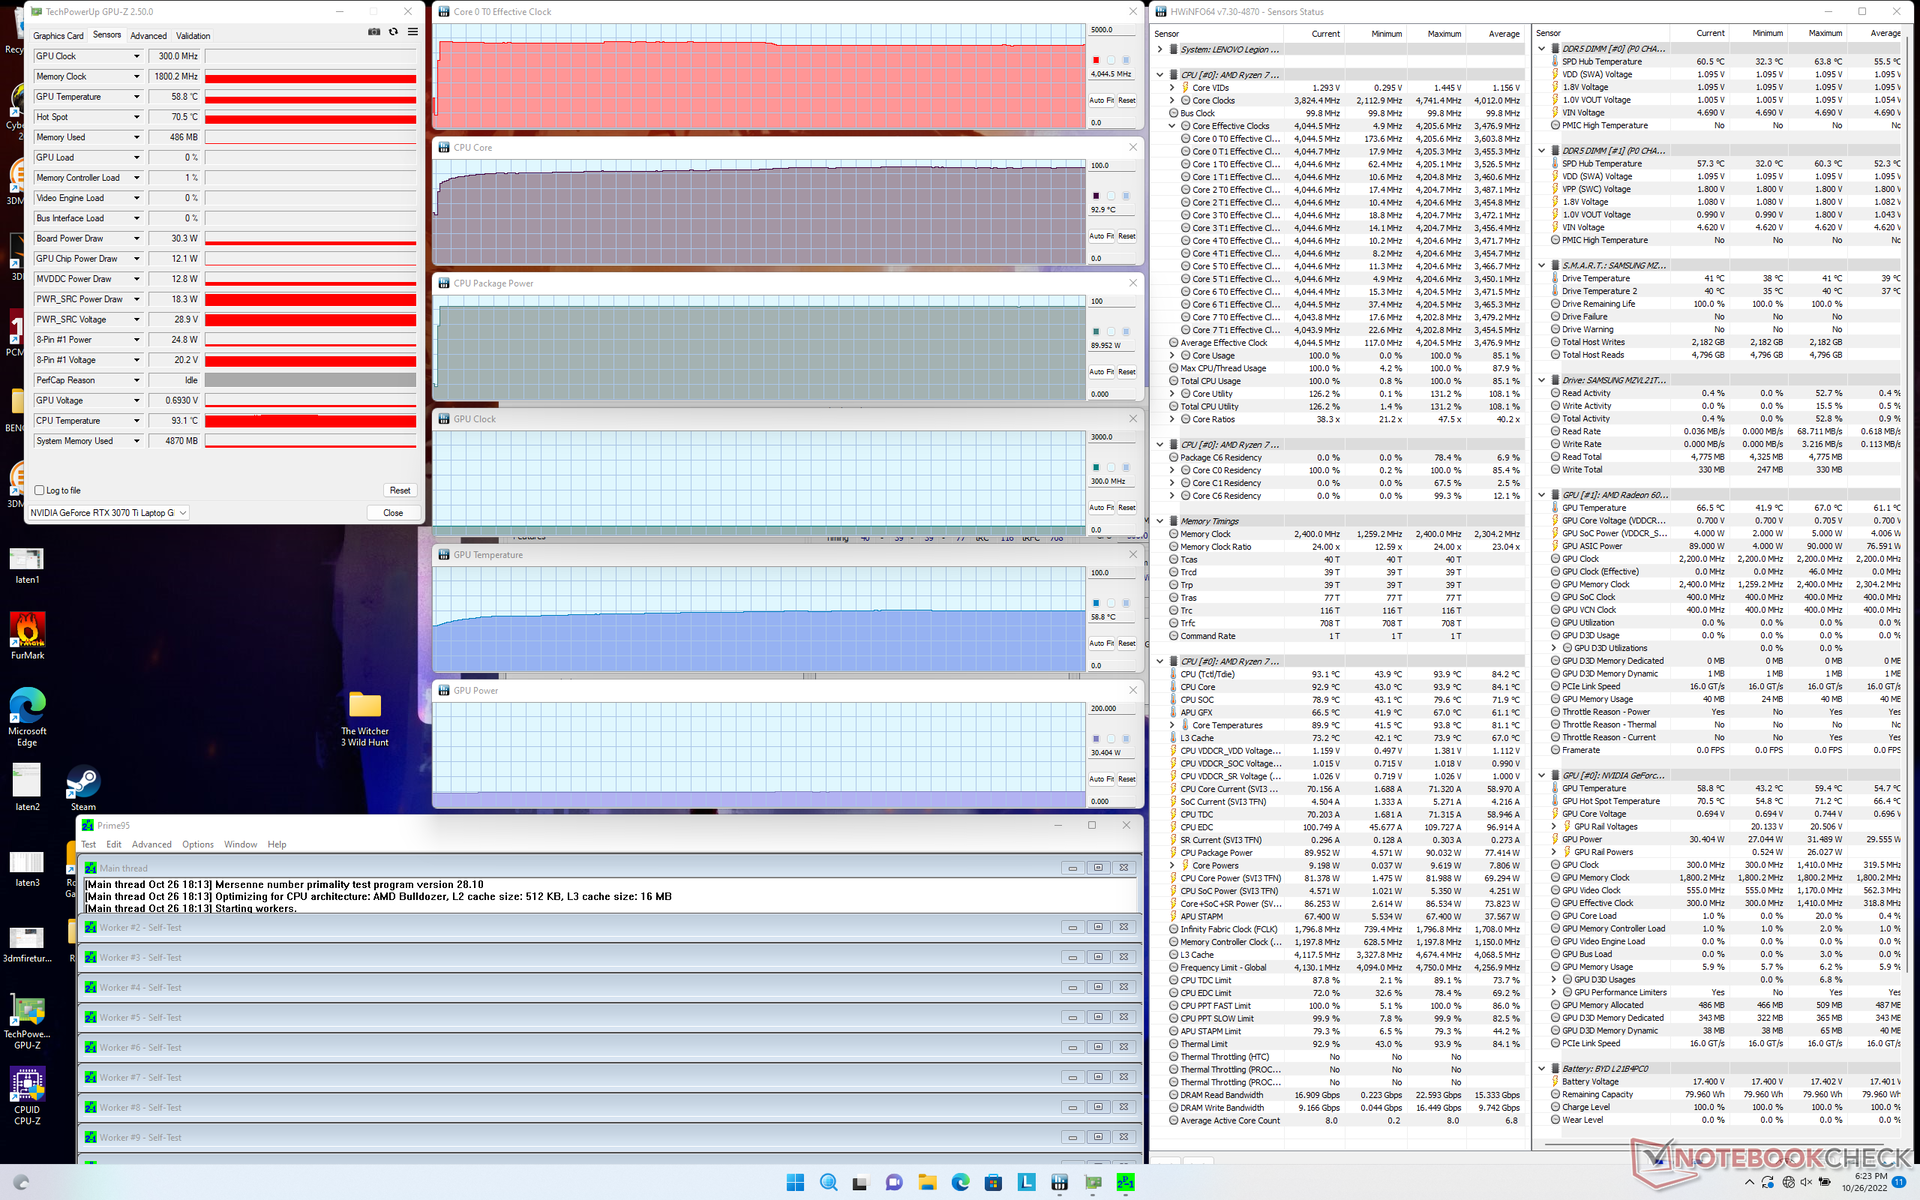
| ZegarCPU (GHz) | Zegar GPU (MHz) | Średnia temperatura CPU (°C) | Średnia temperatura GPU (°C) | |
| System w stanie bezczynności | -- | -- | 44 | 44 |
| Prime95 Stress | 4.1 | -- | 93 | 59 |
| Prime95 + FurMark Stress | 3.3 | 1005 | 89 | 87 |
| Witcher 3 Stress(Turbo on) | ~2.3 | 1620 | 86 | 87 |
| Witcher 3 Stress (Turbo off) | ~2.3 | 1605 | 85 | 86 |
Mówcy
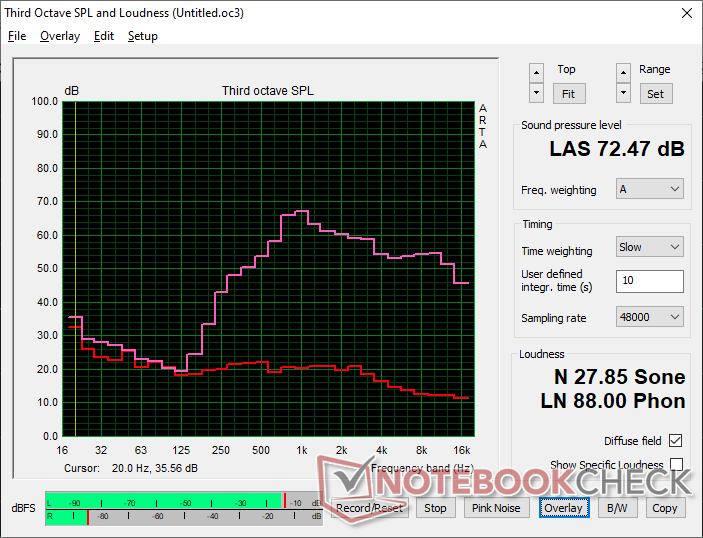
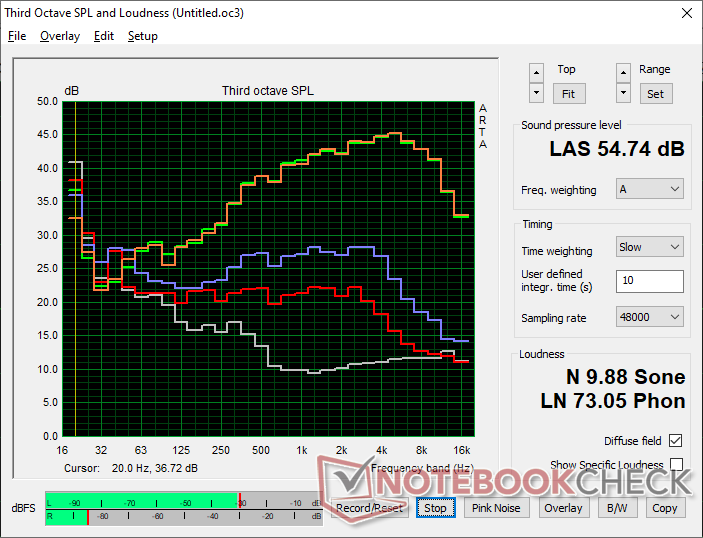
Lenovo Legion 5 Pro 16ARH7H RTX 3070 Ti analiza dźwięku
(±) | głośność głośnika jest średnia, ale dobra (72.5 dB)
Bas 100 - 315 Hz
(-) | prawie brak basu - średnio 22.3% niższa od mediany
(-) | bas nie jest liniowy (15.4% delta do poprzedniej częstotliwości)
Średnie 400 - 2000 Hz
(±) | wyższe średnie - średnio 7.1% wyższe niż mediana
(±) | liniowość środka jest średnia (9.5% delta do poprzedniej częstotliwości)
Wysokie 2–16 kHz
(+) | zrównoważone maksima - tylko 1.9% od mediany
(+) | wzloty są liniowe (3.6% delta do poprzedniej częstotliwości)
Ogólnie 100 - 16.000 Hz
(-) | ogólny dźwięk nie jest liniowy (30.3% różnicy w stosunku do mediany)
W porównaniu do tej samej klasy
» 96% wszystkich testowanych urządzeń w tej klasie było lepszych, 2% podobnych, 3% gorszych
» Najlepszy miał deltę 6%, średnia wynosiła ###średnia###%, najgorsza wynosiła 132%
W porównaniu do wszystkich testowanych urządzeń
» 89% wszystkich testowanych urządzeń było lepszych, 3% podobnych, 9% gorszych
» Najlepszy miał deltę 4%, średnia wynosiła ###średnia###%, najgorsza wynosiła 134%
Asus ROG Zephyrus M16 GU603H analiza dźwięku
(±) | głośność głośnika jest średnia, ale dobra (80 dB)
Bas 100 - 315 Hz
(±) | zredukowany bas - średnio 7.4% niższy od mediany
(±) | liniowość basu jest średnia (9.2% delta do poprzedniej częstotliwości)
Średnie 400 - 2000 Hz
(±) | wyższe średnie - średnio 5.6% wyższe niż mediana
(+) | średnie są liniowe (4% delta do poprzedniej częstotliwości)
Wysokie 2–16 kHz
(+) | zrównoważone maksima - tylko 2.6% od mediany
(+) | wzloty są liniowe (6.7% delta do poprzedniej częstotliwości)
Ogólnie 100 - 16.000 Hz
(+) | ogólny dźwięk jest liniowy (12.1% różnicy w stosunku do mediany)
W porównaniu do tej samej klasy
» 12% wszystkich testowanych urządzeń w tej klasie było lepszych, 4% podobnych, 84% gorszych
» Najlepszy miał deltę 6%, średnia wynosiła ###średnia###%, najgorsza wynosiła 132%
W porównaniu do wszystkich testowanych urządzeń
» 9% wszystkich testowanych urządzeń było lepszych, 2% podobnych, 88% gorszych
» Najlepszy miał deltę 4%, średnia wynosiła ###średnia###%, najgorsza wynosiła 134%
Zarządzanie energią - wymagająca maszyna
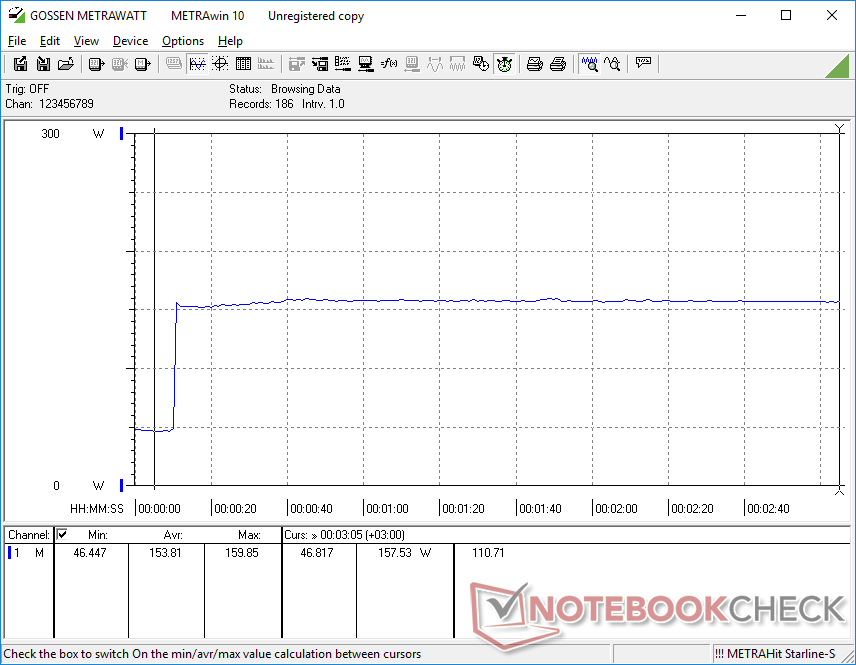
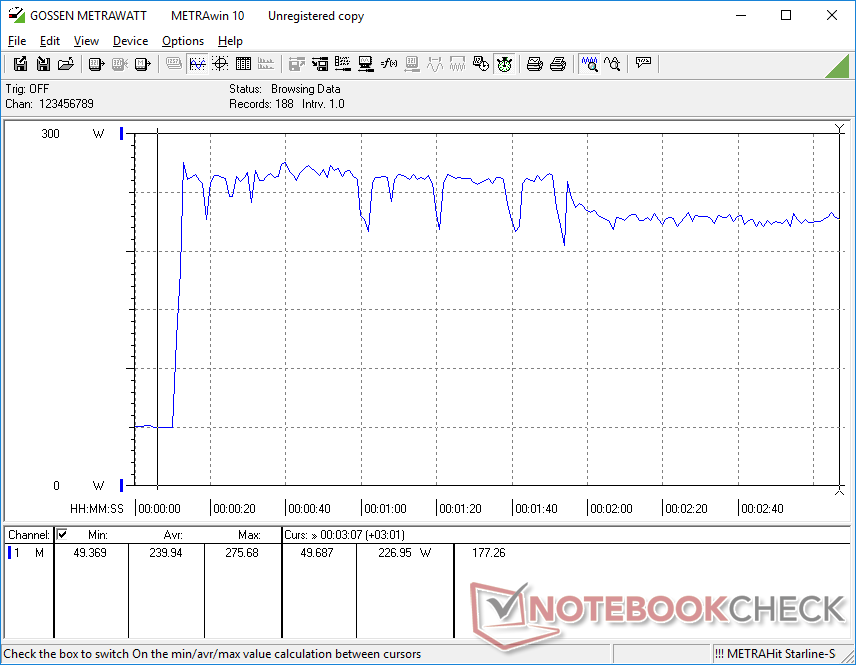
Pobór mocy
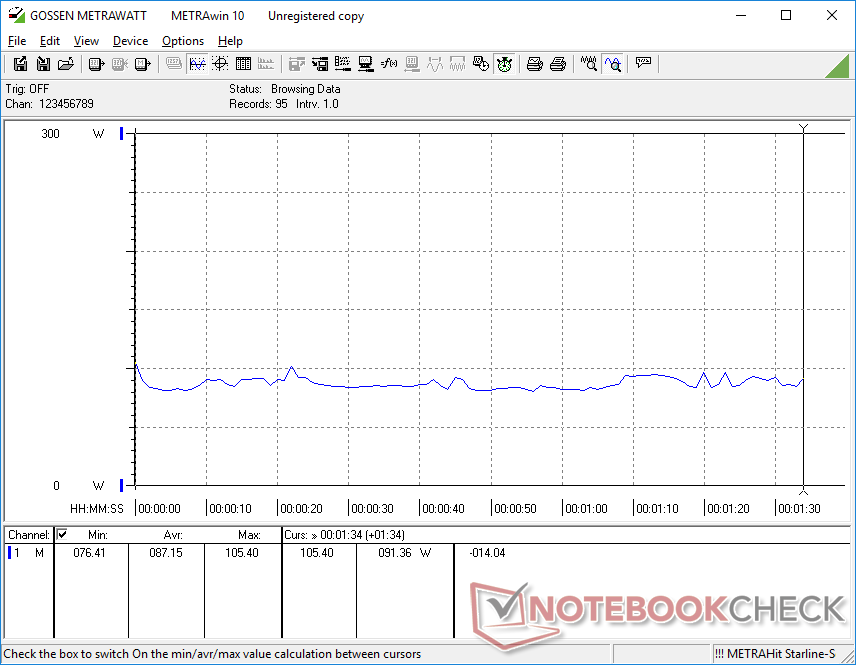
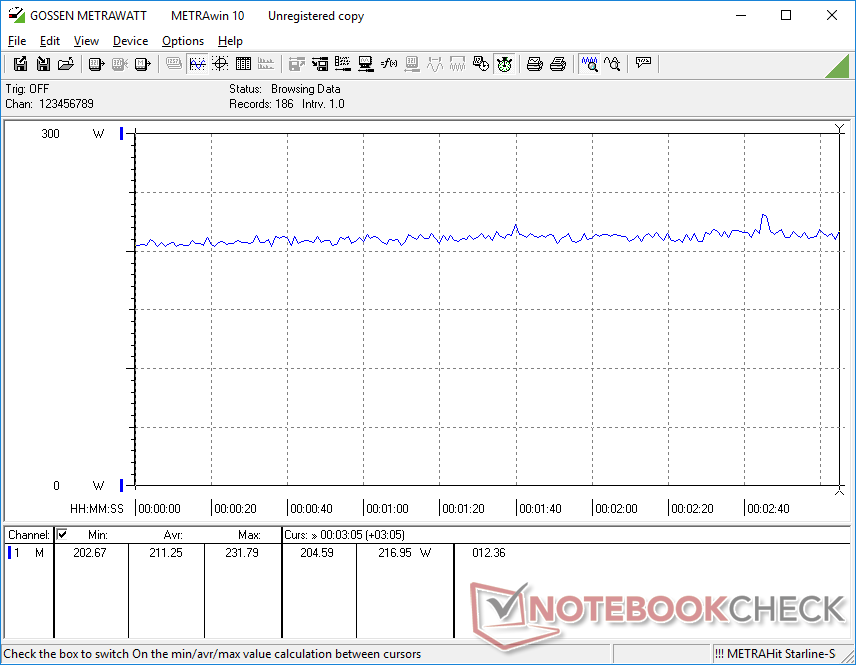
Choć Ryzen 7 6800H jest o około 25 procent wolniejszy od Core i7-12700H, niekoniecznie jest o 25 procent bardziej energooszczędny. W rzeczywistości zużycie energii pomiędzy wersjami AMD i Intela na Legion 5 Pro 16 wynosi około 160 W na każdym systemie podczas uruchamiania Prime95. Pobór mocy pozostaje również dość podobny pomiędzy nimi podczas uruchamiania Witcher 3
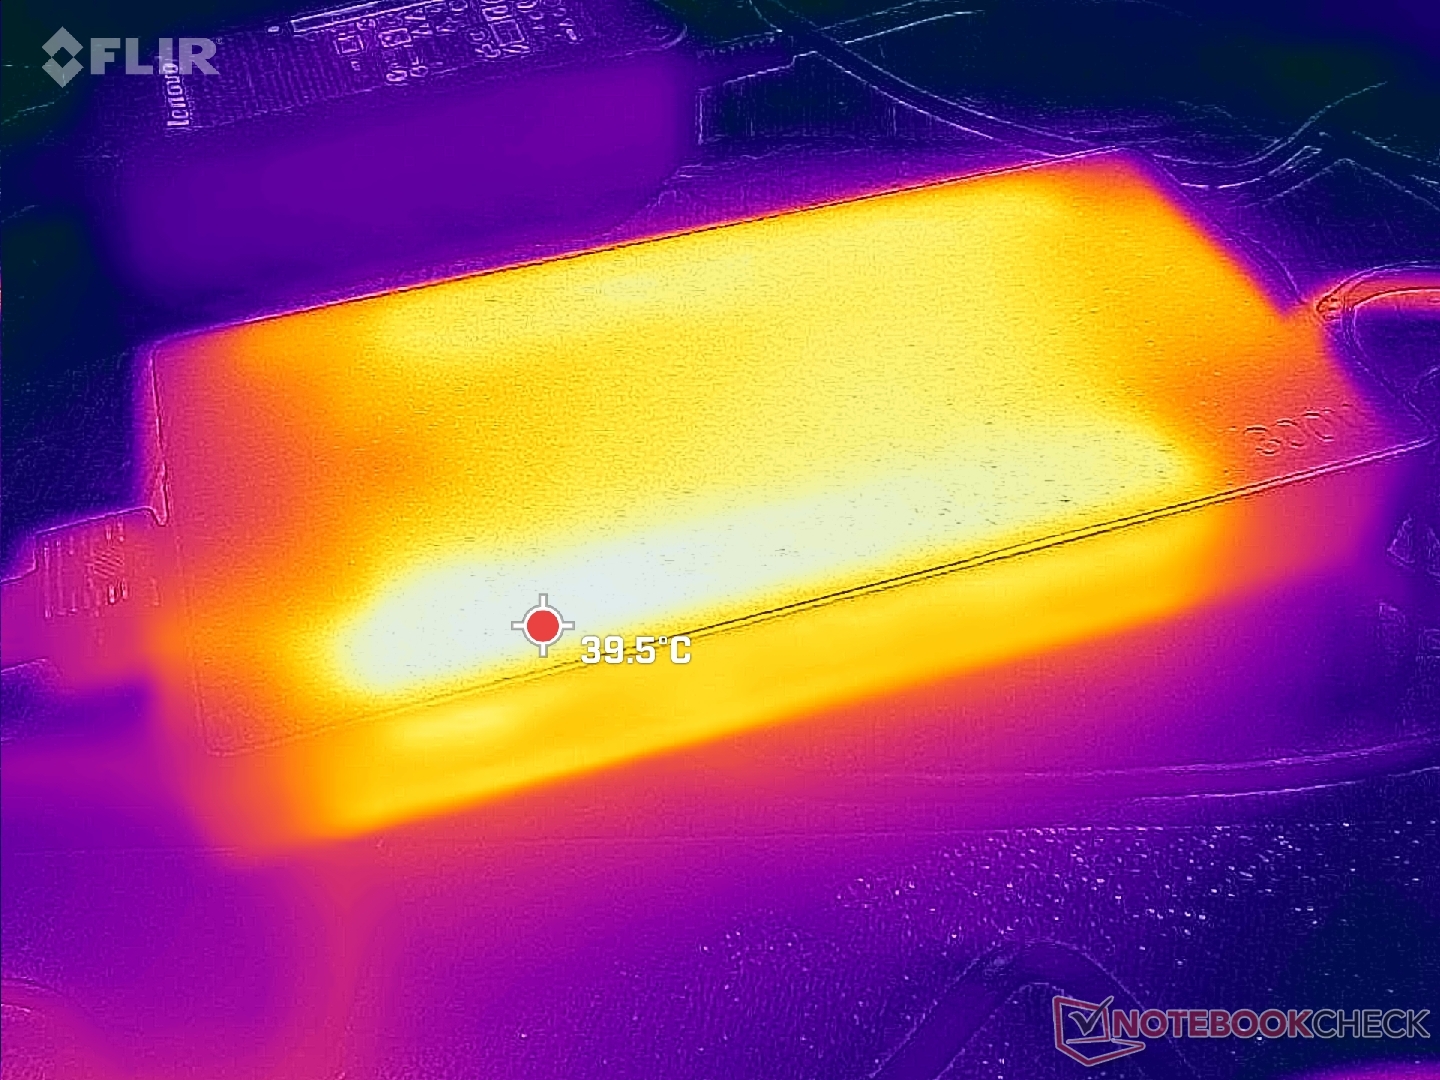
Udało nam się zarejestrować chwilowy maksymalny pobór 275 W z dużego (~19,9 x 9,8 x 2,6 cm) zasilacza sieciowego 300 W, gdy zarówno CPU jak i GPU są wykorzystywane w 100 procentach. System może ładować się w rozsądnym tempie i jednocześnie uruchamiać wymagające obciążenia.
| wyłączony / stan wstrzymania | |
| luz | |
| obciążenie |
|
Legenda:
min: | |
| Lenovo Legion 5 Pro 16ARH7H RTX 3070 Ti R7 6800H, GeForce RTX 3070 Ti Laptop GPU, Samsung PM9A1 MZVL21T0HCLR, IPS, 2560x1600, 16" | Lenovo Legion 5 Pro 16IAH7H i7-12700H, GeForce RTX 3060 Laptop GPU, 2x Samsung PM9A1 MZVL21T0HCLR (RAID 0), IPS, 2560x1600, 16" | Asus ROG Zephyrus M16 GU603H i9-11900H, GeForce RTX 3070 Laptop GPU, Samsung PM9A1 MZVL22T0HBLB, IPS, 2560x1600, 16" | Lenovo Legion 7 16ARHA7 R9 6900HX, Radeon RX 6850M XT, Samsung PM9A1 MZVL22T0HBLB, IPS, 2560x1600, 16" | HP Victus 16-e0145ng R5 5600H, GeForce RTX 3050 Ti Laptop GPU, Samsung SSD PM981a MZVLB512HBJQ, IPS, 1920x1080, 16.1" | Dell G16 7620 i7-12700H, GeForce RTX 3060 Laptop GPU, WDC PC SN810 512GB, IPS, 2560x1600, 16" | |
|---|---|---|---|---|---|---|
| Power Consumption | -50% | 2% | -5% | 33% | -4% | |
| Idle Minimum * (Watt) | 9.7 | 22.8 -135% | 11 -13% | 9.9 -2% | 7 28% | 14.4 -48% |
| Idle Average * (Watt) | 14.8 | 26.5 -79% | 20 -35% | 22 -49% | 9 39% | 17.8 -20% |
| Idle Maximum * (Watt) | 45.8 | 41 10% | 30 34% | 23.1 50% | 15 67% | 31.5 31% |
| Load Average * (Watt) | 87.2 | 191 -119% | 111 -27% | 94.4 -8% | 93 -7% | 101.2 -16% |
| Witcher 3 ultra * (Watt) | 209 | 194.7 7% | 156 25% | 249 -19% | 134.5 36% | 176.9 15% |
| Load Maximum * (Watt) | 275.3 | 238 14% | 197 28% | 276 -0% | 185 33% | 242.9 12% |
* ... im mniej tym lepiej
Power Consumption Witcher 3 / Stresstest
Power Consumption external Monitor
Czas pracy na baterii - nienajgorszy
Czas pracy w sieci WLAN jest o prawie godzinę dłuższy niż w przypadku wersji Intela Legion 5 Pro 16 przy ustawieniu profilu zasilania Balanced z aktywnym iGPU. Lepszy czas pracy na baterii to prawdopodobnie zasługa bardziej wydajnego procesora AMD przy mniejszym obciążeniu, jak wynika z naszej sekcji Zużycie energii powyżej. Niemniej jednak, nadal jest on stosunkowo krótki i wynosi niecałe 4,5 godziny w porównaniu do prawie 8 godzin w Asusie ROG Zephyrus M16.
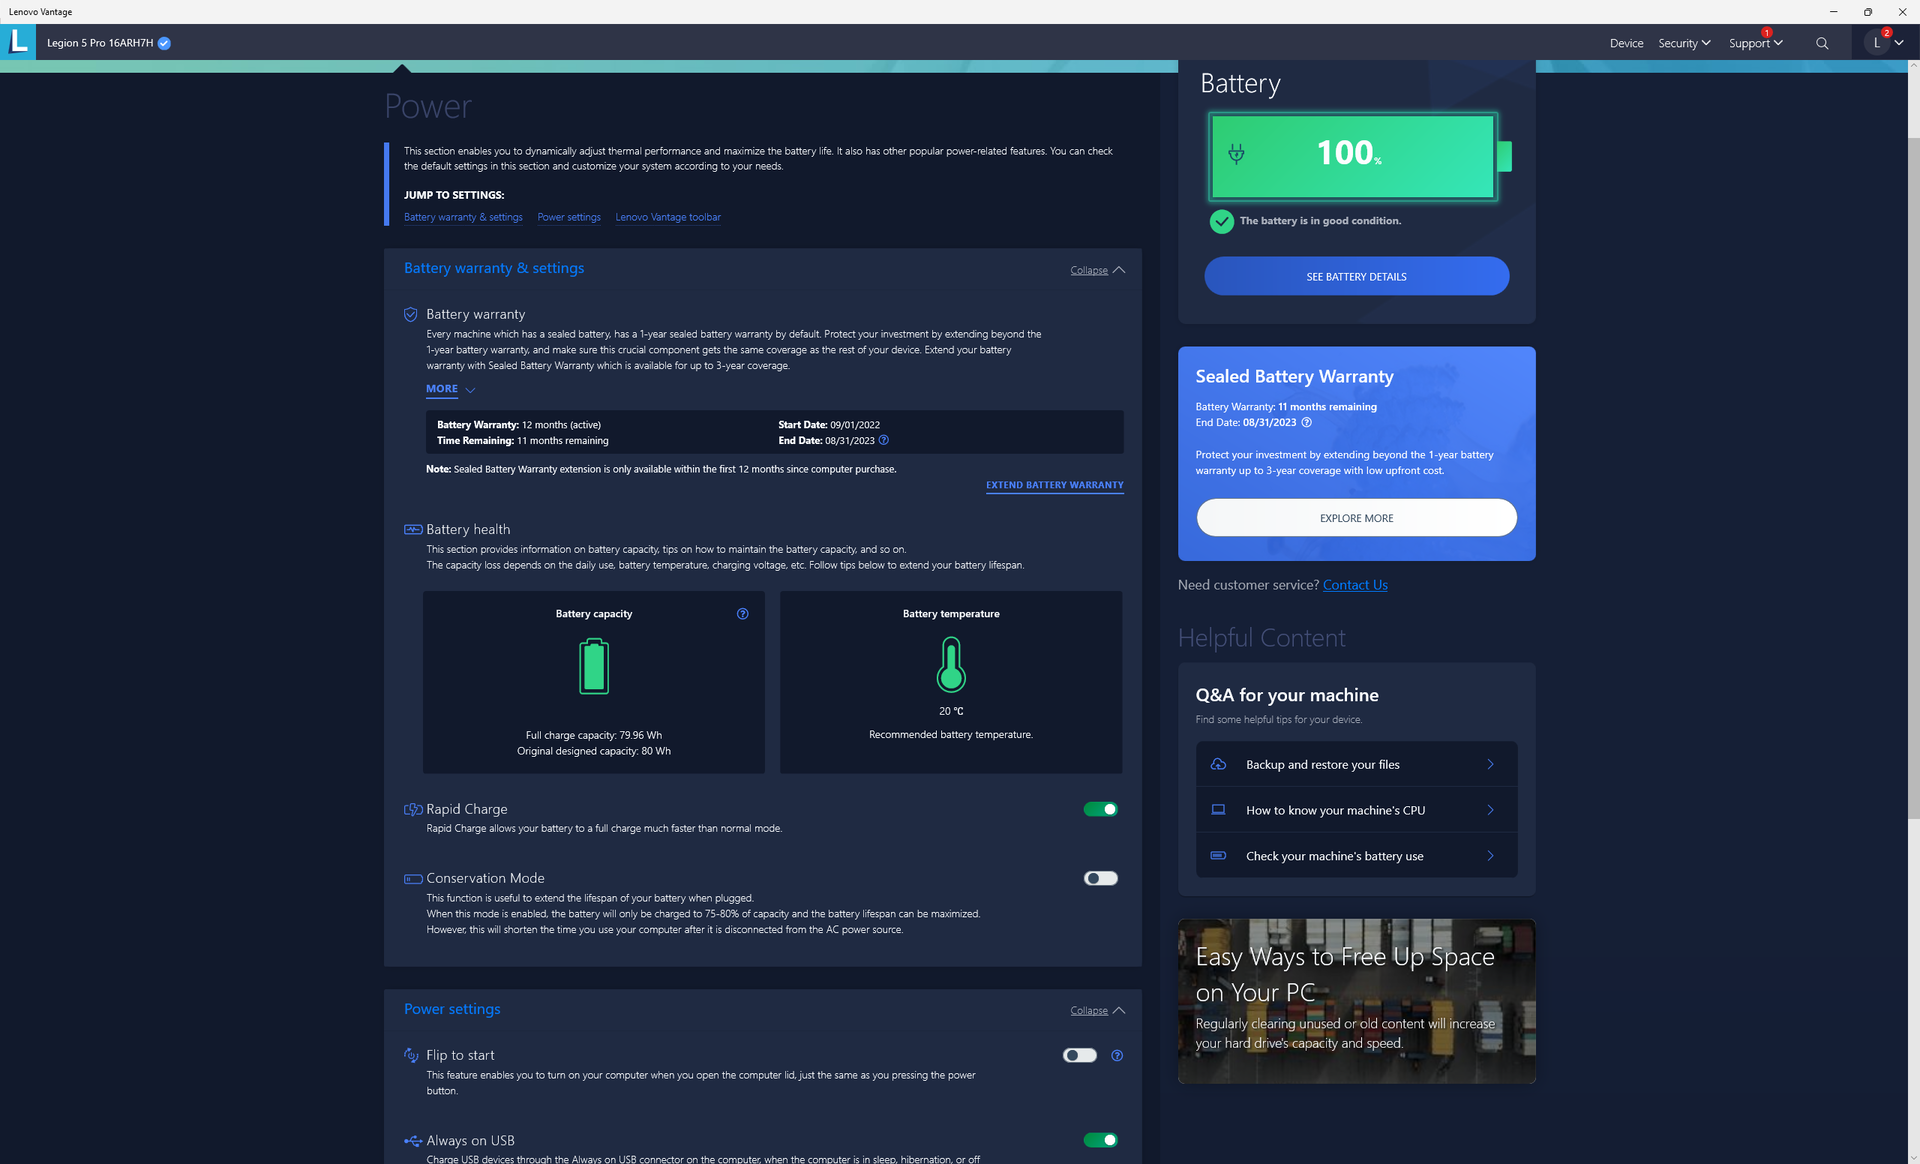
Ładowanie od stanu pustego do pełnego trwa nieco poniżej godziny, gdy włączona jest funkcja Rapid Charge. Większości innych laptopów zajmuje to od 1,5 do 2 godzin.
| Lenovo Legion 5 Pro 16ARH7H RTX 3070 Ti R7 6800H, GeForce RTX 3070 Ti Laptop GPU, 80 Wh | Lenovo Legion 5 Pro 16IAH7H i7-12700H, GeForce RTX 3060 Laptop GPU, 80 Wh | Asus ROG Zephyrus M16 GU603H i9-11900H, GeForce RTX 3070 Laptop GPU, 90 Wh | Lenovo Legion 7 16ARHA7 R9 6900HX, Radeon RX 6850M XT, 99 Wh | HP Victus 16-e0145ng R5 5600H, GeForce RTX 3050 Ti Laptop GPU, 70 Wh | Dell G16 7620 i7-12700H, GeForce RTX 3060 Laptop GPU, 84 Wh | |
|---|---|---|---|---|---|---|
| Czasy pracy | -18% | 75% | 66% | 61% | 14% | |
| WiFi v1.3 (h) | 4.4 | 3.6 -18% | 7.7 75% | 7.3 66% | 7.1 61% | 5 14% |
| H.264 (h) | 4.1 | |||||
| Witcher 3 ultra (h) | 2.1 | |||||
| Load (h) | 0.6 | 1.6 | 1.8 | 0.7 | ||
| Reader / Idle (h) | 13.3 | 4.9 | 7.1 |
Za
Przeciw
Werdykt - Tylko trochę szybciej
Ryzen 7 6800H i 150 W GeForce RTX 3070 Ti są po około 10 procent szybsze niż Ryzen 7 5800H i 140 W GeForce RTX 3070 w zeszłorocznym Legion 5 Pro. Odświeżenie z 2022 roku jest więc jedynie drobną aktualizacją w stosunku do modelu z 2021 roku, bez większych zmian zewnętrznych i wewnętrznych.
Jeśli posiadasz już Lenovo Legion 5 Pro 16 z 2021 roku, to pomijając wersję 2022 niewiele tracisz. Lenovo prawdopodobnie w pełni odświeży serię w ciągu najbliższego roku lub dwóch lat, aby wprowadzić więcej istotnych ulepszeń.
Najbliższymi alternatywami dla Legion 5 Pro 16 są obecnie Dell G16 oraz Asus ROG Zephyrus M16 każde z nich ma podobną częstotliwość odświeżania 165 Hz i opcje procesorów z serii H. Model Asusa jest znacznie mniejszy i lżejszy, ale działa jeszcze cieplej i jest równie głośny. Tymczasem model Della działa ciszej, ale jego rozmiar i temperatury rdzenia są nieco cieplejsze i cięższe od już ciepłego i ciężkiego Lenovo.
W przyszłych rewizjach chętnie zobaczylibyśmy chłodniejsze temperatury rdzenia i bardziej proste oprogramowanie do kontroli wydajności. W obecnej wersji Vantage użytkownicy muszą indywidualnie włączyć cztery oddzielne ustawienia (MUX, GPU Overclock, Vantage Performance i tryby Windows Performance), by w pełni wykorzystać moc laptopa, co może być irytujące przy przełączaniu się między różnymi trybami zasilania.
Cena i dostępność
Lenovo Legion 5 Pro 16ARH7H RTX 3070 Ti
- 29/10/2022 v7 (old)
Allen Ngo
Price comparison

