Recenzja laptopa Alienware x15 R2: Ultrabook-like UFO wznosi się na wyżyny dzięki Core i9-12900H i 140 W RTX 3080 Ti
Minęło już trochę czasu, odkąd Dell wymienił m.in Alienware m15 serią x15. Seria x15 w zasadzie sportuje ten sam język projektowy co m15's Legend chassis, ale jest teraz smuklejsza. W tym roku mamy Alienware x15 R2 oraz Alienware x17 R2 walczą o kawałek twojego ciężko zarobionego ciasta.
Wcześniej recenzowaliśmy Alienware x15 R1 i Alienware x17 R2, więc teraz nadszedł czas, aby sprawdzić również Alienware x15 R2 i zobaczyć, co ma w zanadrzu tegoroczny refresh z Alder Lake-H.
Tegoroczny Alienware x15 R2 to mniej więcej rehash ostatniego modelu x15 R1. Widzimy jednak kilka bardzo potrzebnych wewnętrznych ulepszeń, w tym aktualizacje do Intel 12 gen Alder Lake-H, grafiki Nvidia RTX 30 Ti, wyświetlaczy Dolby Vision i innych
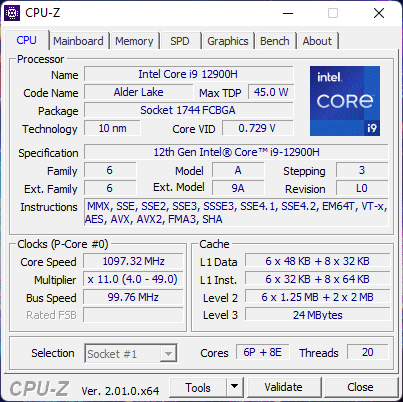
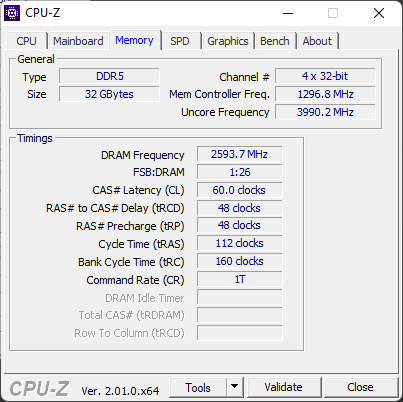
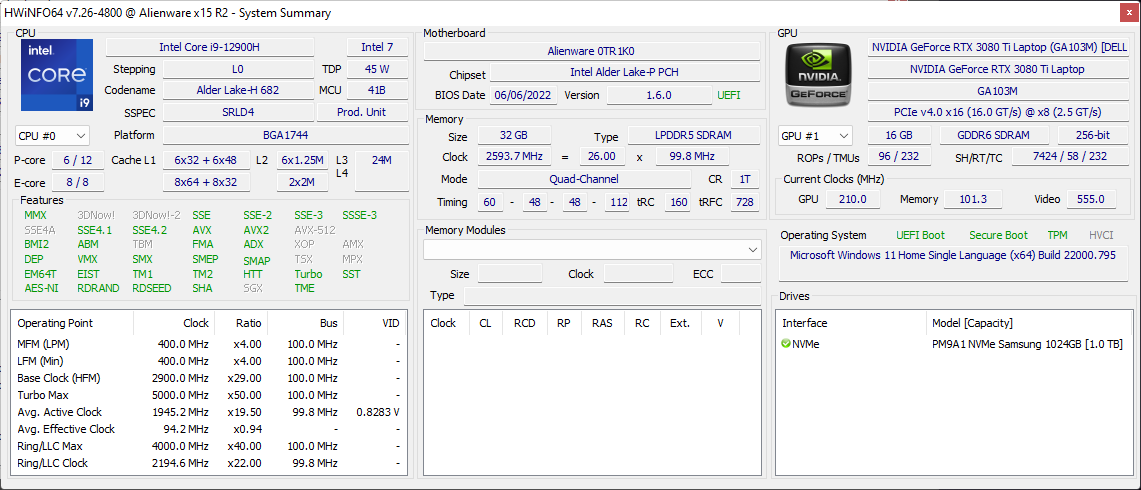
Nasz testowy Alienware x15 R2 jest wyposażony w Intel Core i9-12900H, GPU Nvidia GeForce RTX 3080 Ti "Laptop, wyświetlacz 1080p 360 Hz, 32 GB LPDDR5-4800 RAM oraz 1 TB Samsung PM9A1 NVMe SSD. Ta konfiguracja ustawi cię z powrotem przez ₹3,68,190 (~ 4,500 USD lub 4,583 euro), jeśli zamówisz online przez Dell India.
W tej recenzji sprawdzamy, jak Alienware x15 R2 sprawdza się w praktyce i czy nowe ulepszenia przekładają się na świetne wrażenia za cenę wywoławczą.
Potencjalni konkurenci w porównaniu
Ocena | Data | Model | Waga | Wysokość | Rozmiar | Rezolucja | Cena |
|---|---|---|---|---|---|---|---|
| 87.7 % v7 (old) | 10/2022 | Alienware x15 R2 P111F i9-12900H, GeForce RTX 3080 Ti Laptop GPU | 2.4 kg | 15.9 mm | 15.60" | 1920x1080 | |
| 86.3 % v7 (old) | Asus ROG Strix Scar 15 G533ZW-LN106WS i9-12900H, GeForce RTX 3070 Ti Laptop GPU | 2.3 kg | 27.2 mm | 15.60" | 2560x1440 | ||
| 88.2 % v7 (old) | Asus ROG Zephyrus Duo 16 GX650RX R9 6900HX, GeForce RTX 3080 Ti Laptop GPU | 2.6 kg | 20.5 mm | 16.00" | 3840x2400 | ||
| 87.4 % v7 (old) | MSI Raider GE66 12UHS i9-12900HK, GeForce RTX 3080 Ti Laptop GPU | 2.4 kg | 23.4 mm | 15.60" | 3840x2160 | ||
| 88.3 % v7 (old) | MSI Titan GT77 12UHS i9-12900HX, GeForce RTX 3080 Ti Laptop GPU | 3.3 kg | 23 mm | 17.30" | 1920x1080 | ||
| 86.9 % v7 (old) | MSI Vector GP66 12UGS i9-12900H, GeForce RTX 3070 Ti Laptop GPU | 2.3 kg | 23.4 mm | 15.60" | 1920x1080 | ||
| 88.3 % v7 (old) | Razer Blade 15 Advanced Model Early 2022 i7-12800H, GeForce RTX 3080 Ti Laptop GPU | 2.1 kg | 16.99 mm | 15.60" | 1920x1080 |
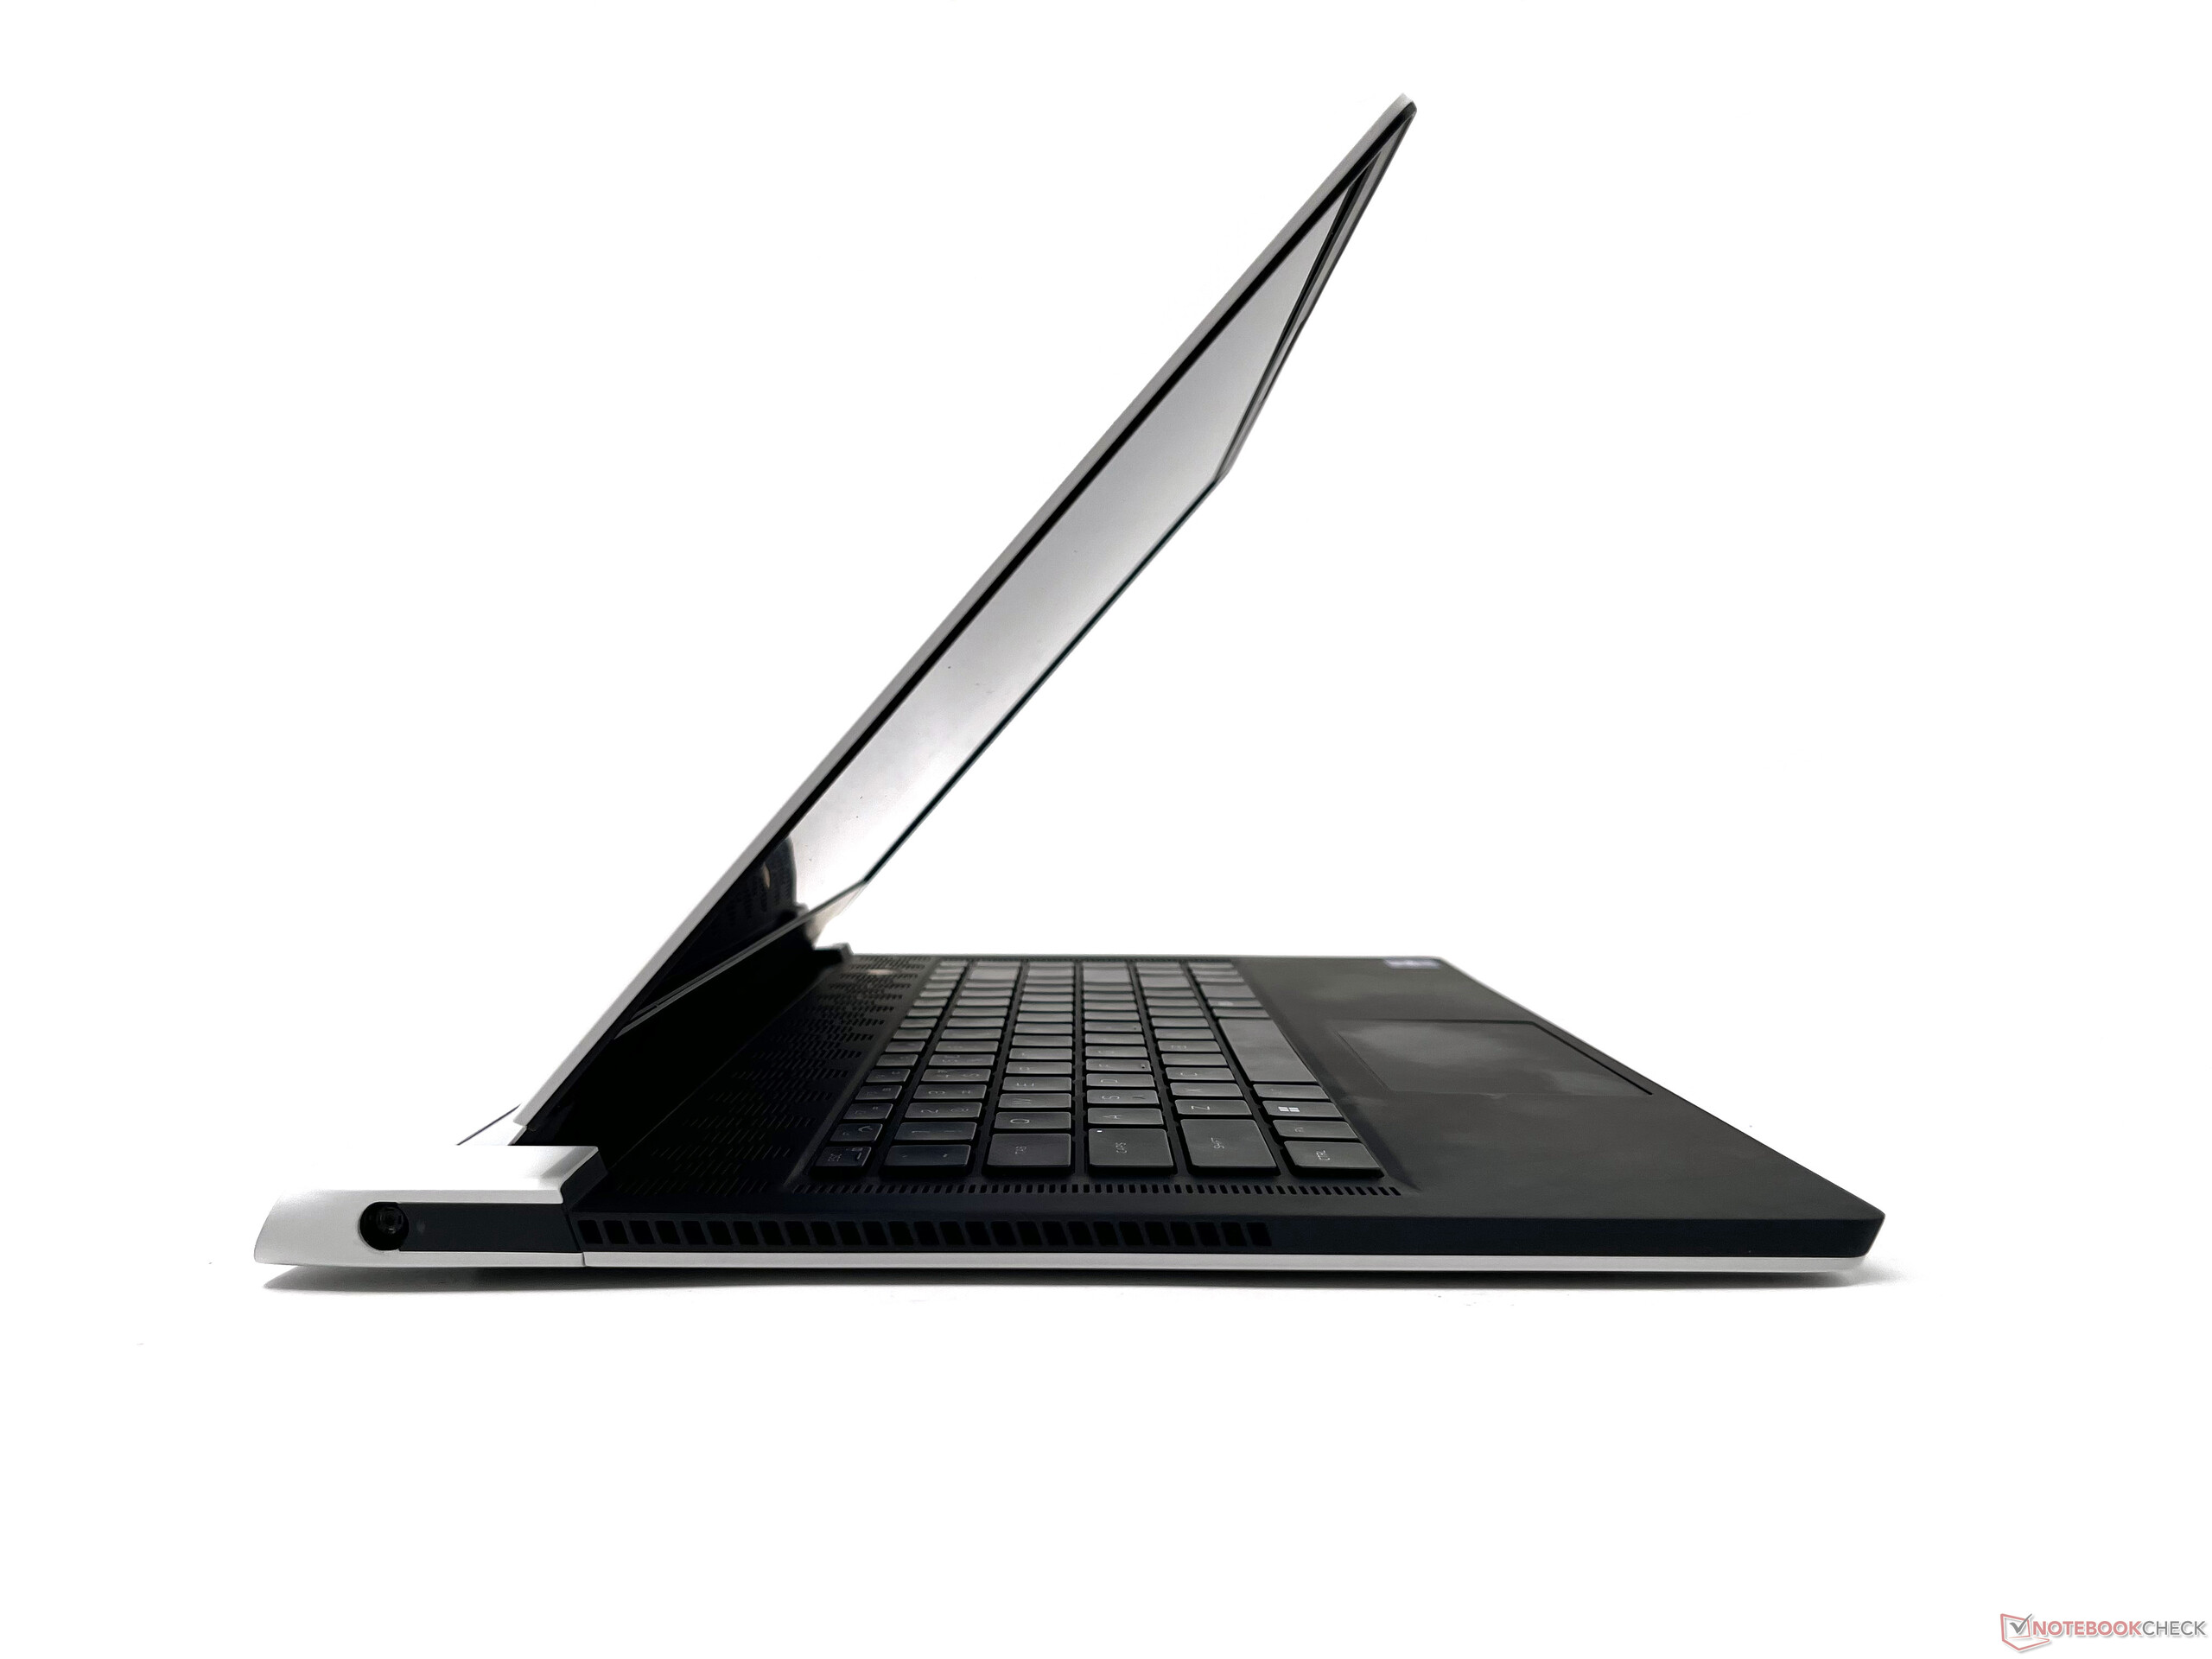
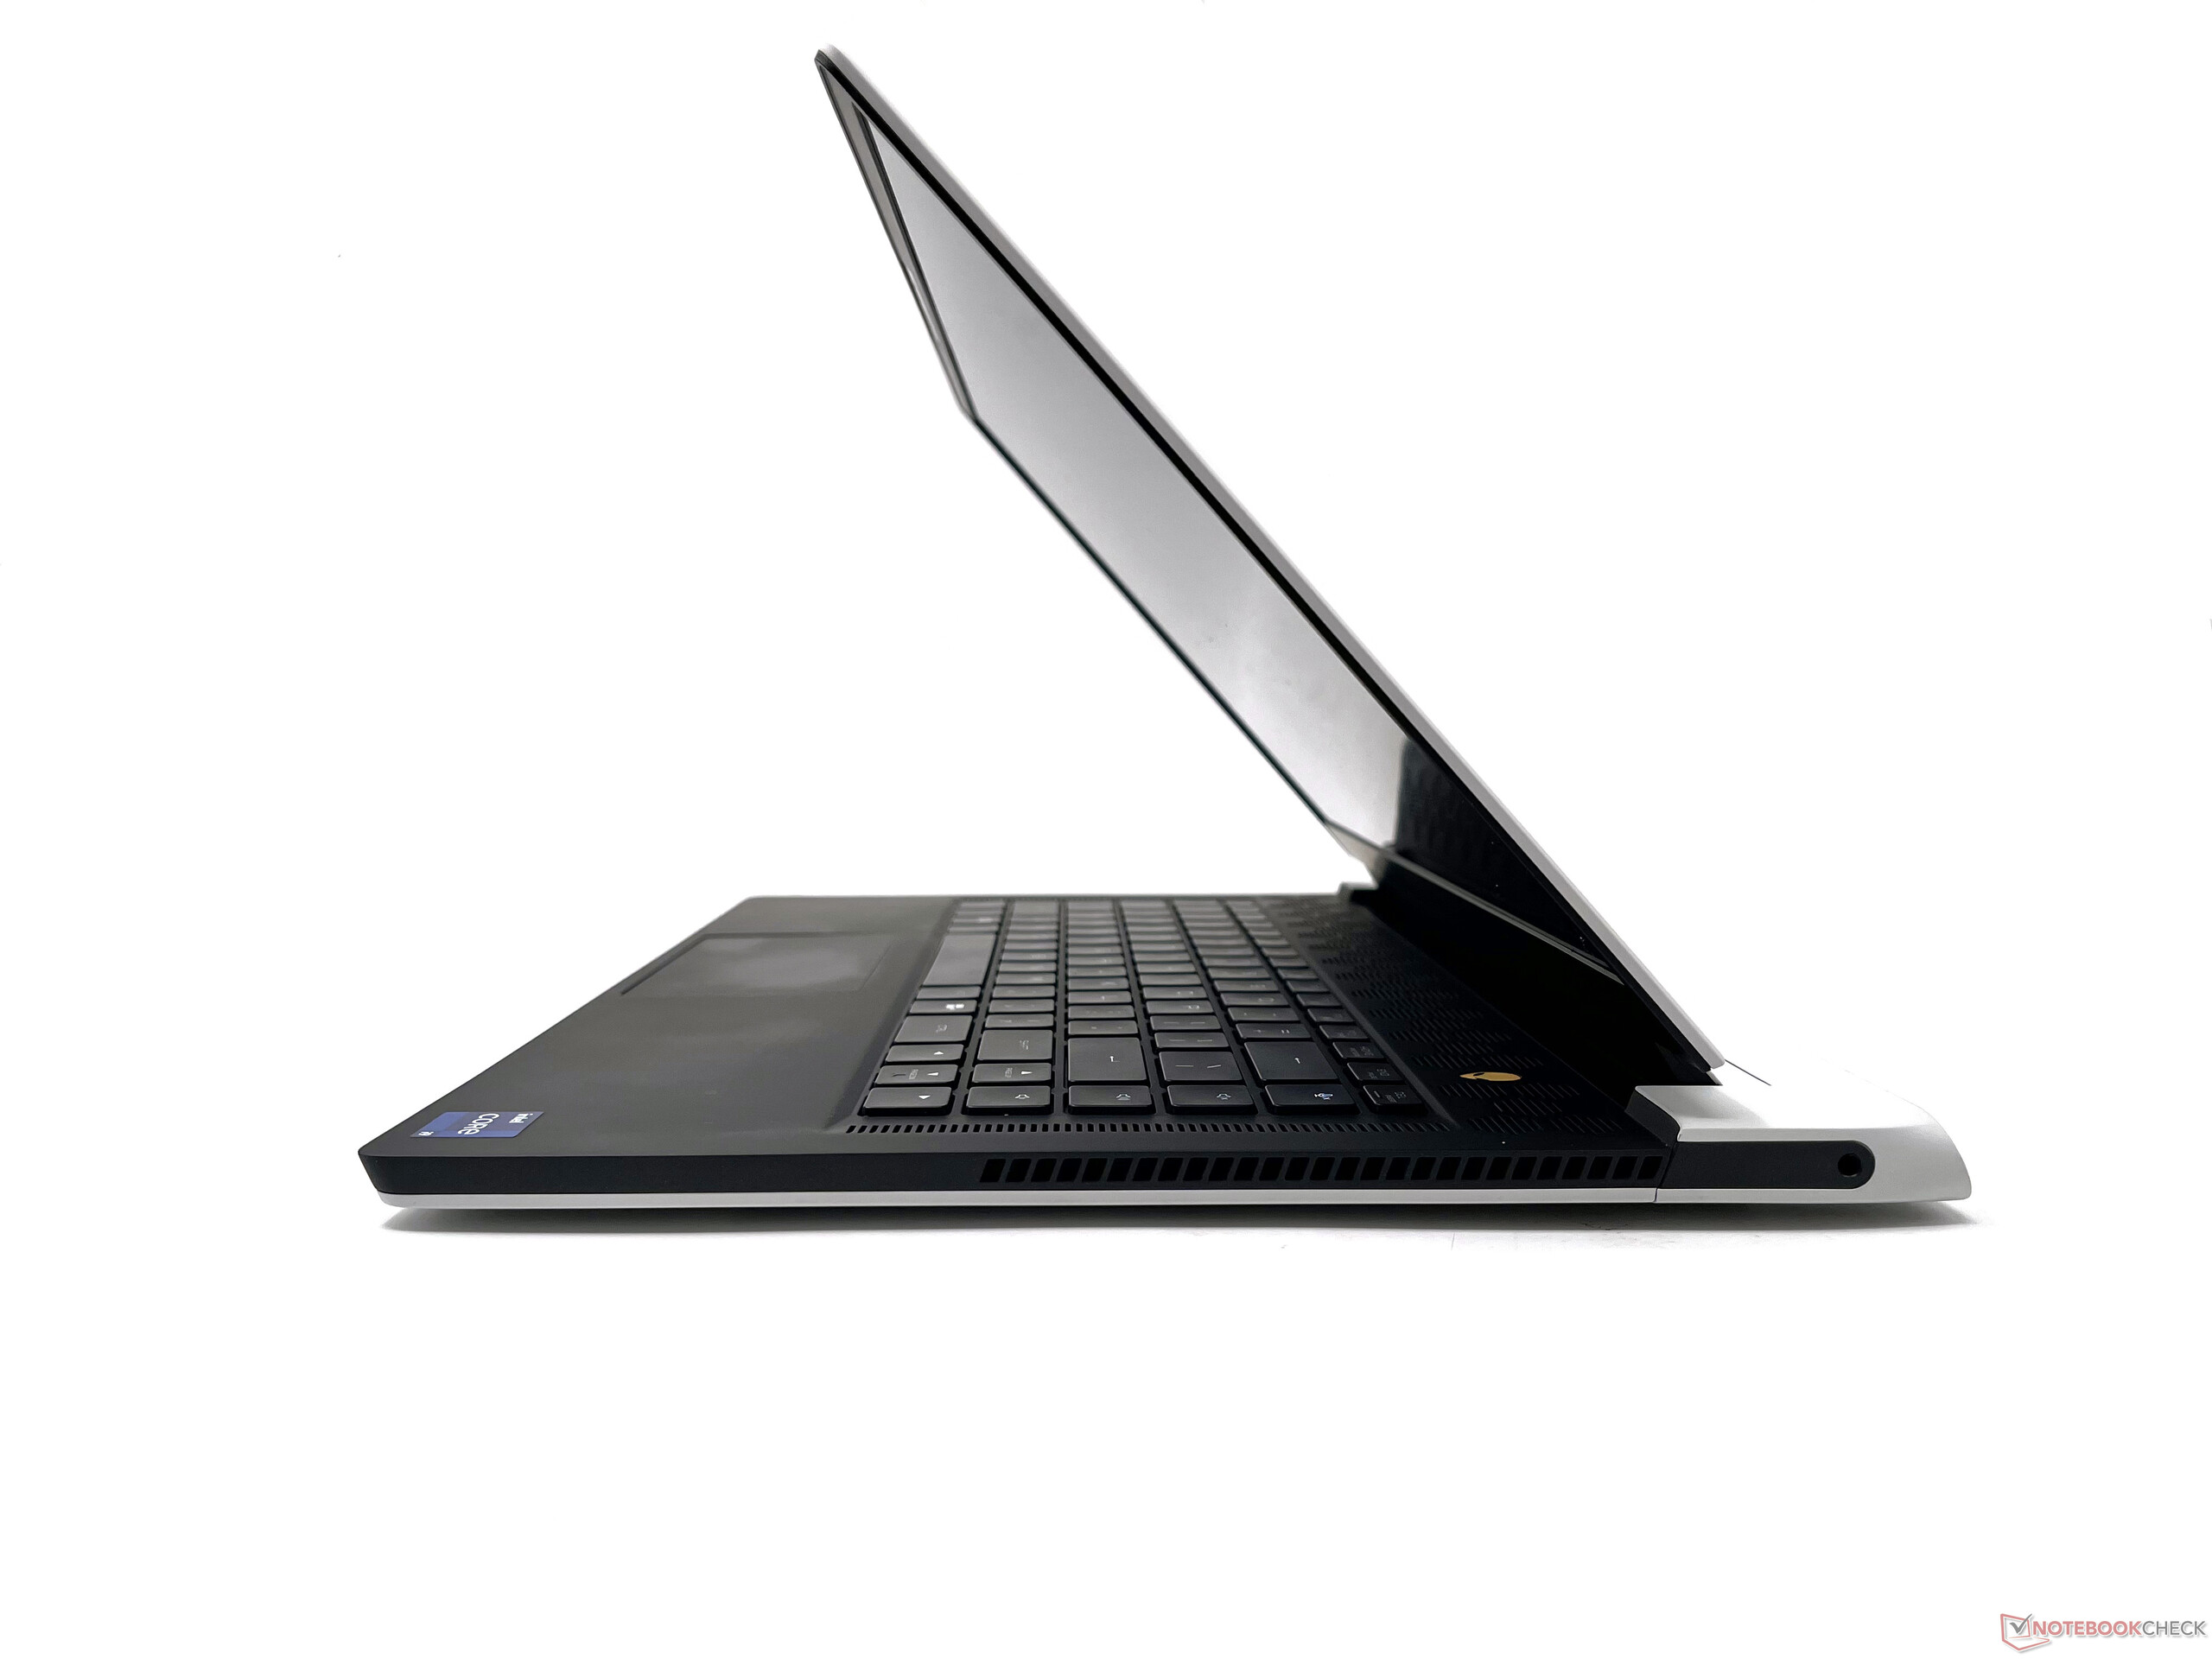
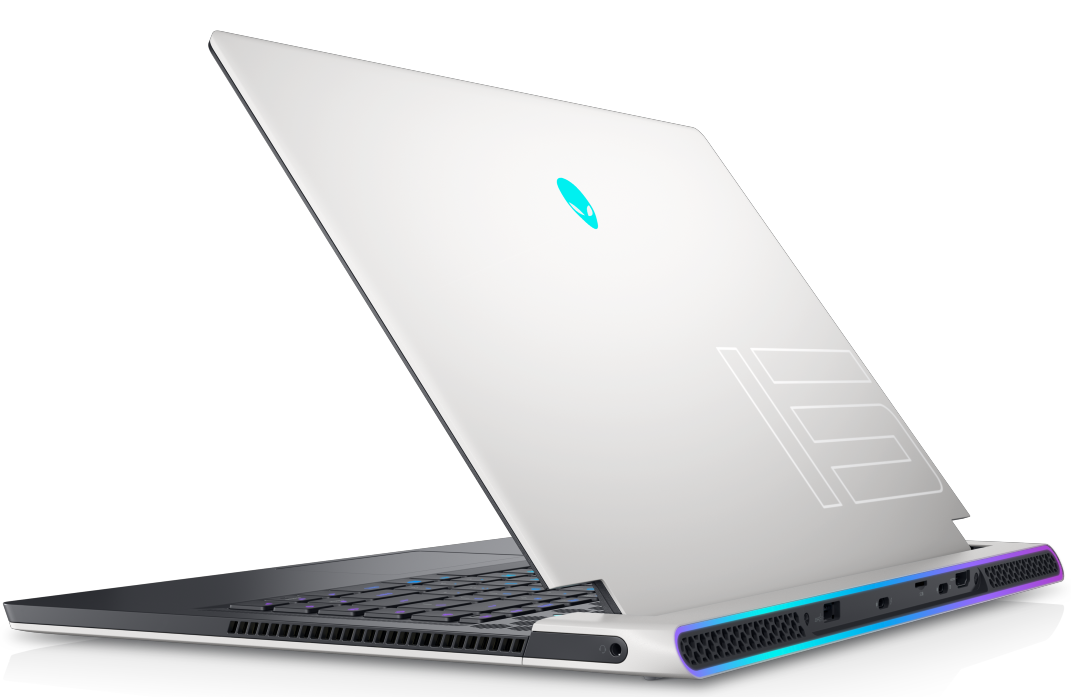
Obudowa: Każdy cal Alienware w obudowie zbliżonej do ultrabooka
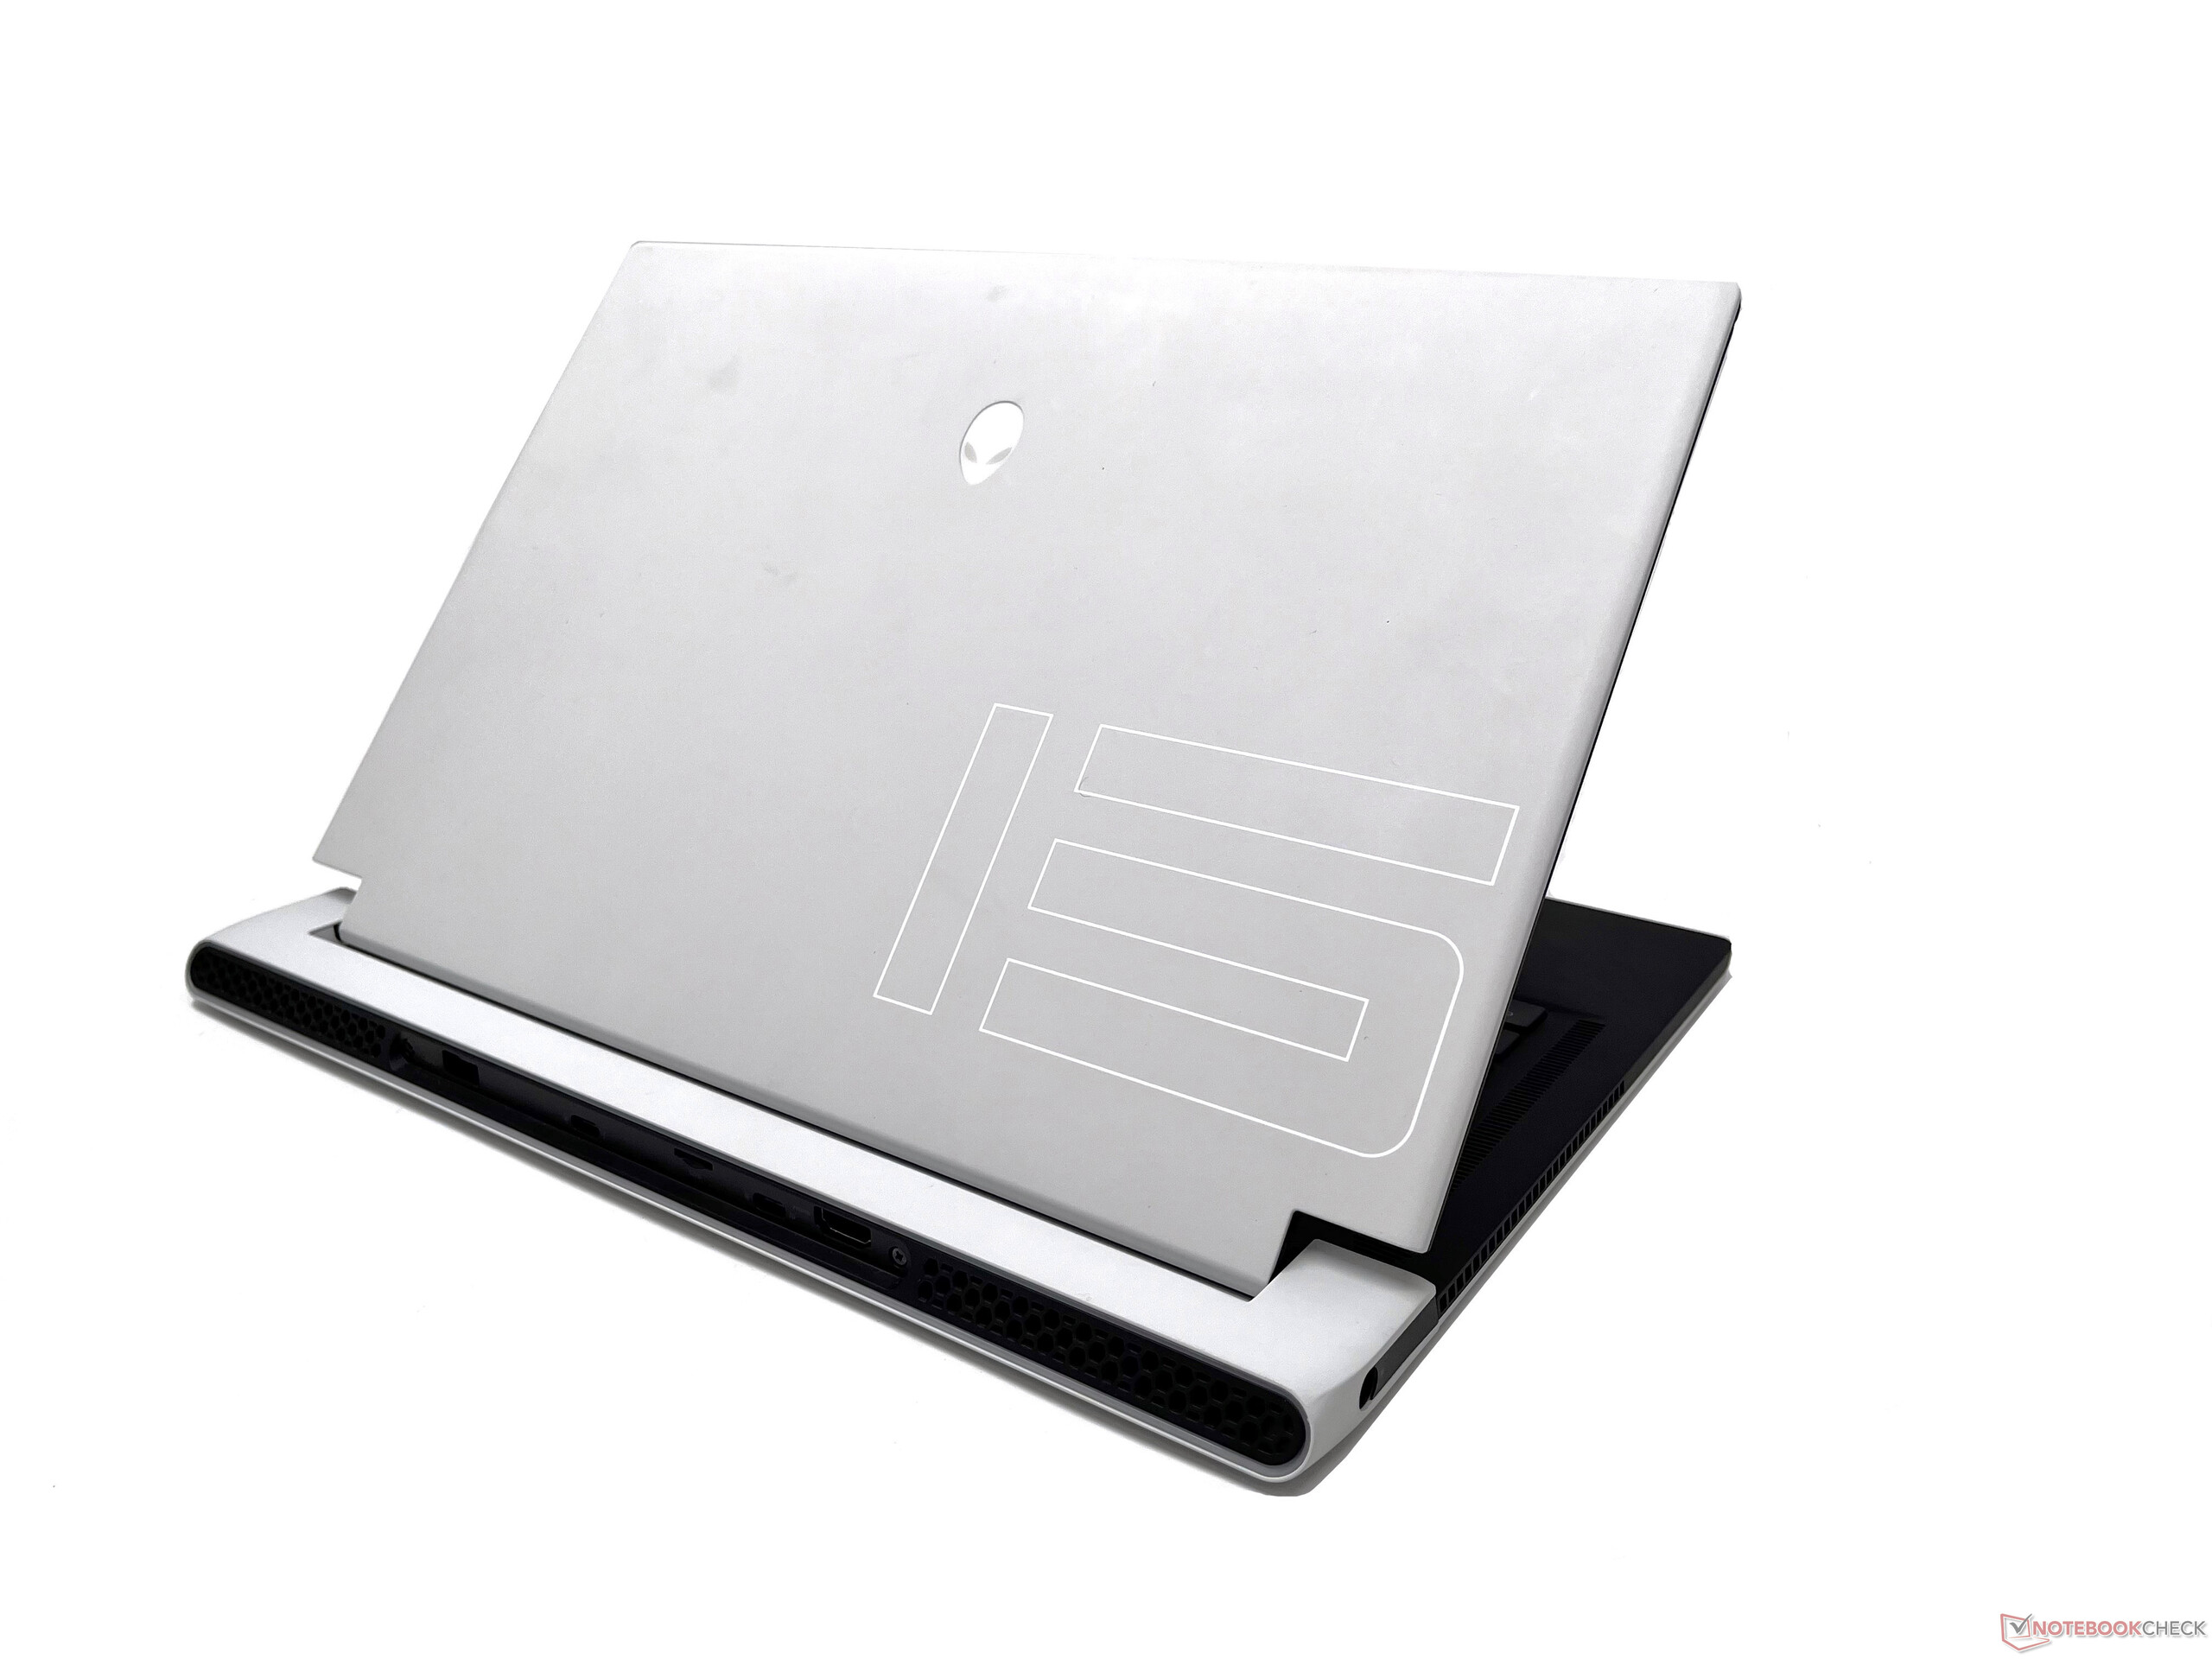
Obudowa Legend 2.0 jest w dużej mierze niezmieniona w stosunku do x15 R1 i równie mocno przyciąga wzrok. X15 R2 wygląda dość smukło jak na oferowany sprzęt, a Alienware udało się uzyskać mieszankę klasy i estetyki dla graczy w sam raz.
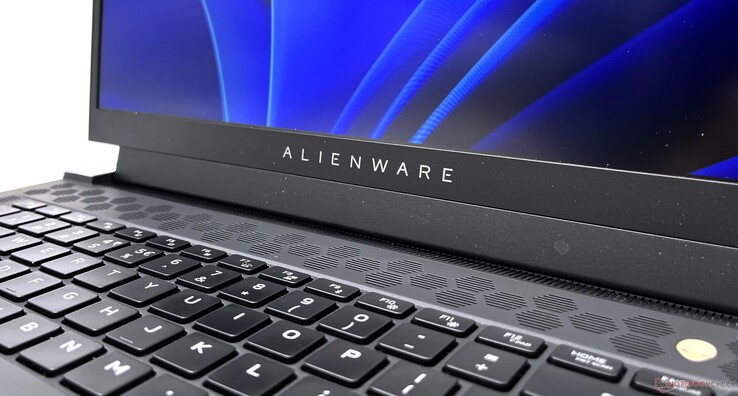
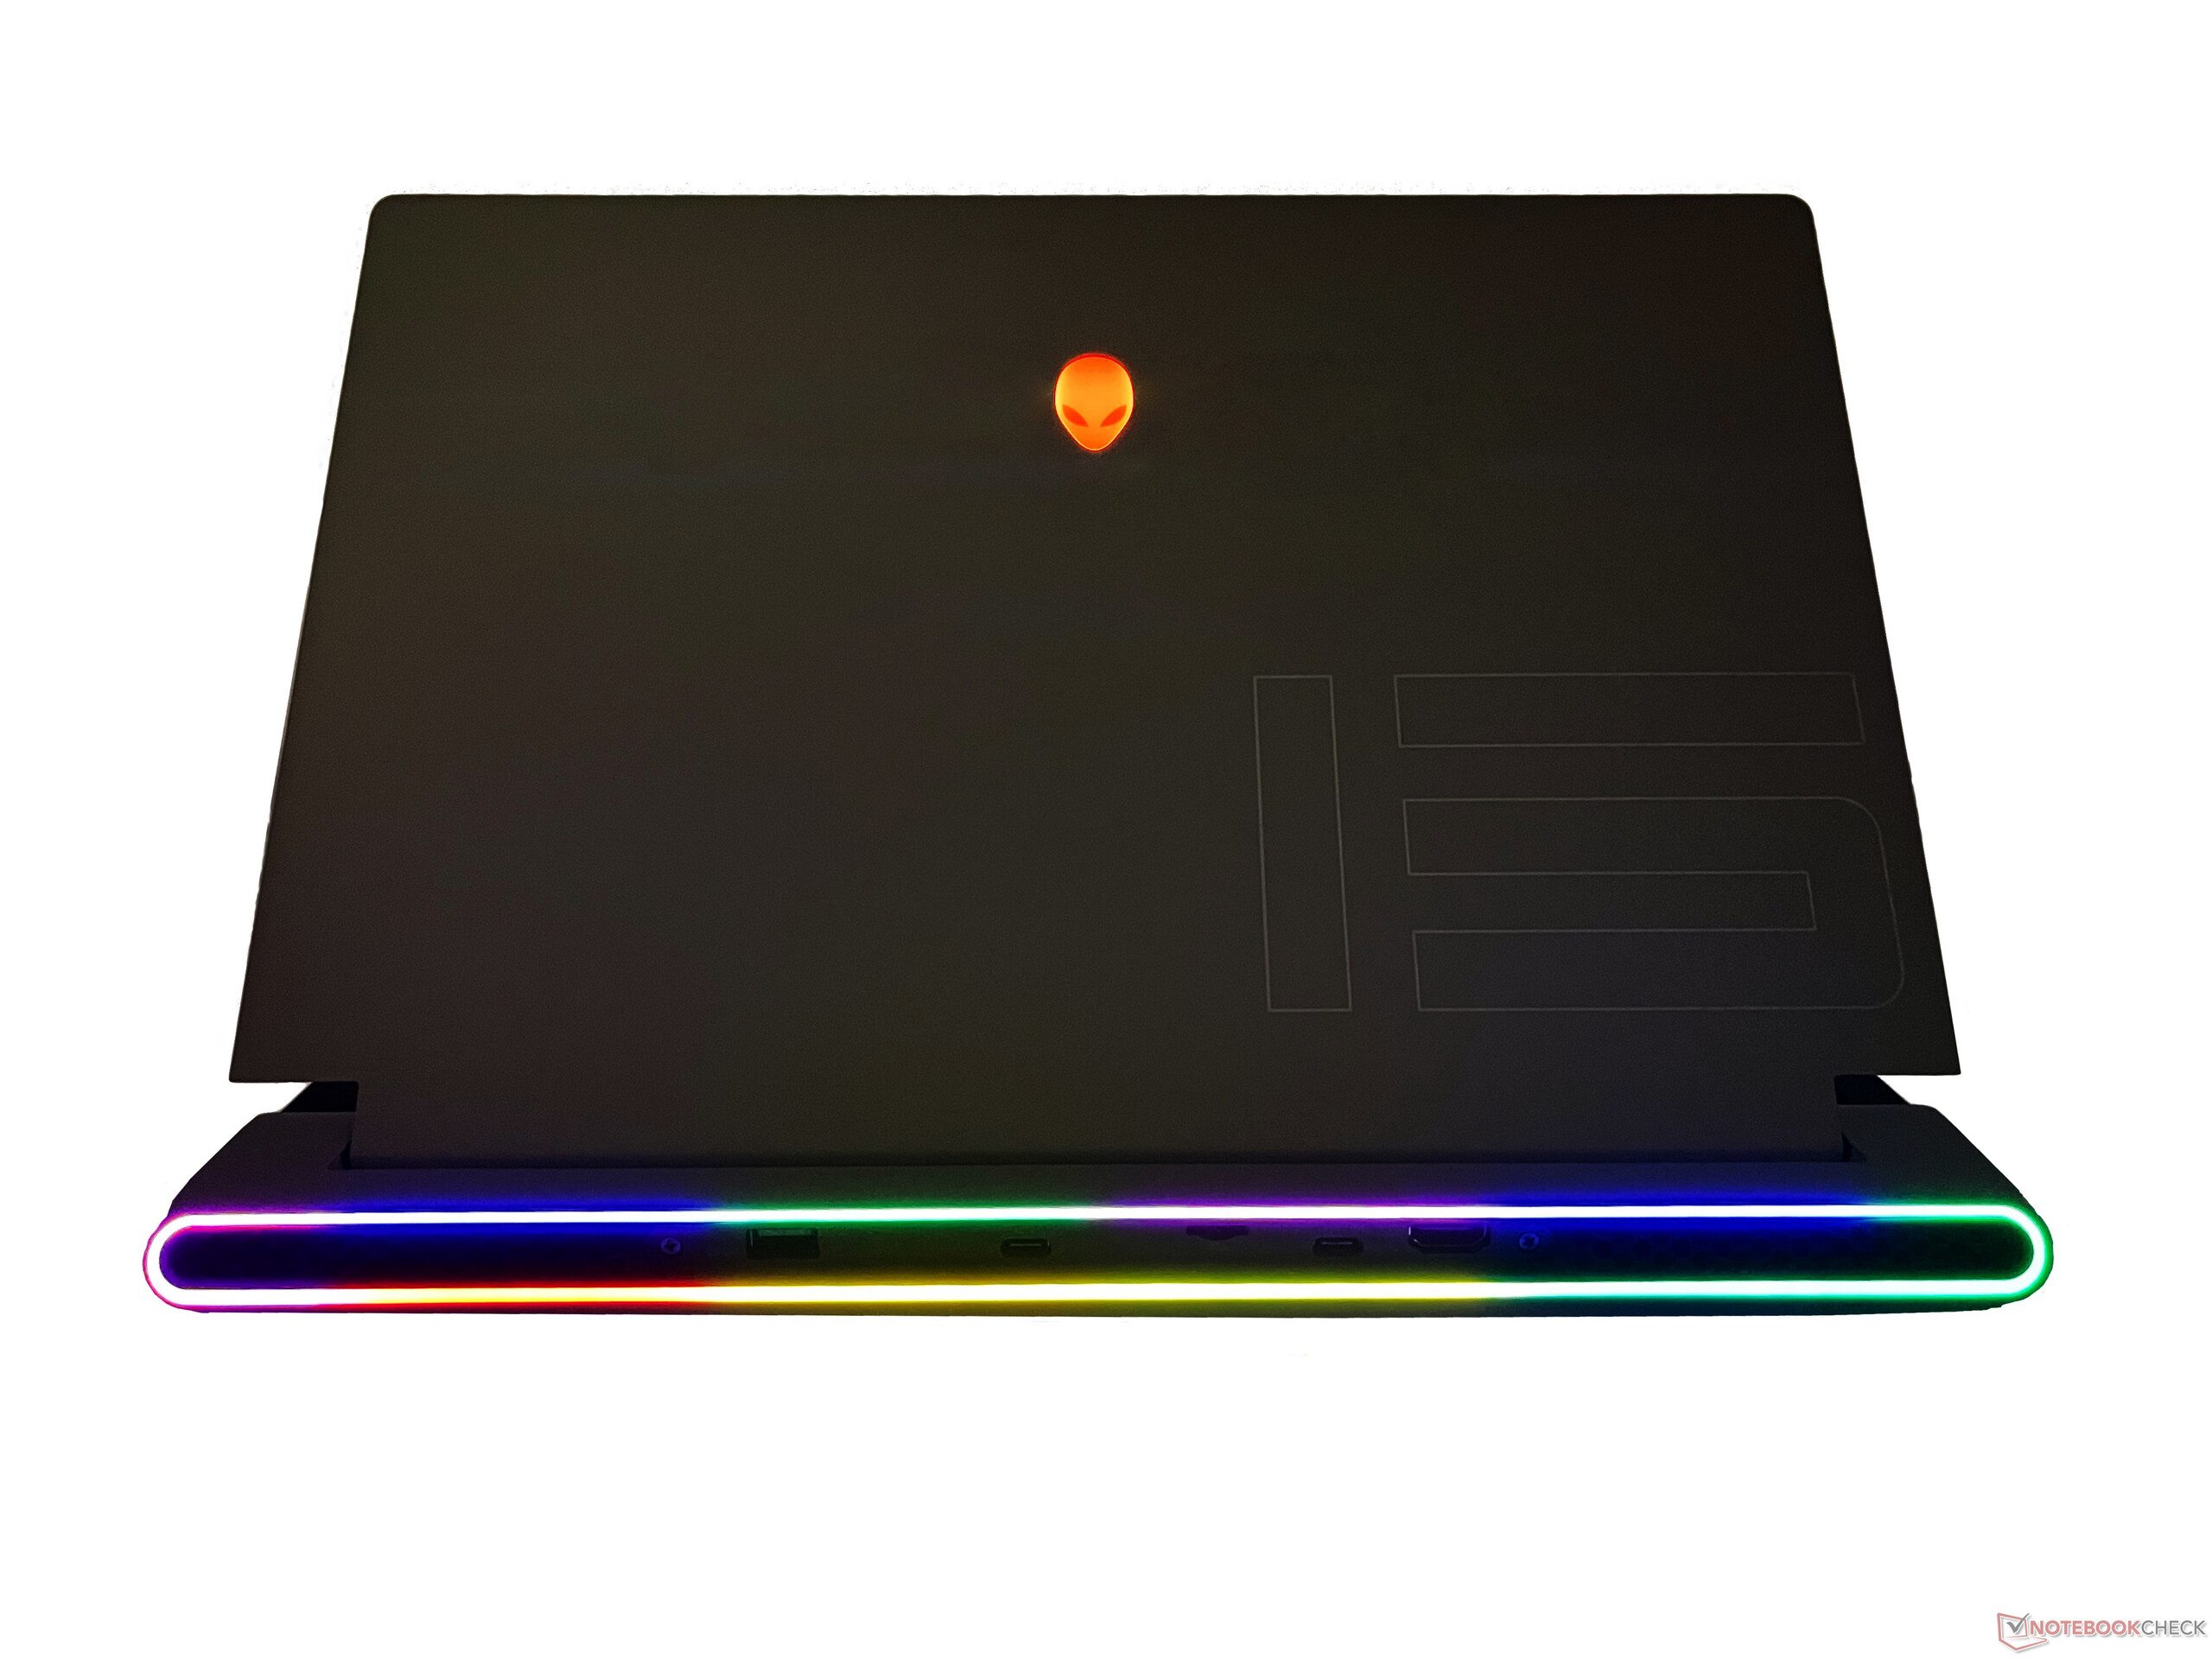
Dwutonowe malowanie z białą obudową i czarnym pokładem klawiatury wygląda atrakcyjnie i jest gładkie w dotyku. Charakterystyczne logo głowy kosmity z tyłu pokrywy i przycisk zasilania świecą w nieskazitelnym kolorze RGB, podobnie jak tylne stadionowe oświetlenie RGB złożone z 90 diod mikro-LED, które można w pełni dostosować lub wyłączyć w centrum dowodzenia Alienware
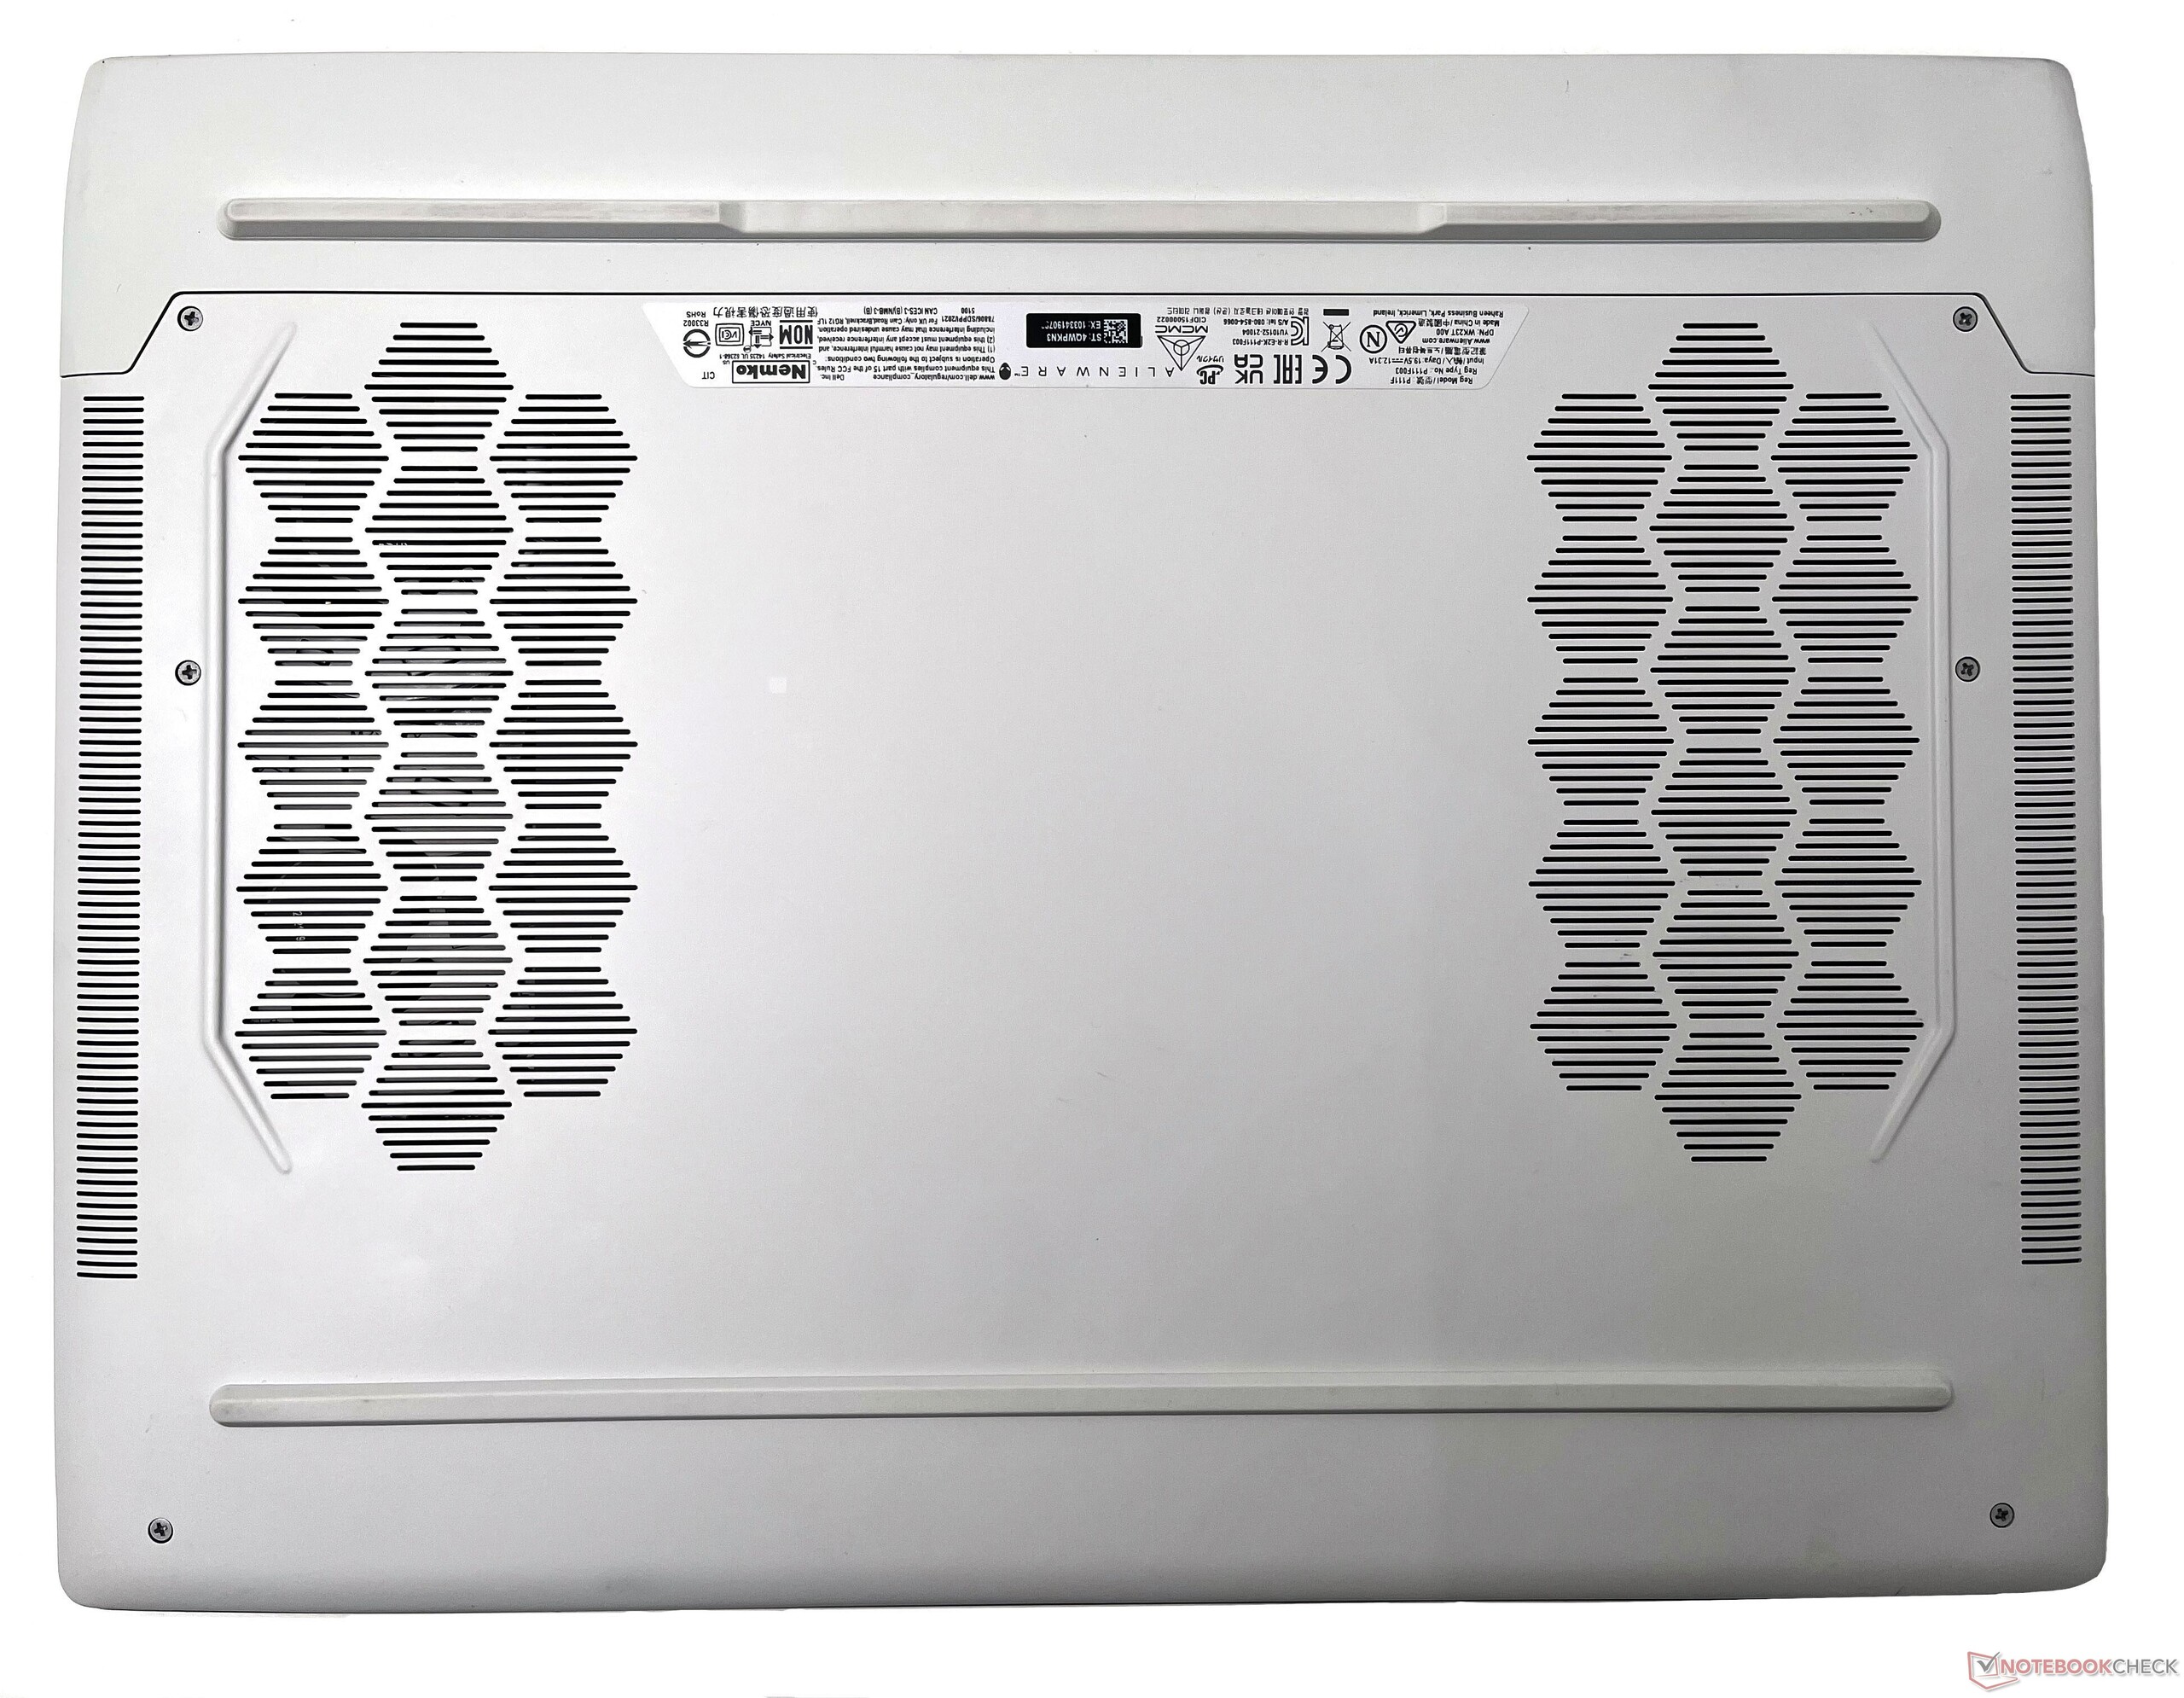
Tylne otwory wentylacyjne mają wzór plastra miodu, który dodaje nieco elegancji. Spód obudowy jest również wykonany z plastiku i posiada wzorzyste otwory wlotowe
Mimo że obudowa klawiatury jest w dużej mierze plastikowa, sprawia wrażenie bardzo dobrej jakości i jednolitej, bez żadnych ostrych krawędzi czy nadmiernego wygięcia - czyli czegoś, z czego Alienware poprzedniej generacji słynął notorycznie. Jest pewne
wygięcie, ale można je zaobserwować tylko przy świadomym wywieraniu nacisku. Pokrywa wyświetlacza jest wykonana ze stopu magnezu dla zapewnienia sztywności z wyraźnie wytrawioną liczbą "15".
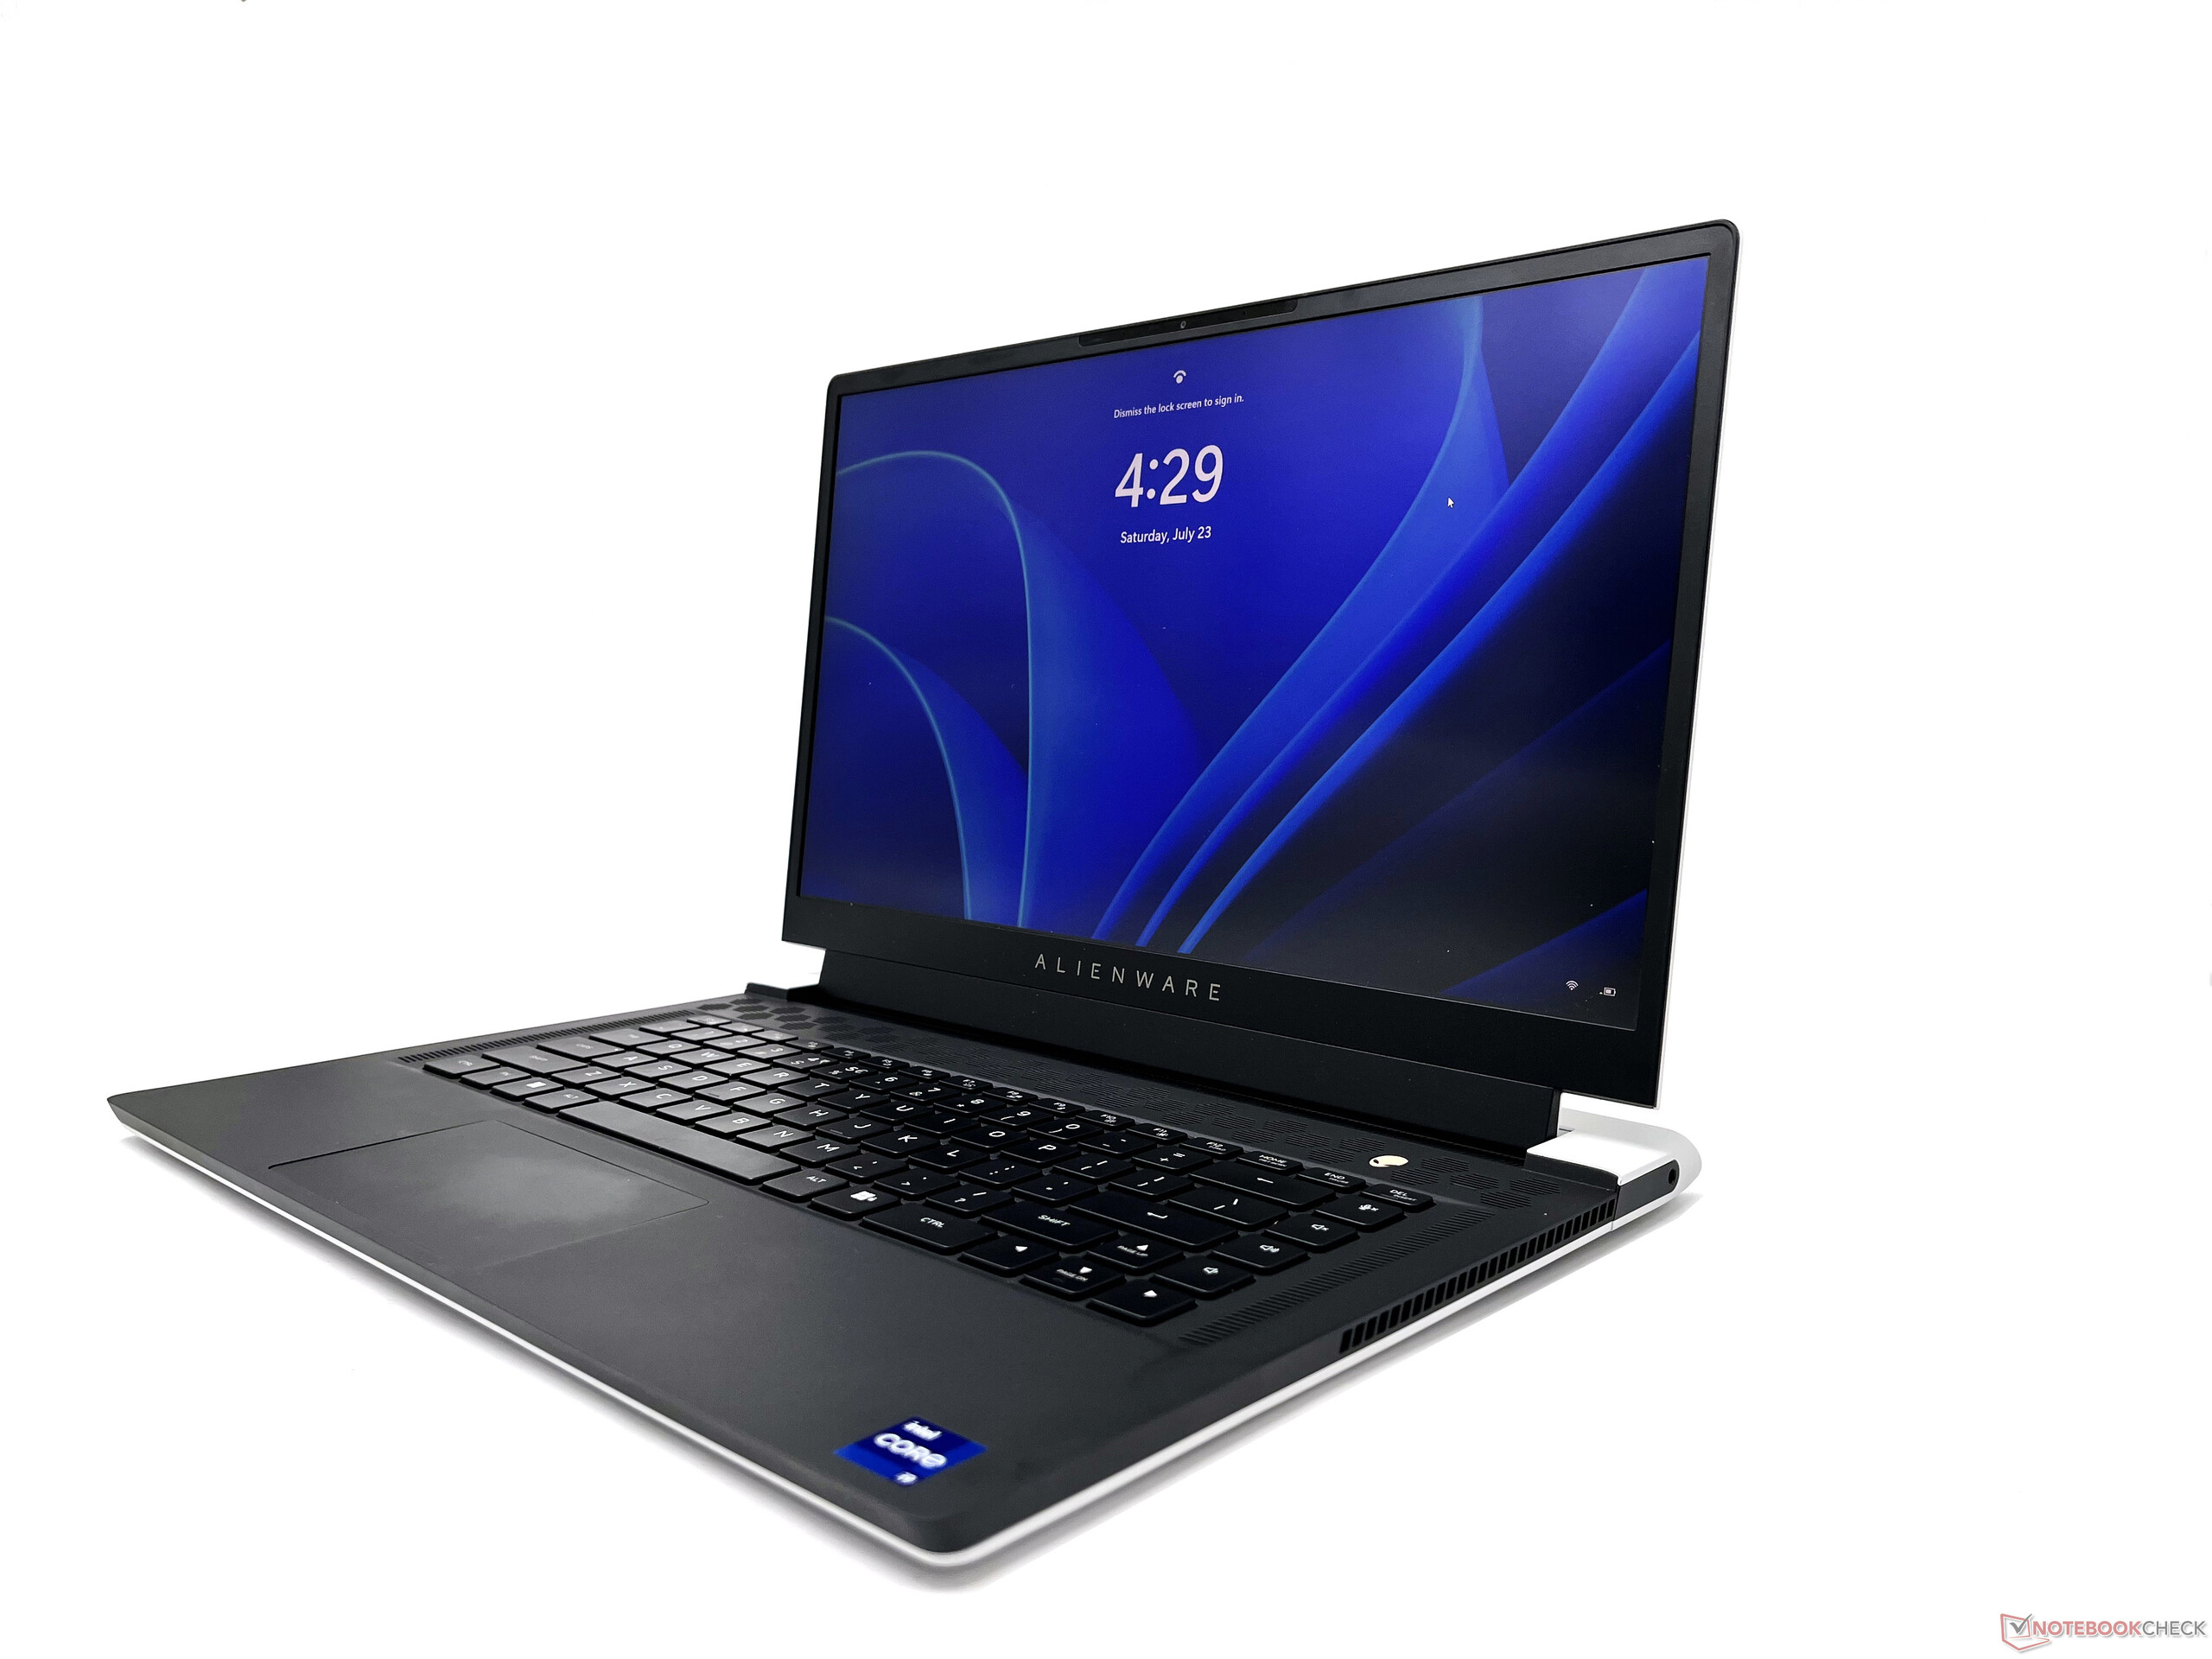
Ogólnie rzecz biorąc, Alienware x15 R2 już na pierwszy rzut oka sprawia wrażenie ultrabooka, zachowując przy tym charakterystyczne cechy Alienware.
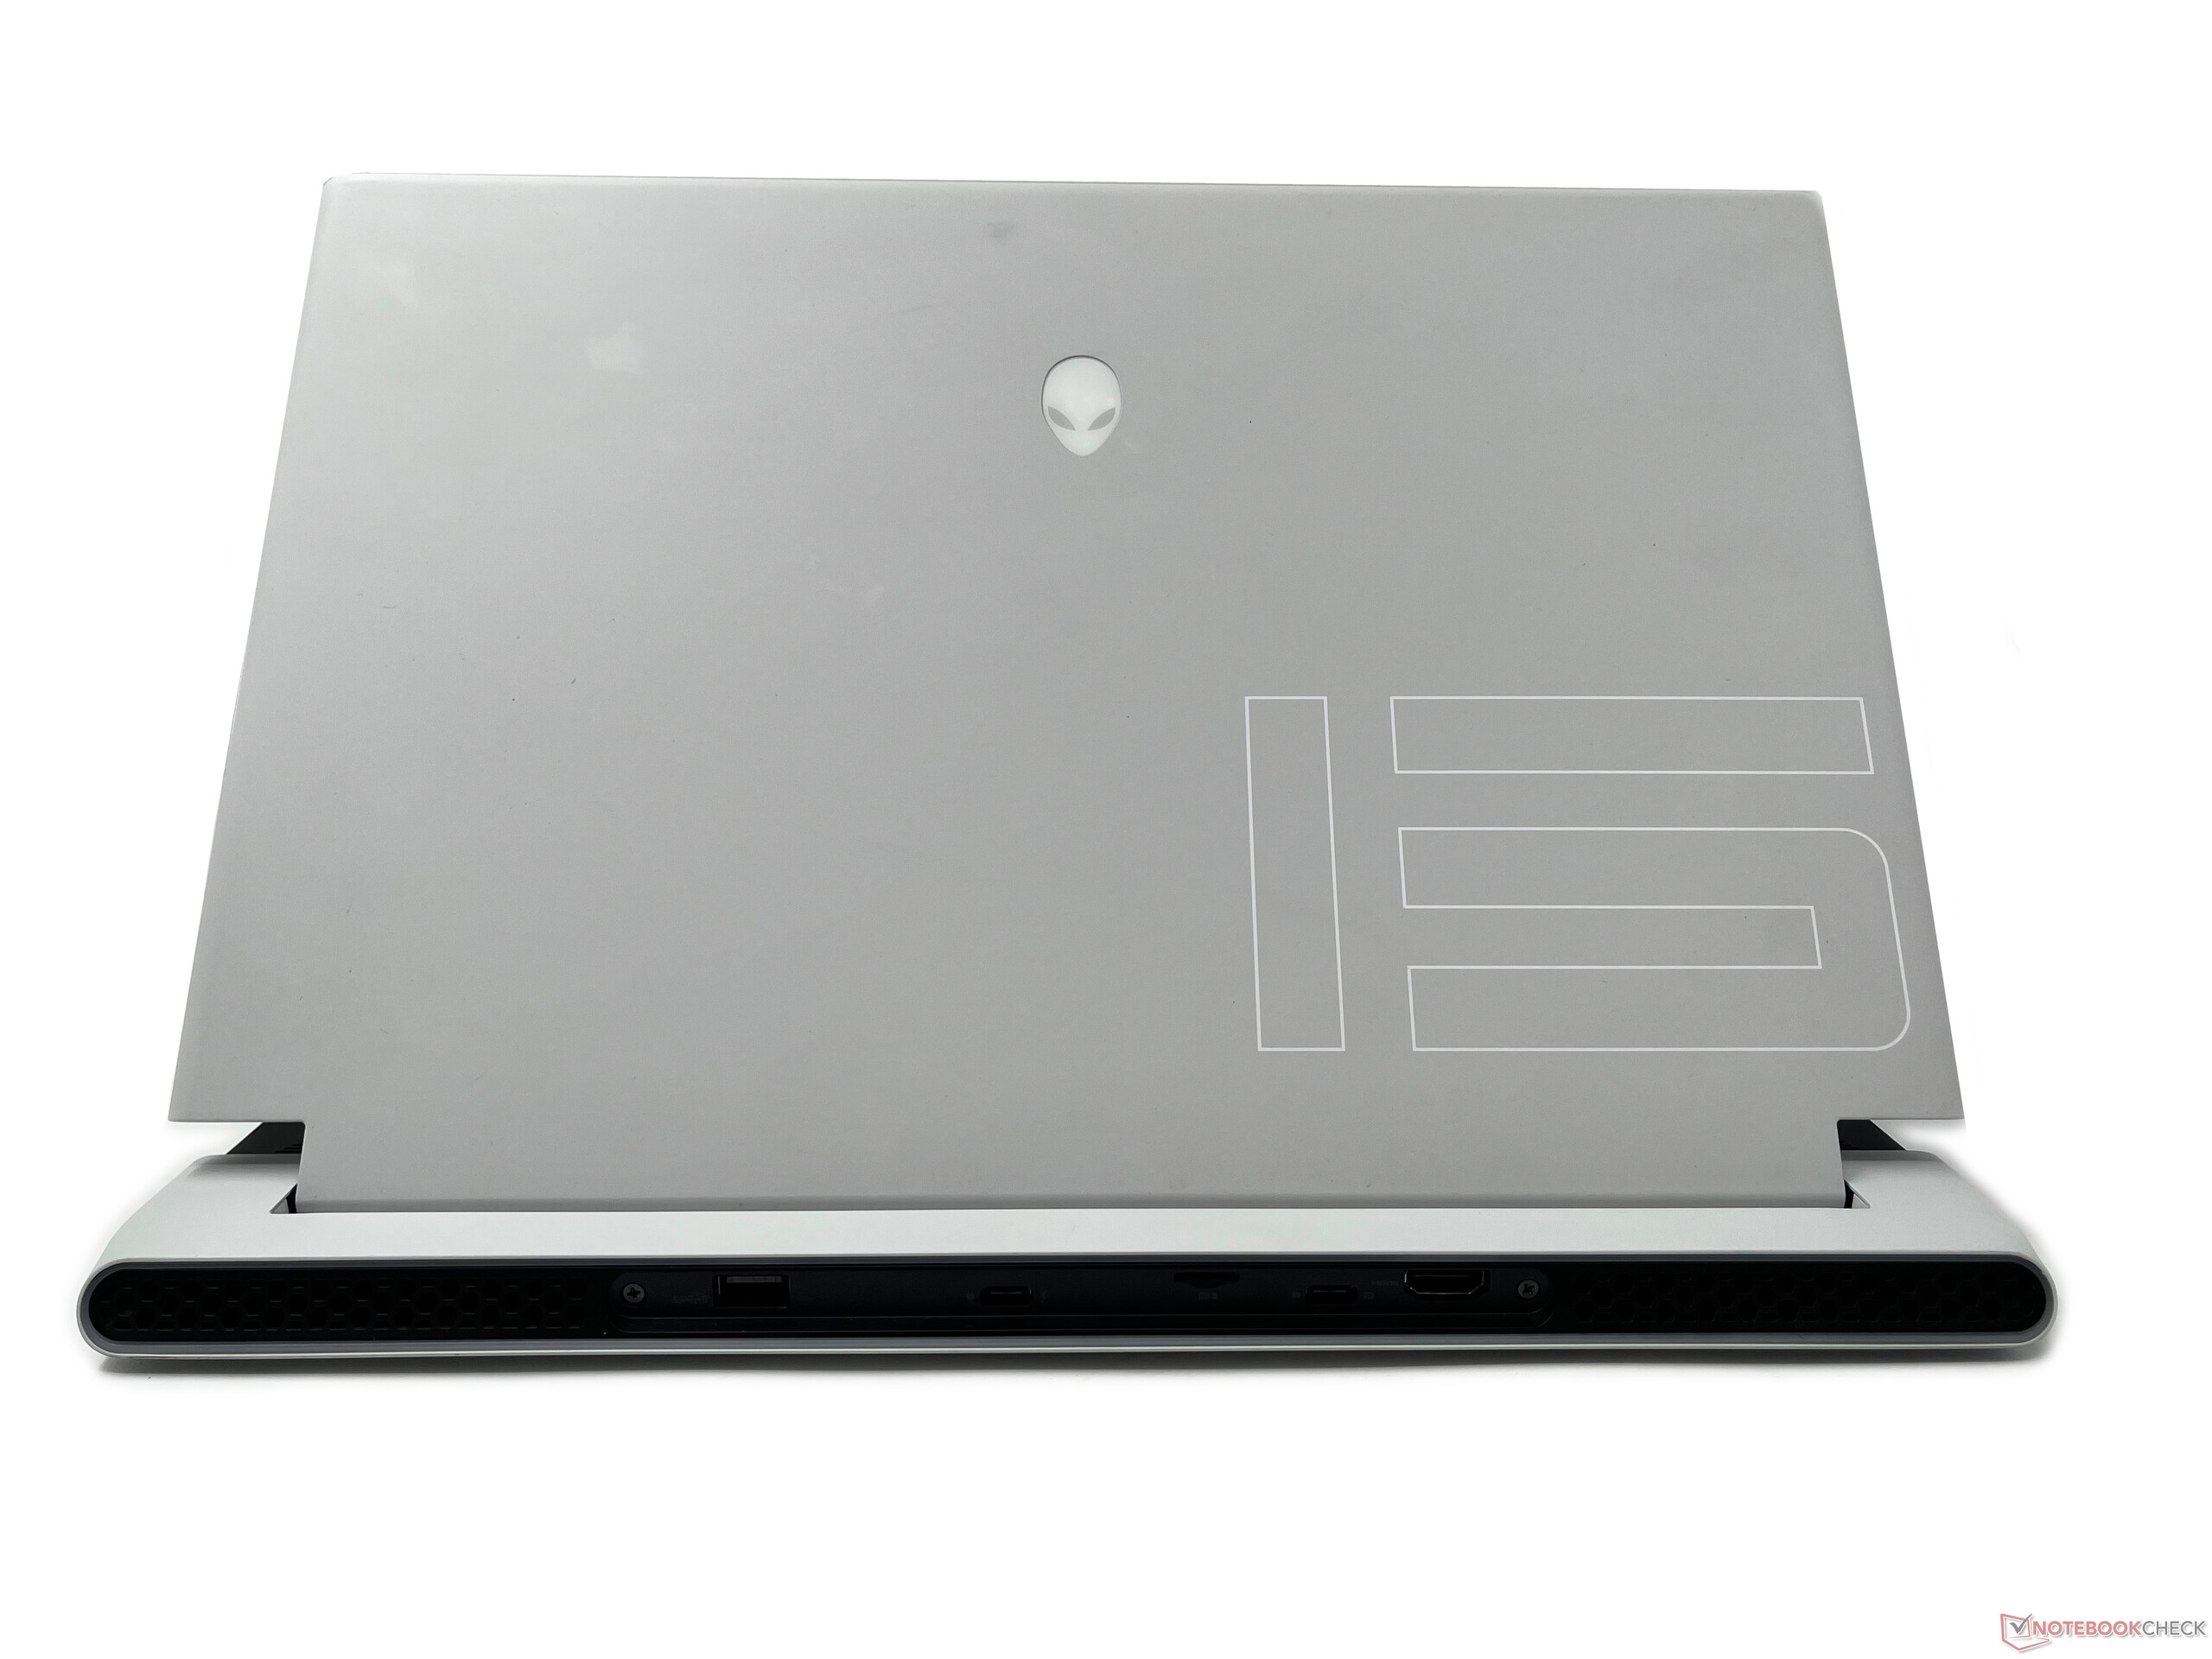
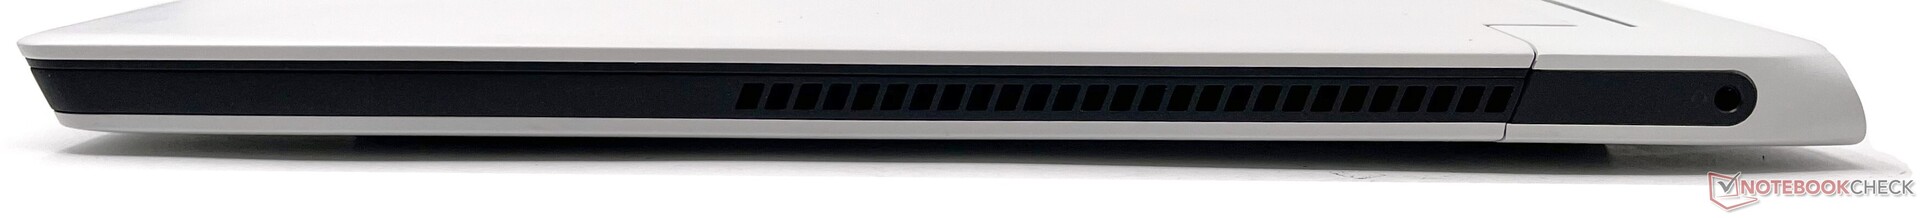
Łączność: Wszystkie porty na rufie
Rozmieszczenie portów w Alienware x15 R2 jest zbliżone do tego, co widzieliśmy w modelu x15 R1
Po lewej stronie znajduje się port zasilacza, a po prawej tylko gniazdo audio 3,5 mm. Gniazdo audio jest umieszczone dalej w kierunku tyłu, co może być uciążliwe, jeśli przewodowe zestawy słuchawkowe używają krótszych kabli
Z tyłu znajduje się port USB 3.2 Gen 1 Type-A z funkcją PowerShare, port USB 3.2 Gen 2 Type-C oraz port Thunderbolt 4. Porty USB Type-C i Thunderbolt 4 obsługują funkcję Power Delivery. Czytnik kart microSD i wyjście HDMI 2.1 uzupełniają wybór portów. Gniazdo blokady Kensington i gniazdo RJ-45 nie są dostępne. Dell dołącza jednak do zestawu klucz USB Type-C do RJ-45, który oferuje łączność 2,5 GbE LAN
Rozmieszczenie portów nie stanowi przeszkody podczas podłączania wielu urządzeń peryferyjnych. Jednak jednostronne umieszczenie wszystkich głównych portów z tyłu może sprawić, że dostęp do nich będzie nieco kłopotliwy, zwłaszcza jeśli często wymieniasz urządzenia peryferyjne.


Czytnik kart SD
Czytnik kart microSD spisuje się w naszych testach godnie. Wydajność wydaje się nieco wolniejsza od tego, co widzieliśmy wcześniej w przypadku x15 R1, ale jest to ta sama liga, co w przypadku Asus ROG Zephyrus Duo 16 oraz Razer Blade 15 Advanced.
| SD Card Reader | |
| average JPG Copy Test (av. of 3 runs) | |
| Alienware x15 RTX 3070 P111F (AV Pro V60) | |
| Razer Blade 15 Advanced Model Early 2022 (AV PRO microSD 128 GB V60) | |
| Asus ROG Zephyrus Duo 16 GX650RX (AV PRO microSD 128 GB V60) | |
| Alienware x15 R2 P111F (AV PRO microSD 128 GB V60) | |
| Średnia w klasie Gaming (20.9 - 210, n=55, ostatnie 2 lata) | |
| MSI Raider GE66 12UHS (AV PRO microSD 128 GB V60) | |
| MSI Titan GT77 12UHS (AV PRO microSD 128 GB V60) | |
| maximum AS SSD Seq Read Test (1GB) | |
| Alienware x15 RTX 3070 P111F (AV Pro V60) | |
| Alienware x15 R2 P111F (AV PRO microSD 128 GB V60) | |
| Asus ROG Zephyrus Duo 16 GX650RX (AV PRO microSD 128 GB V60) | |
| Średnia w klasie Gaming (25.5 - 261, n=52, ostatnie 2 lata) | |
| MSI Titan GT77 12UHS (AV PRO microSD 128 GB V60) | |
Komunikacja
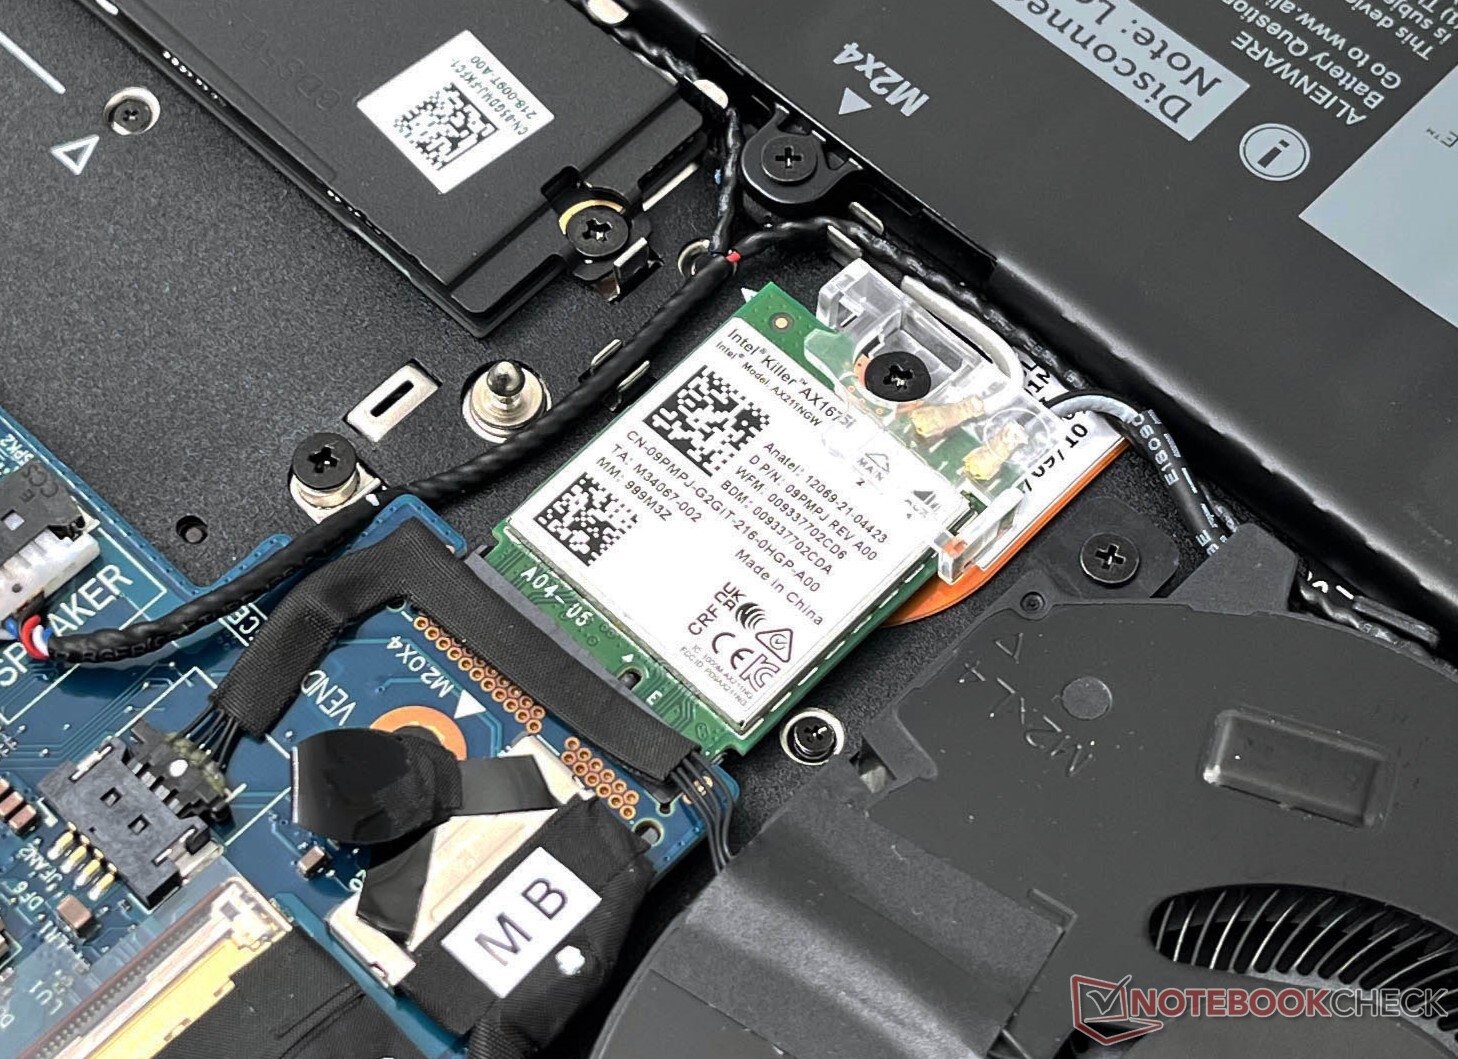
Model x15 R2 jest wyposażony w kartę WLAN Killer Wi-Fi 6E AX1675i. Wydajność jest przyzwoita, ale widzieliśmy szybszą przepustowość tej karty w innych laptopach. Zaobserwowaliśmy pewne spadki w teście transmisji 5 GHz, ale połączenie ogólnie było dość stabilne podczas testów z naszym referencyjnym routerem Asus ROG Rapture GT-AXE11000.
Nie zauważyliśmy żadnych widocznych korzyści z przejścia na pasmo 6 GHz, poza nieco wyższymi średnimi prędkościami odbioru i wyższymi wartościami przepustowości szczytowej.
Kamera internetowa
W erze kamer internetowych FHD Dell umieszcza w Alienware x15 R2 słabą kamerkę 720p. Kamera internetowa nadaje się tylko do okazjonalnych rozmów wideo. Kolory wykazują duże odchylenia, a ciemne obszary okazują się dość hałaśliwe. Ostrość i szczegółowość obrazu jest słaba nawet w odpowiednich warunkach oświetleniowych. Nie ma fizycznej migawki kamery internetowej.


Bezpieczeństwo
W x15 R2 zastosowano zintegrowaną kamerę IR, która obsługuje uwierzytelnianie biometryczne oparte na Windows Hello. Nie ma dostępnego czytnika linii papilarnych
Kamerkę IR można łatwo zapisać i jest ona dość czuła. Obecny jest także moduł TPM 2.0.
Akcesoria
Oprócz zasilacza 240 W i zwykłych papierków Dell dołącza do pudełka klucz USB Type-C do RJ-45 2,5 Gb Ethernet.
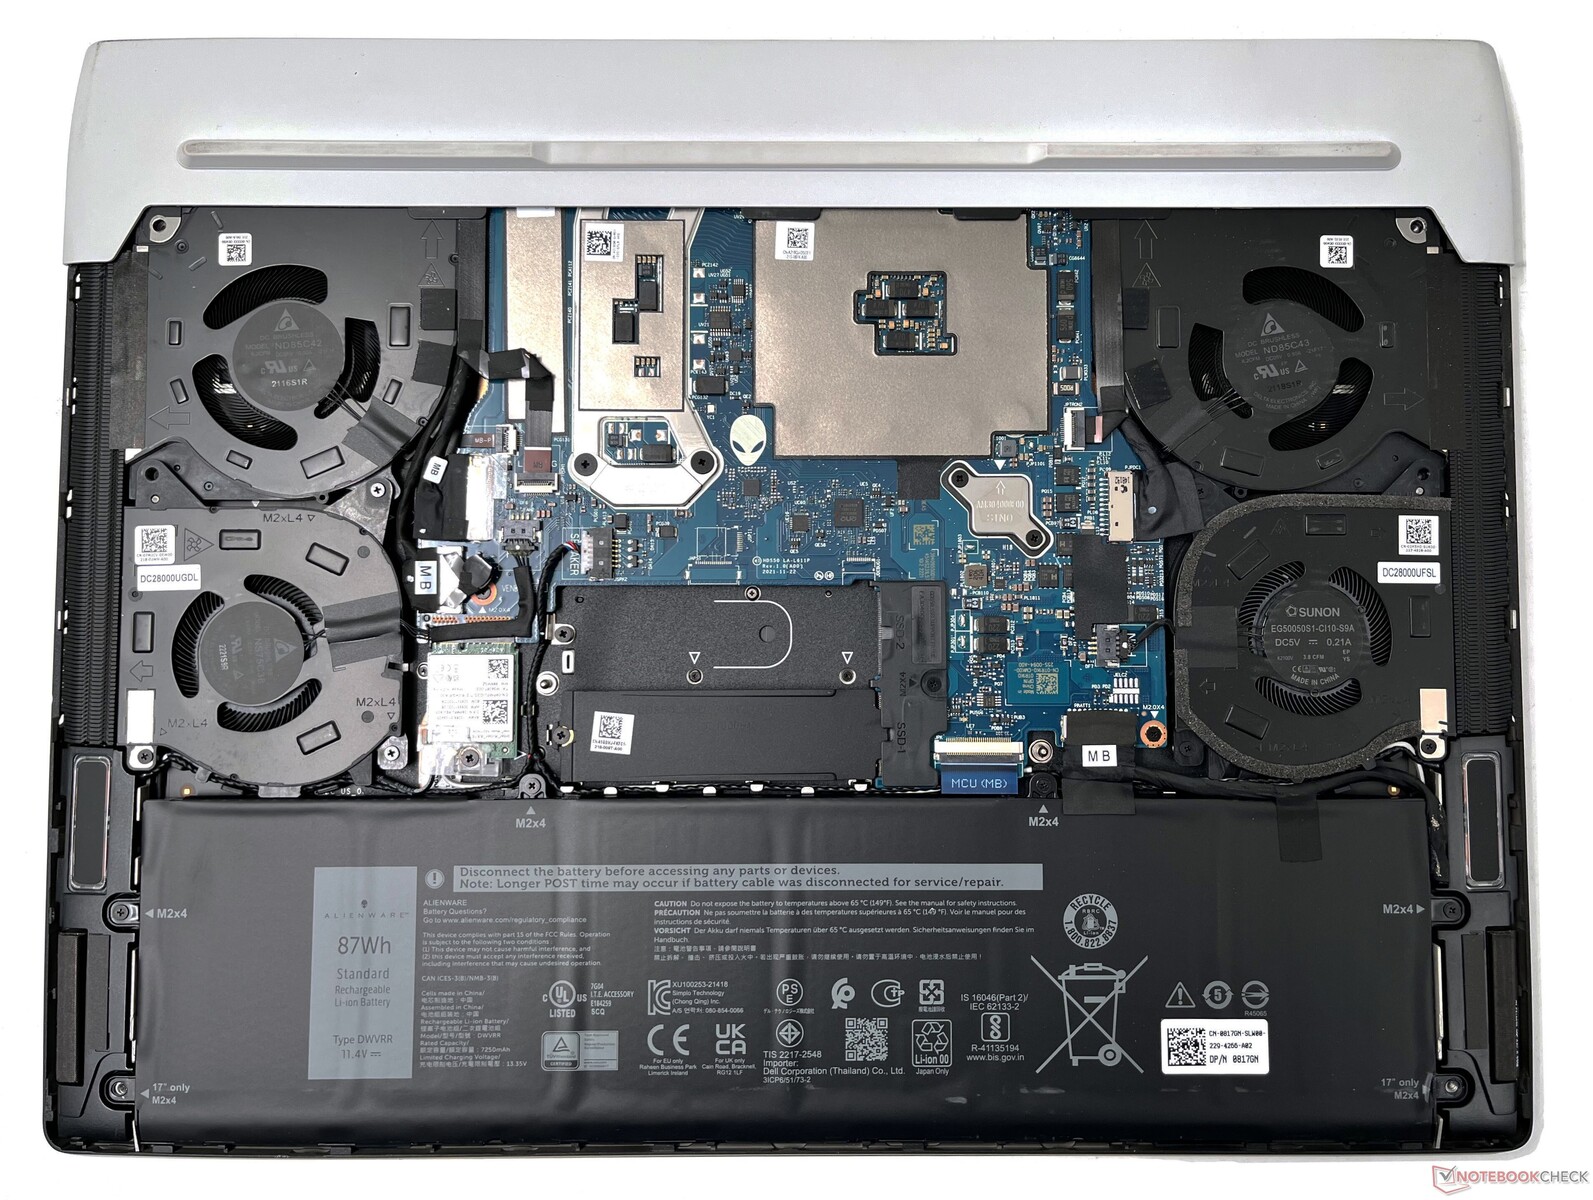
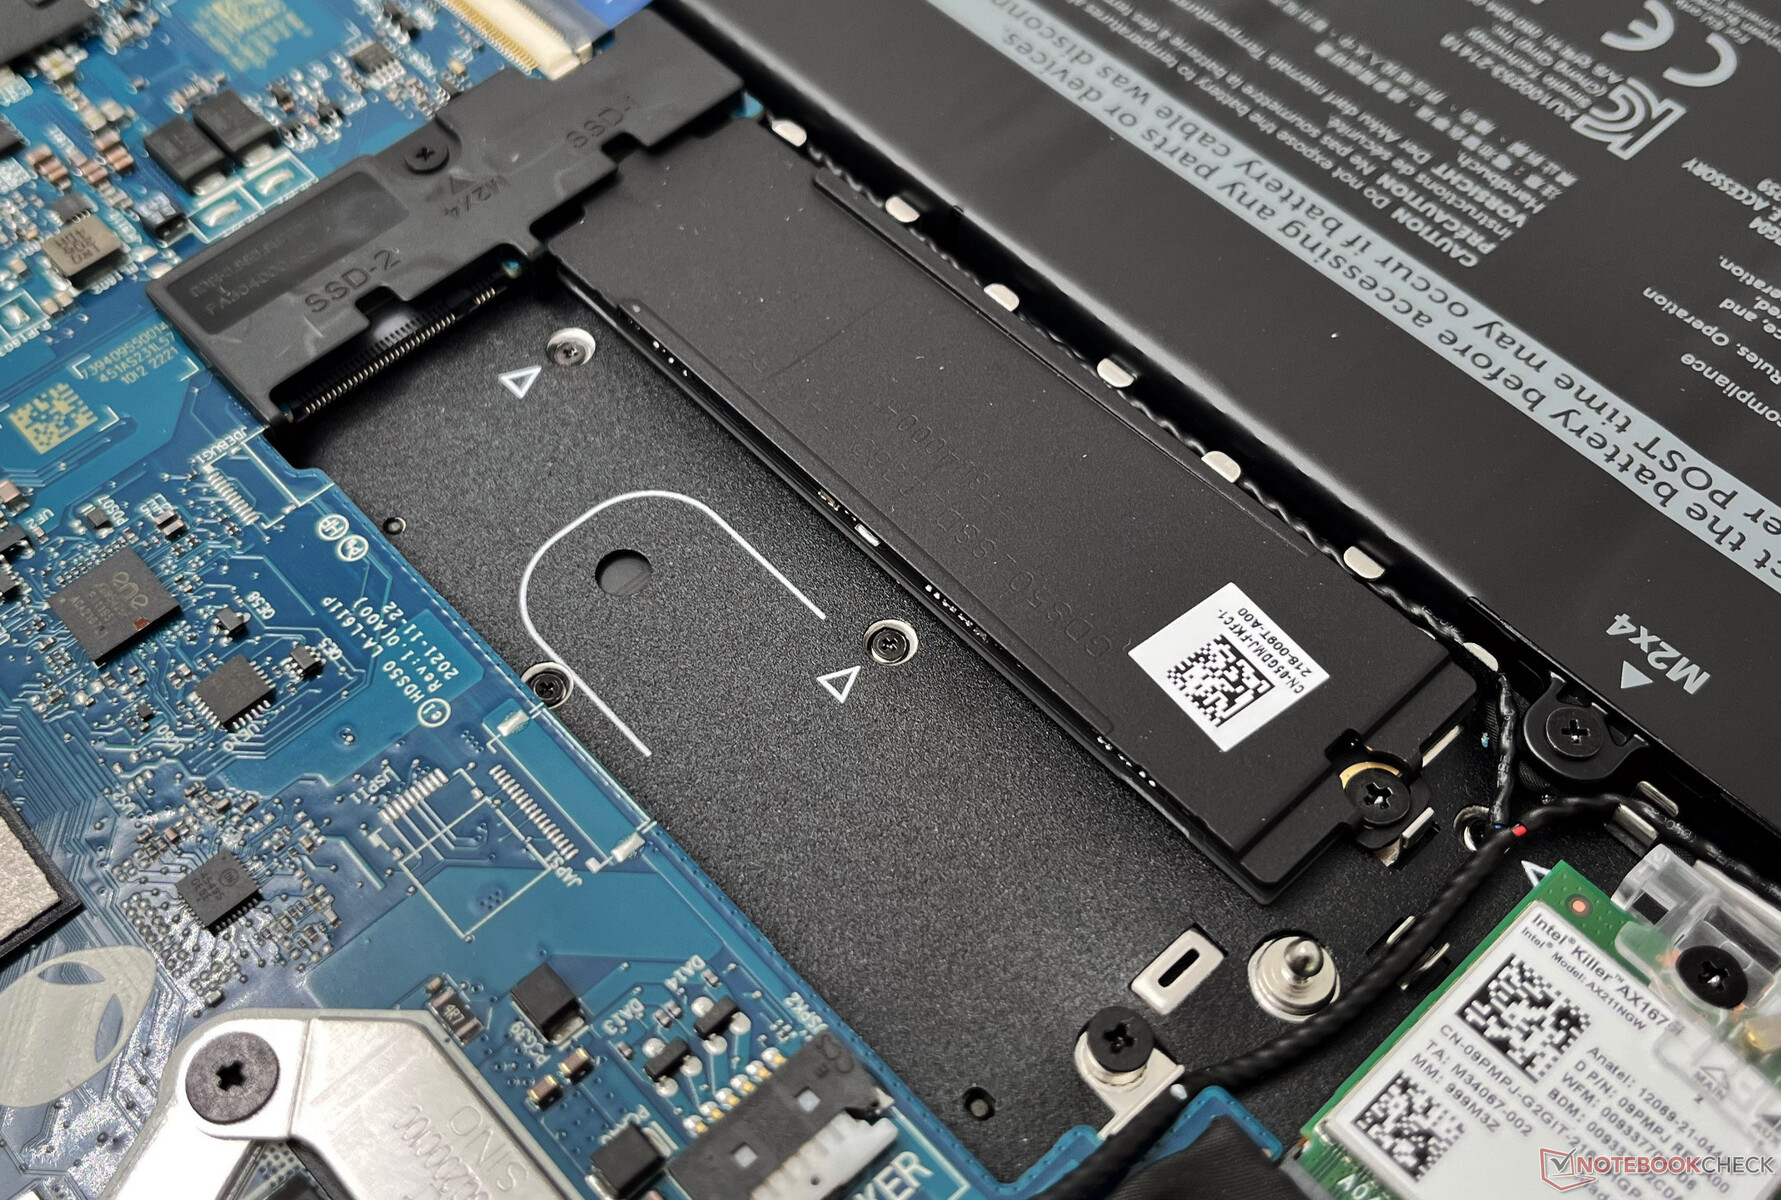
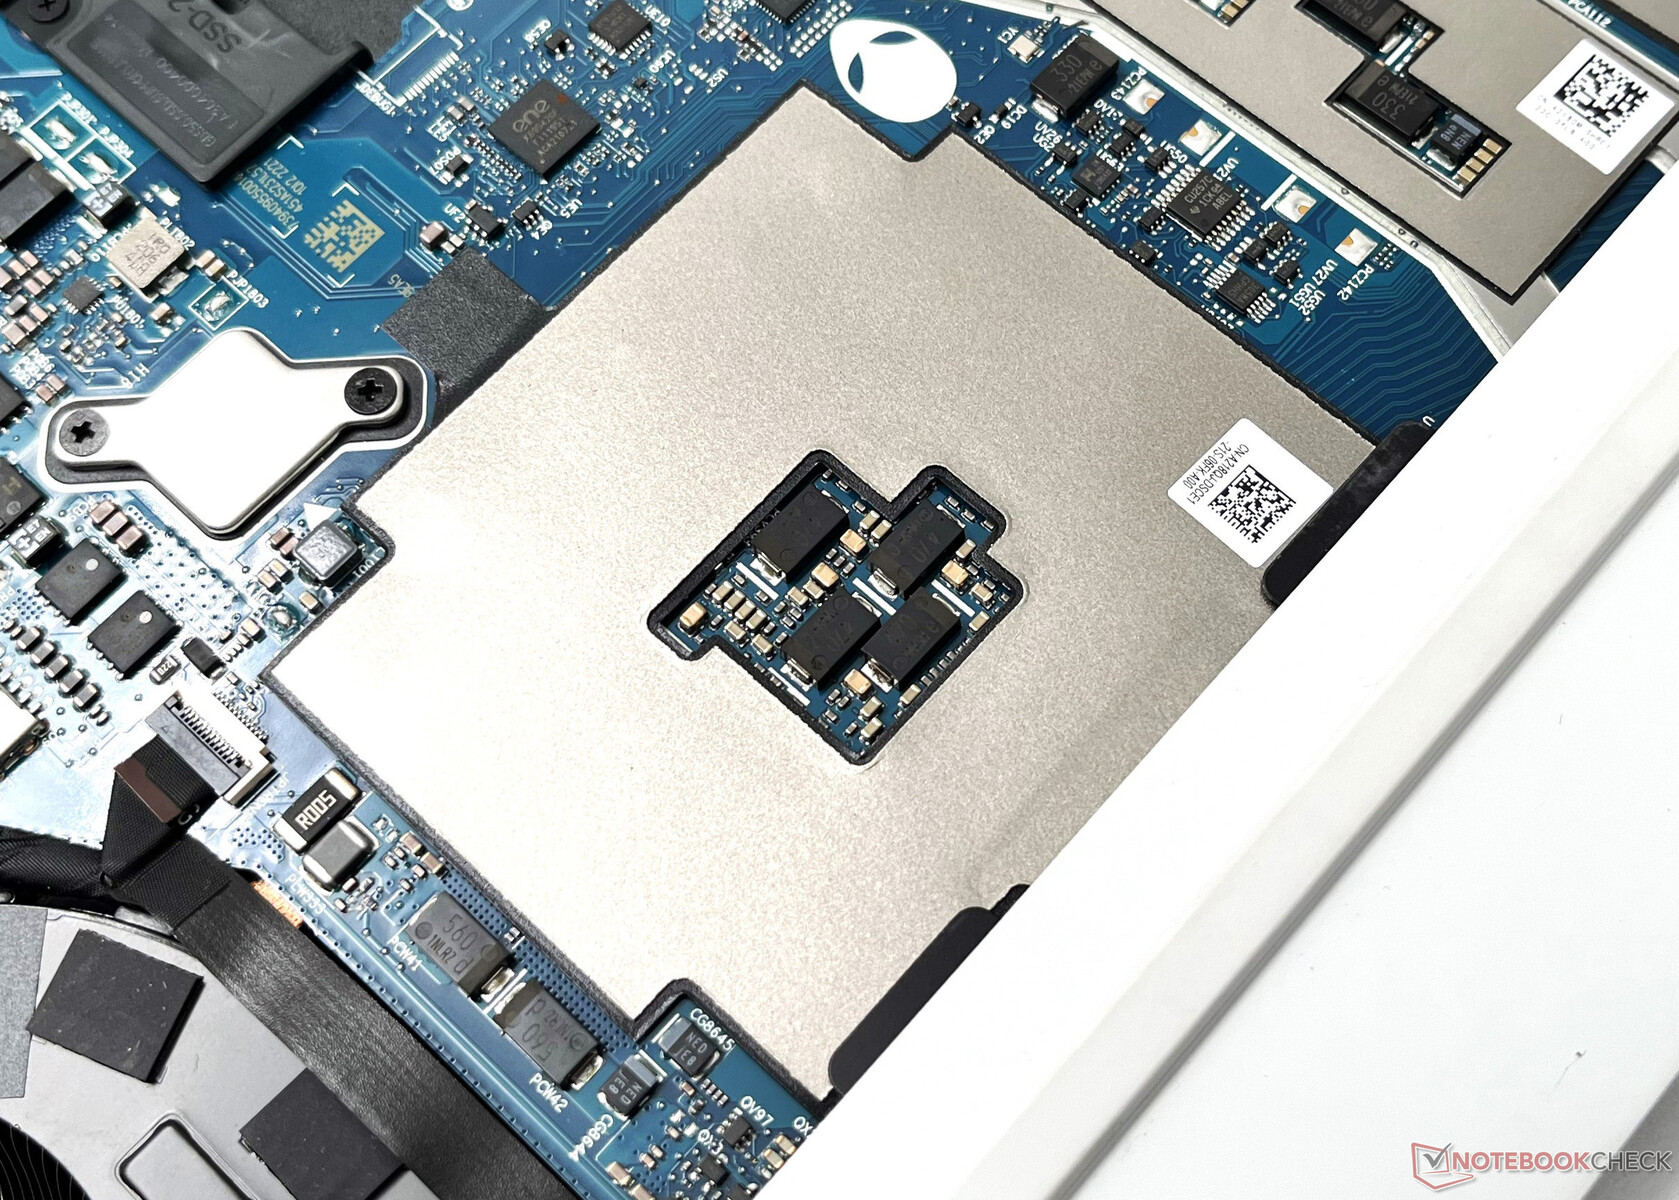
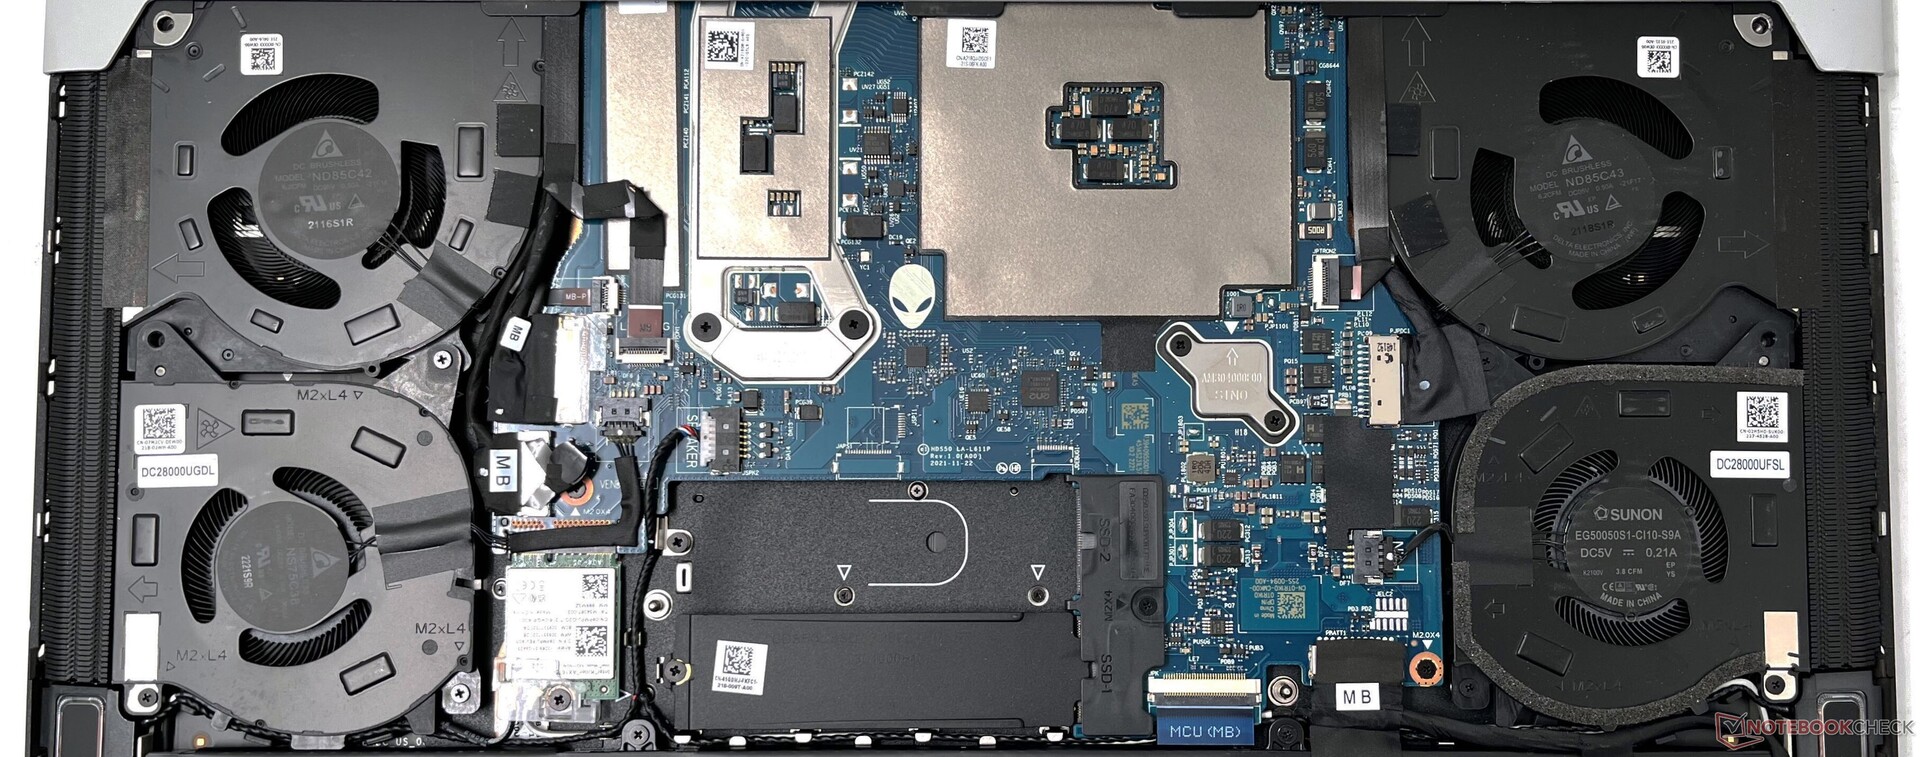
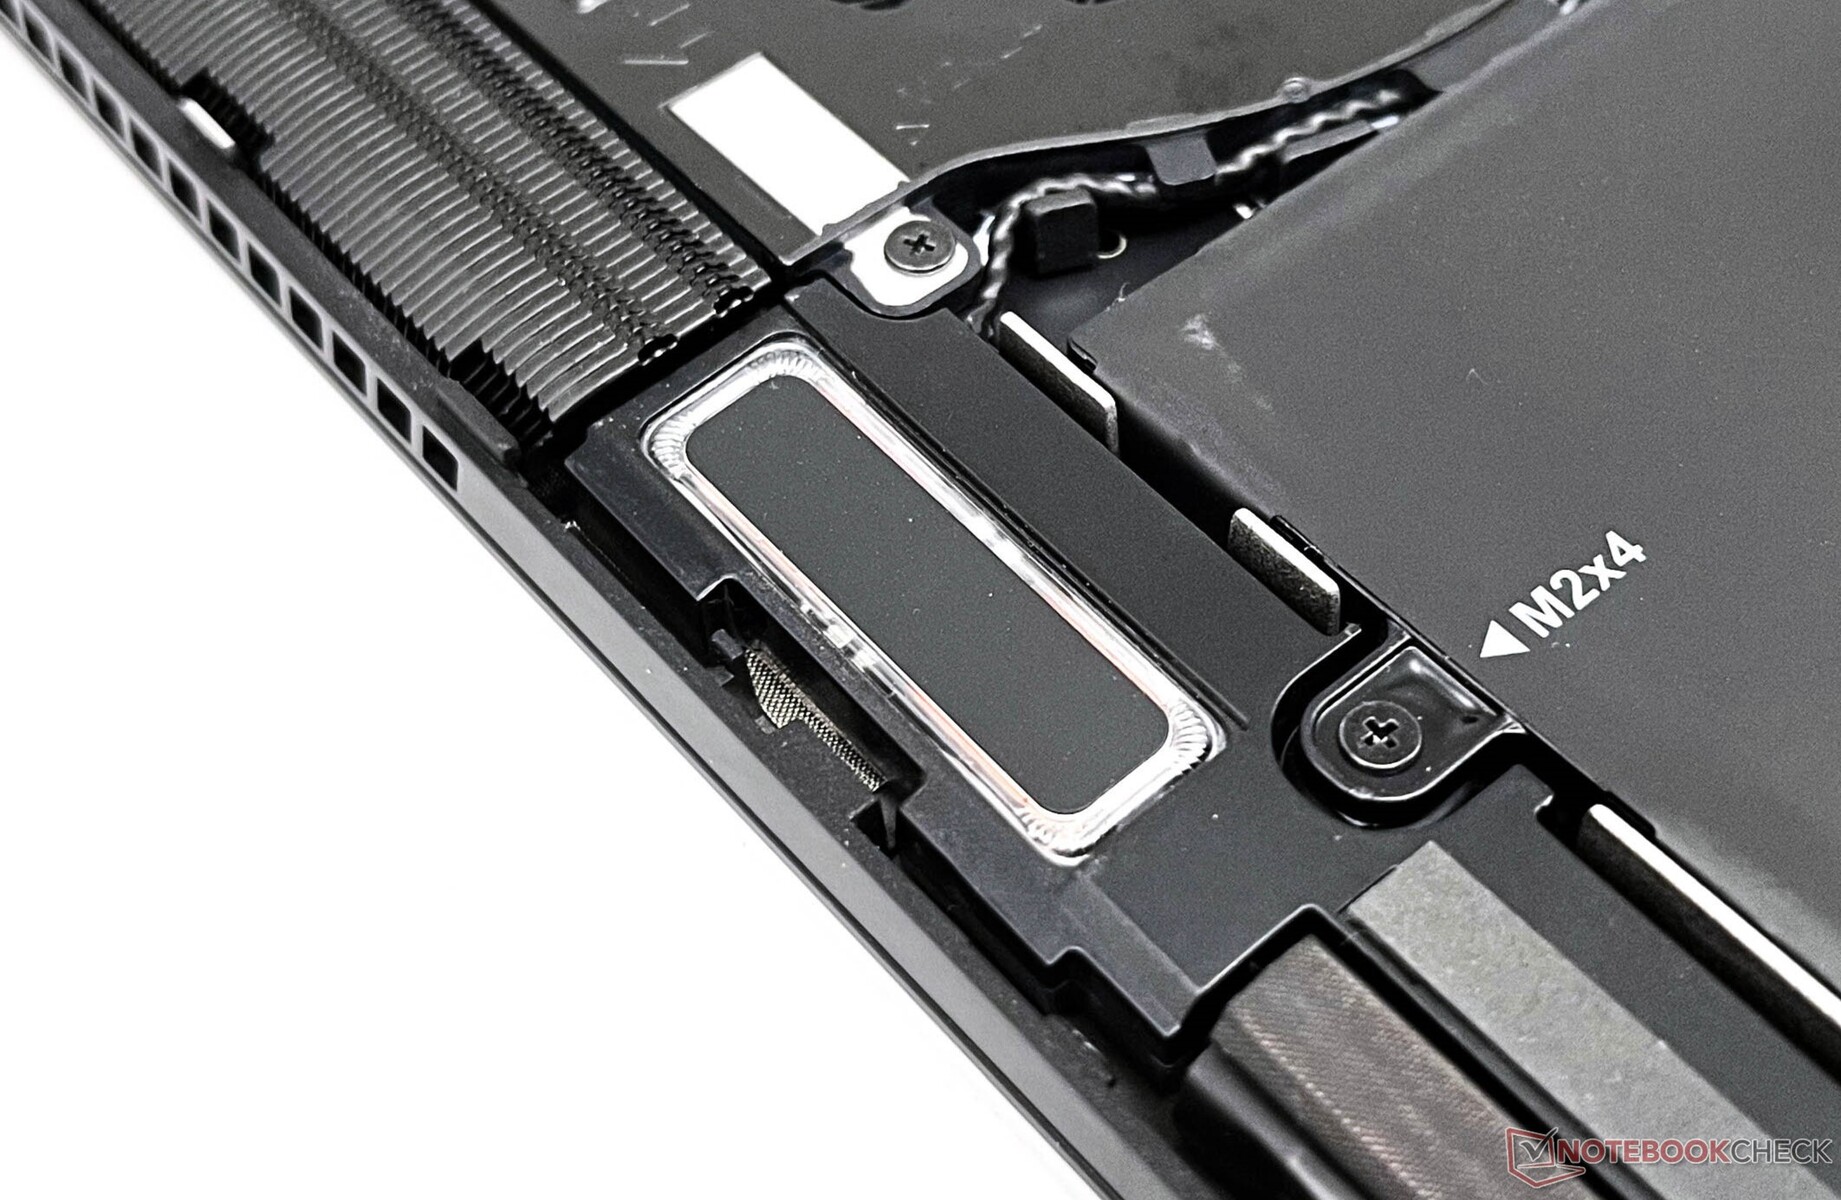
Konserwacja
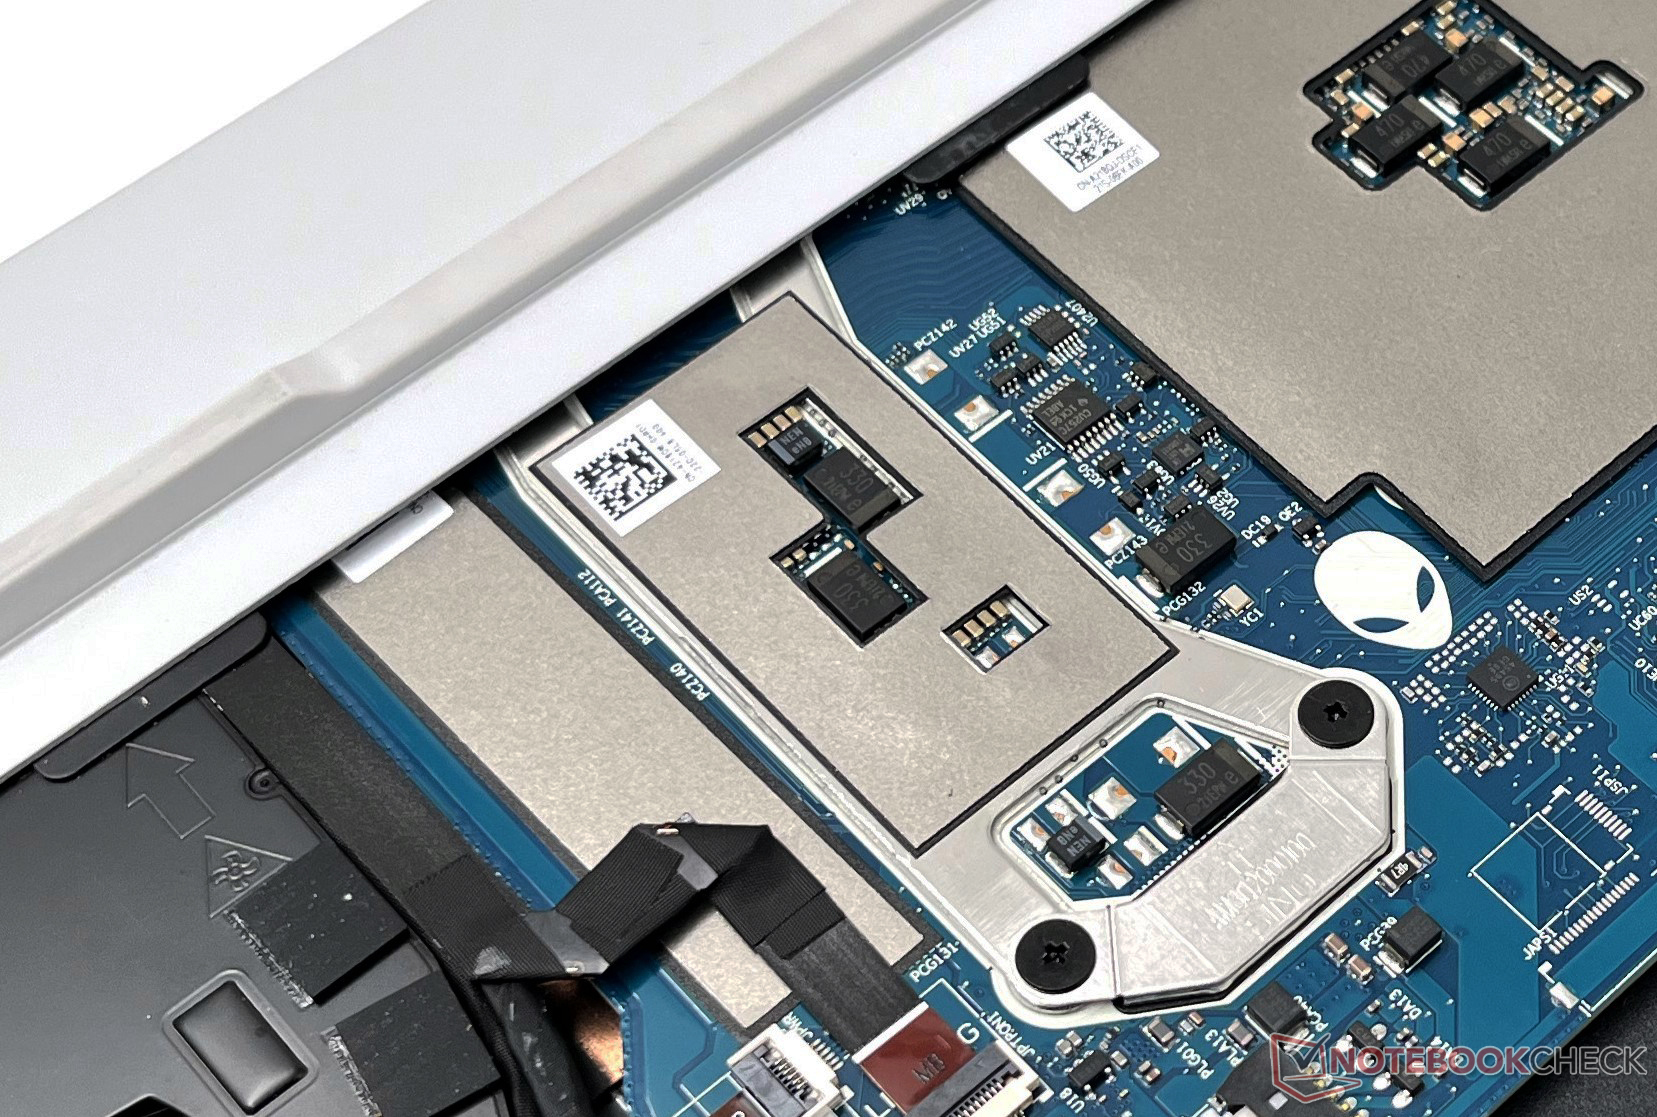
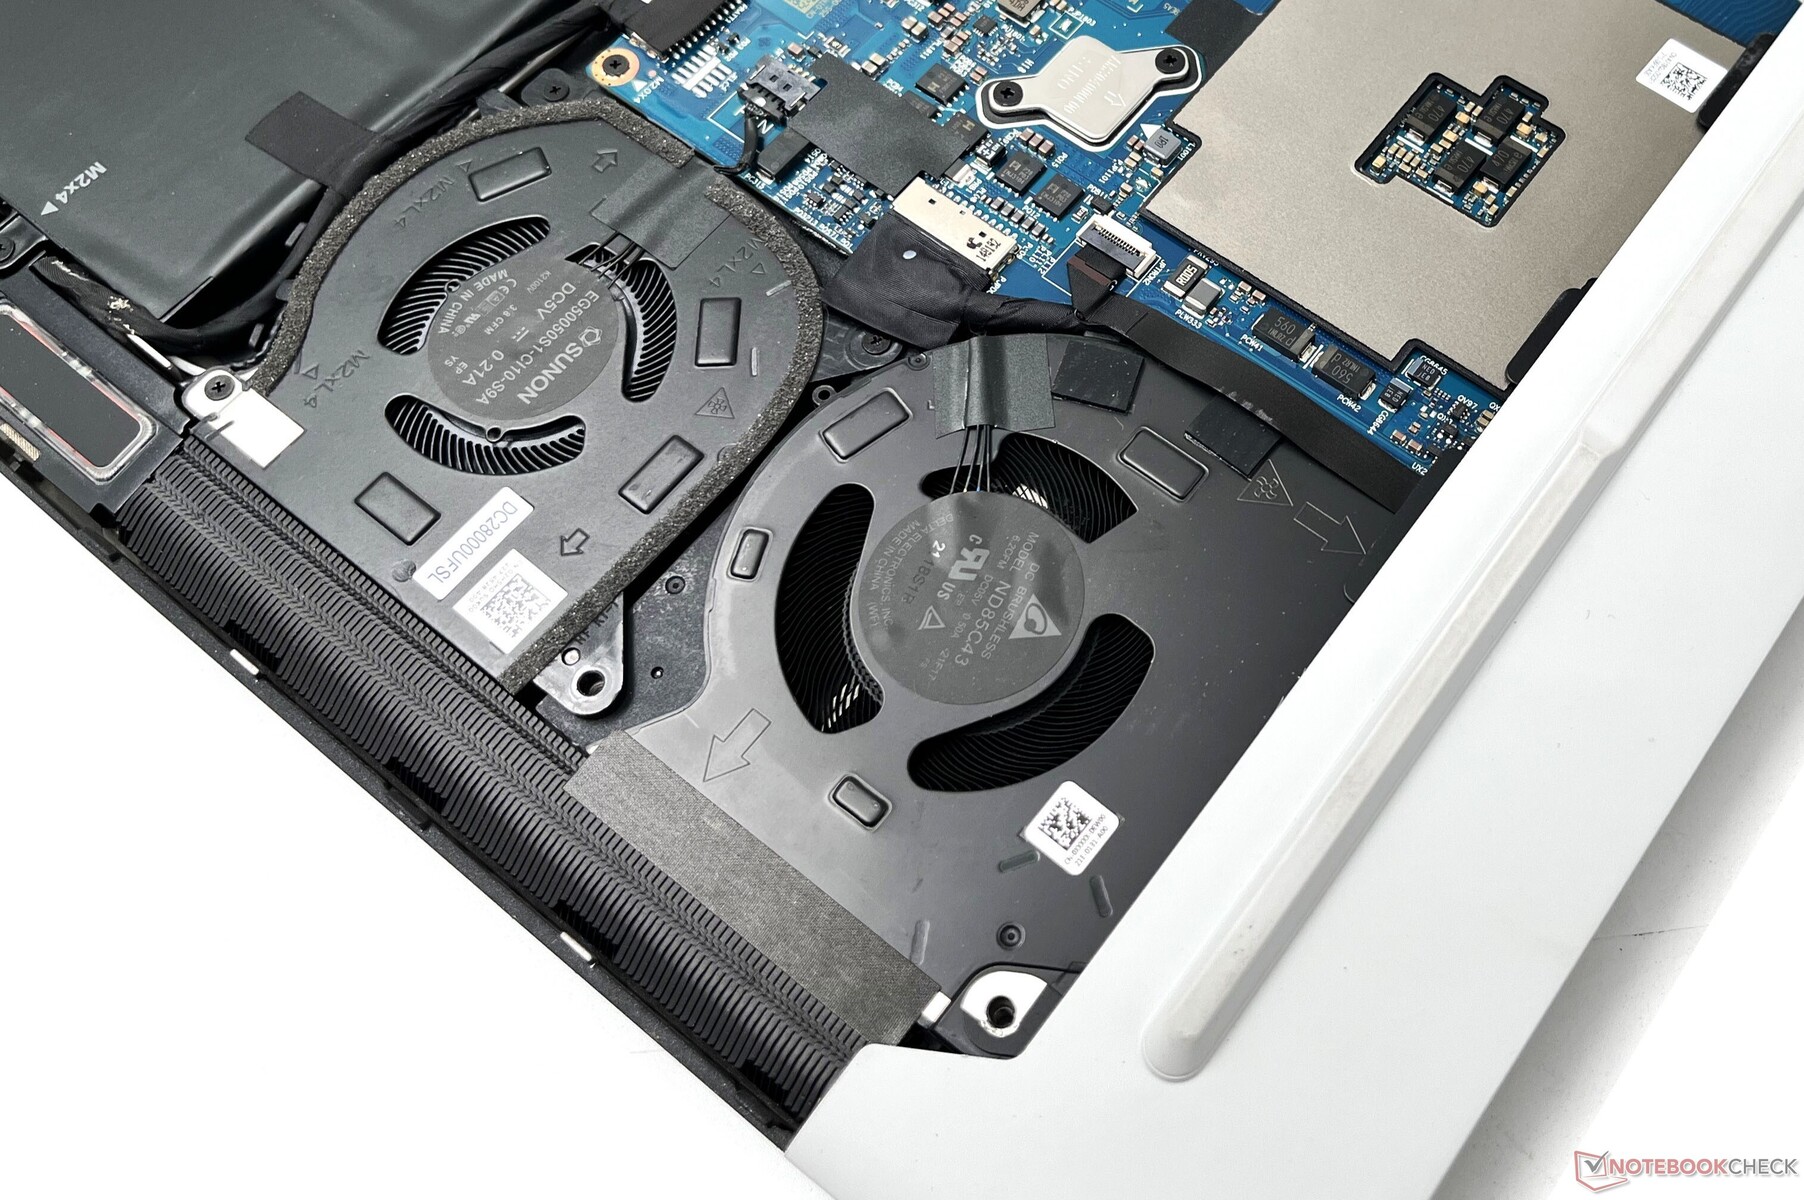
Dostęp do wnętrza obudowy można uzyskać po odkręceniu sześciu śrubek Philipsa na dolnym panelu. Potrzeba trochę wysiłku, aby w pełni otworzyć dolny panel z obudowy. Nie ma tu żadnego otworu konserwacyjnego
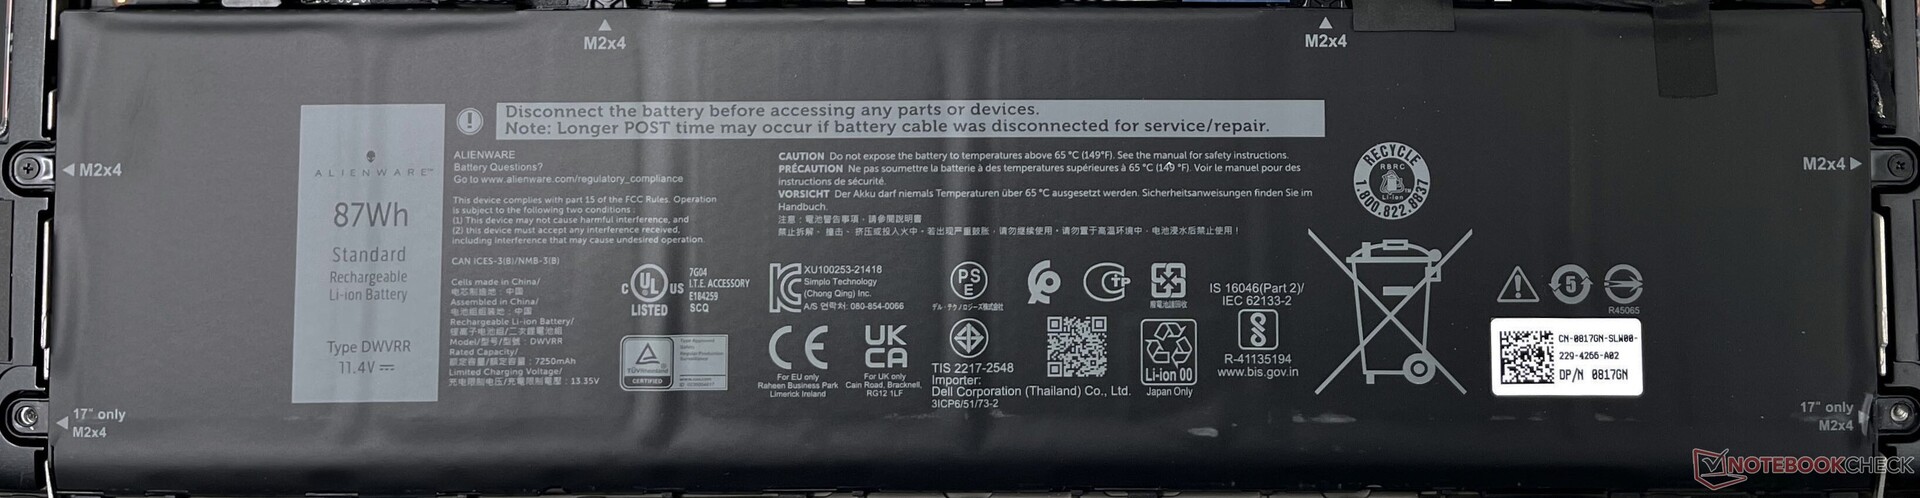
Układ wewnętrzny jest niezmieniony w stosunku do zeszłego roku, co oznacza również, że po raz kolejny trzeba się pogodzić z lutowaną pamięcią RAM. Dysk SSD NVMe, kartę Wi-Fi Killer i akumulator o pojemności 87 Whr można w razie potrzeby wymienić.
Gwarancja
Komputer Alienware x15 R2 jest standardowo wyposażony w roczny pakiet Premium Support Plus firmy Dell oraz usługę Onsite Service. Dodatkowe opcje gwarancji i pomocy technicznej można dodać podczas składania zamówienia w witrynie Dell.com.
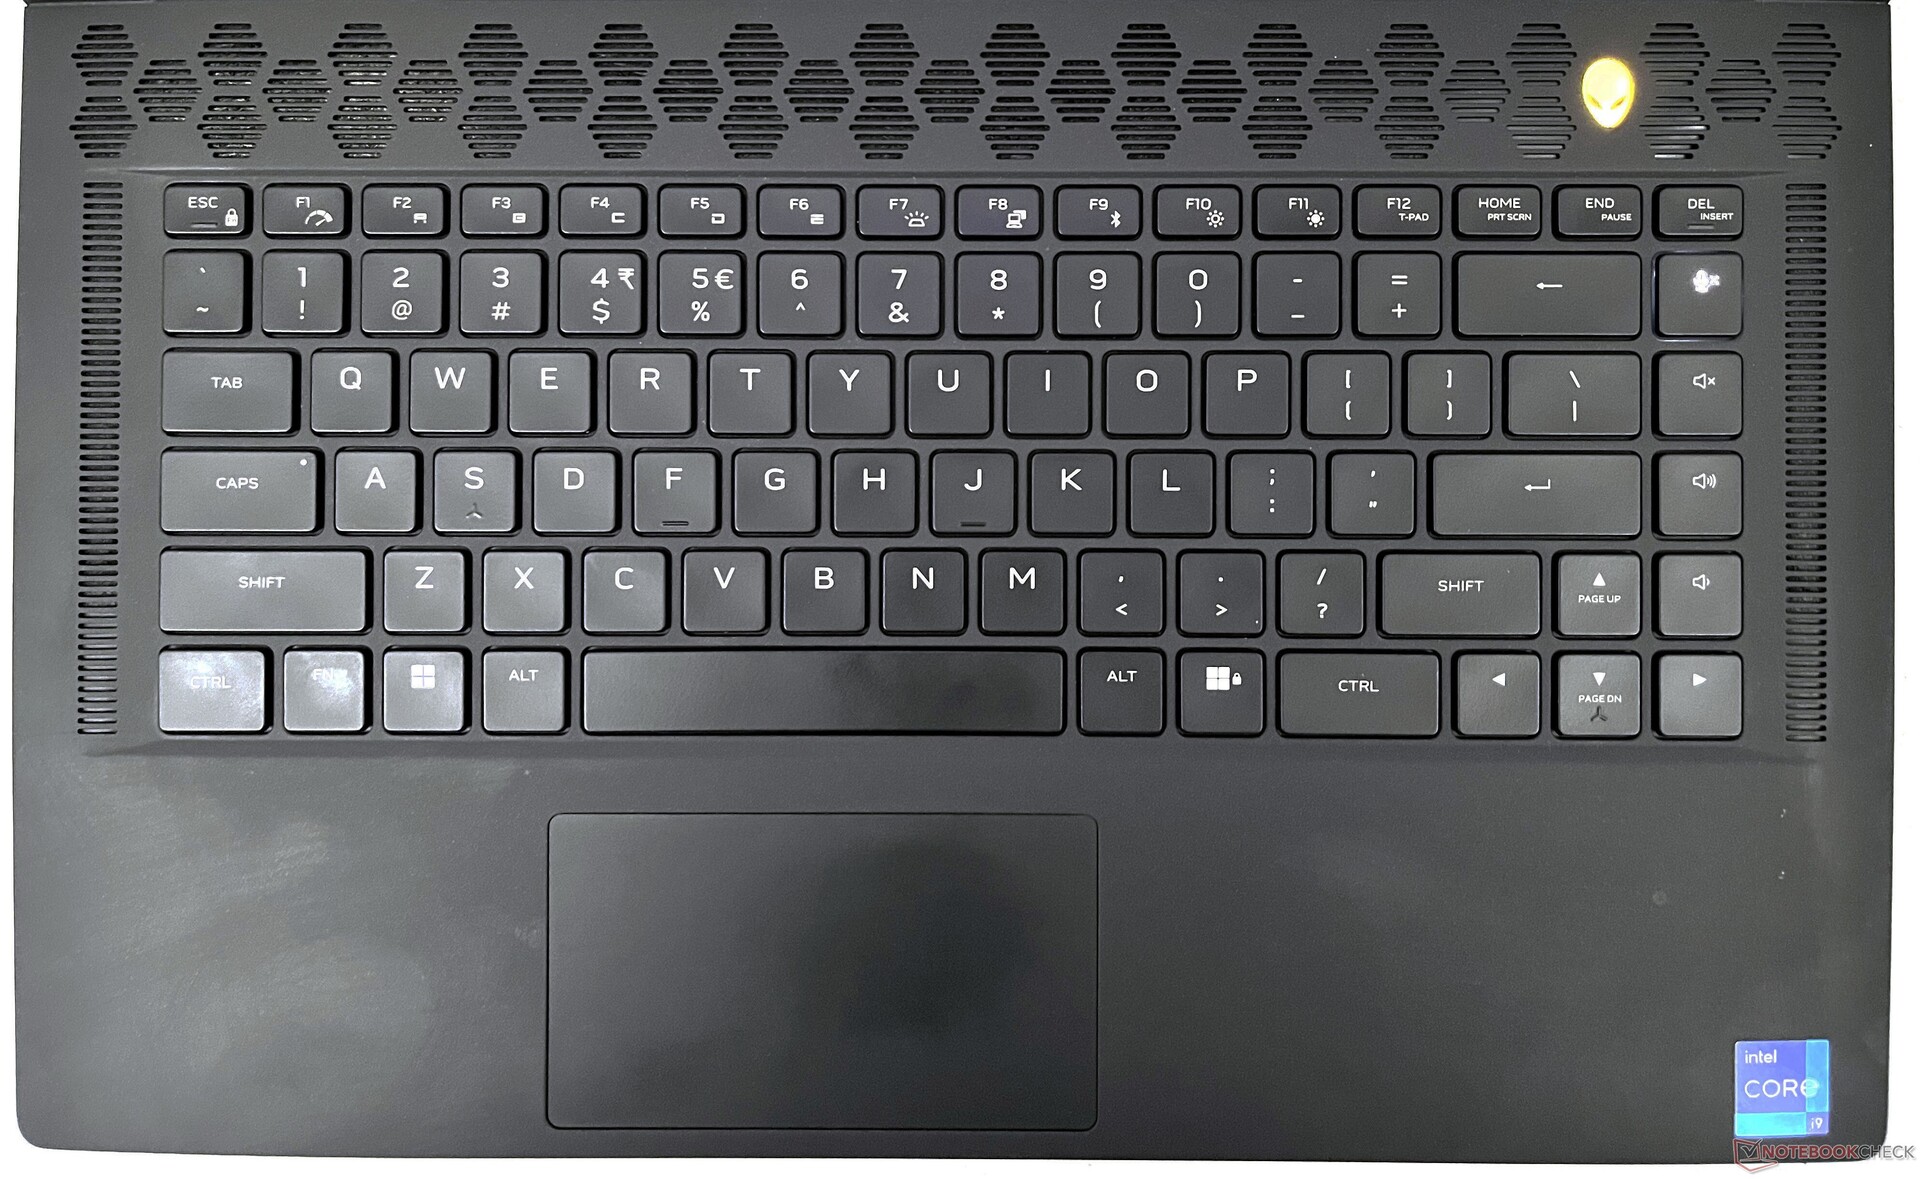
Urządzenia wejściowe: Klawisze pomocnicze pozostają niepodświetlone
Klawiatura
Klawiatura pozostaje bez zmian w stosunku do modelu x15 R1. Dell zastosował cienką klawiaturę z serii Alienware X ze skokiem klawiszy 1,5 mm, funkcją N-key rollover i technologią anti-ghosting. Ze względu na cienką obudowę nie ma klawiszy mechanicznych.
Pisanie na klawiaturze x15 R2 jest generalnie przyjemne dzięki dobrej reakcji na dotyk. Pełnowymiarowe klawisze strzałek zostały przeniesione z x15 R1 i są mile widzianym dodatkiem. Jednakże drugorzędne symbole na klawiszach funkcyjnych nadal pozostają niepodświetlone, co sprawia, że korzystanie z nich w ciemności jest uciążliwe.
Touchpad
Touchpad o wymiarach 10,5 cm x 6 cm sprawia wrażenie nieco mniejszego w porównaniu z konkurencją, ale oferuje płynny ślizg. Obsługiwane są gesty Windows Precision. Klikanie wymaga czasem trochę wysiłku i przydałoby się dodatkowe sprzężenie zwrotne
W przeciwieństwie do x15 R1, schemat kolorystyczny touchpada x15 R2 pasuje do reszty obudowy klawiatury, ale nadal jest magnesem na odciski palców i brud.
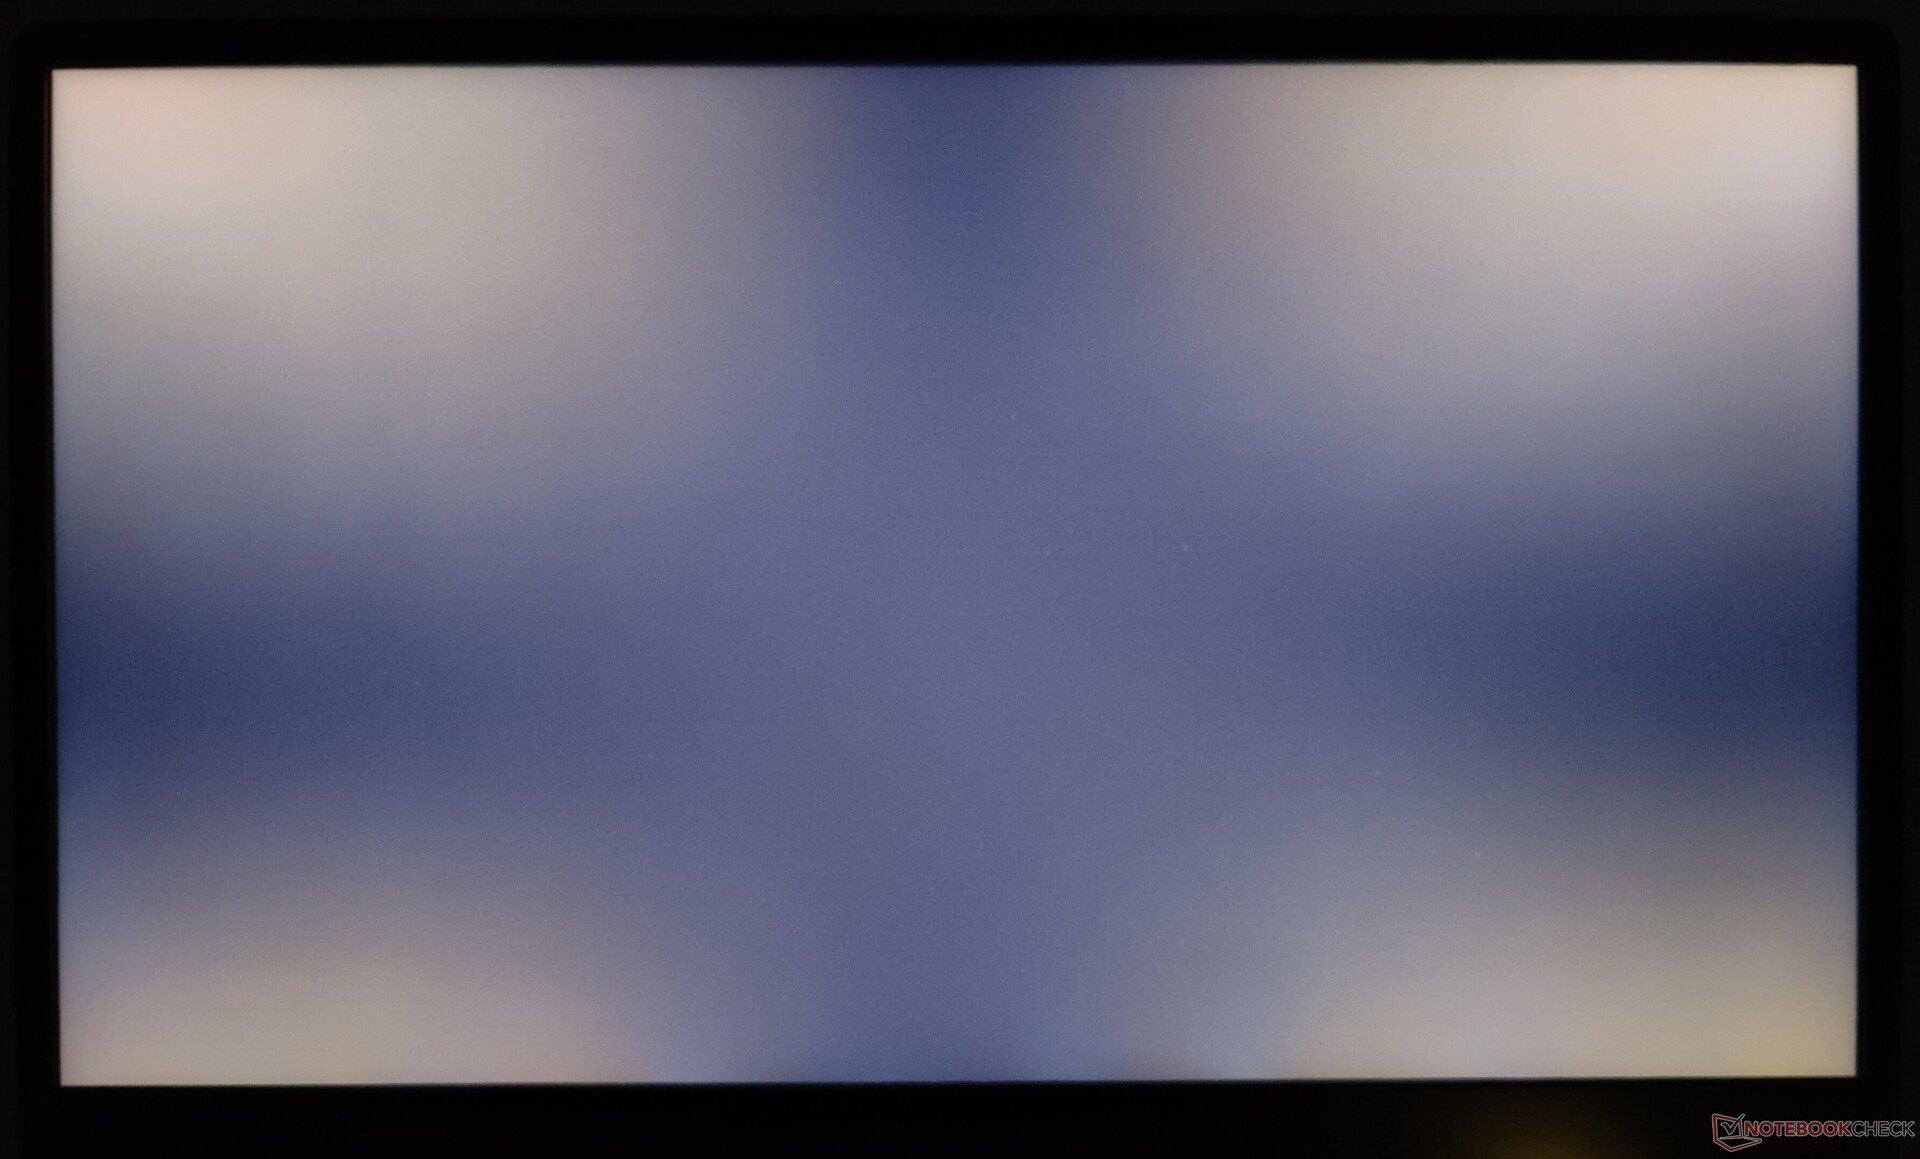
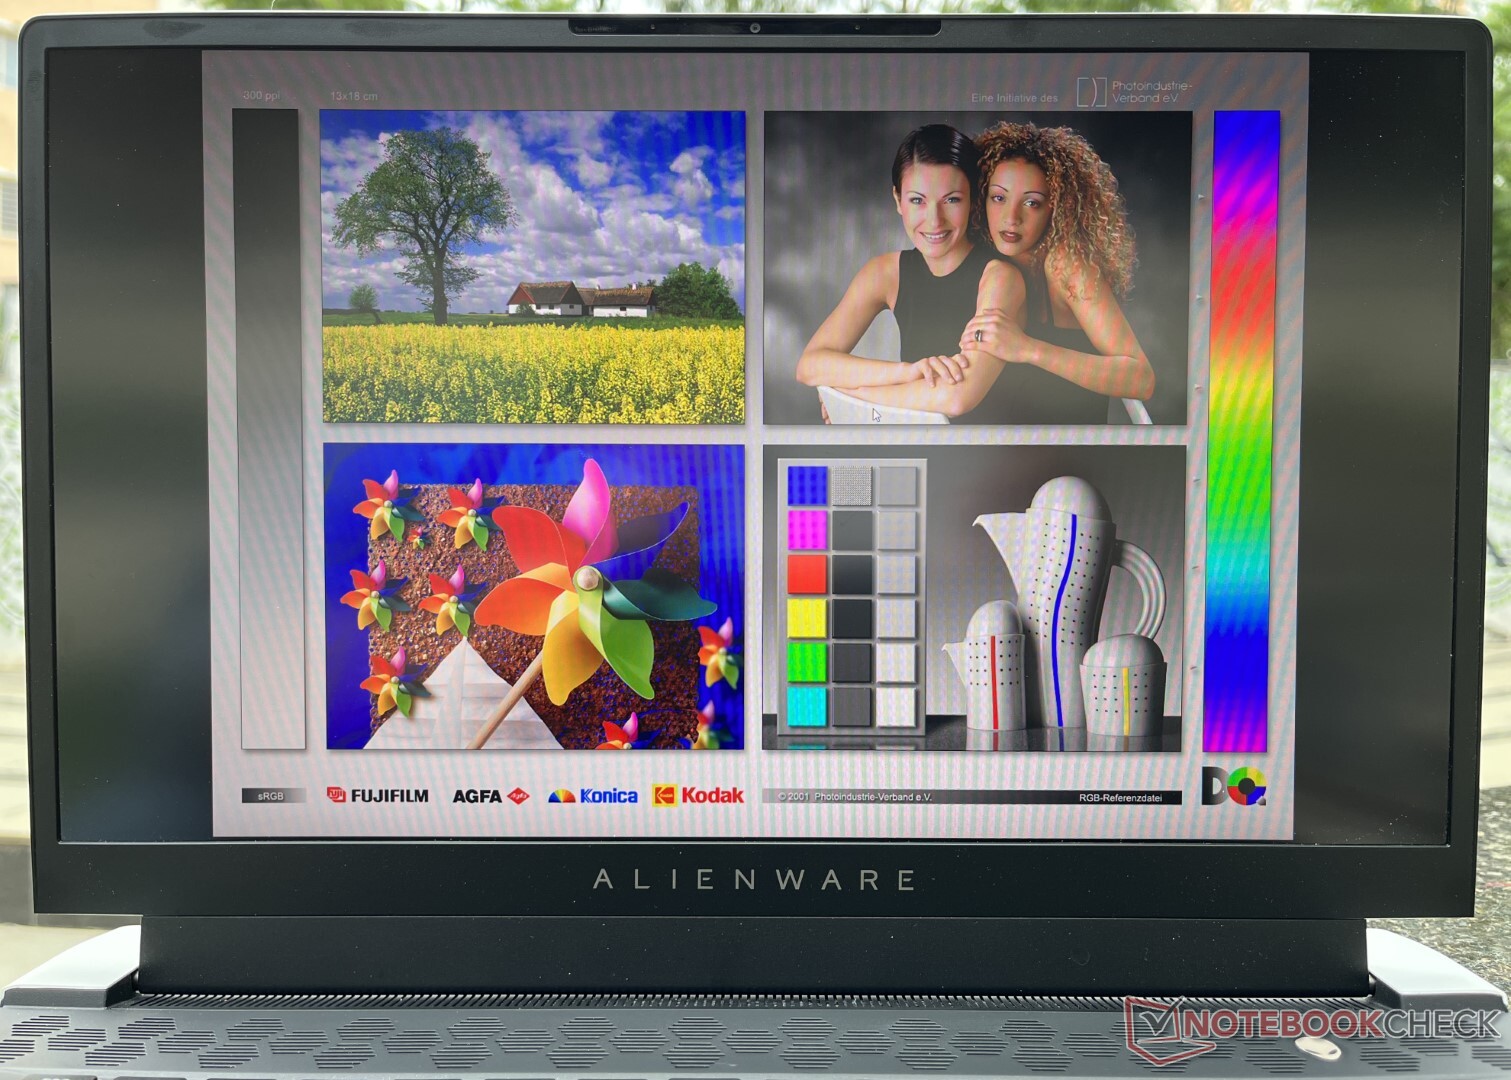
Wyświetlacz: 360 Hz panel G-Sync z Dolby Vision i bez PWM
Nasz Alienware x15 R2 wyposażony jest w panel 1080p 360 Hz. Jest to panel Nvidia G-Sync ze wsparciem dla Dolby Vision HDR. Użytkownicy mogą również skonfigurować x15 R2 z opcjami panelu FHD 165 Hz i QHD 240 Hz z obsługą G-Sync i Dolby Vision.
Rozdzielczość 1080p przekłada się na większy rozmiar pikseli o ogólnej gęstości 141 PPI. Zaobserwowaliśmy znaczny bleeding podświetlenia na wszystkich czterech rogach przy długim czasie ekspozycji.
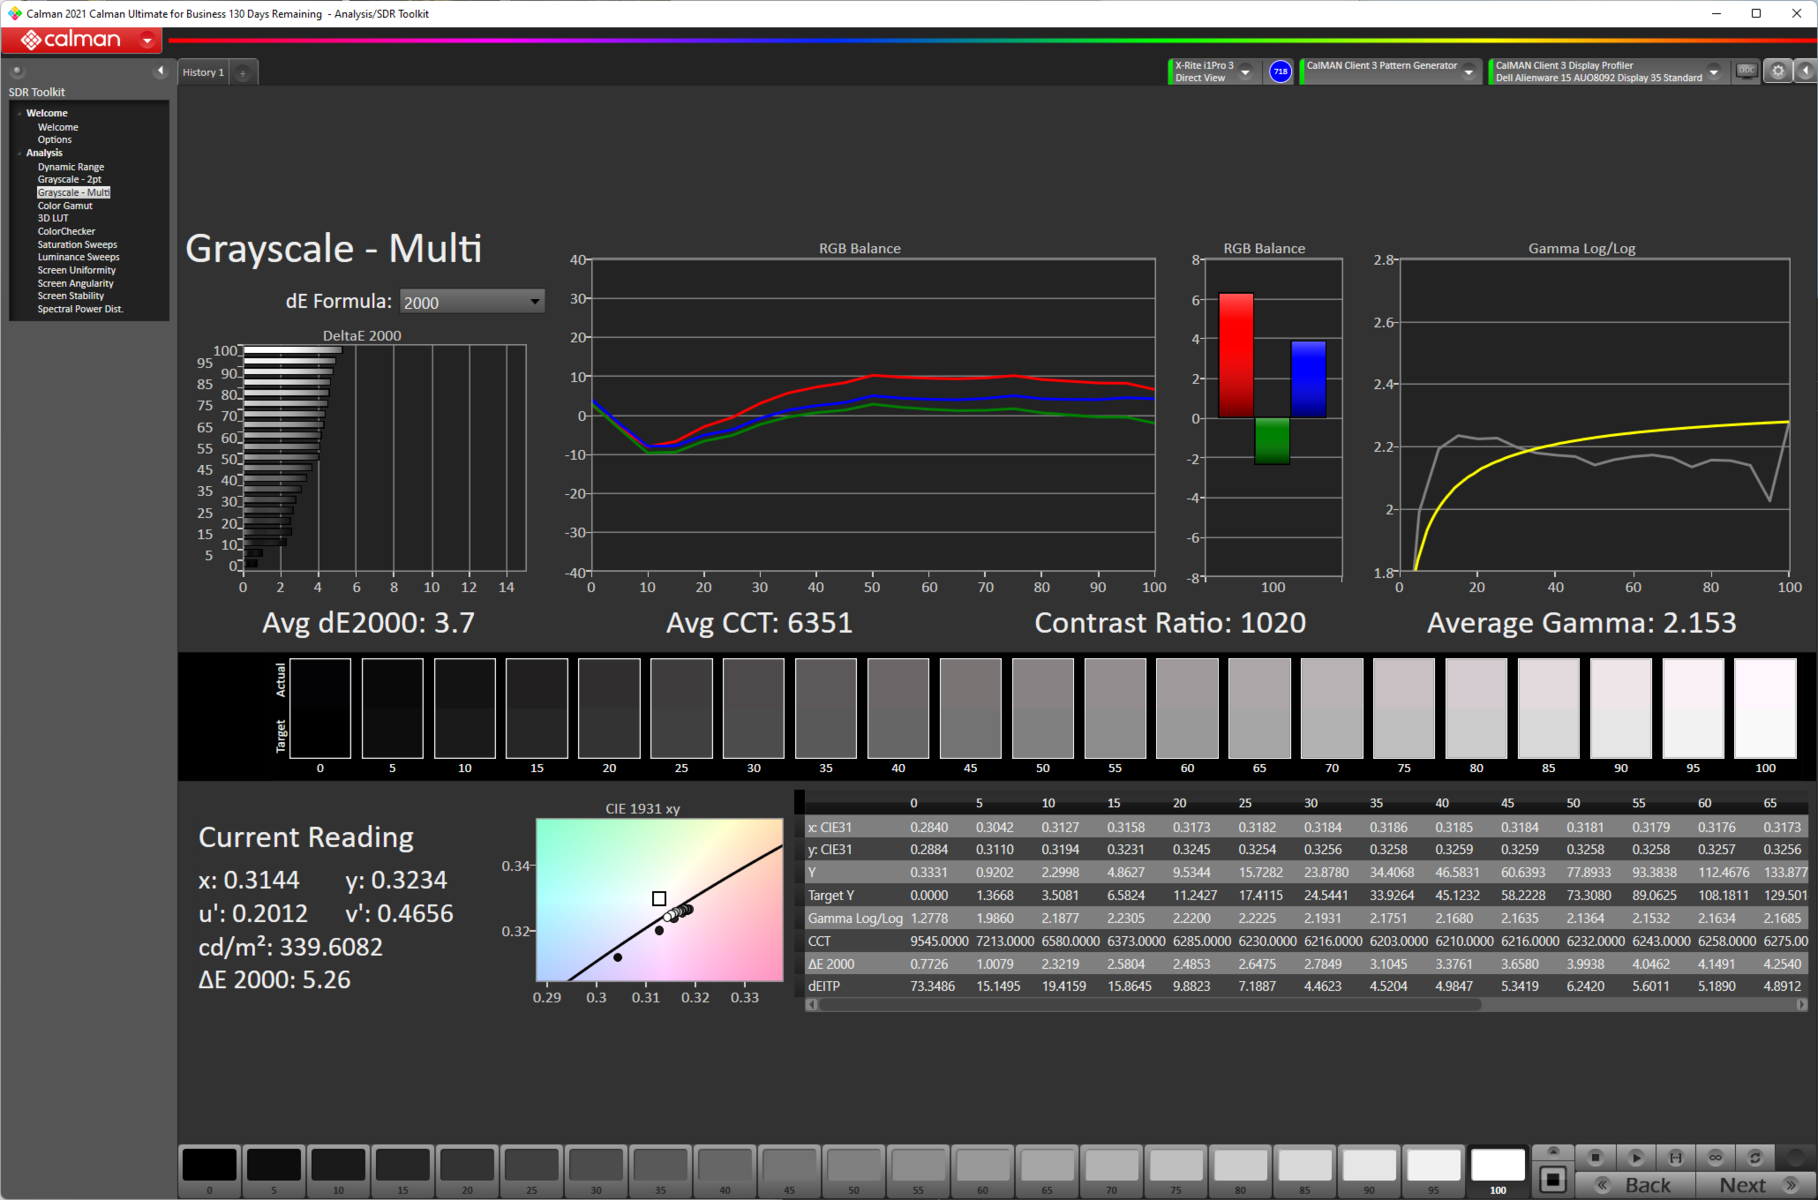
Charakterystyka wyświetlacza x15 R2 jest podobna do tego, co widzieliśmy wcześniej w modelu 2020 Alienware m15 R3, w którym również zastosowano ten sam panel. Rozkład jasności jest przyzwoity na poziomie 82%, a zmierzony współczynnik kontrastu 1033:1 oferuje dobre subiektywne wrażenia z oglądania.

| |||||||||||||||||||||||||
rozświetlenie: 82 %
na akumulatorze: 341 cd/m²
kontrast: 1033:1 (czerń: 0.33 cd/m²)
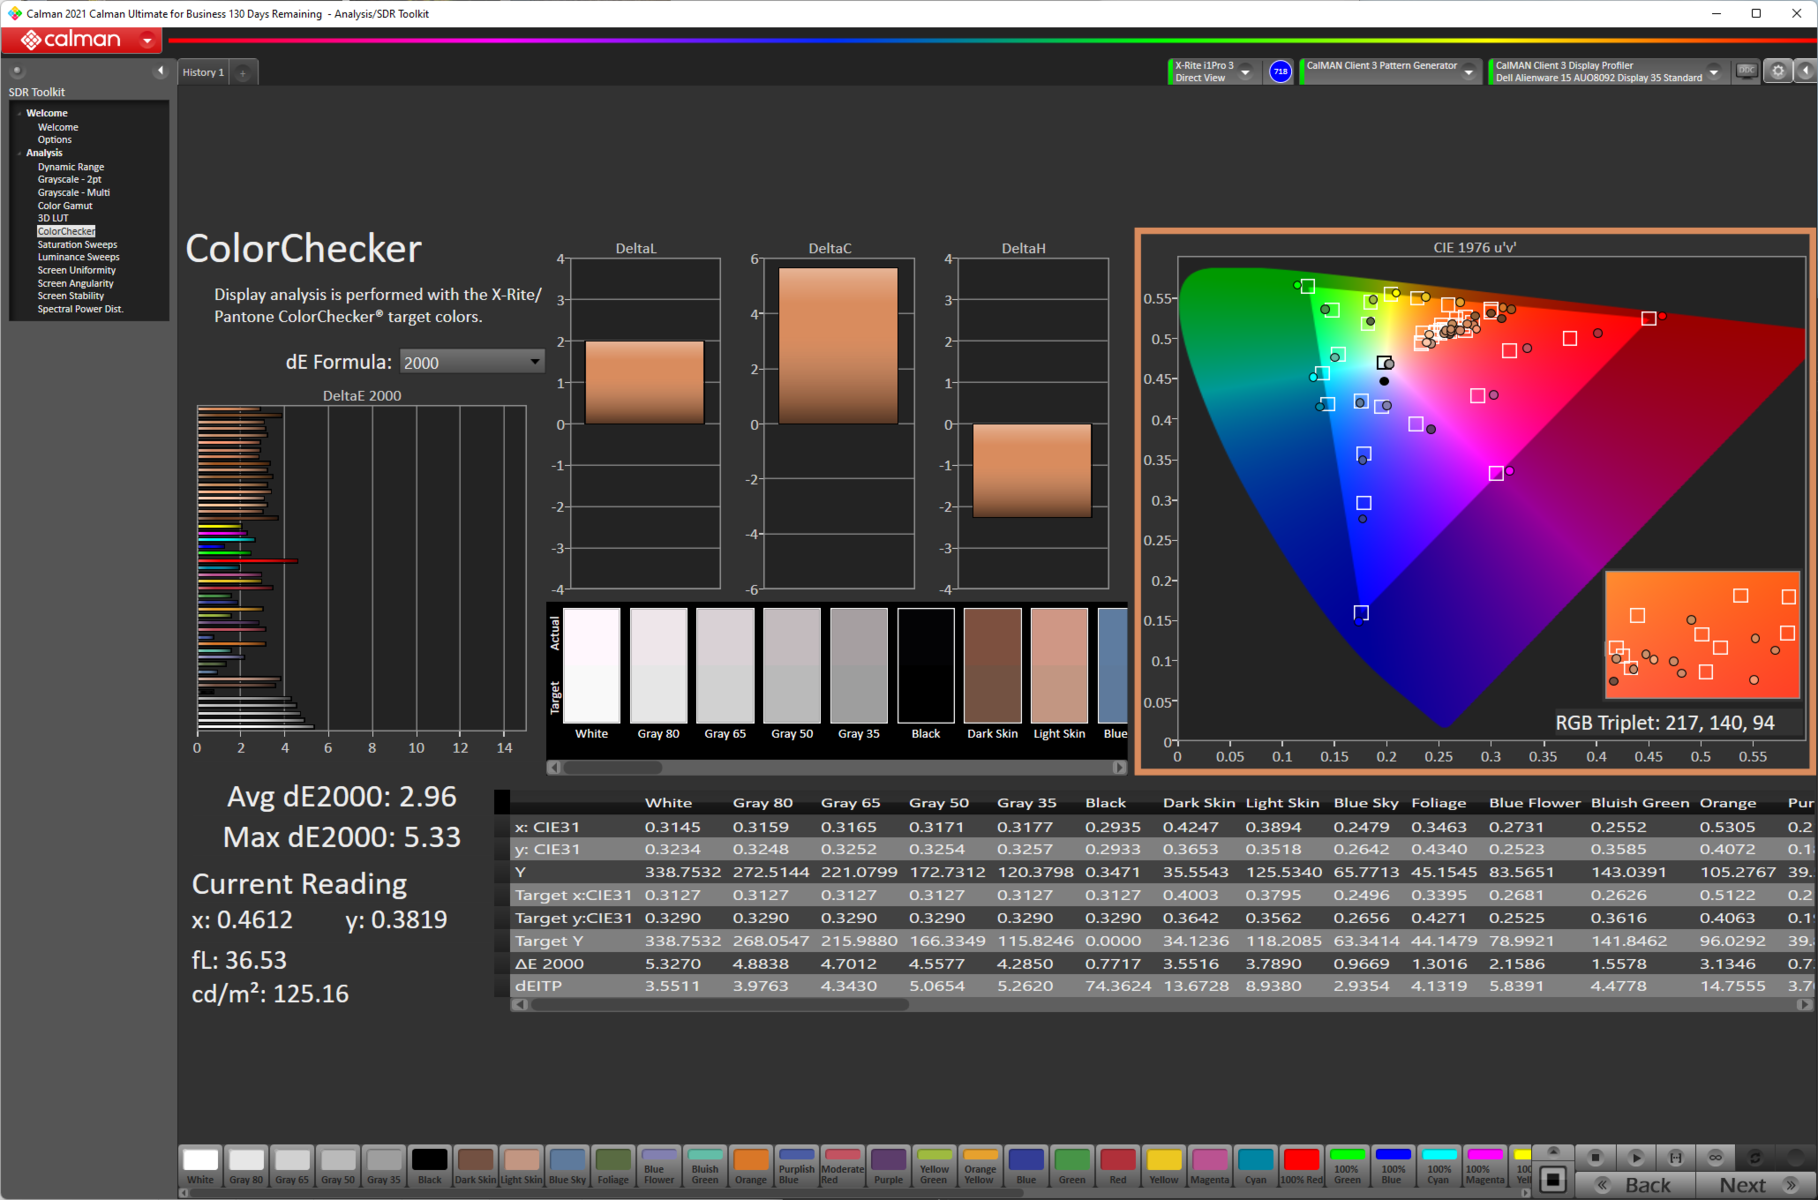
ΔE ColorChecker Calman: 2.96 | ∀{0.5-29.43 Ø4.73}
calibrated: 1.46
ΔE Greyscale Calman: 3.7 | ∀{0.09-98 Ø4.97}
75.7% AdobeRGB 1998 (Argyll 3D)
100% sRGB (Argyll 3D)
74.7% Display P3 (Argyll 3D)
Gamma: 2.15
CCT: 6351 K
| Alienware x15 R2 P111F AU Optronics B156HAN (AUO8092), IPS, 1920x1080, 15.6" | Alienware x15 RTX 3070 P111F LG Philips 156QHG, IPS, 2560x1440, 15.6" | Asus ROG Strix Scar 15 G533ZW-LN106WS BOE CQ NE156QHM-NZ2, IPS-level, 2560x1440, 15.6" | MSI Titan GT77 12UHS Sharp SHP1544 LQ173M1JW08, IPS-Level, 1920x1080, 17.3" | MSI Vector GP66 12UGS BOE NE156FHM-NZ3, IPS, 1920x1080, 15.6" | Razer Blade 15 Advanced Model Early 2022 TL156VDXP02-0, IPS, 1920x1080, 15.6" | |
|---|---|---|---|---|---|---|
| Display | 16% | 14% | -3% | -4% | -13% | |
| Display P3 Coverage (%) | 74.7 | 97.8 31% | 96.2 29% | 70.8 -5% | 70.1 -6% | 65.3 -13% |
| sRGB Coverage (%) | 100 | 99.9 0% | 99.9 0% | 98.9 -1% | 99.5 0% | 85.1 -15% |
| AdobeRGB 1998 Coverage (%) | 75.7 | 84.5 12% | 73 -4% | 72.1 -5% | 67.4 -11% | |
| Response Times | -429% | -232% | -64% | -209% | -168% | |
| Response Time Grey 50% / Grey 80% * (ms) | 1.47 ? | 12 ? -716% | 7.86 ? -435% 4.21 ? -186% | 3.03 ? -106% | 5.8 ? -295% | 4.3 ? -193% |
| Response Time Black / White * (ms) | 4.32 ? | 10.4 ? -141% | 7.5 ? -74% | 5.28 ? -22% | 9.6 ? -122% | 10.5 ? -143% |
| PWM Frequency (Hz) | ||||||
| Screen | -4% | -24% | -7% | 4% | 30% | |
| Brightness middle (cd/m²) | 341 | 409.5 20% | 346 1% | 280 -18% | 353.1 4% | 330 -3% |
| Brightness (cd/m²) | 316 | 390 23% | 329 4% | 275 -13% | 325 3% | 315 0% |
| Brightness Distribution (%) | 82 | 88 7% | 91 11% | 79 -4% | 85 4% | 89 9% |
| Black Level * (cd/m²) | 0.33 | 0.47 -42% | 0.59 -79% | 0.4 -21% | 0.38 -15% | 0.24 27% |
| Contrast (:1) | 1033 | 871 -16% | 586 -43% | 700 -32% | 929 -10% | 1375 33% |
| Colorchecker dE 2000 * | 2.96 | 3.48 -18% | 3.06 -3% | 2.1 29% | 2.24 24% | 1.47 50% |
| Colorchecker dE 2000 max. * | 5.33 | 6.31 -18% | 5.81 -9% | 5.83 -9% | 5 6% | 2.73 49% |
| Colorchecker dE 2000 calibrated * | 1.46 | 0.89 39% | 2.57 -76% | 1.58 -8% | 1.02 30% | 0.63 57% |
| Greyscale dE 2000 * | 3.7 | 5 -35% | 3.3 11% | 4 -8% | 1.8 51% | |
| Gamma | 2.15 102% | 2.16 102% | 2.12 104% | 2.13 103% | 2.24 98% | 2.282 96% |
| CCT | 6351 102% | 6591 99% | 7021 93% | 7060 92% | 6864 95% | 6499 100% |
| Całkowita średnia (program / ustawienia) | -139% /
-67% | -81% /
-61% | -25% /
-15% | -70% /
-28% | -50% /
-7% |
* ... im mniej tym lepiej
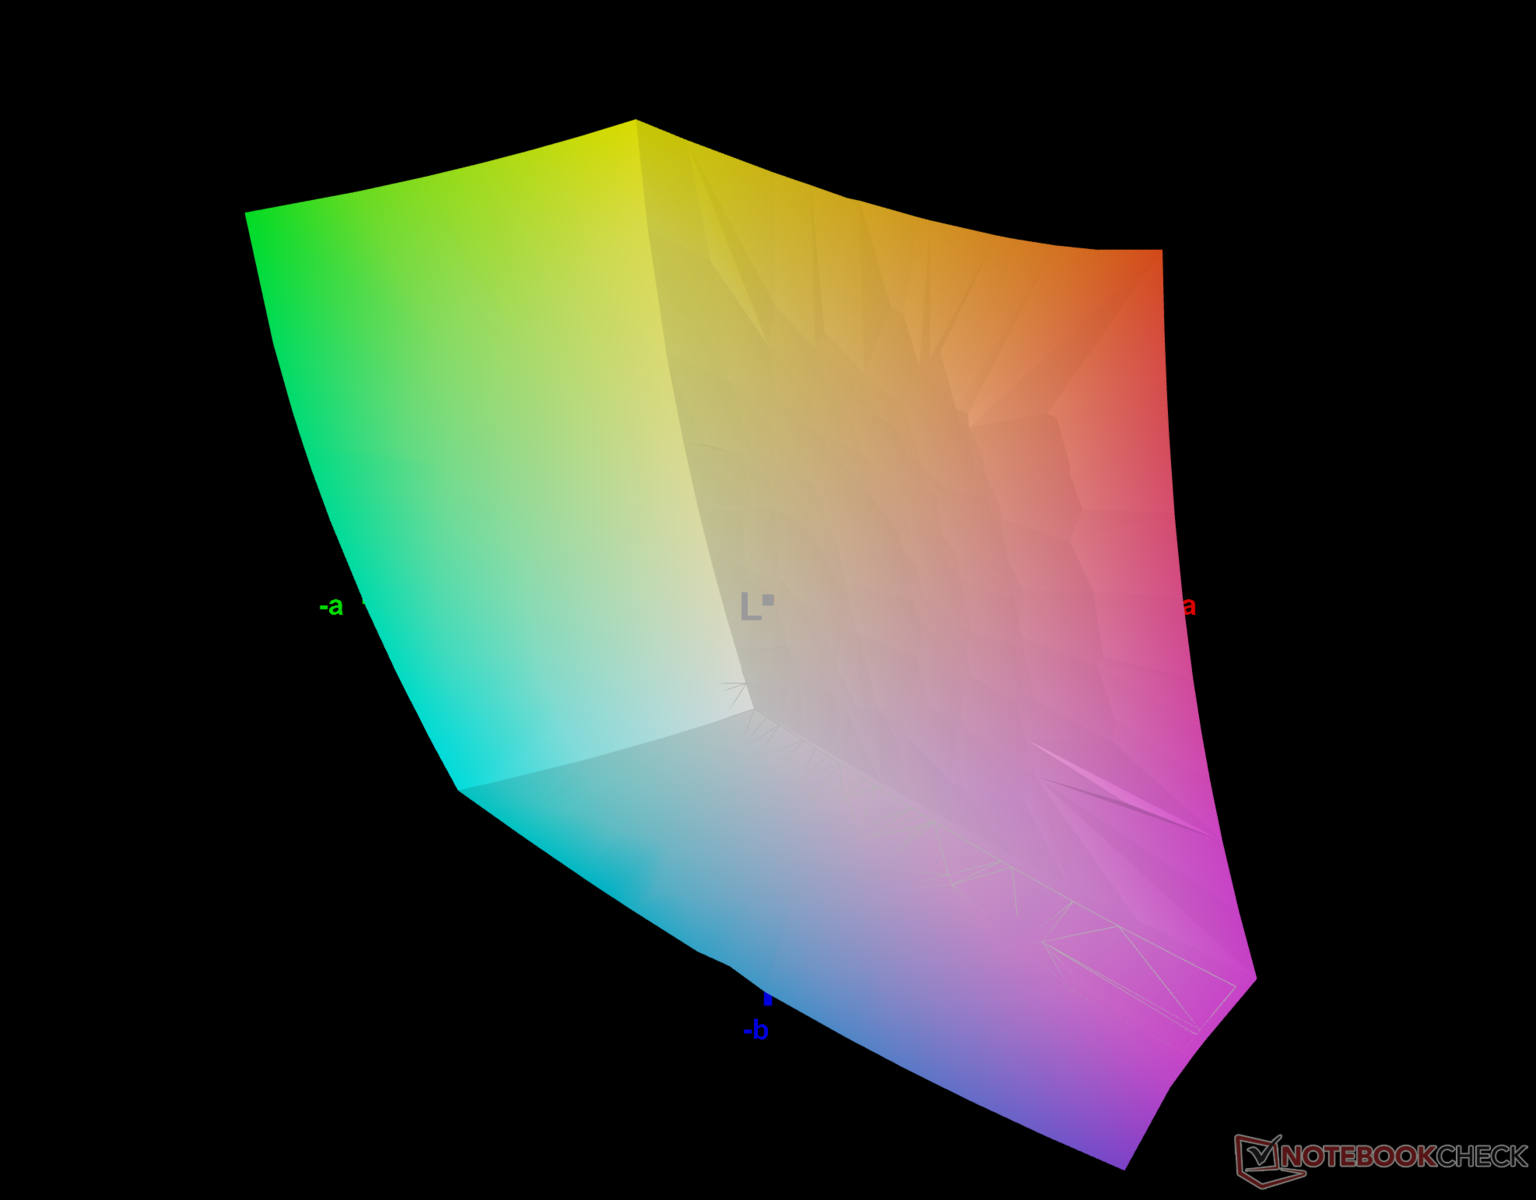
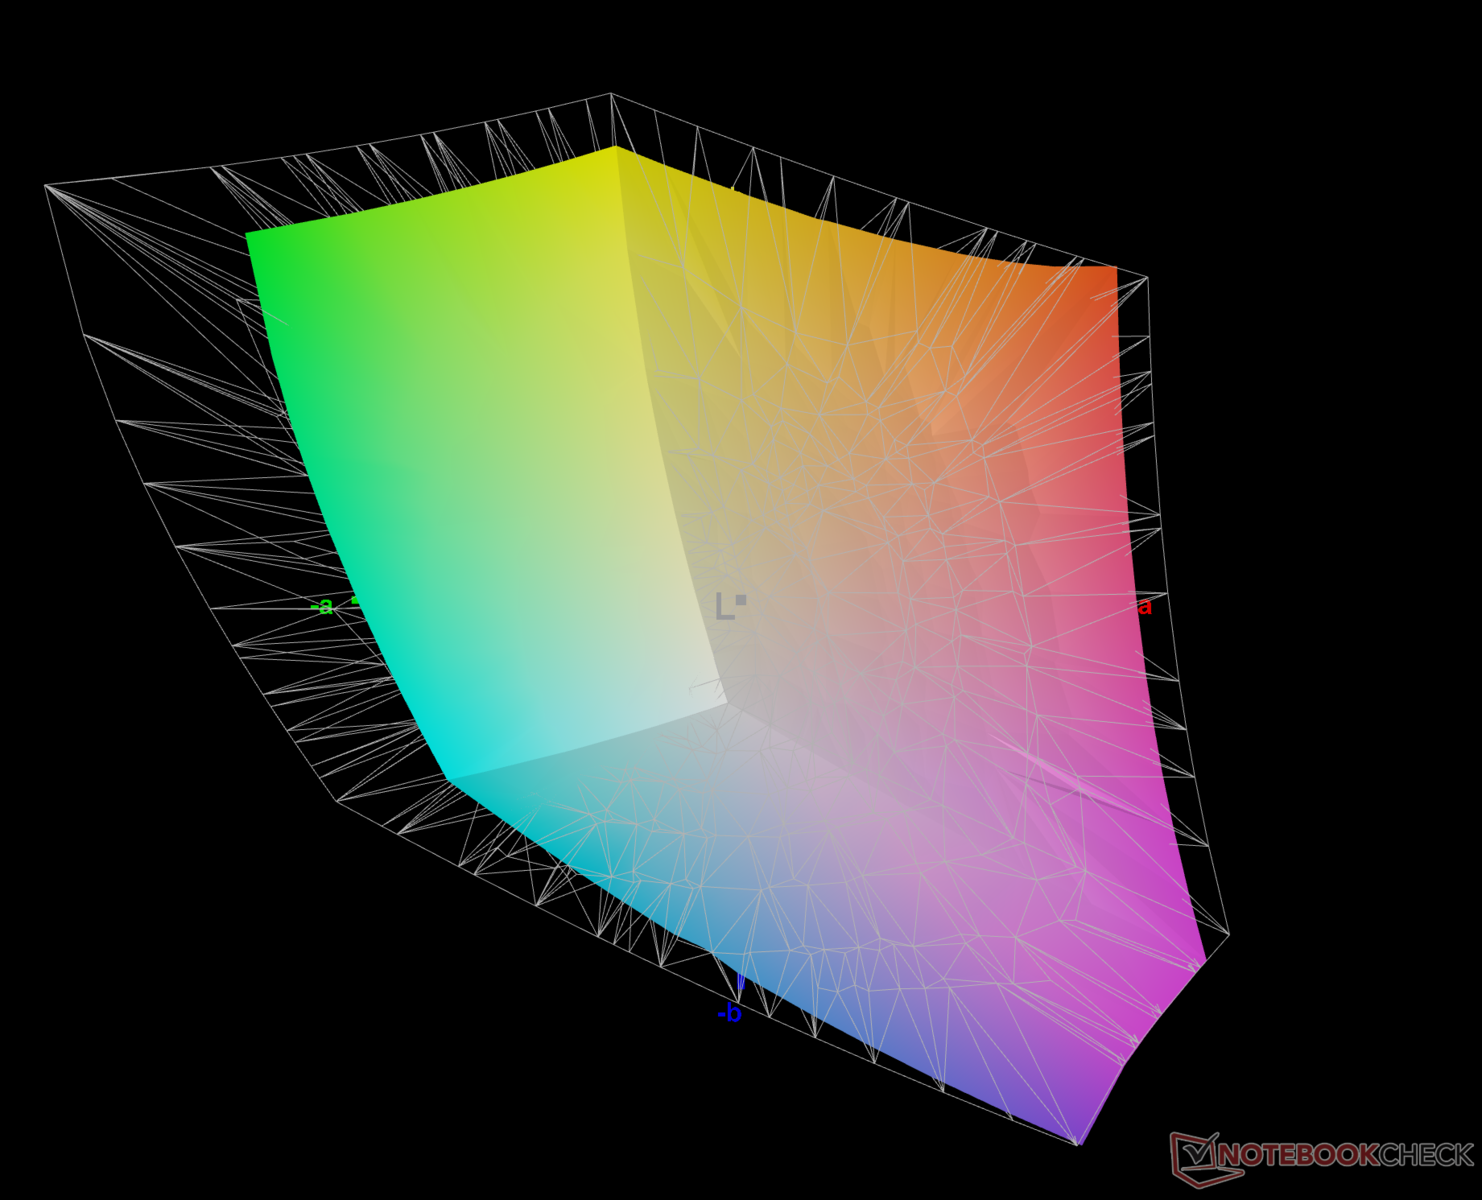
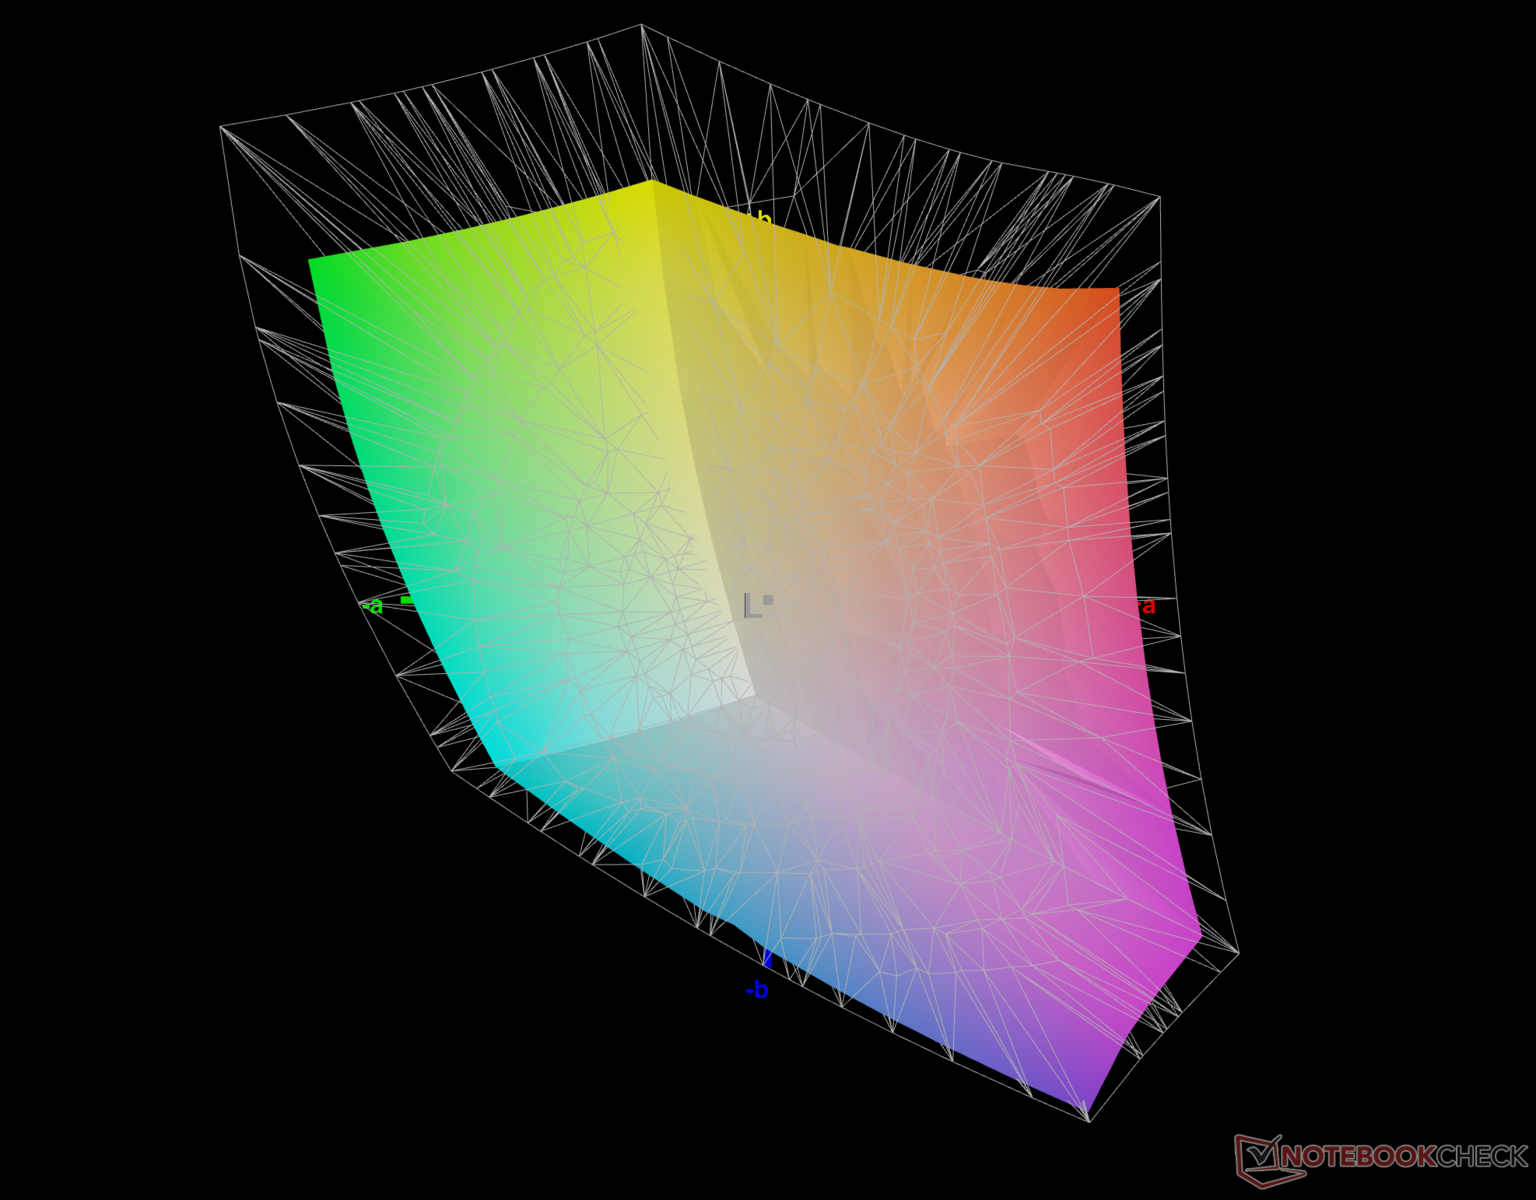
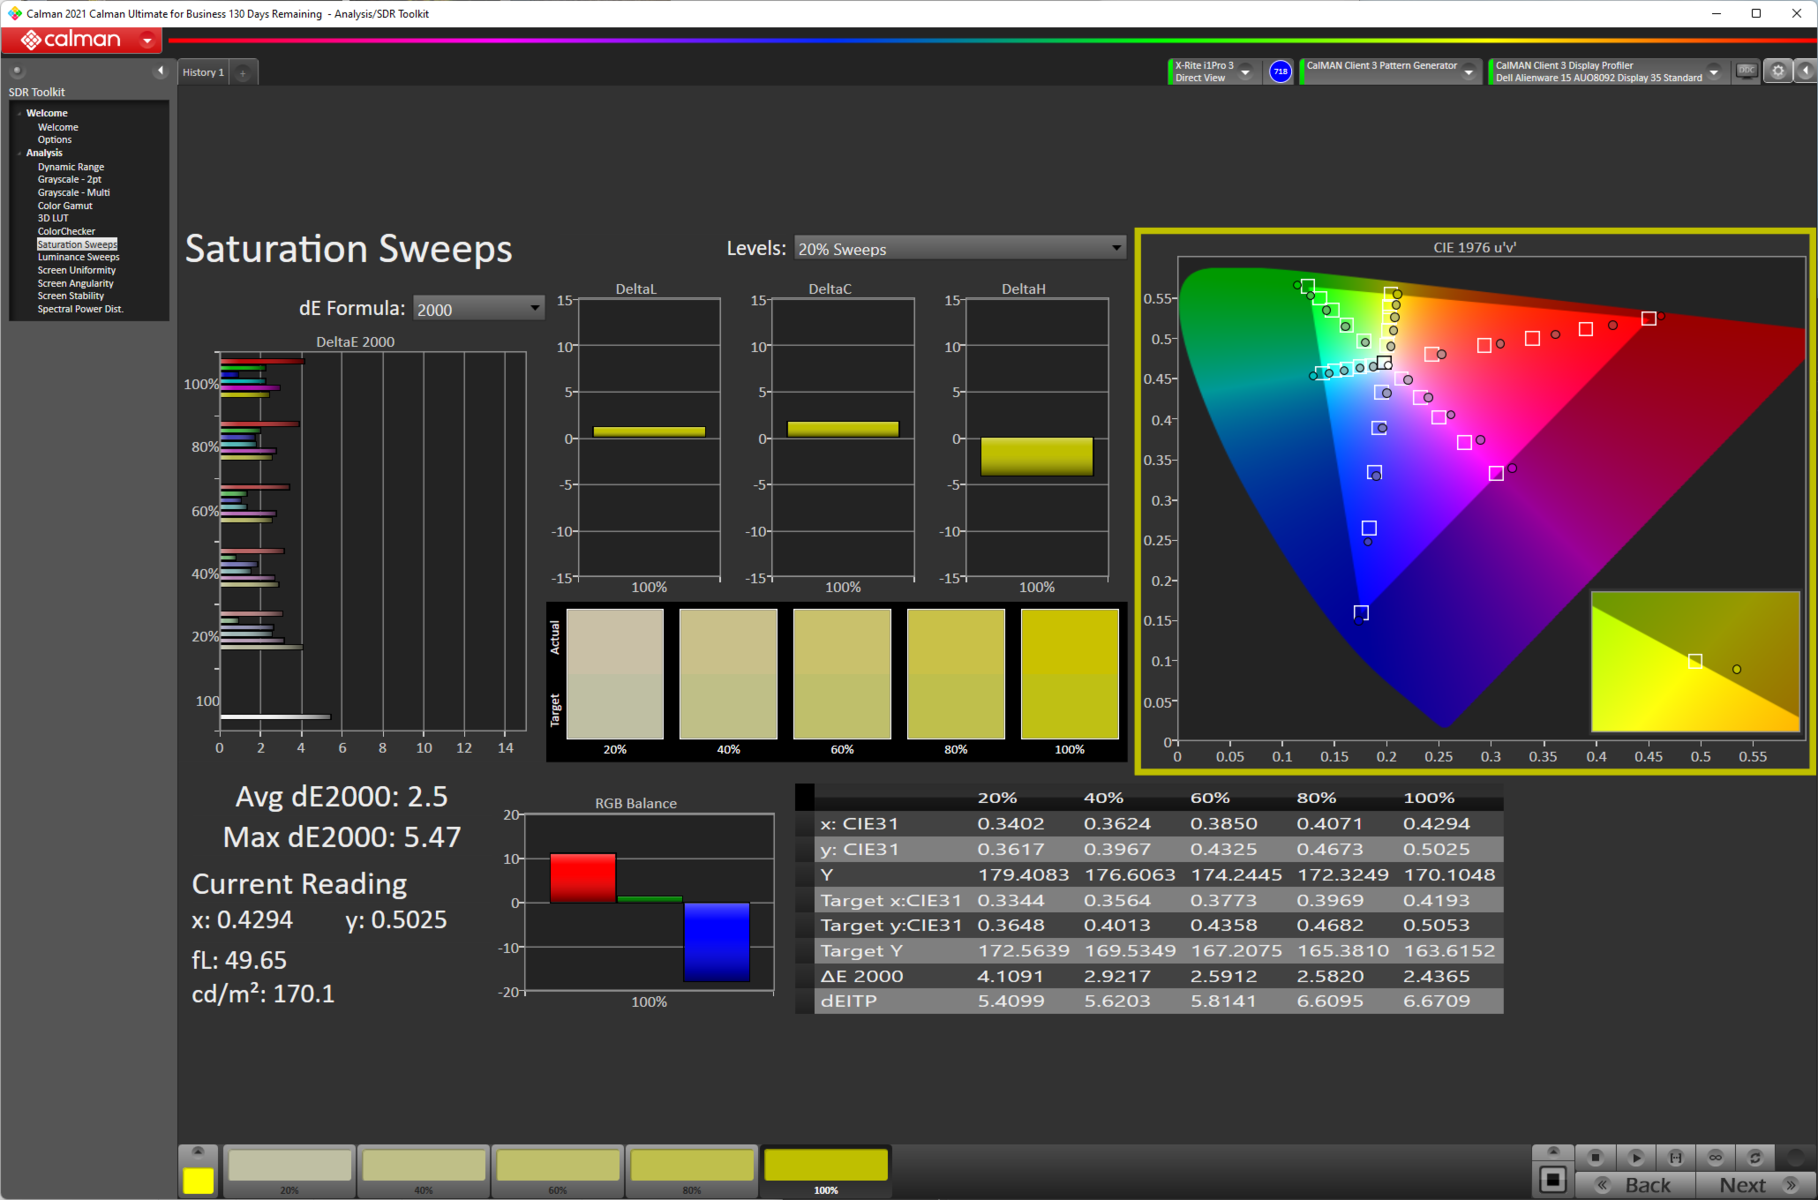
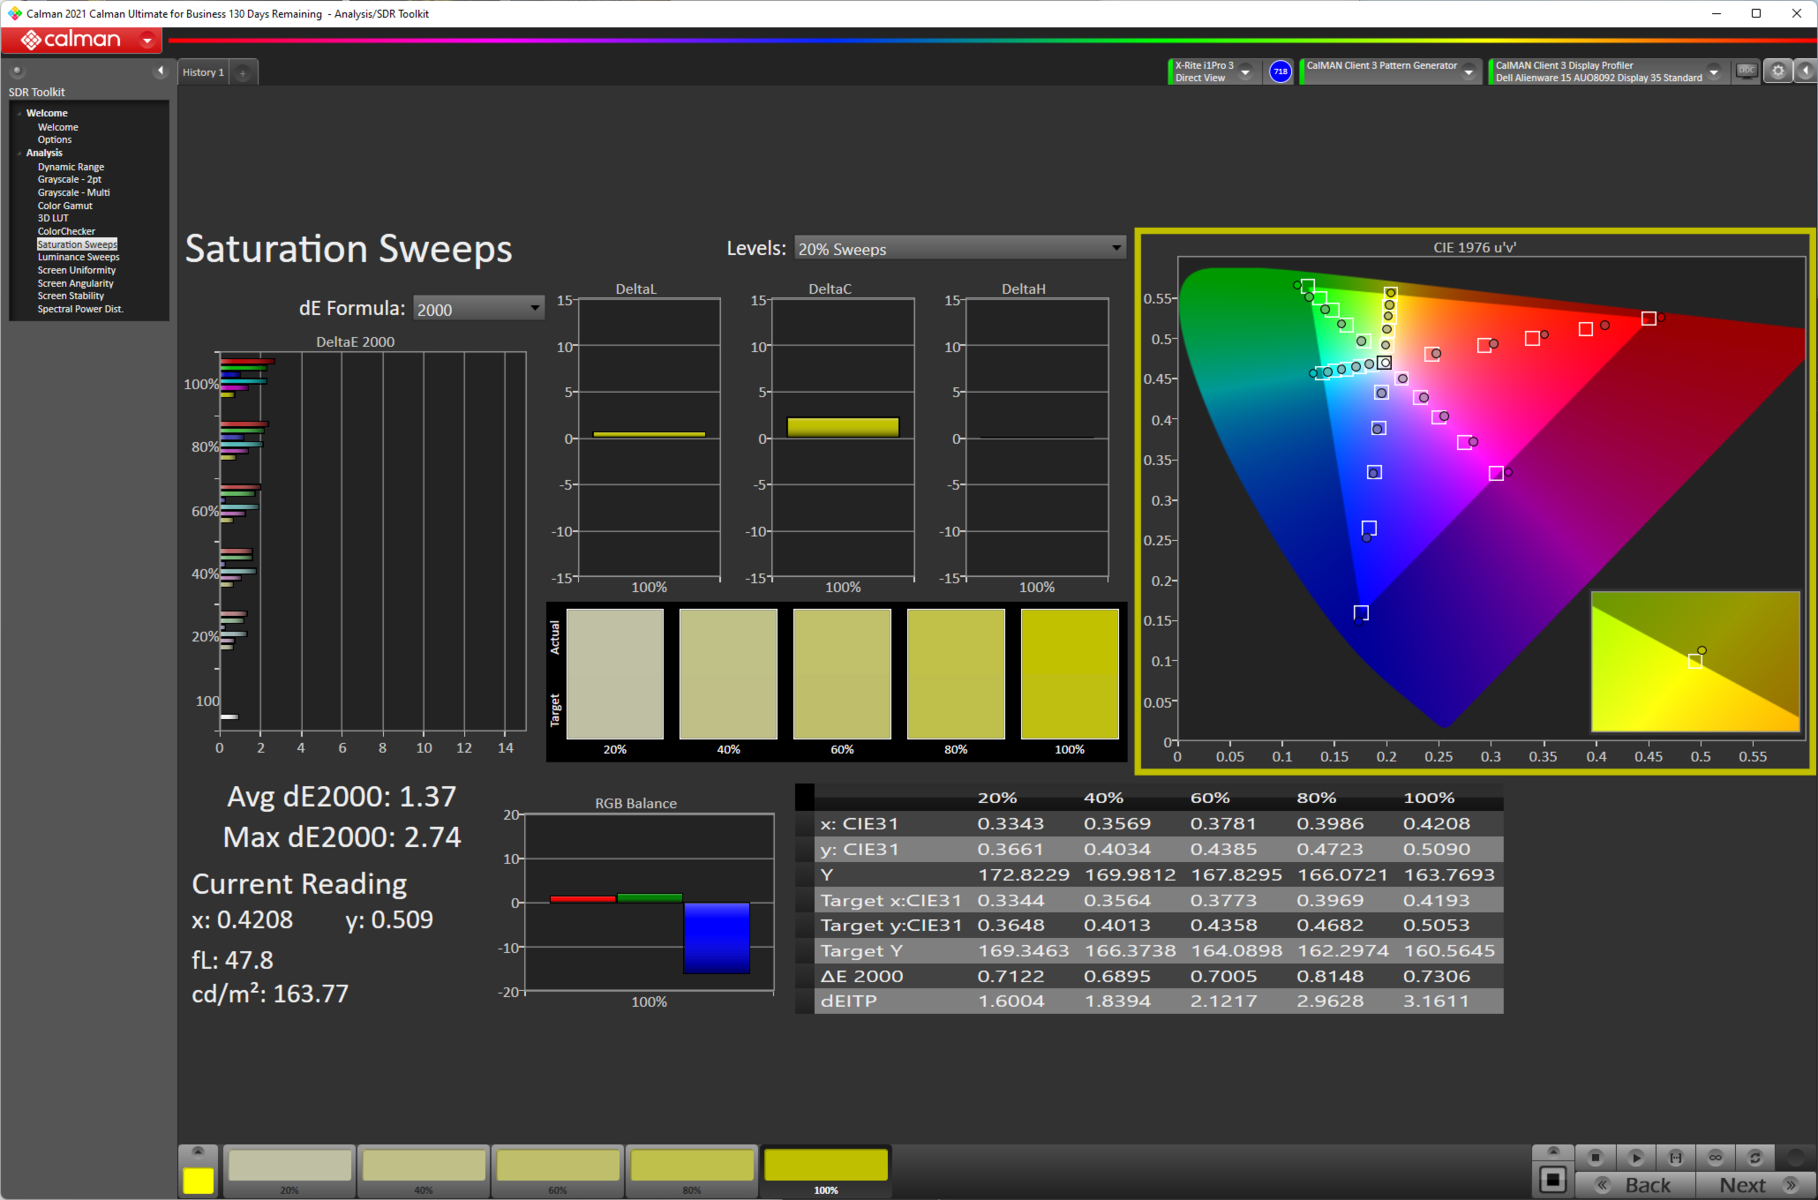
Pokrycie przestrzeni barw Alienware x15 R2 jest dobre, biorąc pod uwagę, że jest to przede wszystkim laptop do gier. Gama kolorów sRGB jest w pełni pokryta, a 75,7% pokrycia przestrzeni AdobeRGB powinno być jeszcze wystarczające do nieprofesjonalnego tworzenia treści. Pokrycie ekranu P3 jest również przyzwoite i wynosi 74,7%.
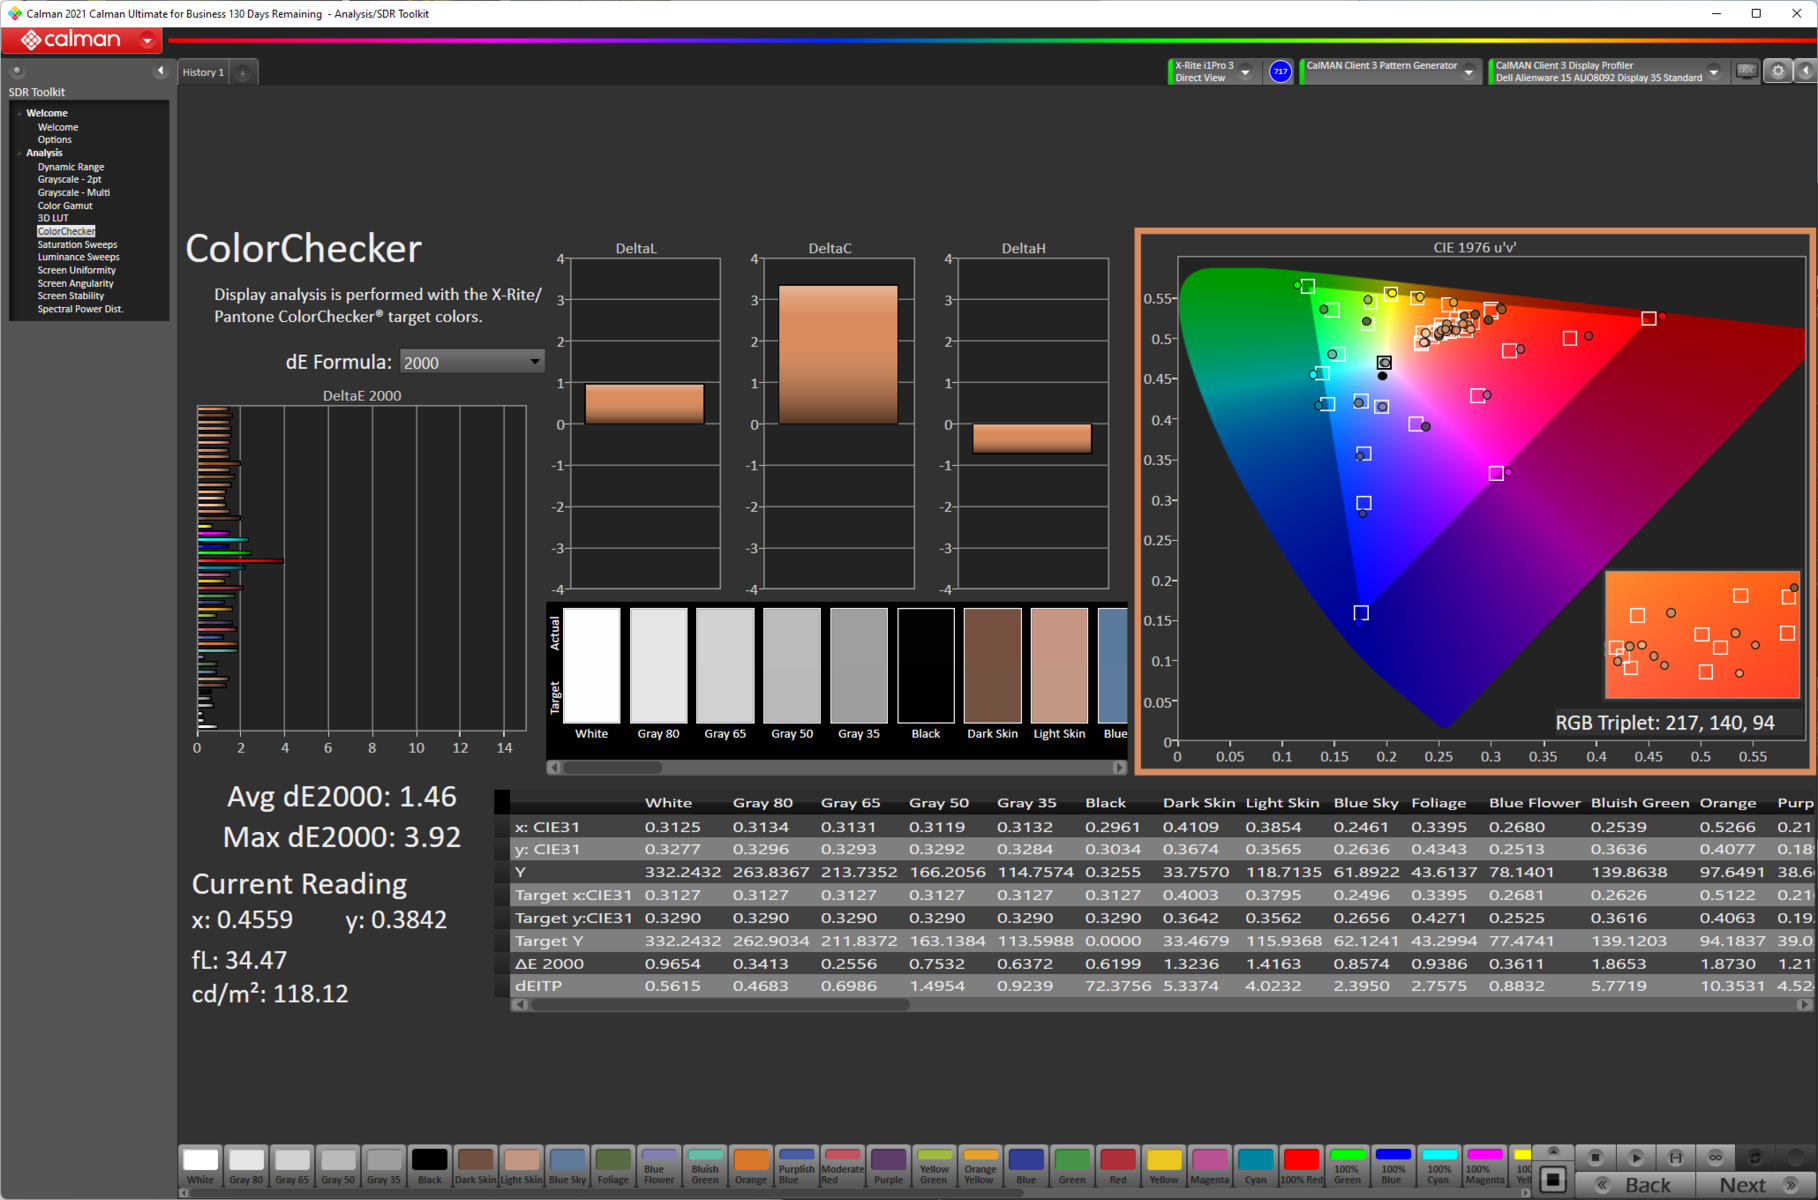
Dokładność kolorów po wyjęciu z pudełka nie jest niczym nadzwyczajnym, niemniej jednak jest ona zadowalająca - średnia Delta E w skali szarości wynosi 3,7, a średnia Delta E w programie ColorChecker 2,96
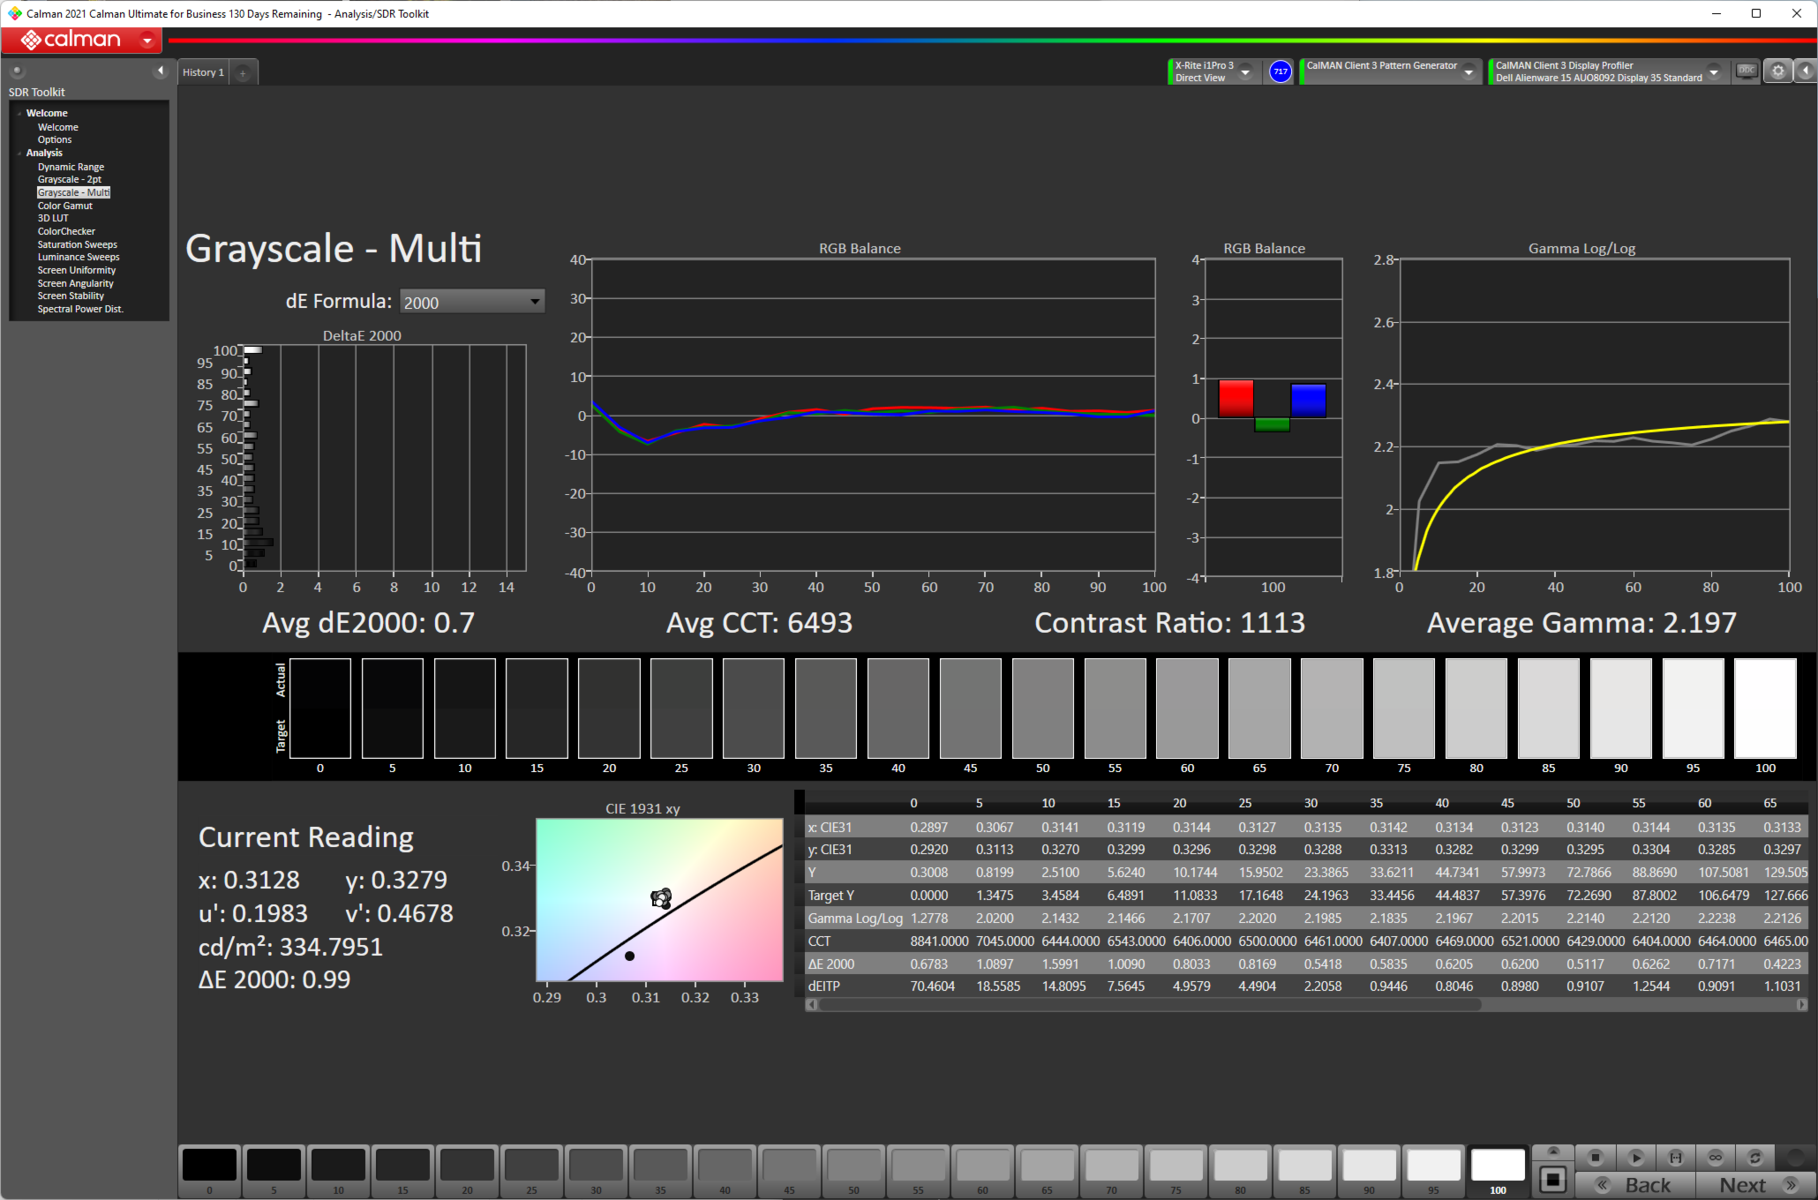
Nasza standardowa procedura kalibracyjna z użyciem spektrofotometru X-rite i1Basic Pro 3 i oprogramowania do kalibracji kolorów Calman Ultimate firmy Portrait Displays pomogła w zauważalnej poprawie dokładności kolorów, zmniejszając średnią Delta E w skali szarości do 0,7, a średnią Delta E ColorChecker do 1,46. Nadal zauważamy większe odchylenia w kolorze czerwonym
Skalibrowany plik ICC można pobrać z powyższego linku.
Wyświetl czasy reakcji
| ↔ Czas reakcji od czerni do bieli | ||
|---|---|---|
| 4.32 ms ... wzrost ↗ i spadek ↘ łącznie | ↗ 2.17 ms wzrost | 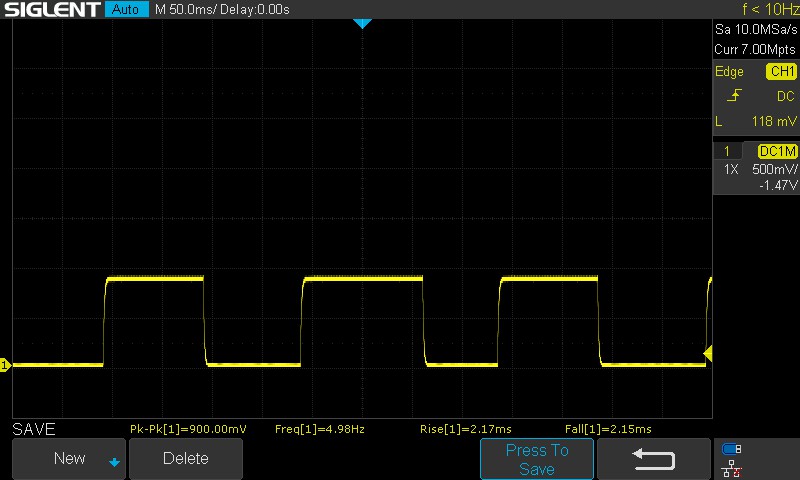 |
| ↘ 2.15 ms upadek | ||
| W naszych testach ekran wykazuje bardzo szybką reakcję i powinien bardzo dobrze nadawać się do szybkich gier. Dla porównania, wszystkie testowane urządzenia wahają się od 0.1 (minimum) do 240 (maksimum) ms. » 17 % wszystkich urządzeń jest lepszych. Oznacza to, że zmierzony czas reakcji jest lepszy od średniej wszystkich testowanych urządzeń (19.9 ms). | ||
| ↔ Czas reakcji 50% szarości do 80% szarości | ||
| 1.47 ms ... wzrost ↗ i spadek ↘ łącznie | ↗ 0.49 ms wzrost | 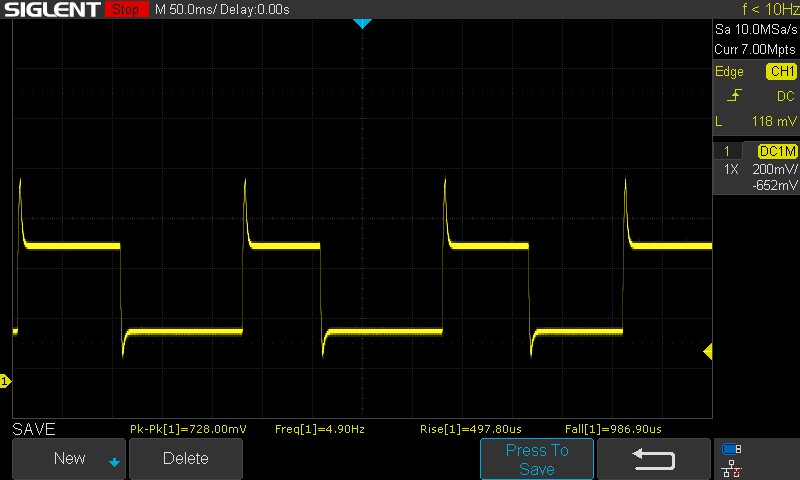 |
| ↘ 0.98 ms upadek | ||
| W naszych testach ekran wykazuje bardzo szybką reakcję i powinien bardzo dobrze nadawać się do szybkich gier. Dla porównania, wszystkie testowane urządzenia wahają się od 0.165 (minimum) do 636 (maksimum) ms. » 7 % wszystkich urządzeń jest lepszych. Oznacza to, że zmierzony czas reakcji jest lepszy od średniej wszystkich testowanych urządzeń (31.1 ms). | ||
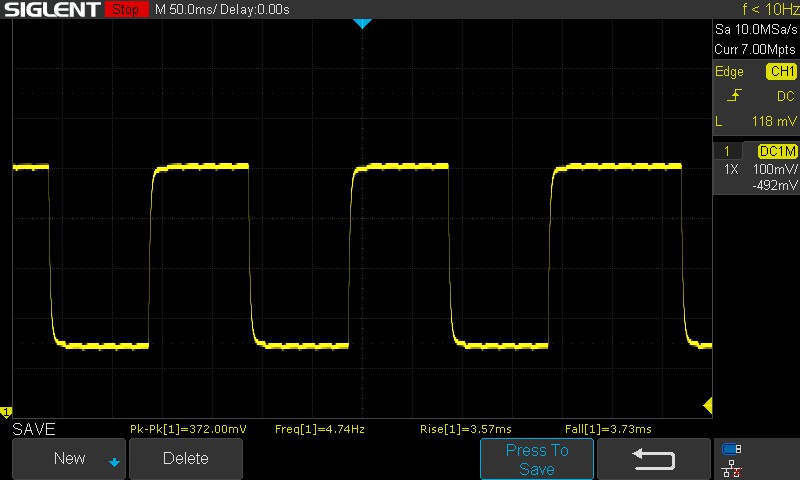
Panel Alienware x15 R2 wykorzystuje domyślnie overdrive, co widać jako "róg" na wykresie czasu reakcji od 50% szarości do 80% szarości. W rezultacie widzimy bardzo szybki łączny czas reakcji 1,47 ms; nie jest to poziom OLED-ów, ale powinien dobrze wróżyć do szybkich gier. Połączony czas reakcji 100% czerni do 100% bieli jest również przyzwoity i wynosi 4,32 ms.
Po wyłączeniu overdrive'u panelu przy odświeżaniu 60 Hz, łączny czas reakcji od 50% szarości do 80% szarości wzrasta do 7,3 ms.
Migotanie ekranu / PWM (modulacja szerokości impulsu)
| Migotanie ekranu/nie wykryto PWM | 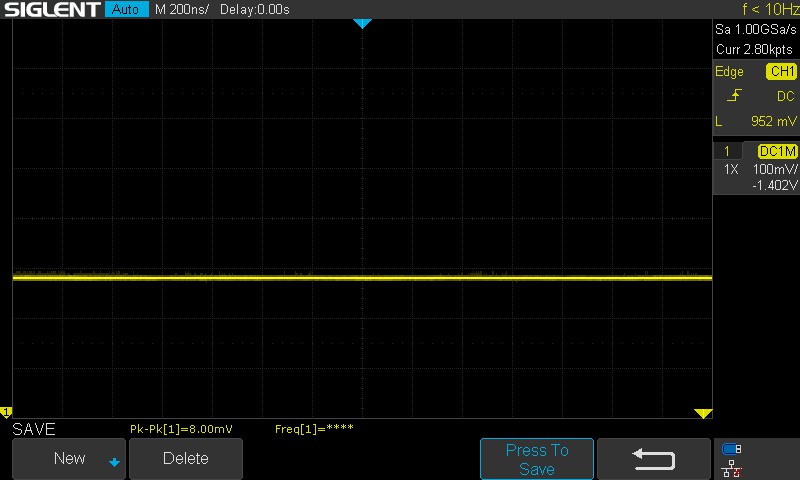 | ||
Dla porównania: 52 % wszystkich testowanych urządzeń nie używa PWM do przyciemniania wyświetlacza. Jeśli wykryto PWM, zmierzono średnio 7798 (minimum: 5 - maksimum: 343500) Hz. | |||
Na wszystkich testowanych poziomach jasności nie zaobserwowano migotania PWM, co powinno wróżyć mniejsze zmęczenie oczu podczas gry
Więcej informacji można znaleźć w naszym artykule "Dlaczego modulacja szerokości impulsów (PWM) to taki ból głowy", a także sprawdź nasząTabela rankingowa PWMw celu porównania częstotliwości PWM we wszystkich recenzowanych urządzeniach
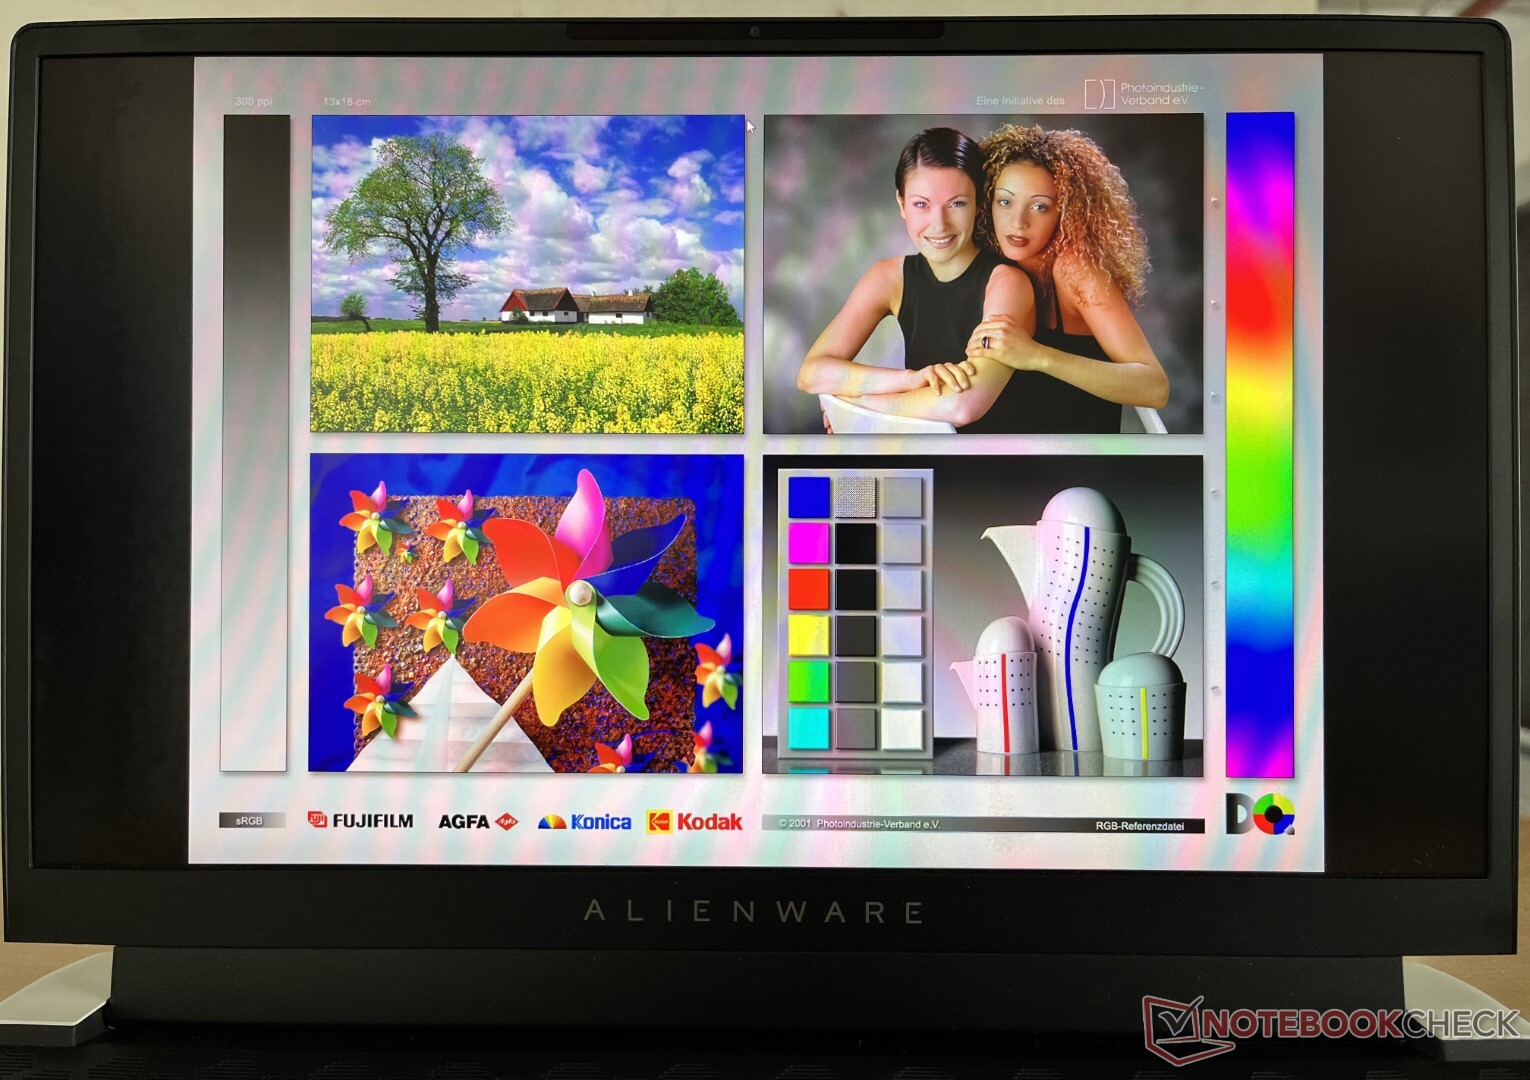
Mimo nieco niższej jasności szczytowej ekran Alienware x15 R2 nadaje się do oglądania na zewnątrz, o ile tylko nie pada na niego ostre światło słoneczne
Nie zaobserwowaliśmy znaczącej utraty jasności ani informacji o kolorach przy ekstremalnych kątach widzenia.

Wydajność: Core i9-12900H oferuje dobrą, trwałą wydajność
Nasz Alienware x15 R2 jest napędzany przez Intel Core i9-12900H oraz procesor o mocy 140 W GPU Nvidia GeForce RTX 3080 Ti Laptop. Nabywcy mogą również skonfigurować x15 R2 z Core i7-12700H i RTX 3060 lub RTX 3070 Ti Laptop GPU opcje wraz z 16 GB lub 32 GB pamięci RAM LPDDR5-5200.
Warunki badania
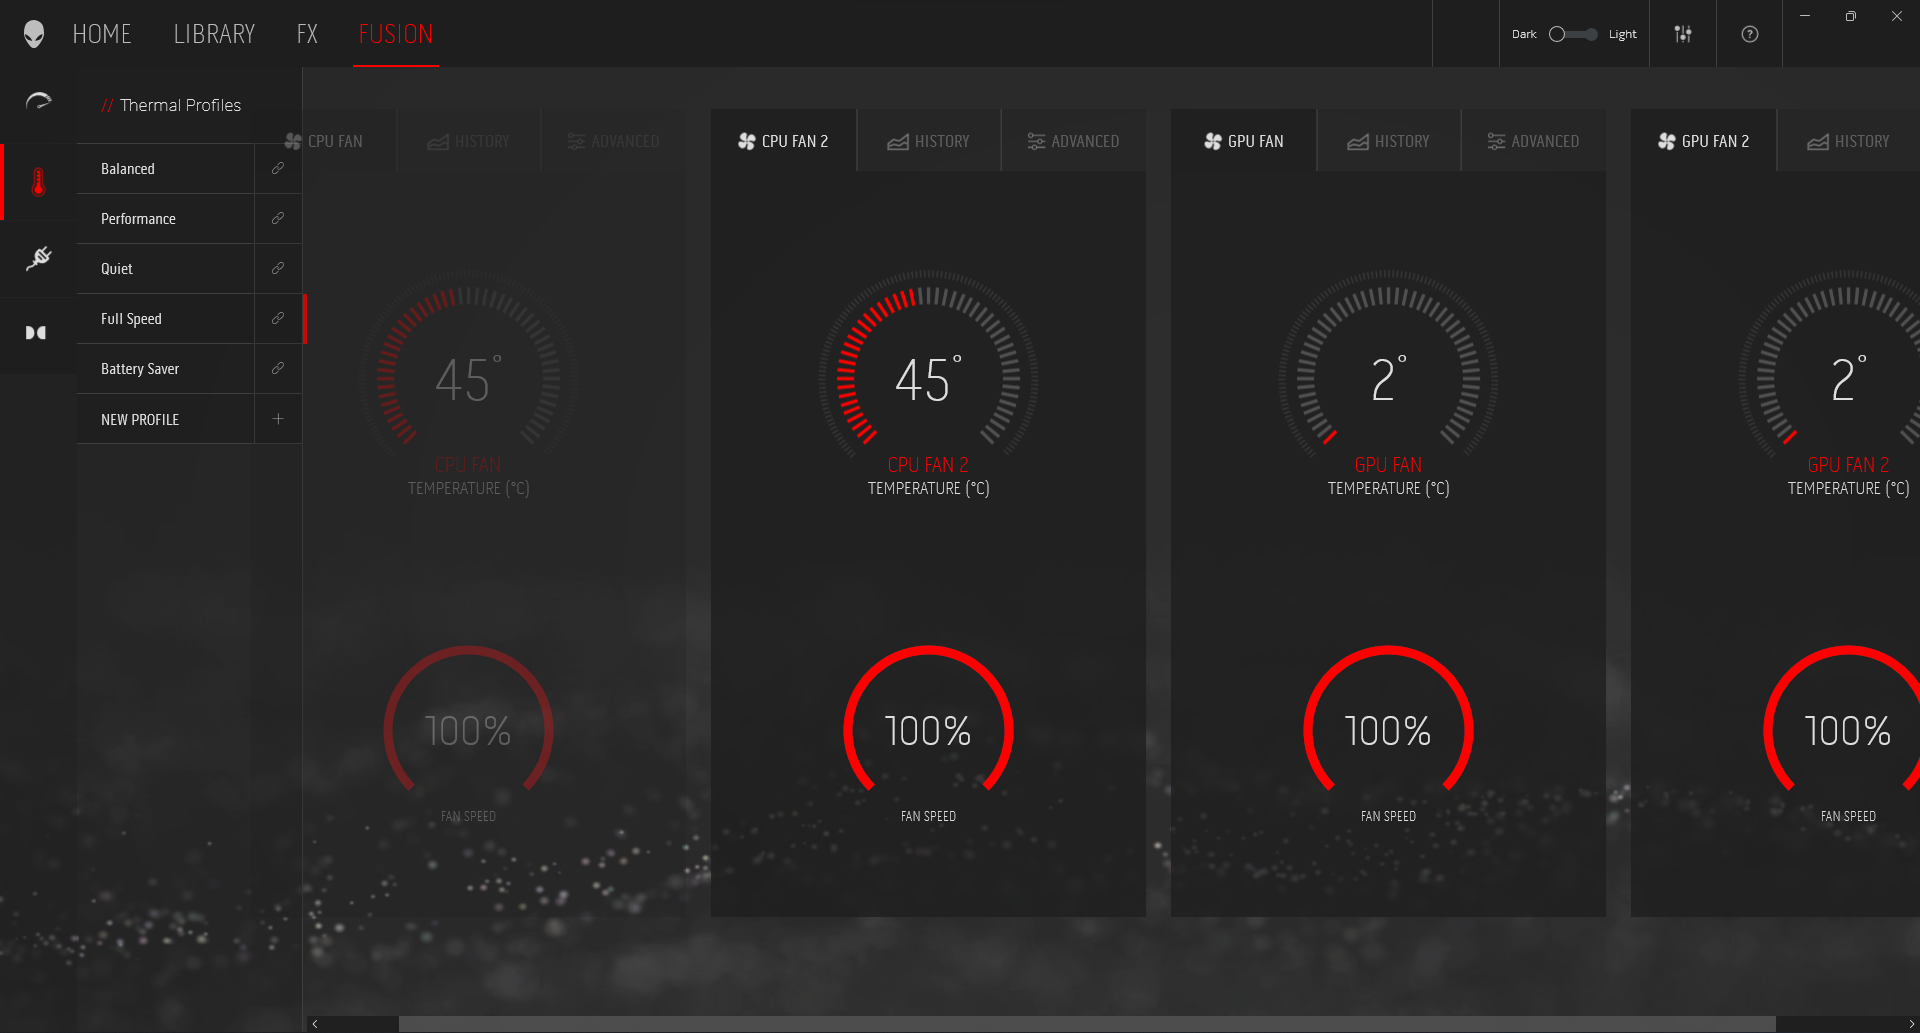
Wydajność laptopa można dostroić za pomocą Alienware Command Center. Musieliśmy zainstalować aplikację ręcznie, gdyż z jakiegoś powodu nie była ona obecna w domyślnym obrazie fabrycznym. Wszystkie testy przeprowadziliśmy w profilu termicznym Full Speed. Skutkuje to odblokowaną mocą bazową procesora (PL1) i maksymalną mocą turbo (PL2) na poziomie 140 W
Większość profili termicznych, w tym Balanced, wykorzystuje PL1/PL2 na poziomie 140 W, natomiast tryby Battery Saver i Quiet wykorzystują 65 W PL1 i 140 W PL2. Wybór profilu termicznego ma głównie wpływ na hałas wentylatora, do czego przejdziemy wkrótce.
Alienware x15 R2 obsługuje technologię Advanced Optimus. Wszystkie testy graficzne były przeprowadzane w trybie MSHybrid, ale możliwa jest zmiana routingu GPU albo przez BIOS, albo przez Nvidia Control Panel.
Procesor
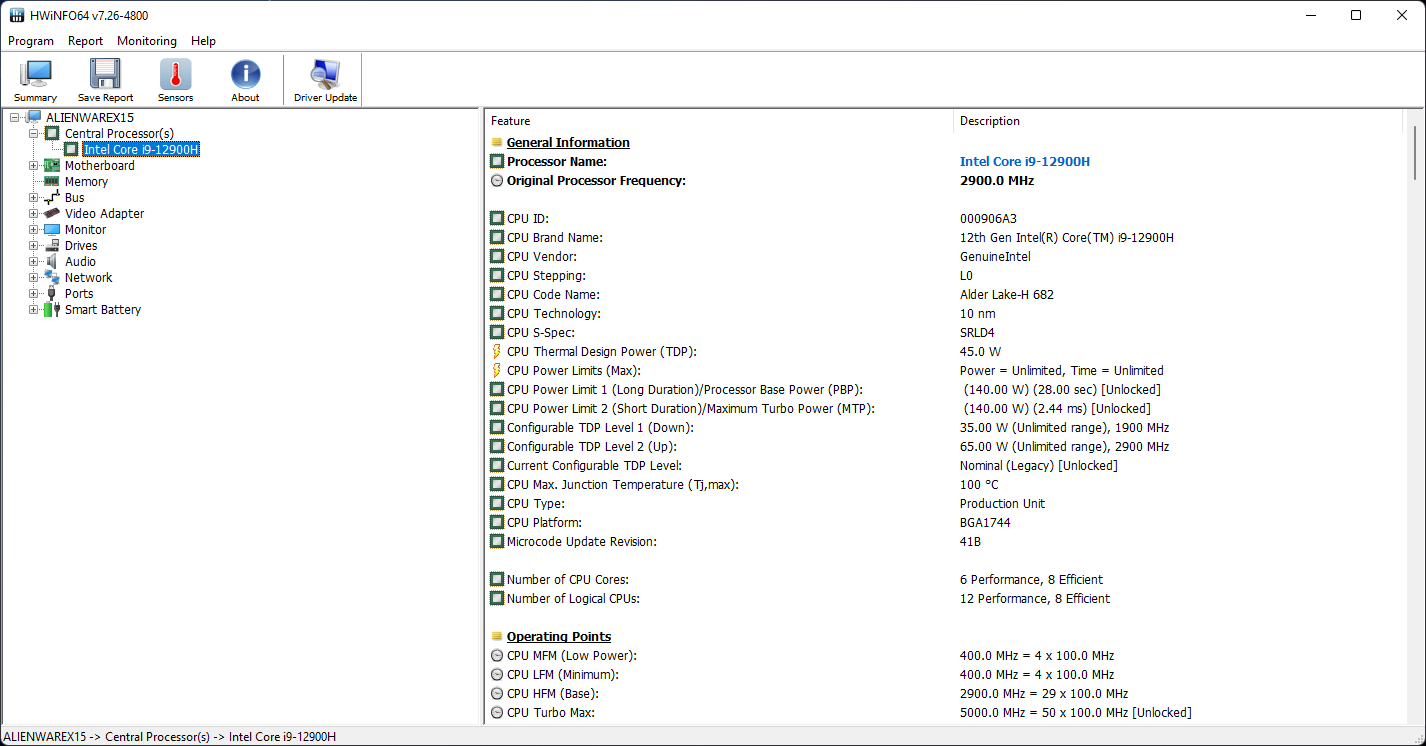
Core i9-12900H to 14-rdzeniowy, 20-wątkowy procesor Alder Lake-H z możliwością podbicia do 5 GHz. Spośród 14 rdzeni osiem z nich to rdzenie o wydajności Golden Cove (P), natomiast pozostałe sześć to rdzenie o wydajności Gracemont (E). Rdzenie P obsługują hyperthreading.
Zaimplementowany przez Della element 31 (oznaczający gal w układzie okresowym) galliowo-silikonowy materiał interfejsu termicznego (TIM) wydaje się działać zgodnie z reklamami. W teście wielordzeniowym Cinebench R15 zaobserwowaliśmy stabilną wydajność przez cały czas jego trwania
Mimo to Alienware x15 R2 wydaje się być w tym teście o około 9% wolniejszy od Asusa ROG Strix Scar 15, który również wykorzystuje ten sam procesor przy mocy 135 W
.Cinebench R15 Multi Loop
Wydajność jednordzeniowa jest na równi z innymi układami Alder Lake-H, a nawet Alder Lake-HXCore i9-12900HXwMSI Titan GT77. Widzimy od 1% do 21% przewagi w pojedynczym rdzeniu dla Core i9-12900H w porównaniu doAMD Ryzen 9 6900HXwAsus ROG Zephyrus Duo 16w zależności od benchmarku. Scar 15 jest w stanie wyprzedzić X15 R2 w większości benchmarków wielordzeniowych.
Zauważyliśmy 11% spadek wydajności wielordzeniowego Cinebench R20 na zasilaniu akumulatorowym, co prawdopodobnie wynika z obniżenia mocy PL1 do 65 W
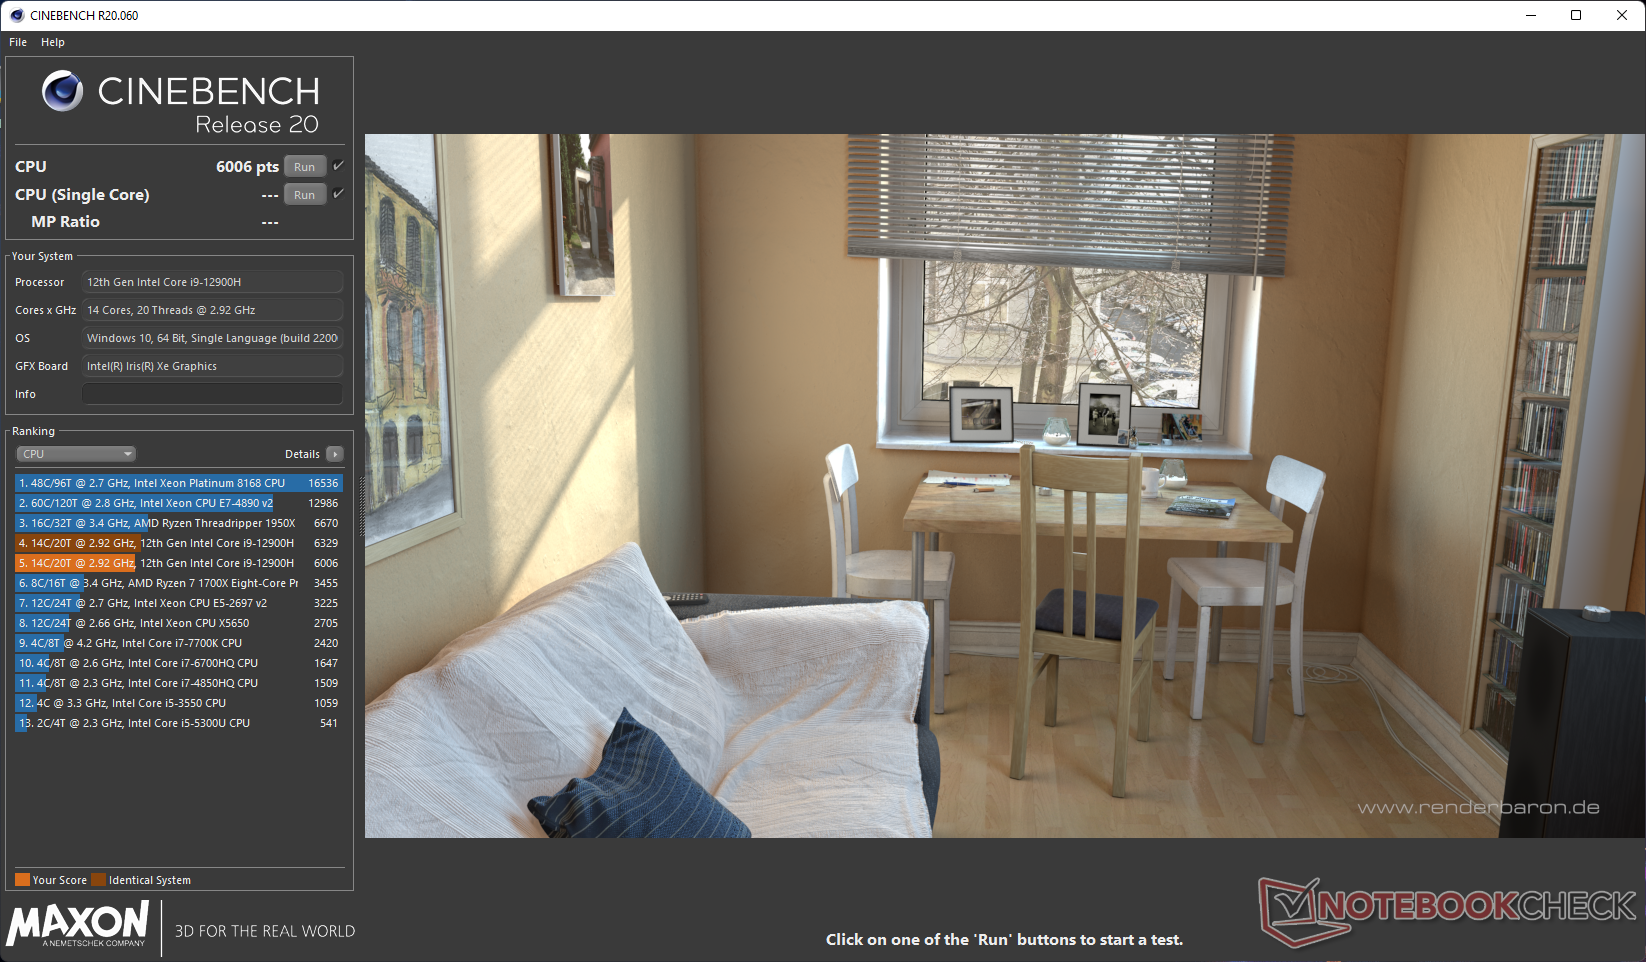
Ogólnie rzecz biorąc, Alienware x15 R2 nie sprawił żadnych niespodzianek w naszym zestawie benchmarków CPU i oferuje o 33% wyższą wydajność procesora w porównaniu z x15 R1. Cienka obudowa mogła przyczynić się do nieco niższych wyników, ale zarządzanie termiczne Della jest w stanie zapewnić dobrą, trwałą wydajność.
Cinebench R23: Multi Core | Single Core
Cinebench R20: CPU (Multi Core) | CPU (Single Core)
Cinebench R15: CPU Multi 64Bit | CPU Single 64Bit
Blender: v2.79 BMW27 CPU
7-Zip 18.03: 7z b 4 | 7z b 4 -mmt1
Geekbench 5.5: Multi-Core | Single-Core
HWBOT x265 Benchmark v2.2: 4k Preset
LibreOffice : 20 Documents To PDF
R Benchmark 2.5: Overall mean
| CPU Performance rating | |
| Średnia w klasie Gaming | |
| MSI Titan GT77 12UHS | |
| Asus ROG Strix Scar 15 G533ZW-LN106WS | |
| Alienware x15 R2 P111F | |
| MSI Raider GE66 12UHS | |
| MSI Vector GP66 12UGS | |
| Przeciętny Intel Core i9-12900H | |
| Asus ROG Zephyrus Duo 16 GX650RX | |
| Razer Blade 15 Advanced Model Early 2022 | |
| Alienware x15 RTX 3070 P111F -2! | |
| Cinebench R23 / Multi Core | |
| Średnia w klasie Gaming (10488 - 40970, n=113, ostatnie 2 lata) | |
| MSI Titan GT77 12UHS | |
| Asus ROG Strix Scar 15 G533ZW-LN106WS | |
| MSI Vector GP66 12UGS | |
| Alienware x15 R2 P111F | |
| MSI Raider GE66 12UHS | |
| Przeciętny Intel Core i9-12900H (7359 - 19648, n=28) | |
| Asus ROG Zephyrus Duo 16 GX650RX | |
| Alienware x15 RTX 3070 P111F | |
| Razer Blade 15 Advanced Model Early 2022 | |
| Cinebench R23 / Single Core | |
| Średnia w klasie Gaming (1166 - 2356, n=113, ostatnie 2 lata) | |
| Asus ROG Strix Scar 15 G533ZW-LN106WS | |
| MSI Titan GT77 12UHS | |
| Alienware x15 R2 P111F | |
| MSI Vector GP66 12UGS | |
| MSI Raider GE66 12UHS | |
| Przeciętny Intel Core i9-12900H (1634 - 1930, n=28) | |
| Razer Blade 15 Advanced Model Early 2022 | |
| Asus ROG Zephyrus Duo 16 GX650RX | |
| Alienware x15 RTX 3070 P111F | |
| Cinebench R20 / CPU (Multi Core) | |
| Średnia w klasie Gaming (4029 - 16108, n=112, ostatnie 2 lata) | |
| MSI Titan GT77 12UHS | |
| Asus ROG Strix Scar 15 G533ZW-LN106WS | |
| Alienware x15 R2 P111F | |
| MSI Vector GP66 12UGS | |
| MSI Raider GE66 12UHS | |
| Przeciętny Intel Core i9-12900H (2681 - 7471, n=28) | |
| Asus ROG Zephyrus Duo 16 GX650RX | |
| Alienware x15 RTX 3070 P111F | |
| Razer Blade 15 Advanced Model Early 2022 | |
| Cinebench R20 / CPU (Single Core) | |
| Średnia w klasie Gaming (442 - 895, n=112, ostatnie 2 lata) | |
| MSI Titan GT77 12UHS | |
| Alienware x15 R2 P111F | |
| MSI Vector GP66 12UGS | |
| Asus ROG Strix Scar 15 G533ZW-LN106WS | |
| MSI Raider GE66 12UHS | |
| Przeciętny Intel Core i9-12900H (624 - 738, n=28) | |
| Razer Blade 15 Advanced Model Early 2022 | |
| Asus ROG Zephyrus Duo 16 GX650RX | |
| Alienware x15 RTX 3070 P111F | |
| Cinebench R15 / CPU Multi 64Bit | |
| Średnia w klasie Gaming (1578 - 6271, n=113, ostatnie 2 lata) | |
| MSI Titan GT77 12UHS | |
| Asus ROG Strix Scar 15 G533ZW-LN106WS | |
| Alienware x15 R2 P111F | |
| MSI Raider GE66 12UHS | |
| Przeciętny Intel Core i9-12900H (1395 - 3077, n=28) | |
| MSI Vector GP66 12UGS | |
| Asus ROG Zephyrus Duo 16 GX650RX | |
| Alienware x15 RTX 3070 P111F | |
| Razer Blade 15 Advanced Model Early 2022 | |
| Cinebench R15 / CPU Single 64Bit | |
| Średnia w klasie Gaming (188.8 - 343, n=112, ostatnie 2 lata) | |
| MSI Titan GT77 12UHS | |
| Asus ROG Strix Scar 15 G533ZW-LN106WS | |
| Alienware x15 R2 P111F | |
| MSI Vector GP66 12UGS | |
| MSI Raider GE66 12UHS | |
| Przeciętny Intel Core i9-12900H (235 - 277, n=29) | |
| Asus ROG Zephyrus Duo 16 GX650RX | |
| Razer Blade 15 Advanced Model Early 2022 | |
| Alienware x15 RTX 3070 P111F | |
| Blender / v2.79 BMW27 CPU | |
| Razer Blade 15 Advanced Model Early 2022 | |
| Przeciętny Intel Core i9-12900H (160 - 451, n=28) | |
| Alienware x15 RTX 3070 P111F | |
| Asus ROG Zephyrus Duo 16 GX650RX | |
| MSI Vector GP66 12UGS | |
| MSI Raider GE66 12UHS | |
| Alienware x15 R2 P111F | |
| Asus ROG Strix Scar 15 G533ZW-LN106WS | |
| Średnia w klasie Gaming (80 - 330, n=110, ostatnie 2 lata) | |
| MSI Titan GT77 12UHS | |
| 7-Zip 18.03 / 7z b 4 | |
| Średnia w klasie Gaming (33491 - 148086, n=111, ostatnie 2 lata) | |
| MSI Titan GT77 12UHS | |
| Alienware x15 R2 P111F | |
| MSI Raider GE66 12UHS | |
| Asus ROG Strix Scar 15 G533ZW-LN106WS | |
| MSI Vector GP66 12UGS | |
| Asus ROG Zephyrus Duo 16 GX650RX | |
| Przeciętny Intel Core i9-12900H (34684 - 76677, n=28) | |
| Alienware x15 RTX 3070 P111F | |
| Razer Blade 15 Advanced Model Early 2022 | |
| 7-Zip 18.03 / 7z b 4 -mmt1 | |
| Średnia w klasie Gaming (4199 - 7436, n=111, ostatnie 2 lata) | |
| MSI Titan GT77 12UHS | |
| MSI Vector GP66 12UGS | |
| MSI Raider GE66 12UHS | |
| Razer Blade 15 Advanced Model Early 2022 | |
| Asus ROG Strix Scar 15 G533ZW-LN106WS | |
| Alienware x15 R2 P111F | |
| Przeciętny Intel Core i9-12900H (5302 - 6289, n=28) | |
| Asus ROG Zephyrus Duo 16 GX650RX | |
| Alienware x15 RTX 3070 P111F | |
| Geekbench 5.5 / Multi-Core | |
| Średnia w klasie Gaming (6460 - 27010, n=111, ostatnie 2 lata) | |
| MSI Titan GT77 12UHS | |
| Asus ROG Strix Scar 15 G533ZW-LN106WS | |
| Alienware x15 R2 P111F | |
| MSI Raider GE66 12UHS | |
| MSI Vector GP66 12UGS | |
| Przeciętny Intel Core i9-12900H (8519 - 14376, n=31) | |
| Asus ROG Zephyrus Duo 16 GX650RX | |
| Razer Blade 15 Advanced Model Early 2022 | |
| Geekbench 5.5 / Single-Core | |
| Średnia w klasie Gaming (986 - 2474, n=111, ostatnie 2 lata) | |
| MSI Titan GT77 12UHS | |
| MSI Vector GP66 12UGS | |
| Alienware x15 R2 P111F | |
| MSI Raider GE66 12UHS | |
| Asus ROG Strix Scar 15 G533ZW-LN106WS | |
| Razer Blade 15 Advanced Model Early 2022 | |
| Przeciętny Intel Core i9-12900H (1631 - 1897, n=31) | |
| Asus ROG Zephyrus Duo 16 GX650RX | |
| HWBOT x265 Benchmark v2.2 / 4k Preset | |
| Średnia w klasie Gaming (11.5 - 44.3, n=111, ostatnie 2 lata) | |
| MSI Titan GT77 12UHS | |
| Asus ROG Strix Scar 15 G533ZW-LN106WS | |
| Alienware x15 R2 P111F | |
| MSI Vector GP66 12UGS | |
| MSI Raider GE66 12UHS | |
| Asus ROG Zephyrus Duo 16 GX650RX | |
| Przeciętny Intel Core i9-12900H (8.05 - 22.5, n=28) | |
| Alienware x15 RTX 3070 P111F | |
| Razer Blade 15 Advanced Model Early 2022 | |
| LibreOffice / 20 Documents To PDF | |
| Średnia w klasie Gaming (19 - 88.8, n=111, ostatnie 2 lata) | |
| Alienware x15 RTX 3070 P111F | |
| Alienware x15 R2 P111F | |
| Asus ROG Zephyrus Duo 16 GX650RX | |
| Razer Blade 15 Advanced Model Early 2022 | |
| Przeciętny Intel Core i9-12900H (36.8 - 59.8, n=28) | |
| MSI Vector GP66 12UGS | |
| Asus ROG Strix Scar 15 G533ZW-LN106WS | |
| MSI Titan GT77 12UHS | |
| MSI Raider GE66 12UHS | |
| R Benchmark 2.5 / Overall mean | |
| Alienware x15 RTX 3070 P111F | |
| Asus ROG Zephyrus Duo 16 GX650RX | |
| Przeciętny Intel Core i9-12900H (0.4218 - 0.506, n=28) | |
| Razer Blade 15 Advanced Model Early 2022 | |
| MSI Raider GE66 12UHS | |
| Alienware x15 R2 P111F | |
| Asus ROG Strix Scar 15 G533ZW-LN106WS | |
| Średnia w klasie Gaming (0.3439 - 0.759, n=112, ostatnie 2 lata) | |
| MSI Vector GP66 12UGS | |
| MSI Titan GT77 12UHS | |
* ... im mniej tym lepiej
AIDA64: FP32 Ray-Trace | FPU Julia | CPU SHA3 | CPU Queen | FPU SinJulia | FPU Mandel | CPU AES | CPU ZLib | FP64 Ray-Trace | CPU PhotoWorxx
| Performance rating | |
| Średnia w klasie Gaming | |
| MSI Titan GT77 12UHS | |
| Asus ROG Zephyrus Duo 16 GX650RX | |
| Alienware x15 R2 P111F | |
| Asus ROG Strix Scar 15 G533ZW-LN106WS | |
| Przeciętny Intel Core i9-12900H | |
| MSI Raider GE66 12UHS | |
| MSI Vector GP66 12UGS | |
| Razer Blade 15 Advanced Model Early 2022 | |
| Alienware x15 RTX 3070 P111F -9! | |
| AIDA64 / FP32 Ray-Trace | |
| Średnia w klasie Gaming (10227 - 85542, n=110, ostatnie 2 lata) | |
| MSI Titan GT77 12UHS | |
| Asus ROG Zephyrus Duo 16 GX650RX | |
| Alienware x15 R2 P111F | |
| Przeciętny Intel Core i9-12900H (4074 - 18289, n=29) | |
| Asus ROG Strix Scar 15 G533ZW-LN106WS | |
| MSI Raider GE66 12UHS | |
| MSI Vector GP66 12UGS | |
| Razer Blade 15 Advanced Model Early 2022 | |
| AIDA64 / FPU Julia | |
| Średnia w klasie Gaming (51376 - 238426, n=110, ostatnie 2 lata) | |
| MSI Titan GT77 12UHS | |
| Asus ROG Zephyrus Duo 16 GX650RX | |
| Alienware x15 R2 P111F | |
| Przeciętny Intel Core i9-12900H (22307 - 93236, n=29) | |
| Asus ROG Strix Scar 15 G533ZW-LN106WS | |
| MSI Raider GE66 12UHS | |
| MSI Vector GP66 12UGS | |
| Razer Blade 15 Advanced Model Early 2022 | |
| AIDA64 / CPU SHA3 | |
| Średnia w klasie Gaming (2180 - 9817, n=110, ostatnie 2 lata) | |
| MSI Titan GT77 12UHS | |
| Alienware x15 R2 P111F | |
| Asus ROG Zephyrus Duo 16 GX650RX | |
| Asus ROG Strix Scar 15 G533ZW-LN106WS | |
| Przeciętny Intel Core i9-12900H (1378 - 4215, n=29) | |
| MSI Vector GP66 12UGS | |
| MSI Raider GE66 12UHS | |
| Razer Blade 15 Advanced Model Early 2022 | |
| AIDA64 / CPU Queen | |
| Średnia w klasie Gaming (49785 - 173351, n=101, ostatnie 2 lata) | |
| Alienware x15 R2 P111F | |
| MSI Vector GP66 12UGS | |
| MSI Raider GE66 12UHS | |
| Asus ROG Zephyrus Duo 16 GX650RX | |
| Asus ROG Strix Scar 15 G533ZW-LN106WS | |
| MSI Titan GT77 12UHS | |
| Przeciętny Intel Core i9-12900H (78172 - 111241, n=28) | |
| Razer Blade 15 Advanced Model Early 2022 | |
| AIDA64 / FPU SinJulia | |
| Średnia w klasie Gaming (4424 - 33636, n=110, ostatnie 2 lata) | |
| MSI Titan GT77 12UHS | |
| Asus ROG Zephyrus Duo 16 GX650RX | |
| Asus ROG Strix Scar 15 G533ZW-LN106WS | |
| Alienware x15 R2 P111F | |
| MSI Vector GP66 12UGS | |
| MSI Raider GE66 12UHS | |
| Przeciętny Intel Core i9-12900H (5709 - 10410, n=29) | |
| Razer Blade 15 Advanced Model Early 2022 | |
| AIDA64 / FPU Mandel | |
| Średnia w klasie Gaming (25115 - 128721, n=110, ostatnie 2 lata) | |
| Asus ROG Zephyrus Duo 16 GX650RX | |
| MSI Titan GT77 12UHS | |
| Alienware x15 R2 P111F | |
| Przeciętny Intel Core i9-12900H (11257 - 45581, n=29) | |
| Asus ROG Strix Scar 15 G533ZW-LN106WS | |
| MSI Raider GE66 12UHS | |
| MSI Vector GP66 12UGS | |
| Razer Blade 15 Advanced Model Early 2022 | |
| AIDA64 / CPU AES | |
| MSI Titan GT77 12UHS | |
| Alienware x15 R2 P111F | |
| Asus ROG Zephyrus Duo 16 GX650RX | |
| Średnia w klasie Gaming (39258 - 247074, n=110, ostatnie 2 lata) | |
| Asus ROG Strix Scar 15 G533ZW-LN106WS | |
| MSI Vector GP66 12UGS | |
| MSI Raider GE66 12UHS | |
| Przeciętny Intel Core i9-12900H (31935 - 151546, n=29) | |
| Razer Blade 15 Advanced Model Early 2022 | |
| AIDA64 / CPU ZLib | |
| Średnia w klasie Gaming (574 - 2531, n=110, ostatnie 2 lata) | |
| MSI Titan GT77 12UHS | |
| Asus ROG Strix Scar 15 G533ZW-LN106WS | |
| Alienware x15 R2 P111F | |
| MSI Vector GP66 12UGS | |
| MSI Raider GE66 12UHS | |
| Przeciętny Intel Core i9-12900H (449 - 1193, n=29) | |
| Asus ROG Zephyrus Duo 16 GX650RX | |
| Razer Blade 15 Advanced Model Early 2022 | |
| Alienware x15 RTX 3070 P111F | |
| AIDA64 / FP64 Ray-Trace | |
| Średnia w klasie Gaming (5509 - 45446, n=110, ostatnie 2 lata) | |
| MSI Titan GT77 12UHS | |
| Asus ROG Zephyrus Duo 16 GX650RX | |
| Alienware x15 R2 P111F | |
| Przeciętny Intel Core i9-12900H (2235 - 10511, n=29) | |
| Asus ROG Strix Scar 15 G533ZW-LN106WS | |
| MSI Raider GE66 12UHS | |
| MSI Vector GP66 12UGS | |
| Razer Blade 15 Advanced Model Early 2022 | |
| AIDA64 / CPU PhotoWorxx | |
| Średnia w klasie Gaming (12271 - 89891, n=110, ostatnie 2 lata) | |
| MSI Titan GT77 12UHS | |
| MSI Raider GE66 12UHS | |
| Asus ROG Strix Scar 15 G533ZW-LN106WS | |
| Alienware x15 R2 P111F | |
| Razer Blade 15 Advanced Model Early 2022 | |
| Przeciętny Intel Core i9-12900H (20960 - 48269, n=30) | |
| Asus ROG Zephyrus Duo 16 GX650RX | |
| MSI Vector GP66 12UGS | |
Sprawdź nasz dedykowany Intel Core i9-12900H aby zobaczyć więcej benchmarków i porównań wydajności.
Wydajność systemu
Alienware x15 R2 ustępuje tylko o 9% MSI Titan GT77 w ogólnej wydajności PCMark 10, przy czym największy deficyt jest widoczny w komponencie Digital Content Creation tego benchmarku. Wyniki CrossMark są porównywalne z wynikami Scar 15 i są o około 15% wyższe od napędzanego Ryzenem 9 6900HX modelu Zephyrus Duo 16.
Subiektywnie rzecz biorąc, nie doświadczyliśmy czkawki w codziennych zadaniach związanych z produktywnością i przeglądaniem stron internetowych.
CrossMark: Overall | Productivity | Creativity | Responsiveness
| PCMark 10 / Score | |
| Średnia w klasie Gaming (5828 - 11574, n=96, ostatnie 2 lata) | |
| MSI Titan GT77 12UHS | |
| MSI Raider GE66 12UHS | |
| MSI Vector GP66 12UGS | |
| Asus ROG Strix Scar 15 G533ZW-LN106WS | |
| Przeciętny Intel Core i9-12900H, NVIDIA GeForce RTX 3080 Ti Laptop GPU (7139 - 8083, n=6) | |
| Alienware x15 R2 P111F | |
| Razer Blade 15 Advanced Model Early 2022 | |
| Alienware x15 RTX 3070 P111F | |
| Asus ROG Zephyrus Duo 16 GX650RX | |
| PCMark 10 / Essentials | |
| Alienware x15 R2 P111F | |
| MSI Titan GT77 12UHS | |
| MSI Raider GE66 12UHS | |
| MSI Vector GP66 12UGS | |
| Przeciętny Intel Core i9-12900H, NVIDIA GeForce RTX 3080 Ti Laptop GPU (10254 - 11178, n=6) | |
| Asus ROG Strix Scar 15 G533ZW-LN106WS | |
| Średnia w klasie Gaming (8810 - 12600, n=100, ostatnie 2 lata) | |
| Razer Blade 15 Advanced Model Early 2022 | |
| Alienware x15 RTX 3070 P111F | |
| Asus ROG Zephyrus Duo 16 GX650RX | |
| PCMark 10 / Productivity | |
| Średnia w klasie Gaming (6845 - 18766, n=98, ostatnie 2 lata) | |
| Asus ROG Strix Scar 15 G533ZW-LN106WS | |
| MSI Raider GE66 12UHS | |
| Alienware x15 R2 P111F | |
| MSI Titan GT77 12UHS | |
| MSI Vector GP66 12UGS | |
| Przeciętny Intel Core i9-12900H, NVIDIA GeForce RTX 3080 Ti Laptop GPU (9102 - 11186, n=6) | |
| Razer Blade 15 Advanced Model Early 2022 | |
| Alienware x15 RTX 3070 P111F | |
| Asus ROG Zephyrus Duo 16 GX650RX | |
| PCMark 10 / Digital Content Creation | |
| Średnia w klasie Gaming (7602 - 19657, n=98, ostatnie 2 lata) | |
| MSI Titan GT77 12UHS | |
| MSI Raider GE66 12UHS | |
| MSI Vector GP66 12UGS | |
| Asus ROG Strix Scar 15 G533ZW-LN106WS | |
| Przeciętny Intel Core i9-12900H, NVIDIA GeForce RTX 3080 Ti Laptop GPU (9847 - 12627, n=6) | |
| Alienware x15 RTX 3070 P111F | |
| Razer Blade 15 Advanced Model Early 2022 | |
| Alienware x15 R2 P111F | |
| Asus ROG Zephyrus Duo 16 GX650RX | |
| CrossMark / Overall | |
| MSI Titan GT77 12UHS | |
| Asus ROG Strix Scar 15 G533ZW-LN106WS | |
| Średnia w klasie Gaming (1366 - 2409, n=98, ostatnie 2 lata) | |
| Alienware x15 R2 P111F | |
| Przeciętny Intel Core i9-12900H, NVIDIA GeForce RTX 3080 Ti Laptop GPU (1696 - 1965, n=3) | |
| Razer Blade 15 Advanced Model Early 2022 | |
| Asus ROG Zephyrus Duo 16 GX650RX | |
| CrossMark / Productivity | |
| MSI Titan GT77 12UHS | |
| Asus ROG Strix Scar 15 G533ZW-LN106WS | |
| Alienware x15 R2 P111F | |
| Średnia w klasie Gaming (1386 - 2254, n=98, ostatnie 2 lata) | |
| Przeciętny Intel Core i9-12900H, NVIDIA GeForce RTX 3080 Ti Laptop GPU (1622 - 1870, n=3) | |
| Razer Blade 15 Advanced Model Early 2022 | |
| Asus ROG Zephyrus Duo 16 GX650RX | |
| CrossMark / Creativity | |
| MSI Titan GT77 12UHS | |
| Średnia w klasie Gaming (1343 - 2729, n=98, ostatnie 2 lata) | |
| Alienware x15 R2 P111F | |
| Asus ROG Strix Scar 15 G533ZW-LN106WS | |
| Przeciętny Intel Core i9-12900H, NVIDIA GeForce RTX 3080 Ti Laptop GPU (1855 - 2135, n=3) | |
| Razer Blade 15 Advanced Model Early 2022 | |
| Asus ROG Zephyrus Duo 16 GX650RX | |
| CrossMark / Responsiveness | |
| Asus ROG Strix Scar 15 G533ZW-LN106WS | |
| MSI Titan GT77 12UHS | |
| Alienware x15 R2 P111F | |
| Asus ROG Zephyrus Duo 16 GX650RX | |
| Średnia w klasie Gaming (1226 - 2334, n=98, ostatnie 2 lata) | |
| Przeciętny Intel Core i9-12900H, NVIDIA GeForce RTX 3080 Ti Laptop GPU (1483 - 1777, n=3) | |
| Razer Blade 15 Advanced Model Early 2022 | |
| PCMark 8 Home Score Accelerated v2 | 6653 pkt. | |
| PCMark 8 Creative Score Accelerated v2 | 10574 pkt. | |
| PCMark 8 Work Score Accelerated v2 | 6944 pkt. | |
| PCMark 10 Score | 7496 pkt. | |
Pomoc | ||
| AIDA64 / Memory Copy | |
| Średnia w klasie Gaming (21750 - 129946, n=110, ostatnie 2 lata) | |
| Alienware x15 R2 P111F | |
| MSI Titan GT77 12UHS | |
| MSI Raider GE66 12UHS | |
| Razer Blade 15 Advanced Model Early 2022 | |
| Asus ROG Strix Scar 15 G533ZW-LN106WS | |
| Przeciętny Intel Core i9-12900H (34438 - 74264, n=29) | |
| Asus ROG Zephyrus Duo 16 GX650RX | |
| MSI Vector GP66 12UGS | |
| AIDA64 / Memory Read | |
| Średnia w klasie Gaming (22956 - 118858, n=110, ostatnie 2 lata) | |
| MSI Raider GE66 12UHS | |
| Razer Blade 15 Advanced Model Early 2022 | |
| Alienware x15 R2 P111F | |
| Asus ROG Strix Scar 15 G533ZW-LN106WS | |
| MSI Titan GT77 12UHS | |
| Przeciętny Intel Core i9-12900H (36365 - 74642, n=29) | |
| Asus ROG Zephyrus Duo 16 GX650RX | |
| MSI Vector GP66 12UGS | |
| AIDA64 / Memory Write | |
| Średnia w klasie Gaming (22297 - 135096, n=110, ostatnie 2 lata) | |
| Razer Blade 15 Advanced Model Early 2022 | |
| MSI Raider GE66 12UHS | |
| Asus ROG Strix Scar 15 G533ZW-LN106WS | |
| Alienware x15 R2 P111F | |
| MSI Titan GT77 12UHS | |
| Przeciętny Intel Core i9-12900H (32276 - 67858, n=29) | |
| Asus ROG Zephyrus Duo 16 GX650RX | |
| MSI Vector GP66 12UGS | |
| AIDA64 / Memory Latency | |
| Alienware x15 R2 P111F | |
| Średnia w klasie Gaming (75.3 - 259, n=110, ostatnie 2 lata) | |
| Asus ROG Strix Scar 15 G533ZW-LN106WS | |
| Razer Blade 15 Advanced Model Early 2022 | |
| MSI Raider GE66 12UHS | |
| Asus ROG Zephyrus Duo 16 GX650RX | |
| MSI Vector GP66 12UGS | |
| MSI Titan GT77 12UHS | |
| Przeciętny Intel Core i9-12900H (74.7 - 118.1, n=28) | |
| Alienware x15 RTX 3070 P111F | |
* ... im mniej tym lepiej
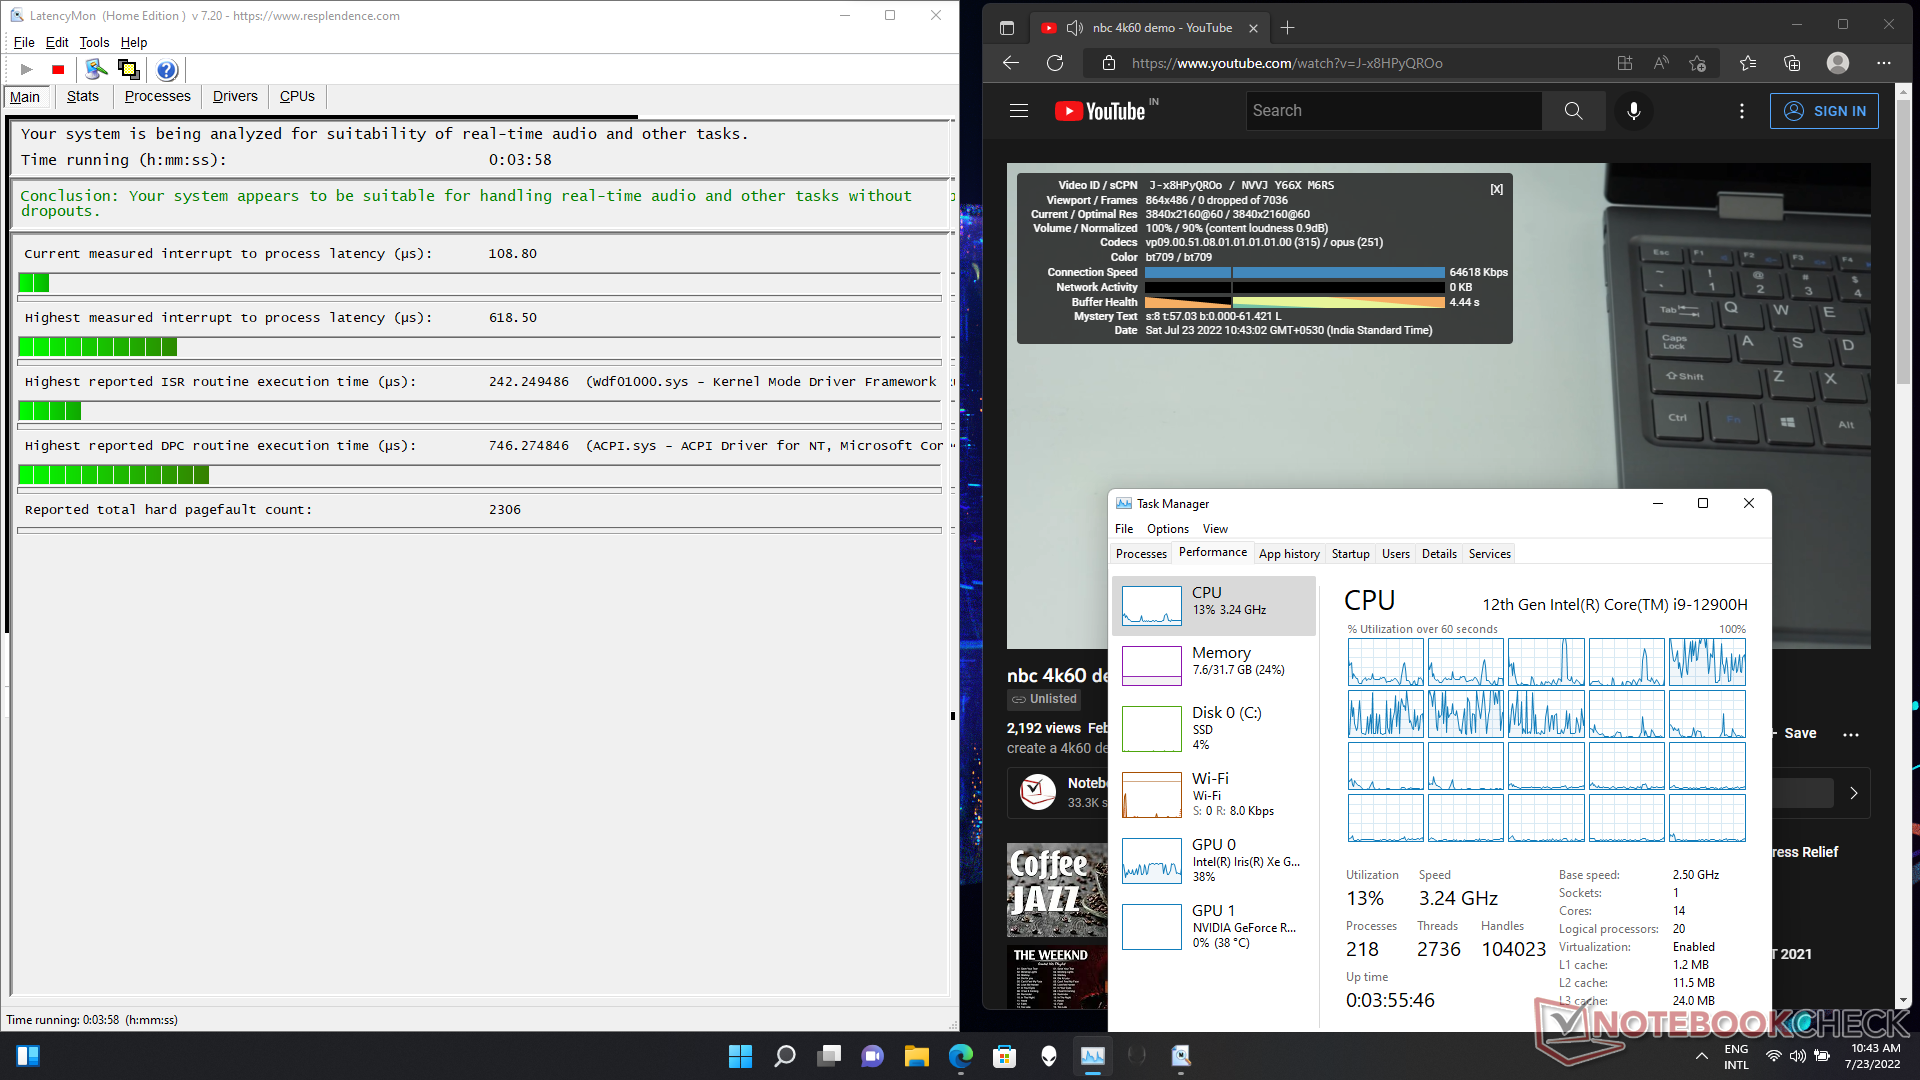
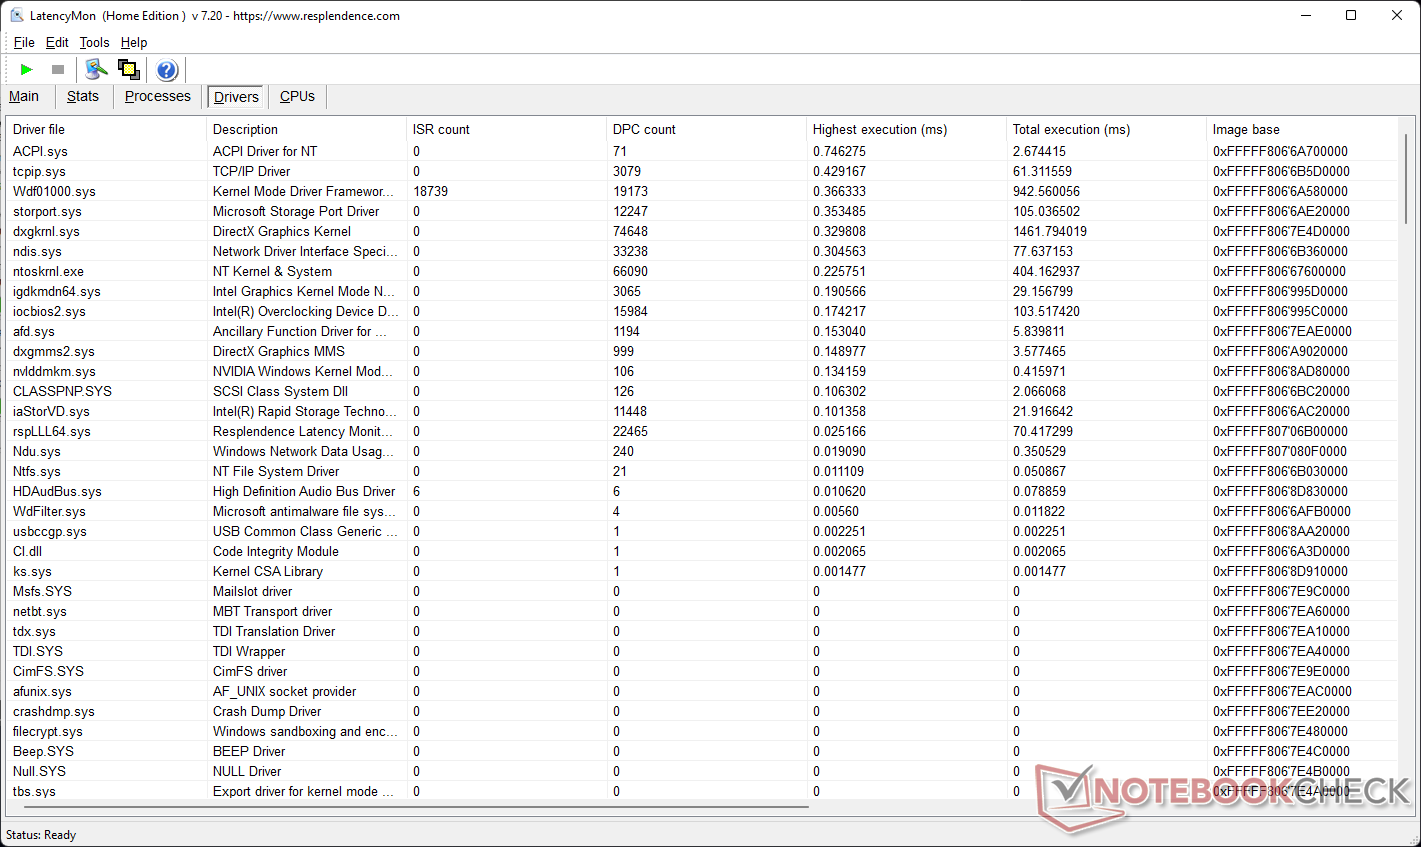
Opóźnienie DPC
Opóźnienia DPC w Alienware x15 R2 są nieco wyższe, ale nasze testy LatencyMon wskazują, że nadal powinny być odpowiednie dla przepływów pracy audio i wideo w czasie rzeczywistym. Do zaobserwowanych opóźnień wydaje się przyczyniać sterownik Windows ACPI.sys.
| DPC Latencies / LatencyMon - interrupt to process latency (max), Web, Youtube, Prime95 | |
| MSI Raider GE66 12UHS | |
| Razer Blade 15 Advanced Model Early 2022 | |
| MSI Vector GP66 12UGS | |
| MSI Titan GT77 12UHS | |
| MSI Titan GT77 12UHS | |
| Alienware x15 RTX 3070 P111F | |
| Asus ROG Strix Scar 15 G533ZW-LN106WS | |
| Alienware x15 R2 P111F | |
| Asus ROG Zephyrus Duo 16 GX650RX | |
* ... im mniej tym lepiej
Więcej porównań pomiędzy recenzowanymi urządzeniami można znaleźć w naszym Ranking Latencji DPC stronie.
Urządzenia do przechowywania danych
Podsystem pamięci masowej to jeden z obszarów, w którym x15 R2 wypada słabo - wcześniej widzieliśmy lepsze osiągi w przypadku dysku Samsung PM9A1. Mimo to sekwencyjne prędkości odczytu i zapisu Q32T1 zbliżają się do wartości reklamowanych dla tego dysku. Tegoroczny x15 R2 oferuje o 40% lepszą wydajność dysku w porównaniu z dyskiem SSD Western Digital SN730 z x15 R1.
Dławienie dysku zaobserwowano przy 43. przebiegu testu pętli odczytu DiskSpd przy głębokości kolejki 8. Nie ma rozwiązania termicznego ani na dysku SSD, ani na dolnym panelu.
Biorąc pod uwagę cienką obudowę, Dell nie oferuje miejsca na 2,5-calowy dysk SATA. Jest jednak zapis o możliwości dodania kolejnego dysku SSD M.2 NVMe.

| Drive Performance rating - Percent | |
| Asus ROG Strix Scar 15 G533ZW-LN106WS | |
| MSI Raider GE66 12UHS | |
| Asus ROG Zephyrus Duo 16 GX650RX | |
| MSI Titan GT77 12UHS | |
| Razer Blade 15 Advanced Model Early 2022 | |
| Przeciętny Samsung PM9A1 MZVL21T0HCLR | |
| Średnia w klasie Gaming | |
| MSI Vector GP66 12UGS | |
| Alienware x15 R2 P111F | |
| Alienware x15 RTX 3070 P111F | |
| DiskSpd | |
| seq read | |
| Asus ROG Zephyrus Duo 16 GX650RX | |
| Razer Blade 15 Advanced Model Early 2022 | |
| MSI Raider GE66 12UHS | |
| Przeciętny Samsung PM9A1 MZVL21T0HCLR (1761 - 4677, n=88) | |
| MSI Titan GT77 12UHS | |
| Alienware x15 R2 P111F | |
| Średnia w klasie Gaming (281 - 9494, n=103, ostatnie 2 lata) | |
| Asus ROG Strix Scar 15 G533ZW-LN106WS | |
| MSI Vector GP66 12UGS | |
| Alienware x15 RTX 3070 P111F | |
| seq write | |
| Asus ROG Zephyrus Duo 16 GX650RX | |
| Asus ROG Strix Scar 15 G533ZW-LN106WS | |
| MSI Titan GT77 12UHS | |
| Średnia w klasie Gaming (1057 - 9832, n=103, ostatnie 2 lata) | |
| Razer Blade 15 Advanced Model Early 2022 | |
| MSI Raider GE66 12UHS | |
| Przeciętny Samsung PM9A1 MZVL21T0HCLR (2220 - 4564, n=88) | |
| MSI Vector GP66 12UGS | |
| Alienware x15 R2 P111F | |
| Alienware x15 RTX 3070 P111F | |
| seq q8 t1 read | |
| Asus ROG Zephyrus Duo 16 GX650RX | |
| Średnia w klasie Gaming (3772 - 15056, n=103, ostatnie 2 lata) | |
| Asus ROG Strix Scar 15 G533ZW-LN106WS | |
| Alienware x15 R2 P111F | |
| MSI Titan GT77 12UHS | |
| Razer Blade 15 Advanced Model Early 2022 | |
| Przeciętny Samsung PM9A1 MZVL21T0HCLR (3421 - 7100, n=88) | |
| MSI Raider GE66 12UHS | |
| MSI Vector GP66 12UGS | |
| Alienware x15 RTX 3070 P111F | |
| seq q8 t1 write | |
| Asus ROG Zephyrus Duo 16 GX650RX | |
| Średnia w klasie Gaming (1218 - 13519, n=103, ostatnie 2 lata) | |
| Asus ROG Strix Scar 15 G533ZW-LN106WS | |
| MSI Titan GT77 12UHS | |
| MSI Raider GE66 12UHS | |
| Razer Blade 15 Advanced Model Early 2022 | |
| Przeciętny Samsung PM9A1 MZVL21T0HCLR (2216 - 5281, n=88) | |
| MSI Vector GP66 12UGS | |
| Alienware x15 R2 P111F | |
| Alienware x15 RTX 3070 P111F | |
| 4k q1 t1 read | |
| Razer Blade 15 Advanced Model Early 2022 | |
| MSI Raider GE66 12UHS | |
| Asus ROG Strix Scar 15 G533ZW-LN106WS | |
| MSI Titan GT77 12UHS | |
| Przeciętny Samsung PM9A1 MZVL21T0HCLR (48.4 - 97.4, n=88) | |
| Asus ROG Zephyrus Duo 16 GX650RX | |
| Średnia w klasie Gaming (32.2 - 111.2, n=103, ostatnie 2 lata) | |
| MSI Vector GP66 12UGS | |
| Alienware x15 RTX 3070 P111F | |
| Alienware x15 R2 P111F | |
| 4k q1 t1 write | |
| MSI Vector GP66 12UGS | |
| Asus ROG Zephyrus Duo 16 GX650RX | |
| Asus ROG Strix Scar 15 G533ZW-LN106WS | |
| MSI Raider GE66 12UHS | |
| Razer Blade 15 Advanced Model Early 2022 | |
| MSI Titan GT77 12UHS | |
| Średnia w klasie Gaming (78 - 347, n=103, ostatnie 2 lata) | |
| Alienware x15 R2 P111F | |
| Przeciętny Samsung PM9A1 MZVL21T0HCLR (49.9 - 280, n=88) | |
| Alienware x15 RTX 3070 P111F | |
| 4k q32 t16 read | |
| MSI Raider GE66 12UHS | |
| Asus ROG Strix Scar 15 G533ZW-LN106WS | |
| MSI Titan GT77 12UHS | |
| Razer Blade 15 Advanced Model Early 2022 | |
| Przeciętny Samsung PM9A1 MZVL21T0HCLR (376 - 4185, n=88) | |
| Asus ROG Zephyrus Duo 16 GX650RX | |
| Średnia w klasie Gaming (539 - 8067, n=103, ostatnie 2 lata) | |
| MSI Vector GP66 12UGS | |
| Alienware x15 R2 P111F | |
| Alienware x15 RTX 3070 P111F | |
| 4k q32 t16 write | |
| Asus ROG Strix Scar 15 G533ZW-LN106WS | |
| MSI Titan GT77 12UHS | |
| MSI Raider GE66 12UHS | |
| MSI Vector GP66 12UGS | |
| Razer Blade 15 Advanced Model Early 2022 | |
| Przeciętny Samsung PM9A1 MZVL21T0HCLR (291 - 3559, n=88) | |
| Średnia w klasie Gaming (227 - 5653, n=103, ostatnie 2 lata) | |
| Asus ROG Zephyrus Duo 16 GX650RX | |
| Alienware x15 R2 P111F | |
| Alienware x15 RTX 3070 P111F | |
| AS SSD | |
| Score Total | |
| Asus ROG Strix Scar 15 G533ZW-LN106WS | |
| MSI Raider GE66 12UHS | |
| MSI Titan GT77 12UHS | |
| Razer Blade 15 Advanced Model Early 2022 | |
| Przeciętny Samsung PM9A1 MZVL21T0HCLR (2577 - 9147, n=87) | |
| Średnia w klasie Gaming (2912 - 14159, n=101, ostatnie 2 lata) | |
| Asus ROG Zephyrus Duo 16 GX650RX | |
| MSI Vector GP66 12UGS | |
| Alienware x15 R2 P111F | |
| Alienware x15 RTX 3070 P111F | |
| Score Read | |
| Asus ROG Strix Scar 15 G533ZW-LN106WS | |
| MSI Raider GE66 12UHS | |
| MSI Titan GT77 12UHS | |
| Razer Blade 15 Advanced Model Early 2022 | |
| Asus ROG Zephyrus Duo 16 GX650RX | |
| Przeciętny Samsung PM9A1 MZVL21T0HCLR (983 - 3469, n=87) | |
| Średnia w klasie Gaming (953 - 5082, n=101, ostatnie 2 lata) | |
| MSI Vector GP66 12UGS | |
| Alienware x15 R2 P111F | |
| Alienware x15 RTX 3070 P111F | |
| Score Write | |
| Asus ROG Strix Scar 15 G533ZW-LN106WS | |
| MSI Raider GE66 12UHS | |
| Razer Blade 15 Advanced Model Early 2022 | |
| MSI Titan GT77 12UHS | |
| Średnia w klasie Gaming (1136 - 6457, n=101, ostatnie 2 lata) | |
| Przeciętny Samsung PM9A1 MZVL21T0HCLR (921 - 4043, n=87) | |
| MSI Vector GP66 12UGS | |
| Asus ROG Zephyrus Duo 16 GX650RX | |
| Alienware x15 R2 P111F | |
| Alienware x15 RTX 3070 P111F | |
| Seq Read | |
| Asus ROG Strix Scar 15 G533ZW-LN106WS | |
| Średnia w klasie Gaming (2346 - 10091, n=101, ostatnie 2 lata) | |
| Asus ROG Zephyrus Duo 16 GX650RX | |
| Razer Blade 15 Advanced Model Early 2022 | |
| Alienware x15 R2 P111F | |
| MSI Raider GE66 12UHS | |
| MSI Titan GT77 12UHS | |
| Przeciętny Samsung PM9A1 MZVL21T0HCLR (2638 - 5621, n=87) | |
| MSI Vector GP66 12UGS | |
| Alienware x15 RTX 3070 P111F | |
| Seq Write | |
| Asus ROG Zephyrus Duo 16 GX650RX | |
| Asus ROG Strix Scar 15 G533ZW-LN106WS | |
| Razer Blade 15 Advanced Model Early 2022 | |
| Średnia w klasie Gaming (114.5 - 10726, n=101, ostatnie 2 lata) | |
| MSI Titan GT77 12UHS | |
| MSI Raider GE66 12UHS | |
| Przeciętny Samsung PM9A1 MZVL21T0HCLR (1617 - 4526, n=87) | |
| MSI Vector GP66 12UGS | |
| Alienware x15 R2 P111F | |
| Alienware x15 RTX 3070 P111F | |
| 4K Read | |
| MSI Raider GE66 12UHS | |
| Razer Blade 15 Advanced Model Early 2022 | |
| Asus ROG Strix Scar 15 G533ZW-LN106WS | |
| Przeciętny Samsung PM9A1 MZVL21T0HCLR (45.9 - 89.2, n=87) | |
| Średnia w klasie Gaming (27.8 - 108.4, n=101, ostatnie 2 lata) | |
| MSI Vector GP66 12UGS | |
| MSI Titan GT77 12UHS | |
| Asus ROG Zephyrus Duo 16 GX650RX | |
| Alienware x15 R2 P111F | |
| Alienware x15 RTX 3070 P111F | |
| 4K Write | |
| MSI Vector GP66 12UGS | |
| Asus ROG Zephyrus Duo 16 GX650RX | |
| Asus ROG Strix Scar 15 G533ZW-LN106WS | |
| MSI Raider GE66 12UHS | |
| Alienware x15 R2 P111F | |
| Średnia w klasie Gaming (75.6 - 307, n=101, ostatnie 2 lata) | |
| MSI Titan GT77 12UHS | |
| Razer Blade 15 Advanced Model Early 2022 | |
| Przeciętny Samsung PM9A1 MZVL21T0HCLR (118.6 - 246, n=87) | |
| Alienware x15 RTX 3070 P111F | |
| 4K-64 Read | |
| MSI Titan GT77 12UHS | |
| MSI Raider GE66 12UHS | |
| Asus ROG Strix Scar 15 G533ZW-LN106WS | |
| Razer Blade 15 Advanced Model Early 2022 | |
| Asus ROG Zephyrus Duo 16 GX650RX | |
| Przeciętny Samsung PM9A1 MZVL21T0HCLR (421 - 2854, n=87) | |
| Średnia w klasie Gaming (517 - 3977, n=101, ostatnie 2 lata) | |
| MSI Vector GP66 12UGS | |
| Alienware x15 R2 P111F | |
| Alienware x15 RTX 3070 P111F | |
| 4K-64 Write | |
| MSI Raider GE66 12UHS | |
| Asus ROG Strix Scar 15 G533ZW-LN106WS | |
| Razer Blade 15 Advanced Model Early 2022 | |
| MSI Titan GT77 12UHS | |
| Średnia w klasie Gaming (850 - 5356, n=101, ostatnie 2 lata) | |
| Przeciętny Samsung PM9A1 MZVL21T0HCLR (367 - 3451, n=87) | |
| MSI Vector GP66 12UGS | |
| Alienware x15 R2 P111F | |
| Asus ROG Zephyrus Duo 16 GX650RX | |
| Alienware x15 RTX 3070 P111F | |
| Access Time Read | |
| Alienware x15 RTX 3070 P111F | |
| Alienware x15 R2 P111F | |
| Średnia w klasie Gaming (0.017 - 0.623, n=101, ostatnie 2 lata) | |
| Asus ROG Zephyrus Duo 16 GX650RX | |
| MSI Titan GT77 12UHS | |
| Razer Blade 15 Advanced Model Early 2022 | |
| Przeciętny Samsung PM9A1 MZVL21T0HCLR (0.018 - 0.083, n=86) | |
| MSI Vector GP66 12UGS | |
| MSI Raider GE66 12UHS | |
| Asus ROG Strix Scar 15 G533ZW-LN106WS | |
| Access Time Write | |
| MSI Vector GP66 12UGS | |
| Alienware x15 RTX 3070 P111F | |
| Średnia w klasie Gaming (0.012 - 0.277, n=101, ostatnie 2 lata) | |
| Przeciętny Samsung PM9A1 MZVL21T0HCLR (0.017 - 0.101, n=87) | |
| Razer Blade 15 Advanced Model Early 2022 | |
| MSI Titan GT77 12UHS | |
| Alienware x15 R2 P111F | |
| MSI Raider GE66 12UHS | |
| Asus ROG Strix Scar 15 G533ZW-LN106WS | |
| Asus ROG Zephyrus Duo 16 GX650RX | |
* ... im mniej tym lepiej
Disk Throttling: DiskSpd Read Loop, Queue Depth 8
Nasze dedykowaneBenchmarki SSD i HDDoferuje więcej porównań wydajności urządzeń pamięci masowej.
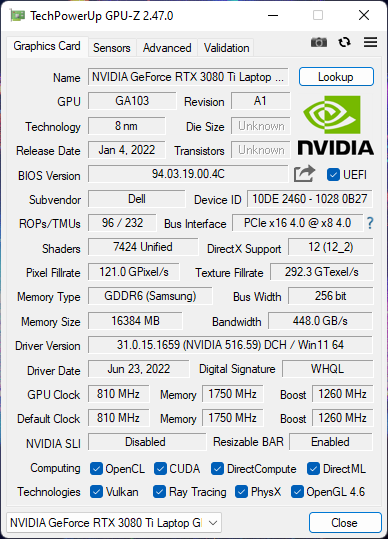
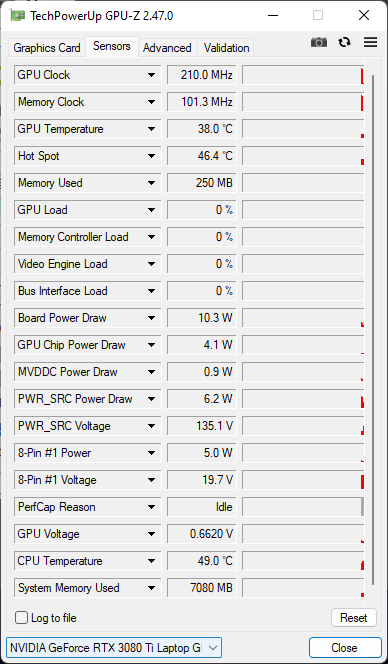
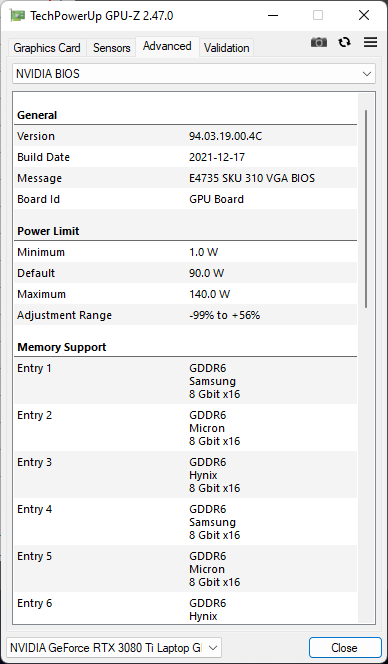
Wydajność GPU
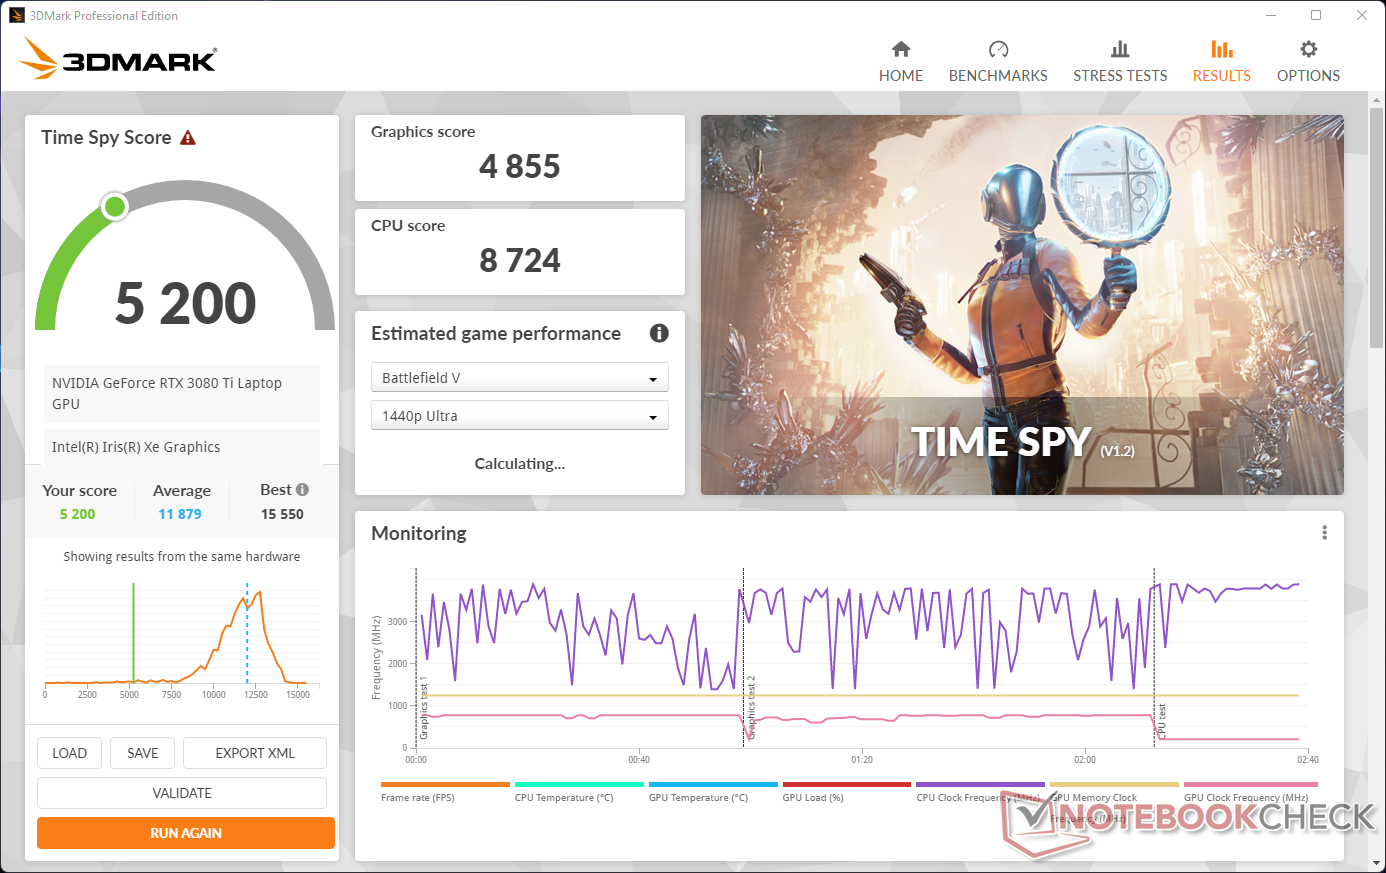
Nasz egzemplarz Alienware x15 R2 wyposażony jest w Procesor graficzny Nvidia GeForce RTX 3080 Ti Laptop z 16 GB pamięci VRAM GDDR6 i całkowitą mocą graficzną (TGP) na poziomie 140 W. Dell nie podaje mocy Dynamic Boost dla tego GPU.
Ogólna wydajność RTX 3080 Ti w 3DMarku w modelu x15 R2 jest porównywalna z wydajnością m.in MSI Raider GE66 (150 W) i MSI Titan GT77 (175 W). Nieco niższa punktacja wynika z niższej mocy obliczeniowej niezbędnej do pracy w cienkiej obudowie. RTX 3080 Ti z Razer Blade 15 Advanced pozostaje w tyle z powodu niskiej mocy 110 W.
| 3DMark Performance rating - Percent | |
| Średnia w klasie Gaming | |
| MSI Titan GT77 12UHS | |
| MSI Raider GE66 12UHS | |
| Alienware x15 R2 P111F | |
| MSI Vector GP66 12UGS | |
| Przeciętny NVIDIA GeForce RTX 3080 Ti Laptop GPU | |
| Asus ROG Strix Scar 15 G533ZW-LN106WS | |
| Alienware x15 RTX 3070 P111F | |
| Asus ROG Zephyrus Duo 16 GX650RX | |
| Razer Blade 15 Advanced Model Early 2022 | |
| 3DMark 11 - 1280x720 Performance GPU | |
| Średnia w klasie Gaming (21841 - 80022, n=109, ostatnie 2 lata) | |
| MSI Titan GT77 12UHS | |
| MSI Raider GE66 12UHS | |
| MSI Vector GP66 12UGS | |
| Asus ROG Zephyrus Duo 16 GX650RX | |
| Asus ROG Strix Scar 15 G533ZW-LN106WS | |
| Przeciętny NVIDIA GeForce RTX 3080 Ti Laptop GPU (13920 - 45841, n=45) | |
| Alienware x15 R2 P111F | |
| Alienware x15 RTX 3070 P111F | |
| Razer Blade 15 Advanced Model Early 2022 | |
| 3DMark | |
| 1280x720 Cloud Gate Standard Graphics | |
| MSI Titan GT77 12UHS | |
| MSI Raider GE66 12UHS | |
| Alienware x15 R2 P111F | |
| MSI Vector GP66 12UGS | |
| Alienware x15 RTX 3070 P111F | |
| Średnia w klasie Gaming (86886 - 223650, n=61, ostatnie 2 lata) | |
| Przeciętny NVIDIA GeForce RTX 3080 Ti Laptop GPU (73574 - 192520, n=26) | |
| Razer Blade 15 Advanced Model Early 2022 | |
| Asus ROG Strix Scar 15 G533ZW-LN106WS | |
| Asus ROG Zephyrus Duo 16 GX650RX | |
| 1920x1080 Fire Strike Graphics | |
| Średnia w klasie Gaming (12242 - 62849, n=121, ostatnie 2 lata) | |
| MSI Titan GT77 12UHS | |
| MSI Raider GE66 12UHS | |
| Alienware x15 R2 P111F | |
| MSI Vector GP66 12UGS | |
| Przeciętny NVIDIA GeForce RTX 3080 Ti Laptop GPU (6928 - 34439, n=43) | |
| Asus ROG Strix Scar 15 G533ZW-LN106WS | |
| Asus ROG Zephyrus Duo 16 GX650RX | |
| Alienware x15 RTX 3070 P111F | |
| Razer Blade 15 Advanced Model Early 2022 | |
| 2560x1440 Time Spy Graphics | |
| Średnia w klasie Gaming (5012 - 26212, n=120, ostatnie 2 lata) | |
| MSI Titan GT77 12UHS | |
| MSI Raider GE66 12UHS | |
| Alienware x15 R2 P111F | |
| Przeciętny NVIDIA GeForce RTX 3080 Ti Laptop GPU (4921 - 13835, n=43) | |
| MSI Vector GP66 12UGS | |
| Asus ROG Zephyrus Duo 16 GX650RX | |
| Asus ROG Strix Scar 15 G533ZW-LN106WS | |
| Alienware x15 RTX 3070 P111F | |
| Razer Blade 15 Advanced Model Early 2022 | |
| 3DMark 11 Performance | 33756 pkt. | |
| 3DMark Ice Storm Standard Score | 265376 pkt. | |
| 3DMark Cloud Gate Standard Score | 62500 pkt. | |
| 3DMark Fire Strike Score | 24365 pkt. | |
| 3DMark Fire Strike Extreme Score | 14539 pkt. | |
| 3DMark Time Spy Score | 12393 pkt. | |
Pomoc | ||
Na zasilaniu bateryjnym widzimy znaczny spadek wyników w 3DMark Time Spy. Ogólny wynik spada o 58%, a wydajność grafiki o 60%
Częstotliwość odświeżania ekranu automatycznie przełącza się z 360 Hz na 60 Hz po odłączeniu od sieci.
Wydajność w grach
Wydajność Alienware x15 R2 w grach jest zgodna z oczekiwaniami, jeśli chodzi o oferowany sprzęt, i generalnie dorównuje innym laptopom z RTX 3080 Ti-. W bardzo niskich ustawieniach jakościowych prowadzi Asus ROG Strix Scar 15 ze swoim 150 W RTX 3070 Ti Laptop GPU w grach takich jak F1 2021, The Witcher 3 , i Cyberpunk 2077, ale x15 R2 zyskuje na znaczeniu po zwiększeniu ustawień graficznych.
| Performance rating - Percent | |
| Średnia w klasie Gaming | |
| MSI Titan GT77 12UHS | |
| MSI Raider GE66 12UHS | |
| MSI Vector GP66 12UGS | |
| Alienware x15 R2 P111F | |
| Przeciętny NVIDIA GeForce RTX 3080 Ti Laptop GPU | |
| Asus ROG Strix Scar 15 G533ZW-LN106WS | |
| Asus ROG Zephyrus Duo 16 GX650RX | |
| Alienware x15 RTX 3070 P111F | |
| The Witcher 3 | |
| 1920x1080 High Graphics & Postprocessing (Nvidia HairWorks Off) | |
| MSI Titan GT77 12UHS | |
| Średnia w klasie Gaming (181 - 341, n=3, ostatnie 2 lata) | |
| Alienware x15 R2 P111F | |
| MSI Vector GP66 12UGS | |
| MSI Raider GE66 12UHS | |
| Przeciętny NVIDIA GeForce RTX 3080 Ti Laptop GPU (144 - 268, n=28) | |
| Asus ROG Strix Scar 15 G533ZW-LN106WS | |
| Asus ROG Zephyrus Duo 16 GX650RX | |
| Alienware x15 RTX 3070 P111F | |
| 1920x1080 Ultra Graphics & Postprocessing (HBAO+) | |
| Średnia w klasie Gaming (95 - 240, n=8, ostatnie 2 lata) | |
| MSI Titan GT77 12UHS | |
| Alienware x15 R2 P111F | |
| MSI Vector GP66 12UGS | |
| Przeciętny NVIDIA GeForce RTX 3080 Ti Laptop GPU (30 - 130.6, n=43) | |
| Asus ROG Zephyrus Duo 16 GX650RX | |
| Asus ROG Strix Scar 15 G533ZW-LN106WS | |
| MSI Raider GE66 12UHS | |
| Alienware x15 RTX 3070 P111F | |
| Final Fantasy XV Benchmark | |
| 1920x1080 Standard Quality | |
| MSI Titan GT77 12UHS | |
| Średnia w klasie Gaming (85.7 - 236, n=90, ostatnie 2 lata) | |
| MSI Raider GE66 12UHS | |
| Alienware x15 R2 P111F | |
| MSI Vector GP66 12UGS | |
| Przeciętny NVIDIA GeForce RTX 3080 Ti Laptop GPU (110 - 189.3, n=27) | |
| Asus ROG Zephyrus Duo 16 GX650RX | |
| Asus ROG Strix Scar 15 G533ZW-LN106WS | |
| Alienware x15 RTX 3070 P111F | |
| 1920x1080 High Quality | |
| Średnia w klasie Gaming (41 - 215, n=104, ostatnie 2 lata) | |
| MSI Titan GT77 12UHS | |
| Alienware x15 R2 P111F | |
| MSI Raider GE66 12UHS | |
| MSI Vector GP66 12UGS | |
| Przeciętny NVIDIA GeForce RTX 3080 Ti Laptop GPU (30.7 - 140.6, n=42) | |
| Asus ROG Zephyrus Duo 16 GX650RX | |
| Asus ROG Strix Scar 15 G533ZW-LN106WS | |
| Alienware x15 RTX 3070 P111F | |
| Strange Brigade | |
| 1920x1080 high AA:high AF:8 | |
| Średnia w klasie Gaming (129.5 - 485, n=80, ostatnie 2 lata) | |
| MSI Titan GT77 12UHS | |
| MSI Vector GP66 12UGS | |
| Asus ROG Strix Scar 15 G533ZW-LN106WS | |
| MSI Raider GE66 12UHS | |
| Przeciętny NVIDIA GeForce RTX 3080 Ti Laptop GPU (156 - 255, n=29) | |
| Alienware x15 RTX 3070 P111F | |
| Alienware x15 R2 P111F | |
| Asus ROG Zephyrus Duo 16 GX650RX | |
| 1920x1080 ultra AA:ultra AF:16 | |
| Średnia w klasie Gaming (76.3 - 456, n=94, ostatnie 2 lata) | |
| MSI Titan GT77 12UHS | |
| MSI Vector GP66 12UGS | |
| MSI Raider GE66 12UHS | |
| Asus ROG Strix Scar 15 G533ZW-LN106WS | |
| Przeciętny NVIDIA GeForce RTX 3080 Ti Laptop GPU (42.3 - 224, n=41) | |
| Asus ROG Zephyrus Duo 16 GX650RX | |
| Alienware x15 R2 P111F | |
| Alienware x15 RTX 3070 P111F | |
| Far Cry 5 | |
| 1920x1080 High Preset AA:T | |
| MSI Titan GT77 12UHS | |
| MSI Raider GE66 12UHS | |
| MSI Vector GP66 12UGS | |
| Alienware x15 R2 P111F | |
| Przeciętny NVIDIA GeForce RTX 3080 Ti Laptop GPU (118 - 167, n=22) | |
| Asus ROG Strix Scar 15 G533ZW-LN106WS | |
| Średnia w klasie Gaming (82 - 163, n=10, ostatnie 2 lata) | |
| Asus ROG Zephyrus Duo 16 GX650RX | |
| Alienware x15 RTX 3070 P111F | |
| 1920x1080 Ultra Preset AA:T | |
| MSI Titan GT77 12UHS | |
| MSI Raider GE66 12UHS | |
| MSI Vector GP66 12UGS | |
| Alienware x15 R2 P111F | |
| Przeciętny NVIDIA GeForce RTX 3080 Ti Laptop GPU (111 - 162, n=24) | |
| Asus ROG Strix Scar 15 G533ZW-LN106WS | |
| Średnia w klasie Gaming (70 - 151, n=10, ostatnie 2 lata) | |
| Alienware x15 RTX 3070 P111F | |
| Asus ROG Zephyrus Duo 16 GX650RX | |
| Cyberpunk 2077 1.6 | |
| 1920x1080 High Preset | |
| MSI Raider GE66 12UHS | |
| MSI Titan GT77 12UHS | |
| Przeciętny NVIDIA GeForce RTX 3080 Ti Laptop GPU (64 - 145.6, n=14) | |
| Alienware x15 R2 P111F | |
| Asus ROG Zephyrus Duo 16 GX650RX | |
| Asus ROG Strix Scar 15 G533ZW-LN106WS | |
| 1920x1080 Ultra Preset | |
| MSI Raider GE66 12UHS | |
| MSI Titan GT77 12UHS | |
| Asus ROG Zephyrus Duo 16 GX650RX | |
| Przeciętny NVIDIA GeForce RTX 3080 Ti Laptop GPU (54 - 144.1, n=16) | |
| Alienware x15 R2 P111F | |
| Asus ROG Strix Scar 15 G533ZW-LN106WS | |
| 1920x1080 Ray Tracing Ultra Preset (DLSS off) | |
| MSI Titan GT77 12UHS | |
| Przeciętny NVIDIA GeForce RTX 3080 Ti Laptop GPU (39.2 - 49.9, n=7) | |
| MSI Raider GE66 12UHS | |
| Alienware x15 R2 P111F | |
| Asus ROG Zephyrus Duo 16 GX650RX | |
| Asus ROG Strix Scar 15 G533ZW-LN106WS | |
| F1 2021 | |
| 1920x1080 High Preset AA:T AF:16x | |
| MSI Titan GT77 12UHS | |
| MSI Raider GE66 12UHS | |
| Alienware x15 R2 P111F | |
| Przeciętny NVIDIA GeForce RTX 3080 Ti Laptop GPU (182.1 - 316, n=17) | |
| Asus ROG Strix Scar 15 G533ZW-LN106WS | |
| Asus ROG Zephyrus Duo 16 GX650RX | |
| 1920x1080 Ultra High Preset + Raytracing AA:T AF:16x | |
| MSI Titan GT77 12UHS | |
| Alienware x15 R2 P111F | |
| MSI Raider GE66 12UHS | |
| Asus ROG Strix Scar 15 G533ZW-LN106WS | |
| Asus ROG Zephyrus Duo 16 GX650RX | |
| Przeciętny NVIDIA GeForce RTX 3080 Ti Laptop GPU (30.2 - 160.6, n=30) | |
| Watch Dogs Legion | |
| 1920x1080 Ultra Preset (DX12) | |
| MSI Titan GT77 12UHS | |
| Przeciętny NVIDIA GeForce RTX 3080 Ti Laptop GPU (78.2 - 87, n=4) | |
| Alienware x15 R2 P111F | |
| 1920x1080 Ultra Preset + Ultra Ray Tracing (DX12) | |
| Przeciętny NVIDIA GeForce RTX 3080 Ti Laptop GPU (50 - 70, n=3) | |
| MSI Titan GT77 12UHS | |
| Alienware x15 R2 P111F | |
| Tiny Tina's Wonderlands | |
| 1920x1080 High Preset (DX12) | |
| Przeciętny NVIDIA GeForce RTX 3080 Ti Laptop GPU (123.5 - 137.1, n=4) | |
| Asus ROG Zephyrus Duo 16 GX650RX | |
| Średnia w klasie Gaming (72.1 - 203, n=5, ostatnie 2 lata) | |
| Alienware x15 R2 P111F | |
| 1920x1080 Badass Preset (DX12) | |
| Przeciętny NVIDIA GeForce RTX 3080 Ti Laptop GPU (100.7 - 110.5, n=4) | |
| Asus ROG Zephyrus Duo 16 GX650RX | |
| Alienware x15 R2 P111F | |
| Średnia w klasie Gaming (55 - 159.4, n=5, ostatnie 2 lata) | |
Wykres Witcher 3 FPS
Trwała wydajność w The Witcher 3 przy 1080p Ultra jest przyzwoita, choć widzimy wahania liczby klatek na sekundę. Pod koniec rozgrywki widać lekki spadek liczby klatek na sekundę, ale x15 R2 jest w stanie szybko się pozbierać.
| low | med. | high | ultra | |
|---|---|---|---|---|
| The Witcher 3 (2015) | 391 | 345 | 229 | 116 |
| Dota 2 Reborn (2015) | 174.7 | 162.2 | 151.6 | 145.7 |
| Final Fantasy XV Benchmark (2018) | 209 | 156.4 | 120.5 | |
| X-Plane 11.11 (2018) | 146.9 | 137.7 | 105.5 | |
| Far Cry 5 (2018) | 172 | 152 | 143 | 135 |
| Strange Brigade (2018) | 458 | 246 | 200 | 180.5 |
| Watch Dogs Legion (2020) | 133.2 | 122.4 | 107.4 | 78.2 |
| F1 2021 (2021) | 361 | 319 | 248 | 146.9 |
| Cyberpunk 2077 1.6 (2022) | 133.7 | 124.6 | 102.6 | 86.1 |
| Tiny Tina's Wonderlands (2022) | 209 | 178.2 | 126.6 | 100.7 |
| Call of Duty Modern Warfare 2 2022 (2022) | 96 |
Sprawdź nasze Karta graficzna Nvidia GeForce RTX 3080 Ti do laptopa aby uzyskać więcej informacji i porównania w benchmarkach.
Emisje: Ten hot rod działa na gorąco
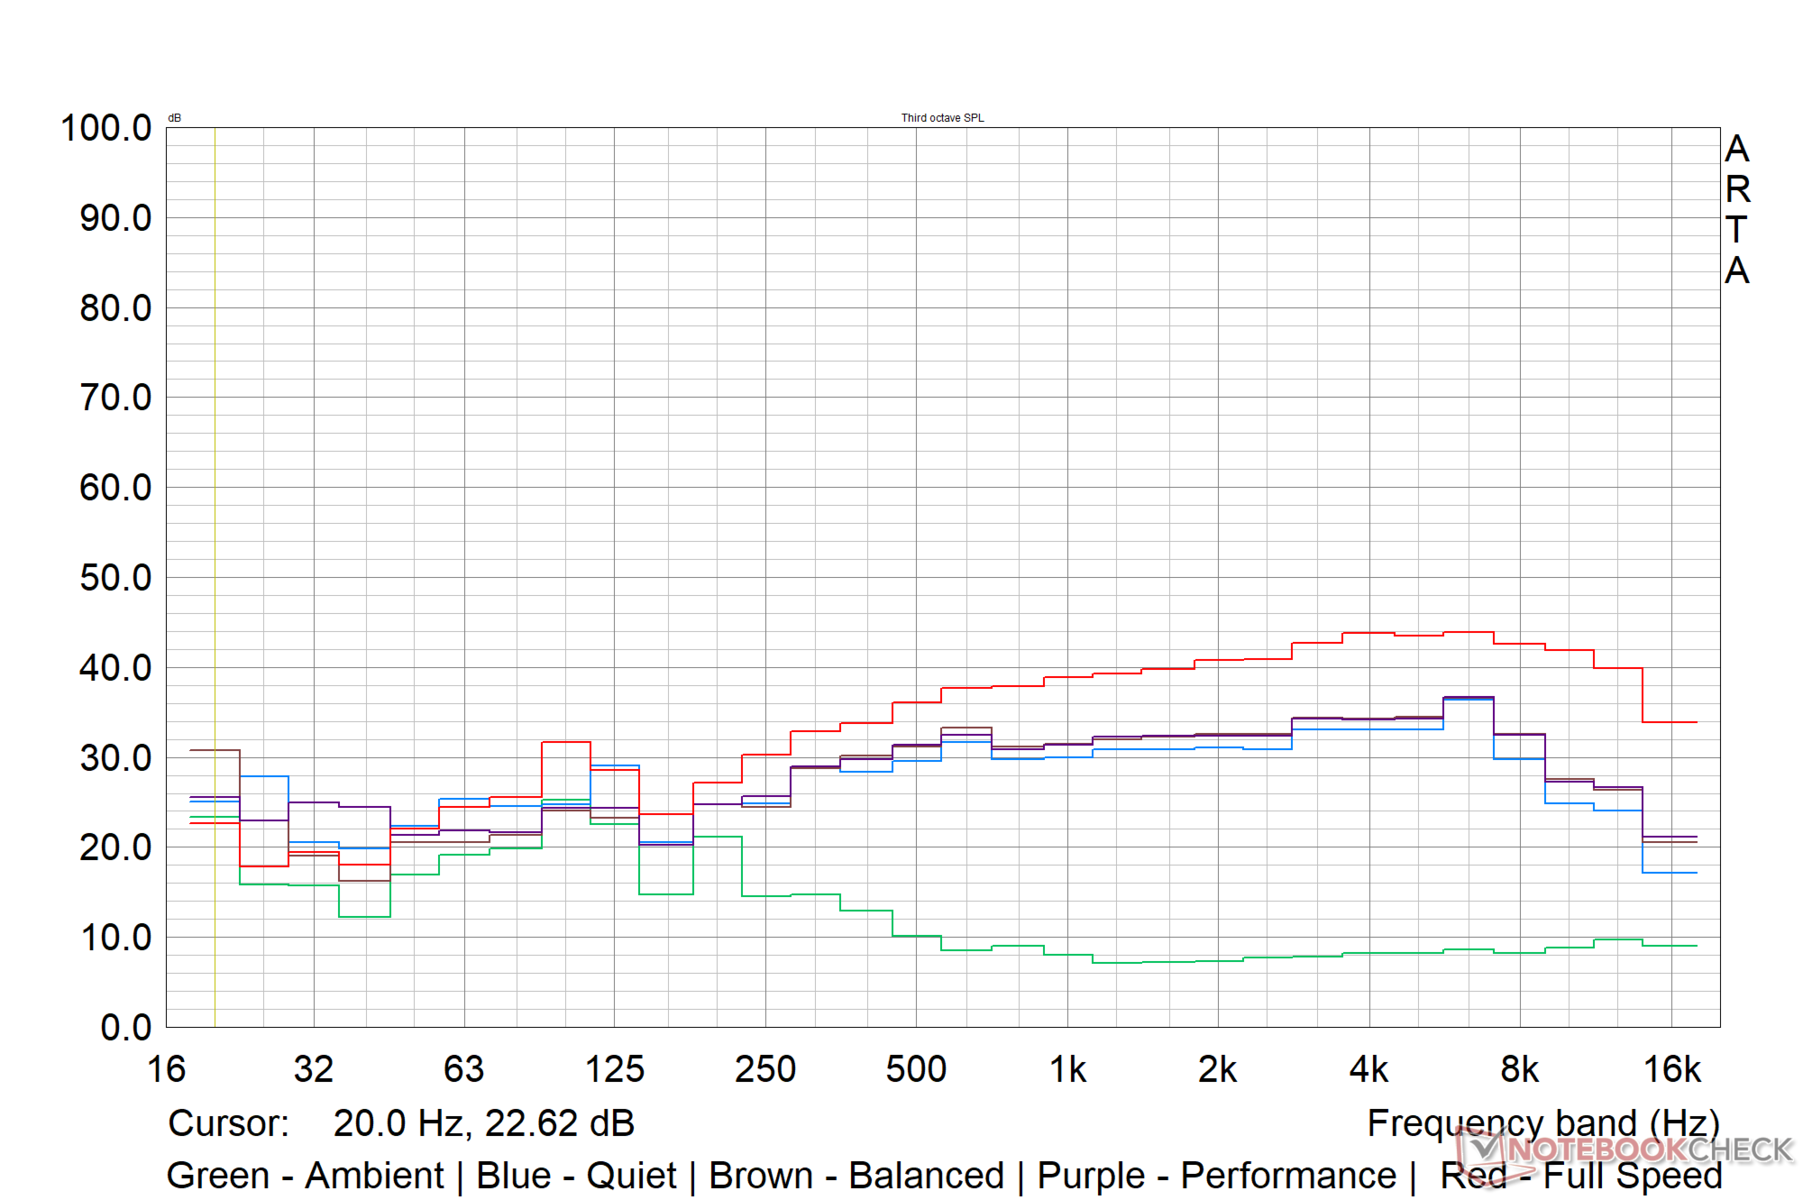
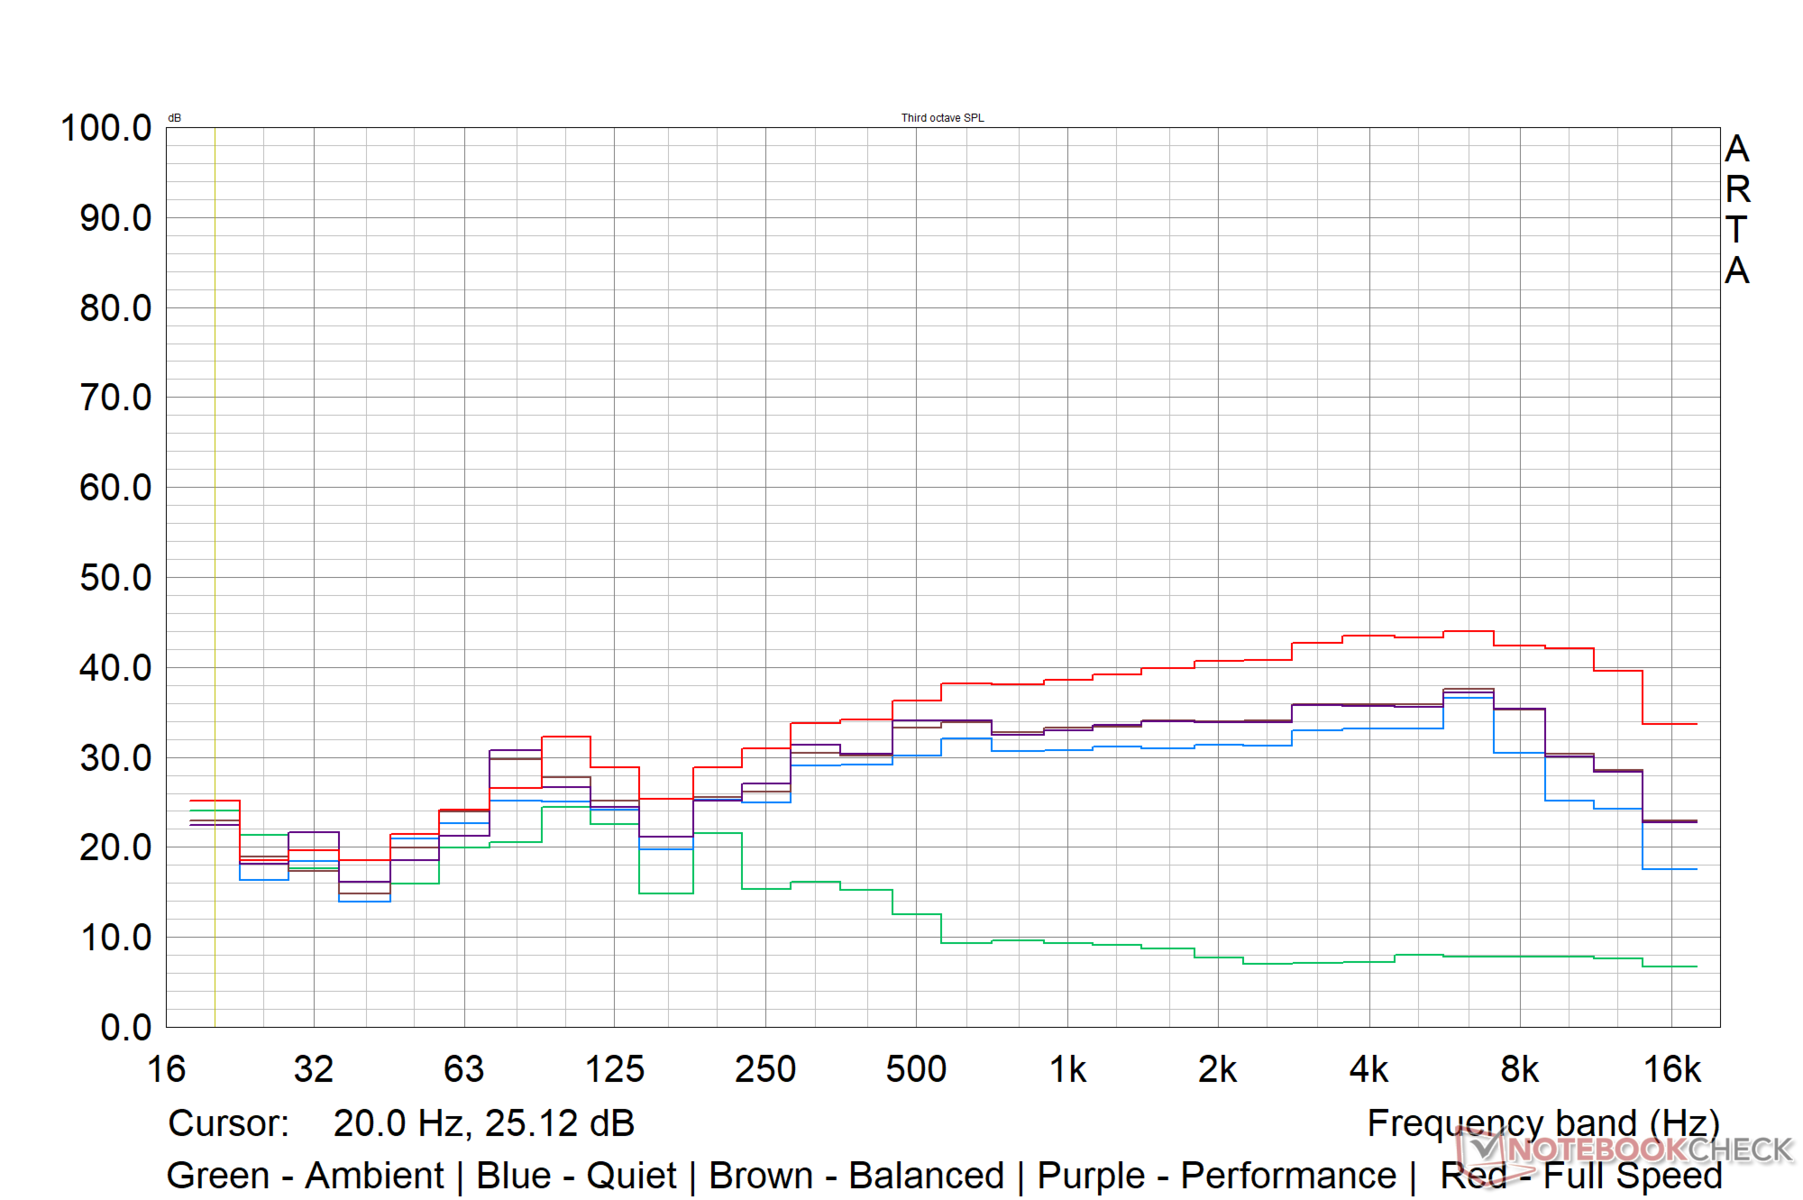
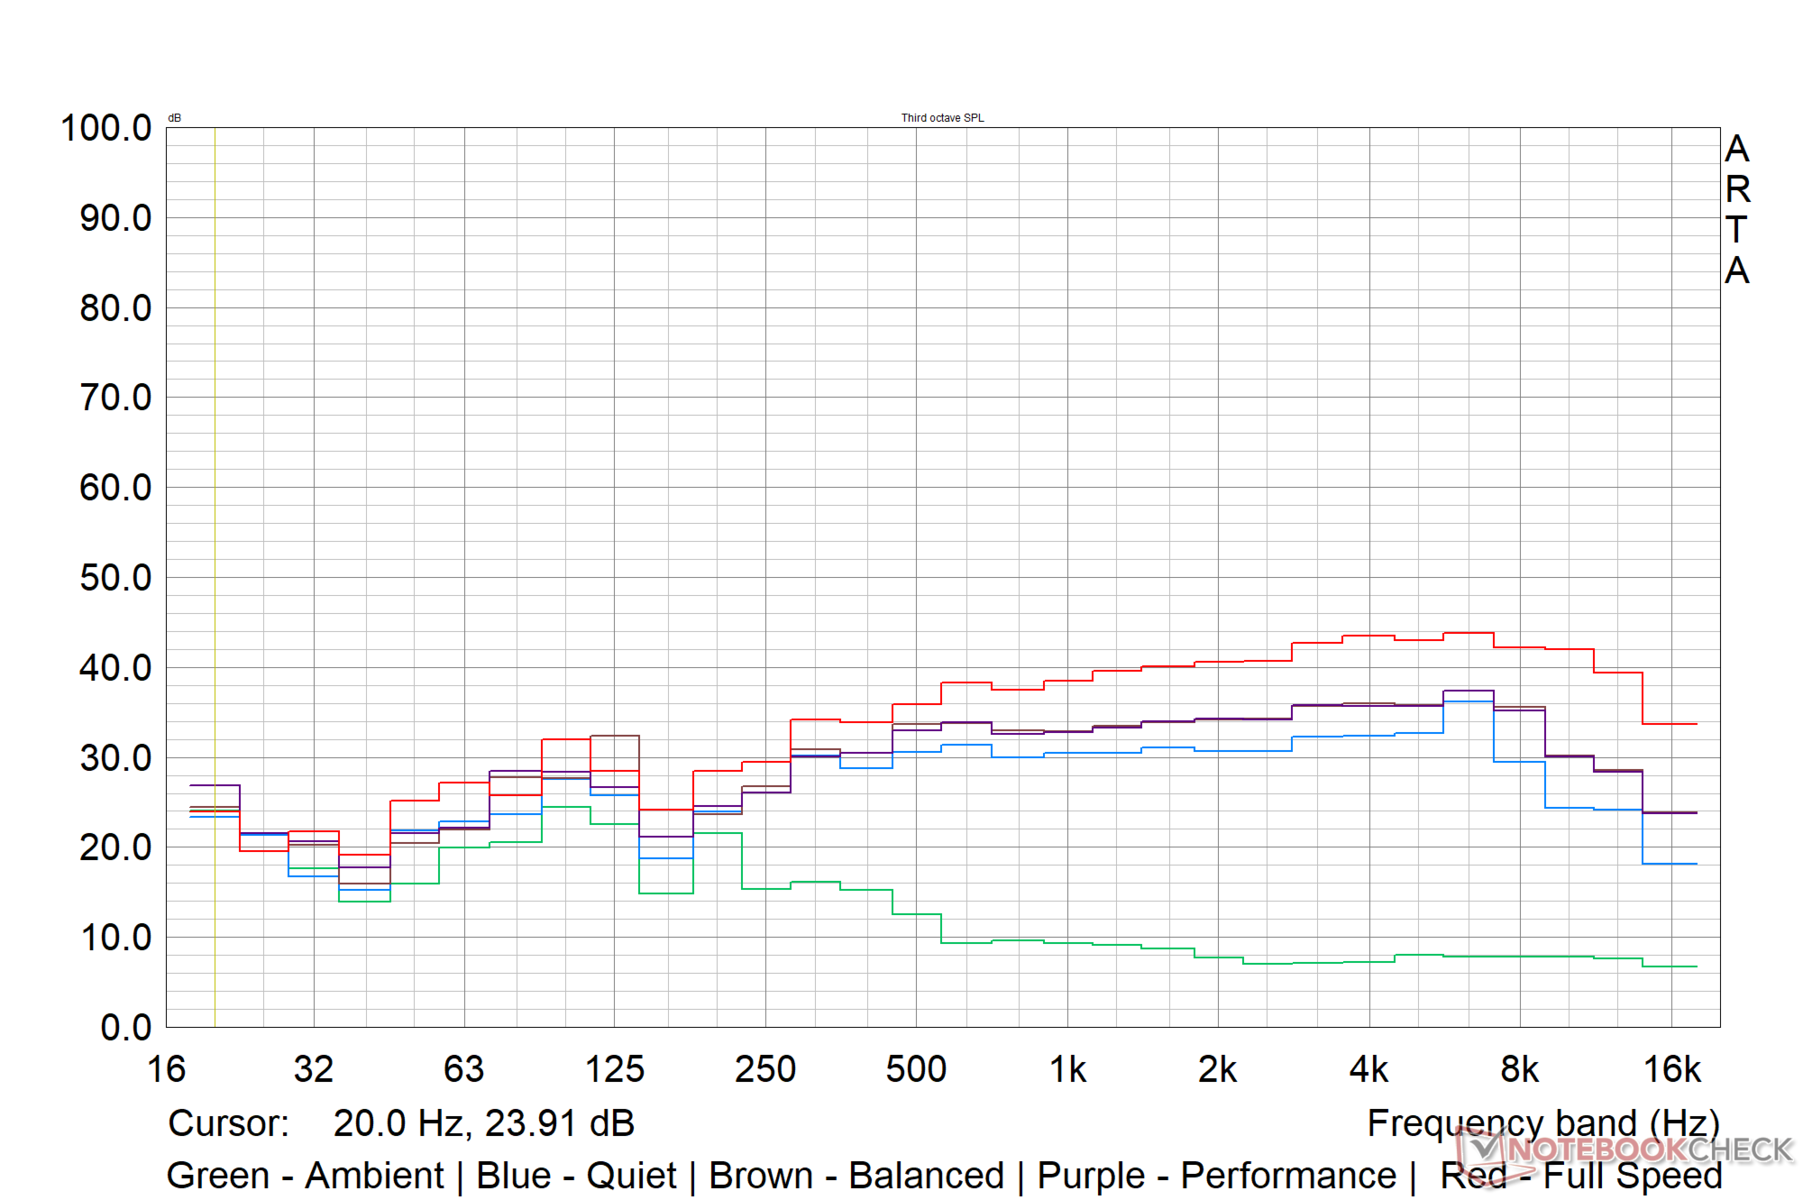
Szum systemu
Jak już wcześniej wspominaliśmy, Dell oferuje cztery profile termiczne do wyboru. Do większości celów tryby Balanced i Performance dobrze spełniają swoje zadanie. Tryb Full Speed jest potrzebny tylko wtedy, gdy chcemy mieć absolutnie nieograniczone chłodzenie.
W trybie Quiet Dell ogranicza hałas wentylatora do 45 dB(A) bez względu na obciążenie. Podczas uruchamiania strony Witcher 3 w rozdzielczości 1080p Ultra w trybach Zrównoważony i Wydajny odnotowaliśmy hałas wentylatora na poziomie 47 db(A).
Zmierzyliśmy poziom hałasu wentylatora w trybie Zrównoważonym. Wydaje się, że Dell ustawił poziom hałasu wentylatora na 53 db(A) w trybie Full Speed niezależnie od obciążenia, a nawet podczas pracy na biegu jałowym.
Hałas
| luz |
| 21.94 / 21.94 / 21.94 dB |
| obciążenie |
| 45.1 / 45.58 dB |
 | ||
30 dB cichy 40 dB(A) słyszalny 50 dB(A) irytujący |
||
min: | ||
| Alienware x15 R2 P111F Intel Core i9-12900H, NVIDIA GeForce RTX 3080 Ti Laptop GPU | Asus ROG Strix Scar 15 G533ZW-LN106WS Intel Core i9-12900H, NVIDIA GeForce RTX 3070 Ti Laptop GPU | Asus ROG Zephyrus Duo 16 GX650RX AMD Ryzen 9 6900HX, NVIDIA GeForce RTX 3080 Ti Laptop GPU | MSI Vector GP66 12UGS Intel Core i9-12900H, NVIDIA GeForce RTX 3070 Ti Laptop GPU | Razer Blade 15 Advanced Model Early 2022 Intel Core i7-12800H, NVIDIA GeForce RTX 3080 Ti Laptop GPU | |
|---|---|---|---|---|---|
| Noise | -46% | -14% | -11% | -10% | |
| wyłączone / środowisko * (dB) | 21.79 | 26.86 -23% | 26 -19% | 22.9 -5% | 26 -19% |
| Idle Minimum * (dB) | 21.94 | 39.07 -78% | 26 -19% | 23.4 -7% | 26 -19% |
| Idle Average * (dB) | 21.94 | 39.07 -78% | 27 -23% | 23.4 -7% | 27 -23% |
| Idle Maximum * (dB) | 21.94 | 39.07 -78% | 29 -32% | 27.4 -25% | 29 -32% |
| Load Average * (dB) | 45.1 | 53.34 -18% | 41 9% | 36 20% | 37 18% |
| Witcher 3 ultra * (dB) | 46.56 | 56.6 -22% | 48 -3% | 58.2 -25% | 44 5% |
| Load Maximum * (dB) | 45.58 | 56.6 -24% | 50 -10% | 58 -27% | 45 1% |
* ... im mniej tym lepiej
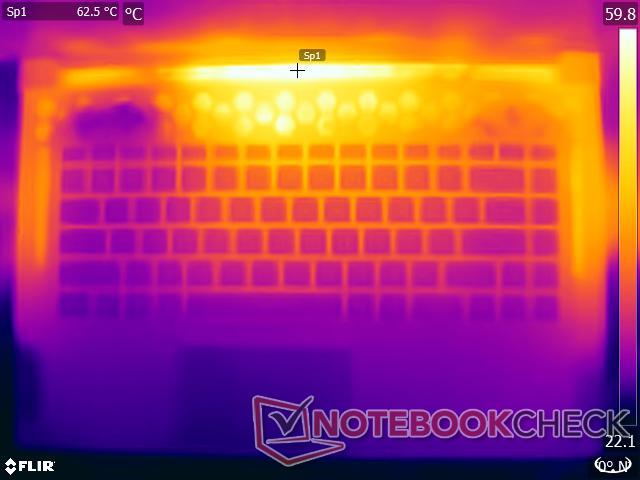
Temperatura
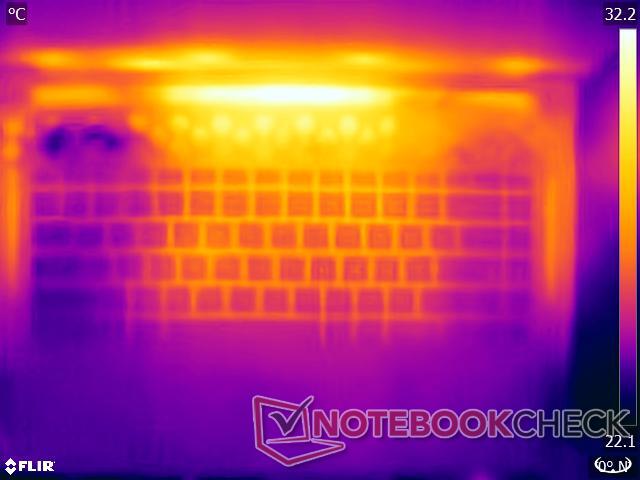
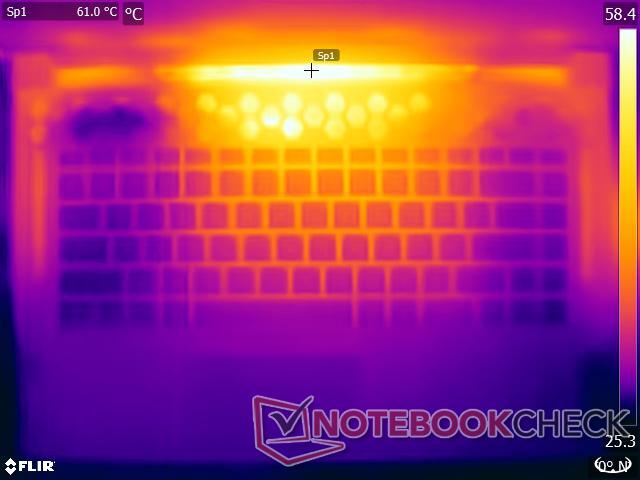
Nawet przy czterech niezależnie sterowanych wentylatorach i czterech ciepłowodach pracujących w profilu Full Speed, podczas testu obciążeniowego The Witcher 3 zaobserwowaliśmy temperatury powierzchni sięgające 66,2°C. Mimo to obszary oparcia dłoni są stosunkowo chłodne nawet pod obciążeniem.
(-) Maksymalna temperatura w górnej części wynosi 58.6 °C / 137 F, w porównaniu do średniej 40.4 °C / 105 F , począwszy od 21.2 do 68.8 °C dla klasy Gaming.
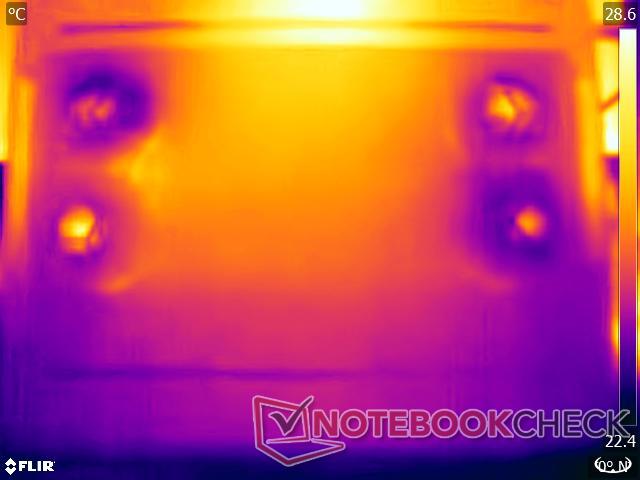
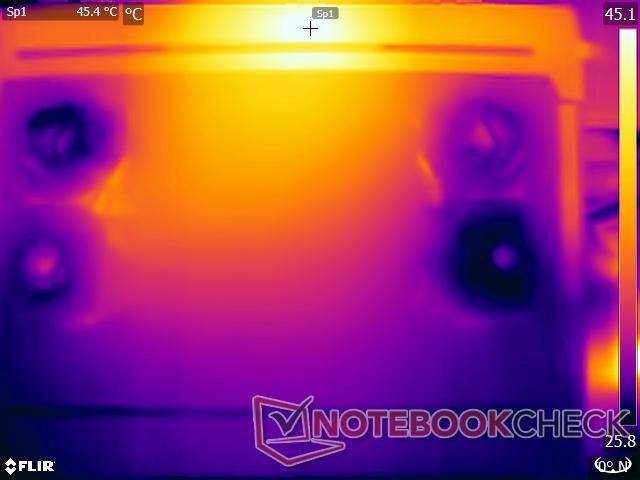
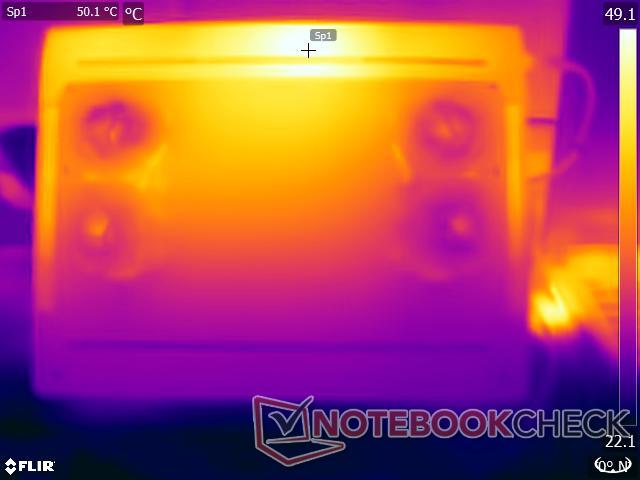
(-) Dno nagrzewa się maksymalnie do 51.8 °C / 125 F, w porównaniu do średniej 43.2 °C / 110 F
(+) W stanie bezczynności średnia temperatura górnej części wynosi 31.4 °C / 89 F, w porównaniu ze średnią temperaturą urządzenia wynoszącą 33.9 °C / ### class_avg_f### F.
(-) Podczas gry w Wiedźmina 3 średnia temperatura górnej części wynosi 46.9 °C / 116 F, w porównaniu do średniej temperatury urządzenia wynoszącej 33.9 °C / ## #class_avg_f### F.
(+) Podparcia dłoni i touchpad osiągają maksymalną temperaturę skóry (33.4 °C / 92.1 F) i dlatego nie są gorące.
(-) Średnia temperatura obszaru podparcia dłoni w podobnych urządzeniach wynosiła 28.8 °C / 83.8 F (-4.6 °C / -8.3 F).
Nasze testy obciążeniowe reprezentują ekstremalne scenariusze, ale zalecamy używanie x15 R2 na kolanach tylko podczas pracy w profilach termicznych Quiet lub Balanced bez większego obciążenia, aby zapewnić tolerowane temperatury powierzchni.
| Alienware x15 R2 P111F Intel Core i9-12900H, NVIDIA GeForce RTX 3080 Ti Laptop GPU | Asus ROG Strix Scar 15 G533ZW-LN106WS Intel Core i9-12900H, NVIDIA GeForce RTX 3070 Ti Laptop GPU | Asus ROG Zephyrus Duo 16 GX650RX AMD Ryzen 9 6900HX, NVIDIA GeForce RTX 3080 Ti Laptop GPU | MSI Vector GP66 12UGS Intel Core i9-12900H, NVIDIA GeForce RTX 3070 Ti Laptop GPU | Razer Blade 15 Advanced Model Early 2022 Intel Core i7-12800H, NVIDIA GeForce RTX 3080 Ti Laptop GPU | |
|---|---|---|---|---|---|
| Heat | 0% | 7% | 8% | -4% | |
| Maximum Upper Side * (°C) | 58.6 | 42.6 27% | 45 23% | 40.2 31% | 53 10% |
| Maximum Bottom * (°C) | 51.8 | 50.2 3% | 50 3% | 43.8 15% | 53 -2% |
| Idle Upper Side * (°C) | 36.4 | 36.2 1% | 33 9% | 34.8 4% | 36 1% |
| Idle Bottom * (°C) | 31 | 40.2 -30% | 33 -6% | 37 -19% | 38 -23% |
* ... im mniej tym lepiej
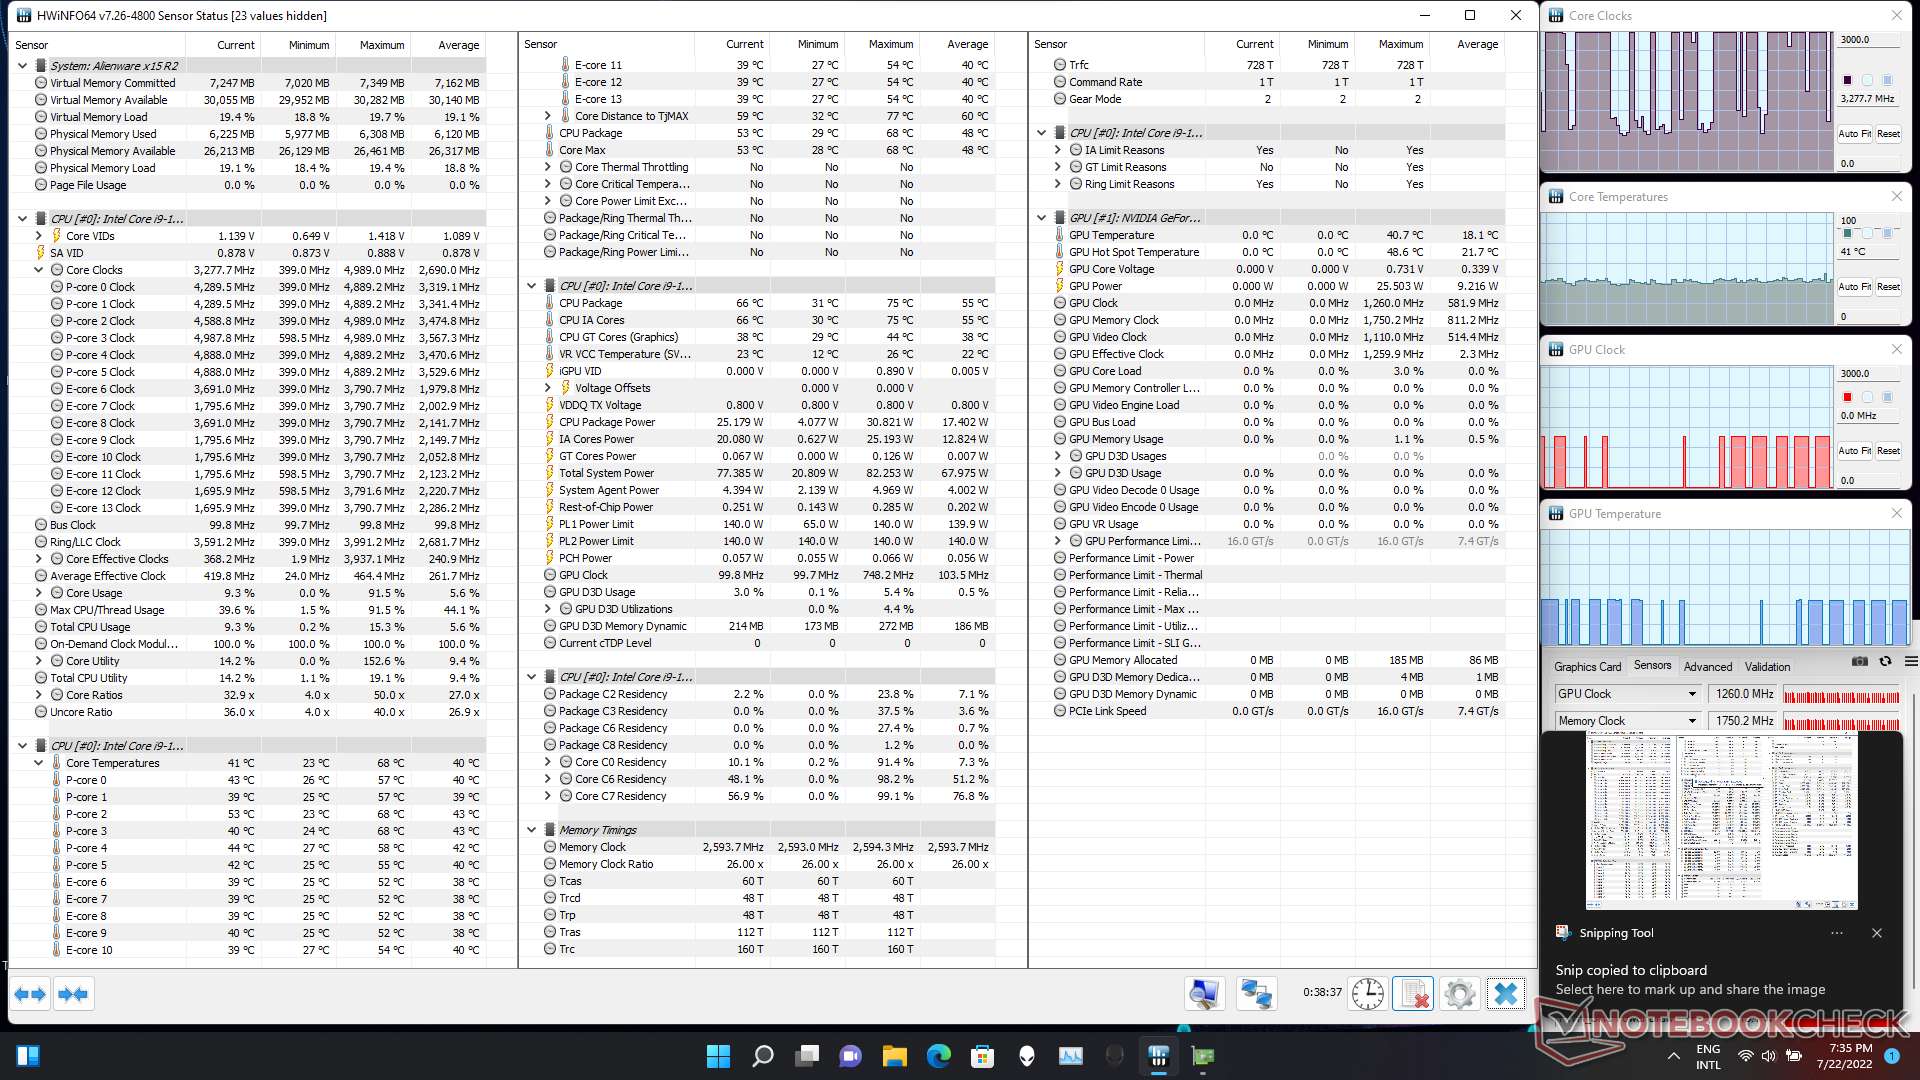
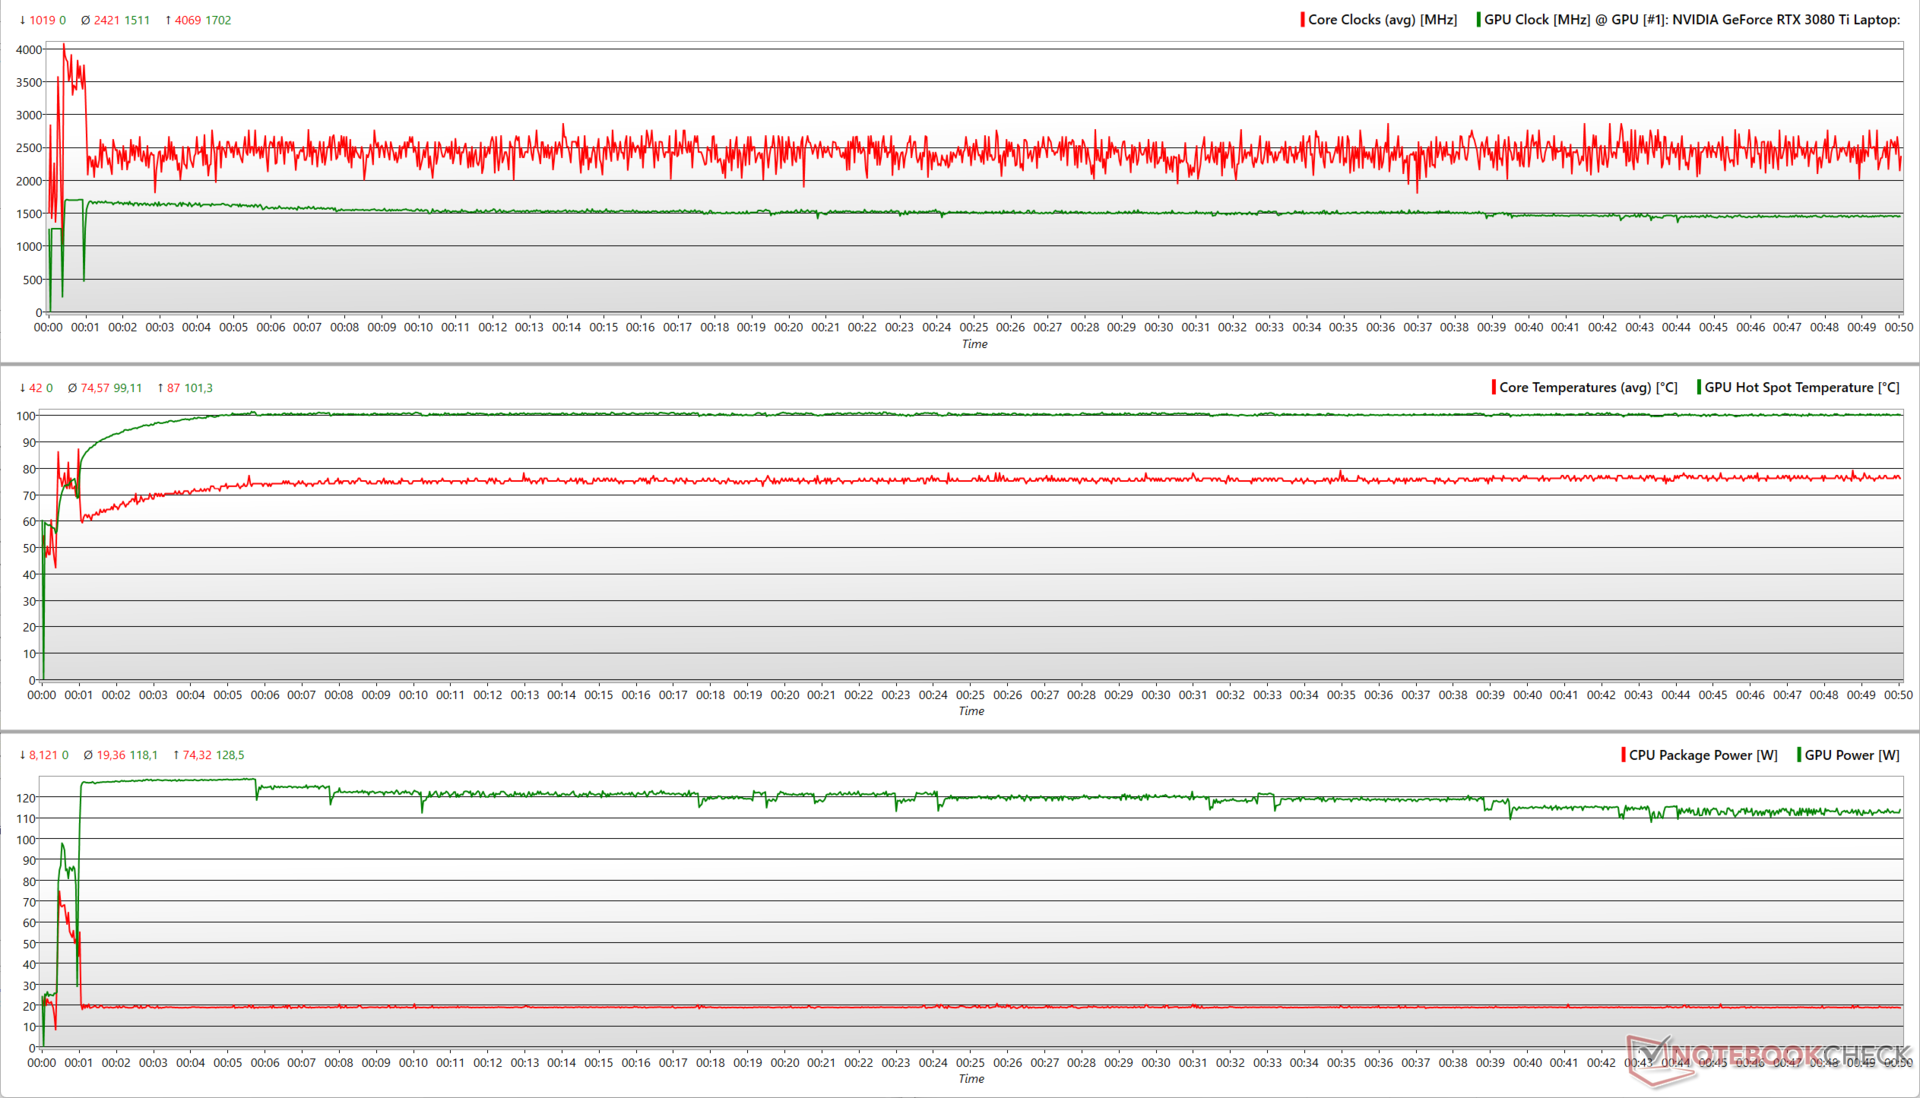
Stress Test
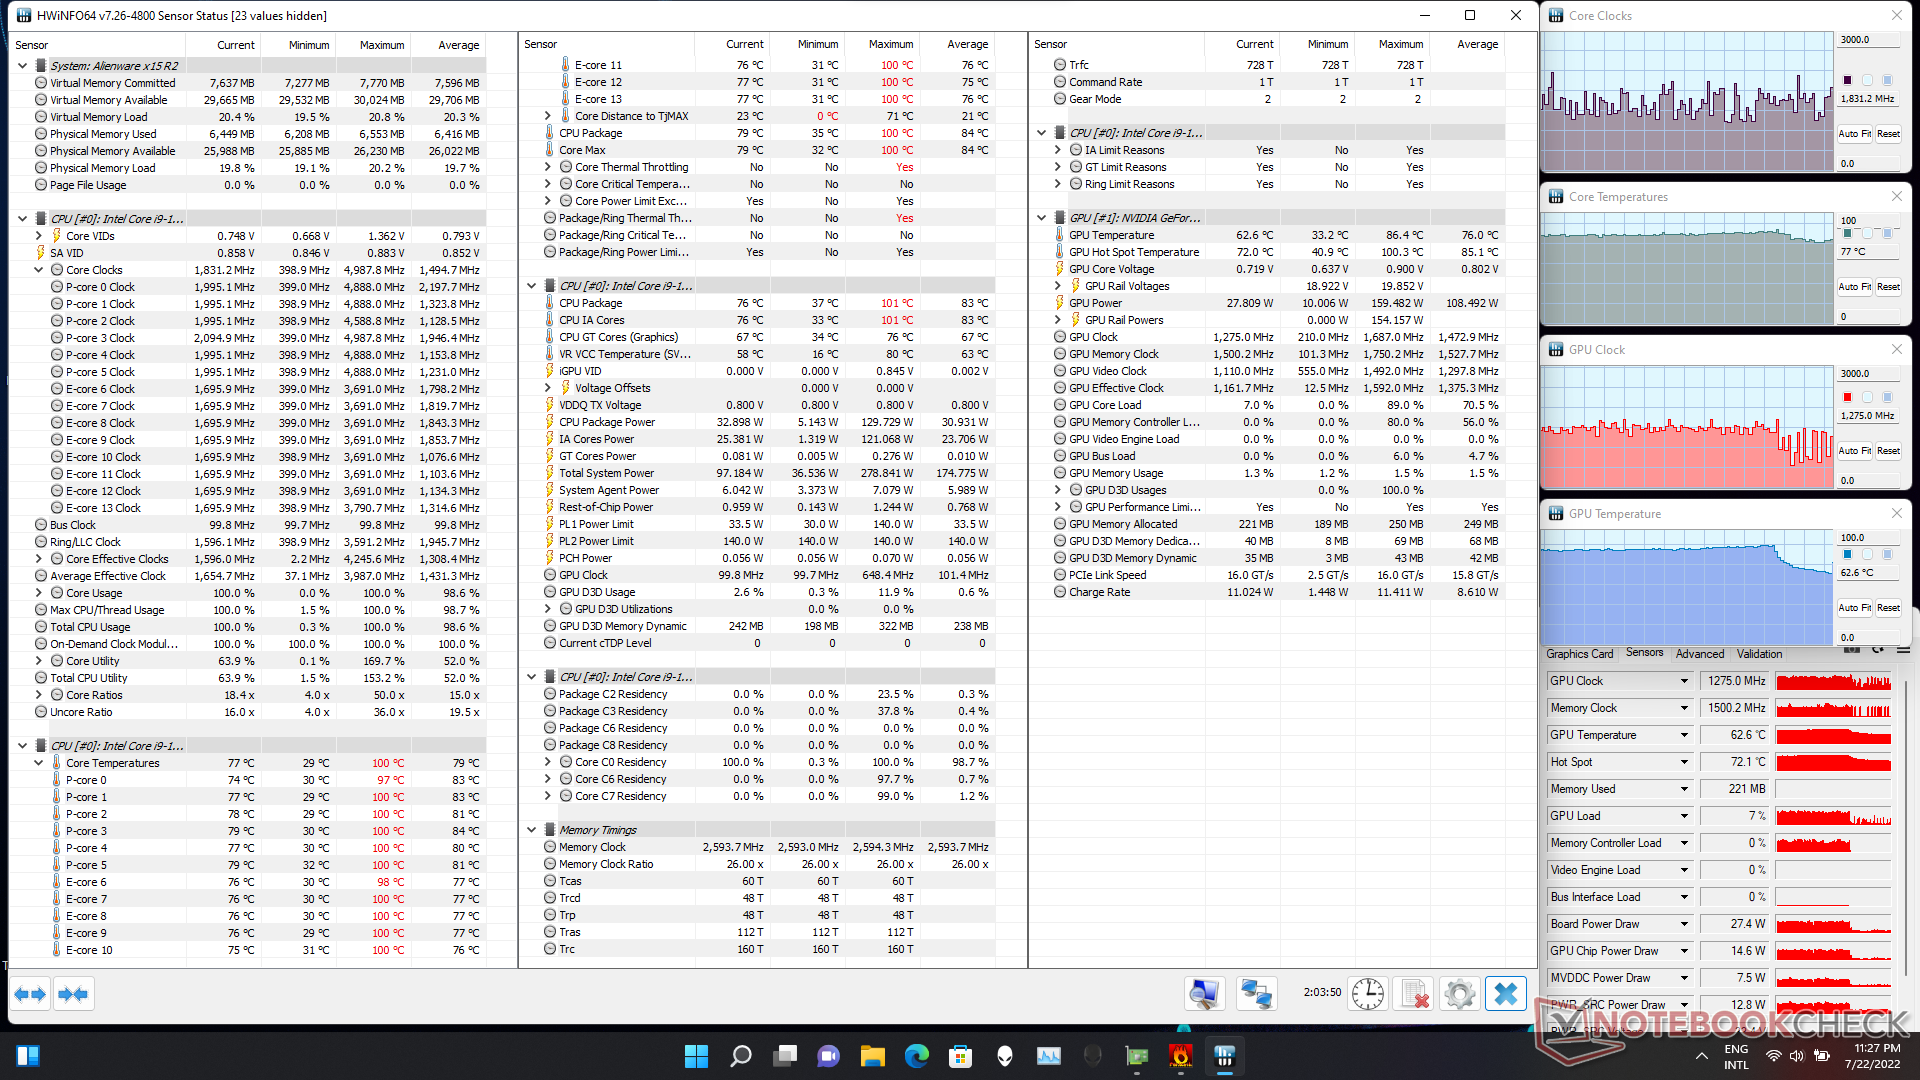
Testy obciążeniowe Alienware x15 R2 pokazują nam, jak różne parametry CPU i GPU zmieniają się pod różnymi obciążeniami
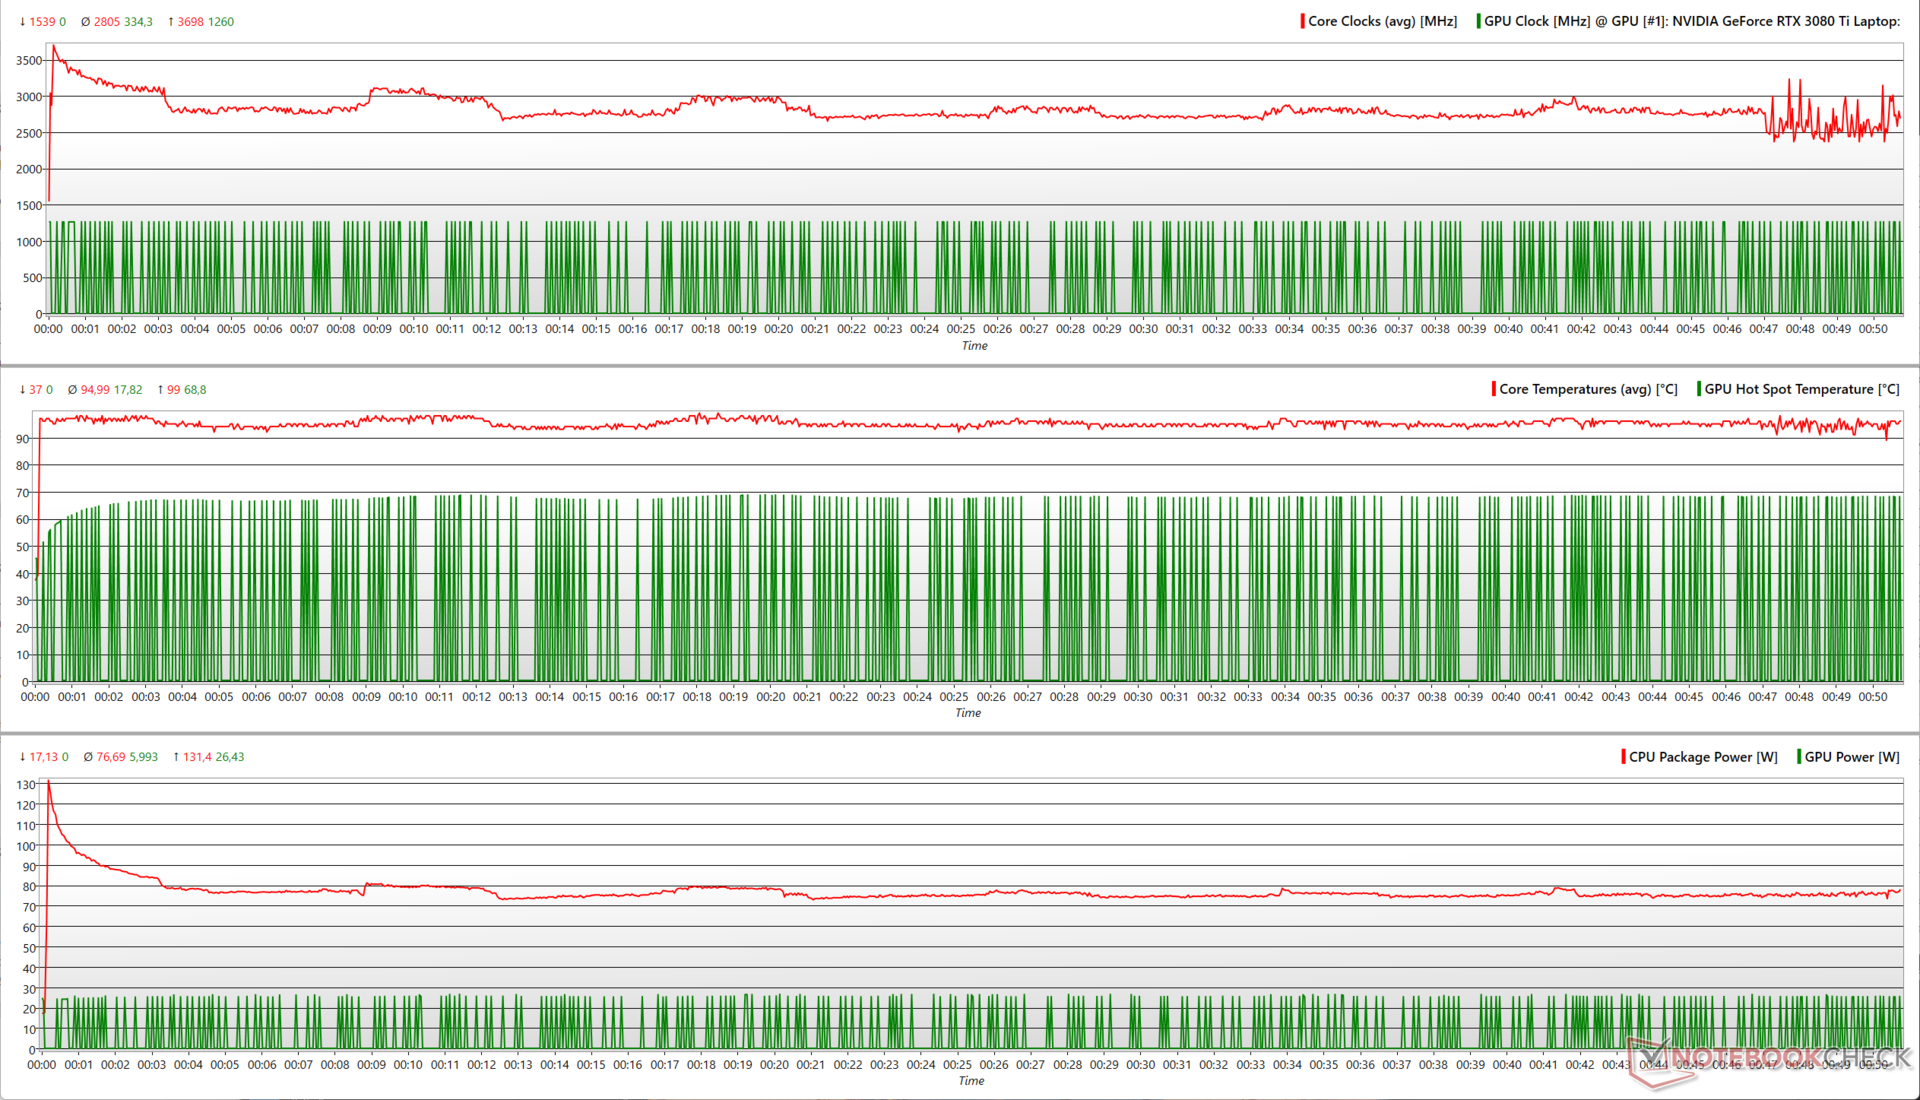
W przypadku samego testu Prime95 in-place FFT, Core i9-12900H początkowo osiąga szczytowe taktowanie bliskie 3,7 GHz, zużywając przy tym 131 W. Następnie zegary oscylują pomiędzy 2,6 GHz a 3 GHz, co odpowiada 75 W i 80 W PL1.
| Test obciążeniowy | Zegar CPU (GHz) | Zegar GPU (MHz) | Średnia temperatura CPU (°C) | Średnia temperatura GPU (°C) |
| System w stanie bezczynności | 3.2 | - | 40 | - |
| Prime95 | 2,69 | - | 95 | 57,2 |
| Prime95 + FurMark | 1.83 | 1,275 | 79 | 76 |
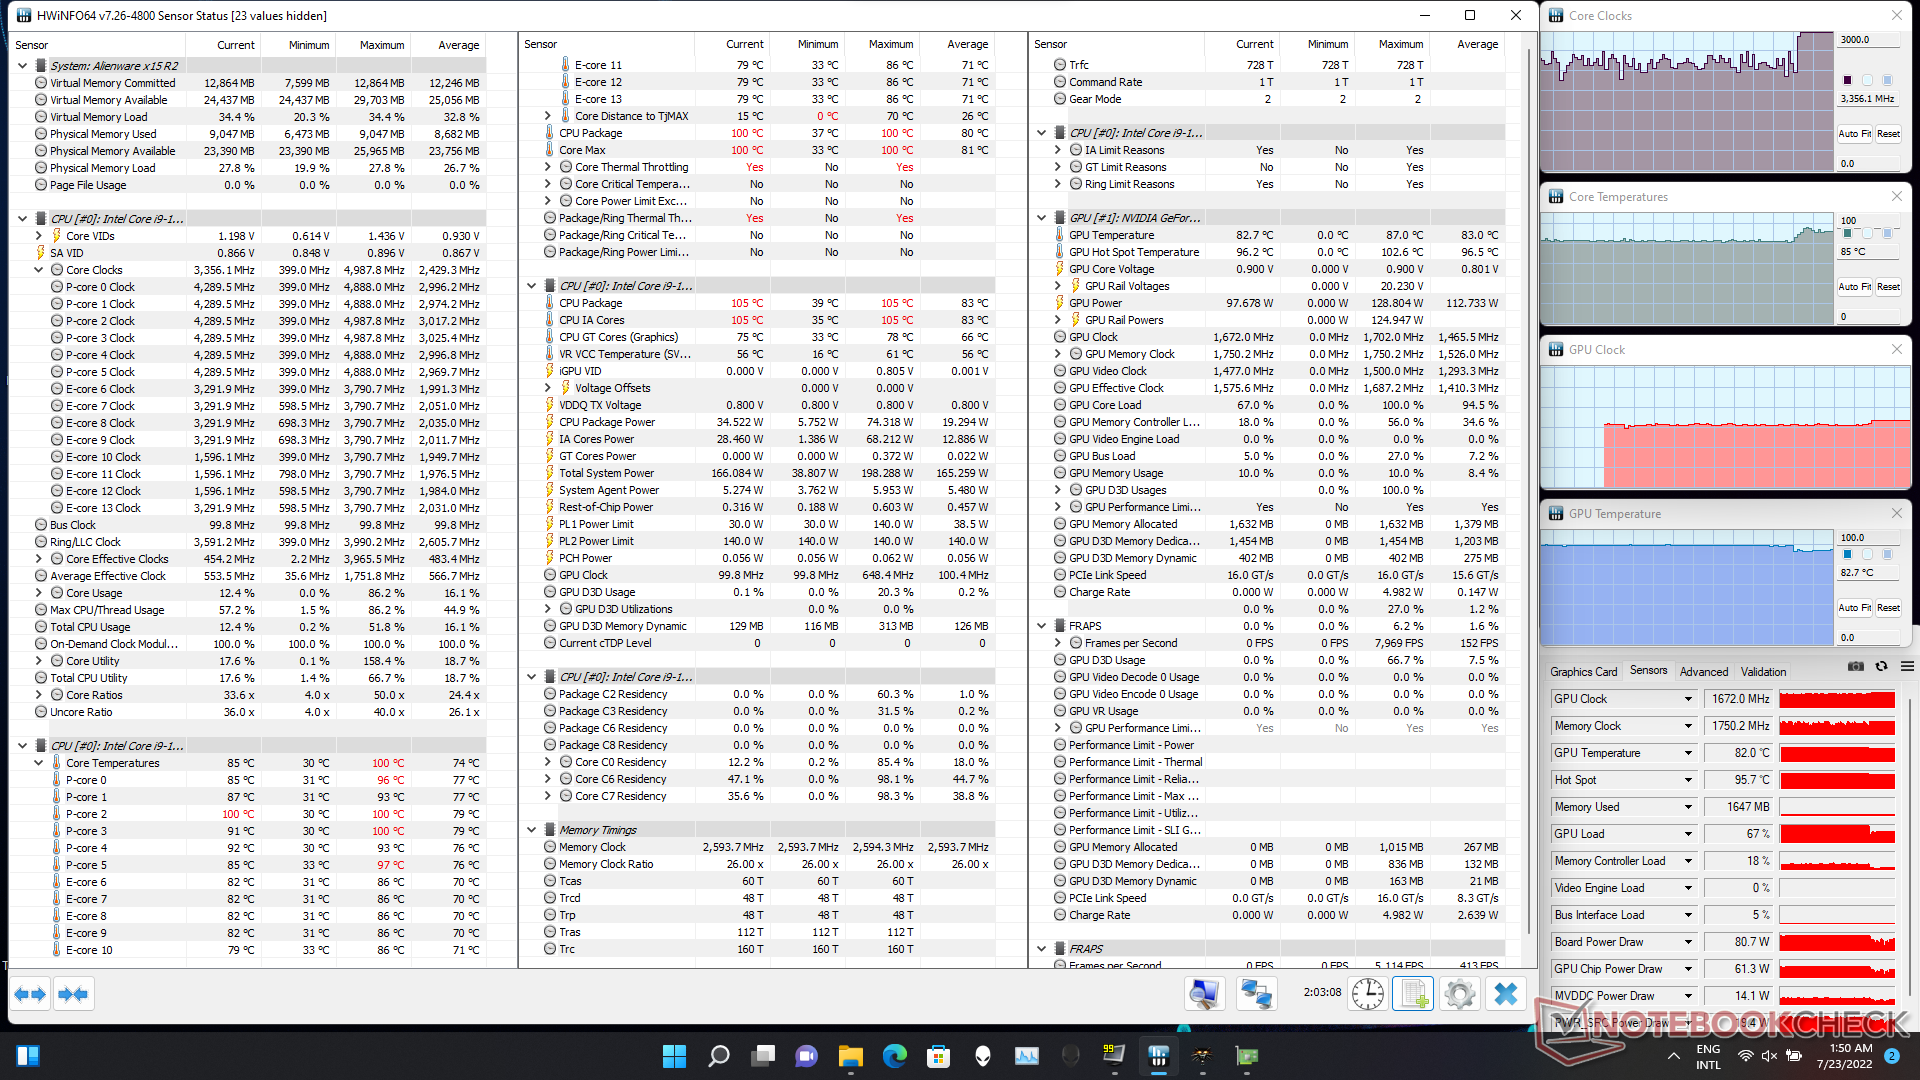
| The Witcher 3 | 3.35 | 1.672 | 74 | 83 |
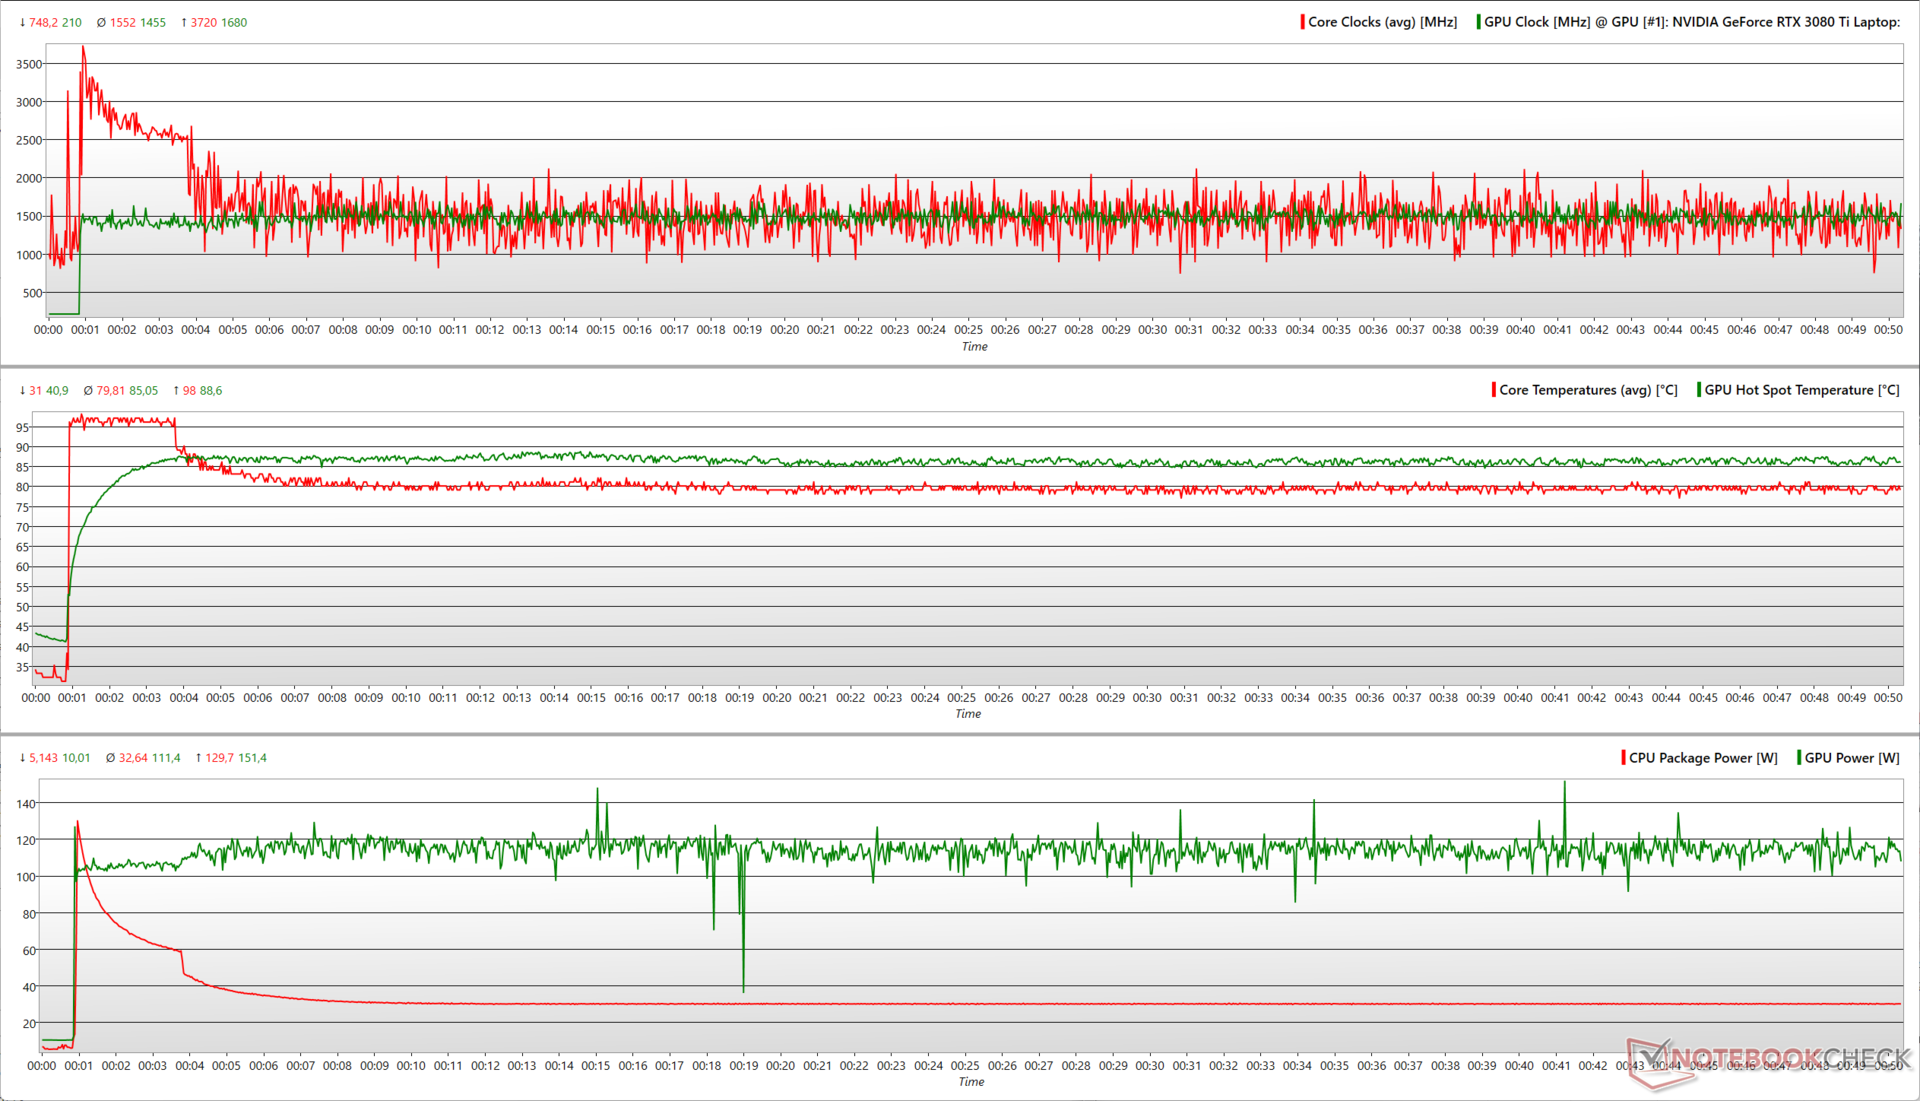
Po dodaniu FurMarka do mieszanki widzimy, że Core i9-12900H jest w stanie osiągnąć 130 W, ale szybko spada do 60 W, a następnie stopniowo do 30 W. Ma to na celu sprostanie 120 W zapotrzebowaniu na energię RTX 3080 Ti, które od czasu do czasu wzrasta do 150 W
Stressing with The Witcher 3 prezentuje bardziej realistyczny scenariusz i znajdujemy zegary CPU szczytujące na poziomie 4 GHz i wkrótce osiadające w pobliżu granicy 2,5 GHz, podczas gdy RTX 3080 Ti spada z początkowego wysokiego poziomu 1 702 MHz i stabilizuje się na poziomie około 1 500 MHz. RTX 3080 Ti zużywa początkowo blisko 130 W, ale wkrótce spada do 120 W. Podczas pracy procesor Core i9-12900H spada z około 75 W do 20 W.
Mówcy
Jak na cienką obudowę, pokładowe audio Alienware x15 R2 jest całkiem przyzwoite. Głośniki o mocy 2x 2 W wytwarzają głośność 80,2 db(A), która powinna być dostrzegalna w całym przeciętnej wielkości pomieszczeniu. Wszystkie premiery Alienware 2022 posiadają certyfikat Dolby Atmos.
Pasmo przenoszenia basów jest ściśle ok, ale średnie i wysokie tony są wyraźniej zarysowane. Przy wyższych głośnościach nie ma odczuwalnych zniekształceń. Subiektywnie rzecz biorąc, pokładowe audio może się sprawdzić w większości zwykłych prac.
Gracze mogą podłączyć lepszą parę słuchawek przez Bluetooth 5.2 lub gniazdo audio 3,5 mm.
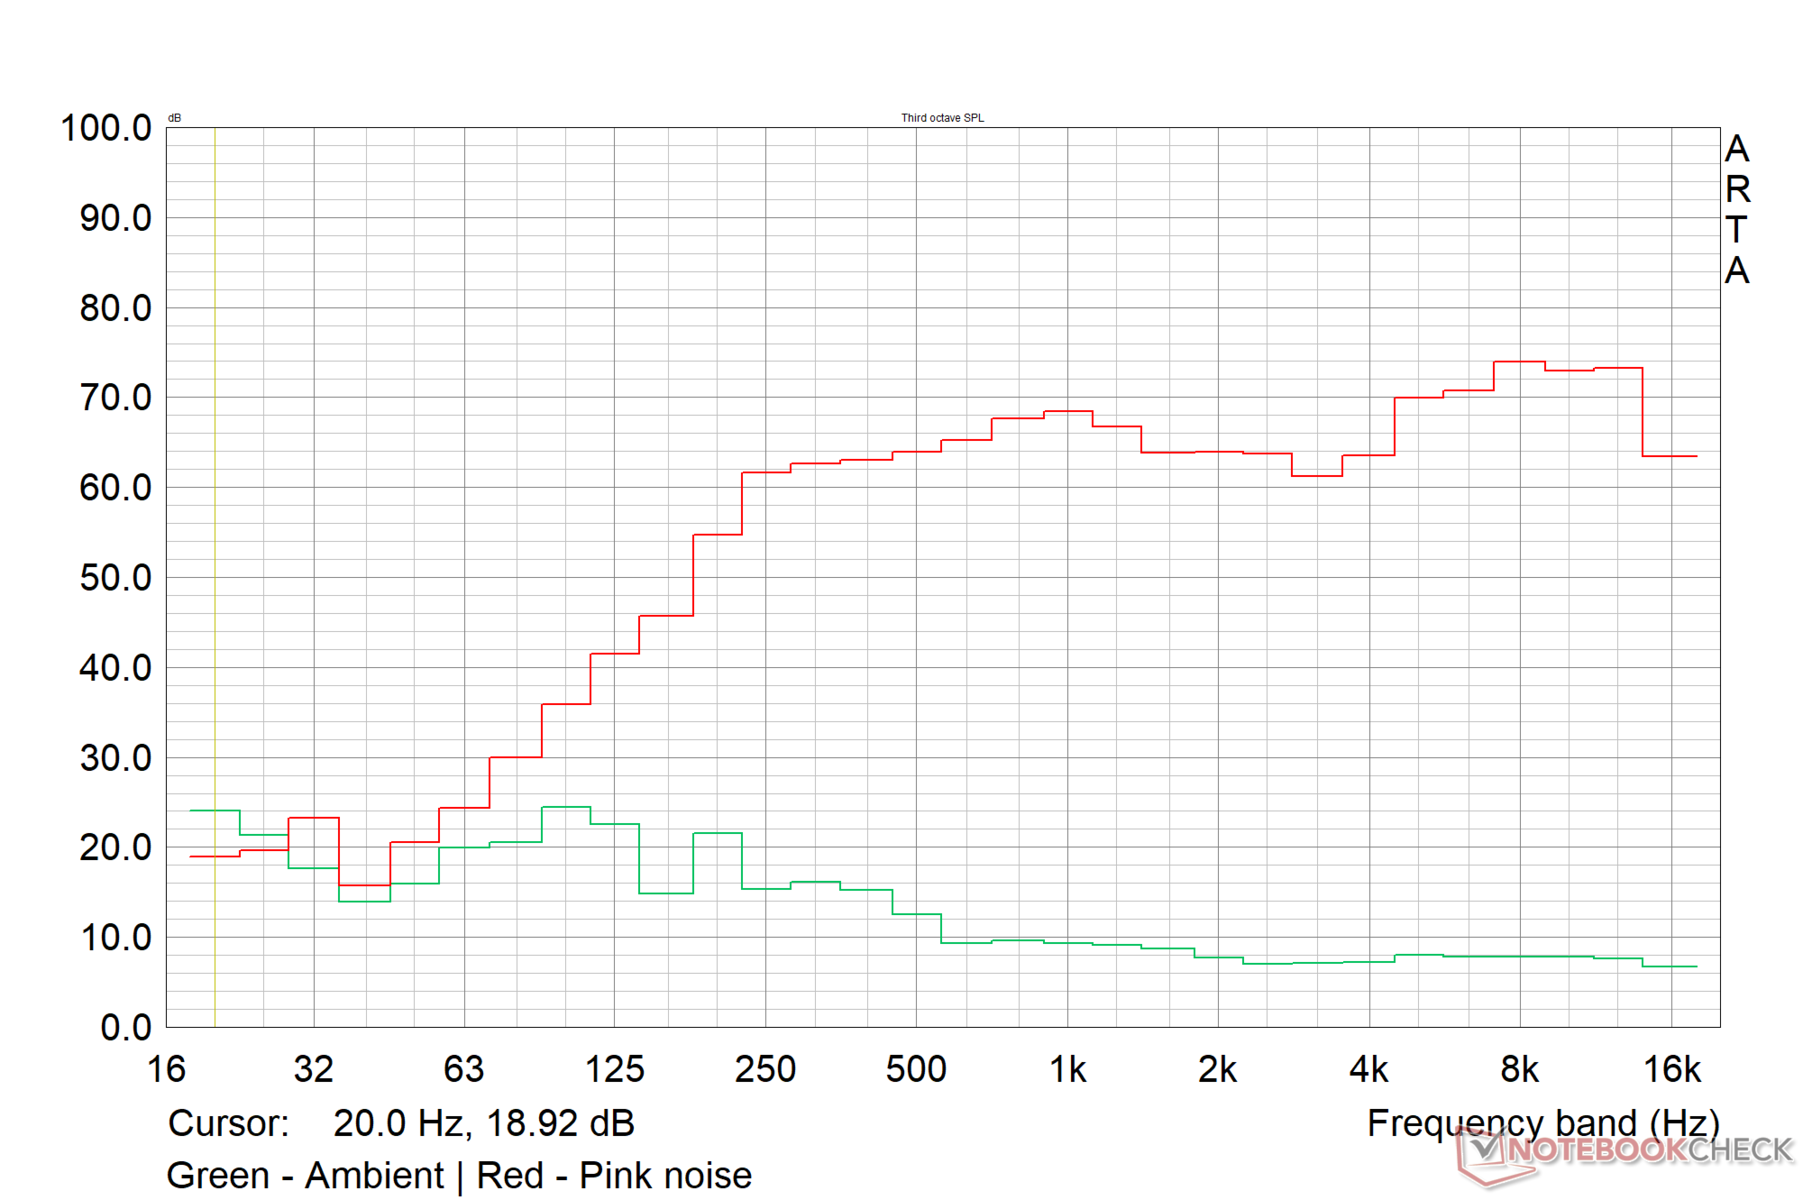
Alienware x15 R2 P111F analiza dźwięku
(±) | głośność głośnika jest średnia, ale dobra (80.2 dB)
Bas 100 - 315 Hz
(±) | zredukowany bas - średnio 13.5% niższy od mediany
(±) | liniowość basu jest średnia (9.9% delta do poprzedniej częstotliwości)
Średnie 400 - 2000 Hz
(+) | zbalansowane środki średnie - tylko 1.7% od mediany
(+) | średnie są liniowe (2.4% delta do poprzedniej częstotliwości)
Wysokie 2–16 kHz
(±) | wyższe maksima - średnio 5% wyższe od mediany
(+) | wzloty są liniowe (4.3% delta do poprzedniej częstotliwości)
Ogólnie 100 - 16.000 Hz
(+) | ogólny dźwięk jest liniowy (12.6% różnicy w stosunku do mediany)
W porównaniu do tej samej klasy
» 16% wszystkich testowanych urządzeń w tej klasie było lepszych, 3% podobnych, 81% gorszych
» Najlepszy miał deltę 6%, średnia wynosiła ###średnia###%, najgorsza wynosiła 132%
W porównaniu do wszystkich testowanych urządzeń
» 11% wszystkich testowanych urządzeń było lepszych, 2% podobnych, 86% gorszych
» Najlepszy miał deltę 4%, średnia wynosiła ###średnia###%, najgorsza wynosiła 134%
Apple MacBook Pro 16 2021 M1 Pro analiza dźwięku
(+) | głośniki mogą odtwarzać stosunkowo głośno (84.7 dB)
Bas 100 - 315 Hz
(+) | dobry bas - tylko 3.8% od mediany
(+) | bas jest liniowy (5.2% delta do poprzedniej częstotliwości)
Średnie 400 - 2000 Hz
(+) | zbalansowane środki średnie - tylko 1.3% od mediany
(+) | średnie są liniowe (2.1% delta do poprzedniej częstotliwości)
Wysokie 2–16 kHz
(+) | zrównoważone maksima - tylko 1.9% od mediany
(+) | wzloty są liniowe (2.7% delta do poprzedniej częstotliwości)
Ogólnie 100 - 16.000 Hz
(+) | ogólny dźwięk jest liniowy (4.6% różnicy w stosunku do mediany)
W porównaniu do tej samej klasy
» 0% wszystkich testowanych urządzeń w tej klasie było lepszych, 0% podobnych, 100% gorszych
» Najlepszy miał deltę 5%, średnia wynosiła ###średnia###%, najgorsza wynosiła 45%
W porównaniu do wszystkich testowanych urządzeń
» 0% wszystkich testowanych urządzeń było lepszych, 0% podobnych, 100% gorszych
» Najlepszy miał deltę 4%, średnia wynosiła ###średnia###%, najgorsza wynosiła 134%
Zarządzanie energią: Ekonomiczne przy maksymalnym obciążeniu
Pobór mocy
Dostarczony zasilacz 240 W jest wystarczający do zasilania 15 R2 w różnych obciążeniach. Pobór mocy jest wyższy, ale można się go spodziewać, biorąc pod uwagę układy wewnętrzne. Zauważyliśmy, że pobór mocy przy maksymalnym obciążeniu może wzrosnąć do prawie 242 W, zanim ustabilizuje się w pobliżu granicy 180 W
Niemniej jednak, zużycie energii przez x15 R2 jest nadal ekonomiczne w porównaniu z konkurencją, zwłaszcza przy maksymalnym obciążeniu. Razer Blade 15 Advanced ma ogólnie niższe zapotrzebowanie na energię, prawdopodobnie dzięki 110 W RTX 3080 Ti.
| wyłączony / stan wstrzymania | |
| luz | |
| obciążenie |
|
Legenda:
min: | |
| Alienware x15 R2 P111F i9-12900H, GeForce RTX 3080 Ti Laptop GPU, IPS, 1920x1080 | Asus ROG Strix Scar 15 G533ZW-LN106WS i9-12900H, GeForce RTX 3070 Ti Laptop GPU, IPS-level, 2560x1440 | Asus ROG Zephyrus Duo 16 GX650RX R9 6900HX, GeForce RTX 3080 Ti Laptop GPU, IPS-Level, 3840x2400 | MSI Vector GP66 12UGS i9-12900H, GeForce RTX 3070 Ti Laptop GPU, IPS, 1920x1080 | Razer Blade 15 Advanced Model Early 2022 i7-12800H, GeForce RTX 3080 Ti Laptop GPU, IPS, 1920x1080 | Przeciętny NVIDIA GeForce RTX 3080 Ti Laptop GPU | Średnia w klasie Gaming | |
|---|---|---|---|---|---|---|---|
| Power Consumption | 15% | -11% | -24% | 8% | -16% | 3% | |
| Idle Minimum * (Watt) | 16.2 | 7.56 53% | 19 -17% | 17.5 -8% | 17 -5% | 17.2 ? -6% | 13.3 ? 18% |
| Idle Average * (Watt) | 20 | 13.5 32% | 24 -20% | 20.1 -1% | 19 5% | 23.3 ? -17% | 19 ? 5% |
| Idle Maximum * (Watt) | 21.2 | 16.87 20% | 31 -46% | 47.3 -123% | 25 -18% | 30.8 ? -45% | 24.5 ? -16% |
| Load Average * (Watt) | 122.1 | 128.9 -6% | 104 15% | 107.3 12% | 108 12% | 121.2 ? 1% | 108.1 ? 11% |
| Witcher 3 ultra * (Watt) | 207 | 196.2 5% | 186.5 10% | 225 -9% | 150 28% | ||
| Load Maximum * (Watt) | 241.9 | 274.86 -14% | 256 -6% | 277.7 -15% | 179 26% | 276 ? -14% | 254 ? -5% |
* ... im mniej tym lepiej
Power Consumption - The Witcher 3 / Stress test
Power Consumption - External monitor
Czas pracy na baterii
Wykorzystaliśmy nasz standardowy skrypt strony internetowej do oceny czasów pracy na baterii zarówno w ustawieniach pełnej jasności jak i 150 cd/m2. Testy czasu pracy na baterii zostały przeprowadzone w trybie MSHybrid przy częstotliwości odświeżania ekranu 60 Hz.
Akumulator x15 R2 o pojemności 87 WHr wytrzymał nieco ponad sześć godzin przy jasności 150 cd/m2. Podobne czasy pracy zaobserwowano także przy pełnej jasności. W trybie dGPU udało nam się uzyskać tylko 3 godziny i 36 minut pracy na akumulatorze przy jasności 150 cd/m2.
| Alienware x15 R2 P111F i9-12900H, GeForce RTX 3080 Ti Laptop GPU, 87 Wh | Alienware x15 RTX 3070 P111F i7-11800H, GeForce RTX 3070 Laptop GPU, 87 Wh | Asus ROG Strix Scar 15 G533ZW-LN106WS i9-12900H, GeForce RTX 3070 Ti Laptop GPU, 90 Wh | Asus ROG Zephyrus Duo 16 GX650RX R9 6900HX, GeForce RTX 3080 Ti Laptop GPU, 90 Wh | Razer Blade 15 Advanced Model Early 2022 i7-12800H, GeForce RTX 3080 Ti Laptop GPU, 80 Wh | Średnia w klasie Gaming | |
|---|---|---|---|---|---|---|
| Czasy pracy | 2% | 40% | 30% | -18% | 17% | |
| WiFi v1.3 (h) | 6 | 6.1 2% | 8.4 40% | 7.8 30% | 4.9 -18% | 7.01 ? 17% |
| Reader / Idle (h) | 9.7 | 12.5 | 8.1 | 8.71 ? | ||
| Load (h) | 0.9 | 0.9 | 1 | 2 | 1.47 ? | |
| H.264 (h) | 8.5 | 9.3 | 5.9 | 8.26 ? | ||
| Witcher 3 ultra (h) | 1.2 |
Za
Przeciw
Werdykt: Ten kosmita spełnia większość wymagań
Alienware x15 R2 jest ewolucją zeszłorocznego modelu x15 R1 i nie wprowadza żadnych rewolucyjnych zmian. We wszystkich tegorocznych konfiguracjach Alienware zastosowano kilka standardowych rozwiązań, takich jak certyfikaty Dolby Vision i Dolby Atmos, Element 31 TIM i Advanced Optimus
Obudowa przypominająca ultrabooka sprawia wrażenie wyraźnej obudowy Alienware z wszystkimi odpowiednimi oznaczeniami. Rozmieszczenie portów nie jest najbardziej idealne, ale wszystko jest pod kontrolą. Jakość kamery internetowej nadal pozostaje na drugim planie. Klawiatura oferuje dobre wrażenia dotykowe, ale drugorzędne funkcje pozostają niepodświetlone.
Jakość wyświetlacza jest dobra dla jego głównego zastosowania jako laptopa do gier. Większość nabywców chciałaby jednak zdecydować się na wariant QHD ze względu na potężne wyposażenie wewnętrzne. Nie ma PWM, a czasy reakcji są dobre, gdy włączony jest overdrive przy 360 Hz.
Alienware x15 R2 powinien być wysoko na liście zalet, jeśli szukasz laptopa do gier, który skutecznie łączy ultrabookową obudowę z nowoczesnym sprzętem z najwyższej półki, o ile wyższe emisje ciepła i hałasu nie są poważnym problemem."
Pomimo cienkiej obudowy Dell wykonał dobrą robotę z termikami, zapewniając brak znaczącego throttlingu pod obciążeniem. Inni konkurenci, jak np MSI Vector GP66 oraz Asus ROG Strix Scar 15 wyposażone w procesor Core i9-12900H osiągają nieco wyższe wyniki, ale x15 R2 dobrze trzyma się podłoża. Wzrost wydajności w porównaniu do zeszłorocznego x15 R1 jest dość znaczący
Prawdopodobnie największą bolączką Alienware x15 R2 jest wysoka emisja ciepła i hałasu. Choć poziom hałasu wentylatorów można w pewnym stopniu kontrolować, wybierając odpowiedni profil termiczny, temperatury powierzchni zdecydowanie wydają się być wyższe. Pobór mocy i czas pracy na akumulatorze są na oczekiwanych liniach dla tej konfiguracji, choć Scar 15 i Razer Blade 15 Advanced są bardziej oszczędnymi pożeraczami energii
Alienware x15 R2 oferuje wyjątkowe połączenie estetyki i flagowej wydajności, do której aspiruje wiele innych laptopów. Jednak przy cenie ₹3 68 190 (~4 500 USD lub 4 583 EUR), Alienware x15 R2 nie jest konkurencyjny cenowo na rynku indyjskim, zwłaszcza gdy istnieją takie opcje jak Asus ROG Strix Scar 15 G533.
Cena i dostępność
Recenzowana konfiguracja Alienware x15 R2 jest dostępna w cenie ~4 137 USD na Amazon India, Amazon US, oraz Dell.com. Zasilany procesorem Core i7-12700H i RTX 3070 Ti- wariant x15 R2 jest dostępny na stronie Best Buy za 2 700 USD.
Alienware x15 R2 P111F
- 04/10/2022 v7 (old)
Vaidyanathan Subramaniam
Price comparison

