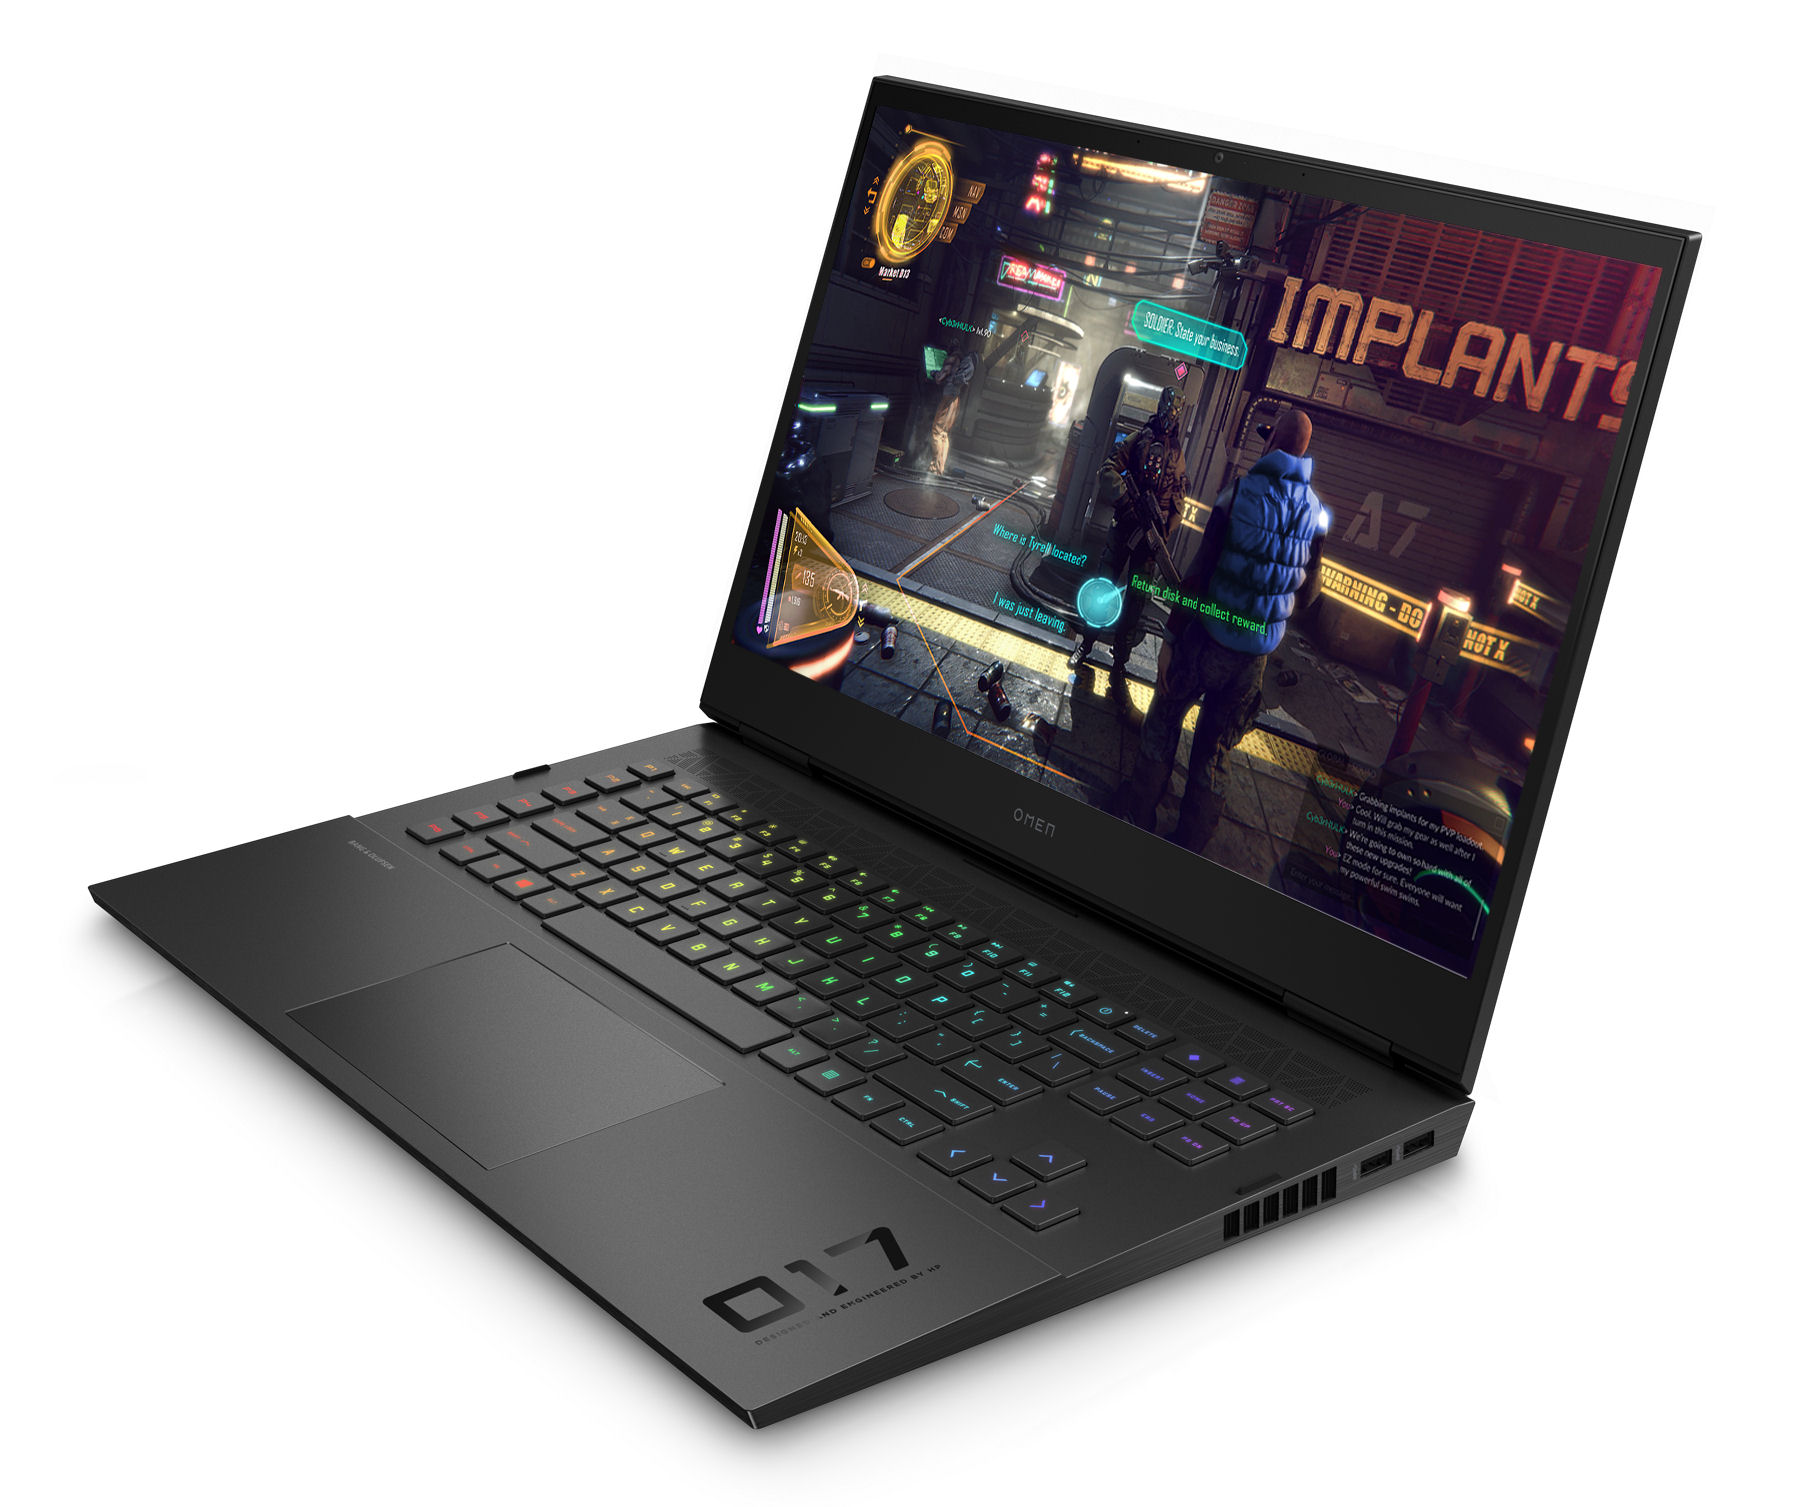
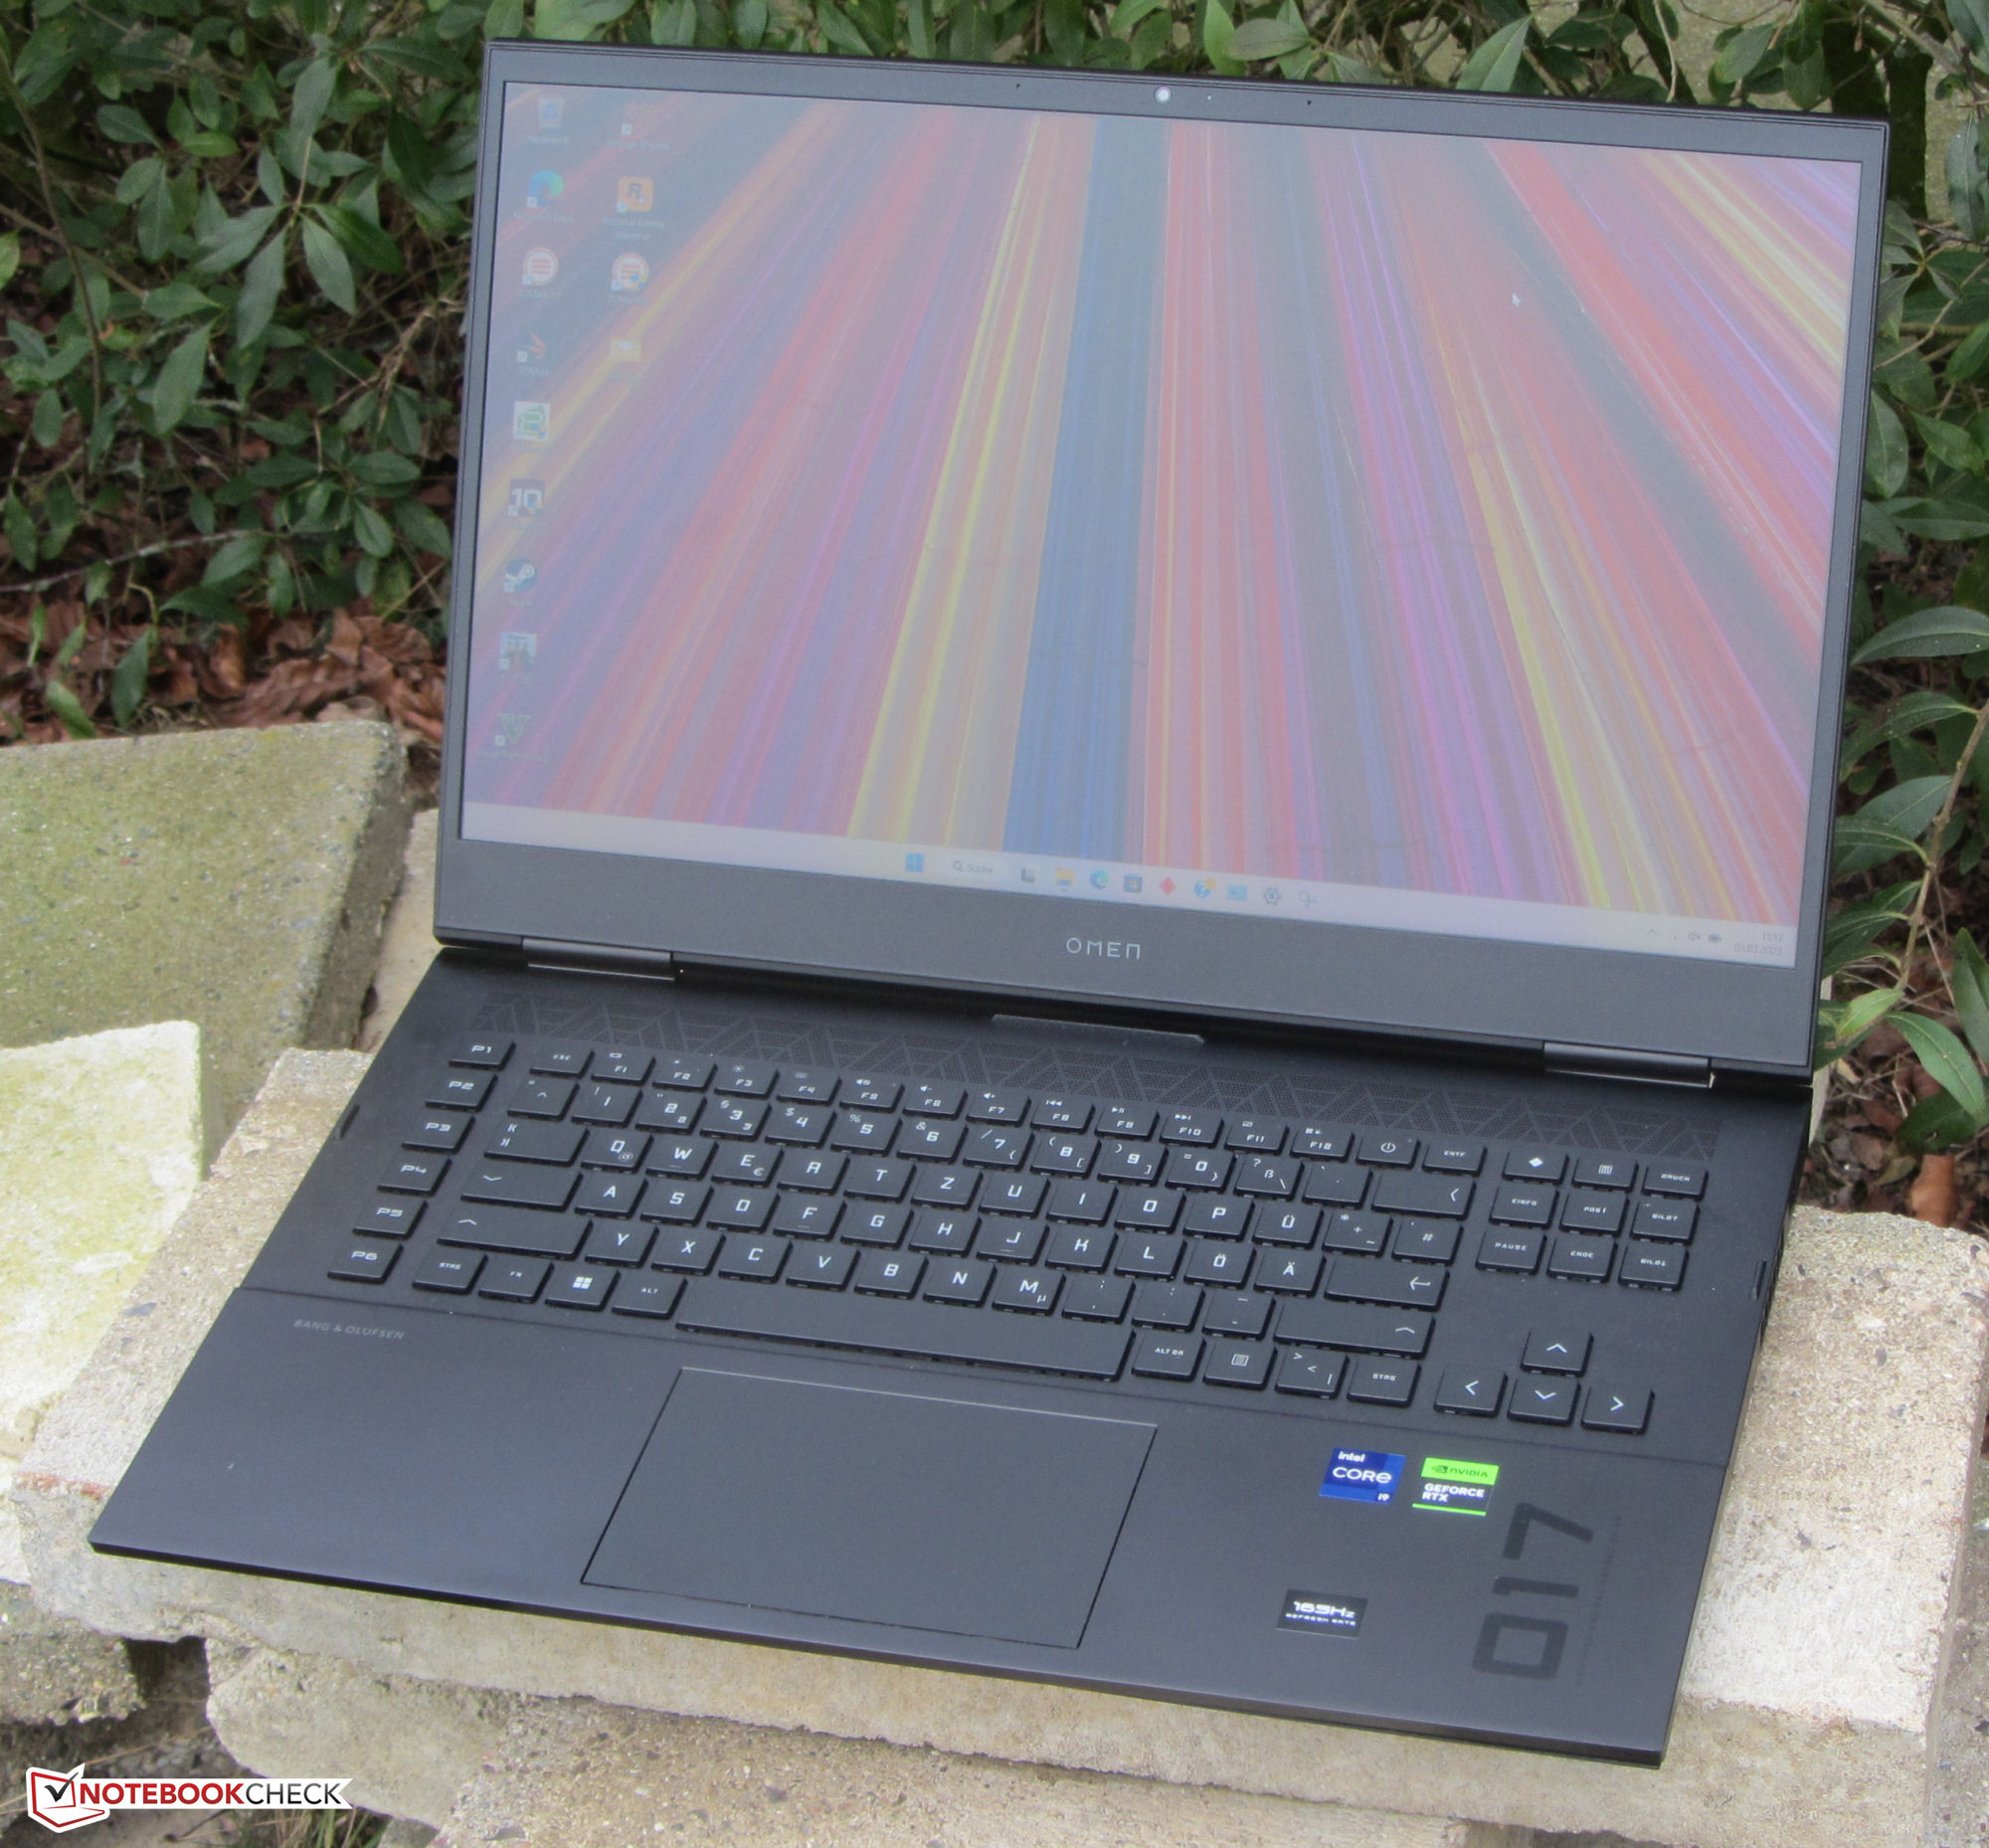
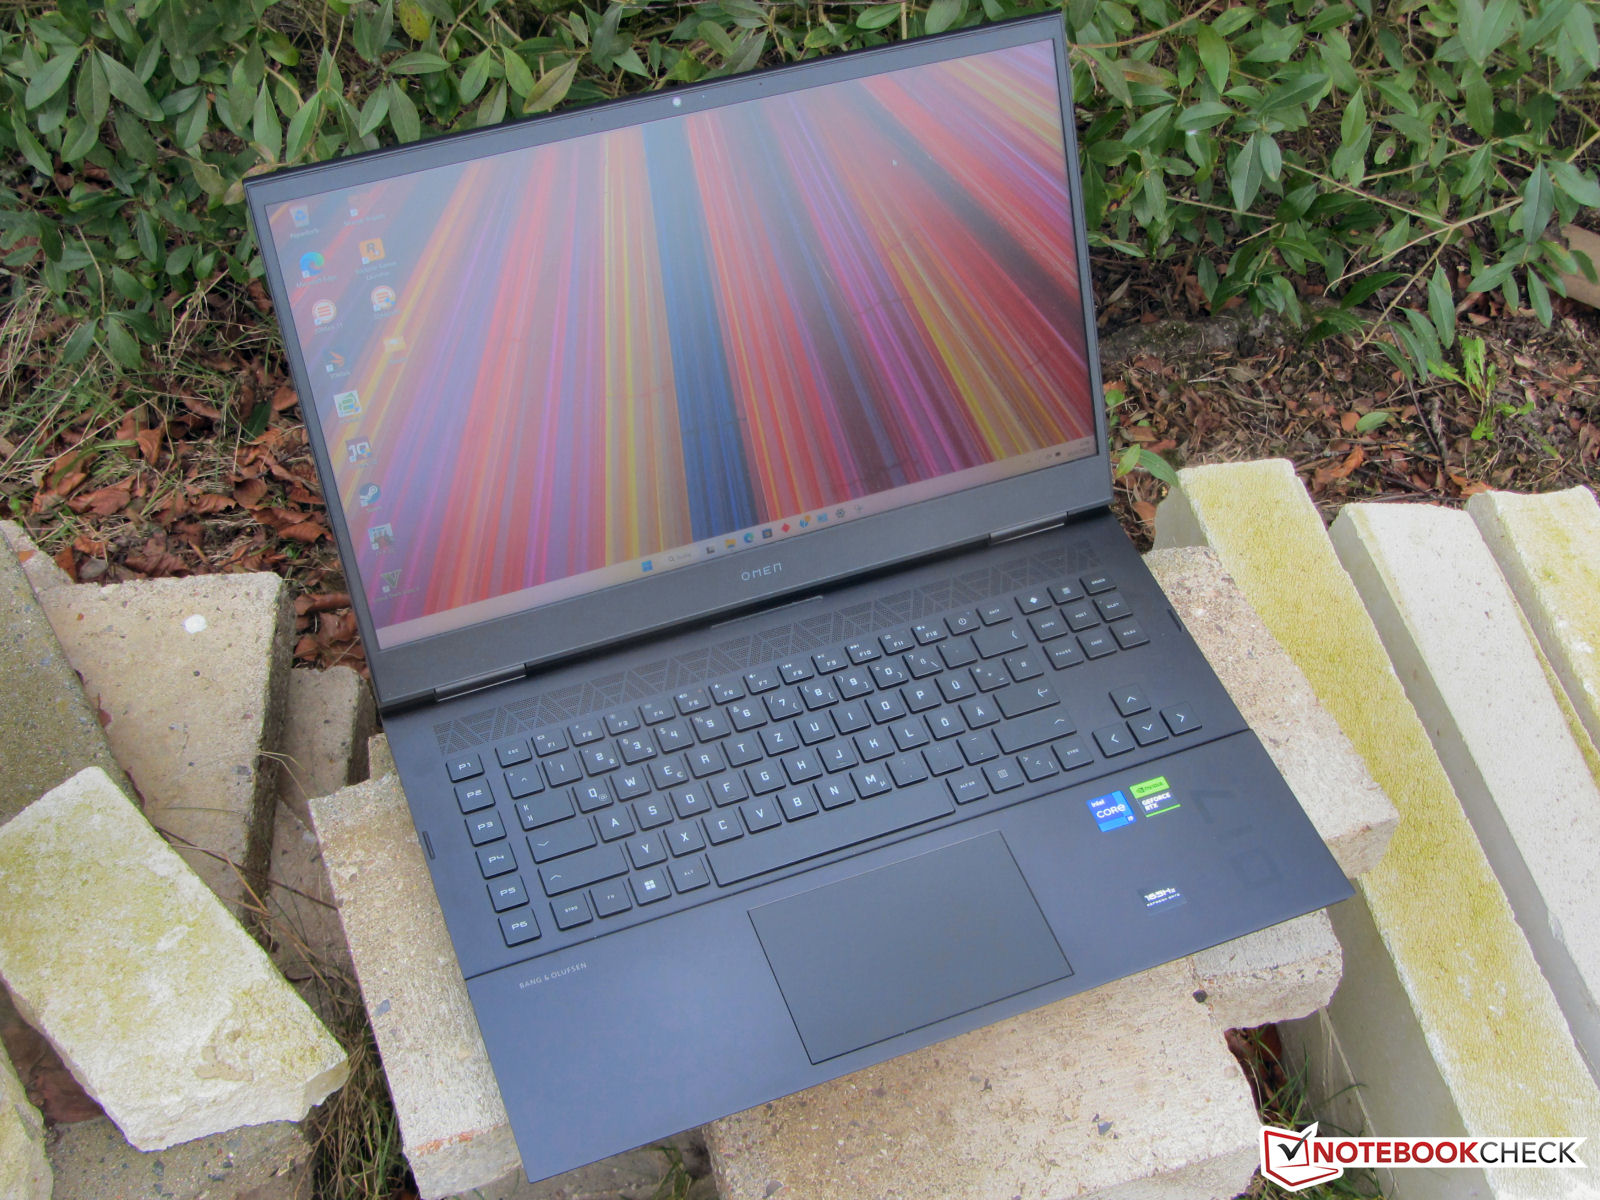
Recenzja HP Omen 17 (2023): Gamingowy laptop wykorzystuje RTX 4080

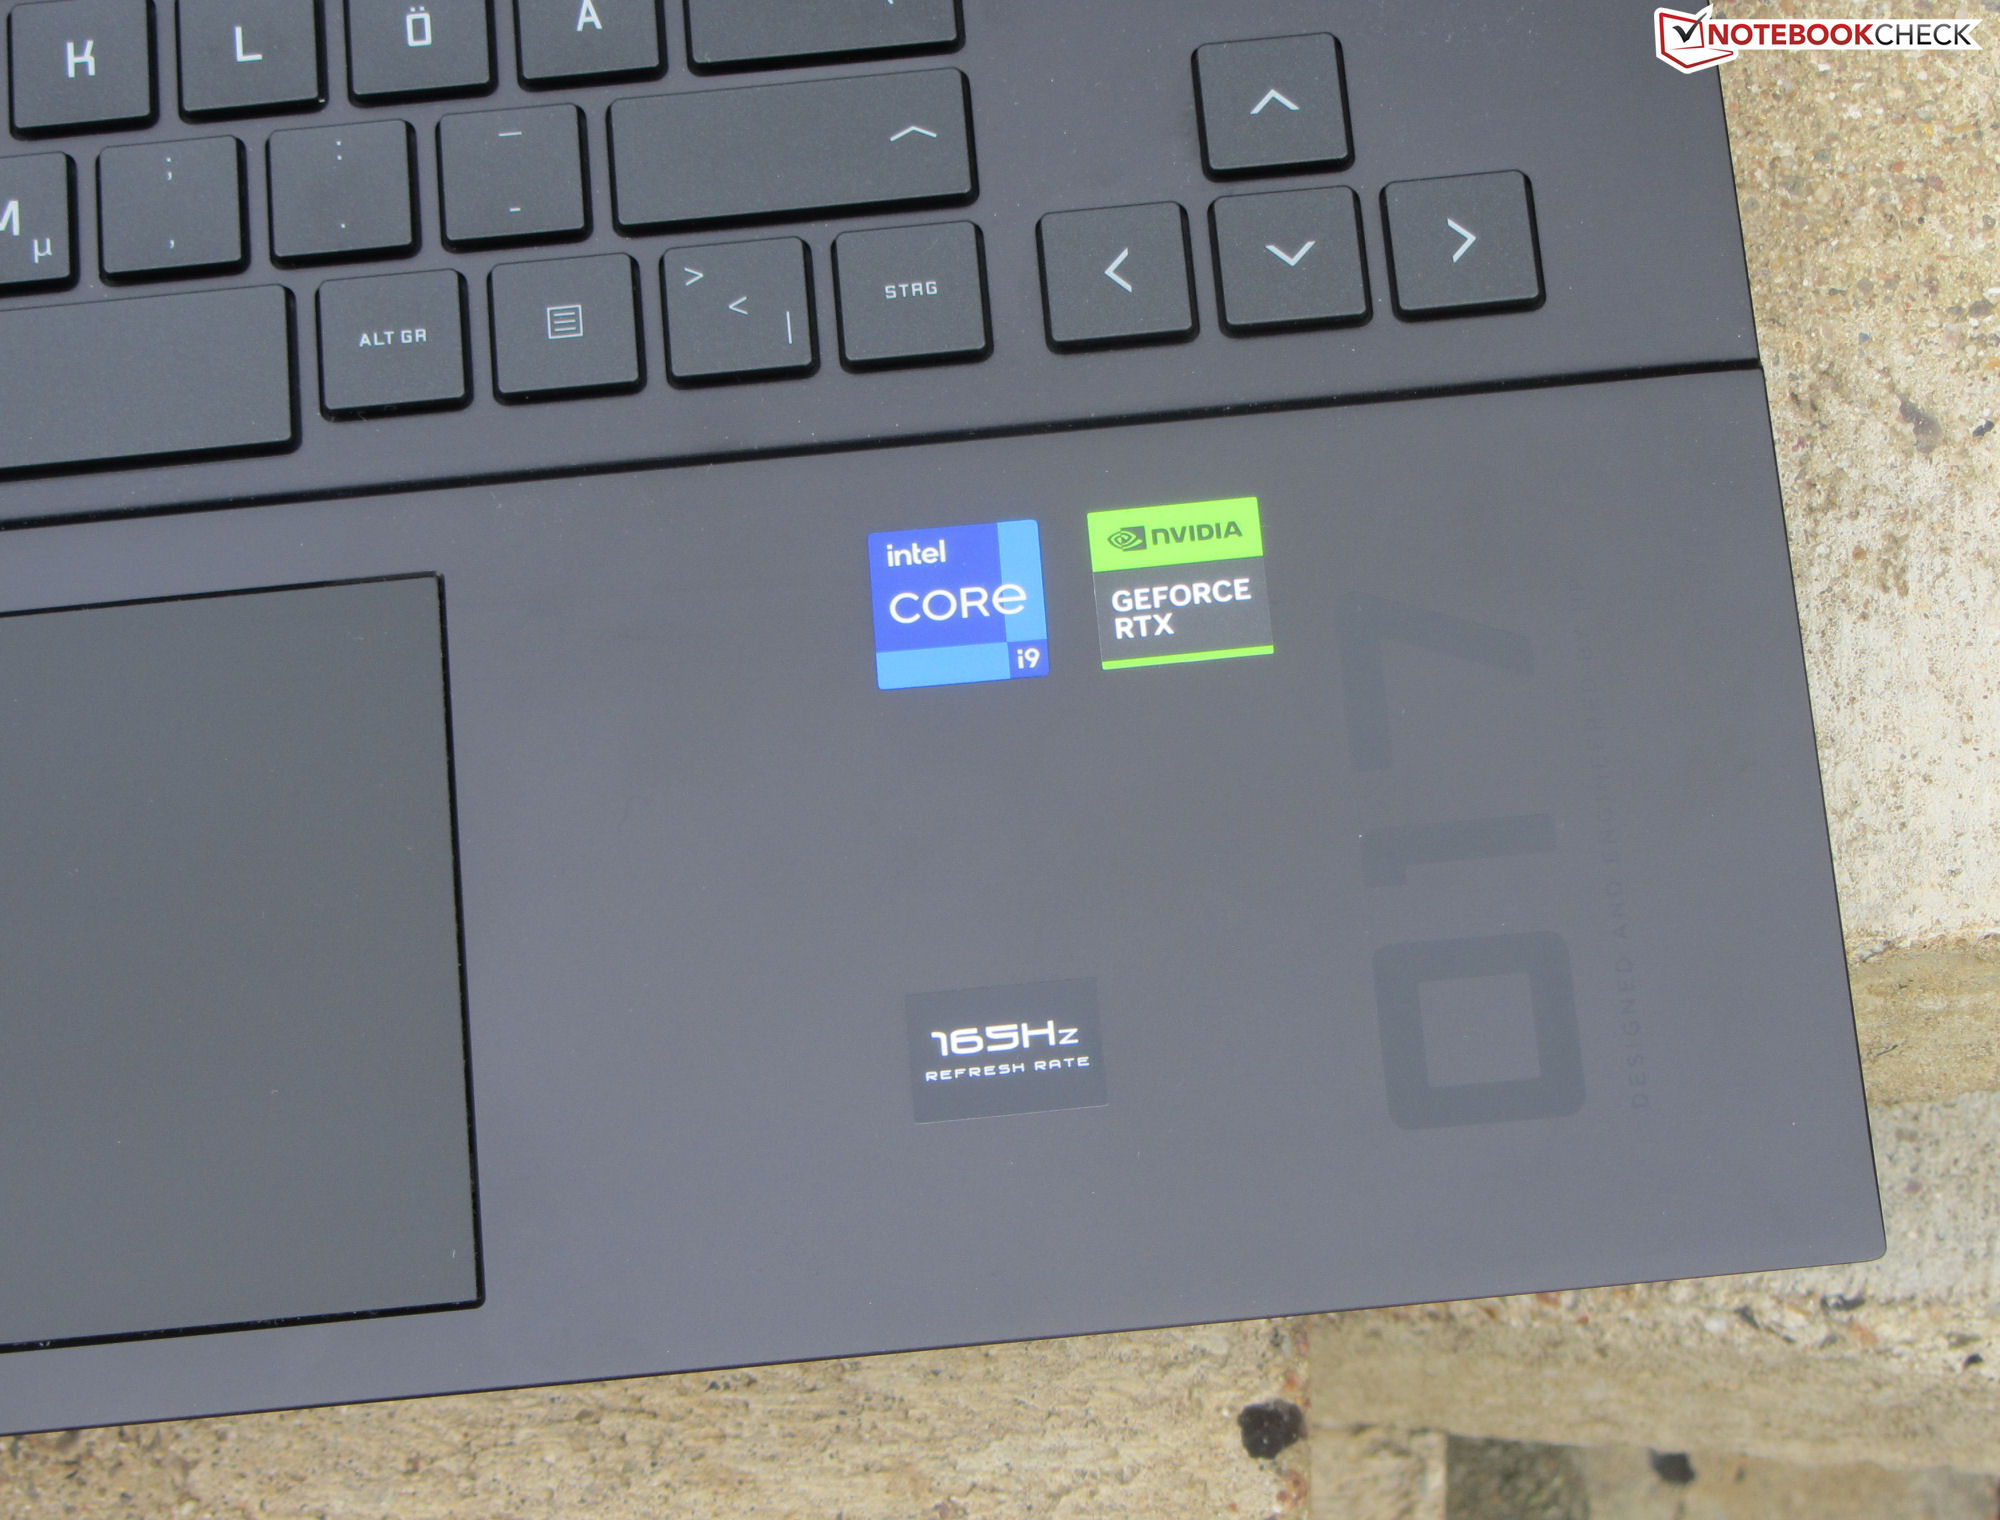
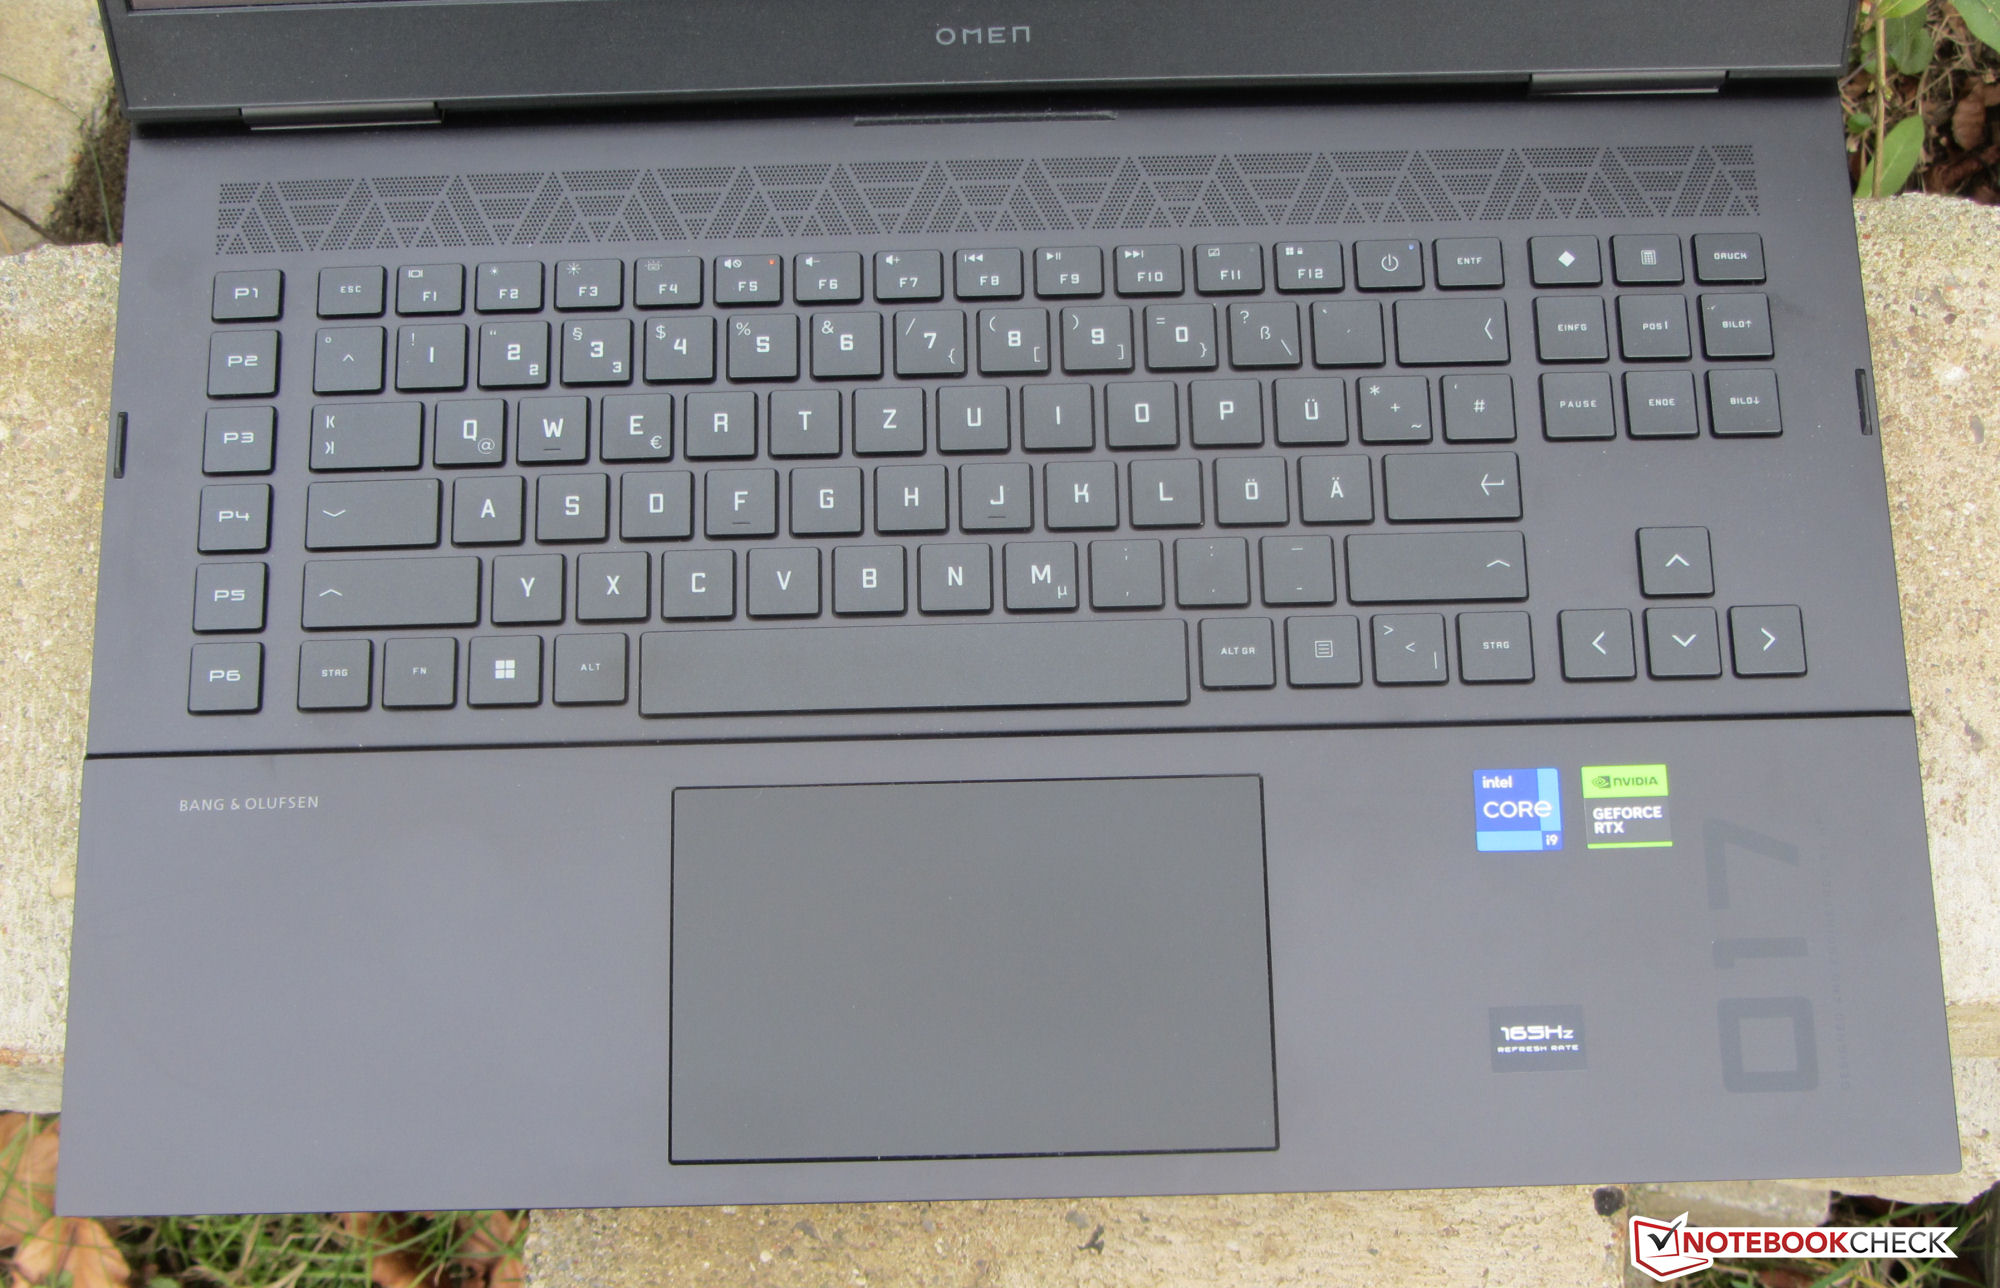
Model 2023 Omen 17, czyli high-endowy laptop do gier, wykorzystuje tę samą obudowę, którą znamy już z poprzednika, ale zawiera aktualny sprzęt: Laptop jest napędzany przez układy Raptor Lake i Ada Lovelace. HP łączy Core i9 z GPU RTX 4080, żądając za cały pakiet prawie 3300 euro (3 582 dolary). Wśród konkurentów są takie laptopy jak np Alienware m17 R5, a także.Razer Blade 16 (początek 2023 roku), theAsus ROG Strix G16 G614JZ, oraz Lenovo Legion Pro 7 16IRX8H.
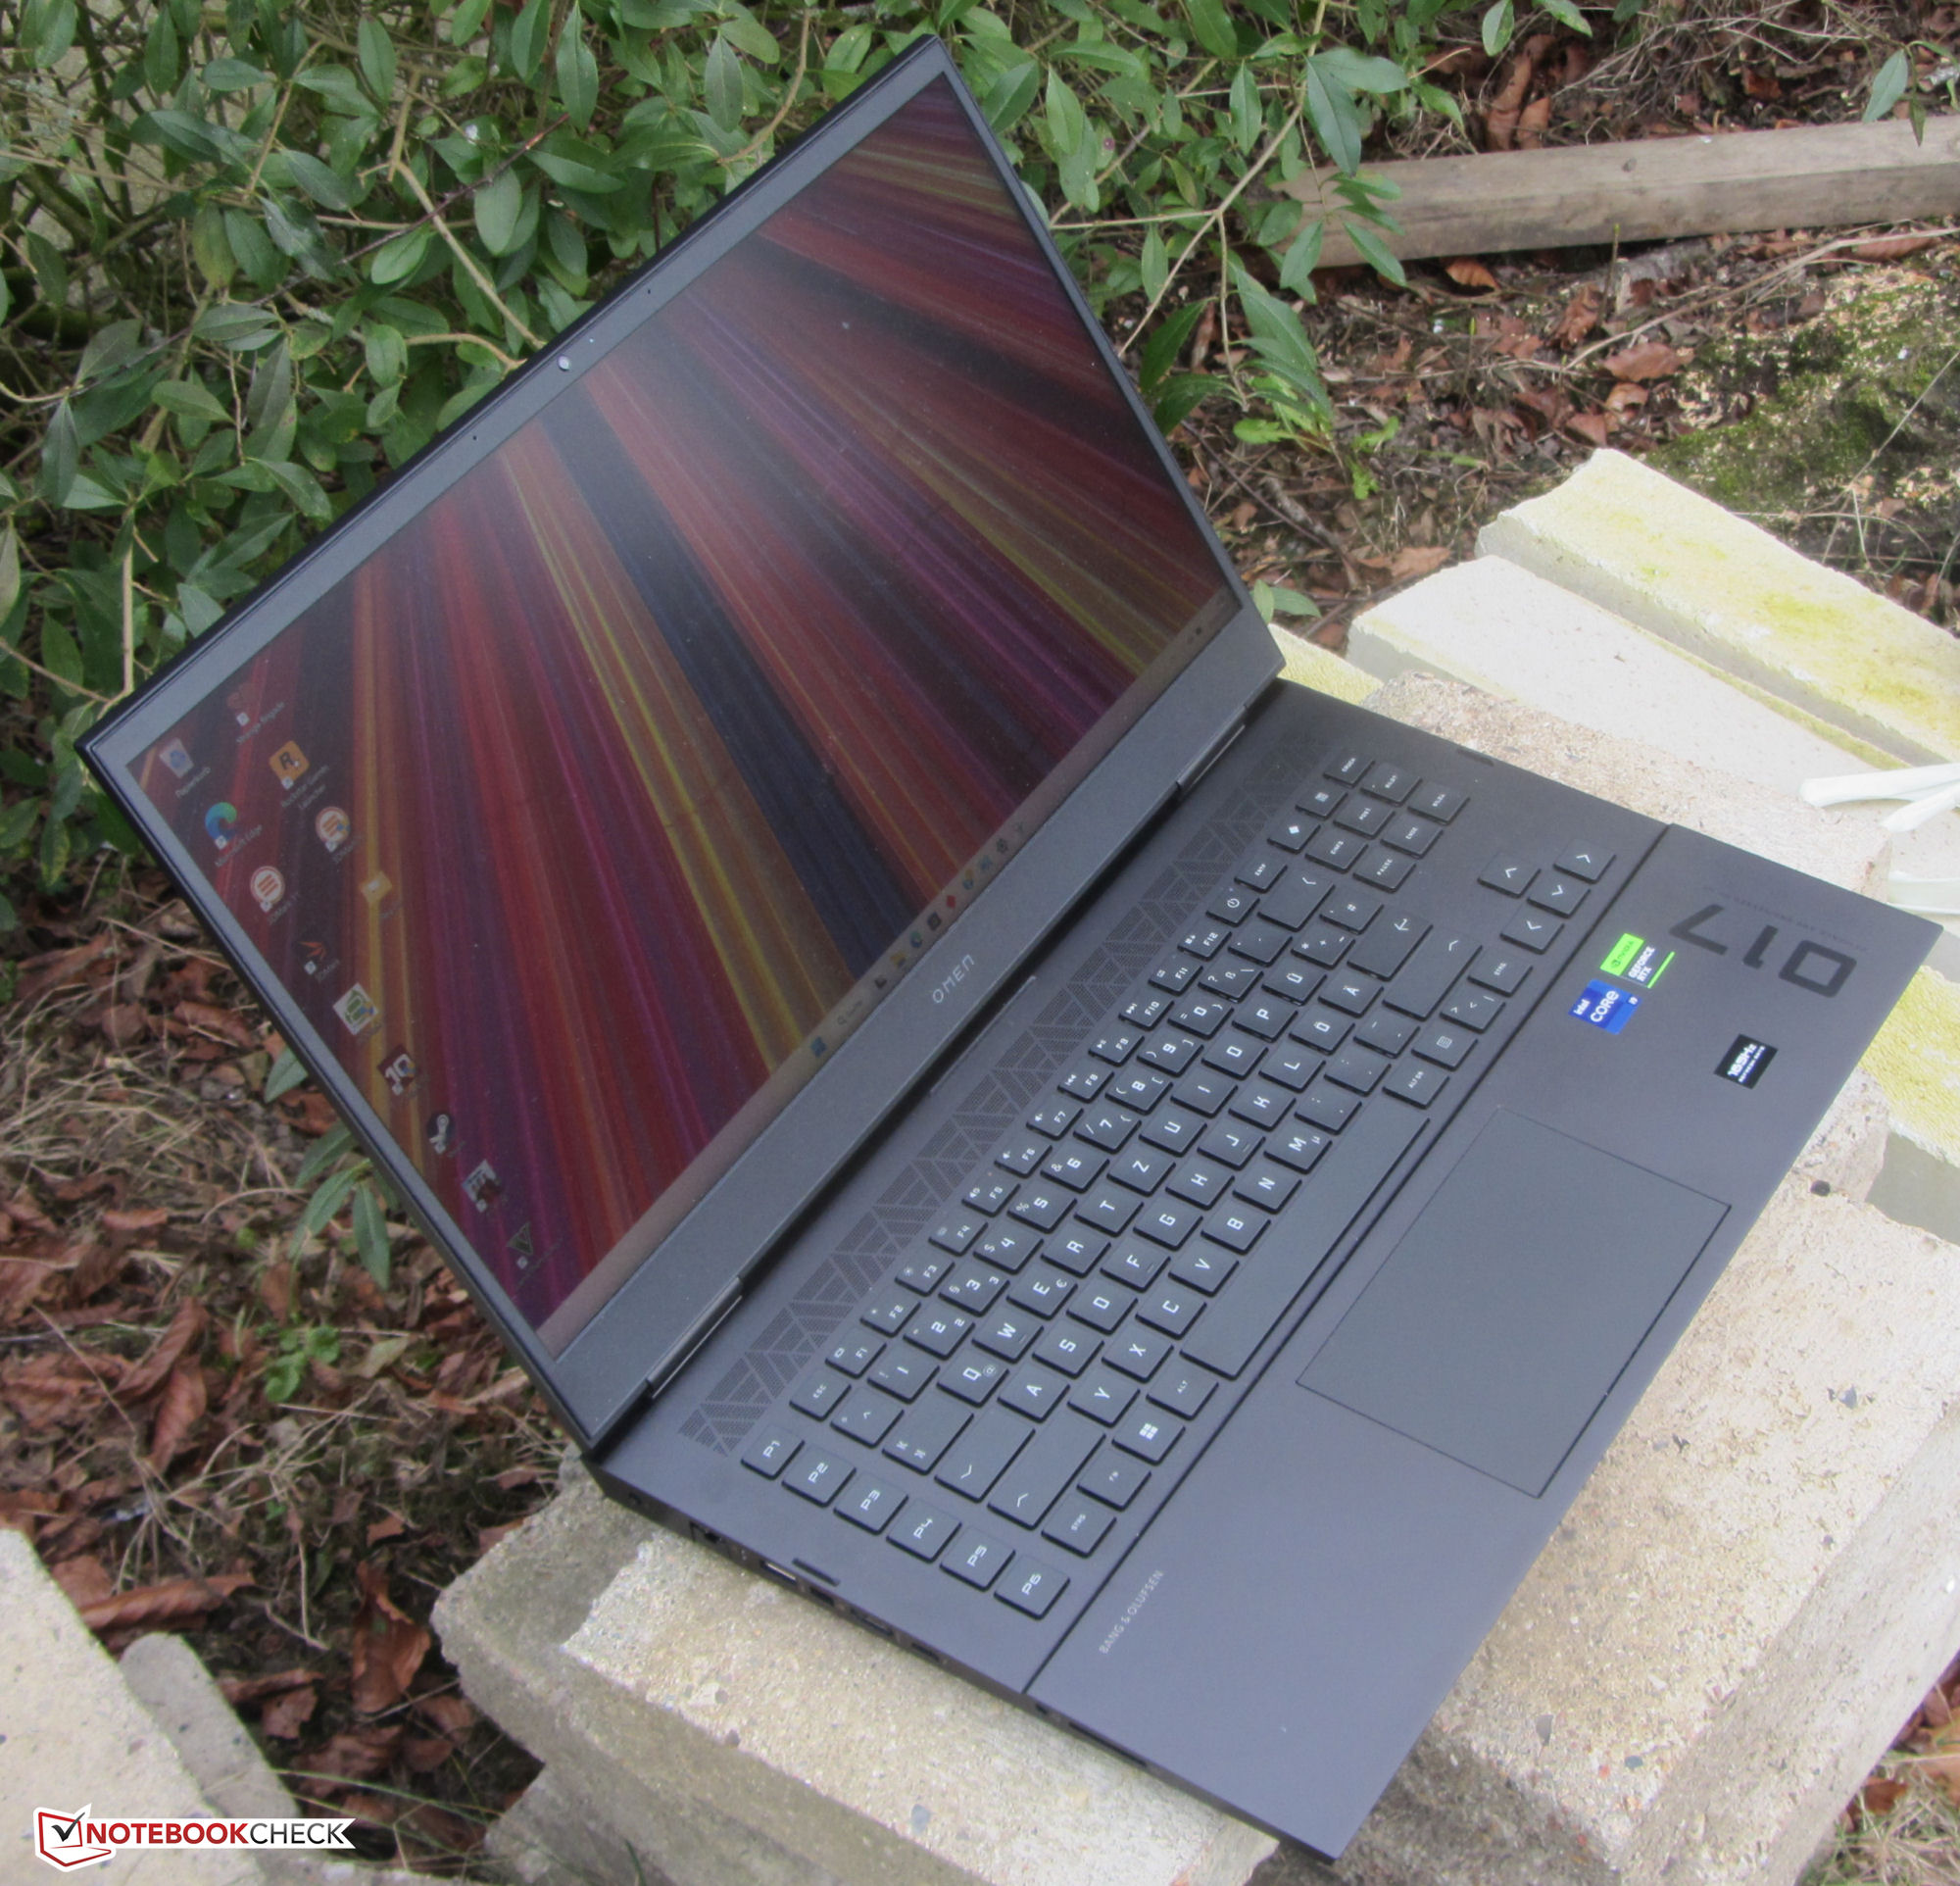
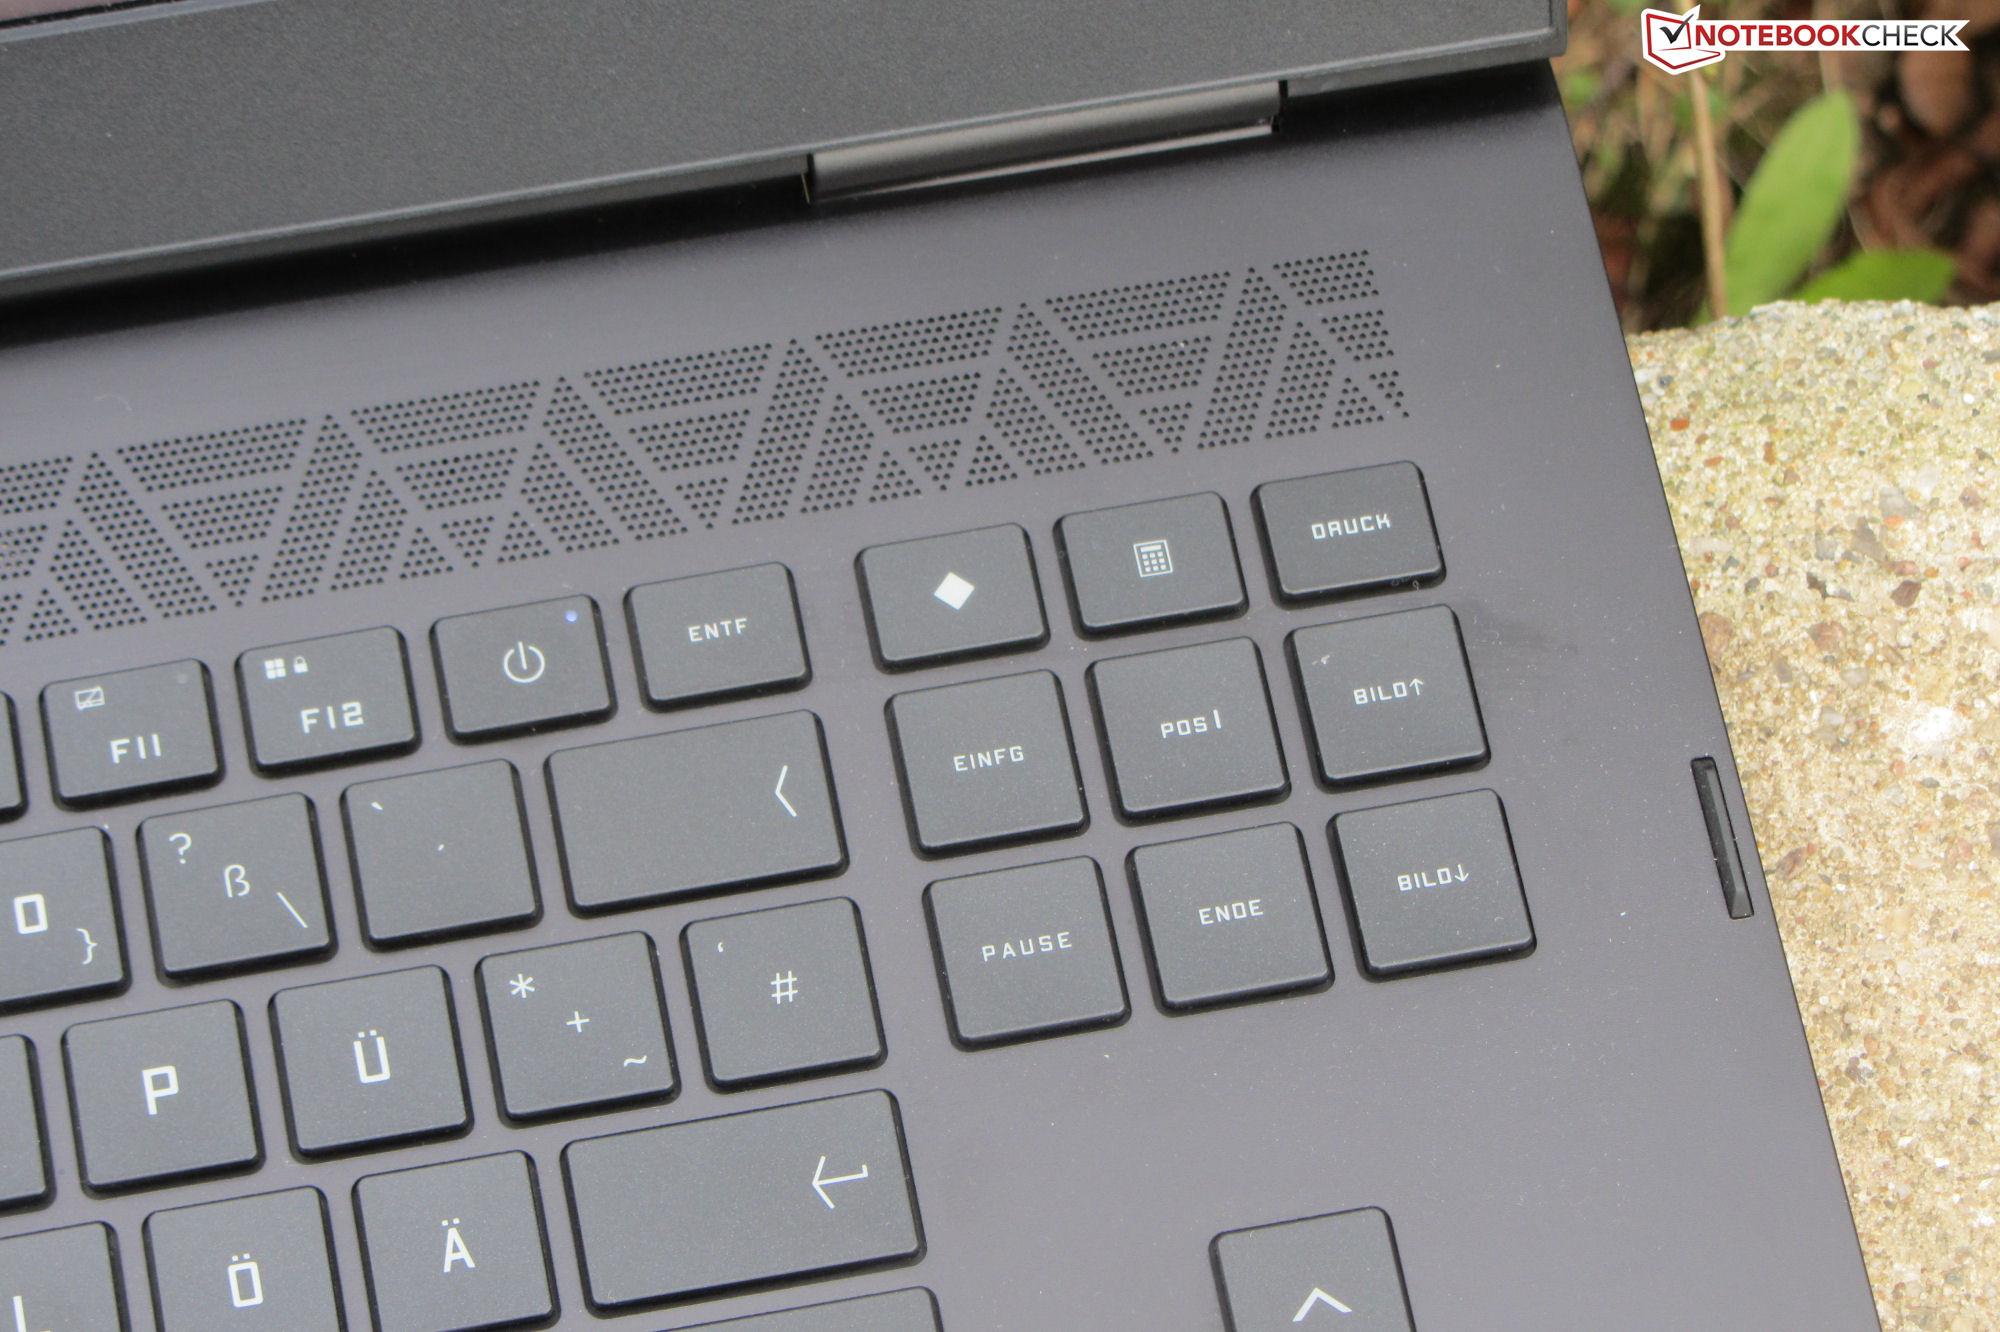
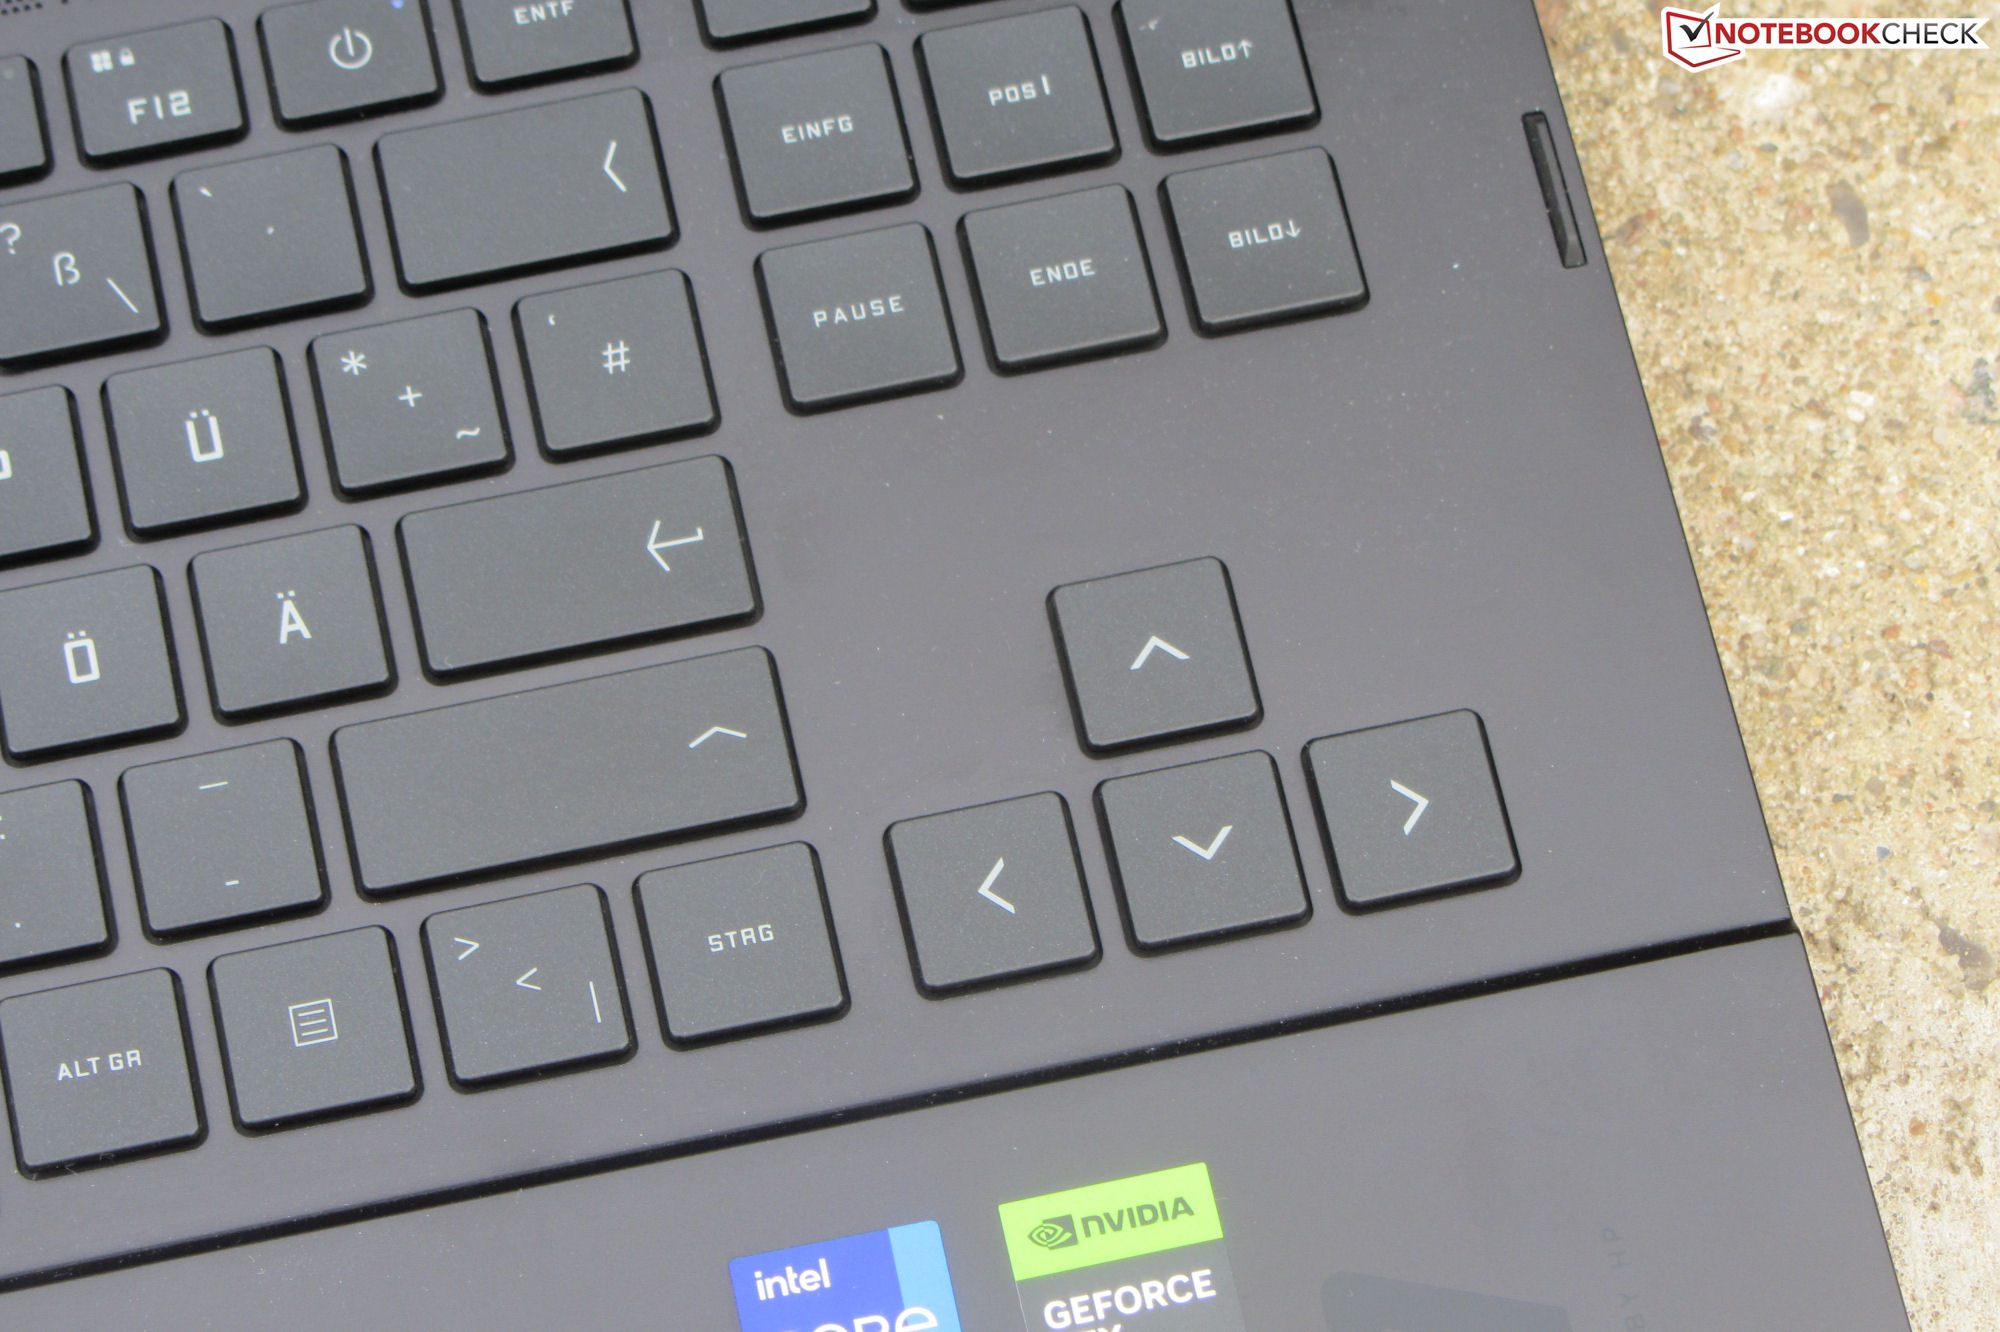
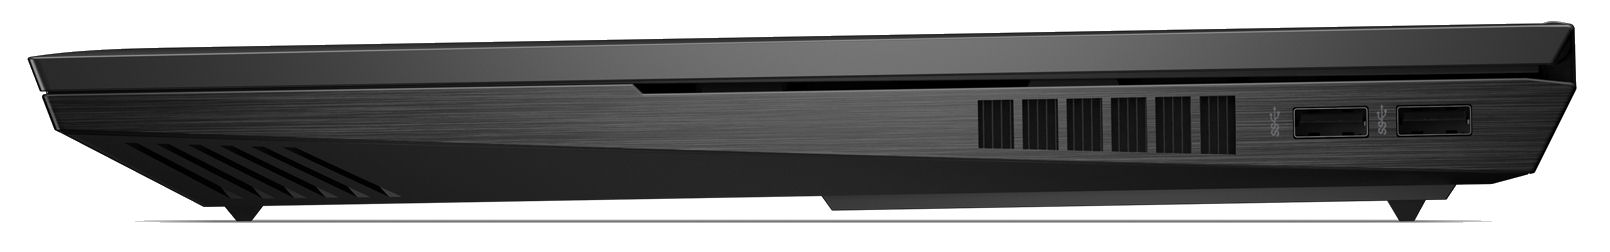
Informacje na temat obudowy, wyposażenia, urządzeń wejściowych i głośników znajdziecie w naszej recenzji poprzedniego modelu, który pod tymi względami jest identyczny.
Potentiële concurrenten in vergelijking
Ocena | Data | Model | Waga | Wysokość | Rozmiar | Rezolucja | Cena |
|---|---|---|---|---|---|---|---|
| 85.4 % v7 (old) | 03/2023 | HP Omen 17-ck2097ng i9-13900HX, GeForce RTX 4080 Laptop GPU | 2.8 kg | 27 mm | 17.30" | 2560x1440 | |
| 86.1 % v7 (old) | 01/2023 | Alienware m17 R5 (R9 6900HX, RX 6850M XT) R9 6900HX, Radeon RX 6850M XT | 3.4 kg | 26.7 mm | 17.00" | 3840x2160 | |
| 91.2 % v7 (old) | 02/2023 | Razer Blade 16 Early 2023 i9-13950HX, GeForce RTX 4080 Laptop GPU | 2.4 kg | 21.99 mm | 16.00" | 2560x1600 | |
| 89.4 % v7 (old) | 02/2023 | Lenovo Legion Pro 7 16IRX8H i9-13900HX, GeForce RTX 4080 Laptop GPU | 2.7 kg | 26 mm | 16.00" | 2560x1600 | |
| 88.4 % v7 (old) | 03/2023 | Asus ROG Strix G16 G614JZ i9-13980HX, GeForce RTX 4080 Laptop GPU | 2.4 kg | 30.4 mm | 16.00" | 2560x1600 |
| SD Card Reader | |
| average JPG Copy Test (av. of 3 runs) | |
| Średnia w klasie Gaming (20.9 - 210, n=54, ostatnie 2 lata) | |
| Razer Blade 16 Early 2023 (AV PRO microSD 128 GB V60) | |
| HP Omen 17-ck2097ng (AV PRO microSD 128 GB V60) | |
| maximum AS SSD Seq Read Test (1GB) | |
| Razer Blade 16 Early 2023 (AV PRO microSD 128 GB V60) | |
| Średnia w klasie Gaming (25.5 - 261, n=51, ostatnie 2 lata) | |
| HP Omen 17-ck2097ng (AV PRO microSD 128 GB V60) | |


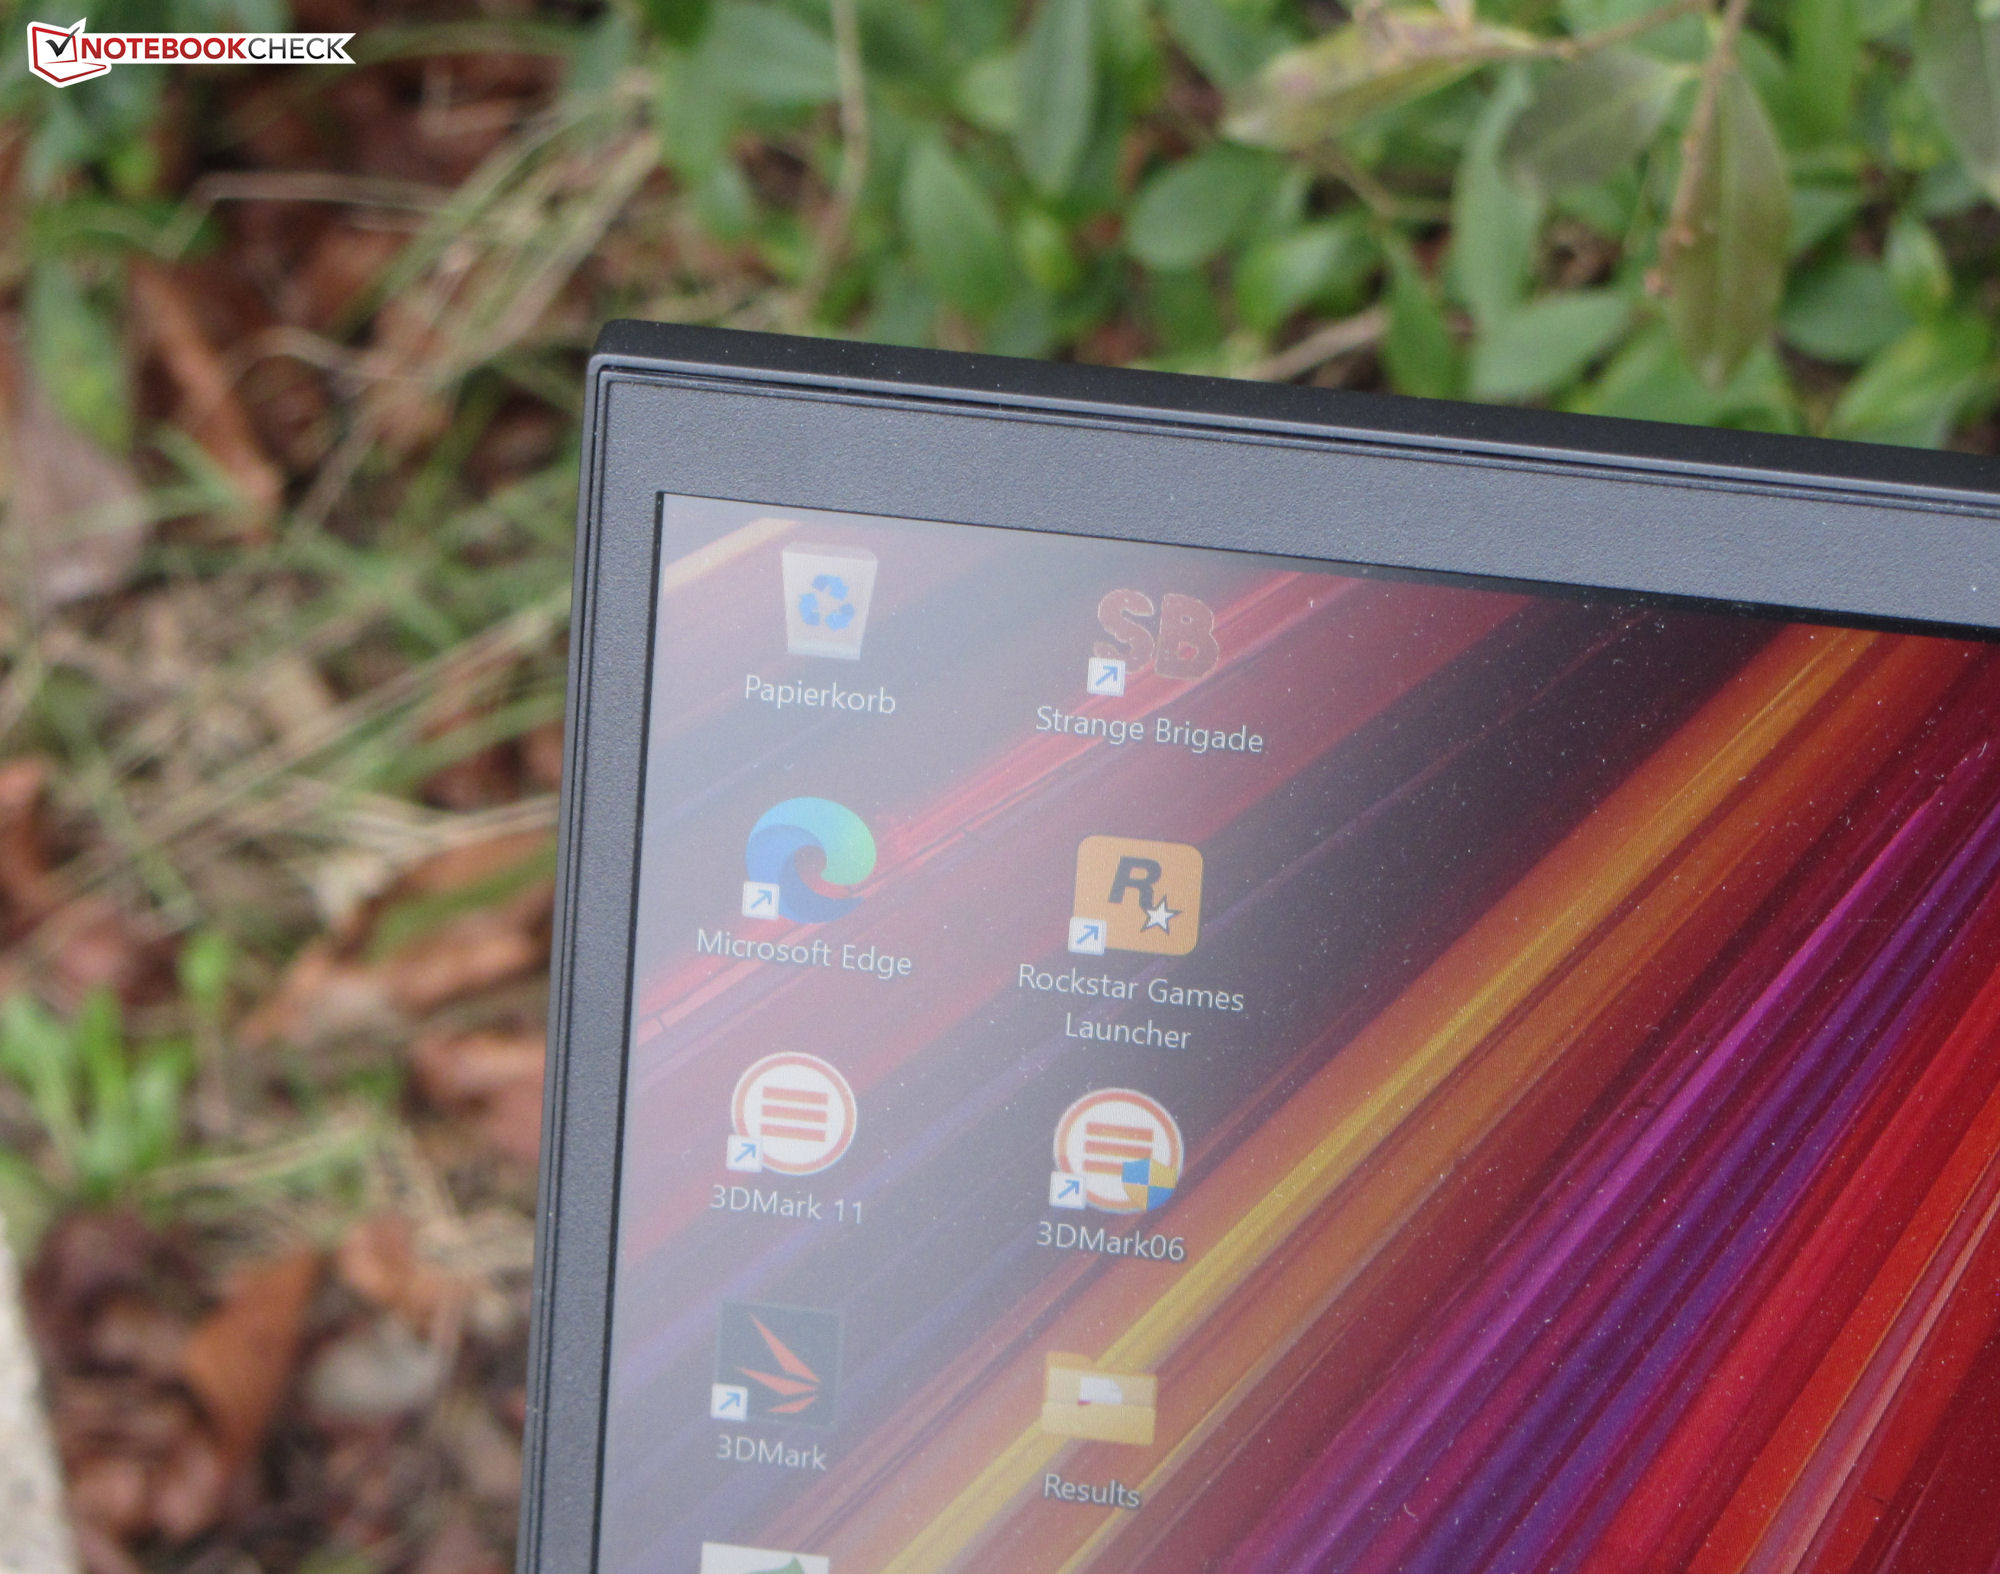
Wyświetlacz - QHD z uwzględnieniem pokrycia sRGB
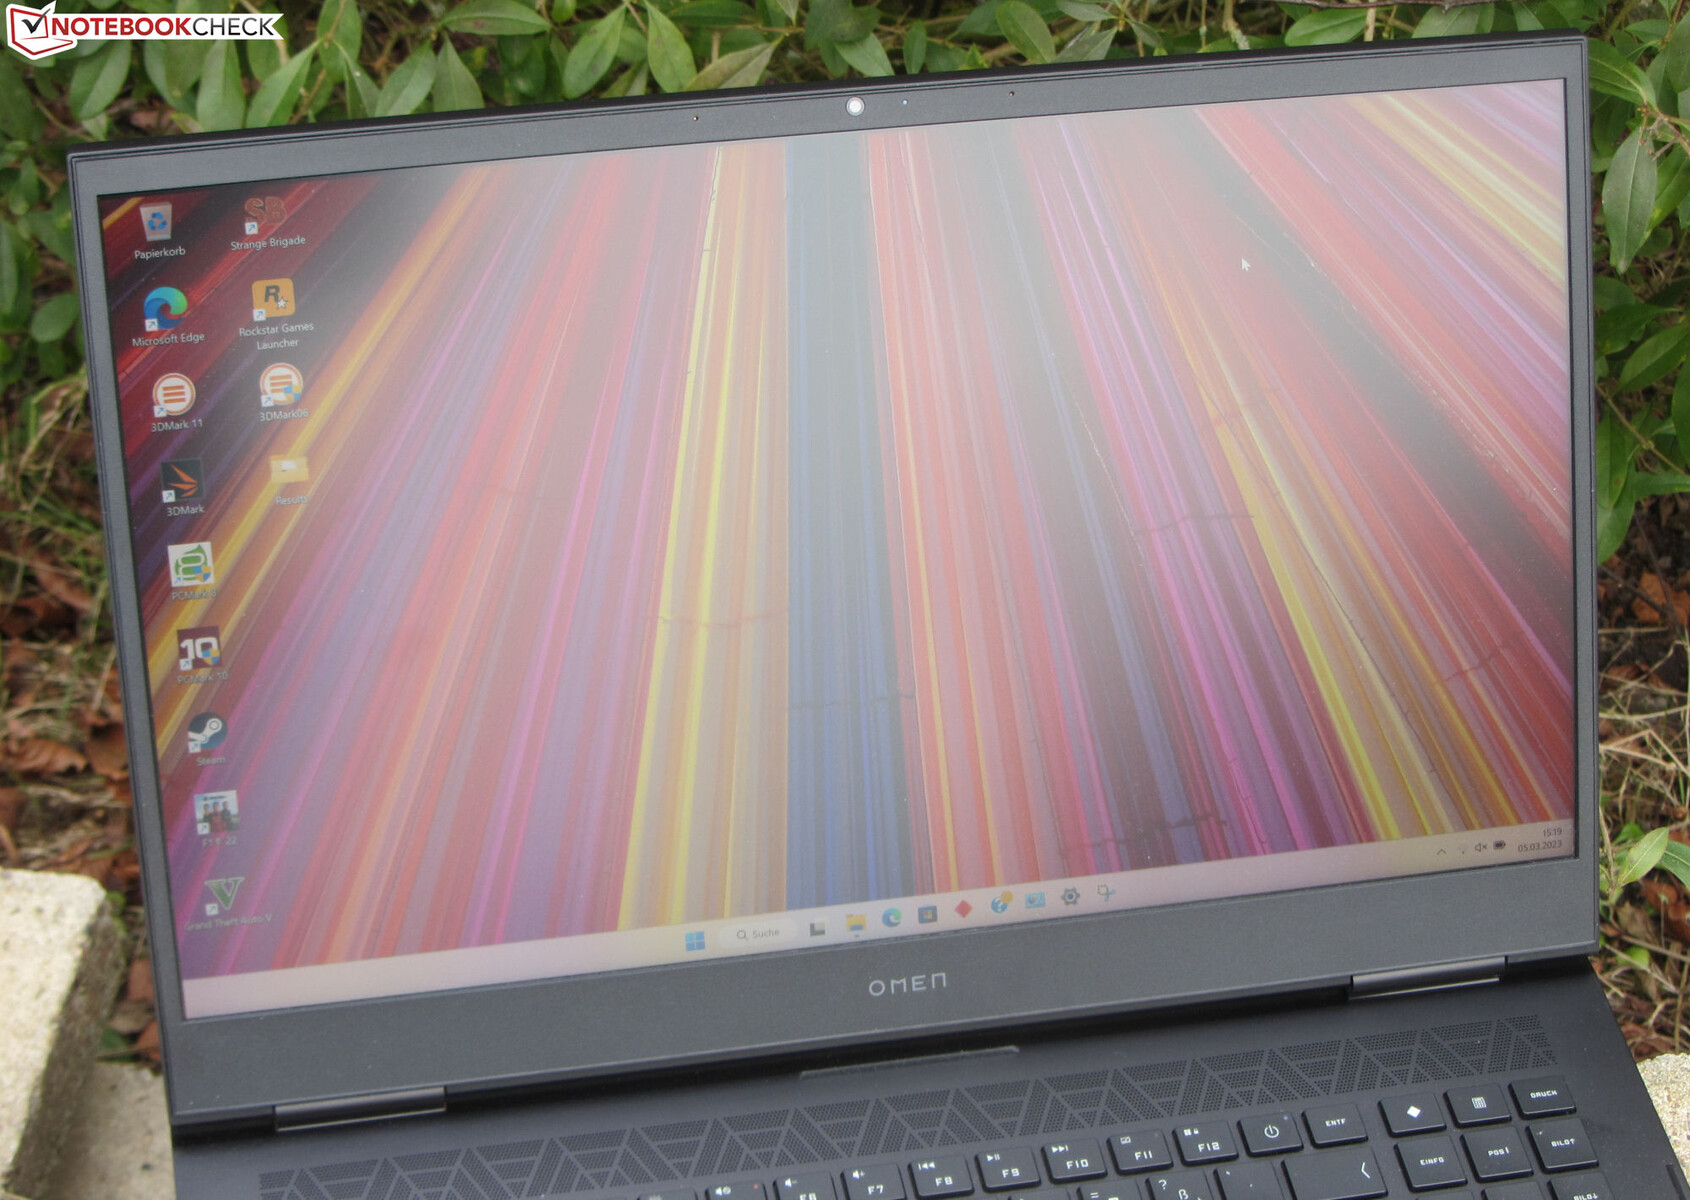
Podczas gdy w tym momencie wielu konkurentów woli stosować wyświetlacze o proporcjach 16:10, HP pozostaje w Omenie wierny formatowi 16:9. Pozytywną cechą jest to, że responsywny panel 165-Hz nie wykazuje migotania PWM na żadnym poziomie jasności.
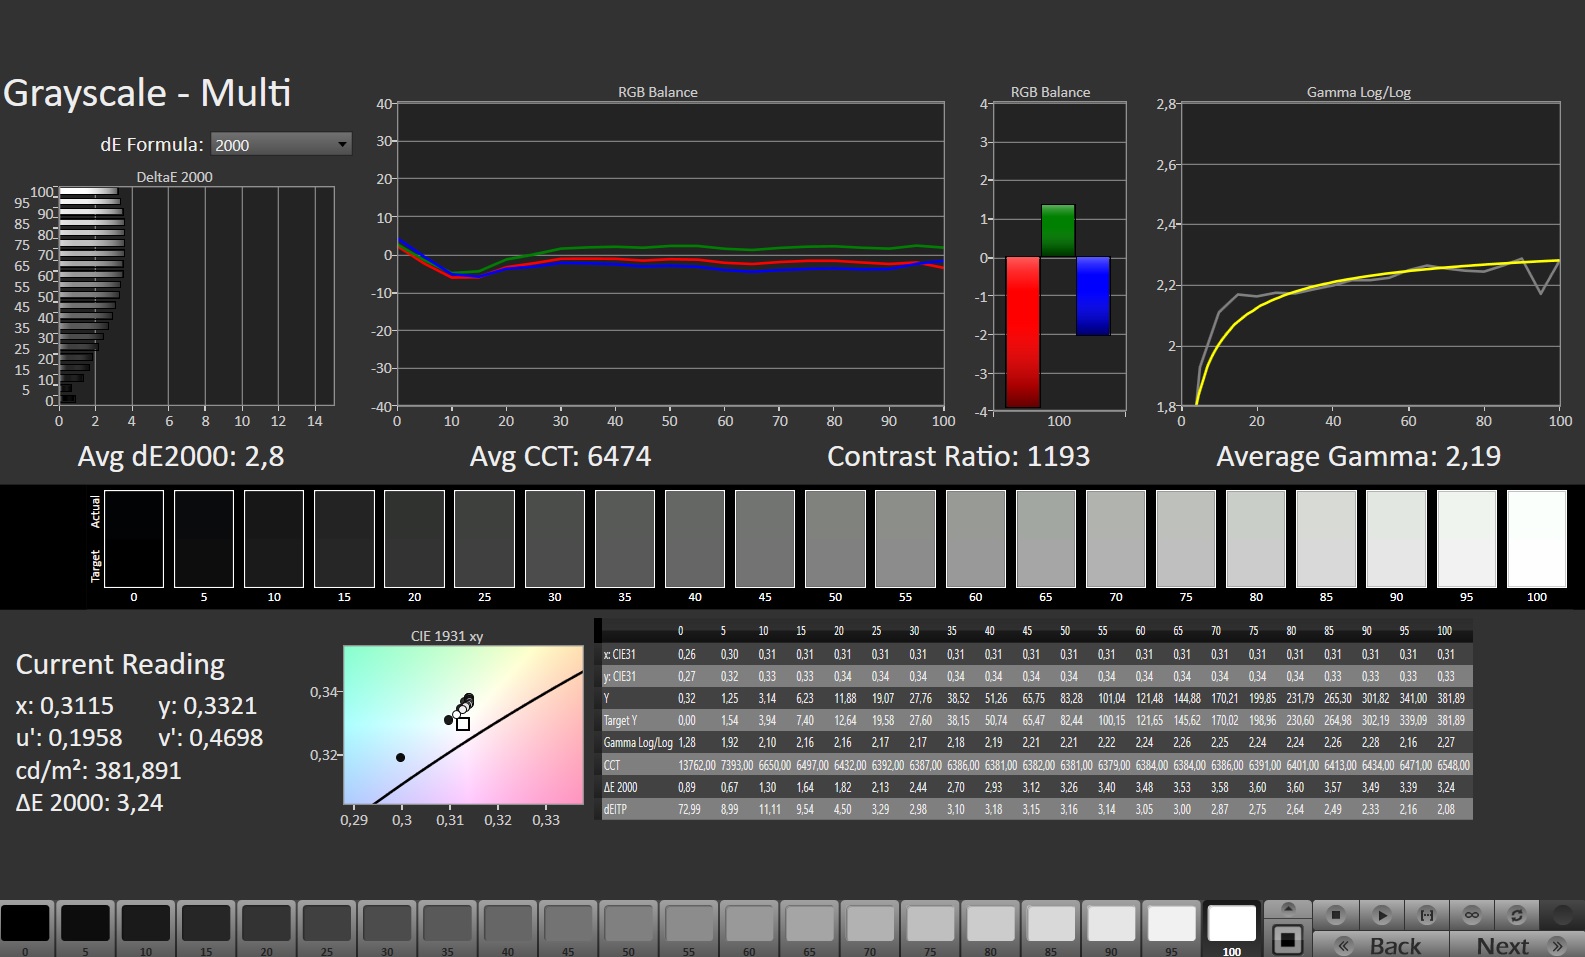
Jasność i kontrast matowego 17,3-calowego wyświetlacza (2 560 x 1 440 pikseli) spełniają wymagania (> 300 cd/m² i 1 000:1). Wyświetlacz Omena oferuje jednak najniższą jasność wśród wyświetlaczy naszych konkurentów. Na stronie Legion 7 Pro ma tutaj najjaśniejszy panel.
| |||||||||||||||||||||||||
rozświetlenie: 90 %
na akumulatorze: 371 cd/m²
kontrast: 1159:1 (czerń: 0.32 cd/m²)
ΔE ColorChecker Calman: 1.74 | ∀{0.5-29.43 Ø4.73}
calibrated: 1.01
ΔE Greyscale Calman: 2.8 | ∀{0.09-98 Ø4.97}
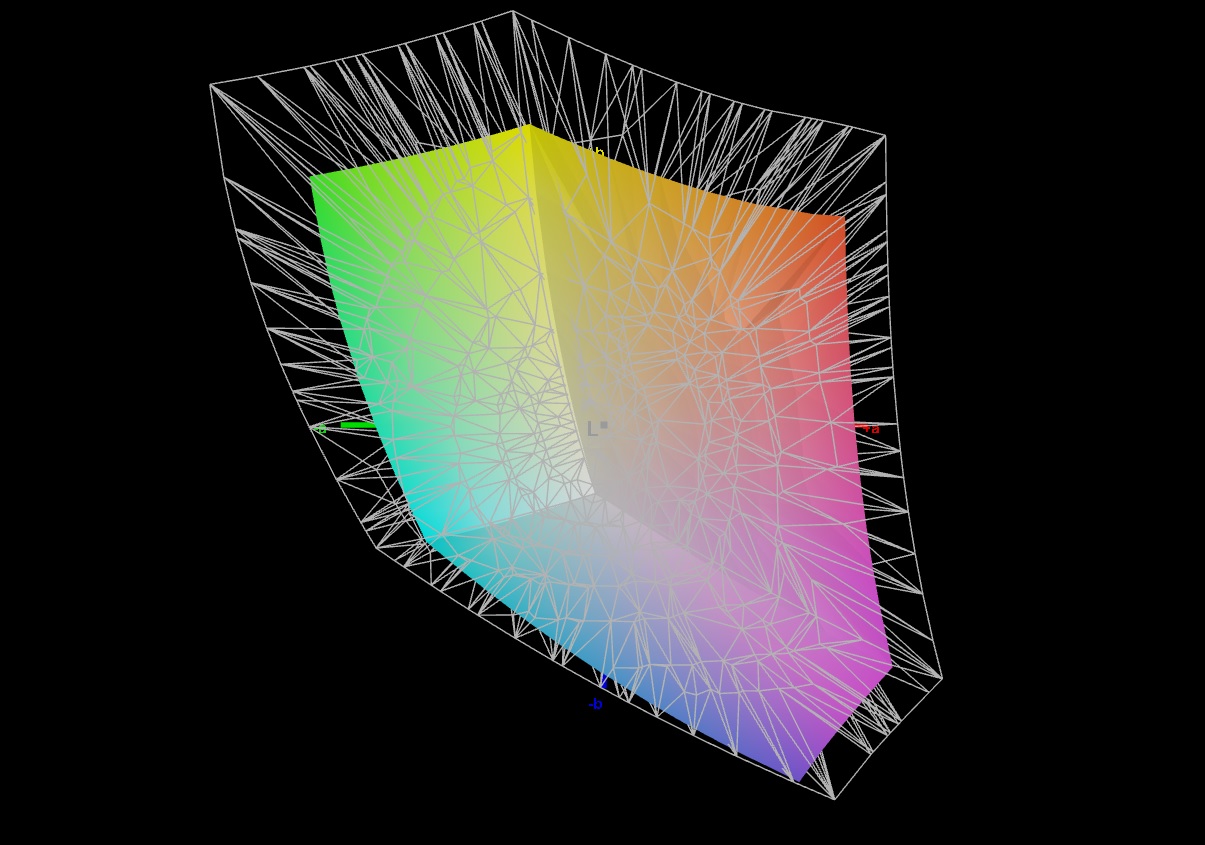
69.6% AdobeRGB 1998 (Argyll 3D)
97.6% sRGB (Argyll 3D)
67.4% Display P3 (Argyll 3D)
Gamma: 2.19
CCT: 6474 K
| HP Omen 17-ck2097ng BOE BOE09BF, IPS, 2560x1440, 17.3" | Alienware m17 R5 (R9 6900HX, RX 6850M XT) AU Optronics AUODBA3, IPS, 3840x2160, 17" | Razer Blade 16 Early 2023 CSOT T3 MNG007DA4-1, IPS, 2560x1600, 16" | Lenovo Legion Pro 7 16IRX8H MNG007DA2-3 (CSO1628), IPS, 2560x1600, 16" | Asus ROG Strix G16 G614JZ TL160ADMP03-0, IPS, 2560x1600, 16" | HP Omen 17-ck1075ng BOE09EE, IPS, 1920x1080, 17.3" | |
|---|---|---|---|---|---|---|
| Display | 24% | 26% | 2% | 23% | -11% | |
| Display P3 Coverage (%) | 67.4 | 97.2 44% | 98.5 46% | 69.1 3% | 97 44% | 59.03 -12% |
| sRGB Coverage (%) | 97.6 | 99.6 2% | 100 2% | 99.7 2% | 99.9 2% | 87.46 -10% |
| AdobeRGB 1998 Coverage (%) | 69.6 | 88.4 27% | 89.7 29% | 71.2 2% | 84.9 22% | 61.04 -12% |
| Response Times | -18% | 12% | 28% | 47% | -1% | |
| Response Time Grey 50% / Grey 80% * (ms) | 15.6 ? | 16.4 ? -5% | 6.6 ? 58% | 12.3 ? 21% | 5.1 ? 67% | 14 ? 10% |
| Response Time Black / White * (ms) | 8.9 ? | 11.6 ? -30% | 12 ? -35% | 5.9 ? 34% | 6.6 ? 26% | 10 ? -12% |
| PWM Frequency (Hz) | 100 ? | |||||
| Screen | -88% | -12% | 25% | 3% | -15% | |
| Brightness middle (cd/m²) | 371 | 484 30% | 456.8 23% | 511 38% | 470 27% | 321 -13% |
| Brightness (cd/m²) | 350 | 449 28% | 437 25% | 469 34% | 459 31% | 302 -14% |
| Brightness Distribution (%) | 90 | 87 -3% | 83 -8% | 86 -4% | 93 3% | 84 -7% |
| Black Level * (cd/m²) | 0.32 | 0.55 -72% | 0.35 -9% | 0.4 -25% | 0.42 -31% | 0.41 -28% |
| Contrast (:1) | 1159 | 880 -24% | 1305 13% | 1278 10% | 1119 -3% | 783 -32% |
| Colorchecker dE 2000 * | 1.74 | 4.8 -176% | 3.7 -113% | 0.95 45% | 1.86 -7% | 1.62 7% |
| Colorchecker dE 2000 max. * | 3.59 | 7.48 -108% | 6.42 -79% | 2.07 42% | 3.87 -8% | 4.08 -14% |
| Colorchecker dE 2000 calibrated * | 1.01 | 4.74 -369% | 0.66 35% | 0.91 10% | 0.93 8% | 1.93 -91% |
| Greyscale dE 2000 * | 2.8 | 5.5 -96% | 2.6 7% | 0.6 79% | 2.7 4% | 1.24 56% |
| Gamma | 2.19 100% | 2.42 91% | 2.3 96% | 2.176 101% | 2.246 98% | 2.41 91% |
| CCT | 6474 100% | 6148 106% | 6108 106% | 6545 99% | 6711 97% | 6261 104% |
| Całkowita średnia (program / ustawienia) | -27% /
-54% | 9% /
-0% | 18% /
21% | 24% /
13% | -9% /
-12% |
* ... im mniej tym lepiej
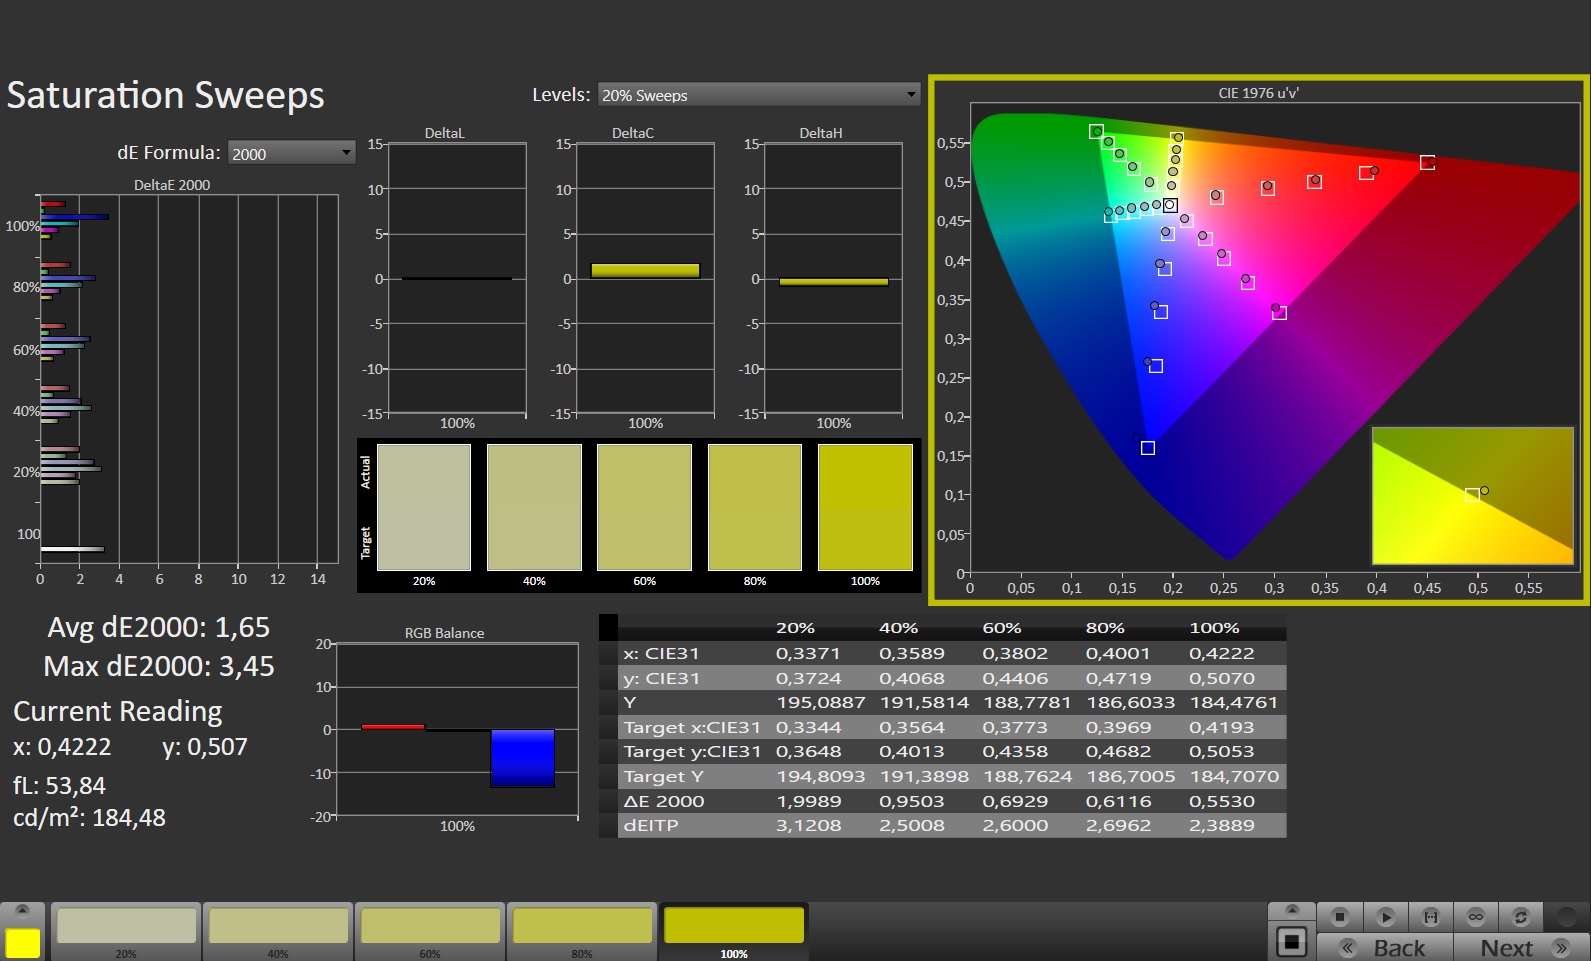
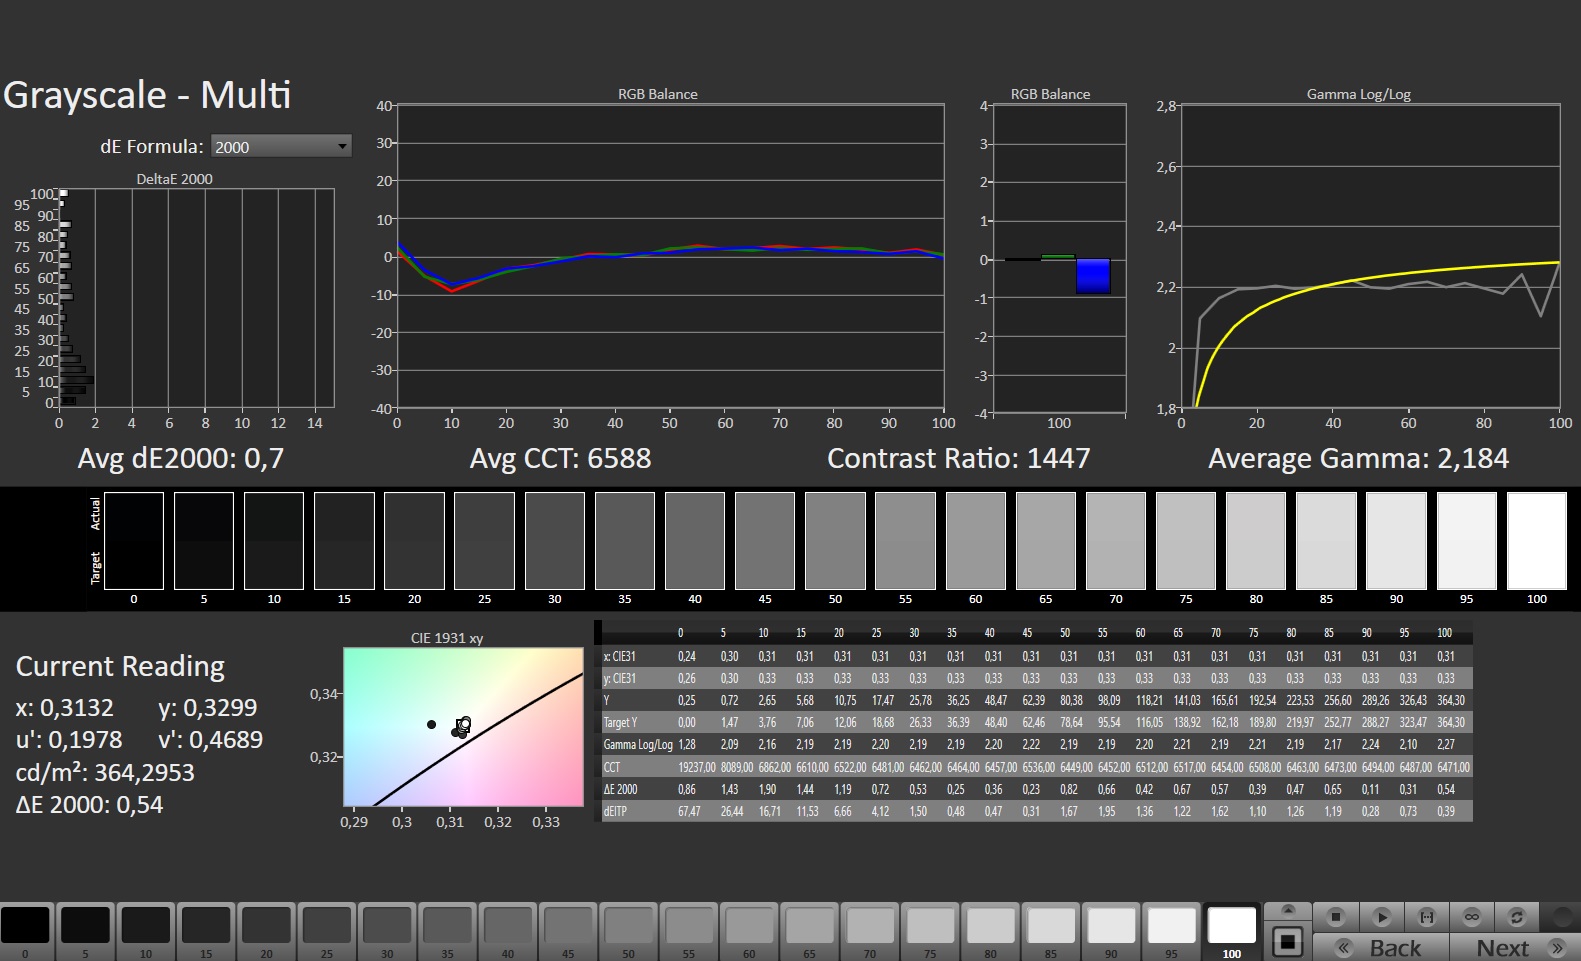
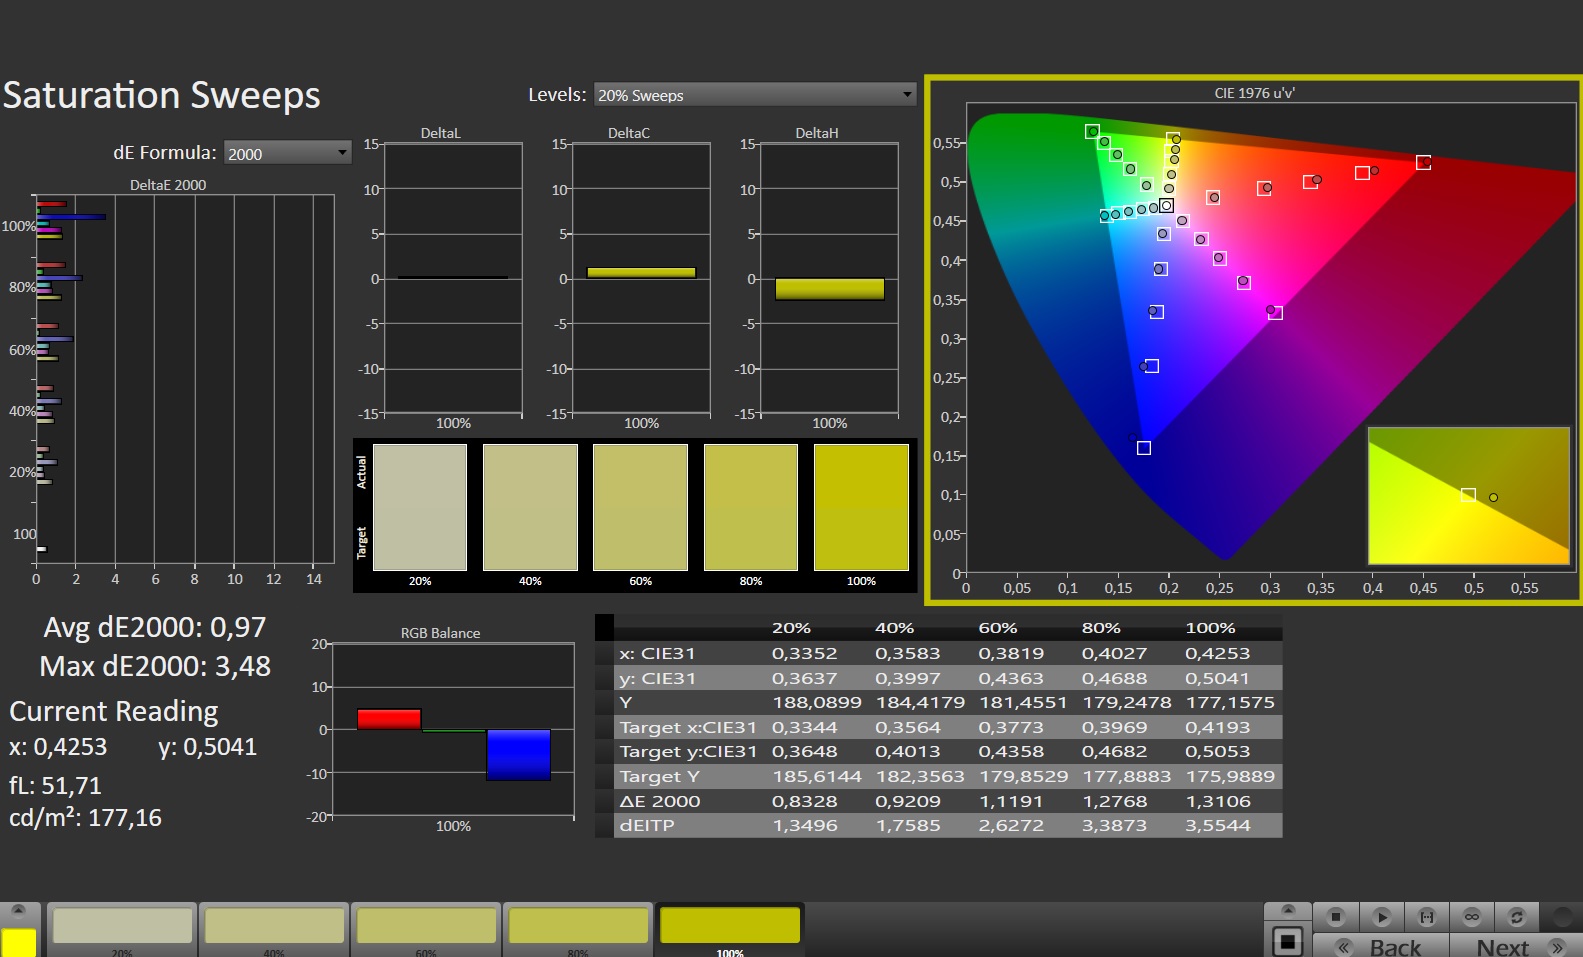
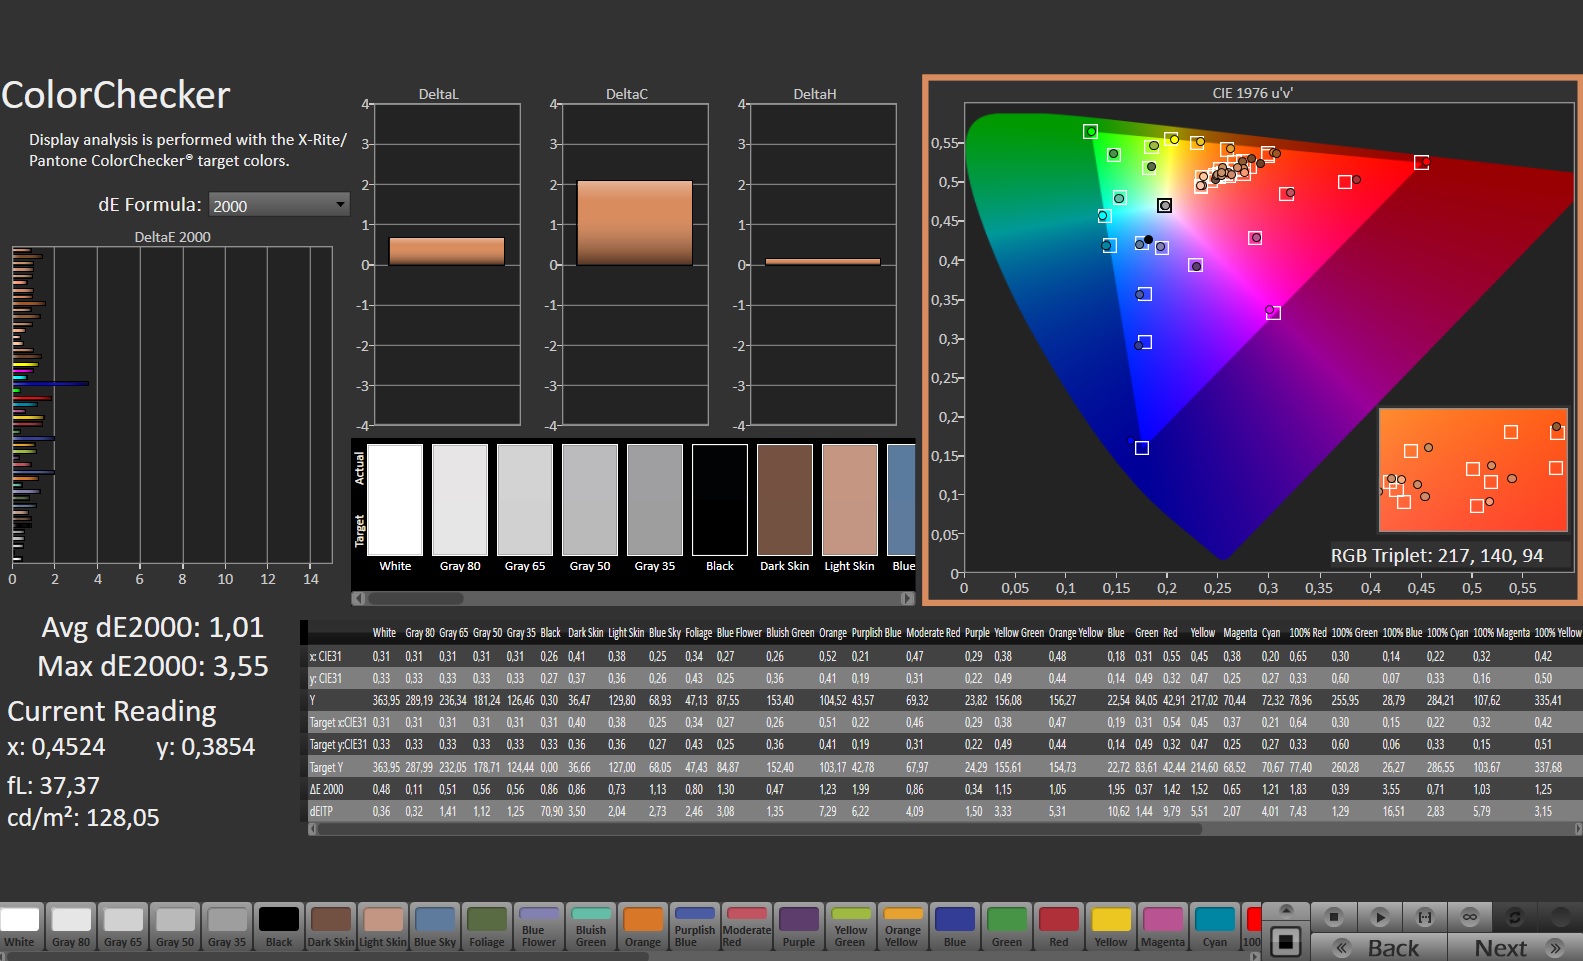
W stanie dostawy odwzorowanie kolorów jest już bardzo dobre, a można je dodatkowo poprawić kalibracją, która powoduje spadek odchylenia kolorów z 1,74 do 1 (wartość docelowa < 3). Ponadto równiej odwzorowywana jest wtedy także skala szarości.
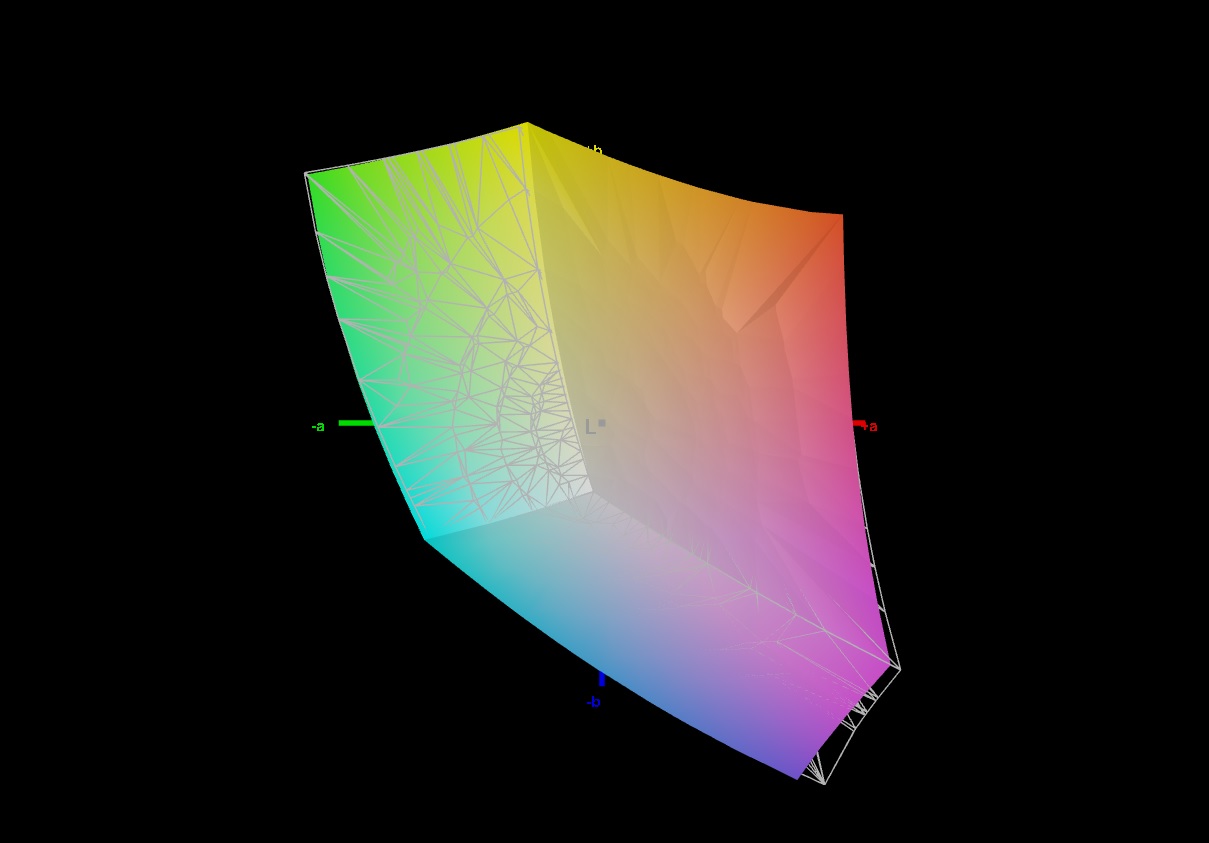
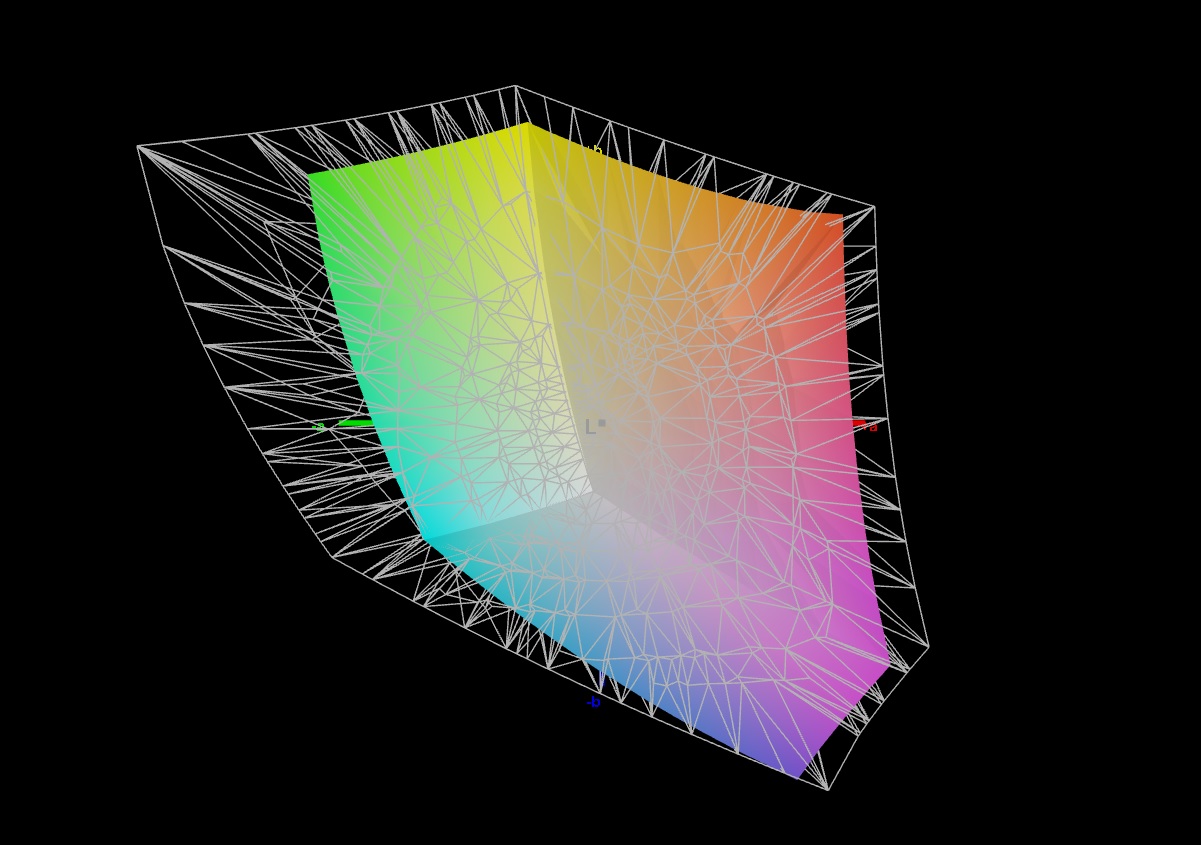
Wyświetlacz jest w stanie pokryć przestrzeń barwną sRGB prawie w całości, ale już nie przestrzenie barw AdobeRGB i DCI-P3. Wyświetlacze większości konkurentów wypadają tu lepiej, przy czym tylko panel ozn Legionranging na tym samym poziomie.

Wyświetl czasy reakcji
| ↔ Czas reakcji od czerni do bieli | ||
|---|---|---|
| 8.9 ms ... wzrost ↗ i spadek ↘ łącznie | ↗ 3.7 ms wzrost | 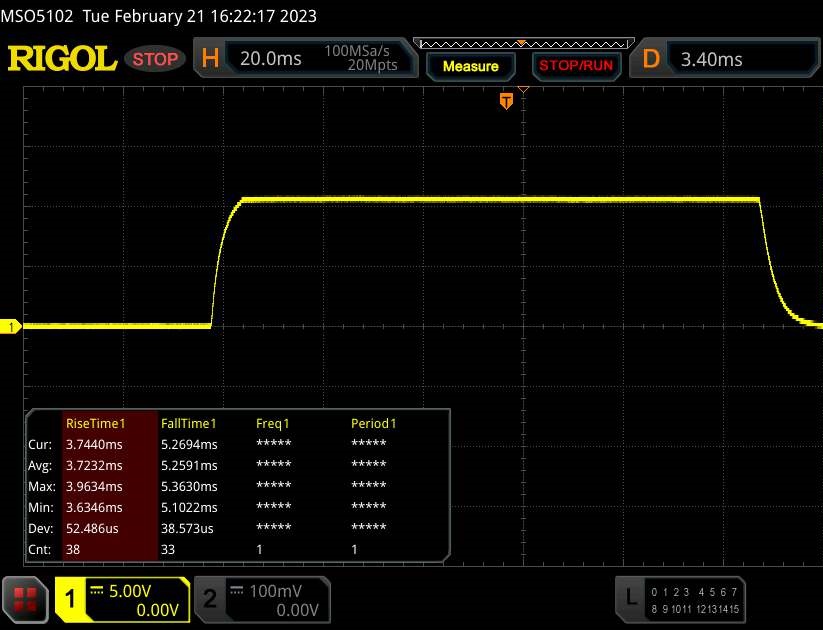 |
| ↘ 5.2 ms upadek | ||
| W naszych testach ekran wykazuje szybki czas reakcji i powinien nadawać się do gier. Dla porównania, wszystkie testowane urządzenia wahają się od 0.1 (minimum) do 240 (maksimum) ms. » 25 % wszystkich urządzeń jest lepszych. Oznacza to, że zmierzony czas reakcji jest lepszy od średniej wszystkich testowanych urządzeń (19.9 ms). | ||
| ↔ Czas reakcji 50% szarości do 80% szarości | ||
| 15.6 ms ... wzrost ↗ i spadek ↘ łącznie | ↗ 7.3 ms wzrost | 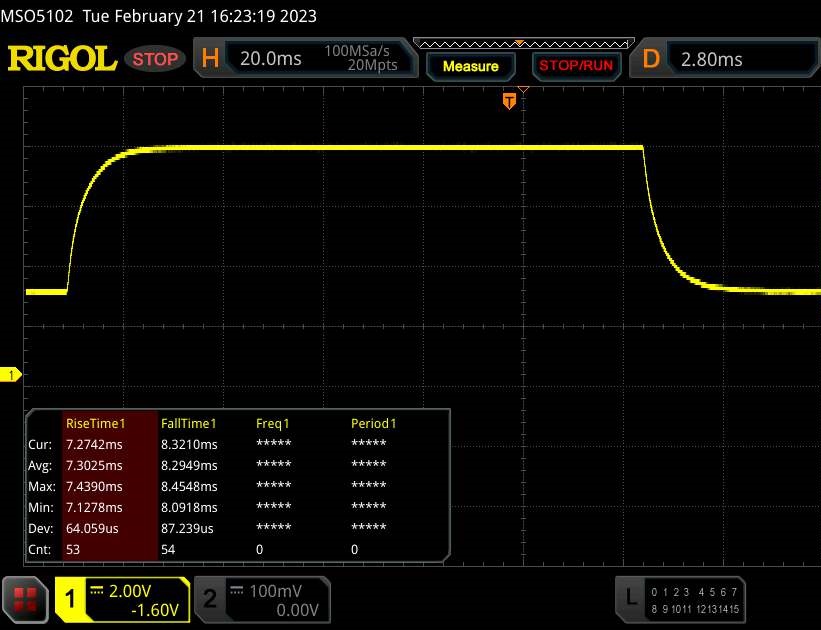 |
| ↘ 8.3 ms upadek | ||
| W naszych testach ekran wykazuje dobry współczynnik reakcji, ale może być zbyt wolny dla graczy rywalizujących ze sobą. Dla porównania, wszystkie testowane urządzenia wahają się od 0.165 (minimum) do 636 (maksimum) ms. » 30 % wszystkich urządzeń jest lepszych. Oznacza to, że zmierzony czas reakcji jest lepszy od średniej wszystkich testowanych urządzeń (31.1 ms). | ||
Migotanie ekranu / PWM (modulacja szerokości impulsu)
| Migotanie ekranu/nie wykryto PWM | 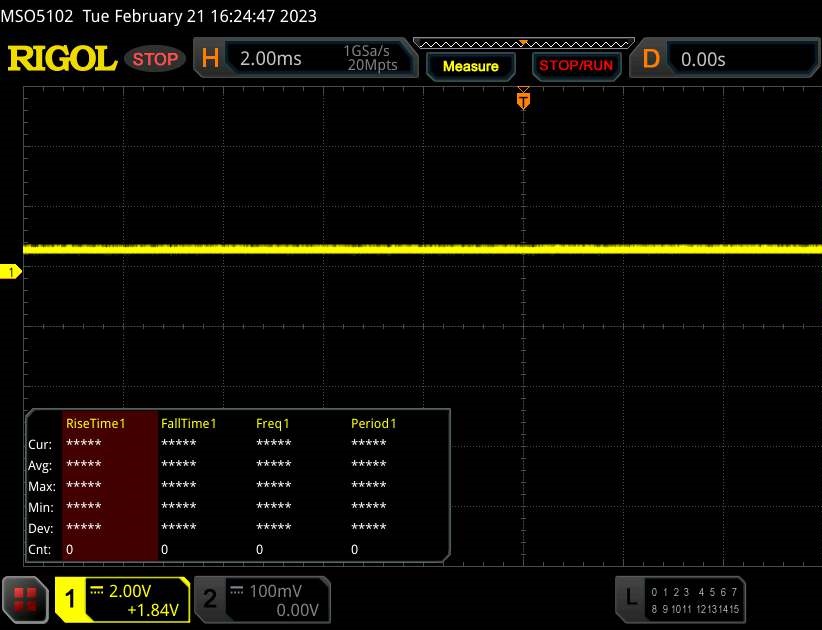 | ||
Dla porównania: 52 % wszystkich testowanych urządzeń nie używa PWM do przyciemniania wyświetlacza. Jeśli wykryto PWM, zmierzono średnio 7798 (minimum: 5 - maksimum: 343500) Hz. | |||
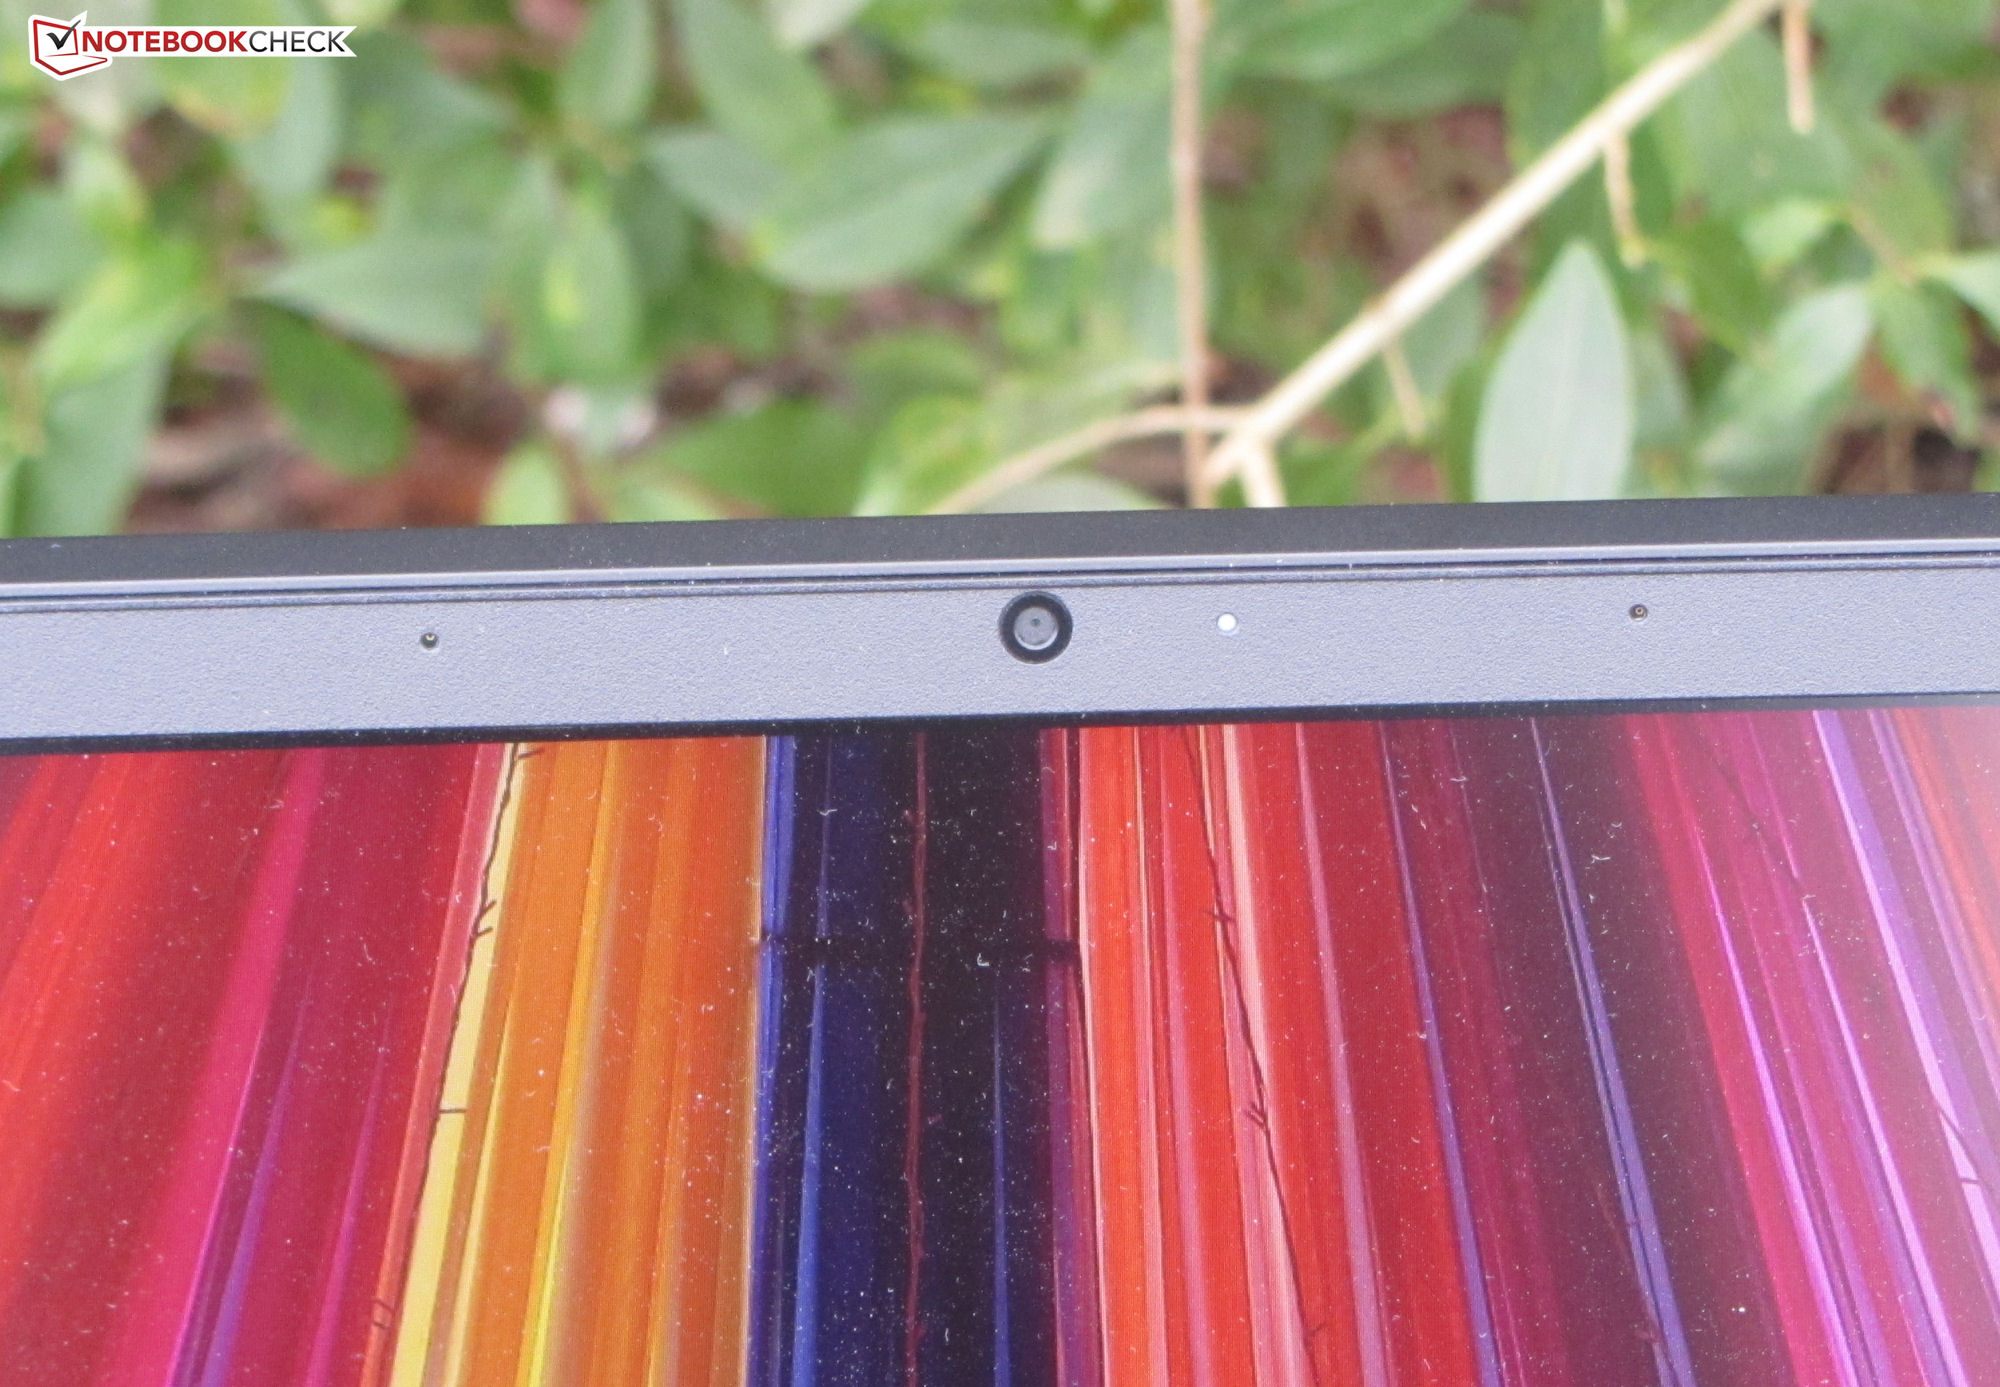
Kąty widzenia panelu IPS są stabilne, więc można go odczytywać pod każdym kątem widzenia. Wyświetlacz może być odczytywany na zewnątrz, o ile nie ma bezpośredniego światła słonecznego.

Wydajność - laptop HP oferuje wydajny sprzęt
Wraz z Omenem 17 Hewlett Packard oferuje 17,3-calowy laptop, który jest skierowany do gier w rozdzielczości QHD, ale dobrze radzi sobie także w innych obszarach zastosowań wymagających dużej wydajności. Niezbędną wydajność obliczeniową zapewniają układy Raptor Lake i Ada Lovelace. Testowany przez nas egzemplarz Omena jest dostępny w cenie około 3300 euro (~3 582 dolarów).
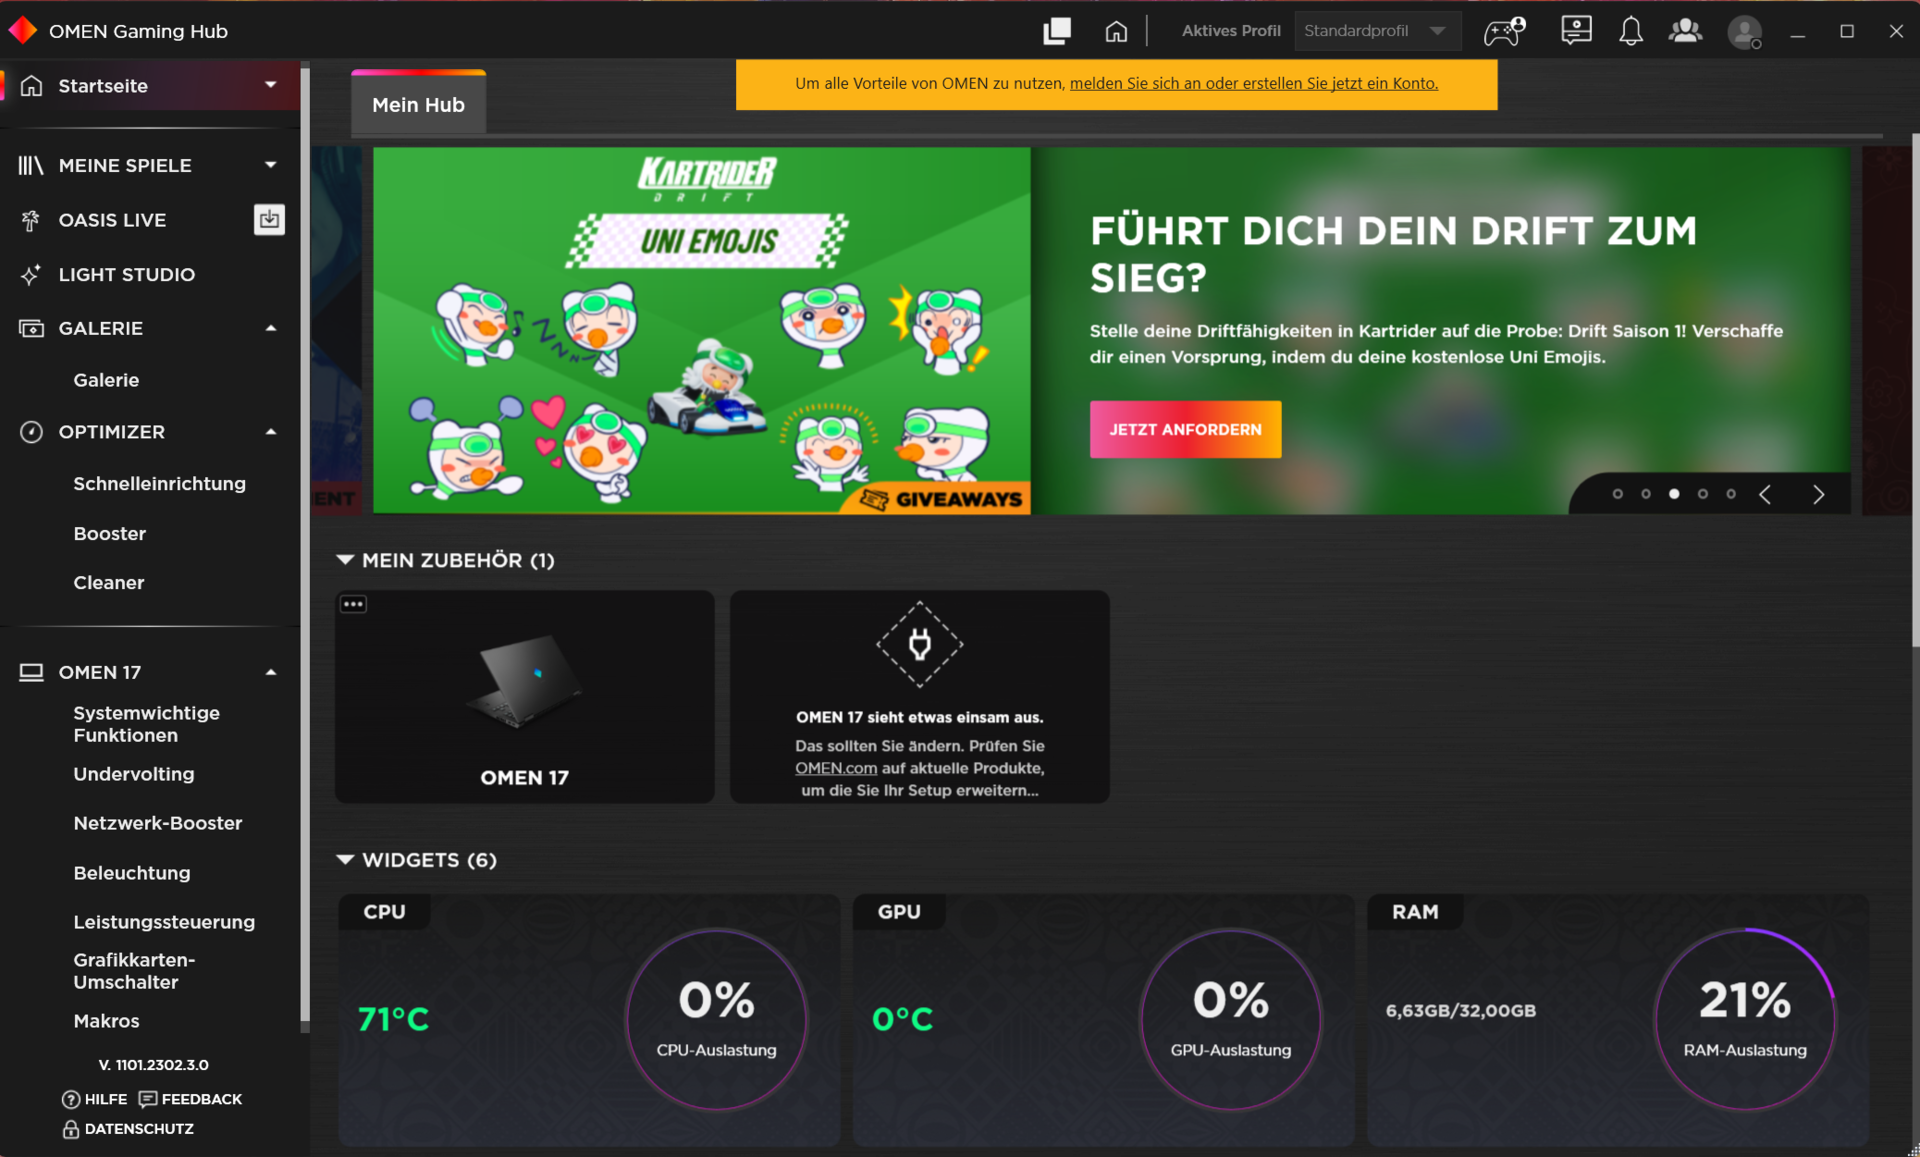
Warunki badania
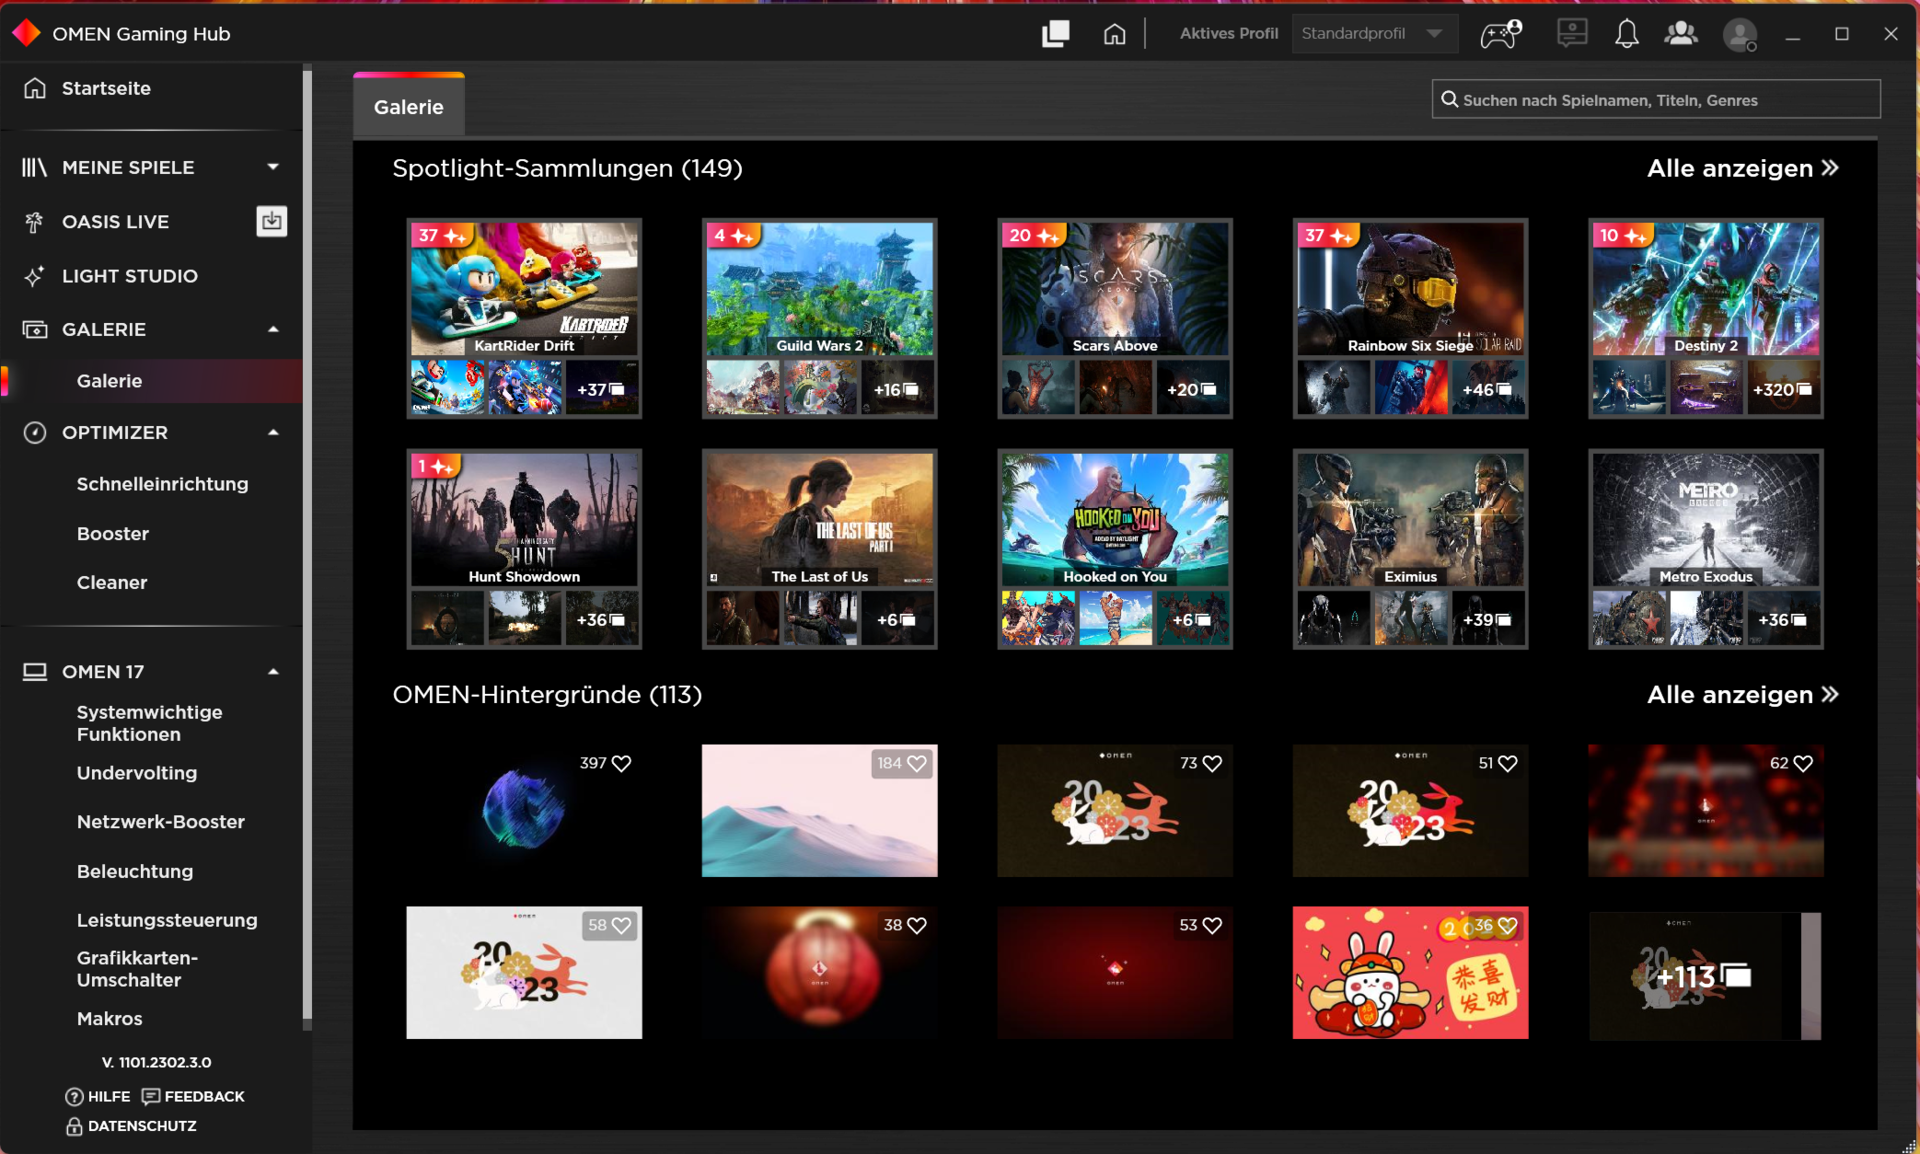
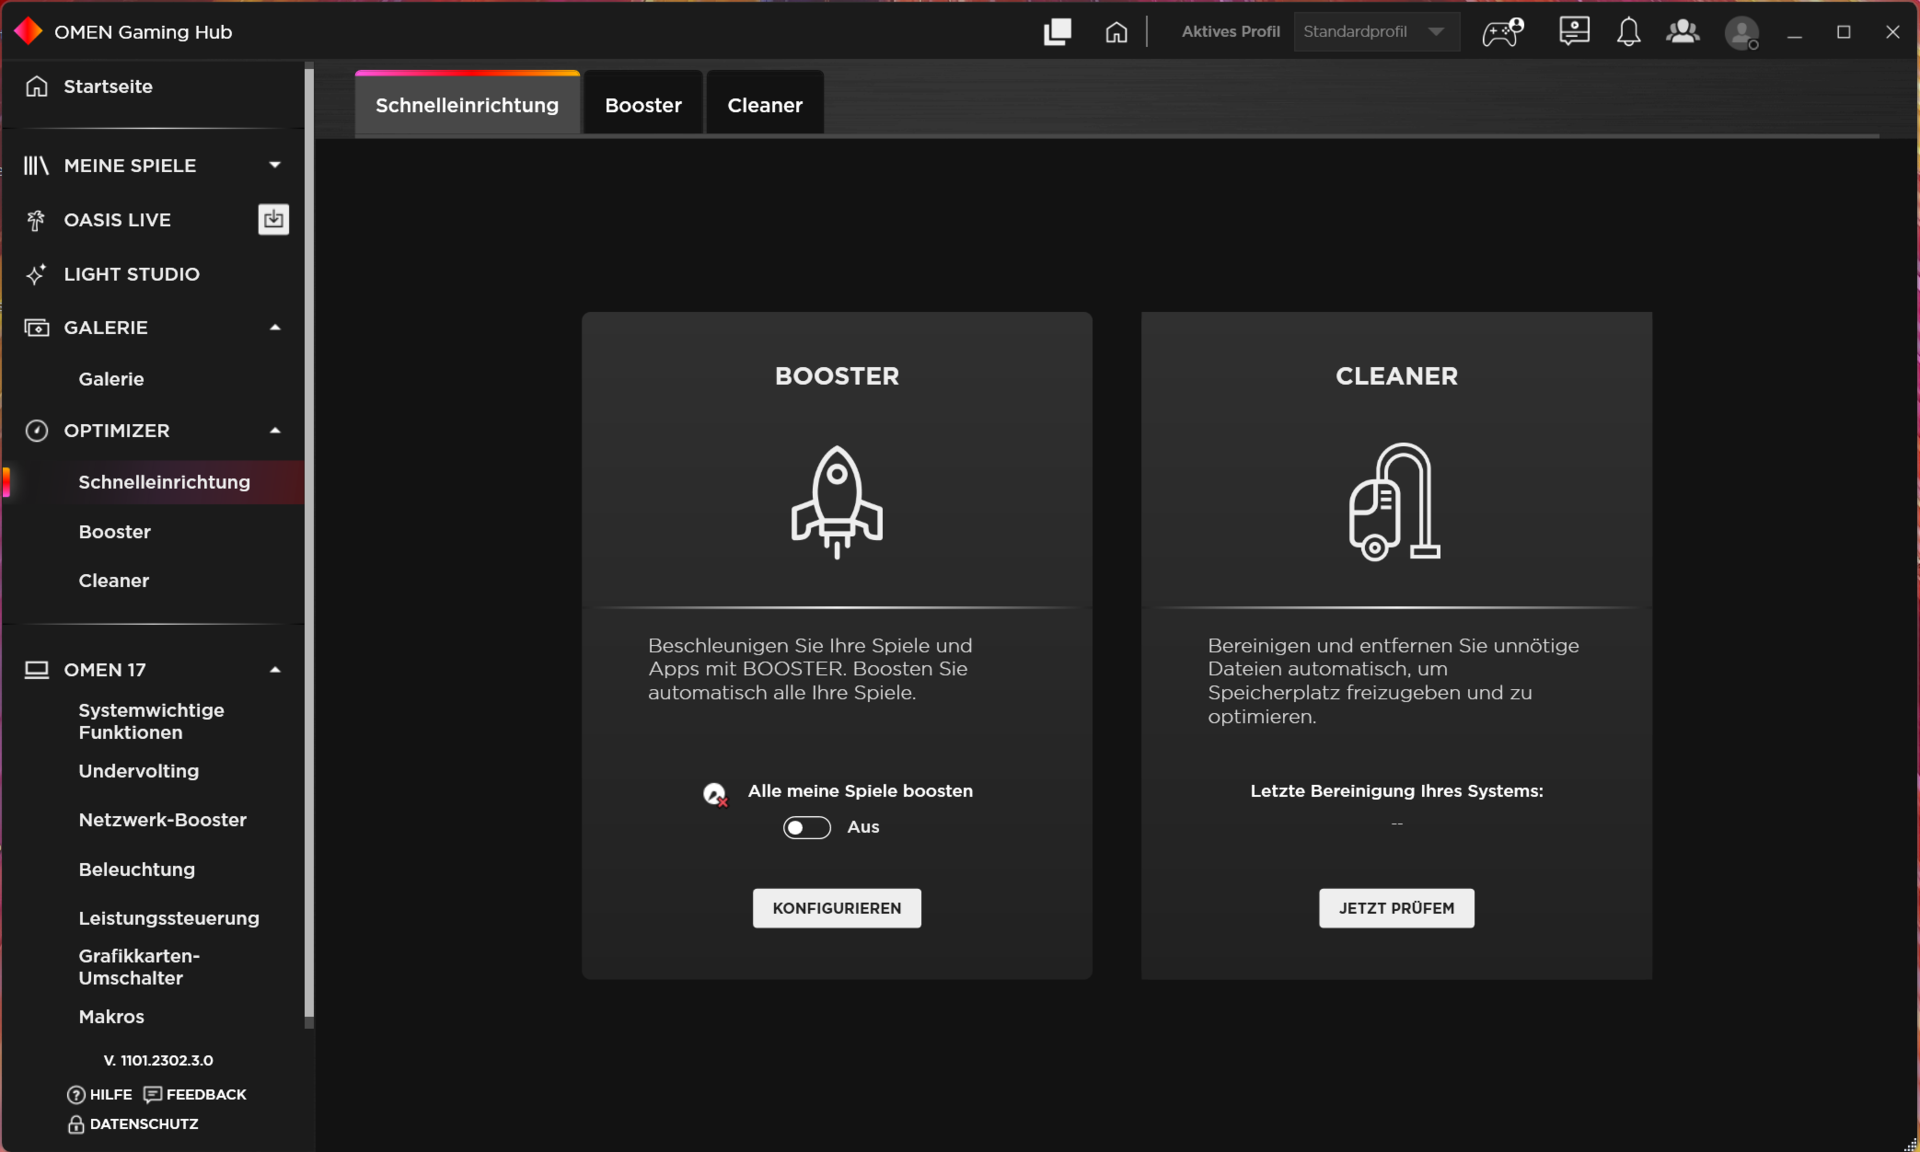
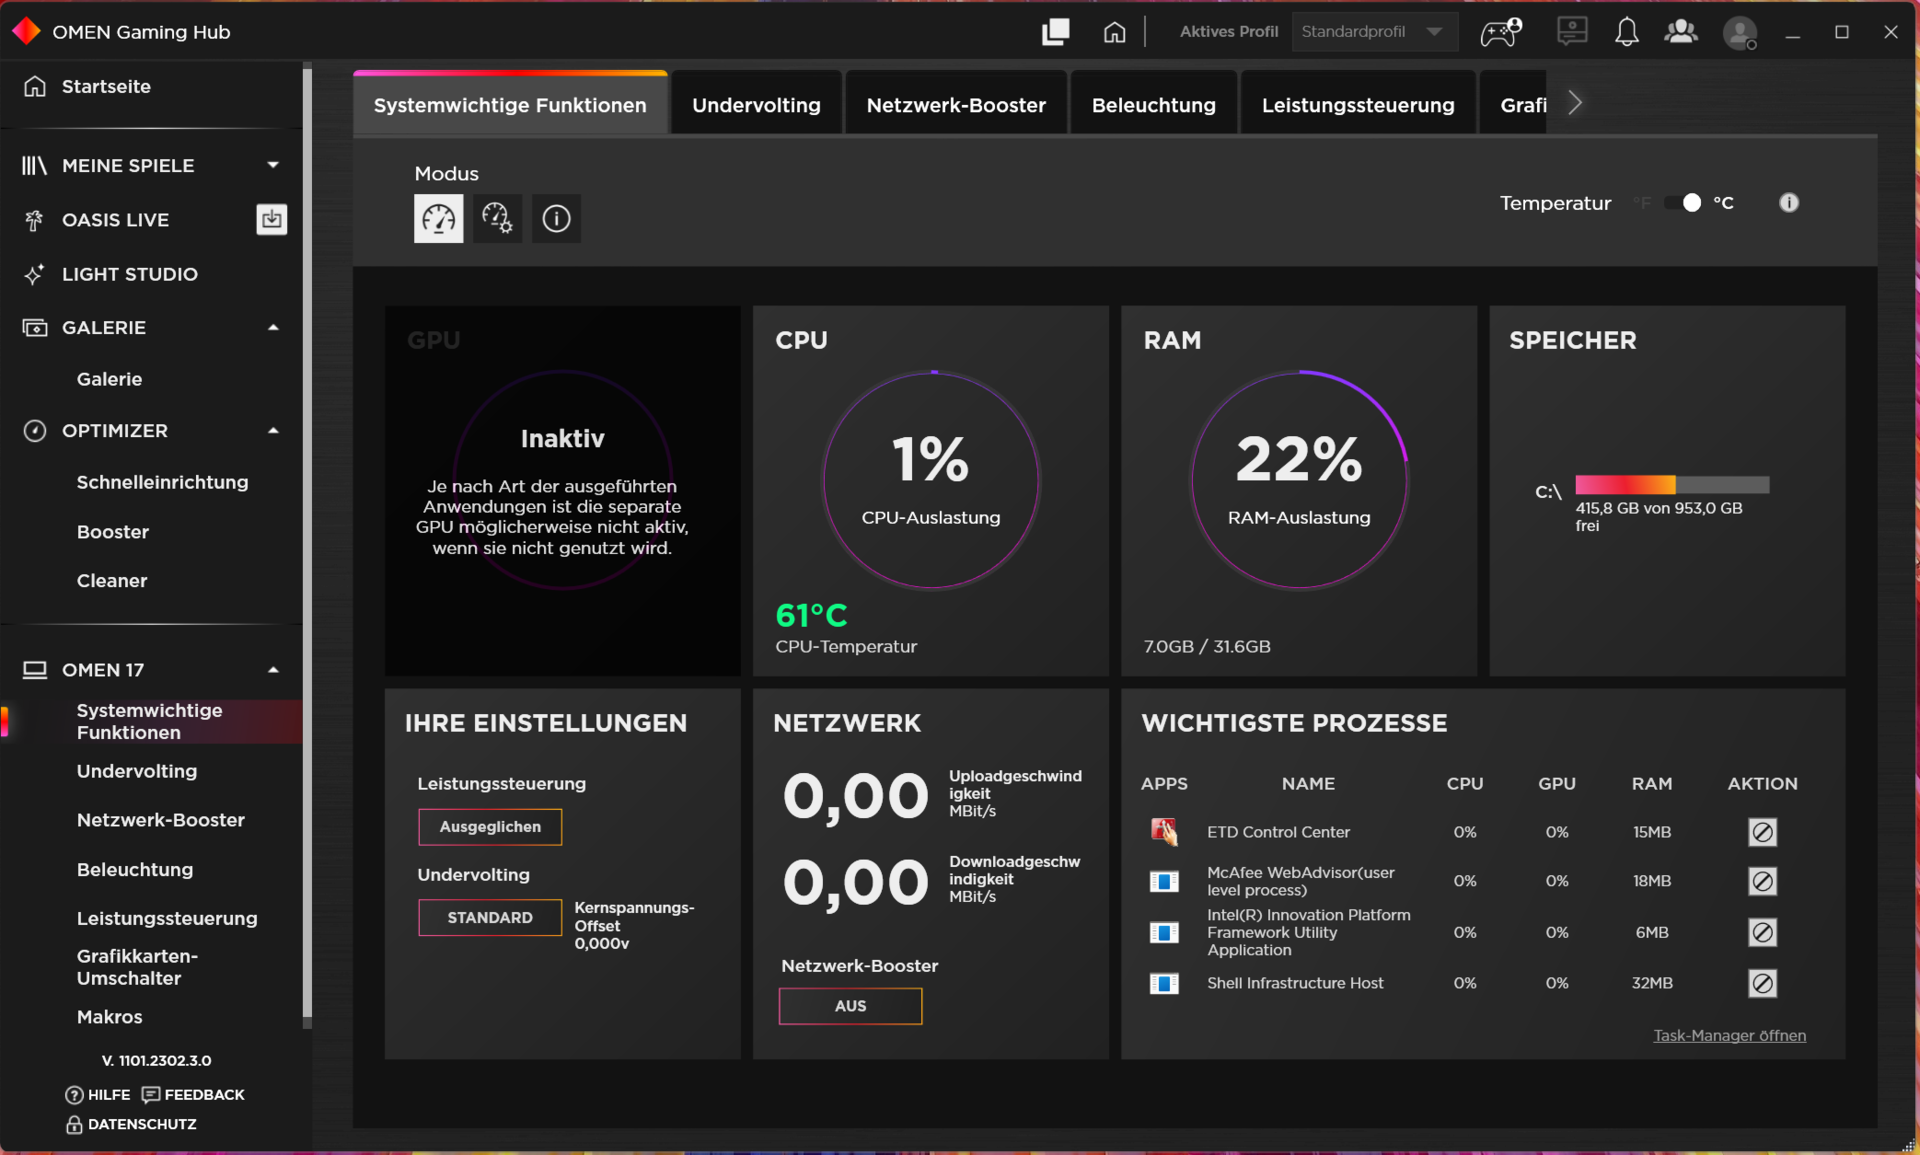
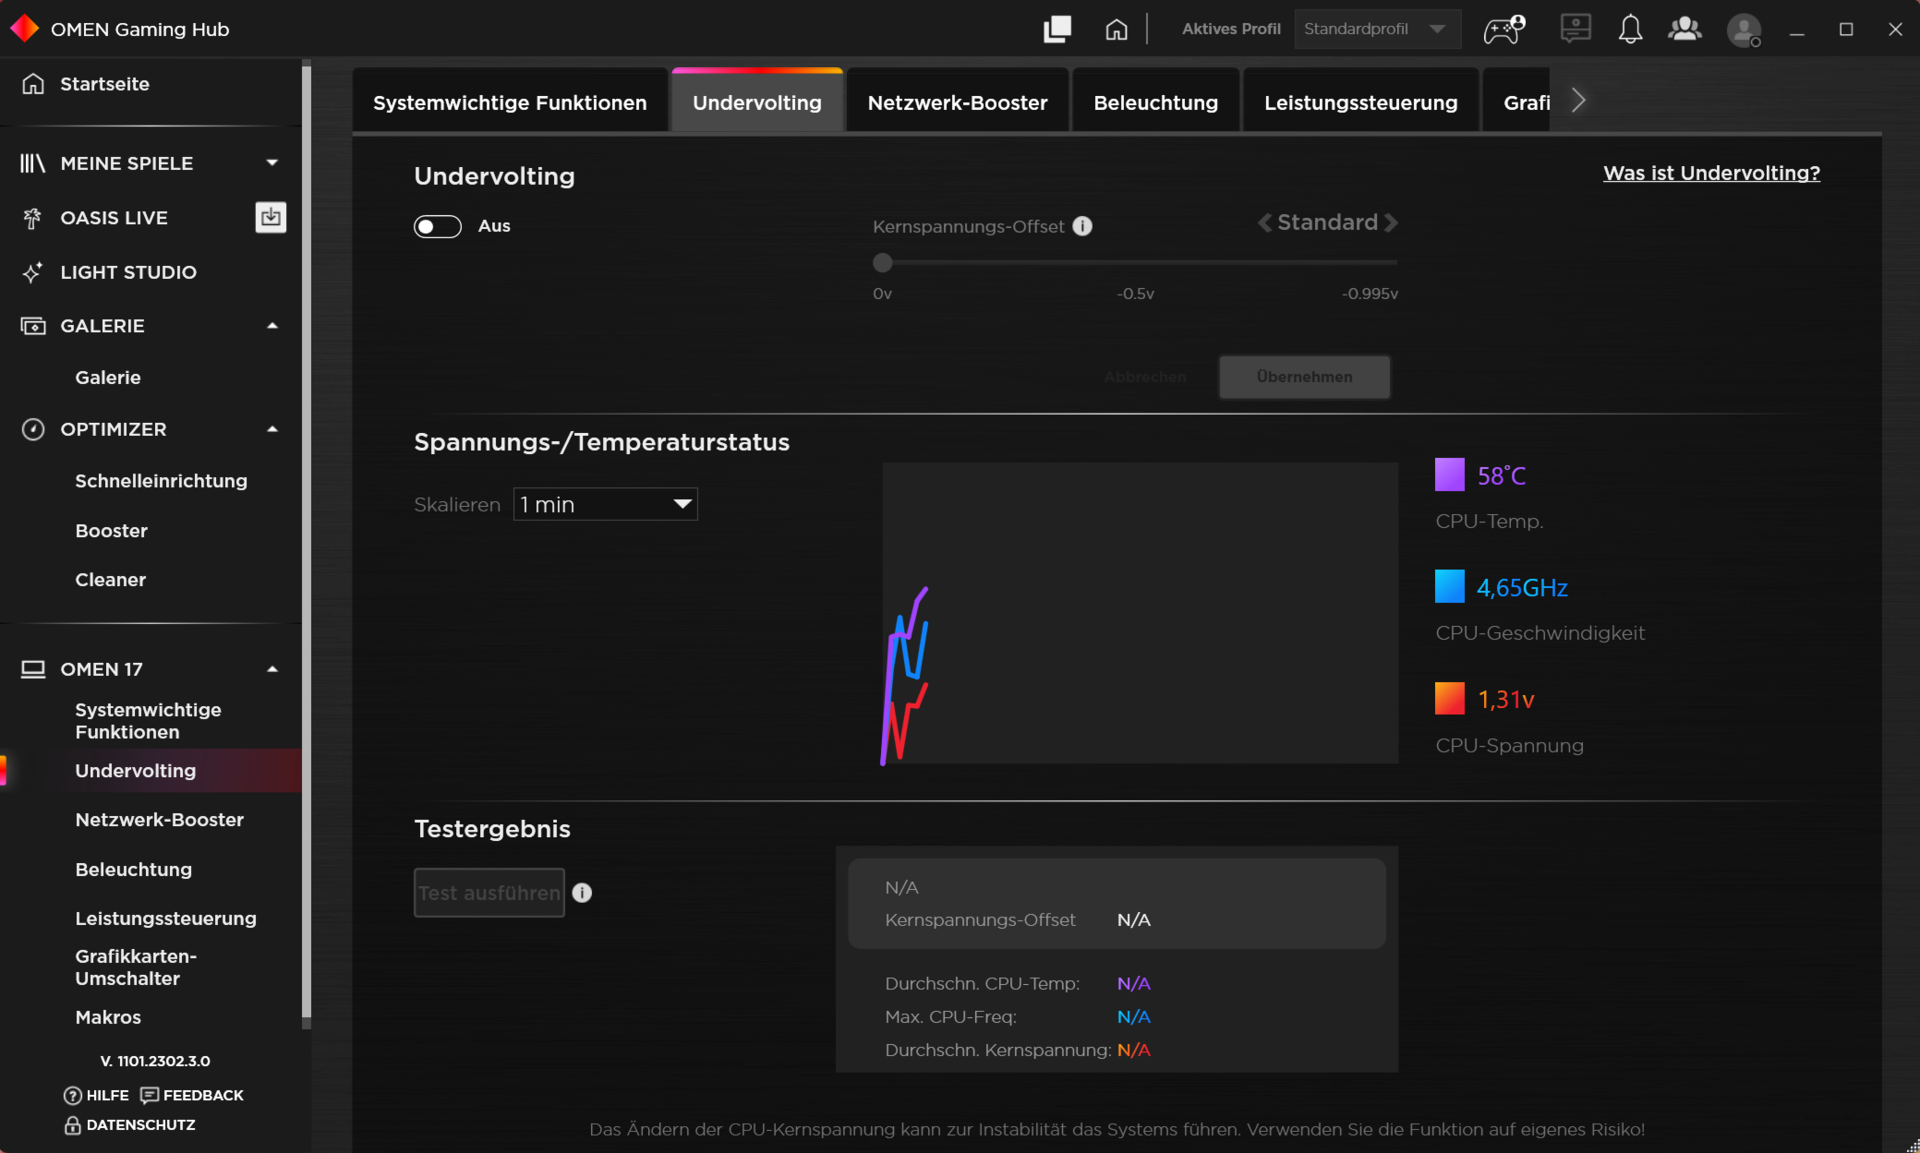
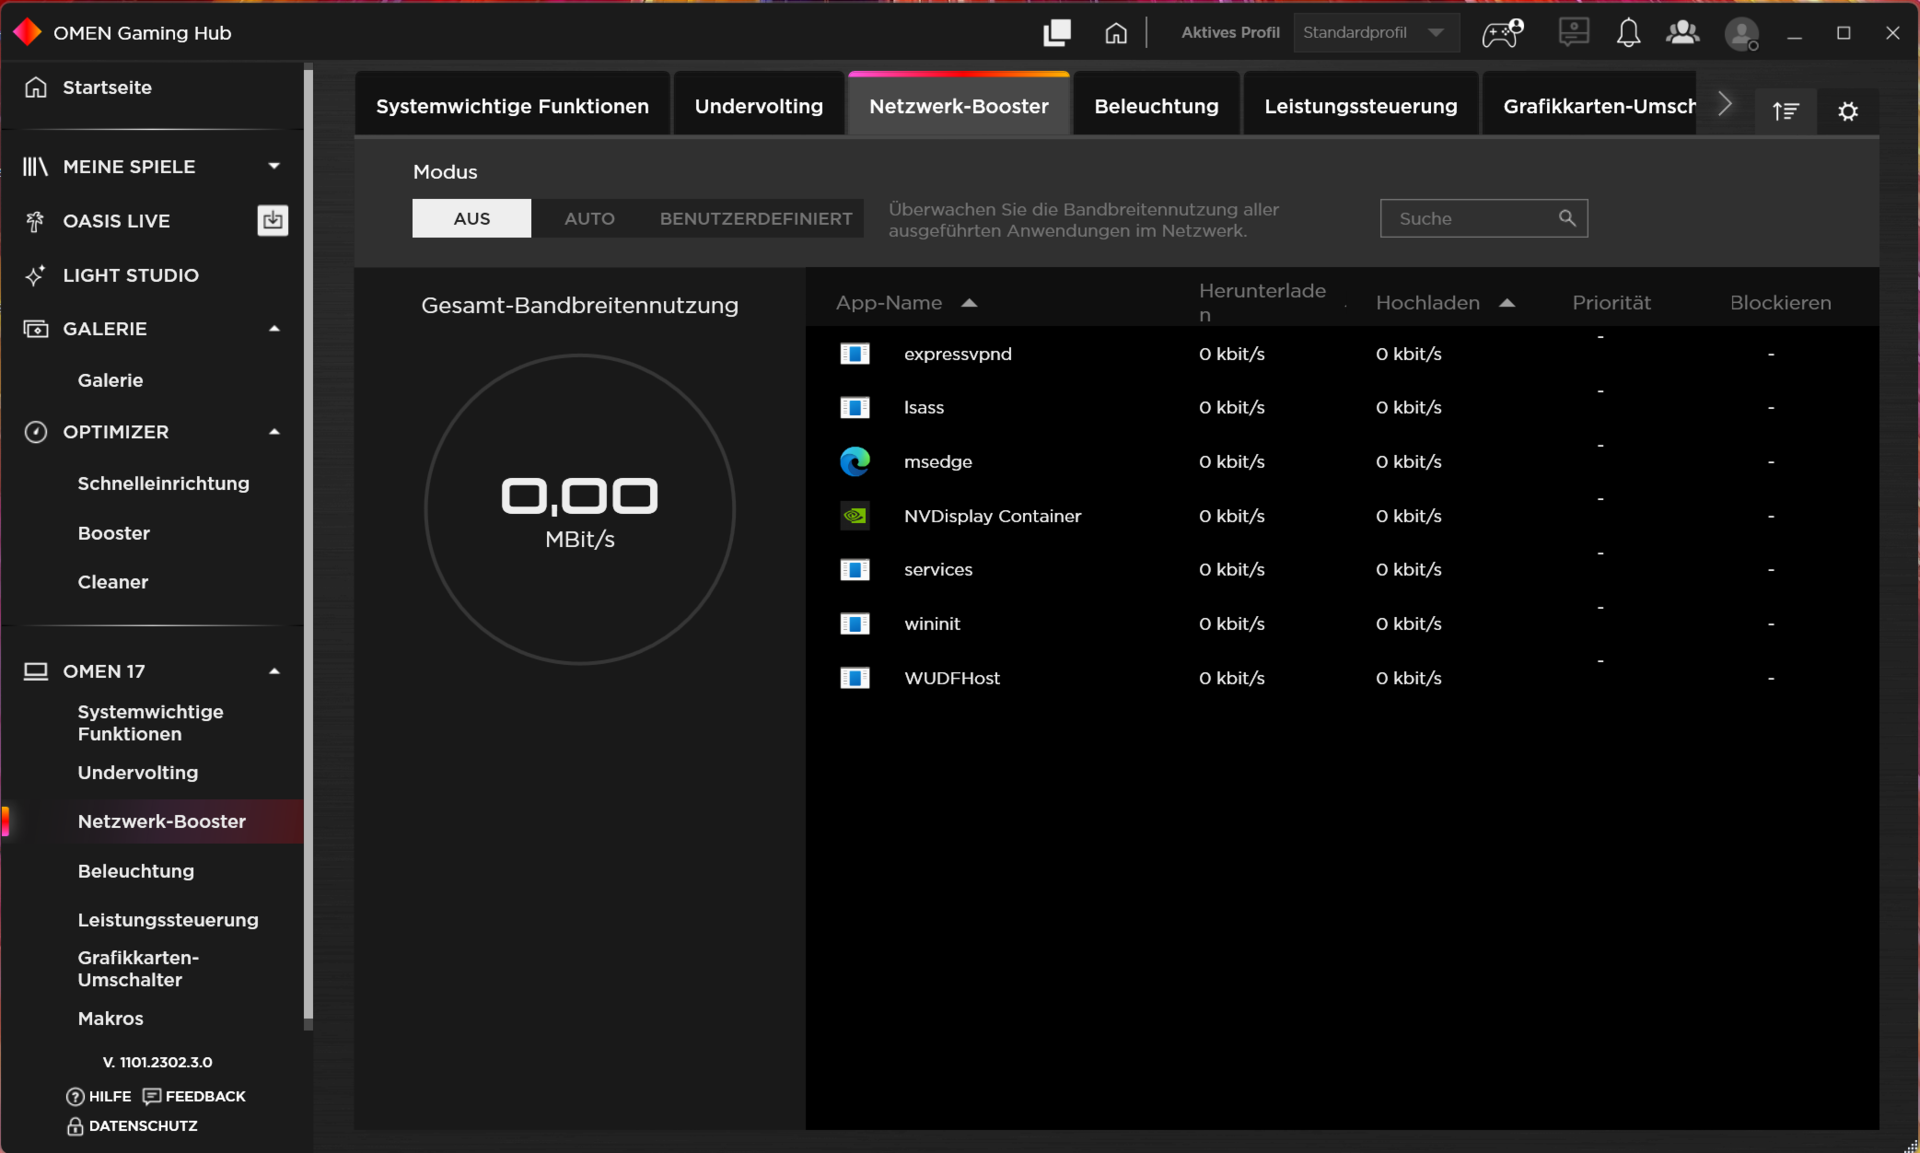
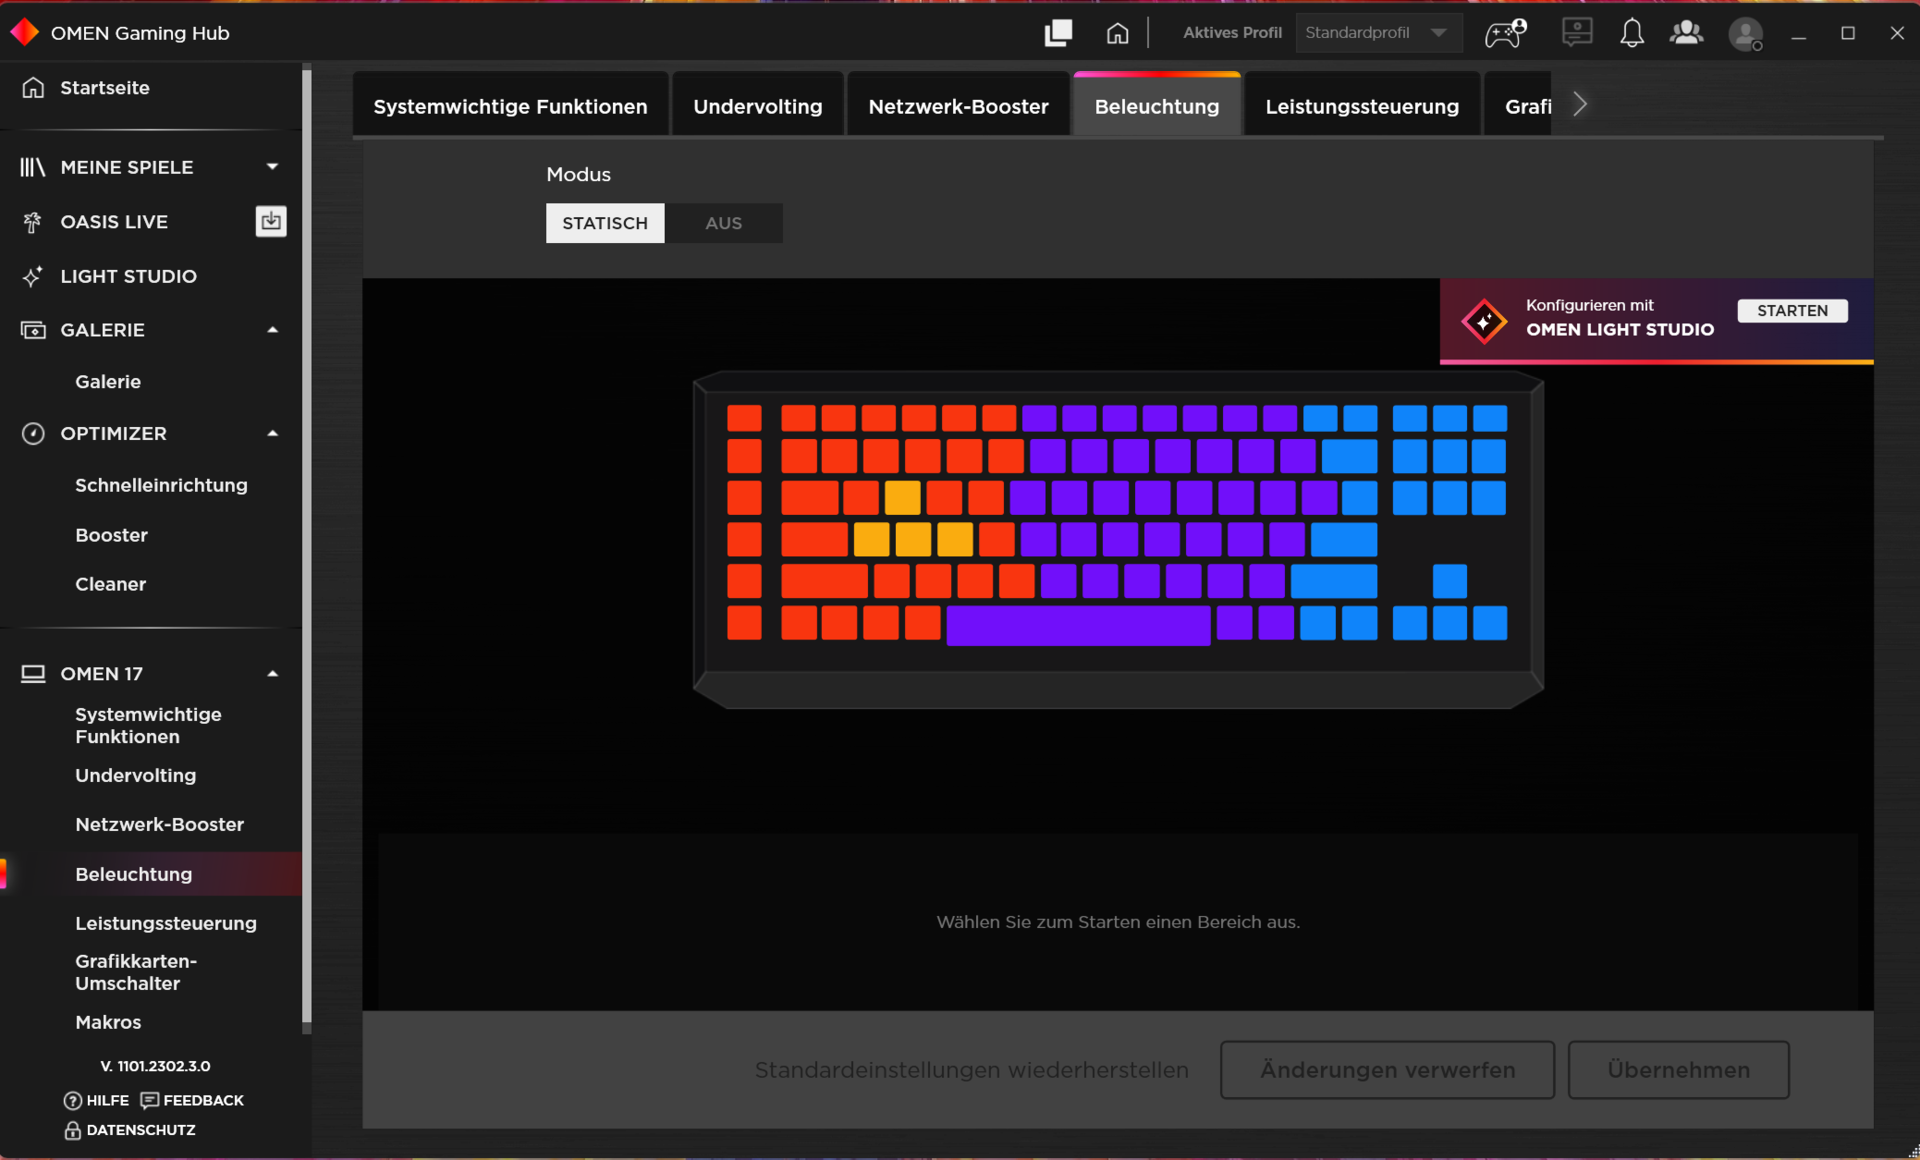
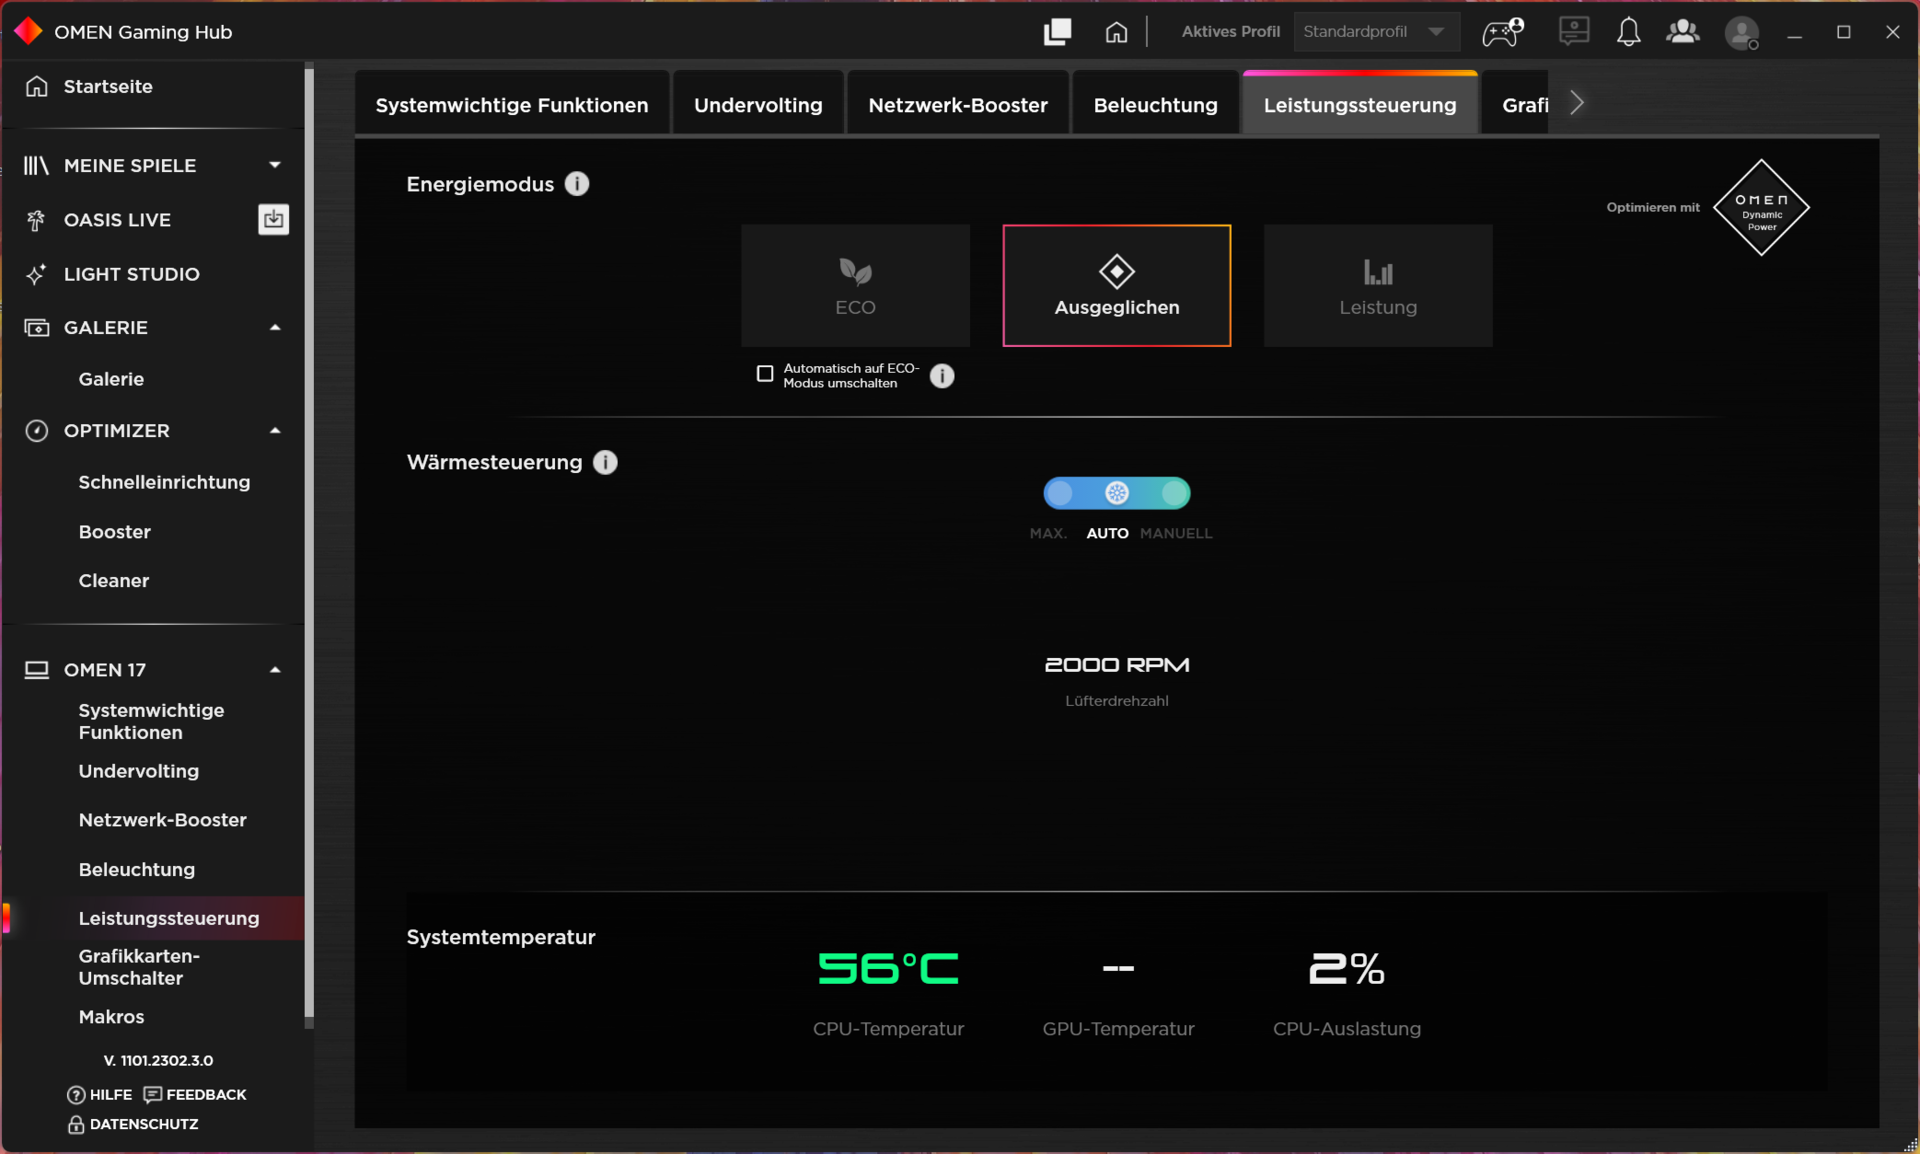
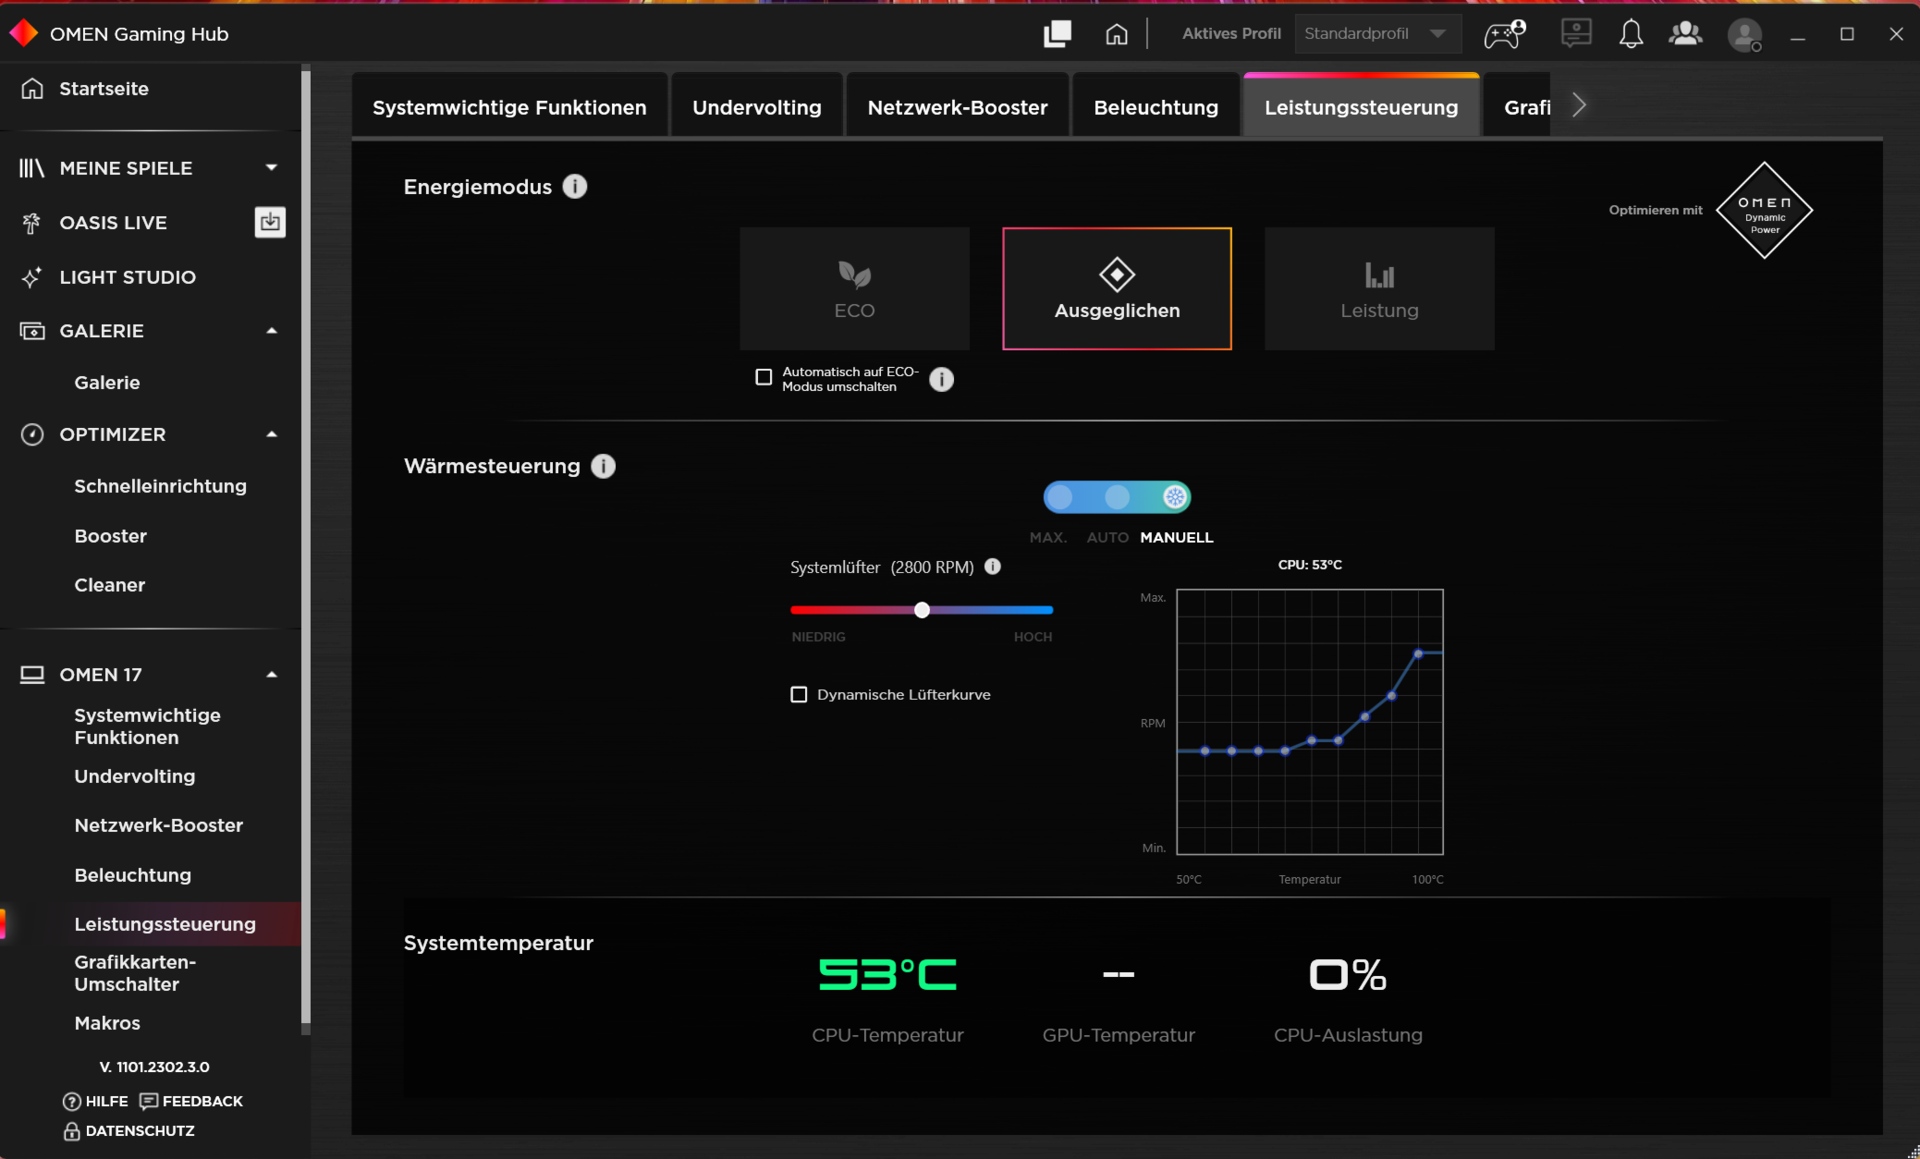
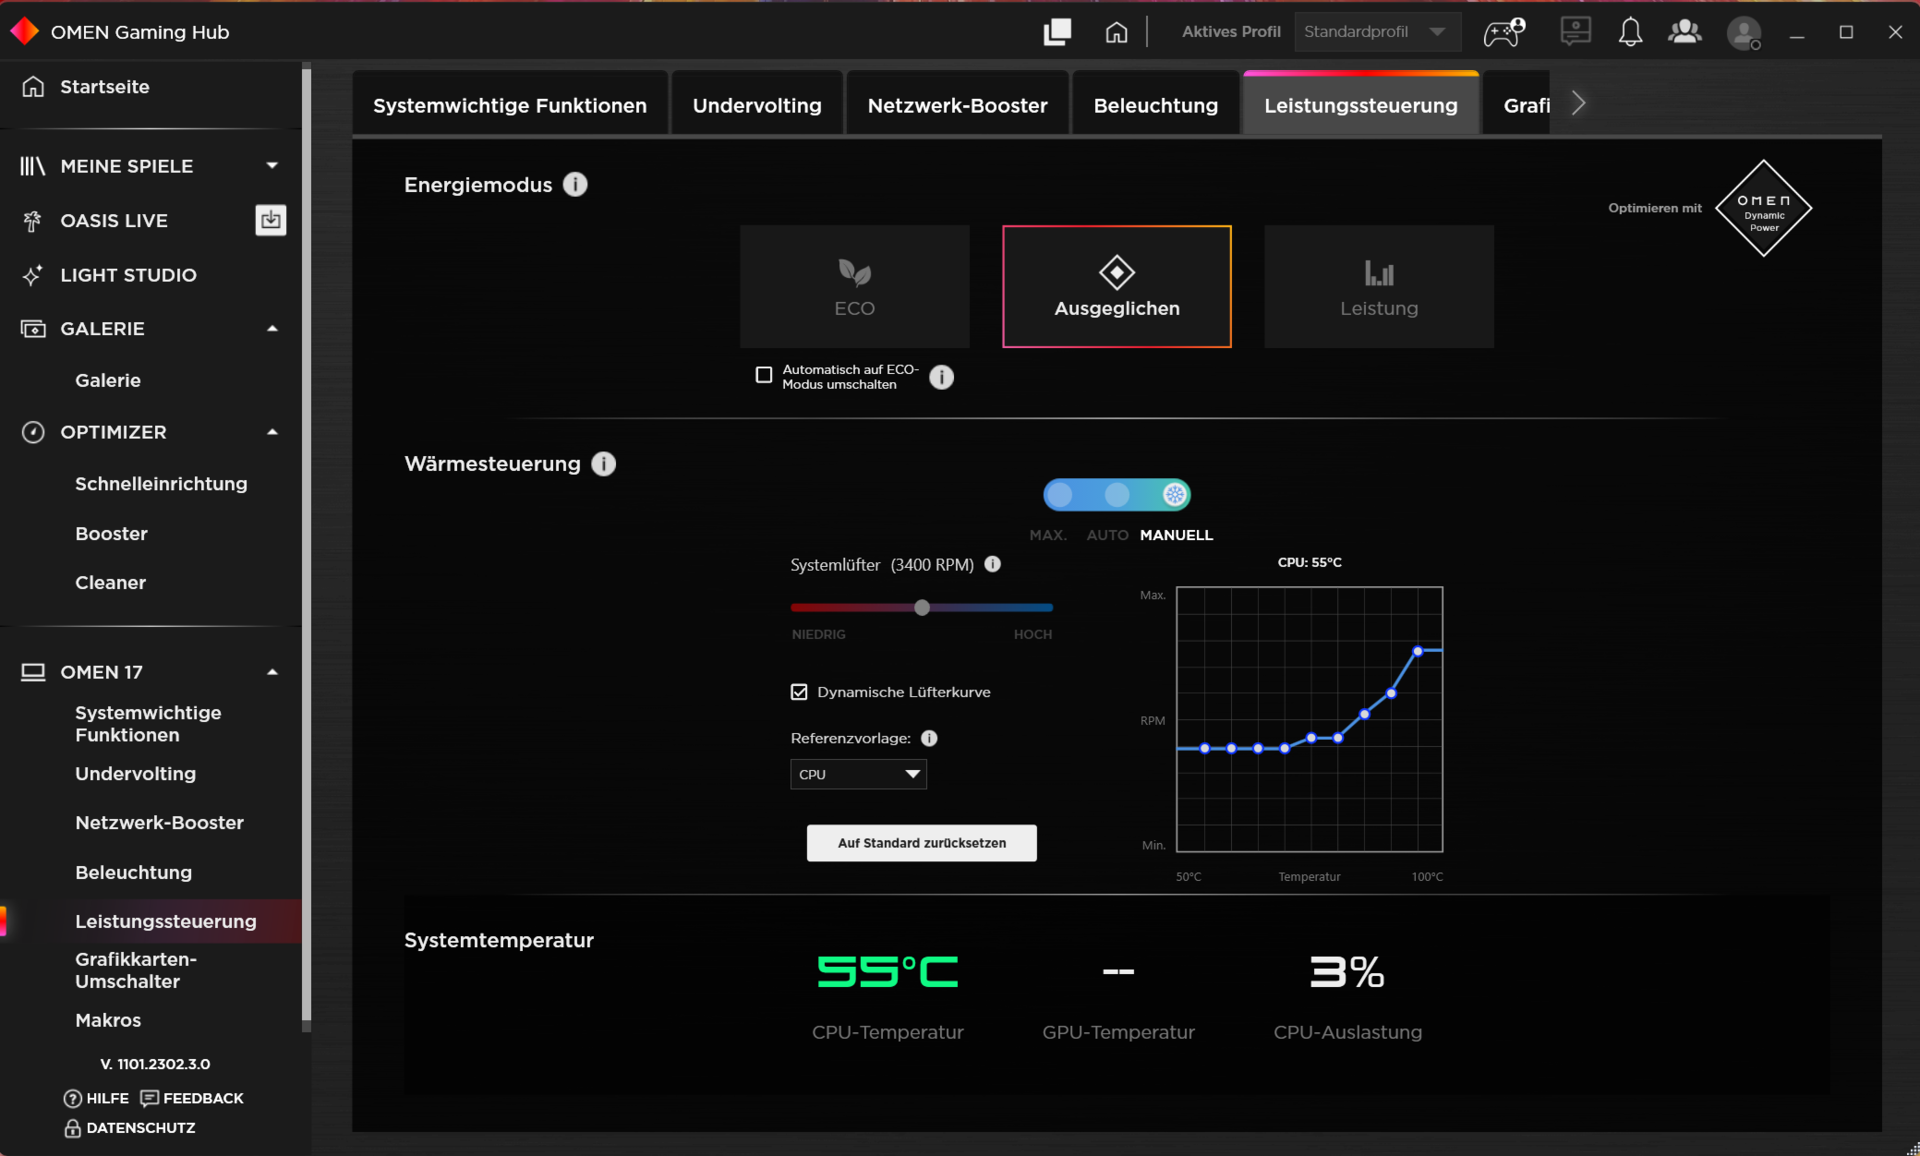
Preinstalowane oprogramowanie Omen Gaming Hub stanowi centrum sterowania laptopem. Oprócz wyboru trybu zasilania (patrz tabela) pozwala ono także na podkręcenie napięcia w procesorze i skonfigurowanie indywidualnej krzywej wentylatora. Ponieważ tryb "Performance" stwarzał w naszym egzemplarzu testowym pewne problemy (dziwne zacinanie się i spadki wydajności), korzystaliśmy głównie z trybu zasilania "Balanced" wraz z automatyczną kontrolą wentylatorów. Optimus został aktywowany.
| Wydajność | Zrównoważony | Eco | |
|---|---|---|---|
| Limit mocy 1 | 100 Watt | 55 Watt | 55 Watt |
| Power Limit 2 | 130 Watt | 130 Watt | 130 Watt |
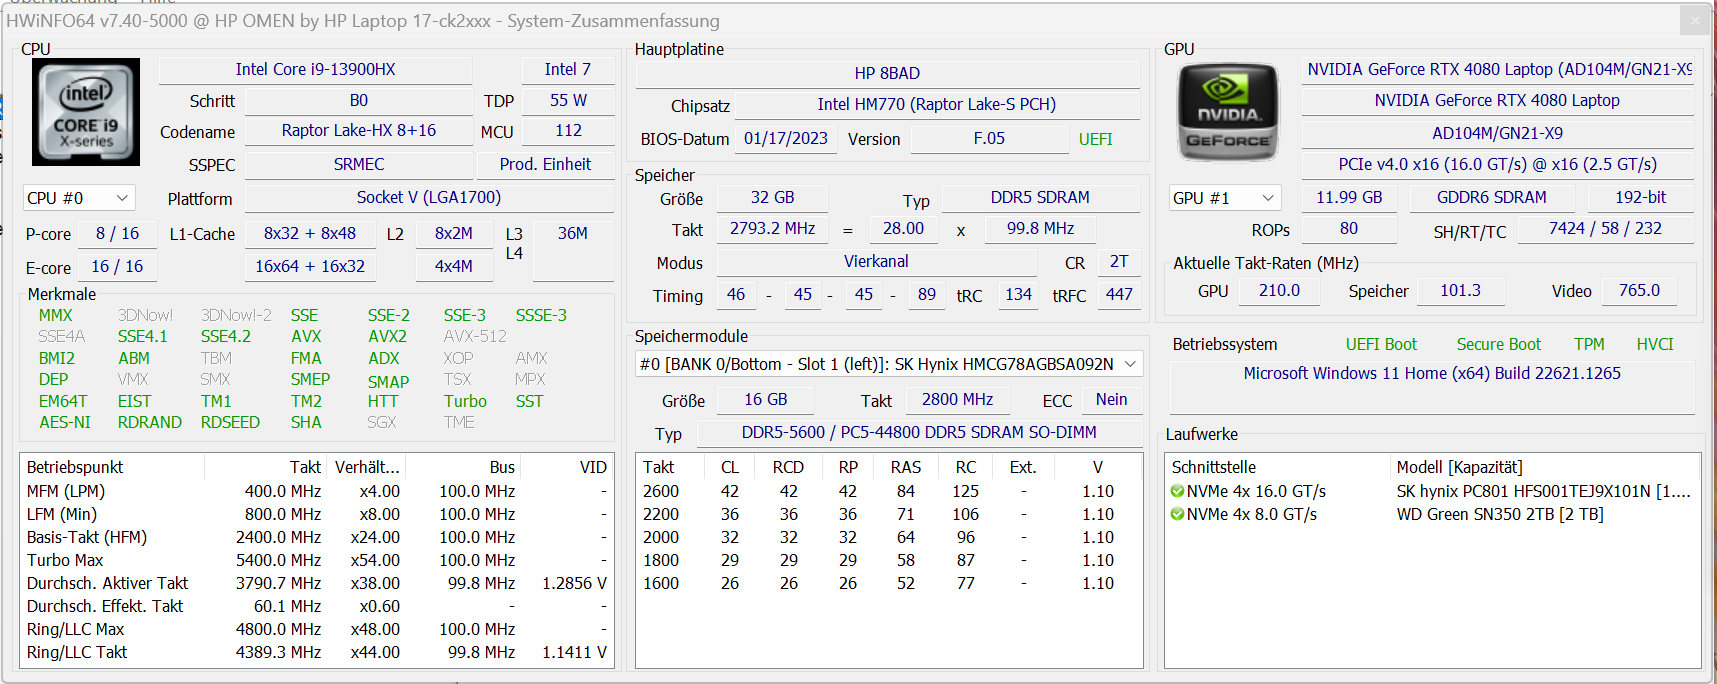
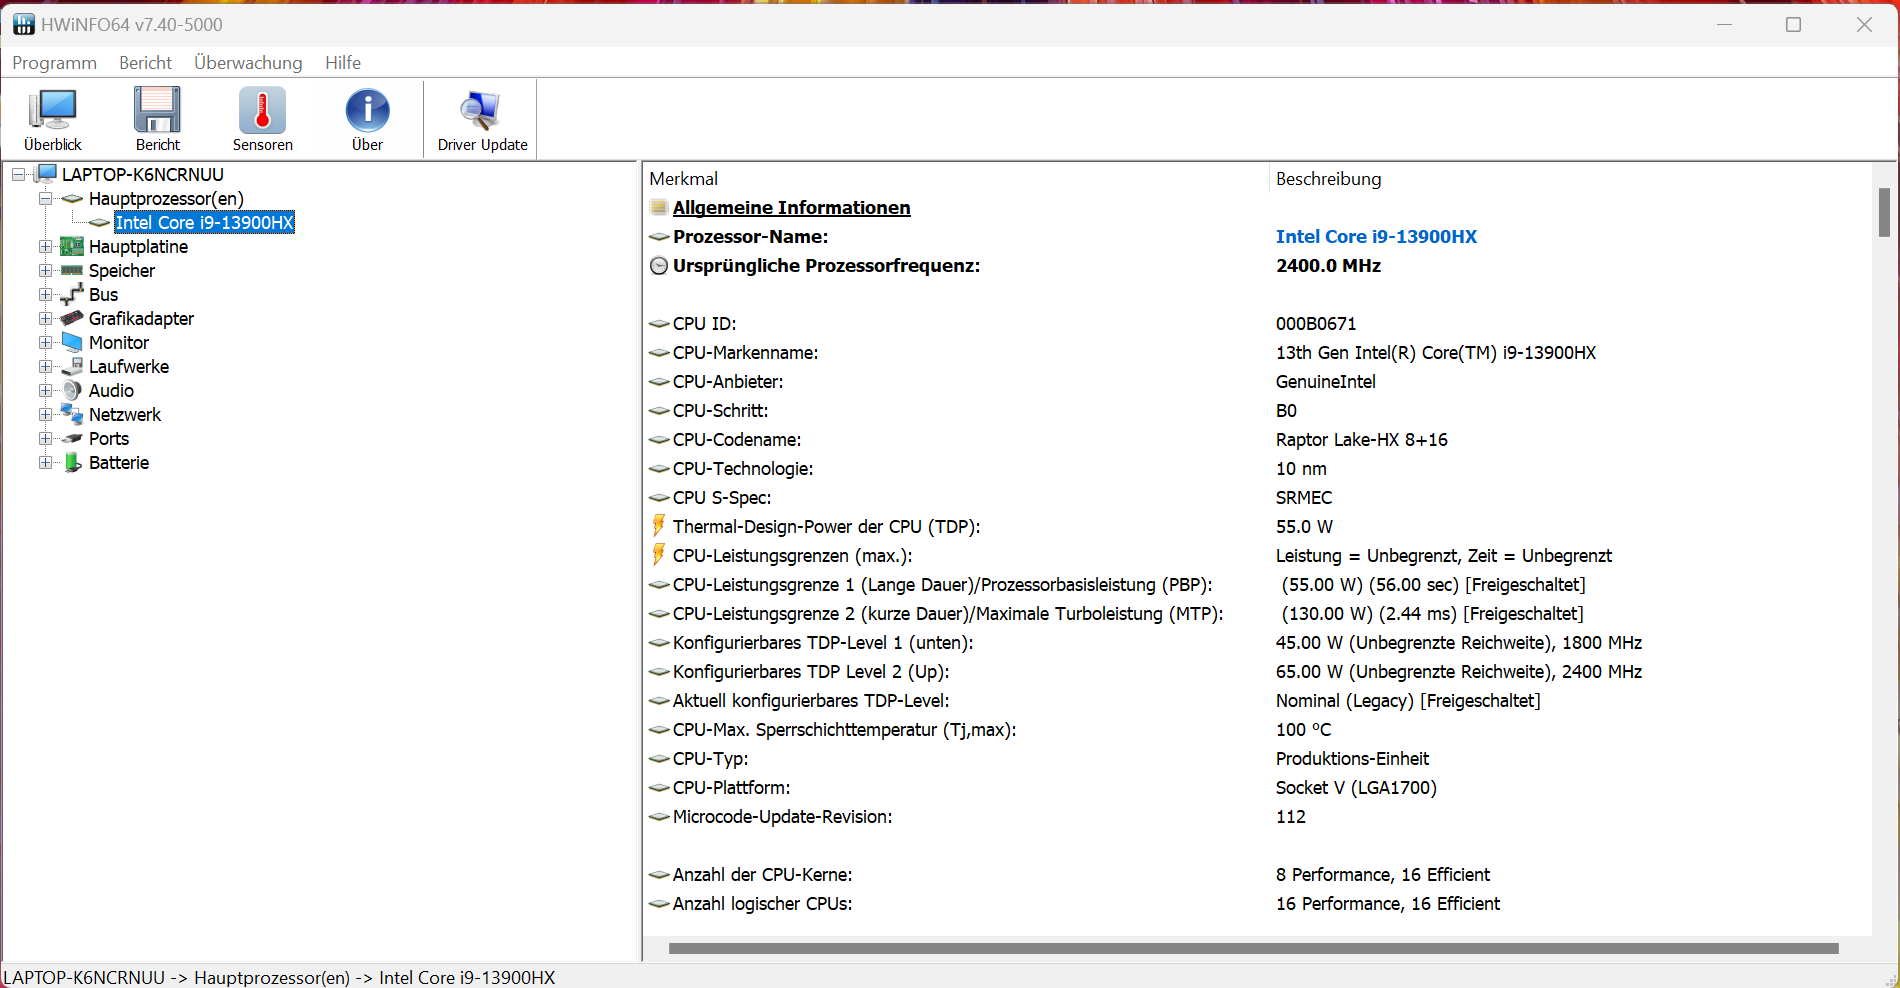
Procesor
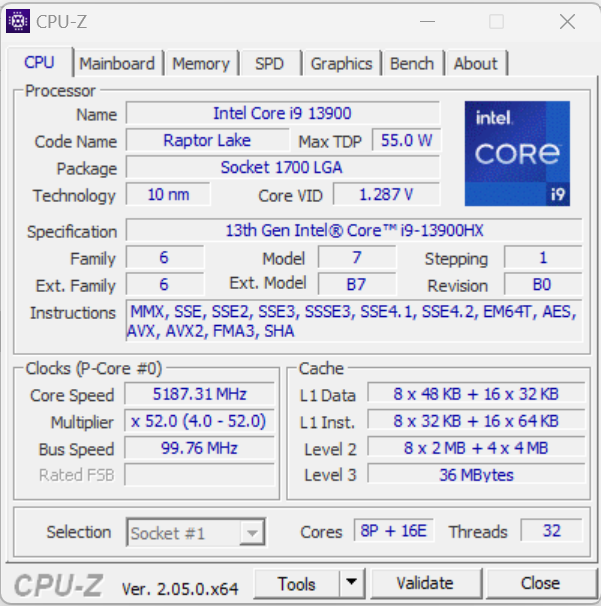
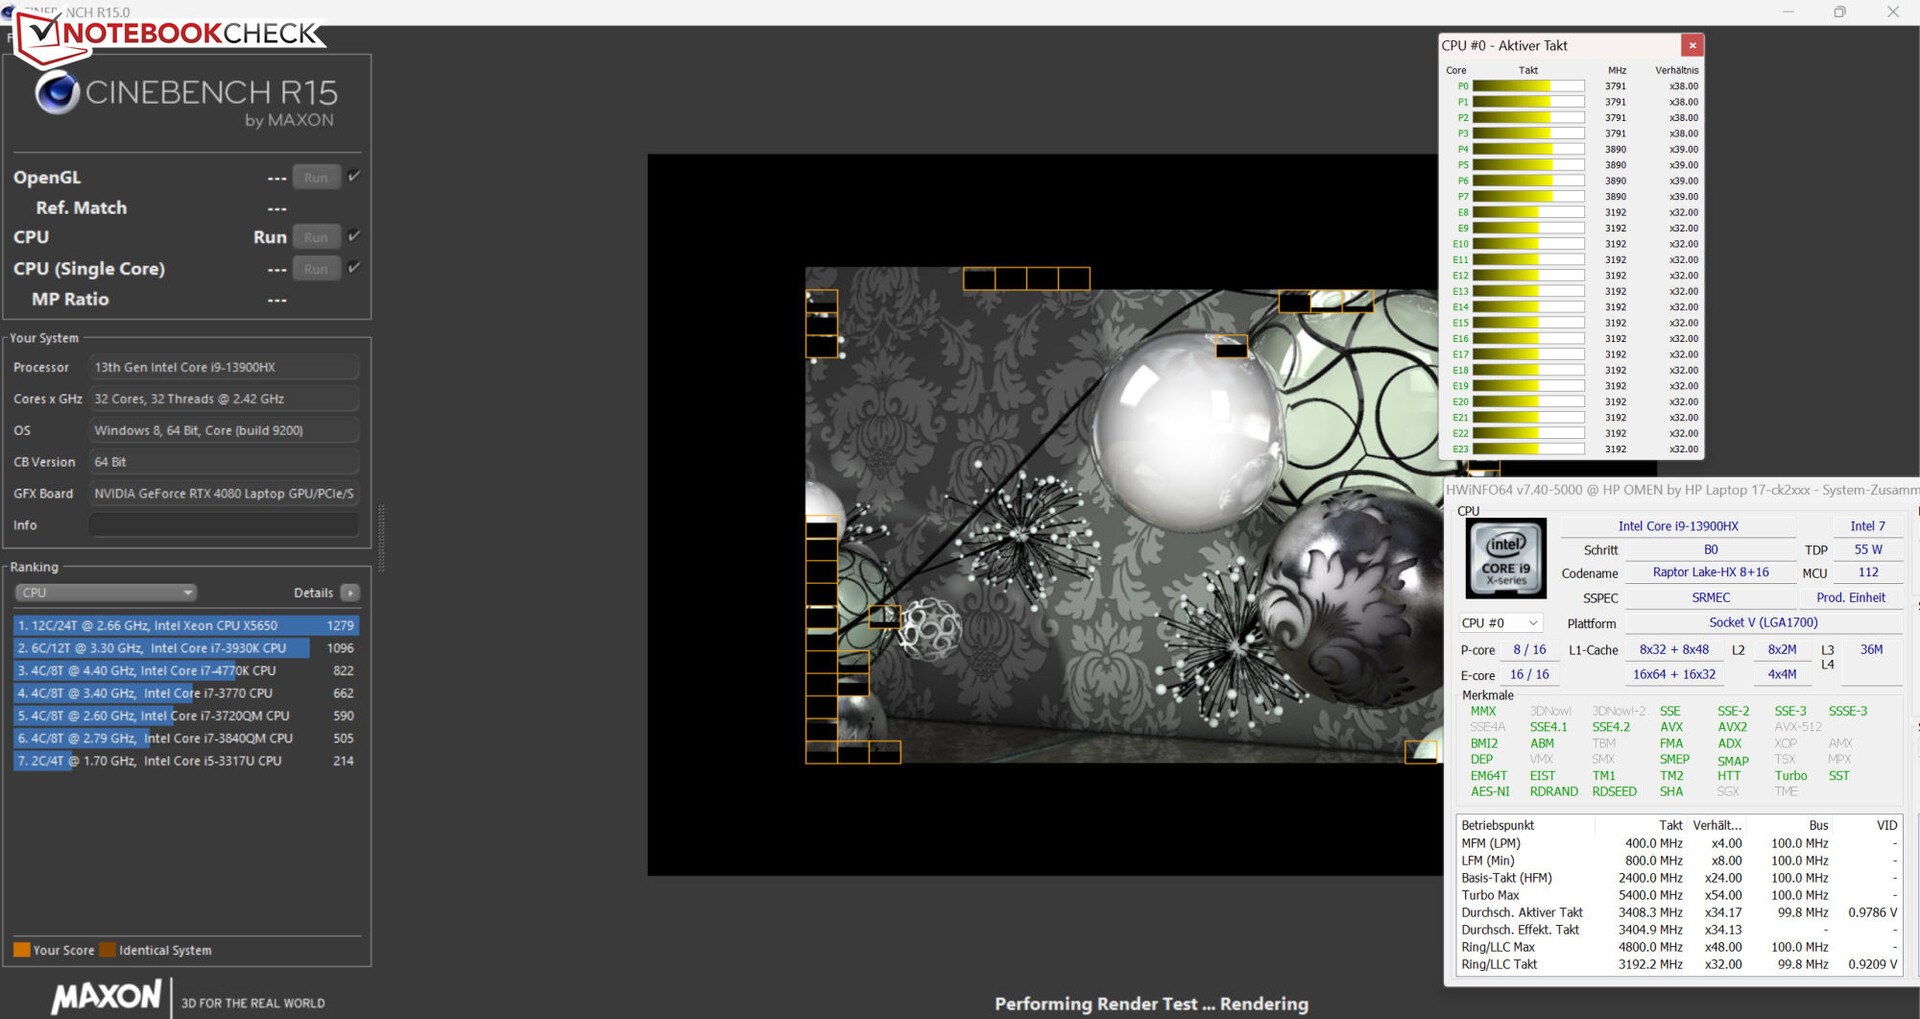
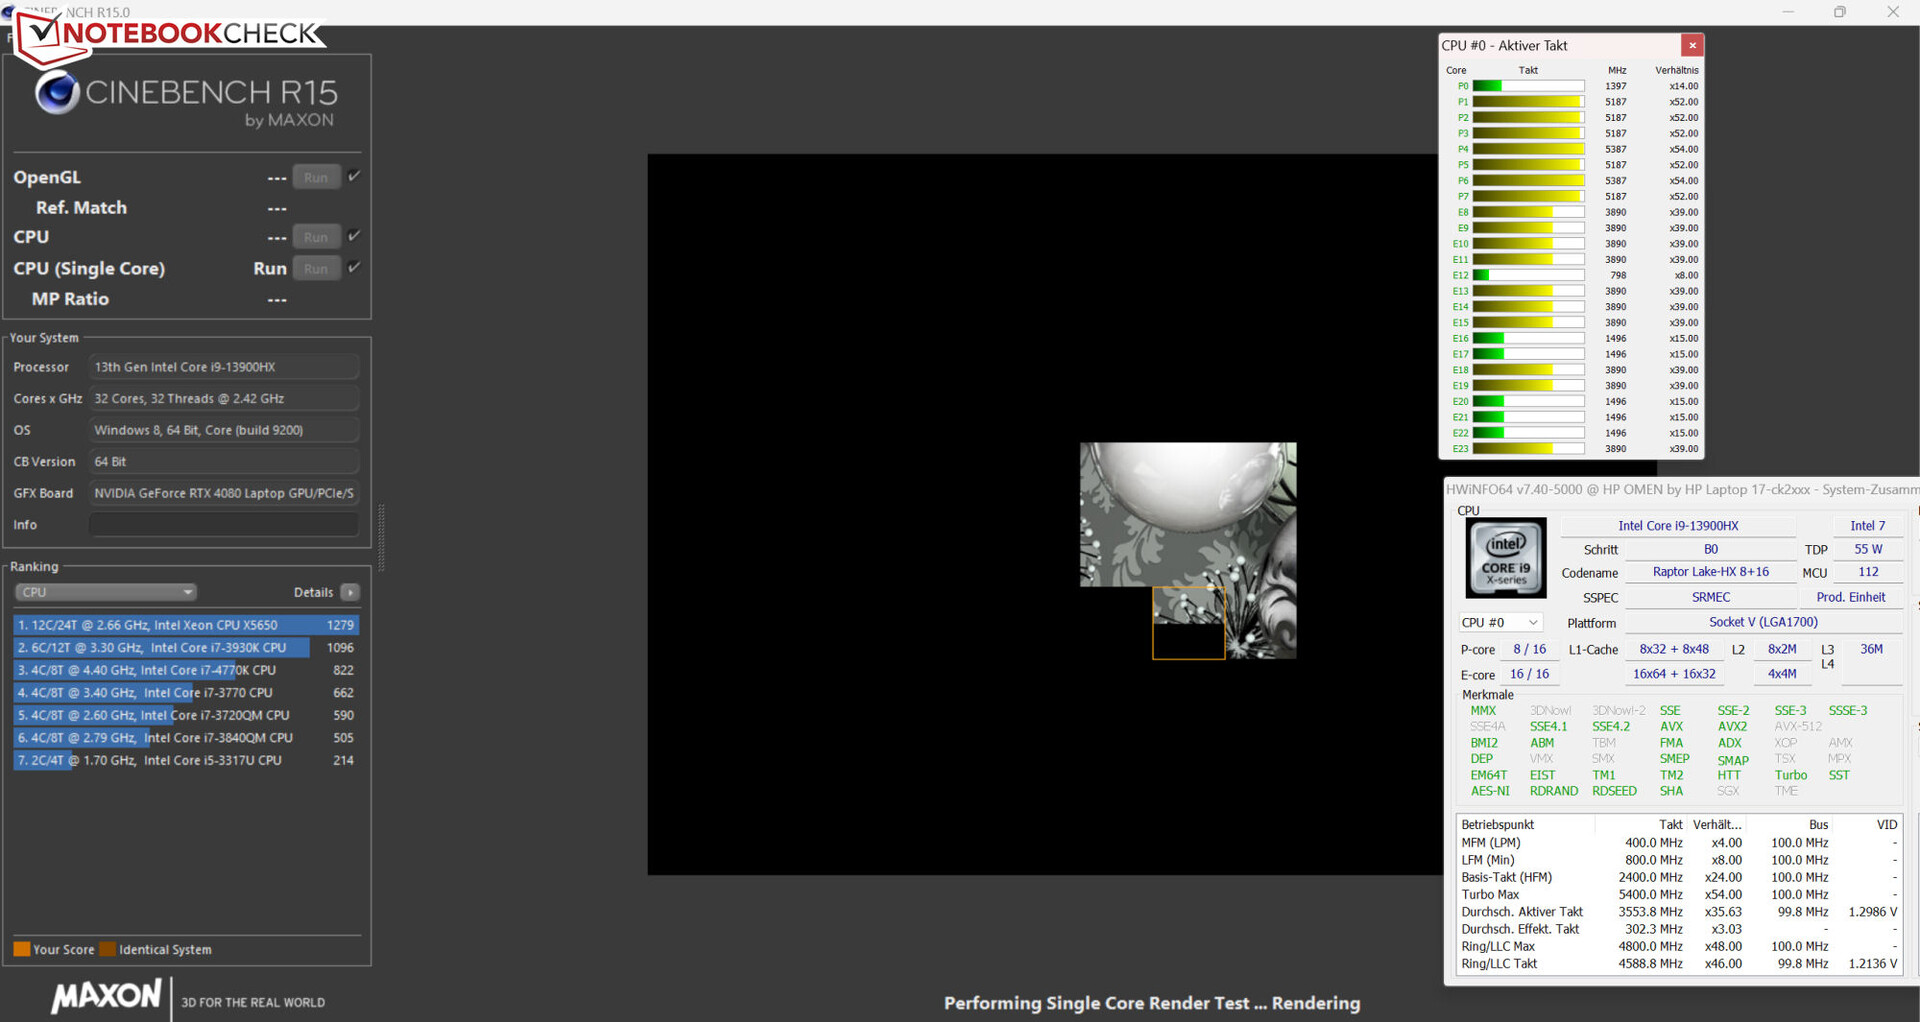
Na stronie .Core i9-13900HXprocesor (Raptor Lake) składa się z szesnastu rdzeni Efficiency (bez hyperthreadingu, od 1,6 do 3,9 GHz) i ośmiu rdzeni Performance (hyperthreading, od 2,2 do 5,4 GHz), co daje łącznie 32 logiczne rdzenie CPU.
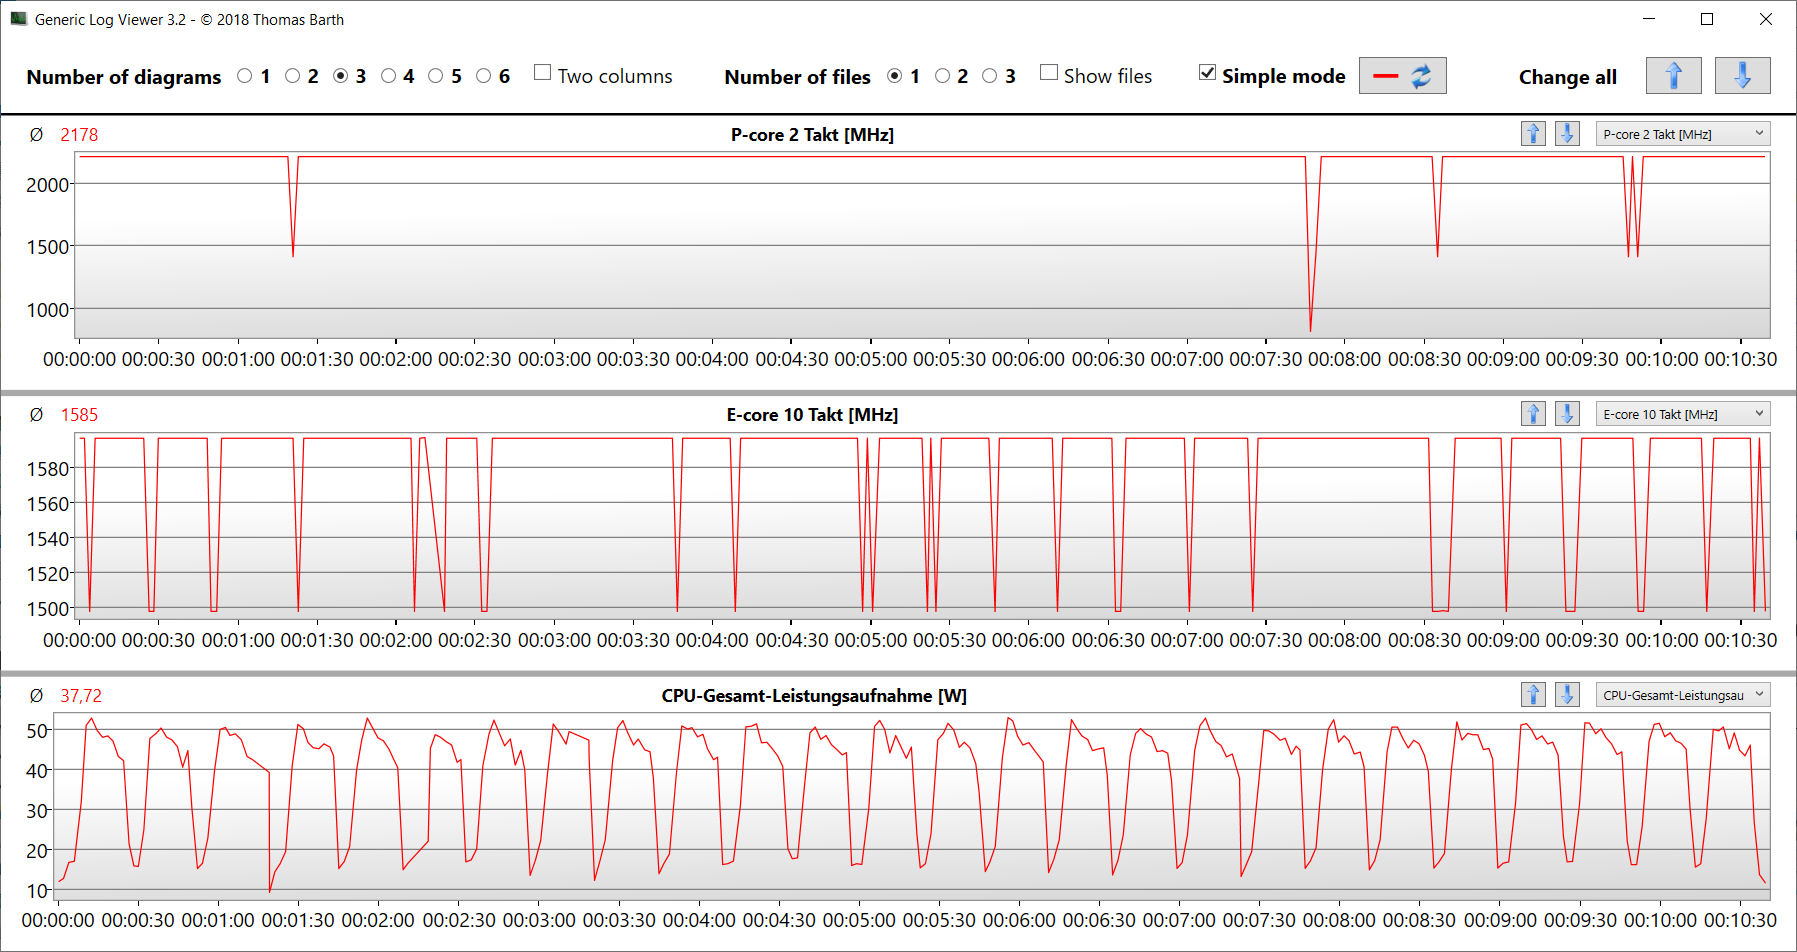
Podczas pracy w sieci procesor przechodzi testy CPU benchmarku Cinebench R15 ze średnimi i wysokimi (wielowątkowymi) oraz wysokimi i maksymalnymi (jednowątkowymi) wartościami taktowania. O ile podczas pracy na akumulatorze wydajność jednowątkowa (254 pkt.) spada nieznacznie, o tyle spadek wydajności wielowątkowej jest znaczny (1 303 pkt.).
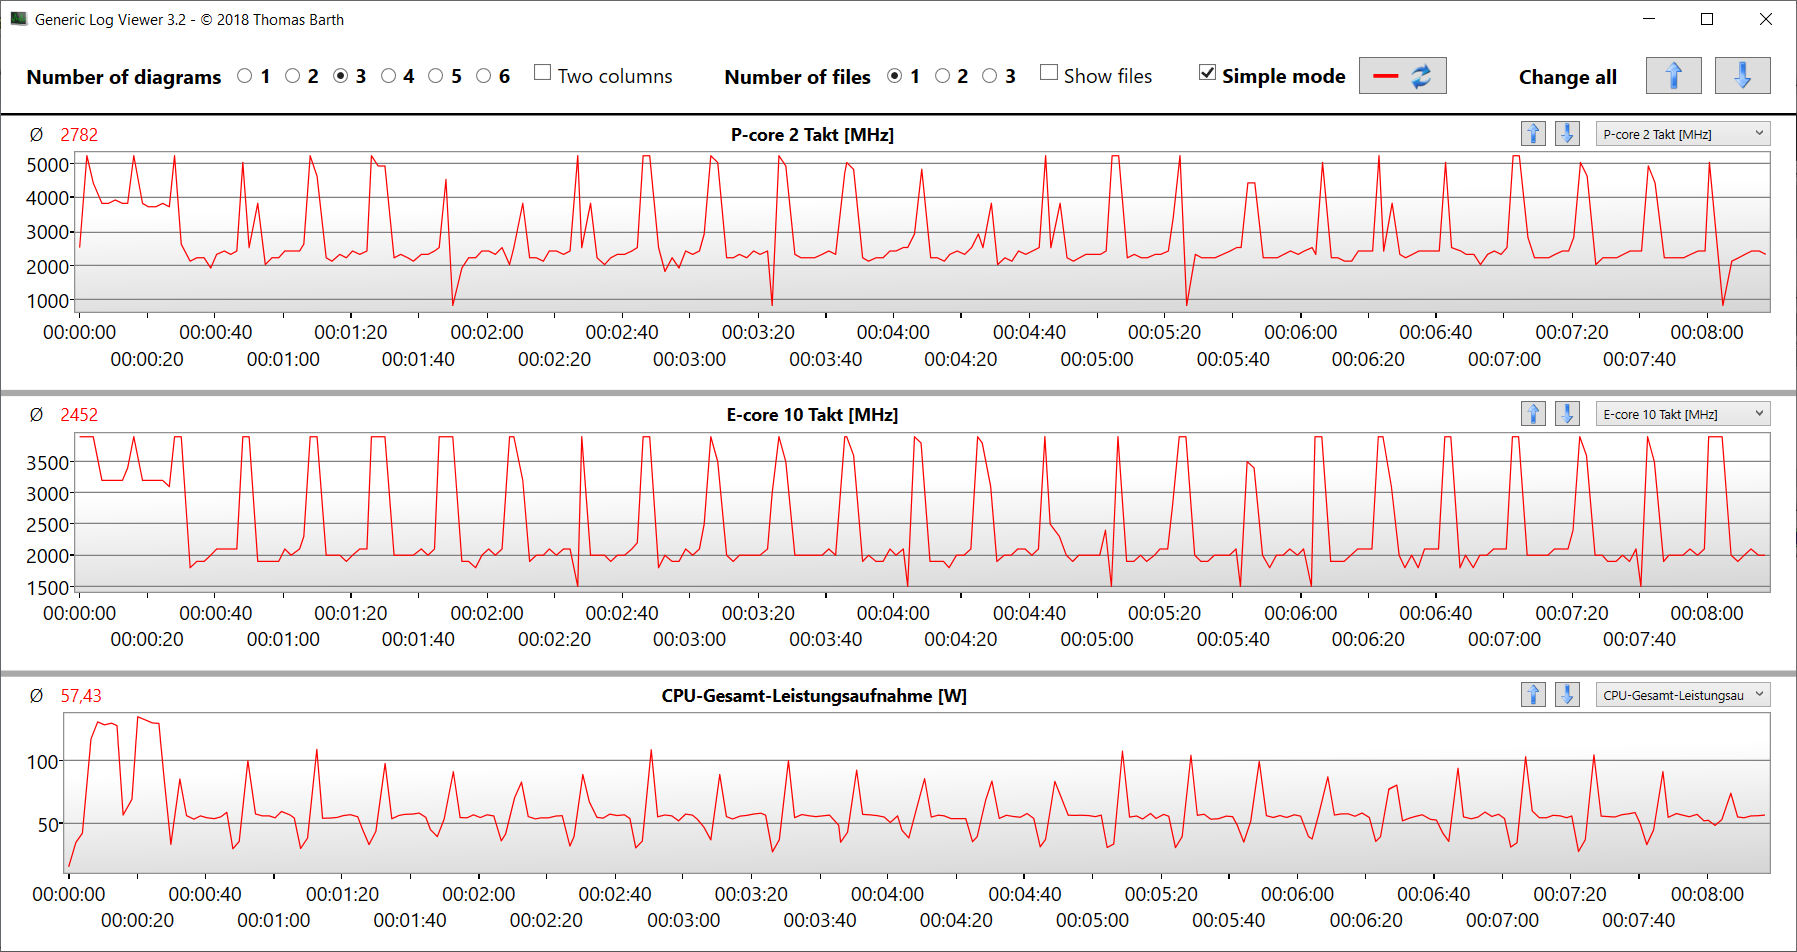
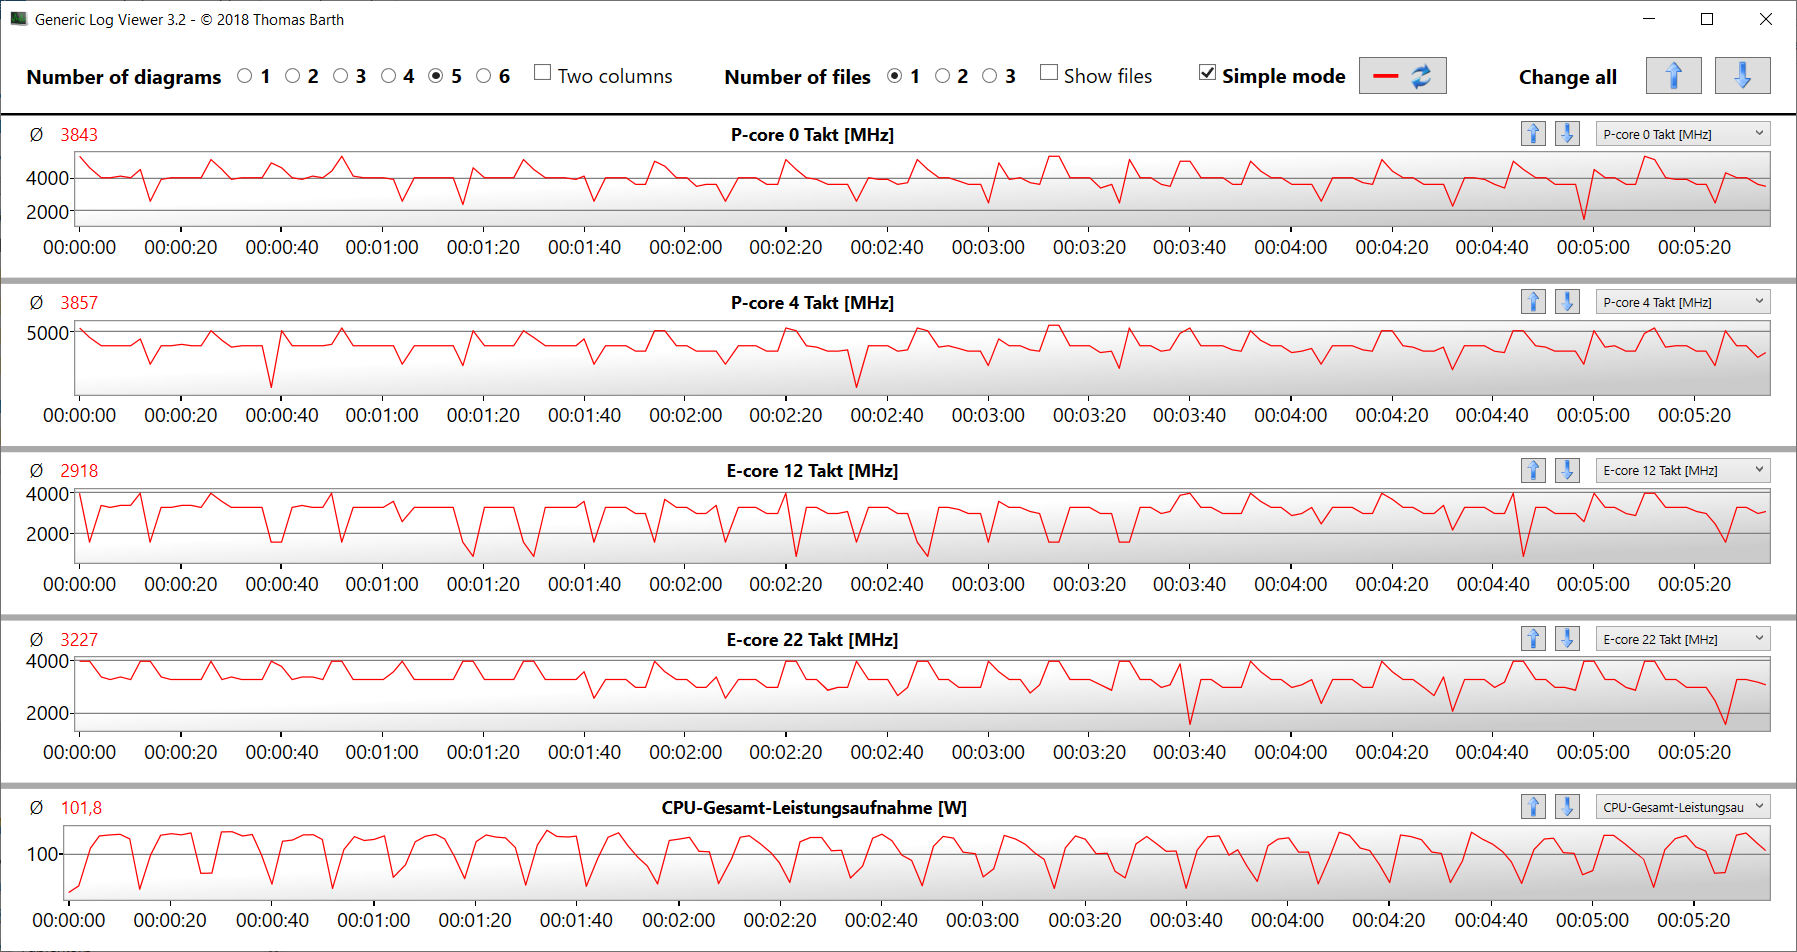
Wyniki benchmarków oscylują na poziomie (jednowątkowo) średniej dla procesora lub poniżej (wielowątkowo). Ogólnie rzecz biorąc, tryb "Performance" daje tylko niewielką przewagę wydajności, przy czym najwięcej zyskują benchmarki AIDA. Z drugiej strony spowoduje on również, że prędkość procesora pozostanie na wysokim poziomie przy stałym obciążeniu wielowątkowym, co pokazuje test pętli CB15.
Cinebench R15 Multi Constant Load Test
| CPU Performance rating - Percent | |
| Lenovo Legion Pro 7 16IRX8H | |
| Asus ROG Strix G16 G614JZ | |
| HP Omen 17-ck2097ng | |
| Przeciętny Intel Core i9-13900HX | |
| HP Omen 17-ck2097ng | |
| Razer Blade 16 Early 2023 | |
| Średnia w klasie Gaming | |
| Alienware m17 R5 (R9 6900HX, RX 6850M XT) | |
| Cinebench R15 | |
| CPU Multi 64Bit | |
| Lenovo Legion Pro 7 16IRX8H | |
| Asus ROG Strix G16 G614JZ (turbo) | |
| Asus ROG Strix G16 G614JZ | |
| Razer Blade 16 Early 2023 | |
| Przeciętny Intel Core i9-13900HX (3913 - 4970, n=22) | |
| HP Omen 17-ck2097ng (Leistung) | |
| HP Omen 17-ck2097ng | |
| Średnia w klasie Gaming (1578 - 6271, n=111, ostatnie 2 lata) | |
| Alienware m17 R5 (R9 6900HX, RX 6850M XT) | |
| CPU Single 64Bit | |
| Asus ROG Strix G16 G614JZ | |
| Asus ROG Strix G16 G614JZ (turbo) | |
| Lenovo Legion Pro 7 16IRX8H | |
| HP Omen 17-ck2097ng | |
| HP Omen 17-ck2097ng (Leistung) | |
| Średnia w klasie Gaming (188.8 - 343, n=111, ostatnie 2 lata) | |
| Przeciętny Intel Core i9-13900HX (247 - 304, n=22) | |
| Razer Blade 16 Early 2023 | |
| Alienware m17 R5 (R9 6900HX, RX 6850M XT) | |
| Blender - v2.79 BMW27 CPU | |
| Alienware m17 R5 (R9 6900HX, RX 6850M XT) | |
| Średnia w klasie Gaming (80 - 330, n=109, ostatnie 2 lata) | |
| HP Omen 17-ck2097ng | |
| Przeciętny Intel Core i9-13900HX (101 - 153, n=22) | |
| Razer Blade 16 Early 2023 | |
| HP Omen 17-ck2097ng (Leistung) | |
| Asus ROG Strix G16 G614JZ | |
| Lenovo Legion Pro 7 16IRX8H | |
| HWBOT x265 Benchmark v2.2 - 4k Preset | |
| Lenovo Legion Pro 7 16IRX8H | |
| HP Omen 17-ck2097ng (Leistung) | |
| Asus ROG Strix G16 G614JZ | |
| Przeciętny Intel Core i9-13900HX (23.5 - 34.4, n=22) | |
| Razer Blade 16 Early 2023 | |
| Średnia w klasie Gaming (11.5 - 44.3, n=110, ostatnie 2 lata) | |
| HP Omen 17-ck2097ng | |
| Alienware m17 R5 (R9 6900HX, RX 6850M XT) | |
| LibreOffice - 20 Documents To PDF | |
| Alienware m17 R5 (R9 6900HX, RX 6850M XT) | |
| Średnia w klasie Gaming (19 - 88.8, n=110, ostatnie 2 lata) | |
| Asus ROG Strix G16 G614JZ | |
| Razer Blade 16 Early 2023 | |
| HP Omen 17-ck2097ng | |
| Lenovo Legion Pro 7 16IRX8H | |
| Przeciętny Intel Core i9-13900HX (32.8 - 51.1, n=21) | |
| HP Omen 17-ck2097ng (Leistung) | |
| R Benchmark 2.5 - Overall mean | |
| Alienware m17 R5 (R9 6900HX, RX 6850M XT) | |
| Średnia w klasie Gaming (0.3439 - 0.759, n=111, ostatnie 2 lata) | |
| Razer Blade 16 Early 2023 | |
| Przeciętny Intel Core i9-13900HX (0.375 - 0.4564, n=22) | |
| Lenovo Legion Pro 7 16IRX8H | |
| HP Omen 17-ck2097ng (Leistung) | |
| Asus ROG Strix G16 G614JZ | |
| HP Omen 17-ck2097ng | |
* ... im mniej tym lepiej
AIDA64: FP32 Ray-Trace | FPU Julia | CPU SHA3 | CPU Queen | FPU SinJulia | FPU Mandel | CPU AES | CPU ZLib | FP64 Ray-Trace | CPU PhotoWorxx
| Performance rating | |
| Lenovo Legion Pro 7 16IRX8H | |
| Asus ROG Strix G16 G614JZ | |
| Średnia w klasie Gaming | |
| Przeciętny Intel Core i9-13900HX | |
| HP Omen 17-ck2097ng | |
| Razer Blade 16 Early 2023 | |
| HP Omen 17-ck2097ng | |
| Alienware m17 R5 (R9 6900HX, RX 6850M XT) | |
| AIDA64 / FP32 Ray-Trace | |
| Średnia w klasie Gaming (10227 - 85542, n=109, ostatnie 2 lata) | |
| Asus ROG Strix G16 G614JZ (v6.75.6100) | |
| Lenovo Legion Pro 7 16IRX8H (v6.85.6300) | |
| Razer Blade 16 Early 2023 (v6.85.6300) | |
| Razer Blade 16 Early 2023 (v8.20.8100) | |
| Razer Blade 16 Early 2023 (v6.92.6600) | |
| Przeciętny Intel Core i9-13900HX (17589 - 27615, n=22) | |
| HP Omen 17-ck2097ng (v6.75.6100, Leistung) | |
| HP Omen 17-ck2097ng (v6.75.6100) | |
| Alienware m17 R5 (R9 6900HX, RX 6850M XT) (v6.75.6100) | |
| AIDA64 / FPU Julia | |
| Średnia w klasie Gaming (51376 - 238426, n=109, ostatnie 2 lata) | |
| Lenovo Legion Pro 7 16IRX8H (v6.85.6300) | |
| Asus ROG Strix G16 G614JZ (v6.75.6100) | |
| Razer Blade 16 Early 2023 (v6.85.6300) | |
| Razer Blade 16 Early 2023 (v8.20.8100) | |
| Razer Blade 16 Early 2023 (v6.92.6600) | |
| Przeciętny Intel Core i9-13900HX (88686 - 137015, n=22) | |
| HP Omen 17-ck2097ng (v6.75.6100, Leistung) | |
| Alienware m17 R5 (R9 6900HX, RX 6850M XT) (v6.75.6100) | |
| HP Omen 17-ck2097ng (v6.75.6100) | |
| AIDA64 / CPU SHA3 | |
| Lenovo Legion Pro 7 16IRX8H (v6.85.6300) | |
| Asus ROG Strix G16 G614JZ (v6.75.6100) | |
| Razer Blade 16 Early 2023 (v6.85.6300) | |
| Razer Blade 16 Early 2023 (v6.92.6600) | |
| Razer Blade 16 Early 2023 (v8.20.8100) | |
| Średnia w klasie Gaming (2180 - 9817, n=109, ostatnie 2 lata) | |
| Przeciętny Intel Core i9-13900HX (4362 - 7029, n=22) | |
| HP Omen 17-ck2097ng (v6.75.6100, Leistung) | |
| HP Omen 17-ck2097ng (v6.75.6100) | |
| Alienware m17 R5 (R9 6900HX, RX 6850M XT) (v6.75.6100) | |
| AIDA64 / CPU Queen | |
| Asus ROG Strix G16 G614JZ (v6.75.6100) | |
| Razer Blade 16 Early 2023 (v6.92.6600) | |
| Razer Blade 16 Early 2023 (v6.85.6300) | |
| HP Omen 17-ck2097ng | |
| Lenovo Legion Pro 7 16IRX8H (v6.85.6300) | |
| Przeciętny Intel Core i9-13900HX (125644 - 141385, n=22) | |
| HP Omen 17-ck2097ng (v6.75.6100, Leistung) | |
| Średnia w klasie Gaming (49785 - 173351, n=100, ostatnie 2 lata) | |
| Alienware m17 R5 (R9 6900HX, RX 6850M XT) (v6.75.6100) | |
| AIDA64 / FPU SinJulia | |
| Asus ROG Strix G16 G614JZ (v6.75.6100) | |
| Razer Blade 16 Early 2023 (v6.85.6300) | |
| Razer Blade 16 Early 2023 (v8.20.8100) | |
| Razer Blade 16 Early 2023 (v6.92.6600) | |
| Lenovo Legion Pro 7 16IRX8H (v6.85.6300) | |
| HP Omen 17-ck2097ng (v6.75.6100, Leistung) | |
| Przeciętny Intel Core i9-13900HX (12334 - 17179, n=22) | |
| Średnia w klasie Gaming (4424 - 33636, n=109, ostatnie 2 lata) | |
| Alienware m17 R5 (R9 6900HX, RX 6850M XT) (v6.75.6100) | |
| HP Omen 17-ck2097ng (v6.75.6100) | |
| AIDA64 / FPU Mandel | |
| Średnia w klasie Gaming (25115 - 128721, n=109, ostatnie 2 lata) | |
| Lenovo Legion Pro 7 16IRX8H (v6.85.6300) | |
| Asus ROG Strix G16 G614JZ (v6.75.6100) | |
| Razer Blade 16 Early 2023 (v6.85.6300) | |
| Razer Blade 16 Early 2023 (v8.20.8100) | |
| Razer Blade 16 Early 2023 (v6.92.6600) | |
| Przeciętny Intel Core i9-13900HX (43850 - 69202, n=22) | |
| HP Omen 17-ck2097ng (v6.75.6100, Leistung) | |
| Alienware m17 R5 (R9 6900HX, RX 6850M XT) (v6.75.6100) | |
| HP Omen 17-ck2097ng (v6.75.6100) | |
| AIDA64 / CPU AES | |
| Razer Blade 16 Early 2023 (v6.92.6600) | |
| Razer Blade 16 Early 2023 (v8.20.8100) | |
| Razer Blade 16 Early 2023 (v6.85.6300) | |
| Przeciętny Intel Core i9-13900HX (89413 - 237881, n=22) | |
| Asus ROG Strix G16 G614JZ (v6.75.6100) | |
| Lenovo Legion Pro 7 16IRX8H (v6.85.6300) | |
| HP Omen 17-ck2097ng (v6.75.6100, Leistung) | |
| Średnia w klasie Gaming (39258 - 247074, n=109, ostatnie 2 lata) | |
| HP Omen 17-ck2097ng (v6.75.6100) | |
| Alienware m17 R5 (R9 6900HX, RX 6850M XT) (v6.75.6100) | |
| AIDA64 / CPU ZLib | |
| Lenovo Legion Pro 7 16IRX8H (v6.85.6300) | |
| Asus ROG Strix G16 G614JZ (v6.75.6100) | |
| Razer Blade 16 Early 2023 (v6.85.6300) | |
| Razer Blade 16 Early 2023 (v6.92.6600) | |
| Razer Blade 16 Early 2023 (v8.20.8100) | |
| Przeciętny Intel Core i9-13900HX (1284 - 1958, n=22) | |
| HP Omen 17-ck2097ng (v6.75.6100, Leistung) | |
| Średnia w klasie Gaming (574 - 2531, n=109, ostatnie 2 lata) | |
| HP Omen 17-ck2097ng (v6.75.6100) | |
| Alienware m17 R5 (R9 6900HX, RX 6850M XT) (v6.75.6100) | |
| AIDA64 / FP64 Ray-Trace | |
| Średnia w klasie Gaming (5509 - 45446, n=109, ostatnie 2 lata) | |
| Lenovo Legion Pro 7 16IRX8H (v6.85.6300) | |
| Asus ROG Strix G16 G614JZ (v6.75.6100) | |
| Razer Blade 16 Early 2023 (v6.85.6300) | |
| Razer Blade 16 Early 2023 (v6.92.6600) | |
| Razer Blade 16 Early 2023 (v8.20.8100) | |
| Przeciętny Intel Core i9-13900HX (9481 - 15279, n=22) | |
| HP Omen 17-ck2097ng (v6.75.6100, Leistung) | |
| HP Omen 17-ck2097ng (v6.75.6100) | |
| Alienware m17 R5 (R9 6900HX, RX 6850M XT) (v6.75.6100) | |
| AIDA64 / CPU PhotoWorxx | |
| Razer Blade 16 Early 2023 (v6.85.6300) | |
| Razer Blade 16 Early 2023 (v6.92.6600) | |
| Razer Blade 16 Early 2023 (v8.20.8100) | |
| HP Omen 17-ck2097ng (v6.75.6100) | |
| HP Omen 17-ck2097ng (v6.75.6100, Leistung) | |
| Lenovo Legion Pro 7 16IRX8H (v6.85.6300) | |
| Przeciętny Intel Core i9-13900HX (42994 - 51994, n=22) | |
| Średnia w klasie Gaming (12271 - 89891, n=109, ostatnie 2 lata) | |
| Asus ROG Strix G16 G614JZ (v6.75.6100) | |
| Alienware m17 R5 (R9 6900HX, RX 6850M XT) (v6.75.6100) | |
Wydajność systemu
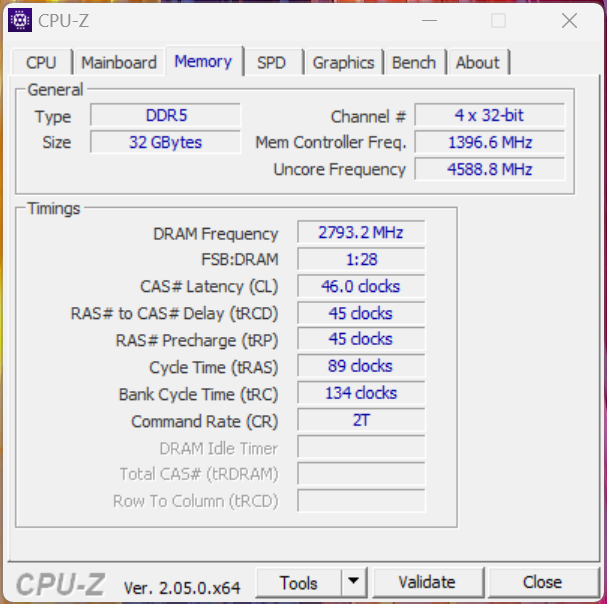
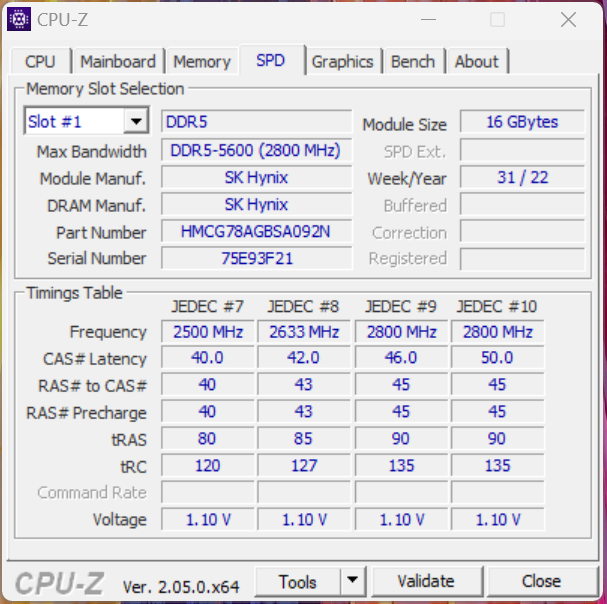
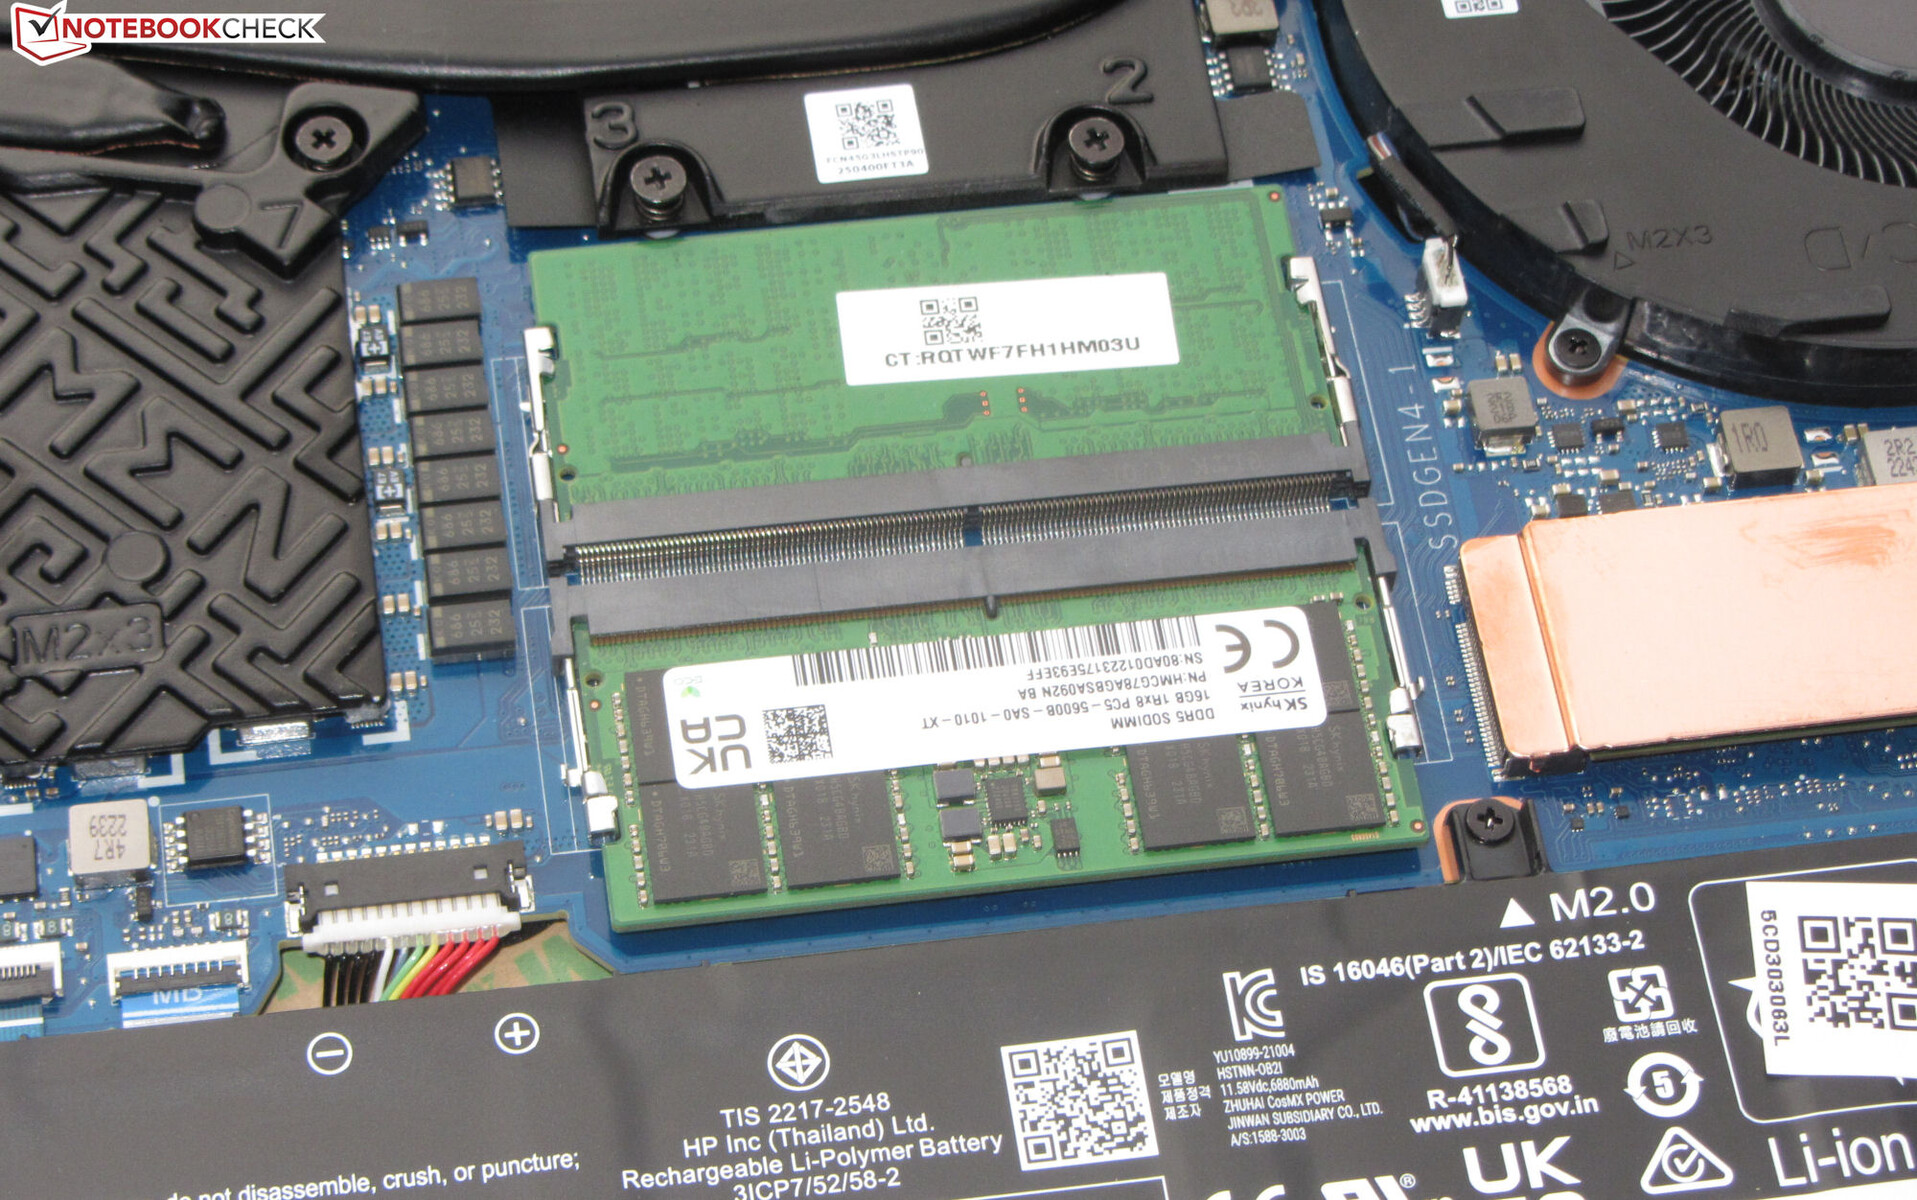
Płynnie działający system oferuje wystarczającą wydajność obliczeniową dla wymagających dużej mocy obliczeniowej obszarów zastosowań, takich jak rendering i gry. Prędkości transferu pamięci roboczej oscylują na normalnym poziomie dla pamięci DDR5-5600. Towarzyszą im dobre wyniki w programie PC-Mark.
CrossMark: Overall | Productivity | Creativity | Responsiveness
| PCMark 10 / Score | |
| Średnia w klasie Gaming (5828 - 11574, n=95, ostatnie 2 lata) | |
| Przeciętny Intel Core i9-13900HX, NVIDIA GeForce RTX 4080 Laptop GPU (7609 - 8549, n=3) | |
| Razer Blade 16 Early 2023 | |
| Lenovo Legion Pro 7 16IRX8H | |
| HP Omen 17-ck2097ng | |
| Alienware m17 R5 (R9 6900HX, RX 6850M XT) | |
| Asus ROG Strix G16 G614JZ | |
| PCMark 10 / Essentials | |
| Asus ROG Strix G16 G614JZ | |
| HP Omen 17-ck2097ng | |
| Lenovo Legion Pro 7 16IRX8H | |
| Przeciętny Intel Core i9-13900HX, NVIDIA GeForce RTX 4080 Laptop GPU (10982 - 11824, n=3) | |
| Razer Blade 16 Early 2023 | |
| Średnia w klasie Gaming (8810 - 12600, n=99, ostatnie 2 lata) | |
| Alienware m17 R5 (R9 6900HX, RX 6850M XT) | |
| PCMark 10 / Productivity | |
| Lenovo Legion Pro 7 16IRX8H | |
| Średnia w klasie Gaming (6845 - 18766, n=97, ostatnie 2 lata) | |
| Przeciętny Intel Core i9-13900HX, NVIDIA GeForce RTX 4080 Laptop GPU (9976 - 10788, n=3) | |
| HP Omen 17-ck2097ng | |
| Alienware m17 R5 (R9 6900HX, RX 6850M XT) | |
| Razer Blade 16 Early 2023 | |
| Asus ROG Strix G16 G614JZ | |
| PCMark 10 / Digital Content Creation | |
| Razer Blade 16 Early 2023 | |
| Średnia w klasie Gaming (7602 - 19657, n=97, ostatnie 2 lata) | |
| Przeciętny Intel Core i9-13900HX, NVIDIA GeForce RTX 4080 Laptop GPU (10135 - 14720, n=3) | |
| Alienware m17 R5 (R9 6900HX, RX 6850M XT) | |
| Asus ROG Strix G16 G614JZ | |
| Lenovo Legion Pro 7 16IRX8H | |
| HP Omen 17-ck2097ng | |
| CrossMark / Overall | |
| Asus ROG Strix G16 G614JZ | |
| Przeciętny Intel Core i9-13900HX, NVIDIA GeForce RTX 4080 Laptop GPU (1991 - 2194, n=2) | |
| HP Omen 17-ck2097ng | |
| Średnia w klasie Gaming (1366 - 2409, n=97, ostatnie 2 lata) | |
| Alienware m17 R5 (R9 6900HX, RX 6850M XT) | |
| Razer Blade 16 Early 2023 | |
| CrossMark / Productivity | |
| Asus ROG Strix G16 G614JZ | |
| Przeciętny Intel Core i9-13900HX, NVIDIA GeForce RTX 4080 Laptop GPU (1828 - 2059, n=2) | |
| Średnia w klasie Gaming (1386 - 2254, n=97, ostatnie 2 lata) | |
| HP Omen 17-ck2097ng | |
| Alienware m17 R5 (R9 6900HX, RX 6850M XT) | |
| Razer Blade 16 Early 2023 | |
| CrossMark / Creativity | |
| Asus ROG Strix G16 G614JZ | |
| Przeciętny Intel Core i9-13900HX, NVIDIA GeForce RTX 4080 Laptop GPU (2239 - 2411, n=2) | |
| HP Omen 17-ck2097ng | |
| Średnia w klasie Gaming (1343 - 2729, n=97, ostatnie 2 lata) | |
| Razer Blade 16 Early 2023 | |
| Alienware m17 R5 (R9 6900HX, RX 6850M XT) | |
| CrossMark / Responsiveness | |
| Asus ROG Strix G16 G614JZ | |
| Przeciętny Intel Core i9-13900HX, NVIDIA GeForce RTX 4080 Laptop GPU (1808 - 1998, n=2) | |
| HP Omen 17-ck2097ng | |
| Średnia w klasie Gaming (1226 - 2334, n=97, ostatnie 2 lata) | |
| Razer Blade 16 Early 2023 | |
| Alienware m17 R5 (R9 6900HX, RX 6850M XT) | |
| PCMark 8 Home Score Accelerated v2 | 5074 pkt. | |
| PCMark 8 Work Score Accelerated v2 | 6244 pkt. | |
| PCMark 10 Score | 7609 pkt. | |
Pomoc | ||
| AIDA64 / Memory Copy | |
| Razer Blade 16 Early 2023 | |
| Razer Blade 16 Early 2023 | |
| Razer Blade 16 Early 2023 | |
| HP Omen 17-ck2097ng | |
| Lenovo Legion Pro 7 16IRX8H | |
| Przeciętny Intel Core i9-13900HX (67716 - 79193, n=22) | |
| Średnia w klasie Gaming (21750 - 129946, n=109, ostatnie 2 lata) | |
| Asus ROG Strix G16 G614JZ | |
| HP Omen 17-ck1075ng | |
| Alienware m17 R5 (R9 6900HX, RX 6850M XT) | |
| AIDA64 / Memory Read | |
| Razer Blade 16 Early 2023 | |
| Razer Blade 16 Early 2023 | |
| Razer Blade 16 Early 2023 | |
| HP Omen 17-ck2097ng | |
| Lenovo Legion Pro 7 16IRX8H | |
| Przeciętny Intel Core i9-13900HX (73998 - 88462, n=22) | |
| Średnia w klasie Gaming (22956 - 118858, n=109, ostatnie 2 lata) | |
| Asus ROG Strix G16 G614JZ | |
| HP Omen 17-ck1075ng | |
| Alienware m17 R5 (R9 6900HX, RX 6850M XT) | |
| AIDA64 / Memory Write | |
| Razer Blade 16 Early 2023 | |
| Razer Blade 16 Early 2023 | |
| Razer Blade 16 Early 2023 | |
| HP Omen 17-ck2097ng | |
| Średnia w klasie Gaming (22297 - 135096, n=109, ostatnie 2 lata) | |
| Przeciętny Intel Core i9-13900HX (65472 - 77045, n=22) | |
| Lenovo Legion Pro 7 16IRX8H | |
| Asus ROG Strix G16 G614JZ | |
| HP Omen 17-ck1075ng | |
| Alienware m17 R5 (R9 6900HX, RX 6850M XT) | |
| AIDA64 / Memory Latency | |
| Średnia w klasie Gaming (75.3 - 259, n=109, ostatnie 2 lata) | |
| HP Omen 17-ck1075ng | |
| Razer Blade 16 Early 2023 | |
| Razer Blade 16 Early 2023 | |
| Razer Blade 16 Early 2023 | |
| Alienware m17 R5 (R9 6900HX, RX 6850M XT) | |
| Asus ROG Strix G16 G614JZ | |
| Przeciętny Intel Core i9-13900HX (75.3 - 91.1, n=22) | |
| HP Omen 17-ck2097ng | |
| Lenovo Legion Pro 7 16IRX8H | |
* ... im mniej tym lepiej
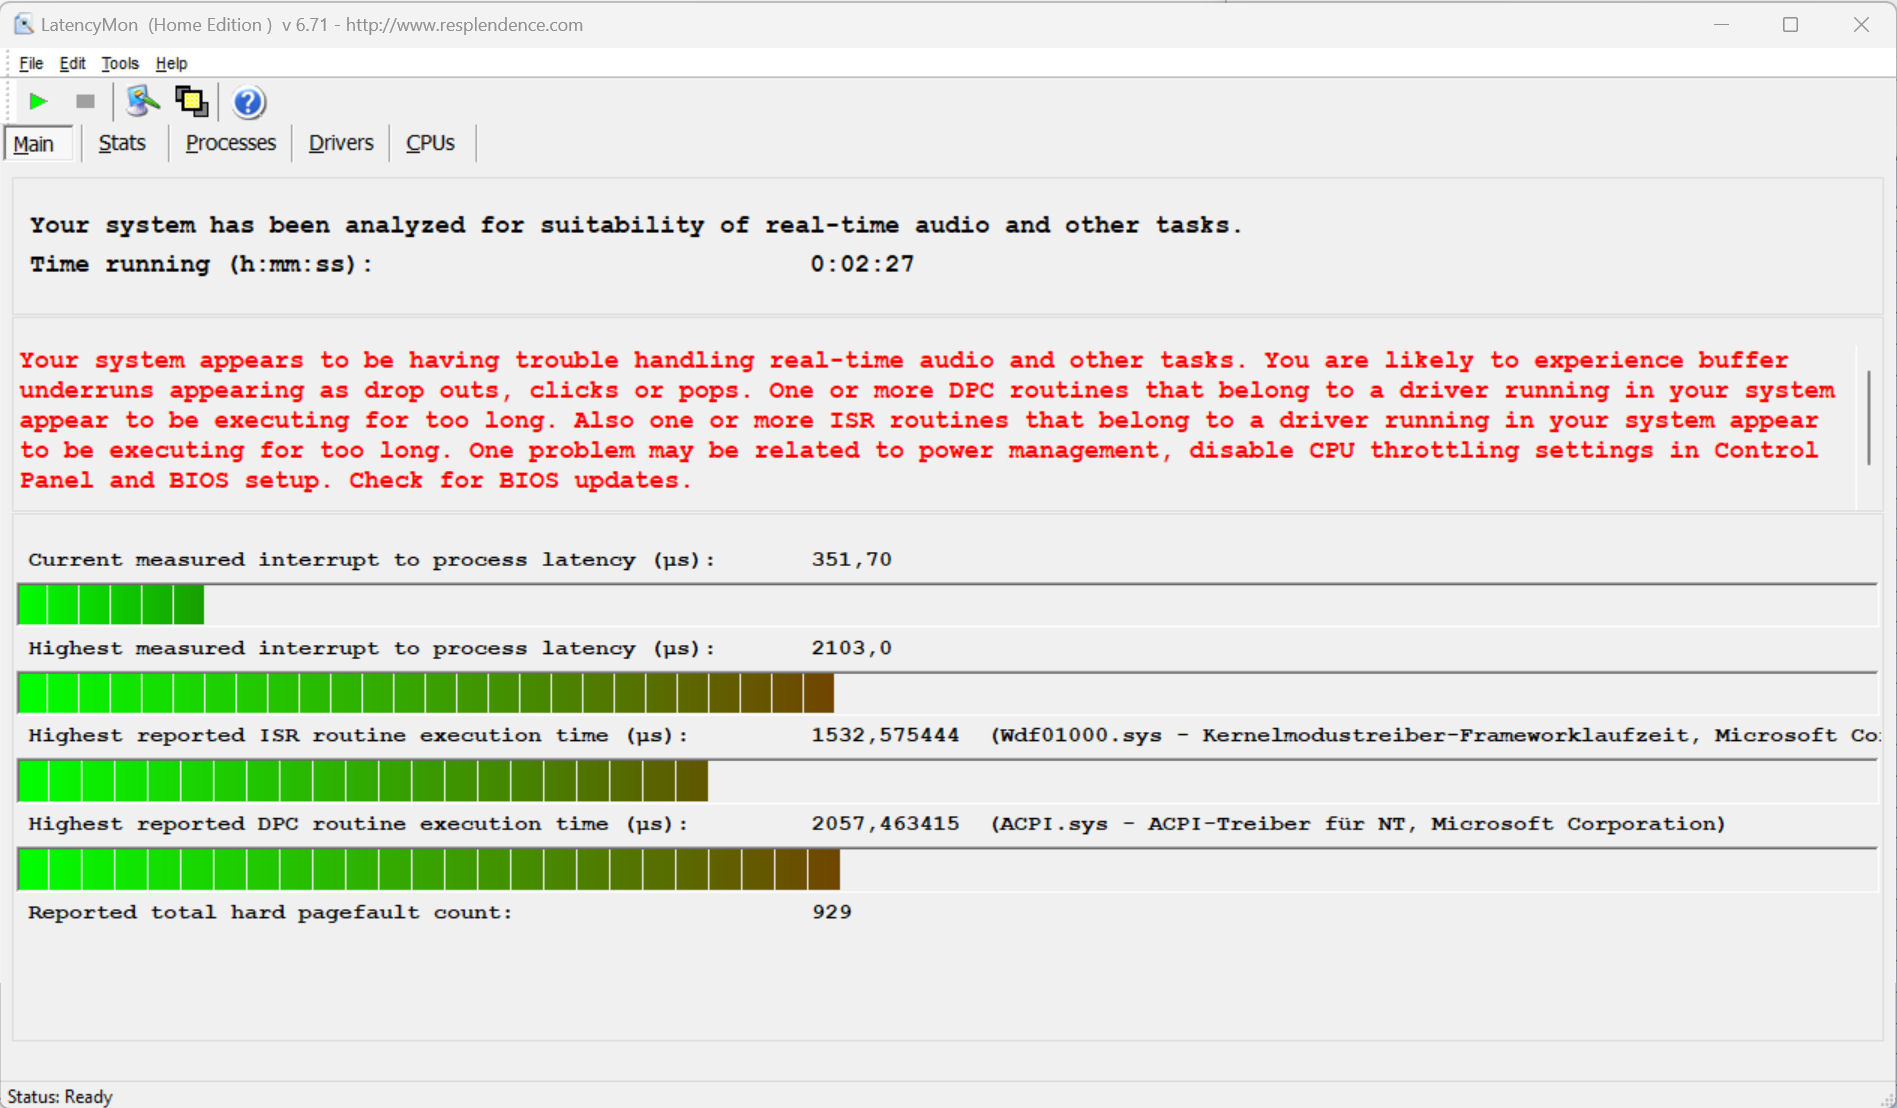
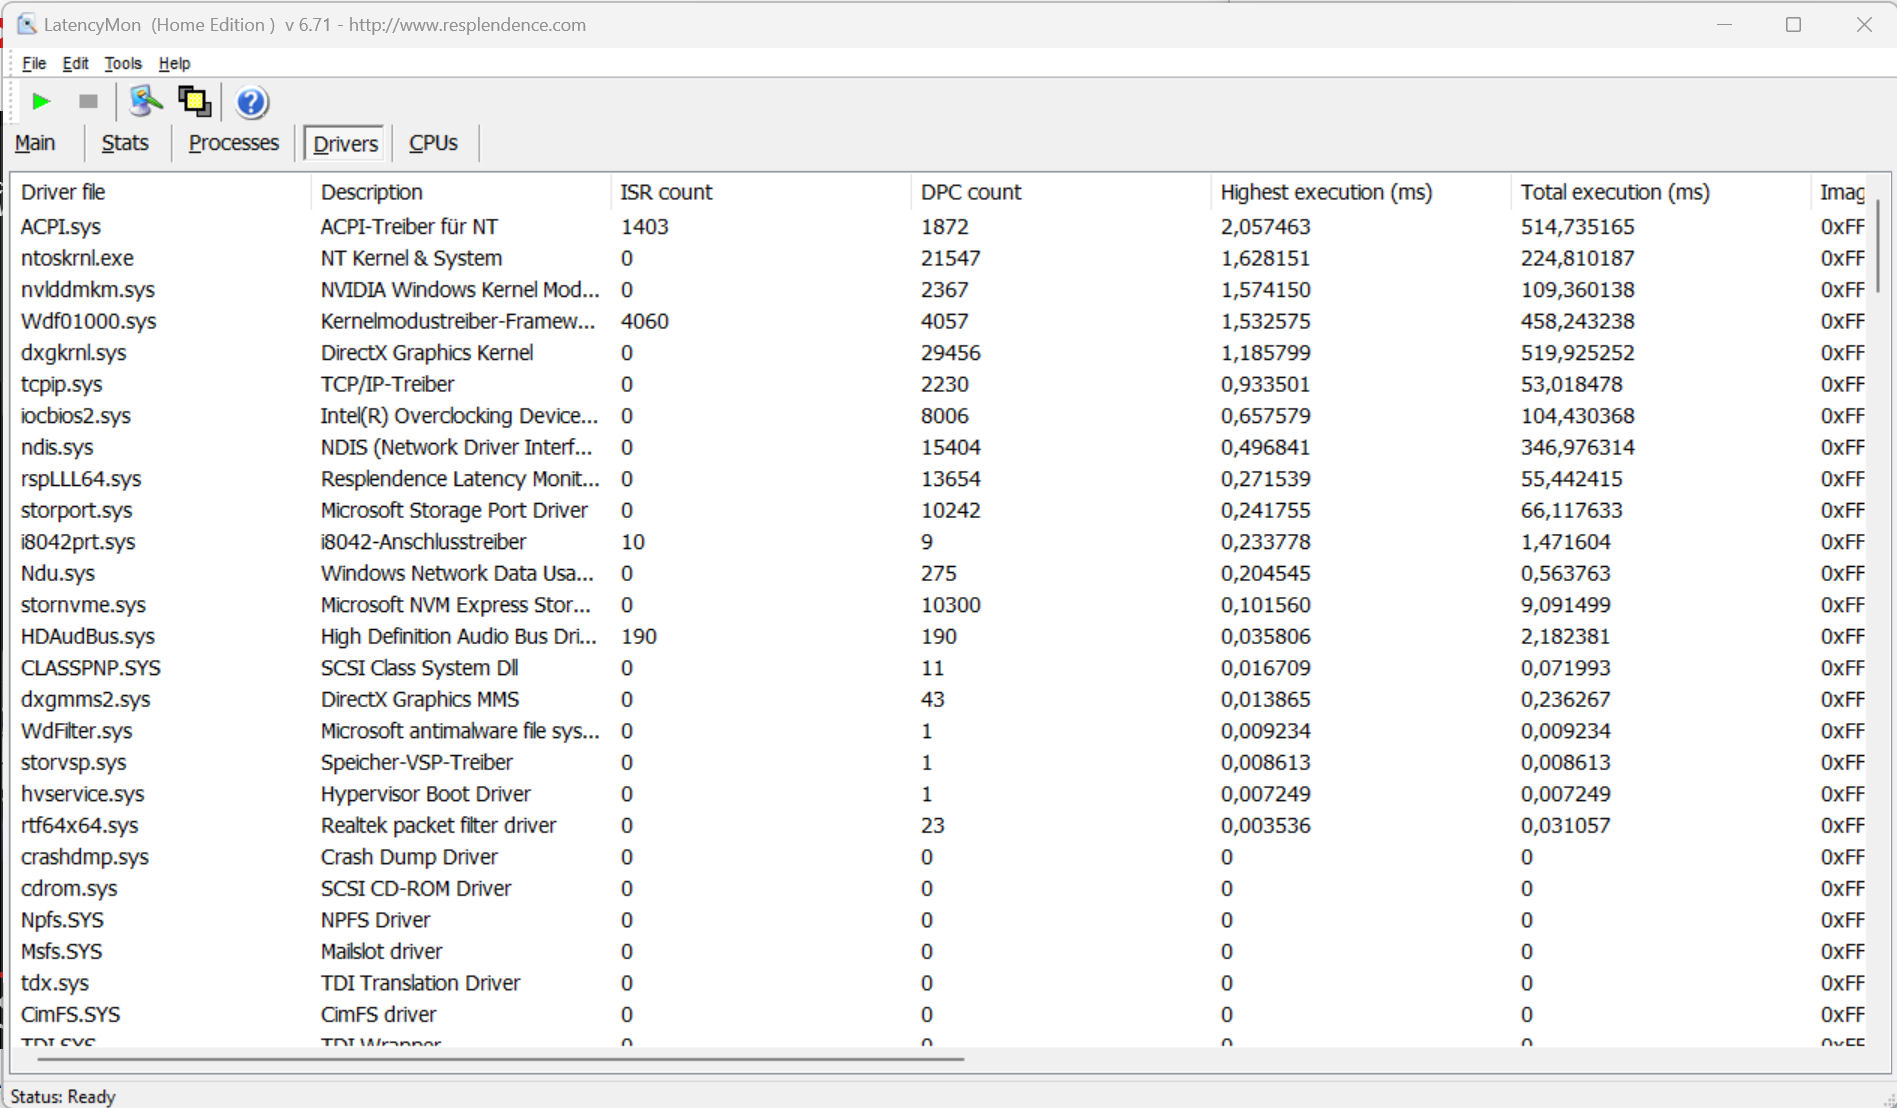
Opóźnienia DPC
Standardowy test Latency Monitor (przeglądanie stron internetowych, odtwarzanie wideo 4k, wysokie obciążenie Prime95) ujawnia pewne rzucające się w oczy zachowanie. System nie wydaje się być przystosowany do przetwarzania wideo i audio w czasie rzeczywistym. Przyszłe aktualizacje oprogramowania mogą przynieść pewne usprawnienia lub jeszcze bardziej pogorszyć sytuację.
| DPC Latencies / LatencyMon - interrupt to process latency (max), Web, Youtube, Prime95 | |
| Asus ROG Strix G16 G614JZ | |
| Razer Blade 16 Early 2023 | |
| HP Omen 17-ck2097ng | |
| Alienware m17 R5 (R9 6900HX, RX 6850M XT) | |
| Lenovo Legion Pro 7 16IRX8H | |
* ... im mniej tym lepiej
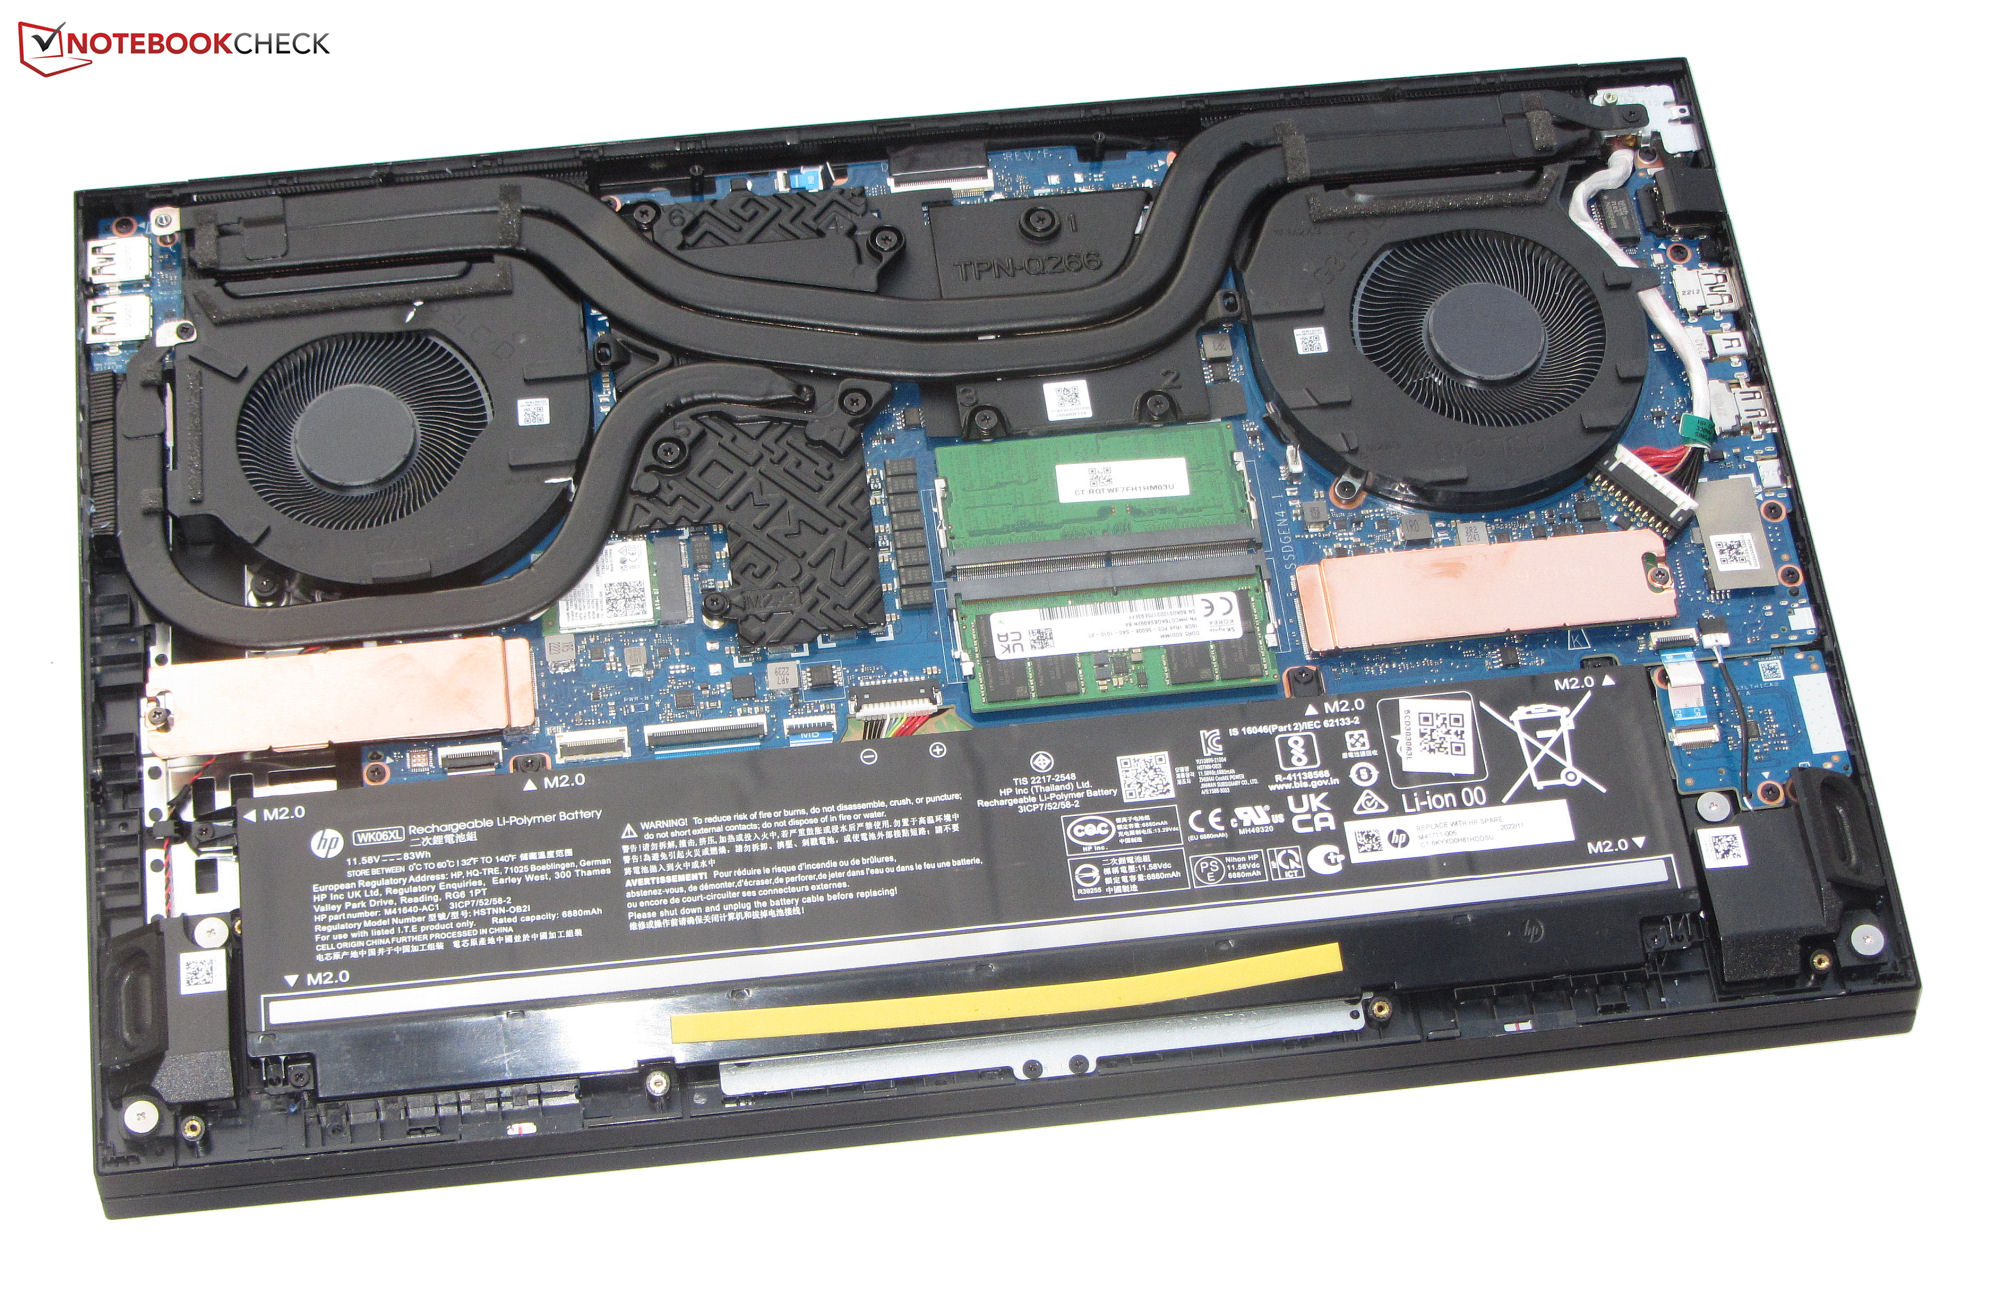
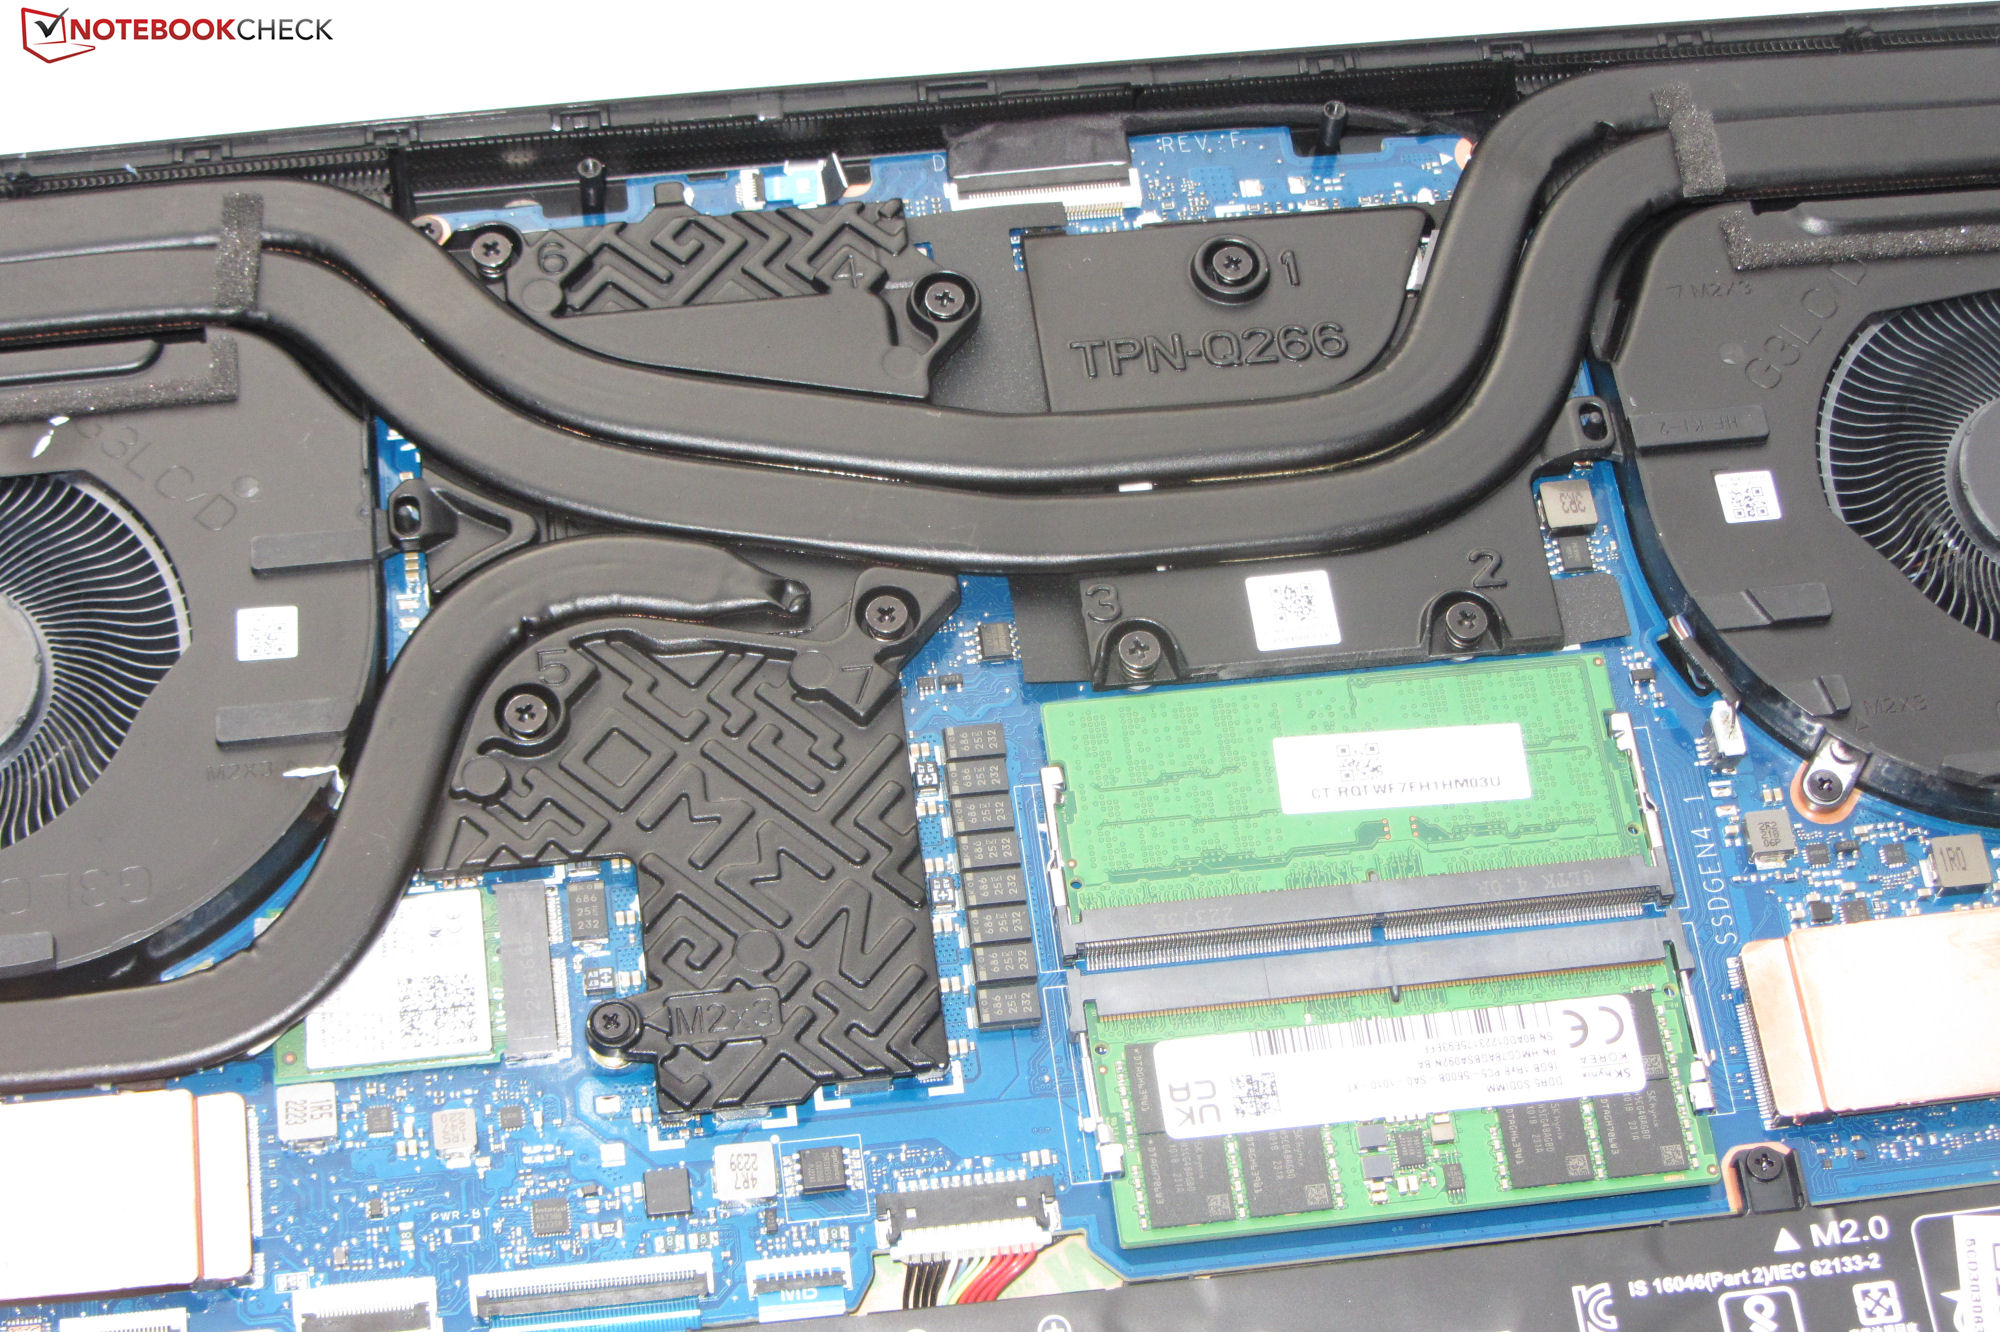
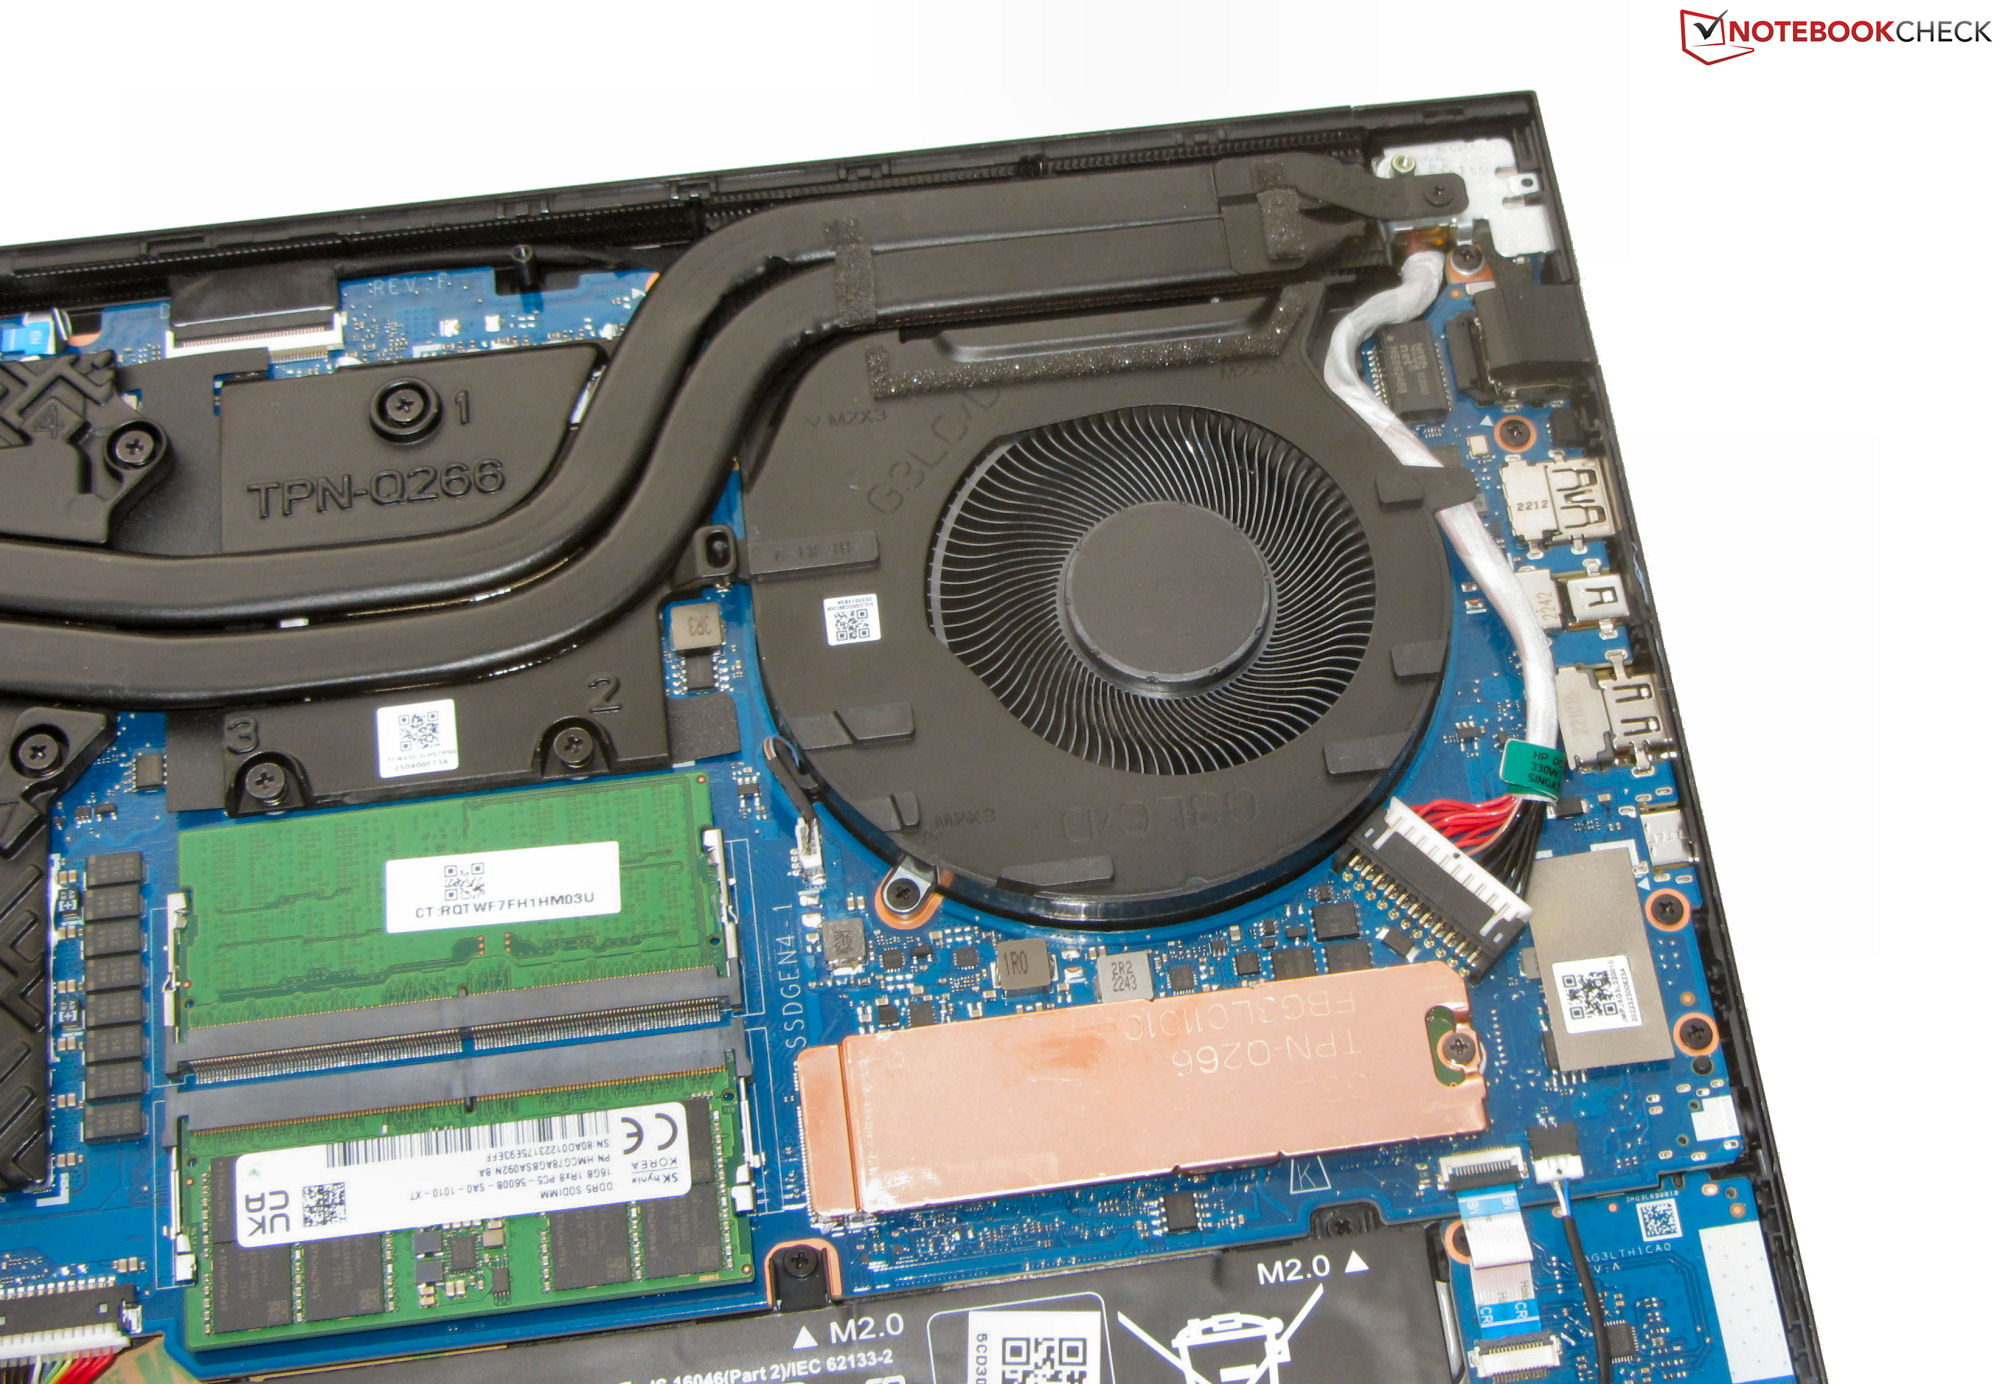
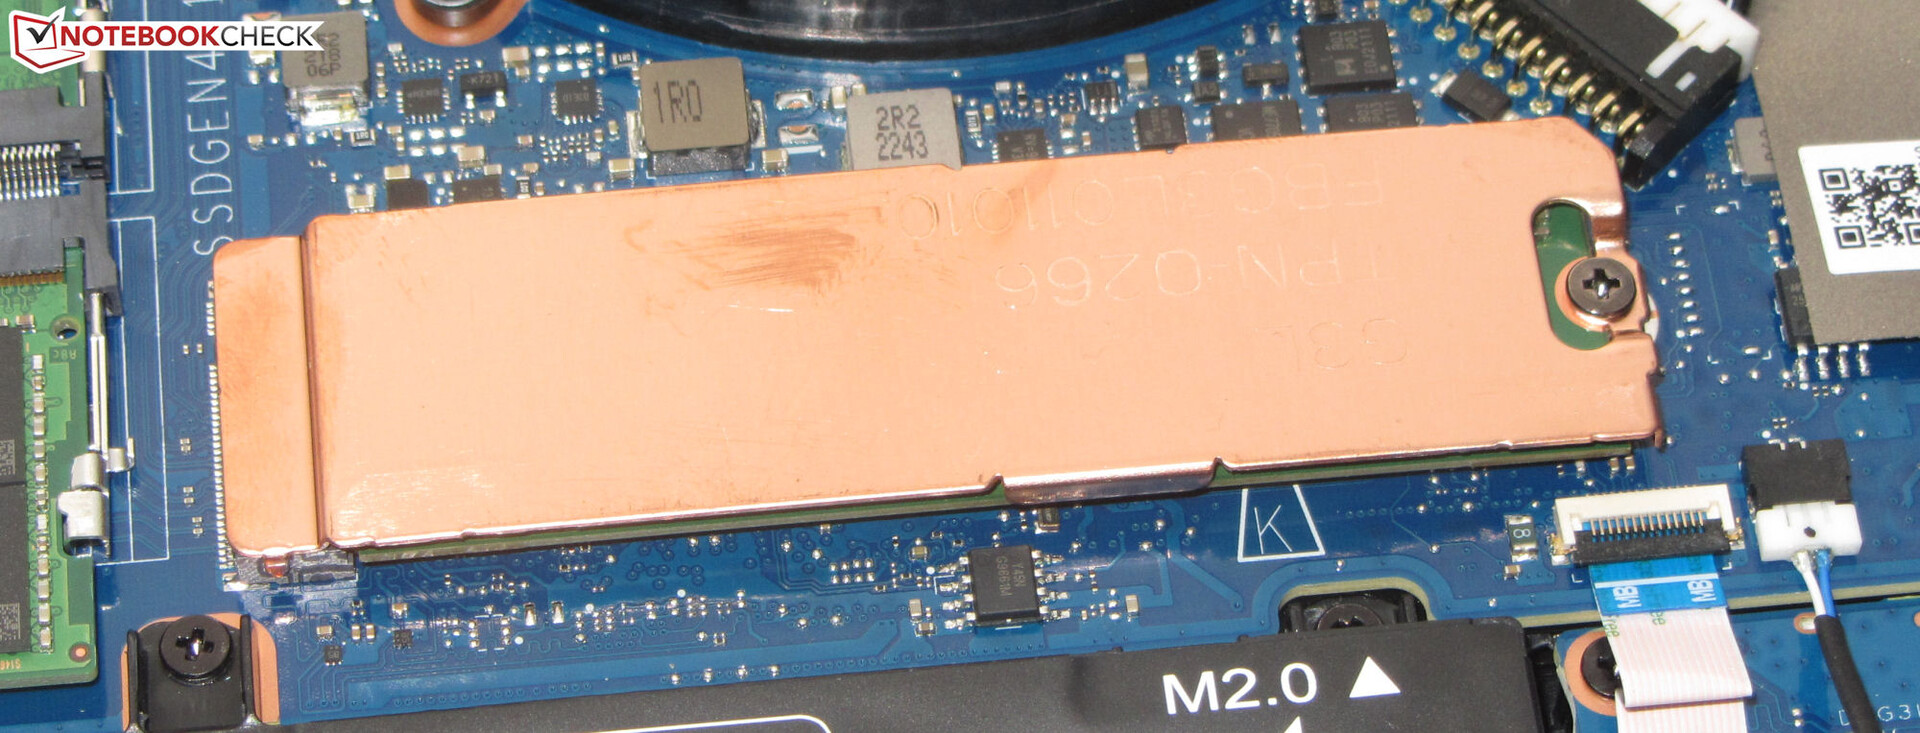
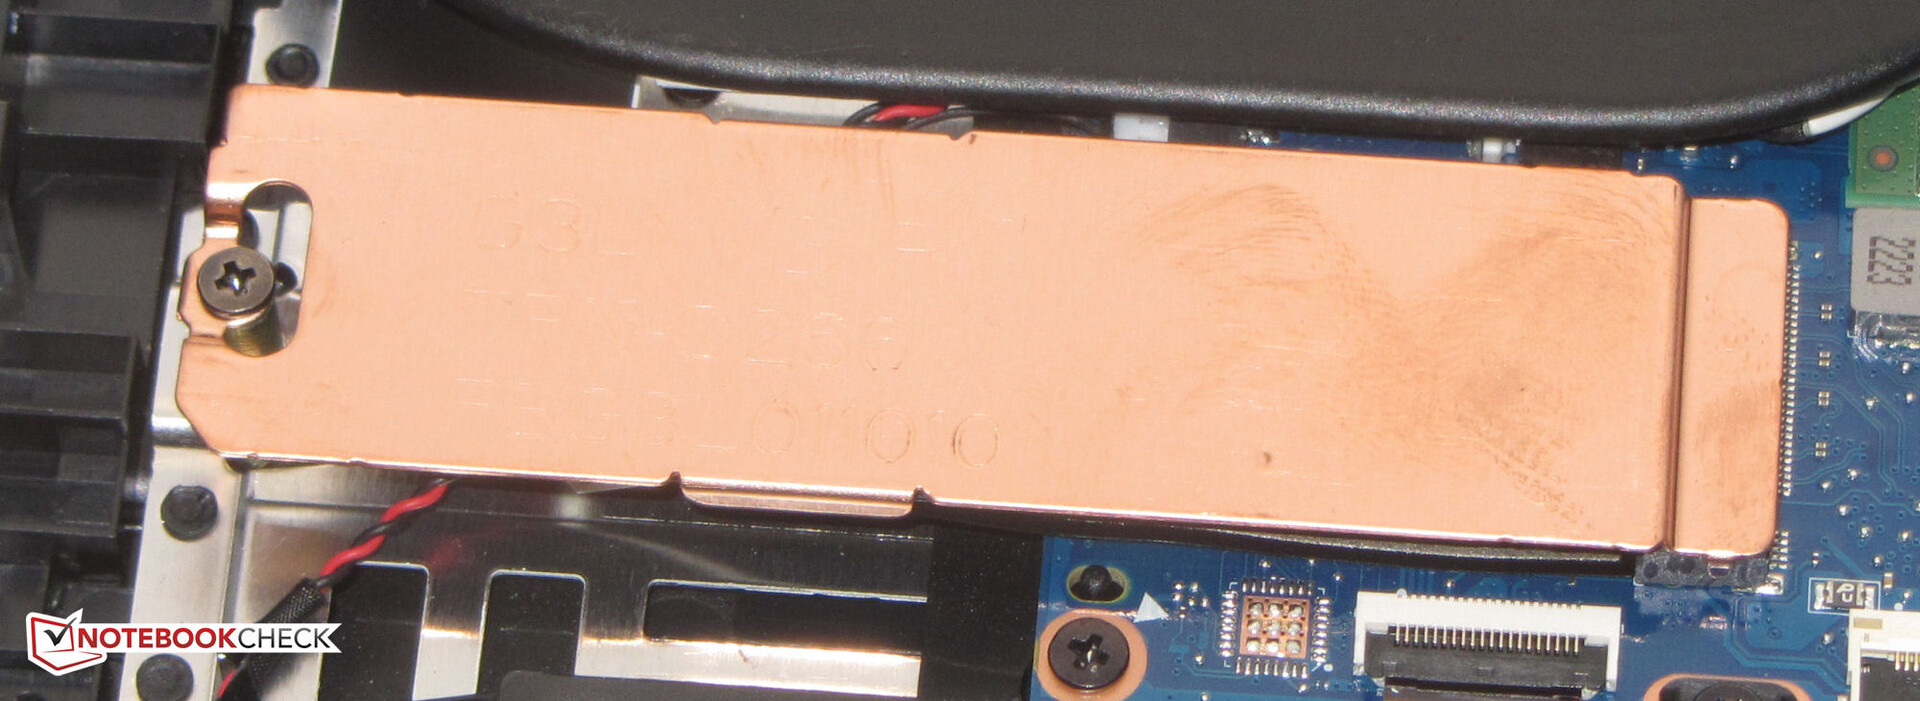
Rozwiązanie w zakresie przechowywania
Omen oferuje miejsce dla dwóch dysków SSD PCIe 4 w formacie M.2-2280. Zastosowany tutaj dysk SSD PCIe 4 (1 TB) firmy SK Hynix zapewnia bardzo dobre transfery. W późniejszych częściach pętli DiskSpd obserwujemy jednak sporadyczne spadki wydajności, prawdopodobnie spowodowane throttlingiem termicznym.

* ... im mniej tym lepiej
Disk Throttling: DiskSpd Read Loop, Queue Depth 8
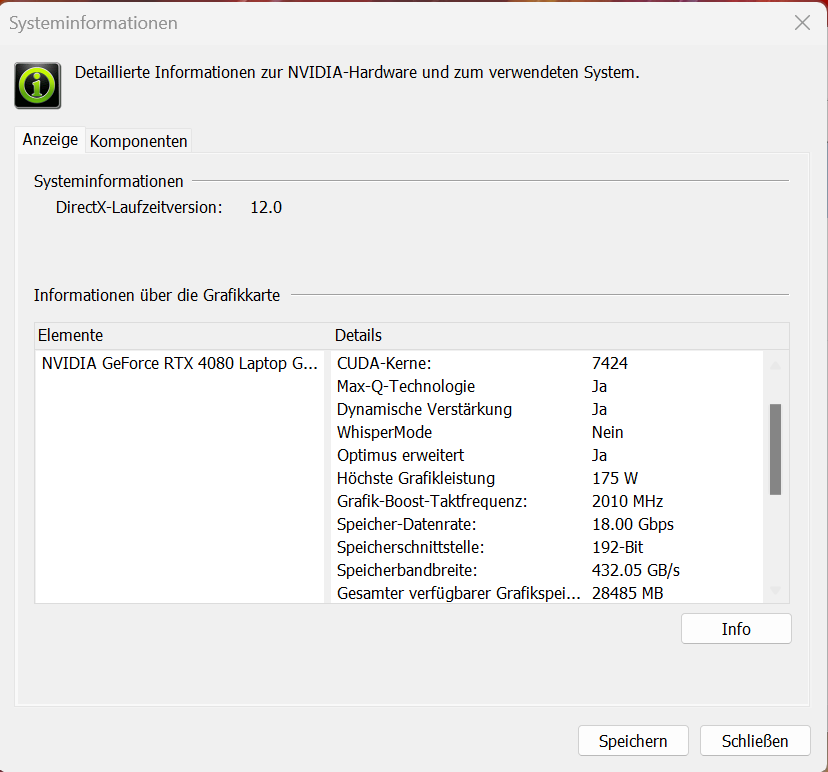
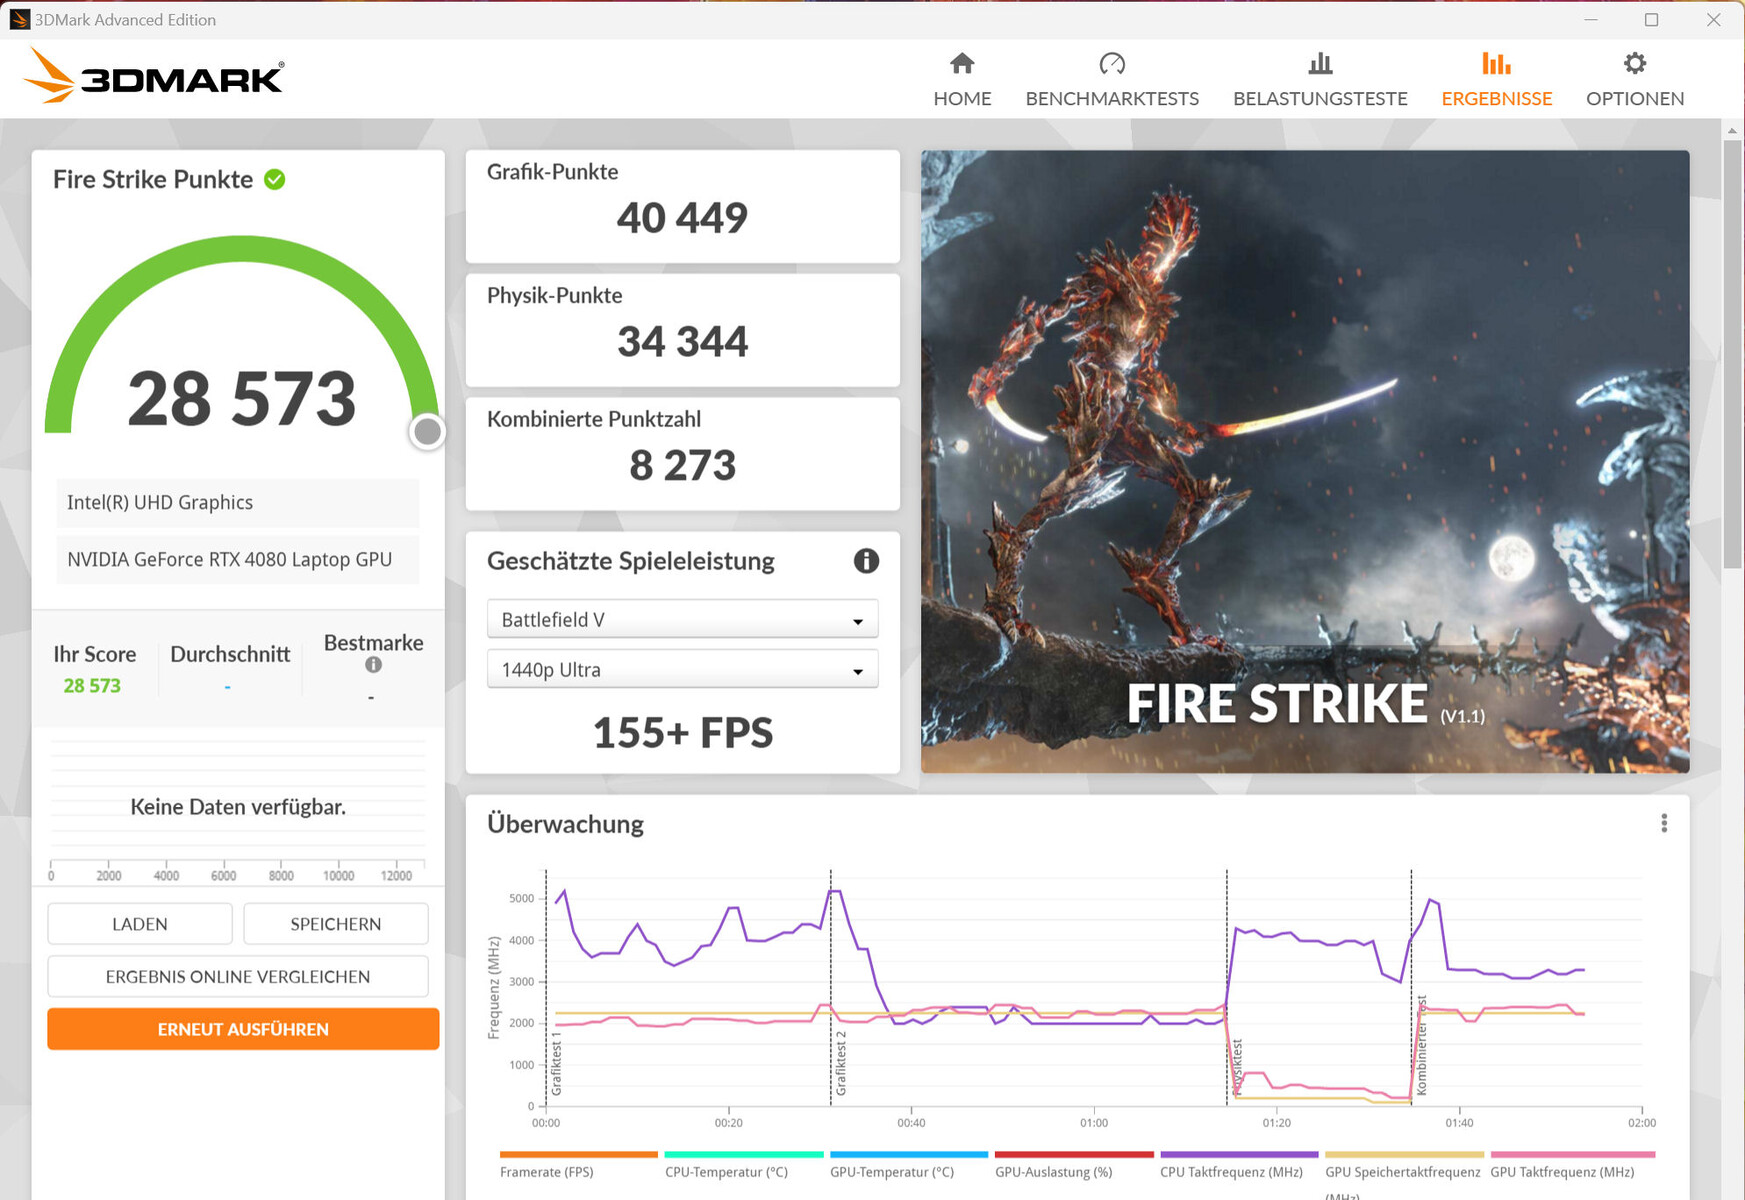
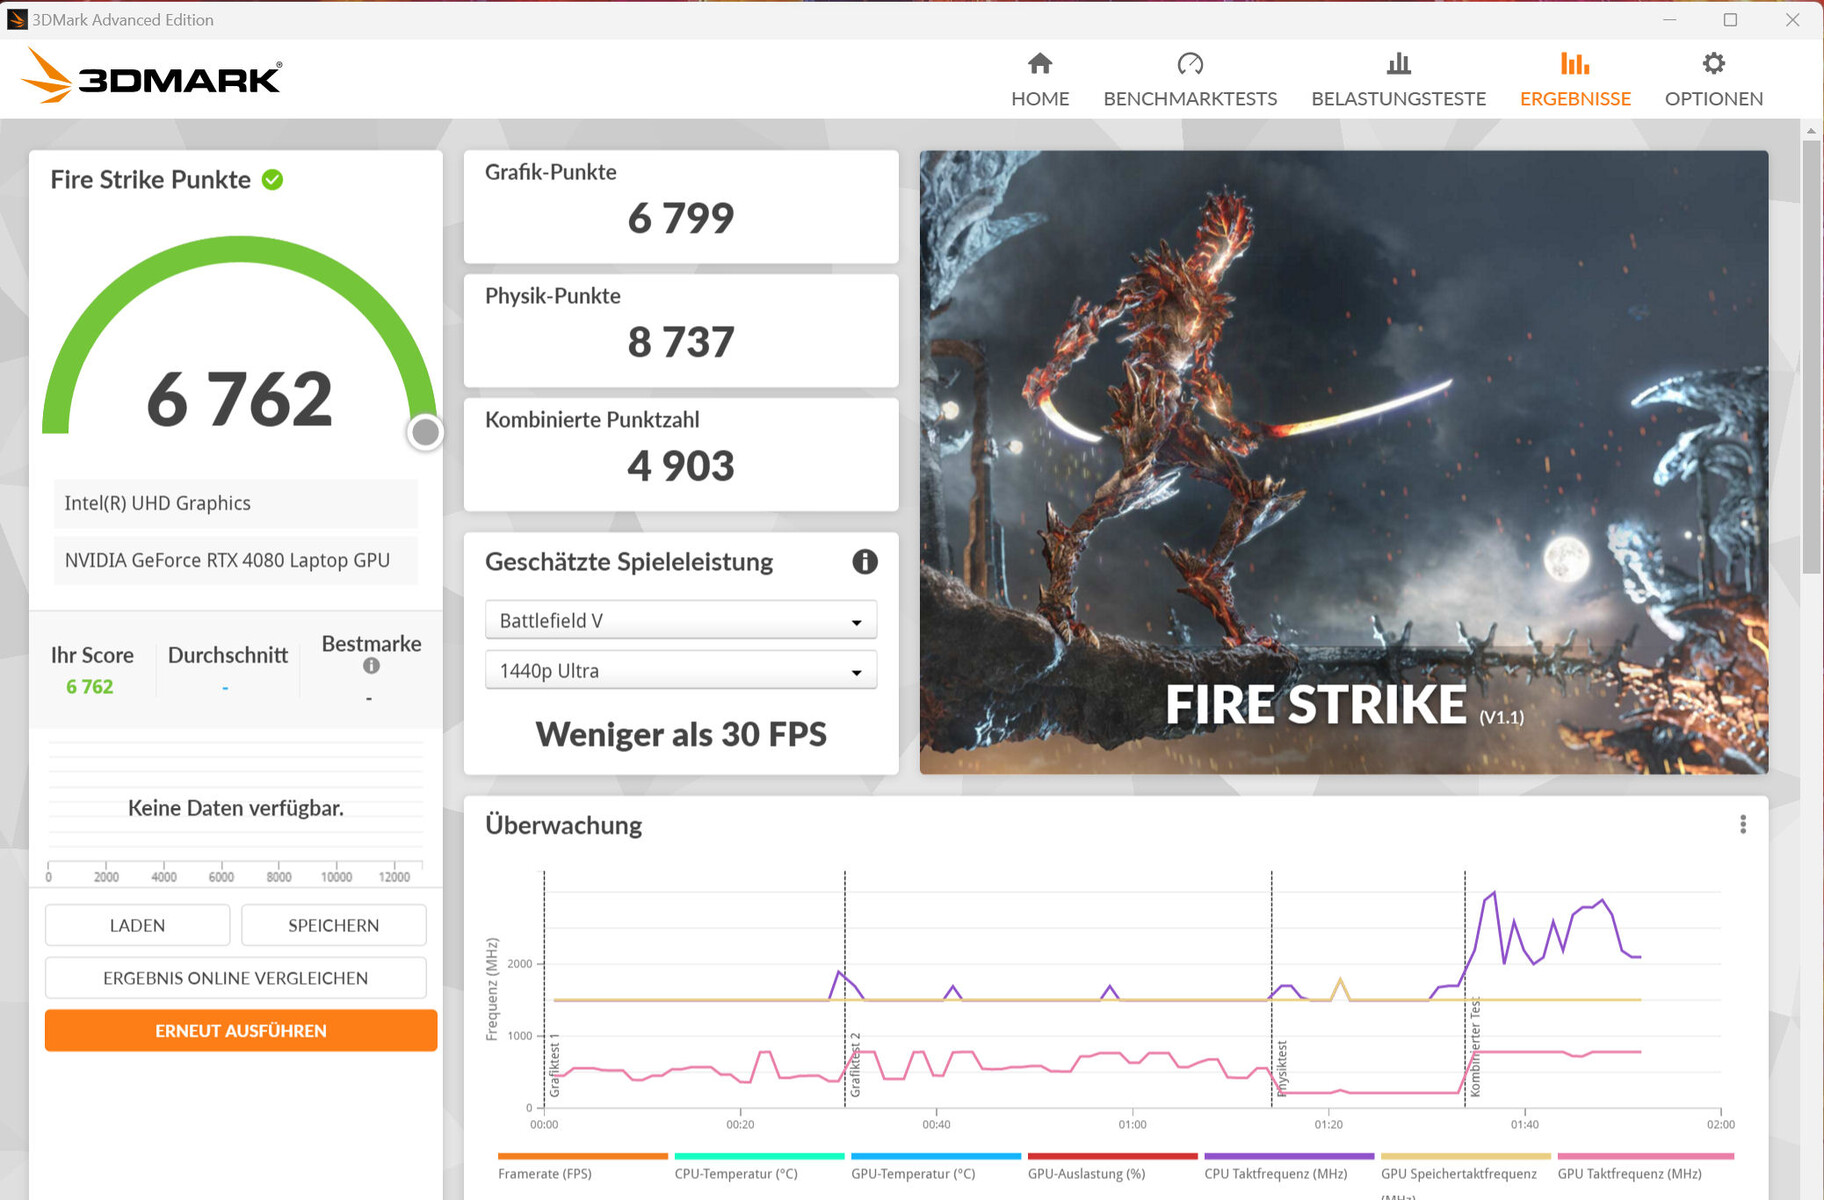
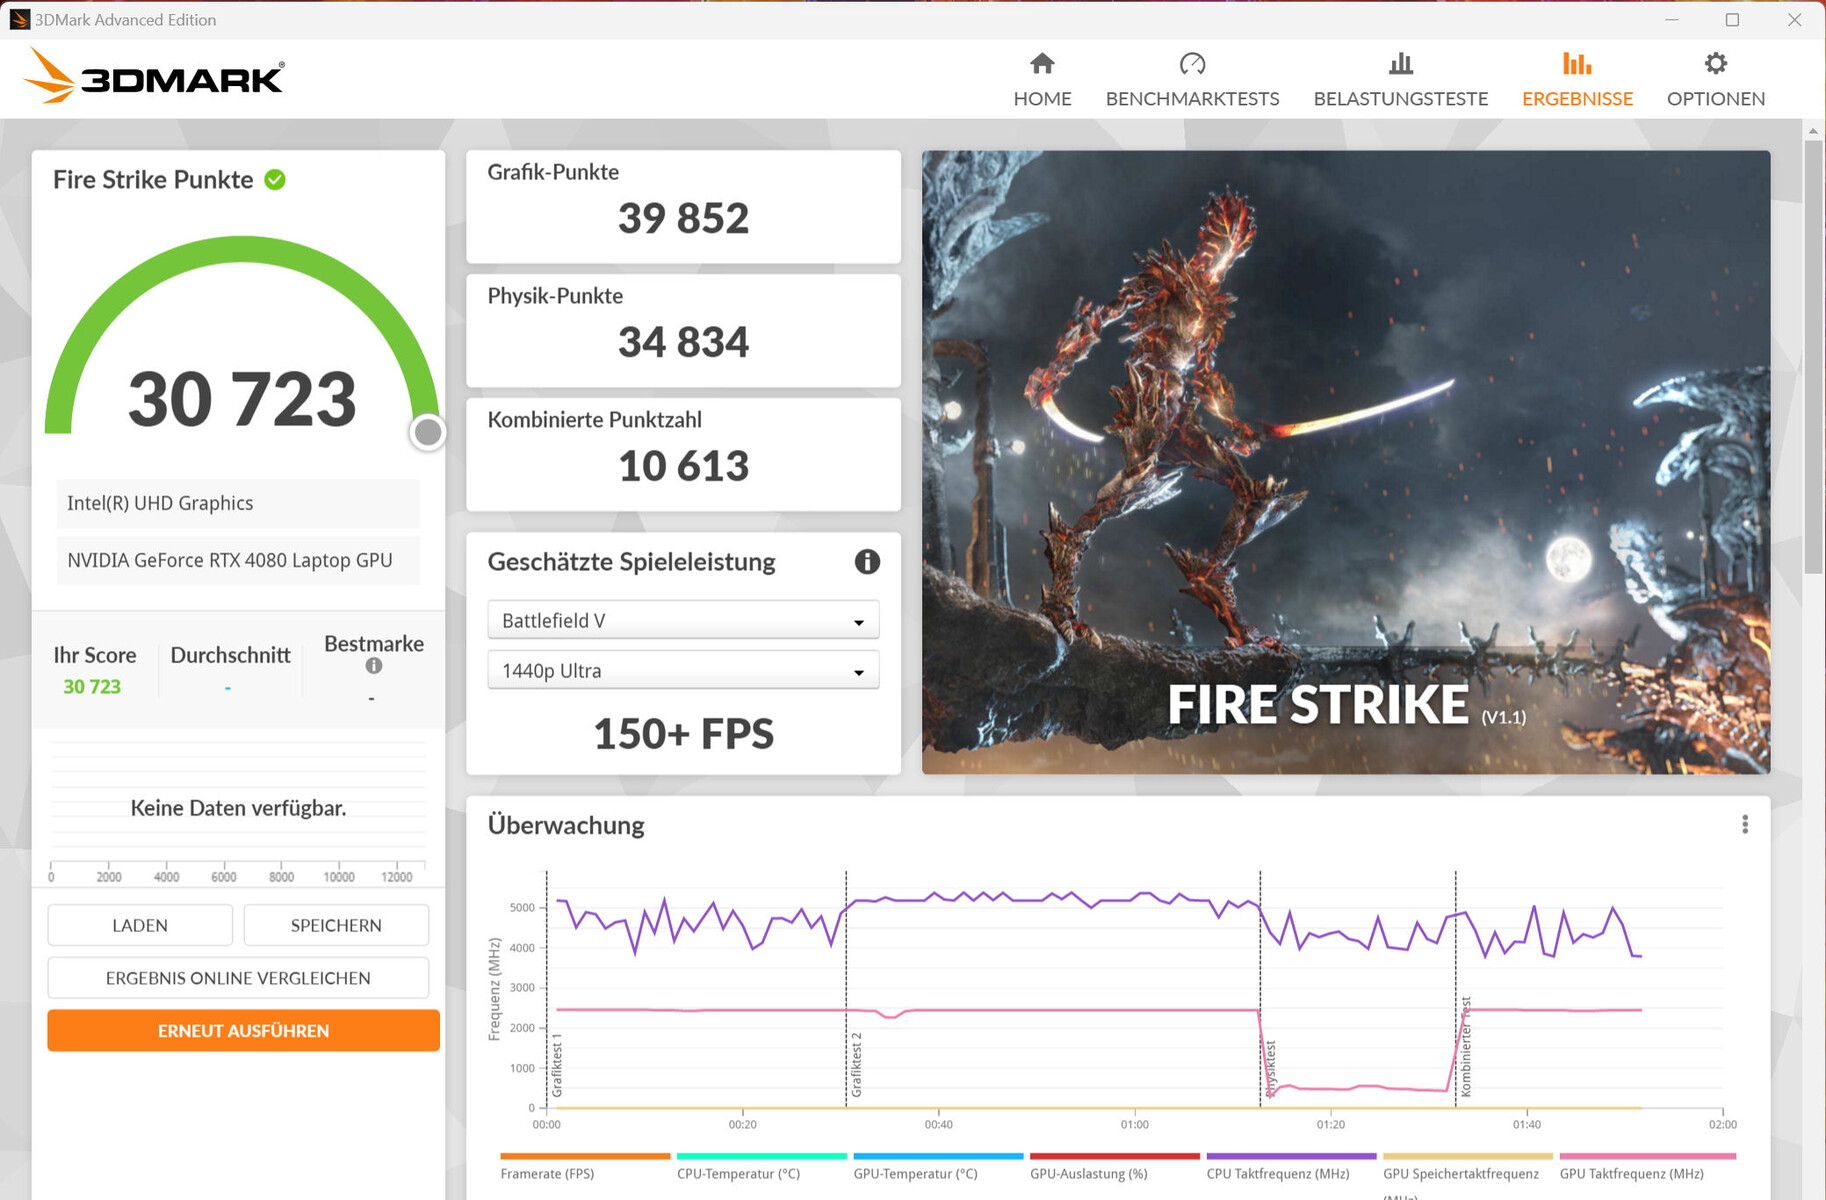
Karta graficzna
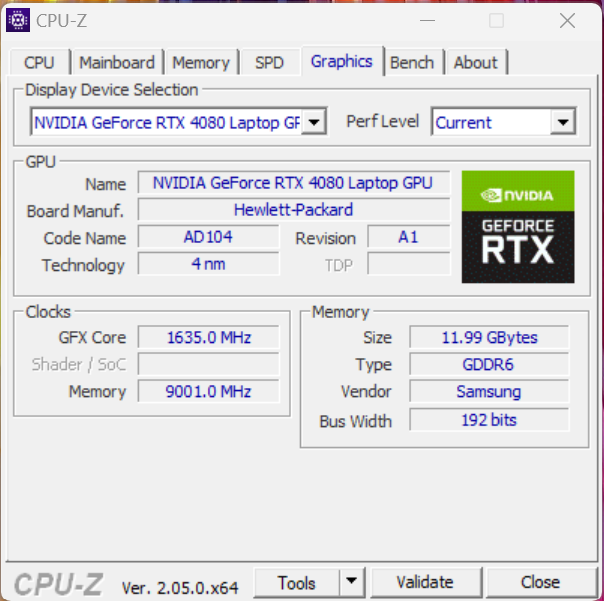
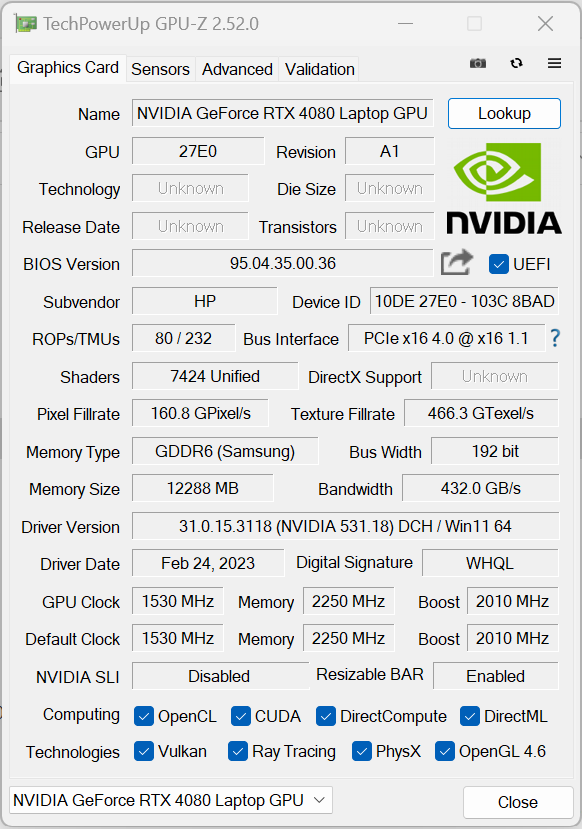
Z.GeForce RTX 4080gPU do laptopa, HP wykorzystuje aktualny numer dwa w portfolio mobilnych GPU Nvidii. Ma on 7 424 shadery, 192-bitową magistralę i może korzystać z szybkich pamięci GDDR6 (12 288 MB). RTX 4080 jest skonfigurowany z TGP o mocy 175 W (150 W + 25 W Dynamic Boost), co jest maksymalną konfiguracją według Nvidii. Według naszego testu The Witcher 3 TGP nie jest w pełni wykorzystywany.
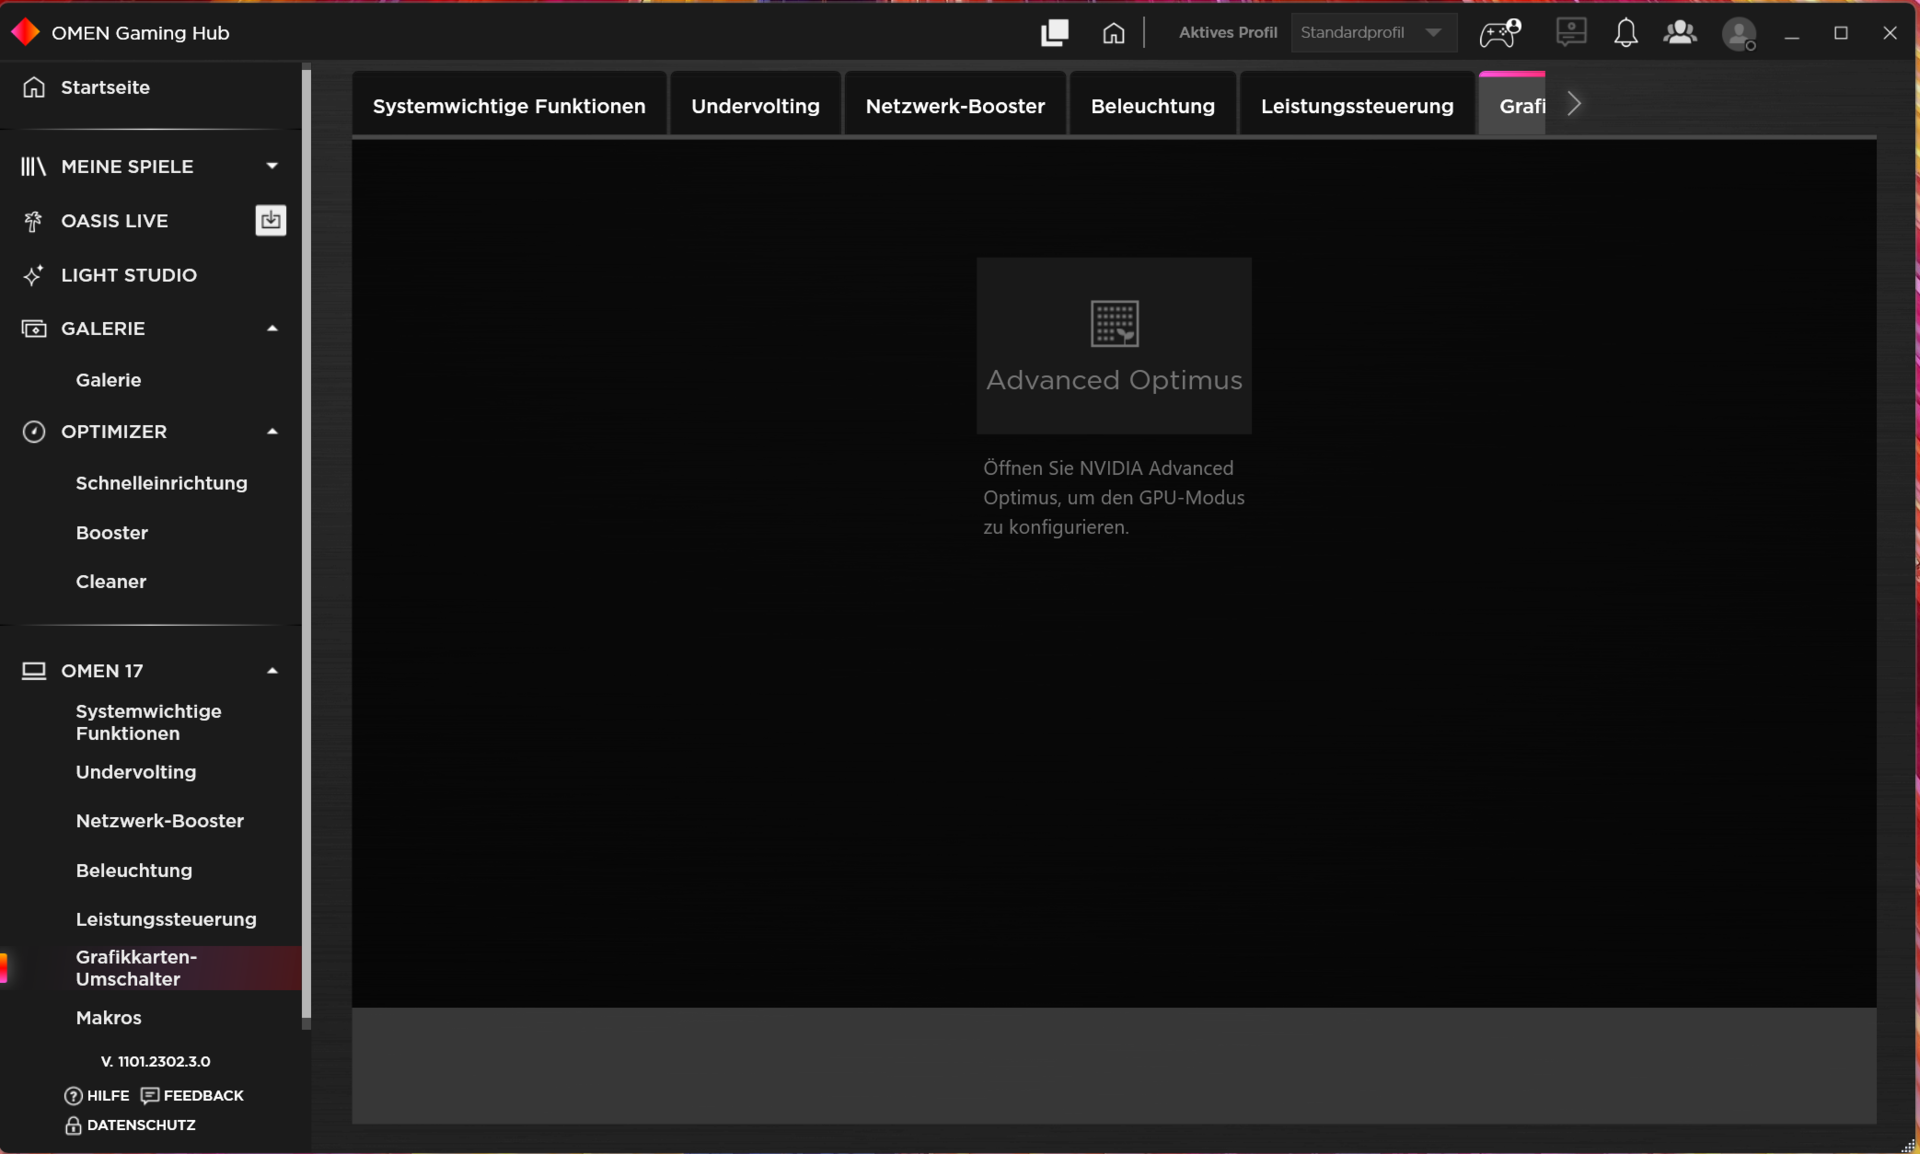
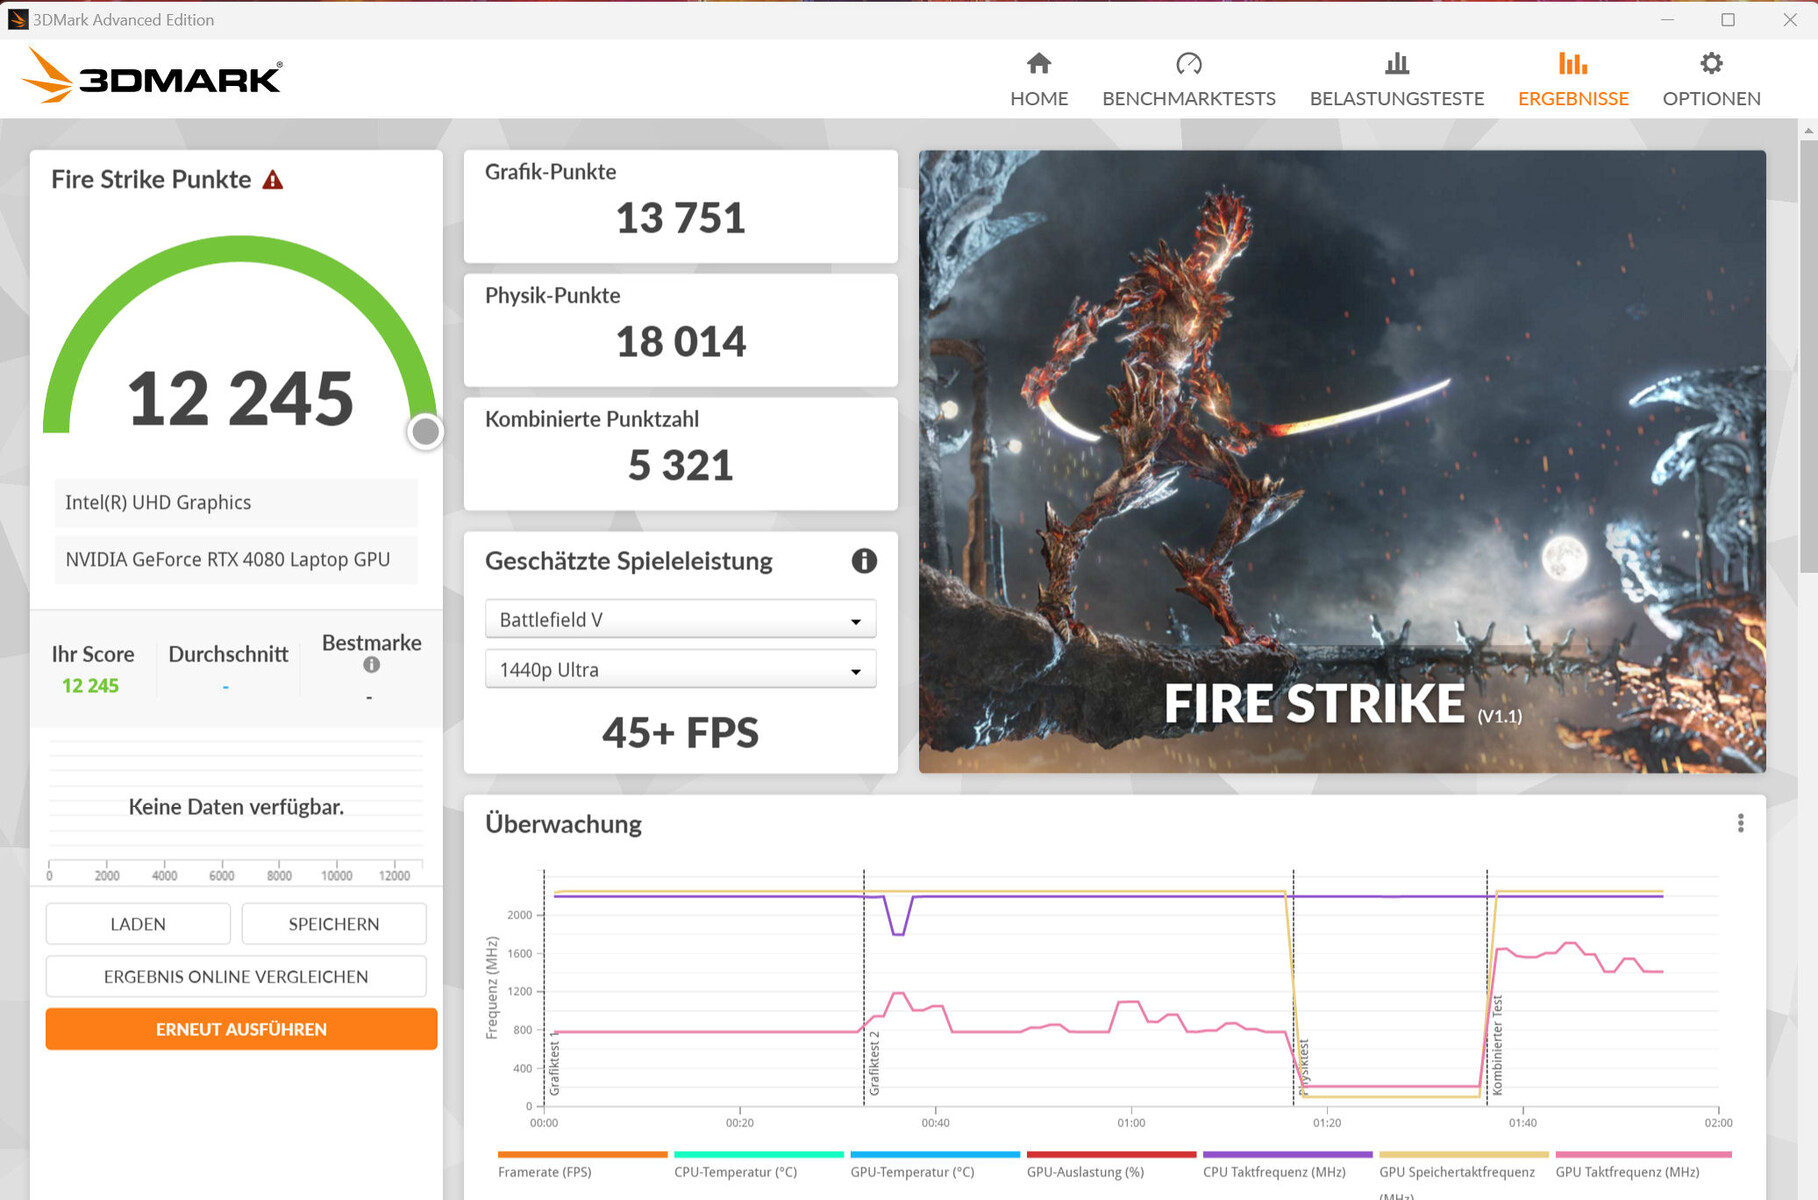
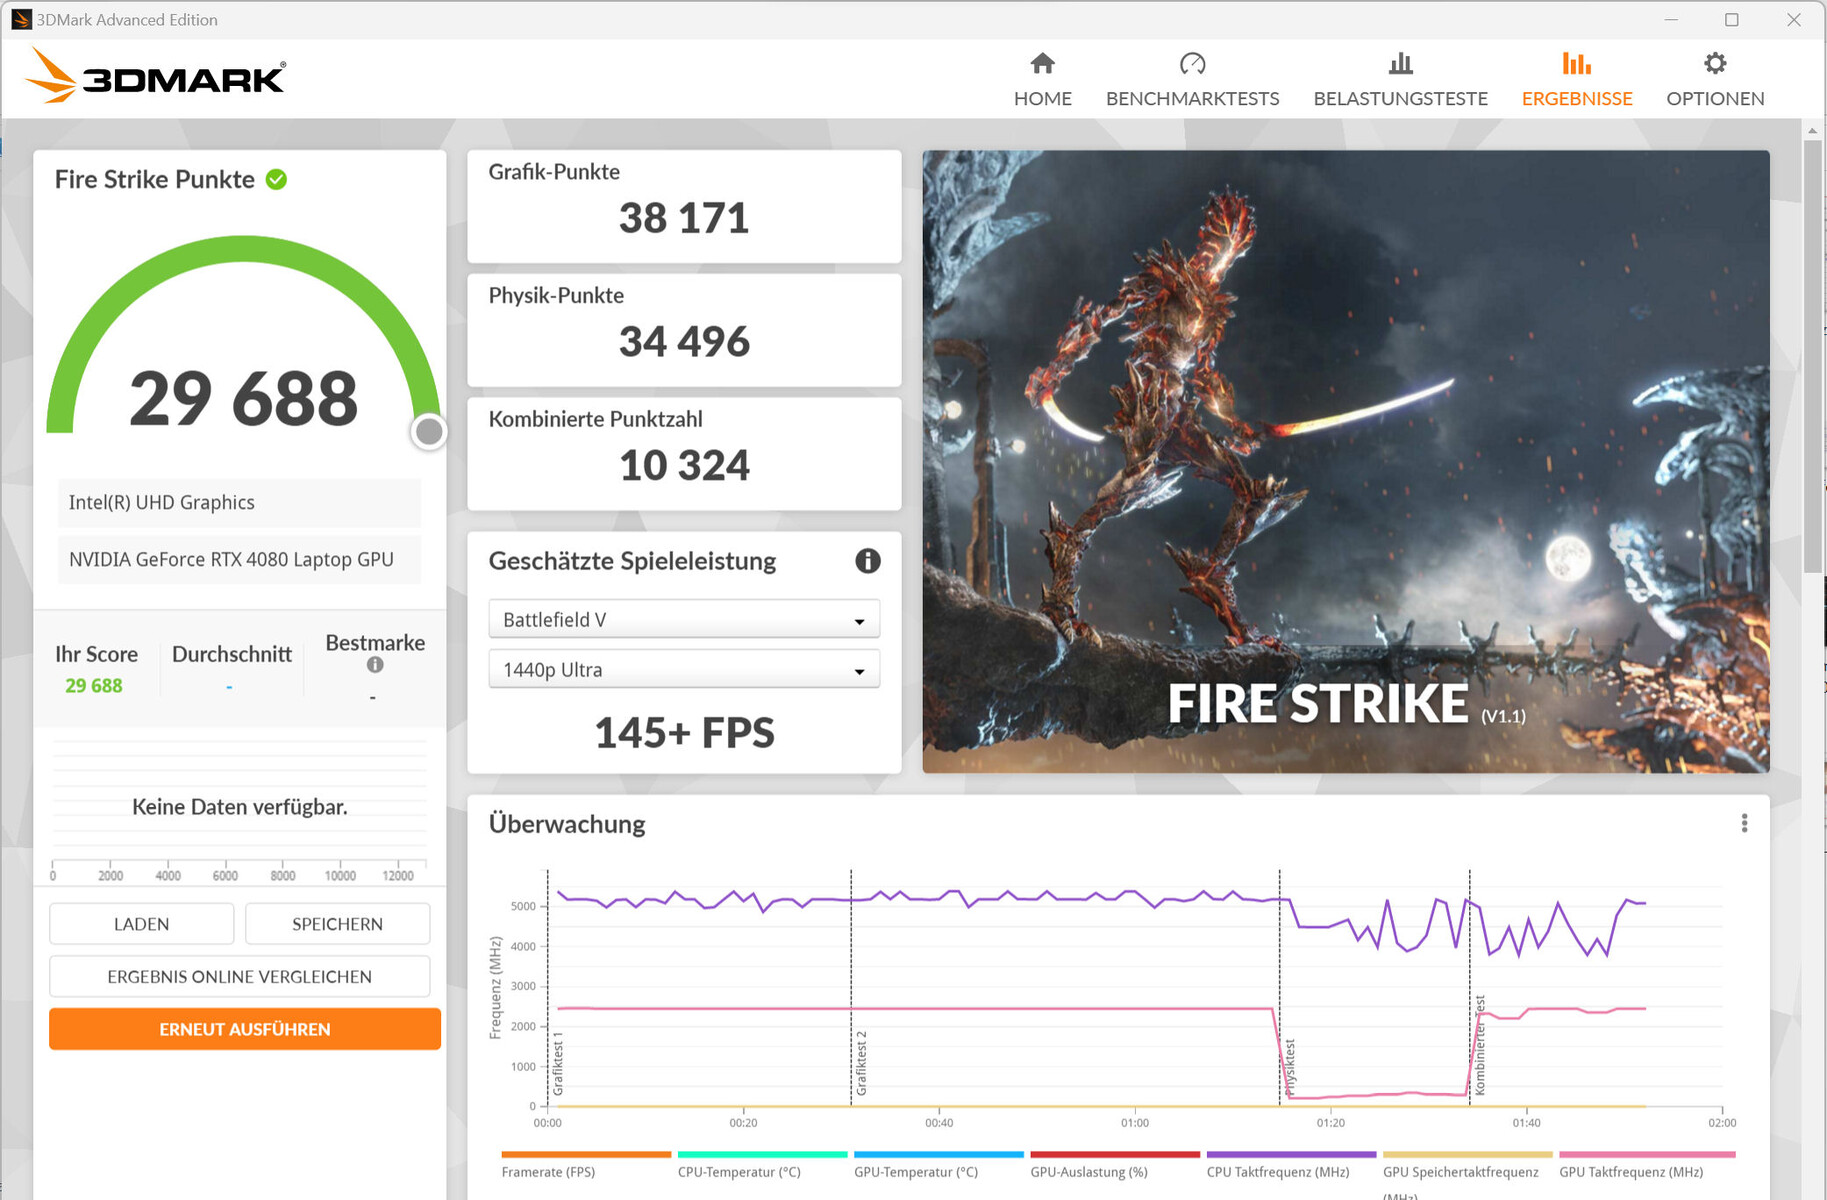
Wyniki benchmarku oscylują poniżej średniej dla przetestowanych przez nas do tej pory kart graficznych RTX 4080. Profil "Performance" doprowadzi do sporadycznego, niewielkiego wzrostu wydajności grafiki. Tryb dGPU nie doprowadzi do dalszej poprawy. Przełączanie między dGPU a Optimusem nie wymaga restartu - wspierany jest Advanced Optimus.
| 3DMark Performance rating - Percent | |
| Asus ROG Strix G16 G614JZ | |
| Lenovo Legion Pro 7 16IRX8H | |
| Razer Blade 16 Early 2023 -1! | |
| Przeciętny NVIDIA GeForce RTX 4080 Laptop GPU | |
| HP Omen 17-ck2097ng | |
| HP Omen 17-ck2097ng | |
| HP Omen 17-ck2097ng | |
| Średnia w klasie Gaming | |
| Alienware m17 R5 (R9 6900HX, RX 6850M XT) | |
| 3DMark 11 - 1280x720 Performance GPU | |
| Lenovo Legion Pro 7 16IRX8H | |
| HP Omen 17-ck2097ng (Leistung) | |
| Asus ROG Strix G16 G614JZ | |
| Przeciętny NVIDIA GeForce RTX 4080 Laptop GPU (45199 - 63128, n=24) | |
| Razer Blade 16 Early 2023 | |
| HP Omen 17-ck2097ng | |
| HP Omen 17-ck2097ng (Leistung, dGPU) | |
| Średnia w klasie Gaming (21841 - 80022, n=108, ostatnie 2 lata) | |
| Alienware m17 R5 (R9 6900HX, RX 6850M XT) | |
| Blender | |
| v3.3 Classroom OPTIX/RTX | |
| Średnia w klasie Gaming (9 - 32, n=111, ostatnie 2 lata) | |
| HP Omen 17-ck2097ng (3.3.3) | |
| Przeciętny NVIDIA GeForce RTX 4080 Laptop GPU (13 - 20, n=22) | |
| Razer Blade 16 Early 2023 (3.3.3) | |
| Lenovo Legion Pro 7 16IRX8H (3.3.3) | |
| Asus ROG Strix G16 G614JZ (3.3.3) | |
| HP Omen 17-ck2097ng (3.3.3, Leistung) | |
| v3.3 Classroom CUDA | |
| Średnia w klasie Gaming (15 - 228, n=111, ostatnie 2 lata) | |
| Lenovo Legion Pro 7 16IRX8H (3.3.3) | |
| HP Omen 17-ck2097ng (3.3.3, Leistung) | |
| Przeciętny NVIDIA GeForce RTX 4080 Laptop GPU (21 - 28, n=23) | |
| Razer Blade 16 Early 2023 (3.3.3) | |
| HP Omen 17-ck2097ng (3.3.3) | |
| Asus ROG Strix G16 G614JZ (3.3.3) | |
| HP Omen 17-ck2097ng (3.3.3, dGPU, Leistung) | |
| V-Ray 5 Benchmark | |
| GPU RTX | |
| HP Omen 17-ck2097ng (5.0.1) | |
| Średnia w klasie Gaming (1146 - 4363, n=37, ostatnie 2 lata) | |
| HP Omen 17-ck2097ng (5.0.1, dGPU, Leistung) | |
| Razer Blade 16 Early 2023 (5.0.1) | |
| HP Omen 17-ck2097ng (5.0.1, Leistung) | |
| Przeciętny NVIDIA GeForce RTX 4080 Laptop GPU (2128 - 2843, n=17) | |
| GPU CUDA | |
| Średnia w klasie Gaming (887 - 3288, n=37, ostatnie 2 lata) | |
| HP Omen 17-ck2097ng (5.0.1, dGPU, Leistung) | |
| HP Omen 17-ck2097ng (5.0.1, Leistung) | |
| HP Omen 17-ck2097ng (5.0.1) | |
| Przeciętny NVIDIA GeForce RTX 4080 Laptop GPU (1647 - 2112, n=17) | |
| Razer Blade 16 Early 2023 (5.0.1) | |
| CPU | |
| HP Omen 17-ck2097ng (5.0.1, Leistung) | |
| Razer Blade 16 Early 2023 (5.0.1) | |
| Średnia w klasie Gaming (5864 - 30302, n=36, ostatnie 2 lata) | |
| HP Omen 17-ck2097ng (5.0.1, dGPU, Leistung) | |
| Przeciętny NVIDIA GeForce RTX 4080 Laptop GPU (11906 - 21823, n=17) | |
| HP Omen 17-ck2097ng (5.0.1) | |
| V-Ray Benchmark Next 4.10 | |
| GPU | |
| HP Omen 17-ck2097ng (v4.10.07, Leistung) | |
| Asus ROG Strix G16 G614JZ (v4.10.07 ) | |
| Lenovo Legion Pro 7 16IRX8H (v4.10.07 ) | |
| HP Omen 17-ck2097ng (v4.10.07 ) | |
| Przeciętny NVIDIA GeForce RTX 4080 Laptop GPU (812 - 1036, n=16) | |
| HP Omen 17-ck2097ng (v4.10.07, dGPU, Leistung) | |
| Średnia w klasie Gaming (427 - 1333, n=105, ostatnie 2 lata) | |
| Alienware m17 R5 (R9 6900HX, RX 6850M XT) (v4.10.07 ) | |
| CPU | |
| Lenovo Legion Pro 7 16IRX8H (v4.10.07 ) | |
| Asus ROG Strix G16 G614JZ (v4.10.07 ) | |
| HP Omen 17-ck2097ng (v4.10.07, Leistung) | |
| Przeciętny NVIDIA GeForce RTX 4080 Laptop GPU (19636 - 31653, n=16) | |
| Średnia w klasie Gaming (10048 - 45327, n=104, ostatnie 2 lata) | |
| HP Omen 17-ck2097ng (v4.10.07, dGPU, Leistung) | |
| HP Omen 17-ck2097ng (v4.10.07 ) | |
| Alienware m17 R5 (R9 6900HX, RX 6850M XT) (v4.10.07 ) | |
| Geekbench 5.5 - OpenCL Score | |
| Asus ROG Strix G16 G614JZ | |
| HP Omen 17-ck2097ng (Leistung) | |
| HP Omen 17-ck2097ng (dGPU, Leistung) | |
| Razer Blade 16 Early 2023 | |
| HP Omen 17-ck2097ng | |
| Przeciętny NVIDIA GeForce RTX 4080 Laptop GPU (146413 - 189320, n=23) | |
| Lenovo Legion Pro 7 16IRX8H | |
| Średnia w klasie Gaming (80702 - 277970, n=107, ostatnie 2 lata) | |
| Alienware m17 R5 (R9 6900HX, RX 6850M XT) | |
| Geekbench 6.0 - GPU OpenCL 6.0 | |
| HP Omen 17-ck2097ng | |
| Przeciętny NVIDIA GeForce RTX 4080 Laptop GPU (153564 - 175235, n=3) | |
| Średnia w klasie Gaming (87350 - 192027, n=4, ostatnie 2 lata) | |
* ... im mniej tym lepiej
Wydajność w grach
Omen, który jest skierowany do gier w rozdzielczości QHD na wysokich do maksymalnych ustawieniach, pozwala również na uzyskanie wyższych rozdzielczości po podłączeniu odpowiedniego monitora. Liczba klatek na sekundę w testowanych przez nas grach oscyluje poniżej średniej dla wszystkich testowanych do tej pory kart graficznych RTX 4080. Profil "Performance" prowadzi do wzrostu liczby klatek na sekundę nieco powyżej średniej. W niektórych grach tryb dGPU jest w stanie zapewnić dodatkowy wzrost.
| Performance rating - Percent | |
| Asus ROG Strix G16 G614JZ | |
| Razer Blade 16 Early 2023 | |
| Lenovo Legion Pro 7 16IRX8H | |
| HP Omen 17-ck2097ng | |
| HP Omen 17-ck2097ng | |
| Przeciętny NVIDIA GeForce RTX 4080 Laptop GPU | |
| HP Omen 17-ck2097ng | |
| Średnia w klasie Gaming | |
| Alienware m17 R5 (R9 6900HX, RX 6850M XT) | |
| The Witcher 3 - 1920x1080 Ultra Graphics & Postprocessing (HBAO+) | |
| Lenovo Legion Pro 7 16IRX8H | |
| Razer Blade 16 Early 2023 | |
| Asus ROG Strix G16 G614JZ | |
| HP Omen 17-ck2097ng (dGPU) | |
| HP Omen 17-ck2097ng (Leistung) | |
| Średnia w klasie Gaming (95 - 240, n=8, ostatnie 2 lata) | |
| Przeciętny NVIDIA GeForce RTX 4080 Laptop GPU (130.4 - 186.1, n=20) | |
| HP Omen 17-ck2097ng | |
| Alienware m17 R5 (R9 6900HX, RX 6850M XT) | |
| GTA V - 1920x1080 Highest AA:4xMSAA + FX AF:16x | |
| Asus ROG Strix G16 G614JZ | |
| Lenovo Legion Pro 7 16IRX8H | |
| Razer Blade 16 Early 2023 | |
| Przeciętny NVIDIA GeForce RTX 4080 Laptop GPU (102.9 - 152.7, n=21) | |
| Średnia w klasie Gaming (48.3 - 186.9, n=102, ostatnie 2 lata) | |
| HP Omen 17-ck2097ng (Leistung) | |
| HP Omen 17-ck2097ng (dGPU, Leistung) | |
| HP Omen 17-ck2097ng | |
| Alienware m17 R5 (R9 6900HX, RX 6850M XT) | |
| Final Fantasy XV Benchmark - 1920x1080 High Quality | |
| Asus ROG Strix G16 G614JZ (1.3) | |
| HP Omen 17-ck2097ng (1.3, dGPU, Leistung) | |
| HP Omen 17-ck2097ng (1.3, Leistung) | |
| Lenovo Legion Pro 7 16IRX8H (1.3) | |
| Przeciętny NVIDIA GeForce RTX 4080 Laptop GPU (129 - 182.1, n=23) | |
| Razer Blade 16 Early 2023 (1.3) | |
| HP Omen 17-ck2097ng (1.3) | |
| Średnia w klasie Gaming (41 - 215, n=103, ostatnie 2 lata) | |
| Alienware m17 R5 (R9 6900HX, RX 6850M XT) (1.3) | |
| Strange Brigade - 1920x1080 ultra AA:ultra AF:16 | |
| Asus ROG Strix G16 G614JZ (1.47.22.14 D3D12) | |
| HP Omen 17-ck2097ng (1.47.22.14 D3D12, dGPU, Leistung) | |
| Razer Blade 16 Early 2023 (1.47.22.14 D3D12) | |
| Lenovo Legion Pro 7 16IRX8H (1.47.22.14 D3D12) | |
| Przeciętny NVIDIA GeForce RTX 4080 Laptop GPU (239 - 357, n=22) | |
| HP Omen 17-ck2097ng (1.47.22.14 D3D12, Leistung) | |
| Średnia w klasie Gaming (76.3 - 456, n=93, ostatnie 2 lata) | |
| HP Omen 17-ck2097ng (1.47.22.14 D3D12) | |
| Alienware m17 R5 (R9 6900HX, RX 6850M XT) (1.47.22.14 D3D12) | |
| Dota 2 Reborn - 1920x1080 ultra (3/3) best looking | |
| Razer Blade 16 Early 2023 | |
| Asus ROG Strix G16 G614JZ | |
| Lenovo Legion Pro 7 16IRX8H | |
| HP Omen 17-ck2097ng (Leistung) | |
| HP Omen 17-ck2097ng (dGPU, Leistung) | |
| Przeciętny NVIDIA GeForce RTX 4080 Laptop GPU (133 - 194.7, n=23) | |
| HP Omen 17-ck2097ng | |
| Średnia w klasie Gaming (84.8 - 248, n=112, ostatnie 2 lata) | |
| Alienware m17 R5 (R9 6900HX, RX 6850M XT) | |
| X-Plane 11.11 - 1920x1080 high (fps_test=3) | |
| Asus ROG Strix G16 G614JZ | |
| Razer Blade 16 Early 2023 | |
| Lenovo Legion Pro 7 16IRX8H | |
| HP Omen 17-ck2097ng (dGPU, Leistung) | |
| Przeciętny NVIDIA GeForce RTX 4080 Laptop GPU (89.3 - 143.5, n=25) | |
| HP Omen 17-ck2097ng (Leistung) | |
| HP Omen 17-ck2097ng | |
| Średnia w klasie Gaming (52.1 - 143.5, n=115, ostatnie 2 lata) | |
| Alienware m17 R5 (R9 6900HX, RX 6850M XT) | |
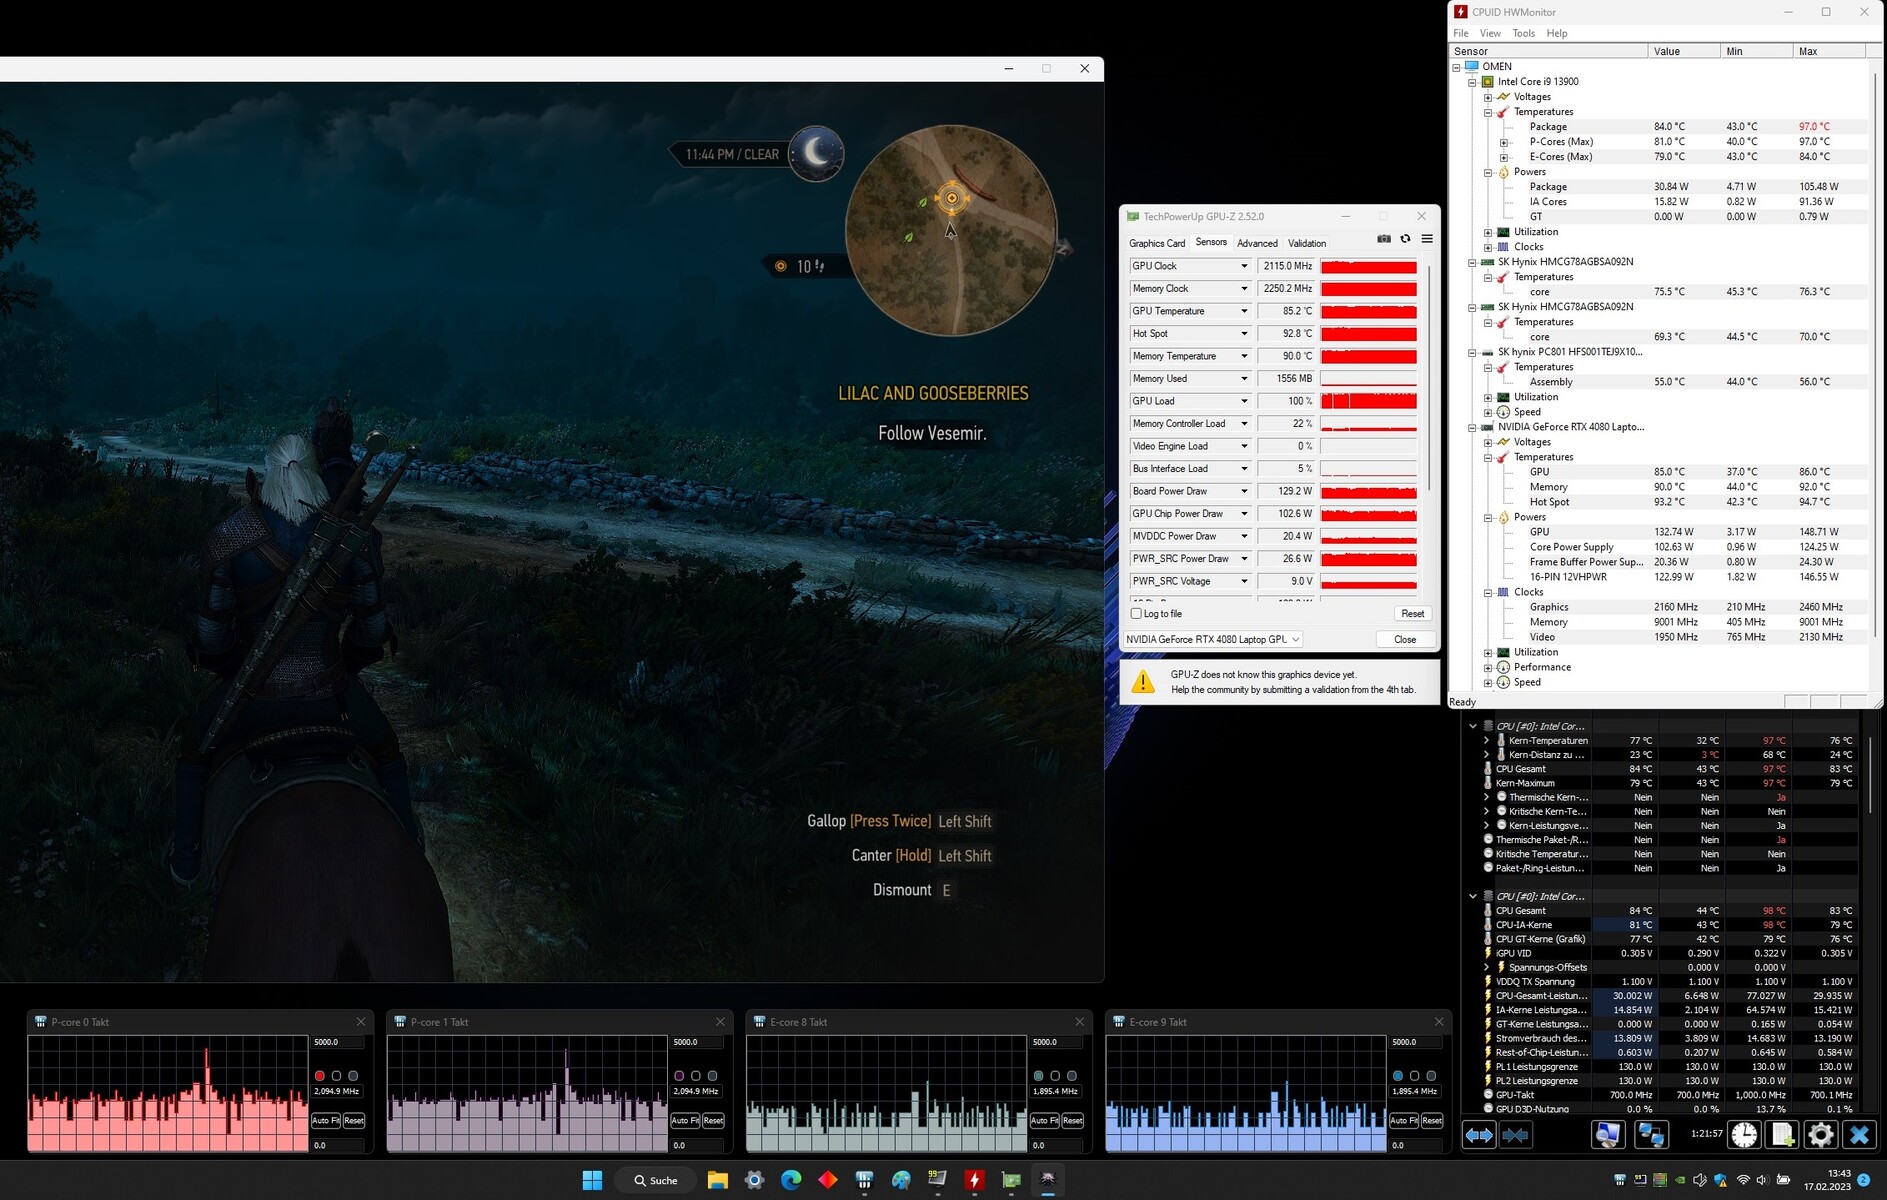
Aby ocenić, czy liczba klatek na sekundę pozostaje w dużym stopniu stała przez dłuższy czas, uruchamiamy grę "The Witcher 3" przez około 60 minut w rozdzielczości Full-HD i maksymalnych ustawieniach jakości. W tym czasie postać gracza nie jest poruszana. Nie zauważamy żadnego spadku liczby klatek na sekundę.
The Witcher 3 FPS Chart
| low | med. | high | ultra | QHD | |
|---|---|---|---|---|---|
| GTA V (2015) | 183.8 | 183.1 | 175.5 | 121.1 | 116 |
| The Witcher 3 (2015) | 459.7 | 400.5 | 287.8 | 164 | |
| Dota 2 Reborn (2015) | 206 | 180.5 | 167.2 | 155.3 | |
| Final Fantasy XV Benchmark (2018) | 192.4 | 173 | 145.4 | 117.5 | |
| X-Plane 11.11 (2018) | 169 | 146.9 | 119.4 | ||
| Far Cry 5 (2018) | 160 | 132 | 129 | 126 | 124 |
| Strange Brigade (2018) | 388 | 300 | 290 | 276 | 208 |
| F1 22 (2022) | 255 | 248 | 231 | 97.5 | 67.6 |
| The Callisto Protocol (2022) | 167.6 | 153.7 | 148.3 | 111.5 | 83.7 |
| Returnal (2023) | 150 | 147 | 137 | 121 | 92 |
| Atomic Heart (2023) | 170.8 | 142.3 | 121.1 | 100.3 | 79.2 |
| Company of Heroes 3 (2023) | 275 | 244.6 | 206.5 | 205.31 | 153.8 |
| Sons of the Forest (2023) | 78.1 | 75 | 74.6 | 69.7 | 66.8 |
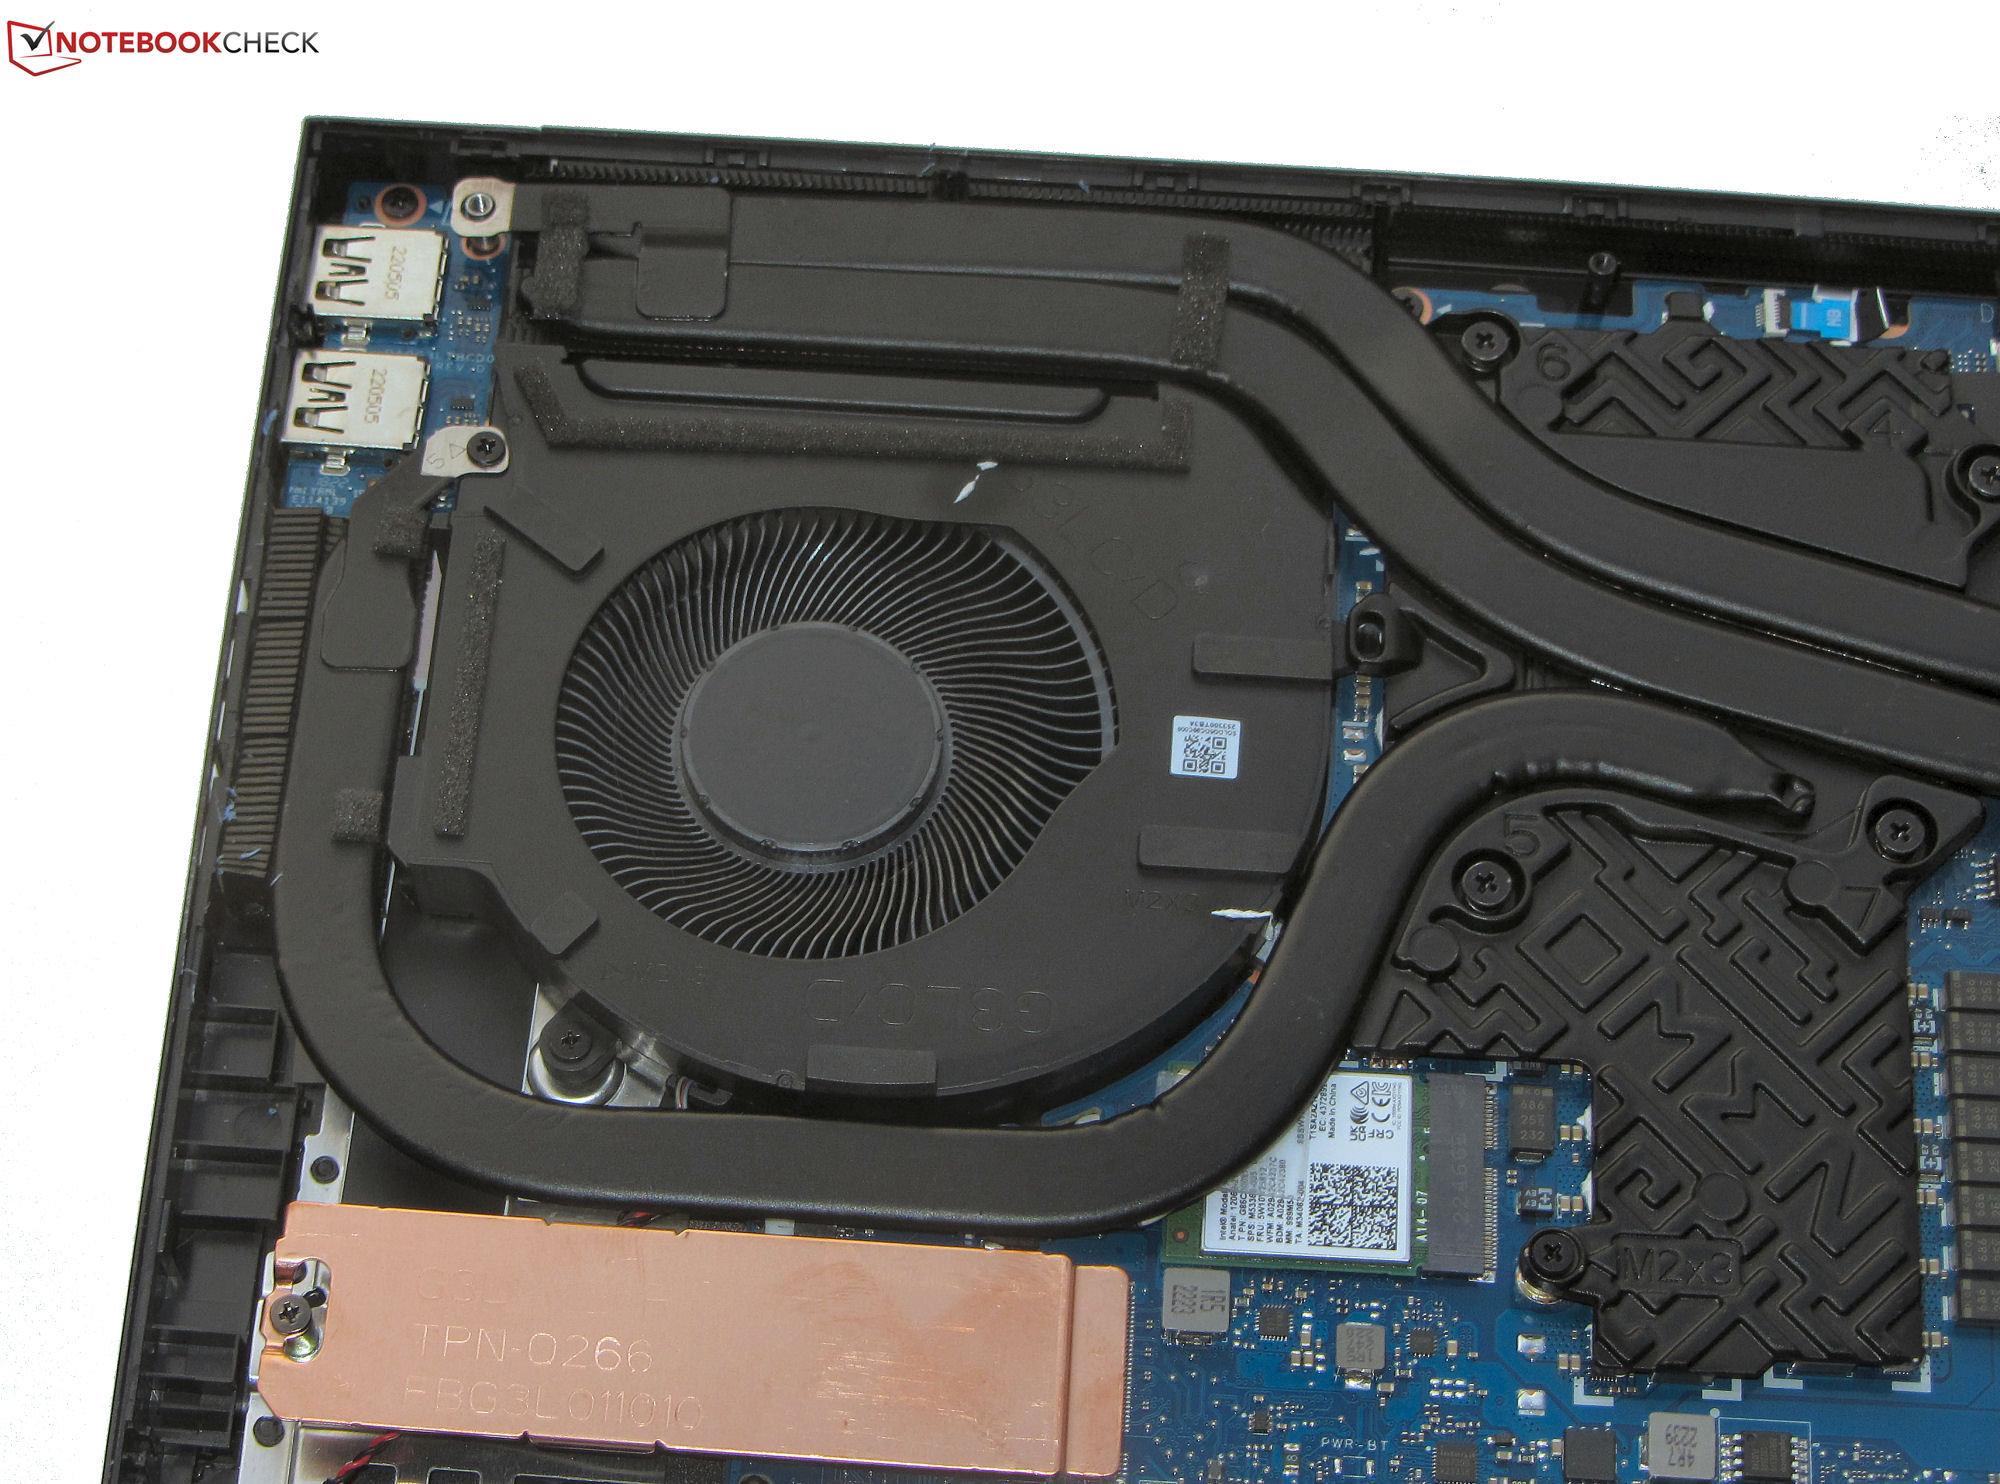
Emisje - laptop HP wytwarza dużo hałasu
Poziomy hałasu
W codziennej pracy (Biuro, Internet) i podczas pracy na biegu jałowym, stale pracujące wentylatory są wyraźnie słyszalne. Przy dużym obciążeniu (stress test, The Witcher 3) poziom hałasu wzrasta dalej i możliwe jest osiągnięcie poziomu 50 dB (A). Tryb "Performance" prowadzi do szybszego wzrostu poziomu hałasu aż do maksimum i utrzymania go na tym poziomie. Szum składa się z lekkiego warkotu, któremu towarzyszy stonowane gwizdanie.
BIOS Omena zawiera autorską opcję HP "Fan always on", która jest domyślnie aktywna. Dezaktywacja tej opcji nie prowadzi do żadnych zmian w naszym testowym egzemplarzu.
Hałas
| luz |
| 31 / 32 / 33 dB |
| obciążenie |
| 45 / 50 dB |
 | ||
30 dB cichy 40 dB(A) słyszalny 50 dB(A) irytujący |
||
min: | ||
| HP Omen 17-ck2097ng i9-13900HX, GeForce RTX 4080 Laptop GPU | Alienware m17 R5 (R9 6900HX, RX 6850M XT) R9 6900HX, Radeon RX 6850M XT | Razer Blade 16 Early 2023 i9-13950HX, GeForce RTX 4080 Laptop GPU | Lenovo Legion Pro 7 16IRX8H i9-13900HX, GeForce RTX 4080 Laptop GPU | Asus ROG Strix G16 G614JZ i9-13980HX, GeForce RTX 4080 Laptop GPU | HP Omen 17-ck1075ng i7-12700H, GeForce RTX 3070 Ti Laptop GPU | |
|---|---|---|---|---|---|---|
| Noise | 11% | 12% | -2% | 2% | -2% | |
| wyłączone / środowisko * (dB) | 24 | 23 4% | 23 4% | 24 -0% | 25 -4% | 25.4 -6% |
| Idle Minimum * (dB) | 31 | 23 26% | 23 26% | 26 16% | 26 16% | 28 10% |
| Idle Average * (dB) | 32 | 28.11 12% | 23 28% | 28 12% | 28 12% | 28 12% |
| Idle Maximum * (dB) | 33 | 28.11 15% | 23.6 28% | 34 -3% | 30 9% | 31.2 5% |
| Load Average * (dB) | 45 | 30.62 32% | 39 13% | 47 -4% | 48 -7% | 52.2 -16% |
| Witcher 3 ultra * (dB) | 45 | 49.75 -11% | 51.6 -15% | 55 -22% | 49 -9% | 52.2 -16% |
| Load Maximum * (dB) | 50 | 50.17 -0% | 51.3 -3% | 56 -12% | 52 -4% | 52.2 -4% |
* ... im mniej tym lepiej
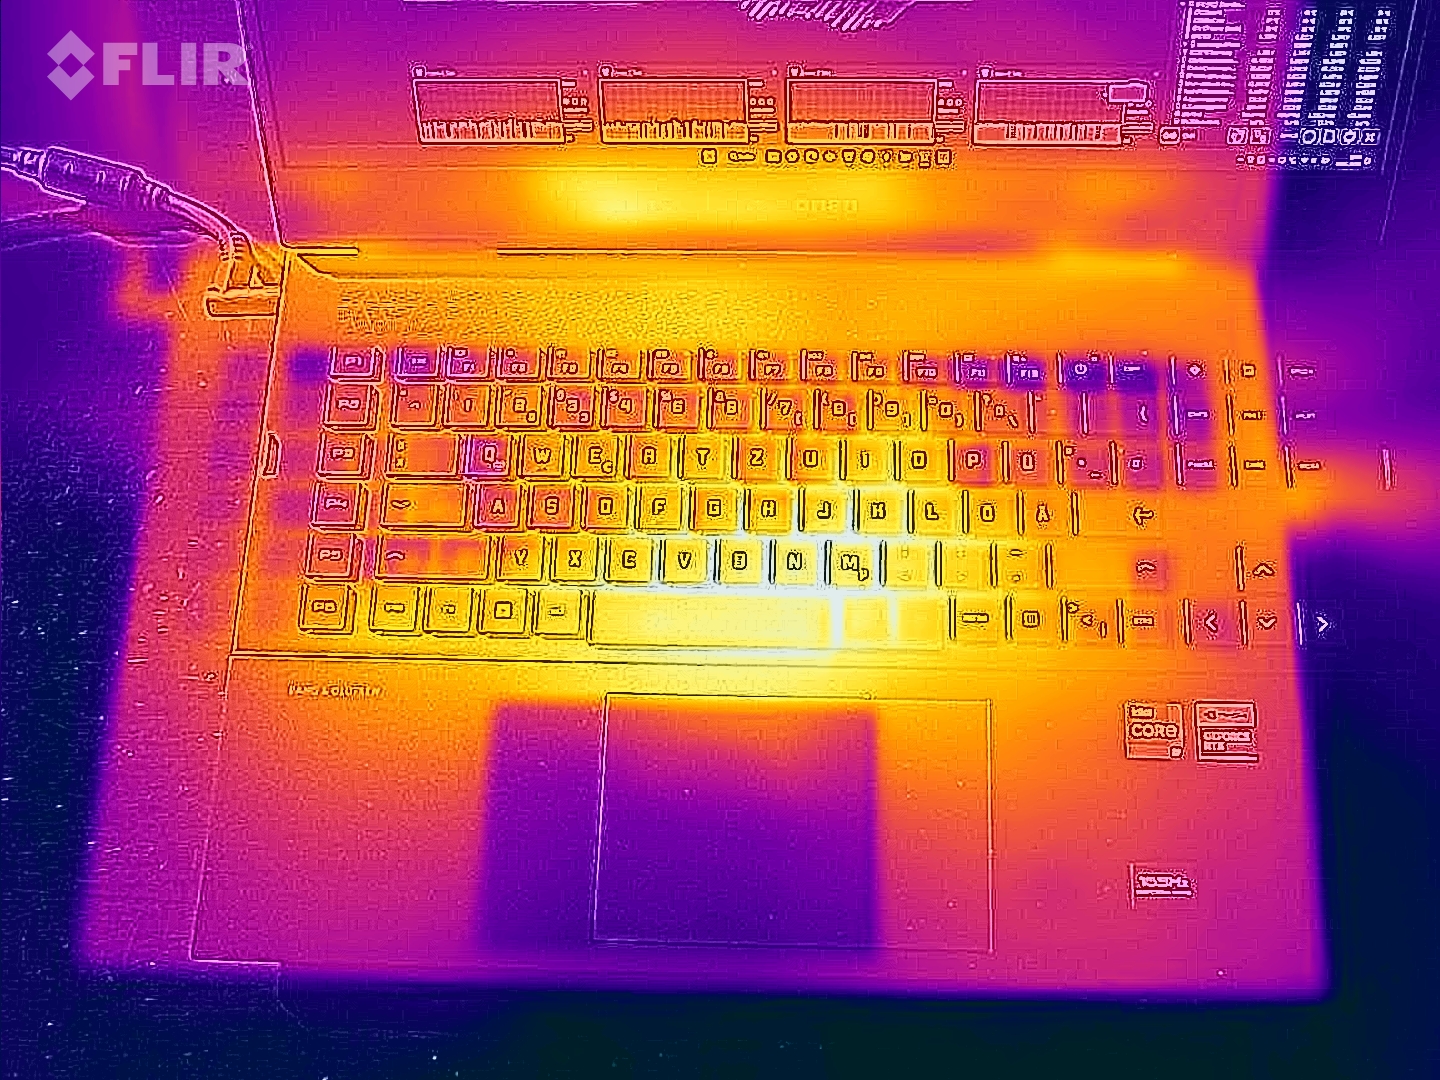
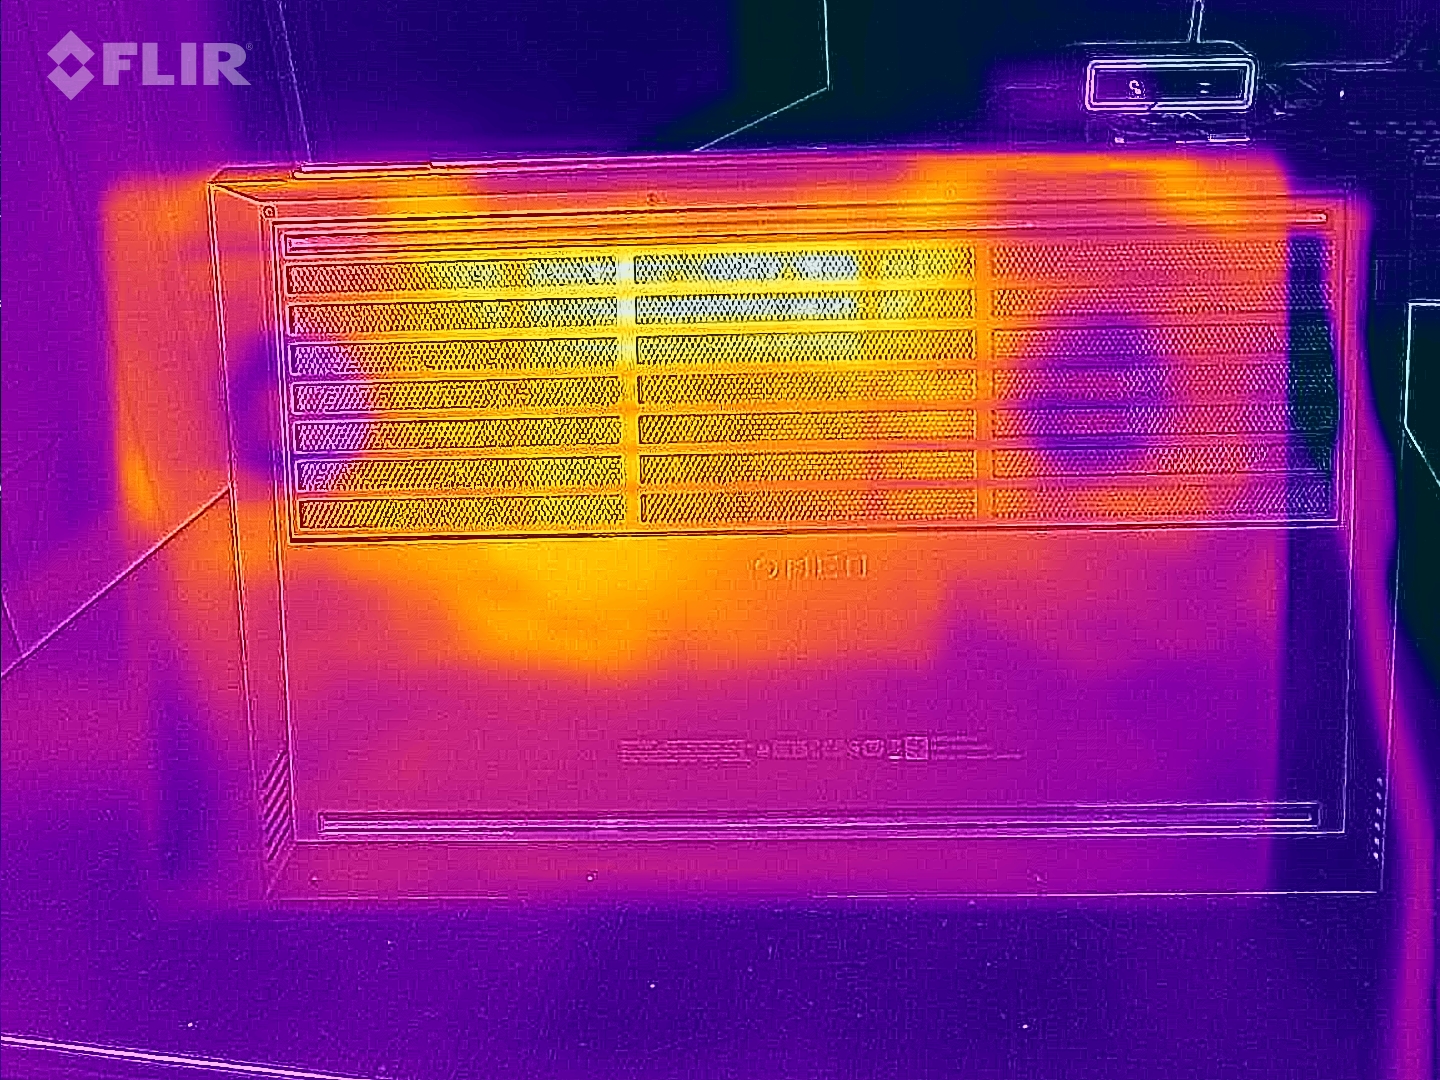
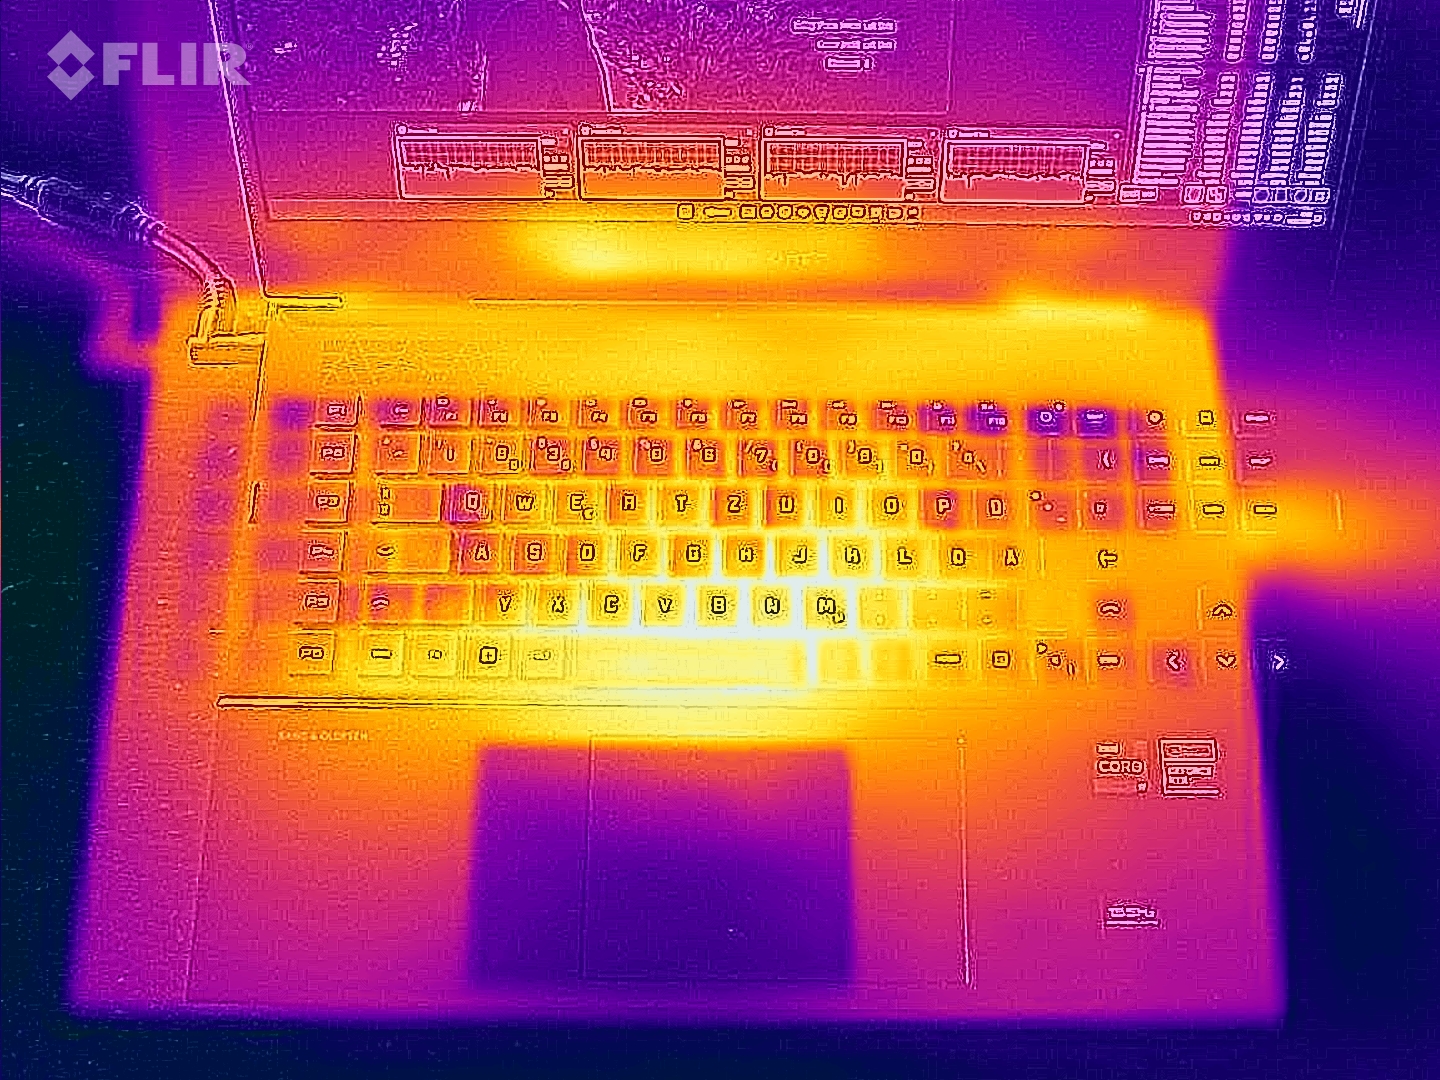
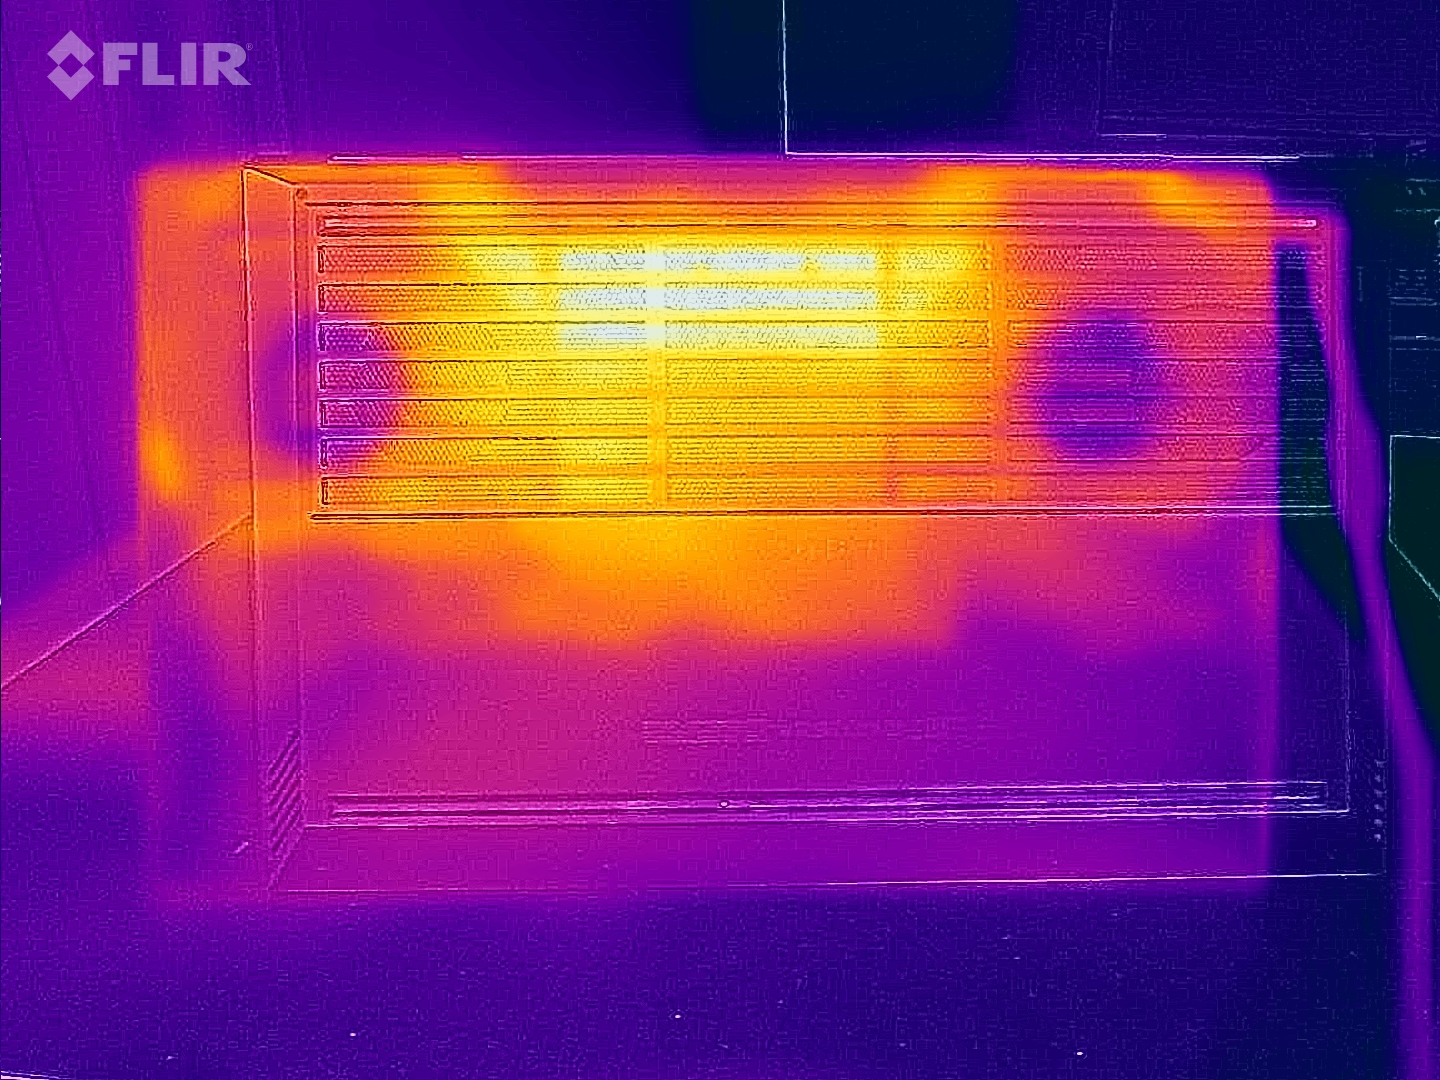
Temperatury
W codziennej pracy (Office, Internet) temperatury obudowy utrzymują się w zielonym zakresie. Pod obciążeniem (stress test, The Witcher 3) laptop nagrzewa się zauważalnie, ale pozostaje to w granicach - przynajmniej u góry. Temperatury procesora nie dają powodów do obaw.
(±) Maksymalna temperatura w górnej części wynosi 41 °C / 106 F, w porównaniu do średniej 40.4 °C / 105 F , począwszy od 21.2 do 68.8 °C dla klasy Gaming.
(-) Dno nagrzewa się maksymalnie do 51 °C / 124 F, w porównaniu do średniej 43.2 °C / 110 F
(+) W stanie bezczynności średnia temperatura górnej części wynosi 23.7 °C / 75 F, w porównaniu ze średnią temperaturą urządzenia wynoszącą 33.9 °C / ### class_avg_f### F.
(-) Podczas gry w Wiedźmina 3 średnia temperatura górnej części wynosi 38.2 °C / 101 F, w porównaniu do średniej temperatury urządzenia wynoszącej 33.9 °C / ## #class_avg_f### F.
(+) Podparcia dłoni i touchpad osiągają maksymalną temperaturę skóry (35 °C / 95 F) i dlatego nie są gorące.
(-) Średnia temperatura obszaru podparcia dłoni w podobnych urządzeniach wynosiła 28.8 °C / 83.8 F (-6.2 °C / -11.2 F).
| HP Omen 17-ck2097ng Intel Core i9-13900HX, NVIDIA GeForce RTX 4080 Laptop GPU | Alienware m17 R5 (R9 6900HX, RX 6850M XT) AMD Ryzen 9 6900HX, AMD Radeon RX 6850M XT | Razer Blade 16 Early 2023 Intel Core i9-13950HX, NVIDIA GeForce RTX 4080 Laptop GPU | Lenovo Legion Pro 7 16IRX8H Intel Core i9-13900HX, NVIDIA GeForce RTX 4080 Laptop GPU | Asus ROG Strix G16 G614JZ Intel Core i9-13980HX, NVIDIA GeForce RTX 4080 Laptop GPU | HP Omen 17-ck1075ng Intel Core i7-12700H, NVIDIA GeForce RTX 3070 Ti Laptop GPU | |
|---|---|---|---|---|---|---|
| Heat | -20% | -8% | -28% | -23% | -16% | |
| Maximum Upper Side * (°C) | 41 | 53 -29% | 40 2% | 48 -17% | 54 -32% | 31.3 24% |
| Maximum Bottom * (°C) | 51 | 56 -10% | 37.6 26% | 49 4% | 55 -8% | 43.3 15% |
| Idle Upper Side * (°C) | 24 | 30 -25% | 32.4 -35% | 40 -67% | 29 -21% | 31.3 -30% |
| Idle Bottom * (°C) | 25 | 29 -16% | 31.4 -26% | 33 -32% | 33 -32% | 43.3 -73% |
* ... im mniej tym lepiej
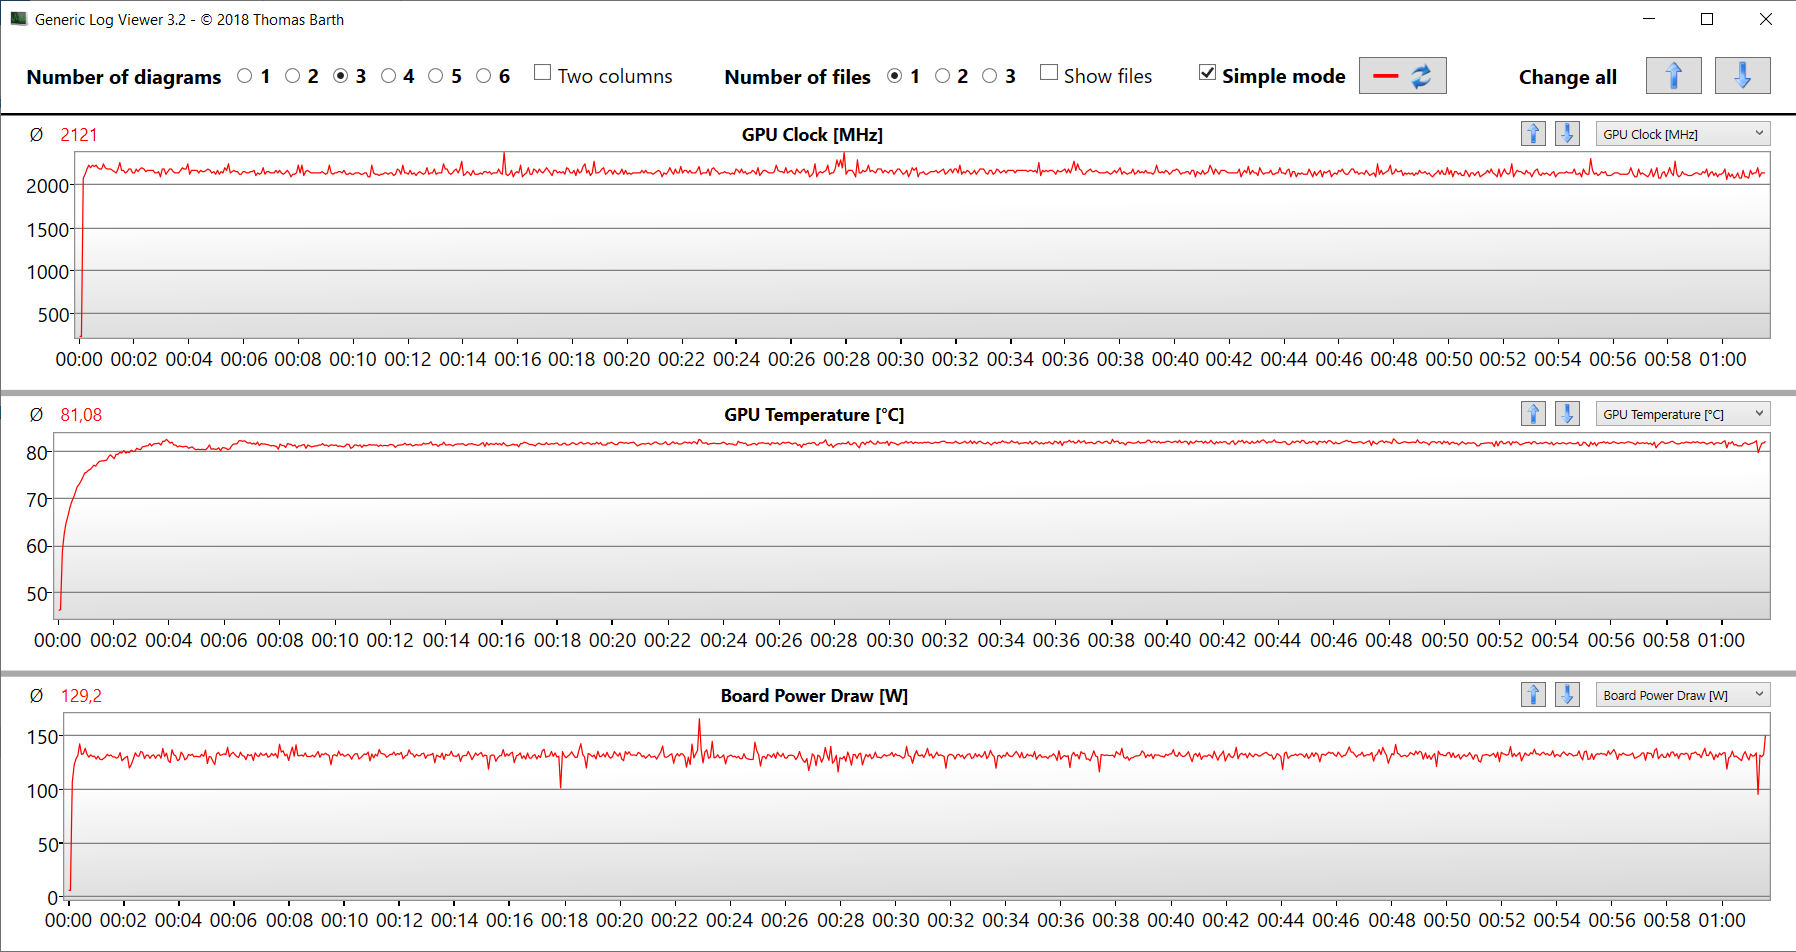
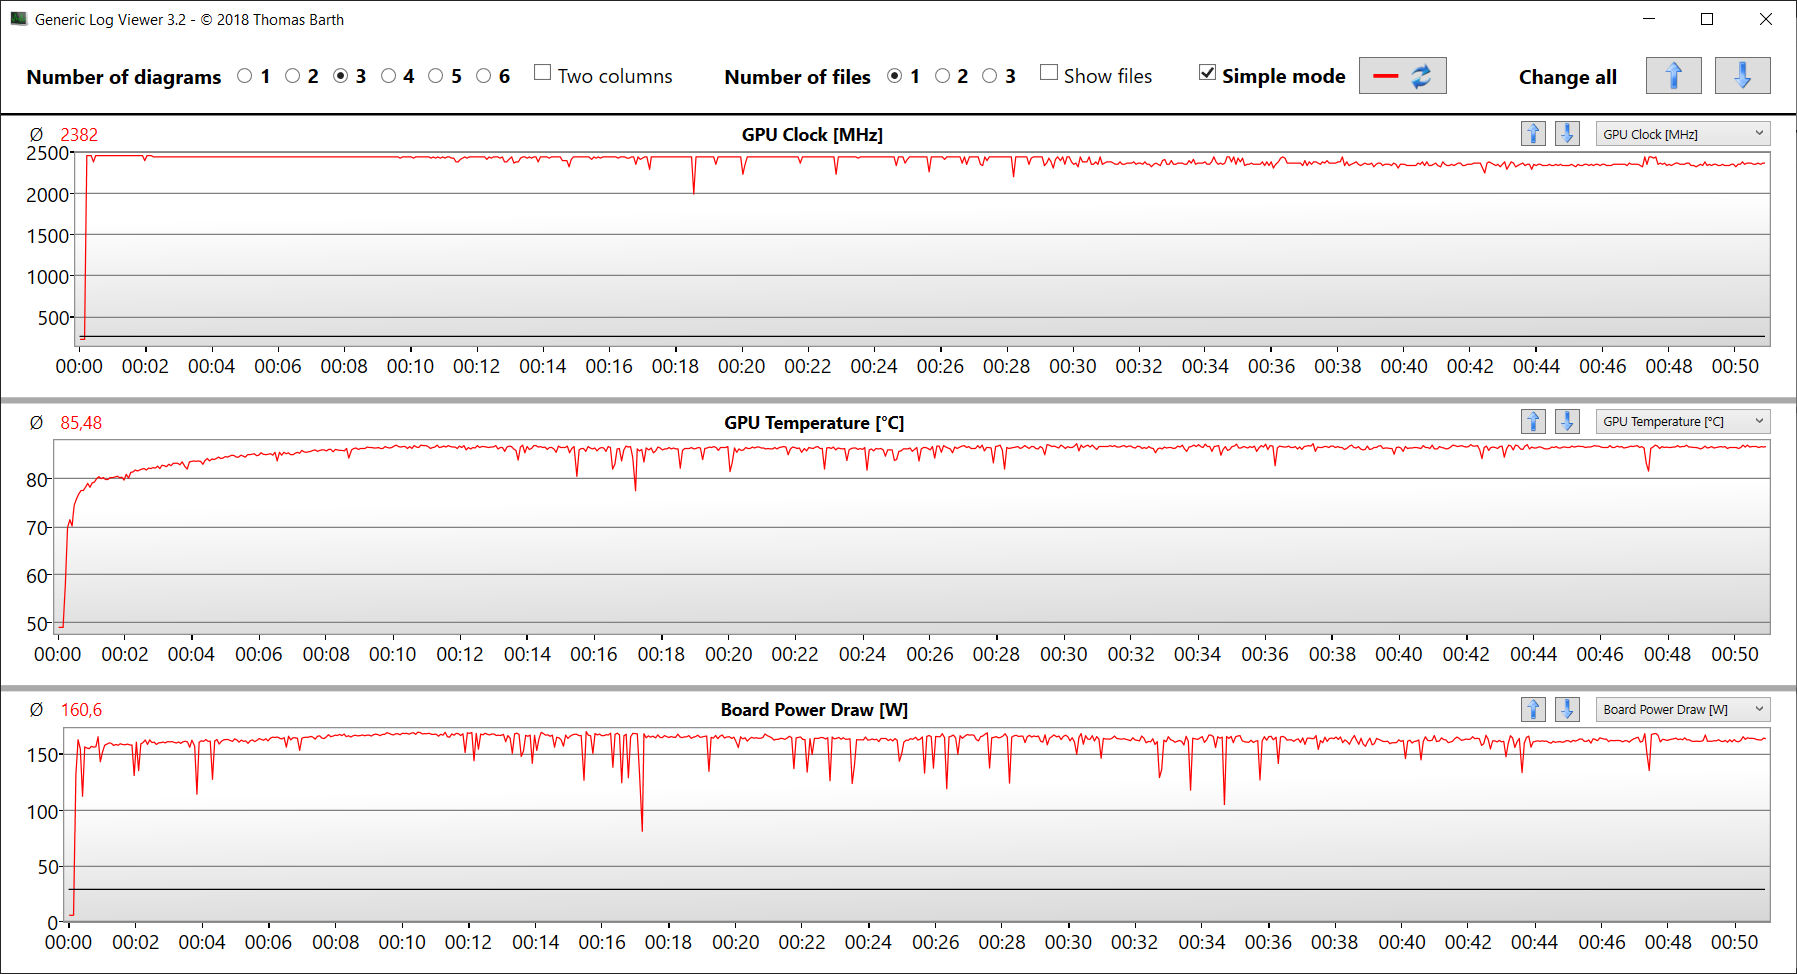
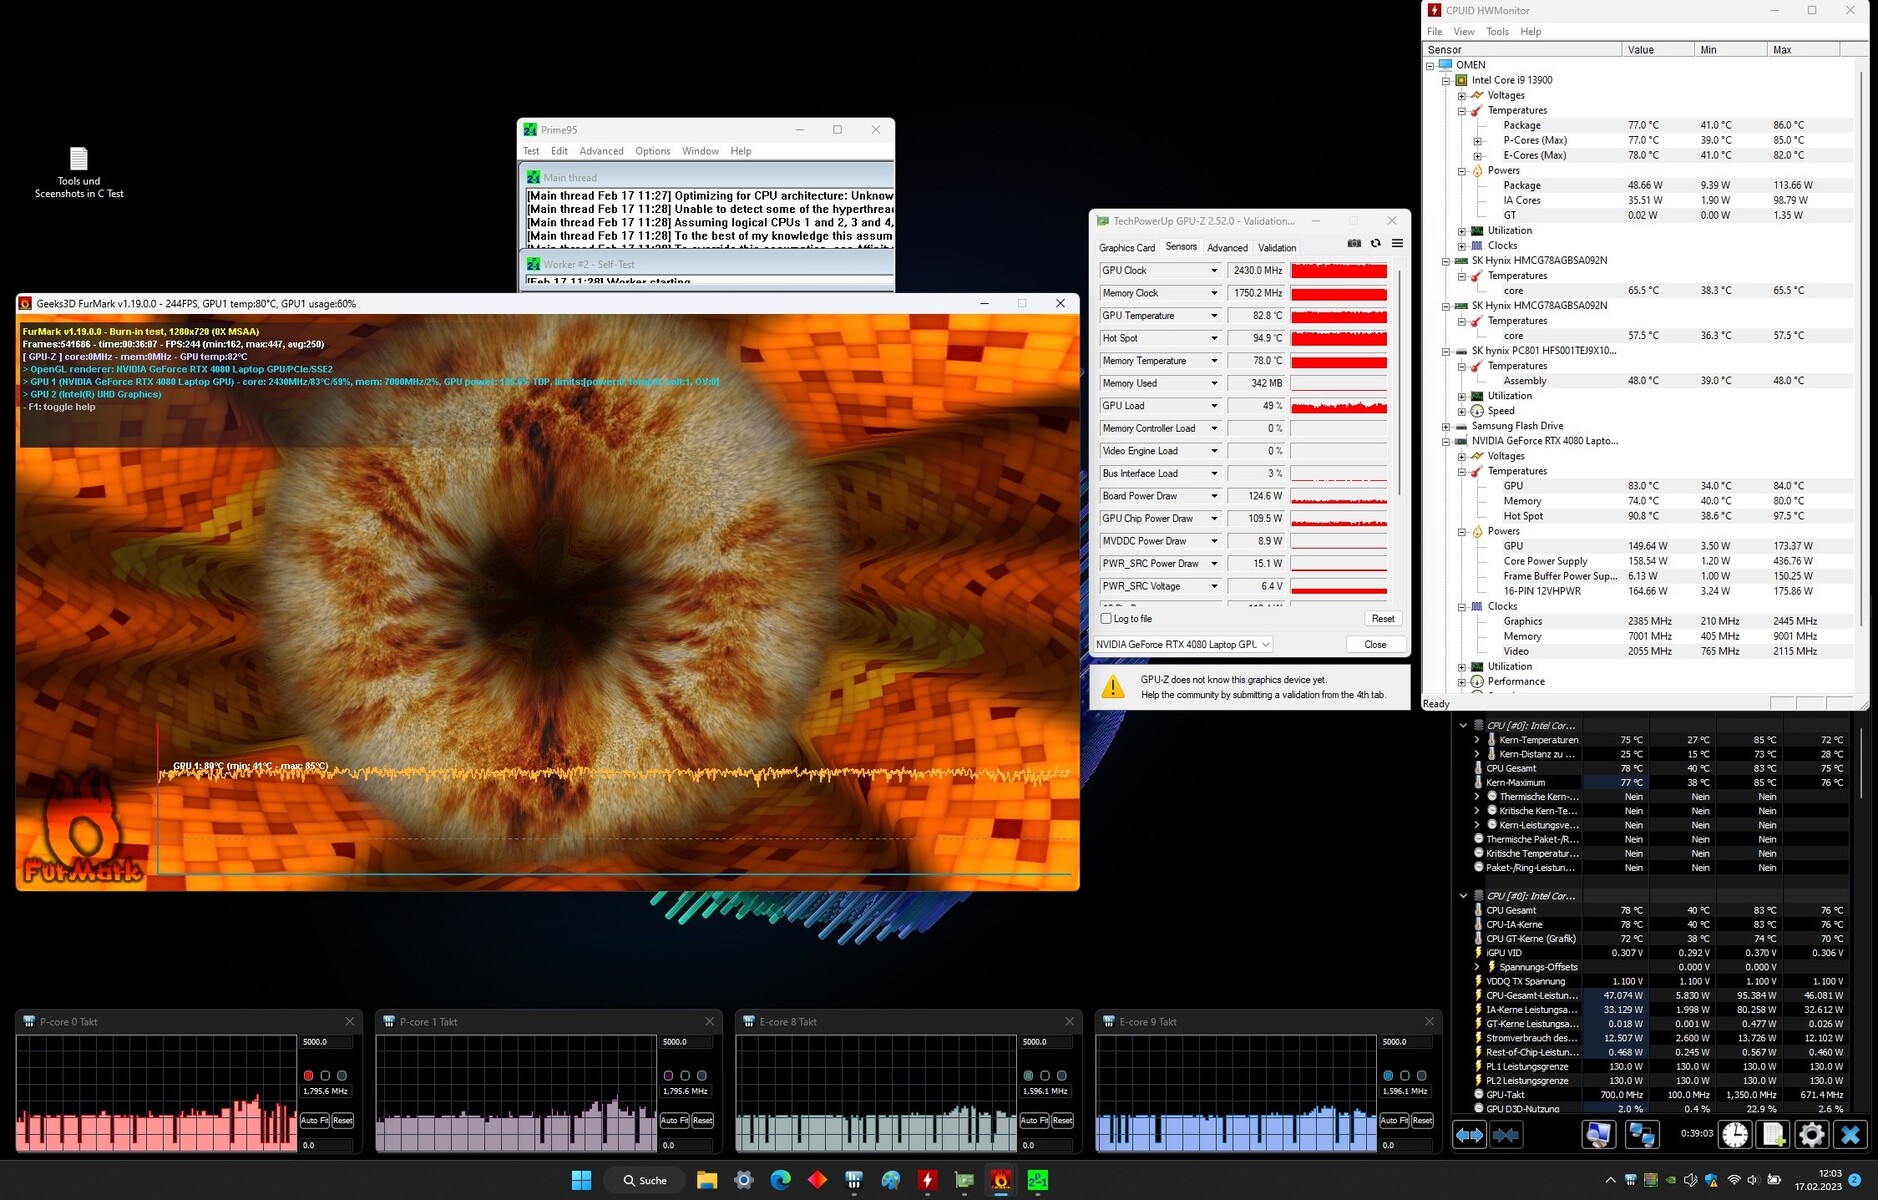
Stress Test
Nasz test obciążeniowy z ciągle działającymi programami Prime95 i Furmark reprezentuje ekstremalny scenariusz, który wykorzystujemy do oceny stabilności systemu pod pełnym obciążeniem. CPU (P: 3,8 GHz, E: 3,2 GHz) i GPU (2 do 2,1 GHz) rozpoczynają test z wysokim taktowaniem. Po krótkim czasie prędkość CPU spada do około 1,8 GHz (rdzenie P) i 2 GHz (rdzenie E), a prędkość GPU wzrasta w tym samym czasie do 2,3 - 2,4 GHz.
Mówcy
Głośniki stereo wytwarzają przyzwoity dźwięk, ale prawie nie ma on basów.
HP Omen 17-ck2097ng analiza dźwięku
(±) | głośność głośnika jest średnia, ale dobra (81 dB)
Bas 100 - 315 Hz
(-) | prawie brak basu - średnio 21% niższa od mediany
(±) | liniowość basu jest średnia (14.6% delta do poprzedniej częstotliwości)
Średnie 400 - 2000 Hz
(+) | zbalansowane środki średnie - tylko 1.4% od mediany
(+) | średnie są liniowe (2.9% delta do poprzedniej częstotliwości)
Wysokie 2–16 kHz
(+) | zrównoważone maksima - tylko 2.2% od mediany
(+) | wzloty są liniowe (3.8% delta do poprzedniej częstotliwości)
Ogólnie 100 - 16.000 Hz
(+) | ogólny dźwięk jest liniowy (13.8% różnicy w stosunku do mediany)
W porównaniu do tej samej klasy
» 21% wszystkich testowanych urządzeń w tej klasie było lepszych, 7% podobnych, 72% gorszych
» Najlepszy miał deltę 6%, średnia wynosiła ###średnia###%, najgorsza wynosiła 132%
W porównaniu do wszystkich testowanych urządzeń
» 15% wszystkich testowanych urządzeń było lepszych, 4% podobnych, 81% gorszych
» Najlepszy miał deltę 4%, średnia wynosiła ###średnia###%, najgorsza wynosiła 134%
Asus ROG Strix Scar 17 SE G733CX-LL014W analiza dźwięku
(±) | głośność głośnika jest średnia, ale dobra (73.3 dB)
Bas 100 - 315 Hz
(±) | zredukowany bas - średnio 6.2% niższy od mediany
(±) | liniowość basu jest średnia (7.5% delta do poprzedniej częstotliwości)
Średnie 400 - 2000 Hz
(+) | zbalansowane środki średnie - tylko 2% od mediany
(+) | średnie są liniowe (3.9% delta do poprzedniej częstotliwości)
Wysokie 2–16 kHz
(+) | zrównoważone maksima - tylko 3.5% od mediany
(±) | liniowość wysokich wartości jest średnia (9.3% delta do poprzedniej częstotliwości)
Ogólnie 100 - 16.000 Hz
(+) | ogólny dźwięk jest liniowy (13.6% różnicy w stosunku do mediany)
W porównaniu do tej samej klasy
» 20% wszystkich testowanych urządzeń w tej klasie było lepszych, 7% podobnych, 73% gorszych
» Najlepszy miał deltę 6%, średnia wynosiła ###średnia###%, najgorsza wynosiła 132%
W porównaniu do wszystkich testowanych urządzeń
» 15% wszystkich testowanych urządzeń było lepszych, 4% podobnych, 82% gorszych
» Najlepszy miał deltę 4%, średnia wynosiła ###średnia###%, najgorsza wynosiła 134%
Zarządzanie energią - laptop gamingowy z zasilaczem o mocy 330 W
Pobór mocy
Pobór mocy waha się na normalnym poziomie dla zastosowanego sprzętu. Podczas naszego testu The Witcher 3 pobór mocy utrzymuje się na stałym poziomie, a podczas stress testu po kilku minutach zużycie spada - procesor jest dławiony. Dołączony do zestawu zasilacz (330 W) jest wystarczająco pojemny.
| wyłączony / stan wstrzymania | |
| luz | |
| obciążenie |
|
Legenda:
min: | |
| HP Omen 17-ck2097ng i9-13900HX, GeForce RTX 4080 Laptop GPU | Alienware m17 R5 (R9 6900HX, RX 6850M XT) R9 6900HX, Radeon RX 6850M XT | Razer Blade 16 Early 2023 i9-13950HX, GeForce RTX 4080 Laptop GPU | Lenovo Legion Pro 7 16IRX8H i9-13900HX, GeForce RTX 4080 Laptop GPU | Asus ROG Strix G16 G614JZ i9-13980HX, GeForce RTX 4080 Laptop GPU | HP Omen 17-ck1075ng i7-12700H, GeForce RTX 3070 Ti Laptop GPU | Przeciętny NVIDIA GeForce RTX 4080 Laptop GPU | Średnia w klasie Gaming | |
|---|---|---|---|---|---|---|---|---|
| Power Consumption | 18% | -16% | -13% | 5% | 13% | -7% | 13% | |
| Idle Minimum * (Watt) | 16 | 13 19% | 15.2 5% | 18 -13% | 10 37% | 12.2 24% | 16.9 ? -6% | 13.2 ? 17% |
| Idle Average * (Watt) | 20 | 16.5 17% | 22.8 -14% | 24 -20% | 16 20% | 18 10% | 22 ? -10% | 18.9 ? 5% |
| Idle Maximum * (Watt) | 26 | 17 35% | 49.8 -92% | 32 -23% | 27 -4% | 19.4 25% | 34.1 ? -31% | 24.3 ? 7% |
| Load Average * (Watt) | 135 | 93 31% | 121.2 10% | 130 4% | 129 4% | 128 5% | 117.9 ? 13% | 108 ? 20% |
| Witcher 3 ultra * (Watt) | 215 | 239 -11% | 242 -13% | 260 -21% | 247 -15% | 209 3% | ||
| Load Maximum * (Watt) | 299 | 251 16% | 273.7 8% | 320 -7% | 342 -14% | 266 11% | 297 ? 1% | 254 ? 15% |
* ... im mniej tym lepiej
Power Consumption The Witcher 3 / Stress Test
Power Consumption with External Monitor
Czas pracy na baterii
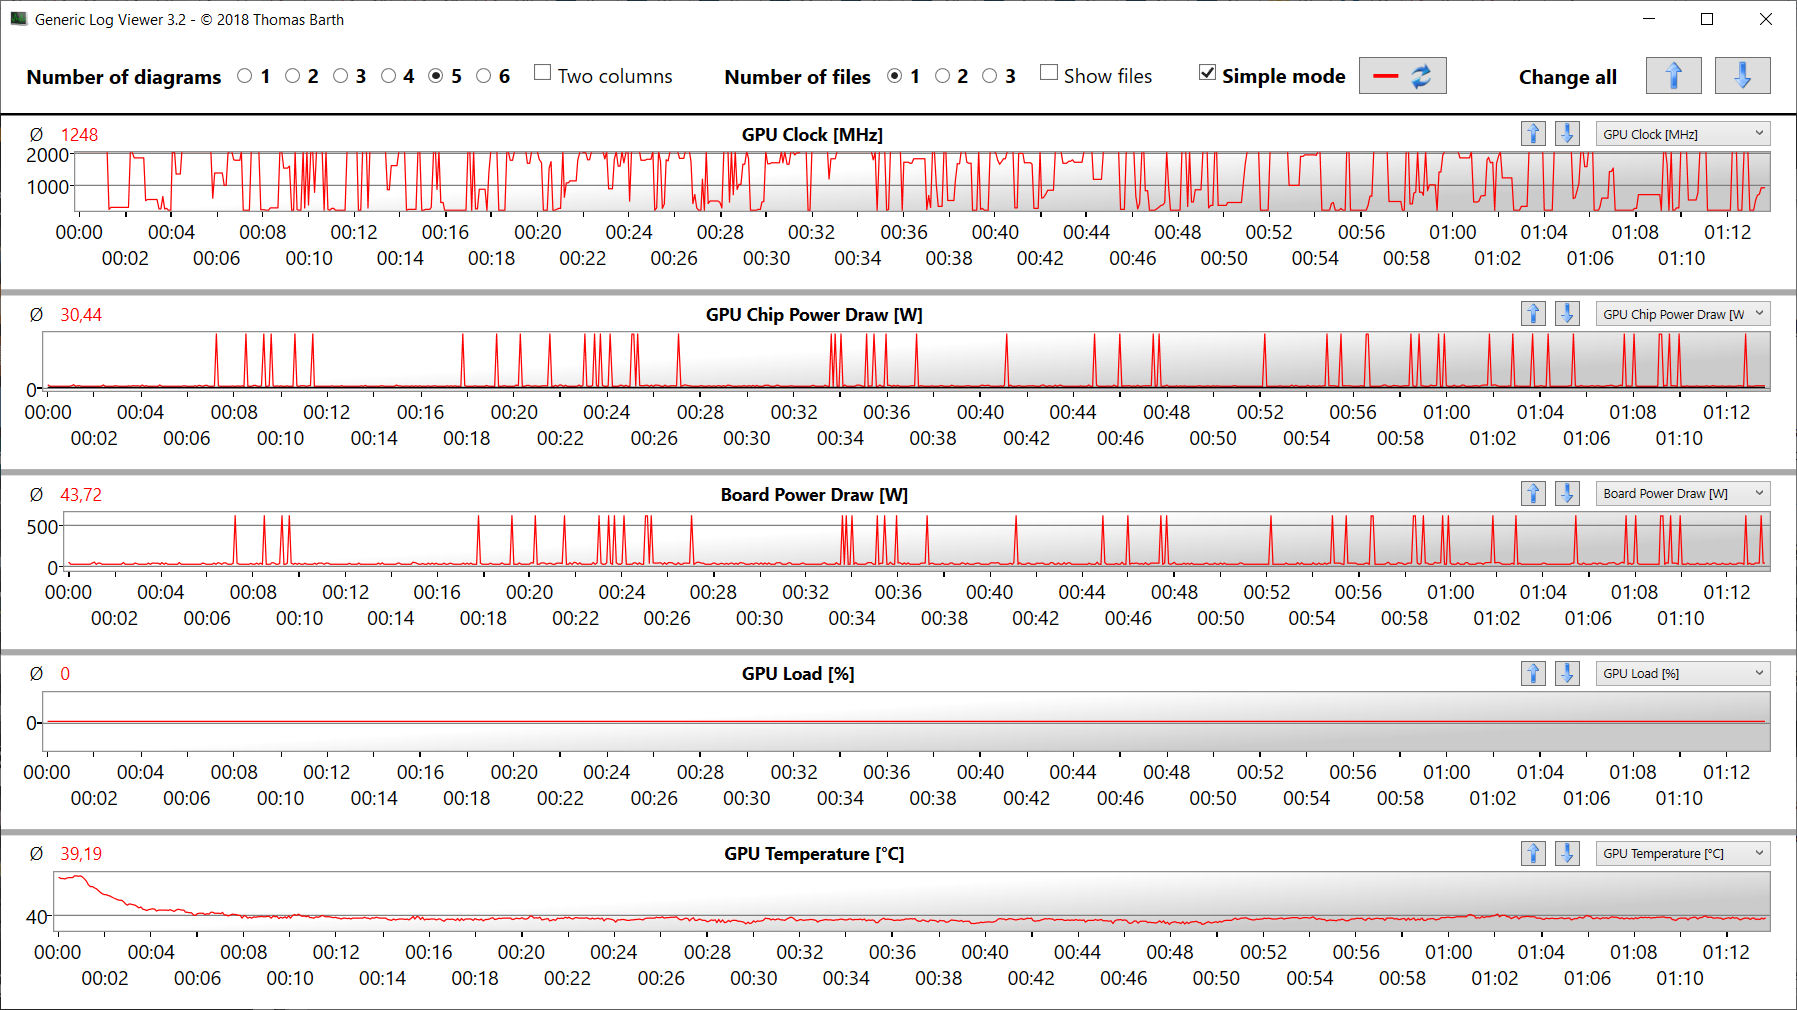
Czasy pracy na akumulatorze w Omenie nie są zadowalające. Nawet mocny laptop do gier musi wytrzymać dłużej w pracy Optimusa z akumulatorem o pojemności 83 Wh. Nie udało nam się do tej pory ustalić, czy jest to spowodowane problemem sprzętowym czy programowym.
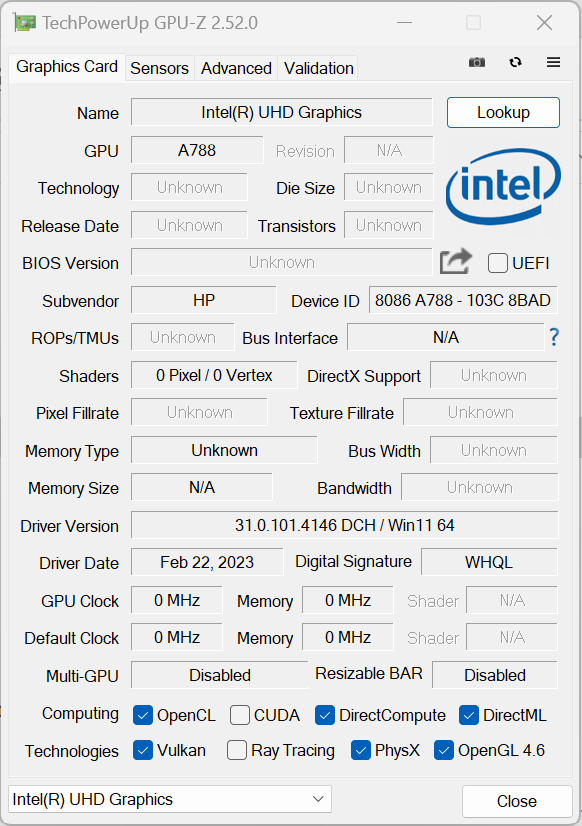
Pliki dziennika podają jedną wskazówkę dotyczącą problemu: podczas testów uruchamiania przy niskim obciążeniu (WiFi, bezczynność, wideo) GPU GeForce powinno być nieaktywne i pozostawić całą pracę procesorowi iGPU. Jednak GPU GeForce często działa tutaj z maksymalną prędkością - przy obciążeniu 0%. Według GPU-Z prowadzi to do zużycia energii na poziomie nawet 45 watów.
Z tego powodu poprosiliśmy o nową jednostkę testową od HP, by to dwukrotnie sprawdzić, ale jeszcze jej nie otrzymaliśmy. Jak tylko uda nam się go zdobyć, przetestujemy to ponownie.
| HP Omen 17-ck2097ng i9-13900HX, GeForce RTX 4080 Laptop GPU, 83 Wh | Alienware m17 R5 (R9 6900HX, RX 6850M XT) R9 6900HX, Radeon RX 6850M XT, 97 Wh | Razer Blade 16 Early 2023 i9-13950HX, GeForce RTX 4080 Laptop GPU, 95.2 Wh | Lenovo Legion Pro 7 16IRX8H i9-13900HX, GeForce RTX 4080 Laptop GPU, 99.9 Wh | Asus ROG Strix G16 G614JZ i9-13980HX, GeForce RTX 4080 Laptop GPU, 90 Wh | HP Omen 17-ck1075ng i7-12700H, GeForce RTX 3070 Ti Laptop GPU, 78 Wh | Średnia w klasie Gaming | |
|---|---|---|---|---|---|---|---|
| Czasy pracy | 31% | 60% | 48% | 74% | 80% | 83% | |
| Reader / Idle (h) | 4.2 | 8.9 112% | 6.4 52% | 8.9 112% | 8.71 ? 107% | ||
| H.264 (h) | 3.7 | 4.9 32% | 8.26 ? 123% | ||||
| WiFi v1.3 (h) | 3.6 | 4.8 33% | 6.1 69% | 5.1 42% | 9.7 169% | 6.2 72% | 7.02 ? 95% |
| Load (h) | 1.4 | 1.8 29% | 1.4 0% | 2.1 50% | 1.1 -21% | 2.2 57% | 1.47 ? 5% |
| Gaming (h) | 1 |
Za
Przeciw
Werdykt - solidny, wysokiej klasy laptop do gier
Wraz z modelem Omen 17, HP dostarcza potężny gamingowy laptop QHD z segmentu high-end. Z jegoCore i9-13900HXi GeForce RTX 4080gPU, laptop powinien sprawdzić się także w innych zastosowaniach, takich jak przetwarzanie i renderowanie wideo. Szybki dysk SSD PCIe 4 (1 TB) zapewnia niezbędną przestrzeń dyskową i gwarantuje krótkie czasy ładowania. Jest też miejsce na drugi dysk SSD.
HP Omen 17 (2023) reprezentuje solidny laptop do gier, ale nie wykorzystuje w pełni swojego potencjału.
Procesor i rdzeń graficzny są w stanie pracować z ciągle wysokim taktowaniem. Hałas i wydzielanie ciepła są na wysokim poziomie, który jest normalny dla tej klasy laptopów. W codziennej pracy laptop wytwarza jednak zbyt dużo hałasu.
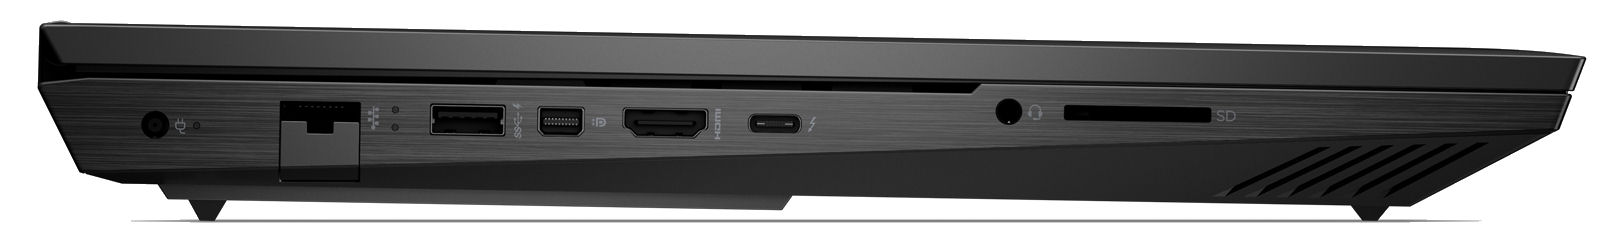
Matowy wyświetlacz 17,3 cala (QHD, IPS, 165 Hz, sRGB) pozostawia po sobie solidne wrażenie. Sprawdza się on ogólnie nieco lepiej, niż panel FHD podobnie skonstruowanego Poprzednika "Omenaale gorzej od większości konkurentów. Złącze Thunderbolt 4 oferuje pewne opcje rozbudowy (rozwiązanie dokujące, zewnętrzne GPU). Poza tym można je wykorzystać do ładowania akumulatora za pomocą ładowarki USB-C (min. 65 W, 20 V), a także wspierane jest Power Delivery.
Ze względu na możliwą wadę, nie jesteśmy w stanie w tym momencie wydać ostatecznej opinii na temat czasu pracy na baterii. Zmierzymy ponownie czas pracy na baterii, gdy tylko otrzymamy od HP egzemplarz zastępczy. Ponieważ czas pracy na akumulatorze praktycznie nie ma wpływu na ostateczną ocenę laptopa do gier, ocena zmieni się co najwyżej nieznacznie.
Jako alternatywę można przyjrzeć się m.in Lenovo Legion Pro 7 16IRX8H, który jest w stanie uzyskać wyższą wydajność z tej samej kombinacji CPU/GPU. Dodatkowo punktuje jaśniejszym wyświetlaczem w formacie 16:10.
Cena i dostępność
Omen 17 (2023) jest dostępny w ofercie HP od 1499,99 dolarów. Model podobny do naszej testowanej konfiguracji z wyjątkiem posiadania procesora i7-13700 kosztowałby w USA 2 429,99 dolarów.
HP Omen 17-ck2097ng
- 28/03/2023 v7 (old)
Sascha Mölck
Przezroczystość
Wyboru urządzeń do recenzji dokonuje nasza redakcja. Próbka testowa została udostępniona autorowi jako pożyczka od producenta lub sprzedawcy detalicznego na potrzeby tej recenzji. Pożyczkodawca nie miał wpływu na tę recenzję, producent nie otrzymał też kopii tej recenzji przed publikacją. Nie było obowiązku publikowania tej recenzji. Jako niezależna firma medialna, Notebookcheck nie podlega władzy producentów, sprzedawców detalicznych ani wydawców.
Tak testuje Notebookcheck
Każdego roku Notebookcheck niezależnie sprawdza setki laptopów i smartfonów, stosując standardowe procedury, aby zapewnić porównywalność wszystkich wyników. Od około 20 lat stale rozwijamy nasze metody badawcze, ustanawiając przy tym standardy branżowe. W naszych laboratoriach testowych doświadczeni technicy i redaktorzy korzystają z wysokiej jakości sprzętu pomiarowego. Testy te obejmują wieloetapowy proces walidacji. Nasz kompleksowy system ocen opiera się na setkach uzasadnionych pomiarów i benchmarków, co pozwala zachować obiektywizm.Price comparison

