Debiut wydajności Radeon RX 6850M XT: Recenzja laptopa Lenovo Legion 7 16ARHA7
16-calowy Legion 7 16 to high-endowy laptop gamingowy od Lenovo, który ma stanowić kontrast dla średniej klasy Legion seria 5 lub budżetowej Seria "IdeaPad Gaming. Ten najnowszy model 2022 jest całkowitym odświeżeniem w stosunku do m.in wersji 2021 z zarówno zmienionymi elementami wewnętrznymi, jak i nowym projektem obudowy
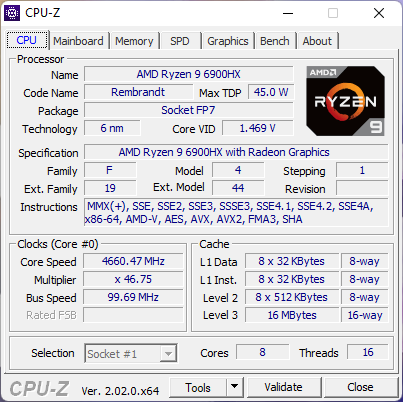
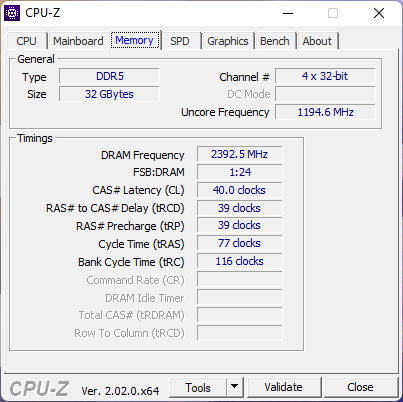
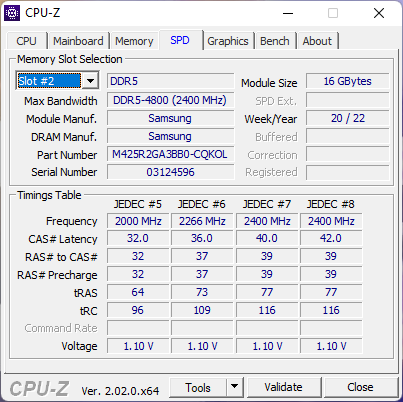
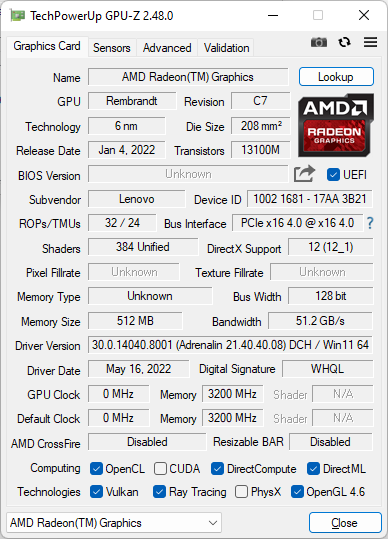
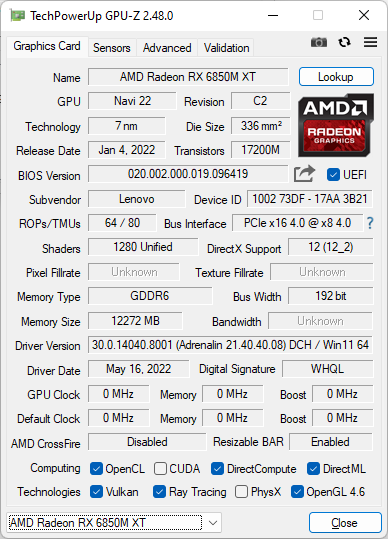
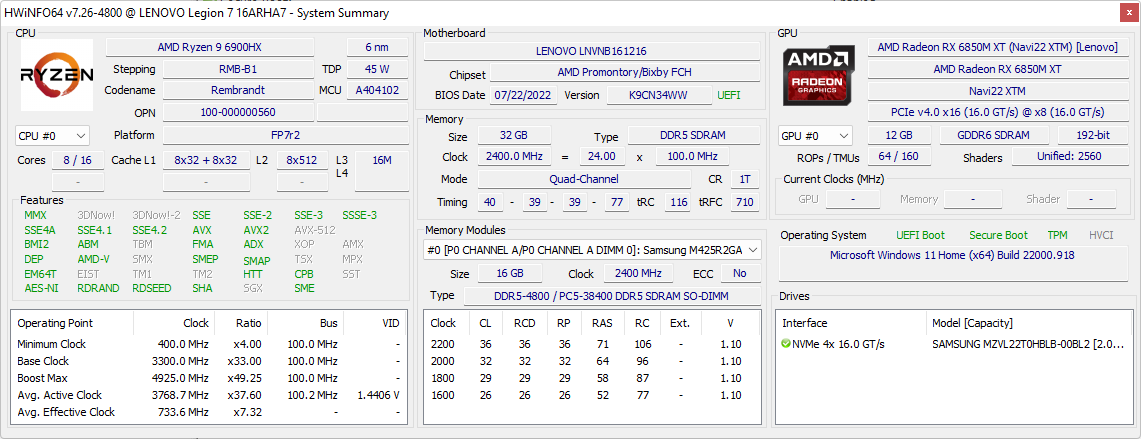
Nasza recenzowana konfiguracja jest wyposażona w procesor AMD Zen 3+ Ryzen 9 6900HX, procesor graficzny Radeon RX 6850M XT o mocy 140 W, 32 GB pamięci RAM DDR5-4800 i dysk SSD PCIe4 x4 NVMe o pojemności 1 TB w cenie detalicznej około 2600 USD. Mniej SKU z Ryzen 7 6800H lub Radeon RX 6700M są również dostępne, ale wszystkie opcje inaczej pochodzą z tego samego matowego 2560 x 1600 165 Hz tylko wyświetlacz IPS.
Alternatywą dla Legion 7 16 są inne wysokiej klasy 16-calowe laptopy do gier, np.Asus ROG Zephyrus Duo 16 lub HP Omen 16. Rozmiary ekranu 15,6 i 17,3 cala są jednak znacznie bardziej powszechne, dlatego porównamy Lenovo także z niektórymi high-endowymi modelami 15,6-calowymi, jak np MSI GE66
Więcej recenzji Lenovo:
Potencjalni konkurenci w porównaniu
Ocena | Data | Model | Waga | Wysokość | Rozmiar | Rezolucja | Cena |
|---|---|---|---|---|---|---|---|
| 90.8 % v7 (old) | 10/2022 | Lenovo Legion 7 16ARHA7 R9 6900HX, Radeon RX 6850M XT | 2.6 kg | 19.4 mm | 16.00" | 2560x1600 | |
| 87.4 % v7 (old) | MSI Raider GE66 12UHS i9-12900HK, GeForce RTX 3080 Ti Laptop GPU | 2.4 kg | 23.4 mm | 15.60" | 3840x2160 | ||
| 87.9 % v7 (old) | 11/2022 | Lenovo Legion Slim 7-16IAH 82TF004YGE i7-12700H, GeForce RTX 3060 Laptop GPU | 2.2 kg | 16.9 mm | 16.00" | 2560x1600 | |
| 88.2 % v7 (old) | Asus ROG Zephyrus Duo 16 GX650RX R9 6900HX, GeForce RTX 3080 Ti Laptop GPU | 2.6 kg | 20.5 mm | 16.00" | 3840x2400 | ||
| 86 % v7 (old) | HP Omen 16-c0077ng R7 5800H, Radeon RX 6600M | 2.3 kg | 26 mm | 16.10" | 2560x1440 | ||
| 87.4 % v7 (old) | Lenovo Legion 5 Pro 16ACH6H (82JQ001PGE) R7 5800H, GeForce RTX 3070 Laptop GPU | 2.6 kg | 26.85 mm | 16.00" | 2560x1600 |
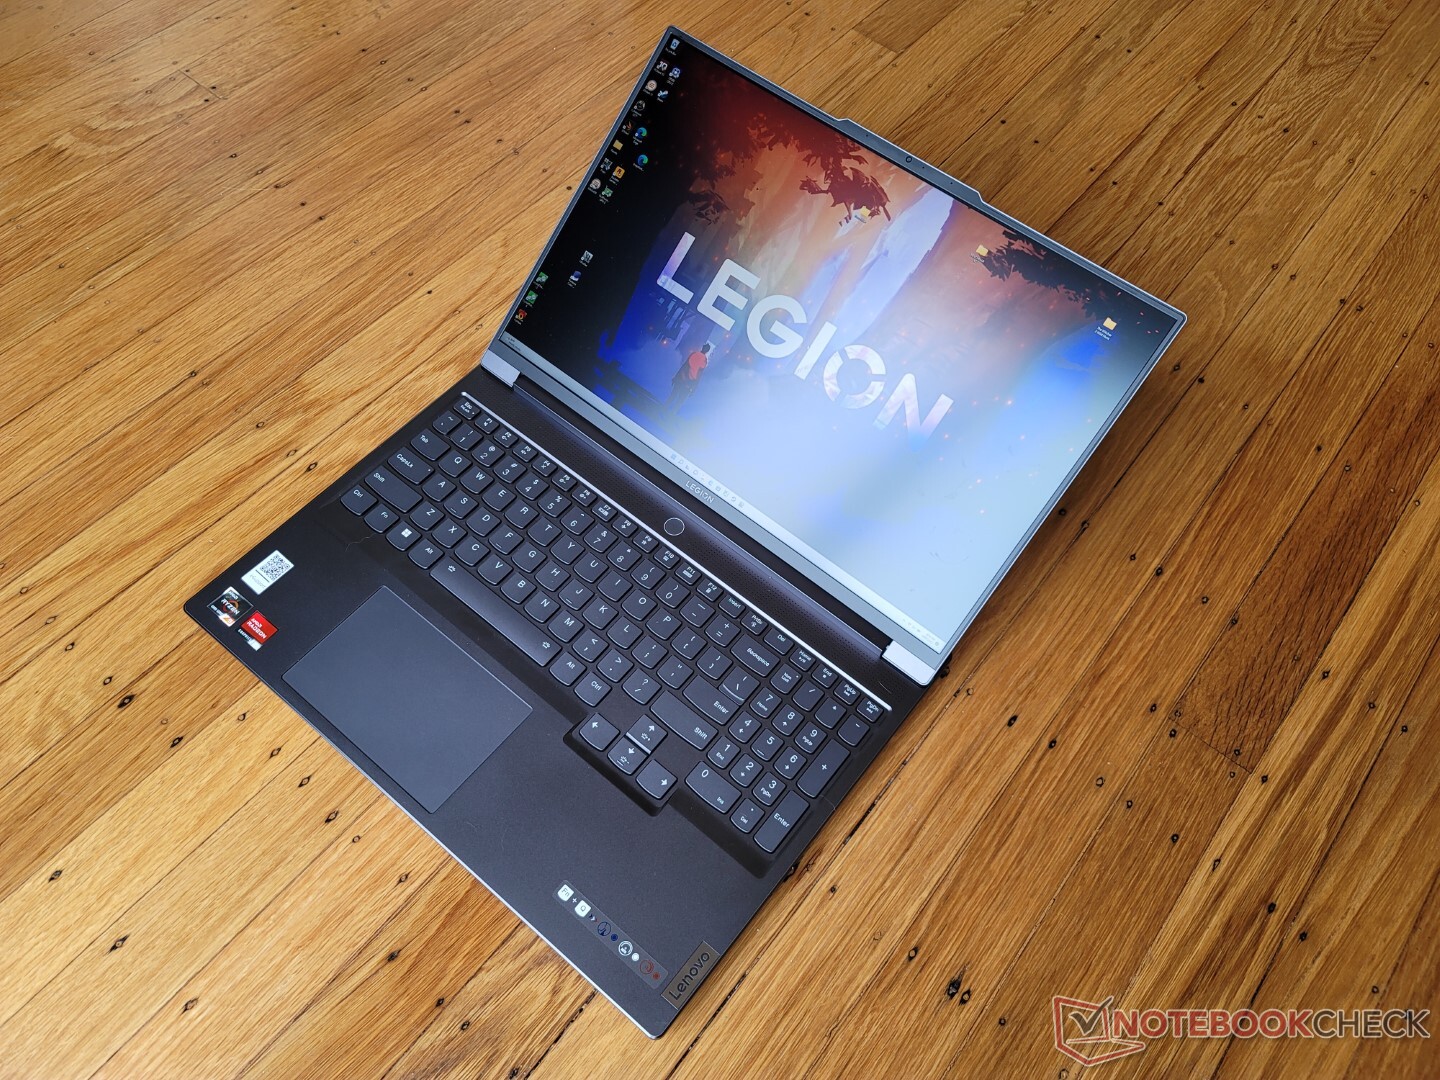
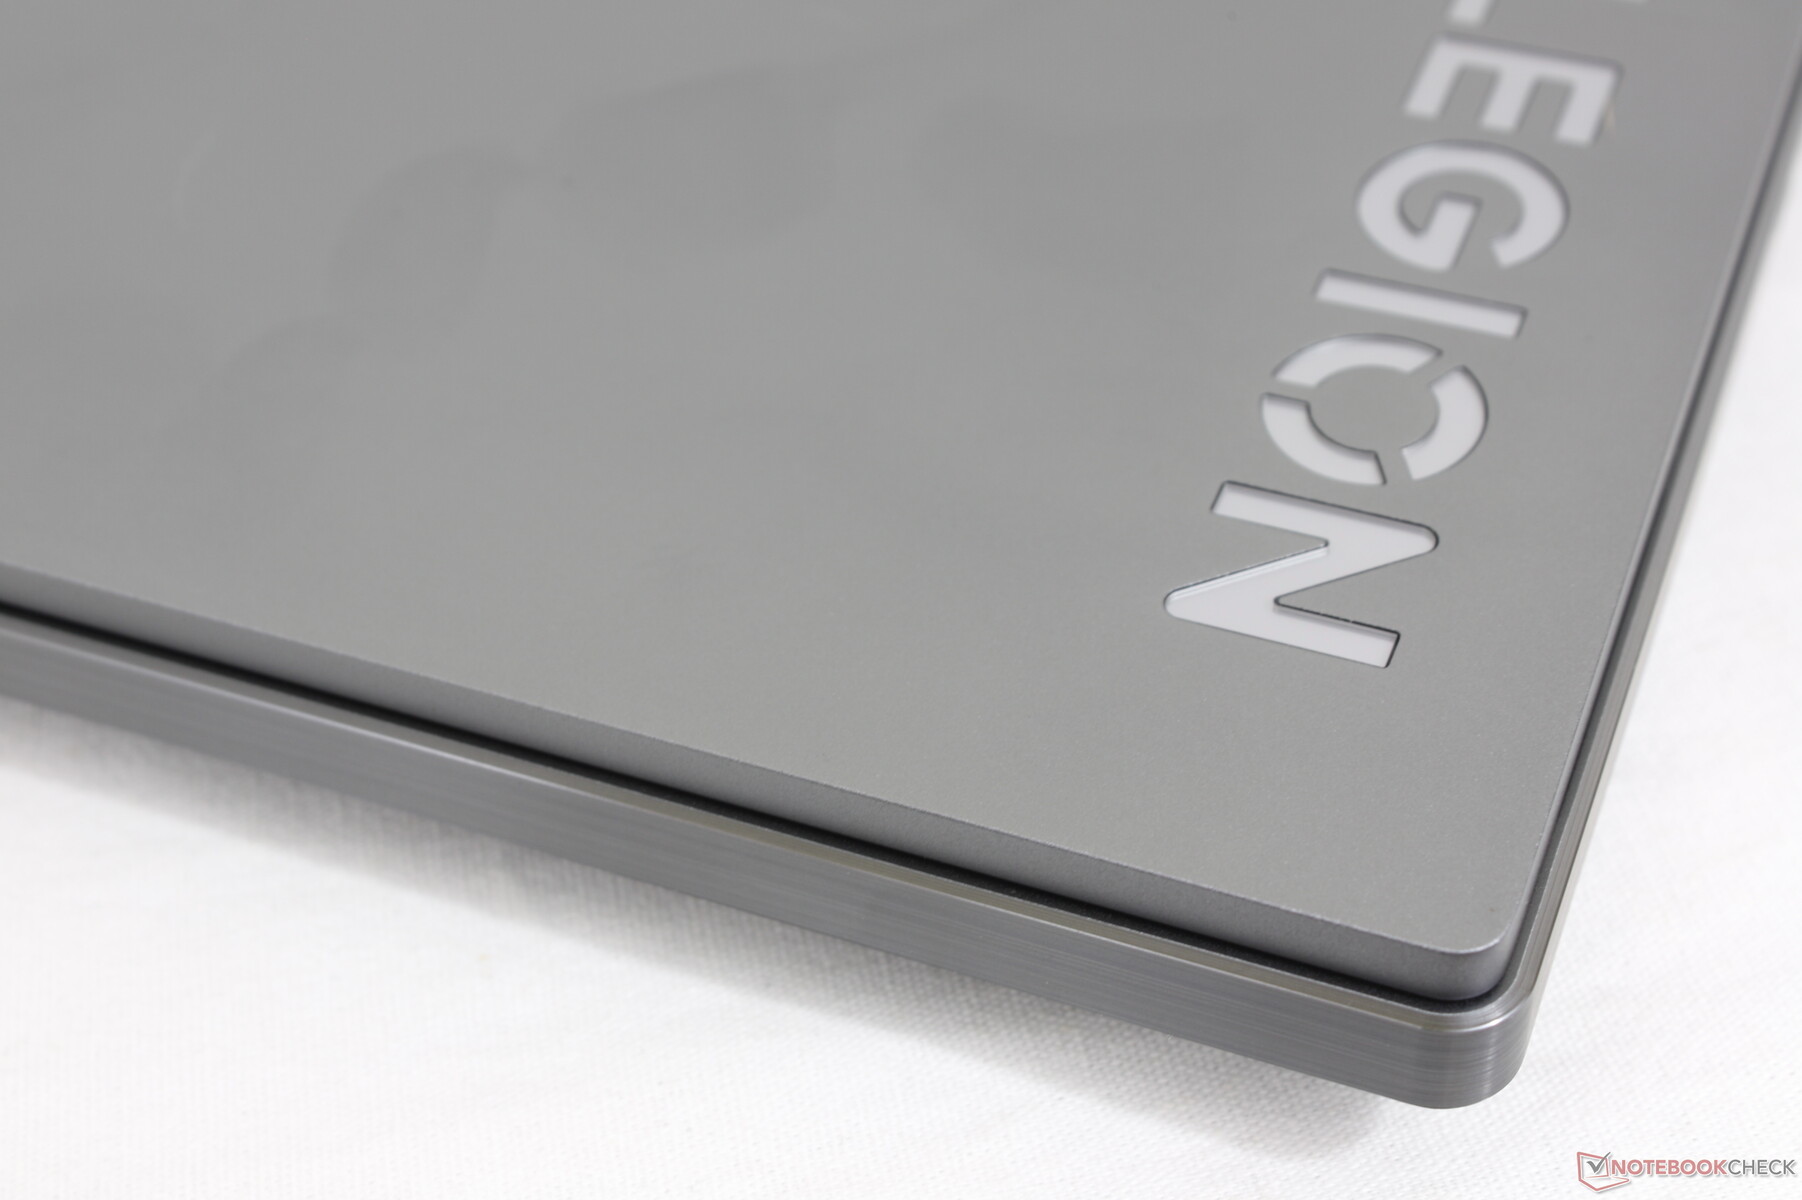
Walizka - profesjonalny wygląd
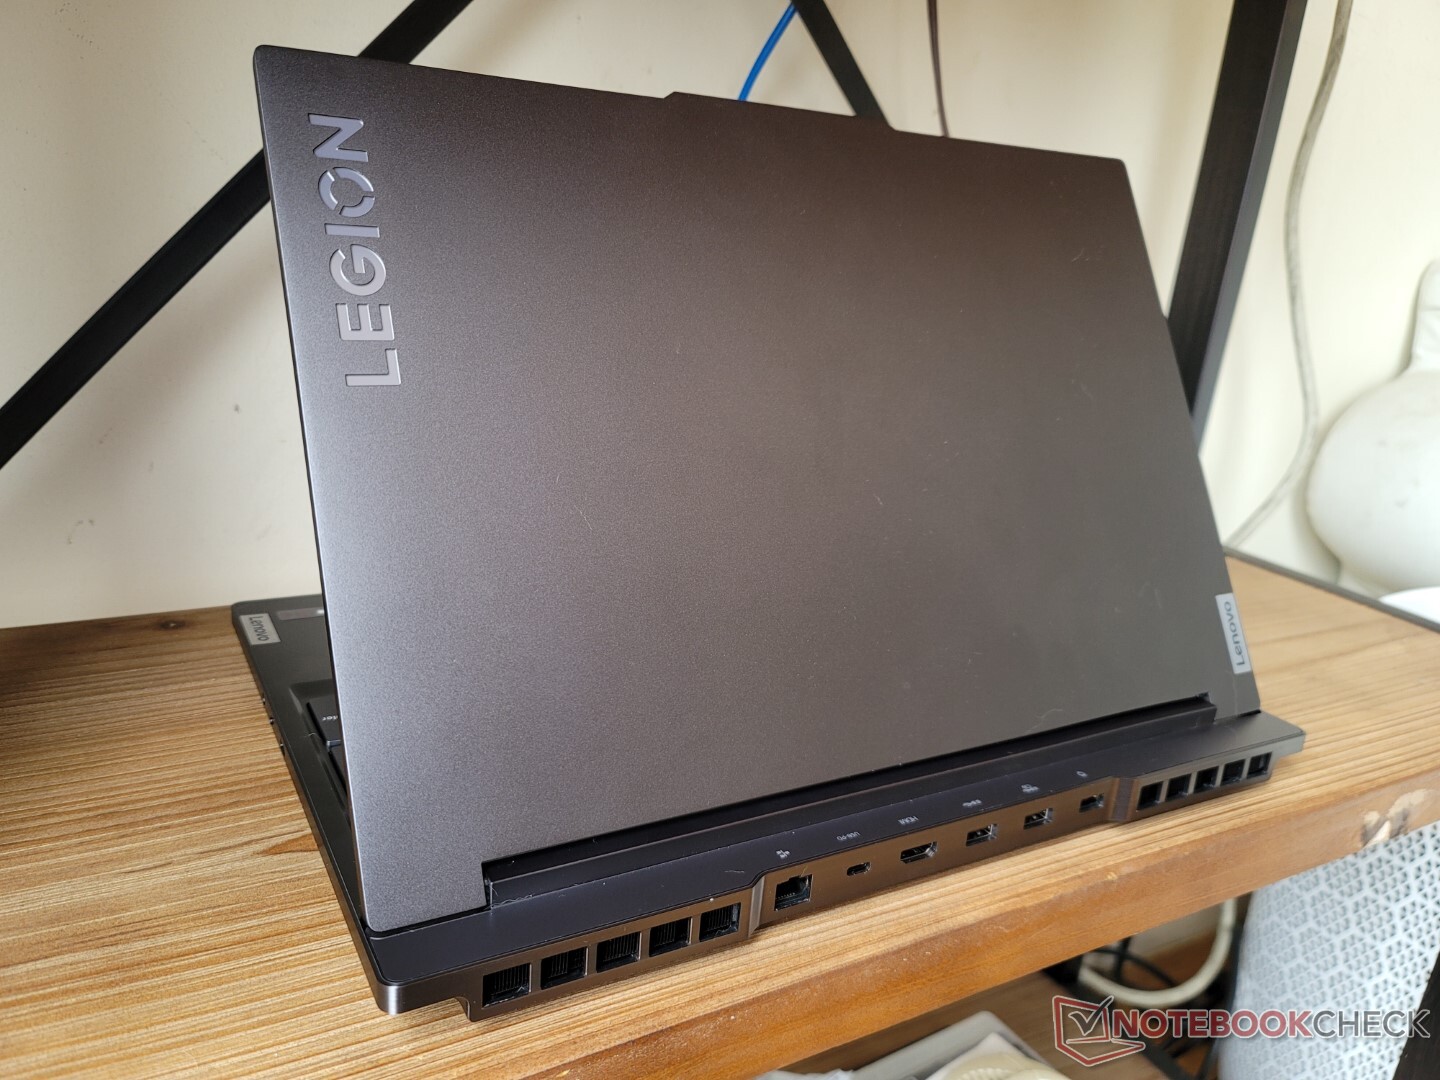
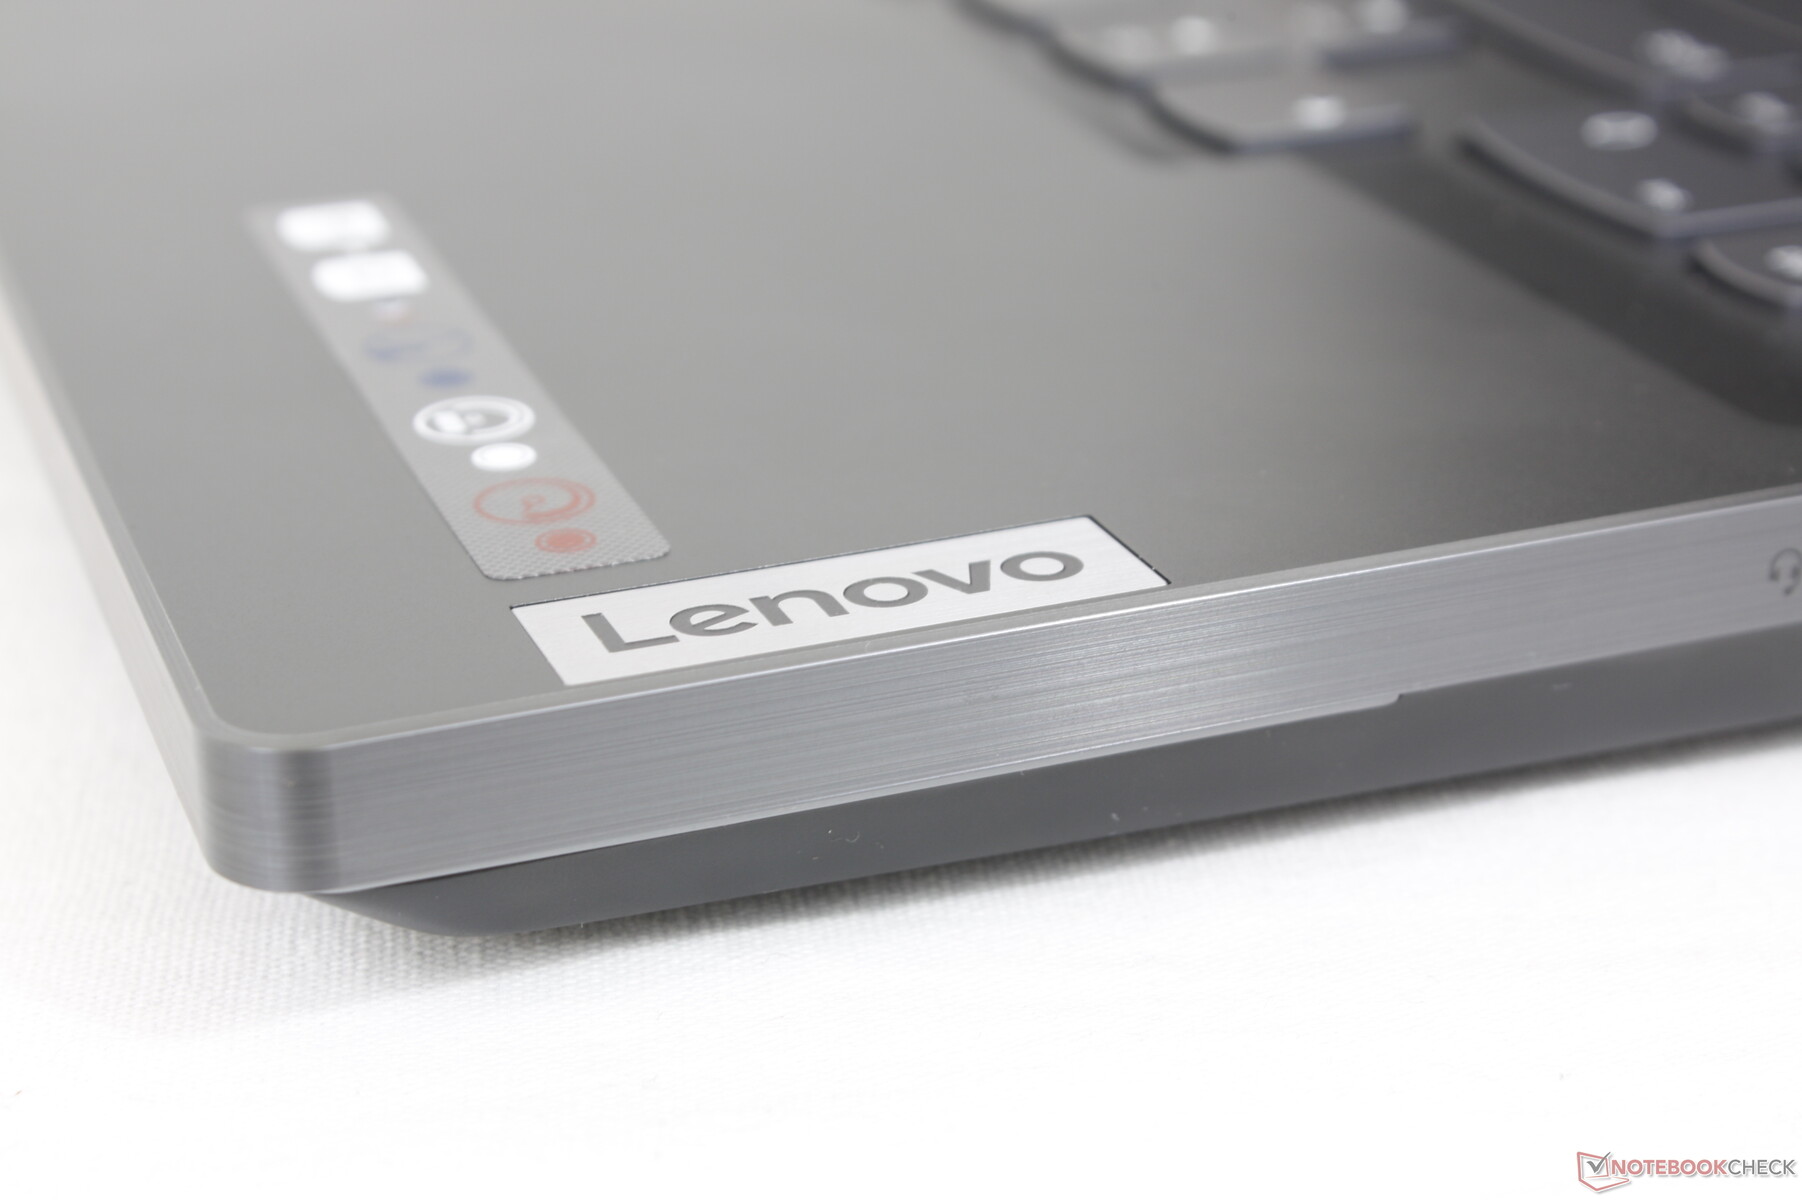
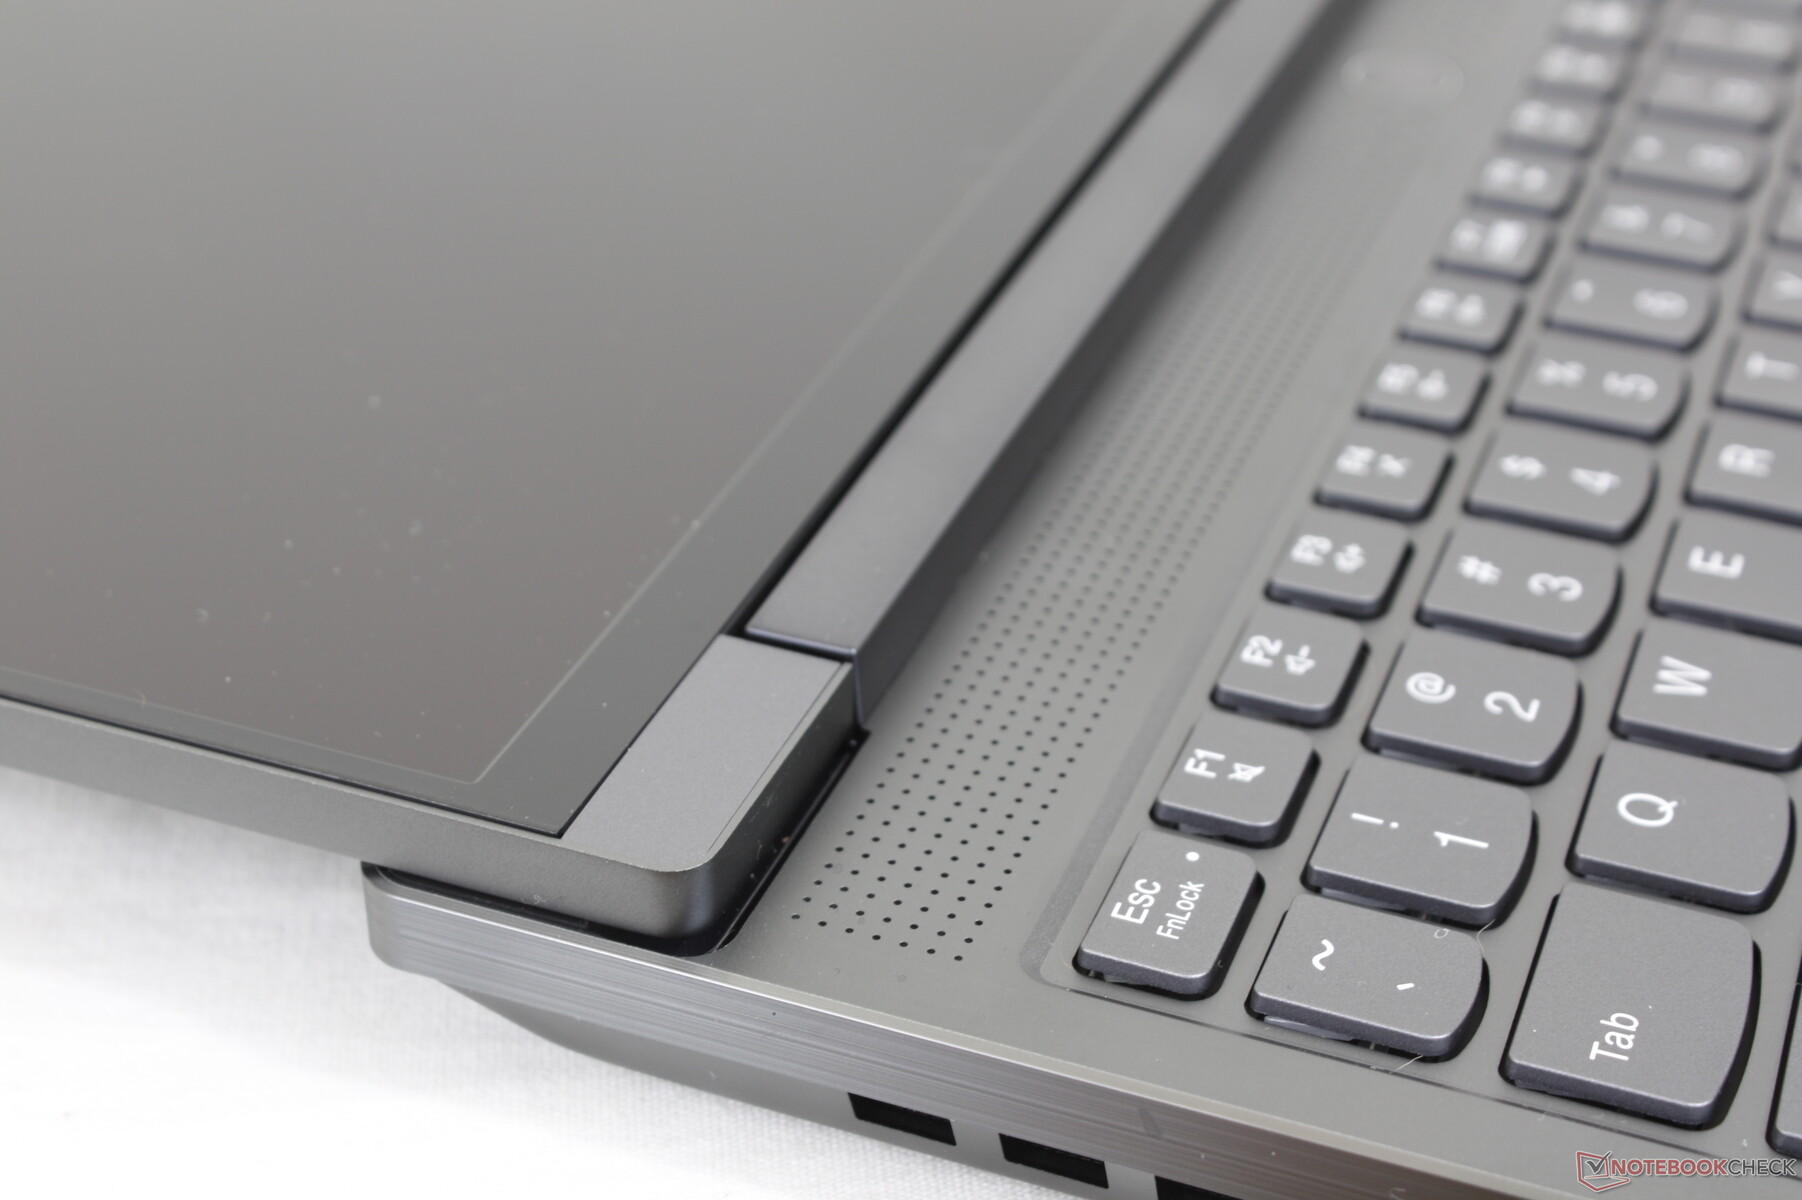
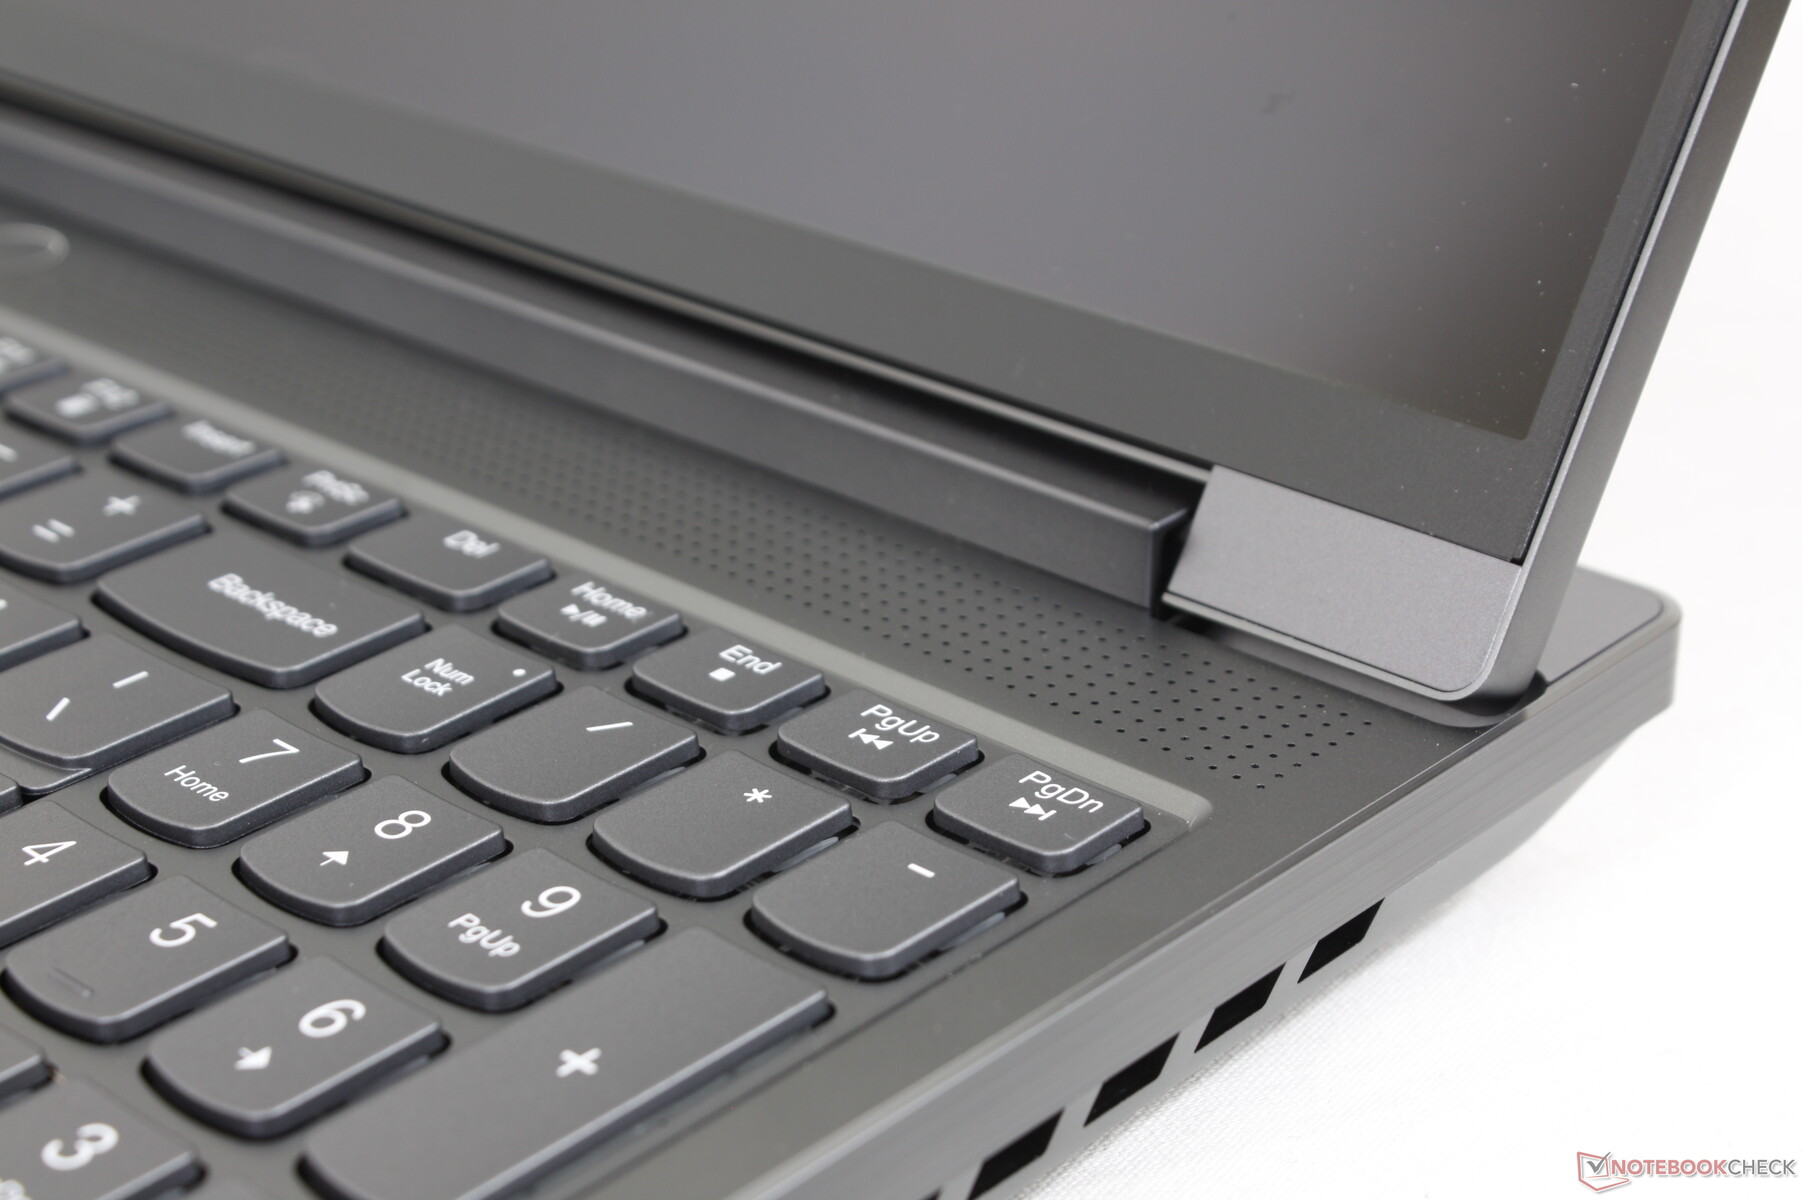
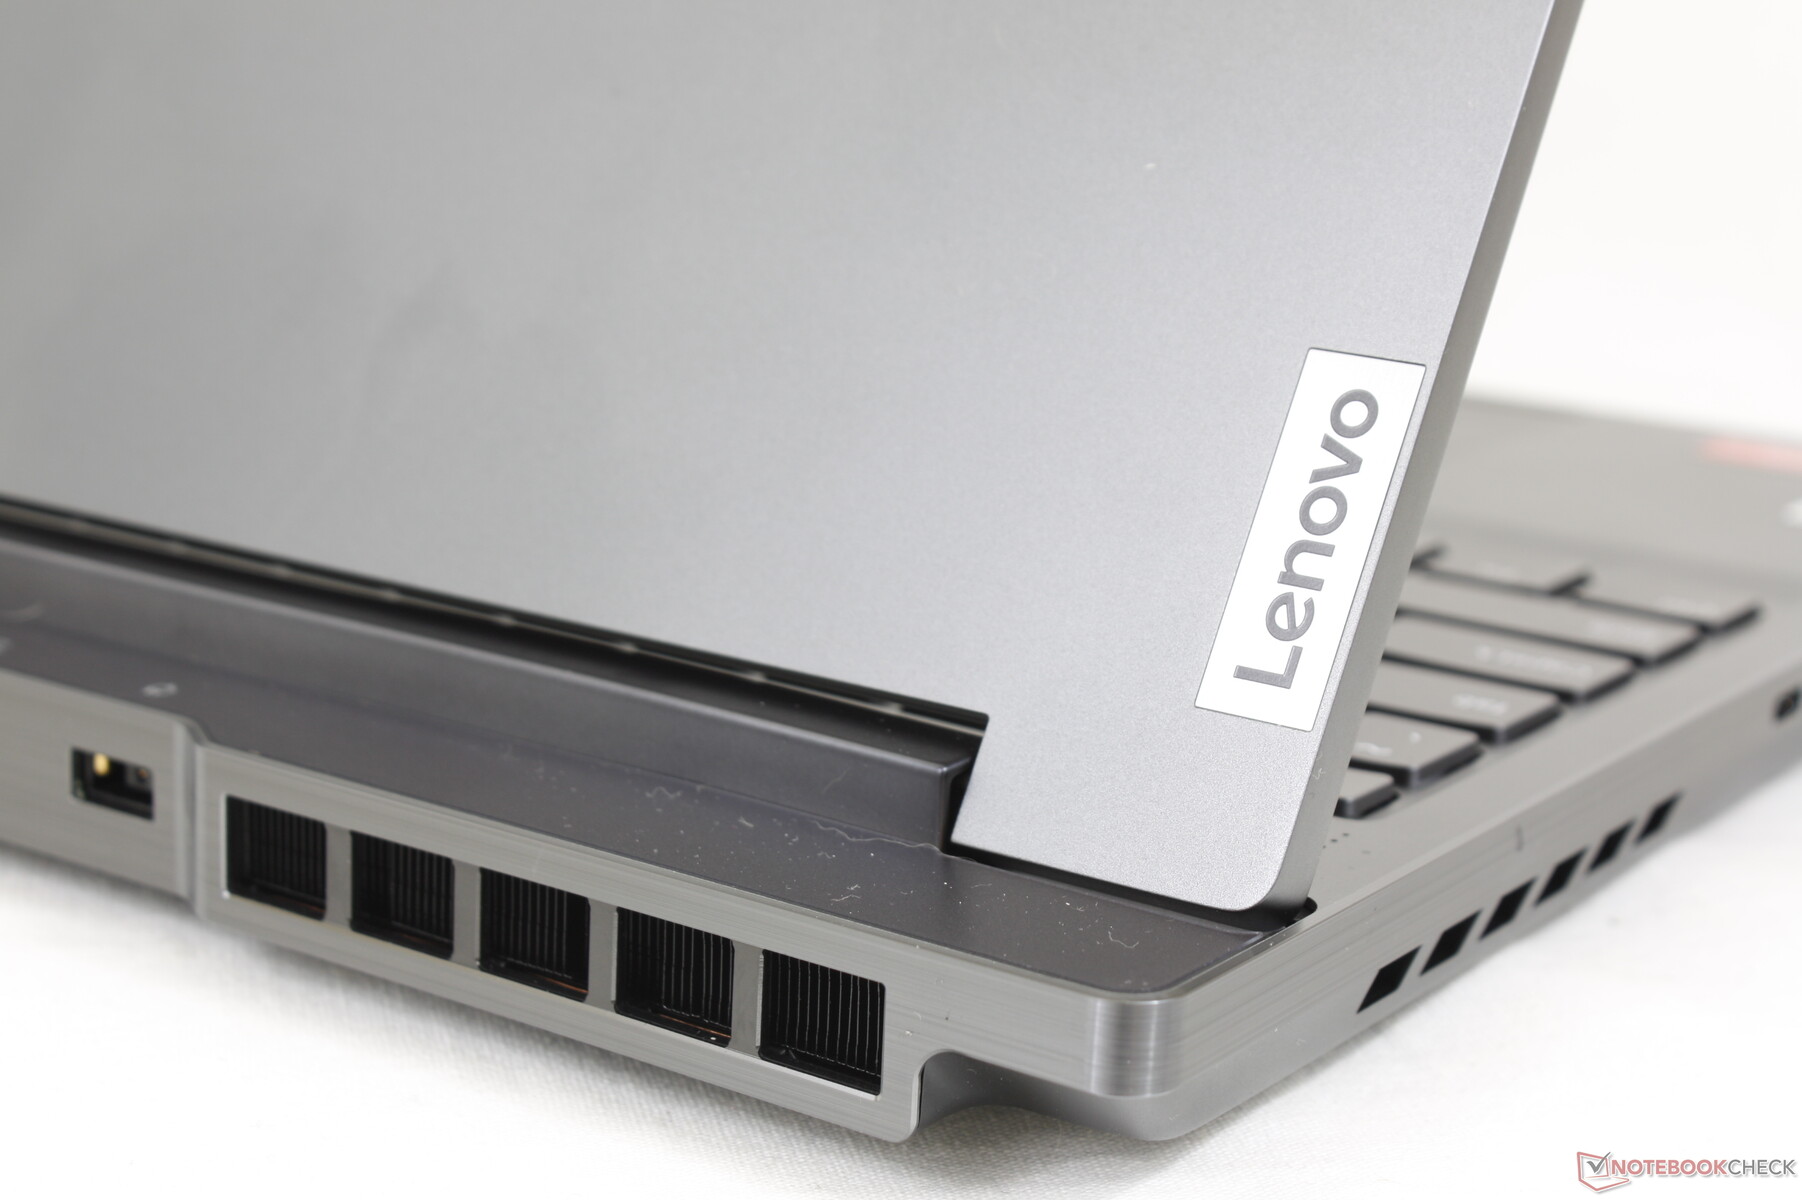
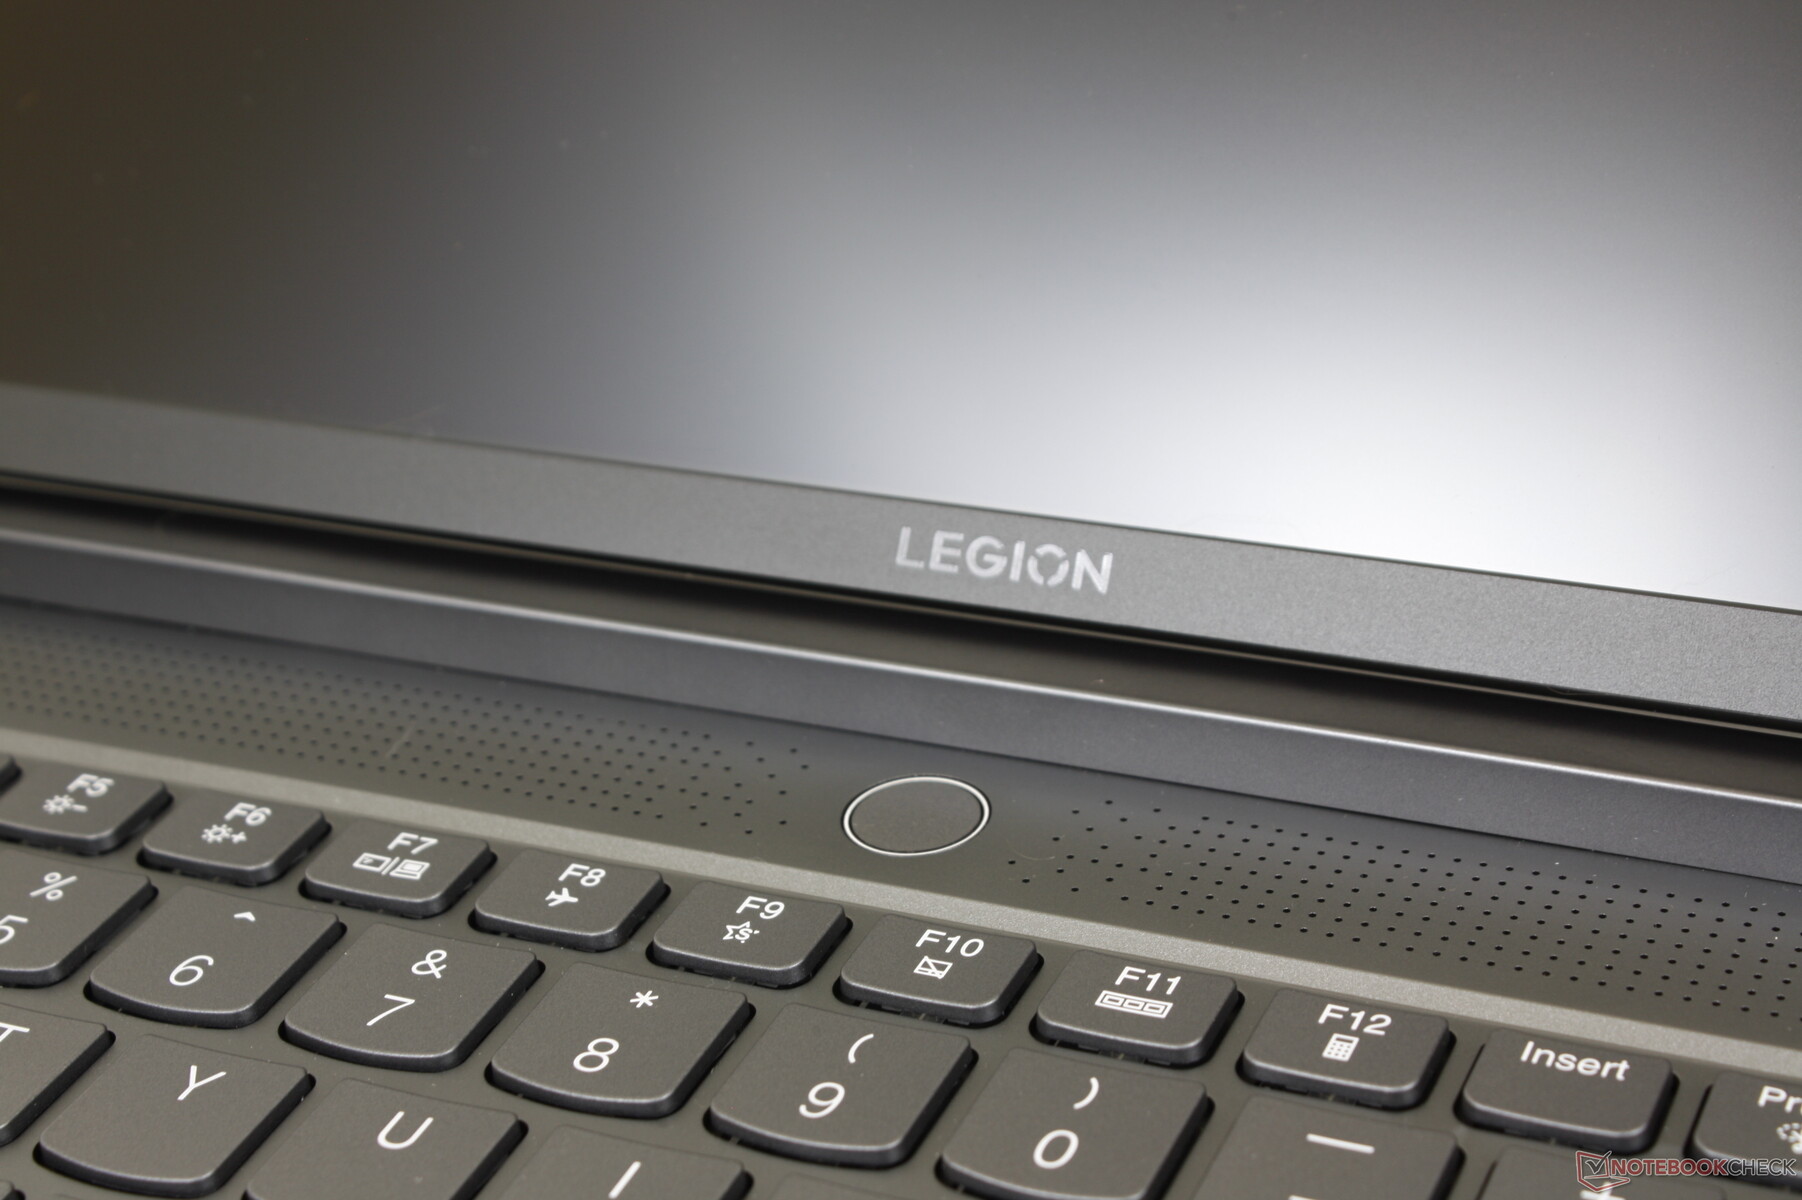
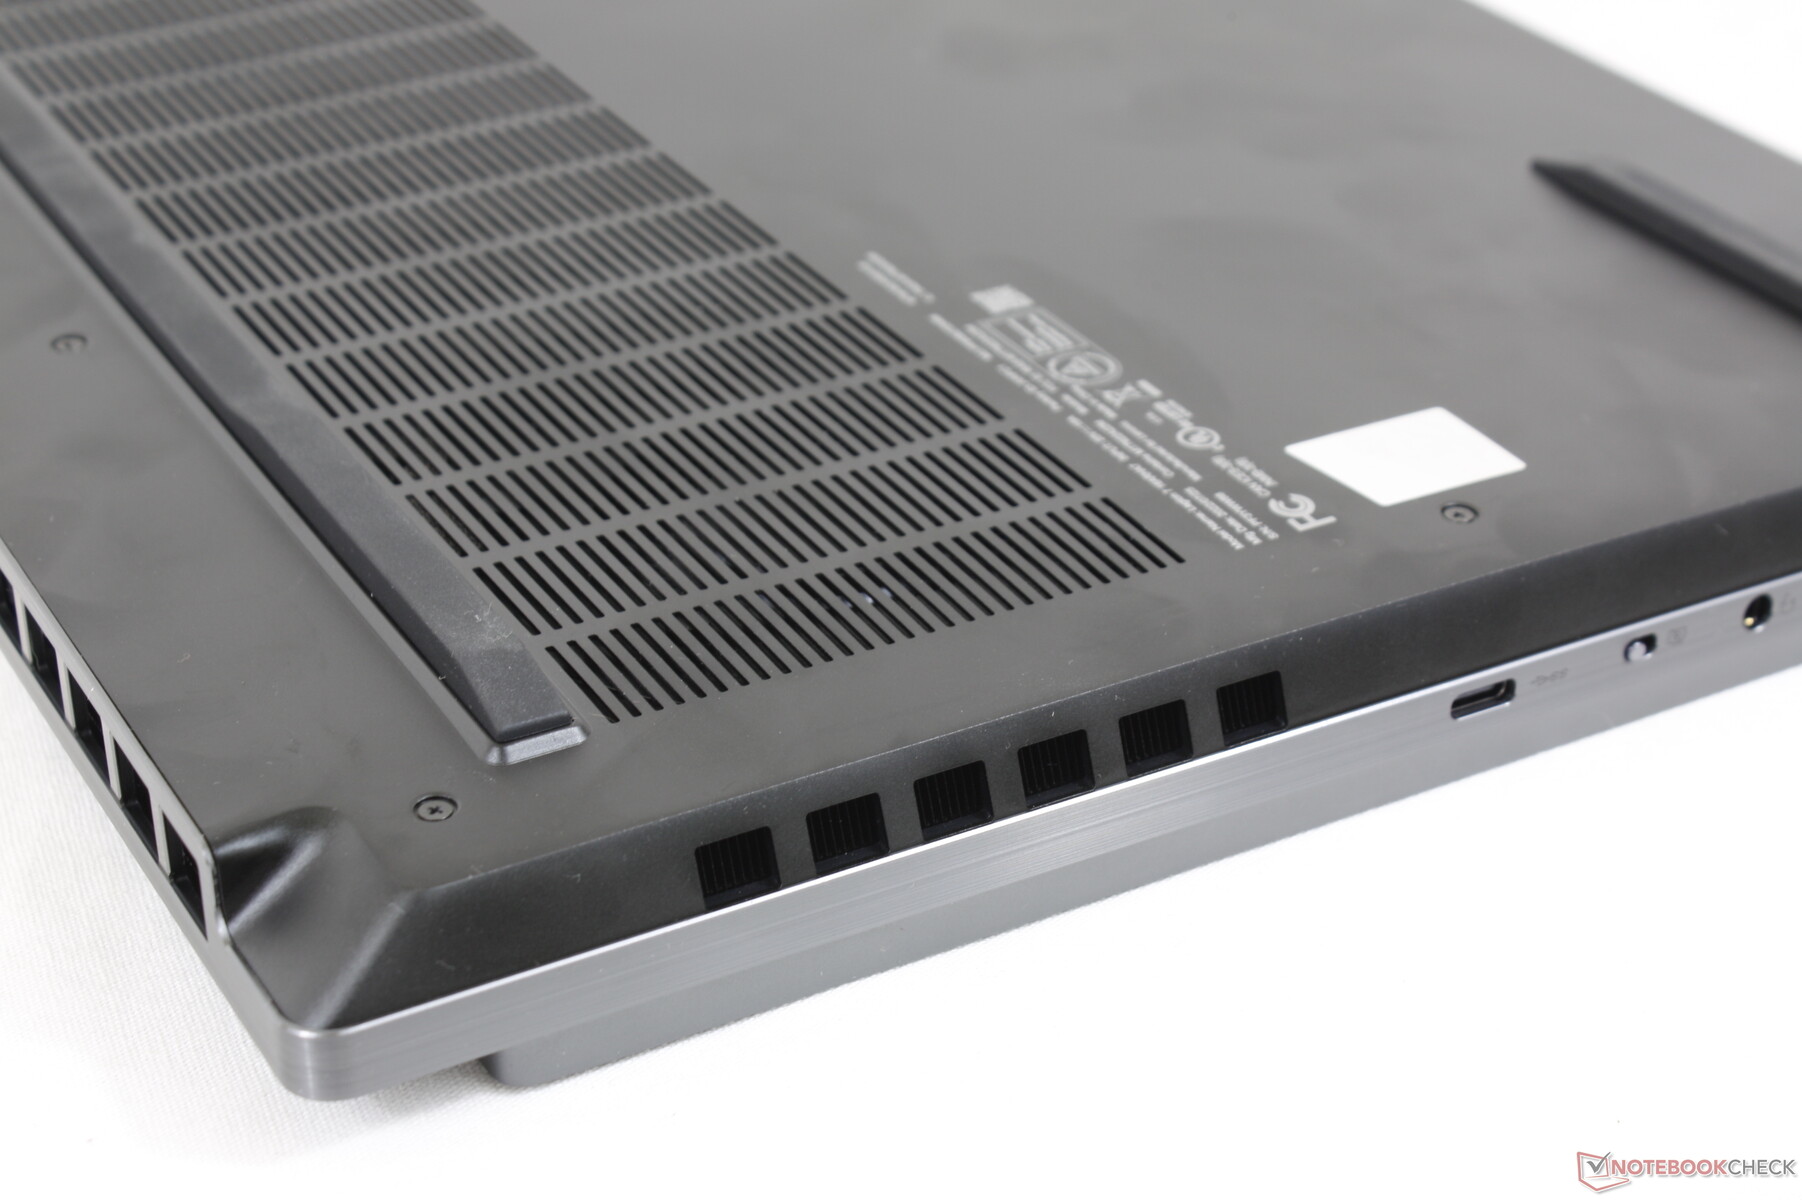
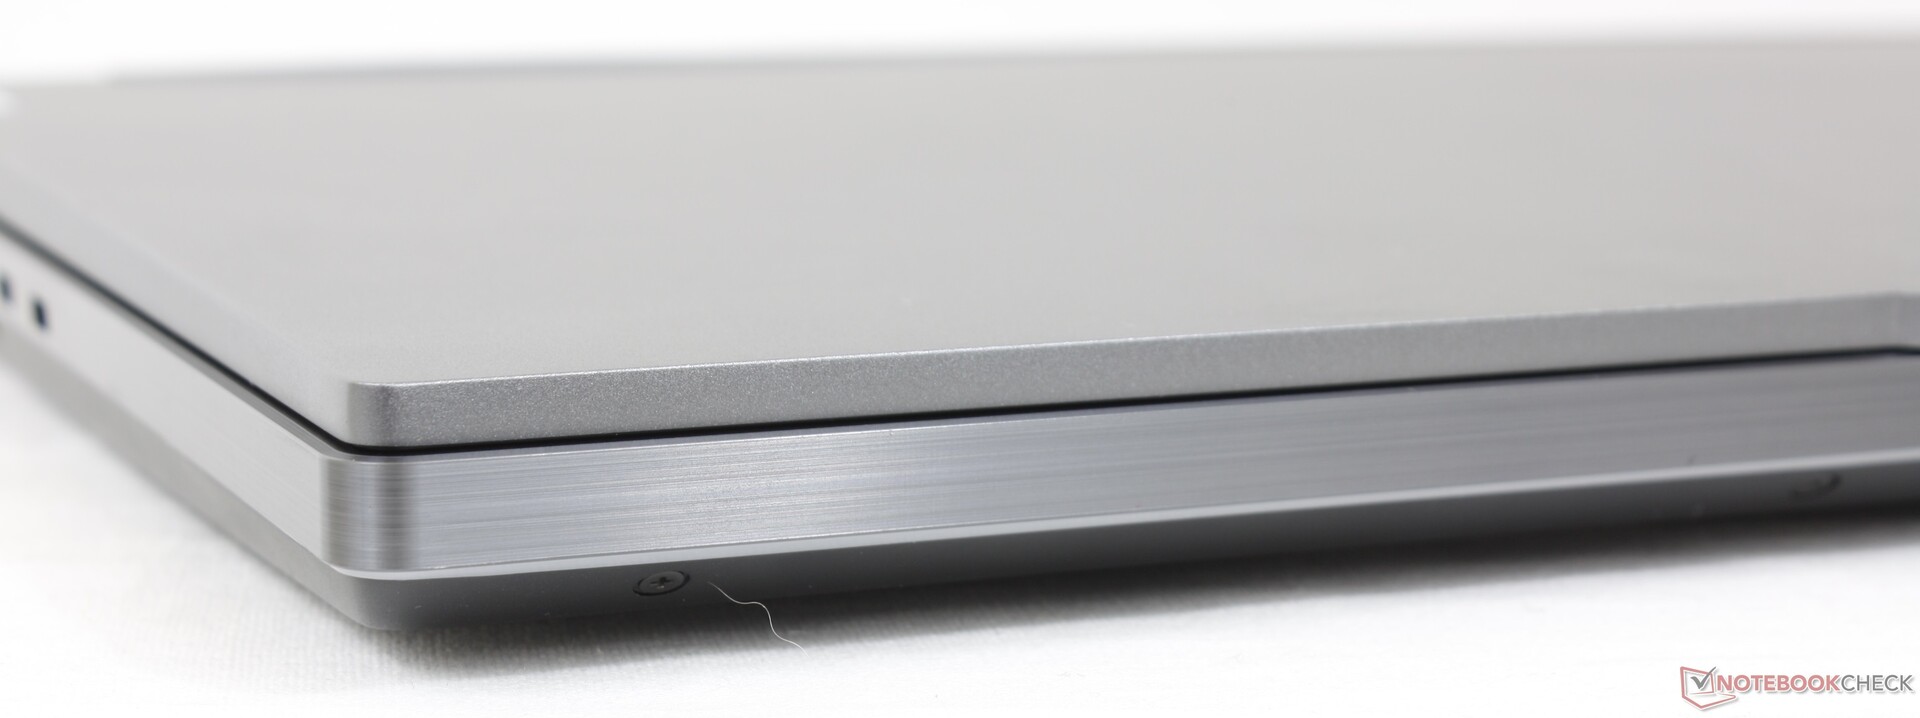
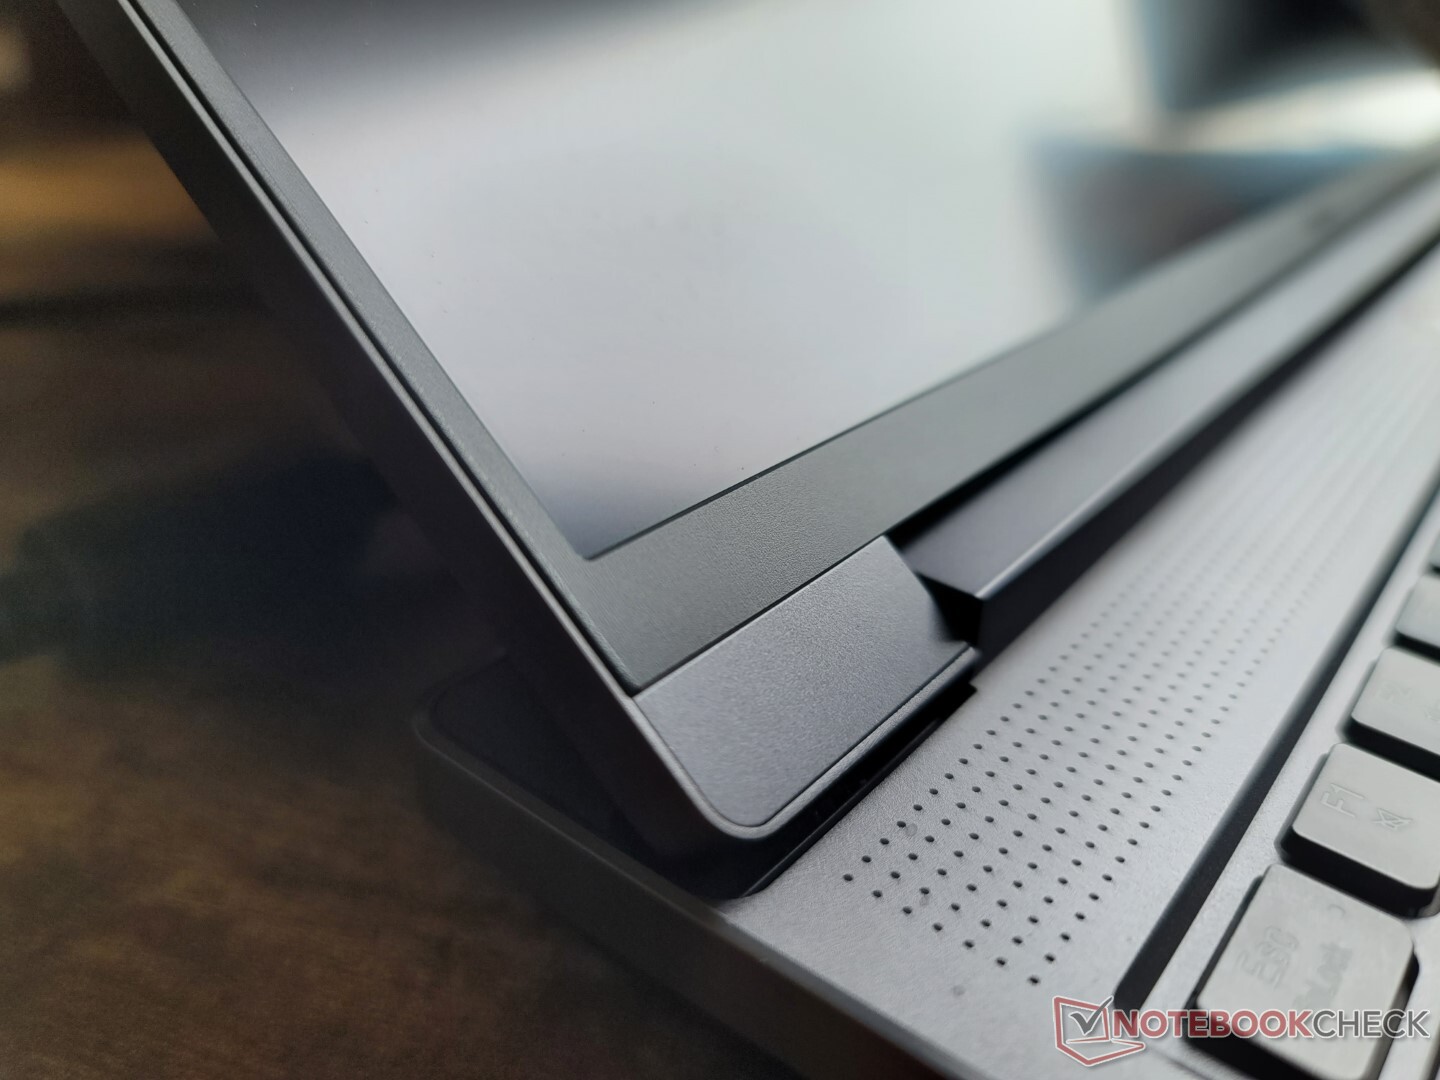
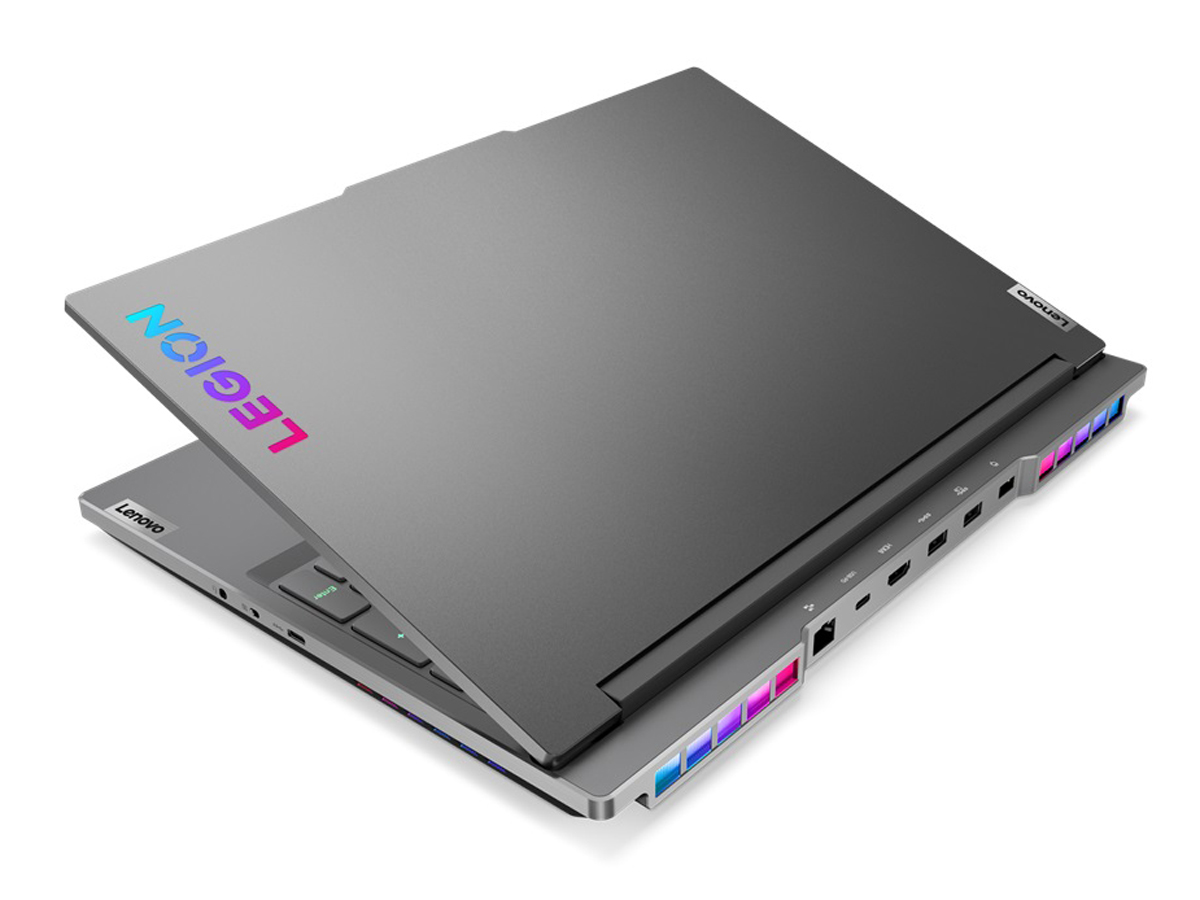
Model 2022 zachowuje materiały z anodyzowanego aluminium i metalowe wykończenia z modelu 2021, ale z kilkoma znaczącymi zmianami. Na przykład, kratki wentylacyjne po bokach są teraz płaskie, a nie wystające z krawędzi, co nadaje im czystszy wygląd. W międzyczasie tył został całkowicie przeprojektowany z bardziej zaokrąglonymi rogami i gładszym przepływem wizualnym. Elementy LED modelu 2021 pozostają bez zmian, w tym cienki pasek świetlny wzdłuż przedniej krawędzi i boków. Gdy światła są wyłączone, monotonny ciemnoszary wygląd mógłby łatwo przejść jako potencjalna mobilna stacja robocza lub model Nvidia Studio
Pod względem jakości wykonania podstawa jest sztywna i bardzo odporna na jakiekolwiek wykrzywienia czy zagłębienia nawet przy wywieraniu nacisku na środek klawiatury. Pokrywa i zawiasy są jednak słabsze i bardziej podatne na uszkodzenia z czasem. Pokrywa wykręca się łatwiej niż w przypadku pokrywy w Razer Blade 15 natomiast zawiasy mają tendencję do chwiania się podczas regulacji kątów.
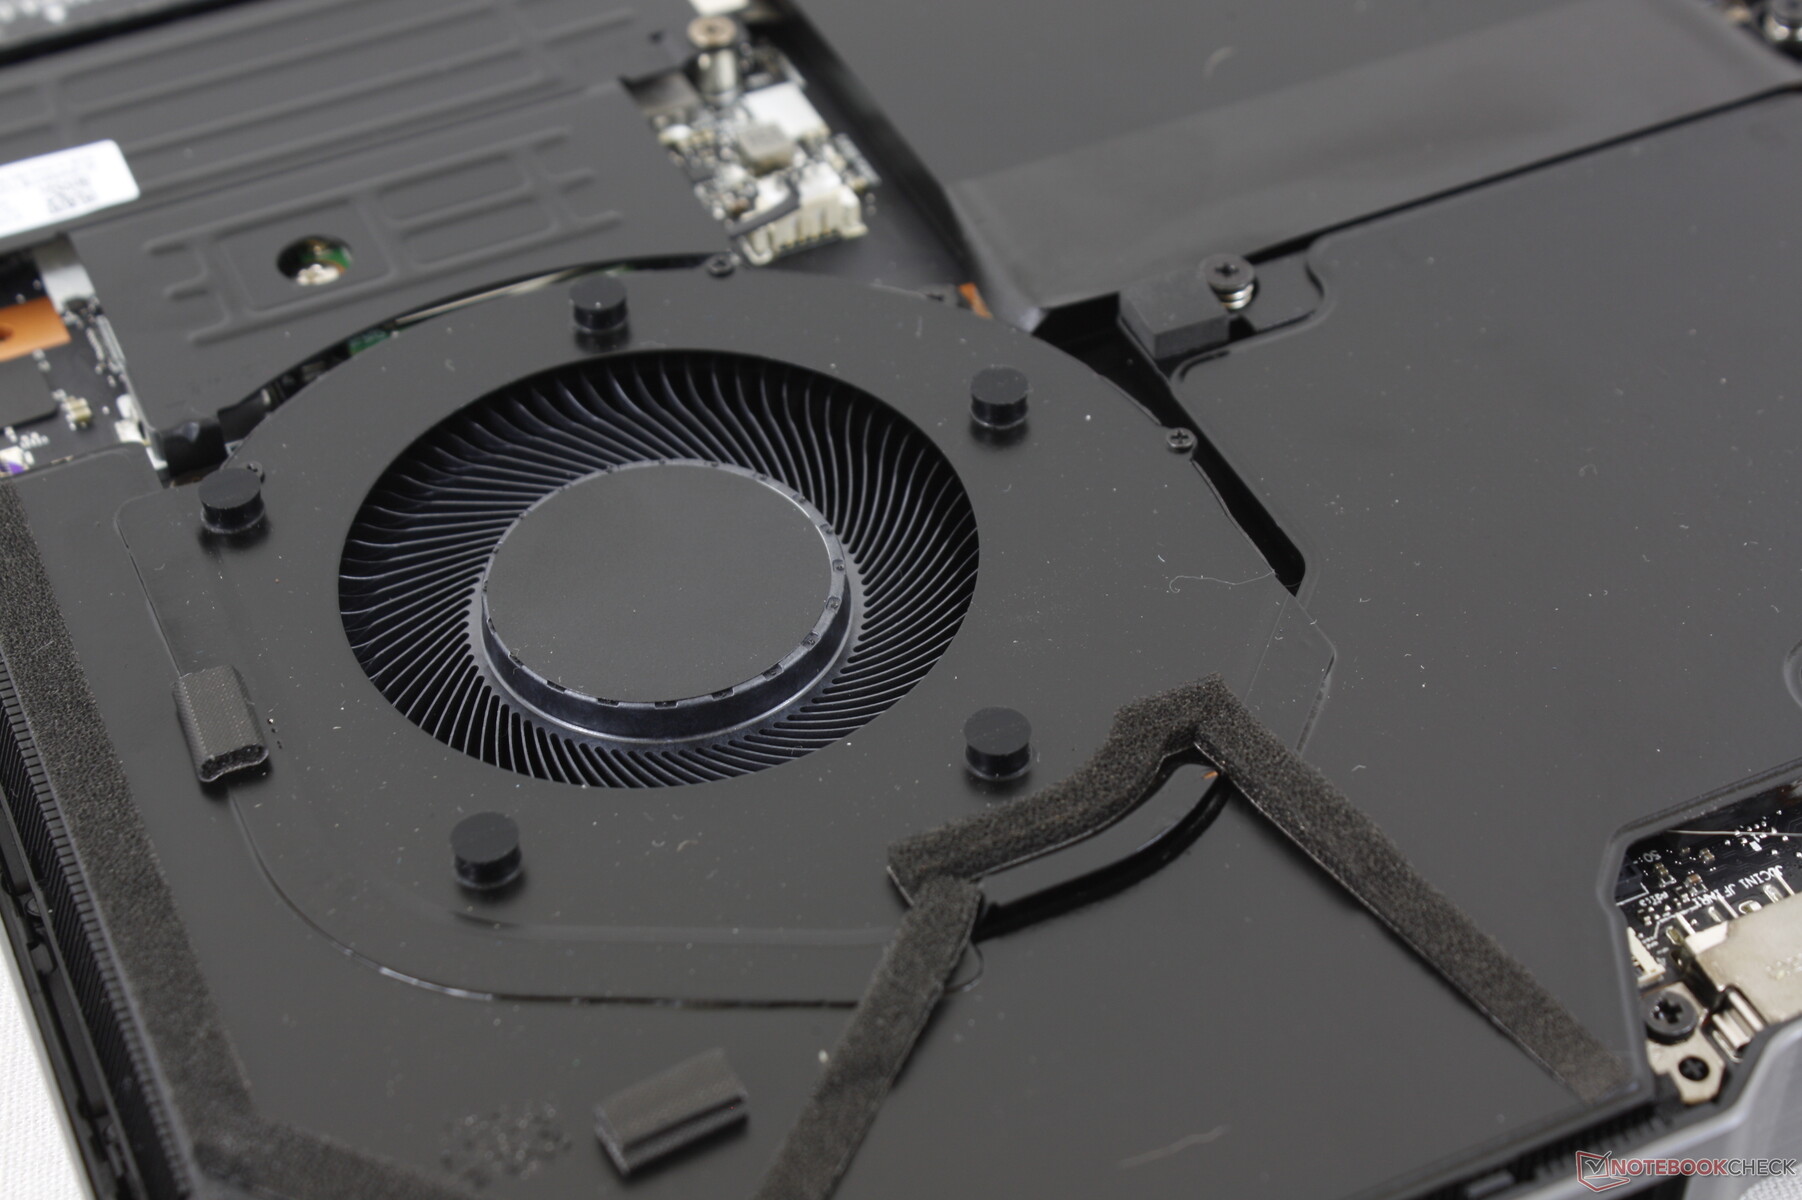
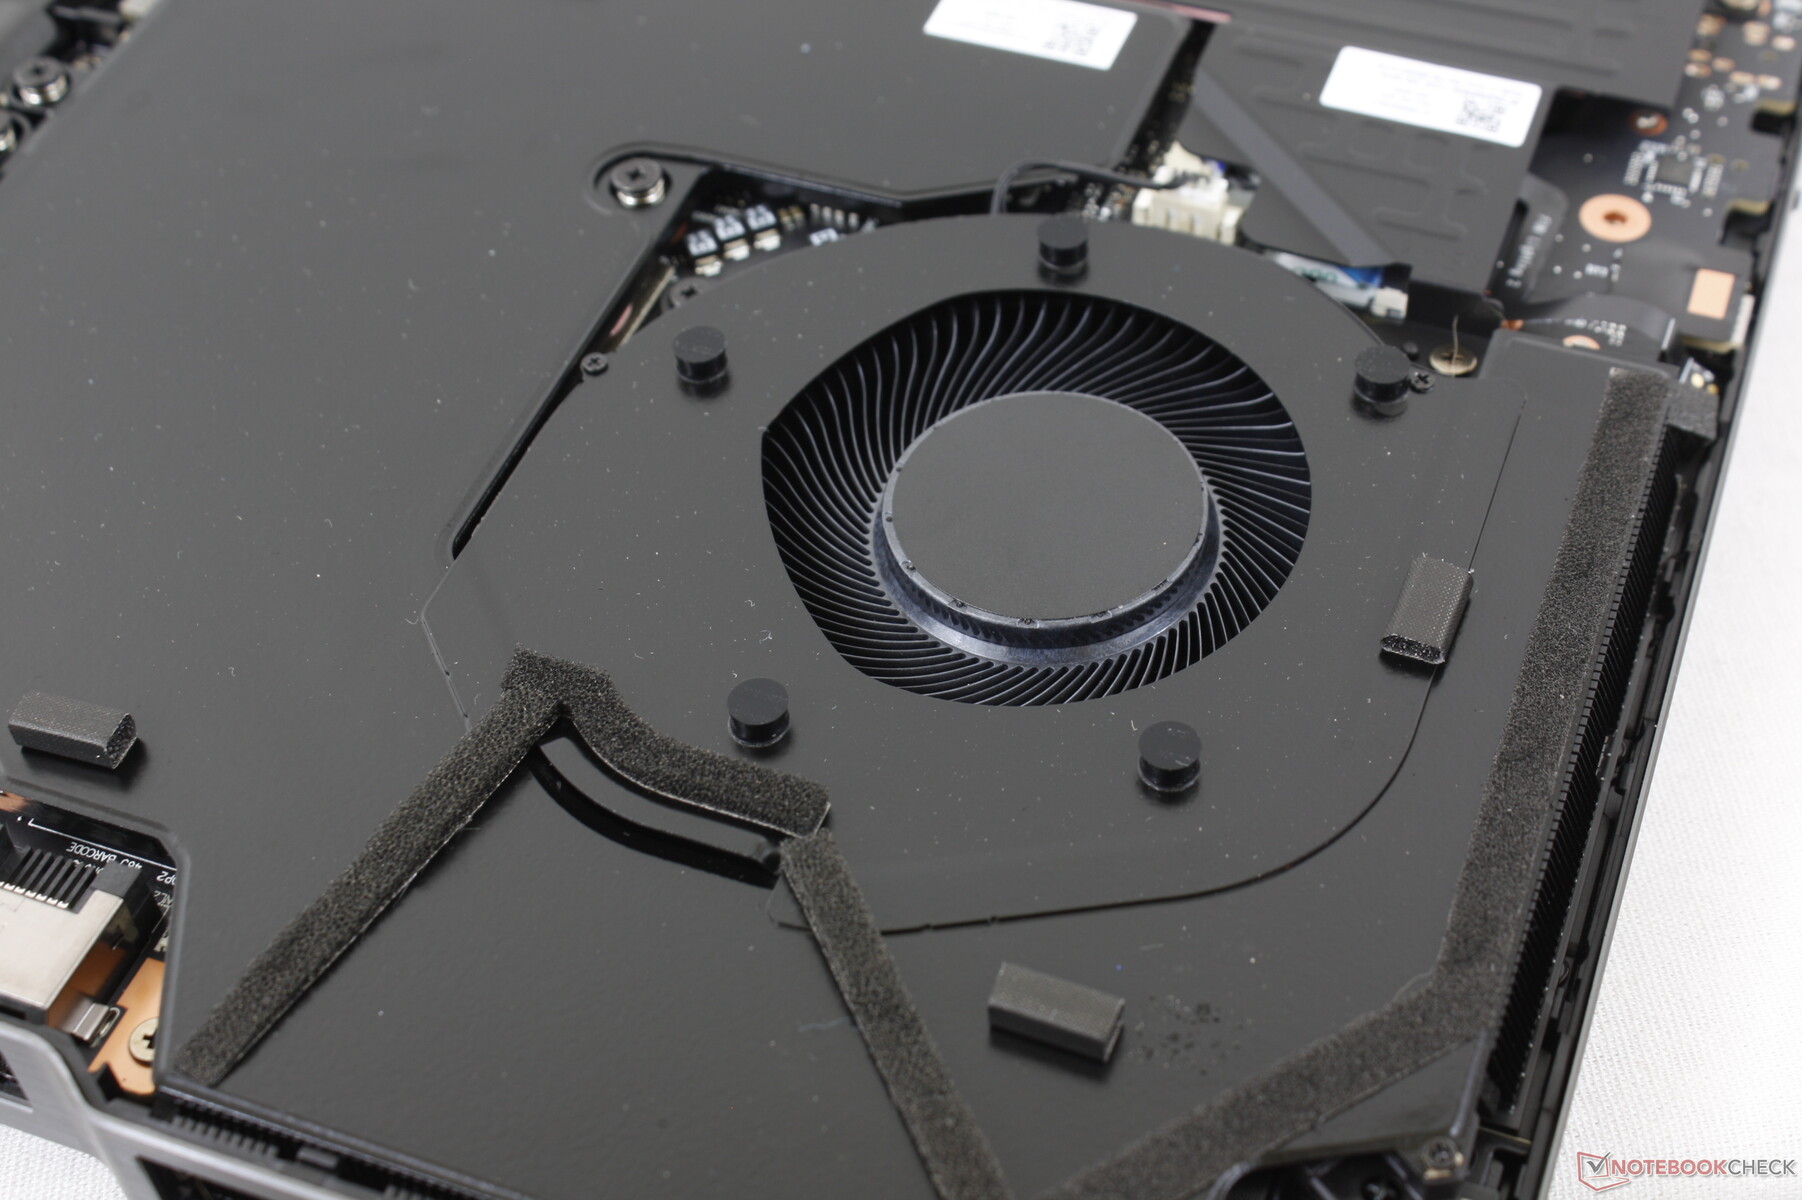
Ogólne wymiary i waga są bardzo zbliżone do Asusa ROG Zephyrus Duo 16, który jest jednym z cięższych laptopów do gier na rynku, pomimo cienkiej <20 mm obudowy. Być może najbardziej zauważalne jest to, że system Asusa jest w stanie zintegrować drugi ekran bez konieczności bycia cięższym lub większym niż nasze Lenovo. Bardzo gęste odczucia związane z legionem można przypisać rozwiązaniu chłodzącemu w postaci komory parowej, która jest tradycyjnie cięższa niż zwykłe miedziane rurki cieplne.
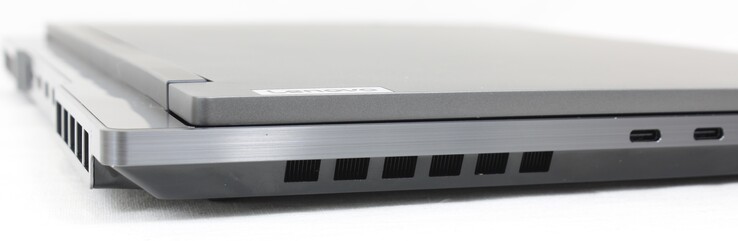
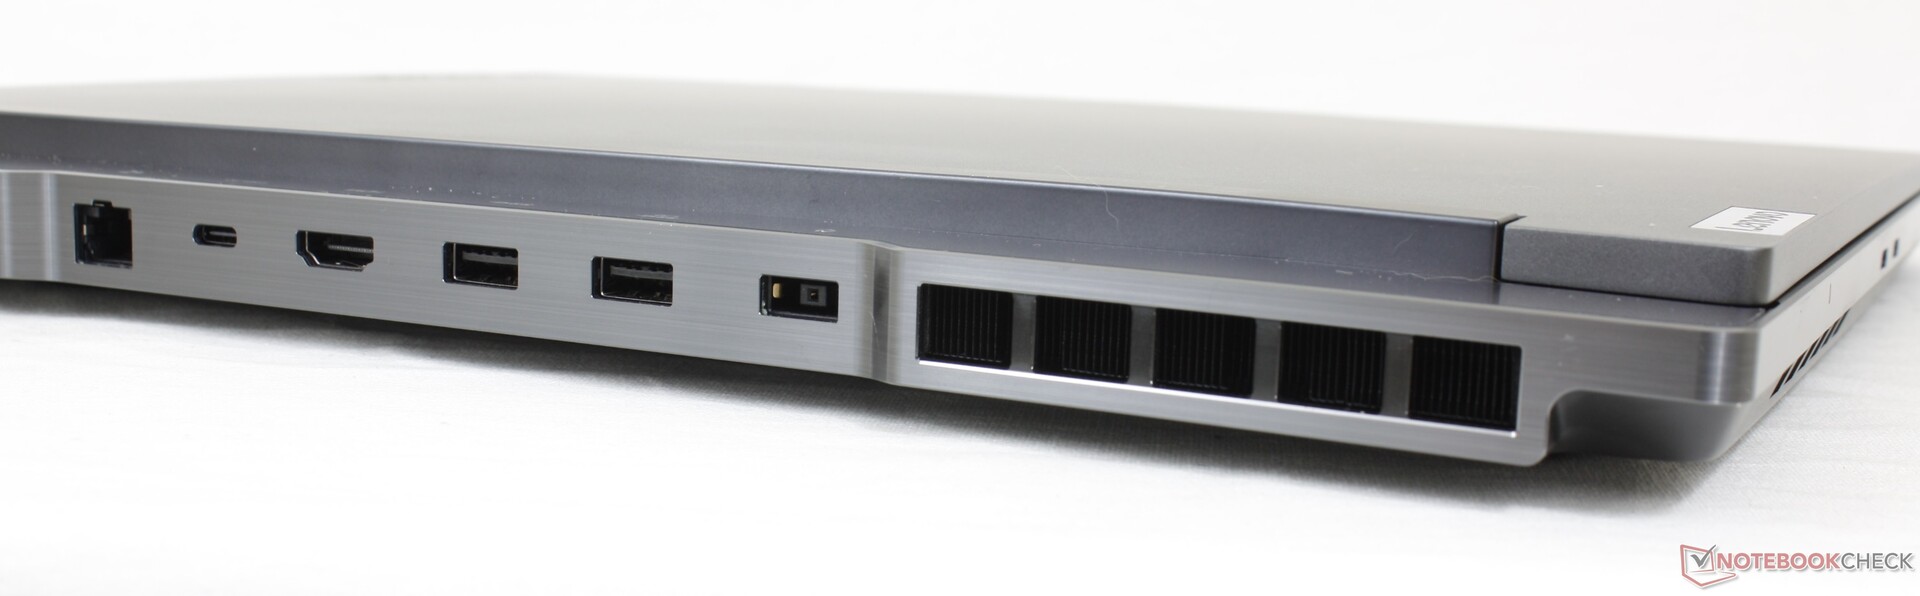
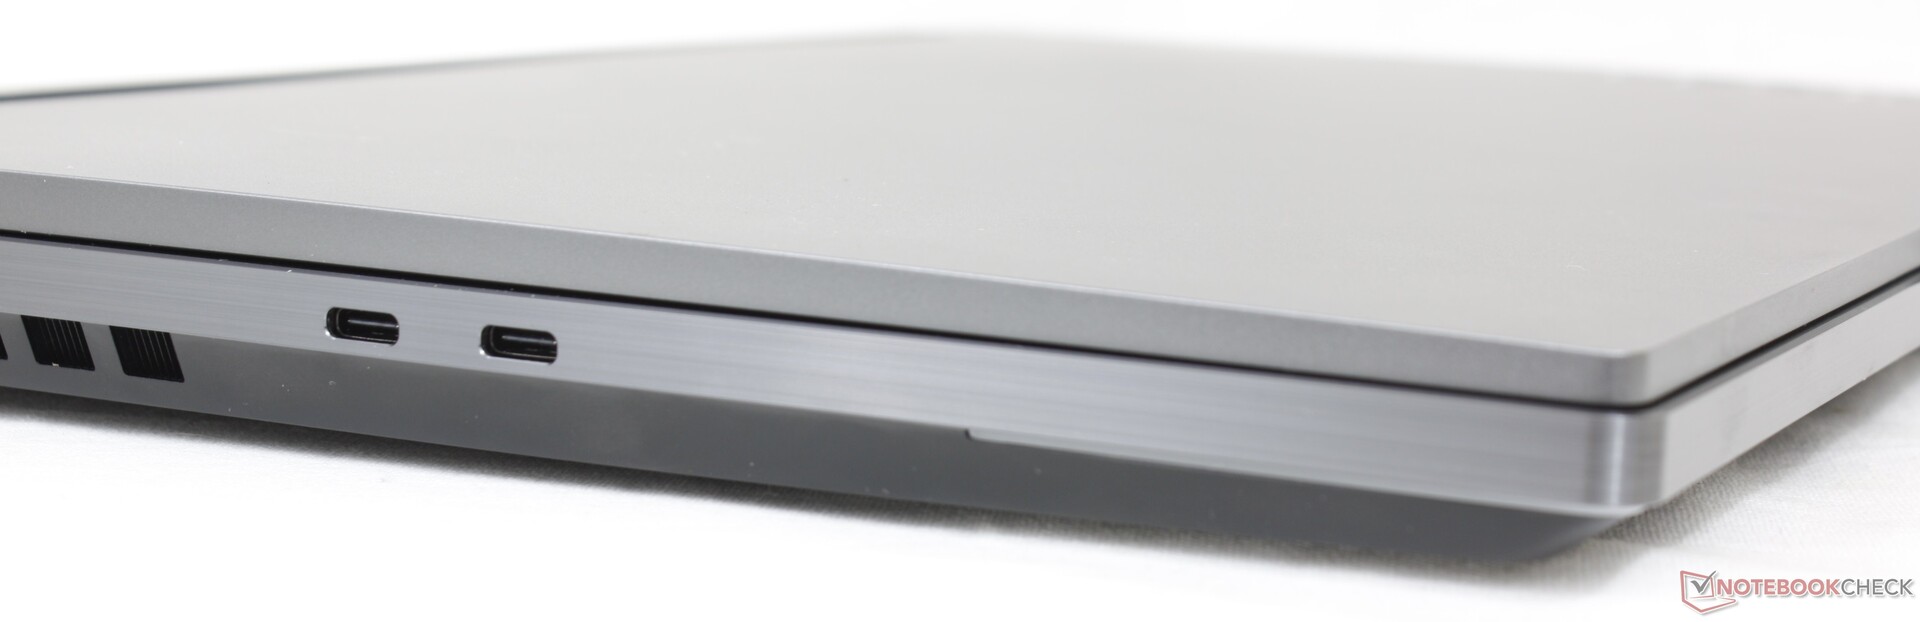
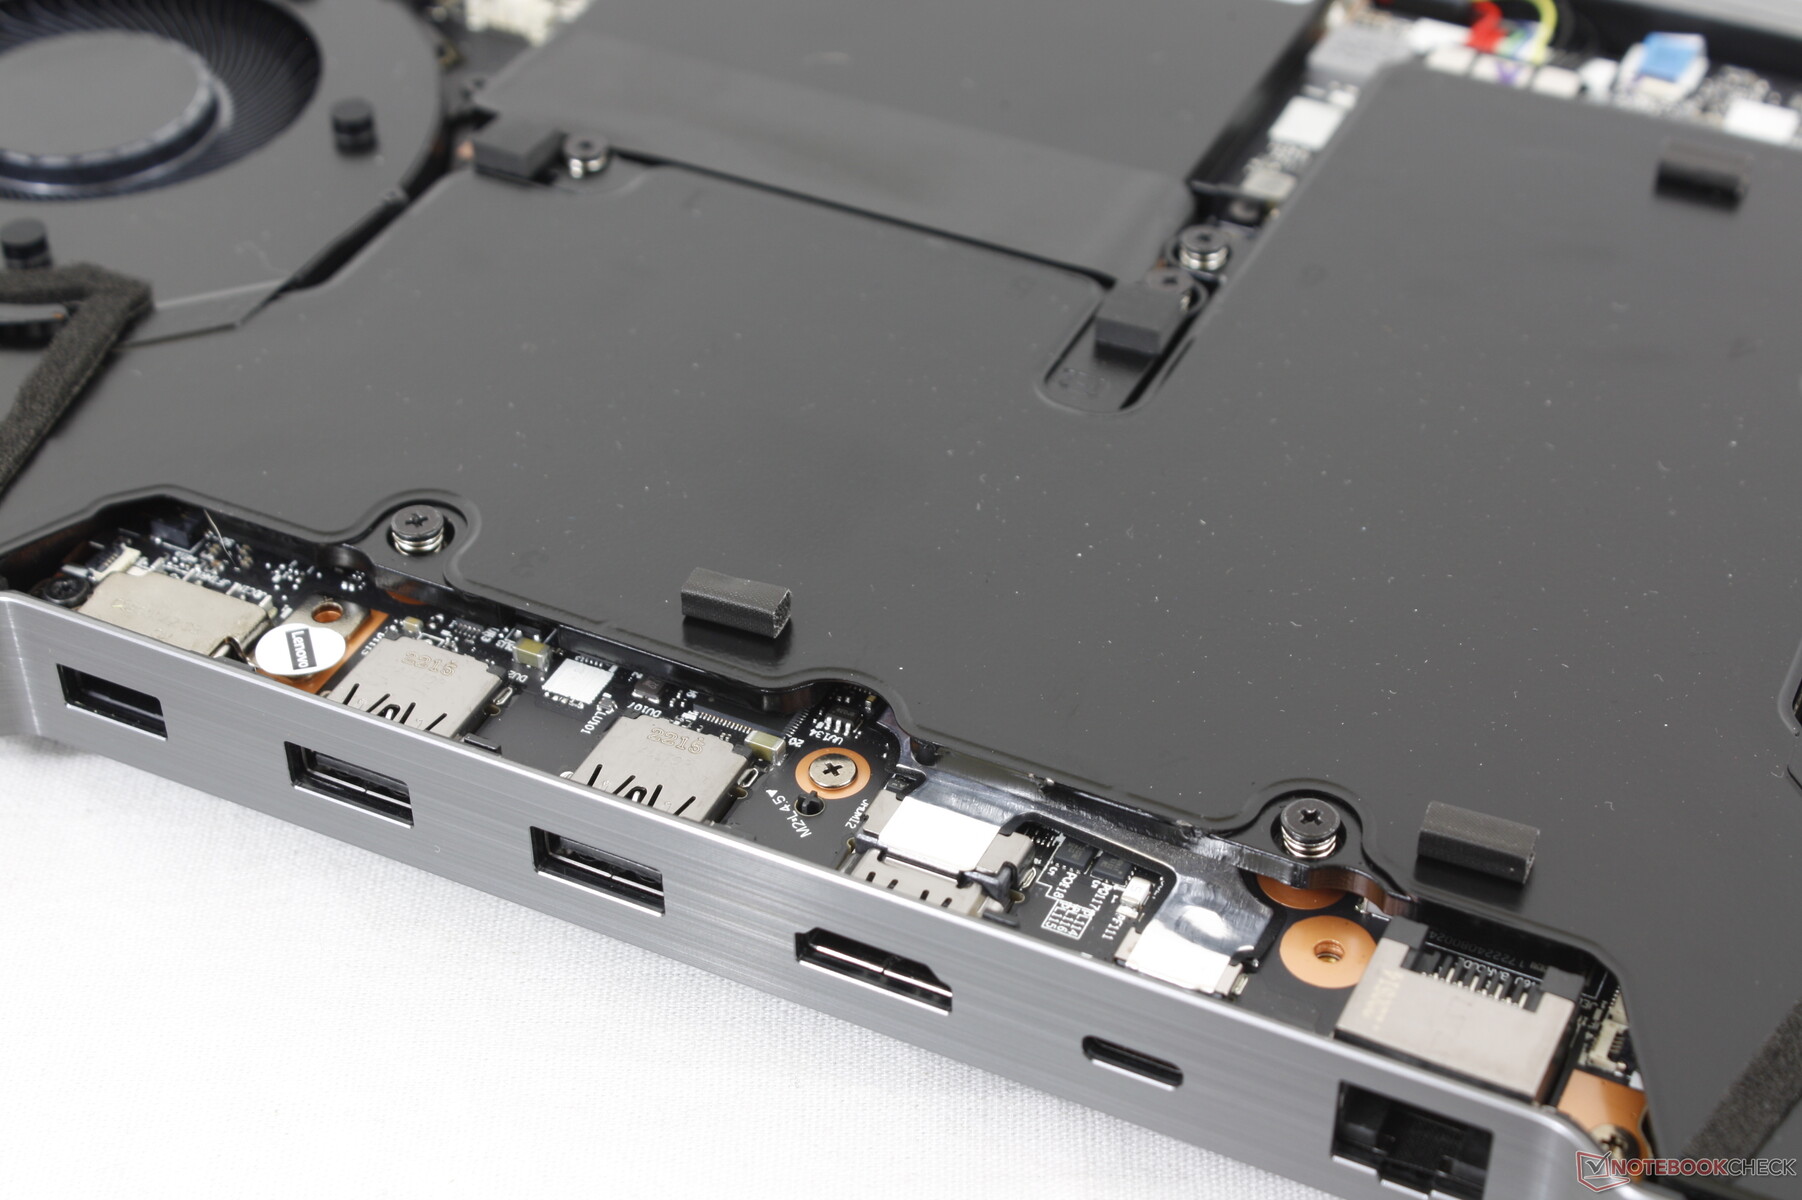
Łączność - mnóstwo portów USB-C
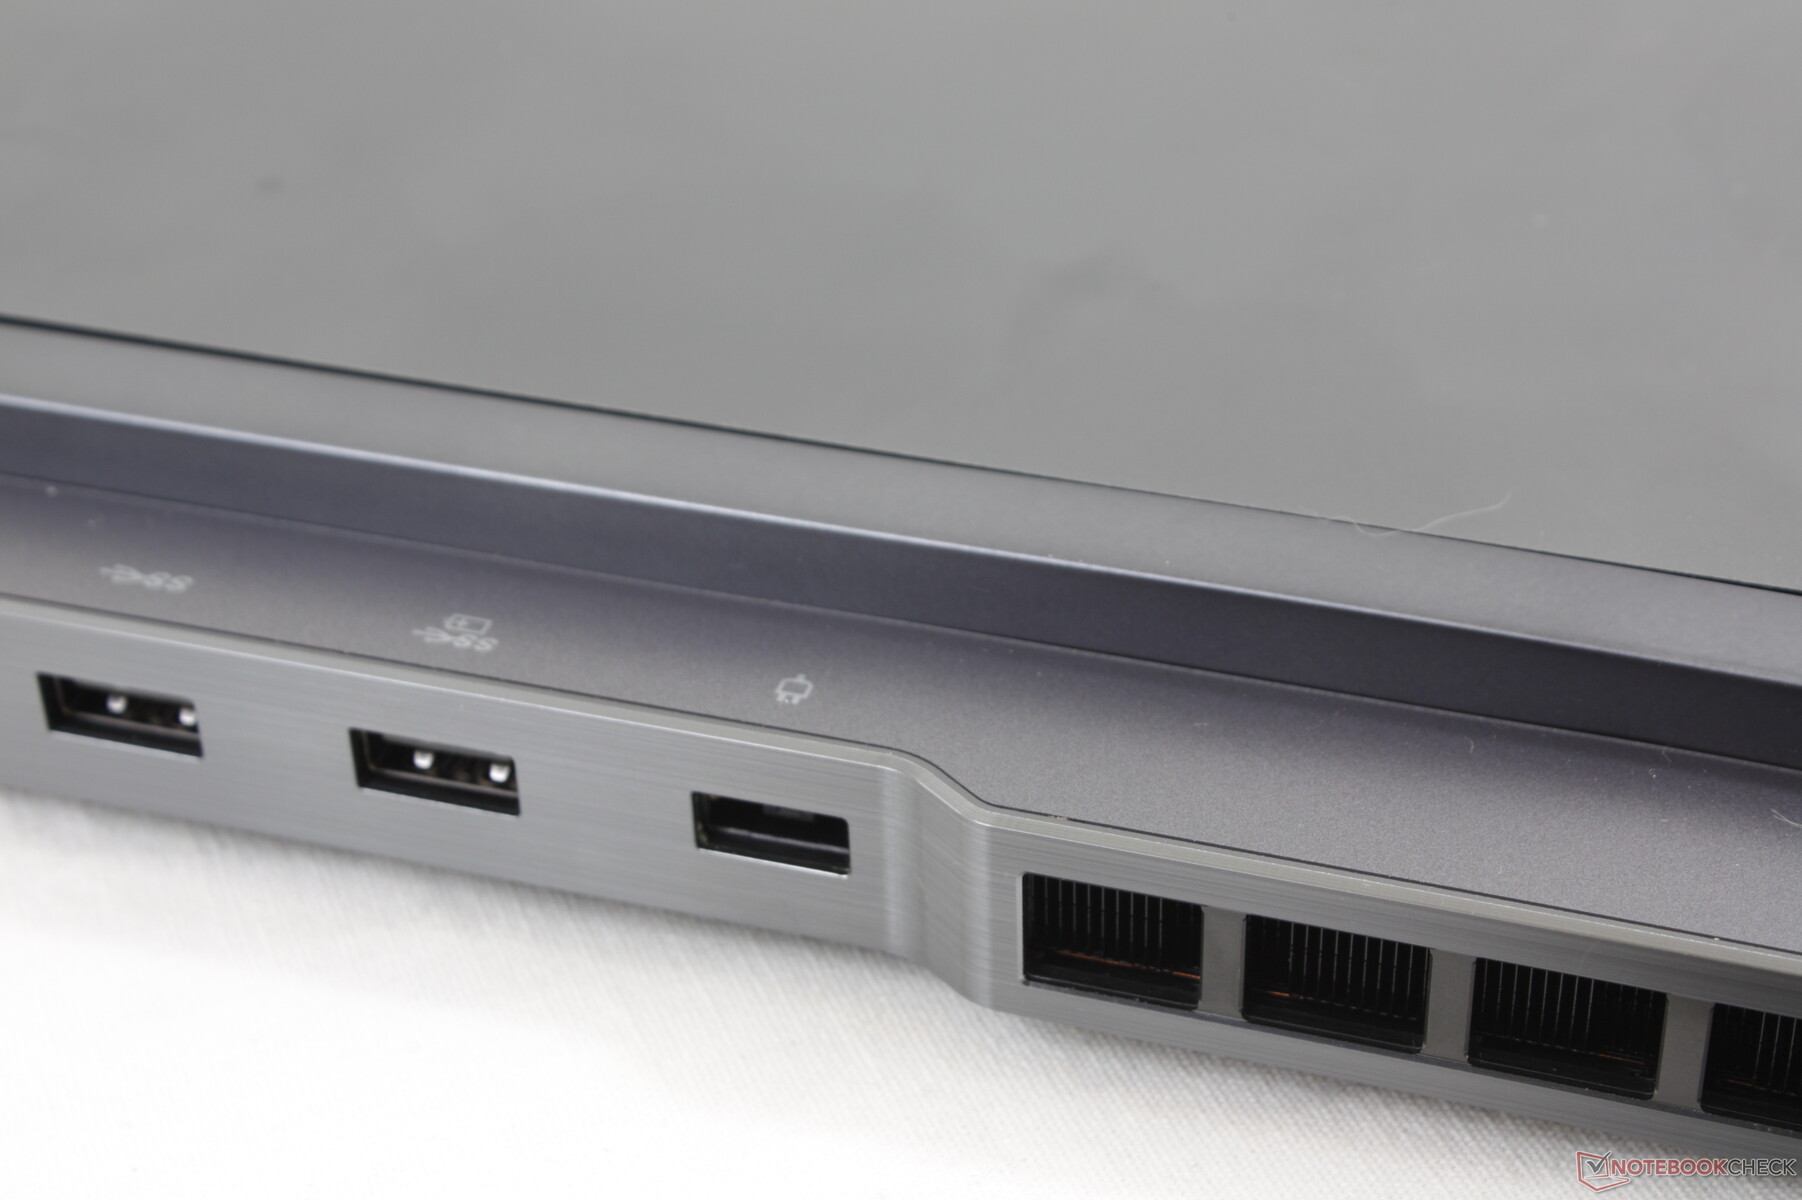
Opcje portów są zróżnicowane i przeważnie wzdłuż tylnej krawędzi obudowy zamiast po bokach. Istnieją cztery pojedyncze porty USB-C, co jest więcej niż w większości innych laptopów do gier. Nie są one jednak stworzone jednakowo, gdyż tylko niektóre porty USB-C obsługują DisplayPort, podczas gdy inne mogą obsługiwać Power Delivery, co pokazują nasze zdjęcia poniżej.
Nie ma obsługi Thunderbolt, w przeciwieństwie do większości laptopów do gier z procesorami Intela.

Komunikacja
System dostarczany jest z niecodziennym MediaTekiem RZ616 dla Wi-Fi 6E i Bluetooth 5.2 zamiast zwykłego rozwiązania Intel AX. Szybkość transferu jest szybka i stabilna po sparowaniu z naszą siecią domową 6 GHz, ale szybkość odbioru jest nieco wolniejsza niż oczekiwaliśmy.
| Networking | |
| iperf3 transmit AX12 | |
| Lenovo Legion 5 Pro 16ACH6H (82JQ001PGE) | |
| HP Omen 16-c0077ng | |
| iperf3 receive AX12 | |
| Lenovo Legion 5 Pro 16ACH6H (82JQ001PGE) | |
| HP Omen 16-c0077ng | |
| iperf3 receive AXE11000 6GHz | |
| Lenovo Legion 7 16ARHA7 | |
| iperf3 transmit AXE11000 | |
| Asus ROG Zephyrus Duo 16 GX650RX | |
| Lenovo Legion Slim 7-16IAH 82TF004YGE | |
| MSI Raider GE66 12UHS | |
| iperf3 receive AXE11000 | |
| MSI Raider GE66 12UHS | |
| Lenovo Legion Slim 7-16IAH 82TF004YGE | |
| Asus ROG Zephyrus Duo 16 GX650RX | |
| iperf3 transmit AXE11000 6GHz | |
| Lenovo Legion 7 16ARHA7 | |
Kamera internetowa
Kamera internetowa o rozdzielczości 2 MP oferuje ostrzejszy obraz niż większość innych laptopów, gdzie 720p jest nadal powszechne. Przełącznik zabicia kamery znajduje się wzdłuż prawej krawędzi, ale nie ma żadnego wskaźnika wizualnego, który pokazywałby, że obiektyw kamery jest w jakikolwiek sposób zablokowany
Nie ma też czujnika IR do obsługi funkcji Hello.


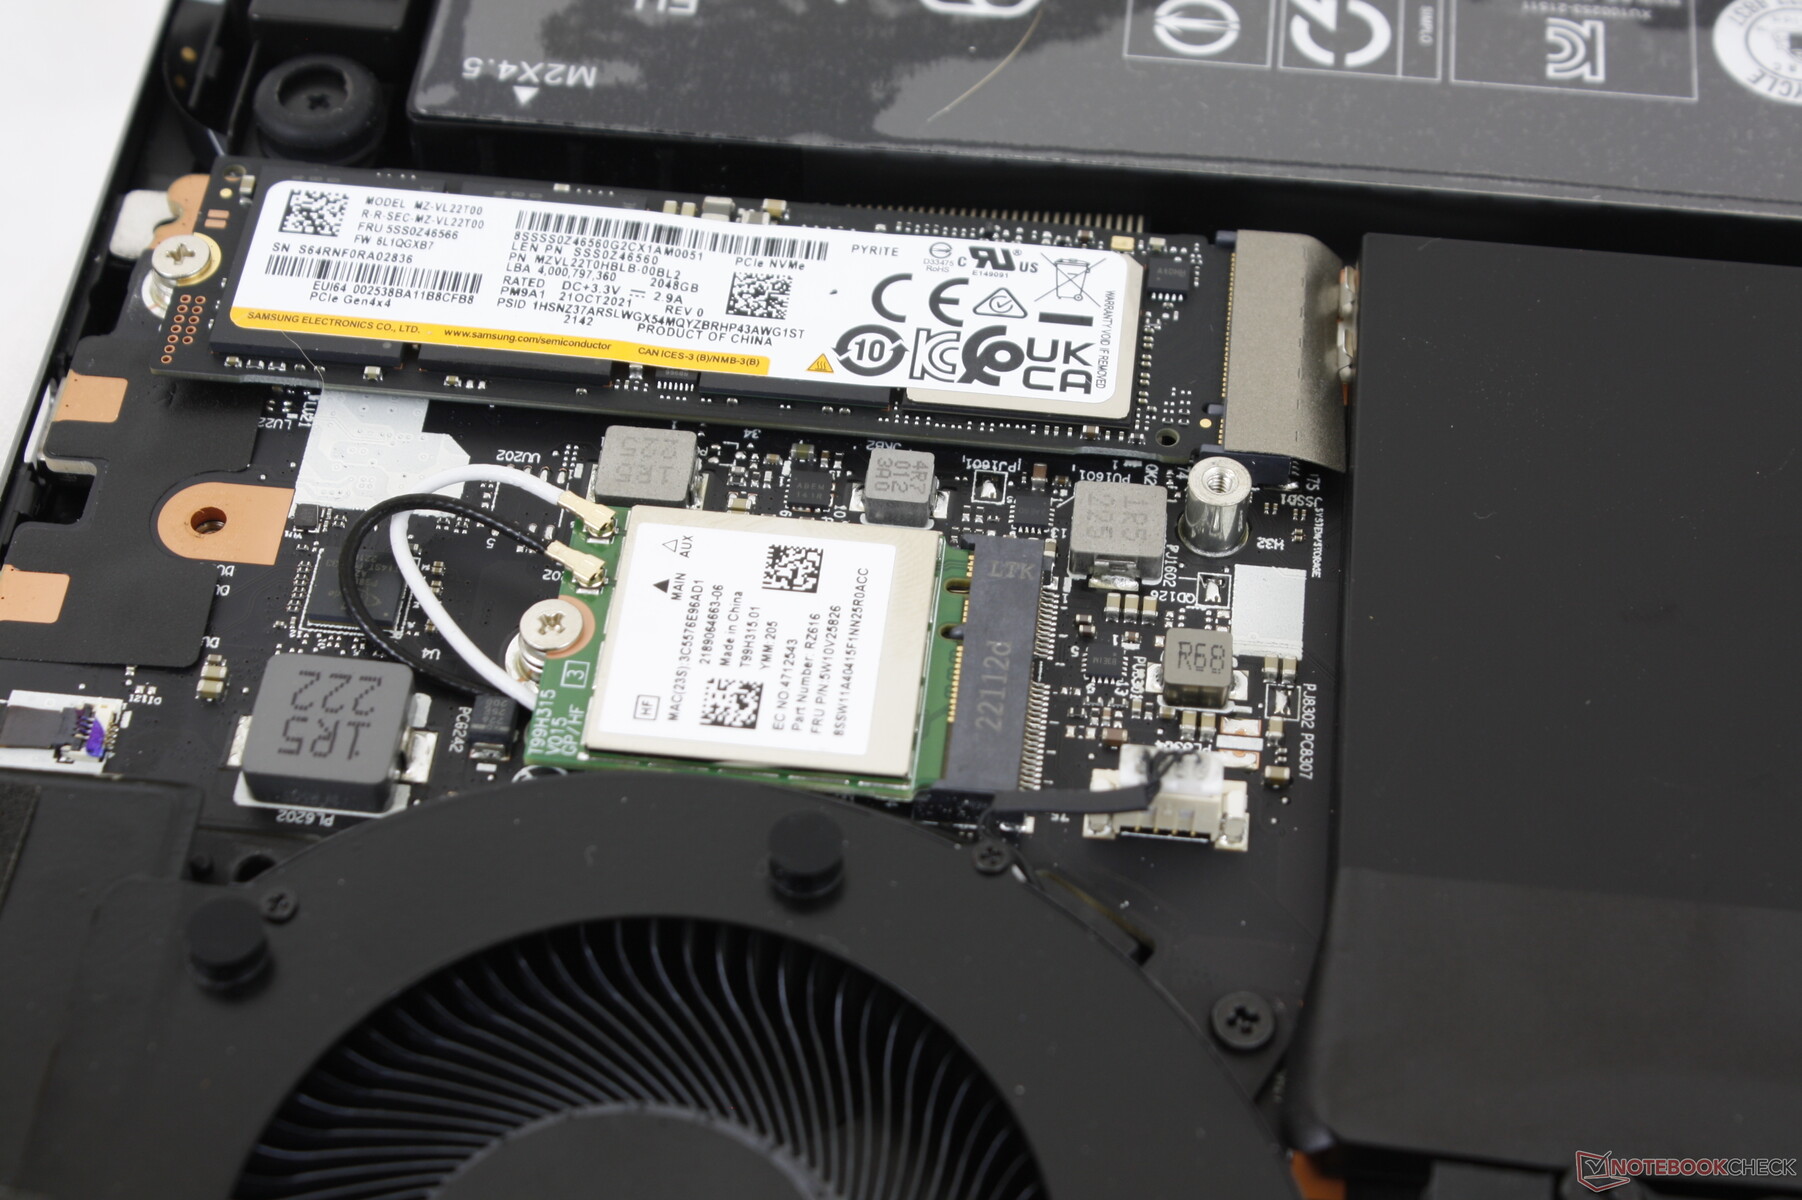
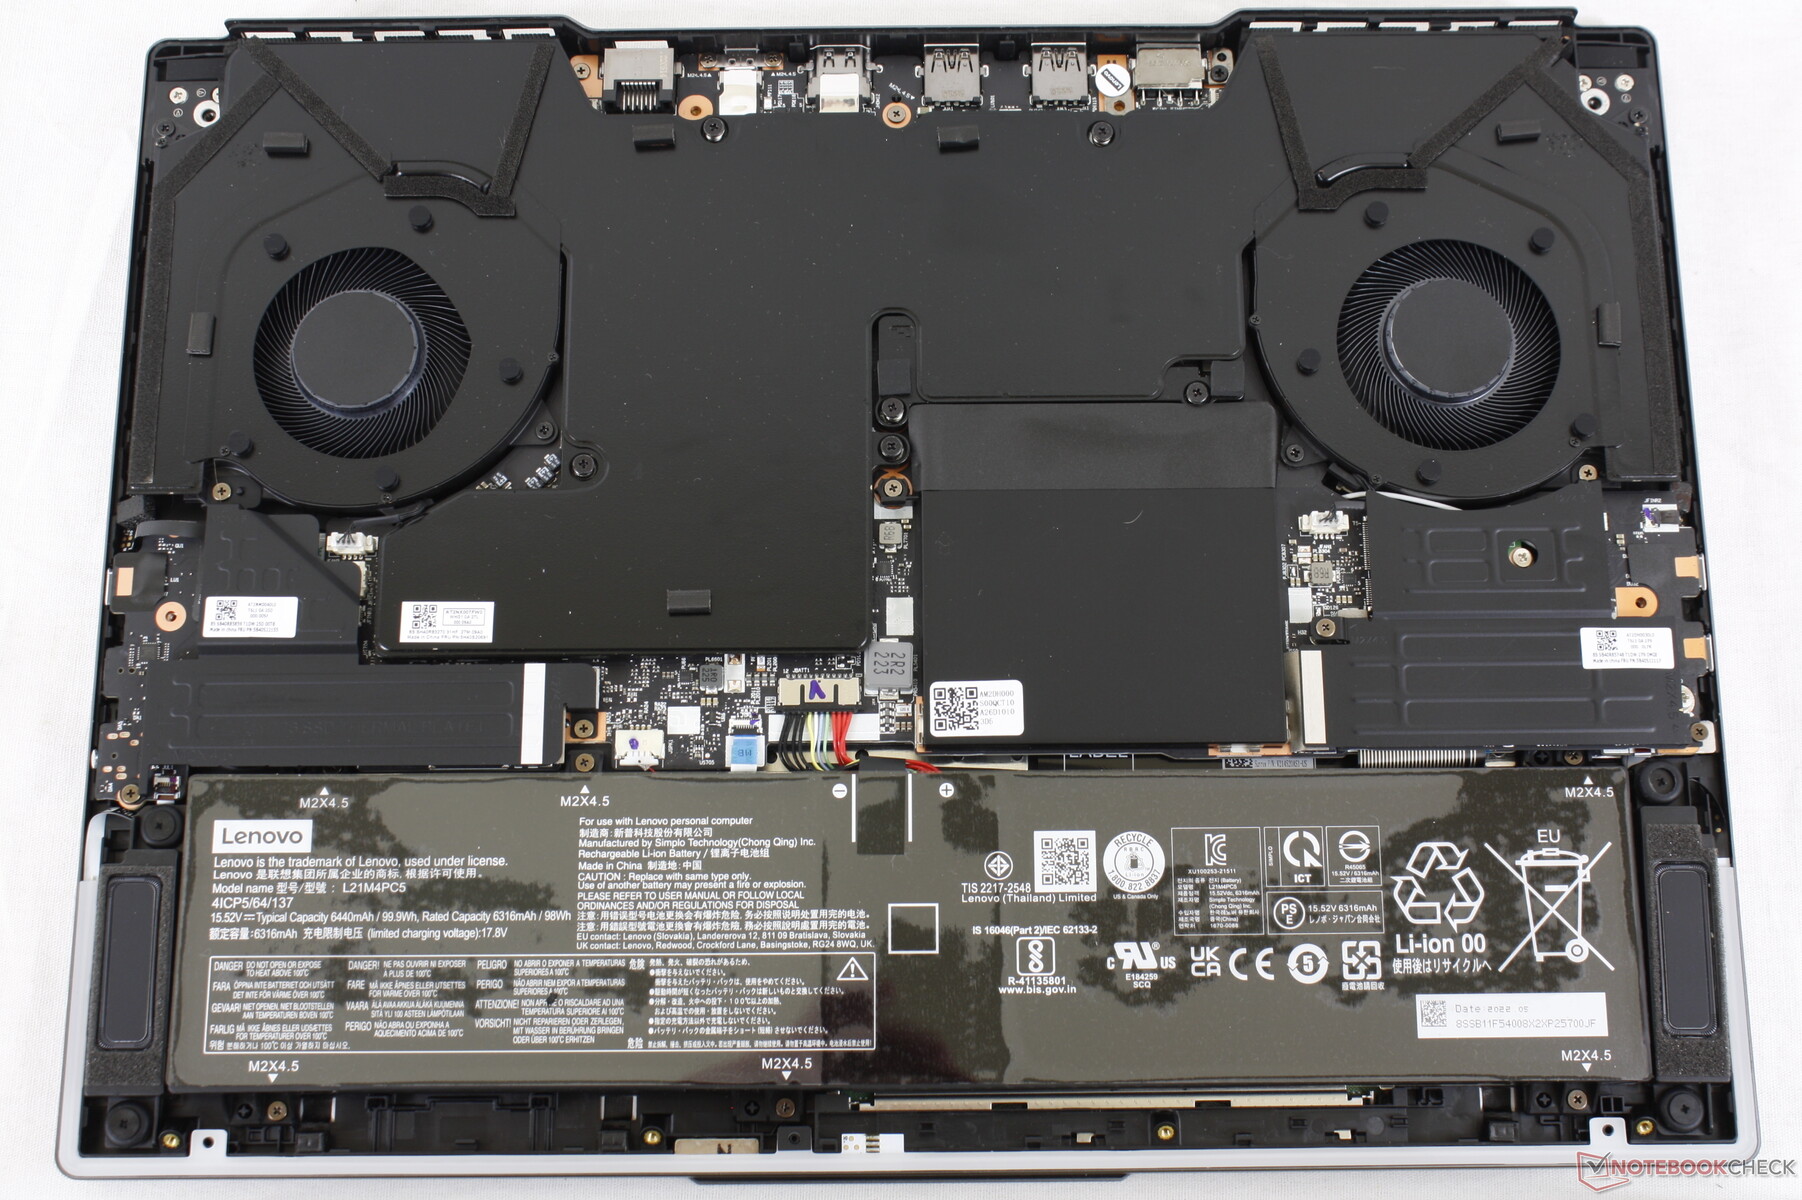
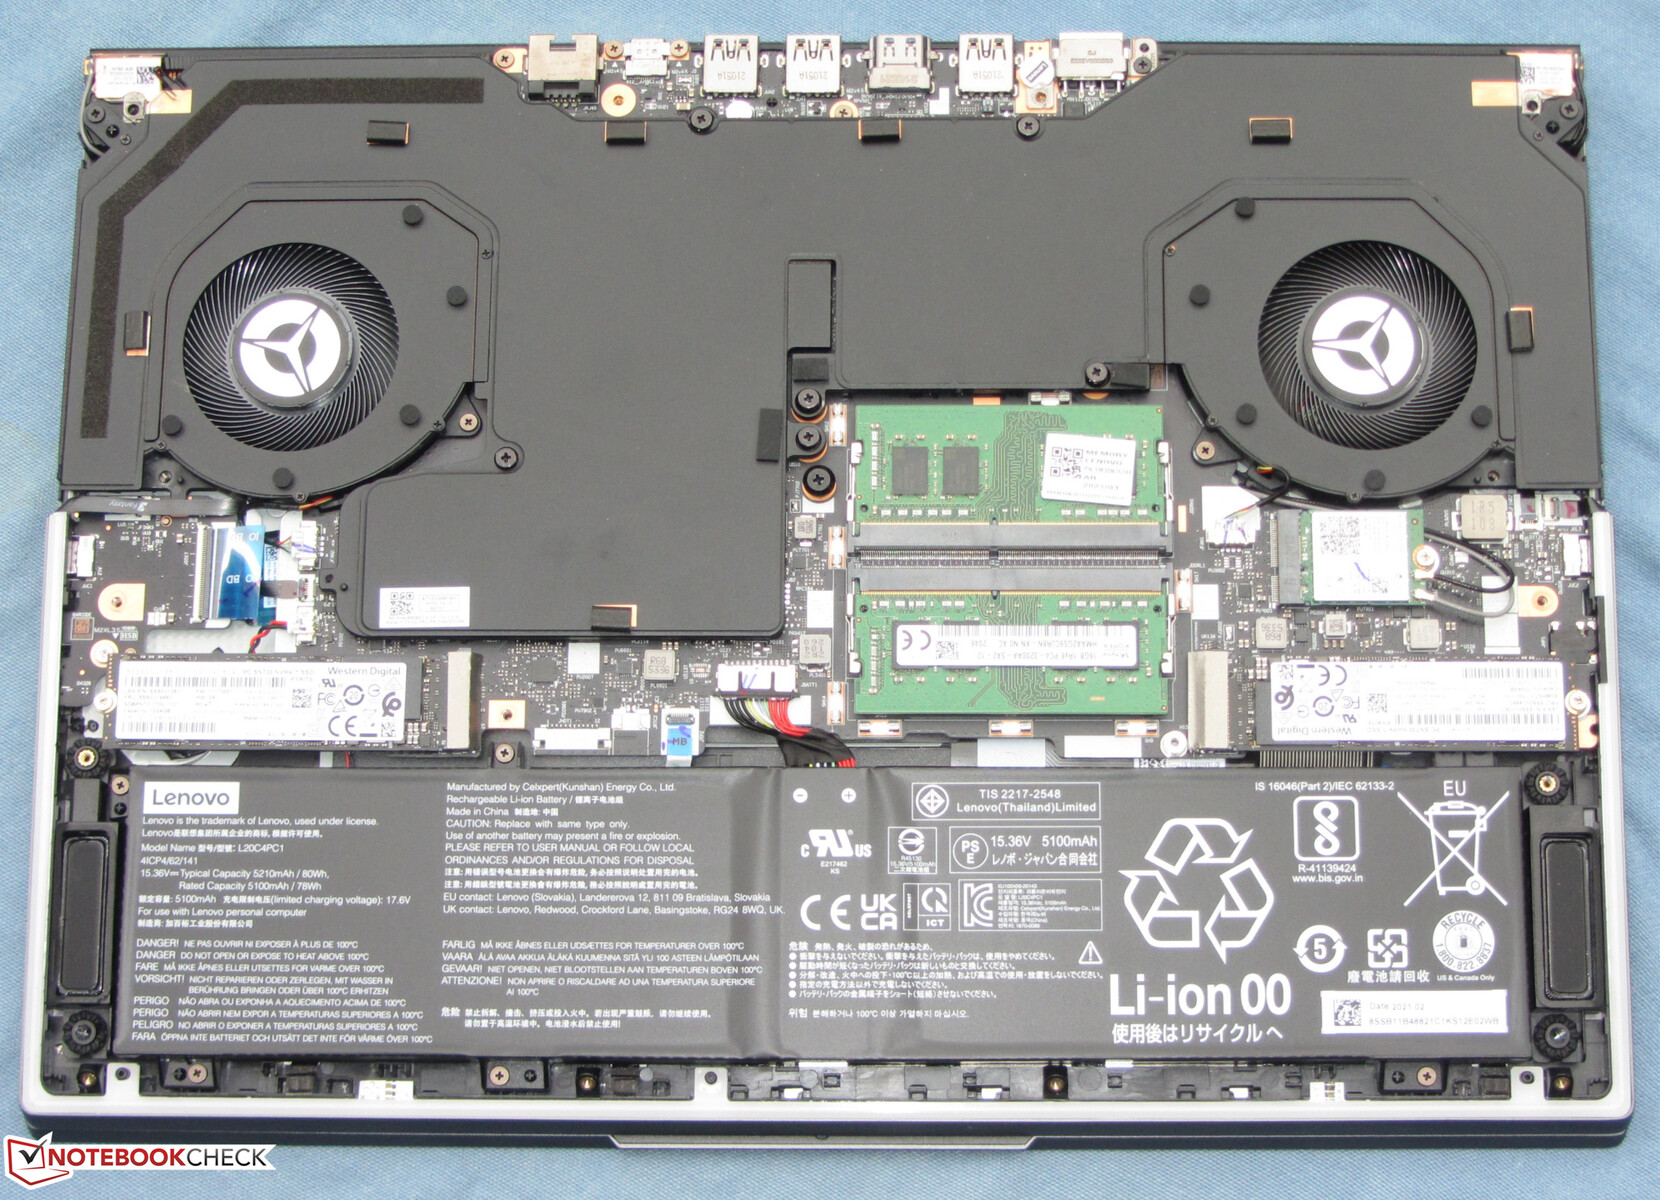
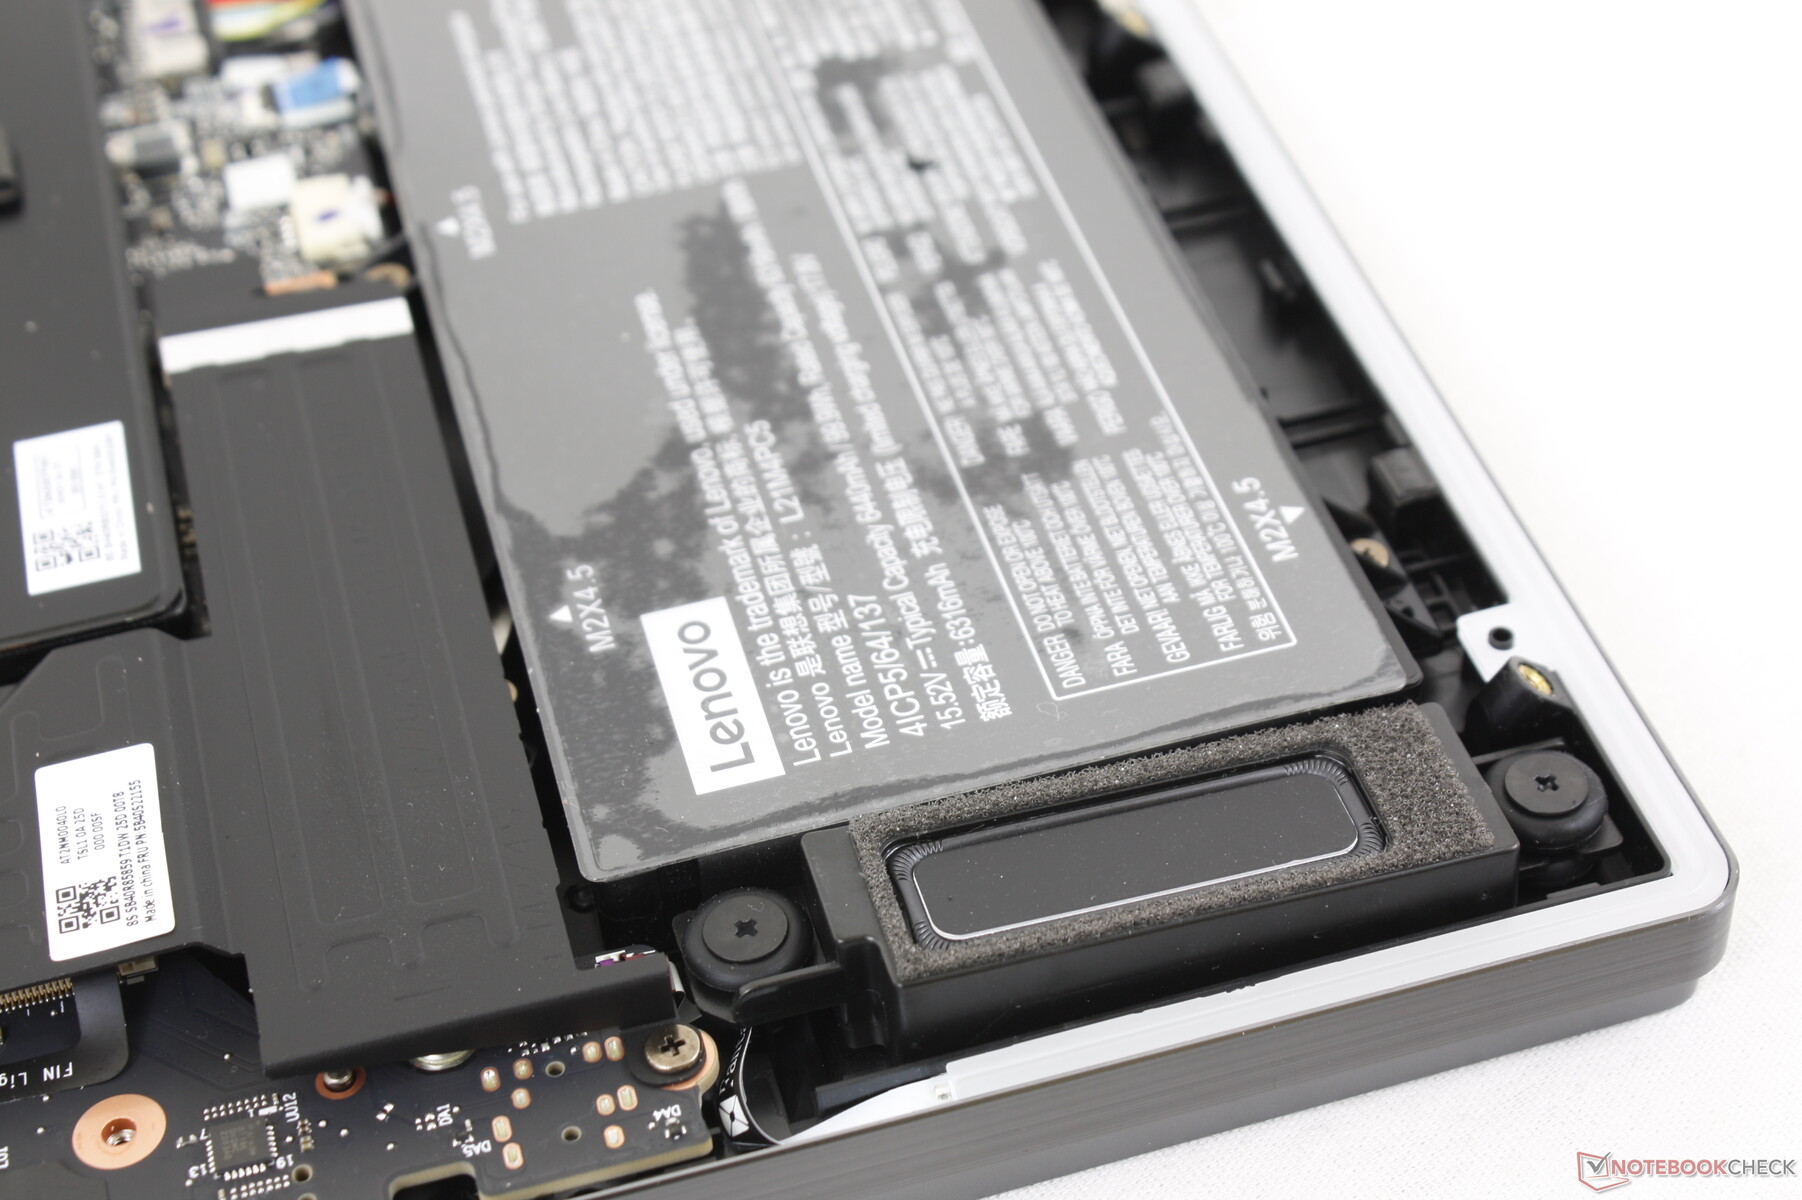
Konserwacja
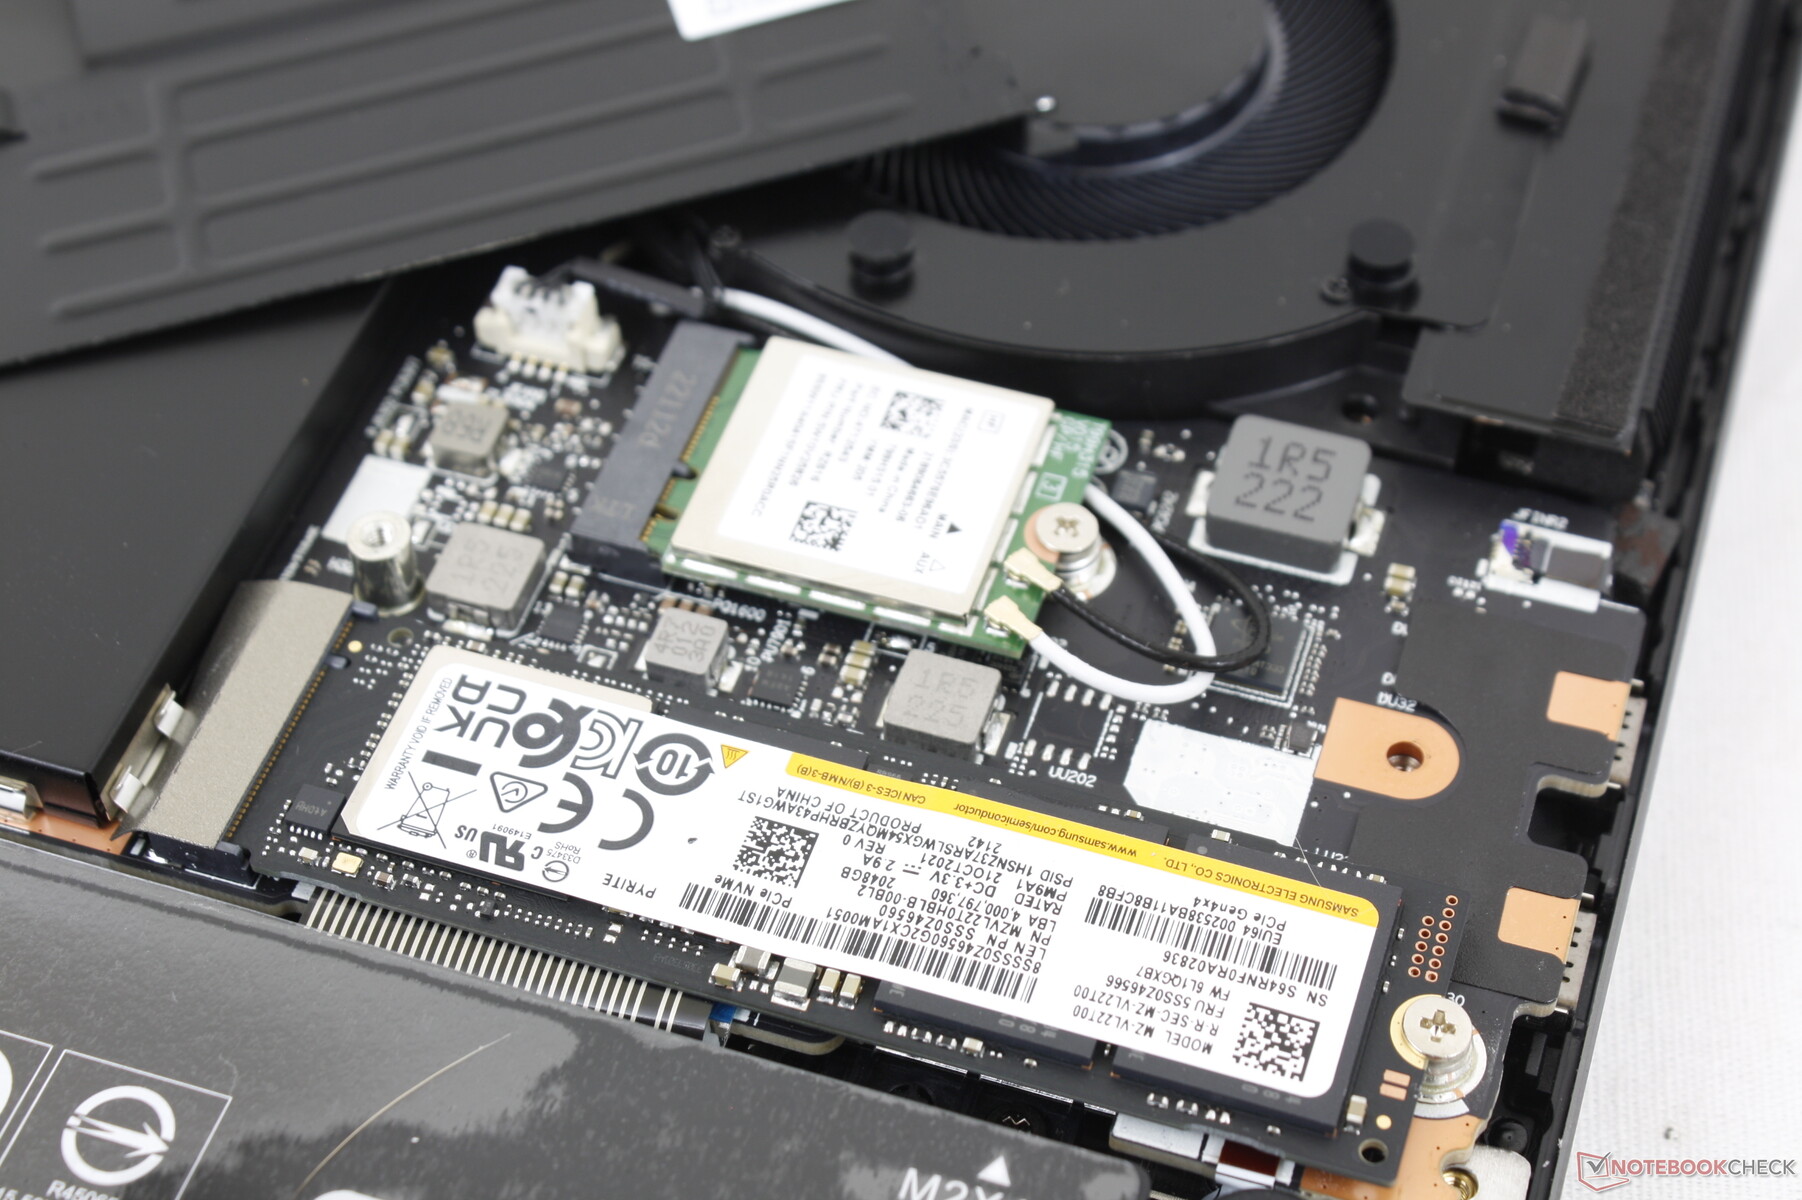
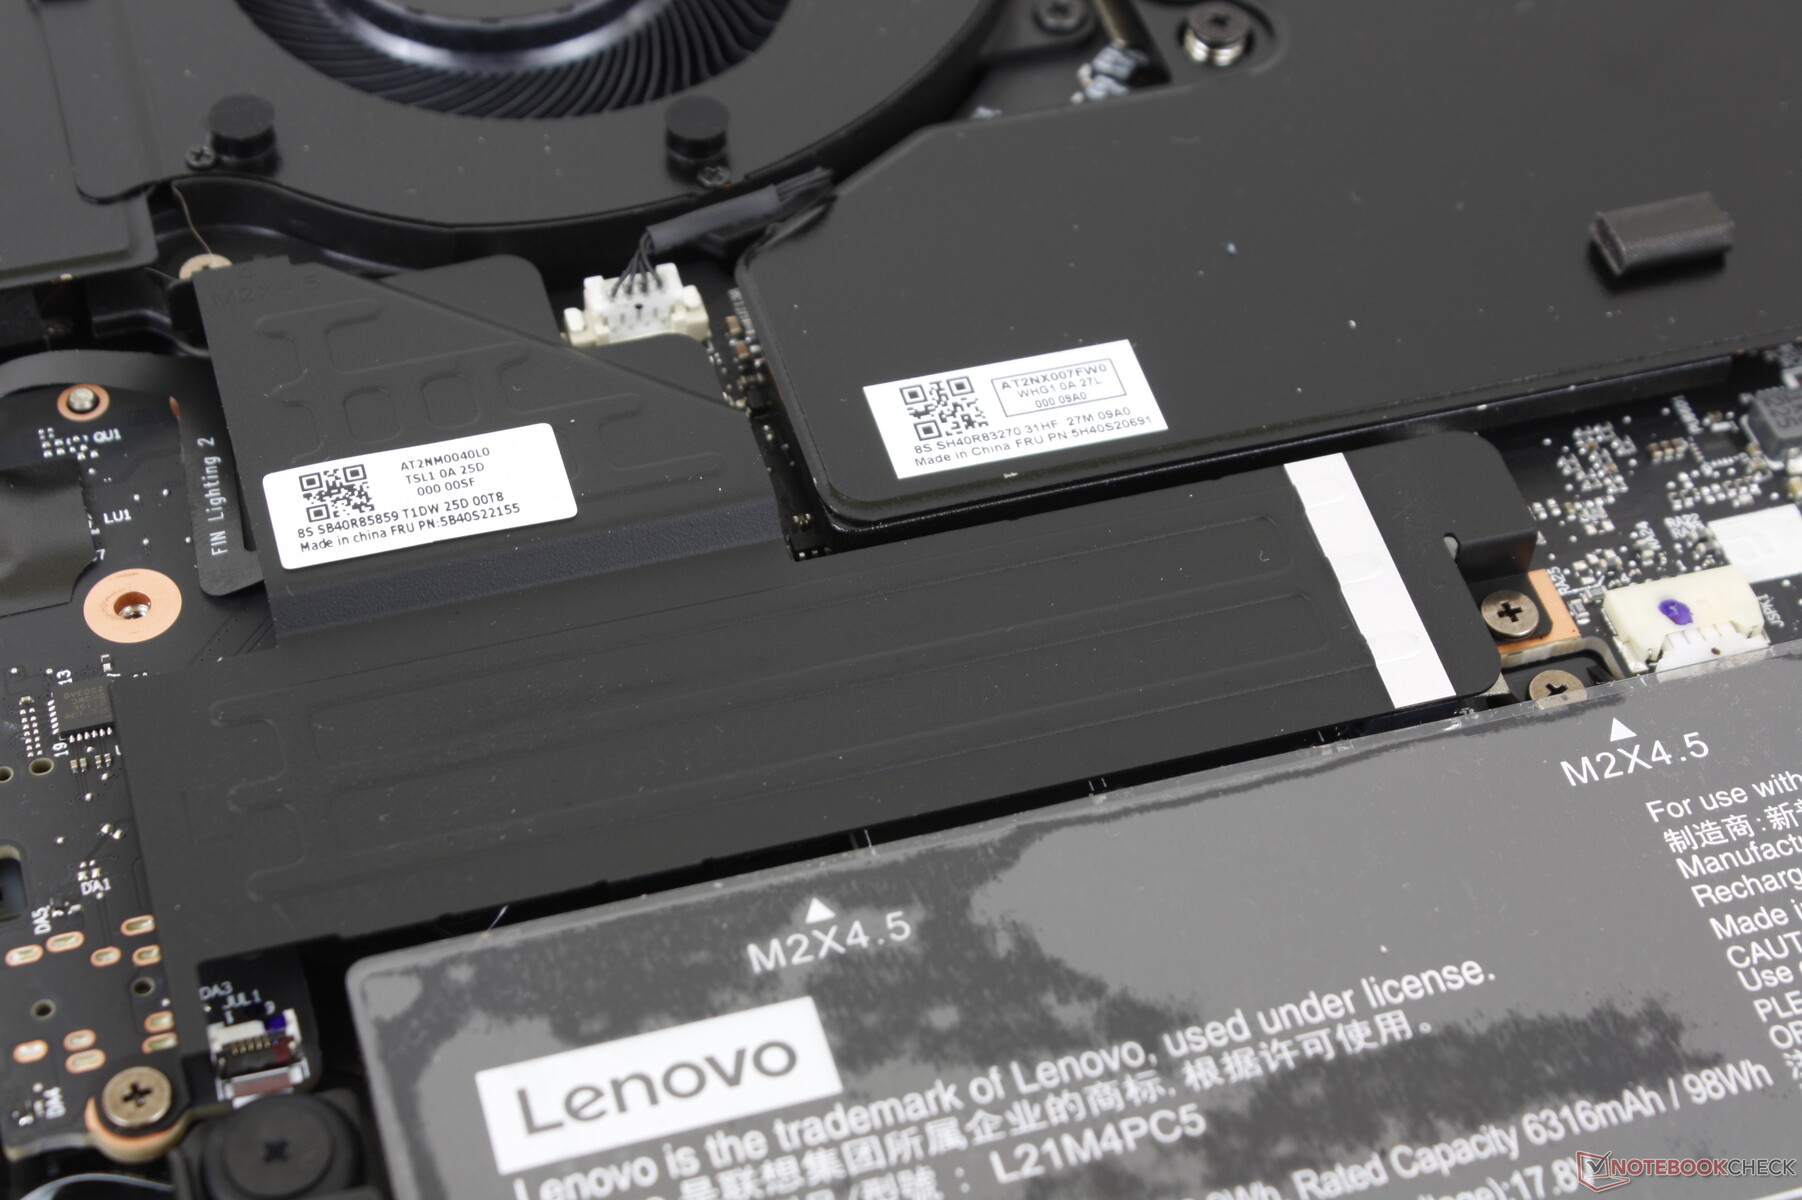
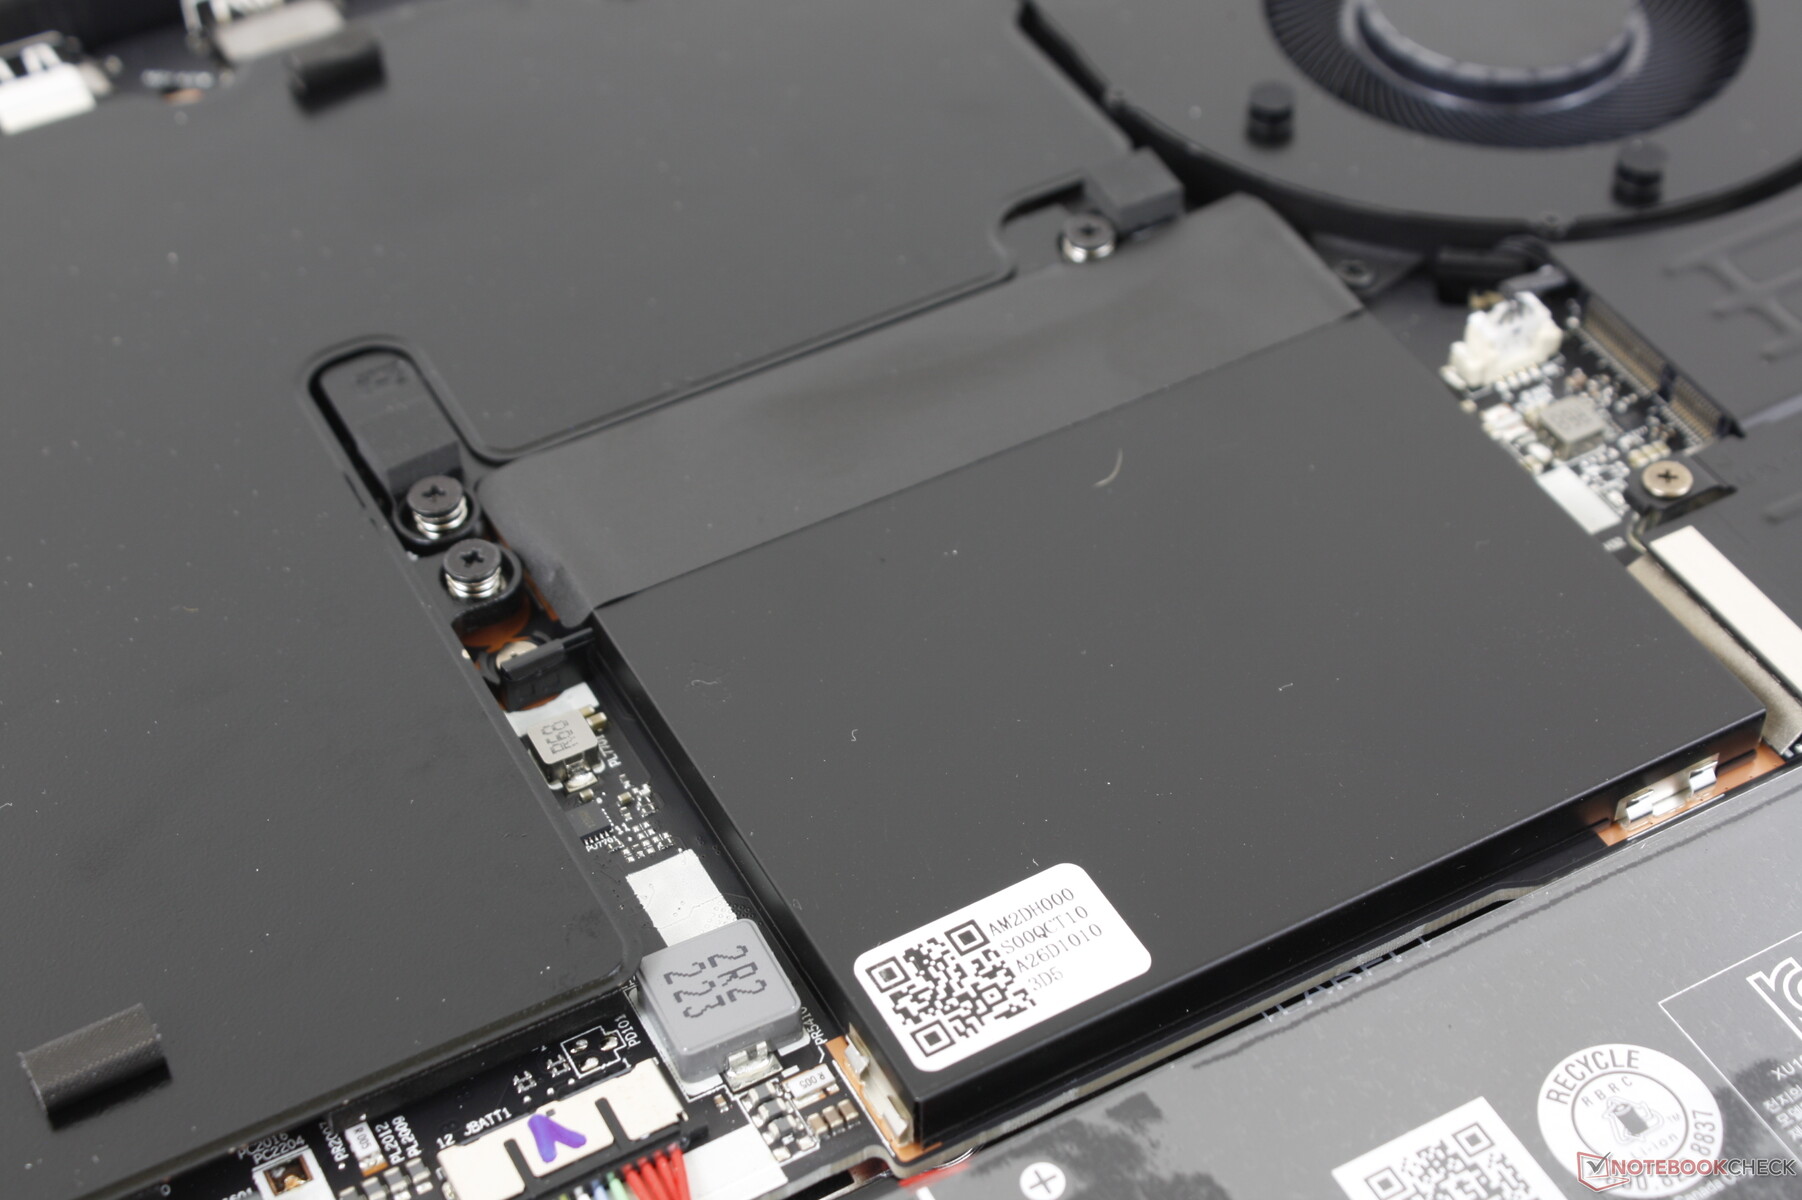
Dolny panel jest zabezpieczony 10 śrubkami Philipsa, co zapewnia stosunkowo łatwą możliwość serwisowania. Właściciele mają dostęp do dwóch gniazd pamięci masowej M.2 2280 oraz dwóch gniazd SODIMM, z których każde posiada własną metalową osłonę.
Akcesoria i gwarancja
Lenovo dołącza narzędzie do zdejmowania nasadek klawiszy w celu ich wyczyszczenia lub wymiany. W przypadku zakupu w USA obowiązuje standardowa roczna ograniczona gwarancja.
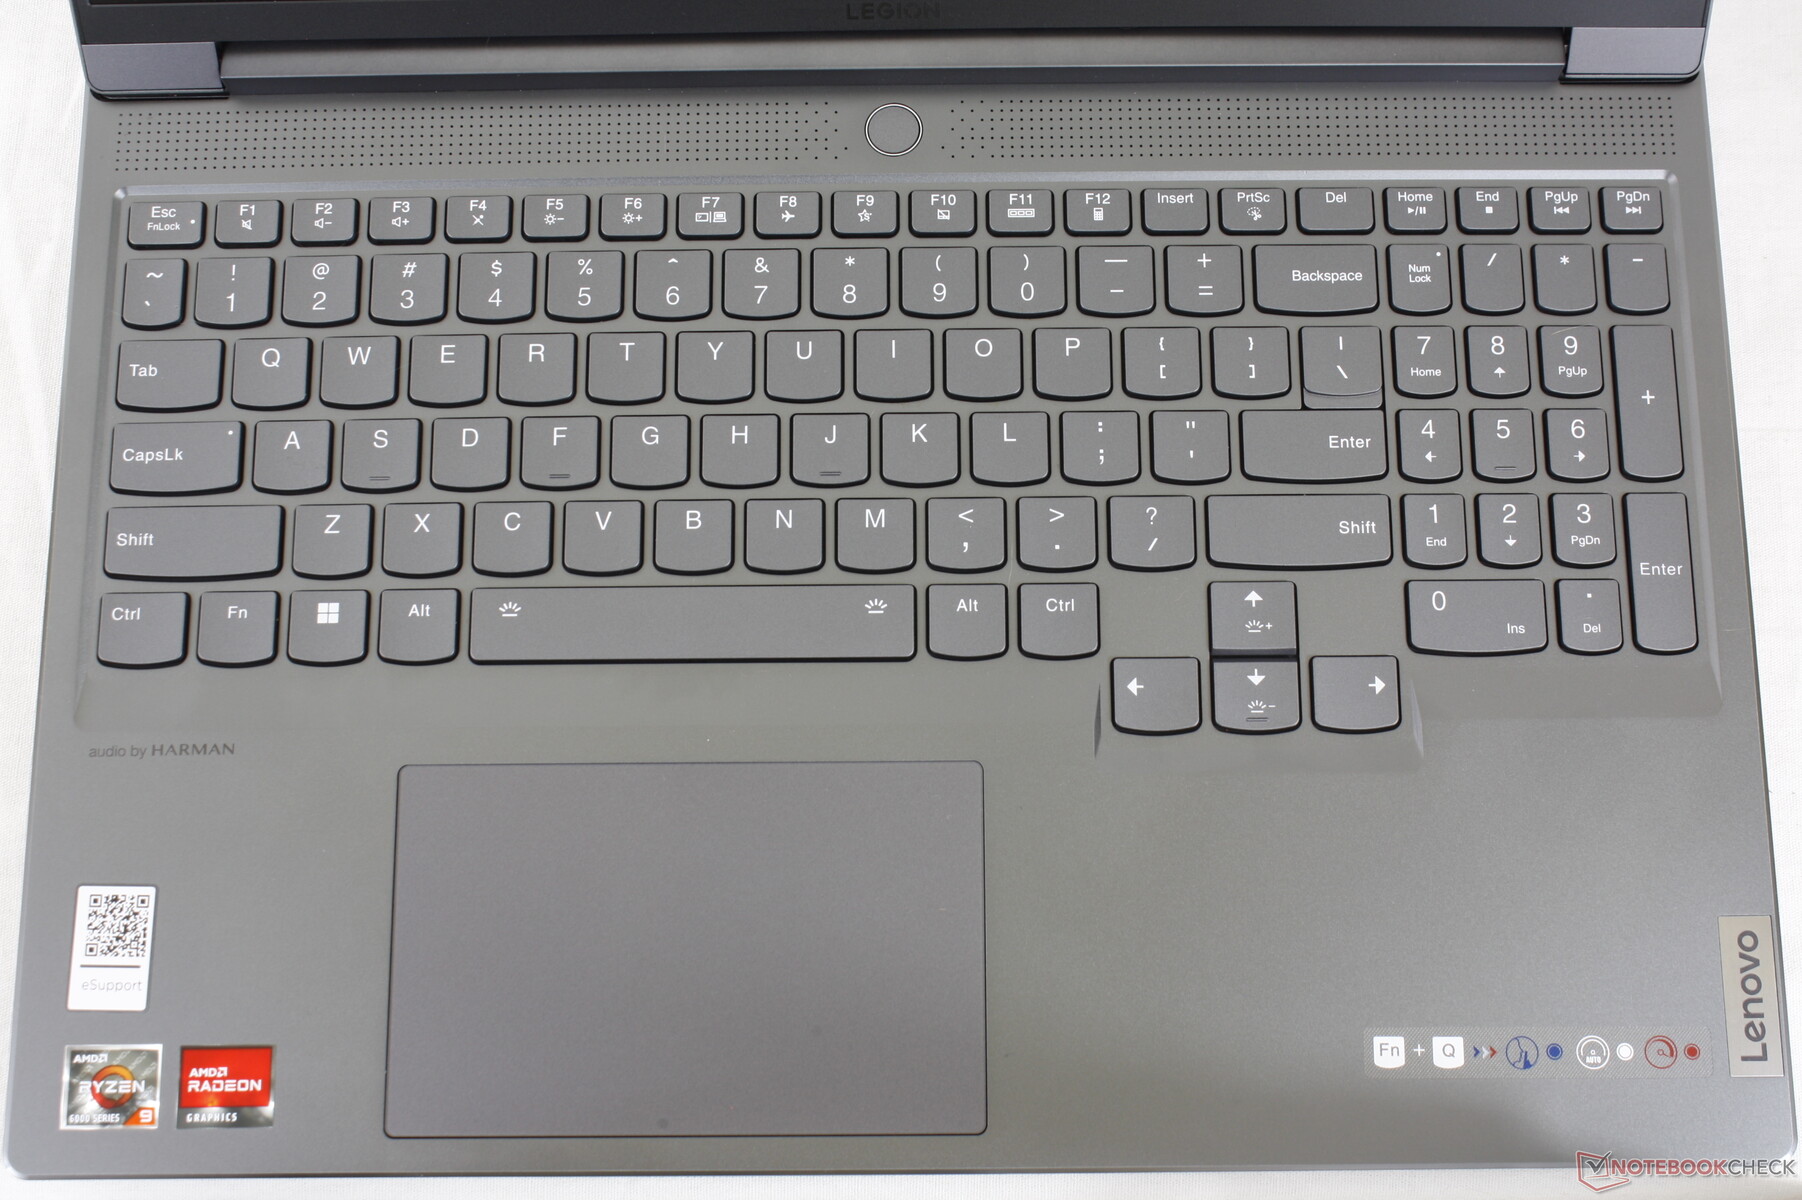
Urządzenia wejściowe - lepsze niż IdeaPad czy Yoga
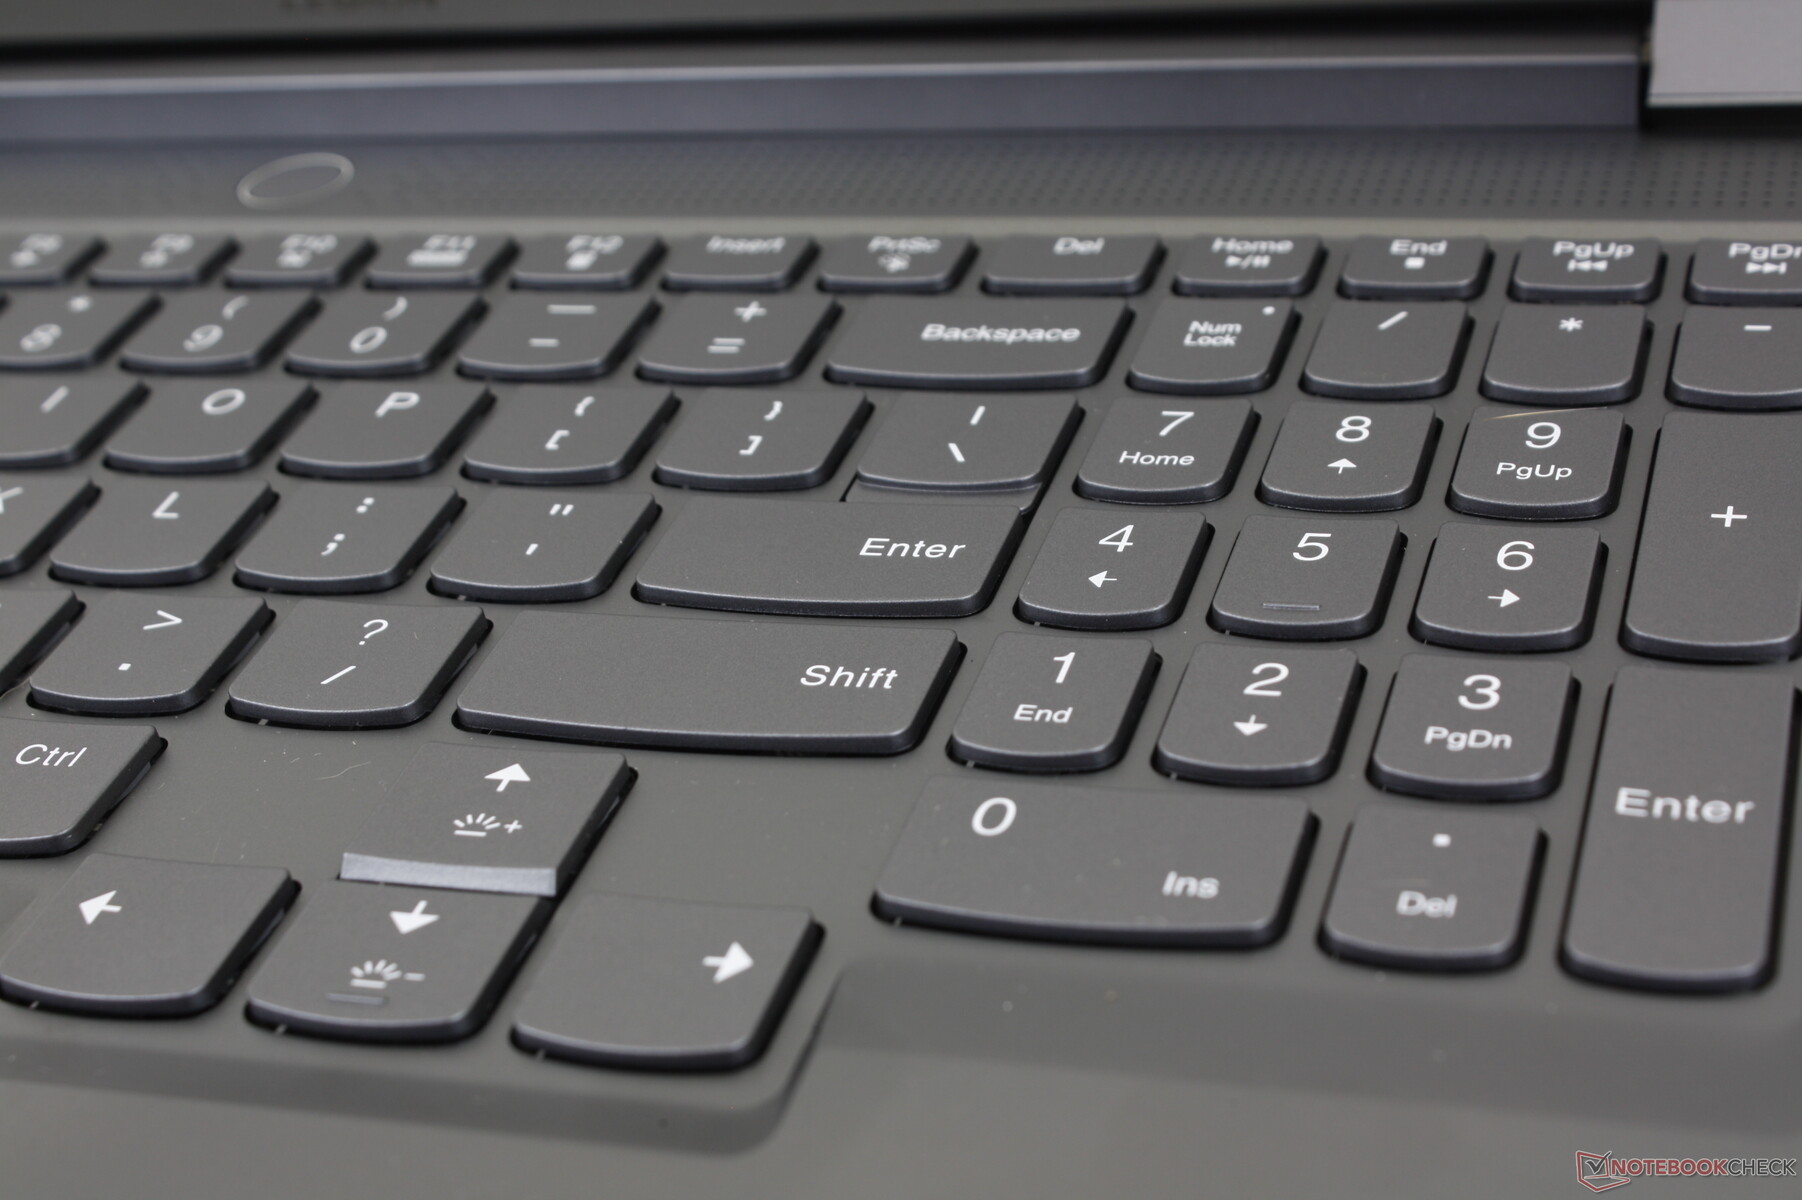
Klawiatura
Początkowo obawialiśmy się, że klawiatura będzie identyczna jak w tańszych IdeaPadach, z płytkim skokiem i miękkim sprzężeniem zwrotnym. Na szczęście klawiatura w modelu Legion 7 16 jest lepszej jakości niż klawiatury w modelach IdeaPad i Yoga. Skok klawiszy jest wyraźnie głębszy, a sprzężenie zwrotne twardsze, co daje bardziej satysfakcjonujące wrażenia z pisania, zwłaszcza w przypadku klawiszy Spacja i Enter. To nie do końca ThinkPad, ale klawiatura jest całkiem blisko.
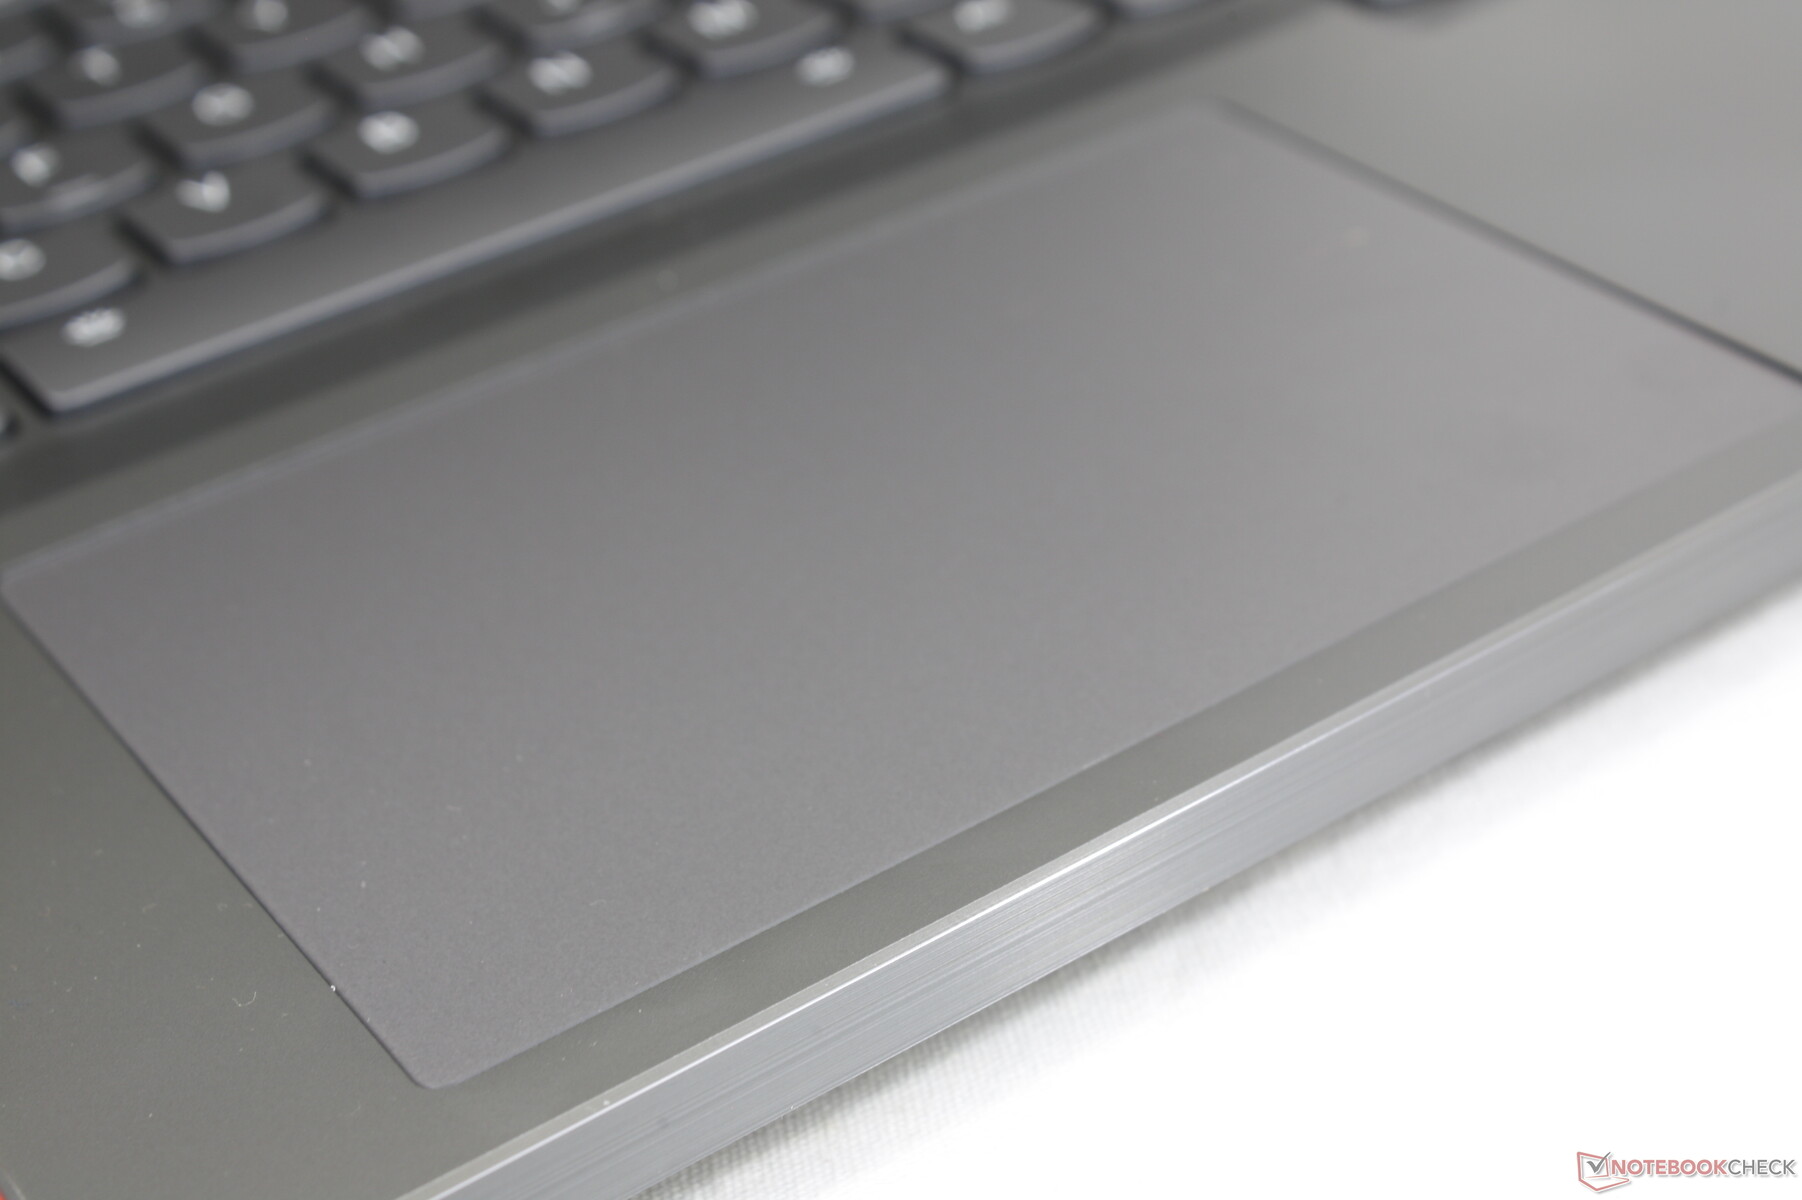
Touchpad
Rozmiar clickpada jest niemal identyczny jak w przypadku clickpada w modeluDell Inspiron 16 Plus 7620 Plus (12 x 7,5 cm vs. 11,5 x 8 cm). Trakcja jest bardzo gładka i tylko trochę lepka przy wolniejszych prędkościach, co ułatwia przeciąganie i upuszczanie.
Kliknięcie na gładziku jest płytkie, ale z przyzwoitym sprzężeniem zwrotnym. Mimo że jest nieco bardziej miękki, reakcja jest przynajmniej twardsza niż w przypadku niektórych innych laptopów do gier, takich jak MSI Stealth GS77.

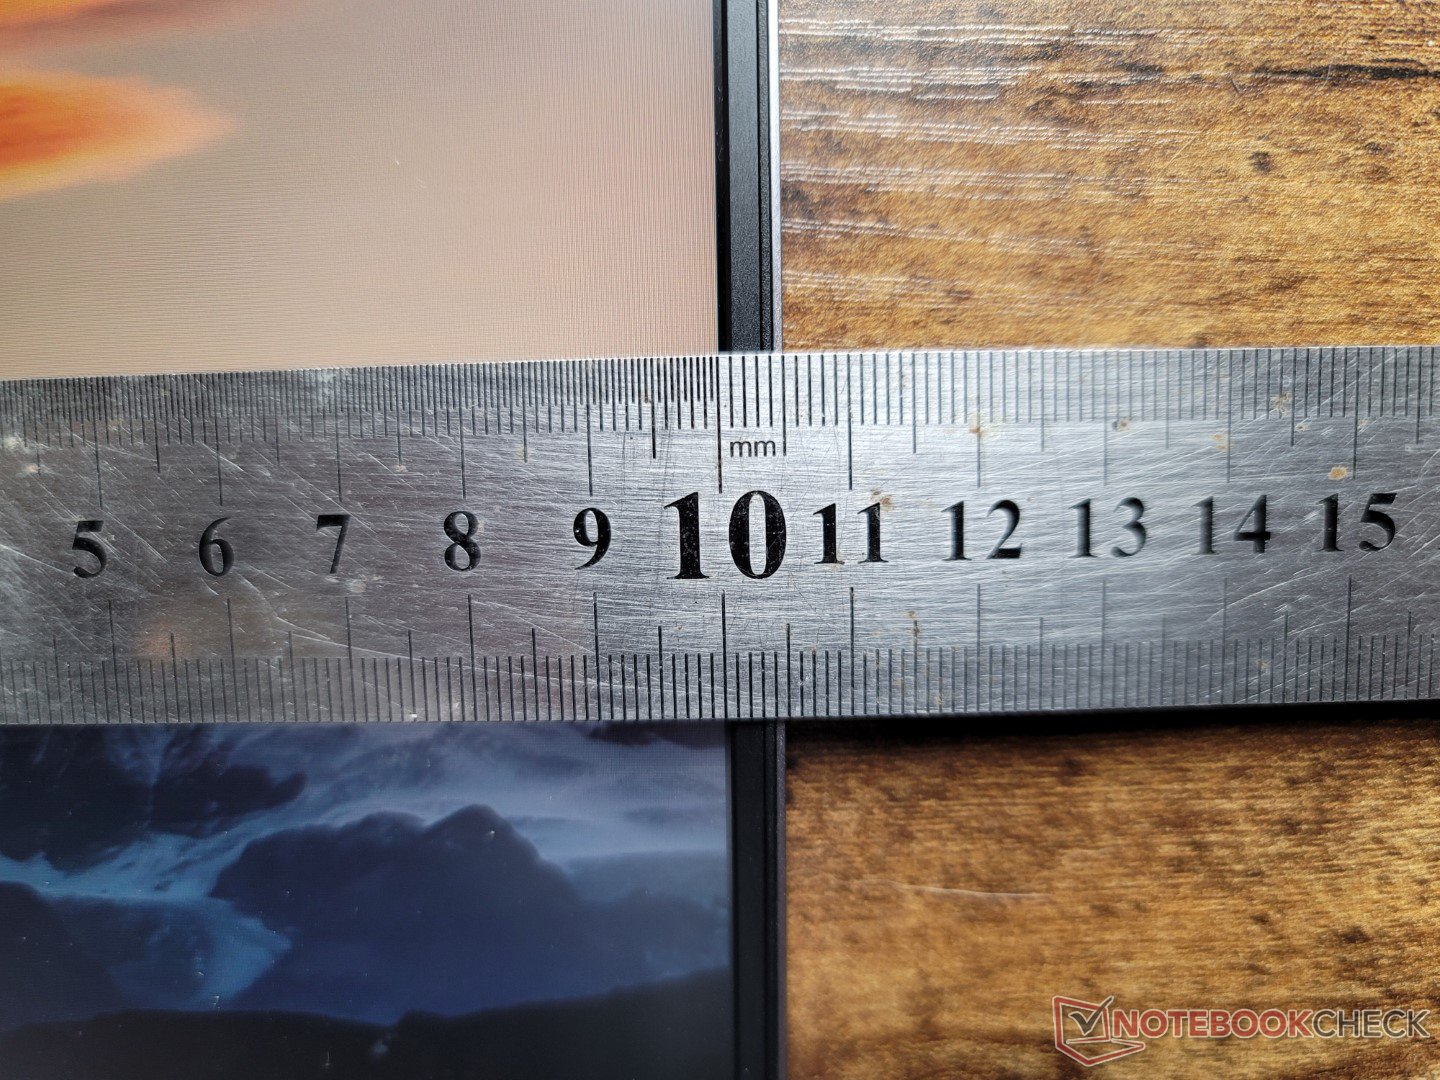
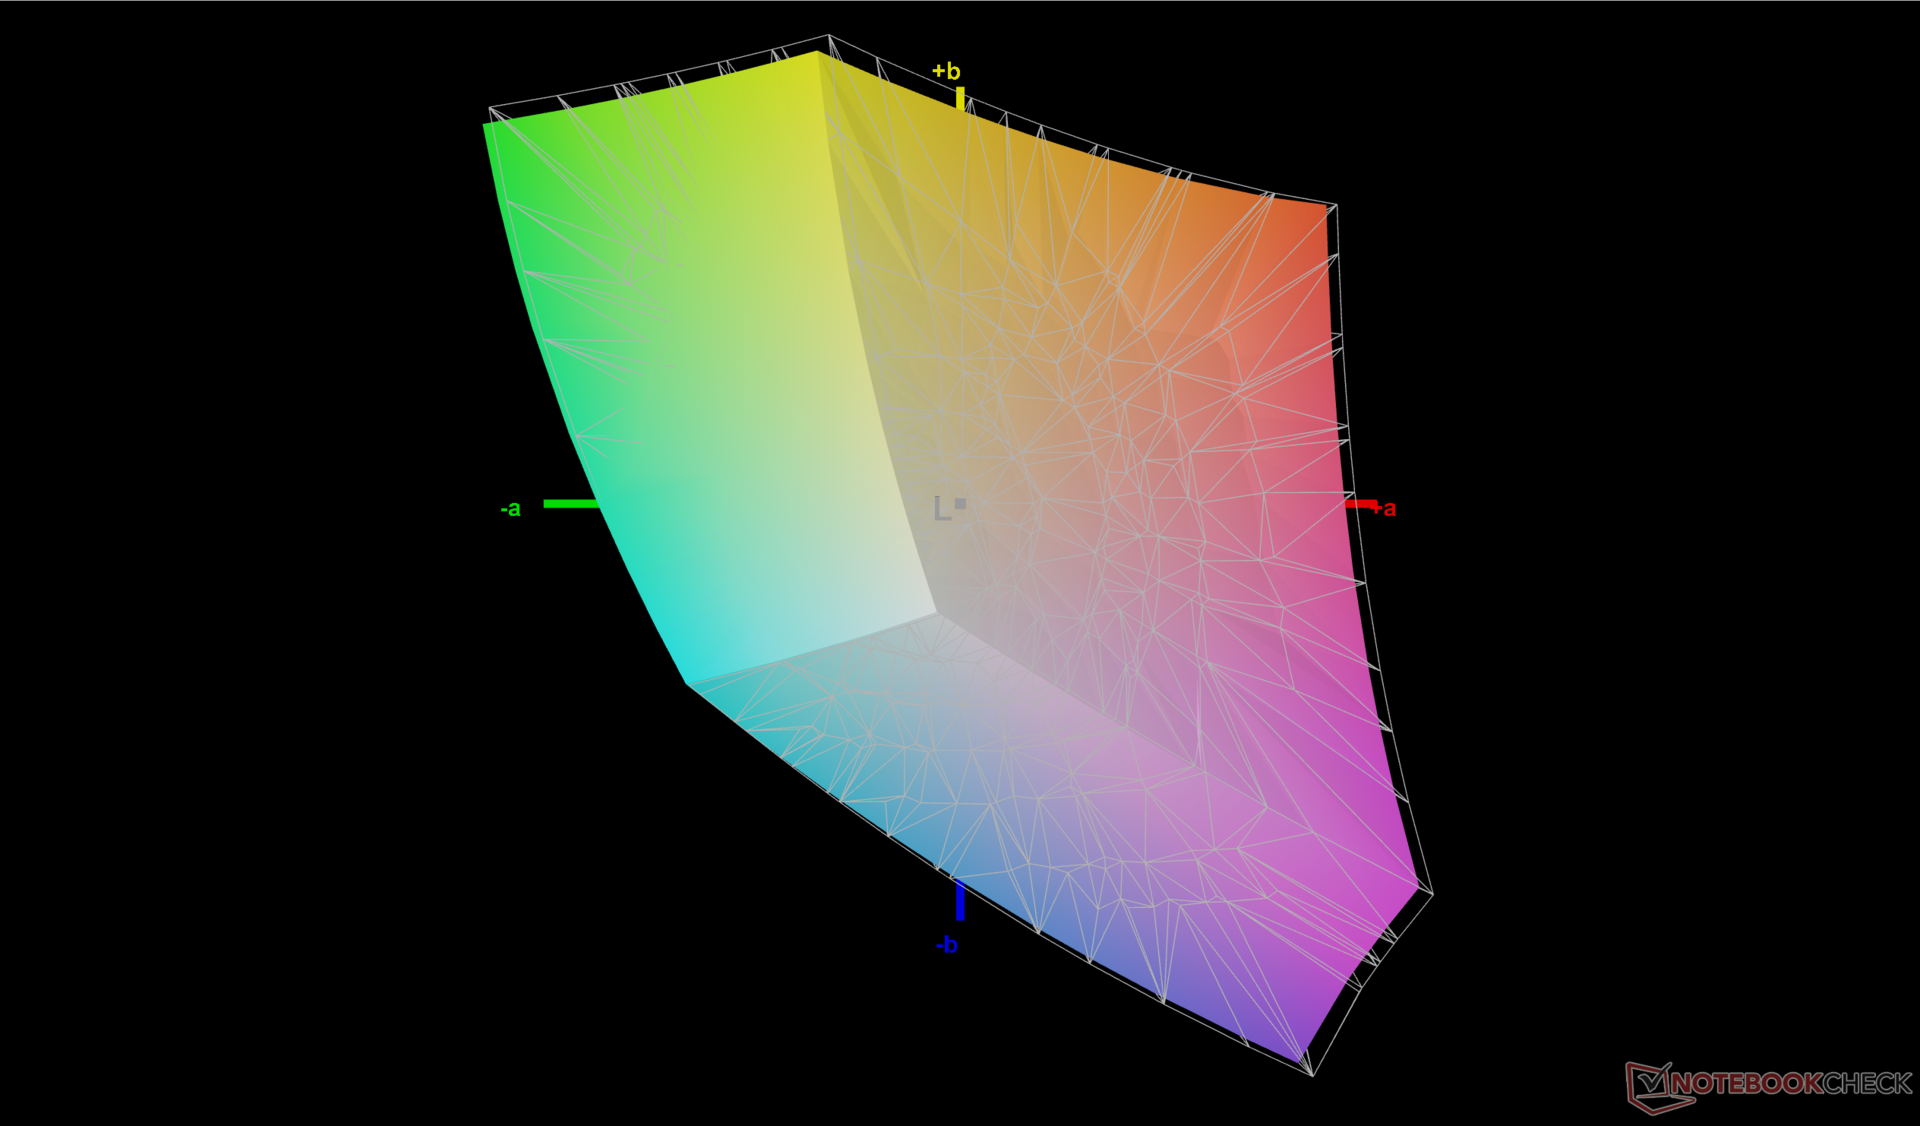
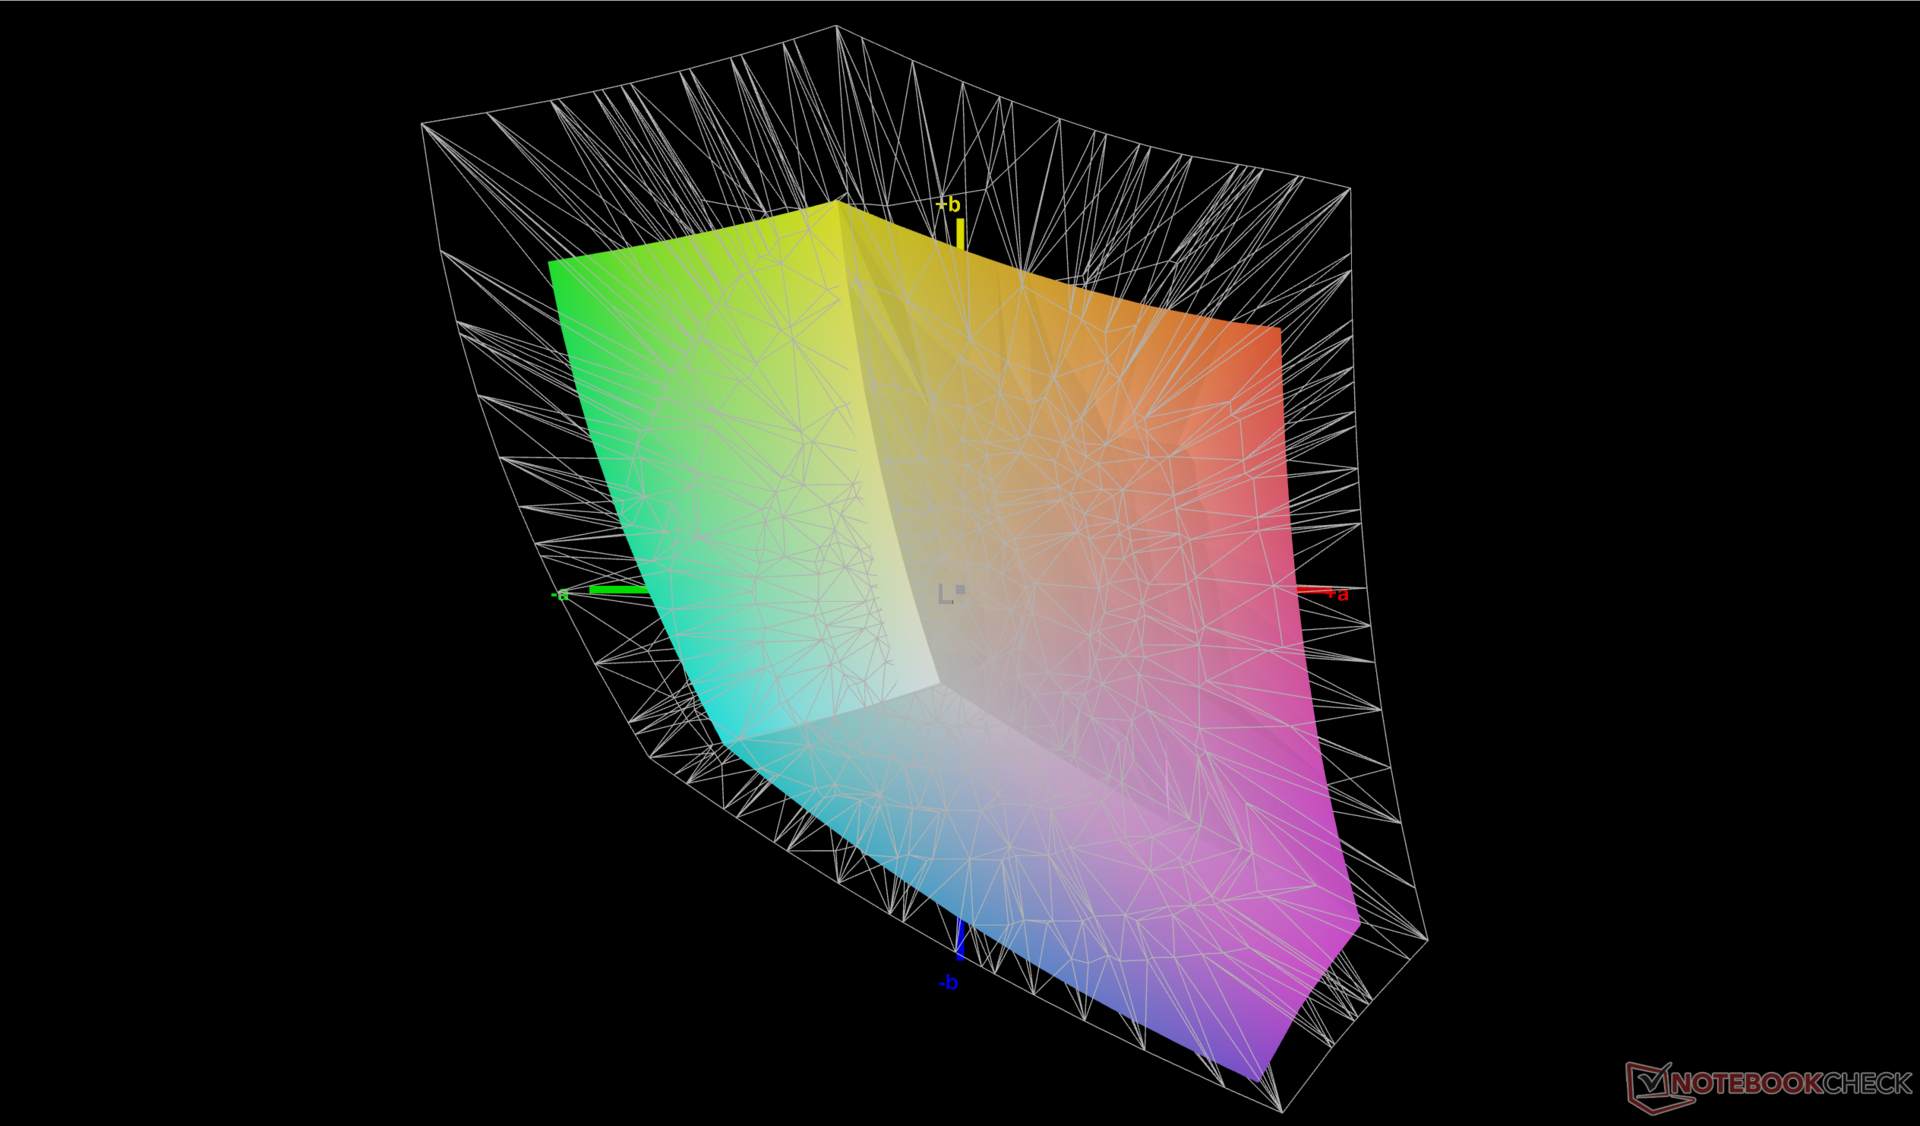
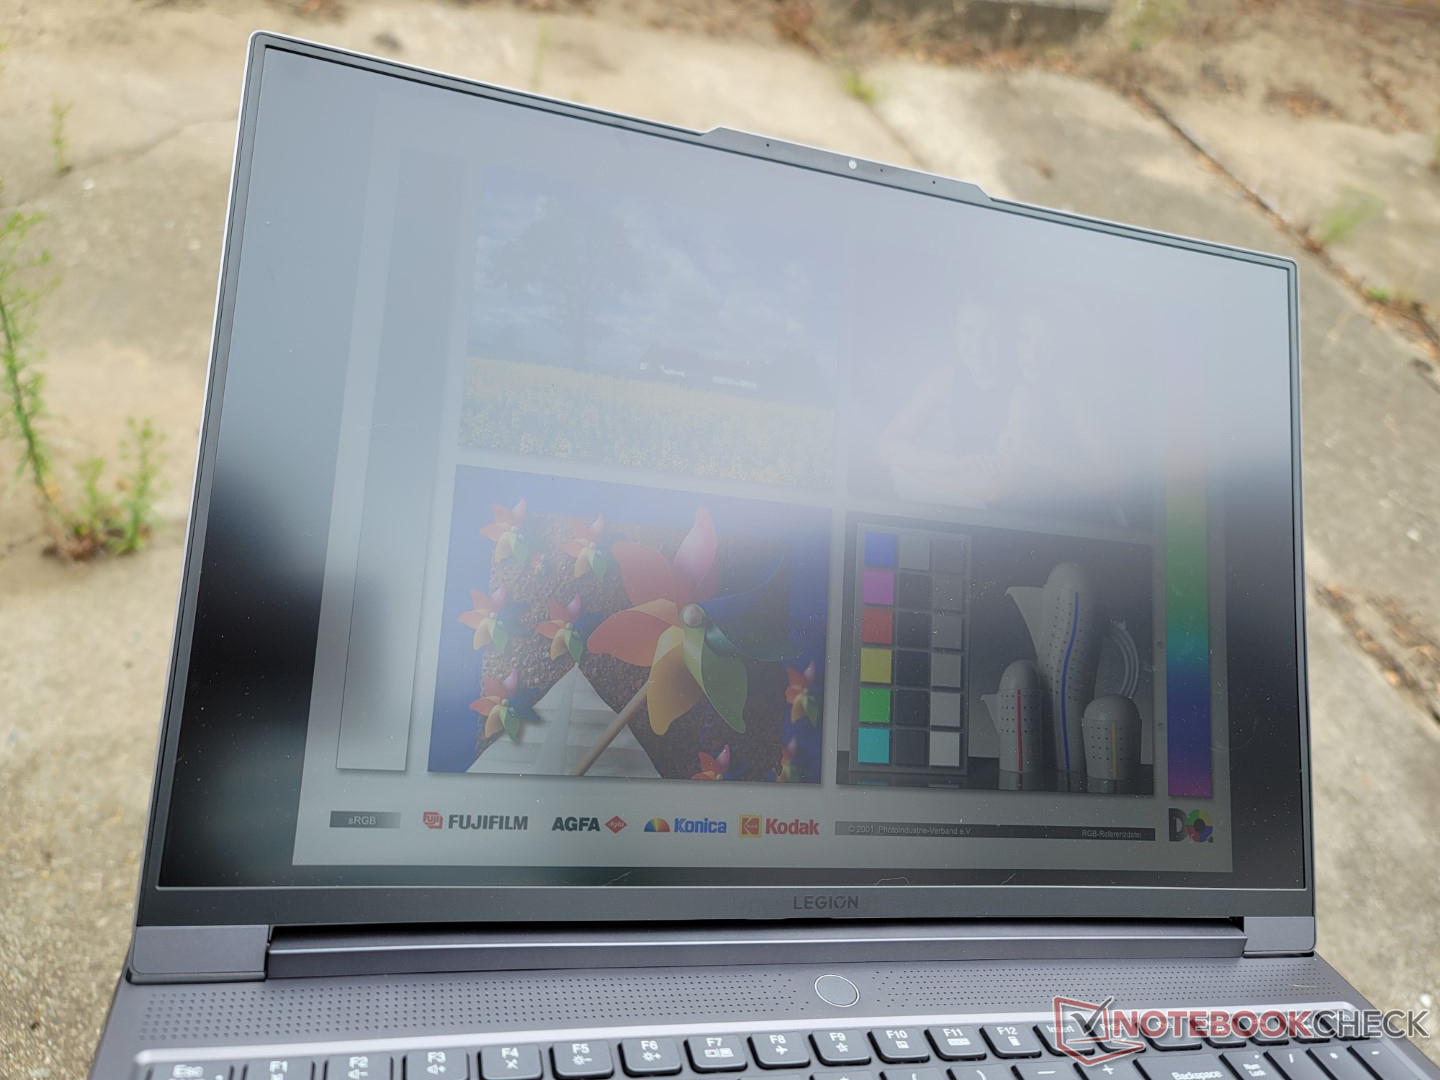
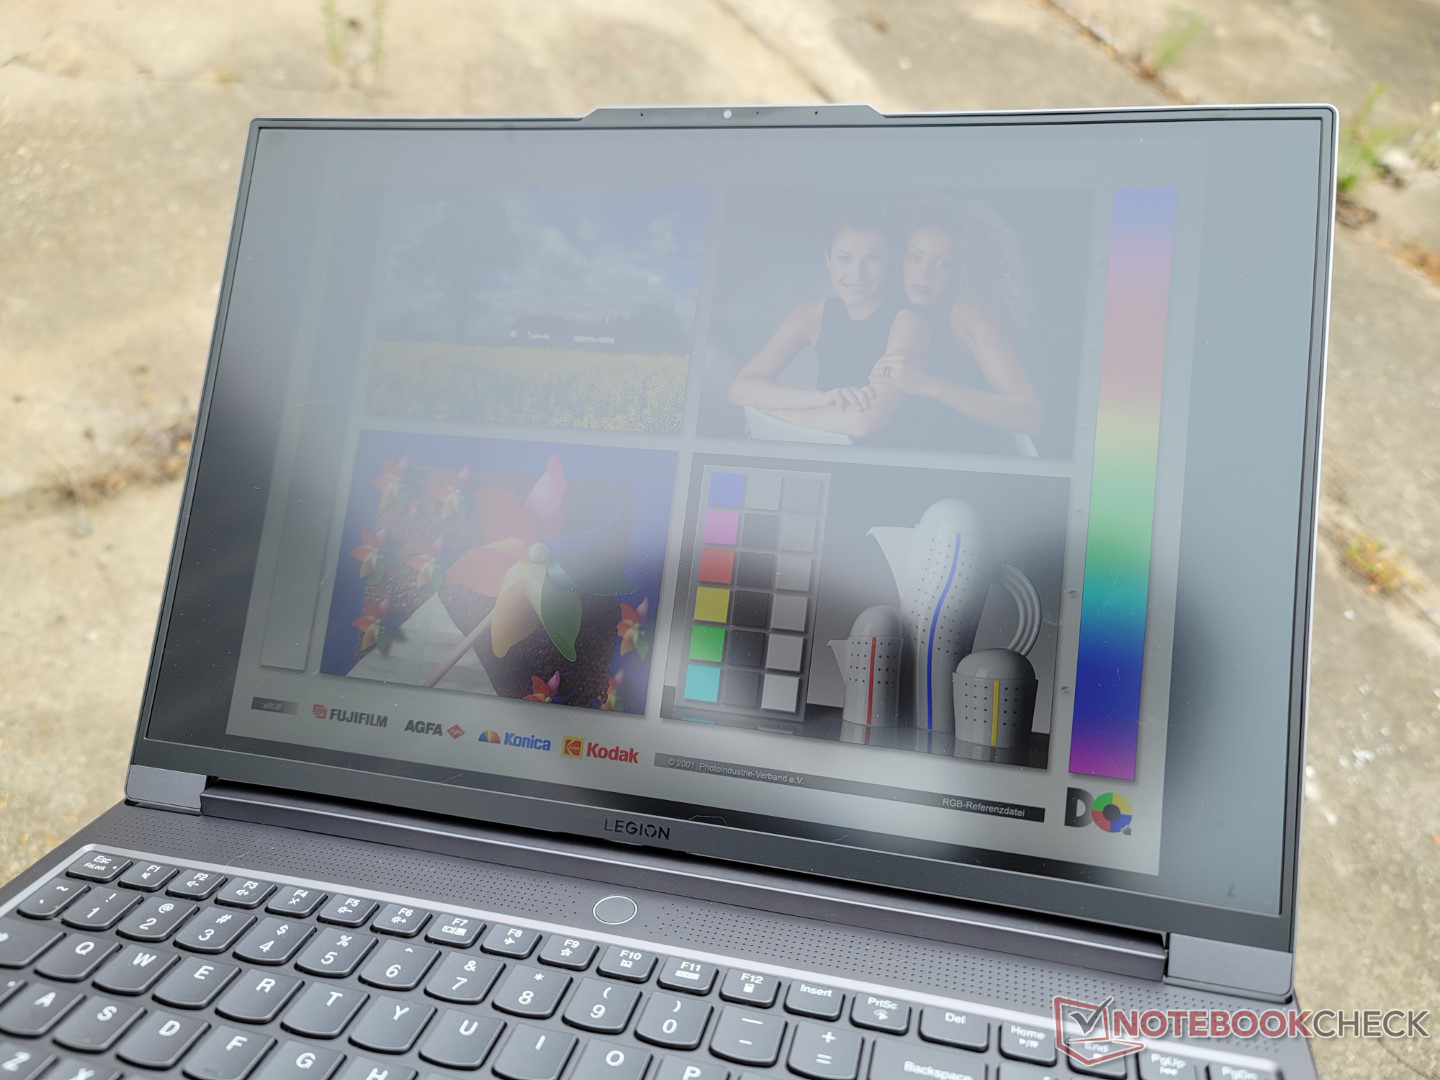
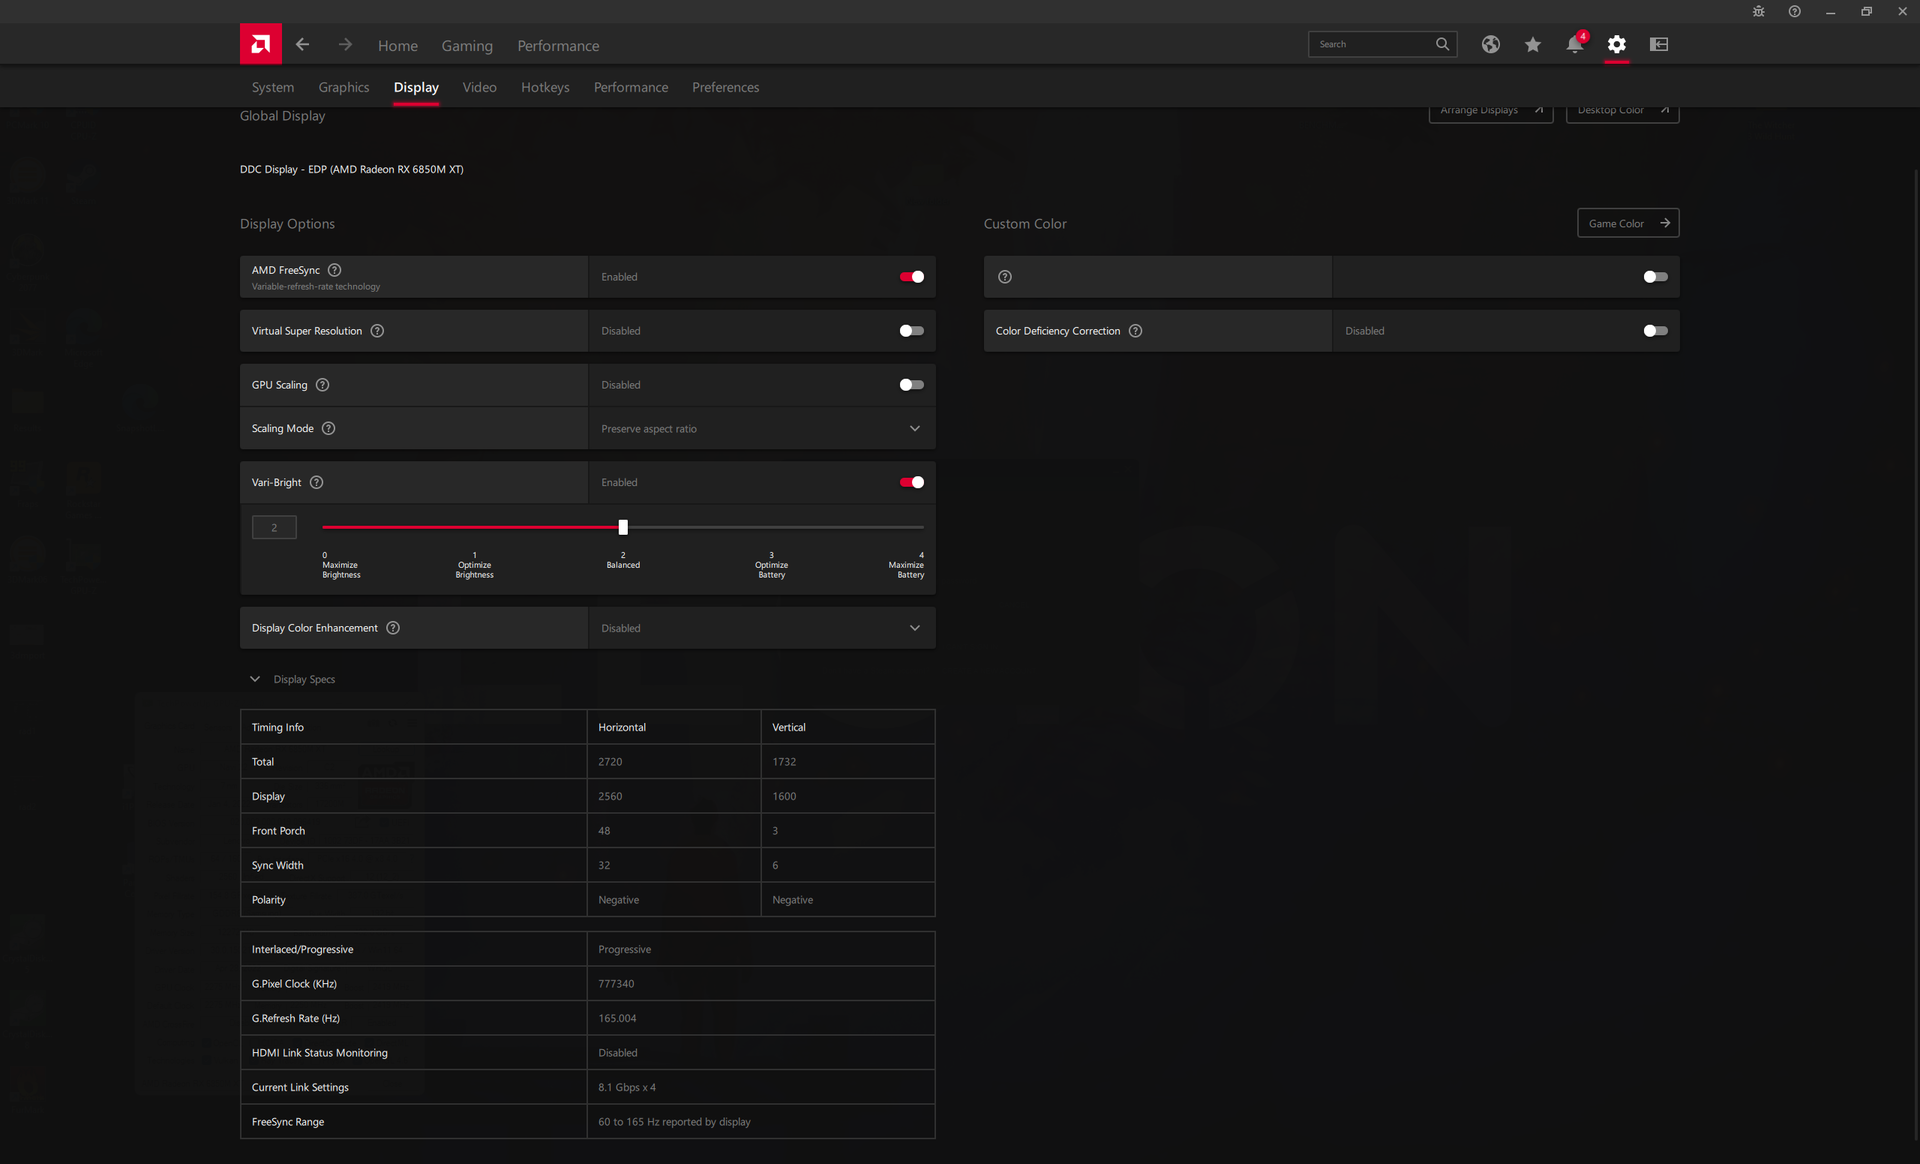
Wyświetlacz - 165 Hz, FreeSync, 100% sRGB Standard
Legion 7 16 wyposażony jest w wysokiej jakości panel BOE IPS, który jest niemal analogiczny do panelu w Asus ROG Zephyrus Duo 16 (NE160QDM-NY1 vs NE160QDM-NX1). Oba panele mają bardzo podobne cechy, w tym czas reakcji, poziom jasności i współczynnik kontrastu, ale różnią się w dwóch kluczowych aspektach: częstotliwości odświeżania i pokrycia kolorów. Wyświetlacz w Lenovo celuje w pokrycie sRGB z szybszą natywną częstotliwością odświeżania 165 Hz w porównaniu z szerszym zakresem kolorów P3, ale wolniejszą częstotliwością odświeżania 120 Hz w Asusie. Jeden panel niekoniecznie jest lepszy od drugiego, w zależności od preferencji użytkownika.
| |||||||||||||||||||||||||
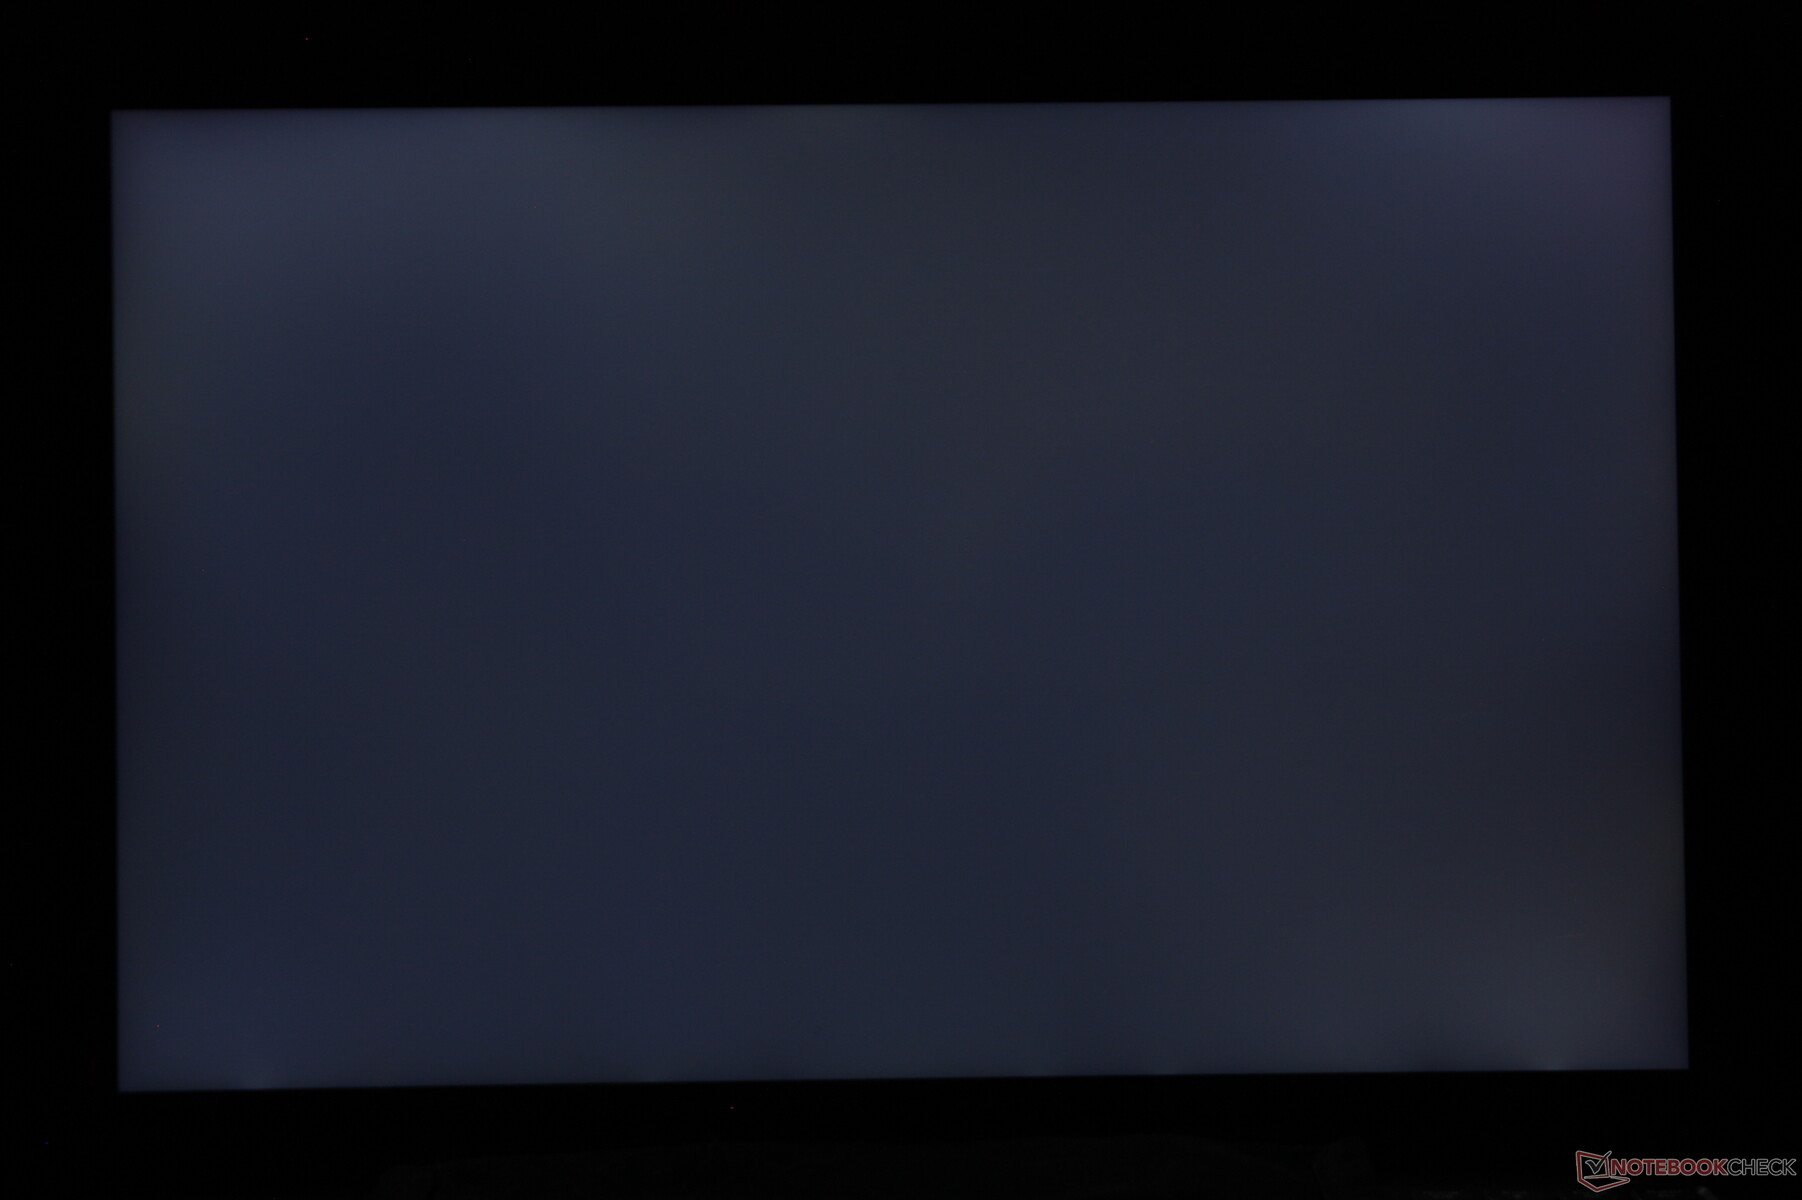
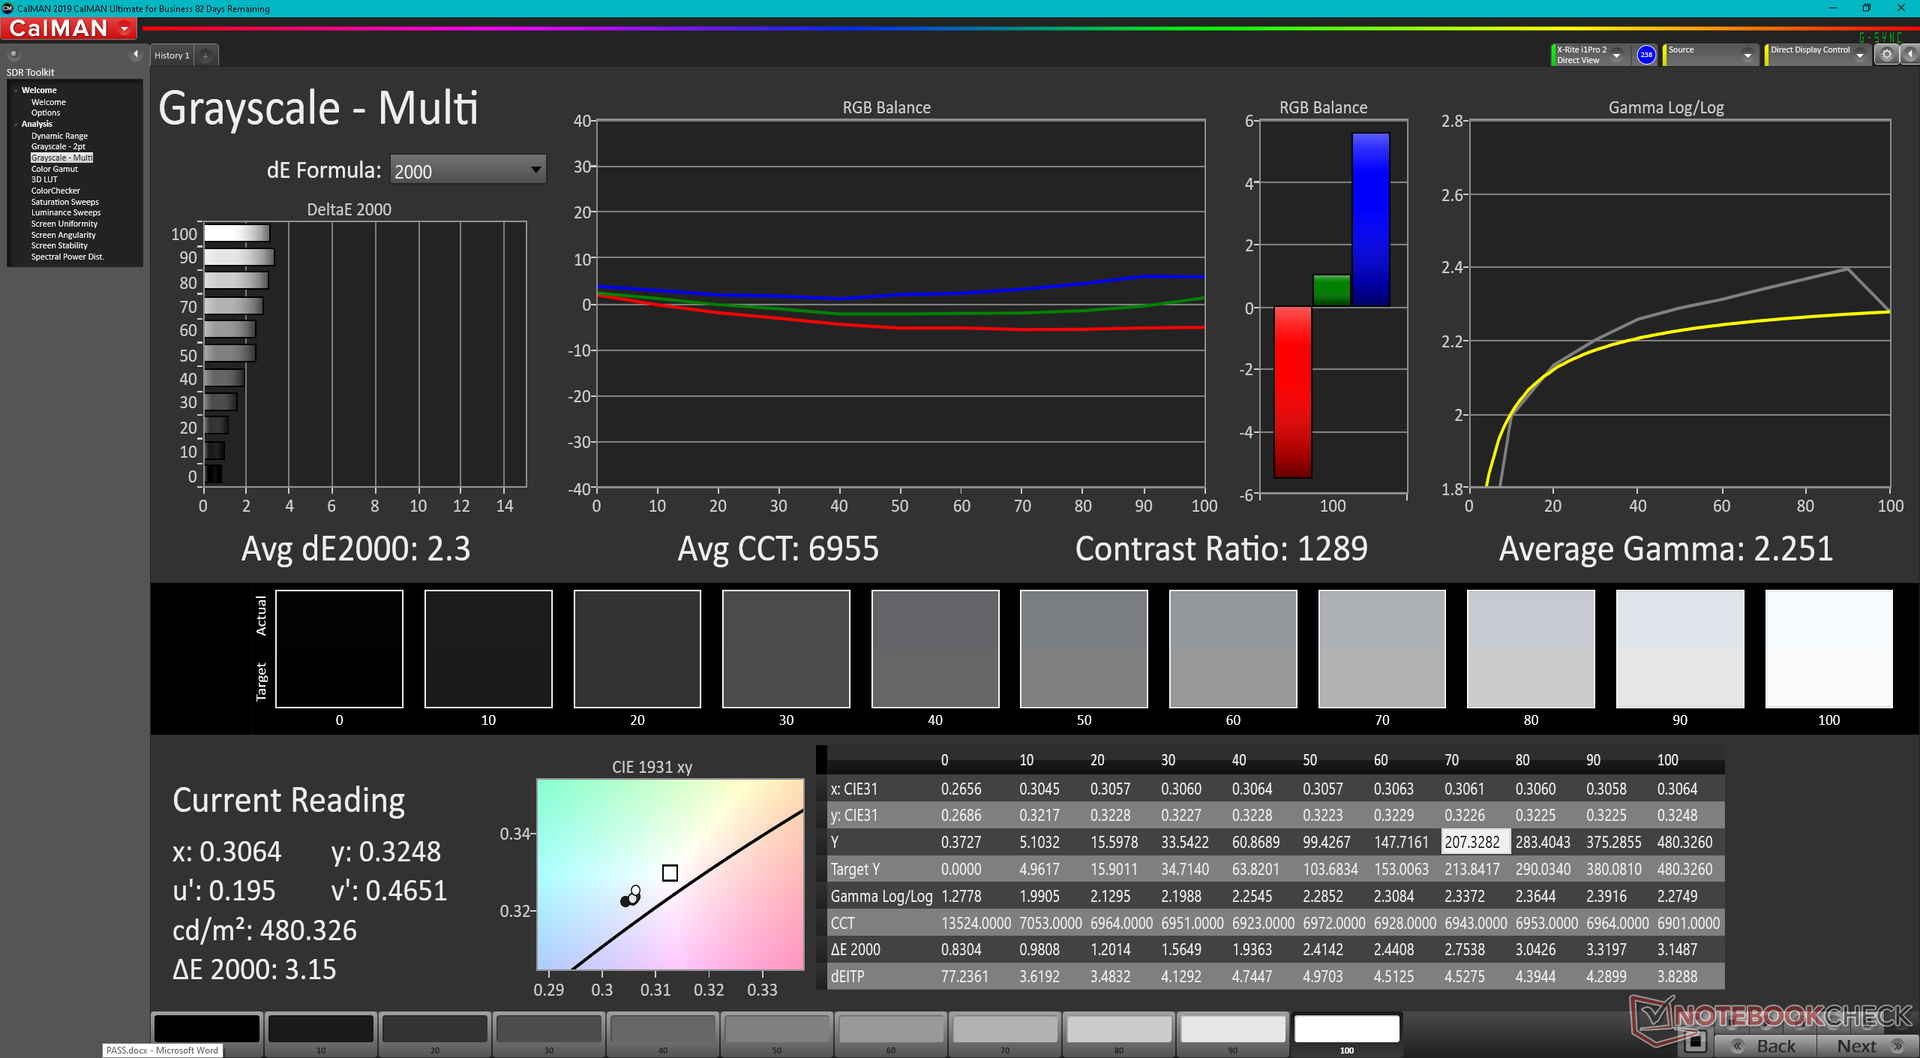
rozświetlenie: 90 %
na akumulatorze: 478.8 cd/m²
kontrast: 1113:1 (czerń: 0.43 cd/m²)
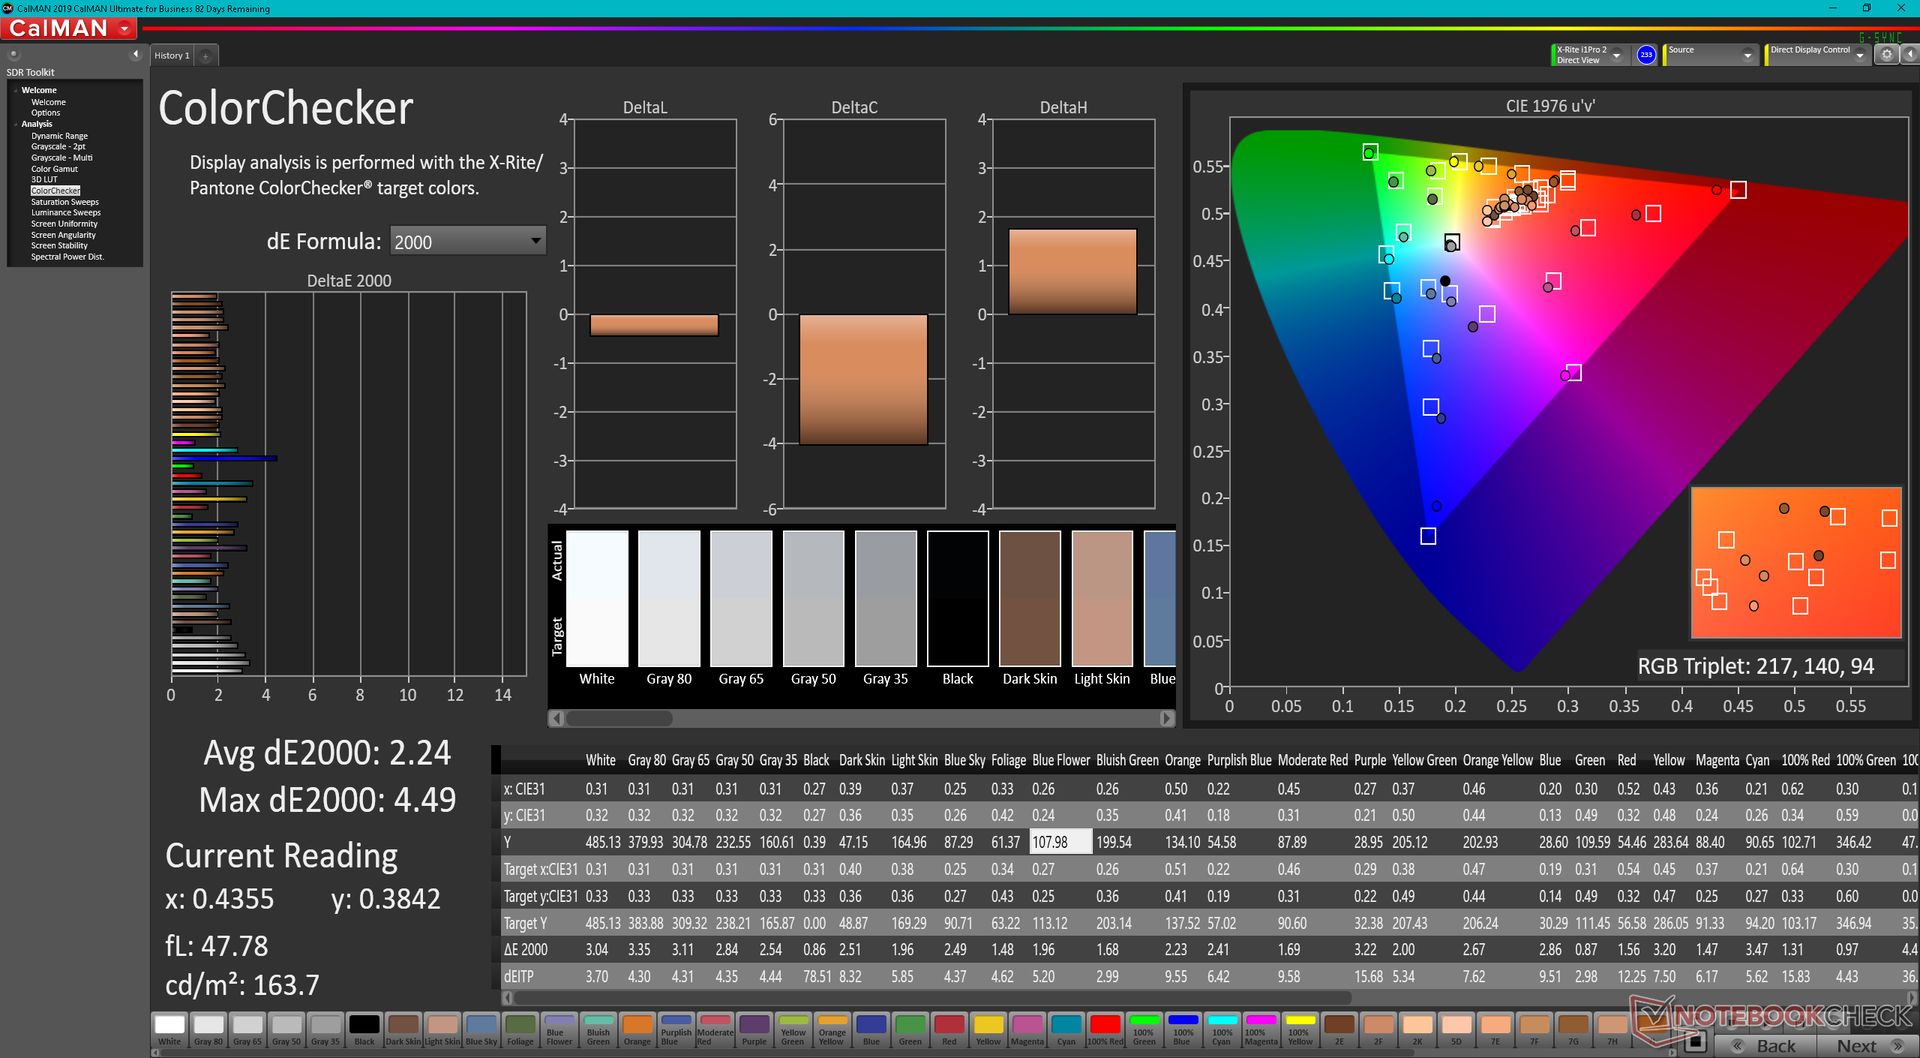
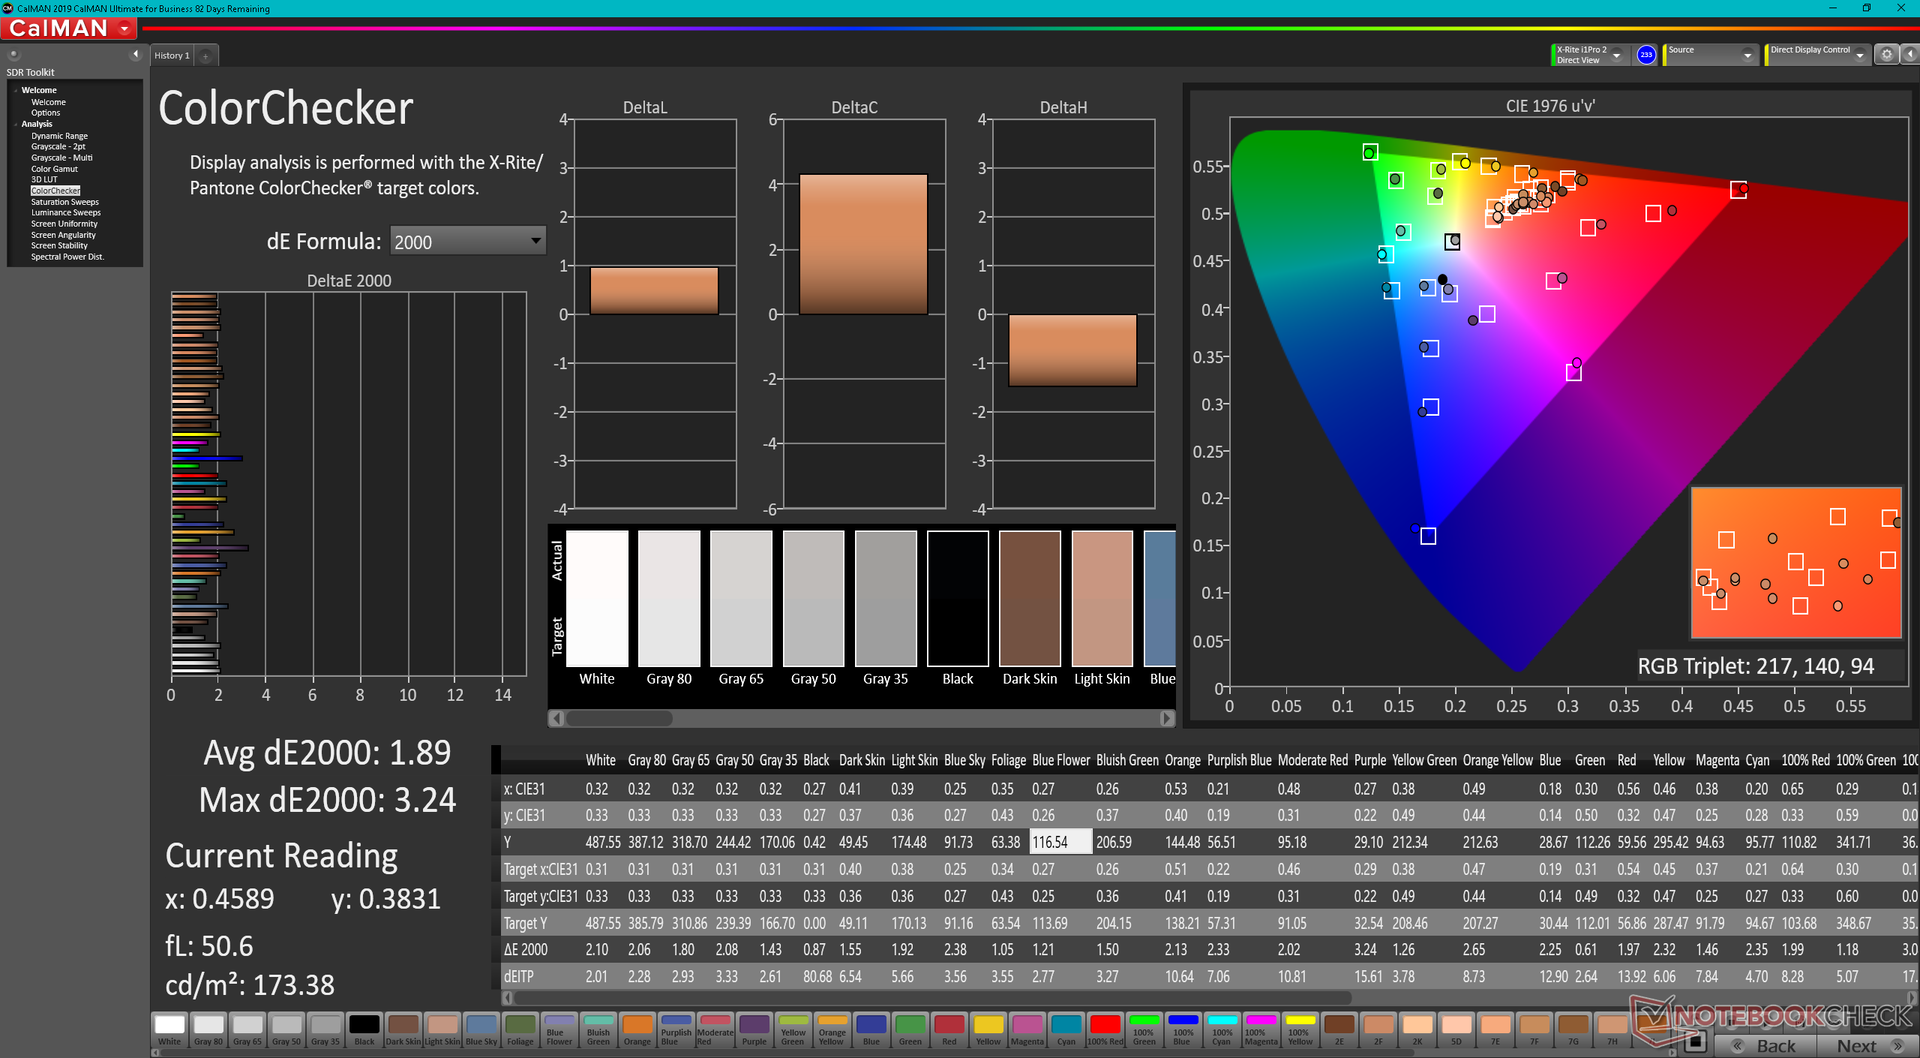
ΔE ColorChecker Calman: 2.24 | ∀{0.5-29.43 Ø4.72}
calibrated: 1.89
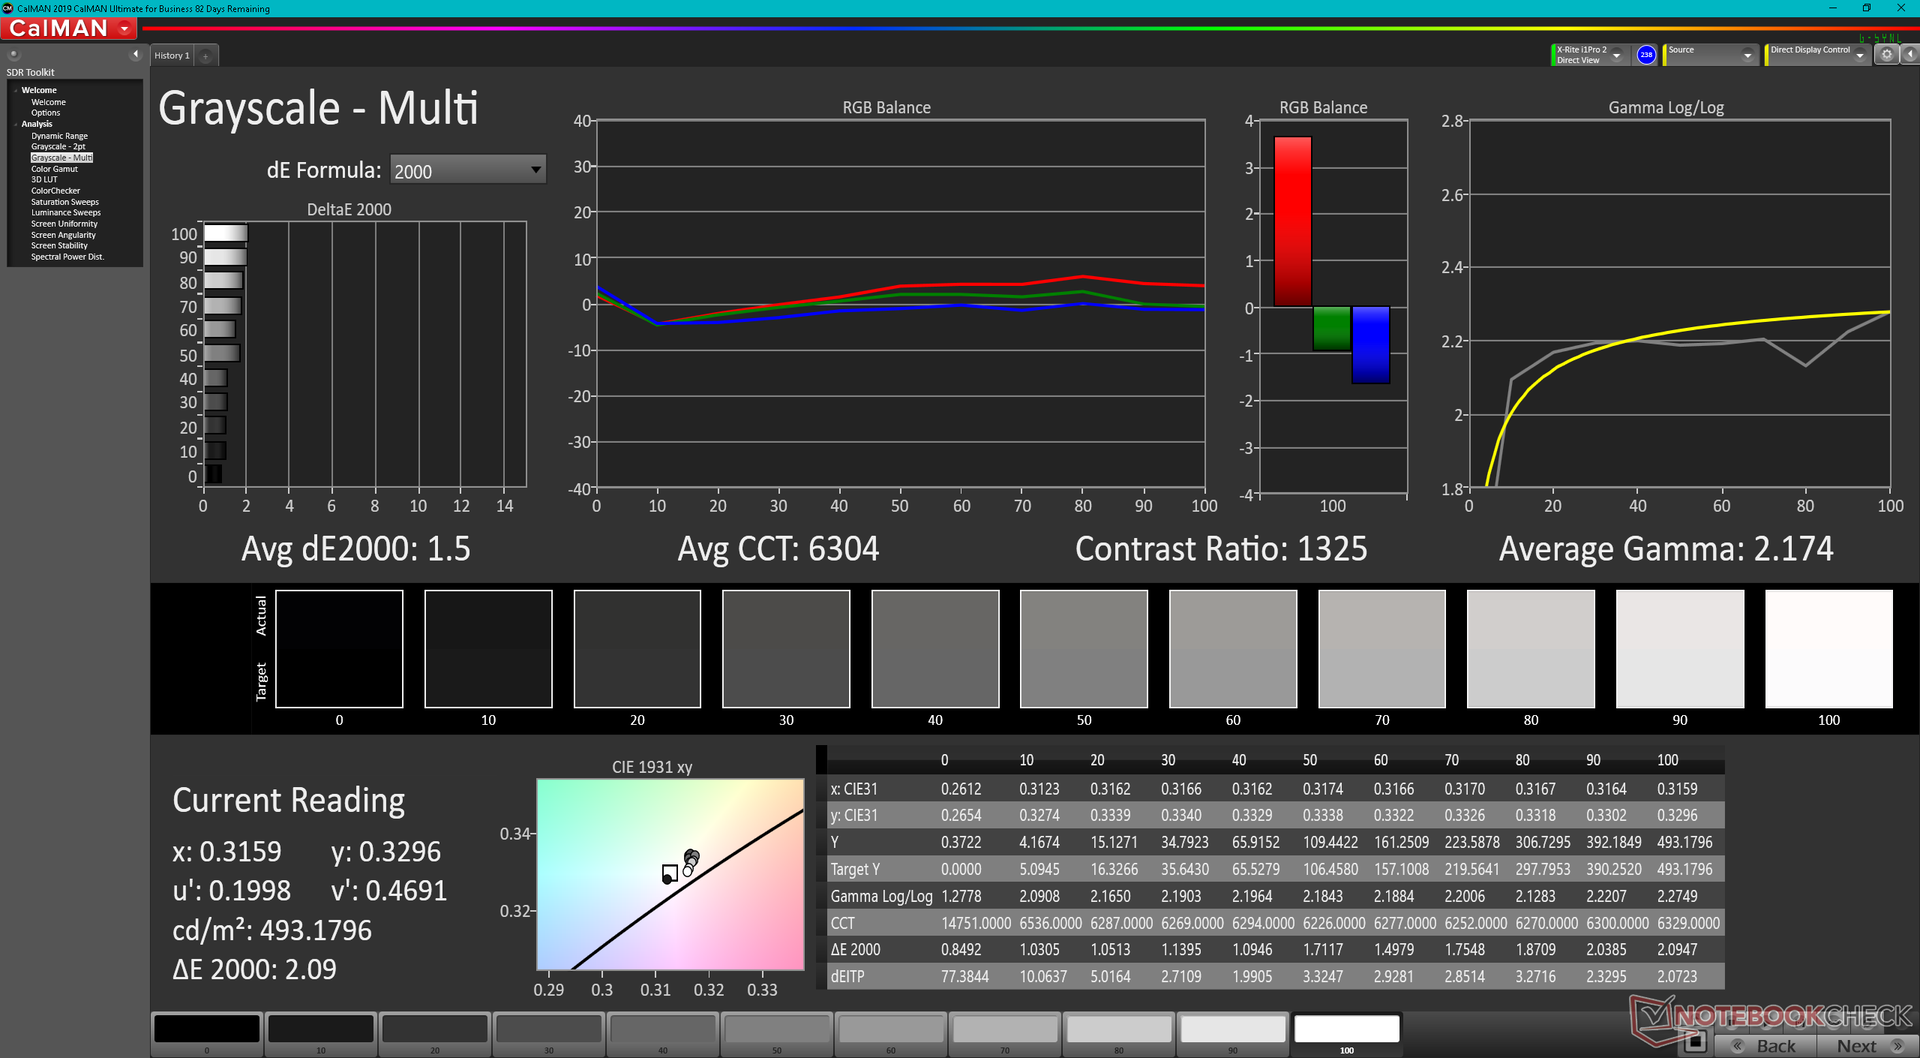
ΔE Greyscale Calman: 2.3 | ∀{0.09-98 Ø4.97}
65.7% AdobeRGB 1998 (Argyll 3D)
95.3% sRGB (Argyll 3D)
63.7% Display P3 (Argyll 3D)
Gamma: 2.25
CCT: 6955 K
| Lenovo Legion 7 16ARHA7 BOE CQ NE160QDM-NY1, IPS, 2560x1600, 16" | MSI Raider GE66 12UHS AUO51EB, IPS, 3840x2160, 15.6" | Lenovo Legion Slim 7-16IAH 82TF004YGE MNG007DA1-G , IPS LED, 2560x1600, 16" | Asus ROG Zephyrus Duo 16 GX650RX BOE NE160QAM-NX1, IPS-Level, 3840x2400, 16" | HP Omen 16-c0077ng BOE09E5, IPS, 2560x1440, 16.1" | Lenovo Legion 5 Pro 16ACH6H (82JQ001PGE) CSOT T3 MNG007DA1-1, IPS, 2560x1600, 16" | |
|---|---|---|---|---|---|---|
| Display | 24% | 9% | 30% | 6% | 8% | |
| Display P3 Coverage (%) | 63.7 | 80.4 26% | 70.5 11% | 98 54% | 68.8 8% | |
| sRGB Coverage (%) | 95.3 | 98.4 3% | 99.1 4% | 99.9 5% | 96.9 2% | 99 4% |
| AdobeRGB 1998 Coverage (%) | 65.7 | 94.7 44% | 72.8 11% | 86.3 31% | 71.1 8% | 73 11% |
| Response Times | -69% | -2% | -9% | -23% | 25% | |
| Response Time Grey 50% / Grey 80% * (ms) | 9.2 ? | 18.8 ? -104% | 12 ? -30% | 14.6 ? -59% | 13 ? -41% | 9.2 ? -0% |
| Response Time Black / White * (ms) | 9.6 ? | 12.8 ? -33% | 7 ? 27% | 5.6 ? 42% | 10 ? -4% | 4.8 50% |
| PWM Frequency (Hz) | ||||||
| Screen | -17% | 2% | -23% | -28% | 9% | |
| Brightness middle (cd/m²) | 478.8 | 351 -27% | 523 9% | 459 -4% | 297 -38% | 551 15% |
| Brightness (cd/m²) | 477 | 347 -27% | 494 4% | 434 -9% | 283 -41% | 523 10% |
| Brightness Distribution (%) | 90 | 90 0% | 90 0% | 88 -2% | 91 1% | 88 -2% |
| Black Level * (cd/m²) | 0.43 | 0.35 19% | 0.4 7% | 0.44 -2% | 0.22 49% | 0.54 -26% |
| Contrast (:1) | 1113 | 1003 -10% | 1308 18% | 1043 -6% | 1350 21% | 1020 -8% |
| Colorchecker dE 2000 * | 2.24 | 2.54 -13% | 2.6 -16% | 2.97 -33% | 3.25 -45% | 1.8 20% |
| Colorchecker dE 2000 max. * | 4.49 | 8.36 -86% | 5 -11% | 8.13 -81% | 6.33 -41% | 2.53 44% |
| Colorchecker dE 2000 calibrated * | 1.89 | 0.67 65% | 1 47% | 1.03 46% | 1.11 41% | 1.66 12% |
| Greyscale dE 2000 * | 2.3 | 4.1 -78% | 3.3 -43% | 4.9 -113% | 6.97 -203% | 1.85 20% |
| Gamma | 2.25 98% | 2.089 105% | 2.17 101% | 2.235 98% | 2.3 96% | 2.3 96% |
| CCT | 6955 93% | 7036 92% | 6013 108% | 6775 96% | 6050 107% | 6338 103% |
| Color Space (Percent of AdobeRGB 1998) (%) | 72.81 | |||||
| Color Space (Percent of sRGB) (%) | 99.41 | |||||
| Całkowita średnia (program / ustawienia) | -21% /
-16% | 3% /
3% | -1% /
-9% | -15% /
-20% | 14% /
12% |
* ... im mniej tym lepiej
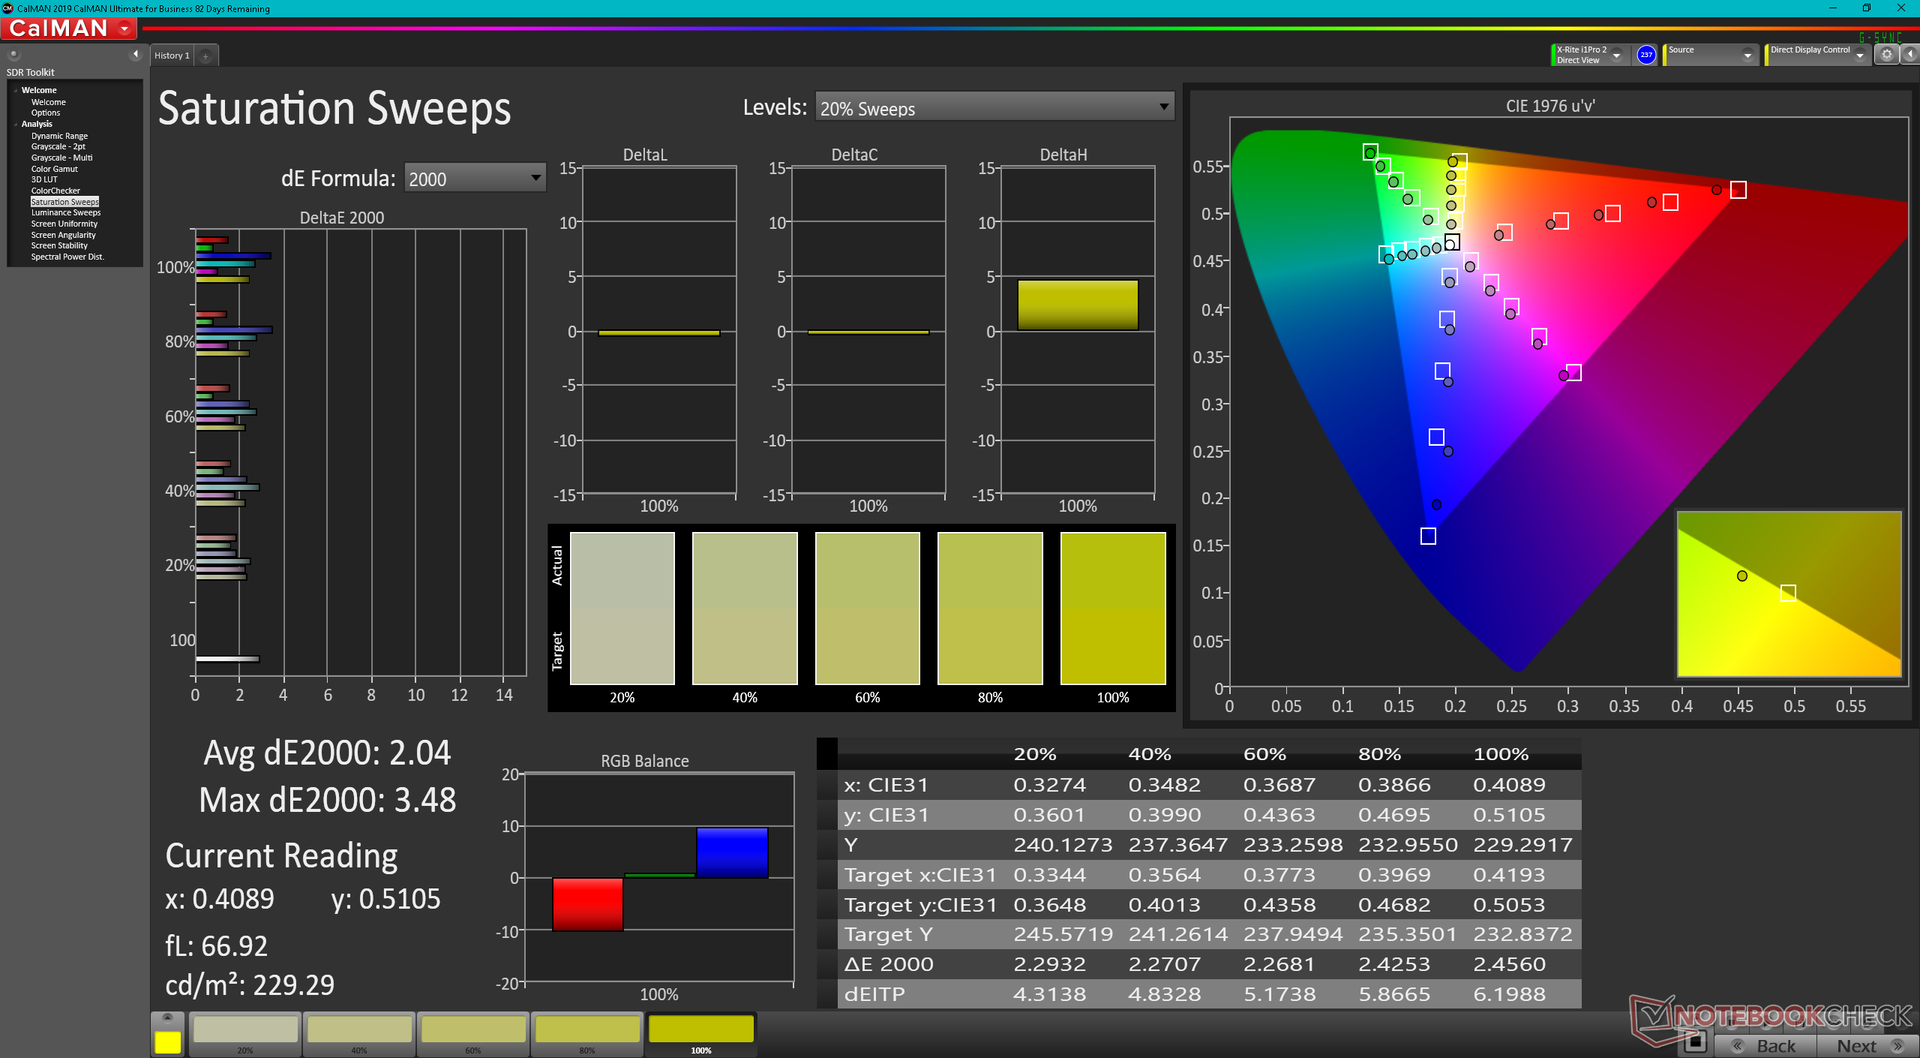
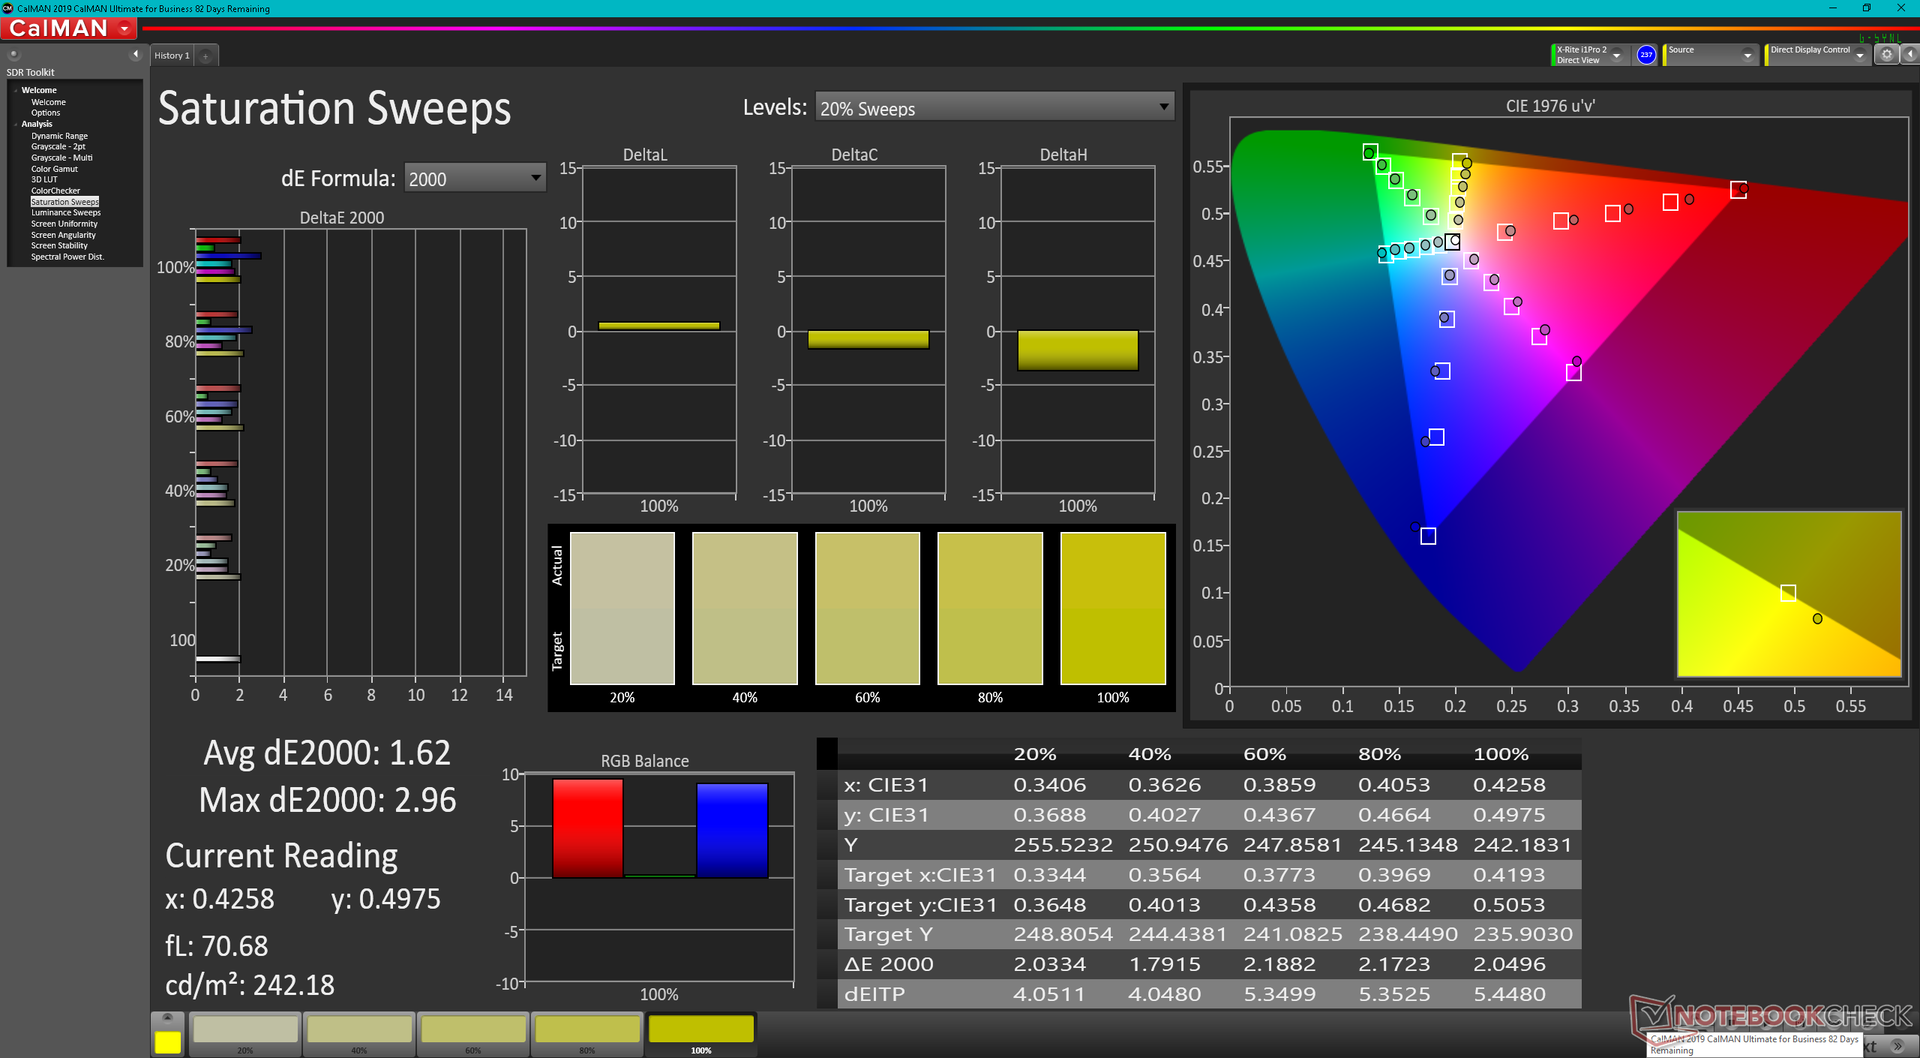
Wyświetlacz jest dobrze skalibrowany po wyjęciu z pudełka, a średnie wartości DeltaE w skali szarości i ColorChecker wynoszą odpowiednio 2,3 i 2,24. Kalibracja panelu jeszcze bardziej poprawiłaby wartości DeltaE do zaledwie 1,5 i 1,8, by lepiej wykorzystać pełne pokrycie palety sRGB.
Wyświetl czasy reakcji
| ↔ Czas reakcji od czerni do bieli | ||
|---|---|---|
| 9.6 ms ... wzrost ↗ i spadek ↘ łącznie | ↗ 4.8 ms wzrost | 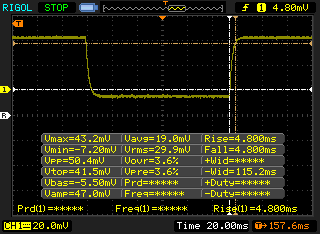 |
| ↘ 4.8 ms upadek | ||
| W naszych testach ekran wykazuje szybki czas reakcji i powinien nadawać się do gier. Dla porównania, wszystkie testowane urządzenia wahają się od 0.1 (minimum) do 240 (maksimum) ms. » 26 % wszystkich urządzeń jest lepszych. Oznacza to, że zmierzony czas reakcji jest lepszy od średniej wszystkich testowanych urządzeń (19.8 ms). | ||
| ↔ Czas reakcji 50% szarości do 80% szarości | ||
| 9.2 ms ... wzrost ↗ i spadek ↘ łącznie | ↗ 4.8 ms wzrost | 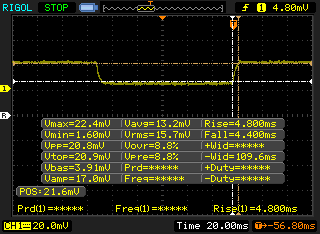 |
| ↘ 4.4 ms upadek | ||
| W naszych testach ekran wykazuje szybki czas reakcji i powinien nadawać się do gier. Dla porównania, wszystkie testowane urządzenia wahają się od 0.165 (minimum) do 636 (maksimum) ms. » 23 % wszystkich urządzeń jest lepszych. Oznacza to, że zmierzony czas reakcji jest lepszy od średniej wszystkich testowanych urządzeń (31 ms). | ||
Migotanie ekranu / PWM (modulacja szerokości impulsu)
| Migotanie ekranu/nie wykryto PWM | 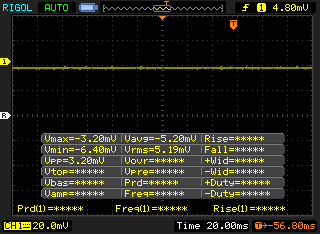 | ||
Dla porównania: 52 % wszystkich testowanych urządzeń nie używa PWM do przyciemniania wyświetlacza. Jeśli wykryto PWM, zmierzono średnio 7772 (minimum: 5 - maksimum: 343500) Hz. | |||
Widoczność na zewnątrz jest lepsza niż w przypadku większości innych laptopów do gier dzięki jasnemu wyświetlaczowi o natężeniu 500 nitów. Jednak nadal będziesz chciał unikać korzystania z systemu w bezpośrednim świetle słonecznym, aby zmaksymalizować widoczność. Odblaski stają się znacznie łatwiejsze do opanowania, jeśli pracuje się w cieniu.

Wydajność
Warunki badania
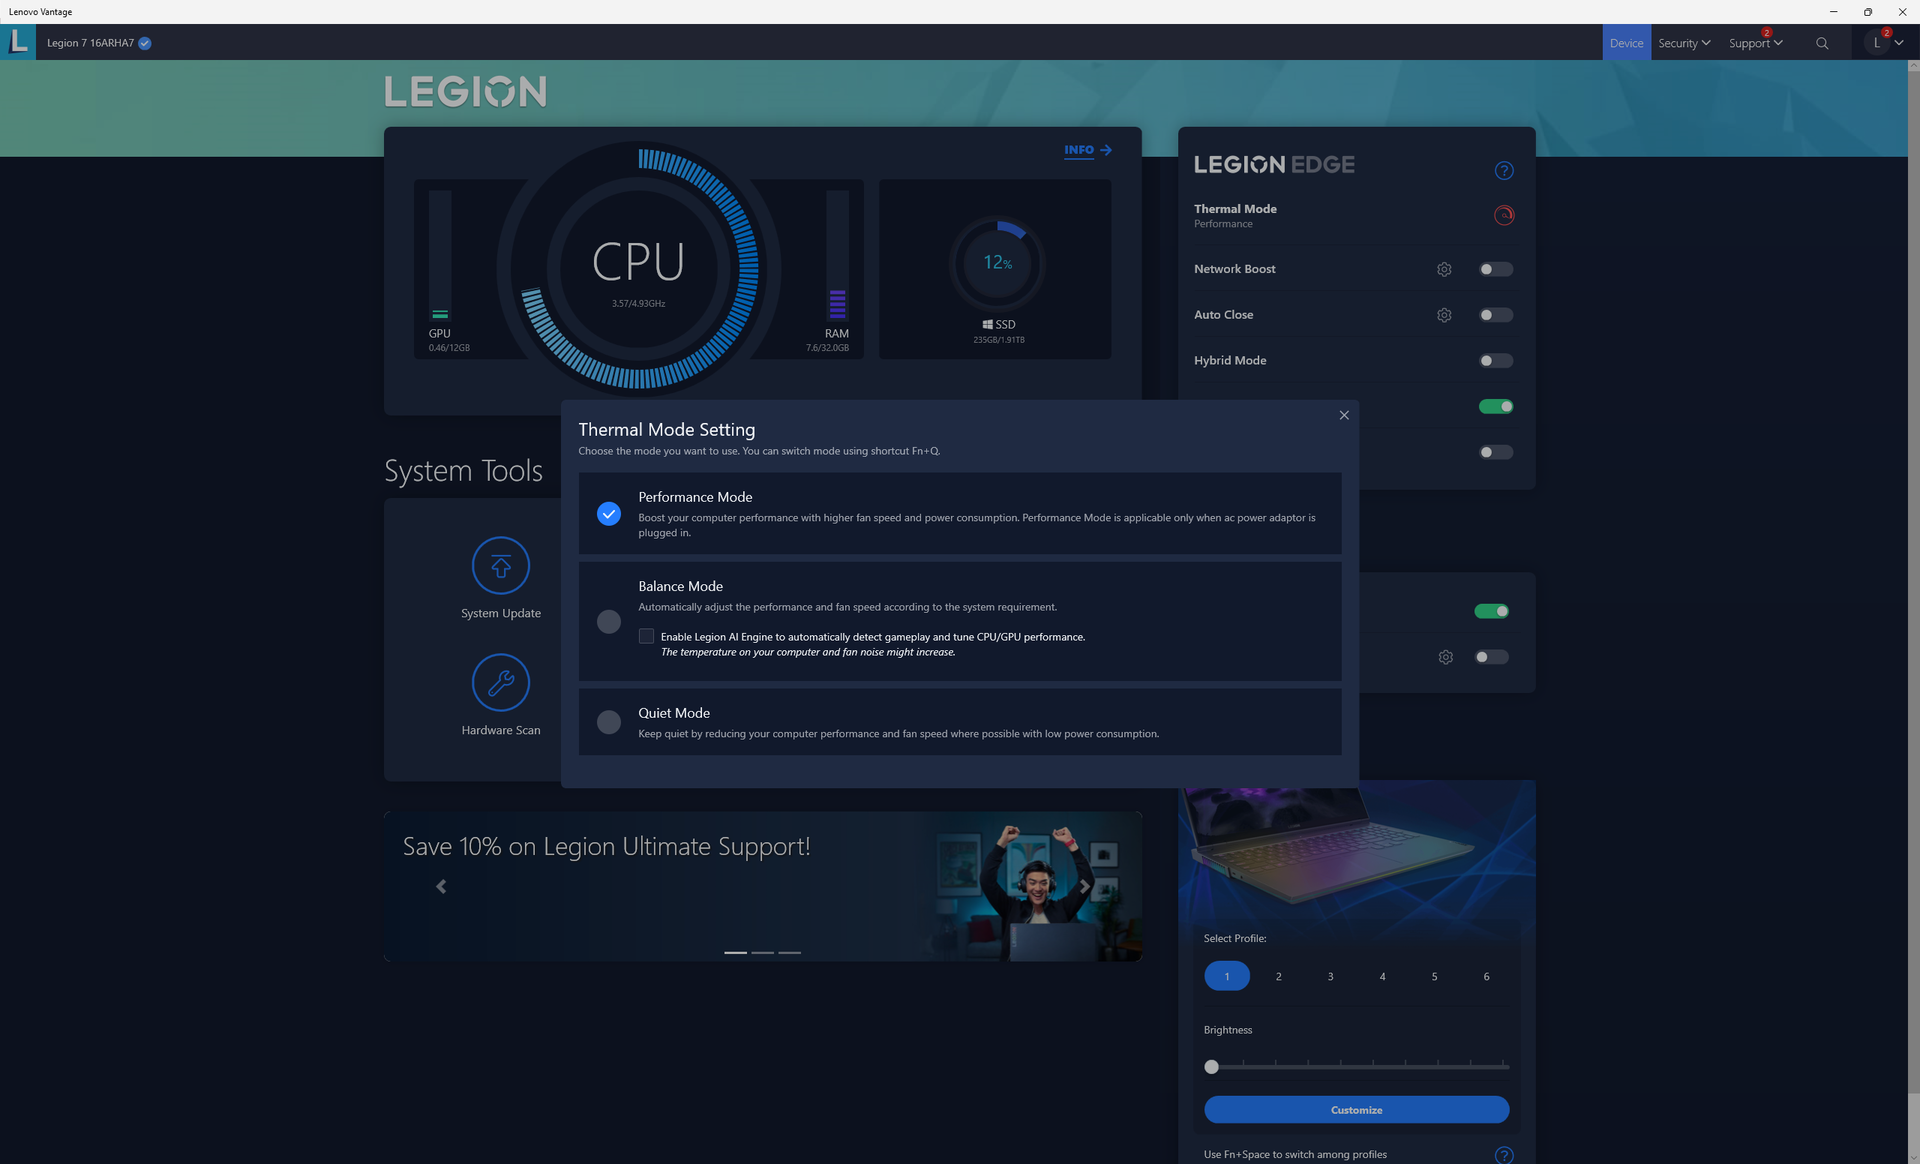
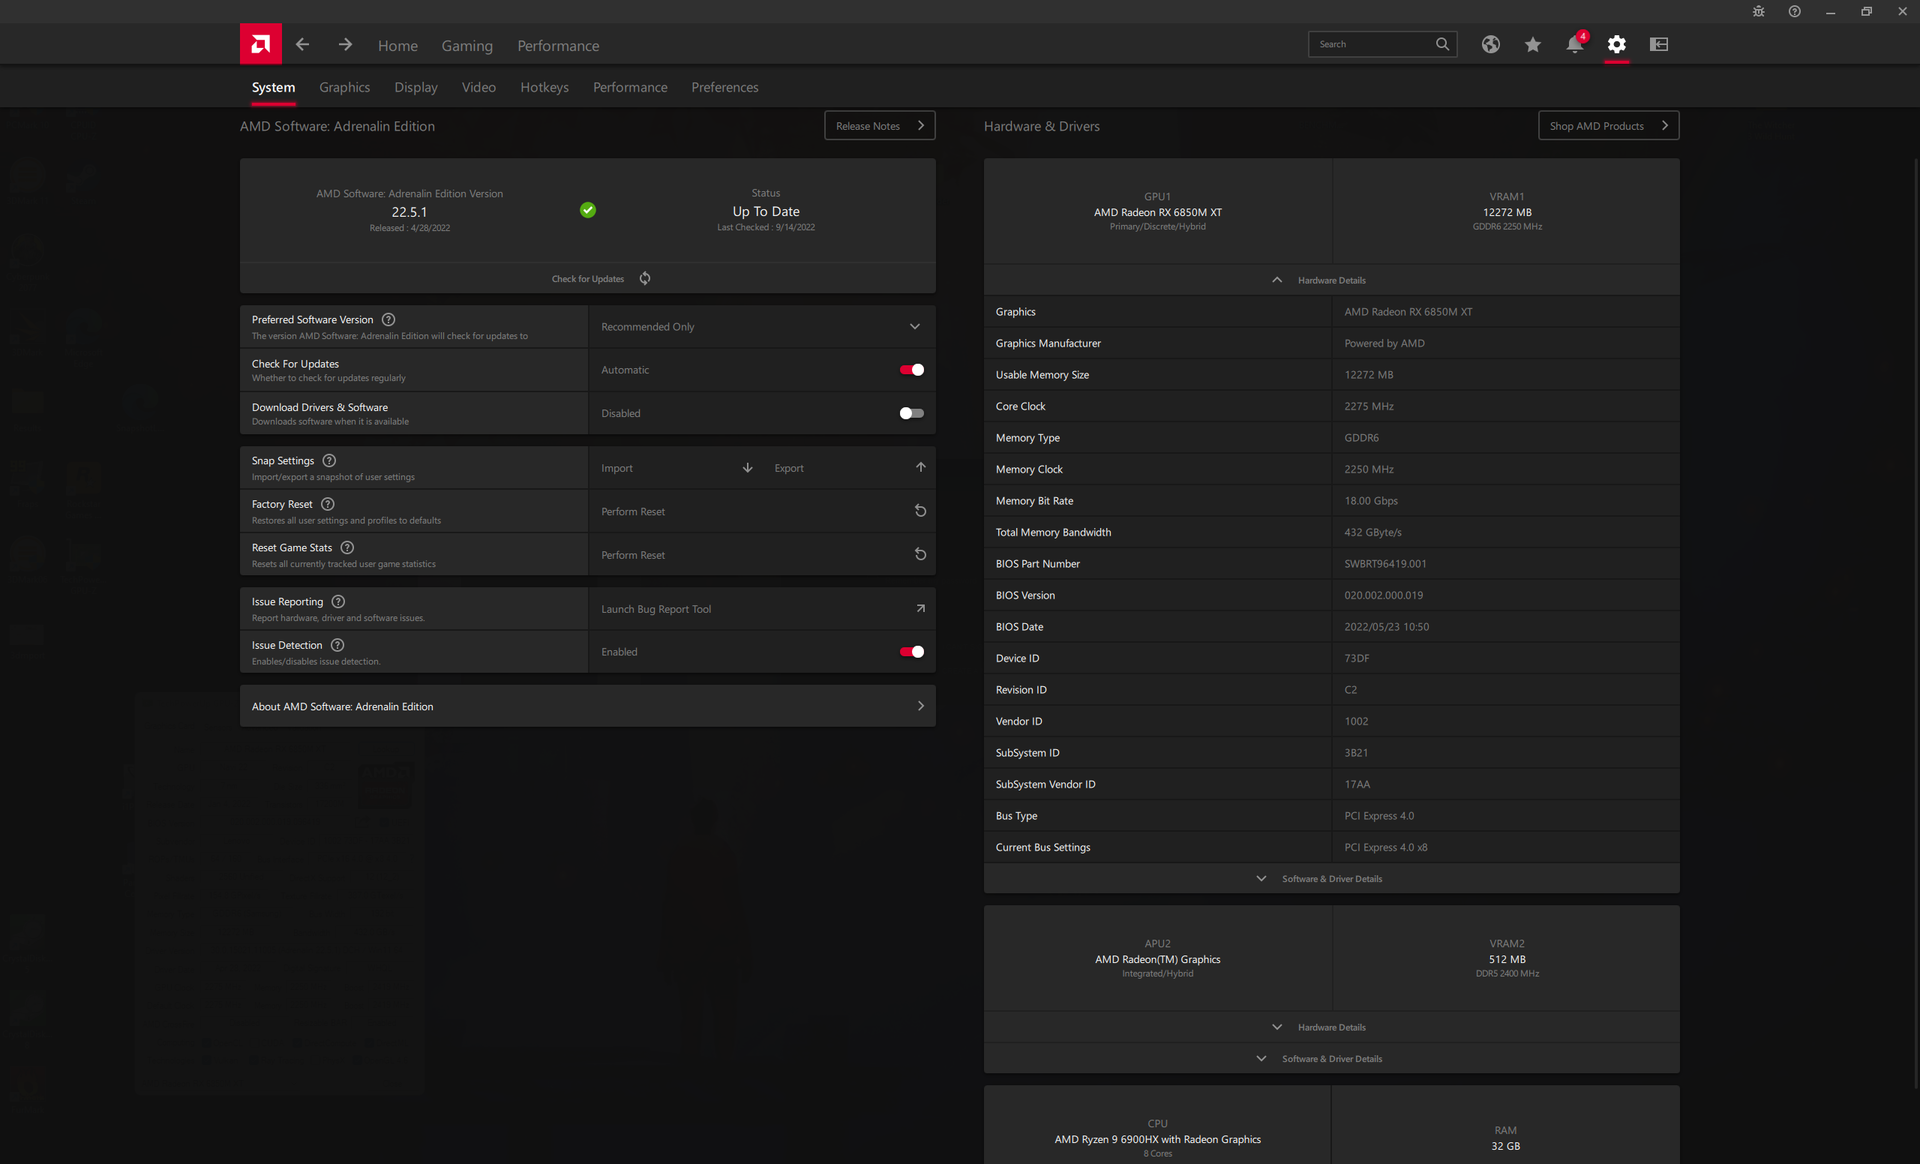
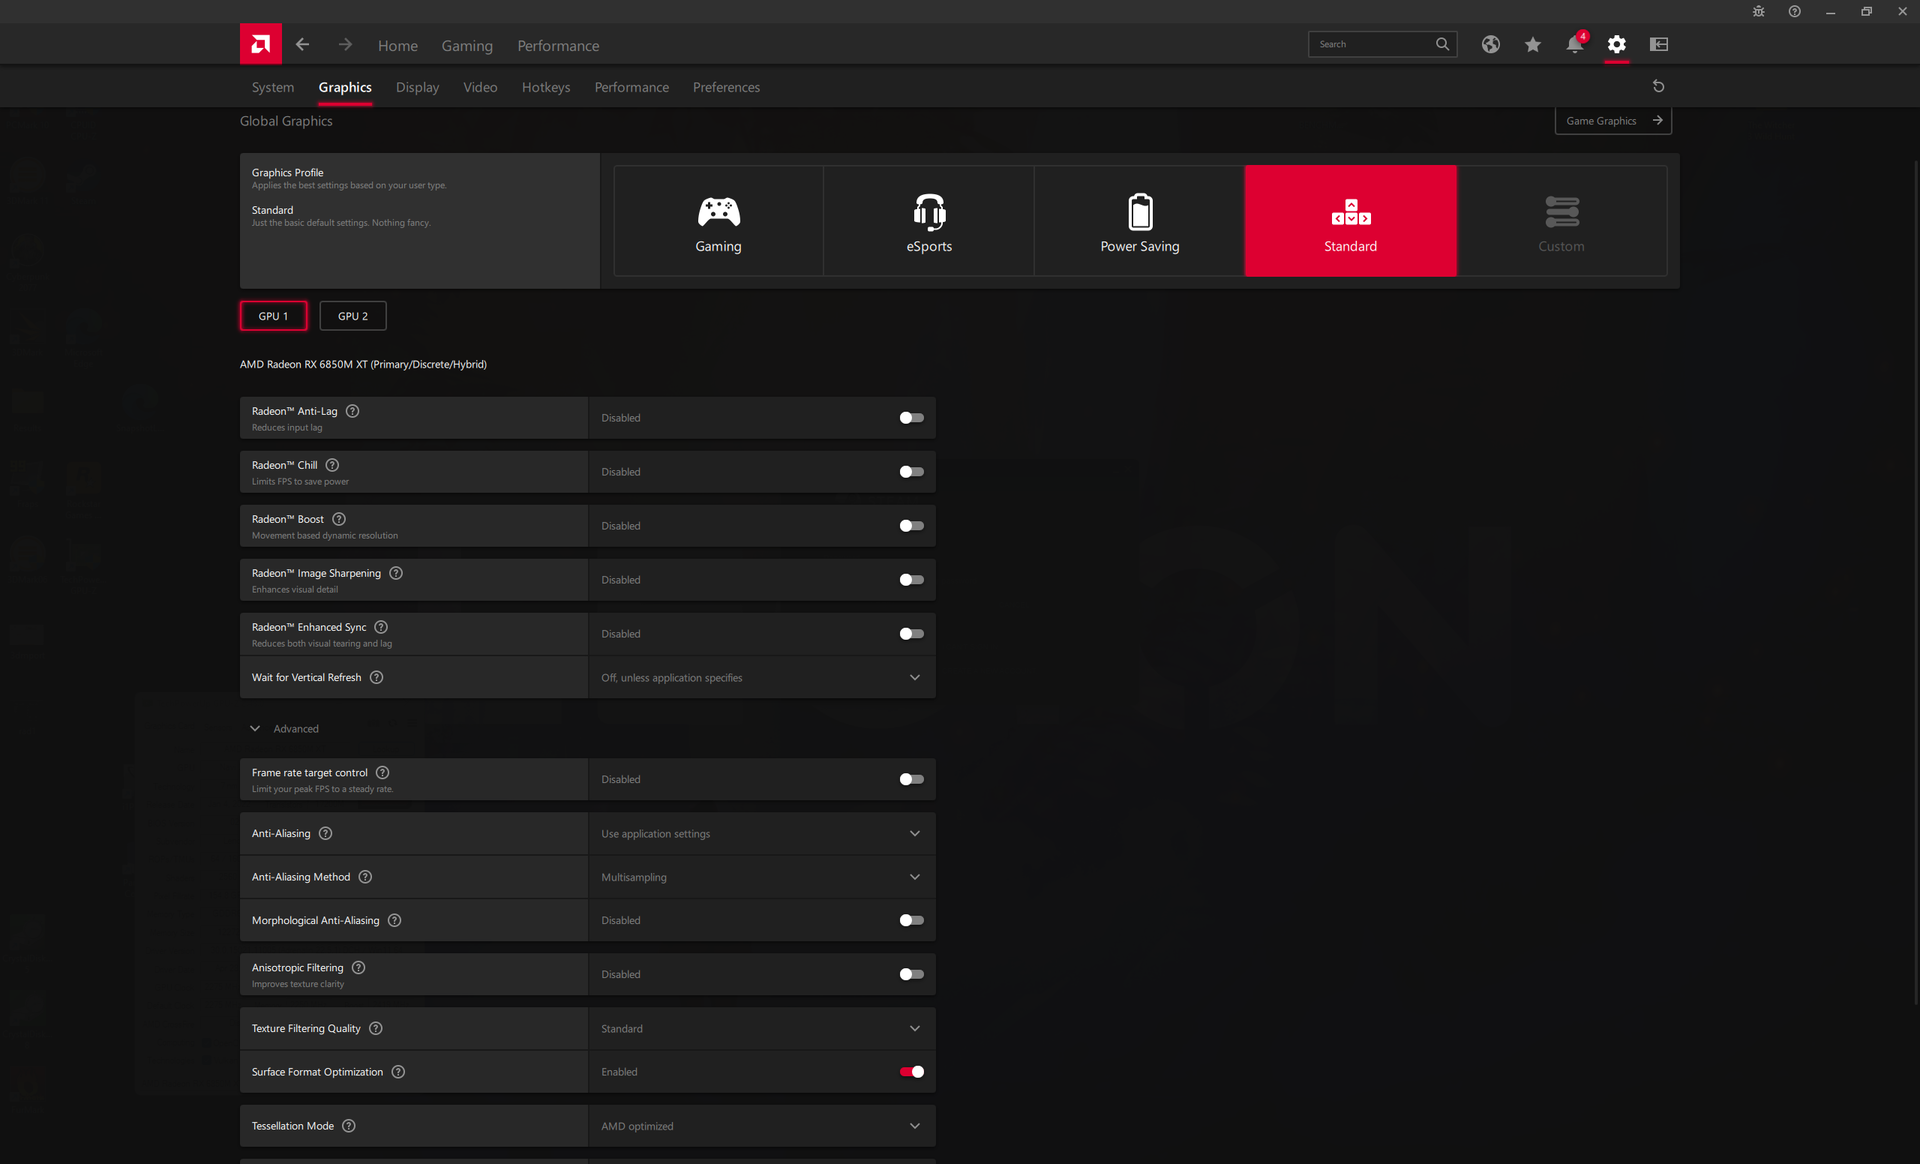
Przed przeprowadzeniem poniższych benchmarków ustawiliśmy nasz komputer w trybie Performance poprzez Lenovo Vantage i High Performance poprzez Windows. Upewniliśmy się także, że tryb "Hybrid Mode" jest wyłączony w Vantage, aby lepiej wykorzystać dyskretny procesor graficzny Radeon.
Zaleca się, aby użytkownicy zapoznali się z programem Lenovo Vantage i oprogramowaniem Radeon. Wydajność systemu, efekty LED i istotne aktualizacje są powiązane z tymi dwoma aplikacjami. W naszym konkretnym egzemplarzu testowym wystąpiły problemy z aktualizacją sterowników graficznych, w wyniku których wyświetlacz pozostawał czarny po ponownym uruchomieniu. Musieliśmy ponownie zainstalować sterowniki po raz drugi, zanim oprogramowanie Radeon mogło się uruchomić bez problemów.

Procesor - marginalne ulepszenia Zen 3+
Wydajność procesora jest doskonała i niemal dokładnie tam, gdzie spodziewamy się jej w stosunku do innych laptopów wyposażonych w ten sam Ryzen 9 6900HX procesor. Niemniej jednak nie spodziewajcie się znaczących zysków względem zeszłorocznego Ryzen 9 5900HX gdyż 6900HX jest w zależności od laptopa 5900HX szybszy tylko o 5 do 25 procent w najlepszym wypadku. Ogólna wydajność wypada słabiej od najnowszych opcji Intel Alder Lake-H 12. gen. jak np.Core i7-12700H lub i9-12900HK o 15 do 20 procent.
Uruchomienie CineBench R15 xT w pętli pokazuje spójne wyniki sugerujące doskonałą trwałość wydajności w warunkach stresu.
Cinebench R15 Multi Loop
Cinebench R23: Multi Core | Single Core
Cinebench R15: CPU Multi 64Bit | CPU Single 64Bit
Blender: v2.79 BMW27 CPU
7-Zip 18.03: 7z b 4 | 7z b 4 -mmt1
Geekbench 5.5: Multi-Core | Single-Core
HWBOT x265 Benchmark v2.2: 4k Preset
LibreOffice : 20 Documents To PDF
R Benchmark 2.5: Overall mean
| Cinebench R20 / CPU (Multi Core) | |
| MSI GE67 HX 12UGS | |
| Lenovo Legion Slim 7-16IAH 82TF004YGE | |
| MSI Raider GE66 12UHS | |
| Lenovo Legion 7 16ARHA7 | |
| Przeciętny AMD Ryzen 9 6900HX (3742 - 5813, n=19) | |
| Asus ROG Strix G15 G513QY | |
| MSI GS76 Stealth 11UH | |
| Eurocom RX315 NH57AF1 | |
| HP Omen 16-c0077ng | |
| MSI Delta 15 A5EFK | |
| MSI GS66 Stealth 10UG | |
| Cinebench R20 / CPU (Single Core) | |
| MSI Raider GE66 12UHS | |
| MSI GE67 HX 12UGS | |
| Lenovo Legion Slim 7-16IAH 82TF004YGE | |
| Lenovo Legion 7 16ARHA7 | |
| MSI GS76 Stealth 11UH | |
| Przeciętny AMD Ryzen 9 6900HX (595 - 631, n=19) | |
| Asus ROG Strix G15 G513QY | |
| Eurocom RX315 NH57AF1 | |
| MSI Delta 15 A5EFK | |
| HP Omen 16-c0077ng | |
| MSI GS66 Stealth 10UG | |
| Cinebench R23 / Multi Core | |
| MSI GE67 HX 12UGS | |
| Lenovo Legion Slim 7-16IAH 82TF004YGE | |
| MSI Raider GE66 12UHS | |
| Lenovo Legion 7 16ARHA7 | |
| Przeciętny AMD Ryzen 9 6900HX (9709 - 15100, n=19) | |
| Asus ROG Strix G15 G513QY | |
| MSI GS76 Stealth 11UH | |
| Eurocom RX315 NH57AF1 | |
| HP Omen 16-c0077ng | |
| MSI Delta 15 A5EFK | |
| MSI GS66 Stealth 10UG | |
| Cinebench R23 / Single Core | |
| MSI Raider GE66 12UHS | |
| MSI GE67 HX 12UGS | |
| Lenovo Legion Slim 7-16IAH 82TF004YGE | |
| MSI GS76 Stealth 11UH | |
| Przeciętny AMD Ryzen 9 6900HX (1516 - 1616, n=19) | |
| Lenovo Legion 7 16ARHA7 | |
| Eurocom RX315 NH57AF1 | |
| Asus ROG Strix G15 G513QY | |
| MSI Delta 15 A5EFK | |
| HP Omen 16-c0077ng | |
| MSI GS66 Stealth 10UG | |
| Cinebench R15 / CPU Multi 64Bit | |
| MSI GE67 HX 12UGS | |
| Lenovo Legion Slim 7-16IAH 82TF004YGE | |
| MSI Raider GE66 12UHS | |
| Lenovo Legion 7 16ARHA7 | |
| Asus ROG Strix G15 G513QY | |
| Przeciętny AMD Ryzen 9 6900HX (1588 - 2411, n=19) | |
| MSI GS76 Stealth 11UH | |
| MSI Delta 15 A5EFK | |
| HP Omen 16-c0077ng | |
| Eurocom RX315 NH57AF1 | |
| MSI GS66 Stealth 10UG | |
| Cinebench R15 / CPU Single 64Bit | |
| MSI Raider GE66 12UHS | |
| MSI GE67 HX 12UGS | |
| Lenovo Legion Slim 7-16IAH 82TF004YGE | |
| Lenovo Legion 7 16ARHA7 | |
| Przeciętny AMD Ryzen 9 6900HX (241 - 261, n=19) | |
| Asus ROG Strix G15 G513QY | |
| MSI Delta 15 A5EFK | |
| MSI GS76 Stealth 11UH | |
| HP Omen 16-c0077ng | |
| Eurocom RX315 NH57AF1 | |
| MSI GS66 Stealth 10UG | |
| Blender / v2.79 BMW27 CPU | |
| MSI GS66 Stealth 10UG | |
| Eurocom RX315 NH57AF1 | |
| HP Omen 16-c0077ng | |
| MSI GS76 Stealth 11UH | |
| MSI Delta 15 A5EFK | |
| Przeciętny AMD Ryzen 9 6900HX (212 - 357, n=21) | |
| Asus ROG Strix G15 G513QY | |
| Lenovo Legion 7 16ARHA7 | |
| MSI Raider GE66 12UHS | |
| Lenovo Legion Slim 7-16IAH 82TF004YGE | |
| MSI GE67 HX 12UGS | |
| 7-Zip 18.03 / 7z b 4 | |
| MSI GE67 HX 12UGS | |
| MSI Raider GE66 12UHS | |
| Lenovo Legion Slim 7-16IAH 82TF004YGE | |
| Lenovo Legion 7 16ARHA7 | |
| Przeciętny AMD Ryzen 9 6900HX (49526 - 65336, n=20) | |
| MSI Delta 15 A5EFK | |
| Asus ROG Strix G15 G513QY | |
| MSI GS76 Stealth 11UH | |
| Eurocom RX315 NH57AF1 | |
| MSI GS66 Stealth 10UG | |
| 7-Zip 18.03 / 7z b 4 -mmt1 | |
| MSI Raider GE66 12UHS | |
| Przeciętny AMD Ryzen 9 6900HX (5090 - 6070, n=20) | |
| MSI Delta 15 A5EFK | |
| Lenovo Legion 7 16ARHA7 | |
| Asus ROG Strix G15 G513QY | |
| MSI GS76 Stealth 11UH | |
| MSI GE67 HX 12UGS | |
| Lenovo Legion Slim 7-16IAH 82TF004YGE | |
| HP Omen 16-c0077ng | |
| Eurocom RX315 NH57AF1 | |
| MSI GS66 Stealth 10UG | |
| Geekbench 5.5 / Multi-Core | |
| MSI GE67 HX 12UGS | |
| MSI Raider GE66 12UHS | |
| Lenovo Legion Slim 7-16IAH 82TF004YGE | |
| Lenovo Legion 7 16ARHA7 | |
| MSI GS76 Stealth 11UH | |
| Przeciętny AMD Ryzen 9 6900HX (8313 - 10490, n=21) | |
| Eurocom RX315 NH57AF1 | |
| MSI Delta 15 A5EFK | |
| MSI GS66 Stealth 10UG | |
| Asus ROG Strix G15 G513QY | |
| HP Omen 16-c0077ng | |
| Geekbench 5.5 / Single-Core | |
| MSI Raider GE66 12UHS | |
| MSI GE67 HX 12UGS | |
| Lenovo Legion Slim 7-16IAH 82TF004YGE | |
| MSI GS76 Stealth 11UH | |
| Lenovo Legion 7 16ARHA7 | |
| Przeciętny AMD Ryzen 9 6900HX (1523 - 1652, n=21) | |
| MSI Delta 15 A5EFK | |
| Eurocom RX315 NH57AF1 | |
| Asus ROG Strix G15 G513QY | |
| HP Omen 16-c0077ng | |
| MSI GS66 Stealth 10UG | |
| HWBOT x265 Benchmark v2.2 / 4k Preset | |
| MSI GE67 HX 12UGS | |
| Lenovo Legion Slim 7-16IAH 82TF004YGE | |
| MSI Raider GE66 12UHS | |
| Lenovo Legion 7 16ARHA7 | |
| Przeciętny AMD Ryzen 9 6900HX (12.6 - 18.7, n=20) | |
| MSI Delta 15 A5EFK | |
| Asus ROG Strix G15 G513QY | |
| HP Omen 16-c0077ng | |
| MSI GS76 Stealth 11UH | |
| Eurocom RX315 NH57AF1 | |
| MSI GS66 Stealth 10UG | |
| LibreOffice / 20 Documents To PDF | |
| HP Omen 16-c0077ng | |
| Lenovo Legion 7 16ARHA7 | |
| Przeciętny AMD Ryzen 9 6900HX (44.8 - 81.7, n=20) | |
| MSI Delta 15 A5EFK | |
| Asus ROG Strix G15 G513QY | |
| MSI GS76 Stealth 11UH | |
| Eurocom RX315 NH57AF1 | |
| MSI GS66 Stealth 10UG | |
| MSI GE67 HX 12UGS | |
| Lenovo Legion Slim 7-16IAH 82TF004YGE | |
| MSI Raider GE66 12UHS | |
| R Benchmark 2.5 / Overall mean | |
| MSI GS66 Stealth 10UG | |
| Eurocom RX315 NH57AF1 | |
| MSI GS76 Stealth 11UH | |
| HP Omen 16-c0077ng | |
| Asus ROG Strix G15 G513QY | |
| MSI Delta 15 A5EFK | |
| Lenovo Legion 7 16ARHA7 | |
| Przeciętny AMD Ryzen 9 6900HX (0.4627 - 0.4974, n=20) | |
| Lenovo Legion Slim 7-16IAH 82TF004YGE | |
| MSI GE67 HX 12UGS | |
| MSI Raider GE66 12UHS | |
* ... im mniej tym lepiej
AIDA64: FP32 Ray-Trace | FPU Julia | CPU SHA3 | CPU Queen | FPU SinJulia | FPU Mandel | CPU AES | CPU ZLib | FP64 Ray-Trace | CPU PhotoWorxx
| Performance rating | |
| Lenovo Legion 7 16ARHA7 | |
| Asus ROG Zephyrus Duo 16 GX650RX | |
| Lenovo Legion Slim 7-16IAH 82TF004YGE | |
| Przeciętny AMD Ryzen 9 6900HX | |
| HP Omen 16-c0077ng | |
| MSI Alpha 15 B5EEK-008 | |
| MSI Raider GE66 12UHS | |
| AIDA64 / FP32 Ray-Trace | |
| Lenovo Legion 7 16ARHA7 | |
| Asus ROG Zephyrus Duo 16 GX650RX | |
| Lenovo Legion Slim 7-16IAH 82TF004YGE | |
| Przeciętny AMD Ryzen 9 6900HX (10950 - 17963, n=20) | |
| HP Omen 16-c0077ng | |
| MSI Alpha 15 B5EEK-008 | |
| MSI Raider GE66 12UHS | |
| AIDA64 / FPU Julia | |
| Lenovo Legion 7 16ARHA7 | |
| Asus ROG Zephyrus Duo 16 GX650RX | |
| Przeciętny AMD Ryzen 9 6900HX (71414 - 110797, n=20) | |
| HP Omen 16-c0077ng | |
| MSI Alpha 15 B5EEK-008 | |
| Lenovo Legion Slim 7-16IAH 82TF004YGE | |
| MSI Raider GE66 12UHS | |
| AIDA64 / CPU SHA3 | |
| Lenovo Legion Slim 7-16IAH 82TF004YGE | |
| Lenovo Legion 7 16ARHA7 | |
| Asus ROG Zephyrus Duo 16 GX650RX | |
| Przeciętny AMD Ryzen 9 6900HX (2471 - 3804, n=20) | |
| HP Omen 16-c0077ng | |
| MSI Alpha 15 B5EEK-008 | |
| MSI Raider GE66 12UHS | |
| AIDA64 / CPU Queen | |
| Lenovo Legion 7 16ARHA7 | |
| MSI Raider GE66 12UHS | |
| Asus ROG Zephyrus Duo 16 GX650RX | |
| Lenovo Legion Slim 7-16IAH 82TF004YGE | |
| Przeciętny AMD Ryzen 9 6900HX (84185 - 107544, n=20) | |
| HP Omen 16-c0077ng | |
| MSI Alpha 15 B5EEK-008 | |
| AIDA64 / FPU SinJulia | |
| Lenovo Legion 7 16ARHA7 | |
| Asus ROG Zephyrus Duo 16 GX650RX | |
| Przeciętny AMD Ryzen 9 6900HX (10970 - 13205, n=20) | |
| HP Omen 16-c0077ng | |
| MSI Alpha 15 B5EEK-008 | |
| Lenovo Legion Slim 7-16IAH 82TF004YGE | |
| MSI Raider GE66 12UHS | |
| AIDA64 / FPU Mandel | |
| Lenovo Legion 7 16ARHA7 | |
| Asus ROG Zephyrus Duo 16 GX650RX | |
| Przeciętny AMD Ryzen 9 6900HX (39164 - 61370, n=20) | |
| HP Omen 16-c0077ng | |
| MSI Alpha 15 B5EEK-008 | |
| Lenovo Legion Slim 7-16IAH 82TF004YGE | |
| MSI Raider GE66 12UHS | |
| AIDA64 / CPU AES | |
| Lenovo Legion 7 16ARHA7 | |
| Asus ROG Zephyrus Duo 16 GX650RX | |
| Lenovo Legion Slim 7-16IAH 82TF004YGE | |
| HP Omen 16-c0077ng | |
| MSI Alpha 15 B5EEK-008 | |
| Przeciętny AMD Ryzen 9 6900HX (54613 - 142360, n=20) | |
| MSI Raider GE66 12UHS | |
| AIDA64 / CPU ZLib | |
| MSI Raider GE66 12UHS | |
| Lenovo Legion Slim 7-16IAH 82TF004YGE | |
| Lenovo Legion 7 16ARHA7 | |
| Asus ROG Zephyrus Duo 16 GX650RX | |
| HP Omen 16-c0077ng | |
| Przeciętny AMD Ryzen 9 6900HX (578 - 911, n=20) | |
| MSI Alpha 15 B5EEK-008 | |
| AIDA64 / FP64 Ray-Trace | |
| Lenovo Legion 7 16ARHA7 | |
| Asus ROG Zephyrus Duo 16 GX650RX | |
| Lenovo Legion Slim 7-16IAH 82TF004YGE | |
| Przeciętny AMD Ryzen 9 6900HX (5798 - 9540, n=20) | |
| HP Omen 16-c0077ng | |
| MSI Alpha 15 B5EEK-008 | |
| MSI Raider GE66 12UHS | |
| AIDA64 / CPU PhotoWorxx | |
| MSI Raider GE66 12UHS | |
| Lenovo Legion Slim 7-16IAH 82TF004YGE | |
| Lenovo Legion 7 16ARHA7 | |
| Asus ROG Zephyrus Duo 16 GX650RX | |
| Przeciętny AMD Ryzen 9 6900HX (26873 - 30604, n=20) | |
| MSI Alpha 15 B5EEK-008 | |
| HP Omen 16-c0077ng | |
Wydajność systemu
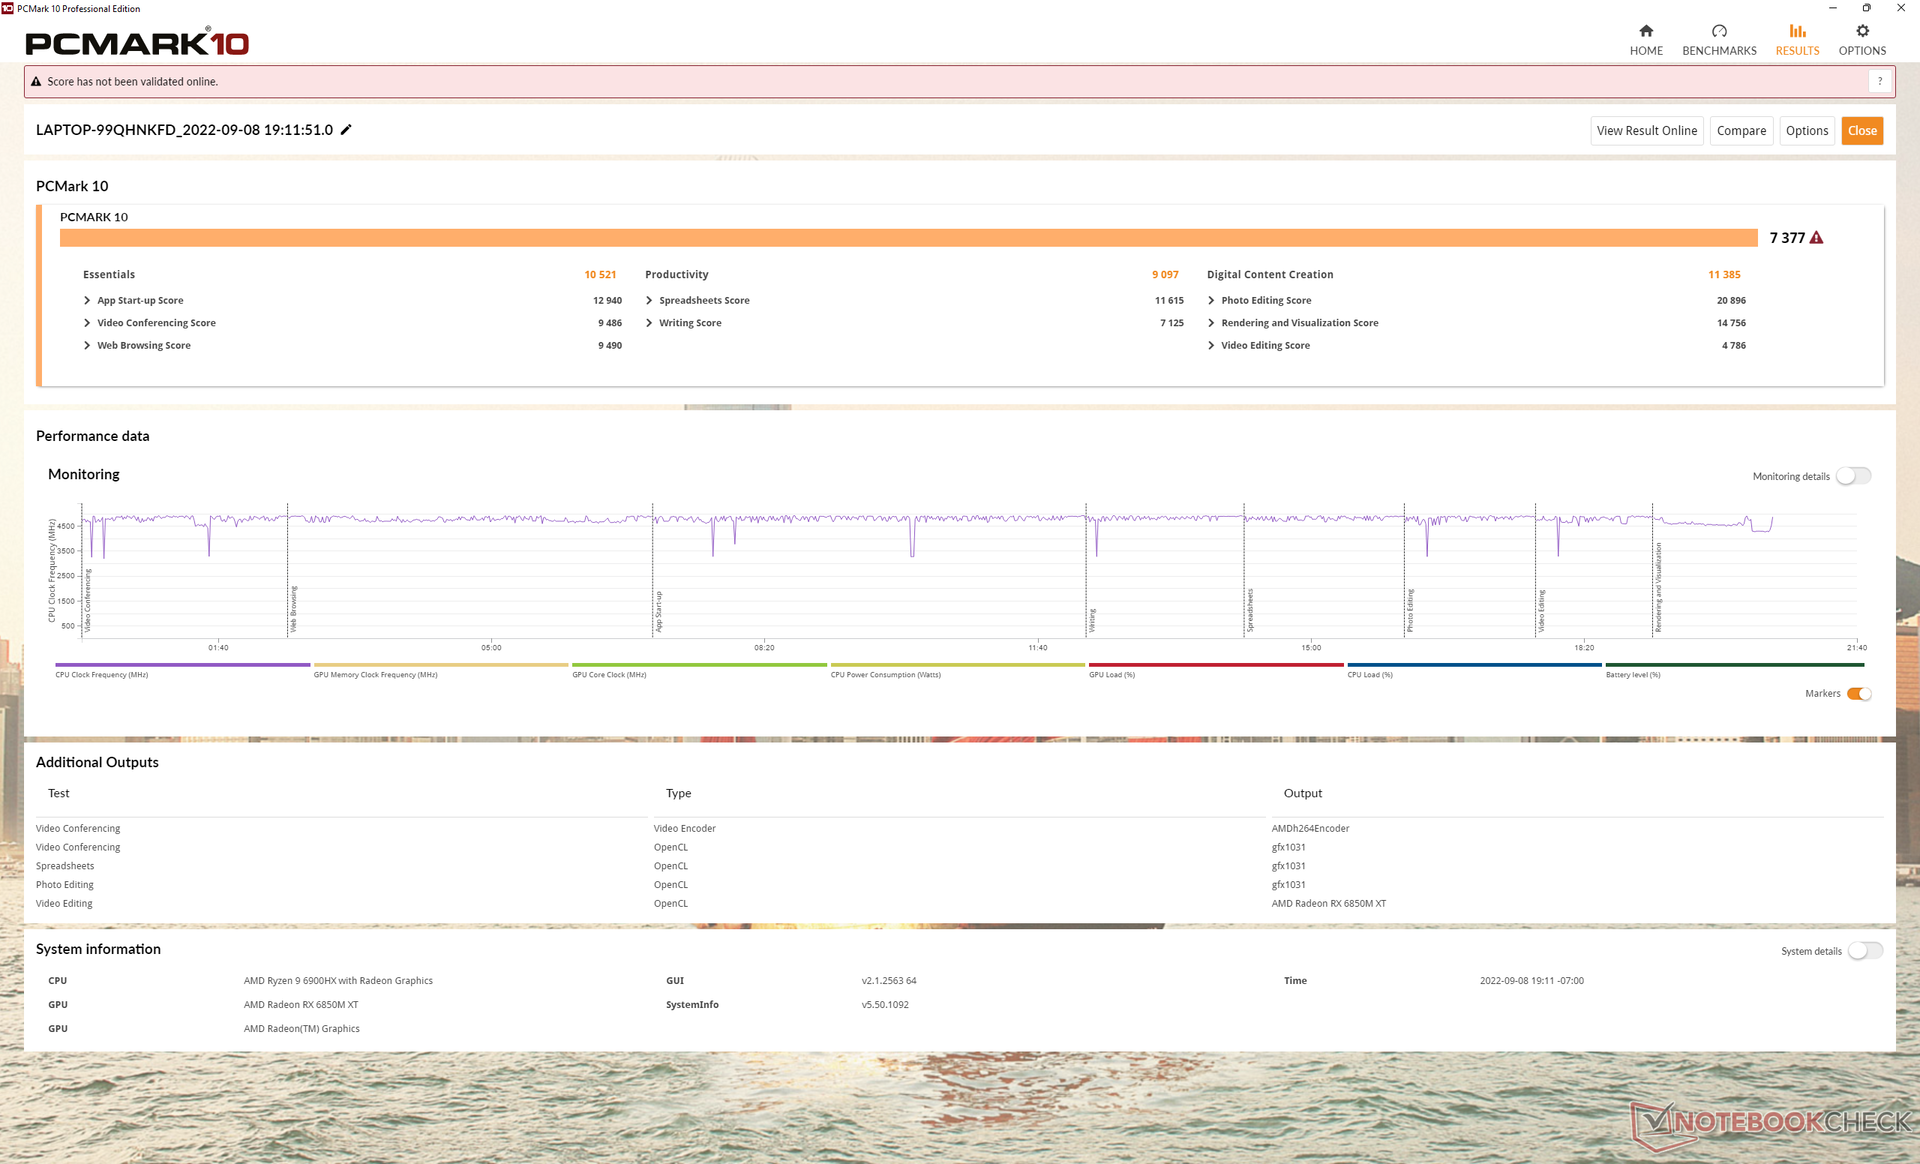
Wyniki PCMark 10 są doskonałe, ale wciąż konsekwentnie za MSI GE66 napędzanym przez szybszy procesor Intel Core i9 12. generacji oraz kartę graficzną GeForce RTX 3080 Ti
W naszym egzemplarzu testowym przynajmniej raz wystąpiły problemy z wybudzaniem z uśpienia. System nie mógł się obudzić po otwarciu pokrywy, co wymagało twardego wyłączenia i zimnego restartu.
CrossMark: Overall | Productivity | Creativity | Responsiveness
| PCMark 10 / Score | |
| MSI Raider GE66 12UHS | |
| Lenovo Legion Slim 7-16IAH 82TF004YGE | |
| Lenovo Legion 7 16ARHA7 | |
| Przeciętny AMD Ryzen 9 6900HX, AMD Radeon RX 6850M XT (7292 - 7377, n=2) | |
| HP Omen 16-c0077ng | |
| Lenovo Legion 5 Pro 16ACH6H (82JQ001PGE) | |
| Asus ROG Zephyrus Duo 16 GX650RX | |
| PCMark 10 / Essentials | |
| MSI Raider GE66 12UHS | |
| Lenovo Legion Slim 7-16IAH 82TF004YGE | |
| Lenovo Legion 7 16ARHA7 | |
| HP Omen 16-c0077ng | |
| Przeciętny AMD Ryzen 9 6900HX, AMD Radeon RX 6850M XT (10250 - 10521, n=2) | |
| Lenovo Legion 5 Pro 16ACH6H (82JQ001PGE) | |
| Asus ROG Zephyrus Duo 16 GX650RX | |
| PCMark 10 / Productivity | |
| MSI Raider GE66 12UHS | |
| Lenovo Legion Slim 7-16IAH 82TF004YGE | |
| HP Omen 16-c0077ng | |
| Lenovo Legion 7 16ARHA7 | |
| Przeciętny AMD Ryzen 9 6900HX, AMD Radeon RX 6850M XT (9090 - 9097, n=2) | |
| Lenovo Legion 5 Pro 16ACH6H (82JQ001PGE) | |
| Asus ROG Zephyrus Duo 16 GX650RX | |
| PCMark 10 / Digital Content Creation | |
| MSI Raider GE66 12UHS | |
| Lenovo Legion 7 16ARHA7 | |
| Przeciętny AMD Ryzen 9 6900HX, AMD Radeon RX 6850M XT (11296 - 11385, n=2) | |
| Lenovo Legion Slim 7-16IAH 82TF004YGE | |
| HP Omen 16-c0077ng | |
| Lenovo Legion 5 Pro 16ACH6H (82JQ001PGE) | |
| Asus ROG Zephyrus Duo 16 GX650RX | |
| CrossMark / Overall | |
| Lenovo Legion Slim 7-16IAH 82TF004YGE | |
| Asus ROG Zephyrus Duo 16 GX650RX | |
| Przeciętny AMD Ryzen 9 6900HX, AMD Radeon RX 6850M XT (1596 - 1597, n=2) | |
| Lenovo Legion 7 16ARHA7 | |
| CrossMark / Productivity | |
| Lenovo Legion Slim 7-16IAH 82TF004YGE | |
| Asus ROG Zephyrus Duo 16 GX650RX | |
| Przeciętny AMD Ryzen 9 6900HX, AMD Radeon RX 6850M XT (1551 - 1565, n=2) | |
| Lenovo Legion 7 16ARHA7 | |
| CrossMark / Creativity | |
| Lenovo Legion Slim 7-16IAH 82TF004YGE | |
| Lenovo Legion 7 16ARHA7 | |
| Przeciętny AMD Ryzen 9 6900HX, AMD Radeon RX 6850M XT (1738 - 1754, n=2) | |
| Asus ROG Zephyrus Duo 16 GX650RX | |
| CrossMark / Responsiveness | |
| Lenovo Legion Slim 7-16IAH 82TF004YGE | |
| Asus ROG Zephyrus Duo 16 GX650RX | |
| Przeciętny AMD Ryzen 9 6900HX, AMD Radeon RX 6850M XT (1310 - 1315, n=2) | |
| Lenovo Legion 7 16ARHA7 | |
| PCMark 10 Score | 7377 pkt. | |
Pomoc | ||
| AIDA64 / Memory Copy | |
| MSI Raider GE66 12UHS | |
| Asus ROG Zephyrus Duo 16 GX650RX | |
| Lenovo Legion 7 16ARHA7 | |
| Przeciętny AMD Ryzen 9 6900HX (47938 - 53345, n=20) | |
| Lenovo Legion Slim 7-16IAH 82TF004YGE | |
| Asus ROG Flow X16 GV601RW-M5082W | |
| HP Omen 16-c0077ng | |
| AIDA64 / Memory Read | |
| MSI Raider GE66 12UHS | |
| Lenovo Legion Slim 7-16IAH 82TF004YGE | |
| Asus ROG Zephyrus Duo 16 GX650RX | |
| Lenovo Legion 7 16ARHA7 | |
| Przeciętny AMD Ryzen 9 6900HX (43892 - 53321, n=20) | |
| Asus ROG Flow X16 GV601RW-M5082W | |
| HP Omen 16-c0077ng | |
| AIDA64 / Memory Write | |
| MSI Raider GE66 12UHS | |
| Lenovo Legion Slim 7-16IAH 82TF004YGE | |
| Asus ROG Zephyrus Duo 16 GX650RX | |
| Lenovo Legion 7 16ARHA7 | |
| Przeciętny AMD Ryzen 9 6900HX (51085 - 57202, n=20) | |
| Asus ROG Flow X16 GV601RW-M5082W | |
| HP Omen 16-c0077ng | |
| AIDA64 / Memory Latency | |
| Lenovo Legion Slim 7-16IAH 82TF004YGE | |
| Asus ROG Flow X16 GV601RW-M5082W | |
| MSI Raider GE66 12UHS | |
| Asus ROG Zephyrus Duo 16 GX650RX | |
| Przeciętny AMD Ryzen 9 6900HX (80.7 - 120.6, n=20) | |
| HP Omen 16-c0077ng | |
| Lenovo Legion 7 16ARHA7 | |
* ... im mniej tym lepiej
Opóźnienie DPC
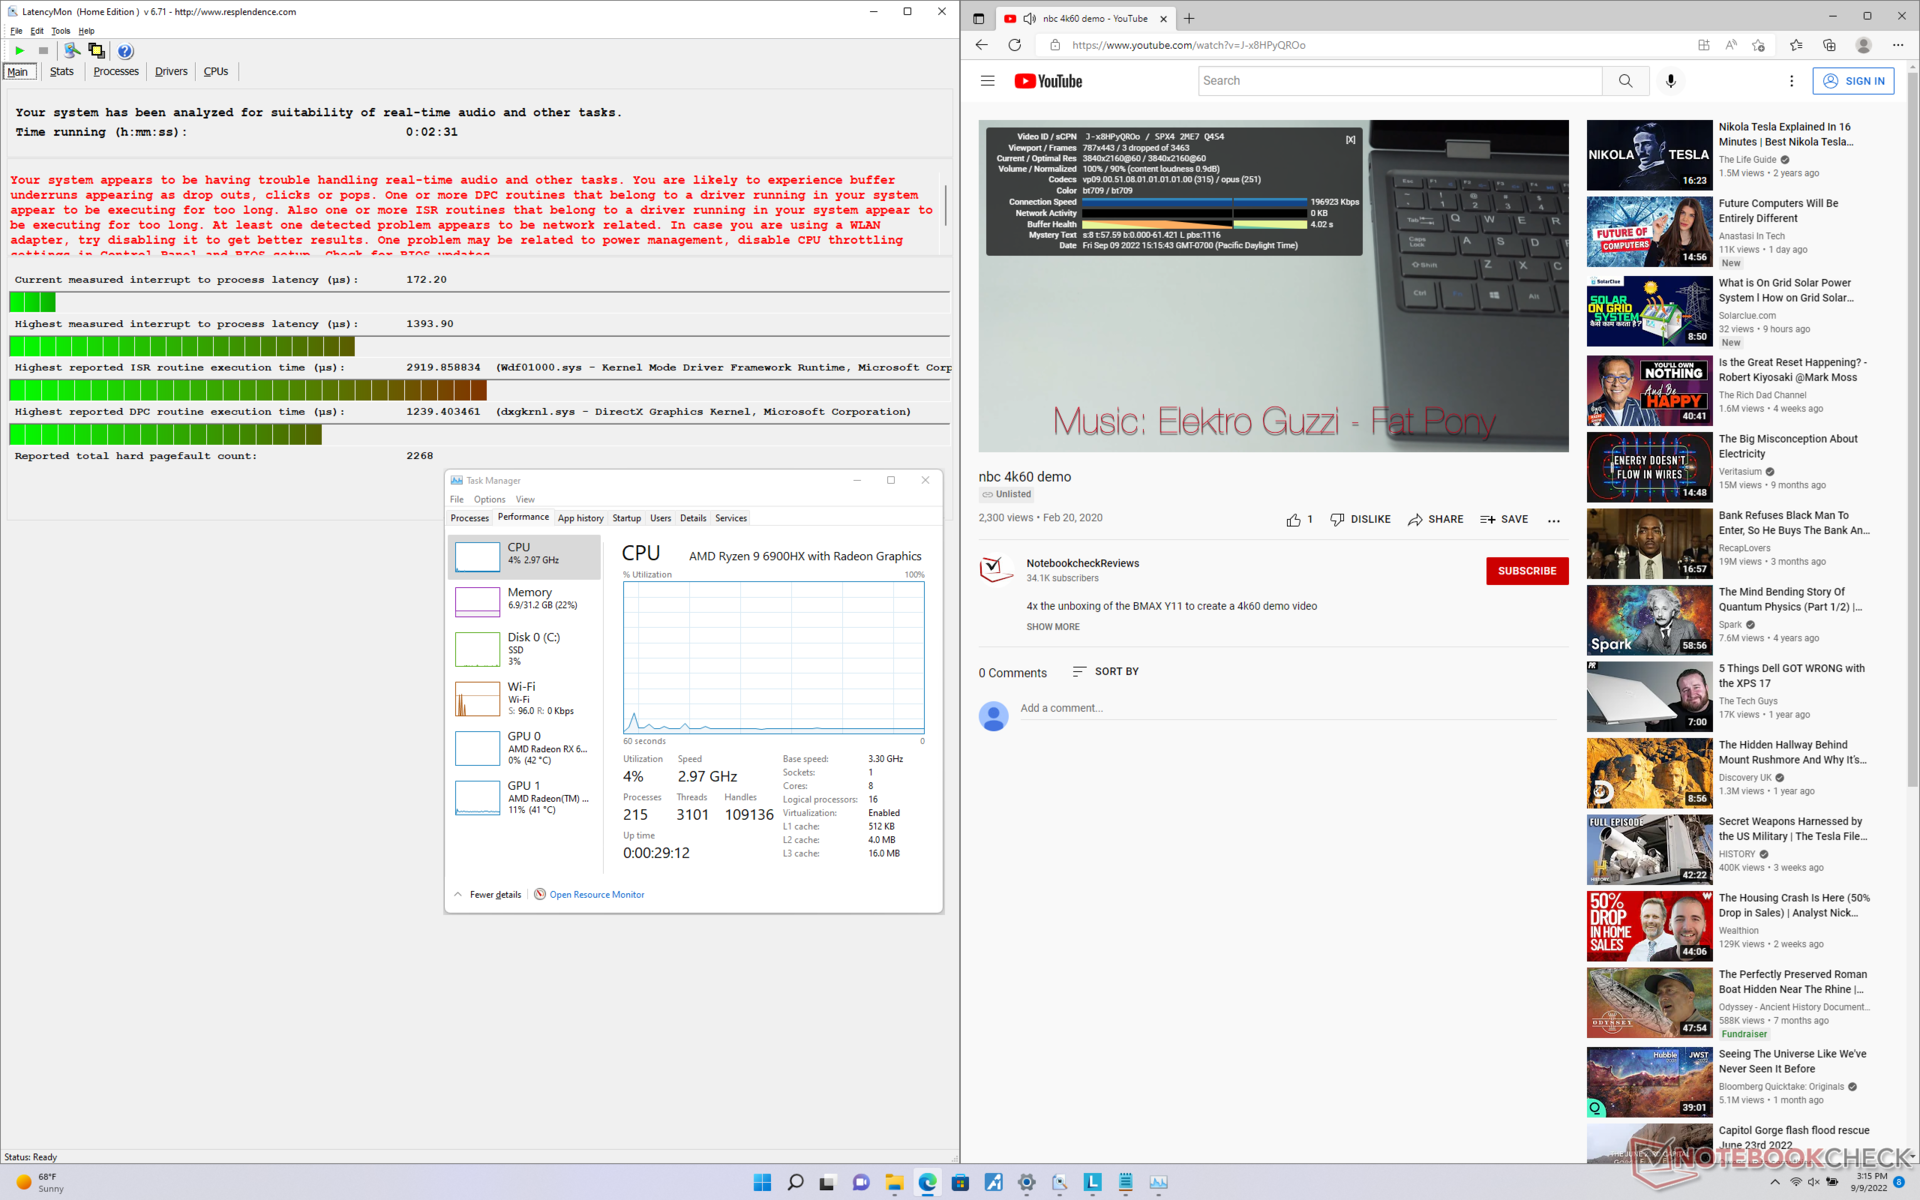
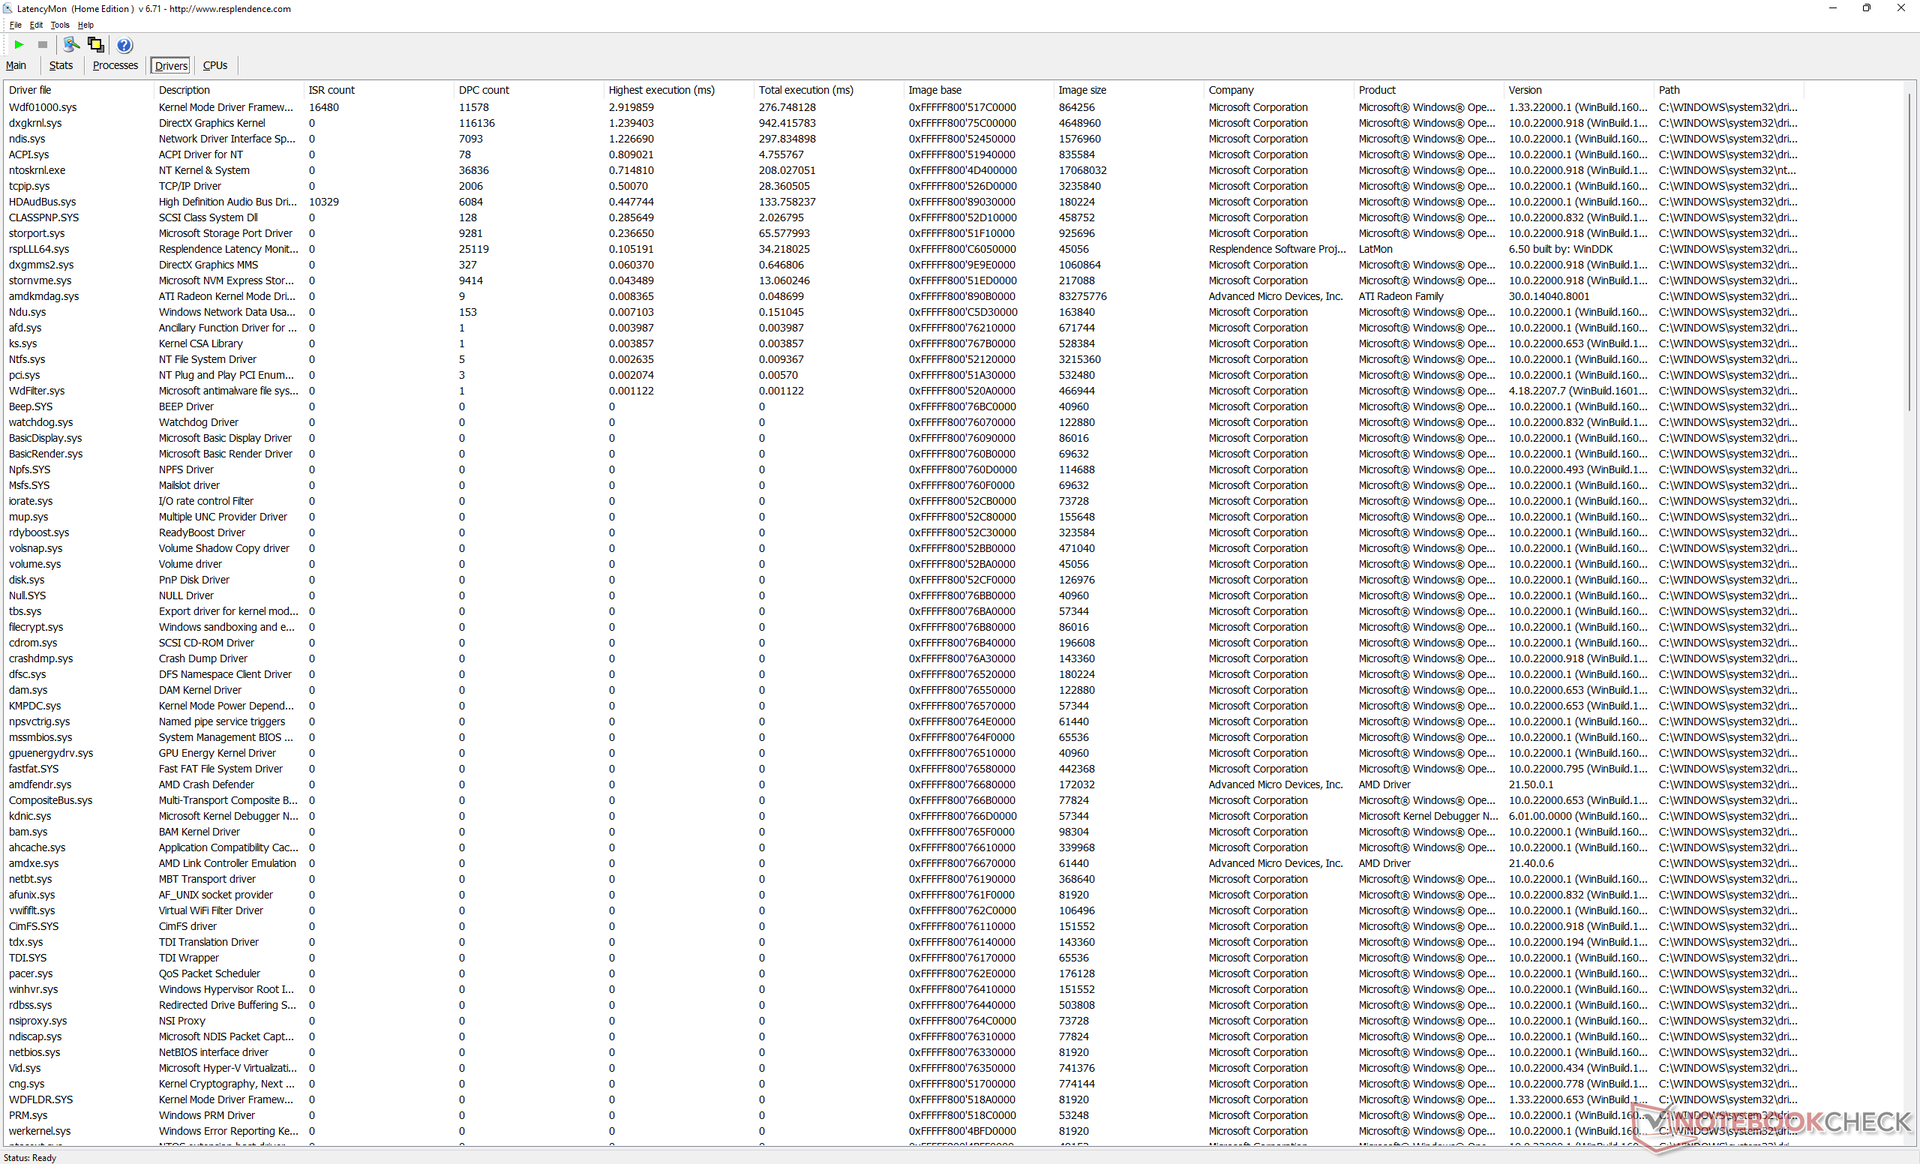
LatencyMon ujawnia problemy z DPC podczas otwierania wielu kart przeglądarki na stronie głównej. odtwarzanie wideo w rozdzielczości 4K przy 60 FPS jest w większości przypadków płynne - podczas naszego trwającego minutę testu wideo spadły tylko 3 klatki.
| DPC Latencies / LatencyMon - interrupt to process latency (max), Web, Youtube, Prime95 | |
| MSI Raider GE66 12UHS | |
| HP Omen 16-c0077ng | |
| Lenovo Legion 7 16ARHA7 | |
| Lenovo Legion 5 Pro 16ACH6H (82JQ001PGE) | |
| Lenovo Legion Slim 7-16IAH 82TF004YGE | |
| Asus ROG Zephyrus Duo 16 GX650RX | |
* ... im mniej tym lepiej
Urządzenia pamięci masowej - do dwóch dysków SSD PCIe4 x4
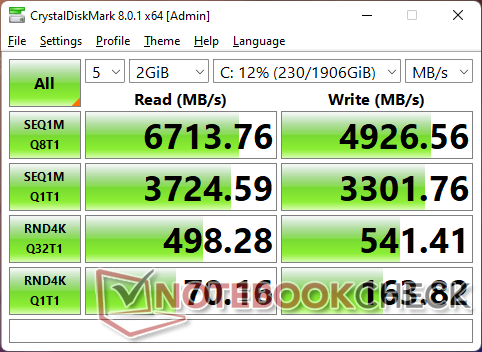
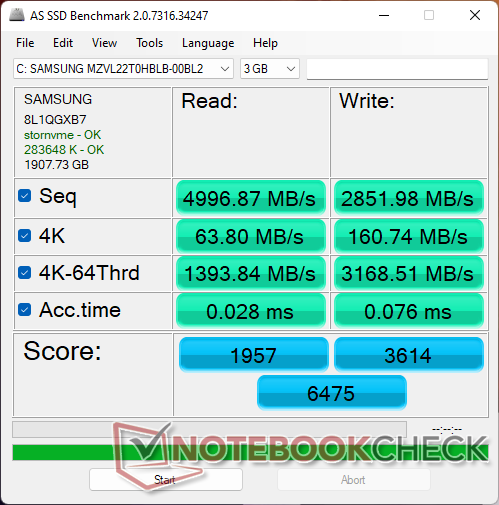
Nasz testowy egzemplarz został dostarczony z tym samym Samsung MZVL22T0HBLB PCIe4 x4 NVMe SSD, który znajduje się w MSI GE66 Raider. Jednak według wielu benchmarków SSD wydajność wydaje się być wolniejsza na Legion niż na MSI w prawie wszystkich przypadkach. Podczas uruchamiania programu DiskSpd w pętli, szybkość transferu w niewytłumaczalny sposób spadała do poziomu 3300 MB/s, a następnie wzrastała, podczas gdy ten sam dysk w GE66 nie wykazywał takiego zachowania.

| Drive Performance rating - Percent | |
| MSI Raider GE66 12UHS | |
| Asus ROG Zephyrus Duo 16 GX650RX | |
| Lenovo Legion Slim 7-16IAH 82TF004YGE | |
| Lenovo Legion 7 16ARHA7 | |
| HP Omen 16-c0077ng | |
| Lenovo Legion 5 Pro 16ACH6H (82JQ001PGE) | |
| DiskSpd | |
| seq read | |
| Asus ROG Zephyrus Duo 16 GX650RX | |
| Lenovo Legion Slim 7-16IAH 82TF004YGE | |
| MSI Raider GE66 12UHS | |
| Lenovo Legion 7 16ARHA7 | |
| HP Omen 16-c0077ng | |
| Lenovo Legion 5 Pro 16ACH6H (82JQ001PGE) | |
| Lenovo Legion 5 Pro 16ACH6H (82JQ001PGE) | |
| seq write | |
| Asus ROG Zephyrus Duo 16 GX650RX | |
| MSI Raider GE66 12UHS | |
| Lenovo Legion Slim 7-16IAH 82TF004YGE | |
| Lenovo Legion 7 16ARHA7 | |
| Lenovo Legion 5 Pro 16ACH6H (82JQ001PGE) | |
| Lenovo Legion 5 Pro 16ACH6H (82JQ001PGE) | |
| HP Omen 16-c0077ng | |
| seq q8 t1 read | |
| Asus ROG Zephyrus Duo 16 GX650RX | |
| Lenovo Legion Slim 7-16IAH 82TF004YGE | |
| Lenovo Legion 7 16ARHA7 | |
| MSI Raider GE66 12UHS | |
| HP Omen 16-c0077ng | |
| Lenovo Legion 5 Pro 16ACH6H (82JQ001PGE) | |
| Lenovo Legion 5 Pro 16ACH6H (82JQ001PGE) | |
| seq q8 t1 write | |
| Asus ROG Zephyrus Duo 16 GX650RX | |
| Lenovo Legion Slim 7-16IAH 82TF004YGE | |
| Lenovo Legion 7 16ARHA7 | |
| MSI Raider GE66 12UHS | |
| Lenovo Legion 5 Pro 16ACH6H (82JQ001PGE) | |
| Lenovo Legion 5 Pro 16ACH6H (82JQ001PGE) | |
| HP Omen 16-c0077ng | |
| 4k q1 t1 read | |
| MSI Raider GE66 12UHS | |
| Lenovo Legion Slim 7-16IAH 82TF004YGE | |
| Asus ROG Zephyrus Duo 16 GX650RX | |
| Lenovo Legion 7 16ARHA7 | |
| HP Omen 16-c0077ng | |
| Lenovo Legion 5 Pro 16ACH6H (82JQ001PGE) | |
| Lenovo Legion 5 Pro 16ACH6H (82JQ001PGE) | |
| 4k q1 t1 write | |
| Asus ROG Zephyrus Duo 16 GX650RX | |
| MSI Raider GE66 12UHS | |
| Lenovo Legion Slim 7-16IAH 82TF004YGE | |
| Lenovo Legion 7 16ARHA7 | |
| HP Omen 16-c0077ng | |
| Lenovo Legion 5 Pro 16ACH6H (82JQ001PGE) | |
| Lenovo Legion 5 Pro 16ACH6H (82JQ001PGE) | |
| 4k q32 t16 read | |
| MSI Raider GE66 12UHS | |
| Asus ROG Zephyrus Duo 16 GX650RX | |
| Lenovo Legion 5 Pro 16ACH6H (82JQ001PGE) | |
| Lenovo Legion 5 Pro 16ACH6H (82JQ001PGE) | |
| HP Omen 16-c0077ng | |
| Lenovo Legion 7 16ARHA7 | |
| Lenovo Legion Slim 7-16IAH 82TF004YGE | |
| 4k q32 t16 write | |
| MSI Raider GE66 12UHS | |
| Lenovo Legion 5 Pro 16ACH6H (82JQ001PGE) | |
| Lenovo Legion 5 Pro 16ACH6H (82JQ001PGE) | |
| HP Omen 16-c0077ng | |
| Asus ROG Zephyrus Duo 16 GX650RX | |
| Lenovo Legion Slim 7-16IAH 82TF004YGE | |
| Lenovo Legion 7 16ARHA7 | |
| AS SSD | |
| Score Total | |
| MSI Raider GE66 12UHS | |
| Lenovo Legion Slim 7-16IAH 82TF004YGE | |
| Asus ROG Zephyrus Duo 16 GX650RX | |
| Lenovo Legion 7 16ARHA7 | |
| HP Omen 16-c0077ng | |
| Lenovo Legion 5 Pro 16ACH6H (82JQ001PGE) | |
| Score Read | |
| MSI Raider GE66 12UHS | |
| Asus ROG Zephyrus Duo 16 GX650RX | |
| HP Omen 16-c0077ng | |
| Lenovo Legion 7 16ARHA7 | |
| Lenovo Legion Slim 7-16IAH 82TF004YGE | |
| Lenovo Legion 5 Pro 16ACH6H (82JQ001PGE) | |
| Score Write | |
| Lenovo Legion Slim 7-16IAH 82TF004YGE | |
| MSI Raider GE66 12UHS | |
| Lenovo Legion 7 16ARHA7 | |
| Asus ROG Zephyrus Duo 16 GX650RX | |
| HP Omen 16-c0077ng | |
| Lenovo Legion 5 Pro 16ACH6H (82JQ001PGE) | |
| Seq Read | |
| Asus ROG Zephyrus Duo 16 GX650RX | |
| Lenovo Legion Slim 7-16IAH 82TF004YGE | |
| MSI Raider GE66 12UHS | |
| Lenovo Legion 7 16ARHA7 | |
| HP Omen 16-c0077ng | |
| Lenovo Legion 5 Pro 16ACH6H (82JQ001PGE) | |
| Seq Write | |
| Asus ROG Zephyrus Duo 16 GX650RX | |
| MSI Raider GE66 12UHS | |
| Lenovo Legion 7 16ARHA7 | |
| HP Omen 16-c0077ng | |
| Lenovo Legion 5 Pro 16ACH6H (82JQ001PGE) | |
| Lenovo Legion Slim 7-16IAH 82TF004YGE | |
| 4K Read | |
| MSI Raider GE66 12UHS | |
| Lenovo Legion Slim 7-16IAH 82TF004YGE | |
| Asus ROG Zephyrus Duo 16 GX650RX | |
| Lenovo Legion 7 16ARHA7 | |
| HP Omen 16-c0077ng | |
| Lenovo Legion 5 Pro 16ACH6H (82JQ001PGE) | |
| 4K Write | |
| Asus ROG Zephyrus Duo 16 GX650RX | |
| Lenovo Legion Slim 7-16IAH 82TF004YGE | |
| MSI Raider GE66 12UHS | |
| Lenovo Legion 7 16ARHA7 | |
| HP Omen 16-c0077ng | |
| Lenovo Legion 5 Pro 16ACH6H (82JQ001PGE) | |
| 4K-64 Read | |
| MSI Raider GE66 12UHS | |
| Asus ROG Zephyrus Duo 16 GX650RX | |
| HP Omen 16-c0077ng | |
| Lenovo Legion 7 16ARHA7 | |
| Lenovo Legion Slim 7-16IAH 82TF004YGE | |
| Lenovo Legion 5 Pro 16ACH6H (82JQ001PGE) | |
| 4K-64 Write | |
| Lenovo Legion Slim 7-16IAH 82TF004YGE | |
| MSI Raider GE66 12UHS | |
| Lenovo Legion 7 16ARHA7 | |
| HP Omen 16-c0077ng | |
| Asus ROG Zephyrus Duo 16 GX650RX | |
| Lenovo Legion 5 Pro 16ACH6H (82JQ001PGE) | |
| Access Time Read | |
| Lenovo Legion 5 Pro 16ACH6H (82JQ001PGE) | |
| HP Omen 16-c0077ng | |
| Asus ROG Zephyrus Duo 16 GX650RX | |
| Lenovo Legion Slim 7-16IAH 82TF004YGE | |
| MSI Raider GE66 12UHS | |
| Lenovo Legion 7 16ARHA7 | |
| Access Time Write | |
| Lenovo Legion 5 Pro 16ACH6H (82JQ001PGE) | |
| Lenovo Legion 7 16ARHA7 | |
| HP Omen 16-c0077ng | |
| MSI Raider GE66 12UHS | |
| Lenovo Legion Slim 7-16IAH 82TF004YGE | |
| Asus ROG Zephyrus Duo 16 GX650RX | |
* ... im mniej tym lepiej
Disk Throttling: DiskSpd Read Loop, Queue Depth 8
Wydajność układu GPU - jak na GeForce RTX 3080
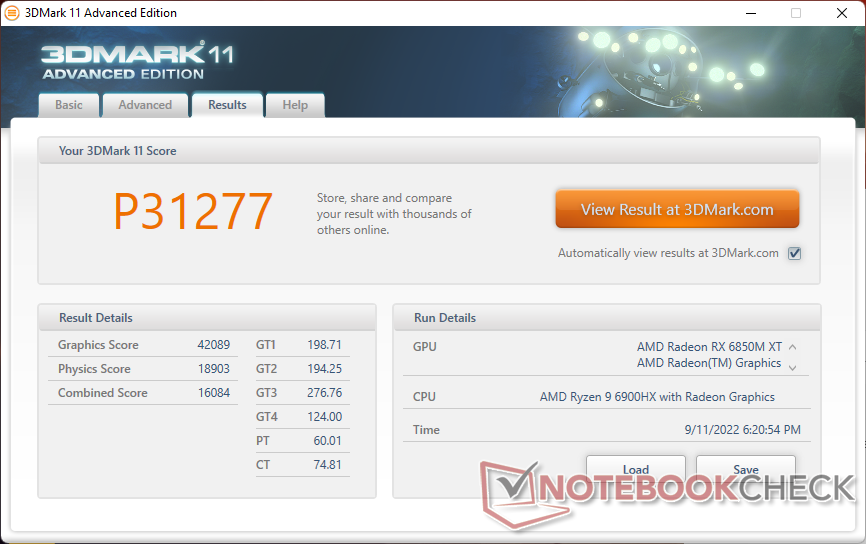
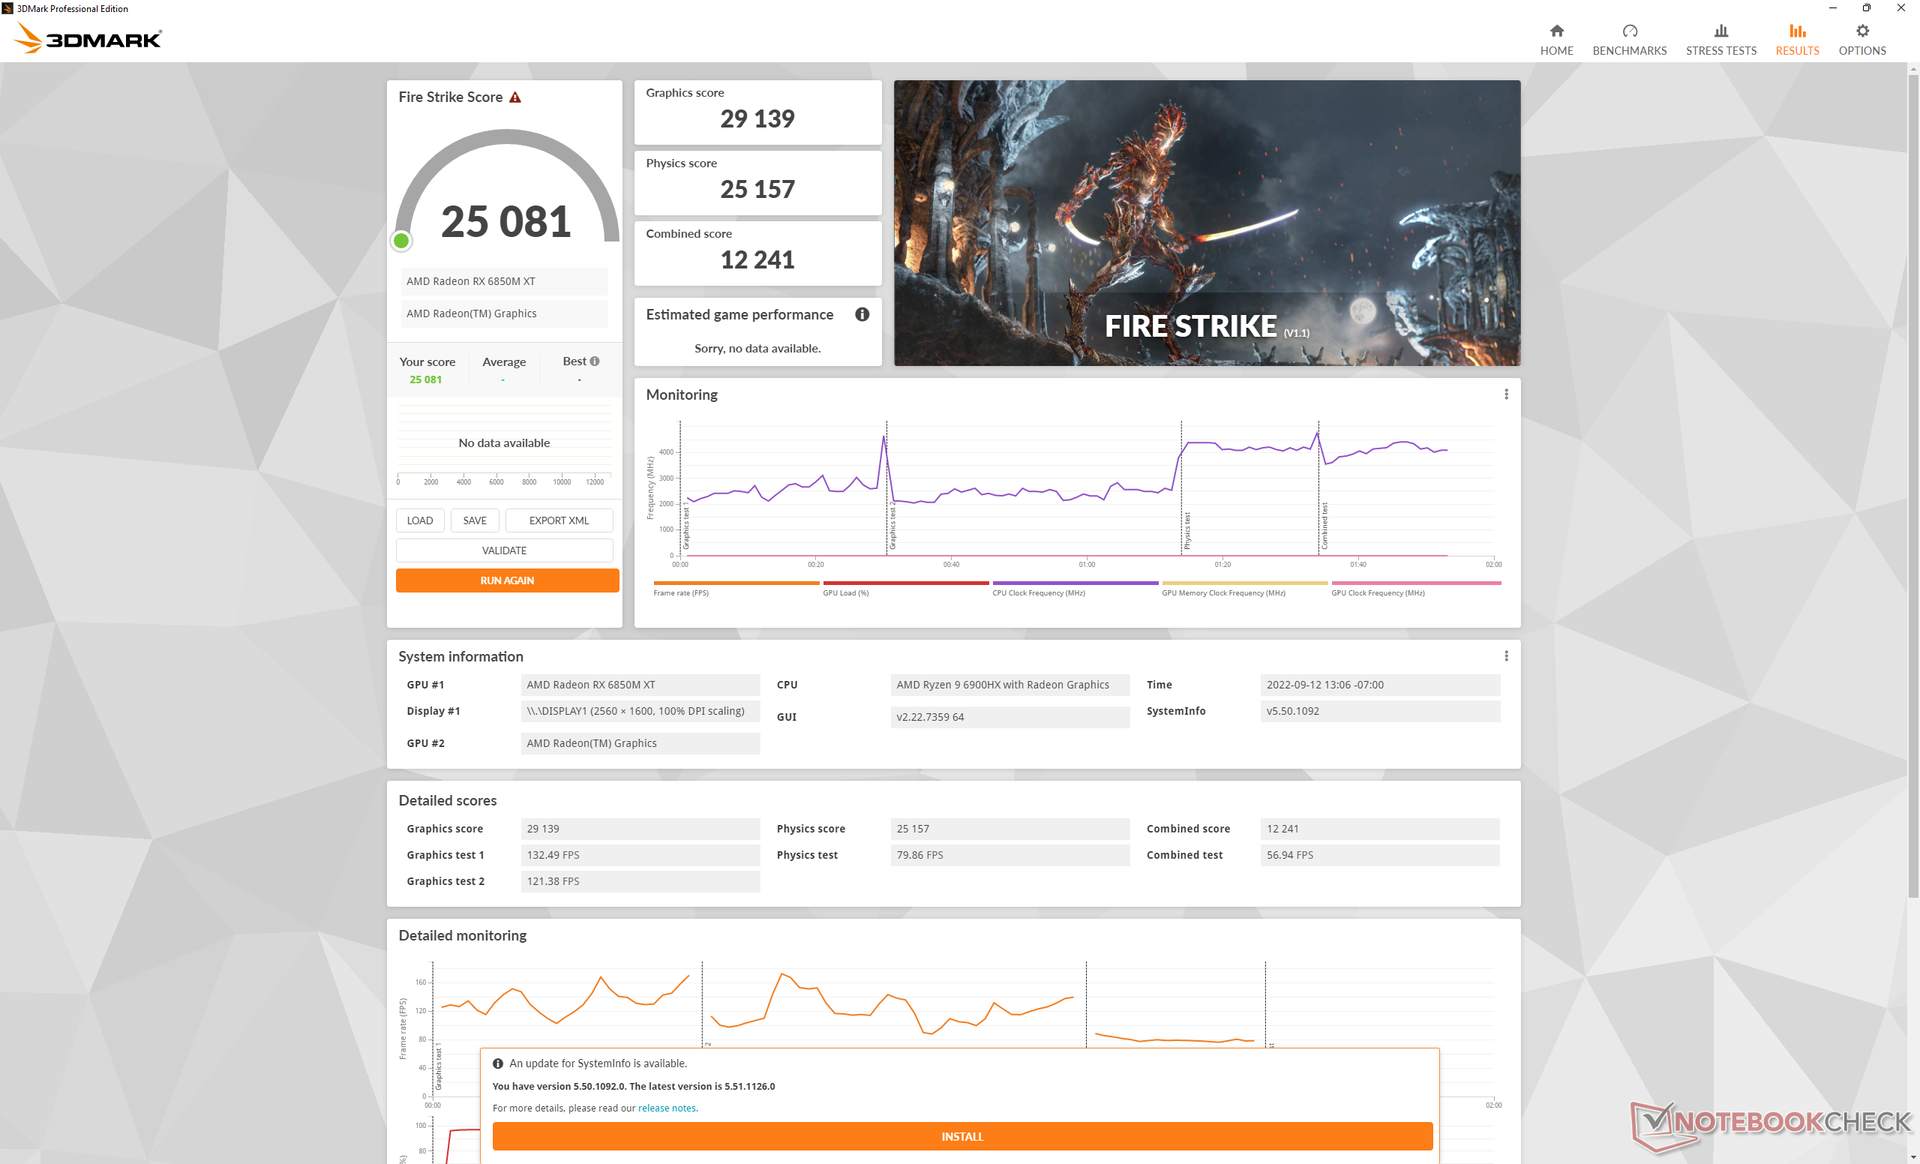
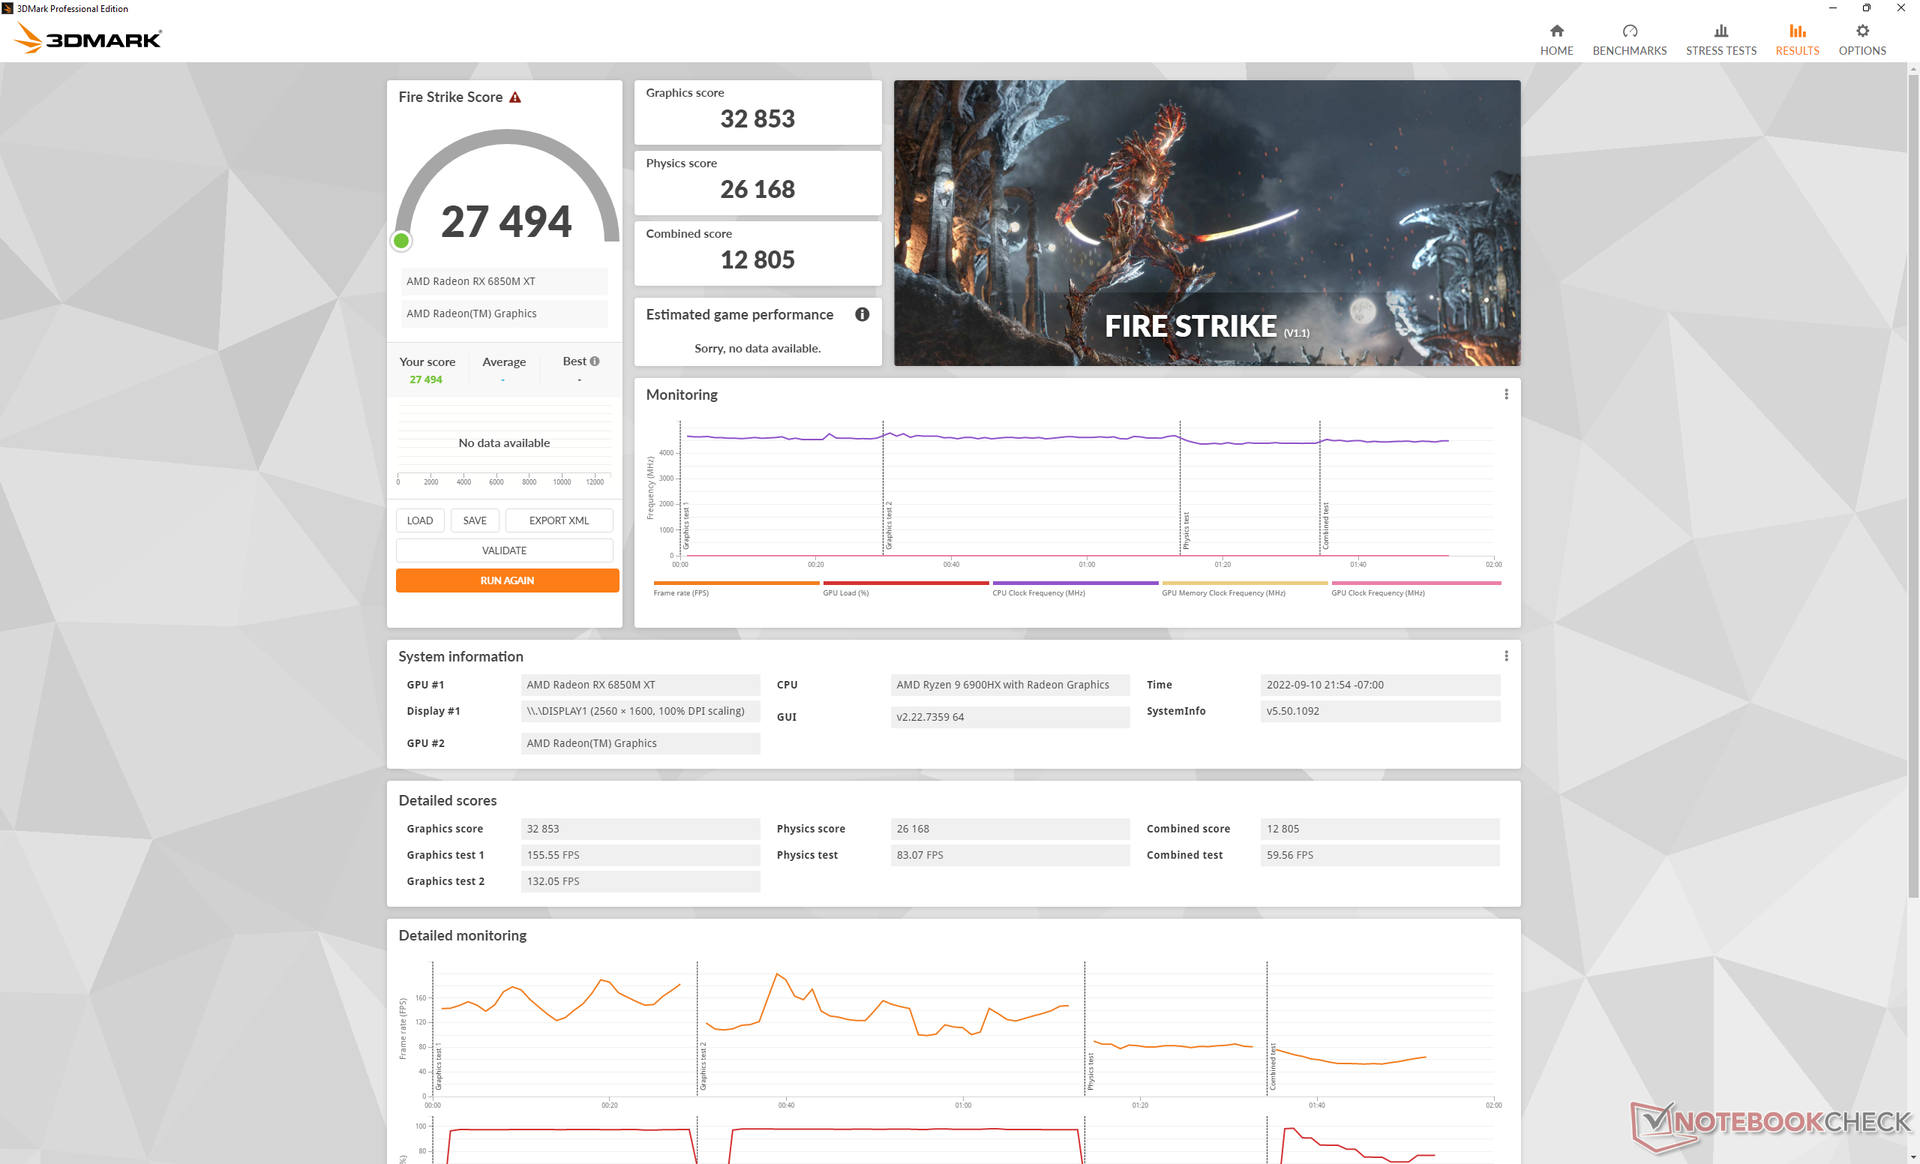
benchmarki 3DMark oceniają naszą 140 W Radeon RX 6850M XT w granicach jednocyfrowych punktów procentowych od Radeon RX 6800M z Asusa ROG Strix G15. Użytkownicy nie powinni więc oczekiwać niczego więcej, niż tylko niewielkich różnic w wydajności pomiędzy tymi dwoma procesorami graficznymi.
Niektóre jednostki SKU są wyposażone w Radeon RX 6700M o około 15 do 20 procent wolniejszej wydajności graficznej niż nasz 6850M XT. Oba warianty są najbardziej równoważne z GeForce RTX 3070 Ti lub 3080, które można znaleźć w innych ultracienkich laptopach do gier, jak np.Maingear Vector Pro czy Razer Blade 15. Na stronieMSI GS76 jest godnym uwagi wyjątkiem, ponieważ jego procesor graficzny o niskim TGP jest wolniejszy niż oczekiwano nawet dla jego ultrataniej kategorii rozmiarowej.
Uruchomienie trybu Balanced zamiast trybu Performance zmniejsza wydajność grafiki aż o 11% według 3DMark Fire Strike.
Rzeczywista wydajność w grach mieści się w granicach 10% MSI GE66 i jego procesora graficznego RTX 3080 Ti w większości przypadków. MSI wychodzi na prowadzenie w większości scenariuszy, ale przewaga w liczbie klatek na sekundę jest w większości przypadków niewielka. DOTA 2 jest niezwykłym wyjątkiem, ponieważ system Lenovo wydaje się być znacznie wolniejszy niż oczekiwano.
| 3DMark | |
| 1920x1080 Fire Strike Graphics | |
| Corsair One i300 | |
| Asus ROG Strix G15 G513QY | |
| Przeciętny AMD Radeon RX 6850M XT (32853 - 34948, n=2) | |
| Lenovo Legion 7 16ARHA7 | |
| MSI GE67 HX 12UGS | |
| MSI Raider GE66 12UHS | |
| Maingear Vector Pro MG-VCP17 | |
| MSI Delta 15 A5EFK | |
| Eurocom RX315 NH57AF1 | |
| MSI GS76 Stealth 11UH | |
| HP Omen 16-c0077ng | |
| MSI GS66 Stealth 10UG | |
| Lenovo Legion 7 15IMH05-81YT001VGE | |
| Lenovo Legion Slim 7-16IAH 82TF004YGE | |
| HP Omen 15-en0375ng | |
| 2560x1440 Time Spy Graphics | |
| Corsair One i300 | |
| MSI Raider GE66 12UHS | |
| MSI GE67 HX 12UGS | |
| Przeciętny AMD Radeon RX 6850M XT (11762 - 11912, n=2) | |
| Lenovo Legion 7 16ARHA7 | |
| Asus ROG Strix G15 G513QY | |
| Maingear Vector Pro MG-VCP17 | |
| Eurocom RX315 NH57AF1 | |
| MSI GS76 Stealth 11UH | |
| MSI Delta 15 A5EFK | |
| MSI GS66 Stealth 10UG | |
| Lenovo Legion 7 15IMH05-81YT001VGE | |
| HP Omen 16-c0077ng | |
| Lenovo Legion Slim 7-16IAH 82TF004YGE | |
| HP Omen 15-en0375ng | |
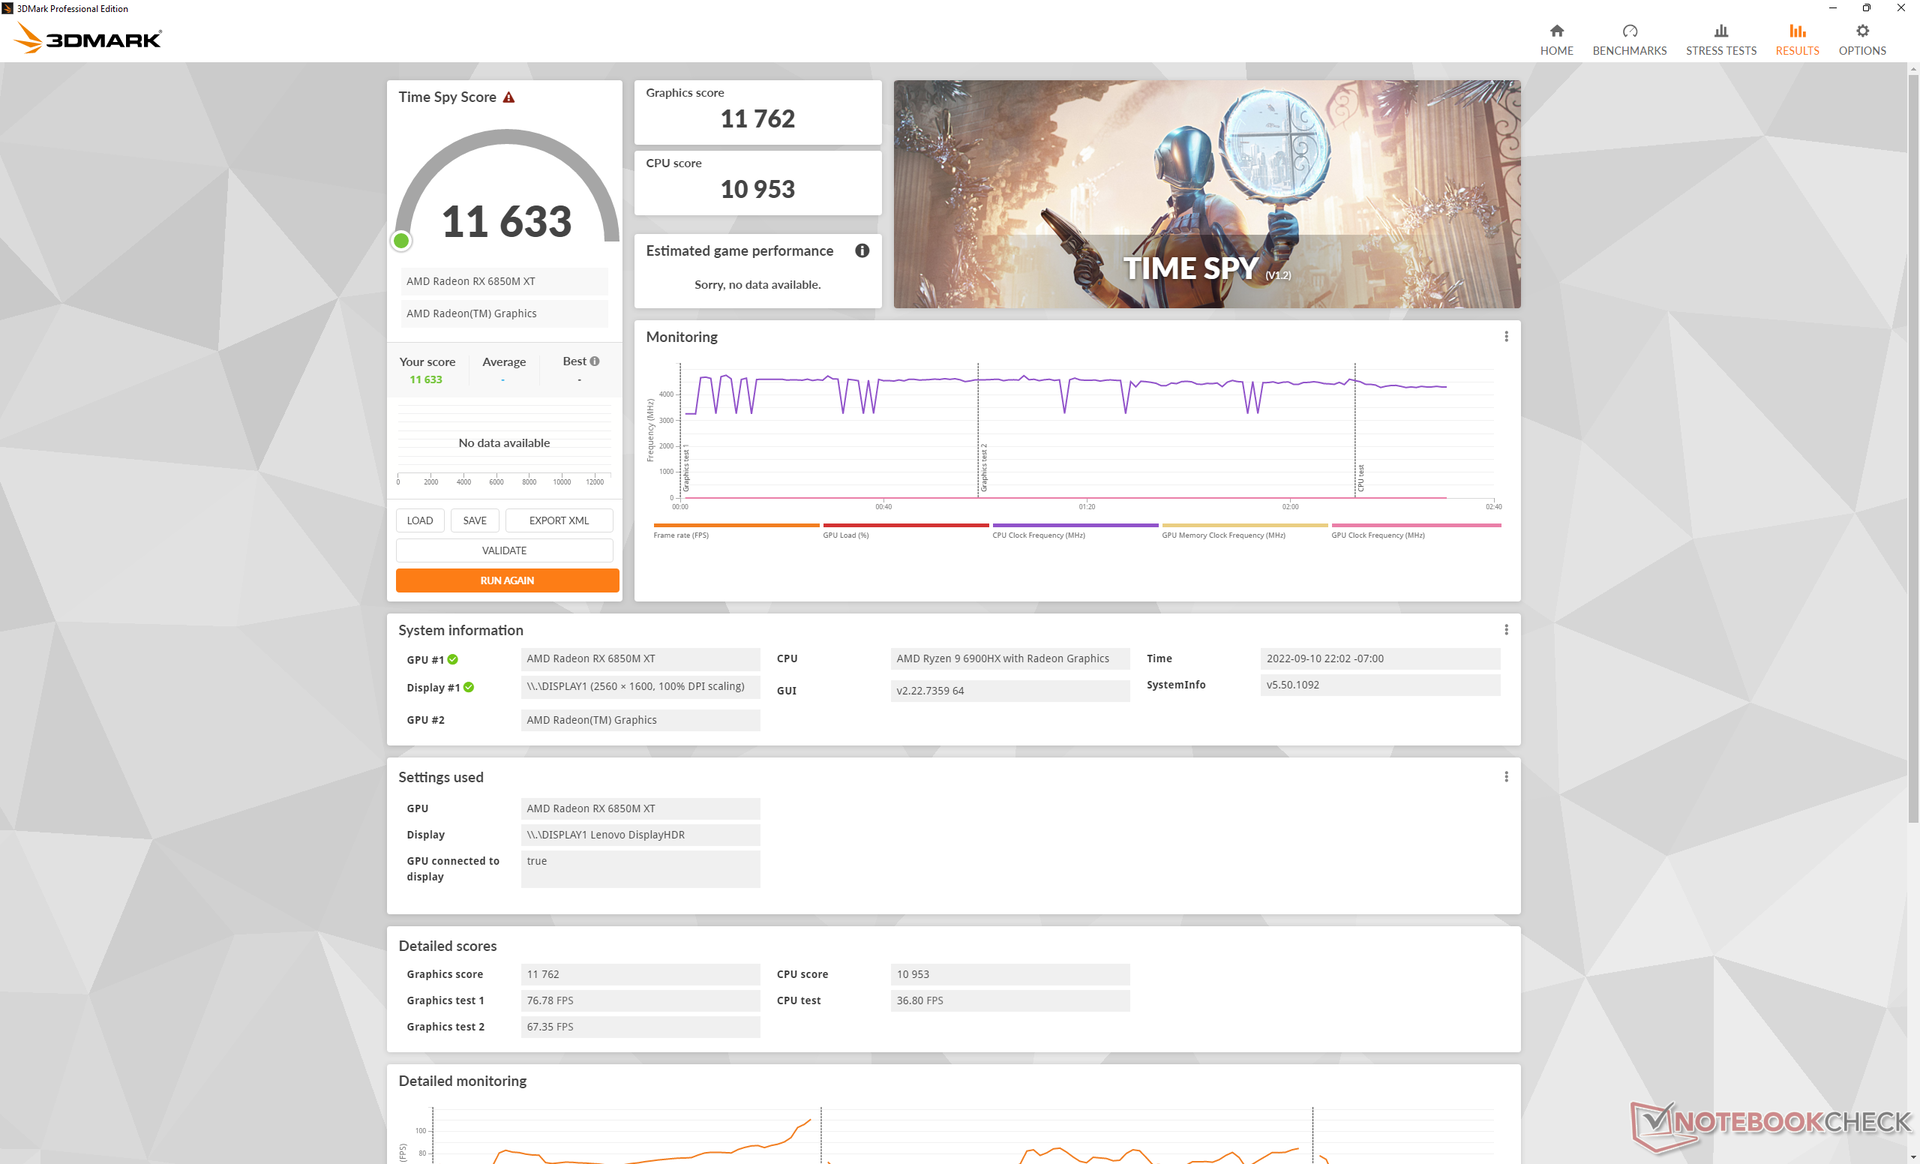
| 2560x1440 Time Spy Score | |
| Corsair One i300 | |
| MSI Raider GE66 12UHS | |
| MSI GE67 HX 12UGS | |
| Przeciętny AMD Radeon RX 6850M XT (11633 - 11666, n=2) | |
| Lenovo Legion 7 16ARHA7 | |
| Maingear Vector Pro MG-VCP17 | |
| Asus ROG Strix G15 G513QY | |
| Eurocom RX315 NH57AF1 | |
| MSI Delta 15 A5EFK | |
| MSI GS76 Stealth 11UH | |
| MSI GS66 Stealth 10UG | |
| Lenovo Legion 7 15IMH05-81YT001VGE | |
| HP Omen 16-c0077ng | |
| Lenovo Legion Slim 7-16IAH 82TF004YGE | |
| HP Omen 15-en0375ng | |
| 2560x1440 Port Royal Graphics | |
| Corsair One i300 | |
| MSI Raider GE66 12UHS | |
| Maingear Vector Pro MG-VCP17 | |
| MSI GS66 Stealth 10UG | |
| Lenovo Legion 7 16ARHA7 | |
| Przeciętny AMD Radeon RX 6850M XT (n=1) | |
| HP Omen 15-en0375ng | |
| 3DMark 11 - 1280x720 Performance GPU | |
| Corsair One i300 | |
| MSI Raider GE66 12UHS | |
| MSI GE67 HX 12UGS | |
| Lenovo Legion 7 16ARHA7 | |
| Przeciętny AMD Radeon RX 6850M XT (41942 - 42089, n=2) | |
| Asus ROG Strix G15 G513QY | |
| Maingear Vector Pro MG-VCP17 | |
| Eurocom RX315 NH57AF1 | |
| MSI GS76 Stealth 11UH | |
| MSI Delta 15 A5EFK | |
| HP Omen 16-c0077ng | |
| Lenovo Legion 7 15IMH05-81YT001VGE | |
| MSI GS66 Stealth 10UG | |
| Lenovo Legion Slim 7-16IAH 82TF004YGE | |
| HP Omen 15-en0375ng | |
| 3DMark 11 Performance | 31277 pkt. | |
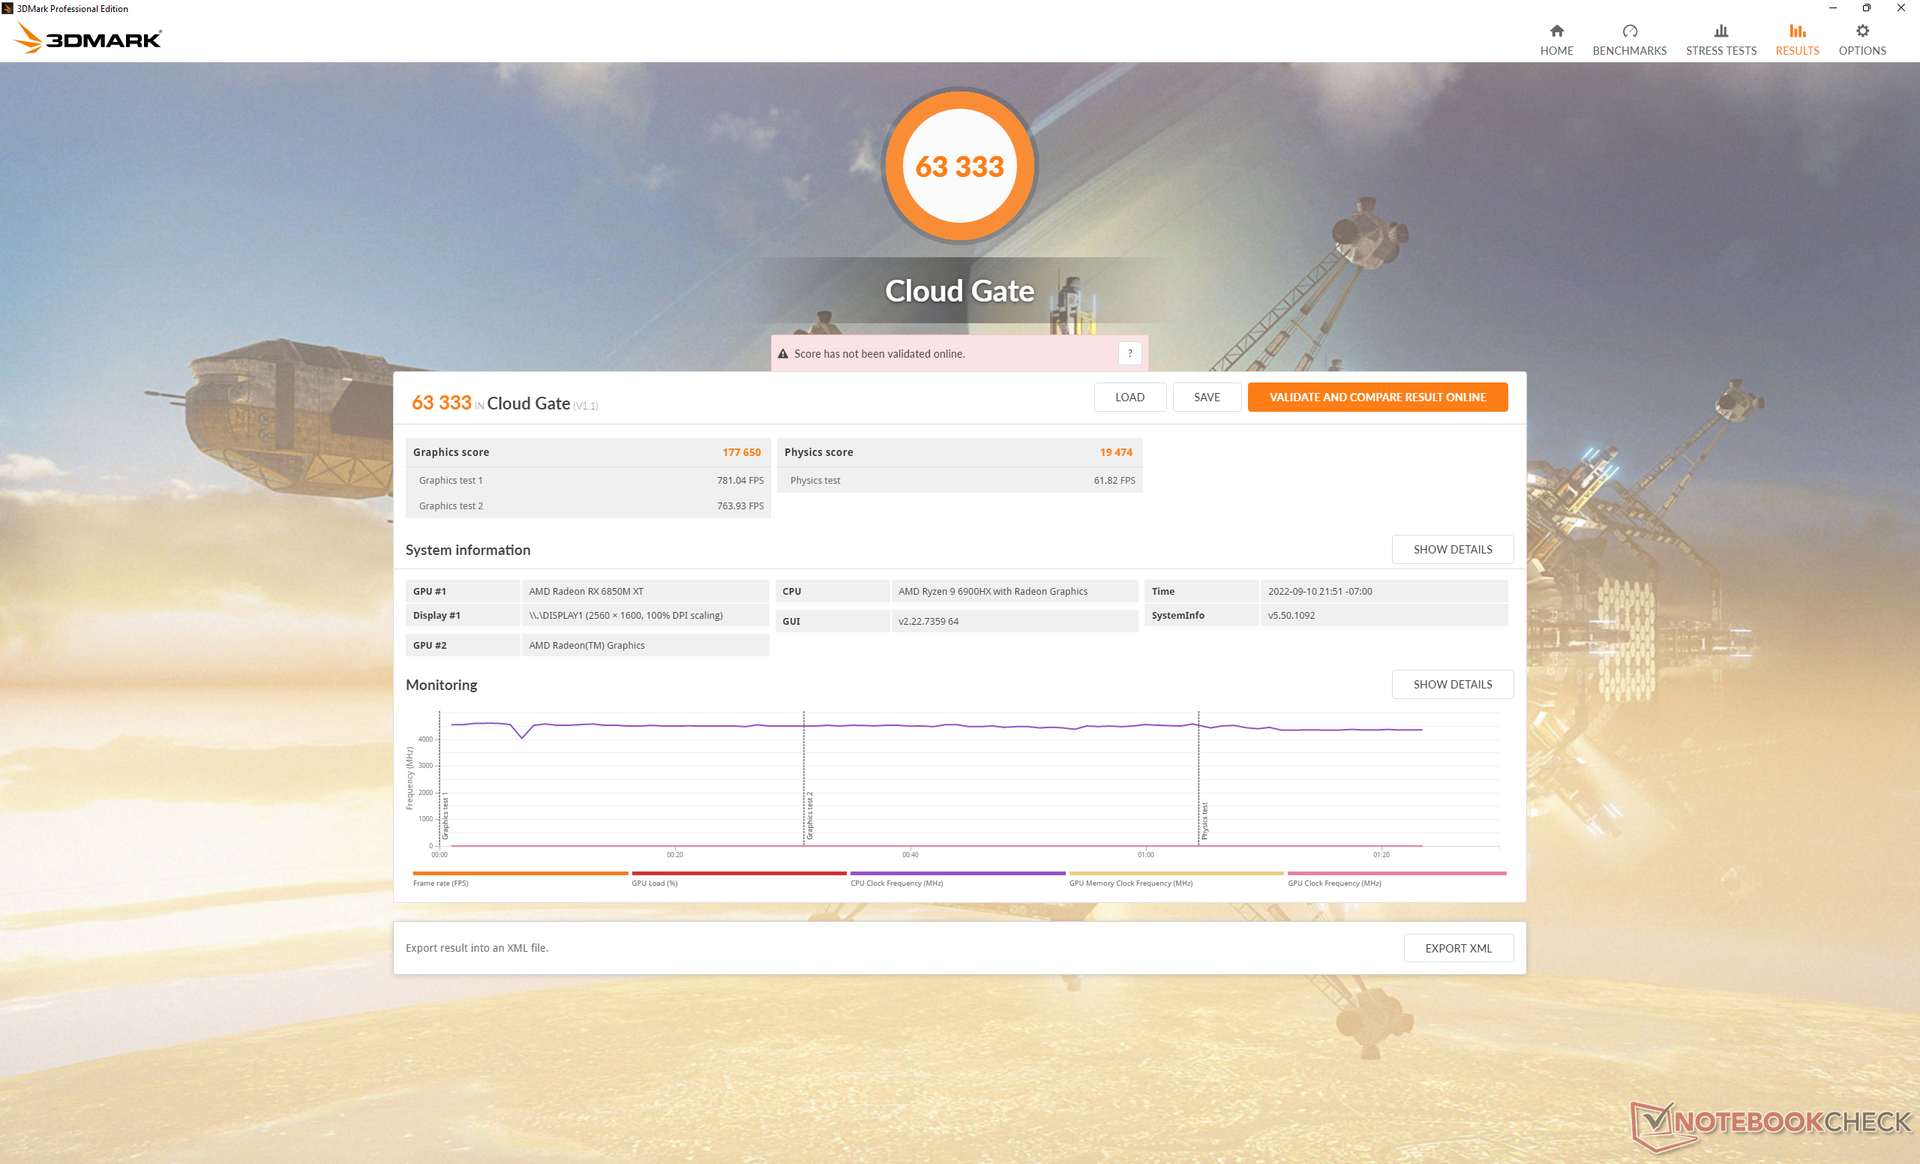
| 3DMark Cloud Gate Standard Score | 63333 pkt. | |
| 3DMark Fire Strike Score | 27494 pkt. | |
| 3DMark Time Spy Score | 11633 pkt. | |
Pomoc | ||
| Final Fantasy XV Benchmark | |
| 1280x720 Lite Quality | |
| Corsair One i300 | |
| MSI Raider GE66 12UHS | |
| MSI GE67 HX 12UGS | |
| Lenovo Legion 7 16ARHA7 | |
| Przeciętny AMD Radeon RX 6850M XT (n=1) | |
| Lenovo Legion Slim 7-16IAH 82TF004YGE | |
| Eurocom RX315 NH57AF1 | |
| MSI GS66 Stealth 10UG | |
| Asus ROG Strix G15 G513QY | |
| 1920x1080 Standard Quality | |
| Corsair One i300 | |
| MSI GE67 HX 12UGS | |
| MSI Raider GE66 12UHS | |
| Lenovo Legion 7 16ARHA7 | |
| Przeciętny AMD Radeon RX 6850M XT (n=1) | |
| Asus ROG Strix G15 G513QY | |
| Eurocom RX315 NH57AF1 | |
| MSI Delta 15 A5EFK | |
| MSI GS66 Stealth 10UG | |
| Lenovo Legion Slim 7-16IAH 82TF004YGE | |
| 1920x1080 High Quality | |
| Corsair One i300 | |
| MSI GE67 HX 12UGS | |
| MSI Raider GE66 12UHS | |
| Przeciętny AMD Radeon RX 6850M XT (111.9 - 113.6, n=2) | |
| Lenovo Legion 7 16ARHA7 | |
| Asus ROG Strix G15 G513QY | |
| Eurocom RX315 NH57AF1 | |
| MSI GS76 Stealth 11UH | |
| MSI GS66 Stealth 10UG | |
| MSI Delta 15 A5EFK | |
| HP Omen 16-c0077ng | |
| Lenovo Legion Slim 7-16IAH 82TF004YGE | |
| 2560x1440 High Quality | |
| Corsair One i300 | |
| MSI GE67 HX 12UGS | |
| MSI Raider GE66 12UHS | |
| Przeciętny AMD Radeon RX 6850M XT (83.8 - 84.5, n=2) | |
| Lenovo Legion 7 16ARHA7 | |
| MSI GS76 Stealth 11UH | |
| Lenovo Legion Slim 7-16IAH 82TF004YGE | |
| HP Omen 16-c0077ng | |
| The Witcher 3 | |
| 1024x768 Low Graphics & Postprocessing | |
| Corsair One i300 | |
| MSI GE67 HX 12UGS | |
| MSI Raider GE66 12UHS | |
| Eurocom RX315 NH57AF1 | |
| Lenovo Legion 7 16ARHA7 | |
| Lenovo Legion Slim 7-16IAH 82TF004YGE | |
| Lenovo Legion 7 15IMH05-81YT001VGE | |
| MSI GS66 Stealth 10UG | |
| Przeciętny AMD Radeon RX 6850M XT (222 - 385, n=2) | |
| Asus ROG Strix G15 G513QY | |
| 1366x768 Medium Graphics & Postprocessing | |
| Corsair One i300 | |
| MSI Raider GE66 12UHS | |
| MSI GE67 HX 12UGS | |
| Eurocom RX315 NH57AF1 | |
| Lenovo Legion 7 16ARHA7 | |
| MSI GS66 Stealth 10UG | |
| Lenovo Legion Slim 7-16IAH 82TF004YGE | |
| Lenovo Legion 7 15IMH05-81YT001VGE | |
| Przeciętny AMD Radeon RX 6850M XT (198.2 - 252, n=2) | |
| MSI Delta 15 A5EFK | |
| Asus ROG Strix G15 G513QY | |
| 1920x1080 High Graphics & Postprocessing (Nvidia HairWorks Off) | |
| Corsair One i300 | |
| MSI GE67 HX 12UGS | |
| MSI Raider GE66 12UHS | |
| Lenovo Legion 7 16ARHA7 | |
| Asus ROG Strix G15 G513QY | |
| Przeciętny AMD Radeon RX 6850M XT (188.6 - 208, n=2) | |
| Eurocom RX315 NH57AF1 | |
| MSI GS76 Stealth 11UH | |
| MSI Delta 15 A5EFK | |
| Lenovo Legion 7 15IMH05-81YT001VGE | |
| MSI GS66 Stealth 10UG | |
| Lenovo Legion Slim 7-16IAH 82TF004YGE | |
| HP Omen 16-c0077ng | |
| HP Omen 15-en0375ng | |
| 1920x1080 Ultra Graphics & Postprocessing (HBAO+) | |
| Corsair One i300 | |
| Przeciętny AMD Radeon RX 6850M XT (118.1 - 126.2, n=2) | |
| Lenovo Legion 7 16ARHA7 | |
| MSI GE67 HX 12UGS | |
| Asus ROG Strix G15 G513QY | |
| MSI Raider GE66 12UHS | |
| Eurocom RX315 NH57AF1 | |
| MSI Delta 15 A5EFK | |
| MSI GS76 Stealth 11UH | |
| MSI GS66 Stealth 10UG | |
| Lenovo Legion 7 15IMH05-81YT001VGE | |
| HP Omen 16-c0077ng | |
| Lenovo Legion Slim 7-16IAH 82TF004YGE | |
| HP Omen 15-en0375ng | |
| X-Plane 11.11 | |
| 1280x720 low (fps_test=1) | |
| Corsair One i300 | |
| MSI Raider GE66 12UHS | |
| Lenovo Legion Slim 7-16IAH 82TF004YGE | |
| MSI GE67 HX 12UGS | |
| MSI GS76 Stealth 11UH | |
| Eurocom RX315 NH57AF1 | |
| Lenovo Legion 7 15IMH05-81YT001VGE | |
| MSI GS66 Stealth 10UG | |
| HP Omen 15-en0375ng | |
| Asus ROG Strix G15 G513QY | |
| Przeciętny AMD Radeon RX 6850M XT (63.3 - 66.9, n=2) | |
| Lenovo Legion 7 16ARHA7 | |
| 1920x1080 med (fps_test=2) | |
| Corsair One i300 | |
| MSI Raider GE66 12UHS | |
| MSI GE67 HX 12UGS | |
| Lenovo Legion Slim 7-16IAH 82TF004YGE | |
| MSI GS76 Stealth 11UH | |
| Lenovo Legion 7 15IMH05-81YT001VGE | |
| Eurocom RX315 NH57AF1 | |
| MSI GS66 Stealth 10UG | |
| HP Omen 15-en0375ng | |
| Asus ROG Strix G15 G513QY | |
| Lenovo Legion 7 16ARHA7 | |
| Przeciętny AMD Radeon RX 6850M XT (51 - 51.2, n=2) | |
| 1920x1080 high (fps_test=3) | |
| Corsair One i300 | |
| MSI Raider GE66 12UHS | |
| MSI GE67 HX 12UGS | |
| Lenovo Legion Slim 7-16IAH 82TF004YGE | |
| MSI GS76 Stealth 11UH | |
| Lenovo Legion 7 15IMH05-81YT001VGE | |
| Eurocom RX315 NH57AF1 | |
| MSI GS66 Stealth 10UG | |
| HP Omen 15-en0375ng | |
| Asus ROG Strix G15 G513QY | |
| HP Omen 16-c0077ng | |
| Lenovo Legion 7 16ARHA7 | |
| Przeciętny AMD Radeon RX 6850M XT (43.3 - 44.1, n=2) | |
| Dota 2 Reborn | |
| 1280x720 min (0/3) fastest | |
| Corsair One i300 | |
| MSI Raider GE66 12UHS | |
| MSI GE67 HX 12UGS | |
| Lenovo Legion Slim 7-16IAH 82TF004YGE | |
| MSI GS76 Stealth 11UH | |
| Eurocom RX315 NH57AF1 | |
| Lenovo Legion 7 15IMH05-81YT001VGE | |
| Lenovo Legion 7 16ARHA7 | |
| Przeciętny AMD Radeon RX 6850M XT (134.7 - 147.3, n=2) | |
| MSI GS66 Stealth 10UG | |
| HP Omen 15-en0375ng | |
| 1366x768 med (1/3) | |
| Corsair One i300 | |
| MSI Raider GE66 12UHS | |
| MSI GE67 HX 12UGS | |
| Lenovo Legion Slim 7-16IAH 82TF004YGE | |
| MSI GS76 Stealth 11UH | |
| Eurocom RX315 NH57AF1 | |
| Lenovo Legion 7 15IMH05-81YT001VGE | |
| MSI Delta 15 A5EFK | |
| MSI GS66 Stealth 10UG | |
| HP Omen 15-en0375ng | |
| Przeciętny AMD Radeon RX 6850M XT (110.9 - 116.5, n=2) | |
| Lenovo Legion 7 16ARHA7 | |
| 1920x1080 high (2/3) | |
| Corsair One i300 | |
| MSI Raider GE66 12UHS | |
| MSI GE67 HX 12UGS | |
| Lenovo Legion Slim 7-16IAH 82TF004YGE | |
| MSI GS76 Stealth 11UH | |
| Eurocom RX315 NH57AF1 | |
| Lenovo Legion 7 15IMH05-81YT001VGE | |
| MSI Delta 15 A5EFK | |
| MSI GS66 Stealth 10UG | |
| HP Omen 16-c0077ng | |
| Lenovo Legion 7 16ARHA7 | |
| Przeciętny AMD Radeon RX 6850M XT (112.5 - 113.7, n=2) | |
| HP Omen 15-en0375ng | |
| 1920x1080 ultra (3/3) best looking | |
| Corsair One i300 | |
| MSI Raider GE66 12UHS | |
| MSI GE67 HX 12UGS | |
| Lenovo Legion Slim 7-16IAH 82TF004YGE | |
| MSI GS76 Stealth 11UH | |
| Eurocom RX315 NH57AF1 | |
| Lenovo Legion 7 15IMH05-81YT001VGE | |
| MSI Delta 15 A5EFK | |
| MSI GS66 Stealth 10UG | |
| HP Omen 16-c0077ng | |
| HP Omen 15-en0375ng | |
| Lenovo Legion 7 16ARHA7 | |
| Przeciętny AMD Radeon RX 6850M XT (94 - 95.2, n=2) | |
| Cyberpunk 2077 1.6 | |
| 1920x1080 Low Preset | |
| Lenovo Legion 7 16ARHA7 | |
| Przeciętny AMD Radeon RX 6850M XT (n=1) | |
| MSI Raider GE66 12UHS | |
| MSI GE67 HX 12UGS | |
| 1920x1080 Medium Preset | |
| MSI Raider GE66 12UHS | |
| Lenovo Legion 7 16ARHA7 | |
| Przeciętny AMD Radeon RX 6850M XT (n=1) | |
| MSI GE67 HX 12UGS | |
| 1920x1080 High Preset | |
| MSI Raider GE66 12UHS | |
| MSI GE67 HX 12UGS | |
| Lenovo Legion 7 16ARHA7 | |
| Przeciętny AMD Radeon RX 6850M XT (n=1) | |
| 1920x1080 Ultra Preset | |
| MSI Raider GE66 12UHS | |
| MSI GE67 HX 12UGS | |
| Lenovo Legion 7 16ARHA7 | |
| Przeciętny AMD Radeon RX 6850M XT (n=1) | |
| 2560x1440 Ultra Preset | |
| MSI Raider GE66 12UHS | |
| MSI GE67 HX 12UGS | |
| Przeciętny AMD Radeon RX 6850M XT (53.6 - 57, n=2) | |
| Lenovo Legion 7 16ARHA7 | |
| GTA V | |
| 1024x768 Lowest Settings possible | |
| Corsair One i300 | |
| MSI Raider GE66 12UHS | |
| MSI GE67 HX 12UGS | |
| Lenovo Legion Slim 7-16IAH 82TF004YGE | |
| Eurocom RX315 NH57AF1 | |
| Lenovo Legion 7 16ARHA7 | |
| MSI GS66 Stealth 10UG | |
| Przeciętny AMD Radeon RX 6850M XT (173.2 - 179.2, n=2) | |
| Asus ROG Strix G15 G513QY | |
| HP Omen 15-en0375ng | |
| 1920x1080 Lowest Settings possible | |
| Corsair One i300 | |
| MSI GE67 HX 12UGS | |
| Lenovo Legion Slim 7-16IAH 82TF004YGE | |
| Lenovo Legion 7 16ARHA7 | |
| Eurocom RX315 NH57AF1 | |
| Przeciętny AMD Radeon RX 6850M XT (173.7 - 180.1, n=2) | |
| MSI GS66 Stealth 10UG | |
| HP Omen 15-en0375ng | |
| Asus ROG Strix G15 G513QY | |
| 1366x768 Normal/Off AF:4x | |
| Corsair One i300 | |
| MSI GE67 HX 12UGS | |
| MSI Raider GE66 12UHS | |
| Lenovo Legion Slim 7-16IAH 82TF004YGE | |
| Eurocom RX315 NH57AF1 | |
| Lenovo Legion 7 16ARHA7 | |
| Przeciętny AMD Radeon RX 6850M XT (168.3 - 173.4, n=2) | |
| MSI GS66 Stealth 10UG | |
| MSI Delta 15 A5EFK | |
| HP Omen 15-en0375ng | |
| Asus ROG Strix G15 G513QY | |
| 1920x1080 Normal/Off AF:4x | |
| Corsair One i300 | |
| MSI GE67 HX 12UGS | |
| Lenovo Legion Slim 7-16IAH 82TF004YGE | |
| Lenovo Legion 7 16ARHA7 | |
| Eurocom RX315 NH57AF1 | |
| Przeciętny AMD Radeon RX 6850M XT (168.2 - 173.4, n=2) | |
| MSI Delta 15 A5EFK | |
| MSI GS66 Stealth 10UG | |
| HP Omen 15-en0375ng | |
| Asus ROG Strix G15 G513QY | |
| 1920x1080 High/On (Advanced Graphics Off) AA:2xMSAA + FX AF:8x | |
| Corsair One i300 | |
| MSI GE67 HX 12UGS | |
| MSI Raider GE66 12UHS | |
| Lenovo Legion Slim 7-16IAH 82TF004YGE | |
| MSI GS76 Stealth 11UH | |
| Lenovo Legion 7 16ARHA7 | |
| Eurocom RX315 NH57AF1 | |
| Przeciętny AMD Radeon RX 6850M XT (152 - 162.4, n=2) | |
| MSI GS66 Stealth 10UG | |
| MSI Delta 15 A5EFK | |
| HP Omen 16-c0077ng | |
| HP Omen 15-en0375ng | |
| Asus ROG Strix G15 G513QY | |
| 1920x1080 Highest AA:4xMSAA + FX AF:16x | |
| Corsair One i300 | |
| MSI GE67 HX 12UGS | |
| MSI Raider GE66 12UHS | |
| MSI GS76 Stealth 11UH | |
| Lenovo Legion Slim 7-16IAH 82TF004YGE | |
| Lenovo Legion 7 16ARHA7 | |
| Eurocom RX315 NH57AF1 | |
| Przeciętny AMD Radeon RX 6850M XT (92.6 - 96.9, n=2) | |
| MSI GS66 Stealth 10UG | |
| MSI Delta 15 A5EFK | |
| Asus ROG Strix G15 G513QY | |
| HP Omen 16-c0077ng | |
| HP Omen 15-en0375ng | |
| 2560x1440 Highest AA:4xMSAA + FX AF:16x | |
| Corsair One i300 | |
| MSI GE67 HX 12UGS | |
| Lenovo Legion 7 16ARHA7 | |
| Przeciętny AMD Radeon RX 6850M XT (88.7 - 90, n=2) | |
| MSI GS76 Stealth 11UH | |
| Lenovo Legion Slim 7-16IAH 82TF004YGE | |
| HP Omen 16-c0077ng | |
| Strange Brigade | |
| 1280x720 lowest AF:1 | |
| Corsair One i300 | |
| MSI Raider GE66 12UHS | |
| MSI GE67 HX 12UGS | |
| Lenovo Legion 7 16ARHA7 | |
| Eurocom RX315 NH57AF1 | |
| Przeciętny AMD Radeon RX 6850M XT (375 - 445, n=2) | |
| Lenovo Legion Slim 7-16IAH 82TF004YGE | |
| MSI GS66 Stealth 10UG | |
| Asus ROG Strix G15 G513QY | |
| 1920x1080 medium AA:medium AF:4 | |
| Corsair One i300 | |
| Lenovo Legion 7 16ARHA7 | |
| Przeciętny AMD Radeon RX 6850M XT (291 - 303, n=2) | |
| MSI GE67 HX 12UGS | |
| MSI Raider GE66 12UHS | |
| Eurocom RX315 NH57AF1 | |
| MSI GS66 Stealth 10UG | |
| Asus ROG Strix G15 G513QY | |
| MSI Delta 15 A5EFK | |
| Lenovo Legion Slim 7-16IAH 82TF004YGE | |
| 1920x1080 high AA:high AF:8 | |
| Corsair One i300 | |
| Lenovo Legion 7 16ARHA7 | |
| Przeciętny AMD Radeon RX 6850M XT (256 - 261, n=2) | |
| MSI GE67 HX 12UGS | |
| MSI Raider GE66 12UHS | |
| Eurocom RX315 NH57AF1 | |
| Asus ROG Strix G15 G513QY | |
| MSI Delta 15 A5EFK | |
| MSI GS76 Stealth 11UH | |
| MSI GS66 Stealth 10UG | |
| HP Omen 16-c0077ng | |
| Lenovo Legion Slim 7-16IAH 82TF004YGE | |
| 1920x1080 ultra AA:ultra AF:16 | |
| Corsair One i300 | |
| Przeciętny AMD Radeon RX 6850M XT (224 - 230, n=2) | |
| Lenovo Legion 7 16ARHA7 | |
| MSI GE67 HX 12UGS | |
| MSI Raider GE66 12UHS | |
| Asus ROG Strix G15 G513QY | |
| Eurocom RX315 NH57AF1 | |
| MSI Delta 15 A5EFK | |
| MSI GS76 Stealth 11UH | |
| MSI GS66 Stealth 10UG | |
| HP Omen 16-c0077ng | |
| Lenovo Legion Slim 7-16IAH 82TF004YGE | |
| 2560x1440 ultra AA:ultra AF:16 | |
| Corsair One i300 | |
| Przeciętny AMD Radeon RX 6850M XT (161.7 - 171, n=2) | |
| Lenovo Legion 7 16ARHA7 | |
| MSI GE67 HX 12UGS | |
| MSI Raider GE66 12UHS | |
| MSI GS76 Stealth 11UH | |
| HP Omen 16-c0077ng | |
| Lenovo Legion Slim 7-16IAH 82TF004YGE | |
Witcher 3 FPS Chart
| low | med. | high | ultra | QHD | |
|---|---|---|---|---|---|
| GTA V (2015) | 179.2 | 173.4 | 162.4 | 96.9 | 90 |
| The Witcher 3 (2015) | 384.5 | 251.6 | 208.1 | 118.1 | |
| Dota 2 Reborn (2015) | 147.3 | 110.9 | 113.7 | 95.2 | |
| Final Fantasy XV Benchmark (2018) | 180.6 | 148.5 | 111.9 | 83.8 | |
| X-Plane 11.11 (2018) | 63.3 | 51.2 | 44.1 | ||
| Strange Brigade (2018) | 445 | 303 | 261 | 224 | 161.7 |
| Metro Exodus (2019) | 157.4 | 150.7 | 109.6 | 86.9 | 68.4 |
| Borderlands 3 (2019) | 112.8 | 102.1 | 94.2 | 85.6 | 68.6 |
| Gears Tactics (2020) | 153 | 252.2 | 155.5 | 117.8 | 83.6 |
| Horizon Zero Dawn (2020) | 181 | 159 | 142 | 123 | 100 |
| Watch Dogs Legion (2020) | 120 | 119 | 108 | 83 | 60 |
| Dirt 5 (2020) | 270 | 169.5 | 131.7 | 110.5 | 89.3 |
| Assassin´s Creed Valhalla (2020) | 235 | 159 | 130 | 112 | 82 |
| Hitman 3 (2021) | 211.9 | 192.6 | 192.9 | 191.3 | 136.1 |
| F1 2021 (2021) | 351 | 308 | 297 | 146 | 95 |
| Far Cry 6 (2021) | 123 | 112 | 100 | 99 | 87 |
| Guardians of the Galaxy (2021) | 130 | 131 | 132 | 129 | 103 |
| God of War (2022) | 89 | 95.6 | 94.5 | 78.4 | 64.7 |
| Cyberpunk 2077 1.6 (2022) | 160 | 135.5 | 105.8 | 87.2 | 53.6 |
| F1 22 (2022) | 245 | 241 | 204 | 52 | 31 |
Emisje
Szum systemu - Loud Gamer
Wewnętrzne wentylatory są generalnie bardzo ciche przy niskim lub średnim obciążeniu. Na przykład w programie 3DMark 06, pod koniec pierwszej 90-sekundowej sceny benchmarku, hałas systemowy osiągnął zaledwie 26,8 dB(A), podczas gdy ciche tło wynosiło 22,8 dB(A). Powtarzając ten sam test na MSI GE66 lub Omen 16 przyniosłoby znacznie głośniejsze wentylatory w zakresie 40-50 dB(A).
Szum wentylatorów stabilizuje się na poziomie 47,2 dB(A) i 54,3 dB(A) podczas pracy w trybach odpowiednio Balanced i Performance Witcher 3 w trybach Zrównoważony i Wydajny. System jest więc znacznie cichszy podczas gry w trybie Balanced, więc użytkownicy mogą rozważyć poświęcenie części wydajności graficznej na rzecz cichszych wentylatorów w zależności od środowiska. Zakres 50 dB(A) jest bardzo głośny i jest niestety powszechny wśród większości laptopów do gier.
Hałas
| luz |
| 23 / 23 / 23 dB |
| obciążenie |
| 26.8 / 54.2 dB |
 | ||
30 dB cichy 40 dB(A) słyszalny 50 dB(A) irytujący |
||
min: | ||
| Lenovo Legion 7 16ARHA7 Radeon RX 6850M XT, R9 6900HX, Samsung PM9A1 MZVL22T0HBLB | MSI Raider GE66 12UHS GeForce RTX 3080 Ti Laptop GPU, i9-12900HK, Samsung PM9A1 MZVL22T0HBLB | Lenovo Legion Slim 7-16IAH 82TF004YGE GeForce RTX 3060 Laptop GPU, i7-12700H, SK Hynix HFS001TEJ9X115N | Asus ROG Zephyrus Duo 16 GX650RX GeForce RTX 3080 Ti Laptop GPU, R9 6900HX, 2x Samsung SSD 980 Pro 2TB MZ-V8P2T0 (RAID 0) | HP Omen 16-c0077ng Radeon RX 6600M, R7 5800H, Samsung PM981a MZVLB1T0HBLR | Lenovo Legion 5 Pro 16ACH6H (82JQ001PGE) GeForce RTX 3070 Laptop GPU, R7 5800H, WDC PC SN730 SDBPNTY-1T00 | |
|---|---|---|---|---|---|---|
| Noise | -24% | -8% | -15% | -35% | -6% | |
| wyłączone / środowisko * (dB) | 22.8 | 26 -14% | 23 -1% | 26 -14% | 25 -10% | 23 -1% |
| Idle Minimum * (dB) | 23 | 27 -17% | 23 -0% | 26 -13% | 25 -9% | 25 -9% |
| Idle Average * (dB) | 23 | 30 -30% | 23 -0% | 27 -17% | 31.2 -36% | 25 -9% |
| Idle Maximum * (dB) | 23 | 39 -70% | 23 -0% | 29 -26% | 33.8 -47% | 25 -9% |
| Load Average * (dB) | 26.8 | 45 -68% | 43.7 -63% | 41 -53% | 55.4 -107% | 35.5 -32% |
| Witcher 3 ultra * (dB) | 54.3 | 45 17% | 51.7 5% | 48 12% | 46.67 14% | |
| Load Maximum * (dB) | 54.2 | 47 13% | 52 4% | 50 8% | 56 -3% | 50.35 7% |
* ... im mniej tym lepiej
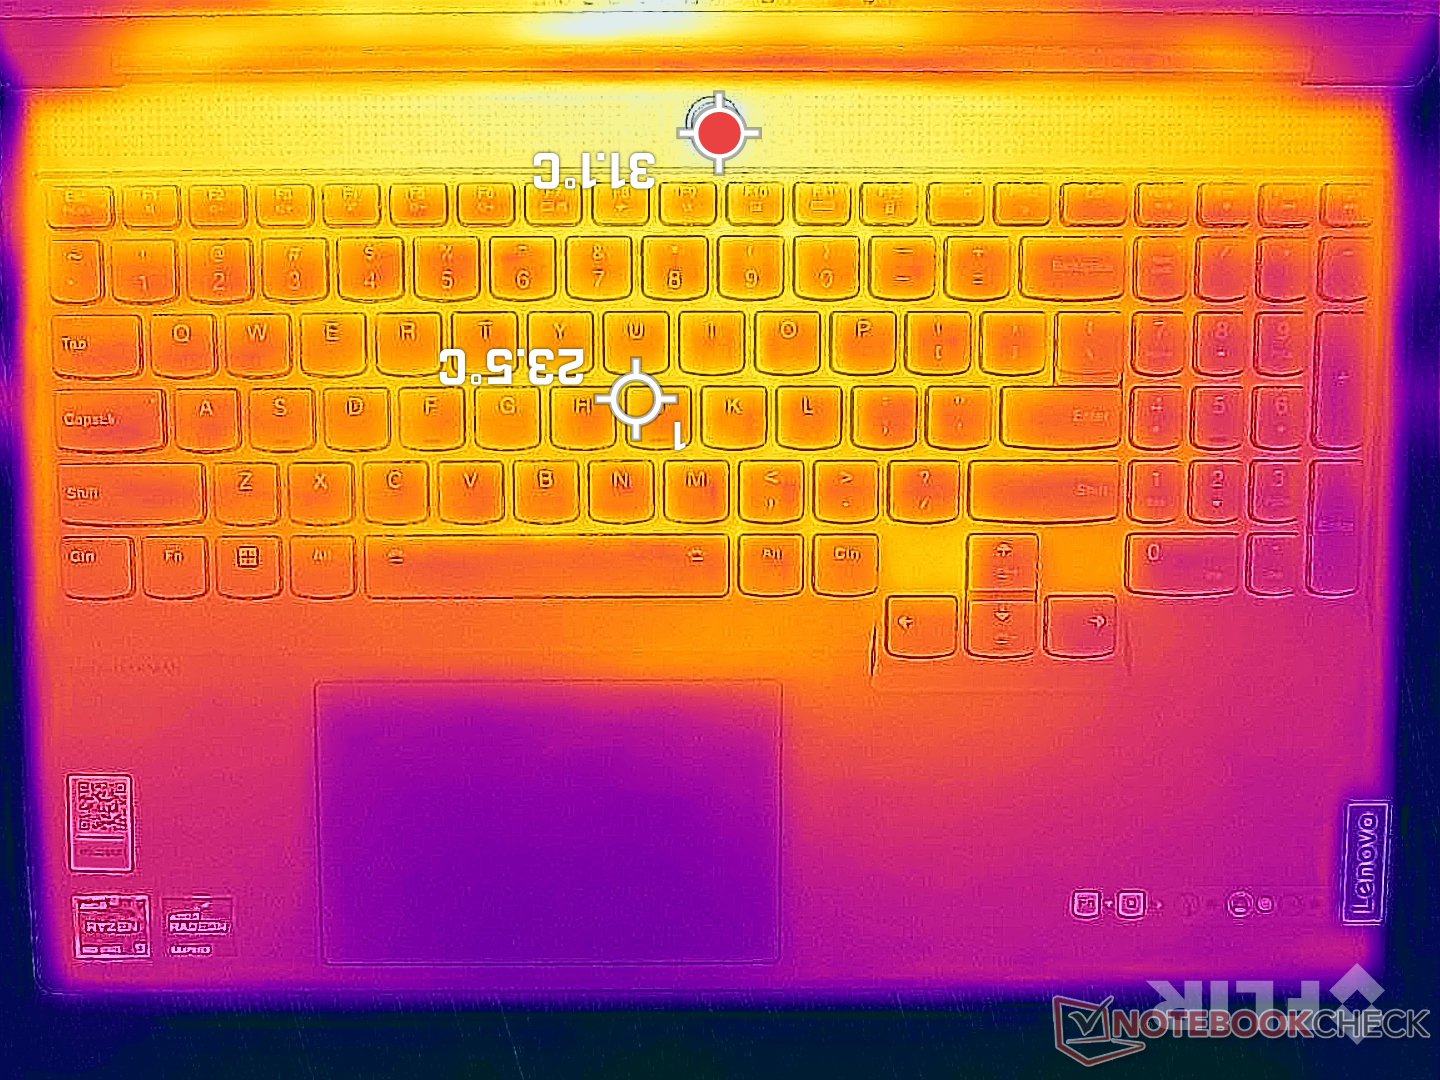
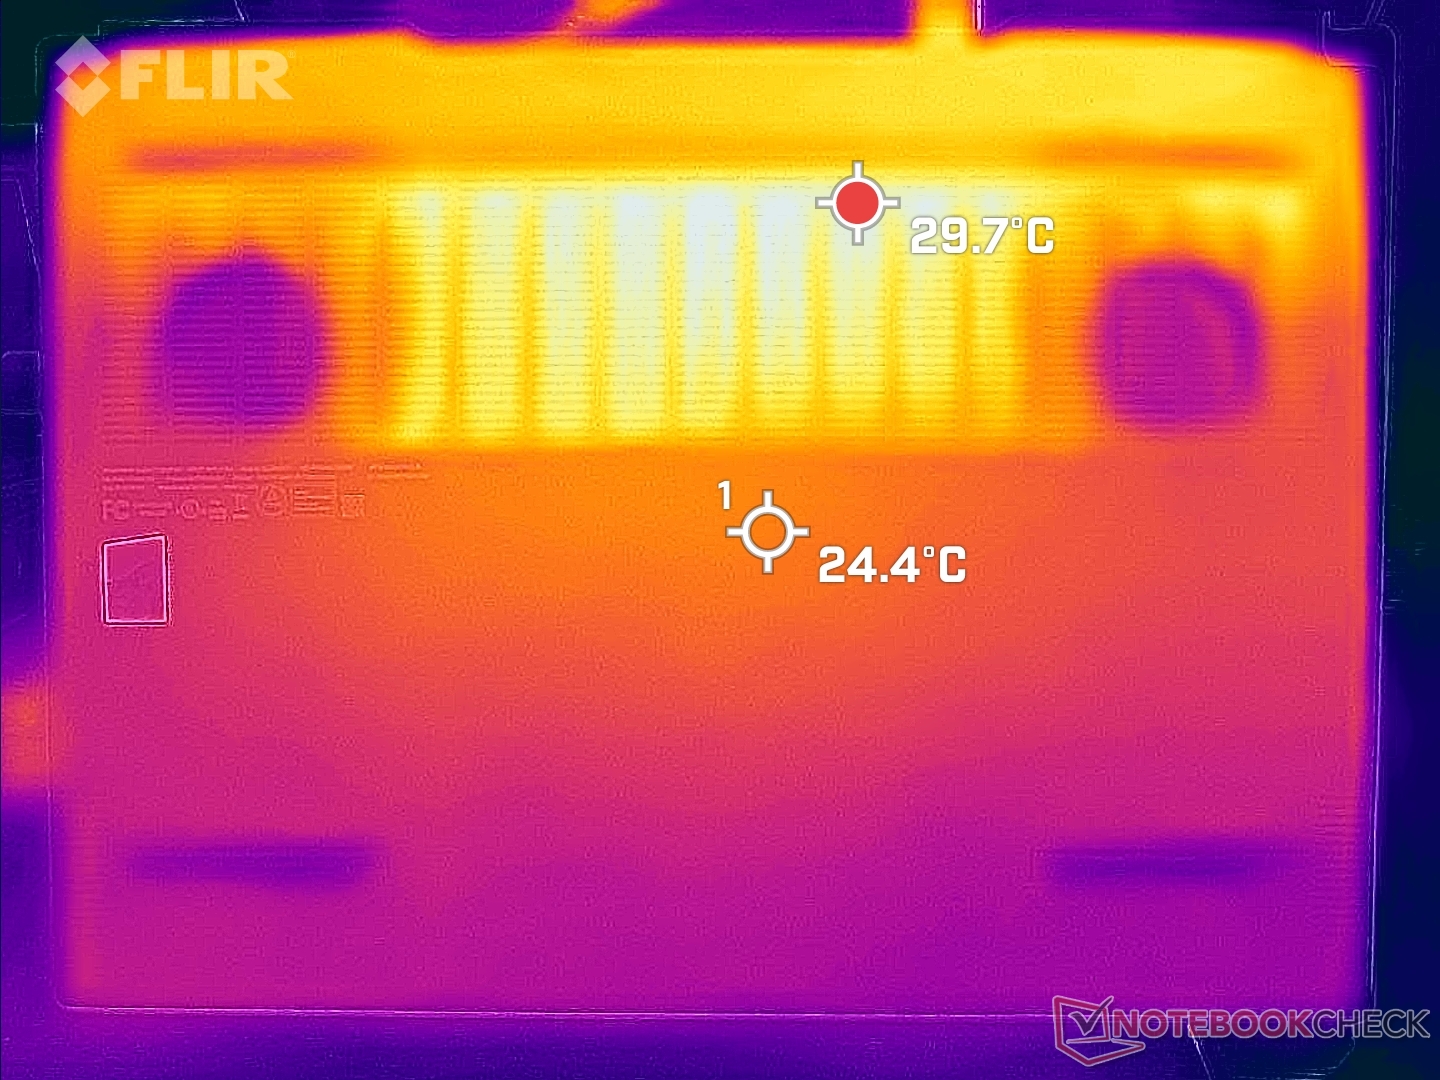
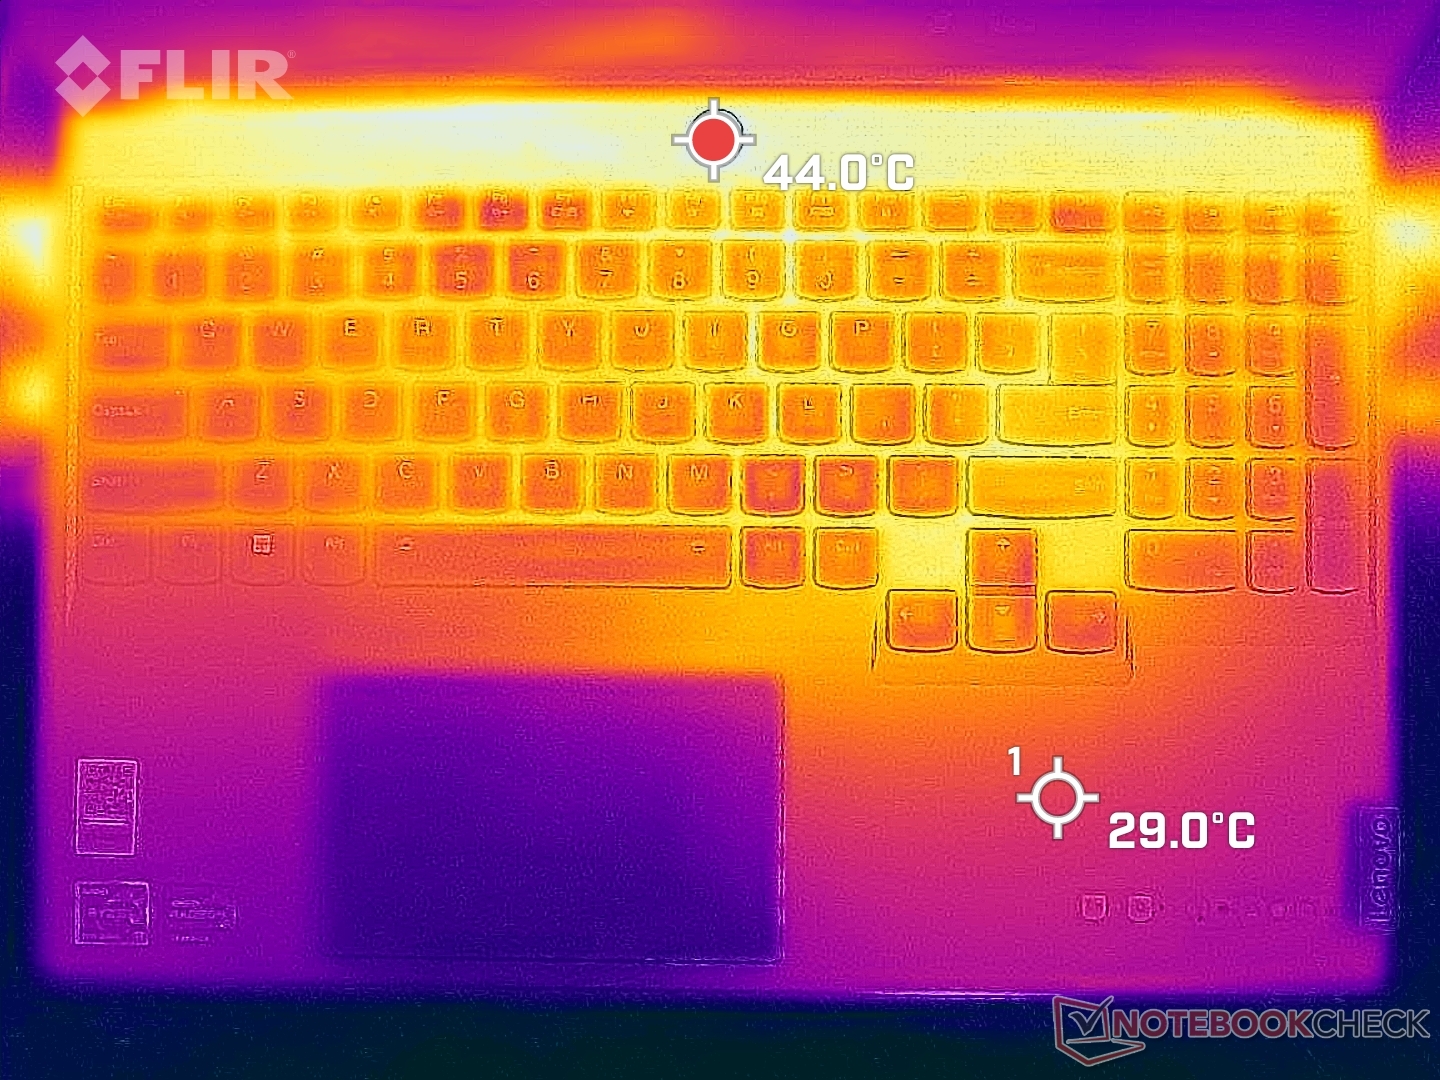
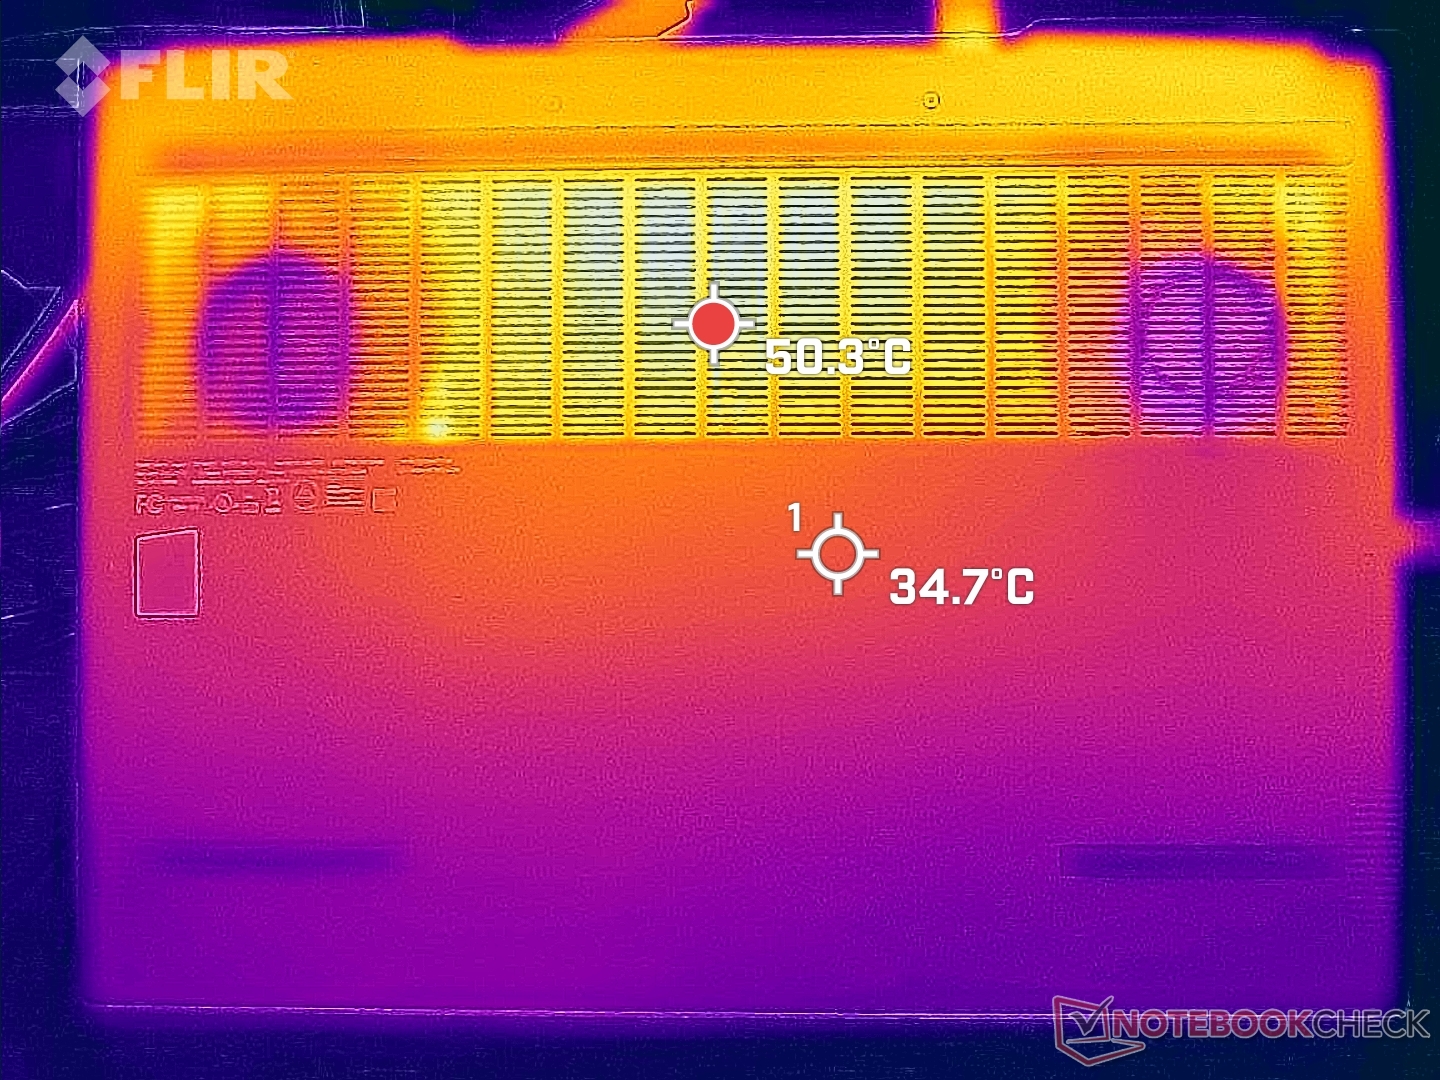
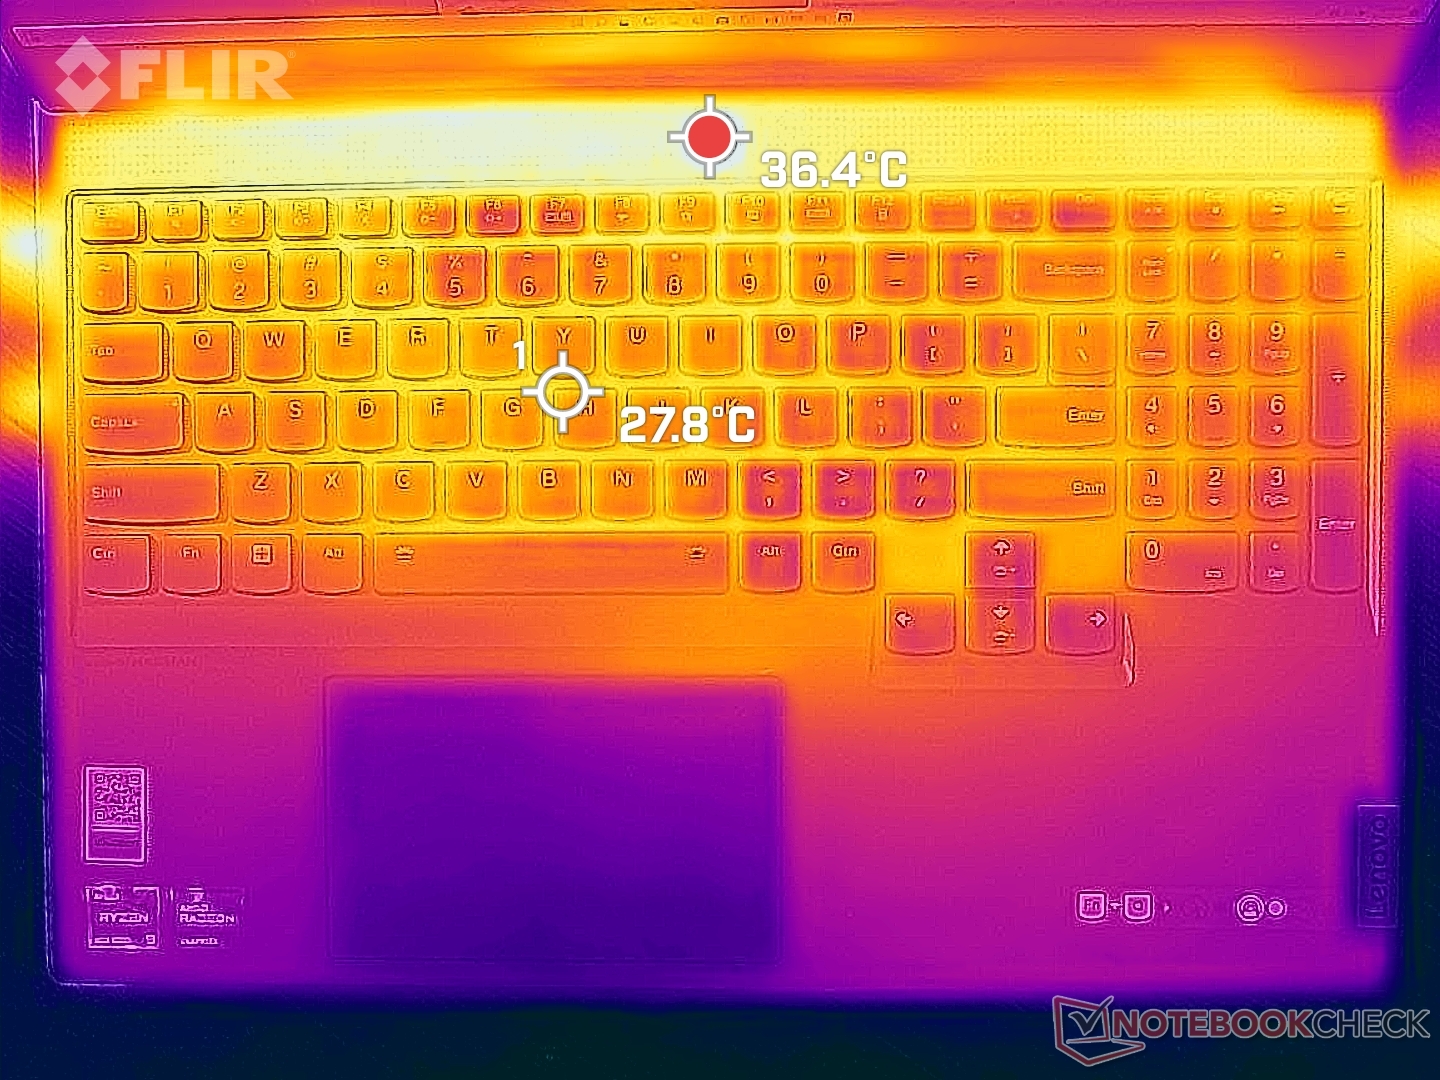
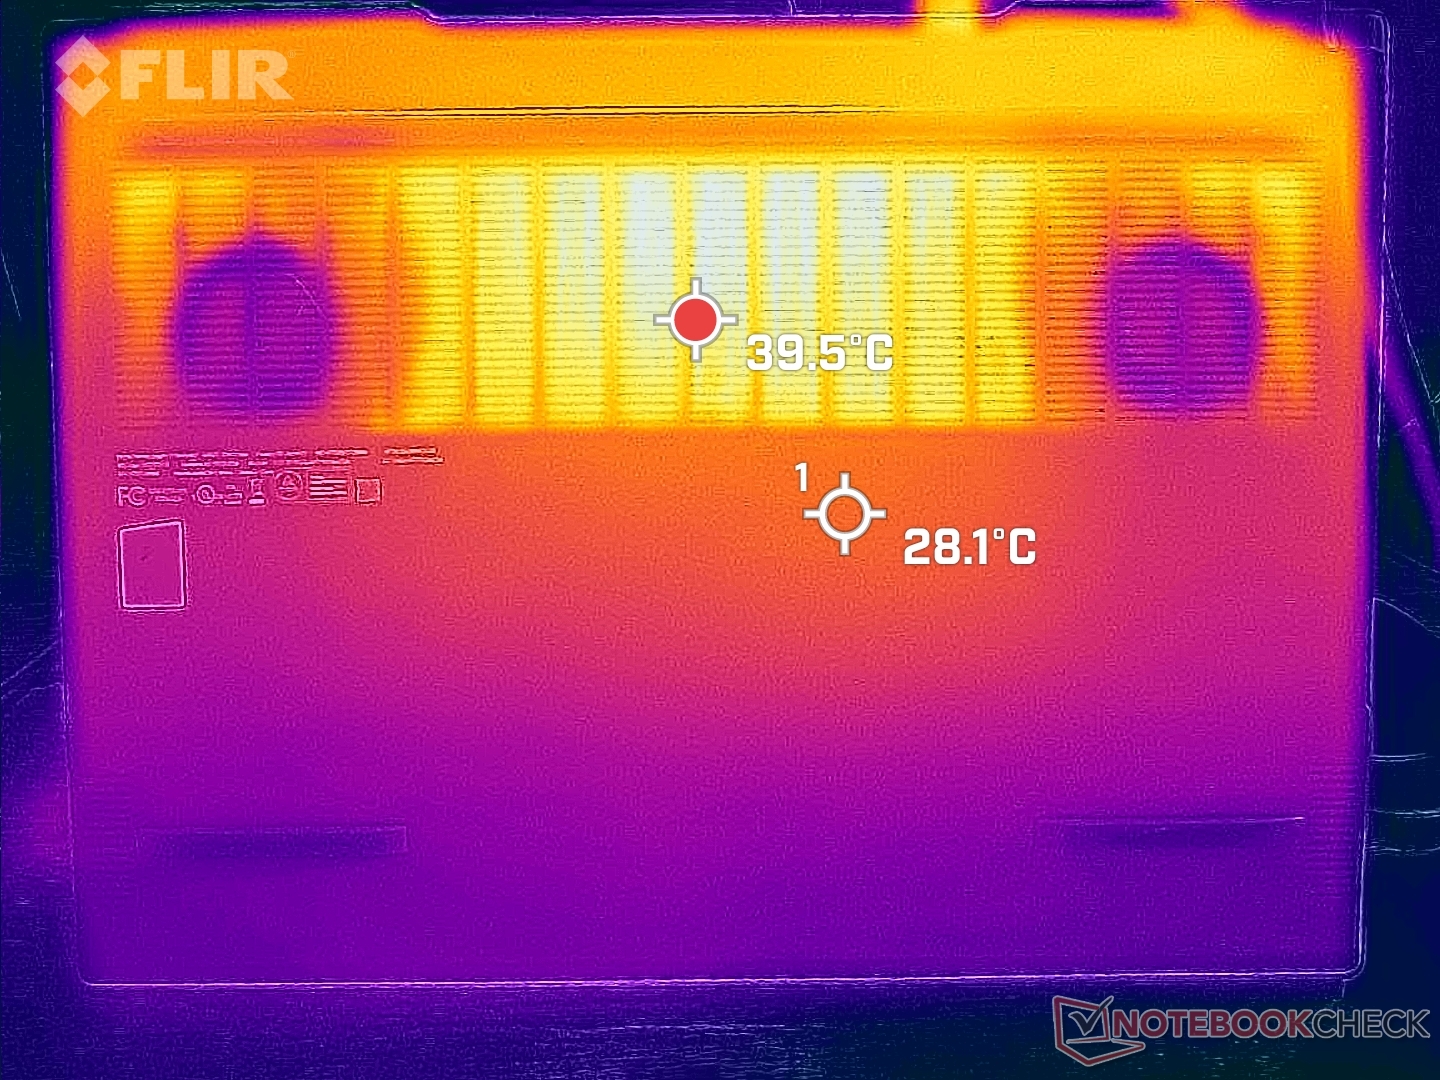
Temperatura
Podczas długotrwałej gry temperatura powierzchni może osiągnąć 46 C i 49 C odpowiednio na wierzchu i spodzie. Na szczęście te punkty gorąca znajdują się w kierunku tyłu i z dala od klawiszy klawiatury. Dla porównaniaMSI Raider GE66 może osiągnąć znacznie wyższe temperatury, sięgające od 54 do 62 stopni C przy podobnym obciążeniu. Spora ilość kratek wentylacyjnych dobrze radzi sobie z utrzymaniem względnie niskiej temperatury systemu pomimo cienkiej obudowy.
Zauważ, że system jest cieplejszy podczas pracy Witcher 3 niż przy jednoczesnym uruchomieniu Prime95 i FurMark. Wyniki te są zgodne z naszymi obserwacjami dotyczącymi zużycia energii, gdzie Witcher 3 wymagałby więcej energii z sieci niż Prime95 i FurMark.
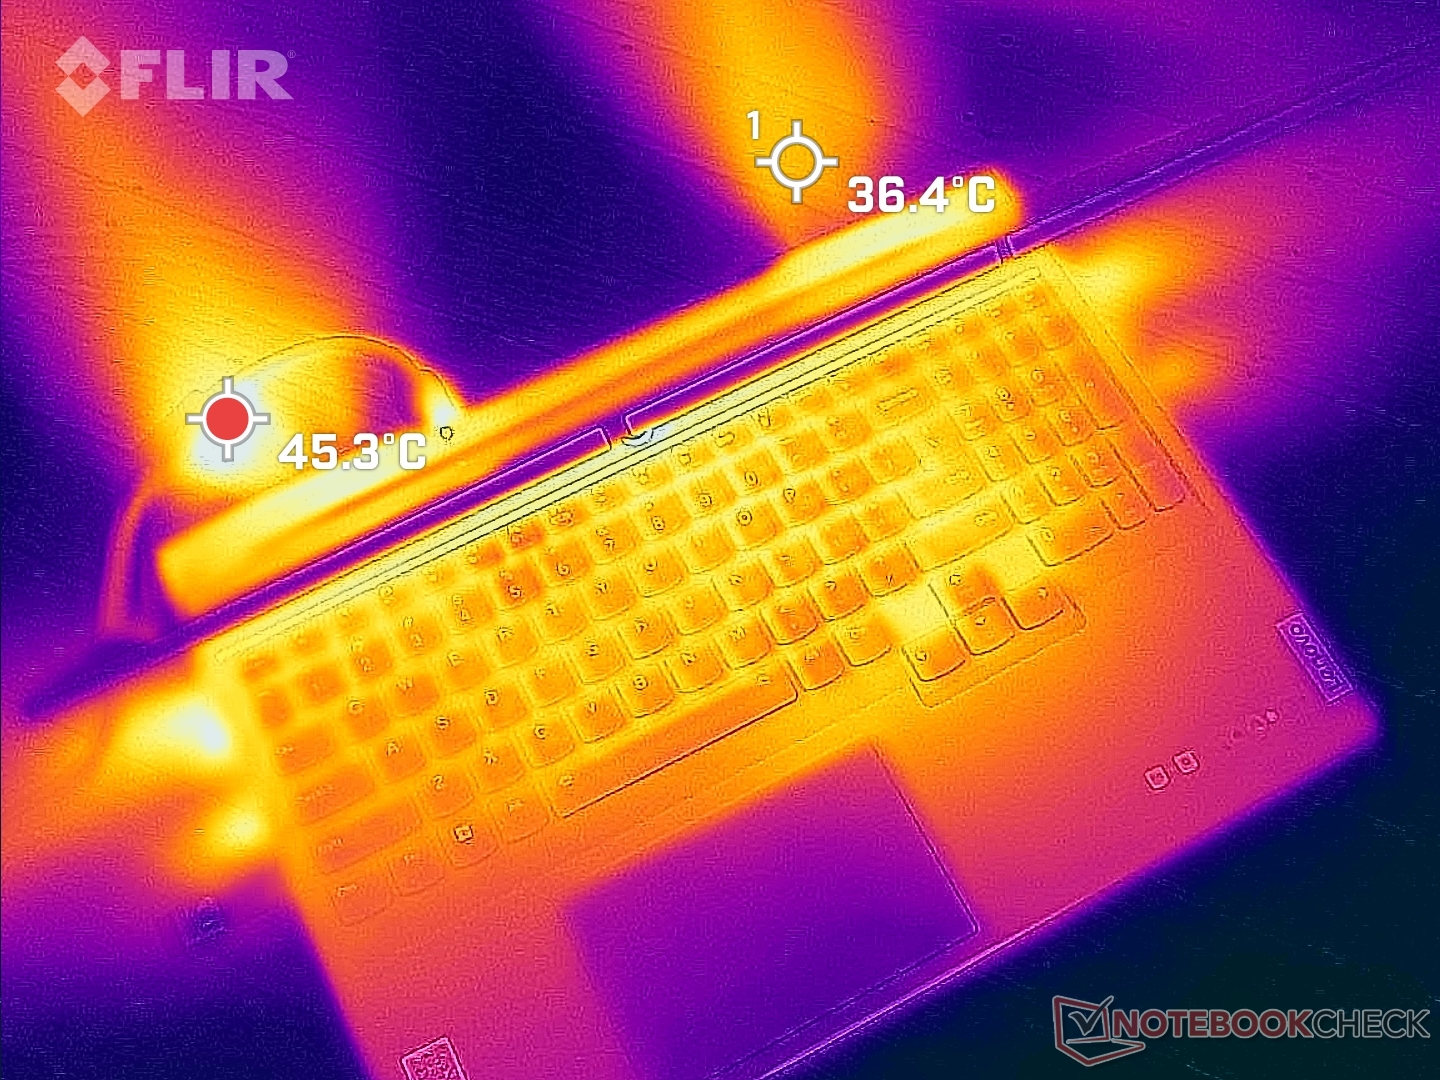
(+) Maksymalna temperatura w górnej części wynosi 37.2 °C / 99 F, w porównaniu do średniej 40.4 °C / 105 F , począwszy od 21.2 do 68.8 °C dla klasy Gaming.
(±) Dno nagrzewa się maksymalnie do 43 °C / 109 F, w porównaniu do średniej 43.2 °C / 110 F
(+) W stanie bezczynności średnia temperatura górnej części wynosi 29.7 °C / 85 F, w porównaniu ze średnią temperaturą urządzenia wynoszącą 33.9 °C / ### class_avg_f### F.
(-) Podczas gry w Wiedźmina 3 średnia temperatura górnej części wynosi 41 °C / 106 F, w porównaniu do średniej temperatury urządzenia wynoszącej 33.9 °C / ## #class_avg_f### F.
(±) Podpórki pod nadgarstki i touchpad mogą się bardzo nagrzać w dotyku, maksymalnie do 38 °C / 100.4 F.
(-) Średnia temperatura obszaru podparcia dłoni w podobnych urządzeniach wynosiła 28.8 °C / 83.8 F (-9.2 °C / -16.6 F).
| Lenovo Legion 7 16ARHA7 AMD Ryzen 9 6900HX, AMD Radeon RX 6850M XT | MSI Raider GE66 12UHS Intel Core i9-12900HK, NVIDIA GeForce RTX 3080 Ti Laptop GPU | Lenovo Legion Slim 7-16IAH 82TF004YGE Intel Core i7-12700H, NVIDIA GeForce RTX 3060 Laptop GPU | Asus ROG Zephyrus Duo 16 GX650RX AMD Ryzen 9 6900HX, NVIDIA GeForce RTX 3080 Ti Laptop GPU | HP Omen 16-c0077ng AMD Ryzen 7 5800H, AMD Radeon RX 6600M | Lenovo Legion 5 Pro 16ACH6H (82JQ001PGE) AMD Ryzen 7 5800H, NVIDIA GeForce RTX 3070 Laptop GPU | |
|---|---|---|---|---|---|---|
| Heat | -23% | -20% | -9% | 1% | -19% | |
| Maximum Upper Side * (°C) | 37.2 | 54 -45% | 48.3 -30% | 45 -21% | 40.6 -9% | 50 -34% |
| Maximum Bottom * (°C) | 43 | 65 -51% | 55.3 -29% | 50 -16% | 36 16% | 55 -28% |
| Idle Upper Side * (°C) | 34 | 30 12% | 35.7 -5% | 33 3% | 31.3 8% | 34 -0% |
| Idle Bottom * (°C) | 32.8 | 35 -7% | 37.6 -15% | 33 -1% | 36 -10% | 37 -13% |
* ... im mniej tym lepiej
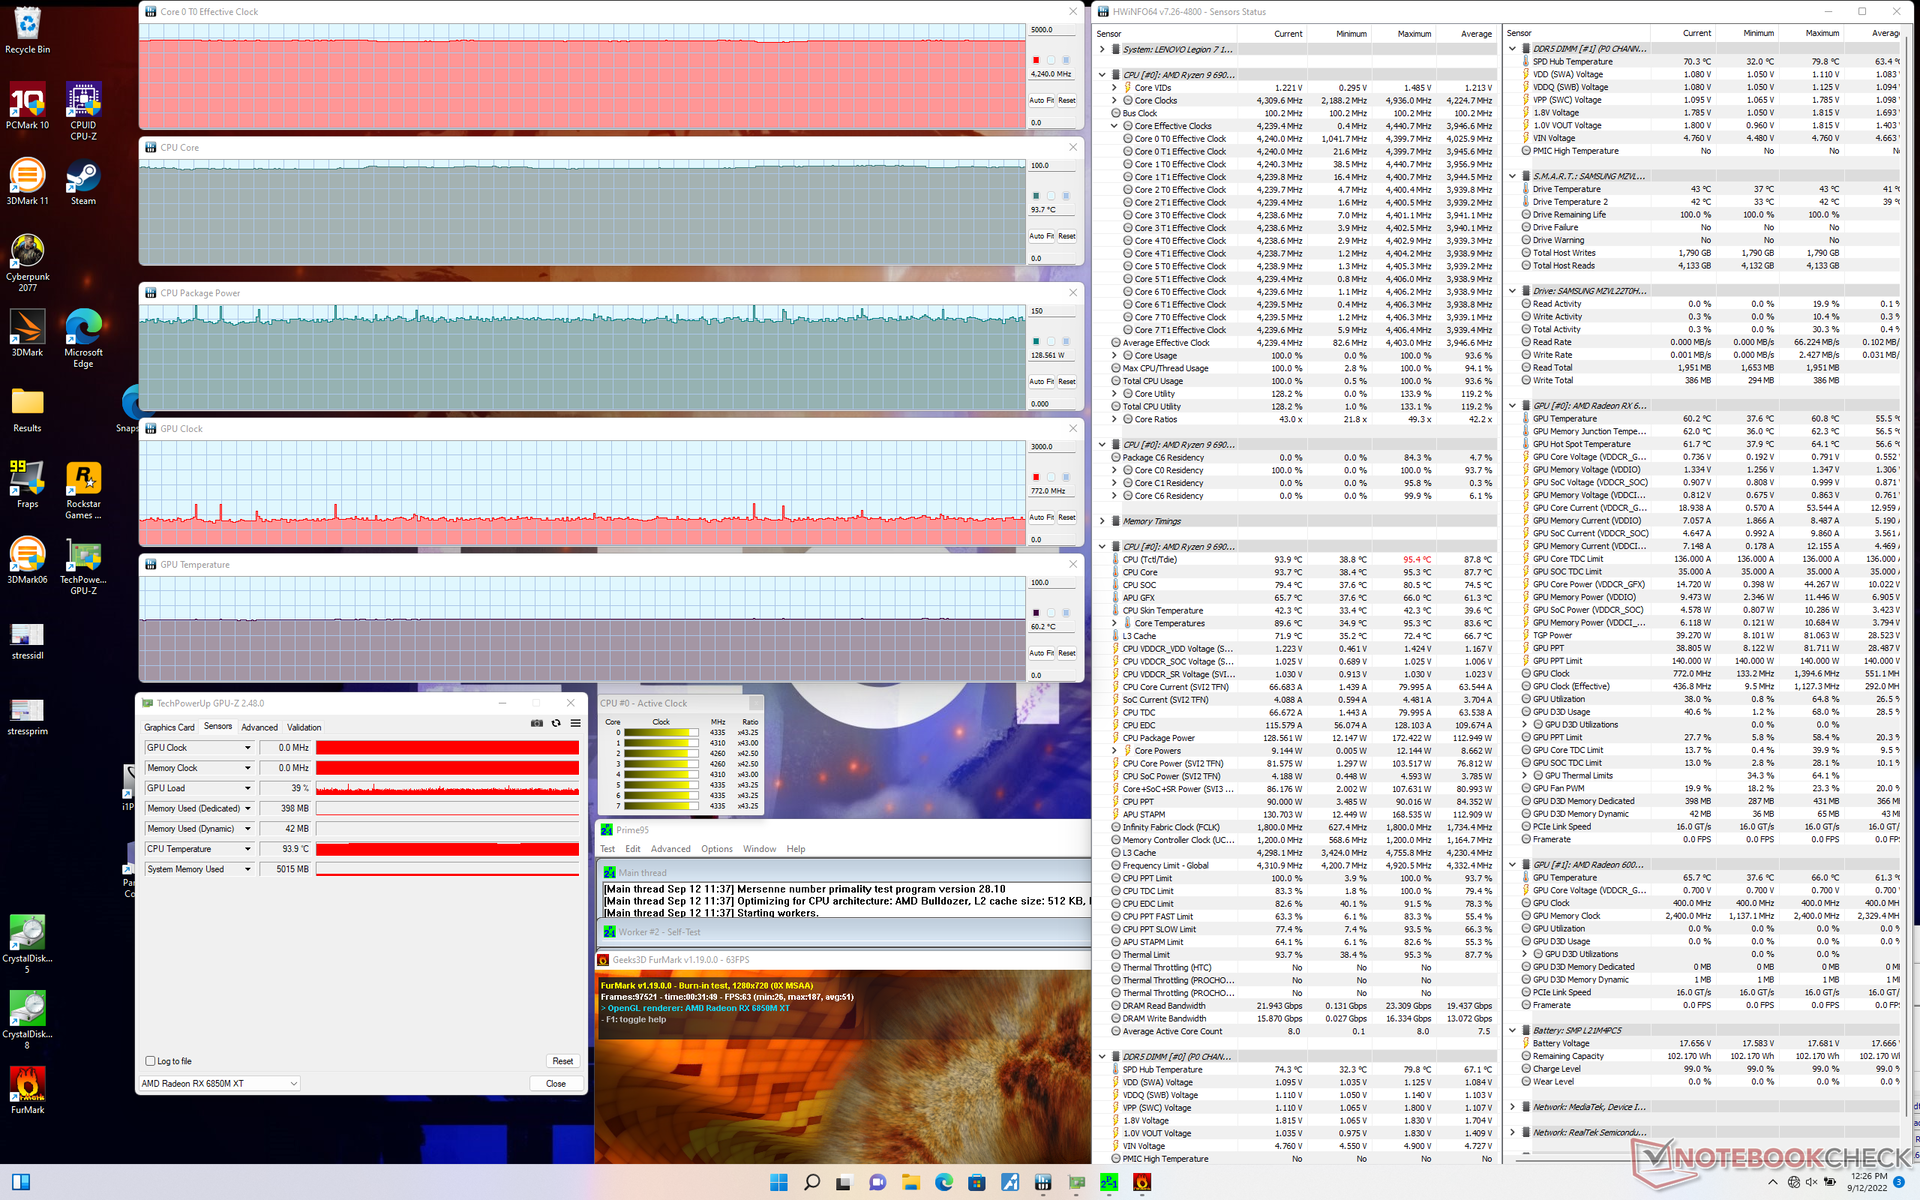
Test obciążeniowy - 140 W GPU TGP
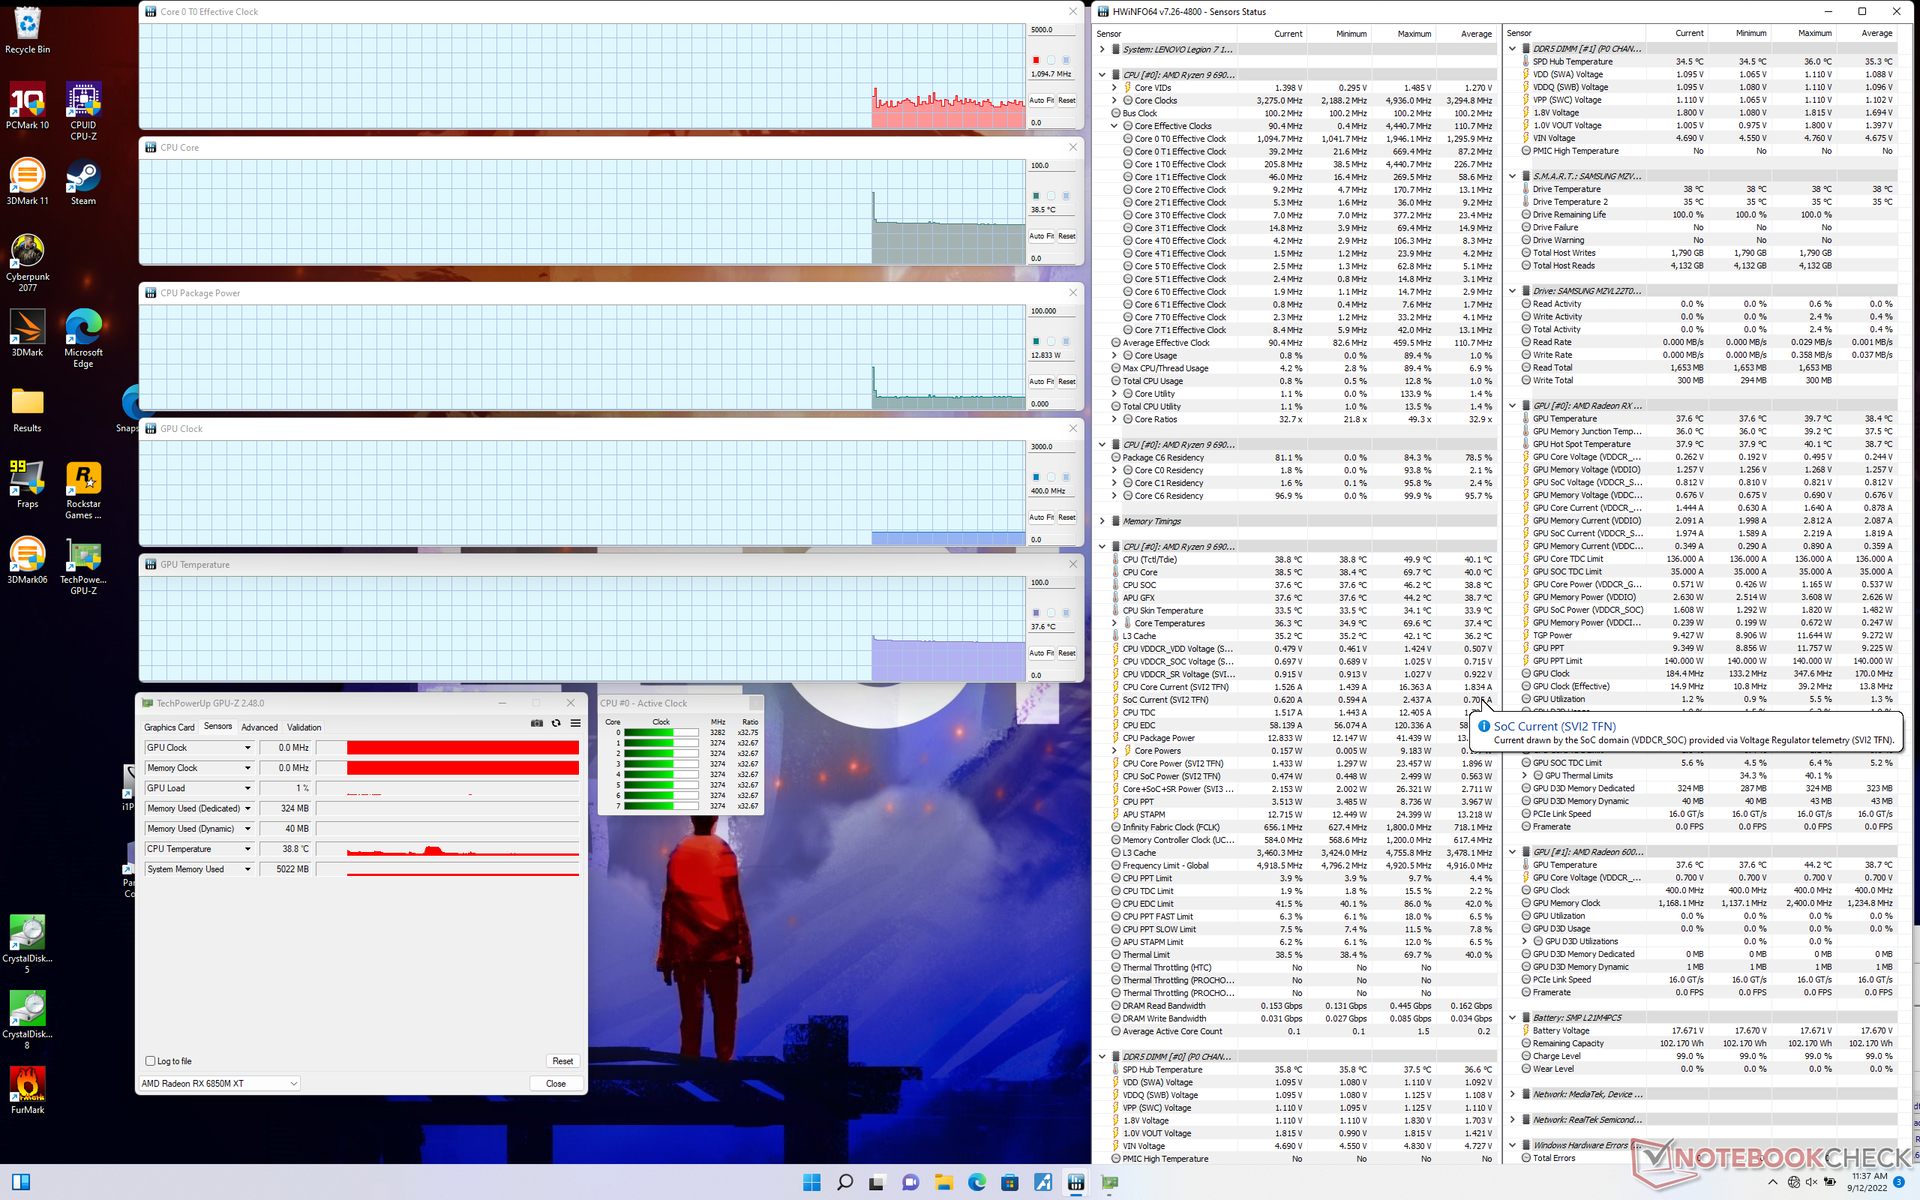
Częstotliwość taktowania procesora, temperatura i pobór mocy na płycie wzrosły do 3,3 GHz, 86 C i 120 W, odpowiednio, podczas inicjowania Prime95. Po kilku sekundach procesor ustabilizowałby się na poziomie 4,2 GHz, 89 C i 99 W. Dla porównania, powtarzając ten sam test na zeszłorocznym Asus ROG Zephyrus Duo 15 z Ryzenem 9 5900HX, zobaczyłoby częstotliwości taktowania CPU w podobnym zakresie 4,2 GHz, ale chłodniejszą temperaturę rdzenia 75 C.
Jeśli Priem95 i FurMark są uruchomione jednocześnie, system wydaje się dławić GPU na rzecz utrzymania wysokiej wydajności CPU.
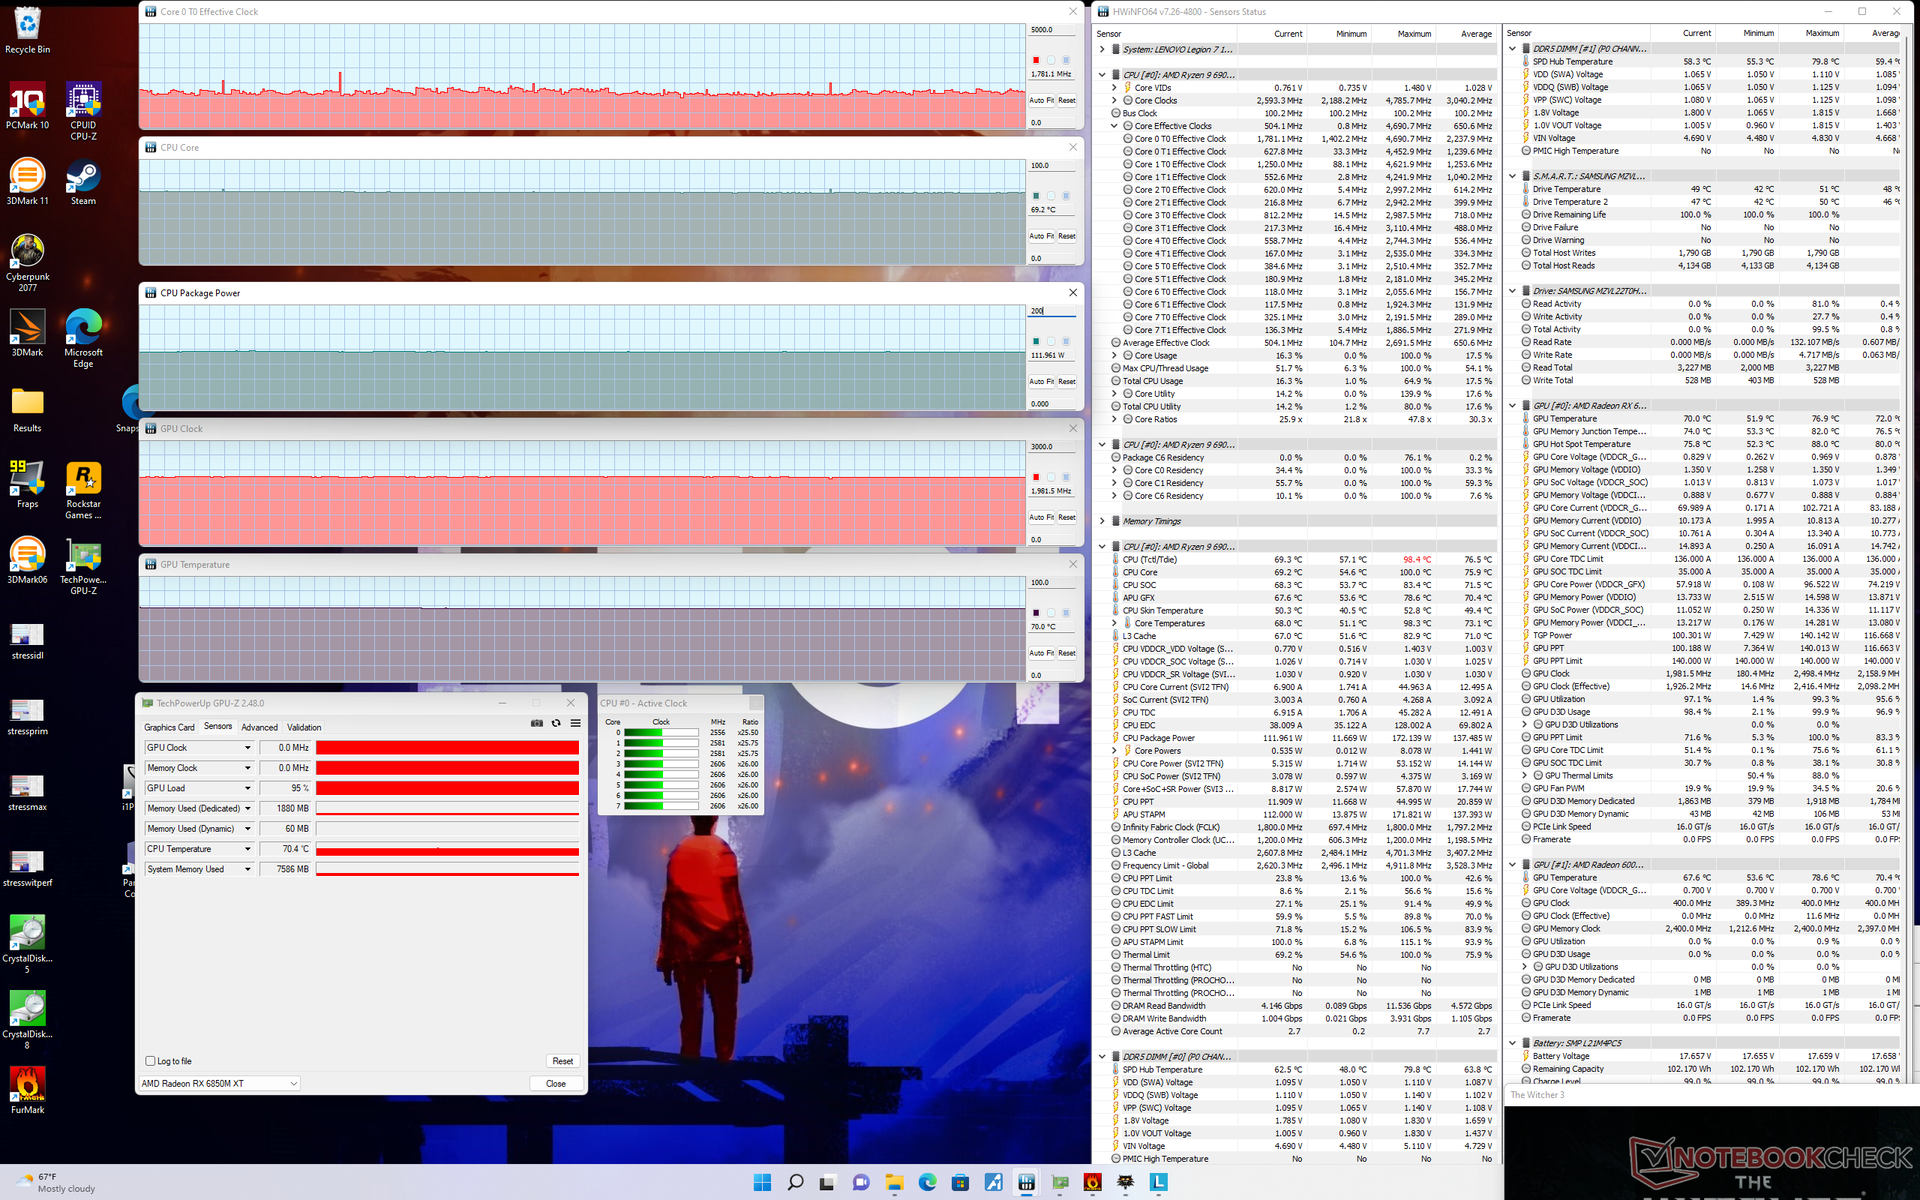
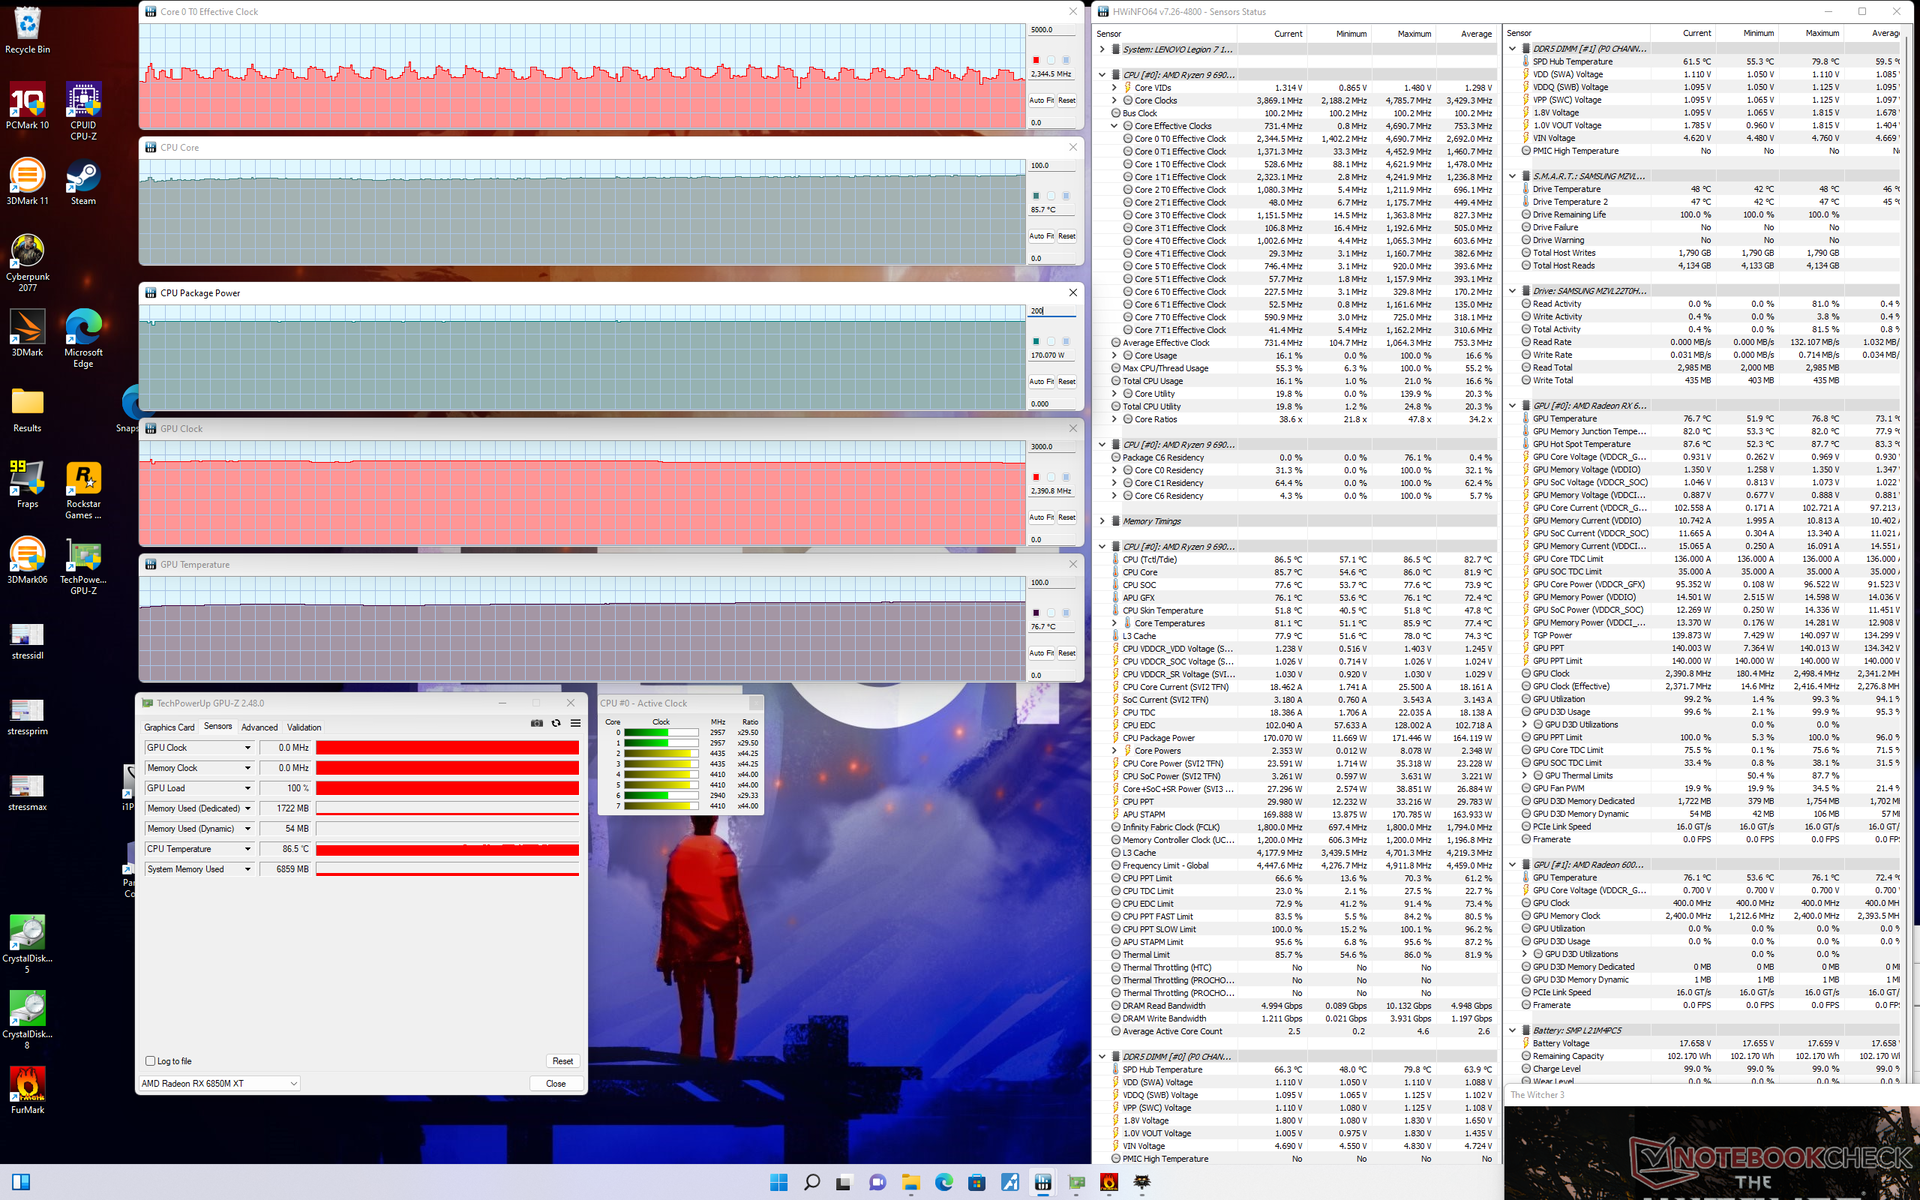
Częstotliwość taktowania GPU, moc TGP i temperatura przy pracy w trybie Witcher 3 w trybie Performance ustabilizowałyby się odpowiednio na poziomie 2391 MHz, 140 W i 77 C, w porównaniu z zaledwie 1982 MHz, 100 W i 70 C w trybie Balanced. W związku z tym, posiadacze kart muszą znosić znacznie głośniejszy hałas wentylatora w trybie Wydajności, jeśli chcą w pełni wykorzystać potencjał dyskretnego procesora graficznego.
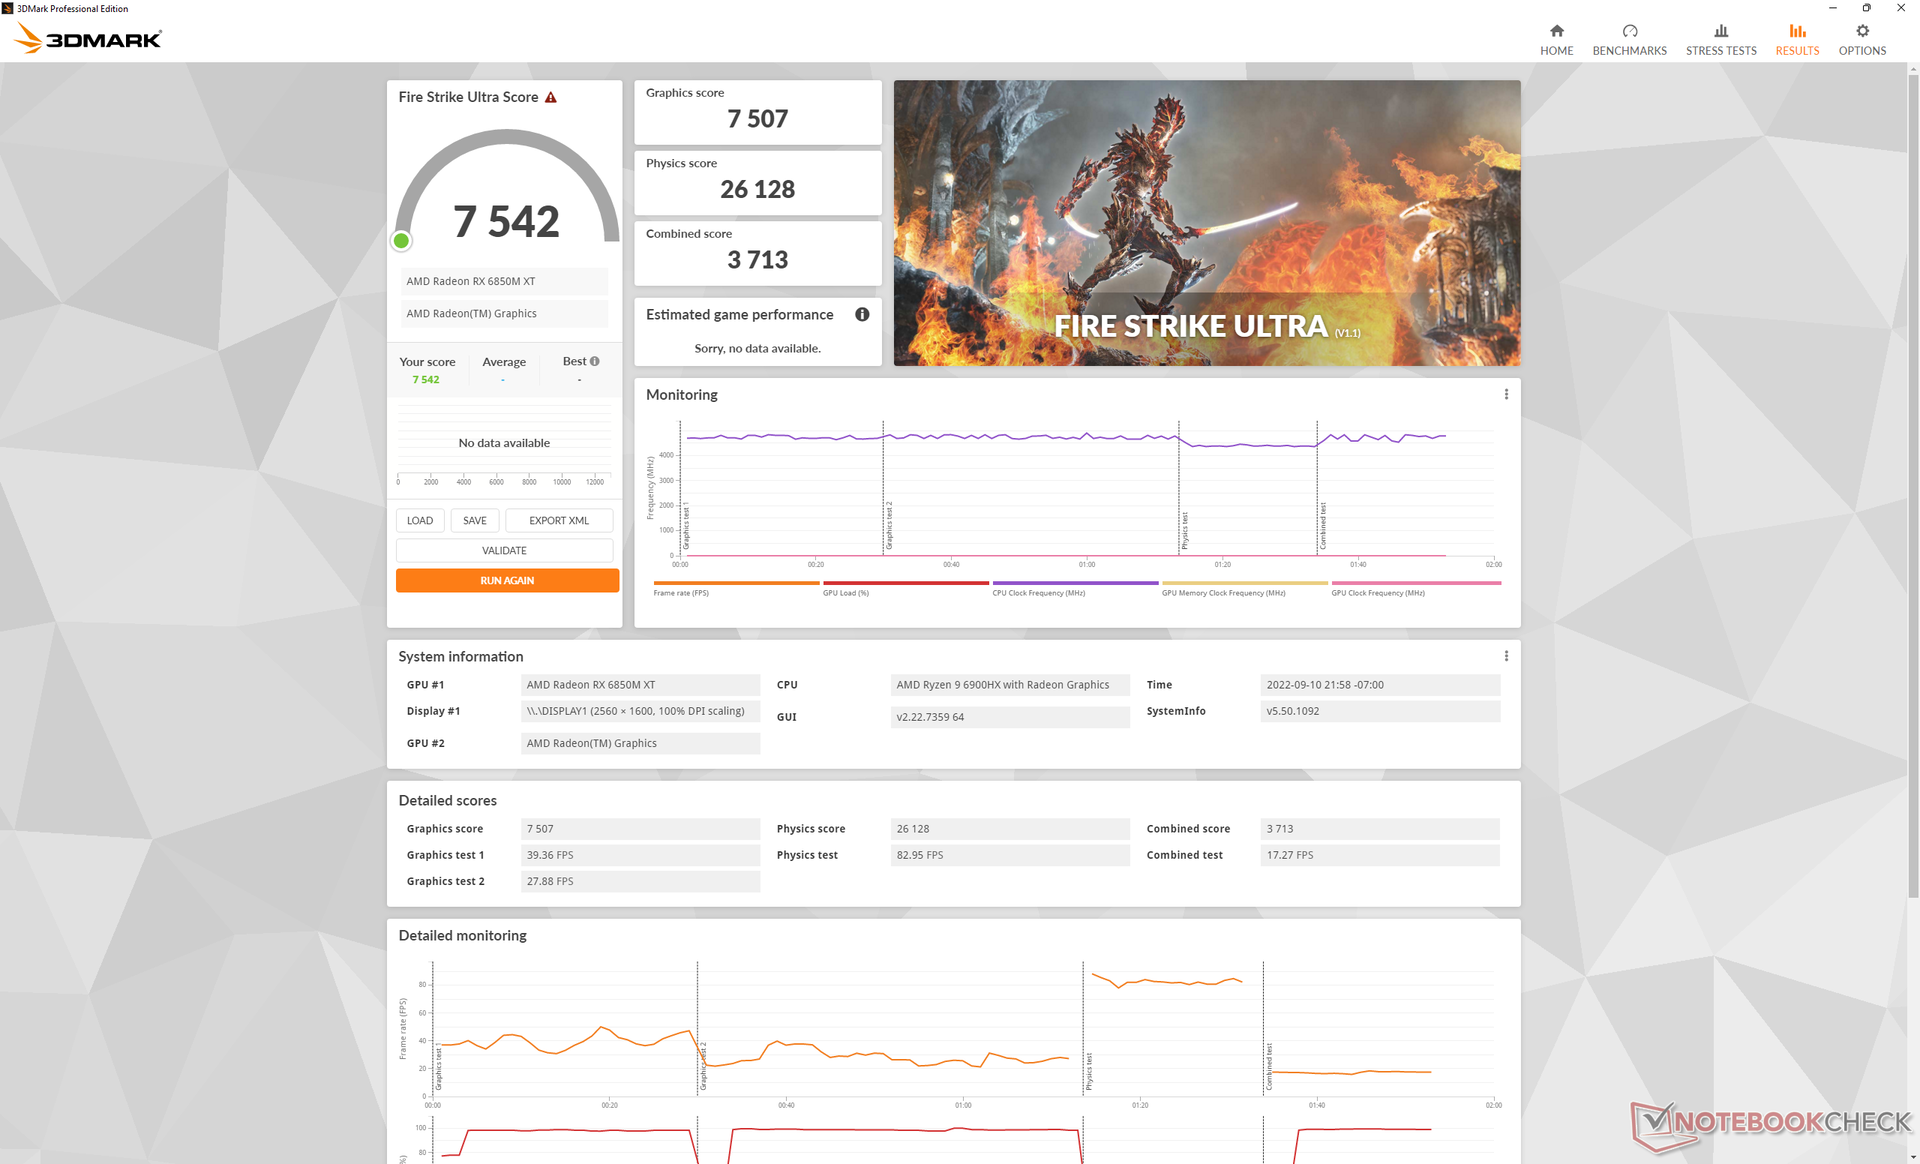
Praca na baterii ogranicza wydajność, zwłaszcza że tryb Performance jest automatycznie wyłączany, jeśli nie jest zasilany z sieci. Uruchomienie Fire Strike na bateriach przyniosło wyniki w dziedzinie fizyki i grafiki na poziomie odpowiednio 20389 i 12512 punktów, w porównaniu do 26168 i 32853 punktów przy zasilaniu sieciowym.
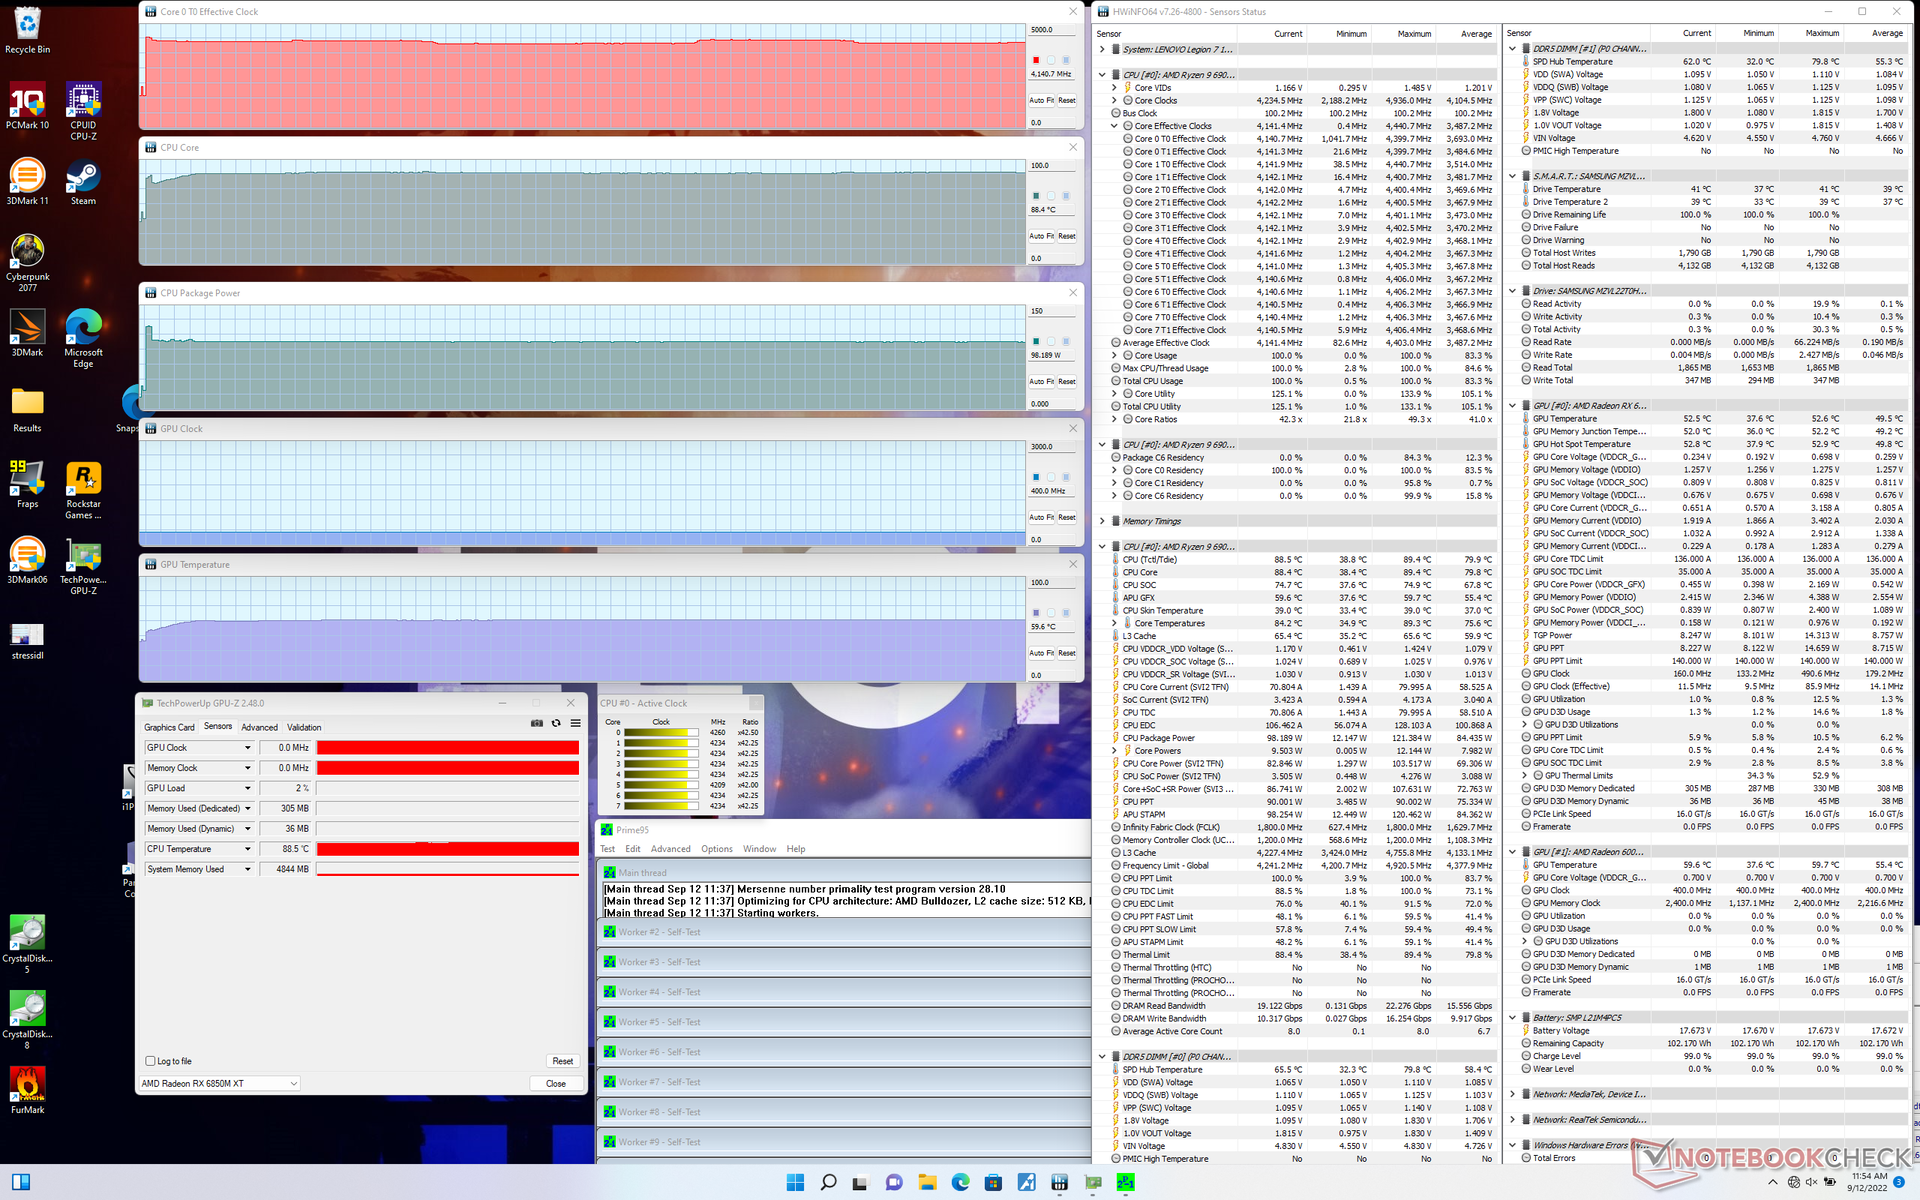
| ZegarCPU (GHz) | Zegar GPU (MHz) | Średnia temperatura CPU (°C) | Średnia temperatura GPU (°C) | |
| System w stanie bezczynności | -- | -- | 39 | 38 |
| Prime95 Stress | 4.1 - 4.2 | -- | 88 | 53 |
| Prime95 + FurMark Stress | 4.2 | 772 | 94 | 60 |
| Witcher 3 Stres (tryb zrównoważony) | 1,8 | 1982 | 69 | 70 |
| Witcher 3 Stres(tryb Performance) | 2,4 - 2,9 | 2391 | 86 | 77 |
Mówcy
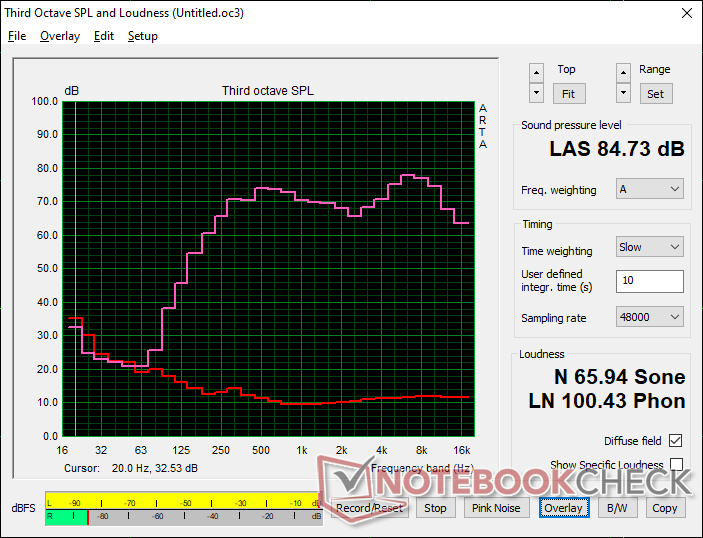
Lenovo Legion 7 16ARHA7 analiza dźwięku
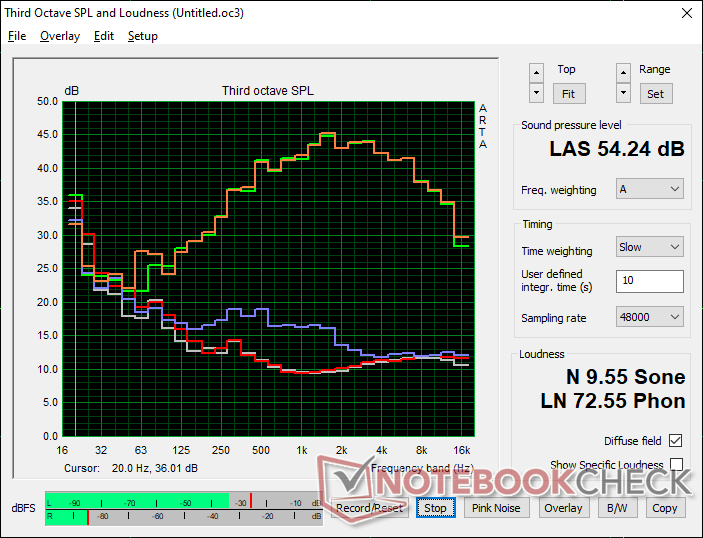
(+) | głośniki mogą odtwarzać stosunkowo głośno (84.7 dB)
Bas 100 - 315 Hz
(±) | zredukowany bas - średnio 14.2% niższy od mediany
(±) | liniowość basu jest średnia (12.8% delta do poprzedniej częstotliwości)
Średnie 400 - 2000 Hz
(+) | zbalansowane środki średnie - tylko 1.8% od mediany
(+) | średnie są liniowe (2.1% delta do poprzedniej częstotliwości)
Wysokie 2–16 kHz
(+) | zrównoważone maksima - tylko 4.6% od mediany
(+) | wzloty są liniowe (4.4% delta do poprzedniej częstotliwości)
Ogólnie 100 - 16.000 Hz
(+) | ogólny dźwięk jest liniowy (10.9% różnicy w stosunku do mediany)
W porównaniu do tej samej klasy
» 7% wszystkich testowanych urządzeń w tej klasie było lepszych, 3% podobnych, 90% gorszych
» Najlepszy miał deltę 6%, średnia wynosiła ###średnia###%, najgorsza wynosiła 132%
W porównaniu do wszystkich testowanych urządzeń
» 6% wszystkich testowanych urządzeń było lepszych, 2% podobnych, 92% gorszych
» Najlepszy miał deltę 4%, średnia wynosiła ###średnia###%, najgorsza wynosiła 134%
Apple MacBook Pro 16 2021 M1 Pro analiza dźwięku
(+) | głośniki mogą odtwarzać stosunkowo głośno (84.7 dB)
Bas 100 - 315 Hz
(+) | dobry bas - tylko 3.8% od mediany
(+) | bas jest liniowy (5.2% delta do poprzedniej częstotliwości)
Średnie 400 - 2000 Hz
(+) | zbalansowane środki średnie - tylko 1.3% od mediany
(+) | średnie są liniowe (2.1% delta do poprzedniej częstotliwości)
Wysokie 2–16 kHz
(+) | zrównoważone maksima - tylko 1.9% od mediany
(+) | wzloty są liniowe (2.7% delta do poprzedniej częstotliwości)
Ogólnie 100 - 16.000 Hz
(+) | ogólny dźwięk jest liniowy (4.6% różnicy w stosunku do mediany)
W porównaniu do tej samej klasy
» 0% wszystkich testowanych urządzeń w tej klasie było lepszych, 0% podobnych, 100% gorszych
» Najlepszy miał deltę 5%, średnia wynosiła ###średnia###%, najgorsza wynosiła 45%
W porównaniu do wszystkich testowanych urządzeń
» 0% wszystkich testowanych urządzeń było lepszych, 0% podobnych, 100% gorszych
» Najlepszy miał deltę 4%, średnia wynosiła ###średnia###%, najgorsza wynosiła 134%
Zarządzanie energią
Pobór mocy - bardziej wymagający niż w przypadku Intela
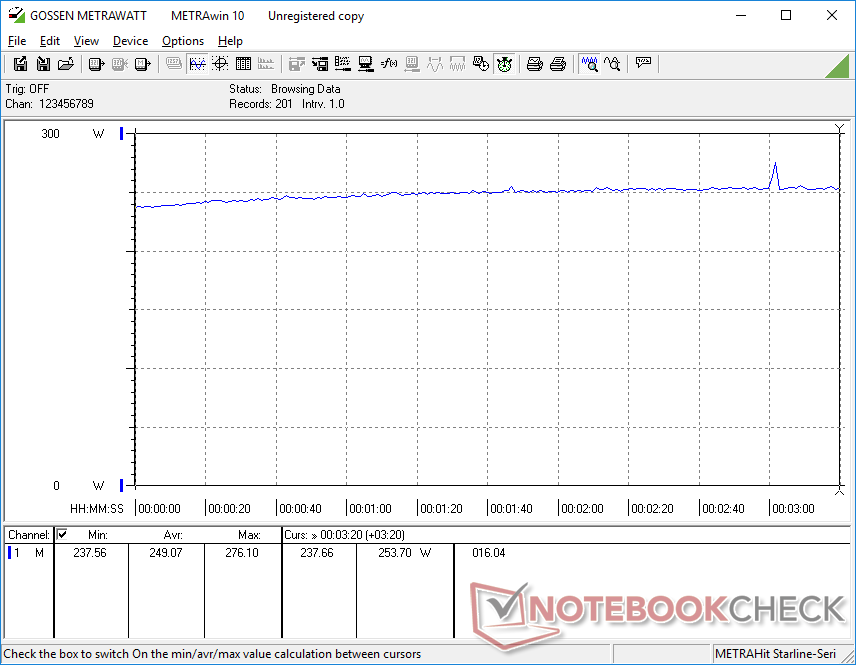
Pobór mocy jest na oczekiwanym poziomie podczas zwykłej pracy na biegu jałowym na pulpicie lub przy średnich obciążeniach, takich jak 3DMark 06. W grach system staje się jednak znacznie bardziej wymagający niż większość innych laptopów. Uruchomienie strony Witcher 3 pobierało średnio 249 W, podczas gdy w MSI Raider GE66 czy Asusie Zephyrus Duo 16, które mają porównywalne grafiki RTX 3080 i procesory z serii H, pobierano tylko 202 W lub 187 W.
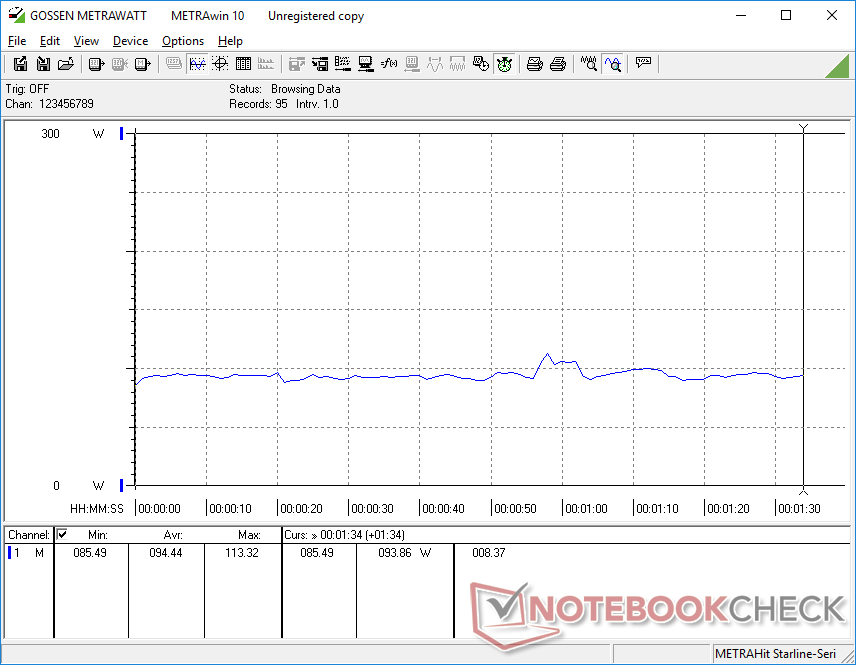
Wysokie zużycie energii przenosi się także na Ryzena 9 6900HX. Podczas uruchamiania Prime95 na zewnętrznym monitorze nasze Lenovo pobierało średnio 135 W, podczas gdy MSI Raider z procesorem Core i9-12900HK pobierał tylko 90 W. Innymi słowy, zasilany przez Intela system MSI wymaga mniej od gniazdka, a jednocześnie zapewnia od 10 do 15 procent szybszą wydajność wielowątkową niż nasze Lenovo.
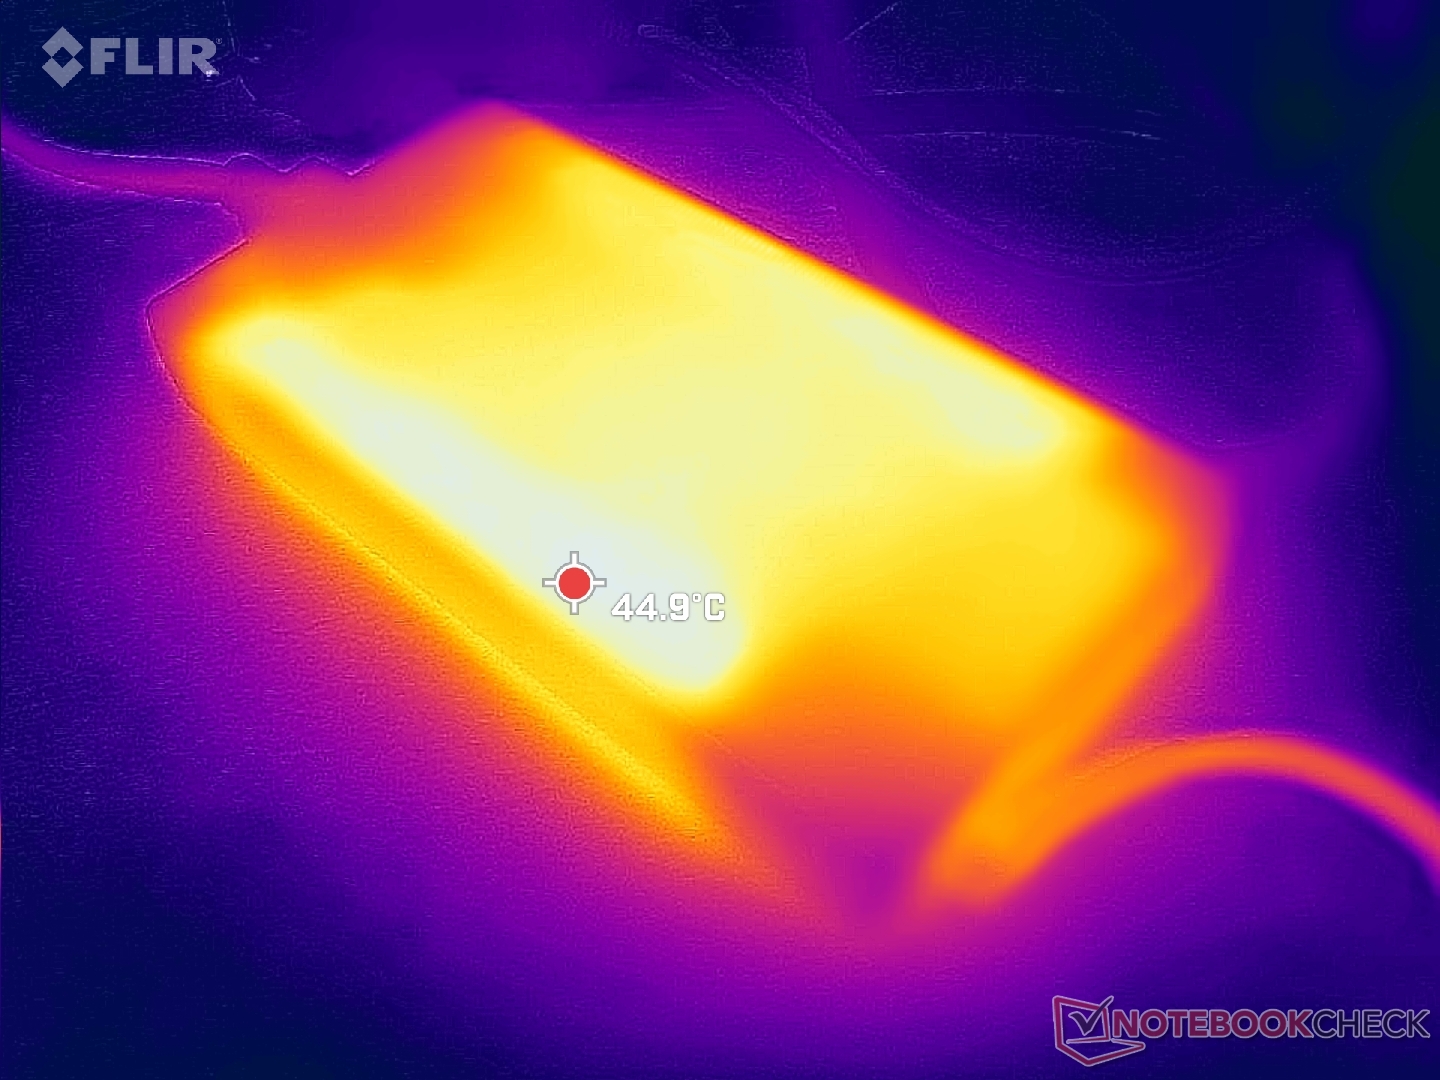
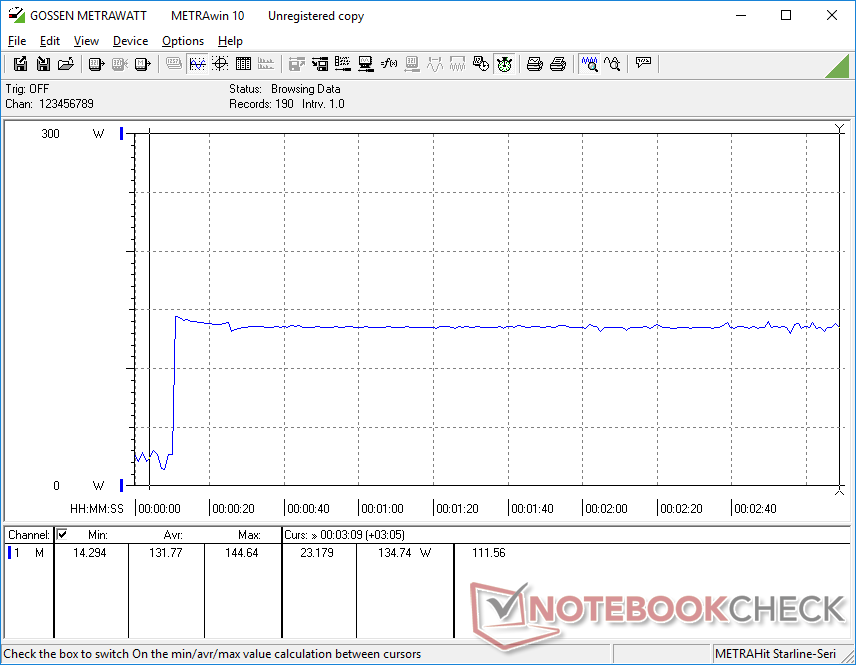
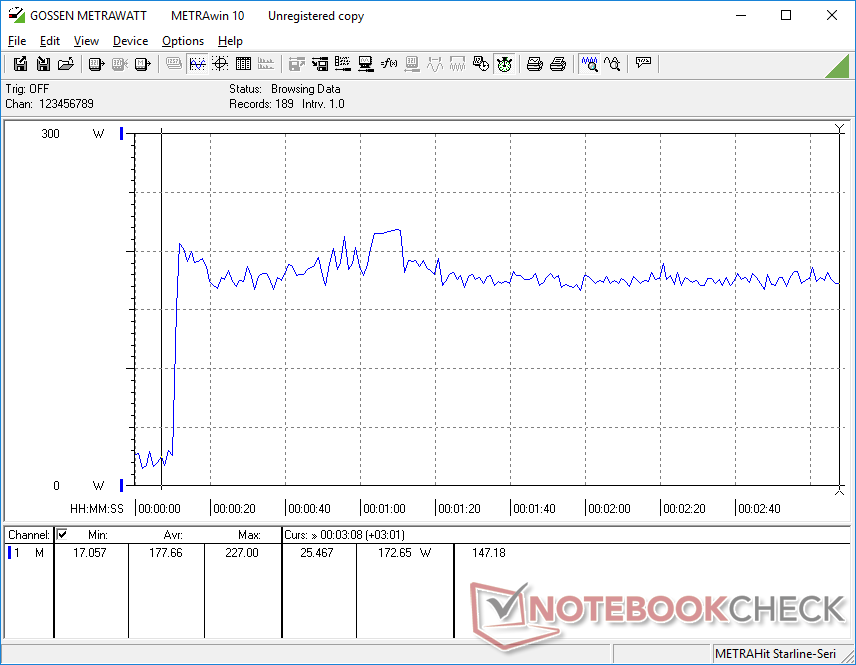
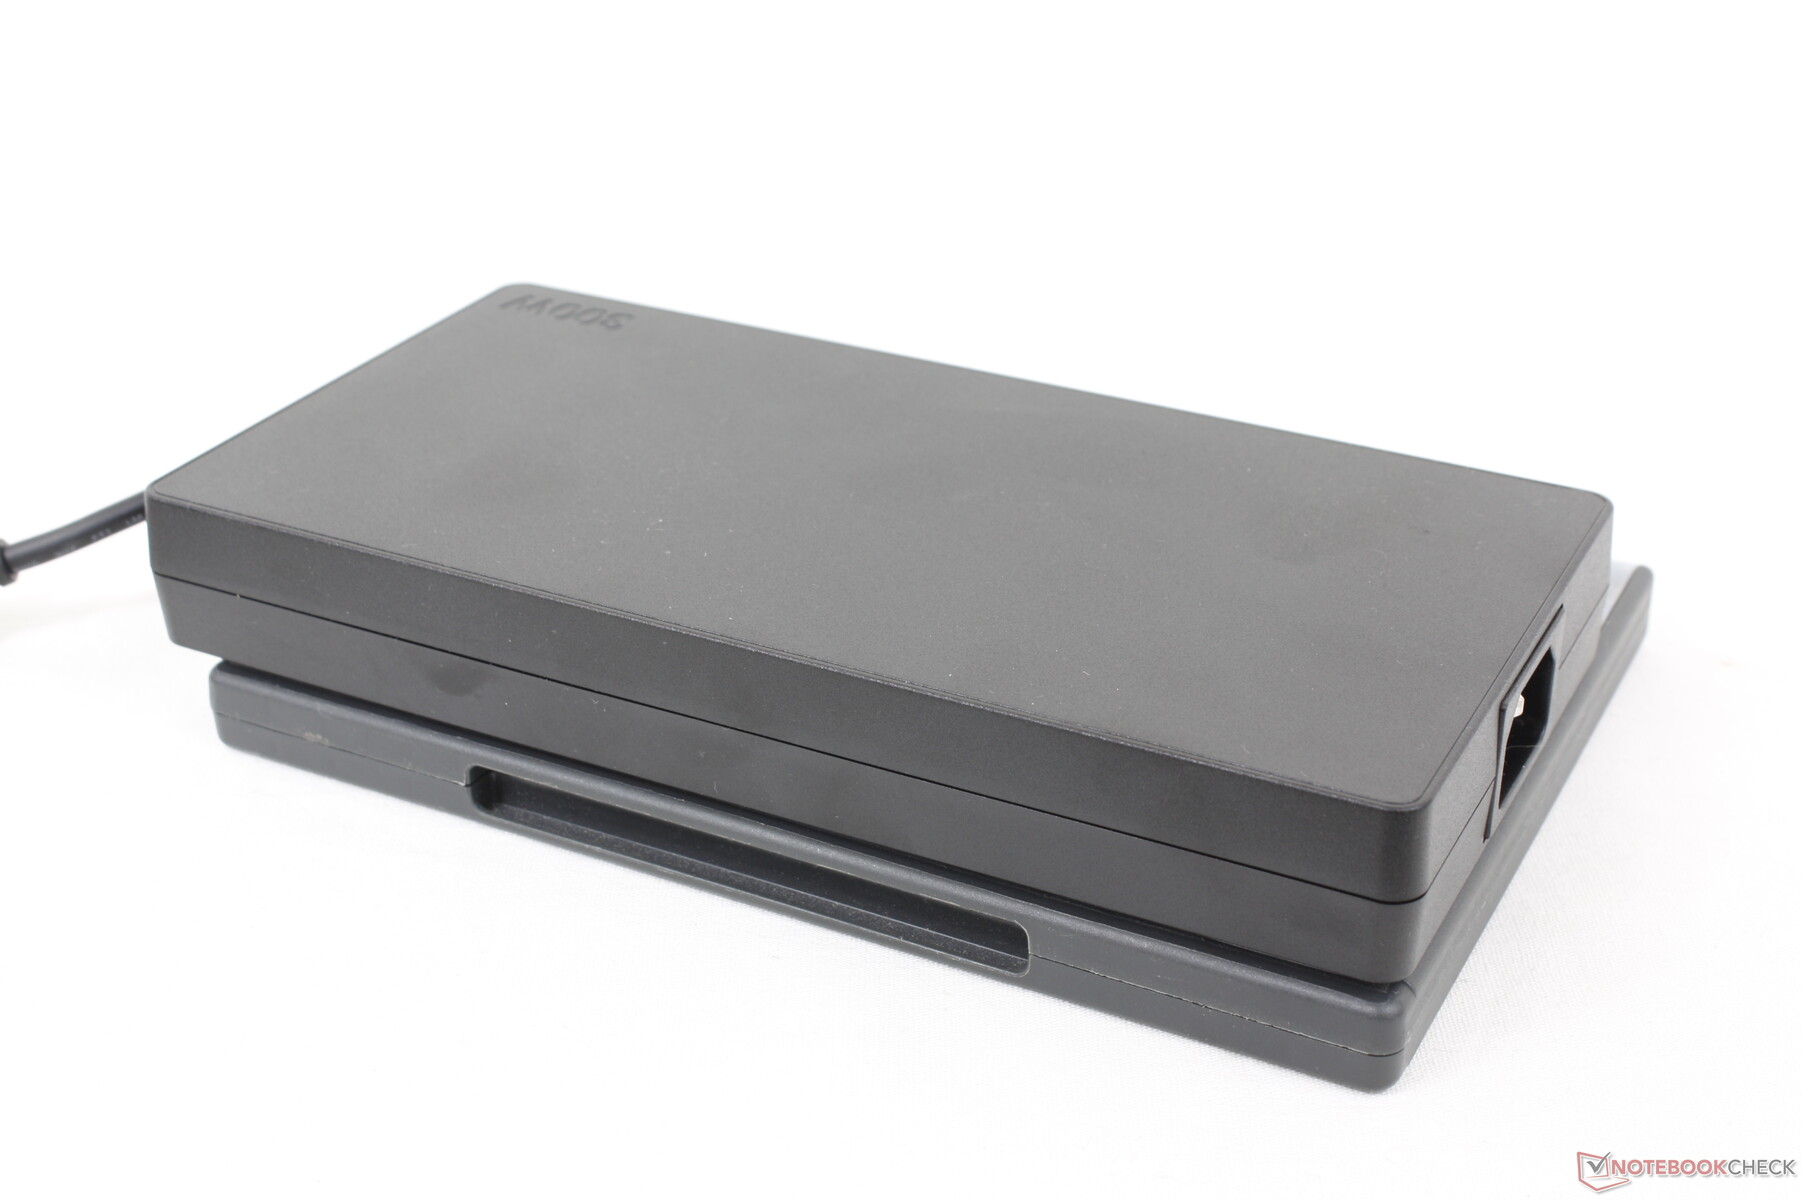
Ze średniej wielkości (~20 x 10 x 2,6 cm) zasilacza sieciowego o mocy 300 W udało nam się zarejestrować chwilowy maksymalny pobór 276 W podczas pracy w trybie Performance Witcher 3 w trybie Performance. Zużycie energii jest niższe podczas jednoczesnego działania programów Prime95 i FurMark, co widać na poniższych zrzutach ekranu.
| wyłączony / stan wstrzymania | |
| luz | |
| obciążenie |
|
Legenda:
min: | |
| Lenovo Legion 7 16ARHA7 R9 6900HX, Radeon RX 6850M XT, Samsung PM9A1 MZVL22T0HBLB, IPS, 2560x1600, 16" | MSI Raider GE66 12UHS i9-12900HK, GeForce RTX 3080 Ti Laptop GPU, Samsung PM9A1 MZVL22T0HBLB, IPS, 3840x2160, 15.6" | Asus ROG Zephyrus Duo 16 GX650RX R9 6900HX, GeForce RTX 3080 Ti Laptop GPU, 2x Samsung SSD 980 Pro 2TB MZ-V8P2T0 (RAID 0), IPS-Level, 3840x2400, 16" | HP Omen 16-c0077ng R7 5800H, Radeon RX 6600M, Samsung PM981a MZVLB1T0HBLR, IPS, 2560x1440, 16.1" | Lenovo Legion 5 Pro 16ACH6H (82JQ001PGE) R7 5800H, GeForce RTX 3070 Laptop GPU, WDC PC SN730 SDBPNTY-1T00, IPS, 2560x1600, 16" | Aorus 5 KB i7-10750H, GeForce RTX 2060 Mobile, ADATA XPG SX8200 Pro (ASX8200PNP-512GT), IPS, 1920x1080, 15.6" | |
|---|---|---|---|---|---|---|
| Power Consumption | -8% | -19% | -2% | 15% | 17% | |
| Idle Minimum * (Watt) | 9.9 | 16 -62% | 19 -92% | 12 -21% | 10.45 -6% | 8 19% |
| Idle Average * (Watt) | 22 | 19 14% | 24 -9% | 12.8 42% | 14.92 32% | 12 45% |
| Idle Maximum * (Watt) | 23.1 | 26 -13% | 31 -34% | 18.5 20% | 16.02 31% | 21 9% |
| Load Average * (Watt) | 94.4 | 110 -17% | 104 -10% | 190 -101% | 119.65 -27% | 128 -36% |
| Witcher 3 ultra * (Watt) | 249 | 202 19% | 186.5 25% | 194 22% | 174.9 30% | 138 45% |
| Load Maximum * (Watt) | 276 | 242 12% | 256 7% | 200 28% | 187.26 32% | 217 21% |
* ... im mniej tym lepiej
Power Consumption Witcher 3 / Stresstest
Power Consumption external Monitor
Czas pracy na baterii - problemy z oszczędzaniem energii
Czas pracy sieci WLAN na profilu zrównoważonej energii jest przyzwoity i porównywalny z Asusem ROG Zephyrus Duo 16 - prawie 7,5 godziny. Czas pracy na baterii jest nienormalnie krótszy w trybie Power Saver, co naszym zdaniem może być błąd w niektórych laptopach Legion zasilanych przez AMD
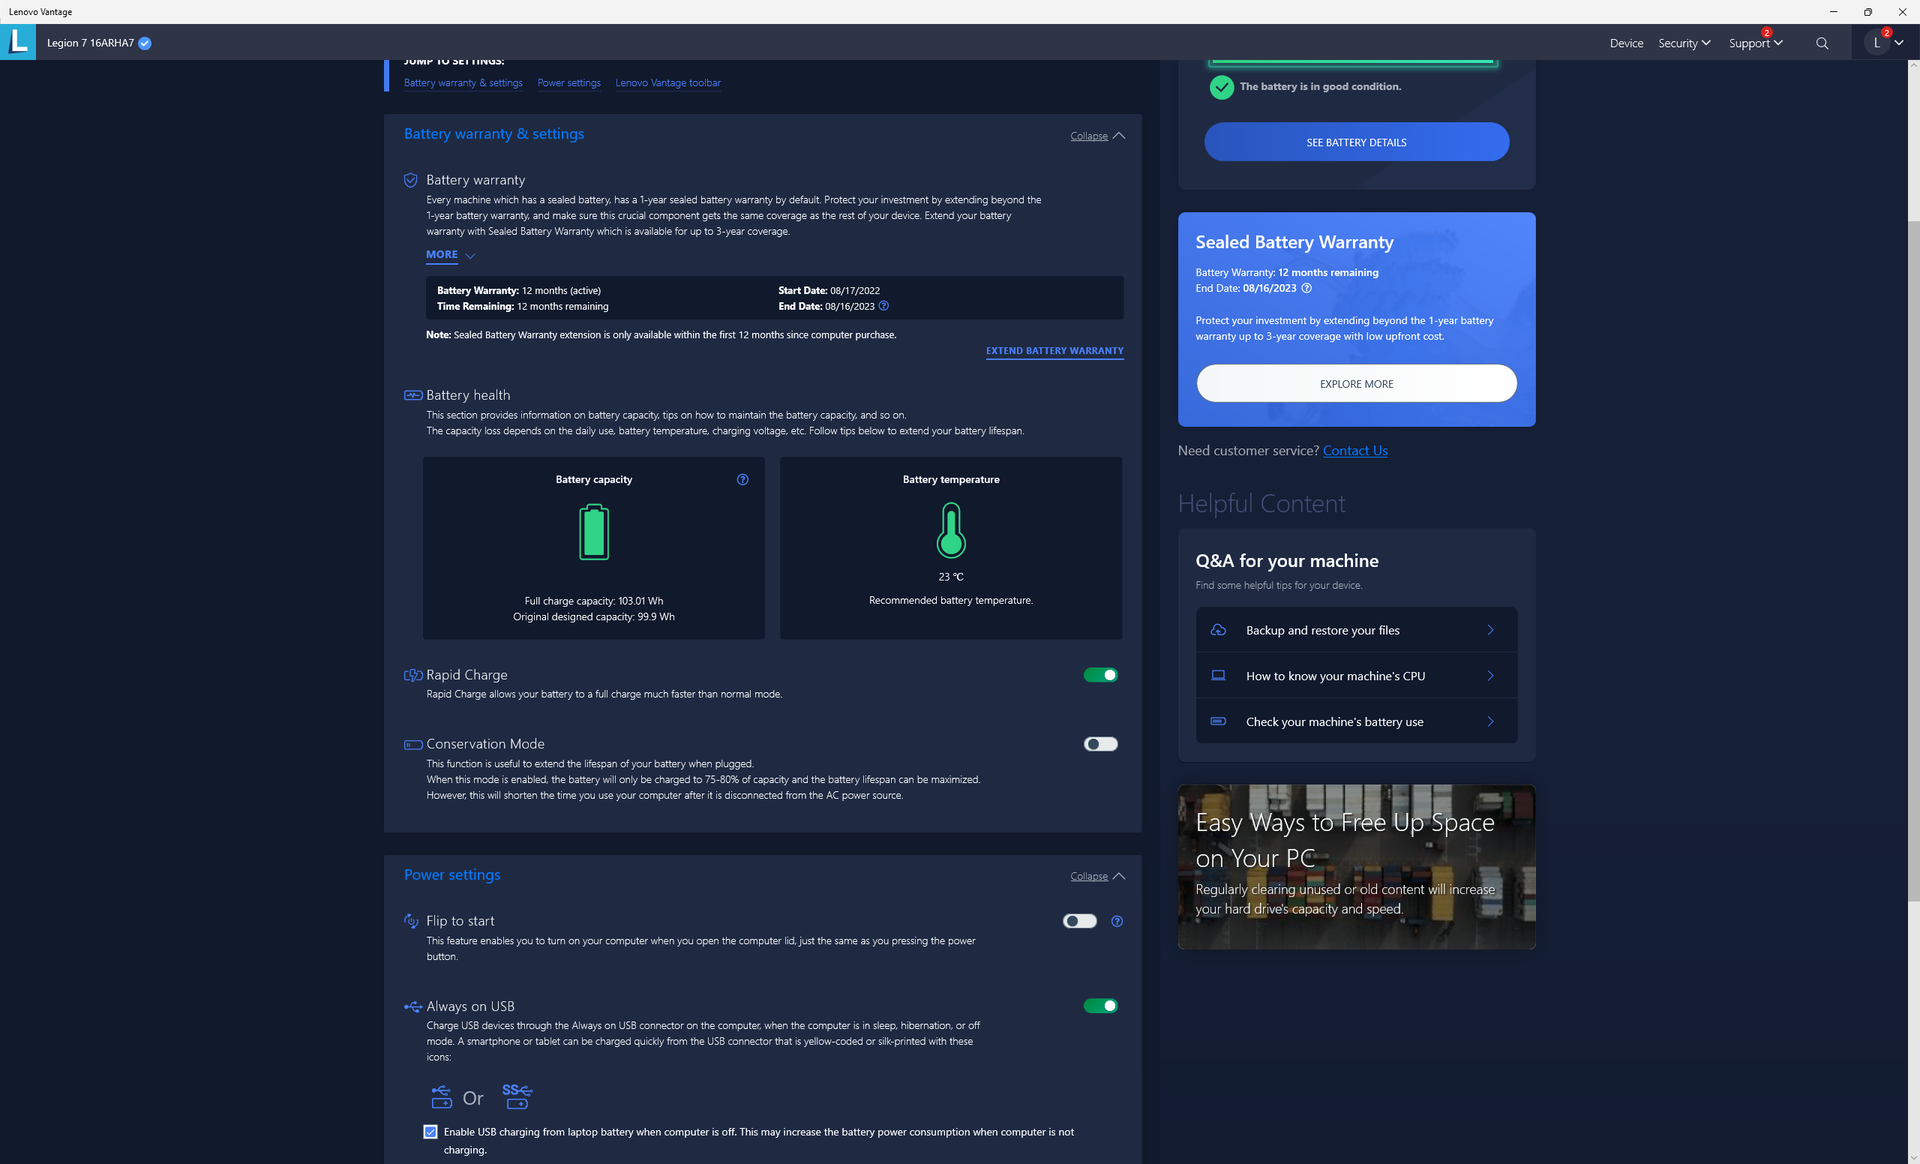
Ładowanie od pustej do pełnej baterii jest stosunkowo szybkie i trwa od 1 do 1,5 godziny, jeśli włączona jest funkcja Rapid Charge za pośrednictwem oprogramowania Lenovo Vantage. System może być również ładowany za pomocą adapterów USB-C innych firm, aczkolwiek w znacznie wolniejszym tempie.
| Lenovo Legion 7 16ARHA7 R9 6900HX, Radeon RX 6850M XT, 99 Wh | MSI Raider GE66 12UHS i9-12900HK, GeForce RTX 3080 Ti Laptop GPU, 99 Wh | Asus ROG Zephyrus Duo 16 GX650RX R9 6900HX, GeForce RTX 3080 Ti Laptop GPU, 90 Wh | HP Omen 16-c0077ng R7 5800H, Radeon RX 6600M, 70 Wh | Lenovo Legion 5 Pro 16ACH6H (82JQ001PGE) R7 5800H, GeForce RTX 3070 Laptop GPU, 80 Wh | Asus ROG Flow X16 GV601RW-M5082W R9 6900HS, GeForce RTX 3070 Ti Laptop GPU, 90 Wh | |
|---|---|---|---|---|---|---|
| Czasy pracy | -14% | 39% | -16% | 7% | -36% | |
| Reader / Idle (h) | 4.9 | 12.5 155% | 9.1 86% | |||
| WiFi v1.3 (h) | 7.3 | 5.7 -22% | 7.8 7% | 6.1 -16% | 7 -4% | 5.7 -22% |
| Load (h) | 1.8 | 1.7 -6% | 1 -44% | 0.7 -61% | 0.9 -50% | |
| H.264 (h) | 7.1 | 9.3 | 7 | |||
| Witcher 3 ultra (h) | 1.4 | 0.9 |
Za
Przeciw
Werdykt - Gra jak gracz, wygląda jak stacja robocza
Trochę to trwało, ale firma Lenovo w końcu znalazła swoje miejsce na rynku laptopów do gier dzięki najnowszemu modelowi 2022 Legion 7. Konstrukcja obudowy została dopracowana do tego stopnia, że może z łatwością stanąć w szranki z bardziej doświadczonymi, ultracienkimi alternatywami dla graczy, takimi jak MSI GS series, Asus Zephyrus S series, a nawet Razer Blade series pod wieloma względami. Smuklejszy wygląd nie poświęca innych równie ważnych cech, takich jak opcje portów, numpad, wygodna klawiatura, sztywny metalowy szkielet, wydajność TDP i TGP oraz łatwość serwisowania. Jest nieco cięższa niż wygląda, ale wrażenie gęstości nie musi odstraszać graczy.
2022 Legion 7 16 to strzał w dziesiątkę dla Lenovo pod względem wyglądu i konstrukcji. Cały sprzęt AMD dobrze wypada w porównaniu z niektórymi najszybszymi laptopami do gier Intel-Nvidia dostępnymi obecnie na rynku.
Jeśli chodzi o procesor Ryzen 9 6900HX i kartę graficzną Radeon RX 6850M XT, są one tylko o włos szybsze niż 5900HX i 6800M, które można znaleźć w znacznie tańszych laptopach, takich jak Asus ROG Strix G15. Ogólna wydajność jest tylko nieznacznie w porównaniu do większości laptopów GeForce RTX 3080 Ti i tak jest to nadal potężna maszyna do gier mimo wszystko.
Zużycie energii podczas gry jest kluczową wadą systemu All-AMD Legion, ponieważ jest wyższe niż wiele alternatyw Intel-Nvidia obecnie na rynku. To nie jest dobre spojrzenie dla Lenovo lub AMD, gdy system wymaga więcej energii, a jednocześnie działa wolniej niż konkurencja dla gorszej wydajności na wat. Opcje wyświetlacza OLED i kilka poprawek błędów OTA w dół linii nie zaszkodziłyby również.
Cena i dostępność
W chwili publikacji Legion 7 16ARHA7 nie jest jeszcze szeroko dostępny w kanałach firm trzecich. Nasza aktualna konfiguracja nie jest jeszcze wysyłana do klientów. Zalecamy sprawdzanie oficjalnej strony produktu Lenovo https://www.lenovo.com/us/en/p/laptops/legion-laptops/legion-7-series/legion-7-gen-7-(16-inch-amd)/len101g0017 w celu uzyskania aktualizacji. Jedyną dostępną obecnie konfiguracją jest mniejszy SKU z procesorem Ryzen 7 i Radeonem RX 6700M w cenie 2380 USD.
Lenovo Legion 7 16ARHA7
- 14/09/2022 v7 (old)
Allen Ngo
Price comparison

