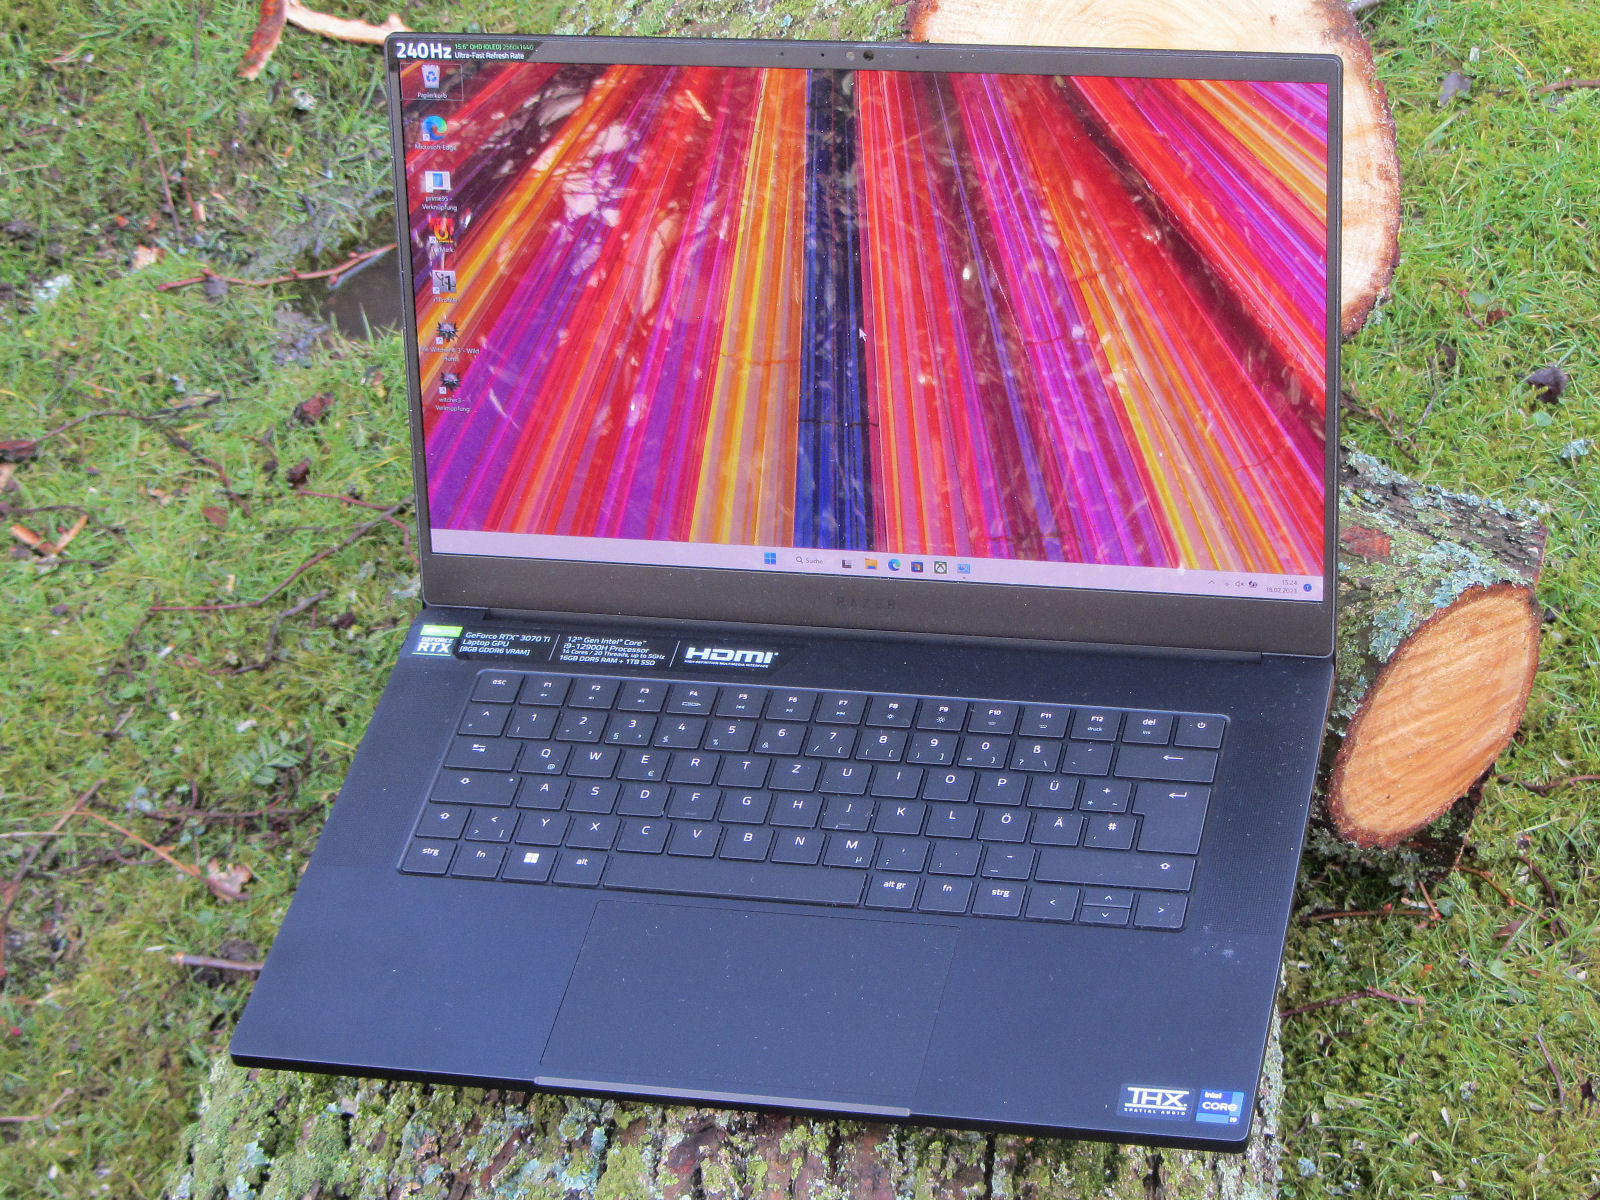
Recenzja Razer Blade 15 OLED (początek 2022 roku): Kompaktowy laptop do gier z RTX 3070 Ti

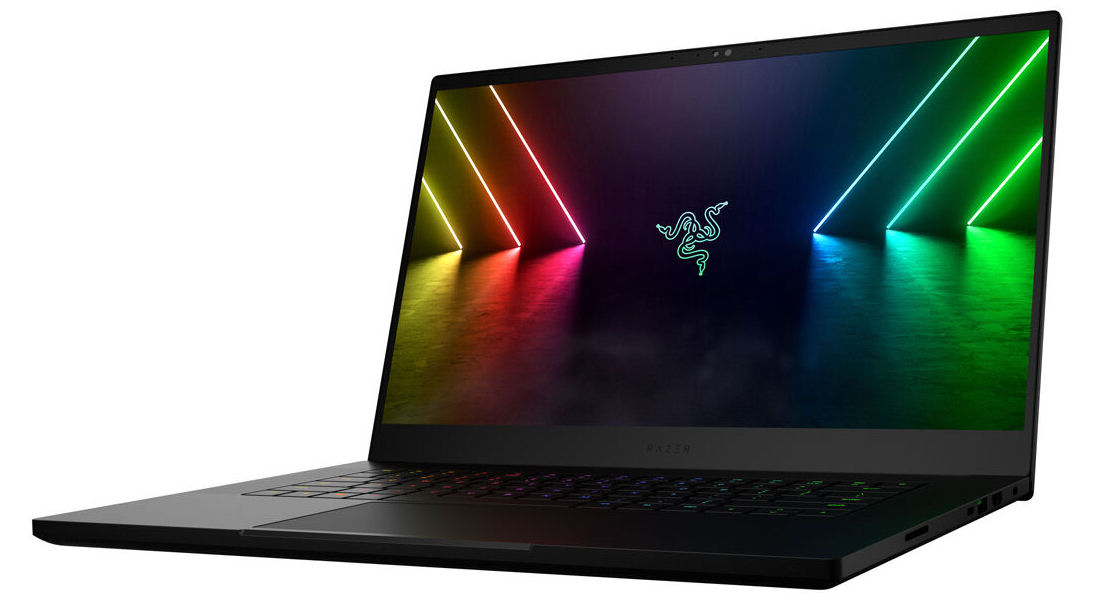
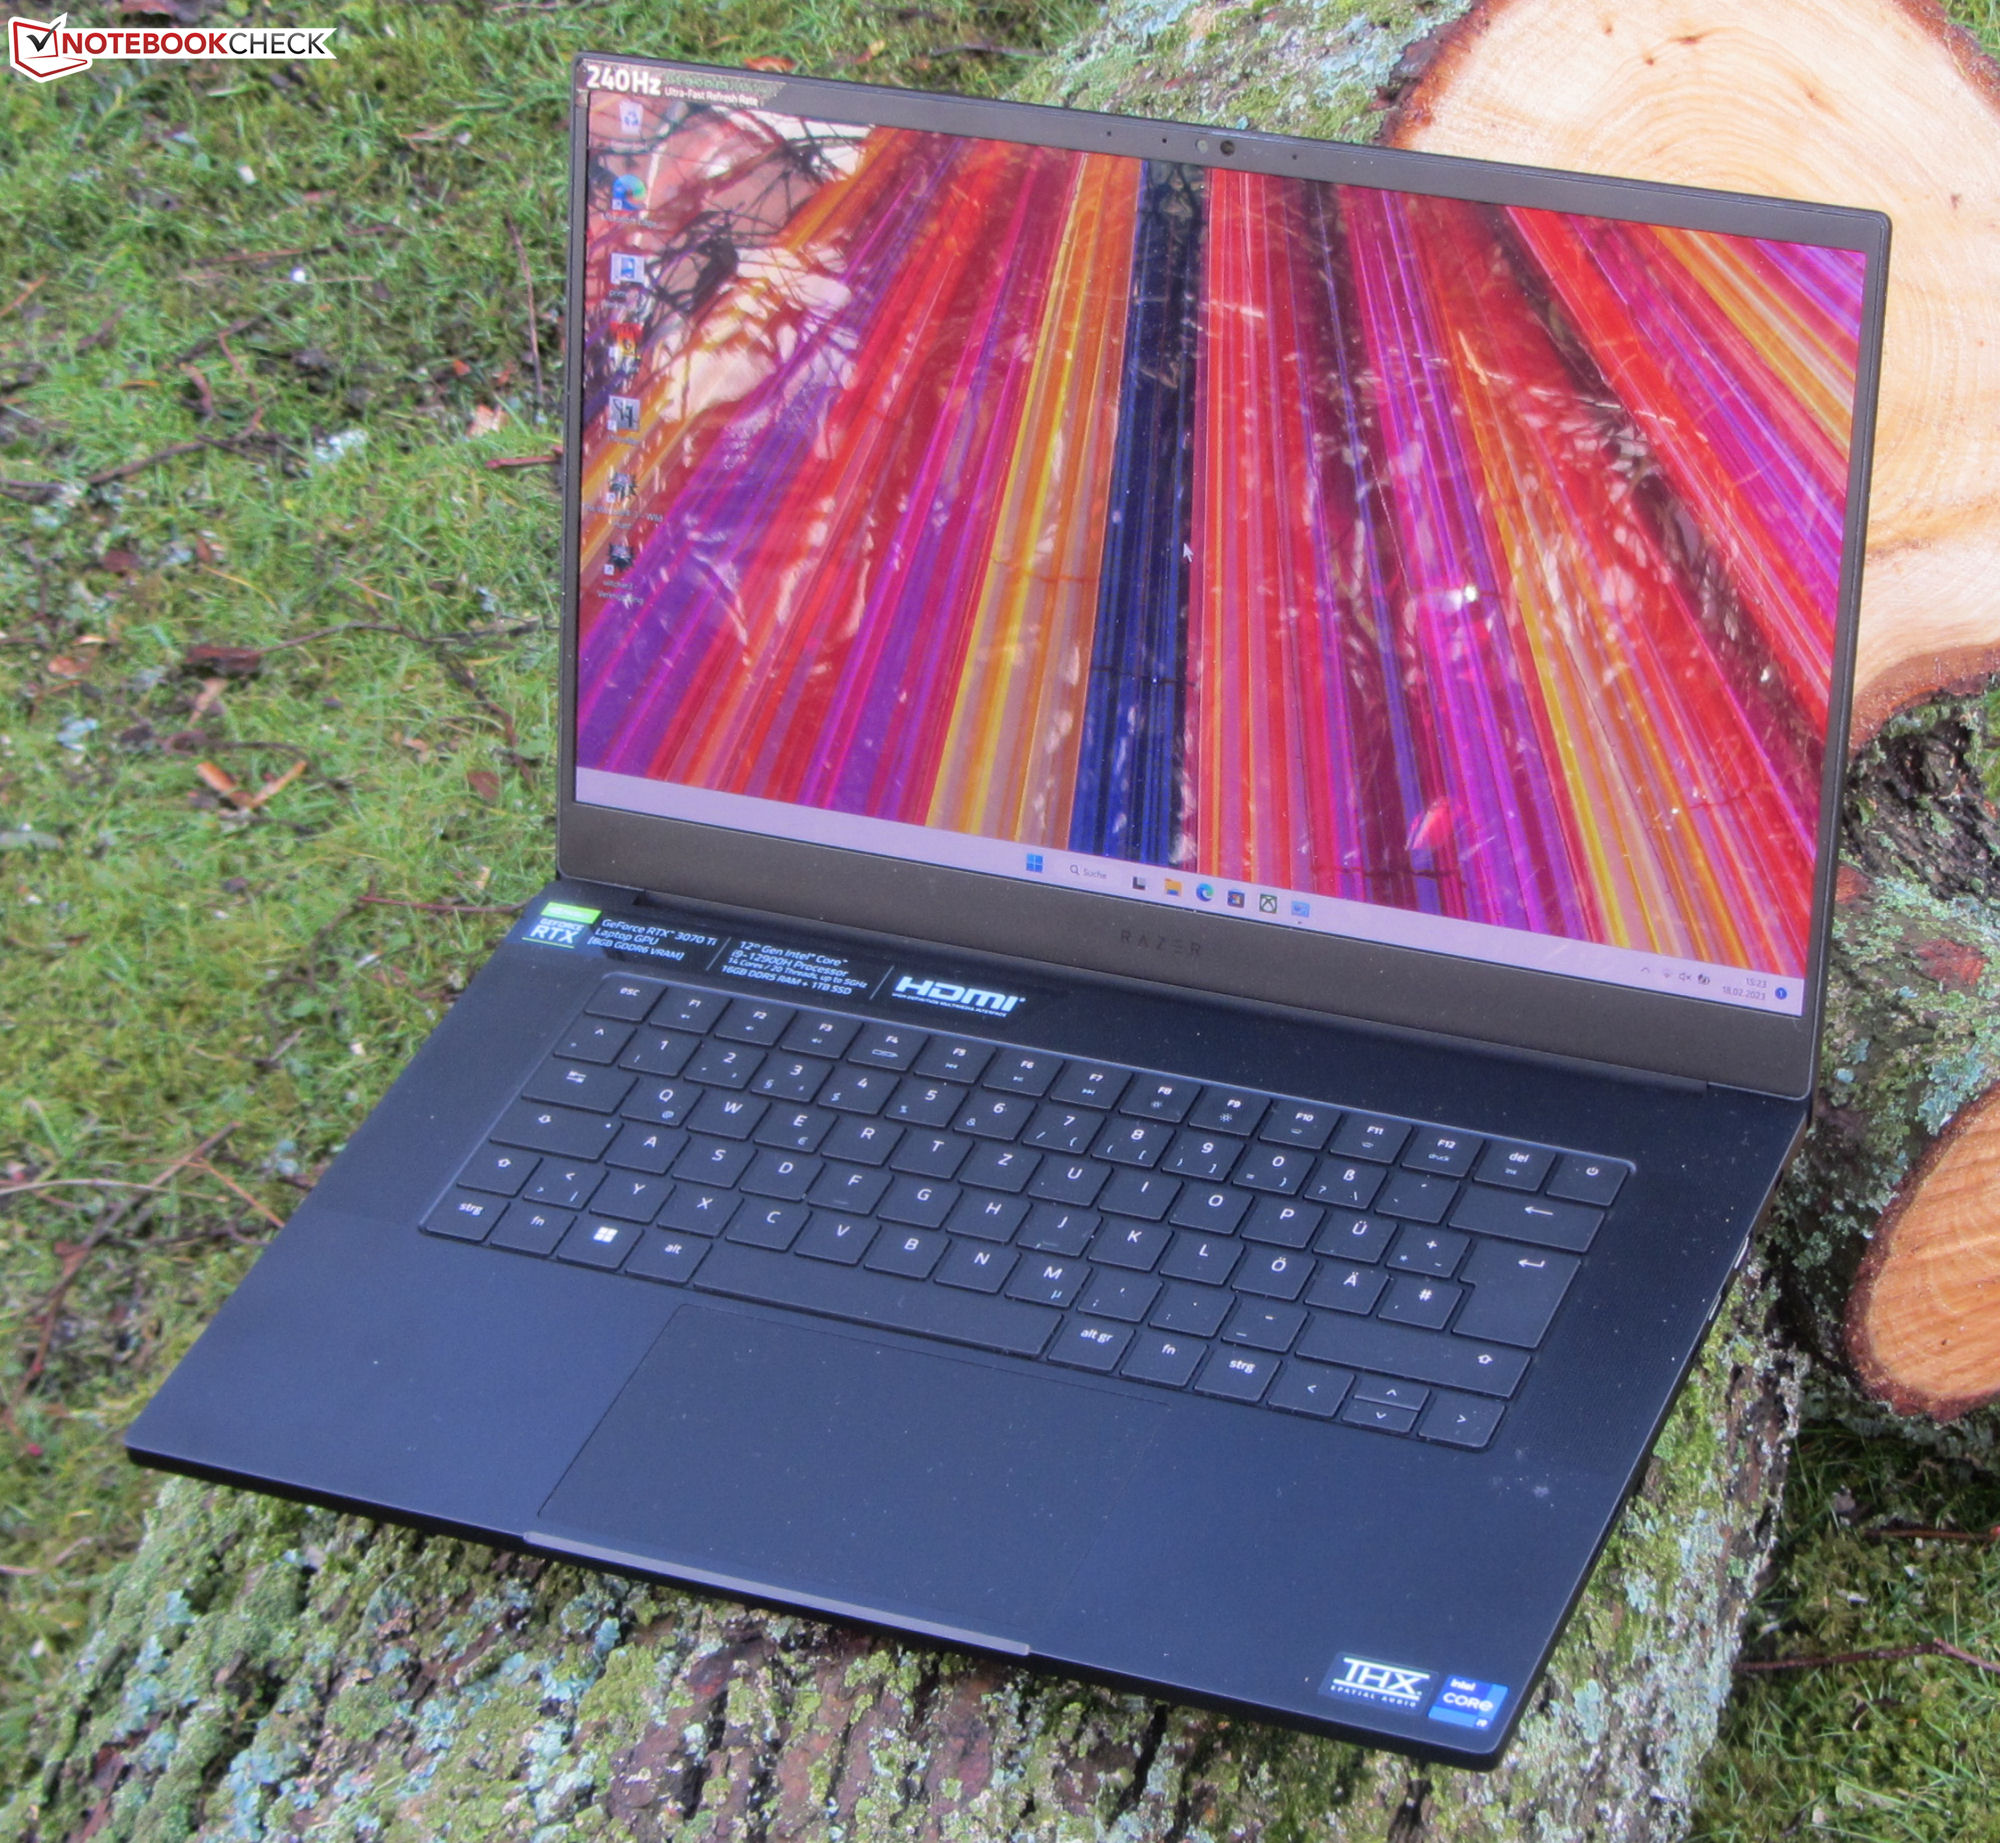
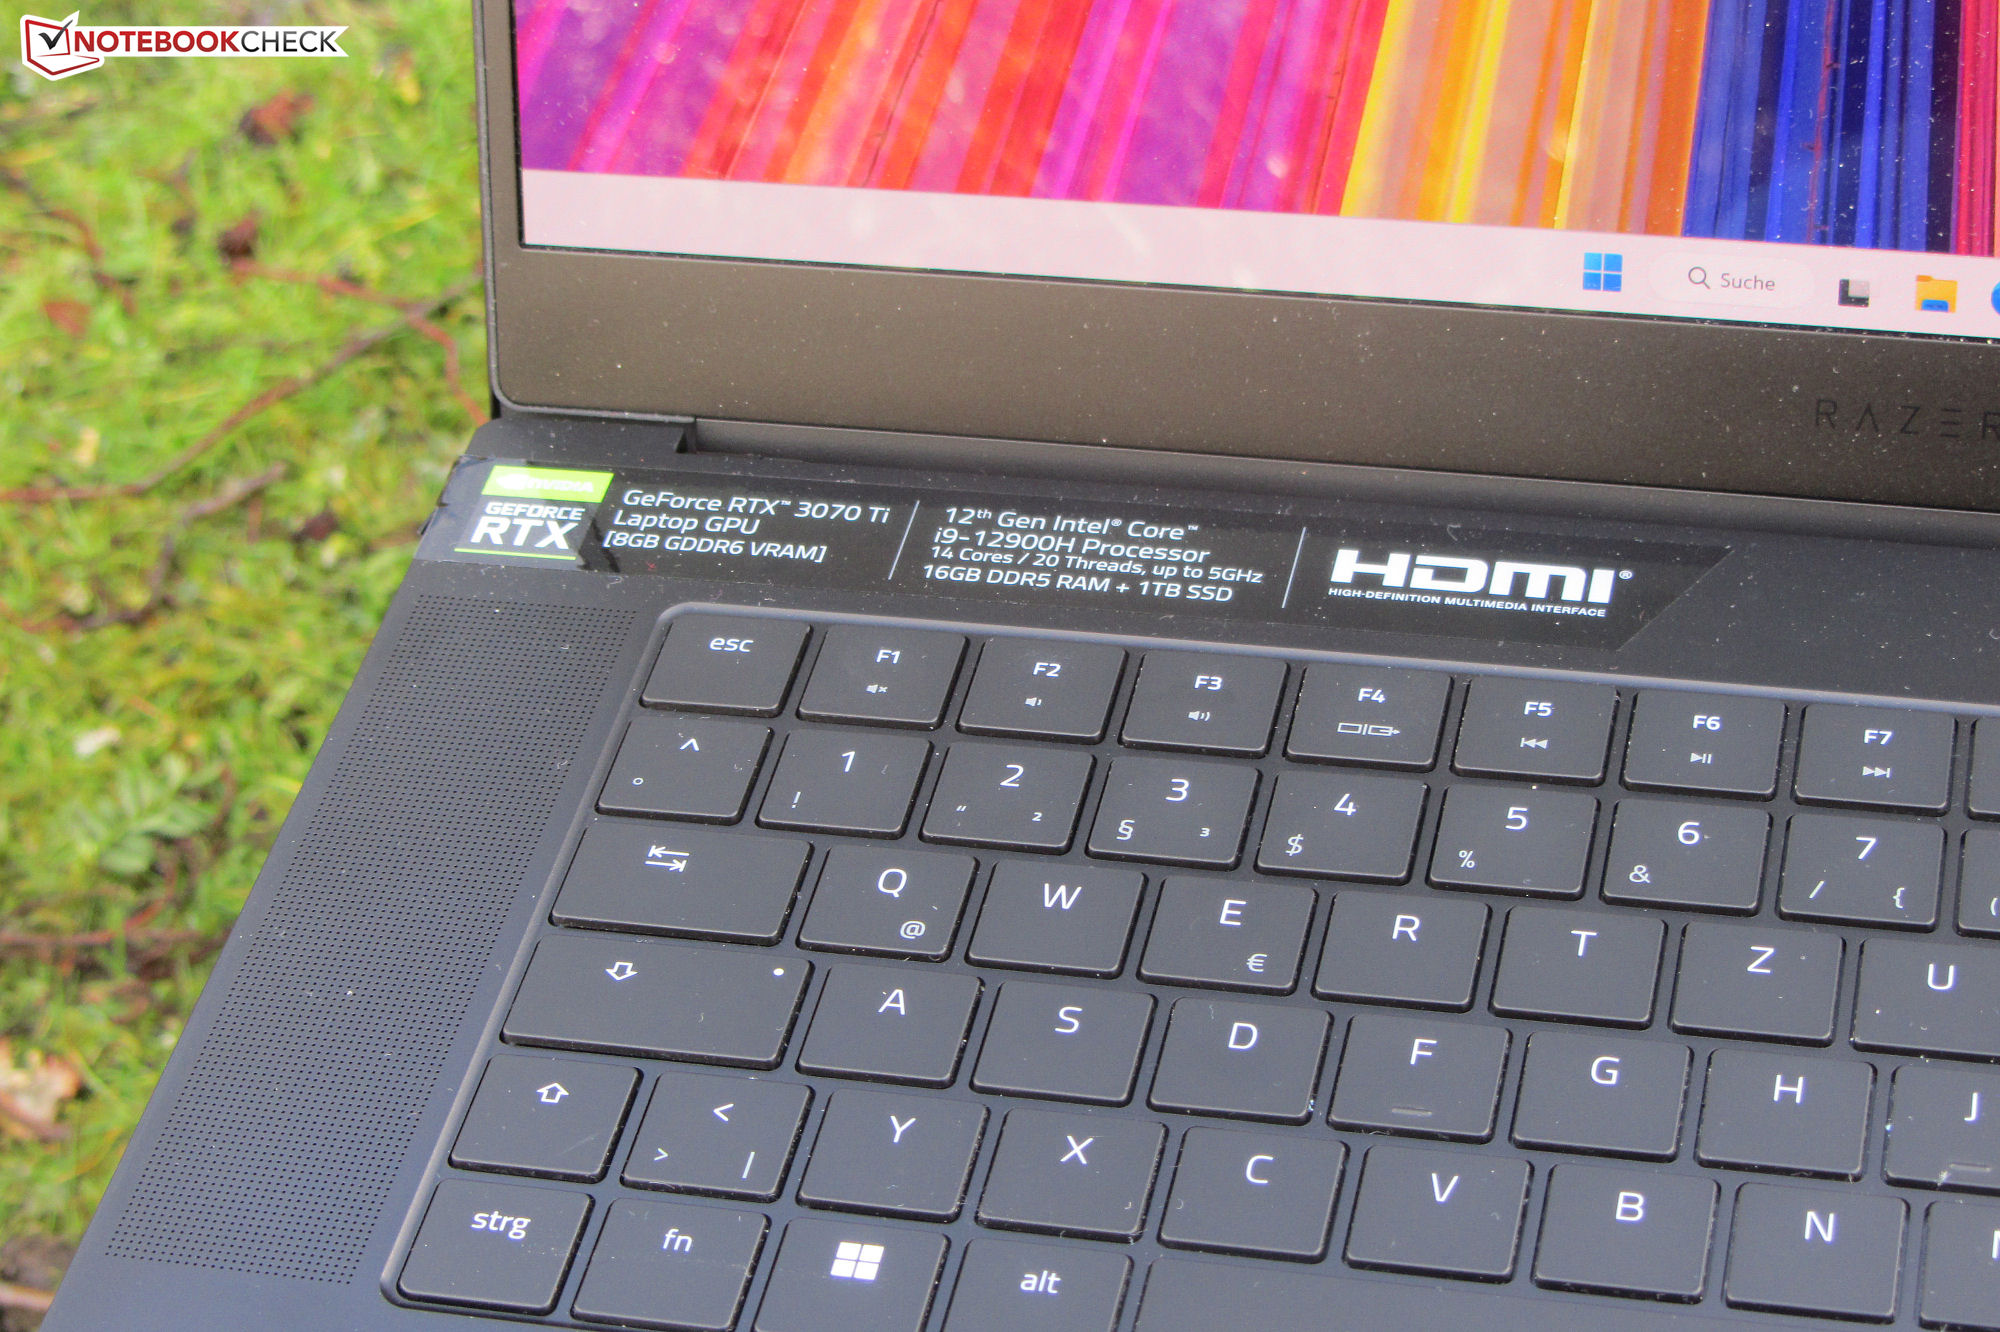
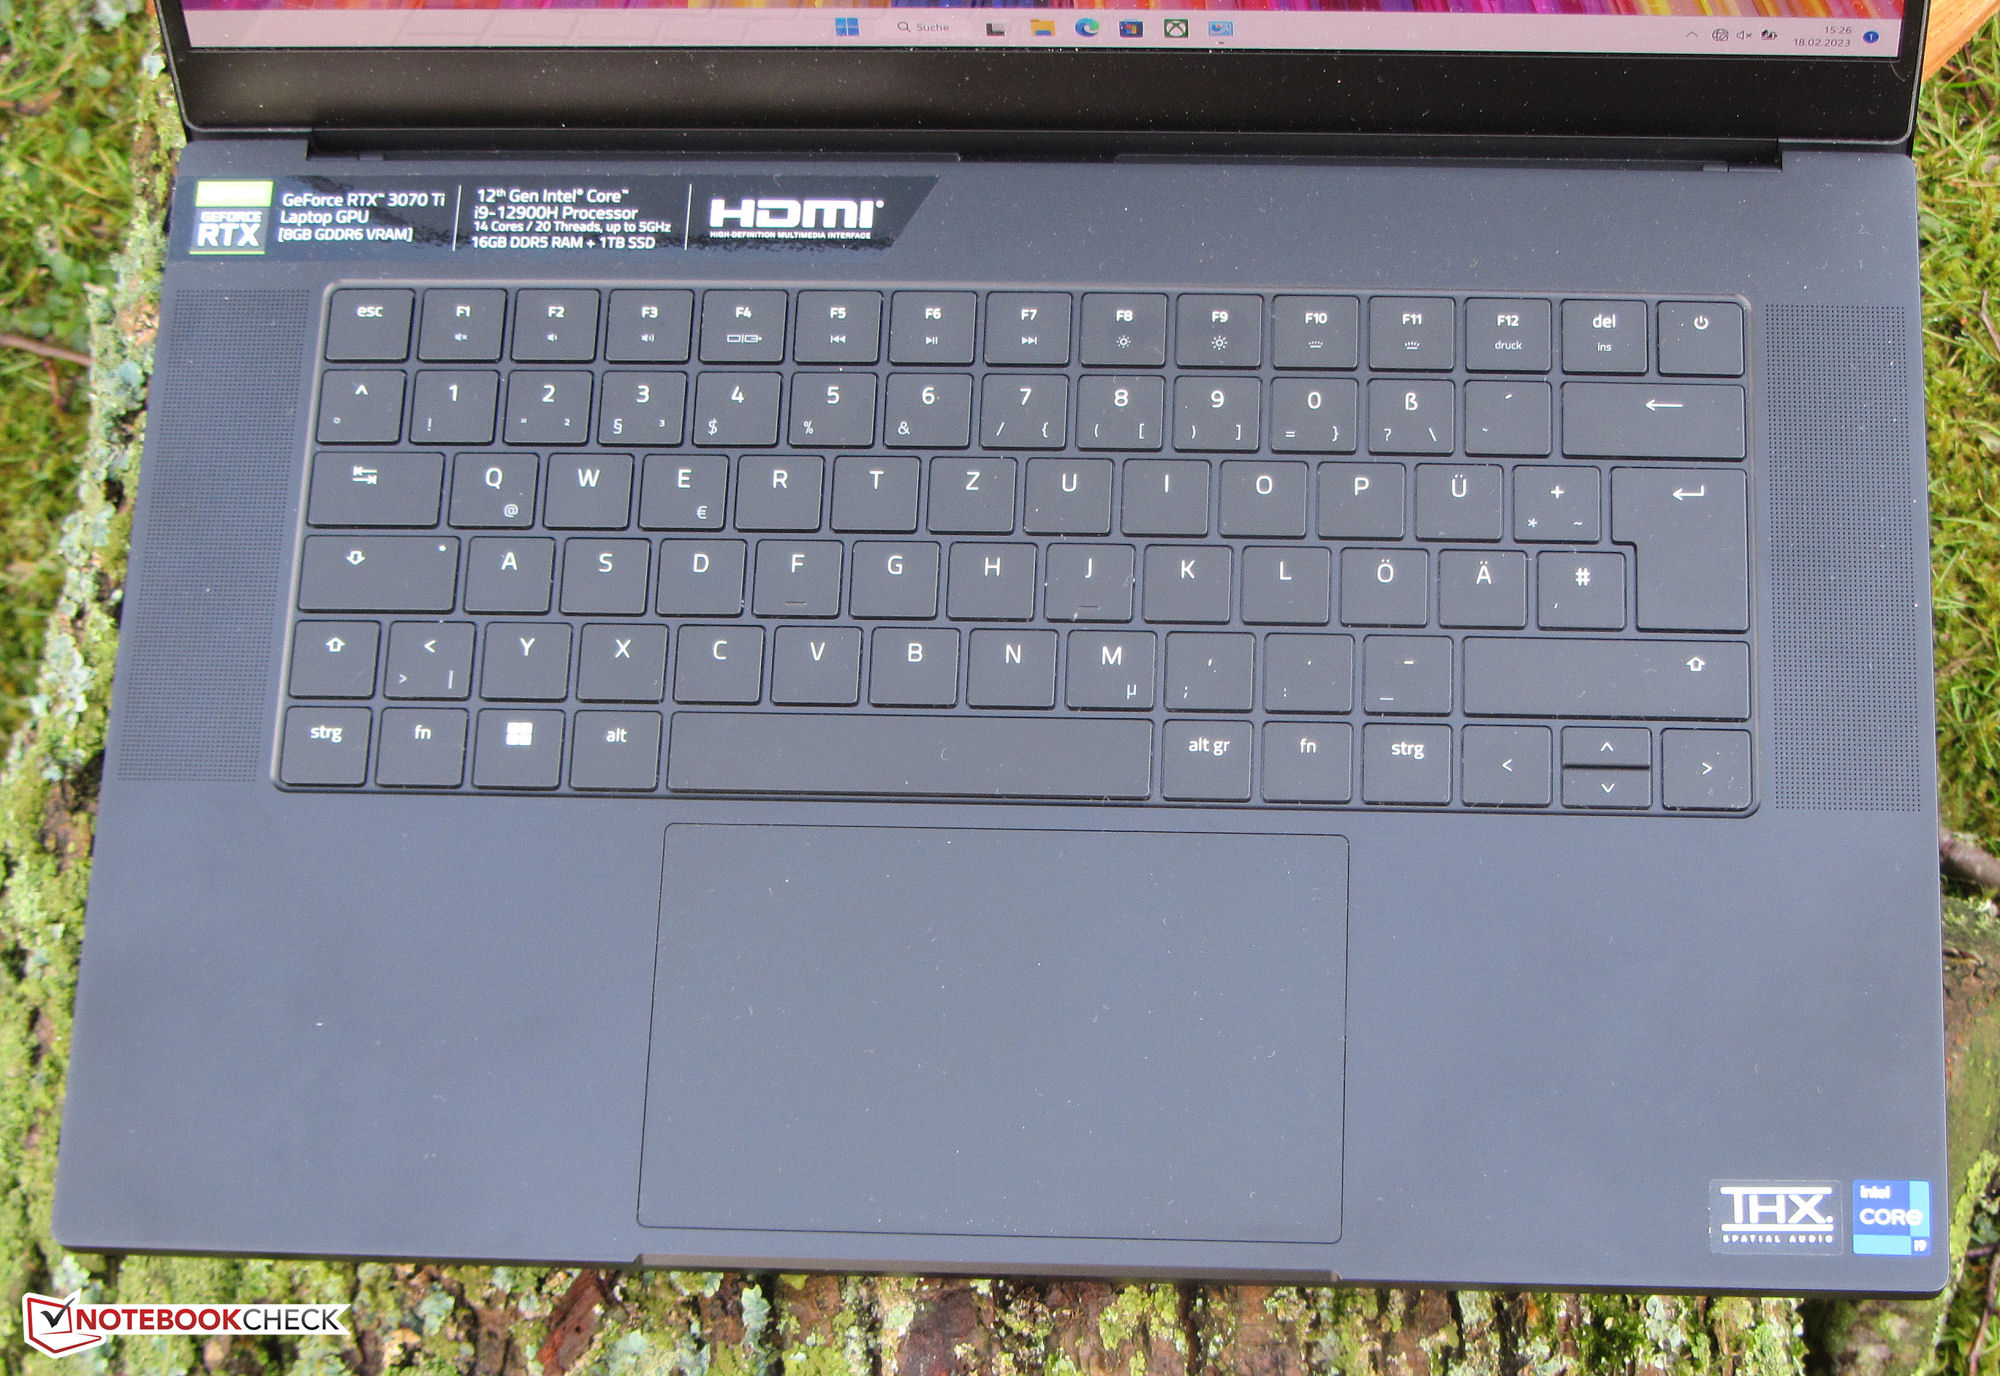
Razer Blade 15 (Early 2022) ma ambicje być laptopem zarówno dla graczy, jak i kreatywnych użytkowników. Na pokładzie znajduje się odpowiedni sprzęt: Core i9-12900HpROCESOR, GeForce RTX 3070 TigPU do laptopa i dokładny pod względem kolorów wyświetlacz OLED (QHD). Podobnych kompaktowych konkurentów można znaleźć w postaci m.in Schenker XMG Fusion 15 (Mid 22), tj.Aorus 15 XE5,HP Omen 16, oraz.Asus ROG Zephyrus M16 GU603Z.
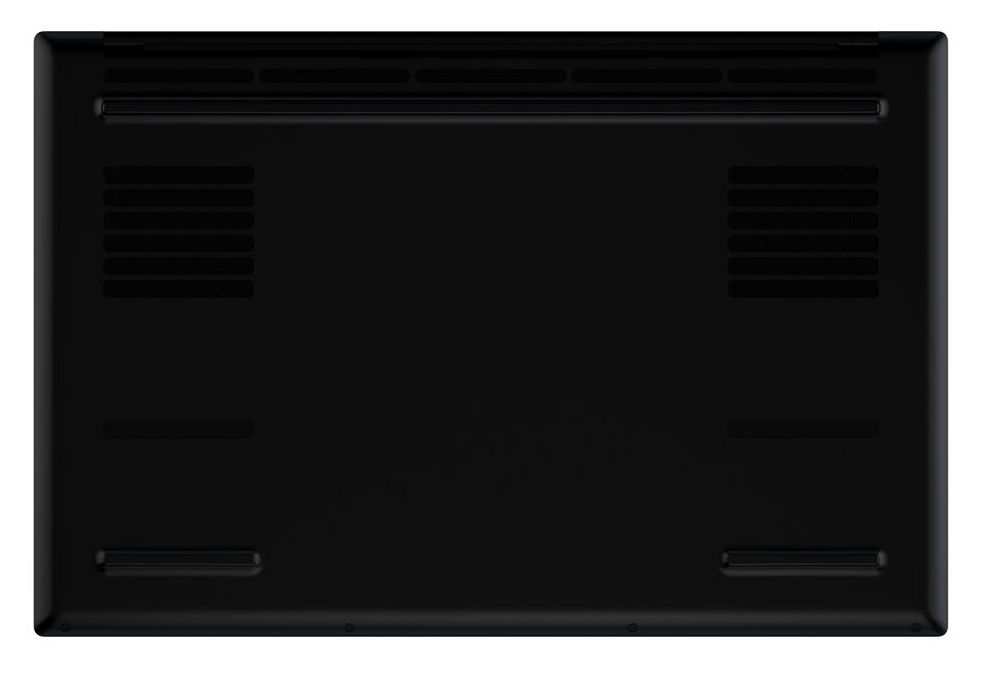
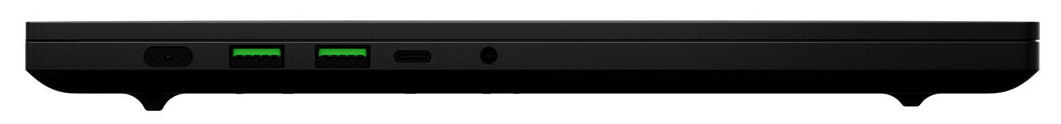
Informacje dotyczące obudowy, funkcji, urządzeń wejściowych i głośników są już pod ręką w naszej recenzji jego rodzeństwa, (12800H, RTX 3080 Ti). Ten ostatni wyposażony jest w panel LED (QHD) - najistotniejsza różnica względem obecnego urządzenia.
Potencjalni konkurenci w porównaniu
Ocena | Data | Model | Waga | Wysokość | Rozmiar | Rezolucja | Cena |
|---|---|---|---|---|---|---|---|
| 89.9 % v7 (old) | 03/2023 | Razer Blade 15 OLED (Early 2022) i9-12900H, GeForce RTX 3070 Ti Laptop GPU | 2 kg | 16.99 mm | 15.60" | 2560x1440 | |
| 87.8 % v7 (old) | 02/2023 | Asus ROG Zephyrus M16 GU603Z i9-12900H, GeForce RTX 3070 Ti Laptop GPU | 2.1 kg | 19.9 mm | 16.00" | 2560x1600 | |
| 85.5 % v7 (old) | 12/2022 | Aorus 15 XE5 i7-12700H, GeForce RTX 3070 Ti Laptop GPU | 2.3 kg | 24 mm | 15.60" | 2560x1440 | |
| 87.4 % v7 (old) | Schenker XMG Fusion 15 (Mid 22) i7-11800H, GeForce RTX 3070 Laptop GPU | 1.9 kg | 21.65 mm | 15.60" | 2560x1440 | ||
| 85.5 % v7 (old) | HP Omen 16-b1090ng i7-12700H, GeForce RTX 3070 Ti Laptop GPU | 2.3 kg | 23 mm | 16.10" | 2560x1440 |

| SD Card Reader | |
| average JPG Copy Test (av. of 3 runs) | |
| Razer Blade 15 2022 (Toshiba Exceria Pro SDXC 64 GB UHS-II) | |
| Asus ROG Zephyrus M16 GU603Z | |
| Średnia w klasie Gaming (20.9 - 210, n=54, ostatnie 2 lata) | |
| Razer Blade 15 OLED (Early 2022) (AV Pro SD microSD 128 GB V60) | |
| Schenker XMG Fusion 15 (Mid 22) (AV PRO microSD 128 GB V60) | |
| HP Omen 16-b1090ng (AV PRO microSD 128 GB V60) | |
| maximum AS SSD Seq Read Test (1GB) | |
| Asus ROG Zephyrus M16 GU603Z | |
| Razer Blade 15 2022 (Toshiba Exceria Pro SDXC 64 GB UHS-II) | |
| Średnia w klasie Gaming (25.5 - 261, n=51, ostatnie 2 lata) | |
| Razer Blade 15 OLED (Early 2022) (AV Pro SD microSD 128 GB V60) | |
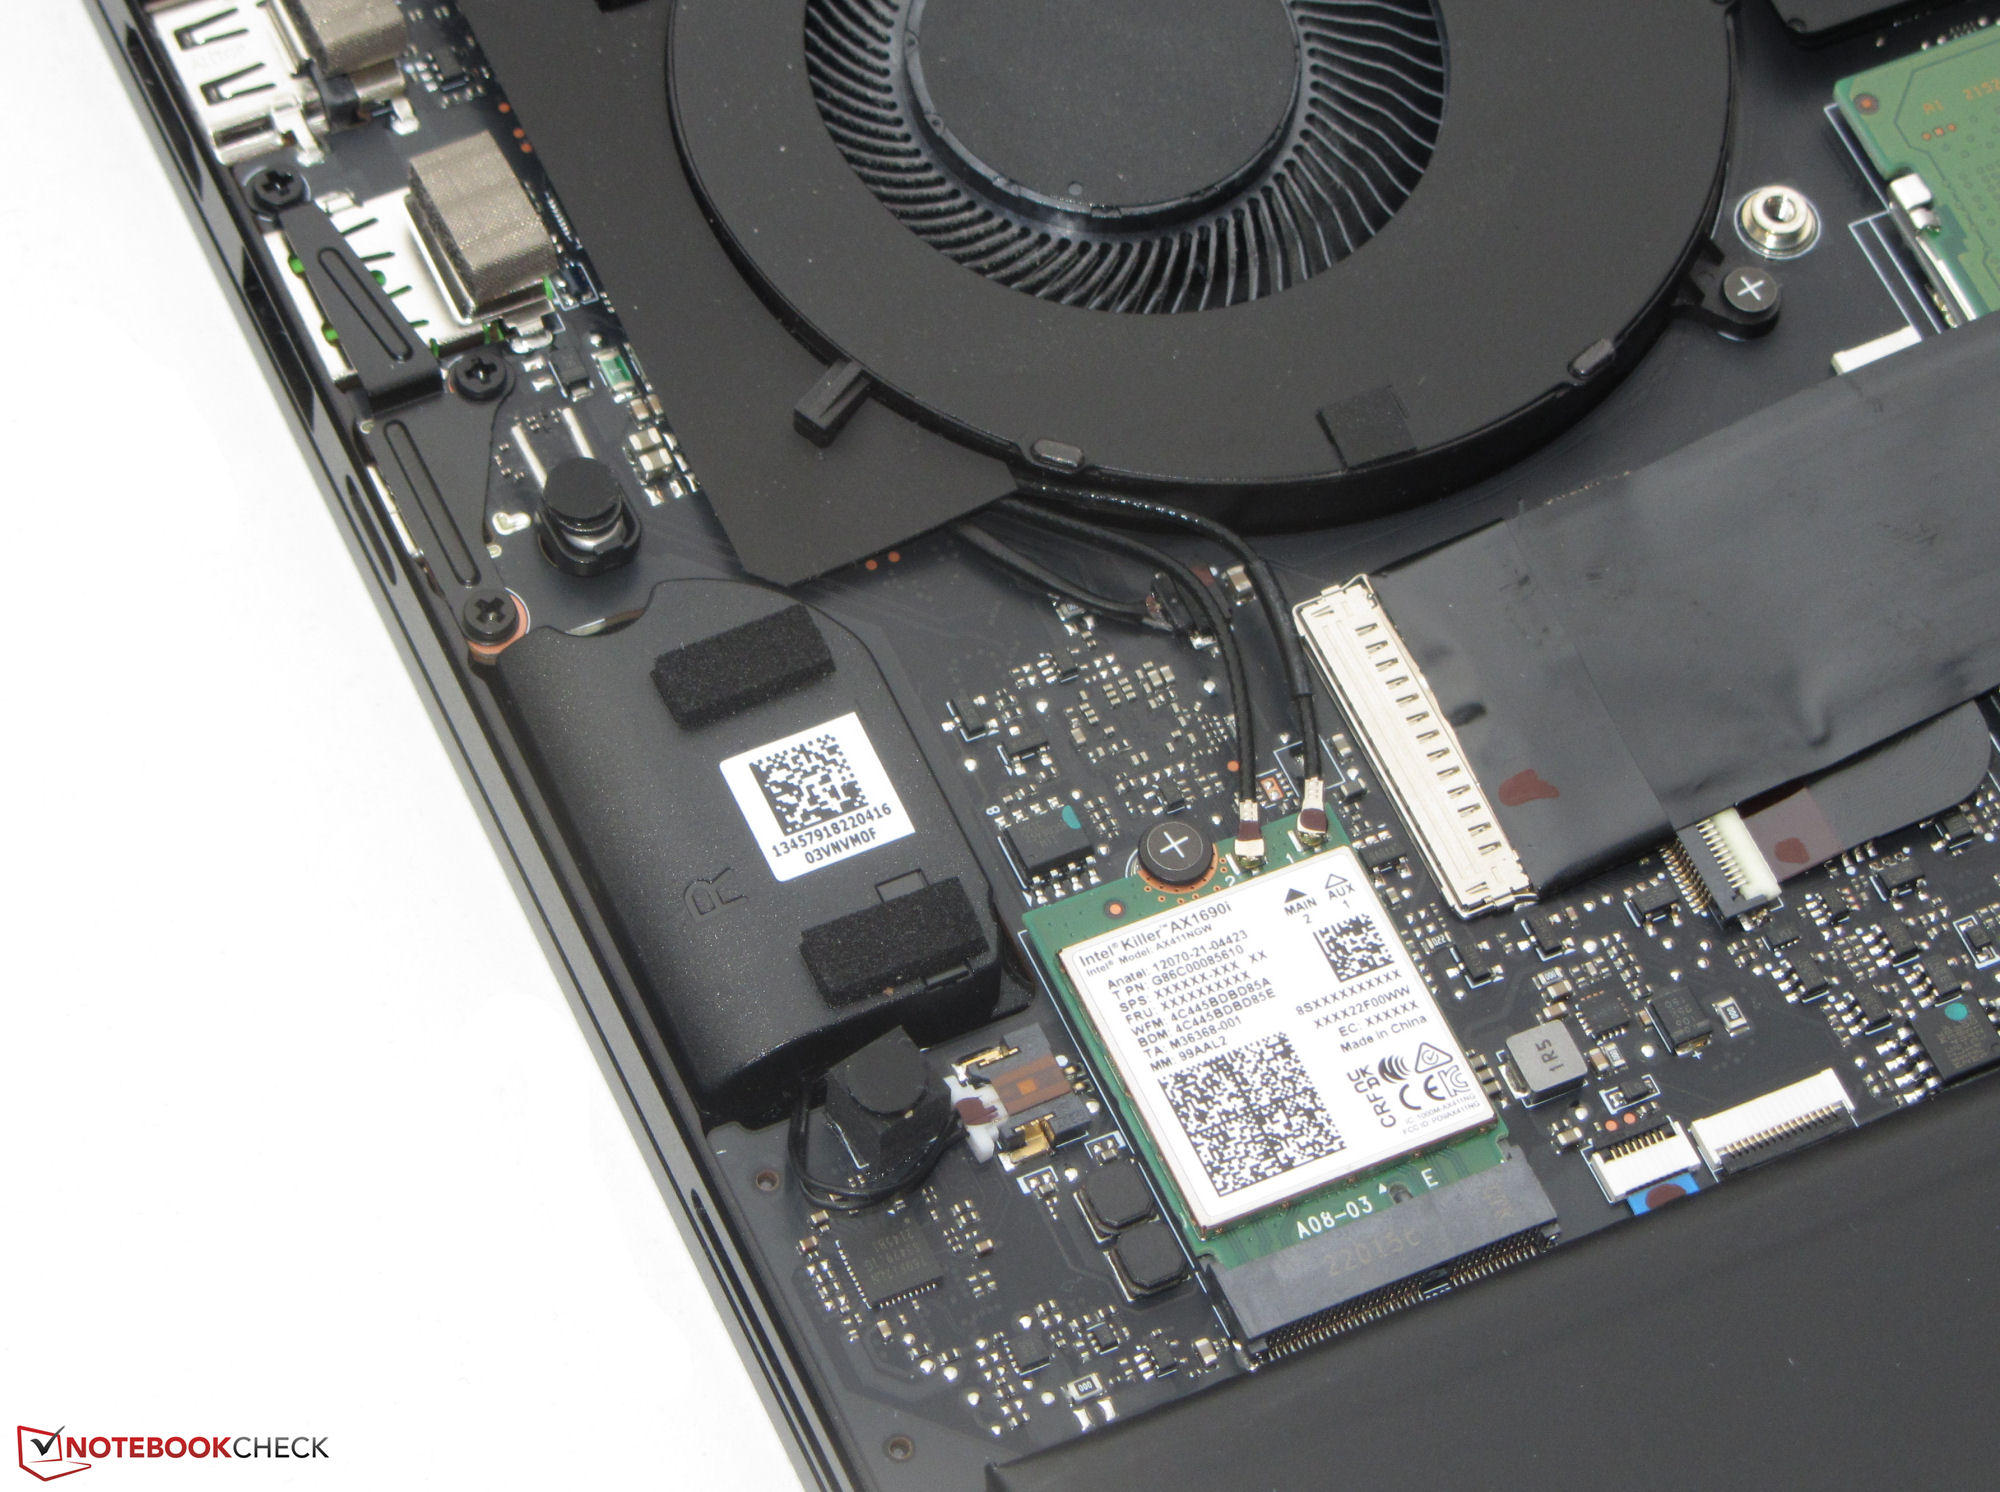
| Networking | |
| iperf3 transmit AX12 | |
| Razer Blade 15 2022 | |
| Przeciętny Killer Wi-Fi 6E AX1690i 160MHz (n=1) | |
| iperf3 receive AX12 | |
| Razer Blade 15 2022 | |
| Przeciętny Killer Wi-Fi 6E AX1690i 160MHz (n=1) | |
| iperf3 receive AXE11000 6GHz | |
| Razer Blade 15 OLED (Early 2022) | |
| Aorus 15 XE5 | |
| Asus ROG Zephyrus M16 GU603Z | |
| Przeciętny Killer Wi-Fi 6E AX1690i 160MHz (1465 - 1762, n=5) | |
| Średnia w klasie Gaming (975 - 1775, n=37, ostatnie 2 lata) | |
| iperf3 receive AXE11000 | |
| Asus ROG Zephyrus M16 GU603Z | |
| Schenker XMG Fusion 15 (Mid 22) | |
| Razer Blade 15 OLED (Early 2022) | |
| Średnia w klasie Gaming (680 - 1745, n=94, ostatnie 2 lata) | |
| Przeciętny Killer Wi-Fi 6E AX1690i 160MHz (917 - 1727, n=9) | |
| HP Omen 16-b1090ng | |

 GeForce RTX 3070 Ti Laptop GPU, i9-12900H, Samsung PM9A1 MZVL21T0HCLR")
 GeForce RTX 3070 Ti Laptop GPU, i9-12900H, Samsung PM9A1 MZVL21T0HCLR")
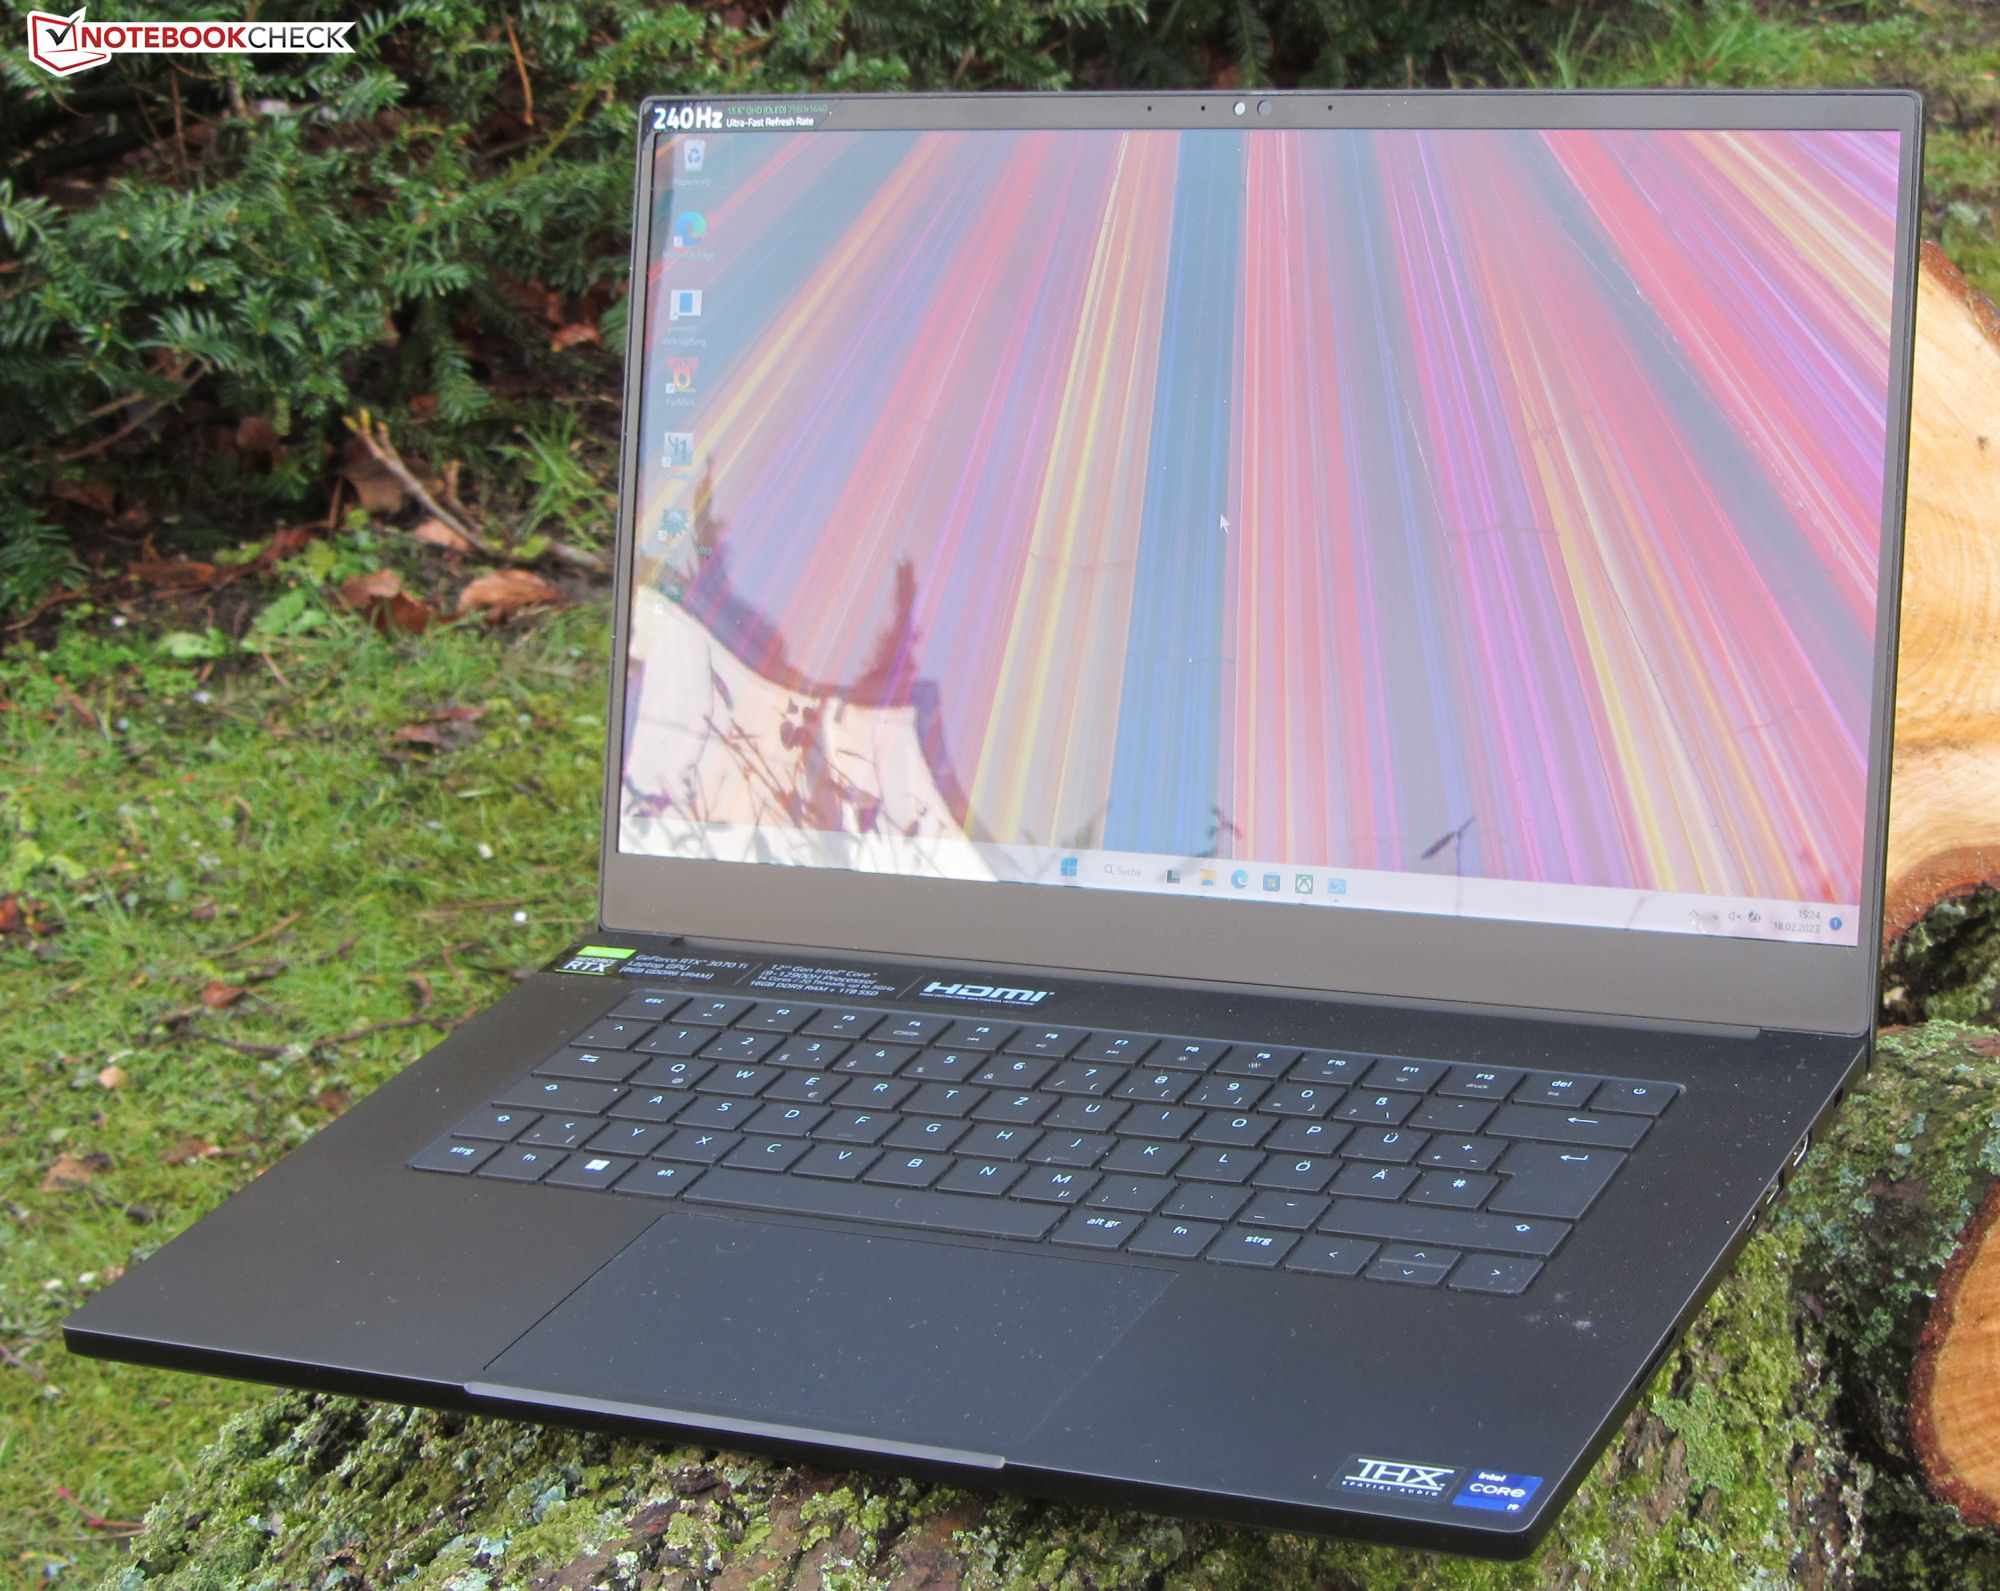
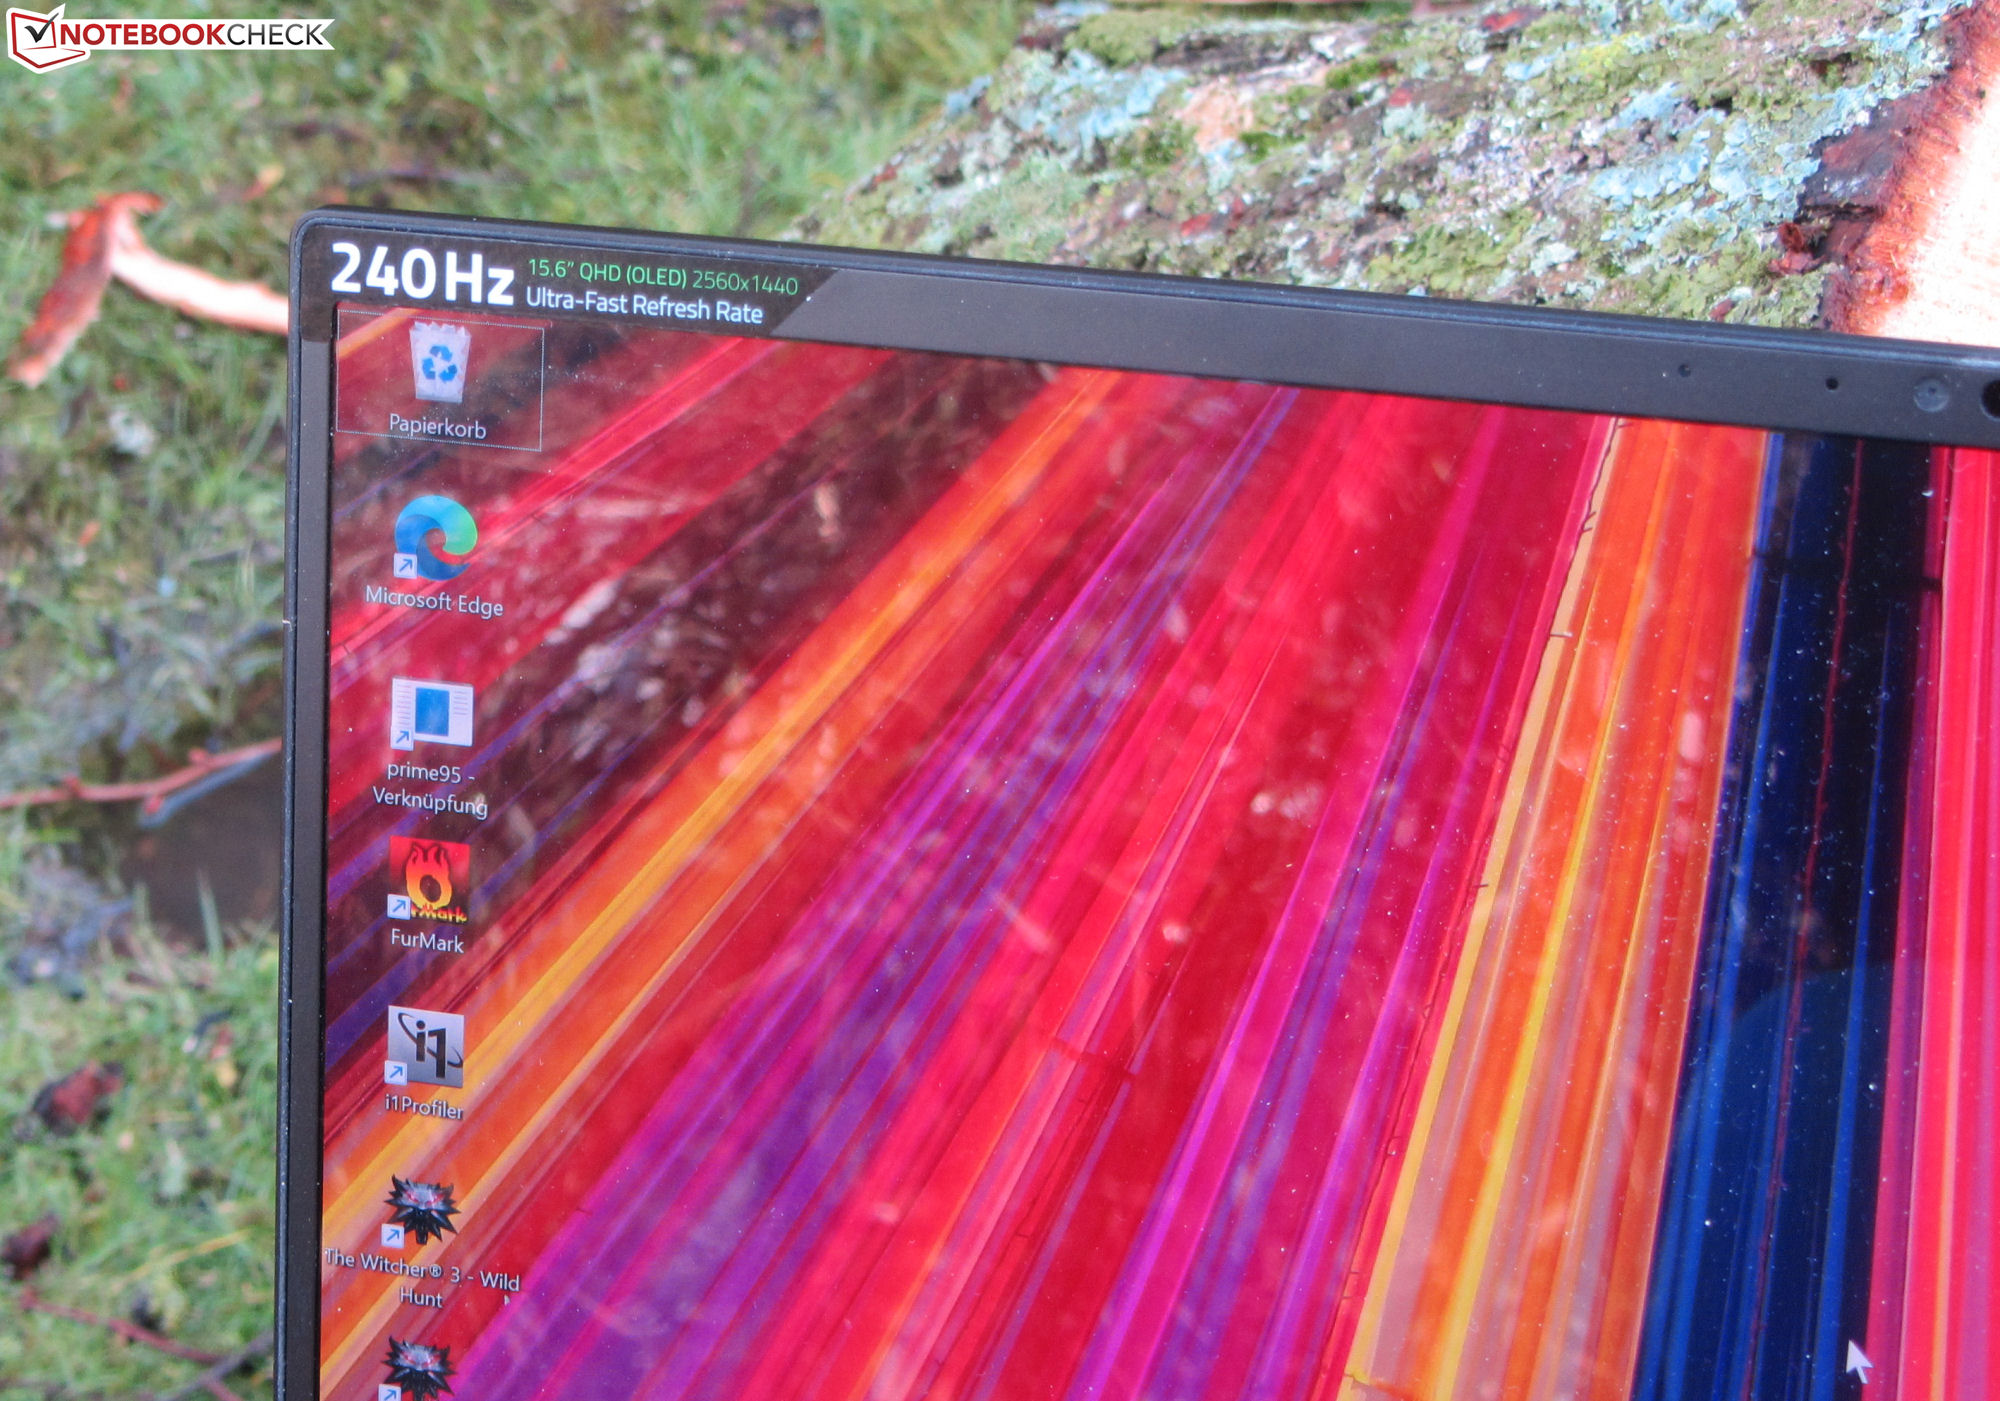
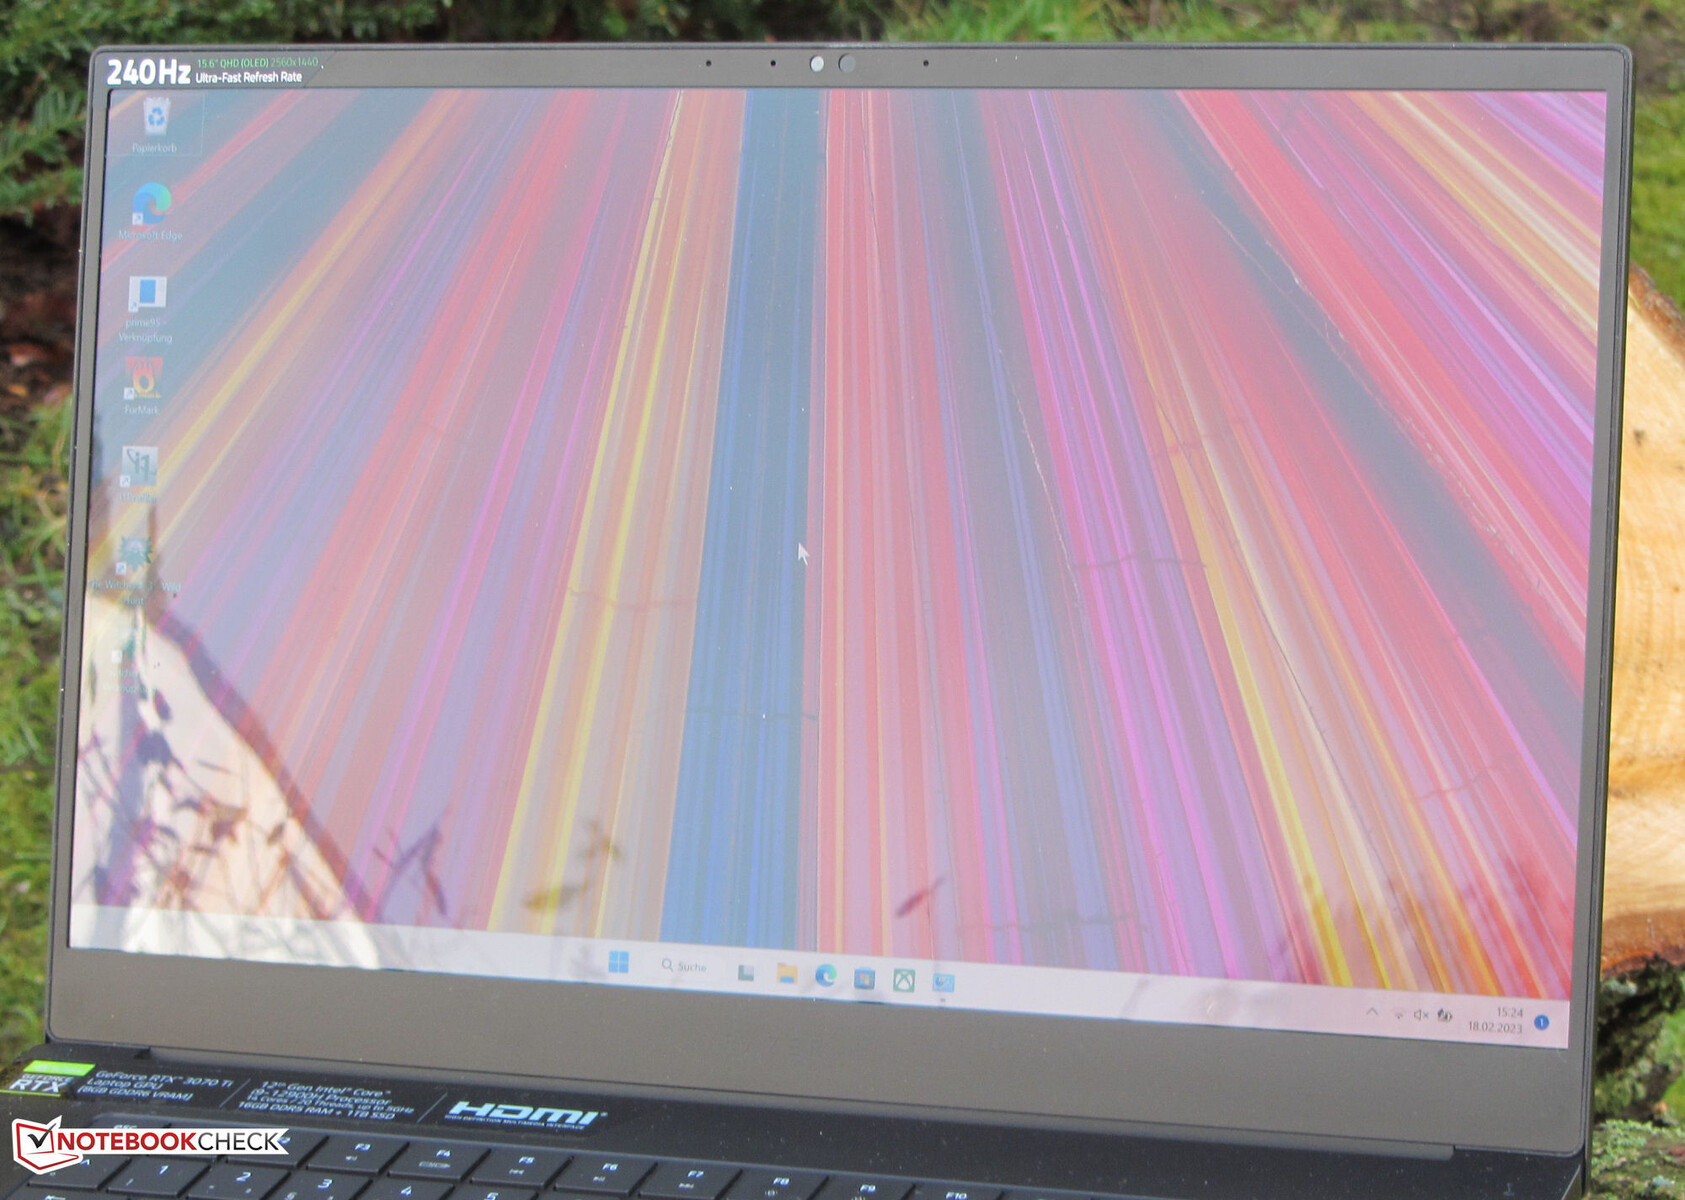
Wyświetlacz - mobilny komputer Razera przynosi ze sobą panel OLED

Wyświetlacz OLED oferuje te same kluczowe dane, co jego rodzeństwo z wyświetlaczem LED: Rozdzielczość 2560 x 1440 pikseli (QHD) przy częstotliwości odświeżania 240 Hz i przekątną 15,6 cala.
Typowo dla OLED-ów, panel zdobywa punkty za wspaniałe poziomy czerni i szybki czas reakcji. Do tego dochodzi stosunkowo wysoka jasność maksymalna. Jest to coś, do czego jego LED-owy odpowiednik nie może się przyczepić.
Słabe strony panelu OLED: Ma on błyszczącą powierzchnię i migocze przy ustawieniu jasności na poziomie ≤ 70 procent z częstotliwością 500 Hz. Technicznie uwarunkowane migotanie jest związane z regulacją jasności panelu. Pod tym względem, matowa, niemigocząca dioda LED matowy, niemigoczący panel LED ma nosa do przodu.
| |||||||||||||||||||||||||
rozświetlenie: 99 %
na akumulatorze: 381 cd/m²
kontrast: 12767:1 (czerń: 0.03 cd/m²)
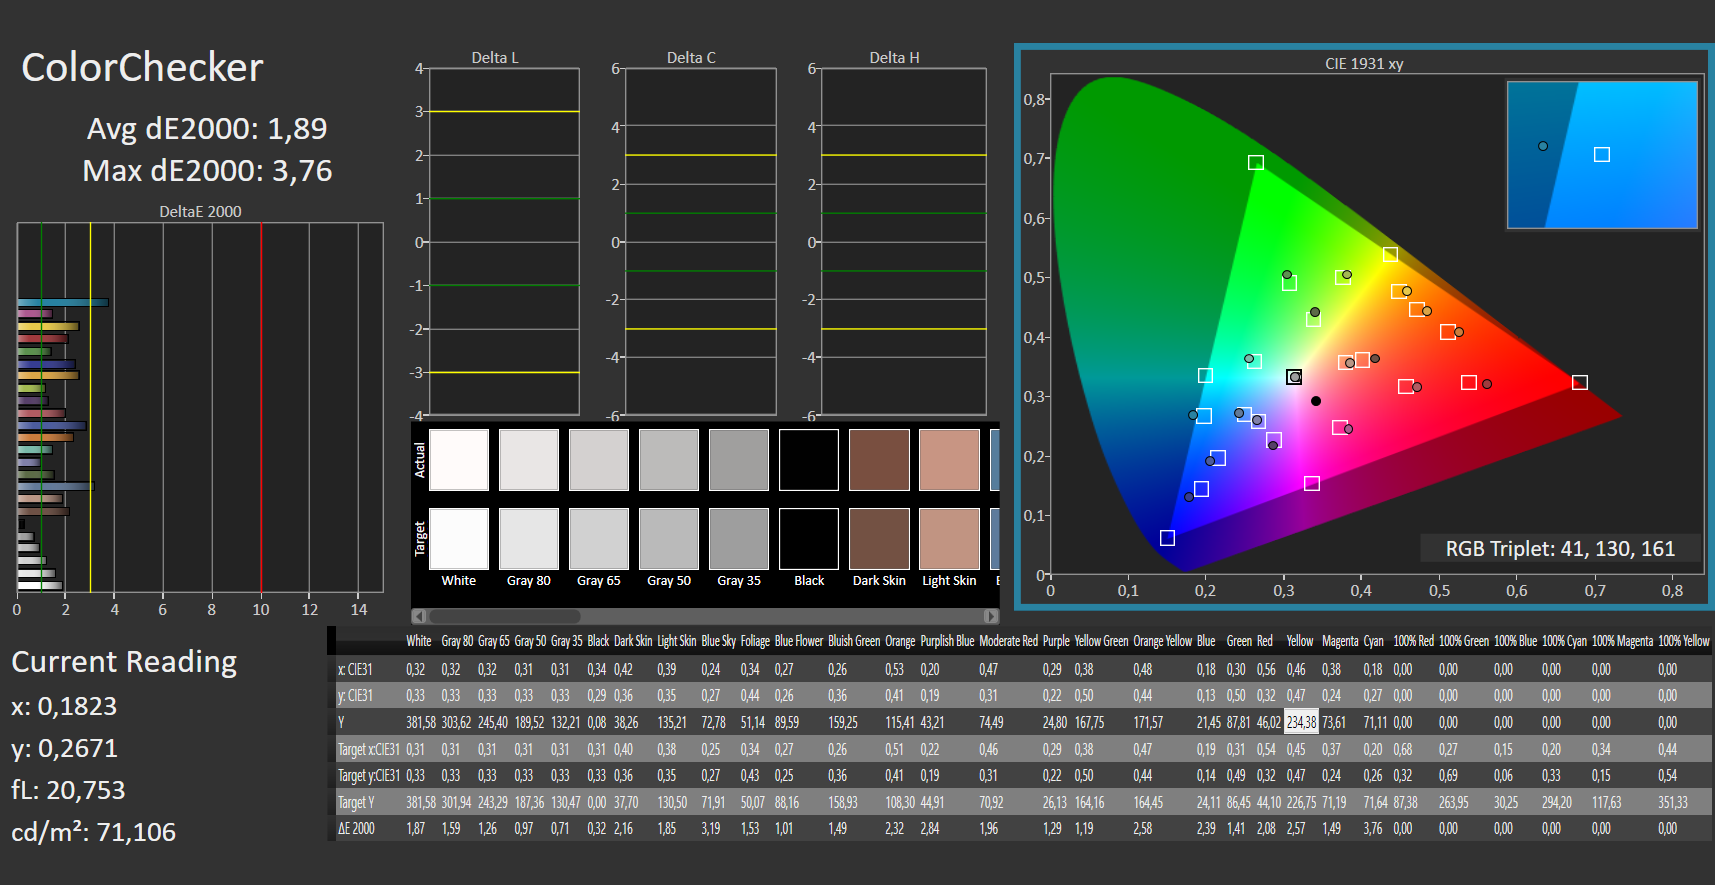
ΔE ColorChecker Calman: 1.89 | ∀{0.5-29.43 Ø4.73}
calibrated: 2.67
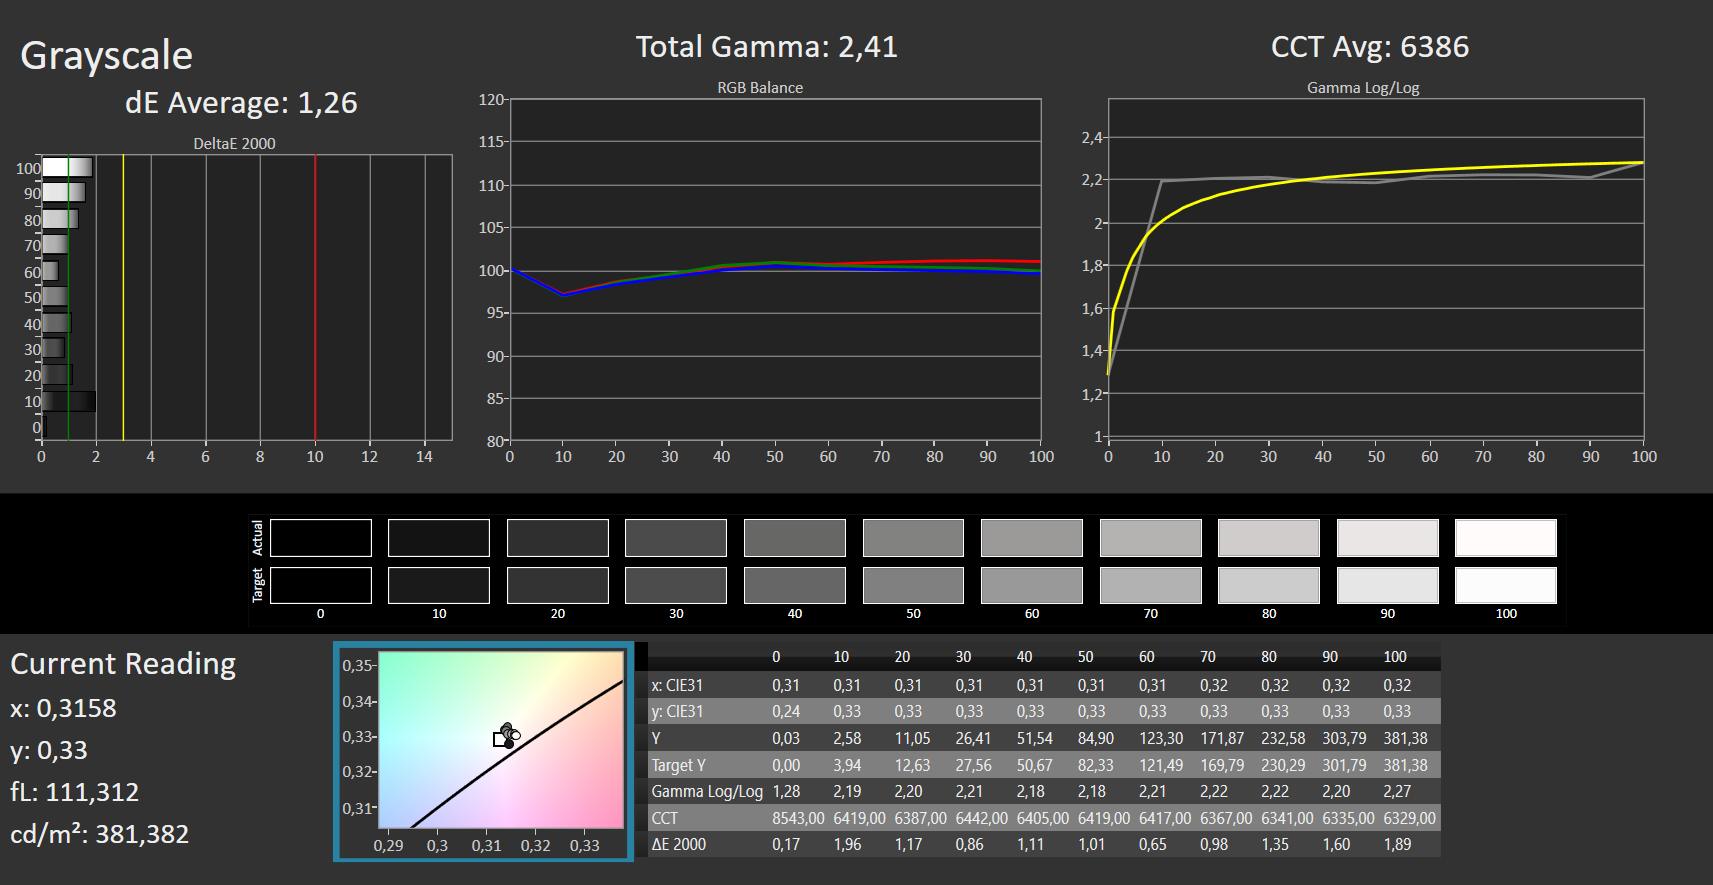
ΔE Greyscale Calman: 1.26 | ∀{0.09-98 Ø4.97}
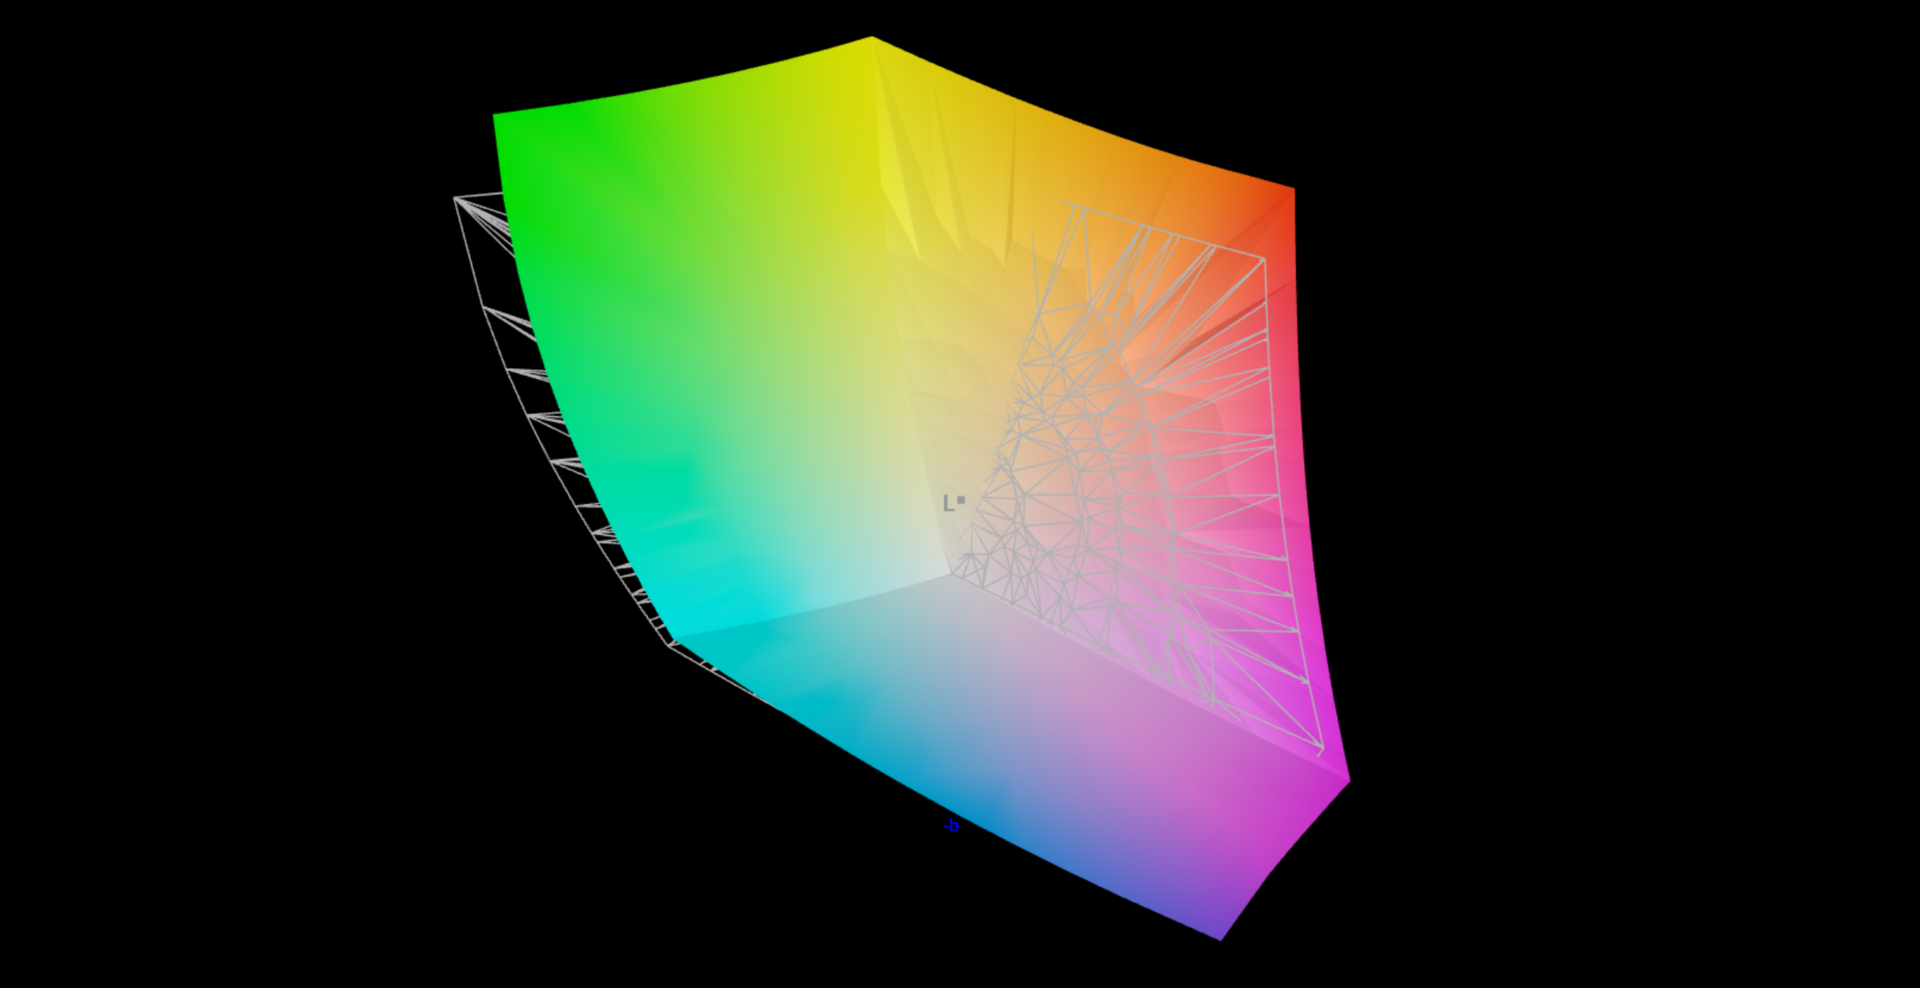
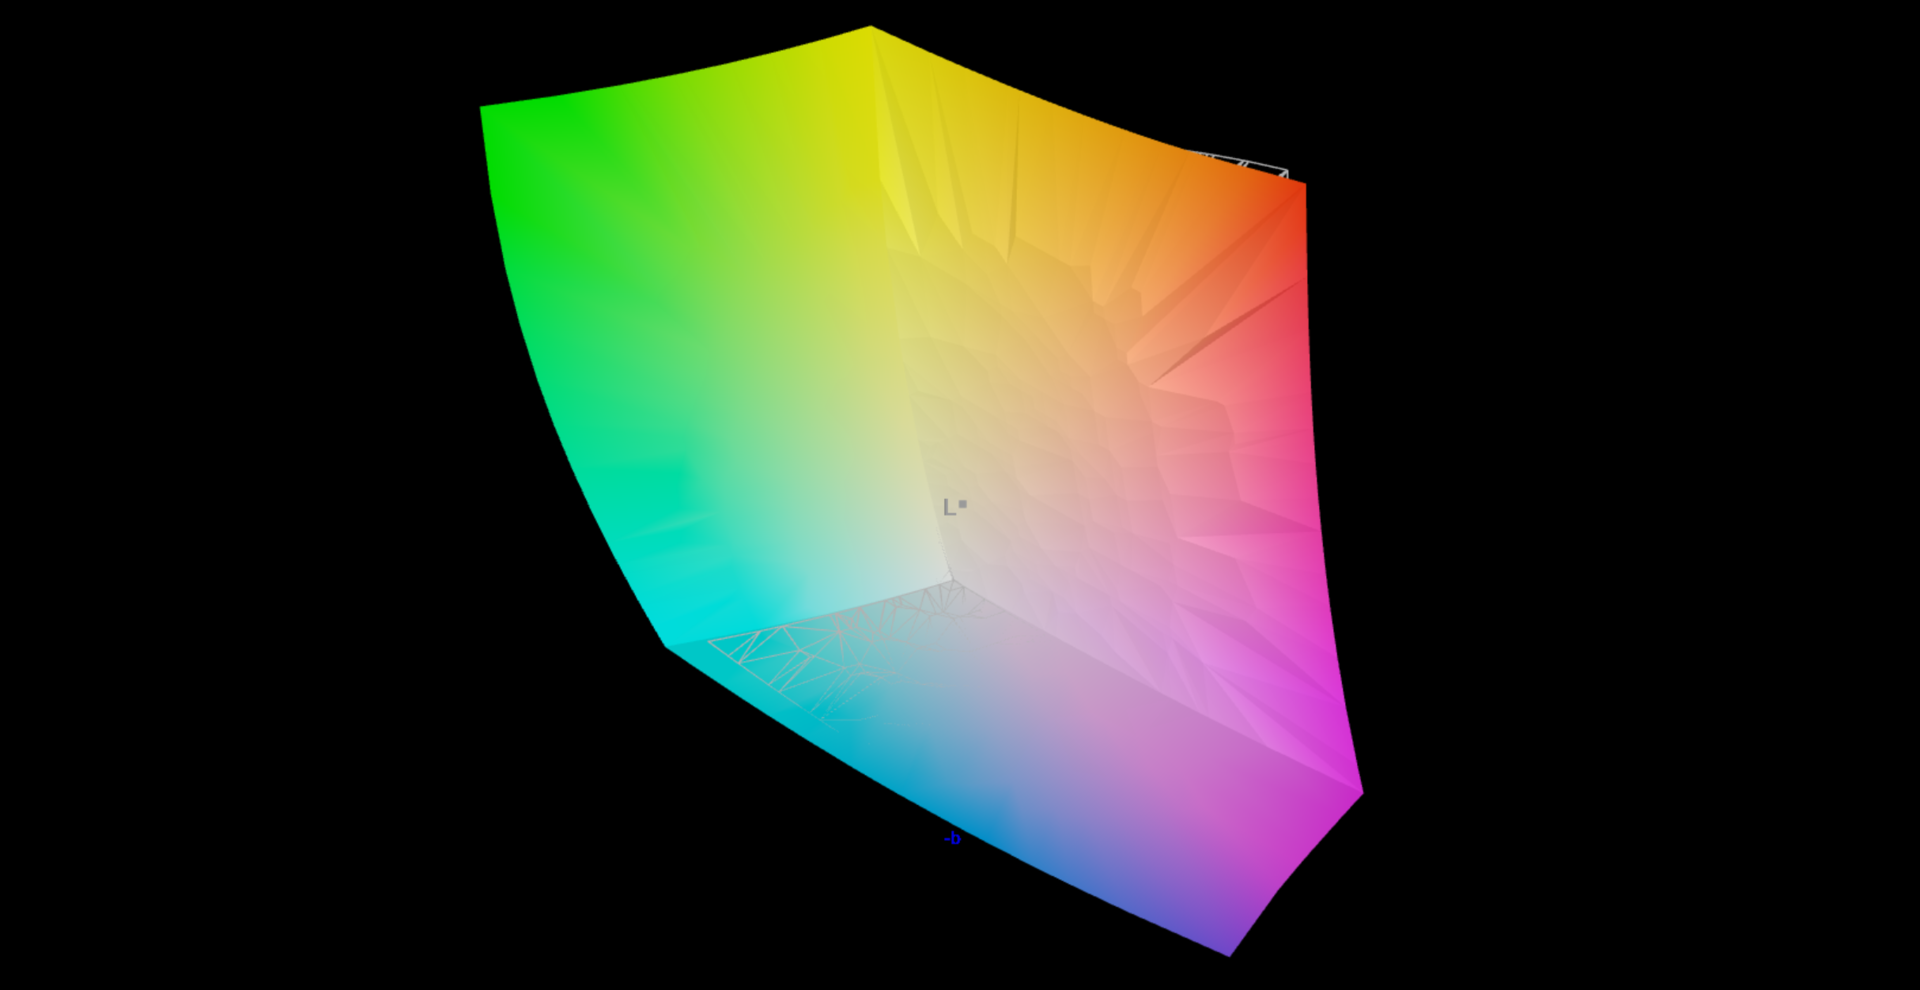
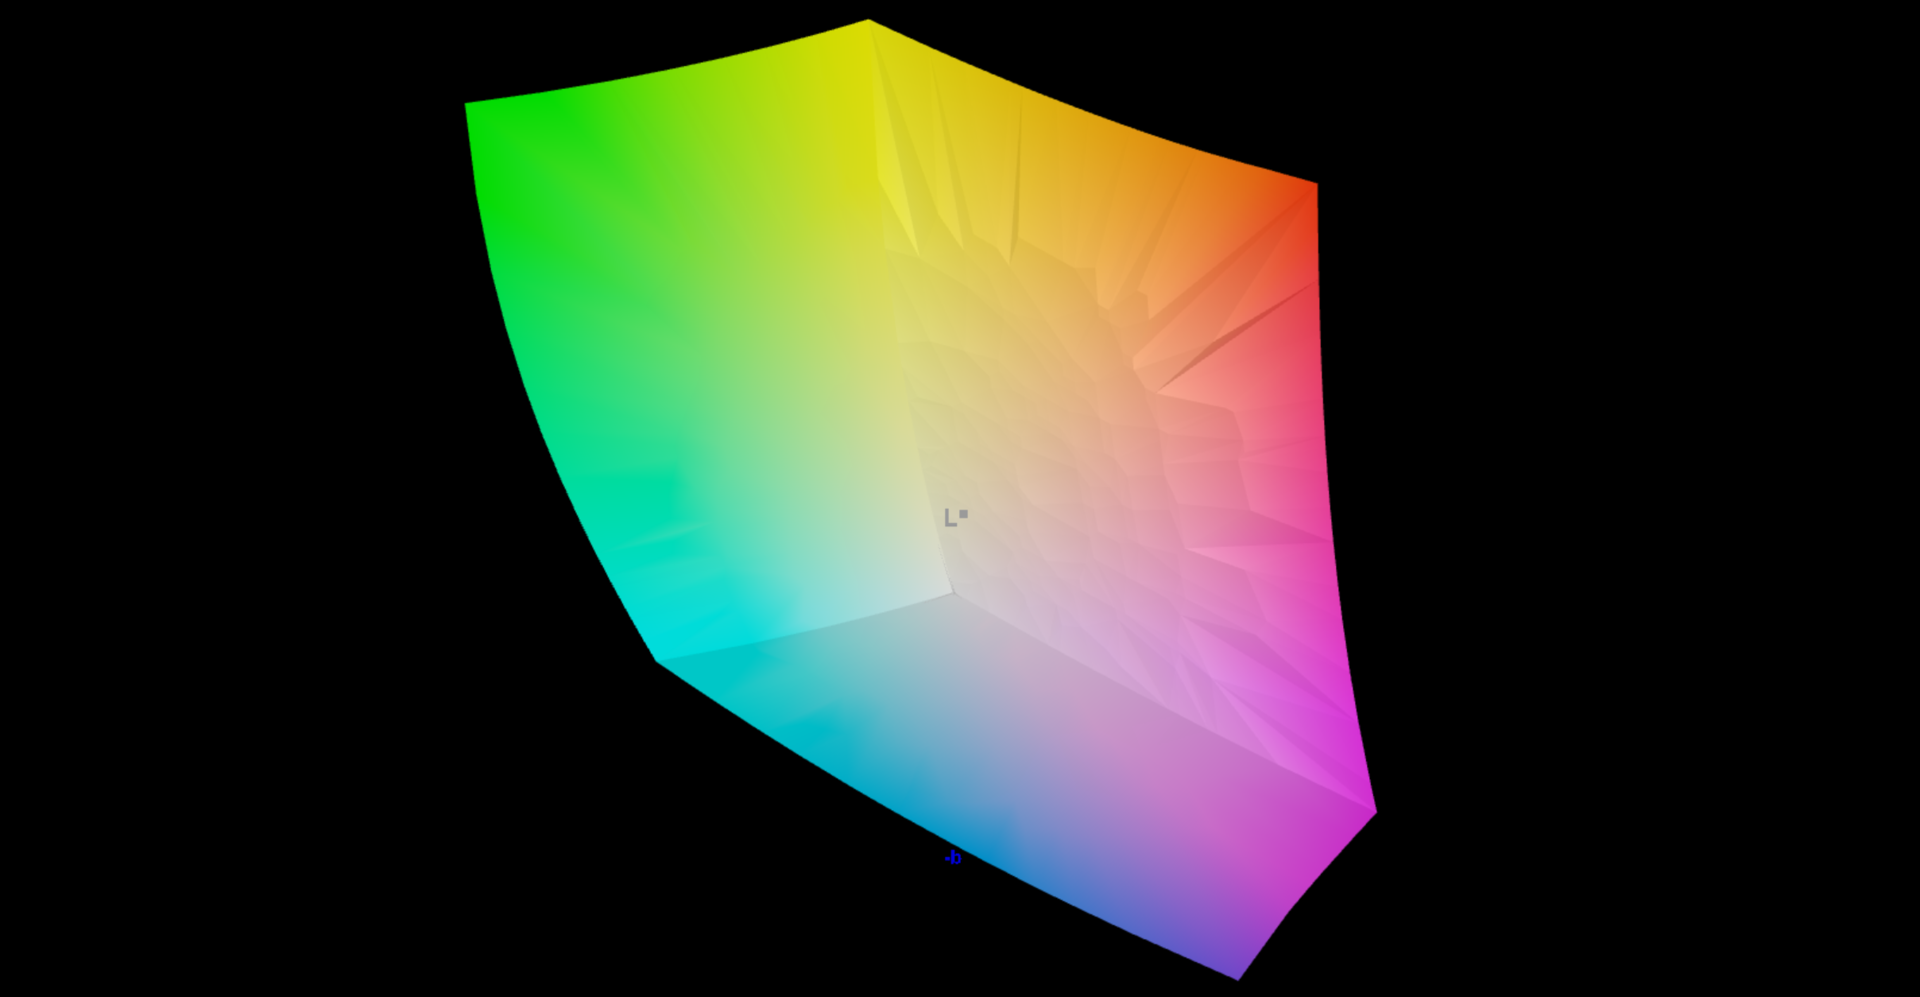
94% AdobeRGB 1998 (Argyll 3D)
99.4% sRGB (Argyll 3D)
97.6% Display P3 (Argyll 3D)
Gamma: 2.41
CCT: 6386 K
| Razer Blade 15 OLED (Early 2022) Samsung ATNA562P02-0, OLED, 2560x1440, 15.6" | Asus ROG Zephyrus M16 GU603Z BOE0A0B (BOE CQ NE160QDM-NY3), IPS, 2560x1600, 16" | Aorus 15 XE5 Chi Mei N156KME-GNA, IPS, 2560x1440, 15.6" | Schenker XMG Fusion 15 (Mid 22) BOE CQ NE156QHM-NY2, IPS, 2560x1440, 15.6" | HP Omen 16-b1090ng BOE09E5, IPS, 2560x1440, 16.1" | Razer Blade 15 2022 Sharp LQ156T1JW03, IPS, 2560x1440, 15.6" | |
|---|---|---|---|---|---|---|
| Display | -6% | -4% | -20% | -17% | -2% | |
| Display P3 Coverage (%) | 97.6 | 92.8 -5% | 95.2 -2% | 67.3 -31% | 71 -27% | 99.1 2% |
| sRGB Coverage (%) | 99.4 | 98.5 -1% | 99.9 1% | 96.7 -3% | 97.9 -2% | 99.9 1% |
| AdobeRGB 1998 Coverage (%) | 94 | 83.1 -12% | 84.5 -10% | 68.2 -27% | 73.3 -22% | 86.8 -8% |
| Response Times | -340% | -475% | -365% | -498% | -550% | |
| Response Time Grey 50% / Grey 80% * (ms) | 2 ? | 7.6 ? -280% | 14.4 ? -620% | 11.6 ? -480% | 14.5 ? -625% | 14.4 ? -620% |
| Response Time Black / White * (ms) | 2 ? | 10 ? -400% | 8.6 ? -330% | 7 ? -250% | 9.4 ? -370% | 11.6 ? -480% |
| PWM Frequency (Hz) | 500 ? | |||||
| Screen | -96% | -169% | -178% | -184% | -106% | |
| Brightness middle (cd/m²) | 383 | 497 30% | 336 -12% | 326 -15% | 335 -13% | 286 -25% |
| Brightness (cd/m²) | 384 | 481 25% | 316 -18% | 303 -21% | 319 -17% | 271 -29% |
| Brightness Distribution (%) | 99 | 82 -17% | 89 -10% | 89 -10% | 90 -9% | 89 -10% |
| Black Level * (cd/m²) | 0.03 | 0.21 -600% | 0.34 -1033% | 0.33 -1000% | 0.28 -833% | 0.25 -733% |
| Contrast (:1) | 12767 | 2367 -81% | 988 -92% | 988 -92% | 1196 -91% | 1144 -91% |
| Colorchecker dE 2000 * | 1.89 | 3.53 -87% | 3.36 -78% | 2.73 -44% | 4.38 -132% | 2.74 -45% |
| Colorchecker dE 2000 max. * | 3.76 | 6.15 -64% | 6.67 -77% | 9.54 -154% | 9.48 -152% | 5.21 -39% |
| Colorchecker dE 2000 calibrated * | 2.67 | 3.53 -32% | 0.74 72% | 1.36 49% | 1.33 50% | 2.52 6% |
| Greyscale dE 2000 * | 1.26 | 1.74 -38% | 4.7 -273% | 5.2 -313% | 7 -456% | 1.1 13% |
| Gamma | 2.41 91% | 2.2 100% | 2.244 98% | 2.074 106% | 2.103 105% | 2.2 100% |
| CCT | 6386 102% | 6418 101% | 6897 94% | 6911 94% | 6244 104% | 6408 101% |
| Całkowita średnia (program / ustawienia) | -147% /
-112% | -216% /
-177% | -188% /
-171% | -233% /
-193% | -219% /
-147% |
* ... im mniej tym lepiej
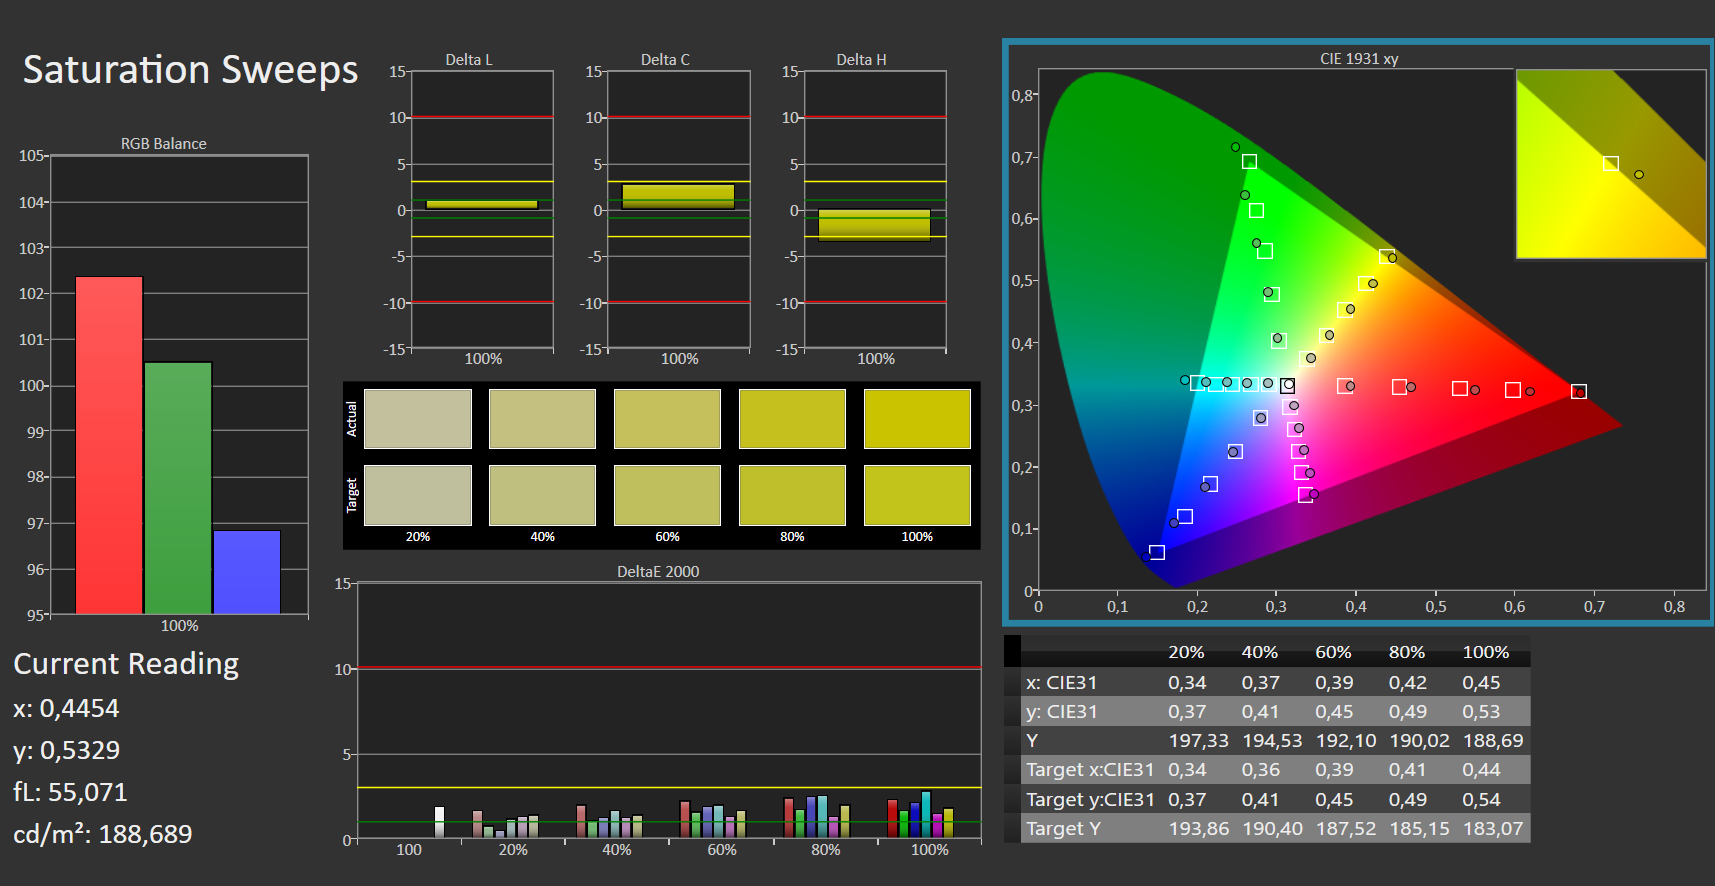
Nawet po wyjęciu z pudełka wyświetlacz zapewnia imponujące odwzorowanie kolorów: Przy odchyleniu 1,9 cel (DeltaE < 3) jest wyraźnie spełniony. Kalibracja nie prowadzi do żadnej poprawy. Dokładność kolorów podano: Przestrzenie barw sRGB i DCI-P3 są odwzorowywane całkowicie i prawie całkowicie, przy czym przestrzeń barw AdobeRGB na poziomie 94 procent. Na stronie panel LED rodzeństwa również zapewnia podobnie dobre wyniki.
Wyświetl czasy reakcji
| ↔ Czas reakcji od czerni do bieli | ||
|---|---|---|
| 2 ms ... wzrost ↗ i spadek ↘ łącznie | ↗ 1 ms wzrost |  |
| ↘ 1 ms upadek | ||
| W naszych testach ekran wykazuje bardzo szybką reakcję i powinien bardzo dobrze nadawać się do szybkich gier. Dla porównania, wszystkie testowane urządzenia wahają się od 0.1 (minimum) do 240 (maksimum) ms. » 11 % wszystkich urządzeń jest lepszych. Oznacza to, że zmierzony czas reakcji jest lepszy od średniej wszystkich testowanych urządzeń (19.9 ms). | ||
| ↔ Czas reakcji 50% szarości do 80% szarości | ||
| 2 ms ... wzrost ↗ i spadek ↘ łącznie | ↗ 1 ms wzrost |  |
| ↘ 1 ms upadek | ||
| W naszych testach ekran wykazuje bardzo szybką reakcję i powinien bardzo dobrze nadawać się do szybkich gier. Dla porównania, wszystkie testowane urządzenia wahają się od 0.165 (minimum) do 636 (maksimum) ms. » 10 % wszystkich urządzeń jest lepszych. Oznacza to, że zmierzony czas reakcji jest lepszy od średniej wszystkich testowanych urządzeń (31.1 ms). | ||
Migotanie ekranu / PWM (modulacja szerokości impulsu)
| Wykryto migotanie ekranu/wykryto PWM | 500 Hz | ≤ 70 % ustawienia jasności |  |
Podświetlenie wyświetlacza miga z częstotliwością 500 Hz (najgorszy przypadek, np. przy użyciu PWM) Wykryto migotanie przy ustawieniu jasności 70 % i poniżej. Powyżej tego ustawienia jasności nie powinno być żadnego migotania ani PWM. Częstotliwość 500 Hz jest stosunkowo wysoka, więc większość użytkowników wrażliwych na PWM nie powinna zauważyć żadnego migotania. Istnieją jednak doniesienia, że niektórzy użytkownicy są nadal wrażliwi na PWM przy częstotliwości 500 Hz i wyższej, więc należy zachować ostrożność. Dla porównania: 52 % wszystkich testowanych urządzeń nie używa PWM do przyciemniania wyświetlacza. Jeśli wykryto PWM, zmierzono średnio 7791 (minimum: 5 - maksimum: 343500) Hz. | |||
Panel charakteryzuje się dużą stabilnością kątów widzenia i jest czytelny pod każdym kątem. Na zewnątrz jest to jednak trudne ze względu na błyszczącą, odbijającą światło powierzchnię wyświetlacza.

Wydajność - Blade 15 jest oparty na Alder Lake i Ampere
Dzięki Blade 15 (początek 2022 roku) Razer ma w swojej ofercie laptopa przeznaczonego do gier w rozdzielczości QHD (ustawienia wysokie do maksymalnych), ale także świetnie radzi sobie w takich dziedzinach jak edycja i renderowanie wideo. Recenzowany tu model można mieć za około 1 967 dolarów.
Warunki badania
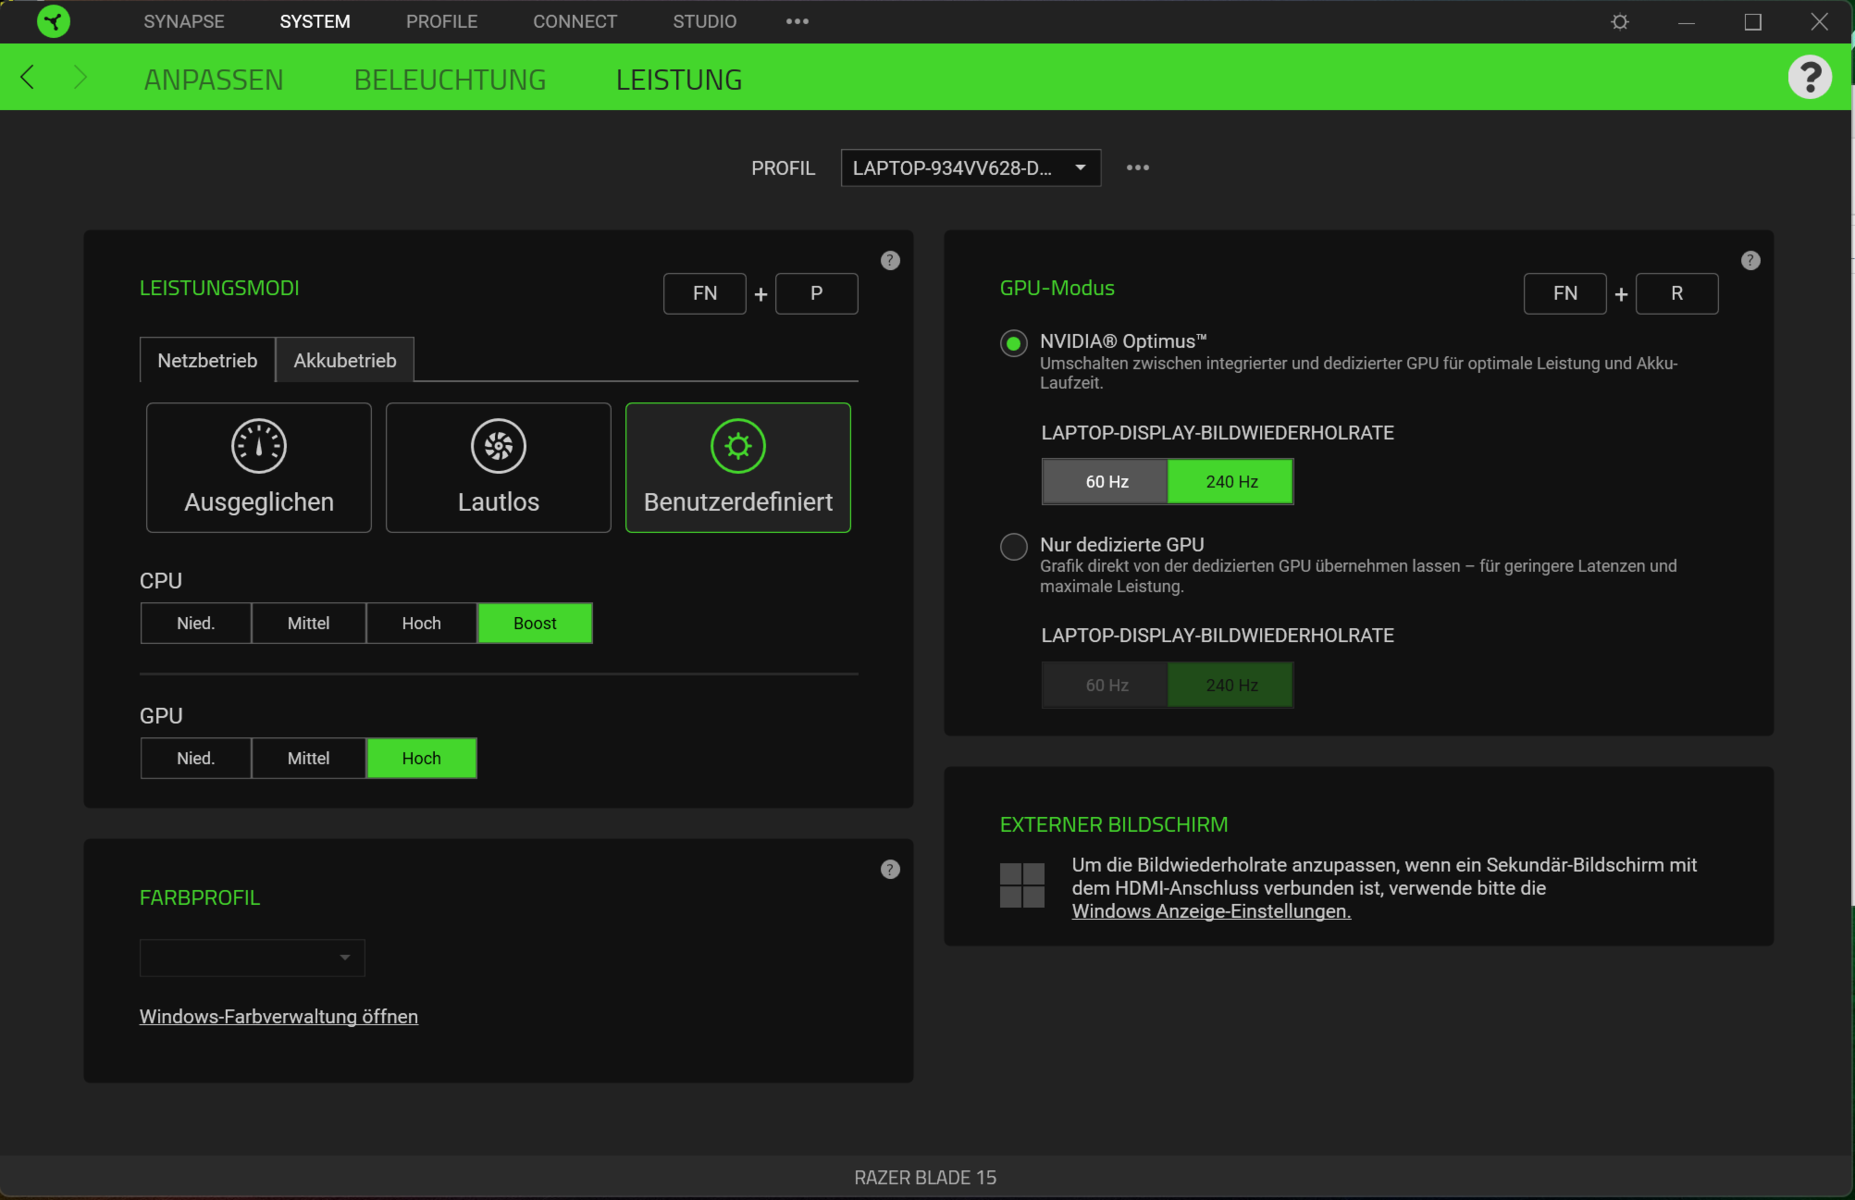
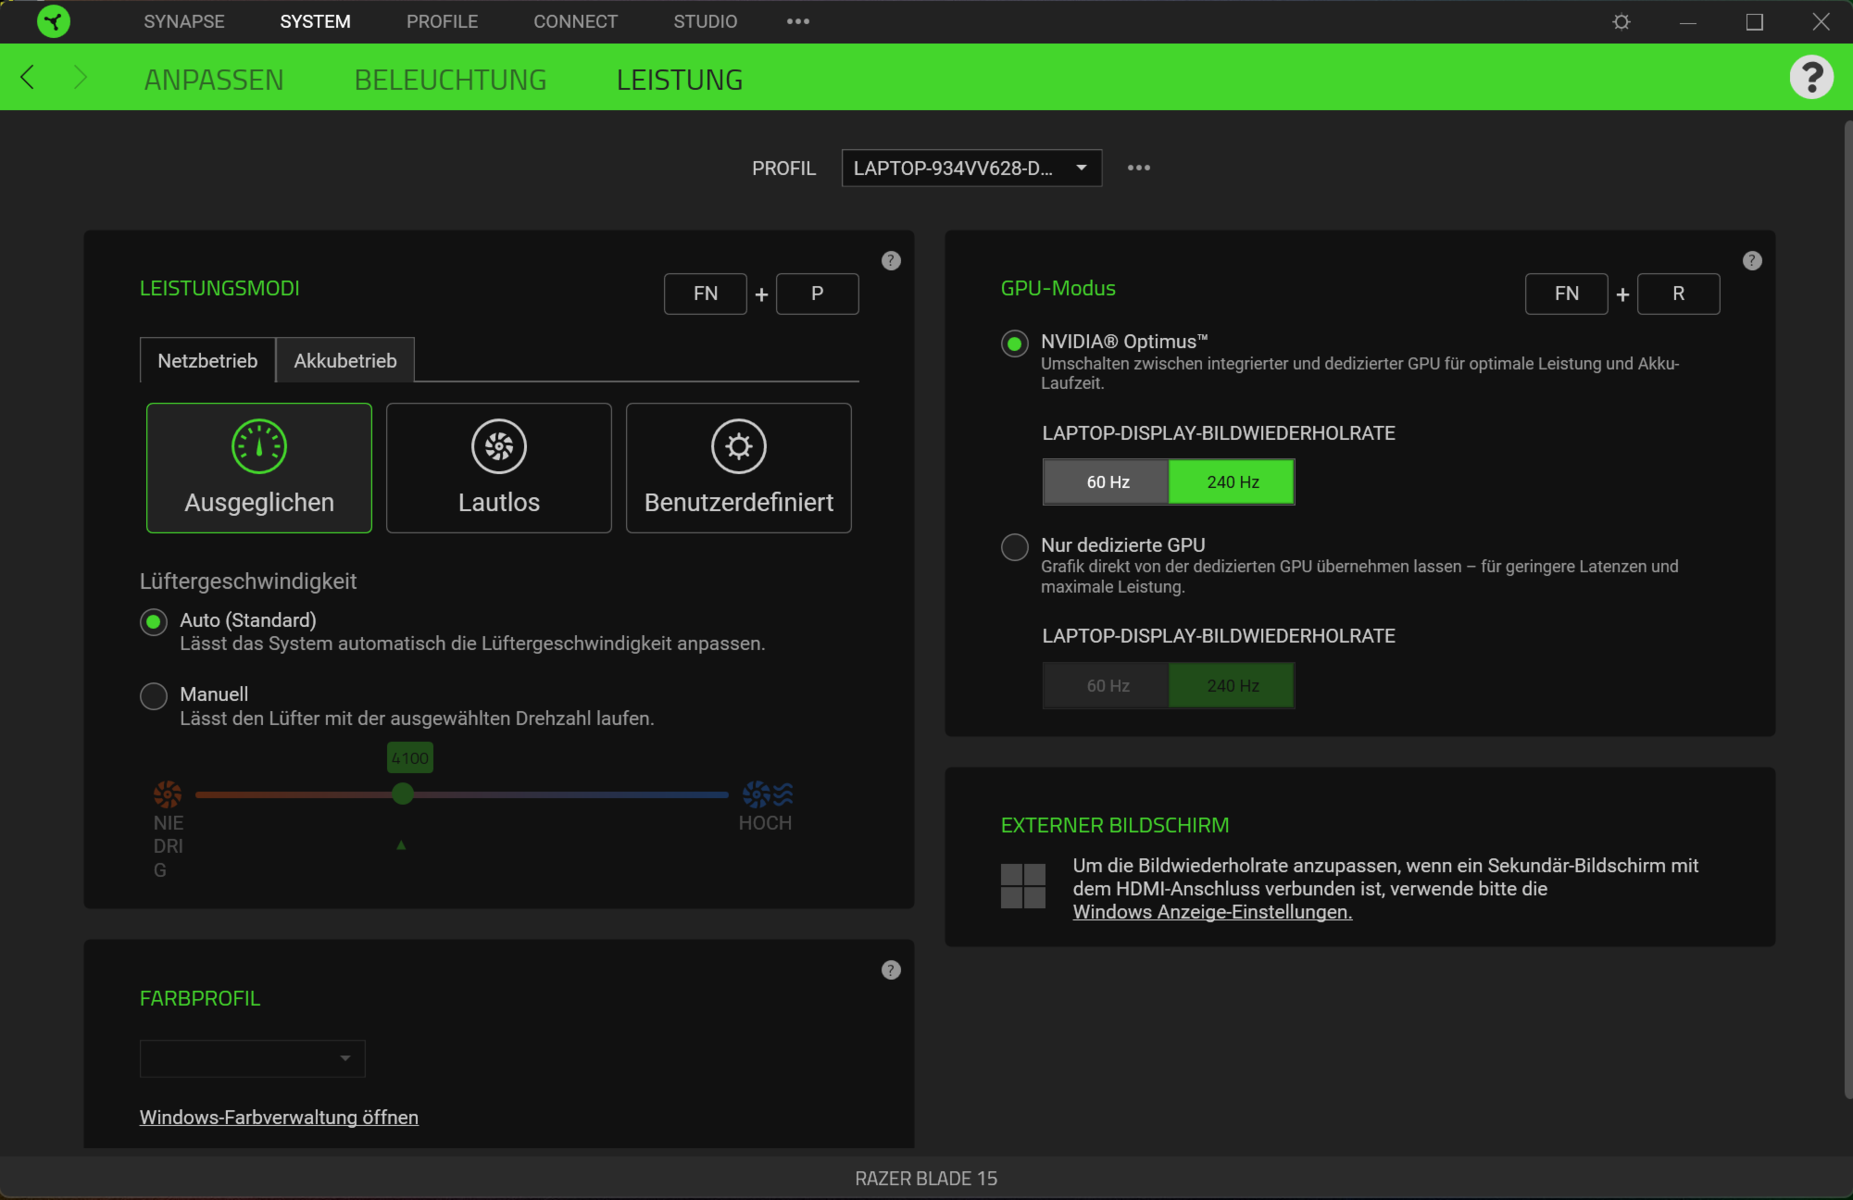
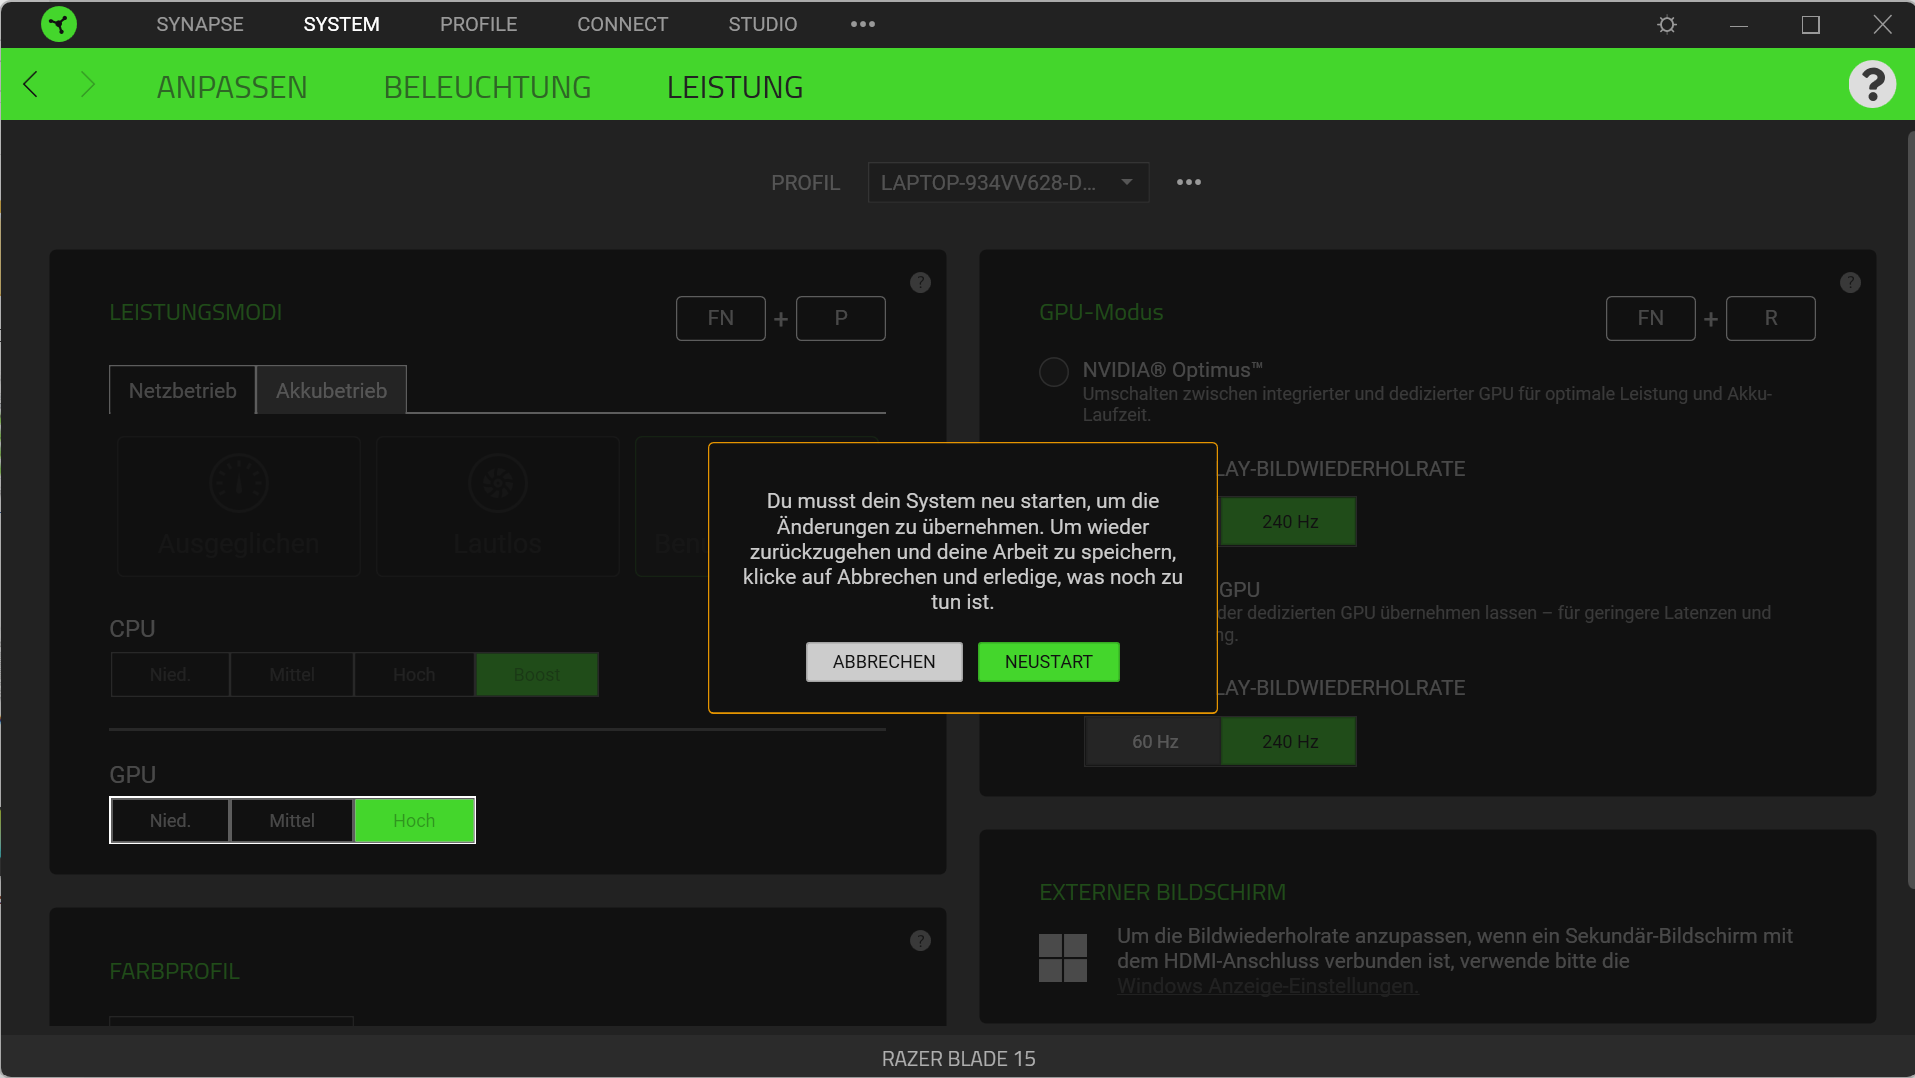
Możliwe jest przełączanie się pomiędzy trzema trybami wydajności ("Balanced", "Silent" i "User-defined") za pomocą kombinacji klawiszy "Fn" + "P". Profil "User-defined" pozwala na ustawienia subpresetów dla CPU ("Low", "Medium", "High", "Boost") i GPU ("Low", "Medium" i "High") - poprzez preinstalowane oprogramowanie Razer Synapse. W trybie bateryjnym dostępny jest tylko profil "Balanced".
Benchmarki przeprowadzono z wykorzystaniem aktywnego trybu "User-defined" przy maksymalnych ustawieniach (podprogramy "Boost" i "High"). Do testu akumulatora wykorzystano profil "Silent".
Procesor
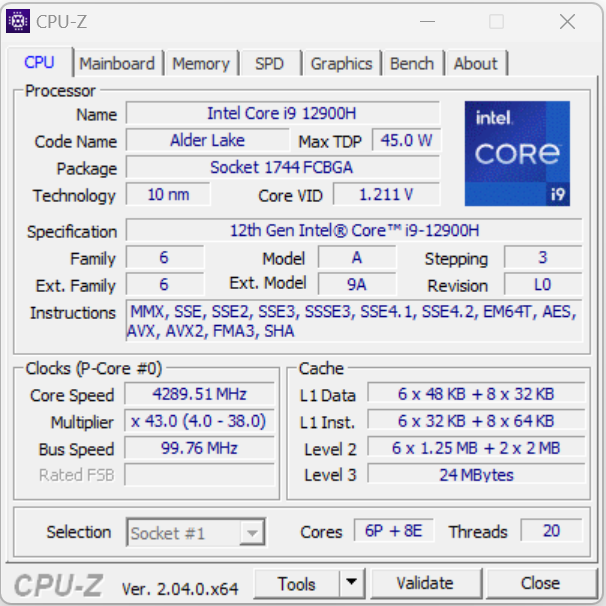
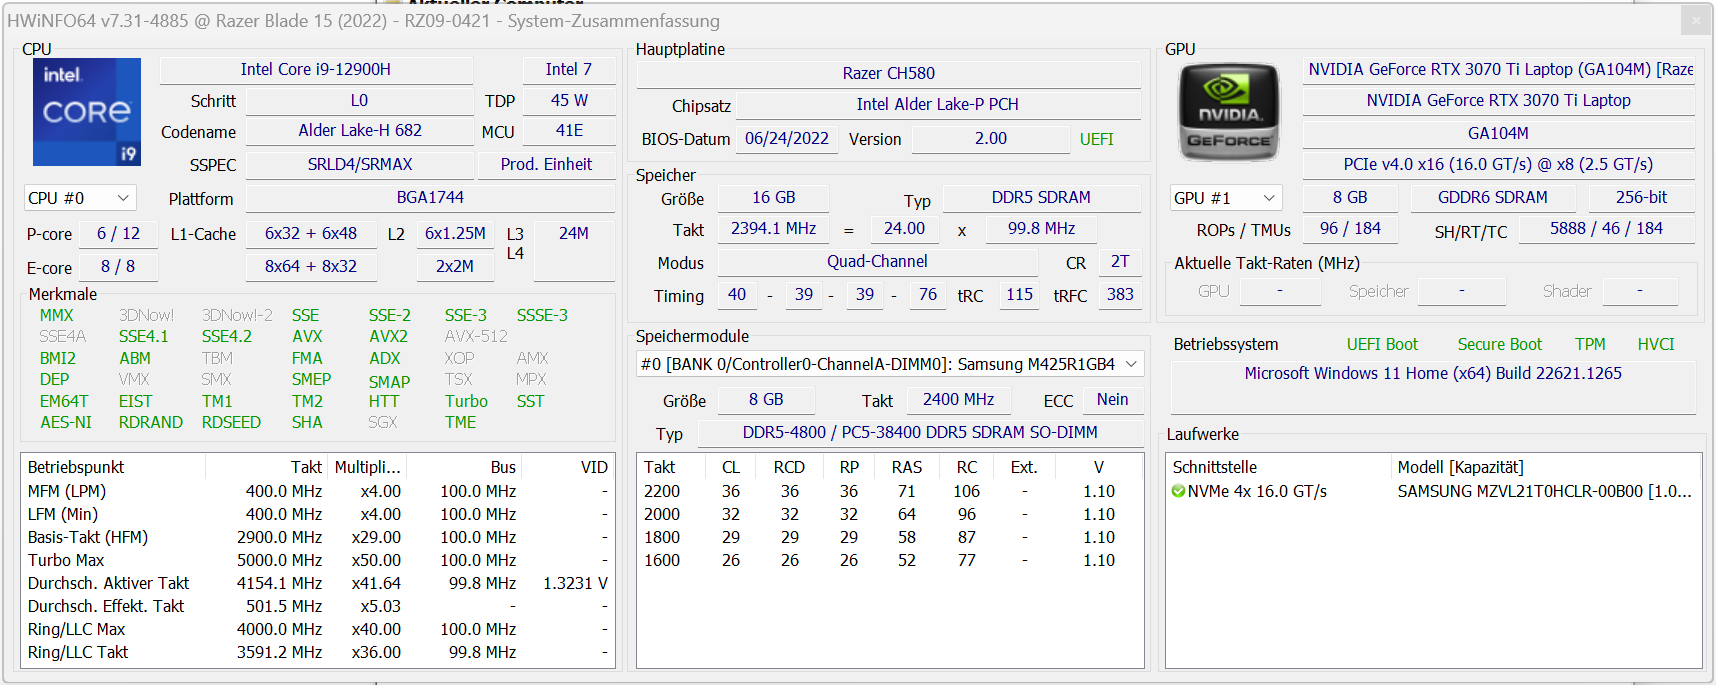
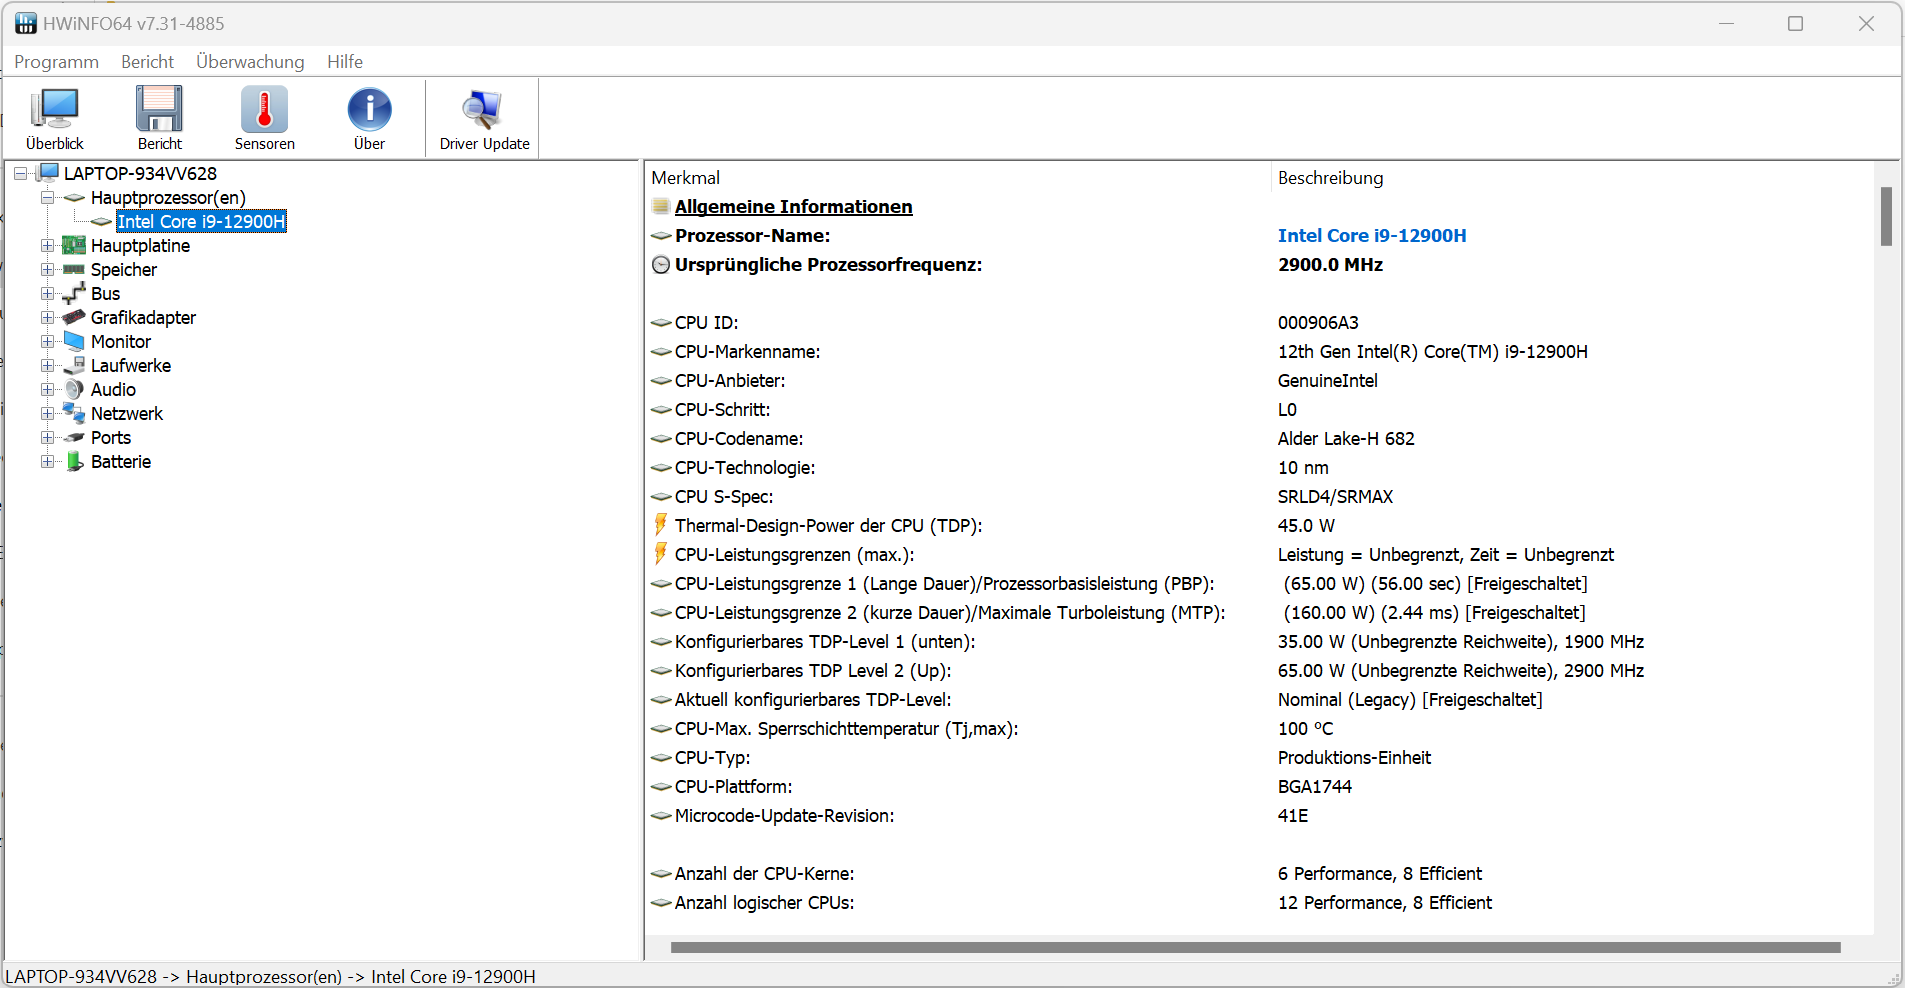
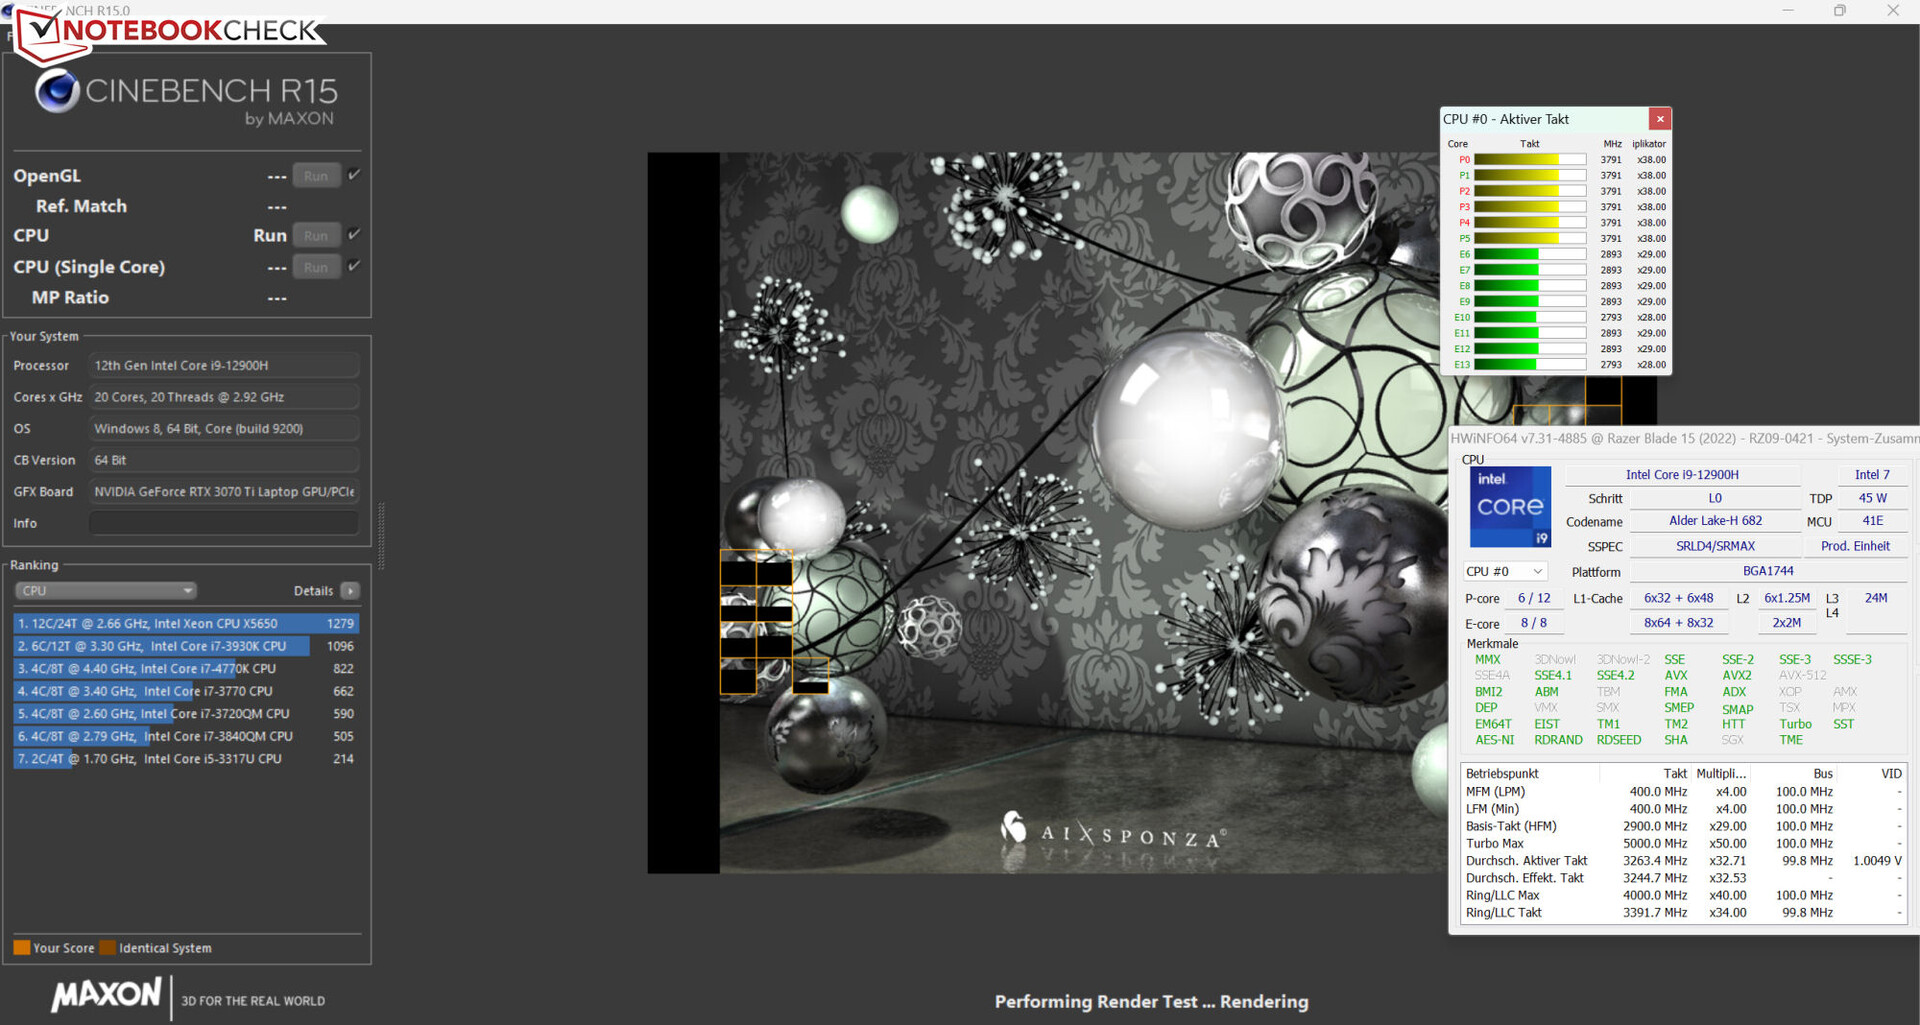
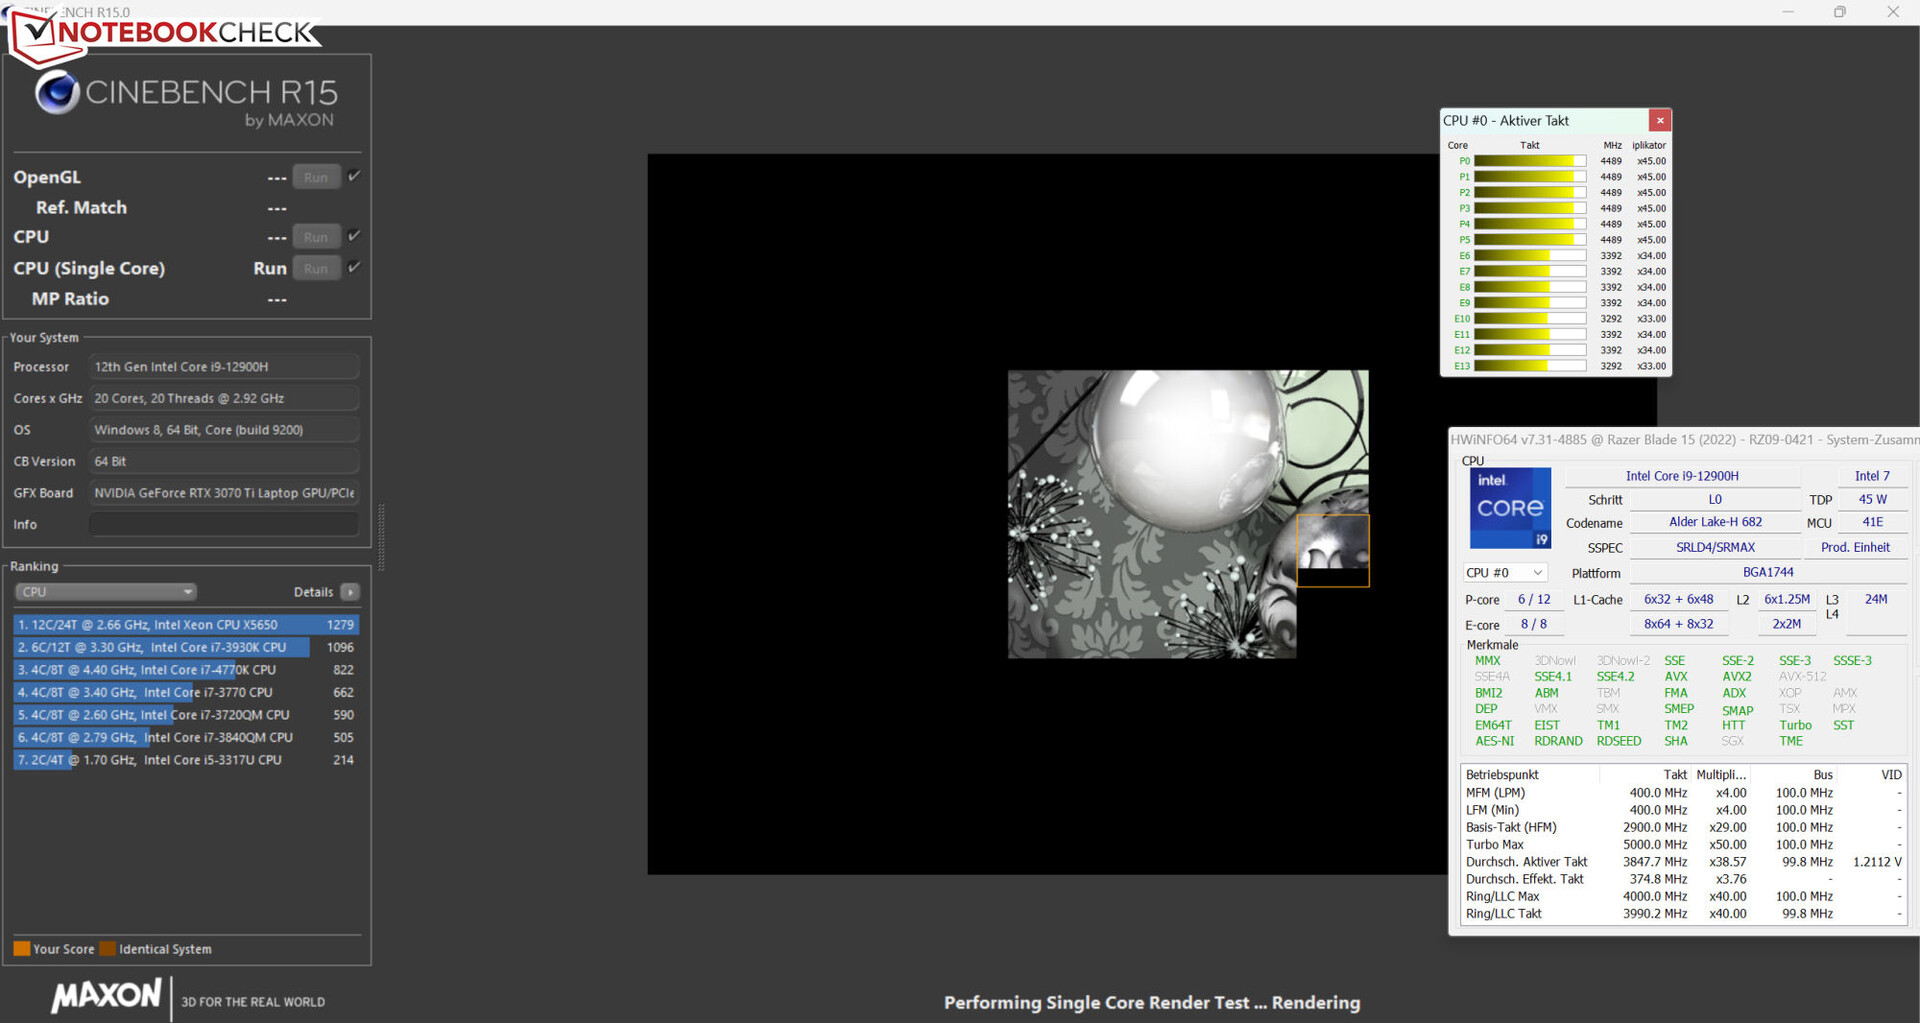
Na stronie .Core i9-12900Hprocesor (Alder Lake) składa się z sześciu rdzeni wydajnościowych (hyperthreading, 2,5 do 5 GHz) i ośmiu rdzeni efektywnościowych (bez hyperthreadingu, 1,8 do 3,8 GHz). W sumie jest 20 logicznych rdzeni procesora.
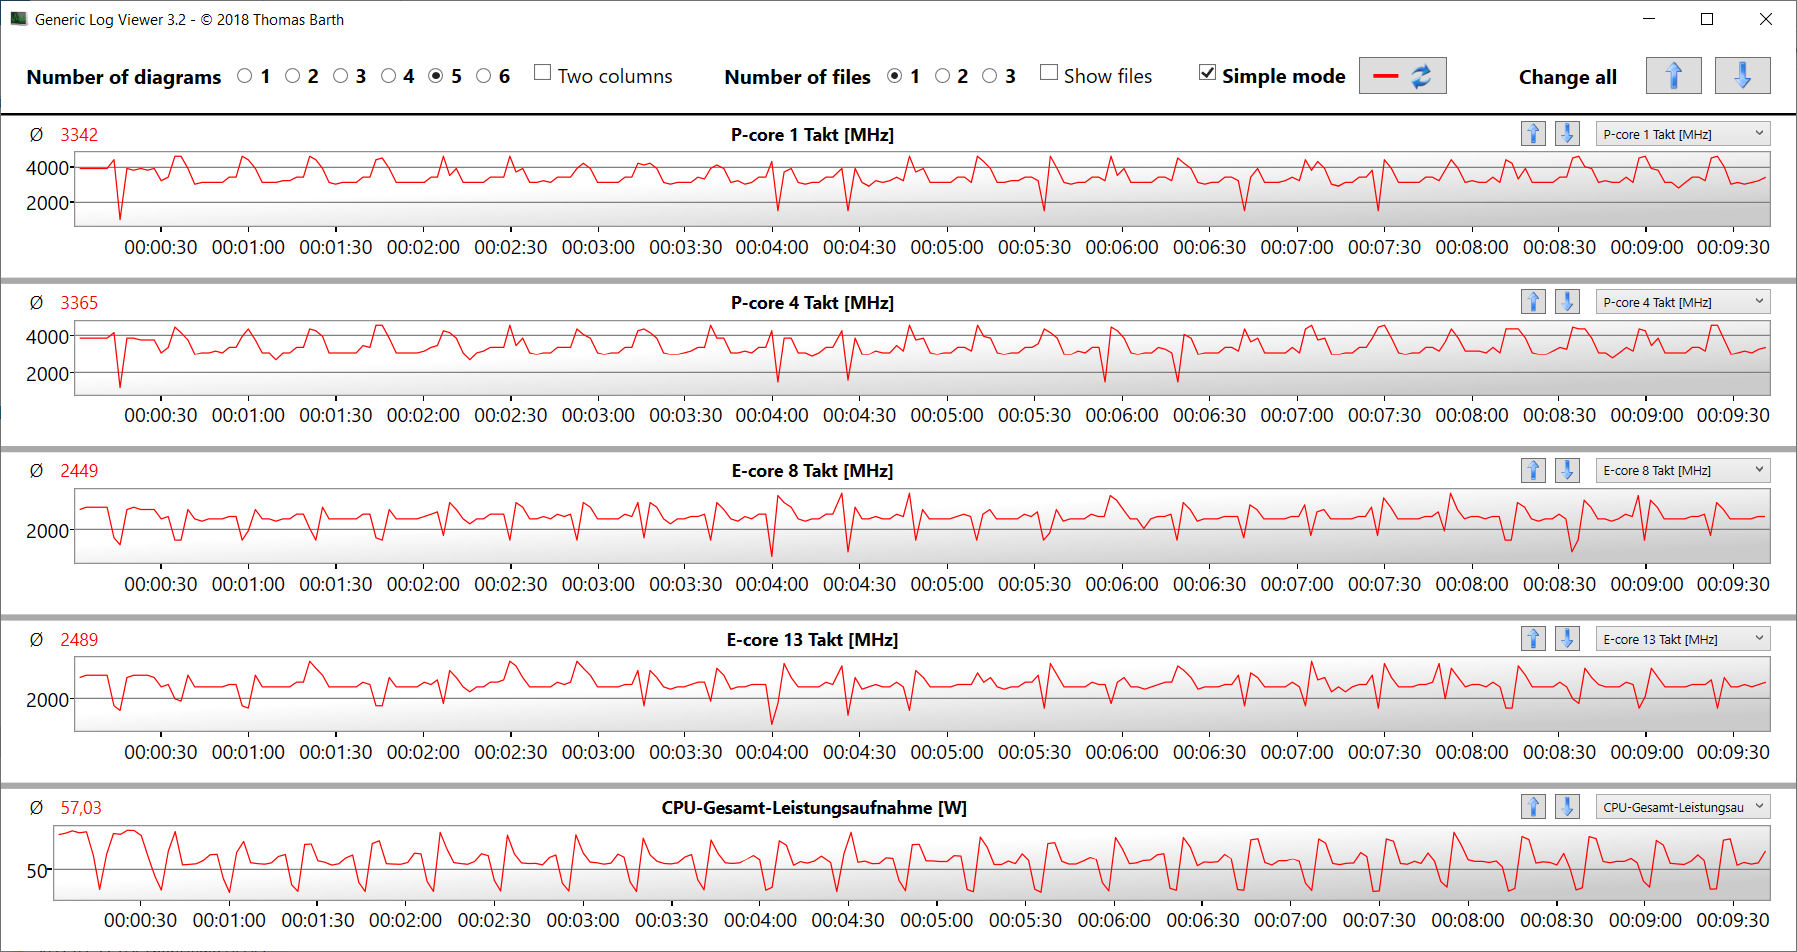
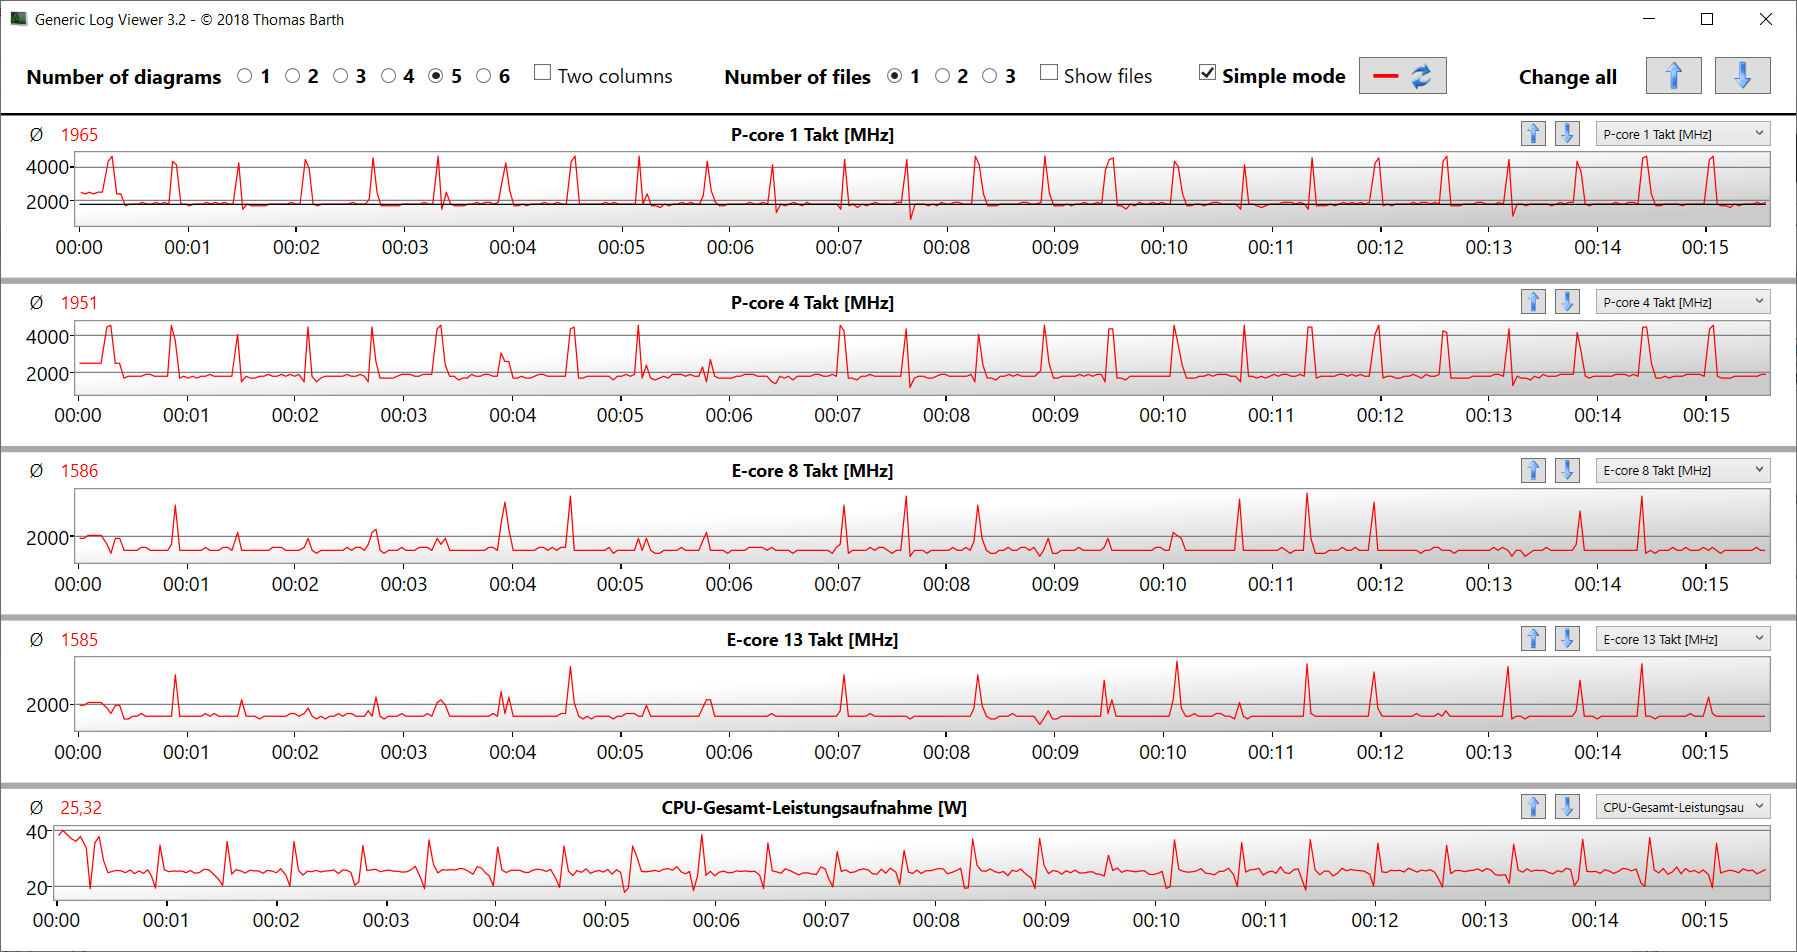
Test wielowątkowy benchmarku Cinebench R15 był przetwarzany z częstotliwością 3,6 do 3,8 GHz (rdzenie P) i 2,8 do 2,9 GHz (rdzenie E). Test jednowątkowy przeprowadziliśmy odpowiednio przy 1,4 do 4,5 GHz (rdzenie P) i 1,5 do 3,5 GHz (rdzenie E). W trybie akumulatorowym taktowania są niższe. Pokazuje to test pętli CB15: Obciążenie wielowątkowe jest konfrontowane z wysoką prędkością zegara turbo tylko przez krótki czas. Po 30-40 sekundach wartości te spadają do mniej więcej bazowego taktowania.
Cinebench R15 Multi Continuous Test
| CPU Performance rating - Percent | |
| Średnia w klasie Gaming | |
| HP Omen 16-b1090ng | |
| Asus ROG Zephyrus M16 GU603Z | |
| Aorus 15 XE5 | |
| Przeciętny Intel Core i9-12900H | |
| Razer Blade 15 2022 | |
| Razer Blade 15 OLED (Early 2022) | |
| Schenker XMG Fusion 15 (Mid 22) | |
| Cinebench R23 | |
| Multi Core | |
| Średnia w klasie Gaming (10488 - 40970, n=110, ostatnie 2 lata) | |
| HP Omen 16-b1090ng | |
| Aorus 15 XE5 | |
| Asus ROG Zephyrus M16 GU603Z | |
| Razer Blade 15 OLED (Early 2022) | |
| Przeciętny Intel Core i9-12900H (7359 - 19648, n=28) | |
| Razer Blade 15 2022 | |
| Schenker XMG Fusion 15 (Mid 22) | |
| Single Core | |
| Średnia w klasie Gaming (1166 - 2356, n=110, ostatnie 2 lata) | |
| Asus ROG Zephyrus M16 GU603Z | |
| Przeciętny Intel Core i9-12900H (1634 - 1930, n=28) | |
| HP Omen 16-b1090ng | |
| Razer Blade 15 2022 | |
| Aorus 15 XE5 | |
| Razer Blade 15 OLED (Early 2022) | |
| Schenker XMG Fusion 15 (Mid 22) | |
| Cinebench R20 | |
| CPU (Multi Core) | |
| Średnia w klasie Gaming (4029 - 16108, n=109, ostatnie 2 lata) | |
| Asus ROG Zephyrus M16 GU603Z | |
| Aorus 15 XE5 | |
| Razer Blade 15 OLED (Early 2022) | |
| HP Omen 16-b1090ng | |
| Razer Blade 15 2022 | |
| Przeciętny Intel Core i9-12900H (2681 - 7471, n=28) | |
| Schenker XMG Fusion 15 (Mid 22) | |
| CPU (Single Core) | |
| Średnia w klasie Gaming (442 - 895, n=109, ostatnie 2 lata) | |
| Asus ROG Zephyrus M16 GU603Z | |
| Przeciętny Intel Core i9-12900H (624 - 738, n=28) | |
| HP Omen 16-b1090ng | |
| Razer Blade 15 2022 | |
| Aorus 15 XE5 | |
| Razer Blade 15 OLED (Early 2022) | |
| Schenker XMG Fusion 15 (Mid 22) | |
| Cinebench R15 | |
| CPU Multi 64Bit | |
| Średnia w klasie Gaming (1578 - 6271, n=109, ostatnie 2 lata) | |
| HP Omen 16-b1090ng | |
| Aorus 15 XE5 | |
| Asus ROG Zephyrus M16 GU603Z | |
| Razer Blade 15 OLED (Early 2022) | |
| Przeciętny Intel Core i9-12900H (1395 - 3077, n=28) | |
| Razer Blade 15 2022 | |
| Schenker XMG Fusion 15 (Mid 22) | |
| CPU Single 64Bit | |
| Średnia w klasie Gaming (188.8 - 343, n=109, ostatnie 2 lata) | |
| Asus ROG Zephyrus M16 GU603Z | |
| Przeciętny Intel Core i9-12900H (235 - 277, n=29) | |
| HP Omen 16-b1090ng | |
| Razer Blade 15 2022 | |
| Aorus 15 XE5 | |
| Razer Blade 15 OLED (Early 2022) | |
| Schenker XMG Fusion 15 (Mid 22) | |
| Blender - v2.79 BMW27 CPU | |
| Schenker XMG Fusion 15 (Mid 22) | |
| Aorus 15 XE5 | |
| Przeciętny Intel Core i9-12900H (160 - 451, n=28) | |
| Razer Blade 15 2022 | |
| Razer Blade 15 OLED (Early 2022) | |
| Asus ROG Zephyrus M16 GU603Z | |
| HP Omen 16-b1090ng | |
| Średnia w klasie Gaming (80 - 330, n=107, ostatnie 2 lata) | |
| 7-Zip 18.03 | |
| 7z b 4 | |
| Średnia w klasie Gaming (33491 - 148086, n=108, ostatnie 2 lata) | |
| HP Omen 16-b1090ng | |
| Asus ROG Zephyrus M16 GU603Z | |
| Razer Blade 15 OLED (Early 2022) | |
| Razer Blade 15 2022 | |
| Przeciętny Intel Core i9-12900H (34684 - 76677, n=28) | |
| Aorus 15 XE5 | |
| Schenker XMG Fusion 15 (Mid 22) | |
| 7z b 4 -mmt1 | |
| Średnia w klasie Gaming (4199 - 7436, n=108, ostatnie 2 lata) | |
| Asus ROG Zephyrus M16 GU603Z | |
| HP Omen 16-b1090ng | |
| Przeciętny Intel Core i9-12900H (5302 - 6289, n=28) | |
| Aorus 15 XE5 | |
| Razer Blade 15 2022 | |
| Schenker XMG Fusion 15 (Mid 22) | |
| Razer Blade 15 OLED (Early 2022) | |
| Geekbench 5.5 | |
| Multi-Core | |
| Średnia w klasie Gaming (6460 - 27010, n=108, ostatnie 2 lata) | |
| HP Omen 16-b1090ng | |
| Aorus 15 XE5 | |
| Asus ROG Zephyrus M16 GU603Z | |
| Razer Blade 15 2022 | |
| Razer Blade 15 OLED (Early 2022) | |
| Przeciętny Intel Core i9-12900H (8519 - 14376, n=31) | |
| Schenker XMG Fusion 15 (Mid 22) | |
| Single-Core | |
| Średnia w klasie Gaming (986 - 2474, n=108, ostatnie 2 lata) | |
| Asus ROG Zephyrus M16 GU603Z | |
| HP Omen 16-b1090ng | |
| Przeciętny Intel Core i9-12900H (1631 - 1897, n=31) | |
| Razer Blade 15 2022 | |
| Aorus 15 XE5 | |
| Razer Blade 15 OLED (Early 2022) | |
| Schenker XMG Fusion 15 (Mid 22) | |
| HWBOT x265 Benchmark v2.2 - 4k Preset | |
| Średnia w klasie Gaming (11.5 - 44.3, n=108, ostatnie 2 lata) | |
| HP Omen 16-b1090ng | |
| Asus ROG Zephyrus M16 GU603Z | |
| Razer Blade 15 OLED (Early 2022) | |
| Razer Blade 15 2022 | |
| Przeciętny Intel Core i9-12900H (8.05 - 22.5, n=28) | |
| Aorus 15 XE5 | |
| Schenker XMG Fusion 15 (Mid 22) | |
| LibreOffice - 20 Documents To PDF | |
| Razer Blade 15 2022 | |
| Razer Blade 15 OLED (Early 2022) | |
| Średnia w klasie Gaming (19 - 88.8, n=108, ostatnie 2 lata) | |
| Schenker XMG Fusion 15 (Mid 22) | |
| Przeciętny Intel Core i9-12900H (36.8 - 59.8, n=28) | |
| Asus ROG Zephyrus M16 GU603Z | |
| HP Omen 16-b1090ng | |
| Aorus 15 XE5 | |
| R Benchmark 2.5 - Overall mean | |
| Schenker XMG Fusion 15 (Mid 22) | |
| Razer Blade 15 OLED (Early 2022) | |
| Razer Blade 15 2022 | |
| Aorus 15 XE5 | |
| Przeciętny Intel Core i9-12900H (0.4218 - 0.506, n=28) | |
| HP Omen 16-b1090ng | |
| Asus ROG Zephyrus M16 GU603Z | |
| Średnia w klasie Gaming (0.3439 - 0.759, n=109, ostatnie 2 lata) | |
* ... im mniej tym lepiej
AIDA64: FP32 Ray-Trace | FPU Julia | CPU SHA3 | CPU Queen | FPU SinJulia | FPU Mandel | CPU AES | CPU ZLib | FP64 Ray-Trace | CPU PhotoWorxx
| Performance rating | |
| Średnia w klasie Gaming | |
| Asus ROG Zephyrus M16 GU603Z | |
| Razer Blade 15 OLED (Early 2022) | |
| Aorus 15 XE5 | |
| Schenker XMG Fusion 15 (Mid 22) | |
| Przeciętny Intel Core i9-12900H | |
| HP Omen 16-b1090ng | |
| Razer Blade 15 2022 | |
| AIDA64 / FP32 Ray-Trace | |
| Średnia w klasie Gaming (10227 - 85542, n=107, ostatnie 2 lata) | |
| Asus ROG Zephyrus M16 GU603Z | |
| Razer Blade 15 OLED (Early 2022) | |
| Aorus 15 XE5 | |
| Schenker XMG Fusion 15 (Mid 22) | |
| Przeciętny Intel Core i9-12900H (4074 - 18289, n=29) | |
| Razer Blade 15 2022 | |
| HP Omen 16-b1090ng | |
| AIDA64 / FPU Julia | |
| Średnia w klasie Gaming (51376 - 238426, n=107, ostatnie 2 lata) | |
| Asus ROG Zephyrus M16 GU603Z | |
| Razer Blade 15 OLED (Early 2022) | |
| Aorus 15 XE5 | |
| Schenker XMG Fusion 15 (Mid 22) | |
| Przeciętny Intel Core i9-12900H (22307 - 93236, n=29) | |
| Razer Blade 15 2022 | |
| HP Omen 16-b1090ng | |
| AIDA64 / CPU SHA3 | |
| Średnia w klasie Gaming (2180 - 9817, n=107, ostatnie 2 lata) | |
| Schenker XMG Fusion 15 (Mid 22) | |
| Asus ROG Zephyrus M16 GU603Z | |
| Razer Blade 15 OLED (Early 2022) | |
| Przeciętny Intel Core i9-12900H (1378 - 4215, n=29) | |
| Aorus 15 XE5 | |
| Razer Blade 15 2022 | |
| HP Omen 16-b1090ng | |
| AIDA64 / CPU Queen | |
| Średnia w klasie Gaming (49785 - 173351, n=98, ostatnie 2 lata) | |
| Razer Blade 15 OLED (Early 2022) | |
| Asus ROG Zephyrus M16 GU603Z | |
| Aorus 15 XE5 | |
| Przeciętny Intel Core i9-12900H (78172 - 111241, n=28) | |
| HP Omen 16-b1090ng | |
| Razer Blade 15 2022 | |
| Schenker XMG Fusion 15 (Mid 22) | |
| AIDA64 / FPU SinJulia | |
| Średnia w klasie Gaming (4424 - 33636, n=107, ostatnie 2 lata) | |
| Razer Blade 15 OLED (Early 2022) | |
| Asus ROG Zephyrus M16 GU603Z | |
| HP Omen 16-b1090ng | |
| Razer Blade 15 2022 | |
| Przeciętny Intel Core i9-12900H (5709 - 10410, n=29) | |
| Schenker XMG Fusion 15 (Mid 22) | |
| Aorus 15 XE5 | |
| AIDA64 / FPU Mandel | |
| Średnia w klasie Gaming (25115 - 128721, n=107, ostatnie 2 lata) | |
| Schenker XMG Fusion 15 (Mid 22) | |
| Asus ROG Zephyrus M16 GU603Z | |
| Razer Blade 15 OLED (Early 2022) | |
| Aorus 15 XE5 | |
| Przeciętny Intel Core i9-12900H (11257 - 45581, n=29) | |
| Razer Blade 15 2022 | |
| HP Omen 16-b1090ng | |
| AIDA64 / CPU AES | |
| Schenker XMG Fusion 15 (Mid 22) | |
| Asus ROG Zephyrus M16 GU603Z | |
| Aorus 15 XE5 | |
| Średnia w klasie Gaming (39258 - 247074, n=107, ostatnie 2 lata) | |
| Razer Blade 15 OLED (Early 2022) | |
| HP Omen 16-b1090ng | |
| Przeciętny Intel Core i9-12900H (31935 - 151546, n=29) | |
| Razer Blade 15 2022 | |
| AIDA64 / CPU ZLib | |
| Średnia w klasie Gaming (574 - 2531, n=107, ostatnie 2 lata) | |
| Razer Blade 15 OLED (Early 2022) | |
| Asus ROG Zephyrus M16 GU603Z | |
| HP Omen 16-b1090ng | |
| Razer Blade 15 2022 | |
| Przeciętny Intel Core i9-12900H (449 - 1193, n=29) | |
| Aorus 15 XE5 | |
| Schenker XMG Fusion 15 (Mid 22) | |
| AIDA64 / FP64 Ray-Trace | |
| Średnia w klasie Gaming (5509 - 45446, n=107, ostatnie 2 lata) | |
| Asus ROG Zephyrus M16 GU603Z | |
| Razer Blade 15 OLED (Early 2022) | |
| Schenker XMG Fusion 15 (Mid 22) | |
| Aorus 15 XE5 | |
| Przeciętny Intel Core i9-12900H (2235 - 10511, n=29) | |
| HP Omen 16-b1090ng | |
| Razer Blade 15 2022 | |
| AIDA64 / CPU PhotoWorxx | |
| Średnia w klasie Gaming (12271 - 89891, n=107, ostatnie 2 lata) | |
| Asus ROG Zephyrus M16 GU603Z | |
| Razer Blade 15 2022 | |
| HP Omen 16-b1090ng | |
| Przeciętny Intel Core i9-12900H (20960 - 48269, n=30) | |
| Aorus 15 XE5 | |
| Razer Blade 15 OLED (Early 2022) | |
| Razer Blade 15 OLED (Early 2022) | |
| Schenker XMG Fusion 15 (Mid 22) | |
Wydajność systemu
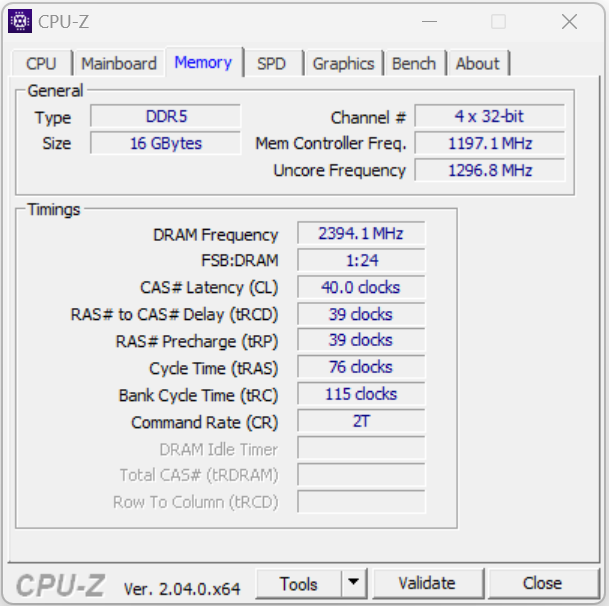
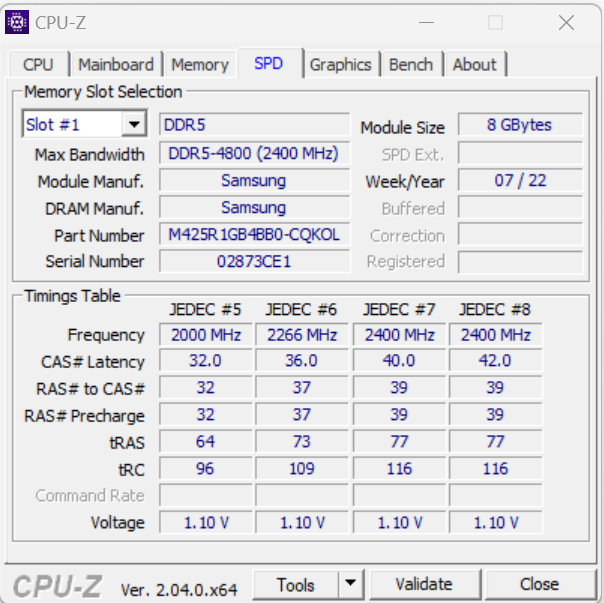
System działa płynnie i niezawodnie oraz zapewnia wystarczającą moc dla wymagających obszarów zastosowań, takich jak renderowanie, edycja wideo i gry. Transfery pamięci RAM są na normalnym poziomie dla pamięci DDR5-4800, a dopełnieniem tego są dobre wyniki PC-Mark.
CrossMark: Overall | Productivity | Creativity | Responsiveness
| PCMark 10 / Score | |
| Średnia w klasie Gaming (5828 - 11574, n=94, ostatnie 2 lata) | |
| Asus ROG Zephyrus M16 GU603Z | |
| Przeciętny Intel Core i9-12900H, NVIDIA GeForce RTX 3070 Ti Laptop GPU (7087 - 8072, n=6) | |
| Razer Blade 15 2022 | |
| Aorus 15 XE5 | |
| Razer Blade 15 OLED (Early 2022) | |
| HP Omen 16-b1090ng | |
| Schenker XMG Fusion 15 (Mid 22) | |
| PCMark 10 / Essentials | |
| Asus ROG Zephyrus M16 GU603Z | |
| Przeciętny Intel Core i9-12900H, NVIDIA GeForce RTX 3070 Ti Laptop GPU (10266 - 11663, n=6) | |
| Aorus 15 XE5 | |
| Razer Blade 15 2022 | |
| Średnia w klasie Gaming (8810 - 12600, n=98, ostatnie 2 lata) | |
| Razer Blade 15 OLED (Early 2022) | |
| HP Omen 16-b1090ng | |
| Schenker XMG Fusion 15 (Mid 22) | |
| PCMark 10 / Productivity | |
| Średnia w klasie Gaming (6845 - 18766, n=96, ostatnie 2 lata) | |
| Aorus 15 XE5 | |
| Asus ROG Zephyrus M16 GU603Z | |
| Przeciętny Intel Core i9-12900H, NVIDIA GeForce RTX 3070 Ti Laptop GPU (9402 - 10742, n=6) | |
| Razer Blade 15 OLED (Early 2022) | |
| Razer Blade 15 2022 | |
| HP Omen 16-b1090ng | |
| Schenker XMG Fusion 15 (Mid 22) | |
| PCMark 10 / Digital Content Creation | |
| Średnia w klasie Gaming (7602 - 19657, n=96, ostatnie 2 lata) | |
| Razer Blade 15 2022 | |
| Asus ROG Zephyrus M16 GU603Z | |
| Przeciętny Intel Core i9-12900H, NVIDIA GeForce RTX 3070 Ti Laptop GPU (10009 - 12541, n=6) | |
| Aorus 15 XE5 | |
| HP Omen 16-b1090ng | |
| Razer Blade 15 OLED (Early 2022) | |
| Schenker XMG Fusion 15 (Mid 22) | |
| CrossMark / Overall | |
| Średnia w klasie Gaming (1366 - 2409, n=96, ostatnie 2 lata) | |
| Aorus 15 XE5 | |
| Asus ROG Zephyrus M16 GU603Z | |
| Przeciętny Intel Core i9-12900H, NVIDIA GeForce RTX 3070 Ti Laptop GPU (1664 - 2044, n=6) | |
| Razer Blade 15 OLED (Early 2022) | |
| Schenker XMG Fusion 15 (Mid 22) | |
| CrossMark / Productivity | |
| Aorus 15 XE5 | |
| Średnia w klasie Gaming (1386 - 2254, n=96, ostatnie 2 lata) | |
| Asus ROG Zephyrus M16 GU603Z | |
| Przeciętny Intel Core i9-12900H, NVIDIA GeForce RTX 3070 Ti Laptop GPU (1591 - 1968, n=6) | |
| Razer Blade 15 OLED (Early 2022) | |
| Schenker XMG Fusion 15 (Mid 22) | |
| CrossMark / Creativity | |
| Średnia w klasie Gaming (1343 - 2729, n=96, ostatnie 2 lata) | |
| Asus ROG Zephyrus M16 GU603Z | |
| Przeciętny Intel Core i9-12900H, NVIDIA GeForce RTX 3070 Ti Laptop GPU (1797 - 2148, n=6) | |
| Aorus 15 XE5 | |
| Razer Blade 15 OLED (Early 2022) | |
| Schenker XMG Fusion 15 (Mid 22) | |
| CrossMark / Responsiveness | |
| Aorus 15 XE5 | |
| Asus ROG Zephyrus M16 GU603Z | |
| Przeciętny Intel Core i9-12900H, NVIDIA GeForce RTX 3070 Ti Laptop GPU (1514 - 2069, n=6) | |
| Średnia w klasie Gaming (1226 - 2334, n=96, ostatnie 2 lata) | |
| Schenker XMG Fusion 15 (Mid 22) | |
| Razer Blade 15 OLED (Early 2022) | |
| PCMark 8 Home Score Accelerated v2 | 5101 pkt. | |
| PCMark 8 Work Score Accelerated v2 | 5789 pkt. | |
| PCMark 10 Score | 7336 pkt. | |
Pomoc | ||
| AIDA64 / Memory Copy | |
| Średnia w klasie Gaming (21750 - 129946, n=107, ostatnie 2 lata) | |
| Asus ROG Zephyrus M16 GU603Z | |
| HP Omen 16-b1090ng | |
| Razer Blade 15 2022 | |
| Przeciętny Intel Core i9-12900H (34438 - 74264, n=29) | |
| Razer Blade 15 OLED (Early 2022) | |
| Aorus 15 XE5 | |
| Schenker XMG Fusion 15 (Mid 22) | |
| AIDA64 / Memory Read | |
| Średnia w klasie Gaming (22956 - 118858, n=107, ostatnie 2 lata) | |
| Asus ROG Zephyrus M16 GU603Z | |
| HP Omen 16-b1090ng | |
| Razer Blade 15 2022 | |
| Przeciętny Intel Core i9-12900H (36365 - 74642, n=29) | |
| Razer Blade 15 OLED (Early 2022) | |
| Aorus 15 XE5 | |
| Schenker XMG Fusion 15 (Mid 22) | |
| AIDA64 / Memory Write | |
| Średnia w klasie Gaming (22297 - 135096, n=107, ostatnie 2 lata) | |
| Asus ROG Zephyrus M16 GU603Z | |
| Razer Blade 15 2022 | |
| HP Omen 16-b1090ng | |
| Przeciętny Intel Core i9-12900H (32276 - 67858, n=29) | |
| Aorus 15 XE5 | |
| Razer Blade 15 OLED (Early 2022) | |
| Schenker XMG Fusion 15 (Mid 22) | |
| AIDA64 / Memory Latency | |
| Średnia w klasie Gaming (75.3 - 259, n=107, ostatnie 2 lata) | |
| Razer Blade 15 OLED (Early 2022) | |
| Aorus 15 XE5 | |
| Schenker XMG Fusion 15 (Mid 22) | |
| HP Omen 16-b1090ng | |
| Asus ROG Zephyrus M16 GU603Z | |
| Przeciętny Intel Core i9-12900H (74.7 - 118.1, n=28) | |
| Razer Blade 15 2022 | |
* ... im mniej tym lepiej
Opóźnienia DPC
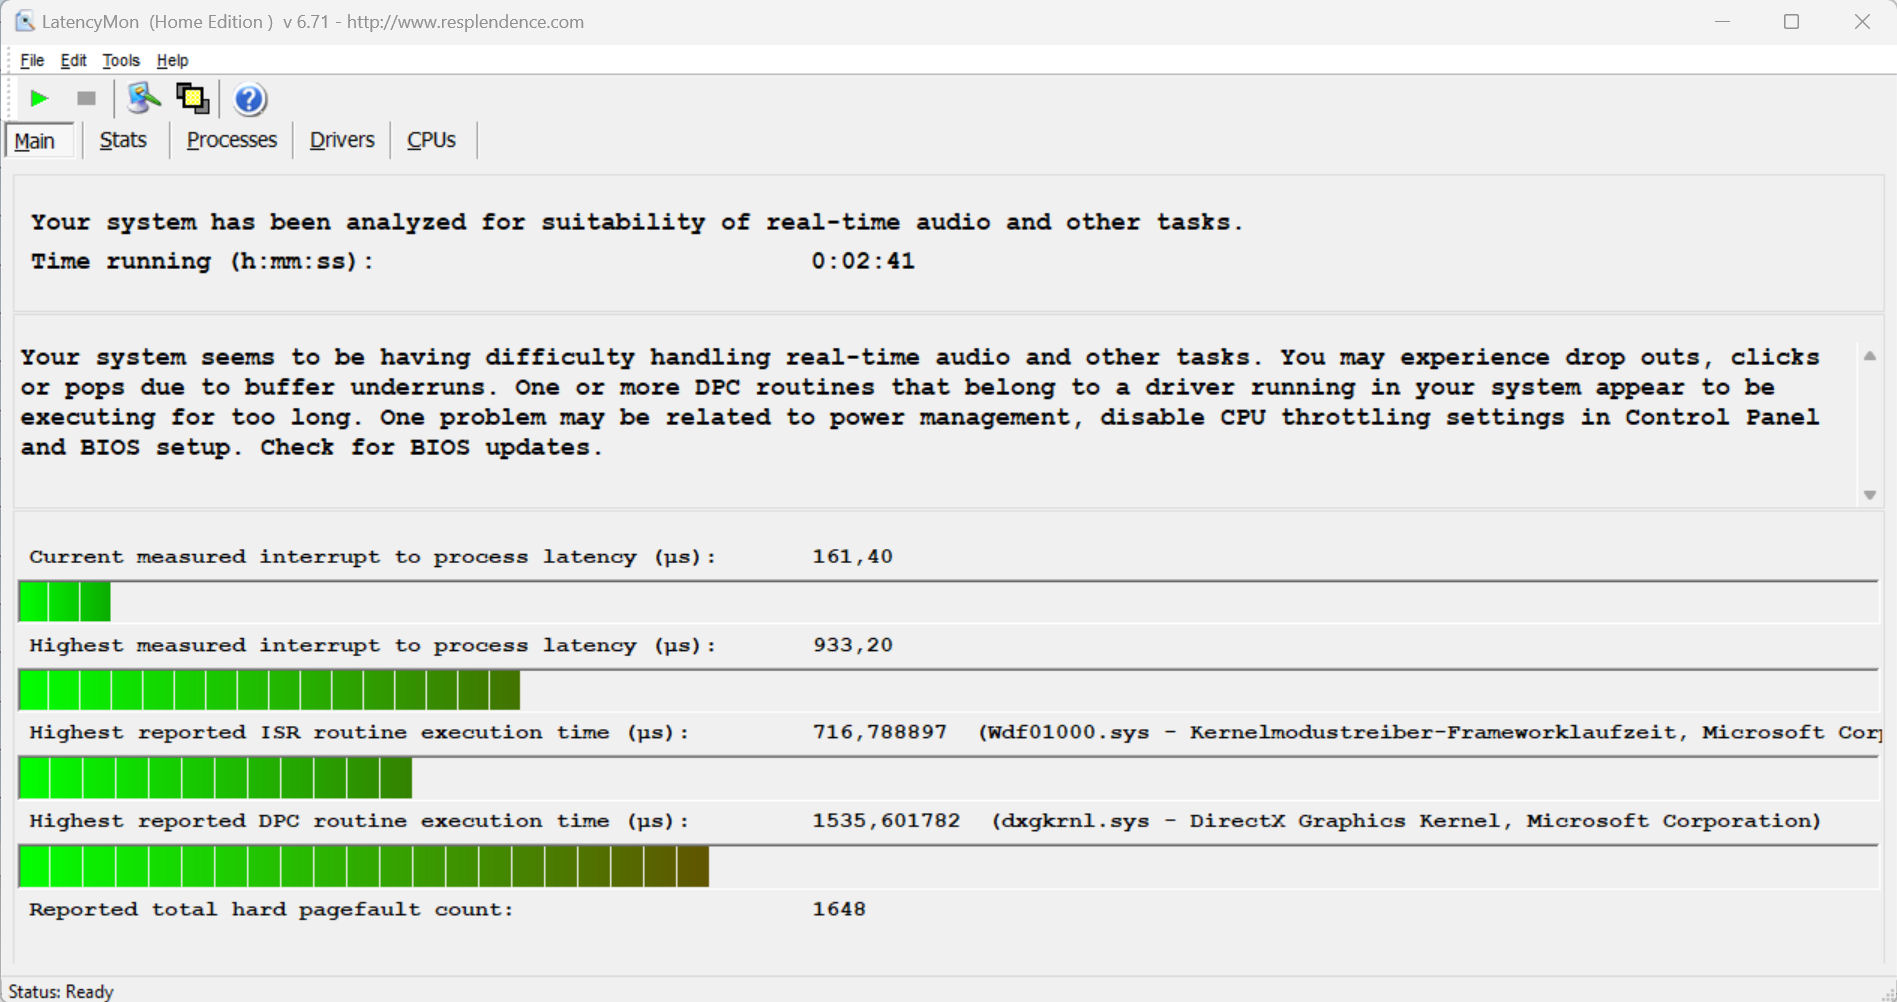
Standardowy test monitora latencji (surfowanie po internecie, odtwarzanie wideo 4k, wysokie obciążenie Prime95) wykazał anomalie. System nie wydaje się być odpowiedni do edycji wideo i audio w czasie rzeczywistym. Przyszłe aktualizacje oprogramowania mogą jednak doprowadzić do poprawy lub pogorszenia wydajności.
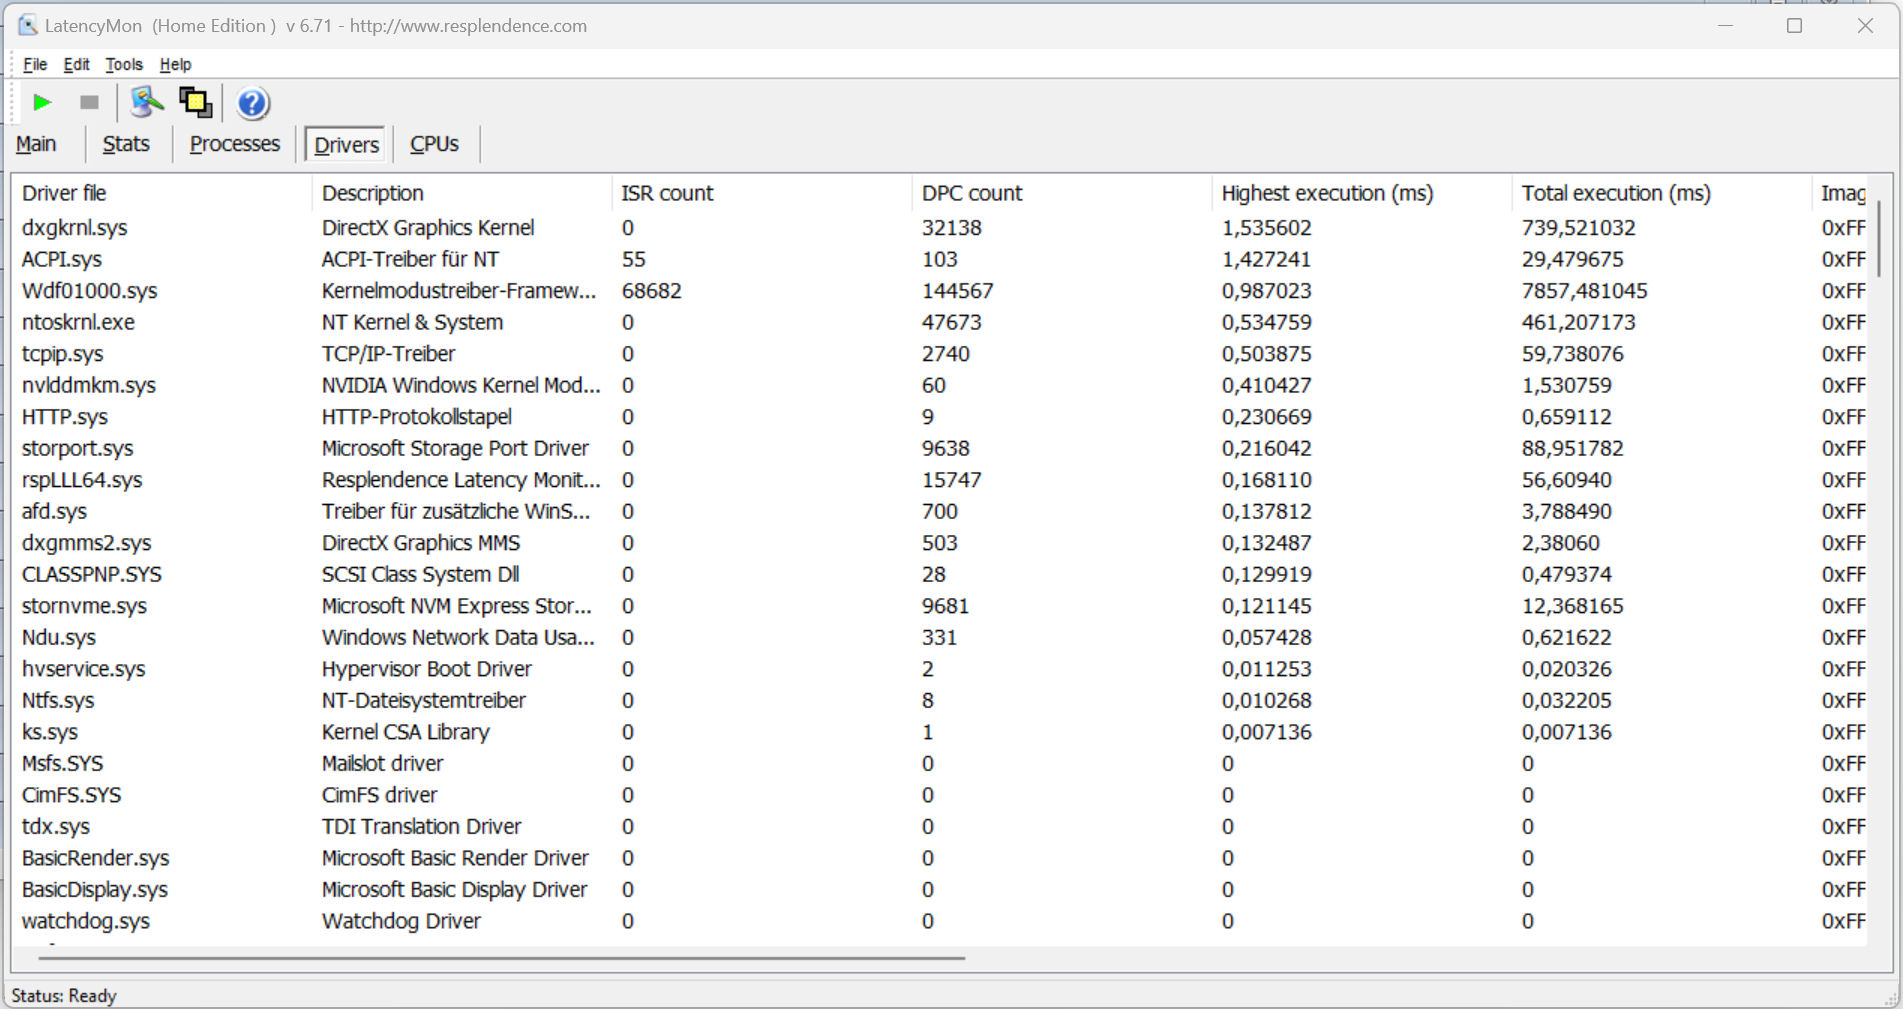
| DPC Latencies / LatencyMon - interrupt to process latency (max), Web, Youtube, Prime95 | |
| Schenker XMG Fusion 15 (Mid 22) | |
| Razer Blade 15 2022 | |
| Aorus 15 XE5 | |
| Asus ROG Zephyrus M16 GU603Z | |
| Razer Blade 15 OLED (Early 2022) | |
| HP Omen 16-b1090ng | |
* ... im mniej tym lepiej
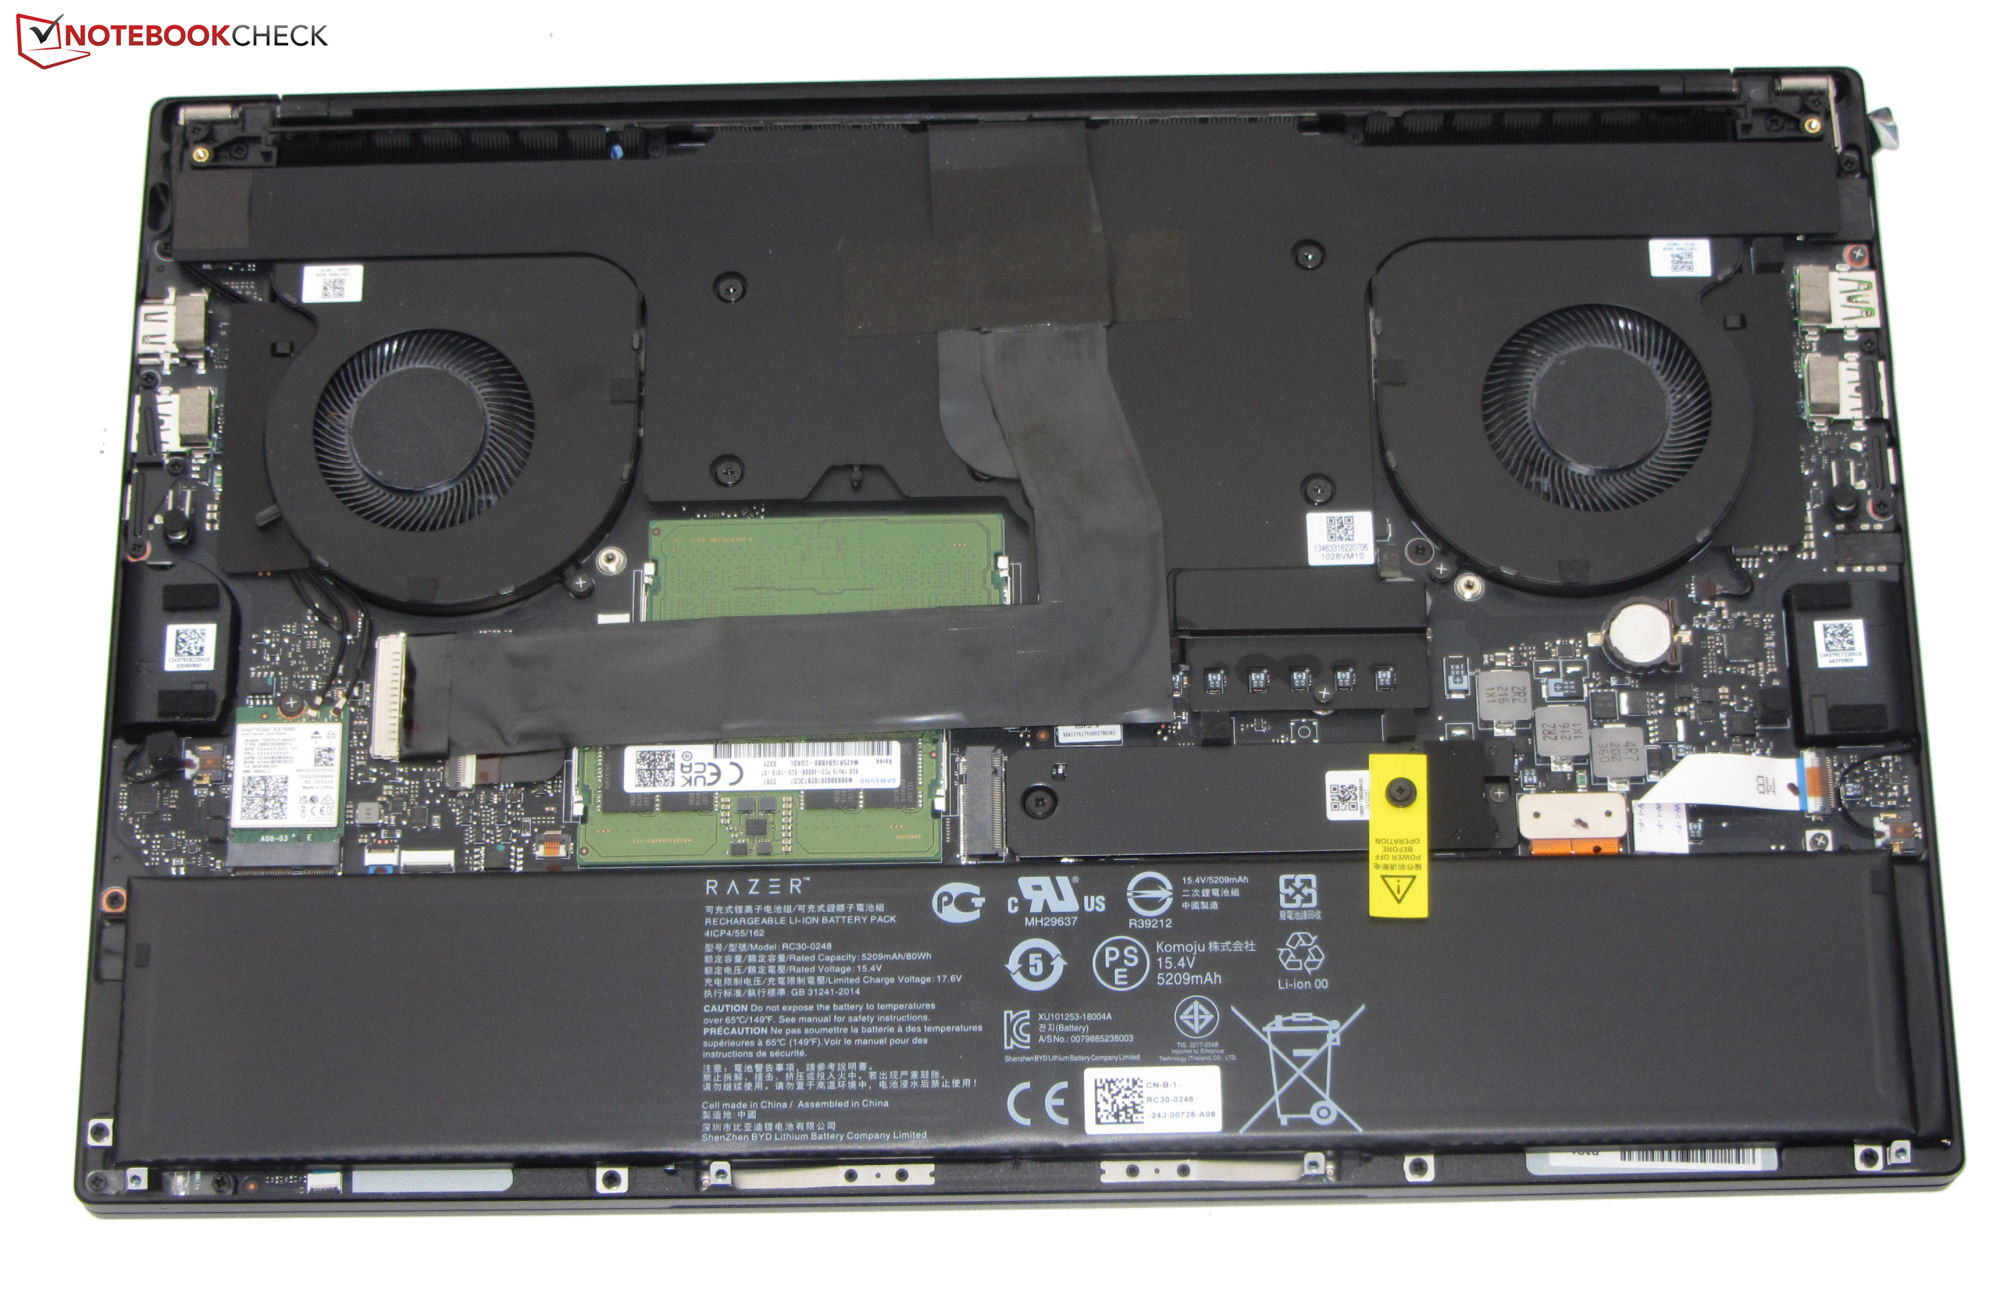
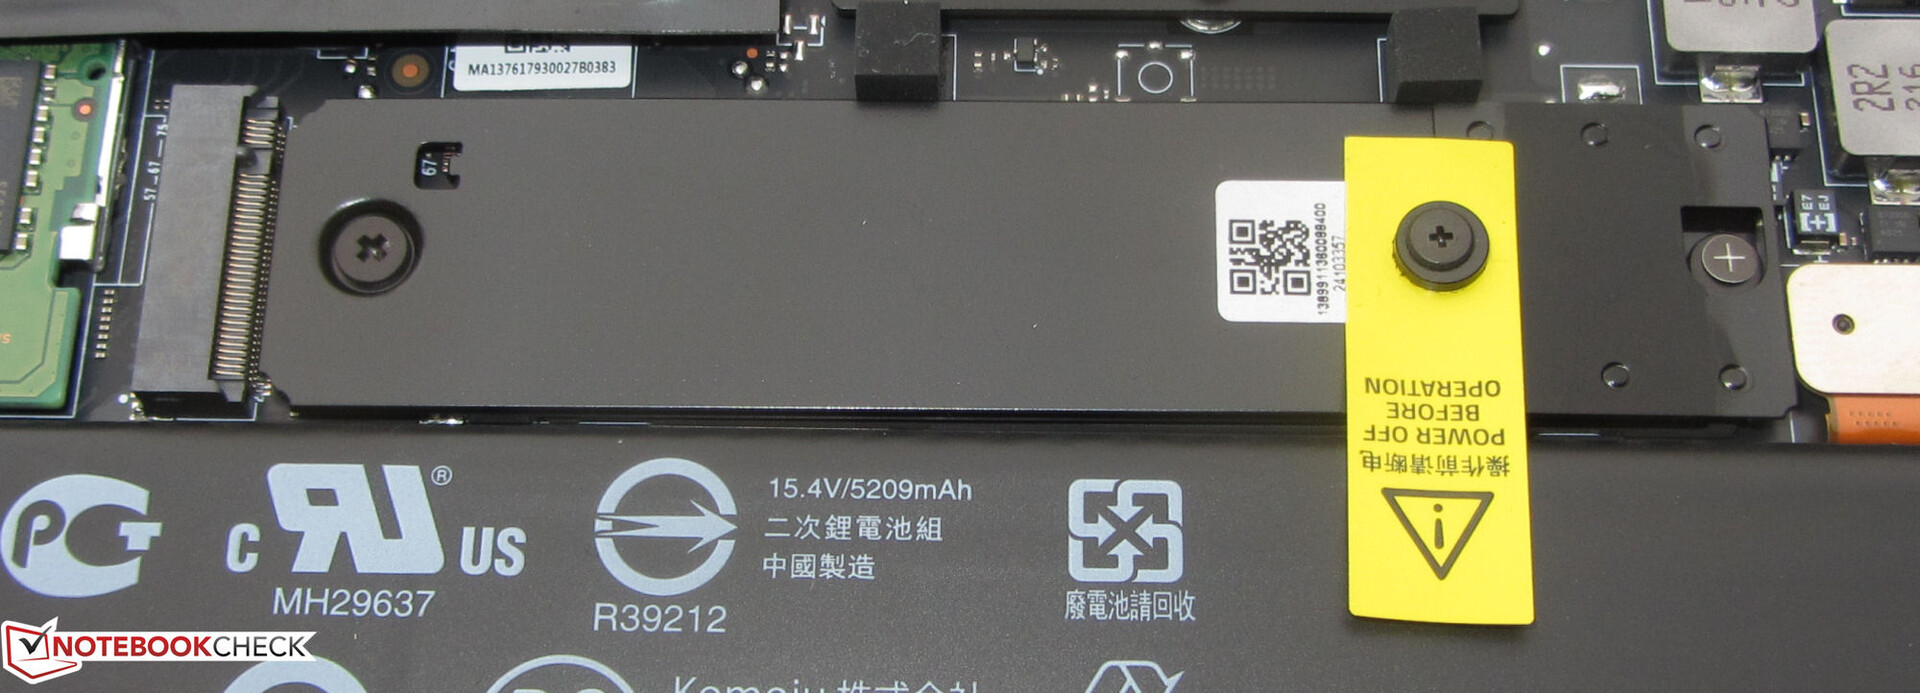
Pamięć masowa
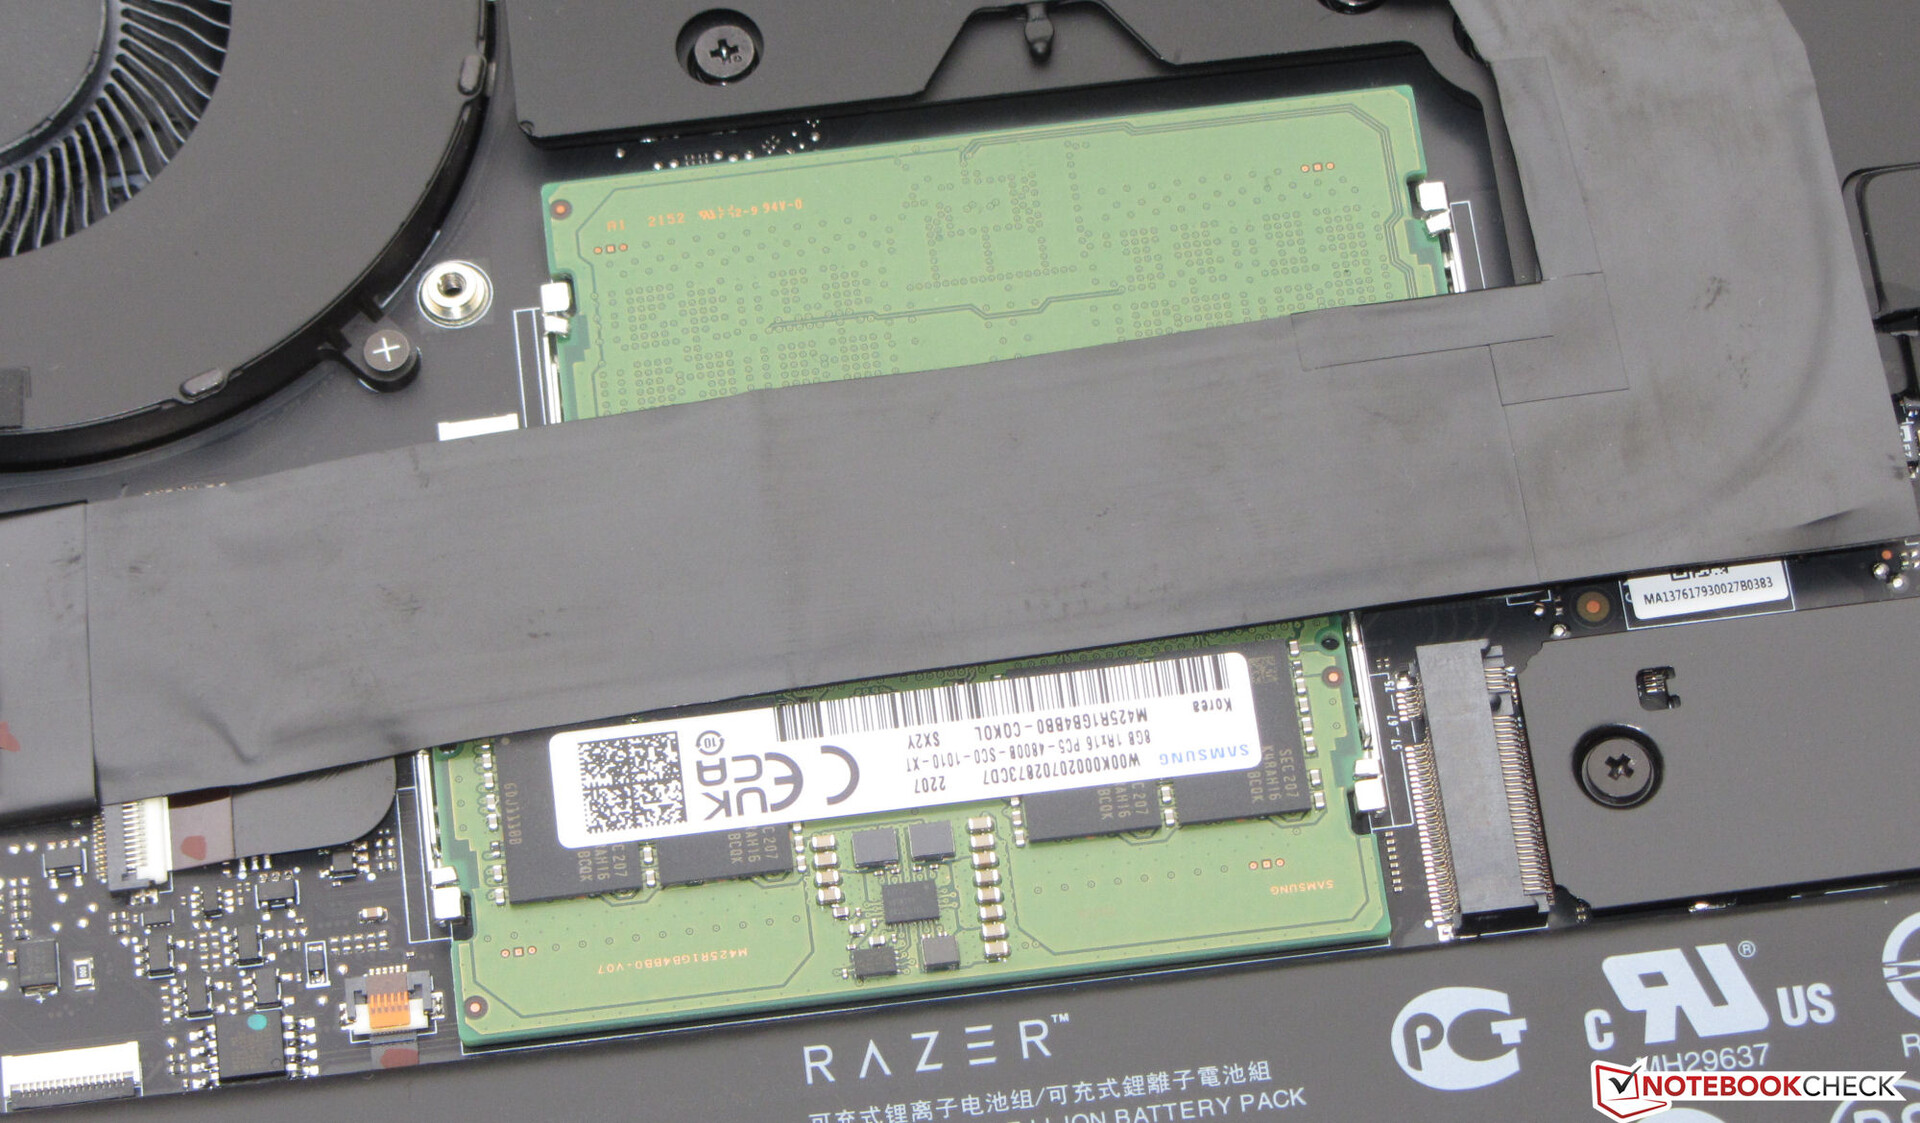
Blade ma miejsce na dwa dyski SSD PCIe-4 w formacie M.2 2280. Zainstalowany dysk SSD PCIe-4 (1 TB) od Samsunga zapewnia bardzo dobre transfery. Spadki wydajności spowodowane throttlingiem termicznym nie występowały.

| Drive Performance rating - Percent | |
| Aorus 15 XE5 | |
| Schenker XMG Fusion 15 (Mid 22) | |
| Razer Blade 15 2022 | |
| Razer Blade 15 OLED (Early 2022) | |
| Asus ROG Zephyrus M16 GU603Z | |
| Średnia w klasie Gaming | |
| Przeciętny Samsung PM9A1 MZVL21T0HCLR | |
| HP Omen 16-b1090ng | |
* ... im mniej tym lepiej
Continuous Performance Read: DiskSpd Read Loop, Queue Depth 8
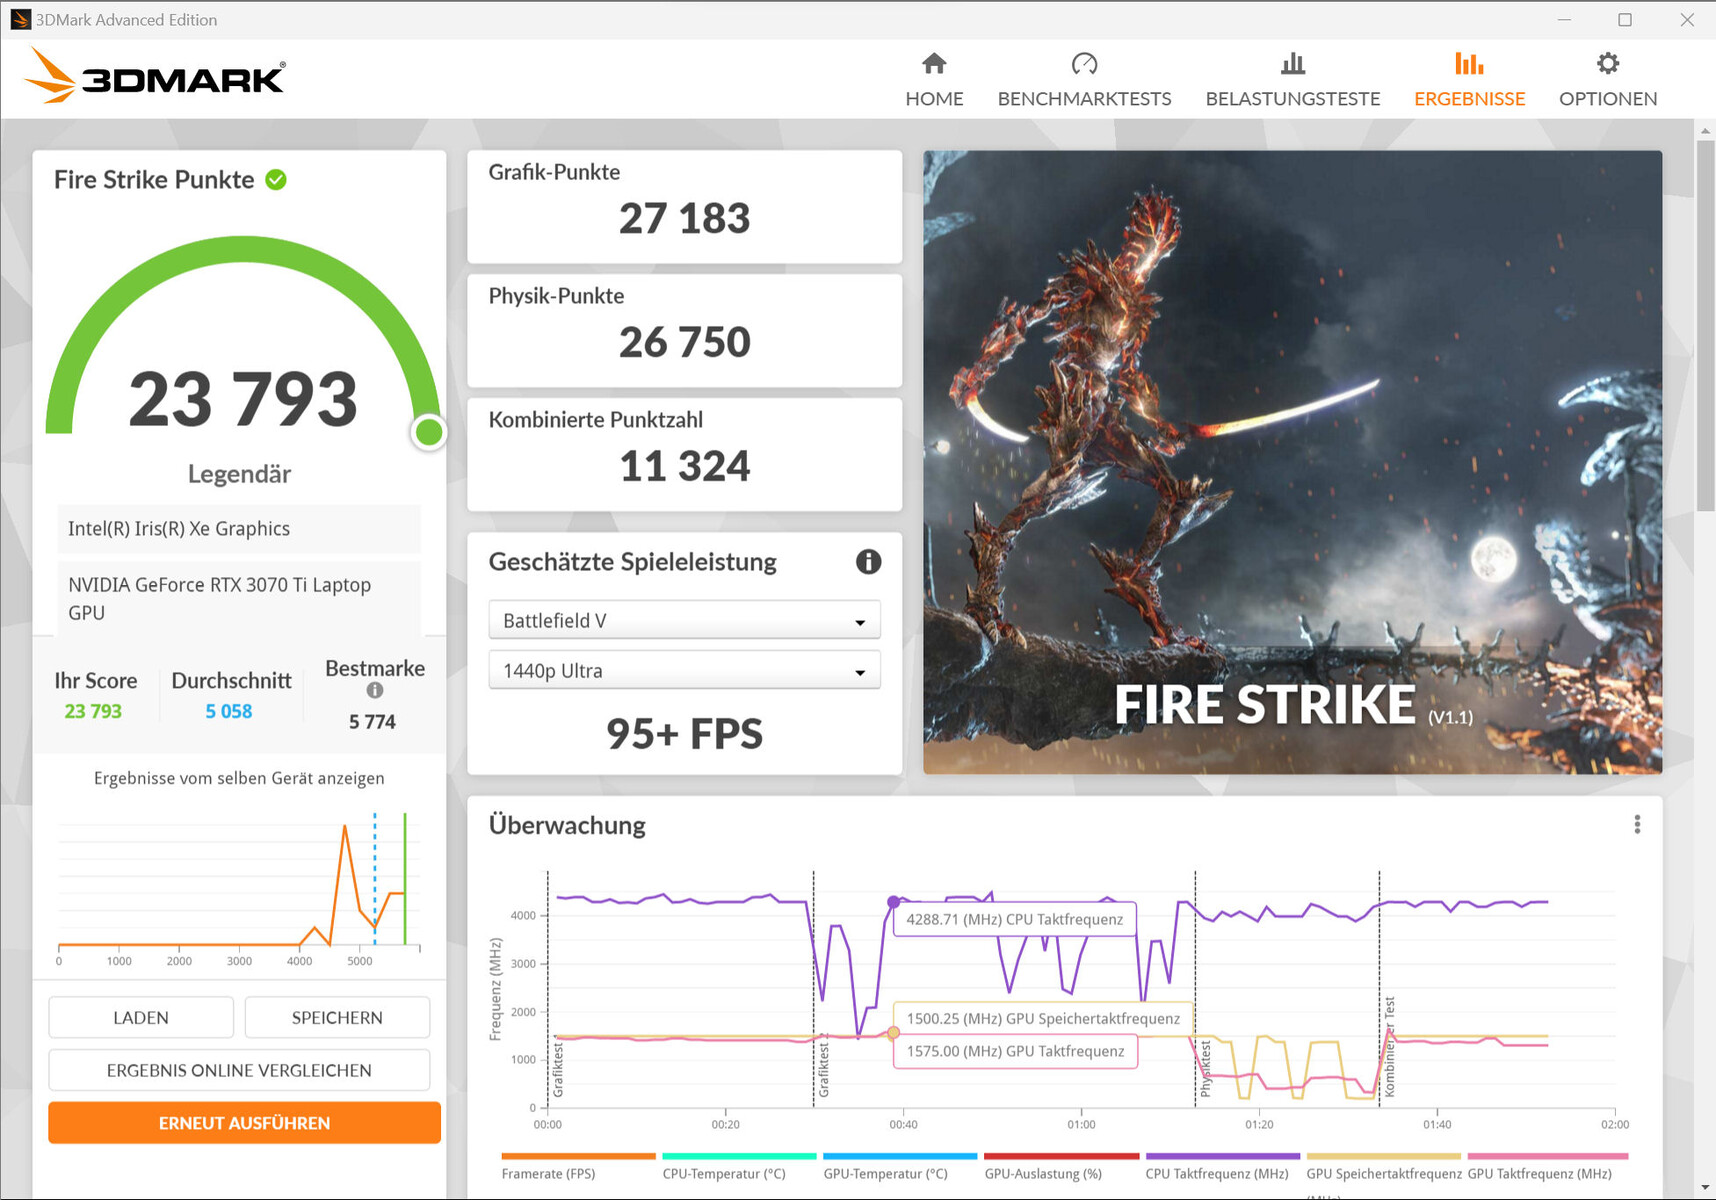
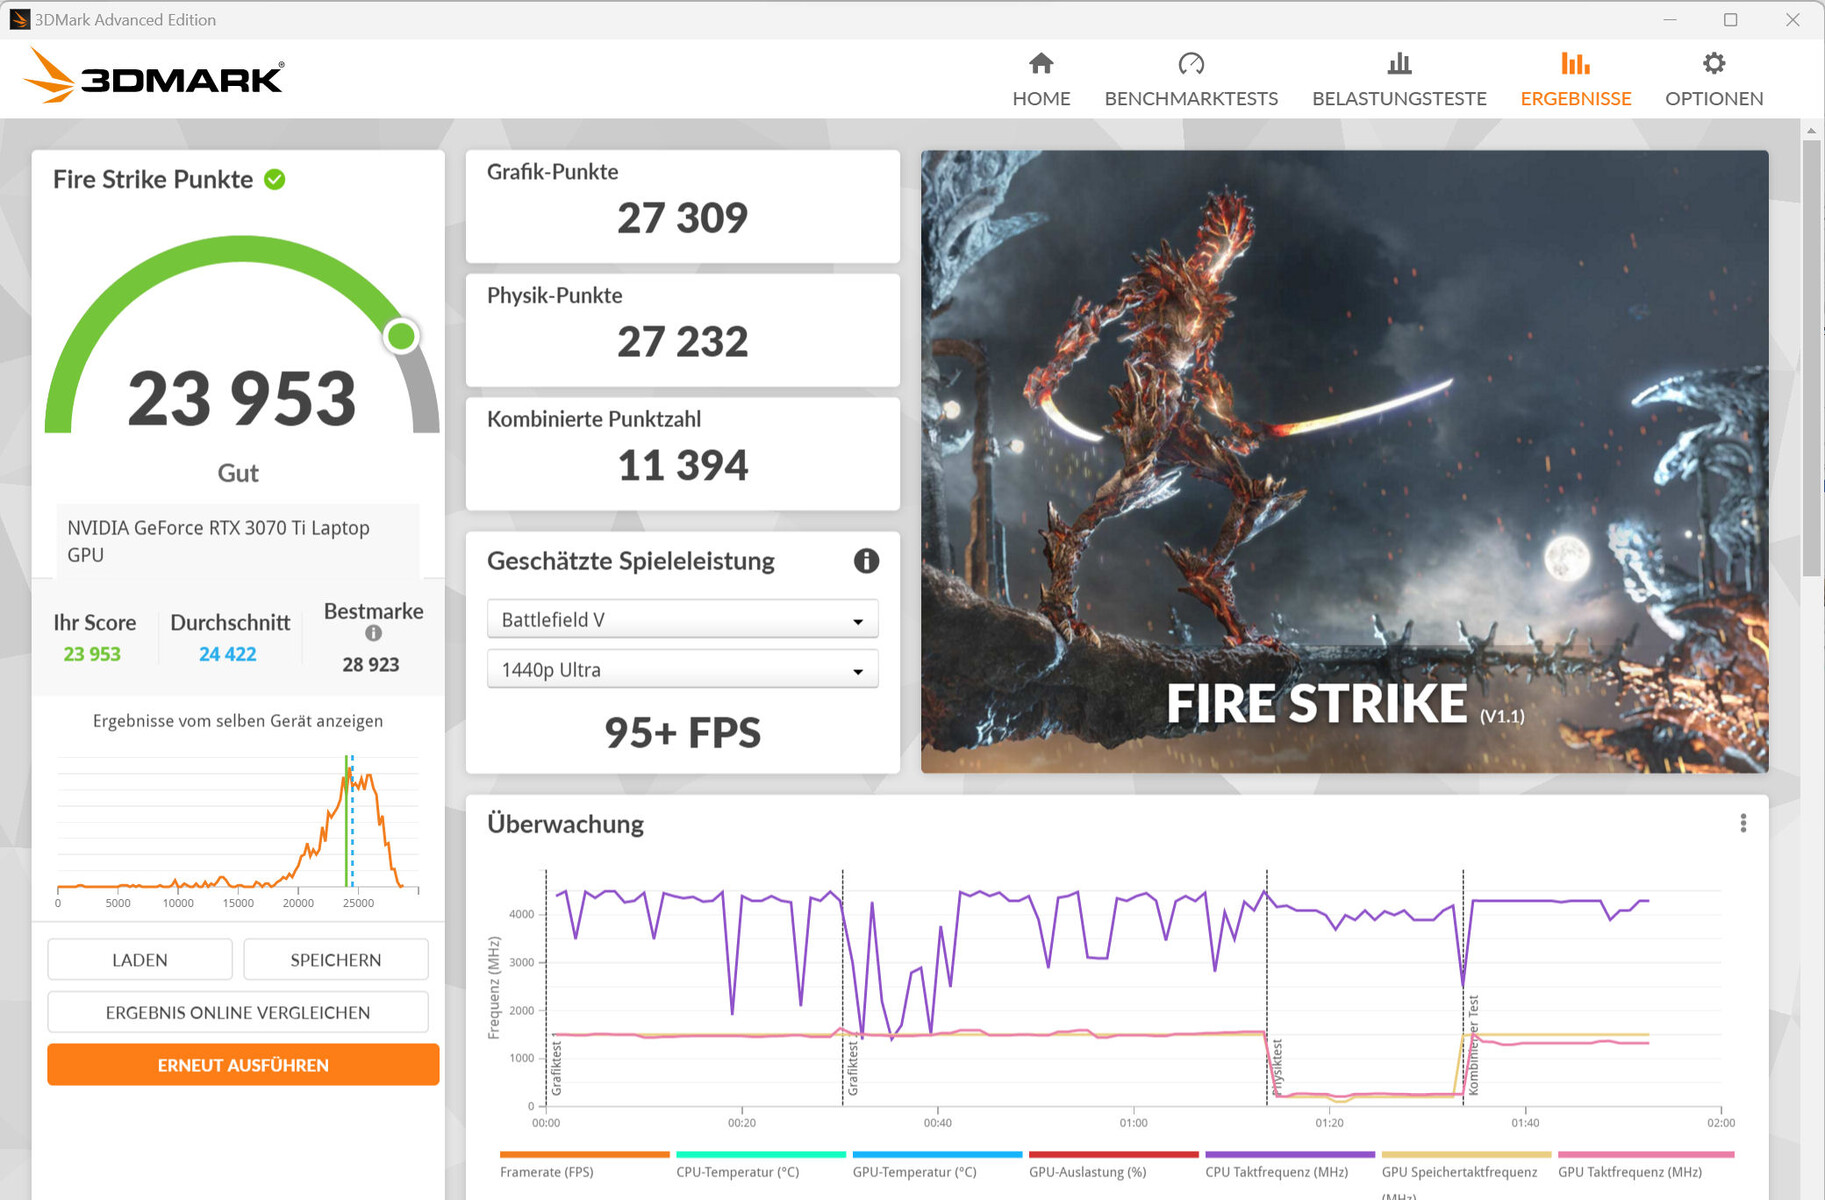
Karta graficzna
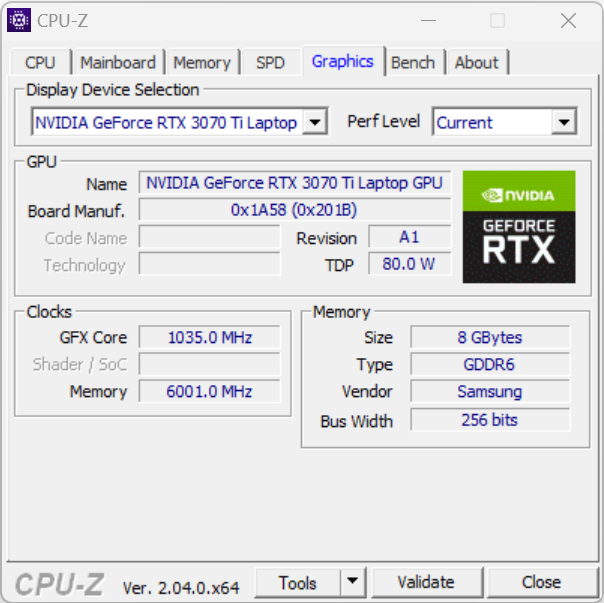
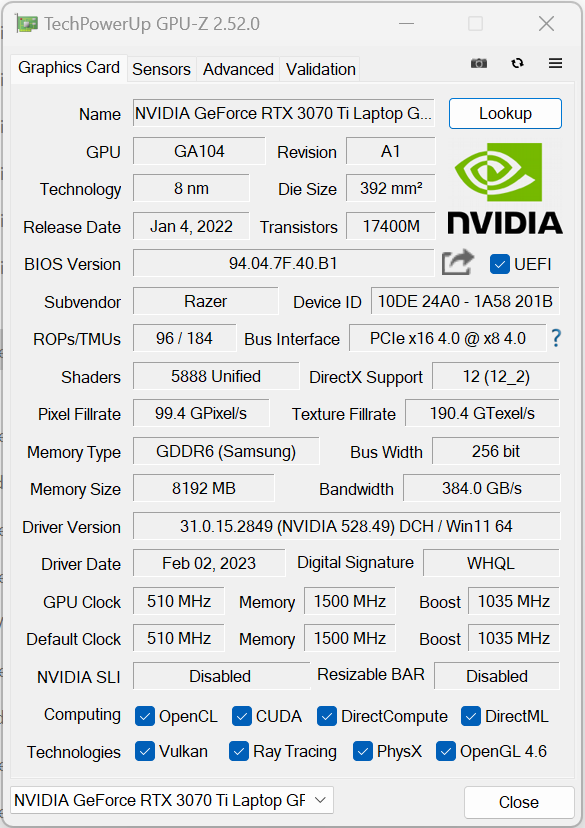
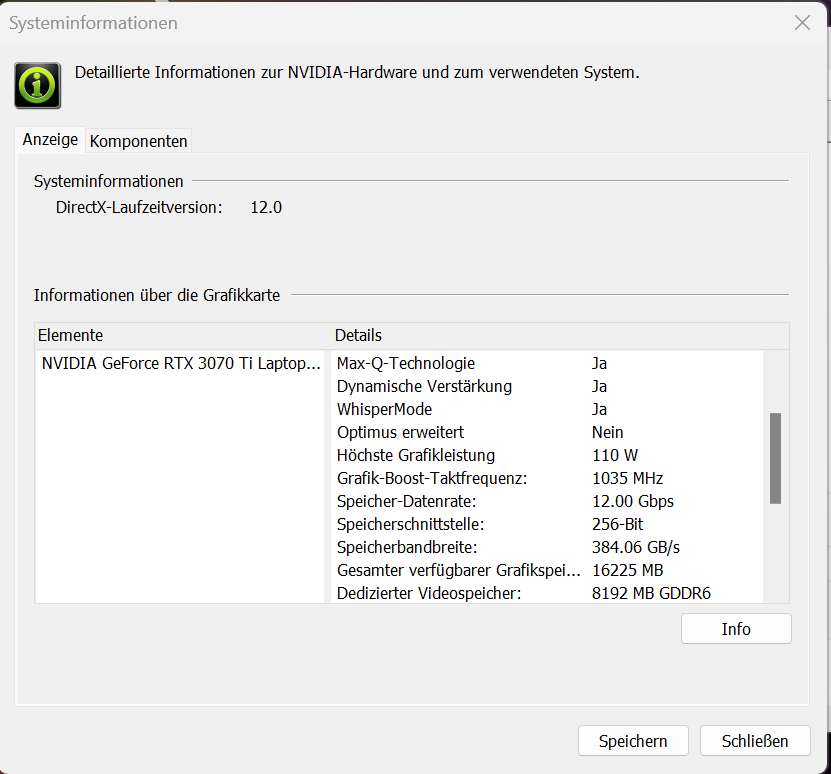
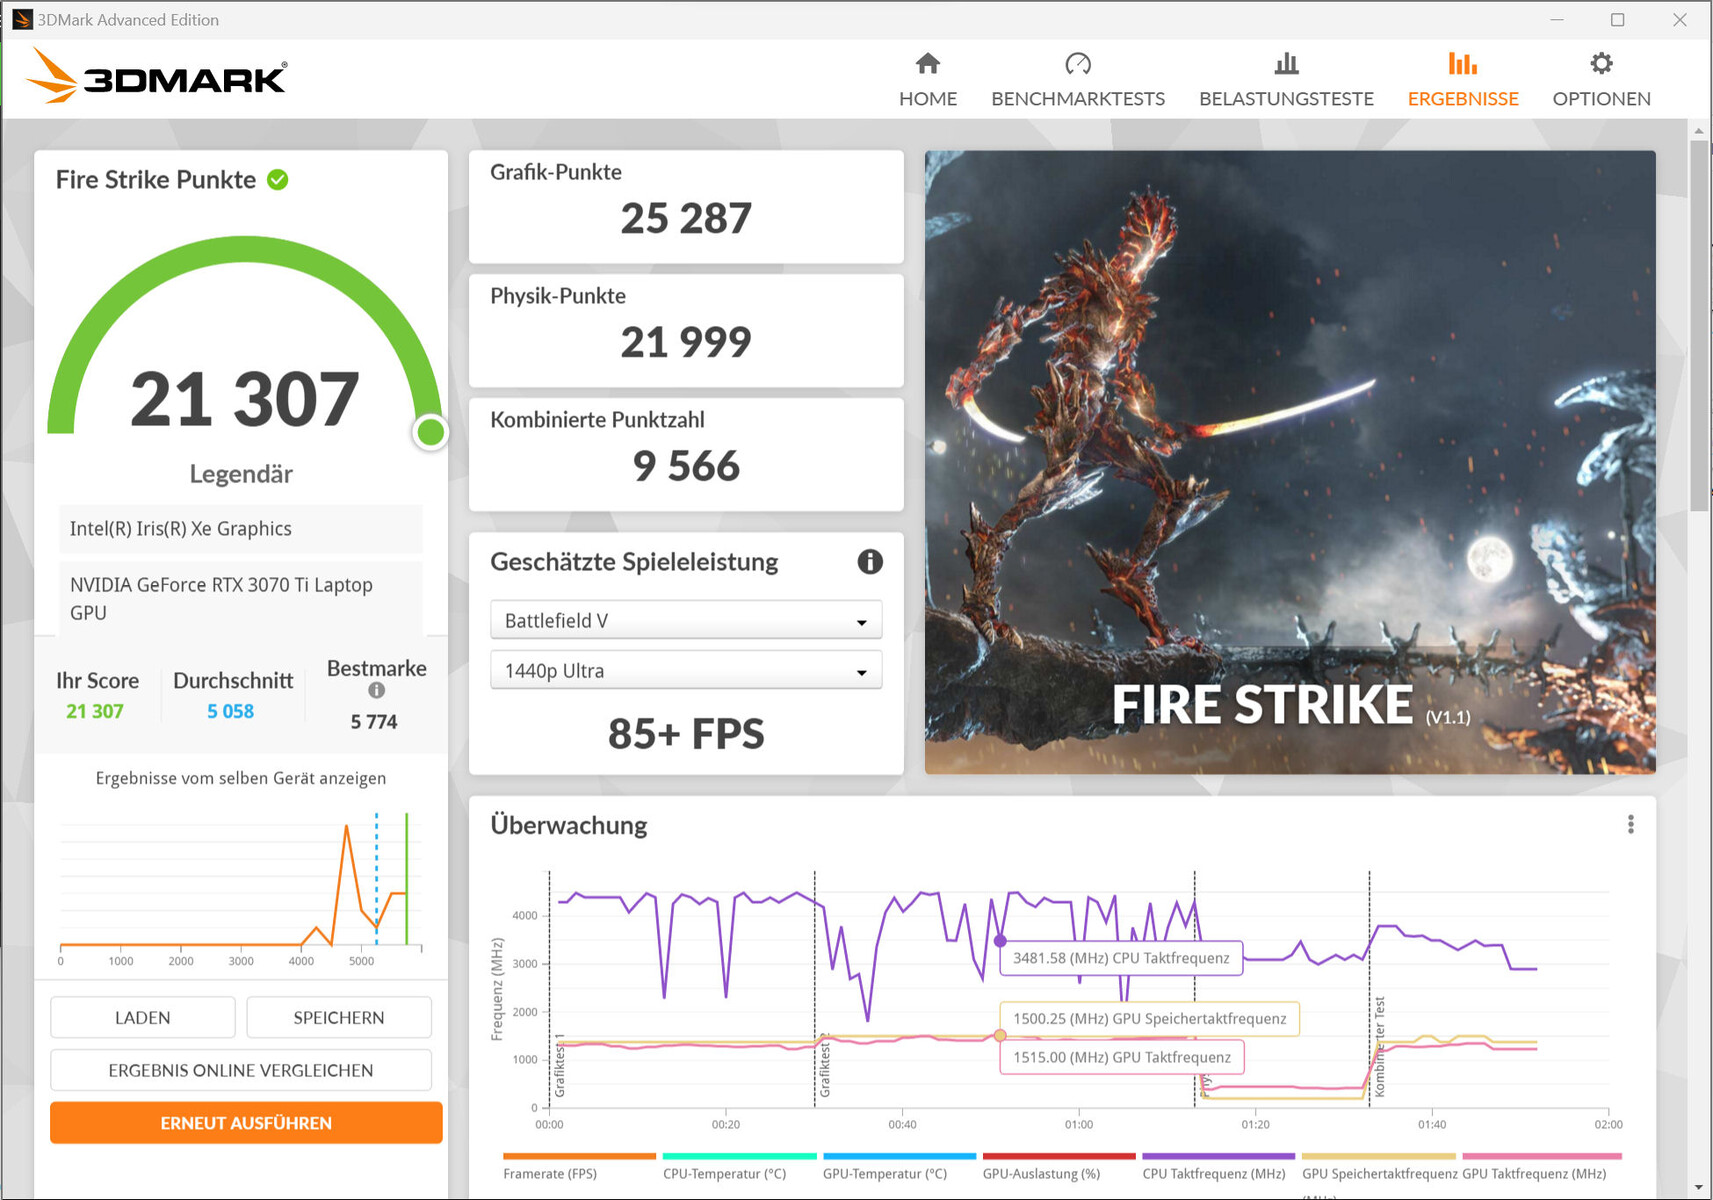
Na stronie .GeForce RTX 3070 TigPU do laptopa (VRAM: 8192 MB GDDR6) zapewnia wyniki w 3D-Marku na średnim poziomie wyznaczonym do tej pory przez GPU, a uwagę zwraca stosunkowo niskie maksymalne TGP na poziomie 110 W. Bezpośrednie wyjście obrazu przez GPU GeForce prowadzi do nieistotnego wzrostu wydajności graficznej. Przełączanie pomiędzy trybem Optimus i dGPU odbywa się bezpośrednio w BIOS-ie lub za pośrednictwem oprogramowania Razer Synapse. Zaawansowany Optimus nie jest obsługiwany.


| 3DMark Performance rating - Percent | |
| Średnia w klasie Gaming | |
| Razer Blade 15 2022 | |
| Razer Blade 15 OLED (Early 2022) | |
| Razer Blade 15 OLED (Early 2022) | |
| Przeciętny NVIDIA GeForce RTX 3070 Ti Laptop GPU | |
| HP Omen 16-b1090ng | |
| Aorus 15 XE5 -1! | |
| Asus ROG Zephyrus M16 GU603Z | |
| Schenker XMG Fusion 15 (Mid 22) | |
| 3DMark 11 - 1280x720 Performance GPU | |
| Średnia w klasie Gaming (21841 - 80022, n=106, ostatnie 2 lata) | |
| Razer Blade 15 2022 | |
| Aorus 15 XE5 | |
| Razer Blade 15 OLED (Early 2022) | |
| Przeciętny NVIDIA GeForce RTX 3070 Ti Laptop GPU (13799 - 42569, n=36) | |
| Razer Blade 15 OLED (Early 2022) (dGPU) | |
| HP Omen 16-b1090ng | |
| Asus ROG Zephyrus M16 GU603Z | |
| Schenker XMG Fusion 15 (Mid 22) | |
| 3DMark 06 Standard Score | 48871 pkt. | |
| 3DMark 11 Performance | 30645 pkt. | |
| 3DMark Cloud Gate Standard Score | 59982 pkt. | |
| 3DMark Fire Strike Score | 23793 pkt. | |
| 3DMark Time Spy Score | 10342 pkt. | |
Pomoc | ||
| Blender | |
| v3.3 Classroom OPTIX/RTX | |
| Asus ROG Zephyrus M16 GU603Z (3.3.3) | |
| Razer Blade 15 OLED (Early 2022) (3.3.3) | |
| Razer Blade 15 OLED (Early 2022) (3.3.3, dGPU) | |
| Przeciętny NVIDIA GeForce RTX 3070 Ti Laptop GPU (22 - 30, n=15) | |
| Aorus 15 XE5 (3.3.0) | |
| Średnia w klasie Gaming (9 - 32, n=109, ostatnie 2 lata) | |
| v3.3 Classroom CUDA | |
| Asus ROG Zephyrus M16 GU603Z (3.3.3) | |
| Razer Blade 15 OLED (Early 2022) (3.3.3) | |
| Razer Blade 15 OLED (Early 2022) (3.3.3, dGPU) | |
| Przeciętny NVIDIA GeForce RTX 3070 Ti Laptop GPU (36 - 46, n=16) | |
| Aorus 15 XE5 (3.3.0) | |
| Średnia w klasie Gaming (15 - 228, n=109, ostatnie 2 lata) | |
| v3.3 Classroom CPU | |
| Schenker XMG Fusion 15 (Mid 22) | |
| Aorus 15 XE5 (3.3.0) | |
| Razer Blade 15 OLED (Early 2022) (3.3.3, dGPU) | |
| Razer Blade 15 OLED (Early 2022) (3.3.3) | |
| Przeciętny NVIDIA GeForce RTX 3070 Ti Laptop GPU (285 - 459, n=16) | |
| Asus ROG Zephyrus M16 GU603Z (3.3.3) | |
| Średnia w klasie Gaming (122 - 565, n=105, ostatnie 2 lata) | |
| GPUScore: Sacred Path | |
| 2560x1440 Official VRS | |
| Razer Blade 15 OLED (Early 2022) (0.9.0 Vulkan 1.3) | |
| Razer Blade 15 OLED (Early 2022) (0.9.0 DirectX 12) | |
| Razer Blade 15 OLED (Early 2022) (0.9.0 Vulkan 1.3, dGPU) | |
| Razer Blade 15 OLED (Early 2022) (0.9.0 DirectX 12. dGPU) | |
| Średnia w klasie Gaming (13.8 - 330, n=141, ostatnie 2 lata) | |
| Przeciętny NVIDIA GeForce RTX 3070 Ti Laptop GPU (17.9 - 134.8, n=4) | |
| 2560x1440 Official | |
| Razer Blade 15 OLED (Early 2022) (0.9.0 Vulkan 1.3, dGPU) | |
| Razer Blade 15 OLED (Early 2022) (0.9.0 DirectX 12, dGPU) | |
| Razer Blade 15 OLED (Early 2022) (0.9.0 Vulkan 1.3) | |
| Razer Blade 15 OLED (Early 2022) (0.9.0 DirectX 12) | |
| Średnia w klasie Gaming (11 - 331, n=235, ostatnie 2 lata) | |
| Asus ROG Zephyrus M16 GU603Z (1.0.0 Vulkan 1.3) | |
| Przeciętny NVIDIA GeForce RTX 3070 Ti Laptop GPU (17 - 130.6, n=6) | |
| Geekbench 5.5 | |
| OpenCL Score | |
| Średnia w klasie Gaming (80702 - 277970, n=105, ostatnie 2 lata) | |
| Razer Blade 15 2022 | |
| Aorus 15 XE5 | |
| Przeciętny NVIDIA GeForce RTX 3070 Ti Laptop GPU (100630 - 150471, n=38) | |
| Razer Blade 15 OLED (Early 2022) | |
| Asus ROG Zephyrus M16 GU603Z | |
| Schenker XMG Fusion 15 (Mid 22) | |
| Razer Blade 15 OLED (Early 2022) (dGPU) | |
| HP Omen 16-b1090ng | |
| Vulkan Score 5.5 | |
| Średnia w klasie Gaming (9296 - 246759, n=81, ostatnie 2 lata) | |
| Razer Blade 15 OLED (Early 2022) (dGPU) | |
| Przeciętny NVIDIA GeForce RTX 3070 Ti Laptop GPU (52594 - 92020, n=10) | |
| Razer Blade 15 2022 | |
| Asus ROG Zephyrus M16 GU603Z | |
| Geekbench 6.0 | |
| GPU Vulkan 6.0 | |
| Średnia w klasie Gaming (90515 - 184611, n=3, ostatnie 2 lata) | |
| Razer Blade 15 OLED (Early 2022) (dGPU) | |
| Przeciętny NVIDIA GeForce RTX 3070 Ti Laptop GPU (19109 - 96149, n=2) | |
| Razer Blade 15 OLED (Early 2022) | |
| GPU OpenCL 6.0 | |
| Średnia w klasie Gaming (111827 - 192027, n=3, ostatnie 2 lata) | |
| Razer Blade 15 OLED (Early 2022) | |
| Przeciętny NVIDIA GeForce RTX 3070 Ti Laptop GPU (103225 - 104147, n=2) | |
| Razer Blade 15 OLED (Early 2022) (dGPU) | |
| V-Ray 5 Benchmark | |
| GPU RTX | |
| Średnia w klasie Gaming (1146 - 4363, n=35, ostatnie 2 lata) | |
| Aorus 15 XE5 (5.0.1) | |
| Przeciętny NVIDIA GeForce RTX 3070 Ti Laptop GPU (1334 - 1847, n=15) | |
| Razer Blade 15 OLED (Early 2022) (5.0.1) | |
| Razer Blade 15 OLED (Early 2022) (5.0.1, dGPU) | |
| Schenker XMG Fusion 15 (Mid 22) (5.0.1) | |
| GPU CUDA | |
| Średnia w klasie Gaming (887 - 3288, n=35, ostatnie 2 lata) | |
| Aorus 15 XE5 (5.0.1) | |
| Przeciętny NVIDIA GeForce RTX 3070 Ti Laptop GPU (1062 - 1391, n=14) | |
| Razer Blade 15 OLED (Early 2022) (5.0.1) | |
| Razer Blade 15 OLED (Early 2022) (5.0.1, dGPU) | |
| Schenker XMG Fusion 15 (Mid 22) (5.0.1) | |
| CPU | |
| Średnia w klasie Gaming (5864 - 30302, n=34, ostatnie 2 lata) | |
| Razer Blade 15 OLED (Early 2022) (5.0.1, dGPU) | |
| Razer Blade 15 OLED (Early 2022) (5.0.1) | |
| Razer Blade 15 2022 (5.0.1) | |
| Przeciętny NVIDIA GeForce RTX 3070 Ti Laptop GPU (2880 - 11931, n=20) | |
| Aorus 15 XE5 (5.0.1) | |
| Schenker XMG Fusion 15 (Mid 22) (5.0.1) | |
| V-Ray Benchmark Next 4.10 | |
| GPU | |
| Średnia w klasie Gaming (427 - 1333, n=103, ostatnie 2 lata) | |
| Aorus 15 XE5 (v4.10.07 ) | |
| Przeciętny NVIDIA GeForce RTX 3070 Ti Laptop GPU (277 - 559, n=33) | |
| Schenker XMG Fusion 15 (Mid 22) (v4.10.07 ) | |
| Razer Blade 15 OLED (Early 2022) (v4.10.07 ) | |
| Razer Blade 15 OLED (Early 2022) (v4.10.07, dGPU) | |
| HP Omen 16-b1090ng (v4.10.07 ) | |
| Asus ROG Zephyrus M16 GU603Z (v4.10.07 ) | |
| CPU | |
| Średnia w klasie Gaming (10048 - 45327, n=102, ostatnie 2 lata) | |
| HP Omen 16-b1090ng (v4.10.07 ) | |
| Razer Blade 15 OLED (Early 2022) (v4.10.07, dGPU) | |
| Asus ROG Zephyrus M16 GU603Z (v4.10.07 ) | |
| Razer Blade 15 OLED (Early 2022) (v4.10.07 ) | |
| Przeciętny NVIDIA GeForce RTX 3070 Ti Laptop GPU (4722 - 19786, n=33) | |
| Aorus 15 XE5 (v4.10.07 ) | |
| Schenker XMG Fusion 15 (Mid 22) (v4.10.07 ) | |
* ... im mniej tym lepiej
Wydajność w grach
Laptop jest przeznaczony do gier w rozdzielczości QHD na ustawieniach wysokich do maksymalnych. Wyższe rozdzielczości byłyby możliwe po podłączeniu do odpowiedniego monitora - choć na niekiedy obniżonych ustawieniach. Liczba klatek na sekundę w testowanych tytułach jest na poziomie typowym dla ustalonego średniaka RTX 3070 Ti. Bezpośrednie wyjście obrazu przez GPU GeForce może prowadzić - w zależności od gry - do minimalnego wzrostu liczby klatek na sekundę.
| Performance rating - Percent | |
| Średnia w klasie Gaming | |
| Razer Blade 15 2022 | |
| Aorus 15 XE5 | |
| Asus ROG Zephyrus M16 GU603Z | |
| HP Omen 16-b1090ng | |
| Razer Blade 15 OLED (Early 2022) | |
| Przeciętny NVIDIA GeForce RTX 3070 Ti Laptop GPU | |
| Razer Blade 15 OLED (Early 2022) | |
| Schenker XMG Fusion 15 (Mid 22) | |
| The Witcher 3 - 1920x1080 Ultra Graphics & Postprocessing (HBAO+) | |
| Średnia w klasie Gaming (95 - 240, n=8, ostatnie 2 lata) | |
| Razer Blade 15 2022 | |
| Przeciętny NVIDIA GeForce RTX 3070 Ti Laptop GPU (76.8 - 124.1, n=39) | |
| Aorus 15 XE5 | |
| Asus ROG Zephyrus M16 GU603Z | |
| HP Omen 16-b1090ng | |
| Razer Blade 15 OLED (Early 2022) (dGPU) | |
| Razer Blade 15 OLED (Early 2022) | |
| Schenker XMG Fusion 15 (Mid 22) | |
| GTA V - 1920x1080 Highest AA:4xMSAA + FX AF:16x | |
| Średnia w klasie Gaming (48.3 - 186.9, n=100, ostatnie 2 lata) | |
| Razer Blade 15 2022 | |
| Aorus 15 XE5 | |
| Razer Blade 15 OLED (Early 2022) (dGPU) | |
| Razer Blade 15 OLED (Early 2022) | |
| HP Omen 16-b1090ng | |
| Asus ROG Zephyrus M16 GU603Z | |
| Przeciętny NVIDIA GeForce RTX 3070 Ti Laptop GPU (44 - 123.9, n=36) | |
| Schenker XMG Fusion 15 (Mid 22) | |
| Final Fantasy XV Benchmark - 1920x1080 High Quality | |
| Średnia w klasie Gaming (41 - 215, n=101, ostatnie 2 lata) | |
| Razer Blade 15 2022 (1.3) | |
| Aorus 15 XE5 (1.3) | |
| Razer Blade 15 OLED (Early 2022) (1.3, dGPU) | |
| Razer Blade 15 OLED (Early 2022) (1.3) | |
| HP Omen 16-b1090ng | |
| Przeciętny NVIDIA GeForce RTX 3070 Ti Laptop GPU (49.5 - 122.4, n=35) | |
| Asus ROG Zephyrus M16 GU603Z (1.3) | |
| Schenker XMG Fusion 15 (Mid 22) (1.3) | |
| Strange Brigade - 1920x1080 ultra AA:ultra AF:16 | |
| Średnia w klasie Gaming (76.3 - 456, n=91, ostatnie 2 lata) | |
| Aorus 15 XE5 (1.47.22.14 D3D12) | |
| Razer Blade 15 2022 (1.47.22.14 D3D12) | |
| Przeciętny NVIDIA GeForce RTX 3070 Ti Laptop GPU (109 - 221, n=37) | |
| Razer Blade 15 OLED (Early 2022) (1.47.22.14 D3D12, dGPU) | |
| Razer Blade 15 OLED (Early 2022) (1.47.22.14 D3D12) | |
| Schenker XMG Fusion 15 (Mid 22) (1.47.22.14 D3D12) | |
| Asus ROG Zephyrus M16 GU603Z (1.47.22.14 D3D12) | |
| HP Omen 16-b1090ng (1.47.22.14 D3D12) | |
| Dota 2 Reborn - 1920x1080 ultra (3/3) best looking | |
| Asus ROG Zephyrus M16 GU603Z | |
| Razer Blade 15 2022 | |
| Średnia w klasie Gaming (84.8 - 248, n=110, ostatnie 2 lata) | |
| HP Omen 16-b1090ng | |
| Aorus 15 XE5 | |
| Przeciętny NVIDIA GeForce RTX 3070 Ti Laptop GPU (68.7 - 160.5, n=38) | |
| Razer Blade 15 OLED (Early 2022) (dGPU) | |
| Razer Blade 15 OLED (Early 2022) | |
| Schenker XMG Fusion 15 (Mid 22) | |
| X-Plane 11.11 - 1920x1080 high (fps_test=3) | |
| Asus ROG Zephyrus M16 GU603Z | |
| HP Omen 16-b1090ng | |
| Razer Blade 15 2022 | |
| Aorus 15 XE5 | |
| Razer Blade 15 OLED (Early 2022) (dGPU) | |
| Średnia w klasie Gaming (52.1 - 143.5, n=113, ostatnie 2 lata) | |
| Przeciętny NVIDIA GeForce RTX 3070 Ti Laptop GPU (51.6 - 116.9, n=37) | |
| Razer Blade 15 OLED (Early 2022) | |
| Schenker XMG Fusion 15 (Mid 22) | |
Aby sprawdzić, czy liczba klatek na sekundę pozostaje stabilna przez dłuższy czas, uruchomiliśmy grę "The Witcher 3" przez około 60 minut w rozdzielczości Full HD i maksymalnych ustawieniach jakości. Postać w grze nie była poruszana i nie było zauważalnego spadku liczby klatek na sekundę.
Witcher 3 FPS Diagram
| low | med. | high | ultra | QHD | |
|---|---|---|---|---|---|
| GTA V (2015) | 182.7 | 177.2 | 172.8 | 113 | 94.3 |
| The Witcher 3 (2015) | 365.8 | 288.5 | 176.6 | 96.4 | |
| Dota 2 Reborn (2015) | 162 | 148.2 | 143.4 | 133 | |
| Final Fantasy XV Benchmark (2018) | 174.2 | 133.3 | 100.3 | 75.1 | |
| X-Plane 11.11 (2018) | 133.3 | 121.6 | 95 | ||
| Far Cry 5 (2018) | 170 | 141 | 135 | 126 | 100 |
| Strange Brigade (2018) | 351 | 240 | 197.2 | 173.4 | 130.9 |
| Flight Simulator 2020 (2020) | 124.8 | 97.8 | 70.2 | 52.2 | 41.3 |
| F1 22 (2022) | 203 | 202 | 173.1 | 65.2 | 42.3 |
| FIFA 23 (2022) | 104.3 | ||||
| A Plague Tale Requiem (2022) | 101.6 | 84 | 73.3 | 62.9 | 50.5 |
| Uncharted Legacy of Thieves Collection (2022) | 78 | 75.2 | 71.8 | 69.3 | 56.2 |
| Call of Duty Modern Warfare 2 2022 (2022) | 126 | 112 | 89 | 85 | 63 |
| Spider-Man Miles Morales (2022) | 107 | 102.6 | 94.9 | 93.2 | 69.6 |
| The Callisto Protocol (2022) | 117 | 99.3 | 71 | 70.7 | 52.8 |
| Need for Speed Unbound (2022) | 112.8 | 106.9 | 93 | 84.6 | 66.7 |
| High On Life (2023) | 175.7 | 139.4 | 117.5 | 97.1 | 60.8 |
| The Witcher 3 v4 (2023) | 174.4 | 149.6 | 81.3 | 71.4 | 47.4 |
| Dead Space Remake (2023) | 82.1 | 74.6 | 68.1 | 66.8 | 47.2 |
| Hogwarts Legacy (2023) | 88.5 | 79 | 69.7 | 59.3 | 42.6 |
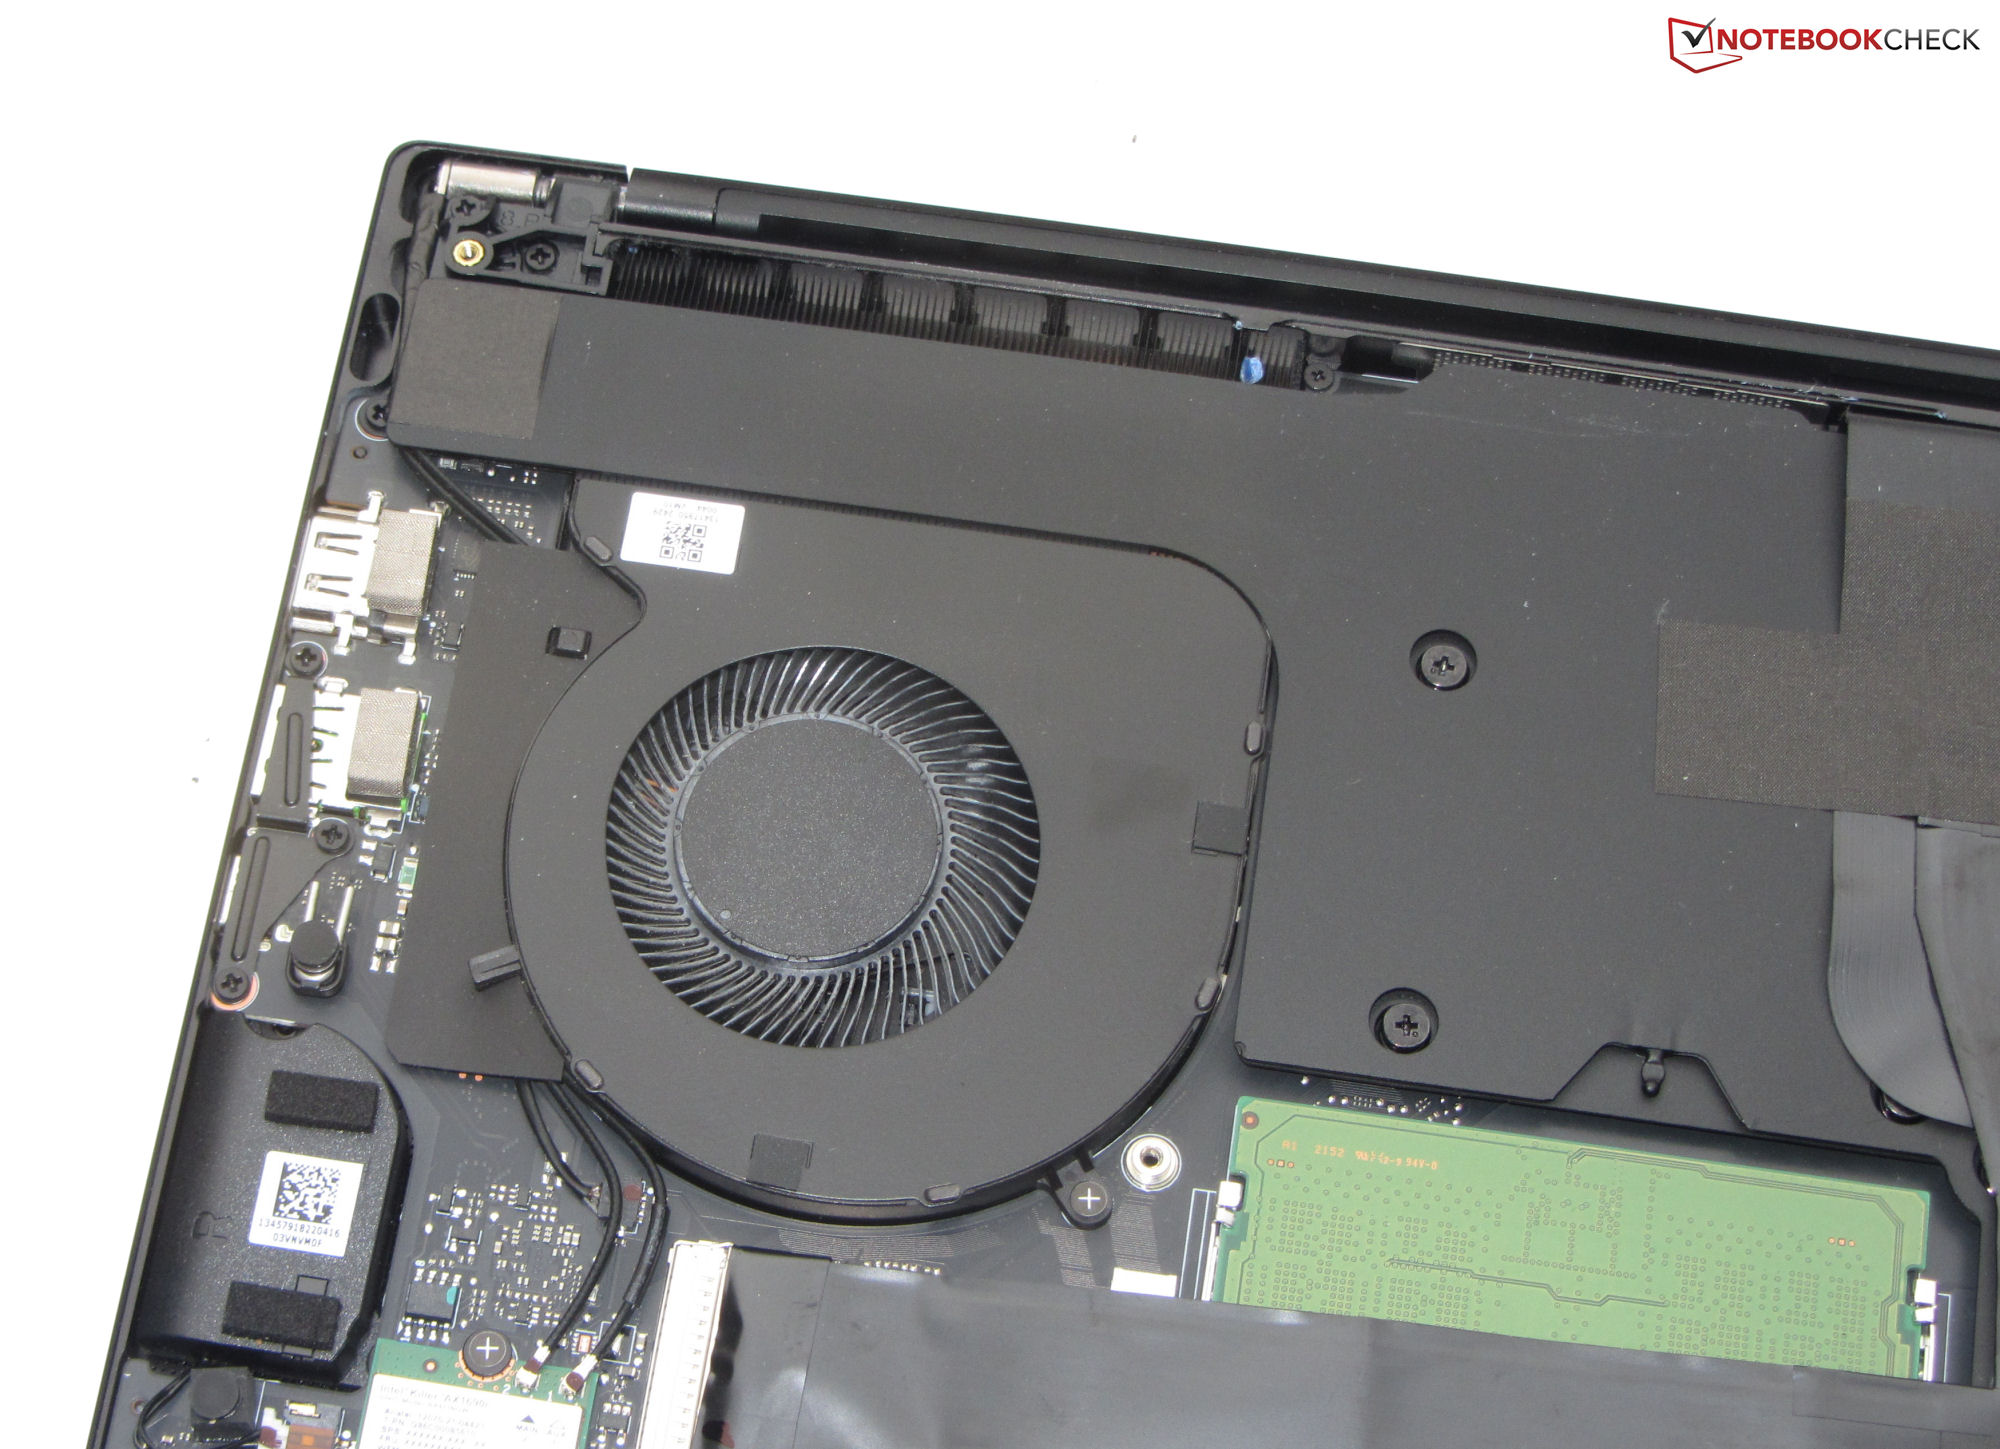
Emisja - laptop Razer nie nagrzewa się nadmiernie
Emisja hałasu
W sumie, jak na laptop do gier, poziom hałasu jest umiarkowany. W stanie bezczynności i w codziennym użytkowaniu (biuro i internet) wentylatory pracują na niskich obrotach i są praktycznie niesłyszalne. Pod pełnym obciążeniem (stress test, Witcher 3 test) poziom ciśnienia akustycznego może wzrosnąć do 43,9 dB (A). Profil wydajności "Silent" nie robi tego, co sugerowałaby nazwa, ale udaje mu się obniżyć hałas w tle - kosztem mocy obliczeniowej.
Hałas
| luz |
| 28 / 28 / 28 dB |
| obciążenie |
| 38.5 / 43.9 dB |
 | ||
30 dB cichy 40 dB(A) słyszalny 50 dB(A) irytujący |
||
min: | ||
| Razer Blade 15 OLED (Early 2022) GeForce RTX 3070 Ti Laptop GPU, i9-12900H, Samsung PM9A1 MZVL21T0HCLR | Asus ROG Zephyrus M16 GU603Z GeForce RTX 3070 Ti Laptop GPU, i9-12900H, Micron 3400 1TB MTFDKBA1T0TFH | Aorus 15 XE5 GeForce RTX 3070 Ti Laptop GPU, i7-12700H, Gigabyte AG470S1TB-SI B10 | Schenker XMG Fusion 15 (Mid 22) GeForce RTX 3070 Laptop GPU, i7-11800H, Samsung SSD 980 Pro 1TB MZ-V8P1T0BW | HP Omen 16-b1090ng GeForce RTX 3070 Ti Laptop GPU, i7-12700H, WDC PC SN810 1TB | Razer Blade 15 2022 GeForce RTX 3080 Ti Laptop GPU, i7-12800H, SSSTC CA6-8D1024 | |
|---|---|---|---|---|---|---|
| Noise | -10% | -6% | -5% | -16% | -4% | |
| wyłączone / środowisko * (dB) | 26 | 23 12% | 24 8% | 26 -0% | 26 -0% | 25.4 2% |
| Idle Minimum * (dB) | 28 | 23 18% | 26 7% | 26 7% | 30 -7% | 26.2 6% |
| Idle Average * (dB) | 28 | 24 14% | 28 -0% | 28 -0% | 31 -11% | 26.2 6% |
| Idle Maximum * (dB) | 28 | 47 -68% | 30 -7% | 31 -11% | 33 -18% | 28.4 -1% |
| Load Average * (dB) | 38.5 | 47.91 -24% | 48 -25% | 45 -17% | 49 -27% | 44.7 -16% |
| Load Maximum * (dB) | 43.9 | 50.25 -14% | 52 -18% | 48 -9% | 57 -30% | 51.9 -18% |
| Witcher 3 ultra * (dB) | 48.91 | 52 | 46 | 53 | 44.7 |
* ... im mniej tym lepiej
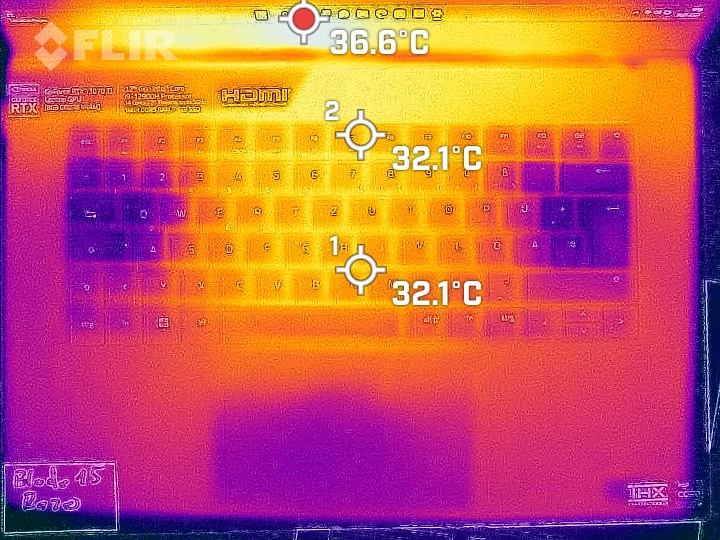
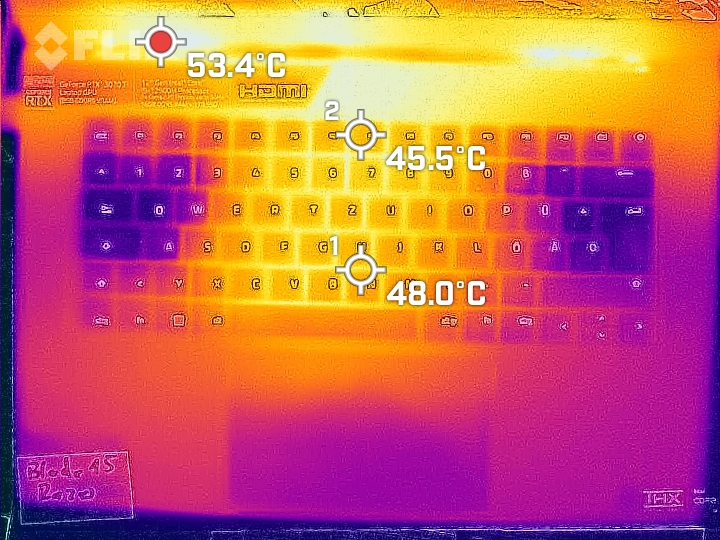
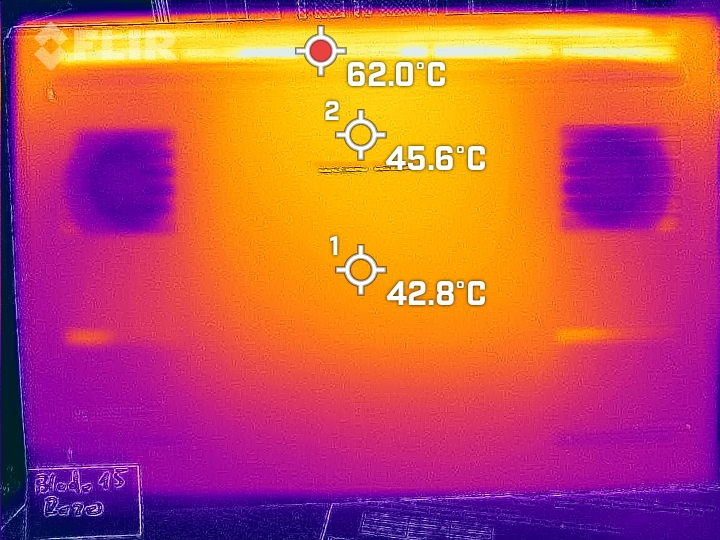
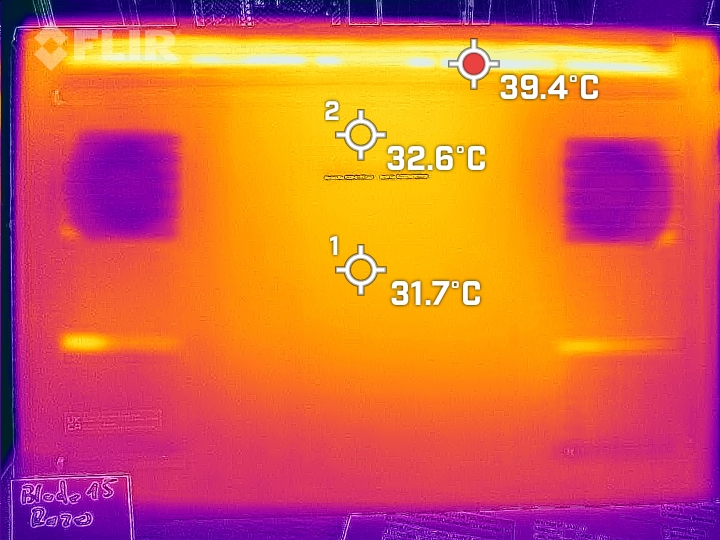
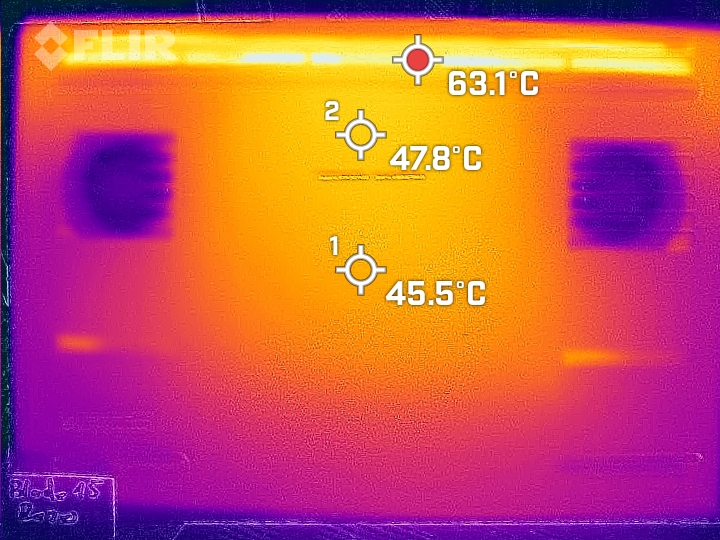
Temperatura
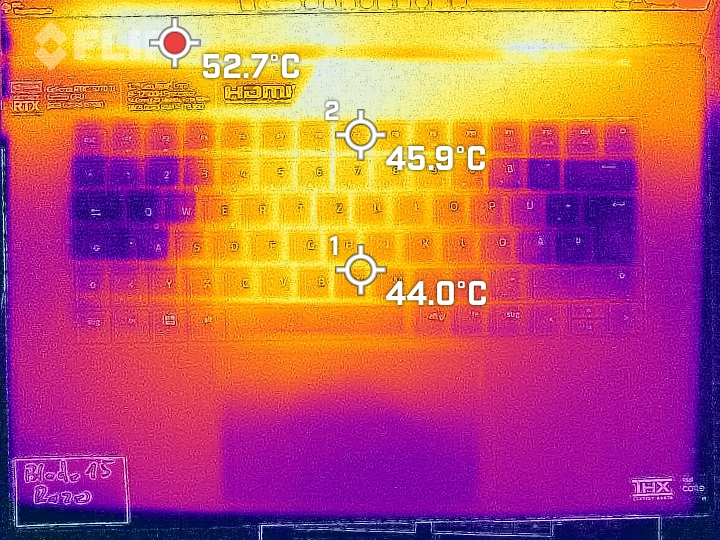
W codziennym użytkowaniu (biuro, internet) temperatury obudowy utrzymują się bardzo mocno w zielonej strefie. Pod obciążeniem (stress test, Witcher 3 test) laptop nagrzewa się zauważalnie, ale nie nadmiernie.
(-) Maksymalna temperatura w górnej części wynosi 49.5 °C / 121 F, w porównaniu do średniej 40.4 °C / 105 F , począwszy od 21.2 do 68.8 °C dla klasy Gaming.
(-) Dno nagrzewa się maksymalnie do 47.5 °C / 118 F, w porównaniu do średniej 43.2 °C / 110 F
(+) W stanie bezczynności średnia temperatura górnej części wynosi 30 °C / 86 F, w porównaniu ze średnią temperaturą urządzenia wynoszącą 33.9 °C / ### class_avg_f### F.
(-) Podczas gry w Wiedźmina 3 średnia temperatura górnej części wynosi 40.3 °C / 105 F, w porównaniu do średniej temperatury urządzenia wynoszącej 33.9 °C / ## #class_avg_f### F.
(±) Podpórki pod nadgarstki i touchpad mogą się bardzo nagrzać w dotyku, maksymalnie do 38 °C / 100.4 F.
(-) Średnia temperatura obszaru podparcia dłoni w podobnych urządzeniach wynosiła 28.8 °C / 83.8 F (-9.2 °C / -16.6 F).
| Razer Blade 15 OLED (Early 2022) Intel Core i9-12900H, NVIDIA GeForce RTX 3070 Ti Laptop GPU | Asus ROG Zephyrus M16 GU603Z Intel Core i9-12900H, NVIDIA GeForce RTX 3070 Ti Laptop GPU | Aorus 15 XE5 Intel Core i7-12700H, NVIDIA GeForce RTX 3070 Ti Laptop GPU | Schenker XMG Fusion 15 (Mid 22) Intel Core i7-11800H, NVIDIA GeForce RTX 3070 Laptop GPU | HP Omen 16-b1090ng Intel Core i7-12700H, NVIDIA GeForce RTX 3070 Ti Laptop GPU | Razer Blade 15 2022 Intel Core i7-12800H, NVIDIA GeForce RTX 3080 Ti Laptop GPU | |
|---|---|---|---|---|---|---|
| Heat | 2% | -12% | -15% | 9% | -6% | |
| Maximum Upper Side * (°C) | 49.5 | 52 -5% | 46 7% | 52 -5% | 41 17% | 50 -1% |
| Maximum Bottom * (°C) | 47.5 | 51 -7% | 57 -20% | 63 -33% | 62 -31% | 47 1% |
| Idle Upper Side * (°C) | 33.4 | 29 13% | 38 -14% | 37 -11% | 25 25% | 37.4 -12% |
| Idle Bottom * (°C) | 35 | 33 6% | 42 -20% | 38 -9% | 26 26% | 38.4 -10% |
* ... im mniej tym lepiej
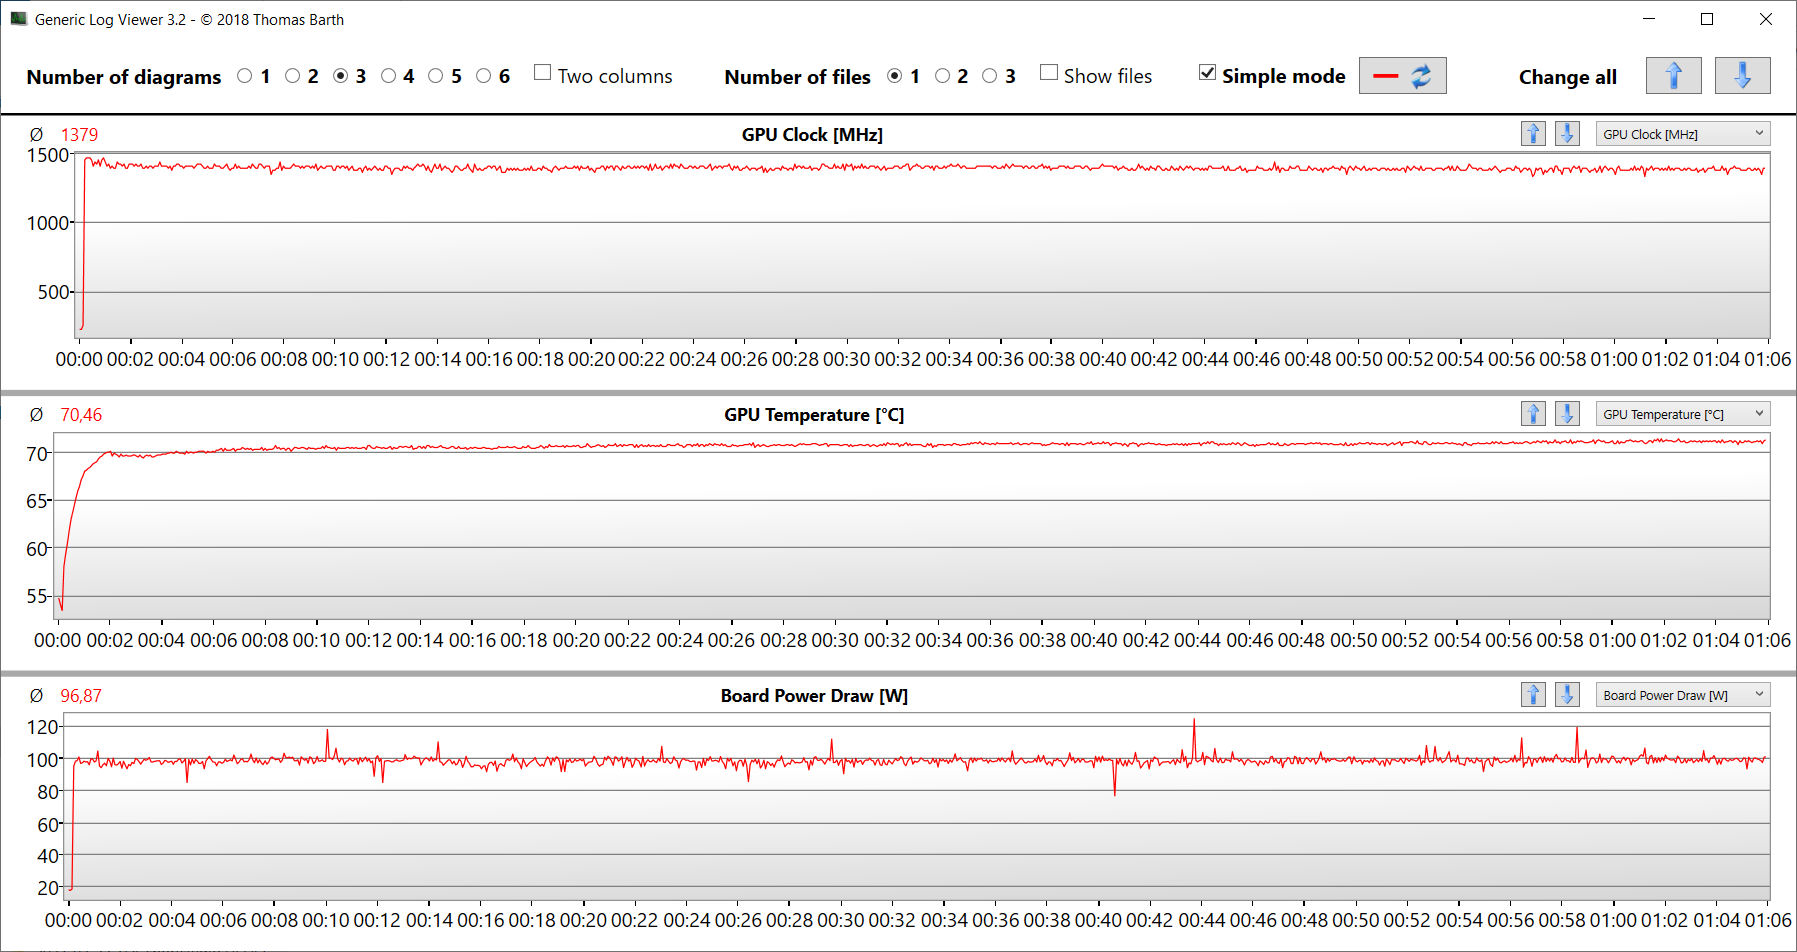
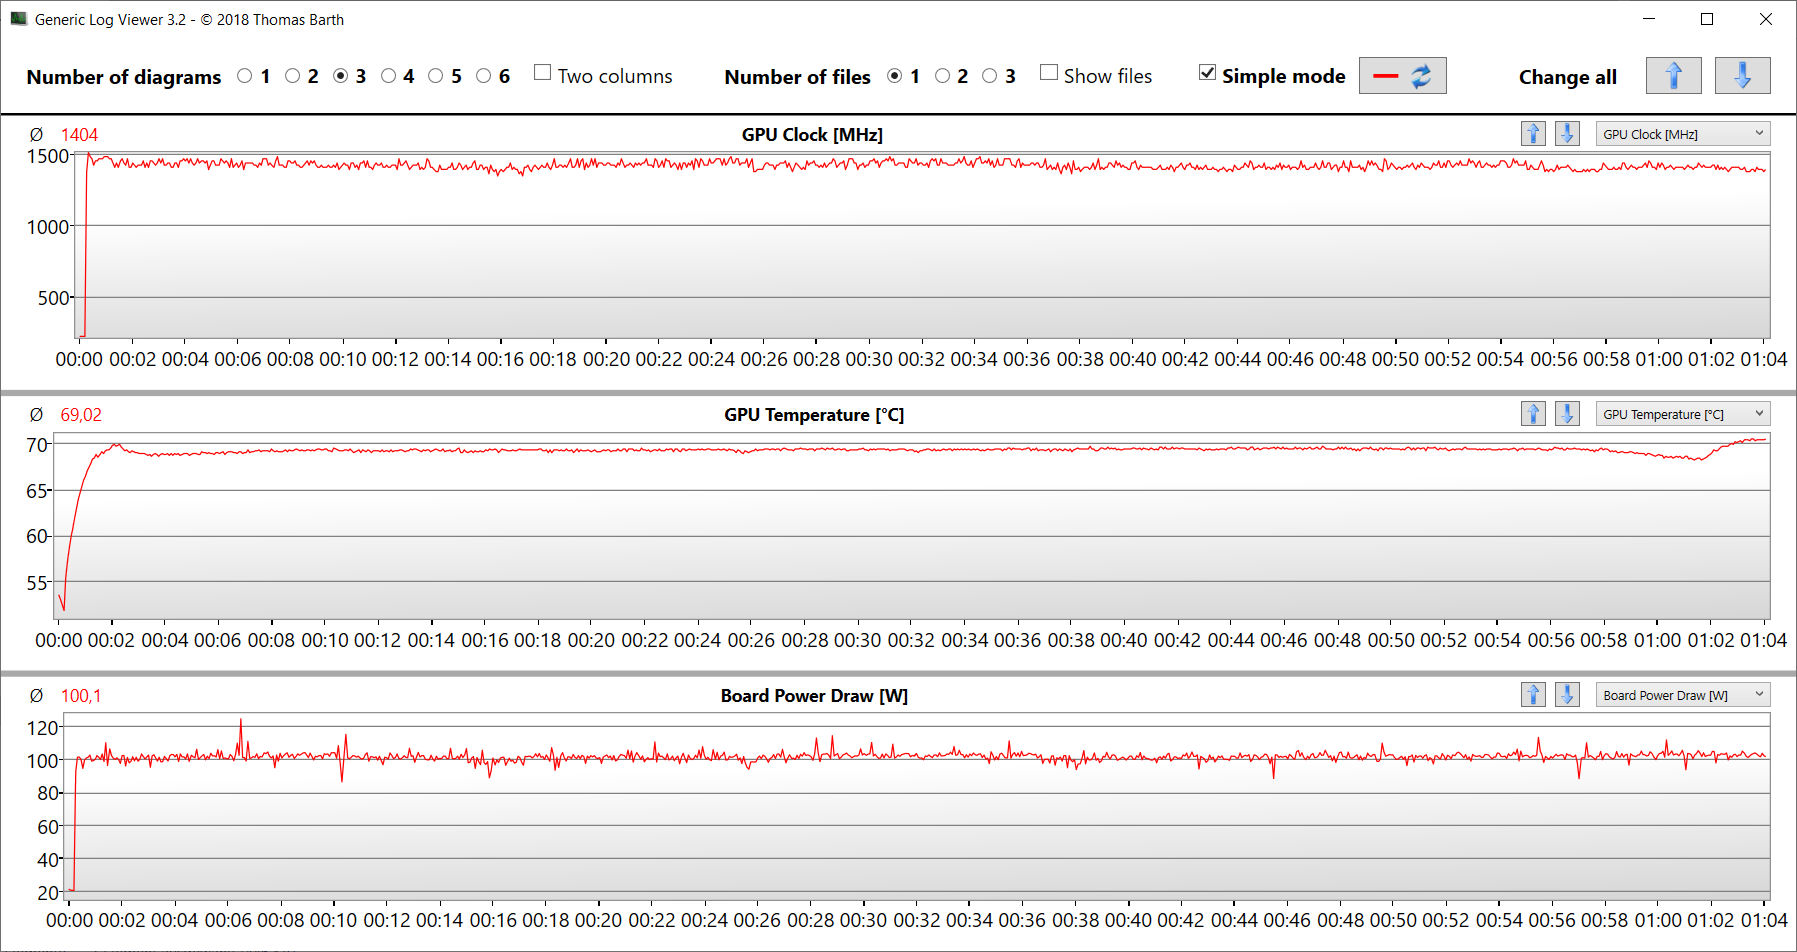
Test na stres
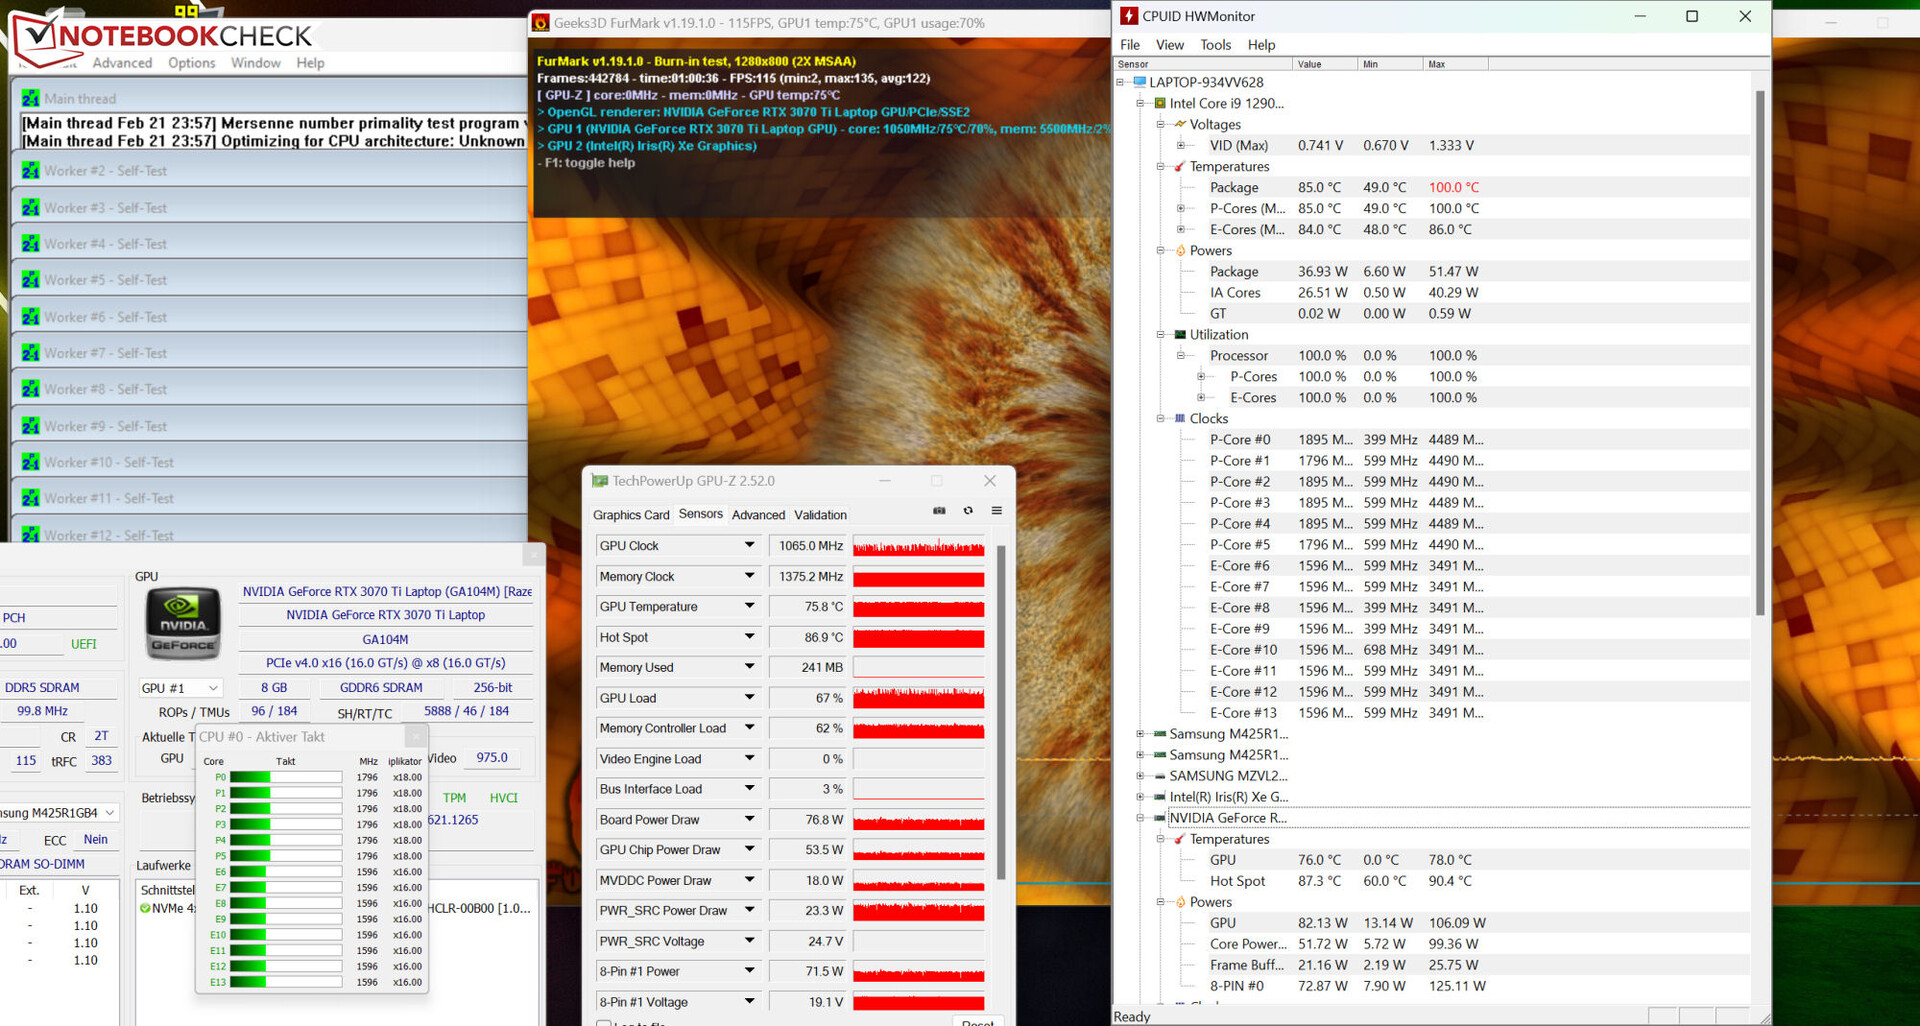
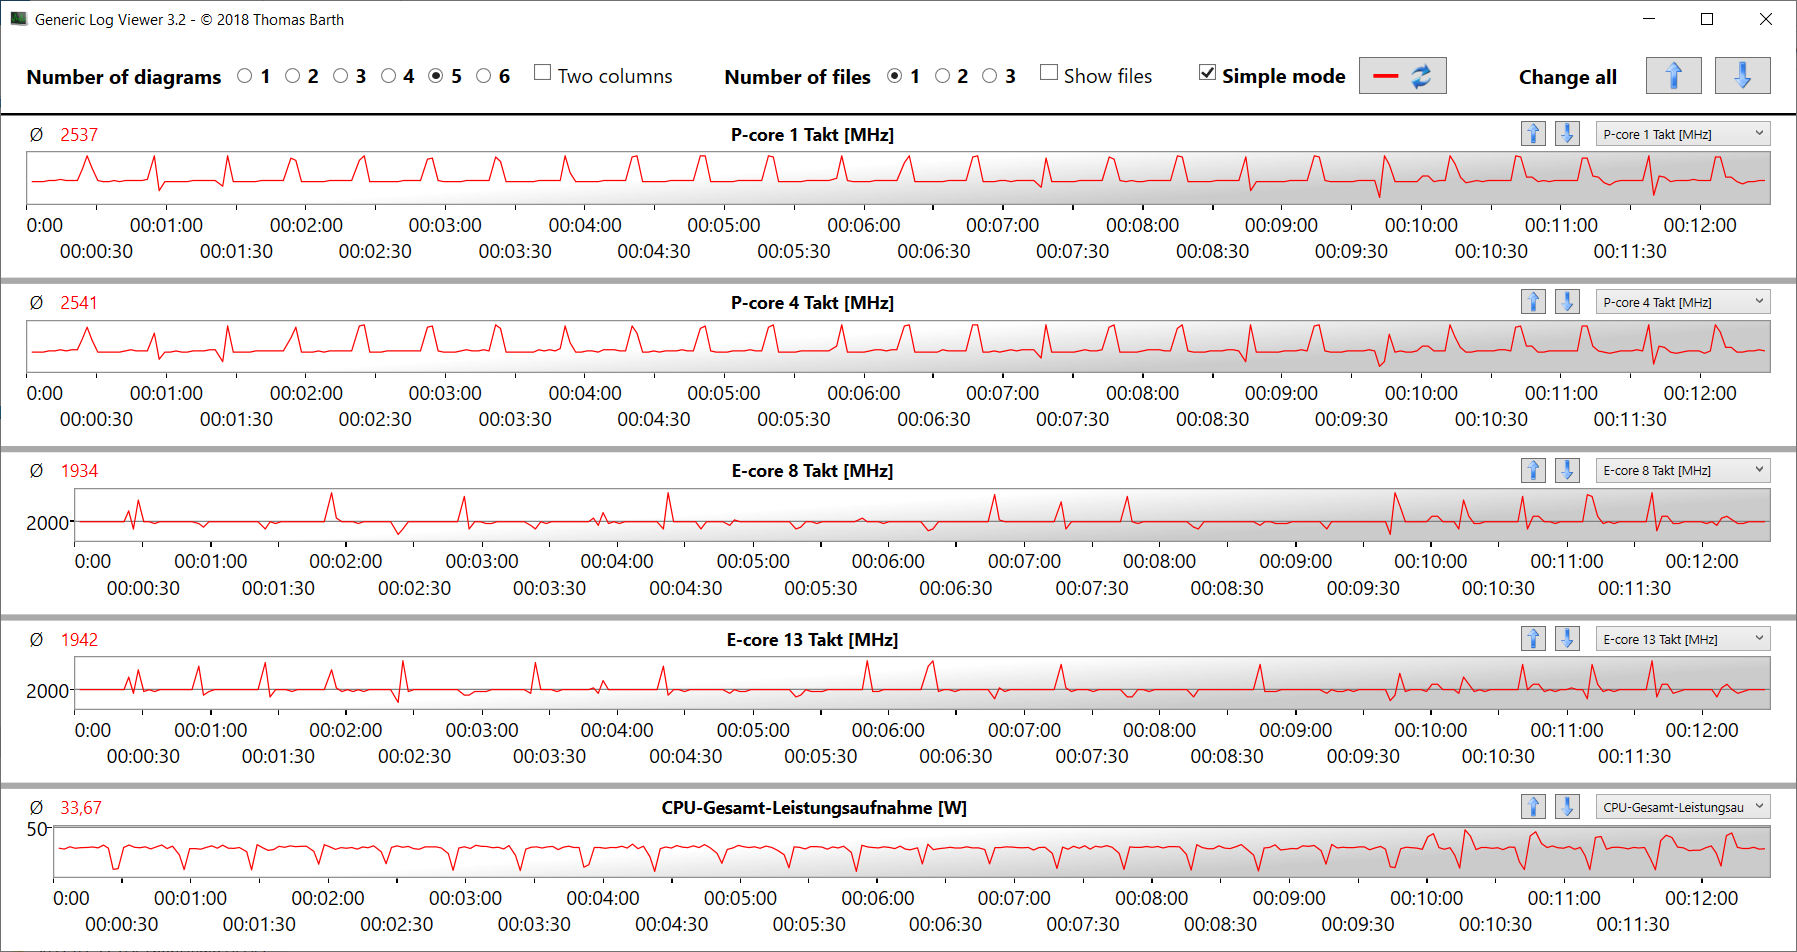
Test stresu (Prime95 i Furmark w trybie ciągłym) przedstawia ekstremalny scenariusz analizy stabilności systemu pod pełnym obciążeniem. W trakcie testu prędkość taktowania CPU spadła z punktu startowego wynoszącego odpowiednio 2,5 GHz (rdzenie P) i 2,1 GHz (rdzenie E) do około 1,7 GHz (rdzenie P) i 1,5 GHz (rdzenie E). Częstotliwość taktowania GPU waha się w granicach od 700 do 1300 MHz.
Mówcy
Głośniki stereo dają przyzwoity dźwięk, ale taki, któremu brakuje basów.
Razer Blade 15 OLED (Early 2022) analiza dźwięku
(+) | głośniki mogą odtwarzać stosunkowo głośno (89.2 dB)
Bas 100 - 315 Hz
(-) | prawie brak basu - średnio 24.8% niższa od mediany
(±) | liniowość basu jest średnia (12.7% delta do poprzedniej częstotliwości)
Średnie 400 - 2000 Hz
(+) | zbalansowane środki średnie - tylko 3% od mediany
(+) | średnie są liniowe (4.3% delta do poprzedniej częstotliwości)
Wysokie 2–16 kHz
(+) | zrównoważone maksima - tylko 2.2% od mediany
(+) | wzloty są liniowe (4.1% delta do poprzedniej częstotliwości)
Ogólnie 100 - 16.000 Hz
(+) | ogólny dźwięk jest liniowy (14.1% różnicy w stosunku do mediany)
W porównaniu do tej samej klasy
» 24% wszystkich testowanych urządzeń w tej klasie było lepszych, 8% podobnych, 68% gorszych
» Najlepszy miał deltę 6%, średnia wynosiła ###średnia###%, najgorsza wynosiła 132%
W porównaniu do wszystkich testowanych urządzeń
» 17% wszystkich testowanych urządzeń było lepszych, 4% podobnych, 80% gorszych
» Najlepszy miał deltę 4%, średnia wynosiła ###średnia###%, najgorsza wynosiła 134%
Asus ROG Zephyrus M16 GU603Z analiza dźwięku
(+) | głośniki mogą odtwarzać stosunkowo głośno (82.96 dB)
Bas 100 - 315 Hz
(±) | zredukowany bas - średnio 11.6% niższy od mediany
(±) | liniowość basu jest średnia (9.2% delta do poprzedniej częstotliwości)
Średnie 400 - 2000 Hz
(+) | zbalansowane środki średnie - tylko 4.3% od mediany
(+) | średnie są liniowe (5.7% delta do poprzedniej częstotliwości)
Wysokie 2–16 kHz
(+) | zrównoważone maksima - tylko 1.6% od mediany
(+) | wzloty są liniowe (3.9% delta do poprzedniej częstotliwości)
Ogólnie 100 - 16.000 Hz
(+) | ogólny dźwięk jest liniowy (10.1% różnicy w stosunku do mediany)
W porównaniu do tej samej klasy
» 5% wszystkich testowanych urządzeń w tej klasie było lepszych, 2% podobnych, 93% gorszych
» Najlepszy miał deltę 6%, średnia wynosiła ###średnia###%, najgorsza wynosiła 132%
W porównaniu do wszystkich testowanych urządzeń
» 5% wszystkich testowanych urządzeń było lepszych, 1% podobnych, 94% gorszych
» Najlepszy miał deltę 4%, średnia wynosiła ###średnia###%, najgorsza wynosiła 134%
Zarządzanie energią - Blade jest bardzo głodny w stanie bezczynności
Pobór mocy
W trybie jałowym zapotrzebowanie na energię (do 39 watów) jest stosunkowo wysokie. Wydaje się, że jest to ogólny problem występujący w modelach Blade 2022, z którym z którym zetknęliśmy się przy wielu okazjach. Pod obciążeniem zużycie jest normalne dla tego rodzaju sprzętu. O ile test Witcher 3 przebiegał przy stałym poborze mocy, o tyle podczas testu obciążeniowego wymagania gwałtownie spadły - procesor został stłumiony. Zasilacz (230 W) jest odpowiednio duży.
| wyłączony / stan wstrzymania | |
| luz | |
| obciążenie |
|
Legenda:
min: | |
| Razer Blade 15 OLED (Early 2022) i9-12900H, GeForce RTX 3070 Ti Laptop GPU, Samsung PM9A1 MZVL21T0HCLR, OLED, 2560x1440, 15.6" | Asus ROG Zephyrus M16 GU603Z i9-12900H, GeForce RTX 3070 Ti Laptop GPU, Micron 3400 1TB MTFDKBA1T0TFH, IPS, 2560x1600, 16" | Aorus 15 XE5 i7-12700H, GeForce RTX 3070 Ti Laptop GPU, Gigabyte AG470S1TB-SI B10, IPS, 2560x1440, 15.6" | Schenker XMG Fusion 15 (Mid 22) i7-11800H, GeForce RTX 3070 Laptop GPU, Samsung SSD 980 Pro 1TB MZ-V8P1T0BW, IPS, 2560x1440, 15.6" | HP Omen 16-b1090ng i7-12700H, GeForce RTX 3070 Ti Laptop GPU, WDC PC SN810 1TB, IPS, 2560x1440, 16.1" | Razer Blade 15 2022 i7-12800H, GeForce RTX 3080 Ti Laptop GPU, SSSTC CA6-8D1024, IPS, 2560x1440, 15.6" | Przeciętny NVIDIA GeForce RTX 3070 Ti Laptop GPU | Średnia w klasie Gaming | |
|---|---|---|---|---|---|---|---|---|
| Power Consumption | 26% | -18% | 24% | 29% | -8% | 18% | 21% | |
| Idle Minimum * (Watt) | 31.6 | 10.8 66% | 31 2% | 12 62% | 4 87% | 33.2 -5% | 14.2 ? 55% | 13.2 ? 58% |
| Idle Average * (Watt) | 33.3 | 17 49% | 35 -5% | 17 49% | 10 70% | 36.4 -9% | 19.9 ? 40% | 18.9 ? 43% |
| Idle Maximum * (Watt) | 38.6 | 17.8 54% | 46 -19% | 24 38% | 19 51% | 37.6 3% | 26.2 ? 32% | 24.3 ? 37% |
| Load Average * (Watt) | 149 | 116 22% | 120 19% | 106 29% | 114 23% | 116.7 22% | 125.8 ? 16% | 108.3 ? 27% |
| Witcher 3 ultra * (Watt) | 149.6 | 144 4% | 202 -35% | 159.9 -7% | 183.2 -22% | 172 -15% | ||
| Load Maximum * (Watt) | 160 | 220 -38% | 268 -68% | 208 -30% | 221 -38% | 228.6 -43% | 248 ? -55% | 254 ? -59% |
* ... im mniej tym lepiej
Power consumption Witcher 3 / Stress test
Power consumption with an external monitor
Żywotność baterii
W teście WiFi (otwieranie stron internetowych przy użyciu skryptu) i teście wideo (krótki film Big Buck Bunny (kodowanie H.264, FHD) w pętli) 15-calowe urządzenie osiągnęło na akumulatorze odpowiednio 4,34 h i 5,52 h. Podczas obu testów funkcje oszczędzania energii w laptopie były wyłączone, a jasność wyświetlacza była ustawiona na 150 cd/m². Test wideo został przeprowadzony także przy wyłączonym module radiowym.
W sumie Blade nie był w stanie zapewnić imponujących czasów pracy na akumulatorze - nawet jak na potężny laptop z matrycą QHD. W przekroju całego testu konkurencja oferuje lepszą wytrzymałość - zarówno w wartościach bezwzględnych, jak i w przeliczeniu na watogodziny.
| Razer Blade 15 OLED (Early 2022) i9-12900H, GeForce RTX 3070 Ti Laptop GPU, 80 Wh | Asus ROG Zephyrus M16 GU603Z i9-12900H, GeForce RTX 3070 Ti Laptop GPU, 90 Wh | Aorus 15 XE5 i7-12700H, GeForce RTX 3070 Ti Laptop GPU, 99 Wh | Schenker XMG Fusion 15 (Mid 22) i7-11800H, GeForce RTX 3070 Laptop GPU, 93.48 Wh | HP Omen 16-b1090ng i7-12700H, GeForce RTX 3070 Ti Laptop GPU, 83 Wh | Razer Blade 15 2022 i7-12800H, GeForce RTX 3080 Ti Laptop GPU, 80 Wh | Średnia w klasie Gaming | |
|---|---|---|---|---|---|---|---|
| Czasy pracy | 17% | 23% | 51% | 21% | 7% | 23% | |
| Reader / Idle (h) | 6.7 | 10 49% | 15.5 131% | 10.1 51% | 8.71 ? 30% | ||
| H.264 (h) | 5.9 | 7.3 24% | 6.2 5% | 7.5 27% | 8.26 ? 40% | ||
| WiFi v1.3 (h) | 4.6 | 7.4 61% | 6.8 48% | 7.4 61% | 5.6 22% | 4.9 7% | 7.04 ? 53% |
| Load (h) | 2.1 | 1.4 -33% | 1.9 -10% | 1.8 -14% | 1.9 -10% | 1.47 ? -30% |
Za
Przeciw
Werdykt - Kompaktowy mocarz
Główne obszary zastosowań Blade 15 powinny obejmować edycję wideo, renderowanie i gry. Na stronie .Core-i9 12900HcPU i GeForce RTX 3070 TigPU (TGP: 110 W) dostarczają niezbędnej mocy. Szybki dysk SSD PCIe-4 (1 TB) zapewnia krótkie czasy ładowania.
Blade 15 OLED (Early 2022) to potężne narzędzie zarówno dla graczy, jak i typów kreatywnych.
Skupia się nie tylko na wysokiej wydajności: Wyniki maksymalne rdzeni obliczeniowych są przeciętne w porównaniu z recenzowanymi wcześniej laptopami z 12900H lub 3070 Ti. Produkcja ciepła jest wprawdzie typowa dla laptopa o tej mocy, ale emisja hałasu jest stosunkowo umiarkowana. Tego ostatniego nie można powiedzieć o poborze mocy w trybie bezczynności: Blade 15 pomaga sobie bardzo dużym łykiem z butelki.
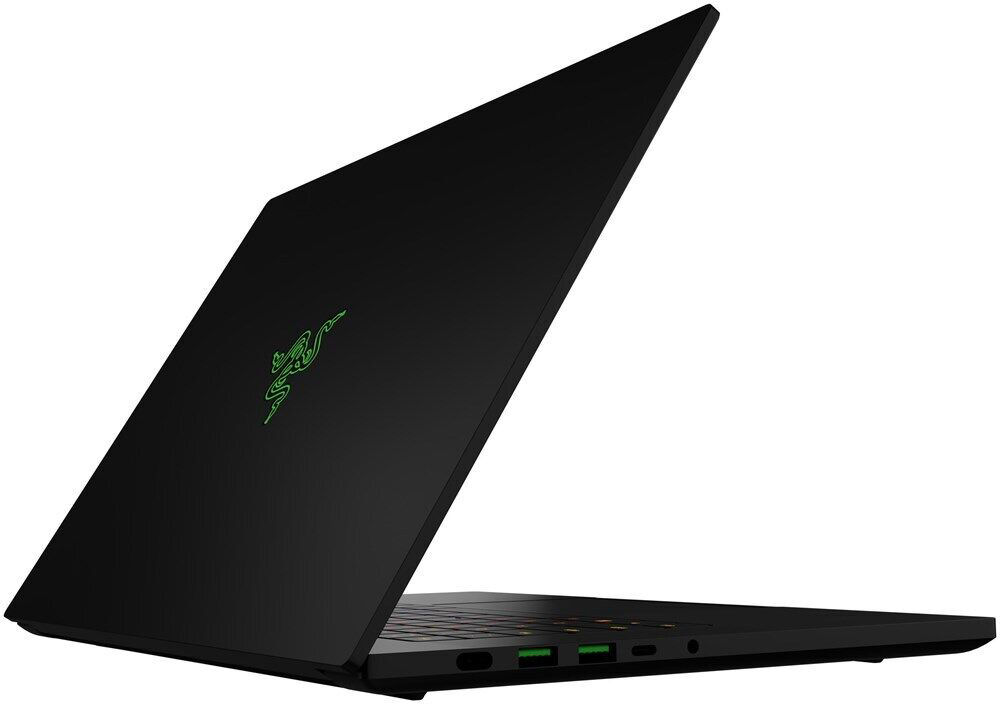
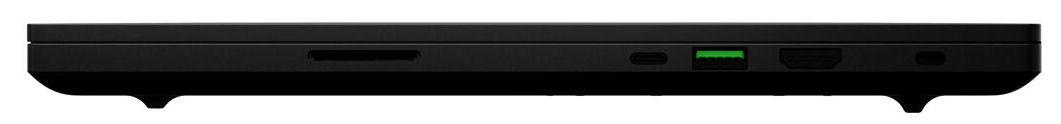
Realne czasy pracy na akumulatorze na poziomie 4 do 6 godzin nie zachwycają. Pod tym względem konkurencja ma znacznie więcej do zaoferowania. Niemniej jednak akumulator można ładować przez uniwersalny zasilacz USB-C (min. 65 W, 20 V), a oba porty USB-C (2x Thunderbolt) obsługują Power Delivery (oraz Displayport).
Ogólnie rzecz biorąc, refleksyjny panel OLED (QHD) wypada nieco lepiej od konwencjonalnego panelu LED (QHD) znajdującego się w recenzowanym wcześniej modelu Blade 2022. Oba wyświetlacze oferują dobre pokrycie przestrzeni barw (sRGB: 100 %) i dobre odwzorowanie kolorów. Model OLED ma nosa do przodu, jeśli chodzi o poziomy czerni, jasność i czasy reakcji, przy czym model LED zdobywa punkty dzięki matowej powierzchni.
Ewentualną alternatywą dla tego urządzenia może być m.in.Asus ROG Zephyrus M16 GU603Z. Pod względem wydajności procesor jest na równi, ale dodatkowe punkty zdobywa dzięki jaśniejszemu wyświetlaczowi w formacie 16:10, a także znacznie dłuższemu czasowi pracy na baterii. Budżetową alternatywą może byćAorus 15 XE5. Pomimo tego, że ta maszyna jest o kilkaset dolarów tańsza w cenie, zapewnia nieco więcej mocy i lepszy czas pracy na baterii niż Blade.
Cena i dostępność
Recenzencką specyfikację Razer Blade 15 OLED (Early 22) można mieć na Amazon za 1 967 dolarów.
Razer Blade 15 OLED (Early 2022)
- 04/03/2023 v7 (old)
Sascha Mölck
Przezroczystość
Wyboru urządzeń do recenzji dokonuje nasza redakcja. Próbka testowa została udostępniona autorowi jako pożyczka od producenta lub sprzedawcy detalicznego na potrzeby tej recenzji. Pożyczkodawca nie miał wpływu na tę recenzję, producent nie otrzymał też kopii tej recenzji przed publikacją. Nie było obowiązku publikowania tej recenzji. Jako niezależna firma medialna, Notebookcheck nie podlega władzy producentów, sprzedawców detalicznych ani wydawców.
Tak testuje Notebookcheck
Każdego roku Notebookcheck niezależnie sprawdza setki laptopów i smartfonów, stosując standardowe procedury, aby zapewnić porównywalność wszystkich wyników. Od około 20 lat stale rozwijamy nasze metody badawcze, ustanawiając przy tym standardy branżowe. W naszych laboratoriach testowych doświadczeni technicy i redaktorzy korzystają z wysokiej jakości sprzętu pomiarowego. Testy te obejmują wieloetapowy proces walidacji. Nasz kompleksowy system ocen opiera się na setkach uzasadnionych pomiarów i benchmarków, co pozwala zachować obiektywizm.Price comparison

