Werdykt - jeden z najlepszych 16-calowych kabrioletów za 1000 USD
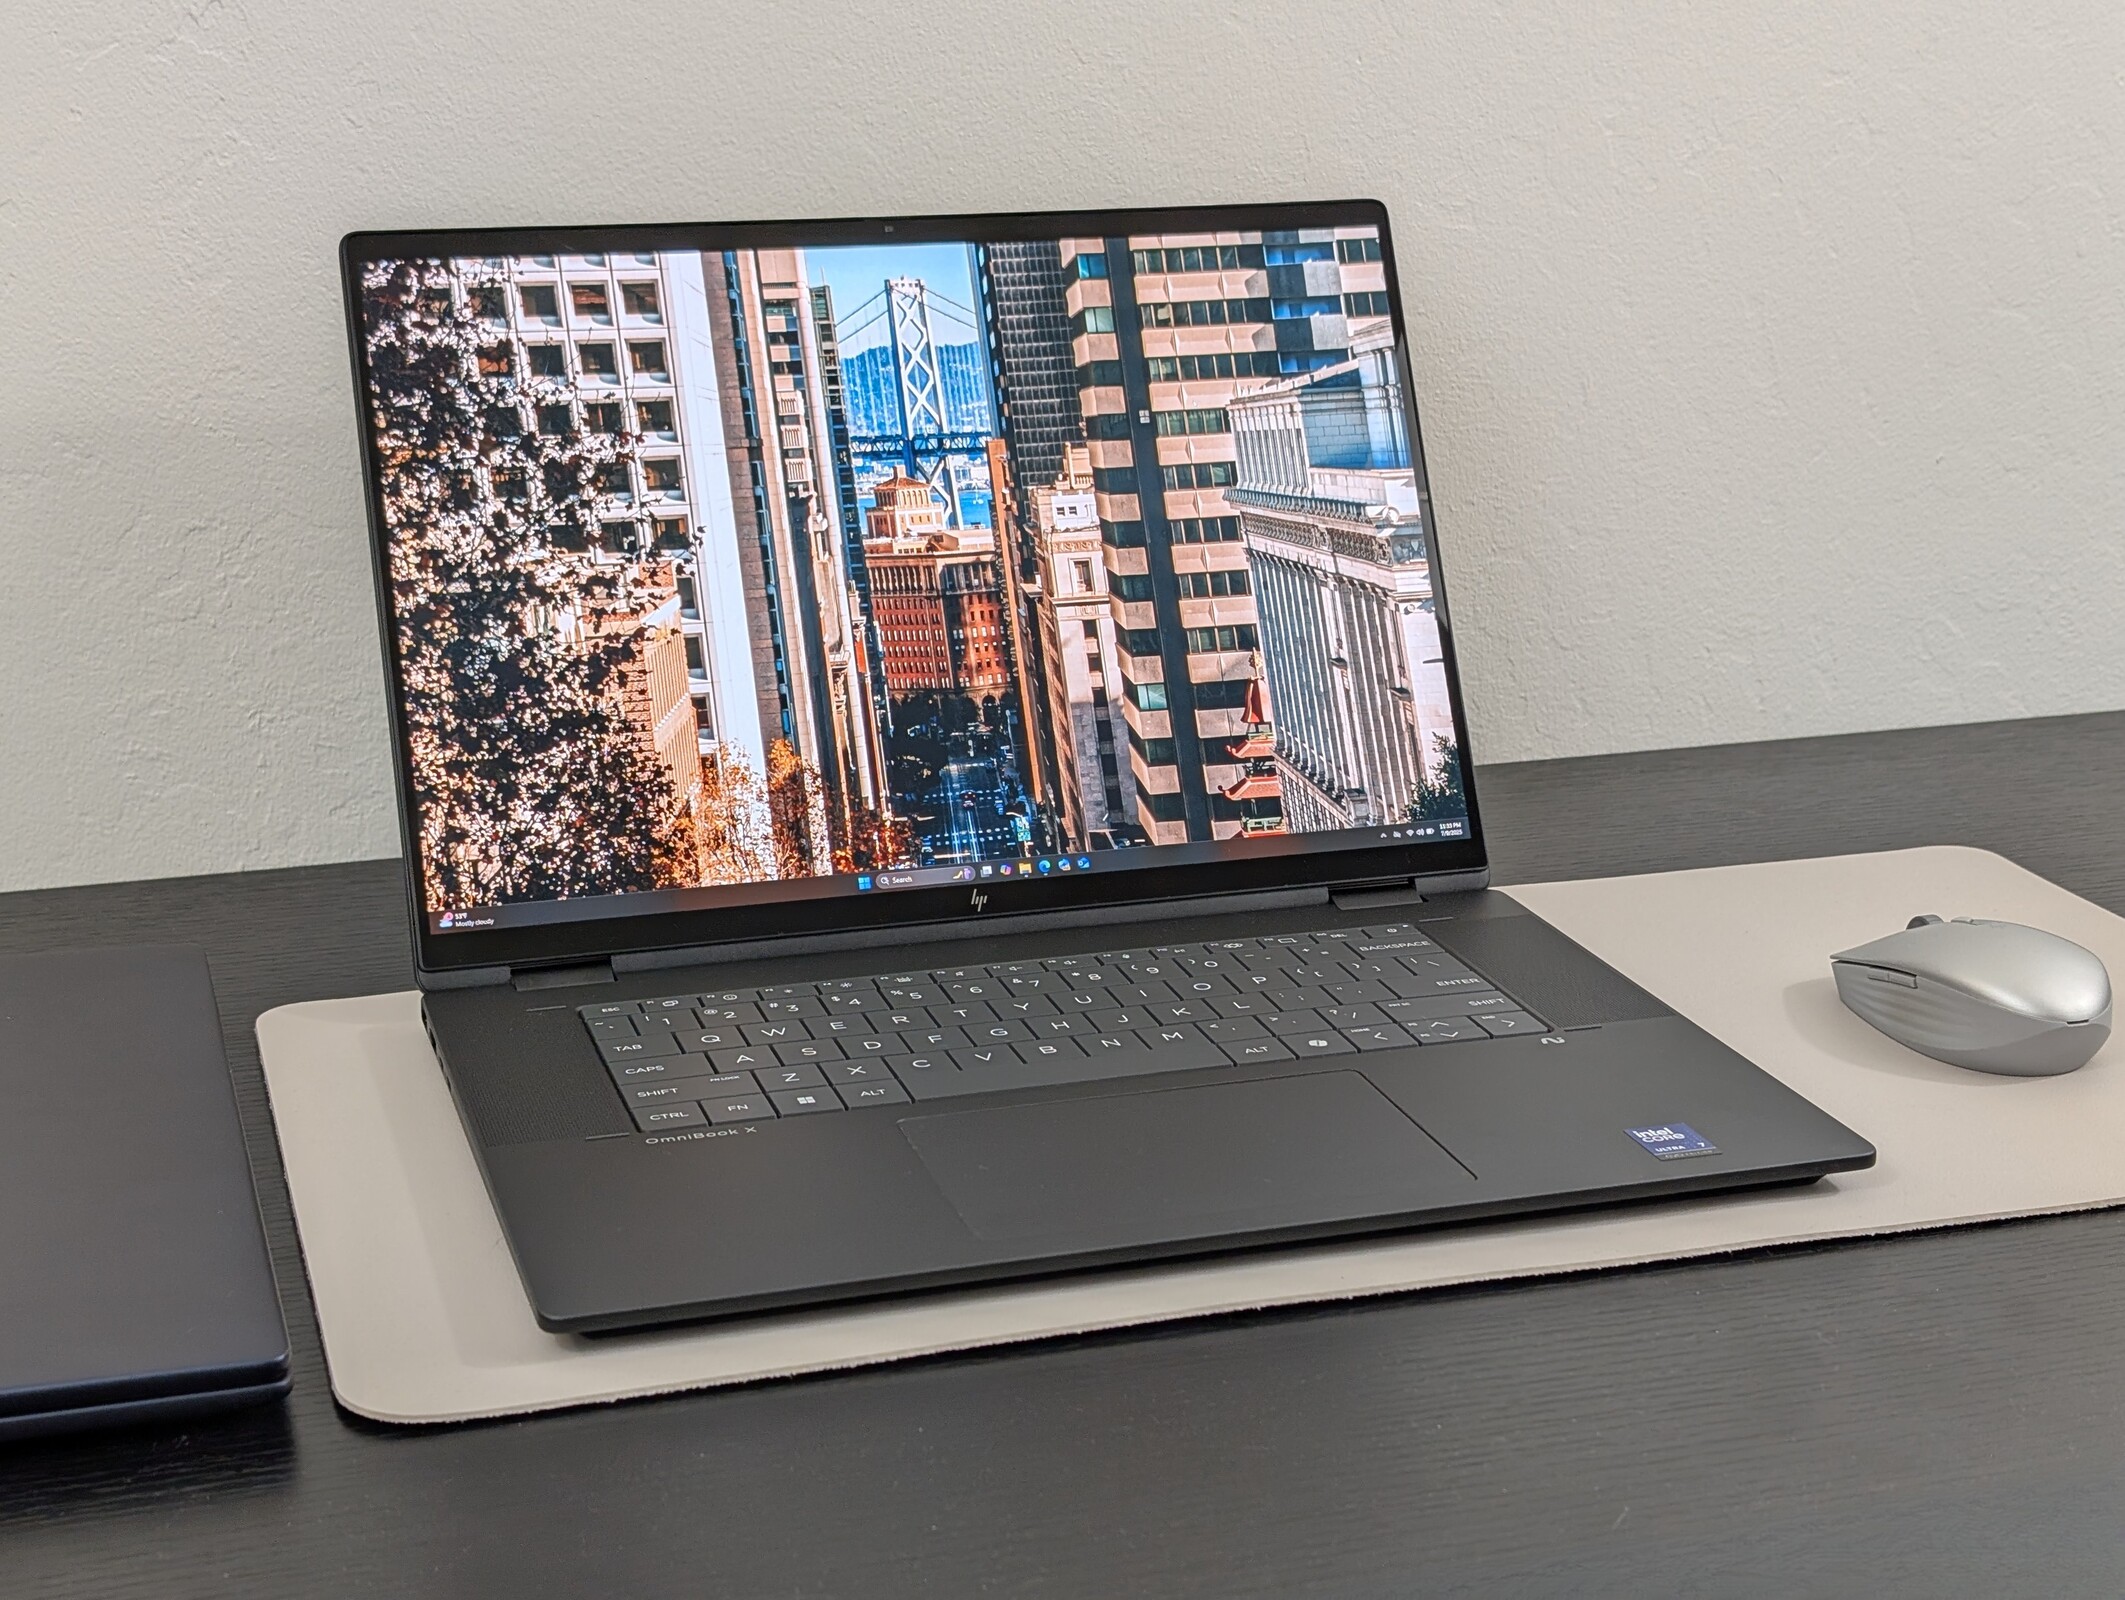
OmniBook X Flip 16 ma więcej wspólnego z flagową serią Spectre niż z tańszą serią Pavilion. Jego gładka metalowa konstrukcja, ekran dotykowy OLED i nowoczesny procesor Lunar Lake bardzo dobrze równoważą przenośność i praktyczność, zwłaszcza w porównaniu do konkurencyjnych modeli Dell 16 Plus 2-w-1 który wydaje się tańszy w porównaniu. Jego forma i kolory OLED są odpowiednie dla wszystkich rodzajów środowisk, od domowych multimediów po edycję w podróży - zgodnie z przydomkiem "omni".
Niektórzy użytkownicy mogą nie docenić tego, jak bardzo różni się klawiatura w porównaniu do większości innych laptopów HP, więc pisanie może wymagać przyzwyczajenia. Ponadto, surowa wydajność będzie wolniejsza niż w przypadku wielu 16-calowych laptopów, takich jak HP Envy 16, które zazwyczaj są wyposażone w procesory z serii H i dyskretną grafikę. Zaawansowani użytkownicy mogą chcieć rozważyć Spectre x360 z serii 16 dla dodatkowej mocy do edycji i gier. Dla wszystkich innych, OmniBook X Flip 16 jest jednym z najlepszych i najbardziej wszechstronnych 16-calowych komputerów konwertowalnych w niskim przedziale 1000 USD.
Za
Przeciw
Cena i dostępność
Amazon wysyła obecnie OmniBook X Flip 16 za 1300 USD w konfiguracji z naszym recenzenckim Core Ultra 7 258V. Alternatywnie, użytkownicy mogą dokonać zakupu bezpośrednio od HP za jedyne 950 USD podczas wyprzedaży.
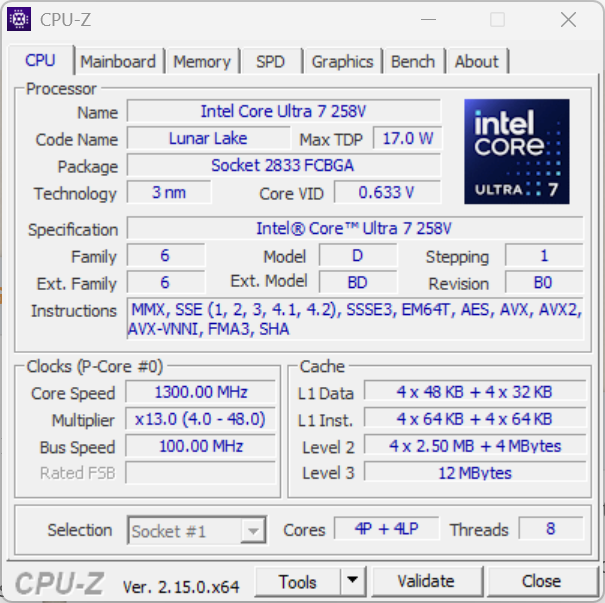
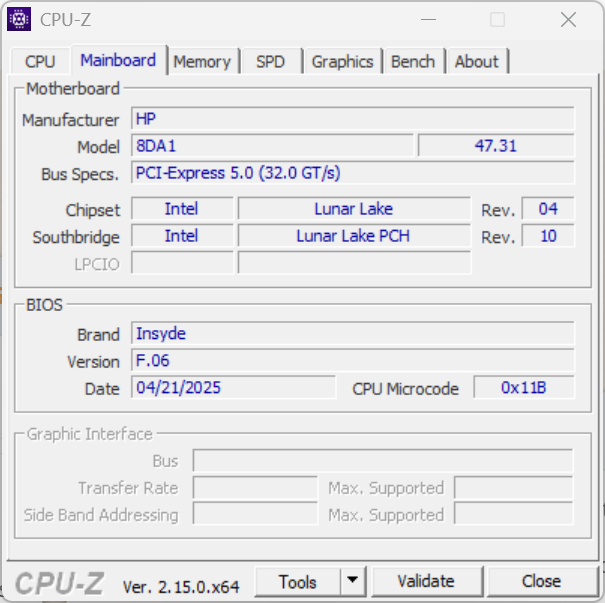
HP OmniBook X Flip 16 to 16-calowy konwertowalny komputer klasy prosumenckiej, znajdujący się tuż poniżej Spectre x360 16 pod względem ceny i funkcji. Nasza jednostka testowa to konfiguracja z wyższej półki z procesorem Intel Core Ultra 7 258V Lunar Lake i ekranem dotykowym OLED 3K 120 Hz za około 1300 USD lub nieco poniżej 1000 USD w sprzedaży.
Wariant AMD tego modelu jest również dostępny z procesorem Ryzen AI 5 340 i ekranem dotykowym o niższej rozdzielczości 1200p za około 700 USD. Jednak wszystkie konfiguracje Intela są obecnie wyposażone w ekran dotykowy OLED 1800p 120 Hz.
Konkurenci w tej przestrzeni obejmują inne prosumenckie 16-calowe konwertowalne komputery, takie jak Lenovo Yoga 7 2-w-1 16, Samsung Galaxy Book5 Pro 360lub Dell 16 Plus 2-w-1.
Więcej recenzji HP:
Specyfikacje
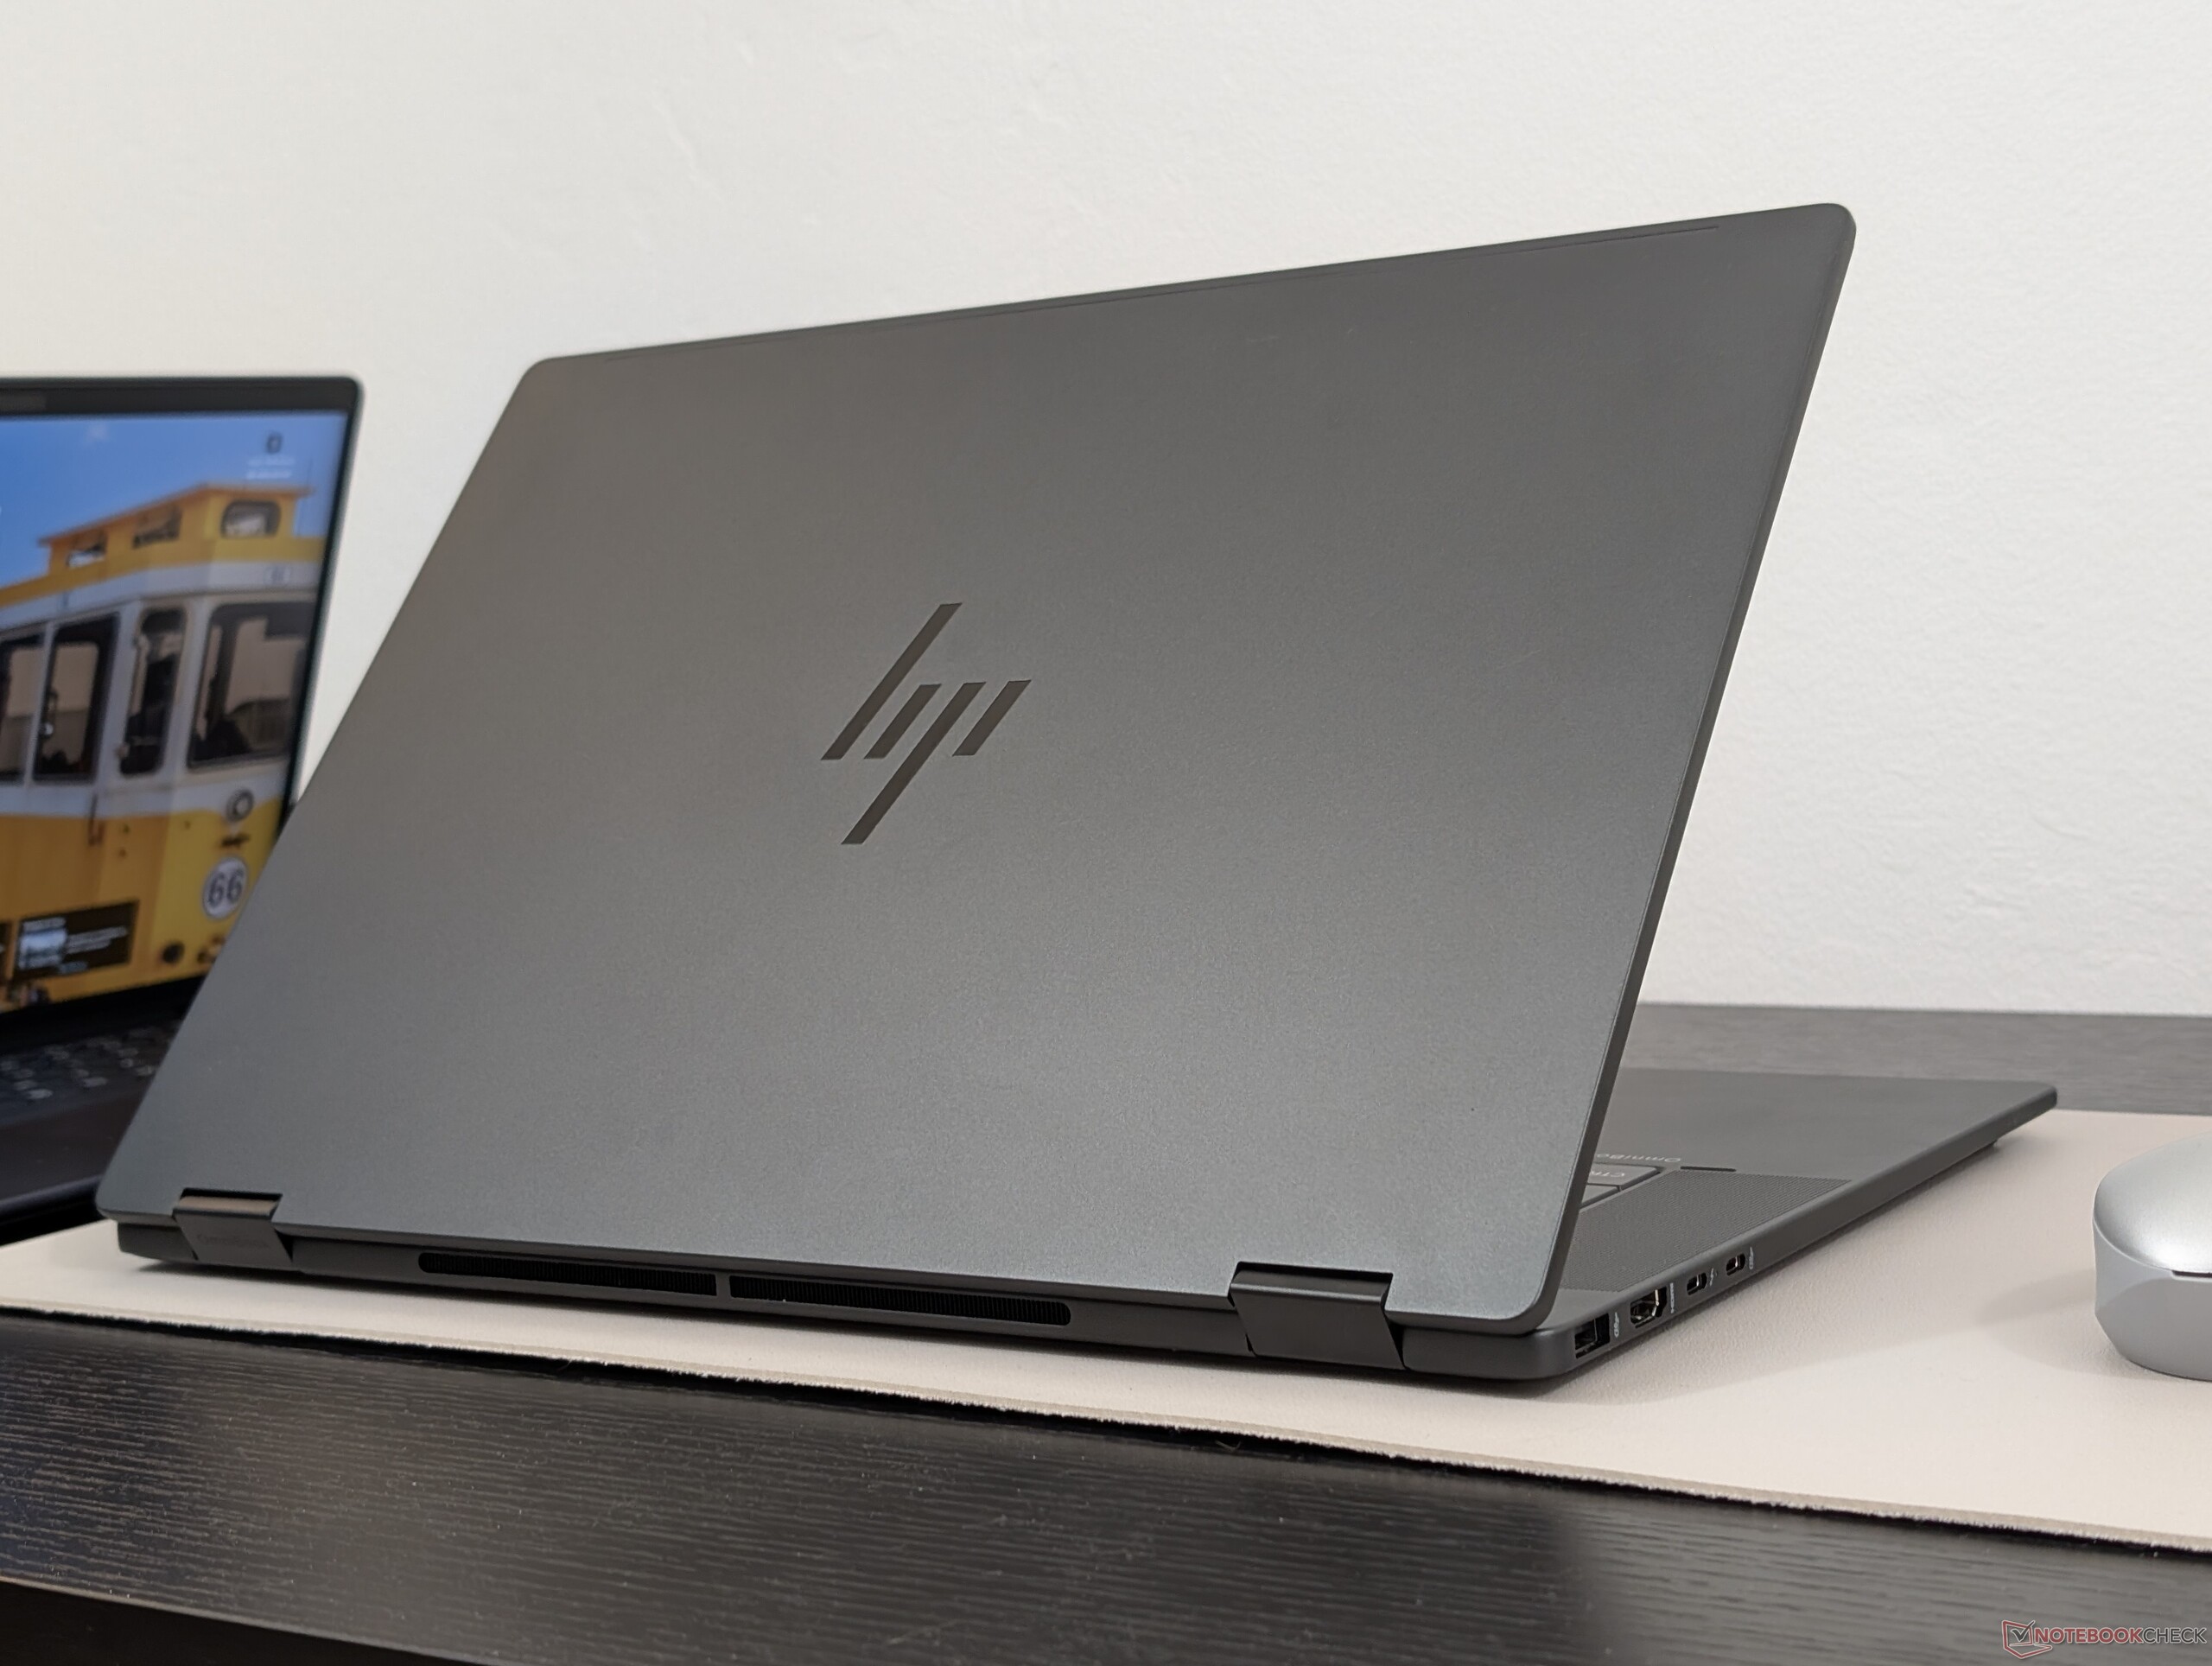
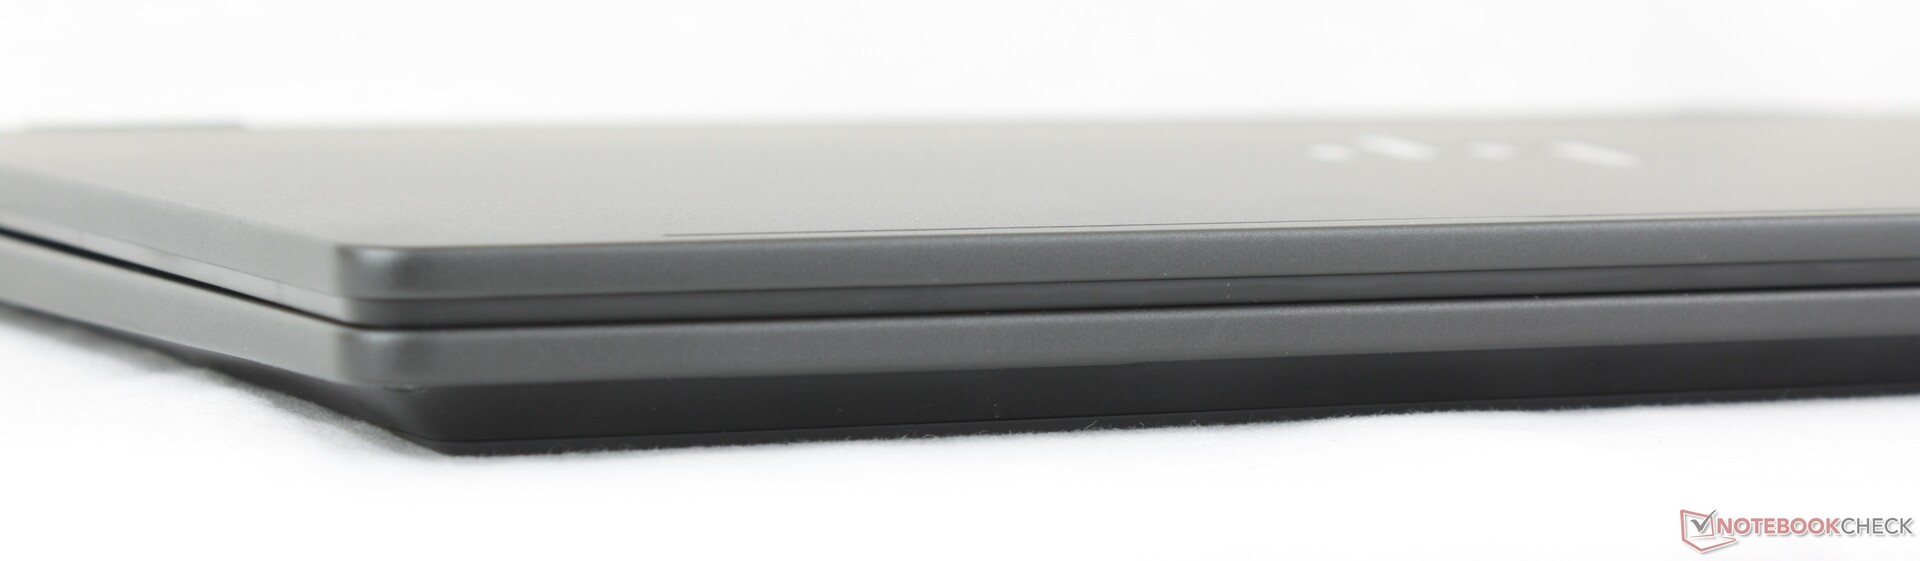
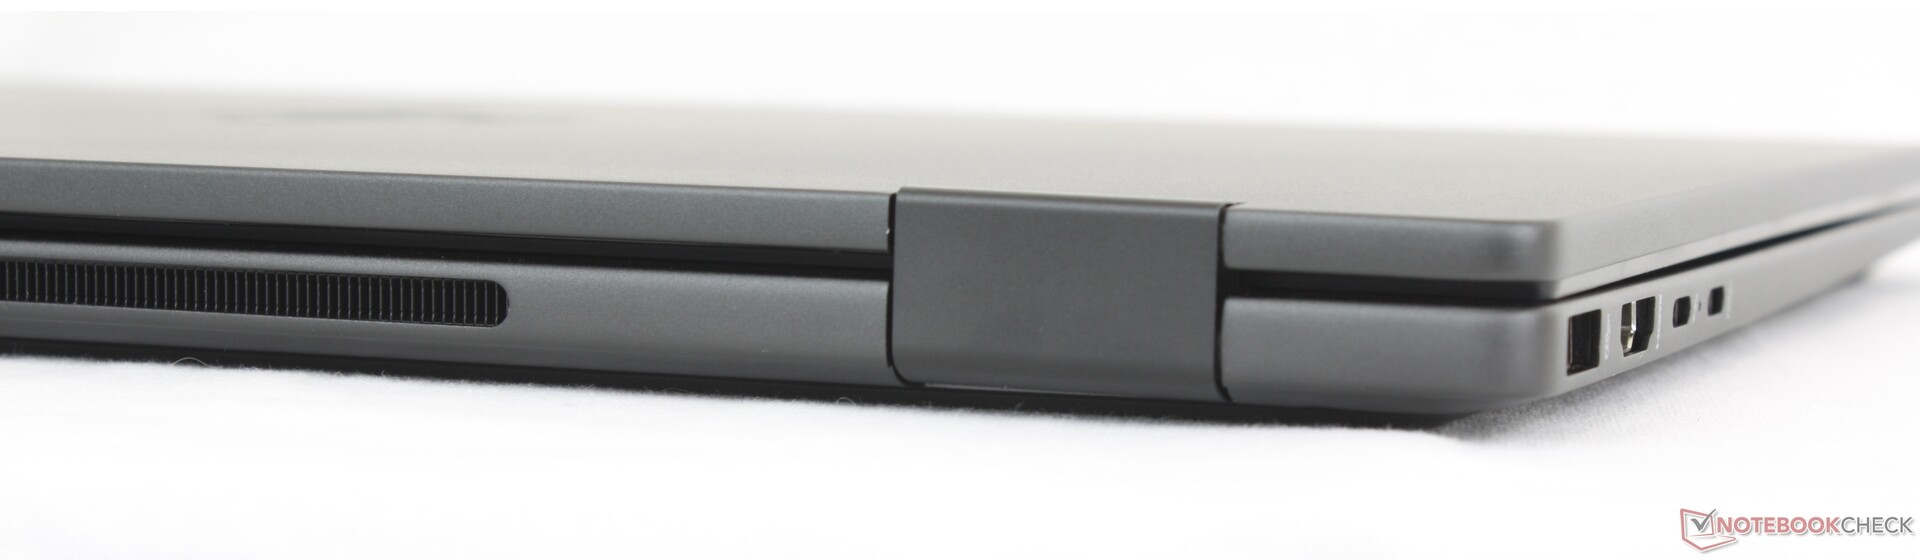
Obudowa - smuklejsza niż Dell
Jednokolorowa, matowa, metalowa konstrukcja sprawia wrażenie mocniejszej i bardziej luksusowej niż podobnie wyceniony Dell 16 Plus 2-w-1. Nadal wygina się nieco bardziej niż droższy Spectre x360 16, podczas gdy użytkownicy, którzy są skłonni wydać setki dolarów więcej, znajdą Samsung Galaxy Book5 Pro 360 będzie zauważalnie lżejszą alternatywą.
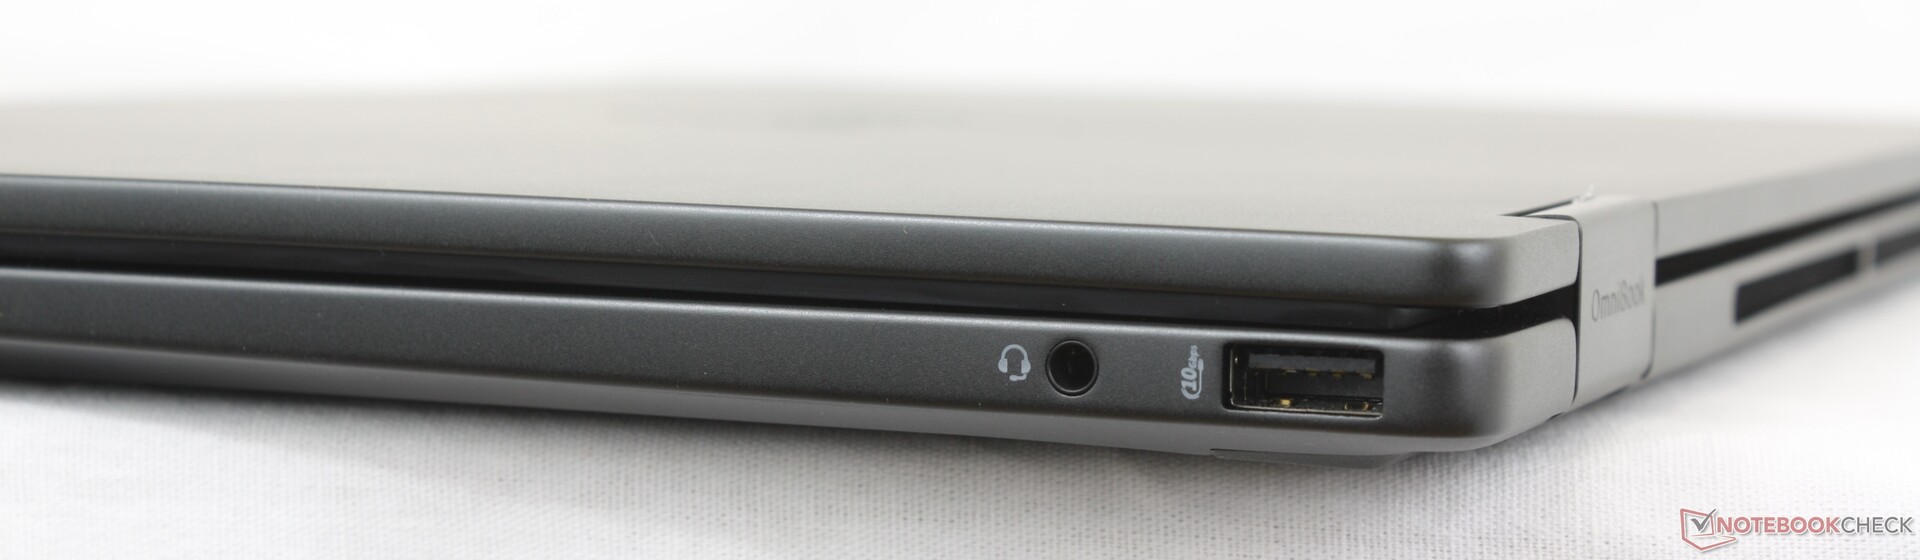
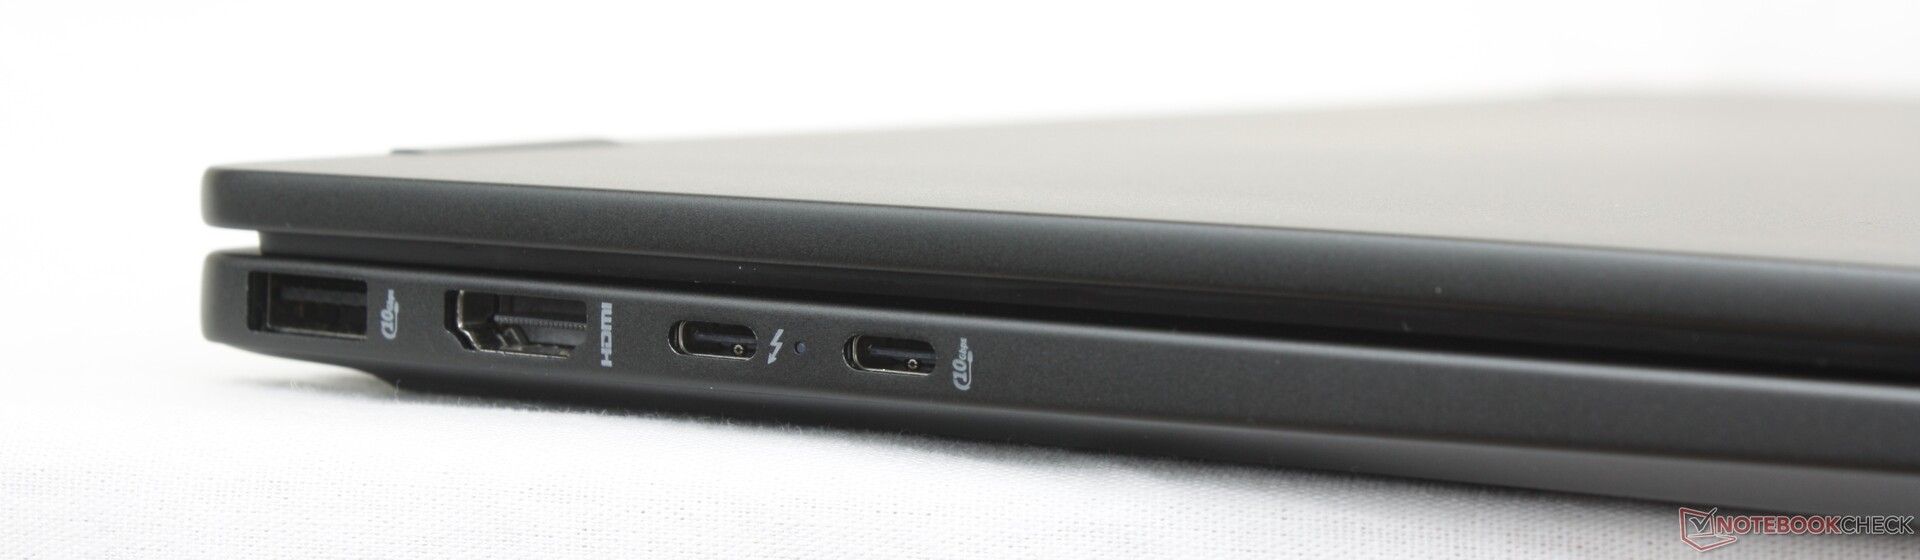
Łączność
HP zawiera wszystkie porty znalezione w Dell Plus 16 2-w-1 plus dodatkowy port USB-A wzdłuż lewej krawędzi. Proszę zauważyć, że tylko jeden z dwóch portów USB-C obsługuje Thunderbolt 4 i DisplayPort 2.1, podczas gdy drugi port USB-C obsługuje tylko 10 Gb/s z DisplayPort 1.4.
Komunikacja
Kamera internetowa
Kamera internetowa 5 MP jest standardowo wyposażona w podczerwień i fizyczną migawkę.


Konserwacja
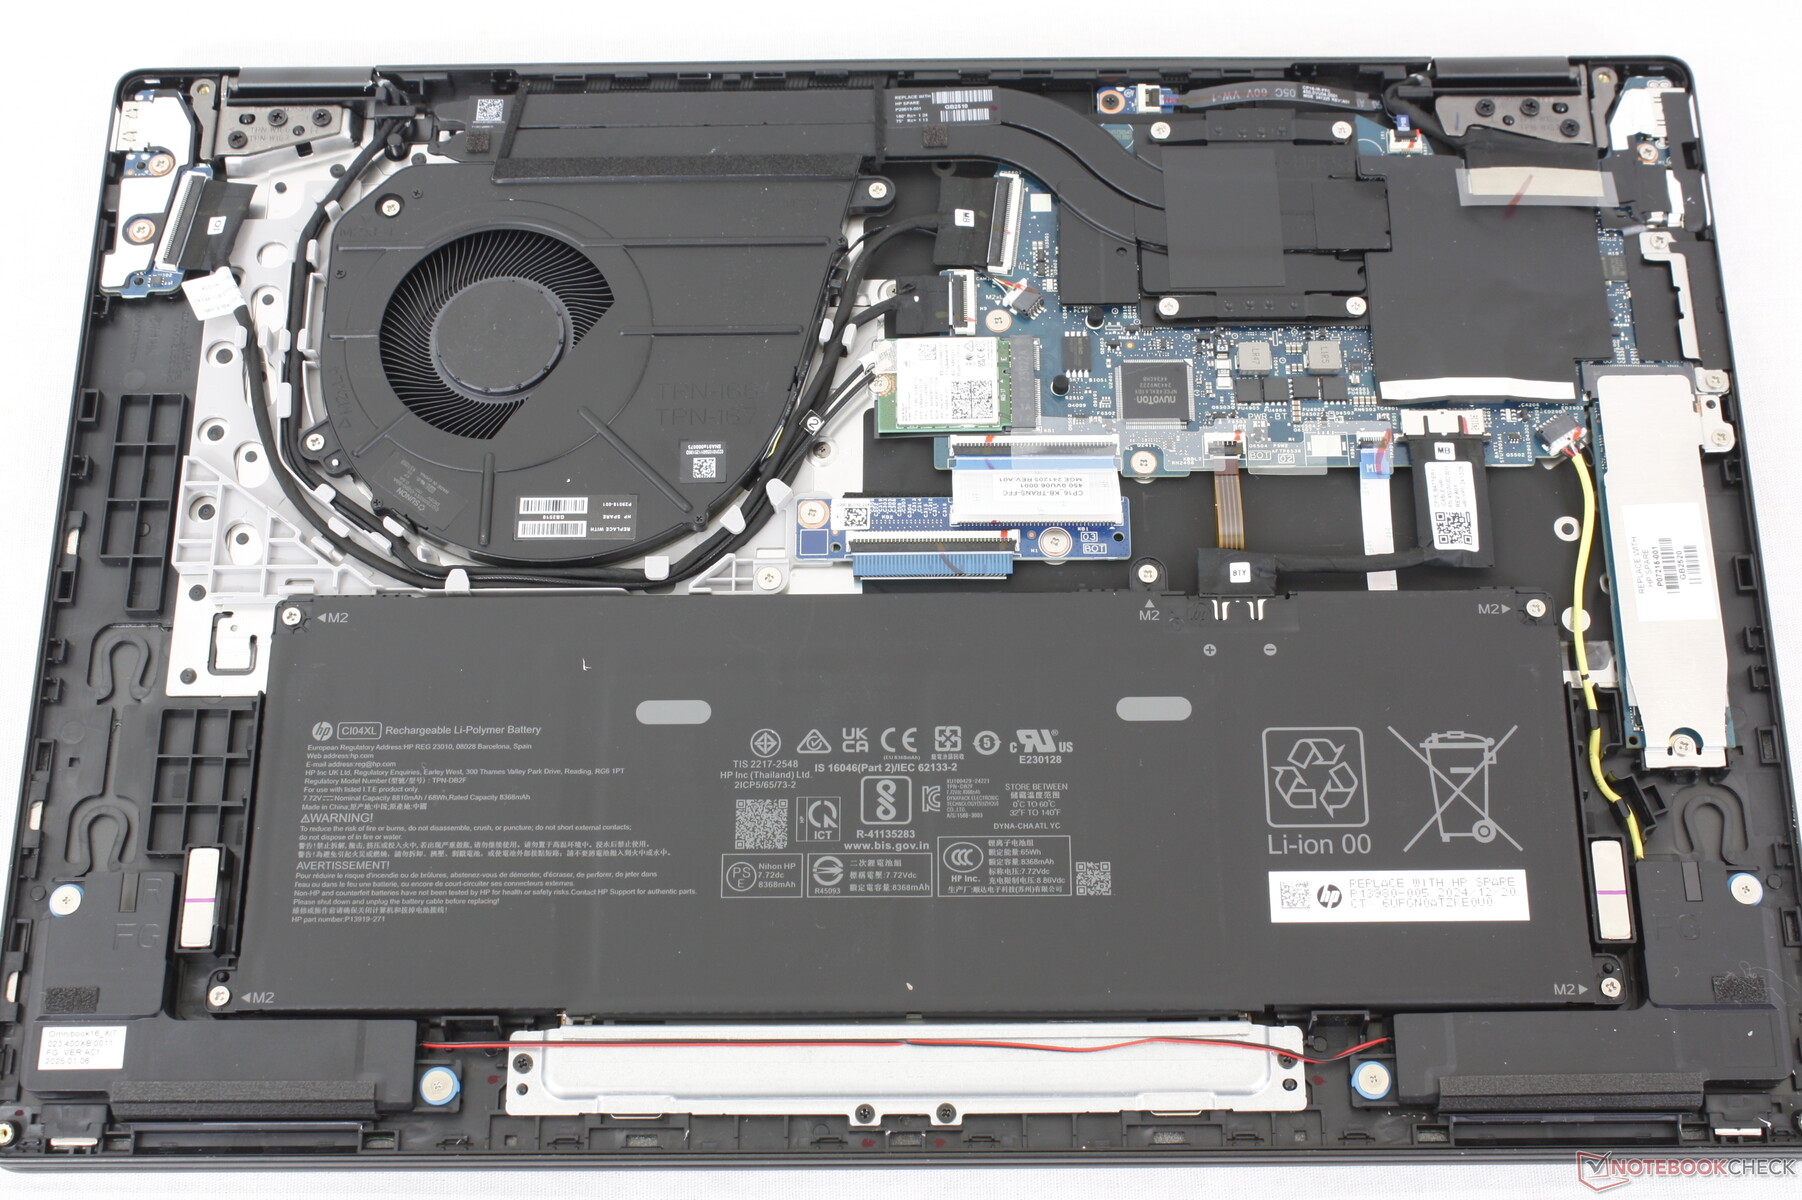
Zrównoważony rozwój
Do produkcji OmniBooka X Flip 16 firma HP wykorzystuje różne ilości metali i tworzyw sztucznych pochodzących z recyklingu i odnawialnych źródeł.
Akcesoria i gwarancja
Pudełko detaliczne zawiera aktywny rysik (TPA-M005P) oprócz zwykłej dokumentacji i zasilacza sieciowego USB-C. W przypadku zakupu w Stanach Zjednoczonych obowiązuje standardowa roczna ograniczona gwarancja producenta.
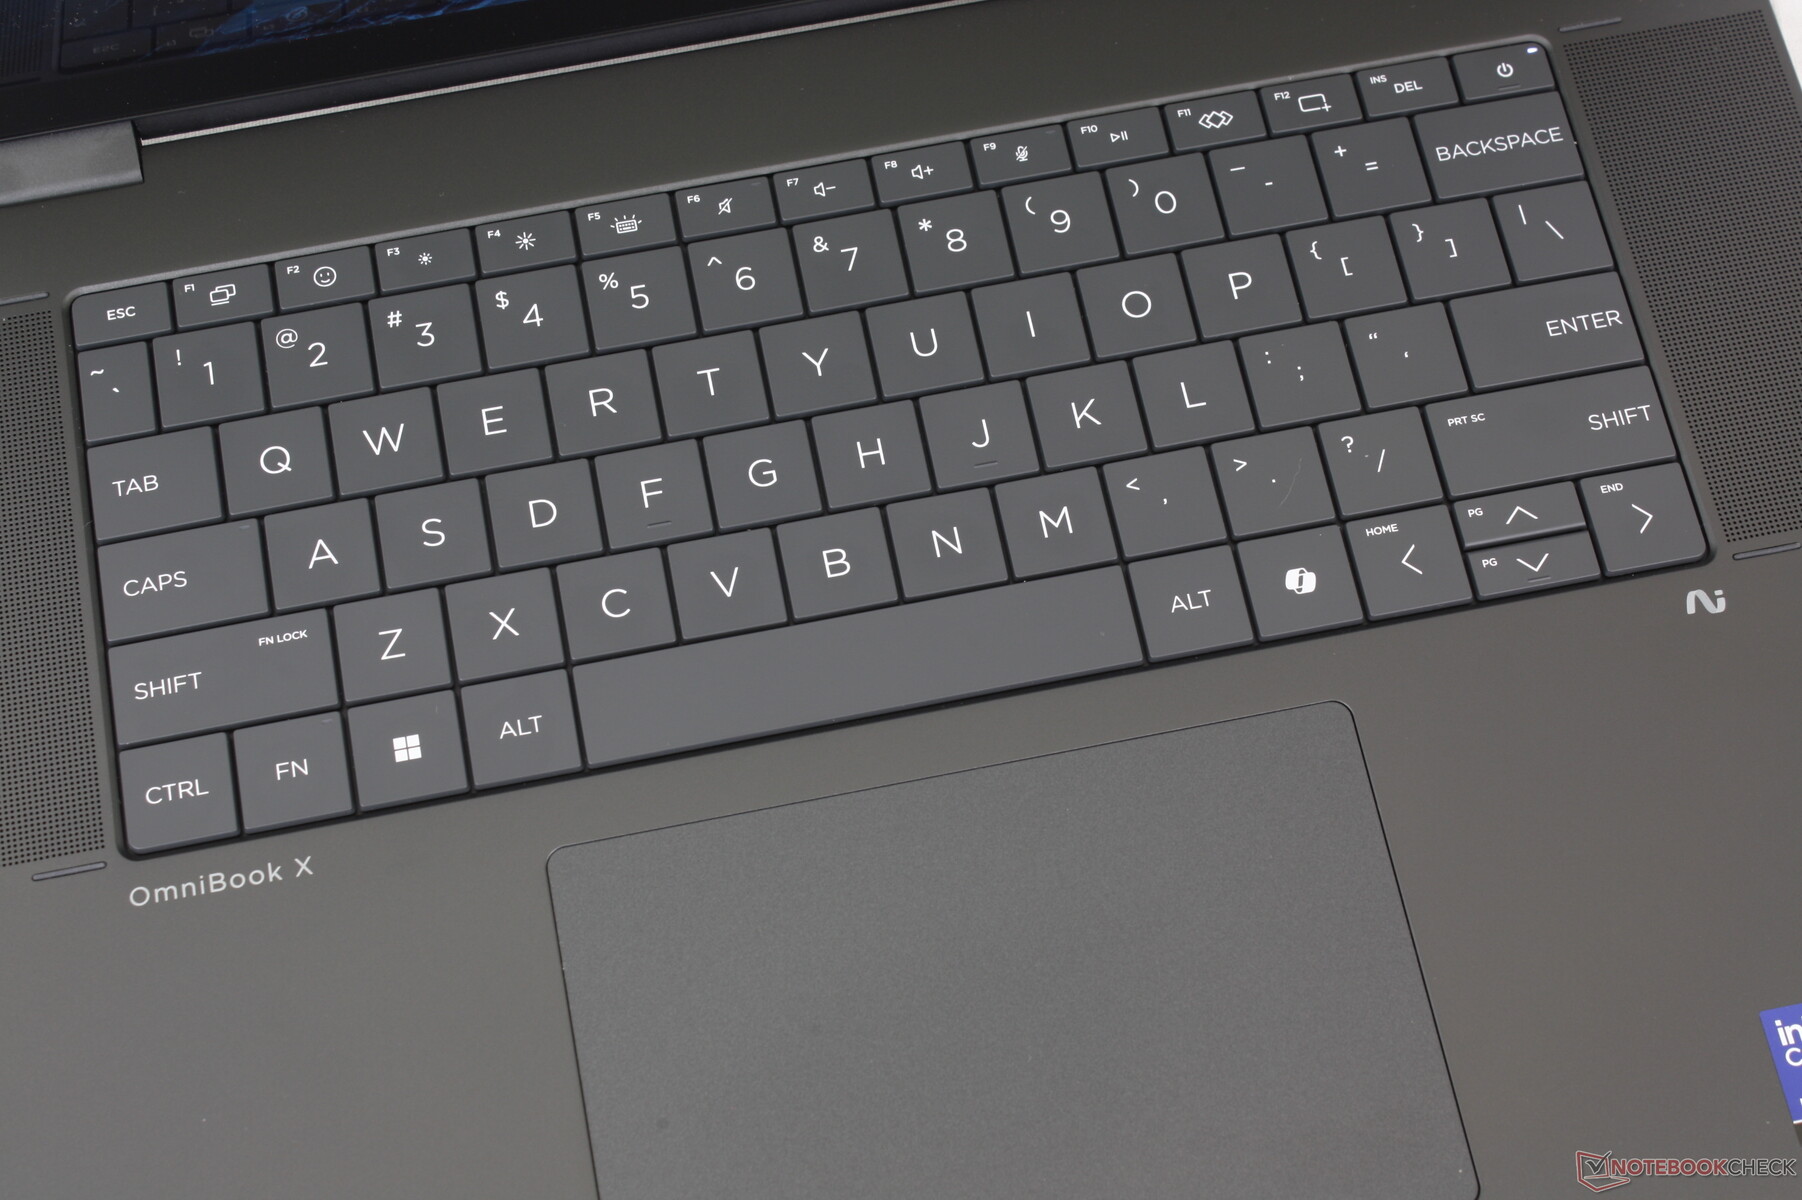
Urządzenia wejściowe
Klawiatura
Klawiatura typu zero-lattice to zmiana w stosunku do obecnej serii Spectre, EliteBook i poprzedniej generacji Envy. Chociaż klawisze są większe, sprzężenie zwrotne jest niestety zarówno lżejsze, jak i płytsze niż w przypadku bardziej tradycyjnych klawiatur w większości innych laptopów HP.
Panel dotykowy
Klawiatura ma mniej więcej taki sam rozmiar, jak w modelu Dell 16 Plus 2-w-1 (13,5 x 8,7 cm vs. 13,3 x 9 cm). Klikanie jest łatwiejsze, ponieważ wymaga mniejszej siły niż w kabriolecie Dell, ale sprzężenie zwrotne jest po gąbczastej stronie.
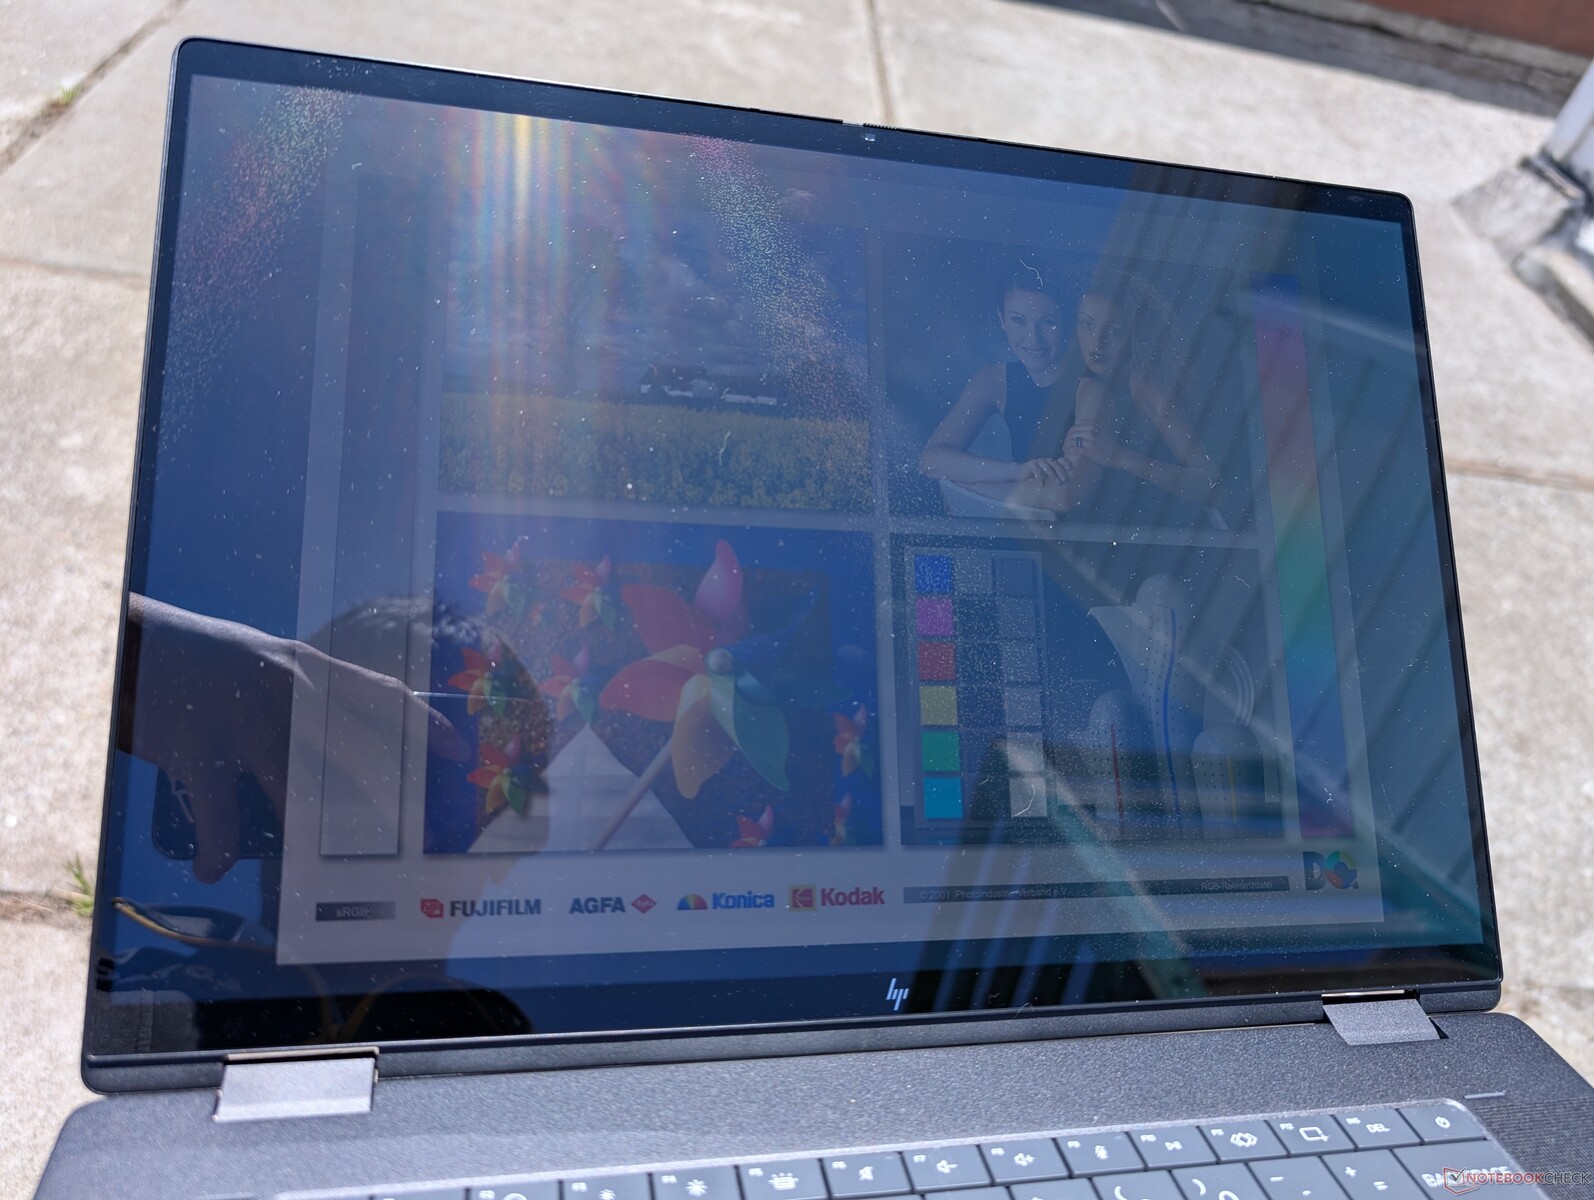
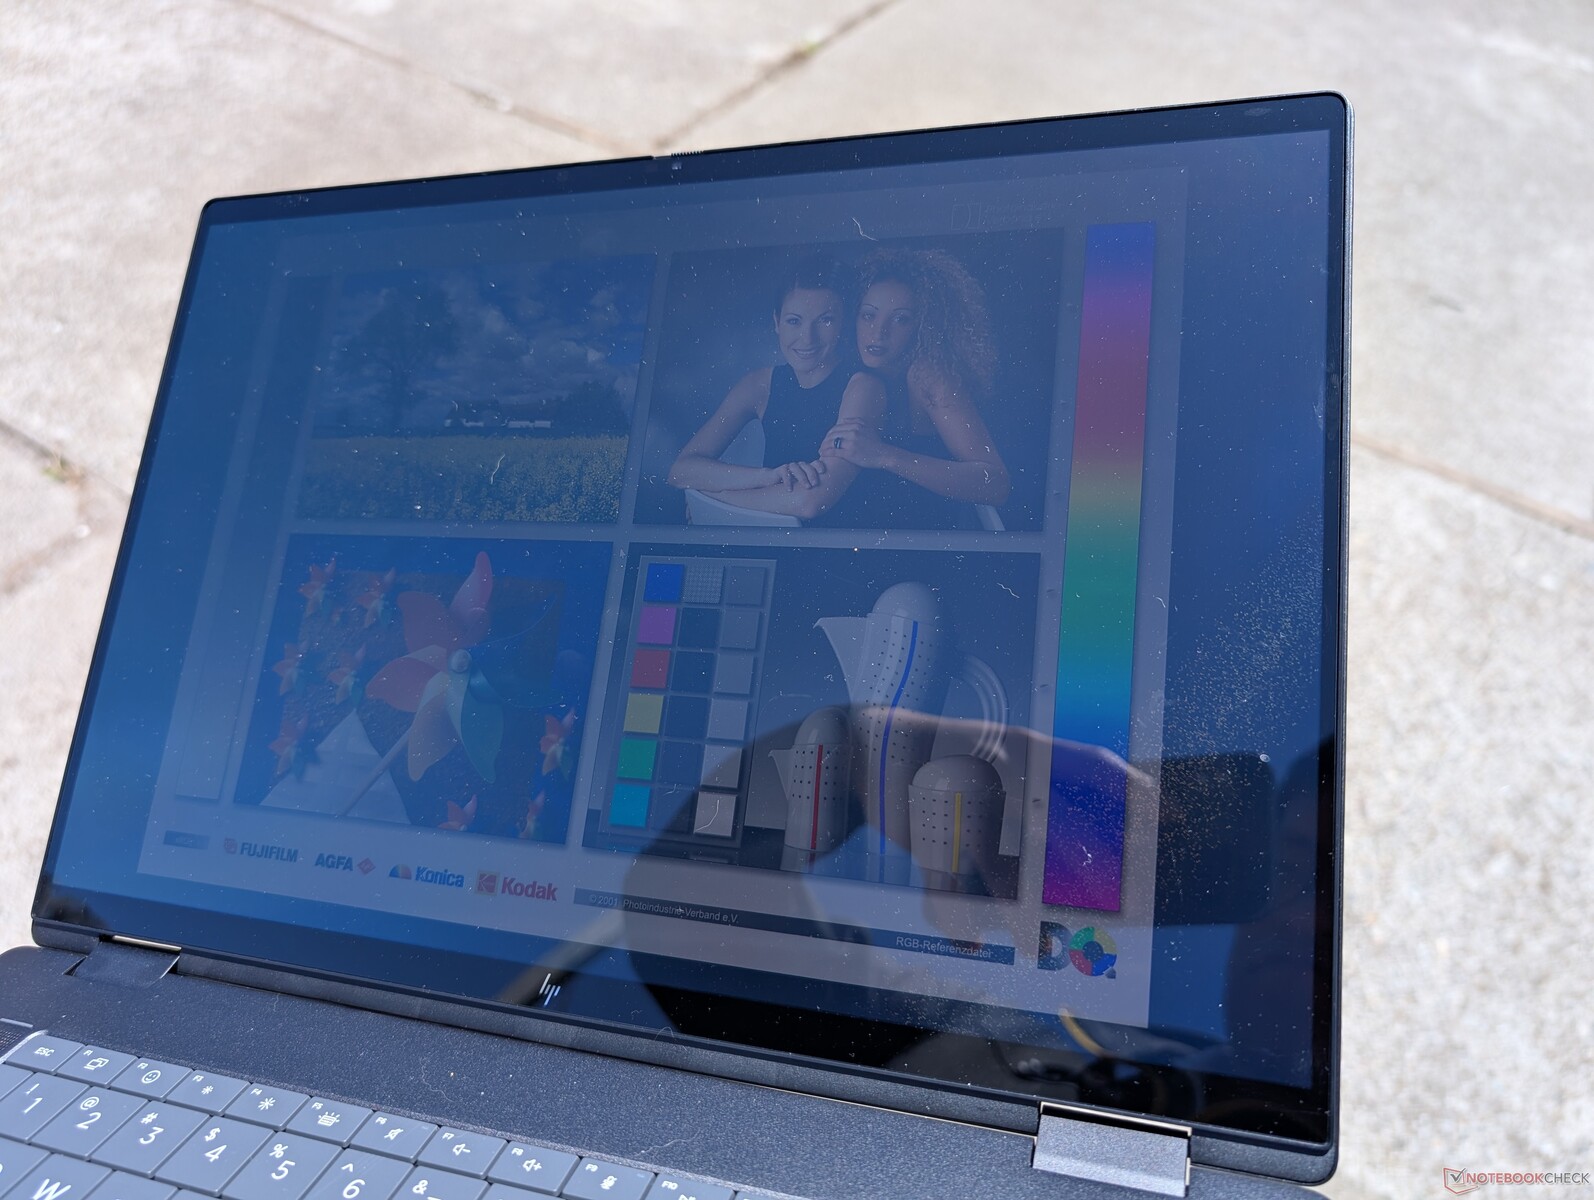
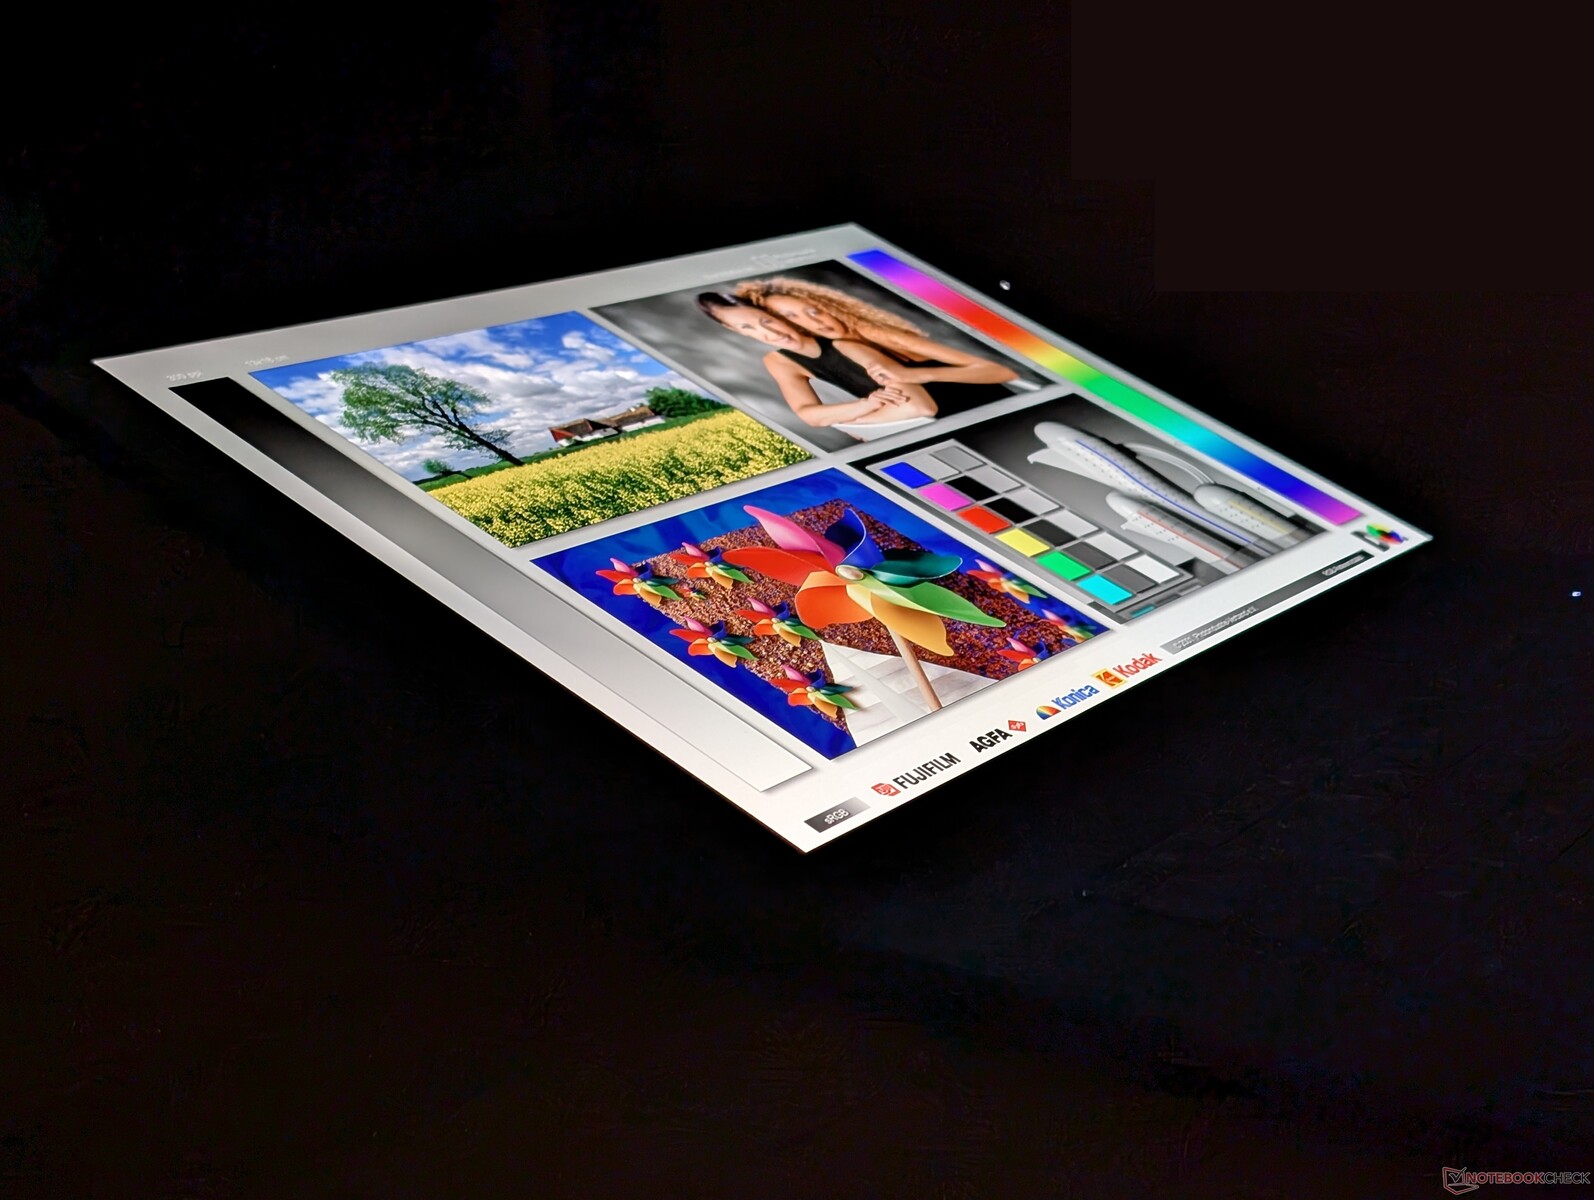
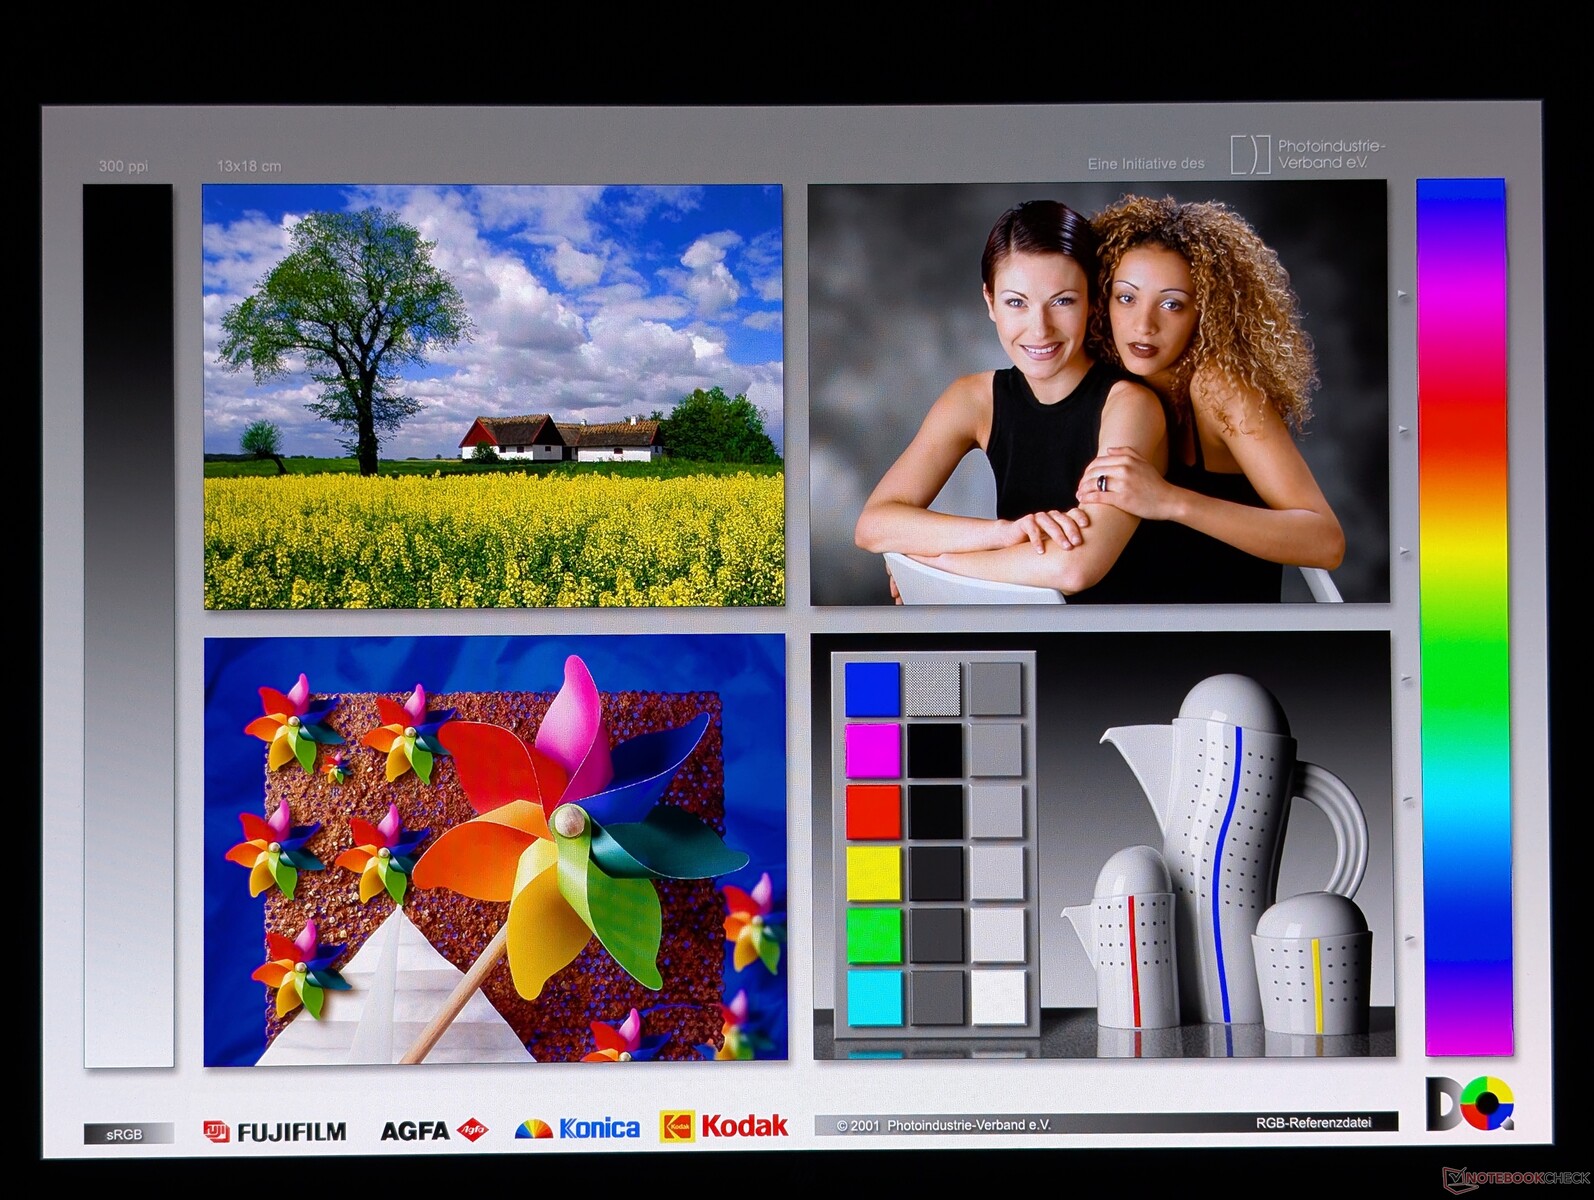
Wyświetlacz - 3K 120 Hz OLED

OmniBook X Flip 16 wykorzystuje podobny ekran dotykowy Samsung OLED 1800p 120 Hz, jaki można znaleźć w Galaxy Book5 Pro 360 lub HP Spectre x360 16. Oferuje on wyższą natywną rozdzielczość niż panele Mini-LED lub IPS w Dell Plus 16 2-w-1 lub MSI Summit A16 AI Plus. Maksymalna jasność osiąga 561 nitów w trybie HDR do obsługi HDR500, ale jest ograniczona do 381 nitów w trybie SDR.


| |||||||||||||||||||||||||
rozświetlenie: 98 %
na akumulatorze: 381.1 cd/m²
kontrast: ∞:1 (czerń: 0 cd/m²)
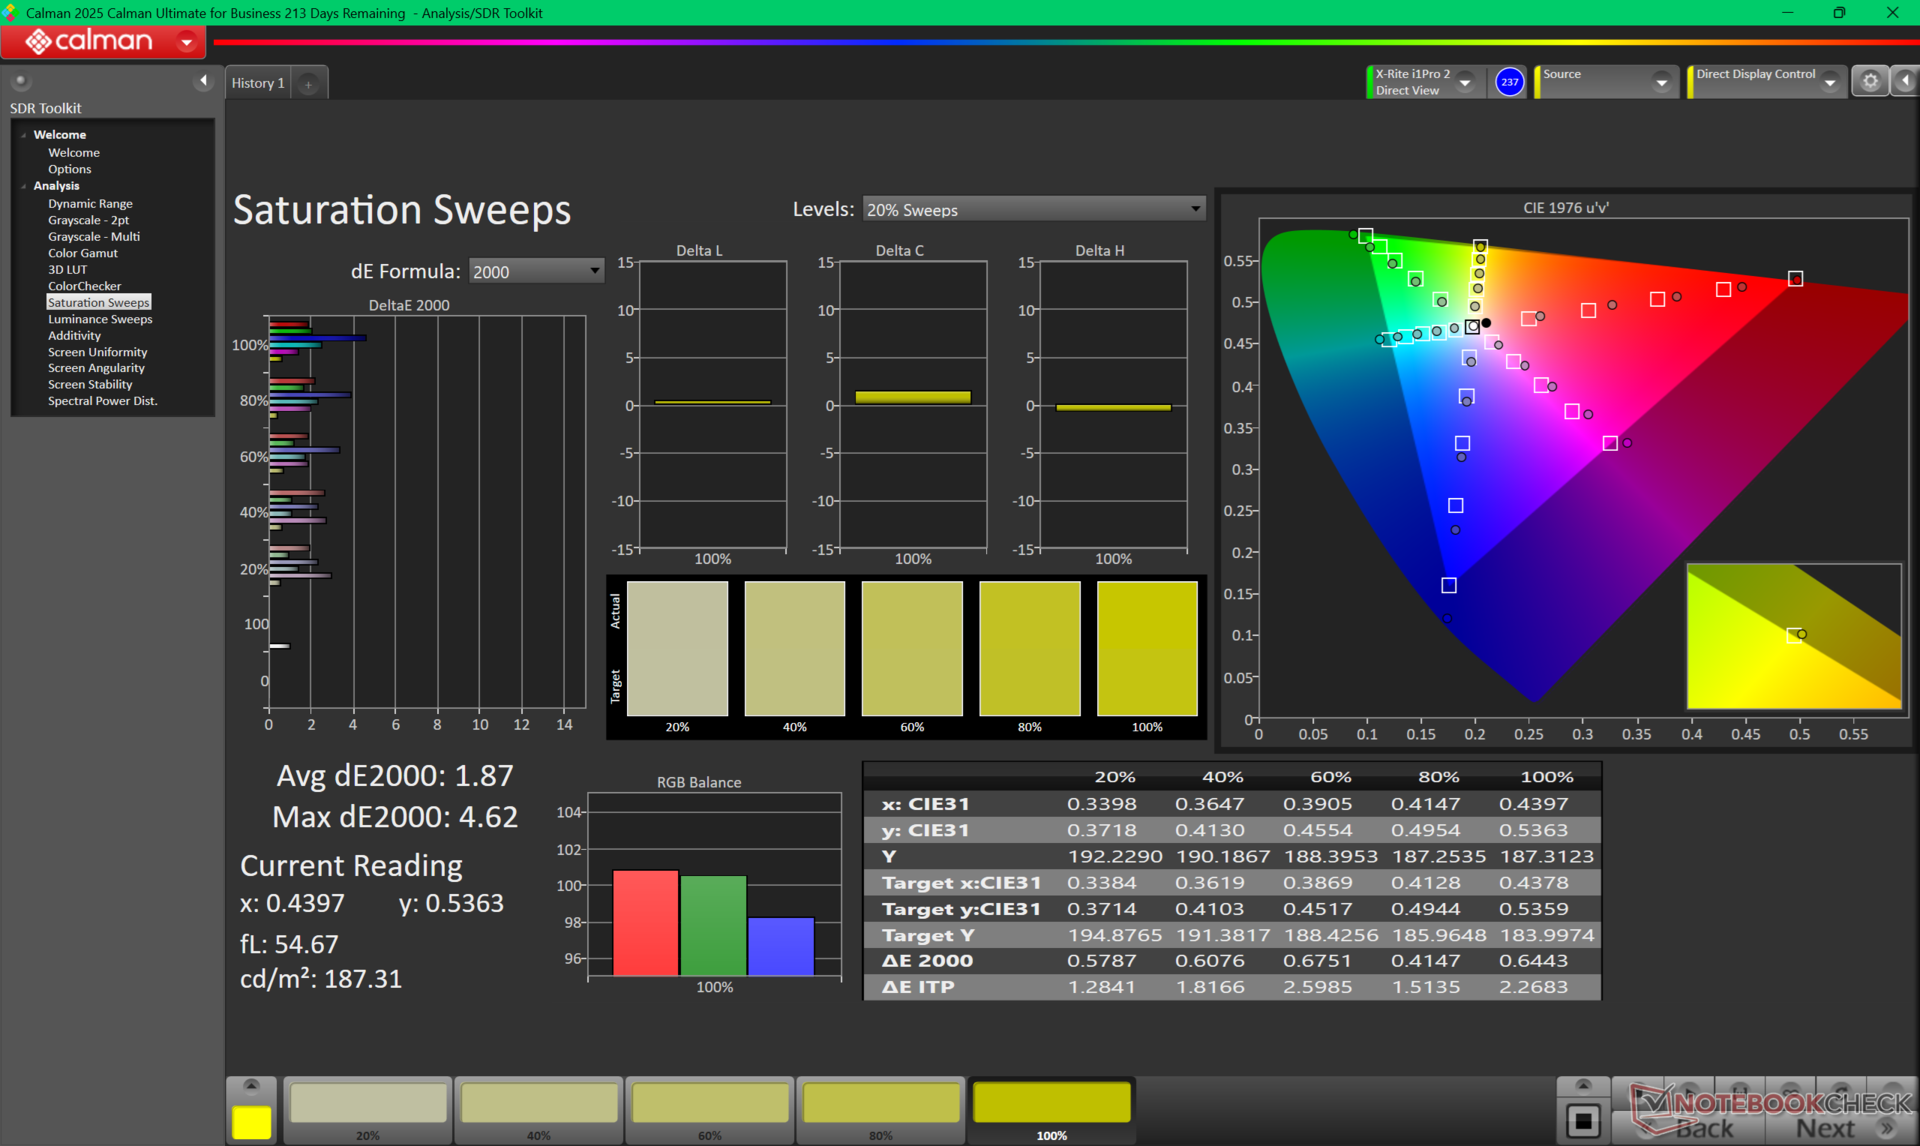
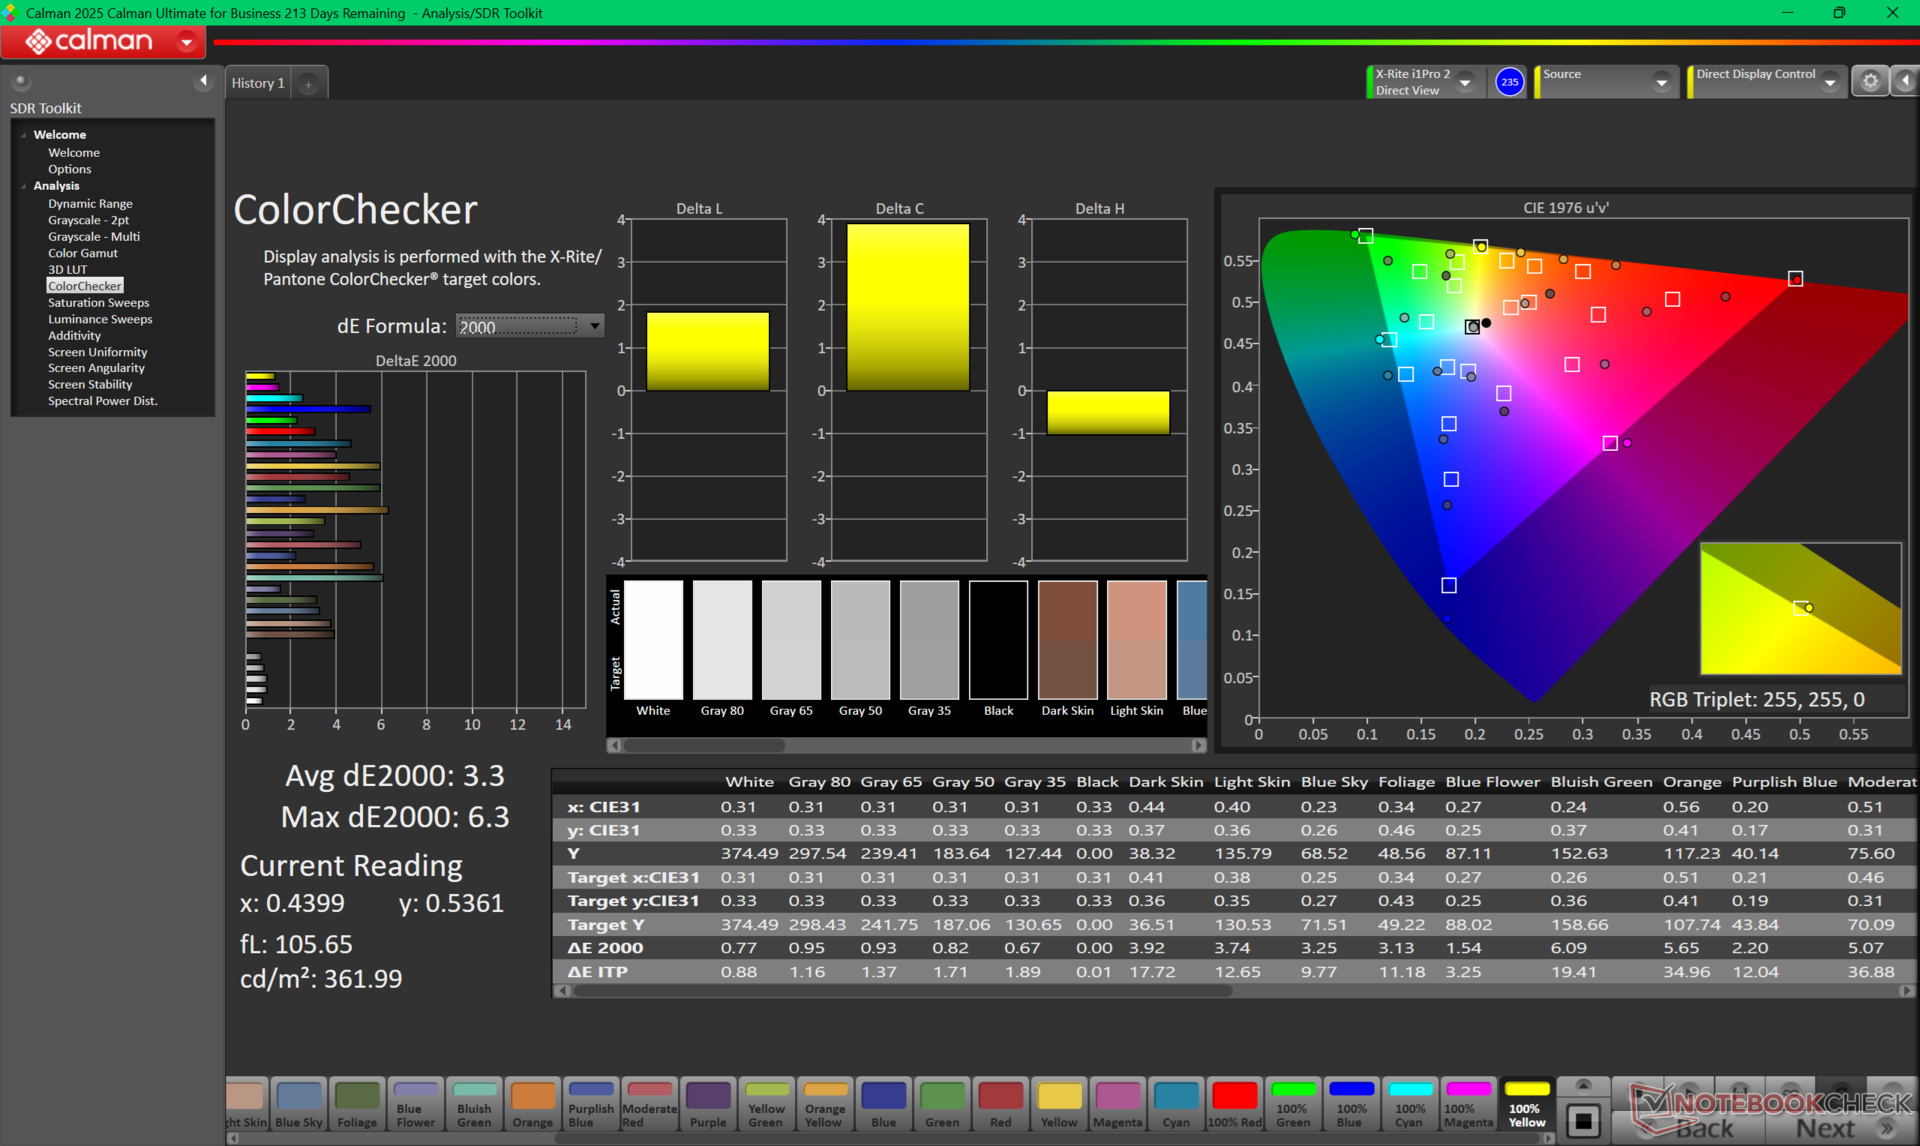
ΔE ColorChecker Calman: 3.3 | ∀{0.5-29.43 Ø4.72}
ΔE Greyscale Calman: 0.9 | ∀{0.09-98 Ø4.97}
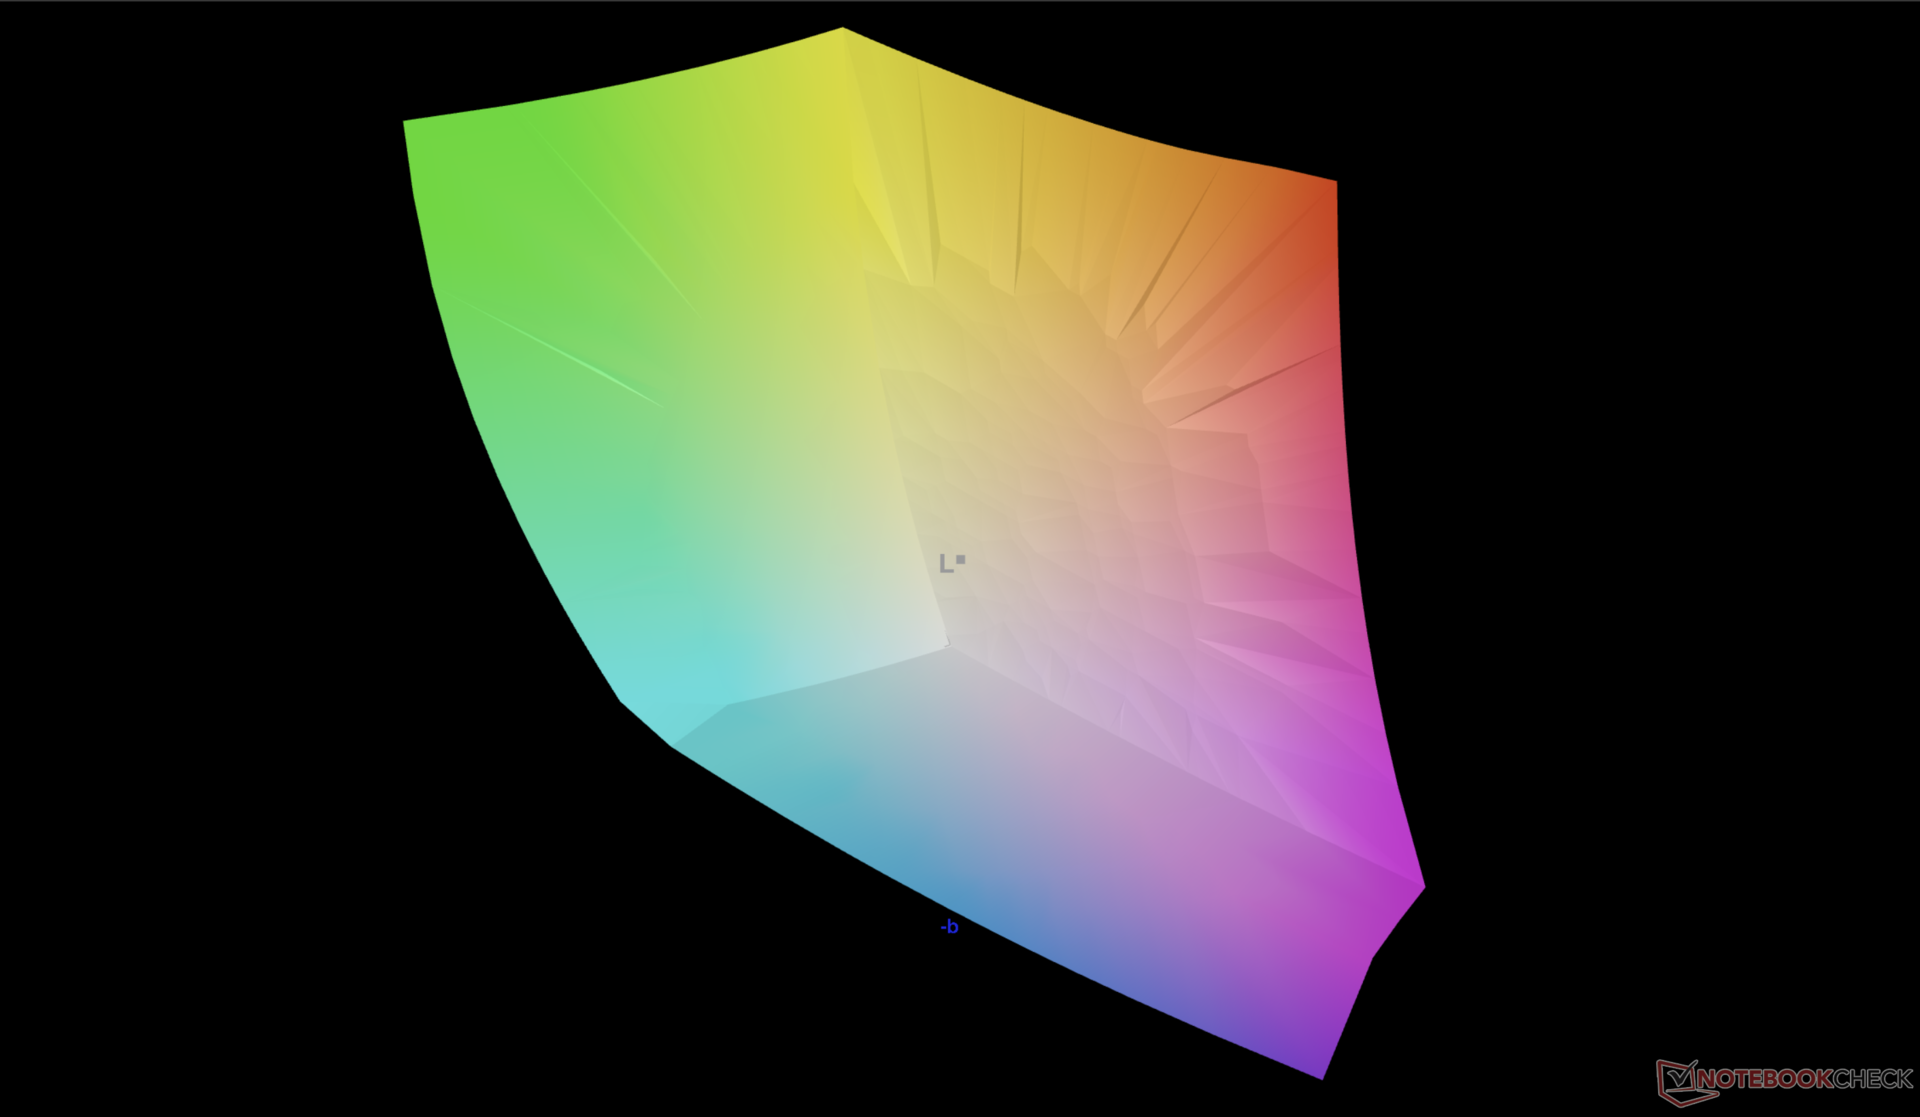
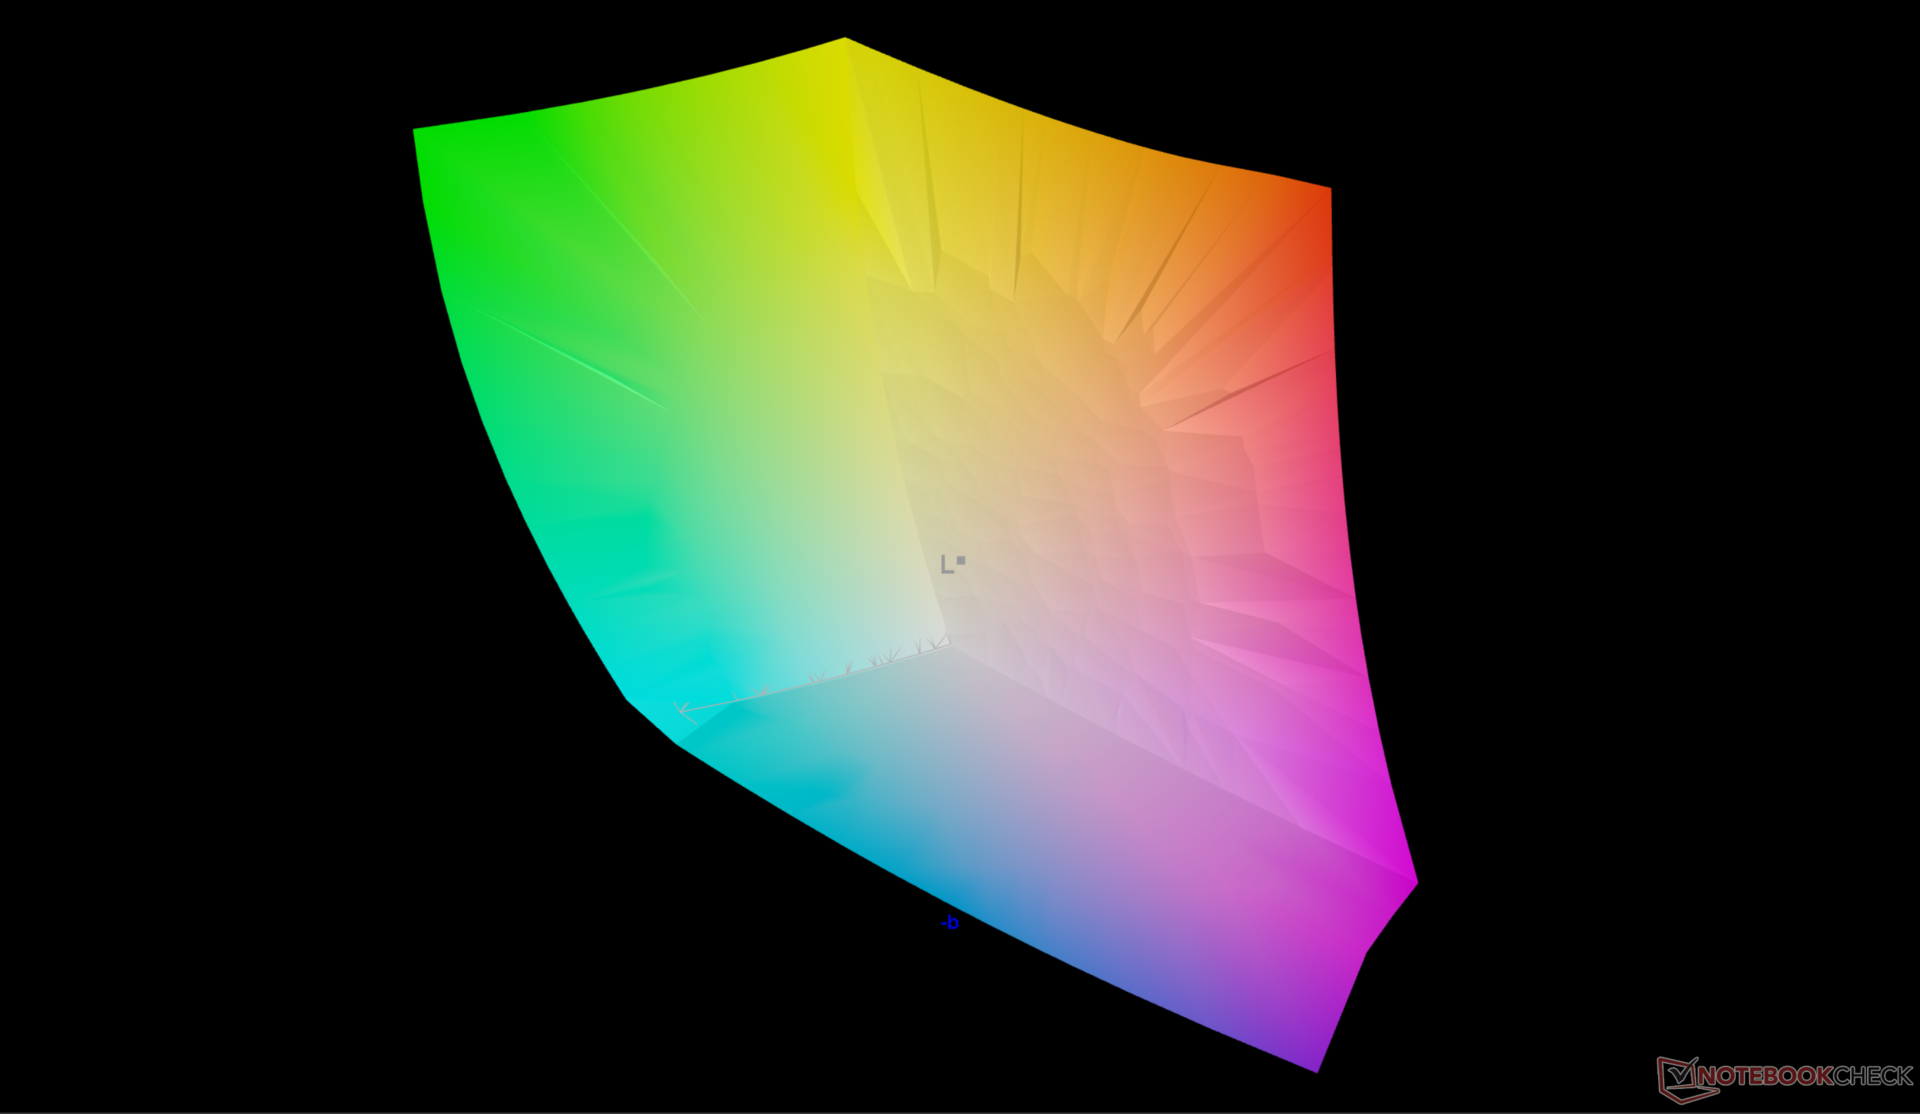
95.2% AdobeRGB 1998 (Argyll 3D)
100% sRGB (Argyll 3D)
99.9% Display P3 (Argyll 3D)
Gamma: 2.23
CCT: 6369 K
| HP OmniBook X Flip 16 Samsung SDC41BA, OLED, 2880x1800, 16", 120 Hz | Dell 16 Plus 2-in-1 AU Optronics B160QAT, Mini-LED, 2560x1600, 16", 90 Hz | Lenovo Yoga 7 2-in-1 16ILL10 LEN160WUM, IPS, 1920x1200, 16", 60 Hz | Samsung Galaxy Book5 Pro 360 ATNA60CL09-0, OLED, 2880x1800, 16", 120 Hz | MSI Summit A16 AI Plus A3HMTG AU Optronics B16QAN02.N, IPS, 2560x1600, 16", 165 Hz | HP Spectre x360 16 RTX 4050 Samsung SDC41A6, OLED, 2880x1800, 16", 120 Hz | |
|---|---|---|---|---|---|---|
| Display | -0% | -53% | 0% | -5% | 1% | |
| Display P3 Coverage (%) | 99.9 | 99.5 0% | 39.7 -60% | 99.9 0% | 96.8 -3% | 99.6 0% |
| sRGB Coverage (%) | 100 | 100 0% | 57.9 -42% | 100 0% | 99.8 0% | 100 0% |
| AdobeRGB 1998 Coverage (%) | 95.2 | 94.2 -1% | 41 -57% | 96.6 1% | 84.7 -11% | 96.7 2% |
| Response Times | -4178% | -3025% | -33% | -1201% | 3% | |
| Response Time Grey 50% / Grey 80% * (ms) | 0.8 ? | 48.8 ? -6000% | 30 ? -3650% | 0.48 ? 40% | 12.9 ? -1513% | 0.78 ? 2% |
| Response Time Black / White * (ms) | 0.9 ? | 57.6 ? -6300% | 22.5 ? -2400% | 0.64 ? 29% | 8.9 ? -889% | 0.86 ? 4% |
| PWM Frequency (Hz) | 473.8 ? | 2807 ? | 240 ? | 480 ? | ||
| PWM Amplitude * (%) | 15 | 50 -233% | 40 -167% | |||
| Screen | -3% | -172% | 9% | -34% | -17% | |
| Brightness middle (cd/m²) | 381.1 | 432.1 13% | 317.9 -17% | 387 2% | 475.4 25% | 385.2 1% |
| Brightness (cd/m²) | 381 | 426 12% | 304 -20% | 392 3% | 440 15% | 387 2% |
| Brightness Distribution (%) | 98 | 97 -1% | 90 -8% | 98 0% | 89 -9% | 99 1% |
| Black Level * (cd/m²) | 0.25 | 0.36 | ||||
| Colorchecker dE 2000 * | 3.3 | 1.95 41% | 7.39 -124% | 1 70% | 2.99 9% | 1.73 48% |
| Colorchecker dE 2000 max. * | 6.3 | 3.87 39% | 21.43 -240% | 1.9 70% | 7.64 -21% | 3.95 37% |
| Greyscale dE 2000 * | 0.9 | 2 -122% | 6.5 -622% | 1.7 -89% | 2.9 -222% | 2.6 -189% |
| Gamma | 2.23 99% | 2.3 96% | 2.22 99% | 2.25 98% | 2.31 95% | 2.17 101% |
| CCT | 6369 102% | 6222 104% | 6140 106% | 6325 103% | 6472 100% | 6133 106% |
| Colorchecker dE 2000 calibrated * | 1.16 | 3.06 | 0.74 | |||
| Contrast (:1) | 1272 | 1321 | ||||
| Całkowita średnia (program / ustawienia) | -1394% /
-1046% | -1083% /
-658% | -8% /
-3% | -413% /
-238% | -4% /
-8% |
* ... im mniej tym lepiej

Wyświetl czasy reakcji
| ↔ Czas reakcji od czerni do bieli | ||
|---|---|---|
| 0.9 ms ... wzrost ↗ i spadek ↘ łącznie | ↗ 0.4 ms wzrost | 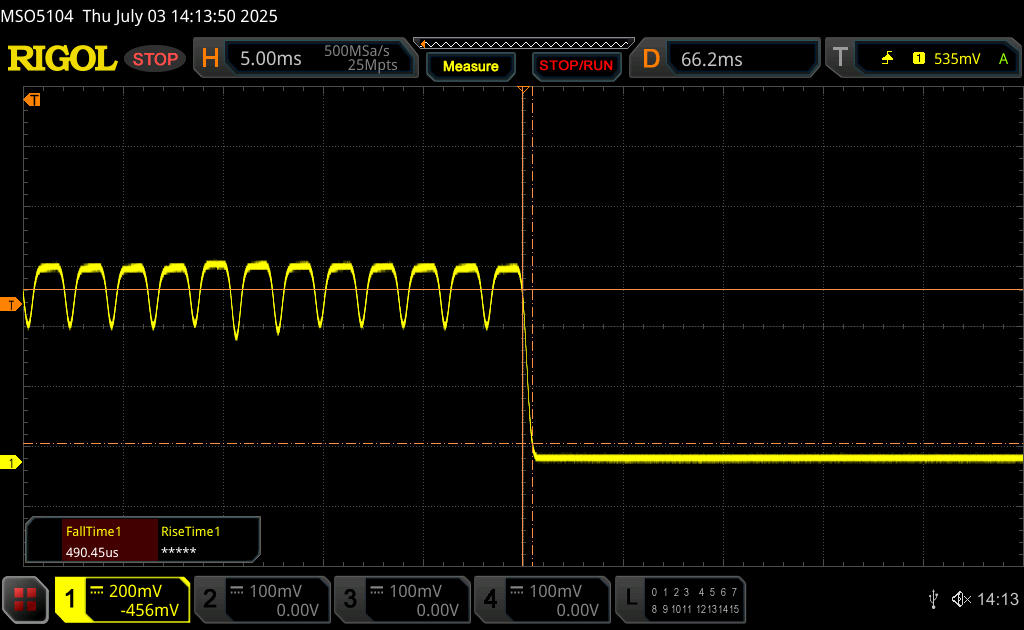 |
| ↘ 0.5 ms upadek | ||
| W naszych testach ekran wykazuje bardzo szybką reakcję i powinien bardzo dobrze nadawać się do szybkich gier. Dla porównania, wszystkie testowane urządzenia wahają się od 0.1 (minimum) do 240 (maksimum) ms. » 3 % wszystkich urządzeń jest lepszych. Oznacza to, że zmierzony czas reakcji jest lepszy od średniej wszystkich testowanych urządzeń (19.8 ms). | ||
| ↔ Czas reakcji 50% szarości do 80% szarości | ||
| 0.8 ms ... wzrost ↗ i spadek ↘ łącznie | ↗ 0.4 ms wzrost | 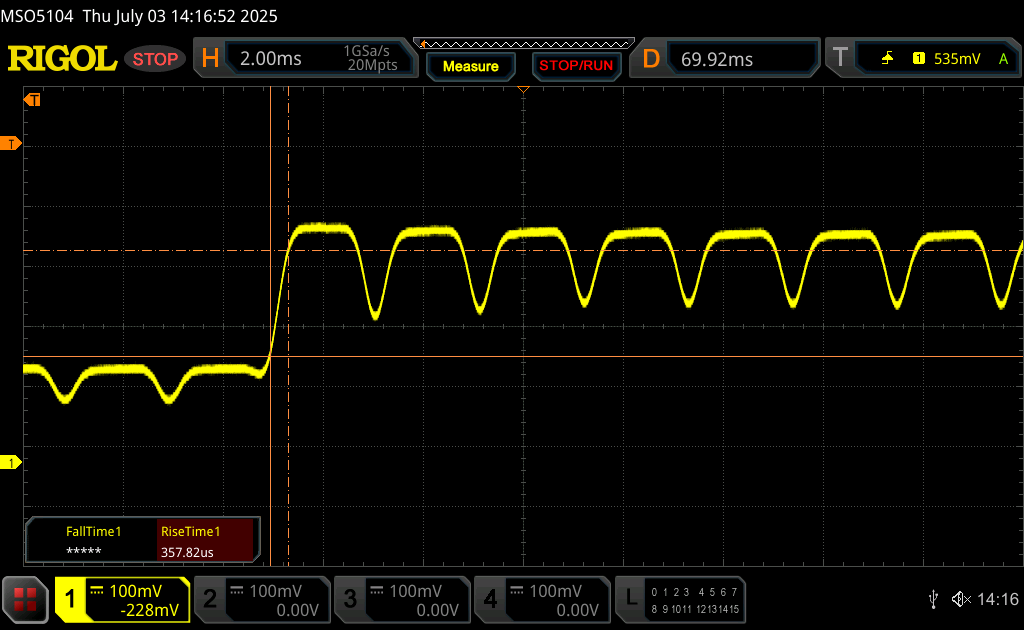 |
| ↘ 0.4 ms upadek | ||
| W naszych testach ekran wykazuje bardzo szybką reakcję i powinien bardzo dobrze nadawać się do szybkich gier. Dla porównania, wszystkie testowane urządzenia wahają się od 0.165 (minimum) do 636 (maksimum) ms. » 3 % wszystkich urządzeń jest lepszych. Oznacza to, że zmierzony czas reakcji jest lepszy od średniej wszystkich testowanych urządzeń (31 ms). | ||
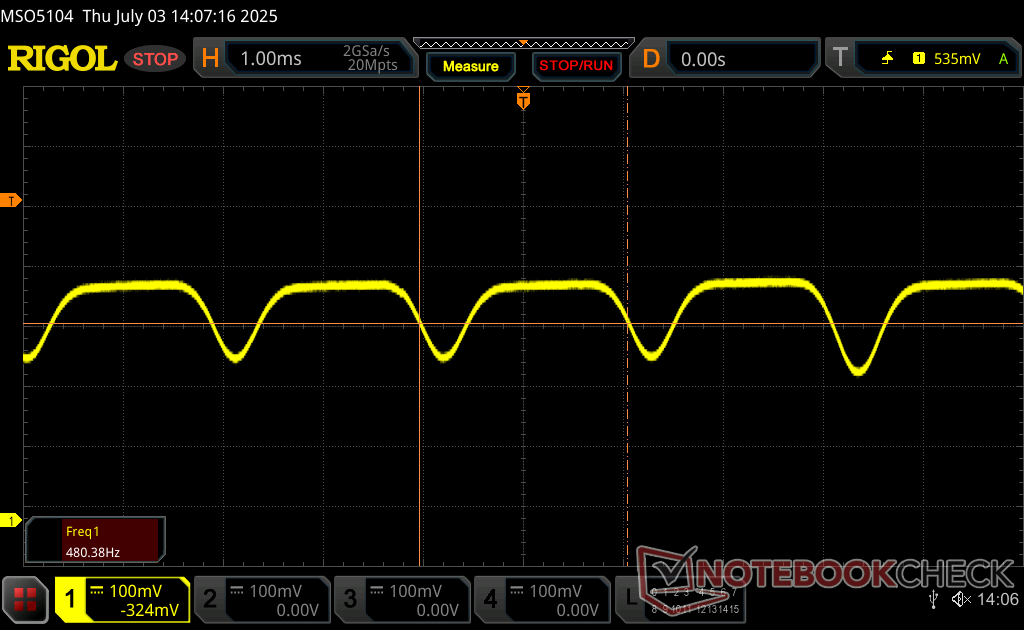
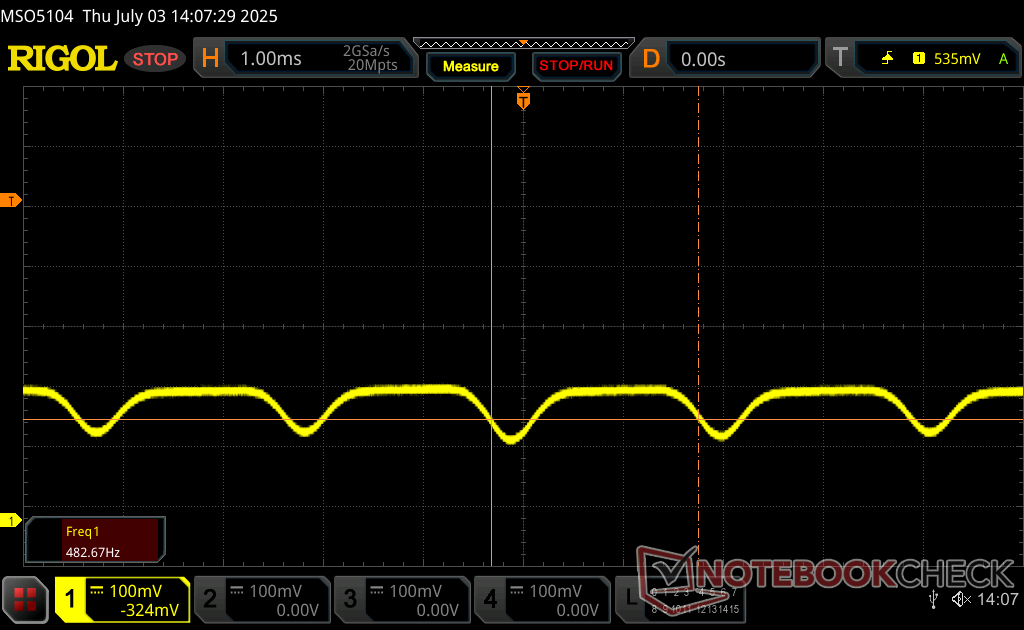
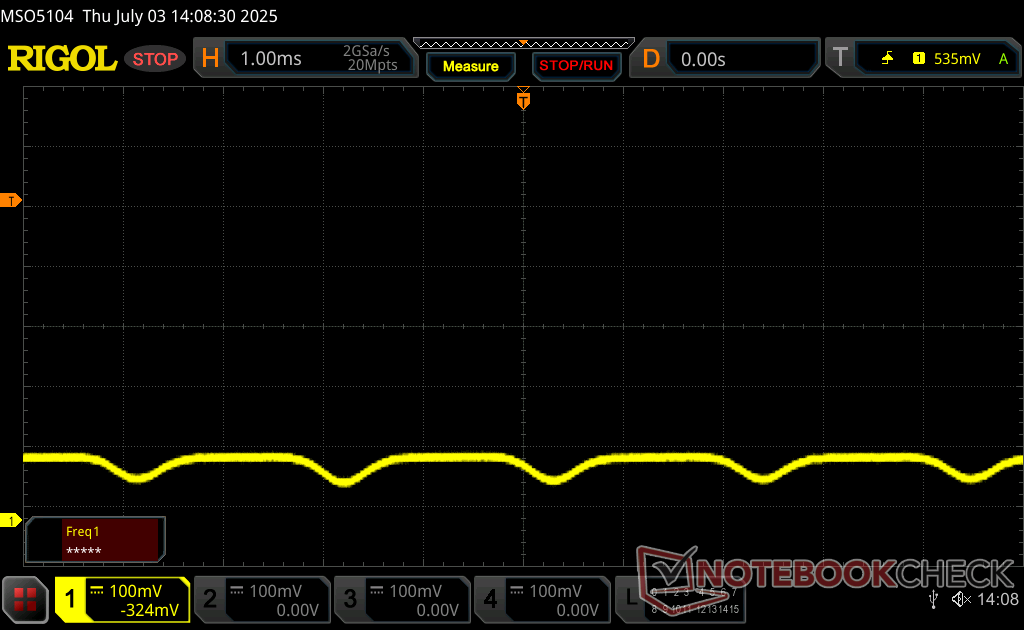
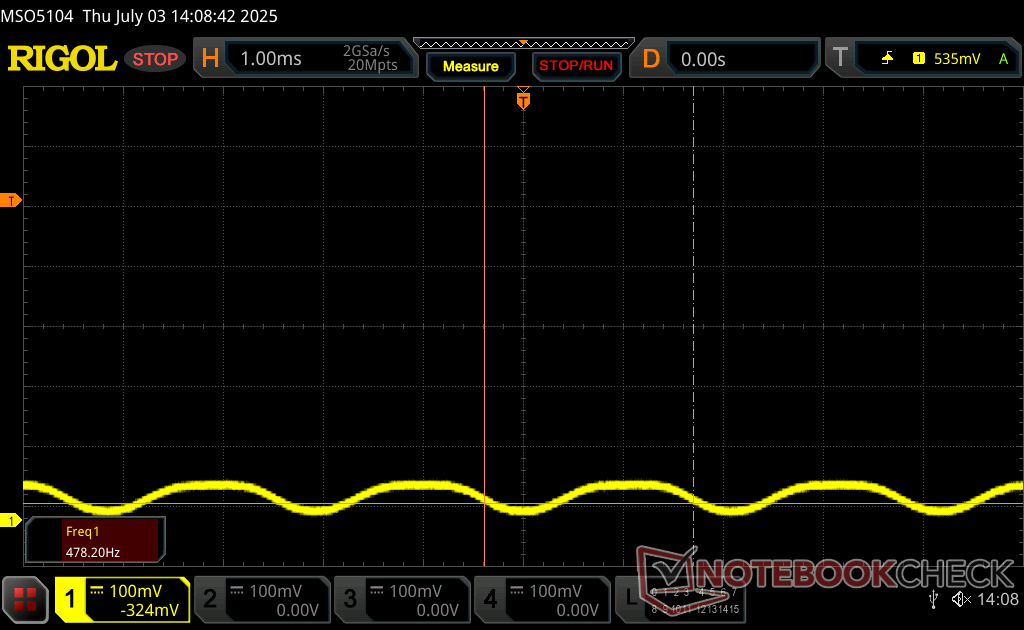
Migotanie ekranu / PWM (modulacja szerokości impulsu)
| Wykryto migotanie ekranu/wykryto PWM | 473.8 Hz Amplitude: 15 % | ≤ 100 % ustawienia jasności | 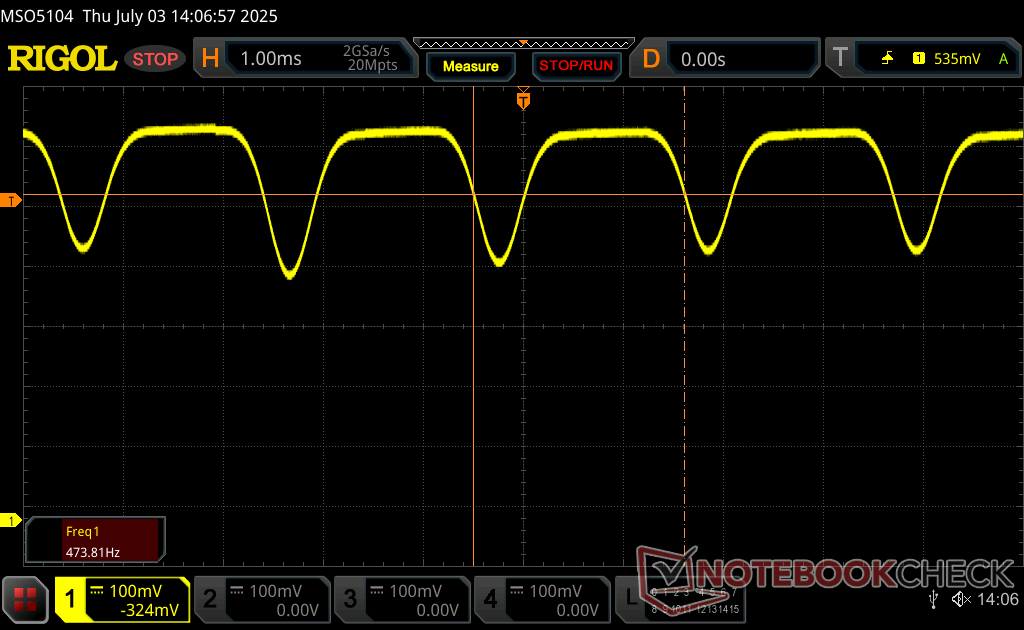 |
Podświetlenie wyświetlacza miga z częstotliwością 473.8 Hz (najgorszy przypadek, np. przy użyciu PWM) Wykryto migotanie przy ustawieniu jasności 100 % i poniżej. Powyżej tego ustawienia jasności nie powinno być żadnego migotania ani PWM. Częstotliwość 473.8 Hz jest stosunkowo wysoka, więc większość użytkowników wrażliwych na PWM nie powinna zauważyć żadnego migotania. Istnieją jednak doniesienia, że niektórzy użytkownicy są nadal wrażliwi na PWM przy częstotliwości 500 Hz i wyższej, więc należy zachować ostrożność. Dla porównania: 52 % wszystkich testowanych urządzeń nie używa PWM do przyciemniania wyświetlacza. Jeśli wykryto PWM, zmierzono średnio 7750 (minimum: 5 - maksimum: 343500) Hz. | |||


Wydajność - Wydajność Lunar Lake
Warunki testowania
Przed uruchomieniem poniższych testów porównawczych ustawiliśmy system Windows w tryb wydajności.
Procesor
The Core Ultra 7 258V oferuje podobną wydajność wielowątkową jak tańszy Core Ultra 5 125U. Zrównoważona wydajność jest również przyzwoita z deficytem około 10 procent podczas uruchamiania CineBench R15 xT w pętli.
Cinebench R15 Multi Loop
Cinebench R23: Multi Core | Single Core
Cinebench R20: CPU (Multi Core) | CPU (Single Core)
Cinebench R15: CPU Multi 64Bit | CPU Single 64Bit
Blender: v2.79 BMW27 CPU
7-Zip 18.03: 7z b 4 | 7z b 4 -mmt1
Geekbench 6.7: Multi-Core | Single-Core
Geekbench 5.5: Multi-Core | Single-Core
HWBOT x265 Benchmark v2.2: 4k Preset
LibreOffice : 20 Documents To PDF
R Benchmark 2.5: Overall mean
| HWBOT x265 Benchmark v2.2 / 4k Preset | |
| MSI Summit A16 AI Plus A3HMTG | |
| Asus Vivobook 16 M1606K | |
| Asus Zenbook S 16 UM5606WA-RK052W | |
| Asus V16 V3607V | |
| HP Spectre x360 16 RTX 4050 | |
| Lenovo Yoga 7 2-in-1 16ILL10 | |
| Samsung Galaxy Book5 Pro 360 | |
| Dell 16 Plus 2-in-1 | |
| HP OmniBook X Flip 16 | |
| Przeciętny Intel Core Ultra 7 258V (7.11 - 14.2, n=24) | |
| Lenovo ThinkBook 16 G7 IML | |
| Acer Aspire 16 A16-51GM-77G2 | |
* ... im mniej tym lepiej
AIDA64: FP32 Ray-Trace | FPU Julia | CPU SHA3 | CPU Queen | FPU SinJulia | FPU Mandel | CPU AES | CPU ZLib | FP64 Ray-Trace | CPU PhotoWorxx
| Performance rating | |
| MSI Summit A16 AI Plus A3HMTG | |
| HP Spectre x360 16 RTX 4050 | |
| Dell 16 Plus 2-in-1 | |
| HP OmniBook X Flip 16 | |
| Lenovo Yoga 7 2-in-1 16ILL10 | |
| Przeciętny Intel Core Ultra 7 258V | |
| Samsung Galaxy Book5 Pro 360 | |
| AIDA64 / FP32 Ray-Trace | |
| MSI Summit A16 AI Plus A3HMTG | |
| HP Spectre x360 16 RTX 4050 | |
| Dell 16 Plus 2-in-1 | |
| Samsung Galaxy Book5 Pro 360 | |
| Lenovo Yoga 7 2-in-1 16ILL10 | |
| Przeciętny Intel Core Ultra 7 258V (8454 - 12781, n=26) | |
| HP OmniBook X Flip 16 | |
| AIDA64 / FPU Julia | |
| MSI Summit A16 AI Plus A3HMTG | |
| HP Spectre x360 16 RTX 4050 | |
| Samsung Galaxy Book5 Pro 360 | |
| HP OmniBook X Flip 16 | |
| Lenovo Yoga 7 2-in-1 16ILL10 | |
| Dell 16 Plus 2-in-1 | |
| Przeciętny Intel Core Ultra 7 258V (40875 - 63401, n=26) | |
| AIDA64 / CPU SHA3 | |
| MSI Summit A16 AI Plus A3HMTG | |
| HP Spectre x360 16 RTX 4050 | |
| Lenovo Yoga 7 2-in-1 16ILL10 | |
| HP OmniBook X Flip 16 | |
| Przeciętny Intel Core Ultra 7 258V (1930 - 2817, n=26) | |
| Samsung Galaxy Book5 Pro 360 | |
| Dell 16 Plus 2-in-1 | |
| AIDA64 / CPU Queen | |
| MSI Summit A16 AI Plus A3HMTG | |
| HP Spectre x360 16 RTX 4050 | |
| Dell 16 Plus 2-in-1 | |
| HP OmniBook X Flip 16 | |
| Lenovo Yoga 7 2-in-1 16ILL10 | |
| Przeciętny Intel Core Ultra 7 258V (48816 - 49818, n=24) | |
| Samsung Galaxy Book5 Pro 360 | |
| AIDA64 / FPU SinJulia | |
| MSI Summit A16 AI Plus A3HMTG | |
| HP Spectre x360 16 RTX 4050 | |
| Lenovo Yoga 7 2-in-1 16ILL10 | |
| HP OmniBook X Flip 16 | |
| Dell 16 Plus 2-in-1 | |
| Przeciętny Intel Core Ultra 7 258V (3817 - 4440, n=26) | |
| Samsung Galaxy Book5 Pro 360 | |
| AIDA64 / FPU Mandel | |
| MSI Summit A16 AI Plus A3HMTG | |
| HP Spectre x360 16 RTX 4050 | |
| Samsung Galaxy Book5 Pro 360 | |
| Lenovo Yoga 7 2-in-1 16ILL10 | |
| HP OmniBook X Flip 16 | |
| Dell 16 Plus 2-in-1 | |
| Przeciętny Intel Core Ultra 7 258V (21670 - 33565, n=26) | |
| AIDA64 / CPU AES | |
| MSI Summit A16 AI Plus A3HMTG | |
| HP Spectre x360 16 RTX 4050 | |
| HP OmniBook X Flip 16 | |
| Dell 16 Plus 2-in-1 | |
| Lenovo Yoga 7 2-in-1 16ILL10 | |
| Przeciętny Intel Core Ultra 7 258V (30957 - 40753, n=26) | |
| Samsung Galaxy Book5 Pro 360 | |
| AIDA64 / CPU ZLib | |
| MSI Summit A16 AI Plus A3HMTG | |
| HP Spectre x360 16 RTX 4050 | |
| Lenovo Yoga 7 2-in-1 16ILL10 | |
| Dell 16 Plus 2-in-1 | |
| HP OmniBook X Flip 16 | |
| Przeciętny Intel Core Ultra 7 258V (422 - 632, n=26) | |
| Samsung Galaxy Book5 Pro 360 | |
| AIDA64 / FP64 Ray-Trace | |
| MSI Summit A16 AI Plus A3HMTG | |
| HP Spectre x360 16 RTX 4050 | |
| Samsung Galaxy Book5 Pro 360 | |
| Dell 16 Plus 2-in-1 | |
| Lenovo Yoga 7 2-in-1 16ILL10 | |
| Przeciętny Intel Core Ultra 7 258V (4258 - 6930, n=26) | |
| HP OmniBook X Flip 16 | |
| AIDA64 / CPU PhotoWorxx | |
| Dell 16 Plus 2-in-1 | |
| HP OmniBook X Flip 16 | |
| Przeciętny Intel Core Ultra 7 258V (44223 - 59245, n=26) | |
| Lenovo Yoga 7 2-in-1 16ILL10 | |
| MSI Summit A16 AI Plus A3HMTG | |
| Samsung Galaxy Book5 Pro 360 | |
| HP Spectre x360 16 RTX 4050 | |
Test warunków skrajnych
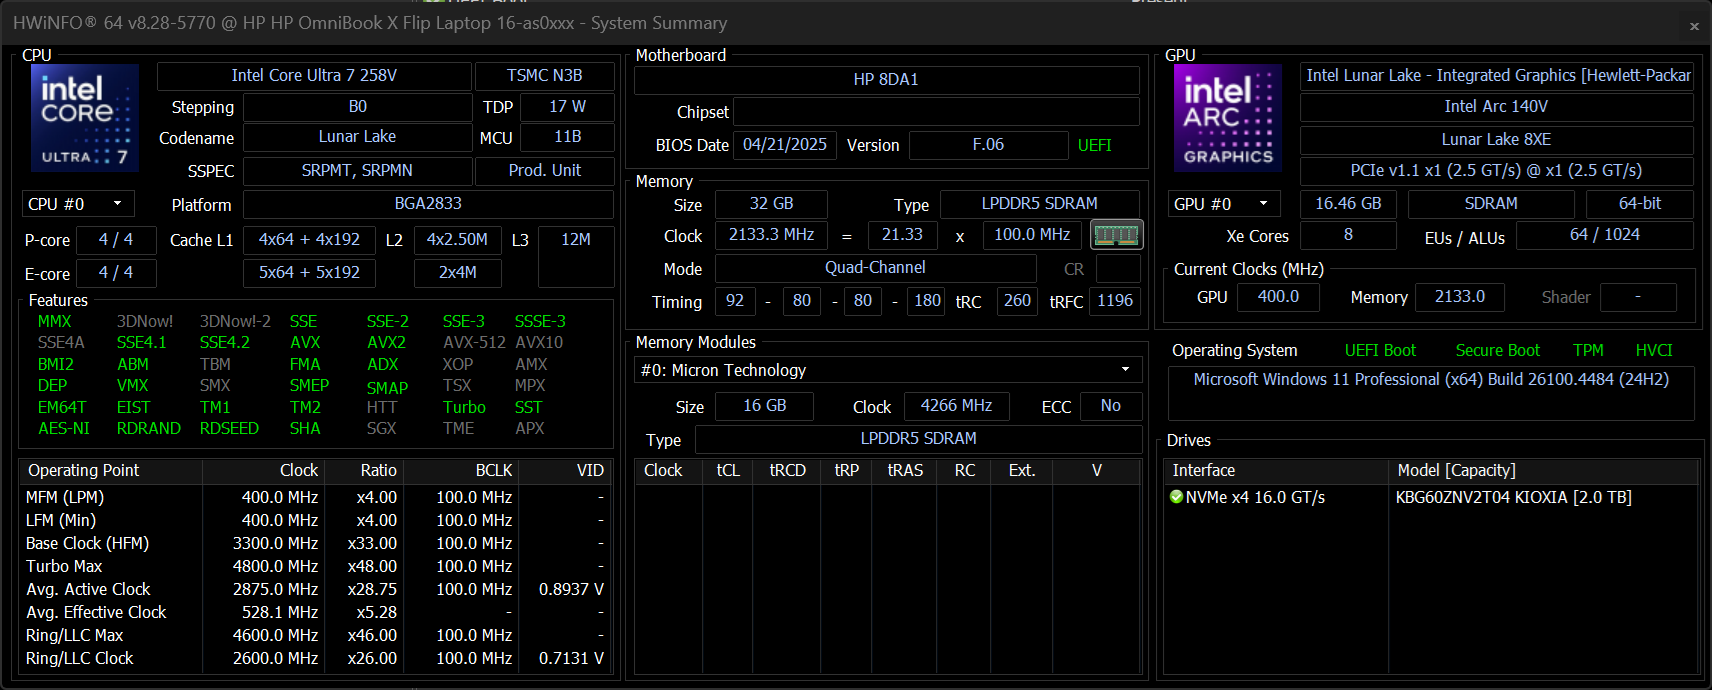
Procesor stabilizuje się na poziomie 2,9 GHz, 82 C i 26 W przy obciążeniu Prime95 w porównaniu do 2,5 GHz, 72 C i 22 W w Dell Plus 16 2-w-1 z tym samym procesorem Core Ultra 7 258V.
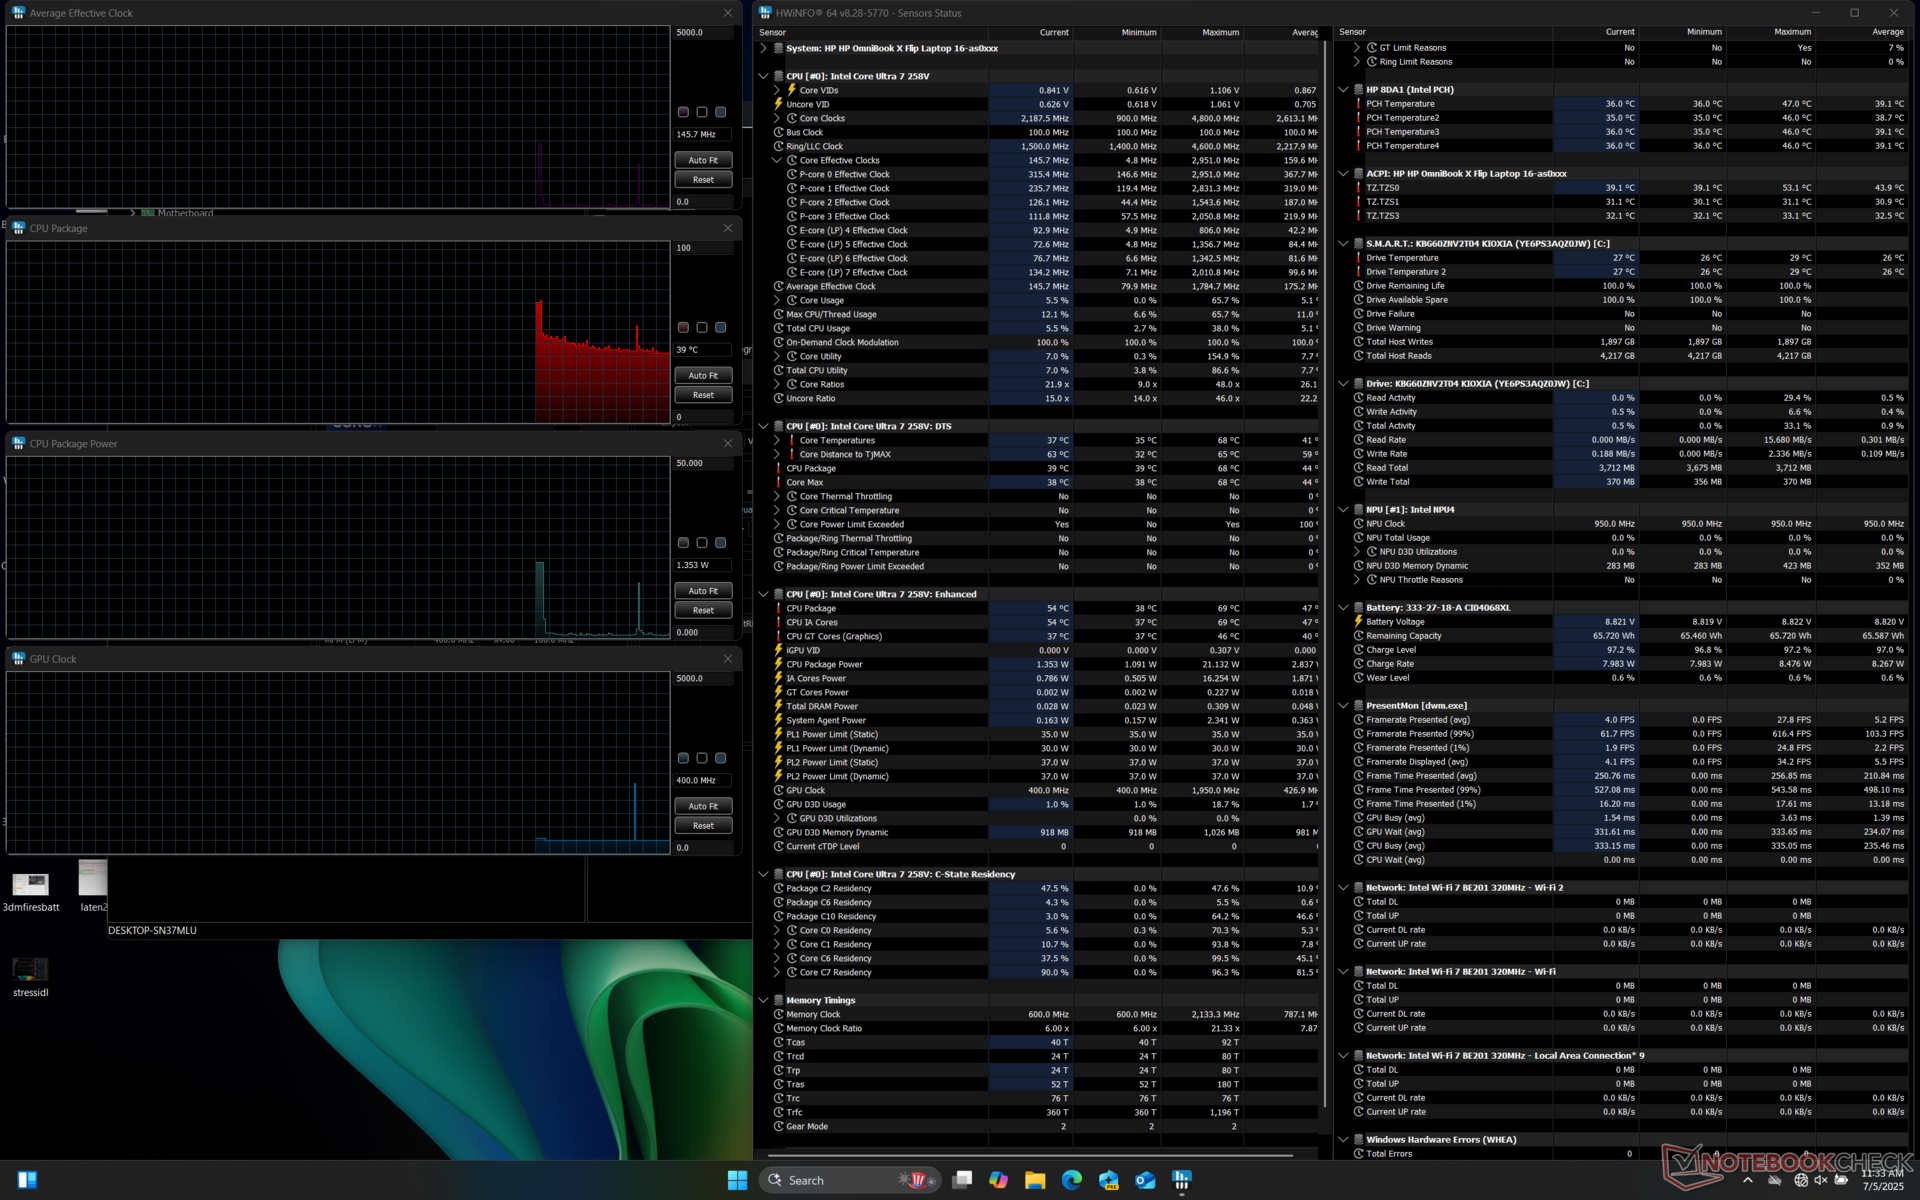

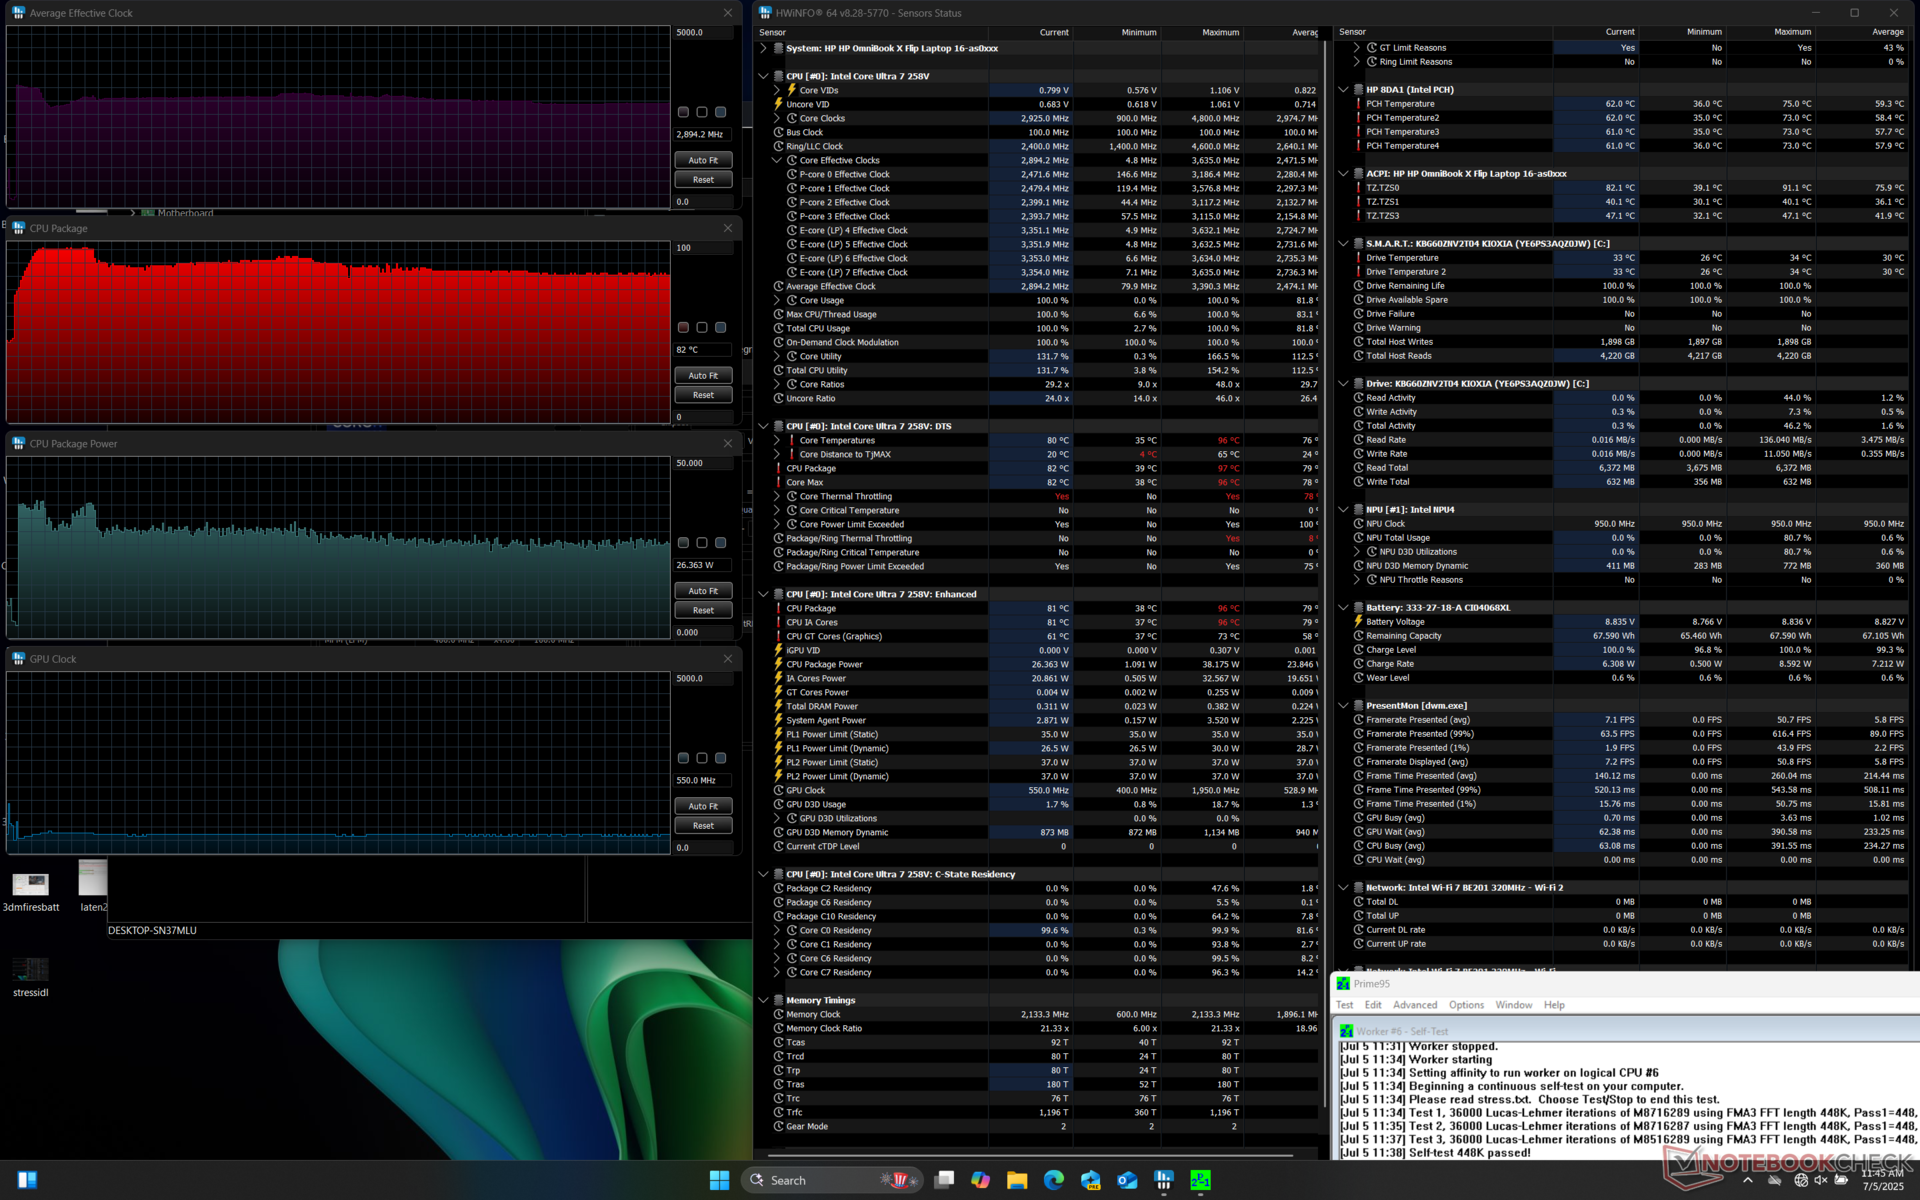
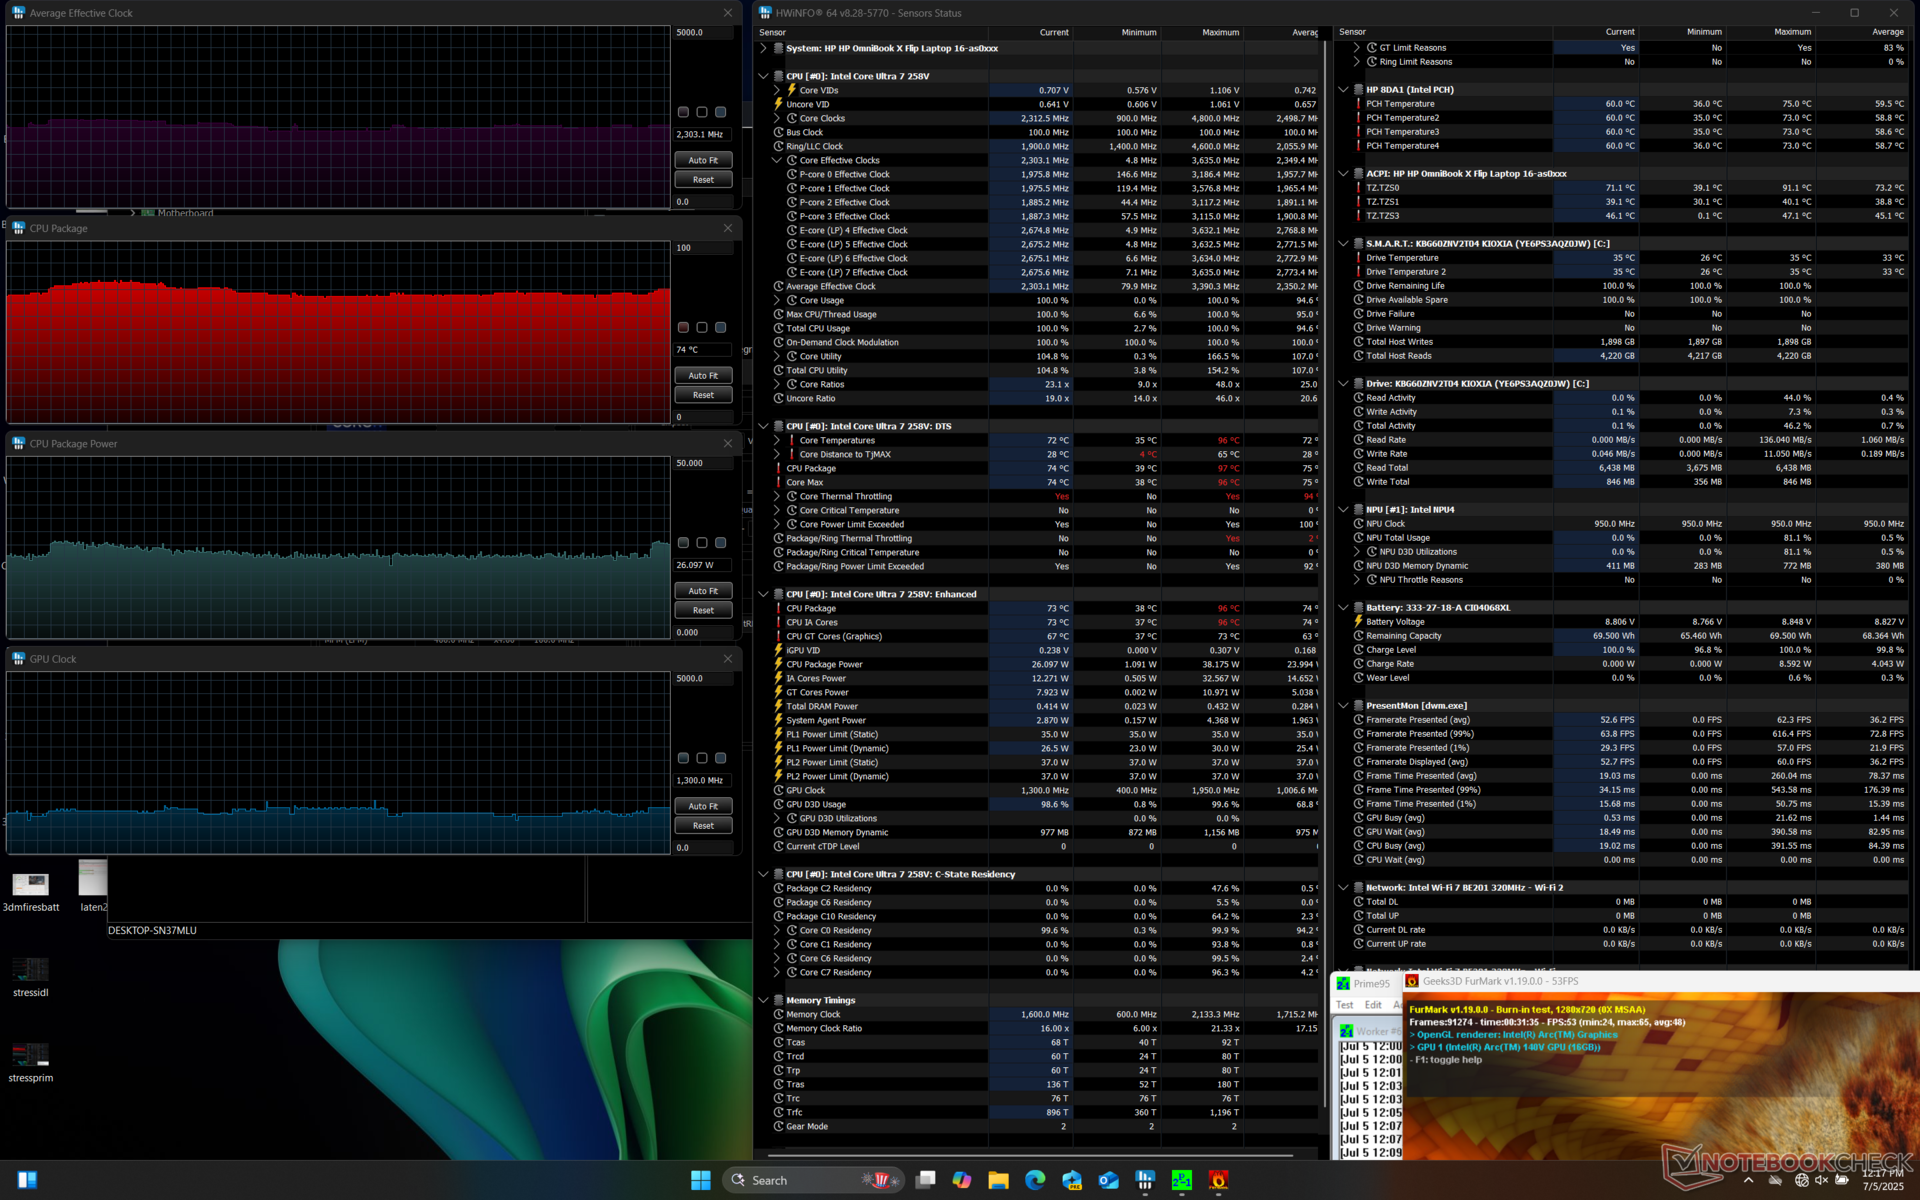
| Średnie taktowanie CPU (GHz) | Taktowanie GPU (MHz) | Średnia temperatura CPU (°C) | |
| System bezczynności | -- | -- | 39 |
| Prime95 Stress | 2.9 | -- | 82 |
| Prime95 + FurMark Stress | 2.3 | 1300 | 74 |
| Cyberpunk 2077 Stress | 1.3 | 1750 | 68 |
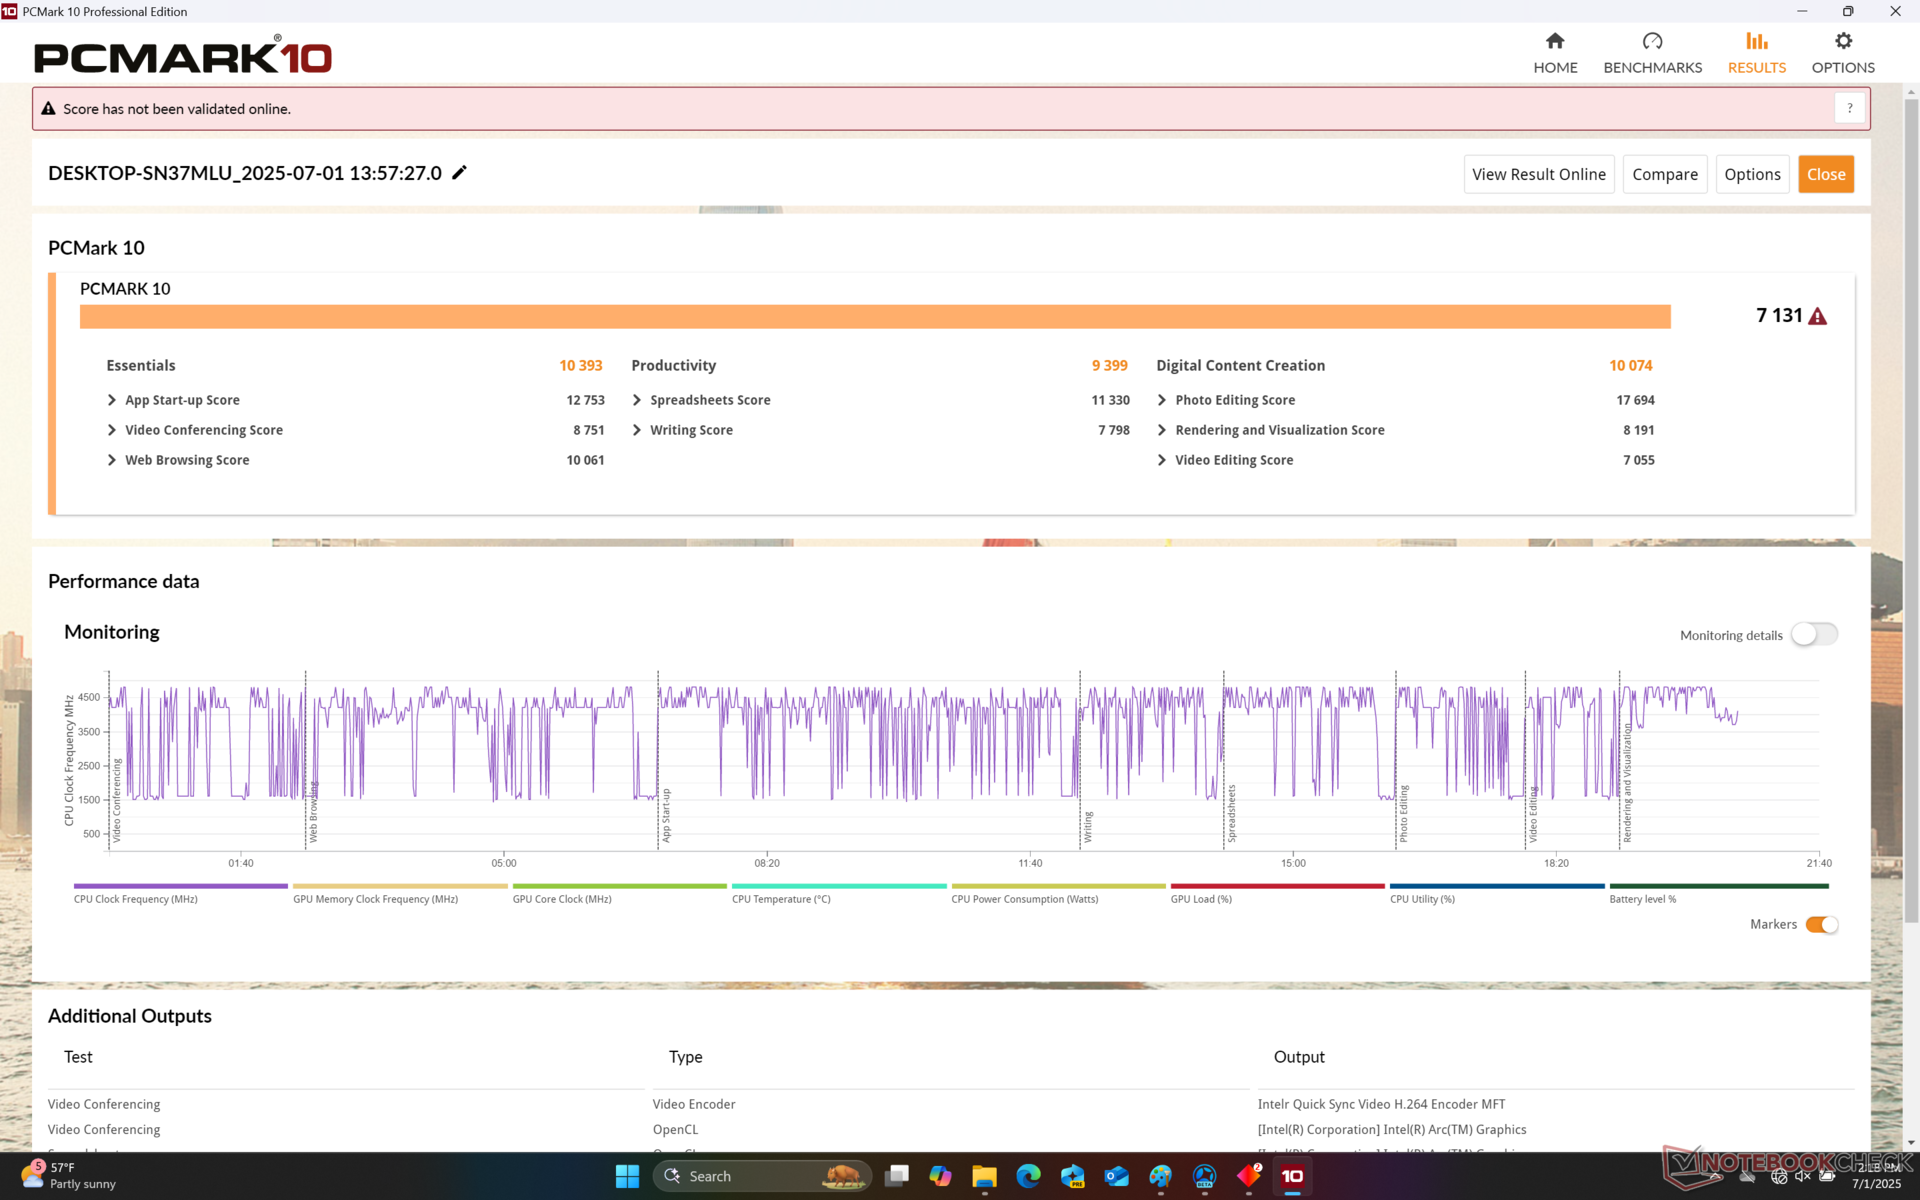
Wydajność systemu
PCMark 10: Score | Essentials | Productivity | Digital Content Creation
CrossMark: Overall | Productivity | Creativity | Responsiveness
WebXPRT 3: Overall
WebXPRT 4: Overall
Mozilla Kraken 1.1: Total
| Performance rating | |
| MSI Summit A16 AI Plus A3HMTG | |
| Lenovo Yoga 7 2-in-1 16ILL10 | |
| HP OmniBook X Flip 16 | |
| Dell 16 Plus 2-in-1 | |
| Przeciętny Intel Core Ultra 7 258V, Intel Arc Graphics 140V | |
| Samsung Galaxy Book5 Pro 360 | |
| HP Spectre x360 16 RTX 4050 | |
| PCMark 10 / Score | |
| MSI Summit A16 AI Plus A3HMTG | |
| Lenovo Yoga 7 2-in-1 16ILL10 | |
| HP OmniBook X Flip 16 | |
| Przeciętny Intel Core Ultra 7 258V, Intel Arc Graphics 140V (6265 - 7420, n=23) | |
| Dell 16 Plus 2-in-1 | |
| HP Spectre x360 16 RTX 4050 | |
| Samsung Galaxy Book5 Pro 360 | |
| PCMark 10 / Essentials | |
| Lenovo Yoga 7 2-in-1 16ILL10 | |
| MSI Summit A16 AI Plus A3HMTG | |
| HP OmniBook X Flip 16 | |
| Przeciętny Intel Core Ultra 7 258V, Intel Arc Graphics 140V (9295 - 11467, n=23) | |
| HP Spectre x360 16 RTX 4050 | |
| Dell 16 Plus 2-in-1 | |
| Samsung Galaxy Book5 Pro 360 | |
| PCMark 10 / Productivity | |
| MSI Summit A16 AI Plus A3HMTG | |
| Lenovo Yoga 7 2-in-1 16ILL10 | |
| HP OmniBook X Flip 16 | |
| HP Spectre x360 16 RTX 4050 | |
| Przeciętny Intel Core Ultra 7 258V, Intel Arc Graphics 140V (7357 - 13600, n=23) | |
| Samsung Galaxy Book5 Pro 360 | |
| Dell 16 Plus 2-in-1 | |
| PCMark 10 / Digital Content Creation | |
| MSI Summit A16 AI Plus A3HMTG | |
| Lenovo Yoga 7 2-in-1 16ILL10 | |
| HP OmniBook X Flip 16 | |
| Przeciętny Intel Core Ultra 7 258V, Intel Arc Graphics 140V (8160 - 10308, n=23) | |
| Dell 16 Plus 2-in-1 | |
| Samsung Galaxy Book5 Pro 360 | |
| HP Spectre x360 16 RTX 4050 | |
| CrossMark / Overall | |
| MSI Summit A16 AI Plus A3HMTG | |
| HP OmniBook X Flip 16 | |
| Lenovo Yoga 7 2-in-1 16ILL10 | |
| Dell 16 Plus 2-in-1 | |
| Przeciętny Intel Core Ultra 7 258V, Intel Arc Graphics 140V (1275 - 1742, n=22) | |
| Samsung Galaxy Book5 Pro 360 | |
| HP Spectre x360 16 RTX 4050 | |
| CrossMark / Productivity | |
| HP OmniBook X Flip 16 | |
| Lenovo Yoga 7 2-in-1 16ILL10 | |
| Dell 16 Plus 2-in-1 | |
| Przeciętny Intel Core Ultra 7 258V, Intel Arc Graphics 140V (1267 - 1684, n=22) | |
| MSI Summit A16 AI Plus A3HMTG | |
| Samsung Galaxy Book5 Pro 360 | |
| HP Spectre x360 16 RTX 4050 | |
| CrossMark / Creativity | |
| MSI Summit A16 AI Plus A3HMTG | |
| Lenovo Yoga 7 2-in-1 16ILL10 | |
| HP OmniBook X Flip 16 | |
| Dell 16 Plus 2-in-1 | |
| Przeciętny Intel Core Ultra 7 258V, Intel Arc Graphics 140V (1393 - 1977, n=22) | |
| HP Spectre x360 16 RTX 4050 | |
| Samsung Galaxy Book5 Pro 360 | |
| CrossMark / Responsiveness | |
| MSI Summit A16 AI Plus A3HMTG | |
| HP OmniBook X Flip 16 | |
| Lenovo Yoga 7 2-in-1 16ILL10 | |
| Samsung Galaxy Book5 Pro 360 | |
| Przeciętny Intel Core Ultra 7 258V, Intel Arc Graphics 140V (999 - 1411, n=22) | |
| Dell 16 Plus 2-in-1 | |
| HP Spectre x360 16 RTX 4050 | |
| WebXPRT 3 / Overall | |
| MSI Summit A16 AI Plus A3HMTG | |
| HP OmniBook X Flip 16 | |
| Lenovo Yoga 7 2-in-1 16ILL10 | |
| Dell 16 Plus 2-in-1 | |
| Przeciętny Intel Core Ultra 7 258V, Intel Arc Graphics 140V (219 - 317, n=22) | |
| HP Spectre x360 16 RTX 4050 | |
| Samsung Galaxy Book5 Pro 360 | |
| WebXPRT 4 / Overall | |
| Lenovo Yoga 7 2-in-1 16ILL10 | |
| Dell 16 Plus 2-in-1 | |
| HP OmniBook X Flip 16 | |
| Przeciętny Intel Core Ultra 7 258V, Intel Arc Graphics 140V (199.5 - 291, n=22) | |
| MSI Summit A16 AI Plus A3HMTG | |
| Samsung Galaxy Book5 Pro 360 | |
| HP Spectre x360 16 RTX 4050 | |
| Mozilla Kraken 1.1 / Total | |
| HP Spectre x360 16 RTX 4050 | |
| Samsung Galaxy Book5 Pro 360 | |
| HP OmniBook X Flip 16 | |
| Przeciętny Intel Core Ultra 7 258V, Intel Arc Graphics 140V (468 - 559, n=24) | |
| Dell 16 Plus 2-in-1 | |
| Lenovo Yoga 7 2-in-1 16ILL10 | |
| MSI Summit A16 AI Plus A3HMTG | |
* ... im mniej tym lepiej
| PCMark 10 Score | 7131 pkt. | |
Pomoc | ||
| AIDA64 / Memory Copy | |
| Przeciętny Intel Core Ultra 7 258V (104408 - 114336, n=24) | |
| HP OmniBook X Flip 16 | |
| Dell 16 Plus 2-in-1 | |
| Samsung Galaxy Book5 Pro 360 | |
| Lenovo Yoga 7 2-in-1 16ILL10 | |
| MSI Summit A16 AI Plus A3HMTG | |
| HP Spectre x360 16 RTX 4050 | |
| AIDA64 / Memory Read | |
| MSI Summit A16 AI Plus A3HMTG | |
| Lenovo Yoga 7 2-in-1 16ILL10 | |
| Dell 16 Plus 2-in-1 | |
| Przeciętny Intel Core Ultra 7 258V (82846 - 89417, n=24) | |
| HP Spectre x360 16 RTX 4050 | |
| HP OmniBook X Flip 16 | |
| Samsung Galaxy Book5 Pro 360 | |
| AIDA64 / Memory Write | |
| Lenovo Yoga 7 2-in-1 16ILL10 | |
| HP OmniBook X Flip 16 | |
| Dell 16 Plus 2-in-1 | |
| Przeciętny Intel Core Ultra 7 258V (108824 - 117989, n=24) | |
| Samsung Galaxy Book5 Pro 360 | |
| MSI Summit A16 AI Plus A3HMTG | |
| HP Spectre x360 16 RTX 4050 | |
| AIDA64 / Memory Latency | |
| HP Spectre x360 16 RTX 4050 | |
| MSI Summit A16 AI Plus A3HMTG | |
| Dell 16 Plus 2-in-1 | |
| Lenovo Yoga 7 2-in-1 16ILL10 | |
| HP OmniBook X Flip 16 | |
| Przeciętny Intel Core Ultra 7 258V (95 - 101.7, n=24) | |
| Samsung Galaxy Book5 Pro 360 | |
* ... im mniej tym lepiej
Opóźnienie DPC
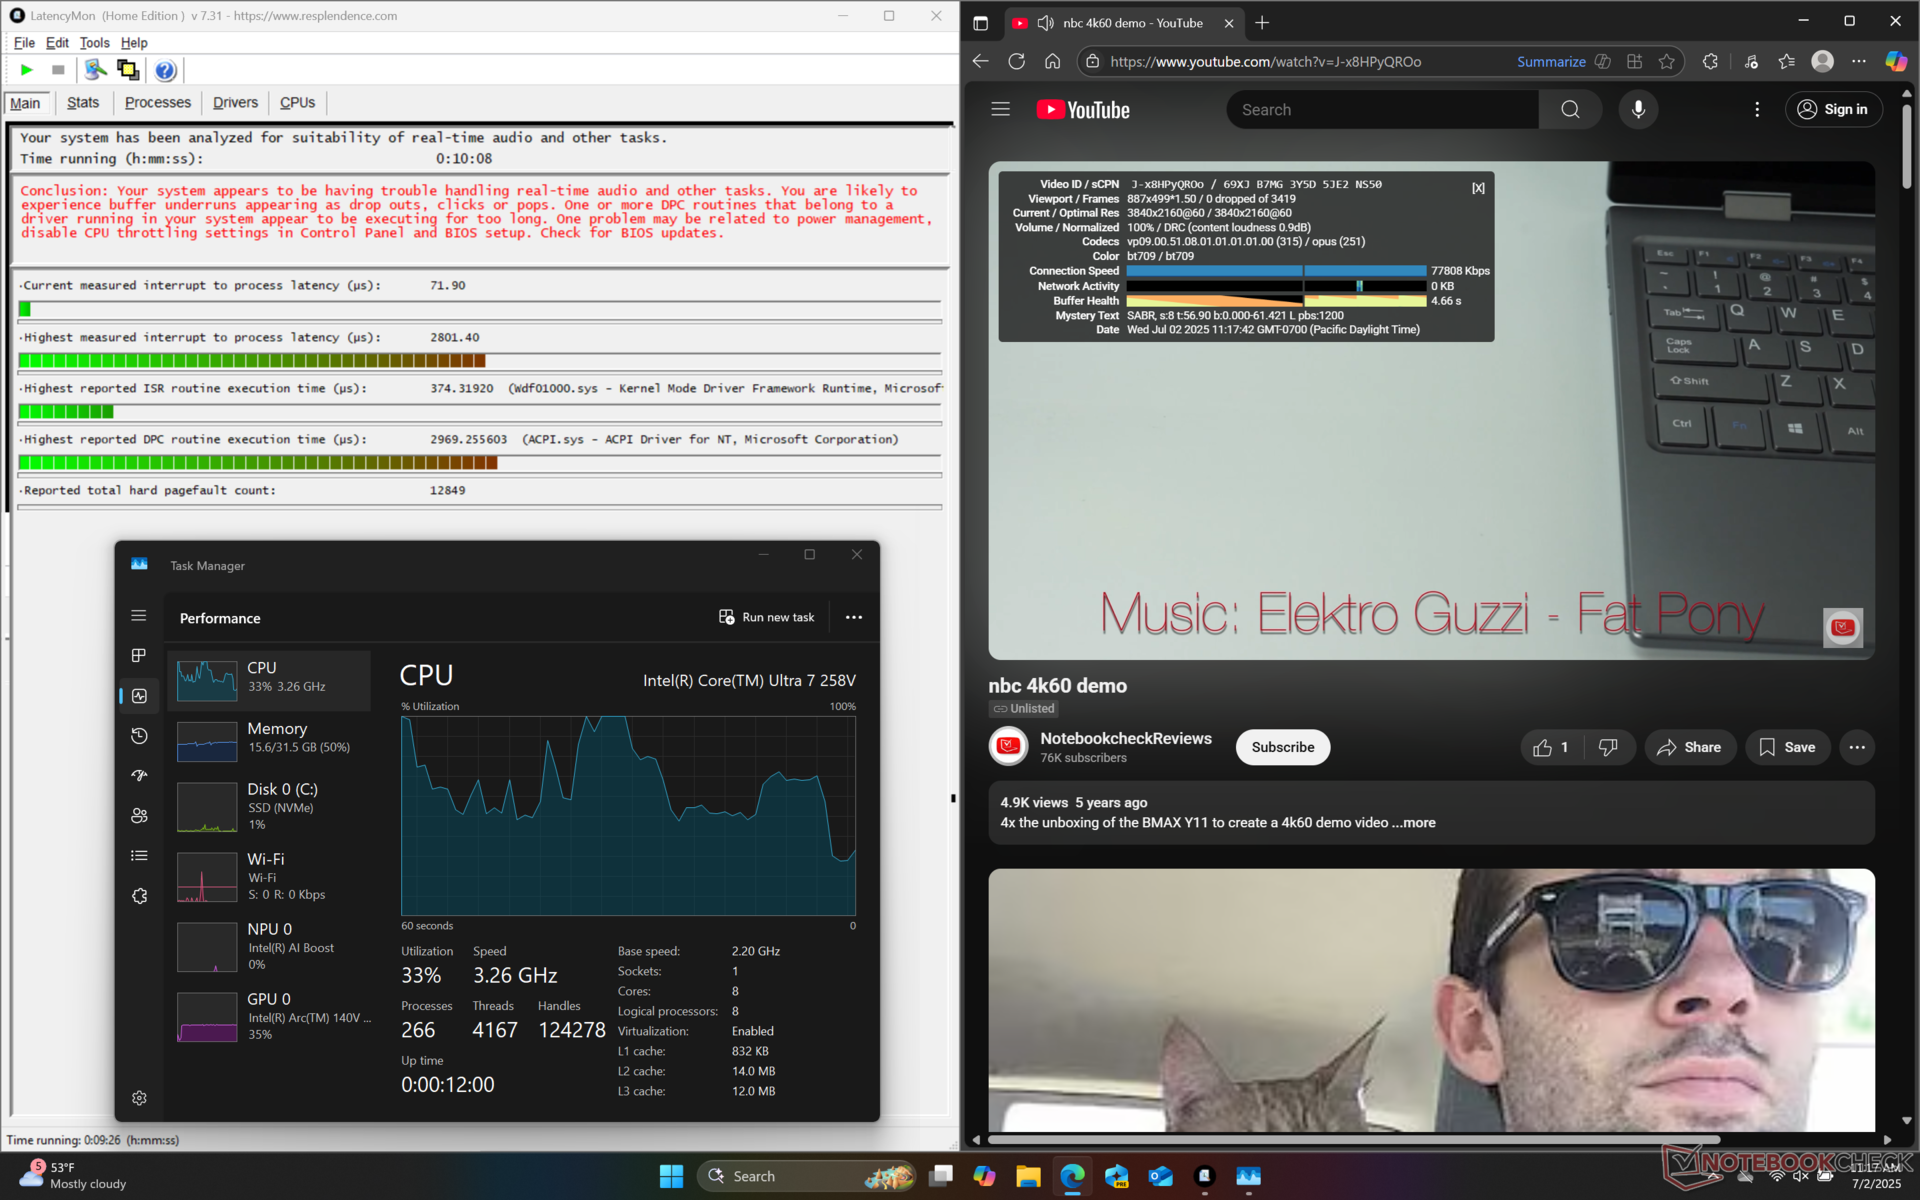
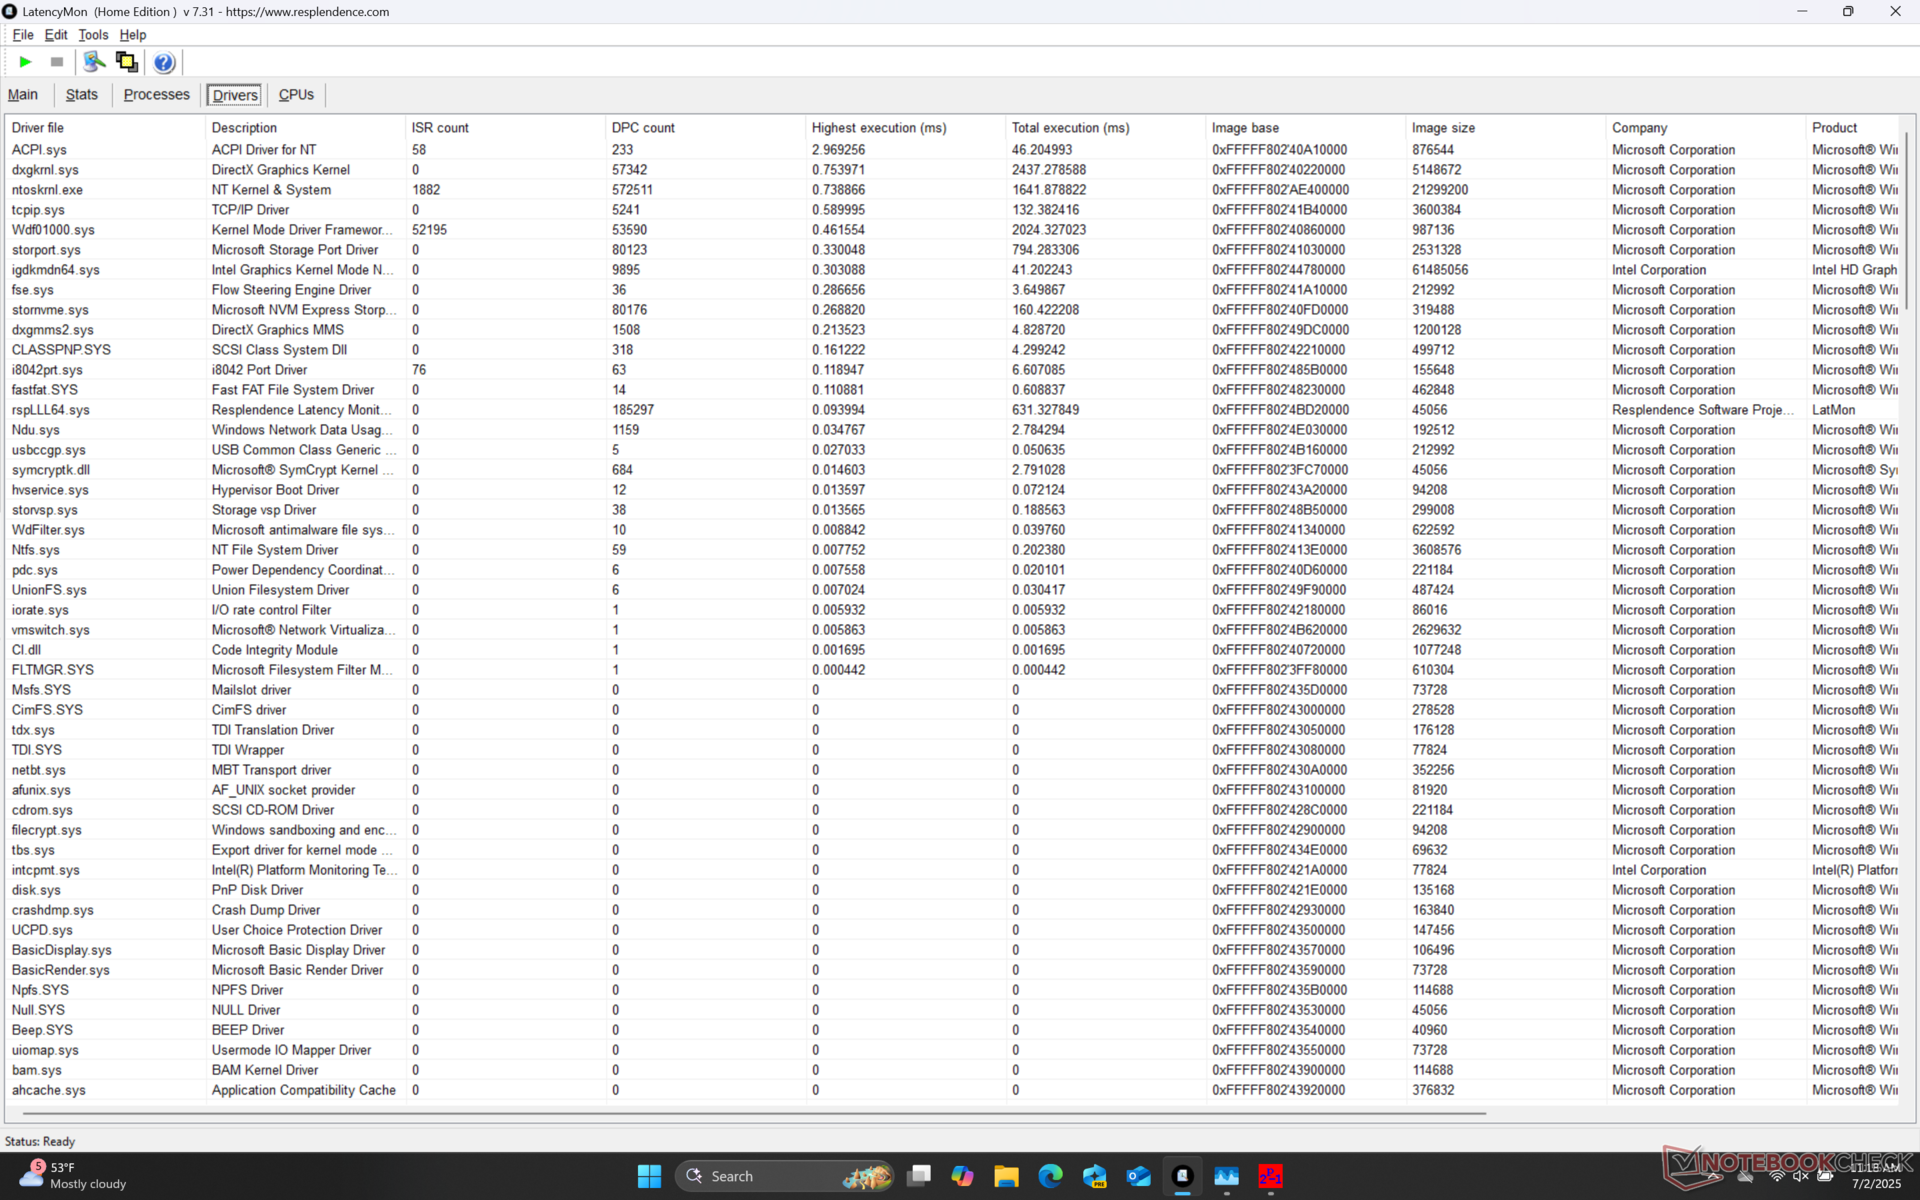
| DPC Latencies / LatencyMon - interrupt to process latency (max), Web, Youtube, Prime95 | |
| HP Spectre x360 16 RTX 4050 | |
| MSI Summit A16 AI Plus A3HMTG | |
| HP OmniBook X Flip 16 | |
| Dell 16 Plus 2-in-1 | |
| Samsung Galaxy Book5 Pro 360 | |
| Lenovo Yoga 7 2-in-1 16ILL10 | |
* ... im mniej tym lepiej
Urządzenia pamięci masowej
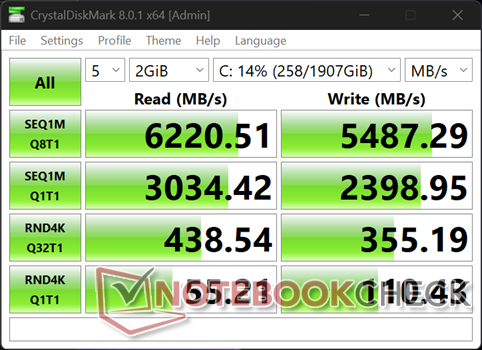
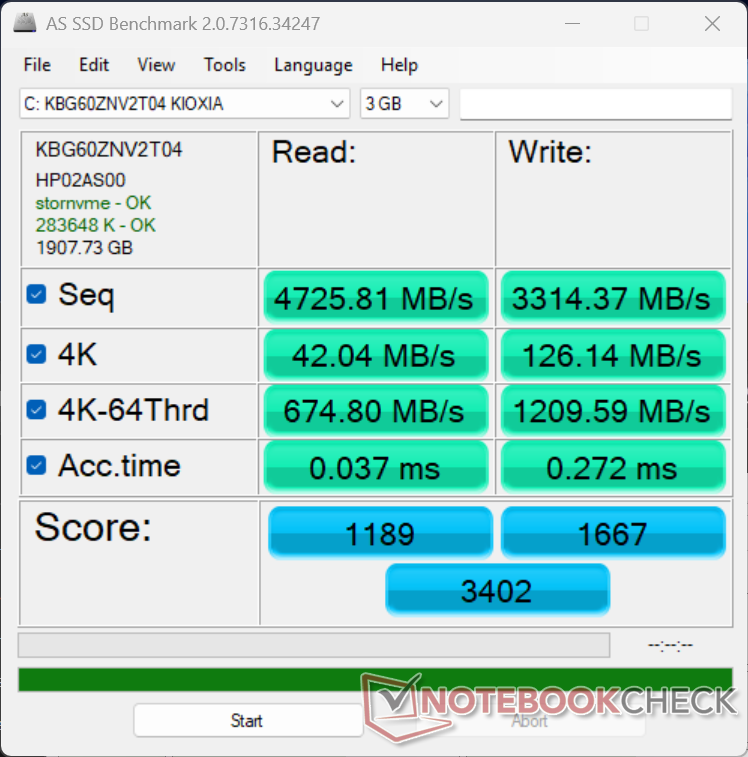

| Drive Performance rating - Percent | |
| Samsung Galaxy Book5 Pro 360 | |
| HP Spectre x360 16 RTX 4050 | |
| Lenovo Yoga 7 2-in-1 16ILL10 | |
| MSI Summit A16 AI Plus A3HMTG | |
| HP OmniBook X Flip 16 | |
| Dell 16 Plus 2-in-1 | |
* ... im mniej tym lepiej
Disk Throttling: DiskSpd Read Loop, Queue Depth 8
Wydajność GPU
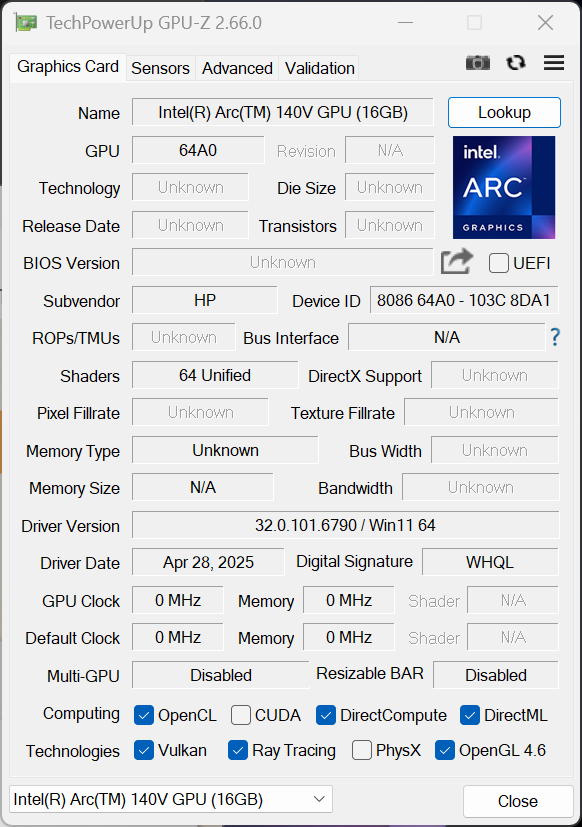
Grafika Arc Graphics 140V jest znaczącym ulepszeniem w stosunku do ostatniej generacji Serii Iris Xe a jednocześnie jest o około 15 procent szybsza niż słabszy Arc 130V konfiguracji. Wciąż nie może się jednak równać z oddzielnym procesorem graficznym Nvidii w HP Spectre x360 16jednak.
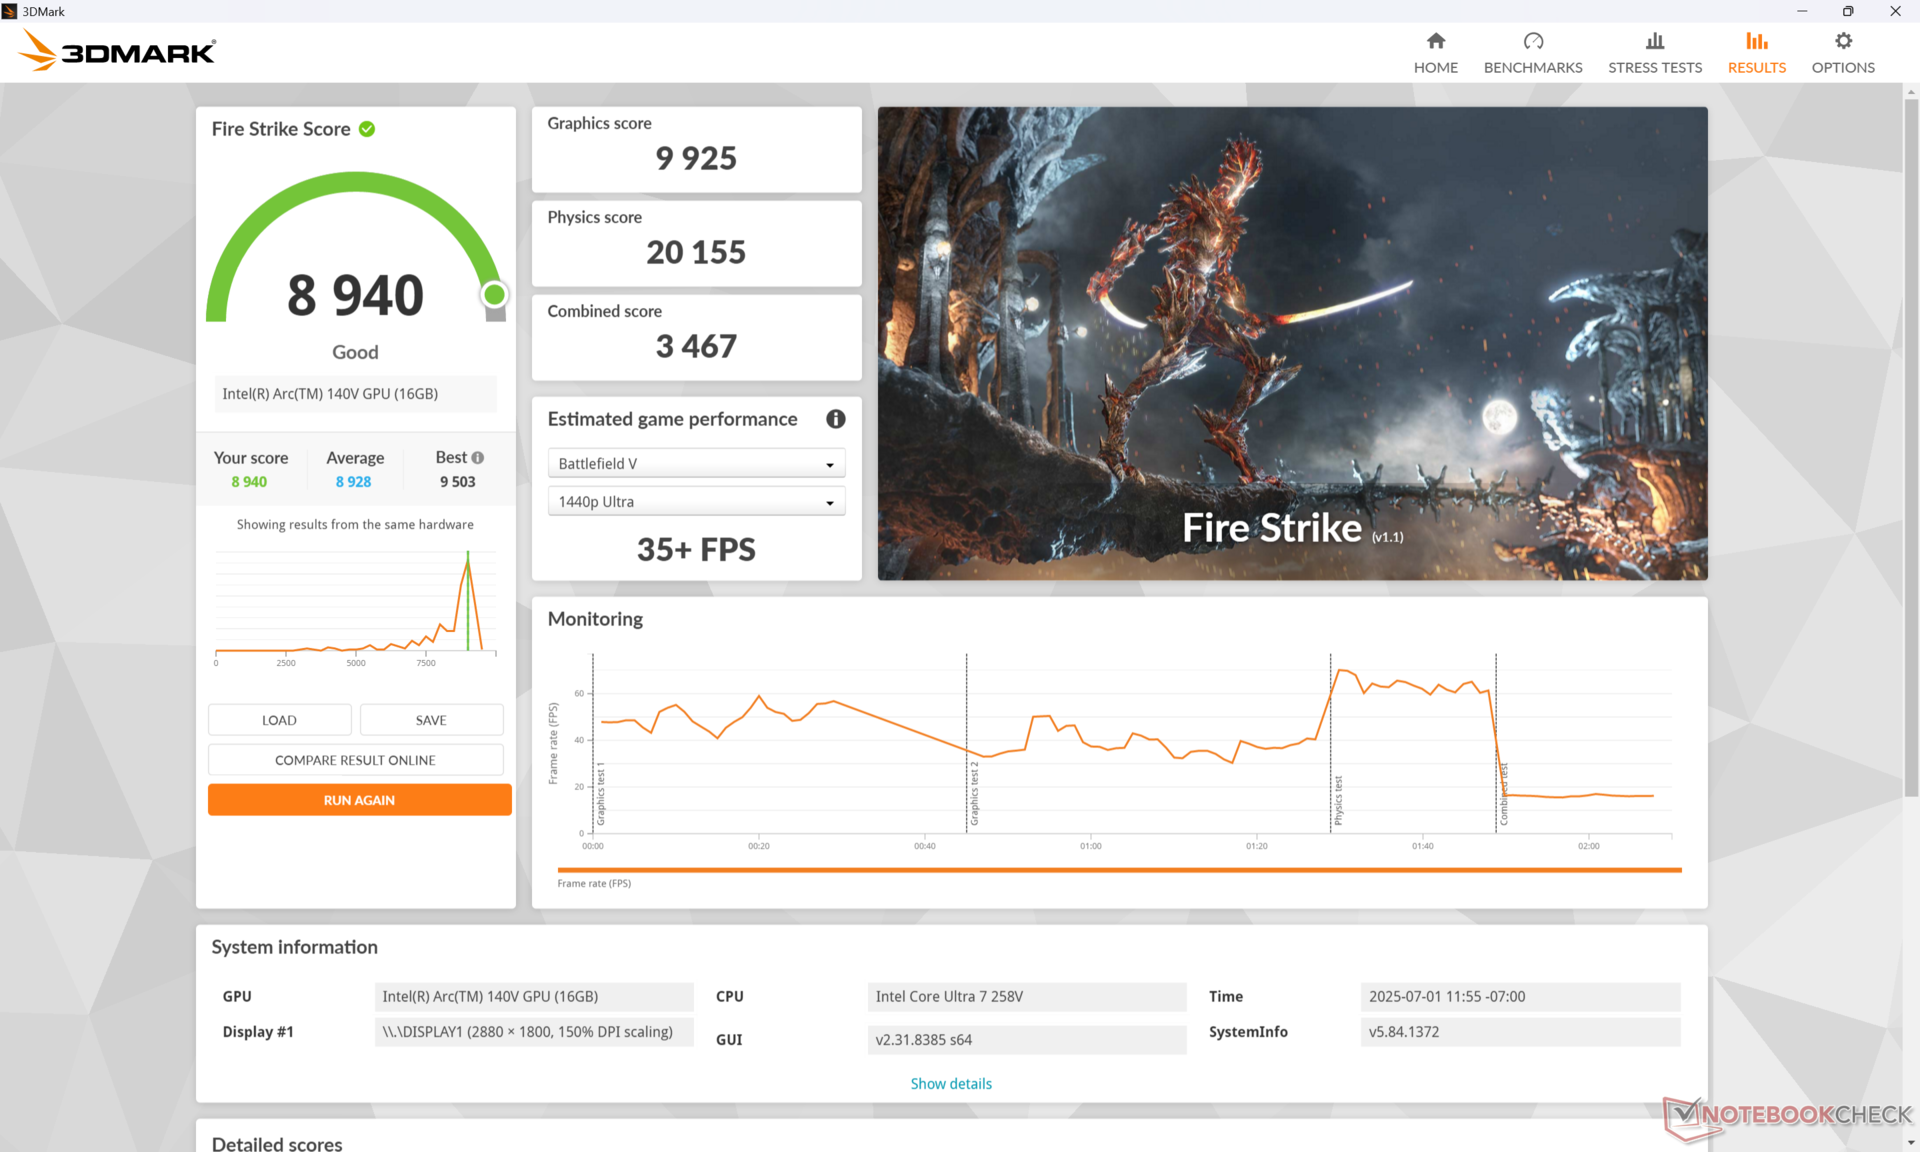
Praca na zasilaniu bateryjnym zmniejsza wydajność nawet o 20 procent.
| Profil zasilania | Wynik grafiki | Wynik fizyki | Wynik łączny |
| Tryb wydajności | 9925 | 20155 | 3467 |
| Tryb zrównoważony | 9910 (-0%) | 20635 (-0%) | 3466 (-0%) |
| Zasilanie bateryjne | 8048 (-19%) | 16246 (-19%) | 2499 (-28%) |
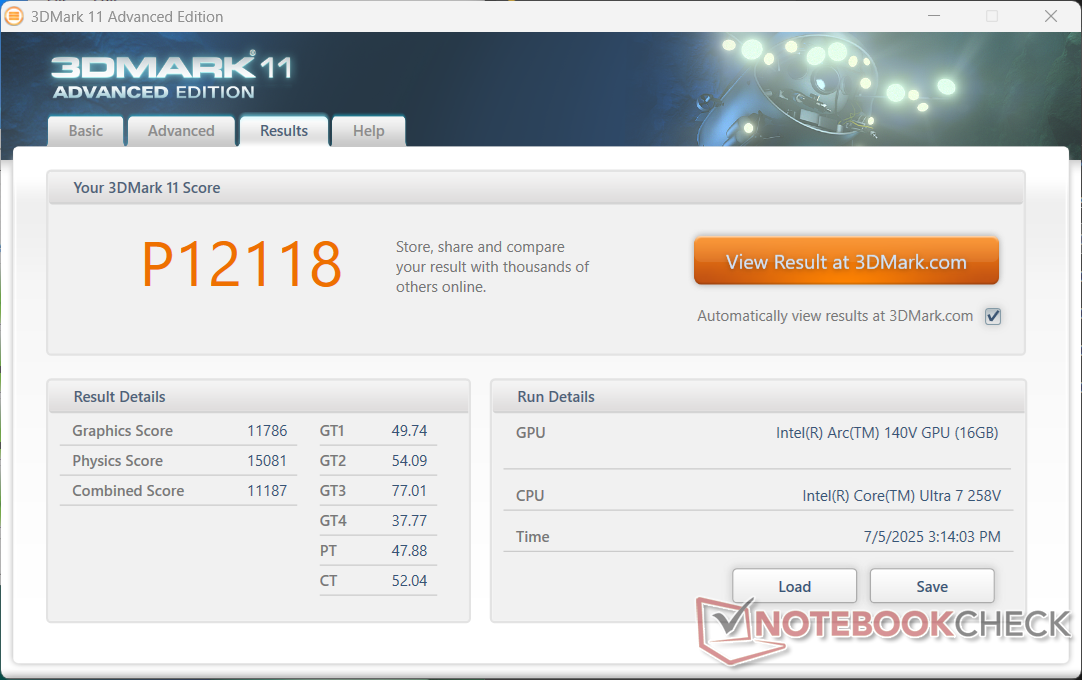
| 3DMark 11 Performance | 12118 pkt. | |
| 3DMark Cloud Gate Standard Score | 32872 pkt. | |
| 3DMark Fire Strike Score | 8940 pkt. | |
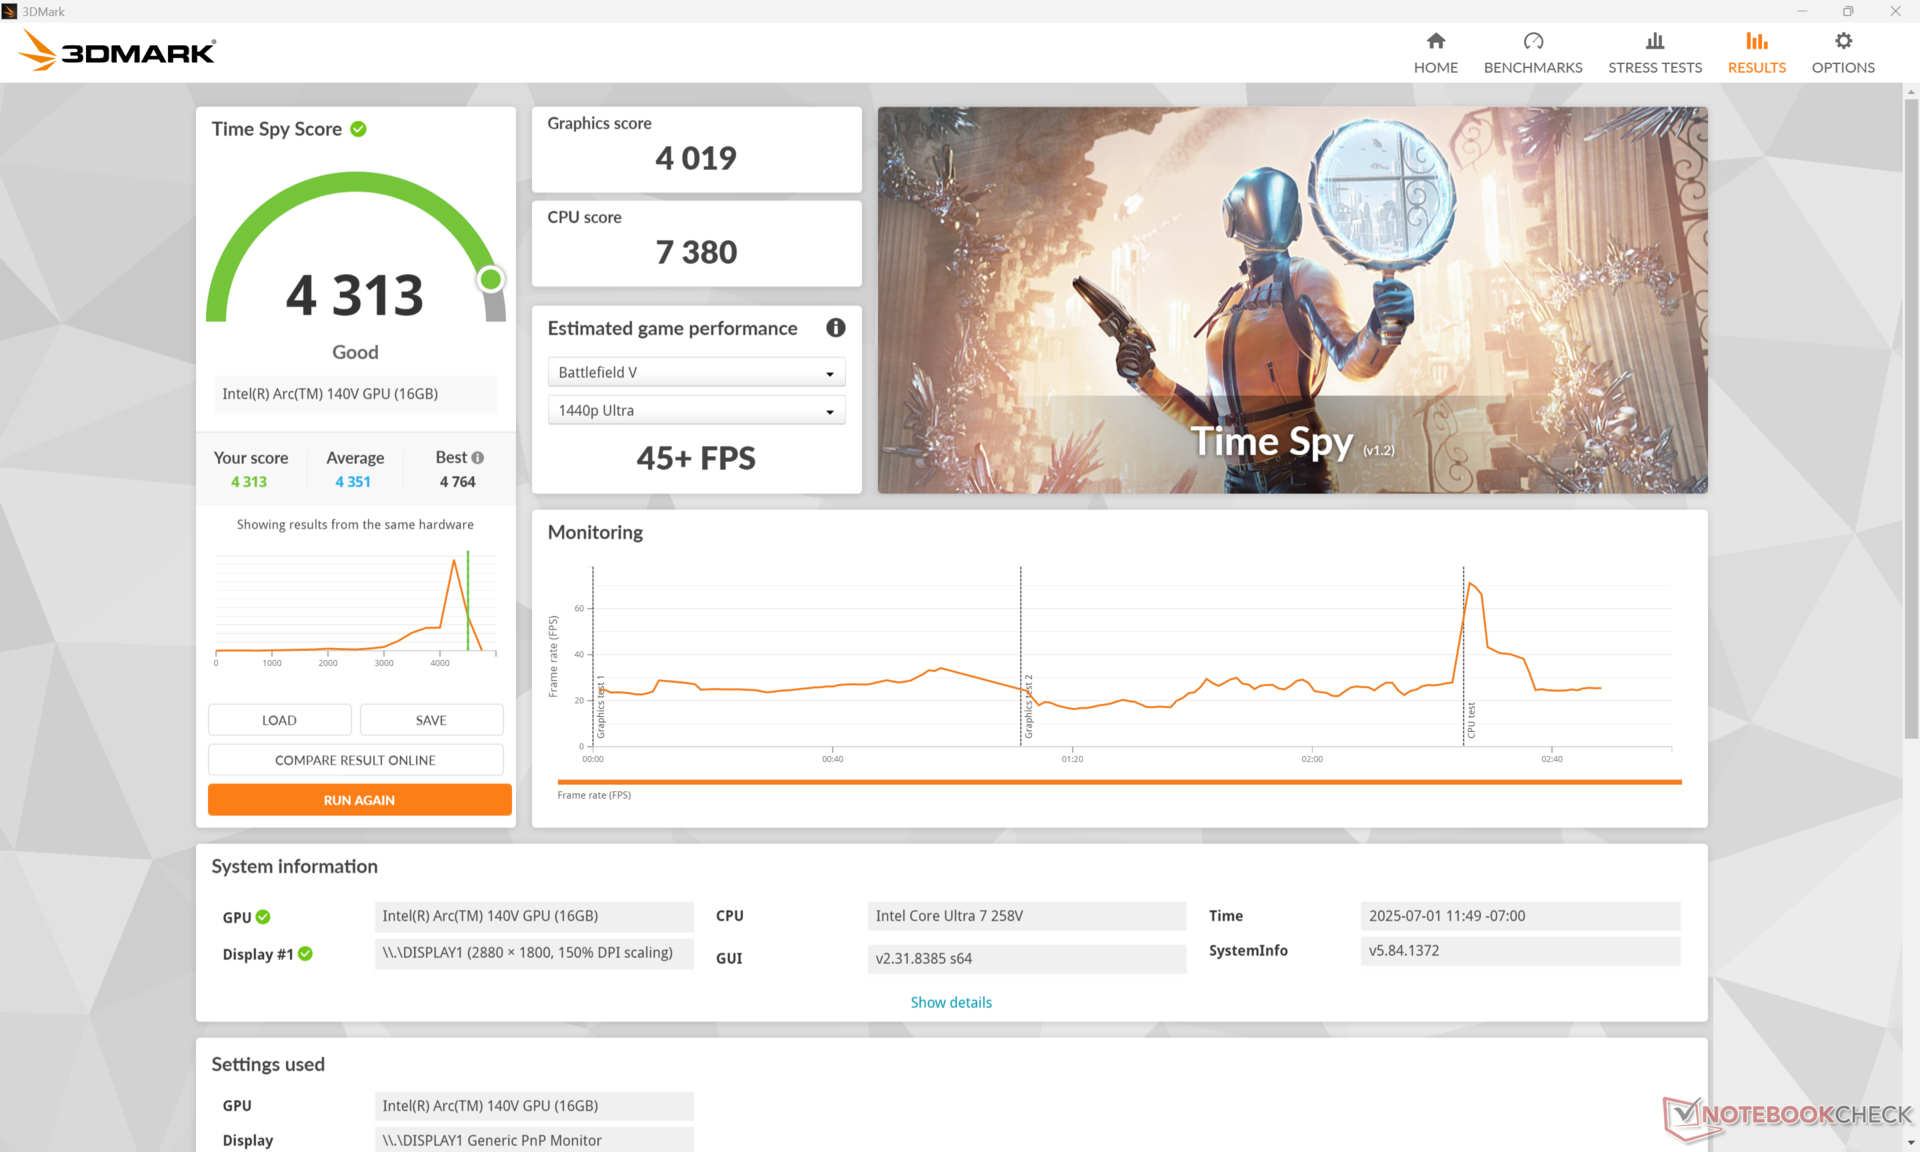
| 3DMark Time Spy Score | 4313 pkt. | |
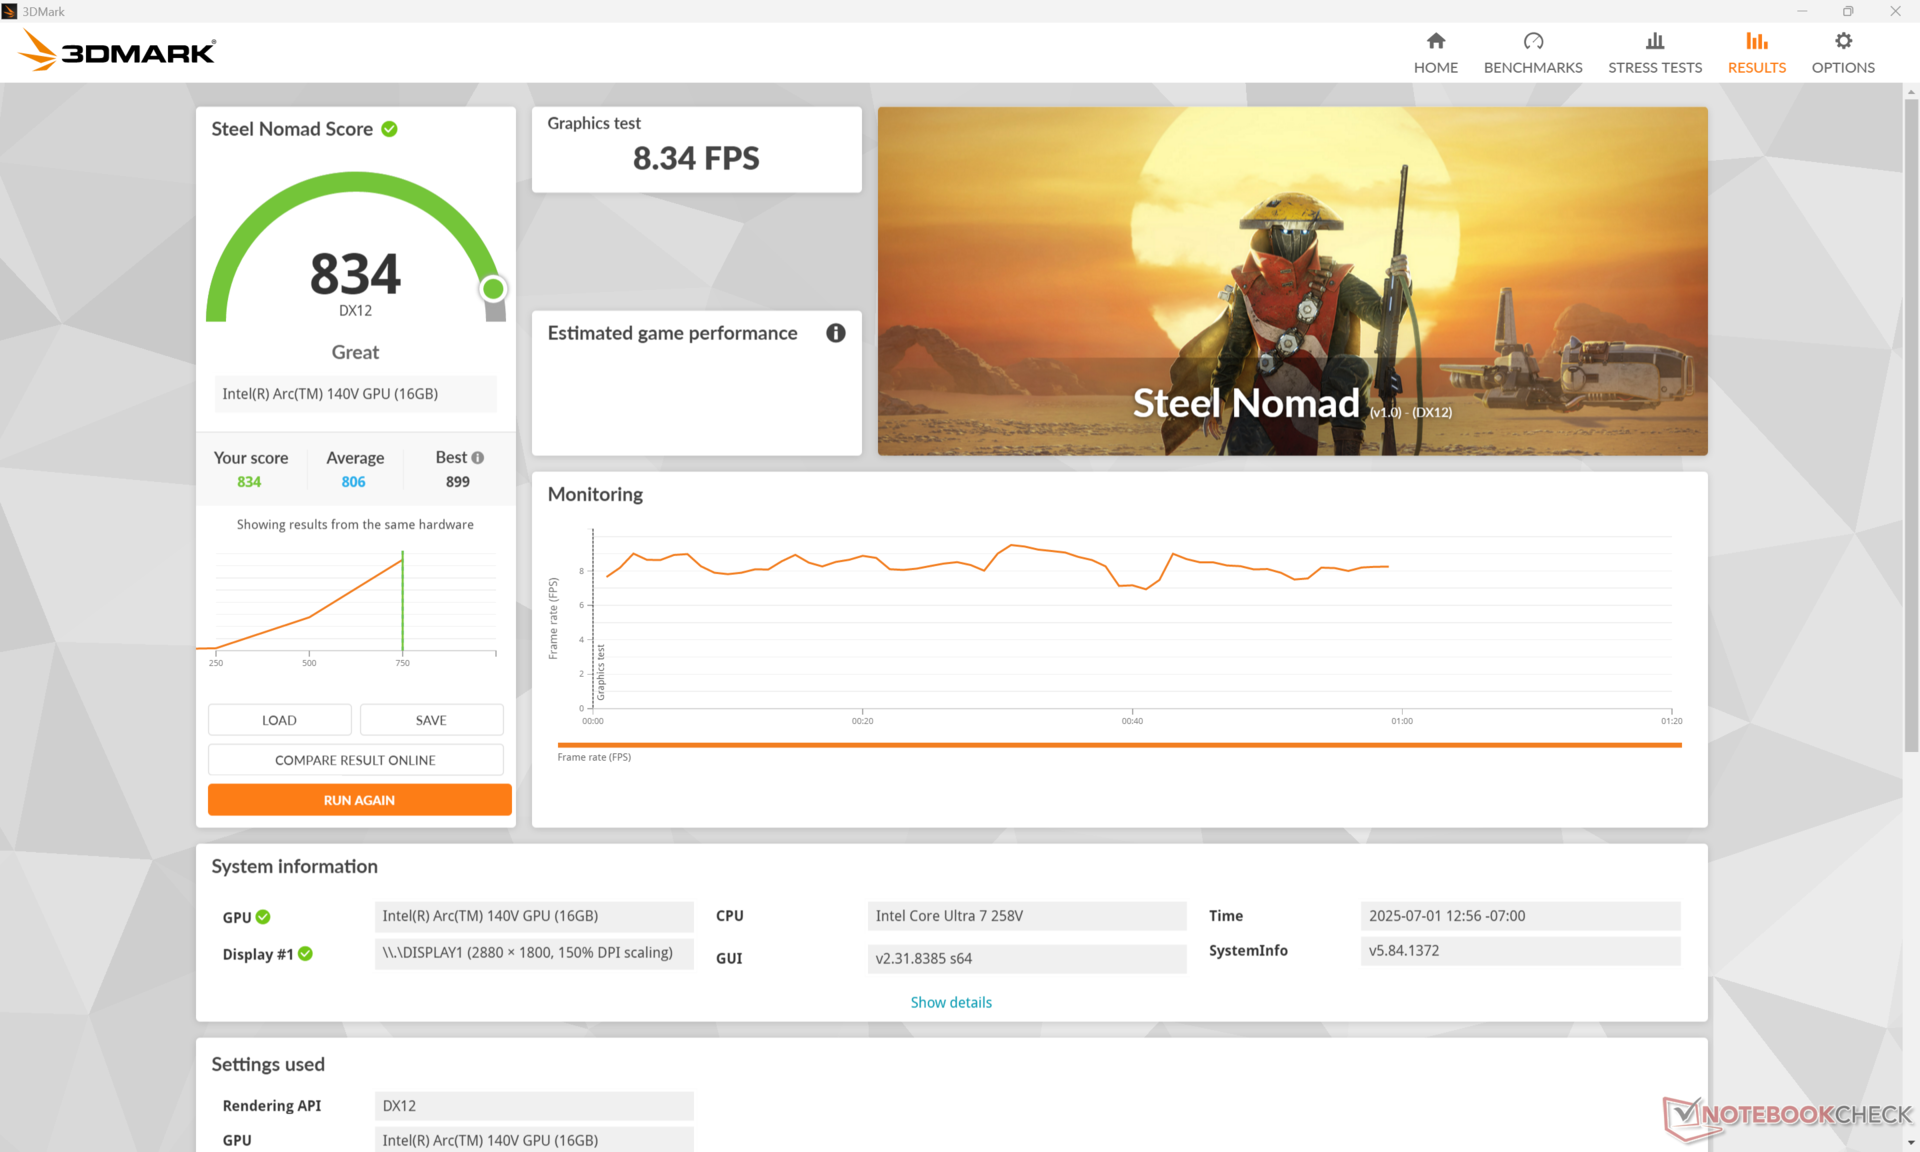
| 3DMark Steel Nomad Score | 834 pkt. | |
Pomoc | ||
* ... im mniej tym lepiej
| F1 24 | |
| 1920x1080 Low Preset AA:T AF:16x | |
| HP OmniBook X Flip 16 | |
| Lenovo Yoga 7 2-in-1 16ILL10 | |
| Dell 16 Plus 2-in-1 | |
| Przeciętny Intel Arc Graphics 140V (54 - 99, n=25) | |
| Asus Zenbook S 16 UM5606WA-RK052W | |
| 1920x1080 Medium Preset AA:T AF:16x | |
| HP OmniBook X Flip 16 | |
| Lenovo Yoga 7 2-in-1 16ILL10 | |
| Dell 16 Plus 2-in-1 | |
| Przeciętny Intel Arc Graphics 140V (49.2 - 88.2, n=24) | |
| Asus Zenbook S 16 UM5606WA-RK052W | |
| 1920x1080 High Preset AA:T AF:16x | |
| HP OmniBook X Flip 16 | |
| Dell 16 Plus 2-in-1 | |
| Lenovo Yoga 7 2-in-1 16ILL10 | |
| Przeciętny Intel Arc Graphics 140V (34.4 - 66.4, n=27) | |
| Asus Zenbook S 16 UM5606WA-RK052W | |
| 1920x1080 Ultra High Preset AA:T AF:16x | |
| HP OmniBook X Flip 16 | |
| Lenovo Yoga 7 2-in-1 16ILL10 | |
| Dell 16 Plus 2-in-1 | |
| Przeciętny Intel Arc Graphics 140V (14.6 - 22, n=25) | |
| Asus Zenbook S 16 UM5606WA-RK052W | |
Cyberpunk 2077 ultra FPS Chart
| low | med. | high | ultra | |
|---|---|---|---|---|
| Dota 2 Reborn (2015) | 97.2 | 88.4 | 63.5 | 84.9 |
| Final Fantasy XV Benchmark (2018) | 92.9 | 48.8 | 35.5 | |
| X-Plane 11.11 (2018) | 41.8 | 37.9 | 31.9 | |
| Strange Brigade (2018) | 246 | 79.6 | 67.7 | 58.7 |
| Baldur's Gate 3 (2023) | 43 | 36.1 | 29.7 | 29.1 |
| Cyberpunk 2077 (2023) | 46.4 | 37.5 | 32.9 | 23.3 |
| F1 24 (2024) | 91.9 | 83.9 | 64.6 | 20.9 |
Emisje
Hałas systemowy
Hałas wentylatora generalnie oscyluje wokół 28,6 dB(A) na cichym tle 27,5 dB(A) podczas przeglądania stron internetowych lub strumieniowego przesyłania wideo. Maksymalny poziom 38 dB(A) osiąga dość szybko, gdy wprowadzane są większe obciążenia, takie jak gry.
Hałas
| luz |
| 28 / 28.3 / 28.3 dB |
| obciążenie |
| 37.7 / 37.6 dB |
 | ||
30 dB cichy 40 dB(A) słyszalny 50 dB(A) irytujący |
||
min: | ||
| HP OmniBook X Flip 16 Arc 140V, Core Ultra 7 258V | Dell 16 Plus 2-in-1 Arc 140V, Core Ultra 7 258V, Samsung BM9C1 1024GB | Lenovo Yoga 7 2-in-1 16ILL10 Arc 140V, Core Ultra 7 256V, WD PC SN7100S SDFPMSL-512G-1101 | Samsung Galaxy Book5 Pro 360 Arc 130V, Core Ultra 5 226V, Samsung PM9B1 512GB MZVL4512HBLU | MSI Summit A16 AI Plus A3HMTG Radeon 880M, Ryzen AI 9 365, Samsung PM9C1 MZVL81T0HELB-00BTW | HP Spectre x360 16 RTX 4050 GeForce RTX 4050 Laptop GPU, Ultra 7 155H, SK hynix PC801 HFS001TEJ9X101N | |
|---|---|---|---|---|---|---|
| Noise | 6% | 4% | 9% | -6% | 17% | |
| wyłączone / środowisko * (dB) | 27.5 | 23.2 16% | 23.3 15% | 23.6 14% | 23.8 13% | 23.3 15% |
| Idle Minimum * (dB) | 28 | 23 18% | 23.3 17% | 23.6 16% | 25 11% | 23.6 16% |
| Idle Average * (dB) | 28.3 | 23 19% | 23.3 18% | 23.6 17% | 25 12% | 23.6 17% |
| Idle Maximum * (dB) | 28.3 | 24.7 13% | 25.7 9% | 23.6 17% | 29.5 -4% | 23.6 17% |
| Load Average * (dB) | 37.7 | 32.5 14% | 40.2 -7% | 29.4 22% | 37.5 1% | 29.2 23% |
| Cyberpunk 2077 ultra * (dB) | 36.2 | 42.6 -18% | 41.6 -15% | 40.6 -12% | 46.5 -28% | |
| Load Maximum * (dB) | 37.6 | 45.6 -21% | 41.6 -11% | 40.6 -8% | 56.1 -49% | 32.1 15% |
| Witcher 3 ultra * (dB) | 32.1 |
* ... im mniej tym lepiej
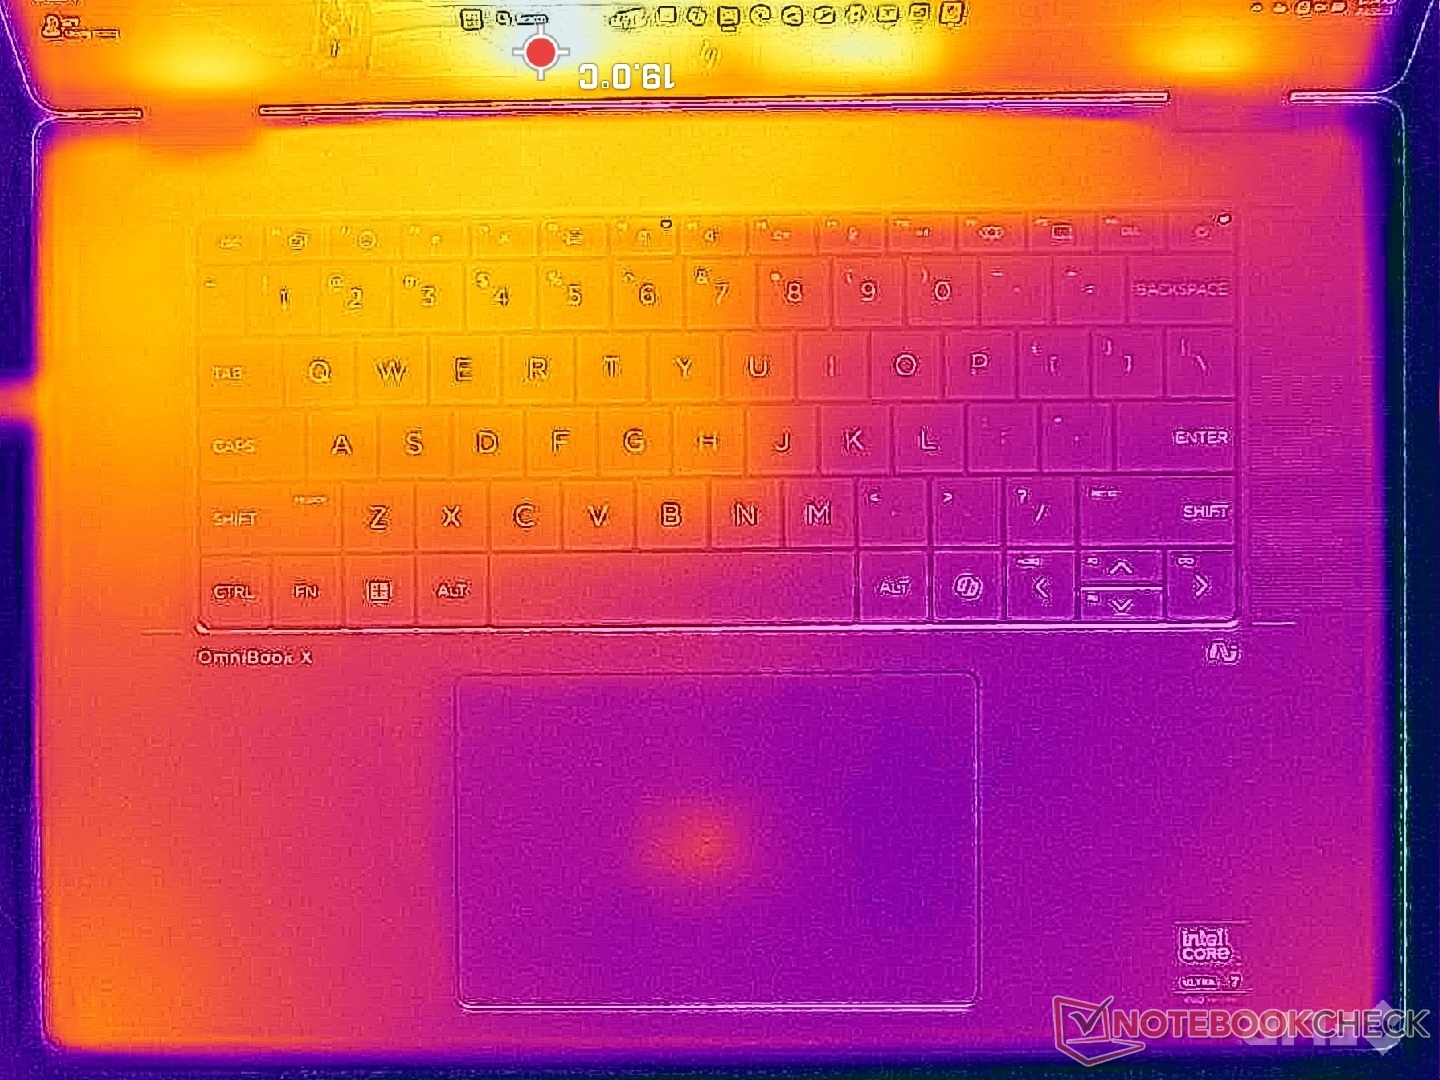
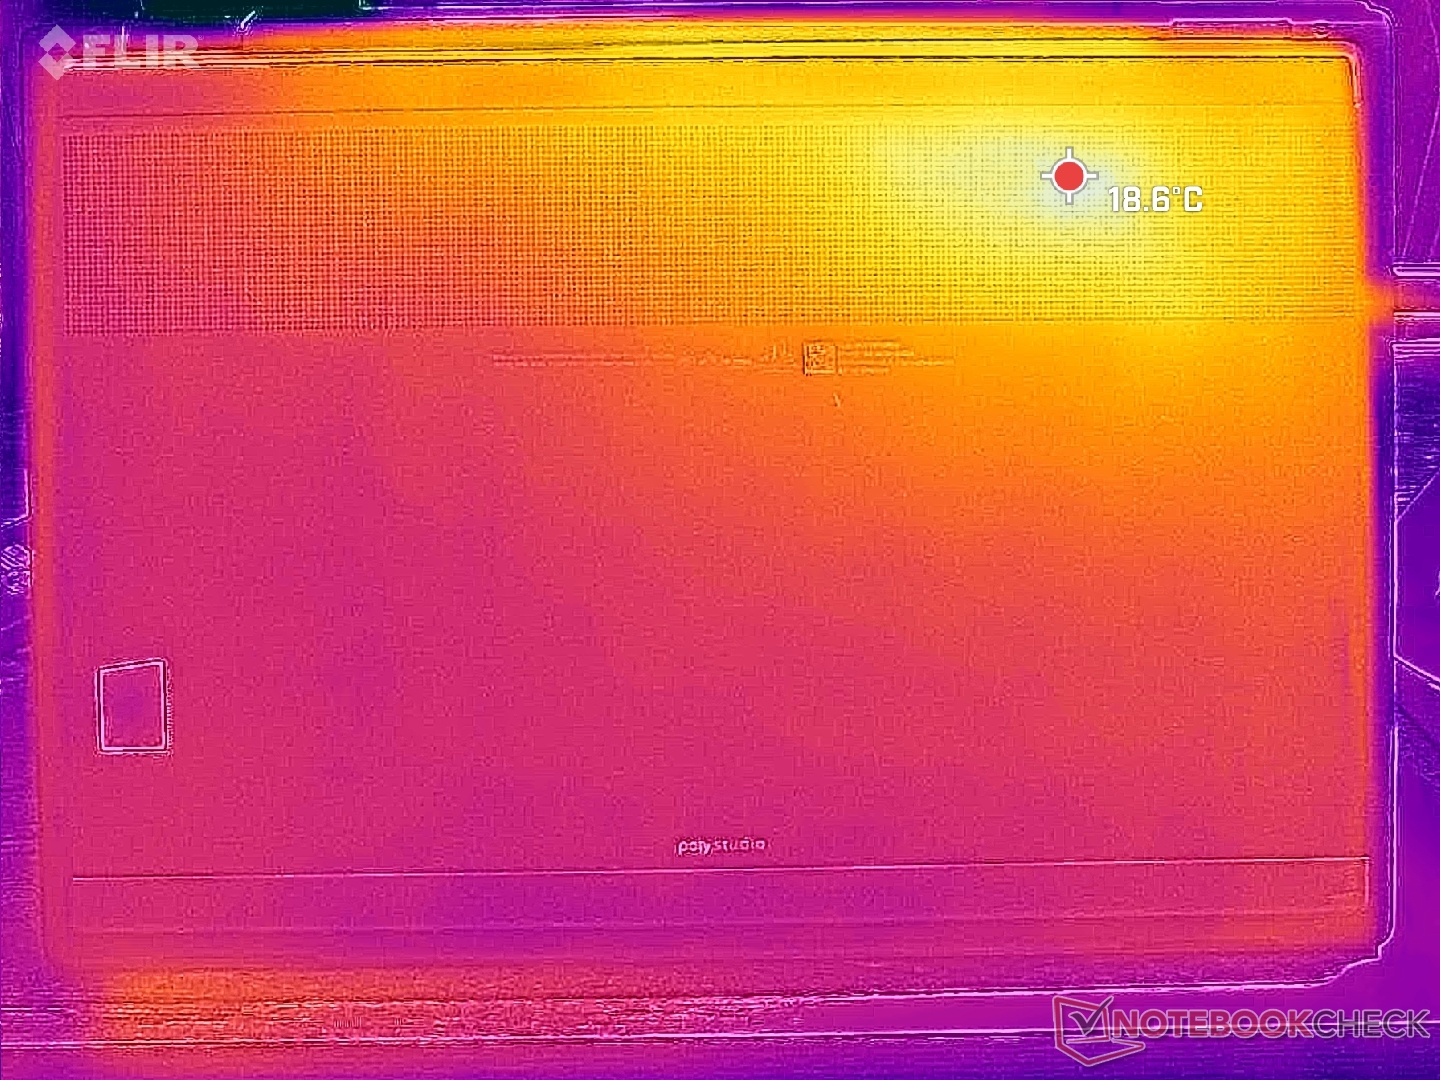
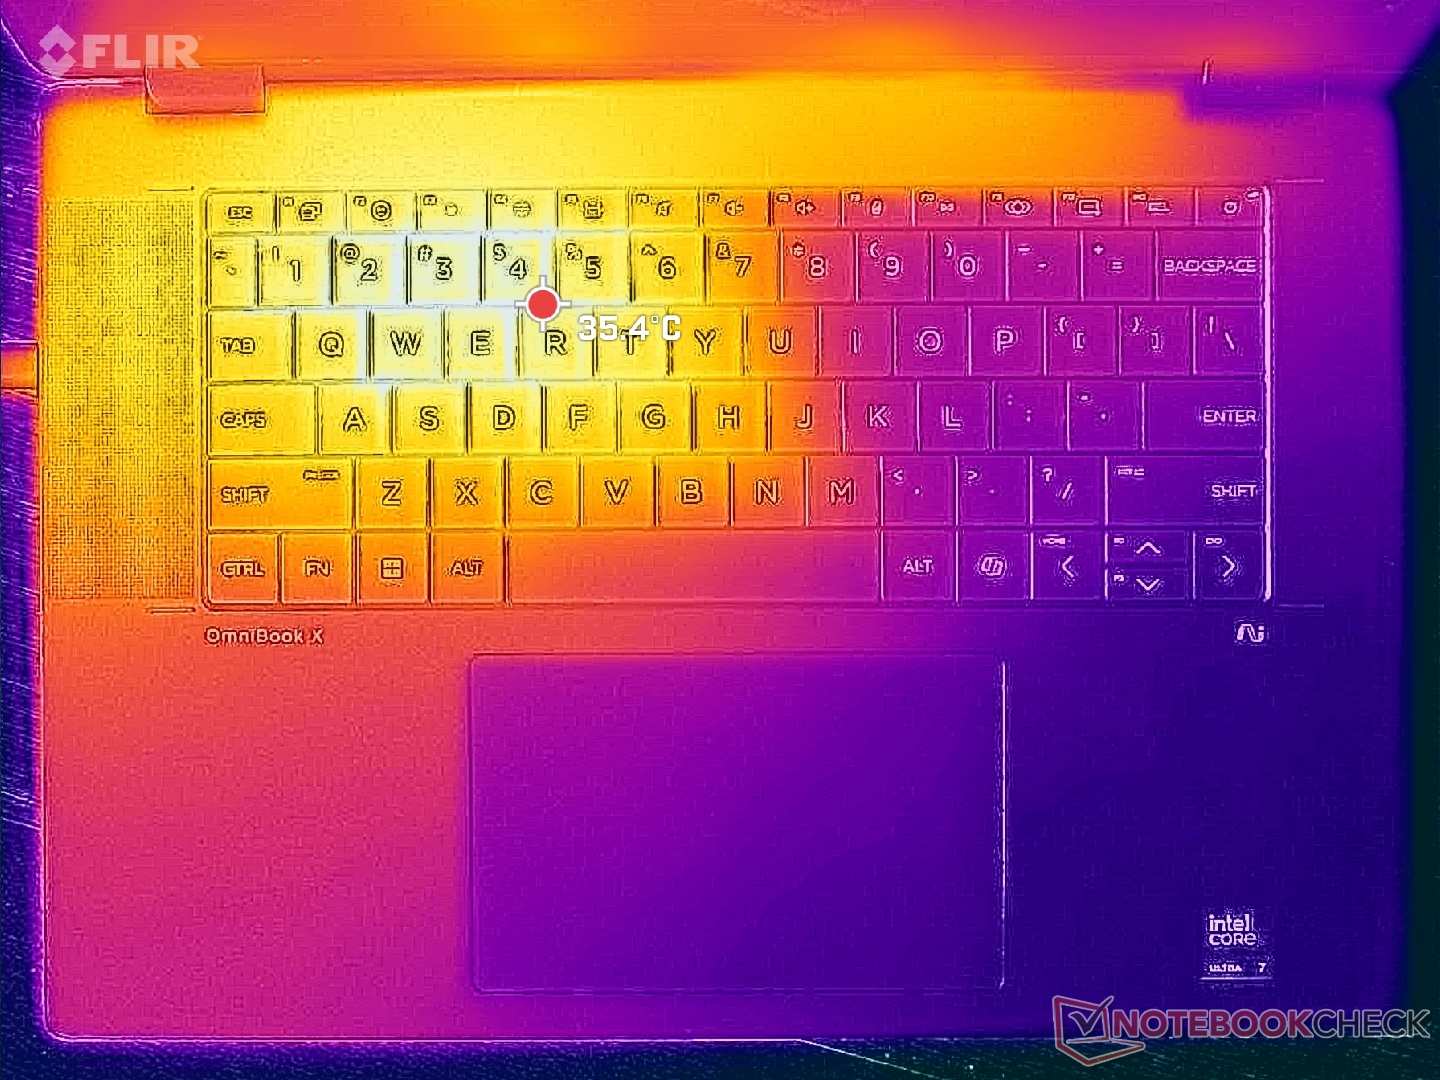
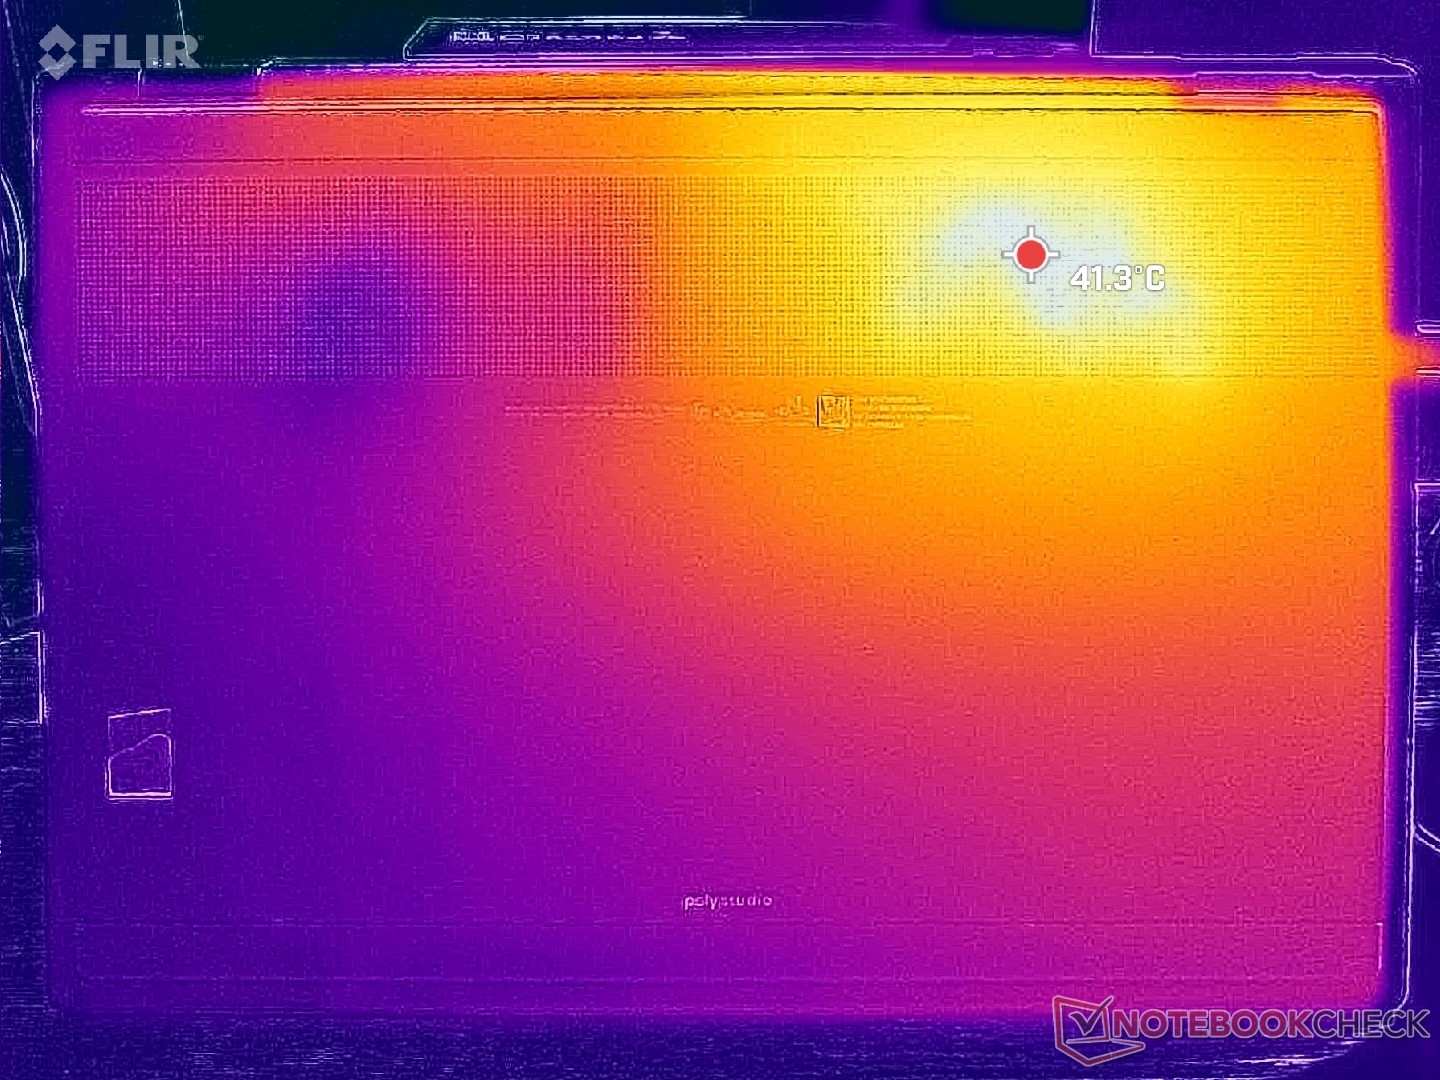
Temperatura
Gorące punkty na powierzchni są podobne do tego, co zaobserwowaliśmy na konkurencyjnym Dell Plus 16 2-w-1. Na HP jednak gorące punkty są zauważalnie chłodniejsze o kilka stopni C.
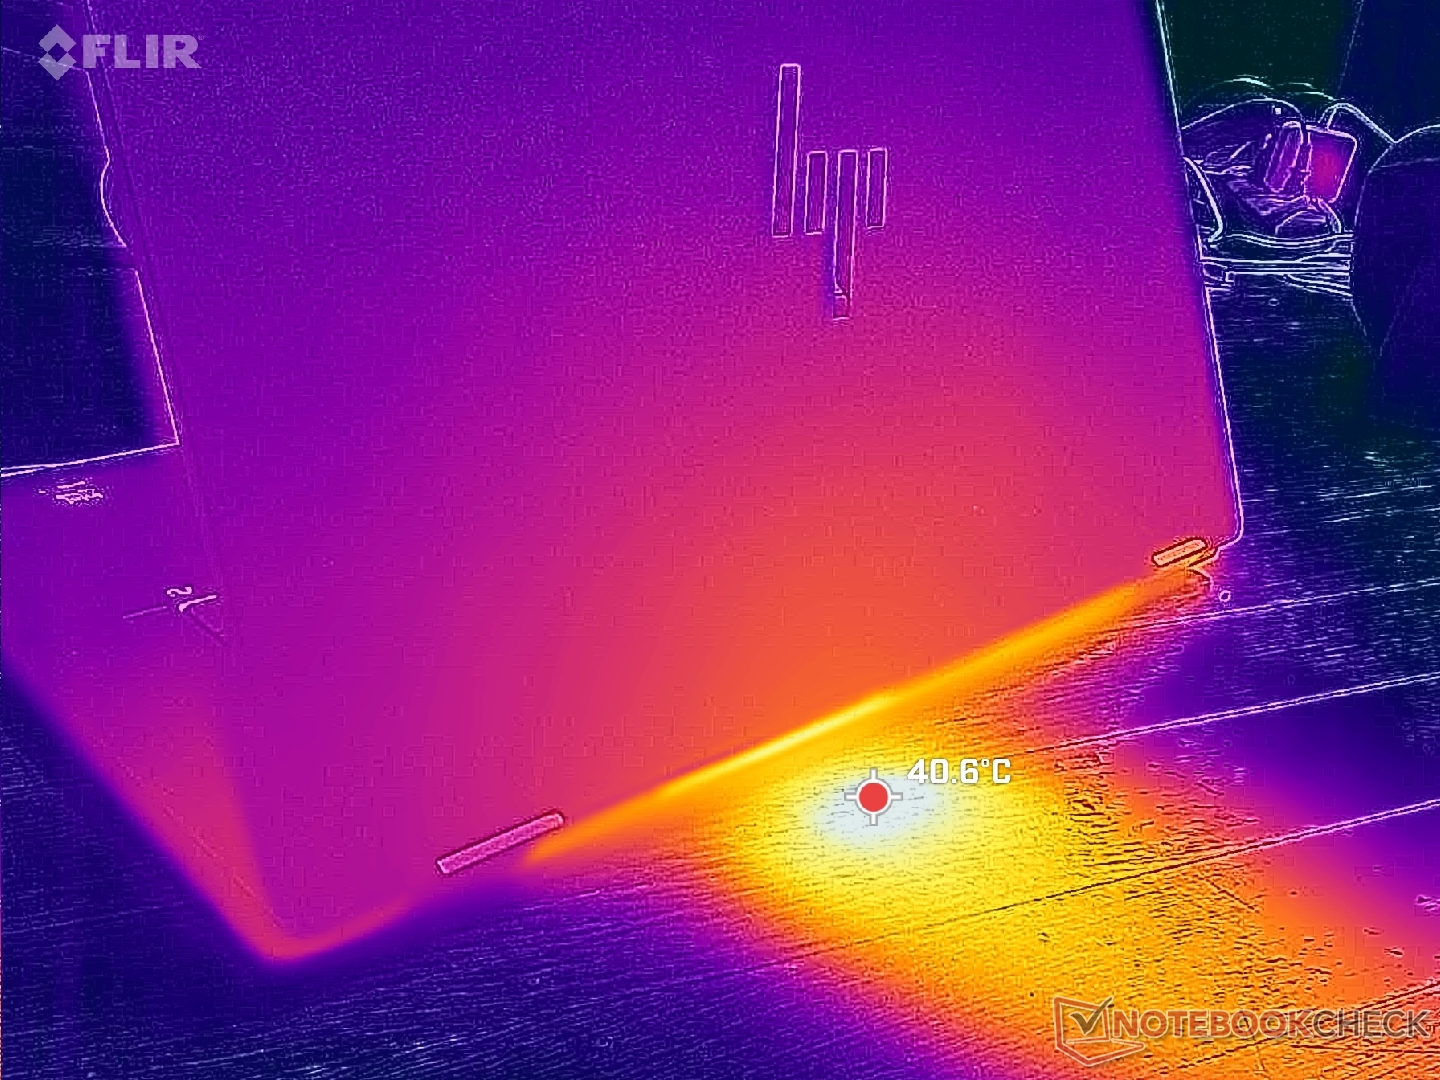
(+) Maksymalna temperatura w górnej części wynosi 38 °C / 100 F, w porównaniu do średniej 35.4 °C / 96 F , począwszy od 19.6 do 60 °C dla klasy Convertible.
(+) Dno nagrzewa się maksymalnie do 39.4 °C / 103 F, w porównaniu do średniej 36.9 °C / 98 F
(+) W stanie bezczynności średnia temperatura górnej części wynosi 23 °C / 73 F, w porównaniu ze średnią temperaturą urządzenia wynoszącą 30.3 °C / ### class_avg_f### F.
(+) Podpórki pod nadgarstki i touchpad są chłodniejsze niż temperatura skóry i maksymalnie 27.2 °C / 81 F i dlatego są chłodne w dotyku.
(±) Średnia temperatura obszaru podparcia dłoni w podobnych urządzeniach wynosiła 28 °C / 82.4 F (+0.8 °C / 1.4 F).
| HP OmniBook X Flip 16 Intel Core Ultra 7 258V, Intel Arc Graphics 140V | Dell 16 Plus 2-in-1 Intel Core Ultra 7 258V, Intel Arc Graphics 140V | Lenovo Yoga 7 2-in-1 16ILL10 Intel Core Ultra 7 256V, Intel Arc Graphics 140V | Samsung Galaxy Book5 Pro 360 Intel Core Ultra 5 226V, Intel Arc Graphics 130V | MSI Summit A16 AI Plus A3HMTG AMD Ryzen AI 9 365, AMD Radeon 880M | HP Spectre x360 16 RTX 4050 Intel Core Ultra 7 155H, NVIDIA GeForce RTX 4050 Laptop GPU | |
|---|---|---|---|---|---|---|
| Heat | -20% | -4% | -3% | -22% | -11% | |
| Maximum Upper Side * (°C) | 38 | 44 -16% | 42.6 -12% | 40.9 -8% | 52.8 -39% | 39.6 -4% |
| Maximum Bottom * (°C) | 39.4 | 39.4 -0% | 36.8 7% | 45.1 -14% | 42 -7% | 39.2 1% |
| Idle Upper Side * (°C) | 25 | 31.8 -27% | 26.4 -6% | 23.8 5% | 30.6 -22% | 29 -16% |
| Idle Bottom * (°C) | 25 | 34.2 -37% | 26.6 -6% | 23.5 6% | 29.6 -18% | 31.6 -26% |
* ... im mniej tym lepiej
Głośniki
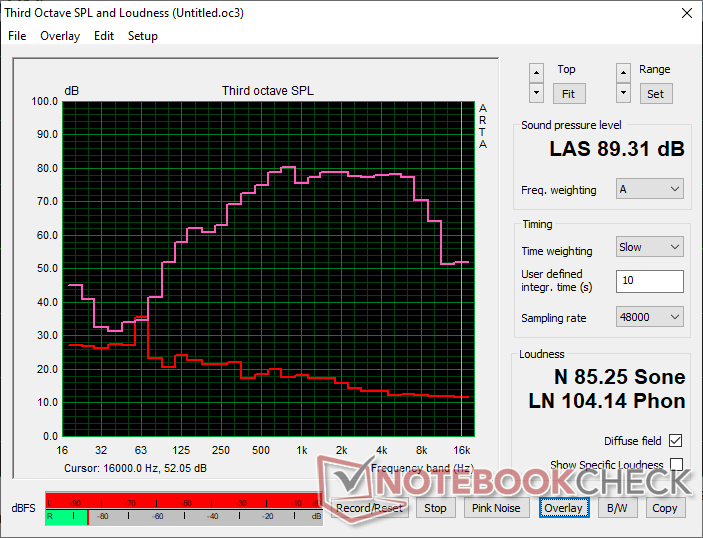
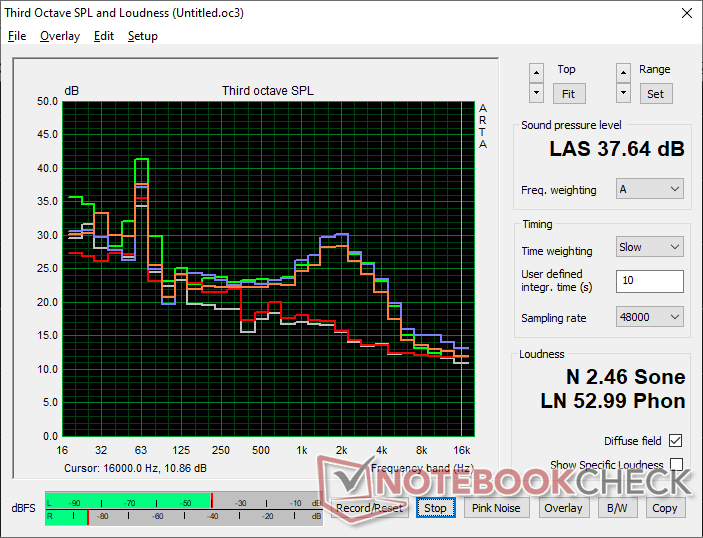
HP OmniBook X Flip 16 analiza dźwięku
(+) | głośniki mogą odtwarzać stosunkowo głośno (89.3 dB)
Bas 100 - 315 Hz
(±) | zredukowany bas - średnio 14.6% niższy od mediany
(±) | liniowość basu jest średnia (8.6% delta do poprzedniej częstotliwości)
Średnie 400 - 2000 Hz
(+) | zbalansowane środki średnie - tylko 2.5% od mediany
(+) | średnie są liniowe (4.1% delta do poprzedniej częstotliwości)
Wysokie 2–16 kHz
(+) | zrównoważone maksima - tylko 3.9% od mediany
(+) | wzloty są liniowe (4% delta do poprzedniej częstotliwości)
Ogólnie 100 - 16.000 Hz
(+) | ogólny dźwięk jest liniowy (14.2% różnicy w stosunku do mediany)
W porównaniu do tej samej klasy
» 21% wszystkich testowanych urządzeń w tej klasie było lepszych, 3% podobnych, 76% gorszych
» Najlepszy miał deltę 6%, średnia wynosiła ###średnia###%, najgorsza wynosiła 57%
W porównaniu do wszystkich testowanych urządzeń
» 17% wszystkich testowanych urządzeń było lepszych, 4% podobnych, 79% gorszych
» Najlepszy miał deltę 4%, średnia wynosiła ###średnia###%, najgorsza wynosiła 134%
Apple MacBook Pro 16 2021 M1 Pro analiza dźwięku
(+) | głośniki mogą odtwarzać stosunkowo głośno (84.7 dB)
Bas 100 - 315 Hz
(+) | dobry bas - tylko 3.8% od mediany
(+) | bas jest liniowy (5.2% delta do poprzedniej częstotliwości)
Średnie 400 - 2000 Hz
(+) | zbalansowane środki średnie - tylko 1.3% od mediany
(+) | średnie są liniowe (2.1% delta do poprzedniej częstotliwości)
Wysokie 2–16 kHz
(+) | zrównoważone maksima - tylko 1.9% od mediany
(+) | wzloty są liniowe (2.7% delta do poprzedniej częstotliwości)
Ogólnie 100 - 16.000 Hz
(+) | ogólny dźwięk jest liniowy (4.6% różnicy w stosunku do mediany)
W porównaniu do tej samej klasy
» 0% wszystkich testowanych urządzeń w tej klasie było lepszych, 0% podobnych, 100% gorszych
» Najlepszy miał deltę 5%, średnia wynosiła ###średnia###%, najgorsza wynosiła 45%
W porównaniu do wszystkich testowanych urządzeń
» 0% wszystkich testowanych urządzeń było lepszych, 0% podobnych, 100% gorszych
» Najlepszy miał deltę 4%, średnia wynosiła ###średnia###%, najgorsza wynosiła 134%
Zarządzanie energią
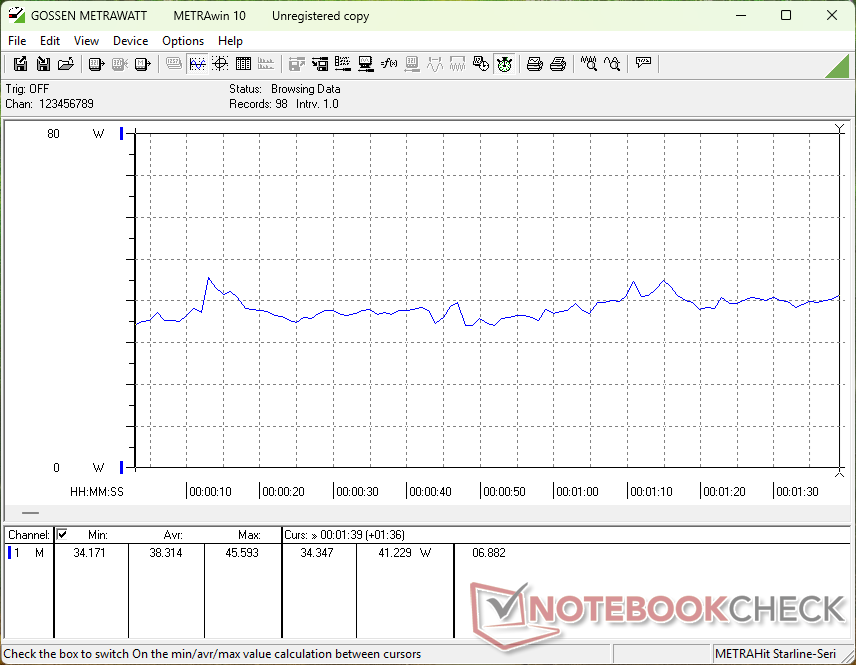
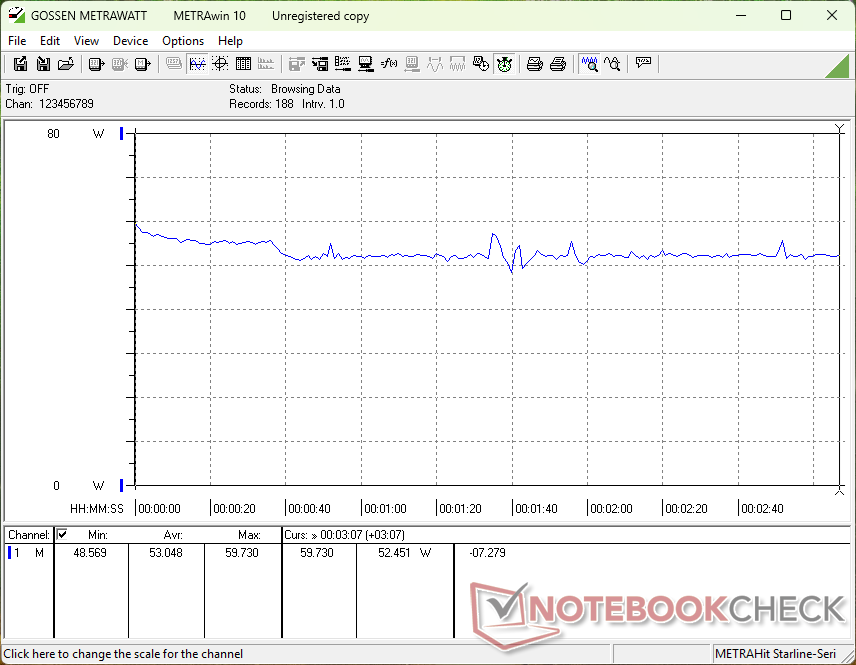
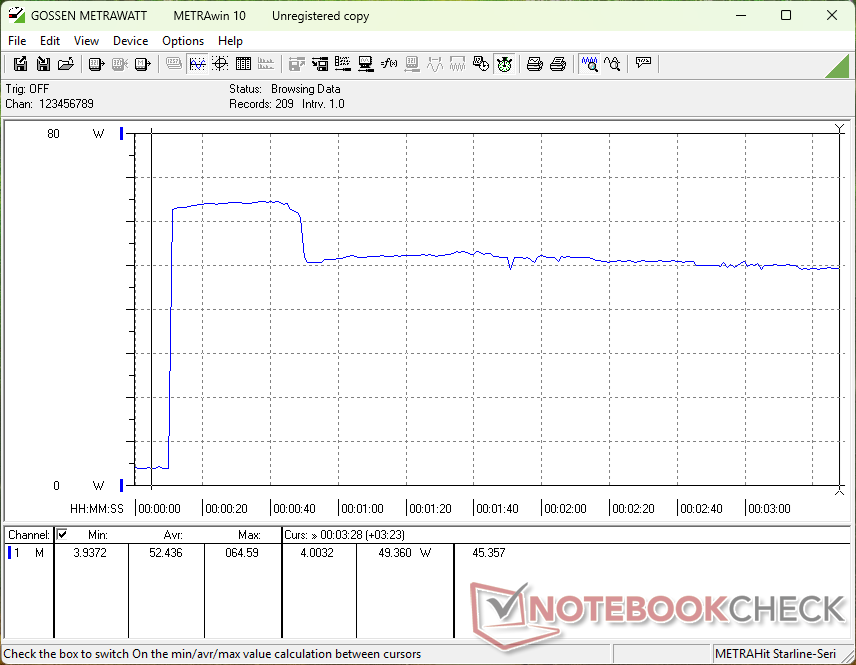
Zużycie energii
Procesory Intel Lunar Lake są niezwykle wydajne i nie inaczej jest w przypadku HP. Na przykład podczas uruchamiania Cyberpunk 2077, OmniBook X Flip 16 wymagałby mniej energii niż na zasilanym przez AMD MSI Summit A16 AI Plus jednocześnie oferując niezmiennie szybszą liczbę klatek na sekundę. Surowa wydajność procesora nadal nie może się jednak równać z Ryzenem AI 9 365.
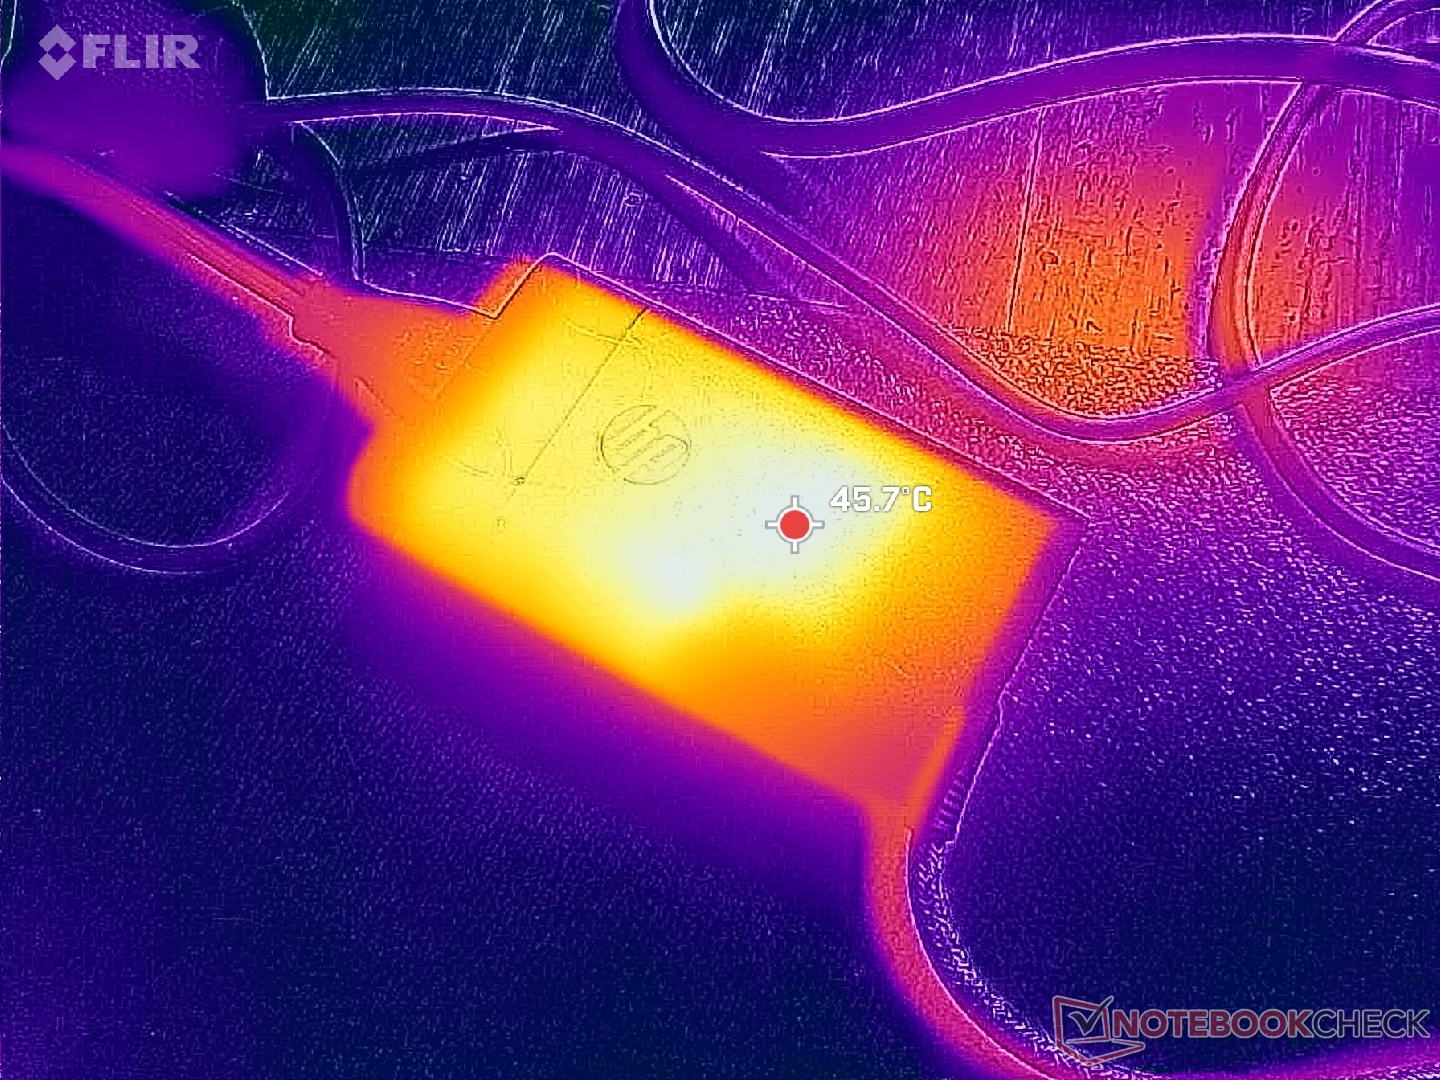
Jesteśmy w stanie zarejestrować tymczasowy maksymalny pobór mocy 65 W z małego (~ 6,8 x 2,2 x 5,4 cm) zasilacza sieciowego USB-C 65 W, gdy procesor jest wykorzystywany w 100 procentach.

| wyłączony / stan wstrzymania | |
| luz | |
| obciążenie |
|
Legenda:
min: | |
| HP OmniBook X Flip 16 Core Ultra 7 258V, Arc 140V, , OLED, 2880x1800, 16" | Dell 16 Plus 2-in-1 Core Ultra 7 258V, Arc 140V, Samsung BM9C1 1024GB, Mini-LED, 2560x1600, 16" | Lenovo Yoga 7 2-in-1 16ILL10 Core Ultra 7 256V, Arc 140V, WD PC SN7100S SDFPMSL-512G-1101, IPS, 1920x1200, 16" | Samsung Galaxy Book5 Pro 360 Core Ultra 5 226V, Arc 130V, Samsung PM9B1 512GB MZVL4512HBLU, OLED, 2880x1800, 16" | MSI Summit A16 AI Plus A3HMTG Ryzen AI 9 365, Radeon 880M, Samsung PM9C1 MZVL81T0HELB-00BTW, IPS, 2560x1600, 16" | HP Spectre x360 16 RTX 4050 Ultra 7 155H, GeForce RTX 4050 Laptop GPU, SK hynix PC801 HFS001TEJ9X101N, OLED, 2880x1800, 16" | |
|---|---|---|---|---|---|---|
| Power Consumption | -47% | -11% | -8% | -54% | -133% | |
| Idle Minimum * (Watt) | 3.1 | 7 -126% | 4.2 -35% | 5.3 -71% | 5.4 -74% | 5.8 -87% |
| Idle Average * (Watt) | 4.4 | 13.2 -200% | 8.3 -89% | 6.7 -52% | 11 -150% | 12.3 -180% |
| Idle Maximum * (Watt) | 11.4 | 13.4 -18% | 9.5 17% | 7.3 36% | 11.2 2% | 33.9 -197% |
| Load Average * (Watt) | 38.3 | 43.9 -15% | 40.3 -5% | 37.6 2% | 76.6 -100% | 83.3 -117% |
| Cyberpunk 2077 ultra external monitor * (Watt) | 48.7 | 40.7 16% | 40.8 16% | 42.8 12% | 49.2 -1% | |
| Cyberpunk 2077 ultra * (Watt) | 53.1 | 44.9 15% | 47.4 11% | 44.6 16% | 61.1 -15% | |
| Load Maximum * (Watt) | 64.9 | 67.8 -4% | 59 9% | 64.1 1% | 91.8 -41% | 120.8 -86% |
| Witcher 3 ultra * (Watt) | 89.1 |
* ... im mniej tym lepiej
Power Consumption Cyberpunk / Stress Test
Power Consumption external Monitor
Żywotność baterii
| HP OmniBook X Flip 16 Core Ultra 7 258V, Arc 140V, 68 Wh | Dell 16 Plus 2-in-1 Core Ultra 7 258V, Arc 140V, 64 Wh | Lenovo Yoga 7 2-in-1 16ILL10 Core Ultra 7 256V, Arc 140V, 70 Wh | Samsung Galaxy Book5 Pro 360 Core Ultra 5 226V, Arc 130V, 76 Wh | MSI Summit A16 AI Plus A3HMTG Ryzen AI 9 365, Radeon 880M, 82 Wh | HP Spectre x360 16 RTX 4050 Ultra 7 155H, GeForce RTX 4050 Laptop GPU, 83 Wh | |
|---|---|---|---|---|---|---|
| Czasy pracy | -30% | 56% | -16% | -29% | -14% | |
| WiFi v1.3 (h) | 12.8 | 8.9 -30% | 20 56% | 10.8 -16% | 9.1 -29% | 11 -14% |
| H.264 (h) | 19.7 | |||||
| Load (h) | 2.1 |
Ocena Notebookcheck
HP OmniBook X Flip 16
- 10/07/2025 v8
Allen Ngo
 Total Sustainability Score:
 Potential Competitors in Comparison
Obraz | Model / recenzja | Cena | Waga | Wysokość | Ekran |
|---|---|---|---|---|---|
1. 86.9%  | HP OmniBook X Flip 16 Intel Core Ultra 7 258V ⎘ Intel Arc Graphics 140V ⎘ 16 GB Pamięć | Amazon: Cena katalogowa: 950 USD | 1.9 kg | 15.5 mm | 16.00" 2880x1800 212 PPI OLED |
2. 83.5%  | Dell 16 Plus 2-in-1 Intel Core Ultra 7 258V ⎘ Intel Arc Graphics 140V ⎘ 32 GB Pamięć, 1024 GB SSD | Amazon: $1,149.99 Cena katalogowa: 1500 USD | 2 kg | 16.99 mm | 16.00" 2560x1600 189 PPI Mini-LED |
3. 84.3%  | Lenovo Yoga 7 2-in-1 16ILL10 Intel Core Ultra 7 256V ⎘ Intel Arc Graphics 140V ⎘ 16 GB Pamięć, 512 GB SSD | Amazon: Cena katalogowa: 1000 USD | 1.9 kg | 15.85 mm | 16.00" 1920x1200 142 PPI IPS |
4. 85.9%  | Samsung Galaxy Book5 Pro 360 Intel Core Ultra 5 226V ⎘ Intel Arc Graphics 130V ⎘ 16 GB Pamięć, 512 GB SSD | Amazon: Cena katalogowa: 1799€ | 1.7 kg | 12.8 mm | 16.00" 2880x1800 212 PPI OLED |
5. 81.9%  | MSI Summit A16 AI Plus A3HMTG AMD Ryzen AI 9 365 ⎘ AMD Radeon 880M ⎘ 32 GB Pamięć, 1024 GB SSD | Amazon: Cena katalogowa: 1600 USD | 2.1 kg | 16.85 mm | 16.00" 2560x1600 189 PPI IPS |
6. 91.1% v7 (old)  | HP Spectre x360 16 RTX 4050 Intel Core Ultra 7 155H ⎘ NVIDIA GeForce RTX 4050 Laptop GPU ⎘ 16 GB Pamięć, 1024 GB SSD | Amazon: Cena katalogowa: 1600 USD | 2 kg | 19.8 mm | 16.00" 2880x1800 212 PPI OLED |
Przezroczystość
Wyboru urządzeń do recenzji dokonuje nasza redakcja. Próbka testowa została udostępniona autorowi jako pożyczka od producenta lub sprzedawcy detalicznego na potrzeby tej recenzji. Pożyczkodawca nie miał wpływu na tę recenzję, producent nie otrzymał też kopii tej recenzji przed publikacją. Nie było obowiązku publikowania tej recenzji. Jako niezależna firma medialna, Notebookcheck nie podlega władzy producentów, sprzedawców detalicznych ani wydawców.
Tak testuje Notebookcheck
Każdego roku Notebookcheck niezależnie sprawdza setki laptopów i smartfonów, stosując standardowe procedury, aby zapewnić porównywalność wszystkich wyników. Od około 20 lat stale rozwijamy nasze metody badawcze, ustanawiając przy tym standardy branżowe. W naszych laboratoriach testowych doświadczeni technicy i redaktorzy korzystają z wysokiej jakości sprzętu pomiarowego. Testy te obejmują wieloetapowy proces walidacji. Nasz kompleksowy system ocen opiera się na setkach uzasadnionych pomiarów i benchmarków, co pozwala zachować obiektywizm.
