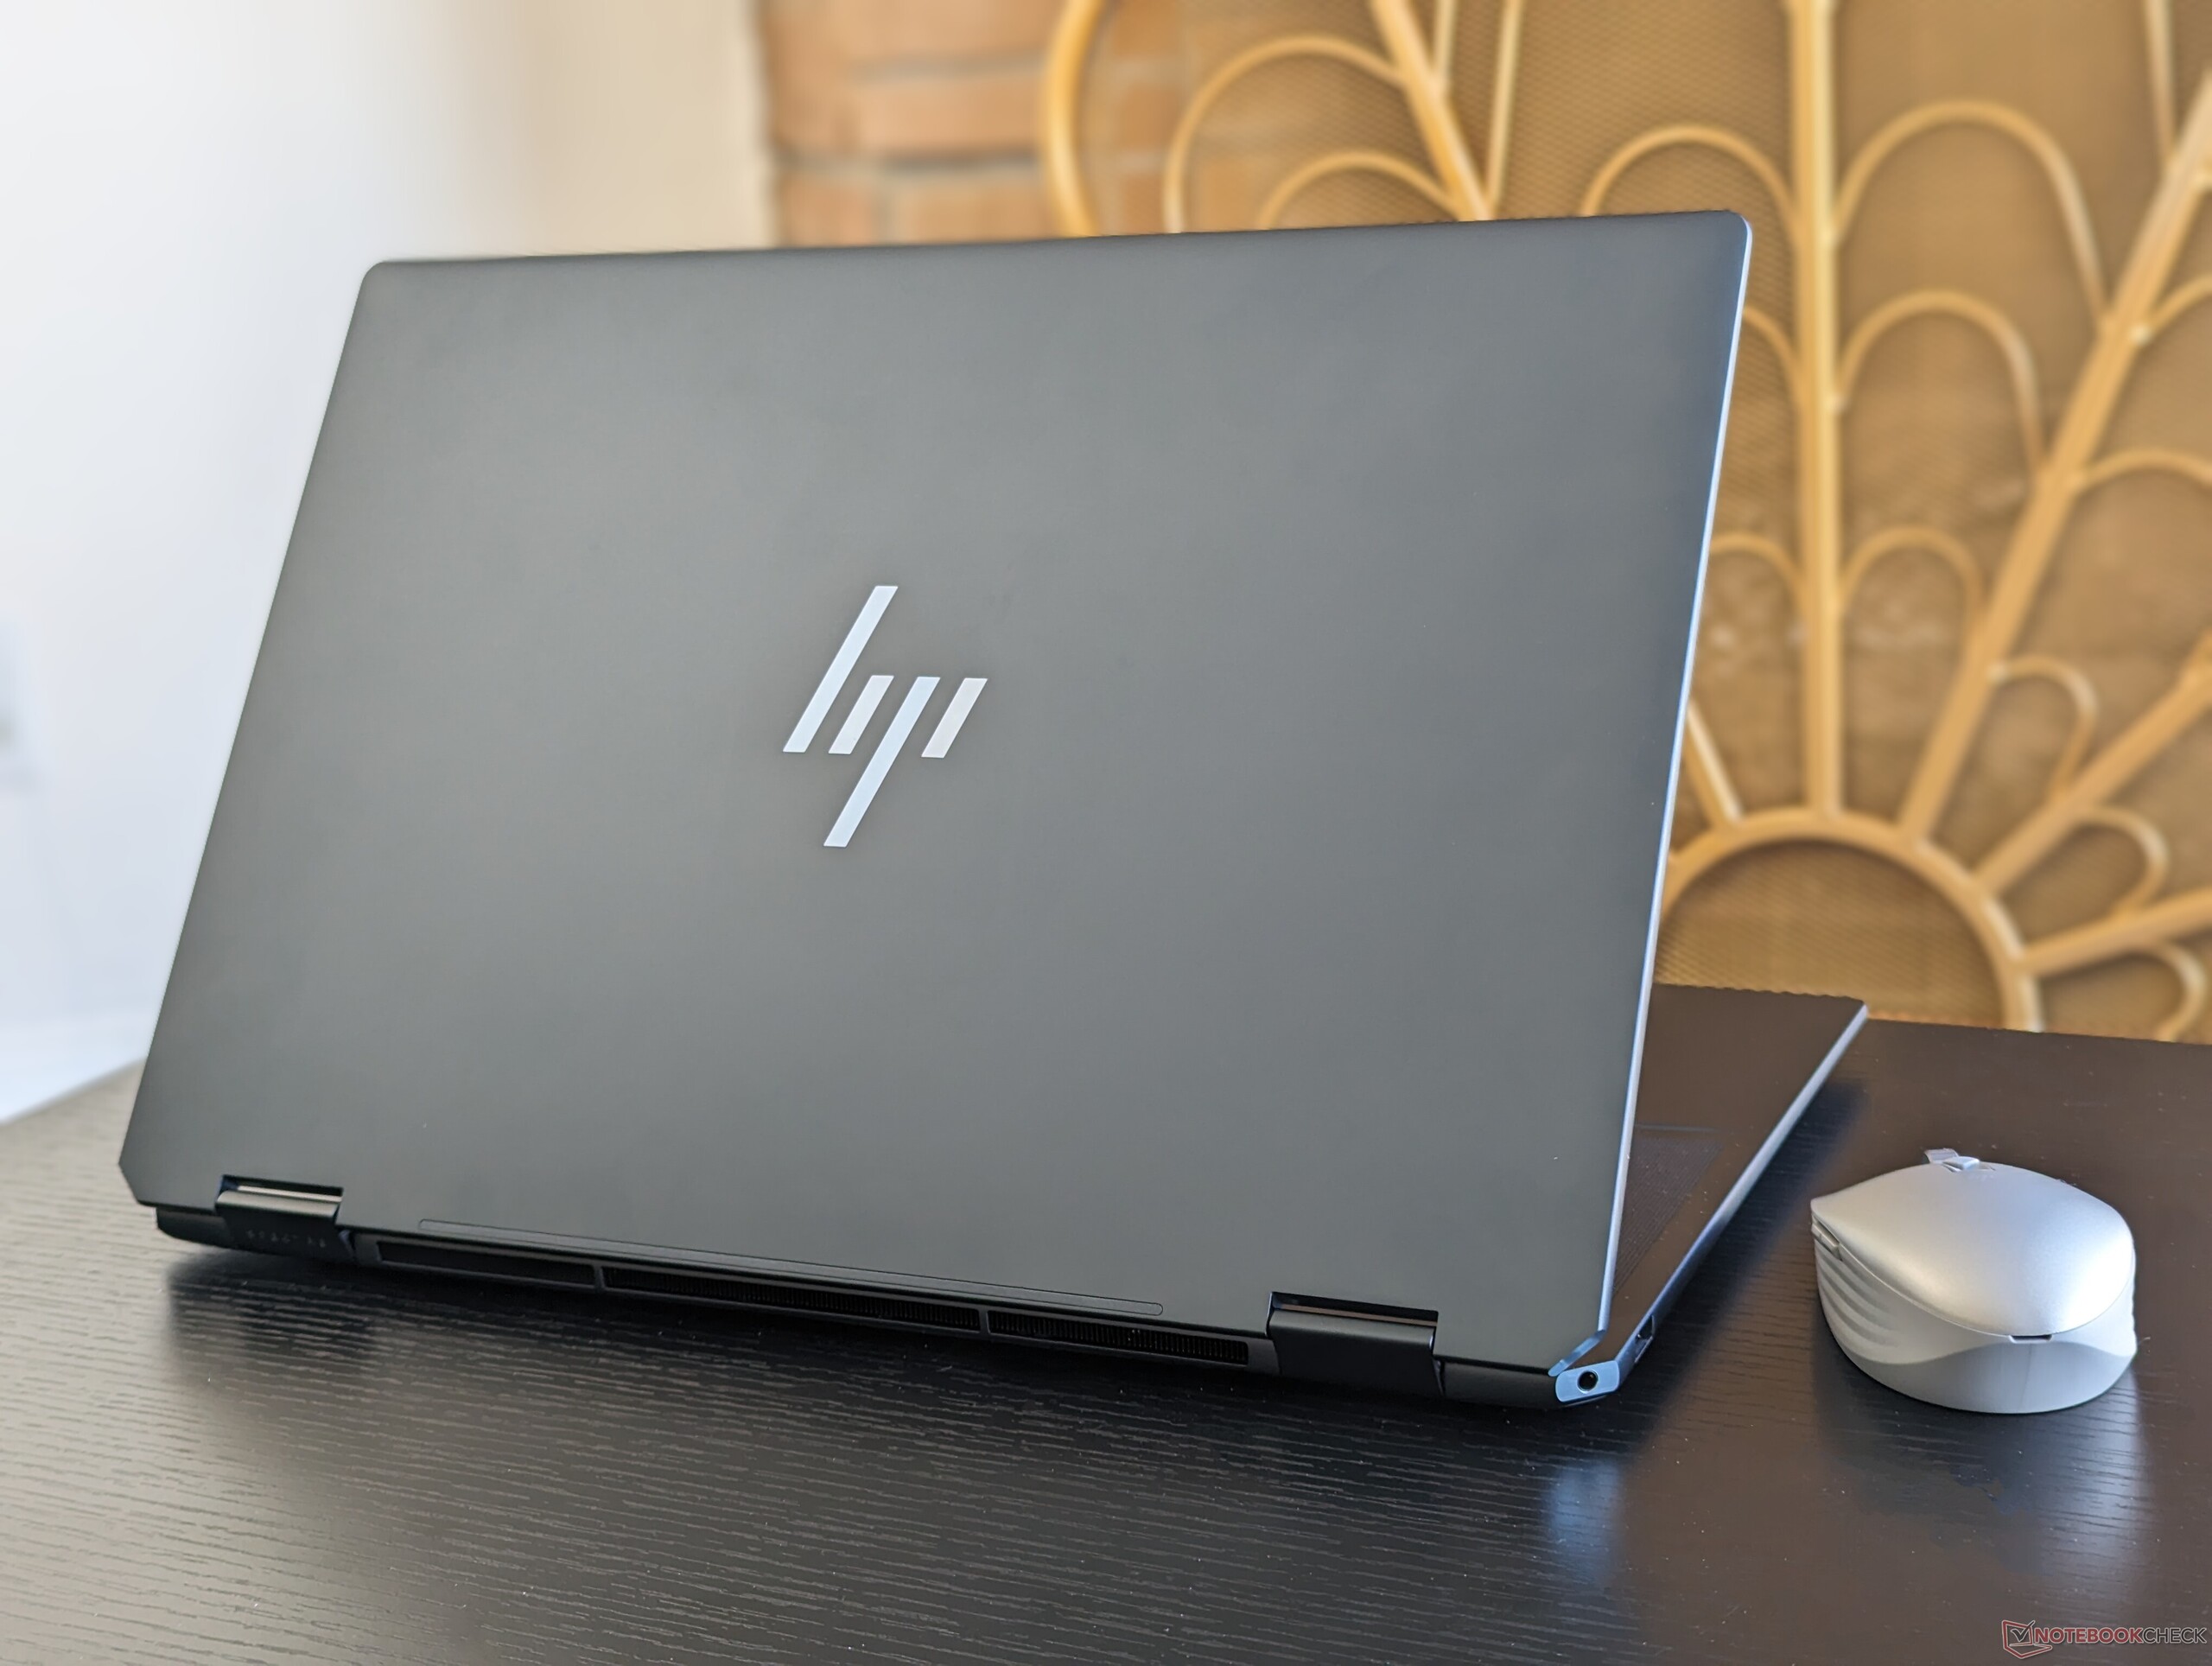
Recenzja konwertowalnego HP Spectre x360 16: Teraz z grafiką RTX 4050 o mocy 55 W GeForce

Po niedawnej recenzji wersji iGPU nowego Spectre x360 16, jesteśmy teraz gotowi sprawdzić konfigurację GeForce RTX tego samego modelu. Zasadniczo wszystko inne w laptopie pozostaje identyczne między tymi dwiema konfiguracjami, dlatego zalecamy sprawdzenie naszej istniejącą recenzję SKU iGPU aby dowiedzieć się więcej o fizycznych cechach konwertowalnego laptopa.
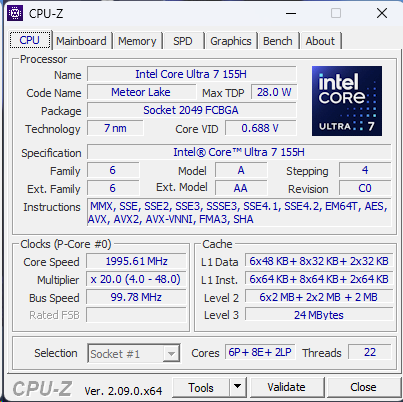
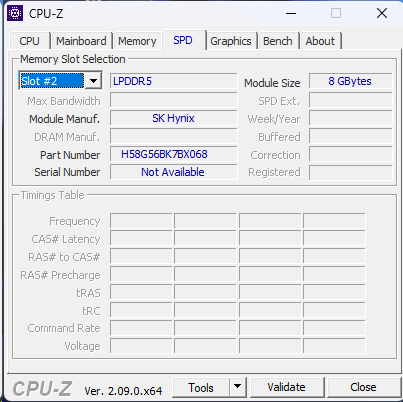
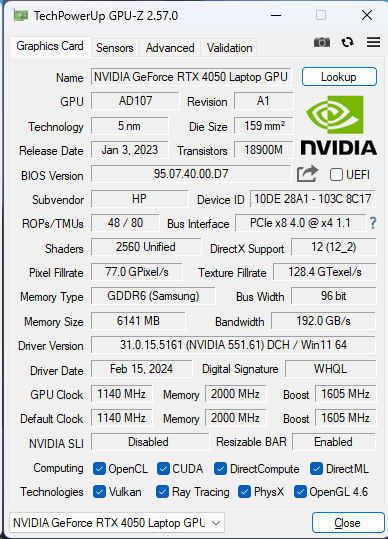
Nasza recenzowana jednostka została skonfigurowana z procesorem Core Ultra 7 155H 1. generacji, procesorem graficznym RTX 4050 o mocy 55 W GeForce, 16 GB przylutowanej pamięci RAM i ekranem dotykowym OLED 1800p w cenie detalicznej około 1600 USD. Inne jednostki SKU mogą zawierać dwukrotnie więcej pamięci RAM lub zamiast tego ekran dotykowy IPS 1600p 120 Hz, ale wszystkie mają ten sam procesor Core Ultra 7 i kartę graficzną RTX 4050.
Więcej recenzji HP:
Potencjalni konkurenci w porównaniu
Ocena | Data | Model | Waga | Wysokość | Rozmiar | Rezolucja | Cena |
|---|---|---|---|---|---|---|---|
| 91.1 % v7 (old) | 03/2024 | HP Spectre x360 16 RTX 4050 Ultra 7 155H, GeForce RTX 4050 Laptop GPU | 2 kg | 19.8 mm | 16.00" | 2880x1800 | |
| 91.4 % v7 (old) | 02/2024 | HP Spectre x360 16-aa0074ng Ultra 7 155H, Arc 8-Core | 1.9 kg | 19.8 mm | 16.00" | 2880x1800 | |
| 87.3 % v7 (old) | 01/2023 | HP Spectre x360 2-in-1 16-f1075ng i7-12700H, Iris Xe G7 96EUs | 2 kg | 19.9 mm | 16.00" | 3072x1920 | |
| 90 % v7 (old) | 03/2024 | Honor MagicBook Pro 16 2024 Ultra 7 155H, GeForce RTX 4060 Laptop GPU | 1.9 kg | 17.9 mm | 16.00" | 3072x1920 | |
| 88.1 % v7 (old) | 12/2023 | MSI Prestige 16 B1MG-001US Ultra 7 155H, Arc 8-Core | 1.6 kg | 19.1 mm | 16.00" | 2560x1600 | |
| 85.8 % v7 (old) | 11/2023 | LG Gram 2in1 16 16T90R - G.AA78G i7-1360P, Iris Xe G7 96EUs | 1.5 kg | 17.2 mm | 16.00" | 2560x1600 |
Sprawa
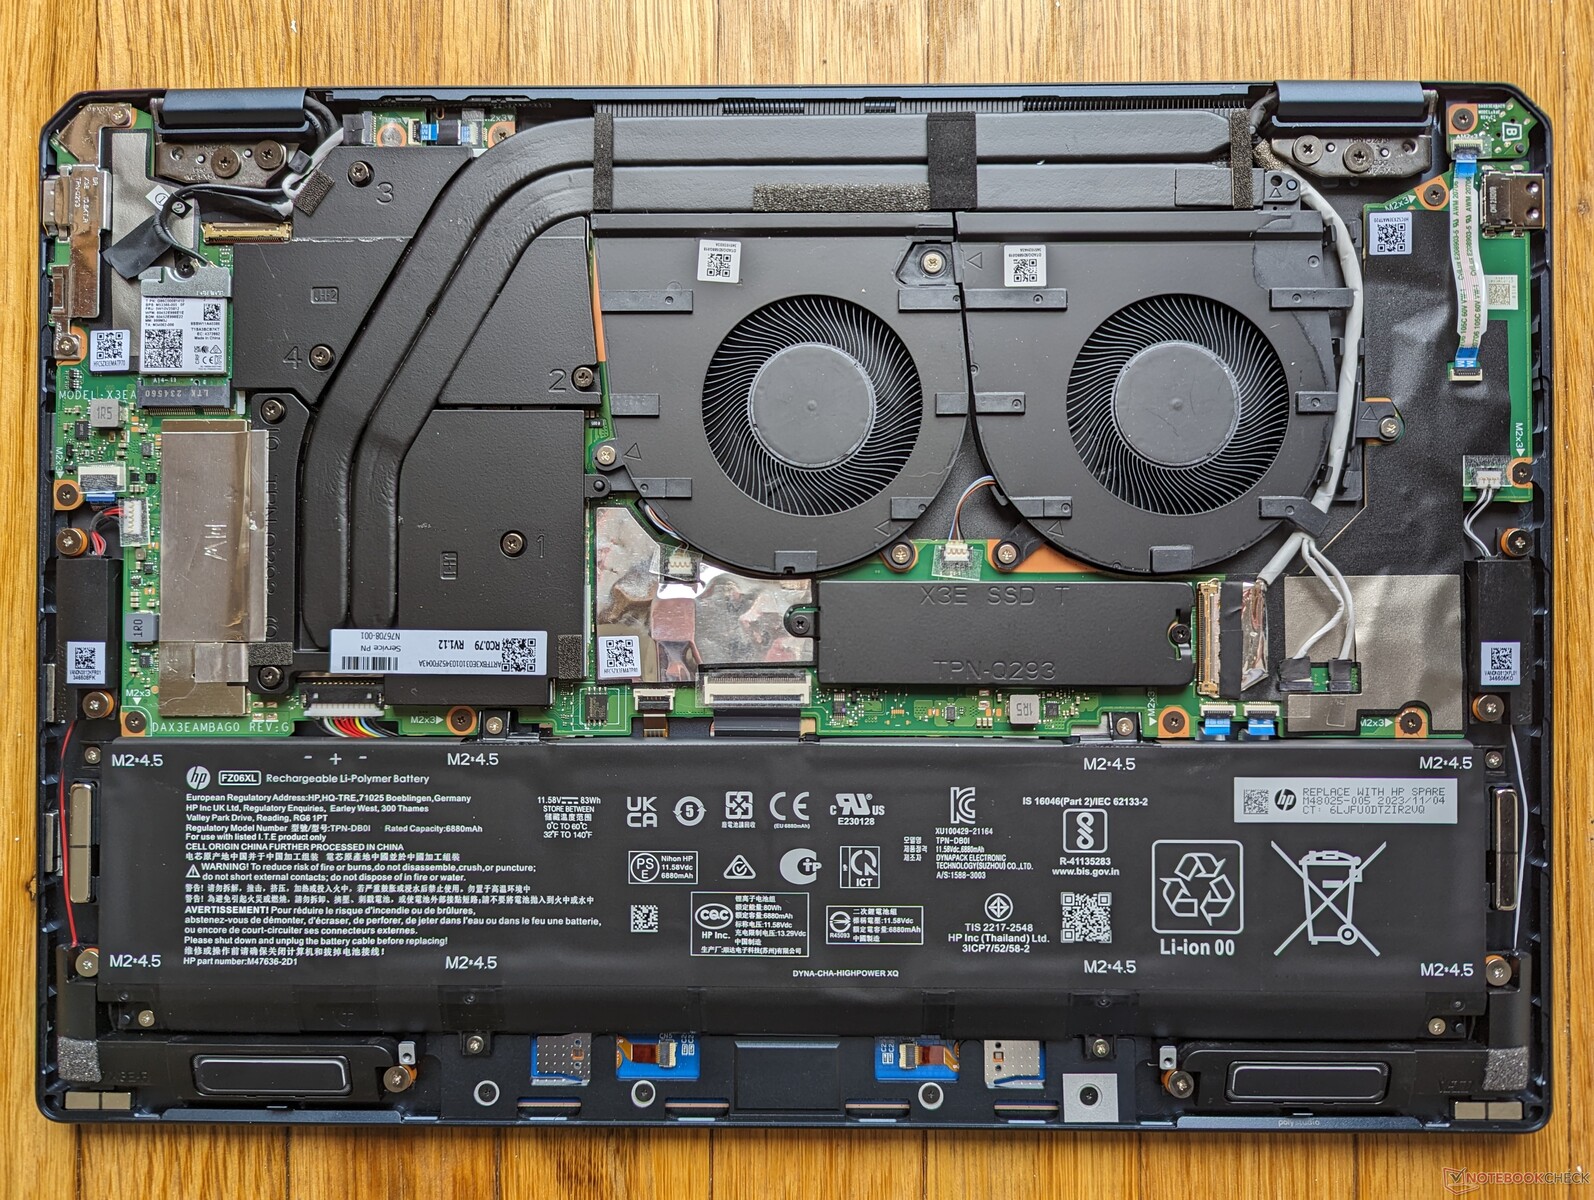
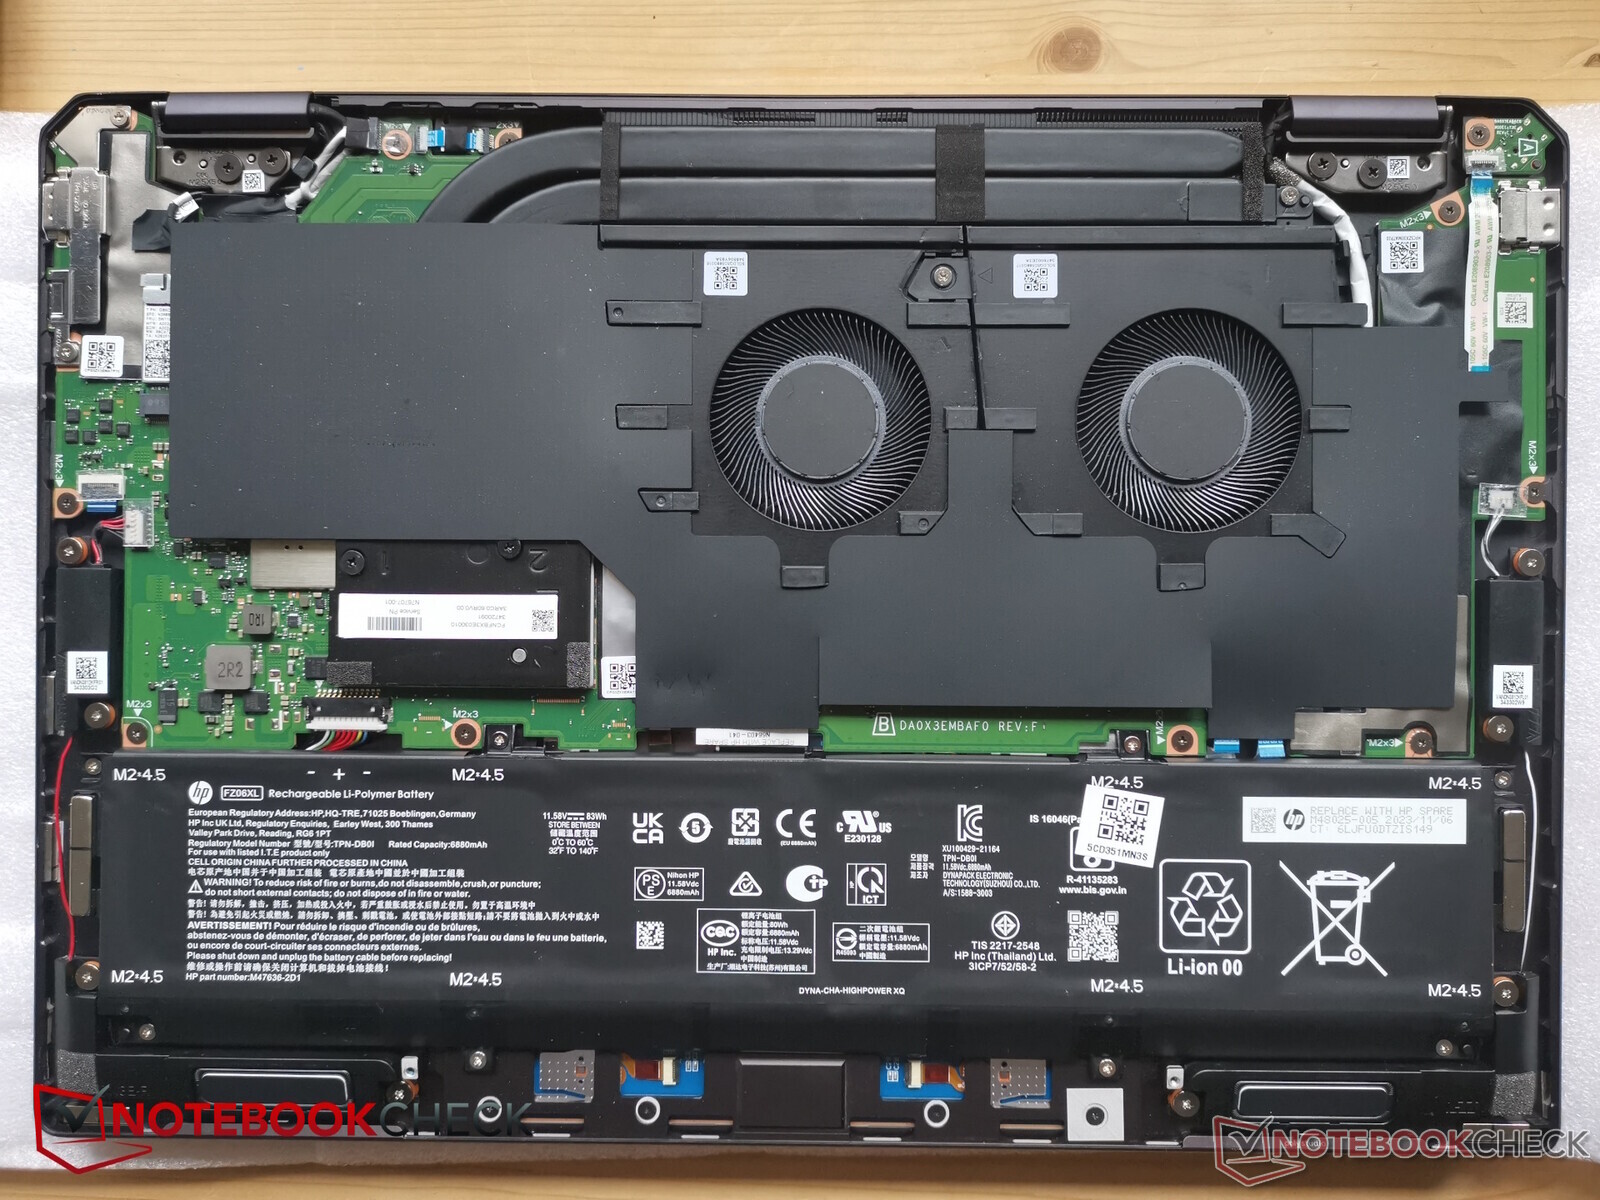
Konfiguracja dGPU jest nieco cięższa od opcji iGPU o około 100 g.
Komunikacja
Kamera internetowa


Konserwacja
Konfiguracja dGPU zawiera dłuższe miedziane rurki cieplne niż wersja iGPU, jak pokazano poniżej, co przyczynia się do nieco większej wagi. Poza tym płyta główna jest niemal identyczna.
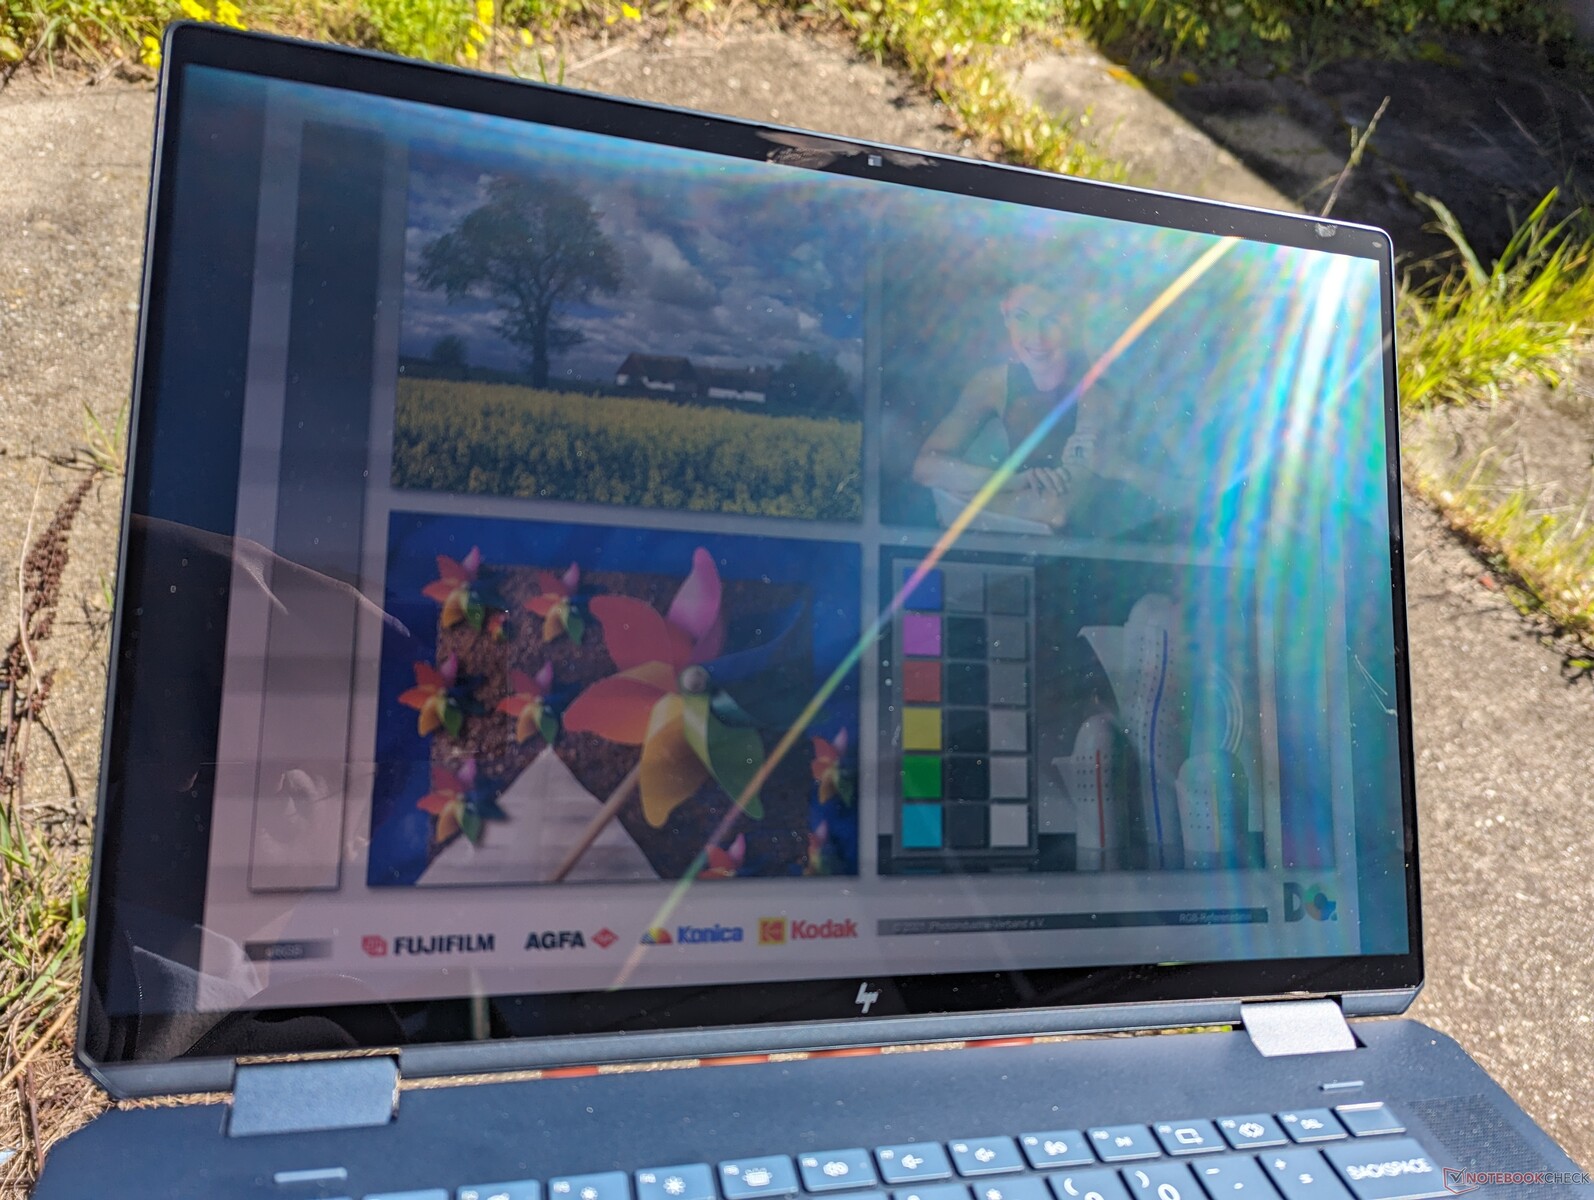
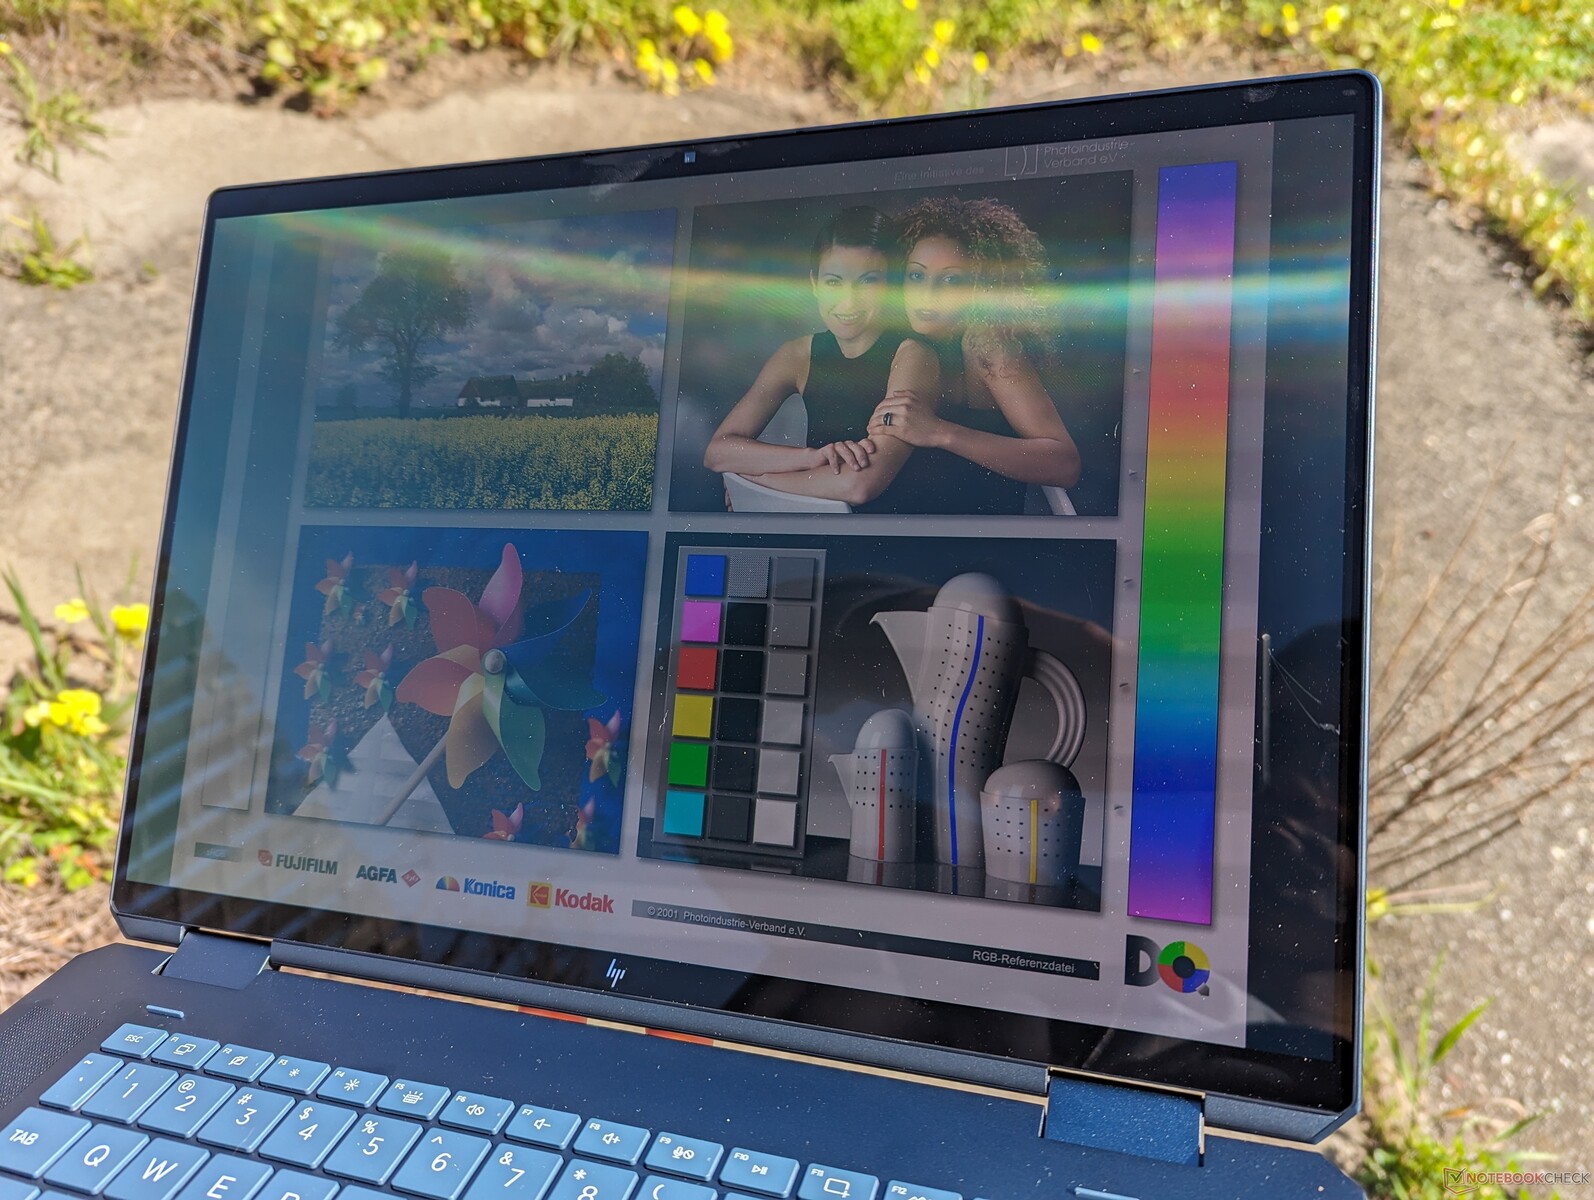
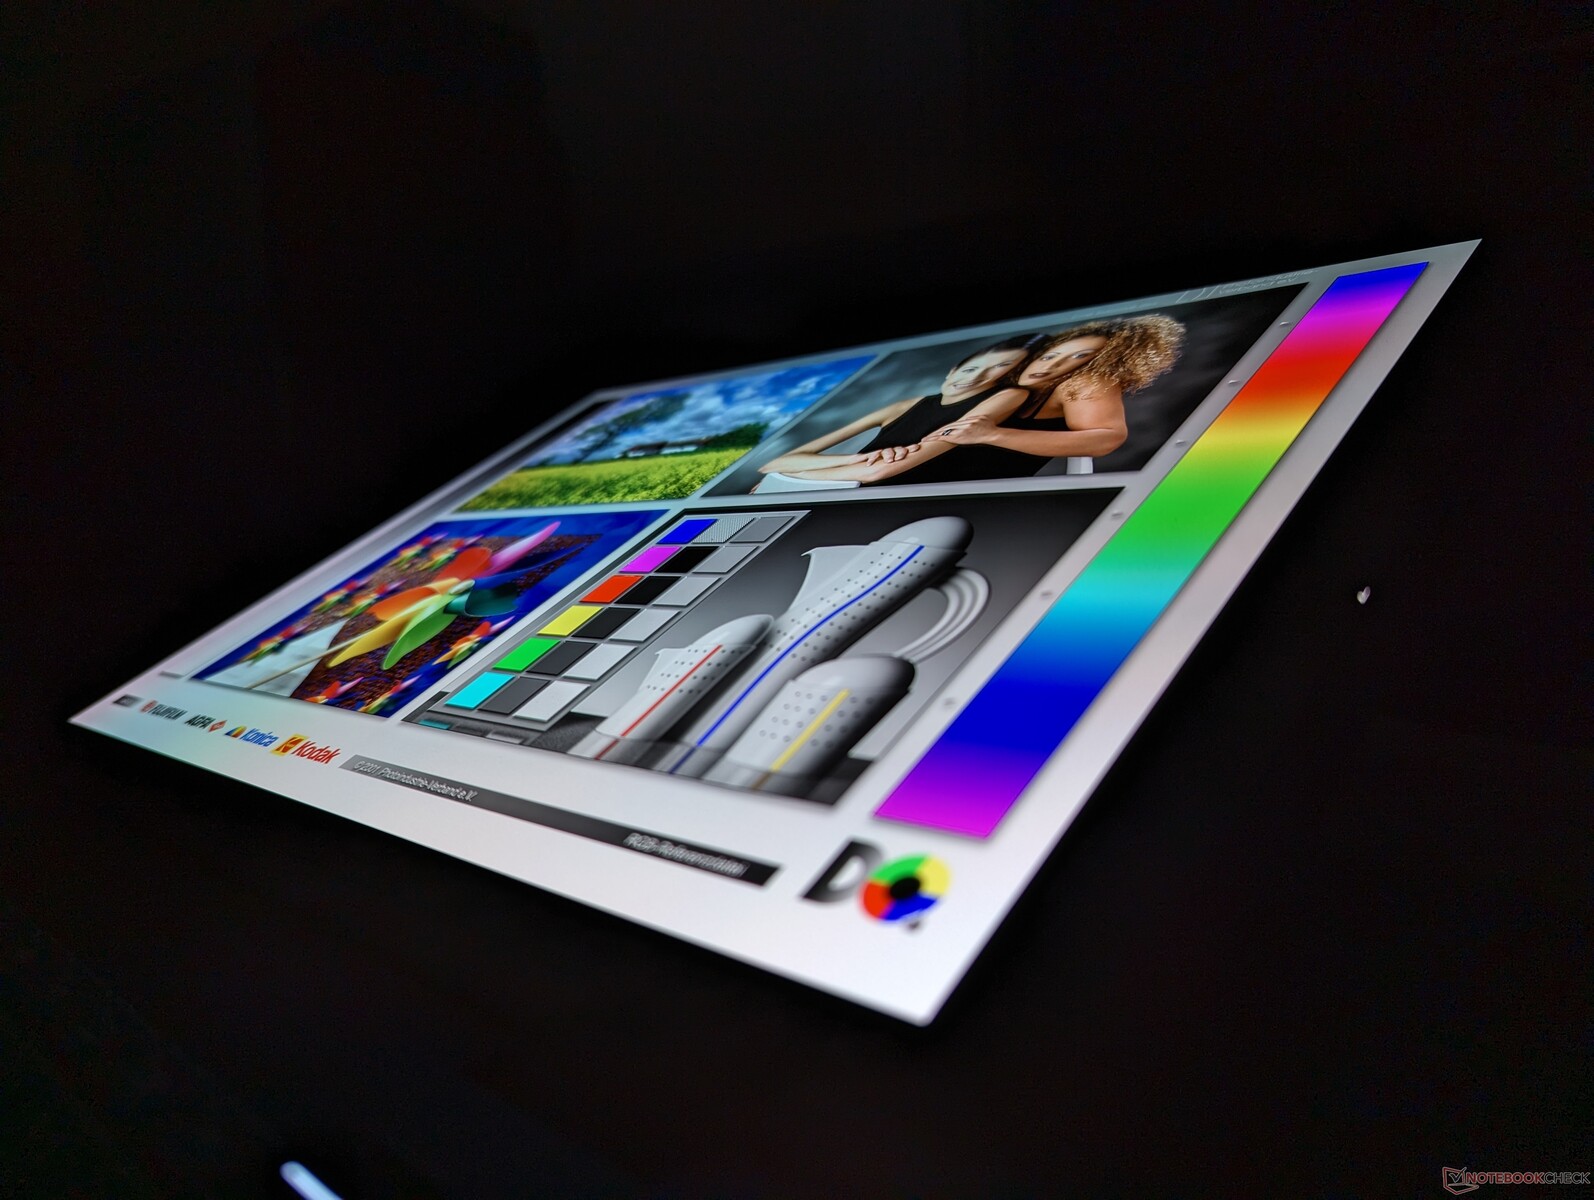
Wyświetlacz
| |||||||||||||||||||||||||
rozświetlenie: 99 %
na akumulatorze: 385.2 cd/m²
kontrast: ∞:1 (czerń: 0 cd/m²)
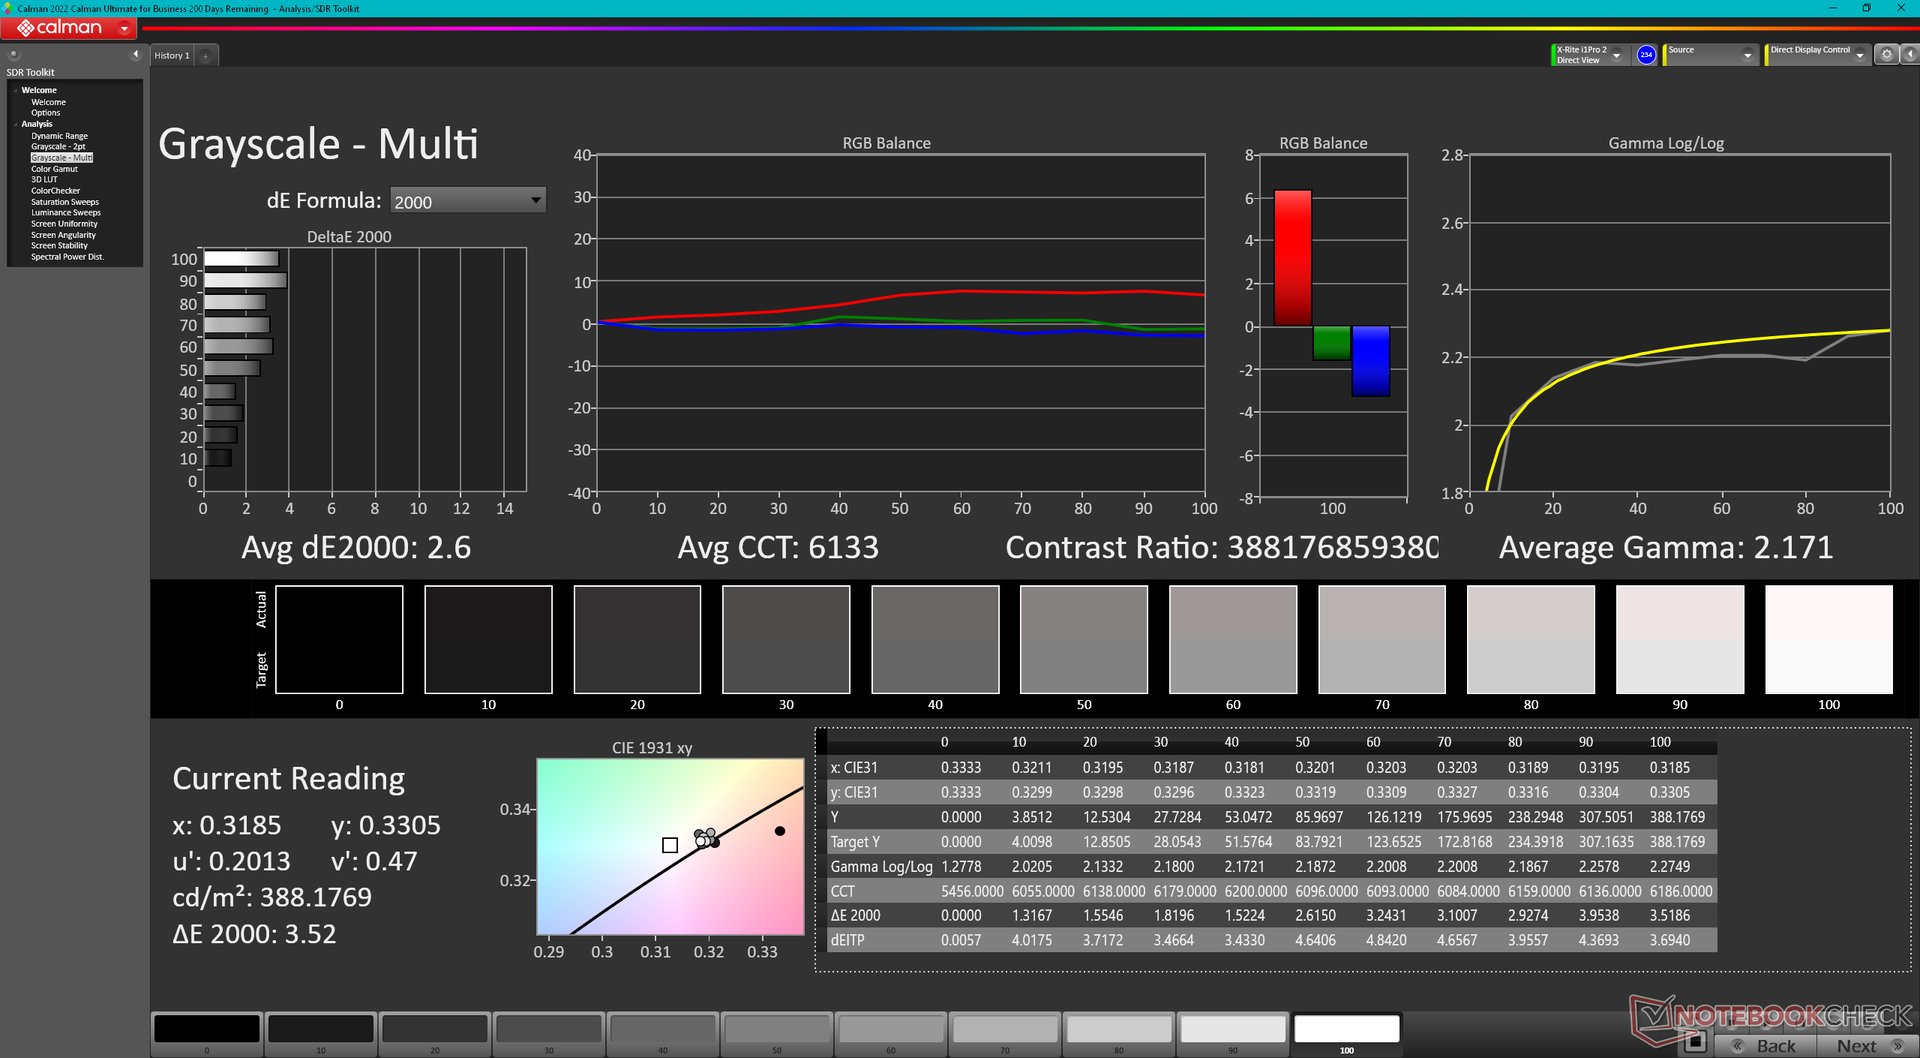
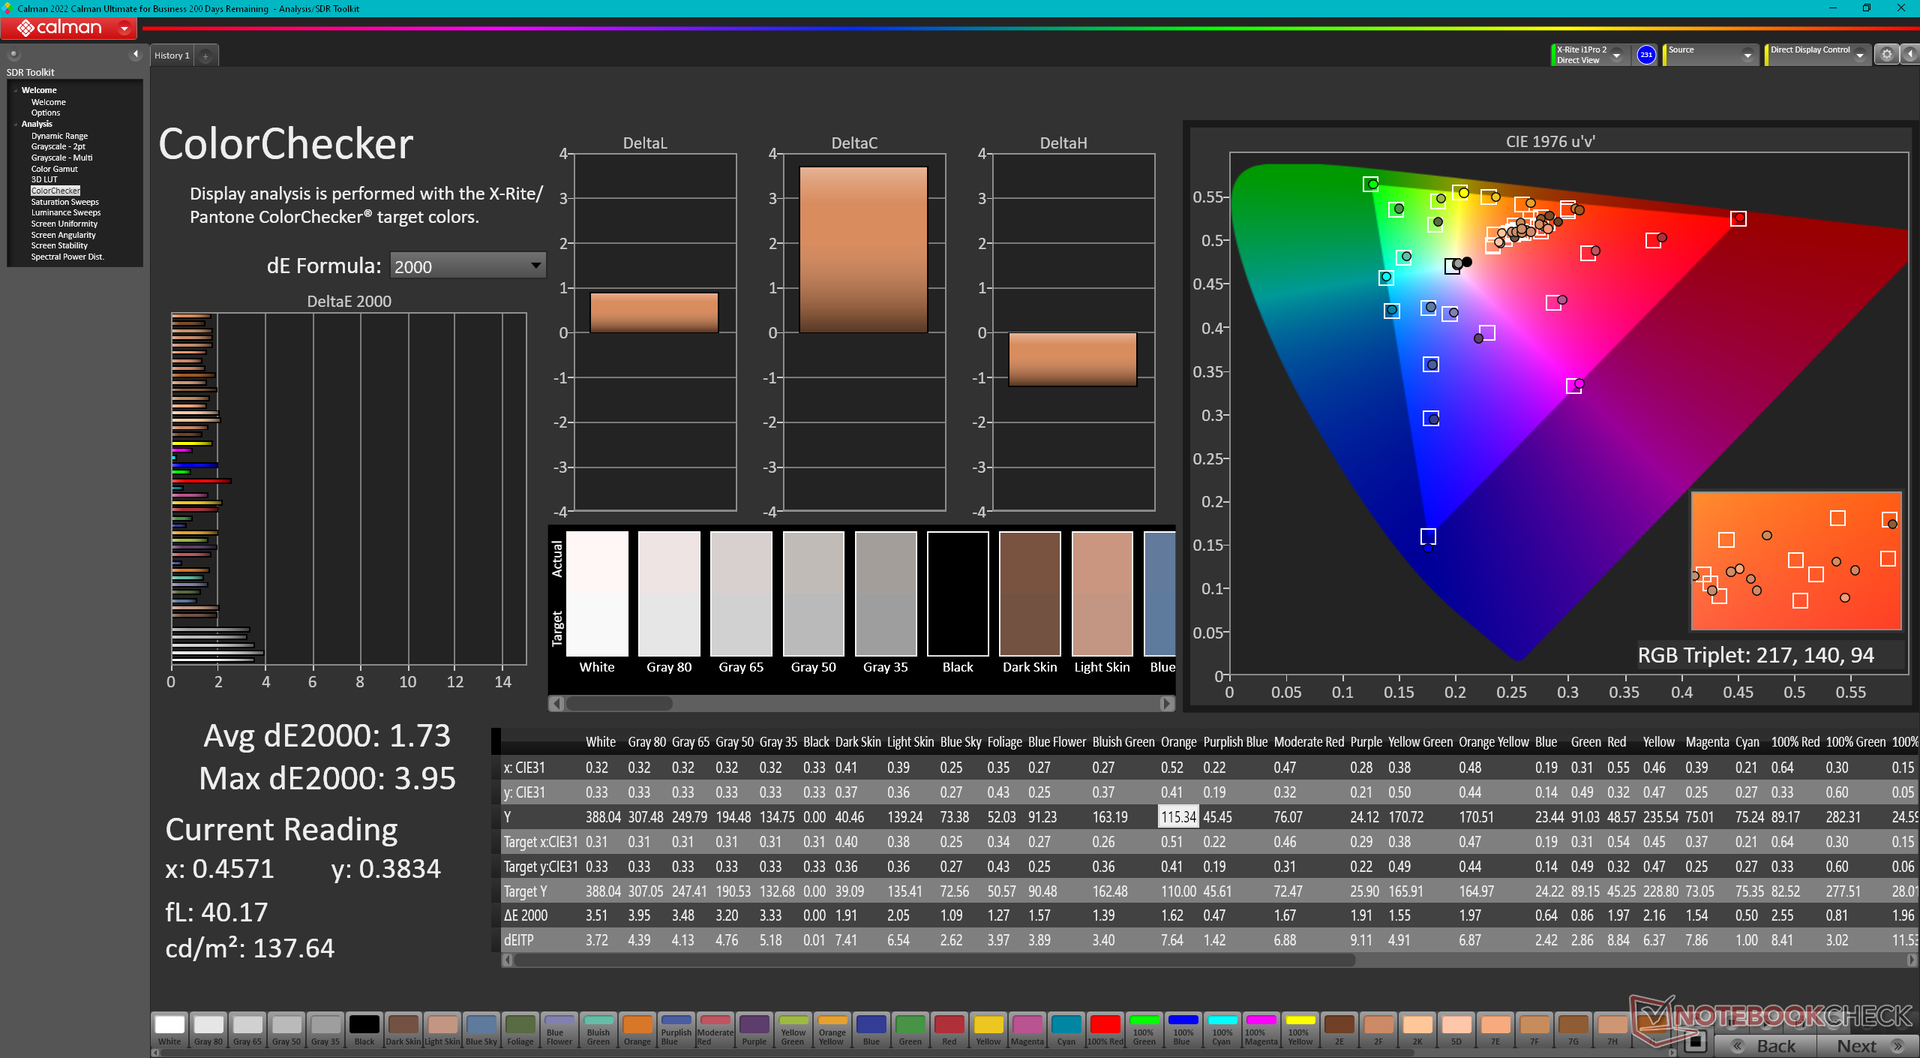
ΔE ColorChecker Calman: 1.73 | ∀{0.5-29.43 Ø4.71}
ΔE Greyscale Calman: 2.6 | ∀{0.09-98 Ø4.96}
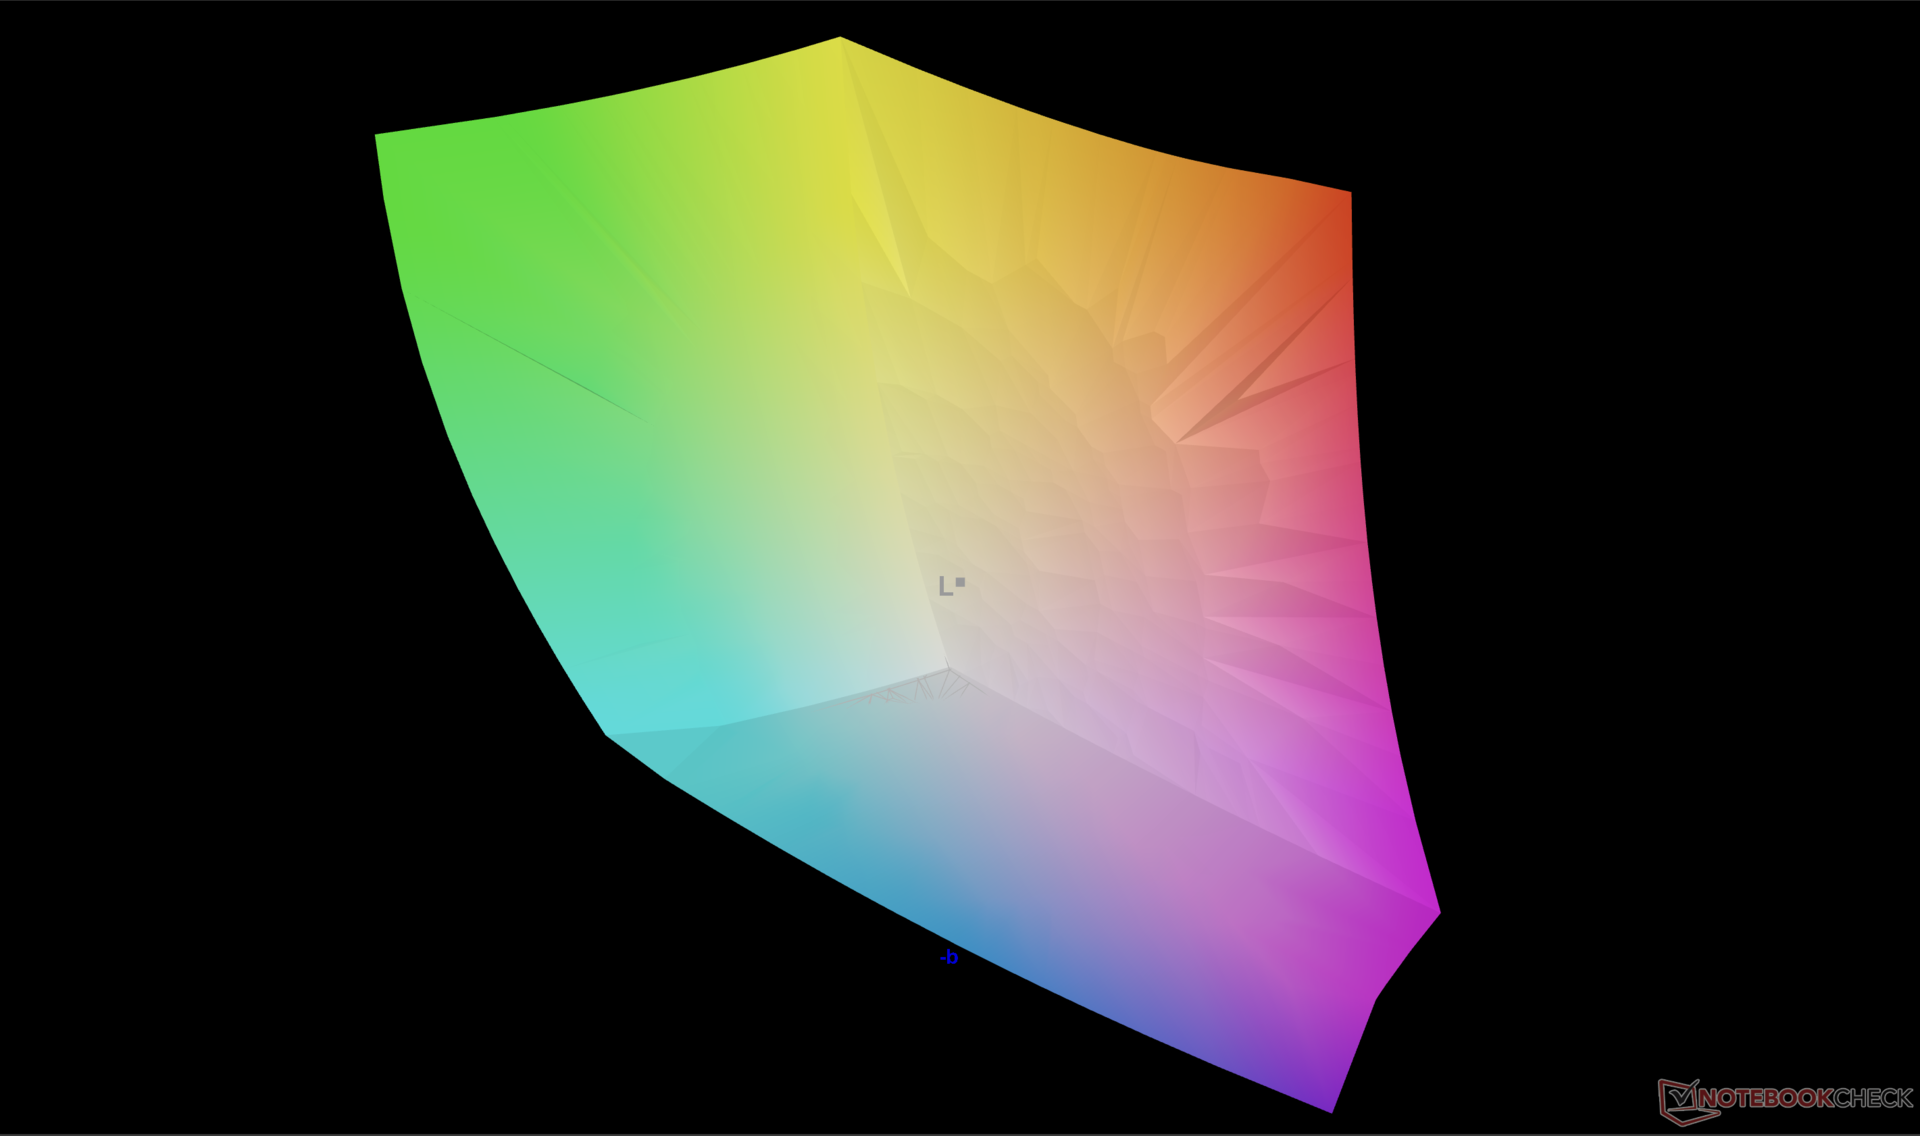
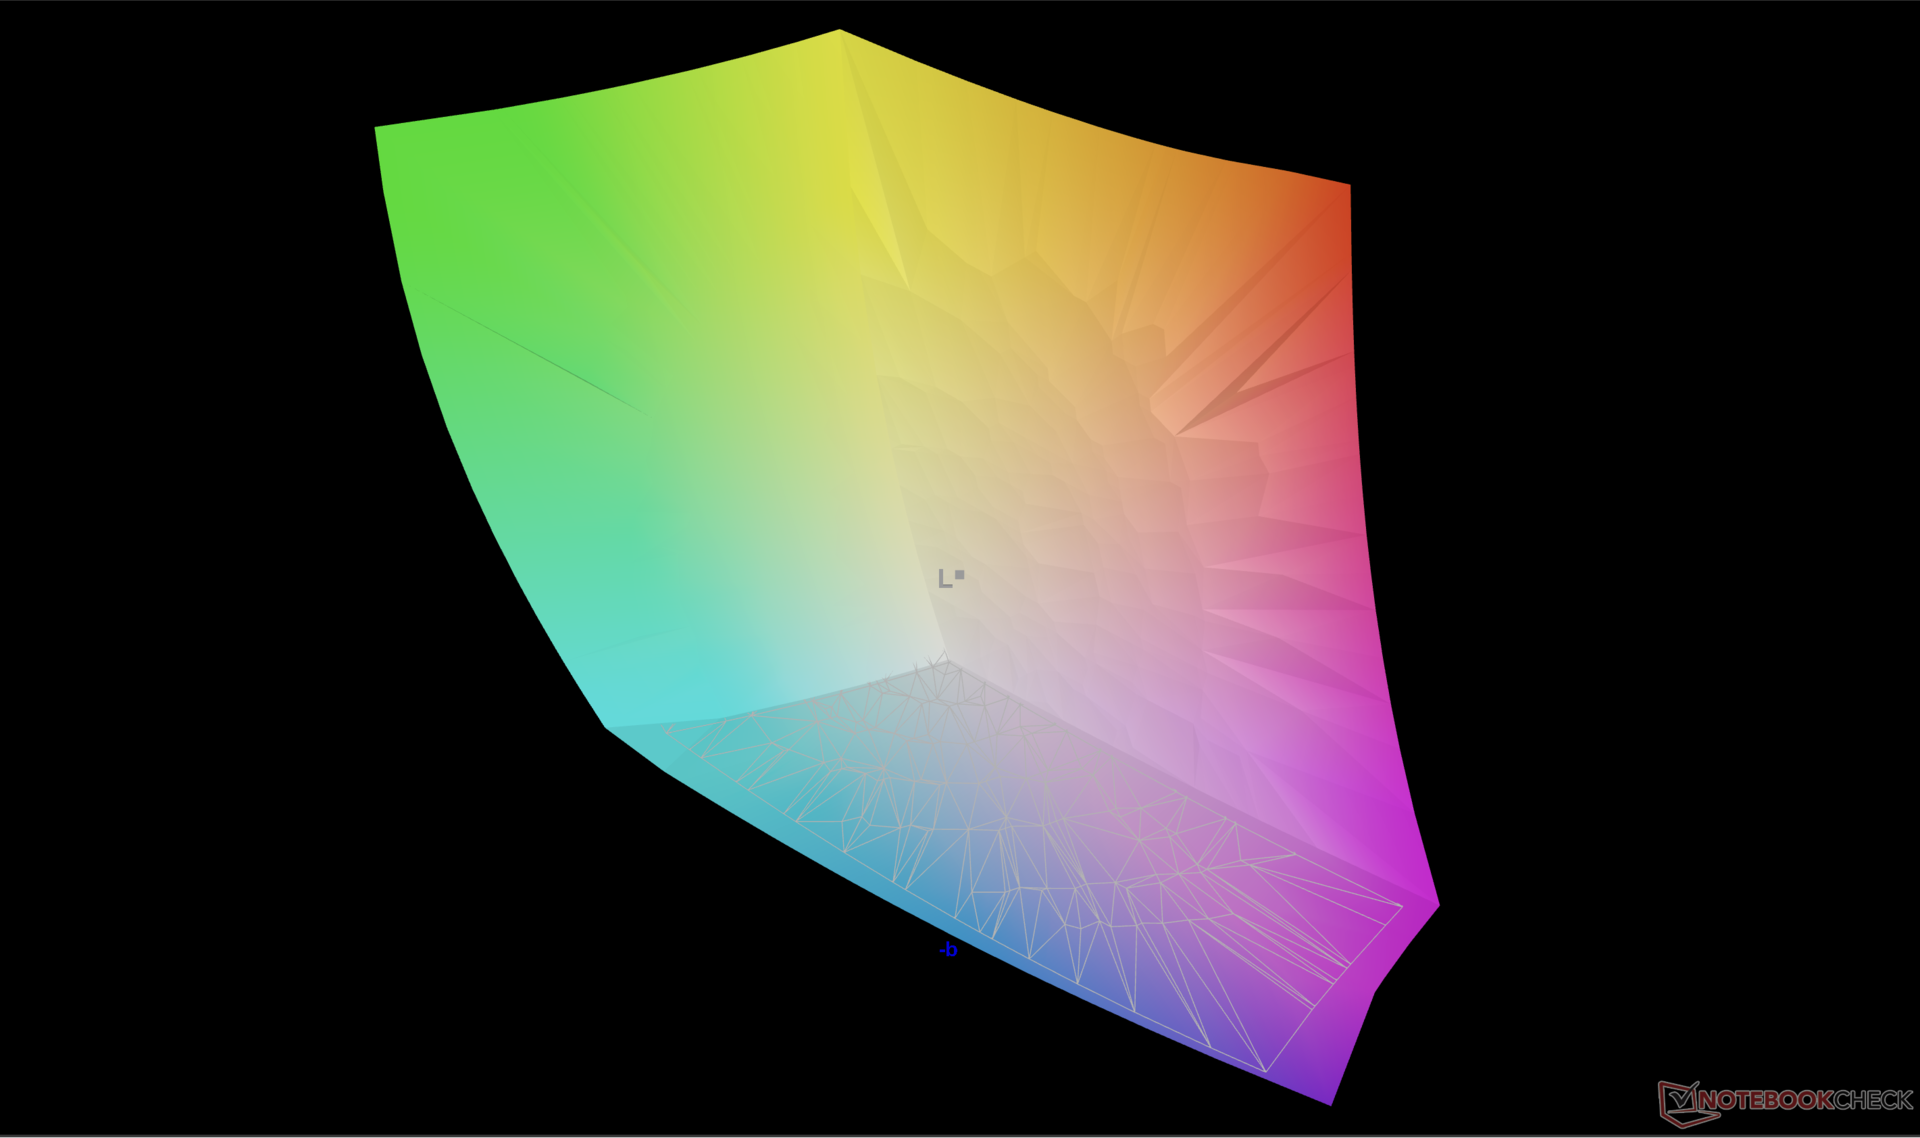
96.7% AdobeRGB 1998 (Argyll 3D)
100% sRGB (Argyll 3D)
99.6% Display P3 (Argyll 3D)
Gamma: 2.17
CCT: 6133 K
| HP Spectre x360 16 RTX 4050 Samsung SDC41A6, OLED, 2880x1800, 16" | HP Spectre x360 16-aa0074ng Samsung SDC41A6, OLED, 2880x1800, 16" | HP Spectre x360 2-in-1 16-f1075ng AU Optronics AUO50A3, IPS, 3072x1920, 16" | Honor MagicBook Pro 16 2024 TL160MDMP01, IPS, 3072x1920, 16" | MSI Prestige 16 B1MG-001US AU Optronics B160QAN03.R, IPS, 2560x1600, 16" | LG Gram 2in1 16 16T90R - G.AA78G LP160WQ1-SPB2, IPS, 2560x1600, 16" | |
|---|---|---|---|---|---|---|
| Display | -1% | -15% | -3% | -5% | -5% | |
| Display P3 Coverage (%) | 99.6 | 98.9 -1% | 75.6 -24% | 98.8 -1% | 96.7 -3% | 96.5 -3% |
| sRGB Coverage (%) | 100 | 99.9 0% | 100.2 0% | 100 0% | 99.8 0% | 99.9 0% |
| AdobeRGB 1998 Coverage (%) | 96.7 | 94.4 -2% | 77.2 -20% | 89.1 -8% | 84.6 -13% | 84.6 -13% |
| Response Times | -10% | -4862% | -630% | -5038% | -3606% | |
| Response Time Grey 50% / Grey 80% * (ms) | 0.78 ? | 0.8 ? -3% | 52 ? -6567% | 6.3 ? -708% | 49.4 ? -6233% | 38.4 ? -4823% |
| Response Time Black / White * (ms) | 0.86 ? | 1 ? -16% | 28 ? -3156% | 5.6 ? -551% | 33.9 ? -3842% | 21.4 ? -2388% |
| PWM Frequency (Hz) | 480 ? | 480 | ||||
| Screen | -7% | -102% | 13% | -88% | -58% | |
| Brightness middle (cd/m²) | 385.2 | 424 10% | 425 10% | 551 43% | 473.6 23% | 329 -15% |
| Brightness (cd/m²) | 387 | 425 10% | 406 5% | 524 35% | 456 18% | 310 -20% |
| Brightness Distribution (%) | 99 | 99 0% | 78 -21% | 91 -8% | 87 -12% | 88 -11% |
| Black Level * (cd/m²) | 0.24 | 0.52 | 0.19 | 0.39 | ||
| Colorchecker dE 2000 * | 1.73 | 2.37 -37% | 5.8 -235% | 1.7 2% | 5.9 -241% | 3.52 -103% |
| Colorchecker dE 2000 max. * | 3.95 | 4.97 -26% | 11.03 -179% | 4.1 -4% | 9.37 -137% | 6.96 -76% |
| Greyscale dE 2000 * | 2.6 | 2.55 2% | 7.57 -191% | 2.4 8% | 7.3 -181% | 5.75 -121% |
| Gamma | 2.17 101% | 2.49 88% | 6600 0% | 2.2 100% | 1.9 116% | 2.137 103% |
| CCT | 6133 106% | 6548 99% | 6842 95% | 7260 90% | 7584 86% | |
| Colorchecker dE 2000 calibrated * | 2.26 | 4.16 | 1 | 0.89 | 1.15 | |
| Contrast (:1) | 1771 | 1060 | 2493 | 844 | ||
| Całkowita średnia (program / ustawienia) | -6% /
-6% | -1660% /
-943% | -207% /
-108% | -1710% /
-966% | -1223% /
-688% |
* ... im mniej tym lepiej
Wyświetl czasy reakcji
| ↔ Czas reakcji od czerni do bieli | ||
|---|---|---|
| 0.86 ms ... wzrost ↗ i spadek ↘ łącznie | ↗ 0.4 ms wzrost | 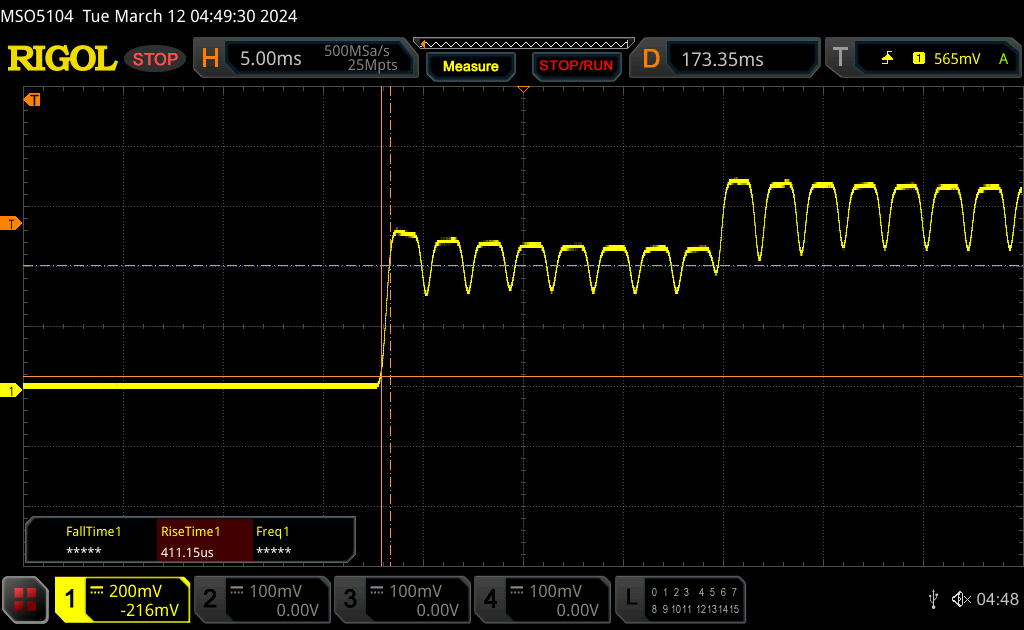 |
| ↘ 0.46 ms upadek | ||
| W naszych testach ekran wykazuje bardzo szybką reakcję i powinien bardzo dobrze nadawać się do szybkich gier. Dla porównania, wszystkie testowane urządzenia wahają się od 0.1 (minimum) do 240 (maksimum) ms. » 3 % wszystkich urządzeń jest lepszych. Oznacza to, że zmierzony czas reakcji jest lepszy od średniej wszystkich testowanych urządzeń (19.8 ms). | ||
| ↔ Czas reakcji 50% szarości do 80% szarości | ||
| 0.78 ms ... wzrost ↗ i spadek ↘ łącznie | ↗ 0.44 ms wzrost |  |
| ↘ 0.34 ms upadek | ||
| W naszych testach ekran wykazuje bardzo szybką reakcję i powinien bardzo dobrze nadawać się do szybkich gier. Dla porównania, wszystkie testowane urządzenia wahają się od 0.165 (minimum) do 636 (maksimum) ms. » 3 % wszystkich urządzeń jest lepszych. Oznacza to, że zmierzony czas reakcji jest lepszy od średniej wszystkich testowanych urządzeń (30.9 ms). | ||
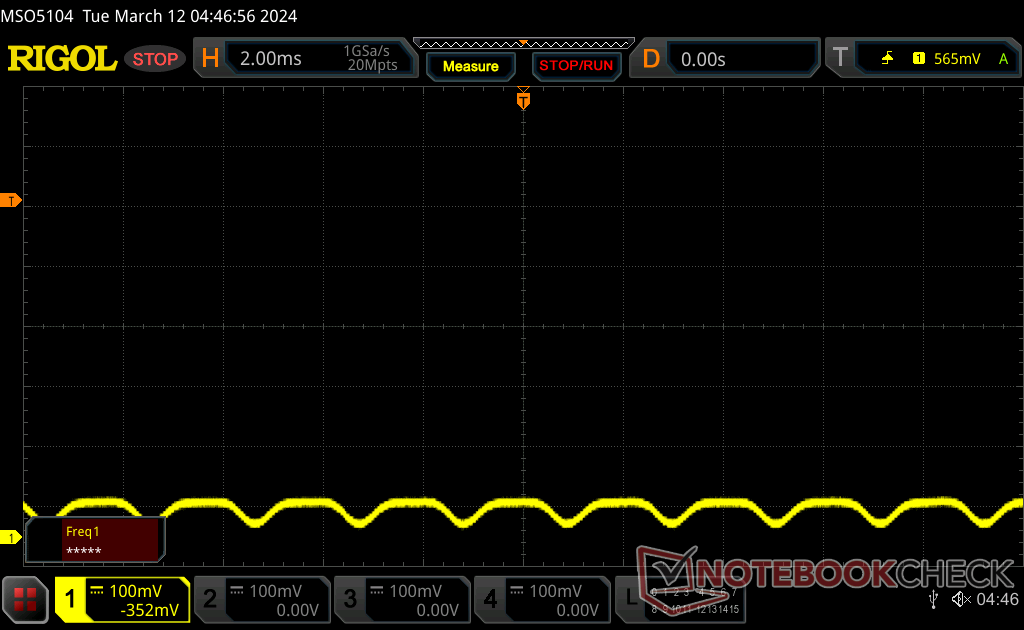
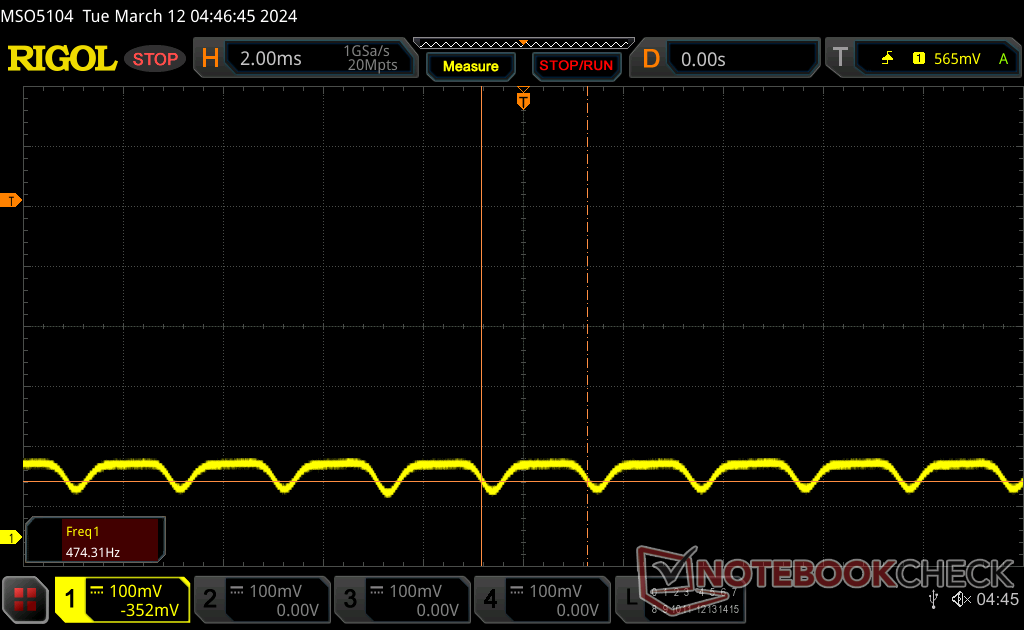
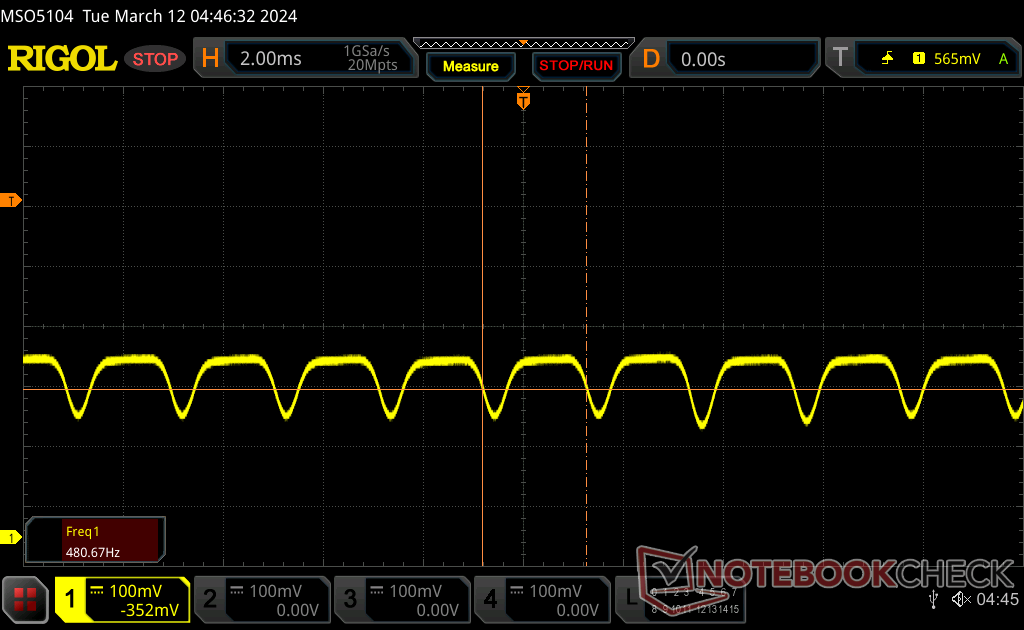
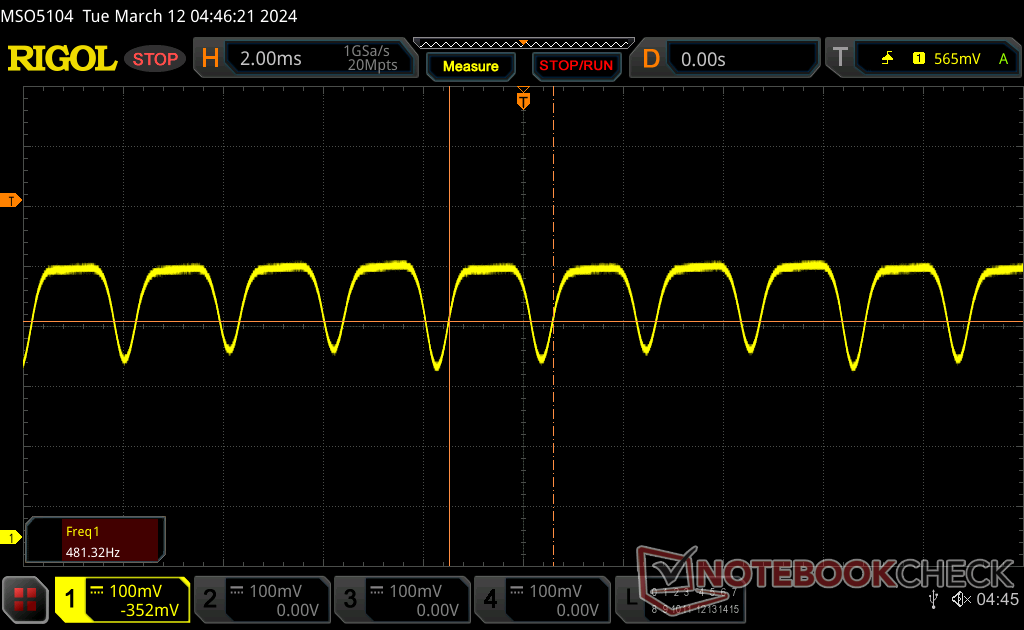
Migotanie ekranu / PWM (modulacja szerokości impulsu)
| Wykryto migotanie ekranu/wykryto PWM | 480 Hz | ≤ 100 % ustawienia jasności | 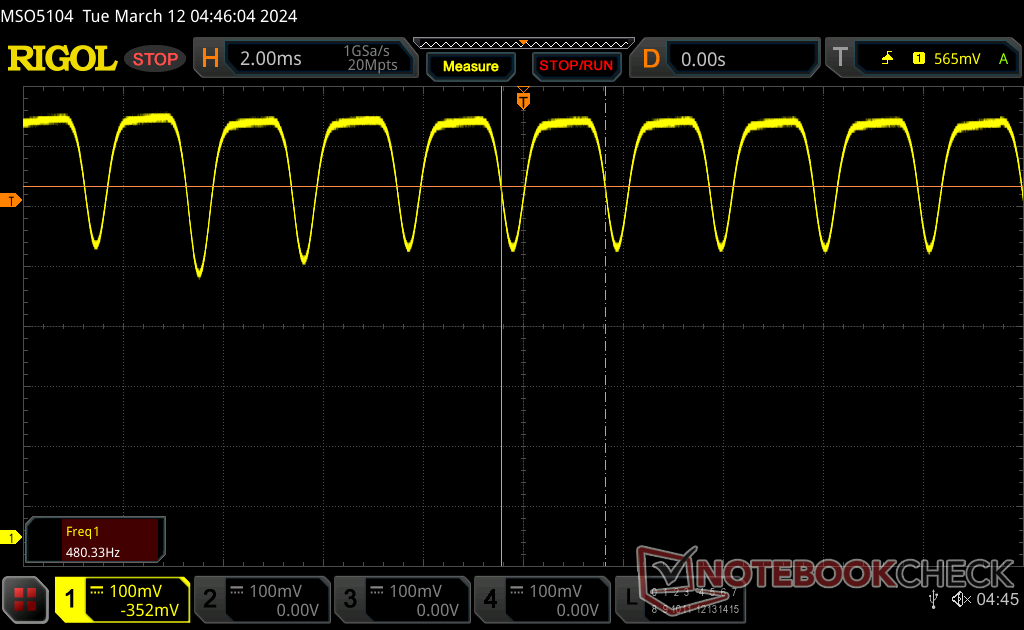 |
Podświetlenie wyświetlacza miga z częstotliwością 480 Hz (najgorszy przypadek, np. przy użyciu PWM) Wykryto migotanie przy ustawieniu jasności 100 % i poniżej. Powyżej tego ustawienia jasności nie powinno być żadnego migotania ani PWM. Częstotliwość 480 Hz jest stosunkowo wysoka, więc większość użytkowników wrażliwych na PWM nie powinna zauważyć żadnego migotania. Istnieją jednak doniesienia, że niektórzy użytkownicy są nadal wrażliwi na PWM przy częstotliwości 500 Hz i wyższej, więc należy zachować ostrożność. Dla porównania: 52 % wszystkich testowanych urządzeń nie używa PWM do przyciemniania wyświetlacza. Jeśli wykryto PWM, zmierzono średnio 7744 (minimum: 5 - maksimum: 343500) Hz. | |||


Wydajność

Warunki testowania
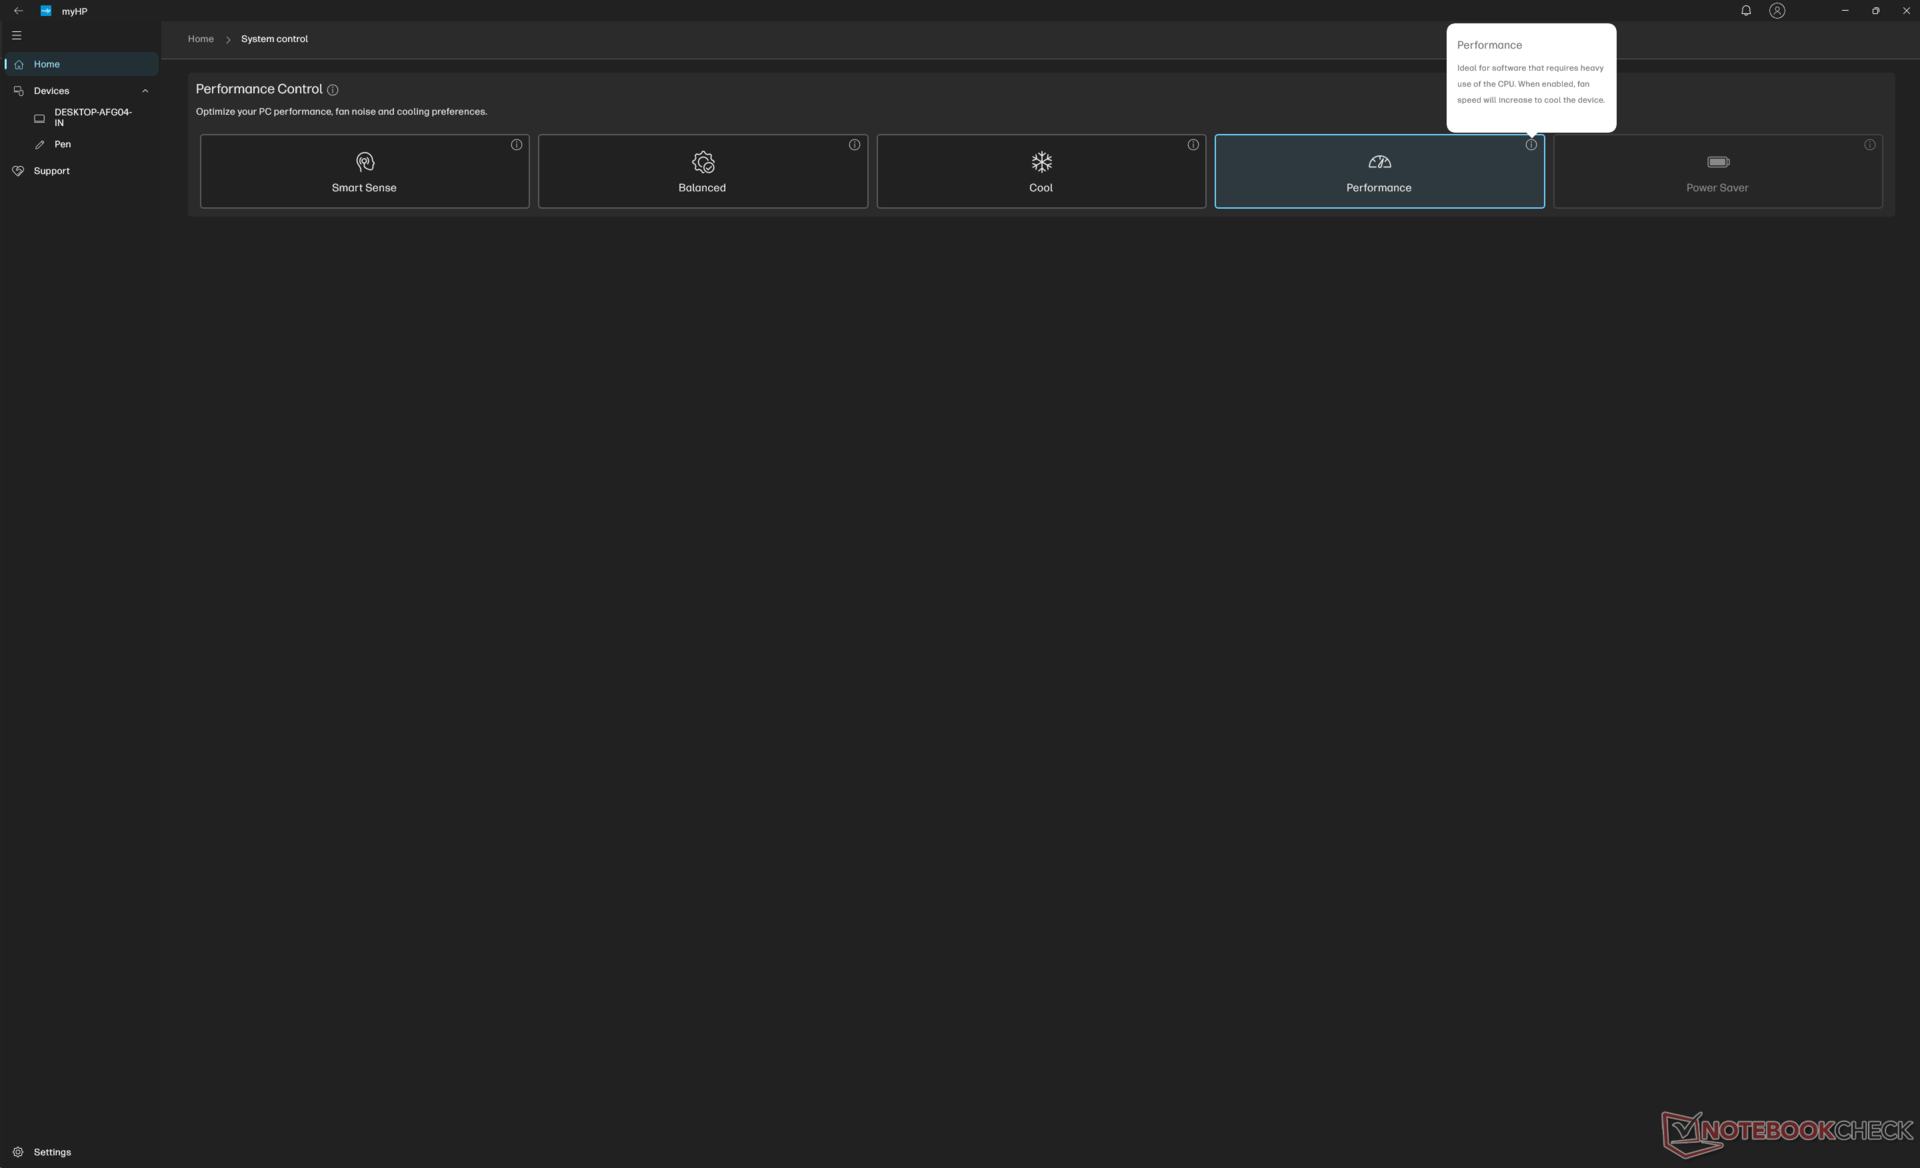
Przed uruchomieniem poniższych testów porównawczych ustawiliśmy system Windows i MyHP w odpowiednich trybach wydajności. Zarówno MyHP, jak i Omen Gaming Hub są zainstalowane w systemie, ale większość ważnych funkcji związanych z użytecznością i profilami zasilania jest powiązana z MyHP.
Procesor
Procesor Core Ultra 7 155H w naszej konfiguracji dGPU zwróciłby niższe wyniki niż ten sam procesor w naszej konfiguracji iGPU. Różnica między tymi dwoma systemami może wynosić nawet 20%, a wyniki nie uległyby poprawie nawet po kilku ponownych testach. Rzeczywiście, przyglądając się bliżej poziomom poboru mocy na płycie CPU w każdej konfiguracji, procesor w naszej jednostce dGPU osiągnąłby zaledwie 28 W, podczas gdy ten sam procesor w naszej jednostce iGPU ustabilizowałby się na wyższym poziomie mocy 40 W.
HP twierdzi, że zdaje sobie sprawę z "nieprawidłowego dławienia procesora podczas niektórych obciążeń" i że trwają prace nad aktualizacją oprogramowania, aby to rozwiązać. Dodamy nowe wyniki tutaj, gdy tylko aktualizacja będzie dostępna.
Cinebench R15 Multi Loop
Cinebench R23: Multi Core | Single Core
Cinebench R20: CPU (Multi Core) | CPU (Single Core)
Cinebench R15: CPU Multi 64Bit | CPU Single 64Bit
Blender: v2.79 BMW27 CPU
7-Zip 18.03: 7z b 4 | 7z b 4 -mmt1
Geekbench 6.7: Multi-Core | Single-Core
Geekbench 5.5: Multi-Core | Single-Core
HWBOT x265 Benchmark v2.2: 4k Preset
LibreOffice : 20 Documents To PDF
R Benchmark 2.5: Overall mean
* ... im mniej tym lepiej
AIDA64: FP32 Ray-Trace | FPU Julia | CPU SHA3 | CPU Queen | FPU SinJulia | FPU Mandel | CPU AES | CPU ZLib | FP64 Ray-Trace | CPU PhotoWorxx
| Performance rating | |
| Honor MagicBook Pro 16 2024 | |
| MSI Prestige 16 B1MG-001US | |
| HP Spectre x360 16 RTX 4050 | |
| Przeciętny Intel Core Ultra 7 155H | |
| HP Spectre x360 16-aa0074ng | |
| HP Spectre x360 2-in-1 16-f1075ng | |
| LG Gram 2in1 16 16T90R - G.AA78G | |
| AIDA64 / FP32 Ray-Trace | |
| Honor MagicBook Pro 16 2024 | |
| MSI Prestige 16 B1MG-001US | |
| HP Spectre x360 16 RTX 4050 | |
| Przeciętny Intel Core Ultra 7 155H (6670 - 18470, n=50) | |
| HP Spectre x360 16-aa0074ng | |
| HP Spectre x360 2-in-1 16-f1075ng | |
| LG Gram 2in1 16 16T90R - G.AA78G | |
| LG Gram 2in1 16 16T90R - G.AA78G | |
| AIDA64 / FPU Julia | |
| Honor MagicBook Pro 16 2024 | |
| MSI Prestige 16 B1MG-001US | |
| HP Spectre x360 16 RTX 4050 | |
| Przeciętny Intel Core Ultra 7 155H (40905 - 93181, n=50) | |
| HP Spectre x360 16-aa0074ng | |
| HP Spectre x360 2-in-1 16-f1075ng | |
| LG Gram 2in1 16 16T90R - G.AA78G | |
| AIDA64 / CPU SHA3 | |
| Honor MagicBook Pro 16 2024 | |
| MSI Prestige 16 B1MG-001US | |
| HP Spectre x360 16 RTX 4050 | |
| Przeciętny Intel Core Ultra 7 155H (1940 - 4436, n=50) | |
| HP Spectre x360 16-aa0074ng | |
| HP Spectre x360 2-in-1 16-f1075ng | |
| LG Gram 2in1 16 16T90R - G.AA78G | |
| AIDA64 / CPU Queen | |
| MSI Prestige 16 B1MG-001US | |
| HP Spectre x360 2-in-1 16-f1075ng | |
| HP Spectre x360 16-aa0074ng | |
| Honor MagicBook Pro 16 2024 | |
| Przeciętny Intel Core Ultra 7 155H (64698 - 94181, n=50) | |
| LG Gram 2in1 16 16T90R - G.AA78G | |
| HP Spectre x360 16 RTX 4050 | |
| AIDA64 / FPU SinJulia | |
| Honor MagicBook Pro 16 2024 | |
| MSI Prestige 16 B1MG-001US | |
| HP Spectre x360 16 RTX 4050 | |
| HP Spectre x360 16-aa0074ng | |
| Przeciętny Intel Core Ultra 7 155H (5639 - 10647, n=50) | |
| HP Spectre x360 2-in-1 16-f1075ng | |
| LG Gram 2in1 16 16T90R - G.AA78G | |
| AIDA64 / FPU Mandel | |
| Honor MagicBook Pro 16 2024 | |
| MSI Prestige 16 B1MG-001US | |
| HP Spectre x360 16 RTX 4050 | |
| Przeciętny Intel Core Ultra 7 155H (18236 - 47685, n=50) | |
| HP Spectre x360 16-aa0074ng | |
| HP Spectre x360 2-in-1 16-f1075ng | |
| LG Gram 2in1 16 16T90R - G.AA78G | |
| AIDA64 / CPU AES | |
| Honor MagicBook Pro 16 2024 | |
| HP Spectre x360 2-in-1 16-f1075ng | |
| LG Gram 2in1 16 16T90R - G.AA78G | |
| Przeciętny Intel Core Ultra 7 155H (45713 - 152179, n=50) | |
| MSI Prestige 16 B1MG-001US | |
| HP Spectre x360 16 RTX 4050 | |
| HP Spectre x360 16-aa0074ng | |
| AIDA64 / CPU ZLib | |
| Honor MagicBook Pro 16 2024 | |
| MSI Prestige 16 B1MG-001US | |
| HP Spectre x360 16 RTX 4050 | |
| Przeciętny Intel Core Ultra 7 155H (557 - 1250, n=50) | |
| HP Spectre x360 16-aa0074ng | |
| HP Spectre x360 2-in-1 16-f1075ng | |
| LG Gram 2in1 16 16T90R - G.AA78G | |
| AIDA64 / FP64 Ray-Trace | |
| Honor MagicBook Pro 16 2024 | |
| MSI Prestige 16 B1MG-001US | |
| HP Spectre x360 16 RTX 4050 | |
| Przeciętny Intel Core Ultra 7 155H (3569 - 9802, n=50) | |
| HP Spectre x360 16-aa0074ng | |
| HP Spectre x360 2-in-1 16-f1075ng | |
| LG Gram 2in1 16 16T90R - G.AA78G | |
| AIDA64 / CPU PhotoWorxx | |
| HP Spectre x360 16-aa0074ng | |
| HP Spectre x360 16 RTX 4050 | |
| Przeciętny Intel Core Ultra 7 155H (32719 - 54223, n=50) | |
| MSI Prestige 16 B1MG-001US | |
| Honor MagicBook Pro 16 2024 | |
| LG Gram 2in1 16 16T90R - G.AA78G | |
| HP Spectre x360 2-in-1 16-f1075ng | |
Test warunków skrajnych
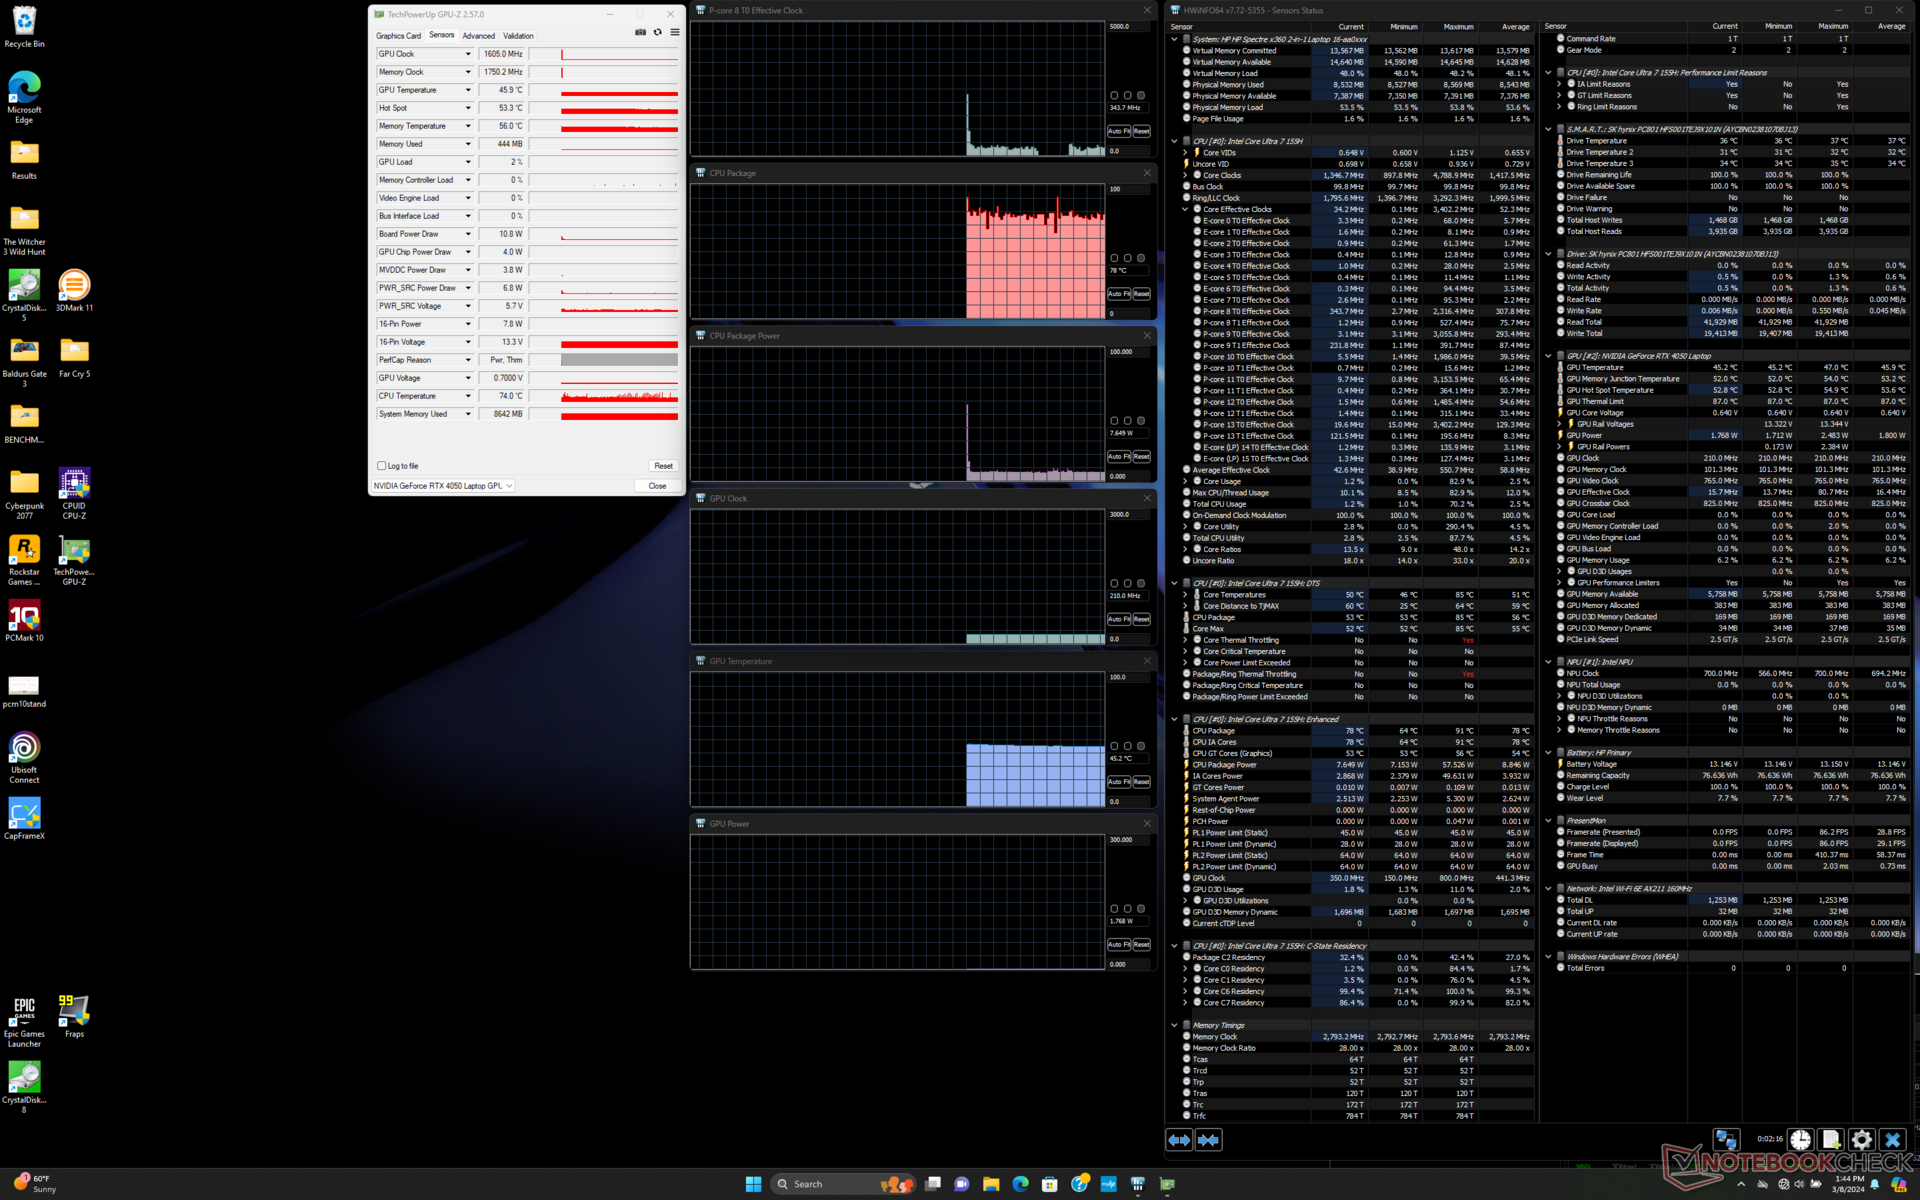
Częstotliwość taktowania procesora i pobór mocy z płyty głównej podczas inicjowania stresu Prime95 osiągnęłyby odpowiednio 3,2 GHz i 65 W, po czym spadłyby do zaledwie 1,4 GHz i 28 W kilka sekund później, reprezentując stosunkowo gwałtowny spadek wydajności. Temperatura rdzenia osiągnęłaby nawet 95 C, gdy Turbo Boost osiągnąłby 3,2 GHz, więc niższe częstotliwości taktowania są niezbędne do utrzymania temperatur w ryzach.
Wydajność graficzna różni się pomiędzy trybami Balanced i Performance. Dla przykładu, częstotliwość taktowania GPU i pobór mocy płyty podczas pracy w trybie Witcher 3 w trybie zrównoważonym ustabilizowałyby się odpowiednio na poziomie 1920 MHz i 39 W, w porównaniu do 2235 MHz i 53 W w trybie wydajności. Temperatury rdzenia są również wyższe w trybie Performance, co pokazuje poniższa tabela.
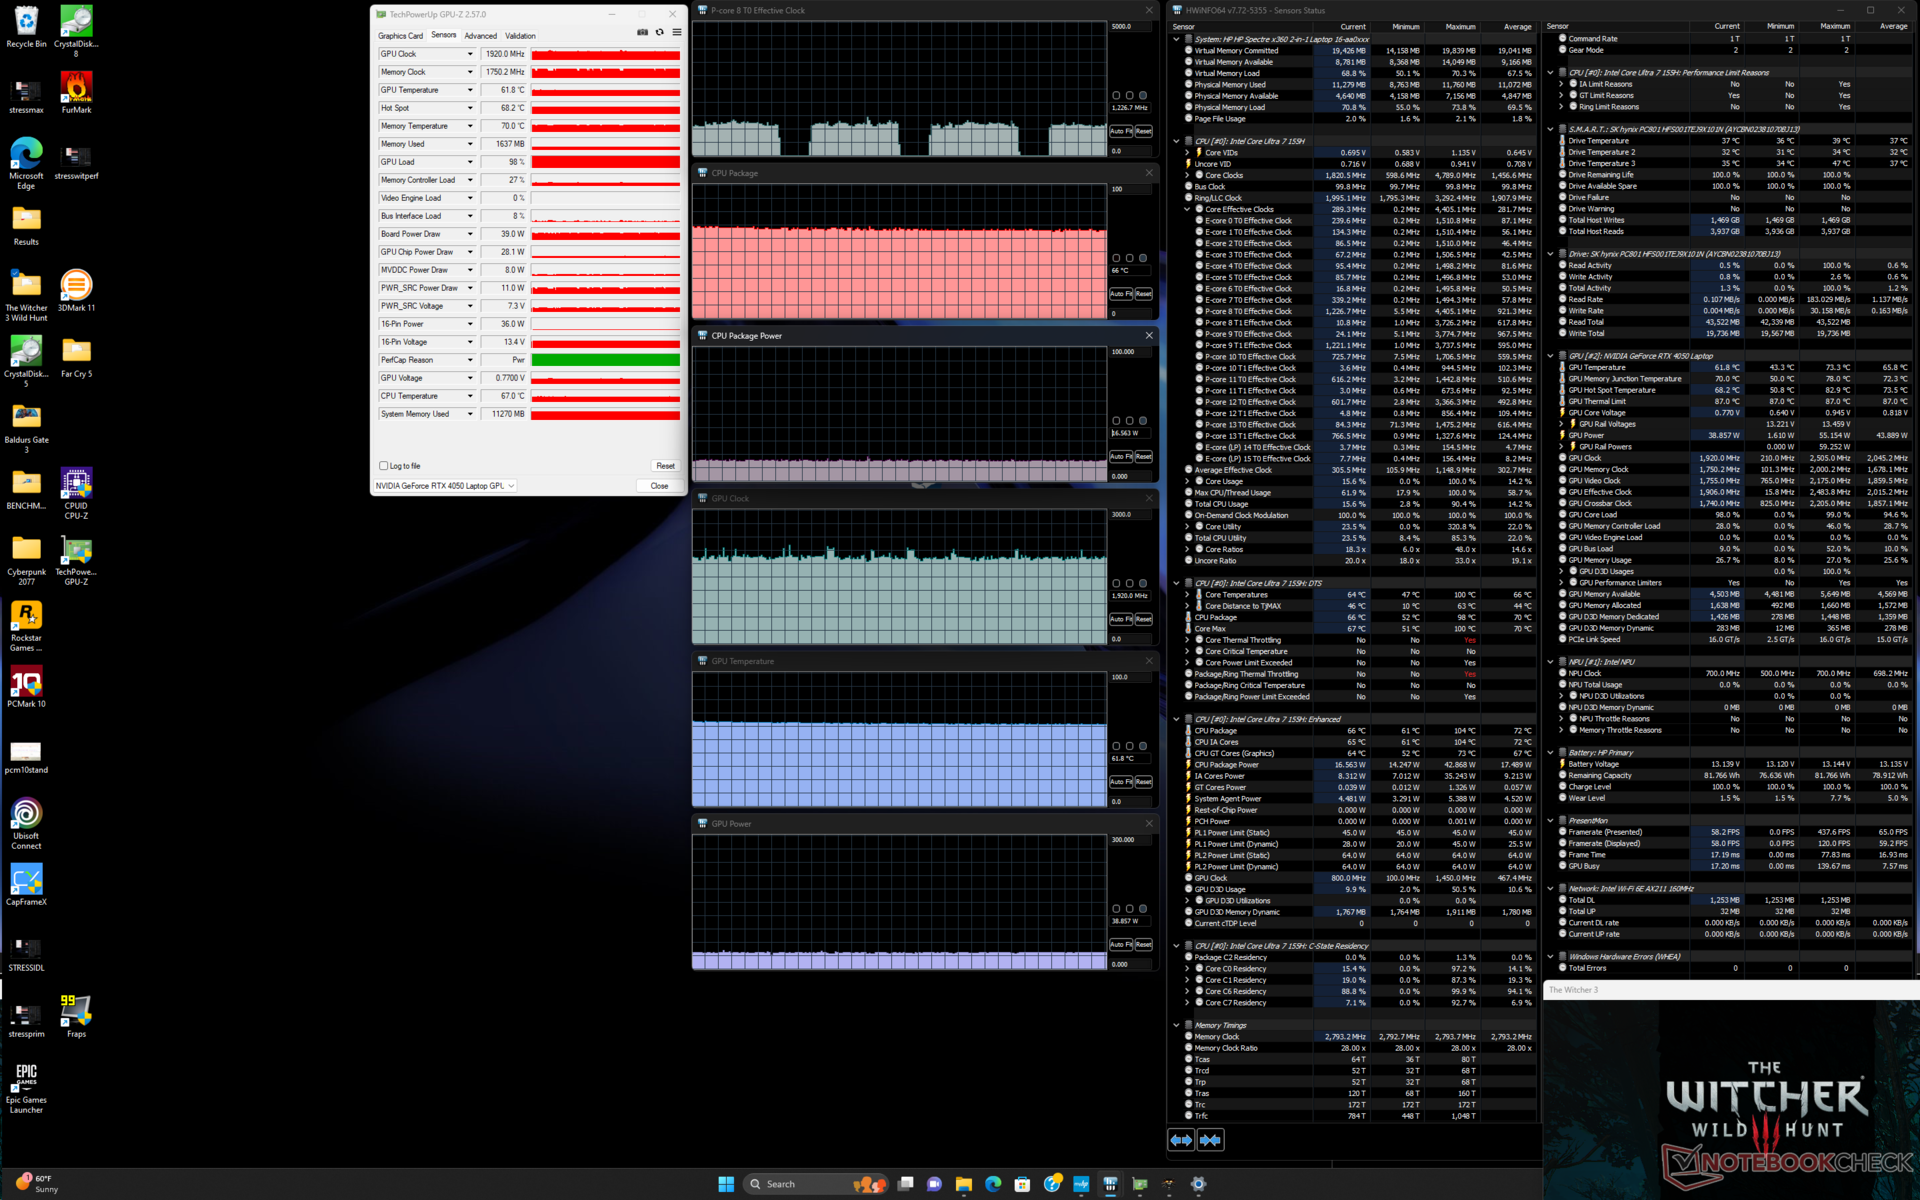

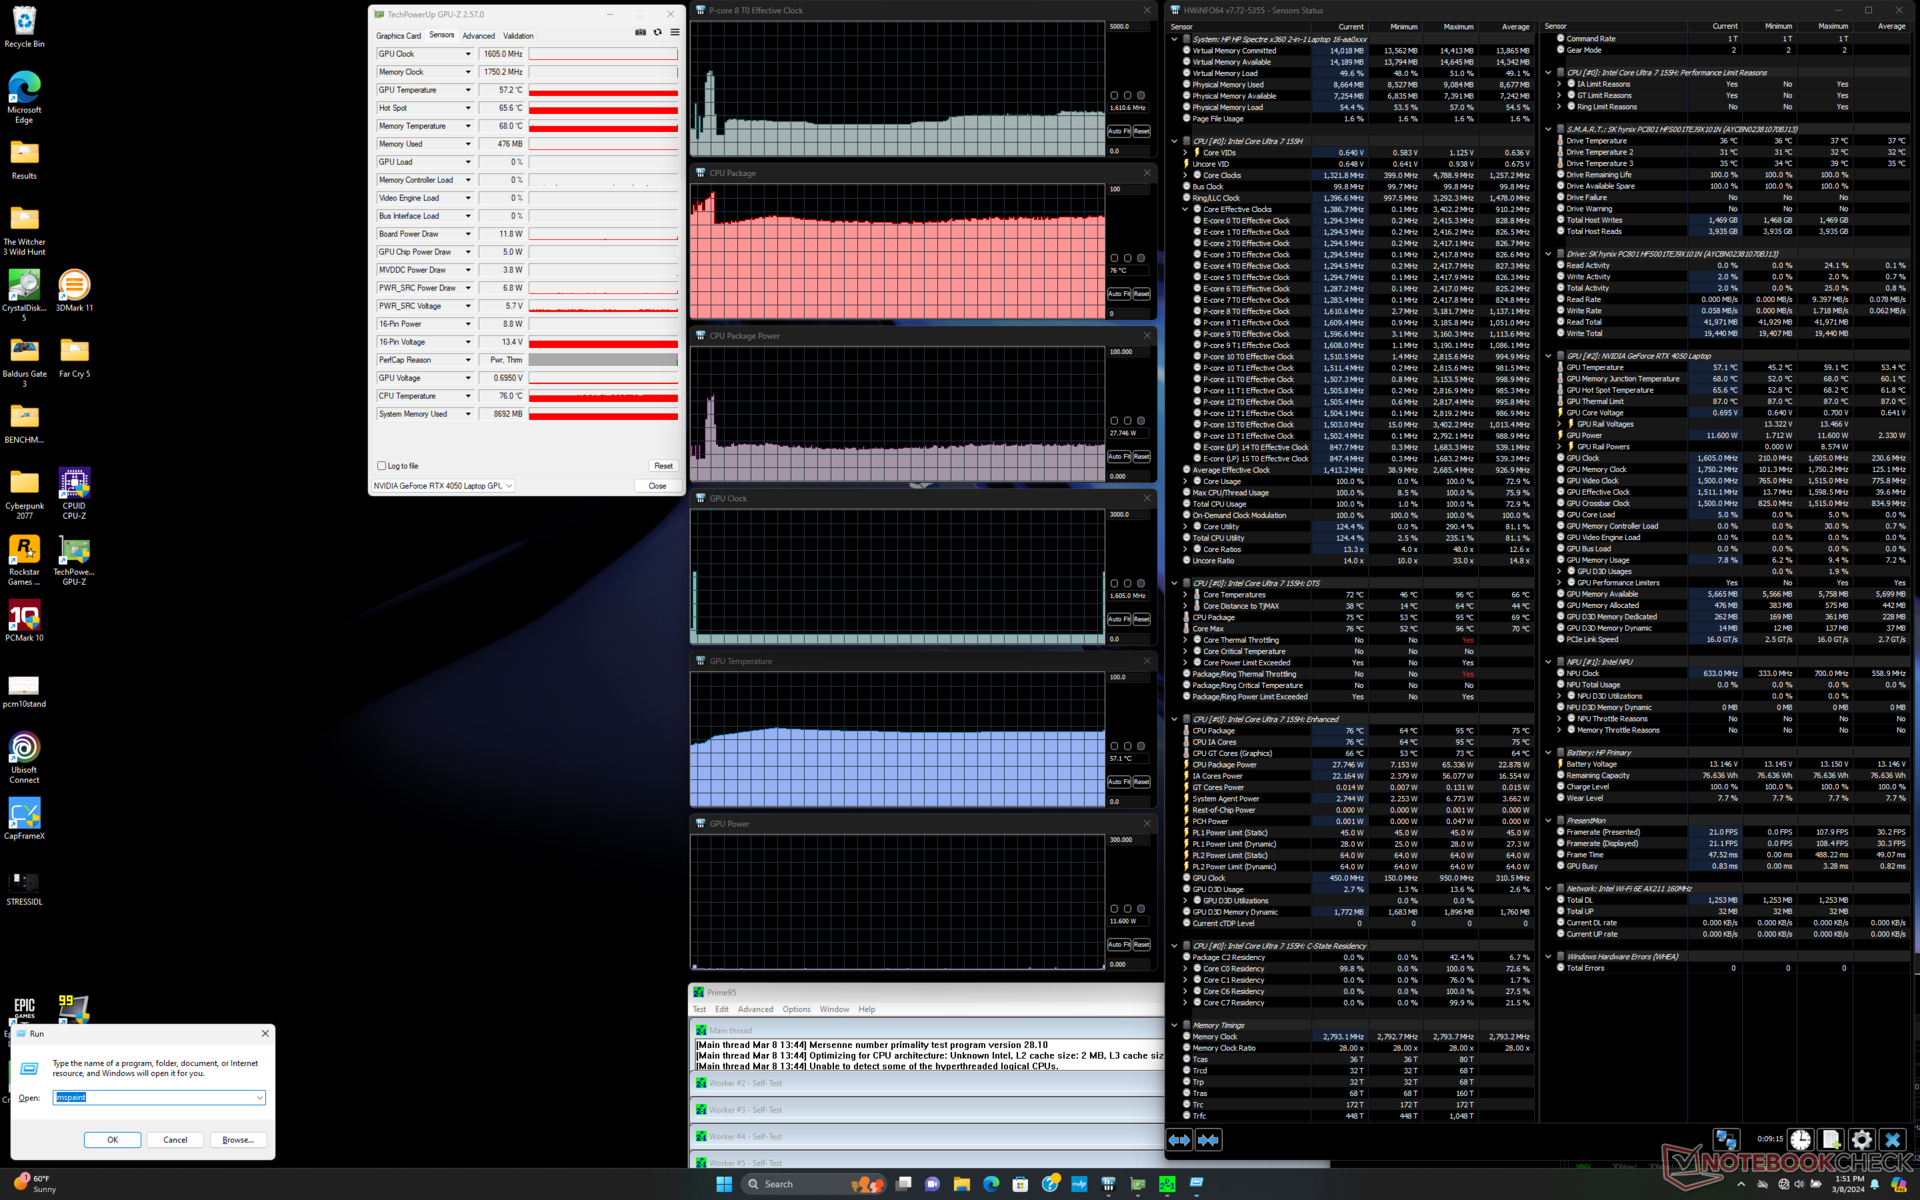
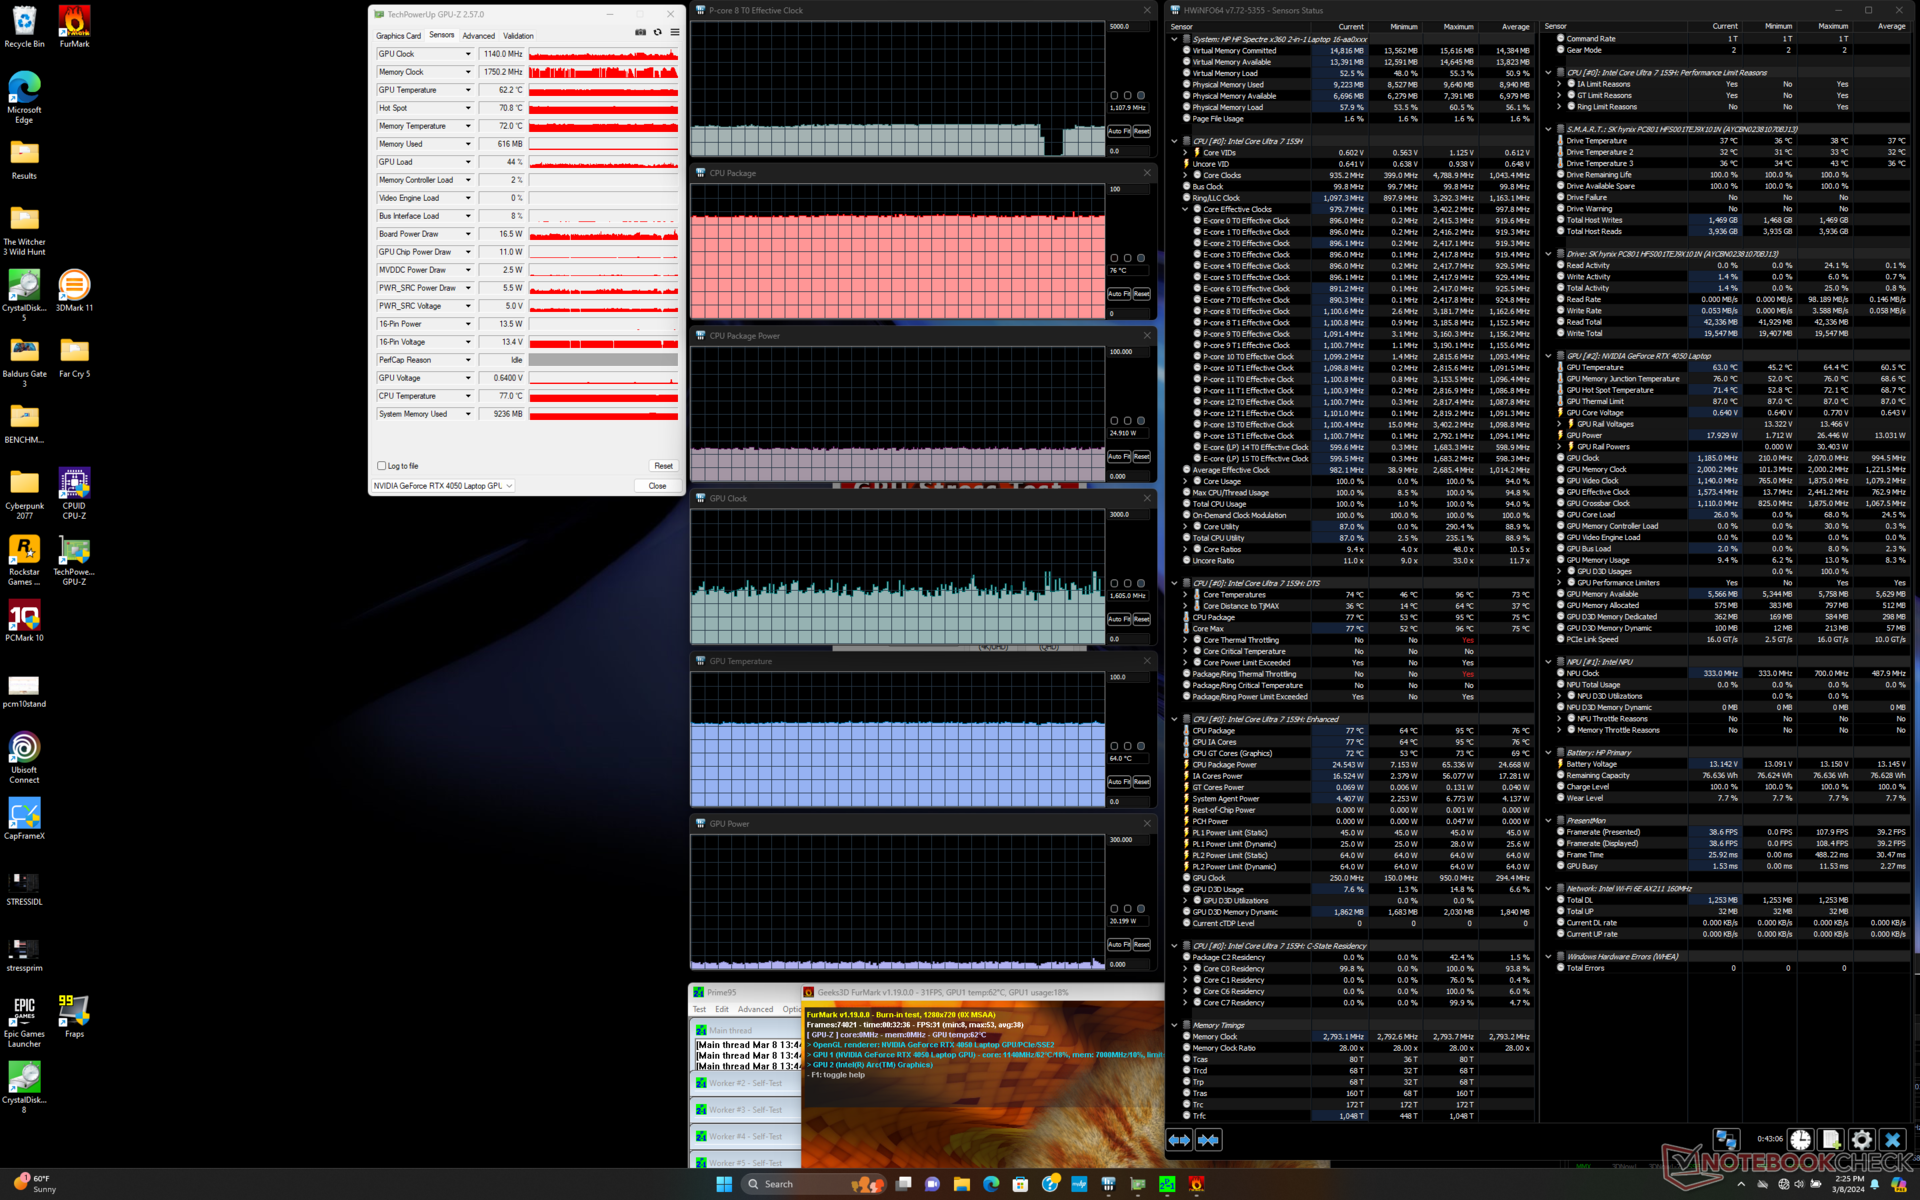
| Taktowanie CPU (GHz) | Taktowanie GPU (MHz) | Średnia temperatura CPU (°C) | Średnia temperatura GPU (°C) | |
| System w stanie spoczynku | -- | -- | 53 | 45 |
| Prime95Stress | ~1.5 | -- | 75 | 57 |
| Prime95+ FurMark Stress | ~1.1 | ~1140 | 77 | 64 |
| Witcher 3 Obciążenie (trybzrównoważony) | ~1.1 | 1920 | 66 | 62 |
| Witcher 3 Obciążenie (trybwydajności) | ~1.1 | 2235 | 72 | 71 |
Wydajność systemu
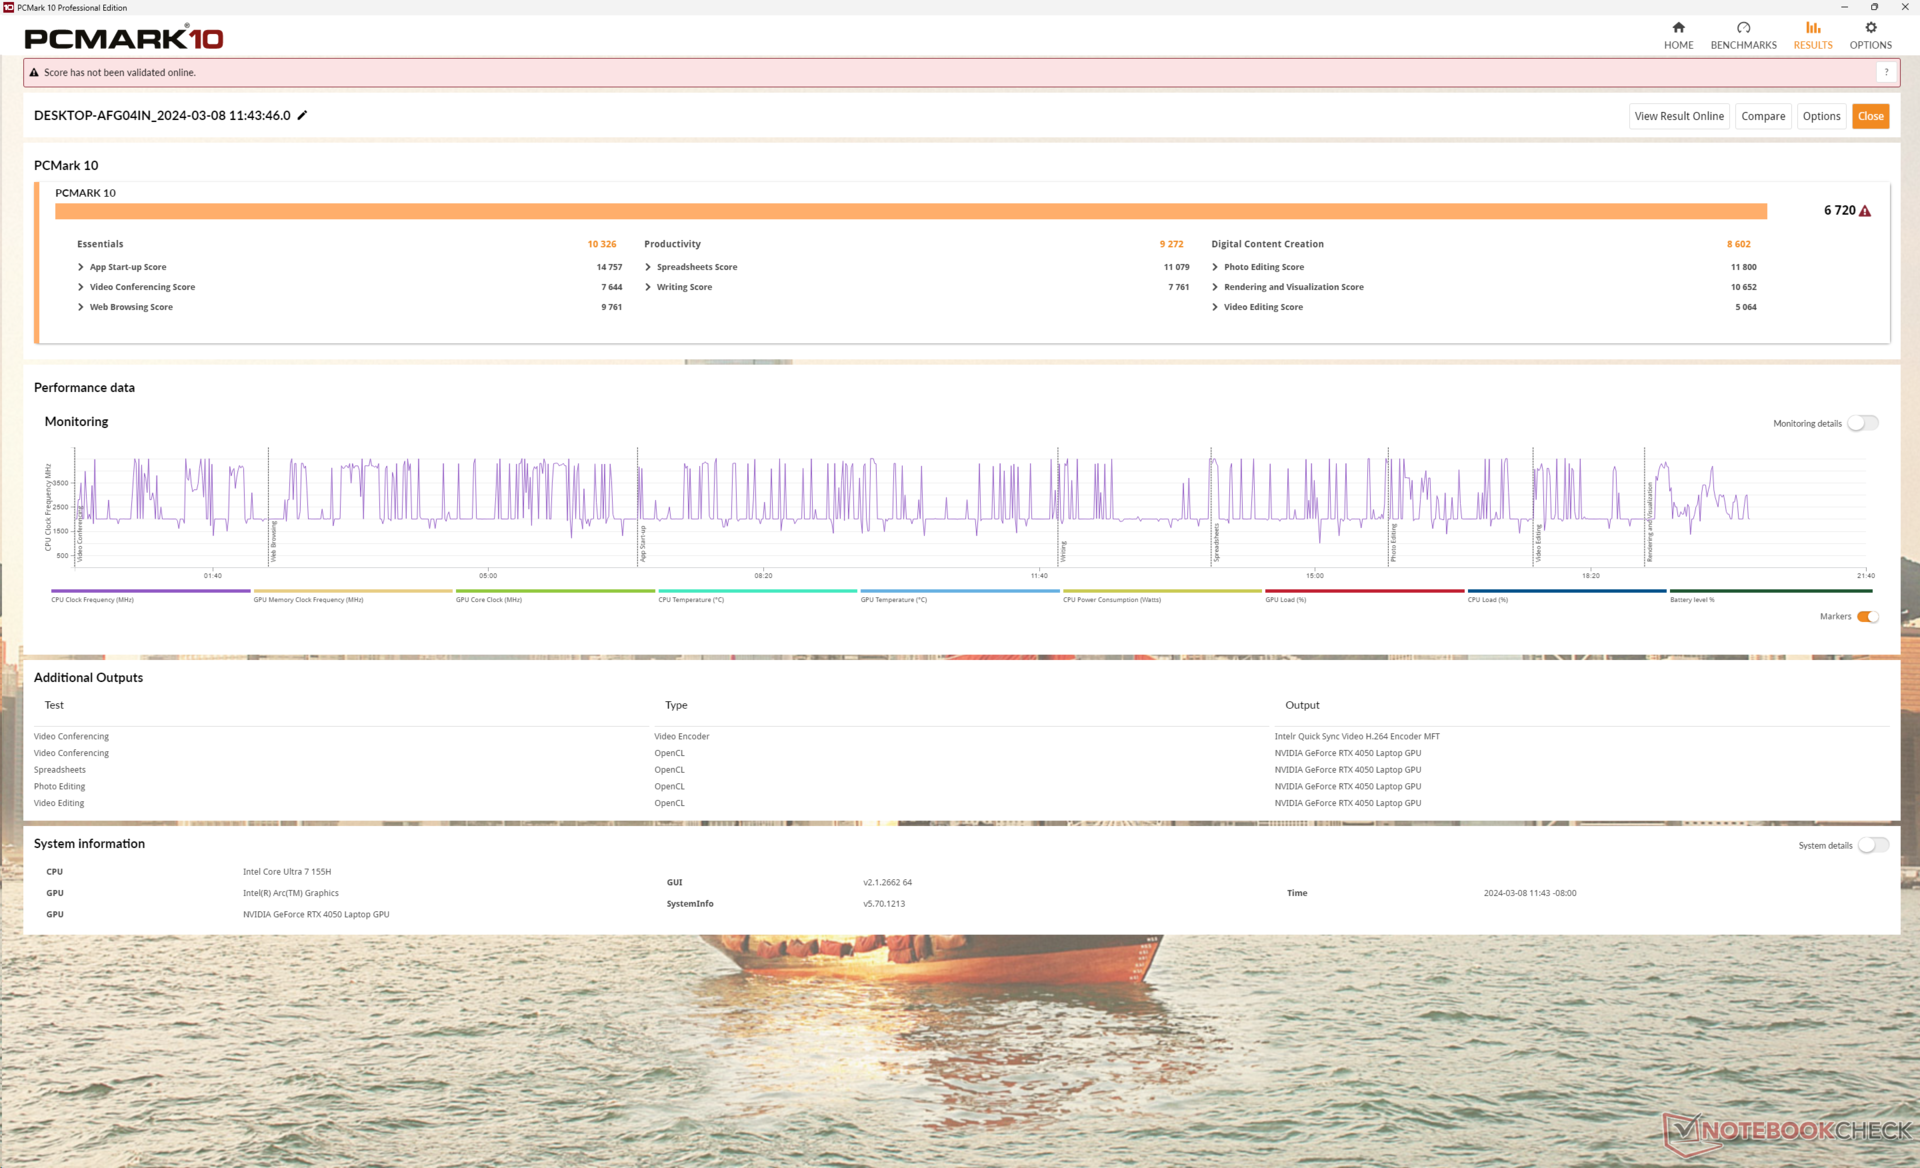
Wyniki PCMark 10 są porównywalne z konfiguracją iGPU tego samego modelu, mimo że nasza wersja dGPU jest znacznie szybsza. PCMark nigdy nie był jednak dokładnym narzędziem do benchmarkowania GPU dla systemów z grafiką Optimus 1.0, takich jak nasza seria Spectre x360 16.
CrossMark: Overall | Productivity | Creativity | Responsiveness
WebXPRT 3: Overall
WebXPRT 4: Overall
Mozilla Kraken 1.1: Total
| PCMark 10 / Score | |
| MSI Prestige 16 B1MG-001US | |
| HP Spectre x360 16-aa0074ng | |
| Przeciętny Intel Core Ultra 7 155H, NVIDIA GeForce RTX 4050 Laptop GPU (6537 - 6973, n=5) | |
| Honor MagicBook Pro 16 2024 | |
| HP Spectre x360 16 RTX 4050 | |
| HP Spectre x360 2-in-1 16-f1075ng | |
| LG Gram 2in1 16 16T90R - G.AA78G | |
| PCMark 10 / Essentials | |
| LG Gram 2in1 16 16T90R - G.AA78G | |
| MSI Prestige 16 B1MG-001US | |
| HP Spectre x360 2-in-1 16-f1075ng | |
| HP Spectre x360 16-aa0074ng | |
| HP Spectre x360 16 RTX 4050 | |
| Przeciętny Intel Core Ultra 7 155H, NVIDIA GeForce RTX 4050 Laptop GPU (9463 - 10446, n=5) | |
| Honor MagicBook Pro 16 2024 | |
| PCMark 10 / Productivity | |
| HP Spectre x360 16 RTX 4050 | |
| Przeciętny Intel Core Ultra 7 155H, NVIDIA GeForce RTX 4050 Laptop GPU (8769 - 9272, n=5) | |
| HP Spectre x360 16-aa0074ng | |
| MSI Prestige 16 B1MG-001US | |
| Honor MagicBook Pro 16 2024 | |
| HP Spectre x360 2-in-1 16-f1075ng | |
| LG Gram 2in1 16 16T90R - G.AA78G | |
| PCMark 10 / Digital Content Creation | |
| Honor MagicBook Pro 16 2024 | |
| MSI Prestige 16 B1MG-001US | |
| Przeciętny Intel Core Ultra 7 155H, NVIDIA GeForce RTX 4050 Laptop GPU (8602 - 10622, n=5) | |
| HP Spectre x360 16-aa0074ng | |
| HP Spectre x360 16 RTX 4050 | |
| HP Spectre x360 2-in-1 16-f1075ng | |
| LG Gram 2in1 16 16T90R - G.AA78G | |
| CrossMark / Overall | |
| MSI Prestige 16 B1MG-001US | |
| Honor MagicBook Pro 16 2024 | |
| HP Spectre x360 16-aa0074ng | |
| HP Spectre x360 2-in-1 16-f1075ng | |
| Przeciętny Intel Core Ultra 7 155H, NVIDIA GeForce RTX 4050 Laptop GPU (1552 - 1740, n=5) | |
| HP Spectre x360 16 RTX 4050 | |
| LG Gram 2in1 16 16T90R - G.AA78G | |
| CrossMark / Productivity | |
| HP Spectre x360 2-in-1 16-f1075ng | |
| MSI Prestige 16 B1MG-001US | |
| Honor MagicBook Pro 16 2024 | |
| HP Spectre x360 16-aa0074ng | |
| Przeciętny Intel Core Ultra 7 155H, NVIDIA GeForce RTX 4050 Laptop GPU (1459 - 1659, n=5) | |
| LG Gram 2in1 16 16T90R - G.AA78G | |
| HP Spectre x360 16 RTX 4050 | |
| CrossMark / Creativity | |
| MSI Prestige 16 B1MG-001US | |
| HP Spectre x360 16-aa0074ng | |
| Przeciętny Intel Core Ultra 7 155H, NVIDIA GeForce RTX 4050 Laptop GPU (1811 - 1943, n=5) | |
| HP Spectre x360 16 RTX 4050 | |
| Honor MagicBook Pro 16 2024 | |
| HP Spectre x360 2-in-1 16-f1075ng | |
| LG Gram 2in1 16 16T90R - G.AA78G | |
| CrossMark / Responsiveness | |
| HP Spectre x360 2-in-1 16-f1075ng | |
| Honor MagicBook Pro 16 2024 | |
| MSI Prestige 16 B1MG-001US | |
| LG Gram 2in1 16 16T90R - G.AA78G | |
| HP Spectre x360 16-aa0074ng | |
| Przeciętny Intel Core Ultra 7 155H, NVIDIA GeForce RTX 4050 Laptop GPU (1167 - 1467, n=5) | |
| HP Spectre x360 16 RTX 4050 | |
| WebXPRT 3 / Overall | |
| MSI Prestige 16 B1MG-001US | |
| Honor MagicBook Pro 16 2024 | |
| HP Spectre x360 16 RTX 4050 | |
| Przeciętny Intel Core Ultra 7 155H, NVIDIA GeForce RTX 4050 Laptop GPU (262 - 285, n=5) | |
| HP Spectre x360 16-aa0074ng | |
| HP Spectre x360 2-in-1 16-f1075ng | |
| LG Gram 2in1 16 16T90R - G.AA78G | |
| WebXPRT 4 / Overall | |
| MSI Prestige 16 B1MG-001US | |
| HP Spectre x360 16-aa0074ng | |
| Honor MagicBook Pro 16 2024 | |
| HP Spectre x360 16 RTX 4050 | |
| Przeciętny Intel Core Ultra 7 155H, NVIDIA GeForce RTX 4050 Laptop GPU (247 - 260, n=5) | |
| HP Spectre x360 2-in-1 16-f1075ng | |
| Mozilla Kraken 1.1 / Total | |
| LG Gram 2in1 16 16T90R - G.AA78G | |
| HP Spectre x360 16 RTX 4050 | |
| MSI Prestige 16 B1MG-001US | |
| HP Spectre x360 2-in-1 16-f1075ng | |
| Honor MagicBook Pro 16 2024 | |
| HP Spectre x360 16-aa0074ng | |
| Przeciętny Intel Core Ultra 7 155H, NVIDIA GeForce RTX 4050 Laptop GPU (416 - 561, n=5) | |
* ... im mniej tym lepiej
| PCMark 10 Score | 6720 pkt. | |
Pomoc | ||
| AIDA64 / Memory Copy | |
| HP Spectre x360 16-aa0074ng | |
| HP Spectre x360 16 RTX 4050 | |
| Honor MagicBook Pro 16 2024 | |
| Przeciętny Intel Core Ultra 7 155H (62397 - 96791, n=50) | |
| MSI Prestige 16 B1MG-001US | |
| LG Gram 2in1 16 16T90R - G.AA78G | |
| HP Spectre x360 2-in-1 16-f1075ng | |
| AIDA64 / Memory Read | |
| HP Spectre x360 16 RTX 4050 | |
| HP Spectre x360 16-aa0074ng | |
| Przeciętny Intel Core Ultra 7 155H (60544 - 90647, n=50) | |
| Honor MagicBook Pro 16 2024 | |
| MSI Prestige 16 B1MG-001US | |
| LG Gram 2in1 16 16T90R - G.AA78G | |
| HP Spectre x360 2-in-1 16-f1075ng | |
| AIDA64 / Memory Write | |
| HP Spectre x360 16 RTX 4050 | |
| LG Gram 2in1 16 16T90R - G.AA78G | |
| MSI Prestige 16 B1MG-001US | |
| Honor MagicBook Pro 16 2024 | |
| HP Spectre x360 16-aa0074ng | |
| Przeciętny Intel Core Ultra 7 155H (58692 - 93451, n=50) | |
| HP Spectre x360 2-in-1 16-f1075ng | |
| AIDA64 / Memory Latency | |
| Przeciętny Intel Core Ultra 7 155H (116.2 - 233, n=50) | |
| Honor MagicBook Pro 16 2024 | |
| HP Spectre x360 16-aa0074ng | |
| HP Spectre x360 16 RTX 4050 | |
| MSI Prestige 16 B1MG-001US | |
| LG Gram 2in1 16 16T90R - G.AA78G | |
| HP Spectre x360 2-in-1 16-f1075ng | |
* ... im mniej tym lepiej
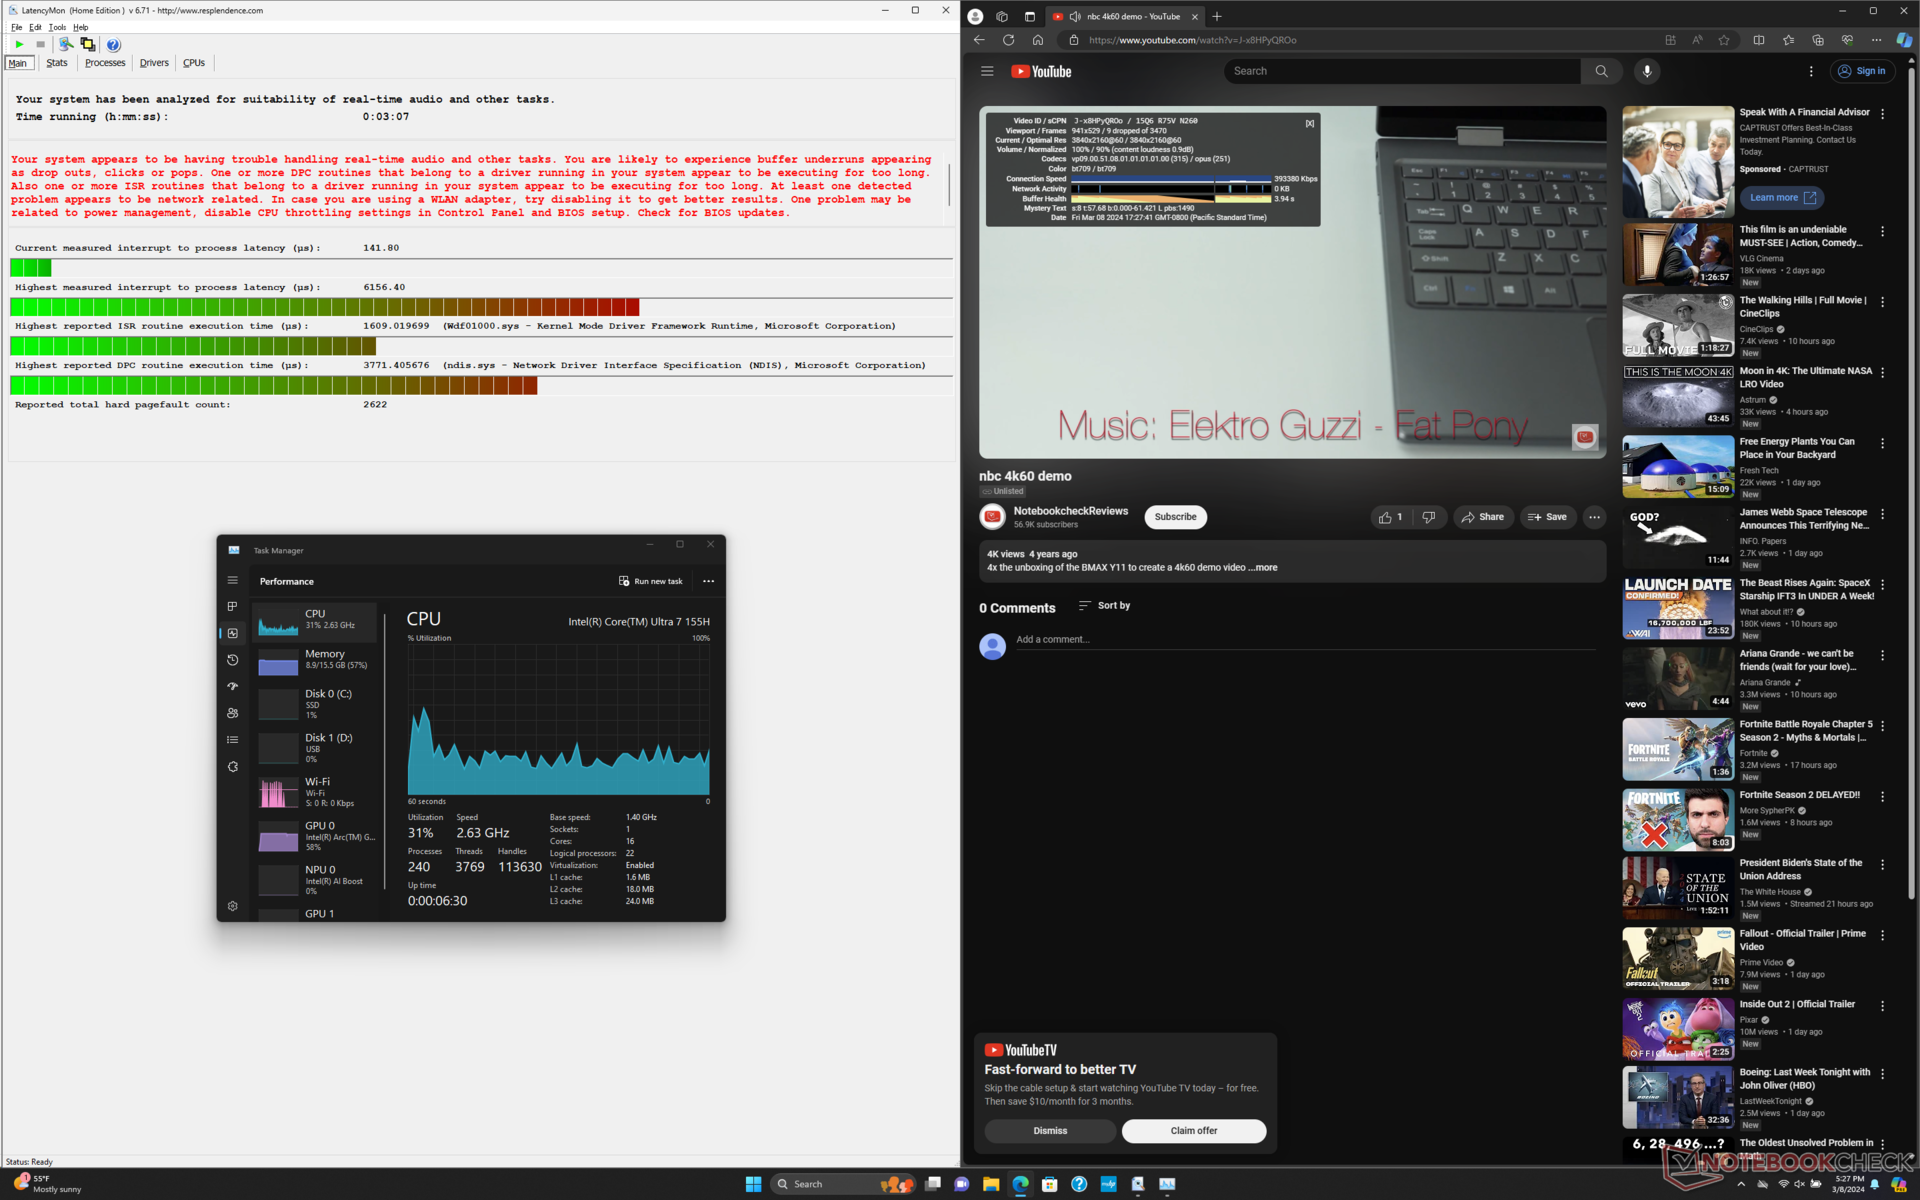
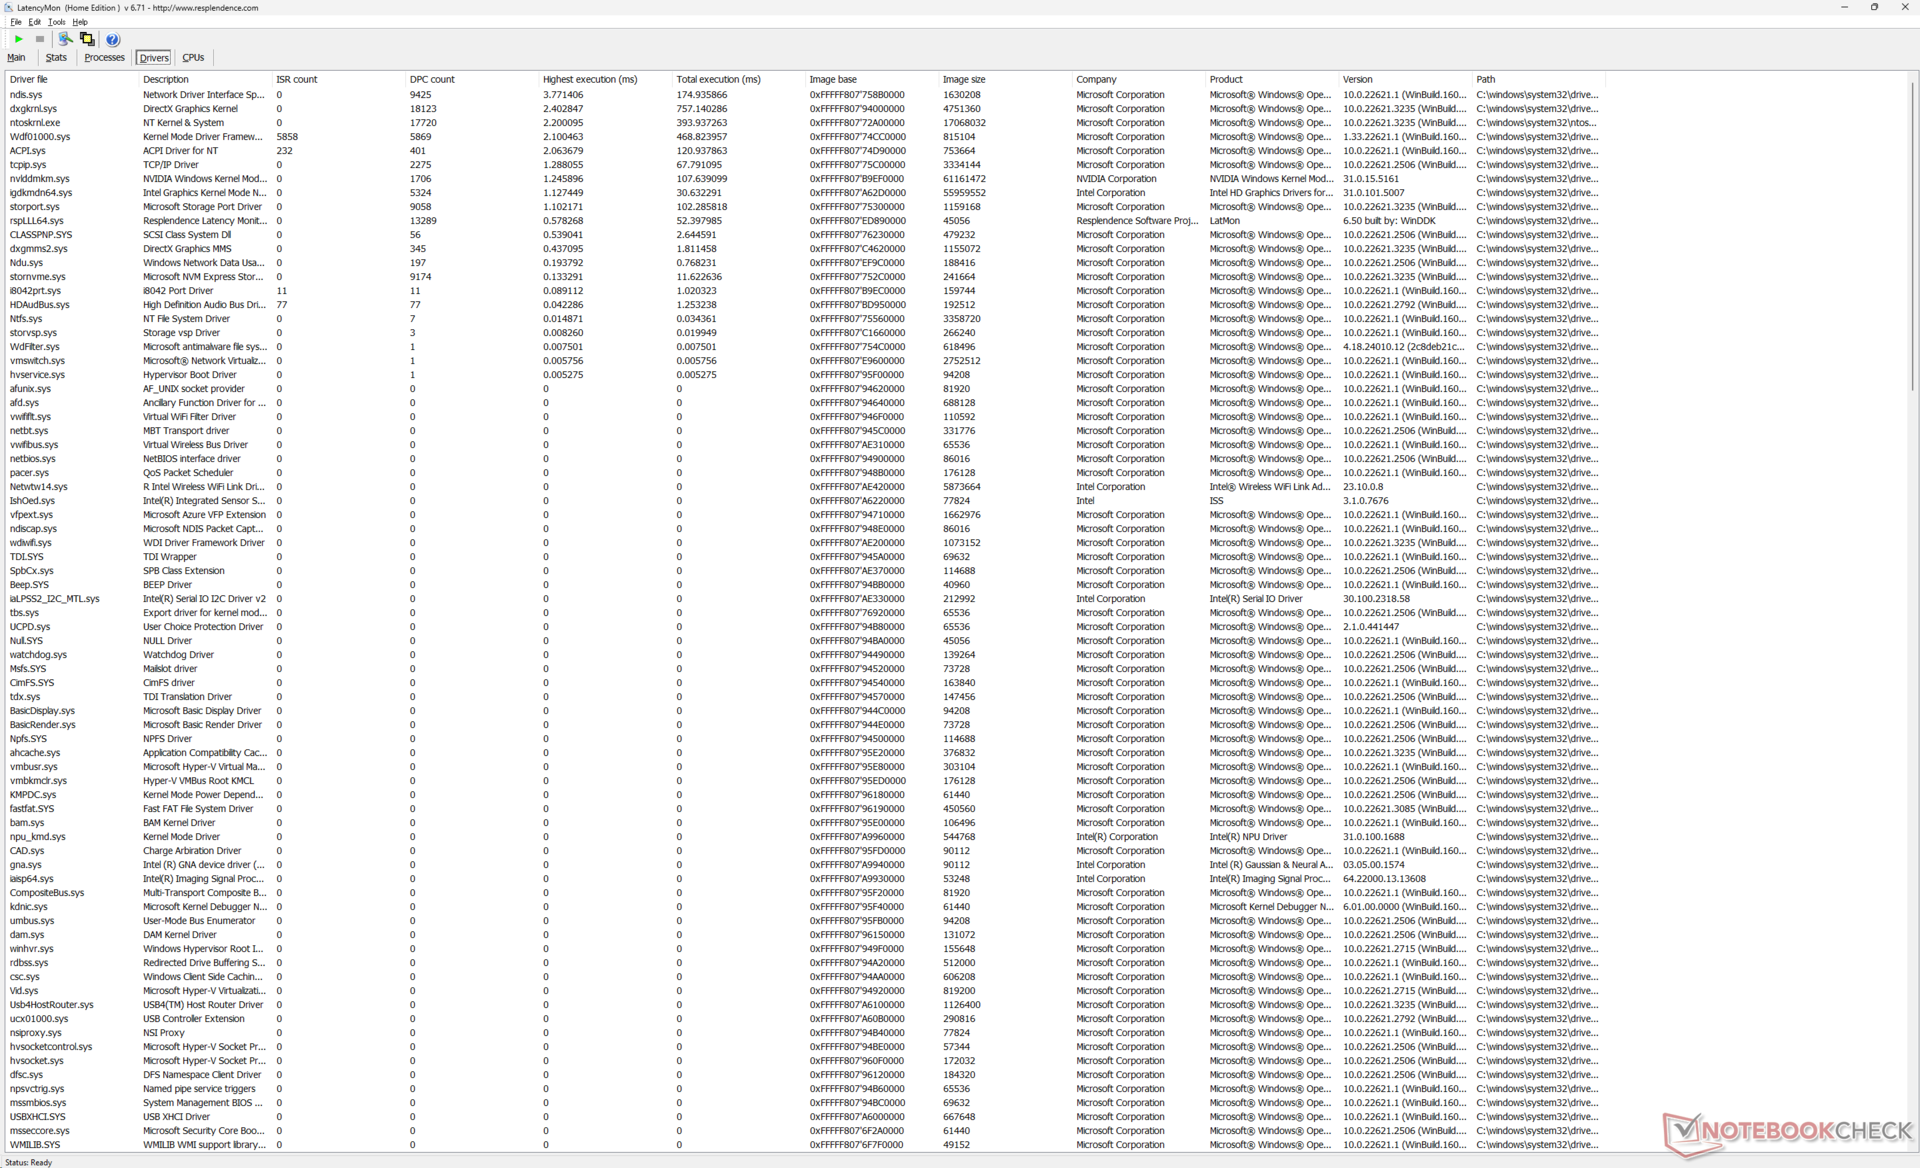
Opóźnienie DPC
LatencyMon ujawnił zarówno problemy z DPC, jak i spadki klatek podczas naszego minutowego testu wideo 4K60. Nasza jednostka testowa iGPU również wykazywała spadki klatek podczas tego samego testu, co sugeruje potencjalny problem w obu konfiguracjach.
| DPC Latencies / LatencyMon - interrupt to process latency (max), Web, Youtube, Prime95 | |
| LG Gram 2in1 16 16T90R - G.AA78G | |
| HP Spectre x360 16 RTX 4050 | |
| Honor MagicBook Pro 16 2024 | |
| HP Spectre x360 2-in-1 16-f1075ng | |
| HP Spectre x360 16-aa0074ng | |
| MSI Prestige 16 B1MG-001US | |
* ... im mniej tym lepiej
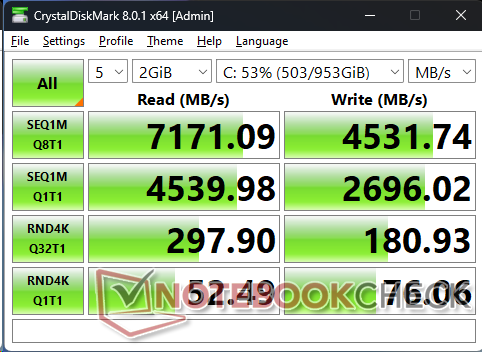
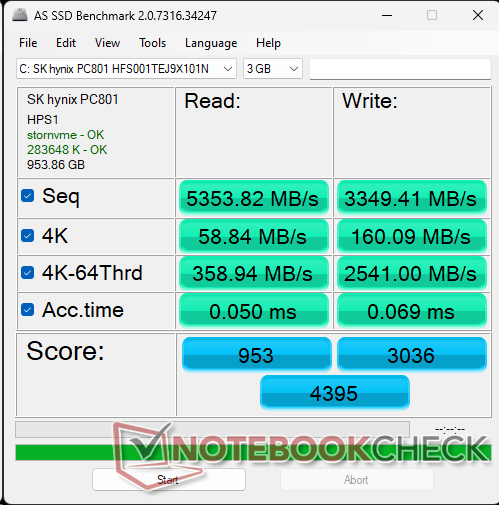
Urządzenia pamięci masowej
Nasza konkretna jednostka testowa jest dostarczana z SK Hynix PC801 zamiast Kioxia XG8. Niemniej jednak prędkości transferu są doskonałe, bez zauważalnych problemów z dławieniem podczas uruchamiania DiskSpd w pętli.

* ... im mniej tym lepiej
Disk Throttling: DiskSpd Read Loop, Queue Depth 8
Wydajność GPU
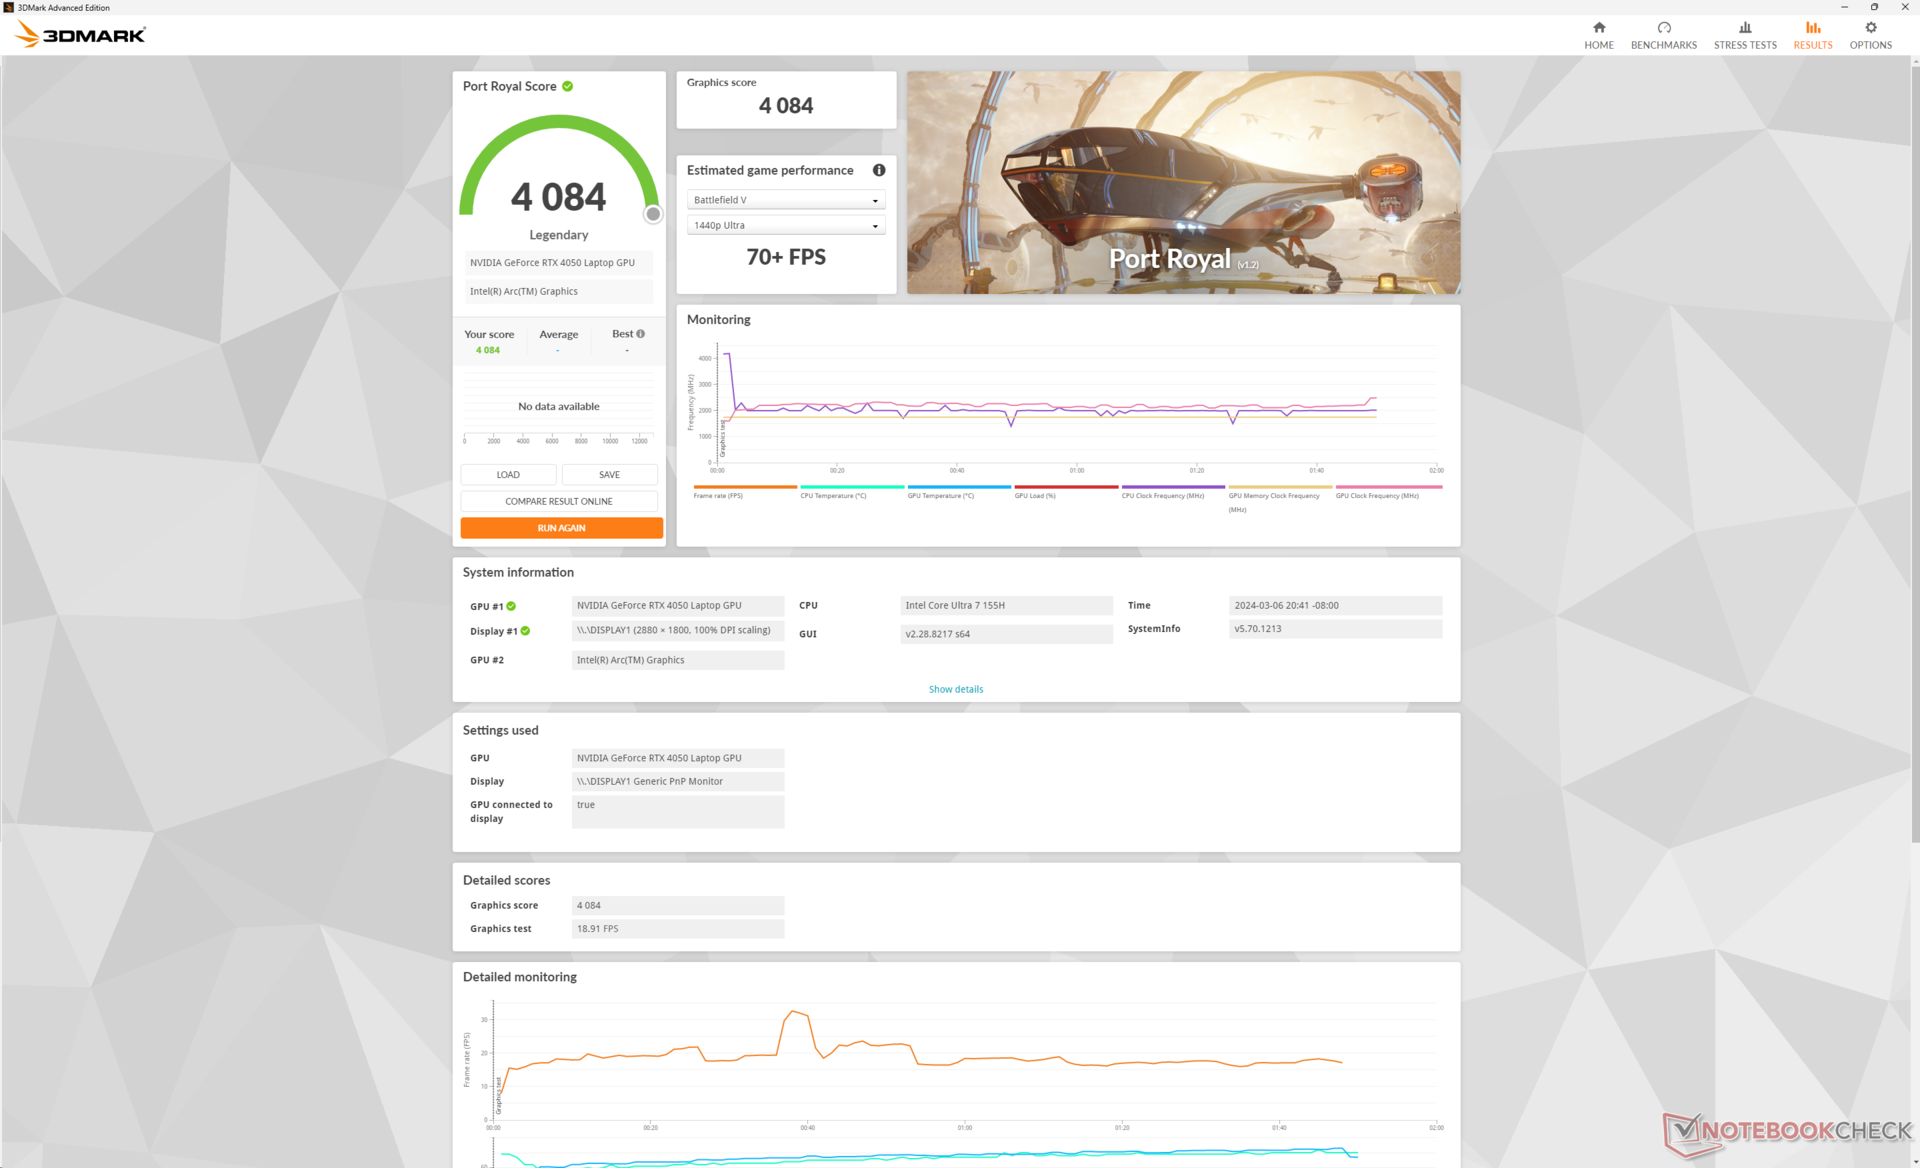
Nie trzeba dodawać, że karta GeForce RTX 4050 oferuje ogromny wzrost wydajności w porównaniu ze zintegrowaną konfiguracją Arc 8. wyniki 3DMark są około 2x wyższe, podczas gdy akceleracja CUDA pozwala na szybsze renderowanie w Blenderze prawie 10-krotnie.
Z perspektywy innych laptopów z tym samym GPU RTX 4050, Spectre x360 16 wypada jednak słabiej. Docelowe 55 W TGP jest niższe niż w konkurencyjnych laptopach, takich jak Acer Predator Helios Neo 16 lub Victus 15, które mają odpowiednio 130 W i 75 W. W rezultacie wyniki 3DMark są o około 10 do 15 procent wolniejsze niż w przypadku przeciętnego laptopa w naszej bazie danych z tym samym procesorem graficznym GeForce RTX 4050.
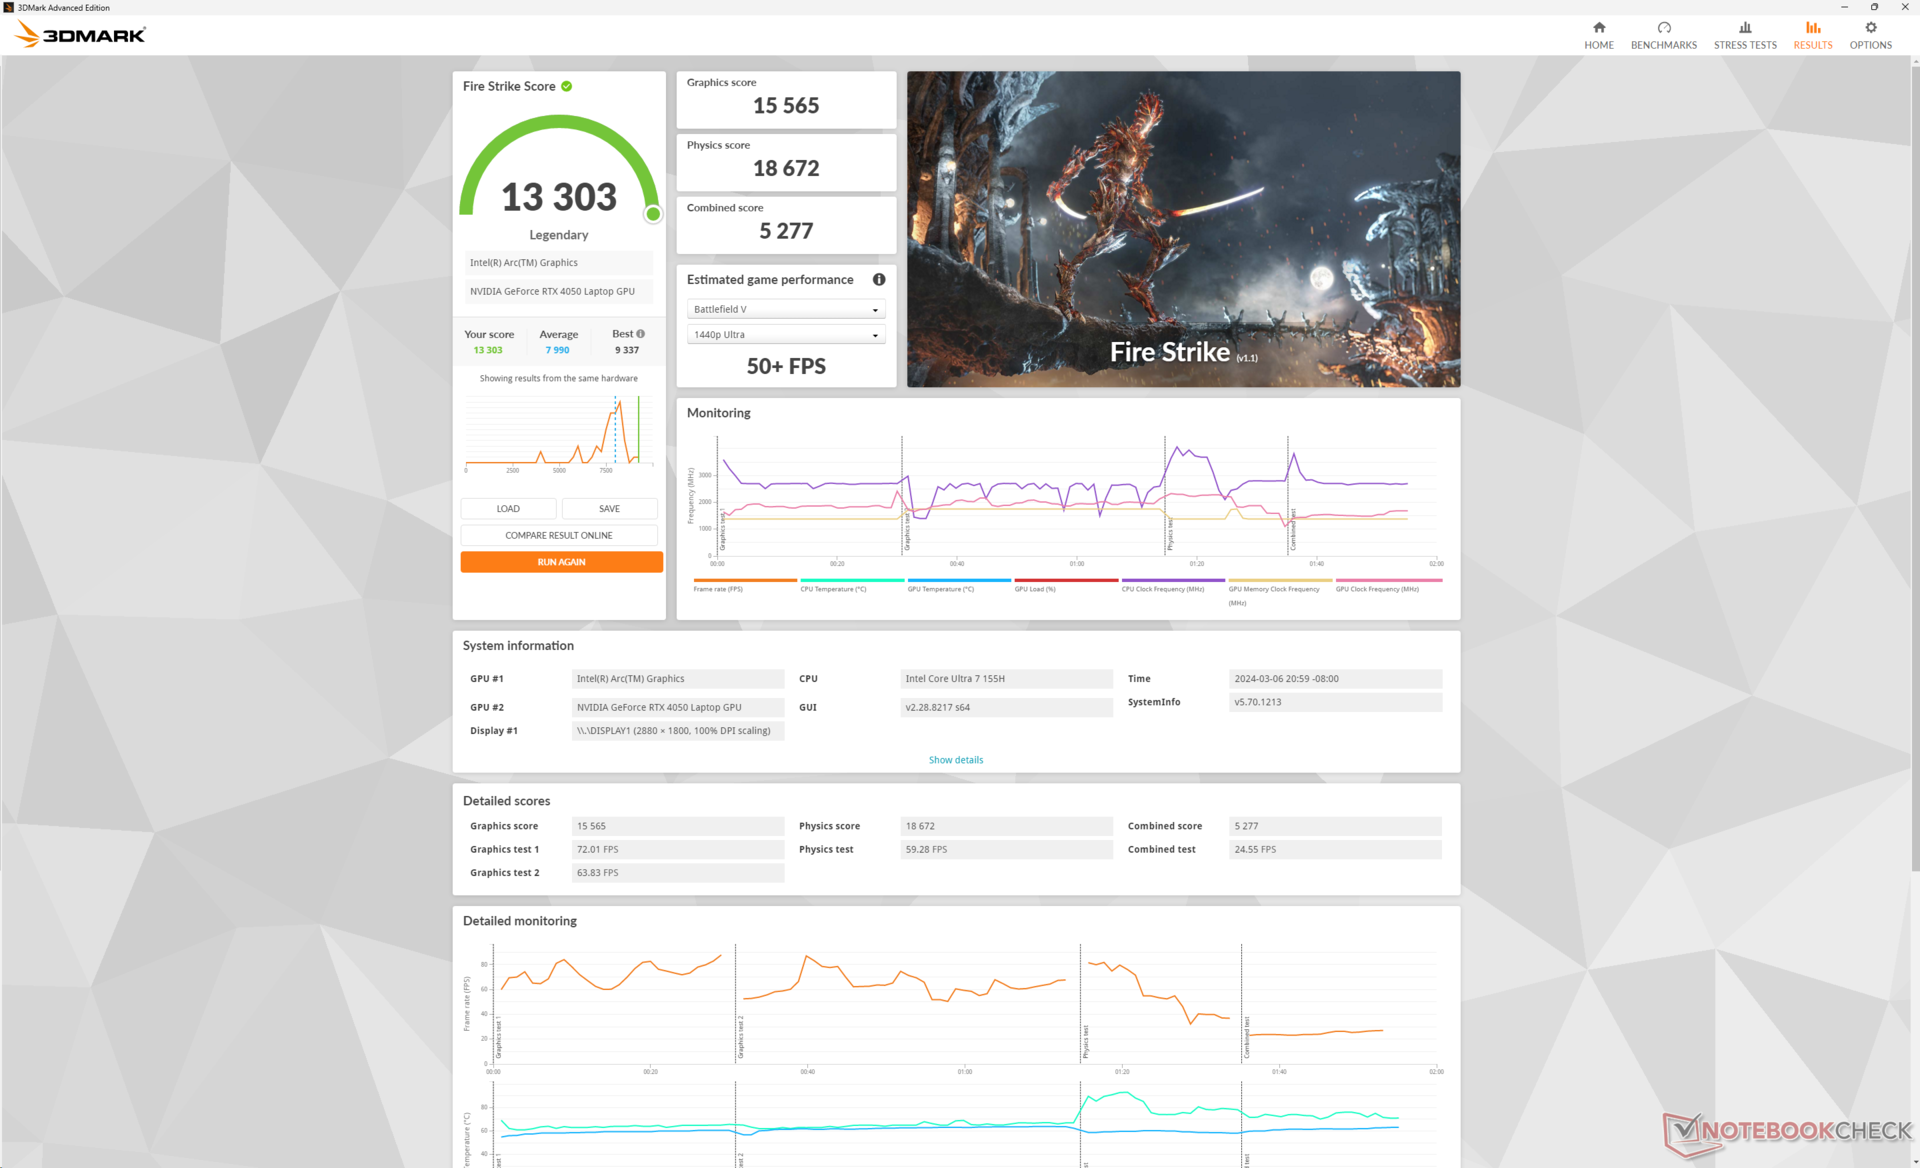
| Profil zasilania | Wynik grafiki | Wynik fizyki | Wynik łączny |
| Tryb wydajności | 17908 | 17248 | 7364 |
| Tryb zrównoważony | 15565 (-13%) | 18672 (+8%) | 5277 (-28%) |
| Zasilanie bateryjne | 14156 (-21%) | 21326 (+24%) | 5985 (-19%) |
Fire Strike wyniki są niespójne, co pokazuje powyższa tabela. Wynik CPU wzrósłby w trybach Balanced i Battery, podczas gdy wynik GPU jest odwrotny, nawet po kilku ponownych testach w stanie zimnym. Ponownie, HP jest świadome tego problemu i twierdzi, że trwają prace nad poprawką.
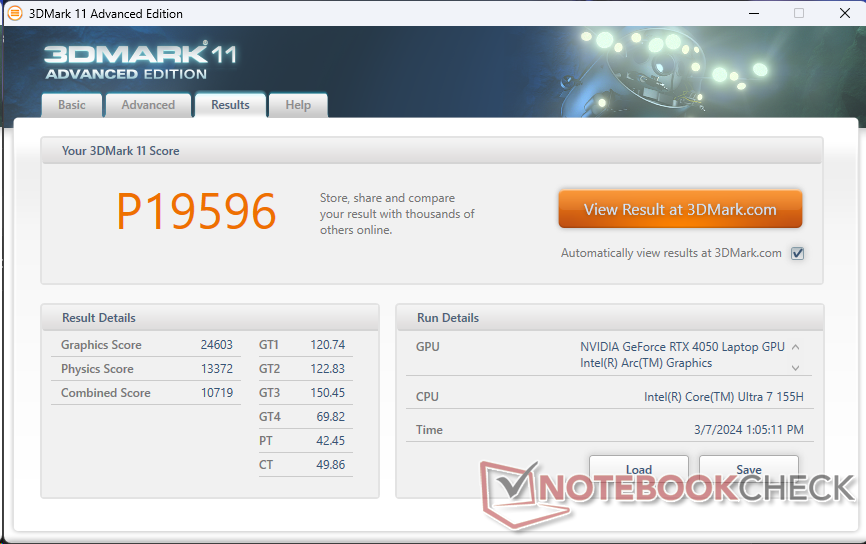
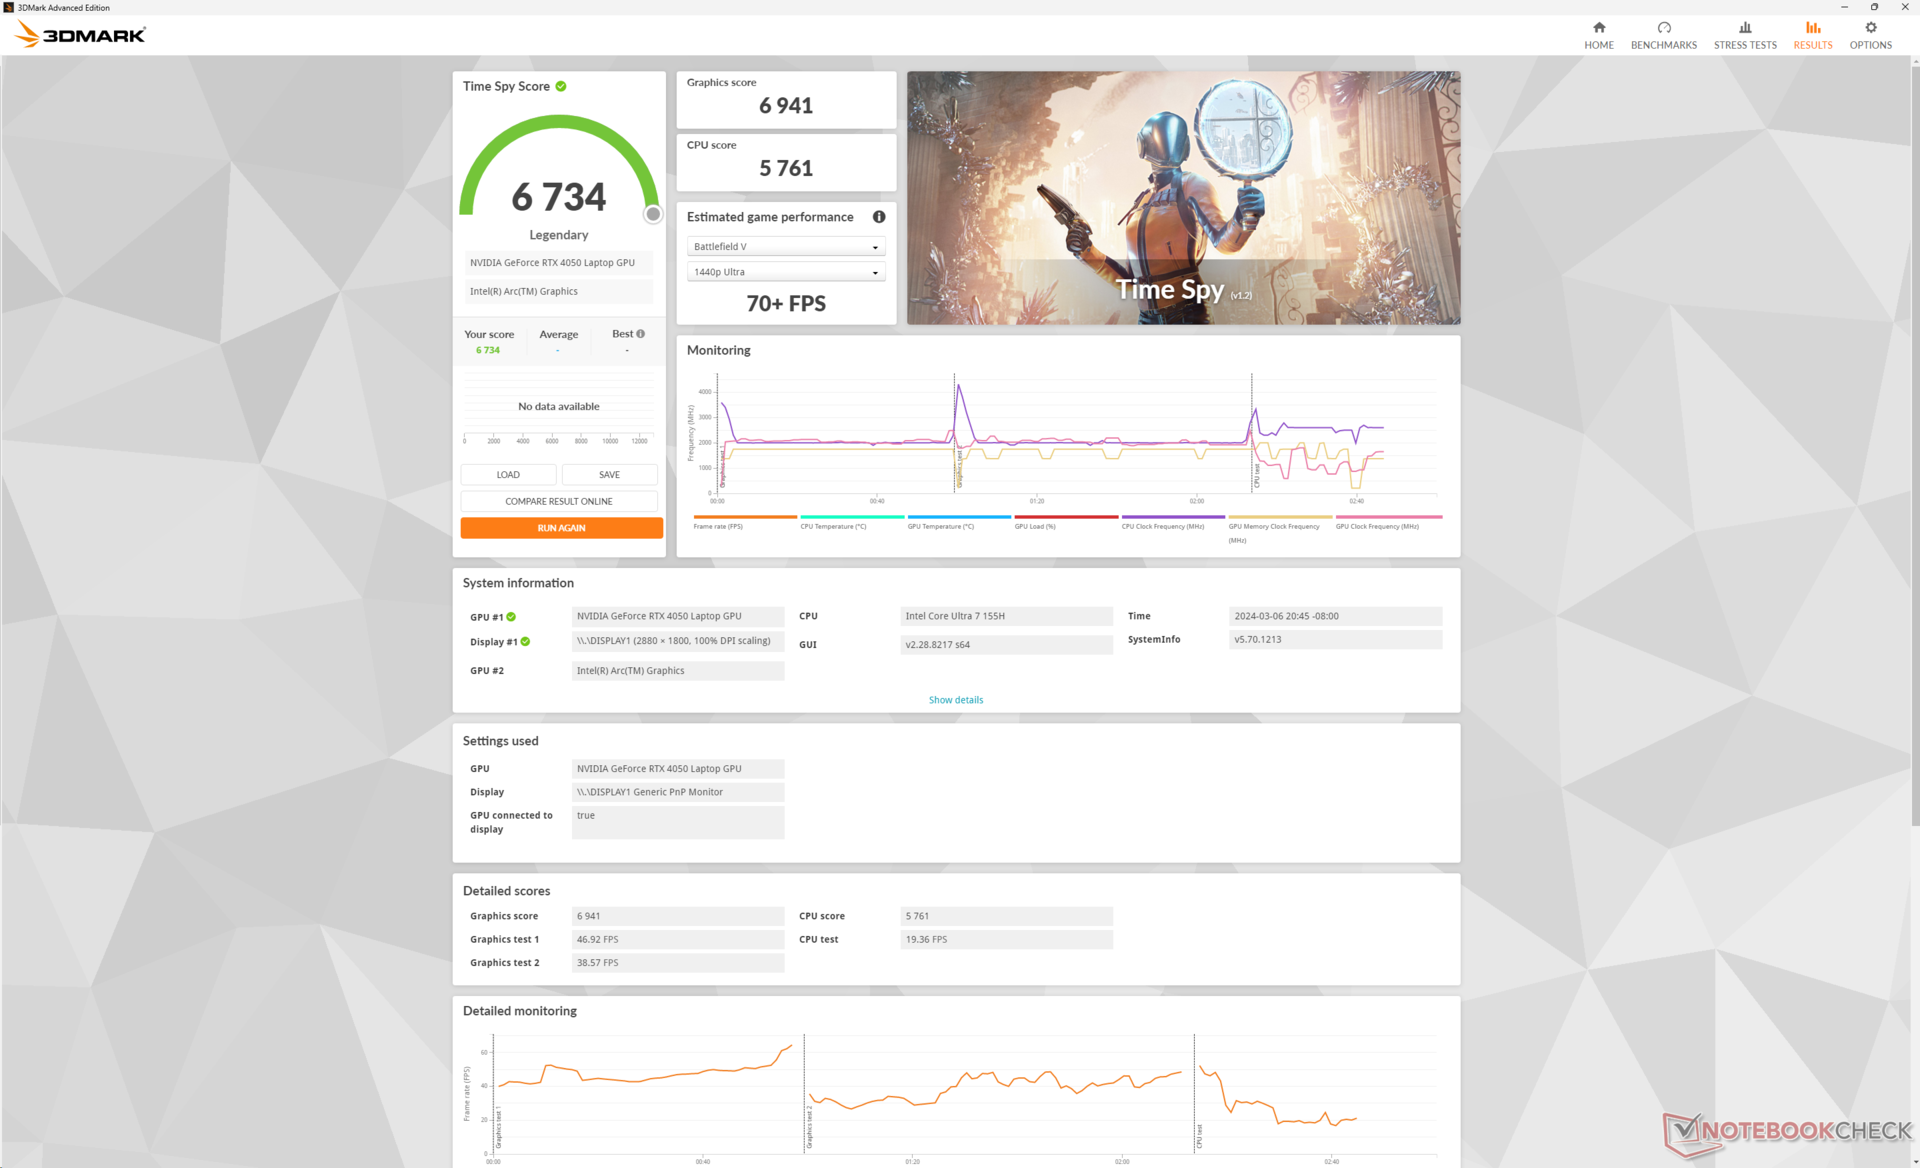
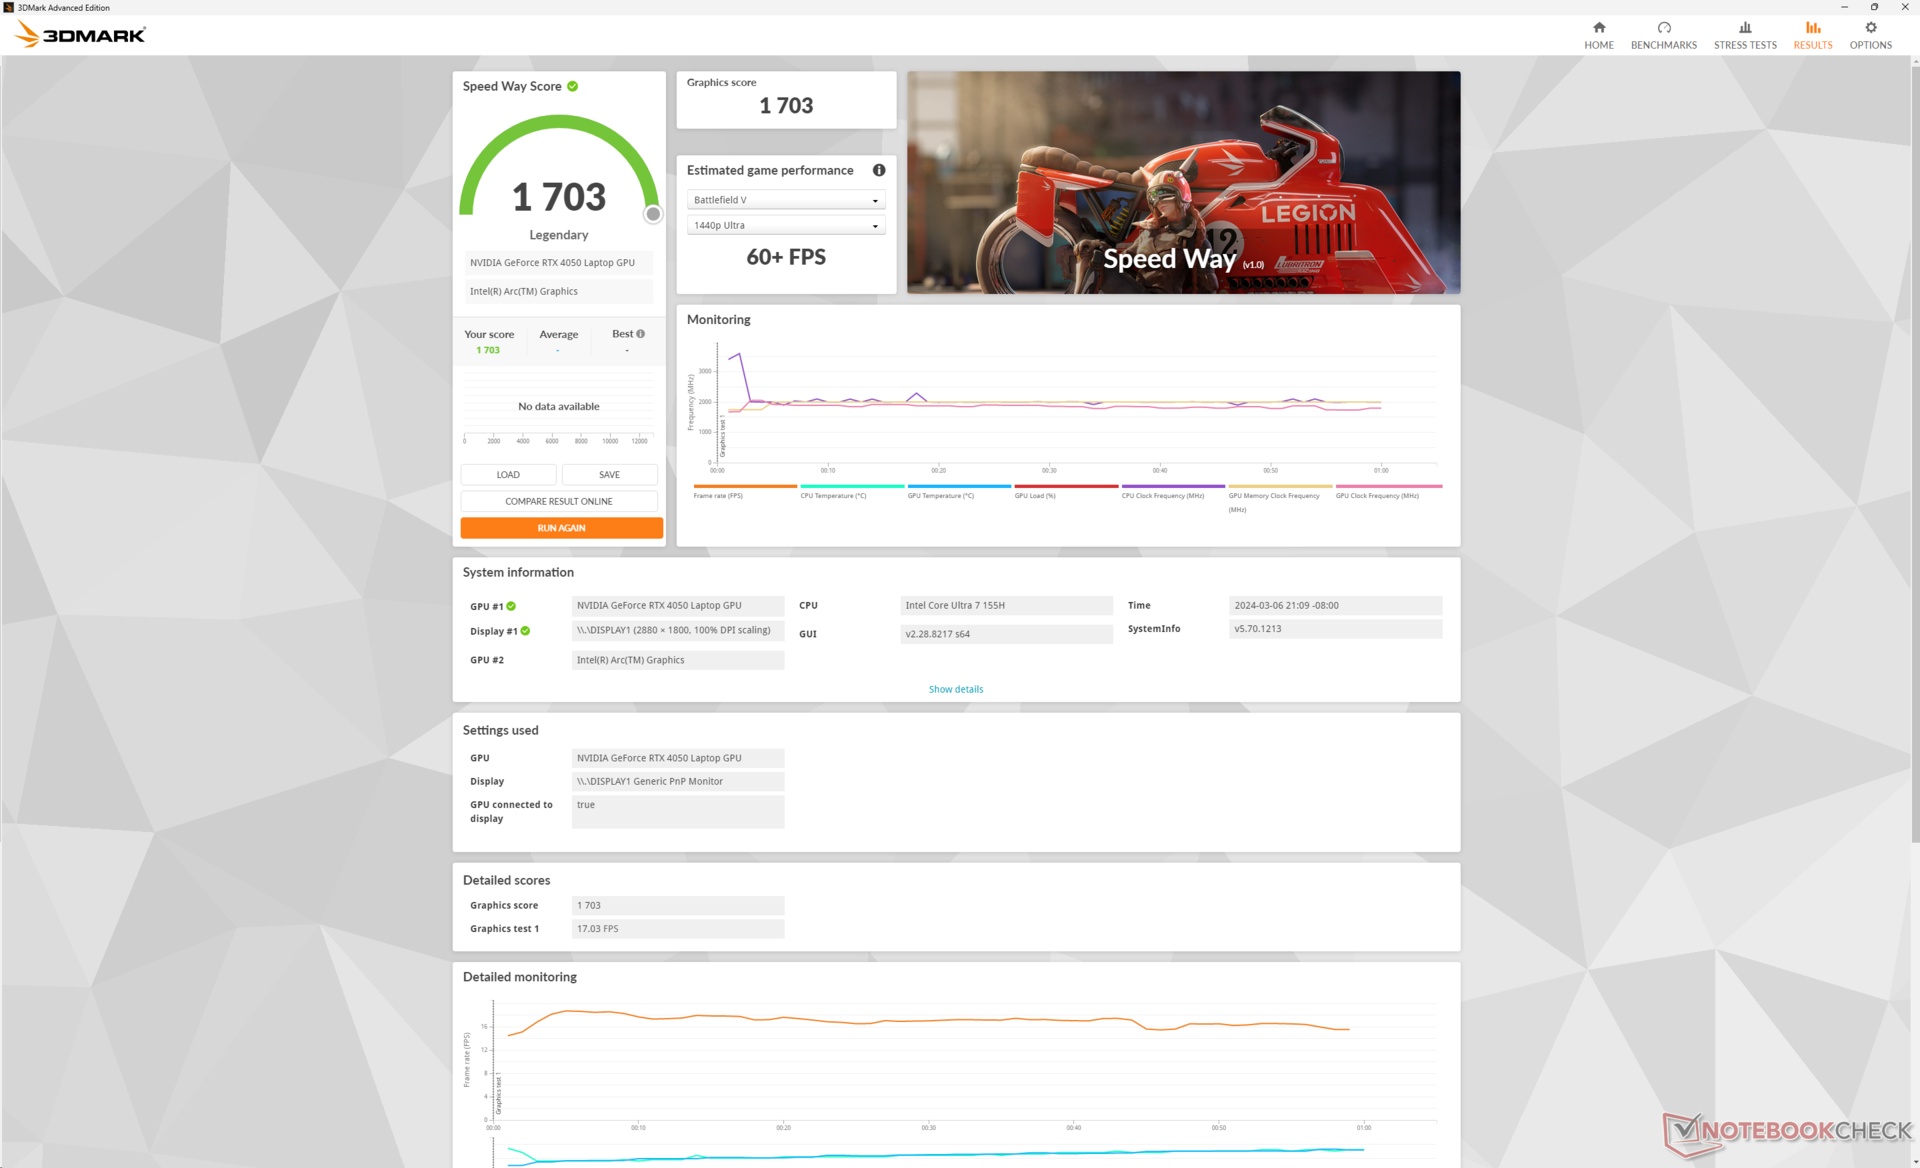
| 3DMark 11 Performance | 19596 pkt. | |
| 3DMark Fire Strike Score | 15586 pkt. | |
| 3DMark Time Spy Score | 6734 pkt. | |
Pomoc | ||
* ... im mniej tym lepiej
Wydajność w grach
Karta graficzna GeForce RTX 4050 jest wydajna w grach, pomimo swojego statusu podstawowego GPU RTX. Wymagające gry, takie jak Cyberpunk 2077, działają dobrze przy ustawieniach 1080p Ultra przed jakimikolwiek ulepszeniami DLSS. Jednak w wyższych rozdzielczościach sytuacja staje się niestabilna, w którym to przypadku zalecane są niższe ustawienia, aby utrzymać liczbę klatek na sekundę na powierzchni. Gry wyglądają bardzo ostro podczas grania na natywnym wyświetlaczu OLED 1800p, ale proszę być przygotowanym na zmniejszenie większości efektów graficznych.
| The Witcher 3 - 1920x1080 Ultra Graphics & Postprocessing (HBAO+) | |
| Honor MagicBook Pro 16 2024 | |
| HP Spectre x360 16 RTX 4050 | |
| MSI Prestige 16 B1MG-001US | |
| HP Spectre x360 16-aa0074ng | |
| LG Gram 2in1 16 16T90R - G.AA78G | |
| HP Spectre x360 2-in-1 16-f1075ng | |
| GTA V - 1920x1080 Highest AA:4xMSAA + FX AF:16x | |
| Honor MagicBook Pro 16 2024 | |
| HP Spectre x360 16 RTX 4050 | |
| HP Spectre x360 16-aa0074ng | |
| LG Gram 2in1 16 16T90R - G.AA78G | |
| HP Spectre x360 2-in-1 16-f1075ng | |
| Final Fantasy XV Benchmark - 1920x1080 High Quality | |
| Honor MagicBook Pro 16 2024 | |
| HP Spectre x360 16 RTX 4050 | |
| MSI Prestige 16 B1MG-001US | |
| HP Spectre x360 16-aa0074ng | |
| LG Gram 2in1 16 16T90R - G.AA78G | |
| HP Spectre x360 2-in-1 16-f1075ng | |
| Strange Brigade - 1920x1080 ultra AA:ultra AF:16 | |
| Honor MagicBook Pro 16 2024 | |
| HP Spectre x360 16 RTX 4050 | |
| HP Spectre x360 16-aa0074ng | |
| MSI Prestige 16 B1MG-001US | |
| LG Gram 2in1 16 16T90R - G.AA78G | |
| HP Spectre x360 2-in-1 16-f1075ng | |
| Dota 2 Reborn - 1920x1080 ultra (3/3) best looking | |
| Honor MagicBook Pro 16 2024 | |
| HP Spectre x360 16 RTX 4050 | |
| MSI Prestige 16 B1MG-001US | |
| HP Spectre x360 16-aa0074ng | |
| LG Gram 2in1 16 16T90R - G.AA78G | |
| HP Spectre x360 2-in-1 16-f1075ng | |
| X-Plane 11.11 - 1920x1080 high (fps_test=3) | |
| Honor MagicBook Pro 16 2024 | |
| HP Spectre x360 16 RTX 4050 | |
| HP Spectre x360 2-in-1 16-f1075ng | |
| LG Gram 2in1 16 16T90R - G.AA78G | |
| MSI Prestige 16 B1MG-001US | |
| HP Spectre x360 16-aa0074ng | |
| Tiny Tina's Wonderlands | |
| 1920x1080 Medium Preset (DX12) | |
| Przeciętny NVIDIA GeForce RTX 4050 Laptop GPU (93.4 - 149.2, n=7) | |
| HP Spectre x360 16 RTX 4050 | |
| Lenovo ThinkPad E16 G1 Core i5-1335U | |
| 1920x1080 High Preset (DX12) | |
| Przeciętny NVIDIA GeForce RTX 4050 Laptop GPU (63.3 - 99.5, n=7) | |
| HP Spectre x360 16 RTX 4050 | |
| Lenovo ThinkPad E16 G1 Core i5-1335U | |
| 1920x1080 Badass Preset (DX12) | |
| Przeciętny NVIDIA GeForce RTX 4050 Laptop GPU (49.8 - 77.3, n=7) | |
| HP Spectre x360 16 RTX 4050 | |
| Lenovo ThinkPad E16 G1 Core i5-1335U | |
| 2560x1440 Badass Preset (DX12) | |
| Przeciętny NVIDIA GeForce RTX 4050 Laptop GPU (33.6 - 49.5, n=4) | |
| HP Spectre x360 16 RTX 4050 | |
| Baldur's Gate 3 | |
| 1920x1080 Medium Preset AA:T | |
| Przeciętny NVIDIA GeForce RTX 4050 Laptop GPU (56 - 91.9, n=10) | |
| HP Spectre x360 16 RTX 4050 | |
| 1920x1080 High Preset AA:T | |
| Przeciętny NVIDIA GeForce RTX 4050 Laptop GPU (49.8 - 83.5, n=10) | |
| HP Spectre x360 16 RTX 4050 | |
| 1920x1080 Ultra Preset AA:T | |
| HP Spectre x360 16 RTX 4050 | |
| Przeciętny NVIDIA GeForce RTX 4050 Laptop GPU (48.3 - 81.3, n=11) | |
| 2560x1440 Ultra Preset AA:T | |
| HP Spectre x360 16 RTX 4050 | |
| Przeciętny NVIDIA GeForce RTX 4050 Laptop GPU (32.4 - 55, n=7) | |
Witcher 3 FPS Chart
| low | med. | high | ultra | QHD | |
|---|---|---|---|---|---|
| GTA V (2015) | 171.3 | 162.2 | 135.3 | 76.7 | 57.3 |
| The Witcher 3 (2015) | 299 | 209.6 | 120.1 | 62.7 | |
| Dota 2 Reborn (2015) | 142 | 124.2 | 119.6 | 106.4 | |
| Final Fantasy XV Benchmark (2018) | 132.7 | 94.5 | 68.6 | 49.6 | |
| X-Plane 11.11 (2018) | 100.6 | 86.7 | 69.7 | ||
| Far Cry 5 (2018) | 97 | 93 | 95 | 87 | 64 |
| Strange Brigade (2018) | 299 | 171.1 | 137.4 | 121.3 | 81.2 |
| Tiny Tina's Wonderlands (2022) | 135.1 | 113.4 | 75.4 | 59.1 | 40.4 |
| F1 22 (2022) | 159.4 | 146.6 | 124.6 | 42 | 26.9 |
| Baldur's Gate 3 (2023) | 84.9 | 71.4 | 64 | 63.1 | 42.5 |
| Cyberpunk 2077 (2023) | 79.3 | 63.3 | 53.5 | 46 | 27.5 |
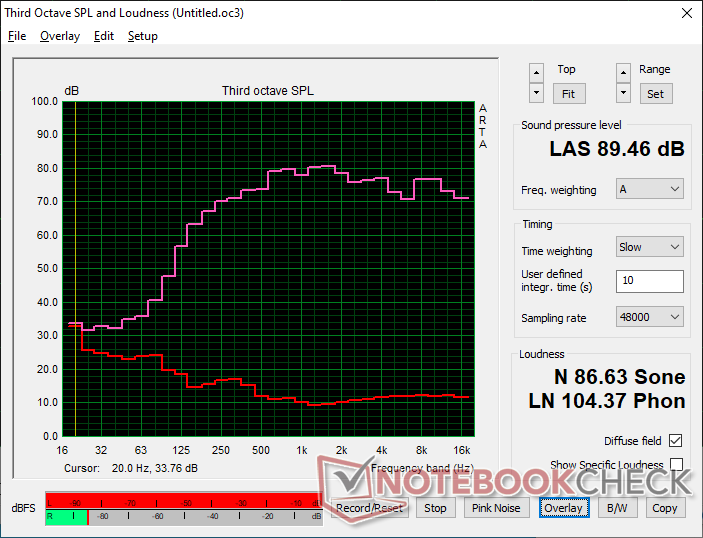
Emisje - jeden z najcichszych 16-calowych kabrioletów
Hałas systemowy
Hałas wentylatorów jest tylko nieznacznie głośniejszy niż w konfiguracji iGPU, która już na początku była bardzo cicha. Jesteśmy w stanie zarejestrować maksymalnie 32 dB(A) podczas grania w trybie Performance w porównaniu do 29 dB(A) w wersji iGPU lub 39 dB(A) w zeszłorocznym Spectre x360 16 zeszłorocznej konstrukcji Spectre x360 16 konstrukcja.
Hałas
| luz |
| 23.6 / 23.6 / 23.6 dB |
| obciążenie |
| 29.2 / 32.1 dB |
 | ||
30 dB cichy 40 dB(A) słyszalny 50 dB(A) irytujący |
||
min: | ||
| HP Spectre x360 16 RTX 4050 GeForce RTX 4050 Laptop GPU, Ultra 7 155H, SK hynix PC801 HFS001TEJ9X101N | HP Spectre x360 16-aa0074ng Arc 8-Core, Ultra 7 155H, Kioxia XG8 KXG80ZNV1T02 | HP Spectre x360 2-in-1 16-f1075ng Iris Xe G7 96EUs, i7-12700H, SK Hynix PC711 1TB HFS001TDE9X073N | Honor MagicBook Pro 16 2024 GeForce RTX 4060 Laptop GPU, Ultra 7 155H, WD PC SN740 SDDPNQD-1T00 | MSI Prestige 16 B1MG-001US Arc 8-Core, Ultra 7 155H, Samsung PM9A1 MZVL22T0HBLB | LG Gram 2in1 16 16T90R - G.AA78G Iris Xe G7 96EUs, i7-1360P, Samsung PM9A1 MZVL21T0HCLR | |
|---|---|---|---|---|---|---|
| Noise | 8% | -21% | -13% | -24% | -12% | |
| wyłączone / środowisko * (dB) | 23.3 | 23 1% | 26 -12% | 24 -3% | 24.5 -5% | 25.1 -8% |
| Idle Minimum * (dB) | 23.6 | 23 3% | 26 -10% | 24 -2% | 24.5 -4% | 25.1 -6% |
| Idle Average * (dB) | 23.6 | 23 3% | 26 -10% | 24 -2% | 26.3 -11% | 25.1 -6% |
| Idle Maximum * (dB) | 23.6 | 23 3% | 26 -10% | 27.2 -15% | 26.3 -11% | 26.1 -11% |
| Load Average * (dB) | 29.2 | 23 21% | 42.9 -47% | 29 1% | 36.5 -25% | 31.4 -8% |
| Witcher 3 ultra * (dB) | 32.1 | 27 16% | 42.9 -34% | 42.1 -31% | 46.3 -44% | 41.1 -28% |
| Load Maximum * (dB) | 32.1 | 28.62 11% | 39.1 -22% | 45 -40% | 52.9 -65% | 36.6 -14% |
* ... im mniej tym lepiej
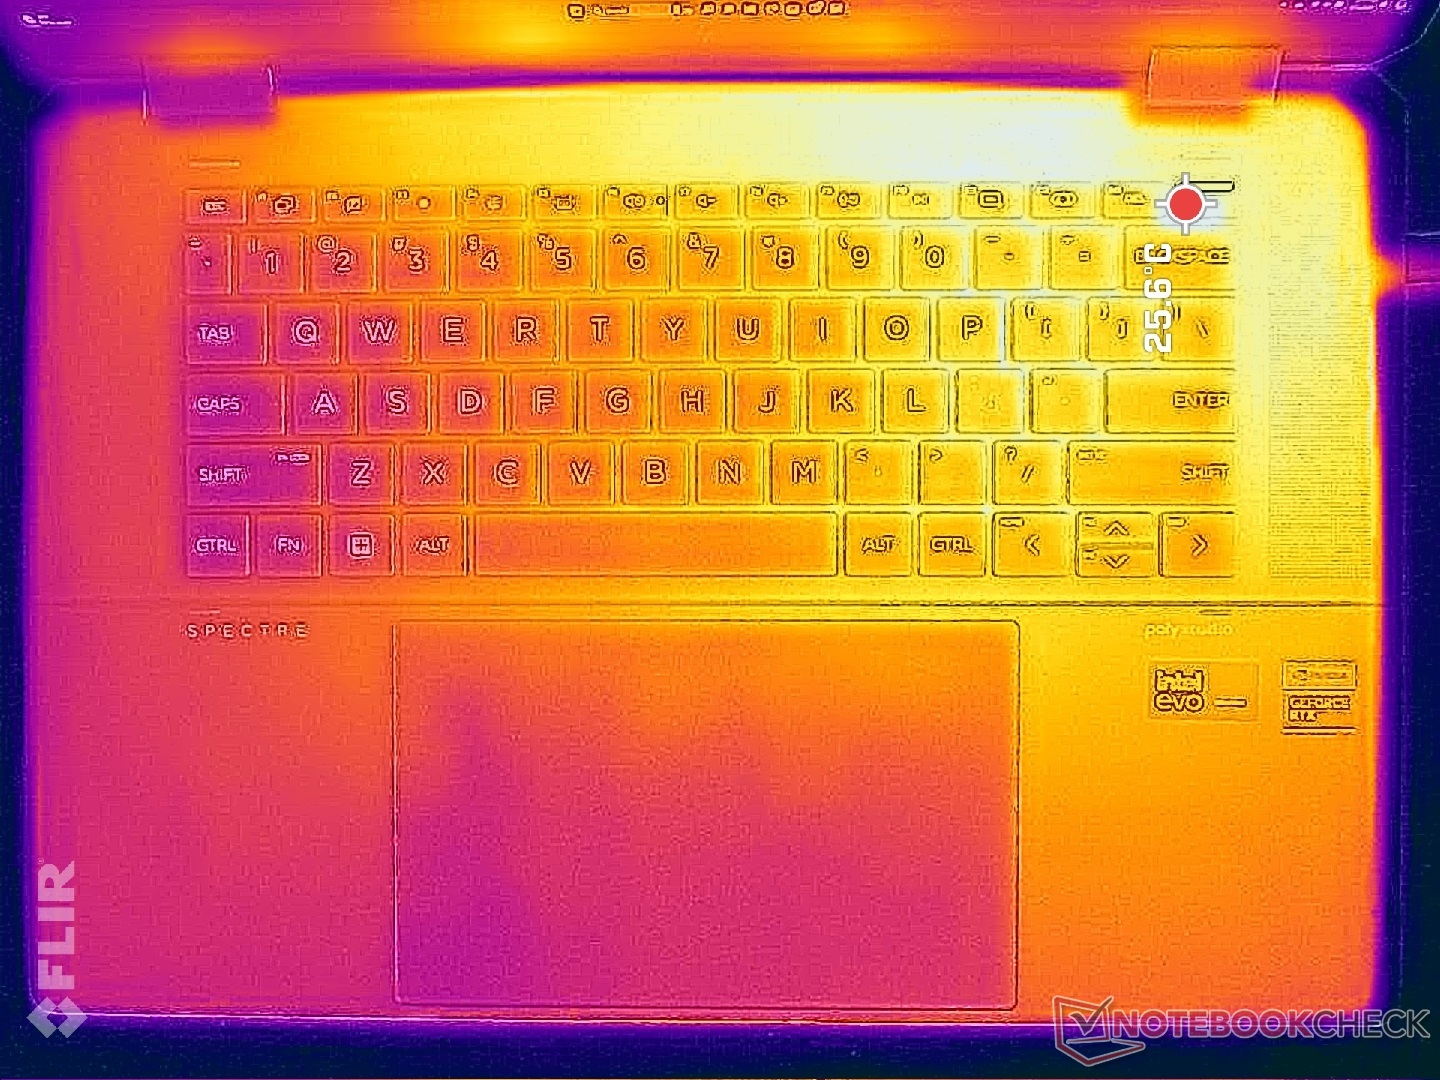
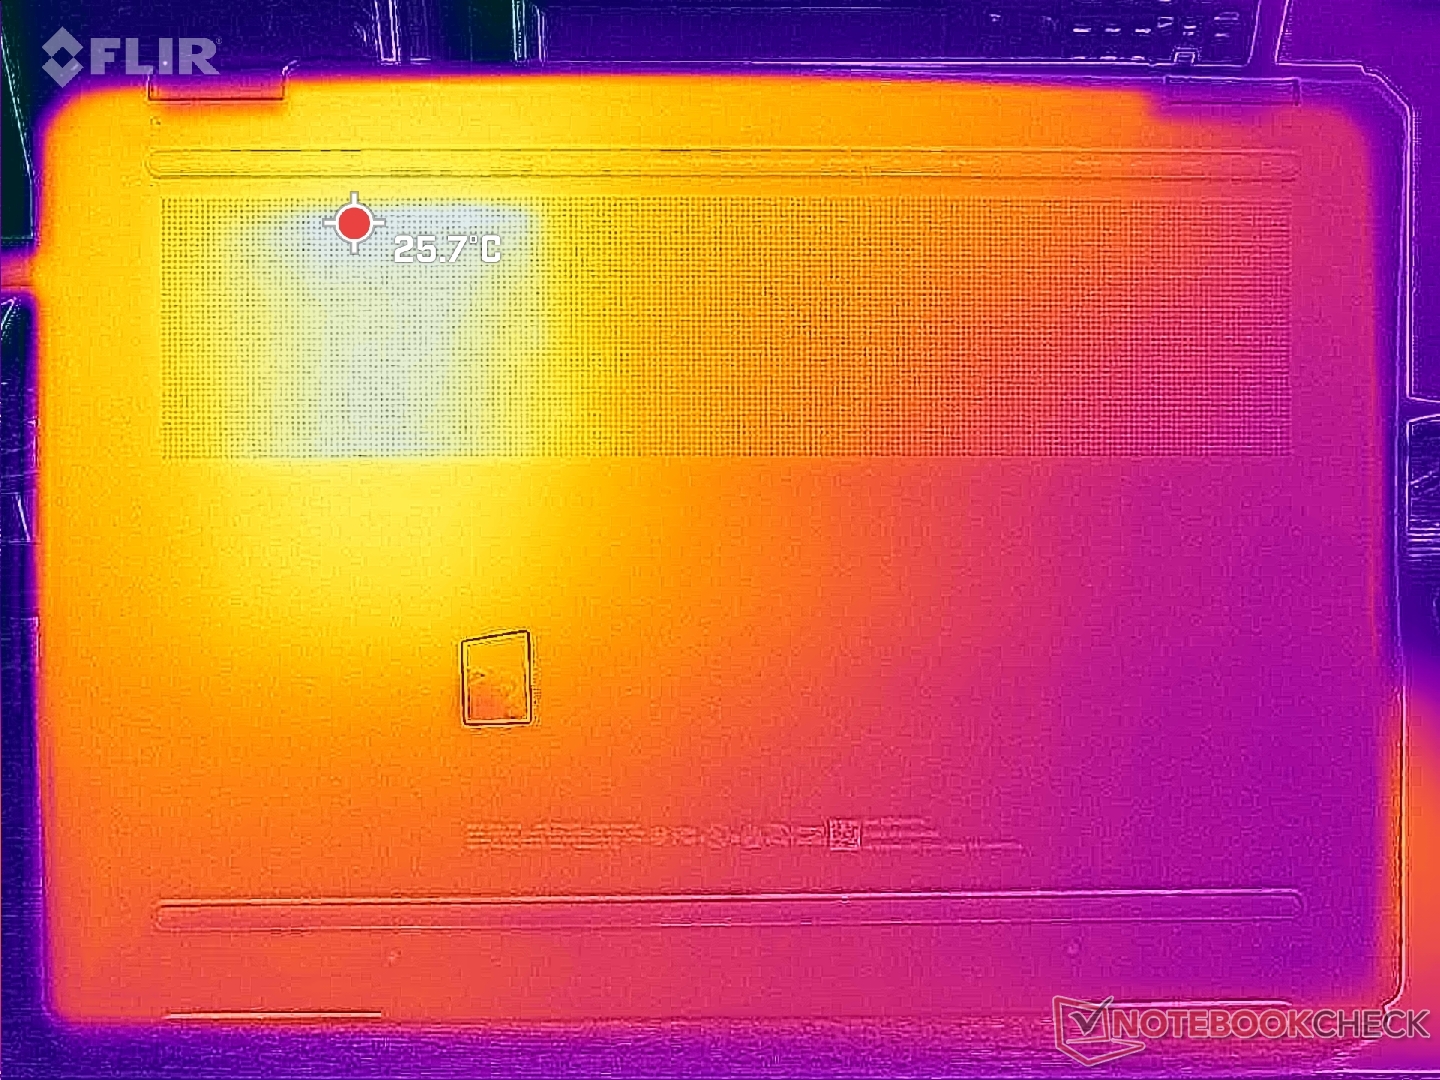
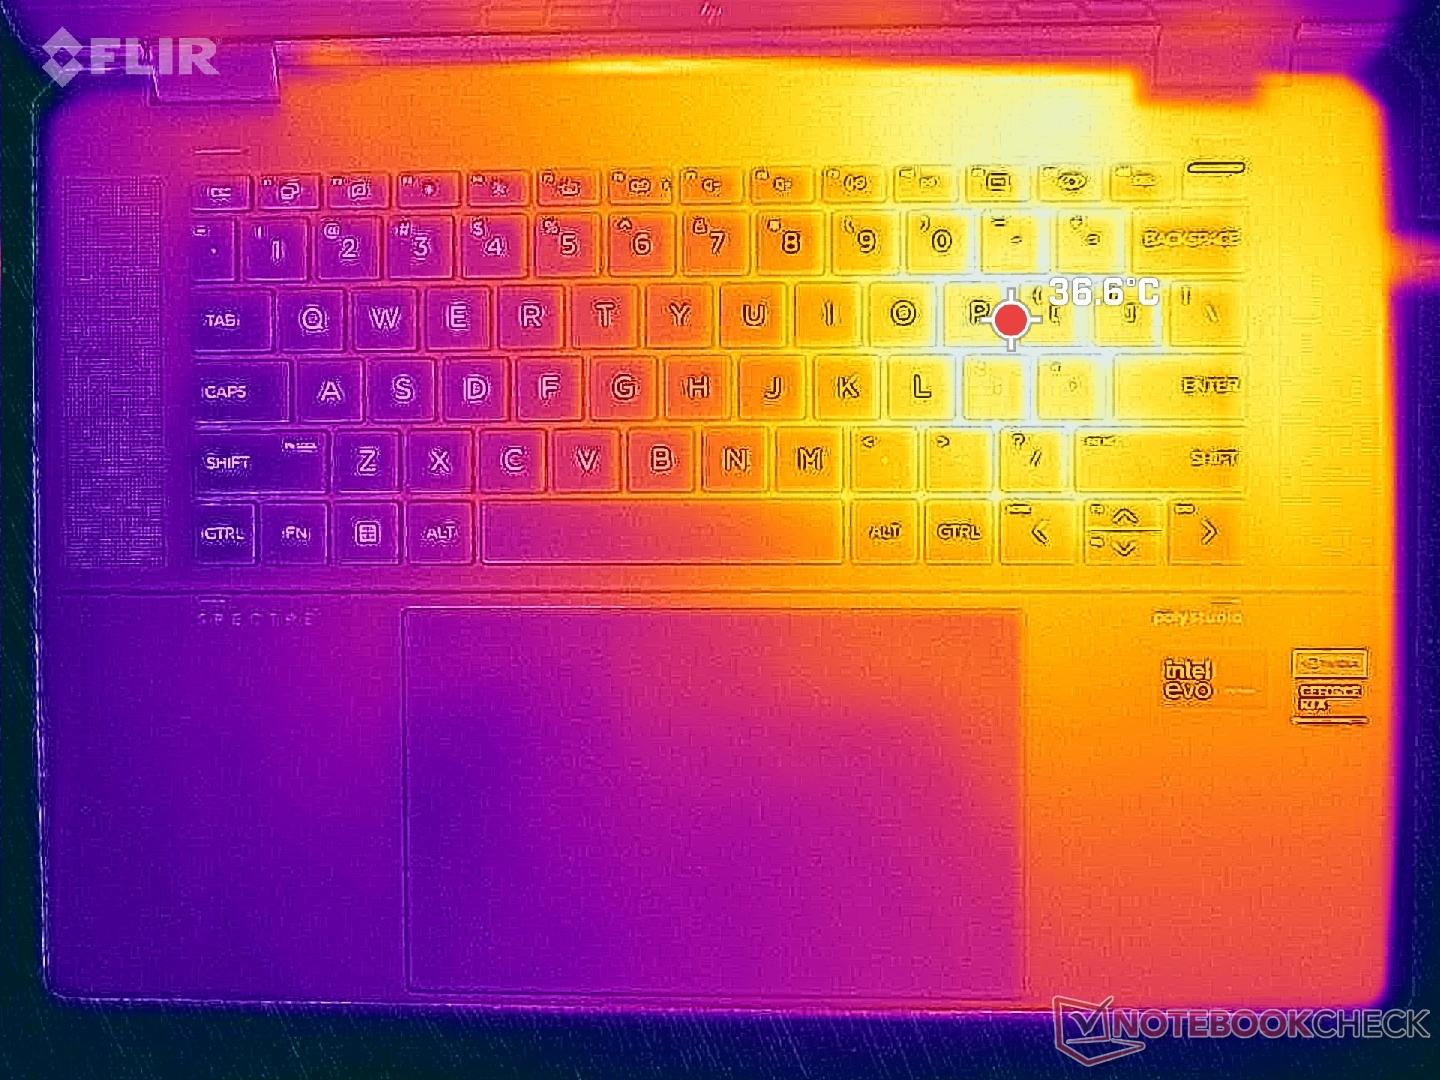
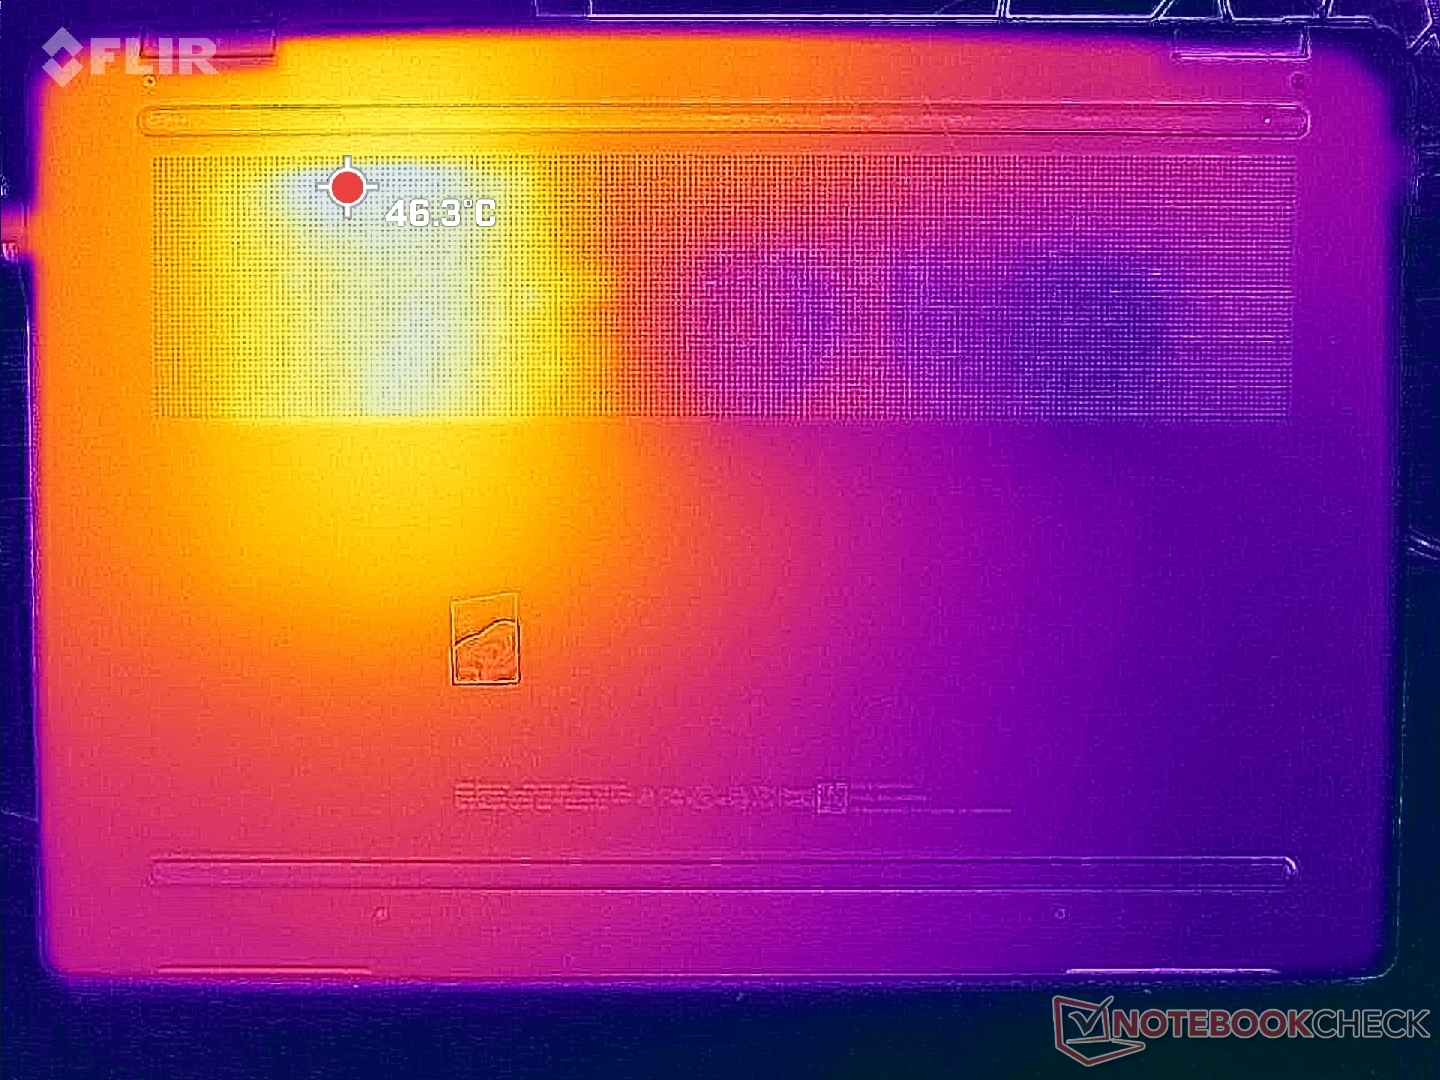
Temperatura
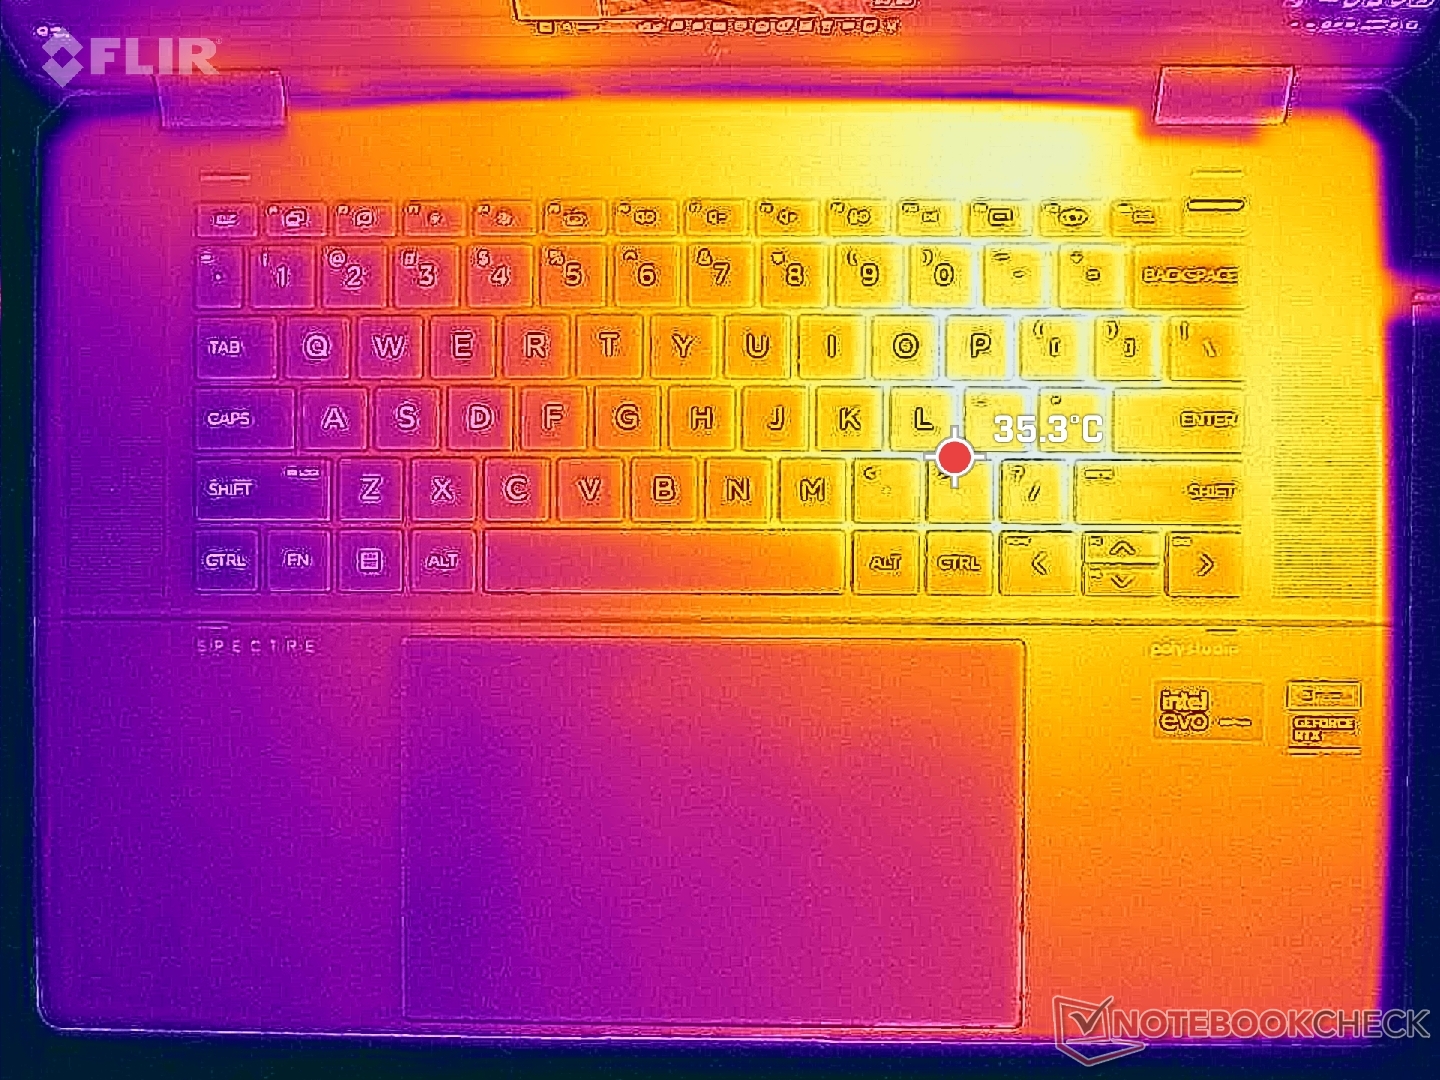
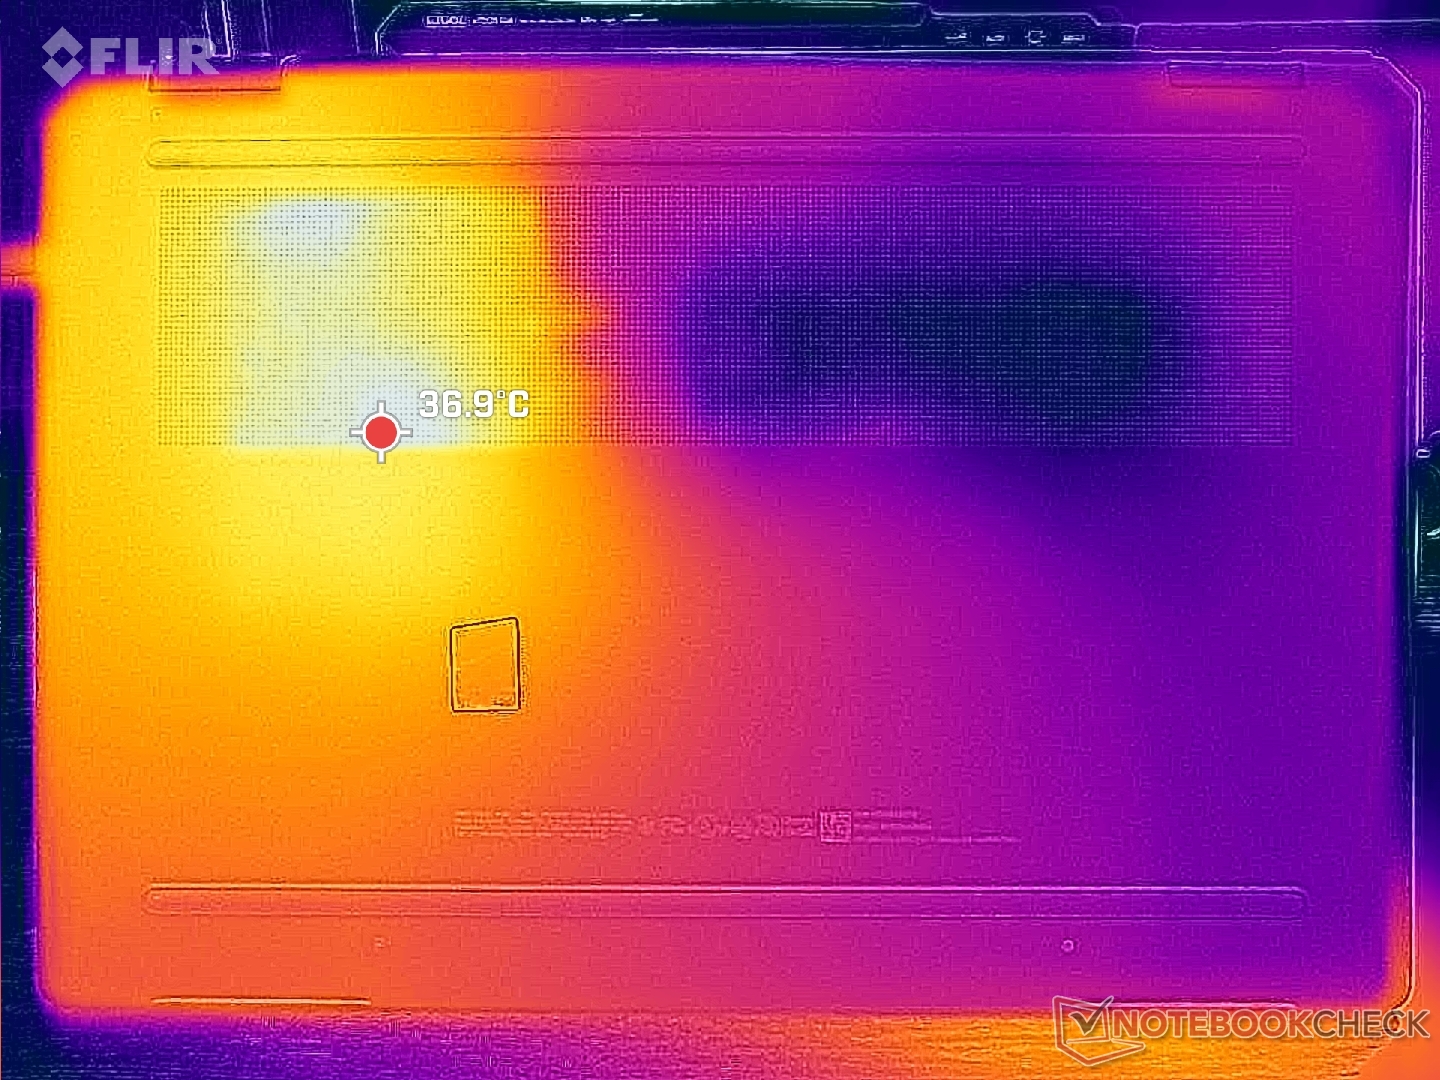
Temperatury powierzchniowe są ponownie znacznie wyższe na prawej połowie laptopa niż na lewej, jak pokazują poniższe mapy temperatur ze względu na sposób zaprojektowania rozwiązania chłodzącego. Gorące punkty są przewidywalnie cieplejsze w naszej wersji dGPU niż w wersji iGPU; górna i dolna część podczas pracy Witcher 3 osiągnęłyby odpowiednio 40 C i 46 C, w porównaniu do zaledwie 35 C i 40 C w wersji iGPU.
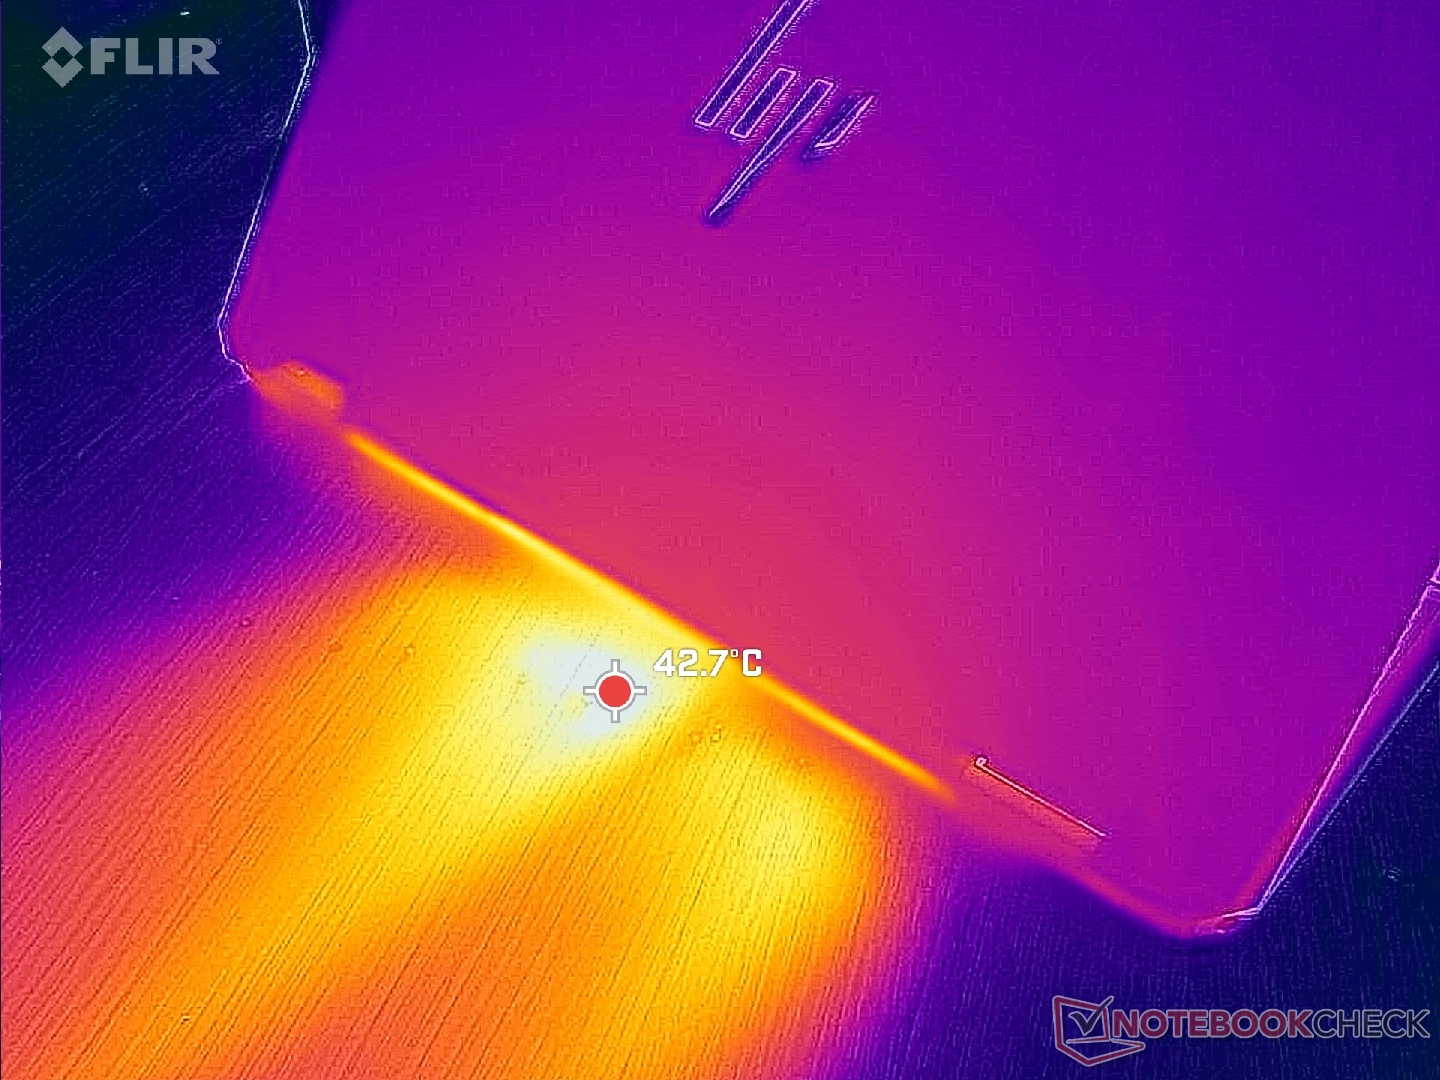
(+) Maksymalna temperatura w górnej części wynosi 39.6 °C / 103 F, w porównaniu do średniej 35.4 °C / 96 F , począwszy od 19.6 do 60 °C dla klasy Convertible.
(+) Dno nagrzewa się maksymalnie do 39.2 °C / 103 F, w porównaniu do średniej 36.9 °C / 98 F
(+) W stanie bezczynności średnia temperatura górnej części wynosi 26.1 °C / 79 F, w porównaniu ze średnią temperaturą urządzenia wynoszącą 30.3 °C / ### class_avg_f### F.
(+) Podczas gry w Wiedźmina 3 średnia temperatura górnej części wynosi 31.6 °C / 89 F, w porównaniu do średniej temperatury urządzenia wynoszącej 30.3 °C / ## #class_avg_f### F.
(+) Podparcia dłoni i touchpad osiągają maksymalną temperaturę skóry (32.2 °C / 90 F) i dlatego nie są gorące.
(-) Średnia temperatura obszaru podparcia dłoni w podobnych urządzeniach wynosiła 28 °C / 82.4 F (-4.2 °C / -7.6 F).
| HP Spectre x360 16 RTX 4050 Intel Core Ultra 7 155H, NVIDIA GeForce RTX 4050 Laptop GPU | HP Spectre x360 16-aa0074ng Intel Core Ultra 7 155H, Intel Arc 8-Core iGPU | HP Spectre x360 2-in-1 16-f1075ng Intel Core i7-12700H, Intel Iris Xe Graphics G7 96EUs | Honor MagicBook Pro 16 2024 Intel Core Ultra 7 155H, NVIDIA GeForce RTX 4060 Laptop GPU | MSI Prestige 16 B1MG-001US Intel Core Ultra 7 155H, Intel Arc 8-Core iGPU | LG Gram 2in1 16 16T90R - G.AA78G Intel Core i7-1360P, Intel Iris Xe Graphics G7 96EUs | |
|---|---|---|---|---|---|---|
| Heat | -1% | 8% | 9% | -1% | -24% | |
| Maximum Upper Side * (°C) | 39.6 | 37 7% | 37.4 6% | 39.7 -0% | 48.8 -23% | 55 -39% |
| Maximum Bottom * (°C) | 39.2 | 44 -12% | 39.1 -0% | 42.9 -9% | 47.6 -21% | 55.4 -41% |
| Idle Upper Side * (°C) | 29 | 31 -7% | 27.1 7% | 23.7 18% | 24.2 17% | 34.9 -20% |
| Idle Bottom * (°C) | 31.6 | 29 8% | 26.3 17% | 23.5 26% | 23.6 25% | 30 5% |
* ... im mniej tym lepiej
Głośniki
HP Spectre x360 16 RTX 4050 analiza dźwięku
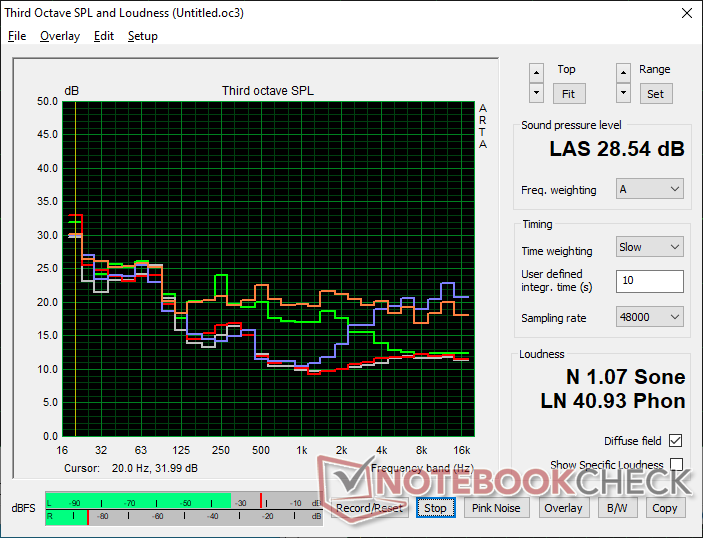
(+) | głośniki mogą odtwarzać stosunkowo głośno (89.5 dB)
Bas 100 - 315 Hz
(±) | zredukowany bas - średnio 13.2% niższy od mediany
(±) | liniowość basu jest średnia (7.9% delta do poprzedniej częstotliwości)
Średnie 400 - 2000 Hz
(+) | zbalansowane środki średnie - tylko 3.2% od mediany
(+) | średnie są liniowe (3% delta do poprzedniej częstotliwości)
Wysokie 2–16 kHz
(+) | zrównoważone maksima - tylko 1.6% od mediany
(+) | wzloty są liniowe (3.5% delta do poprzedniej częstotliwości)
Ogólnie 100 - 16.000 Hz
(+) | ogólny dźwięk jest liniowy (9.2% różnicy w stosunku do mediany)
W porównaniu do tej samej klasy
» 4% wszystkich testowanych urządzeń w tej klasie było lepszych, 1% podobnych, 95% gorszych
» Najlepszy miał deltę 6%, średnia wynosiła ###średnia###%, najgorsza wynosiła 57%
W porównaniu do wszystkich testowanych urządzeń
» 3% wszystkich testowanych urządzeń było lepszych, 1% podobnych, 96% gorszych
» Najlepszy miał deltę 4%, średnia wynosiła ###średnia###%, najgorsza wynosiła 134%
Apple MacBook Pro 16 2021 M1 Pro analiza dźwięku
(+) | głośniki mogą odtwarzać stosunkowo głośno (84.7 dB)
Bas 100 - 315 Hz
(+) | dobry bas - tylko 3.8% od mediany
(+) | bas jest liniowy (5.2% delta do poprzedniej częstotliwości)
Średnie 400 - 2000 Hz
(+) | zbalansowane środki średnie - tylko 1.3% od mediany
(+) | średnie są liniowe (2.1% delta do poprzedniej częstotliwości)
Wysokie 2–16 kHz
(+) | zrównoważone maksima - tylko 1.9% od mediany
(+) | wzloty są liniowe (2.7% delta do poprzedniej częstotliwości)
Ogólnie 100 - 16.000 Hz
(+) | ogólny dźwięk jest liniowy (4.6% różnicy w stosunku do mediany)
W porównaniu do tej samej klasy
» 0% wszystkich testowanych urządzeń w tej klasie było lepszych, 0% podobnych, 100% gorszych
» Najlepszy miał deltę 5%, średnia wynosiła ###średnia###%, najgorsza wynosiła 45%
W porównaniu do wszystkich testowanych urządzeń
» 0% wszystkich testowanych urządzeń było lepszych, 0% podobnych, 100% gorszych
» Najlepszy miał deltę 4%, średnia wynosiła ###średnia###%, najgorsza wynosiła 134%
Zarządzanie energią
Zużycie energii
Praca Witcher 3 w trybie Performance wymaga około 93 W lub prawie 2x więcej niż konfiguracja iGPU. Liczba klatek na sekundę z GPU Nvidia jest od 2x do 3x wyższa, więc wyższe zapotrzebowanie na energię jest nadal opłacalne z punktu widzenia wydajności na wat.
Powtórzenie powyższego testu w trybie zrównoważonym zamiast w trybie wydajności obniżyłoby zużycie energii do 75 W. Oszczędność energii koreluje z naszymi obserwacjami TGP w sekcji Stress Test powyżej. Jeśli chcą Państwo w pełni wykorzystać możliwości swojego systemu, należy włączyć tryb wydajności za pośrednictwem MyHP.
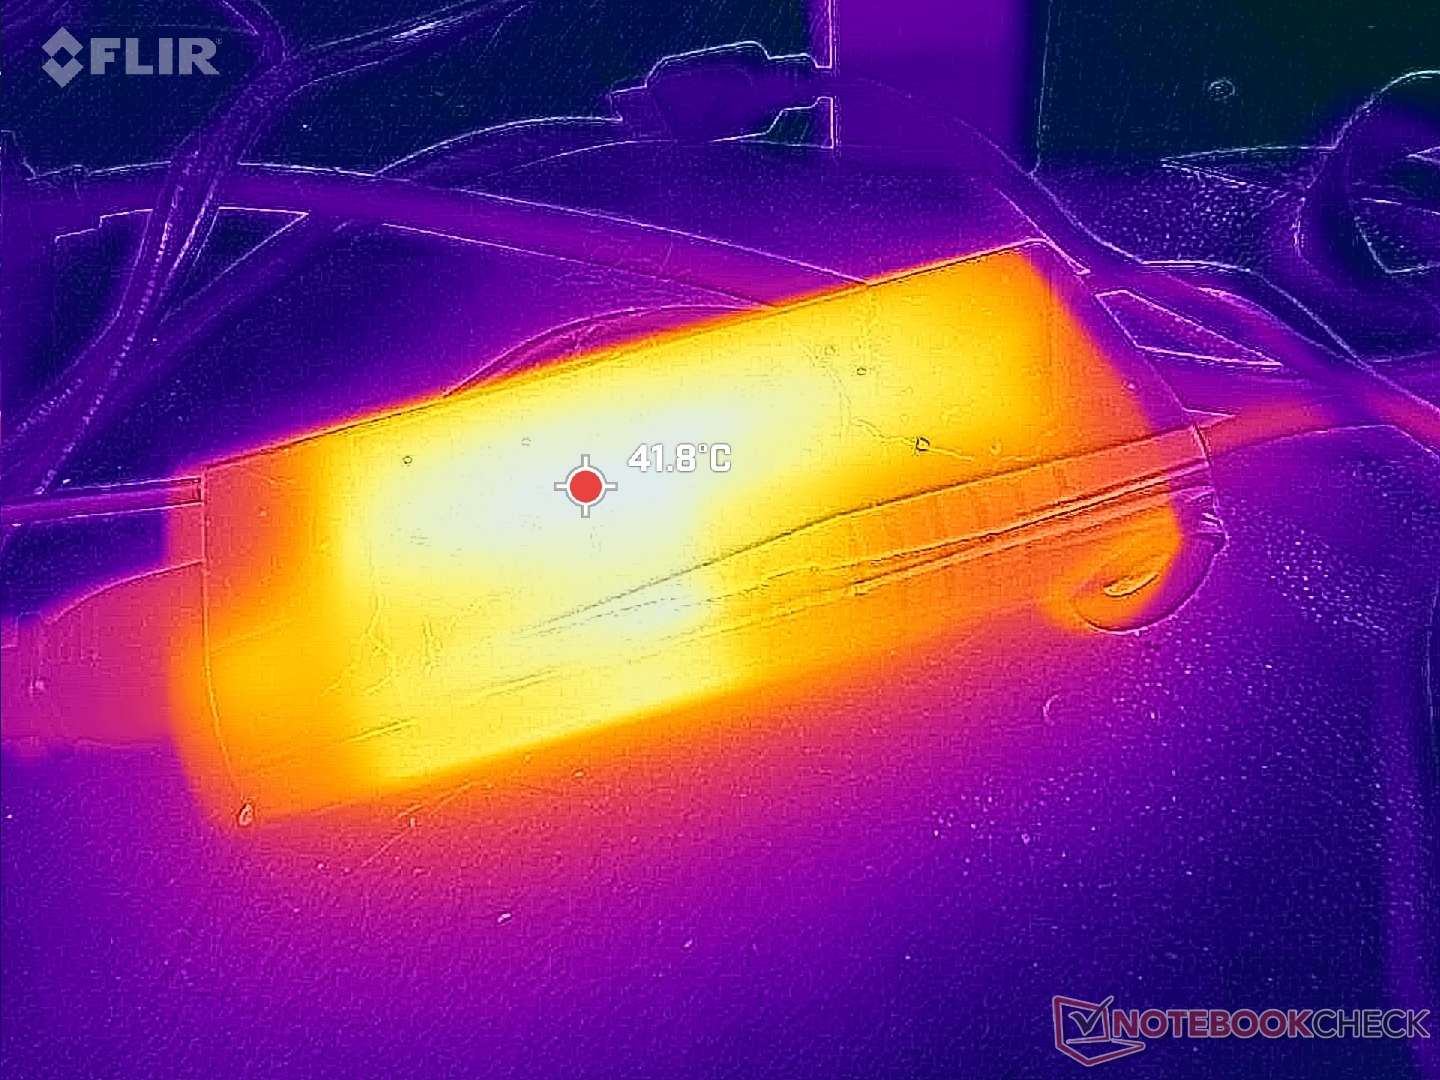
Jesteśmy w stanie zarejestrować tymczasowy maksymalny pobór mocy 121 W z małego-średniego (~13,8 x 6,5 x 2,9 cm) zasilacza sieciowego USB-C o mocy 140 W, gdy procesor i karta graficzna są wykorzystywane w 100 procentach. Szybkość ładowania nie ma znaczącego wpływu, ponieważ jak wspomniano powyżej, dławienie wydajności włącza się bardzo szybko, aby obniżyć zużycie energii do 70 W. Proszę zauważyć, że konfiguracja iGPU jest dostarczana z mniejszym zasilaczem USB-C o mocy 100 W.
(Uwaga redaktora: Ta sekcja zostanie zaktualizowana po zakończeniu naprawy naszego multimetru Metrahit Energy. Przepraszamy za niedogodności)
| wyłączony / stan wstrzymania | |
| luz | |
| obciążenie |
|
Legenda:
min: | |
| HP Spectre x360 16 RTX 4050 Ultra 7 155H, GeForce RTX 4050 Laptop GPU, SK hynix PC801 HFS001TEJ9X101N, OLED, 2880x1800, 16" | HP Spectre x360 16-aa0074ng Ultra 7 155H, Arc 8-Core, Kioxia XG8 KXG80ZNV1T02, OLED, 2880x1800, 16" | HP Spectre x360 2-in-1 16-f1075ng i7-12700H, Iris Xe G7 96EUs, SK Hynix PC711 1TB HFS001TDE9X073N, IPS, 3072x1920, 16" | Honor MagicBook Pro 16 2024 Ultra 7 155H, GeForce RTX 4060 Laptop GPU, WD PC SN740 SDDPNQD-1T00, IPS, 3072x1920, 16" | MSI Prestige 16 B1MG-001US Ultra 7 155H, Arc 8-Core, Samsung PM9A1 MZVL22T0HBLB, IPS, 2560x1600, 16" | LG Gram 2in1 16 16T90R - G.AA78G i7-1360P, Iris Xe G7 96EUs, Samsung PM9A1 MZVL21T0HCLR, IPS, 2560x1600, 16" | |
|---|---|---|---|---|---|---|
| Power Consumption | 48% | 26% | -10% | 33% | 39% | |
| Idle Minimum * (Watt) | 5.8 | 4.1 29% | 9 -55% | 5.2 10% | 3 48% | 5.5 5% |
| Idle Average * (Watt) | 12.3 | 4.5 63% | 11.1 10% | 14.4 -17% | 9.5 23% | 7.2 41% |
| Idle Maximum * (Watt) | 33.9 | 5.9 83% | 16.4 52% | 15.4 55% | 12 65% | 12.9 62% |
| Load Average * (Watt) | 83.3 | 51.2 39% | 38.3 54% | 105.4 -27% | 68.3 18% | 55 34% |
| Witcher 3 ultra * (Watt) | 89.1 | 47.6 47% | 34.4 61% | 107.6 -21% | 59.8 33% | 47 47% |
| Load Maximum * (Watt) | 120.8 | 90.4 25% | 82.5 32% | 195.2 -62% | 104.8 13% | 63.6 47% |
* ... im mniej tym lepiej
Power Consumption Witcher 3 / Stresstest
Power Consumption external Monitor
Żywotność baterii
Czas pracy na baterii jest przewidywalnie krótszy niż w konfiguracji iGPU, ale różnica jest zaskakująco niewielka. Jesteśmy w stanie wycisnąć 11 godzin rzeczywistego przeglądania na profilu zrównoważonym lub tylko o godzinę mniej niż to, co zarejestrowaliśmy na jednostce iGPU. Wybór konfiguracji IPS prawdopodobnie wydłuży czas pracy.
| HP Spectre x360 16 RTX 4050 Ultra 7 155H, GeForce RTX 4050 Laptop GPU, 83 Wh | HP Spectre x360 16-aa0074ng Ultra 7 155H, Arc 8-Core, 83 Wh | HP Spectre x360 2-in-1 16-f1075ng i7-12700H, Iris Xe G7 96EUs, 83 Wh | Honor MagicBook Pro 16 2024 Ultra 7 155H, GeForce RTX 4060 Laptop GPU, 75 Wh | MSI Prestige 16 B1MG-001US Ultra 7 155H, Arc 8-Core, 99.9 Wh | LG Gram 2in1 16 16T90R - G.AA78G i7-1360P, Iris Xe G7 96EUs, 80 Wh | |
|---|---|---|---|---|---|---|
| Czasy pracy | 9% | -5% | 11% | 66% | 8% | |
| WiFi v1.3 (h) | 11 | 12 9% | 10.5 -5% | 12.2 11% | 18.3 66% | 11.9 8% |
| H.264 (h) | 14.4 | 11.2 | 13.1 | |||
| Load (h) | 2.3 | 1.6 | 1 | 2.8 | 2 | |
| Reader / Idle (h) | 20.6 | 25.1 |
Za
Przeciw
Werdykt - wszechstronność kosztem wydajności
HP Spectre x360 16 to jeden z najcichszych i najbardziej przenośnych 16-calowych laptopów konwertowalnych na rynku z dyskretną grafiką GeForce RTX 4050. System ten został zaprojektowany z myślą o zaawansowanych użytkownikach, którzy mogą również wykorzystać obudowę 2 w 1 i głębokie kolory P3 ekranu dotykowego OLED. Z tej perspektywy model ten jest sukcesem.
Cienka konstrukcja wymagała kompromisów w zakresie wydajności. W szczególności procesor graficzny RTX 4050 o mocy 55 W jest znacznie wolniejszy niż większość innych laptopów z tą samą opcją graficzną. Spectre x360 16 jest oczywiście nadal szybki jak na swój rozmiar, ale jego GPU GeForce jest zdecydowanie w dolnej części spektrum ze względu na niski docelowy TGP. Użytkownicy, którzy chcą zmaksymalizować wydajność lub nie uważają formatu 2 w 1 za użyteczny, mogą rozważyć MSI Prestige 16 lub Honor MagicBook Pro 16 które można skonfigurować z grafiką RTX wyższej klasy niż HP, zachowując jednocześnie podobną filozofię cienkiej i lekkiej konstrukcji.
Spectre x360 16 to wysokiej klasy i dobrze zbudowany 16-calowy laptop konwertowalny. Wydajność jest ogólnie doskonała, ale z pewnością istnieją szybsze alternatywy, jeśli chcą Państwo zrezygnować z konstrukcji 2 w 1.
Musimy również wspomnieć o wolniejszej niż oczekiwano wydajności procesora w konfiguracji dGPU w momencie pisania tego tekstu. HP twierdzi, że trwają prace nad poprawką i zaktualizujemy sekcję CPU, gdy poprawka zostanie uruchomiona. W przeciwnym razie GPU wydaje się działać poprawnie.
Cena i dostępność
HP dostarcza obecnie model Spectre x360 16 2-in-1 z grafiką GeForce RTX 4050 w cenie od 1440 USD z ekranem dotykowym IPS lub 1600 USD z ekranem dotykowym OLED, jak w recenzji.
HP Spectre x360 16 RTX 4050
- 13/03/2024 v7 (old)
Allen Ngo
Przezroczystość
Wyboru urządzeń do recenzji dokonuje nasza redakcja. Próbka testowa została udostępniona autorowi jako pożyczka od producenta lub sprzedawcy detalicznego na potrzeby tej recenzji. Pożyczkodawca nie miał wpływu na tę recenzję, producent nie otrzymał też kopii tej recenzji przed publikacją. Nie było obowiązku publikowania tej recenzji. Jako niezależna firma medialna, Notebookcheck nie podlega władzy producentów, sprzedawców detalicznych ani wydawców.
Tak testuje Notebookcheck
Każdego roku Notebookcheck niezależnie sprawdza setki laptopów i smartfonów, stosując standardowe procedury, aby zapewnić porównywalność wszystkich wyników. Od około 20 lat stale rozwijamy nasze metody badawcze, ustanawiając przy tym standardy branżowe. W naszych laboratoriach testowych doświadczeni technicy i redaktorzy korzystają z wysokiej jakości sprzętu pomiarowego. Testy te obejmują wieloetapowy proces walidacji. Nasz kompleksowy system ocen opiera się na setkach uzasadnionych pomiarów i benchmarków, co pozwala zachować obiektywizm.Price comparison

