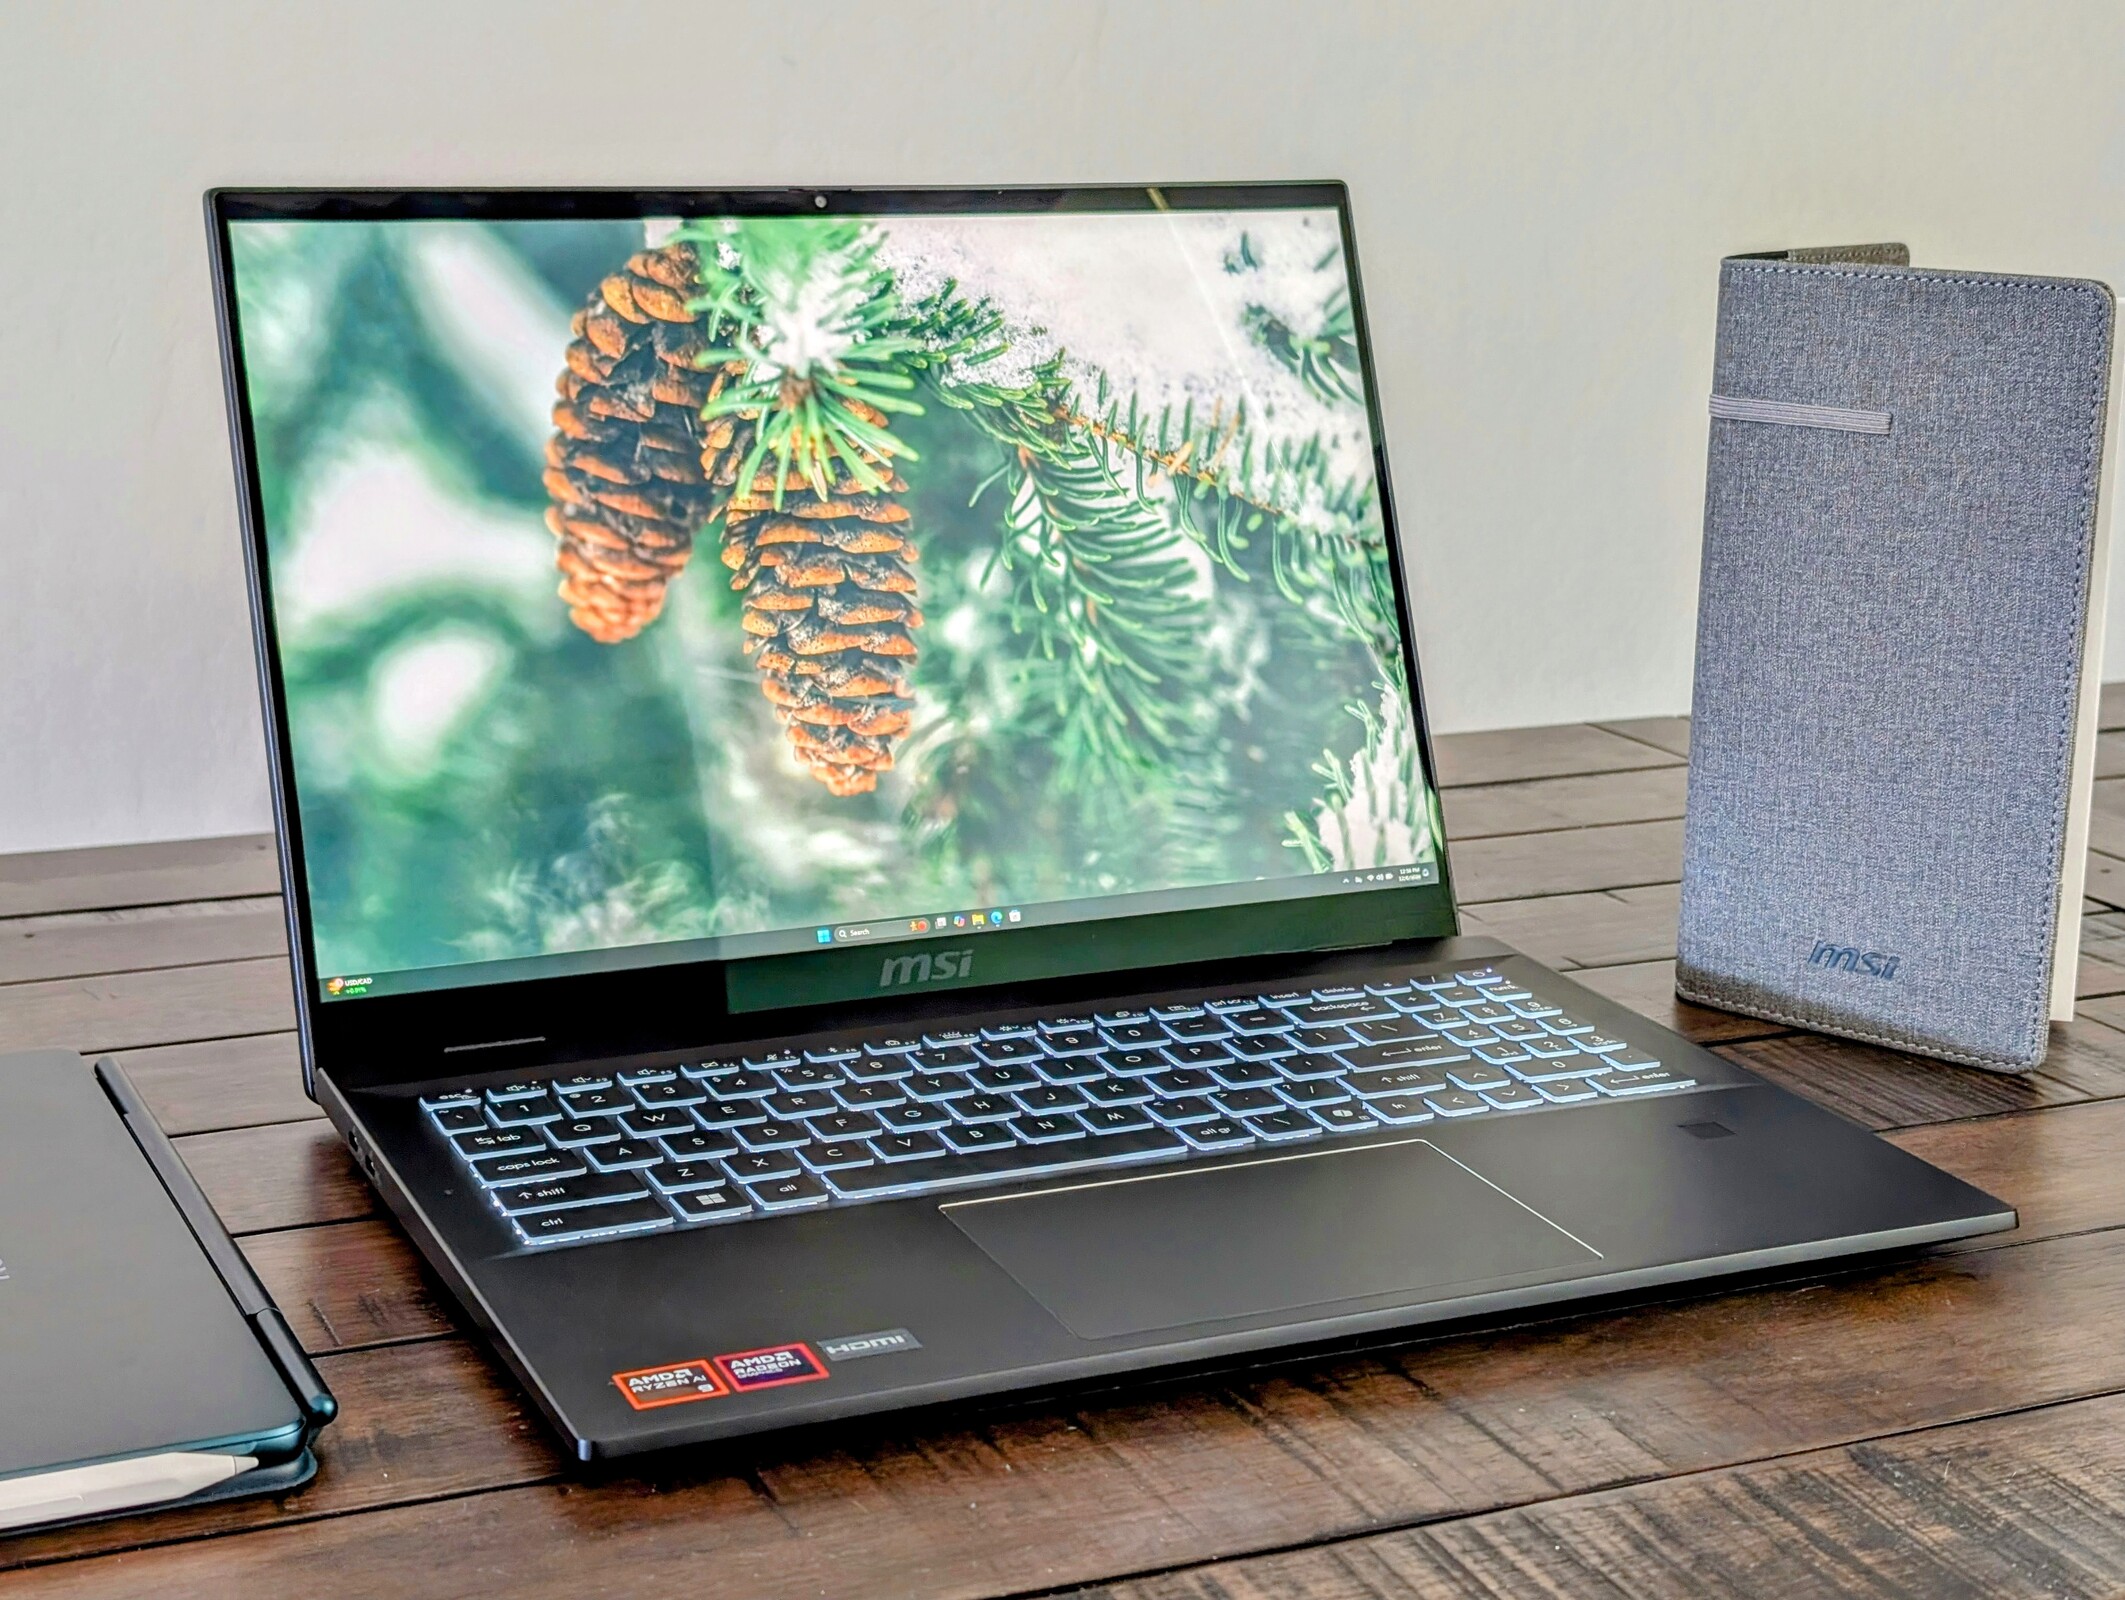
Recenzja MSI Summit A16 AI Plus: Wydajny konwertowalny AMD Ryzen 9
Wzrost wydajności Zen 5.
Model MSI jest obecnie jednym z najszybszych 16-calowych laptopów konwertowalnych na rynku pod względem wydajności procesora. Jednak brak oddzielnych opcji graficznych powstrzymuje go przed innymi głównymi konkurentami, takimi jak HP Spectre x360 16.Allen Ngo, 👁 Allen Ngo (tłumaczenie DeepL / Ninh Duy) Opublikowany 🇺🇸 🇩🇪 ...
Werdykt - Ekstremalna wydajność procesora, ale bez oddzielnych opcji GPU
Największymi atutami, które pomagają odróżnić Summit A16 AI Plus od reszty, są szybki procesor i jasny ekran dotykowy 165 Hz. Procesor AMD Zen 5 jest kilka kroków powyżej Core i7-1280P w poprzednim modelu, podczas gdy wyświetlacz nadal jest jednym z lepszych 16-calowych paneli IPS.
Kilka wad sprawia, że MSI nie jest najlepszym 16-calowym laptopem konwertowalnym na rynku. Kamera internetowa 2 MP, brak opcji wyświetlacza OLED 3K lub 4K oraz brak obsługi oddzielnych procesorów graficznych lub dodatkowych dysków SSD M.2 mogą odstraszyć zaawansowanych użytkowników lub bardziej oddanych graczy. Użytkownicy mogą zatem preferować HP Spectre x360 16 ze względu na jego wyższą wydajność graficzną lub znacznie lżejszy Samsung Galaxy Book5 Pro 360 16 i jego ekran dotykowy OLED o wyższej rozdzielczości.
Warto zauważyć, że doświadczyliśmy znaczących problemów w naszym urządzeniu związanych z nieprawidłowym działaniem clickpada i czasami niezwykle długim czasem uruchamiania. Nie jesteśmy pewni, czy problemy te są powszechne, ale warto je sprawdzić natychmiast po zakupie.
Za
Przeciw
Porównanie możliwych alternatyw
Obraz | Model / recenzja | Cena | Waga | Wysokość | Ekran |
|---|---|---|---|---|---|
1. 81.9%  | MSI Summit A16 AI Plus A3HMTG AMD Ryzen AI 9 365 ⎘ AMD Radeon 880M ⎘ 32 GB Pamięć, 1024 GB SSD | Amazon: Cena katalogowa: 1600 USD | 2.1 kg | 16.85 mm | 16.00" 2560x1600 189 PPI IPS |
2. 84.2% v7 (old)  | MSI Summit E16 Flip A12UDT-031 Intel Core i7-1280P ⎘ NVIDIA GeForce RTX 3050 Ti Laptop GPU ⎘ 32 GB Pamięć, 2048 GB SSD | Amazon: Cena katalogowa: 2580 Euro | 1.9 kg | 16.85 mm | 16.00" 2560x1600 189 PPI IPS |
3. 91.1% v7 (old)  | HP Spectre x360 16 RTX 4050 Intel Core Ultra 7 155H ⎘ NVIDIA GeForce RTX 4050 Laptop GPU ⎘ 16 GB Pamięć, 1024 GB SSD | Amazon: Cena katalogowa: 1600 USD | 2 kg | 19.8 mm | 16.00" 2880x1800 212 PPI OLED |
4. 86.5% v7 (old)  | Asus ExpertBook B5 Flip B5602FBN Intel Core i7-1260P ⎘ Intel Arc A350M ⎘ 16 GB Pamięć, 1024 GB SSD | Amazon: Cena katalogowa: 2199 Euro | 1.8 kg | 19.9 mm | 16.00" 3840x2400 283 PPI OLED |
5. 82.8%  | LG gram Pro 2-in-1 16T90SP Intel Core Ultra 7 155H ⎘ Intel Arc 8-Core iGPU ⎘ 16 GB Pamięć, 1024 GB SSD | Amazon: Cena katalogowa: 1850€ | 1.4 kg | 12.9 mm | 16.00" 2880x1800 212 PPI OLED |
6. 86.7% v7 (old)  | Lenovo Yoga 7 2-in-1 16IML9 Intel Core Ultra 5 125U ⎘ Intel Graphics 4-Core iGPU (Meteor / Arrow Lake) ⎘ 16 GB Pamięć, 512 GB SSD | Amazon: $949.00 Cena katalogowa: 900 USD | 2.1 kg | 16.99 mm | 16.00" 1920x1200 142 PPI IPS |
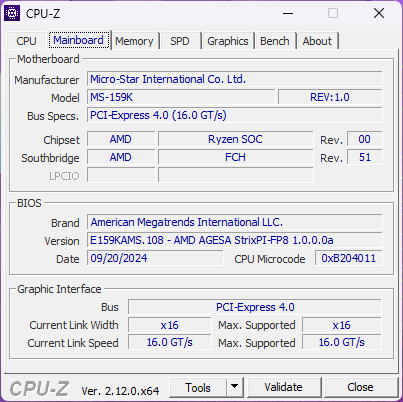
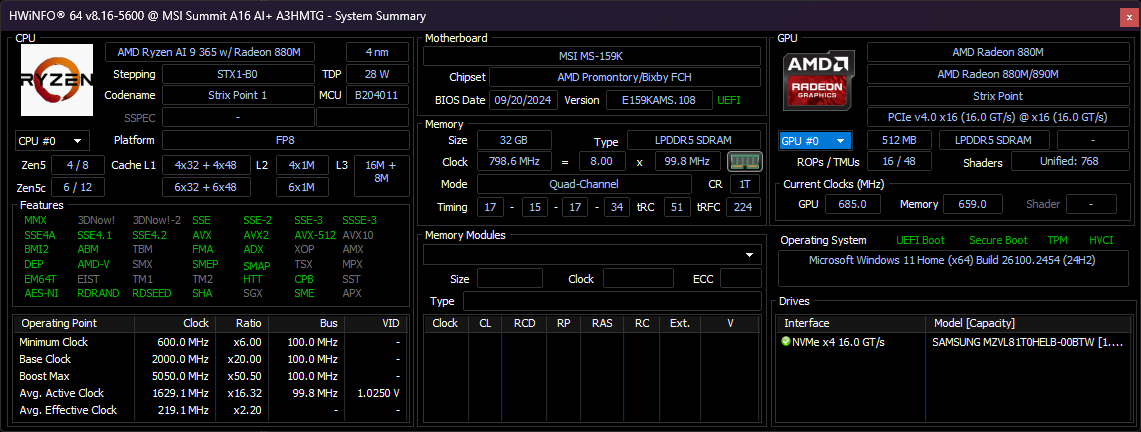
2024 Summit A16 AI Plus jest następcą 2022 Summit E16 Flip. Chociaż ich nazwy mogą być różne, poza tym wykorzystują tę samą zewnętrzną konstrukcję 2 w 1. Wewnętrznie jednak model 2024 zastąpił procesor Intela i kartę graficzną Nvidii na rzecz pojedynczego rozwiązania AMD Zen 5.
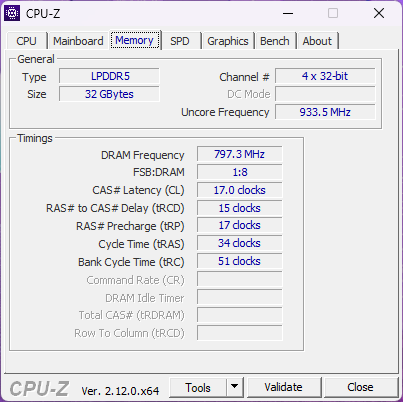
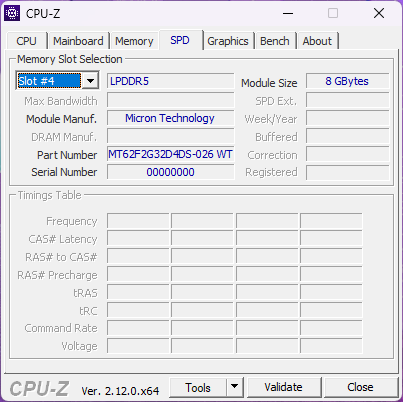
Nasza jednostka testowa została skonfigurowana z procesorem Ryzen AI 9 365, zintegrowaną grafiką Radeon 880M i ekranem dotykowym IPS 1600p 165 Hz za około 1600 USD. Żadne inne główne jednostki SKU nie są obecnie dostępne, więc te trzy główne cechy są stałe dla wszystkich.
Alternatywy dla Summit A16 AI Plus obejmują inne 16-calowe multimedialne urządzenia konwertowalne, takie jak Lenovo Yoga 7 2-w-1, HP Spectre x360 16lub LG Gram Pro 2-w-1.
Więcej recenzji MSI:
Specyfikacje
Przypadek
Obudowa pozostaje identyczna z konstrukcją z 2022 roku. Mimo to jej rozmiar i waga pozostają konkurencyjne w stosunku do obecnych alternatyw HP, Lenovo czy Asusa.
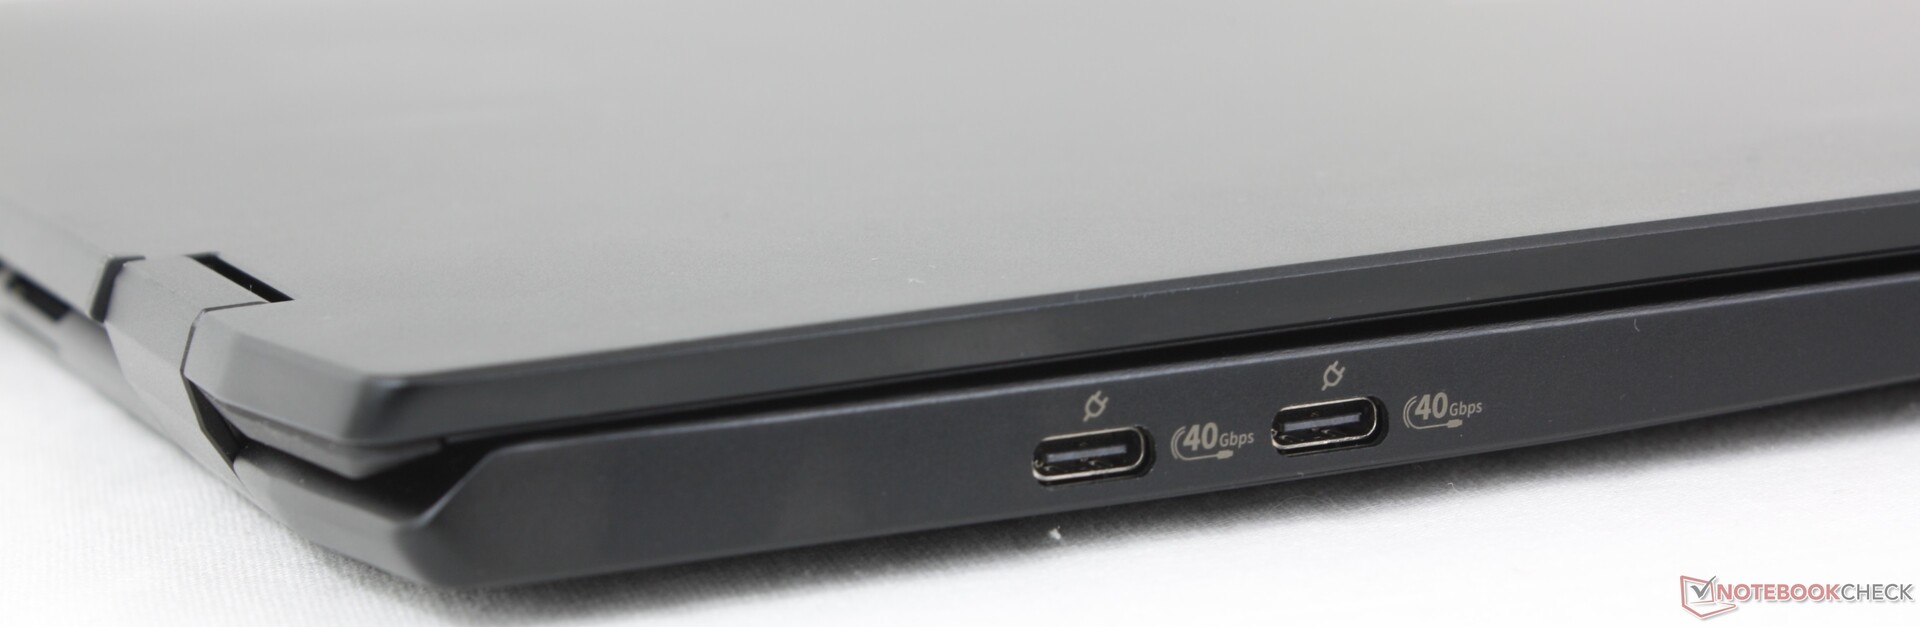
Łączność
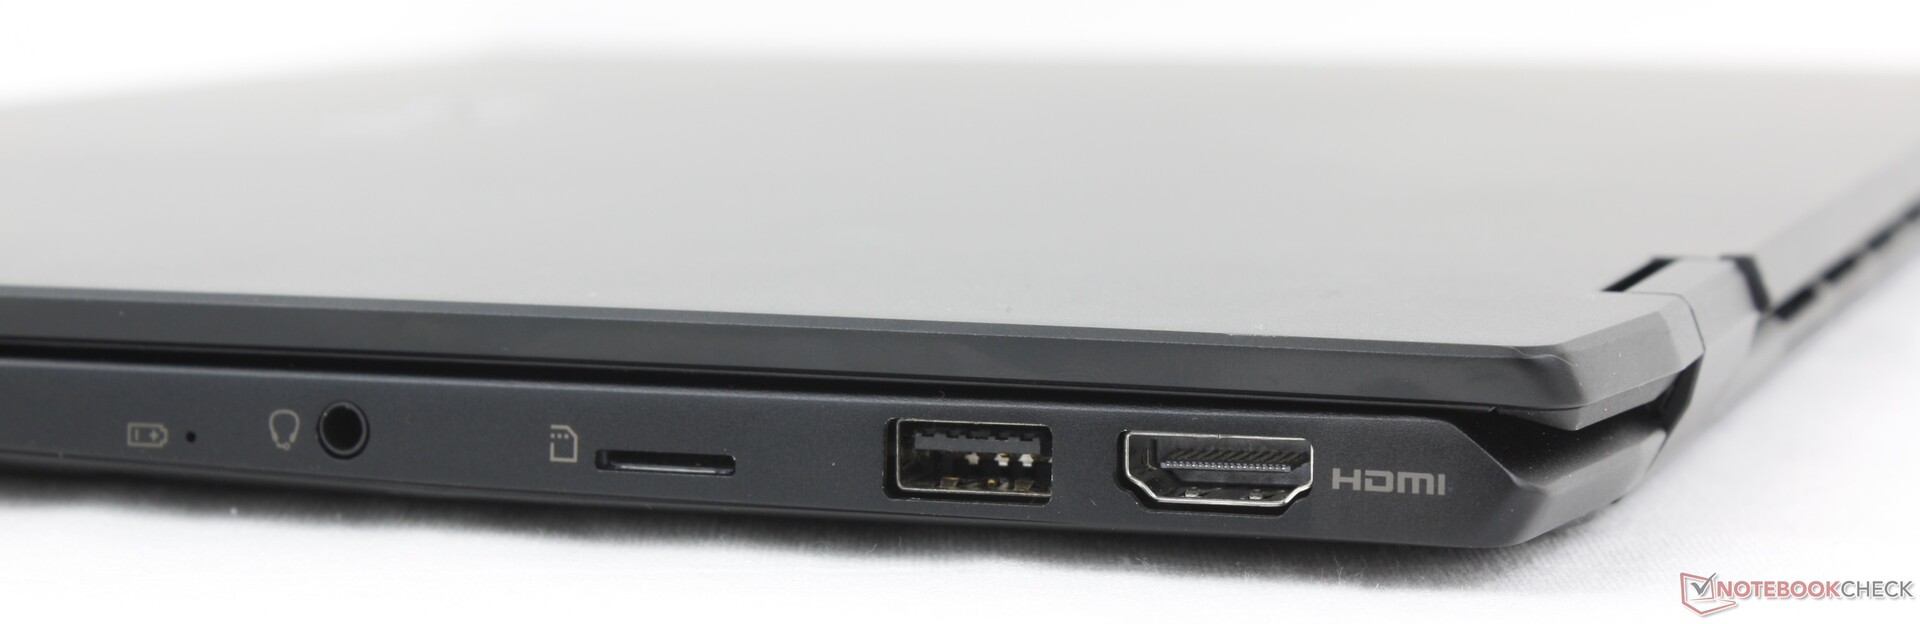
Opcje portów są nieco inne niż w wersji 2022. Na przykład port HDMI znajduje się teraz wzdłuż prawej krawędzi systemu zamiast lewej. Ponadto nowszy model ma o jeden port USB-A mniej niż starsza konstrukcja.
Czytnik kart SD
| SD Card Reader | |
| average JPG Copy Test (av. of 3 runs) | |
| MSI Summit E16 Flip A12UDT-031 (AV Pro SD microSD 128 GB V60) | |
| MSI Summit A16 AI Plus A3HMTG (AV Pro SD microSD 128 GB V60) | |
| Lenovo Yoga 7 2-in-1 16IML9 (AV Pro SD microSD 128 GB V60) | |
| Asus ExpertBook B5 Flip B5602FBN (AV Pro SD microSD 128 GB V60) | |
| maximum AS SSD Seq Read Test (1GB) | |
| MSI Summit A16 AI Plus A3HMTG (AV Pro SD microSD 128 GB V60) | |
| MSI Summit E16 Flip A12UDT-031 (AV Pro SD microSD 128 GB V60) | |
| Lenovo Yoga 7 2-in-1 16IML9 (AV Pro SD microSD 128 GB V60) | |
| Asus ExpertBook B5 Flip B5602FBN (AV Pro SD microSD 128 GB V60) | |
Komunikacja
Qualcomm FastConnect 7800 jest standardem dla Wi-Fi 7 i Bluetooth 5.4. Wydajność jest niezawodna, ale nie tak szybka, jak się spodziewaliśmy w porównaniu do bardziej powszechnego Intel AX211.
Kamera internetowa
Kamera internetowa 2 MP z podczerwienią i fizyczną migawką pozostały niezmienione.


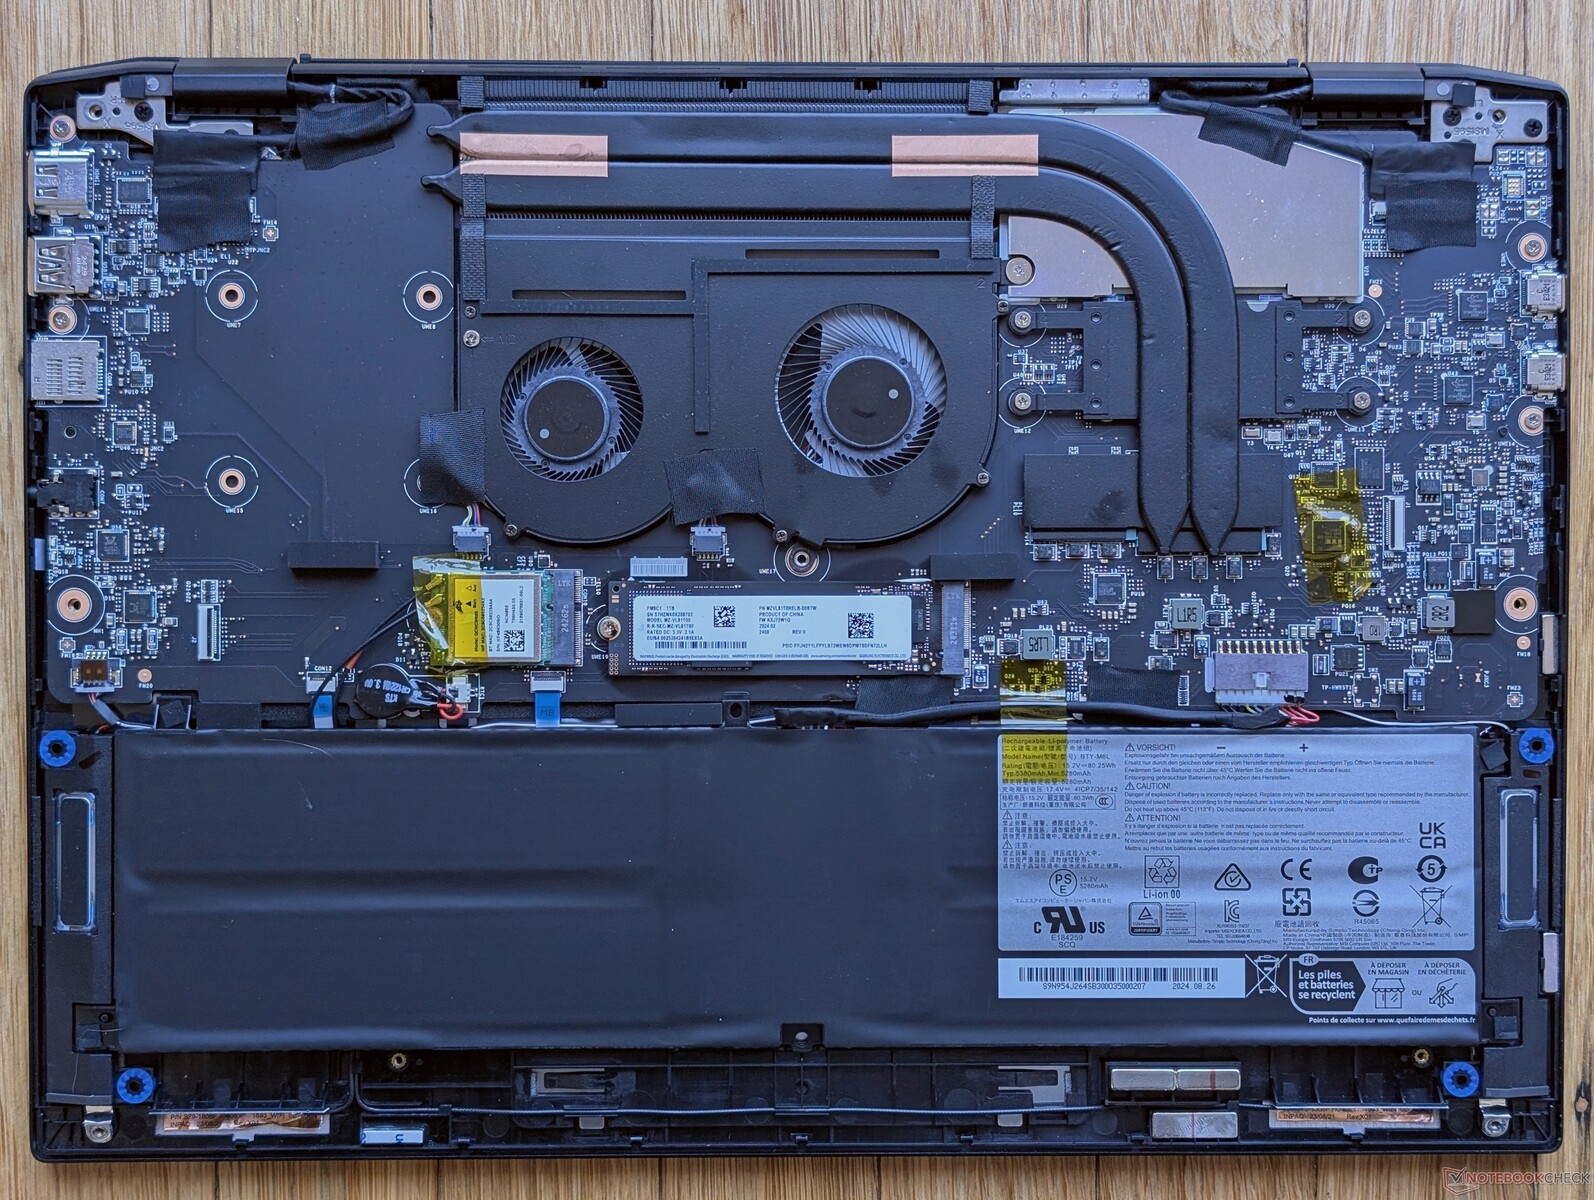
Konserwacja
Aby zdjąć dolny panel, należy zerwać naklejkę antysabotażową. Wewnętrznie, model ten jest podobny do starszego Summit E16 Flip, aczkolwiek bez dedykowanego GPU, co widać poniżej po niezajętej przestrzeni na lewo od wentylatorów.

Zrównoważony rozwój
MSI nie reklamuje żadnych środków zrównoważonego rozwoju przy produkcji tego modelu. Opakowanie jest w dużej mierze kartonowe i papierowe, z kilkoma plastikowymi opakowaniami na akcesoria.
Akcesoria i gwarancja
Pudełko detaliczne zawiera aktywny rysik MSI Pen 2, który obsługuje Microsoft MPP 2.6 i haptyczne sprzężenie zwrotne.
Obowiązuje standardowa roczna ograniczona gwarancja producenta.
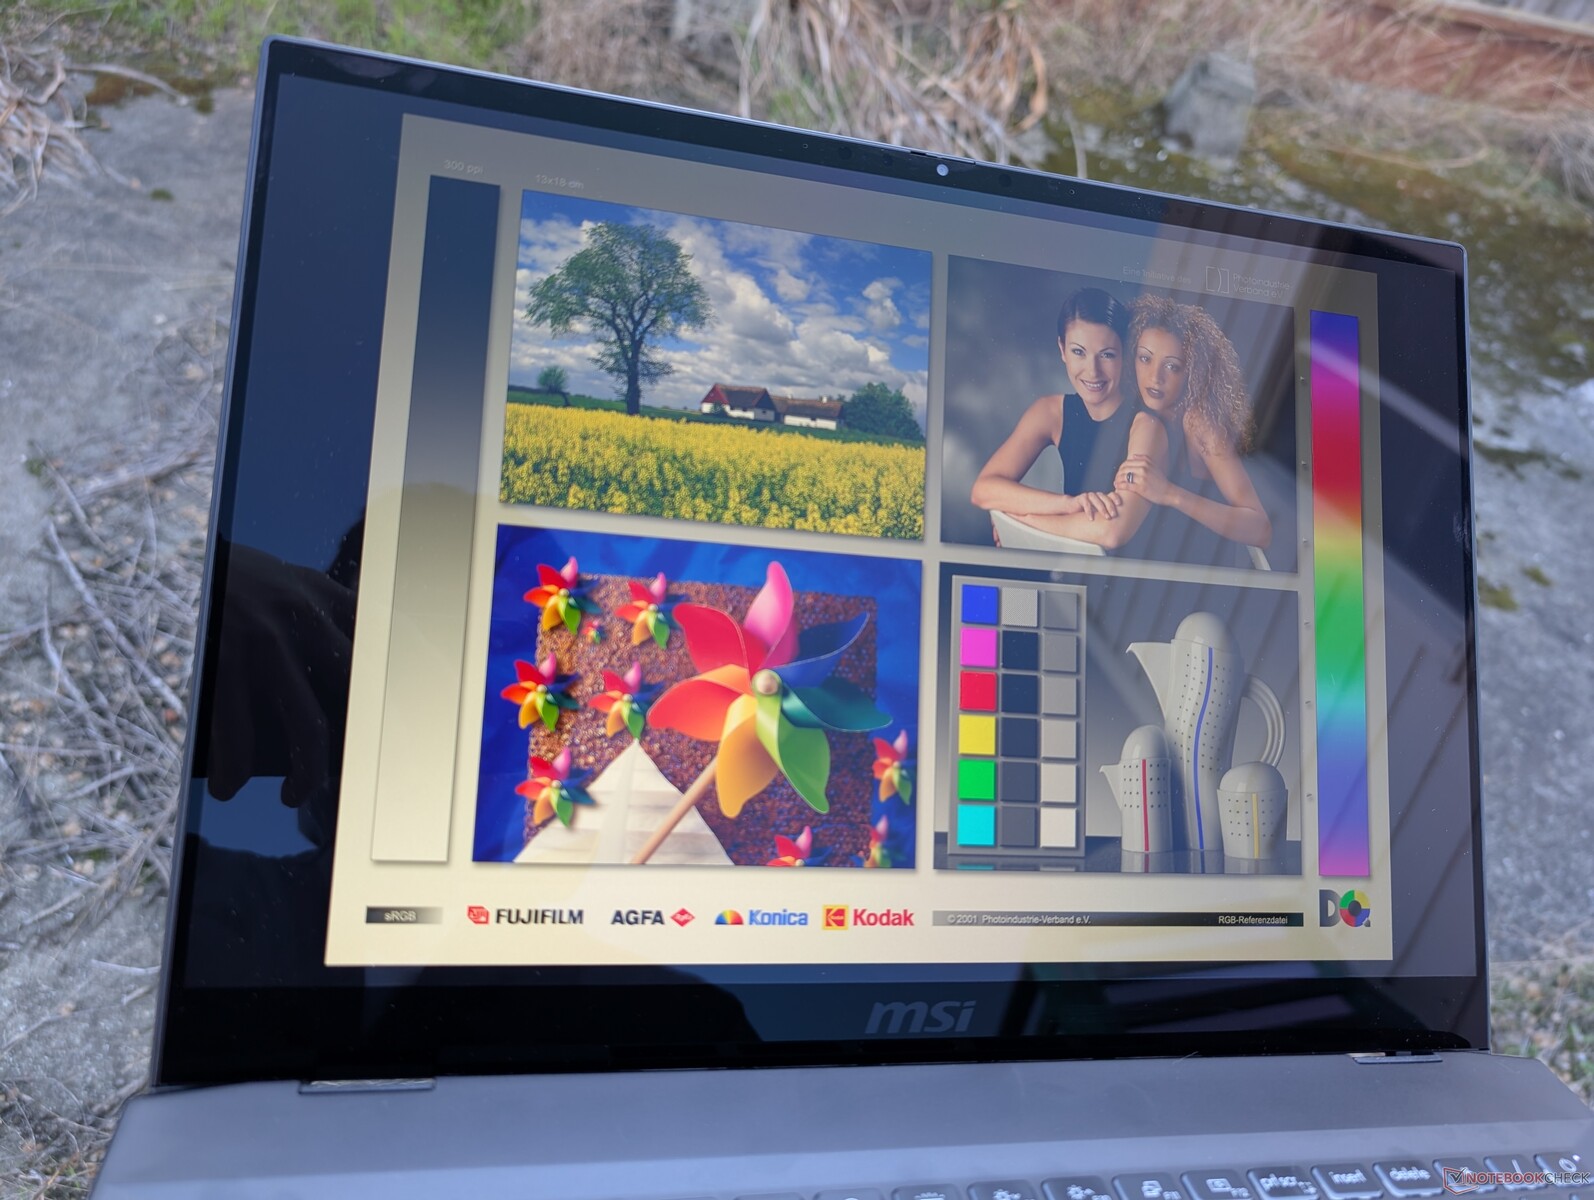
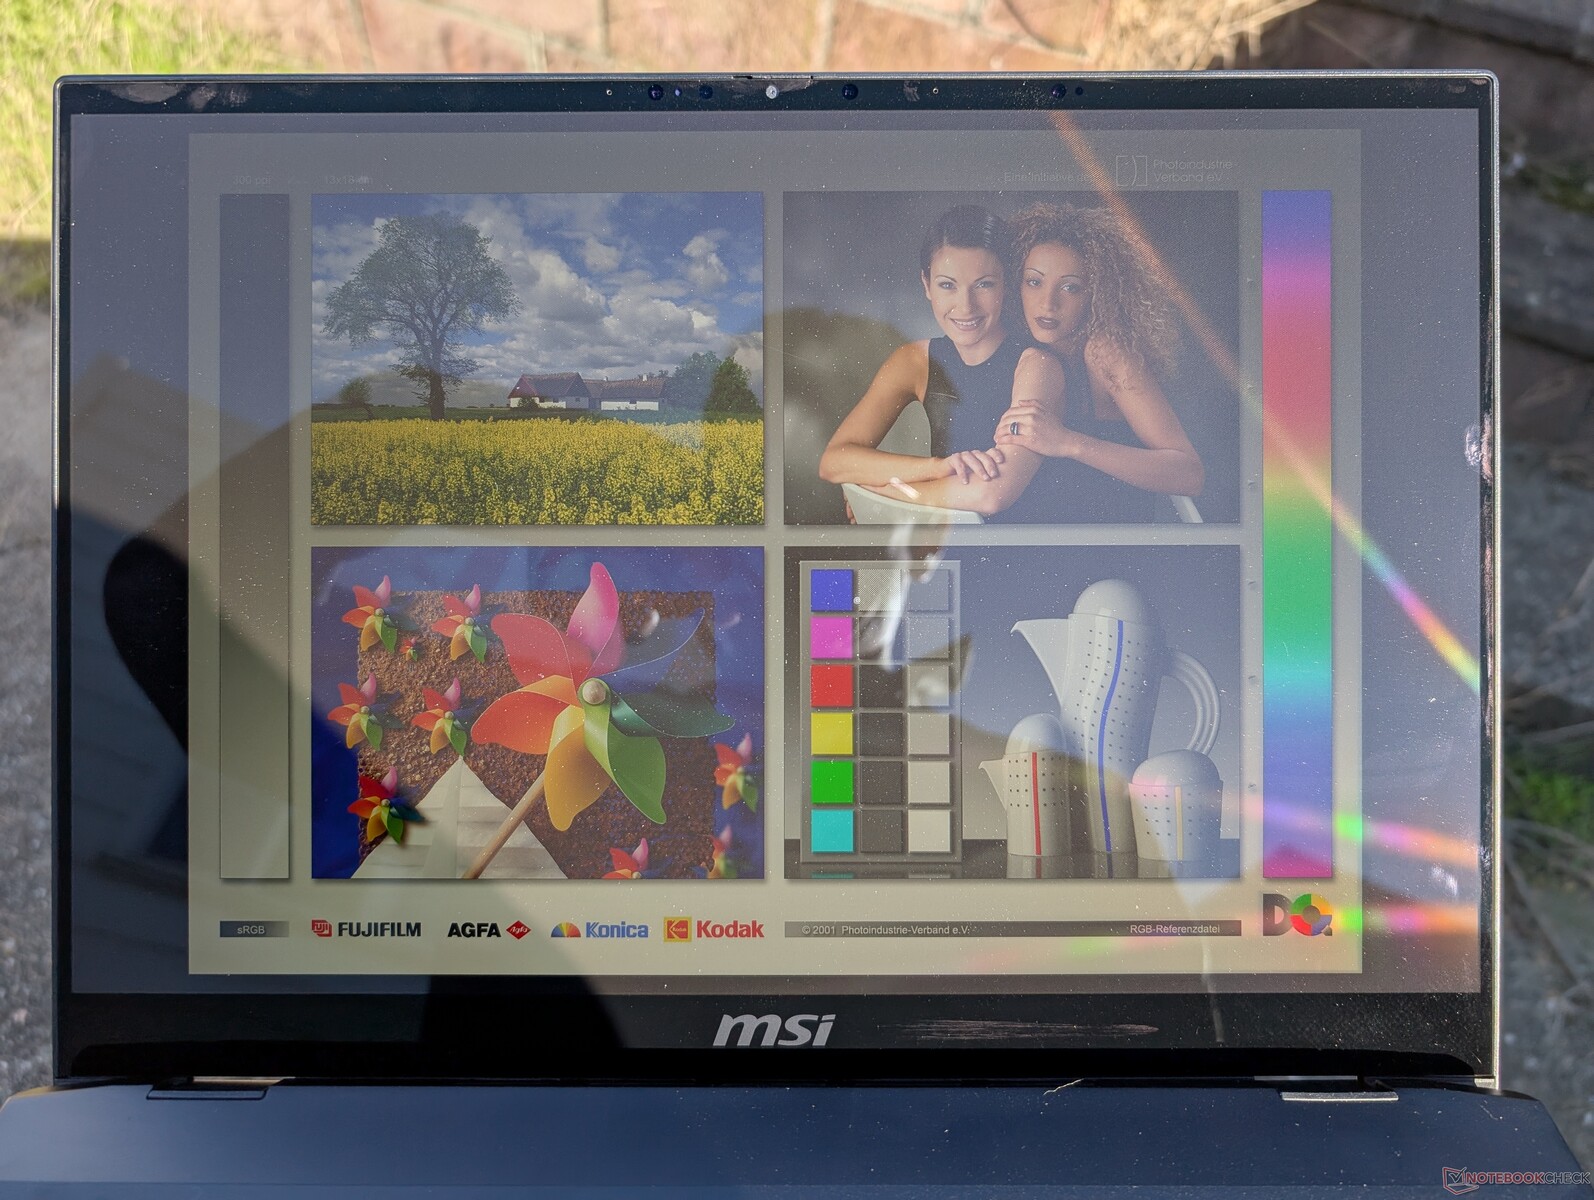
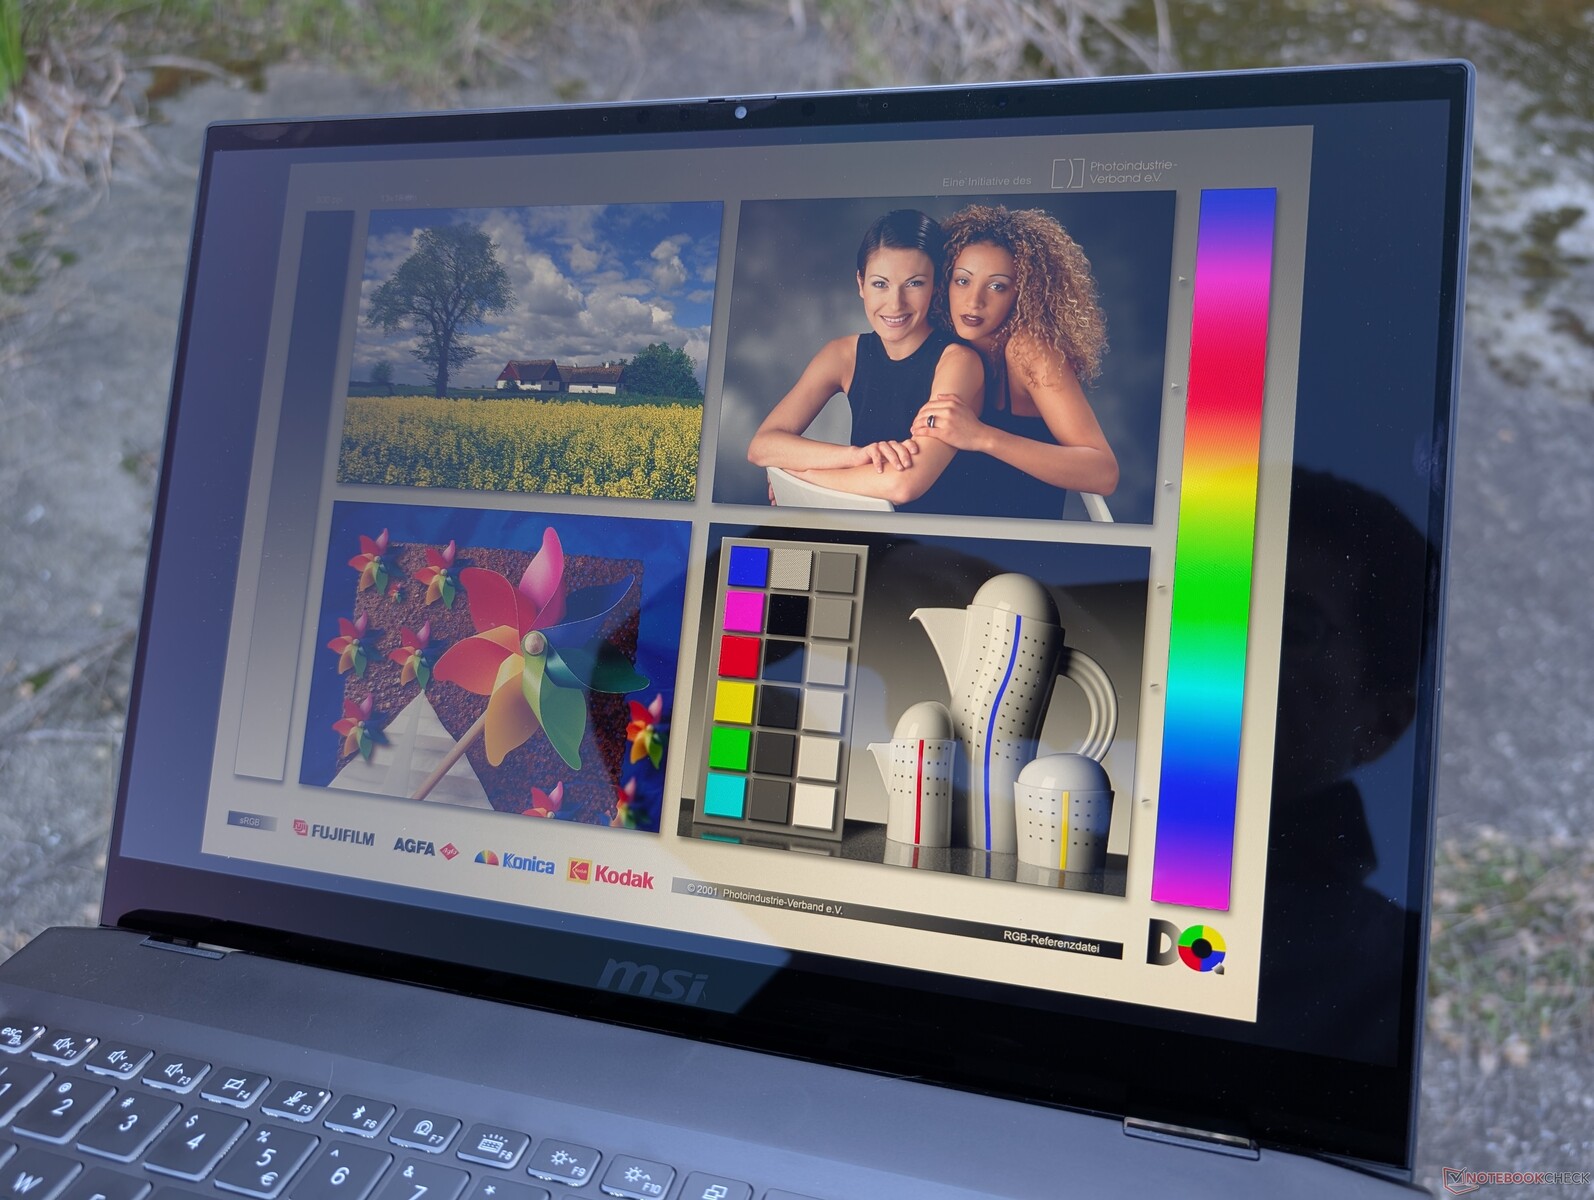
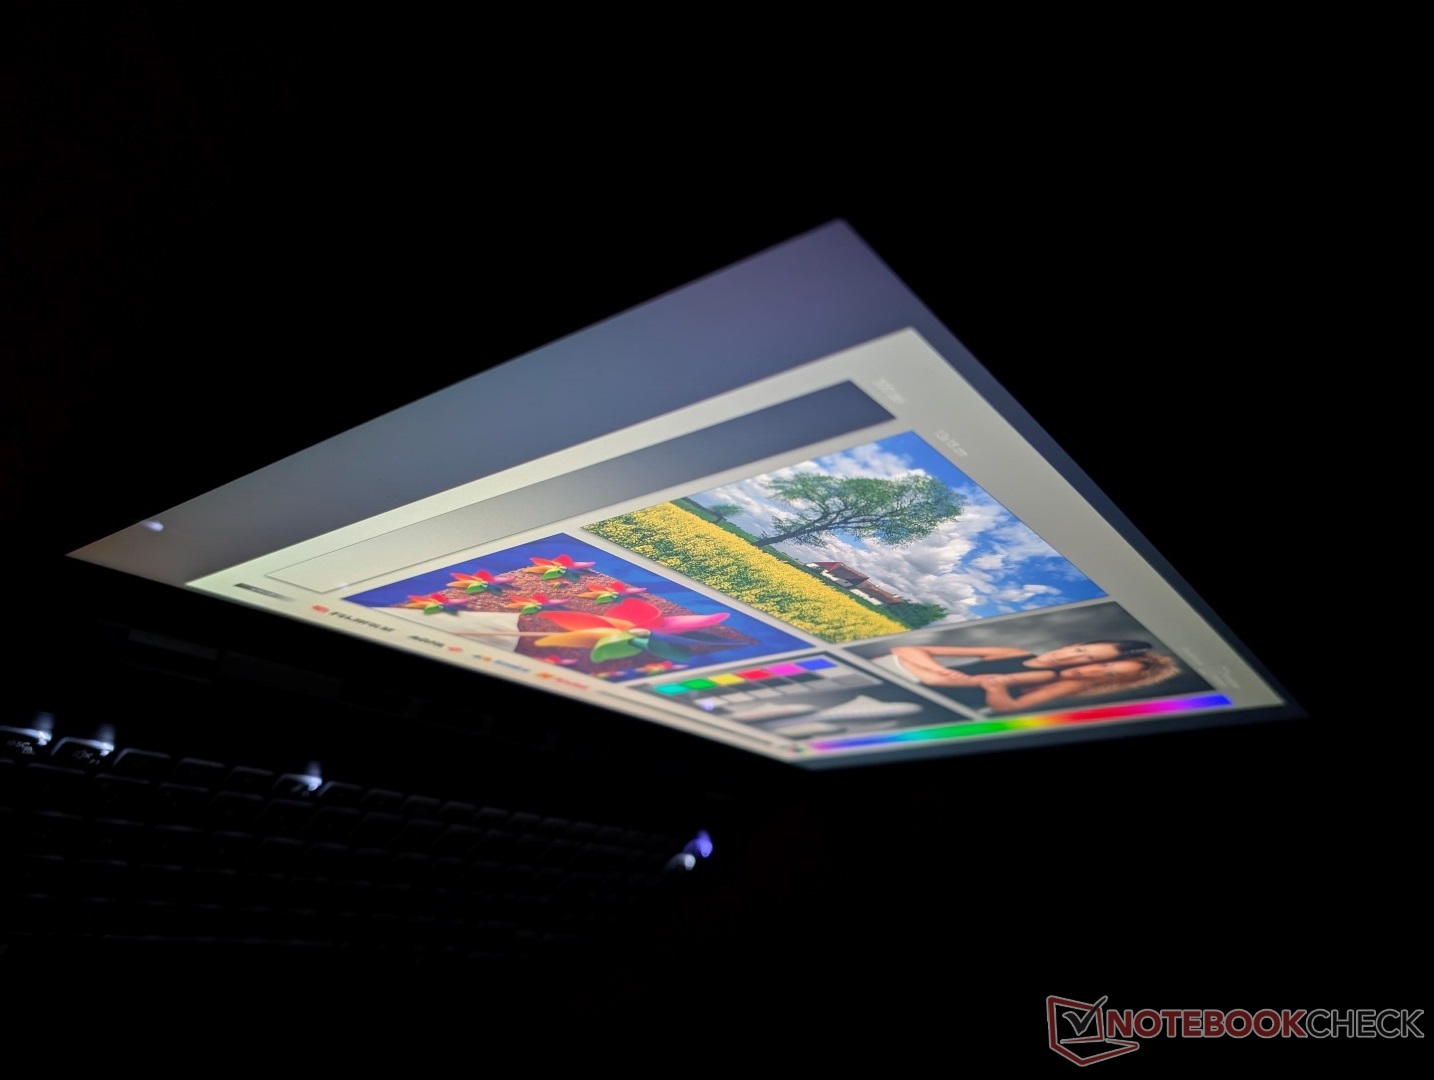
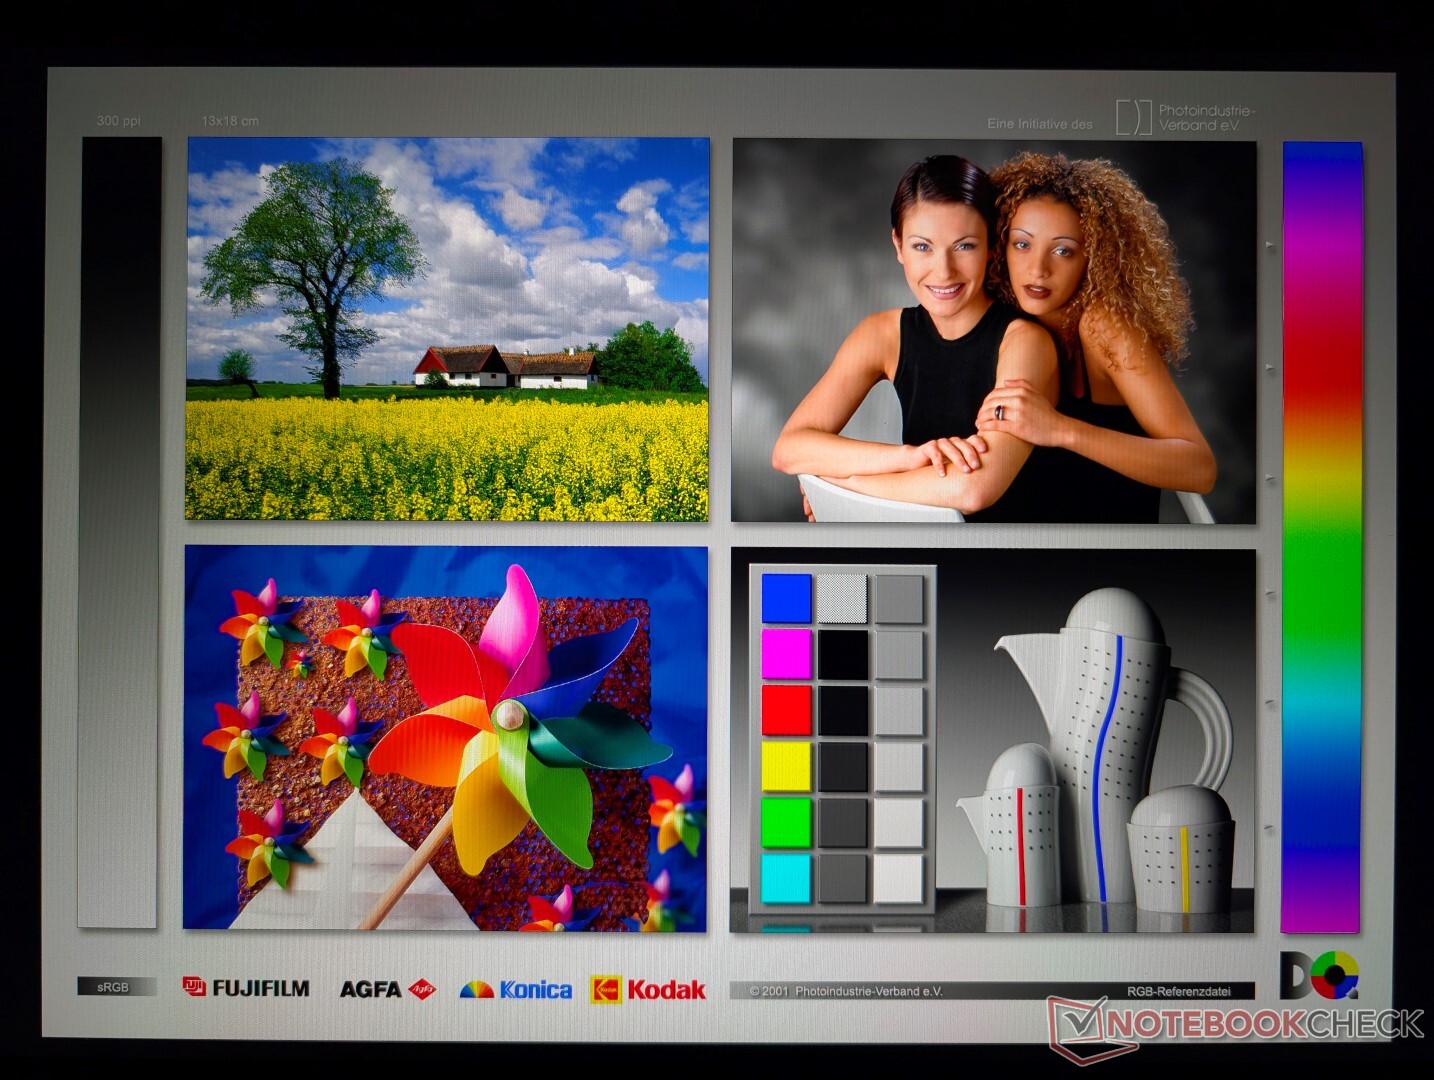
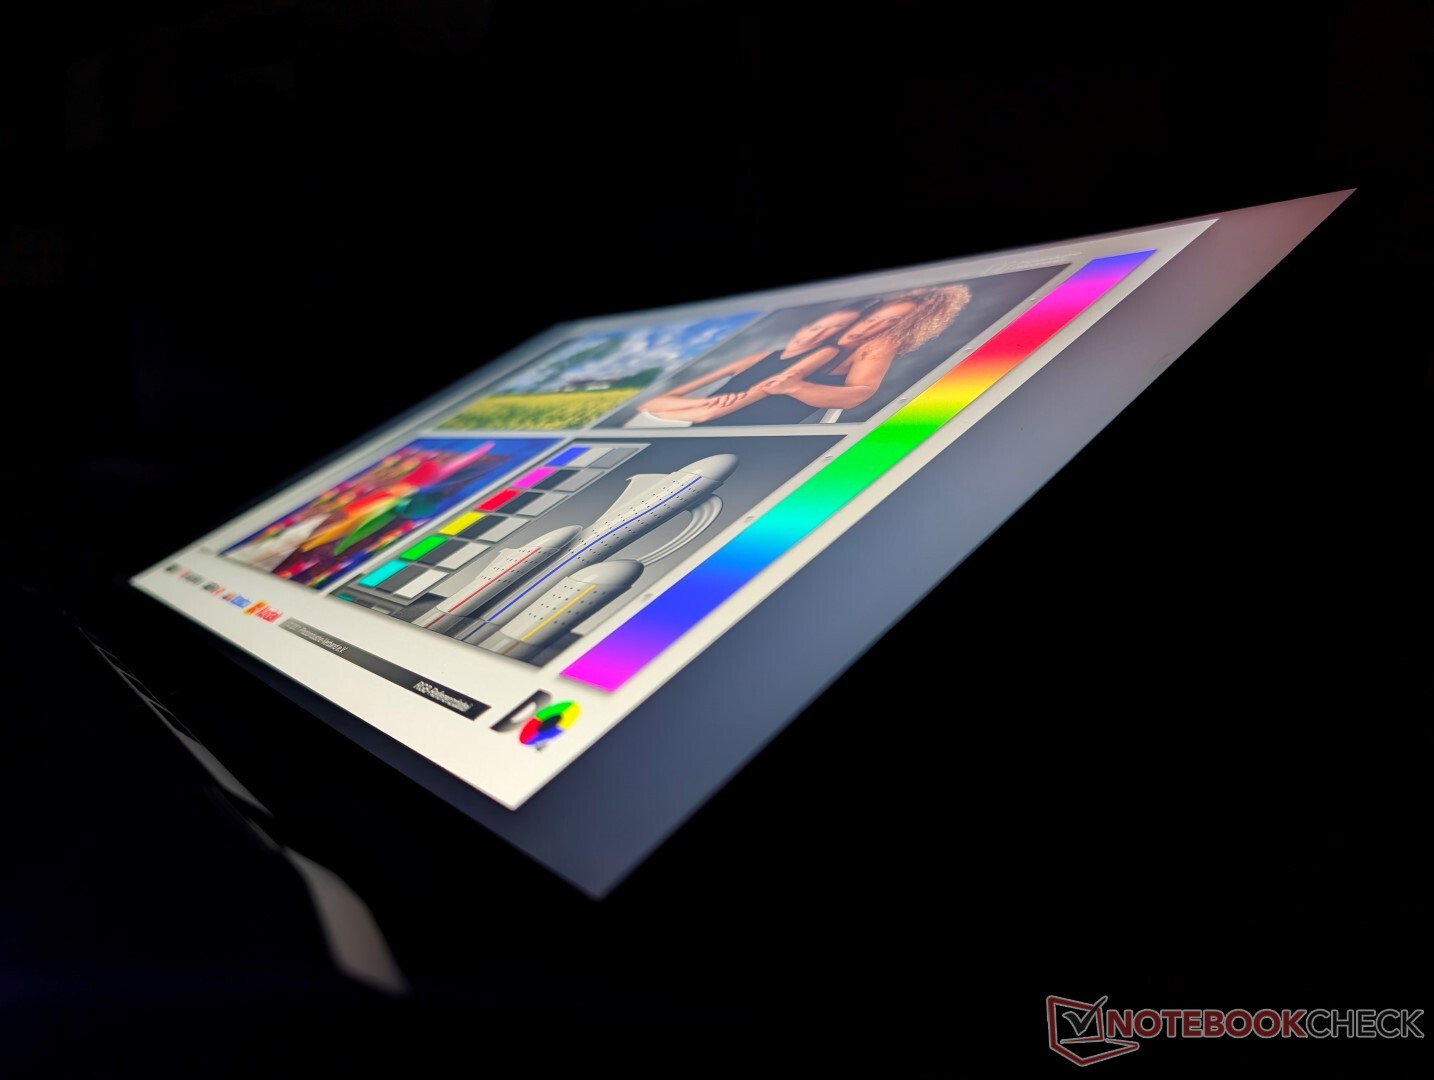
Wyświetlacz
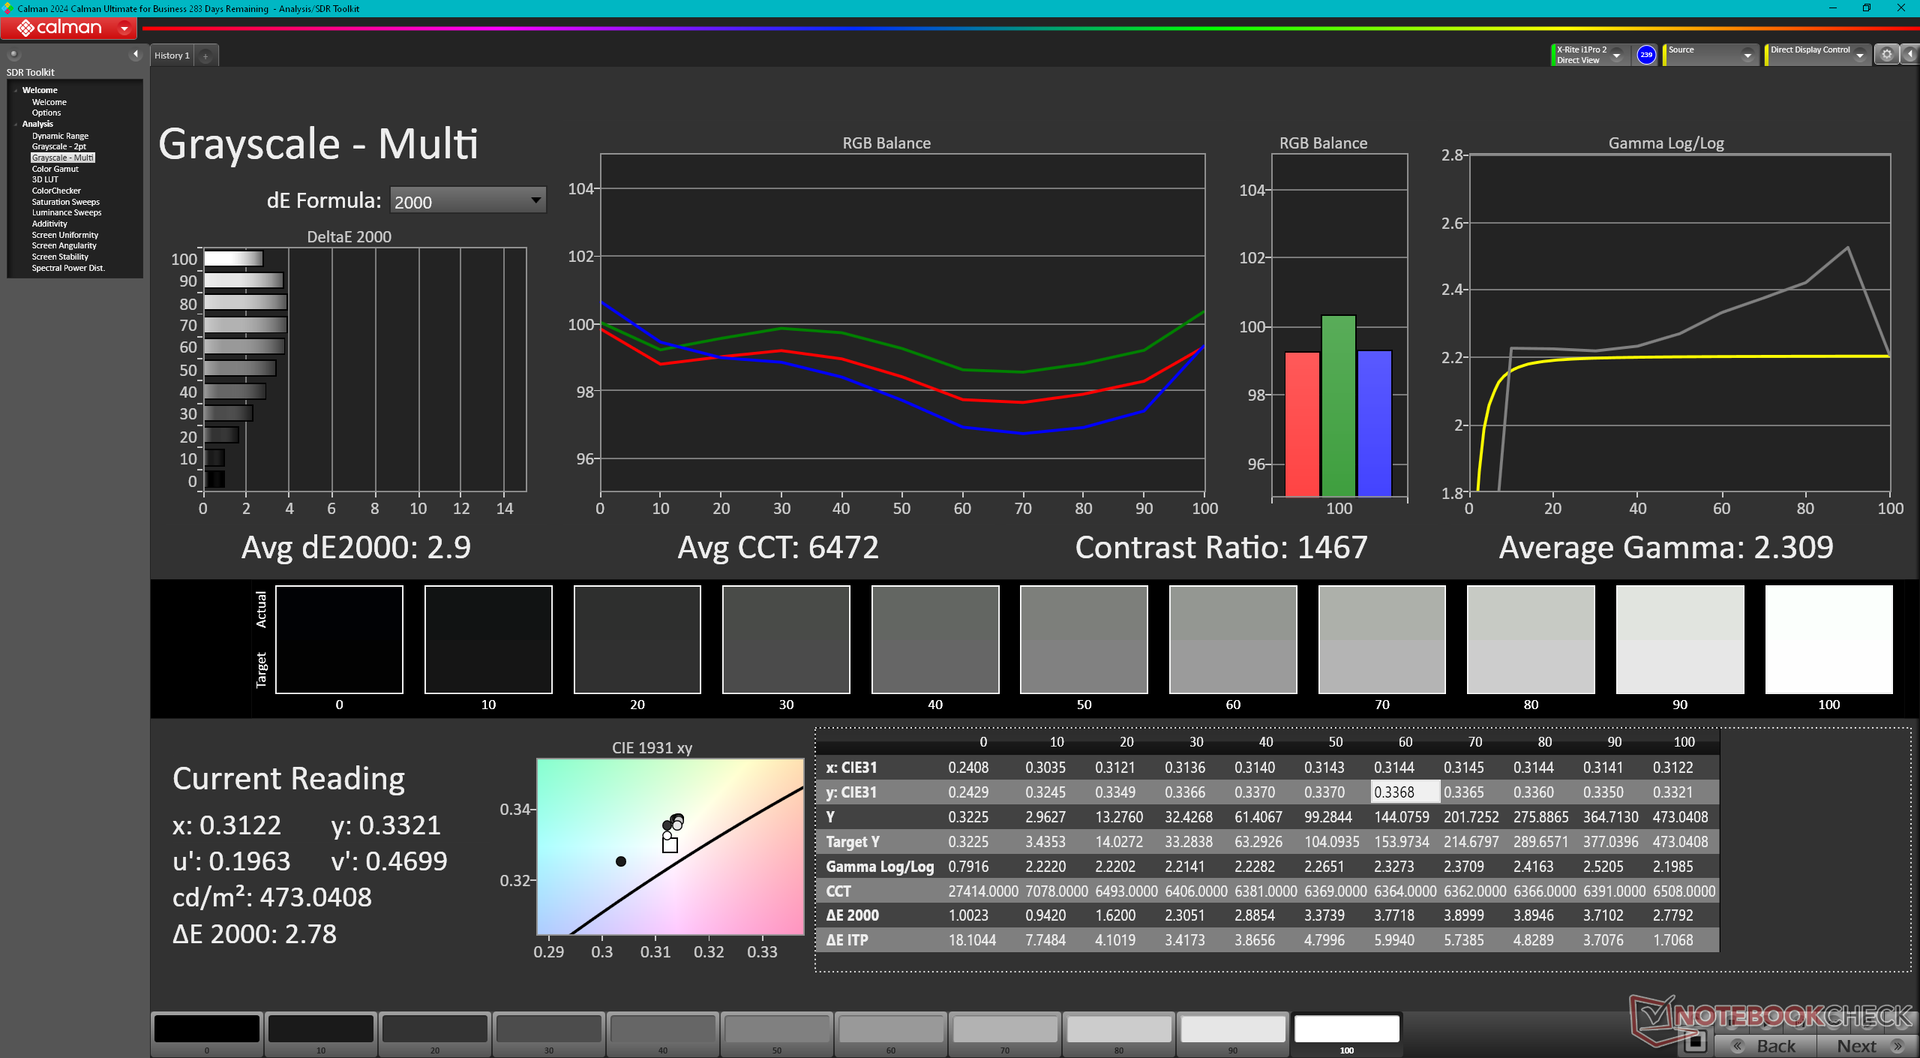
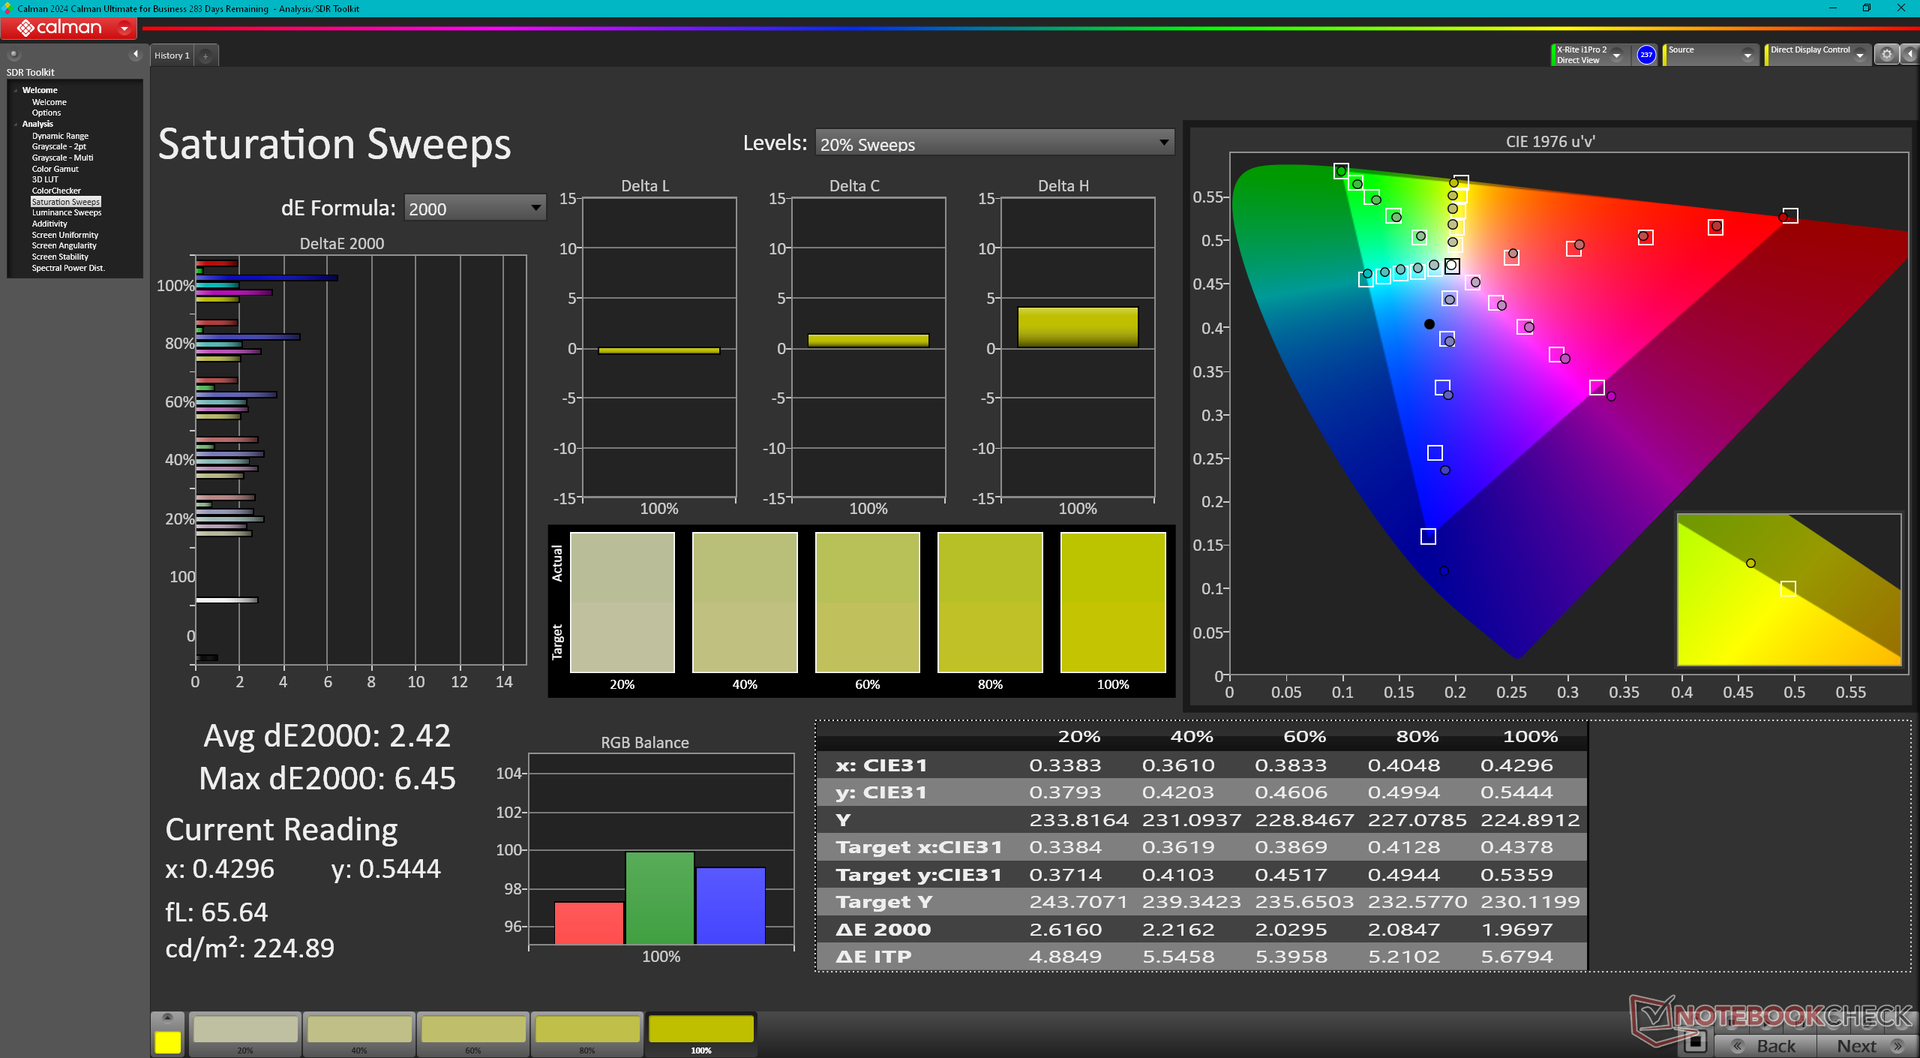
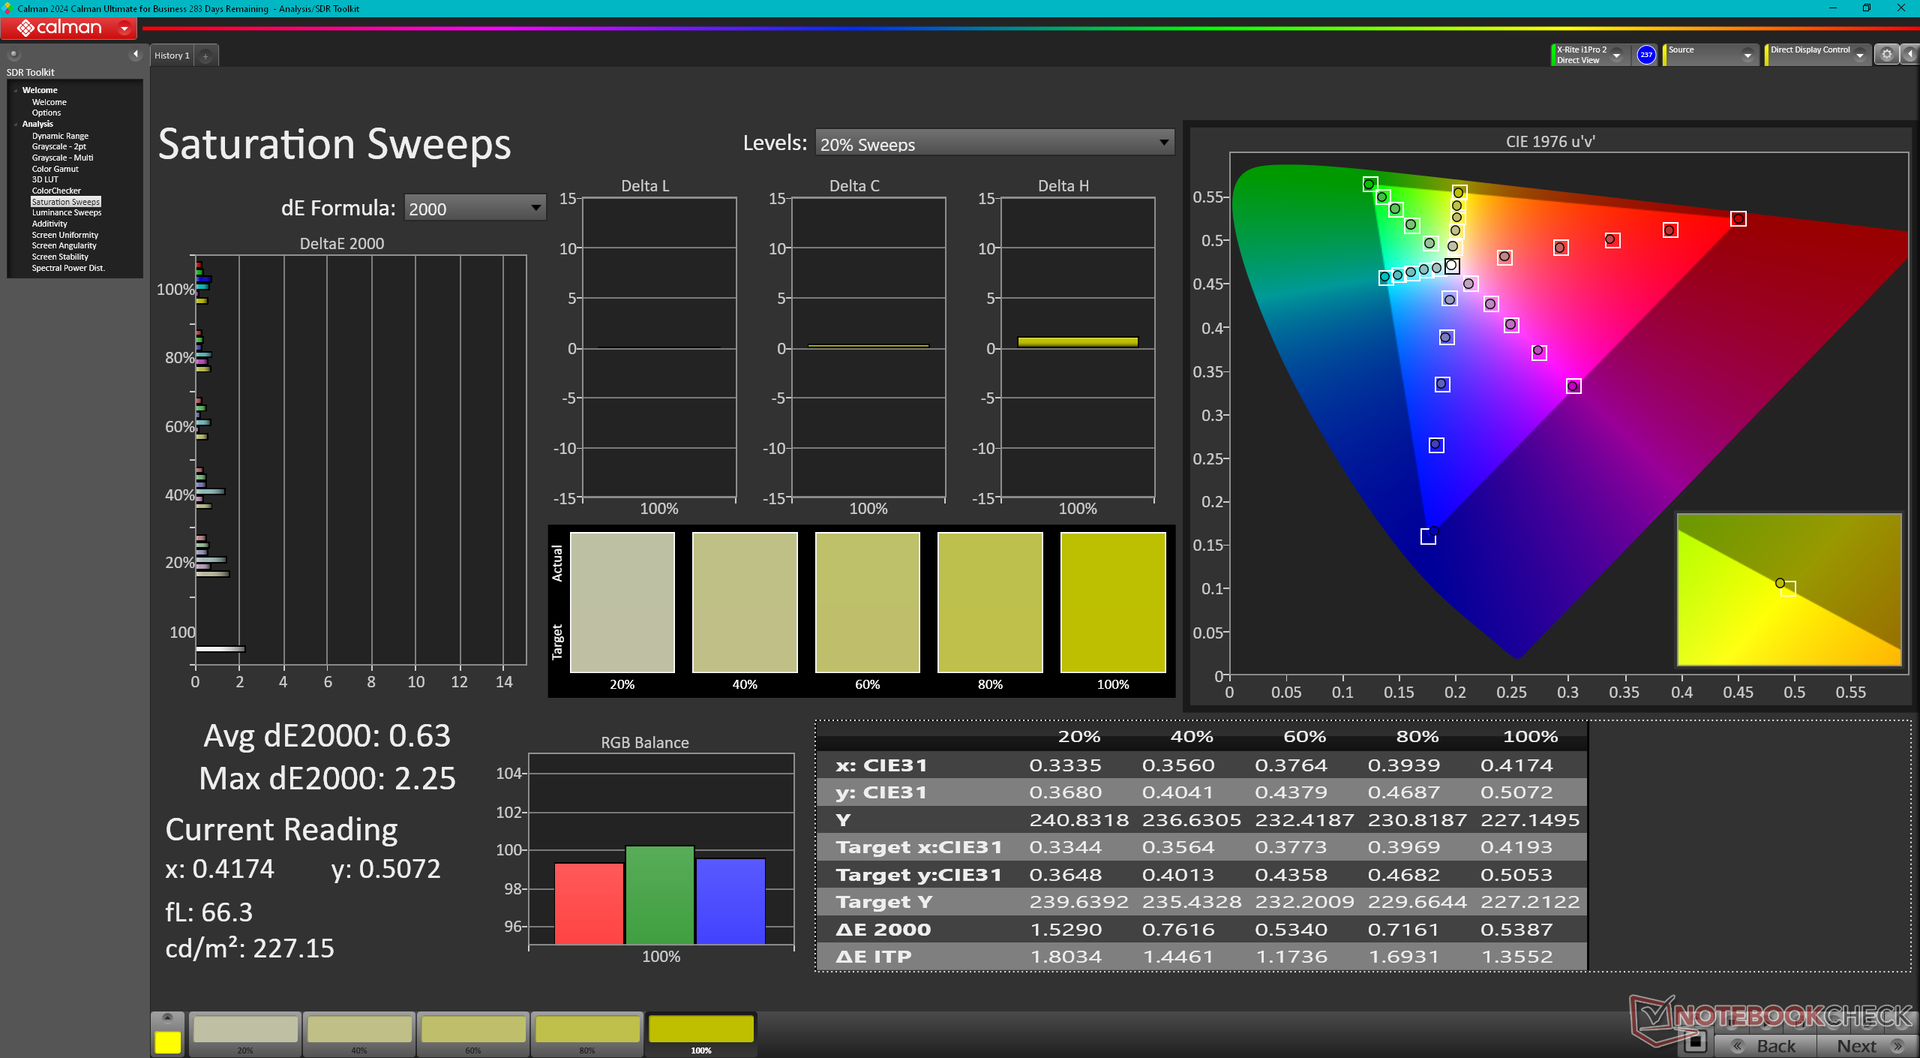
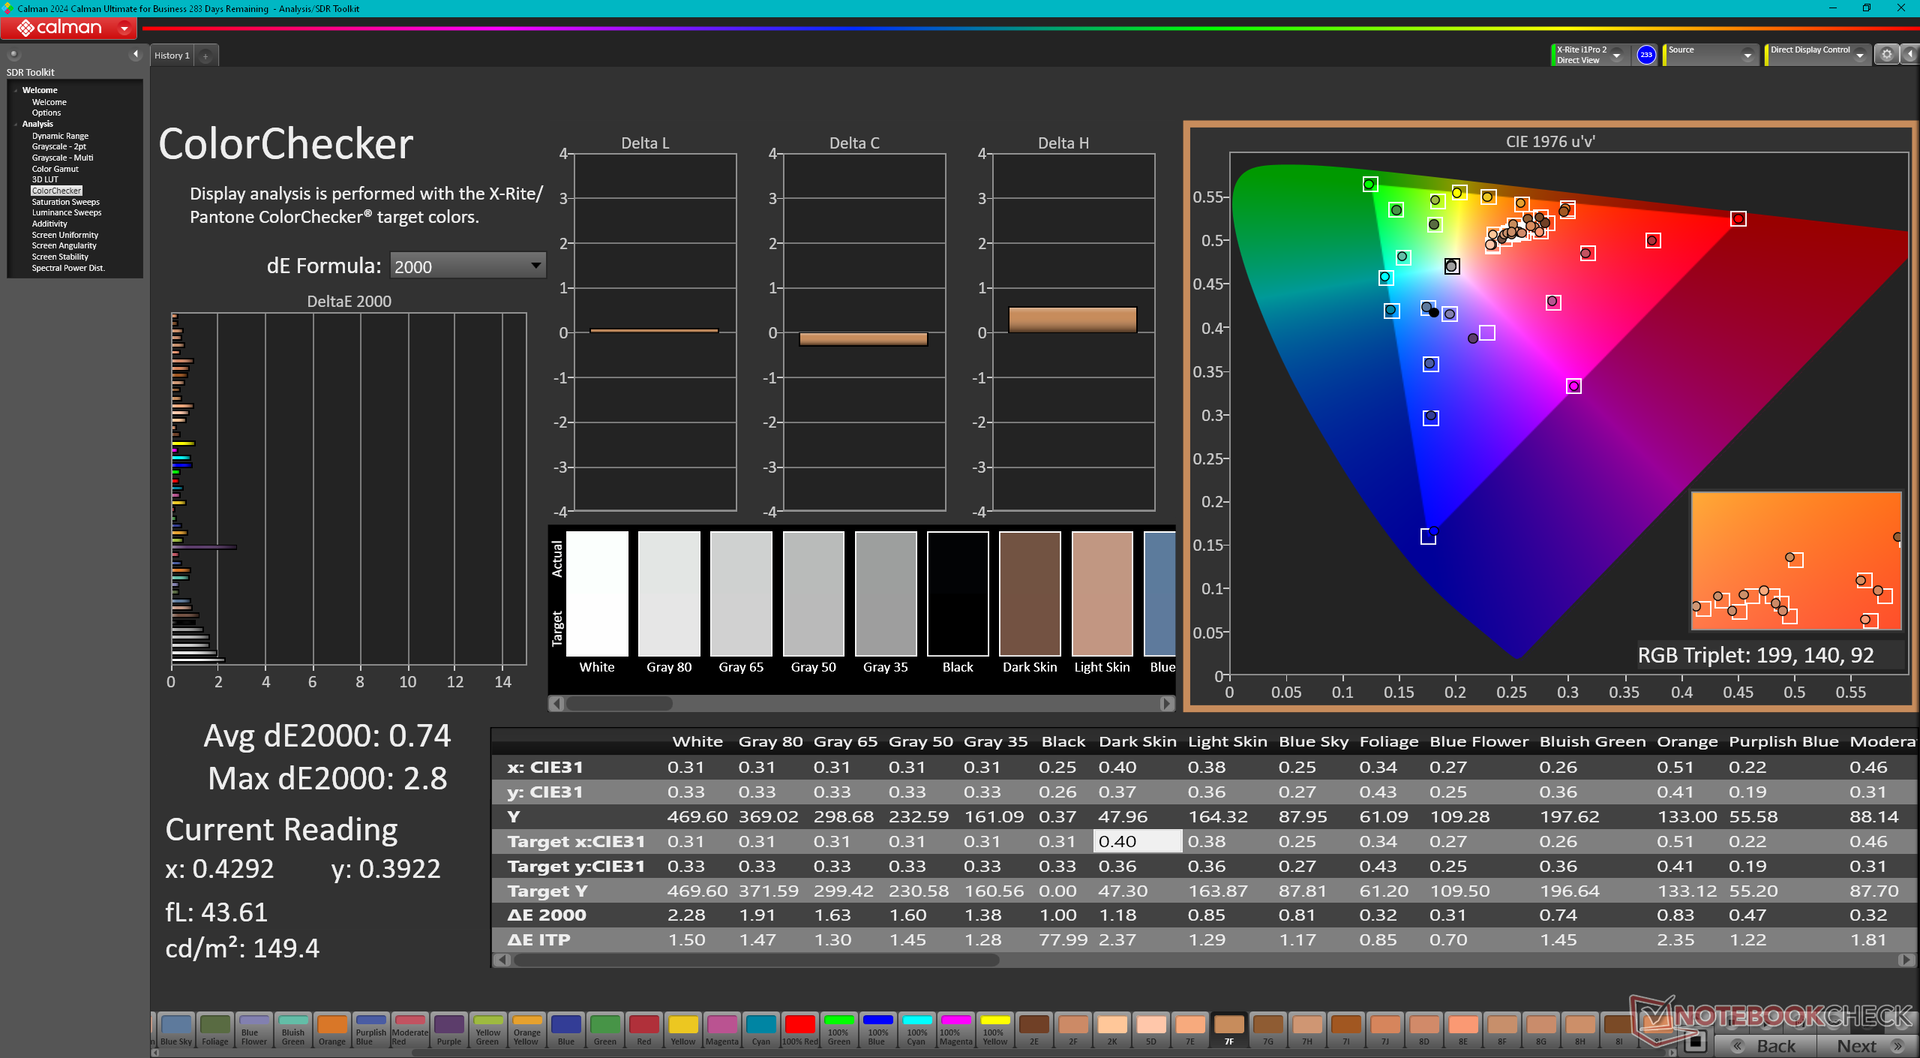
MSI nie wprowadziło żadnych zmian w ekranie dotykowym, ponieważ nasz model 2024 wykorzystuje ten sam wysokiej klasy panel AU Optronics B16QAN02.N, który można znaleźć w modelu 2022, zapewniając takie same wrażenia wizualne. Niekoniecznie jest to zła rzecz, ponieważ panel FreeSync zapewnia krótki czas reakcji, głębokie kolory P3 i wysoką częstotliwość odświeżania. Mimo to, Windows HDR i zmienna częstotliwość odświeżania (VRR) byłyby miłymi dodatkami.
Proszę zauważyć, że maksymalna jasność spada z 475 nitów do 363 nitów podczas pracy na zasilaniu bateryjnym, chyba że funkcja AMD Vari-Bright jest wyłączona.


| |||||||||||||||||||||||||
rozświetlenie: 89 %
na akumulatorze: 475.4 cd/m²
kontrast: 1321:1 (czerń: 0.36 cd/m²)
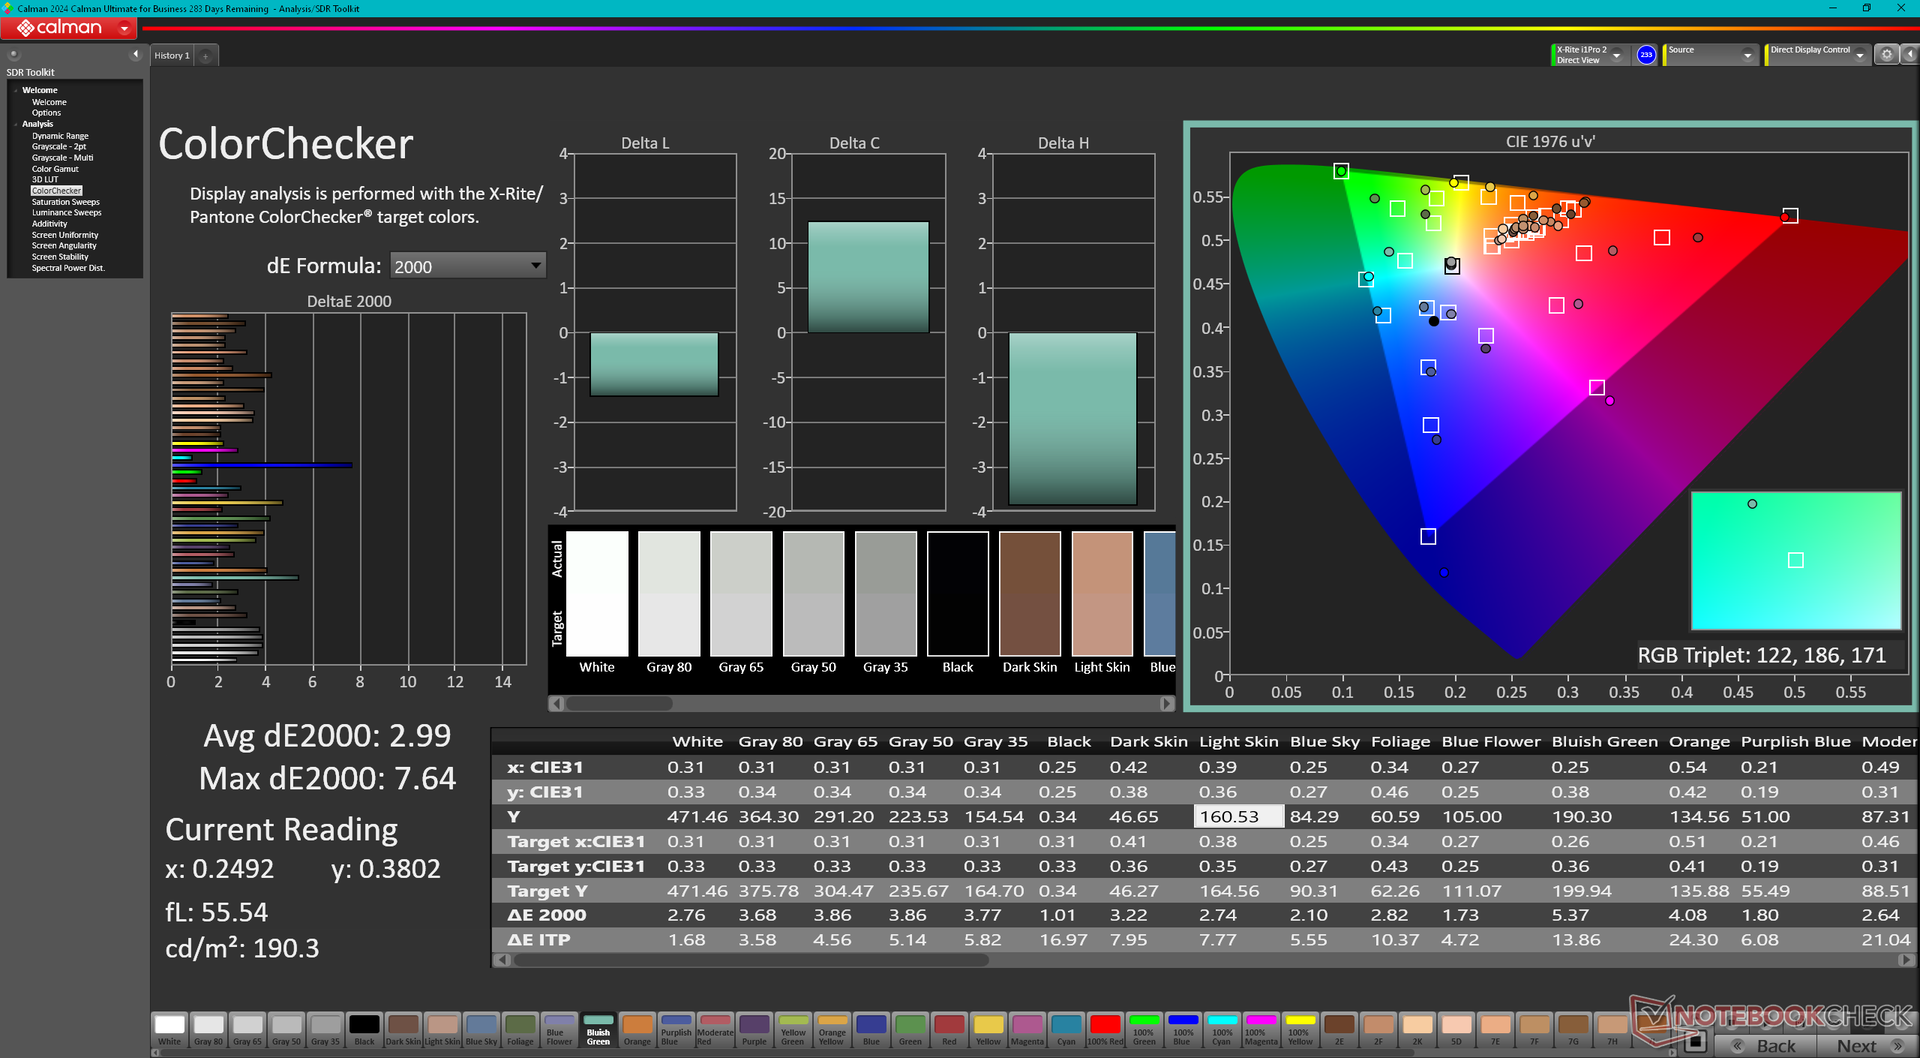
ΔE ColorChecker Calman: 2.99 | ∀{0.5-29.43 Ø4.73}
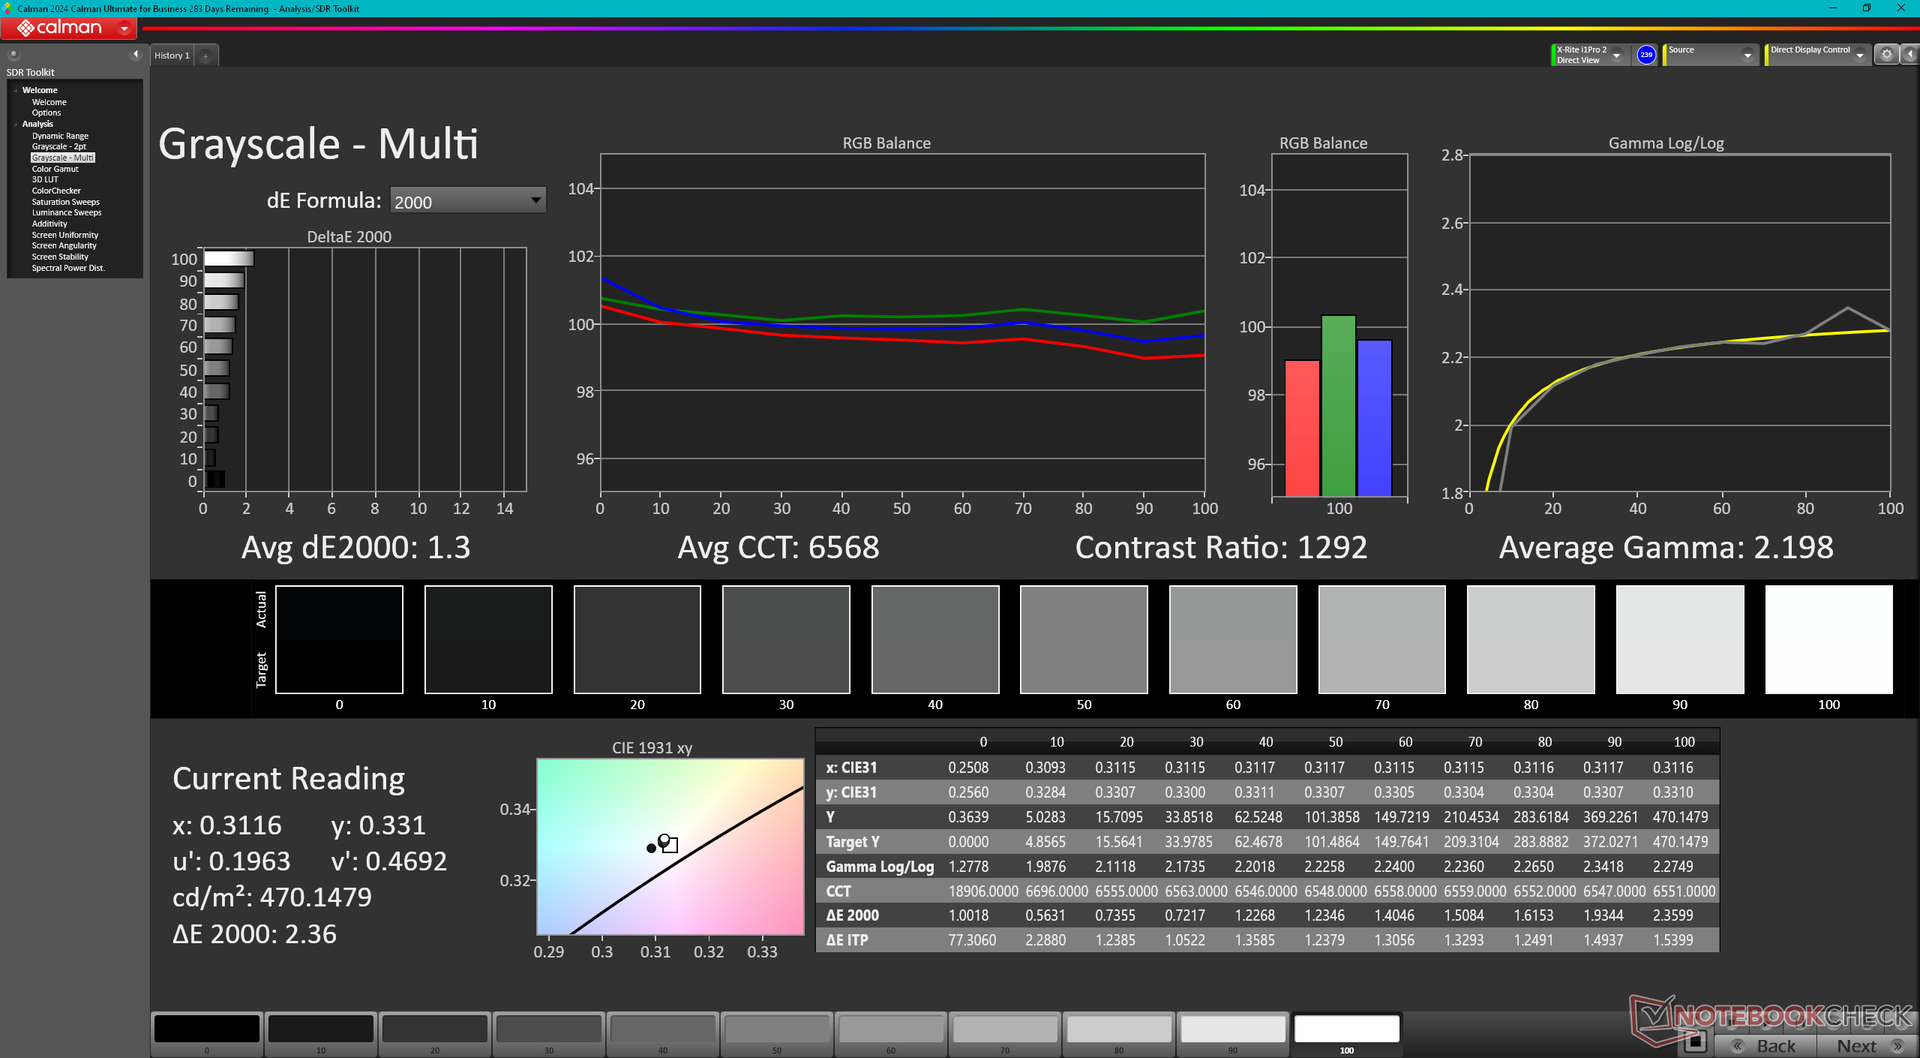
calibrated: 0.74
ΔE Greyscale Calman: 2.9 | ∀{0.09-98 Ø4.97}
84.7% AdobeRGB 1998 (Argyll 3D)
99.8% sRGB (Argyll 3D)
96.8% Display P3 (Argyll 3D)
Gamma: 2.31
CCT: 6472 K
| MSI Summit A16 AI Plus A3HMTG AU Optronics B16QAN02.N, IPS, 2560x1600, 16", 165 Hz | MSI Summit E16 Flip A12UDT-031 AU Optronics B16QAN02.N, IPS, 2560x1600, 16", 165 Hz | HP Spectre x360 16 RTX 4050 Samsung SDC41A6, OLED, 2880x1800, 16", 120 Hz | Asus ExpertBook B5 Flip B5602FBN Samsung ATNA60YV02-0, OLED, 3840x2400, 16", 60 Hz | LG gram Pro 2-in-1 16T90SP ATNA60CL06-0, OLED, 2880x1800, 16", 120 Hz | Lenovo Yoga 7 2-in-1 16IML9 LEN160FHD, IPS, 1920x1200, 16", 60 Hz | |
|---|---|---|---|---|---|---|
| Display | 1% | 6% | -4% | 4% | -49% | |
| Display P3 Coverage (%) | 96.8 | 98.9 2% | 99.6 3% | 71.7 -26% | 99.9 3% | 40.9 -58% |
| sRGB Coverage (%) | 99.8 | 100 0% | 100 0% | 100 0% | 100 0% | 61.4 -38% |
| AdobeRGB 1998 Coverage (%) | 84.7 | 86.5 2% | 96.7 14% | 97.1 15% | 92.7 9% | 42.3 -50% |
| Response Times | -1% | 92% | 81% | 18% | -147% | |
| Response Time Grey 50% / Grey 80% * (ms) | 12.9 ? | 13 ? -1% | 0.78 ? 94% | 2 ? 84% | 14 ? -9% | 32.1 ? -149% |
| Response Time Black / White * (ms) | 8.9 ? | 9 ? -1% | 0.86 ? 90% | 2 ? 78% | 5 ? 44% | 21.8 ? -145% |
| PWM Frequency (Hz) | 480 ? | 240 ? | 481 | |||
| PWM Amplitude * (%) | 33 | |||||
| Screen | -10% | 13% | 297% | 206% | -51% | |
| Brightness middle (cd/m²) | 475.4 | 314 -34% | 385.2 -19% | 379 -20% | 402 -15% | 313.3 -34% |
| Brightness (cd/m²) | 440 | 294 -33% | 387 -12% | 382 -13% | 403 -8% | 294 -33% |
| Brightness Distribution (%) | 89 | 89 0% | 99 11% | 98 10% | 99 11% | 82 -8% |
| Black Level * (cd/m²) | 0.36 | 0.28 22% | 0.01 97% | 0.017 95% | 0.35 3% | |
| Contrast (:1) | 1321 | 1121 -15% | 37900 2769% | 23647 1690% | 895 -32% | |
| Colorchecker dE 2000 * | 2.99 | 3.08 -3% | 1.73 42% | 2.79 7% | 1.67 44% | 4.41 -47% |
| Colorchecker dE 2000 max. * | 7.64 | 5.49 28% | 3.95 48% | 5.29 31% | 2.87 62% | 15.75 -106% |
| Colorchecker dE 2000 calibrated * | 0.74 | 0.88 -19% | 2.5 -238% | 1.32 -78% | 1.84 -149% | |
| Greyscale dE 2000 * | 2.9 | 3.99 -38% | 2.6 10% | 1.92 34% | 1.27 56% | 4.4 -52% |
| Gamma | 2.31 95% | 2.3 96% | 2.17 101% | 2.38 92% | 2.25 98% | 2.3 96% |
| CCT | 6472 100% | 6219 105% | 6133 106% | 6270 104% | 6724 97% | 7395 88% |
| Całkowita średnia (program / ustawienia) | -3% /
-6% | 37% /
26% | 125% /
202% | 76% /
136% | -82% /
-64% |
* ... im mniej tym lepiej
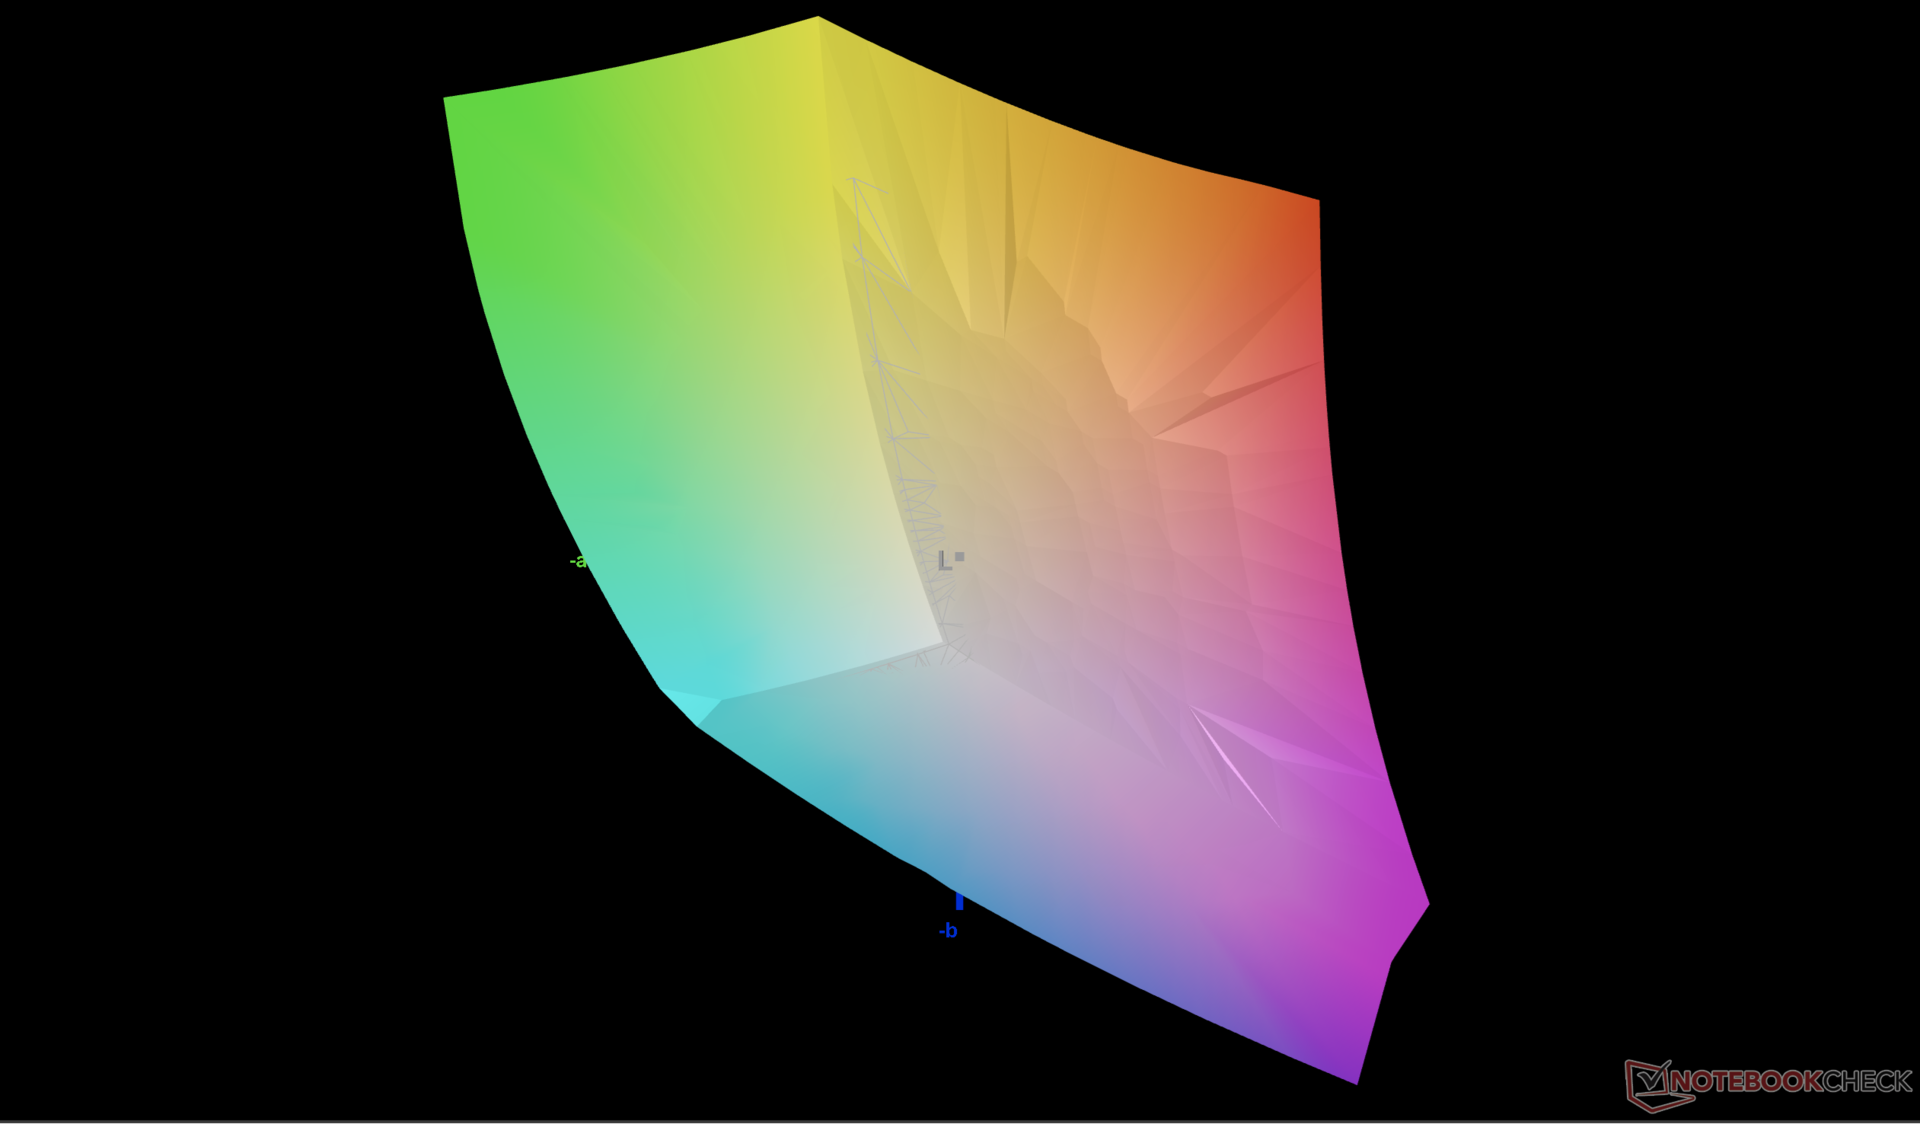
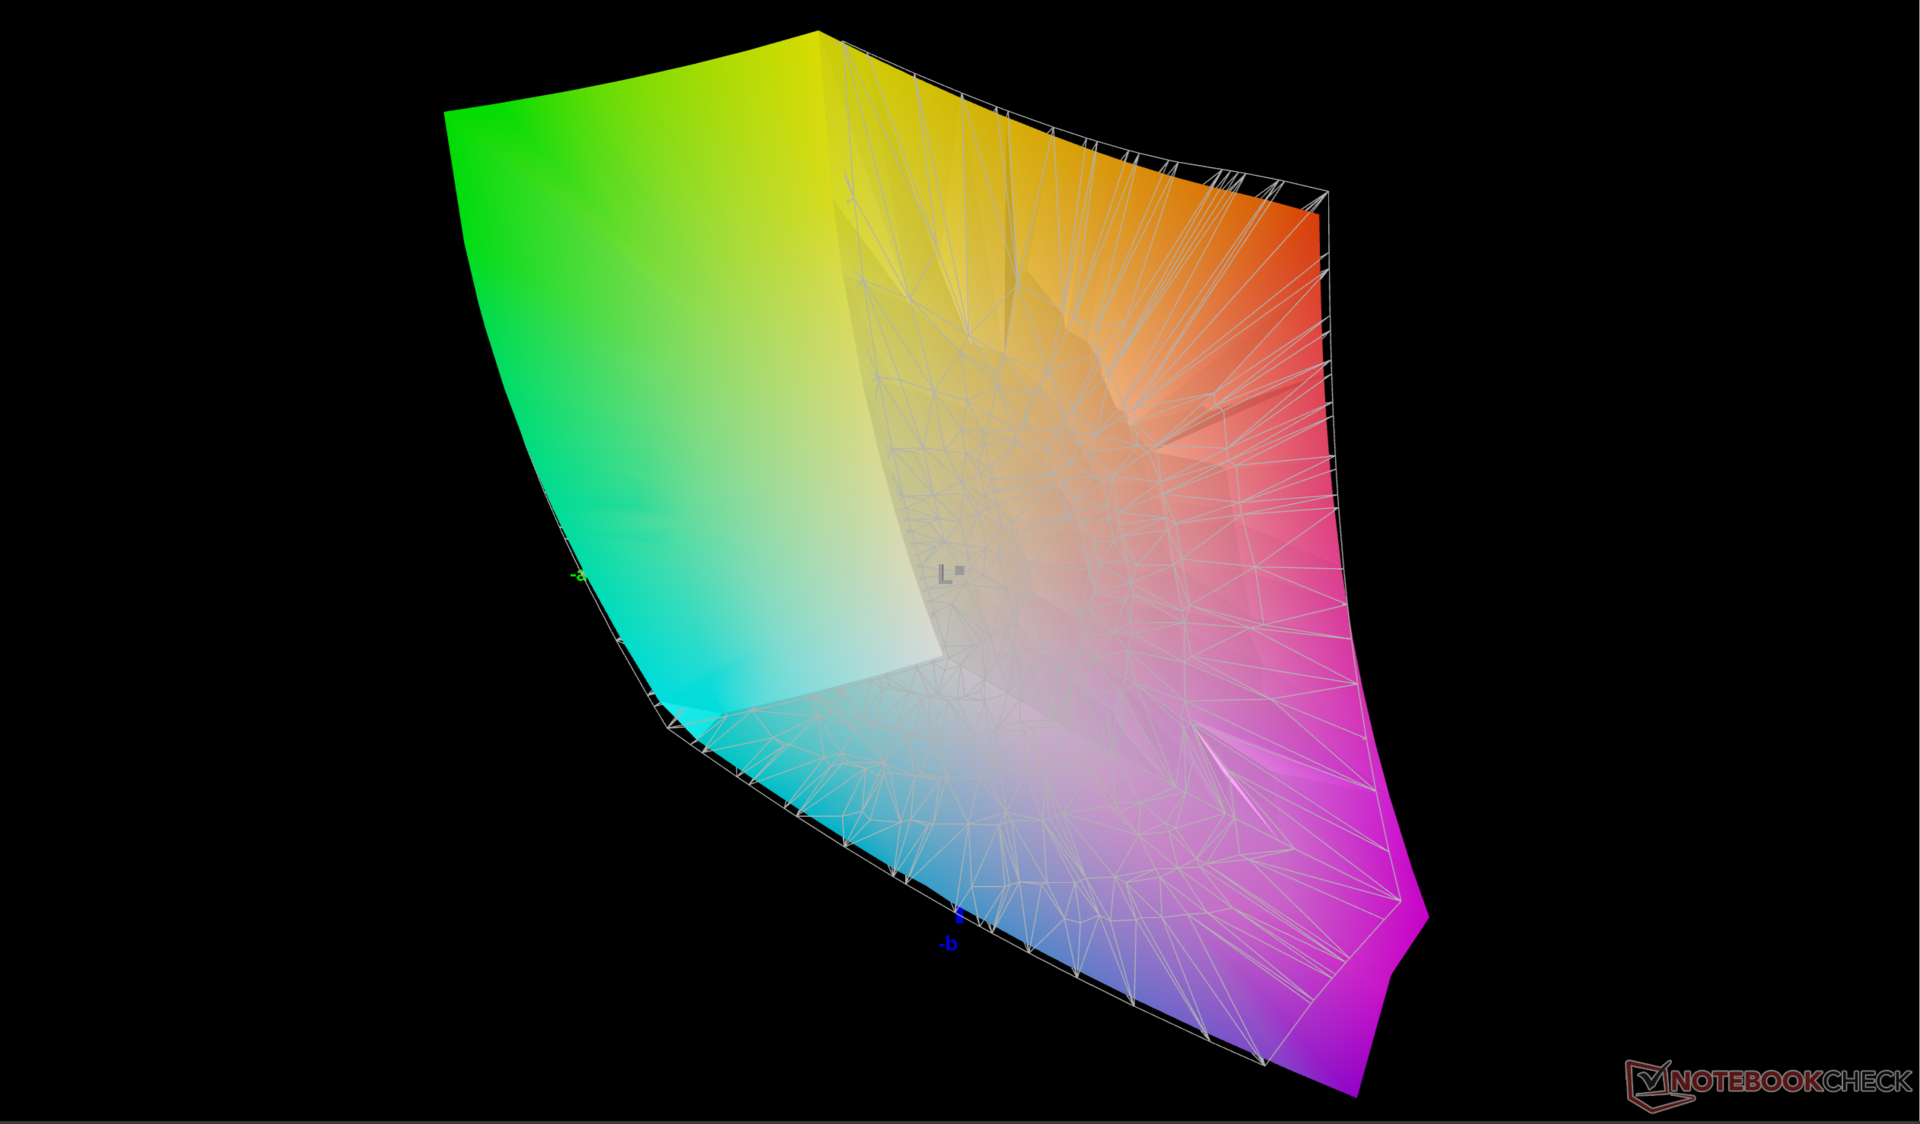
Panel jest przyzwoicie skalibrowany względem standardu P3 z niskimi średnimi wartościami deltaE.
Wyświetl czasy reakcji
| ↔ Czas reakcji od czerni do bieli | ||
|---|---|---|
| 8.9 ms ... wzrost ↗ i spadek ↘ łącznie | ↗ 4.7 ms wzrost | 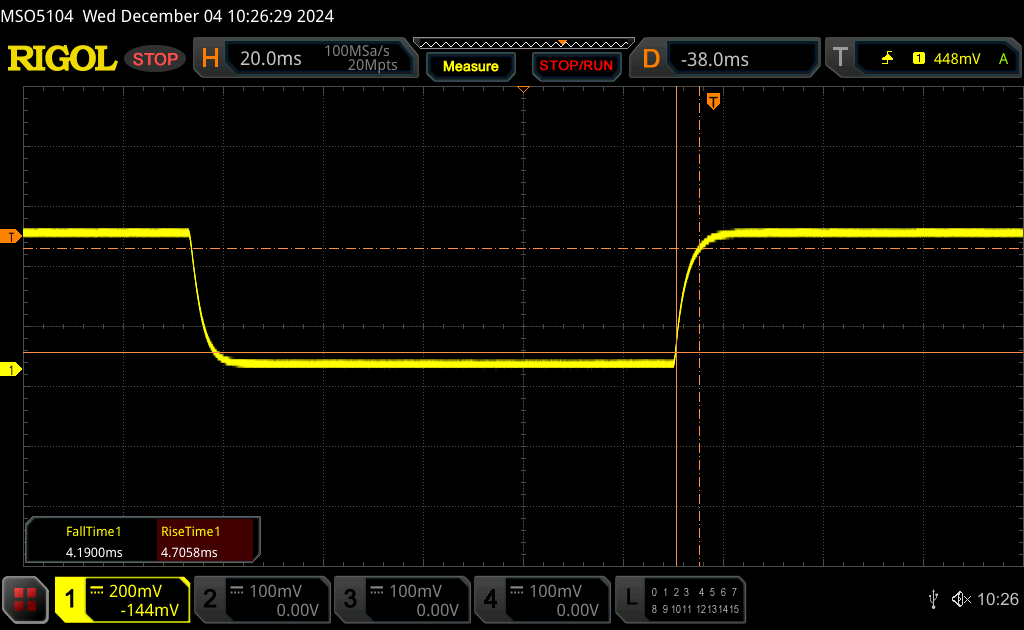 |
| ↘ 4.2 ms upadek | ||
| W naszych testach ekran wykazuje szybki czas reakcji i powinien nadawać się do gier. Dla porównania, wszystkie testowane urządzenia wahają się od 0.1 (minimum) do 240 (maksimum) ms. » 25 % wszystkich urządzeń jest lepszych. Oznacza to, że zmierzony czas reakcji jest lepszy od średniej wszystkich testowanych urządzeń (19.9 ms). | ||
| ↔ Czas reakcji 50% szarości do 80% szarości | ||
| 12.9 ms ... wzrost ↗ i spadek ↘ łącznie | ↗ 6.2 ms wzrost | 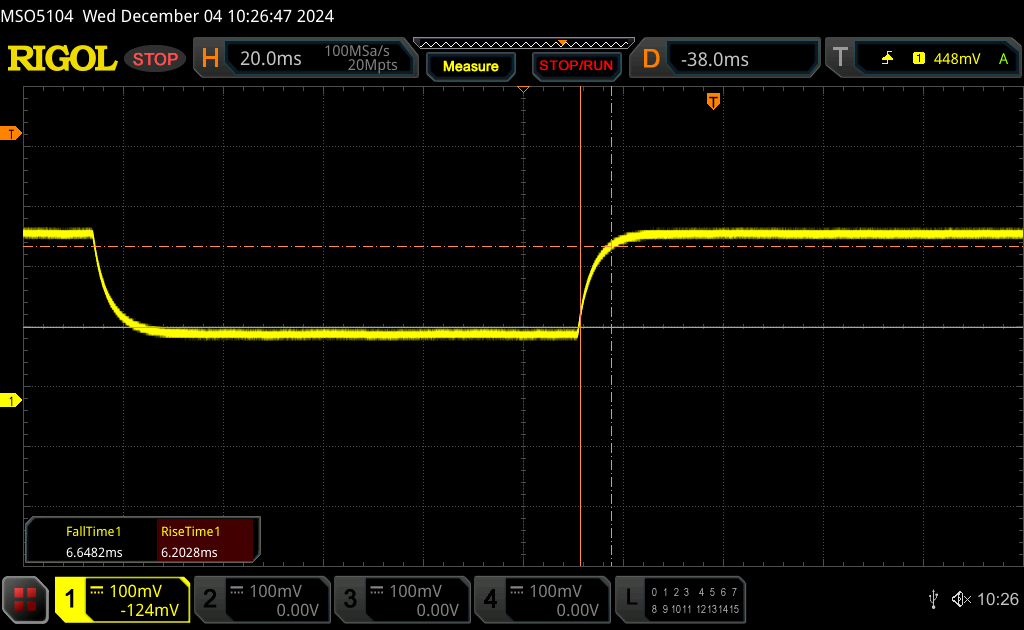 |
| ↘ 6.7 ms upadek | ||
| W naszych testach ekran wykazuje dobry współczynnik reakcji, ale może być zbyt wolny dla graczy rywalizujących ze sobą. Dla porównania, wszystkie testowane urządzenia wahają się od 0.165 (minimum) do 636 (maksimum) ms. » 26 % wszystkich urządzeń jest lepszych. Oznacza to, że zmierzony czas reakcji jest lepszy od średniej wszystkich testowanych urządzeń (31.1 ms). | ||
Migotanie ekranu / PWM (modulacja szerokości impulsu)
| Migotanie ekranu/nie wykryto PWM | 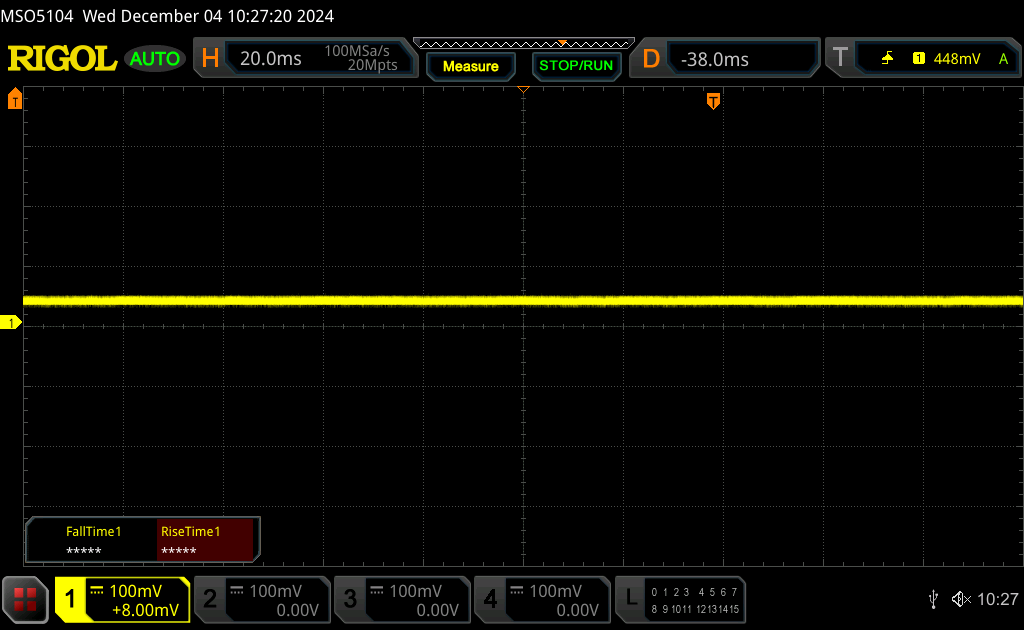 | ||
Dla porównania: 52 % wszystkich testowanych urządzeń nie używa PWM do przyciemniania wyświetlacza. Jeśli wykryto PWM, zmierzono średnio 7810 (minimum: 5 - maksimum: 343500) Hz. | |||
Wydajność
Warunki testowania
Przed wykonaniem poniższych testów ustawiliśmy system Windows i MSI Center na tryb wydajności. Dostępny jest również oddzielny tryb maksymalnego wentylatora o nazwie Cooler Boost.
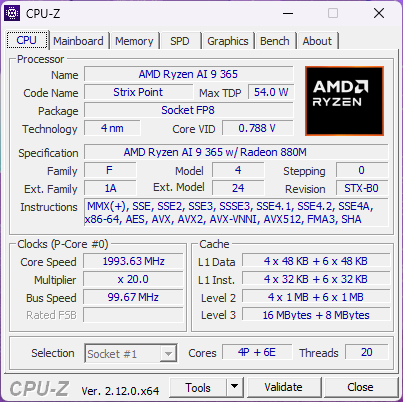
Procesor
Surowa wydajność procesora Ryzen AI 9 365 jest jednym z najszybszych spośród wszystkich 16-calowych laptopów nie przeznaczonych do gier. W porównaniu do 2022 Summit E16 Flip i jego Core i7-1280Pnasz procesor AMD jest o około 20 do 25 procent szybszy. Zrównoważona wydajność jest również lepsza niż oczekiwano dla kabrioletu, bez większych spadków w czasie podczas uruchamiania CineBench R15 xT w pętli.
Cinebench R15 Multi Loop
Cinebench R23: Multi Core | Single Core
Cinebench R20: CPU (Multi Core) | CPU (Single Core)
Cinebench R15: CPU Multi 64Bit | CPU Single 64Bit
Blender: v2.79 BMW27 CPU
7-Zip 18.03: 7z b 4 | 7z b 4 -mmt1
Geekbench 6.6: Multi-Core | Single-Core
Geekbench 5.5: Multi-Core | Single-Core
HWBOT x265 Benchmark v2.2: 4k Preset
LibreOffice : 20 Documents To PDF
R Benchmark 2.5: Overall mean
* ... im mniej tym lepiej
AIDA64: FP32 Ray-Trace | FPU Julia | CPU SHA3 | CPU Queen | FPU SinJulia | FPU Mandel | CPU AES | CPU ZLib | FP64 Ray-Trace | CPU PhotoWorxx
| Performance rating | |
| MSI Summit A16 AI Plus A3HMTG | |
| Przeciętny AMD Ryzen AI 9 365 | |
| HP Spectre x360 16 RTX 4050 | |
| MSI Summit E16 Flip A12UDT-031 | |
| LG gram Pro 2-in-1 16T90SP | |
| Asus ExpertBook B5 Flip B5602FBN | |
| Lenovo Yoga 7 2-in-1 16IML9 | |
| AIDA64 / FP32 Ray-Trace | |
| MSI Summit A16 AI Plus A3HMTG | |
| Przeciętny AMD Ryzen AI 9 365 (17096 - 32742, n=7) | |
| HP Spectre x360 16 RTX 4050 | |
| MSI Summit E16 Flip A12UDT-031 | |
| LG gram Pro 2-in-1 16T90SP | |
| Asus ExpertBook B5 Flip B5602FBN | |
| Lenovo Yoga 7 2-in-1 16IML9 | |
| AIDA64 / FPU Julia | |
| MSI Summit A16 AI Plus A3HMTG | |
| Przeciętny AMD Ryzen AI 9 365 (61976 - 126955, n=7) | |
| HP Spectre x360 16 RTX 4050 | |
| MSI Summit E16 Flip A12UDT-031 | |
| LG gram Pro 2-in-1 16T90SP | |
| Asus ExpertBook B5 Flip B5602FBN | |
| Lenovo Yoga 7 2-in-1 16IML9 | |
| AIDA64 / CPU SHA3 | |
| MSI Summit A16 AI Plus A3HMTG | |
| Przeciętny AMD Ryzen AI 9 365 (2951 - 5178, n=7) | |
| HP Spectre x360 16 RTX 4050 | |
| MSI Summit E16 Flip A12UDT-031 | |
| LG gram Pro 2-in-1 16T90SP | |
| Asus ExpertBook B5 Flip B5602FBN | |
| Lenovo Yoga 7 2-in-1 16IML9 | |
| AIDA64 / CPU Queen | |
| MSI Summit E16 Flip A12UDT-031 | |
| MSI Summit A16 AI Plus A3HMTG | |
| Przeciętny AMD Ryzen AI 9 365 (85333 - 93045, n=7) | |
| HP Spectre x360 16 RTX 4050 | |
| Asus ExpertBook B5 Flip B5602FBN | |
| LG gram Pro 2-in-1 16T90SP | |
| Lenovo Yoga 7 2-in-1 16IML9 | |
| AIDA64 / FPU SinJulia | |
| MSI Summit A16 AI Plus A3HMTG | |
| Przeciętny AMD Ryzen AI 9 365 (11586 - 16342, n=7) | |
| HP Spectre x360 16 RTX 4050 | |
| MSI Summit E16 Flip A12UDT-031 | |
| LG gram Pro 2-in-1 16T90SP | |
| Asus ExpertBook B5 Flip B5602FBN | |
| Lenovo Yoga 7 2-in-1 16IML9 | |
| AIDA64 / FPU Mandel | |
| MSI Summit A16 AI Plus A3HMTG | |
| Przeciętny AMD Ryzen AI 9 365 (33409 - 67374, n=7) | |
| HP Spectre x360 16 RTX 4050 | |
| MSI Summit E16 Flip A12UDT-031 | |
| LG gram Pro 2-in-1 16T90SP | |
| Asus ExpertBook B5 Flip B5602FBN | |
| Lenovo Yoga 7 2-in-1 16IML9 | |
| AIDA64 / CPU AES | |
| MSI Summit A16 AI Plus A3HMTG | |
| Przeciętny AMD Ryzen AI 9 365 (47468 - 99502, n=7) | |
| HP Spectre x360 16 RTX 4050 | |
| MSI Summit E16 Flip A12UDT-031 | |
| LG gram Pro 2-in-1 16T90SP | |
| Asus ExpertBook B5 Flip B5602FBN | |
| Lenovo Yoga 7 2-in-1 16IML9 | |
| AIDA64 / CPU ZLib | |
| MSI Summit A16 AI Plus A3HMTG | |
| Przeciętny AMD Ryzen AI 9 365 (706 - 1343, n=7) | |
| HP Spectre x360 16 RTX 4050 | |
| MSI Summit E16 Flip A12UDT-031 | |
| LG gram Pro 2-in-1 16T90SP | |
| Asus ExpertBook B5 Flip B5602FBN | |
| Lenovo Yoga 7 2-in-1 16IML9 | |
| AIDA64 / FP64 Ray-Trace | |
| MSI Summit A16 AI Plus A3HMTG | |
| Przeciętny AMD Ryzen AI 9 365 (9061 - 17848, n=7) | |
| HP Spectre x360 16 RTX 4050 | |
| MSI Summit E16 Flip A12UDT-031 | |
| LG gram Pro 2-in-1 16T90SP | |
| Asus ExpertBook B5 Flip B5602FBN | |
| Lenovo Yoga 7 2-in-1 16IML9 | |
| AIDA64 / CPU PhotoWorxx | |
| Przeciętny AMD Ryzen AI 9 365 (47654 - 53550, n=7) | |
| MSI Summit A16 AI Plus A3HMTG | |
| LG gram Pro 2-in-1 16T90SP | |
| HP Spectre x360 16 RTX 4050 | |
| Lenovo Yoga 7 2-in-1 16IML9 | |
| MSI Summit E16 Flip A12UDT-031 | |
| Asus ExpertBook B5 Flip B5602FBN | |
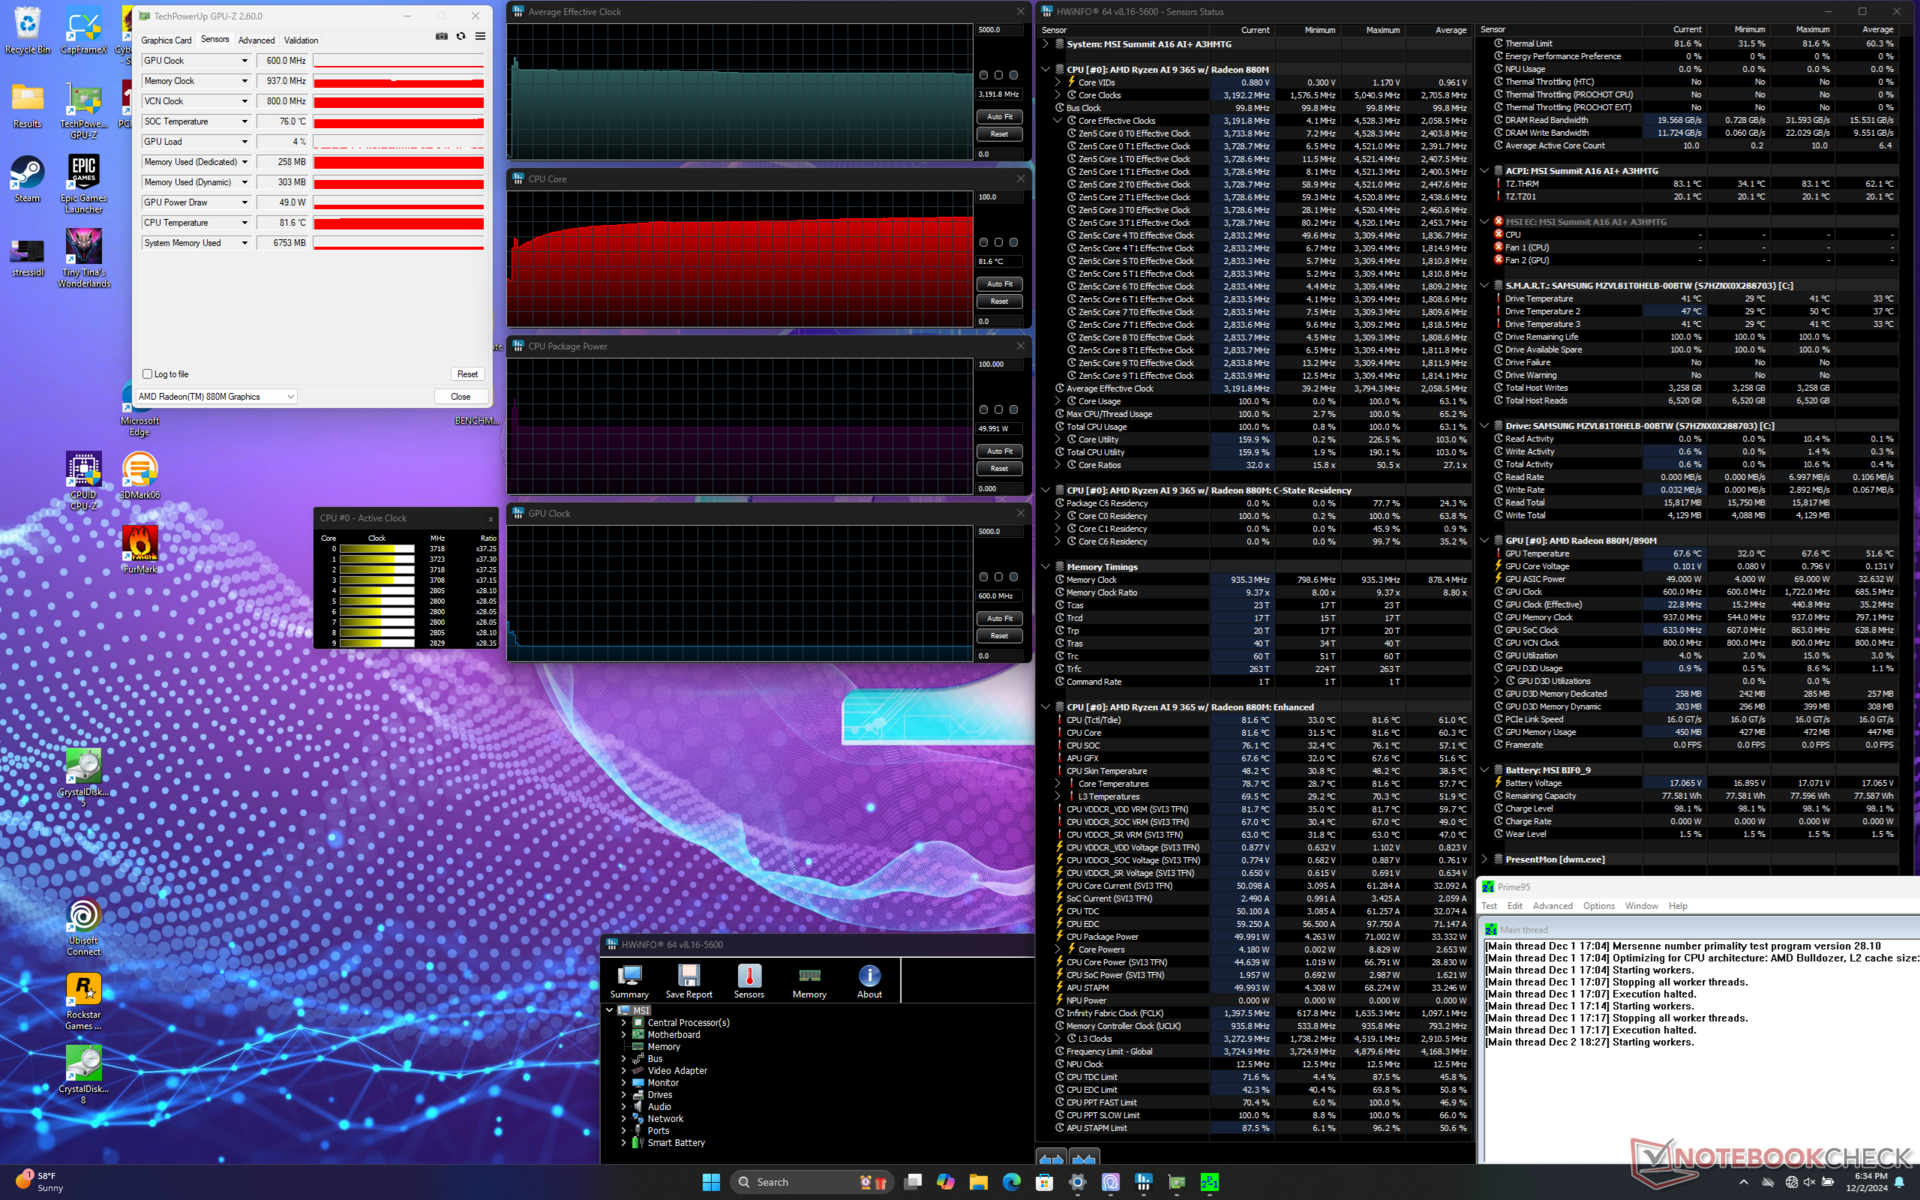
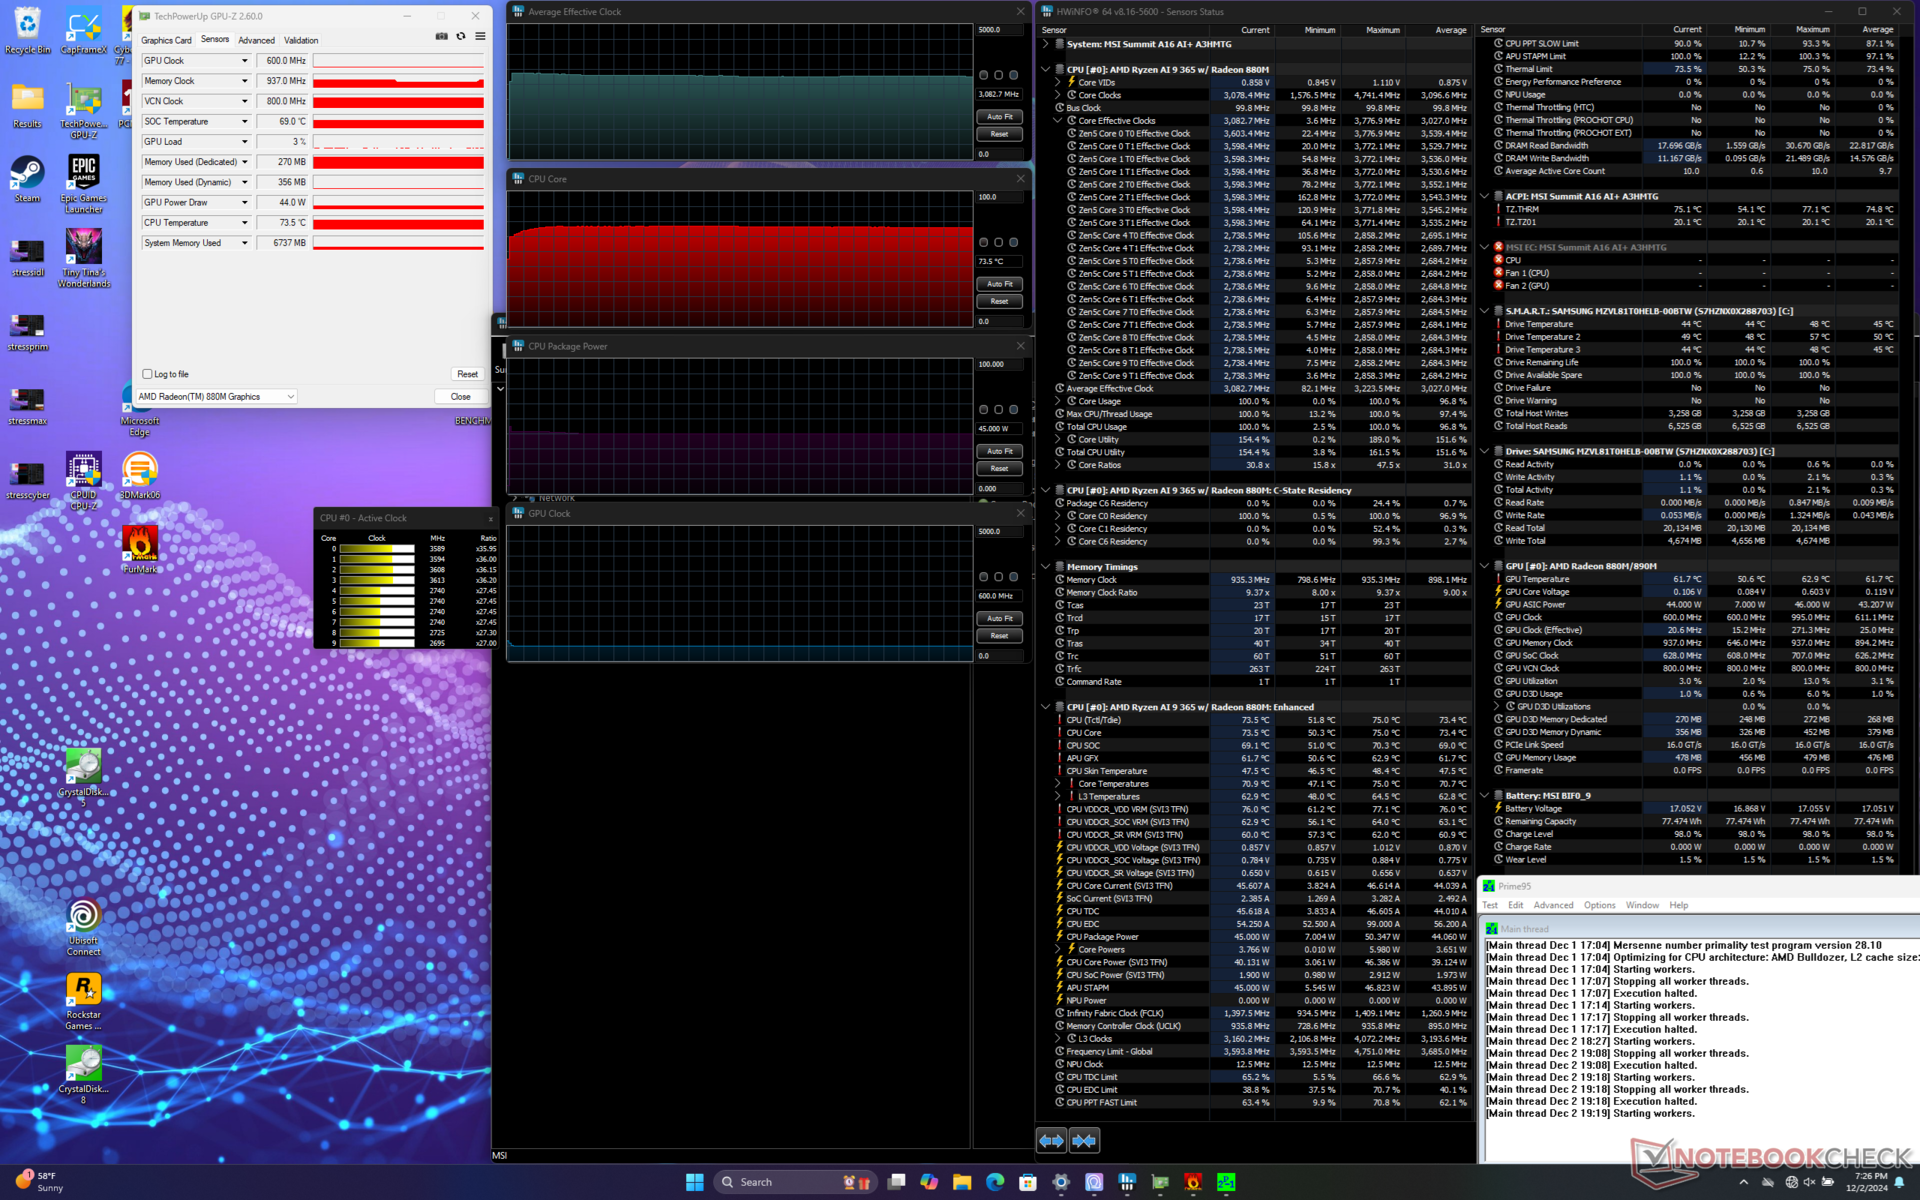
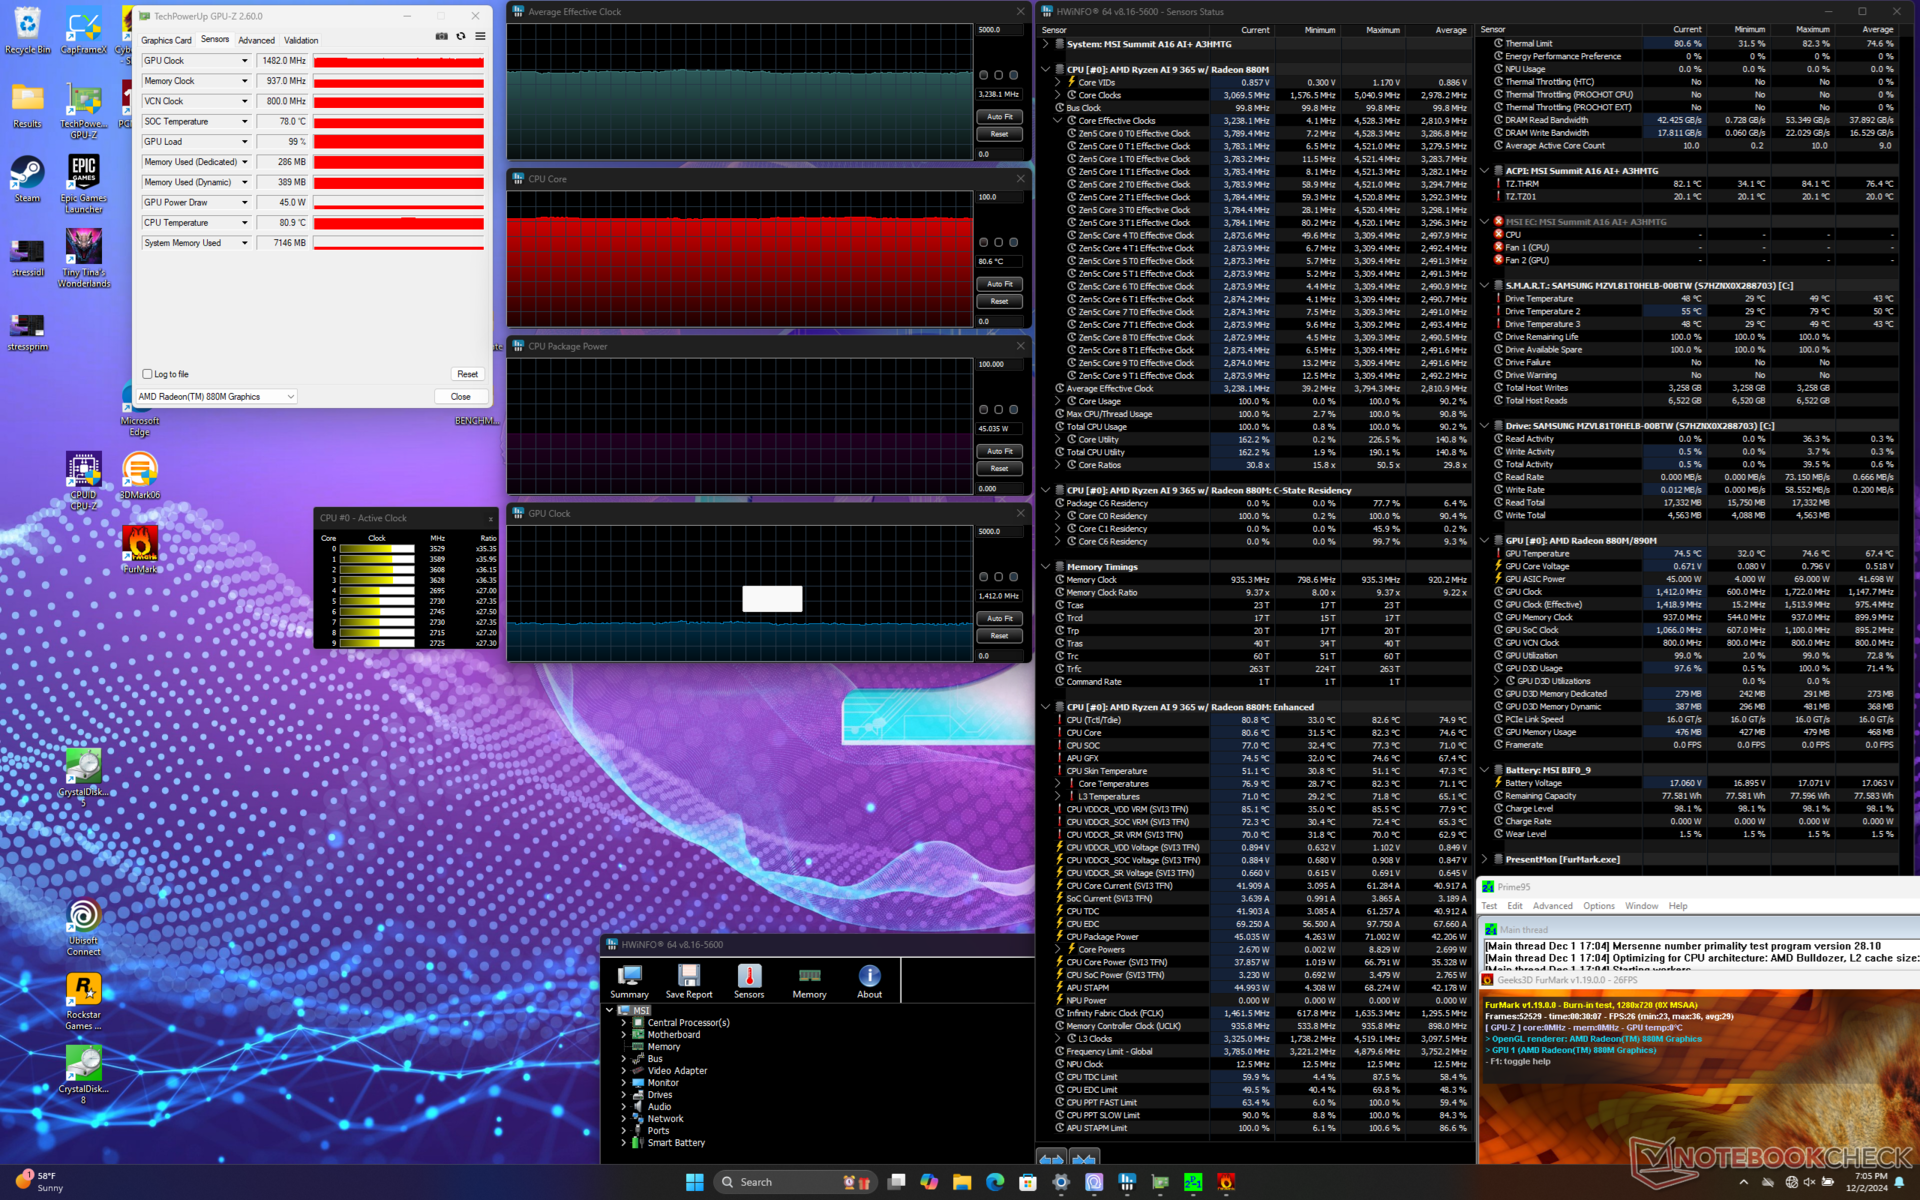
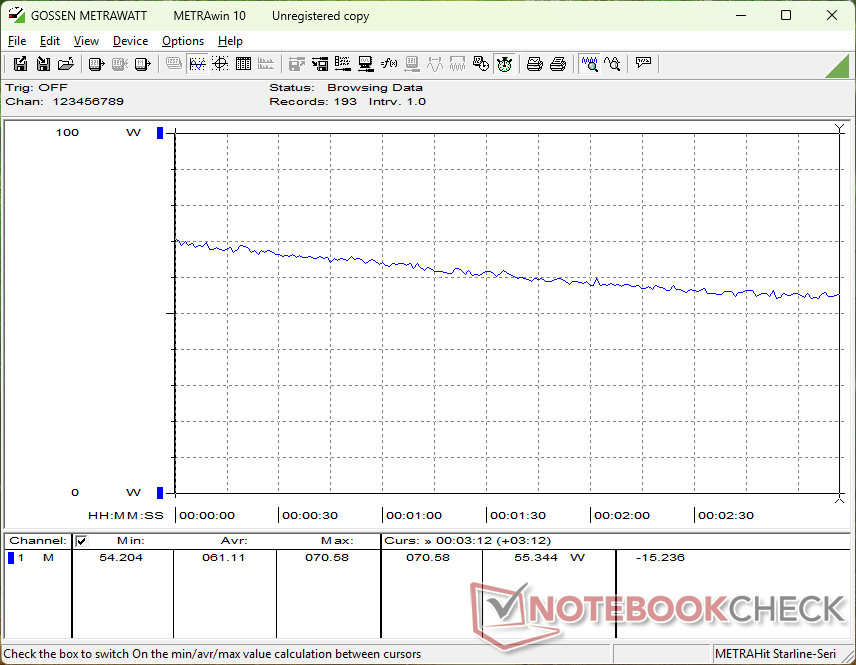
Test warunków skrajnych
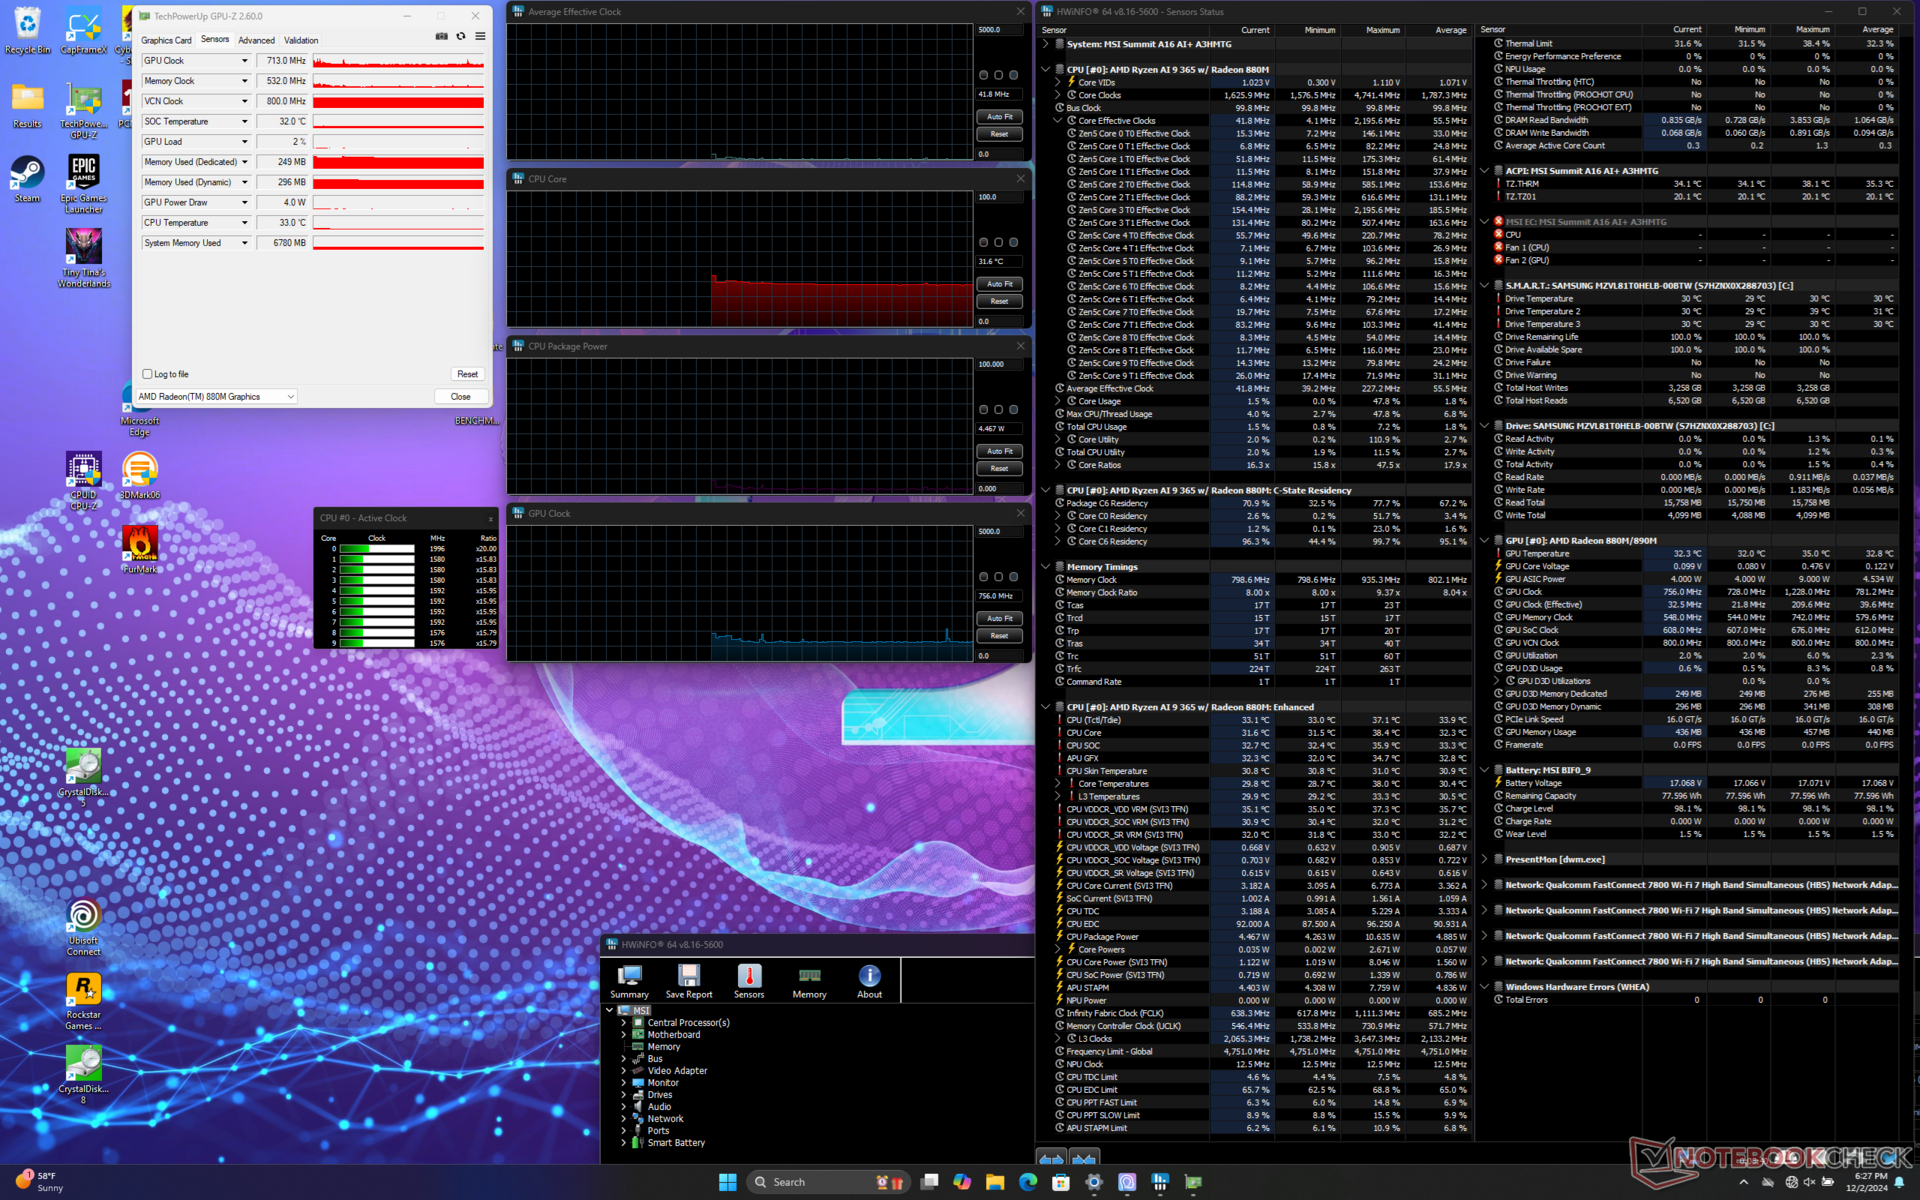
Po zainicjowaniu stresu Prime95, procesor zwiększyłby taktowanie do 3,8 GHz i 71 W tylko przez kilka pierwszych sekund, po czym spadłby do 3,2 GHz i 50 W. Temperatura rdzenia ustabilizowałaby się na poziomie 82 C, gdyby Cooler Boost był wyłączony lub 74 C, gdyby Cooler Boost był włączony. Głównym celem tej funkcji jest obniżenie temperatury rdzenia, a nie bezpośrednie zwiększenie wydajności.
W przypadku gier temperatura rdzenia ustabilizowałaby się na poziomie 75 C w porównaniu do 72 C w przypadku HP Spectre x360 16 z szybszą grafiką RTX 4050.
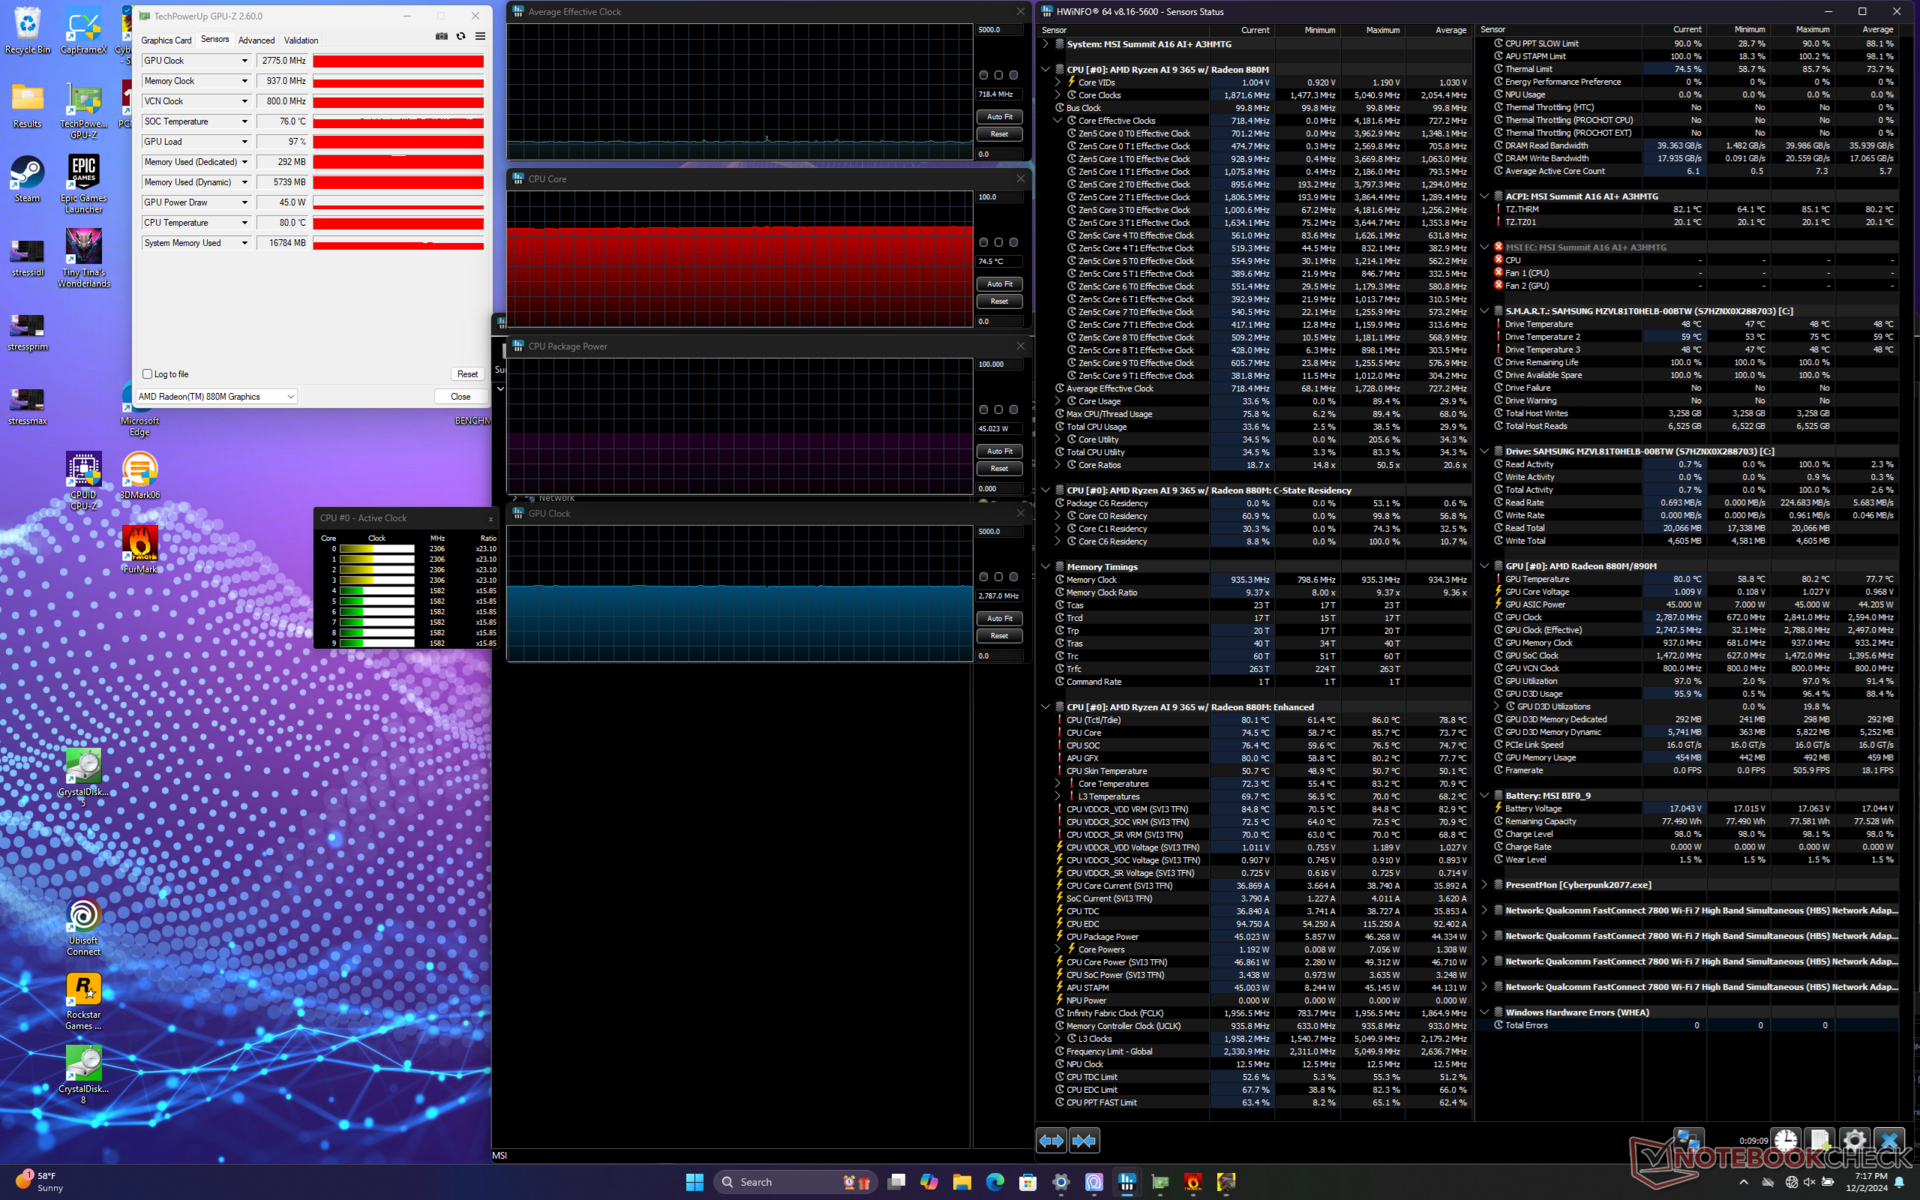
| Średnie taktowanie CPU (GHz) | Taktowanie GPU (MHz) | Średnia temperatura CPU (°C) | |
| System bezczynności | -- | -- | 32 |
| Prime95 Stress (Cooler Boost wyłączony) | 3.2 | -- | 82 |
| Prime95 Stress (Cooler Boost włączony) | 3.1 | -- | 74 |
| Prime95 + FurMark Stress | 3.2 | 1412 | 81 |
| Cyberpunk 2077 Stress | 0.7 | 2787 | 75 |
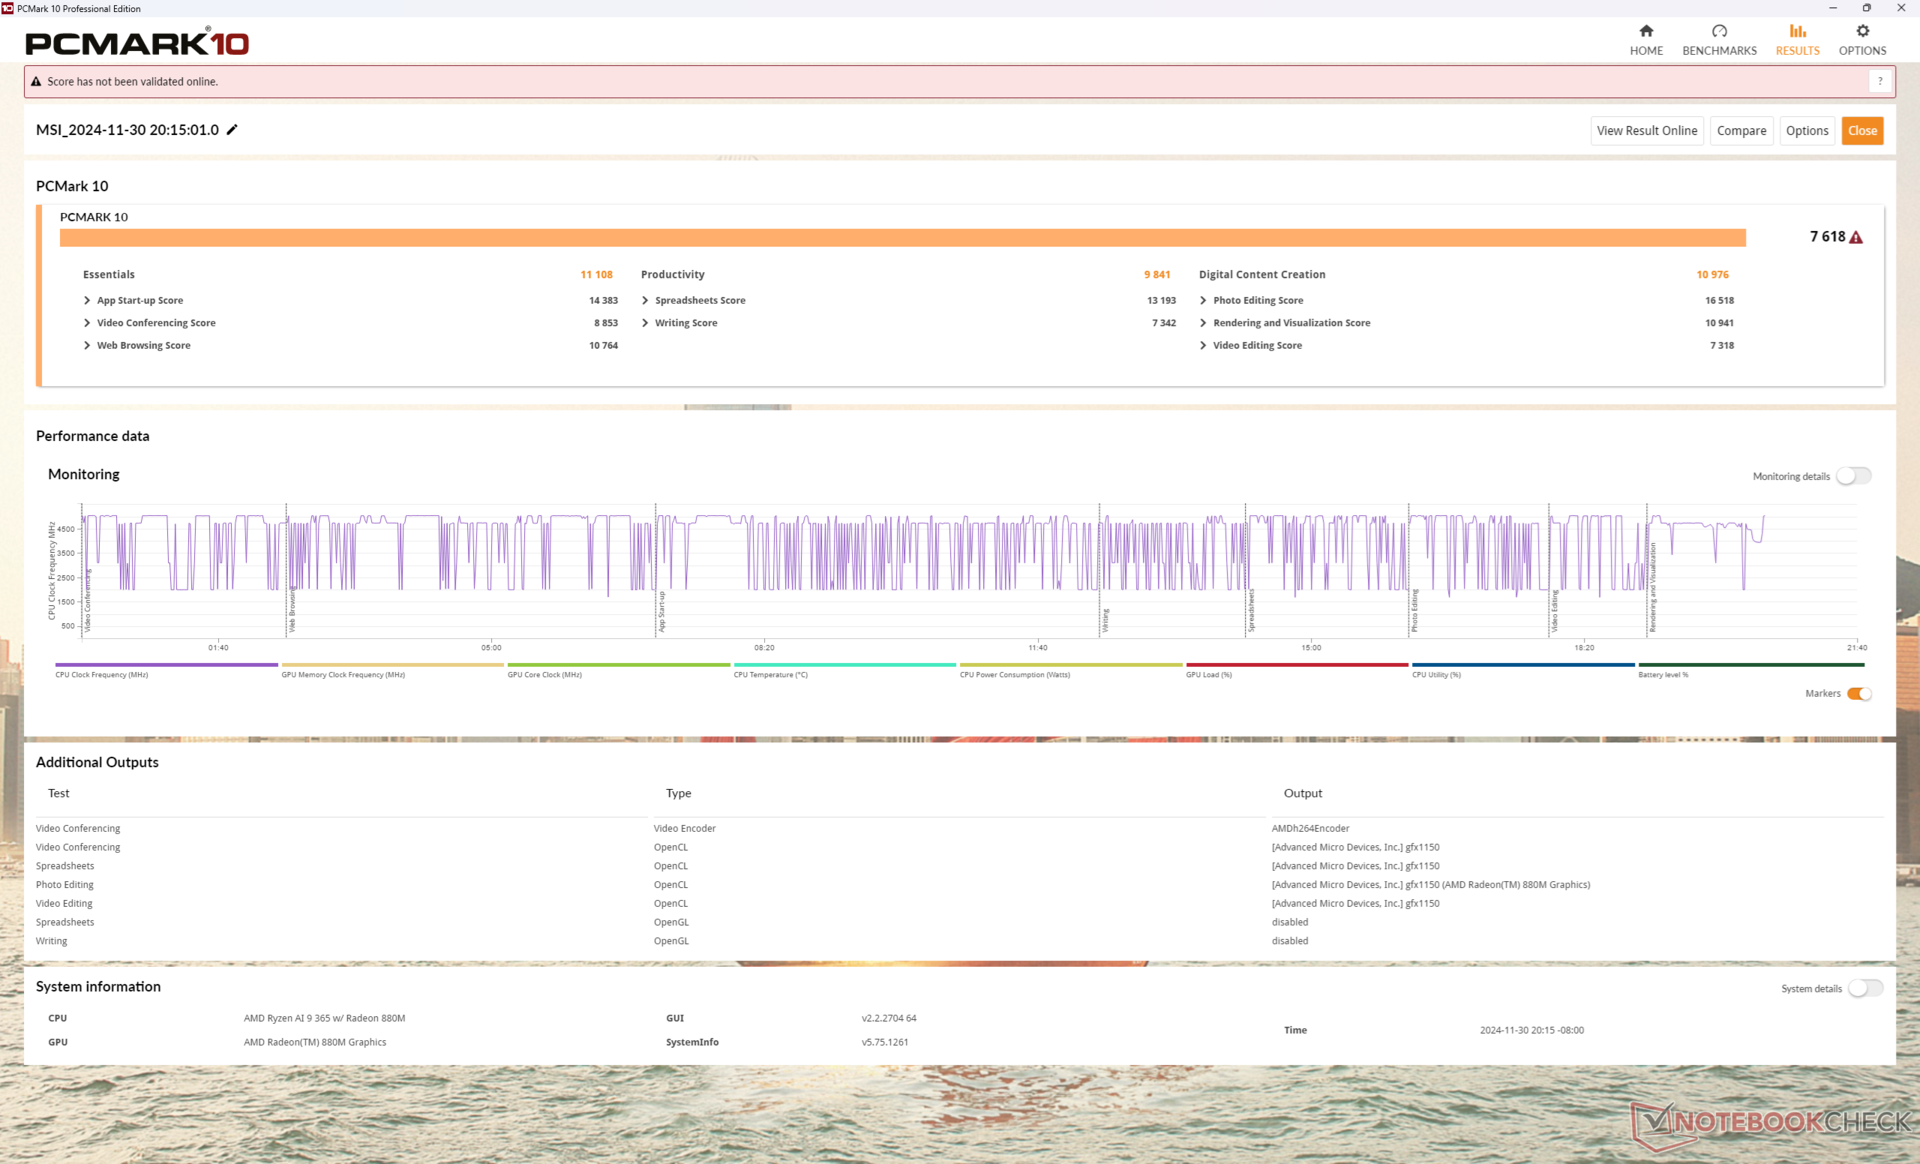
Wydajność systemu
Wyniki PCMark są jednymi z najwyższych w kategorii 16-calowych urządzeń konwertowalnych dzięki szybkiemu procesorowi Zen 5 i zintegrowanemu układowi graficznemu.
CrossMark: Overall | Productivity | Creativity | Responsiveness
WebXPRT 3: Overall
WebXPRT 4: Overall
Mozilla Kraken 1.1: Total
| PCMark 10 / Score | |
| MSI Summit A16 AI Plus A3HMTG | |
| Przeciętny AMD Ryzen AI 9 365, AMD Radeon 880M (7045 - 7641, n=5) | |
| HP Spectre x360 16 RTX 4050 | |
| LG gram Pro 2-in-1 16T90SP | |
| MSI Summit E16 Flip A12UDT-031 | |
| Lenovo Yoga 7 2-in-1 16IML9 | |
| Asus ExpertBook B5 Flip B5602FBN | |
| PCMark 10 / Essentials | |
| MSI Summit A16 AI Plus A3HMTG | |
| Przeciętny AMD Ryzen AI 9 365, AMD Radeon 880M (10421 - 11140, n=5) | |
| Lenovo Yoga 7 2-in-1 16IML9 | |
| HP Spectre x360 16 RTX 4050 | |
| LG gram Pro 2-in-1 16T90SP | |
| MSI Summit E16 Flip A12UDT-031 | |
| Asus ExpertBook B5 Flip B5602FBN | |
| PCMark 10 / Productivity | |
| Przeciętny AMD Ryzen AI 9 365, AMD Radeon 880M (9841 - 10293, n=5) | |
| MSI Summit A16 AI Plus A3HMTG | |
| HP Spectre x360 16 RTX 4050 | |
| LG gram Pro 2-in-1 16T90SP | |
| Lenovo Yoga 7 2-in-1 16IML9 | |
| MSI Summit E16 Flip A12UDT-031 | |
| Asus ExpertBook B5 Flip B5602FBN | |
| PCMark 10 / Digital Content Creation | |
| MSI Summit A16 AI Plus A3HMTG | |
| Przeciętny AMD Ryzen AI 9 365, AMD Radeon 880M (8973 - 10976, n=5) | |
| HP Spectre x360 16 RTX 4050 | |
| MSI Summit E16 Flip A12UDT-031 | |
| LG gram Pro 2-in-1 16T90SP | |
| Asus ExpertBook B5 Flip B5602FBN | |
| Lenovo Yoga 7 2-in-1 16IML9 | |
| CrossMark / Overall | |
| MSI Summit A16 AI Plus A3HMTG | |
| Przeciętny AMD Ryzen AI 9 365, AMD Radeon 880M (1658 - 1743, n=4) | |
| Asus ExpertBook B5 Flip B5602FBN | |
| MSI Summit E16 Flip A12UDT-031 | |
| Lenovo Yoga 7 2-in-1 16IML9 | |
| HP Spectre x360 16 RTX 4050 | |
| LG gram Pro 2-in-1 16T90SP | |
| CrossMark / Productivity | |
| Asus ExpertBook B5 Flip B5602FBN | |
| MSI Summit A16 AI Plus A3HMTG | |
| MSI Summit E16 Flip A12UDT-031 | |
| Przeciętny AMD Ryzen AI 9 365, AMD Radeon 880M (1508 - 1599, n=4) | |
| LG gram Pro 2-in-1 16T90SP | |
| HP Spectre x360 16 RTX 4050 | |
| Lenovo Yoga 7 2-in-1 16IML9 | |
| CrossMark / Creativity | |
| Przeciętny AMD Ryzen AI 9 365, AMD Radeon 880M (2044 - 2074, n=4) | |
| MSI Summit A16 AI Plus A3HMTG | |
| HP Spectre x360 16 RTX 4050 | |
| MSI Summit E16 Flip A12UDT-031 | |
| Asus ExpertBook B5 Flip B5602FBN | |
| LG gram Pro 2-in-1 16T90SP | |
| Lenovo Yoga 7 2-in-1 16IML9 | |
| CrossMark / Responsiveness | |
| Asus ExpertBook B5 Flip B5602FBN | |
| MSI Summit E16 Flip A12UDT-031 | |
| MSI Summit A16 AI Plus A3HMTG | |
| Przeciętny AMD Ryzen AI 9 365, AMD Radeon 880M (1124 - 1360, n=4) | |
| LG gram Pro 2-in-1 16T90SP | |
| HP Spectre x360 16 RTX 4050 | |
| Lenovo Yoga 7 2-in-1 16IML9 | |
| WebXPRT 3 / Overall | |
| MSI Summit A16 AI Plus A3HMTG | |
| Przeciętny AMD Ryzen AI 9 365, AMD Radeon 880M (309 - 336, n=4) | |
| Asus ExpertBook B5 Flip B5602FBN | |
| HP Spectre x360 16 RTX 4050 | |
| LG gram Pro 2-in-1 16T90SP | |
| MSI Summit E16 Flip A12UDT-031 | |
| Lenovo Yoga 7 2-in-1 16IML9 | |
| WebXPRT 4 / Overall | |
| Przeciętny AMD Ryzen AI 9 365, AMD Radeon 880M (255 - 330, n=6) | |
| MSI Summit A16 AI Plus A3HMTG | |
| HP Spectre x360 16 RTX 4050 | |
| LG gram Pro 2-in-1 16T90SP | |
| Asus ExpertBook B5 Flip B5602FBN | |
| MSI Summit E16 Flip A12UDT-031 | |
| Lenovo Yoga 7 2-in-1 16IML9 | |
| Mozilla Kraken 1.1 / Total | |
| Lenovo Yoga 7 2-in-1 16IML9 | |
| MSI Summit E16 Flip A12UDT-031 | |
| LG gram Pro 2-in-1 16T90SP | |
| Asus ExpertBook B5 Flip B5602FBN | |
| HP Spectre x360 16 RTX 4050 | |
| Przeciętny AMD Ryzen AI 9 365, AMD Radeon 880M (430 - 456, n=6) | |
| MSI Summit A16 AI Plus A3HMTG | |
* ... im mniej tym lepiej
| PCMark 10 Score | 7618 pkt. | |
Pomoc | ||
| AIDA64 / Memory Copy | |
| Przeciętny AMD Ryzen AI 9 365 (87648 - 94710, n=7) | |
| MSI Summit A16 AI Plus A3HMTG | |
| LG gram Pro 2-in-1 16T90SP | |
| HP Spectre x360 16 RTX 4050 | |
| Lenovo Yoga 7 2-in-1 16IML9 | |
| MSI Summit E16 Flip A12UDT-031 | |
| Asus ExpertBook B5 Flip B5602FBN | |
| AIDA64 / Memory Read | |
| MSI Summit A16 AI Plus A3HMTG | |
| Przeciętny AMD Ryzen AI 9 365 (89012 - 104349, n=7) | |
| HP Spectre x360 16 RTX 4050 | |
| LG gram Pro 2-in-1 16T90SP | |
| MSI Summit E16 Flip A12UDT-031 | |
| Lenovo Yoga 7 2-in-1 16IML9 | |
| Asus ExpertBook B5 Flip B5602FBN | |
| AIDA64 / Memory Write | |
| Przeciętny AMD Ryzen AI 9 365 (93627 - 106646, n=7) | |
| MSI Summit A16 AI Plus A3HMTG | |
| HP Spectre x360 16 RTX 4050 | |
| LG gram Pro 2-in-1 16T90SP | |
| Lenovo Yoga 7 2-in-1 16IML9 | |
| MSI Summit E16 Flip A12UDT-031 | |
| Asus ExpertBook B5 Flip B5602FBN | |
| AIDA64 / Memory Latency | |
| MSI Summit E16 Flip A12UDT-031 | |
| Lenovo Yoga 7 2-in-1 16IML9 | |
| HP Spectre x360 16 RTX 4050 | |
| LG gram Pro 2-in-1 16T90SP | |
| MSI Summit A16 AI Plus A3HMTG | |
| Przeciętny AMD Ryzen AI 9 365 (103.6 - 129.8, n=7) | |
| Asus ExpertBook B5 Flip B5602FBN | |
* ... im mniej tym lepiej
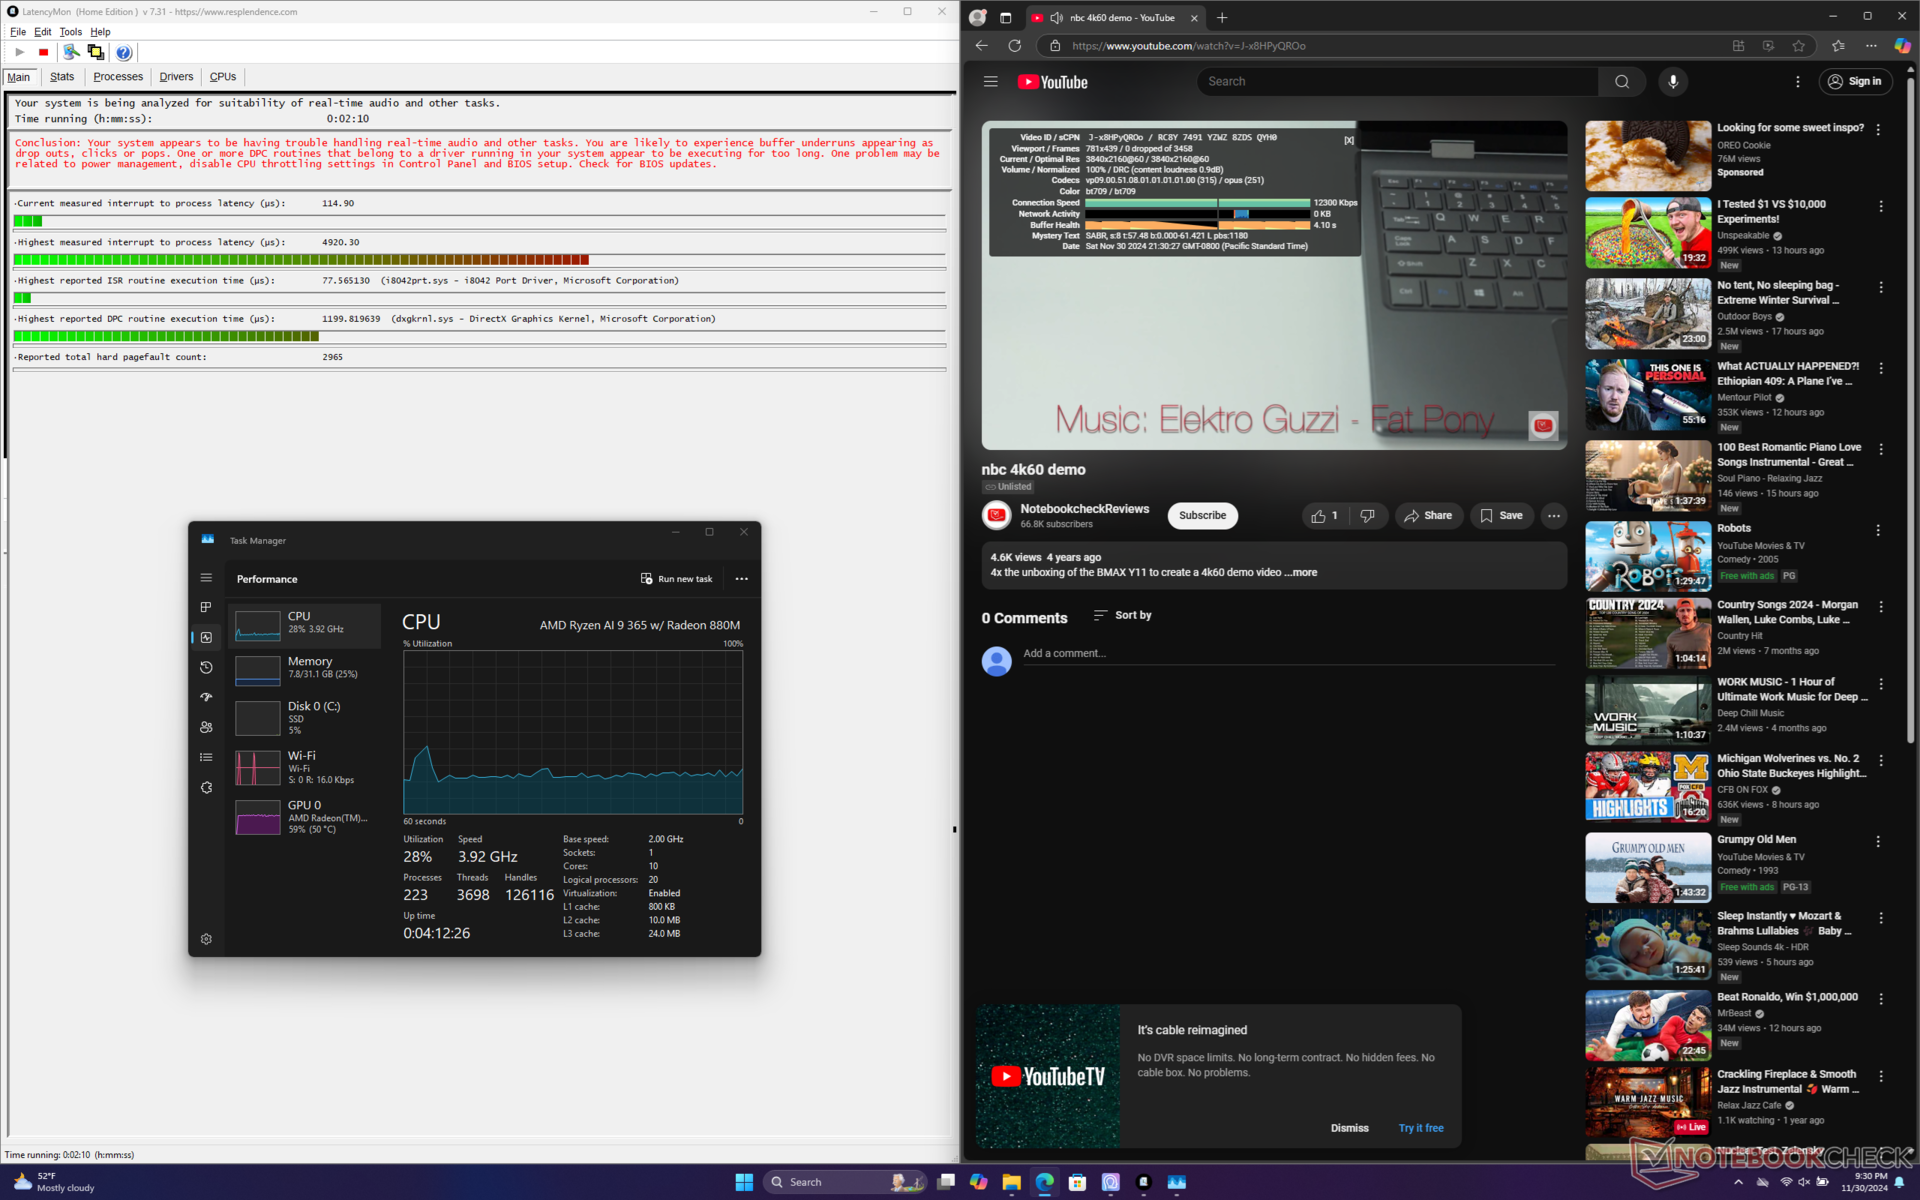
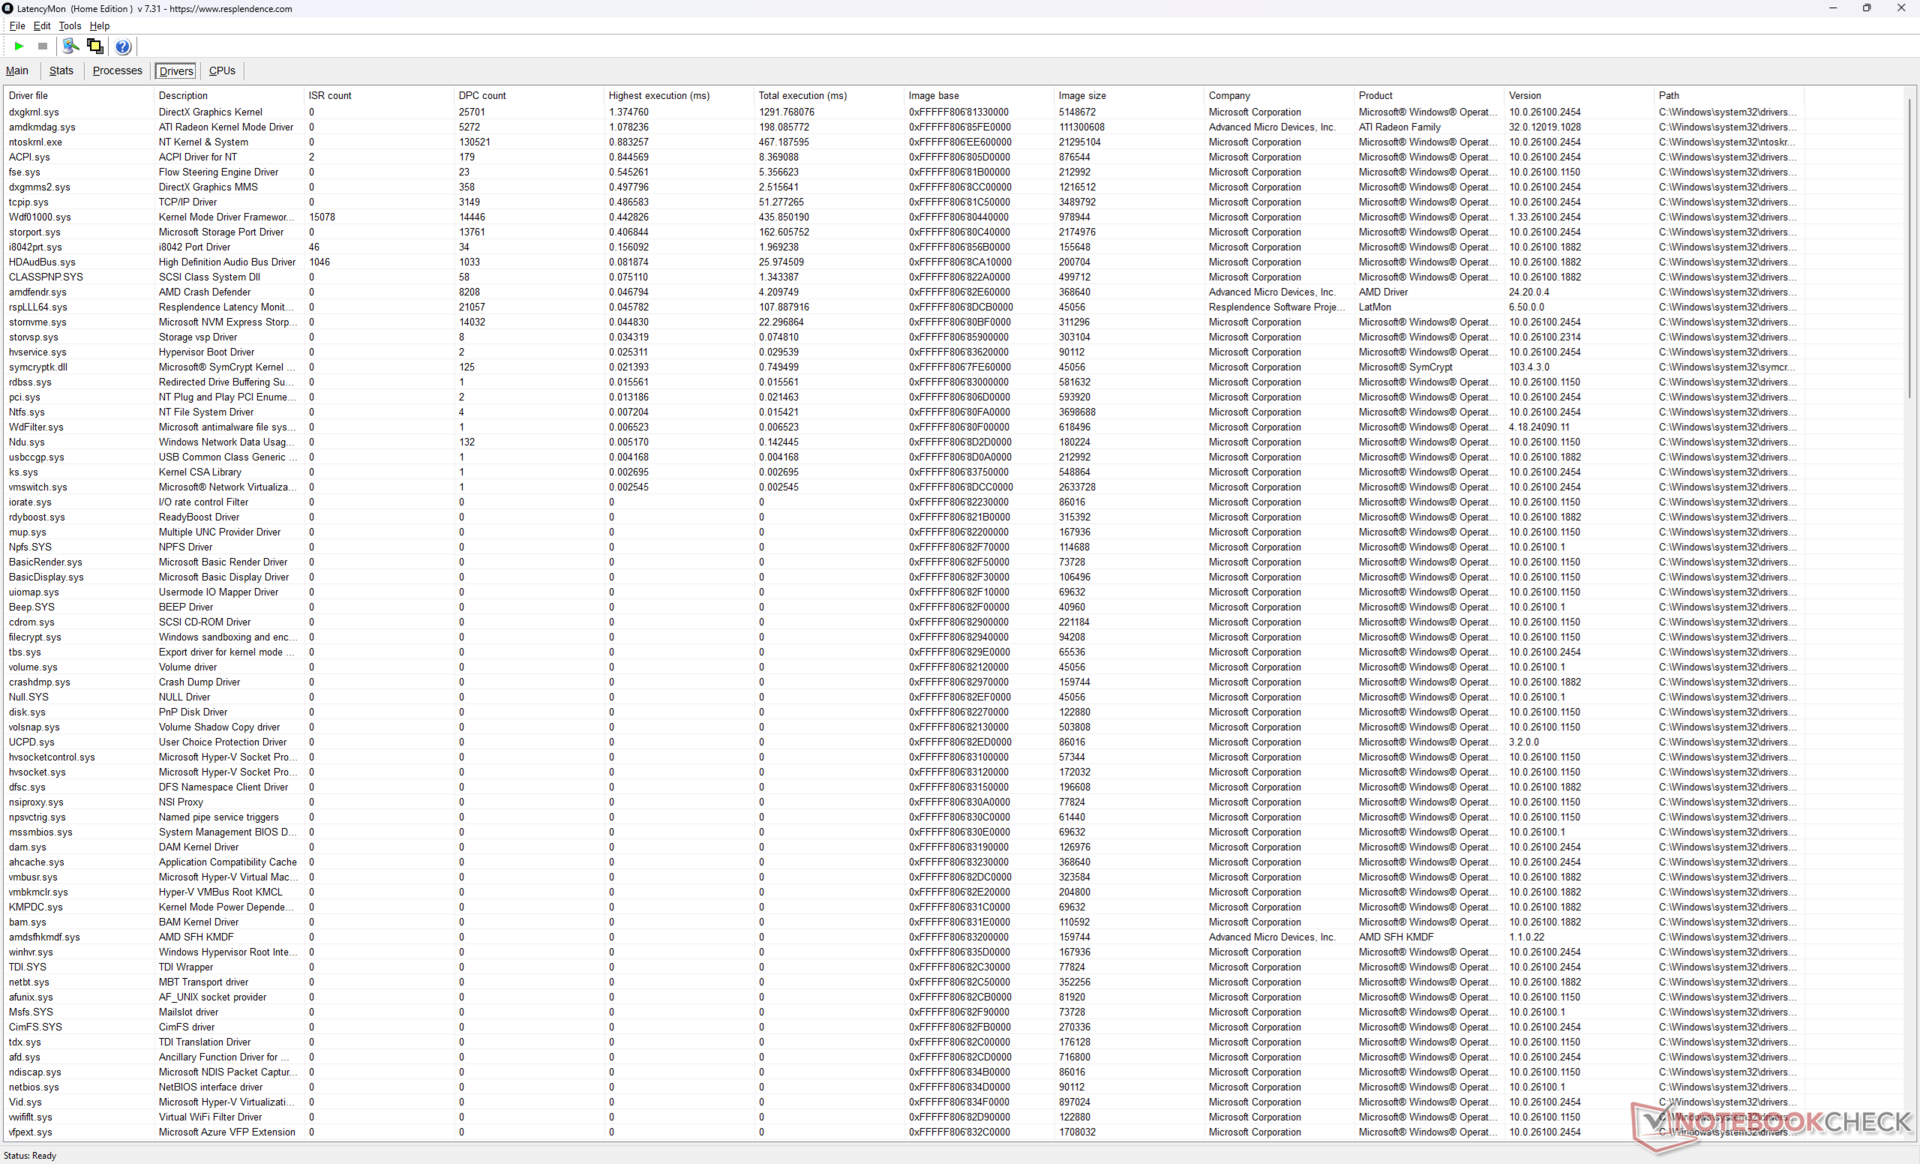
Opóźnienie DPC
LatencyMon ujawnia problemy z DPC podczas otwierania wielu kart przeglądarki na naszej stronie głównej. odtwarzanie wideo 4K przy 60 FPS jest poza tym idealne i nie odnotowano żadnych spadków klatek.
| DPC Latencies / LatencyMon - interrupt to process latency (max), Web, Youtube, Prime95 | |
| LG gram Pro 2-in-1 16T90SP | |
| HP Spectre x360 16 RTX 4050 | |
| MSI Summit A16 AI Plus A3HMTG | |
| Asus ExpertBook B5 Flip B5602FBN | |
| MSI Summit E16 Flip A12UDT-031 | |
| Lenovo Yoga 7 2-in-1 16IML9 | |
* ... im mniej tym lepiej
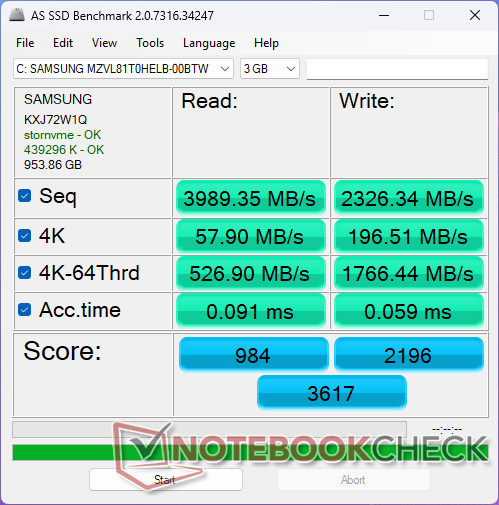
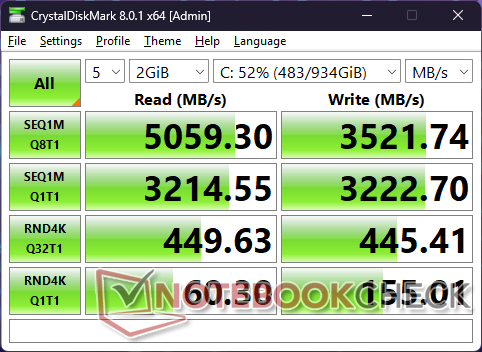
Urządzenia pamięci masowej
Nasze urządzenie jest dostarczane z Samsung PM9C1 zamiast PM9A1, który można znaleźć w modelu 2022. Niestety, PM9C1 oferuje wolniejszy transfer o ponad 1500 MB/s, jak pokazuje nasz wykres porównawczy poniżej.

* ... im mniej tym lepiej
Disk Throttling: DiskSpd Read Loop, Queue Depth 8
Wydajność GPU
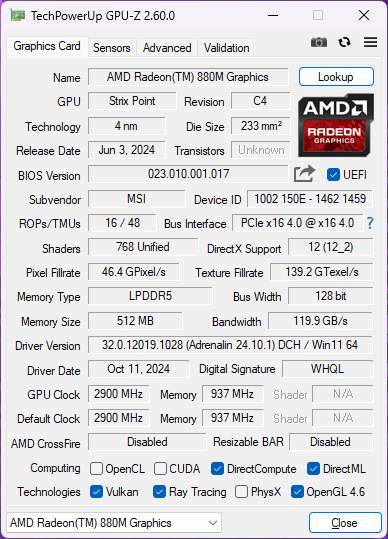
Zintegrowany Radeon 880M jest znaczącym ulepszeniem w stosunku do Iris Xe 96 EUs powszechnie występującymi w większości laptopów konwertowalnych od 2020 roku. W porównaniu do poprzedniego mistrza Radeon 780Mradeon 880M jest o około 15 do 25 procent szybszy. To wystarczająco szybko, aby grać w nowoczesne tytuły w rozdzielczości 1080p przy niskich ustawieniach, w tym nawet w wymagające tytuły, takie jak Cyberpunk 2077.
MSI nie oferuje jednostek SKU z kartami Radeon 890M który zwiększyłby wydajność graficzną o kolejne 10 do 15 procent.
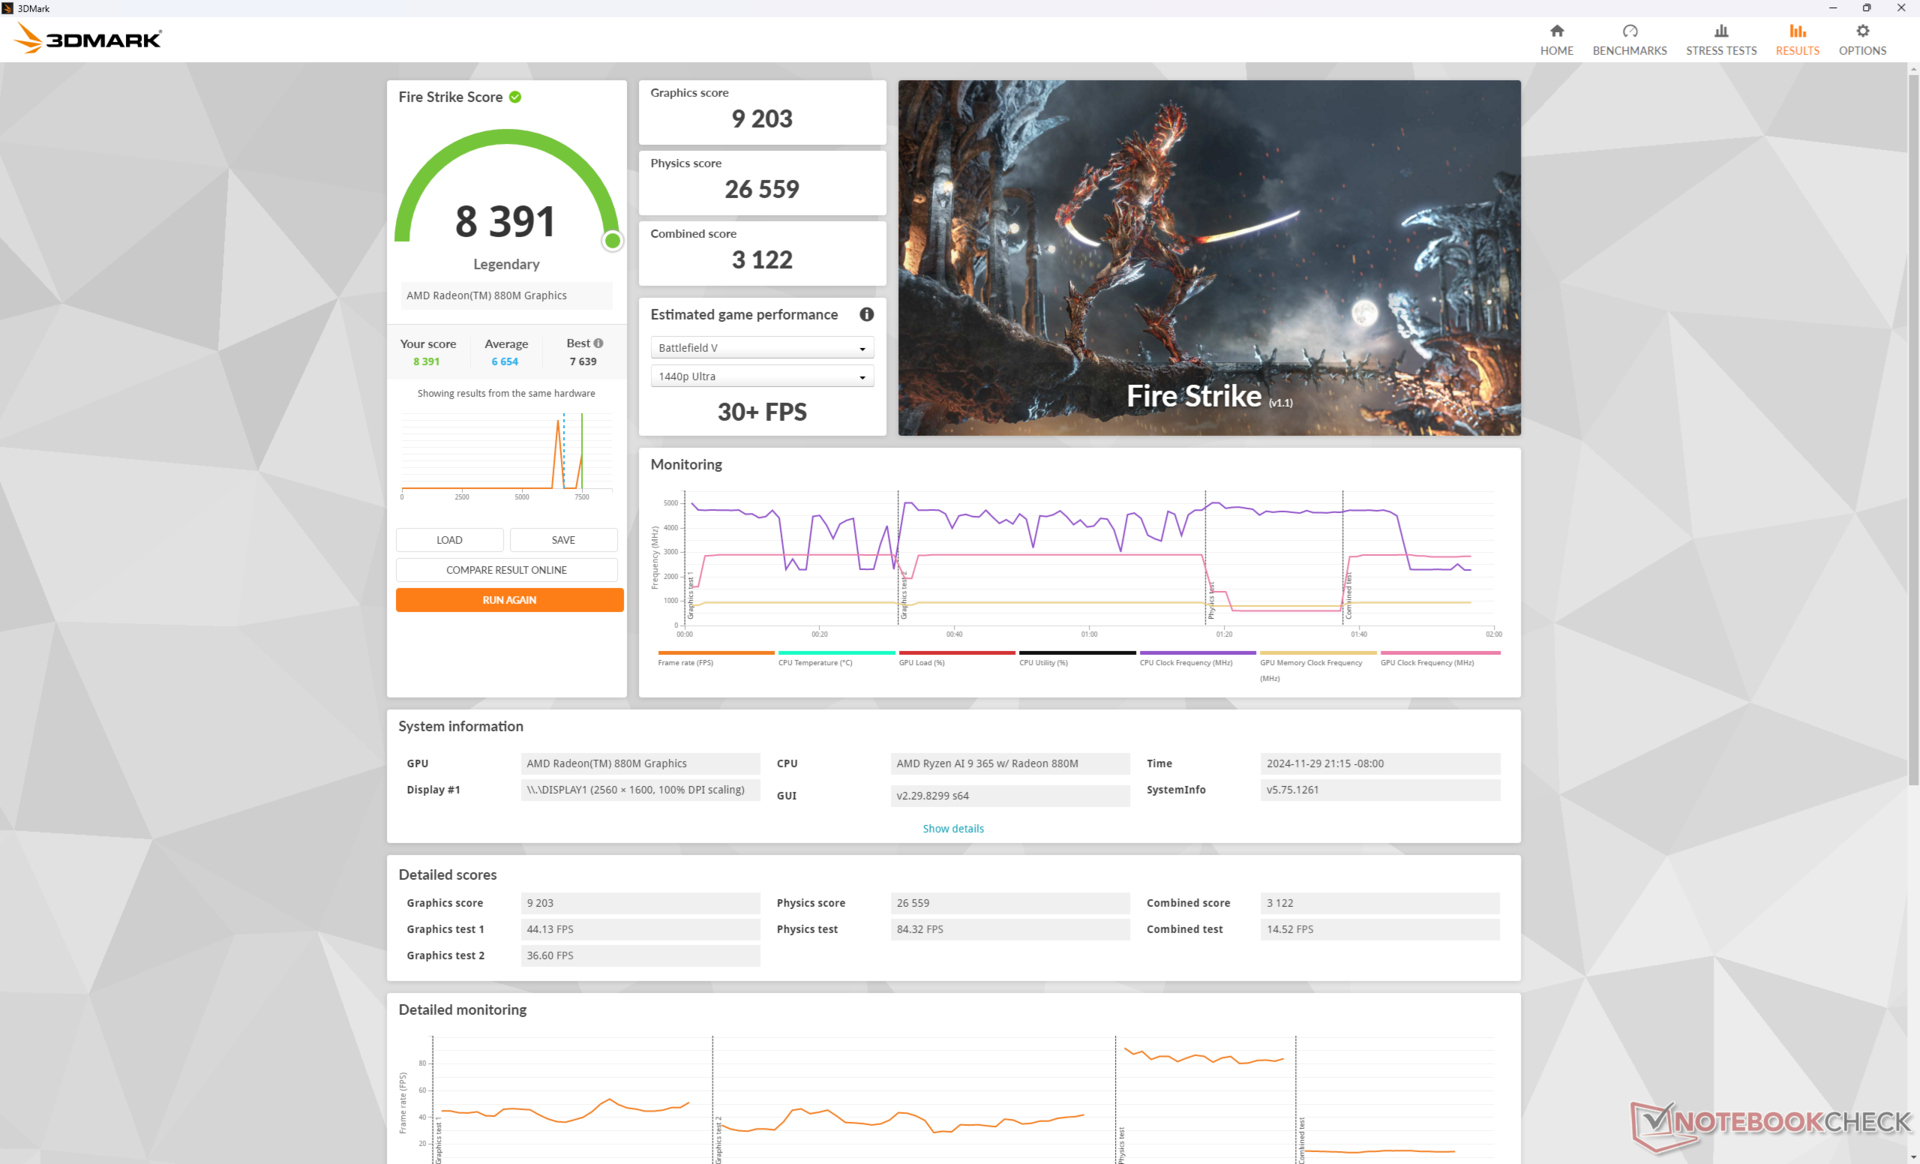
| Profil zasilania | Wynik grafiki | Wynik fizyki | Wynik łączny |
| Tryb wydajności | 9203 | 26559 | 3122 |
| Tryb zrównoważony | 8821 (-4%) | 25223 (-5%) | 2948 (-6%) |
| Zasilanie bateryjne | 8747 (-5%) | 20465 (-23%) | 3098 (-1%) |
Praca w trybie zrównoważonym zamiast w trybie wydajności nieznacznie obniża wydajność, jak pokazuje powyższa tabela wyników Fire Strike.
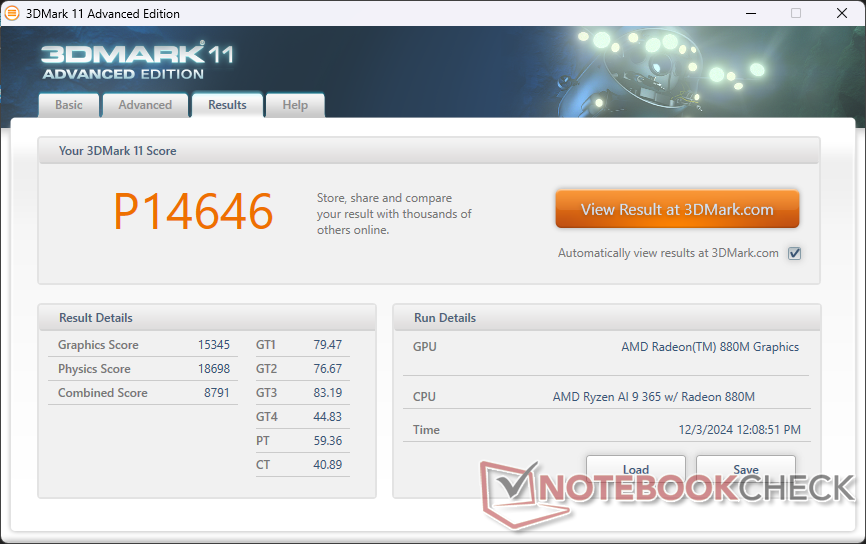
| 3DMark 11 Performance | 14646 pkt. | |
| 3DMark Cloud Gate Standard Score | 36919 pkt. | |
| 3DMark Fire Strike Score | 8391 pkt. | |
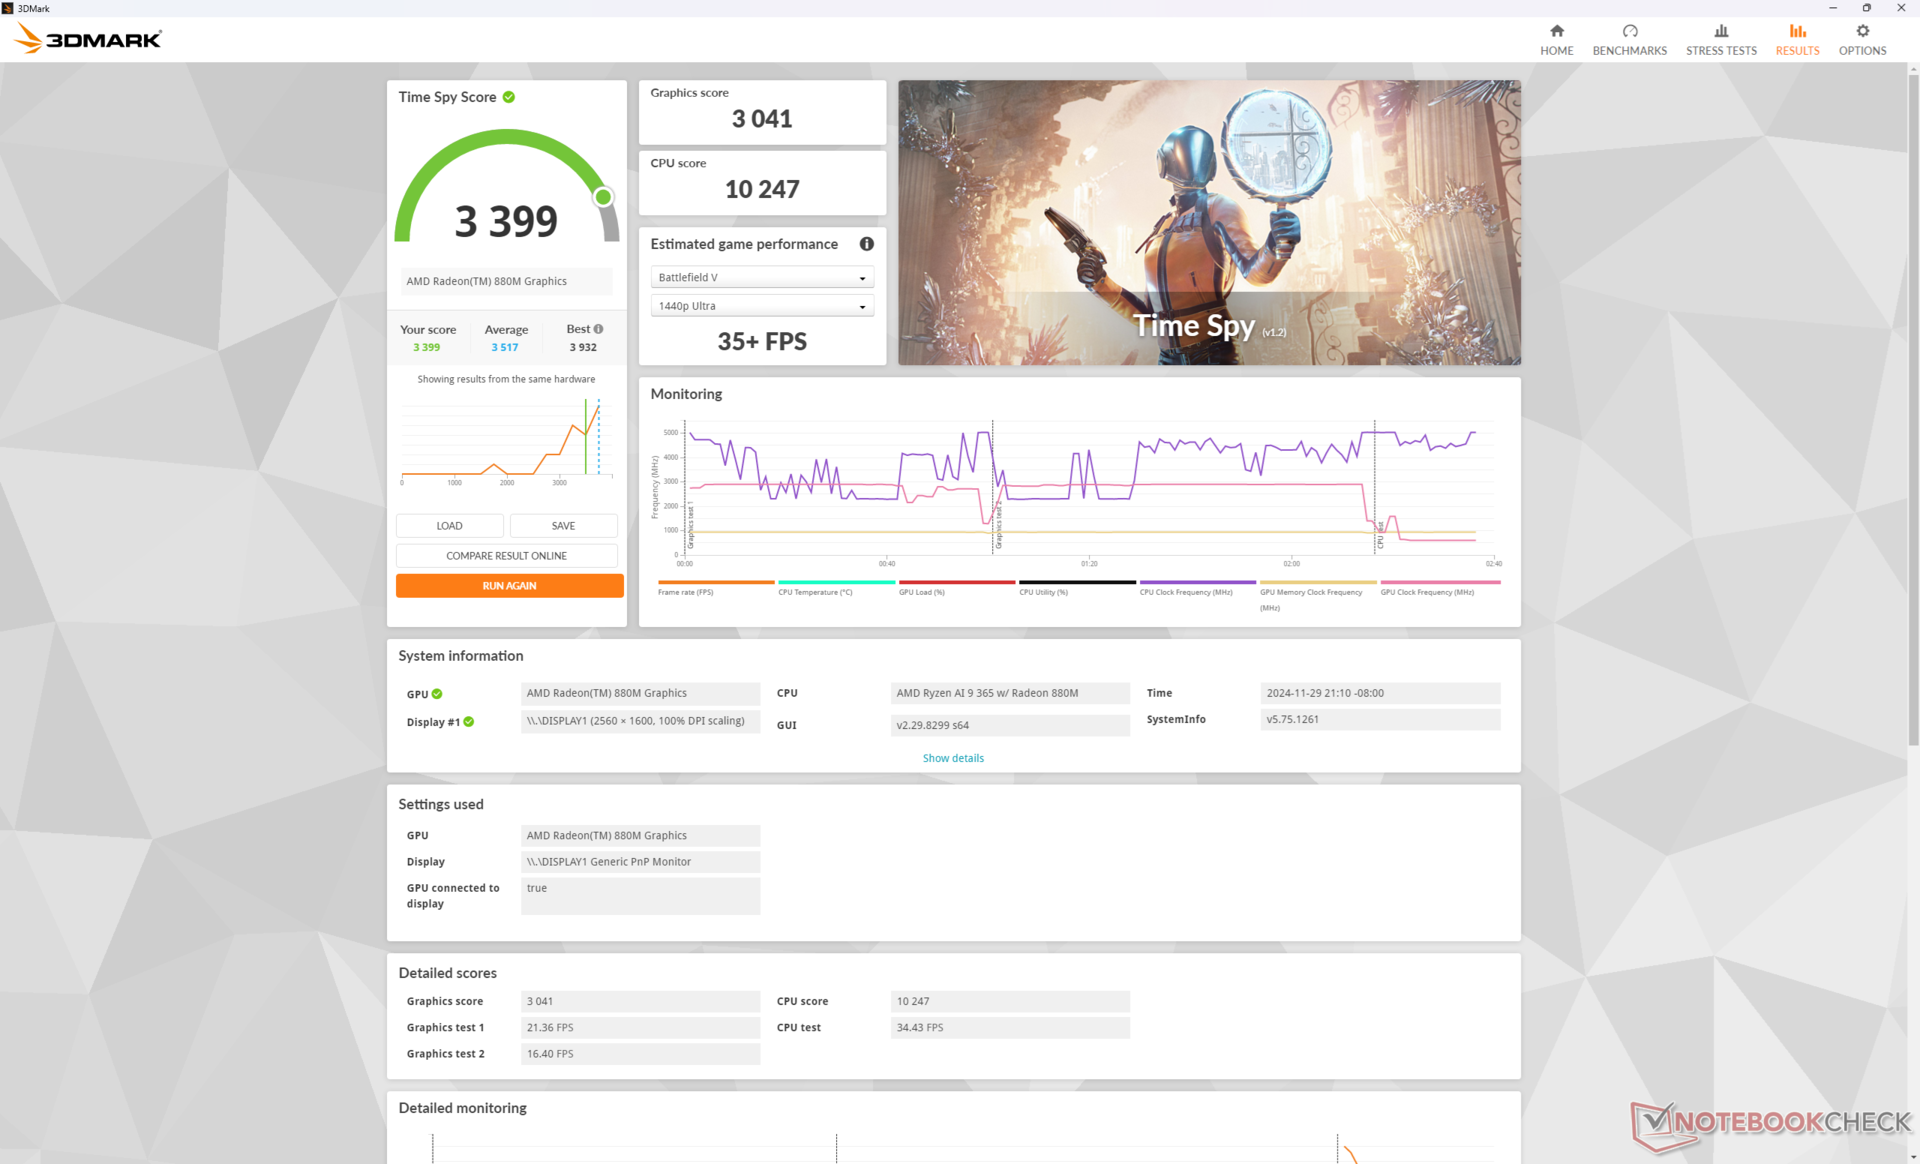
| 3DMark Time Spy Score | 3399 pkt. | |
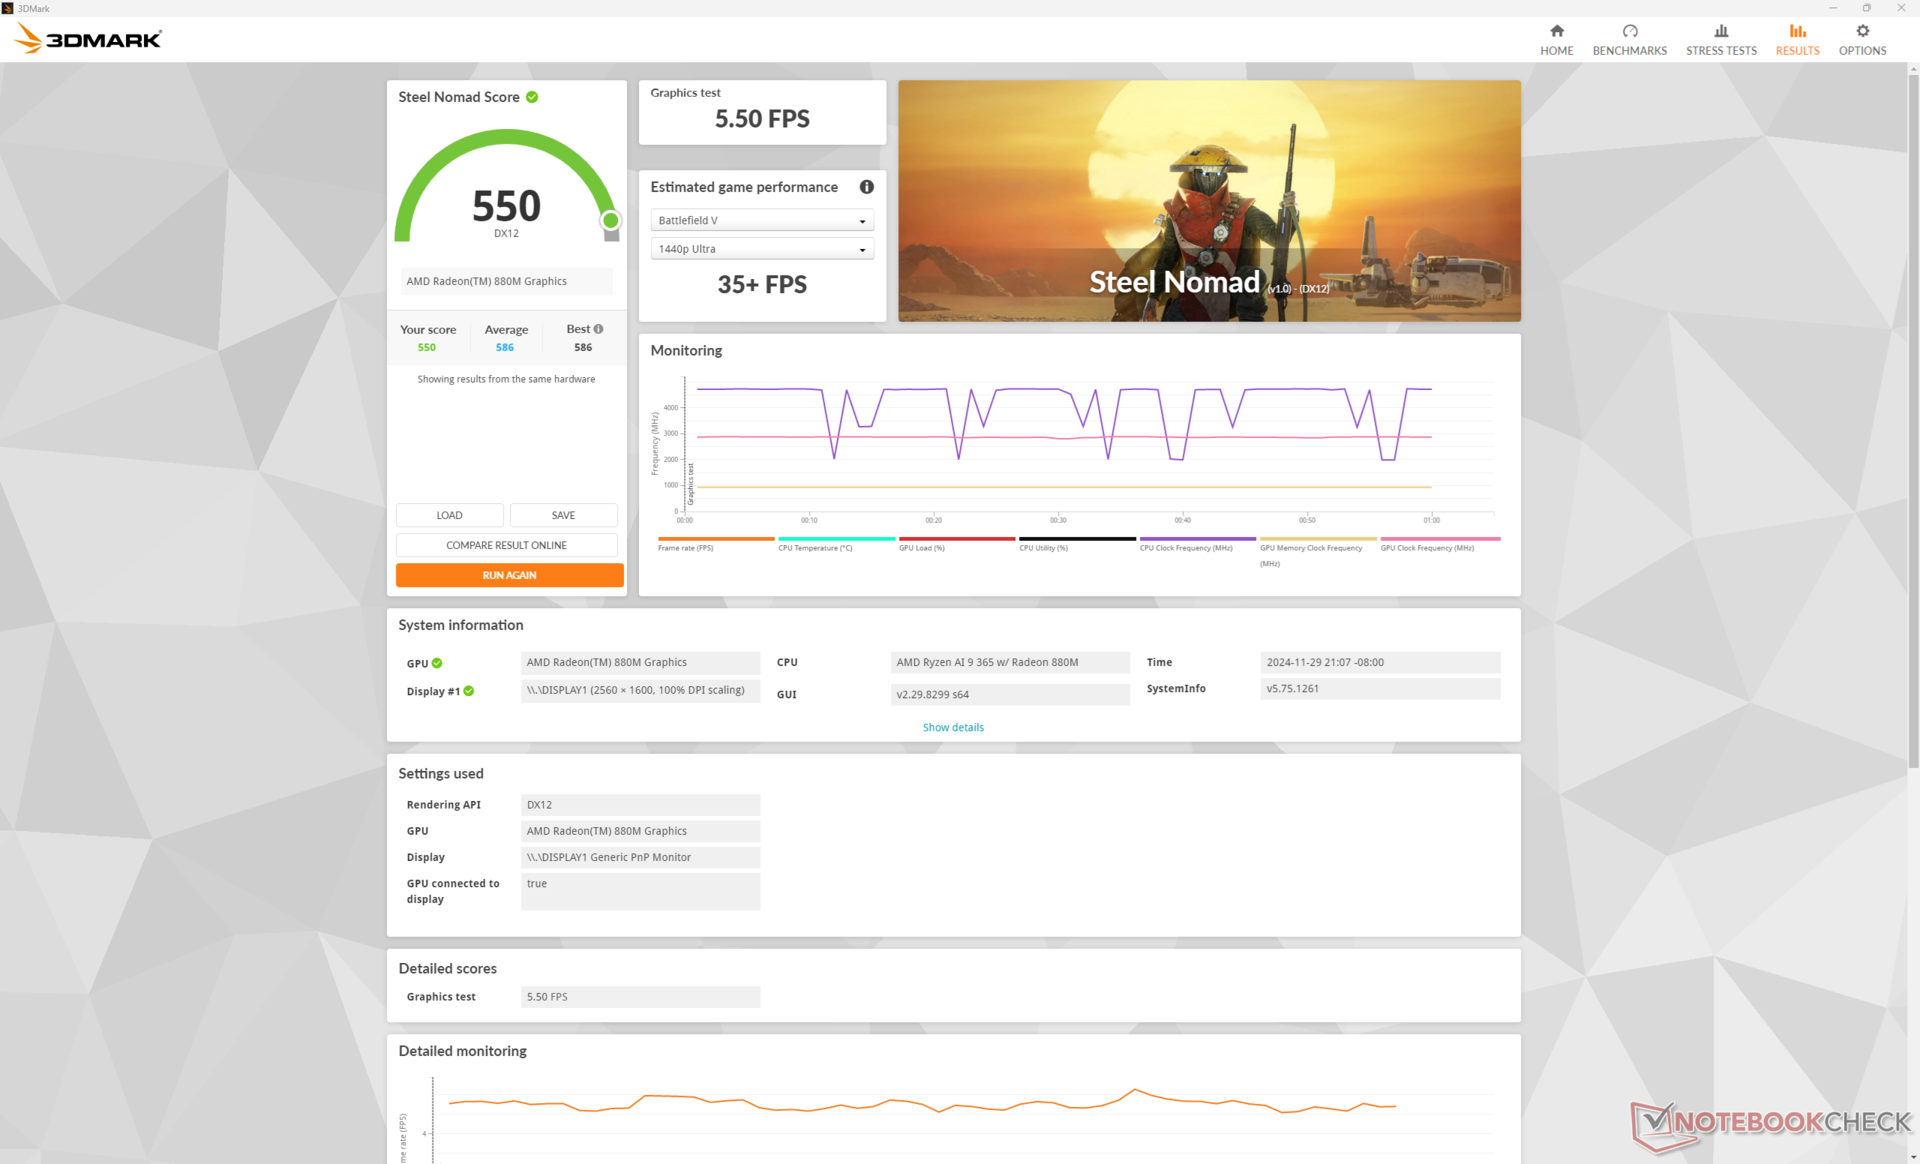
| 3DMark Steel Nomad Score | 550 pkt. | |
Pomoc | ||
* ... im mniej tym lepiej
Cyberpunk 2077 ultra FPS Chart
| low | med. | high | ultra | QHD | |
|---|---|---|---|---|---|
| GTA V (2015) | 170.6 | 80.5 | 32.5 | 22.3 | |
| Dota 2 Reborn (2015) | 156.7 | 133.6 | 47.2 | 46.2 | |
| Final Fantasy XV Benchmark (2018) | 87 | 43.7 | 31.4 | 23.2 | |
| X-Plane 11.11 (2018) | 79.9 | 63.1 | 48.8 | ||
| Far Cry 5 (2018) | 102 | 58 | 53 | 50 | |
| Strange Brigade (2018) | 192.9 | 79.7 | 67 | 56.7 | 35.7 |
| Tiny Tina's Wonderlands (2022) | 84.9 | 61.4 | 40.2 | 31.9 | |
| F1 22 (2022) | 101.1 | 92.5 | 70.3 | 18.3 | 11.2 |
| Baldur's Gate 3 (2023) | 44.1 | 36.1 | 29.9 | 28.9 | |
| Cyberpunk 2077 (2023) | 49.5 | 38.3 | 30.4 | 26.3 | 19.1 |
Emisje
Hałas systemowy
Hałas wentylatorów nie jest dużo cichszy niż wcześniej, pomimo braku oddzielnego GPU. Wentylatory są prawie zawsze aktywne bez względu na obciążenie i stosunkowo szybko przyspieszają, gdy wprowadzane są wyższe obciążenia. Co więcej, hałas wentylatorów jest wysoki, więc wszelkie zmiany prędkości obrotowej są bardziej zauważalne.
Przy ponad 46 dB(A) podczas grania, Summit A16 może być tak głośny, jak wiele dedykowanych laptopów do gier.
Hałas
| luz |
| 25 / 25 / 29.5 dB |
| obciążenie |
| 37.5 / 56.1 dB |
 | ||
30 dB cichy 40 dB(A) słyszalny 50 dB(A) irytujący |
||
min: | ||
| MSI Summit A16 AI Plus A3HMTG Radeon 880M, Ryzen AI 9 365, Samsung PM9C1 MZVL81T0HELB-00BTW | MSI Summit E16 Flip A12UDT-031 GeForce RTX 3050 Ti Laptop GPU, i7-1280P, Samsung PM9A1 MZVL22T0HBLB | HP Spectre x360 16 RTX 4050 GeForce RTX 4050 Laptop GPU, Ultra 7 155H, SK hynix PC801 HFS001TEJ9X101N | Asus ExpertBook B5 Flip B5602FBN A350M, i7-1260P, WD PC SN735 SDBPNHH-1T00 | LG gram Pro 2-in-1 16T90SP Arc 8-Core, Ultra 7 155H, SK hynix PC801 HFS001TEJ9X101N | Lenovo Yoga 7 2-in-1 16IML9 Graphics 4-Core iGPU (Arrow Lake), Ultra 5 125U, SK hynix HFS512GEJ4X112N | |
|---|---|---|---|---|---|---|
| Noise | -3% | 17% | -6% | 5% | 15% | |
| wyłączone / środowisko * (dB) | 23.8 | 25 -5% | 23.3 2% | 27.5 -16% | 25.12 -6% | 22.8 4% |
| Idle Minimum * (dB) | 25 | 25 -0% | 23.6 6% | 27.5 -10% | 25.12 -0% | 22.8 9% |
| Idle Average * (dB) | 25 | 25 -0% | 23.6 6% | 27.5 -10% | 26.17 -5% | 22.8 9% |
| Idle Maximum * (dB) | 29.5 | 28.9 2% | 23.6 20% | 28.3 4% | 26.17 11% | 22.8 23% |
| Load Average * (dB) | 37.5 | 49.3 -31% | 29.2 22% | 40.7 -9% | 36.33 3% | 30.8 18% |
| Cyberpunk 2077 ultra * (dB) | 46.5 | |||||
| Load Maximum * (dB) | 56.1 | 48.2 14% | 32.1 43% | 53.6 4% | 41.61 26% | 40.8 27% |
| Witcher 3 ultra * (dB) | 32.1 | 31 |
* ... im mniej tym lepiej
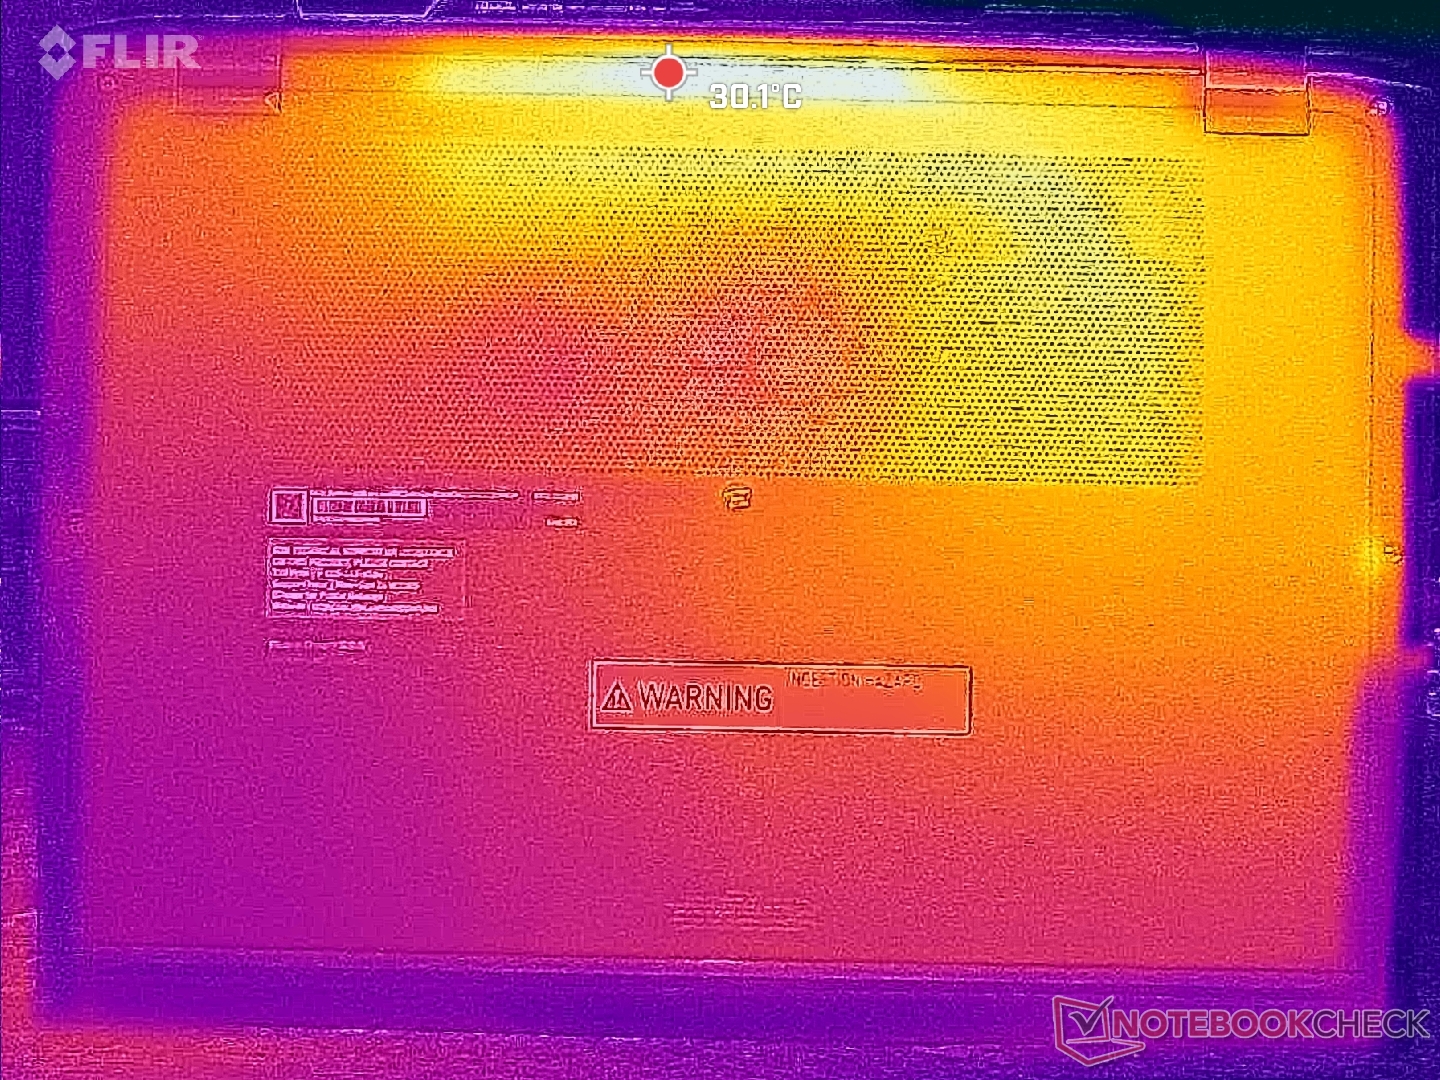
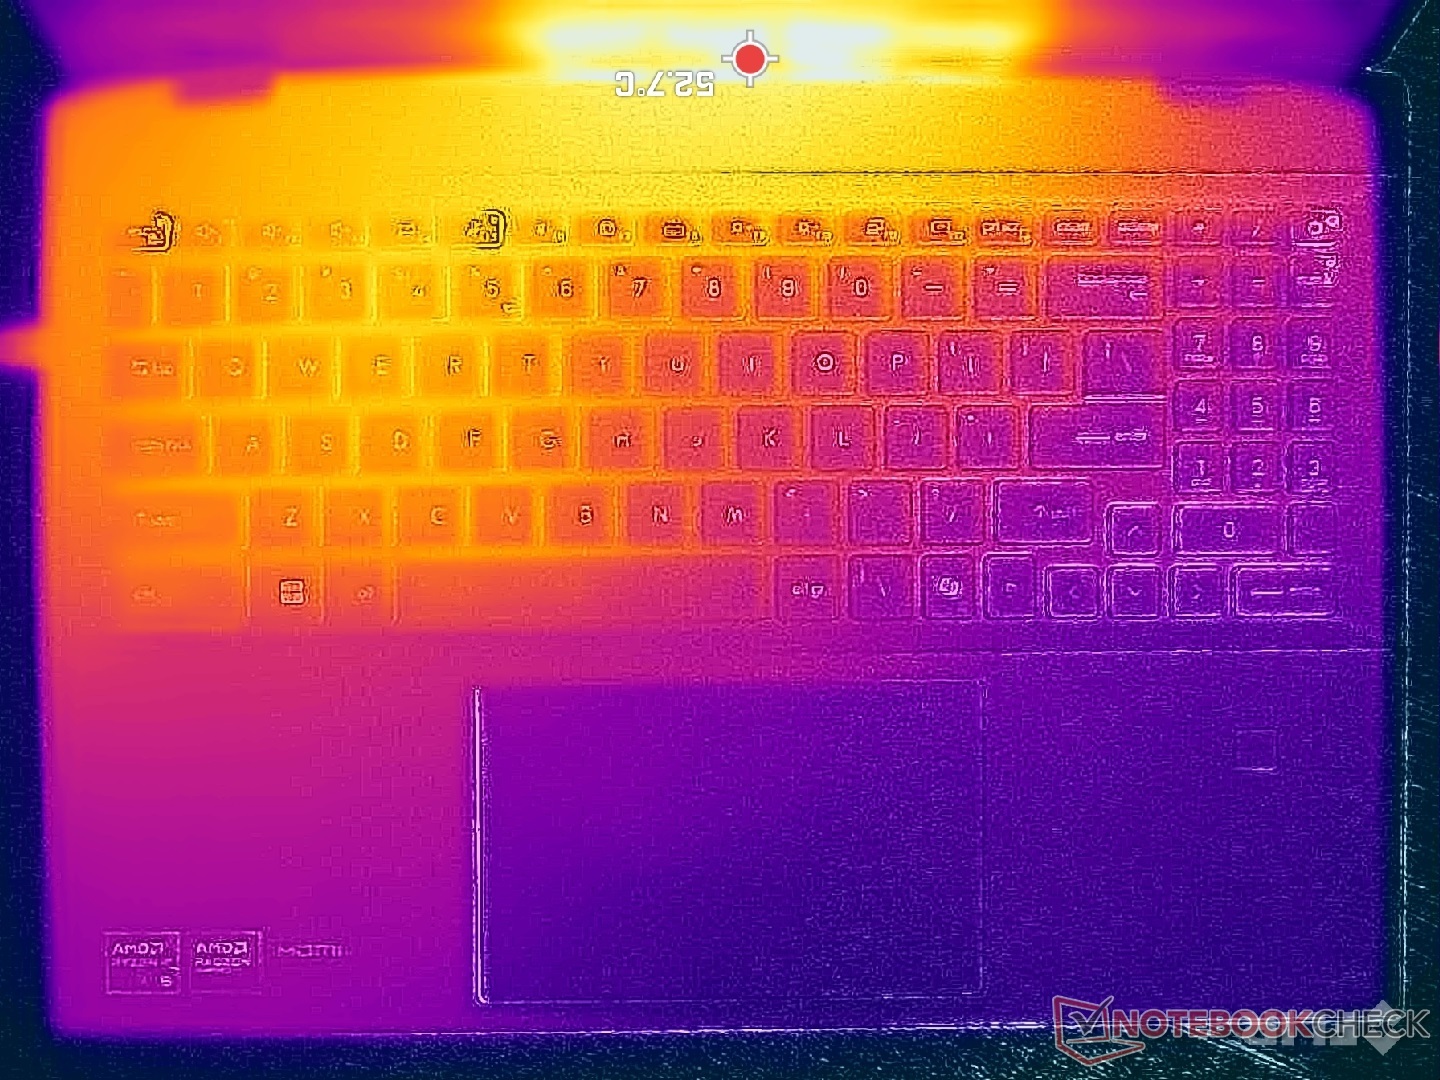
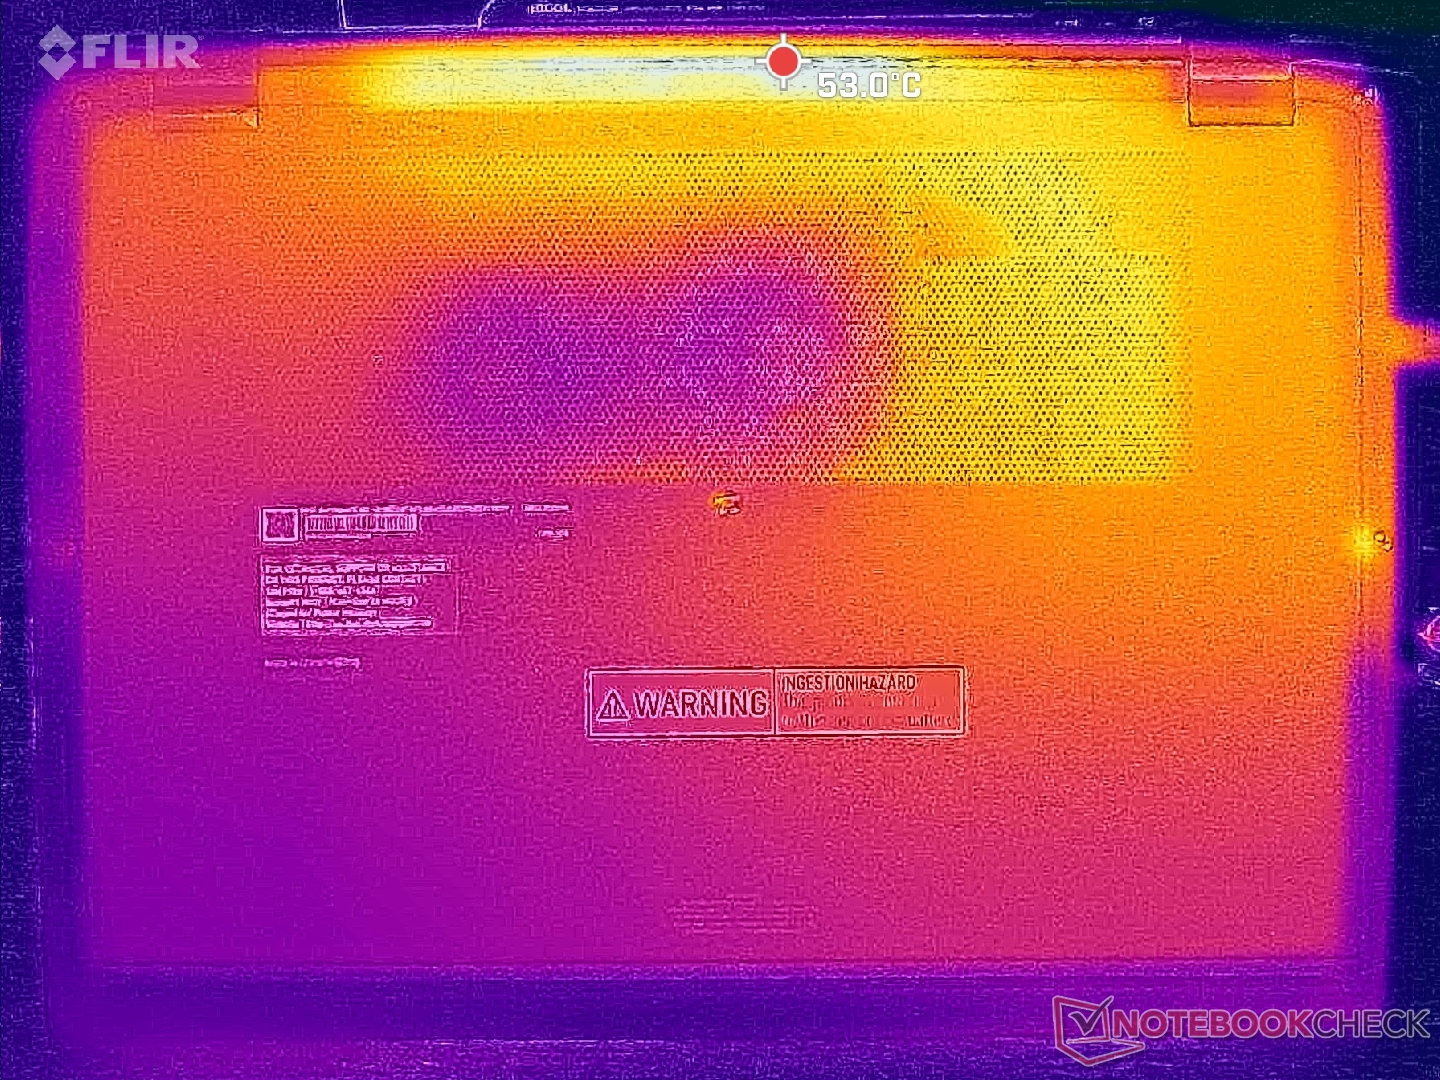
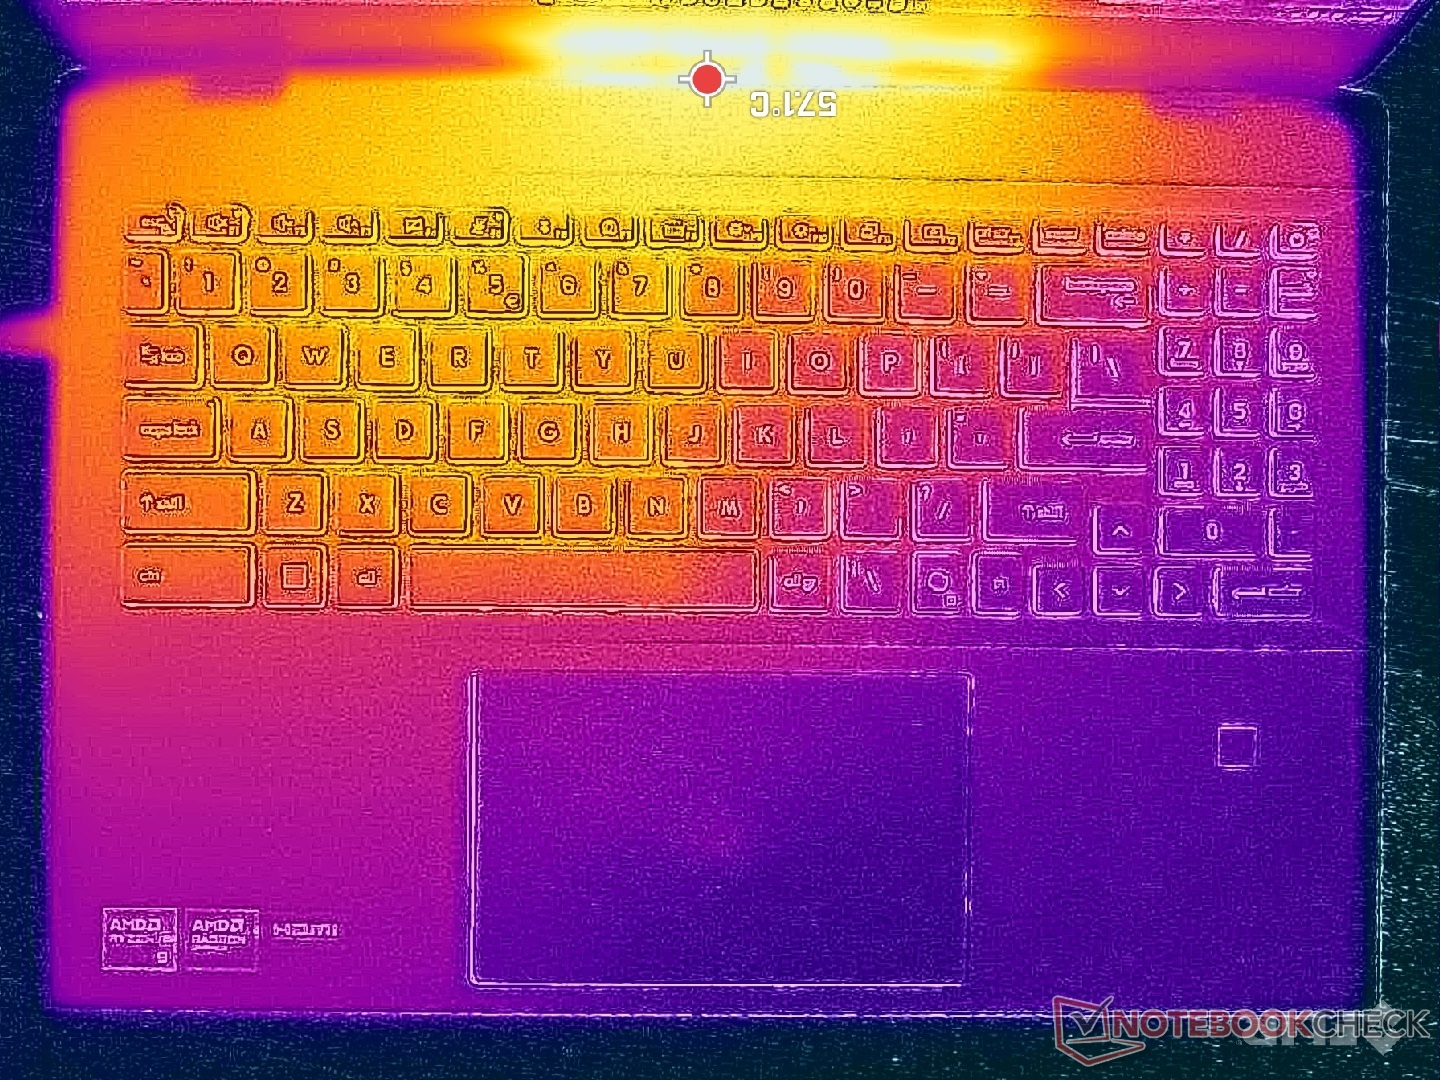
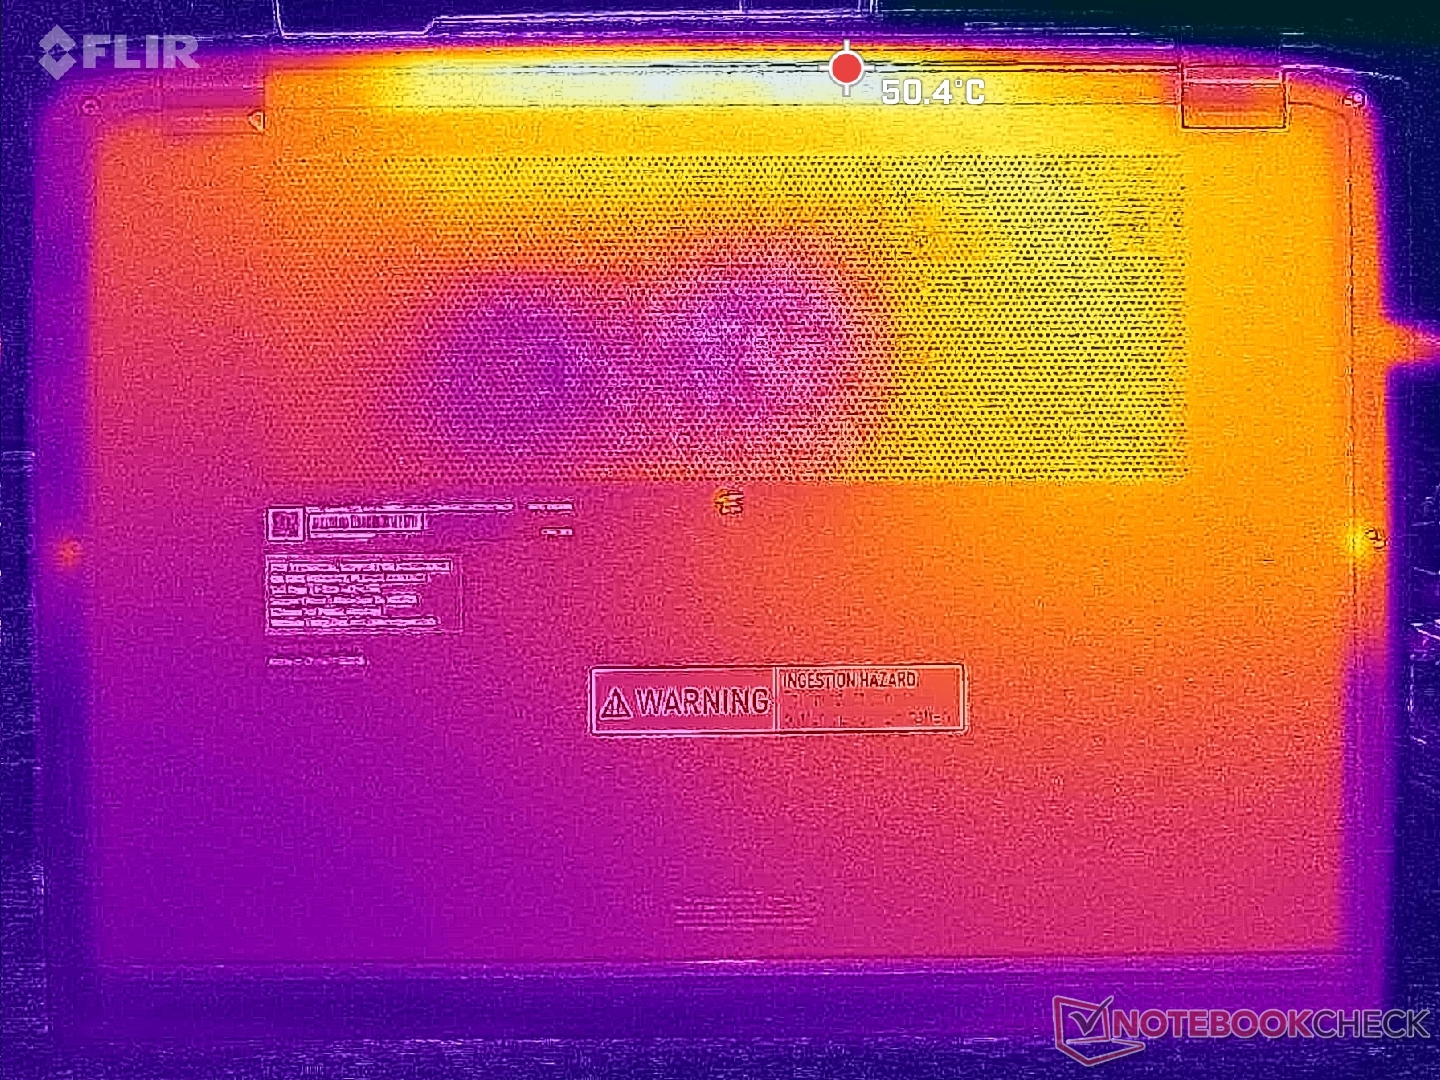
Temperatura
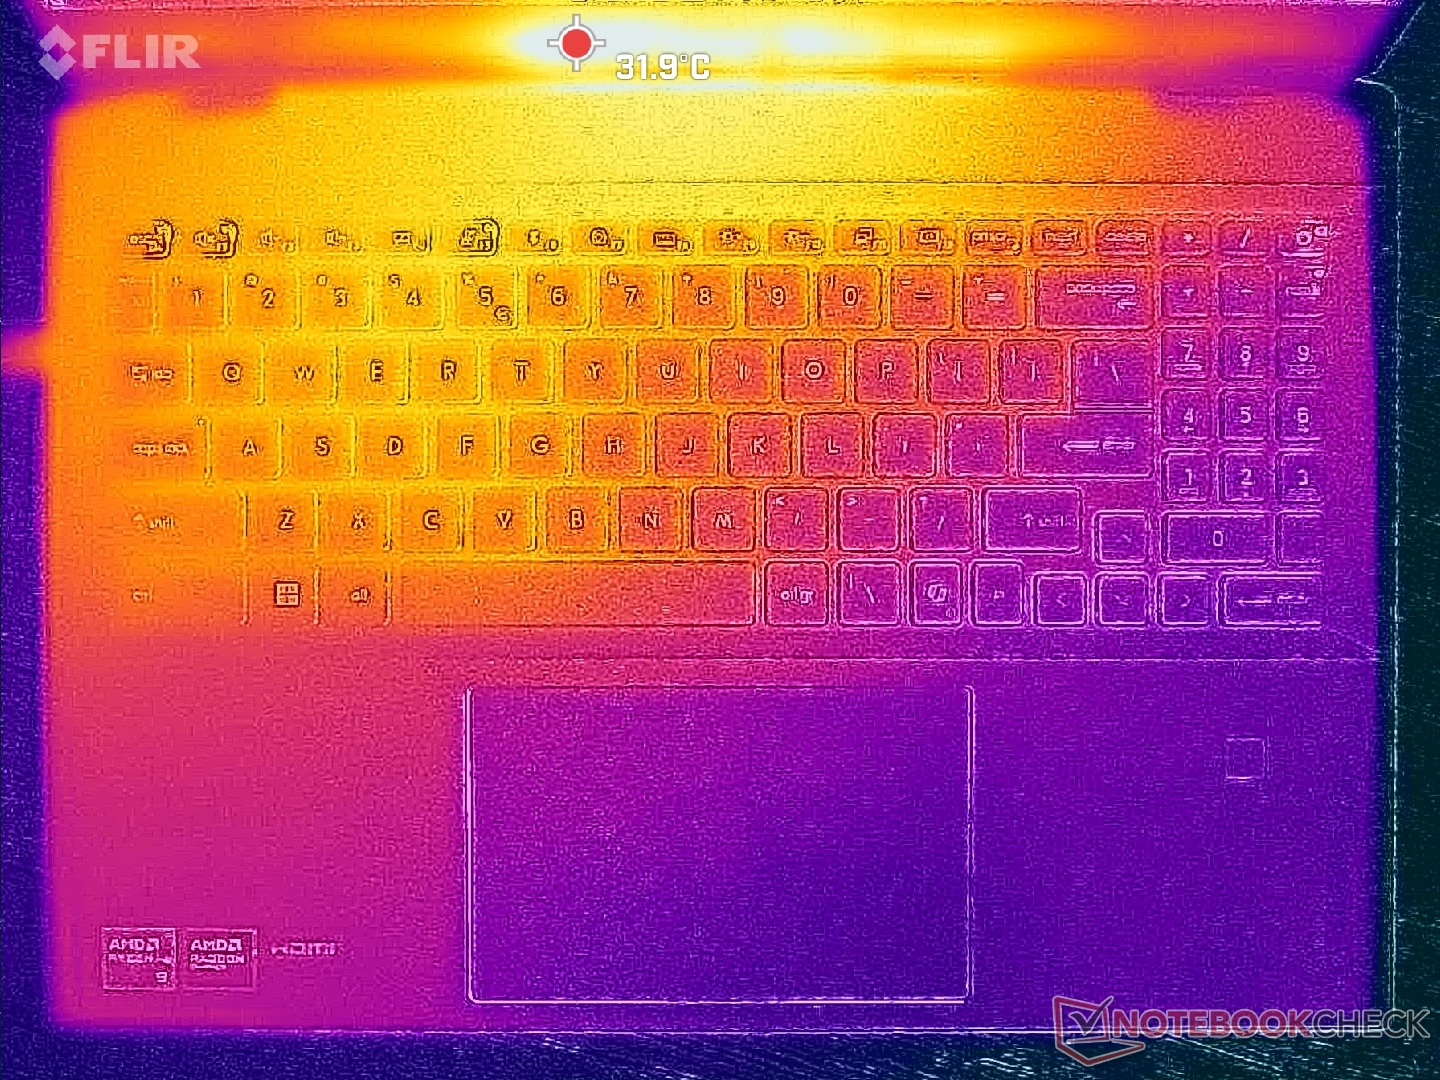
Gorące punkty mogą być bardzo ciepłe wzdłuż tylnej części, znacznie przekraczając 45 C podczas pracy z wymagającymi obciążeniami. Średnia temperatura powierzchni jest jednak niższa niż w modelu 2022, ponieważ nasza jednostka AMD nie posiada dedykowanego GPU. Jest to oczywiste, ponieważ prawa połowa naszego modelu 2024 byłaby znacznie chłodniejsza niż prawa połowa modelu 2022, w którym znajdowałby się dGPU.
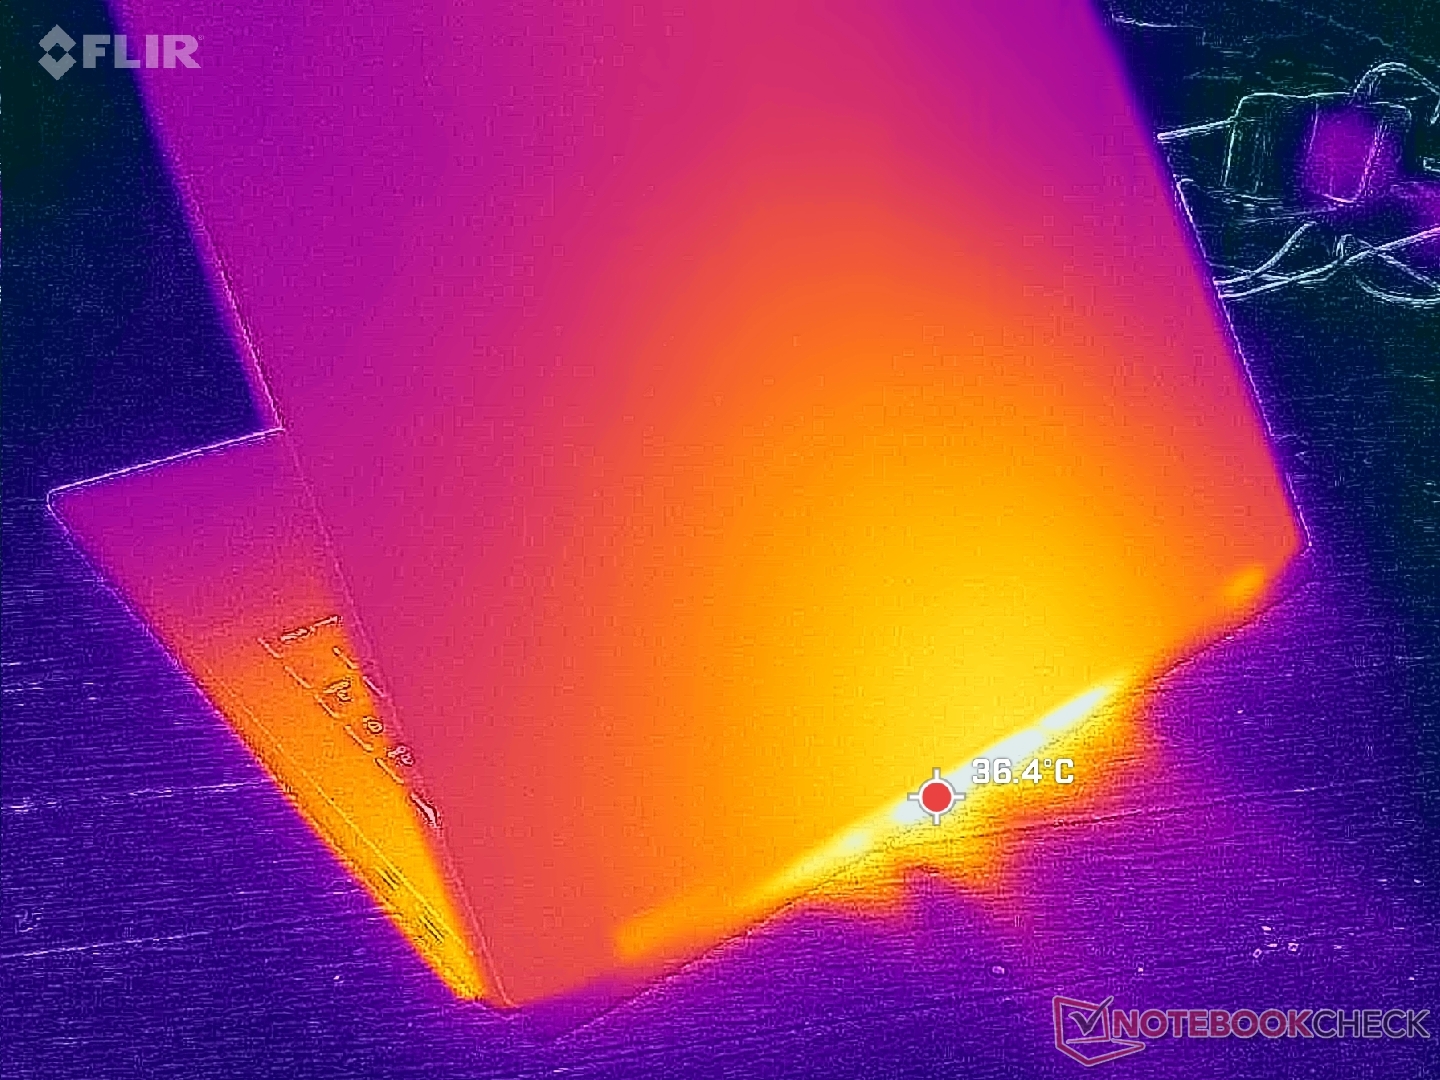
(-) Maksymalna temperatura w górnej części wynosi 52.8 °C / 127 F, w porównaniu do średniej 35.4 °C / 96 F , począwszy od 19.6 do 60 °C dla klasy Convertible.
(±) Dno nagrzewa się maksymalnie do 42 °C / 108 F, w porównaniu do średniej 36.9 °C / 98 F
(+) W stanie bezczynności średnia temperatura górnej części wynosi 25.2 °C / 77 F, w porównaniu ze średnią temperaturą urządzenia wynoszącą 30.3 °C / ### class_avg_f### F.
(±) 3: The average temperature for the upper side is 34.9 °C / 95 F, compared to the average of 30.3 °C / 87 F for the class Convertible.
(+) Podpórki pod nadgarstki i touchpad są chłodniejsze niż temperatura skóry i maksymalnie 30.4 °C / 86.7 F i dlatego są chłodne w dotyku.
(-) Średnia temperatura obszaru podparcia dłoni w podobnych urządzeniach wynosiła 28 °C / 82.4 F (-2.4 °C / -4.3 F).
| MSI Summit A16 AI Plus A3HMTG AMD Ryzen AI 9 365, AMD Radeon 880M | MSI Summit E16 Flip A12UDT-031 Intel Core i7-1280P, NVIDIA GeForce RTX 3050 Ti Laptop GPU | HP Spectre x360 16 RTX 4050 Intel Core Ultra 7 155H, NVIDIA GeForce RTX 4050 Laptop GPU | Asus ExpertBook B5 Flip B5602FBN Intel Core i7-1260P, Intel Arc A350M | LG gram Pro 2-in-1 16T90SP Intel Core Ultra 7 155H, Intel Arc 8-Core iGPU | Lenovo Yoga 7 2-in-1 16IML9 Intel Core Ultra 5 125U, Intel Graphics 4-Core iGPU (Meteor / Arrow Lake) | |
|---|---|---|---|---|---|---|
| Heat | -3% | 8% | 11% | 3% | 16% | |
| Maximum Upper Side * (°C) | 52.8 | 49.2 7% | 39.6 25% | 37.9 28% | 34.5 35% | 37.8 28% |
| Maximum Bottom * (°C) | 42 | 50.2 -20% | 39.2 7% | 39.4 6% | 55.4 -32% | 38.8 8% |
| Idle Upper Side * (°C) | 30.6 | 29.4 4% | 29 5% | 28.8 6% | 28.7 6% | 25.4 17% |
| Idle Bottom * (°C) | 29.6 | 30 -1% | 31.6 -7% | 29.1 2% | 28.7 3% | 26.8 9% |
* ... im mniej tym lepiej
Głośniki
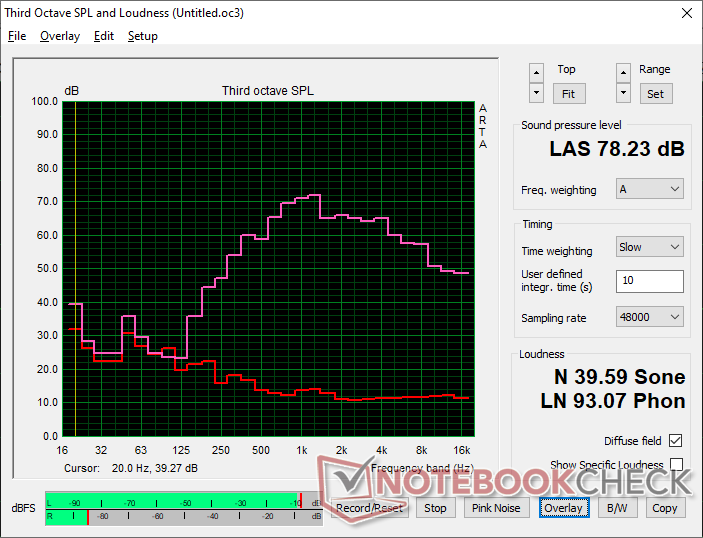
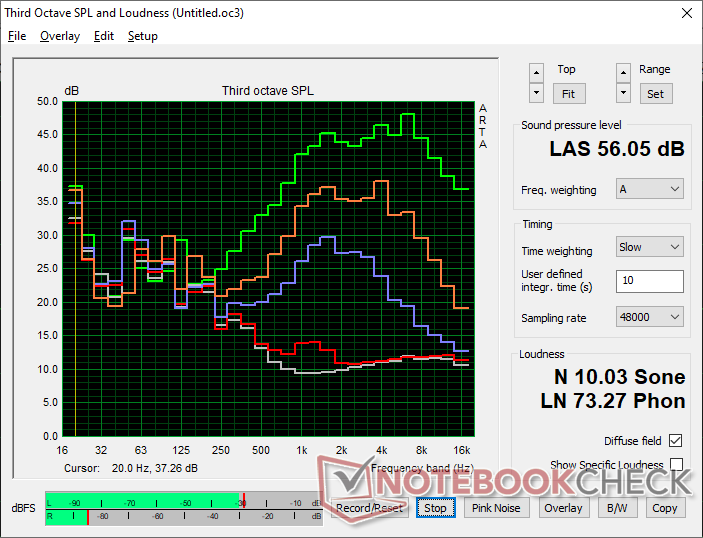
MSI Summit A16 AI Plus A3HMTG analiza dźwięku
(±) | głośność głośnika jest średnia, ale dobra (78.2 dB)
Bas 100 - 315 Hz
(-) | prawie brak basu - średnio 20.8% niższa od mediany
(±) | liniowość basu jest średnia (11.7% delta do poprzedniej częstotliwości)
Średnie 400 - 2000 Hz
(±) | wyższe średnie - średnio 7.2% wyższe niż mediana
(±) | liniowość środka jest średnia (7.7% delta do poprzedniej częstotliwości)
Wysokie 2–16 kHz
(+) | zrównoważone maksima - tylko 4.3% od mediany
(+) | wzloty są liniowe (5.3% delta do poprzedniej częstotliwości)
Ogólnie 100 - 16.000 Hz
(±) | liniowość ogólnego dźwięku jest średnia (23.5% różnicy w stosunku do mediany)
W porównaniu do tej samej klasy
» 71% wszystkich testowanych urządzeń w tej klasie było lepszych, 5% podobnych, 24% gorszych
» Najlepszy miał deltę 6%, średnia wynosiła ###średnia###%, najgorsza wynosiła 57%
W porównaniu do wszystkich testowanych urządzeń
» 70% wszystkich testowanych urządzeń było lepszych, 6% podobnych, 24% gorszych
» Najlepszy miał deltę 4%, średnia wynosiła ###średnia###%, najgorsza wynosiła 134%
Apple MacBook Pro 16 2021 M1 Pro analiza dźwięku
(+) | głośniki mogą odtwarzać stosunkowo głośno (84.7 dB)
Bas 100 - 315 Hz
(+) | dobry bas - tylko 3.8% od mediany
(+) | bas jest liniowy (5.2% delta do poprzedniej częstotliwości)
Średnie 400 - 2000 Hz
(+) | zbalansowane środki średnie - tylko 1.3% od mediany
(+) | średnie są liniowe (2.1% delta do poprzedniej częstotliwości)
Wysokie 2–16 kHz
(+) | zrównoważone maksima - tylko 1.9% od mediany
(+) | wzloty są liniowe (2.7% delta do poprzedniej częstotliwości)
Ogólnie 100 - 16.000 Hz
(+) | ogólny dźwięk jest liniowy (4.6% różnicy w stosunku do mediany)
W porównaniu do tej samej klasy
» 0% wszystkich testowanych urządzeń w tej klasie było lepszych, 0% podobnych, 100% gorszych
» Najlepszy miał deltę 5%, średnia wynosiła ###średnia###%, najgorsza wynosiła 45%
W porównaniu do wszystkich testowanych urządzeń
» 0% wszystkich testowanych urządzeń było lepszych, 0% podobnych, 100% gorszych
» Najlepszy miał deltę 4%, średnia wynosiła ###średnia###%, najgorsza wynosiła 134%
Zarządzanie energią
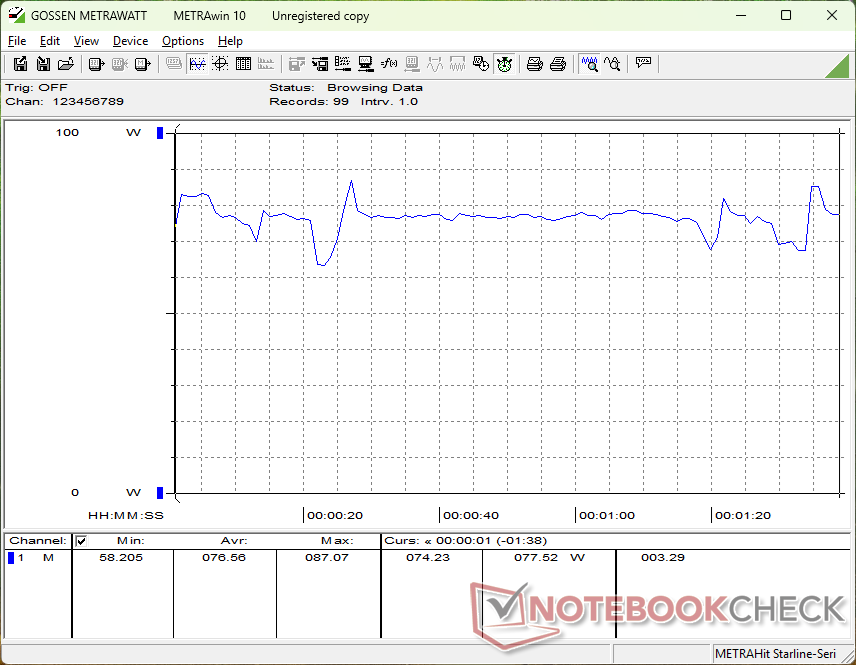
Zużycie energii
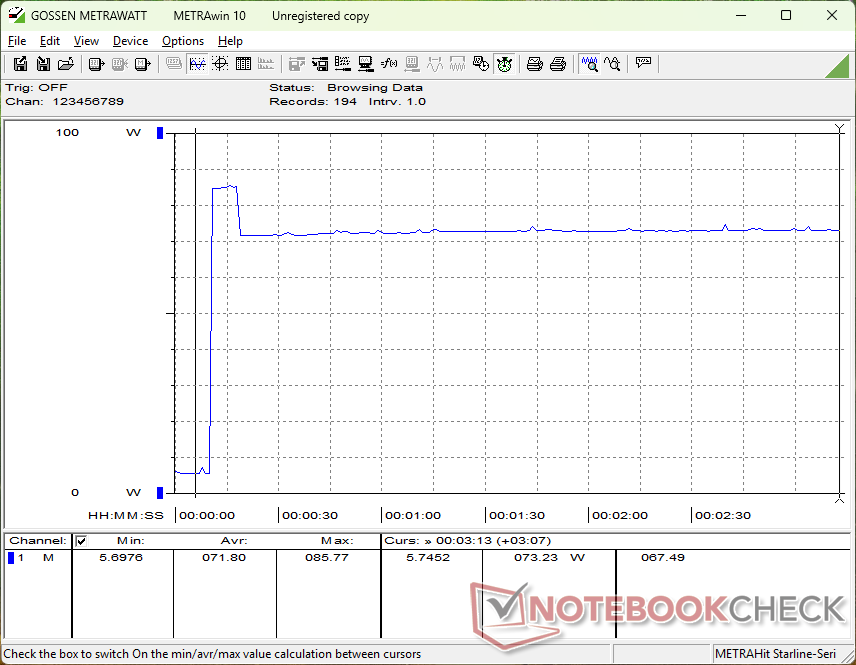
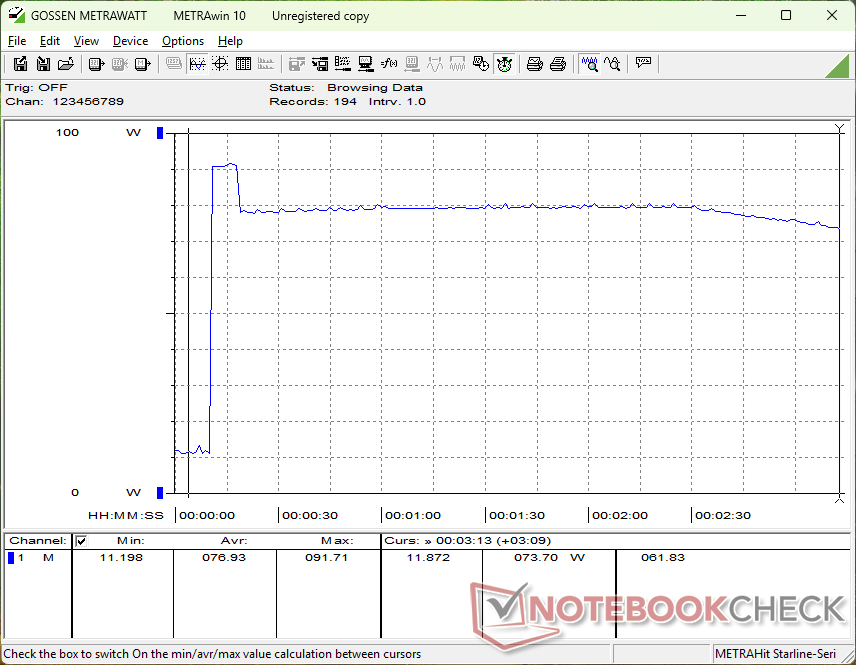
Nasz system AMD jest mniej wymagający niż model Intel-Nvidia 2022 o kilka watów na biegu jałowym, co przyczynia się do ogólnie dłuższego czasu pracy na baterii, jak odnotowano w następnej sekcji poniżej. Zużycie energii może być o kilka watów wyższe podczas uruchamiania stresu Prime95, ale jest to równoważone przez szybszą wydajność procesora, więc wydajność na wat jest nadal na korzyść naszej jednostki zasilanej przez AMD.
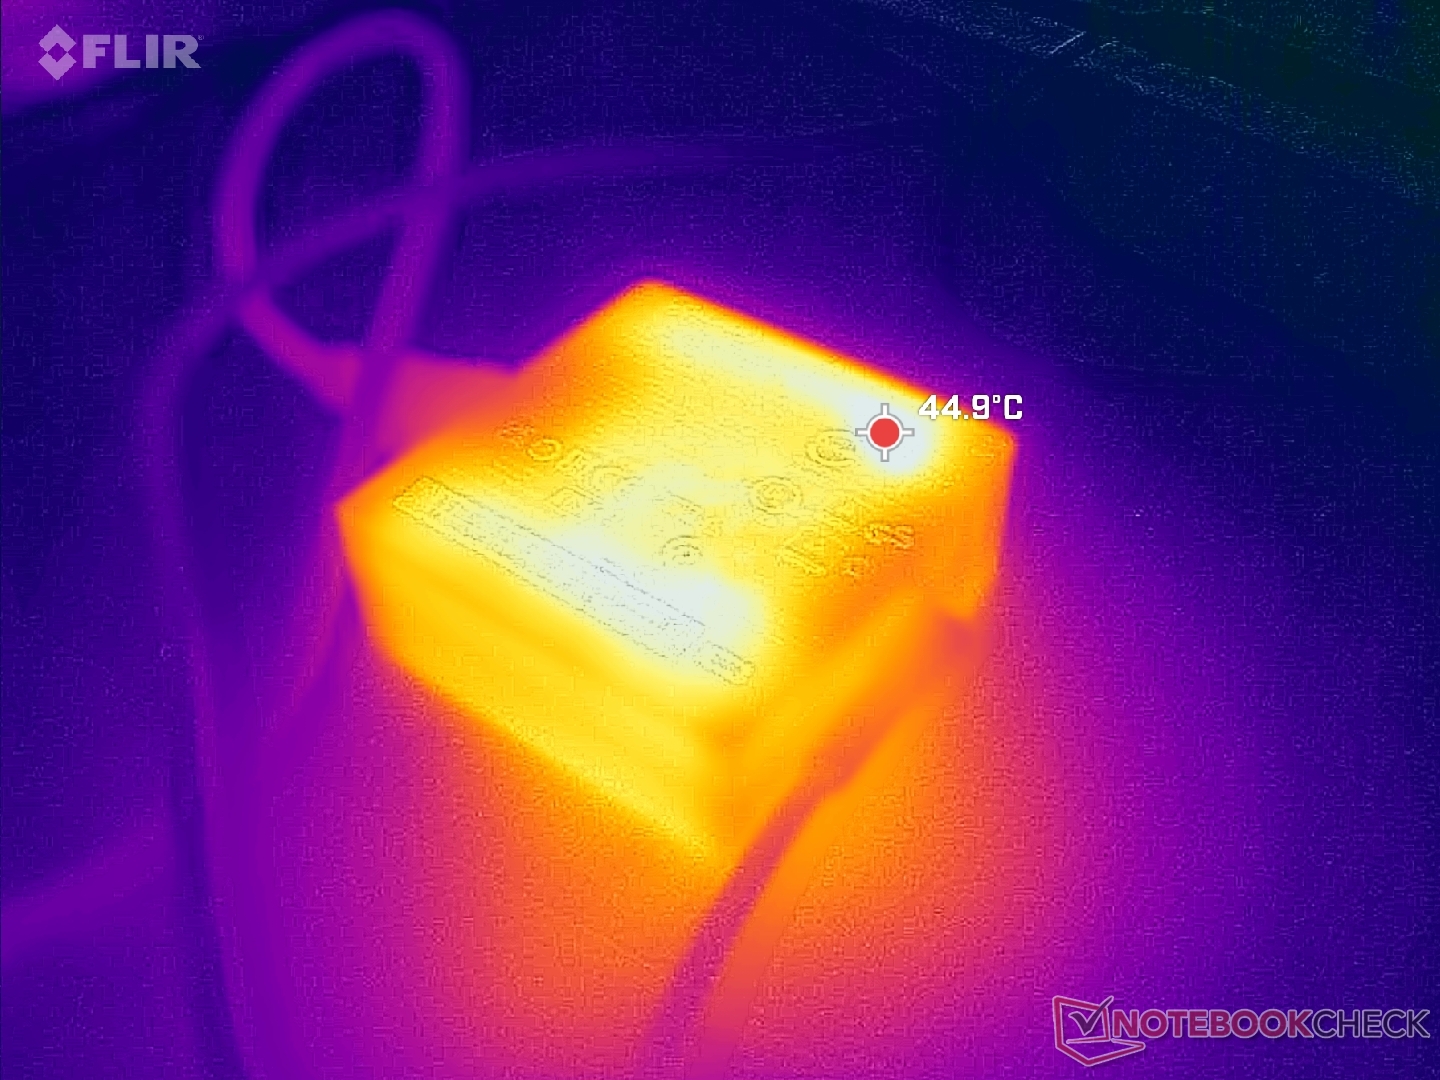
Zasilacz sieciowy USB-C o mocy 100 W jest dość mały i ma zaledwie 7,5 x 7,5 x 2,9 cm.
| wyłączony / stan wstrzymania | |
| luz | |
| obciążenie |
|
Legenda:
min: | |
| MSI Summit A16 AI Plus A3HMTG Ryzen AI 9 365, Radeon 880M, Samsung PM9C1 MZVL81T0HELB-00BTW, IPS, 2560x1600, 16" | MSI Summit E16 Flip A12UDT-031 i7-1280P, GeForce RTX 3050 Ti Laptop GPU, Samsung PM9A1 MZVL22T0HBLB, IPS, 2560x1600, 16" | HP Spectre x360 16 RTX 4050 Ultra 7 155H, GeForce RTX 4050 Laptop GPU, SK hynix PC801 HFS001TEJ9X101N, OLED, 2880x1800, 16" | Asus ExpertBook B5 Flip B5602FBN i7-1260P, A350M, WD PC SN735 SDBPNHH-1T00, OLED, 3840x2400, 16" | LG gram Pro 2-in-1 16T90SP Ultra 7 155H, Arc 8-Core, SK hynix PC801 HFS001TEJ9X101N, OLED, 2880x1800, 16" | Lenovo Yoga 7 2-in-1 16IML9 Ultra 5 125U, Graphics 4-Core iGPU (Arrow Lake), SK hynix HFS512GEJ4X112N, IPS, 1920x1200, 16" | |
|---|---|---|---|---|---|---|
| Power Consumption | -38% | -53% | 3% | 24% | 33% | |
| Idle Minimum * (Watt) | 5.4 | 9.8 -81% | 5.8 -7% | 6.5 -20% | 6 -11% | 3 44% |
| Idle Average * (Watt) | 11 | 15.3 -39% | 12.3 -12% | 7.6 31% | 7.5 32% | 8.5 23% |
| Idle Maximum * (Watt) | 11.2 | 16.3 -46% | 33.9 -203% | 9.8 12% | 8.2 27% | 8.9 21% |
| Load Average * (Watt) | 76.6 | 87 -14% | 83.3 -9% | 85 -11% | 45.2 41% | 41.1 46% |
| Cyberpunk 2077 ultra external monitor * (Watt) | 49.2 | |||||
| Cyberpunk 2077 ultra * (Watt) | 61.1 | |||||
| Load Maximum * (Watt) | 91.8 | 100 -9% | 120.8 -32% | 91 1% | 61.4 33% | 64.6 30% |
| Witcher 3 ultra * (Watt) | 86.1 | 89.1 | 85.6 | 38.9 | 30.7 |
* ... im mniej tym lepiej
Power Consumption Cyberpunk / Stress Test
Power Consumption external Monitor
Żywotność baterii
Czas działania WLAN jest o około dwie godziny dłuższy niż w naszym modelu 2022, głównie ze względu na brak dedykowanego procesora graficznego w naszej jednostce 2024.
| MSI Summit A16 AI Plus A3HMTG Ryzen AI 9 365, Radeon 880M, 82 Wh | MSI Summit E16 Flip A12UDT-031 i7-1280P, GeForce RTX 3050 Ti Laptop GPU, 82 Wh | HP Spectre x360 16 RTX 4050 Ultra 7 155H, GeForce RTX 4050 Laptop GPU, 83 Wh | Asus ExpertBook B5 Flip B5602FBN i7-1260P, A350M, 84 Wh | LG gram Pro 2-in-1 16T90SP Ultra 7 155H, Arc 8-Core, 77 Wh | Lenovo Yoga 7 2-in-1 16IML9 Ultra 5 125U, Graphics 4-Core iGPU (Arrow Lake), 71 Wh | |
|---|---|---|---|---|---|---|
| Czasy pracy | -22% | 21% | -11% | 7% | 35% | |
| WiFi v1.3 (h) | 9.1 | 7.1 -22% | 11 21% | 8.1 -11% | 9.7 7% | 12.3 35% |
| Load (h) | 1.7 |
Ocena Notebookcheck
MSI Summit A16 AI Plus A3HMTG
- 05/12/2024 v8
Allen Ngo
 Total Sustainability Score:
 Przezroczystość
Wyboru urządzeń do recenzji dokonuje nasza redakcja. Próbka testowa została udostępniona autorowi jako pożyczka od producenta lub sprzedawcy detalicznego na potrzeby tej recenzji. Pożyczkodawca nie miał wpływu na tę recenzję, producent nie otrzymał też kopii tej recenzji przed publikacją. Nie było obowiązku publikowania tej recenzji. Jako niezależna firma medialna, Notebookcheck nie podlega władzy producentów, sprzedawców detalicznych ani wydawców.
Tak testuje Notebookcheck
Każdego roku Notebookcheck niezależnie sprawdza setki laptopów i smartfonów, stosując standardowe procedury, aby zapewnić porównywalność wszystkich wyników. Od około 20 lat stale rozwijamy nasze metody badawcze, ustanawiając przy tym standardy branżowe. W naszych laboratoriach testowych doświadczeni technicy i redaktorzy korzystają z wysokiej jakości sprzętu pomiarowego. Testy te obejmują wieloetapowy proces walidacji. Nasz kompleksowy system ocen opiera się na setkach uzasadnionych pomiarów i benchmarków, co pozwala zachować obiektywizm.
