Recenzja laptopa Lenovo ThinkPad T16 Gen 1 Core i7: Cichość kosztem wydajności
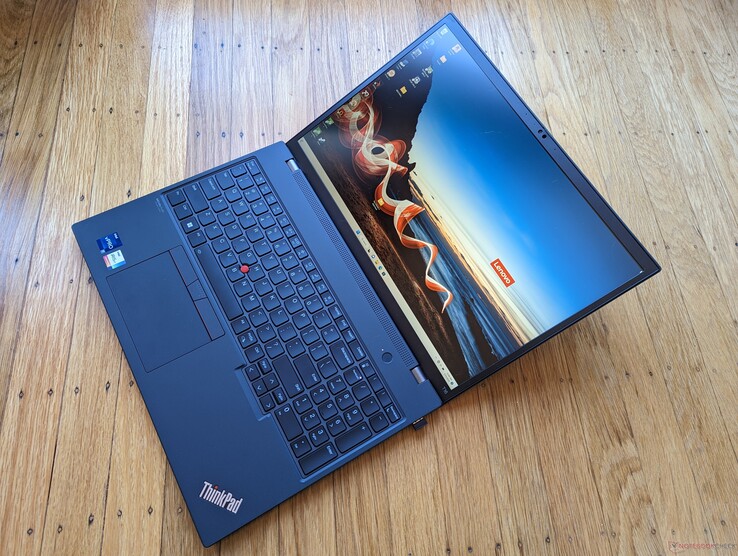
ThinkPad T16 G1 to drugi 16-calowy ThinkPad firmy Lenovo, który ma być krokiem naprzód w stosunku do istniejącej serii ThinkBook 16 dla użytkowników indywidualnych. Wyposażono go w procesory Core U i Core P 12. generacji oraz dyskretny układ graficzny GeForce MX550 w wybranych jednostkach.
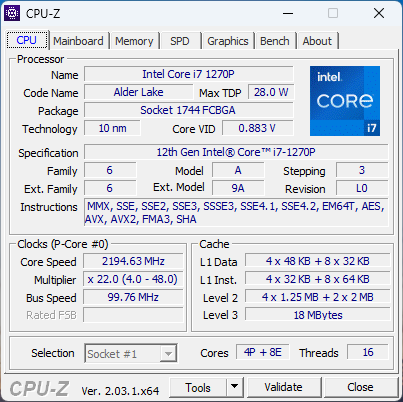
Ostatnio recenzowaliśmy konfiguracje Core i5-1240P i Ryzen 5 Pro 6650U, więc ta recenzja skupi się na konfiguracji Core i7-1270P. Polecamy zapoznać się z naszą dotychczasową recenzją Wersji z procesorem Core i5 by dowiedzieć się więcej o obudowie i innych cechach fizycznych ThinkPada T16 G1. Jak dużej różnicy w wydajności mogą oczekiwać użytkownicy po przesiadce na droższy wariant Core i7?
Konkurenci ThinkPada T16 G1 to m.in. 16-calowy LG Gram 16, MSI Summit E16, czy HP EliteBook 860/865 G9. W chwili pisania tego tekstu Dell nie wprowadził jeszcze na rynek bezpośredniego 16-calowego konkurenta Latitude. Nasza recenzowana konfiguracja kosztuje około 1800 USD.
Więcej recenzji Lenovo:
Potencjalni konkurenci w porównaniu
Ocena | Data | Model | Waga | Wysokość | Rozmiar | Rezolucja | Cena |
|---|---|---|---|---|---|---|---|
| 88.6 % v7 (old) | 01/2023 | Lenovo ThinkPad T16 Gen 1 Core i7-1270P i7-1270P, Iris Xe G7 96EUs | 2 kg | 20.5 mm | 16.00" | 1920x1200 | |
| 90.2 % v7 (old) | 02/2023 | Lenovo ThinkPad T16 G1 21CH004MGE R5 PRO 6650U, Radeon 660M | 1.8 kg | 20.5 mm | 16.00" | 2560x1600 | |
| 86.6 % v7 (old) | 01/2023 | LG Gram 16Z90Q i7-1260P, Iris Xe G7 96EUs | 1.2 kg | 16.8 mm | 16.00" | 2560x1600 | |
| 87.2 % v7 (old) | 12/2022 | HP EliteBook 865 G9 R7 PRO 6850U, Radeon 680M | 1.9 kg | 19 mm | 16.00" | 1920x1200 | |
| 86.4 % v7 (old) | Huawei MateBook 16s i7 i7-12700H, Iris Xe G7 96EUs | 2 kg | 17.8 mm | 16.00" | 2520x1680 | ||
| 93.2 % v7 (old) | Apple MacBook Pro 16 2021 M1 Pro M1 Pro, M1 Pro 16-Core GPU | 2.2 kg | 16.8 mm | 16.20" | 3456x2234 |
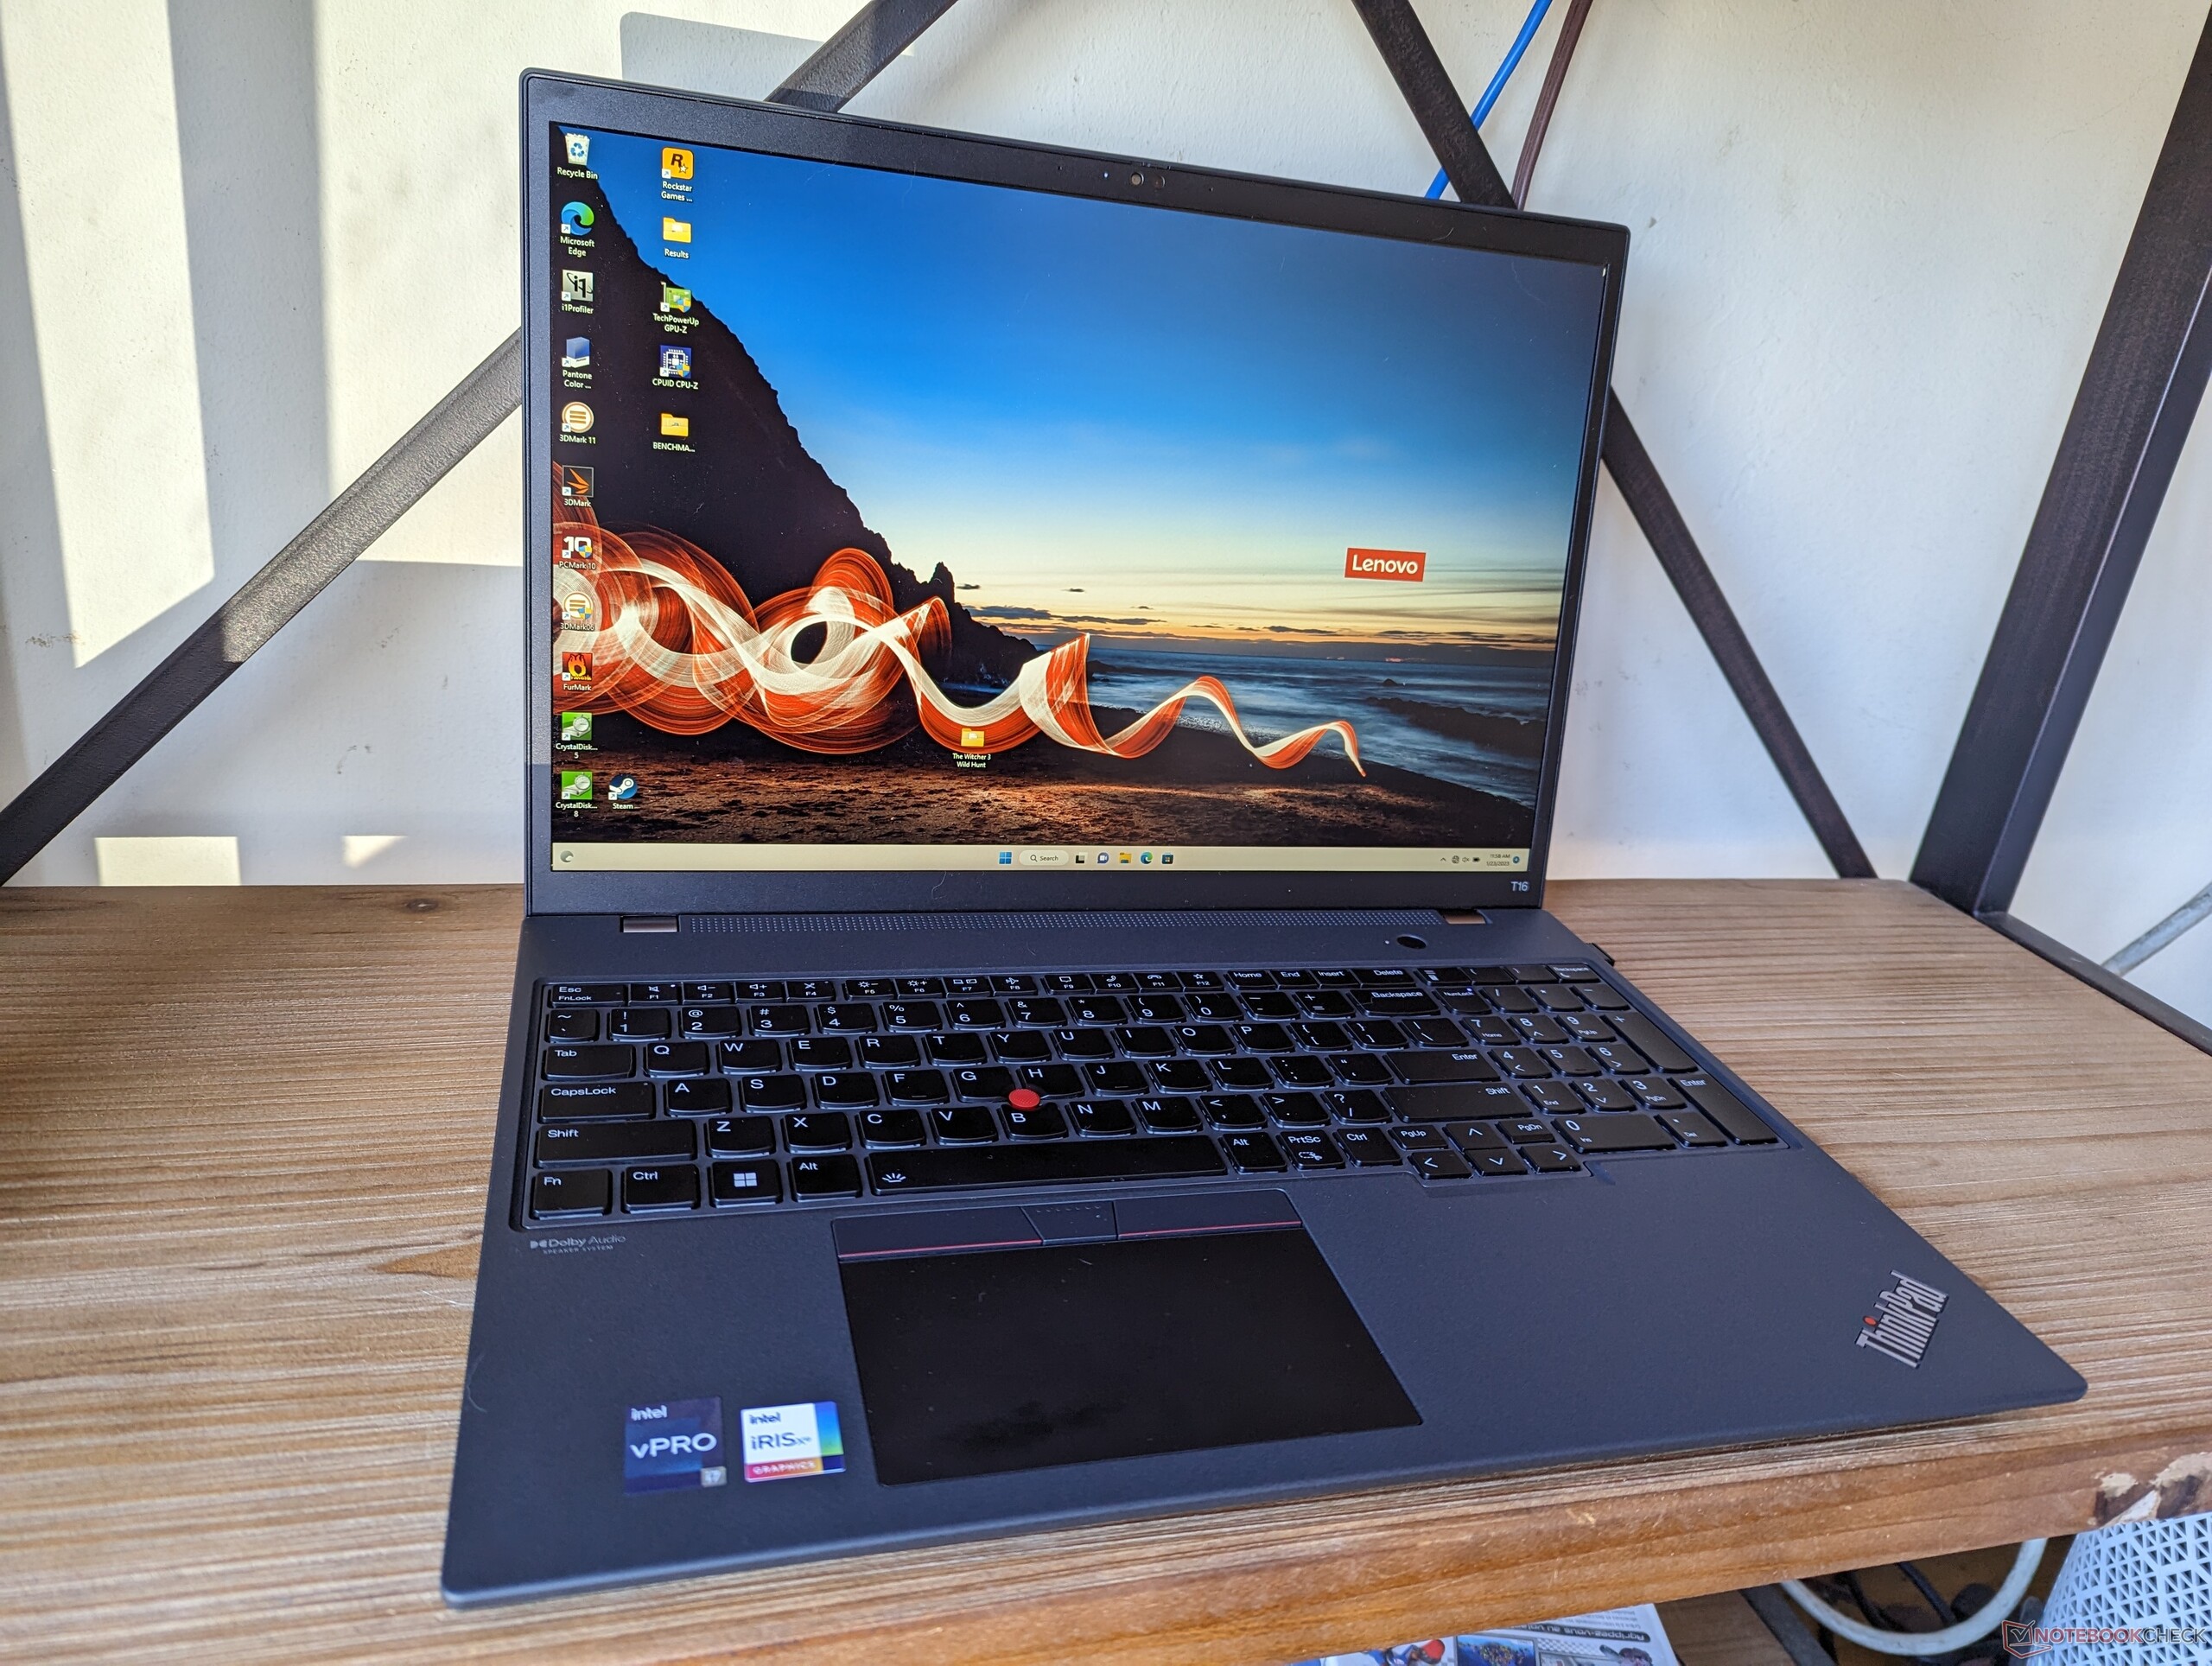
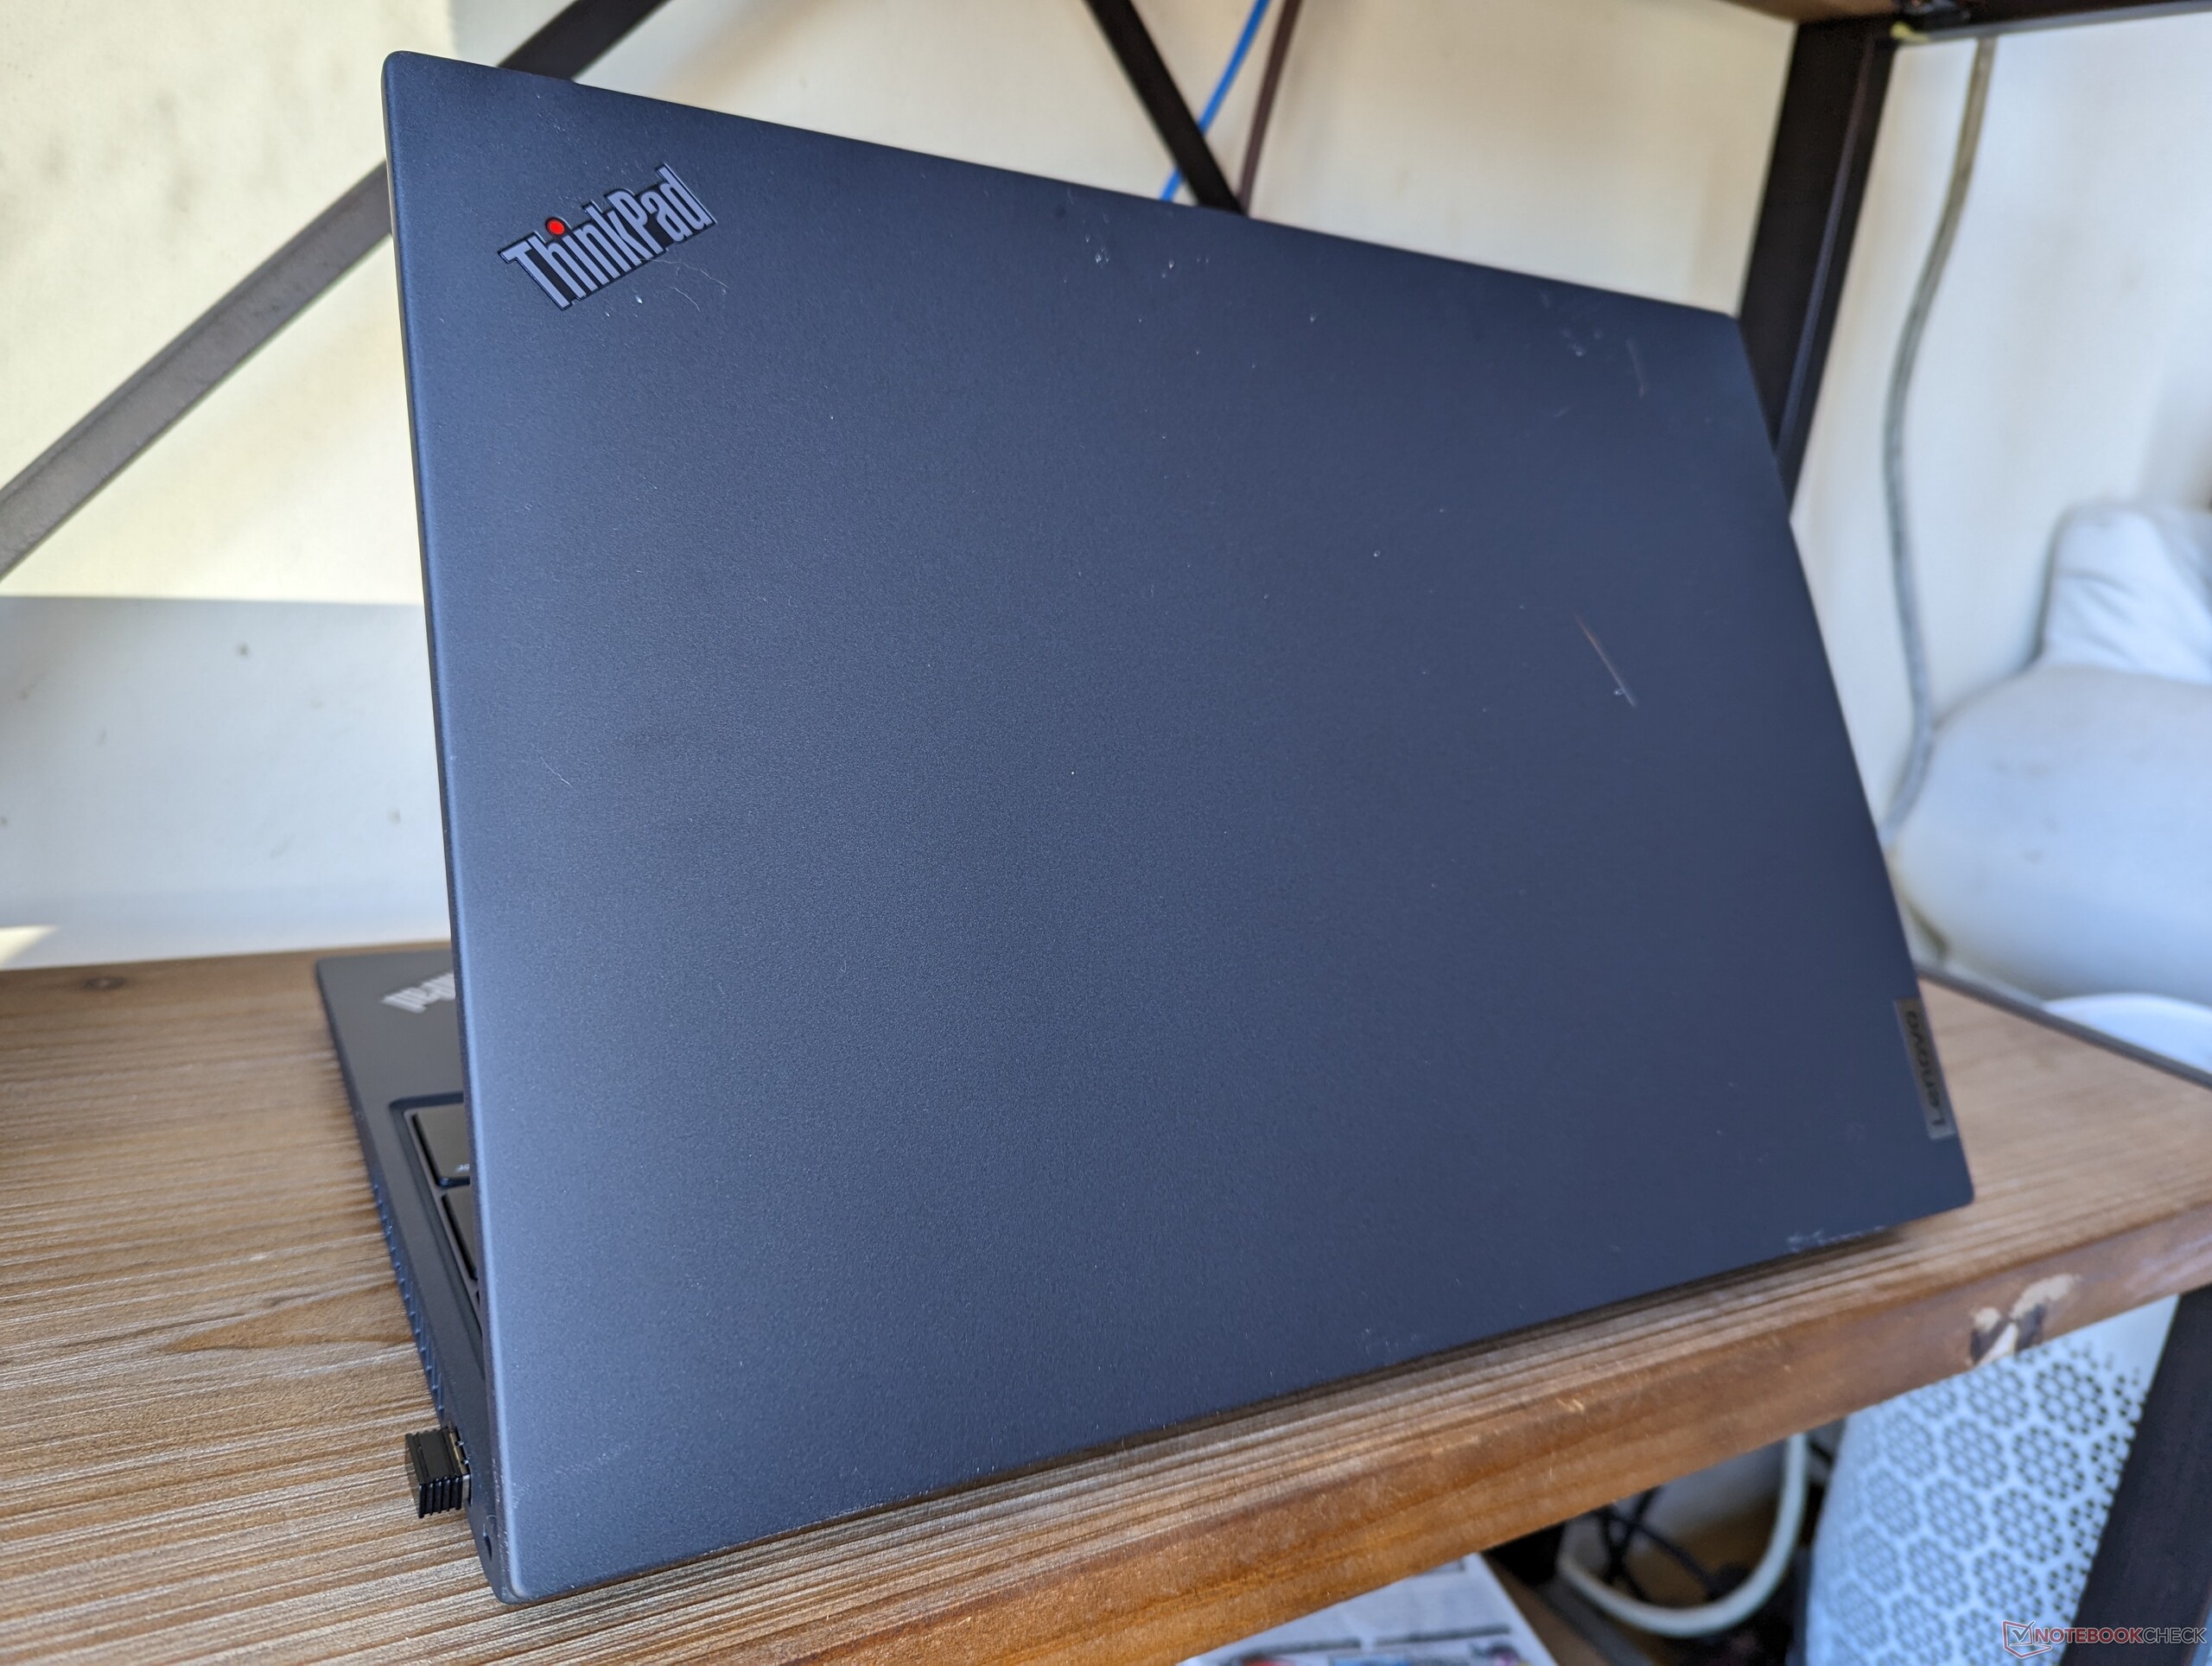
Przypadek - Mały wielki
Choć model ten ma zaledwie kilka miesięcy, jego konstrukcja obudowy jest nieco większa we wszystkich wymiarach w porównaniu z konkurencyjnymi 16-calowymi laptopami, takimi jak HP EliteBook 865 G9 czy Apple MacBook Pro 16. Zwłaszcza LG Gram 16 jest szczególnie lżejszy o 800 gramów.
Na matowych czarnych powierzchniach bardzo szybko gromadzą się tłuszcze i odciski palców. Ciemne włókno węglowe, włókno szklane i plastik kontrastują z jasnoszarym stopem metalu w konkurencyjnym HP EliteBook.
Komunikacja
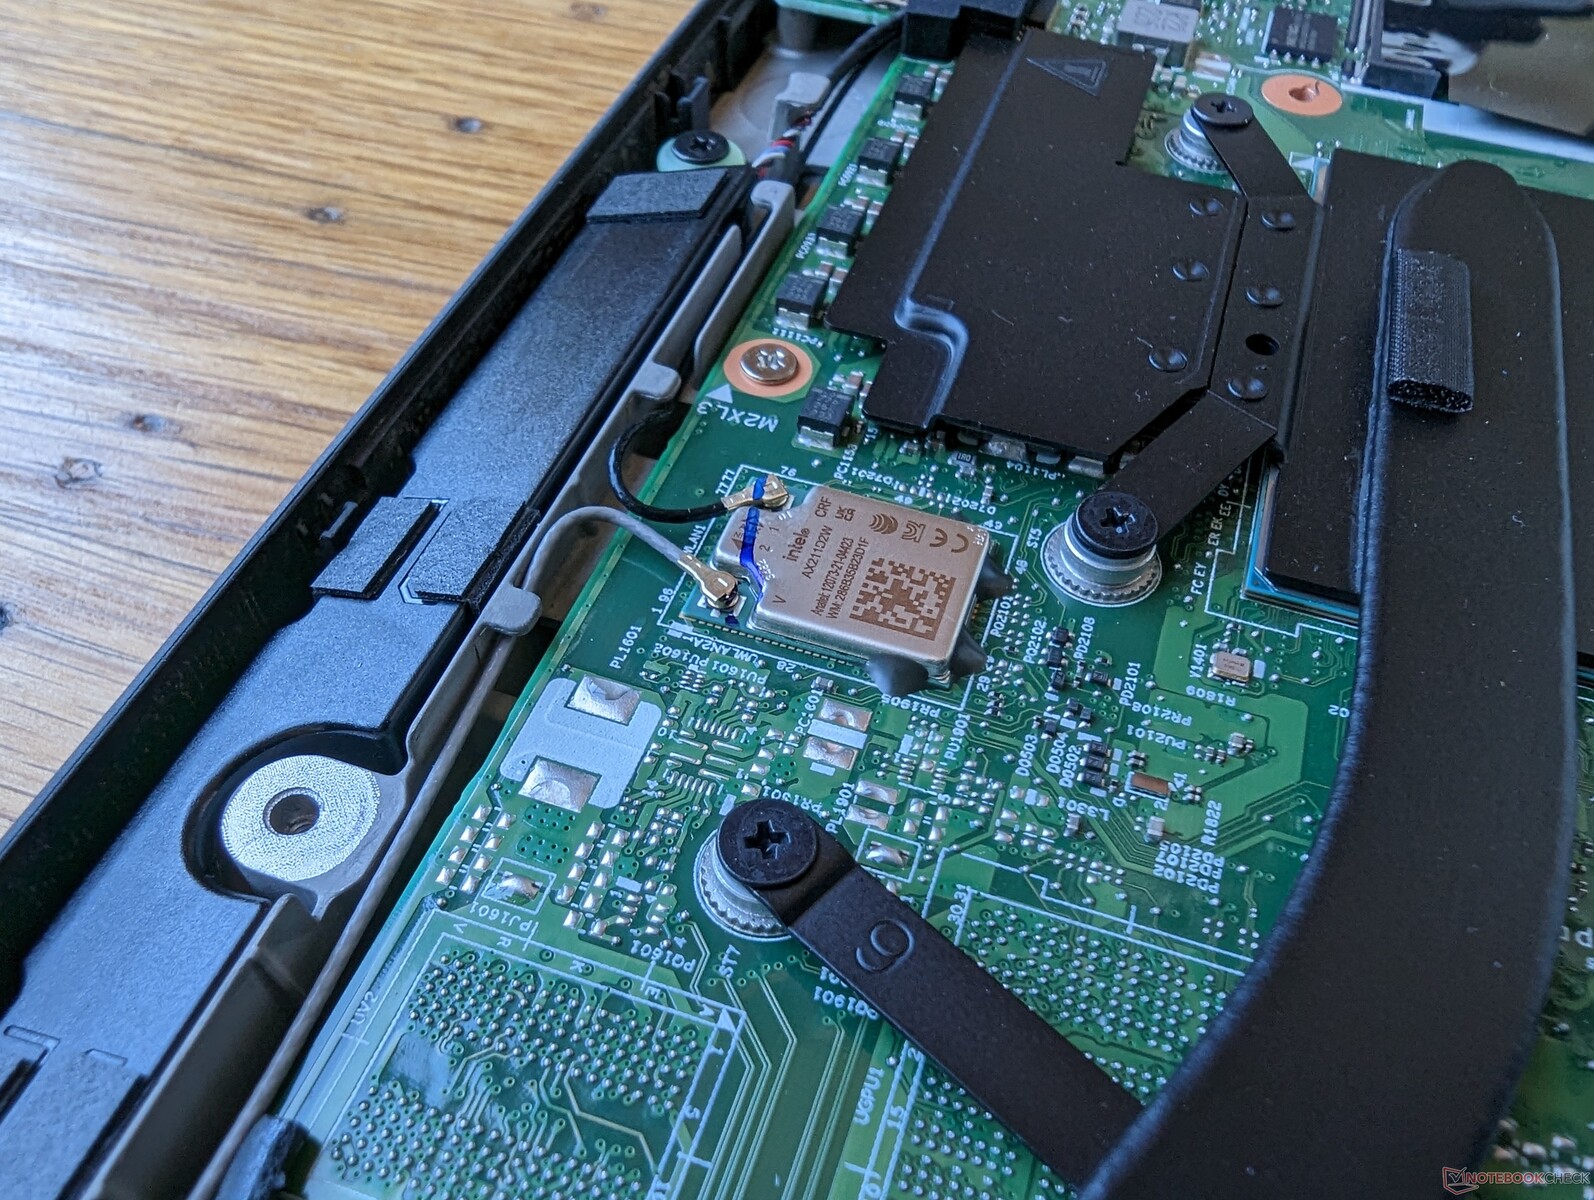
Standardem jest Intel AX211, który zapewnia łączność Bluetooth 5.2 i Wi-Fi 6E. Szybkość transferu jest stała po sparowaniu z naszym testowym routerem Asus AXE11000.
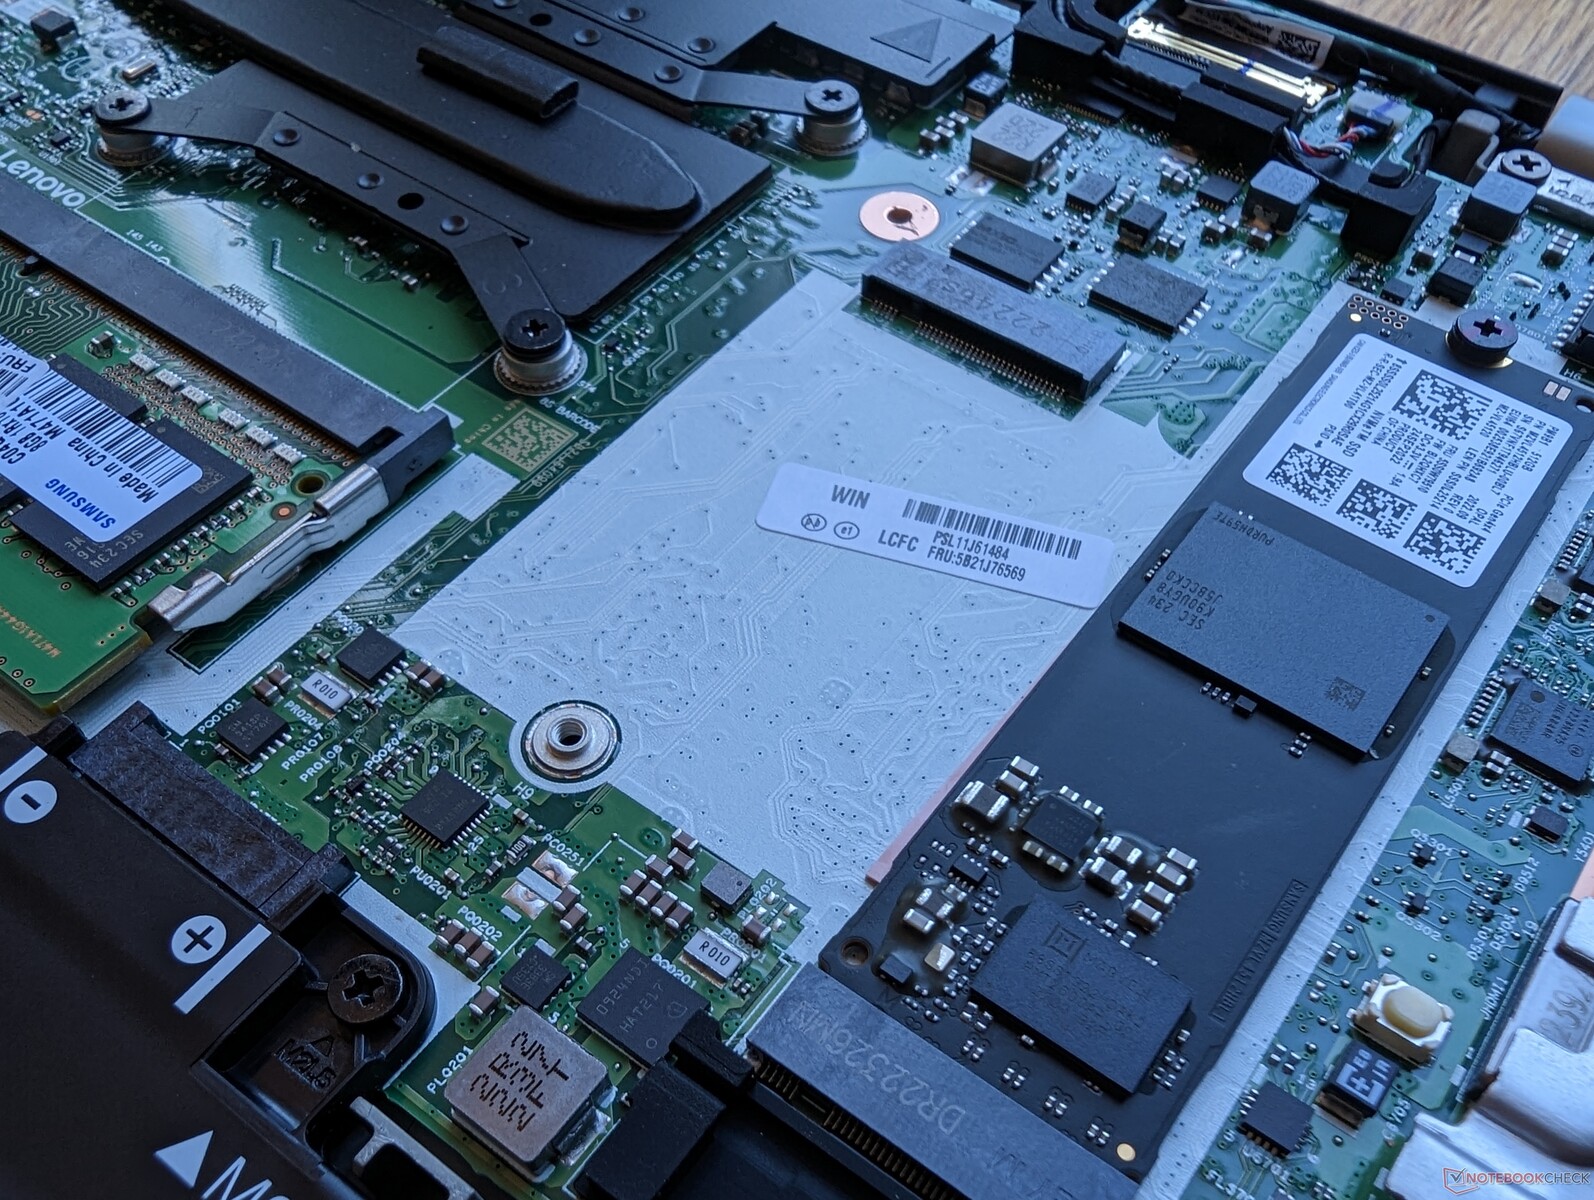
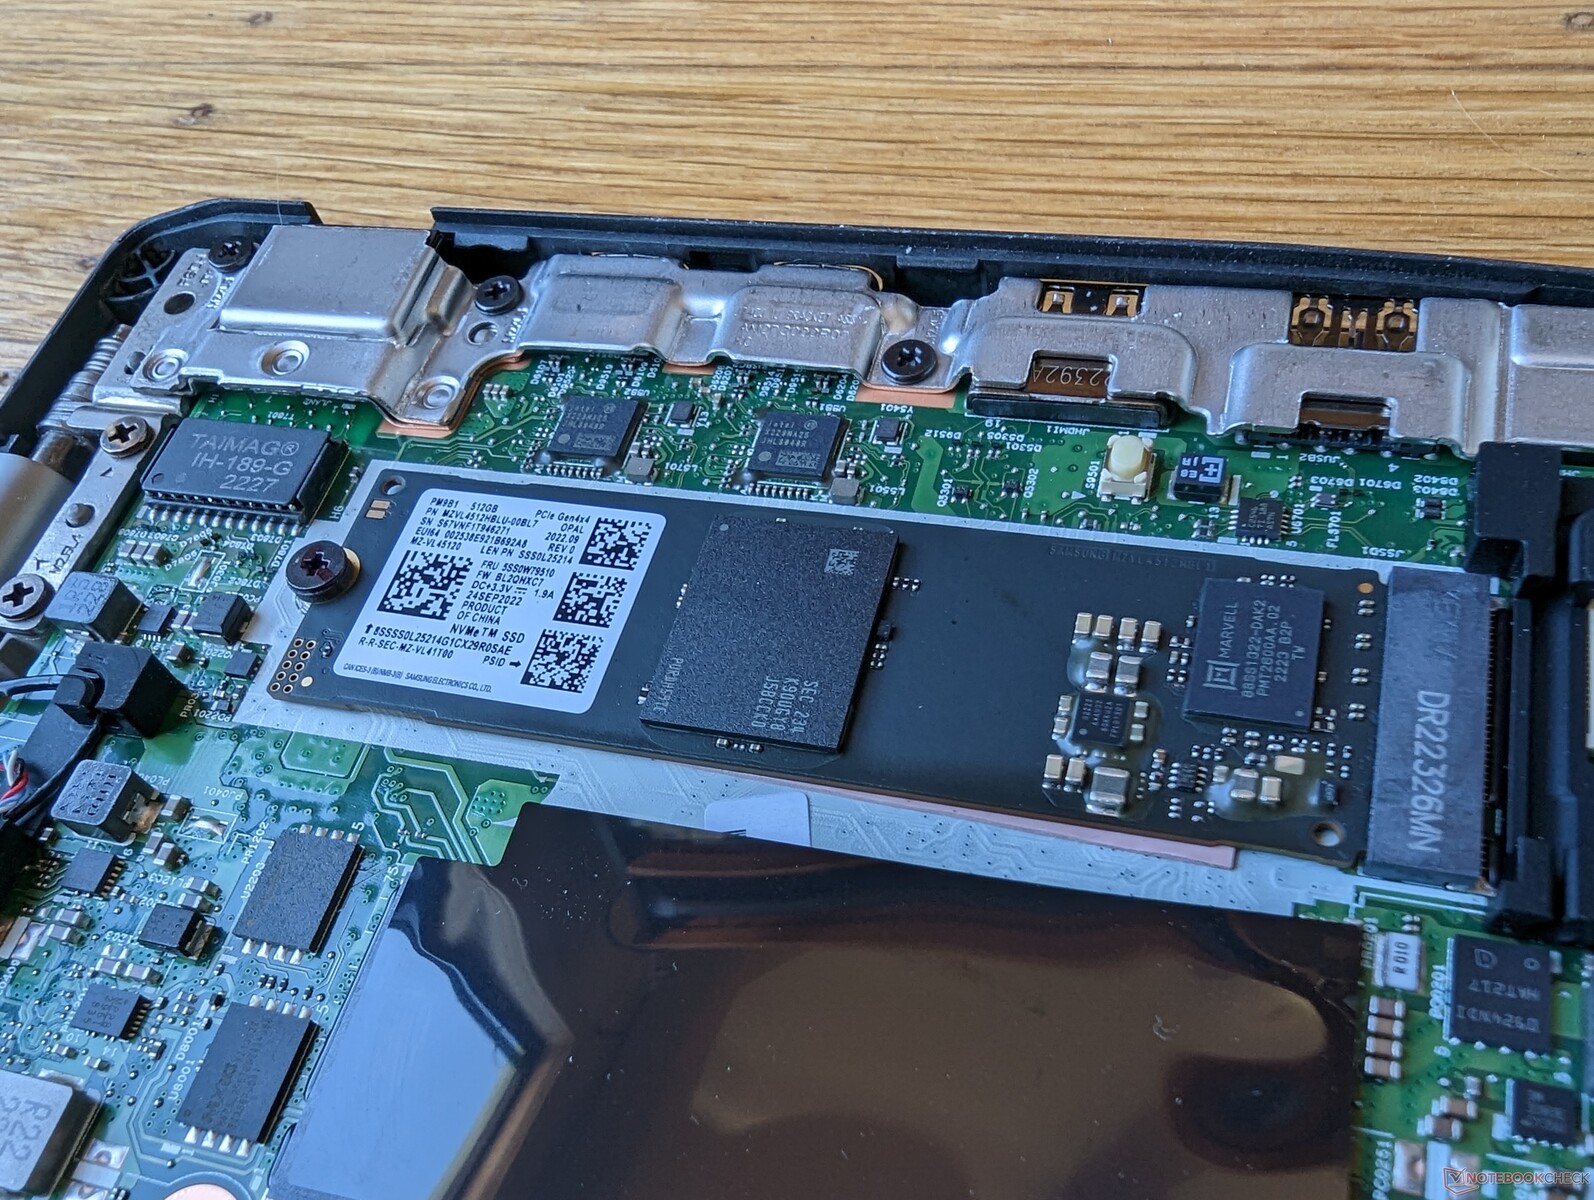
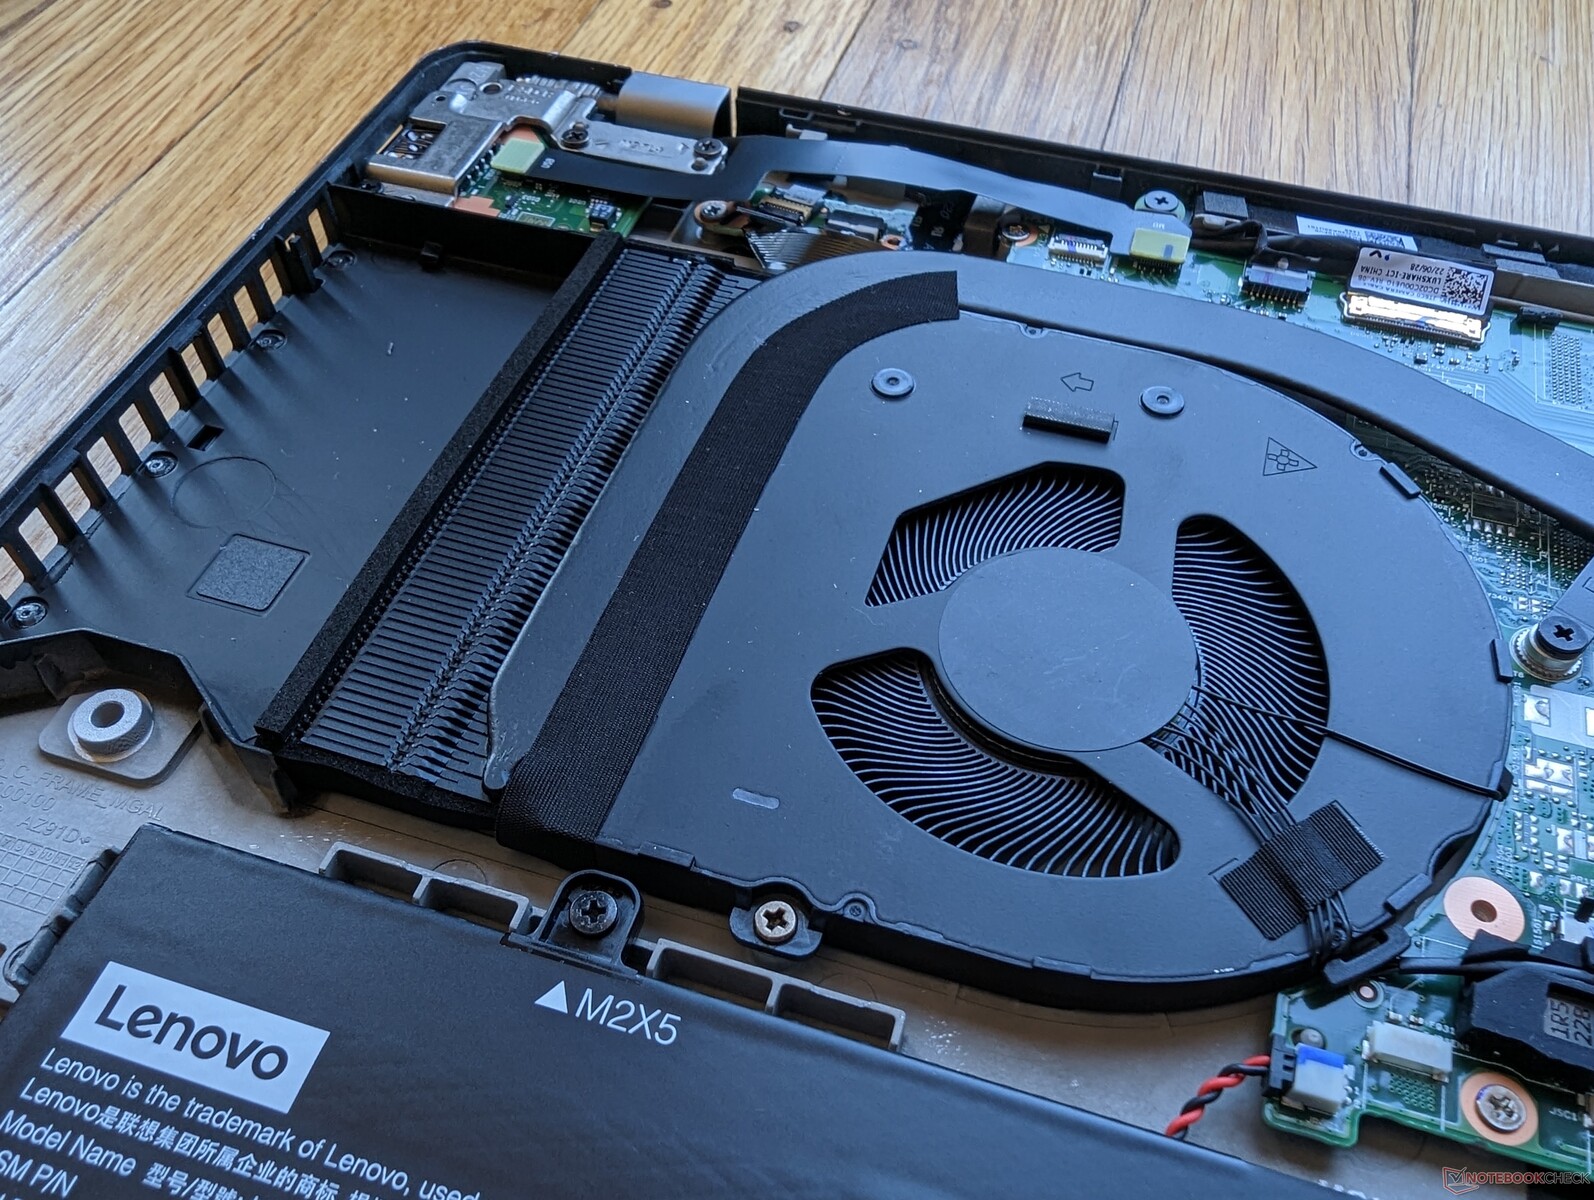
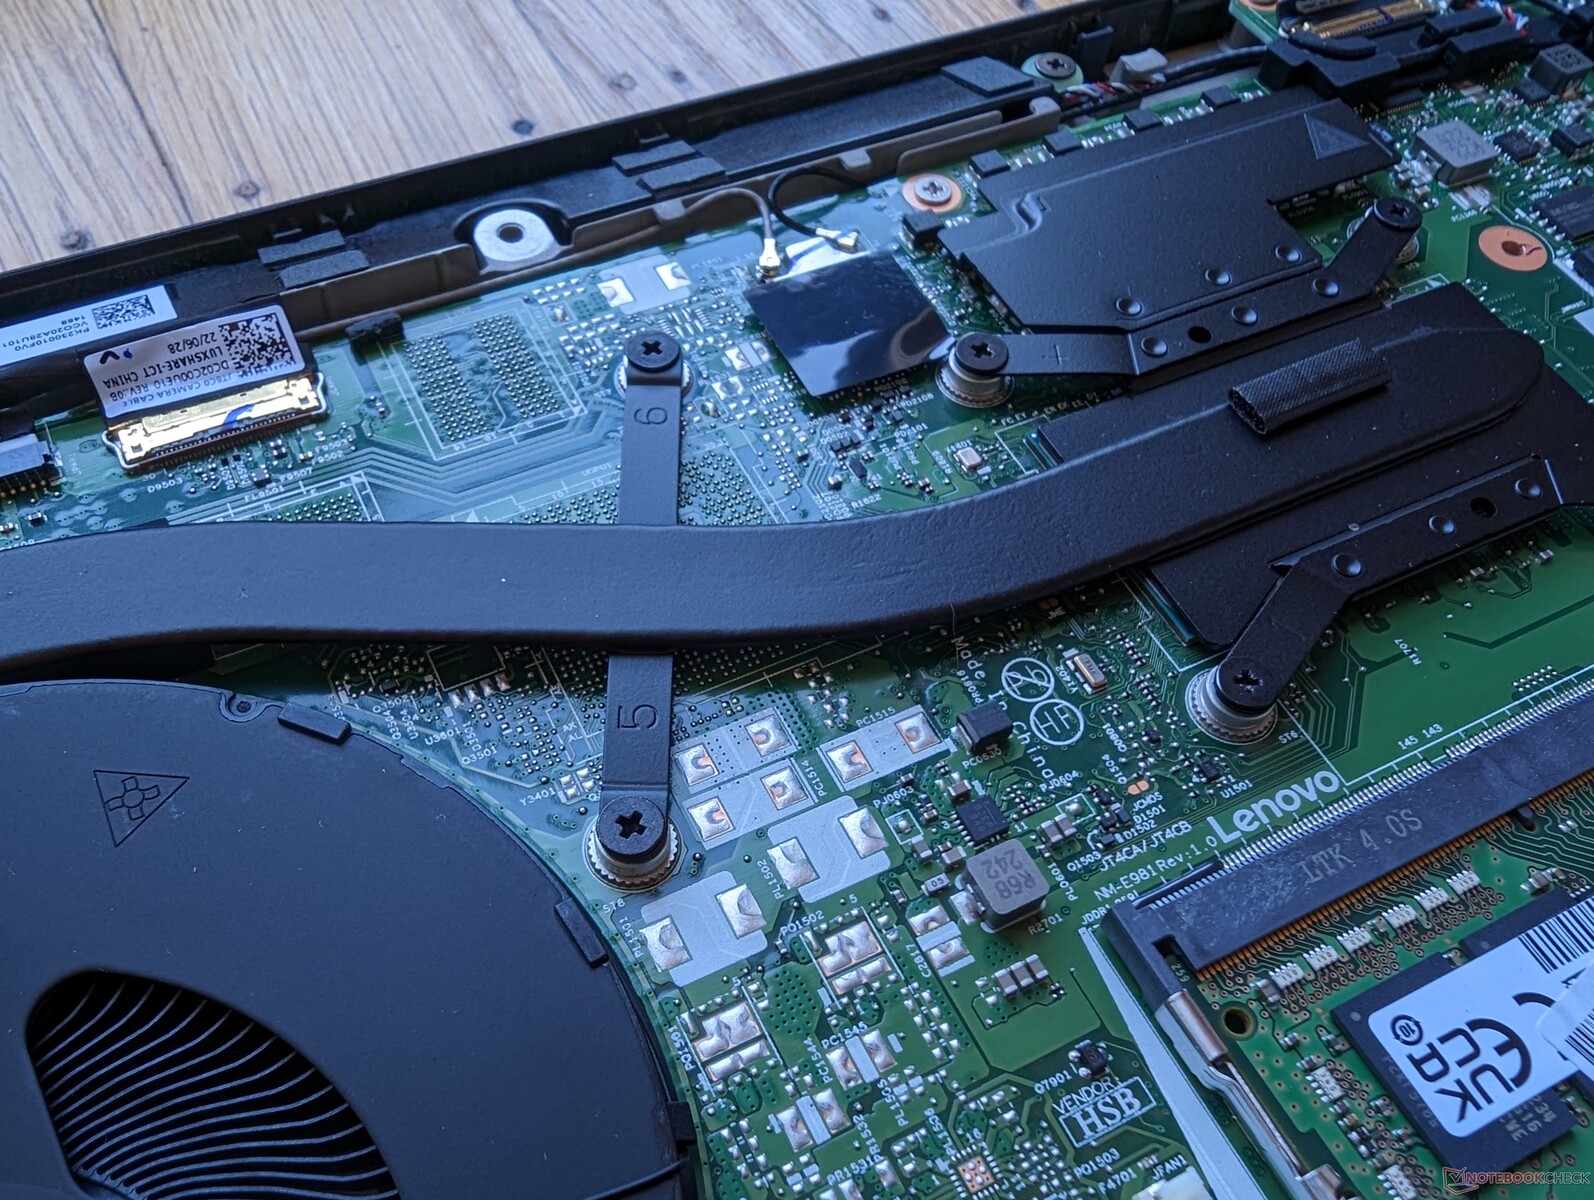
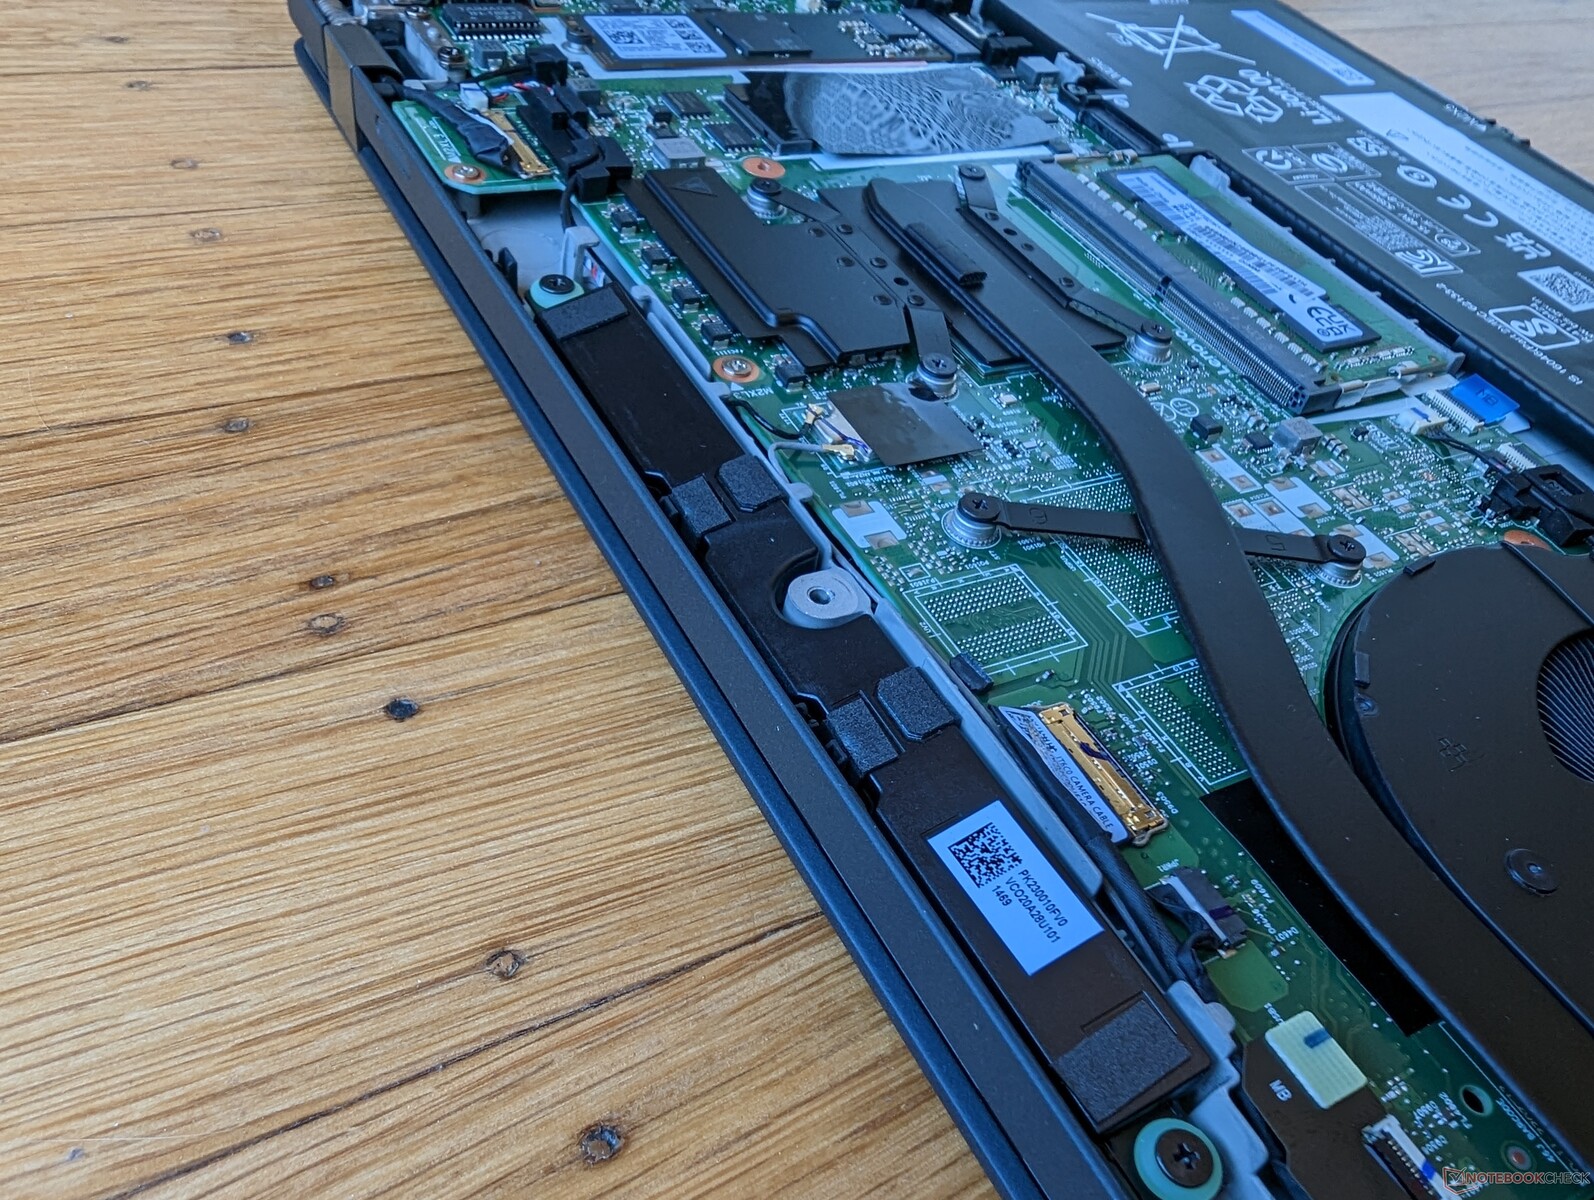
W naszej konkretnej konfiguracji gniazdo M.2 WWAN jest puste, co widać na poniższym zdjęciu. Niestety Lenovo nie dołącza anteny w przypadku konfiguracji bez WWAN.
| Networking | |
| iperf3 transmit AX12 | |
| Apple MacBook Pro 16 2021 M1 Pro | |
| iperf3 receive AX12 | |
| Apple MacBook Pro 16 2021 M1 Pro | |
| iperf3 receive AXE11000 6GHz | |
| Lenovo ThinkPad T16 G1 21CH004MGE | |
| Huawei MateBook 16s i7 | |
| Lenovo ThinkPad T16 Gen 1 Core i7-1270P | |
| iperf3 receive AXE11000 | |
| Lenovo ThinkPad T16 G1 21CH004MGE | |
| HP EliteBook 865 G9 | |
| LG Gram 16Z90Q | |
| Lenovo ThinkPad T16 Gen 1 Core i7-1270P | |
| Apple MacBook Pro 16 2021 M1 Pro | |
| iperf3 transmit AXE11000 | |
| Lenovo ThinkPad T16 G1 21CH004MGE | |
| HP EliteBook 865 G9 | |
| LG Gram 16Z90Q | |
| Lenovo ThinkPad T16 Gen 1 Core i7-1270P | |
| Apple MacBook Pro 16 2021 M1 Pro | |
| iperf3 transmit AXE11000 6GHz | |
| Lenovo ThinkPad T16 G1 21CH004MGE | |
| Huawei MateBook 16s i7 | |
| Lenovo ThinkPad T16 Gen 1 Core i7-1270P | |
Kamera internetowa
Kamera internetowa 2 MP wypada blado w porównaniu z kamerami 5 MP, które są obecnie dostępne w wielu modelach HP EliteBook. W ThinkPadzie T16 znajdziemy zarówno migawkę na podczerwień, jak i fizyczną.


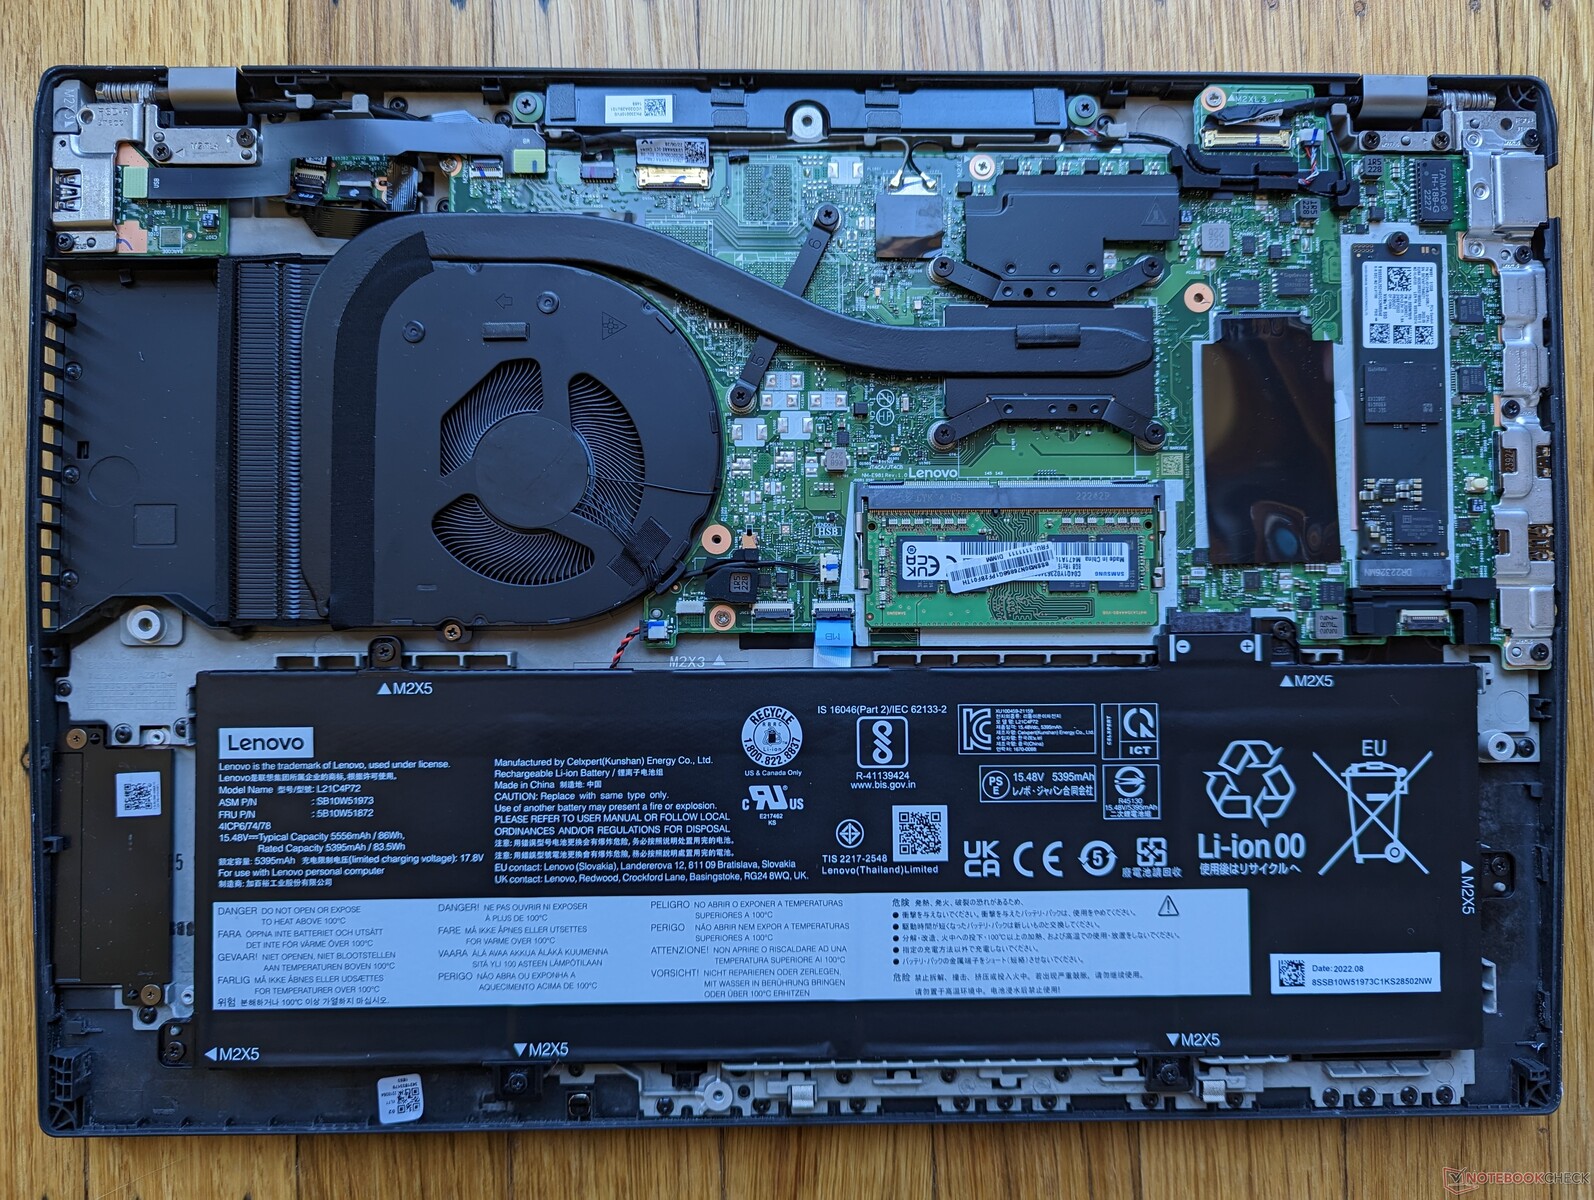
Konserwacja
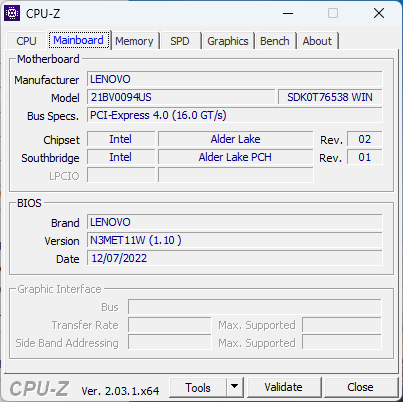
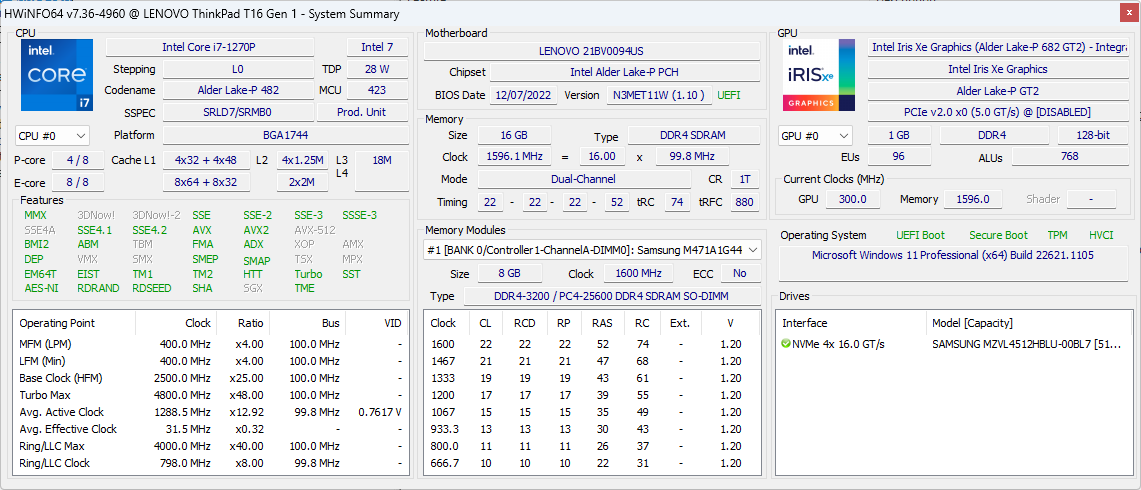
Spód jest zabezpieczony ośmioma śrubkami Philipsa, co ułatwia serwisowanie. Należy pamiętać, że omawiany model jest wyposażony w 8 GB wlutowanej pamięci RAM oraz 1x gniazdo SODIMM do rozbudowy, podczas gdy większość innych laptopów używa wyłącznie wlutowanej pamięci RAM lub 2x SODIMM. Niektóre jednostki mogą być wyposażone w 16 GB pamięci RAM.
Akcesoria i gwarancja
W pudełku detalicznym nie ma żadnych dodatków poza zasilaczem sieciowym i papierami. W przypadku zakupu w USA obowiązuje roczny limit producenta.
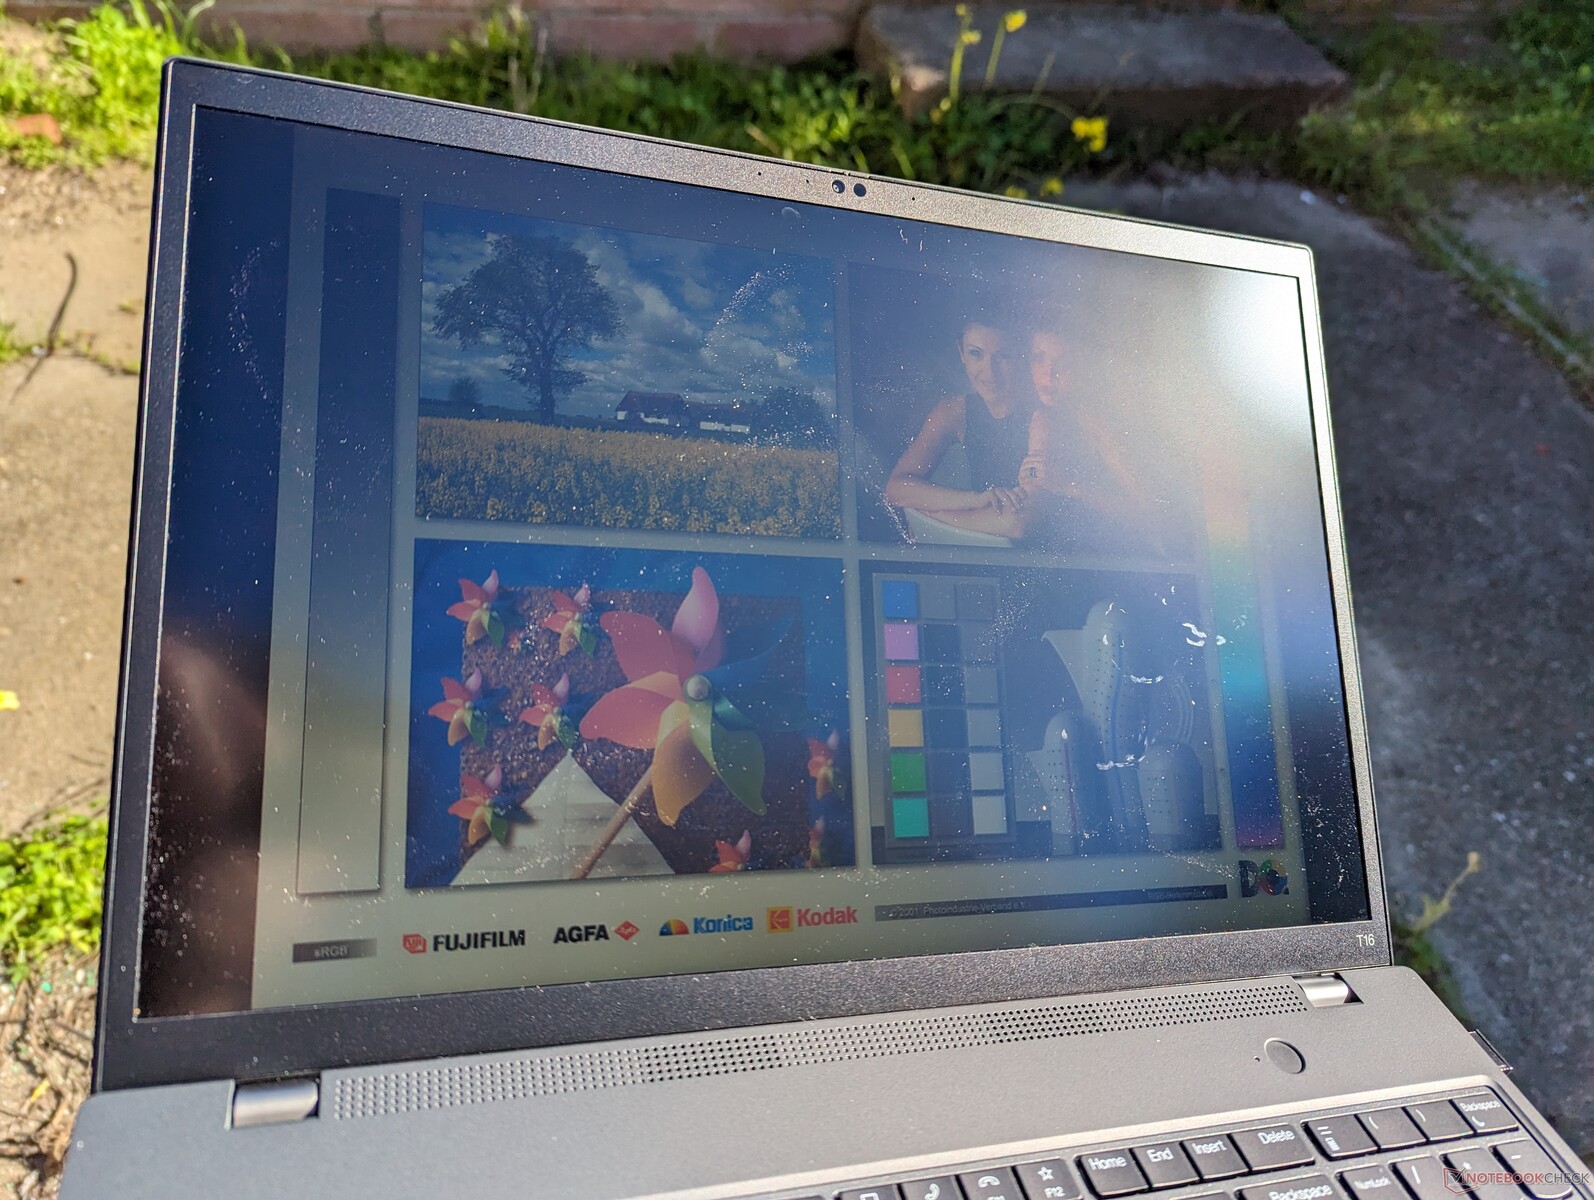
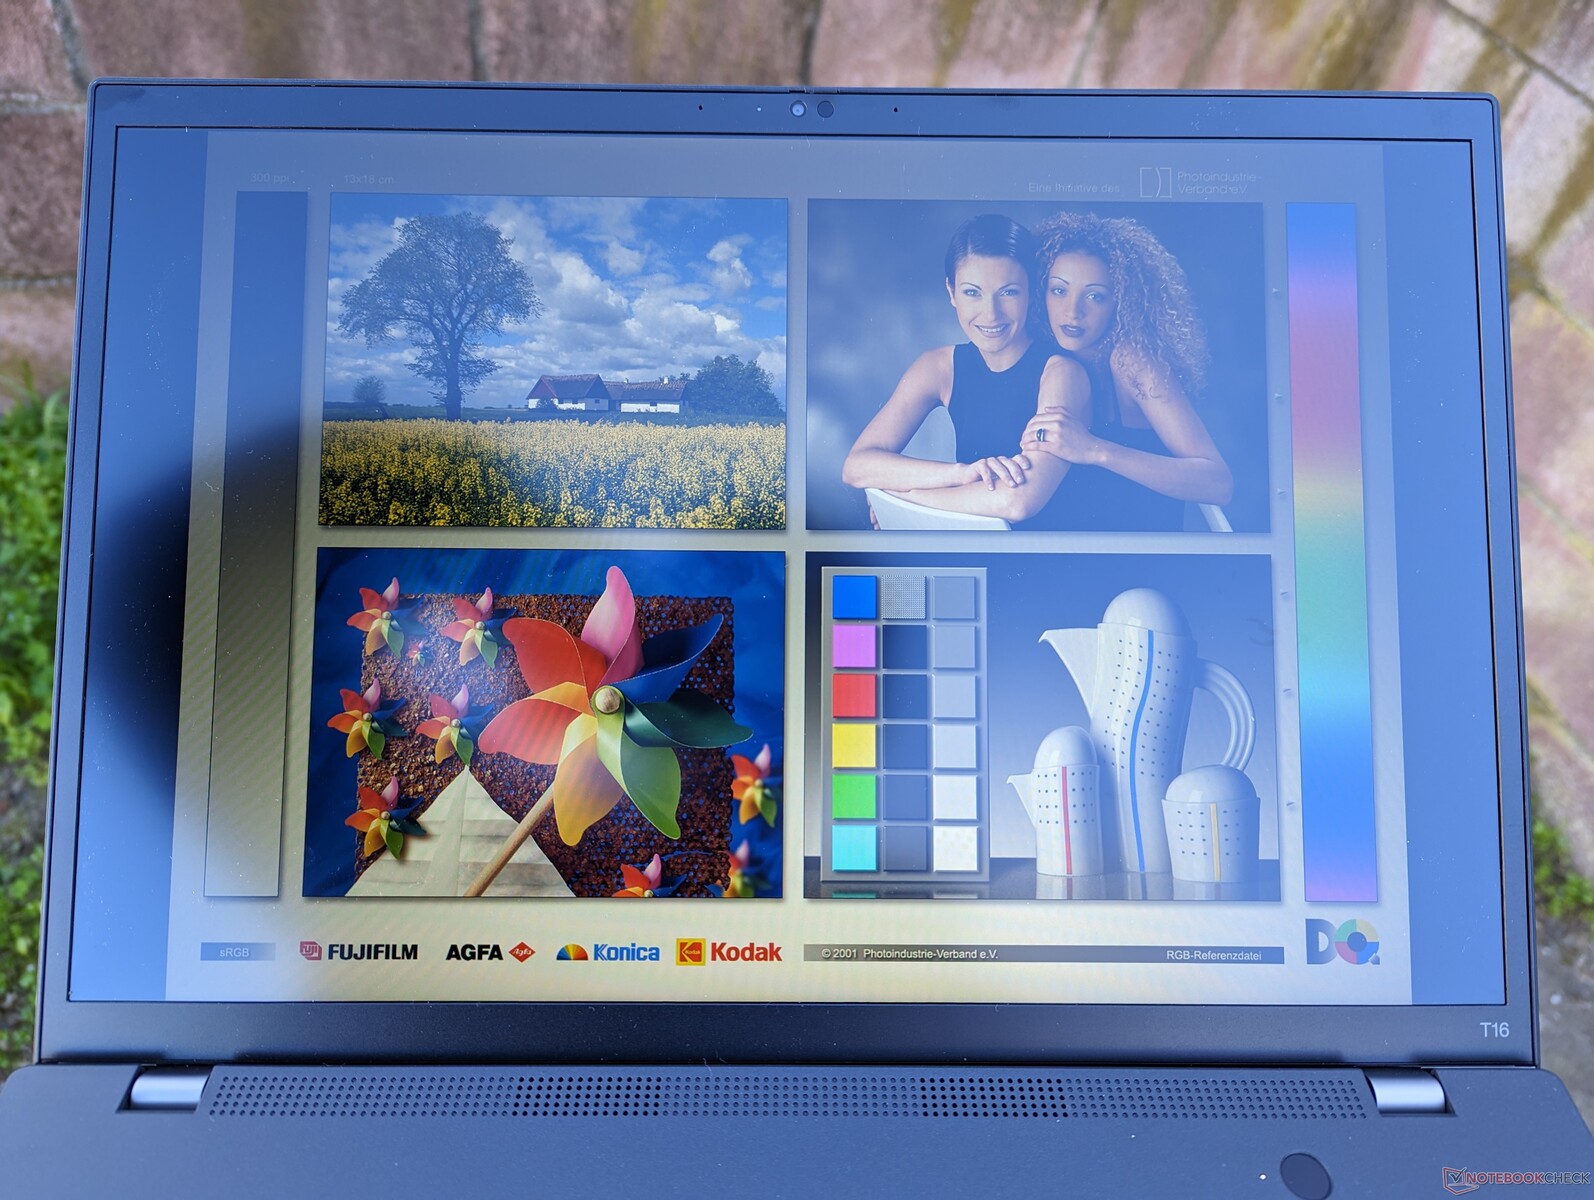
Wyświetlacz - Low-End to High-End
Lenovo oferuje obecnie pięć różnych wariantów matowych wyświetlaczy IPS, jak poniżej:
- 1920 x 1200, 300 nitów, 45% NTSC
- 1920 x 1200, 300 nitów, ekran dotykowy, 45% NTSC
- 1920 x 1200, niskie zużycie energii, 400 nitów, 100% sRGB, niski poziom światła niebieskiego
- 1920 x 1200, ekran dotykowy z Privacy Guard, 500 nitów, 100% sRGB, niski poziom światła niebieskiego
- 2560 x 1600, 400 nitów, niski poziom światła niebieskiego, kalibracja International Color Consortium
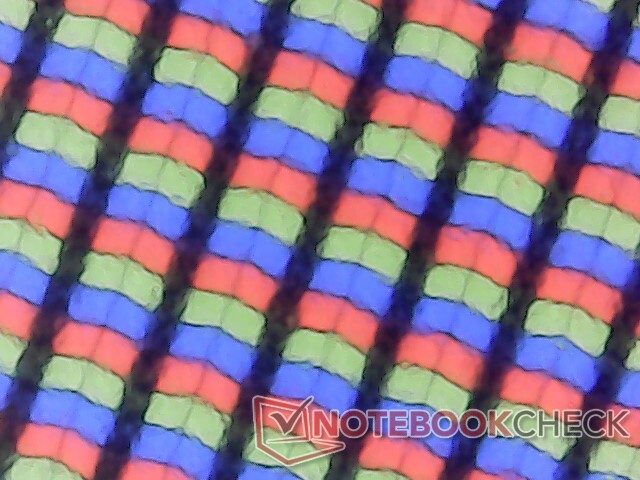
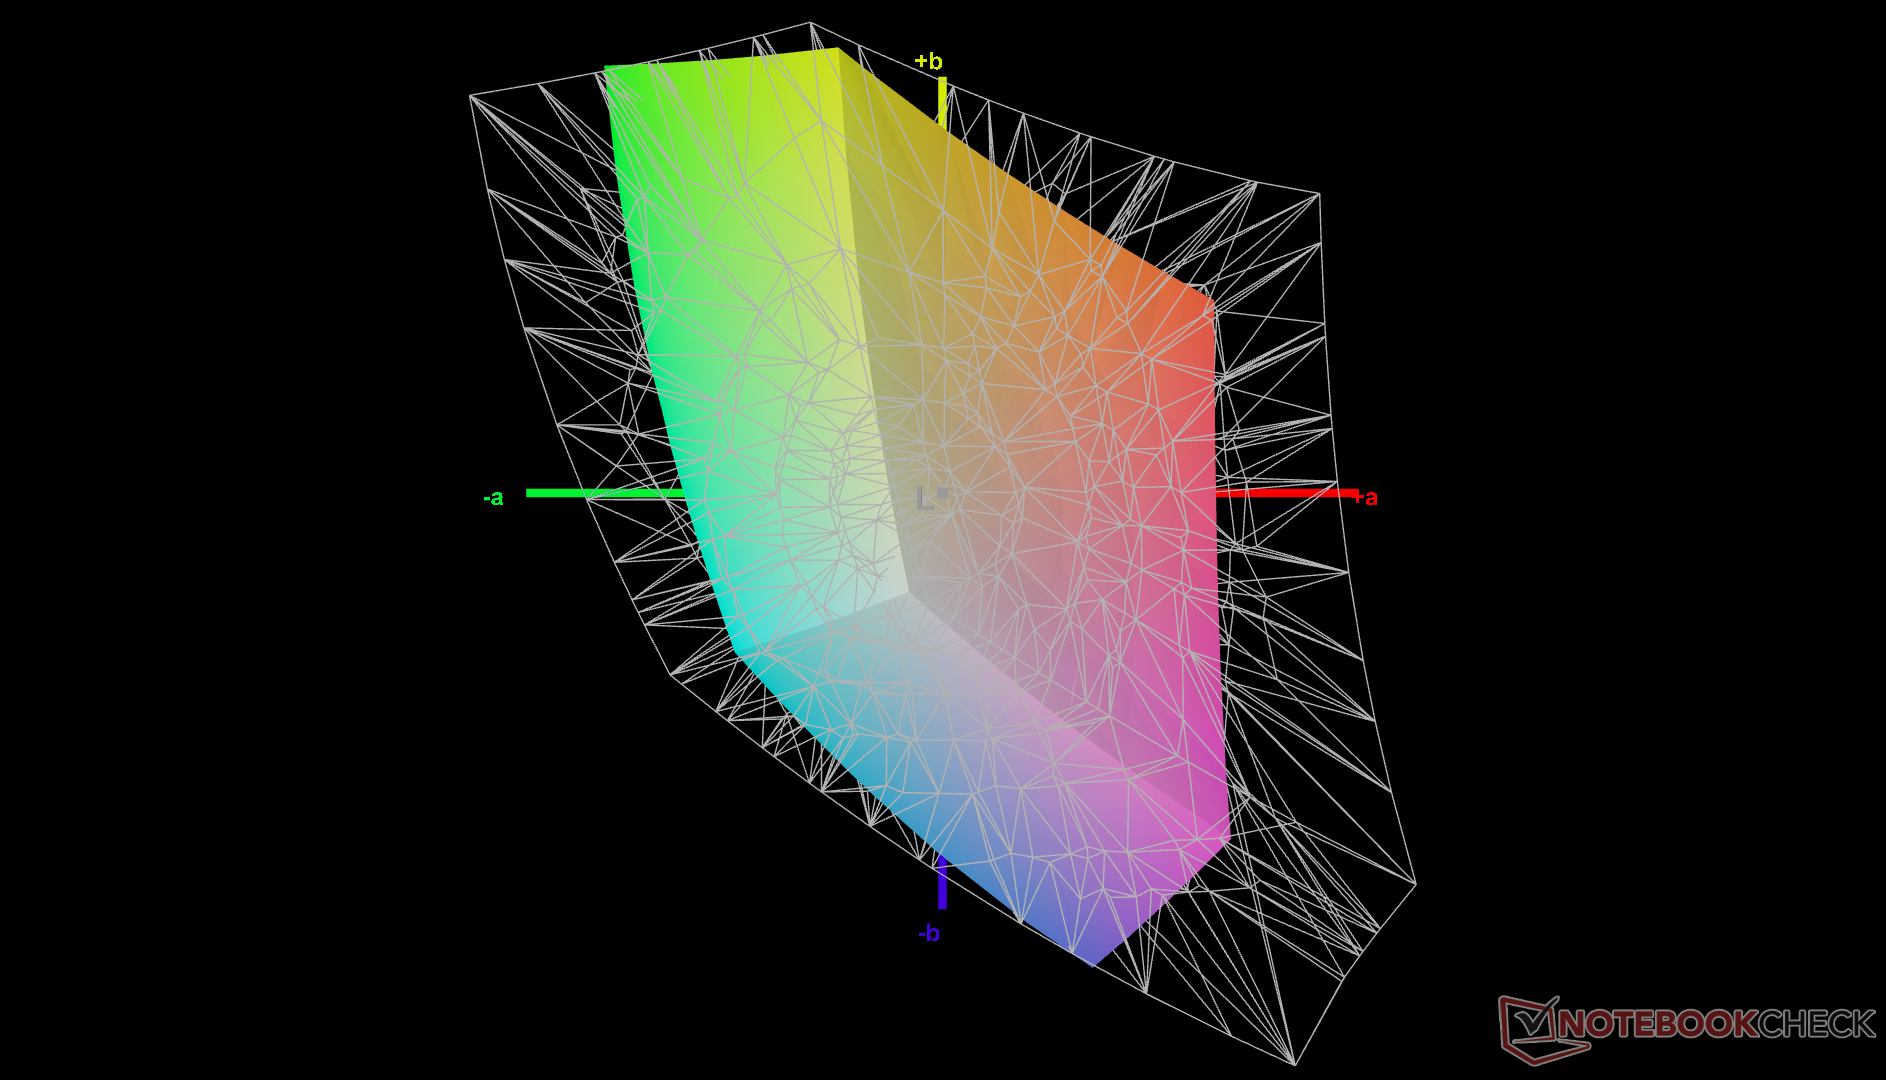
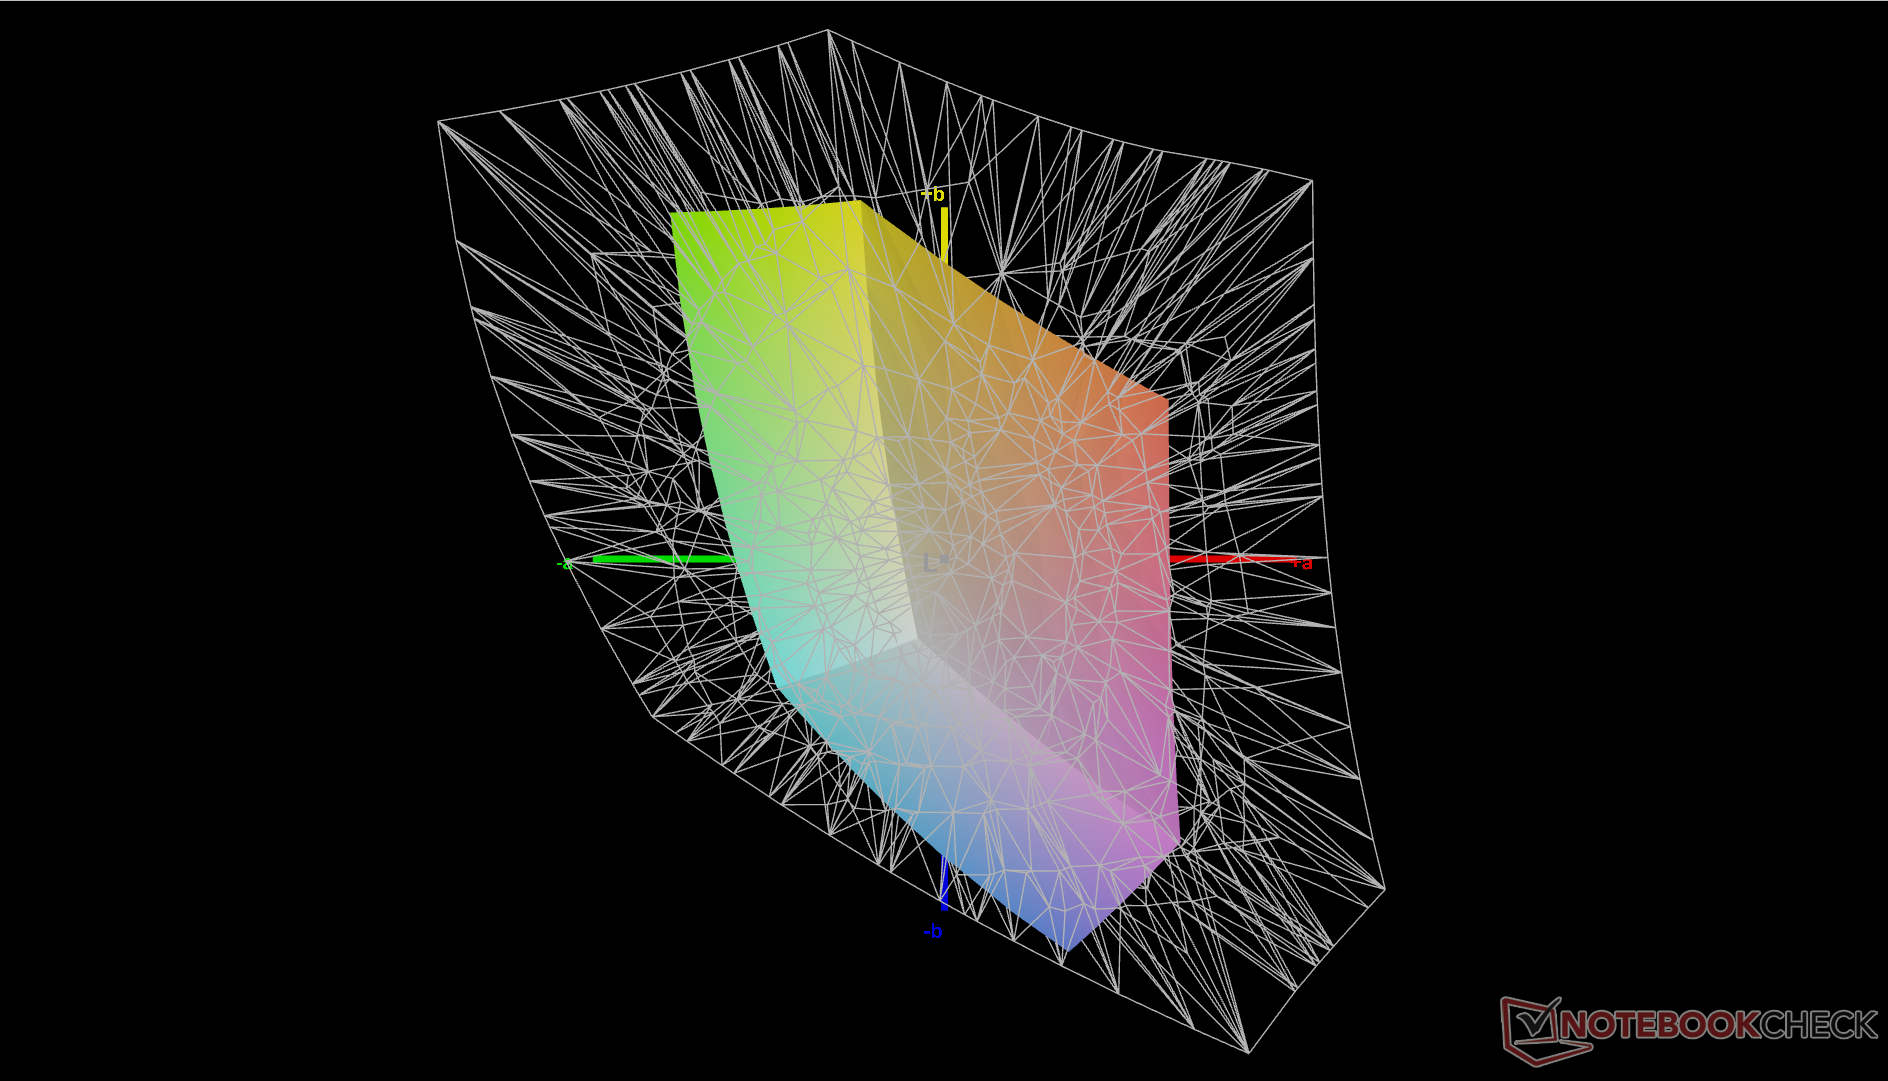
Nasza konfiguracja pochodzi z pogrubionego powyżej panelu B160UAN03.2, który jest najmniej kosztowną opcją. W porównaniu do wyższej klasy panelu 1600p, nasz 1200p ma zarówno gorsze kolory jak i ostrość o zauważalne marginesy. To wciąż przyzwoity wyświetlacz, jednak, zwłaszcza w porównaniu do innych paneli z podobnym 60 procent sRGB gamut, ale będziesz chciał wybrać pełne pokrycie sRGB dla każdego rodzaju edycji wideo lub grafiki.


| |||||||||||||||||||||||||
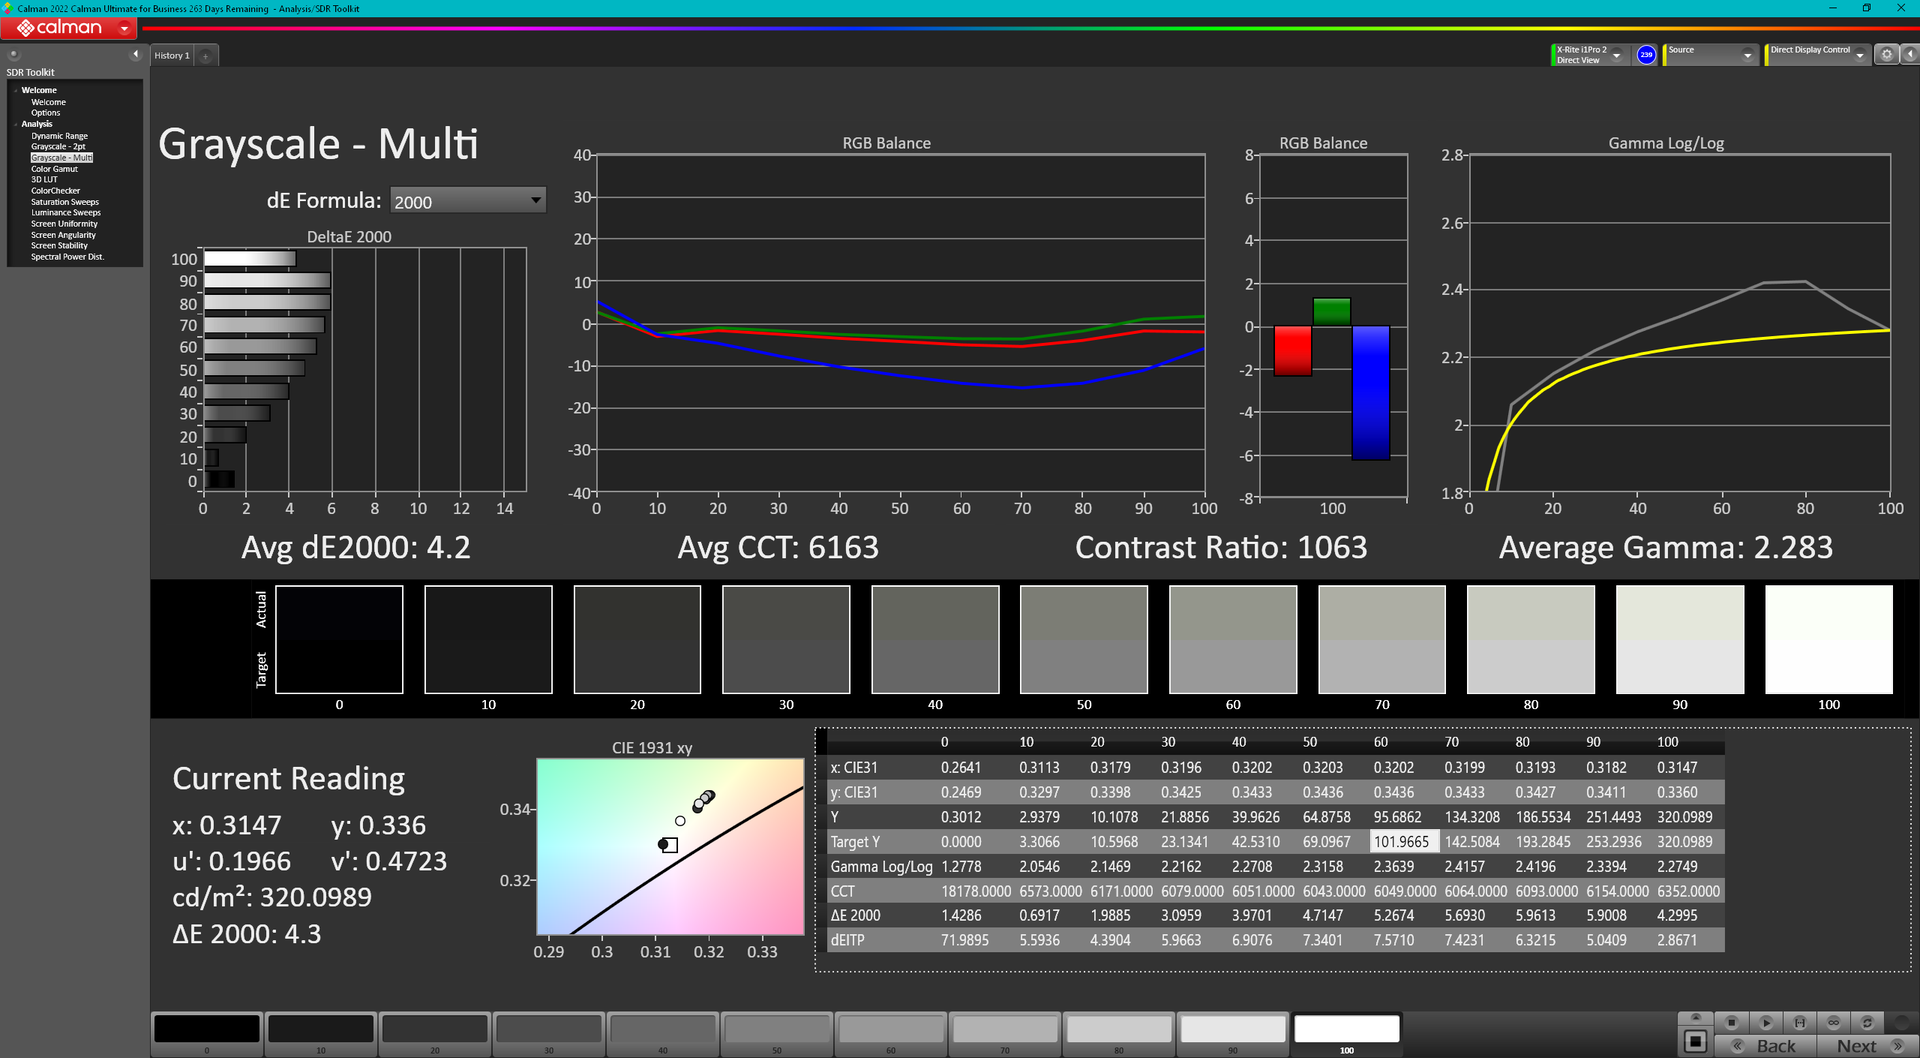
rozświetlenie: 82 %
na akumulatorze: 321.3 cd/m²
kontrast: 1036:1 (czerń: 0.31 cd/m²)
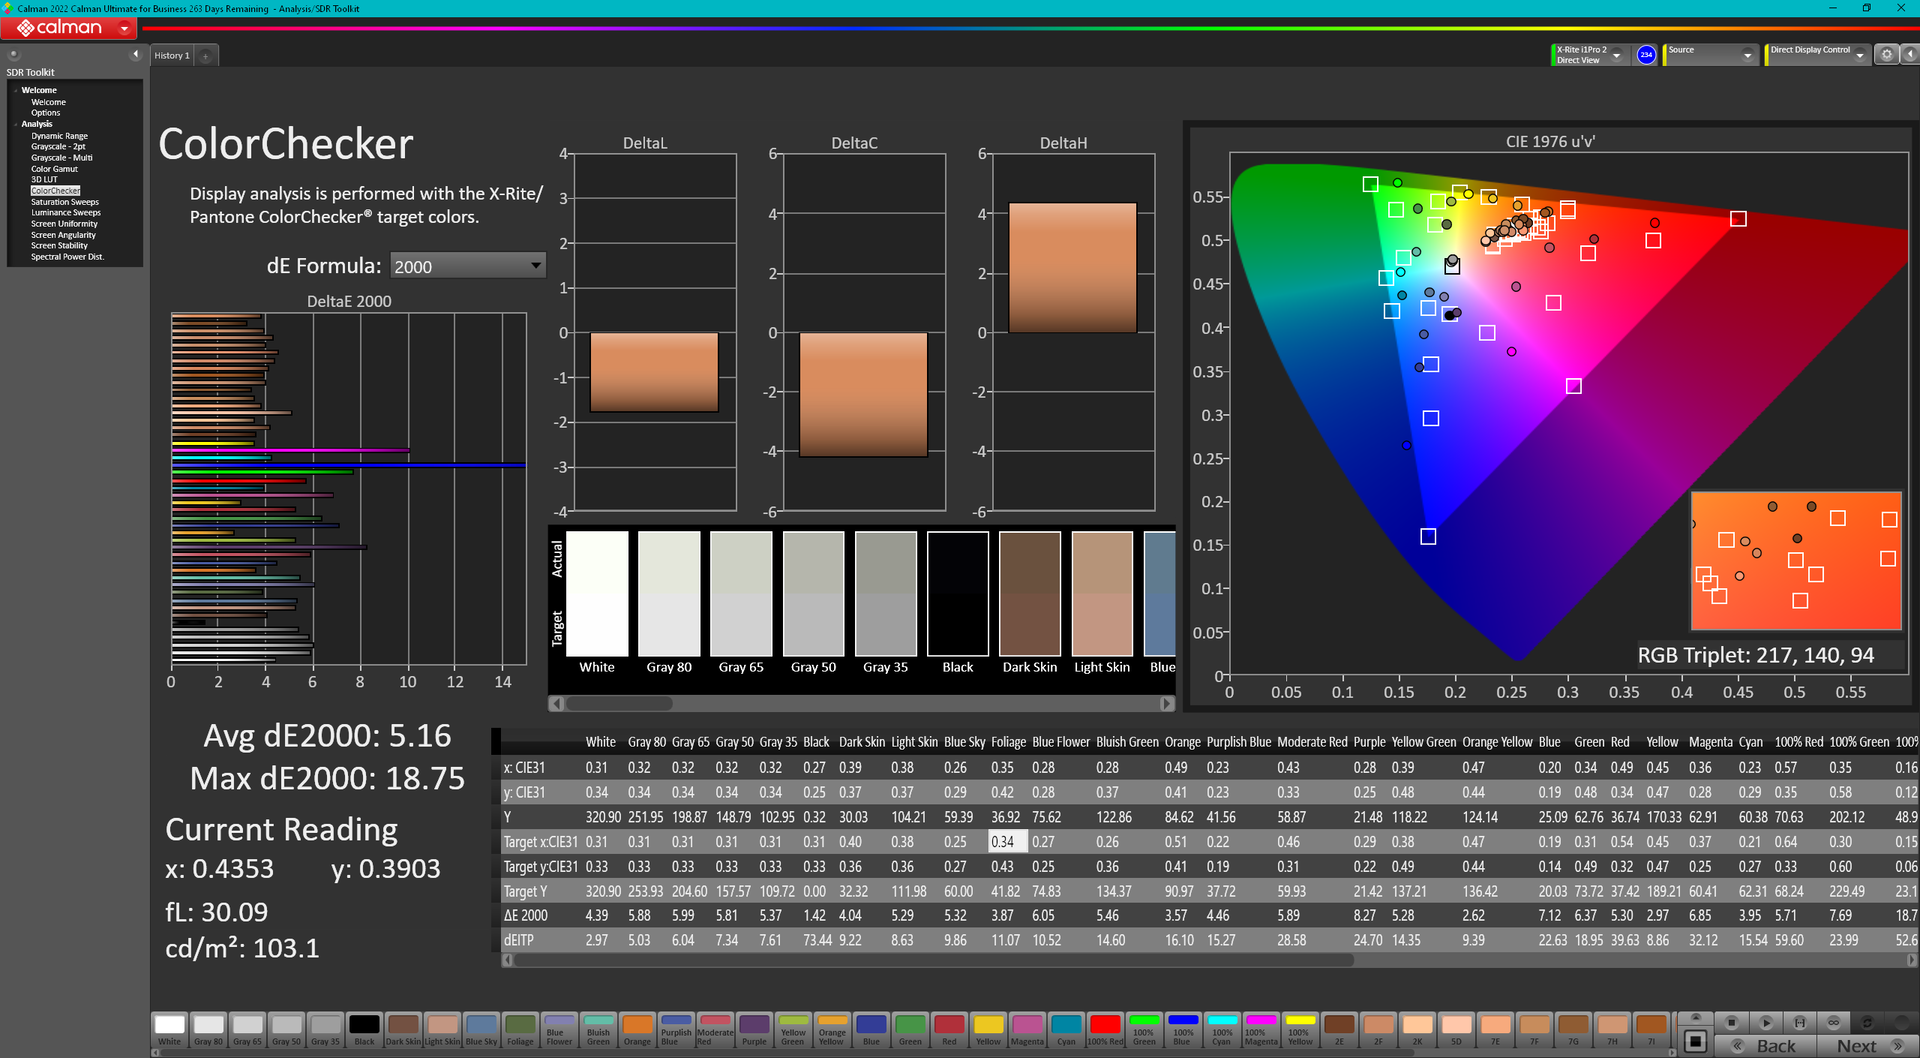
ΔE ColorChecker Calman: 5.16 | ∀{0.5-29.43 Ø4.71}
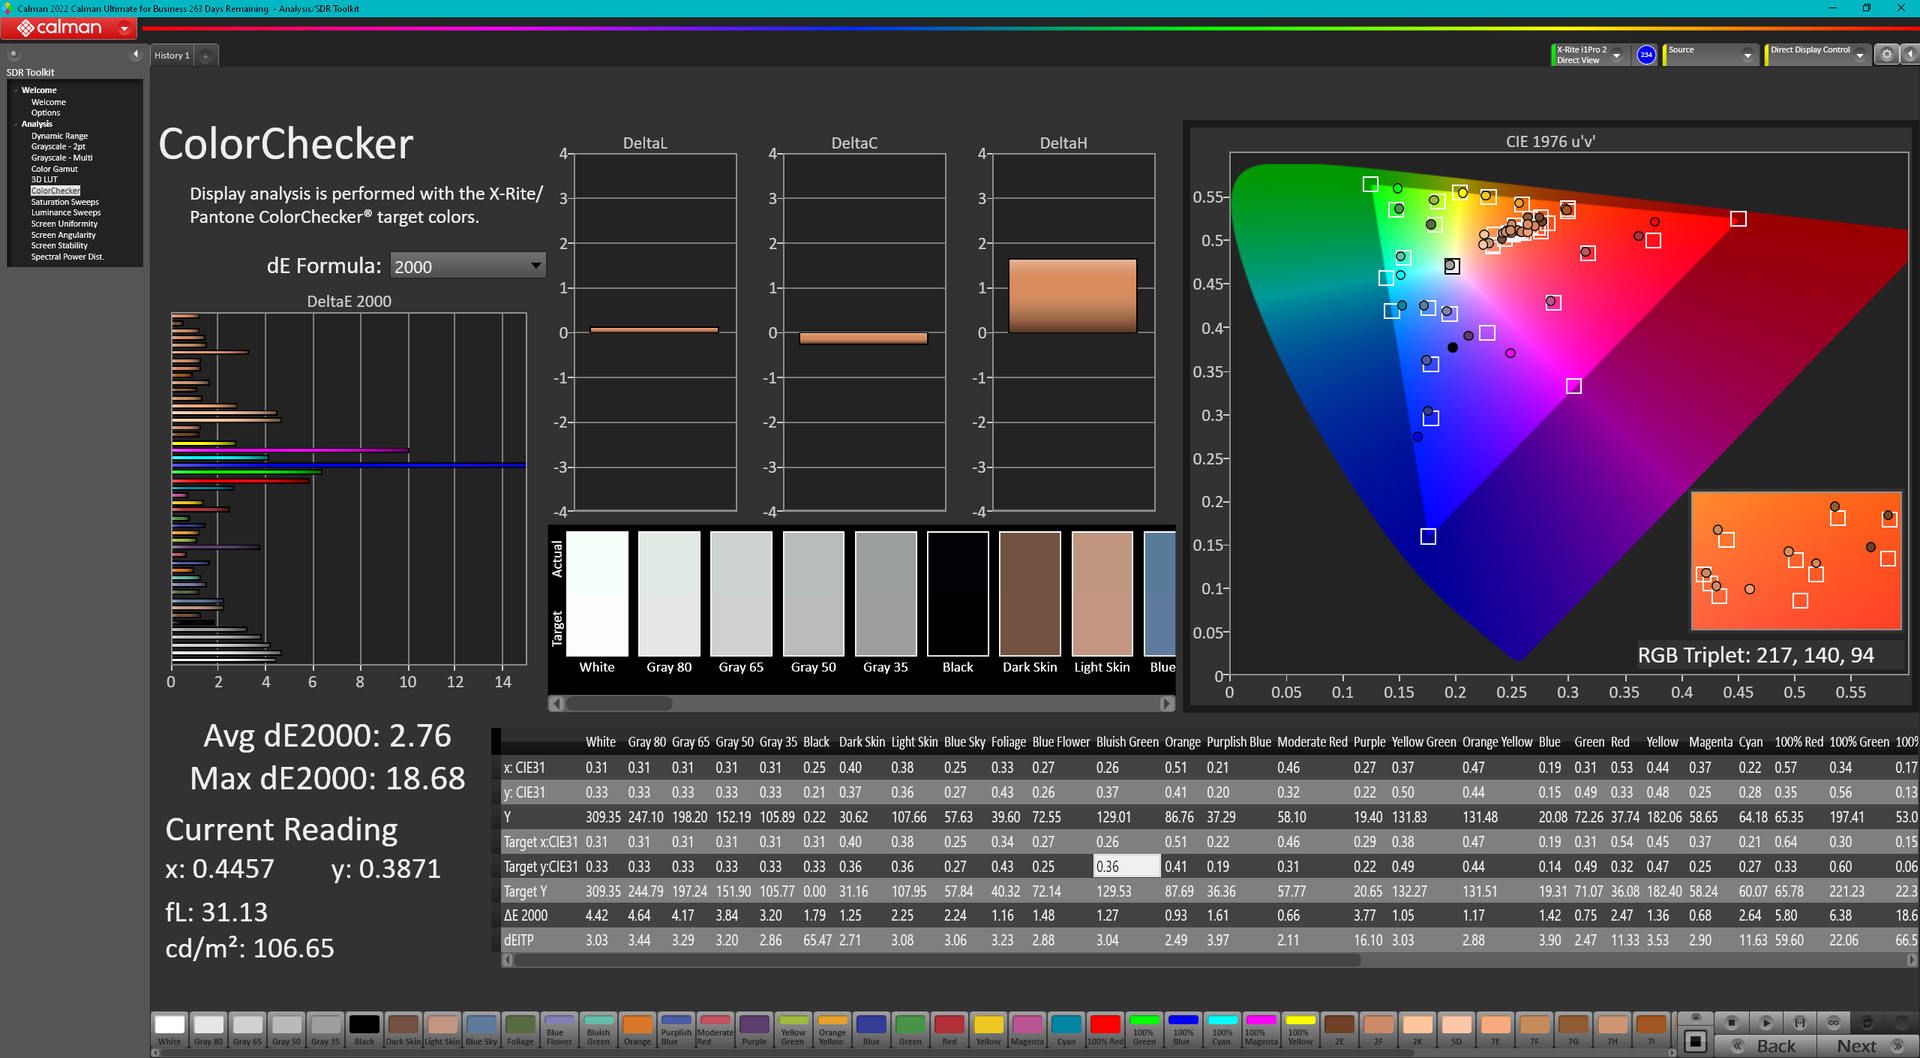
calibrated: 2.76
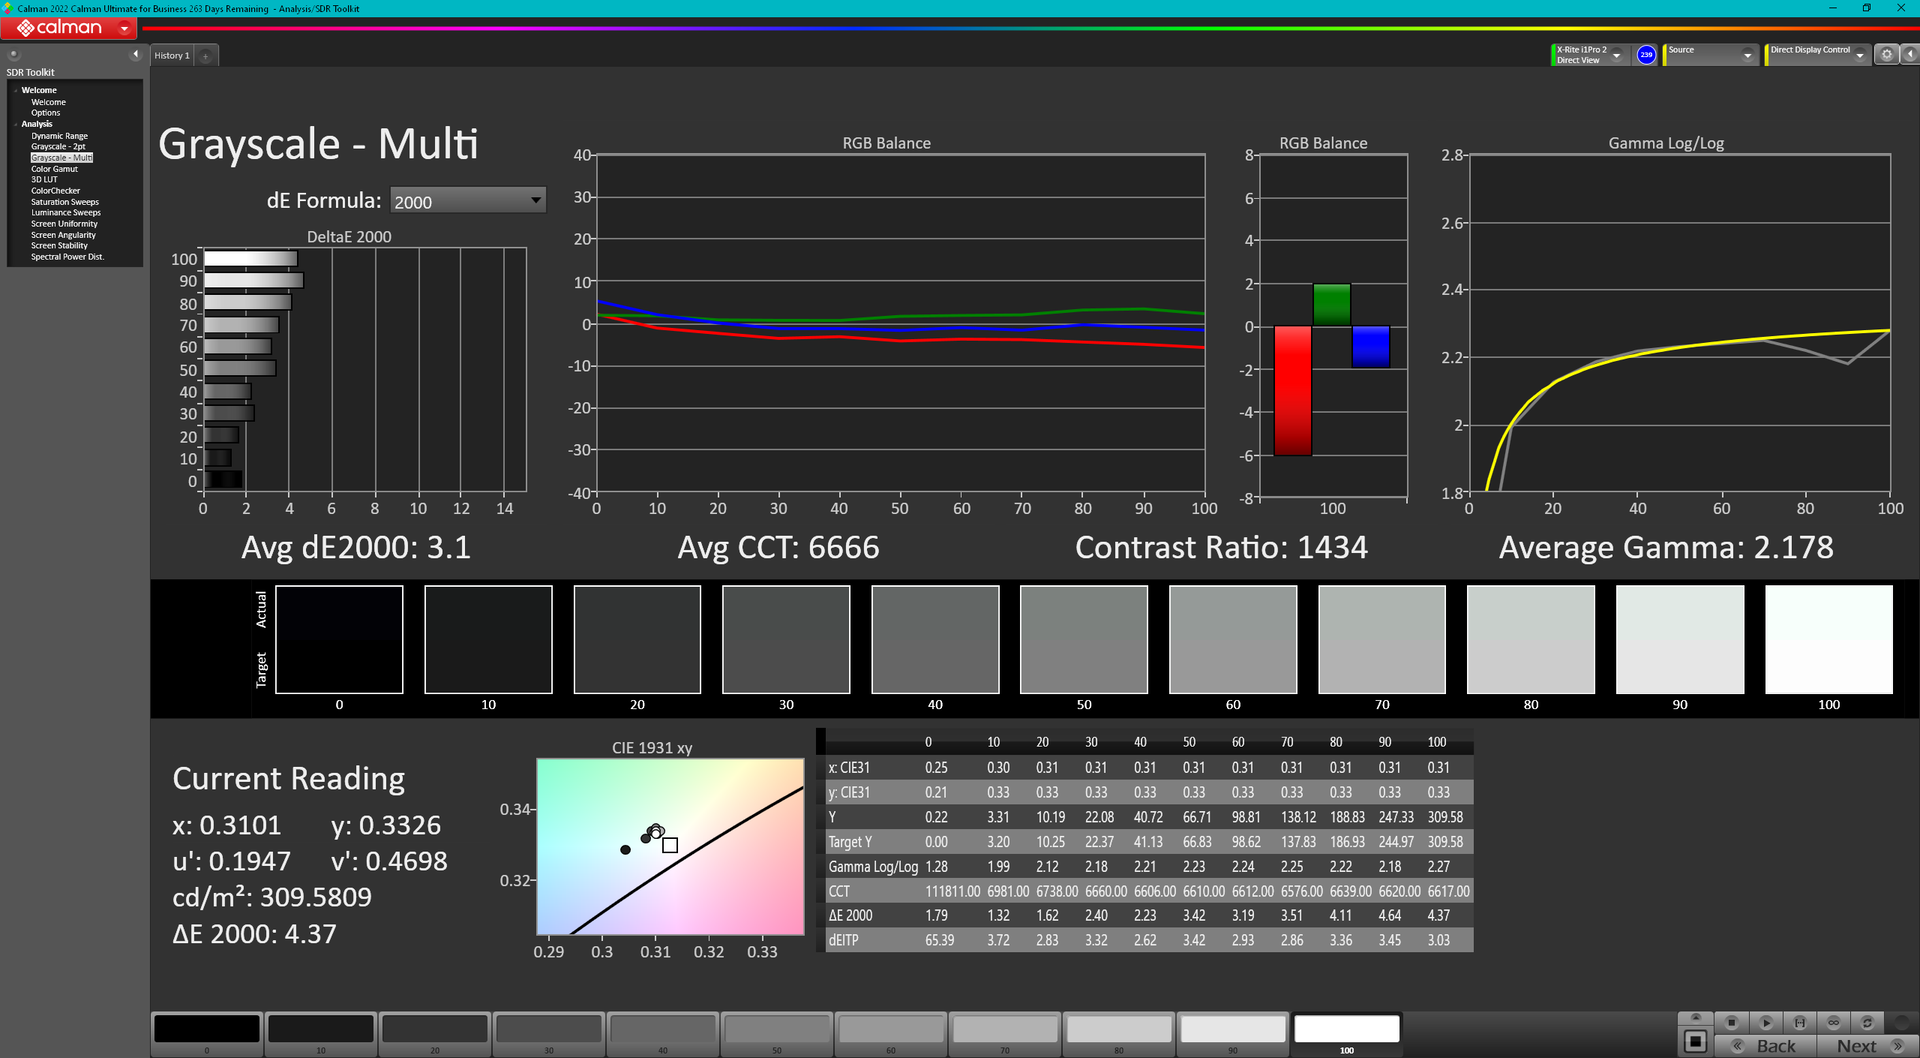
ΔE Greyscale Calman: 4.2 | ∀{0.09-98 Ø4.96}
41% AdobeRGB 1998 (Argyll 3D)
59% sRGB (Argyll 3D)
39.7% Display P3 (Argyll 3D)
Gamma: 2.28
CCT: 6163 K
| Lenovo ThinkPad T16 Gen 1 Core i7-1270P B160UAN3.2, IPS, 1920x1200, 16" | Lenovo ThinkPad T16 G1 21CH004MGE MNG007DA1-C, IPS-LED, 2560x1600, 16" | LG Gram 16Z90Q LG LP160WQ1-SPB2 (LGD06EB), IPS, 2560x1600, 16" | HP EliteBook 865 G9 X160NV42, IPS, 1920x1200, 16" | Huawei MateBook 16s i7 BOE XS TV160DKT-NH0, IPS, 2520x1680, 16" | Apple MacBook Pro 16 2021 M1 Pro Liquid Retina XDR, Mini-LED, 3456x2234, 16.2" | |
|---|---|---|---|---|---|---|
| Display | 66% | 106% | 76% | 63% | 111% | |
| Display P3 Coverage (%) | 39.7 | 66.7 68% | 96.8 144% | 71.4 80% | 64.5 62% | 99.1 150% |
| sRGB Coverage (%) | 59 | 95.7 62% | 99.9 69% | 99.3 68% | 96.7 64% | 100 69% |
| AdobeRGB 1998 Coverage (%) | 41 | 69.1 69% | 84.6 106% | 73.2 79% | 66.6 62% | 88 115% |
| Response Times | 7% | -19% | -9% | -9% | -161% | |
| Response Time Grey 50% / Grey 80% * (ms) | 29.2 ? | 32.1 ? -10% | 45.7 ? -57% | 35.5 ? -22% | 35.7 ? -22% | 42.8 ? -47% |
| Response Time Black / White * (ms) | 24.4 ? | 18.9 ? 23% | 19.7 ? 19% | 23.5 ? 4% | 23.2 ? 5% | 91.6 ? -275% |
| PWM Frequency (Hz) | 56.7 | 14880 | ||||
| Screen | 43% | 23% | 73% | 49% | 352% | |
| Brightness middle (cd/m²) | 321.3 | 417 30% | 366 14% | 865 169% | 311 -3% | 514 60% |
| Brightness (cd/m²) | 315 | 388 23% | 347 10% | 771 145% | 319 1% | 497 58% |
| Brightness Distribution (%) | 82 | 81 -1% | 89 9% | 72 -12% | 91 11% | 95 16% |
| Black Level * (cd/m²) | 0.31 | 0.24 23% | 0.32 -3% | 0.3 3% | 0.17 45% | 0.02 94% |
| Contrast (:1) | 1036 | 1738 68% | 1144 10% | 2883 178% | 1829 77% | 25700 2381% |
| Colorchecker dE 2000 * | 5.16 | 1.7 67% | 2.82 45% | 2.4 53% | 1 81% | 1.4 73% |
| Colorchecker dE 2000 max. * | 18.75 | 3.5 81% | 4.65 75% | 5.8 69% | 1.7 91% | 2.8 85% |
| Colorchecker dE 2000 calibrated * | 2.76 | 1.4 49% | 2.69 3% | 1.5 46% | 0.8 71% | |
| Greyscale dE 2000 * | 4.2 | 2.4 43% | 2.3 45% | 3.8 10% | 1.5 64% | 2.3 45% |
| Gamma | 2.28 96% | 2.16 102% | 1.971 112% | 2.36 93% | 2.15 102% | 2.27 97% |
| CCT | 6163 105% | 6924 94% | 6796 96% | 6922 94% | 6432 101% | 6792 96% |
| Całkowita średnia (program / ustawienia) | 39% /
43% | 37% /
35% | 47% /
62% | 34% /
44% | 101% /
217% |
* ... im mniej tym lepiej
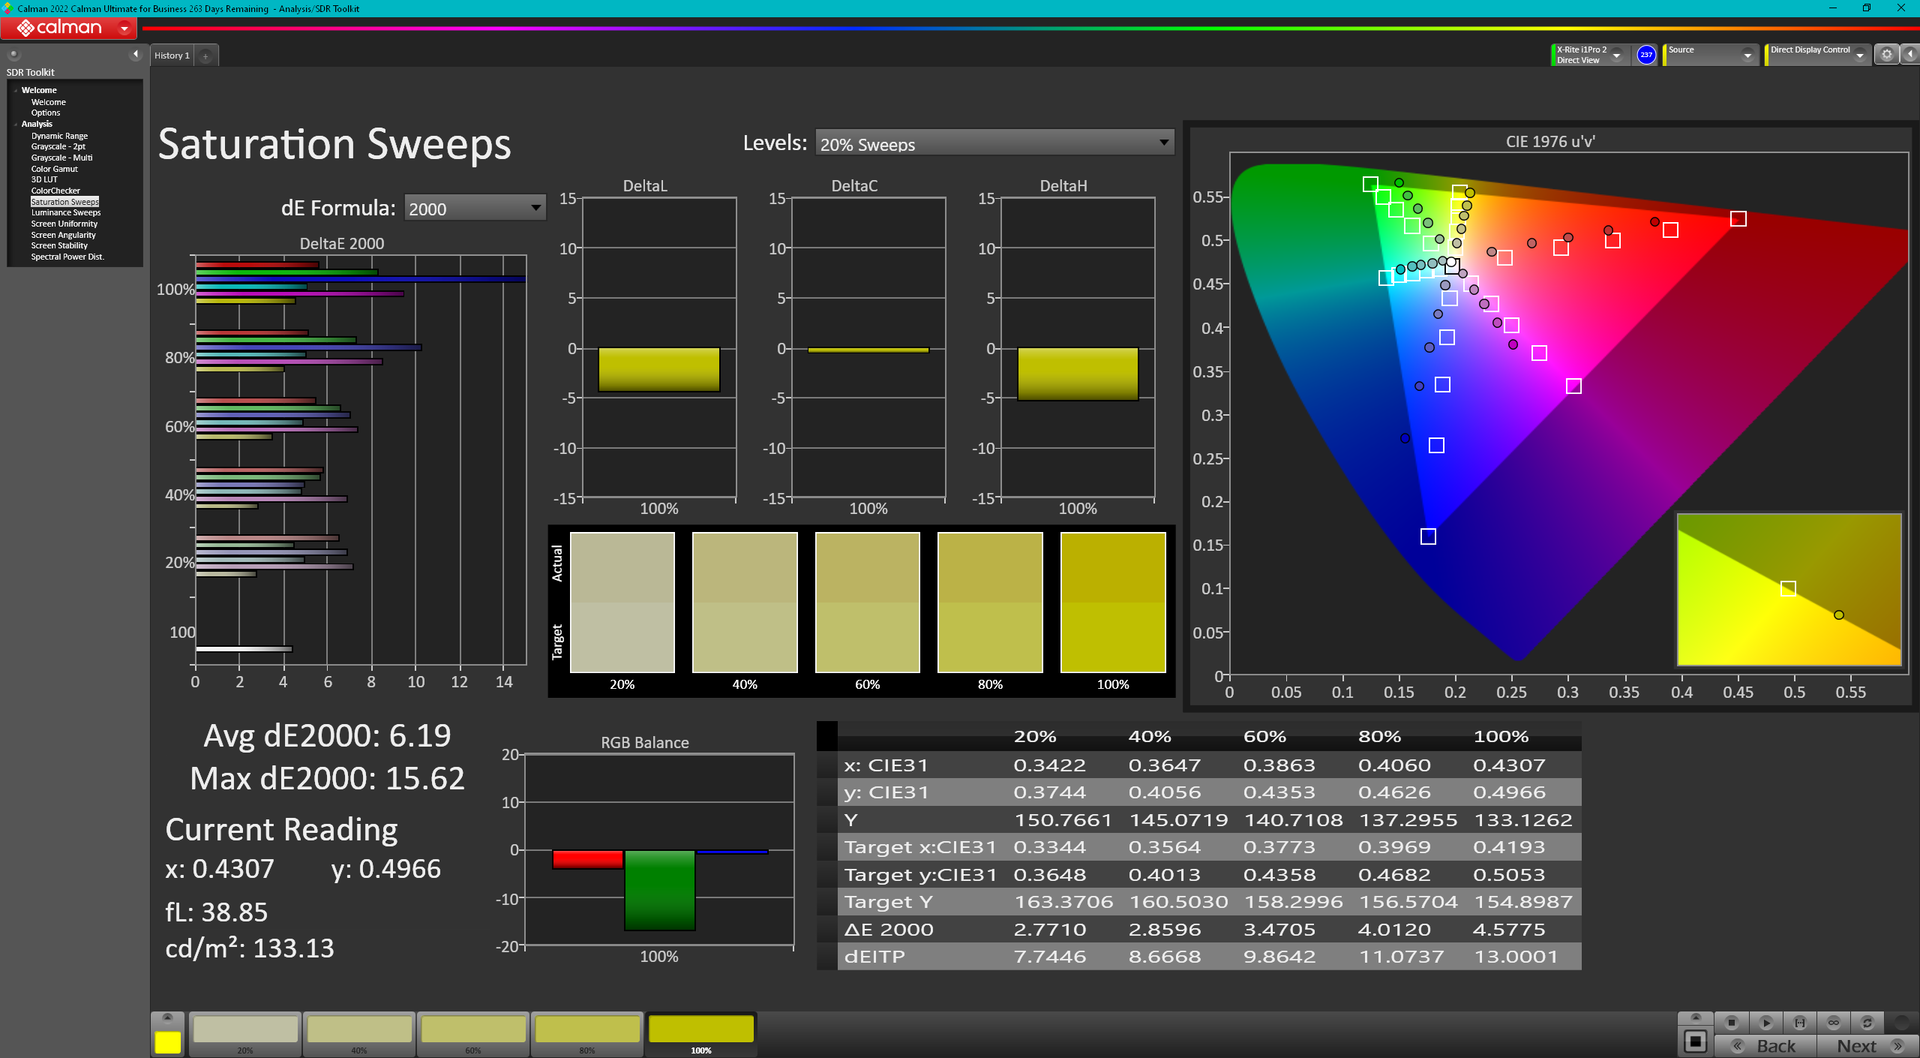
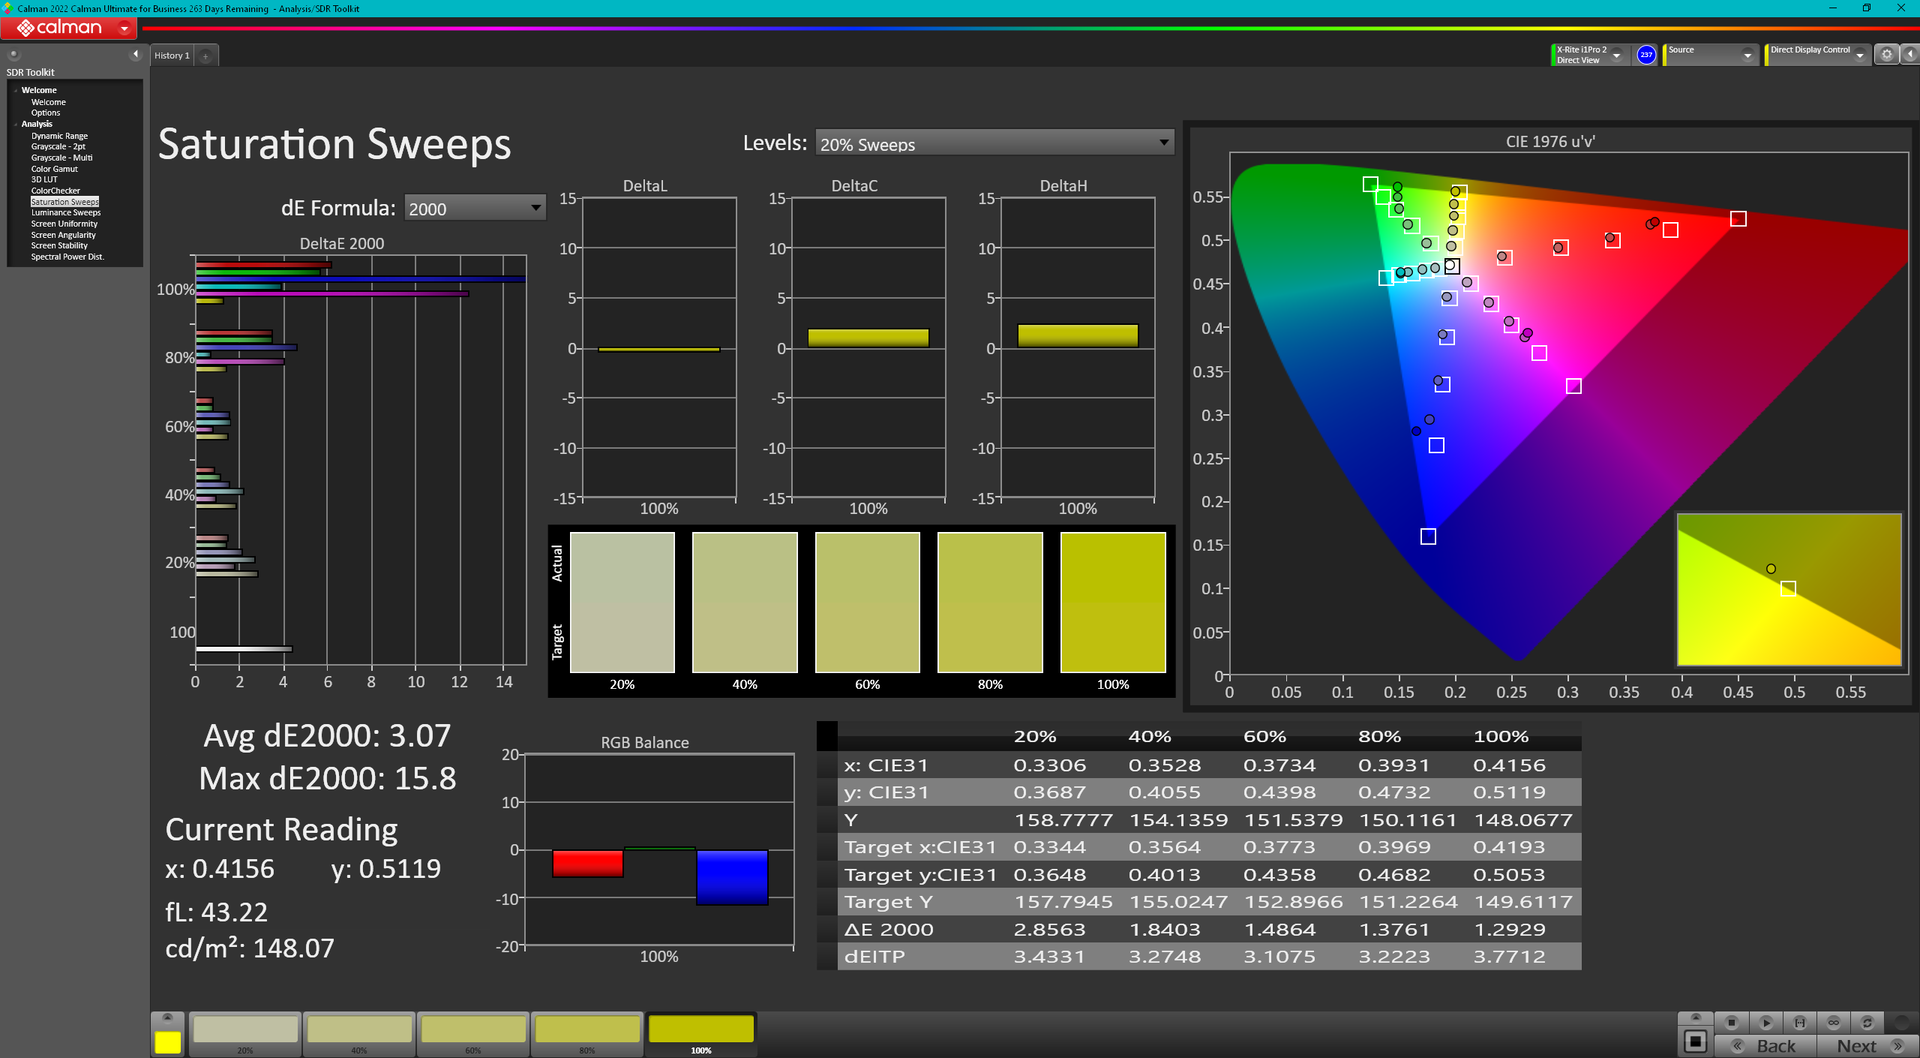
Temperatura barwowa jest zbyt ciepła po wyjęciu z pudełka, co na szczęście można naprawić odpowiednią kalibracją. Średnia DeltaE kolorów poprawi się z 5,05 do 2,23, ale kolory nadal są niedokładne przy wysokich poziomach nasycenia ze względu na ograniczone pokrycie kolorów przez panel. Zalecamy zastosowanie naszego skalibrowanego profilu ICM powyżej, ponieważ wyświetlacz nie jest skalibrowany fabrycznie.
Wyświetl czasy reakcji
| ↔ Czas reakcji od czerni do bieli | ||
|---|---|---|
| 24.4 ms ... wzrost ↗ i spadek ↘ łącznie | ↗ 14 ms wzrost | 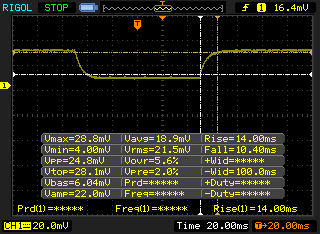 |
| ↘ 10.4 ms upadek | ||
| W naszych testach ekran wykazuje dobry współczynnik reakcji, ale może być zbyt wolny dla graczy rywalizujących ze sobą. Dla porównania, wszystkie testowane urządzenia wahają się od 0.1 (minimum) do 240 (maksimum) ms. » 58 % wszystkich urządzeń jest lepszych. Oznacza to, że zmierzony czas reakcji jest gorszy od średniej wszystkich testowanych urządzeń (19.8 ms). | ||
| ↔ Czas reakcji 50% szarości do 80% szarości | ||
| 29.2 ms ... wzrost ↗ i spadek ↘ łącznie | ↗ 15.6 ms wzrost | 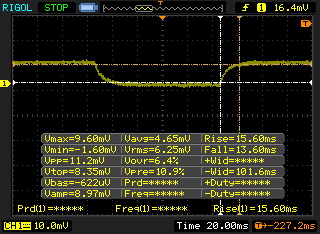 |
| ↘ 13.6 ms upadek | ||
| W naszych testach ekran wykazuje stosunkowo powolne tempo reakcji i może być zbyt wolny dla graczy. Dla porównania, wszystkie testowane urządzenia wahają się od 0.165 (minimum) do 636 (maksimum) ms. » 40 % wszystkich urządzeń jest lepszych. Oznacza to, że zmierzony czas reakcji jest zbliżony do średniej wszystkich testowanych urządzeń (30.9 ms). | ||
Migotanie ekranu / PWM (modulacja szerokości impulsu)
| Migotanie ekranu/nie wykryto PWM | 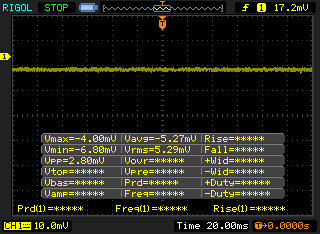 | ||
Dla porównania: 52 % wszystkich testowanych urządzeń nie używa PWM do przyciemniania wyświetlacza. Jeśli wykryto PWM, zmierzono średnio 7744 (minimum: 5 - maksimum: 343500) Hz. | |||
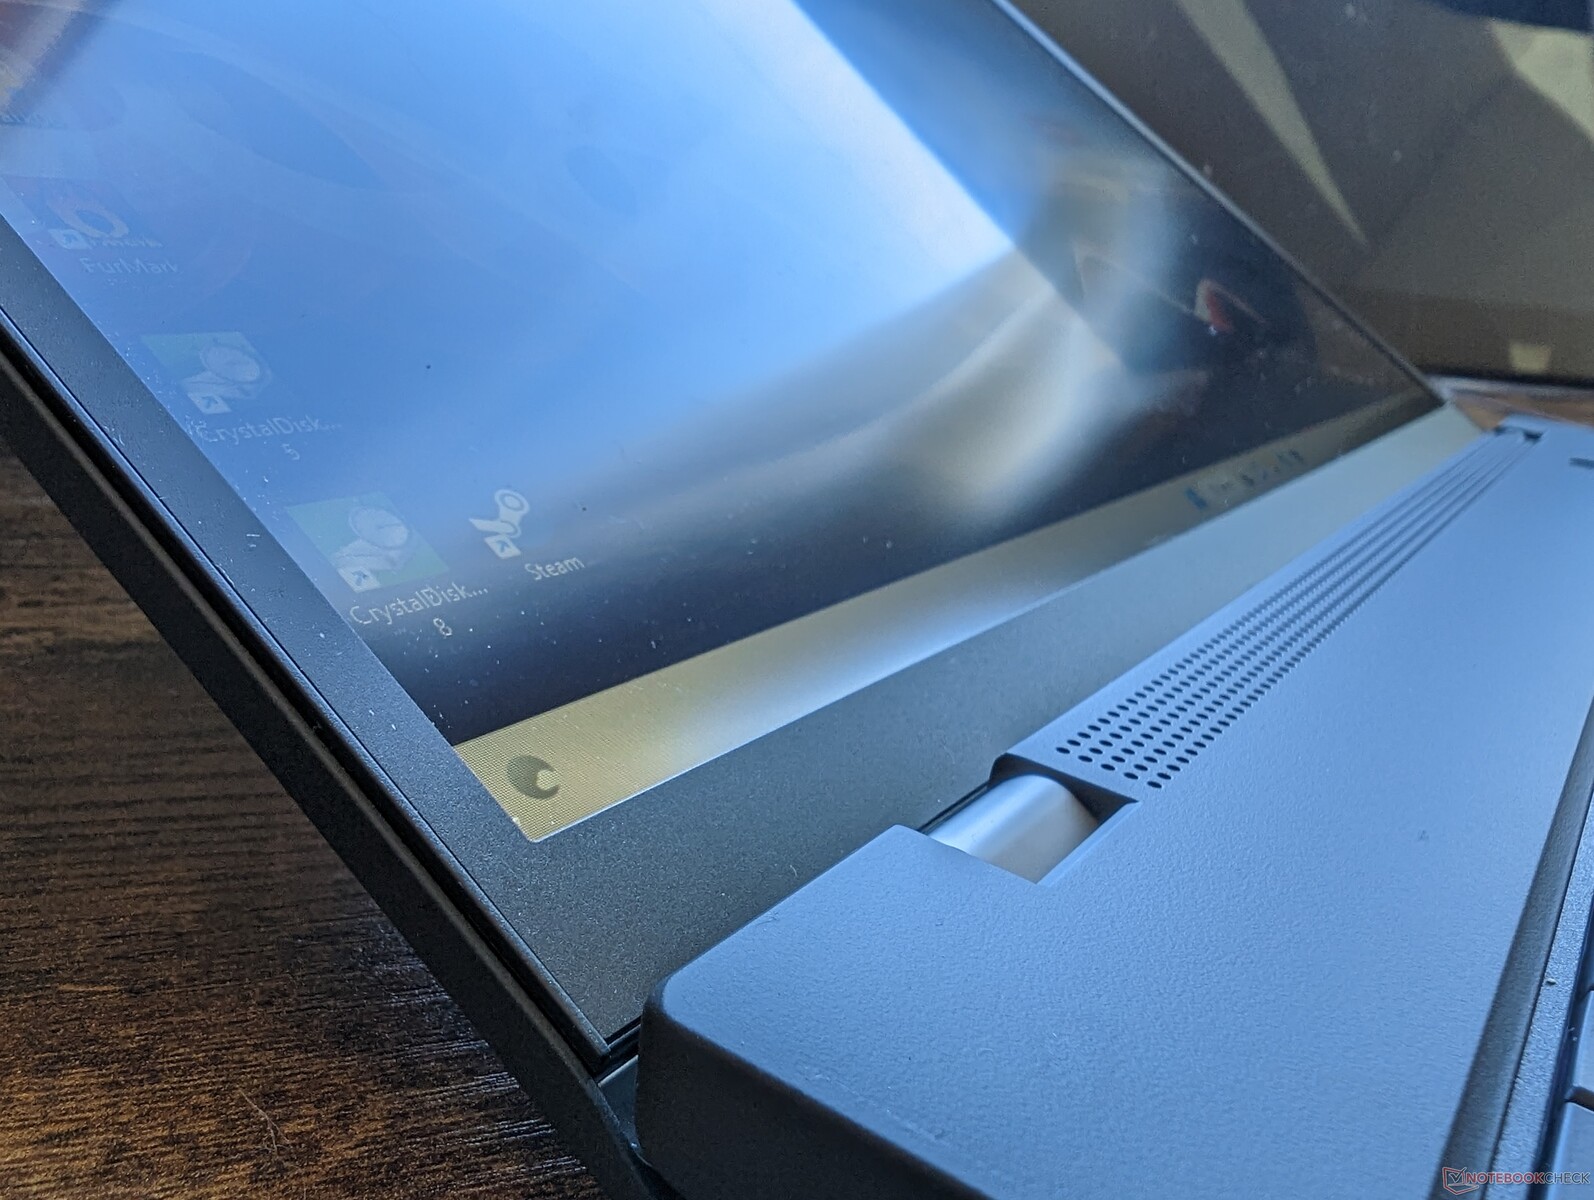
Widoczność na zewnątrz jest w najlepszym wypadku przeciętna na naszym 300-nitowym panelu. Użytkownicy mogą rozważyć opcje 500-nitowe, aby zmniejszyć efekty odblasków. Jeśli widoczność jest problemem, polecamy przyjrzeć się HP EliteBook 860/865 G9 i jego znacznie jaśniejszym, 1000-nitowym opcjom panelu.

Wydajność - Opcje Intel 12. gen
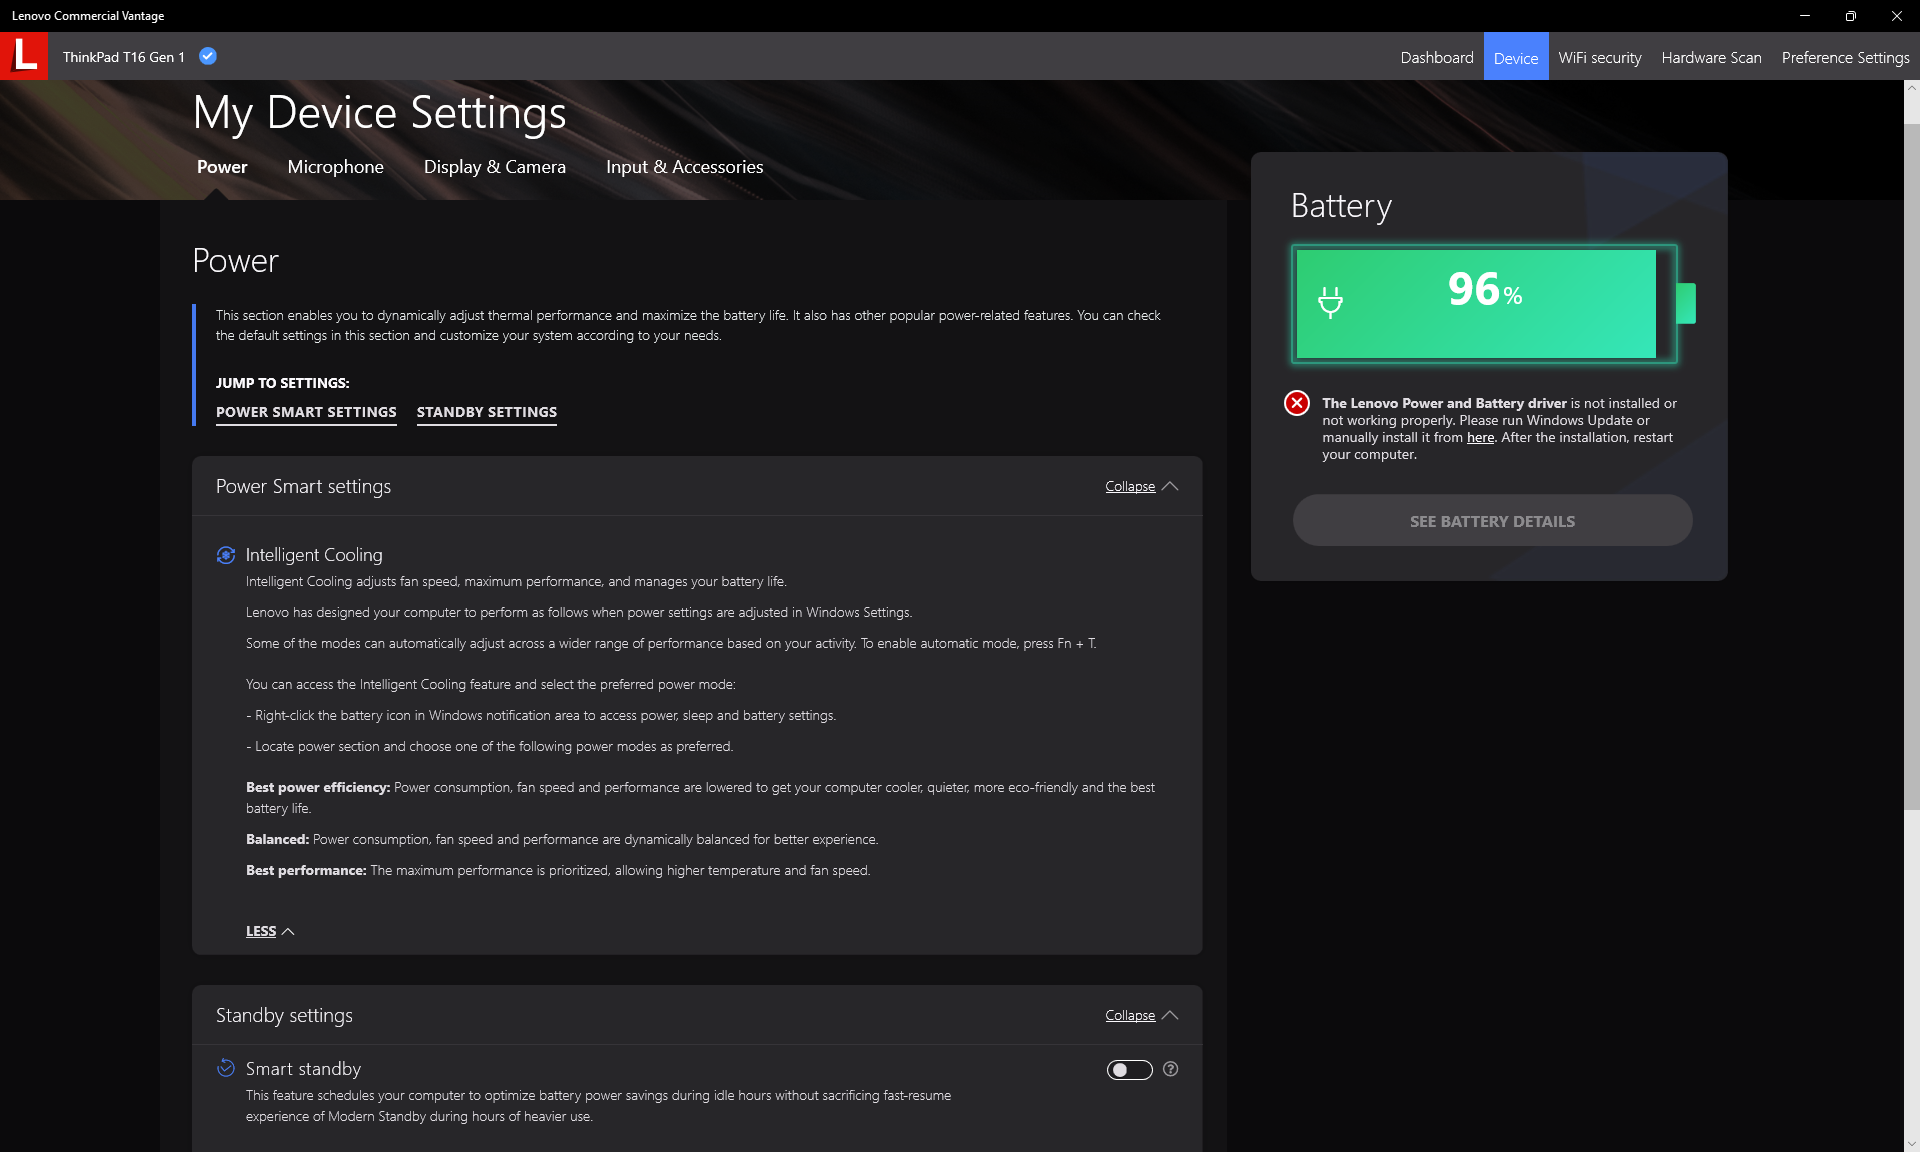
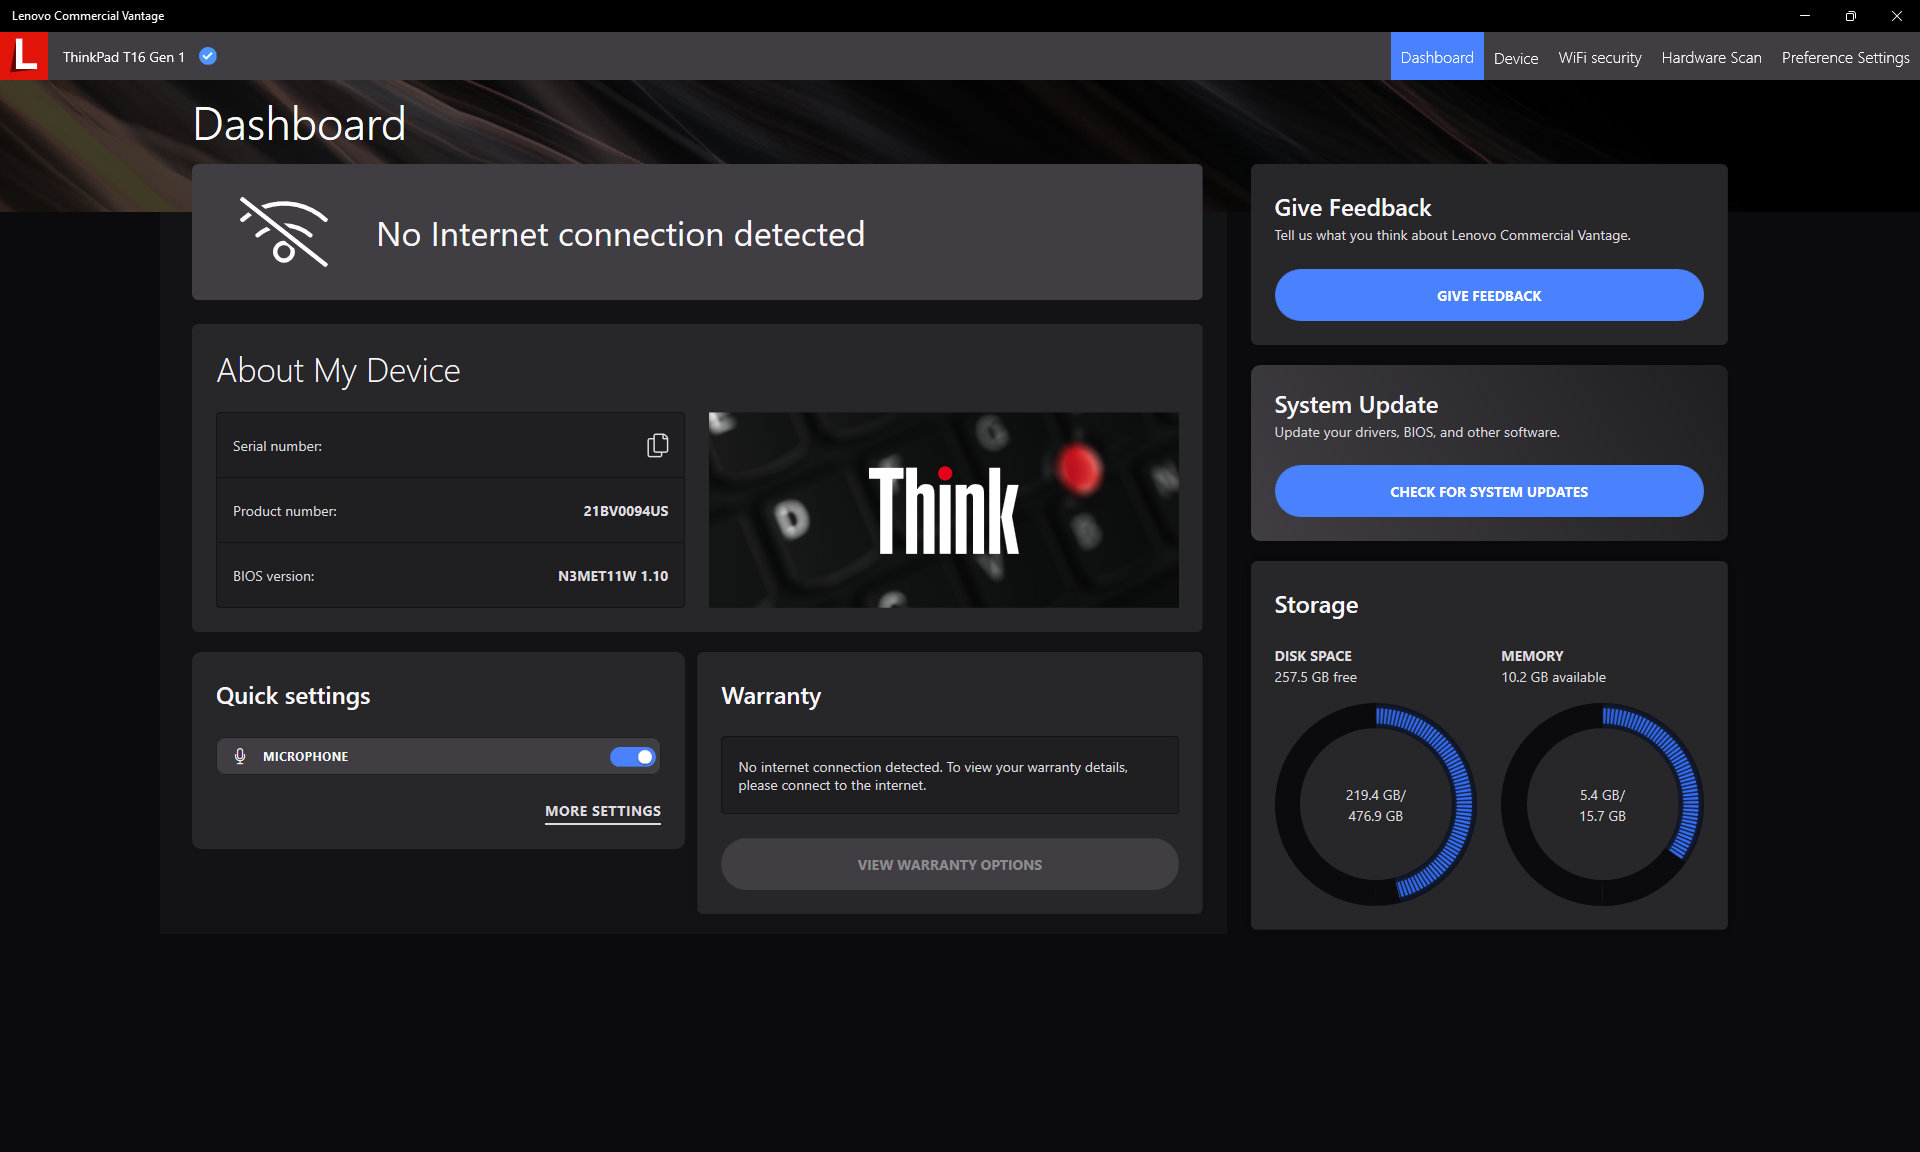
Warunki badania
Przed przeprowadzeniem poniższych testów porównawczych ustawiliśmy nasze urządzenie w systemie Windows w trybie Performance. Użytkownicy powinni zapoznać się z oprogramowaniem Lenovo Commercial Vantage, ponieważ jest to centrum dodatkowych ustawień związanych z aktualizacjami, gwarancją, bezpieczeństwem i innymi. Poniższe zrzuty ekranu pokazują kilka opcji.
Procesor - Turbo Boost mógłby być lepszy
Nasza Core i7-1270P wykazywałby podobne zachowanie, jak ten, który zaobserwowaliśmy na Core i5-1240P SKU. Na przykład podczas pracy w pętli CineBench R15 xT początkowy wynik 1782 punktów spadał z czasem aż o 44 procent, czyli znacznie więcej, niż w większości innych laptopów. Dla porównania.Ryzen 5 PRO 6650U SKU byłby wolniejszy podczas kilku minut testu pętli, ale jest w stanie utrzymać szybsze taktowanie i wydajność przez dłuższy czas, co pokazuje nasz poniższy wykres. Korzyści z Turbo Boost w Core i7-1270P są więc bardzo krótkotrwałe w ThinkPadzie T16 G1.
Użytkownicy mogą zainstalować ThrottleStop, aby zminimalizować dławienie wydajności o około 20 procent, jeśli jest to pożądane. Mimo to rozczarowujące jest to, że Lenovo nie oferuje takiej opcji wydajności bez uciekania się do oprogramowania firm trzecich.
Cinebench R15 Multi Loop
Cinebench R20: CPU (Multi Core) | CPU (Single Core)
Cinebench R23: Multi Core | Single Core
Cinebench R15: CPU Multi 64Bit | CPU Single 64Bit
Blender: v2.79 BMW27 CPU
7-Zip 18.03: 7z b 4 | 7z b 4 -mmt1
Geekbench 5.5: Multi-Core | Single-Core
HWBOT x265 Benchmark v2.2: 4k Preset
LibreOffice : 20 Documents To PDF
R Benchmark 2.5: Overall mean
| CPU Performance rating | |
| Huawei MateBook 16s i7 | |
| MSI Summit E16 Flip A12UDT-031 | |
| Apple MacBook Pro 16 2021 M1 Pro -5! | |
| Lenovo Yoga 7-14ARB G7 | |
| Lenovo ThinkPad T16 Gen 1 Core i7-1270P | |
| Przeciętny Intel Core i7-1270P | |
| HP EliteBook 865 G9 | |
| Lenovo ThinkPad T16 G1 21CH004MGE | |
| Lenovo ThinkBook 13s G3 20YA0005GE | |
| LG Gram 16Z90Q | |
| Lenovo ThinkPad T16 G1 21BWS00200 | |
| Asus ZenBook Flip 15 Q508U | |
| LG Gram 16 (2021) | |
| Asus ZenBook 14 UX434FL-DB77 -2! | |
| Cinebench R20 / CPU (Multi Core) | |
| Huawei MateBook 16s i7 | |
| MSI Summit E16 Flip A12UDT-031 | |
| Lenovo Yoga 7-14ARB G7 | |
| Lenovo ThinkPad T16 Gen 1 Core i7-1270P | |
| HP EliteBook 865 G9 | |
| Lenovo ThinkPad T16 G1 21CH004MGE | |
| Asus ZenBook Flip 15 Q508U | |
| Przeciętny Intel Core i7-1270P (3167 - 3905, n=2) | |
| LG Gram 16Z90Q | |
| Lenovo ThinkBook 13s G3 20YA0005GE | |
| Lenovo ThinkPad T16 G1 21BWS00200 | |
| Apple MacBook Pro 16 2021 M1 Pro | |
| LG Gram 16 (2021) | |
| Asus ZenBook 14 UX434FL-DB77 | |
| Cinebench R20 / CPU (Single Core) | |
| Huawei MateBook 16s i7 | |
| MSI Summit E16 Flip A12UDT-031 | |
| Lenovo ThinkPad T16 Gen 1 Core i7-1270P | |
| Przeciętny Intel Core i7-1270P (595 - 627, n=2) | |
| LG Gram 16Z90Q | |
| Lenovo Yoga 7-14ARB G7 | |
| HP EliteBook 865 G9 | |
| Lenovo ThinkPad T16 G1 21BWS00200 | |
| Lenovo ThinkPad T16 G1 21CH004MGE | |
| Lenovo ThinkBook 13s G3 20YA0005GE | |
| LG Gram 16 (2021) | |
| Asus ZenBook Flip 15 Q508U | |
| Asus ZenBook 14 UX434FL-DB77 | |
| Apple MacBook Pro 16 2021 M1 Pro | |
| Cinebench R23 / Multi Core | |
| MSI Summit E16 Flip A12UDT-031 | |
| Huawei MateBook 16s i7 | |
| Apple MacBook Pro 16 2021 M1 Pro | |
| Lenovo Yoga 7-14ARB G7 | |
| Lenovo ThinkPad T16 Gen 1 Core i7-1270P | |
| HP EliteBook 865 G9 | |
| Przeciętny Intel Core i7-1270P (8426 - 11010, n=2) | |
| Lenovo ThinkPad T16 G1 21CH004MGE | |
| Asus ZenBook Flip 15 Q508U | |
| Lenovo ThinkBook 13s G3 20YA0005GE | |
| LG Gram 16Z90Q | |
| Lenovo ThinkPad T16 G1 21BWS00200 | |
| LG Gram 16 (2021) | |
| Cinebench R23 / Single Core | |
| Huawei MateBook 16s i7 | |
| Lenovo ThinkPad T16 Gen 1 Core i7-1270P | |
| MSI Summit E16 Flip A12UDT-031 | |
| Lenovo ThinkPad T16 G1 21BWS00200 | |
| Przeciętny Intel Core i7-1270P (1552 - 1688, n=2) | |
| LG Gram 16Z90Q | |
| Apple MacBook Pro 16 2021 M1 Pro | |
| Lenovo Yoga 7-14ARB G7 | |
| Lenovo ThinkPad T16 G1 21CH004MGE | |
| Lenovo ThinkBook 13s G3 20YA0005GE | |
| HP EliteBook 865 G9 | |
| LG Gram 16 (2021) | |
| Asus ZenBook Flip 15 Q508U | |
| Cinebench R15 / CPU Multi 64Bit | |
| Huawei MateBook 16s i7 | |
| Huawei MateBook 16s i7 | |
| MSI Summit E16 Flip A12UDT-031 | |
| Lenovo Yoga 7-14ARB G7 | |
| Lenovo ThinkBook 13s G3 20YA0005GE | |
| Lenovo ThinkBook 13s G3 20YA0005GE | |
| Lenovo ThinkPad T16 Gen 1 Core i7-1270P | |
| Lenovo ThinkPad T16 G1 21BWS00200 | |
| Lenovo ThinkPad T16 G1 21BWS00200 | |
| Przeciętny Intel Core i7-1270P (1695 - 1783, n=2) | |
| Apple MacBook Pro 16 2021 M1 Pro | |
| HP EliteBook 865 G9 | |
| Asus ZenBook Flip 15 Q508U | |
| Lenovo ThinkPad T16 G1 21CH004MGE | |
| LG Gram 16Z90Q | |
| LG Gram 16 (2021) | |
| Asus ZenBook 14 UX434FL-DB77 | |
| Cinebench R15 / CPU Single 64Bit | |
| Huawei MateBook 16s i7 | |
| Lenovo Yoga 7-14ARB G7 | |
| MSI Summit E16 Flip A12UDT-031 | |
| Lenovo ThinkPad T16 Gen 1 Core i7-1270P | |
| Lenovo ThinkPad T16 G1 21CH004MGE | |
| HP EliteBook 865 G9 | |
| Przeciętny Intel Core i7-1270P (226 - 233, n=2) | |
| Lenovo ThinkBook 13s G3 20YA0005GE | |
| Lenovo ThinkPad T16 G1 21BWS00200 | |
| LG Gram 16Z90Q | |
| Apple MacBook Pro 16 2021 M1 Pro | |
| LG Gram 16 (2021) | |
| Asus ZenBook Flip 15 Q508U | |
| Asus ZenBook 14 UX434FL-DB77 | |
| Blender / v2.79 BMW27 CPU | |
| LG Gram 16 (2021) | |
| Asus ZenBook 14 UX434FL-DB77 | |
| LG Gram 16Z90Q | |
| Lenovo ThinkPad T16 G1 21BWS00200 | |
| Lenovo ThinkBook 13s G3 20YA0005GE | |
| Przeciętny Intel Core i7-1270P (372 - 375, n=2) | |
| Lenovo ThinkPad T16 Gen 1 Core i7-1270P | |
| Lenovo ThinkPad T16 G1 21CH004MGE | |
| Asus ZenBook Flip 15 Q508U | |
| MSI Summit E16 Flip A12UDT-031 | |
| HP EliteBook 865 G9 | |
| Lenovo Yoga 7-14ARB G7 | |
| Huawei MateBook 16s i7 | |
| Apple MacBook Pro 16 2021 M1 Pro | |
| 7-Zip 18.03 / 7z b 4 | |
| Huawei MateBook 16s i7 | |
| Lenovo Yoga 7-14ARB G7 | |
| MSI Summit E16 Flip A12UDT-031 | |
| HP EliteBook 865 G9 | |
| Asus ZenBook Flip 15 Q508U | |
| Lenovo ThinkPad T16 G1 21CH004MGE | |
| Lenovo ThinkBook 13s G3 20YA0005GE | |
| Lenovo ThinkPad T16 Gen 1 Core i7-1270P | |
| Przeciętny Intel Core i7-1270P (38099 - 38449, n=2) | |
| LG Gram 16Z90Q | |
| Lenovo ThinkPad T16 G1 21BWS00200 | |
| LG Gram 16 (2021) | |
| Asus ZenBook 14 UX434FL-DB77 | |
| 7-Zip 18.03 / 7z b 4 -mmt1 | |
| Huawei MateBook 16s i7 | |
| Lenovo ThinkPad T16 Gen 1 Core i7-1270P | |
| HP EliteBook 865 G9 | |
| Lenovo Yoga 7-14ARB G7 | |
| Lenovo ThinkBook 13s G3 20YA0005GE | |
| Przeciętny Intel Core i7-1270P (4874 - 5684, n=2) | |
| Lenovo ThinkPad T16 G1 21CH004MGE | |
| MSI Summit E16 Flip A12UDT-031 | |
| LG Gram 16Z90Q | |
| LG Gram 16 (2021) | |
| Lenovo ThinkPad T16 G1 21BWS00200 | |
| Asus ZenBook Flip 15 Q508U | |
| Asus ZenBook 14 UX434FL-DB77 | |
| Geekbench 5.5 / Multi-Core | |
| Huawei MateBook 16s i7 | |
| Apple MacBook Pro 16 2021 M1 Pro | |
| MSI Summit E16 Flip A12UDT-031 | |
| LG Gram 16Z90Q | |
| Lenovo Yoga 7-14ARB G7 | |
| Przeciętny Intel Core i7-1270P (8610 - 8710, n=2) | |
| Lenovo ThinkPad T16 Gen 1 Core i7-1270P | |
| Lenovo ThinkPad T16 G1 21CH004MGE | |
| Lenovo ThinkPad T16 G1 21BWS00200 | |
| HP EliteBook 865 G9 | |
| Lenovo ThinkBook 13s G3 20YA0005GE | |
| Asus ZenBook Flip 15 Q508U | |
| LG Gram 16 (2021) | |
| Asus ZenBook 14 UX434FL-DB77 | |
| Geekbench 5.5 / Single-Core | |
| Huawei MateBook 16s i7 | |
| Apple MacBook Pro 16 2021 M1 Pro | |
| Lenovo ThinkPad T16 Gen 1 Core i7-1270P | |
| LG Gram 16Z90Q | |
| Przeciętny Intel Core i7-1270P (1564 - 1724, n=2) | |
| MSI Summit E16 Flip A12UDT-031 | |
| Lenovo Yoga 7-14ARB G7 | |
| Lenovo ThinkPad T16 G1 21BWS00200 | |
| LG Gram 16 (2021) | |
| Lenovo ThinkPad T16 G1 21CH004MGE | |
| Lenovo ThinkBook 13s G3 20YA0005GE | |
| HP EliteBook 865 G9 | |
| Asus ZenBook Flip 15 Q508U | |
| Asus ZenBook 14 UX434FL-DB77 | |
| HWBOT x265 Benchmark v2.2 / 4k Preset | |
| Huawei MateBook 16s i7 | |
| Lenovo Yoga 7-14ARB G7 | |
| MSI Summit E16 Flip A12UDT-031 | |
| Lenovo ThinkPad T16 G1 21CH004MGE | |
| HP EliteBook 865 G9 | |
| Lenovo ThinkPad T16 Gen 1 Core i7-1270P | |
| Przeciętny Intel Core i7-1270P (9.56 - 11.3, n=2) | |
| Lenovo ThinkBook 13s G3 20YA0005GE | |
| Asus ZenBook Flip 15 Q508U | |
| Lenovo ThinkPad T16 G1 21BWS00200 | |
| LG Gram 16Z90Q | |
| LG Gram 16 (2021) | |
| Asus ZenBook 14 UX434FL-DB77 | |
| LibreOffice / 20 Documents To PDF | |
| Asus ZenBook 14 UX434FL-DB77 | |
| Asus ZenBook Flip 15 Q508U | |
| Lenovo Yoga 7-14ARB G7 | |
| LG Gram 16Z90Q | |
| HP EliteBook 865 G9 | |
| MSI Summit E16 Flip A12UDT-031 | |
| Lenovo ThinkBook 13s G3 20YA0005GE | |
| Lenovo ThinkPad T16 G1 21CH004MGE | |
| Przeciętny Intel Core i7-1270P (47.1 - 48.6, n=2) | |
| Lenovo ThinkPad T16 G1 21BWS00200 | |
| Lenovo ThinkPad T16 Gen 1 Core i7-1270P | |
| LG Gram 16 (2021) | |
| Huawei MateBook 16s i7 | |
| R Benchmark 2.5 / Overall mean | |
| Asus ZenBook 14 UX434FL-DB77 | |
| LG Gram 16 (2021) | |
| Asus ZenBook Flip 15 Q508U | |
| Lenovo ThinkBook 13s G3 20YA0005GE | |
| LG Gram 16Z90Q | |
| Przeciętny Intel Core i7-1270P (0.4926 - 0.575, n=2) | |
| Lenovo ThinkPad T16 G1 21CH004MGE | |
| Lenovo ThinkPad T16 G1 21BWS00200 | |
| HP EliteBook 865 G9 | |
| MSI Summit E16 Flip A12UDT-031 | |
| Lenovo Yoga 7-14ARB G7 | |
| Lenovo ThinkPad T16 Gen 1 Core i7-1270P | |
| Huawei MateBook 16s i7 | |
Cinebench R20: CPU (Multi Core) | CPU (Single Core)
Cinebench R23: Multi Core | Single Core
Cinebench R15: CPU Multi 64Bit | CPU Single 64Bit
Blender: v2.79 BMW27 CPU
7-Zip 18.03: 7z b 4 | 7z b 4 -mmt1
Geekbench 5.5: Multi-Core | Single-Core
HWBOT x265 Benchmark v2.2: 4k Preset
LibreOffice : 20 Documents To PDF
R Benchmark 2.5: Overall mean
* ... im mniej tym lepiej
| Blender | |
| v3.3 Classroom HIP/AMD | |
| Lenovo ThinkPad T16 G1 21CH004MGE | |
| HP EliteBook 865 G9 | |
| v3.3 Classroom CPU | |
| LG Gram 16Z90Q | |
| Lenovo ThinkPad T16 Gen 1 Core i7-1270P | |
| Przeciętny Intel Iris Xe Graphics G7 96EUs (336 - 1259, n=109) | |
| Lenovo ThinkPad T16 G1 21CH004MGE | |
| HP EliteBook 865 G9 | |
| Huawei MateBook 16s i7 | |
* ... im mniej tym lepiej
AIDA64: FP32 Ray-Trace | FPU Julia | CPU SHA3 | CPU Queen | FPU SinJulia | FPU Mandel | CPU AES | CPU ZLib | FP64 Ray-Trace | CPU PhotoWorxx
| Performance rating | |
| HP EliteBook 865 G9 | |
| Lenovo ThinkPad T16 G1 21CH004MGE | |
| Huawei MateBook 16s i7 | |
| Lenovo ThinkPad T16 Gen 1 Core i7-1270P | |
| LG Gram 16Z90Q | |
| Przeciętny Intel Core i7-1270P | |
| AIDA64 / FP32 Ray-Trace | |
| HP EliteBook 865 G9 | |
| Lenovo ThinkPad T16 G1 21CH004MGE | |
| Lenovo ThinkPad T16 Gen 1 Core i7-1270P | |
| LG Gram 16Z90Q | |
| Huawei MateBook 16s i7 | |
| Przeciętny Intel Core i7-1270P (4789 - 6722, n=2) | |
| AIDA64 / FPU Julia | |
| HP EliteBook 865 G9 | |
| Lenovo ThinkPad T16 G1 21CH004MGE | |
| Lenovo ThinkPad T16 Gen 1 Core i7-1270P | |
| Przeciętny Intel Core i7-1270P (22017 - 37567, n=2) | |
| Huawei MateBook 16s i7 | |
| LG Gram 16Z90Q | |
| AIDA64 / CPU SHA3 | |
| HP EliteBook 865 G9 | |
| Lenovo ThinkPad T16 G1 21CH004MGE | |
| Huawei MateBook 16s i7 | |
| Lenovo ThinkPad T16 Gen 1 Core i7-1270P | |
| Przeciętny Intel Core i7-1270P (1543 - 1853, n=2) | |
| LG Gram 16Z90Q | |
| AIDA64 / CPU Queen | |
| Huawei MateBook 16s i7 | |
| HP EliteBook 865 G9 | |
| Lenovo ThinkPad T16 G1 21CH004MGE | |
| Lenovo ThinkPad T16 Gen 1 Core i7-1270P | |
| LG Gram 16Z90Q | |
| Przeciętny Intel Core i7-1270P (61703 - 76671, n=2) | |
| AIDA64 / FPU SinJulia | |
| HP EliteBook 865 G9 | |
| Lenovo ThinkPad T16 G1 21CH004MGE | |
| Huawei MateBook 16s i7 | |
| Przeciętny Intel Core i7-1270P (5059 - 5210, n=2) | |
| Lenovo ThinkPad T16 Gen 1 Core i7-1270P | |
| LG Gram 16Z90Q | |
| AIDA64 / FPU Mandel | |
| HP EliteBook 865 G9 | |
| Lenovo ThinkPad T16 G1 21CH004MGE | |
| Lenovo ThinkPad T16 Gen 1 Core i7-1270P | |
| Huawei MateBook 16s i7 | |
| Przeciętny Intel Core i7-1270P (12876 - 17891, n=2) | |
| LG Gram 16Z90Q | |
| AIDA64 / CPU AES | |
| Lenovo ThinkPad T16 G1 21CH004MGE | |
| Huawei MateBook 16s i7 | |
| HP EliteBook 865 G9 | |
| Lenovo ThinkPad T16 Gen 1 Core i7-1270P | |
| Przeciętny Intel Core i7-1270P (33137 - 39956, n=2) | |
| LG Gram 16Z90Q | |
| AIDA64 / CPU ZLib | |
| Huawei MateBook 16s i7 | |
| HP EliteBook 865 G9 | |
| Lenovo ThinkPad T16 G1 21CH004MGE | |
| Lenovo ThinkPad T16 Gen 1 Core i7-1270P | |
| Przeciętny Intel Core i7-1270P (553 - 579, n=2) | |
| LG Gram 16Z90Q | |
| AIDA64 / FP64 Ray-Trace | |
| HP EliteBook 865 G9 | |
| Lenovo ThinkPad T16 G1 21CH004MGE | |
| LG Gram 16Z90Q | |
| Lenovo ThinkPad T16 Gen 1 Core i7-1270P | |
| Huawei MateBook 16s i7 | |
| Przeciętny Intel Core i7-1270P (2603 - 3521, n=2) | |
| AIDA64 / CPU PhotoWorxx | |
| Huawei MateBook 16s i7 | |
| LG Gram 16Z90Q | |
| Przeciętny Intel Core i7-1270P (21056 - 34745, n=2) | |
| Lenovo ThinkPad T16 G1 21CH004MGE | |
| Lenovo ThinkPad T16 Gen 1 Core i7-1270P | |
| HP EliteBook 865 G9 | |
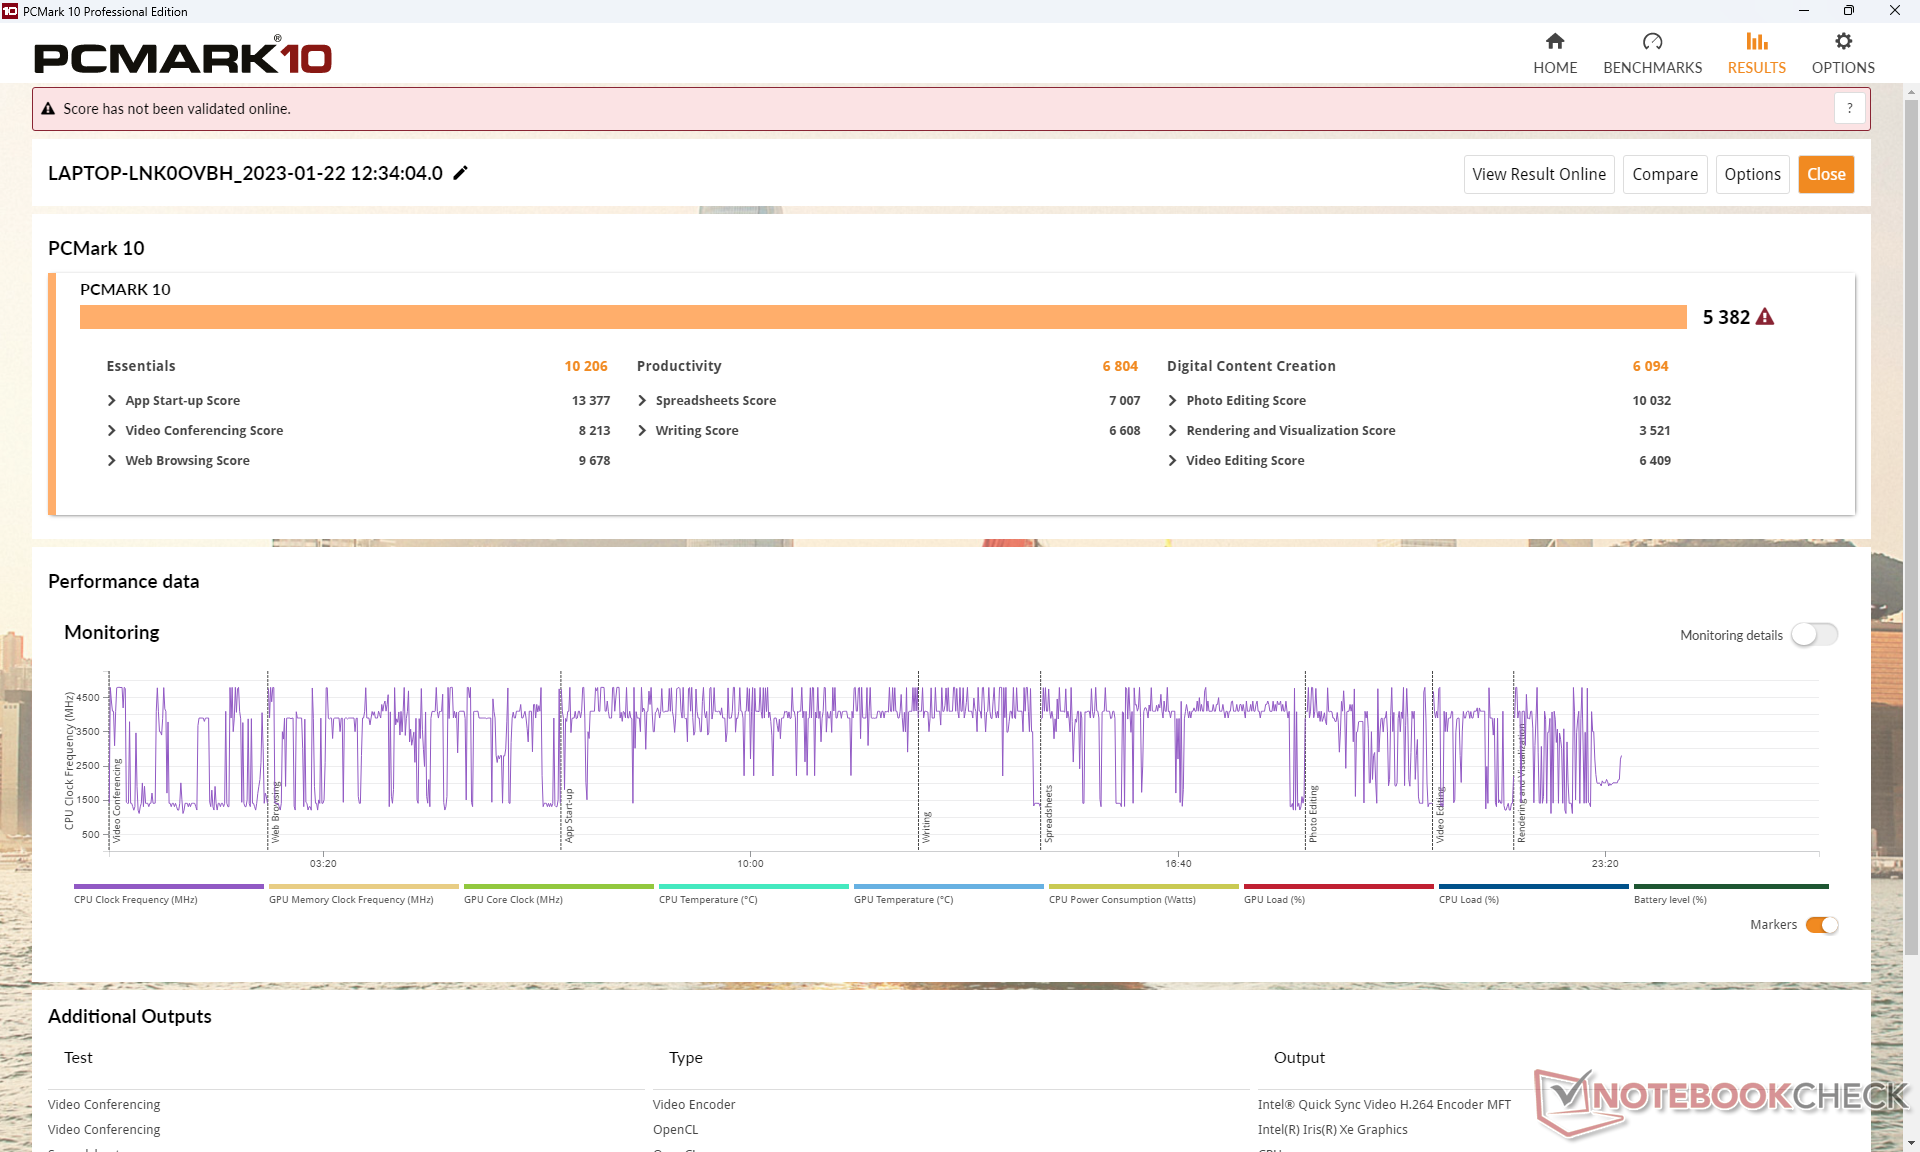
Wydajność systemu
Średnie wyniki PCMark mieszczą się pomiędzy wolniejszymi jednostkami Core i5 a szybszymi Ryzenami 5, co pokazuje poniższy wykres porównawczy. Jednostka AMD jest wyraźnie lepsza w podteście produktywności, co prawdopodobnie wynika z jej szybszej wydajności wielowątkowej i zintegrowanego GPU w porównaniu z jednostkami Intela.
CrossMark: Overall | Productivity | Creativity | Responsiveness
| PCMark 10 / Score | |
| Huawei MateBook 16s i7 | |
| Lenovo ThinkPad T16 G1 21CH004MGE | |
| HP EliteBook 865 G9 | |
| Przeciętny Intel Core i7-1270P, Intel Iris Xe Graphics G7 96EUs (5382 - 5647, n=2) | |
| Lenovo ThinkPad T16 Gen 1 Core i7-1270P | |
| LG Gram 16Z90Q | |
| Lenovo ThinkPad T16 G1 21BWS00200 | |
| PCMark 10 / Essentials | |
| Huawei MateBook 16s i7 | |
| Przeciętny Intel Core i7-1270P, Intel Iris Xe Graphics G7 96EUs (10206 - 11224, n=2) | |
| Lenovo ThinkPad T16 Gen 1 Core i7-1270P | |
| LG Gram 16Z90Q | |
| Lenovo ThinkPad T16 G1 21CH004MGE | |
| Lenovo ThinkPad T16 G1 21BWS00200 | |
| HP EliteBook 865 G9 | |
| PCMark 10 / Productivity | |
| Lenovo ThinkPad T16 G1 21CH004MGE | |
| HP EliteBook 865 G9 | |
| Huawei MateBook 16s i7 | |
| Przeciętny Intel Core i7-1270P, Intel Iris Xe Graphics G7 96EUs (6804 - 6805, n=2) | |
| Lenovo ThinkPad T16 Gen 1 Core i7-1270P | |
| LG Gram 16Z90Q | |
| Lenovo ThinkPad T16 G1 21BWS00200 | |
| PCMark 10 / Digital Content Creation | |
| Huawei MateBook 16s i7 | |
| HP EliteBook 865 G9 | |
| Lenovo ThinkPad T16 G1 21CH004MGE | |
| Przeciętny Intel Core i7-1270P, Intel Iris Xe Graphics G7 96EUs (6094 - 6398, n=2) | |
| Lenovo ThinkPad T16 Gen 1 Core i7-1270P | |
| LG Gram 16Z90Q | |
| Lenovo ThinkPad T16 G1 21BWS00200 | |
| CrossMark / Overall | |
| Huawei MateBook 16s i7 | |
| Przeciętny Intel Core i7-1270P, Intel Iris Xe Graphics G7 96EUs (1585 - 1712, n=2) | |
| Lenovo ThinkPad T16 Gen 1 Core i7-1270P | |
| Apple MacBook Pro 16 2021 M1 Pro | |
| Lenovo ThinkPad T16 G1 21CH004MGE | |
| Lenovo ThinkPad T16 G1 21BWS00200 | |
| HP EliteBook 865 G9 | |
| CrossMark / Productivity | |
| Huawei MateBook 16s i7 | |
| Przeciętny Intel Core i7-1270P, Intel Iris Xe Graphics G7 96EUs (1567 - 1636, n=2) | |
| Lenovo ThinkPad T16 Gen 1 Core i7-1270P | |
| Lenovo ThinkPad T16 G1 21CH004MGE | |
| Lenovo ThinkPad T16 G1 21BWS00200 | |
| HP EliteBook 865 G9 | |
| Apple MacBook Pro 16 2021 M1 Pro | |
| CrossMark / Creativity | |
| Apple MacBook Pro 16 2021 M1 Pro | |
| Huawei MateBook 16s i7 | |
| Przeciętny Intel Core i7-1270P, Intel Iris Xe Graphics G7 96EUs (1684 - 1839, n=2) | |
| Lenovo ThinkPad T16 Gen 1 Core i7-1270P | |
| Lenovo ThinkPad T16 G1 21CH004MGE | |
| Lenovo ThinkPad T16 G1 21BWS00200 | |
| HP EliteBook 865 G9 | |
| CrossMark / Responsiveness | |
| Huawei MateBook 16s i7 | |
| Przeciętny Intel Core i7-1270P, Intel Iris Xe Graphics G7 96EUs (1365 - 1584, n=2) | |
| Lenovo ThinkPad T16 Gen 1 Core i7-1270P | |
| Lenovo ThinkPad T16 G1 21BWS00200 | |
| Lenovo ThinkPad T16 G1 21CH004MGE | |
| HP EliteBook 865 G9 | |
| Apple MacBook Pro 16 2021 M1 Pro | |
| PCMark 10 Score | 5382 pkt. | |
Pomoc | ||
| AIDA64 / Memory Copy | |
| Huawei MateBook 16s i7 | |
| LG Gram 16Z90Q | |
| Przeciętny Intel Core i7-1270P (39471 - 62300, n=2) | |
| Lenovo ThinkPad T16 G1 21CH004MGE | |
| Lenovo ThinkPad T16 Gen 1 Core i7-1270P | |
| HP EliteBook 865 G9 | |
| AIDA64 / Memory Read | |
| Huawei MateBook 16s i7 | |
| LG Gram 16Z90Q | |
| Przeciętny Intel Core i7-1270P (42289 - 72572, n=2) | |
| Lenovo ThinkPad T16 Gen 1 Core i7-1270P | |
| Lenovo ThinkPad T16 G1 21CH004MGE | |
| HP EliteBook 865 G9 | |
| AIDA64 / Memory Write | |
| LG Gram 16Z90Q | |
| Huawei MateBook 16s i7 | |
| Przeciętny Intel Core i7-1270P (43051 - 61340, n=2) | |
| Lenovo ThinkPad T16 G1 21CH004MGE | |
| Lenovo ThinkPad T16 Gen 1 Core i7-1270P | |
| HP EliteBook 865 G9 | |
| AIDA64 / Memory Latency | |
| Lenovo ThinkPad T16 G1 21CH004MGE | |
| Huawei MateBook 16s i7 | |
| LG Gram 16Z90Q | |
| HP EliteBook 865 G9 | |
| Lenovo ThinkPad T16 Gen 1 Core i7-1270P | |
| Przeciętny Intel Core i7-1270P (89.3 - 89.3, n=2) | |
* ... im mniej tym lepiej
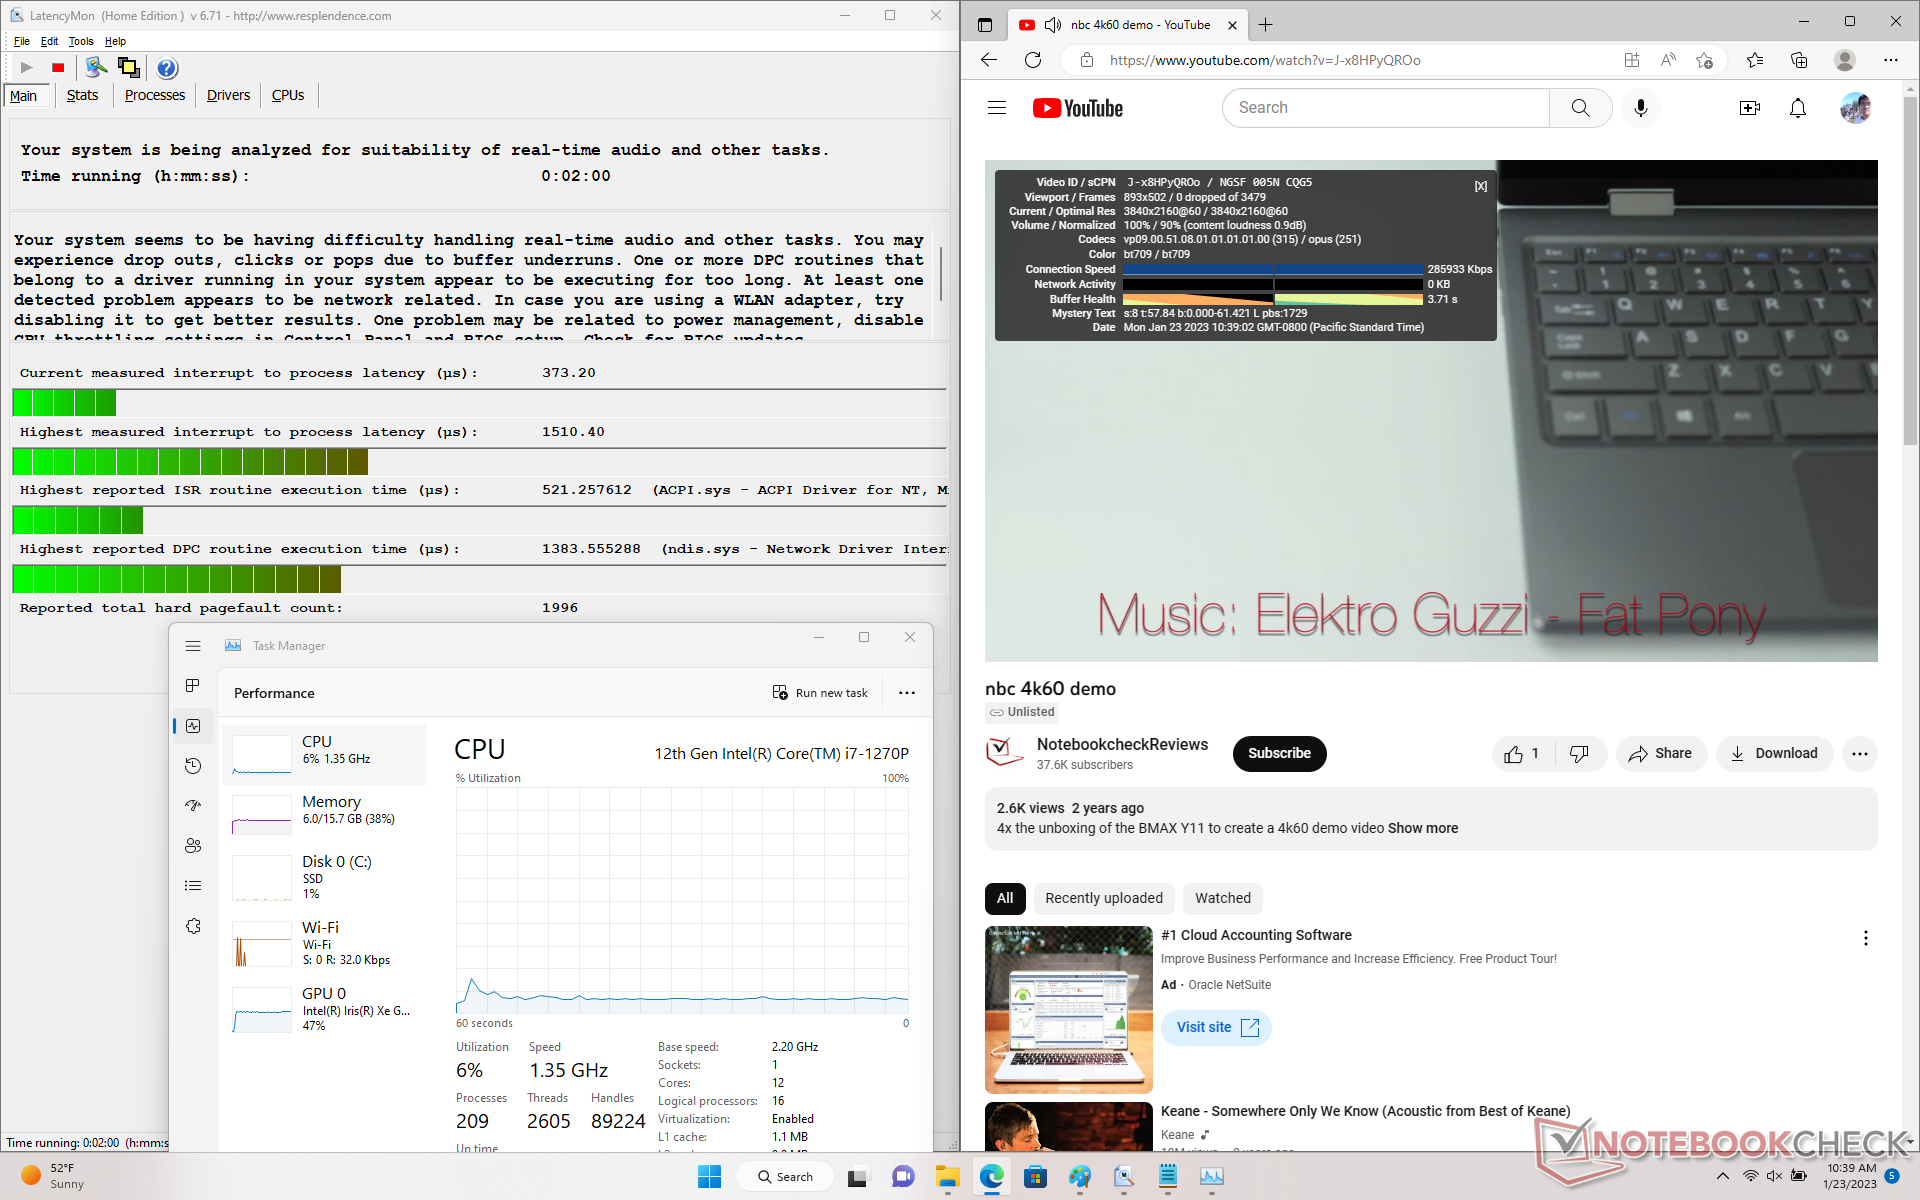
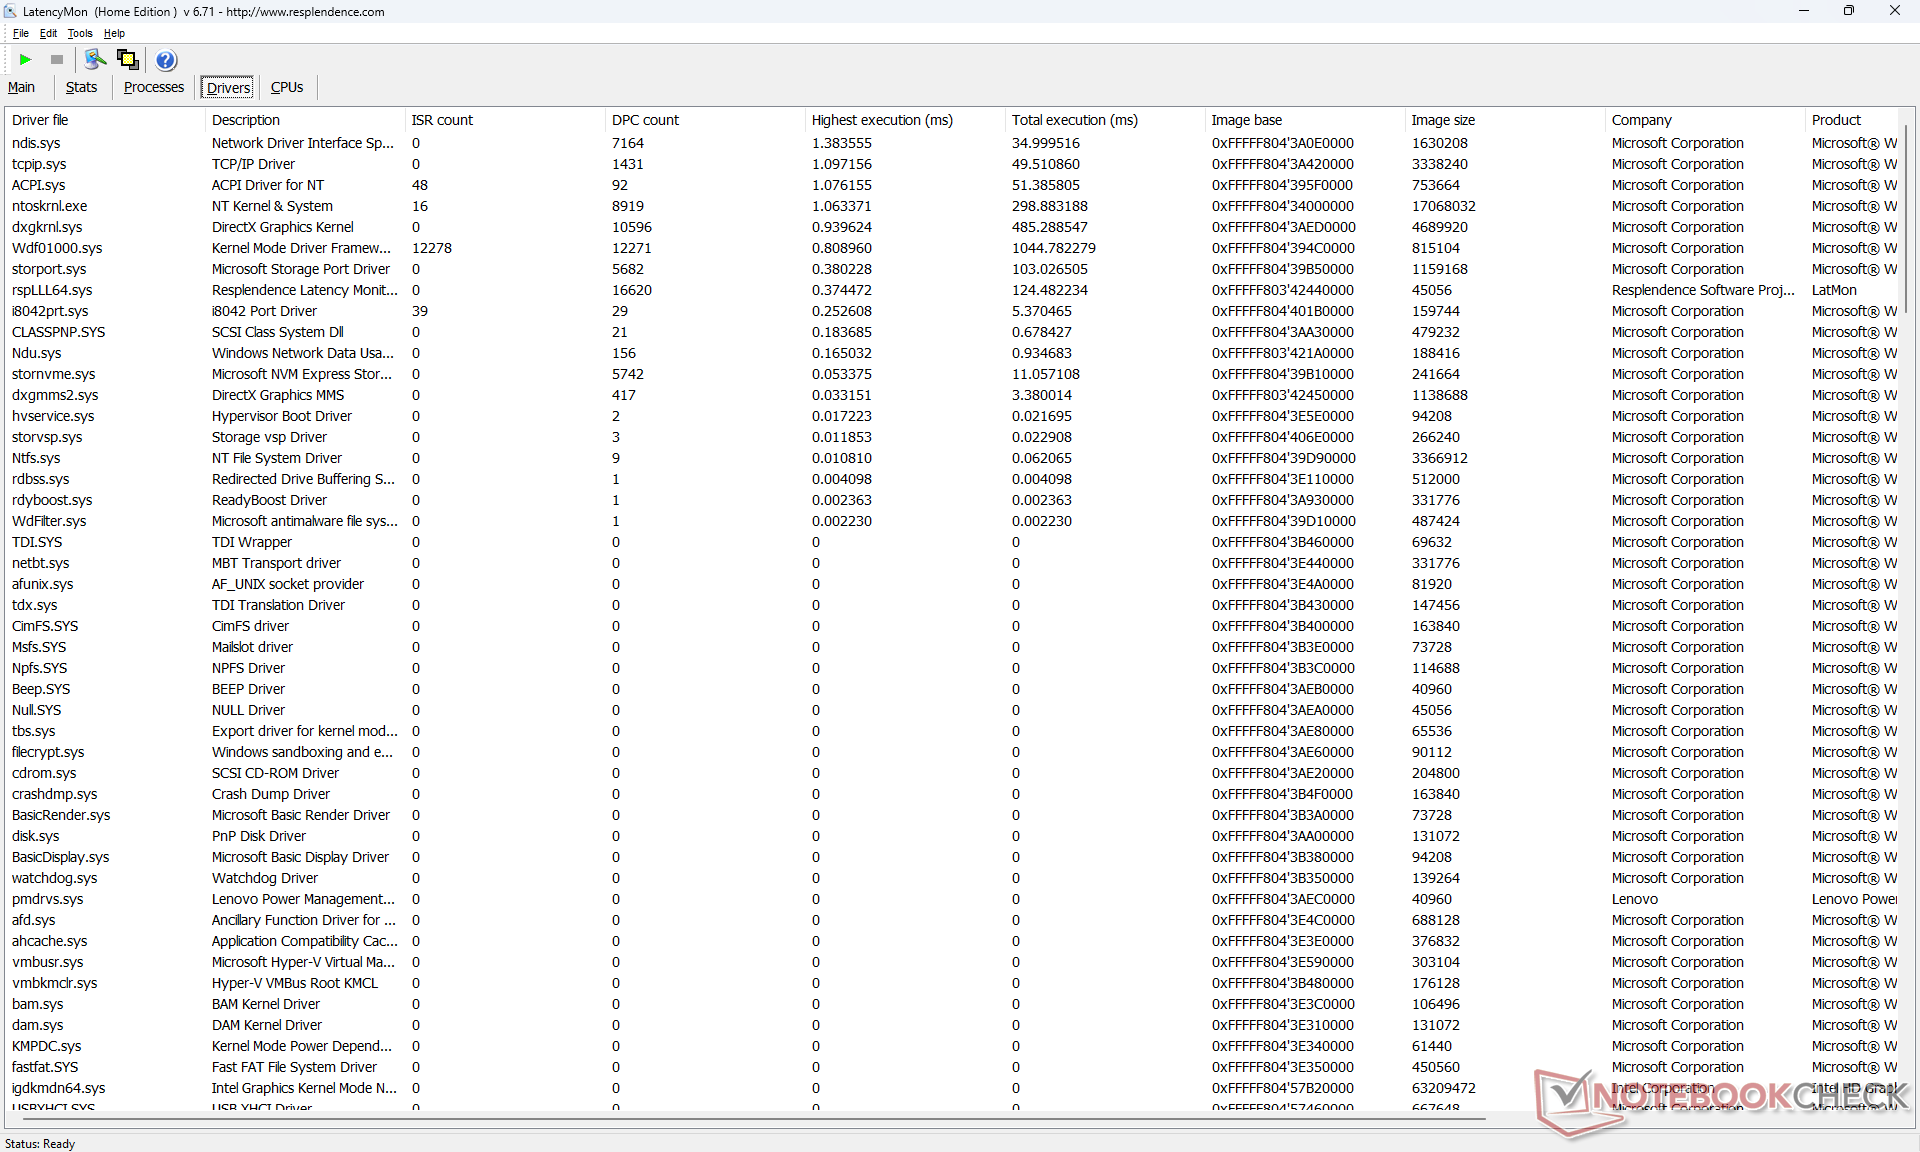
Opóźnienie DPC
LatencyMon pokazuje problemy z DPC podczas otwierania wielu kart przeglądarki na naszej stronie głównej. odtwarzanie wideo 4K przy 60 FPS jest poza tym perfekcyjne i bez żadnych zrzuconych klatek.
| DPC Latencies / LatencyMon - interrupt to process latency (max), Web, Youtube, Prime95 | |
| LG Gram 16Z90Q | |
| Lenovo ThinkPad T16 Gen 1 Core i7-1270P | |
| Lenovo ThinkPad T16 G1 21CH004MGE | |
| HP EliteBook 865 G9 | |
* ... im mniej tym lepiej
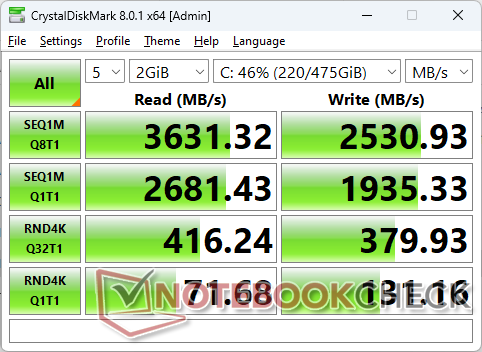
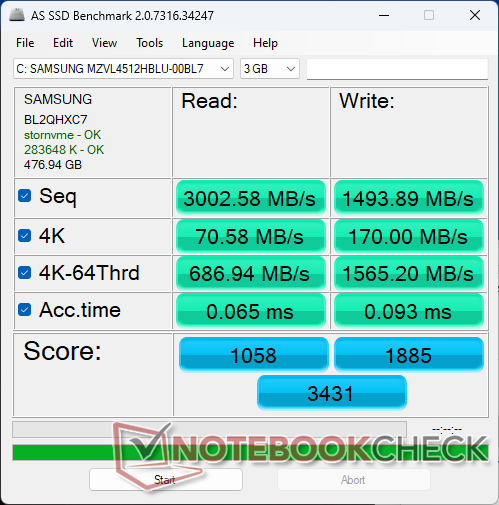
Urządzenia do przechowywania danych
Nasze urządzenie jest dostarczane z dyskiem 512 GB Samsung PM9B1 PCIe4 x4 NVMe SSD zamiast bardziej popularnego Samsunga PM9A1. Seria PM9B1 oferuje wolniejsze prędkości transferu o prawie połowę; sekwencyjne prędkości odczytu sięgają ~3600 MB/s w naszym urządzeniu w porównaniu z ~6300 MB/s w modelu LG Gram 16 z Samsungiem PM9A1.

| Drive Performance rating - Percent | |
| Huawei MateBook 16s i7 | |
| LG Gram 16Z90Q | |
| Lenovo ThinkPad T16 G1 21CH004MGE | |
| Lenovo ThinkPad T16 Gen 1 Core i7-1270P | |
| HP EliteBook 865 G9 | |
* ... im mniej tym lepiej
Disk Throttling: DiskSpd Read Loop, Queue Depth 8
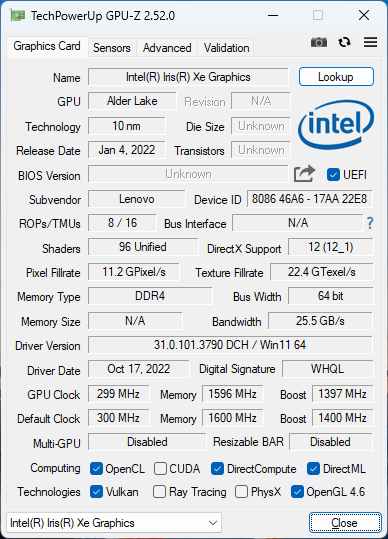
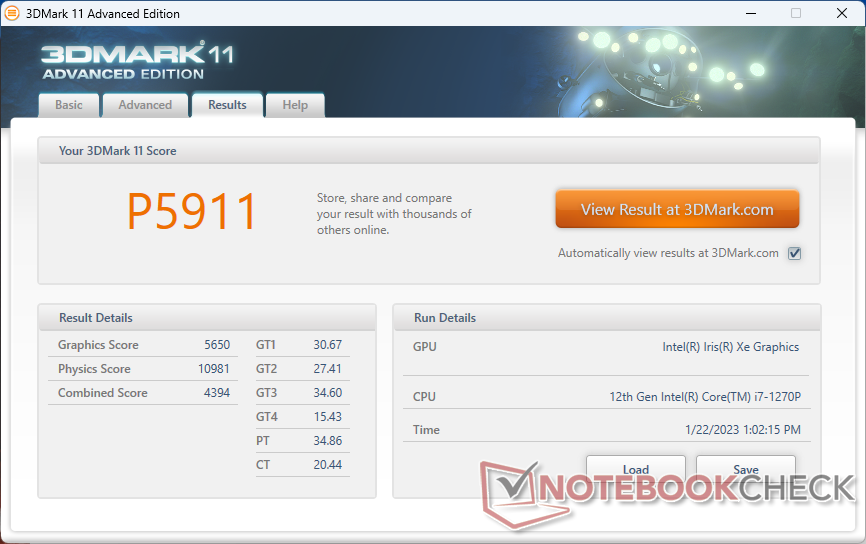
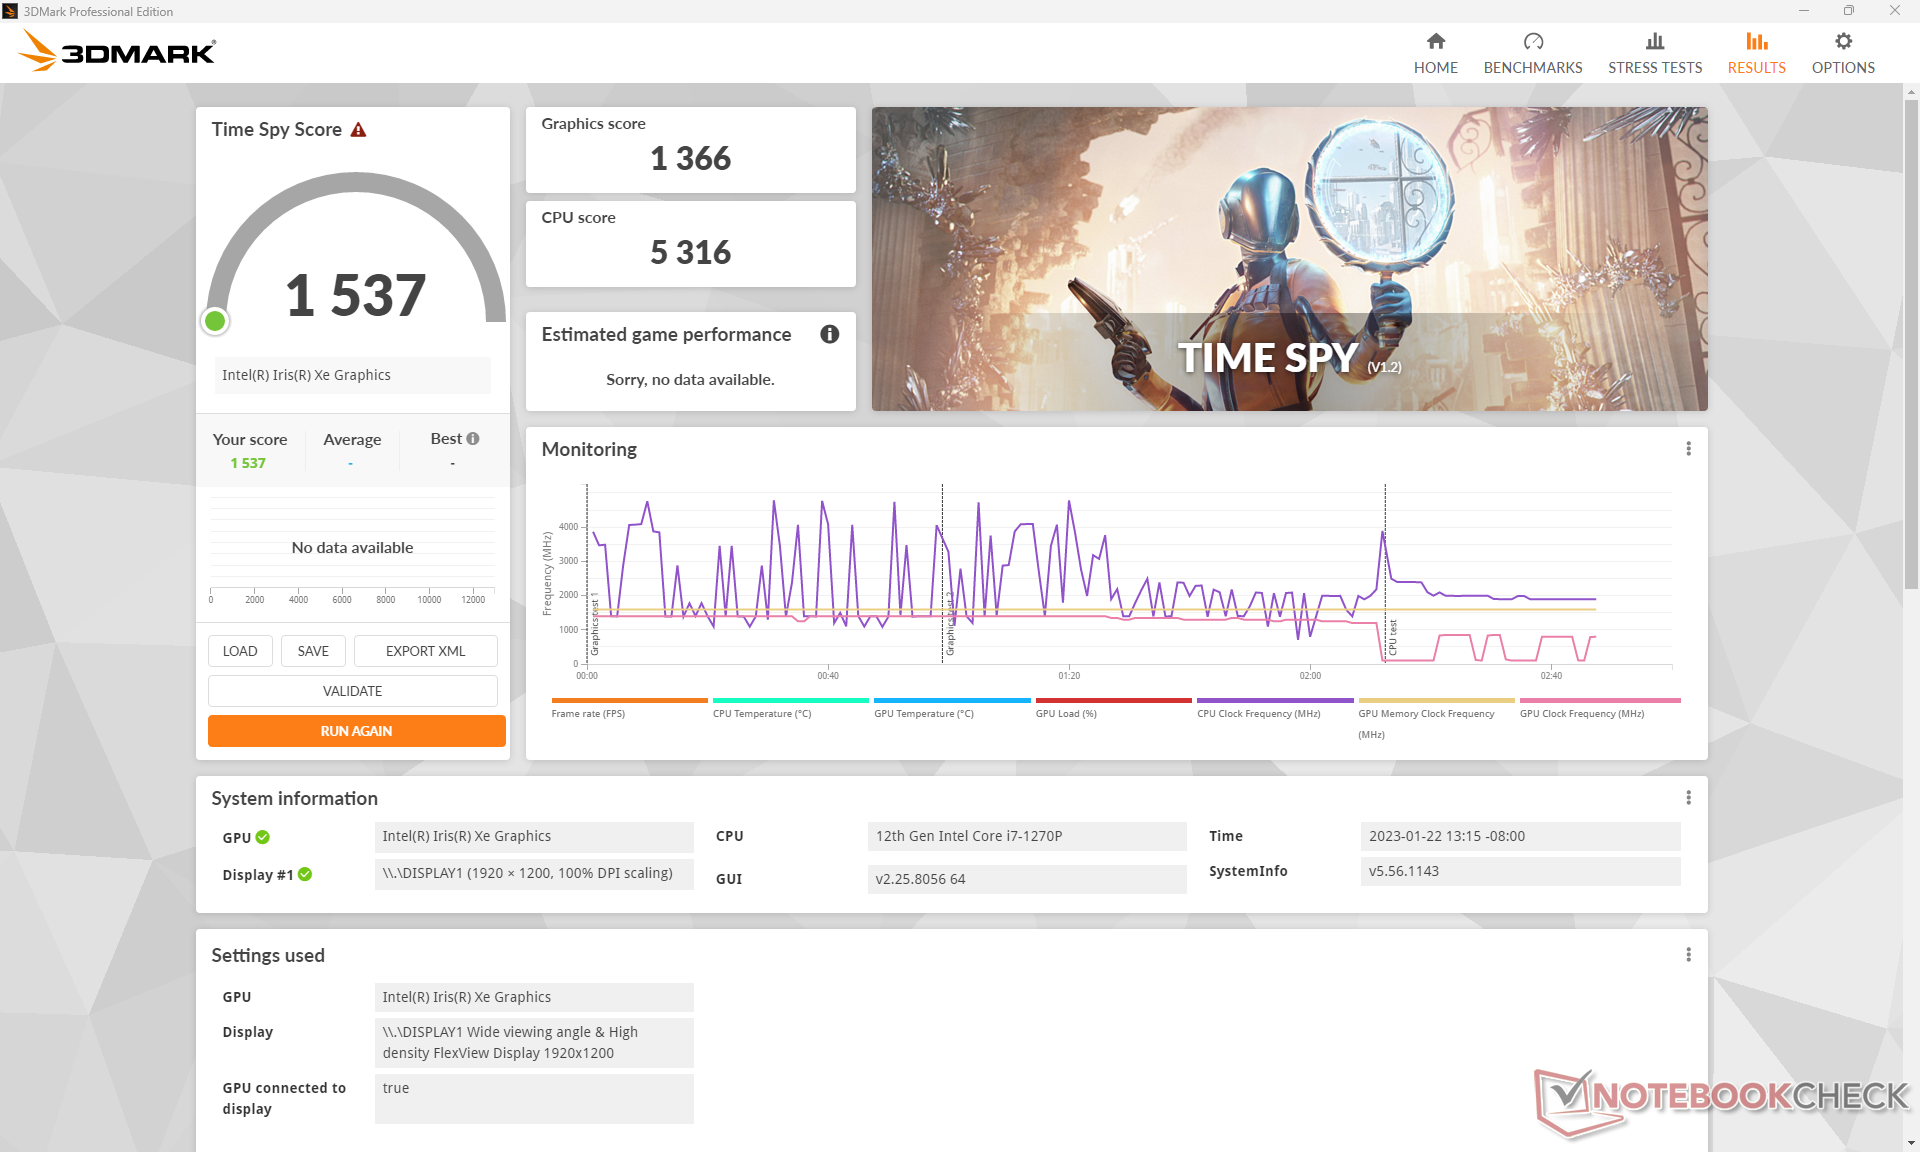
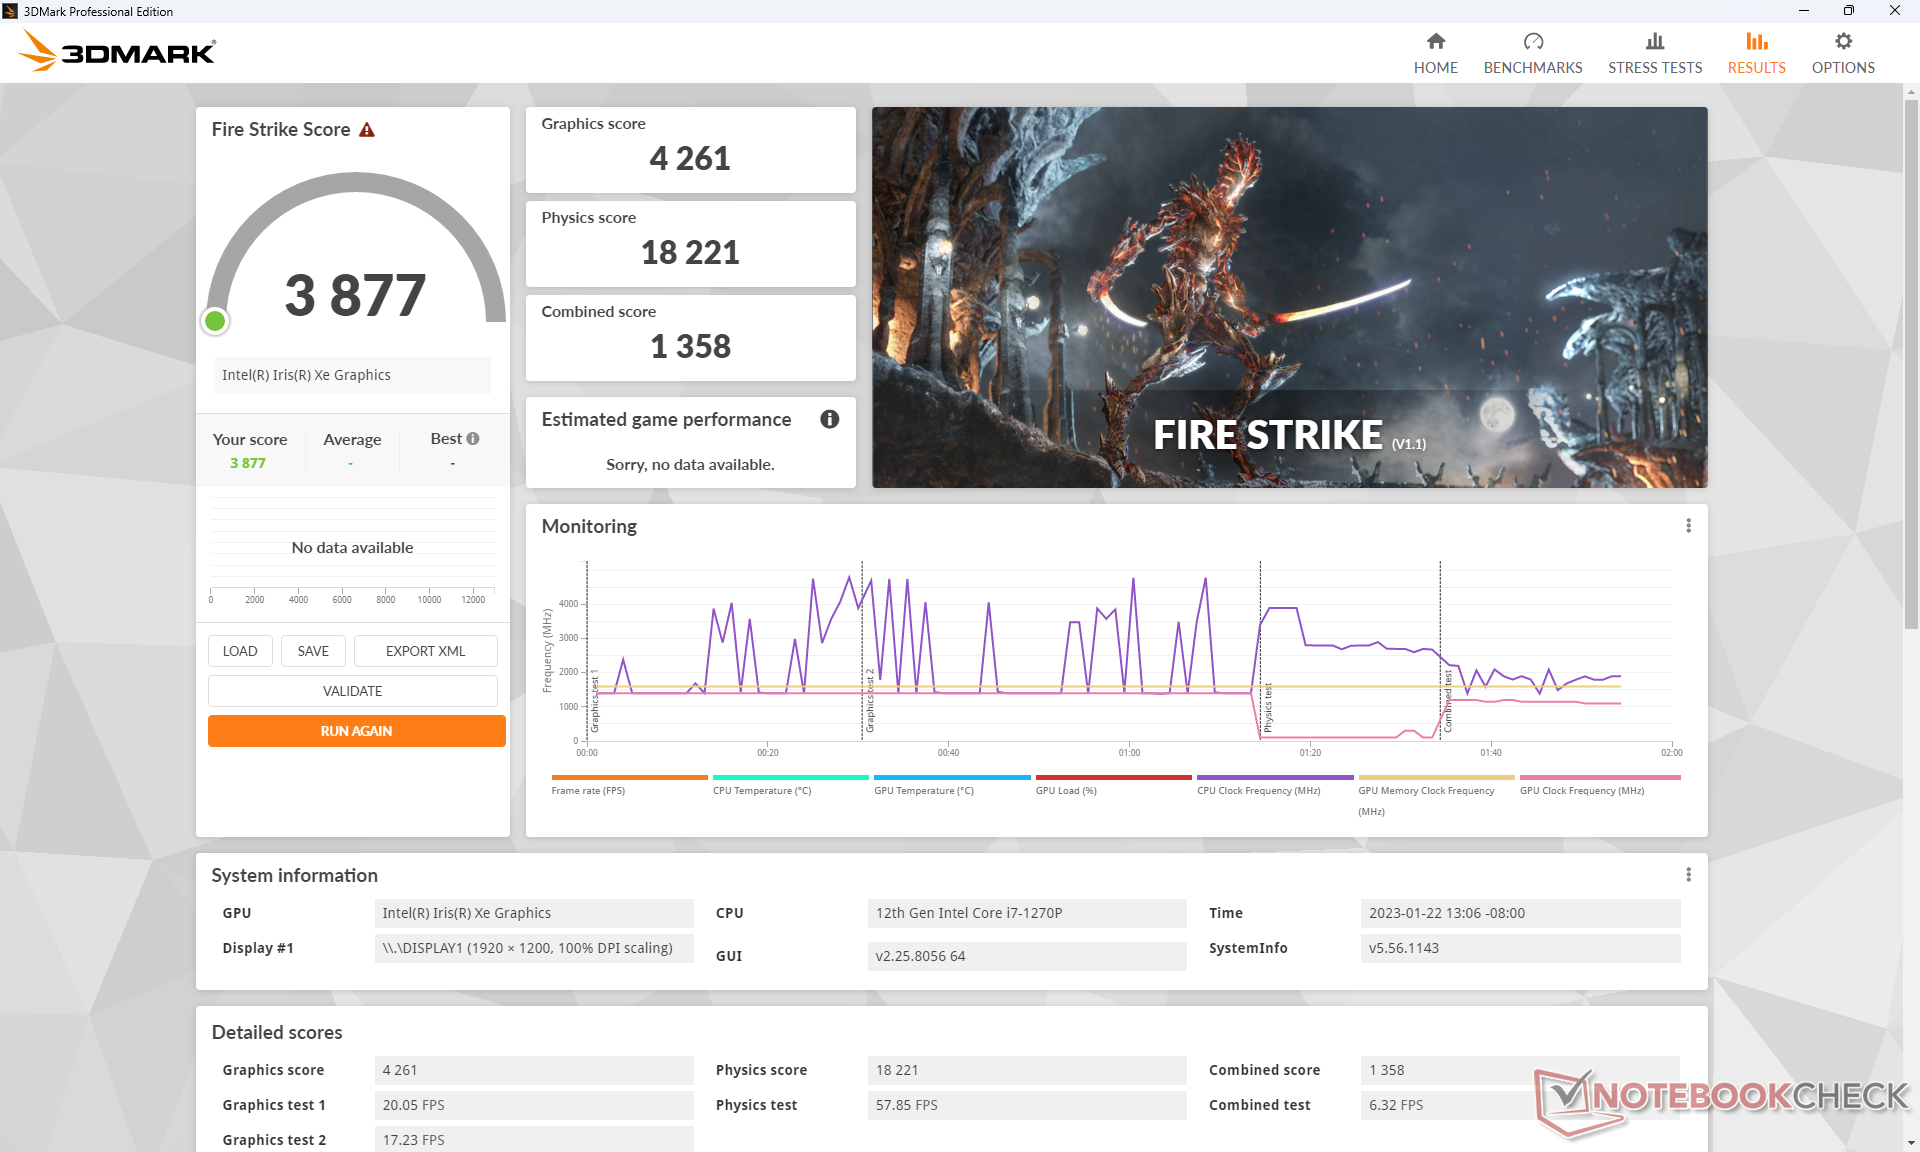
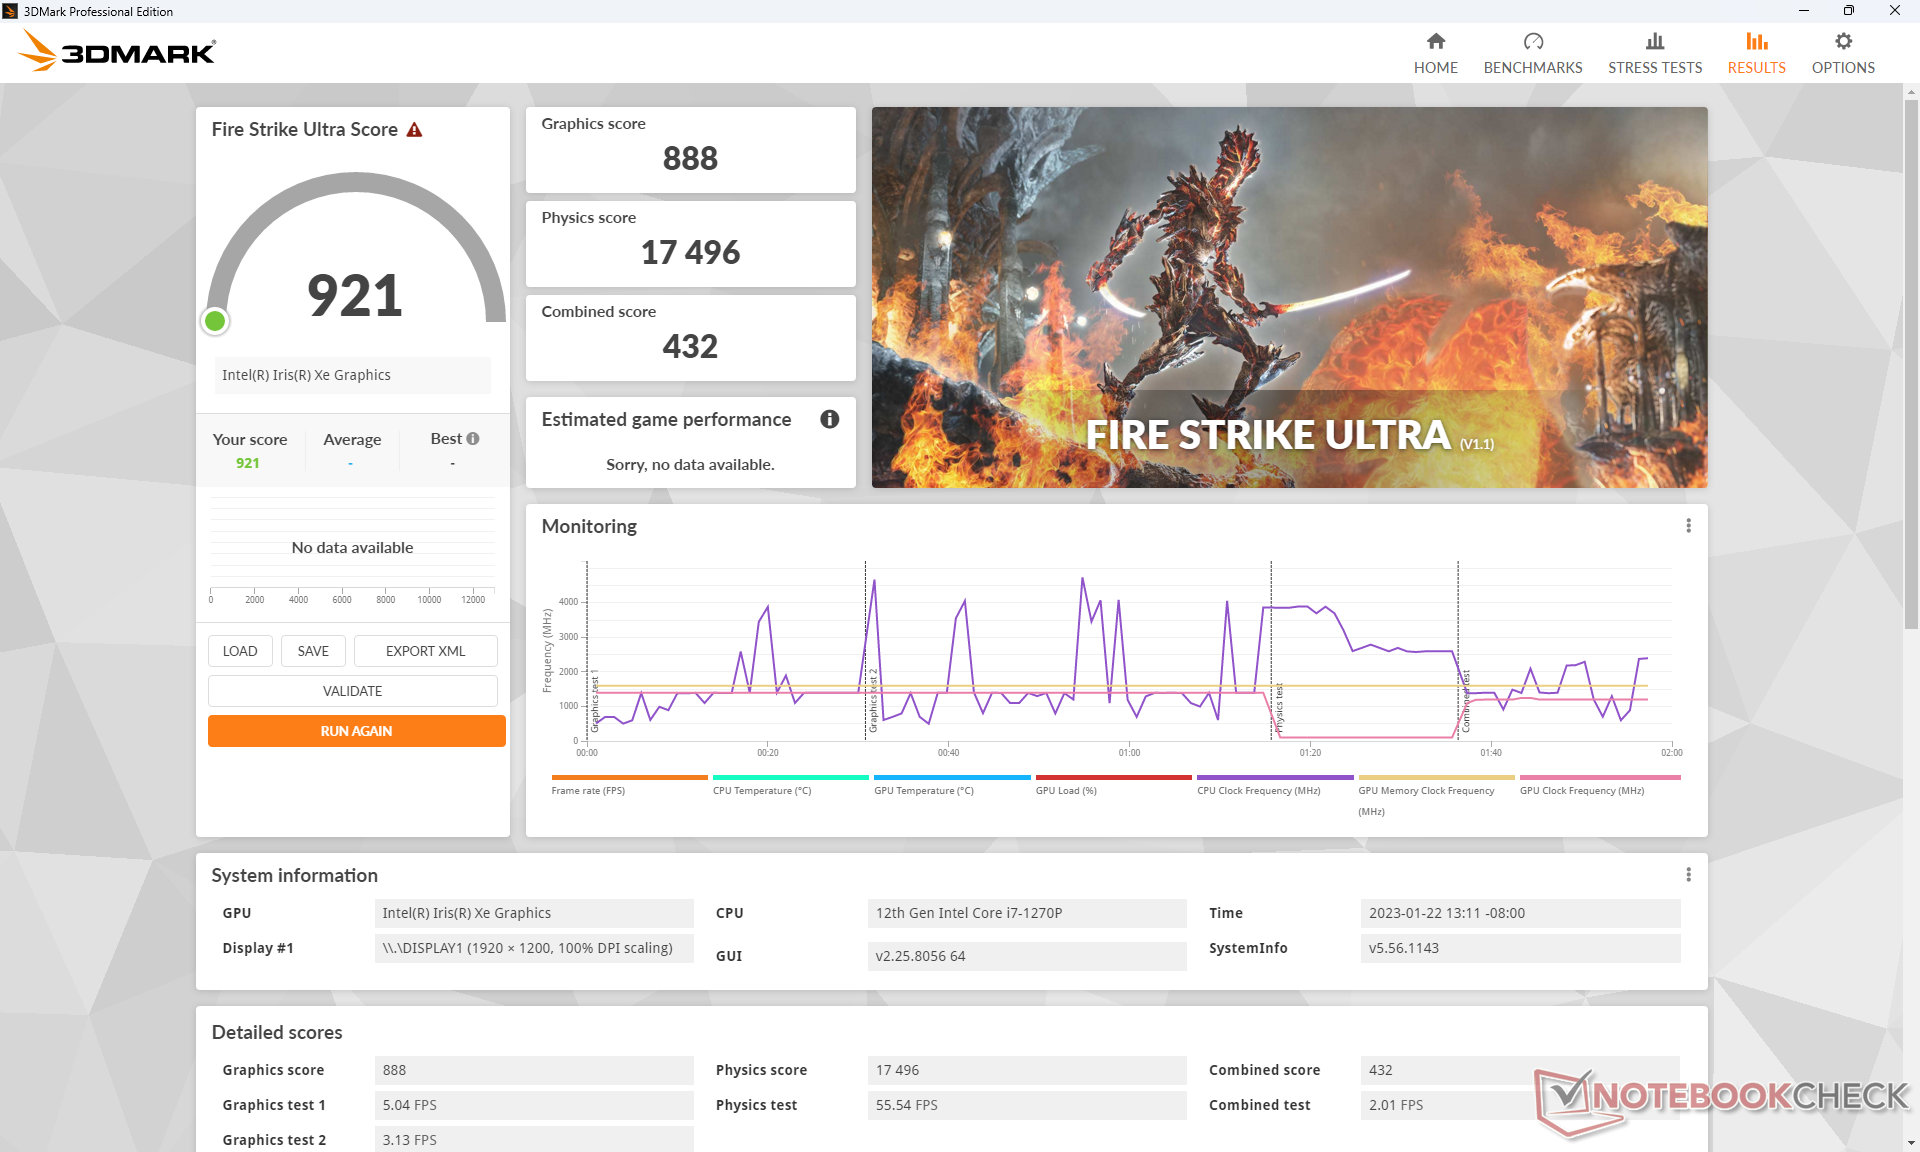
Wydajność układu GPU - ograniczona przez powolną pracę pamięci RAM
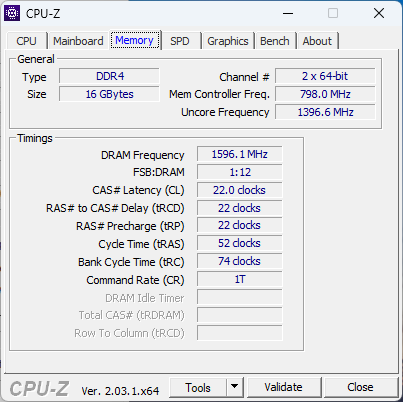
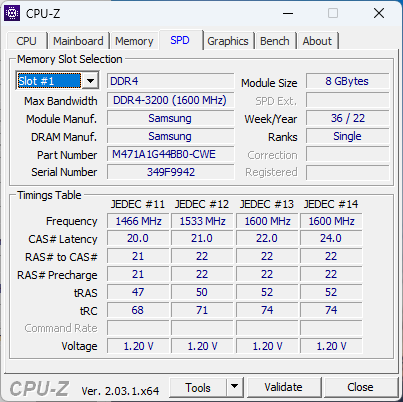
Wydajność graficzna jest o około 10 procent wolniejsza od przeciętnego laptopa z naszej bazy danych wyposażonego w ten sam Iris Xe 96 EUs GPU. Niższą wydajność można częściowo przypisać powolnej pamięci RAM DDR4-3200 względem większości innych laptopów napędzanych przez procesory Intela 12. generacji. Na stronie LG Gram 16jest standardowo wyposażony w szybszą pamięć LPDDR5-5200.
Ponadto wydajność grafiki może stopniowo spadać podczas długotrwałego działania pod wysokim obciążeniem. Na przykład, podczas pracy w trybie jałowym Witcher 3 na niskich ustawieniach, na przykład, liczba klatek na sekundę spadała z 84 FPS na początku testu do ~70 FPS po kilku minutach, jak pokazuje poniższy wykres, z powodu ograniczonego potencjału Turbo Boost systemu.
Aktualizacja do Ryzen 5 Radeon 660M SKU tego samego modelu zwiększy wydajność grafiki o około 10-15 procent.
| 3DMark Performance rating - Percent | |
| MSI Summit E16 Flip A12UDT-031 | |
| Lenovo Yoga 7-14ARB G7 | |
| Asus ZenBook Flip 15 Q508U | |
| Huawei MateBook 16s i7 | |
| LG Gram 16 (2021) | |
| Lenovo ThinkPad T16 G1 21CH004MGE | |
| Przeciętny Intel Iris Xe Graphics G7 96EUs | |
| LG Gram 16Z90Q | |
| HP EliteBook 865 G9 | |
| Lenovo ThinkPad T16 Gen 1 Core i7-1270P | |
| Lenovo ThinkBook 13s G3 20YA0005GE | |
| Lenovo ThinkPad T16 G1 21BWS00200 | |
| Asus ZenBook 14 UX434FL-DB77 | |
| 3DMark 11 - 1280x720 Performance GPU | |
| MSI Summit E16 Flip A12UDT-031 | |
| Lenovo Yoga 7-14ARB G7 | |
| Asus ZenBook Flip 15 Q508U | |
| Lenovo ThinkPad T16 G1 21CH004MGE | |
| HP EliteBook 865 G9 | |
| Huawei MateBook 16s i7 | |
| Przeciętny Intel Iris Xe Graphics G7 96EUs (2867 - 7676, n=209) | |
| LG Gram 16 (2021) | |
| Lenovo ThinkBook 13s G3 20YA0005GE | |
| LG Gram 16Z90Q | |
| Lenovo ThinkPad T16 Gen 1 Core i7-1270P | |
| Lenovo ThinkPad T16 G1 21BWS00200 | |
| Asus ZenBook 14 UX434FL-DB77 | |
| 3DMark 11 Performance | 5911 pkt. | |
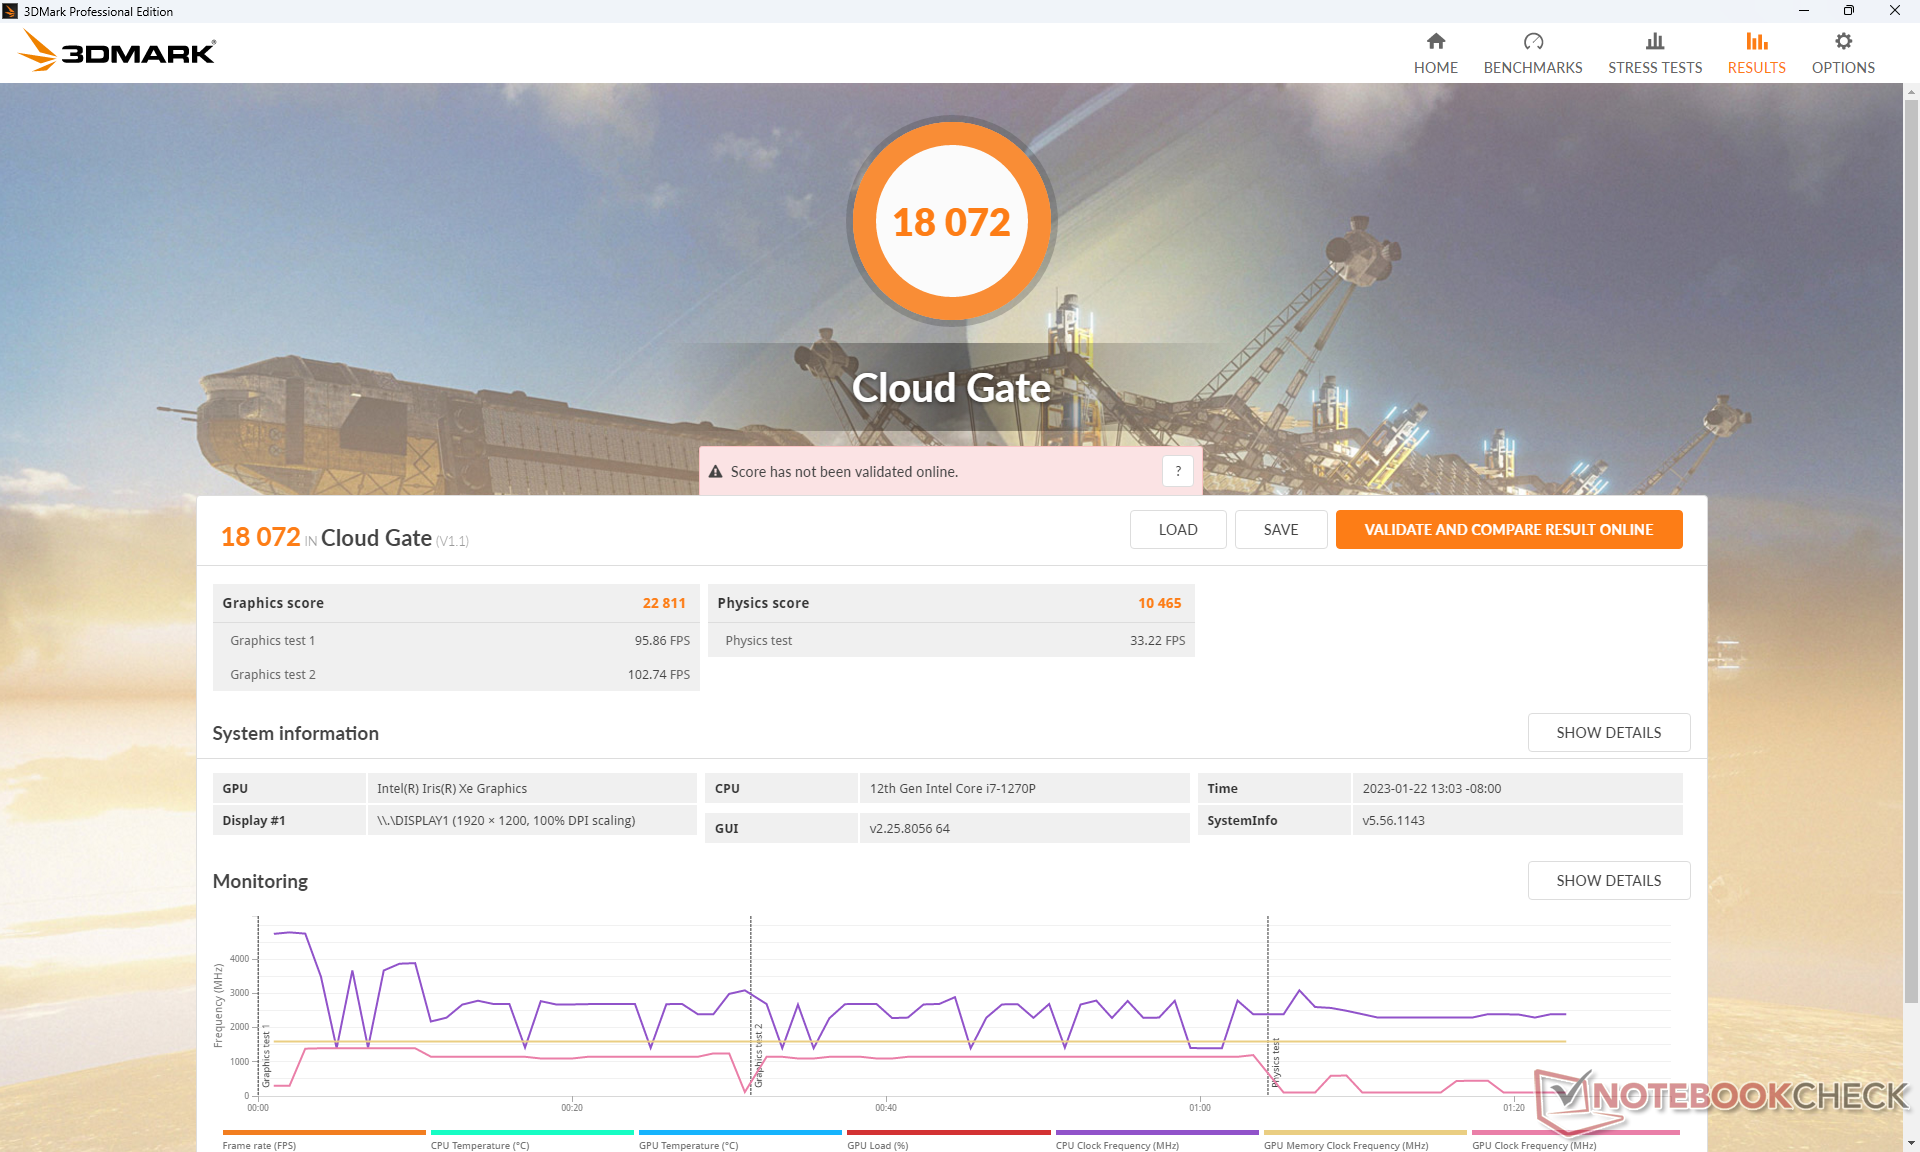
| 3DMark Cloud Gate Standard Score | 18072 pkt. | |
| 3DMark Fire Strike Score | 3877 pkt. | |
| 3DMark Time Spy Score | 1537 pkt. | |
Pomoc | ||
| Cyberpunk 2077 1.6 - 1920x1080 Low Preset | |
| Lenovo Yoga 7-14ARB G7 | |
| Asus ZenBook Flip 15 Q508U | |
| Przeciętny Intel Iris Xe Graphics G7 96EUs (13 - 25.9, n=42) | |
| Lenovo ThinkPad T16 Gen 1 Core i7-1270P | |
Witcher 3 FPS Chart
| low | med. | high | ultra | |
|---|---|---|---|---|
| GTA V (2015) | 97.8 | 74.8 | 14.1 | 4.85 |
| The Witcher 3 (2015) | 82.1 | 50.4 | 24.4 | 11.2 |
| Dota 2 Reborn (2015) | 110.6 | 71.9 | 48.9 | 44.6 |
| Final Fantasy XV Benchmark (2018) | 31.4 | 16.8 | 12.6 | |
| X-Plane 11.11 (2018) | 39.7 | 31.9 | 29.2 | |
| Strange Brigade (2018) | 79.2 | 29.8 | 24.2 | 19.1 |
| Cyberpunk 2077 1.6 (2022) | 18.4 |
Emisje
Hałas systemu - prawie zawsze cichy
Szum wentylatora jest jednym z najcichszych dla tego rozmiaru ekranu, co częściowo tłumaczy słabą trwałość wydajności procesora w powyższych benchmarkach. Wewnętrzny wentylator jest ledwie słyszalny nawet w trybie Performance i przy wymagających obciążeniach, takich jak gry. Raz na jakiś czas może pulsować na krótko do 34 dB(A), po czym wraca do stanu bliskiego ciszy, ale nawet to maksimum jest cichsze, niż w większości laptopów. StronaHP EliteBook 865 G9 stosuje podobne podejście do hałasu wentylatorów, dzięki czemu jest bardzo cichy. W rezultacie nie ma powodu, by wybierać do kontroli hałasu wentylatora tryb inny niż Performance.
Hałas
| luz |
| 24.7 / 24.7 / 24.7 dB |
| obciążenie |
| 24.5 / 34.4 dB |
 | ||
30 dB cichy 40 dB(A) słyszalny 50 dB(A) irytujący |
||
min: | ||
| Lenovo ThinkPad T16 Gen 1 Core i7-1270P Iris Xe G7 96EUs, i7-1270P, Samsung PM9B1 512GB MZAL4512HBLU | Lenovo ThinkPad T16 G1 21CH004MGE Radeon 660M, R5 PRO 6650U, Micron 2450 512GB MTFDKBA512TFK | LG Gram 16Z90Q Iris Xe G7 96EUs, i7-1260P, Samsung PM9A1 MZVL21T0HCLR | HP EliteBook 865 G9 Radeon 680M, R7 PRO 6850U, Samsung PM991 MZVLQ512HBLU | Huawei MateBook 16s i7 Iris Xe G7 96EUs, i7-12700H, Silicon Motion PCIe-8 SSD | Apple MacBook Pro 16 2021 M1 Pro M1 Pro 16-Core GPU, M1 Pro, Apple SSD AP1024R | |
|---|---|---|---|---|---|---|
| Noise | -6% | -21% | -1% | -15% | -3% | |
| wyłączone / środowisko * (dB) | 24.7 | 23.1 6% | 25 -1% | 23 7% | 24 3% | 24.7 -0% |
| Idle Minimum * (dB) | 24.7 | 23.1 6% | 26 -5% | 23 7% | 24 3% | 24.7 -0% |
| Idle Average * (dB) | 24.7 | 23.1 6% | 27 -9% | 23 7% | 25.2 -2% | 24.7 -0% |
| Idle Maximum * (dB) | 24.7 | 23.1 6% | 28 -13% | 23 7% | 27.2 -10% | 24.7 -0% |
| Load Average * (dB) | 24.5 | 25.4 -4% | 38 -55% | 29.1 -19% | 34.8 -42% | 26.1 -7% |
| Witcher 3 ultra * (dB) | 24.3 | 35.93 -48% | 37 -52% | 29.1 -20% | 34.8 -43% | |
| Load Maximum * (dB) | 34.4 | 39.1 -14% | 38 -10% | 32.9 4% | 39 -13% | 37.4 -9% |
* ... im mniej tym lepiej
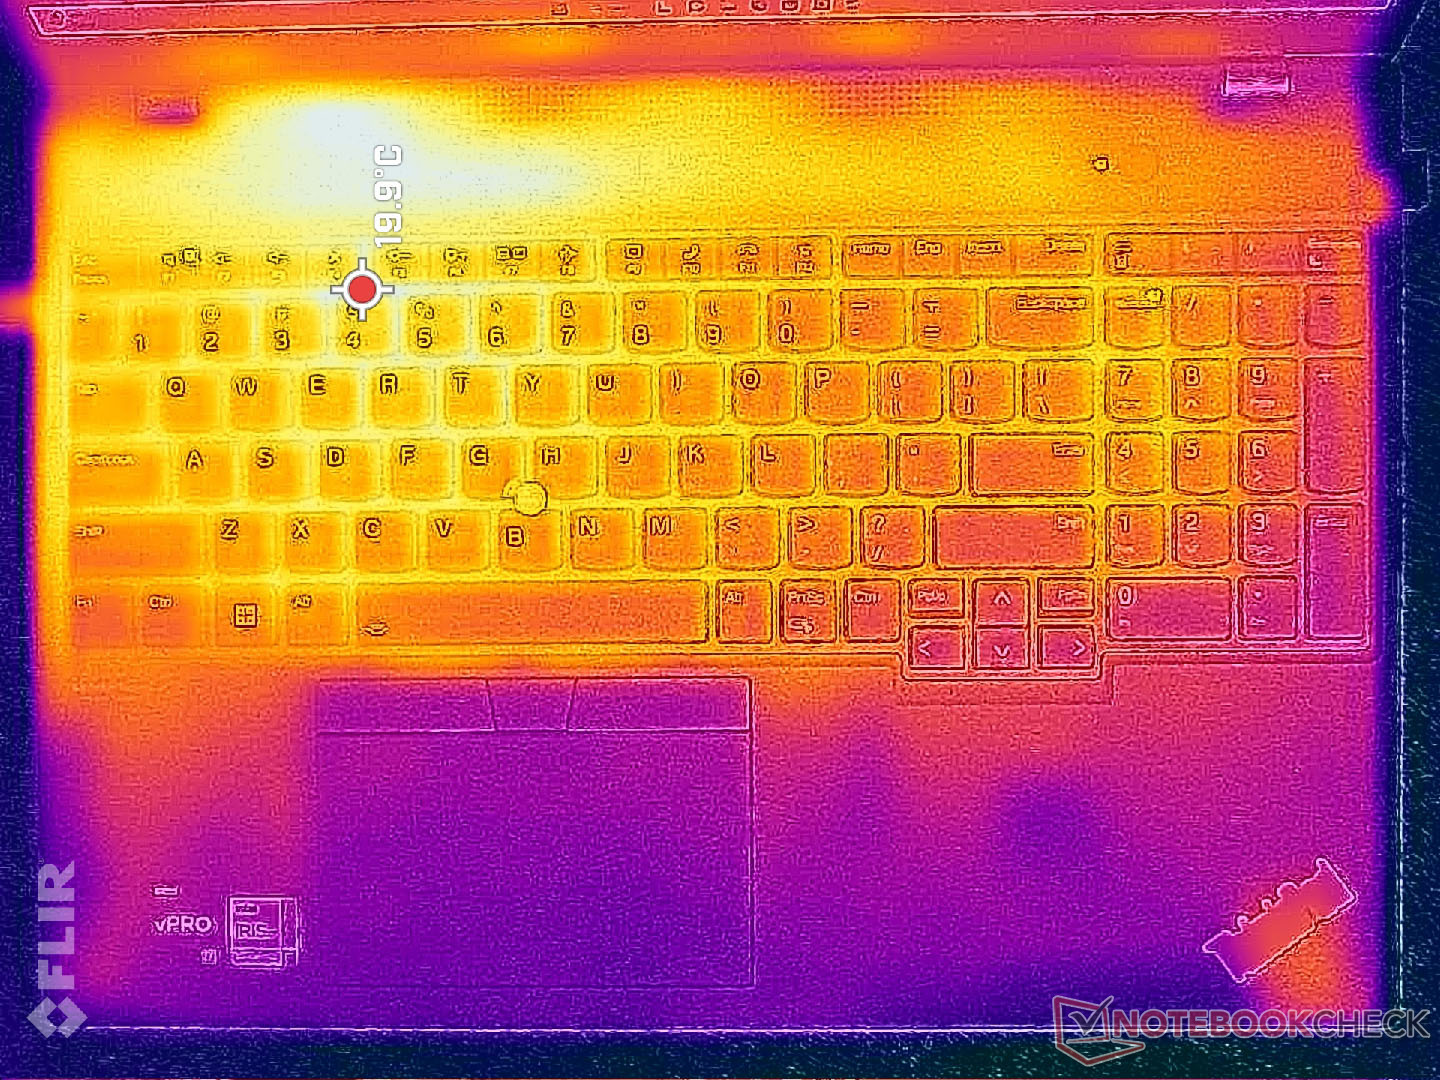
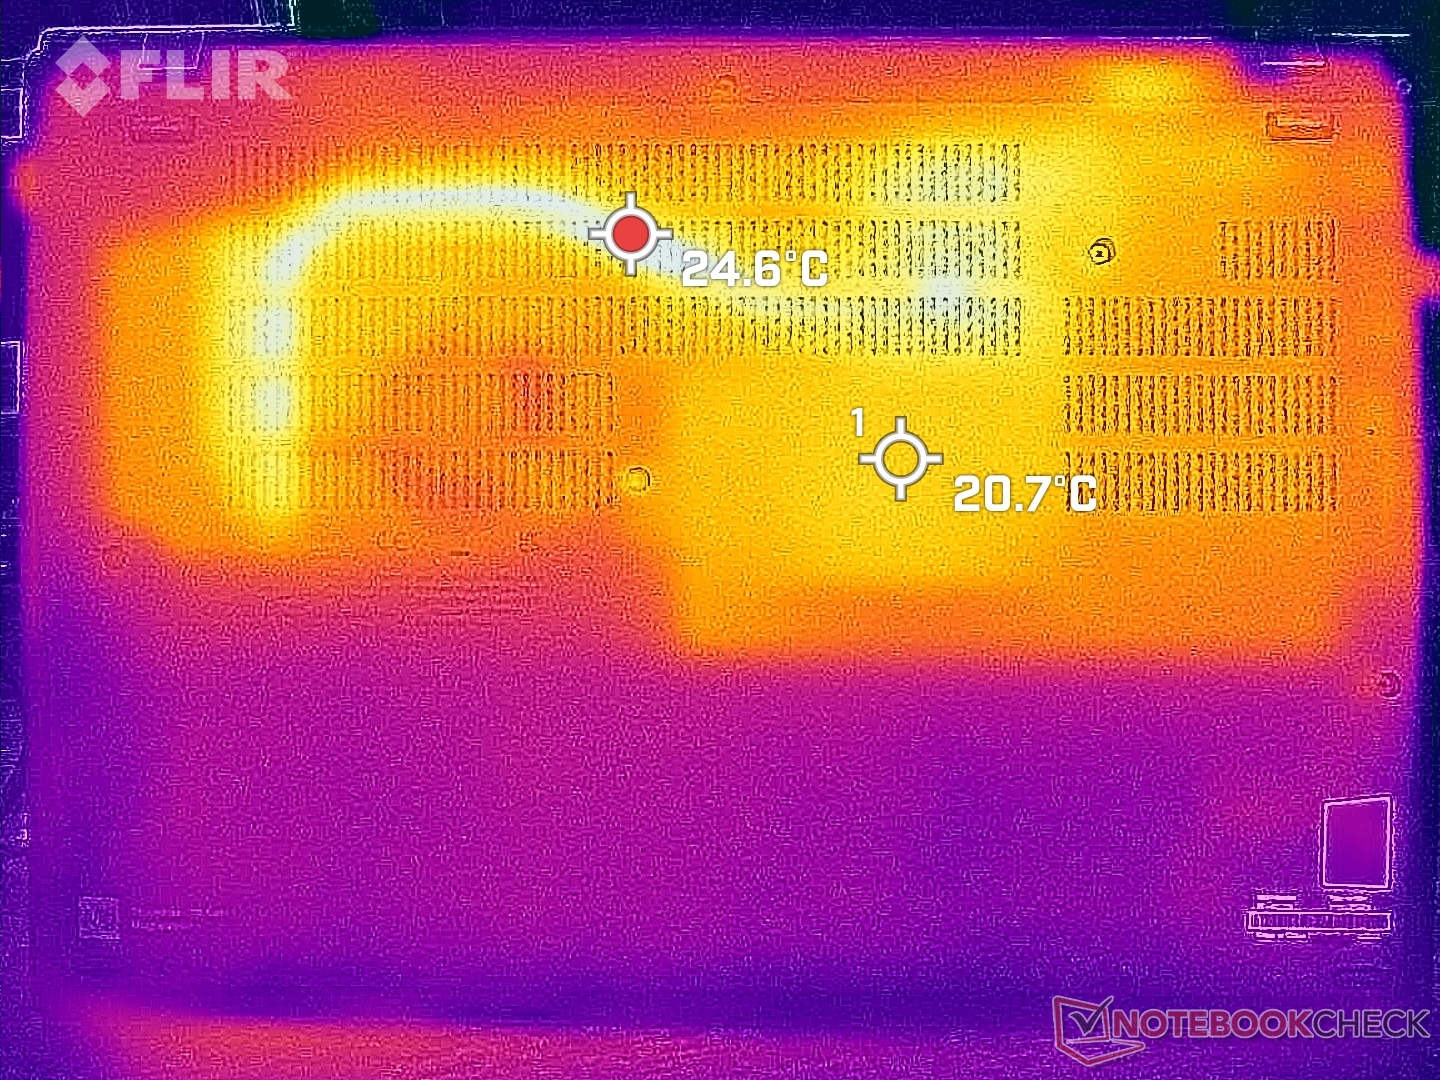
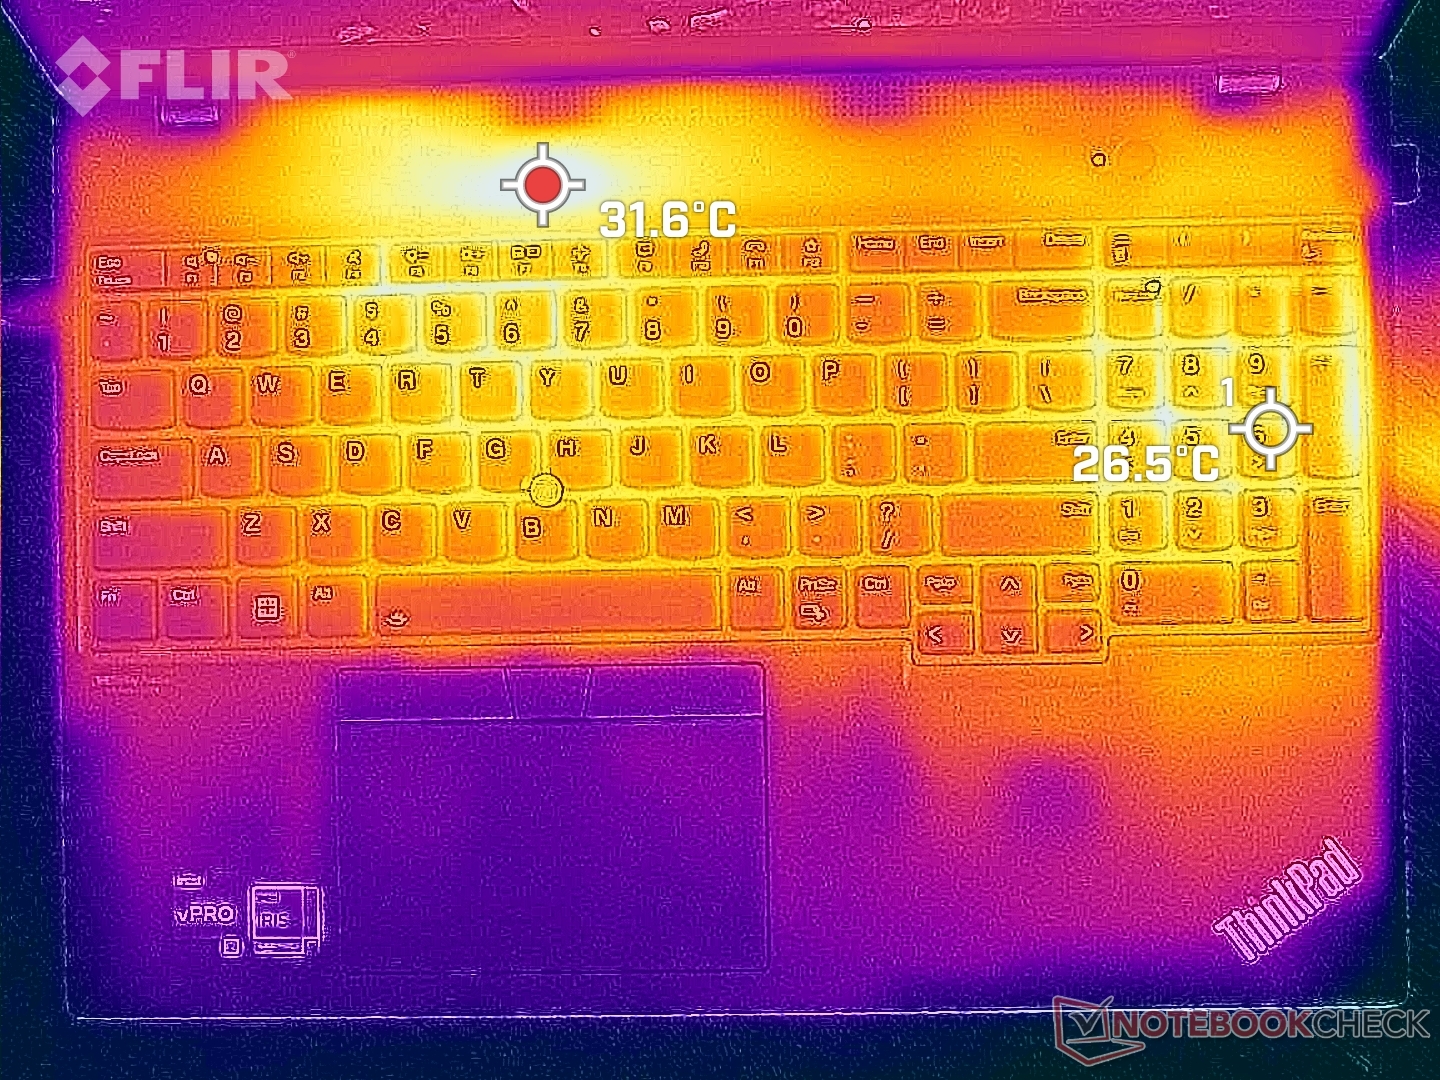
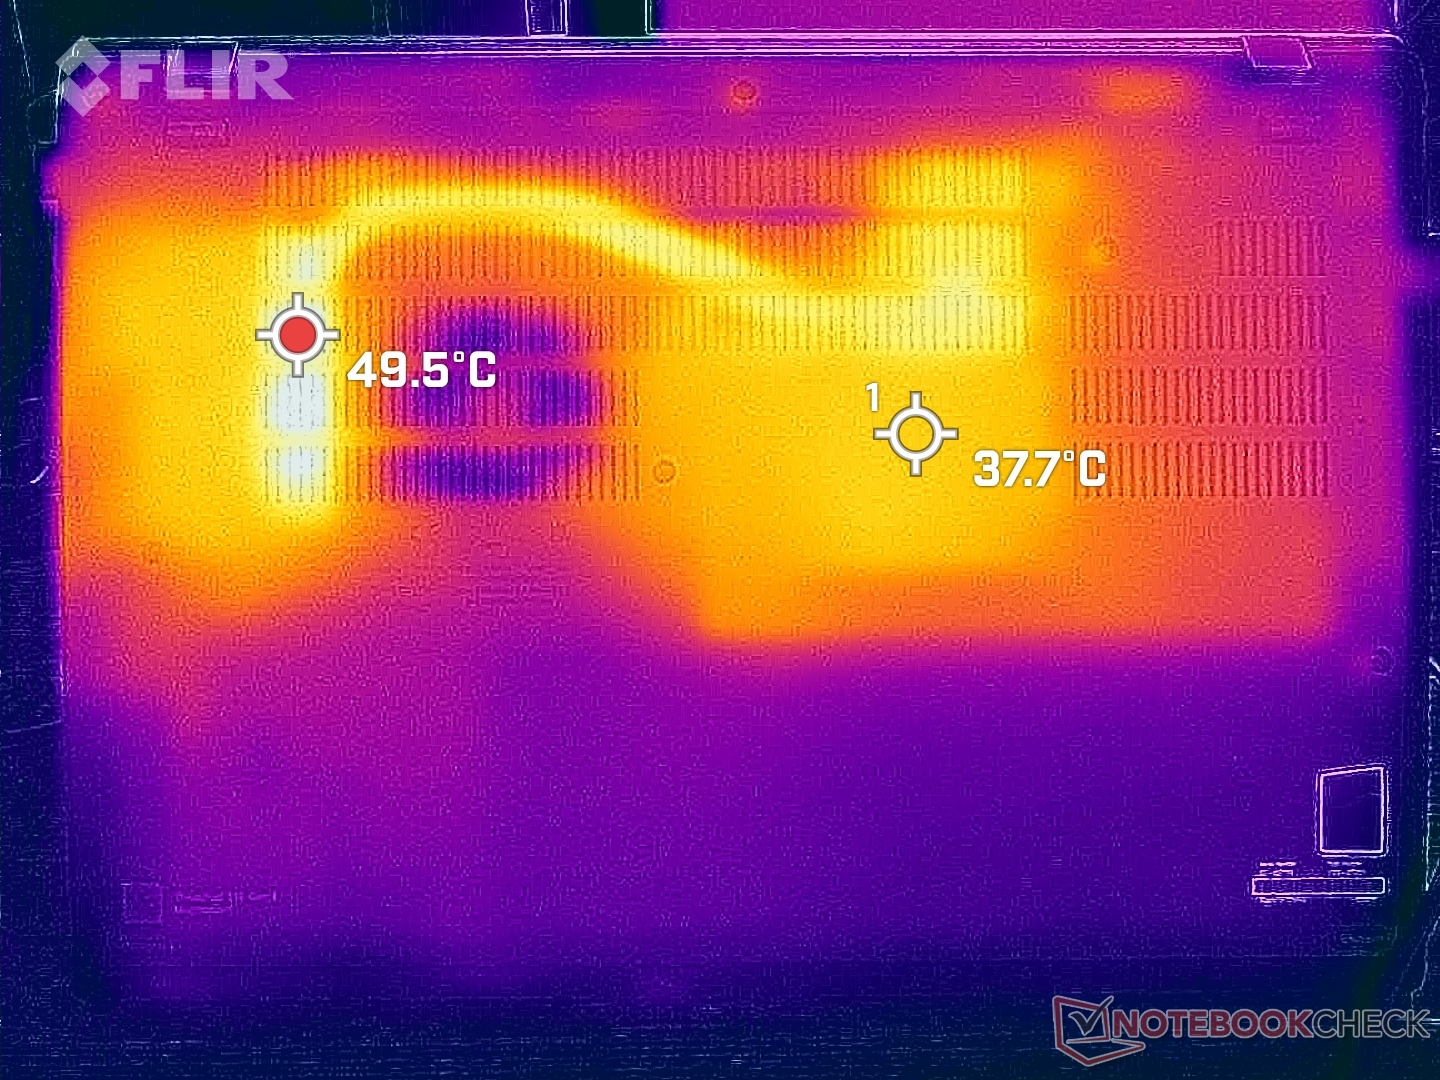
Temperatura
Temperatury powierzchni są znacznie chłodniejsze na górnym pokładzie niż na spodzie. Średnia temperatura na pokładzie klawiatury i oparciach dłoni wynosi około 29 C podczas pracy pod wymagającym obciążeniem w porównaniu z 36 C na powierzchni spodniej. Jest to kontrast z większością innych laptopów jak np LG Gram 16 gdzie środek klawiatury może osiągnąć 44 C, by być o ponad 10 C cieplejszym niż w naszym ThinkPadzie T16 G1.
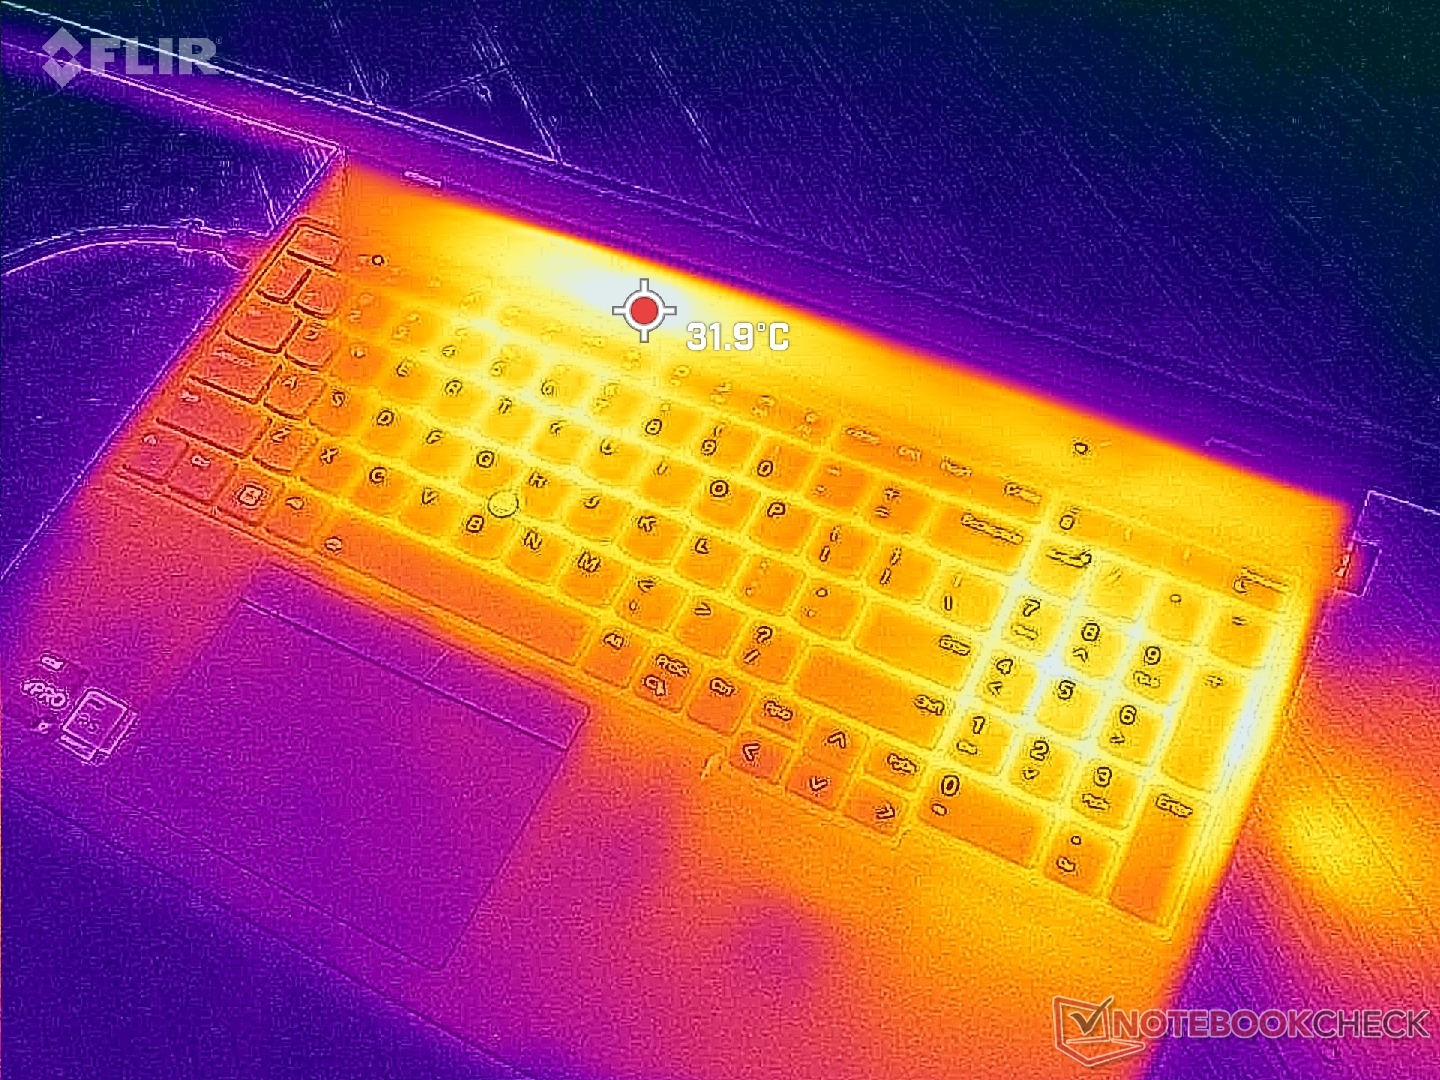
(+) Maksymalna temperatura w górnej części wynosi 33.8 °C / 93 F, w porównaniu do średniej 34.3 °C / 94 F , począwszy od 21.2 do 62.5 °C dla klasy Office.
(-) Dno nagrzewa się maksymalnie do 47 °C / 117 F, w porównaniu do średniej 36.8 °C / 98 F
(+) W stanie bezczynności średnia temperatura górnej części wynosi 22.6 °C / 73 F, w porównaniu ze średnią temperaturą urządzenia wynoszącą 29.5 °C / ### class_avg_f### F.
(+) Podpórki pod nadgarstki i touchpad są chłodniejsze niż temperatura skóry i maksymalnie 24.6 °C / 76.3 F i dlatego są chłodne w dotyku.
(+) Średnia temperatura obszaru podparcia dłoni w podobnych urządzeniach wynosiła 27.6 °C / 81.7 F (+3 °C / 5.4 F).
| Lenovo ThinkPad T16 Gen 1 Core i7-1270P Intel Core i7-1270P, Intel Iris Xe Graphics G7 96EUs | Lenovo ThinkPad T16 G1 21BWS00200 Intel Core i5-1240P, Intel Iris Xe Graphics G7 80EUs | LG Gram 16Z90Q Intel Core i7-1260P, Intel Iris Xe Graphics G7 96EUs | HP EliteBook 865 G9 AMD Ryzen 7 PRO 6850U, AMD Radeon 680M | Huawei MateBook 16s i7 Intel Core i7-12700H, Intel Iris Xe Graphics G7 96EUs | Apple MacBook Pro 16 2021 M1 Pro Apple M1 Pro, Apple M1 Pro 16-Core GPU | |
|---|---|---|---|---|---|---|
| Heat | -19% | -6% | 0% | -13% | 3% | |
| Maximum Upper Side * (°C) | 33.8 | 45 -33% | 45 -33% | 39.4 -17% | 40.9 -21% | 41 -21% |
| Maximum Bottom * (°C) | 47 | 42.8 9% | 43 9% | 47.6 -1% | 48.3 -3% | 39 17% |
| Idle Upper Side * (°C) | 24.6 | 33 -34% | 26 -6% | 23.6 4% | 29.2 -19% | 24 2% |
| Idle Bottom * (°C) | 28.2 | 33.6 -19% | 26 8% | 24.1 15% | 30.4 -8% | 24 15% |
* ... im mniej tym lepiej
Stress Test
Gwałtowne spadki wydajności podczas naszych Witcher 3 i CineBench R15 xT można zaobserwować poprzez HWiNFO. Na przykład podczas uruchomienia Prime95, częstotliwość taktowania procesora i pobór mocy na płycie głównej wzrosły odpowiednio do 3,5 GHz i 48 W. Kiedy temperatura rdzenia osiągnie 97 C kilka sekund później, taktowanie zegara i pobór mocy na płycie zaczęłyby jednak systematycznie spadać do poziomu 1,7 GHz i 22 W, odpowiednio, w celu utrzymania chłodniejszej temperatury rdzenia wynoszącej 69 C. Zastosowanie ThrottleStop spowodowało podniesienie stabilnego taktowania do wyższego przedziału 2 do 3 GHz, aczkolwiek kosztem cieplejszej temperatury rdzenia.
Częstotliwość taktowania GPU i temperatura podczas pracy Witcher 3 ustabilizowałyby się odpowiednio na poziomie 998 MHz i 67 C, w porównaniu z 1100 MHz i 58 C w mniejszym modelu HP Dragonfly Folio 13.5 G3. Praca na zasilaniu akumulatorowym nie wydaje się mieć wpływu na wydajność.
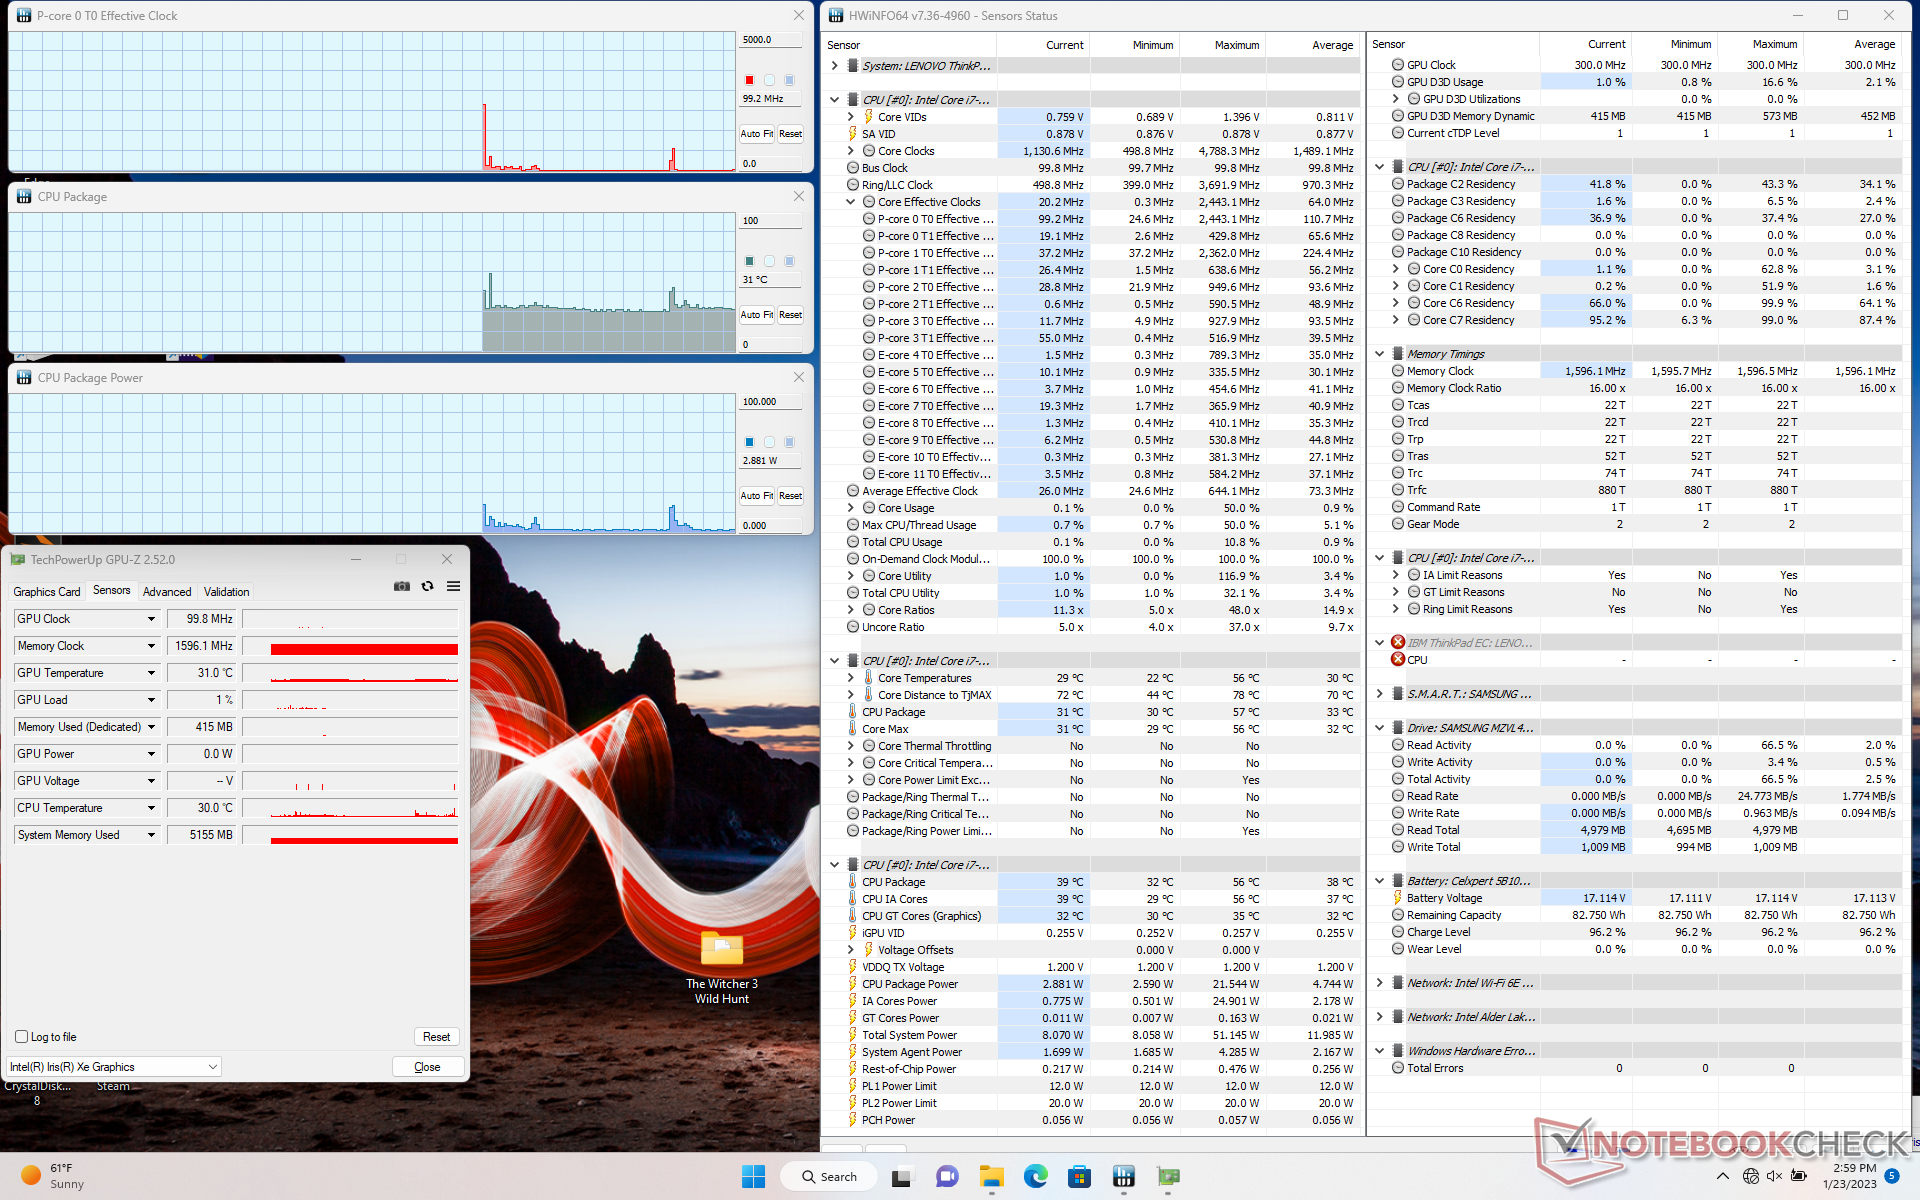
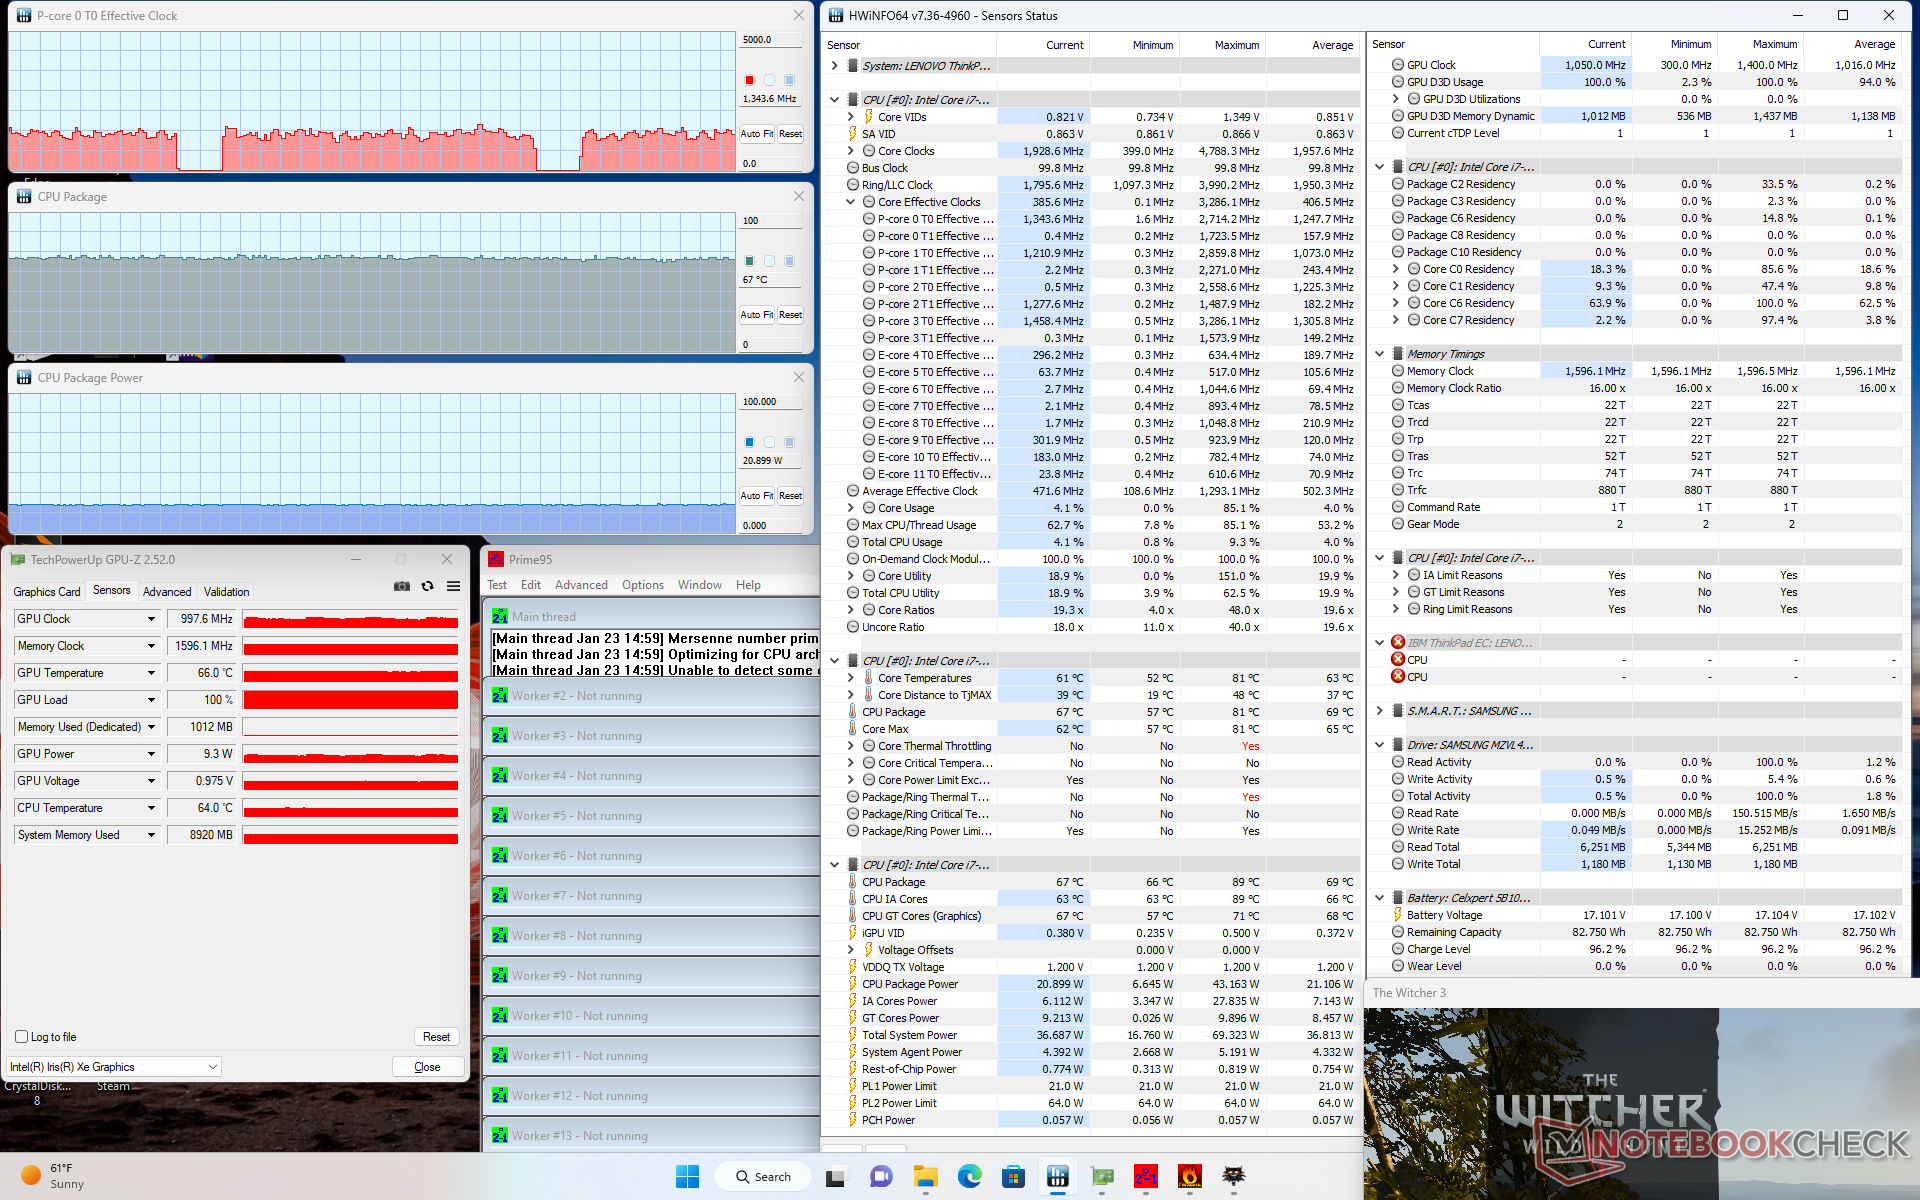
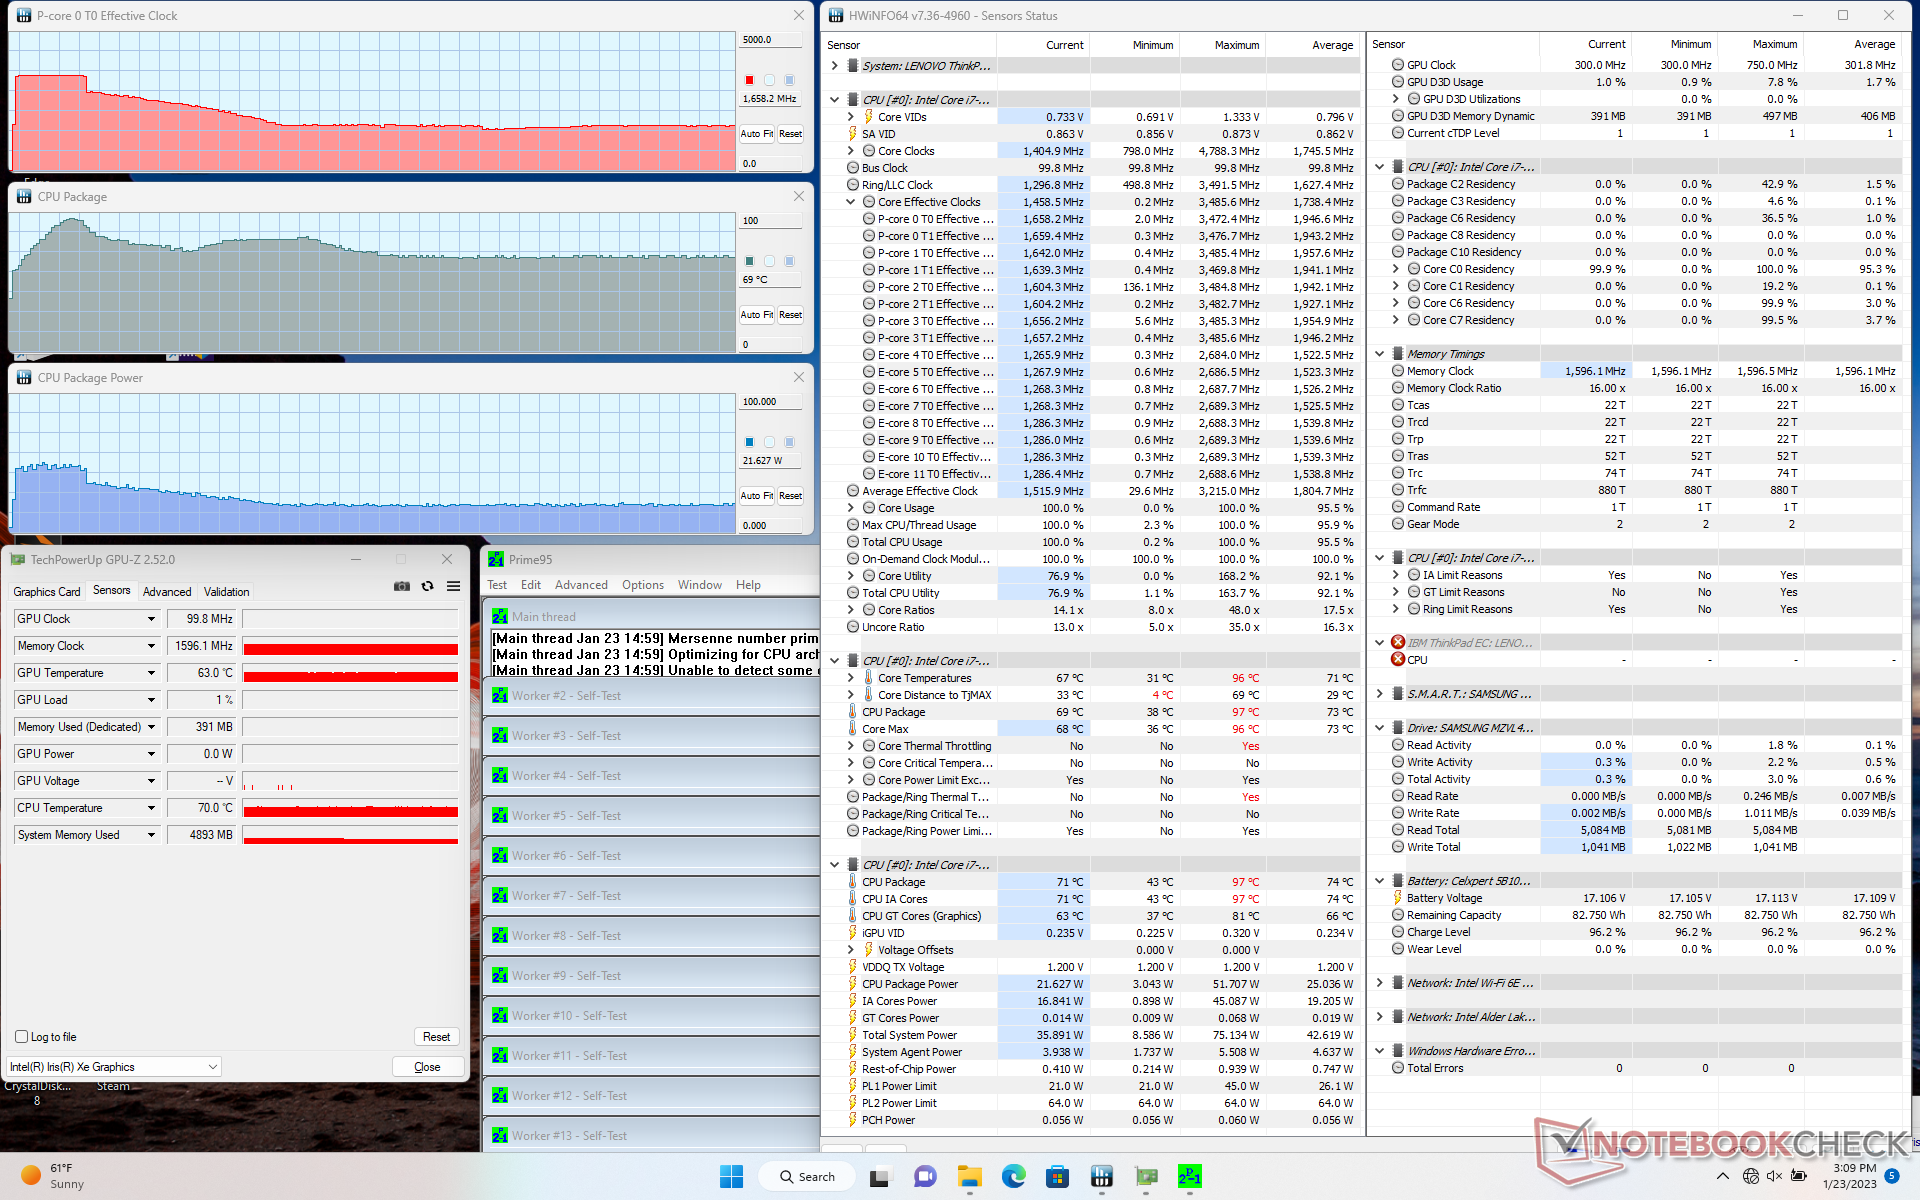
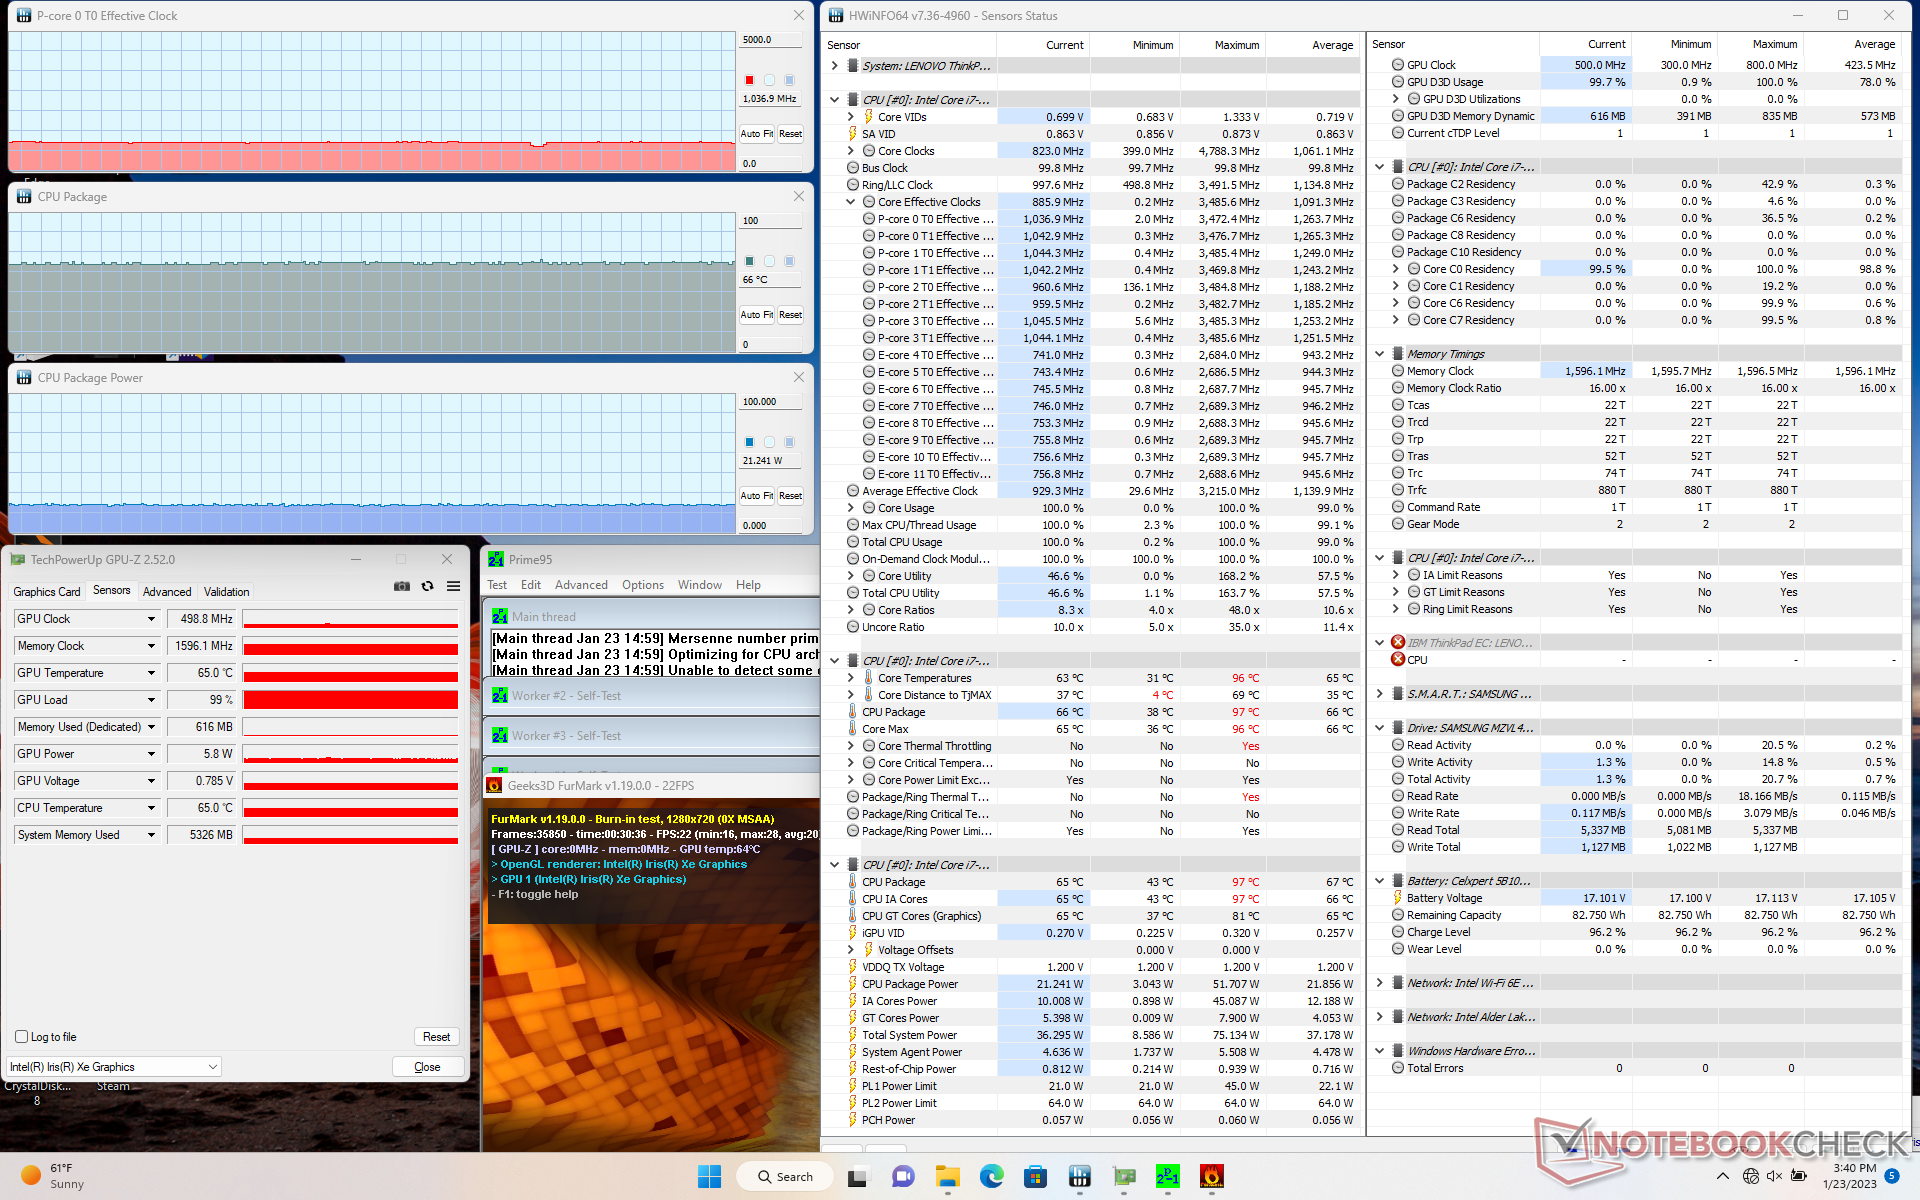
| ZegarCPU (GHz) | Zegar GPU (MHz) | Średnia temperatura CPU (°C) | |
| System w stanie bezczynności | -- | -- | 31 |
| Prime95 Stress | 1.7 | -- | 69 |
| Prime95 + FurMark Stress | 1.0 | 499 | 66 |
| Witcher 3 Stress | ~1,3 | 998 | 67 |
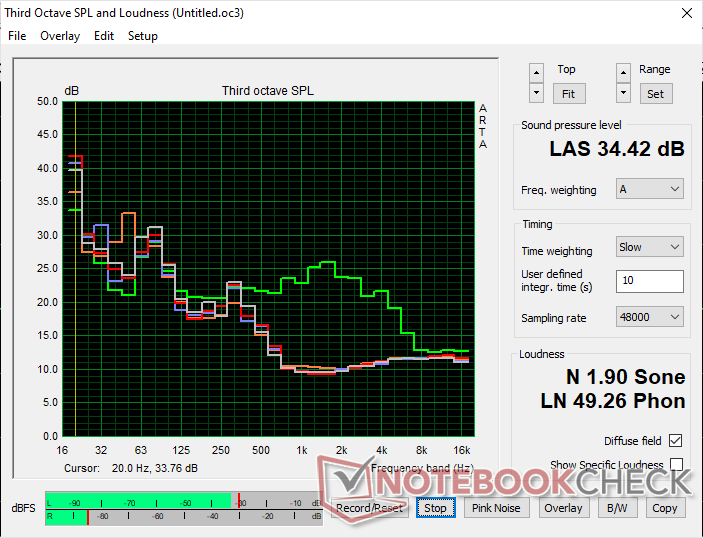
Mówcy
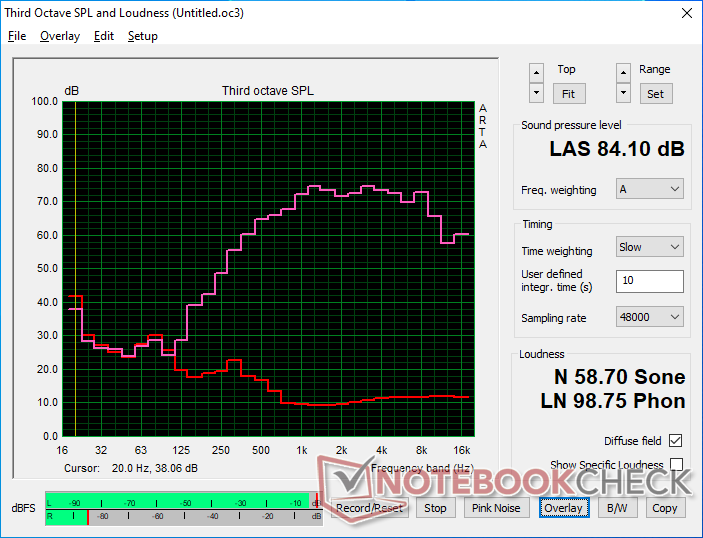
Lenovo ThinkPad T16 Gen 1 Core i7-1270P analiza dźwięku
(+) | głośniki mogą odtwarzać stosunkowo głośno (84.1 dB)
Bas 100 - 315 Hz
(-) | prawie brak basu - średnio 26.3% niższa od mediany
(±) | liniowość basu jest średnia (11.1% delta do poprzedniej częstotliwości)
Średnie 400 - 2000 Hz
(+) | zbalansowane środki średnie - tylko 4.5% od mediany
(+) | średnie są liniowe (5.1% delta do poprzedniej częstotliwości)
Wysokie 2–16 kHz
(±) | wyższe maksima - średnio 5.8% wyższe od mediany
(+) | wzloty są liniowe (4.8% delta do poprzedniej częstotliwości)
Ogólnie 100 - 16.000 Hz
(±) | liniowość ogólnego dźwięku jest średnia (20.1% różnicy w stosunku do mediany)
W porównaniu do tej samej klasy
» 43% wszystkich testowanych urządzeń w tej klasie było lepszych, 10% podobnych, 47% gorszych
» Najlepszy miał deltę 7%, średnia wynosiła ###średnia###%, najgorsza wynosiła 53%
W porównaniu do wszystkich testowanych urządzeń
» 52% wszystkich testowanych urządzeń było lepszych, 8% podobnych, 40% gorszych
» Najlepszy miał deltę 4%, średnia wynosiła ###średnia###%, najgorsza wynosiła 134%
Apple MacBook Pro 16 2021 M1 Pro analiza dźwięku
(+) | głośniki mogą odtwarzać stosunkowo głośno (84.7 dB)
Bas 100 - 315 Hz
(+) | dobry bas - tylko 3.8% od mediany
(+) | bas jest liniowy (5.2% delta do poprzedniej częstotliwości)
Średnie 400 - 2000 Hz
(+) | zbalansowane środki średnie - tylko 1.3% od mediany
(+) | średnie są liniowe (2.1% delta do poprzedniej częstotliwości)
Wysokie 2–16 kHz
(+) | zrównoważone maksima - tylko 1.9% od mediany
(+) | wzloty są liniowe (2.7% delta do poprzedniej częstotliwości)
Ogólnie 100 - 16.000 Hz
(+) | ogólny dźwięk jest liniowy (4.6% różnicy w stosunku do mediany)
W porównaniu do tej samej klasy
» 0% wszystkich testowanych urządzeń w tej klasie było lepszych, 0% podobnych, 100% gorszych
» Najlepszy miał deltę 5%, średnia wynosiła ###średnia###%, najgorsza wynosiła 45%
W porównaniu do wszystkich testowanych urządzeń
» 0% wszystkich testowanych urządzeń było lepszych, 0% podobnych, 100% gorszych
» Najlepszy miał deltę 4%, średnia wynosiła ###średnia###%, najgorsza wynosiła 134%
Zarządzanie energią
Pobór mocy
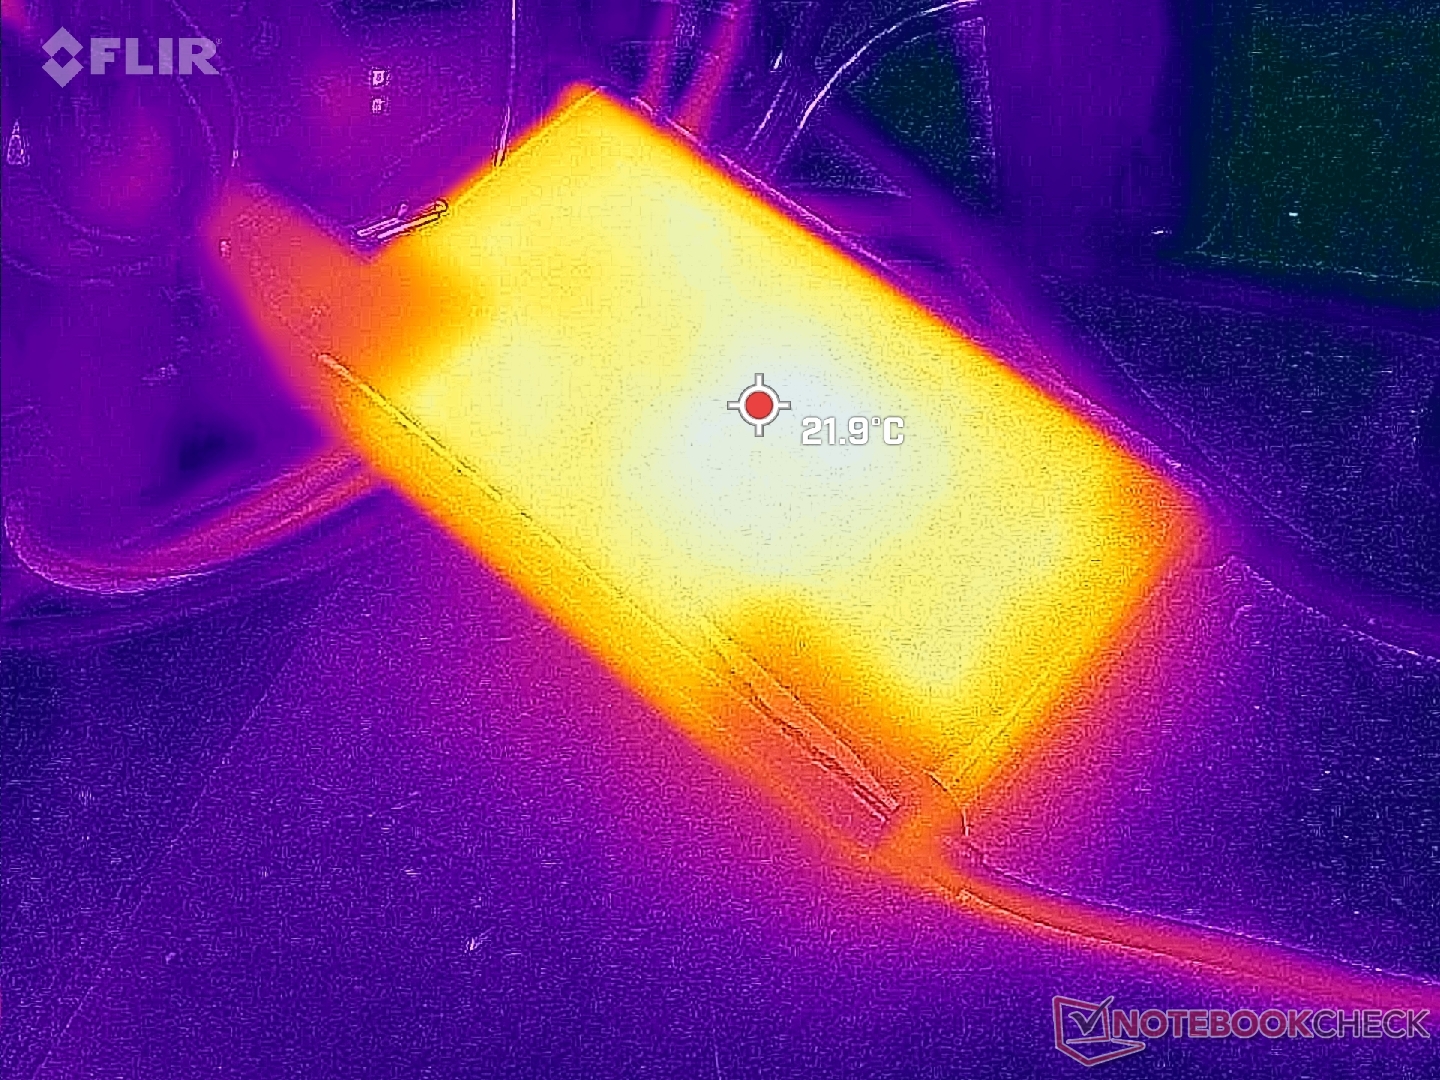
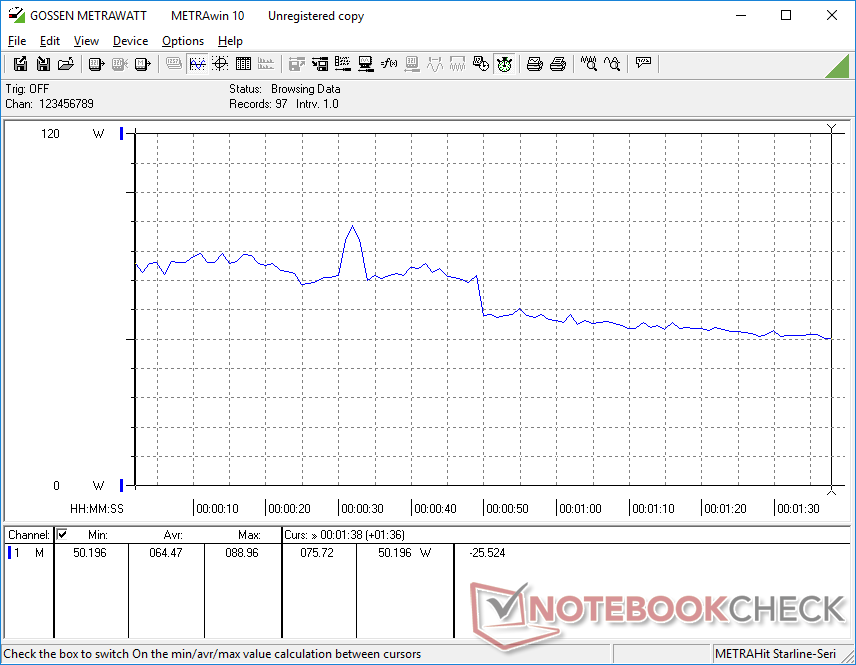
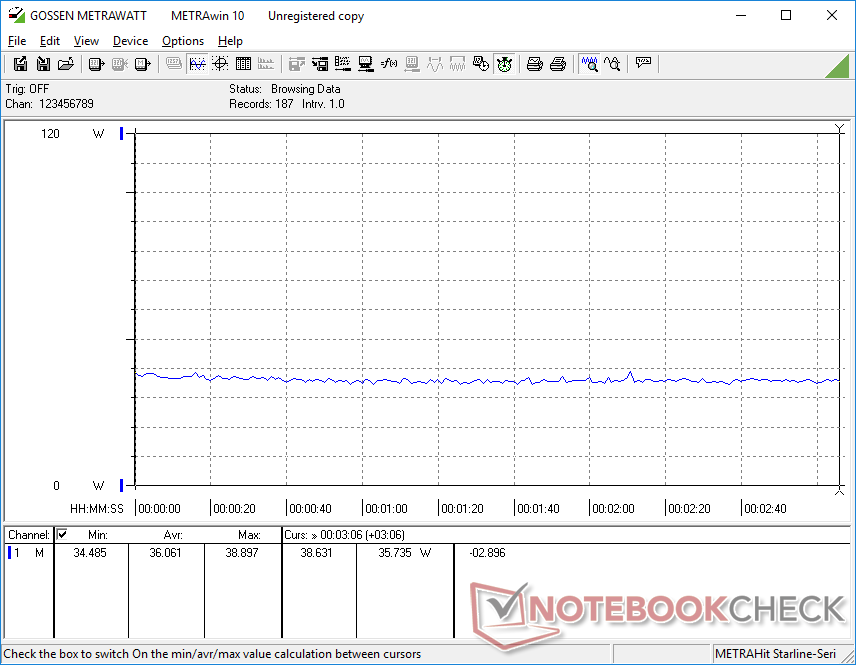
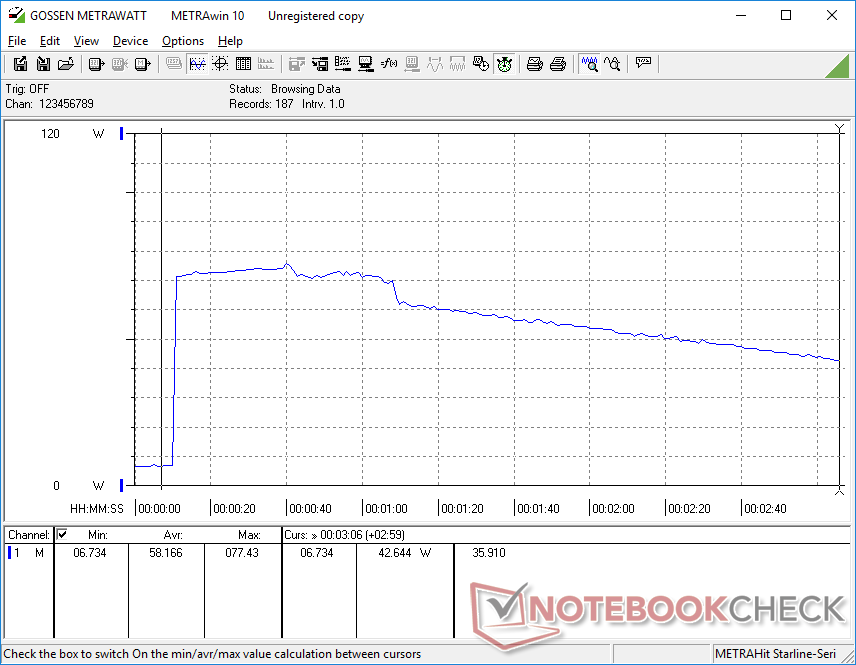
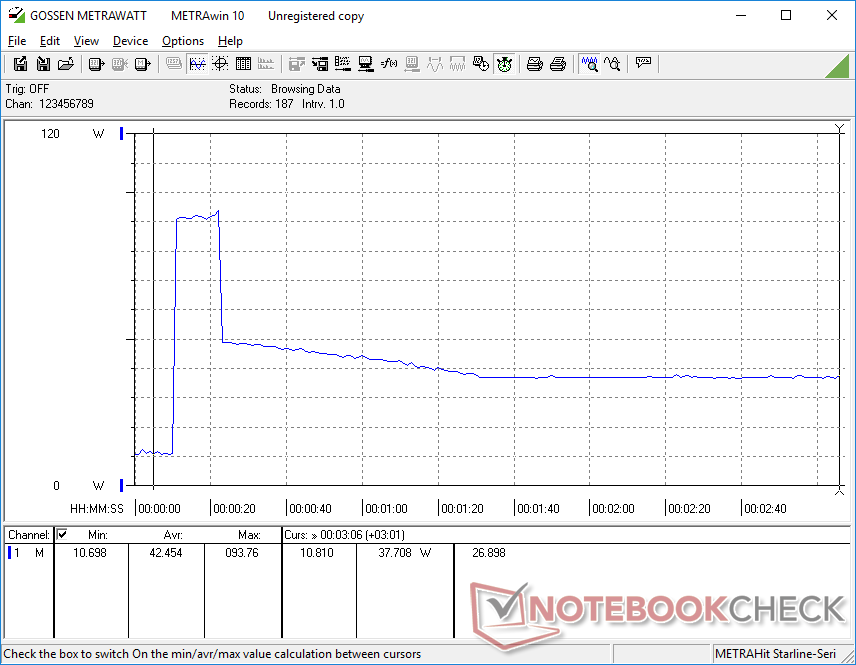
Pobór mocy przy wyższych obciążeniach odzwierciedla nasze obserwacje dotyczące częstotliwości taktowania i wydajności. Mianowicie, może on być wysoki w pierwszych kilku chwilach stresu, a następnie spadać z klifu do niższych poziomów z powodu dławienia wydajności. Na przykład podczas pracy z Prime95 zużycie energii byłoby wysokie i wynosiłoby około 77 W przez około 60 sekund, po czym z czasem spadłoby do 42 W lub niżej. Dzieje się tak nawet przy ustawieniu trybu High Performance.
W przypadku małego i średniego (~14,6 x 7,7 x 2,5 cm) zasilacza USB-C o mocy 135 W, gdy procesor i zintegrowany układ graficzny są wykorzystywane w 100 procentach, udało nam się zarejestrować maksymalny pobór 94 W. Takie tempo jest jednak tylko chwilowe, co pokazuje poniższy wykres. Stosunkowo wysoki narzut pozwala laptopowi zasilać bardziej wymagające urządzenia Thunderbolt, jak niektóre stacje dokujące i monitory. Lenovo oferuje alternatywnie mniejszy i bardziej przenośny zasilacz sieciowy o mocy 65 W.
| wyłączony / stan wstrzymania | |
| luz | |
| obciążenie |
|
Legenda:
min: | |
| Lenovo ThinkPad T16 Gen 1 Core i7-1270P i7-1270P, Iris Xe G7 96EUs, Samsung PM9B1 512GB MZAL4512HBLU, IPS, 1920x1200, 16" | Lenovo ThinkPad T16 G1 21BWS00200 i5-1240P, Iris Xe G7 80EUs, Samsung PM9A1 MZVL2512HCJQ, IPS, 1920x1200, 16" | LG Gram 16Z90Q i7-1260P, Iris Xe G7 96EUs, Samsung PM9A1 MZVL21T0HCLR, IPS, 2560x1600, 16" | HP EliteBook 865 G9 R7 PRO 6850U, Radeon 680M, Samsung PM991 MZVLQ512HBLU, IPS, 1920x1200, 16" | Huawei MateBook 16s i7 i7-12700H, Iris Xe G7 96EUs, Silicon Motion PCIe-8 SSD, IPS, 2520x1680, 16" | Apple MacBook Pro 16 2021 M1 Pro M1 Pro, M1 Pro 16-Core GPU, Apple SSD AP1024R, Mini-LED, 3456x2234, 16.2" | |
|---|---|---|---|---|---|---|
| Power Consumption | 21% | -3% | -21% | -45% | -34% | |
| Idle Minimum * (Watt) | 3.5 | 2.9 17% | 5 -43% | 5.3 -51% | 6.8 -94% | 5 -43% |
| Idle Average * (Watt) | 7.4 | 6 19% | 8 -8% | 12.8 -73% | 13.2 -78% | 15.1 -104% |
| Idle Maximum * (Watt) | 10.7 | 6.9 36% | 14 -31% | 14.1 -32% | 13.8 -29% | 15.5 -45% |
| Load Average * (Watt) | 64.5 | 27.3 58% | 47 27% | 48.5 25% | 75.2 -17% | 54 16% |
| Witcher 3 ultra * (Watt) | 36.1 | 42.6 -18% | 37.8 -5% | 48.7 -35% | 56.1 -55% | |
| Load Maximum * (Watt) | 93.8 | 81.53 13% | 56 40% | 56.6 40% | 90.6 3% | 90 4% |
* ... im mniej tym lepiej
Power Consumption Witcher 3 / Stresstest
Power Consumption external Monitor
Czas pracy na baterii - przeglądanie stron internetowych przez cały dzień
Czas pracy w sieci WLAN jest znacznie krótszy od tego, który odnotowaliśmy w Thinkpadzie T16 G1 z procesorem Core i5, co pokazuje poniższa tabela. Upewniliśmy się, że test został przeprowadzony na tych samych ustawieniach profilu zasilania Balanced pomiędzy dwoma konfiguracjami i wyniki nie uległy zmianie. Mimo to, 8 godzin przeglądania stron internetowych w świecie rzeczywistym jest prawdopodobnie wystarczające dla większości użytkowników.
Ładowanie od pustej do pełnej pojemności trwa około 90 minut przy użyciu dołączonego zasilacza AC.
| Lenovo ThinkPad T16 Gen 1 Core i7-1270P i7-1270P, Iris Xe G7 96EUs, 86 Wh | Lenovo ThinkPad T16 G1 21BWS00200 i5-1240P, Iris Xe G7 80EUs, 86 Wh | LG Gram 16Z90Q i7-1260P, Iris Xe G7 96EUs, 80 Wh | HP EliteBook 865 G9 R7 PRO 6850U, Radeon 680M, 76 Wh | Huawei MateBook 16s i7 i7-12700H, Iris Xe G7 96EUs, 84 Wh | Apple MacBook Pro 16 2021 M1 Pro M1 Pro, M1 Pro 16-Core GPU, 99.6 Wh | |
|---|---|---|---|---|---|---|
| Czasy pracy | 76% | 26% | 88% | 1% | 111% | |
| WiFi v1.3 (h) | 8 | 14.1 76% | 10.1 26% | 15 88% | 8.1 1% | 16.9 111% |
| H.264 (h) | 10.4 | 18.5 | 9.3 | 17.5 | ||
| Load (h) | 3.5 | 2.6 | 1.8 | 1.9 | ||
| Reader / Idle (h) | 18.1 |
Za
Przeciw
Werdykt - Nie dla użytkowników o ekstremalnej wydajności
Choć ThinkPad T16 G1 nie został zaprojektowany z myślą o użytkownikach o wysokiej wydajności, to jednak rozczarowujące jest tak silne dławienie procesora przy bardziej wymagających obciążeniach. Dławienie jest na tyle znaczące, że wydajność naszego Core i7-1270P może po pewnym czasie spaść do poziomu równie wolnego jak tańszy SKU Core i5-1240P. Takie zachowanie oznacza, że opcja Core i7-1270P jest najlepsza tylko w przypadku krótkich wybuchów wysokiej wydajności, takich jak uruchamianie aplikacji lub przetwarzanie obrazów, a nie w przypadku długotrwałego kodowania wideo lub ciężkiej pracy z grafiką, gdzie throttling może pojawić się z czasem.
Wbudowana opcja zwiększenia wydajności procesora kosztem głośniejszego szumu wentylatora i/lub cieplejszych temperatur złagodziłaby nieco throttling.
Opcja Ryzen 5 Pro 6650U oferuje bardziej spójną wydajność od opcji Core i7-1270P. Dławienie wydajności jest cięższe w przypadku konfiguracji z procesorem z serii Core P.
Poza procesorem użytkownicy powinni też uważać na wolną pamięć systemową RAM i niektóre z dostępnych opcji wyświetlania. Ten pierwszy wpływa na wydajność grafiki nawet o 10 procent, podczas gdy niektóre panele mogą nie mieć kolorów wymaganych przez grafików. KonkurencyjnyHP EliteBook 865 G9 to smuklejsza alternatywa z opcjami niedostępnymi w ThinkPadzie T16 G1, w tym jaśniejszym wyświetlaczem 1000-nitów i kamerą internetową o wyższej rozdzielczości 5 MP.
Cena i dostępność
ThinkPad T16 G1 jest już sprzedawany bezpośrednio przez Lenovo w cenie od 1050 USD za podstawową konfigurację z procesorem Core i5-1235U do 2040 USD za konfigurację z procesorem Core i7-1270P. Newegg i Amazon również mają ten model w magazynie w różnych konfiguracjach, zaczynających się od około 1500 USD w przypadku konfiguracji z procesorem Core i7-1270P.
Lenovo ThinkPad T16 Gen 1 Core i7-1270P
- 25/01/2023 v7 (old)
Allen Ngo
Przezroczystość
Wyboru urządzeń do recenzji dokonuje nasza redakcja. Próbka testowa została udostępniona autorowi jako pożyczka od producenta lub sprzedawcy detalicznego na potrzeby tej recenzji. Pożyczkodawca nie miał wpływu na tę recenzję, producent nie otrzymał też kopii tej recenzji przed publikacją. Nie było obowiązku publikowania tej recenzji. Jako niezależna firma medialna, Notebookcheck nie podlega władzy producentów, sprzedawców detalicznych ani wydawców.
Tak testuje Notebookcheck
Każdego roku Notebookcheck niezależnie sprawdza setki laptopów i smartfonów, stosując standardowe procedury, aby zapewnić porównywalność wszystkich wyników. Od około 20 lat stale rozwijamy nasze metody badawcze, ustanawiając przy tym standardy branżowe. W naszych laboratoriach testowych doświadczeni technicy i redaktorzy korzystają z wysokiej jakości sprzętu pomiarowego. Testy te obejmują wieloetapowy proces walidacji. Nasz kompleksowy system ocen opiera się na setkach uzasadnionych pomiarów i benchmarków, co pozwala zachować obiektywizm.Price comparison

