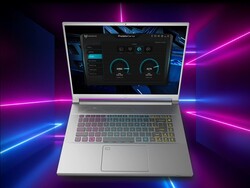
Recenzja Acer Predator Triton 300 SE PT314: Chłodzenie ciekłym metalem dla 14-calowego laptopa
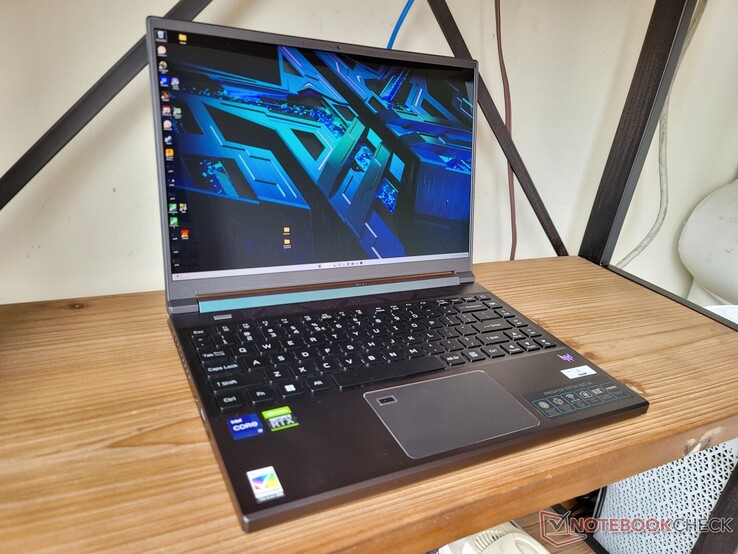
Minęły dwa lata odkąd ostatnio recenzowaliśmy Predator Triton 300. Ten najnowszy model, o nazwie Predator Triton 300 SE, wykorzystuje nowsze procesory 12. generacji z serii Core H i procesory graficzne Nvidia Ampere RTX w mniejszej, 14-calowej obudowie. Tym samym konkuruje z niektórymi najmniejszymi laptopami do gier na rynku, m.in Razer Blade 14, Asus Zephyrus G14oraz Alienware x14.
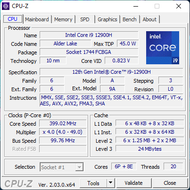
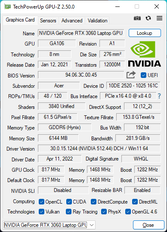
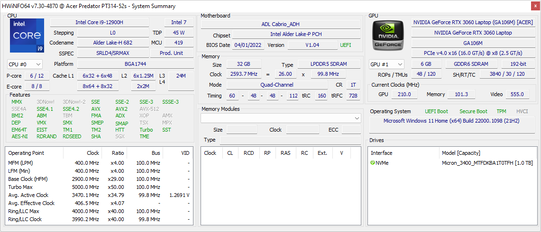
Nasz egzemplarz recenzencki to SKU z wyższej półki z procesorem Core i9-12900H i wyświetlaczem OLED 90 Hz 1800p za około 1950 USD. Inna konfiguracja jest dostępna z procesorem Core i7-12700H, wyświetlaczem IPS 165 Hz 1200p, połową pamięci RAM i pamięcią masową za setki dolarów mniej. Wszystkie opcje w tej chwili inaczej pochodzą z tym samym 95 W GeForce RTX 3060 GPU
Dostępna jest większa 16-calowa wersja, która dzieli tę samą nazwę Predator Triton 300 SE, ale z innym numerem modelu (PT316 vs. PT314)
Więcej recenzji Acer:
Potencjalni konkurenci w porównaniu
Ocena | Data | Model | Waga | Wysokość | Rozmiar | Rezolucja | Cena |
|---|---|---|---|---|---|---|---|
| 86 % v7 (old) | 11/2022 | Acer Predator Triton 300 SE i9-12900H, GeForce RTX 3060 Laptop GPU | 1.7 kg | 19.8 mm | 14.00" | 2880x1800 | |
| 86.4 % v7 (old) | 10/2022 | Asus ROG Zephyrus G14 GA402RJ R7 6800HS, Radeon RX 6700S | 1.7 kg | 19.5 mm | 14.00" | 2560x1600 | |
| 89.4 % v7 (old) | Razer Blade 14 Ryzen 9 6900HX R9 6900HX, GeForce RTX 3070 Ti Laptop GPU | 1.8 kg | 16.8 mm | 14.00" | 2560x1440 | ||
| 86.7 % v7 (old) | Alienware x14 i7 RTX 3060 i7-12700H, GeForce RTX 3060 Laptop GPU | 1.8 kg | 14.5 mm | 14.00" | 1920x1080 | ||
| 87.2 % v7 (old) | 09/2022 | Dell Inspiron 14 Plus 7420 i7-12700H, GeForce RTX 3050 4GB Laptop GPU | 1.7 kg | 18.87 mm | 14.00" | 2240x1400 | |
| 87.7 % v7 (old) | Schenker Vision 14 i7-11370H, GeForce RTX 3050 Ti Laptop GPU | 1.1 kg | 15.6 mm | 14.00" | 2880x1800 |
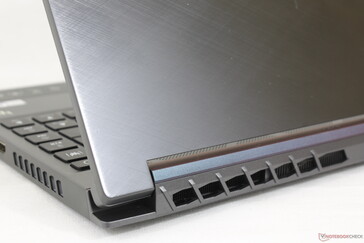
Obudowa - podobna wielkością do Zephyrusa G14
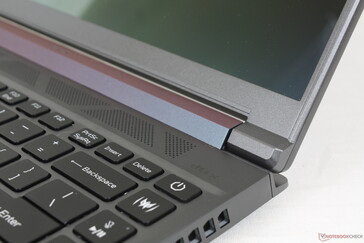
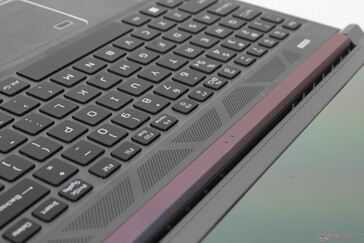
Metalowa podstawa jest mocna, z minimalnymi tylko oznakami skręcania lub wypaczania i bez skrzypienia podczas wywierania nacisku wzdłuż środka klawiatury lub na rogach. Nie jest ona tak sztywna jak w Razer Blade 14, ale z pewnością nie sprawia też wrażenia taniej
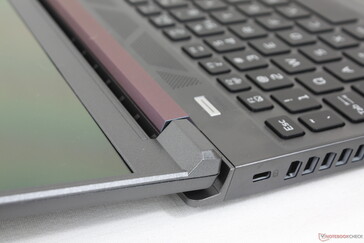
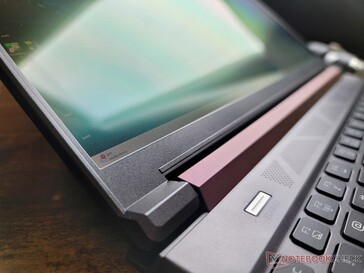
Najsłabszym obszarem obudowy jest jej wyświetlacz. Choć jest to częste w większości laptopów, wyświetlacz w Acerze jest szczególnie cienki i zauważalnie bardziej podatny na odkształcenia, niż wyświetlacze w Zephyrusie G14 czy Blade 14. Doceniamy to, że wyświetlacz może się otworzyć o prawie pełne 180 stopni, inaczej niż we wspomnianych modelach Asusa czy Razera, ale zawiasy w Acerze wydają się słabsze i mają tendencję do większego przechylania się.
Przypadkowo zarówno waga jak i wymiary są niemal identyczne jak w przypadku Asusa Zephyrusa G14. Blade 14 i Alienware x14 są zauważalnie cieńsze, ale rekompensują to większym rozmiarem stopy. Większość zwykłych 14-calowych ultrabooków, jak np.Schenker Vision 14 może być znacznie lżejsza o ponad pół kilograma, ale bez korzyści związanych z wydajnością.
Łączność - Obsługa Thunderbolt 4
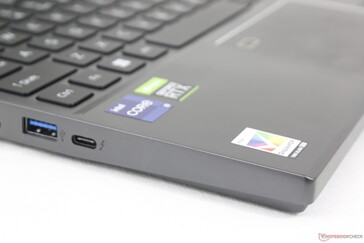
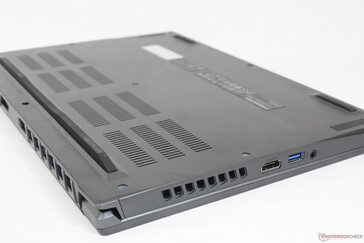
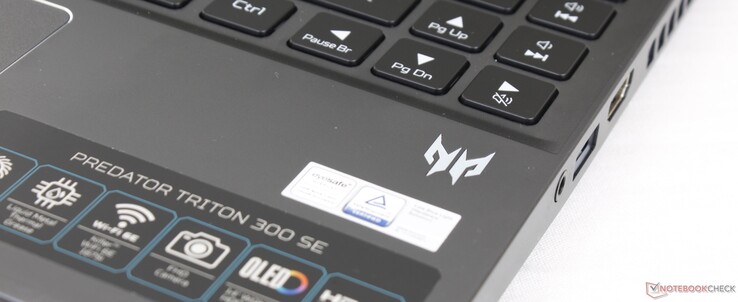
Opcje portów są bardziej ograniczone niż w Asusie Zephyrusie G14 lub Razer Blade 14, ponieważ każda z alternatyw integruje jeden port USB-C więcej niż nasz Acer. Rozmieszczenie portów jest również nieco niekorzystne, ponieważ porty są ciasno upakowane i stosunkowo blisko przedniej krawędzi. Widać, że duże kratki wentylacyjne wokół obudowy zabierają cenną przestrzeń z portów.
Komunikacja
| Networking | |
| iperf3 transmit AX12 | |
| Alienware x14 i7 RTX 3060 | |
| Schenker Vision 14 | |
| Razer Blade 14 Ryzen 9 6900HX | |
| iperf3 receive AX12 | |
| Schenker Vision 14 | |
| Razer Blade 14 Ryzen 9 6900HX | |
| Alienware x14 i7 RTX 3060 | |
| iperf3 receive AXE11000 6GHz | |
| Acer Predator Triton 300 SE | |
| Dell Inspiron 14 Plus 7420 | |
| iperf3 receive AXE11000 | |
| Asus ROG Zephyrus G14 GA402RJ | |
| iperf3 transmit AXE11000 6GHz | |
| Acer Predator Triton 300 SE | |
| Dell Inspiron 14 Plus 7420 | |
Kamera internetowa
W standardzie jest kamera 2 MP, która ma być porównywalna z wieloma Ultrabookami ze średniej półki. Nie ma czujnika IR ani nawet migawki prywatności.
Konserwacja
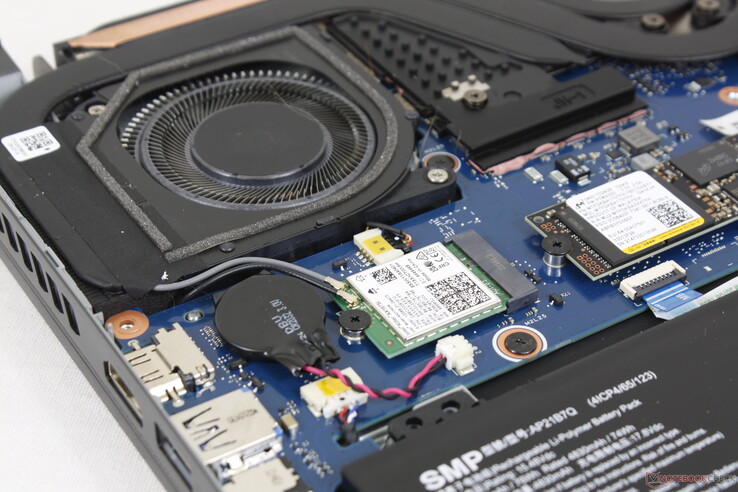
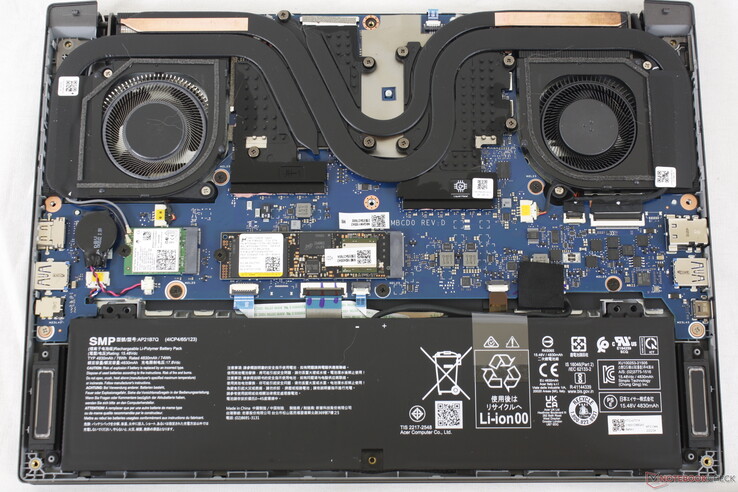
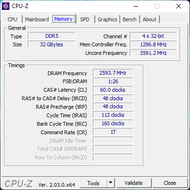
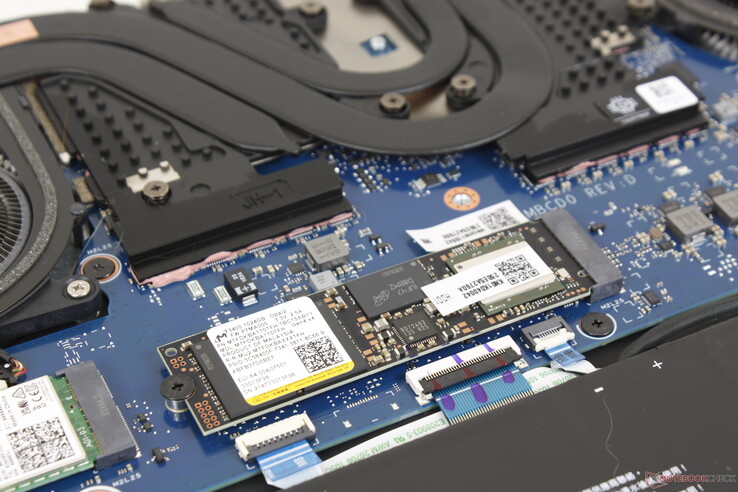
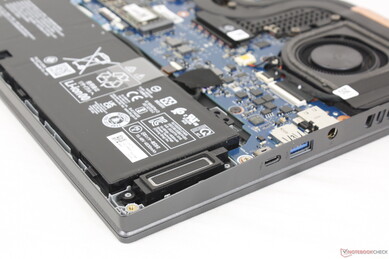
Spodnia ścianka jest zabezpieczona dziewięcioma śrubkami T6 Torx, co pozwala na stosunkowo łatwe serwisowanie. Użytkownicy mogą uaktualnić tylko dysk SSD, moduł WLAN i akumulator. Moduły RAM są lutowane, inaczej niż w modelu poprzedniej generacji.
Akcesoria i gwarancja
W pudełku detalicznym oprócz zasilacza i papierów znajduje się poręczne etui. Inni producenci rzadko dołączają już futerały bez dodatkowych opłat. W przypadku zakupu w USA obowiązuje zwyczajowa roczna ograniczona gwarancja producenta.
Urządzenia wejściowe - miękkie i ciche klawisze
Klawiatura
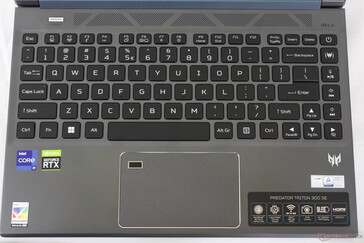
Klawisze mają płytki skok i stosunkowo słaby feedback, podobnie jak w Blade 14 i wielu niedrogich ultrabookach, np Asus VivoBook S14. Jeśli pisałeś już wcześniej na Ultrabooku, to będziesz wiedział, czego się tu spodziewać. Sprzężenie zwrotne jest stosunkowo ciche, ale nie jest tak ostre i pewne, jak w przypadku klawiszy w biznesowych ThinkPadach czy EliteBookach
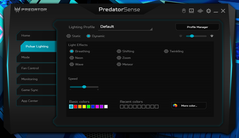
Trójstrefowe podświetlenie RGB jest standardem, podczas gdy Blade 14 posiada podświetlenie RGB na klawisze. Wszystkie klawisze i symbole są podświetlane.
Touchpad
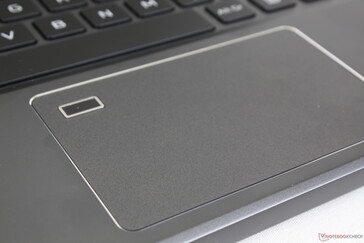
Klawiatura jest nieco większa niż klawiatura w modelu Zephyrusie G14 (10,5 x 6,5 cm vs. 10,5 x 6 cm). Czytnik linii papilarnych w rogu zmniejsza jednak efektywną przestrzeń do sterowania kursorem lub wprowadzania wielodotykowego, przez co gładzik może sprawiać wrażenie mniejszego. Większość innych laptopów przeniosła czytnik linii papilarnych do wygodniejszych miejsc, takich jak przycisk zasilania czy klawiatura. Pod tym względem Predator Triton 300 SE może sprawiać wrażenie starszej konstrukcji obudowy.
Sprzężenie zwrotne podczas klikania na klawiaturze jest miękkie i bardzo płytkie, co daje słabe wrażenie. W miarę możliwości warto używać myszy USB.
Wyświetlacz - opcje OLED i IPS
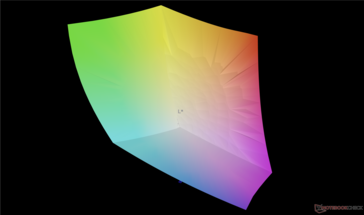
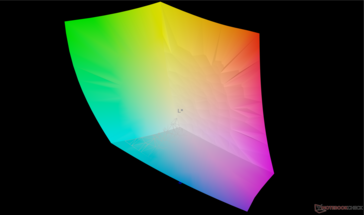
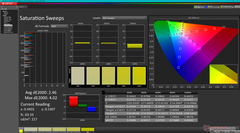
Predator Triton 300 SE to jeden z niewielu laptopów do gier z matrycą OLED, który oferuje zarówno pełne kolory DCI-P3, jak i stosunkowo szybką częstotliwość odświeżania 90 Hz. Niektóre alternatywy IPS mogą mieć jeszcze szybsze odświeżanie, takie jak panel na Blade 14, ale zwykle obiecują one tylko pokrycie sRGB.
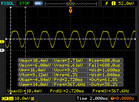
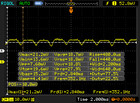
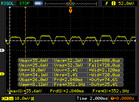
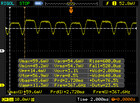
Brak obsługi synchronizacji adaptacyjnej jest zauważalną wadą 14-calowego Predatora Triton 300 SE. Choć ghosting może być prawie nieistniejący, panel OLED zdecydowanie niesie ze sobą własny zestaw wad w porównaniu do IPS. Na przykład migotanie o częstotliwości około 352 Hz jest obecne na wszystkich poziomach jasności, podobnie jak w innych 14-calowych laptopach OLED, takich jak Asus VivoBook 14.
Acer oferuje SKU IPS o niższej rozdzielczości 1200p z obsługą MUX i szybszą częstotliwością odświeżania 165 Hz. Jeśli pełne pokrycie kolorów P3 nie jest ważne dla Twoich zadań, to alternatywa IPS może być warta rozważenia, zwłaszcza do gier.
| |||||||||||||||||||||||||
rozświetlenie: 99 %
na akumulatorze: 414.3 cd/m²
kontrast: ∞:1 (czerń: 0 cd/m²)
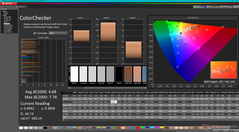
ΔE ColorChecker Calman: 4.68 | ∀{0.5-29.43 Ø4.77}
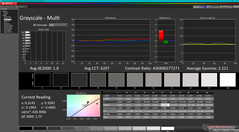
ΔE Greyscale Calman: 1.8 | ∀{0.09-98 Ø5}
99% AdobeRGB 1998 (Argyll 3D)
100% sRGB (Argyll 3D)
99.9% Display P3 (Argyll 3D)
Gamma: 2.22
CCT: 6207 K
| Acer Predator Triton 300 SE Samsung ATNA40YK07-0, OLED, 2880x1800, 14" | Asus ROG Zephyrus G14 GA402RJ BOEhydis NE140QDM-NX1, IPS, 2560x1600, 14" | Razer Blade 14 Ryzen 9 6900HX TL140BDXP02-0, IPS, 2560x1440, 14" | Alienware x14 i7 RTX 3060 SHP154D, IPS, 1920x1080, 14" | Dell Inspiron 14 Plus 7420 InfoVision 140NWHE, IPS, 2240x1400, 14" | Schenker Vision 14 MNE007ZA1, IPS, 2880x1800, 14" | |
|---|---|---|---|---|---|---|
| Display | -5% | -5% | -4% | -21% | -17% | |
| Display P3 Coverage (%) | 99.9 | 97.6 -2% | 97.2 -3% | 99.6 0% | 68.8 -31% | 74.3 -26% |
| sRGB Coverage (%) | 100 | 99.9 0% | 99.9 0% | 100 0% | 99.3 -1% | 97.6 -2% |
| AdobeRGB 1998 Coverage (%) | 99 | 85.6 -14% | 85.7 -13% | 87.6 -12% | 69.5 -30% | 75.7 -24% |
| Response Times | -426% | -1077% | -533% | -1944% | -2062% | |
| Response Time Grey 50% / Grey 80% * (ms) | 1.36 ? | 8.3 ? -510% | 16.8 ? -1135% | 9.6 ? -606% | 32.8 ? -2312% | 40.4 ? -2871% |
| Response Time Black / White * (ms) | 1.36 ? | 6 ? -341% | 15.2 ? -1018% | 7.6 ? -459% | 22.8 ? -1576% | 18.4 ? -1253% |
| PWM Frequency (Hz) | 367.6 ? | 26191 ? | ||||
| Screen | 5% | 13% | -24% | -12% | 5% | |
| Brightness middle (cd/m²) | 414.3 | 500 21% | 354 -15% | 434 5% | 331.1 -20% | 407 -2% |
| Brightness (cd/m²) | 416 | 470 13% | 328 -21% | 411 -1% | 326 -22% | 407 -2% |
| Brightness Distribution (%) | 99 | 85 -14% | 86 -13% | 89 -10% | 85 -14% | 94 -5% |
| Black Level * (cd/m²) | 0.42 | 0.37 | 0.25 | 0.29 | 0.25 | |
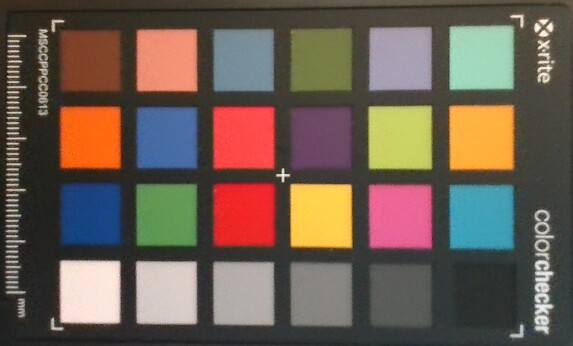
| Colorchecker dE 2000 * | 4.68 | 2.45 48% | 1.66 65% | 3 36% | 2.23 52% | 2.6 44% |
| Colorchecker dE 2000 max. * | 7.78 | 5.34 31% | 3.83 51% | 7.1 9% | 5.44 30% | 4.4 43% |
| Greyscale dE 2000 * | 1.8 | 3.1 -72% | 1.6 11% | 5.1 -183% | 3.6 -100% | 2.7 -50% |
| Gamma | 2.22 99% | 2.213 99% | 2.23 99% | 2.19 100% | 2.21 100% | 2.18 101% |
| CCT | 6207 105% | 7251 90% | 6542 99% | 6204 105% | 6022 108% | 6316 103% |
| Contrast (:1) | 1190 | 957 | 1736 | 1142 | 1628 | |
| Colorchecker dE 2000 calibrated * | 1.2 | 0.7 | 0.63 | 2 | ||
| Całkowita średnia (program / ustawienia) | -142% /
-76% | -356% /
-190% | -187% /
-111% | -659% /
-366% | -691% /
-377% |
* ... im mniej tym lepiej
Wyświetl czasy reakcji
| ↔ Czas reakcji od czerni do bieli | ||
|---|---|---|
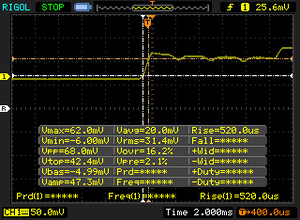
| 1.36 ms ... wzrost ↗ i spadek ↘ łącznie | ↗ 0.52 ms wzrost | |
| ↘ 0.84 ms upadek | ||
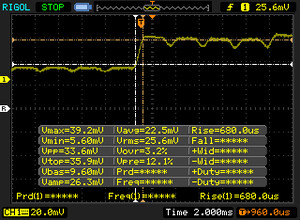
| W naszych testach ekran wykazuje bardzo szybką reakcję i powinien bardzo dobrze nadawać się do szybkich gier. Dla porównania, wszystkie testowane urządzenia wahają się od 0.1 (minimum) do 240 (maksimum) ms. » 7 % wszystkich urządzeń jest lepszych. Oznacza to, że zmierzony czas reakcji jest lepszy od średniej wszystkich testowanych urządzeń (20.2 ms). | ||
| ↔ Czas reakcji 50% szarości do 80% szarości | ||
| 1.36 ms ... wzrost ↗ i spadek ↘ łącznie | ↗ 0.68 ms wzrost | |
| ↘ 0.68 ms upadek | ||
| W naszych testach ekran wykazuje bardzo szybką reakcję i powinien bardzo dobrze nadawać się do szybkich gier. Dla porównania, wszystkie testowane urządzenia wahają się od 0.165 (minimum) do 636 (maksimum) ms. » 5 % wszystkich urządzeń jest lepszych. Oznacza to, że zmierzony czas reakcji jest lepszy od średniej wszystkich testowanych urządzeń (31.5 ms). | ||
Migotanie ekranu / PWM (modulacja szerokości impulsu)
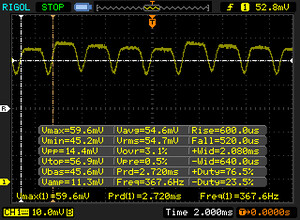
| Wykryto migotanie ekranu/wykryto PWM | 367.6 Hz | ≤ 100 % ustawienia jasności | |
Podświetlenie wyświetlacza miga z częstotliwością 367.6 Hz (najgorszy przypadek, np. przy użyciu PWM) Wykryto migotanie przy ustawieniu jasności 100 % i poniżej. Powyżej tego ustawienia jasności nie powinno być żadnego migotania ani PWM. Częstotliwość 367.6 Hz jest stosunkowo wysoka, więc większość użytkowników wrażliwych na PWM nie powinna zauważyć żadnego migotania. Istnieją jednak doniesienia, że niektórzy użytkownicy są nadal wrażliwi na PWM przy częstotliwości 500 Hz i wyższej, więc należy zachować ostrożność. Dla porównania: 53 % wszystkich testowanych urządzeń nie używa PWM do przyciemniania wyświetlacza. Jeśli wykryto PWM, zmierzono średnio 8070 (minimum: 5 - maksimum: 343500) Hz. | |||
Widoczność na zewnątrz jest przyzwoita, jeśli znajduje się w cieniu, dzięki głębokim poziomom czerni i kolorom błyszczącego panelu OLED. Niemniej jednak, odblaski są nadal nieuniknione w większości warunków. Matowy wyświetlacz w Zephyrusie G14 jest o około 100 nitów jaśniejszy, co zapewnia nieco lepszą czytelność.
Wydajność - 12. gen. Core i9
Warunki badania
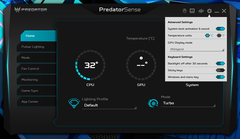
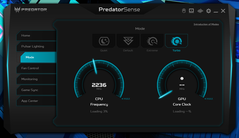
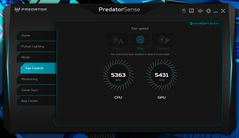
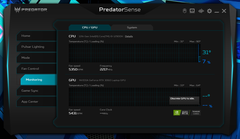
Przed przeprowadzeniem poniższych benchmarków ustawiliśmy nasze urządzenie w trybie "Best performance" za pośrednictwem systemu Windows oraz w trybie "Turbo" za pośrednictwem preinstalowanego oprogramowania PredatorSense. Zaleca się, aby właściciele zapoznali się z oprogramowaniem PredatorSense, ponieważ jest to główny punkt kontrolny do regulacji podświetlenia klawiatury, wentylatorów, ustawień rozruchu i innych, jak widać na poniższych zrzutach ekranu
Niestety, MUX jest dostępny tylko w modelach bez wyświetlacza OLED, co zostało potwierdzone przez firmę Acer. Próba wyjścia z trybu MSHybrid za pośrednictwem PredatorSense spowodowała awarię naszego urządzenia.
Procesor
Wydajność procesora jest jedną z najszybszych wśród wszystkich 14-calowych laptopów do gier. Aby uzyskać coś znacznie szybszego, należałoby rozważyć większe modele, takie jak MSI GE77 zCore i9-12900HX. Mimo to Core i9-12900H w naszym 14-calowym Acerze nie jest w stanie utrzymać bardzo wysokich częstotliwości taktowania Turbo Boost przez dłuższy czas, co pokazuje poniższa sekcja Stress Test
Zmniejszenie wydajności do Core i7-12700H Może wiązać się z deficytem wydajności rzędu 1-2%, co wynika z naszego doświadczenia z Alienware x14. Potencjalni nabywcy mogą w ten sposób zaoszczędzić kilkaset dolarów i otrzymać zasadniczo taką samą wydajność procesora jak w przypadku droższego modelu Core i9-12900H.
Cinebench R15 Multi Loop
Cinebench R23: Multi Core | Single Core
Cinebench R15: CPU Multi 64Bit | CPU Single 64Bit
Blender: v2.79 BMW27 CPU
7-Zip 18.03: 7z b 4 | 7z b 4 -mmt1
Geekbench 5.5: Multi-Core | Single-Core
HWBOT x265 Benchmark v2.2: 4k Preset
LibreOffice : 20 Documents To PDF
R Benchmark 2.5: Overall mean
| Cinebench R20 / CPU (Multi Core) | |
| MSI Raider GE77 HX 12UHS | |
| Acer Predator Triton 300 SE | |
| Alienware x14 i7 RTX 3060 | |
| Przeciętny Intel Core i9-12900H (2681 - 7471, n=28) | |
| Lenovo IdeaPad Gaming 3 15IAH7 | |
| Razer Blade 14 Ryzen 9 6900HX | |
| Acer Nitro 5 AN515-46-R1A1 | |
| Razer Blade 14 Ryzen 9 RTX 3070 | |
| Asus ROG Zephyrus G14 GA402RJ | |
| Asus ZenBook 14X UM5401QA-KN162 | |
| Lenovo Legion 5 Pro 16 ARH7H-82RG0047GE | |
| Schenker Vision 14 | |
| Cinebench R20 / CPU (Single Core) | |
| MSI Raider GE77 HX 12UHS | |
| Acer Predator Triton 300 SE | |
| Przeciętny Intel Core i9-12900H (624 - 738, n=28) | |
| Alienware x14 i7 RTX 3060 | |
| Lenovo IdeaPad Gaming 3 15IAH7 | |
| Acer Nitro 5 AN515-46-R1A1 | |
| Razer Blade 14 Ryzen 9 6900HX | |
| Schenker Vision 14 | |
| Lenovo Legion 5 Pro 16 ARH7H-82RG0047GE | |
| Asus ROG Zephyrus G14 GA402RJ | |
| Asus ZenBook 14X UM5401QA-KN162 | |
| Razer Blade 14 Ryzen 9 RTX 3070 | |
| Cinebench R23 / Multi Core | |
| MSI Raider GE77 HX 12UHS | |
| Acer Predator Triton 300 SE | |
| Alienware x14 i7 RTX 3060 | |
| Przeciętny Intel Core i9-12900H (7359 - 19648, n=28) | |
| Lenovo IdeaPad Gaming 3 15IAH7 | |
| Razer Blade 14 Ryzen 9 6900HX | |
| Acer Nitro 5 AN515-46-R1A1 | |
| Razer Blade 14 Ryzen 9 RTX 3070 | |
| Asus ROG Zephyrus G14 GA402RJ | |
| Asus ZenBook 14X UM5401QA-KN162 | |
| Lenovo Legion 5 Pro 16 ARH7H-82RG0047GE | |
| Schenker Vision 14 | |
| Cinebench R23 / Single Core | |
| Acer Predator Triton 300 SE | |
| MSI Raider GE77 HX 12UHS | |
| Przeciętny Intel Core i9-12900H (1634 - 1930, n=28) | |
| Alienware x14 i7 RTX 3060 | |
| Lenovo IdeaPad Gaming 3 15IAH7 | |
| Acer Nitro 5 AN515-46-R1A1 | |
| Razer Blade 14 Ryzen 9 6900HX | |
| Schenker Vision 14 | |
| Lenovo Legion 5 Pro 16 ARH7H-82RG0047GE | |
| Asus ROG Zephyrus G14 GA402RJ | |
| Asus ZenBook 14X UM5401QA-KN162 | |
| Razer Blade 14 Ryzen 9 RTX 3070 | |
| Cinebench R15 / CPU Multi 64Bit | |
| MSI Raider GE77 HX 12UHS | |
| Alienware x14 i7 RTX 3060 | |
| Przeciętny Intel Core i9-12900H (1395 - 3077, n=28) | |
| Acer Predator Triton 300 SE | |
| Razer Blade 14 Ryzen 9 6900HX | |
| Lenovo IdeaPad Gaming 3 15IAH7 | |
| Acer Nitro 5 AN515-46-R1A1 | |
| Razer Blade 14 Ryzen 9 RTX 3070 | |
| Asus ROG Zephyrus G14 GA402RJ | |
| Asus ZenBook 14X UM5401QA-KN162 | |
| Lenovo Legion 5 Pro 16 ARH7H-82RG0047GE | |
| Schenker Vision 14 | |
| Schenker Vision 14 | |
| Cinebench R15 / CPU Single 64Bit | |
| MSI Raider GE77 HX 12UHS | |
| Acer Predator Triton 300 SE | |
| Przeciętny Intel Core i9-12900H (235 - 277, n=29) | |
| Alienware x14 i7 RTX 3060 | |
| Acer Nitro 5 AN515-46-R1A1 | |
| Lenovo IdeaPad Gaming 3 15IAH7 | |
| Razer Blade 14 Ryzen 9 6900HX | |
| Lenovo Legion 5 Pro 16 ARH7H-82RG0047GE | |
| Asus ROG Zephyrus G14 GA402RJ | |
| Schenker Vision 14 | |
| Asus ZenBook 14X UM5401QA-KN162 | |
| Razer Blade 14 Ryzen 9 RTX 3070 | |
| Blender / v2.79 BMW27 CPU | |
| Schenker Vision 14 | |
| Lenovo Legion 5 Pro 16 ARH7H-82RG0047GE | |
| Asus ZenBook 14X UM5401QA-KN162 | |
| Asus ROG Zephyrus G14 GA402RJ | |
| Razer Blade 14 Ryzen 9 RTX 3070 | |
| Acer Nitro 5 AN515-46-R1A1 | |
| Przeciętny Intel Core i9-12900H (160 - 451, n=28) | |
| Alienware x14 i7 RTX 3060 | |
| Lenovo IdeaPad Gaming 3 15IAH7 | |
| Razer Blade 14 Ryzen 9 6900HX | |
| Acer Predator Triton 300 SE | |
| MSI Raider GE77 HX 12UHS | |
| 7-Zip 18.03 / 7z b 4 | |
| MSI Raider GE77 HX 12UHS | |
| Alienware x14 i7 RTX 3060 | |
| Acer Predator Triton 300 SE | |
| Razer Blade 14 Ryzen 9 6900HX | |
| Acer Nitro 5 AN515-46-R1A1 | |
| Przeciętny Intel Core i9-12900H (34684 - 76677, n=28) | |
| Asus ROG Zephyrus G14 GA402RJ | |
| Asus ZenBook 14X UM5401QA-KN162 | |
| Razer Blade 14 Ryzen 9 RTX 3070 | |
| Lenovo Legion 5 Pro 16 ARH7H-82RG0047GE | |
| Lenovo IdeaPad Gaming 3 15IAH7 | |
| Schenker Vision 14 | |
| 7-Zip 18.03 / 7z b 4 -mmt1 | |
| MSI Raider GE77 HX 12UHS | |
| Przeciętny Intel Core i9-12900H (5302 - 6289, n=28) | |
| Razer Blade 14 Ryzen 9 6900HX | |
| Acer Nitro 5 AN515-46-R1A1 | |
| Alienware x14 i7 RTX 3060 | |
| Acer Predator Triton 300 SE | |
| Lenovo Legion 5 Pro 16 ARH7H-82RG0047GE | |
| Schenker Vision 14 | |
| Asus ROG Zephyrus G14 GA402RJ | |
| Lenovo IdeaPad Gaming 3 15IAH7 | |
| Asus ZenBook 14X UM5401QA-KN162 | |
| Razer Blade 14 Ryzen 9 RTX 3070 | |
| Geekbench 5.5 / Multi-Core | |
| MSI Raider GE77 HX 12UHS | |
| Alienware x14 i7 RTX 3060 | |
| Acer Predator Triton 300 SE | |
| Przeciętny Intel Core i9-12900H (8519 - 14376, n=31) | |
| Razer Blade 14 Ryzen 9 6900HX | |
| Acer Nitro 5 AN515-46-R1A1 | |
| Asus ROG Zephyrus G14 GA402RJ | |
| Asus ZenBook 14X UM5401QA-KN162 | |
| Lenovo IdeaPad Gaming 3 15IAH7 | |
| Lenovo Legion 5 Pro 16 ARH7H-82RG0047GE | |
| Schenker Vision 14 | |
| Geekbench 5.5 / Single-Core | |
| MSI Raider GE77 HX 12UHS | |
| Acer Predator Triton 300 SE | |
| Przeciętny Intel Core i9-12900H (1631 - 1897, n=31) | |
| Alienware x14 i7 RTX 3060 | |
| Lenovo IdeaPad Gaming 3 15IAH7 | |
| Schenker Vision 14 | |
| Razer Blade 14 Ryzen 9 6900HX | |
| Acer Nitro 5 AN515-46-R1A1 | |
| Asus ROG Zephyrus G14 GA402RJ | |
| Lenovo Legion 5 Pro 16 ARH7H-82RG0047GE | |
| Asus ZenBook 14X UM5401QA-KN162 | |
| HWBOT x265 Benchmark v2.2 / 4k Preset | |
| MSI Raider GE77 HX 12UHS | |
| Acer Predator Triton 300 SE | |
| Razer Blade 14 Ryzen 9 6900HX | |
| Alienware x14 i7 RTX 3060 | |
| Przeciętny Intel Core i9-12900H (8.05 - 22.5, n=28) | |
| Acer Nitro 5 AN515-46-R1A1 | |
| Lenovo IdeaPad Gaming 3 15IAH7 | |
| Razer Blade 14 Ryzen 9 RTX 3070 | |
| Asus ROG Zephyrus G14 GA402RJ | |
| Lenovo Legion 5 Pro 16 ARH7H-82RG0047GE | |
| Asus ZenBook 14X UM5401QA-KN162 | |
| Schenker Vision 14 | |
| LibreOffice / 20 Documents To PDF | |
| Lenovo Legion 5 Pro 16 ARH7H-82RG0047GE | |
| Razer Blade 14 Ryzen 9 RTX 3070 | |
| Asus ROG Zephyrus G14 GA402RJ | |
| Asus ZenBook 14X UM5401QA-KN162 | |
| Acer Nitro 5 AN515-46-R1A1 | |
| Razer Blade 14 Ryzen 9 6900HX | |
| Lenovo IdeaPad Gaming 3 15IAH7 | |
| Schenker Vision 14 | |
| MSI Raider GE77 HX 12UHS | |
| Przeciętny Intel Core i9-12900H (36.8 - 59.8, n=28) | |
| Acer Predator Triton 300 SE | |
| Alienware x14 i7 RTX 3060 | |
| R Benchmark 2.5 / Overall mean | |
| Razer Blade 14 Ryzen 9 RTX 3070 | |
| Schenker Vision 14 | |
| Asus ZenBook 14X UM5401QA-KN162 | |
| Asus ROG Zephyrus G14 GA402RJ | |
| Lenovo IdeaPad Gaming 3 15IAH7 | |
| Lenovo Legion 5 Pro 16 ARH7H-82RG0047GE | |
| Acer Nitro 5 AN515-46-R1A1 | |
| Razer Blade 14 Ryzen 9 6900HX | |
| Alienware x14 i7 RTX 3060 | |
| Przeciętny Intel Core i9-12900H (0.4218 - 0.506, n=28) | |
| Acer Predator Triton 300 SE | |
| MSI Raider GE77 HX 12UHS | |
* ... im mniej tym lepiej
AIDA64: FP32 Ray-Trace | FPU Julia | CPU SHA3 | CPU Queen | FPU SinJulia | FPU Mandel | CPU AES | CPU ZLib | FP64 Ray-Trace | CPU PhotoWorxx
| Performance rating | |
| Razer Blade 14 Ryzen 9 6900HX | |
| Acer Predator Triton 300 SE | |
| Asus ROG Zephyrus G14 GA402RJ | |
| Przeciętny Intel Core i9-12900H | |
| Dell Inspiron 14 Plus 7420 | |
| Alienware x14 i7 RTX 3060 | |
| Schenker Vision 14 | |
| AIDA64 / FP32 Ray-Trace | |
| Razer Blade 14 Ryzen 9 6900HX | |
| Acer Predator Triton 300 SE | |
| Asus ROG Zephyrus G14 GA402RJ | |
| Dell Inspiron 14 Plus 7420 | |
| Przeciętny Intel Core i9-12900H (4074 - 18289, n=28) | |
| Schenker Vision 14 | |
| Alienware x14 i7 RTX 3060 | |
| AIDA64 / FPU Julia | |
| Razer Blade 14 Ryzen 9 6900HX | |
| Asus ROG Zephyrus G14 GA402RJ | |
| Acer Predator Triton 300 SE | |
| Dell Inspiron 14 Plus 7420 | |
| Przeciętny Intel Core i9-12900H (22307 - 93236, n=28) | |
| Alienware x14 i7 RTX 3060 | |
| Schenker Vision 14 | |
| AIDA64 / CPU SHA3 | |
| Acer Predator Triton 300 SE | |
| Razer Blade 14 Ryzen 9 6900HX | |
| Przeciętny Intel Core i9-12900H (1378 - 4215, n=28) | |
| Asus ROG Zephyrus G14 GA402RJ | |
| Alienware x14 i7 RTX 3060 | |
| Dell Inspiron 14 Plus 7420 | |
| Schenker Vision 14 | |
| AIDA64 / CPU Queen | |
| Acer Predator Triton 300 SE | |
| Razer Blade 14 Ryzen 9 6900HX | |
| Asus ROG Zephyrus G14 GA402RJ | |
| Przeciętny Intel Core i9-12900H (78172 - 111241, n=28) | |
| Alienware x14 i7 RTX 3060 | |
| Dell Inspiron 14 Plus 7420 | |
| Schenker Vision 14 | |
| AIDA64 / FPU SinJulia | |
| Razer Blade 14 Ryzen 9 6900HX | |
| Asus ROG Zephyrus G14 GA402RJ | |
| Acer Predator Triton 300 SE | |
| Alienware x14 i7 RTX 3060 | |
| Przeciętny Intel Core i9-12900H (5709 - 10410, n=28) | |
| Dell Inspiron 14 Plus 7420 | |
| Schenker Vision 14 | |
| AIDA64 / FPU Mandel | |
| Razer Blade 14 Ryzen 9 6900HX | |
| Asus ROG Zephyrus G14 GA402RJ | |
| Acer Predator Triton 300 SE | |
| Dell Inspiron 14 Plus 7420 | |
| Przeciętny Intel Core i9-12900H (11257 - 45581, n=28) | |
| Alienware x14 i7 RTX 3060 | |
| Schenker Vision 14 | |
| AIDA64 / CPU AES | |
| Razer Blade 14 Ryzen 9 6900HX | |
| Acer Predator Triton 300 SE | |
| Asus ROG Zephyrus G14 GA402RJ | |
| Alienware x14 i7 RTX 3060 | |
| Przeciętny Intel Core i9-12900H (31935 - 151546, n=28) | |
| Schenker Vision 14 | |
| Dell Inspiron 14 Plus 7420 | |
| AIDA64 / CPU ZLib | |
| Acer Predator Triton 300 SE | |
| Alienware x14 i7 RTX 3060 | |
| Dell Inspiron 14 Plus 7420 | |
| Przeciętny Intel Core i9-12900H (449 - 1193, n=28) | |
| Razer Blade 14 Ryzen 9 6900HX | |
| Asus ROG Zephyrus G14 GA402RJ | |
| Schenker Vision 14 | |
| AIDA64 / FP64 Ray-Trace | |
| Razer Blade 14 Ryzen 9 6900HX | |
| Acer Predator Triton 300 SE | |
| Asus ROG Zephyrus G14 GA402RJ | |
| Dell Inspiron 14 Plus 7420 | |
| Przeciętny Intel Core i9-12900H (2235 - 10511, n=28) | |
| Alienware x14 i7 RTX 3060 | |
| Schenker Vision 14 | |
| AIDA64 / CPU PhotoWorxx | |
| Acer Predator Triton 300 SE | |
| Alienware x14 i7 RTX 3060 | |
| Przeciętny Intel Core i9-12900H (20960 - 48269, n=29) | |
| Dell Inspiron 14 Plus 7420 | |
| Razer Blade 14 Ryzen 9 6900HX | |
| Schenker Vision 14 | |
| Asus ROG Zephyrus G14 GA402RJ | |
Wydajność systemu
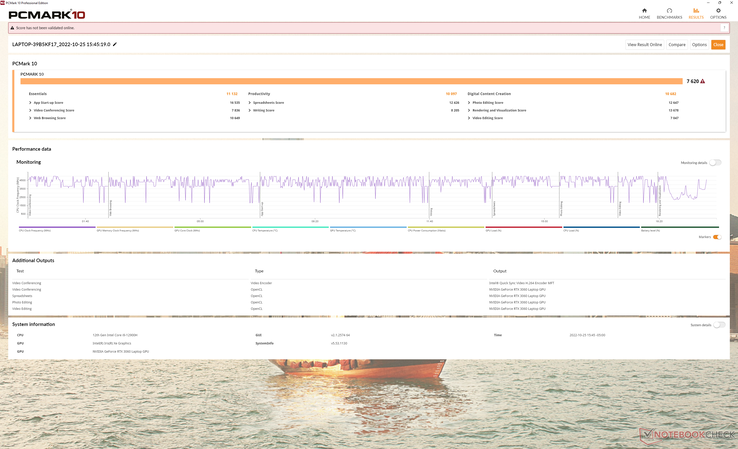
Wyniki PCMark są o prawie 50 procent szybsze, niż w Predatorze Triton 300 z 2020 roku, gdyż starszy model miał niezwykle niski wynik w kategorii Digital Content Creation. Wyniki są teraz takie, jakie powinny być w stosunku do innych laptopów do gier z najnowszymi procesorami Zen 3+ lub Core H 12. generacji, jak np.Dell G16.
CrossMark: Overall | Productivity | Creativity | Responsiveness
| PCMark 10 / Score | |
| Acer Predator Triton 300 SE | |
| Asus ROG Zephyrus G14 GA402RJ | |
| Razer Blade 14 Ryzen 9 6900HX | |
| Alienware x14 i7 RTX 3060 | |
| Dell Inspiron 14 Plus 7420 | |
| Schenker Vision 14 | |
| Acer Predator Triton 300 PT315-52-79LP | |
| PCMark 10 / Essentials | |
| Acer Predator Triton 300 SE | |
| Razer Blade 14 Ryzen 9 6900HX | |
| Alienware x14 i7 RTX 3060 | |
| Dell Inspiron 14 Plus 7420 | |
| Asus ROG Zephyrus G14 GA402RJ | |
| Acer Predator Triton 300 PT315-52-79LP | |
| Schenker Vision 14 | |
| PCMark 10 / Productivity | |
| Acer Predator Triton 300 SE | |
| Alienware x14 i7 RTX 3060 | |
| Asus ROG Zephyrus G14 GA402RJ | |
| Razer Blade 14 Ryzen 9 6900HX | |
| Dell Inspiron 14 Plus 7420 | |
| Schenker Vision 14 | |
| Acer Predator Triton 300 PT315-52-79LP | |
| PCMark 10 / Digital Content Creation | |
| Asus ROG Zephyrus G14 GA402RJ | |
| Razer Blade 14 Ryzen 9 6900HX | |
| Acer Predator Triton 300 SE | |
| Alienware x14 i7 RTX 3060 | |
| Dell Inspiron 14 Plus 7420 | |
| Schenker Vision 14 | |
| Acer Predator Triton 300 PT315-52-79LP | |
| CrossMark / Overall | |
| Acer Predator Triton 300 SE | |
| Alienware x14 i7 RTX 3060 | |
| Dell Inspiron 14 Plus 7420 | |
| Schenker Vision 14 | |
| CrossMark / Productivity | |
| Acer Predator Triton 300 SE | |
| Alienware x14 i7 RTX 3060 | |
| Dell Inspiron 14 Plus 7420 | |
| Schenker Vision 14 | |
| CrossMark / Creativity | |
| Acer Predator Triton 300 SE | |
| Alienware x14 i7 RTX 3060 | |
| Dell Inspiron 14 Plus 7420 | |
| Schenker Vision 14 | |
| CrossMark / Responsiveness | |
| Acer Predator Triton 300 SE | |
| Alienware x14 i7 RTX 3060 | |
| Schenker Vision 14 | |
| Dell Inspiron 14 Plus 7420 | |
| PCMark 10 Score | 7620 pkt. | |
Pomoc | ||
| AIDA64 / Memory Copy | |
| Alienware x14 i7 RTX 3060 | |
| Acer Predator Triton 300 SE | |
| Przeciętny Intel Core i9-12900H (34438 - 74264, n=28) | |
| Dell Inspiron 14 Plus 7420 | |
| Razer Blade 14 Ryzen 9 6900HX | |
| Asus ROG Zephyrus G14 GA402RJ | |
| Schenker Vision 14 | |
| AIDA64 / Memory Read | |
| Alienware x14 i7 RTX 3060 | |
| Acer Predator Triton 300 SE | |
| Dell Inspiron 14 Plus 7420 | |
| Przeciętny Intel Core i9-12900H (36365 - 74642, n=28) | |
| Razer Blade 14 Ryzen 9 6900HX | |
| Asus ROG Zephyrus G14 GA402RJ | |
| Schenker Vision 14 | |
| AIDA64 / Memory Write | |
| Alienware x14 i7 RTX 3060 | |
| Acer Predator Triton 300 SE | |
| Przeciętny Intel Core i9-12900H (32276 - 67858, n=28) | |
| Dell Inspiron 14 Plus 7420 | |
| Asus ROG Zephyrus G14 GA402RJ | |
| Razer Blade 14 Ryzen 9 6900HX | |
| Schenker Vision 14 | |
| AIDA64 / Memory Latency | |
| Dell Inspiron 14 Plus 7420 | |
| Alienware x14 i7 RTX 3060 | |
| Acer Predator Triton 300 SE | |
| Asus ROG Zephyrus G14 GA402RJ | |
| Przeciętny Intel Core i9-12900H (74.7 - 118.1, n=27) | |
| Razer Blade 14 Ryzen 9 6900HX | |
| Schenker Vision 14 | |
* ... im mniej tym lepiej
Opóźnienie DPC
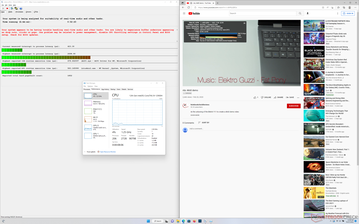
LatencyMon ujawnia problemy DPC podczas otwierania wielu kart przeglądarki naszej strony głównej. Strona 2020 Predator Triton 300 również cierpiałby na podobne problemy z DPC, więc trochę rozczarowujące jest to, że nie zostały one rozwiązane. Poza tym, nie ma żadnych większych pominiętych klatek podczas odtwarzania wideo 4K60.
| DPC Latencies / LatencyMon - interrupt to process latency (max), Web, Youtube, Prime95 | |
| Acer Predator Triton 300 SE | |
| Razer Blade 14 Ryzen 9 6900HX | |
| Alienware x14 i7 RTX 3060 | |
| Asus ROG Zephyrus G14 GA402RJ | |
| Schenker Vision 14 | |
| Dell Inspiron 14 Plus 7420 | |
* ... im mniej tym lepiej
Urządzenia do przechowywania - bez rozpraszacza ciepła w zestawie
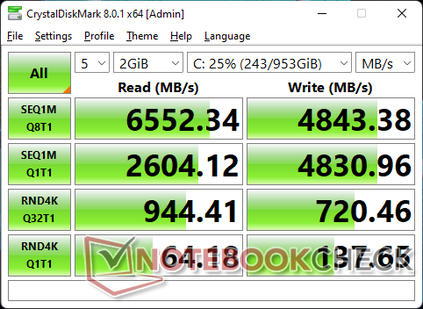
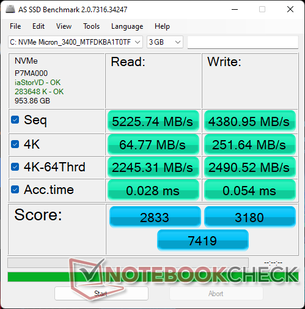
Nasz testowy egzemplarz wyposażony jest w 1 TB Micron 3400 PCIe4 NVMe SSD zapewniający sekwencyjny odczyt i zapis na poziomie odpowiednio 6600 MB/s i 5000 MB/s. Niestety, dysk nie jest w stanie utrzymać tak dużych prędkości przez dłuższy czas, prawdopodobnie z powodu braku rozpraszacza ciepła. Nasze wyniki w pętli DiskSpd poniżej pokazują szybkość odczytu do 6500 MB/s na początku testu, a następnie spadają do 1700 MB/s lub nawet 400 MB/s w czasie. Konkurenci tacy jak np Razer Blade 14 znacznie lepiej radzą sobie z utrzymaniem szybszego transferu SSD.
| Drive Performance rating - Percent | |
| Razer Blade 14 Ryzen 9 6900HX | |
| Schenker Vision 14 | |
| Acer Predator Triton 300 SE -11! | |
| Alienware x14 i7 RTX 3060 | |
| Asus ROG Zephyrus G14 GA402RJ | |
| Dell Inspiron 14 Plus 7420 | |
| DiskSpd | |
| seq read | |
| Razer Blade 14 Ryzen 9 6900HX | |
| Schenker Vision 14 | |
| Alienware x14 i7 RTX 3060 | |
| Acer Predator Triton 300 SE | |
| Dell Inspiron 14 Plus 7420 | |
| Asus ROG Zephyrus G14 GA402RJ | |
| seq write | |
| Schenker Vision 14 | |
| Razer Blade 14 Ryzen 9 6900HX | |
| Alienware x14 i7 RTX 3060 | |
| Acer Predator Triton 300 SE | |
| Asus ROG Zephyrus G14 GA402RJ | |
| Dell Inspiron 14 Plus 7420 | |
| seq q8 t1 read | |
| Alienware x14 i7 RTX 3060 | |
| Schenker Vision 14 | |
| Razer Blade 14 Ryzen 9 6900HX | |
| Acer Predator Triton 300 SE | |
| Asus ROG Zephyrus G14 GA402RJ | |
| Dell Inspiron 14 Plus 7420 | |
| seq q8 t1 write | |
| Alienware x14 i7 RTX 3060 | |
| Razer Blade 14 Ryzen 9 6900HX | |
| Schenker Vision 14 | |
| Acer Predator Triton 300 SE | |
| Asus ROG Zephyrus G14 GA402RJ | |
| Dell Inspiron 14 Plus 7420 | |
| 4k q1 t1 read | |
| Schenker Vision 14 | |
| Razer Blade 14 Ryzen 9 6900HX | |
| Alienware x14 i7 RTX 3060 | |
| Acer Predator Triton 300 SE | |
| Dell Inspiron 14 Plus 7420 | |
| Asus ROG Zephyrus G14 GA402RJ | |
| 4k q1 t1 write | |
| Acer Predator Triton 300 SE | |
| Schenker Vision 14 | |
| Asus ROG Zephyrus G14 GA402RJ | |
| Alienware x14 i7 RTX 3060 | |
| Razer Blade 14 Ryzen 9 6900HX | |
| Dell Inspiron 14 Plus 7420 | |
| 4k q32 t16 read | |
| Razer Blade 14 Ryzen 9 6900HX | |
| Schenker Vision 14 | |
| Acer Predator Triton 300 SE | |
| Asus ROG Zephyrus G14 GA402RJ | |
| Alienware x14 i7 RTX 3060 | |
| Dell Inspiron 14 Plus 7420 | |
| 4k q32 t16 write | |
| Razer Blade 14 Ryzen 9 6900HX | |
| Asus ROG Zephyrus G14 GA402RJ | |
| Acer Predator Triton 300 SE | |
| Schenker Vision 14 | |
| Alienware x14 i7 RTX 3060 | |
| Dell Inspiron 14 Plus 7420 | |
| AS SSD | |
| Score Total | |
| Razer Blade 14 Ryzen 9 6900HX | |
| Asus ROG Zephyrus G14 GA402RJ | |
| Schenker Vision 14 | |
| Alienware x14 i7 RTX 3060 | |
| Dell Inspiron 14 Plus 7420 | |
| Score Read | |
| Razer Blade 14 Ryzen 9 6900HX | |
| Schenker Vision 14 | |
| Asus ROG Zephyrus G14 GA402RJ | |
| Alienware x14 i7 RTX 3060 | |
| Dell Inspiron 14 Plus 7420 | |
| Score Write | |
| Razer Blade 14 Ryzen 9 6900HX | |
| Asus ROG Zephyrus G14 GA402RJ | |
| Alienware x14 i7 RTX 3060 | |
| Dell Inspiron 14 Plus 7420 | |
| Schenker Vision 14 | |
| Seq Read | |
| Razer Blade 14 Ryzen 9 6900HX | |
| Alienware x14 i7 RTX 3060 | |
| Schenker Vision 14 | |
| Asus ROG Zephyrus G14 GA402RJ | |
| Dell Inspiron 14 Plus 7420 | |
| Seq Write | |
| Razer Blade 14 Ryzen 9 6900HX | |
| Schenker Vision 14 | |
| Asus ROG Zephyrus G14 GA402RJ | |
| Alienware x14 i7 RTX 3060 | |
| Dell Inspiron 14 Plus 7420 | |
| 4K Read | |
| Schenker Vision 14 | |
| Alienware x14 i7 RTX 3060 | |
| Razer Blade 14 Ryzen 9 6900HX | |
| Asus ROG Zephyrus G14 GA402RJ | |
| Dell Inspiron 14 Plus 7420 | |
| 4K Write | |
| Alienware x14 i7 RTX 3060 | |
| Schenker Vision 14 | |
| Asus ROG Zephyrus G14 GA402RJ | |
| Dell Inspiron 14 Plus 7420 | |
| Razer Blade 14 Ryzen 9 6900HX | |
| 4K-64 Read | |
| Razer Blade 14 Ryzen 9 6900HX | |
| Asus ROG Zephyrus G14 GA402RJ | |
| Schenker Vision 14 | |
| Alienware x14 i7 RTX 3060 | |
| Dell Inspiron 14 Plus 7420 | |
| 4K-64 Write | |
| Razer Blade 14 Ryzen 9 6900HX | |
| Asus ROG Zephyrus G14 GA402RJ | |
| Alienware x14 i7 RTX 3060 | |
| Dell Inspiron 14 Plus 7420 | |
| Schenker Vision 14 | |
| Access Time Read | |
| Asus ROG Zephyrus G14 GA402RJ | |
| Dell Inspiron 14 Plus 7420 | |
| Razer Blade 14 Ryzen 9 6900HX | |
| Alienware x14 i7 RTX 3060 | |
| Schenker Vision 14 | |
| Access Time Write | |
| Asus ROG Zephyrus G14 GA402RJ | |
| Dell Inspiron 14 Plus 7420 | |
| Razer Blade 14 Ryzen 9 6900HX | |
| Schenker Vision 14 | |
| Alienware x14 i7 RTX 3060 | |
* ... im mniej tym lepiej
Disk Throttling: DiskSpd Read Loop, Queue Depth 8
Wydajność GPU - 95 W TGP
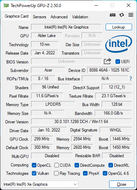
Wydajność graficzna mieści się w granicach 1 do 2 procent od przeciętnego laptopa z naszej bazy danych wyposażonego w ten sam GeForce RTX 3060 Nawet w trybie Turbo. Jeśli tryb Turbo jest wyłączony, wydajność spadłaby o około 5 do 6 procent, by być wolniejszą od średniej. Tak więc użytkownicy muszą uruchomić Predator Triton 300 SE na najgłośniejszym ustawieniu, jeśli chcą uzyskać jak najwięcej z laptopa podczas gry.
Ogólna wydajność jest nadal szybsza niż w przypadku starszego RTX 2060 w 2020 Predator Triton 300 o około 25 do 30 procent. Większość gier działa stabilnie w maksymalnych ustawieniach 1080p, z wyjątkiem najbardziej wymagających tytułów jak Cyberpunk 2077. Wydajność zaczyna się zacinać przy natywnej rozdzielczości 1800p i nie ma tu niestety wsparcia G-Sync, które łagodziłoby nierówne tempo klatek. Uważamy, że rozdzielczość 1800p przy średnich i średnio-wysokich ustawieniach to najsłodszy punkt dla tej maszyny.
| 3DMark | |
| 1920x1080 Fire Strike Graphics | |
| Razer Blade 14 Ryzen 9 6900HX | |
| Asus ROG Zephyrus G14 GA402RJ | |
| Lenovo Legion 7 15IMH05-81YT001VGE | |
| Przeciętny NVIDIA GeForce RTX 3060 Laptop GPU (16354 - 23109, n=49) | |
| Acer Predator Triton 300 SE | |
| Asus ROG Zephyrus M15 GU502LU-BI7N4 | |
| Acer Predator Triton 300 PT315-52-79LP | |
| Dell Inspiron 14 Plus 7420 | |
| Schenker Vision 14 | |
| 2560x1440 Time Spy Graphics | |
| Razer Blade 14 Ryzen 9 6900HX | |
| Lenovo Legion 7 15IMH05-81YT001VGE | |
| Asus ROG Zephyrus G14 GA402RJ | |
| Przeciętny NVIDIA GeForce RTX 3060 Laptop GPU (6285 - 9235, n=49) | |
| Acer Predator Triton 300 SE | |
| Asus ROG Zephyrus M15 GU502LU-BI7N4 | |
| Acer Predator Triton 300 PT315-52-79LP | |
| Schenker Vision 14 | |
| Dell Inspiron 14 Plus 7420 | |
| 2560x1440 Time Spy Score | |
| Razer Blade 14 Ryzen 9 6900HX | |
| Lenovo Legion 7 15IMH05-81YT001VGE | |
| Asus ROG Zephyrus G14 GA402RJ | |
| Acer Predator Triton 300 SE | |
| Przeciętny NVIDIA GeForce RTX 3060 Laptop GPU (6473 - 9677, n=50) | |
| Asus ROG Zephyrus M15 GU502LU-BI7N4 | |
| Acer Predator Triton 300 PT315-52-79LP | |
| Dell Inspiron 14 Plus 7420 | |
| Schenker Vision 14 | |
| 3DMark 11 - 1280x720 Performance GPU | |
| Razer Blade 14 Ryzen 9 6900HX | |
| Asus ROG Zephyrus G14 GA402RJ | |
| Lenovo Legion 7 15IMH05-81YT001VGE | |
| Przeciętny NVIDIA GeForce RTX 3060 Laptop GPU (13799 - 30772, n=43) | |
| Acer Predator Triton 300 SE | |
| Asus ROG Zephyrus M15 GU502LU-BI7N4 | |
| Acer Predator Triton 300 PT315-52-79LP | |
| Schenker Vision 14 | |
| Dell Inspiron 14 Plus 7420 | |
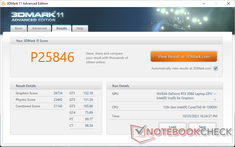
| 3DMark 11 Performance | 25846 pkt. | |
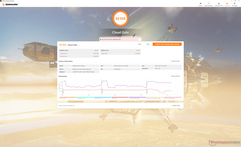
| 3DMark Cloud Gate Standard Score | 52555 pkt. | |
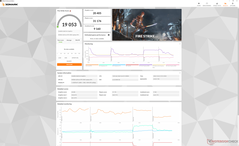
| 3DMark Fire Strike Score | 19053 pkt. | |
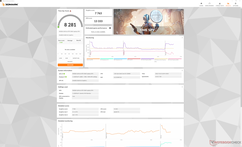
| 3DMark Time Spy Score | 8281 pkt. | |
Pomoc | ||
* ... im mniej tym lepiej
| Final Fantasy XV Benchmark | |
| 1280x720 Lite Quality | |
| Razer Blade 14 Ryzen 9 6900HX | |
| Acer Predator Triton 300 SE | |
| Przeciętny NVIDIA GeForce RTX 3060 Laptop GPU (122.5 - 214, n=33) | |
| Asus ROG Zephyrus M15 GU502LU-BI7N4 | |
| Dell Inspiron 14 Plus 7420 | |
| Schenker Vision 14 | |
| 1920x1080 Standard Quality | |
| Razer Blade 14 Ryzen 9 6900HX | |
| Asus ROG Zephyrus G14 GA402RJ | |
| Przeciętny NVIDIA GeForce RTX 3060 Laptop GPU (70.4 - 133.5, n=37) | |
| Acer Predator Triton 300 SE | |
| Asus ROG Zephyrus M15 GU502LU-BI7N4 | |
| Dell Inspiron 14 Plus 7420 | |
| Schenker Vision 14 | |
| 1920x1080 High Quality | |
| Razer Blade 14 Ryzen 9 6900HX | |
| Przeciętny NVIDIA GeForce RTX 3060 Laptop GPU (55 - 100.9, n=42) | |
| Acer Predator Triton 300 SE | |
| Asus ROG Zephyrus G14 GA402RJ | |
| Asus ROG Zephyrus M15 GU502LU-BI7N4 | |
| Dell Inspiron 14 Plus 7420 | |
| Schenker Vision 14 | |
| 2560x1440 High Quality | |
| Razer Blade 14 Ryzen 9 6900HX | |
| Acer Predator Triton 300 SE | |
| Przeciętny NVIDIA GeForce RTX 3060 Laptop GPU (41.1 - 73.7, n=25) | |
| Schenker Vision 14 | |
| The Witcher 3 | |
| 1024x768 Low Graphics & Postprocessing | |
| Razer Blade 14 Ryzen 9 6900HX | |
| Lenovo Legion 7 15IMH05-81YT001VGE | |
| Acer Predator Triton 300 SE | |
| Przeciętny NVIDIA GeForce RTX 3060 Laptop GPU (221 - 449, n=35) | |
| Asus ROG Zephyrus M15 GU502LU-BI7N4 | |
| Dell Inspiron 14 Plus 7420 | |
| Schenker Vision 14 | |
| 1366x768 Medium Graphics & Postprocessing | |
| Razer Blade 14 Ryzen 9 6900HX | |
| Asus ROG Zephyrus G14 GA402RJ | |
| Lenovo Legion 7 15IMH05-81YT001VGE | |
| Przeciętny NVIDIA GeForce RTX 3060 Laptop GPU (204 - 296, n=33) | |
| Acer Predator Triton 300 SE | |
| Asus ROG Zephyrus M15 GU502LU-BI7N4 | |
| Dell Inspiron 14 Plus 7420 | |
| Schenker Vision 14 | |
| 1920x1080 High Graphics & Postprocessing (Nvidia HairWorks Off) | |
| Razer Blade 14 Ryzen 9 6900HX | |
| Lenovo Legion 7 15IMH05-81YT001VGE | |
| Acer Predator Triton 300 SE | |
| Przeciętny NVIDIA GeForce RTX 3060 Laptop GPU (81 - 186.8, n=41) | |
| Asus ROG Zephyrus G14 GA402RJ | |
| Asus ROG Zephyrus M15 GU502LU-BI7N4 | |
| Dell Inspiron 14 Plus 7420 | |
| Schenker Vision 14 | |
| 1920x1080 Ultra Graphics & Postprocessing (HBAO+) | |
| Razer Blade 14 Ryzen 9 6900HX | |
| Lenovo Legion 7 15IMH05-81YT001VGE | |
| Asus ROG Zephyrus G14 GA402RJ | |
| Przeciętny NVIDIA GeForce RTX 3060 Laptop GPU (58.2 - 91.5, n=48) | |
| Acer Predator Triton 300 SE | |
| Asus ROG Zephyrus M15 GU502LU-BI7N4 | |
| Dell Inspiron 14 Plus 7420 | |
| Schenker Vision 14 | |
| X-Plane 11.11 | |
| 1280x720 low (fps_test=1) | |
| Acer Predator Triton 300 SE | |
| Dell Inspiron 14 Plus 7420 | |
| Przeciętny NVIDIA GeForce RTX 3060 Laptop GPU (83.6 - 157.1, n=48) | |
| Razer Blade 14 Ryzen 9 6900HX | |
| Lenovo Legion 7 15IMH05-81YT001VGE | |
| Asus ROG Zephyrus M15 GU502LU-BI7N4 | |
| Schenker Vision 14 | |
| Asus ROG Zephyrus G14 GA402RJ | |
| 1920x1080 med (fps_test=2) | |
| Acer Predator Triton 300 SE | |
| Dell Inspiron 14 Plus 7420 | |
| Lenovo Legion 7 15IMH05-81YT001VGE | |
| Przeciętny NVIDIA GeForce RTX 3060 Laptop GPU (73 - 138.3, n=48) | |
| Razer Blade 14 Ryzen 9 6900HX | |
| Asus ROG Zephyrus M15 GU502LU-BI7N4 | |
| Schenker Vision 14 | |
| Asus ROG Zephyrus G14 GA402RJ | |
| 1920x1080 high (fps_test=3) | |
| Acer Predator Triton 300 SE | |
| Dell Inspiron 14 Plus 7420 | |
| Lenovo Legion 7 15IMH05-81YT001VGE | |
| Przeciętny NVIDIA GeForce RTX 3060 Laptop GPU (61.9 - 109.3, n=48) | |
| Razer Blade 14 Ryzen 9 6900HX | |
| Schenker Vision 14 | |
| Asus ROG Zephyrus M15 GU502LU-BI7N4 | |
| Asus ROG Zephyrus G14 GA402RJ | |
| Dota 2 Reborn | |
| 1280x720 min (0/3) fastest | |
| Acer Predator Triton 300 SE | |
| Dell Inspiron 14 Plus 7420 | |
| Lenovo Legion 7 15IMH05-81YT001VGE | |
| Przeciętny NVIDIA GeForce RTX 3060 Laptop GPU (112.5 - 204, n=49) | |
| Asus ROG Zephyrus M15 GU502LU-BI7N4 | |
| Schenker Vision 14 | |
| Razer Blade 14 Ryzen 9 6900HX | |
| Asus ROG Zephyrus G14 GA402RJ | |
| 1366x768 med (1/3) | |
| Acer Predator Triton 300 SE | |
| Dell Inspiron 14 Plus 7420 | |
| Przeciętny NVIDIA GeForce RTX 3060 Laptop GPU (106 - 177.4, n=49) | |
| Lenovo Legion 7 15IMH05-81YT001VGE | |
| Asus ROG Zephyrus M15 GU502LU-BI7N4 | |
| Schenker Vision 14 | |
| Razer Blade 14 Ryzen 9 6900HX | |
| 1920x1080 high (2/3) | |
| Acer Predator Triton 300 SE | |
| Dell Inspiron 14 Plus 7420 | |
| Lenovo Legion 7 15IMH05-81YT001VGE | |
| Przeciętny NVIDIA GeForce RTX 3060 Laptop GPU (98.9 - 169.2, n=49) | |
| Razer Blade 14 Ryzen 9 6900HX | |
| Asus ROG Zephyrus M15 GU502LU-BI7N4 | |
| Schenker Vision 14 | |
| Asus ROG Zephyrus G14 GA402RJ | |
| 1920x1080 ultra (3/3) best looking | |
| Acer Predator Triton 300 SE | |
| Dell Inspiron 14 Plus 7420 | |
| Lenovo Legion 7 15IMH05-81YT001VGE | |
| Przeciętny NVIDIA GeForce RTX 3060 Laptop GPU (90.7 - 154.8, n=49) | |
| Razer Blade 14 Ryzen 9 6900HX | |
| Asus ROG Zephyrus M15 GU502LU-BI7N4 | |
| Schenker Vision 14 | |
| Asus ROG Zephyrus G14 GA402RJ | |
| Cyberpunk 2077 1.6 | |
| 1920x1080 Low Preset | |
| Razer Blade 14 Ryzen 9 6900HX | |
| Acer Predator Triton 300 SE | |
| Przeciętny NVIDIA GeForce RTX 3060 Laptop GPU (80 - 135.7, n=14) | |
| Dell Inspiron 14 Plus 7420 | |
| 1920x1080 Medium Preset | |
| Razer Blade 14 Ryzen 9 6900HX | |
| Asus ROG Zephyrus G14 GA402RJ | |
| Przeciętny NVIDIA GeForce RTX 3060 Laptop GPU (68 - 118, n=14) | |
| Acer Predator Triton 300 SE | |
| Dell Inspiron 14 Plus 7420 | |
| 1920x1080 High Preset | |
| Razer Blade 14 Ryzen 9 6900HX | |
| Asus ROG Zephyrus G14 GA402RJ | |
| Acer Predator Triton 300 SE | |
| Przeciętny NVIDIA GeForce RTX 3060 Laptop GPU (42.2 - 87.7, n=14) | |
| Dell Inspiron 14 Plus 7420 | |
| 1920x1080 Ultra Preset | |
| Razer Blade 14 Ryzen 9 6900HX | |
| Przeciętny NVIDIA GeForce RTX 3060 Laptop GPU (40 - 78.8, n=16) | |
| Asus ROG Zephyrus G14 GA402RJ | |
| Acer Predator Triton 300 SE | |
| Dell Inspiron 14 Plus 7420 | |
| 2560x1440 Ultra Preset | |
| Razer Blade 14 Ryzen 9 6900HX | |
| Przeciętny NVIDIA GeForce RTX 3060 Laptop GPU (23 - 45.8, n=9) | |
| Acer Predator Triton 300 SE | |
| Asus ROG Zephyrus G14 GA402RJ | |
Witcher 3 FPS Chart
| low | med. | high | ultra | QHD | |
|---|---|---|---|---|---|
| GTA V (2015) | 185.9 | 181.8 | 172.3 | 99.6 | 75.2 |
| The Witcher 3 (2015) | 341.1 | 230 | 145.6 | 75 | |
| Dota 2 Reborn (2015) | 185 | 169.2 | 162.1 | 153.6 | |
| Final Fantasy XV Benchmark (2018) | 176.4 | 105.1 | 79.1 | 60.5 | |
| X-Plane 11.11 (2018) | 141.8 | 126.1 | 101 | ||
| Strange Brigade (2018) | 389 | 196.7 | 157.8 | 138.6 | 100.8 |
| Cyberpunk 2077 1.6 (2022) | 109.8 | 71.9 | 70.4 | 57.7 | 36 |
Emisje - głośne podczas gry
Szum systemu
Tryby wentylatora PredatorSense obejmują Quiet, Default i Turbo. Przy ustawieniu Default lub wyższym wentylatory często pulsują, dlatego przy przeglądaniu stron internetowych lub strumieniowaniu wideo zaleca się ustawienie systemu na tryb Quiet. W przeciwnym razie hałas wentylatorów może wynosić nawet 34 dB(A) w stosunku do cichego tła 24 dB(A) przy niewymagającym obciążeniu.
Istnieje ogromna różnica w hałasie wentylatora pomiędzy ustawieniami trybu Domyślnego i Turbo. Szum wentylatora podczas pracy na stronie Witcher 3 w trybie domyślnym wynosi 47 dB(A), natomiast w trybie Turbo - 60 dB(A). 60 dB(A) to znacznie głośniej niż w większości innych laptopów niezależnie od ich wielkości, co pokazuje nasza tabela poniżej. Jak stwierdzono wcześniej, włączenie trybu Turbo jest obowiązkowe, by w pełni wykorzystać możliwości 95 W GPU TGP. Niemniej jednak użytkownicy mogą rozważyć grę w trybie Default ze względu na cichszy szum wentylatora, nawet jeśli wiąże się to z 5-6% spadkiem wydajności.
Hałas
| luz |
| 23.8 / 23.8 / 30.6 dB |
| obciążenie |
| 44.2 / 60 dB |
 | ||
30 dB cichy 40 dB(A) słyszalny 50 dB(A) irytujący |
||
min: | ||
| Acer Predator Triton 300 SE GeForce RTX 3060 Laptop GPU, i9-12900H, Micron 3400 1TB MTFDKBA1T0TFH | Asus ROG Zephyrus G14 GA402RJ Radeon RX 6700S, R7 6800HS, Micron 2450 1TB MTFDKBA1T0TFK | Razer Blade 14 Ryzen 9 6900HX GeForce RTX 3070 Ti Laptop GPU, R9 6900HX, Samsung PM9A1 MZVL21T0HCLR | Alienware x14 i7 RTX 3060 GeForce RTX 3060 Laptop GPU, i7-12700H, WDC PC SN810 1TB | Dell Inspiron 14 Plus 7420 GeForce RTX 3050 4GB Laptop GPU, i7-12700H, SK Hynix BC711 512GB HFM512GD3GX013N | Schenker Vision 14 GeForce RTX 3050 Ti Laptop GPU, i7-11370H, Samsung SSD 980 Pro 1TB MZ-V8P1T0BW | |
|---|---|---|---|---|---|---|
| Noise | 5% | 16% | 4% | 8% | 8% | |
| wyłączone / środowisko * (dB) | 23.8 | 25 -5% | 23.3 2% | 24.7 -4% | 23.2 3% | 24.3 -2% |
| Idle Minimum * (dB) | 23.8 | 25 -5% | 23.3 2% | 24.7 -4% | 23.2 3% | 24.3 -2% |
| Idle Average * (dB) | 23.8 | 26 -9% | 23.3 2% | 24.7 -4% | 23.2 3% | 24.3 -2% |
| Idle Maximum * (dB) | 30.6 | 29 5% | 23.3 24% | 30.9 -1% | 23.2 24% | 25.9 15% |
| Load Average * (dB) | 44.2 | 45 -2% | 34.7 21% | 40 10% | 47.5 -7% | 43.3 2% |
| Witcher 3 ultra * (dB) | 60.1 | 43 28% | 42.1 30% | 51.5 14% | 51.7 14% | 44.6 26% |
| Load Maximum * (dB) | 60 | 45 25% | 42.1 30% | 51.5 14% | 51.7 14% | 49.5 17% |
* ... im mniej tym lepiej
Temperatura
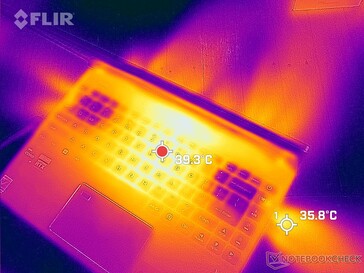
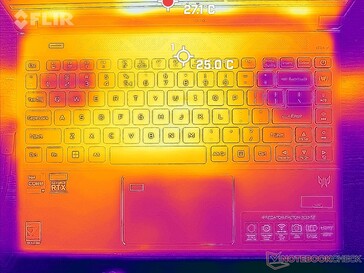
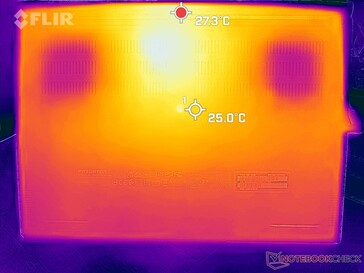
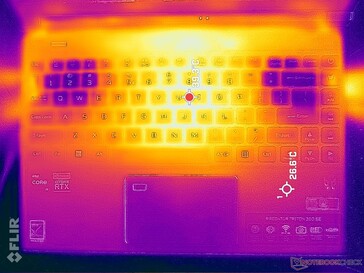
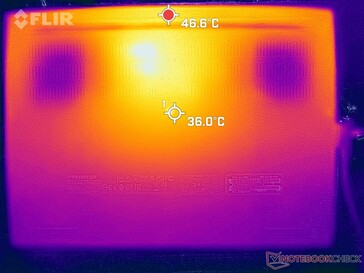
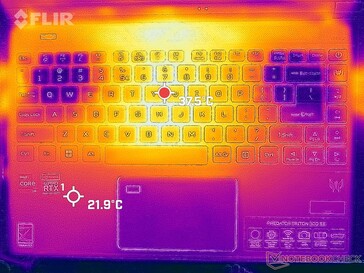
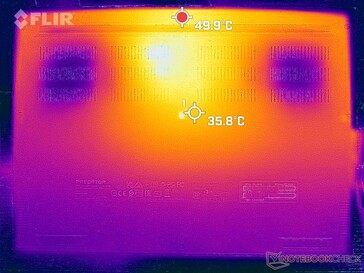
Gorące punkty osiągają do 43 C i 46 C, odpowiednio na górze i na dole, w kierunku tyłu obudowy, co pokazują poniższe mapy ciepła. Ogólne temperatury powierzchni są wyraźnie niższe od tych, które odnotowaliśmy w Zephyrusie G14 czy Alienware x14 gdzie w podobnych warunkach gorące punkty mogą z łatwością osiągnąć ponad 50 C
Prawie połowa obudowy jest przeznaczona na wentylację, w tym krawędzie, tył, spód i boki klawiatury. Należy pamiętać, aby przypadkowo nie zablokować żadnej z kratek wentylacyjnych, aby zachować optymalne chłodzenie.
(±) Maksymalna temperatura w górnej części wynosi 43 °C / 109 F, w porównaniu do średniej 40.4 °C / 105 F , począwszy od 21.2 do 68.8 °C dla klasy Gaming.
(-) Dno nagrzewa się maksymalnie do 46.4 °C / 116 F, w porównaniu do średniej 43.3 °C / 110 F
(+) W stanie bezczynności średnia temperatura górnej części wynosi 26 °C / 79 F, w porównaniu ze średnią temperaturą urządzenia wynoszącą 33.9 °C / ### class_avg_f### F.
(±) Podczas gry w Wiedźmina 3 średnia temperatura górnej części wynosi 37.1 °C / 99 F, w porównaniu do średniej temperatury urządzenia wynoszącej 33.9 °C / ## #class_avg_f### F.
(+) Podparcia dłoni i touchpad osiągają maksymalną temperaturę skóry (32 °C / 89.6 F) i dlatego nie są gorące.
(-) Średnia temperatura obszaru podparcia dłoni w podobnych urządzeniach wynosiła 28.8 °C / 83.8 F (-3.2 °C / -5.8 F).
| Acer Predator Triton 300 SE Intel Core i9-12900H, NVIDIA GeForce RTX 3060 Laptop GPU | Asus ROG Zephyrus G14 GA402RJ AMD Ryzen 7 6800HS, AMD Radeon RX 6700S | Razer Blade 14 Ryzen 9 6900HX AMD Ryzen 9 6900HX, NVIDIA GeForce RTX 3070 Ti Laptop GPU | Alienware x14 i7 RTX 3060 Intel Core i7-12700H, NVIDIA GeForce RTX 3060 Laptop GPU | Dell Inspiron 14 Plus 7420 Intel Core i7-12700H, NVIDIA GeForce RTX 3050 4GB Laptop GPU | Schenker Vision 14 Intel Core i7-11370H, NVIDIA GeForce RTX 3050 Ti Laptop GPU | |
|---|---|---|---|---|---|---|
| Heat | -24% | -13% | -1% | 8% | -12% | |
| Maximum Upper Side * (°C) | 43 | 53 -23% | 40.6 6% | 51.3 -19% | 40 7% | 49.7 -16% |
| Maximum Bottom * (°C) | 46.4 | 54 -16% | 42.6 8% | 44.4 4% | 36.4 22% | 56 -21% |
| Idle Upper Side * (°C) | 28.2 | 34 -21% | 38 -35% | 27.2 4% | 27 4% | 28.8 -2% |
| Idle Bottom * (°C) | 28.4 | 38 -34% | 37 -30% | 26.6 6% | 29.2 -3% | 30.6 -8% |
* ... im mniej tym lepiej
Stress Test
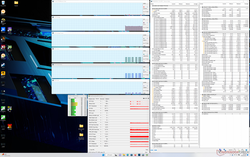
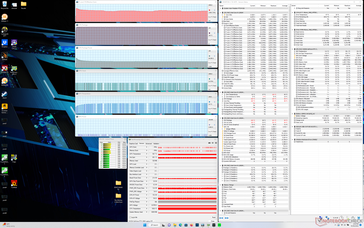
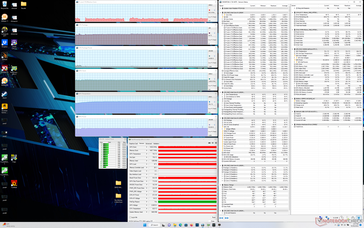
Częstotliwość taktowania procesora, temperatura i pobór mocy na płycie skoczyłyby do 3,7 GHz, 100 C i 108 W, odpowiednio, przy inicjowaniu stresu Prime95. Jednak po kilku sekundach częstotliwość taktowania i pobór mocy zaczęły spadać, a następnie ustabilizowały się na poziomie odpowiednio 3,0 GHz i 69 W, przy temperaturze rdzenia wynoszącej 100 C. Bardzo niewiele procesorów w laptopach stabilizuje się w temperaturach powyżej 90 C, więc jest to trochę niepokojące w przypadku firmy Acer. Na przykład Dell Precision 5470 z tym samym procesorem Core i9-12900H w podobnych warunkach ustabilizowałby się na poziomie 2,4 GHz i 80 C. Widać wyraźnie, że system firmy Acer forsuje procesor Core i9 na tyle, na ile pozwala na to rozwiązanie chłodzące.
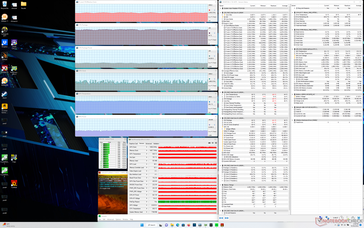
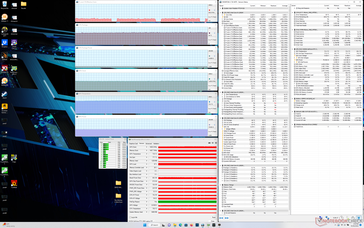
Uruchomienie Witcher 3 tryb Turbo powoduje stabilizację GPU Nvidii na poziomie 1830 MHz, 70 C i 93 W. Jeśli tryb Turbo jest wyłączony, częstotliwość taktowania zegara i pobór mocy płyty głównej spadłyby odpowiednio do 1605 MHz i 80 W, a temperatura wzrosłaby nieznacznie do 73 C z powodu niższego pułapu wentylatora. Użytkownicy muszą więc włączyć tryb Turbo, jeśli chcą w pełni wykorzystać potencjał 95 W GPU TGP.
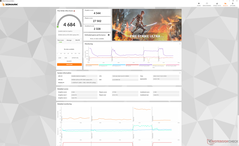
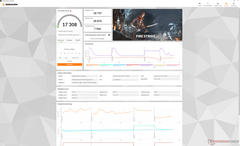
Praca na zasilaniu akumulatorowym ogranicza wydajność, zwłaszcza że tryb Turbo wymaga zasilania z sieci. Test Fire Strike na zasilaniu akumulatorowym przyniósłby wyniki w zakresie fizyki i grafiki w wysokości odpowiednio 14166 i 11131 pkt. w porównaniu z 31176 i 20405 pkt. na zasilaniu sieciowym.
| ZegarCPU (GHz) | Zegar GPU (MHz) | Średnia temperatura CPU (°C) | Średnia temperatura GPU (°C) | |
| System w stanie bezczynności | -- | -- | 37 | 40 |
| Prime95 Stress | 3.0 - 3.1 | -- | 100 | 59 |
| Prime95 + FurMark Stress | 2.5 | ~1050 | 85 | 69 |
| Witcher 3 Stress (Turbo off) | ~0,8 | 1605 | 69 | 73 |
| Witcher 3 Stress (Turbo on) | ~0.8 | 1830 | 63 | 70 |
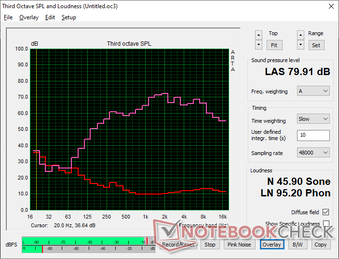
Mówcy
Acer Predator Triton 300 SE analiza dźwięku
(±) | głośność głośnika jest średnia, ale dobra (79.9 dB)
Bas 100 - 315 Hz
(±) | zredukowany bas - średnio 10.3% niższy od mediany
(±) | liniowość basu jest średnia (9.7% delta do poprzedniej częstotliwości)
Średnie 400 - 2000 Hz
(±) | wyższe średnie - średnio 5% wyższe niż mediana
(+) | średnie są liniowe (4% delta do poprzedniej częstotliwości)
Wysokie 2–16 kHz
(±) | wyższe maksima - średnio 5.5% wyższe od mediany
(±) | liniowość wysokich wartości jest średnia (7.6% delta do poprzedniej częstotliwości)
Ogólnie 100 - 16.000 Hz
(±) | liniowość ogólnego dźwięku jest średnia (15.1% różnicy w stosunku do mediany)
W porównaniu do tej samej klasy
» 32% wszystkich testowanych urządzeń w tej klasie było lepszych, 6% podobnych, 62% gorszych
» Najlepszy miał deltę 6%, średnia wynosiła ###średnia###%, najgorsza wynosiła 132%
W porównaniu do wszystkich testowanych urządzeń
» 20% wszystkich testowanych urządzeń było lepszych, 4% podobnych, 76% gorszych
» Najlepszy miał deltę 4%, średnia wynosiła ###średnia###%, najgorsza wynosiła 134%
Apple MacBook Pro 16 2021 M1 Pro analiza dźwięku
(+) | głośniki mogą odtwarzać stosunkowo głośno (84.7 dB)
Bas 100 - 315 Hz
(+) | dobry bas - tylko 3.8% od mediany
(+) | bas jest liniowy (5.2% delta do poprzedniej częstotliwości)
Średnie 400 - 2000 Hz
(+) | zbalansowane środki średnie - tylko 1.3% od mediany
(+) | średnie są liniowe (2.1% delta do poprzedniej częstotliwości)
Wysokie 2–16 kHz
(+) | zrównoważone maksima - tylko 1.9% od mediany
(+) | wzloty są liniowe (2.7% delta do poprzedniej częstotliwości)
Ogólnie 100 - 16.000 Hz
(+) | ogólny dźwięk jest liniowy (4.6% różnicy w stosunku do mediany)
W porównaniu do tej samej klasy
» 0% wszystkich testowanych urządzeń w tej klasie było lepszych, 0% podobnych, 100% gorszych
» Najlepszy miał deltę 5%, średnia wynosiła ###średnia###%, najgorsza wynosiła 45%
W porównaniu do wszystkich testowanych urządzeń
» 0% wszystkich testowanych urządzeń było lepszych, 0% podobnych, 100% gorszych
» Najlepszy miał deltę 4%, średnia wynosiła ###średnia###%, najgorsza wynosiła 134%
Zarządzanie energią
Zużycie energii - bardziej wydajne niż w przypadku modelu poprzedniej generacji
Ogólne zużycie energii jest dość podobne do Alienware x14 który jest wyposażony w podobne opcje CPU i GPU. Podczas pracy na pulpicie w trybie oszczędzania energii i na najniższym ustawieniu jasności pobór mocy wyniósłby zaledwie 8 W, natomiast w trybie najwyższej wydajności i na najwyższym ustawieniu jasności - około 18 W. Należy pamiętać, że pobór mocy, a tym samym czas pracy na baterii, jest wrażliwy na kolory na ekranie, inaczej niż w przypadku paneli IPS, co pokazały nasze pomiary poboru mocy OLED tutaj.
Uruchomienie Witcher 3do reprezentowania obciążenia w grach zużywa około 14 procent mniej energii niż na 2020 Predator Triton 300 a jednocześnie zapewnia do 30 procent szybszą wydajność grafiki, co znacznie zwiększa wydajność na wat. Procesor 12. generacji jest jednak teraz jeszcze bardziej energochłonny niż wcześniej.
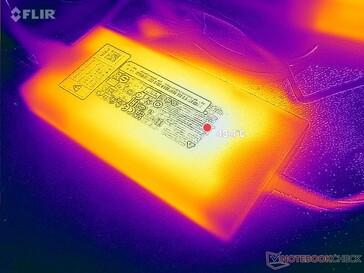
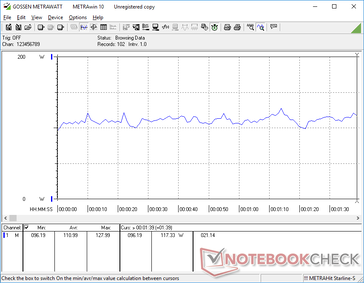
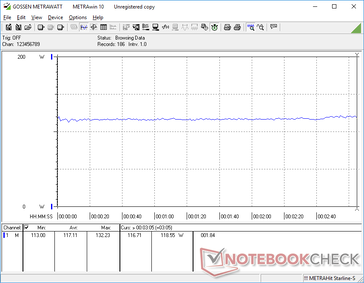
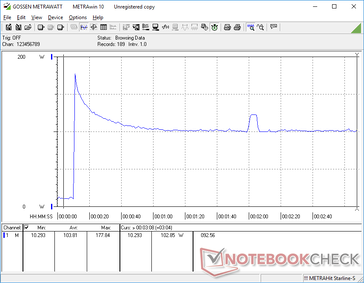
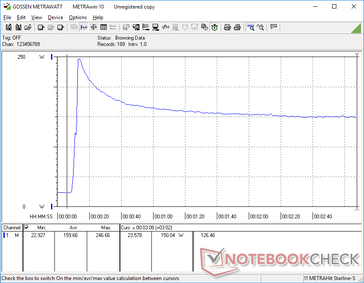
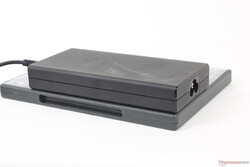
Udało nam się zarejestrować chwilowy maksymalny pobór mocy 246 W ze średniej wielkości (~15,1 x 7,2 x 2,3 cm) zasilacza sieciowego 200 W, gdy CPU i GPU były wykorzystywane w 100 procentach. Z powodu problemów termicznych wskaźnik ten szybko by spadł i ustabilizował się na bezpiecznym poziomie 150 W, jak pokazuje nasz wykres poniżej. System może nadal ładować się w rozsądnym tempie podczas gry.
| wyłączony / stan wstrzymania | |
| luz | |
| obciążenie |
|
Legenda:
min: | |
| Acer Predator Triton 300 SE i9-12900H, GeForce RTX 3060 Laptop GPU, Micron 3400 1TB MTFDKBA1T0TFH, OLED, 2880x1800, 14" | Asus ROG Zephyrus G14 GA402RJ R7 6800HS, Radeon RX 6700S, Micron 2450 1TB MTFDKBA1T0TFK, IPS, 2560x1600, 14" | Razer Blade 14 Ryzen 9 6900HX R9 6900HX, GeForce RTX 3070 Ti Laptop GPU, Samsung PM9A1 MZVL21T0HCLR, IPS, 2560x1440, 14" | Alienware x14 i7 RTX 3060 i7-12700H, GeForce RTX 3060 Laptop GPU, WDC PC SN810 1TB, IPS, 1920x1080, 14" | Schenker Vision 14 i7-11370H, GeForce RTX 3050 Ti Laptop GPU, Samsung SSD 980 Pro 1TB MZ-V8P1T0BW, IPS, 2880x1800, 14" | Acer Predator Triton 300 PT315-52-79LP i7-10750H, GeForce RTX 2060 Mobile, WDC PC SN730 SDBQNTY-1T00, IPS, 1920x1080, 15.6" | |
|---|---|---|---|---|---|---|
| Power Consumption | -24% | -34% | 15% | 22% | 12% | |
| Idle Minimum * (Watt) | 7.6 | 12 -58% | 10.2 -34% | 7.9 -4% | 6.7 12% | 4 47% |
| Idle Average * (Watt) | 12.3 | 18 -46% | 26 -111% | 11.1 10% | 12.6 -2% | 10 19% |
| Idle Maximum * (Watt) | 17.6 | 26 -48% | 26.7 -52% | 11.8 33% | 15.4 12% | 19 -8% |
| Load Average * (Watt) | 111 | 88 21% | 89.3 20% | 107.4 3% | 85.7 23% | 96 14% |
| Witcher 3 ultra * (Watt) | 117.1 | 157.7 -35% | 158.7 -36% | 111 5% | 83 29% | 136 -16% |
| Load Maximum * (Watt) | 245.8 | 194 21% | 227.5 7% | 140.4 43% | 110.9 55% | 214 13% |
* ... im mniej tym lepiej
Power Consumption Witcher 3 / Stresstest
Power Consumption external Monitor
Czas pracy na baterii - niezły jak na rozmiar i moc
Czasy pracy są przeciętne i wynoszą nieco ponad 6 godzin przeglądania sieci WLAN w świecie rzeczywistym przy zrównoważonym profilu zasilania. Mimo to większość innych 14-calowych laptopów wytrzymuje jeszcze dłużej, w tym Asus ROG Zephyrus G14 czy Razer Blade 14 - po kilka godzin. Bardziej energochłonny procesor Intela i panel OLED są prawdopodobnie odpowiedzialne za krótszy czas pracy na baterii.
Ładowanie od pustego do pełnego trwa stosunkowo wolno, bo 2 godziny. Co więcej, systemu nie da się naładować przez USB-C.
| Acer Predator Triton 300 SE i9-12900H, GeForce RTX 3060 Laptop GPU, 76 Wh | Asus ROG Zephyrus G14 GA402RJ R7 6800HS, Radeon RX 6700S, 76 Wh | Razer Blade 14 Ryzen 9 6900HX R9 6900HX, GeForce RTX 3070 Ti Laptop GPU, 62 Wh | Alienware x14 i7 RTX 3060 i7-12700H, GeForce RTX 3060 Laptop GPU, 80 Wh | Dell Inspiron 14 Plus 7420 i7-12700H, GeForce RTX 3050 4GB Laptop GPU, 64 Wh | Schenker Vision 14 i7-11370H, GeForce RTX 3050 Ti Laptop GPU, 53 Wh | |
|---|---|---|---|---|---|---|
| Czasy pracy | 65% | 42% | 3% | 11% | -2% | |
| Reader / Idle (h) | 8.1 | 12.2 51% | 11.9 47% | |||
| WiFi v1.3 (h) | 6.2 | 10.2 65% | 9.5 53% | 8.9 44% | 7.2 16% | 5.5 -11% |
| Load (h) | 1.3 | 1.6 23% | 0.8 -38% | 0.9 -31% | 1.4 8% | |
| H.264 (h) | 9.4 | 6.8 | ||||
| Witcher 3 ultra (h) | 0.8 |
Za
Przeciw
Werdykt - Dobry, ale niewystarczająco dobry
14-calowy Predator Triton 300 SE staje do ostrej rywalizacji z m.in Asus Zephyrus G14, Razer Blade 14oraz Alienware x14. W porównaniu do Zephyrusa G14, laptop Asusa jest często na stronie sprzedaż za setki dolarów mniej, oferując przy tym ten sam poziom wydajności graficznej oraz niemal identyczną wagę i wymiary. W porównaniu z Blade 14, laptop Razera jest prawdopodobnie bardziej smukły dzięki cieńszej konstrukcji i podświetleniu RGB na klawisze. I wreszcie Alienware x14 integruje twardsze klawisze klawiatury i jeszcze cieńszy profil. Wszystkie te maszyny mają też lepszą wydajność SSD niż Acer.
Acer Predator Triton 300 SE to wyjątkowo mocny laptop do gier, niezależnie od rozmiaru. Inne 14-calowe laptopy do gier mają go jednak na koncie, jeżeli chodzi o hałas wentylatora i wydajność dysku SSD.
System Acer jest również głośniejszy niż trzy wspomniane alternatywy podczas uruchamiania gier. Rozumiemy, że tryb Turbo będzie głośny bez względu na wszystko, ale fakt, że jest on o wiele głośniejszy niż u konkurencji, stawia system pod znakiem zapytania. Tryb Turbo musi być włączony, by w pełni wykorzystać możliwości GPU w Acerze.
Jest kilka odkupionych cech, takich jak panel OLED 16:10 90 Hz, szybki procesor Core i9 i wsparcie dla Thunderbolt 4 - wszystkie te elementy są niedostępne w Razer Blade 14 i większości modeli Asus Zephyrus G14. W rzeczywistości Predator Triton 300 SE jest obecnie jednym z jedynych gamingowych laptopów o proporcjach 16:10 w kategorii 14 cali. Jeśli jednak takie unikalne cechy nie są priorytetem, to warto rozważyć Zephyrusa G14, Blade 14 czy Alienware x14.
Cena i dostępność
14-calowy Predator Triton 300 SE jest już szeroko dostępny u takich sprzedawców jak Amazon, Best Buyoraz Newegg za około 2000 USD, jeśli jest skonfigurowany tak jak nasz egzemplarz recenzencki. Mniejsze jednostki SKUz procesorem Core i7 są dostępne w cenie 1600 USD.
Acer Predator Triton 300 SE
- 02/11/2022 v7 (old)
Allen Ngo


