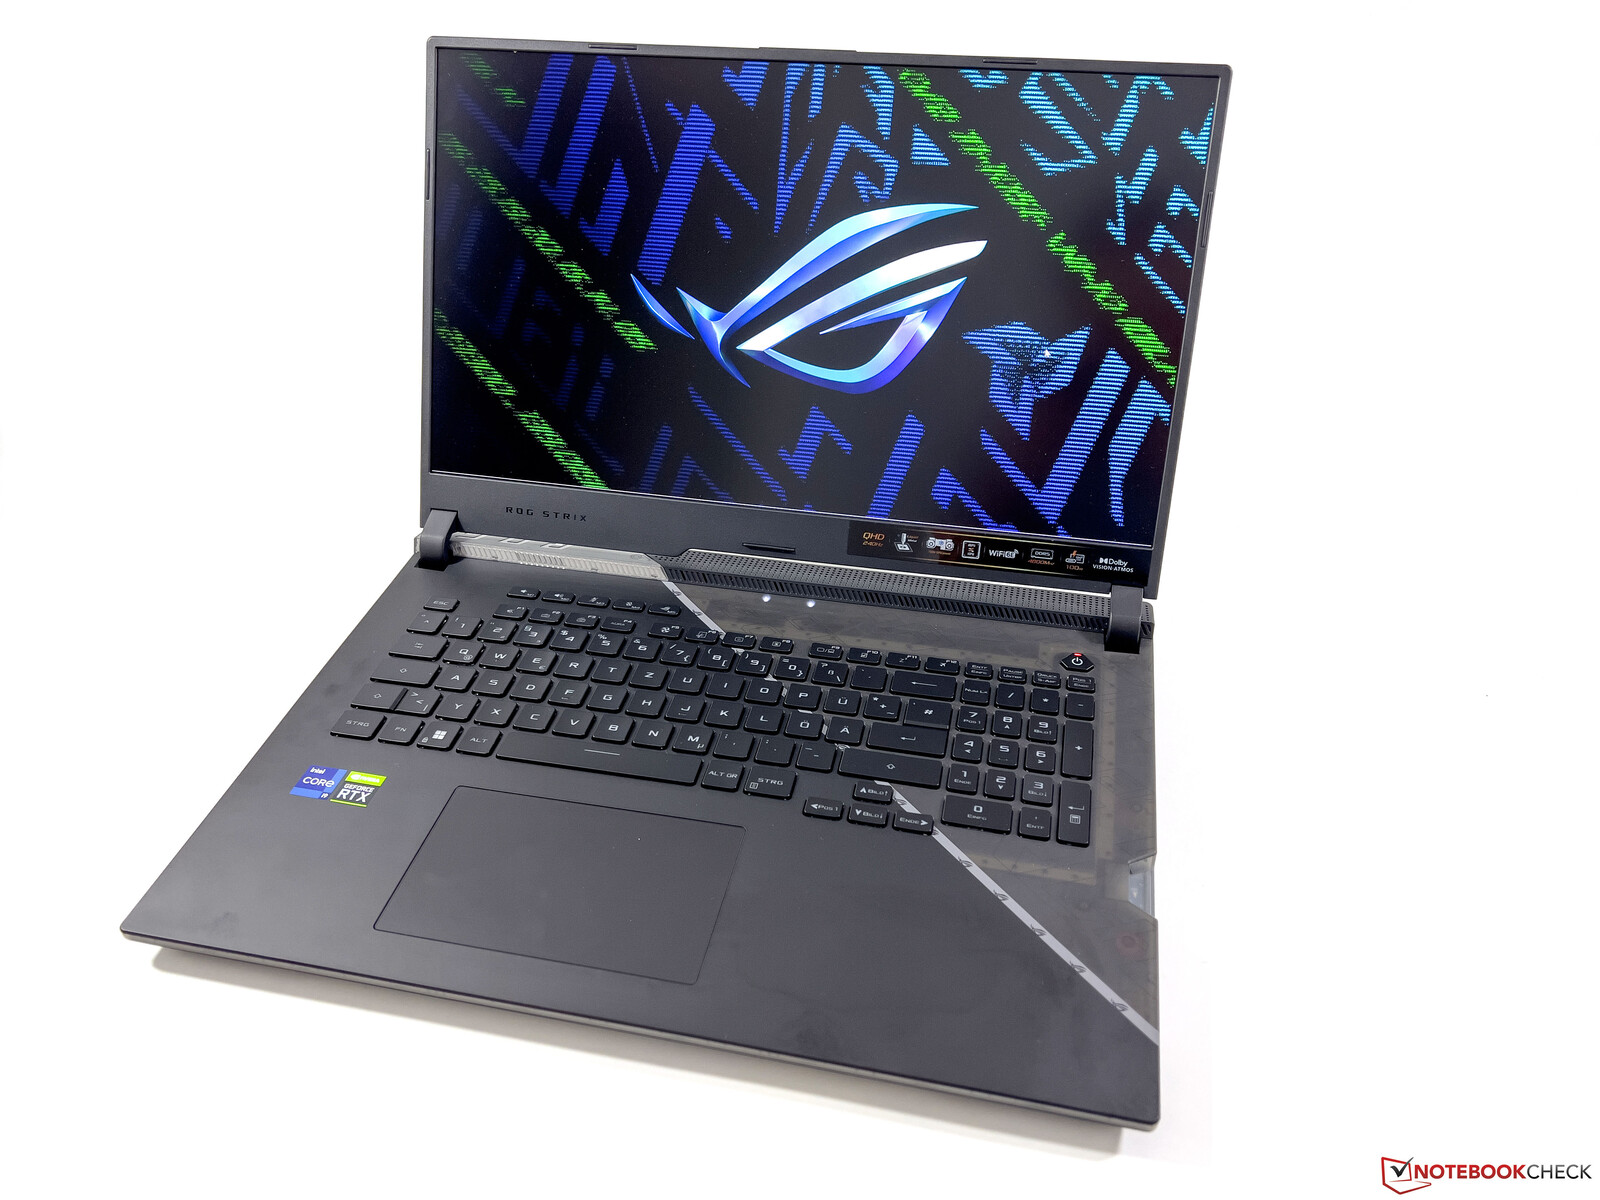
Recenzja Asus ROG Strix Scar 17 SE - w pełni wyposażony laptop do gier z RTX 3080 Ti
ROG Strix Scar SE to gamingowy flagowiec od Asusa, który również w 2022 roku ponownie został wyposażony w najszybsze komponenty, jakie są obecnie dostępne na rynku. Testujemy topowy model G733CX z procesorem Intel Core i9-12950HX, kartą graficzną Nvidia GeForce RTX 3080 Ti, dwoma 2-TB dyskami SSD od Samsunga oraz szybkim panelem QHD o częstotliwości odświeżania 240 Hz. Cena jest również wysoka, ponieważ MSRP naszego testowego egzemplarza wynosi 3 999 euro (~4 129 dolarów).
Potencjalni konkurenci w porównaniu
Ocena | Data | Model | Waga | Wysokość | Rozmiar | Rezolucja | Cena |
|---|---|---|---|---|---|---|---|
| 86.9 % v7 (old) | 11/2022 | Asus ROG Strix Scar 17 SE G733CX-LL014W i9-12950HX, GeForce RTX 3080 Ti Laptop GPU | 2.9 kg | 28.3 mm | 17.30" | 2560x1440 | |
| 88.9 % v7 (old) | 10/2022 | Lenovo Legion 7 16IAX7-82TD004SGE i9-12900HX, GeForce RTX 3080 Ti Laptop GPU | 2.6 kg | 20 mm | 16.00" | 2560x1600 | |
| 88.3 % v7 (old) | MSI Titan GT77 12UHS i9-12900HX, GeForce RTX 3080 Ti Laptop GPU | 3.3 kg | 23 mm | 17.30" | 1920x1080 | ||
| 87.6 % v7 (old) | 09/2022 | Schenker XMG Neo 17 M22 R9 6900HX, GeForce RTX 3080 Ti Laptop GPU | 2.8 kg | 27 mm | 17.00" | 2560x1600 | |
| 89.2 % v7 (old) | Alienware x17 R2 P48E i9-12900HK, GeForce RTX 3080 Ti Laptop GPU | 3.1 kg | 20.9 mm | 17.30" | 1920x1080 |
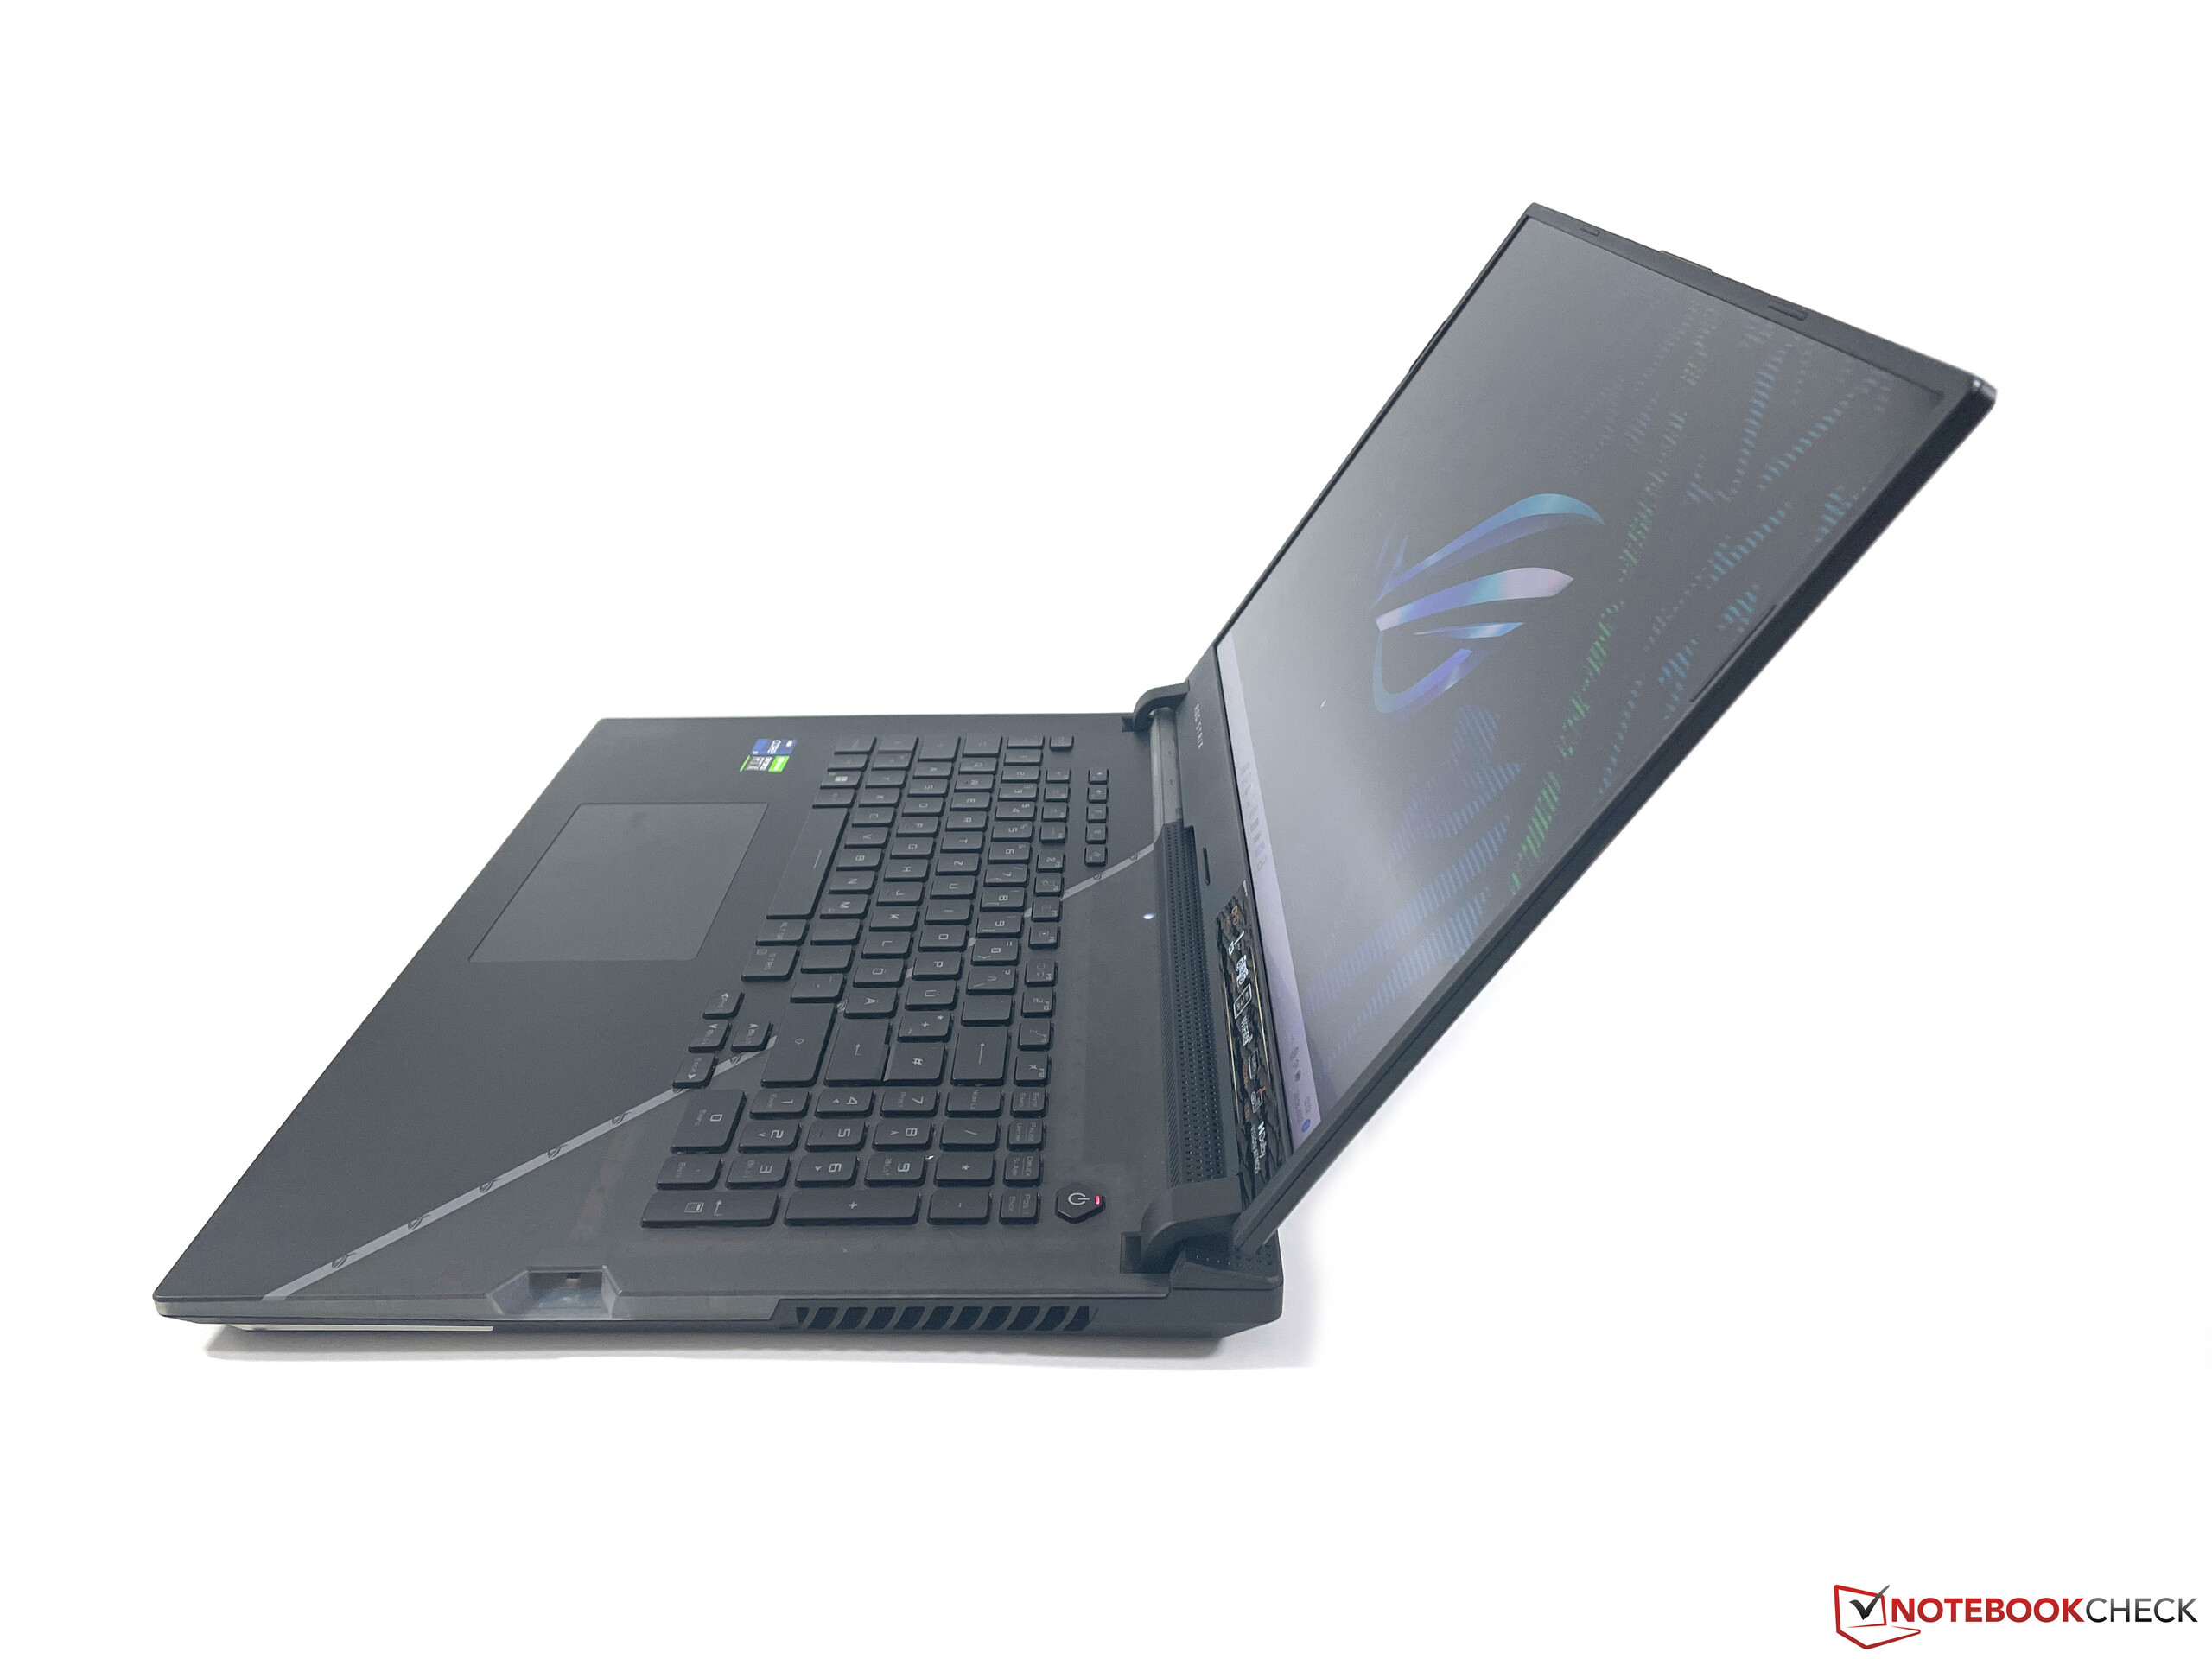
Obudowa - Gamingowy laptop z wyróżniającym się designem i rozbudowanym podświetleniem
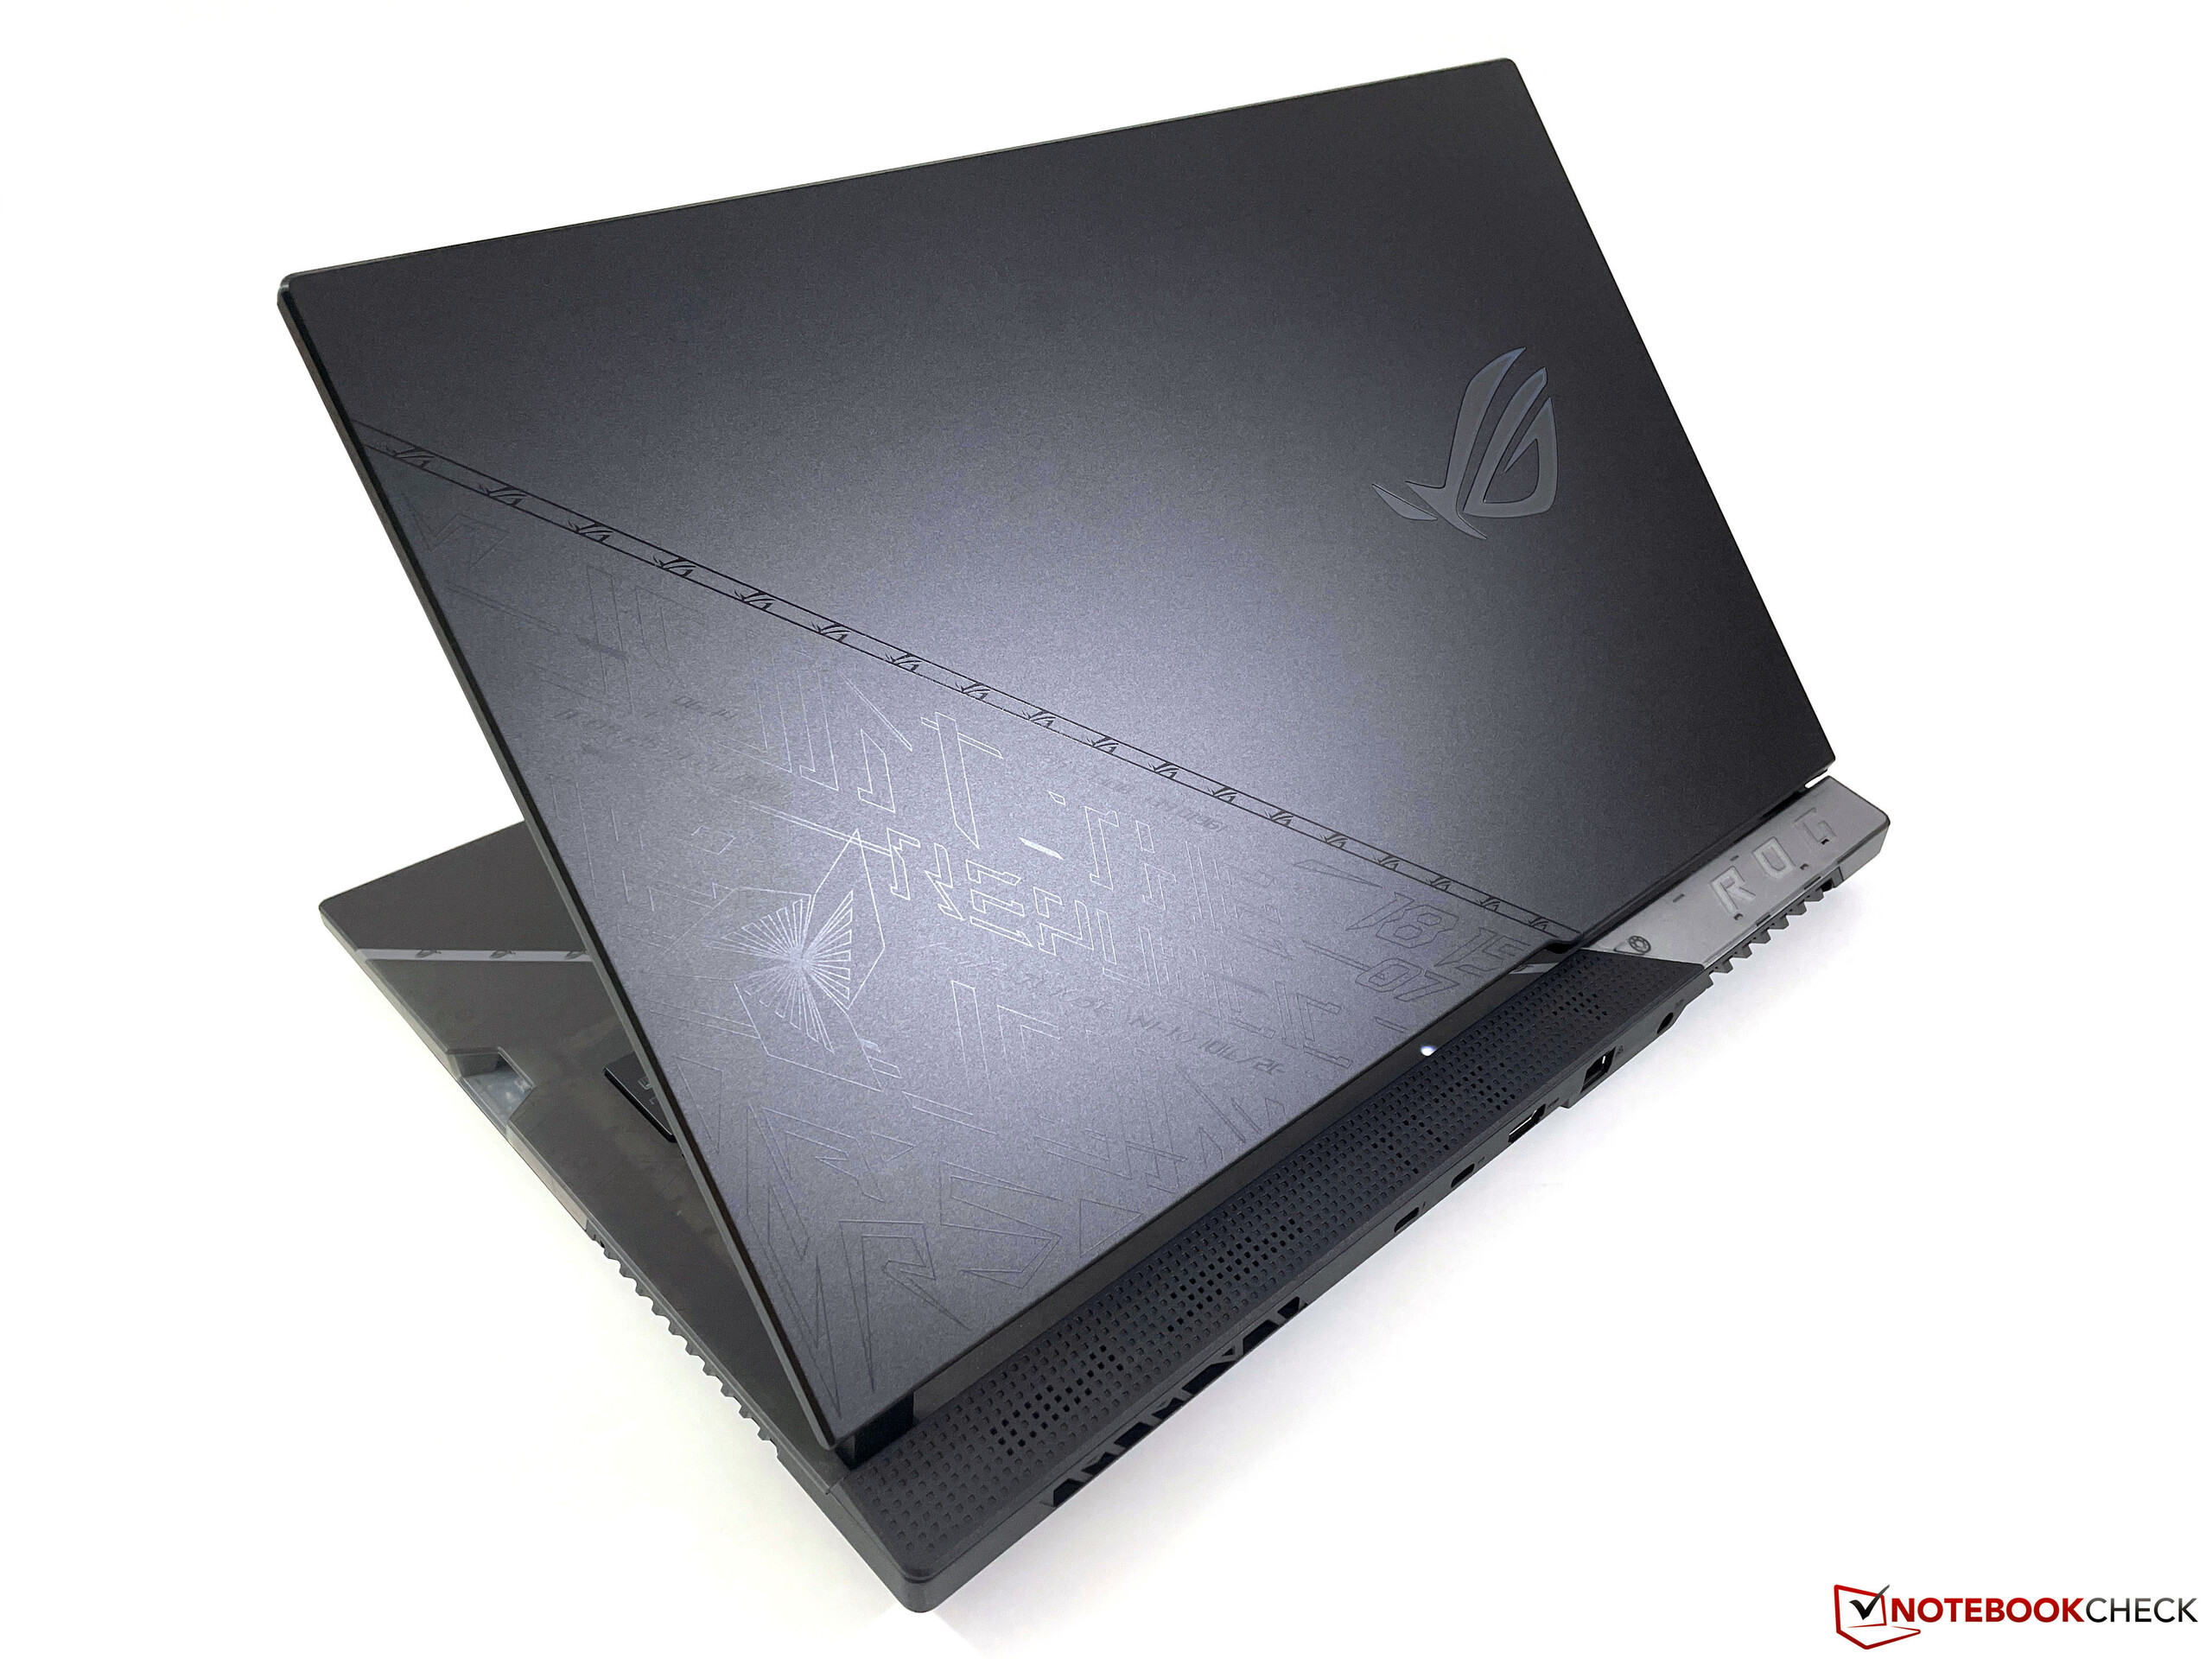
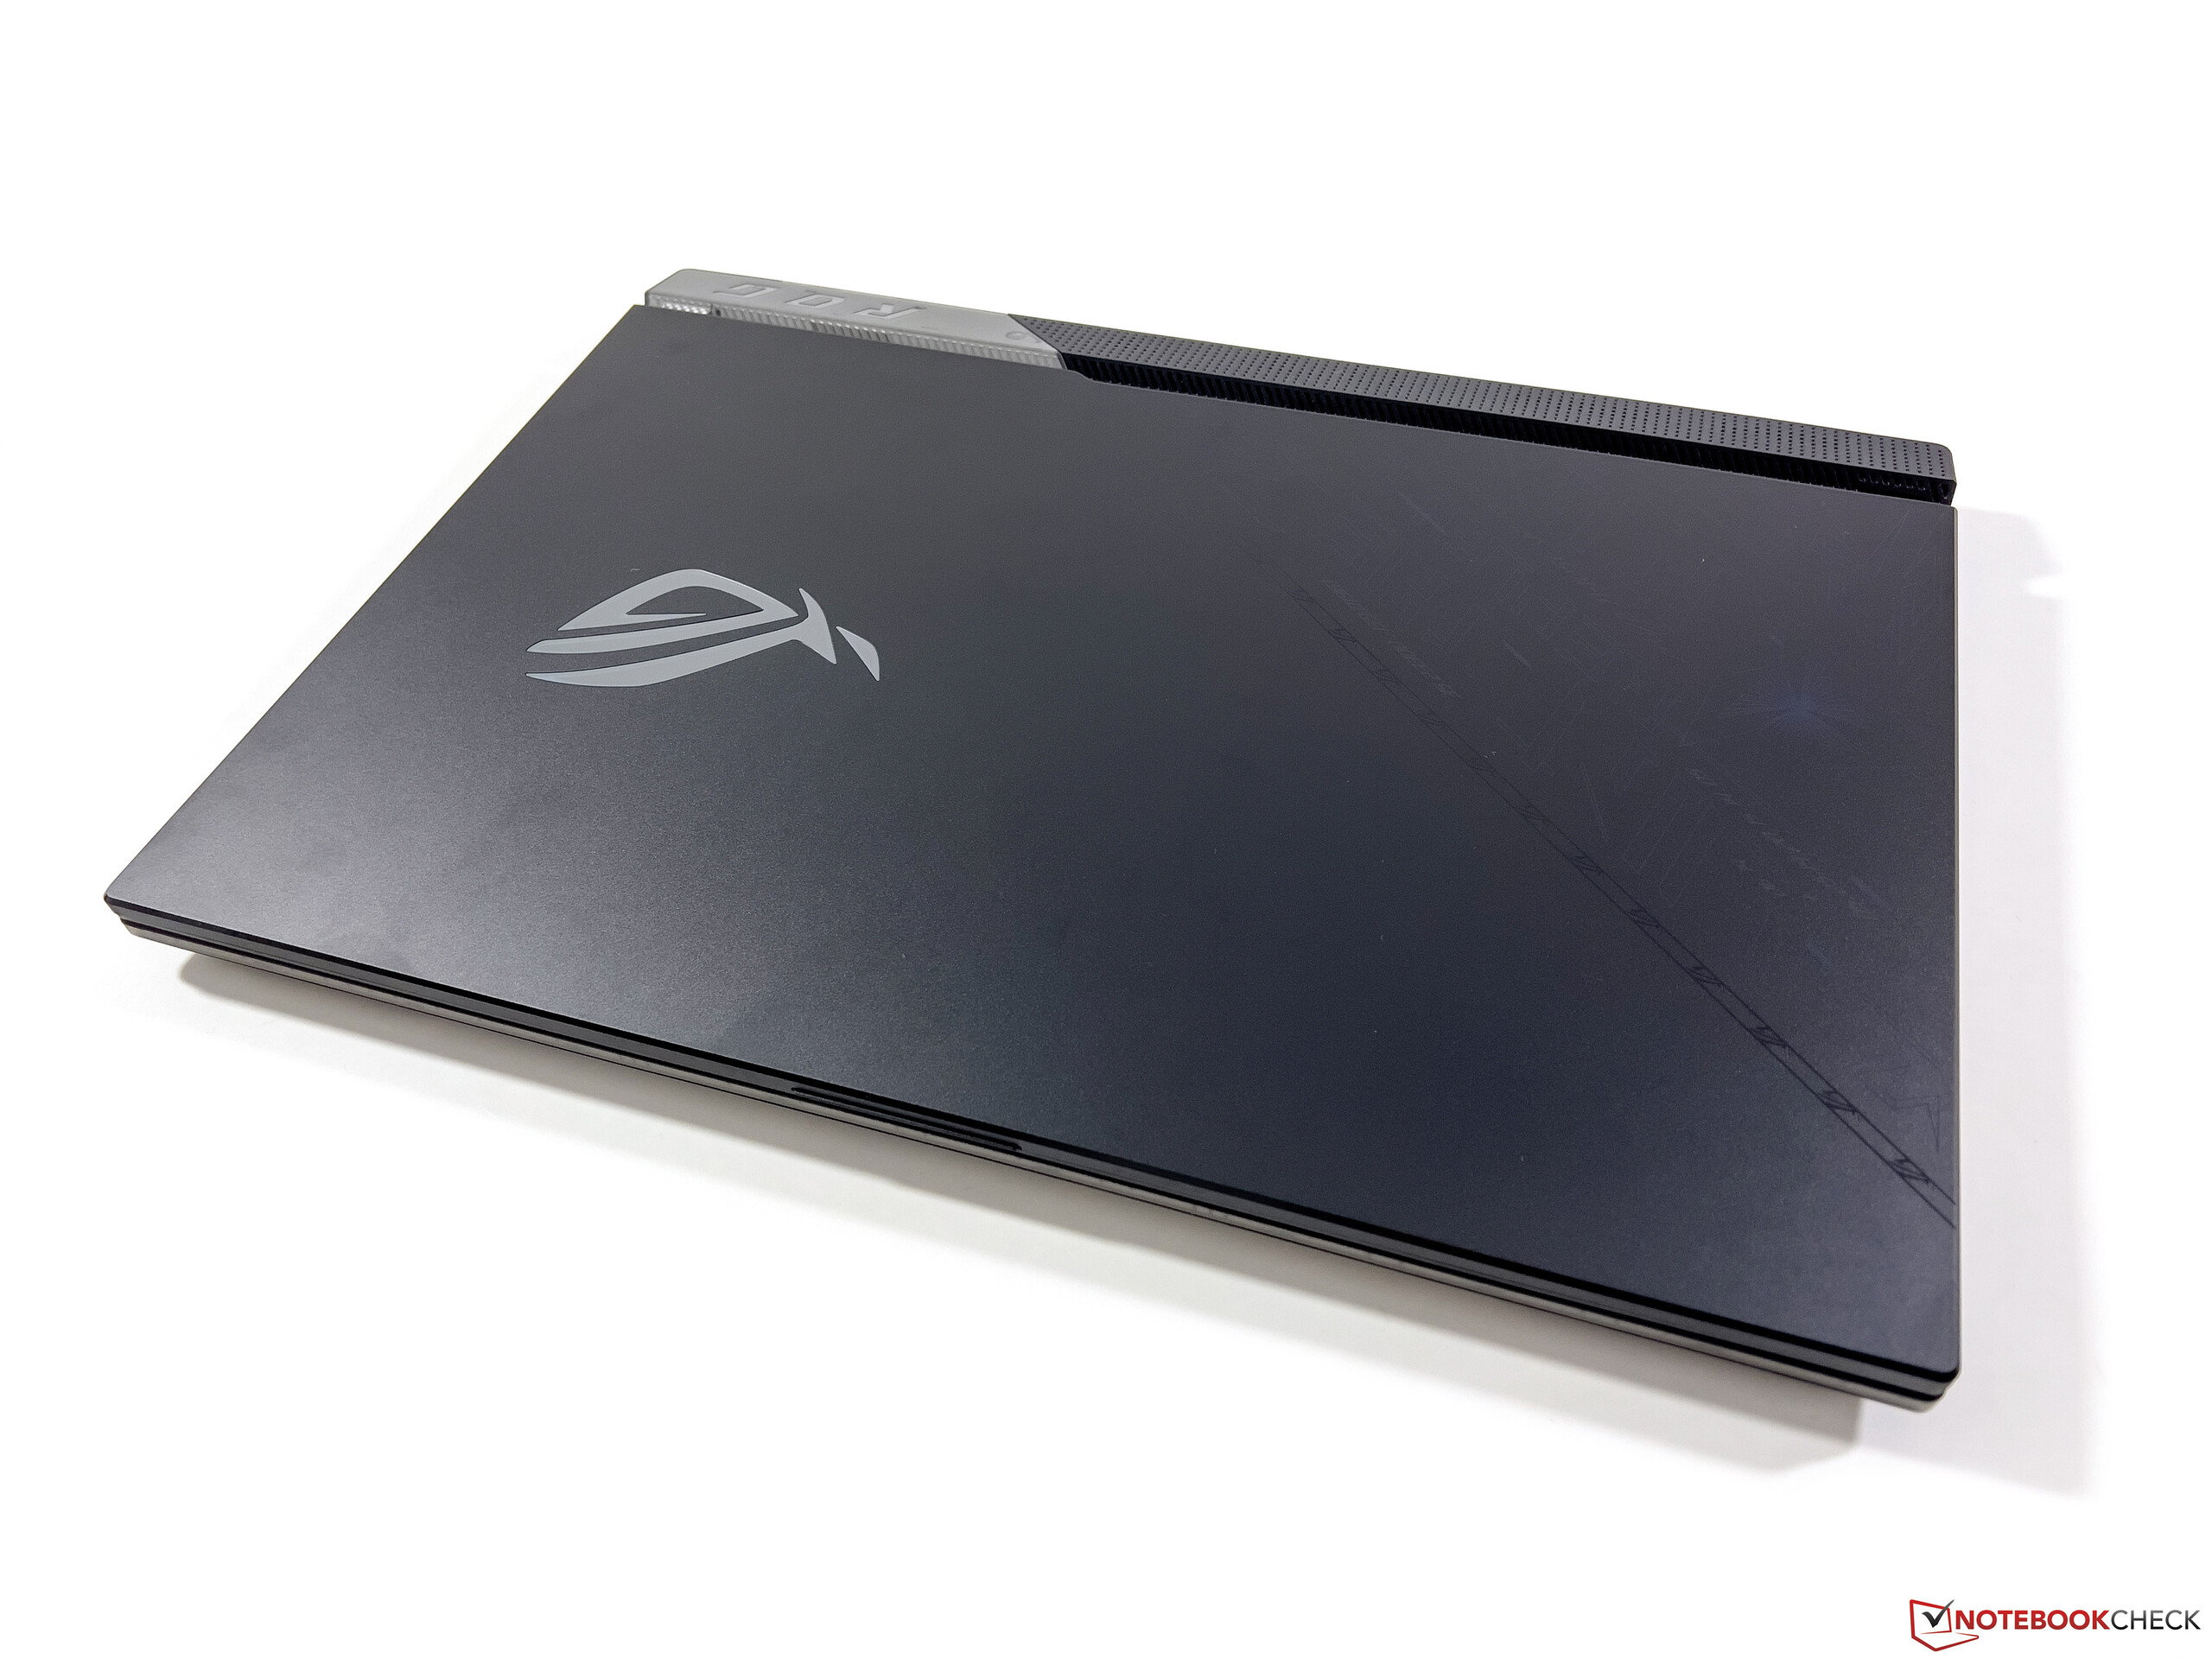
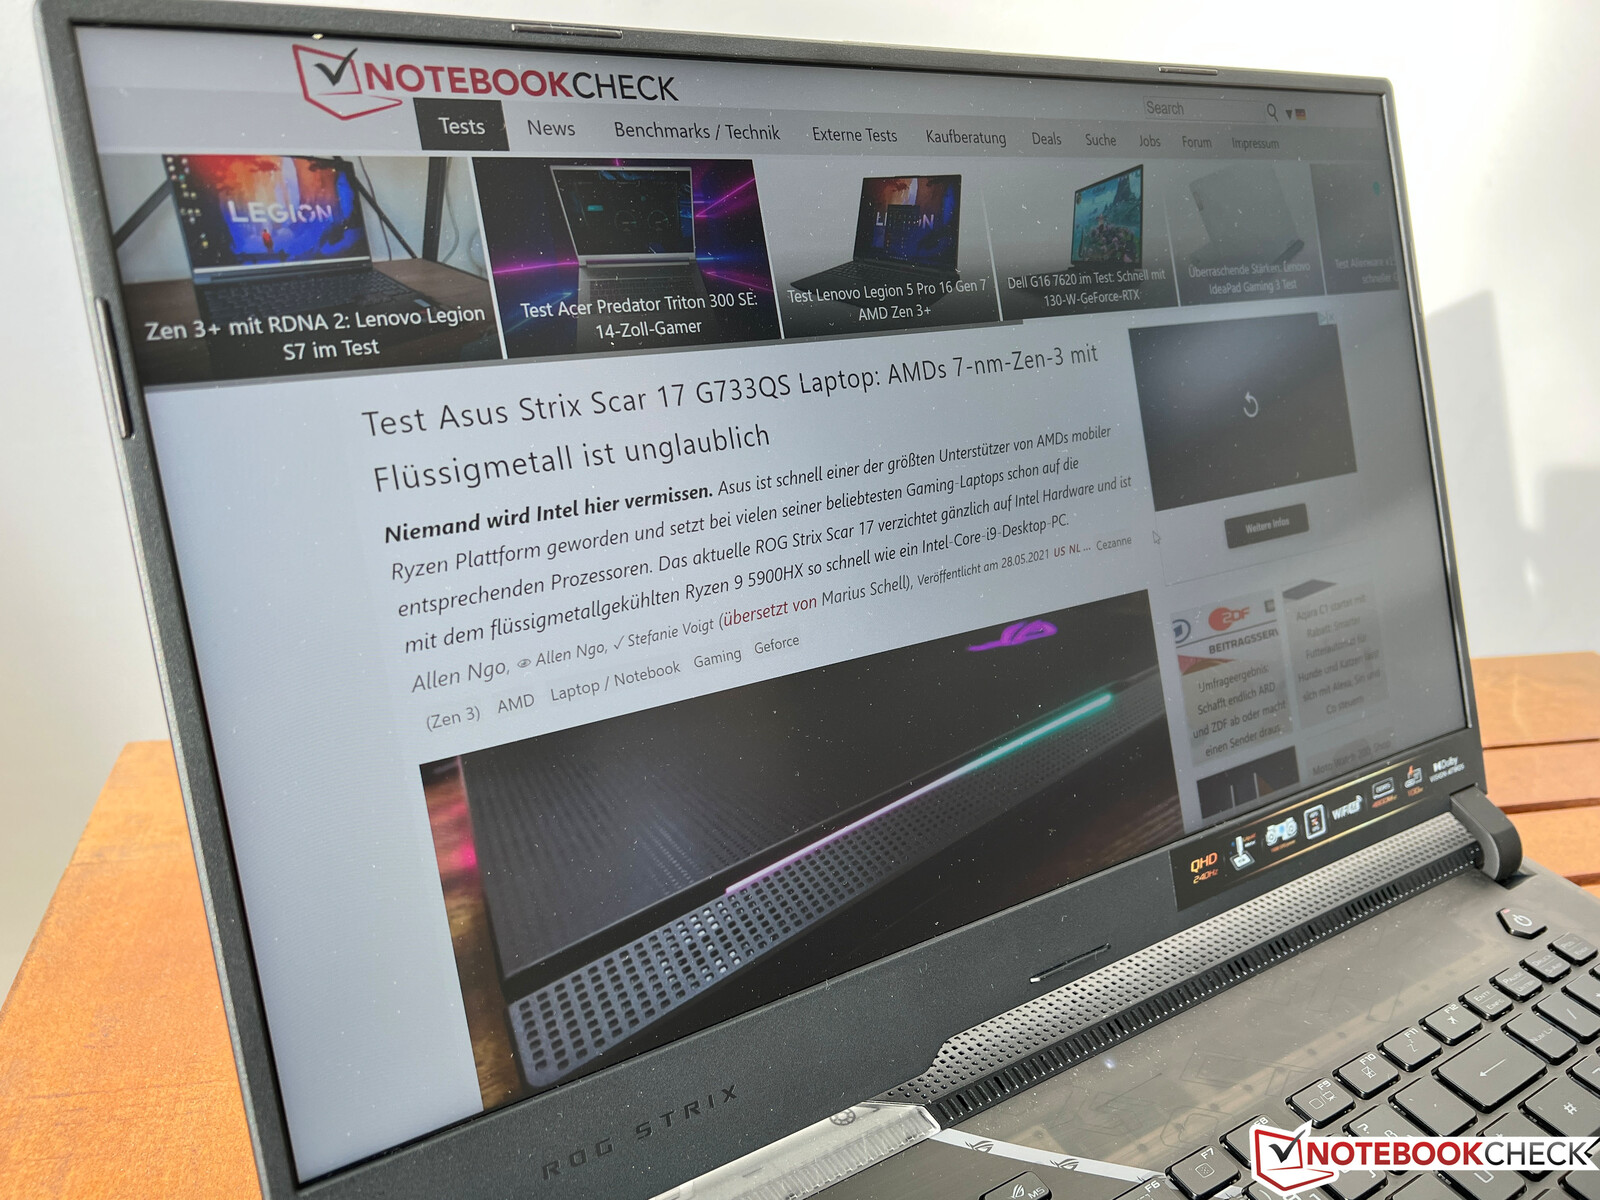
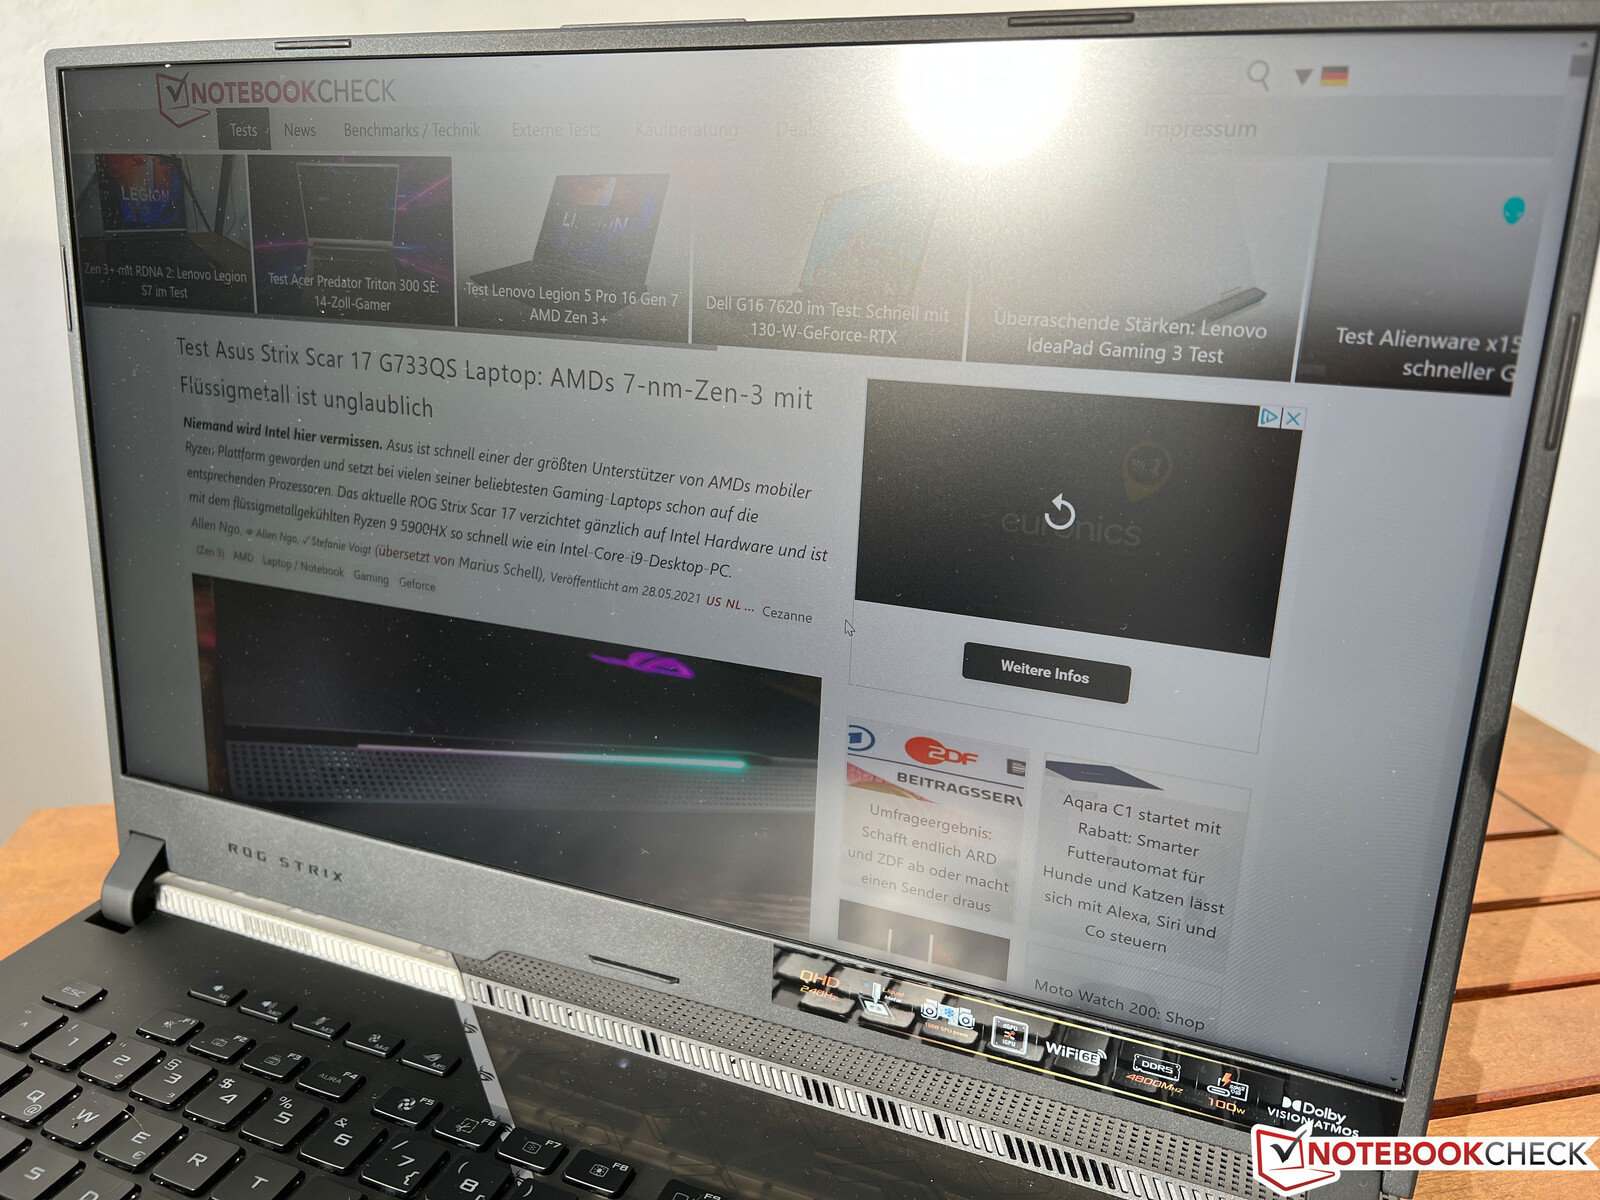
ROG Strix Scar 17 to ewidentnie laptop gamingowy, który wcale nie ukrywa swoich ambicji. Obudowa jest w dużej mierze identyczna jak np ubiegłorocznego "G733QS, a jedna część jednostki zasadniczej jest ponownie przezroczysta. Do tego dochodzą obszernie podświetlane elementy i kilka dodatkowych elementów wzorniczych czy gimmicków, jak np. specjalny napis na pokrywie, który staje się widoczny tylko wtedy, gdy świecimy na niego lampą UV
Jakość plastikowej obudowy jest ogólnie dobra, chociaż powierzchnie nadal są podatne na odciski palców i można usłyszeć okazjonalny lekki szum podczas otwierania wyświetlacza. Stabilność grubej jednostki zasadniczej jest przyzwoita, ale wciąż można minimalnie naciskać na jednostkę zasadniczą w centralnym obszarze klawiatury. O ile stosunkowo smukła pokrywa wyświetlacza spisuje się dobrze, o tyle zawias nie jest w stanie zapobiec na przykład lekkiemu chybotaniu się po poruszeniu laptopa.
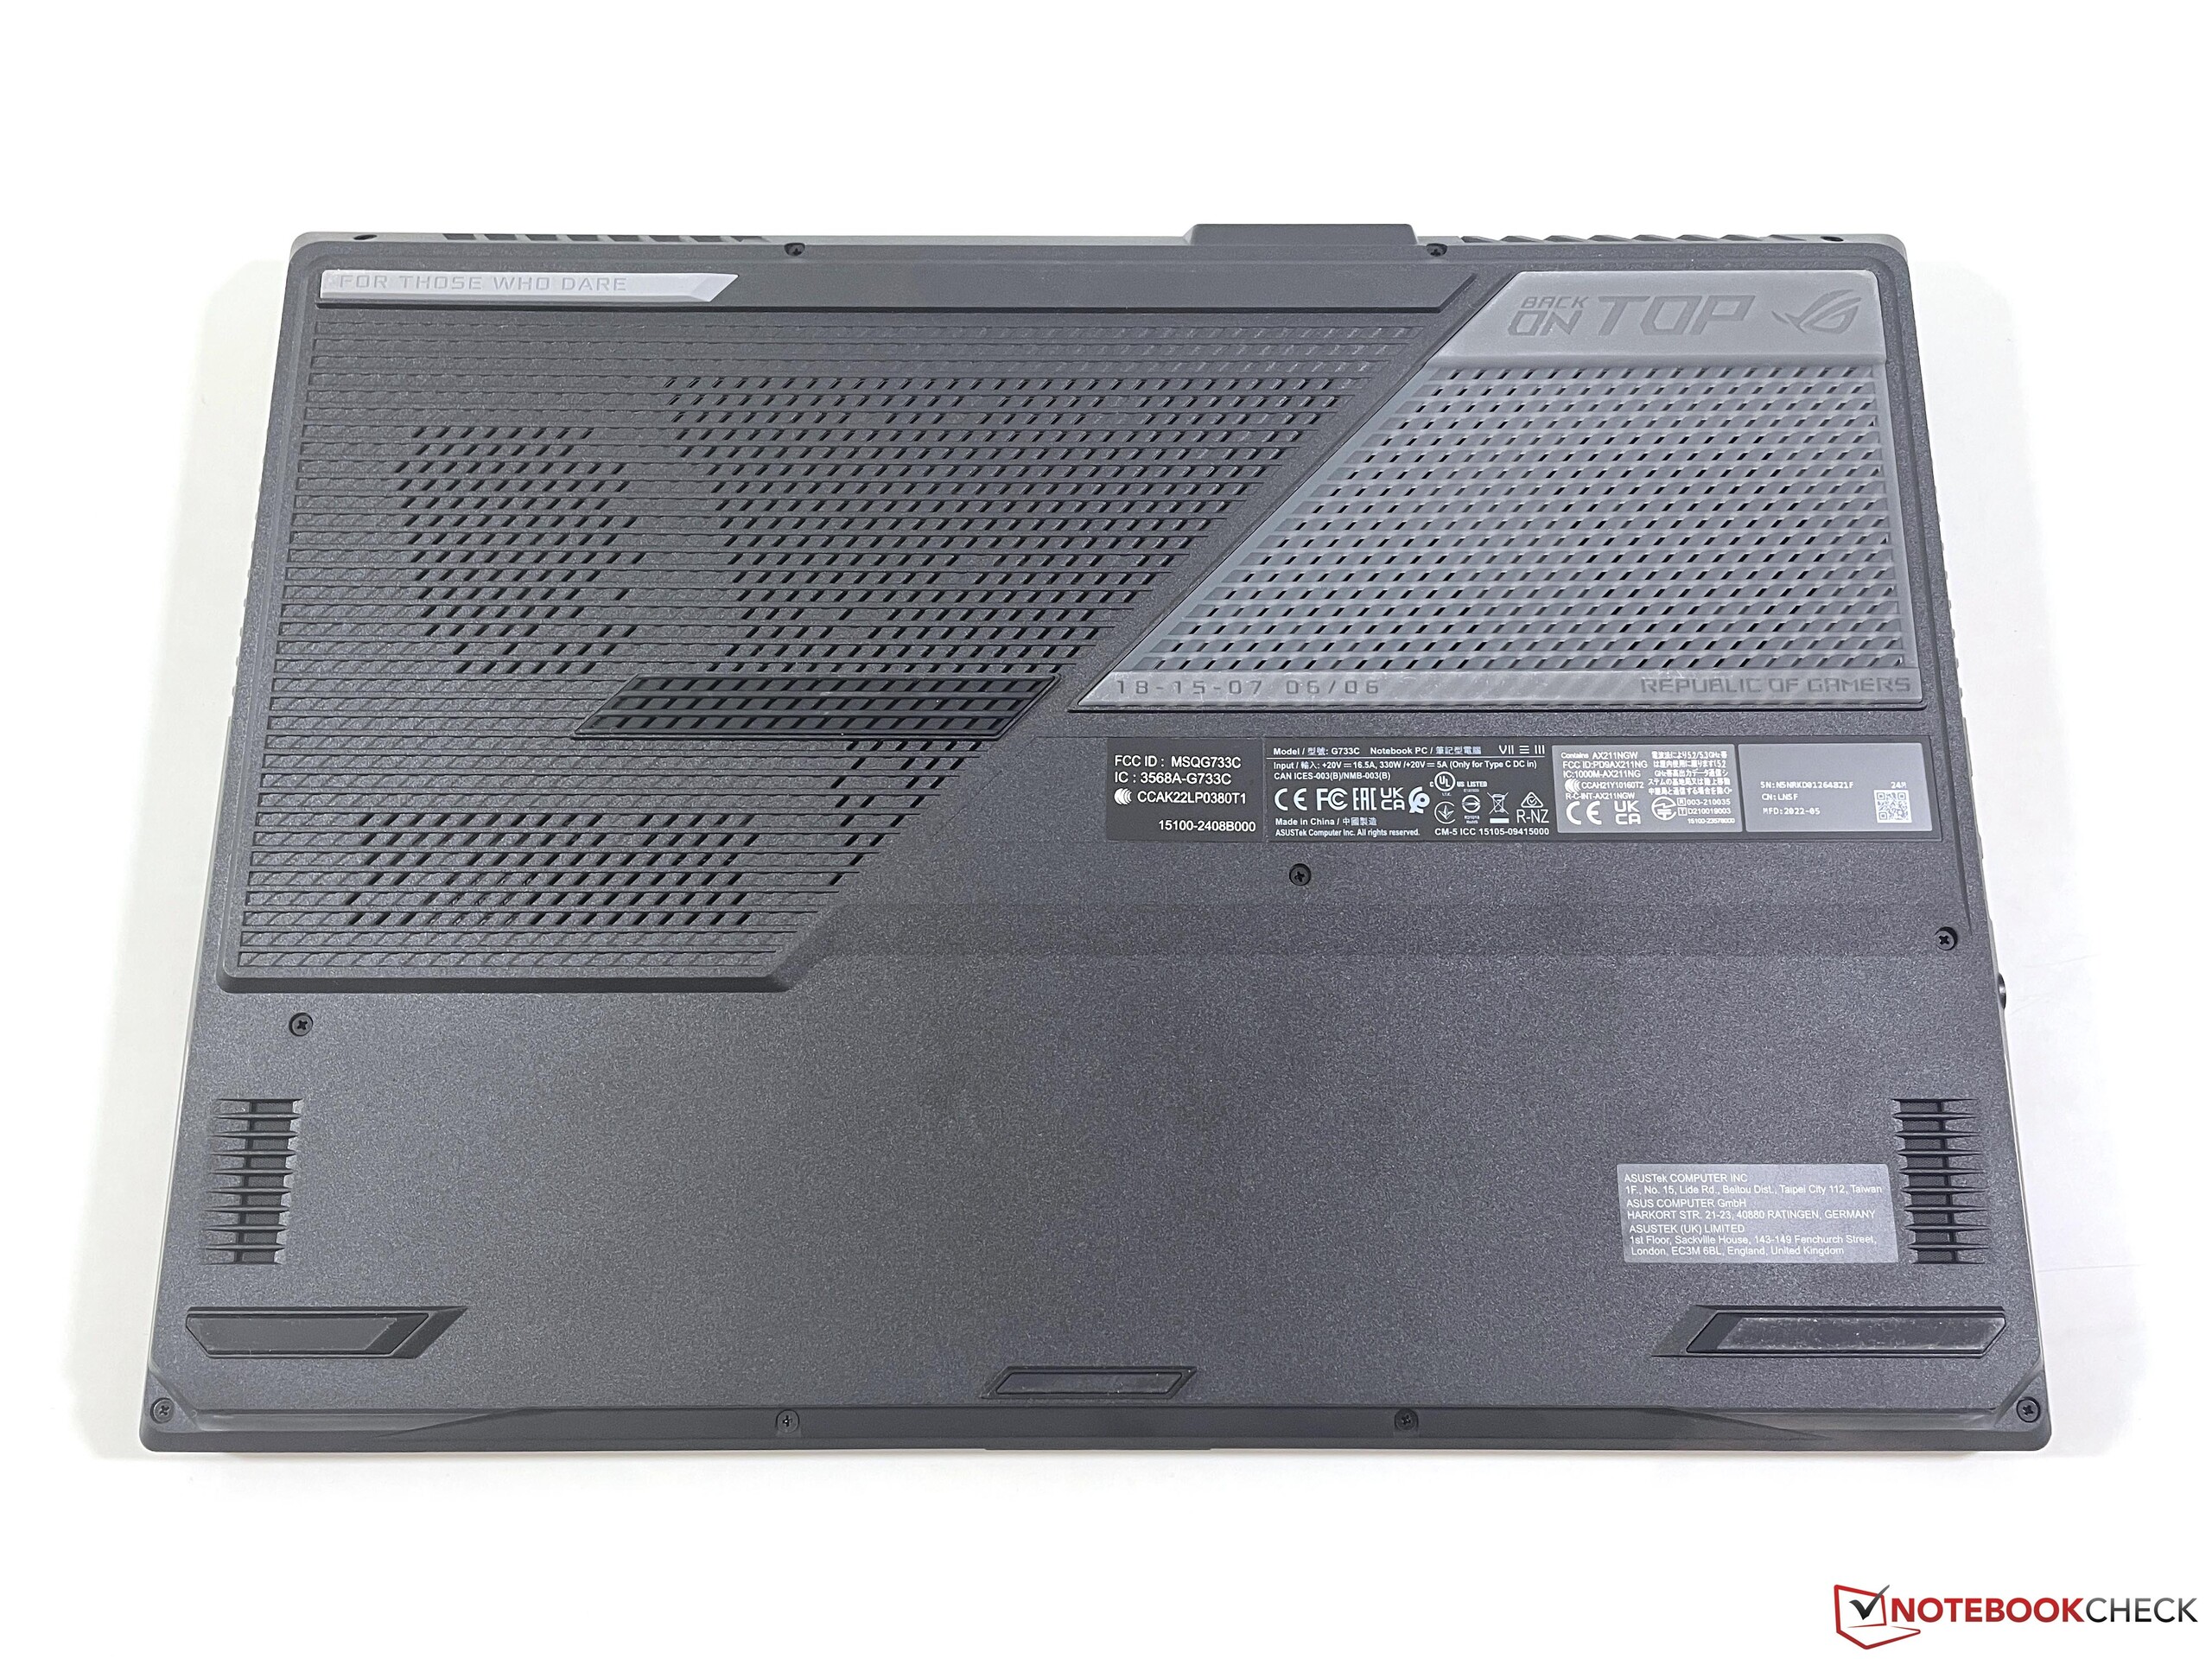
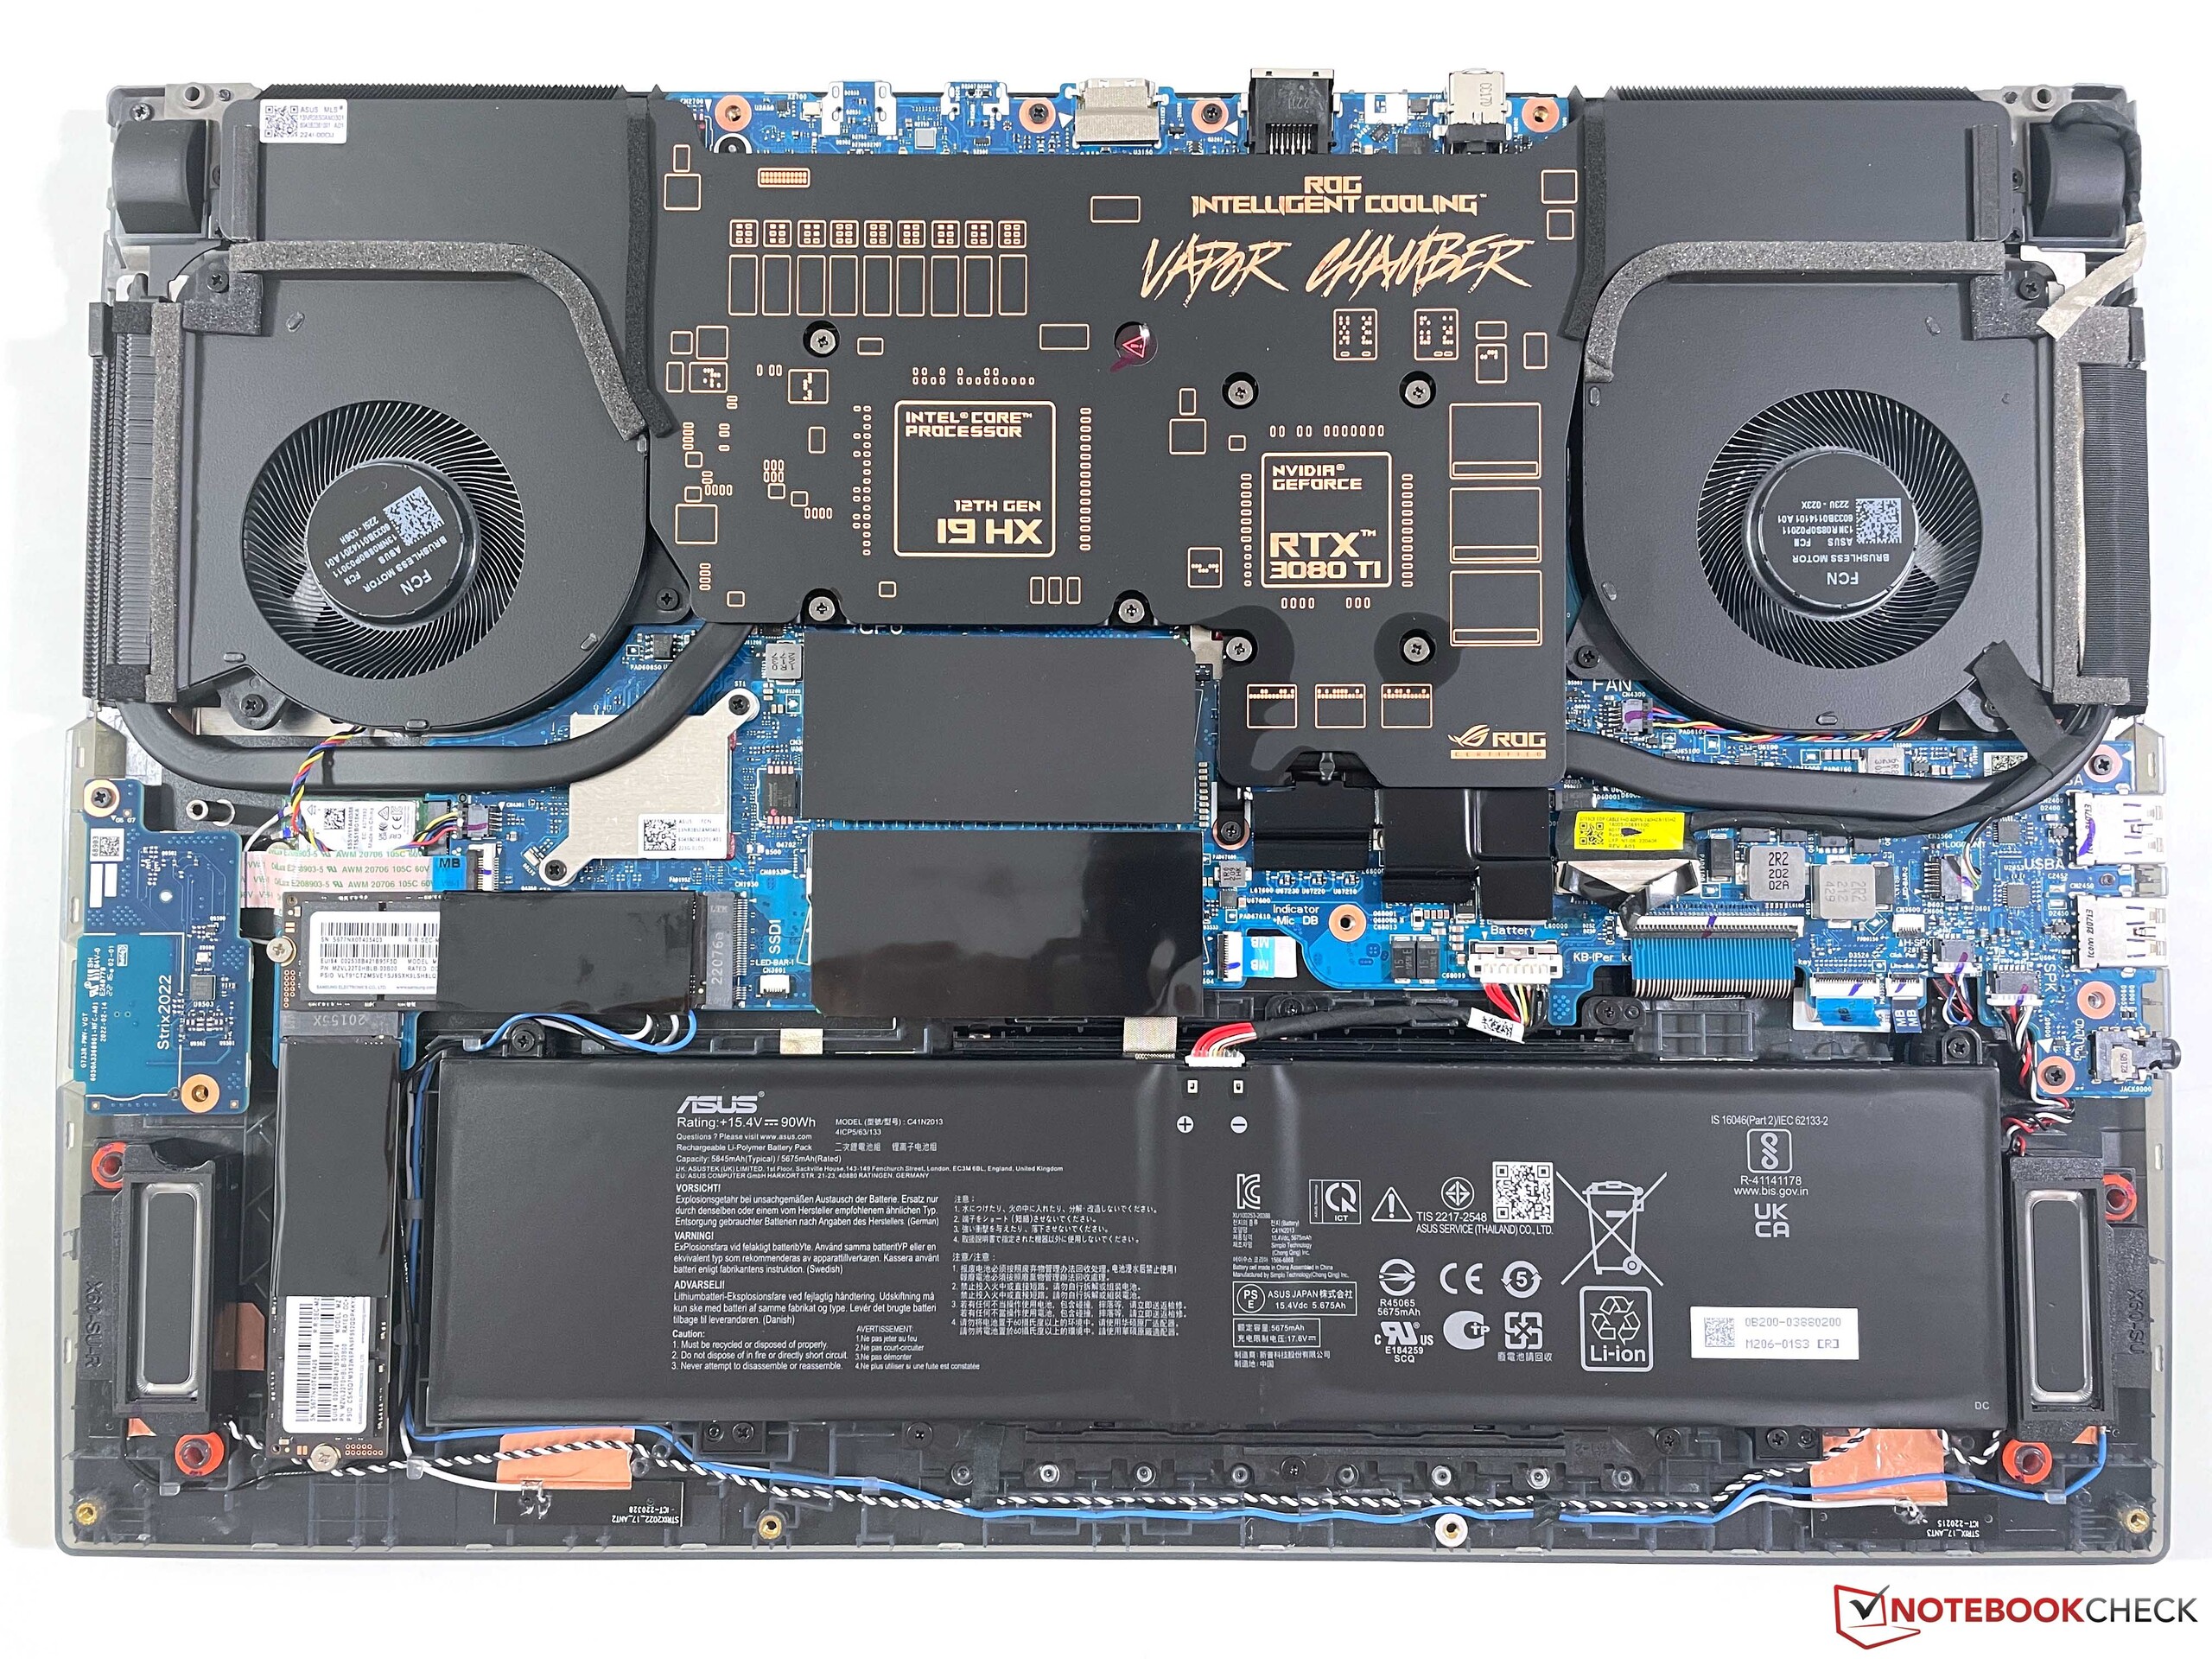
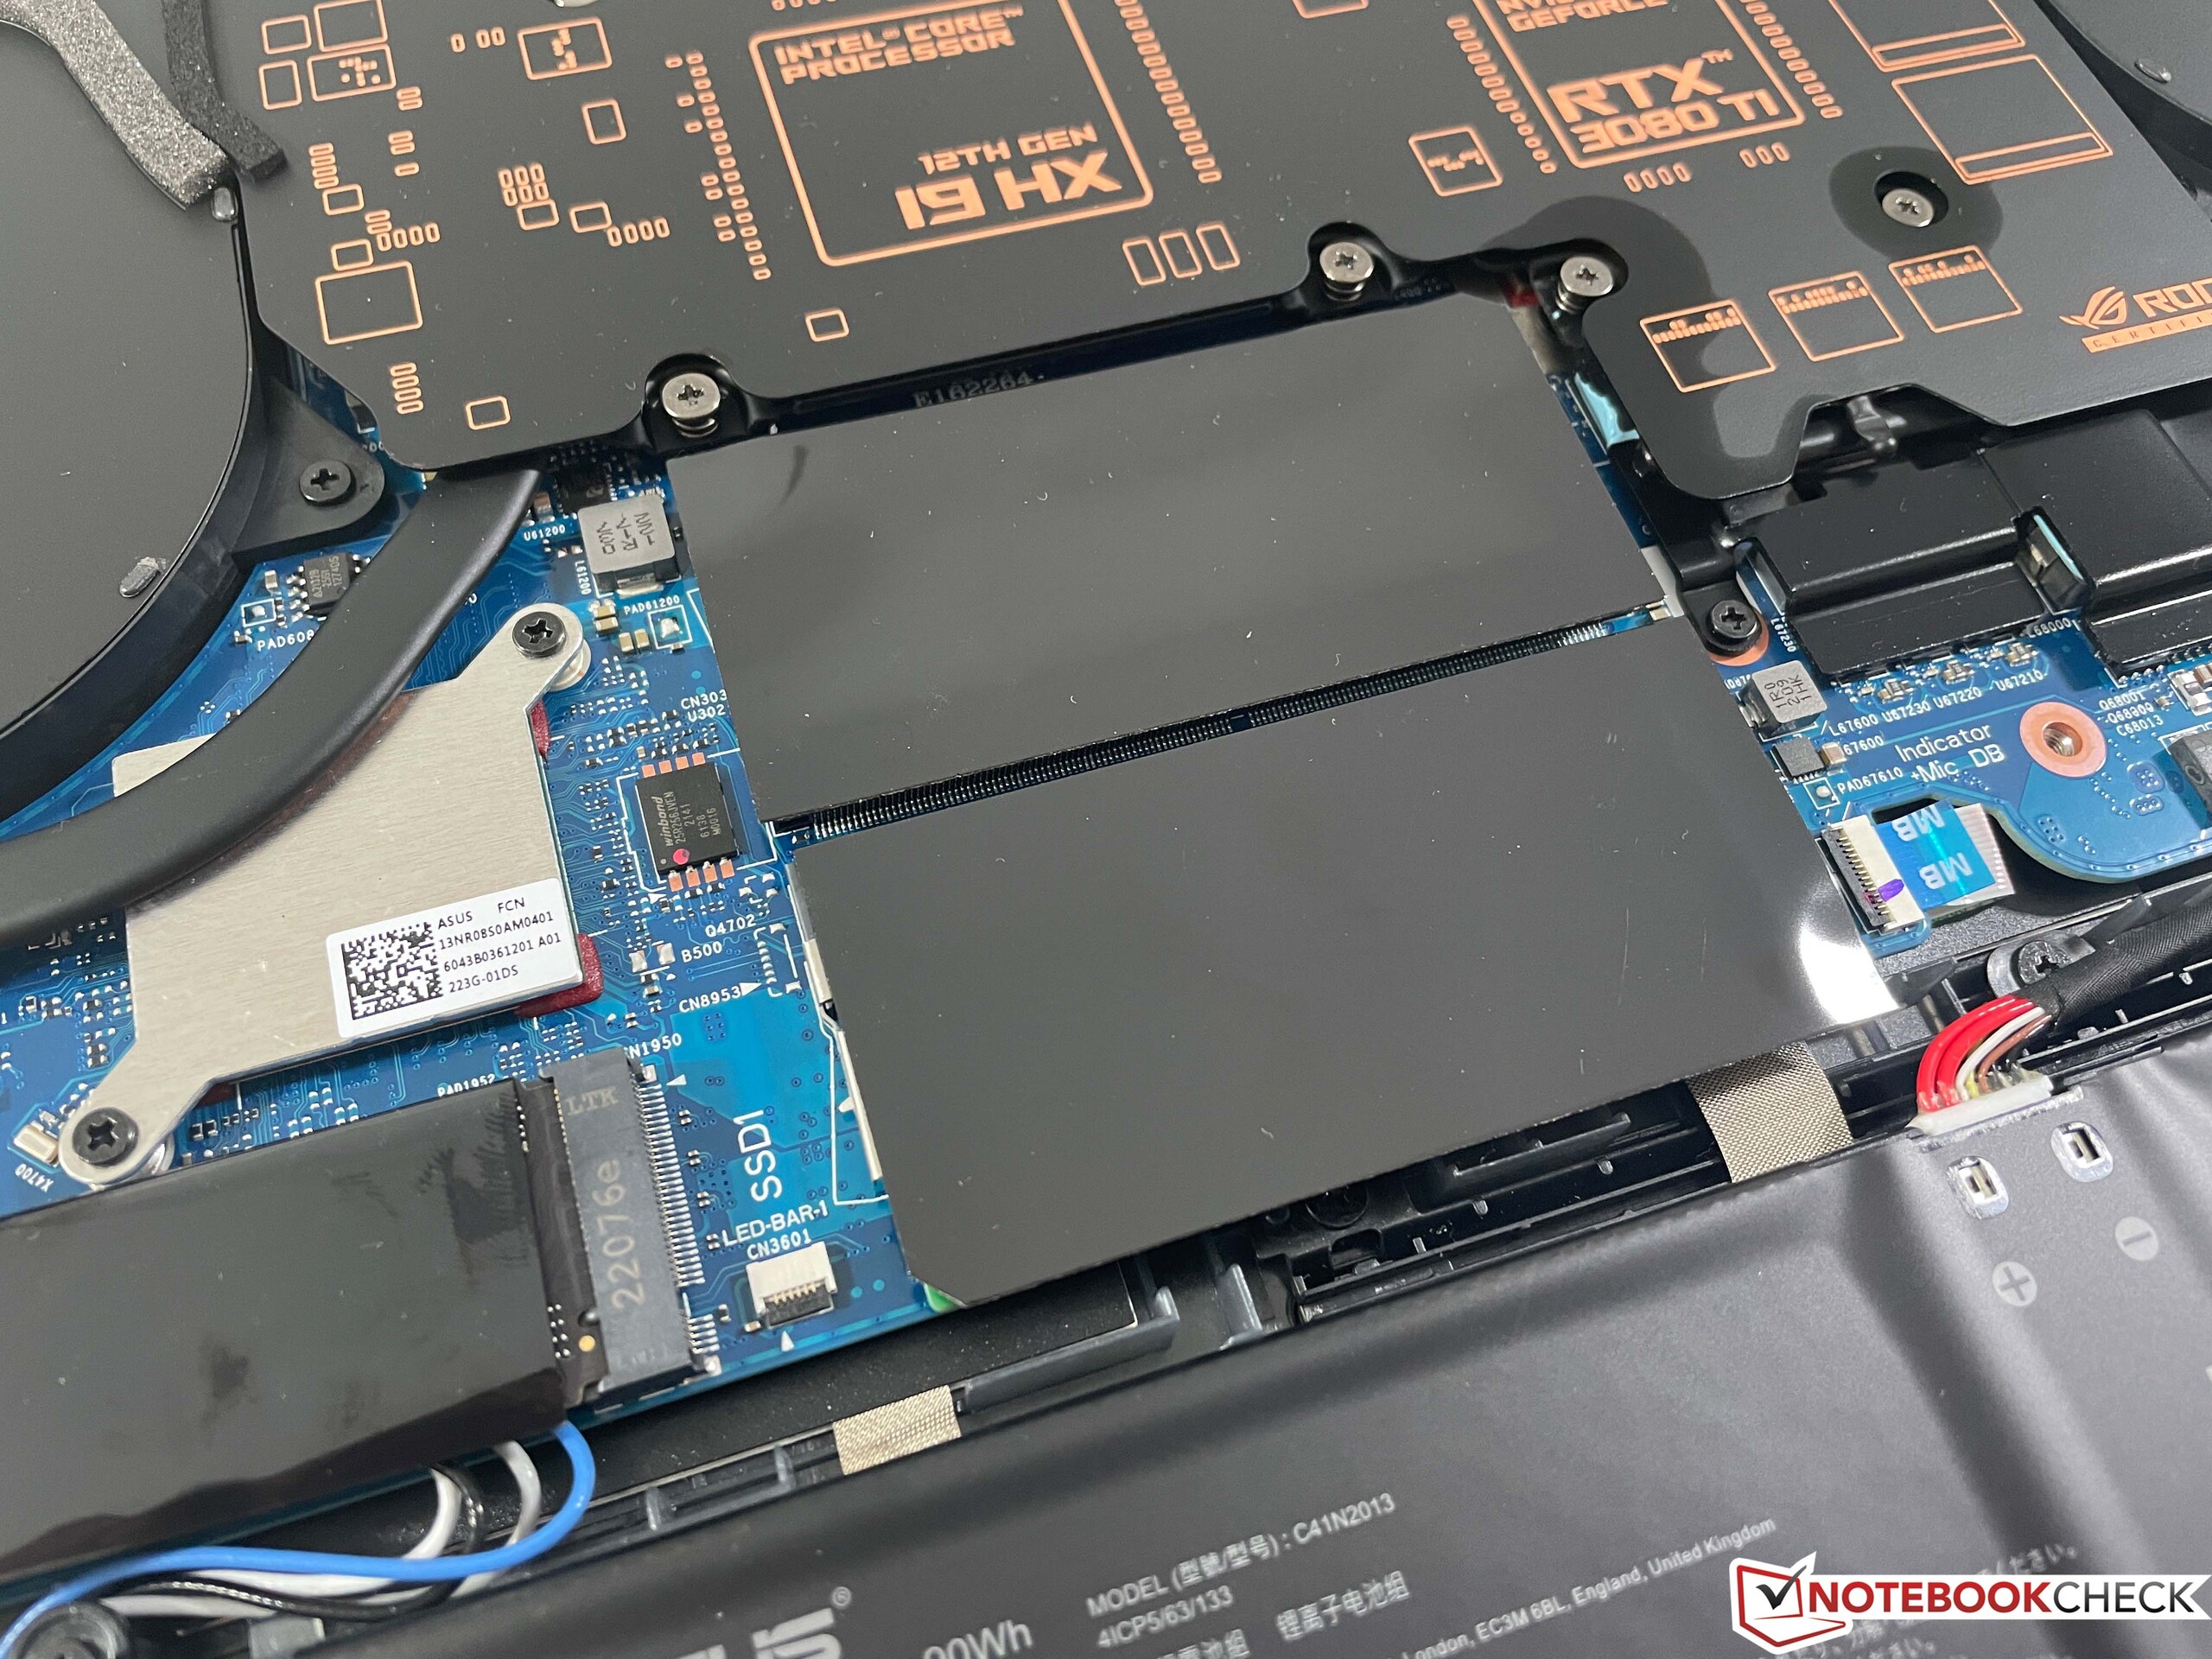
Choć dolną pokrywę obudowy można zdjąć, trzeba to robić ostrożnie. Jako że podświetlenie jest zintegrowane z tą częścią, trzeba najpierw odłączyć dwa małe płaskie kabelki, zanim będzie można zdjąć pokrywę. Dzięki dostępowi do wentylatorów, dwóch dysków SSD, dwóch modułów RAM i modułu WLAN, możliwości konserwacji są dobre.
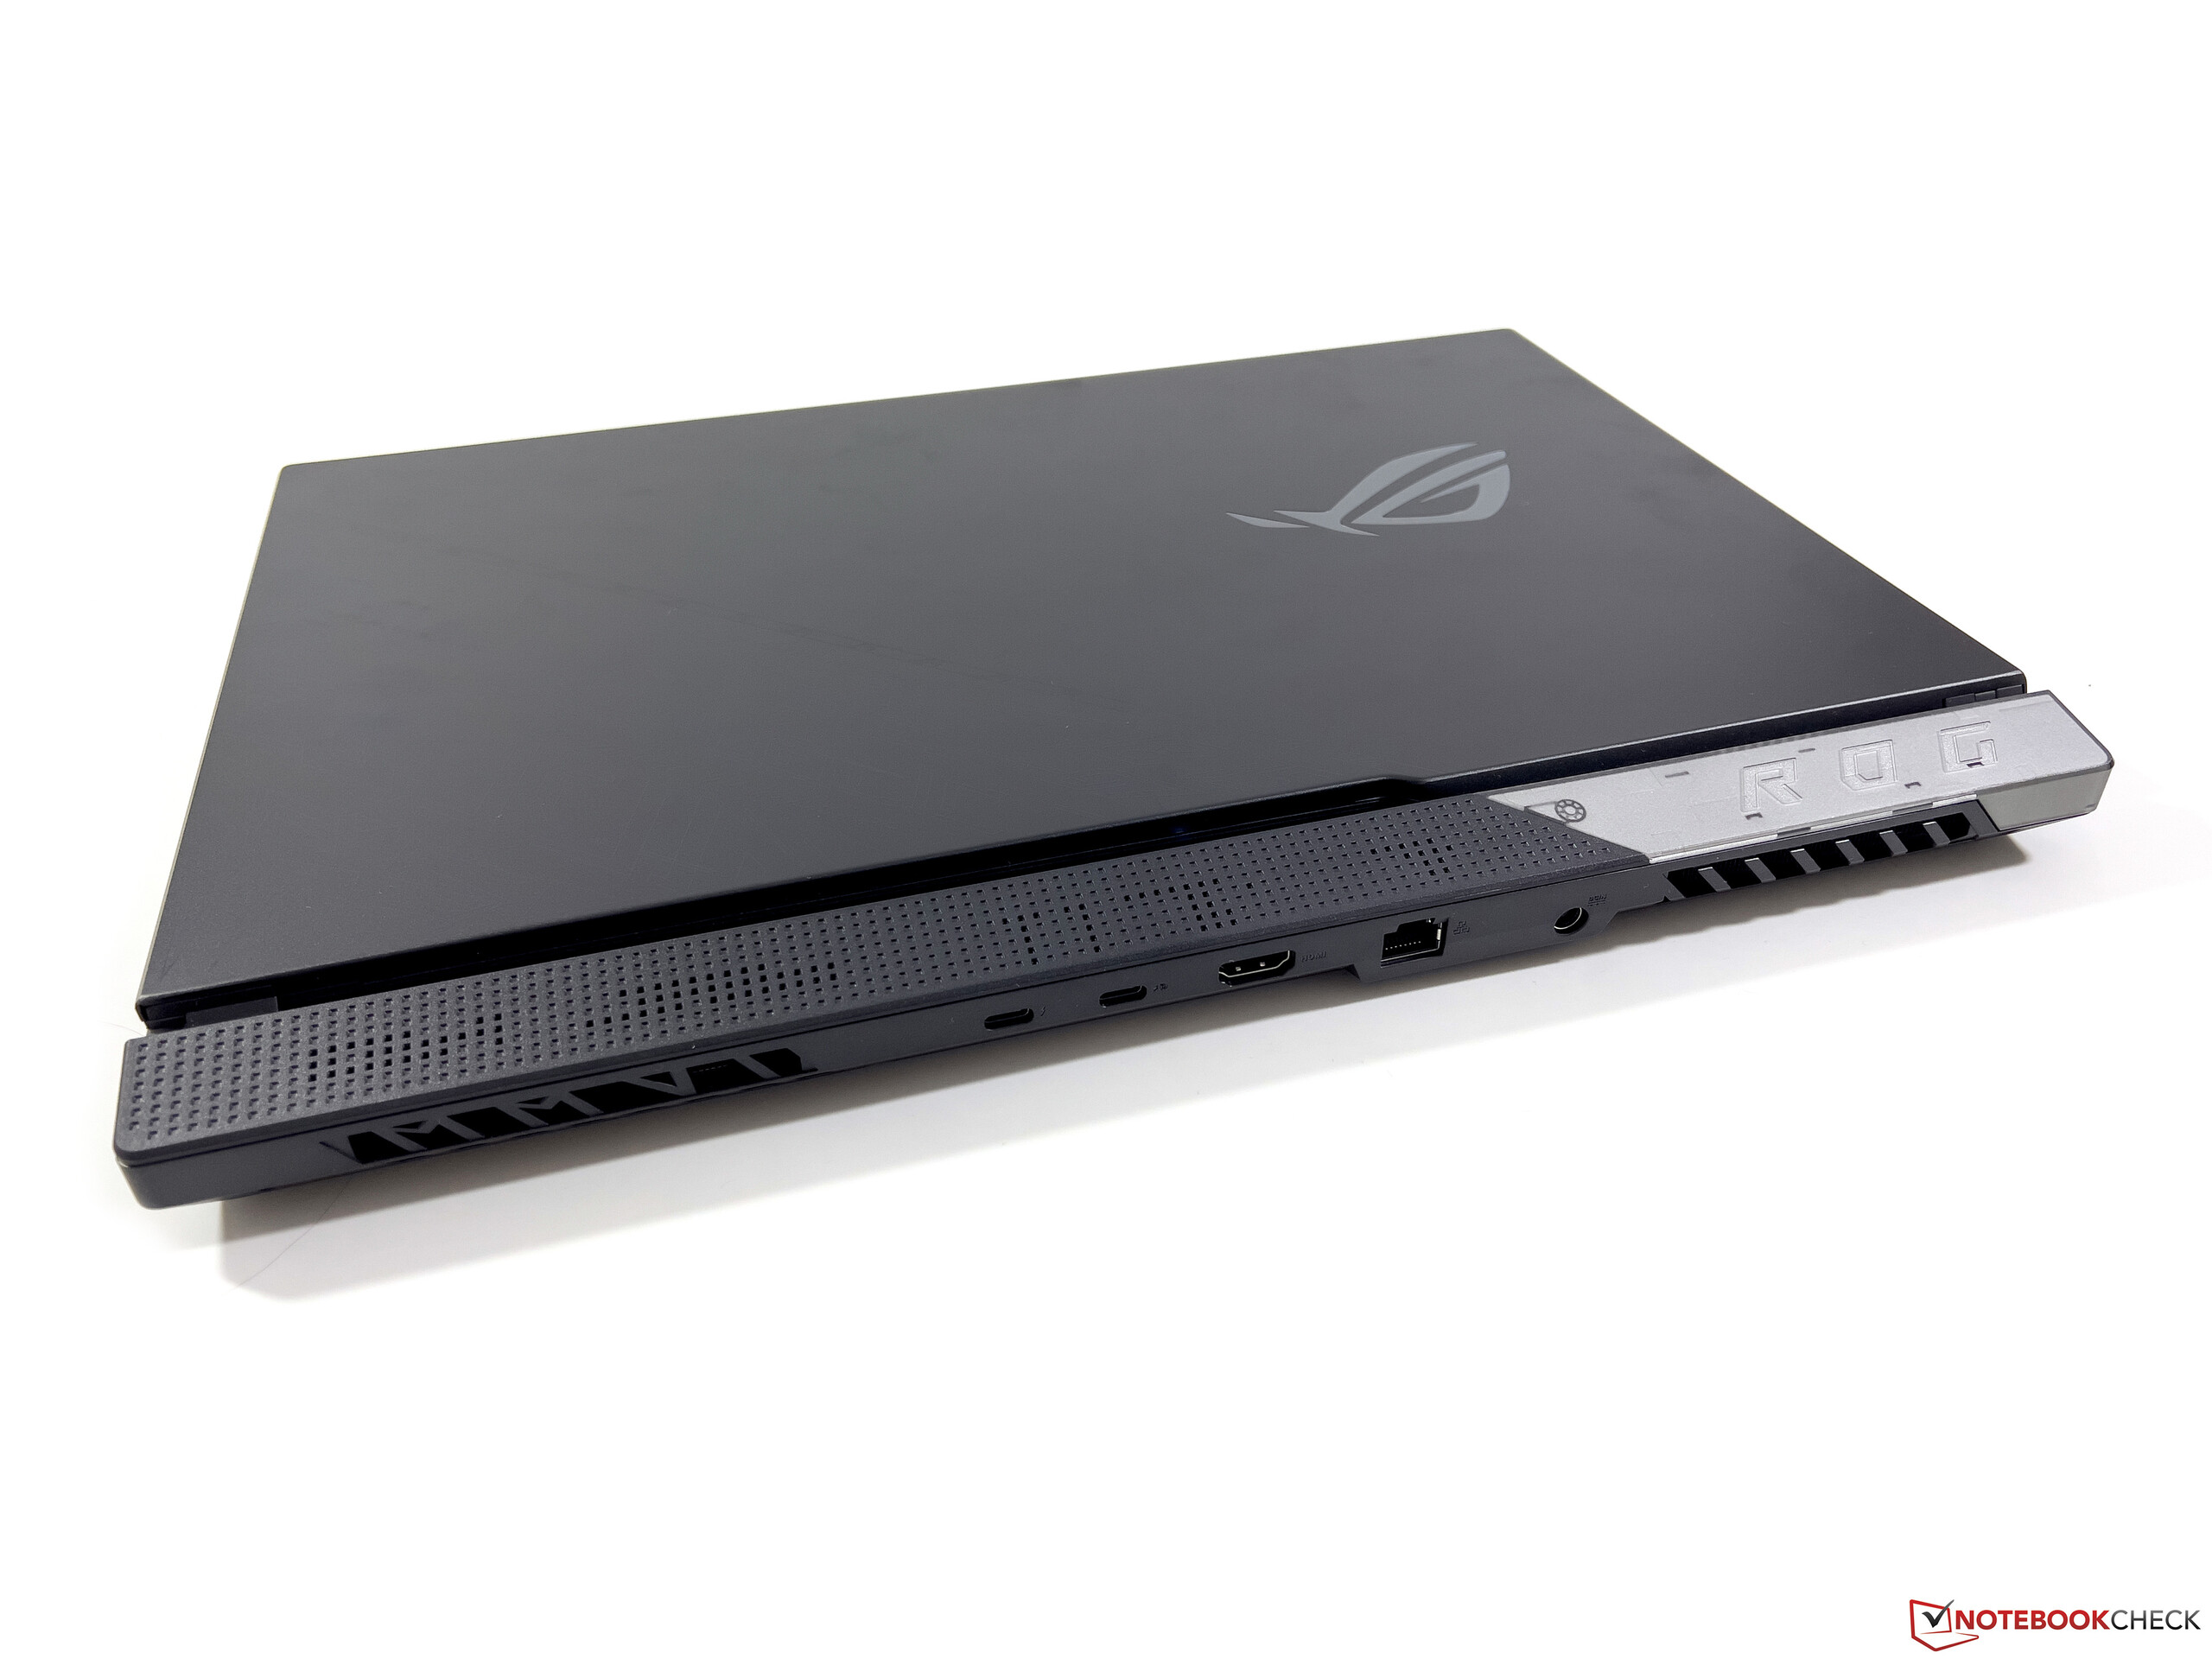
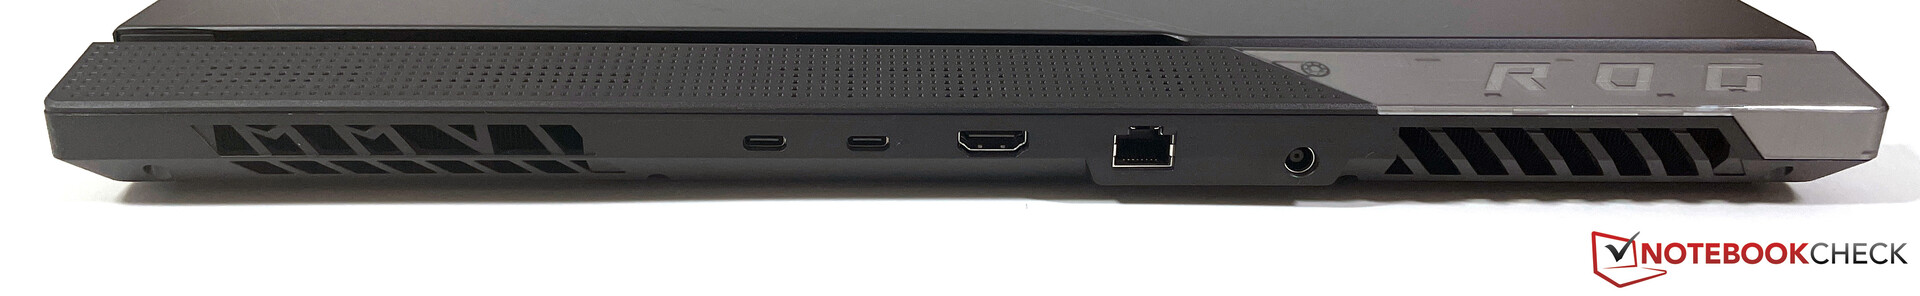
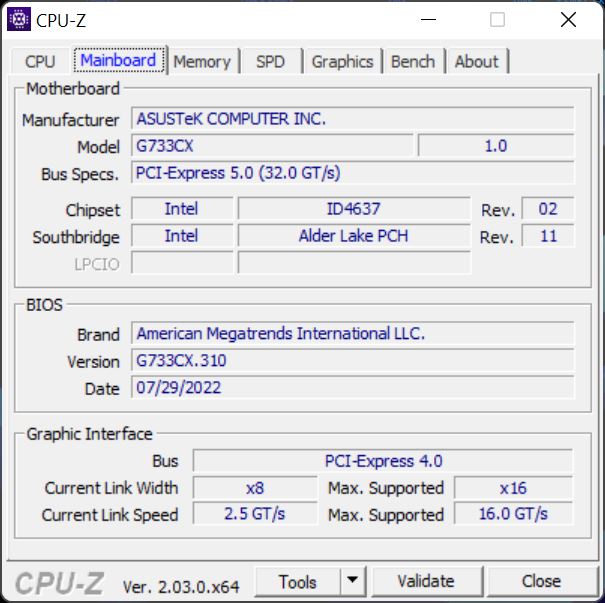
Sprzęt - ROG Strix Scar 17 z HDMI 2.1 i Wi-Fi 6E
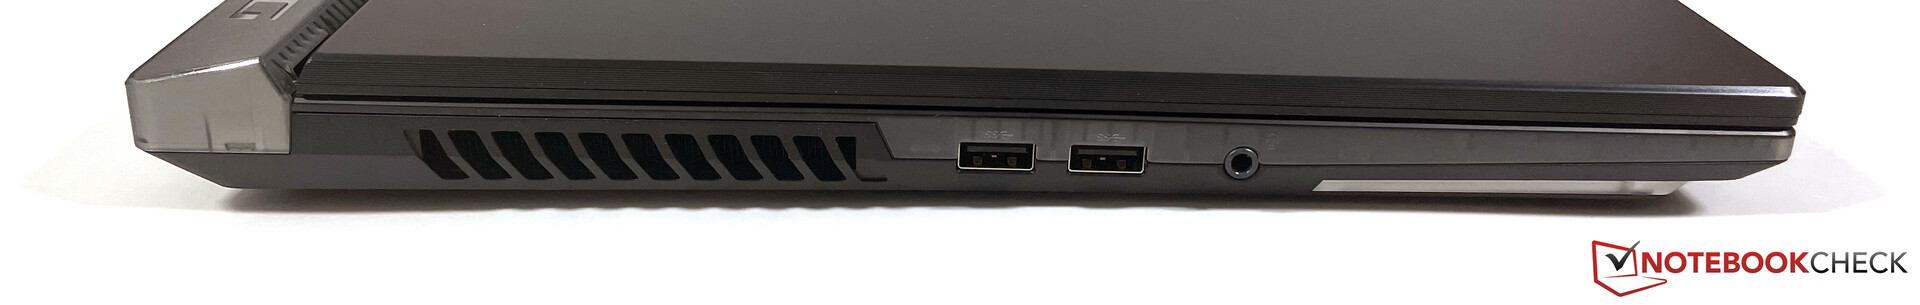
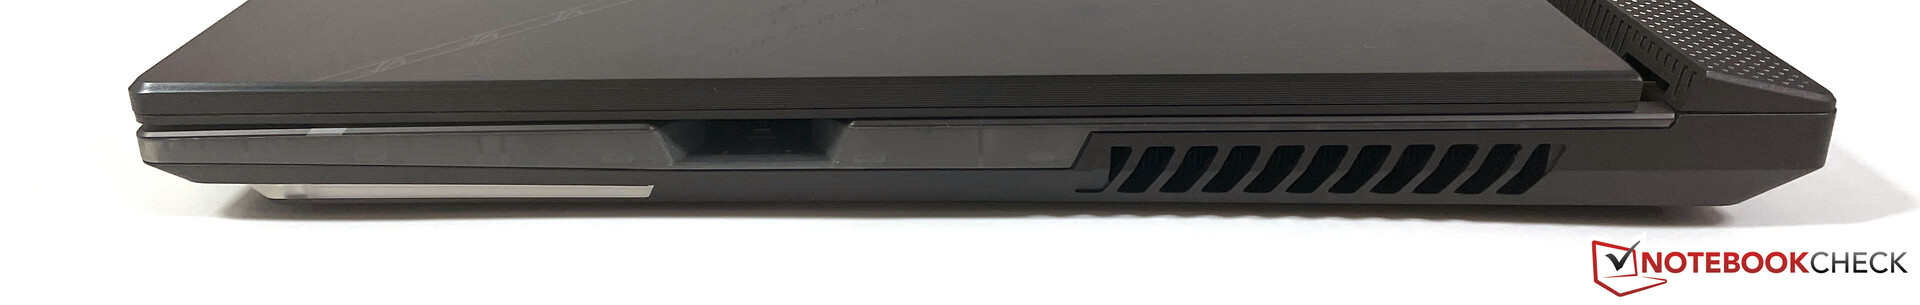
Oprócz złącza Thunderbolt, G733CX oferuje port HDMI 2.1, a port USB z tyłu może być również wykorzystany do ładowania w drodze (maks. 100 W). Większość złączy znajduje się z tyłu, a na lewym boku znajdziemy tylko dwa zwykłe porty USB-A i 3,5-mm port audio. Prawy bok oferuje także gniazdo dla Asus Keystone, pozwalające na przechowywanie ustawień i danych systemowych.
Wydajność WLAN z Intel AX211 jest bardzo dobra, bez problemu udało nam się również połączyć z siecią 6-GHz naszego referencyjnego routera Asusa. Dla połączeń przewodowych jest też złącze Ethernet o przepustowości 2,5 Gbit/s. Użytkownicy ROG Strix Scar 17 muszą obejść się bez kamerki internetowej, ale w razie potrzeby producent oferuje odpowiednią kamerkę zewnętrzną (ROG Eye S).
| Networking | |
| iperf3 receive AXE11000 6GHz | |
| Asus ROG Strix Scar 17 SE G733CX-LL014W | |
| Lenovo Legion 7 16IAX7-82TD004SGE | |
| MSI Titan GT77 12UHS | |
| Średnia w klasie Gaming (975 - 1775, n=35, ostatnie 2 lata) | |
| Przeciętny Intel Wi-Fi 6E AX211 (700 - 1857, n=226) | |
| iperf3 transmit AXE11000 6GHz | |
| Lenovo Legion 7 16IAX7-82TD004SGE | |
| Asus ROG Strix Scar 17 SE G733CX-LL014W | |
| MSI Titan GT77 12UHS | |
| Średnia w klasie Gaming (723 - 1868, n=36, ostatnie 2 lata) | |
| Przeciętny Intel Wi-Fi 6E AX211 (385 - 1851, n=226) | |
| iperf3 receive AXE11000 | |
| MSI Titan GT77 12UHS | |
| Średnia w klasie Gaming (680 - 1745, n=87, ostatnie 2 lata) | |
| Przeciętny Intel Wi-Fi 6E AX211 (582 - 1890, n=276) | |
| Schenker XMG Neo 17 M22 | |
| iperf3 transmit AXE11000 | |
| MSI Titan GT77 12UHS | |
| Średnia w klasie Gaming (560 - 1862, n=87, ostatnie 2 lata) | |
| Przeciętny Intel Wi-Fi 6E AX211 (64 - 1921, n=276) | |
| Schenker XMG Neo 17 M22 | |
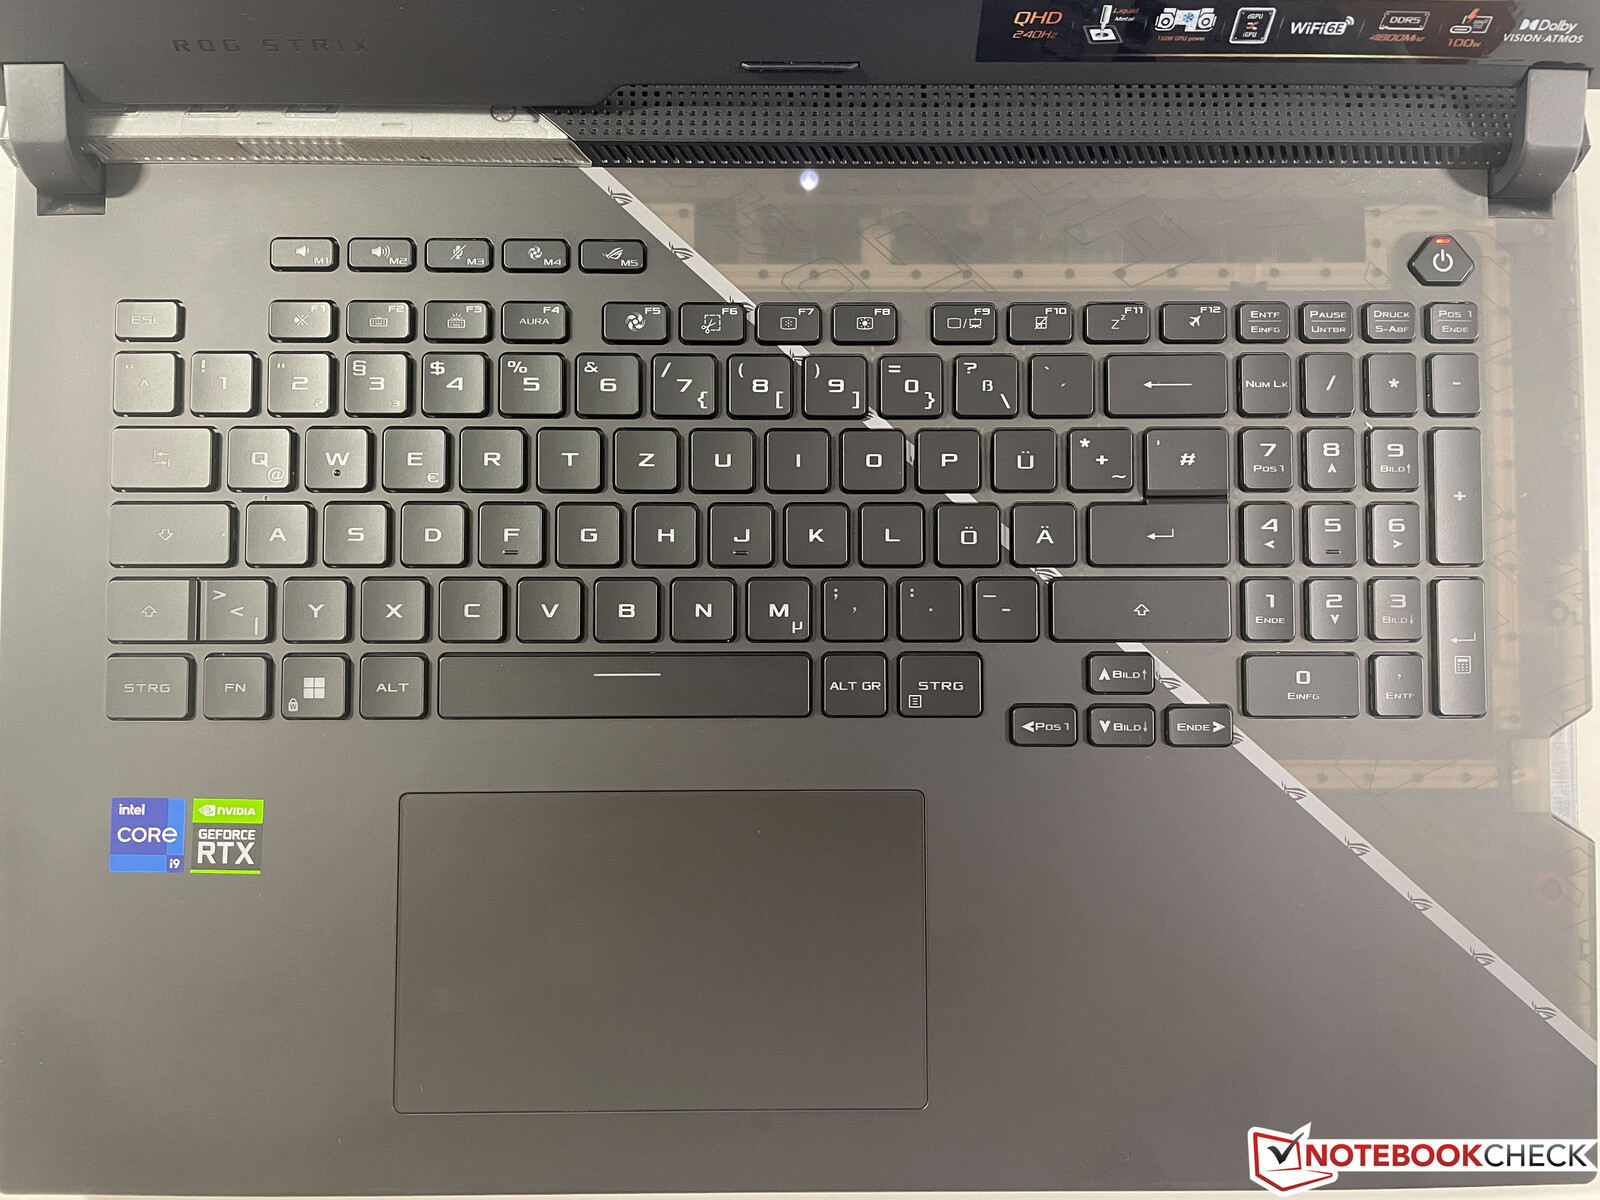
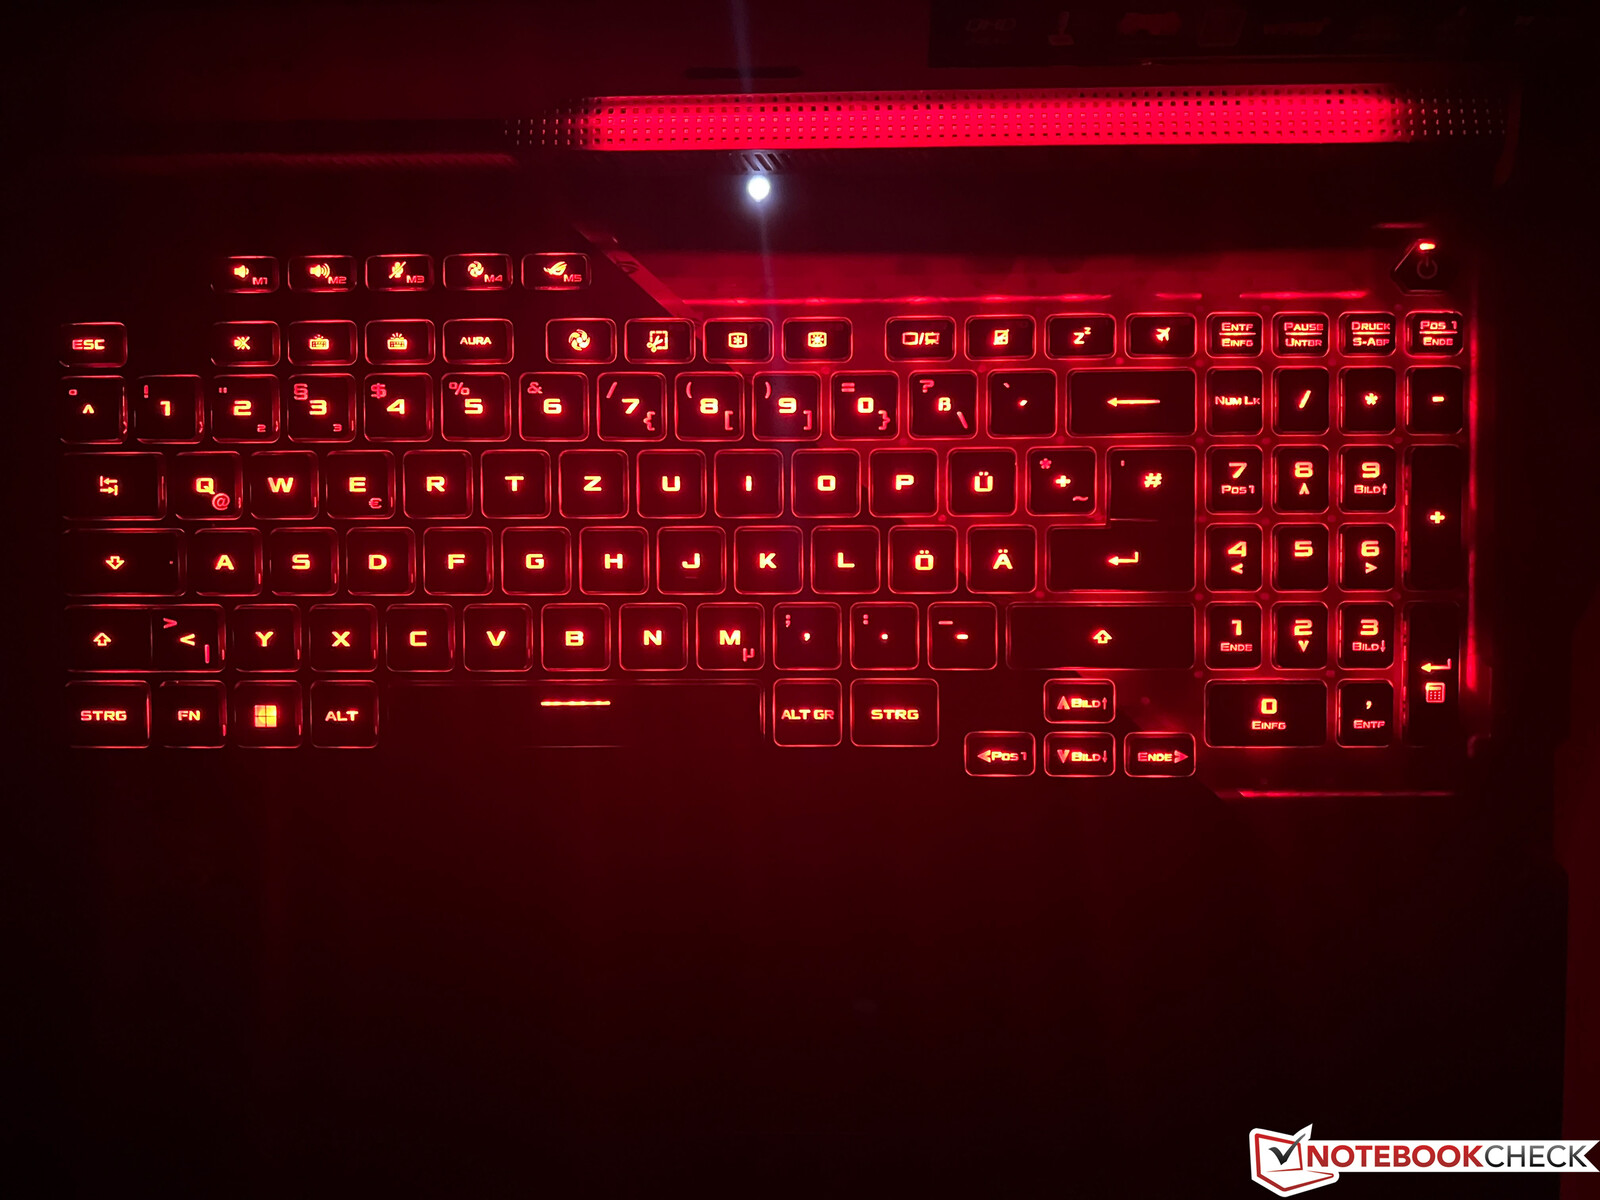
Urządzenia wejściowe - Asus z dobrą klawiaturą
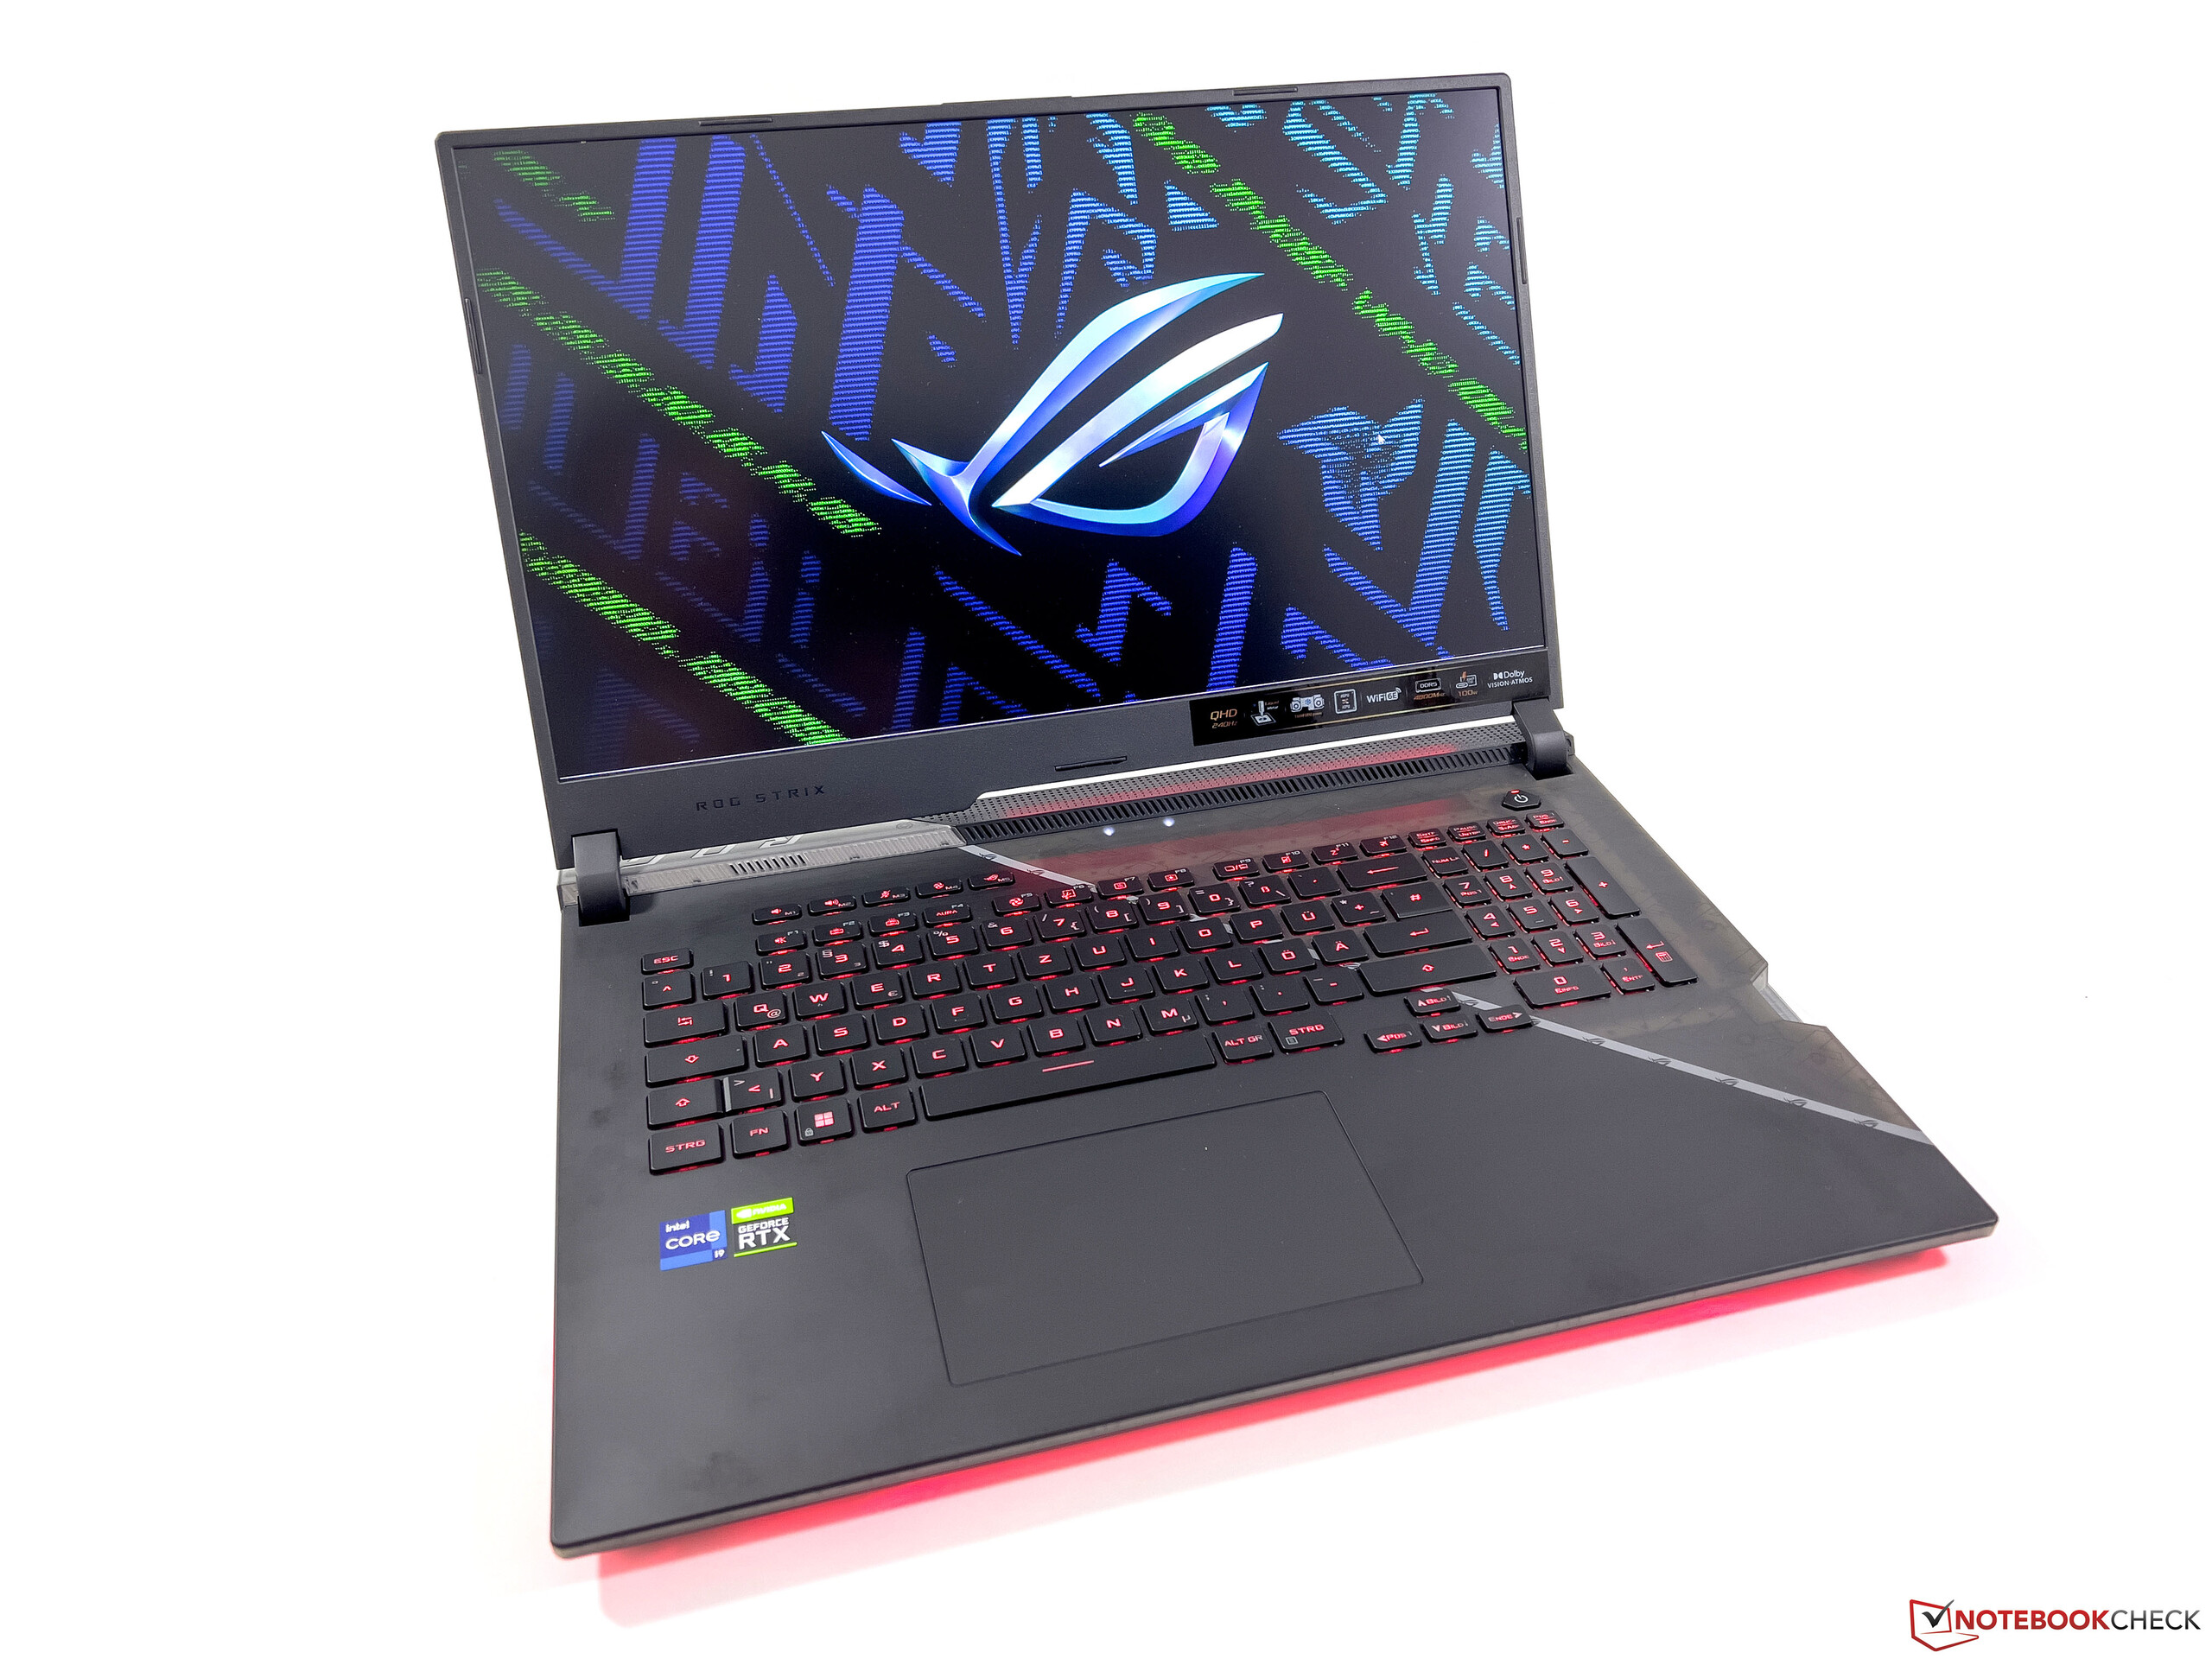
Asus ponownie zmienił układ klawiatury, stosując teraz bardziej konwencjonalny układ z mniejszymi klawiszami specjalnymi. Ponownie pojawił się też "zwykły" blok numeryczny, co oznacza również, że klawisze strzałek przesunęły się nieco w lewo i są teraz mniejsze. Nie wszystkim użytkownikom przypadnie to do gustu. Jakość klawiatury jest jednak bardzo dobra dzięki długiej piaście 2 mm, a do tego można zaszaleć z podświetleniem, które pozwala na konfigurację każdego klawisza osobno, w tym trybów specyficznych dla gier dzięki technologii AuraSync. Duży ClickPad oferuje dobre właściwości ślizgowe i działa niezawodnie, ale jest też dość głośny podczas jego naciskania.
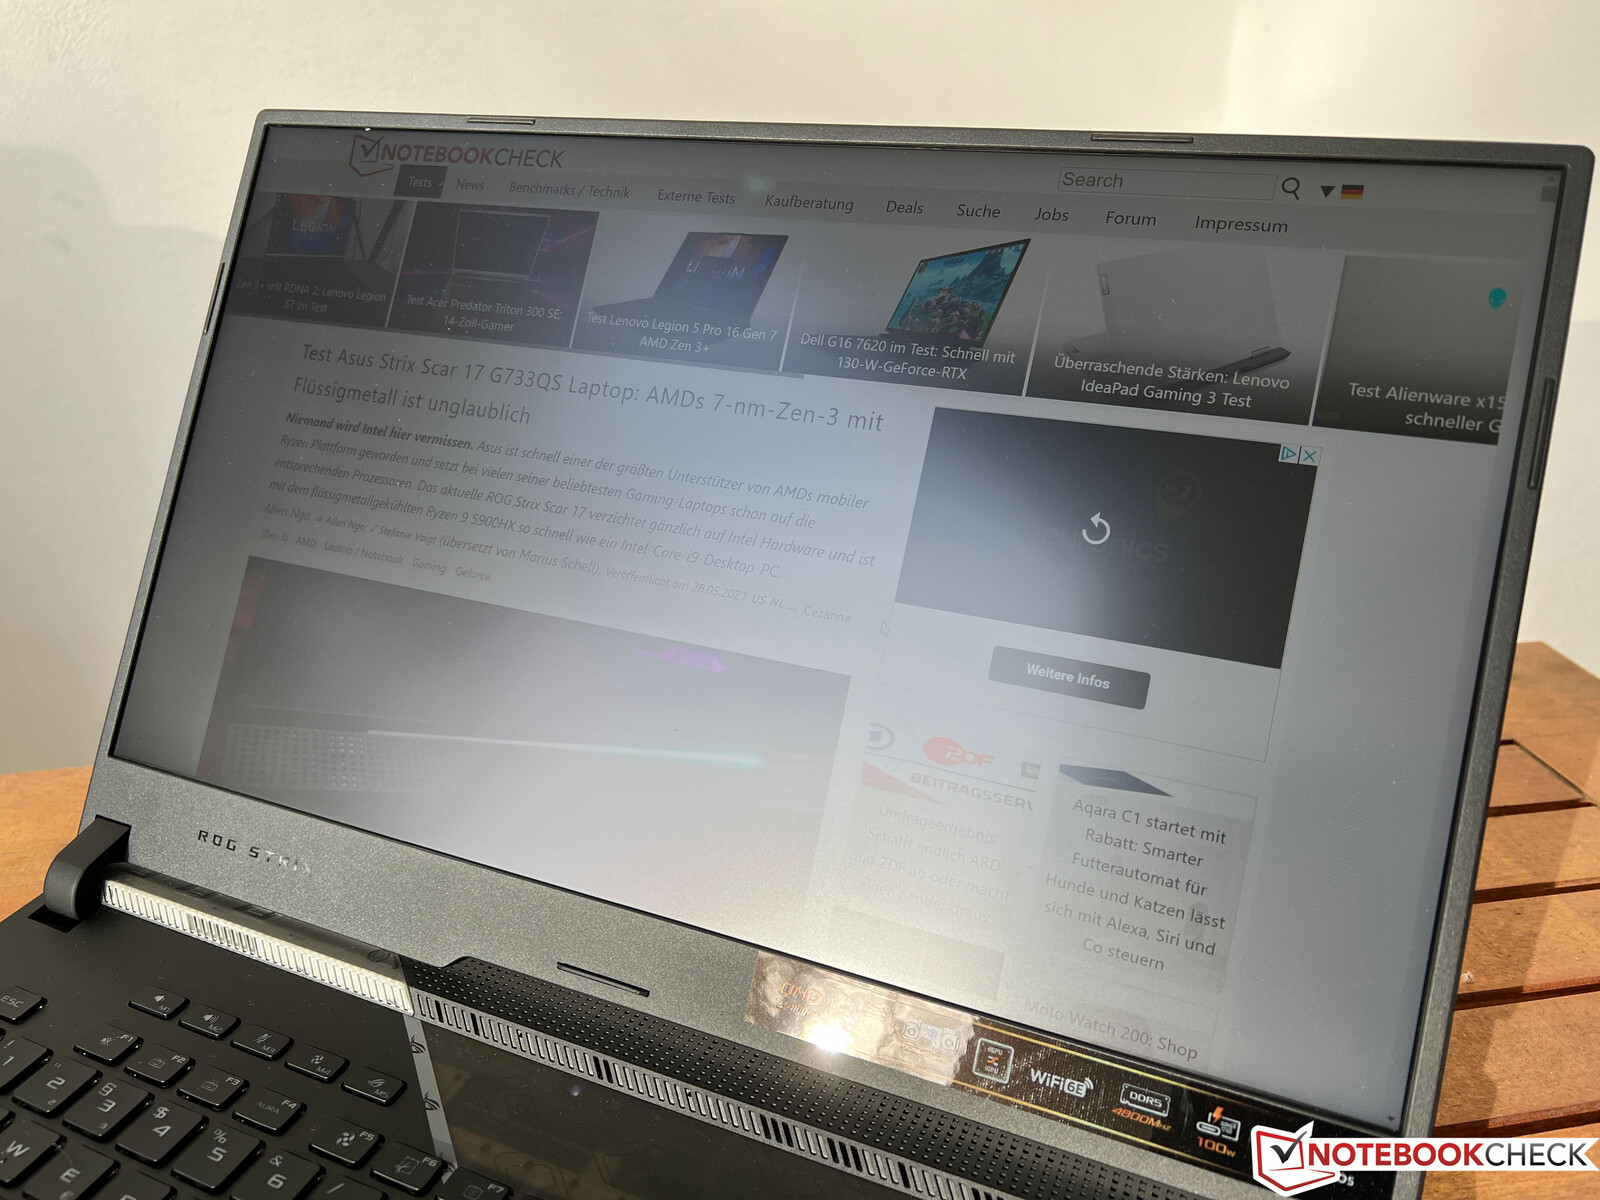
Wyświetlacz - QHD z częstotliwością 240 Hz
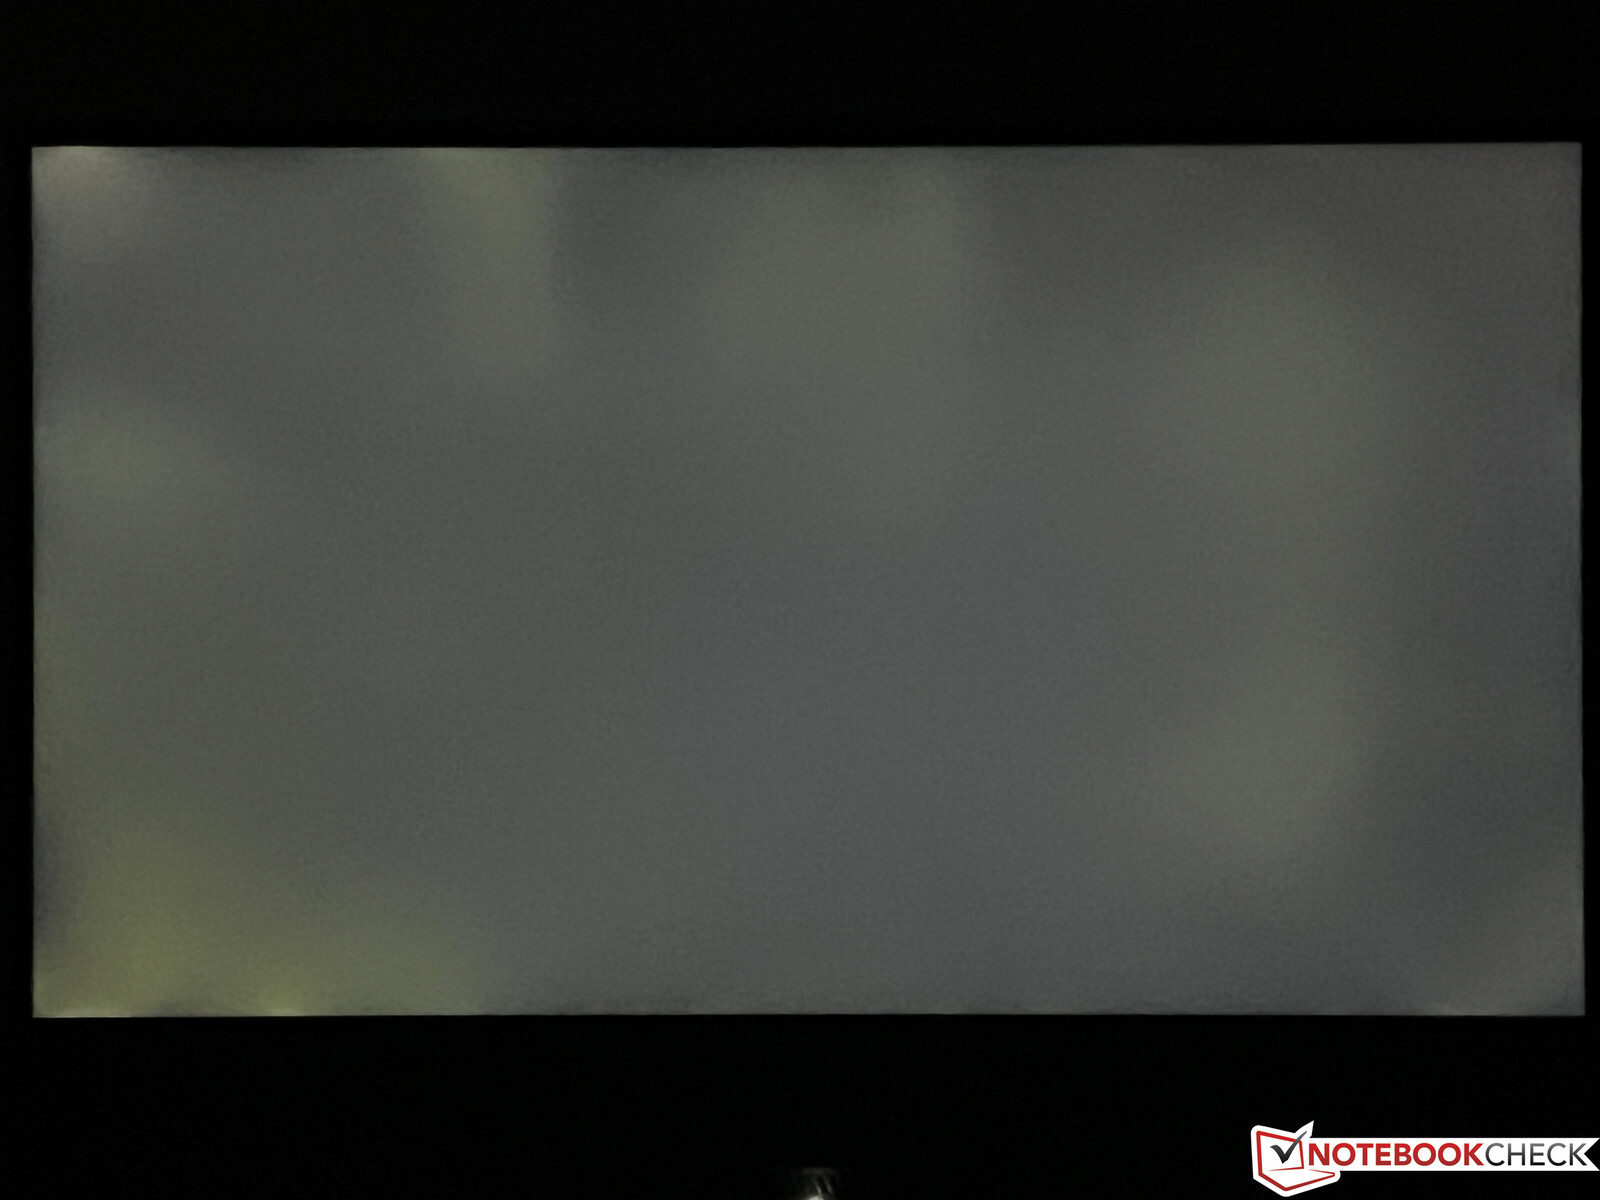
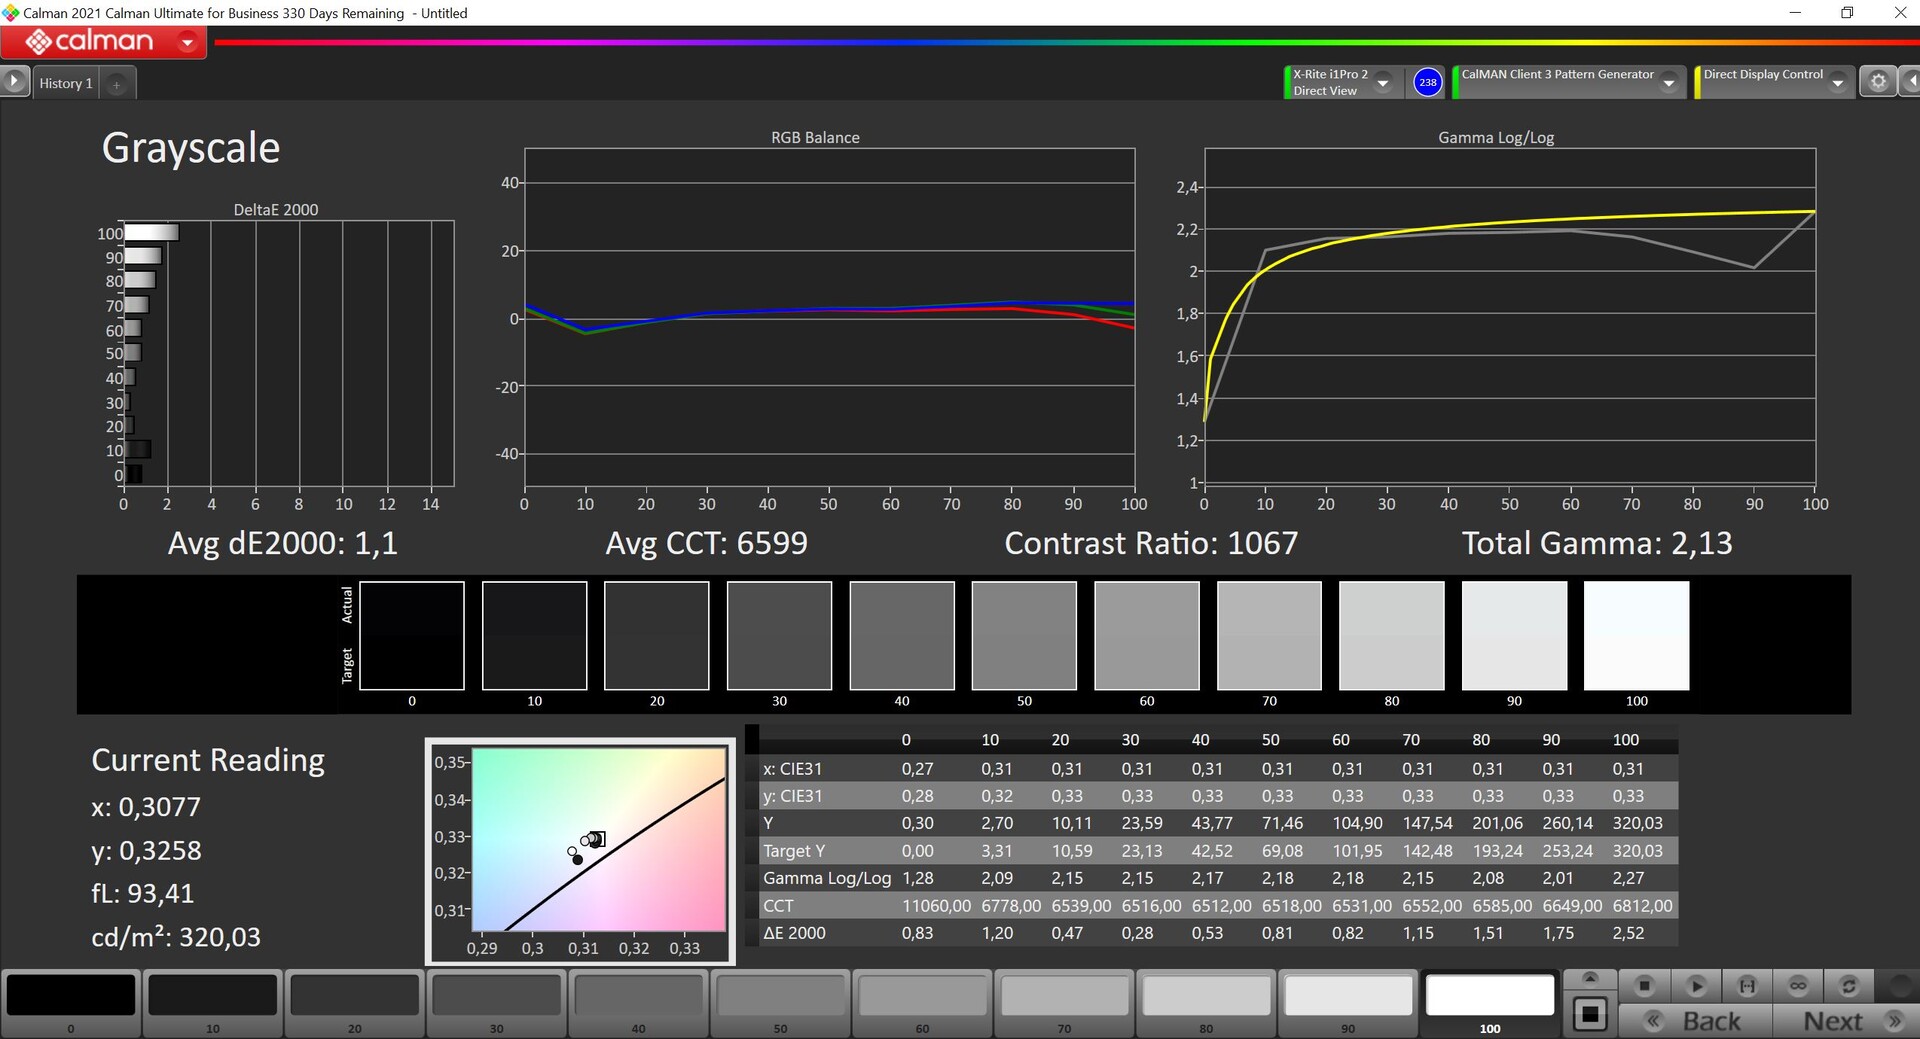
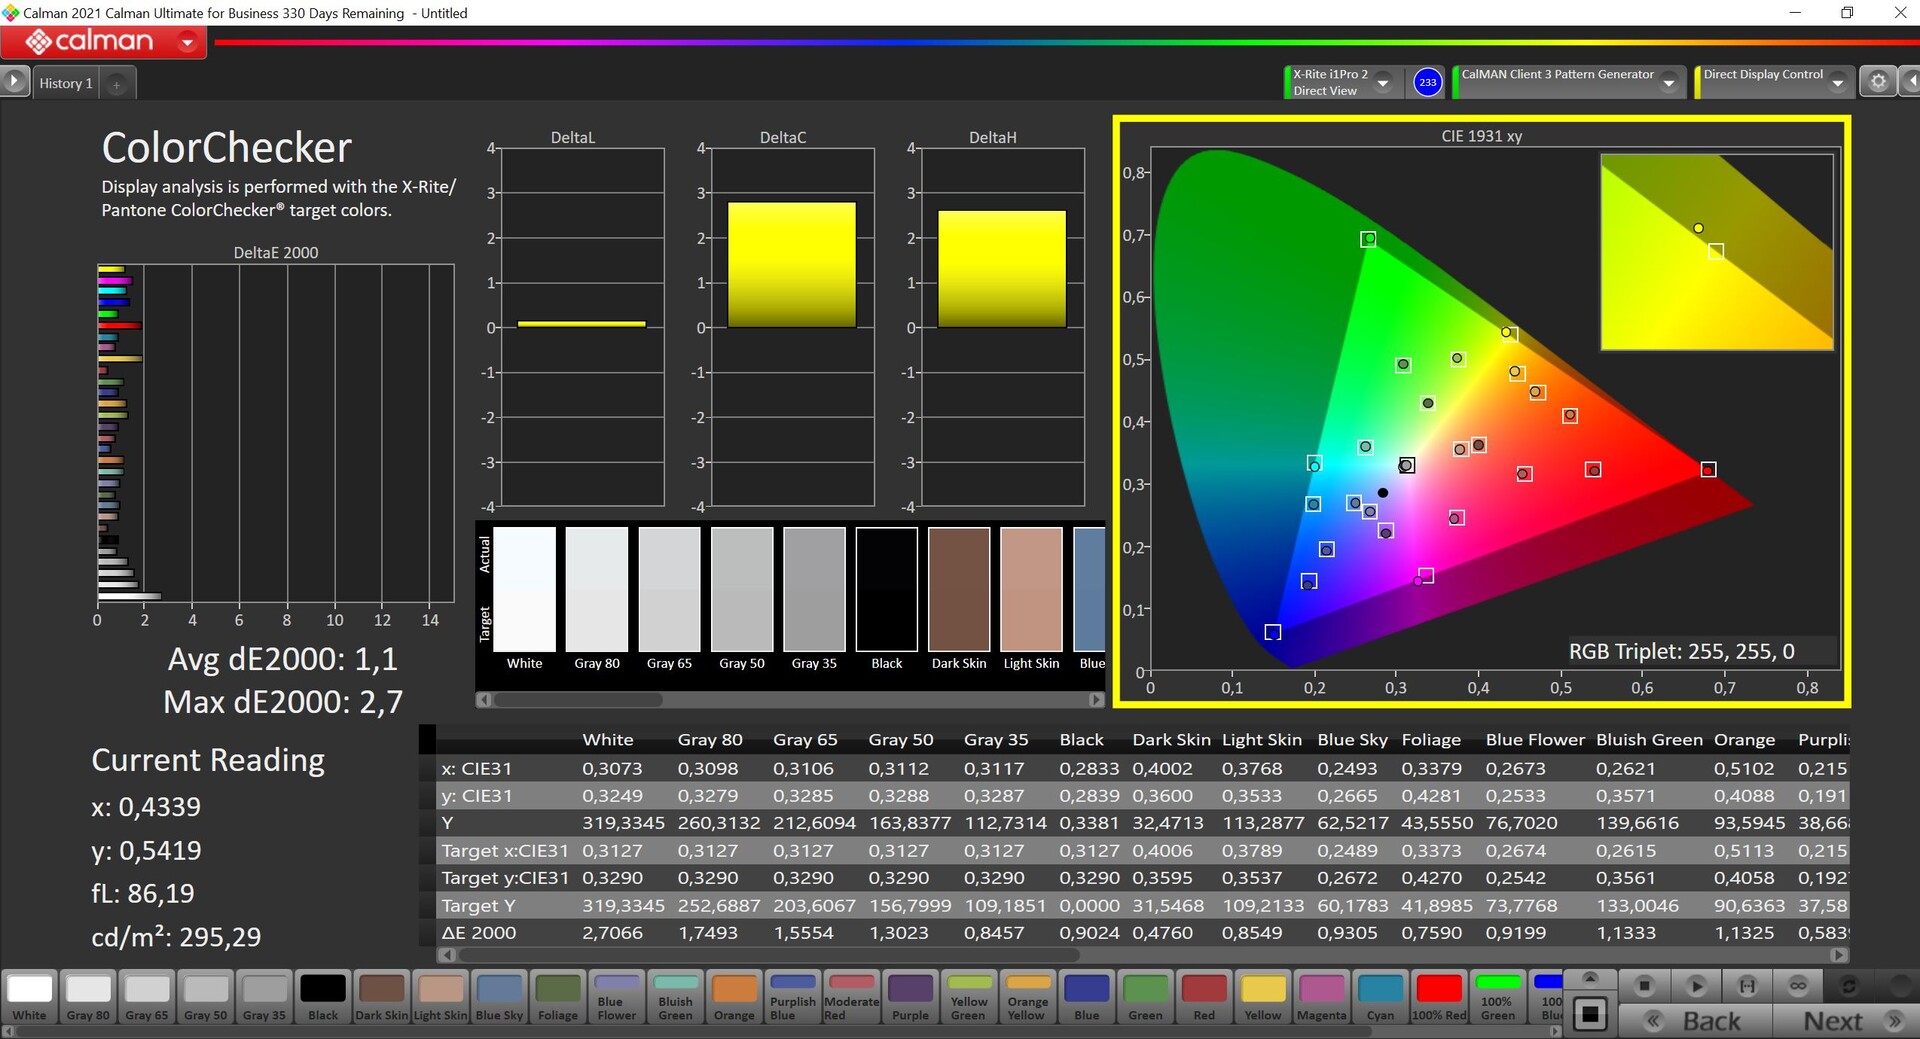
Oprócz panelu Full-HD o częstotliwości 360 Hz, który testowaliśmy w zeszłorocznym Scar 17 G733QS, Asus oferuje również panel QHD o częstotliwości odświeżania 240 Hz, który to panel znalazł się w naszym egzemplarzu testowym. Subiektywne wrażenie obrazu z matowego panelu IPS (2560 x 1440 pikseli, 16:9) jest bardzo dobre, a oprócz Dolby Vision HDR obsługiwany jest także Adaptive Sync. Czasy reakcji są wyjątkowo szybkie, a PWM nie jest wykorzystywane. Jasność wynosi średnio około 300 cd/m², co również jest tym samym poziomem, co w przypadku panelu Full-HD z 360 Hz. Z drugiej strony wartość czerni jest nieco wysoka, co skutkuje także przeciętnym współczynnikiem kontrastu wynoszącym około 1000:1.
| |||||||||||||||||||||||||
rozświetlenie: 87 %
na akumulatorze: 320 cd/m²
kontrast: 1067:1 (czerń: 0.3 cd/m²)
ΔE ColorChecker Calman: 1.1 | ∀{0.5-29.43 Ø4.71}
ΔE Greyscale Calman: 1.1 | ∀{0.09-98 Ø4.96}
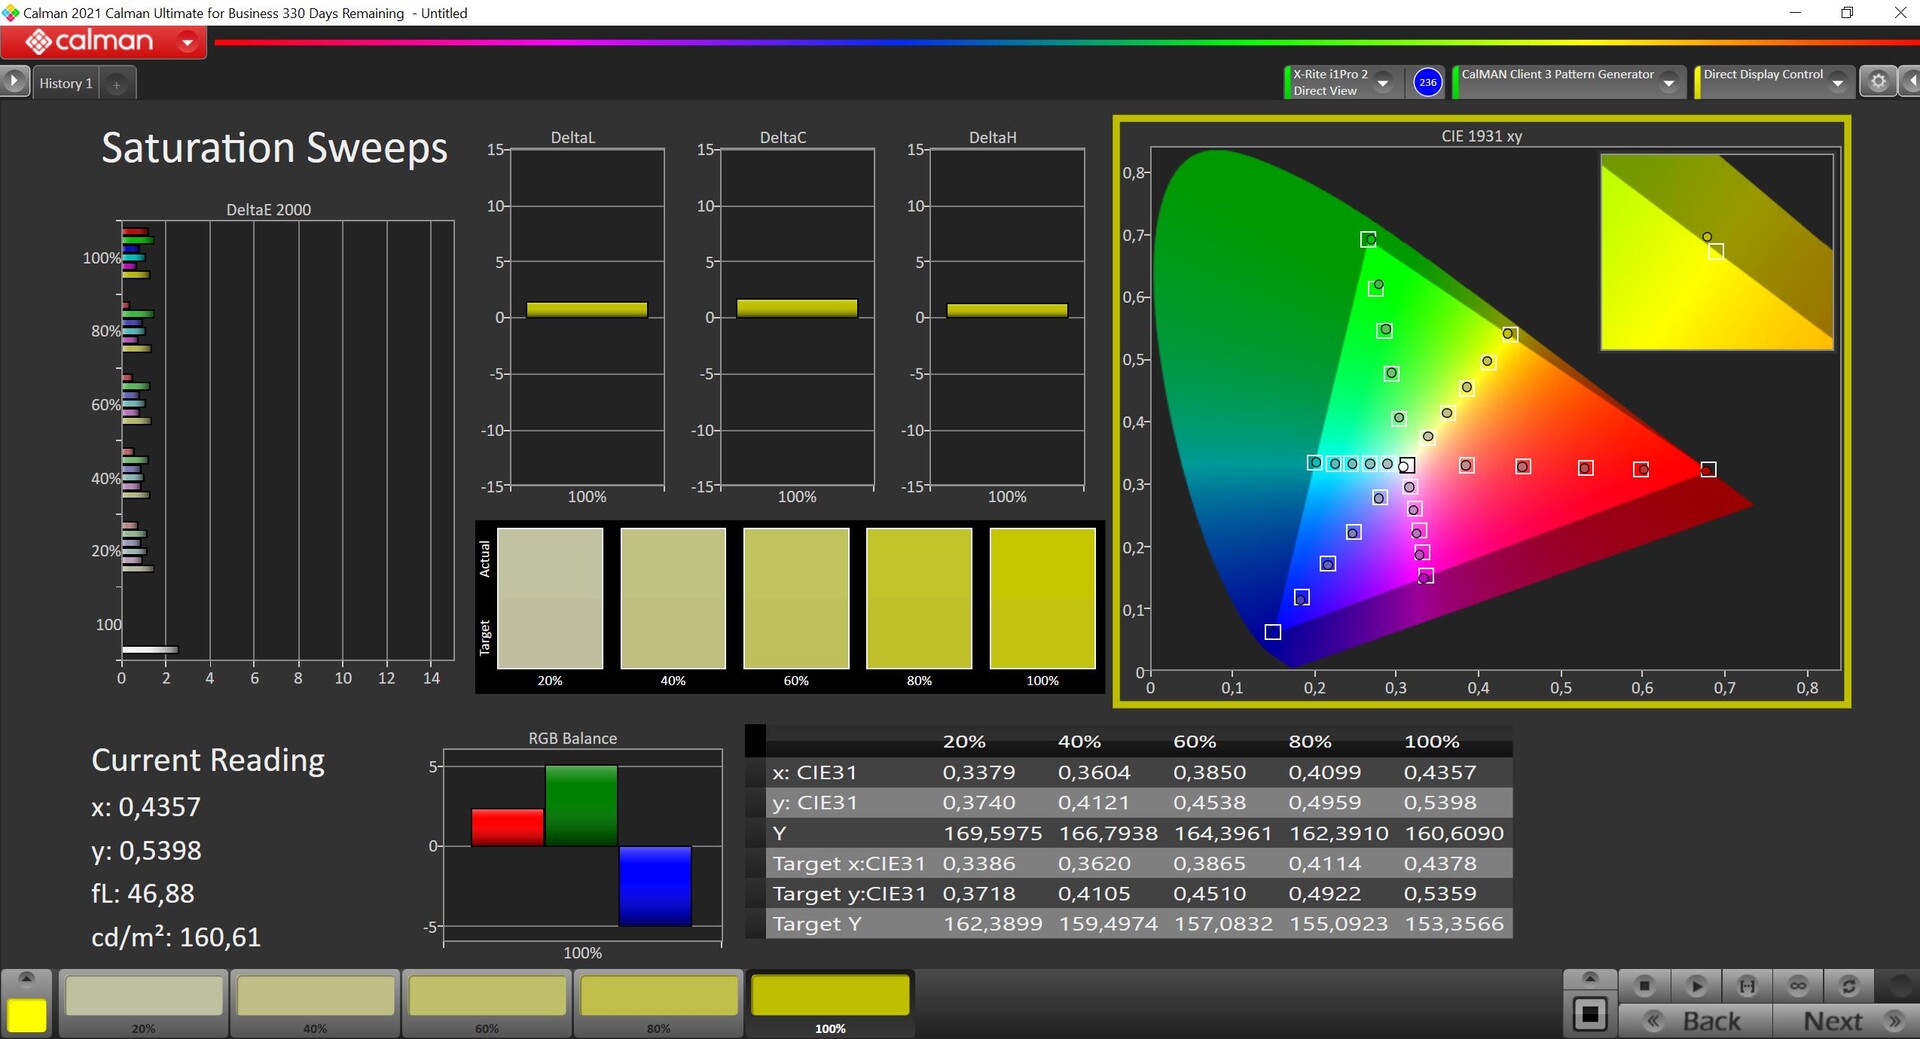
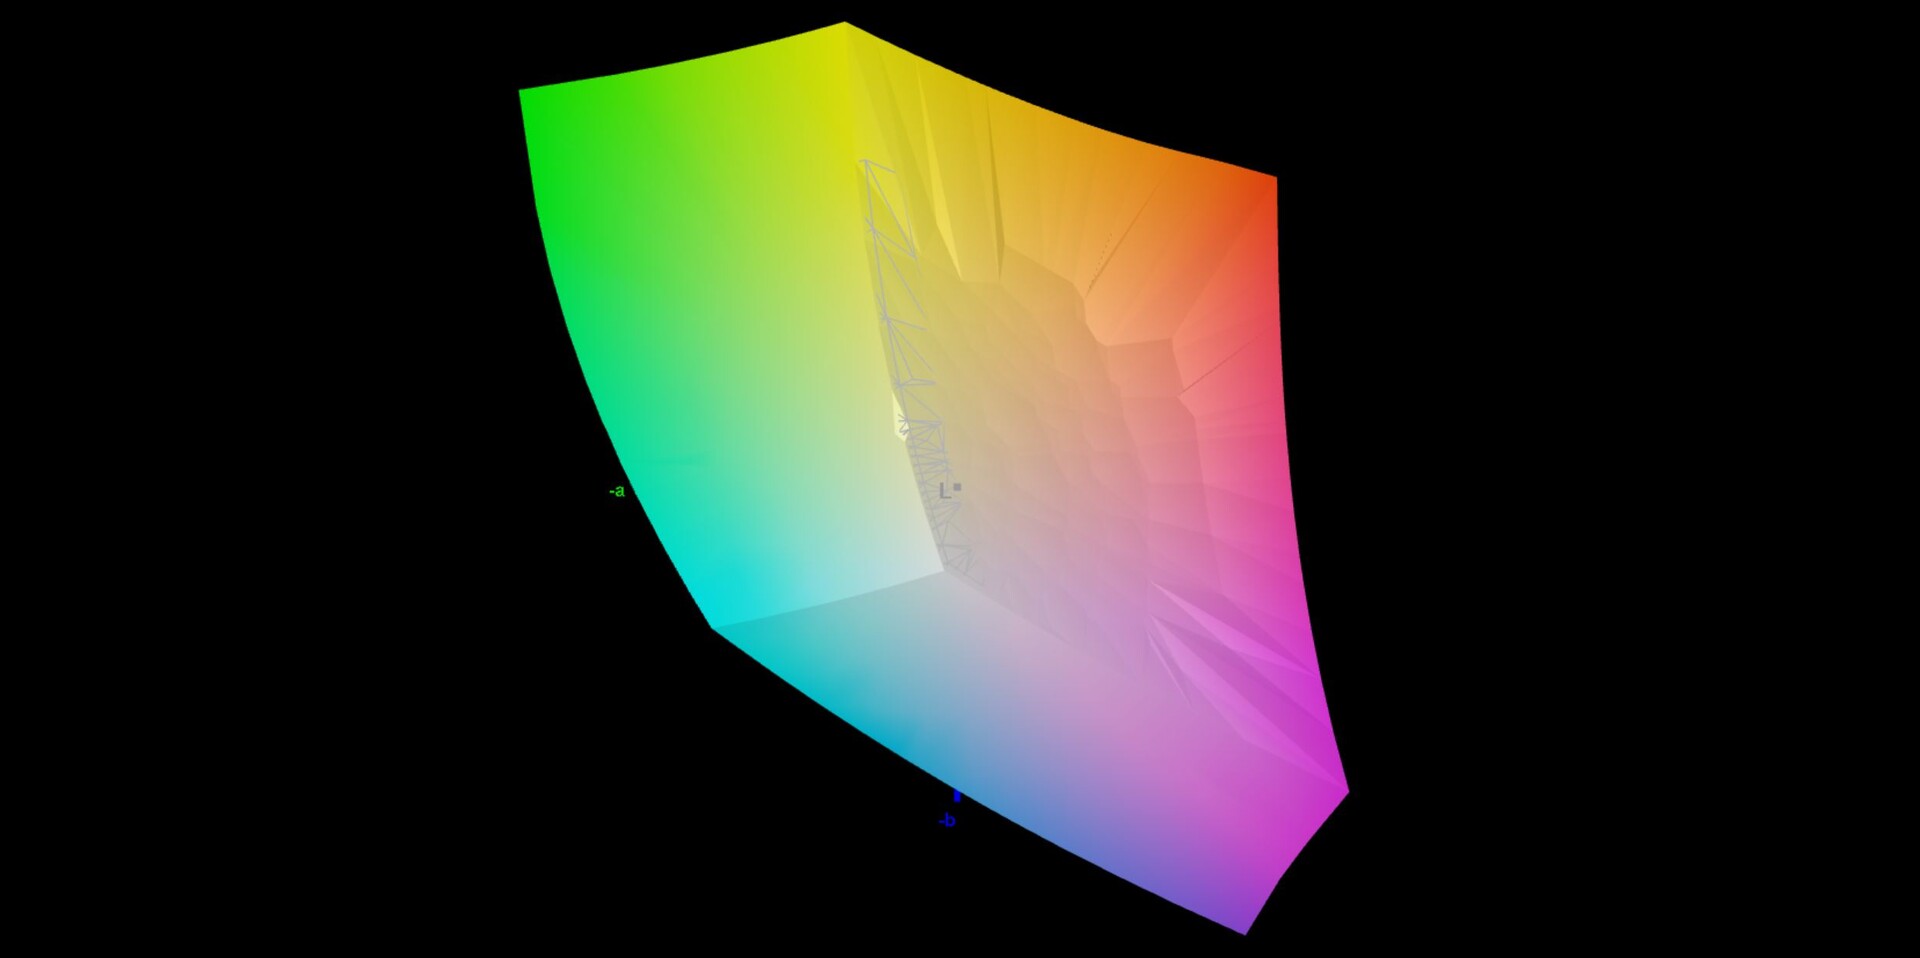
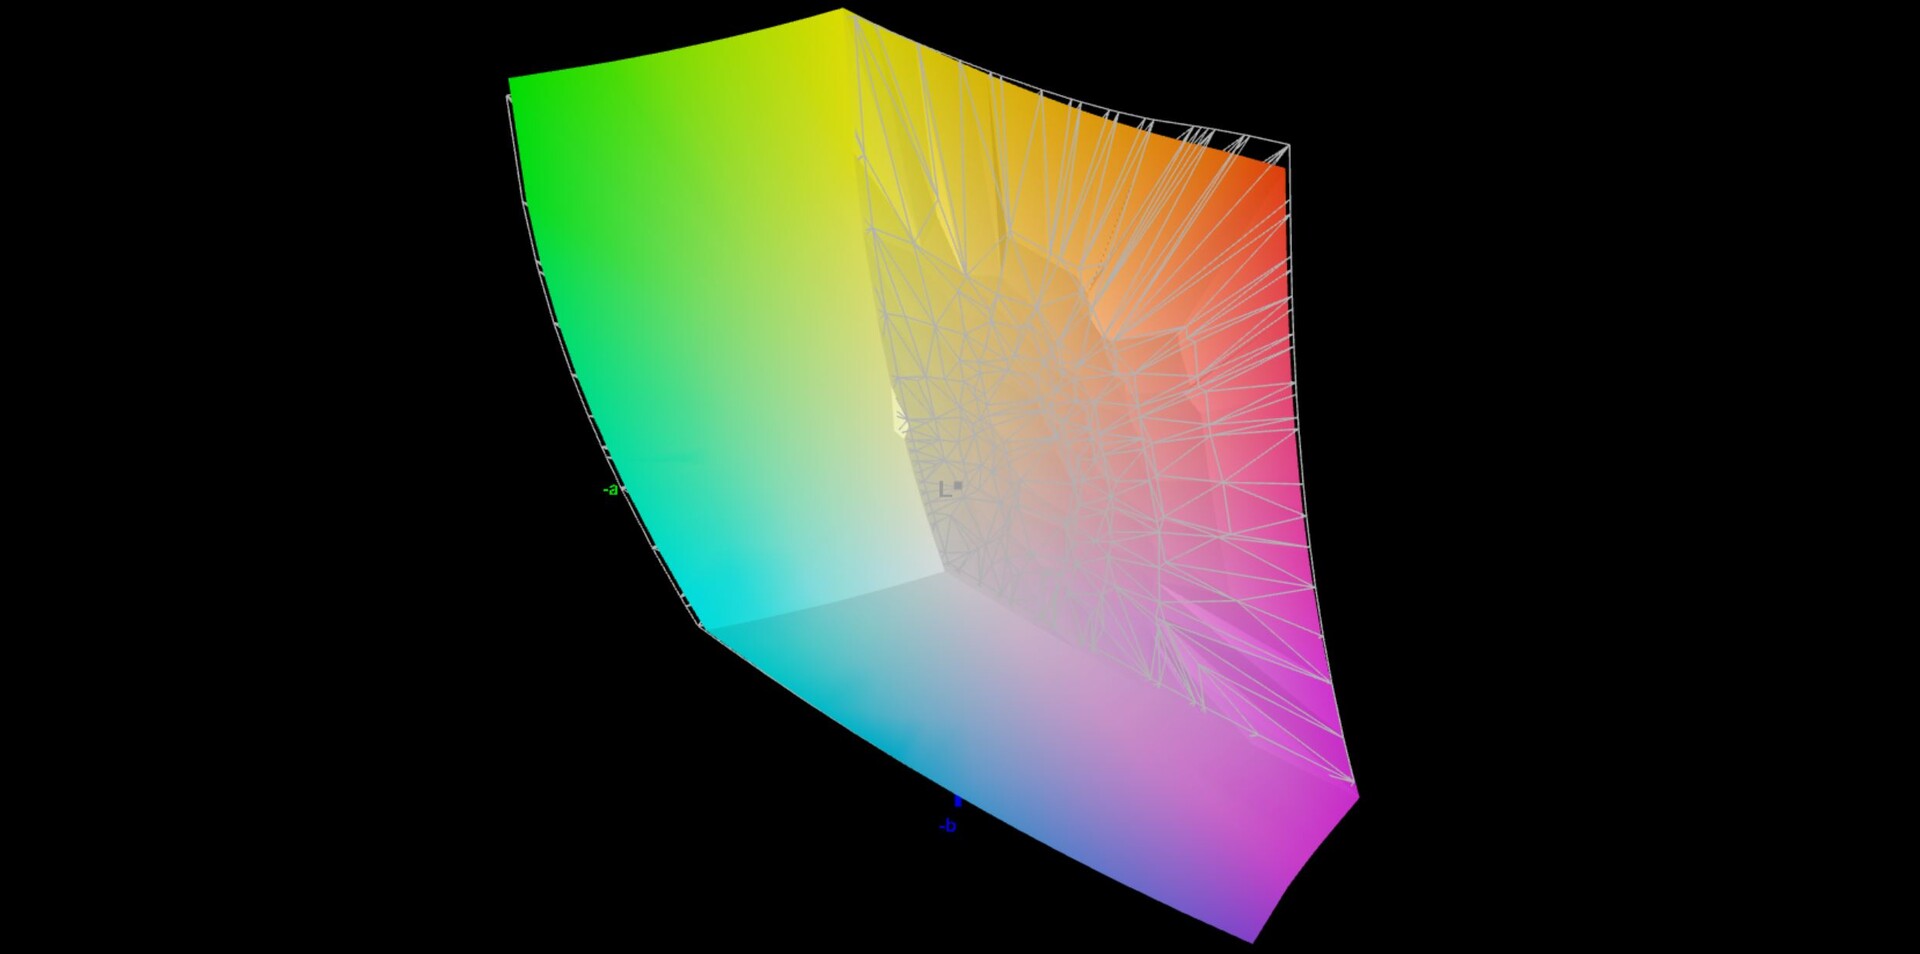
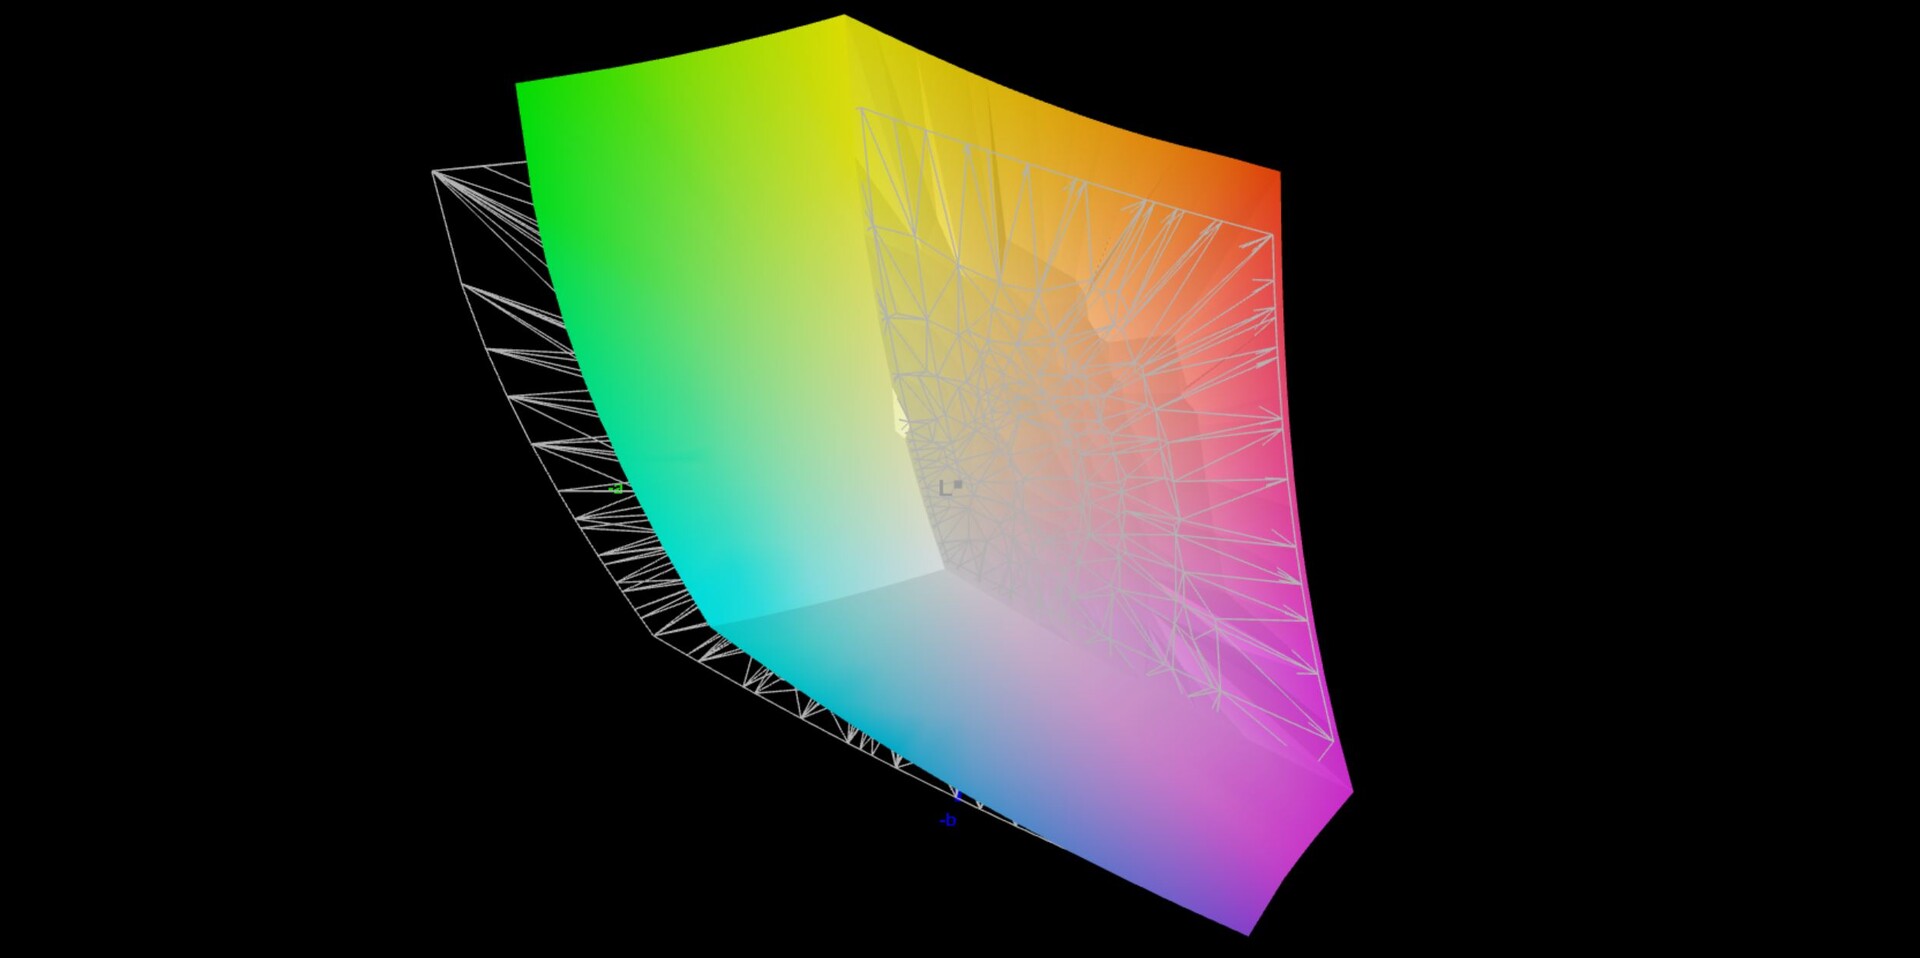
84.8% AdobeRGB 1998 (Argyll 3D)
99.9% sRGB (Argyll 3D)
97.1% Display P3 (Argyll 3D)
Gamma: 2.13
CCT: 6599 K
| Asus ROG Strix Scar 17 SE G733CX-LL014W NE173QHM-NZ2, IPS, 2560x1440, 17.3" | Lenovo Legion 7 16IAX7-82TD004SGE NE160QDM-NY1, IPS, 2560x1600, 16" | MSI Titan GT77 12UHS Sharp SHP1544 LQ173M1JW08, IPS-Level, 1920x1080, 17.3" | Schenker XMG Neo 17 M22 BOE0A99, IPS, 2560x1600, 17" | Alienware x17 R2 P48E AU Optronics B173HAN, IPS, 1920x1080, 17.3" | Asus Strix Scar 17 G733QSA-XS99 AU Optronics B173HAN05.4, IPS, 1920x1080, 17.3" | |
|---|---|---|---|---|---|---|
| Display | -16% | -14% | -16% | -8% | -14% | |
| Display P3 Coverage (%) | 97.1 | 69.3 -29% | 70.8 -27% | 69 -29% | 79.2 -18% | 71 -27% |
| sRGB Coverage (%) | 99.9 | 98.2 -2% | 98.9 -1% | 99.8 0% | 99.8 0% | 99.4 -1% |
| AdobeRGB 1998 Coverage (%) | 84.8 | 70.8 -17% | 73 -14% | 69.6 -18% | 79.6 -6% | 72.2 -15% |
| Response Times | -38% | 48% | -25% | -55% | -12% | |
| Response Time Grey 50% / Grey 80% * (ms) | 5.7 ? | 12.6 ? -121% | 3.03 ? 47% | 10.8 ? -89% | 12.4 ? -118% | 6.6 ? -16% |
| Response Time Black / White * (ms) | 10.1 ? | 5.6 ? 45% | 5.28 ? 48% | 6.1 ? 40% | 9.2 ? 9% | 10.8 ? -7% |
| PWM Frequency (Hz) | ||||||
| Screen | -41% | -63% | -9% | -89% | -25% | |
| Brightness middle (cd/m²) | 320 | 547 71% | 280 -12% | 415 30% | 365.4 14% | 303.8 -5% |
| Brightness (cd/m²) | 303 | 523 73% | 275 -9% | 399 32% | 344 14% | 292 -4% |
| Brightness Distribution (%) | 87 | 88 1% | 79 -9% | 90 3% | 85 -2% | 85 -2% |
| Black Level * (cd/m²) | 0.3 | 0.44 -47% | 0.4 -33% | 0.43 -43% | 0.29 3% | 0.23 23% |
| Contrast (:1) | 1067 | 1243 16% | 700 -34% | 965 -10% | 1260 18% | 1321 24% |
| Colorchecker dE 2000 * | 1.1 | 2.1 -91% | 2.1 -91% | 1.44 -31% | 3.17 -188% | 1.87 -70% |
| Colorchecker dE 2000 max. * | 2.7 | 7 -159% | 5.83 -116% | 2.33 14% | 7.69 -185% | 3.26 -21% |
| Greyscale dE 2000 * | 1.1 | 3.2 -191% | 3.3 -200% | 1.8 -64% | 5.3 -382% | 2.7 -145% |
| Gamma | 2.13 103% | 2.23 99% | 2.13 103% | 2.132 103% | 2.18 101% | 2.26 97% |
| CCT | 6599 98% | 6979 93% | 7060 92% | 6327 103% | 5879 111% | 6436 101% |
| Colorchecker dE 2000 calibrated * | 0.9 | 1.58 | 0.89 | 0.51 | 1.45 | |
| Color Space (Percent of AdobeRGB 1998) (%) | 65.6 | |||||
| Color Space (Percent of sRGB) (%) | 99.4 | |||||
| Całkowita średnia (program / ustawienia) | -32% /
-35% | -10% /
-35% | -17% /
-13% | -51% /
-65% | -17% /
-20% |
* ... im mniej tym lepiej
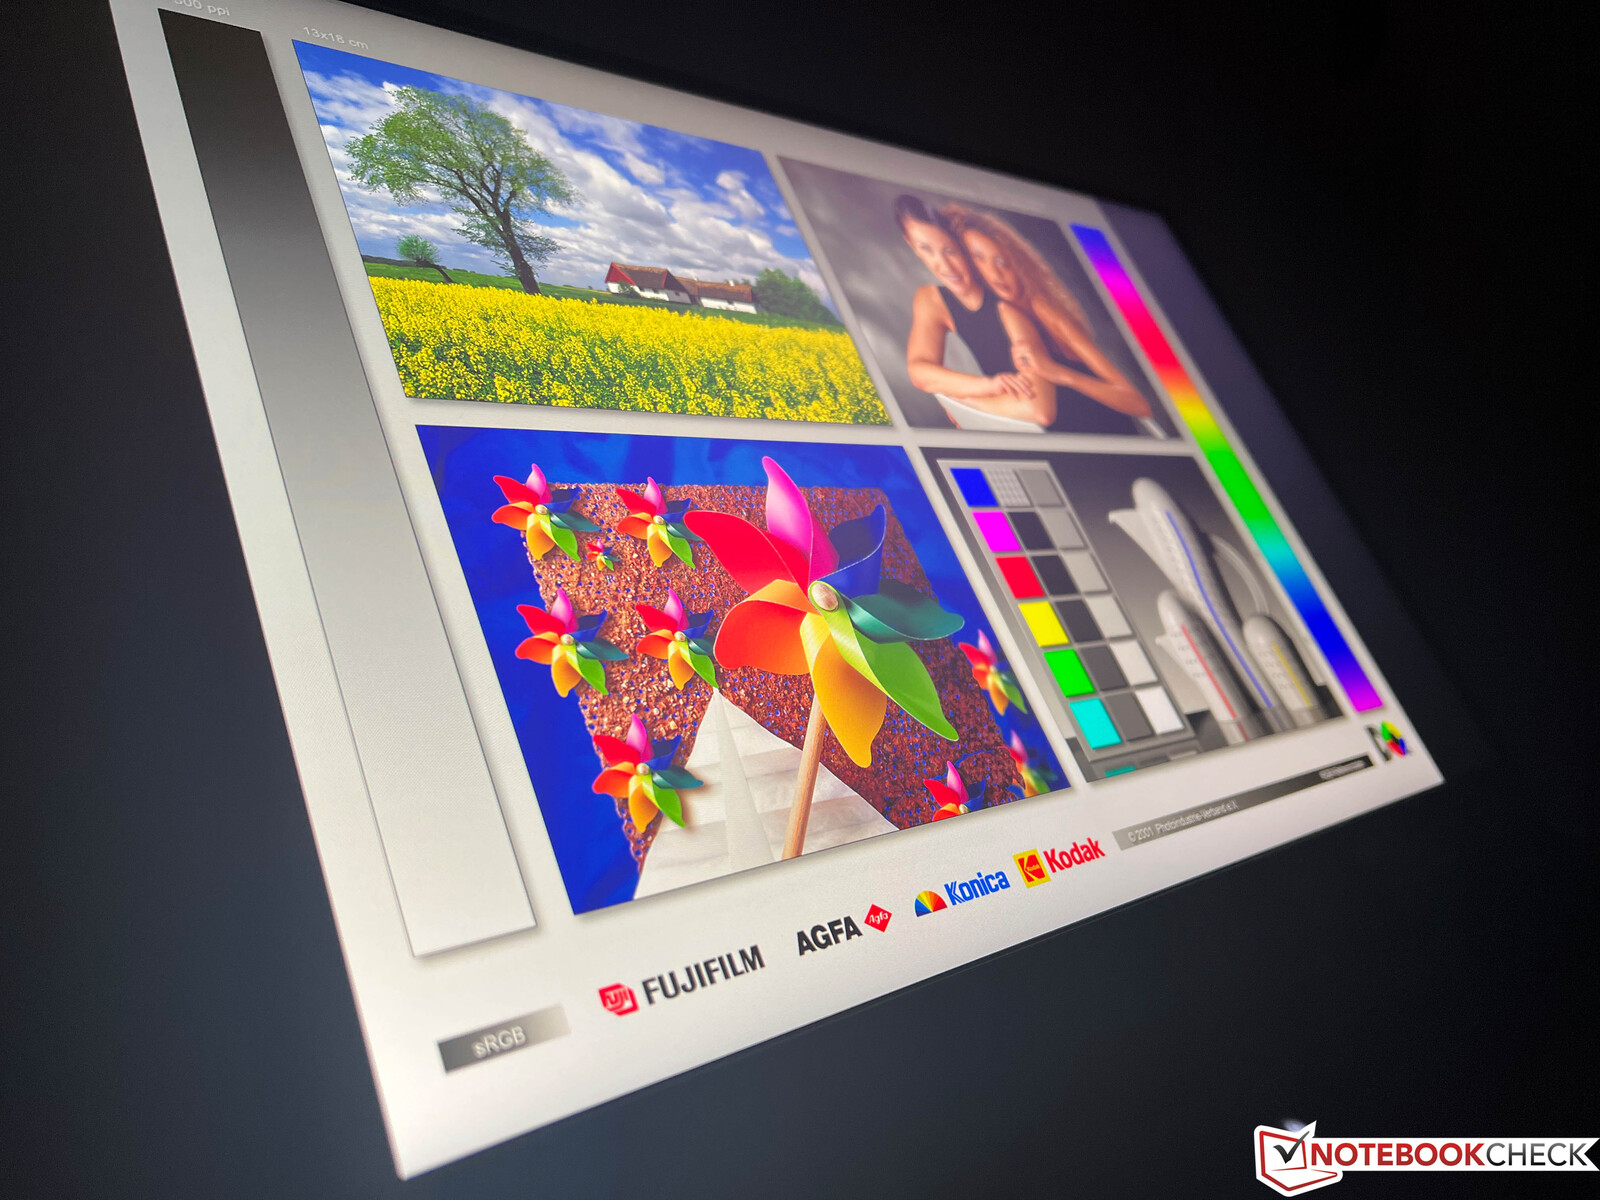
Wyświetlacz pokrywa przestrzeń barwną P3, a nasza analiza za pomocą profesjonalnego oprogramowania CalMAN wykazała, że ekran jest bardzo dokładny już w stanie dostawy. Nie ma też żadnego odcienia kolorów, a nasza własna kalibracja nie doprowadziła do dodatkowej poprawy, więc nie oferujemy tutaj dla Was profilu. Ten panel QHD nadaje się do obróbki obrazu i wideo bez żadnych ograniczeń.
Wyświetl czasy reakcji
| ↔ Czas reakcji od czerni do bieli | ||
|---|---|---|
| 10.1 ms ... wzrost ↗ i spadek ↘ łącznie | ↗ 5 ms wzrost | 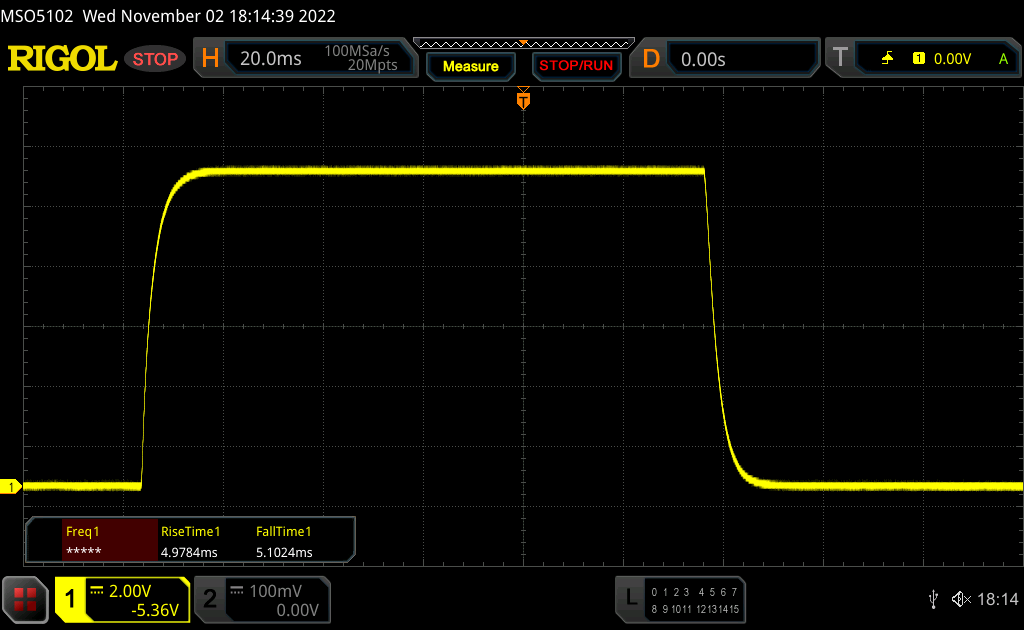 |
| ↘ 5.1 ms upadek | ||
| W naszych testach ekran wykazuje dobry współczynnik reakcji, ale może być zbyt wolny dla graczy rywalizujących ze sobą. Dla porównania, wszystkie testowane urządzenia wahają się od 0.1 (minimum) do 240 (maksimum) ms. » 28 % wszystkich urządzeń jest lepszych. Oznacza to, że zmierzony czas reakcji jest lepszy od średniej wszystkich testowanych urządzeń (19.8 ms). | ||
| ↔ Czas reakcji 50% szarości do 80% szarości | ||
| 5.7 ms ... wzrost ↗ i spadek ↘ łącznie | ↗ 2.7 ms wzrost | 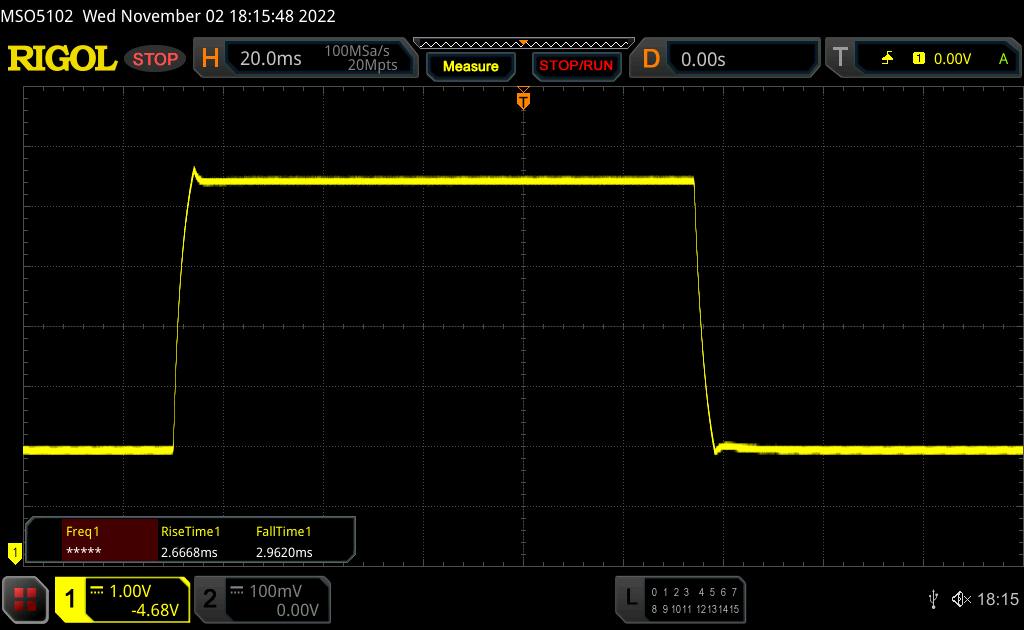 |
| ↘ 3 ms upadek | ||
| W naszych testach ekran wykazuje bardzo szybką reakcję i powinien bardzo dobrze nadawać się do szybkich gier. Dla porównania, wszystkie testowane urządzenia wahają się od 0.165 (minimum) do 636 (maksimum) ms. » 18 % wszystkich urządzeń jest lepszych. Oznacza to, że zmierzony czas reakcji jest lepszy od średniej wszystkich testowanych urządzeń (30.9 ms). | ||
Migotanie ekranu / PWM (modulacja szerokości impulsu)
| Migotanie ekranu/nie wykryto PWM | 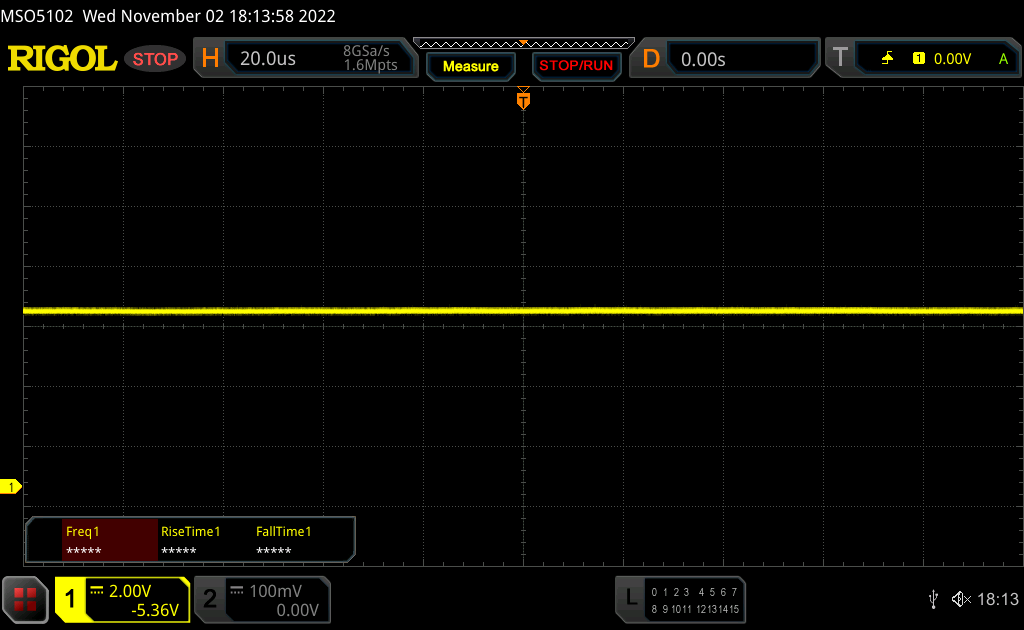 | ||
Dla porównania: 52 % wszystkich testowanych urządzeń nie używa PWM do przyciemniania wyświetlacza. Jeśli wykryto PWM, zmierzono średnio 7741 (minimum: 5 - maksimum: 343500) Hz. | |||
Wydajność - Intel HX z zaciągniętym hamulcem
Warunki badania
Oprogramowanie ROG oferuje rozbudowane opcje konfiguracyjne i profile zasilania. Można na przykład całkowicie wyłączyć zintegrowane GPU (MUX) lub ręcznie ustawić wartości mocy dla CPU i GPU. Do naszych benchmarków i pomiarów poniżej używamy profilu Performance, ponieważ już wtedy udostępniamy pełną wydajność GPU. Co prawda wydajność CPU jest nawet nieco wyższa w trybie Turbo, ale nie usprawiedliwia to naszym zdaniem znacznie wyższego hałasu wentylatora.
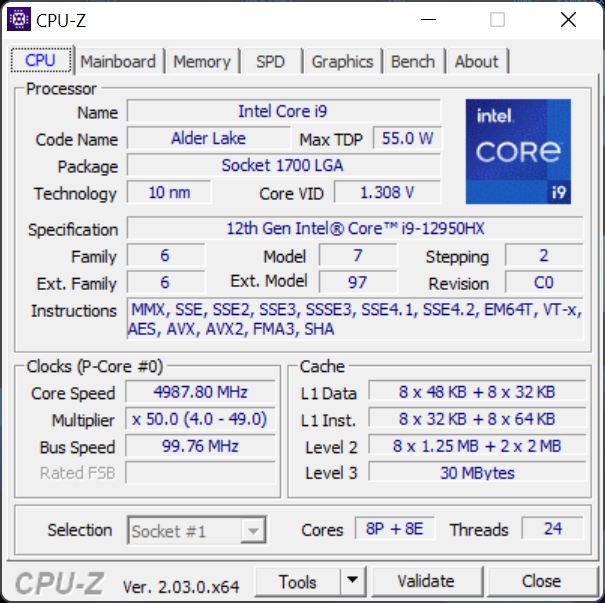
Procesor - Core i9-12950HX
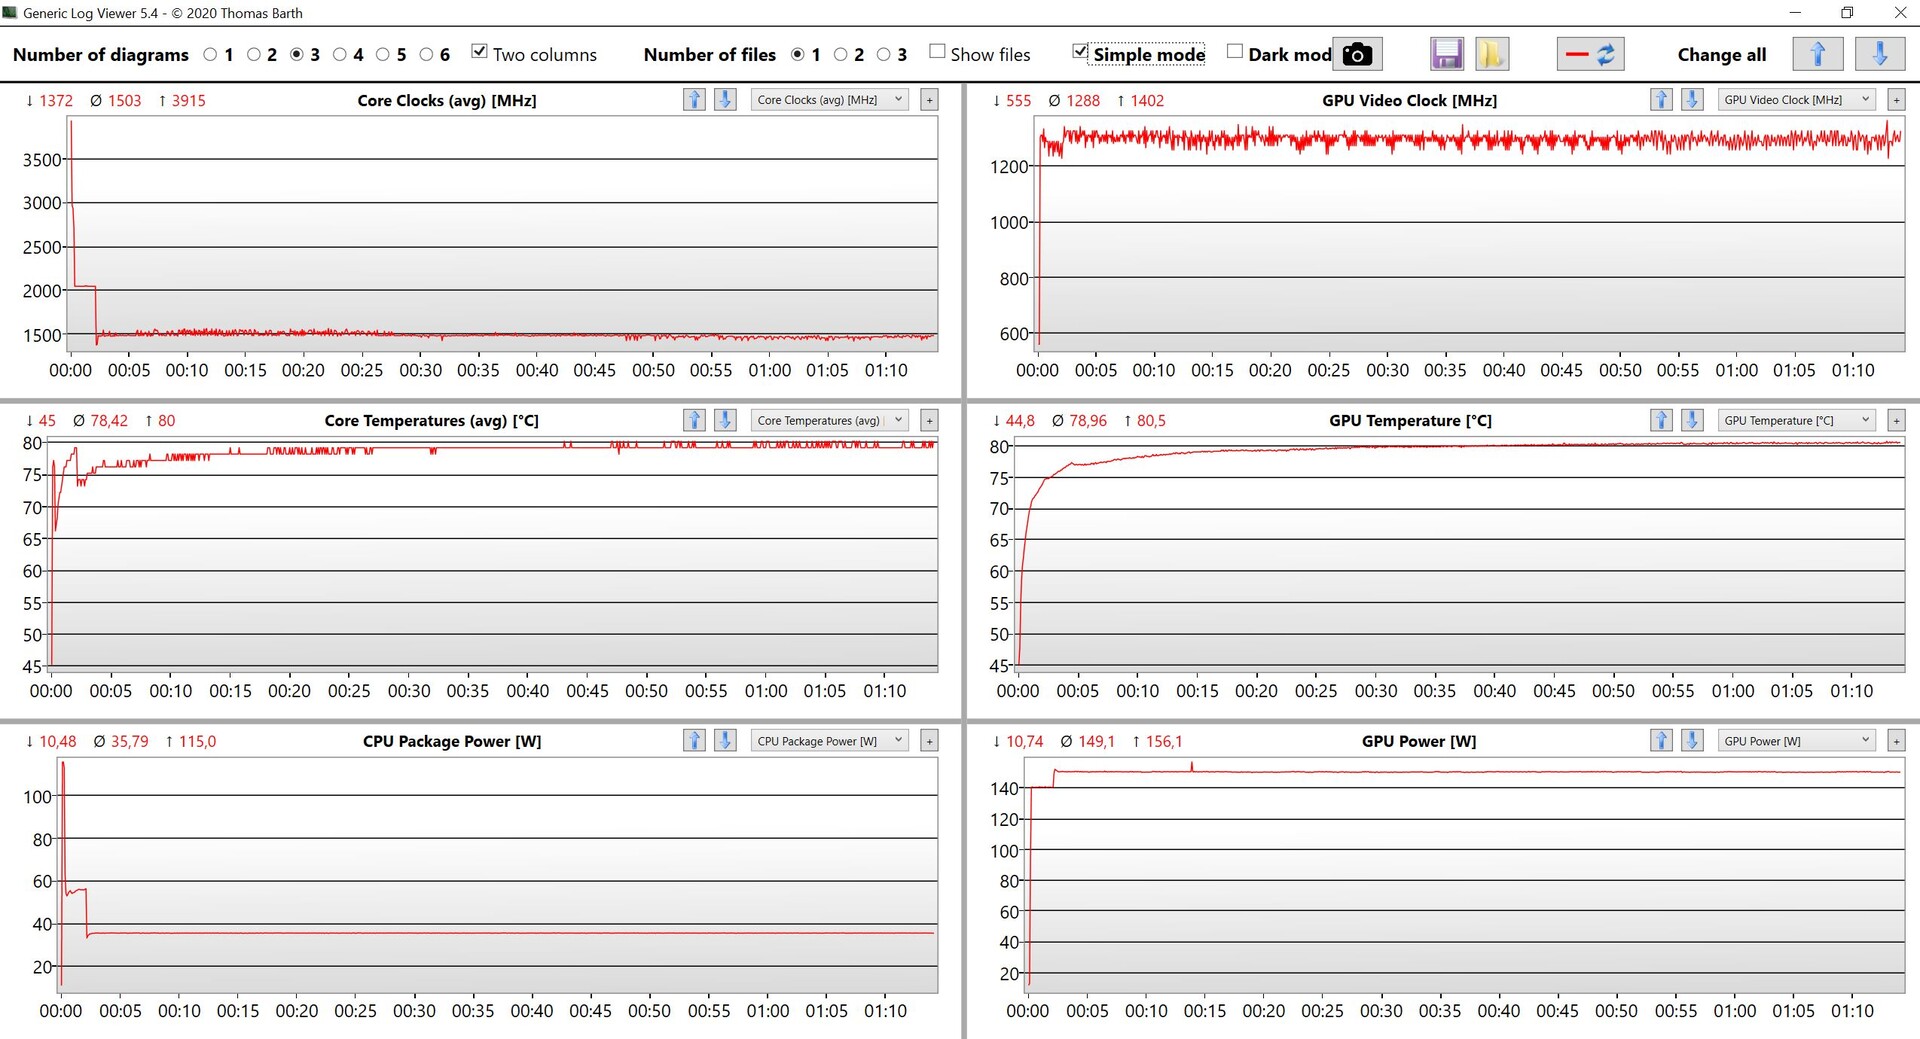
Na stronie .Intel Core i9-12950HX to obecnie najszybszy mobilny procesor od Intela. Choć jest w stanie zużywać do 175 W, to w naszym egzemplarzu testowym trzyma się daleko od tej wartości. Zamiast tego widzimy maksymalne zużycie 115 W (nawet w trybie Turbo), a w pewnym momencie wartość ta wyrównuje się do 70 W (105 W w trybie Turbo). Choć wydajność procesora nie jest wcale zła, to równie dobrze można by ją uzyskać ze zwykłym Core i9, a dodatkowa premia za układ HX nie jest warta dodatkowego wydatku
Podczas pracy na akumulatorze pobór mocy jest ograniczony do 35 W, co prowadzi do obniżenia wydajności wielordzeniowej o około 40%. Dodatkowe benchmarki CPU można znaleźć w naszej odpowiedniej sekcji technicznej.
Cinebench R15 Multi Constant Load Test
Cinebench R23: Multi Core | Single Core
Cinebench R20: CPU (Multi Core) | CPU (Single Core)
Cinebench R15: CPU Multi 64Bit | CPU Single 64Bit
Blender: v2.79 BMW27 CPU
7-Zip 18.03: 7z b 4 | 7z b 4 -mmt1
Geekbench 5.5: Multi-Core | Single-Core
HWBOT x265 Benchmark v2.2: 4k Preset
LibreOffice : 20 Documents To PDF
R Benchmark 2.5: Overall mean
| CPU Performance rating | |
| Średnia w klasie Gaming | |
| Lenovo Legion 7 16IAX7-82TD004SGE | |
| MSI Titan GT77 12UHS | |
| Asus ROG Strix Scar 17 SE G733CX-LL014W | |
| Przeciętny Intel Core i9-12950HX | |
| Alienware x17 R2 P48E | |
| Schenker XMG Neo 17 M22 | |
| Asus Strix Scar 17 G733QSA-XS99 | |
| Cinebench R23 / Multi Core | |
| Średnia w klasie Gaming (10488 - 42661, n=104, ostatnie 2 lata) | |
| MSI Titan GT77 12UHS | |
| Lenovo Legion 7 16IAX7-82TD004SGE | |
| Asus ROG Strix Scar 17 SE G733CX-LL014W | |
| Przeciętny Intel Core i9-12950HX (16277 - 23113, n=7) | |
| Alienware x17 R2 P48E | |
| Schenker XMG Neo 17 M22 | |
| Asus Strix Scar 17 G733QSA-XS99 | |
| Cinebench R23 / Single Core | |
| Średnia w klasie Gaming (1601 - 2415, n=104, ostatnie 2 lata) | |
| Lenovo Legion 7 16IAX7-82TD004SGE | |
| MSI Titan GT77 12UHS | |
| Alienware x17 R2 P48E | |
| Asus ROG Strix Scar 17 SE G733CX-LL014W | |
| Przeciętny Intel Core i9-12950HX (1465 - 1922, n=7) | |
| Schenker XMG Neo 17 M22 | |
| Asus Strix Scar 17 G733QSA-XS99 | |
| Cinebench R20 / CPU (Multi Core) | |
| Średnia w klasie Gaming (4029 - 16433, n=103, ostatnie 2 lata) | |
| MSI Titan GT77 12UHS | |
| Lenovo Legion 7 16IAX7-82TD004SGE | |
| Przeciętny Intel Core i9-12950HX (6625 - 8777, n=7) | |
| Asus ROG Strix Scar 17 SE G733CX-LL014W | |
| Alienware x17 R2 P48E | |
| Schenker XMG Neo 17 M22 | |
| Asus Strix Scar 17 G733QSA-XS99 | |
| Cinebench R20 / CPU (Single Core) | |
| Średnia w klasie Gaming (622 - 913, n=103, ostatnie 2 lata) | |
| Lenovo Legion 7 16IAX7-82TD004SGE | |
| Asus ROG Strix Scar 17 SE G733CX-LL014W | |
| MSI Titan GT77 12UHS | |
| Alienware x17 R2 P48E | |
| Przeciętny Intel Core i9-12950HX (703 - 741, n=7) | |
| Schenker XMG Neo 17 M22 | |
| Asus Strix Scar 17 G733QSA-XS99 | |
| Cinebench R15 / CPU Multi 64Bit | |
| Średnia w klasie Gaming (1578 - 6330, n=102, ostatnie 2 lata) | |
| MSI Titan GT77 12UHS | |
| Lenovo Legion 7 16IAX7-82TD004SGE | |
| Asus ROG Strix Scar 17 SE G733CX-LL014W | |
| Przeciętny Intel Core i9-12950HX (2464 - 3530, n=7) | |
| Alienware x17 R2 P48E | |
| Schenker XMG Neo 17 M22 | |
| Asus Strix Scar 17 G733QSA-XS99 | |
| Cinebench R15 / CPU Single 64Bit | |
| Średnia w klasie Gaming (188.8 - 350, n=103, ostatnie 2 lata) | |
| Lenovo Legion 7 16IAX7-82TD004SGE | |
| MSI Titan GT77 12UHS | |
| Asus ROG Strix Scar 17 SE G733CX-LL014W | |
| Alienware x17 R2 P48E | |
| Przeciętny Intel Core i9-12950HX (167 - 276, n=7) | |
| Schenker XMG Neo 17 M22 | |
| Asus Strix Scar 17 G733QSA-XS99 | |
| Blender / v2.79 BMW27 CPU | |
| Asus Strix Scar 17 G733QSA-XS99 | |
| Schenker XMG Neo 17 M22 | |
| Asus ROG Strix Scar 17 SE G733CX-LL014W | |
| Alienware x17 R2 P48E | |
| Przeciętny Intel Core i9-12950HX (138 - 193, n=7) | |
| Lenovo Legion 7 16IAX7-82TD004SGE | |
| Średnia w klasie Gaming (79 - 330, n=101, ostatnie 2 lata) | |
| MSI Titan GT77 12UHS | |
| 7-Zip 18.03 / 7z b 4 | |
| Średnia w klasie Gaming (33491 - 148086, n=102, ostatnie 2 lata) | |
| Lenovo Legion 7 16IAX7-82TD004SGE | |
| MSI Titan GT77 12UHS | |
| Przeciętny Intel Core i9-12950HX (65637 - 85019, n=7) | |
| Asus ROG Strix Scar 17 SE G733CX-LL014W | |
| Alienware x17 R2 P48E | |
| Schenker XMG Neo 17 M22 | |
| Asus Strix Scar 17 G733QSA-XS99 | |
| 7-Zip 18.03 / 7z b 4 -mmt1 | |
| Średnia w klasie Gaming (4824 - 7436, n=102, ostatnie 2 lata) | |
| Lenovo Legion 7 16IAX7-82TD004SGE | |
| MSI Titan GT77 12UHS | |
| Asus ROG Strix Scar 17 SE G733CX-LL014W | |
| Przeciętny Intel Core i9-12950HX (6022 - 6318, n=7) | |
| Schenker XMG Neo 17 M22 | |
| Alienware x17 R2 P48E | |
| Asus Strix Scar 17 G733QSA-XS99 | |
| Geekbench 5.5 / Multi-Core | |
| Średnia w klasie Gaming (6460 - 28263, n=102, ostatnie 2 lata) | |
| Lenovo Legion 7 16IAX7-82TD004SGE | |
| MSI Titan GT77 12UHS | |
| Asus ROG Strix Scar 17 SE G733CX-LL014W | |
| Przeciętny Intel Core i9-12950HX (14028 - 16009, n=7) | |
| Alienware x17 R2 P48E | |
| Schenker XMG Neo 17 M22 | |
| Asus Strix Scar 17 G733QSA-XS99 | |
| Geekbench 5.5 / Single-Core | |
| Średnia w klasie Gaming (1403 - 2474, n=102, ostatnie 2 lata) | |
| MSI Titan GT77 12UHS | |
| Przeciętny Intel Core i9-12950HX (1847 - 1945, n=7) | |
| Alienware x17 R2 P48E | |
| Lenovo Legion 7 16IAX7-82TD004SGE | |
| Asus ROG Strix Scar 17 SE G733CX-LL014W | |
| Schenker XMG Neo 17 M22 | |
| Asus Strix Scar 17 G733QSA-XS99 | |
| HWBOT x265 Benchmark v2.2 / 4k Preset | |
| Średnia w klasie Gaming (11.5 - 44.4, n=102, ostatnie 2 lata) | |
| MSI Titan GT77 12UHS | |
| Lenovo Legion 7 16IAX7-82TD004SGE | |
| Asus ROG Strix Scar 17 SE G733CX-LL014W | |
| Przeciętny Intel Core i9-12950HX (18.6 - 26.5, n=7) | |
| Alienware x17 R2 P48E | |
| Schenker XMG Neo 17 M22 | |
| Asus Strix Scar 17 G733QSA-XS99 | |
| LibreOffice / 20 Documents To PDF | |
| Schenker XMG Neo 17 M22 | |
| Średnia w klasie Gaming (33.2 - 88.8, n=102, ostatnie 2 lata) | |
| Asus Strix Scar 17 G733QSA-XS99 | |
| Alienware x17 R2 P48E | |
| Przeciętny Intel Core i9-12950HX (34.7 - 45.4, n=7) | |
| MSI Titan GT77 12UHS | |
| Asus ROG Strix Scar 17 SE G733CX-LL014W | |
| Lenovo Legion 7 16IAX7-82TD004SGE | |
| R Benchmark 2.5 / Overall mean | |
| Asus Strix Scar 17 G733QSA-XS99 | |
| Schenker XMG Neo 17 M22 | |
| Przeciętny Intel Core i9-12950HX (0.4251 - 0.4515, n=7) | |
| Alienware x17 R2 P48E | |
| Asus ROG Strix Scar 17 SE G733CX-LL014W | |
| Średnia w klasie Gaming (0.3439 - 0.59, n=102, ostatnie 2 lata) | |
| Lenovo Legion 7 16IAX7-82TD004SGE | |
| MSI Titan GT77 12UHS | |
* ... im mniej tym lepiej
AIDA64: FP32 Ray-Trace | FPU Julia | CPU SHA3 | CPU Queen | FPU SinJulia | FPU Mandel | CPU AES | CPU ZLib | FP64 Ray-Trace | CPU PhotoWorxx
| Performance rating | |
| Średnia w klasie Gaming | |
| MSI Titan GT77 12UHS | |
| Asus ROG Strix Scar 17 SE G733CX-LL014W | |
| Przeciętny Intel Core i9-12950HX | |
| Schenker XMG Neo 17 M22 | |
| Asus Strix Scar 17 G733QSA-XS99 | |
| Lenovo Legion 7 16IAX7-82TD004SGE | |
| Alienware x17 R2 P48E | |
| AIDA64 / FP32 Ray-Trace | |
| Średnia w klasie Gaming (10227 - 85542, n=102, ostatnie 2 lata) | |
| MSI Titan GT77 12UHS | |
| Przeciętny Intel Core i9-12950HX (15499 - 22868, n=7) | |
| Asus ROG Strix Scar 17 SE G733CX-LL014W | |
| Schenker XMG Neo 17 M22 | |
| Asus Strix Scar 17 G733QSA-XS99 | |
| Lenovo Legion 7 16IAX7-82TD004SGE | |
| Alienware x17 R2 P48E | |
| AIDA64 / FPU Julia | |
| Średnia w klasie Gaming (51376 - 372155, n=102, ostatnie 2 lata) | |
| MSI Titan GT77 12UHS | |
| Asus Strix Scar 17 G733QSA-XS99 | |
| Schenker XMG Neo 17 M22 | |
| Przeciętny Intel Core i9-12950HX (77846 - 115907, n=7) | |
| Asus ROG Strix Scar 17 SE G733CX-LL014W | |
| Lenovo Legion 7 16IAX7-82TD004SGE | |
| Alienware x17 R2 P48E | |
| AIDA64 / CPU SHA3 | |
| Średnia w klasie Gaming (2180 - 10115, n=102, ostatnie 2 lata) | |
| MSI Titan GT77 12UHS | |
| Lenovo Legion 7 16IAX7-82TD004SGE | |
| Asus ROG Strix Scar 17 SE G733CX-LL014W | |
| Przeciętny Intel Core i9-12950HX (3426 - 5069, n=7) | |
| Alienware x17 R2 P48E | |
| Asus Strix Scar 17 G733QSA-XS99 | |
| Schenker XMG Neo 17 M22 | |
| AIDA64 / CPU Queen | |
| Średnia w klasie Gaming (49785 - 173351, n=86, ostatnie 2 lata) | |
| Alienware x17 R2 P48E | |
| Asus ROG Strix Scar 17 SE G733CX-LL014W | |
| Przeciętny Intel Core i9-12950HX (102752 - 104726, n=7) | |
| Asus Strix Scar 17 G733QSA-XS99 | |
| MSI Titan GT77 12UHS | |
| Schenker XMG Neo 17 M22 | |
| Lenovo Legion 7 16IAX7-82TD004SGE | |
| AIDA64 / FPU SinJulia | |
| Średnia w klasie Gaming (4424 - 33636, n=102, ostatnie 2 lata) | |
| Lenovo Legion 7 16IAX7-82TD004SGE | |
| MSI Titan GT77 12UHS | |
| Schenker XMG Neo 17 M22 | |
| Asus Strix Scar 17 G733QSA-XS99 | |
| Przeciętny Intel Core i9-12950HX (10134 - 12823, n=7) | |
| Asus ROG Strix Scar 17 SE G733CX-LL014W | |
| Alienware x17 R2 P48E | |
| AIDA64 / FPU Mandel | |
| Średnia w klasie Gaming (25115 - 196829, n=102, ostatnie 2 lata) | |
| Asus Strix Scar 17 G733QSA-XS99 | |
| Schenker XMG Neo 17 M22 | |
| MSI Titan GT77 12UHS | |
| Przeciętny Intel Core i9-12950HX (37146 - 57340, n=7) | |
| Asus ROG Strix Scar 17 SE G733CX-LL014W | |
| Lenovo Legion 7 16IAX7-82TD004SGE | |
| Alienware x17 R2 P48E | |
| AIDA64 / CPU AES | |
| MSI Titan GT77 12UHS | |
| Asus ROG Strix Scar 17 SE G733CX-LL014W | |
| Schenker XMG Neo 17 M22 | |
| Asus Strix Scar 17 G733QSA-XS99 | |
| Lenovo Legion 7 16IAX7-82TD004SGE | |
| Przeciętny Intel Core i9-12950HX (72599 - 181128, n=7) | |
| Średnia w klasie Gaming (39258 - 247074, n=102, ostatnie 2 lata) | |
| Alienware x17 R2 P48E | |
| AIDA64 / CPU ZLib | |
| Średnia w klasie Gaming (574 - 2531, n=102, ostatnie 2 lata) | |
| Lenovo Legion 7 16IAX7-82TD004SGE | |
| MSI Titan GT77 12UHS | |
| Asus ROG Strix Scar 17 SE G733CX-LL014W | |
| Alienware x17 R2 P48E | |
| Przeciętny Intel Core i9-12950HX (996 - 1417, n=7) | |
| Asus Strix Scar 17 G733QSA-XS99 | |
| Schenker XMG Neo 17 M22 | |
| AIDA64 / FP64 Ray-Trace | |
| Średnia w klasie Gaming (5509 - 45446, n=102, ostatnie 2 lata) | |
| MSI Titan GT77 12UHS | |
| Przeciętny Intel Core i9-12950HX (8455 - 12432, n=7) | |
| Asus ROG Strix Scar 17 SE G733CX-LL014W | |
| Asus Strix Scar 17 G733QSA-XS99 | |
| Schenker XMG Neo 17 M22 | |
| Lenovo Legion 7 16IAX7-82TD004SGE | |
| Alienware x17 R2 P48E | |
| AIDA64 / CPU PhotoWorxx | |
| Średnia w klasie Gaming (12271 - 89891, n=102, ostatnie 2 lata) | |
| Asus ROG Strix Scar 17 SE G733CX-LL014W | |
| MSI Titan GT77 12UHS | |
| Przeciętny Intel Core i9-12950HX (35479 - 42655, n=7) | |
| Lenovo Legion 7 16IAX7-82TD004SGE | |
| Alienware x17 R2 P48E | |
| Schenker XMG Neo 17 M22 | |
| Asus Strix Scar 17 G733QSA-XS99 | |
Wydajność systemu
Subiektywne wrażenie wydajności jest znakomite, co potwierdzają również dobre wyniki w benchmarkach. W trakcie testów nie zauważamy żadnych problemów.
CrossMark: Overall | Productivity | Creativity | Responsiveness
| PCMark 10 / Score | |
| Lenovo Legion 7 16IAX7-82TD004SGE | |
| Średnia w klasie Gaming (5828 - 12414, n=93, ostatnie 2 lata) | |
| MSI Titan GT77 12UHS | |
| Alienware x17 R2 P48E | |
| Asus ROG Strix Scar 17 SE G733CX-LL014W | |
| Przeciętny Intel Core i9-12950HX, NVIDIA GeForce RTX 3080 Ti Laptop GPU (n=1) | |
| Asus Strix Scar 17 G733QSA-XS99 | |
| Schenker XMG Neo 17 M22 | |
| PCMark 10 / Essentials | |
| Alienware x17 R2 P48E | |
| Lenovo Legion 7 16IAX7-82TD004SGE | |
| MSI Titan GT77 12UHS | |
| Średnia w klasie Gaming (8810 - 11935, n=97, ostatnie 2 lata) | |
| Asus Strix Scar 17 G733QSA-XS99 | |
| Asus ROG Strix Scar 17 SE G733CX-LL014W | |
| Przeciętny Intel Core i9-12950HX, NVIDIA GeForce RTX 3080 Ti Laptop GPU (n=1) | |
| Schenker XMG Neo 17 M22 | |
| PCMark 10 / Productivity | |
| Średnia w klasie Gaming (6845 - 25323, n=95, ostatnie 2 lata) | |
| Lenovo Legion 7 16IAX7-82TD004SGE | |
| MSI Titan GT77 12UHS | |
| Alienware x17 R2 P48E | |
| Asus ROG Strix Scar 17 SE G733CX-LL014W | |
| Przeciętny Intel Core i9-12950HX, NVIDIA GeForce RTX 3080 Ti Laptop GPU (n=1) | |
| Asus Strix Scar 17 G733QSA-XS99 | |
| Schenker XMG Neo 17 M22 | |
| PCMark 10 / Digital Content Creation | |
| Lenovo Legion 7 16IAX7-82TD004SGE | |
| Średnia w klasie Gaming (7602 - 19954, n=95, ostatnie 2 lata) | |
| MSI Titan GT77 12UHS | |
| Alienware x17 R2 P48E | |
| Asus ROG Strix Scar 17 SE G733CX-LL014W | |
| Przeciętny Intel Core i9-12950HX, NVIDIA GeForce RTX 3080 Ti Laptop GPU (n=1) | |
| Asus Strix Scar 17 G733QSA-XS99 | |
| Schenker XMG Neo 17 M22 | |
| CrossMark / Overall | |
| Lenovo Legion 7 16IAX7-82TD004SGE | |
| Asus ROG Strix Scar 17 SE G733CX-LL014W | |
| Przeciętny Intel Core i9-12950HX, NVIDIA GeForce RTX 3080 Ti Laptop GPU (n=1) | |
| MSI Titan GT77 12UHS | |
| Średnia w klasie Gaming (1366 - 2409, n=94, ostatnie 2 lata) | |
| Alienware x17 R2 P48E | |
| Schenker XMG Neo 17 M22 | |
| CrossMark / Productivity | |
| Lenovo Legion 7 16IAX7-82TD004SGE | |
| MSI Titan GT77 12UHS | |
| Asus ROG Strix Scar 17 SE G733CX-LL014W | |
| Przeciętny Intel Core i9-12950HX, NVIDIA GeForce RTX 3080 Ti Laptop GPU (n=1) | |
| Średnia w klasie Gaming (1386 - 2254, n=94, ostatnie 2 lata) | |
| Alienware x17 R2 P48E | |
| Schenker XMG Neo 17 M22 | |
| CrossMark / Creativity | |
| Asus ROG Strix Scar 17 SE G733CX-LL014W | |
| Przeciętny Intel Core i9-12950HX, NVIDIA GeForce RTX 3080 Ti Laptop GPU (n=1) | |
| Lenovo Legion 7 16IAX7-82TD004SGE | |
| MSI Titan GT77 12UHS | |
| Średnia w klasie Gaming (1343 - 2786, n=94, ostatnie 2 lata) | |
| Alienware x17 R2 P48E | |
| Schenker XMG Neo 17 M22 | |
| CrossMark / Responsiveness | |
| Lenovo Legion 7 16IAX7-82TD004SGE | |
| MSI Titan GT77 12UHS | |
| Asus ROG Strix Scar 17 SE G733CX-LL014W | |
| Przeciętny Intel Core i9-12950HX, NVIDIA GeForce RTX 3080 Ti Laptop GPU (n=1) | |
| Średnia w klasie Gaming (1226 - 2334, n=94, ostatnie 2 lata) | |
| Alienware x17 R2 P48E | |
| Schenker XMG Neo 17 M22 | |
| PCMark 10 Score | 7208 pkt. | |
Pomoc | ||
| AIDA64 / Memory Copy | |
| Średnia w klasie Gaming (21750 - 129946, n=102, ostatnie 2 lata) | |
| MSI Titan GT77 12UHS | |
| Lenovo Legion 7 16IAX7-82TD004SGE | |
| Asus ROG Strix Scar 17 SE G733CX-LL014W | |
| Przeciętny Intel Core i9-12950HX (59731 - 64732, n=7) | |
| Alienware x17 R2 P48E | |
| Schenker XMG Neo 17 M22 | |
| Asus Strix Scar 17 G733QSA-XS99 | |
| AIDA64 / Memory Read | |
| Średnia w klasie Gaming (22956 - 118858, n=102, ostatnie 2 lata) | |
| Lenovo Legion 7 16IAX7-82TD004SGE | |
| Asus ROG Strix Scar 17 SE G733CX-LL014W | |
| Przeciętny Intel Core i9-12950HX (59744 - 70359, n=7) | |
| MSI Titan GT77 12UHS | |
| Alienware x17 R2 P48E | |
| Schenker XMG Neo 17 M22 | |
| Asus Strix Scar 17 G733QSA-XS99 | |
| AIDA64 / Memory Write | |
| Średnia w klasie Gaming (22297 - 135096, n=102, ostatnie 2 lata) | |
| Asus ROG Strix Scar 17 SE G733CX-LL014W | |
| Lenovo Legion 7 16IAX7-82TD004SGE | |
| Przeciętny Intel Core i9-12950HX (57750 - 67899, n=7) | |
| MSI Titan GT77 12UHS | |
| Schenker XMG Neo 17 M22 | |
| Alienware x17 R2 P48E | |
| Asus Strix Scar 17 G733QSA-XS99 | |
| AIDA64 / Memory Latency | |
| Średnia w klasie Gaming (75.3 - 165.4, n=102, ostatnie 2 lata) | |
| Alienware x17 R2 P48E | |
| Schenker XMG Neo 17 M22 | |
| MSI Titan GT77 12UHS | |
| Przeciętny Intel Core i9-12950HX (84.5 - 92.2, n=7) | |
| Lenovo Legion 7 16IAX7-82TD004SGE | |
| Asus ROG Strix Scar 17 SE G733CX-LL014W | |
| Asus Strix Scar 17 G733QSA-XS99 | |
* ... im mniej tym lepiej
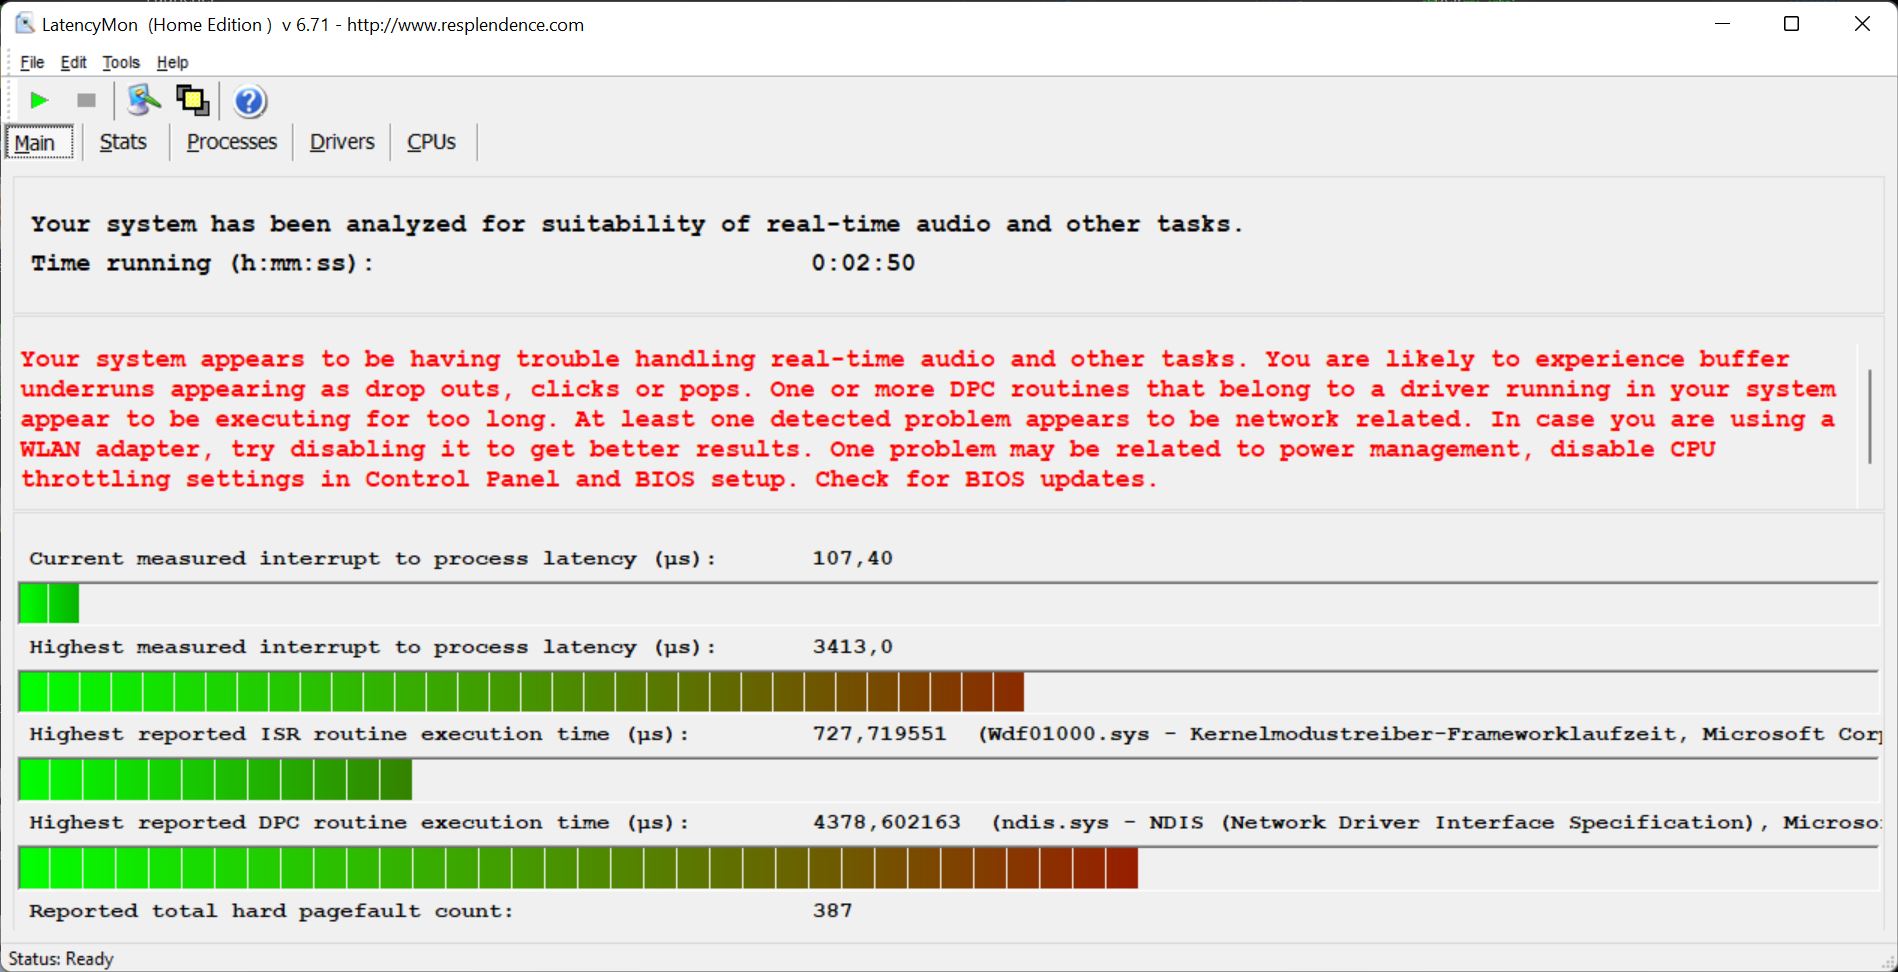
Opóźnienia DPC
W naszym standardowym teście opóźnień (surfowanie po Internecie, film 4K z YouTube, obciążenie procesora) nasza jednostka testowa z wersją BIOS-u ma pewne problemy, więc nie nadaje się do przetwarzania wideo i audio w czasie rzeczywistym.
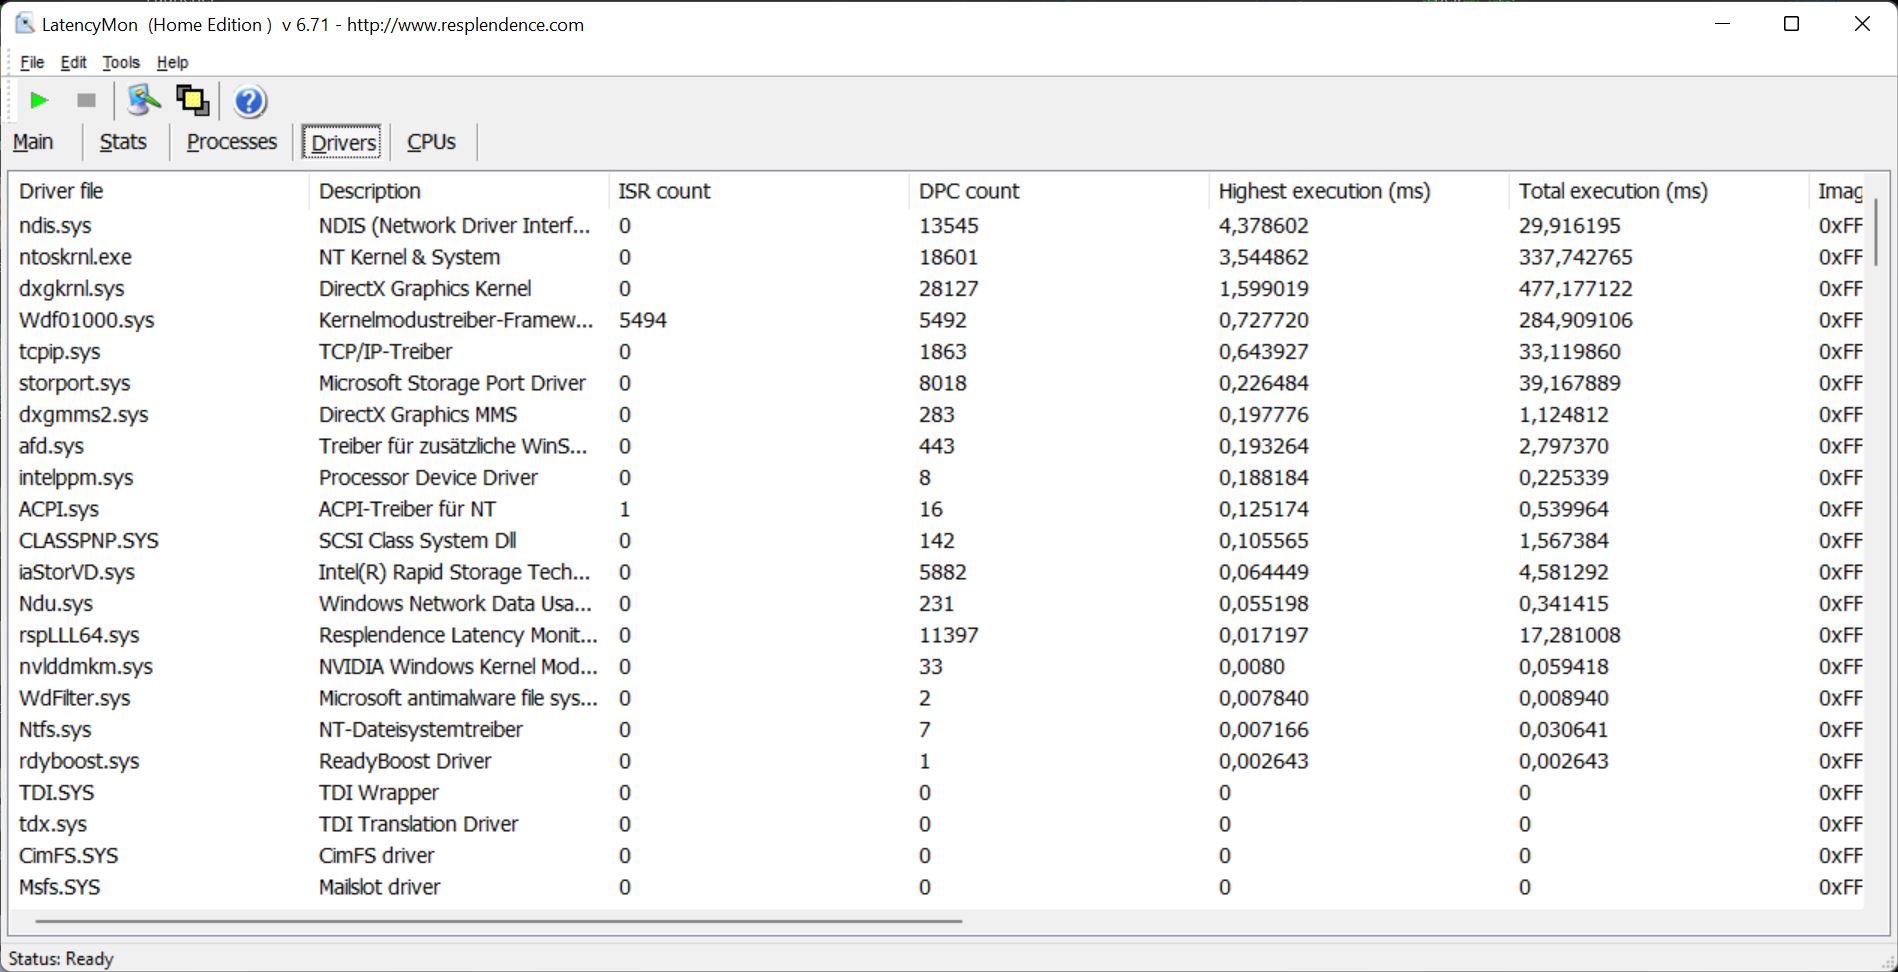
| DPC Latencies / LatencyMon - interrupt to process latency (max), Web, Youtube, Prime95 | |
| Schenker XMG Neo 17 M22 | |
| Asus ROG Strix Scar 17 SE G733CX-LL014W | |
| MSI Titan GT77 12UHS | |
| MSI Titan GT77 12UHS | |
| Lenovo Legion 7 16IAX7-82TD004SGE | |
| Alienware x17 R2 P48E | |
| Asus Strix Scar 17 G733QSA-XS99 | |
* ... im mniej tym lepiej
Rozwiązanie w zakresie przechowywania
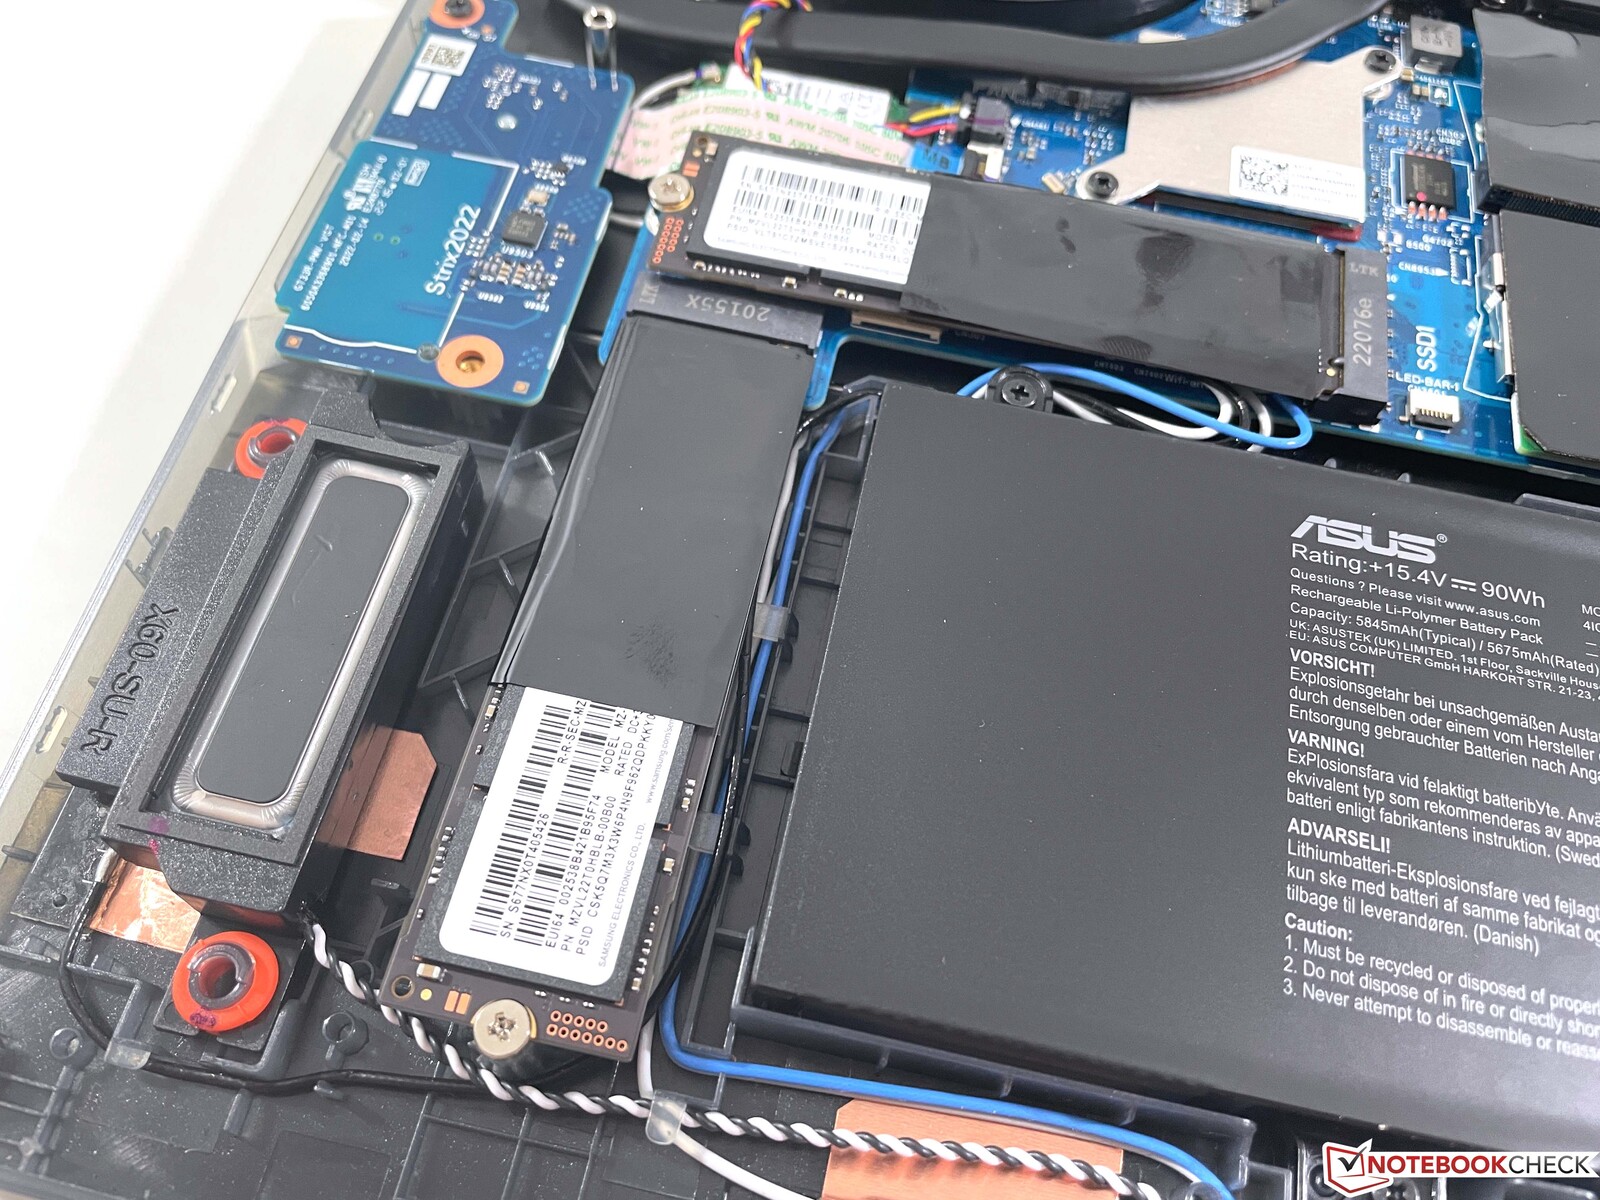
Asus zastosował tutaj dwa szybkie 2-TB dyski SSD od Samsunga (PM91A) w konfiguracji RAID 0. Pozwala to na uzyskanie ekstremalnie wysokich transferów, przekraczających 10 GB/s. Wydajność nie pozostaje jednak stabilna pod stałym obciążeniem, zamiast tego masowo spada. Nie powinno to jednak powodować żadnych ograniczeń podczas codziennych rozgrywek. Dodatkowe benchmarki SSD można znaleźć tutaj.

| Drive Performance rating - Percent | |
| Asus ROG Strix Scar 17 SE G733CX-LL014W | |
| Schenker XMG Neo 17 M22 | |
| MSI Titan GT77 12UHS | |
| Lenovo Legion 7 16IAX7-82TD004SGE | |
| Przeciętny Samsung PM9A1 MZVL22T0HBLB | |
| Średnia w klasie Gaming | |
| Alienware x17 R2 P48E | |
| Asus Strix Scar 17 G733QSA-XS99 | |
* ... im mniej tym lepiej
Disk Throttling: DiskSpd Read Loop, Queue Depth 8
Karta graficzna
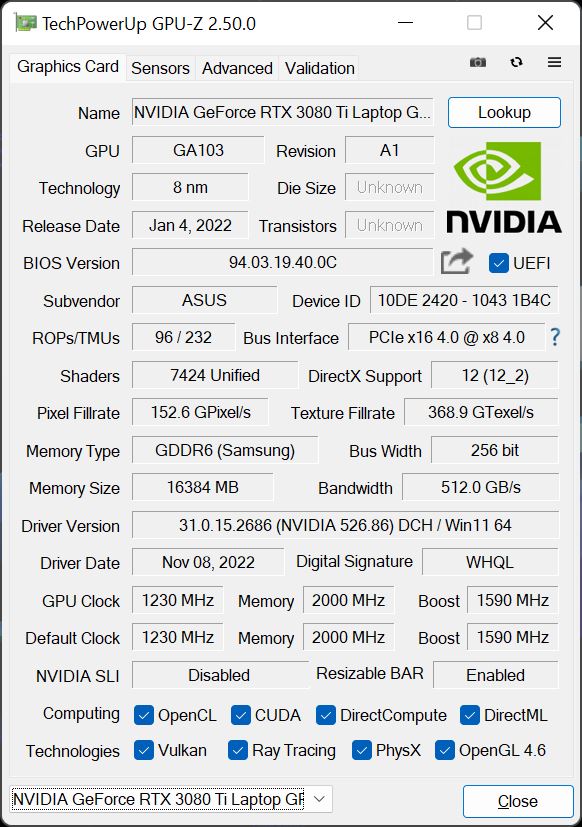
Asus wykorzystuje m.in.GeForce RTX 3080 Ti w wersji z TGP na poziomie 150 W, a GPU jest w stanie wykorzystać dodatkowe 25 W Dynamic Boost z procesora. Tę wartość (175 W) osiąga także w trybie Performance, więc nie ma konieczności korzystania z trybu Turbo. Jest też MUX pozwalający na całkowite wyłączenie zintegrowanego GPU (wymaga restartu), co poprawia latencje podczas grania, ale nie ma większego wpływu na samą wydajność graficzną
Wydajność graficzna plasuje się w grupie najlepszych, a także jest wyższa od średnich wartości dla RTX 3080 Ti w naszej bazie danych. Dodatkowo wydajność graficzna pozostaje całkowicie stabilna. Test stresu 3DMark Time Spy przechodzi bez problemów, nie ma też spadku wydajności w naszym teście stałego obciążenia The Witcher 3. Wydajność w grach jest bez problemu wystarczająca do uzyskania maksymalnych detali w natywnej rozdzielczości QHD, nawet w wymagających grach.
Podczas pracy na baterii GPU może pobierać maksymalnie 44 waty, co odpowiada spadkowi wydajności o około 70%. Dodatkowe benchmarki GPU można znaleźć tutaj.
| 3DMark Performance rating - Percent | |
| Średnia w klasie Gaming | |
| Alienware x17 R2 P48E -4! | |
| MSI Titan GT77 12UHS -2! | |
| Lenovo Legion 7 16IAX7-82TD004SGE -2! | |
| Asus ROG Strix Scar 17 SE G733CX-LL014W | |
| Schenker XMG Neo 17 M22 | |
| Asus Strix Scar 17 G733QSA-XS99 -3! | |
| Przeciętny NVIDIA GeForce RTX 3080 Ti Laptop GPU | |
| 3DMark 11 - 1280x720 Performance GPU | |
| Średnia w klasie Gaming (21841 - 80022, n=103, ostatnie 2 lata) | |
| MSI Titan GT77 12UHS | |
| Alienware x17 R2 P48E | |
| Asus ROG Strix Scar 17 SE G733CX-LL014W | |
| Schenker XMG Neo 17 M22 | |
| Lenovo Legion 7 16IAX7-82TD004SGE | |
| Asus Strix Scar 17 G733QSA-XS99 | |
| Przeciętny NVIDIA GeForce RTX 3080 Ti Laptop GPU (13920 - 45841, n=45) | |
| 3DMark | |
| 1920x1080 Fire Strike Graphics | |
| Średnia w klasie Gaming (18629 - 62849, n=112, ostatnie 2 lata) | |
| MSI Titan GT77 12UHS | |
| Schenker XMG Neo 17 M22 | |
| Lenovo Legion 7 16IAX7-82TD004SGE | |
| Alienware x17 R2 P48E | |
| Asus ROG Strix Scar 17 SE G733CX-LL014W | |
| Asus Strix Scar 17 G733QSA-XS99 | |
| Przeciętny NVIDIA GeForce RTX 3080 Ti Laptop GPU (6928 - 34439, n=43) | |
| 2560x1440 Time Spy Graphics | |
| Średnia w klasie Gaming (6387 - 26212, n=112, ostatnie 2 lata) | |
| MSI Titan GT77 12UHS | |
| Alienware x17 R2 P48E | |
| Asus ROG Strix Scar 17 SE G733CX-LL014W | |
| Schenker XMG Neo 17 M22 | |
| Lenovo Legion 7 16IAX7-82TD004SGE | |
| Przeciętny NVIDIA GeForce RTX 3080 Ti Laptop GPU (4921 - 13835, n=43) | |
| Asus Strix Scar 17 G733QSA-XS99 | |
| Wild Life Extreme Unlimited | |
| Średnia w klasie Gaming (22281 - 47946, n=17, ostatnie 2 lata) | |
| MSI Titan GT77 12UHS | |
| Schenker XMG Neo 17 M22 | |
| Lenovo Legion 7 16IAX7-82TD004SGE | |
| Asus ROG Strix Scar 17 SE G733CX-LL014W | |
| Przeciętny NVIDIA GeForce RTX 3080 Ti Laptop GPU (20846 - 28879, n=9) | |
| V-Ray Benchmark Next 4.10 - GPU | |
| Średnia w klasie Gaming (427 - 1627, n=96, ostatnie 2 lata) | |
| MSI Titan GT77 12UHS | |
| Asus ROG Strix Scar 17 SE G733CX-LL014W | |
| Schenker XMG Neo 17 M22 | |
| Lenovo Legion 7 16IAX7-82TD004SGE | |
| Przeciętny NVIDIA GeForce RTX 3080 Ti Laptop GPU (311 - 552, n=35) | |
| Asus Strix Scar 17 G733QSA-XS99 | |
| Geekbench 5.5 - OpenCL Score | |
| Średnia w klasie Gaming (80702 - 277970, n=98, ostatnie 2 lata) | |
| Asus ROG Strix Scar 17 SE G733CX-LL014W | |
| Alienware x17 R2 P48E | |
| Schenker XMG Neo 17 M22 | |
| Lenovo Legion 7 16IAX7-82TD004SGE | |
| Asus Strix Scar 17 G733QSA-XS99 | |
| Przeciętny NVIDIA GeForce RTX 3080 Ti Laptop GPU (88580 - 151633, n=41) | |
| MSI Titan GT77 12UHS | |
| 3DMark 11 Performance | 35997 pkt. | |
| 3DMark Fire Strike Score | 28793 pkt. | |
| 3DMark Time Spy Score | 12904 pkt. | |
Pomoc | ||
| Blender / v3.3 Classroom OPTIX/RTX | |
| Przeciętny NVIDIA GeForce RTX 3080 Ti Laptop GPU (20 - 28, n=13) | |
| Lenovo Legion 7 16IAX7-82TD004SGE | |
| Asus ROG Strix Scar 17 SE G733CX-LL014W | |
| MSI Titan GT77 12UHS | |
| Średnia w klasie Gaming (9 - 32, n=103, ostatnie 2 lata) | |
| Blender / v3.3 Classroom CUDA | |
| Lenovo Legion 7 16IAX7-82TD004SGE | |
| Przeciętny NVIDIA GeForce RTX 3080 Ti Laptop GPU (32 - 41, n=13) | |
| Asus ROG Strix Scar 17 SE G733CX-LL014W | |
| Średnia w klasie Gaming (15 - 228, n=103, ostatnie 2 lata) | |
| MSI Titan GT77 12UHS | |
| Blender / v3.3 Classroom CPU | |
| Asus ROG Strix Scar 17 SE G733CX-LL014W | |
| Przeciętny NVIDIA GeForce RTX 3080 Ti Laptop GPU (261 - 429, n=13) | |
| Lenovo Legion 7 16IAX7-82TD004SGE | |
| MSI Titan GT77 12UHS | |
| Średnia w klasie Gaming (122 - 565, n=99, ostatnie 2 lata) | |
* ... im mniej tym lepiej
| The Witcher 3 - 1920x1080 Ultra Graphics & Postprocessing (HBAO+) | |
| Średnia w klasie Gaming (104.7 - 240, n=7, ostatnie 2 lata) | |
| MSI Titan GT77 12UHS | |
| Alienware x17 R2 P48E | |
| Schenker XMG Neo 17 M22 | |
| Asus ROG Strix Scar 17 SE G733CX-LL014W | |
| Lenovo Legion 7 16IAX7-82TD004SGE | |
| Przeciętny NVIDIA GeForce RTX 3080 Ti Laptop GPU (30 - 130.6, n=43) | |
| Asus Strix Scar 17 G733QSA-XS99 | |
| Cyberpunk 2077 1.6 | |
| 1920x1080 Ultra Preset | |
| Alienware x17 R2 P48E | |
| MSI Titan GT77 12UHS | |
| Przeciętny NVIDIA GeForce RTX 3080 Ti Laptop GPU (54 - 144.1, n=16) | |
| Asus ROG Strix Scar 17 SE G733CX-LL014W | |
| Lenovo Legion 7 16IAX7-82TD004SGE | |
| 2560x1440 Ultra Preset | |
| Asus ROG Strix Scar 17 SE G733CX-LL014W | |
| Przeciętny NVIDIA GeForce RTX 3080 Ti Laptop GPU (36 - 69.6, n=13) | |
| Lenovo Legion 7 16IAX7-82TD004SGE | |
| GTA V | |
| 1920x1080 Highest AA:4xMSAA + FX AF:16x | |
| Średnia w klasie Gaming (67.1 - 186.9, n=90, ostatnie 2 lata) | |
| MSI Titan GT77 12UHS | |
| Asus ROG Strix Scar 17 SE G733CX-LL014W | |
| Alienware x17 R2 P48E | |
| Lenovo Legion 7 16IAX7-82TD004SGE | |
| Przeciętny NVIDIA GeForce RTX 3080 Ti Laptop GPU (30 - 139.2, n=42) | |
| Schenker XMG Neo 17 M22 | |
| Asus Strix Scar 17 G733QSA-XS99 | |
| 2560x1440 Highest AA:4xMSAA + FX AF:16x | |
| Średnia w klasie Gaming (62.7 - 183.9, n=68, ostatnie 2 lata) | |
| Asus ROG Strix Scar 17 SE G733CX-LL014W | |
| Schenker XMG Neo 17 M22 | |
| Przeciętny NVIDIA GeForce RTX 3080 Ti Laptop GPU (30 - 121.2, n=28) | |
| Lenovo Legion 7 16IAX7-82TD004SGE | |
| F1 22 | |
| 1920x1080 Ultra High Preset AA:T AF:16x | |
| Schenker XMG Neo 17 M22 | |
| Przeciętny NVIDIA GeForce RTX 3080 Ti Laptop GPU (78.9 - 91, n=4) | |
| MSI Titan GT77 12UHS | |
| Asus ROG Strix Scar 17 SE G733CX-LL014W | |
| Średnia w klasie Gaming (40.1 - 121.2, n=4, ostatnie 2 lata) | |
| 2560x1440 Ultra High Preset AA:T AF:16x | |
| Schenker XMG Neo 17 M22 | |
| Przeciętny NVIDIA GeForce RTX 3080 Ti Laptop GPU (52.9 - 62, n=2) | |
| Średnia w klasie Gaming (42 - 77.8, n=3, ostatnie 2 lata) | |
| Asus ROG Strix Scar 17 SE G733CX-LL014W | |
| Final Fantasy XV Benchmark | |
| 1920x1080 High Quality | |
| Średnia w klasie Gaming (64.2 - 215, n=91, ostatnie 2 lata) | |
| MSI Titan GT77 12UHS | |
| Alienware x17 R2 P48E | |
| Schenker XMG Neo 17 M22 | |
| Lenovo Legion 7 16IAX7-82TD004SGE | |
| Asus ROG Strix Scar 17 SE G733CX-LL014W | |
| Przeciętny NVIDIA GeForce RTX 3080 Ti Laptop GPU (30.7 - 140.6, n=42) | |
| Asus Strix Scar 17 G733QSA-XS99 | |
| 2560x1440 High Quality | |
| Średnia w klasie Gaming (73.6 - 184.3, n=83, ostatnie 2 lata) | |
| Schenker XMG Neo 17 M22 | |
| Lenovo Legion 7 16IAX7-82TD004SGE | |
| Asus ROG Strix Scar 17 SE G733CX-LL014W | |
| Przeciętny NVIDIA GeForce RTX 3080 Ti Laptop GPU (30.8 - 105.8, n=34) | |
The Witcher 3 FPS Chart
| low | med. | high | ultra | QHD | |
|---|---|---|---|---|---|
| GTA V (2015) | 186.8 | 180.7 | 126.7 | 114.1 | |
| The Witcher 3 (2015) | 118.8 | ||||
| Dota 2 Reborn (2015) | 211 | 191 | 180.8 | 169.8 | |
| Final Fantasy XV Benchmark (2018) | 173.3 | 156.2 | 118.5 | 92.8 | |
| X-Plane 11.11 (2018) | 165.3 | 143.5 | 116.2 | ||
| Strange Brigade (2018) | 236 | 211 | 157.7 | ||
| F1 2021 (2021) | 236 | 211 | 132.8 | 106.2 | |
| Cyberpunk 2077 1.6 (2022) | 103 | 101 | 98 | 87 | 56 |
| F1 22 (2022) | 235 | 235 | 199.7 | 78.9 | 52.9 |
| Call of Duty Modern Warfare 2 2022 (2022) | 135 | 109 | 107 | 78 |
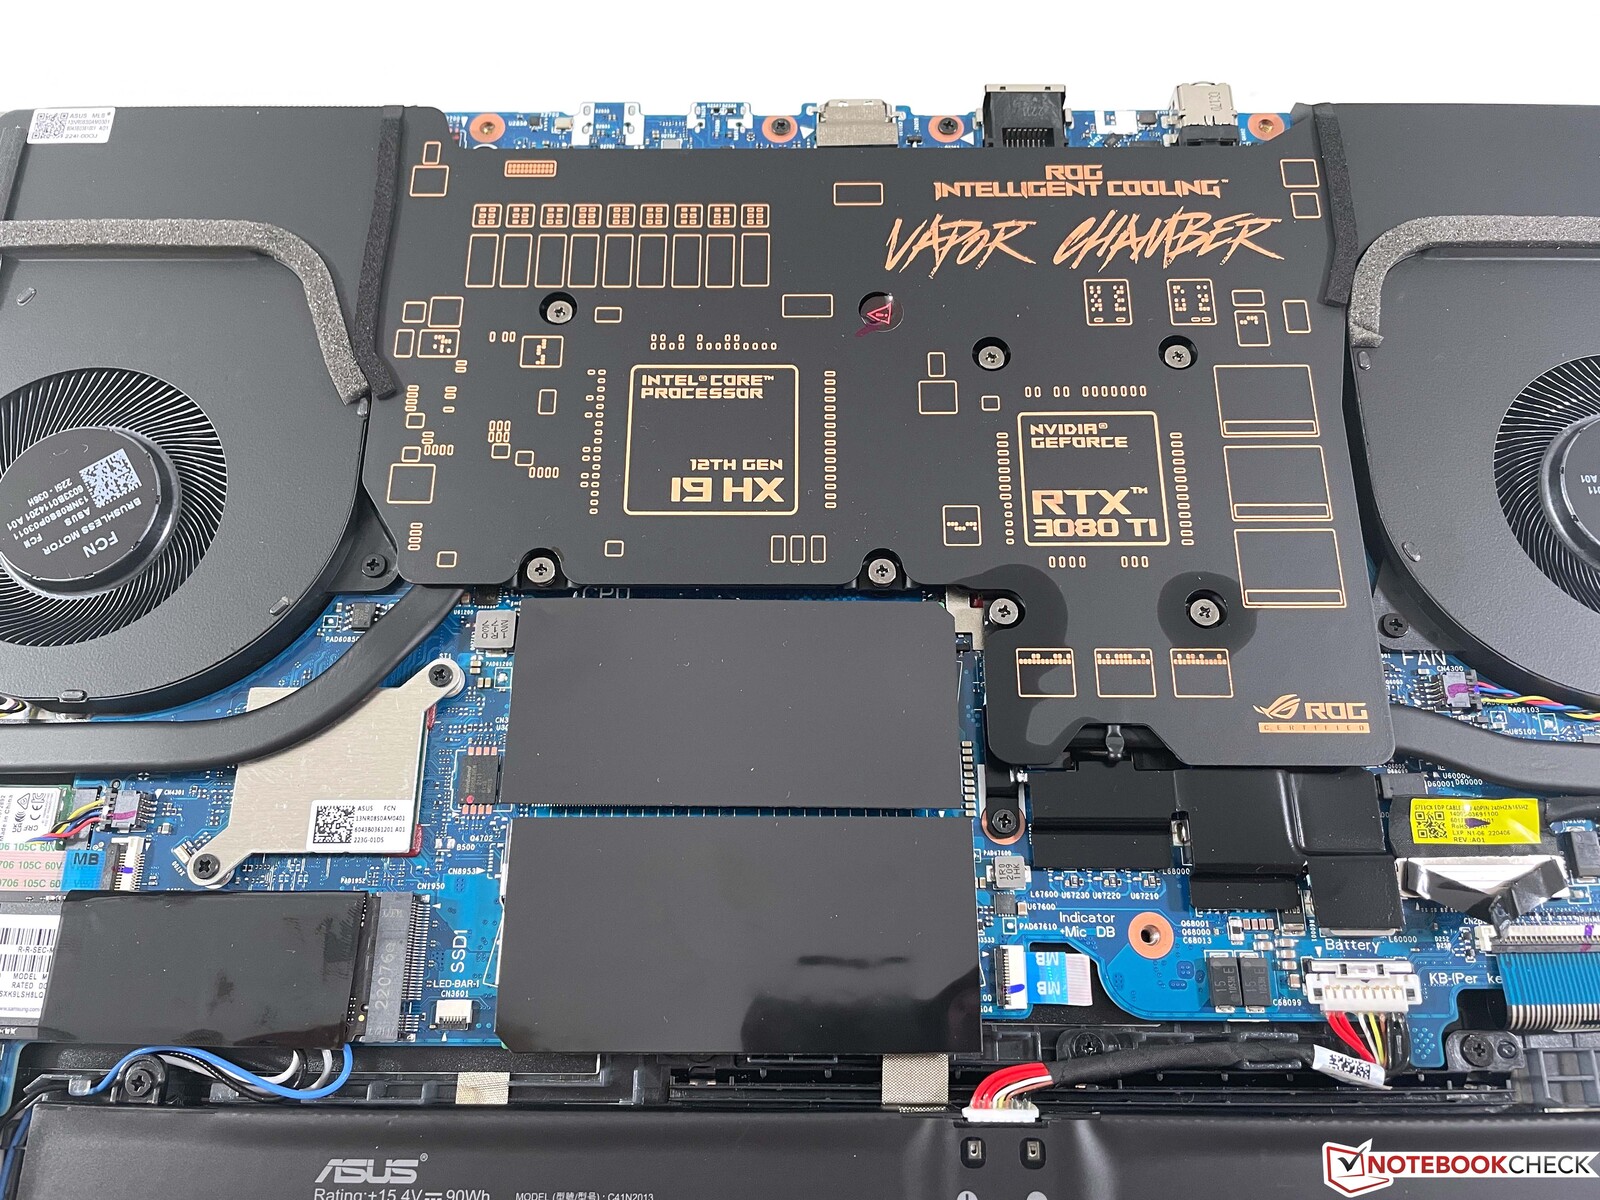
Emisje i zarządzanie energią
Poziomy hałasu
Asus zastosował tutaj system chłodzenia z komorą parową. W trybie zasilania Performance urządzenie również pozostaje stosunkowo ciche, a podczas testu obciążeniowego, jak i podczas grania jesteśmy w stanie zmierzyć maksymalnie 46 dB(A). Jest to oczywiście nadal zauważalne, ale nasz testowy egzemplarz jest przy tym wyraźnie cichszy od konkurencji. W trybie Turbo wydajność w grach jest tylko nieznacznie wyższa, ale dwa pracujące wentylatory wytwarzają głośne 54 dB(A). Podczas pracy w trybie jałowym wentylatory często pozostają wyłączone, ale prawie zawsze zauważamy jakieś ciche elektroniczne odgłosy. Pod obciążeniem z GPU dochodzi też jakiś słyszalny warkot cewek, którego się domyślamy.
Hałas
| luz |
| 23.9 / 23.9 / 23.9 dB |
| obciążenie |
| 34.3 / 45.9 dB |
 | ||
30 dB cichy 40 dB(A) słyszalny 50 dB(A) irytujący |
||
min: | ||
| Asus ROG Strix Scar 17 SE G733CX-LL014W GeForce RTX 3080 Ti Laptop GPU, i9-12950HX, Samsung PM9A1 MZVL22T0HBLB | Lenovo Legion 7 16IAX7-82TD004SGE GeForce RTX 3080 Ti Laptop GPU, i9-12900HX, Micron 3400 1TB MTFDKBA1T0TFH | MSI Titan GT77 12UHS GeForce RTX 3080 Ti Laptop GPU, i9-12900HX, Samsung PM9A1 MZVL21T0HCLR | Schenker XMG Neo 17 M22 GeForce RTX 3080 Ti Laptop GPU, R9 6900HX, Samsung SSD 980 Pro 1TB MZ-V8P1T0BW | Alienware x17 R2 P48E GeForce RTX 3080 Ti Laptop GPU, i9-12900HK, 2x Samsung PM9A1 1TB (RAID 0) | Asus Strix Scar 17 G733QSA-XS99 GeForce RTX 3080 Laptop GPU, R9 5900HX, 2x Samsung PM981a MZVLB1T0HBLR (RAID 0) | |
|---|---|---|---|---|---|---|
| Noise | -19% | -9% | -27% | 1% | -4% | |
| wyłączone / środowisko * (dB) | 23.9 | 24.5 -3% | 21.9 8% | 26 -9% | 22.7 5% | 25 -5% |
| Idle Minimum * (dB) | 23.9 | 24.5 -3% | 24.53 -3% | 26 -9% | 23.1 3% | 25.2 -5% |
| Idle Average * (dB) | 23.9 | 30 -26% | 24.53 -3% | 29 -21% | 23.1 3% | 25.2 -5% |
| Idle Maximum * (dB) | 23.9 | 32.5 -36% | 24.53 -3% | 40 -67% | 23.1 3% | 25.2 -5% |
| Load Average * (dB) | 34.3 | 43.9 -28% | 46.25 -35% | 47 -37% | 31.9 7% | 30.7 10% |
| Load Maximum * (dB) | 45.9 | 54.2 -18% | 54.25 -18% | 54 -18% | 52.5 -14% | 51.3 -12% |
| Witcher 3 ultra * (dB) | 48.8 | 56.86 | 52 | 52.5 | 51.3 |
* ... im mniej tym lepiej
Temperatura
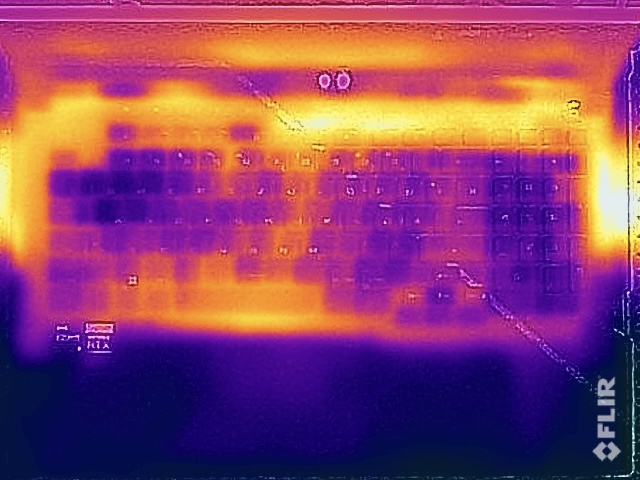
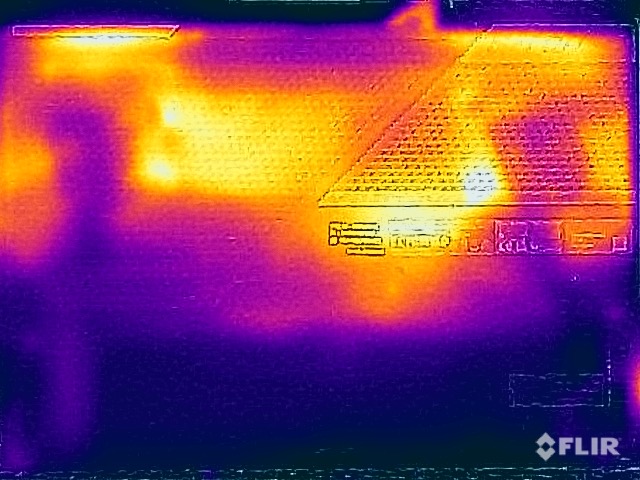
Pomimo stosunkowo cichych wentylatorów, temperatury powierzchni nie dają powodów do obaw. Nawet jeśli w niektórych odizolowanych miejscach pod obciążeniem zmierzyliśmy ponad 50°C (122°F), klawiatura pozostaje bardzo chłodna, a podczas gry nie ma żadnych ograniczeń
W teście obciążeniowym GPU jest traktowane w sposób uprzywilejowany - działa stabilnie przy 150 watach, gdy tylko procesor osiągnie poziom około 36 watów. Tuż po stress teście nie ma spadku wydajności.
(-) Maksymalna temperatura w górnej części wynosi 48.8 °C / 120 F, w porównaniu do średniej 40.4 °C / 105 F , począwszy od 21.2 do 68.8 °C dla klasy Gaming.
(-) Dno nagrzewa się maksymalnie do 52.4 °C / 126 F, w porównaniu do średniej 43.2 °C / 110 F
(+) W stanie bezczynności średnia temperatura górnej części wynosi 28.6 °C / 83 F, w porównaniu ze średnią temperaturą urządzenia wynoszącą 33.9 °C / ### class_avg_f### F.
(±) Podczas gry w Wiedźmina 3 średnia temperatura górnej części wynosi 35.1 °C / 95 F, w porównaniu do średniej temperatury urządzenia wynoszącej 33.9 °C / ## #class_avg_f### F.
(+) Podpórki pod nadgarstki i touchpad są chłodniejsze niż temperatura skóry i maksymalnie 26 °C / 78.8 F i dlatego są chłodne w dotyku.
(+) Średnia temperatura obszaru podparcia dłoni w podobnych urządzeniach wynosiła 28.8 °C / 83.8 F (+2.8 °C / 5 F).
| Asus ROG Strix Scar 17 SE G733CX-LL014W Intel Core i9-12950HX, NVIDIA GeForce RTX 3080 Ti Laptop GPU | Lenovo Legion 7 16IAX7-82TD004SGE Intel Core i9-12900HX, NVIDIA GeForce RTX 3080 Ti Laptop GPU | MSI Titan GT77 12UHS Intel Core i9-12900HX, NVIDIA GeForce RTX 3080 Ti Laptop GPU | Schenker XMG Neo 17 M22 AMD Ryzen 9 6900HX, NVIDIA GeForce RTX 3080 Ti Laptop GPU | Alienware x17 R2 P48E Intel Core i9-12900HK, NVIDIA GeForce RTX 3080 Ti Laptop GPU | Asus Strix Scar 17 G733QSA-XS99 AMD Ryzen 9 5900HX, NVIDIA GeForce RTX 3080 Laptop GPU | |
|---|---|---|---|---|---|---|
| Heat | -8% | -3% | 1% | 7% | 4% | |
| Maximum Upper Side * (°C) | 48.8 | 44.4 9% | 40.8 16% | 49 -0% | 49.6 -2% | 40 18% |
| Maximum Bottom * (°C) | 52.4 | 60.8 -16% | 52.4 -0% | 52 1% | 42.4 19% | 39.8 24% |
| Idle Upper Side * (°C) | 30.4 | 33.8 -11% | 34.6 -14% | 30 1% | 29.2 4% | 34.6 -14% |
| Idle Bottom * (°C) | 34.1 | 38.8 -14% | 38.4 -13% | 33 3% | 32 6% | 38.4 -13% |
* ... im mniej tym lepiej
Mówcy
System dźwiękowy składa się łącznie z czterech modułów, które wytwarzają potężny i przestrzenny dźwięk. Mimo że głośniki nie są najgłośniejsze na rynku, ich jakość jest ogólnie bardzo dobra. Jednak ze względu na głośny szum wentylatora podczas gry, nadal polecamy zestaw słuchawkowy.
Asus ROG Strix Scar 17 SE G733CX-LL014W analiza dźwięku
(±) | głośność głośnika jest średnia, ale dobra (73.3 dB)
Bas 100 - 315 Hz
(±) | zredukowany bas - średnio 6.2% niższy od mediany
(±) | liniowość basu jest średnia (7.5% delta do poprzedniej częstotliwości)
Średnie 400 - 2000 Hz
(+) | zbalansowane środki średnie - tylko 2% od mediany
(+) | średnie są liniowe (3.9% delta do poprzedniej częstotliwości)
Wysokie 2–16 kHz
(+) | zrównoważone maksima - tylko 3.5% od mediany
(±) | liniowość wysokich wartości jest średnia (9.3% delta do poprzedniej częstotliwości)
Ogólnie 100 - 16.000 Hz
(+) | ogólny dźwięk jest liniowy (13.6% różnicy w stosunku do mediany)
W porównaniu do tej samej klasy
» 20% wszystkich testowanych urządzeń w tej klasie było lepszych, 7% podobnych, 73% gorszych
» Najlepszy miał deltę 6%, średnia wynosiła ###średnia###%, najgorsza wynosiła 132%
W porównaniu do wszystkich testowanych urządzeń
» 15% wszystkich testowanych urządzeń było lepszych, 4% podobnych, 81% gorszych
» Najlepszy miał deltę 4%, średnia wynosiła ###średnia###%, najgorsza wynosiła 134%
MSI Titan GT77 12UHS analiza dźwięku
(+) | głośniki mogą odtwarzać stosunkowo głośno (83.4 dB)
Bas 100 - 315 Hz
(-) | prawie brak basu - średnio 71.8% niższa od mediany
(+) | bas jest liniowy (0% delta do poprzedniej częstotliwości)
Średnie 400 - 2000 Hz
(-) | prawie żadnych średnich - średnio 71.8% niższa od mediany
(+) | średnie są liniowe (0% delta do poprzedniej częstotliwości)
Wysokie 2–16 kHz
(-) | prawie żadnych maksimów - średnio 71.8% niższa od mediany
(+) | wzloty są liniowe (0% delta do poprzedniej częstotliwości)
Ogólnie 100 - 16.000 Hz
(-) | ogólny dźwięk nie jest liniowy (107.7% różnicy w stosunku do mediany)
W porównaniu do tej samej klasy
» 100% wszystkich testowanych urządzeń w tej klasie było lepszych, 0% podobnych, 0% gorszych
» Najlepszy miał deltę 6%, średnia wynosiła ###średnia###%, najgorsza wynosiła 132%
W porównaniu do wszystkich testowanych urządzeń
» 96% wszystkich testowanych urządzeń było lepszych, 0% podobnych, 4% gorszych
» Najlepszy miał deltę 4%, średnia wynosiła ###średnia###%, najgorsza wynosiła 134%
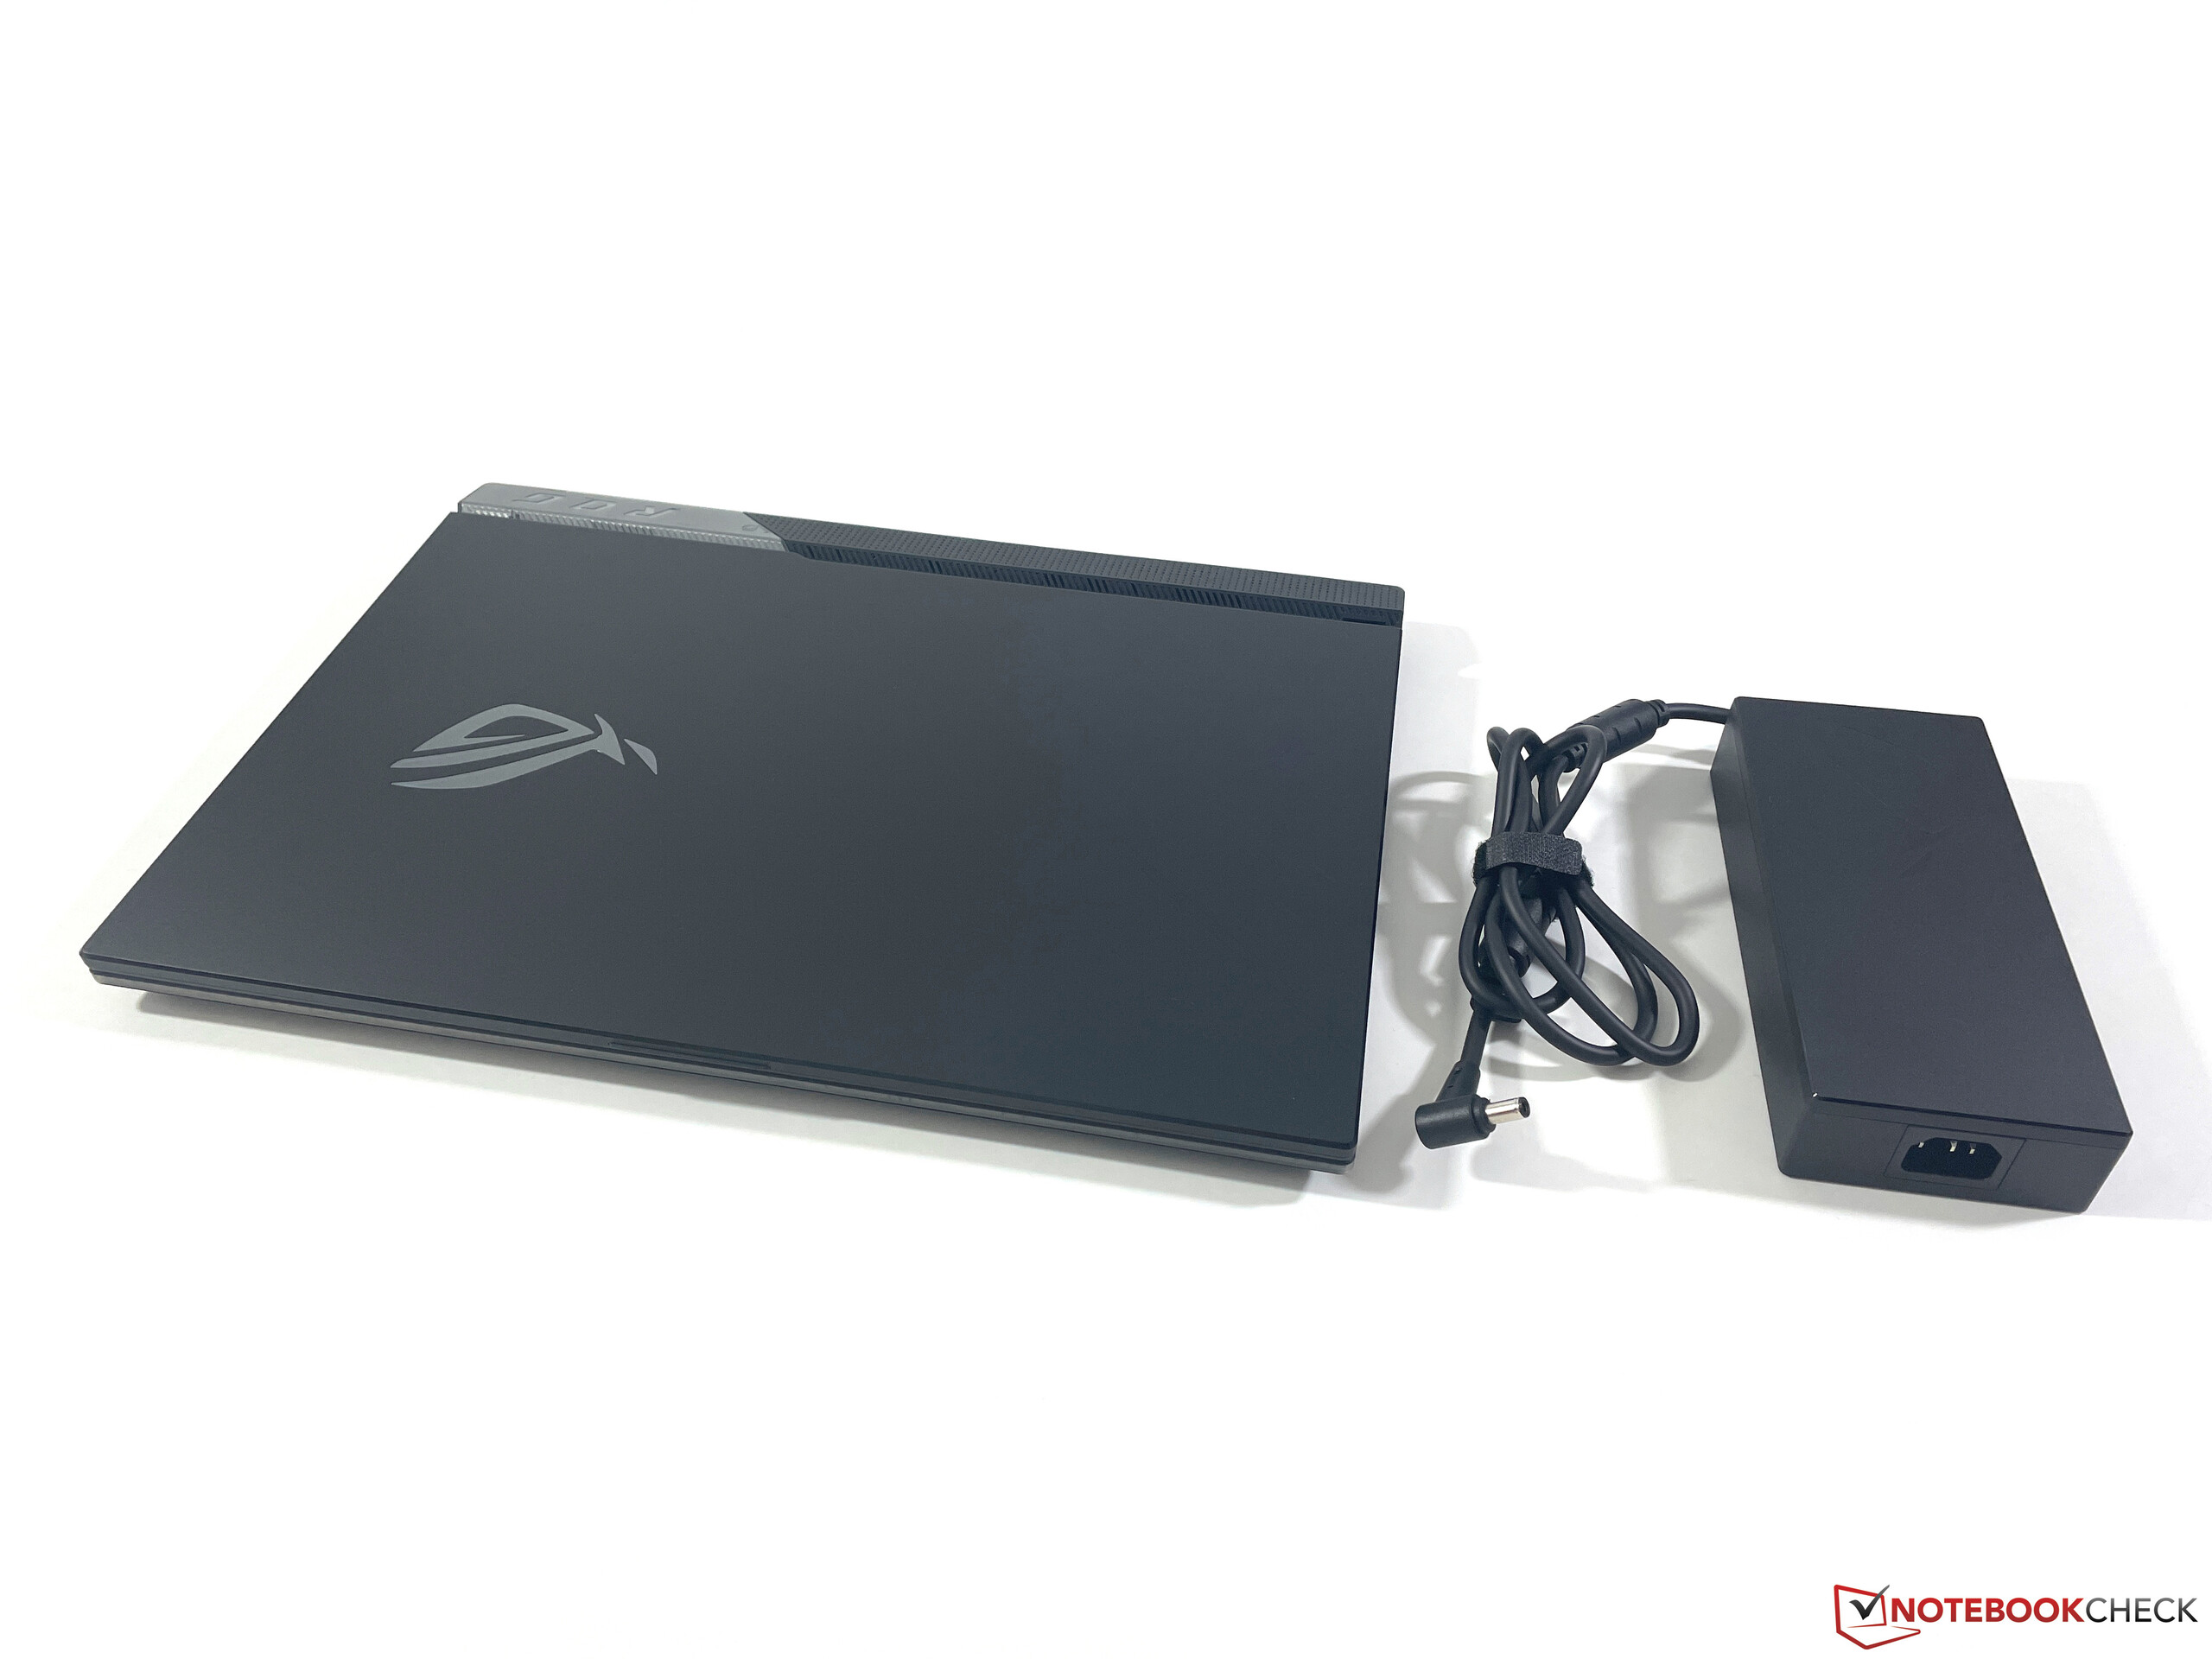
Pobór mocy
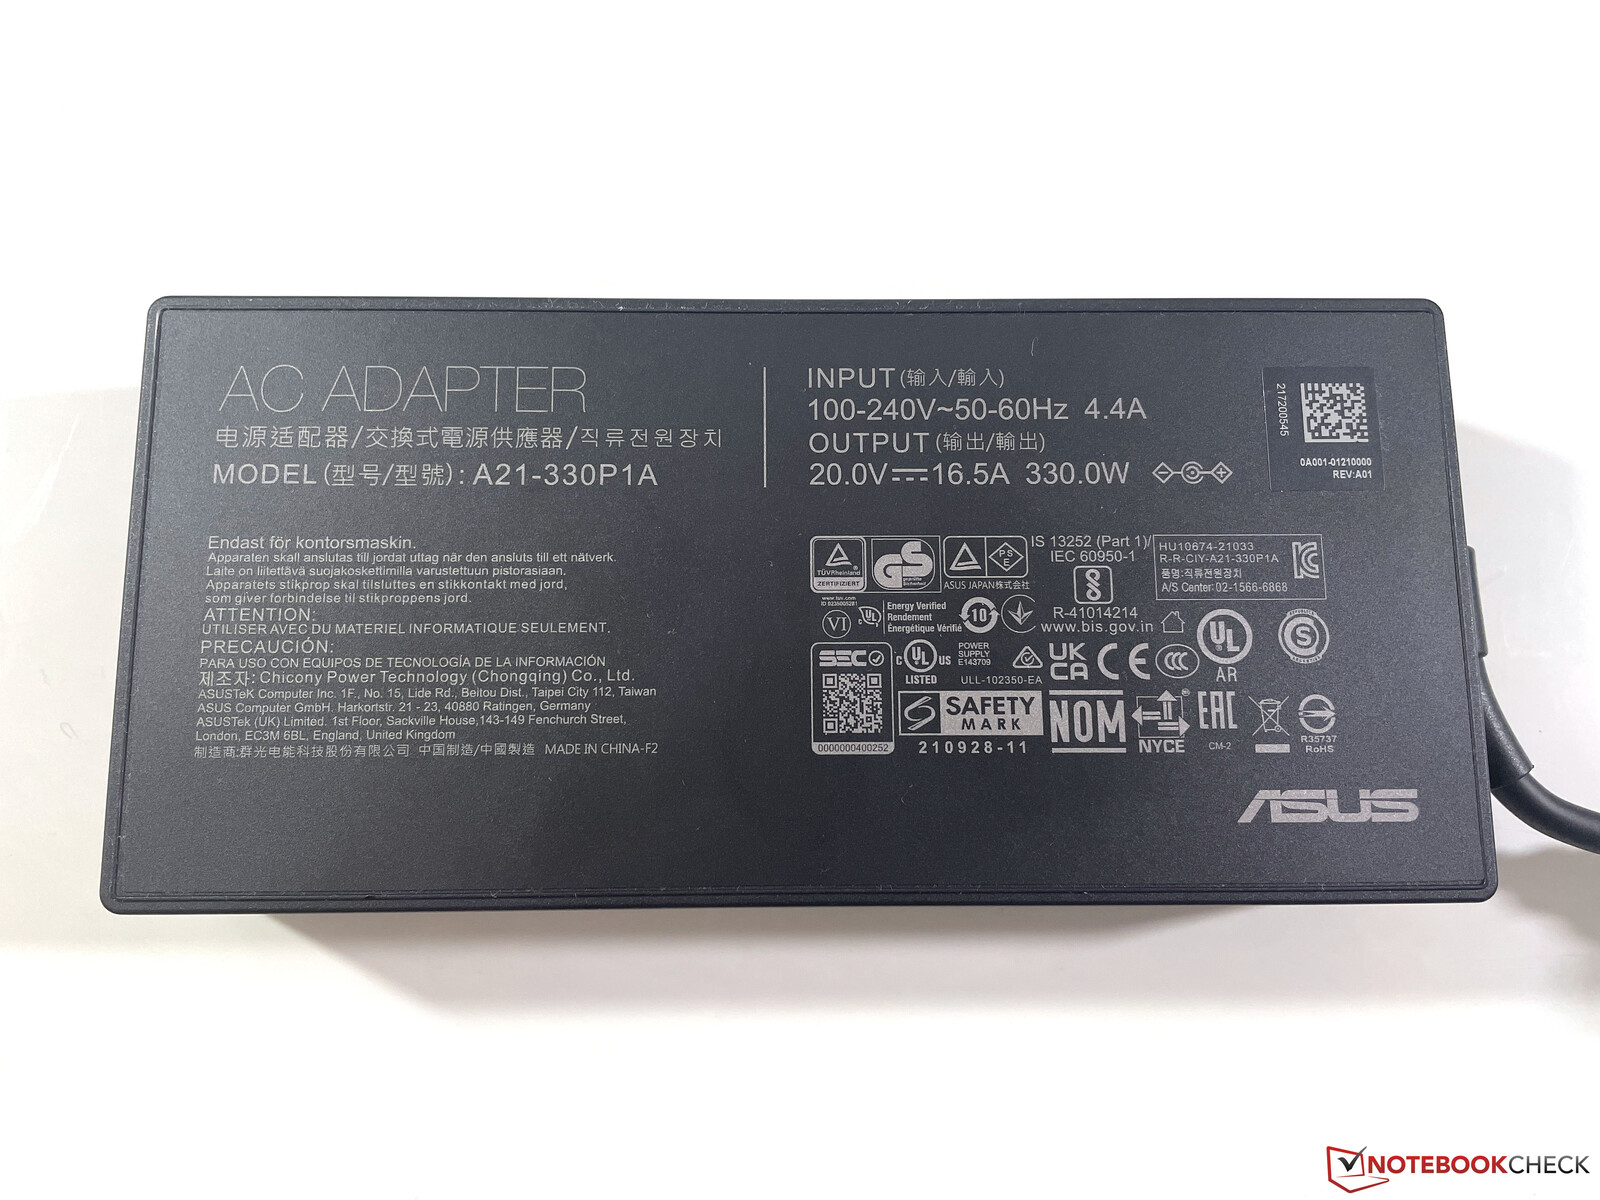
ROG Strix Scar 17 SE nie jest zbyt wydajnym laptopem, co nie jest zbyt zaskakujące, biorąc pod uwagę potężny sprzęt. Już podczas pracy w trybie jałowym mierzymy do 27 watów, a podczas grania wartość ta wzrasta do około 230 watów. Zasilacz o mocy 330 W jest więc wystarczająco duży. Zużycie energii w trybie czuwania również jest dość wysokie i wynosi 2,6 W, ale to zasługa domyślnie włączonych efektów świetlnych.
| wyłączony / stan wstrzymania | |
| luz | |
| obciążenie |
|
Legenda:
min: | |
Power Consumption The Witcher 3 / Stress Test
Power Consumption With External Monitor
Czas pracy na baterii
W naszym teście działania WLAN przy 150 cd/m², co odpowiada 48% maksymalnej jasności, nasz egzemplarz testowy wytrzymał tylko około 4 godzin. Biorąc pod uwagę wysokie wartości zużycia, nie jest to bardzo zaskakujące. Niektórzy konkurenci wytrzymują tu znacznie dłużej, jeśli trzeba będzie mostkować czasy z dala od gniazdka. Gaming jest możliwy przez około godzinę, ale tylko przy znacznym spadku wydajności. Całkowite naładowanie 90-Wh baterii zajmuje około 100 minut, przy czym 80% pojemności jest dostępne już po około 53 minutach.
| Battery Runtime - WiFi Websurfing | |
| Asus Strix Scar 17 G733QSA-XS99 | |
| Schenker XMG Neo 17 M22 | |
| Średnia w klasie Gaming (1.967 - 14.6, n=100, ostatnie 2 lata) | |
| MSI Titan GT77 12UHS | |
| Lenovo Legion 7 16IAX7-82TD004SGE | |
| Asus ROG Strix Scar 17 SE G733CX-LL014W | |
| Alienware x17 R2 P48E | |
Za
Przeciw
Werdykt - W pełni wyposażony szybki laptop do gier
Obecny Asus ROG Strix Scar 17 SE dostarcza naprawdę wszystko, czego pragnie serce gracza. Szybki panel QHD z 240 Hz wraz z GeForce RTX 3080 Ti, który oferuje również wystarczającą moc dla natywnej rozdzielczości w maksymalnych detalach. O ile wydajność procesora jest również dobra jak na laptopa dla graczy, to potencjał procesora HX nie może być w pełni wykorzystany. Warto więc zaoszczędzić sobie dodatkowej premii za mocniejszy procesor i wybrać po prostu zwykły Core i9
Inne zalety to bardzo wierne kolory, jeśli trzeba np. bezpośrednio pracować przy obróbce wideo, umiarkowane temperatury powierzchni oraz stosunkowo ciche wentylatory podczas grania. Co prawda dostępny jest tryb Turbo, który również staje się znacznie głośniejszy, ale nie ma to większego wpływu na wydajność w grach, więc naszym zdaniem nie warto
Nowy Asus ROG Strix Scar 17 SE oferuje mnóstwo wydajności i funkcji gamingowych, ale warto zaoszczędzić na dodatkowej dopłacie za procesor Intel HX.
Konkurenci na rynku gier oferują podobną specyfikację wydajności, ale także jaśniejsze wyświetlacze w częściach i mniej krzykliwe obudowy. Ponadto elektroniczne szumy mogą stać się na dłuższą metę irytujące.
Cena i dostępność
Nasza testowa konfiguracja ROG Strix Scar 17 SE jest dostępna w Amazon za 3899 USD, a mniejsza konfiguracja ze zwykłym Core i9-12900H jest tam również dostępna za 2278$.
Asus ROG Strix Scar 17 SE G733CX-LL014W
- 18/11/2022 v7 (old)
Andreas Osthoff
Price comparison

