Debiut wydajności Radeona RX 6550M: Recenzja laptopa Lenovo ThinkPad Z16 Gen 2
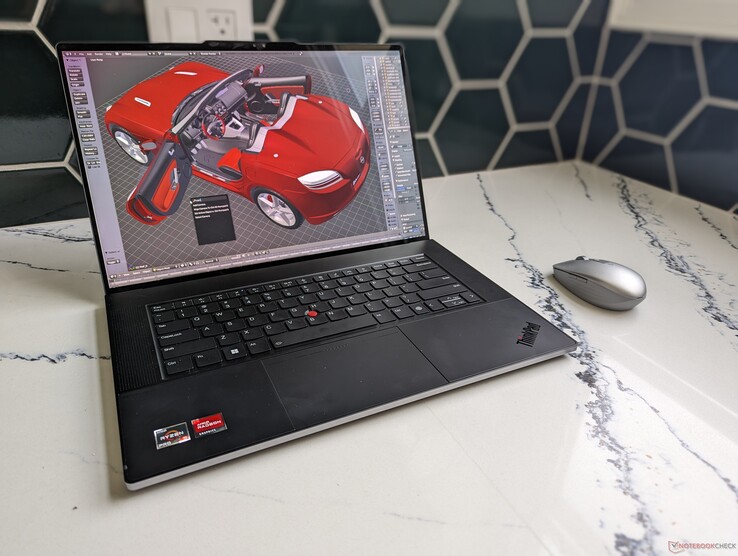
ThinkPad Z16 G2 jest następcą rocznego ThinkPada Z16 G1 z nowymi opcjami procesorów AMD Zen 4, szybszą grafiką Radeon RX i nowym ekranem dotykowym OLED 2400p. Jest to również jeden z niewielu laptopów z niecodzienną podstawową kartą graficzną Radeon RX 6550M. Obudowa jest poza tym identyczna jak w ThinkPad Z16 G1, więc zalecamy sprawdzenie naszą recenzję modelu pierwszej generacji aby dowiedzieć się więcej o cechach fizycznych i opcjach łączności tej serii.
Nasza konkretna jednostka testowa to najwyższej klasy konfiguracja z procesorem Ryzen 9 Pro 7940HS, kartą graficzną Radeon RX 6550M, ekranem dotykowym OLED i 64 GB pamięci RAM za około 2600 USD. Mniejsze SKU zaczynają się od Ryzen 5 Pro 7640HS, zintegrowanej grafiki i wyświetlacza IPS 1200p za 1600 USD. ThinkPad Z16 może być uważany za półprofesjonalny laptop do multimediów lub tworzenia treści, ponieważ posiada procesory Ryzen Pro zamiast typowych opcji innych niż Pro.
Alternatywy dla ThinkPada Z16 G2 obejmują inne wysokiej klasy 16-calowe laptopy dla twórców treści, takie jak MSI Creator Z16P, Apple MacBook Pro 16, Asus Vivobook Pro 16Xlub Dell XPS.
Więcej recenzji Lenovo:
Potencjalni konkurenci w porównaniu
Ocena | Data | Model | Waga | Wysokość | Rozmiar | Rezolucja | Cena |
|---|---|---|---|---|---|---|---|
| 88.6 % v7 (old) | 12/2023 | Lenovo ThinkPad Z16 Gen 2 R9 PRO 7940HS, Radeon RX 6550M | 1.8 kg | 15.8 mm | 16.00" | 3840x2400 | |
| 87.3 % v7 (old) | 10/2022 | Lenovo ThinkPad Z16 G1 21D5S00T00 R7 PRO 6850H, Radeon RX 6500M | 1.9 kg | 15.8 mm | 16.00" | 1920x1200 | |
| 85.7 % v7 (old) | 11/2023 | Lenovo ThinkBook 16 G6 ABP R5 7530U, Vega 7 | 1.8 kg | 17.5 mm | 16.00" | 1920x1200 | |
| 83.7 % v7 (old) | MSI Creator Z16P B12UHST i9-12900H, GeForce RTX 3080 Ti Laptop GPU | 2.4 kg | 20.4 mm | 16.00" | 2560x1600 | ||
| 93.7 % v7 (old) | 11/2023 | Apple MacBook Pro 16 2023 M3 Pro Apple M3 Pro 12-Core, M3 Pro 18-Core GPU | 2.1 kg | 16.9 mm | 16.20" | 3456x2234 | |
| 86.2 % v7 (old) | 07/2023 | Asus Vivobook Pro 16X K6604JV-MX016W i9-13980HX, GeForce RTX 4060 Laptop GPU | 2.1 kg | 22.8 mm | 16.00" | 3200x2000 |
Sprawa
Czytnik kart SD
| SD Card Reader | |
| average JPG Copy Test (av. of 3 runs) | |
| Lenovo ThinkPad Z16 Gen 2 (Toshiba Exceria Pro SDXC 64 GB UHS-II) | |
| Asus Vivobook Pro 16X K6604JV-MX016W | |
| Lenovo ThinkPad Z16 G1 21D5S00T00 | |
| Lenovo ThinkBook 16 G6 ABP (Angelbird AV Pro V60) | |
| MSI Creator Z16P B12UHST (AV PRO microSD 128 GB V60) | |
| maximum AS SSD Seq Read Test (1GB) | |
| Lenovo ThinkPad Z16 G1 21D5S00T00 | |
| Lenovo ThinkPad Z16 Gen 2 (Toshiba Exceria Pro SDXC 64 GB UHS-II) | |
| Asus Vivobook Pro 16X K6604JV-MX016W | |
| Lenovo ThinkBook 16 G6 ABP (Angelbird AV Pro V60) | |
Komunikacja
Lenovo wymieniło Qualcomm WCN685x z zeszłorocznego modelu na MediaTek MT7922 w tegorocznym modelu. Prędkości transferu pozostają stabilne i doskonałe po sparowaniu z naszymi sieciami Wi-Fi 6 lub Wi-Fi 6E.
| Networking | |
| iperf3 transmit AXE11000 | |
| Lenovo ThinkPad Z16 G1 21D5S00T00 | |
| Asus Vivobook Pro 16X K6604JV-MX016W | |
| Lenovo ThinkPad Z16 Gen 2 | |
| Lenovo ThinkBook 16 G6 ABP | |
| iperf3 receive AXE11000 | |
| Lenovo ThinkPad Z16 G1 21D5S00T00 | |
| Asus Vivobook Pro 16X K6604JV-MX016W | |
| MSI Creator Z16P B12UHST | |
| Lenovo ThinkPad Z16 Gen 2 | |
| Lenovo ThinkBook 16 G6 ABP | |
| iperf3 transmit AXE11000 6GHz | |
| Lenovo ThinkPad Z16 G1 21D5S00T00 | |
| Asus Vivobook Pro 16X K6604JV-MX016W | |
| Lenovo ThinkPad Z16 Gen 2 | |
| iperf3 receive AXE11000 6GHz | |
| Lenovo ThinkPad Z16 G1 21D5S00T00 | |
| Asus Vivobook Pro 16X K6604JV-MX016W | |
| Lenovo ThinkPad Z16 Gen 2 | |
Kamera internetowa
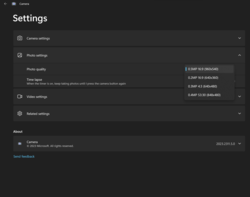
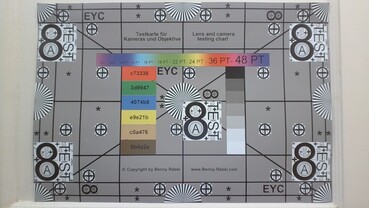
Chociaż Lenovo reklamuje kamerę internetową 2 MP, jesteśmy w stanie wybrać tylko do 0,5 MP za pomocą wbudowanej aplikacji aparatu, jak pokazano na zrzucie ekranu po prawej stronie. Powiadomiliśmy Lenovo o błędzie i zaktualizujemy tę sekcję, jeśli otrzymamy odpowiedź.
Konserwacja
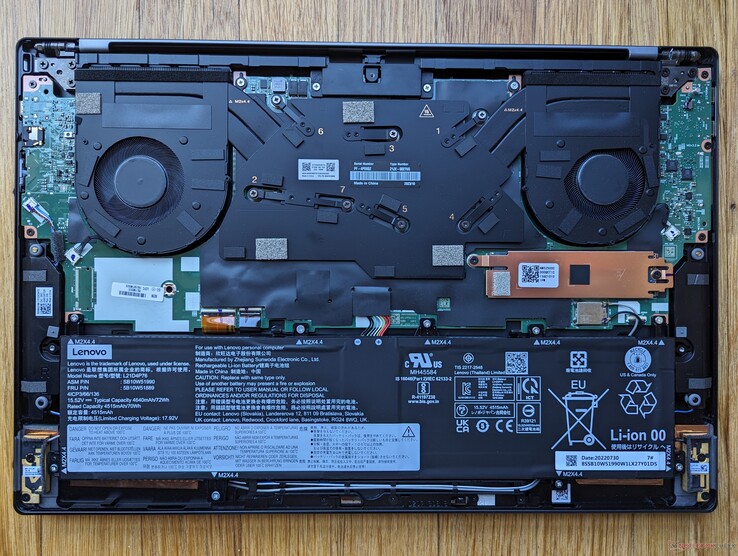
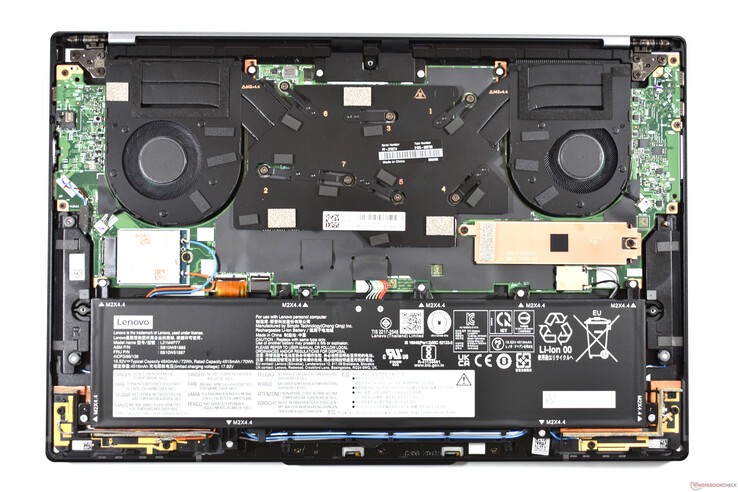
Demontaż dolnego panelu nie wykazuje większych różnic wewnętrznych pomiędzy wersjami Gen 1 i Gen 2. Nasza konfiguracja Gen 2 nie obejmuje jednak obsługi sieci WAN, a zatem gniazdo M.2 WAN i antena są nieobecne. Oznacza to niestety, że użytkownicy nie mogą zakupić SKU bez WAN z zamiarem dodania modułu WAN w przyszłości.
Wyświetlacz
Lenovo oferuje cztery następujące opcje wyświetlaczy, z których wszystkie mają tylko 60 Hz i nie obsługują FreeSync:
- 1920 x 1200, IPS, matowy, bezdotykowy, 100% sRGB, 400 nitów
- 1920 x 1200, IPS, błyszczący, dotykowy, 100% sRGB, 400 nitów
- 3840 x 2400, OLED, błyszczący, dotykowy, 100% DCI-P3, 400 nitów, HDR400
Ten sam panel OLED Samsung ATNA60YV04-0 w naszej jednostce testowej można również znaleźć w najnowszym ThinkPadzie P1 G6, więc wrażenia z oglądania są podobne między tymi dwoma modelami. Nierzadko zdarza się, że producent wdraża te same opcje paneli w wielu modelach.
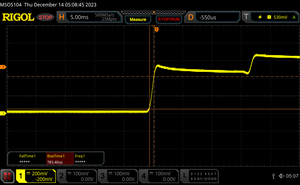
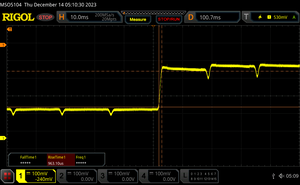
W porównaniu do panelu 1200p w naszej jednostce Gen 1, panel OLED oferuje głębsze poziomy czerni, obsługę HDR, krótszy czas reakcji czerni i bieli, żywsze kolory i wyższą rozdzielczość natywną. Bez względu na opcję, cieszymy się, że pełne pokrycie sRGB jest standardem i nie trzeba unikać low-endowych SKU. Mamy nadzieję, że przyszłe wersje będą zawierały panele o wysokim odświeżaniu, podobnie jak seria Asus VivoBook.
| |||||||||||||||||||||||||
rozświetlenie: 97 %
na akumulatorze: 390.1 cd/m²
kontrast: ∞:1 (czerń: 0 cd/m²)
ΔE ColorChecker Calman: 1.41 | ∀{0.5-29.43 Ø4.76}
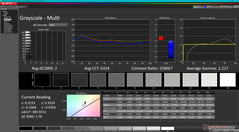
ΔE Greyscale Calman: 2 | ∀{0.09-98 Ø5}
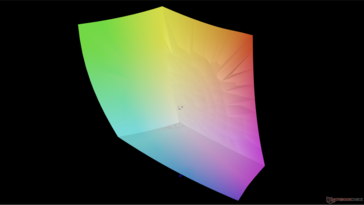
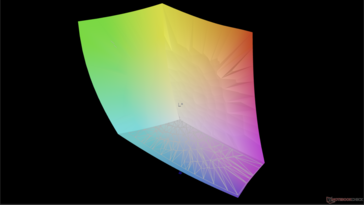
96.7% AdobeRGB 1998 (Argyll 3D)
100% sRGB (Argyll 3D)
99.7% Display P3 (Argyll 3D)
Gamma: 2.22
CCT: 6324 K
| Lenovo ThinkPad Z16 Gen 2 Samsung ATNA60YV04-0, OLED, 3840x2400, 16" | Lenovo ThinkPad Z16 G1 21D5S00T00 NE160WUM-N62 , IPS LED, 1920x1200, 16" | Lenovo ThinkBook 16 G6 ABP LEN160WUXGA, IPS, 1920x1200, 16" | MSI Creator Z16P B12UHST AUOD298, IPS True Pixel (~100% DCI-P3), 2560x1600, 16" | Asus Vivobook Pro 16X K6604JV-MX016W Samsung SDC4178 ATNA60BX01-1, OLED, 3200x2000, 16" | Apple MacBook Pro 16 2023 M3 Max Mini-LED, 3456x2234, 16" | |
|---|---|---|---|---|---|---|
| Display | -18% | -52% | -4% | -1% | -1% | |
| Display P3 Coverage (%) | 99.7 | 70 -30% | 40.4 -59% | 97.6 -2% | 98.4 -1% | 99.2 -1% |
| sRGB Coverage (%) | 100 | 99.7 0% | 59.8 -40% | 99.9 0% | 99.7 0% | |
| AdobeRGB 1998 Coverage (%) | 96.7 | 72.1 -25% | 42 -57% | 86.8 -10% | 95.8 -1% | |
| Response Times | -1637% | -1414% | -417% | 20% | -2852% | |
| Response Time Grey 50% / Grey 80% * (ms) | 1.86 ? | 40 ? -2051% | 32.8 ? -1663% | 12.9 ? -594% | 1.6 ? 14% | 66.9 ? -3497% |
| Response Time Black / White * (ms) | 1.89 ? | 25 ? -1223% | 23.9 ? -1165% | 6.4 ? -239% | 1.4 ? 26% | 43.6 ? -2207% |
| PWM Frequency (Hz) | 60 ? | 120 ? | 14877 | |||
| Screen | -3% | -185% | -23% | -5% | 25% | |
| Brightness middle (cd/m²) | 390.1 | 487 25% | 310 -21% | 428 10% | 347 -11% | 630 61% |
| Brightness (cd/m²) | 393 | 446 13% | 290 -26% | 394 0% | 346 -12% | 604 54% |
| Brightness Distribution (%) | 97 | 83 -14% | 86 -11% | 86 -11% | 97 0% | 94 -3% |
| Black Level * (cd/m²) | 0.31 | 0.22 | 0.42 | 0.06 | ||
| Colorchecker dE 2000 * | 1.41 | 1.8 -28% | 6.2 -340% | 1.67 -18% | 1.89 -34% | 1.2 15% |
| Colorchecker dE 2000 max. * | 3.43 | 3.3 4% | 24.7 -620% | 5.71 -66% | 3.26 5% | 2.8 18% |
| Greyscale dE 2000 * | 2 | 2.3 -15% | 3.8 -90% | 3.1 -55% | 1.55 22% | 1.9 5% |
| Gamma | 2.22 99% | 2.16 102% | 2.22 99% | 2.195 100% | 2.39 92% | 2.29 96% |
| CCT | 6324 103% | 6867 95% | 6011 108% | 6498 100% | 6458 101% | 6812 95% |
| Contrast (:1) | 1571 | 1409 | 1019 | 5783 | ||
| Colorchecker dE 2000 calibrated * | 0.8 | 5.3 | 0.71 | 1.97 | ||
| Całkowita średnia (program / ustawienia) | -553% /
-304% | -550% /
-372% | -148% /
-90% | 5% /
1% | -943% /
-617% |
* ... im mniej tym lepiej
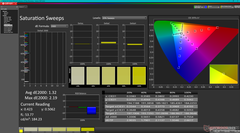
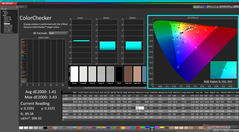
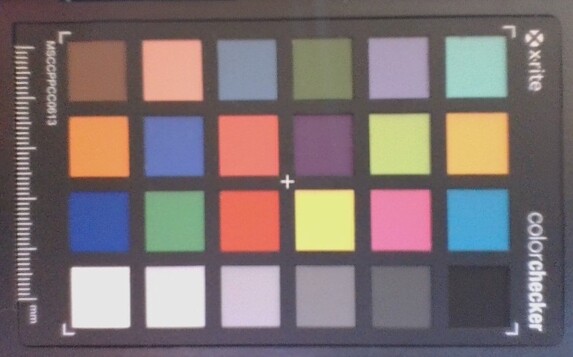
Wyświetlacz OLED jest dobrze skalibrowany po wyjęciu z pudełka, a średnie wartości deltaE dla skali szarości i kolorów wynoszą odpowiednio zaledwie 2,0 i 1,41. Kalibracja przez użytkownika końcowego nie jest zatem konieczna dla zdecydowanej większości użytkowników.
Wyświetl czasy reakcji
| ↔ Czas reakcji od czerni do bieli | ||
|---|---|---|
| 1.89 ms ... wzrost ↗ i spadek ↘ łącznie | ↗ ms wzrost | |
| ↘ 0.89 ms upadek | ||
| W naszych testach ekran wykazuje bardzo szybką reakcję i powinien bardzo dobrze nadawać się do szybkich gier. Dla porównania, wszystkie testowane urządzenia wahają się od 0.1 (minimum) do 240 (maksimum) ms. » 10 % wszystkich urządzeń jest lepszych. Oznacza to, że zmierzony czas reakcji jest lepszy od średniej wszystkich testowanych urządzeń (20.1 ms). | ||
| ↔ Czas reakcji 50% szarości do 80% szarości | ||
| 1.86 ms ... wzrost ↗ i spadek ↘ łącznie | ↗ 0.96 ms wzrost | |
| ↘ 0.9 ms upadek | ||
| W naszych testach ekran wykazuje bardzo szybką reakcję i powinien bardzo dobrze nadawać się do szybkich gier. Dla porównania, wszystkie testowane urządzenia wahają się od 0.165 (minimum) do 636 (maksimum) ms. » 8 % wszystkich urządzeń jest lepszych. Oznacza to, że zmierzony czas reakcji jest lepszy od średniej wszystkich testowanych urządzeń (31.5 ms). | ||
Migotanie ekranu / PWM (modulacja szerokości impulsu)
| Wykryto migotanie ekranu/wykryto PWM | 60 Hz | ≤ 100 % ustawienia jasności | |
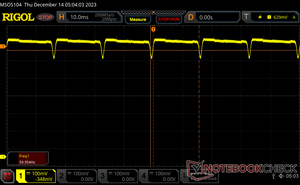
Podświetlenie wyświetlacza miga z częstotliwością 60 Hz (najgorszy przypadek, np. przy użyciu PWM) Wykryto migotanie przy ustawieniu jasności 100 % i poniżej. Powyżej tego ustawienia jasności nie powinno być żadnego migotania ani PWM. Częstotliwość 60 Hz jest bardzo niska, więc migotanie może powodować zmęczenie oczu i bóle głowy po dłuższym użytkowaniu. Dla porównania: 53 % wszystkich testowanych urządzeń nie używa PWM do przyciemniania wyświetlacza. Jeśli wykryto PWM, zmierzono średnio 8023 (minimum: 5 - maksimum: 343500) Hz. | |||
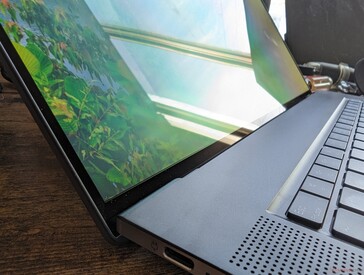
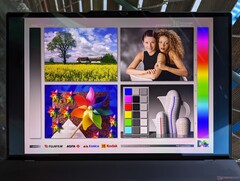
Kąty widzenia są szersze niż w przypadku IPS, a głębsze poziomy czerni pomagają zachować kolory przy jasnym oświetleniu otoczenia. Mimo to, odblaski z błyszczącej nakładki są nieuniknione, a maksymalna jasność nie jest jaśniejsza niż podstawowa konfiguracja 1200p IPS. Dla porównania, wyświetlacz w MacBooku Pro 16 jest o 50 procent jaśniejszy, co zapewnia lepszą widoczność na zewnątrz.
Wydajność
Warunki testowania
Przed uruchomieniem poniższych testów porównawczych ustawiliśmy system Windows na tryb wydajności. Preinstalowane oprogramowanie Lenovo Commercial Vantage nie zawiera żadnych dodatkowych ustawień profilu zasilania poza zwykłym wyborem systemu Windows. Niemniej jednak jest ono niezbędne do aktualizacji BIOS-u i dostosowywania sposobu ładowania baterii.
Procesor
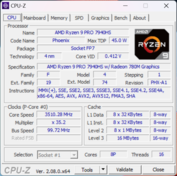
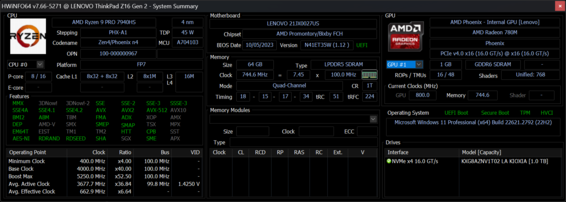
Ryzen Ryzen 9 Pro 7940HS działa identycznie jak Ryzen 9 7940HS jaki można znaleźć w Asus TUF Gaming A16. Dzięki temu użytkownicy nie będą musieli poświęcać wydajności, aby skorzystać z funkcji Pro. Ogólna wydajność jest porównywalna z zeszłorocznymi procesorami 12. generacji Core i9-12900H zarówno w obciążeniach jedno-, jak i wielowątkowych.
Różnice w wydajności pomiędzy naszym Zen 4 Ryzen 9 Pro 7940HS a Zen 3+ Ryzen 7 Pro 6850H w zeszłorocznym ThinkPadzie Z16 Gen 1 mogą być dość znaczące i wynosić od 35 do 45 procent w przypadku obciążeń wielowątkowych ze względu na większą liczbę rdzeni. W związku z tym wzrost wydajności dzięki Zen 4 jest jednym z głównych powodów, dla których warto wybrać wersję Gen 2 ThinkPada Z16 zamiast Gen 1.
Niższe konfiguracje oferują Ryzen 7 Pro 7840HS lub Ryzen 5 Pro 7640HS zamiast nich. Opcja Ryzen 7 działa prawie identycznie jak opcja Ryzen 9 w oparciu o nasz czas spędzony z Lenovo Legion Slim 5 16 dlatego też zaleca się wybór konfiguracji Ryzen 7, aby zaoszczędzić na kosztach. W rzeczywistości Ryzen 7 Pro 7840HS ma dokładnie taką samą liczbę rdzeni i funkcji jak Ryzen 9 Pro 7940HS, z bardzo niewielkimi różnicami w docelowych częstotliwościach taktowania wynoszącymi od 100 do 200 MHz.
Oczekuje się, że obniżenie do konfiguracji Ryzen 5 Pro 7640HS wpłynie na wydajność procesora bardziej znacząco, o około 30 do 35 procent, w oparciu o nasz czas spędzony z HP ZBook Firefly 14 G10. Różnice w wydajności między opcjami Ryzen 5, Ryzen 7 i Ryzen 9 są zatem mocno wypaczone między jednostkami SKU Ryzen 5 i Ryzen 7.
Cinebench R15 Multi Loop
Cinebench R23: Multi Core | Single Core
Cinebench R20: CPU (Multi Core) | CPU (Single Core)
Cinebench R15: CPU Multi 64Bit | CPU Single 64Bit
Blender: v2.79 BMW27 CPU
7-Zip 18.03: 7z b 4 | 7z b 4 -mmt1
Geekbench 5.5: Multi-Core | Single-Core
HWBOT x265 Benchmark v2.2: 4k Preset
LibreOffice : 20 Documents To PDF
R Benchmark 2.5: Overall mean
| CPU Performance rating | |
| Asus Zephyrus Duo 16 GX650PY-NM006W | |
| MSI Raider GE68HX 13VF | |
| Asus Vivobook Pro 16X K6604JV-MX016W | |
| Alienware m16 R1 AMD | |
| MSI Raider GE68 HX 13VG, i7-13700HX | |
| Lenovo ThinkPad P1 G6 21FV001KUS | |
| MSI Creator Z16P B12UHST | |
| Lenovo Legion Slim 5 16APH8 | |
| Lenovo ThinkPad Z16 Gen 2 | |
| MSI Stealth 16 Mercedes-AMG Motorsport A13VG | |
| HP Victus 16-r0076TX -1! | |
| Apple MacBook Pro 16 2023 M3 Pro -8! | |
| Lenovo Legion Slim 7 16APH8 | |
| Przeciętny AMD Ryzen 9 PRO 7940HS | |
| Lenovo ThinkPad Z16 G1 21D5S00T00 | |
| HP ZBook Firefly 14 G10 A | |
| LG Gram 2in1 16 16T90R - G.AA78G | |
| Lenovo ThinkBook 16 G6 ABP | |
| Cinebench R23 / Multi Core | |
| Asus Zephyrus Duo 16 GX650PY-NM006W | |
| MSI Raider GE68HX 13VF | |
| Asus Vivobook Pro 16X K6604JV-MX016W | |
| Alienware m16 R1 AMD | |
| MSI Raider GE68 HX 13VG, i7-13700HX | |
| MSI Stealth 16 Mercedes-AMG Motorsport A13VG | |
| MSI Creator Z16P B12UHST | |
| HP Victus 16-r0076TX | |
| Lenovo ThinkPad P1 G6 21FV001KUS | |
| Lenovo Legion Slim 5 16APH8 | |
| Lenovo ThinkPad Z16 Gen 2 | |
| Lenovo Legion Slim 7 16APH8 | |
| Przeciętny AMD Ryzen 9 PRO 7940HS (14919 - 16938, n=3) | |
| Apple MacBook Pro 16 2023 M3 Pro | |
| Lenovo ThinkPad Z16 G1 21D5S00T00 | |
| LG Gram 2in1 16 16T90R - G.AA78G | |
| HP ZBook Firefly 14 G10 A | |
| Lenovo ThinkBook 16 G6 ABP | |
| Cinebench R23 / Single Core | |
| MSI Raider GE68HX 13VF | |
| MSI Stealth 16 Mercedes-AMG Motorsport A13VG | |
| Lenovo ThinkPad P1 G6 21FV001KUS | |
| Apple MacBook Pro 16 2023 M3 Pro | |
| Asus Zephyrus Duo 16 GX650PY-NM006W | |
| MSI Creator Z16P B12UHST | |
| MSI Raider GE68 HX 13VG, i7-13700HX | |
| Alienware m16 R1 AMD | |
| Asus Vivobook Pro 16X K6604JV-MX016W | |
| Lenovo ThinkPad Z16 Gen 2 | |
| Lenovo Legion Slim 5 16APH8 | |
| Lenovo Legion Slim 7 16APH8 | |
| Przeciętny AMD Ryzen 9 PRO 7940HS (1568 - 1794, n=3) | |
| LG Gram 2in1 16 16T90R - G.AA78G | |
| HP Victus 16-r0076TX | |
| HP ZBook Firefly 14 G10 A | |
| Lenovo ThinkPad Z16 G1 21D5S00T00 | |
| Lenovo ThinkBook 16 G6 ABP | |
| Cinebench R20 / CPU (Multi Core) | |
| Asus Zephyrus Duo 16 GX650PY-NM006W | |
| MSI Raider GE68HX 13VF | |
| Asus Vivobook Pro 16X K6604JV-MX016W | |
| Alienware m16 R1 AMD | |
| MSI Raider GE68 HX 13VG, i7-13700HX | |
| MSI Stealth 16 Mercedes-AMG Motorsport A13VG | |
| HP Victus 16-r0076TX | |
| MSI Creator Z16P B12UHST | |
| Lenovo ThinkPad P1 G6 21FV001KUS | |
| Lenovo Legion Slim 5 16APH8 | |
| Lenovo ThinkPad Z16 Gen 2 | |
| Lenovo Legion Slim 7 16APH8 | |
| Przeciętny AMD Ryzen 9 PRO 7940HS (5790 - 6601, n=3) | |
| Lenovo ThinkPad Z16 G1 21D5S00T00 | |
| HP ZBook Firefly 14 G10 A | |
| LG Gram 2in1 16 16T90R - G.AA78G | |
| Lenovo ThinkBook 16 G6 ABP | |
| Cinebench R20 / CPU (Single Core) | |
| MSI Raider GE68HX 13VF | |
| MSI Stealth 16 Mercedes-AMG Motorsport A13VG | |
| Lenovo ThinkPad P1 G6 21FV001KUS | |
| Asus Zephyrus Duo 16 GX650PY-NM006W | |
| MSI Creator Z16P B12UHST | |
| MSI Raider GE68 HX 13VG, i7-13700HX | |
| Alienware m16 R1 AMD | |
| Asus Vivobook Pro 16X K6604JV-MX016W | |
| Lenovo Legion Slim 5 16APH8 | |
| Lenovo ThinkPad Z16 Gen 2 | |
| Lenovo Legion Slim 7 16APH8 | |
| Przeciętny AMD Ryzen 9 PRO 7940HS (611 - 695, n=3) | |
| LG Gram 2in1 16 16T90R - G.AA78G | |
| HP Victus 16-r0076TX | |
| HP ZBook Firefly 14 G10 A | |
| Lenovo ThinkPad Z16 G1 21D5S00T00 | |
| Lenovo ThinkBook 16 G6 ABP | |
| Cinebench R15 / CPU Multi 64Bit | |
| Asus Zephyrus Duo 16 GX650PY-NM006W | |
| Asus Vivobook Pro 16X K6604JV-MX016W | |
| MSI Raider GE68HX 13VF | |
| Alienware m16 R1 AMD | |
| MSI Raider GE68 HX 13VG, i7-13700HX | |
| MSI Stealth 16 Mercedes-AMG Motorsport A13VG | |
| MSI Creator Z16P B12UHST | |
| HP Victus 16-r0076TX | |
| Lenovo ThinkPad P1 G6 21FV001KUS | |
| Lenovo ThinkPad Z16 Gen 2 | |
| Lenovo Legion Slim 5 16APH8 | |
| Lenovo Legion Slim 7 16APH8 | |
| Przeciętny AMD Ryzen 9 PRO 7940HS (2356 - 2718, n=3) | |
| LG Gram 2in1 16 16T90R - G.AA78G | |
| Apple MacBook Pro 16 2023 M3 Pro | |
| Lenovo ThinkPad Z16 G1 21D5S00T00 | |
| HP ZBook Firefly 14 G10 A | |
| Lenovo ThinkBook 16 G6 ABP | |
| Cinebench R15 / CPU Single 64Bit | |
| Asus Zephyrus Duo 16 GX650PY-NM006W | |
| MSI Raider GE68HX 13VF | |
| Alienware m16 R1 AMD | |
| Asus Vivobook Pro 16X K6604JV-MX016W | |
| Lenovo ThinkPad P1 G6 21FV001KUS | |
| Lenovo Legion Slim 5 16APH8 | |
| MSI Stealth 16 Mercedes-AMG Motorsport A13VG | |
| Lenovo ThinkPad Z16 Gen 2 | |
| MSI Creator Z16P B12UHST | |
| MSI Raider GE68 HX 13VG, i7-13700HX | |
| Lenovo Legion Slim 7 16APH8 | |
| Przeciętny AMD Ryzen 9 PRO 7940HS (247 - 280, n=3) | |
| HP ZBook Firefly 14 G10 A | |
| Lenovo ThinkPad Z16 G1 21D5S00T00 | |
| LG Gram 2in1 16 16T90R - G.AA78G | |
| HP Victus 16-r0076TX | |
| Lenovo ThinkBook 16 G6 ABP | |
| Blender / v2.79 BMW27 CPU | |
| Lenovo ThinkBook 16 G6 ABP | |
| Apple MacBook Pro 16 2023 M3 Pro | |
| LG Gram 2in1 16 16T90R - G.AA78G | |
| HP ZBook Firefly 14 G10 A | |
| Lenovo ThinkPad Z16 G1 21D5S00T00 | |
| MSI Stealth 16 Mercedes-AMG Motorsport A13VG | |
| Przeciętny AMD Ryzen 9 PRO 7940HS (191 - 215, n=3) | |
| Lenovo Legion Slim 7 16APH8 | |
| HP Victus 16-r0076TX | |
| Lenovo ThinkPad P1 G6 21FV001KUS | |
| Lenovo ThinkPad Z16 Gen 2 | |
| MSI Creator Z16P B12UHST | |
| Lenovo Legion Slim 5 16APH8 | |
| MSI Raider GE68 HX 13VG, i7-13700HX | |
| Asus Vivobook Pro 16X K6604JV-MX016W | |
| Alienware m16 R1 AMD | |
| MSI Raider GE68HX 13VF | |
| Asus Zephyrus Duo 16 GX650PY-NM006W | |
| 7-Zip 18.03 / 7z b 4 | |
| Asus Zephyrus Duo 16 GX650PY-NM006W | |
| MSI Raider GE68HX 13VF | |
| Alienware m16 R1 AMD | |
| Asus Vivobook Pro 16X K6604JV-MX016W | |
| MSI Raider GE68 HX 13VG, i7-13700HX | |
| MSI Creator Z16P B12UHST | |
| HP Victus 16-r0076TX | |
| Lenovo ThinkPad P1 G6 21FV001KUS | |
| Lenovo Legion Slim 7 16APH8 | |
| Lenovo Legion Slim 5 16APH8 | |
| Lenovo ThinkPad Z16 Gen 2 | |
| Przeciętny AMD Ryzen 9 PRO 7940HS (61111 - 67813, n=3) | |
| MSI Stealth 16 Mercedes-AMG Motorsport A13VG | |
| Lenovo ThinkPad Z16 G1 21D5S00T00 | |
| HP ZBook Firefly 14 G10 A | |
| LG Gram 2in1 16 16T90R - G.AA78G | |
| Lenovo ThinkBook 16 G6 ABP | |
| 7-Zip 18.03 / 7z b 4 -mmt1 | |
| Asus Zephyrus Duo 16 GX650PY-NM006W | |
| Alienware m16 R1 AMD | |
| Asus Vivobook Pro 16X K6604JV-MX016W | |
| MSI Raider GE68HX 13VF | |
| Lenovo Legion Slim 7 16APH8 | |
| Lenovo Legion Slim 5 16APH8 | |
| Lenovo ThinkPad P1 G6 21FV001KUS | |
| MSI Stealth 16 Mercedes-AMG Motorsport A13VG | |
| Lenovo ThinkPad Z16 Gen 2 | |
| Przeciętny AMD Ryzen 9 PRO 7940HS (5844 - 6497, n=3) | |
| MSI Raider GE68 HX 13VG, i7-13700HX | |
| MSI Creator Z16P B12UHST | |
| HP ZBook Firefly 14 G10 A | |
| HP Victus 16-r0076TX | |
| Lenovo ThinkPad Z16 G1 21D5S00T00 | |
| Lenovo ThinkBook 16 G6 ABP | |
| LG Gram 2in1 16 16T90R - G.AA78G | |
| Geekbench 5.5 / Multi-Core | |
| MSI Raider GE68HX 13VF | |
| Asus Zephyrus Duo 16 GX650PY-NM006W | |
| Asus Vivobook Pro 16X K6604JV-MX016W | |
| MSI Raider GE68 HX 13VG, i7-13700HX | |
| Apple MacBook Pro 16 2023 M3 Pro | |
| Alienware m16 R1 AMD | |
| MSI Creator Z16P B12UHST | |
| Lenovo ThinkPad P1 G6 21FV001KUS | |
| HP Victus 16-r0076TX | |
| Lenovo ThinkPad Z16 Gen 2 | |
| Lenovo Legion Slim 7 16APH8 | |
| Lenovo Legion Slim 5 16APH8 | |
| Przeciętny AMD Ryzen 9 PRO 7940HS (9897 - 12038, n=3) | |
| MSI Stealth 16 Mercedes-AMG Motorsport A13VG | |
| LG Gram 2in1 16 16T90R - G.AA78G | |
| HP ZBook Firefly 14 G10 A | |
| Lenovo ThinkPad Z16 G1 21D5S00T00 | |
| Lenovo ThinkBook 16 G6 ABP | |
| Geekbench 5.5 / Single-Core | |
| Apple MacBook Pro 16 2023 M3 Pro | |
| Asus Zephyrus Duo 16 GX650PY-NM006W | |
| MSI Raider GE68HX 13VF | |
| Alienware m16 R1 AMD | |
| Asus Vivobook Pro 16X K6604JV-MX016W | |
| Lenovo Legion Slim 5 16APH8 | |
| MSI Stealth 16 Mercedes-AMG Motorsport A13VG | |
| Lenovo ThinkPad P1 G6 21FV001KUS | |
| Lenovo ThinkPad Z16 Gen 2 | |
| Lenovo Legion Slim 7 16APH8 | |
| MSI Raider GE68 HX 13VG, i7-13700HX | |
| Przeciętny AMD Ryzen 9 PRO 7940HS (1758 - 1969, n=3) | |
| MSI Creator Z16P B12UHST | |
| HP ZBook Firefly 14 G10 A | |
| HP Victus 16-r0076TX | |
| LG Gram 2in1 16 16T90R - G.AA78G | |
| Lenovo ThinkBook 16 G6 ABP | |
| Lenovo ThinkPad Z16 G1 21D5S00T00 | |
| HWBOT x265 Benchmark v2.2 / 4k Preset | |
| Asus Zephyrus Duo 16 GX650PY-NM006W | |
| MSI Raider GE68HX 13VF | |
| Alienware m16 R1 AMD | |
| Asus Vivobook Pro 16X K6604JV-MX016W | |
| MSI Raider GE68 HX 13VG, i7-13700HX | |
| Lenovo Legion Slim 5 16APH8 | |
| Lenovo ThinkPad Z16 Gen 2 | |
| HP Victus 16-r0076TX | |
| Lenovo Legion Slim 7 16APH8 | |
| Lenovo ThinkPad P1 G6 21FV001KUS | |
| MSI Creator Z16P B12UHST | |
| Przeciętny AMD Ryzen 9 PRO 7940HS (17 - 20.4, n=3) | |
| Lenovo ThinkPad Z16 G1 21D5S00T00 | |
| HP ZBook Firefly 14 G10 A | |
| MSI Stealth 16 Mercedes-AMG Motorsport A13VG | |
| Lenovo ThinkBook 16 G6 ABP | |
| LG Gram 2in1 16 16T90R - G.AA78G | |
| LibreOffice / 20 Documents To PDF | |
| Lenovo Legion Slim 7 16APH8 | |
| Asus Zephyrus Duo 16 GX650PY-NM006W | |
| MSI Stealth 16 Mercedes-AMG Motorsport A13VG | |
| LG Gram 2in1 16 16T90R - G.AA78G | |
| HP ZBook Firefly 14 G10 A | |
| Lenovo ThinkBook 16 G6 ABP | |
| MSI Raider GE68 HX 13VG, i7-13700HX | |
| Asus Vivobook Pro 16X K6604JV-MX016W | |
| Lenovo ThinkPad Z16 G1 21D5S00T00 | |
| Przeciętny AMD Ryzen 9 PRO 7940HS (46.1 - 55, n=3) | |
| Lenovo ThinkPad Z16 Gen 2 | |
| Lenovo ThinkPad P1 G6 21FV001KUS | |
| Alienware m16 R1 AMD | |
| MSI Creator Z16P B12UHST | |
| Lenovo Legion Slim 5 16APH8 | |
| MSI Raider GE68HX 13VF | |
| R Benchmark 2.5 / Overall mean | |
| LG Gram 2in1 16 16T90R - G.AA78G | |
| Lenovo ThinkBook 16 G6 ABP | |
| Lenovo ThinkPad Z16 G1 21D5S00T00 | |
| HP Victus 16-r0076TX | |
| HP ZBook Firefly 14 G10 A | |
| Przeciętny AMD Ryzen 9 PRO 7940HS (0.4462 - 0.4835, n=3) | |
| Lenovo ThinkPad Z16 Gen 2 | |
| Lenovo Legion Slim 7 16APH8 | |
| MSI Raider GE68 HX 13VG, i7-13700HX | |
| Lenovo Legion Slim 5 16APH8 | |
| MSI Creator Z16P B12UHST | |
| MSI Stealth 16 Mercedes-AMG Motorsport A13VG | |
| Alienware m16 R1 AMD | |
| Lenovo ThinkPad P1 G6 21FV001KUS | |
| Asus Vivobook Pro 16X K6604JV-MX016W | |
| Asus Zephyrus Duo 16 GX650PY-NM006W | |
| MSI Raider GE68HX 13VF | |
Cinebench R23: Multi Core | Single Core
Cinebench R20: CPU (Multi Core) | CPU (Single Core)
Cinebench R15: CPU Multi 64Bit | CPU Single 64Bit
Blender: v2.79 BMW27 CPU
7-Zip 18.03: 7z b 4 | 7z b 4 -mmt1
Geekbench 5.5: Multi-Core | Single-Core
HWBOT x265 Benchmark v2.2: 4k Preset
LibreOffice : 20 Documents To PDF
R Benchmark 2.5: Overall mean
* ... im mniej tym lepiej
AIDA64: FP32 Ray-Trace | FPU Julia | CPU SHA3 | CPU Queen | FPU SinJulia | FPU Mandel | CPU AES | CPU ZLib | FP64 Ray-Trace | CPU PhotoWorxx
| Performance rating | |
| Lenovo ThinkPad Z16 Gen 2 | |
| Asus Vivobook Pro 16X K6604JV-MX016W | |
| Przeciętny AMD Ryzen 9 PRO 7940HS | |
| Lenovo ThinkPad Z16 G1 21D5S00T00 | |
| MSI Creator Z16P B12UHST | |
| Lenovo ThinkBook 16 G6 ABP | |
| AIDA64 / FP32 Ray-Trace | |
| Lenovo ThinkPad Z16 Gen 2 | |
| Przeciętny AMD Ryzen 9 PRO 7940HS (24034 - 27411, n=3) | |
| Asus Vivobook Pro 16X K6604JV-MX016W | |
| Lenovo ThinkPad Z16 G1 21D5S00T00 | |
| Lenovo ThinkBook 16 G6 ABP | |
| MSI Creator Z16P B12UHST | |
| AIDA64 / FPU Julia | |
| Lenovo ThinkPad Z16 Gen 2 | |
| Asus Vivobook Pro 16X K6604JV-MX016W | |
| Przeciętny AMD Ryzen 9 PRO 7940HS (101262 - 116960, n=3) | |
| Lenovo ThinkPad Z16 G1 21D5S00T00 | |
| Lenovo ThinkBook 16 G6 ABP | |
| MSI Creator Z16P B12UHST | |
| AIDA64 / CPU SHA3 | |
| Asus Vivobook Pro 16X K6604JV-MX016W | |
| Lenovo ThinkPad Z16 Gen 2 | |
| Przeciętny AMD Ryzen 9 PRO 7940HS (4418 - 4944, n=3) | |
| Lenovo ThinkPad Z16 G1 21D5S00T00 | |
| MSI Creator Z16P B12UHST | |
| Lenovo ThinkBook 16 G6 ABP | |
| AIDA64 / CPU Queen | |
| Asus Vivobook Pro 16X K6604JV-MX016W | |
| Lenovo ThinkPad Z16 Gen 2 | |
| Przeciętny AMD Ryzen 9 PRO 7940HS (112873 - 124565, n=3) | |
| MSI Creator Z16P B12UHST | |
| Lenovo ThinkPad Z16 G1 21D5S00T00 | |
| Lenovo ThinkBook 16 G6 ABP | |
| AIDA64 / FPU SinJulia | |
| Lenovo ThinkPad Z16 Gen 2 | |
| Przeciętny AMD Ryzen 9 PRO 7940HS (14147 - 15304, n=3) | |
| Asus Vivobook Pro 16X K6604JV-MX016W | |
| Lenovo ThinkPad Z16 G1 21D5S00T00 | |
| MSI Creator Z16P B12UHST | |
| Lenovo ThinkBook 16 G6 ABP | |
| AIDA64 / FPU Mandel | |
| Lenovo ThinkPad Z16 Gen 2 | |
| Przeciętny AMD Ryzen 9 PRO 7940HS (54003 - 62357, n=3) | |
| Asus Vivobook Pro 16X K6604JV-MX016W | |
| Lenovo ThinkPad Z16 G1 21D5S00T00 | |
| Lenovo ThinkBook 16 G6 ABP | |
| MSI Creator Z16P B12UHST | |
| AIDA64 / CPU AES | |
| Asus Vivobook Pro 16X K6604JV-MX016W | |
| MSI Creator Z16P B12UHST | |
| Lenovo ThinkPad Z16 Gen 2 | |
| Przeciętny AMD Ryzen 9 PRO 7940HS (76133 - 88705, n=3) | |
| Lenovo ThinkPad Z16 G1 21D5S00T00 | |
| Lenovo ThinkBook 16 G6 ABP | |
| AIDA64 / CPU ZLib | |
| Asus Vivobook Pro 16X K6604JV-MX016W | |
| MSI Creator Z16P B12UHST | |
| Lenovo ThinkPad Z16 Gen 2 | |
| Przeciętny AMD Ryzen 9 PRO 7940HS (976 - 1079, n=3) | |
| Lenovo ThinkPad Z16 G1 21D5S00T00 | |
| Lenovo ThinkBook 16 G6 ABP | |
| AIDA64 / FP64 Ray-Trace | |
| Lenovo ThinkPad Z16 Gen 2 | |
| Przeciętny AMD Ryzen 9 PRO 7940HS (12715 - 14590, n=3) | |
| Asus Vivobook Pro 16X K6604JV-MX016W | |
| Lenovo ThinkPad Z16 G1 21D5S00T00 | |
| Lenovo ThinkBook 16 G6 ABP | |
| MSI Creator Z16P B12UHST | |
| AIDA64 / CPU PhotoWorxx | |
| Asus Vivobook Pro 16X K6604JV-MX016W | |
| MSI Creator Z16P B12UHST | |
| Lenovo ThinkPad Z16 Gen 2 | |
| Przeciętny AMD Ryzen 9 PRO 7940HS (24030 - 37800, n=3) | |
| Lenovo ThinkPad Z16 G1 21D5S00T00 | |
| Lenovo ThinkBook 16 G6 ABP | |
Wydajność systemu
CrossMark: Overall | Productivity | Creativity | Responsiveness
WebXPRT 3: Overall
WebXPRT 4: Overall
Mozilla Kraken 1.1: Total
| PCMark 10 / Score | |
| MSI Creator Z16P B12UHST | |
| Lenovo ThinkPad Z16 Gen 2 | |
| Przeciętny AMD Ryzen 9 PRO 7940HS, AMD Radeon RX 6550M (n=1) | |
| Asus Vivobook Pro 16X K6604JV-MX016W | |
| Lenovo ThinkPad Z16 G1 21D5S00T00 | |
| Lenovo ThinkBook 16 G6 ABP | |
| PCMark 10 / Essentials | |
| Lenovo ThinkPad Z16 Gen 2 | |
| Przeciętny AMD Ryzen 9 PRO 7940HS, AMD Radeon RX 6550M (n=1) | |
| MSI Creator Z16P B12UHST | |
| Lenovo ThinkBook 16 G6 ABP | |
| Asus Vivobook Pro 16X K6604JV-MX016W | |
| Lenovo ThinkPad Z16 G1 21D5S00T00 | |
| PCMark 10 / Productivity | |
| MSI Creator Z16P B12UHST | |
| Lenovo ThinkPad Z16 Gen 2 | |
| Przeciętny AMD Ryzen 9 PRO 7940HS, AMD Radeon RX 6550M (n=1) | |
| Lenovo ThinkBook 16 G6 ABP | |
| Asus Vivobook Pro 16X K6604JV-MX016W | |
| Lenovo ThinkPad Z16 G1 21D5S00T00 | |
| PCMark 10 / Digital Content Creation | |
| MSI Creator Z16P B12UHST | |
| Lenovo ThinkPad Z16 Gen 2 | |
| Przeciętny AMD Ryzen 9 PRO 7940HS, AMD Radeon RX 6550M (n=1) | |
| Asus Vivobook Pro 16X K6604JV-MX016W | |
| Lenovo ThinkPad Z16 G1 21D5S00T00 | |
| Lenovo ThinkBook 16 G6 ABP | |
| CrossMark / Overall | |
| Asus Vivobook Pro 16X K6604JV-MX016W | |
| Apple MacBook Pro 16 2023 M3 Pro | |
| Lenovo ThinkPad Z16 Gen 2 | |
| Przeciętny AMD Ryzen 9 PRO 7940HS, AMD Radeon RX 6550M (n=1) | |
| Lenovo ThinkPad Z16 G1 21D5S00T00 | |
| Lenovo ThinkBook 16 G6 ABP | |
| CrossMark / Productivity | |
| Asus Vivobook Pro 16X K6604JV-MX016W | |
| Apple MacBook Pro 16 2023 M3 Pro | |
| Lenovo ThinkPad Z16 Gen 2 | |
| Przeciętny AMD Ryzen 9 PRO 7940HS, AMD Radeon RX 6550M (n=1) | |
| Lenovo ThinkPad Z16 G1 21D5S00T00 | |
| Lenovo ThinkBook 16 G6 ABP | |
| CrossMark / Creativity | |
| Apple MacBook Pro 16 2023 M3 Pro | |
| Asus Vivobook Pro 16X K6604JV-MX016W | |
| Lenovo ThinkPad Z16 Gen 2 | |
| Przeciętny AMD Ryzen 9 PRO 7940HS, AMD Radeon RX 6550M (n=1) | |
| Lenovo ThinkPad Z16 G1 21D5S00T00 | |
| Lenovo ThinkBook 16 G6 ABP | |
| CrossMark / Responsiveness | |
| Asus Vivobook Pro 16X K6604JV-MX016W | |
| Apple MacBook Pro 16 2023 M3 Pro | |
| Lenovo ThinkPad Z16 Gen 2 | |
| Przeciętny AMD Ryzen 9 PRO 7940HS, AMD Radeon RX 6550M (n=1) | |
| Lenovo ThinkPad Z16 G1 21D5S00T00 | |
| Lenovo ThinkBook 16 G6 ABP | |
| WebXPRT 3 / Overall | |
| Apple MacBook Pro 16 2023 M3 Pro | |
| MSI Creator Z16P B12UHST | |
| Lenovo ThinkPad Z16 Gen 2 | |
| Przeciętny AMD Ryzen 9 PRO 7940HS, AMD Radeon RX 6550M (n=1) | |
| Asus Vivobook Pro 16X K6604JV-MX016W | |
| Lenovo ThinkBook 16 G6 ABP | |
| Lenovo ThinkPad Z16 G1 21D5S00T00 | |
| WebXPRT 4 / Overall | |
| Lenovo ThinkPad Z16 Gen 2 | |
| Przeciętny AMD Ryzen 9 PRO 7940HS, AMD Radeon RX 6550M (n=1) | |
| Asus Vivobook Pro 16X K6604JV-MX016W | |
| Lenovo ThinkBook 16 G6 ABP | |
| Lenovo ThinkPad Z16 G1 21D5S00T00 | |
| Mozilla Kraken 1.1 / Total | |
| Lenovo ThinkBook 16 G6 ABP | |
| Lenovo ThinkPad Z16 G1 21D5S00T00 | |
| Lenovo ThinkPad Z16 Gen 2 | |
| Przeciętny AMD Ryzen 9 PRO 7940HS, AMD Radeon RX 6550M (n=1) | |
| Asus Vivobook Pro 16X K6604JV-MX016W | |
| MSI Creator Z16P B12UHST | |
| Apple MacBook Pro 16 2023 M3 Pro | |
* ... im mniej tym lepiej
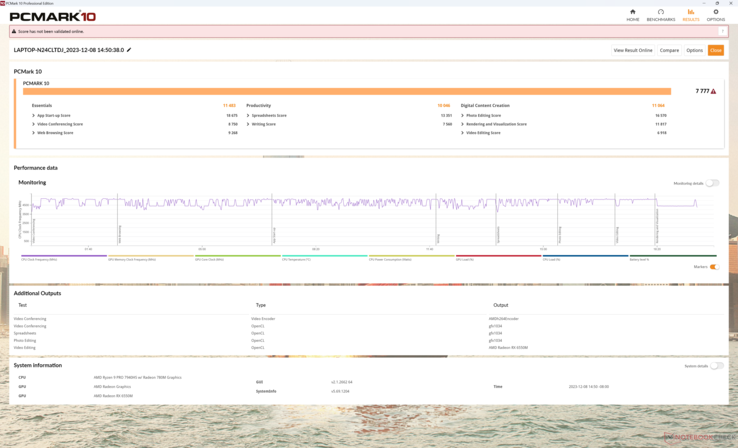
| PCMark 10 Score | 7777 pkt. | |
Pomoc | ||
| AIDA64 / Memory Copy | |
| Asus Vivobook Pro 16X K6604JV-MX016W | |
| Lenovo ThinkPad Z16 Gen 2 | |
| MSI Creator Z16P B12UHST | |
| Lenovo ThinkPad Z16 G1 21D5S00T00 | |
| Przeciętny AMD Ryzen 9 PRO 7940HS (34339 - 66740, n=3) | |
| Lenovo ThinkBook 16 G6 ABP | |
| AIDA64 / Memory Read | |
| Asus Vivobook Pro 16X K6604JV-MX016W | |
| MSI Creator Z16P B12UHST | |
| Lenovo ThinkPad Z16 Gen 2 | |
| Lenovo ThinkPad Z16 G1 21D5S00T00 | |
| Lenovo ThinkBook 16 G6 ABP | |
| Przeciętny AMD Ryzen 9 PRO 7940HS (30289 - 50398, n=3) | |
| AIDA64 / Memory Write | |
| Lenovo ThinkPad Z16 Gen 2 | |
| Asus Vivobook Pro 16X K6604JV-MX016W | |
| MSI Creator Z16P B12UHST | |
| Przeciętny AMD Ryzen 9 PRO 7940HS (39877 - 91516, n=3) | |
| Lenovo ThinkPad Z16 G1 21D5S00T00 | |
| Lenovo ThinkBook 16 G6 ABP | |
| AIDA64 / Memory Latency | |
| Lenovo ThinkPad Z16 G1 21D5S00T00 | |
| Lenovo ThinkPad Z16 Gen 2 | |
| Przeciętny AMD Ryzen 9 PRO 7940HS (102.2 - 121.3, n=3) | |
| Lenovo ThinkBook 16 G6 ABP | |
| MSI Creator Z16P B12UHST | |
| Asus Vivobook Pro 16X K6604JV-MX016W | |
* ... im mniej tym lepiej
Opóźnienie DPC
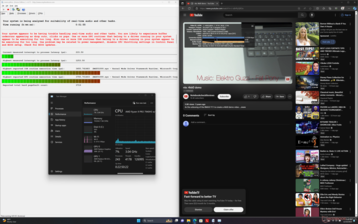
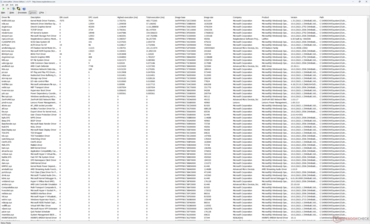
LatencyMon pokazuje drobne problemy z DPC podczas otwierania wielu kart przeglądarki na naszej stronie głównej. odtwarzanie wideo 4K przy 60 klatkach na sekundę jest poza tym idealne i nie odnotowano żadnych spadków klatek, w przeciwieństwie do tego, czego doświadczyliśmy na ostatnim napędzanym przez Intel-Nvidia ThinkPad P1 G6.
| DPC Latencies / LatencyMon - interrupt to process latency (max), Web, Youtube, Prime95 | |
| Asus Vivobook Pro 16X K6604JV-MX016W | |
| Lenovo ThinkPad Z16 Gen 2 | |
| Lenovo ThinkBook 16 G6 ABP | |
| MSI Creator Z16P B12UHST | |
| Lenovo ThinkPad Z16 G1 21D5S00T00 | |
* ... im mniej tym lepiej
Urządzenia pamięci masowej
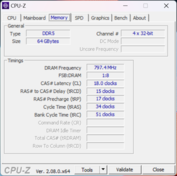
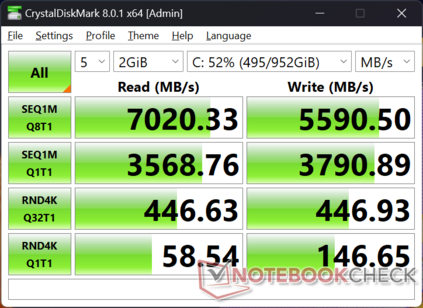
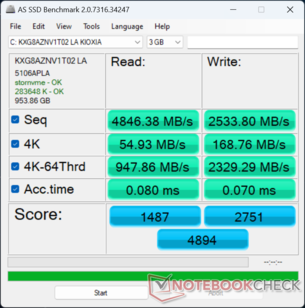
Nasza jednostka testowa jest dostarczana z Kioxia XG8 podczas gdy nasz starszy ThinkPad Z16 Gen 1 został dostarczony z dyskiem Samsung PM9A1. Niemniej jednak, oba dyski SSD to wysokiej klasy dyski PCIe4 x4 NVMe o podobnej maksymalnej szybkości odczytu wynoszącej ~7000 MB/s każdy.
Niestety, dysk Kioxia również wykazywał problemy z dławieniem wydajności po kilku minutach stresu, podobnie jak w przypadku dysku Samsung w naszym ThinkPadzie Z16 Gen 1, co pokazuje poniższy wykres porównawczy. Szybkość odczytu spadła z ~7000 MB/s do ~5800 MB/s w miarę upływu czasu, prawdopodobnie z powodu niewystarczającego rozpraszania ciepła. Zastosowanie dużej podkładki termicznej pomiędzy dyskiem SSD a metalową dolną pokrywą może poprawić wydajność.
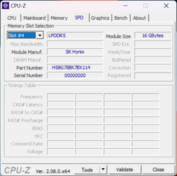
Pamięć RAM jest przylutowana i nie ma wsparcia dla drugiego dysku SSD, w przeciwieństwie do MSI Creator Z16P w którym zintegrowano dwa gniazda pamięci RAM i dwa gniazda na dyski SSD M.2.
| Drive Performance rating - Percent | |
| MSI Creator Z16P B12UHST | |
| Lenovo ThinkPad Z16 G1 21D5S00T00 | |
| Lenovo ThinkPad Z16 Gen 2 | |
| Lenovo ThinkBook 16 G6 ABP | |
| Asus Vivobook Pro 16X K6604JV-MX016W | |
* ... im mniej tym lepiej
Disk Throttling: DiskSpd Read Loop, Queue Depth 8
Wydajność GPU
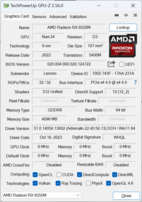
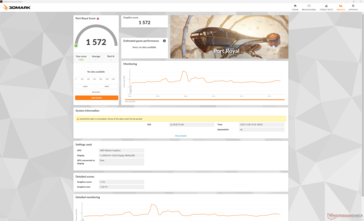
Relacja pomiędzy kartami Radeon RX 6550M i RX 6500M jest podobna do tej pomiędzy kartami GeForce RTX 3050 Ti i RTX 3050; ich różnice są niewielkie i mieszczą się średnio w granicach 10 punktów procentowych. Oba układy GPU Radeon dzielą tę samą 64-bitową szerokość magistrali pamięci, architekturę RDNA2, 1024 procesory strumieniowe, 4 GB pamięci VRAM GDDR6 i nie tylko. Radeon RX 6550M osiąga nieco wyższe docelowe częstotliwości taktowania (2560 MHz vs 2191 MHz) i maksymalne TGP (60 W vs 55 W) niż 6500M, ale to wszystko.
Niewielki wzrost częstotliwości taktowania prowadzi do niewielkiego wzrostu wyników benchmarków, co pokazuje poniższy wykres porównawczy.
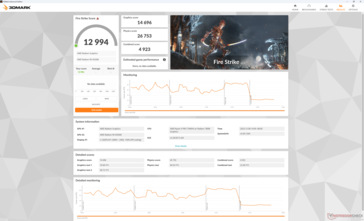
Praca w trybie zrównoważonym zamiast w trybie wydajności wpływa na wydajność tylko nieznacznie, jak pokazują nasze wyniki Fire Strike w poniższej tabeli. Praca na zasilaniu bateryjnym obniżyłaby wydajność grafiki znacznie bardziej niż wydajność procesora.
| Profil zasilania | Wynik fizyki | Wynik grafiki | Wynik łączny |
| Tryb wydajności | 26753 | 14696 | 4923 |
| Tryb zrównoważony | 26333 (-2%) | 13975 (-5%) | 4776 (-3%) |
| Zasilanie bateryjne | 25622 (-4%) | 9649 (-34%) | 3114 (-37%) |
Proszę pamiętać, że Radeon RX 6550M oparty na RDNA2 pojawia się tuż po premierze high-endowego Radeona RX 7900M opartego na RDNA3 , co oznacza, że wkrótce pojawi się więcej procesorów graficznych RDNA3 ze średniej półki. RDNA3 to znacząca poprawa w stosunku do RDNA2 pod względem wydajności, zużycia energii, obsługi skalowania AI, a zwłaszcza możliwości ray-tracingu.
| 3DMark Performance rating - Percent | |
| Asus Zephyrus Duo 16 GX650PY-NM006W | |
| Alienware m16 R1 AMD | |
| Lenovo ThinkPad P1 G6 21FV001KUS | |
| MSI Raider GE68 HX 13VG, i7-13700HX | |
| MSI Raider GE68HX 13VF | |
| HP Victus 16-r0076TX -1! | |
| MSI Creator Z16P B12UHST -1! | |
| Lenovo ThinkPad Z16 G1 21D5S00T00 -1! | |
| Asus VivoBook Pro 16 -1! | |
| Lenovo ThinkPad Z16 Gen 2 | |
| Przeciętny AMD Radeon RX 6550M | |
| HP Victus 15 fa0020nr | |
| Asus VivoBook Pro 16X OLED N7600PC-L2026X -1! | |
| LG Gram 2in1 16 16T90R - G.AA78G -1! | |
| 3DMark 11 - 1280x720 Performance GPU | |
| Asus Zephyrus Duo 16 GX650PY-NM006W | |
| Alienware m16 R1 AMD | |
| Lenovo ThinkPad P1 G6 21FV001KUS | |
| MSI Raider GE68 HX 13VG, i7-13700HX | |
| MSI Raider GE68HX 13VF | |
| HP Victus 16-r0076TX | |
| Lenovo ThinkPad Z16 Gen 2 | |
| Przeciętny AMD Radeon RX 6550M (n=1) | |
| HP Victus 15 fa0020nr | |
| Asus VivoBook Pro 16 | |
| Lenovo ThinkPad Z16 G1 21D5S00T00 | |
| Asus VivoBook Pro 16X OLED N7600PC-L2026X | |
| MSI Creator Z16P B12UHST | |
| LG Gram 2in1 16 16T90R - G.AA78G | |
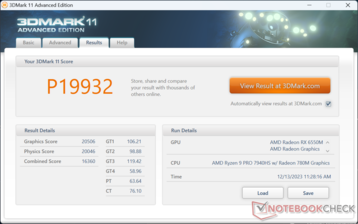
| 3DMark 11 Performance | 19932 pkt. | |
| 3DMark Fire Strike Score | 12994 pkt. | |
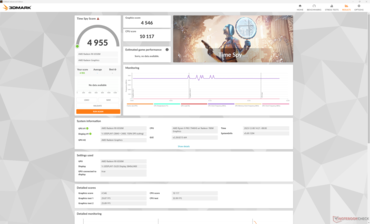
| 3DMark Time Spy Score | 4955 pkt. | |
Pomoc | ||
| Blender | |
| v3.3 Classroom METAL | |
| Apple MacBook Pro 16 2023 M3 Pro | |
| v3.3 Classroom HIP/AMD | |
| Lenovo ThinkPad Z16 G1 21D5S00T00 | |
| v3.3 Classroom OPTIX/RTX | |
| Asus VivoBook Pro 16 | |
| HP Victus 16-r0076TX | |
| MSI Raider GE68HX 13VF | |
| MSI Raider GE68 HX 13VG, i7-13700HX | |
| Alienware m16 R1 AMD | |
| Lenovo ThinkPad P1 G6 21FV001KUS | |
| Asus Zephyrus Duo 16 GX650PY-NM006W | |
| v3.3 Classroom CUDA | |
| Asus VivoBook Pro 16 | |
| HP Victus 16-r0076TX | |
| MSI Raider GE68HX 13VF | |
| MSI Raider GE68 HX 13VG, i7-13700HX | |
| Lenovo ThinkPad P1 G6 21FV001KUS | |
| Alienware m16 R1 AMD | |
| Asus Zephyrus Duo 16 GX650PY-NM006W | |
| v3.3 Classroom CPU | |
| LG Gram 2in1 16 16T90R - G.AA78G | |
| Lenovo ThinkPad Z16 G1 21D5S00T00 | |
| Asus VivoBook Pro 16 | |
| HP Victus 16-r0076TX | |
| Lenovo ThinkPad P1 G6 21FV001KUS | |
| Apple MacBook Pro 16 2023 M3 Pro | |
| Lenovo ThinkPad Z16 Gen 2 | |
| Przeciętny AMD Radeon RX 6550M (n=1) | |
| MSI Raider GE68 HX 13VG, i7-13700HX | |
| MSI Raider GE68HX 13VF | |
| Alienware m16 R1 AMD | |
| Asus Zephyrus Duo 16 GX650PY-NM006W | |
* ... im mniej tym lepiej
Wydajność w grach
Wydajność w grach może wahać się od niemal identycznej z Radeonem RX 6500M do nawet 30 procent szybszej w zależności od tytułu i ustawień. Dla przykładu, Final Fantasy XV będzie działać niemal tak samo pomiędzy naszymi modelami Radeon RX 6550M i 6500M, podczas gdy inne tytuły, takie jak Far Cry 5 lub F1 22, mogą działać od 15 do 30 procent szybciej. Tymczasem Tiny Tina's Wonderlands może działać nawet o 30 procent szybciej tylko przy wyższych ustawieniach graficznych. Wyniki są zatem bardzo zależne od aplikacji, ale korzyści z wydajności są generalnie wyższe niż sugerowałyby wyniki 3DMark, co jest świetną wiadomością dla graczy.
Co ciekawe, ogólna wydajność jest zbliżona do wydajności MacBookiem Pro 16 M3 Pro podczas testowania nowszych gier, takich jak Cyberpunk 2077 i Baldur's Gate 3. Biorąc pod uwagę, że nasz Radeon jest większym dyskretnym GPU, mówi to wiele o wydajności zintegrowanego rozwiązania SoC Apple.
| Performance rating - Percent | |
| Asus Zephyrus Duo 16 GX650PY-NM006W | |
| Alienware m16 R1 AMD -1! | |
| Lenovo ThinkPad P1 G6 21FV001KUS -1! | |
| MSI Raider GE68 HX 13VG, i7-13700HX | |
| MSI Raider GE68HX 13VF -1! | |
| MSI Creator Z16P B12UHST | |
| HP Victus 16-r0076TX -1! | |
| Lenovo ThinkPad Z16 Gen 2 -1! | |
| Apple MacBook Pro 16 2023 M3 Pro -4! | |
| Lenovo ThinkPad Z16 G1 21D5S00T00 | |
| LG Gram 2in1 16 16T90R - G.AA78G | |
| The Witcher 3 - 1920x1080 Ultra Graphics & Postprocessing (HBAO+) | |
| Asus Zephyrus Duo 16 GX650PY-NM006W | |
| Alienware m16 R1 AMD | |
| Lenovo ThinkPad P1 G6 21FV001KUS | |
| MSI Raider GE68 HX 13VG, i7-13700HX | |
| MSI Raider GE68HX 13VF | |
| HP Victus 16-r0076TX | |
| MSI Creator Z16P B12UHST | |
| Lenovo ThinkPad Z16 Gen 2 | |
| Apple MacBook Pro 16 2023 M3 Pro | |
| Lenovo ThinkPad Z16 G1 21D5S00T00 | |
| LG Gram 2in1 16 16T90R - G.AA78G | |
| GTA V - 1920x1080 Highest AA:4xMSAA + FX AF:16x | |
| Asus Zephyrus Duo 16 GX650PY-NM006W | |
| Lenovo ThinkPad P1 G6 21FV001KUS | |
| MSI Raider GE68 HX 13VG, i7-13700HX | |
| MSI Creator Z16P B12UHST | |
| Apple MacBook Pro 16 2023 M3 Pro | |
| Lenovo ThinkPad Z16 G1 21D5S00T00 | |
| LG Gram 2in1 16 16T90R - G.AA78G | |
| Final Fantasy XV Benchmark - 1920x1080 High Quality | |
| Asus Zephyrus Duo 16 GX650PY-NM006W | |
| Alienware m16 R1 AMD | |
| Lenovo ThinkPad P1 G6 21FV001KUS | |
| MSI Raider GE68 HX 13VG, i7-13700HX | |
| MSI Raider GE68HX 13VF | |
| MSI Creator Z16P B12UHST | |
| HP Victus 16-r0076TX | |
| Lenovo ThinkPad Z16 Gen 2 | |
| Lenovo ThinkPad Z16 G1 21D5S00T00 | |
| LG Gram 2in1 16 16T90R - G.AA78G | |
| Strange Brigade - 1920x1080 ultra AA:ultra AF:16 | |
| Alienware m16 R1 AMD | |
| Asus Zephyrus Duo 16 GX650PY-NM006W | |
| MSI Raider GE68 HX 13VG, i7-13700HX | |
| MSI Raider GE68HX 13VF | |
| MSI Creator Z16P B12UHST | |
| HP Victus 16-r0076TX | |
| Lenovo ThinkPad Z16 Gen 2 | |
| Lenovo ThinkPad Z16 G1 21D5S00T00 | |
| LG Gram 2in1 16 16T90R - G.AA78G | |
| Dota 2 Reborn - 1920x1080 ultra (3/3) best looking | |
| MSI Raider GE68HX 13VF | |
| Asus Zephyrus Duo 16 GX650PY-NM006W | |
| MSI Raider GE68 HX 13VG, i7-13700HX | |
| Alienware m16 R1 AMD | |
| MSI Creator Z16P B12UHST | |
| Lenovo ThinkPad P1 G6 21FV001KUS | |
| HP Victus 16-r0076TX | |
| Lenovo ThinkPad Z16 Gen 2 | |
| Lenovo ThinkPad Z16 G1 21D5S00T00 | |
| LG Gram 2in1 16 16T90R - G.AA78G | |
| X-Plane 11.11 - 1920x1080 high (fps_test=3) | |
| MSI Raider GE68HX 13VF | |
| MSI Raider GE68 HX 13VG, i7-13700HX | |
| Lenovo ThinkPad P1 G6 21FV001KUS | |
| Asus Zephyrus Duo 16 GX650PY-NM006W | |
| Alienware m16 R1 AMD | |
| HP Victus 16-r0076TX | |
| MSI Creator Z16P B12UHST | |
| LG Gram 2in1 16 16T90R - G.AA78G | |
| Lenovo ThinkPad Z16 G1 21D5S00T00 | |
| Lenovo ThinkPad Z16 Gen 2 | |
| Cyberpunk 2077 | |
| 1280x720 Low Preset (FSR off) | |
| Lenovo ThinkPad Z16 Gen 2 | |
| Przeciętny AMD Radeon RX 6550M (n=1) | |
| LG Gram 2in1 16 16T90R - G.AA78G | |
| 1920x1080 Low Preset (FSR off) | |
| Lenovo ThinkPad Z16 Gen 2 | |
| Przeciętny AMD Radeon RX 6550M (n=1) | |
| Apple MacBook Pro 16 2023 M3 Pro | |
| LG Gram 2in1 16 16T90R - G.AA78G | |
| 1920x1080 Medium Preset (FSR off) | |
| Lenovo ThinkPad Z16 Gen 2 | |
| Przeciętny AMD Radeon RX 6550M (n=1) | |
| Apple MacBook Pro 16 2023 M3 Pro | |
| LG Gram 2in1 16 16T90R - G.AA78G | |
| 1920x1080 High Preset (FSR off) | |
| Lenovo ThinkPad P1 G6 21FV001KUS | |
| Apple MacBook Pro 16 2023 M3 Pro | |
| Lenovo ThinkPad Z16 Gen 2 | |
| Przeciętny AMD Radeon RX 6550M (n=1) | |
| LG Gram 2in1 16 16T90R - G.AA78G | |
| 1920x1080 Ultra Preset (FSR off) | |
| Lenovo ThinkPad P1 G6 21FV001KUS | |
| Apple MacBook Pro 16 2023 M3 Pro | |
| Lenovo ThinkPad Z16 Gen 2 | |
| Przeciętny AMD Radeon RX 6550M (n=1) | |
| LG Gram 2in1 16 16T90R - G.AA78G | |
| 2560x1440 Ultra Preset (FSR off) | |
| Lenovo ThinkPad P1 G6 21FV001KUS | |
| Lenovo ThinkPad Z16 Gen 2 | |
| Przeciętny AMD Radeon RX 6550M (n=1) | |
| Baldur's Gate 3 | |
| 1920x1080 Low Preset AA:SM | |
| Lenovo ThinkPad Z16 Gen 2 | |
| Przeciętny AMD Radeon RX 6550M (n=1) | |
| 1920x1080 Medium Preset AA:T | |
| Lenovo ThinkPad Z16 Gen 2 | |
| Przeciętny AMD Radeon RX 6550M (n=1) | |
| 1920x1080 High Preset AA:T | |
| Apple MacBook Pro 16 2023 M3 Pro | |
| Lenovo ThinkPad Z16 Gen 2 | |
| Przeciętny AMD Radeon RX 6550M (n=1) | |
| 1920x1080 Ultra Preset AA:T | |
| Lenovo ThinkPad P1 G6 21FV001KUS | |
| Apple MacBook Pro 16 2023 M3 Pro | |
| Lenovo ThinkPad Z16 Gen 2 | |
| Przeciętny AMD Radeon RX 6550M (n=1) | |
| 2560x1440 Ultra Preset AA:T | |
| Lenovo ThinkPad P1 G6 21FV001KUS | |
| Lenovo ThinkPad Z16 Gen 2 | |
| Przeciętny AMD Radeon RX 6550M (n=1) | |
Witcher 3 FPS Chart
| low | med. | high | ultra | QHD | |
|---|---|---|---|---|---|
| The Witcher 3 (2015) | 277.2 | 171.5 | 83.2 | 49.4 | |
| Dota 2 Reborn (2015) | 137.1 | 127.3 | 112.3 | 103 | |
| Final Fantasy XV Benchmark (2018) | 129.3 | 67.4 | 47.8 | 31.2 | |
| X-Plane 11.11 (2018) | 53.7 | 41.2 | 33 | ||
| Far Cry 5 (2018) | 115 | 91 | 84 | 79 | |
| Strange Brigade (2018) | 319 | 122.5 | 101.1 | 88.4 | |
| Tiny Tina's Wonderlands (2022) | 124.1 | 95.5 | 59.7 | 30.3 | 27.2 |
| F1 22 (2022) | 132.5 | 120.8 | 87.5 | 19.3 | 11.3 |
| Baldur's Gate 3 (2023) | 61.6 | 52.9 | 44.7 | 43 | 29 |
| Cyberpunk 2077 (2023) | 62.8 | 45.9 | 34.7 | 28.6 | 17.3 |
Emisje
Hałas systemowy
Hałas wentylatorów w dużym stopniu zależy od wybranego profilu zasilania. Na przykład, wentylatory są naprawdę ciche tylko w trybie oszczędzania energii, ponieważ w przeciwnym razie są zawsze aktywne przy prawie 30 dB(A) bez względu na obciążenie ekranu. Podobnie, hałas wentylatorów podczas grania w trybie zrównoważonym wynosiłby około 41 do 45 dB(A) w porównaniu do 52 dB(A) w trybie wydajności, co jest znaczącą różnicą pomimo niewielkich różnic w wydajności między tymi dwoma profilami, jak wspomniano powyżej. W szczególności tryb wydajności jest zauważalnie głośniejszy niż w wielu innych 16-calowych laptopach, takich jak MSI Creator Z16P czy MacBook Pro 16.
Pulsowanie wentylatora jest jednak ograniczone do minimum. Na przykład podczas uruchamiania 3DMark 06 hałas wentylatora utrzymywał się na stałym poziomie 29,5 dB(A) przez całą pierwszą scenę testu porównawczego bez nagłych skoków.
Hałas
| luz |
| 22.9 / 29.4 / 29.4 dB |
| obciążenie |
| 29.5 / 52 dB |
 | ||
30 dB cichy 40 dB(A) słyszalny 50 dB(A) irytujący |
||
min: | ||
| Lenovo ThinkPad Z16 Gen 2 Radeon RX 6550M, R9 PRO 7940HS, Kioxia XG8 KXG8AZNV1T02 | Lenovo ThinkPad Z16 G1 21D5S00T00 Radeon RX 6500M, R7 PRO 6850H, Samsung PM9A1 MZVL21T0HCLR | Lenovo ThinkBook 16 G6 ABP Vega 7, R5 7530U, SK hynix HFS512GEJ9X125N | MSI Creator Z16P B12UHST GeForce RTX 3080 Ti Laptop GPU, i9-12900H, Samsung PM9A1 MZVL22T0HBLB | Apple MacBook Pro 16 2023 M3 Pro M3 Pro 18-Core GPU, Apple M3 Pro 12-Core, Apple SSD AP0512Z | Asus Vivobook Pro 16X K6604JV-MX016W GeForce RTX 4060 Laptop GPU, i9-13980HX, Solidigm P41 Plus SSDPFKNU010TZ | |
|---|---|---|---|---|---|---|
| Noise | 9% | 11% | -8% | 12% | -18% | |
| wyłączone / środowisko * (dB) | 22.6 | 23.7 -5% | 24.3 -8% | 26 -15% | 24.4 -8% | 25.2 -12% |
| Idle Minimum * (dB) | 22.9 | 23.7 -3% | 24.3 -6% | 27 -18% | 24.4 -7% | 26.6 -16% |
| Idle Average * (dB) | 29.4 | 23.7 19% | 24.3 17% | 29 1% | 24.4 17% | 26.6 10% |
| Idle Maximum * (dB) | 29.4 | 23.7 19% | 24.3 17% | 31 -5% | 24.4 17% | 29.2 1% |
| Load Average * (dB) | 29.5 | 25.9 12% | 29.7 -1% | 43 -46% | 26.9 9% | 53.4 -81% |
| Witcher 3 ultra * (dB) | 52 | 46.9 10% | 32.1 38% | 43 17% | 25.1 52% | |
| Load Maximum * (dB) | 52 | 46.9 10% | 41.4 20% | 46 12% | 50.4 3% | 56.9 -9% |
* ... im mniej tym lepiej
Temperatura
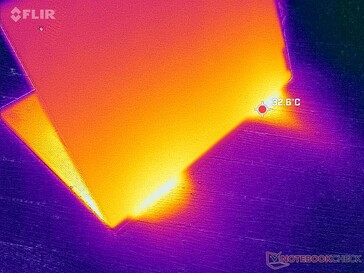
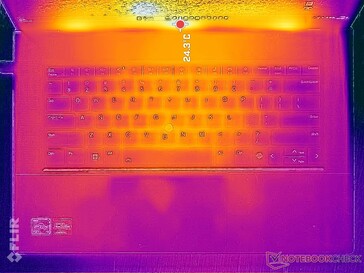
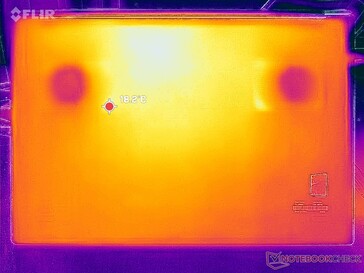
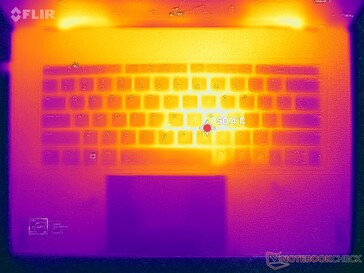
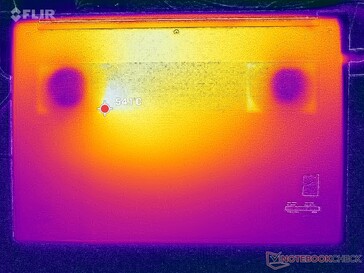
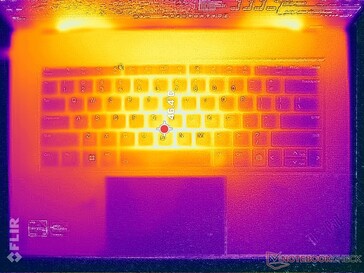
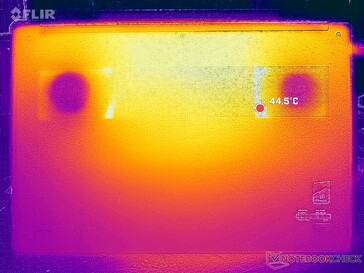
Temperatury powierzchni rosną i spadają dość szybko i w szerszym zakresie, ponieważ większość obudowy jest metalowa. Podczas uruchamiania wymagających obciążeń, takich jak gry, gorące punkty mogą być ciepłe nawet do 47 ° C i 43 ° C odpowiednio na środku klawiatury i dolnej płycie, ale może być jeszcze cieplej do ponad 50 ° C w zależności od temperatury otoczenia, tak jak to zaobserwowaliśmy na ThinkPad Z16 Gen 1. Wyniki są jednak znacznie chłodniejsze niż to, co zarejestrowaliśmy na MSI Creator Z16P który nagrzewał się o wiele za bardzo.
(±) Maksymalna temperatura w górnej części wynosi 43 °C / 109 F, w porównaniu do średniej 36.9 °C / 98 F , począwszy od 21.1 do 71 °C dla klasy Multimedia.
(±) Dno nagrzewa się maksymalnie do 41.6 °C / 107 F, w porównaniu do średniej 39.1 °C / 102 F
(+) W stanie bezczynności średnia temperatura górnej części wynosi 20.3 °C / 69 F, w porównaniu ze średnią temperaturą urządzenia wynoszącą 31.3 °C / ### class_avg_f### F.
(-) Podczas gry w Wiedźmina 3 średnia temperatura górnej części wynosi 38.1 °C / 101 F, w porównaniu do średniej temperatury urządzenia wynoszącej 31.3 °C / ## #class_avg_f### F.
(+) Podpórki pod nadgarstki i touchpad są chłodniejsze niż temperatura skóry i maksymalnie 30 °C / 86 F i dlatego są chłodne w dotyku.
(±) Średnia temperatura obszaru podparcia dłoni w podobnych urządzeniach wynosiła 28.7 °C / 83.7 F (-1.3 °C / -2.3 F).
| Lenovo ThinkPad Z16 Gen 2 AMD Ryzen 9 PRO 7940HS, AMD Radeon RX 6550M | Lenovo ThinkPad Z16 G1 21D5S00T00 AMD Ryzen 7 PRO 6850H, AMD Radeon RX 6500M | Lenovo ThinkBook 16 G6 ABP AMD Ryzen 5 7530U, AMD Radeon RX Vega 7 | MSI Creator Z16P B12UHST Intel Core i9-12900H, NVIDIA GeForce RTX 3080 Ti Laptop GPU | Apple MacBook Pro 16 2023 M3 Pro Apple M3 Pro 12-Core, Apple M3 Pro 18-Core GPU | Asus Vivobook Pro 16X K6604JV-MX016W Intel Core i9-13980HX, NVIDIA GeForce RTX 4060 Laptop GPU | |
|---|---|---|---|---|---|---|
| Heat | -33% | -30% | -49% | -2% | -36% | |
| Maximum Upper Side * (°C) | 43 | 56.8 -32% | 40.8 5% | 67 -56% | 38.1 11% | 39.7 8% |
| Maximum Bottom * (°C) | 41.6 | 53.3 -28% | 50.5 -21% | 69 -66% | 37 11% | 60 -44% |
| Idle Upper Side * (°C) | 21.2 | 28.2 -33% | 29.3 -38% | 29 -37% | 24.2 -14% | 30.9 -46% |
| Idle Bottom * (°C) | 21.4 | 29.4 -37% | 35.2 -64% | 29 -36% | 24.6 -15% | 34.7 -62% |
* ... im mniej tym lepiej
Test warunków skrajnych
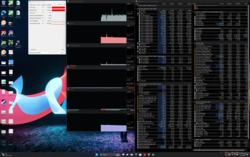
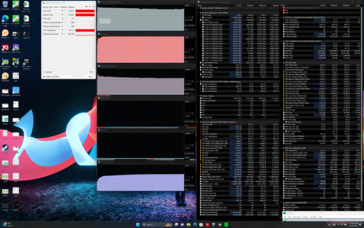
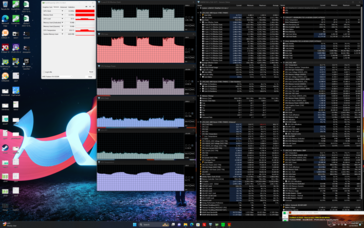
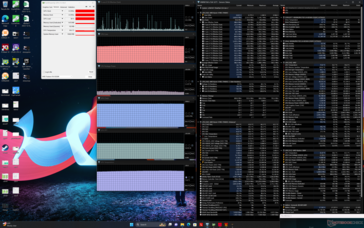
Po uruchomieniu obciążenia Prime95, procesor przyspieszył do 4,6 GHz i 82 W przez zaledwie kilka sekund, po czym spadł i ustabilizował się na poziomie 4,4 GHz, 69 W i ciepłej temperaturze 100 C. Oczywiste jest, że procesor działa tak szybko, jak to tylko możliwe w granicach zastosowanego rozwiązania chłodzącego.
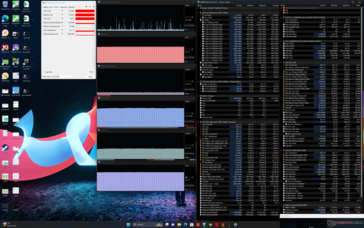
Częstotliwość taktowania GPU i pobór mocy na płycie podczas pracy w trybie Performance ustabilizowałyby się odpowiednio na poziomie 2630 MHz i 59 W, w porównaniu do 2133 MHz i 39 W podczas pracy w trybie Balanced. Co najważniejsze, deficyt wydajności pomiędzy tymi dwoma trybami podczas pracy Witcher 3 jest minimalny przy zaledwie kilku klatkach, mimo że różnice w hałasie wentylatora są znaczące. Dlatego też użytkownicy mogą rozważyć grę w trybie zrównoważonym ze względu na znacznie cichsze wentylatory i nieco niższe temperatury rdzenia.
| Taktowanie CPU (GHz) | Taktowanie GPU (MHz) | Średnia temperatura CPU (°C) | Średnia temperatura GPU (°C) | |
| System w stanie spoczynku | -- | -- | 32 | 33 |
| Prime95Stress | 4.2 | -- | 100 | 64 |
| Prime95+ FurMark Stress | 2.5 - 4.0 | 750 - 1000 | 64 - 100 | 62 - 72 |
| Witcher 3 Obciążenie (trybzrównoważony) | ~0,2 | 2133 | 62 | 71 |
| Witcher 3 Obciążenie (trybwydajności) | ~0.2 | 2630 | 64 | 76 |
Lenovo ThinkPad Z16 Gen 2 analiza dźwięku
(+) | głośniki mogą odtwarzać stosunkowo głośno (84.8 dB)
Bas 100 - 315 Hz
(±) | zredukowany bas - średnio 13% niższy od mediany
(±) | liniowość basu jest średnia (11.1% delta do poprzedniej częstotliwości)
Średnie 400 - 2000 Hz
(±) | wyższe średnie - średnio 5.5% wyższe niż mediana
(+) | średnie są liniowe (4.9% delta do poprzedniej częstotliwości)
Wysokie 2–16 kHz
(+) | zrównoważone maksima - tylko 4.7% od mediany
(+) | wzloty są liniowe (5.2% delta do poprzedniej częstotliwości)
Ogólnie 100 - 16.000 Hz
(+) | ogólny dźwięk jest liniowy (14.8% różnicy w stosunku do mediany)
W porównaniu do tej samej klasy
» 33% wszystkich testowanych urządzeń w tej klasie było lepszych, 4% podobnych, 62% gorszych
» Najlepszy miał deltę 5%, średnia wynosiła ###średnia###%, najgorsza wynosiła 45%
W porównaniu do wszystkich testowanych urządzeń
» 19% wszystkich testowanych urządzeń było lepszych, 4% podobnych, 77% gorszych
» Najlepszy miał deltę 4%, średnia wynosiła ###średnia###%, najgorsza wynosiła 134%
Apple MacBook Pro 16 2021 M1 Pro analiza dźwięku
(+) | głośniki mogą odtwarzać stosunkowo głośno (84.7 dB)
Bas 100 - 315 Hz
(+) | dobry bas - tylko 3.8% od mediany
(+) | bas jest liniowy (5.2% delta do poprzedniej częstotliwości)
Średnie 400 - 2000 Hz
(+) | zbalansowane środki średnie - tylko 1.3% od mediany
(+) | średnie są liniowe (2.1% delta do poprzedniej częstotliwości)
Wysokie 2–16 kHz
(+) | zrównoważone maksima - tylko 1.9% od mediany
(+) | wzloty są liniowe (2.7% delta do poprzedniej częstotliwości)
Ogólnie 100 - 16.000 Hz
(+) | ogólny dźwięk jest liniowy (4.6% różnicy w stosunku do mediany)
W porównaniu do tej samej klasy
» 0% wszystkich testowanych urządzeń w tej klasie było lepszych, 0% podobnych, 100% gorszych
» Najlepszy miał deltę 5%, średnia wynosiła ###średnia###%, najgorsza wynosiła 45%
W porównaniu do wszystkich testowanych urządzeń
» 0% wszystkich testowanych urządzeń było lepszych, 0% podobnych, 100% gorszych
» Najlepszy miał deltę 4%, średnia wynosiła ###średnia###%, najgorsza wynosiła 134%
Zarządzanie energią
Zużycie energii
Panel OLED 4K ma znaczący wpływ na zużycie energii. Dla przykładu, pobór mocy wyniósłby zaledwie 7 W na biegu jałowym na całkowicie czarnym ekranie, podczas gdy całkowicie biały ekran przy maksymalnej jasności może wymagać prawie 19 W w porównaniu do zaledwie 10 W w konfiguracji IPS. Różnice w zużyciu energii między IPS i OLED zostały omówione bardziej szczegółowo tutaj.
Zużycie energii podczas wykonywania zadań intensywnie wykorzystujących procesor lub kartę graficzną jest nieco wyższe niż w przypadku ThinkPad Z16 Gen 1, nawet po uwzględnieniu bardziej wymagającego panelu OLED. Różnice są jednak niewielkie w porównaniu do dużego wzrostu wydajności, jaki oferuje procesor Zen 4 Ryzen 9.
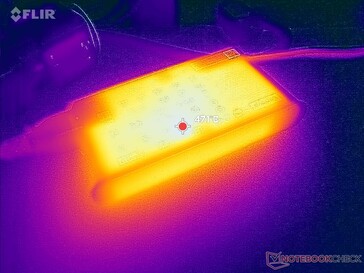
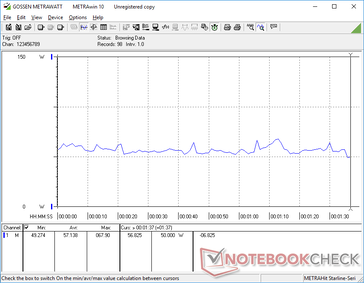
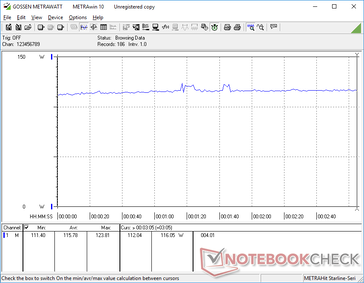
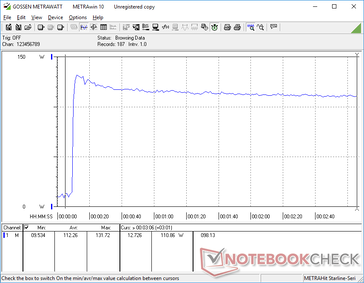
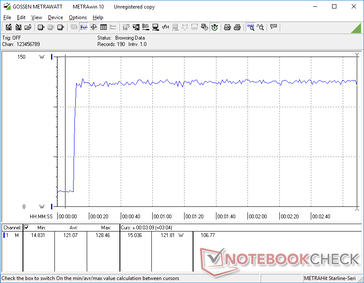
Jesteśmy w stanie zmierzyć maksymalny pobór mocy 132 W ze średniej wielkości (~ 14,6 x 7,7 x 2,3 cm) zasilacza sieciowego USB-C o mocy 135 W. Gry wymagają już prawie 120 W, co oznacza, że szybkość ładowania spowolni do indeksowania, jeśli jednocześnie uruchomimy wymagające obciążenia.
| wyłączony / stan wstrzymania | |
| luz | |
| obciążenie |
|
Legenda:
min: | |
| Lenovo ThinkPad Z16 Gen 2 R9 PRO 7940HS, Radeon RX 6550M, Kioxia XG8 KXG8AZNV1T02, OLED, 3840x2400, 16" | Lenovo ThinkPad Z16 G1 21D5S00T00 R7 PRO 6850H, Radeon RX 6500M, Samsung PM9A1 MZVL21T0HCLR, IPS LED, 1920x1200, 16" | Lenovo ThinkBook 16 G6 ABP R5 7530U, Vega 7, SK hynix HFS512GEJ9X125N, IPS, 1920x1200, 16" | MSI Creator Z16P B12UHST i9-12900H, GeForce RTX 3080 Ti Laptop GPU, Samsung PM9A1 MZVL22T0HBLB, IPS True Pixel (~100% DCI-P3), 2560x1600, 16" | Asus Vivobook Pro 16X K6604JV-MX016W i9-13980HX, GeForce RTX 4060 Laptop GPU, Solidigm P41 Plus SSDPFKNU010TZ, OLED, 3200x2000, 16" | Apple MacBook Pro 16 2023 M3 Max Apple M3 Max 16-Core, M3 Max 40-Core GPU, Apple SSD AP8192Z, Mini-LED, 3456x2234, 16" | |
|---|---|---|---|---|---|---|
| Power Consumption | 15% | 45% | -60% | -71% | -17% | |
| Idle Minimum * (Watt) | 7.5 | 5.3 29% | 3.7 51% | 11 -47% | 13.8 -84% | 5.2 31% |
| Idle Average * (Watt) | 9.6 | 8.6 10% | 7.1 26% | 17 -77% | 16 -67% | 16.9 -76% |
| Idle Maximum * (Watt) | 18.5 | 9.5 49% | 7.7 58% | 26 -41% | 19 -3% | 17.2 7% |
| Load Average * (Watt) | 57.1 | 65.2 -14% | 43.9 23% | 124 -117% | 147 -157% | 90.5 -58% |
| Witcher 3 ultra * (Watt) | 115.8 | 93.6 19% | 40.8 65% | 133.5 -15% | 147.8 -28% | 109 6% |
| Load Maximum * (Watt) | 131.7 | 133.81 -2% | 66.6 49% | 212 -61% | 244 -85% | 145.2 -10% |
* ... im mniej tym lepiej
Power Consumption Witcher 3 / Stresstest
Power Consumption external Monitor
Żywotność baterii
Czas pracy jest generalnie krótszy niż w przypadku zeszłorocznego modelu, głównie ze względu na bardziej wymagający panel OLED. Ponieważ większość stron internetowych ma głównie biały kolor, zużycie energii może być o 10 W wyższe, nawet jeśli aktywne aplikacje są mało wymagające, jak wspomniano w sekcji Zużycie energii powyżej. Byliśmy w stanie zarejestrować czas pracy WLAN wynoszący zaledwie 6 godzin w porównaniu do 10 godzin w konfiguracji ThinkPad Z16 IPS lub ponad 16 godzin w konfiguracji MacBook Pro 16.
Ładowanie od stanu pustego do pełnej pojemności jest wolniejsze niż zwykle i wynosi około 2,5 godziny w porównaniu do 1,5 do 2 godzin w przypadku większości ultrabooków. Jest to jeden z niewielu laptopów z procesorem Ryzen 9 i dyskretną grafiką, który jest zasilany przez USB-C.
| Lenovo ThinkPad Z16 Gen 2 R9 PRO 7940HS, Radeon RX 6550M, 72 Wh | Lenovo ThinkPad Z16 G1 21D5S00T00 R7 PRO 6850H, Radeon RX 6500M, 72 Wh | Lenovo ThinkBook 16 G6 ABP R5 7530U, Vega 7, 45 Wh | MSI Creator Z16P B12UHST i9-12900H, GeForce RTX 3080 Ti Laptop GPU, 90 Wh | Asus Vivobook Pro 16X K6604JV-MX016W i9-13980HX, GeForce RTX 4060 Laptop GPU, 90 Wh | Apple MacBook Pro 16 2023 M3 Max Apple M3 Max 16-Core, M3 Max 40-Core GPU, 99.6 Wh | |
|---|---|---|---|---|---|---|
| Czasy pracy | 45% | 68% | -27% | -2% | 75% | |
| Reader / Idle (h) | 10.2 | |||||
| WiFi v1.3 (h) | 6 | 9.9 65% | 10.1 68% | 5.2 -13% | 6.5 8% | 16.7 178% |
| Load (h) | 1.7 | 2.1 24% | 1 -41% | 1.5 -12% | 1.2 -29% | |
| H.264 (h) | 11.9 | 11.6 | 5.8 | 5.3 | 20.4 |
Za
Przeciw
Werdykt - świetny design powstrzymywany przez przeciętny procesor graficzny
W naszej recenzji oryginalnego modelu Gen 1 chwaliliśmy ThinkPada Z16 za solidną i atrakcyjną konstrukcję oraz wygodną klawiaturę i gładzik. Model Gen 2 zachowuje wszystkie te zalety, dodając jednocześnie znacznie szybszy procesor Ryzen Pro i wysokiej jakości ekran dotykowy OLED, zapewniający odpowiednio zauważalnie lepszą wydajność i kolory. Te dwa dodatki to główne powody, dla których warto wybrać wersję Gen 2 zamiast Gen 1.
ThinkPad Z16 Gen 2 jest zdecydowanie elegancki i seksowny, a nowy procesor Zen 4 Pro nie ma sobie równych. Radeon RX 6550M to jednak zbyt mało i zbyt późno, zwłaszcza w tym przedziale cenowym.
Nowy układ graficzny Radeon RX 6550M również pomaga rozróżnić obie wersje modelu, ale jego wydajność nie jest imponująca, zwłaszcza jeśli weźmiemy pod uwagę wysoką cenę wywoławczą wynoszącą ponad 1600 USD. Nie dość, że GPU jest starszej architektury AMD, to laptopy z GeForce RTX 3050 Ti można znaleźć za mniej niż tysiąc, oferując podobny poziom wydajności. GPU Radeon jest zdecydowanie jednym z najsłabszych aspektów serii ThinkPad Z16.
Jeśli nie zależy Państwu na Ryzen Pro, to warto sięgnąć po
Asus Vivobook Pro 16X lub nawet HP Spectre x360 z serii 16 mogą służyć jako doskonałe alternatywy dla ThinkPada Z16 Gen 2, ponieważ każdy z nich oferuje podobne opcje OLED i dyskretnej grafiki w cienkich obudowach. Miejmy nadzieję, że przyszłe wersje Lenovo będą zawierać albo GeForce RTX, albo nowsze opcje RDNA3.Cena i dostępność
Lenovo wysyła obecnie ThinkPada Z16 Gen 2 w cenie od 1600 USD za konfigurację z procesorem Ryzen 5, zintegrowanym GPU i ekranem IPS 1200p do ponad 2600 USD za wersję recenzowaną.
Lenovo ThinkPad Z16 Gen 2
- 16/12/2023 v7 (old)
Allen Ngo
Przezroczystość
Wyboru urządzeń do recenzji dokonuje nasza redakcja. Próbka testowa została udostępniona autorowi jako pożyczka od producenta lub sprzedawcy detalicznego na potrzeby tej recenzji. Pożyczkodawca nie miał wpływu na tę recenzję, producent nie otrzymał też kopii tej recenzji przed publikacją. Nie było obowiązku publikowania tej recenzji. Jako niezależna firma medialna, Notebookcheck nie podlega władzy producentów, sprzedawców detalicznych ani wydawców.
Tak testuje Notebookcheck
Każdego roku Notebookcheck niezależnie sprawdza setki laptopów i smartfonów, stosując standardowe procedury, aby zapewnić porównywalność wszystkich wyników. Od około 20 lat stale rozwijamy nasze metody badawcze, ustanawiając przy tym standardy branżowe. W naszych laboratoriach testowych doświadczeni technicy i redaktorzy korzystają z wysokiej jakości sprzętu pomiarowego. Testy te obejmują wieloetapowy proces walidacji. Nasz kompleksowy system ocen opiera się na setkach uzasadnionych pomiarów i benchmarków, co pozwala zachować obiektywizm.


