Recenzja laptopa MSI Prestige 16 B1MG: Od Core i7 Xe do Core Ultra 7 Arc

16-calowy MSI Prestige 16 AI B1MG to jeden z pierwszych laptopów na rynku z opcją procesora Core Ultra Meteor Lake 14. generacji. Zastępuje on starszy 15,6-calowy model Prestige 15 z odnowionymi elementami wewnętrznymi i zewnętrznymi, zapewniającymi zupełnie nowe wrażenia użytkownika. Rodzina MSI Prestige składa się z laptopów z wyższej średniej półki, plasujących się pomiędzy niższymi modelami Rodziną Modern i wyższej klasy Rodziną Summit.
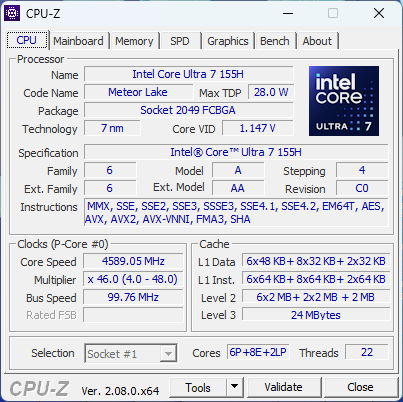
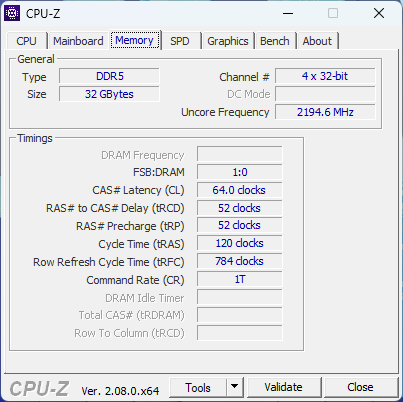
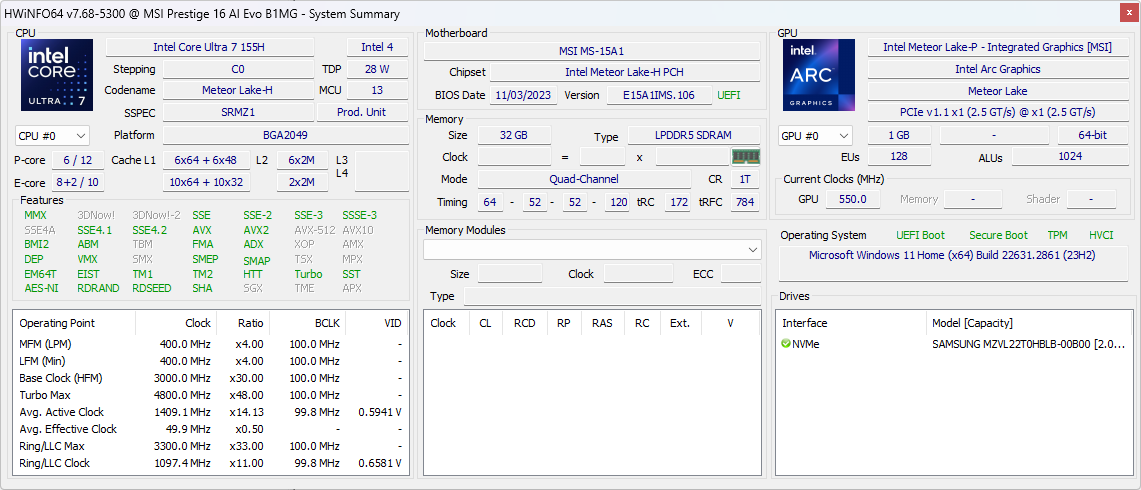
Nasza recenzowana konfiguracja to jednostka detaliczna za 1400 USD z procesorem Core Ultra 7 155H, zintegrowaną grafiką Arc 8, wyświetlaczem IPS 1600p, 32 GB pamięci RAM LPDDR5-6400 MHz i 2 TB NVMe SSD. Dostępne są również wyższej klasy jednostki SKU z procesorem Core Ultra 9 185H, grafiką GeForce RTX 4060 lub 4070, grafiką Arc 370M i wyświetlaczem OLED 4K (2400p).
Konkurentami Prestige 16 są inne cienkie i lekkie laptopy multimedialne lub do tworzenia treści, takie jak Seria Dell XPS, Asus VivoBook Pro 16,LG Gram 16 2-w-1lub Lenovo Yoga Pro 9i 16.
Więcej recenzji MSI:
Potencjalni konkurenci w porównaniu
Ocena | Data | Model | Waga | Wysokość | Rozmiar | Rezolucja | Cena |
|---|---|---|---|---|---|---|---|
| 88.1 % v7 (old) | 12/2023 | MSI Prestige 16 B1MG-001US Ultra 7 155H, Arc 8-Core | 1.6 kg | 19.1 mm | 16.00" | 2560x1600 | |
| 85.4 % v7 (old) | 12/2022 | MSI Prestige 15 A12UD-093 i7-1280P, GeForce RTX 3050 Ti Laptop GPU | 1.8 kg | 20.1 mm | 15.60" | 3840x2160 | |
| 85.8 % v7 (old) | 11/2023 | LG Gram 2in1 16 16T90R - G.AA78G i7-1360P, Iris Xe G7 96EUs | 1.5 kg | 17.2 mm | 16.00" | 2560x1600 | |
| 85.7 % v7 (old) | 11/2023 | Lenovo ThinkBook 16 G6 ABP R5 7530U, Vega 7 | 1.8 kg | 17.5 mm | 16.00" | 1920x1200 | |
| 87.6 % v7 (old) | 11/2023 | Asus VivoBook Pro 16 K6602VU i9-13900H, GeForce RTX 4050 Laptop GPU | 1.9 kg | 19 mm | 16.00" | 3200x2000 | |
| 87.1 % v7 (old) | 08/2023 | Dell Inspiron 16 Plus 7630 i7-13700H, GeForce RTX 4060 Laptop GPU | 2.2 kg | 19.95 mm | 16.00" | 2560x1600 |
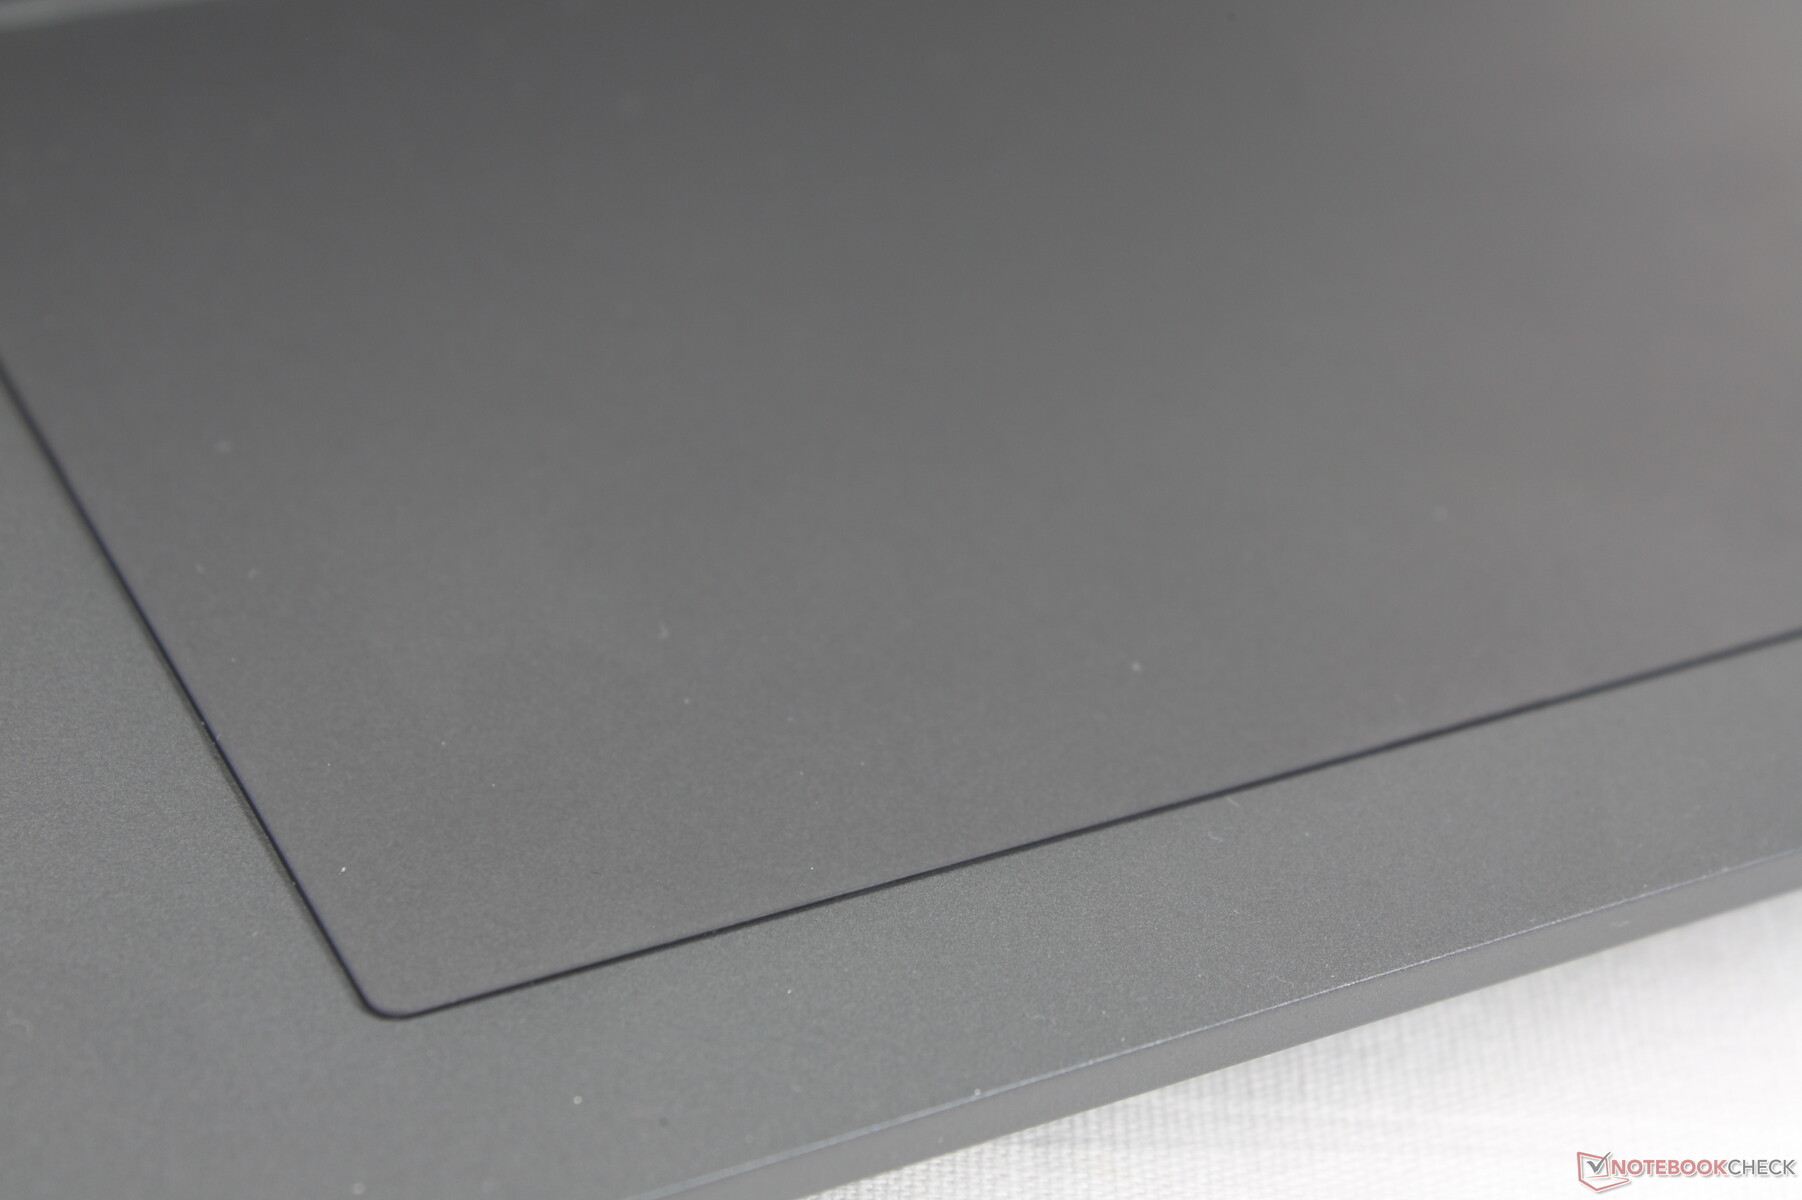
Obudowa - cienki wygląd, cienkie materiały
Metalowa obudowa jest twardsza i solidniejsza niż w tańszych modelach z serii MSI Modern lub Asus VivoBook. Przykładowo, wywieranie nacisku na środek klawiatury ledwo wypaczy jej powierzchnię. Pokrywa jest stosunkowo bardziej podatna na skręcanie i uszkodzenia, zwłaszcza że nie posiada wzmocnienia Gorilla Glass. Nacisk na środek zewnętrznej pokrywy wypaczyłby jej powierzchnię bardziej niż byśmy tego chcieli. W tym przypadku alternatywy, takie jak HP Spectre lub Razer Blade, są znacznie mocniejsze, mimo że są cięższe.
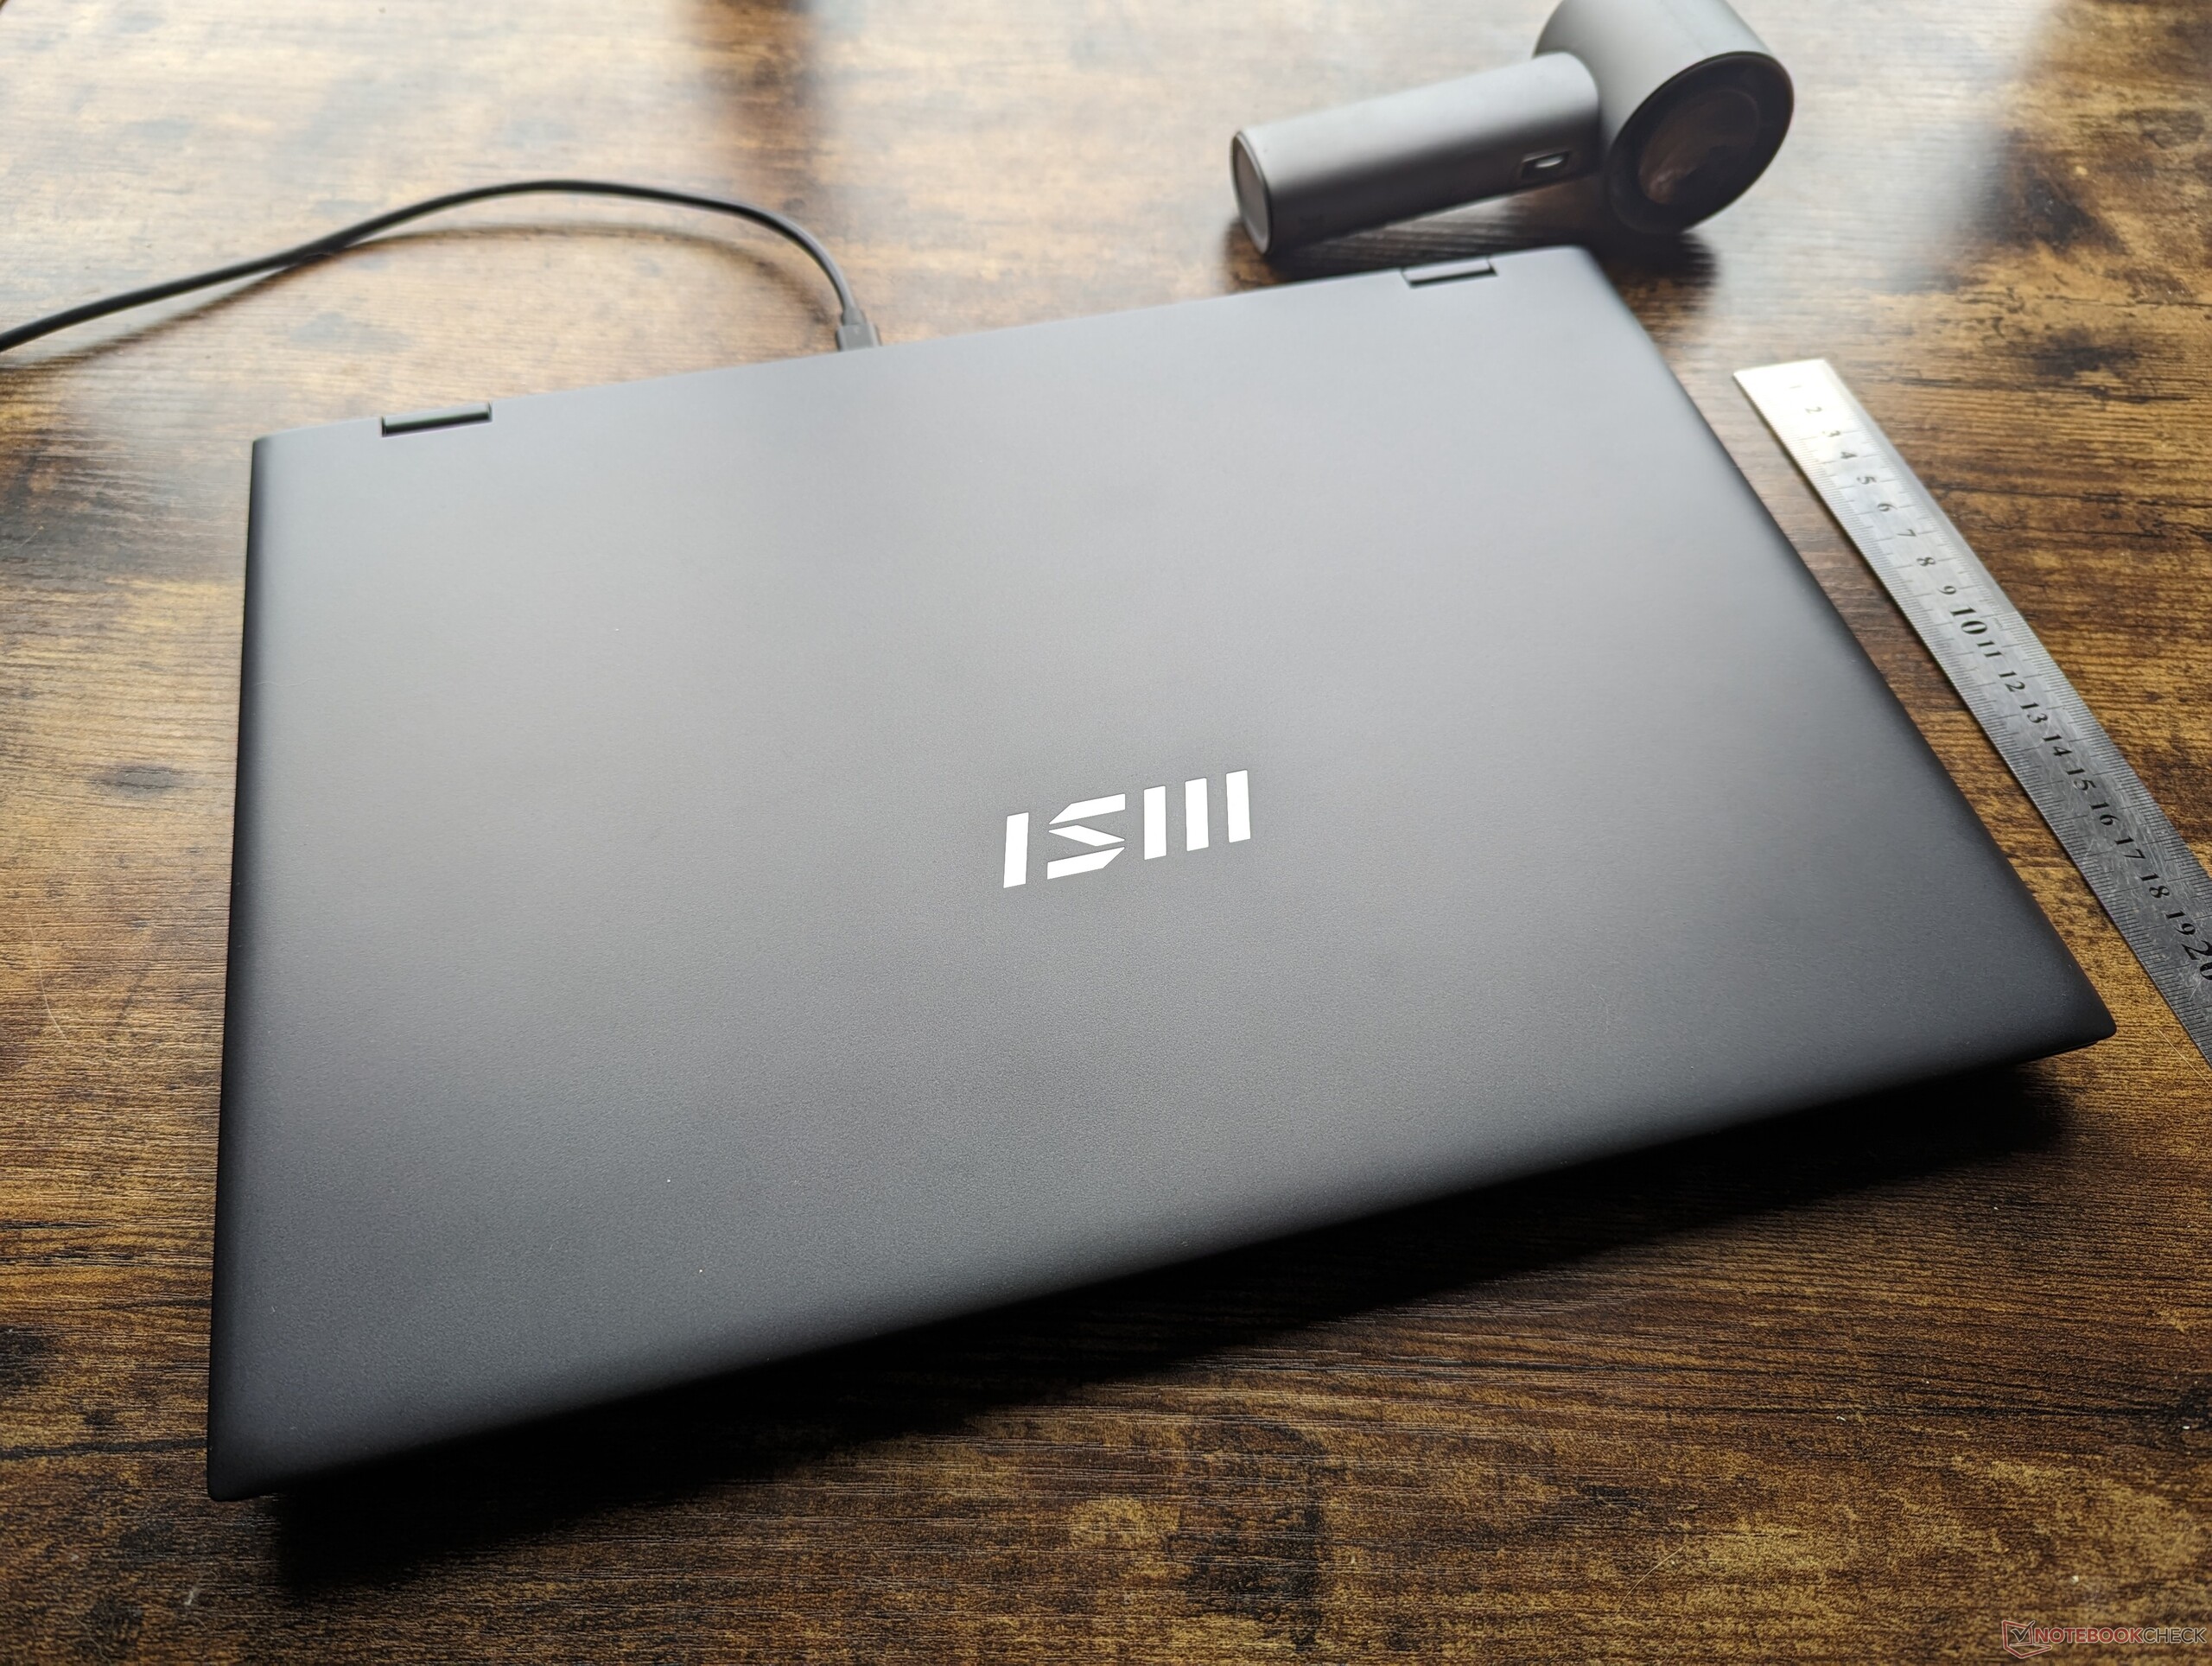
Kwadratowy współczynnik proporcji 16:10 sprawia, że Prestige 16 zajmuje większą powierzchnię niż poprzedni Prestige 15. Różnicę nadrabia jednak cieńszym profilem i mniejszą wagą. W rzeczywistości Prestige 16 jest jednym z najlżejszych 16-calowych laptopów multimedialnych rywalizujących z LG Gram 16 2-w-1. Spodziewamy się jednak, że jednostki SKU z dyskretną grafiką będą nieco cięższe.
Łączność - gotowy na Wi-Fi 7
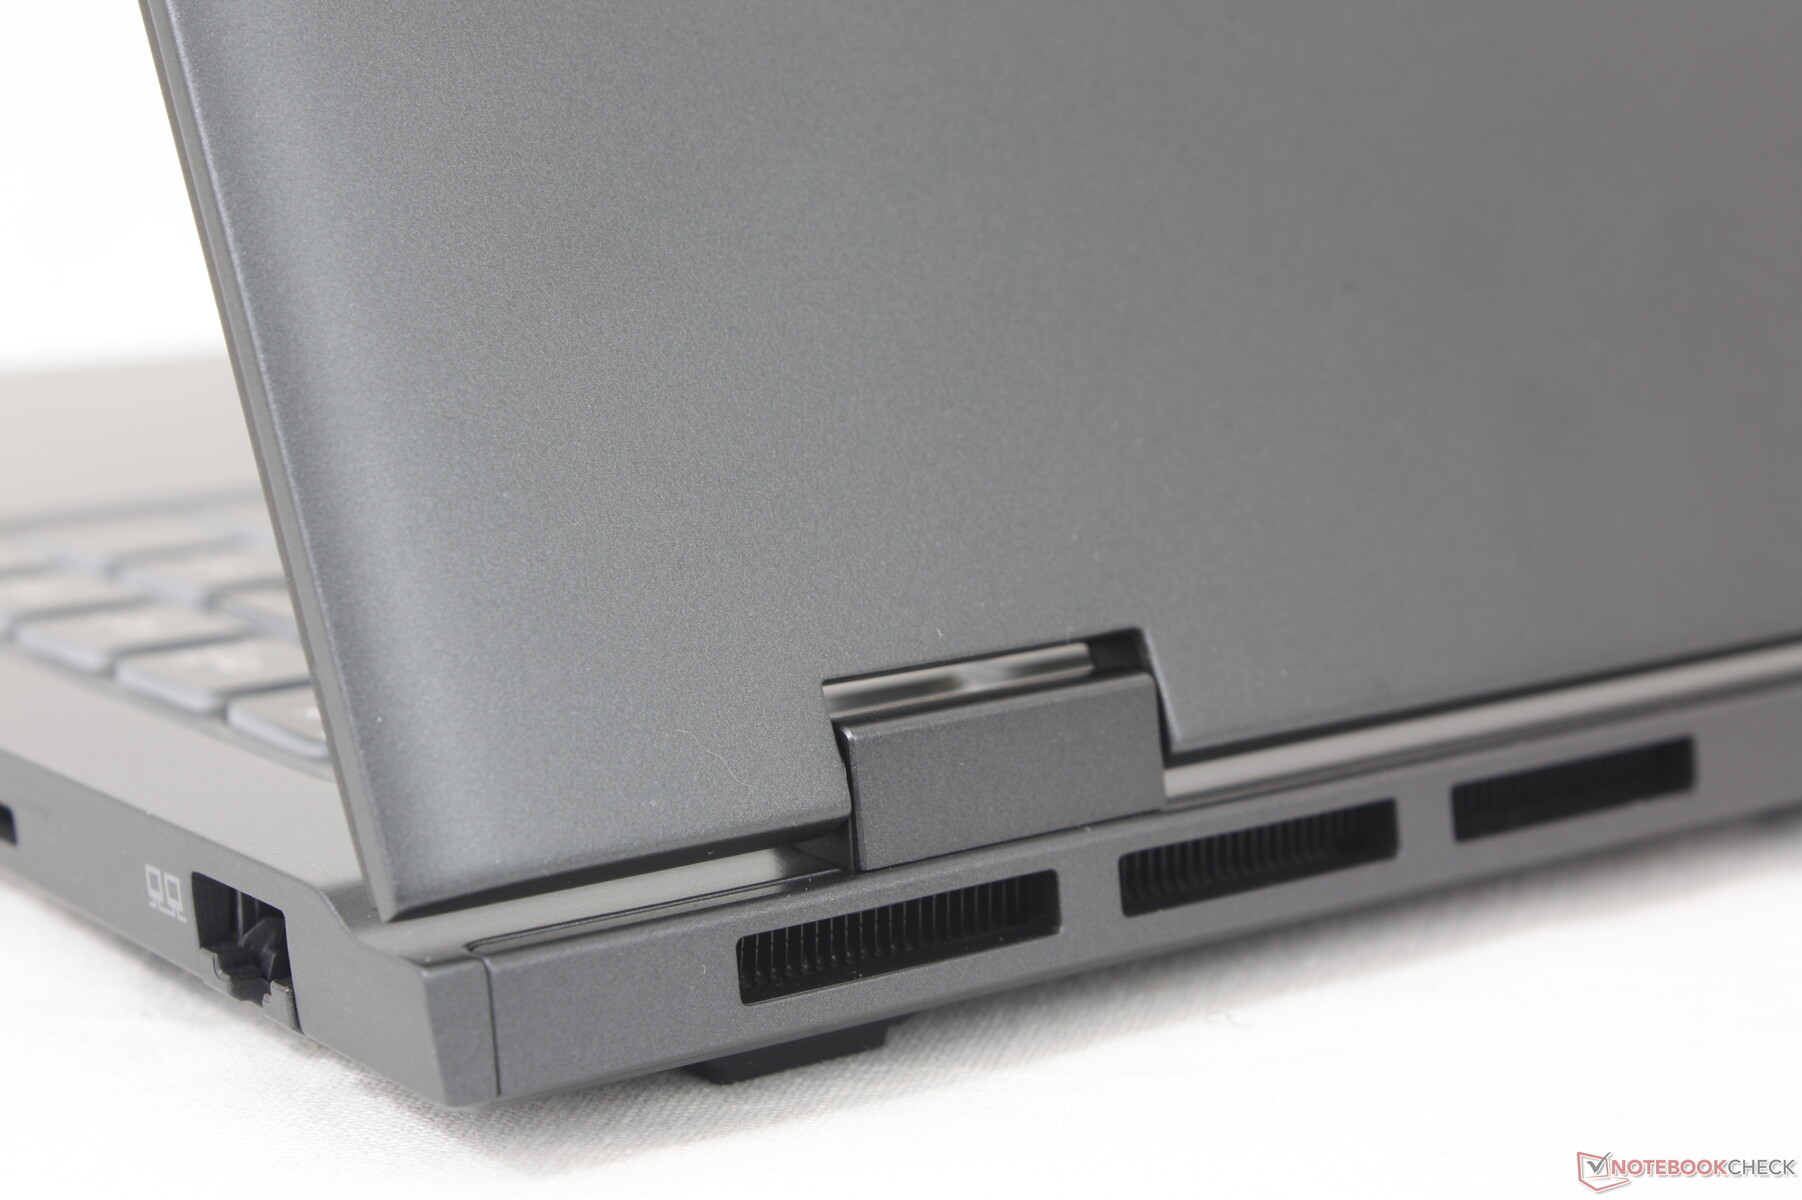
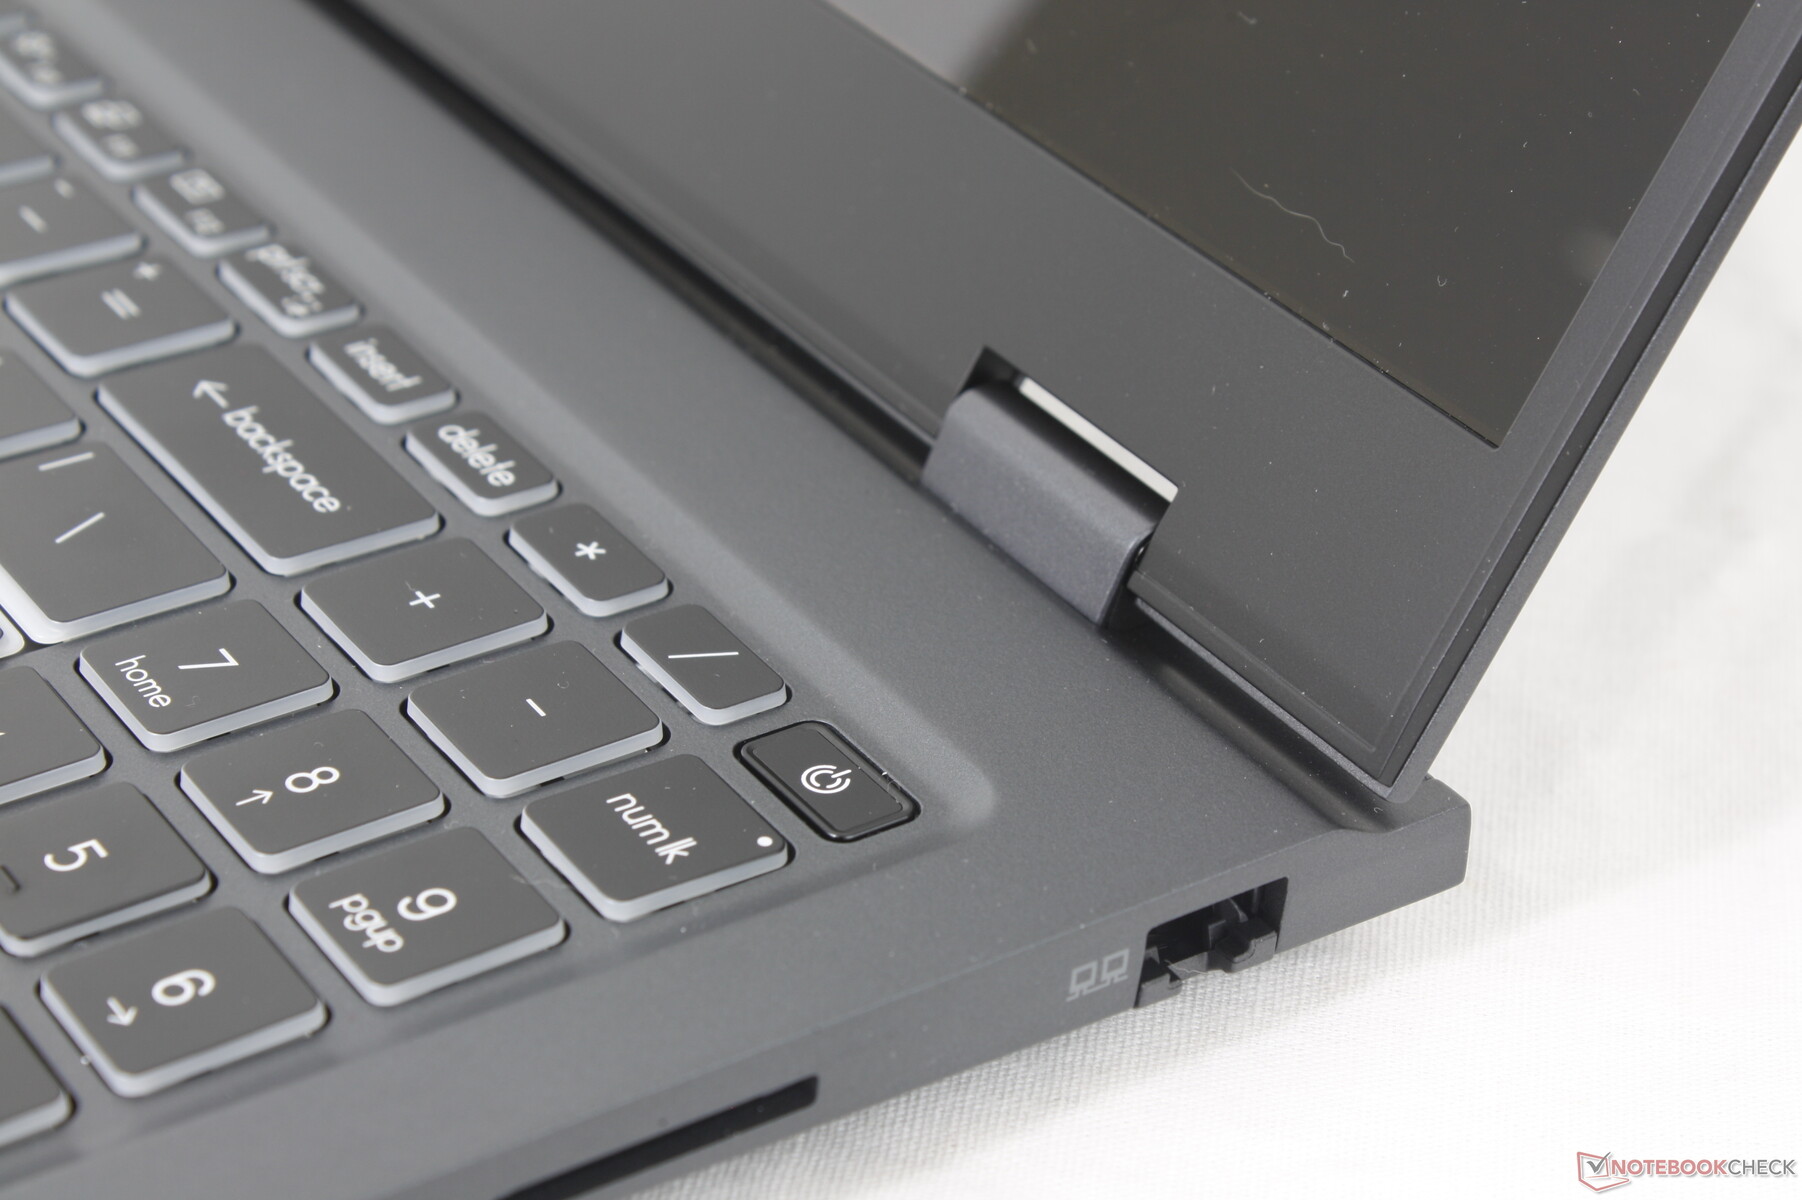
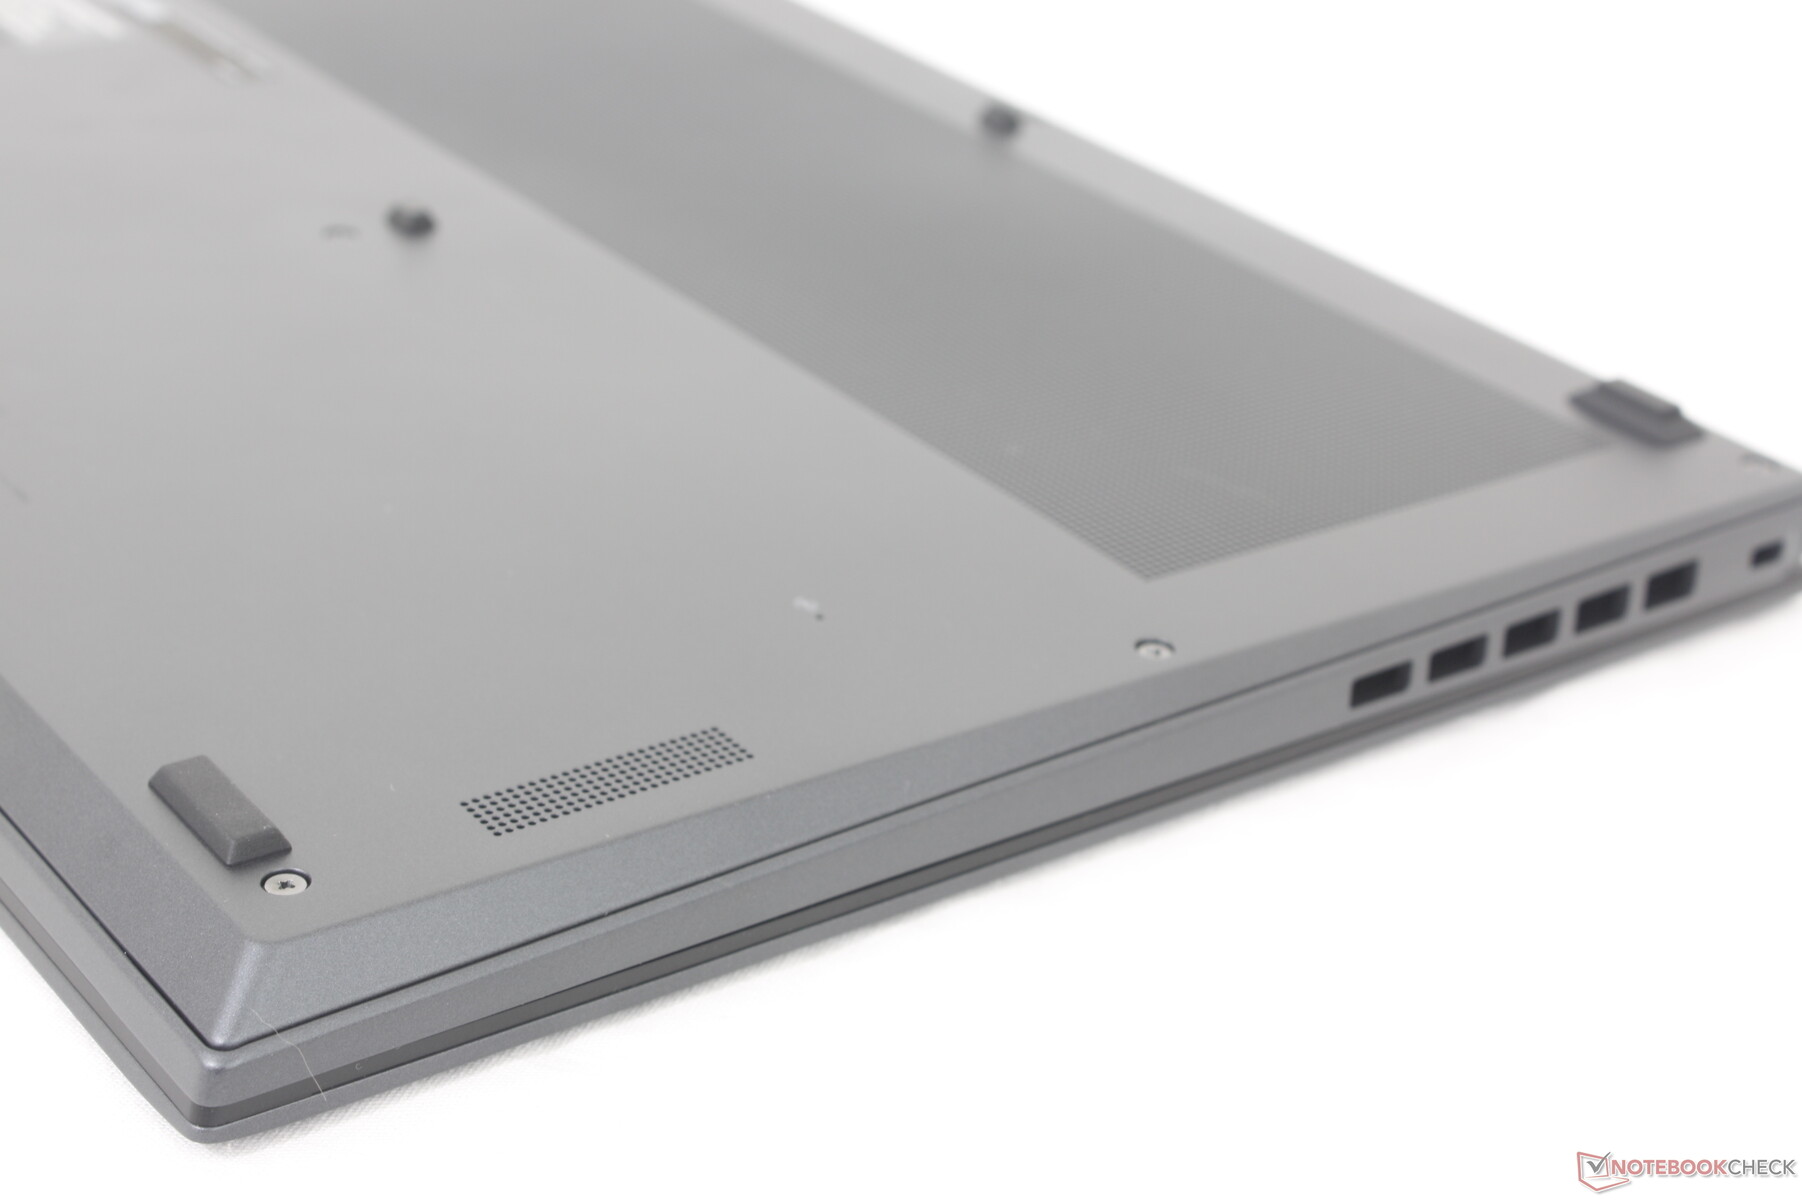
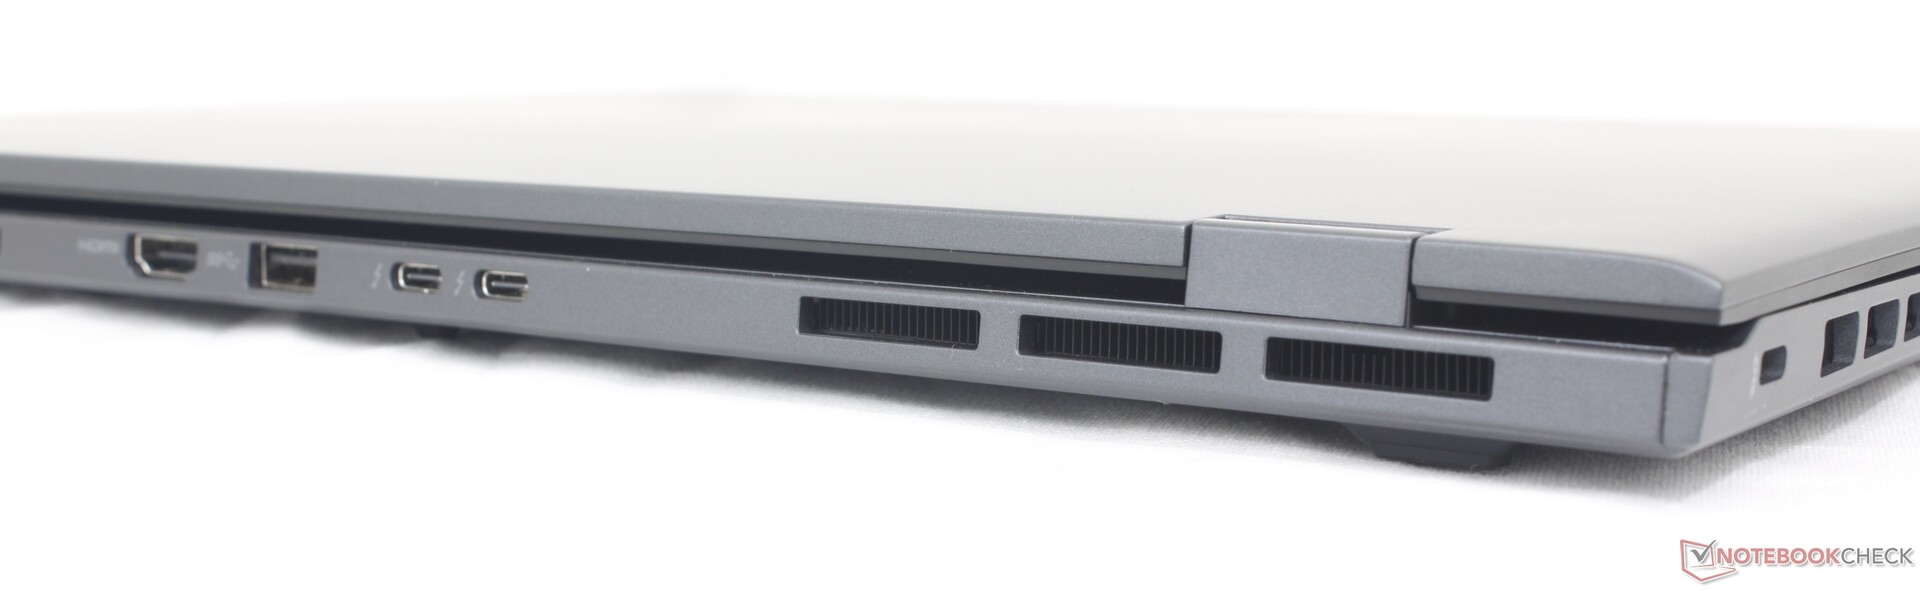
W przeciwieństwie do większości innych ultrabooków, porty w Prestige 16 są skoncentrowane z tyłu zamiast po bokach. Takie podejście projektowe pozwala na lepszą wentylację wzdłuż boków, aczkolwiek kosztem gorszej dostępności portów. Powszechnie używane porty, takie jak HDMI, USB-C, a nawet USB-A, znajdują się z tyłu, co może nie być idealne dla większości użytkowników.
W porównaniu do Prestige 15, Prestige 16 zamienił jeden port USB-A na port RJ-45. Dwa porty Thunderbolt 4 pozostają nienaruszone dla jednostek SKU ze zintegrowaną grafiką. W przypadku konfiguracji z oddzielną grafiką, tylko jeden z dwóch portów USB-C jest kompatybilny z Thunderbolt.
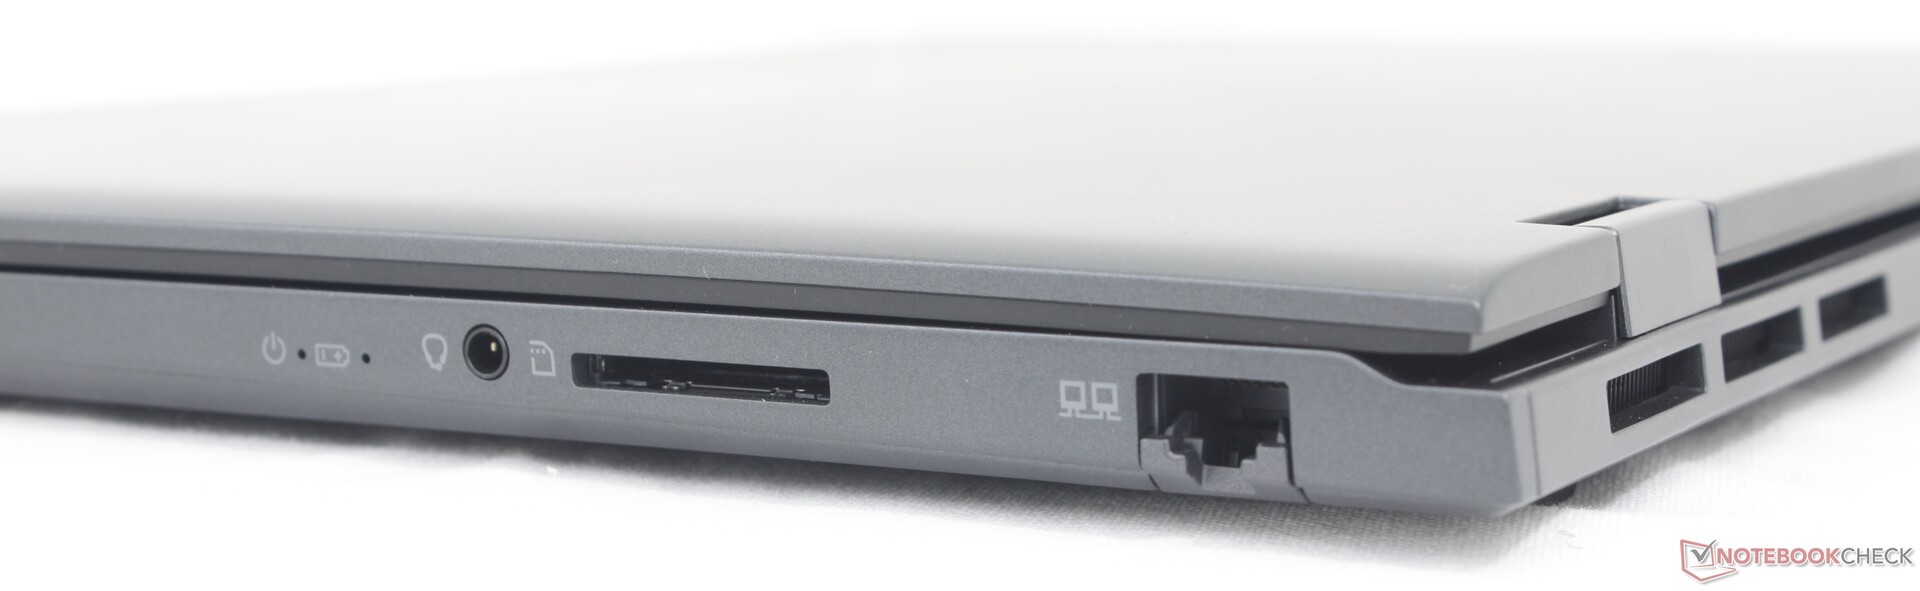
Czytnik kart SD
Zintegrowany czytnik kart SD został ulepszony, aby zapewnić znacznie większą prędkość. Przesłanie 1 GB zdjęć z naszej karty testowej UHS-II na pulpit zajęłoby niecałe 6 sekund w porównaniu do ponad 12 sekund w Prestige 15.
| SD Card Reader | |
| average JPG Copy Test (av. of 3 runs) | |
| MSI Prestige 16 B1MG-001US (Toshiba Exceria Pro SDXC 64 GB UHS-II) | |
| Asus VivoBook Pro 16 K6602VU (Angelbird AV Pro V60) | |
| Lenovo ThinkBook 16 G6 ABP (Angelbird AV Pro V60) | |
| MSI Prestige 15 A12UD-093 (AV Pro SD microSD 128 GB V60) | |
| LG Gram 2in1 16 16T90R - G.AA78G | |
| Dell Inspiron 16 Plus 7630 (AV Pro SD microSD 128 GB V60) | |
| maximum AS SSD Seq Read Test (1GB) | |
| Asus VivoBook Pro 16 K6602VU (Angelbird AV Pro V60) | |
| MSI Prestige 16 B1MG-001US (Toshiba Exceria Pro SDXC 64 GB UHS-II) | |
| Lenovo ThinkBook 16 G6 ABP (Angelbird AV Pro V60) | |
| MSI Prestige 15 A12UD-093 (AV Pro SD microSD 128 GB V60) | |
| Dell Inspiron 16 Plus 7630 (AV Pro SD microSD 128 GB V60) | |
| LG Gram 2in1 16 16T90R - G.AA78G | |
Komunikacja
Prestige 16 jest jednym z pierwszych laptopów wyposażonych w moduł WLAN Killer BE1750W zapewniający kompatybilność z Wi-Fi 7. Routery Wi-Fi 7 nie są jednak jeszcze powszechnie dostępne, więc włączenie Wi-Fi 7 w tej chwili jest bardziej związane z zabezpieczeniem na przyszłość niż z jakimikolwiek natychmiastowymi korzyściami. Niemniej jednak nie doświadczyliśmy żadnych problemów z łącznością po sparowaniu z naszym routerem testowym Wi-Fi 6E.
Kamera internetowa
Kamera internetowa 2 MP z podczerwienią i fizyczną migawką prywatności są standardem. Alternatywy takie jak HP Spectre już zaczęły być dostarczane z czujnikami 5 MP o wyższej rozdzielczości.


Konserwacja
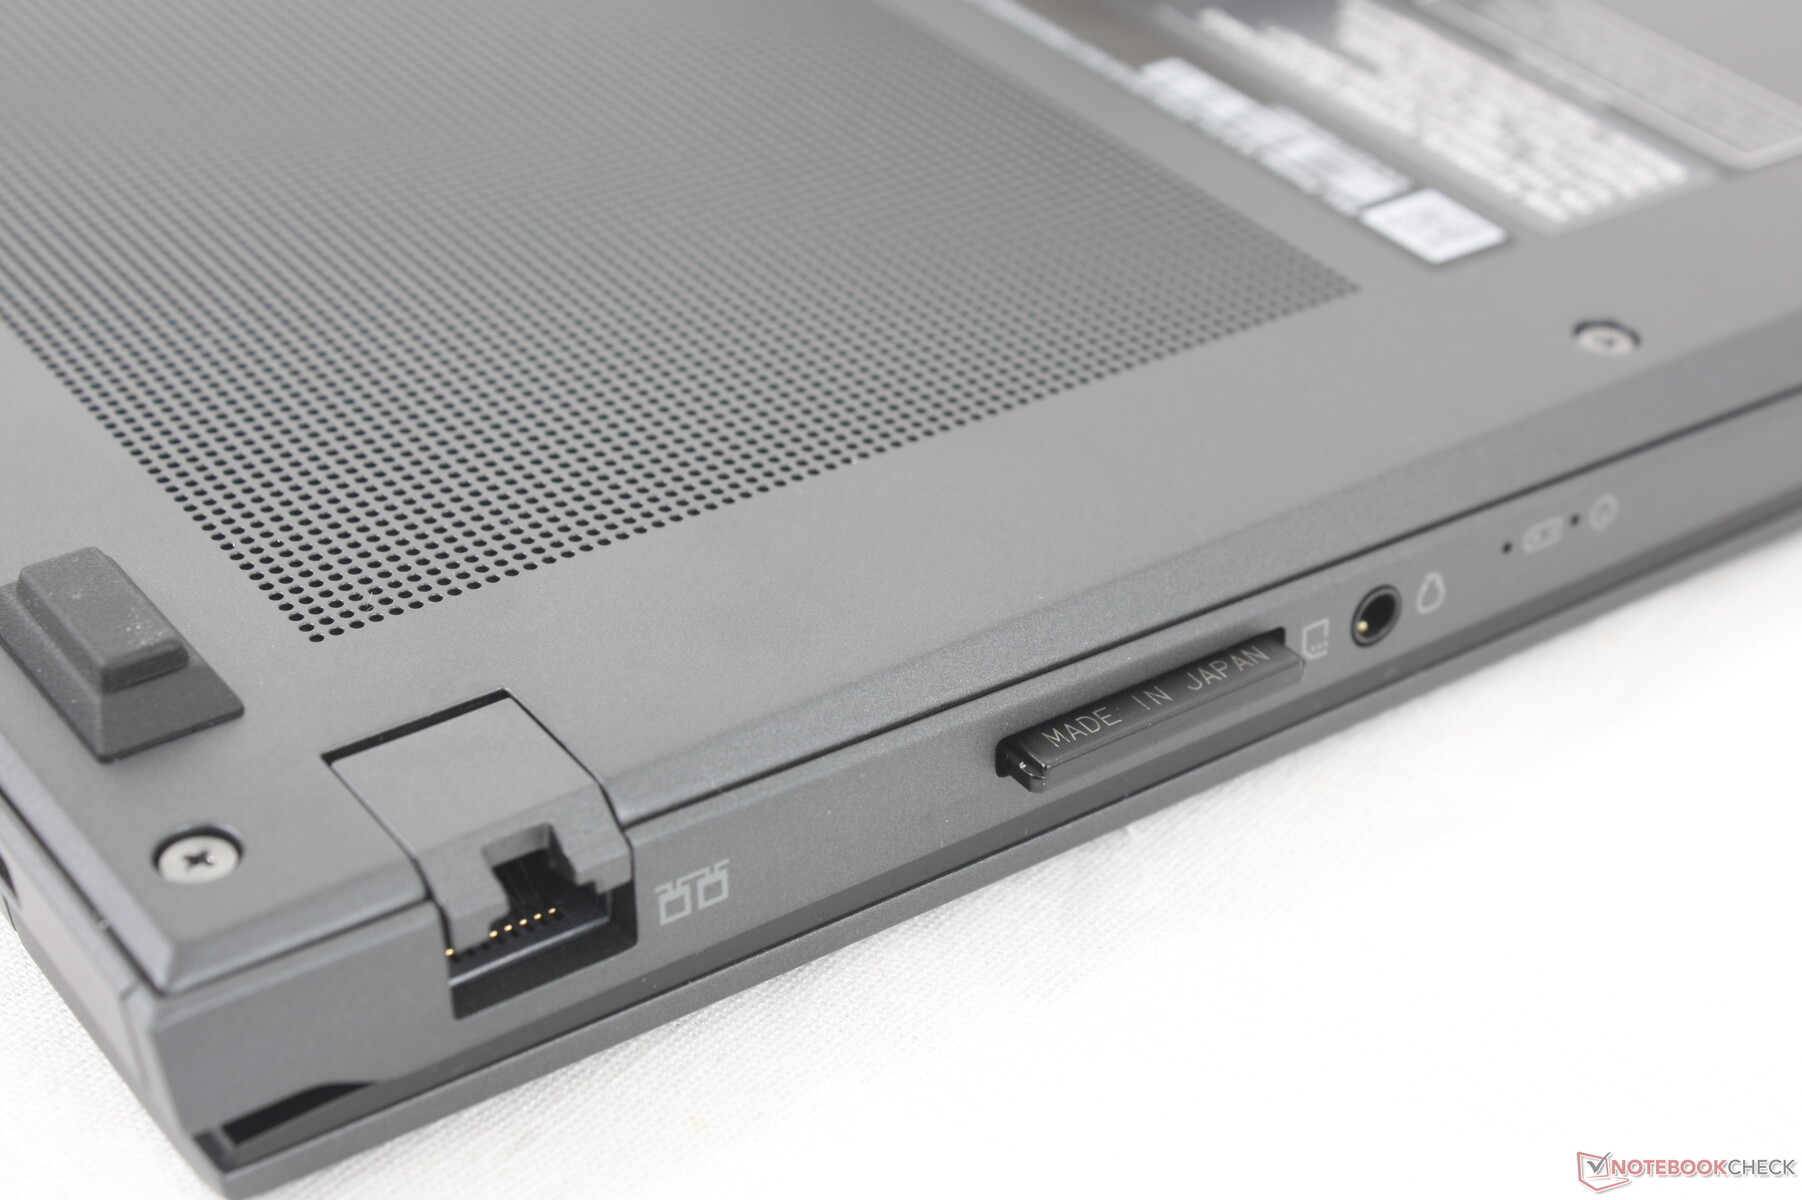
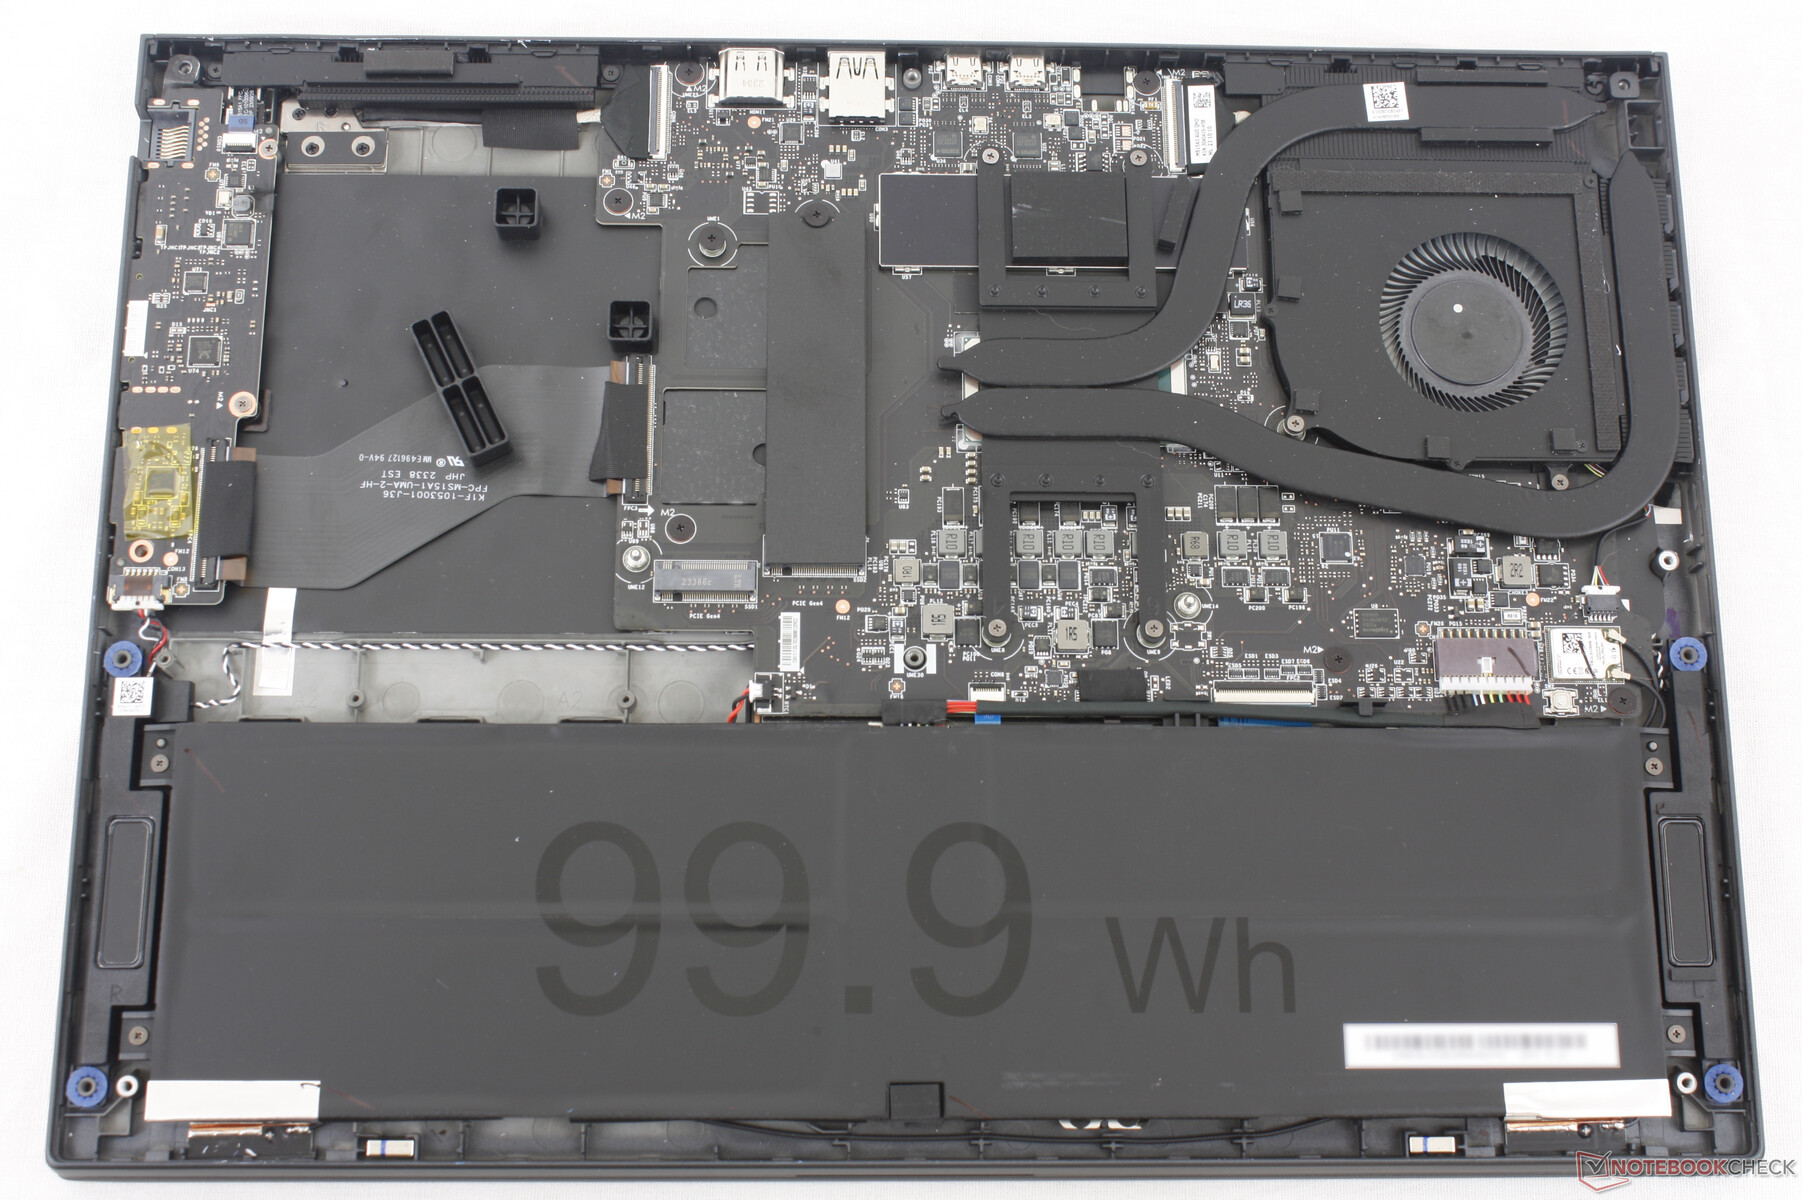
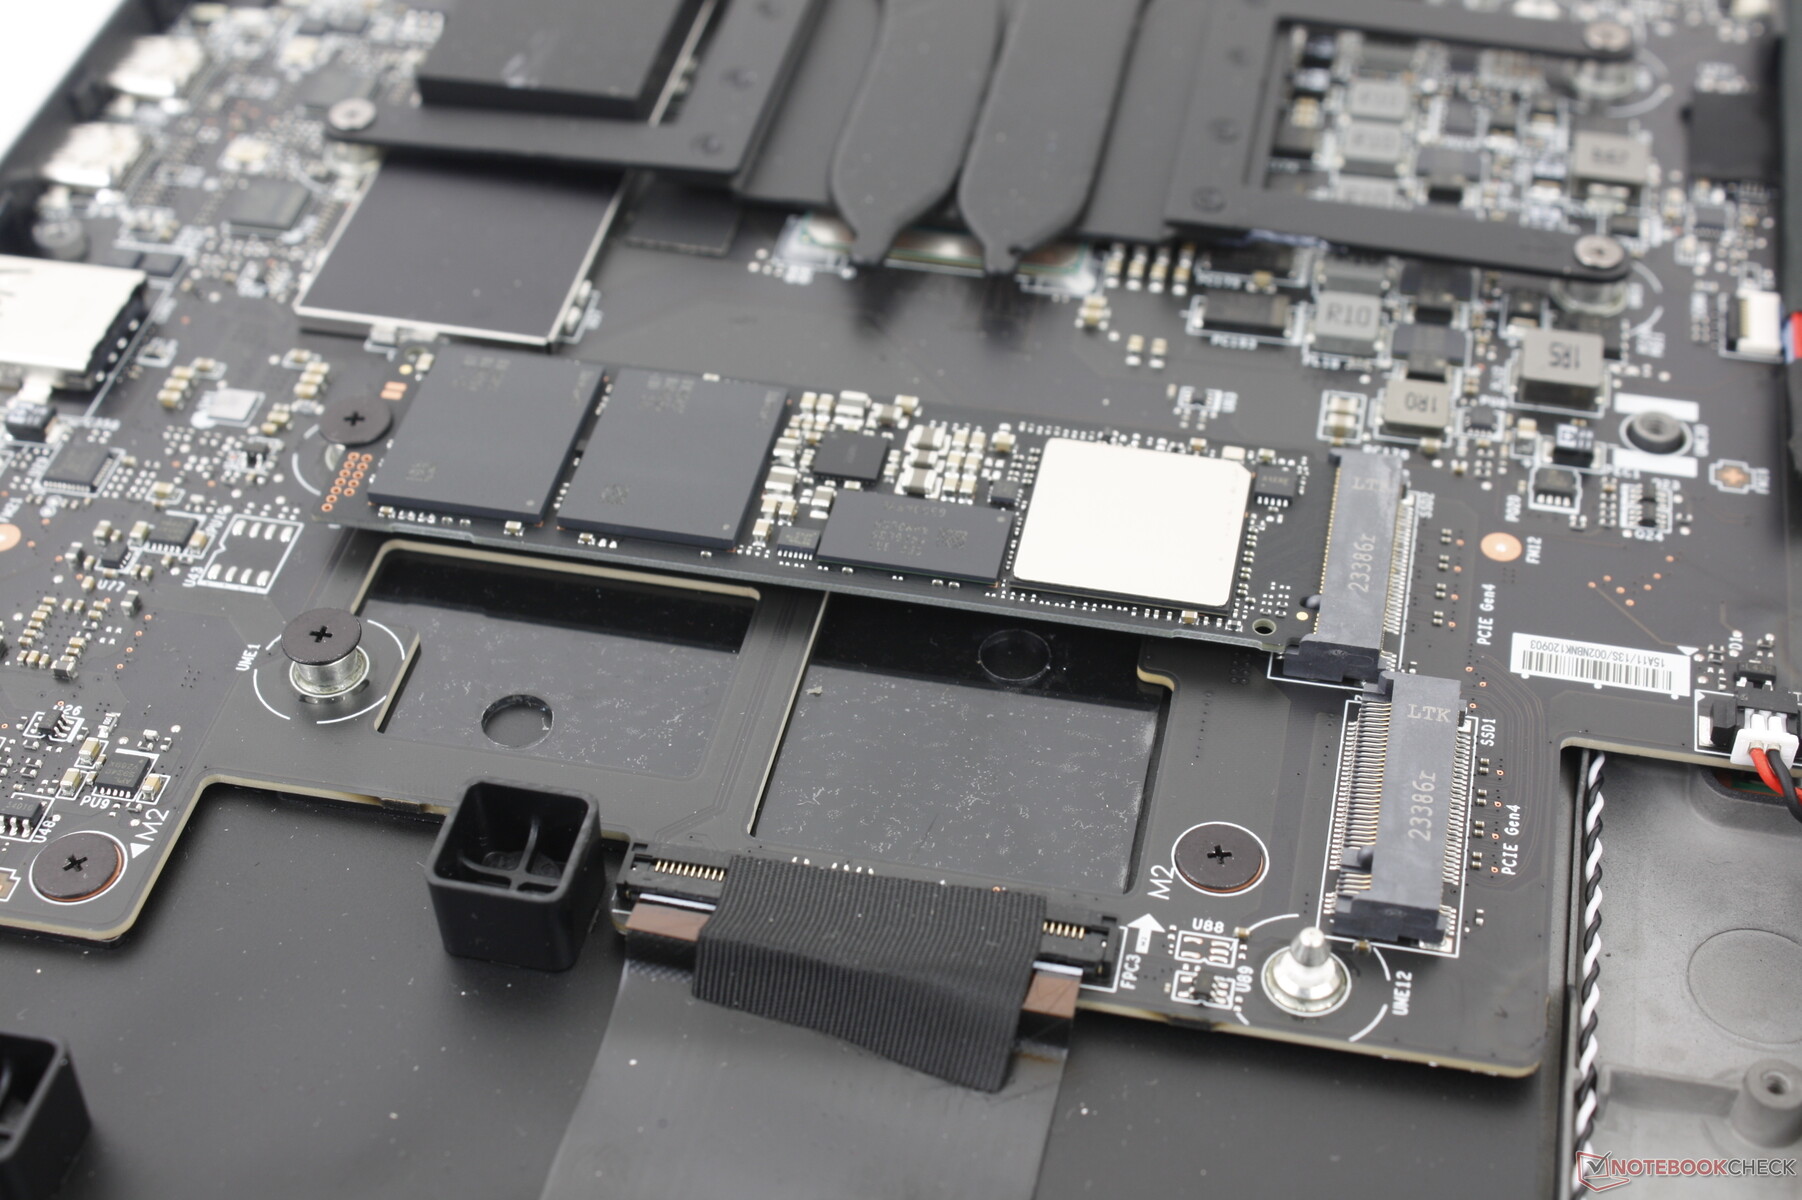
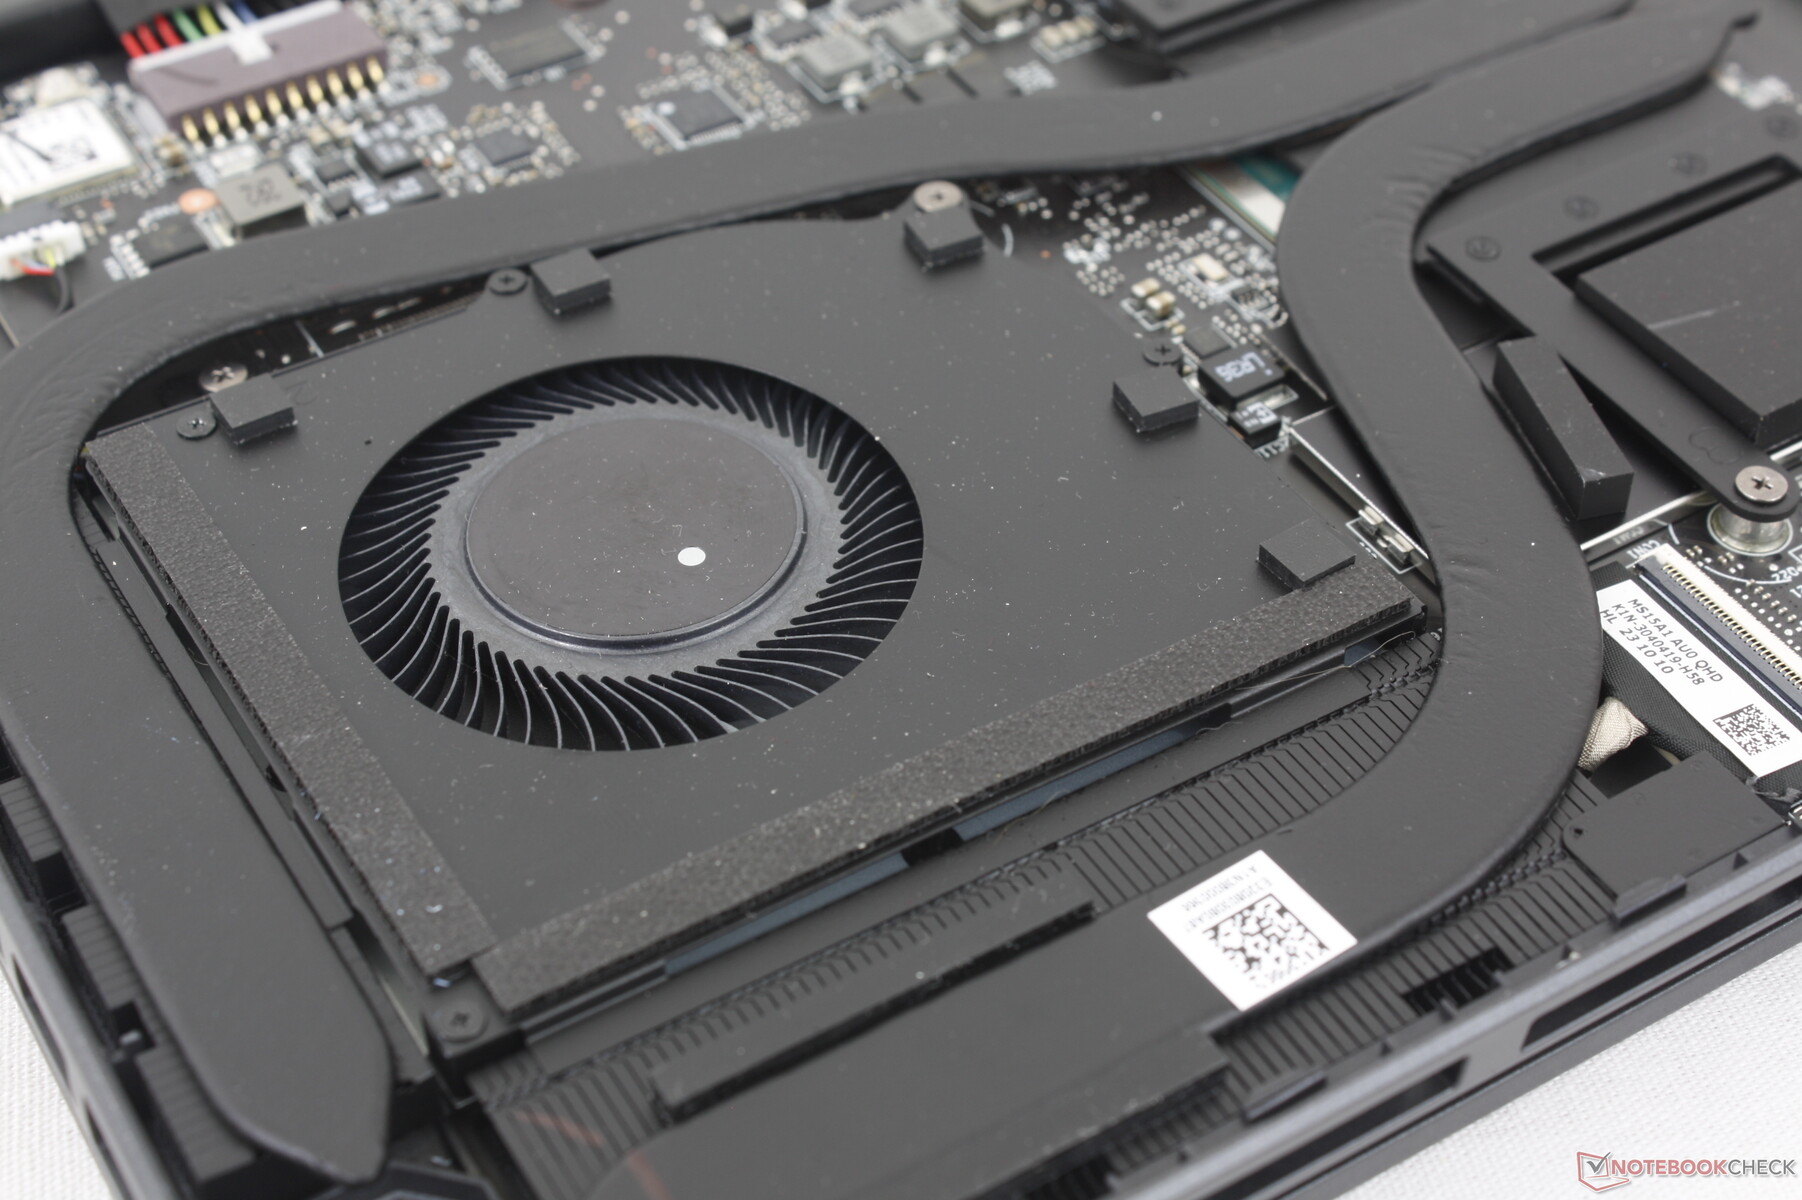
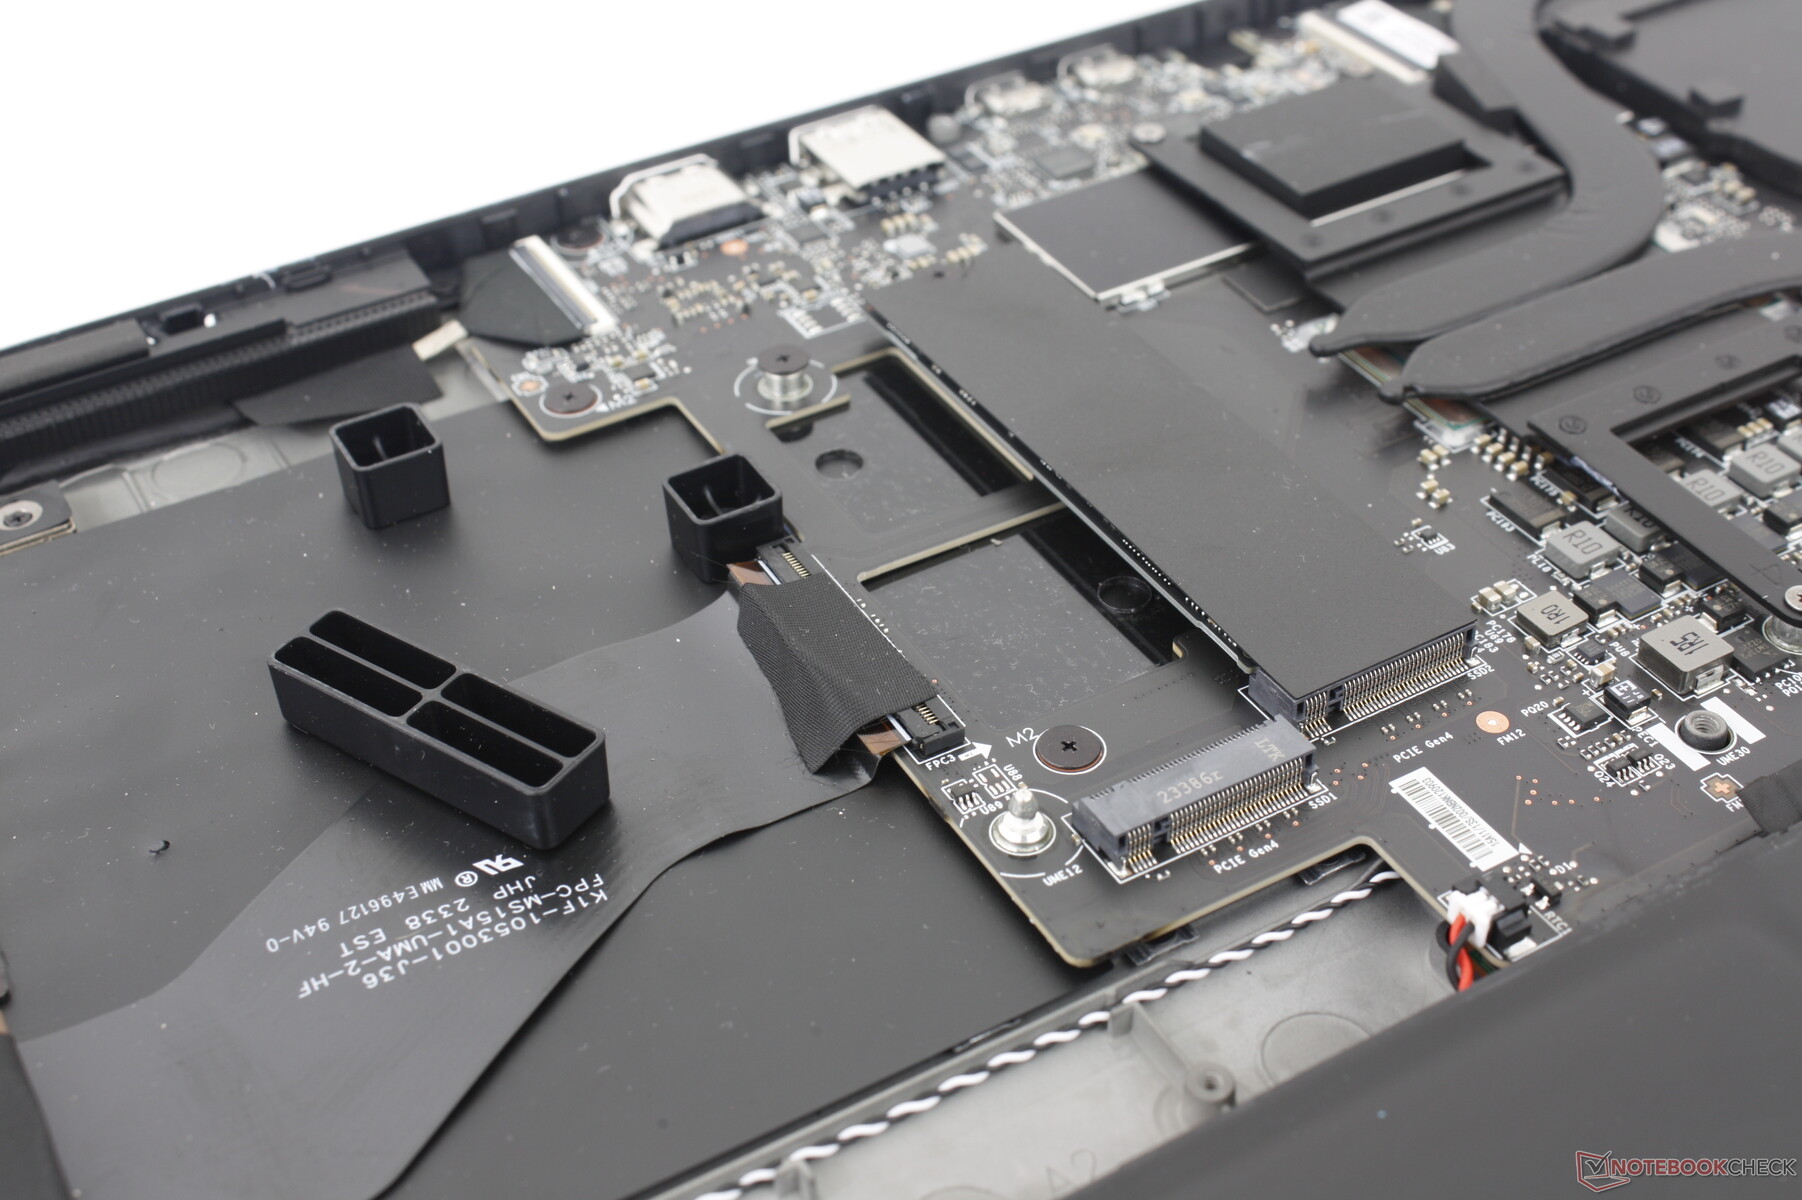
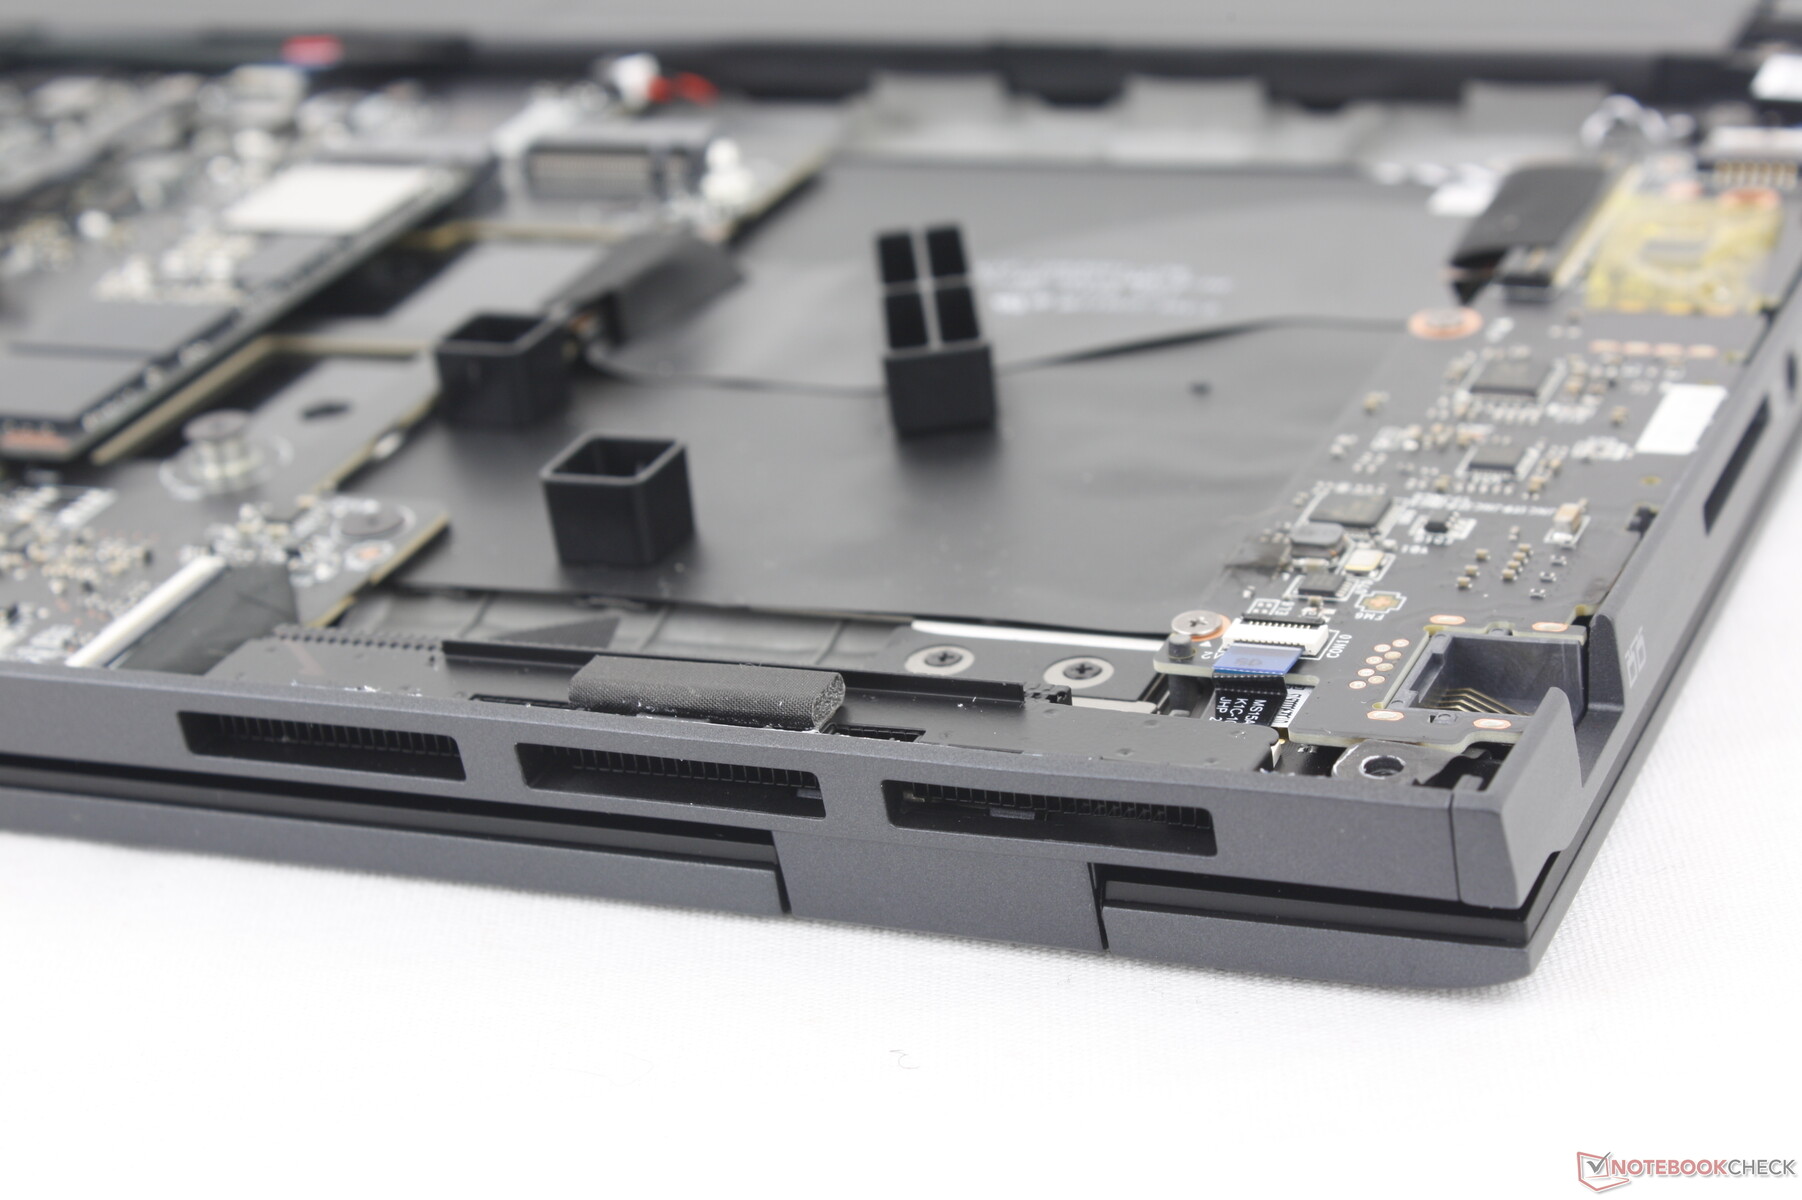
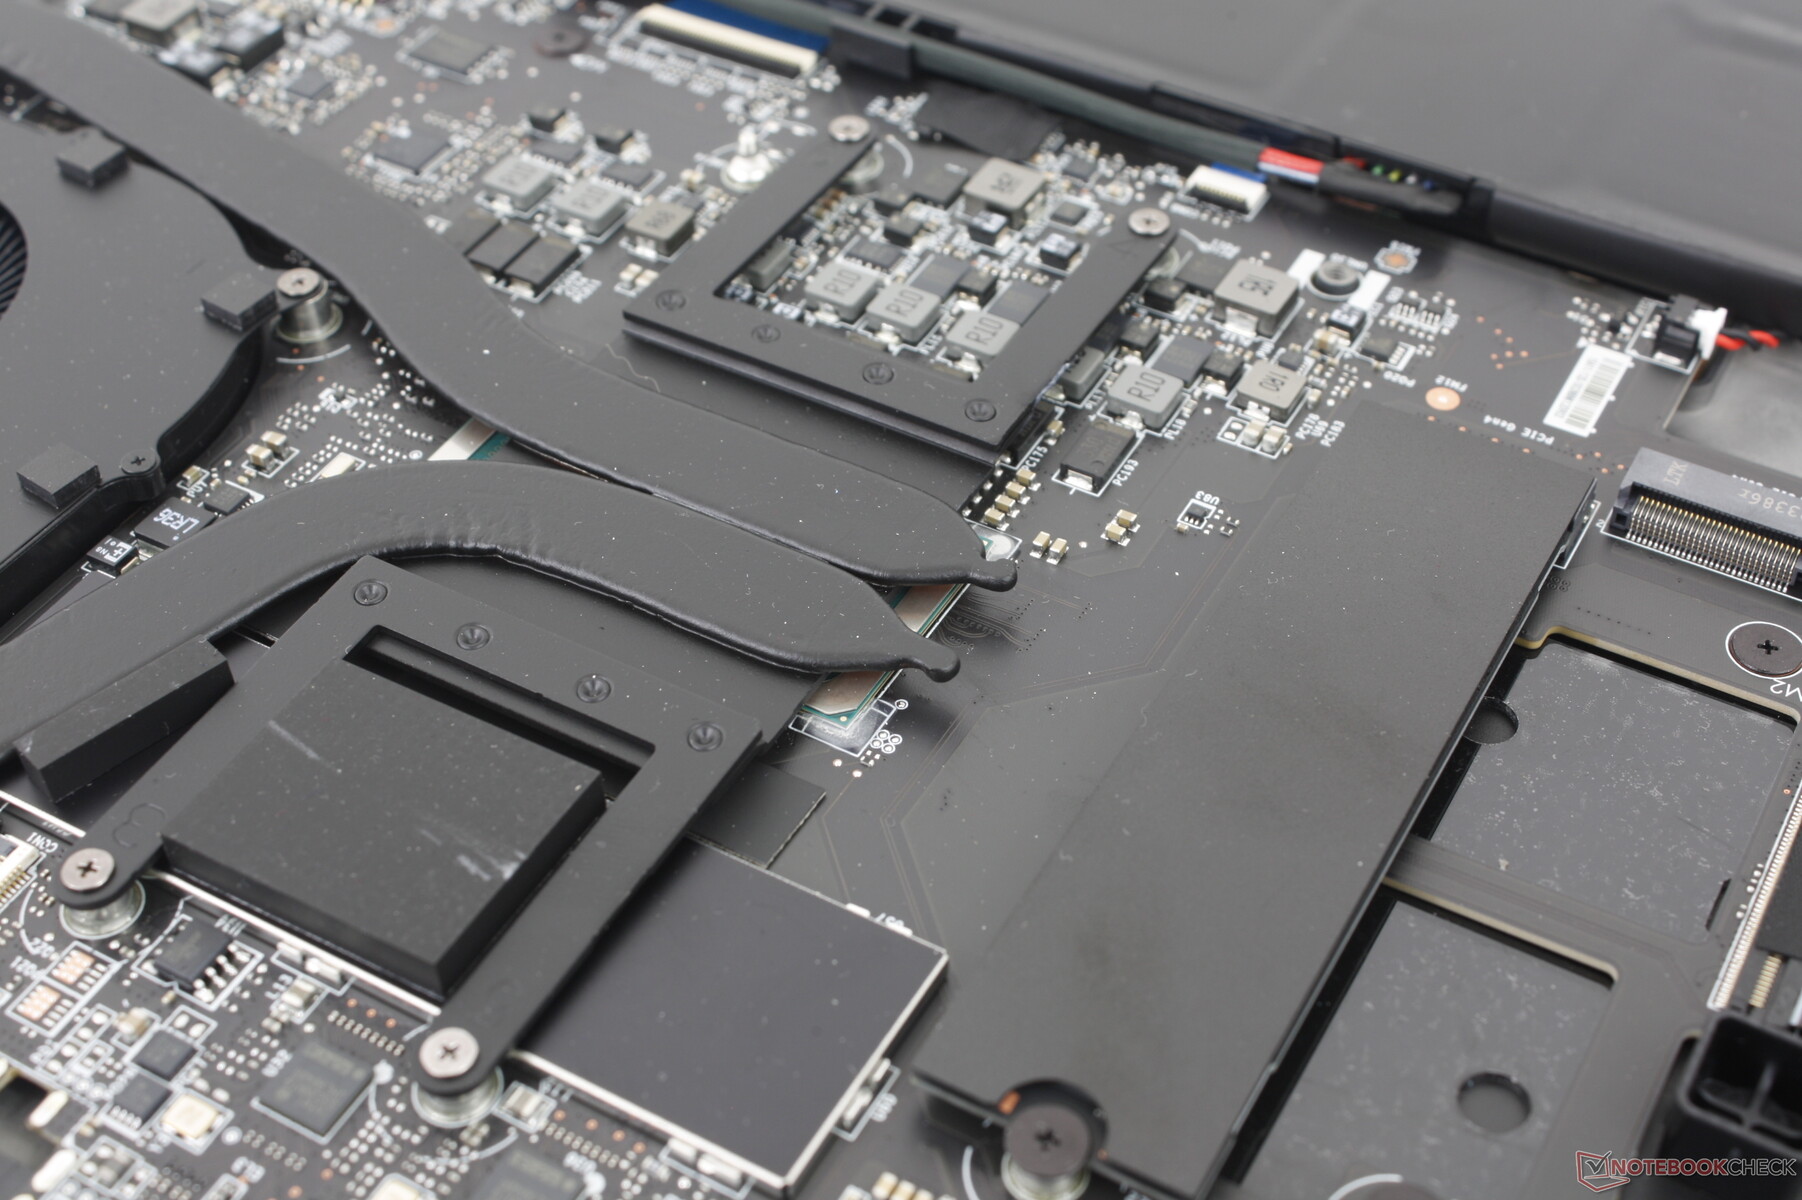
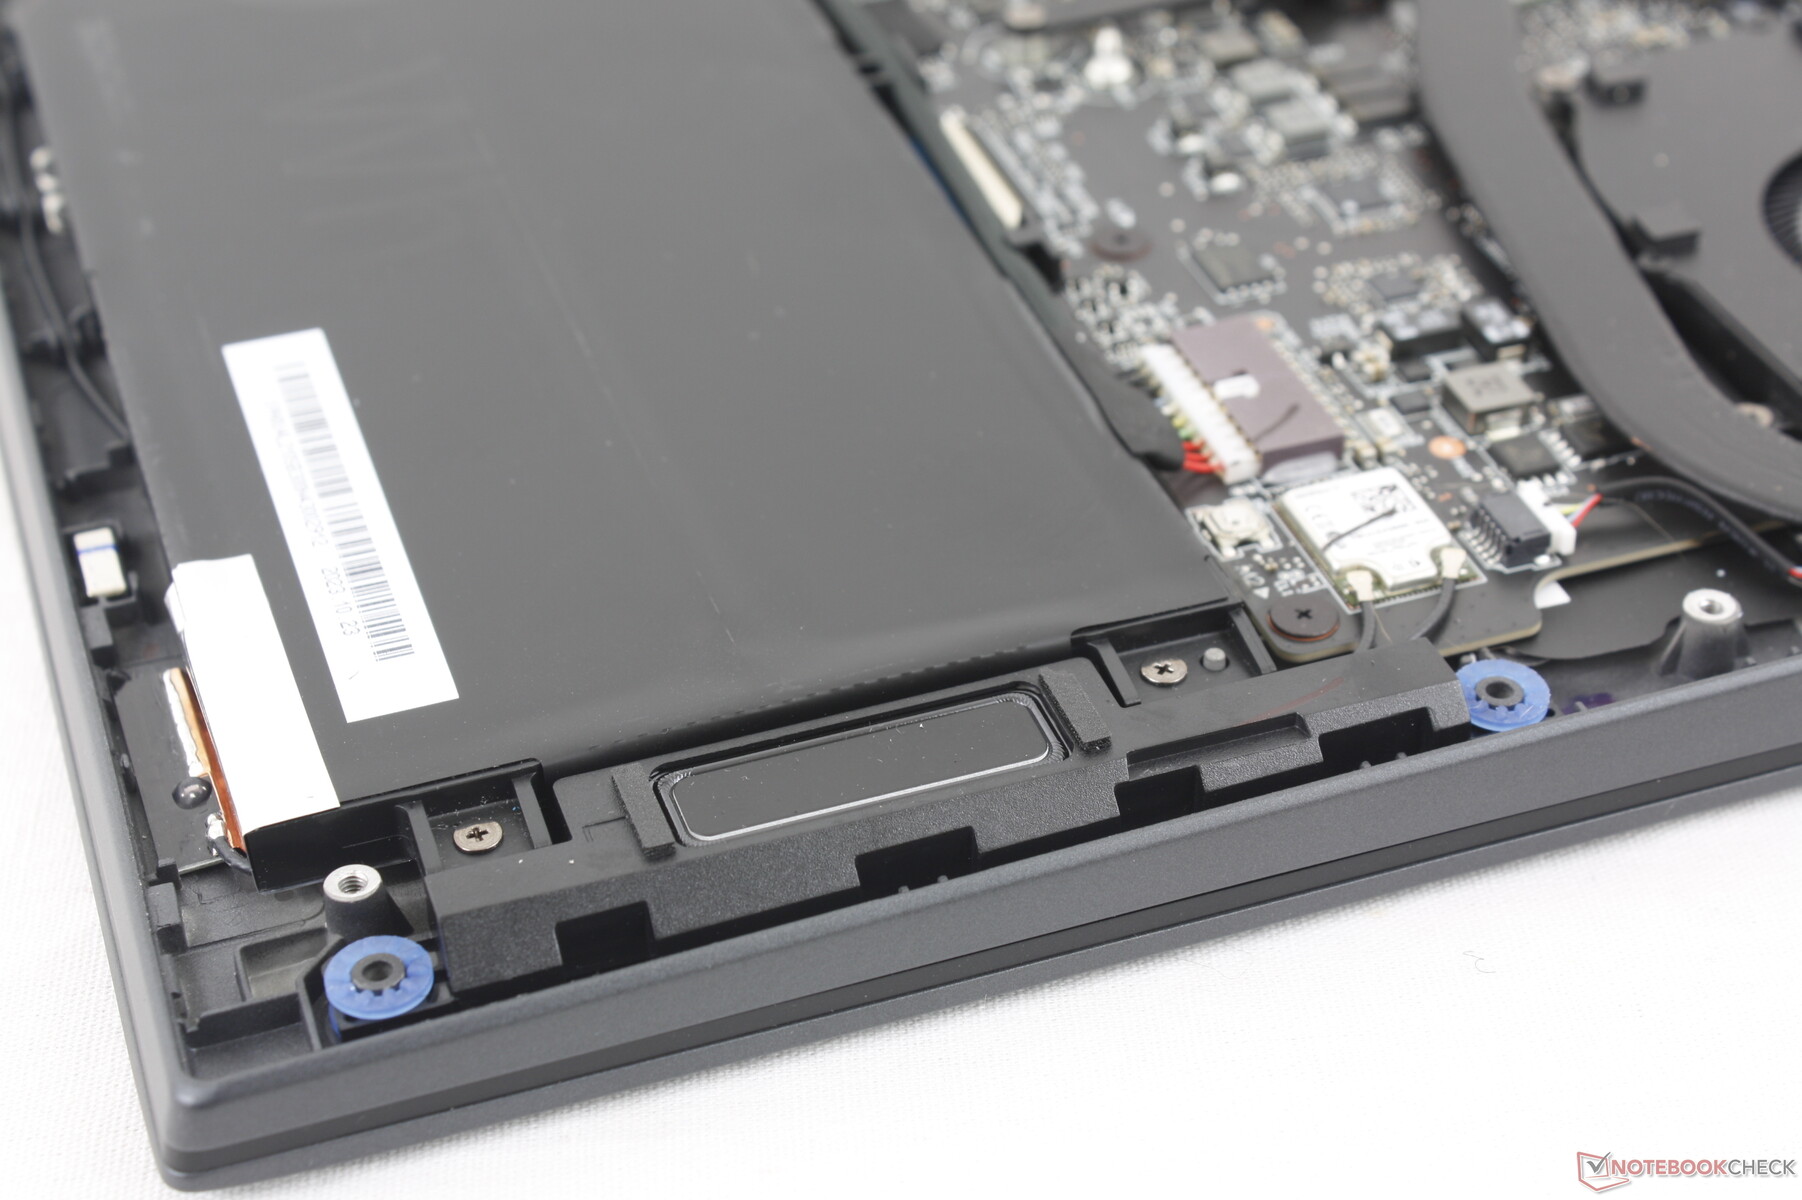
Dolny panel odskakuje dość łatwo po odkręceniu ośmiu śrub krzyżakowych. Proszę pamiętać, że fabryczna naklejka plombująca musi zostać zerwana aby uzyskać dostęp do elementów wewnętrznych.
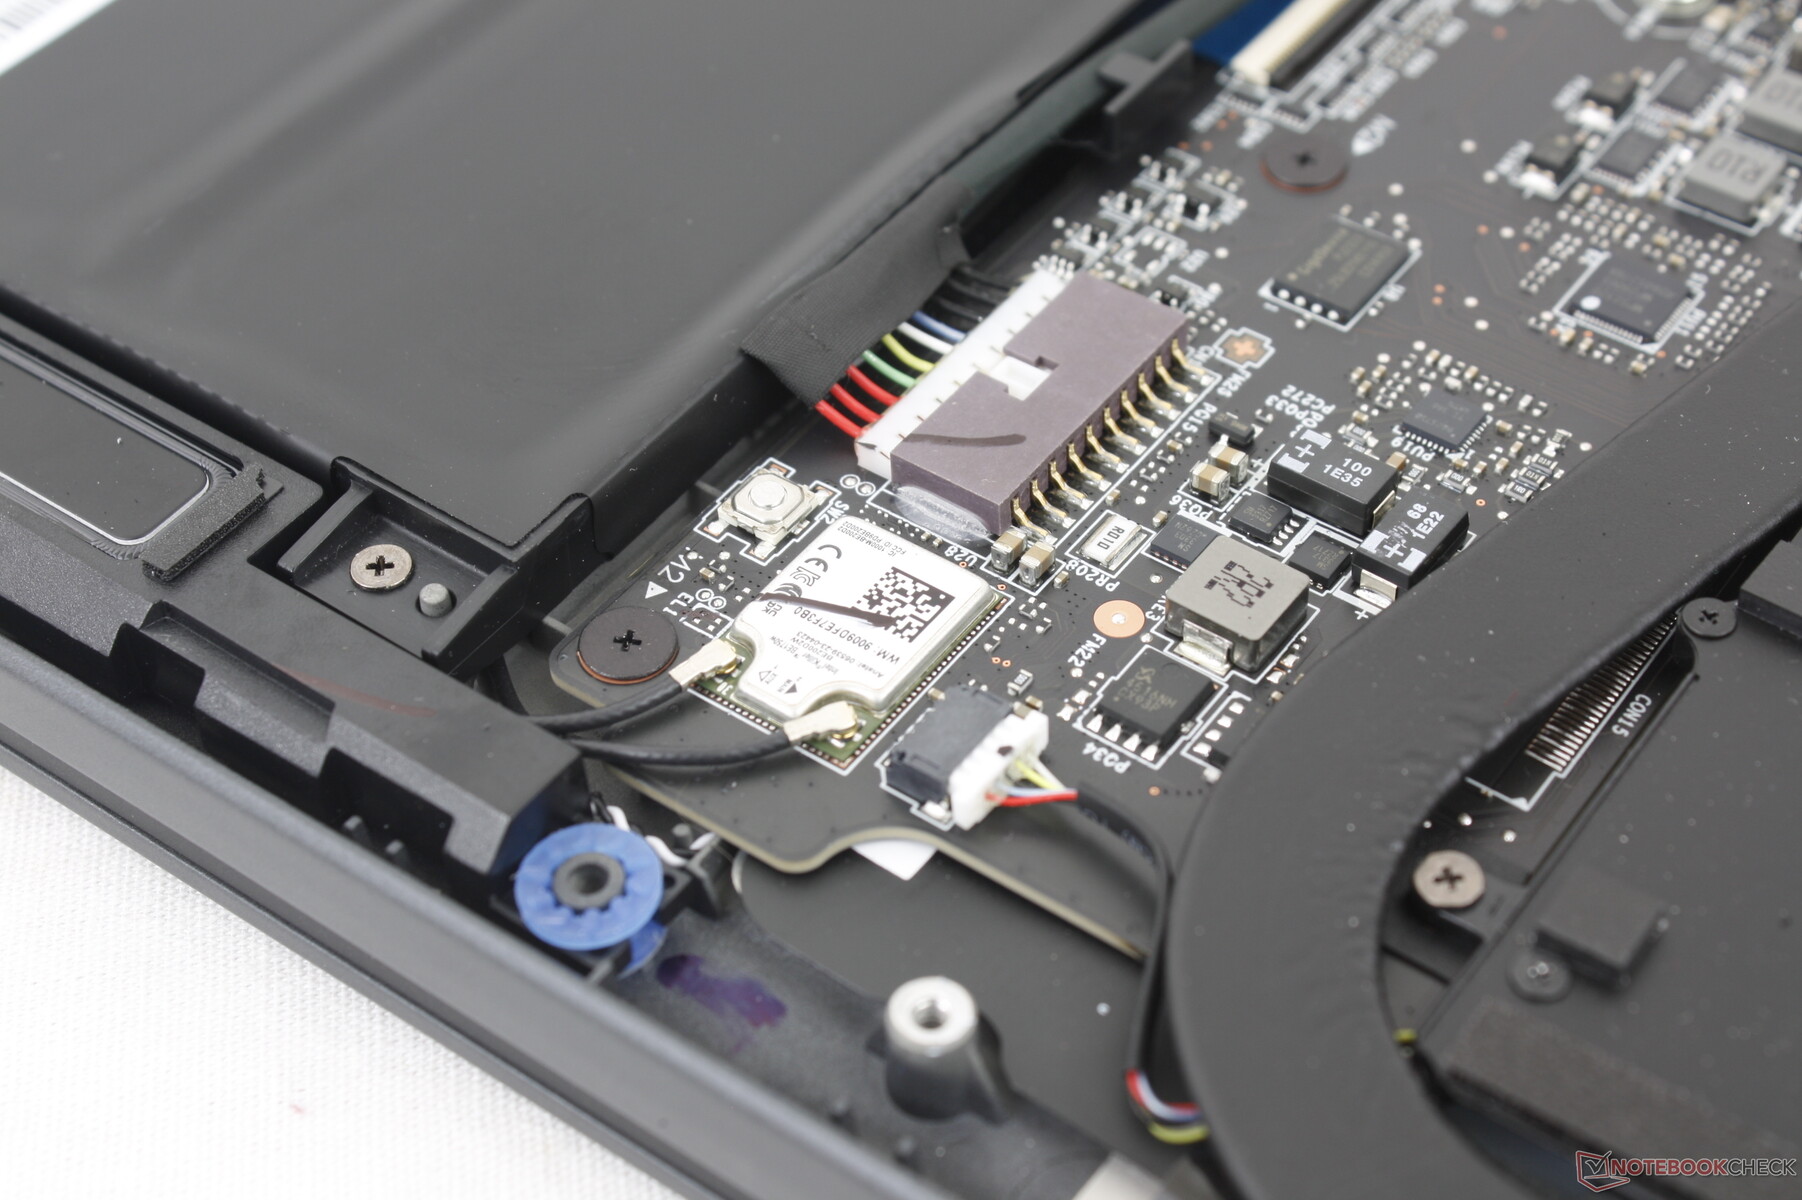
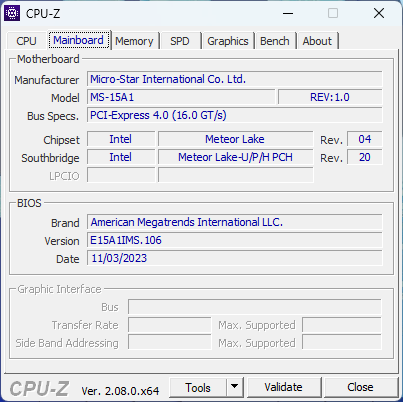
Po wejściu do środka, właściciele będą mieli dostęp do dwóch gniazd M.2 2280 PCIe4 x4 NVMe SSD, podczas gdy moduły RAM i WLAN są przylutowane. Dla porównania, wszystkie te moduły są wyjmowane w starszej konstrukcji Prestige 15.
Proszę zwrócić uwagę na dużą pustą przestrzeń zarezerwowaną dla jednostek SKU z oddzielną grafiką. Model ten jest wyposażony w więcej rurek cieplnych, dodatkowy wentylator i przestawione dyski SSD M.2, jeśli jest skonfigurowany z dedykowanym GPU.
Akcesoria i gwarancja
W pudełku nie ma żadnych dodatków poza zasilaczem sieciowym i dokumentacją. Zwykła roczna ograniczona gwarancja ma zastosowanie w przypadku zakupu w USA.
Urządzenia wejściowe - większe niż wcześniej
Klawiatura
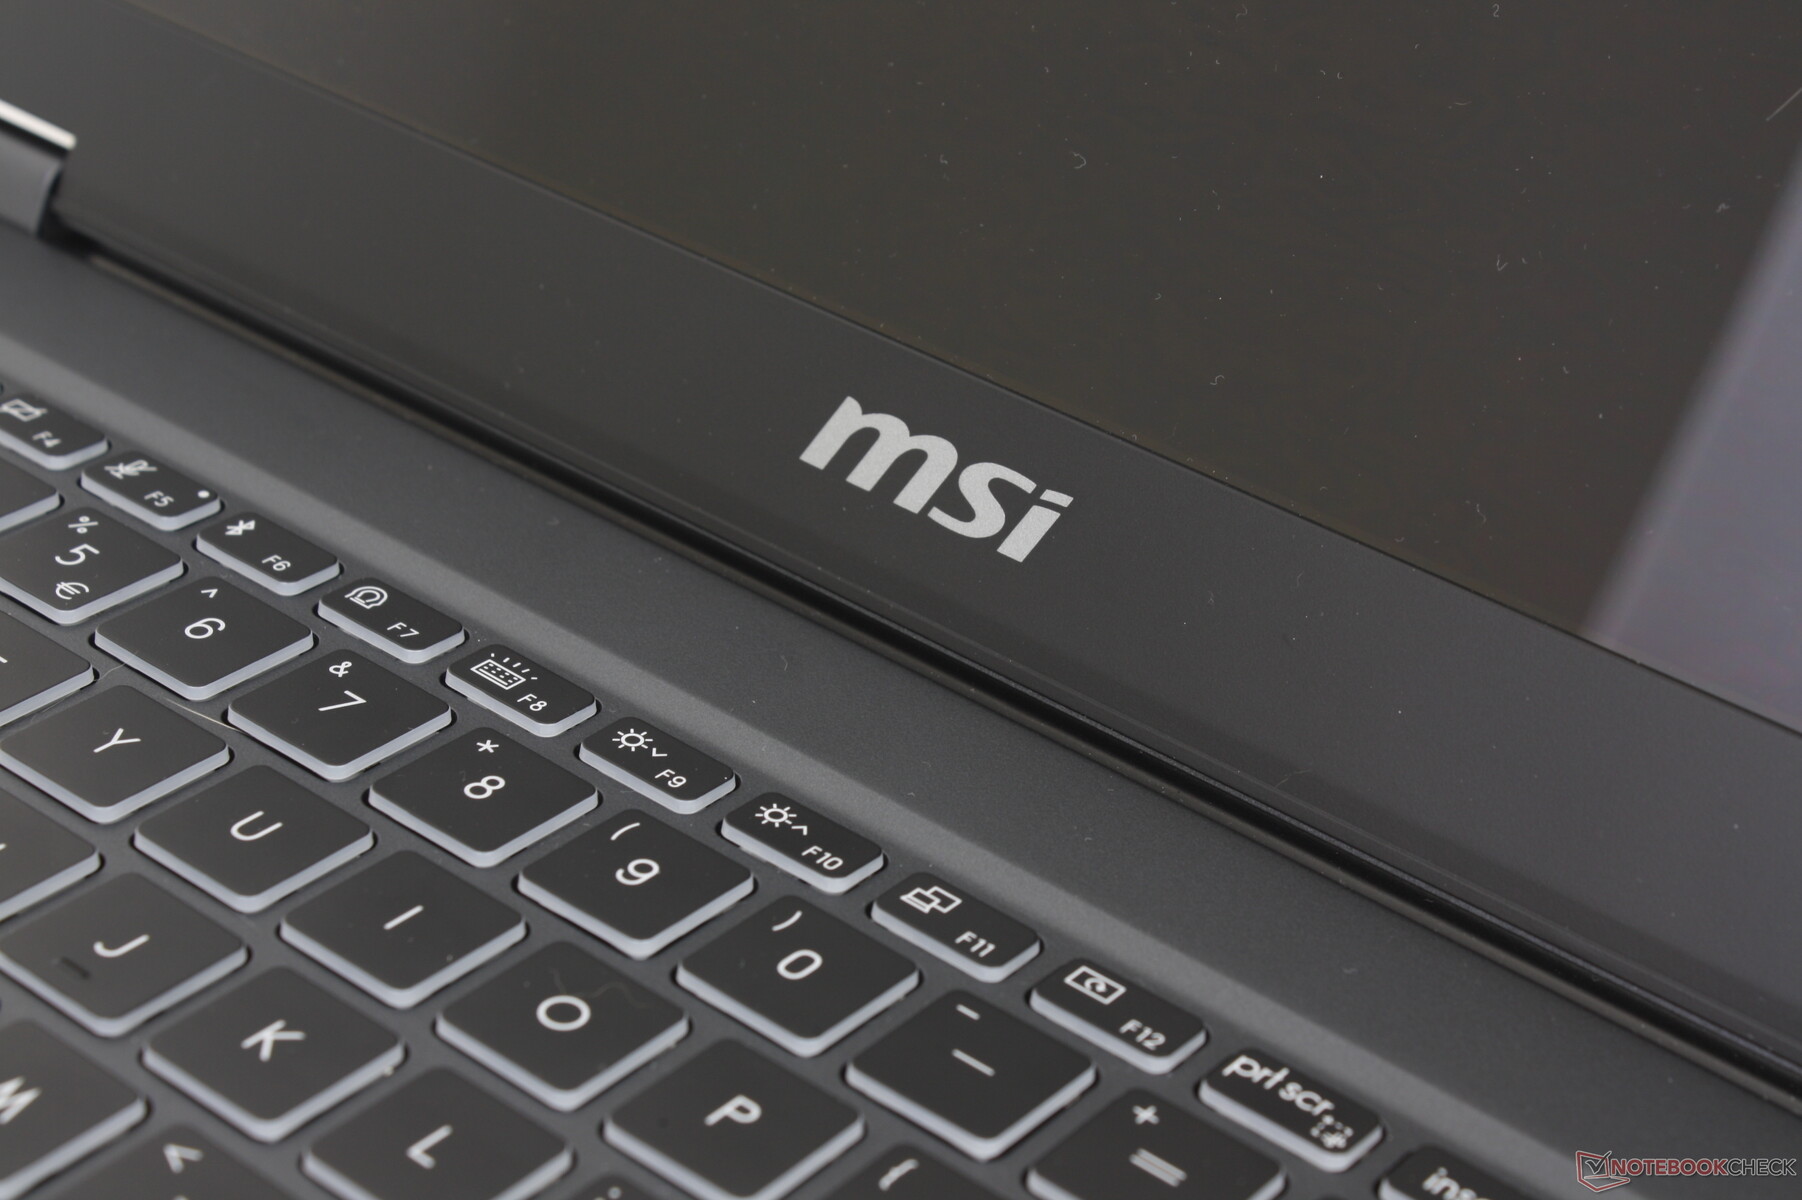
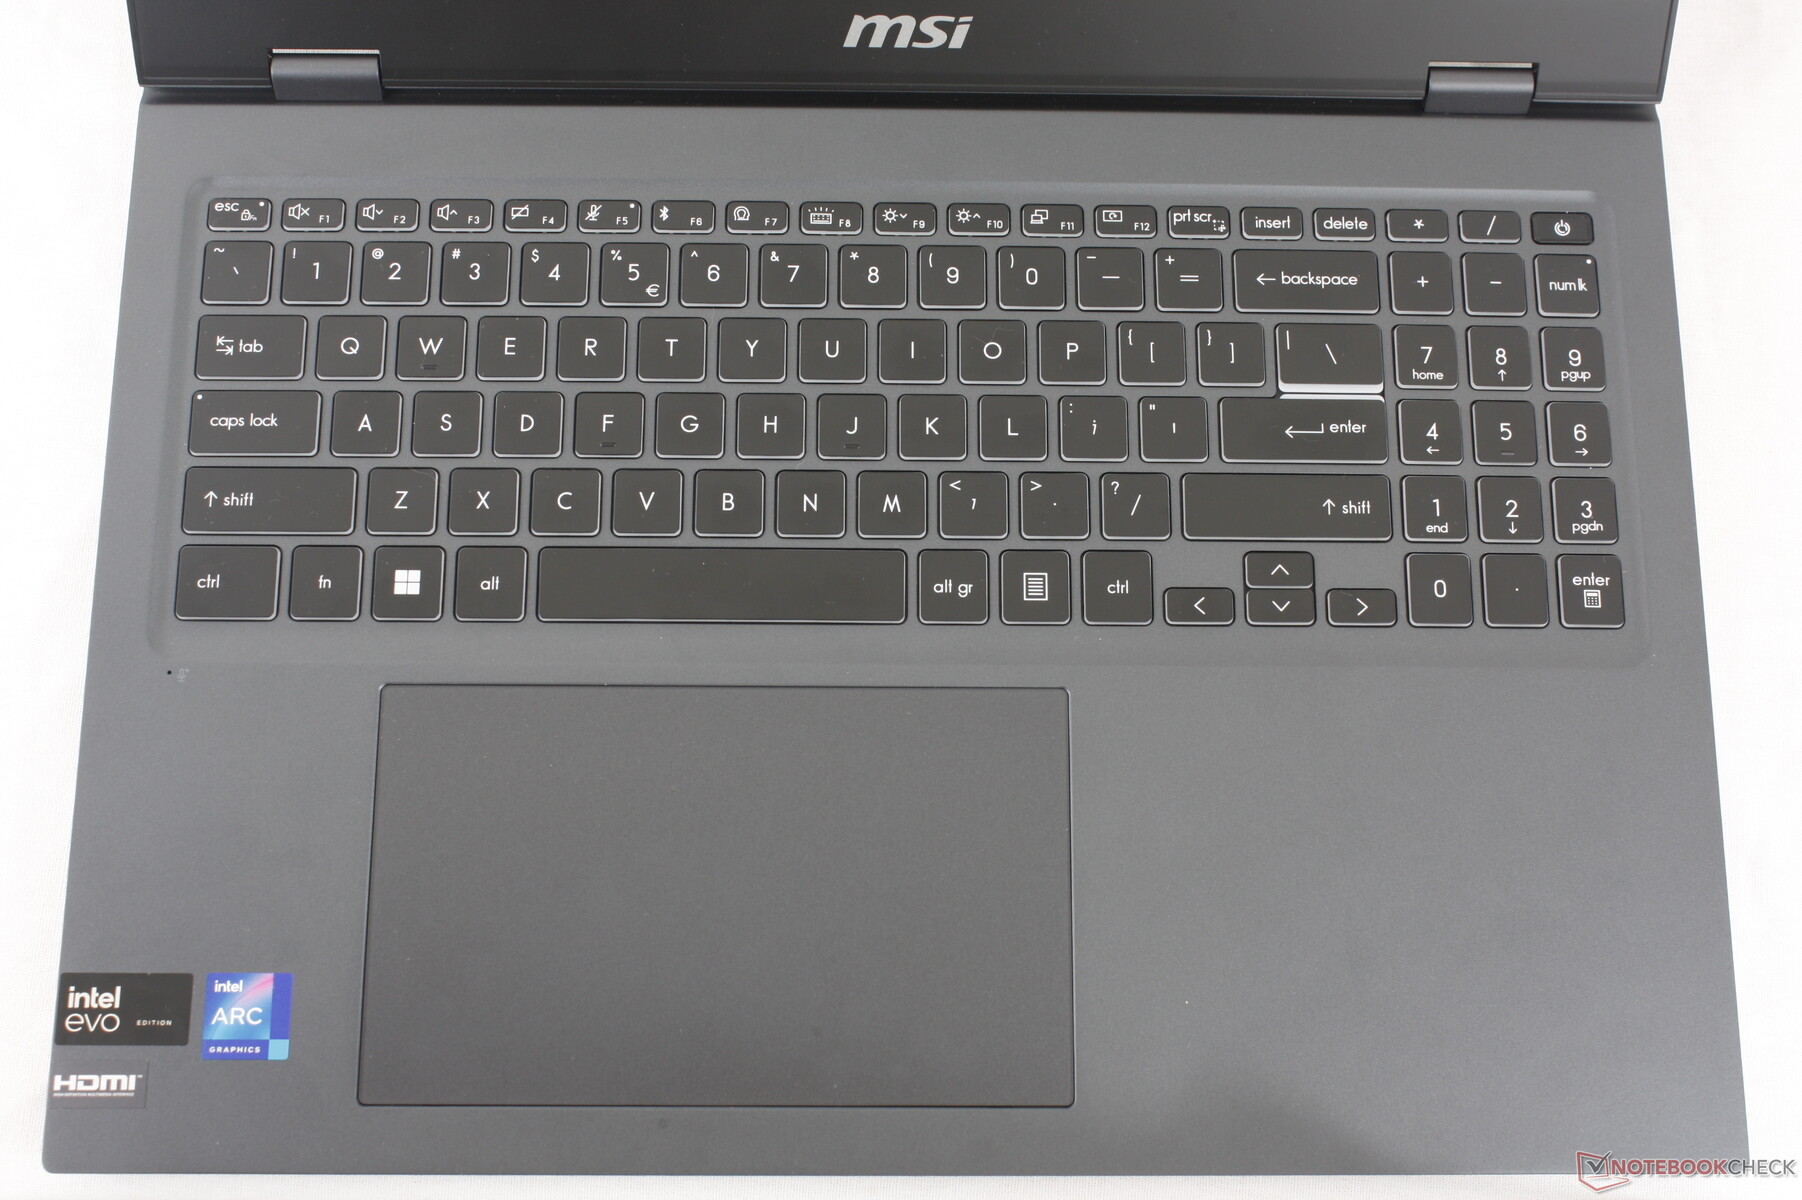
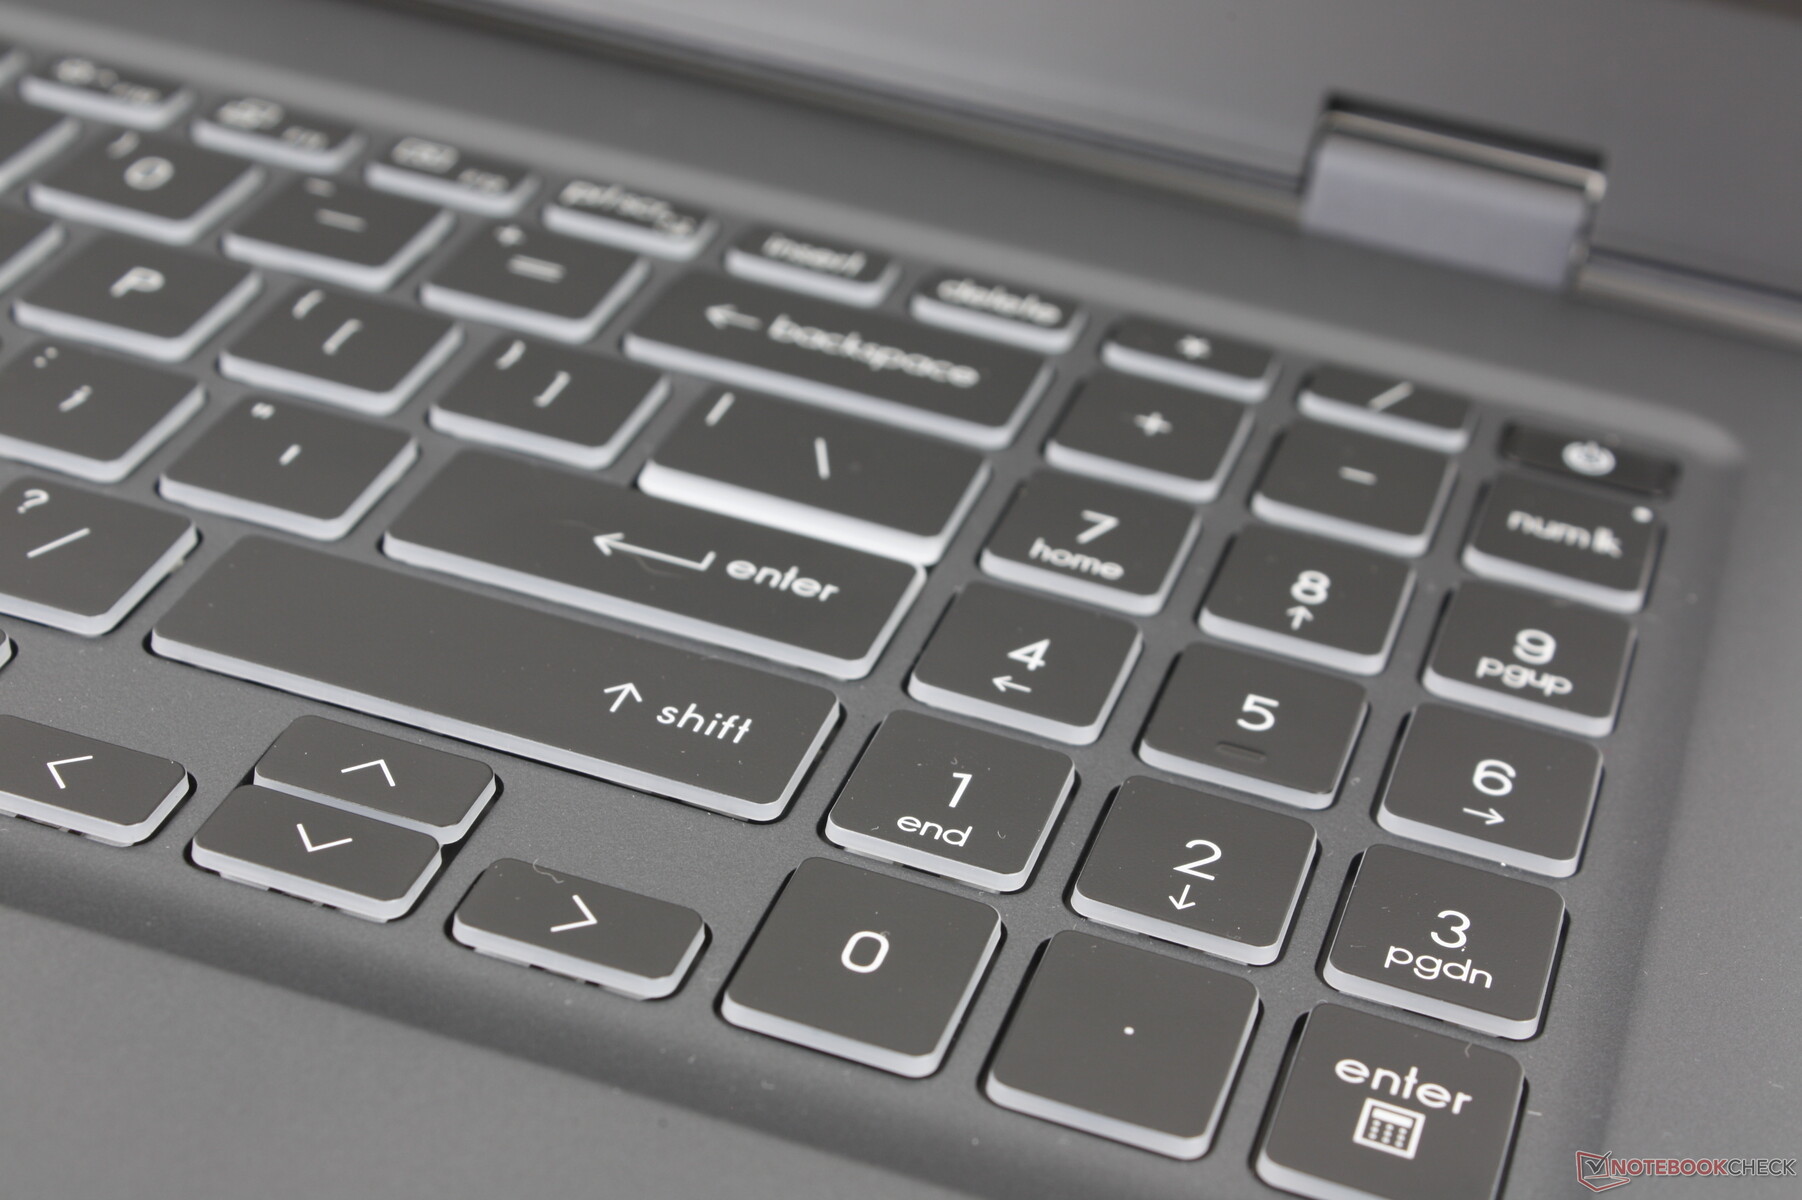
Klawiatura została zmodernizowana i zawiera zintegrowaną klawiaturę numeryczną. W przeciwnym razie sprzężenie zwrotne klawiszy jest takie samo jak w Prestige 15, co zapewnia podobne wrażenia z pisania pomimo zmian w układzie. Nadal uważamy, że skok klawiszy jest zauważalnie płytszy niż w laptopach do gier MSI lub konkurencyjnej serii HP Spectre. Nie są one zbyt miękkie ani niewygodne, ale mocniejsze lub ostrzejsze sprzężenie zwrotne przy każdym naciśnięciu również by nie zaszkodziło.
Panel dotykowy
Klawiatura jest teraz znacznie większa (15 x 9 cm), aby zaradzić niewygodnym wąskim wymiarom klawiatury w starszych modelach Prestige 15 konstrukcja. Trakcja jest płynna i niezawodna, bez zacinania się, nawet przy wolniejszych prędkościach.
Sprzężenie zwrotne podczas klikania jest tylko przeciętne, jeśli nie nieco gąbczaste. Naciskanie wymaga dużej siły palca, więc czynności te mogą być męczące bez zewnętrznej myszy.

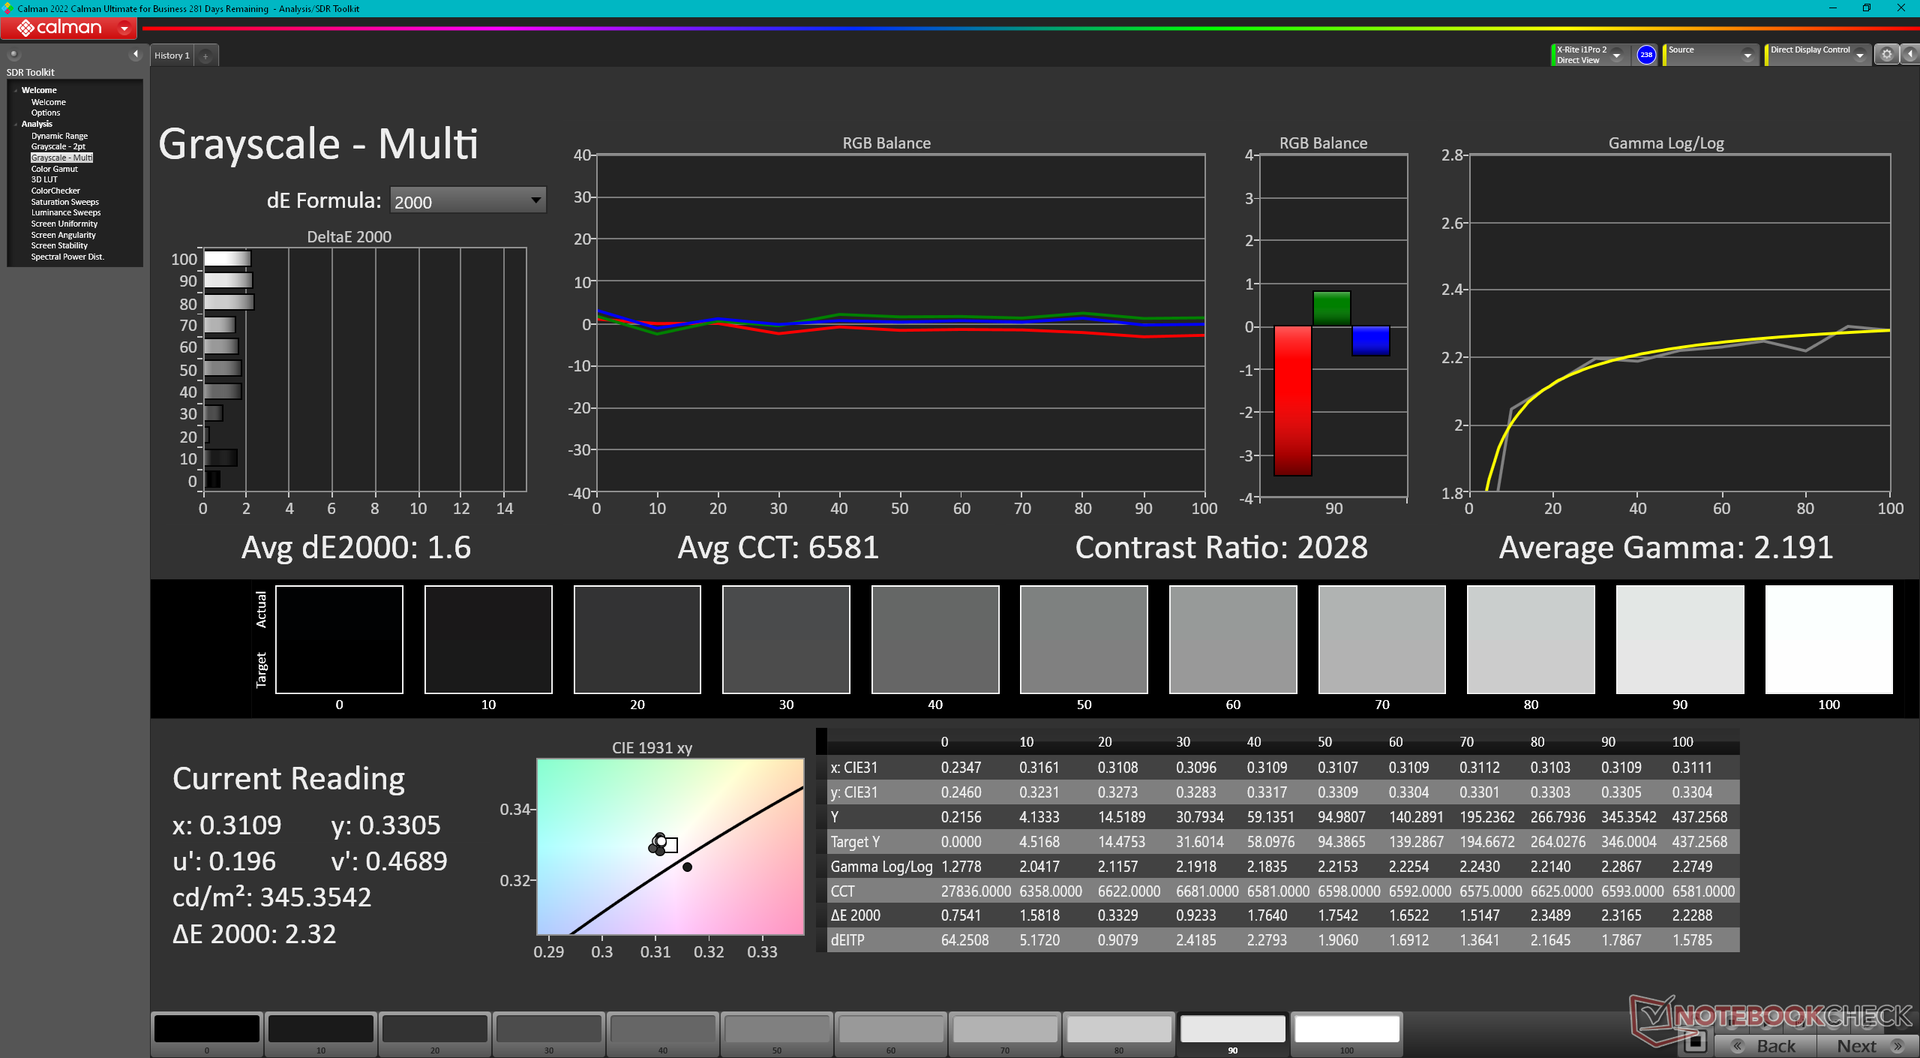
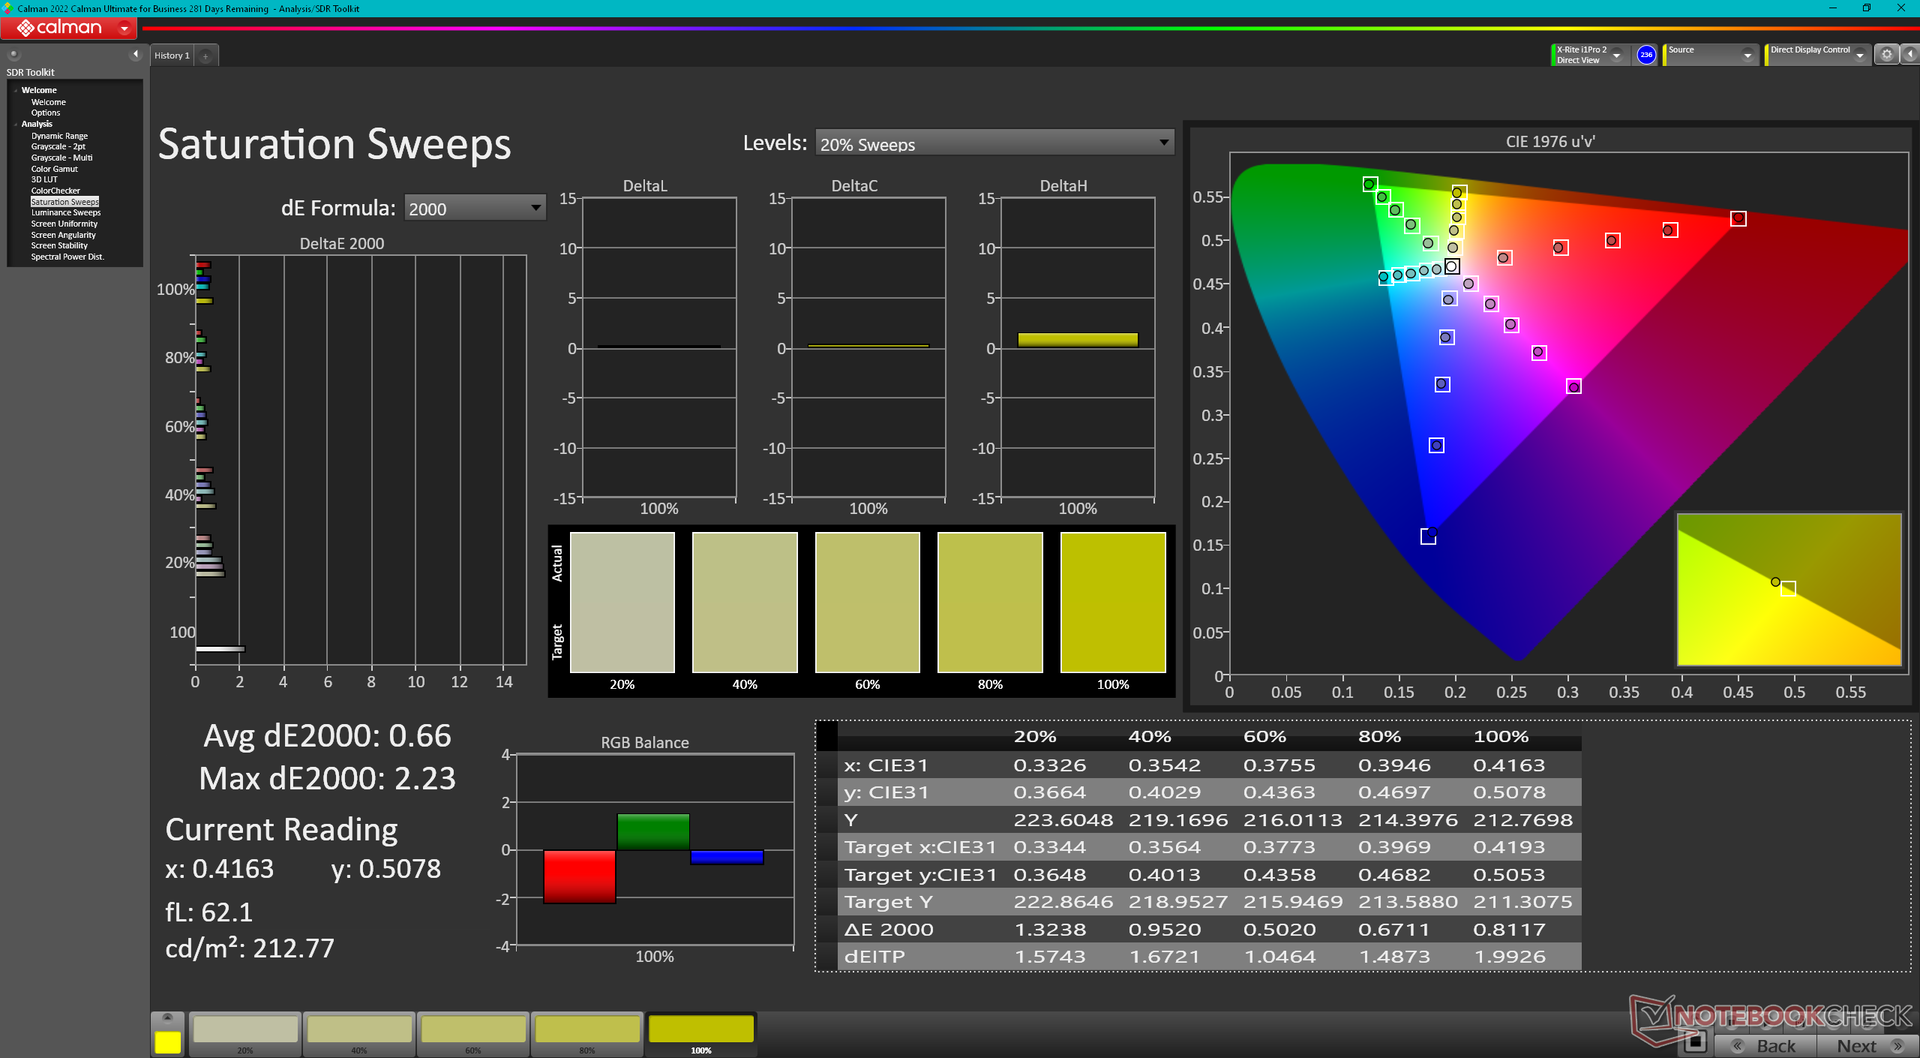
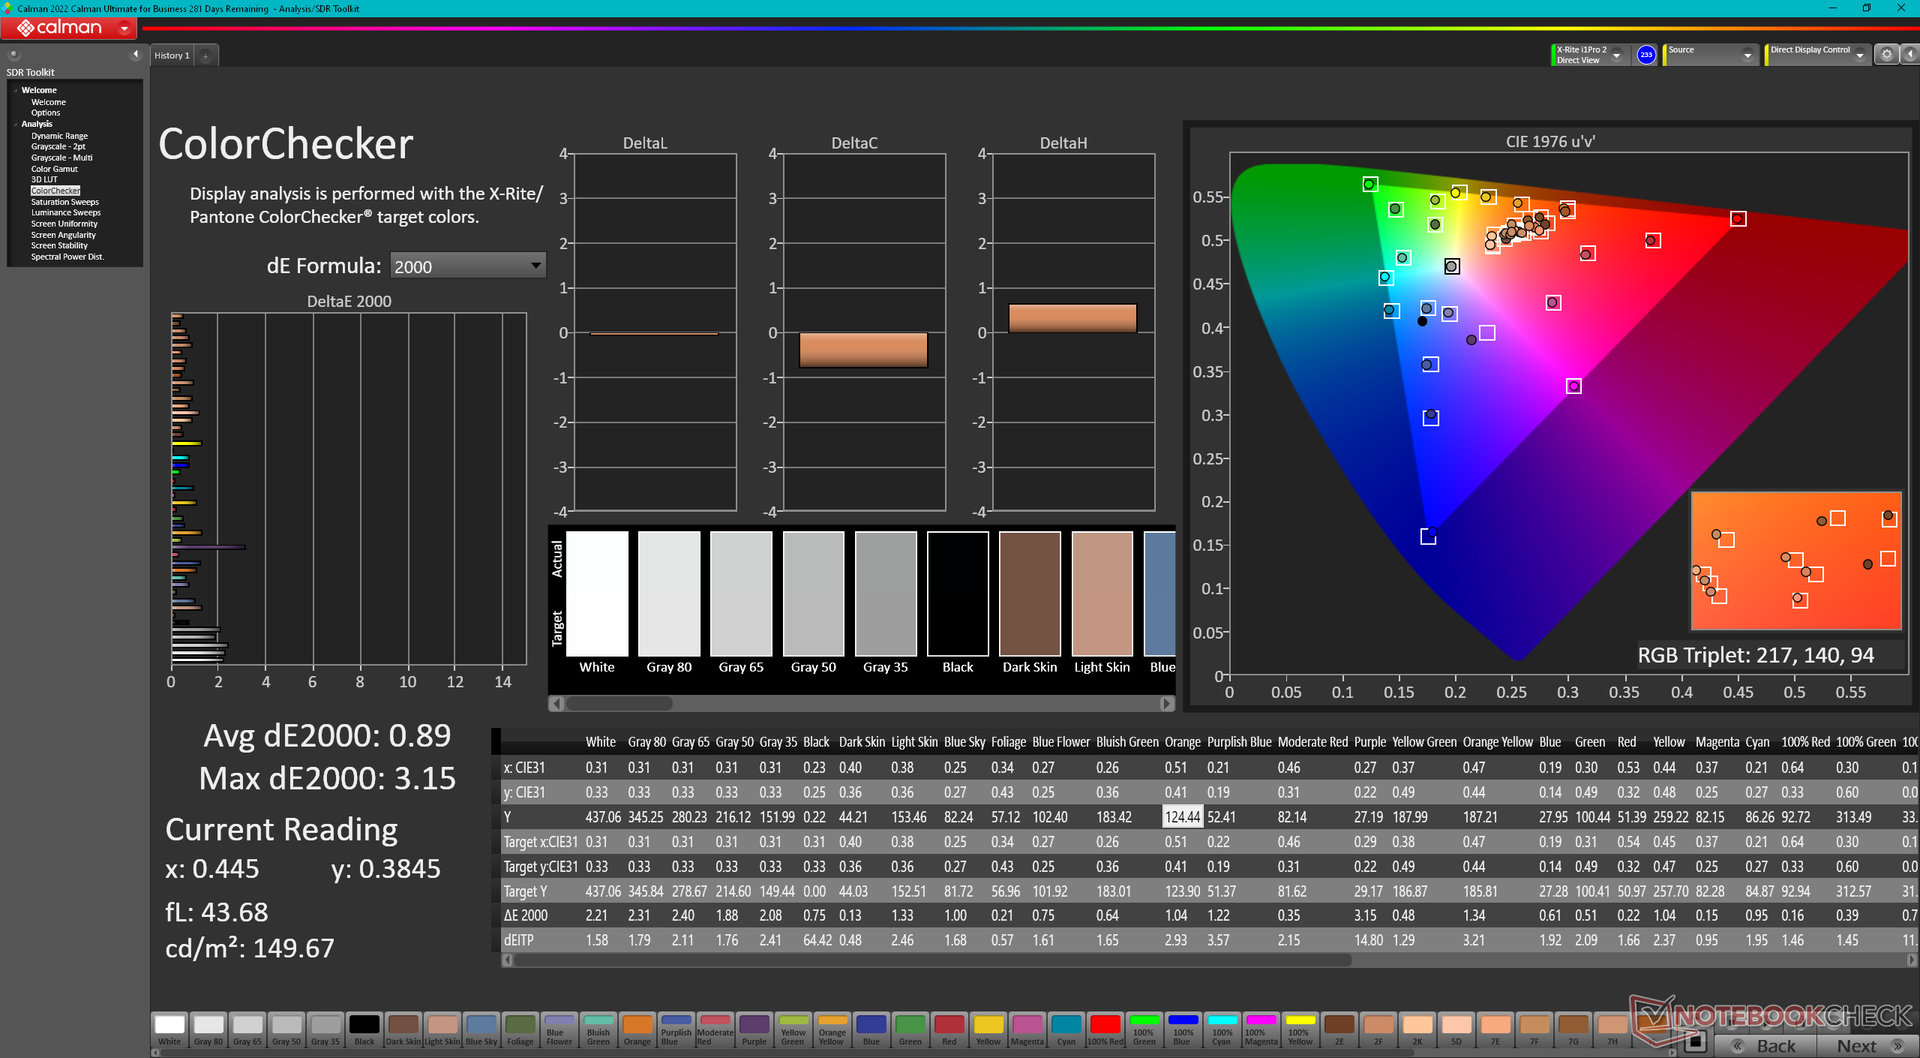
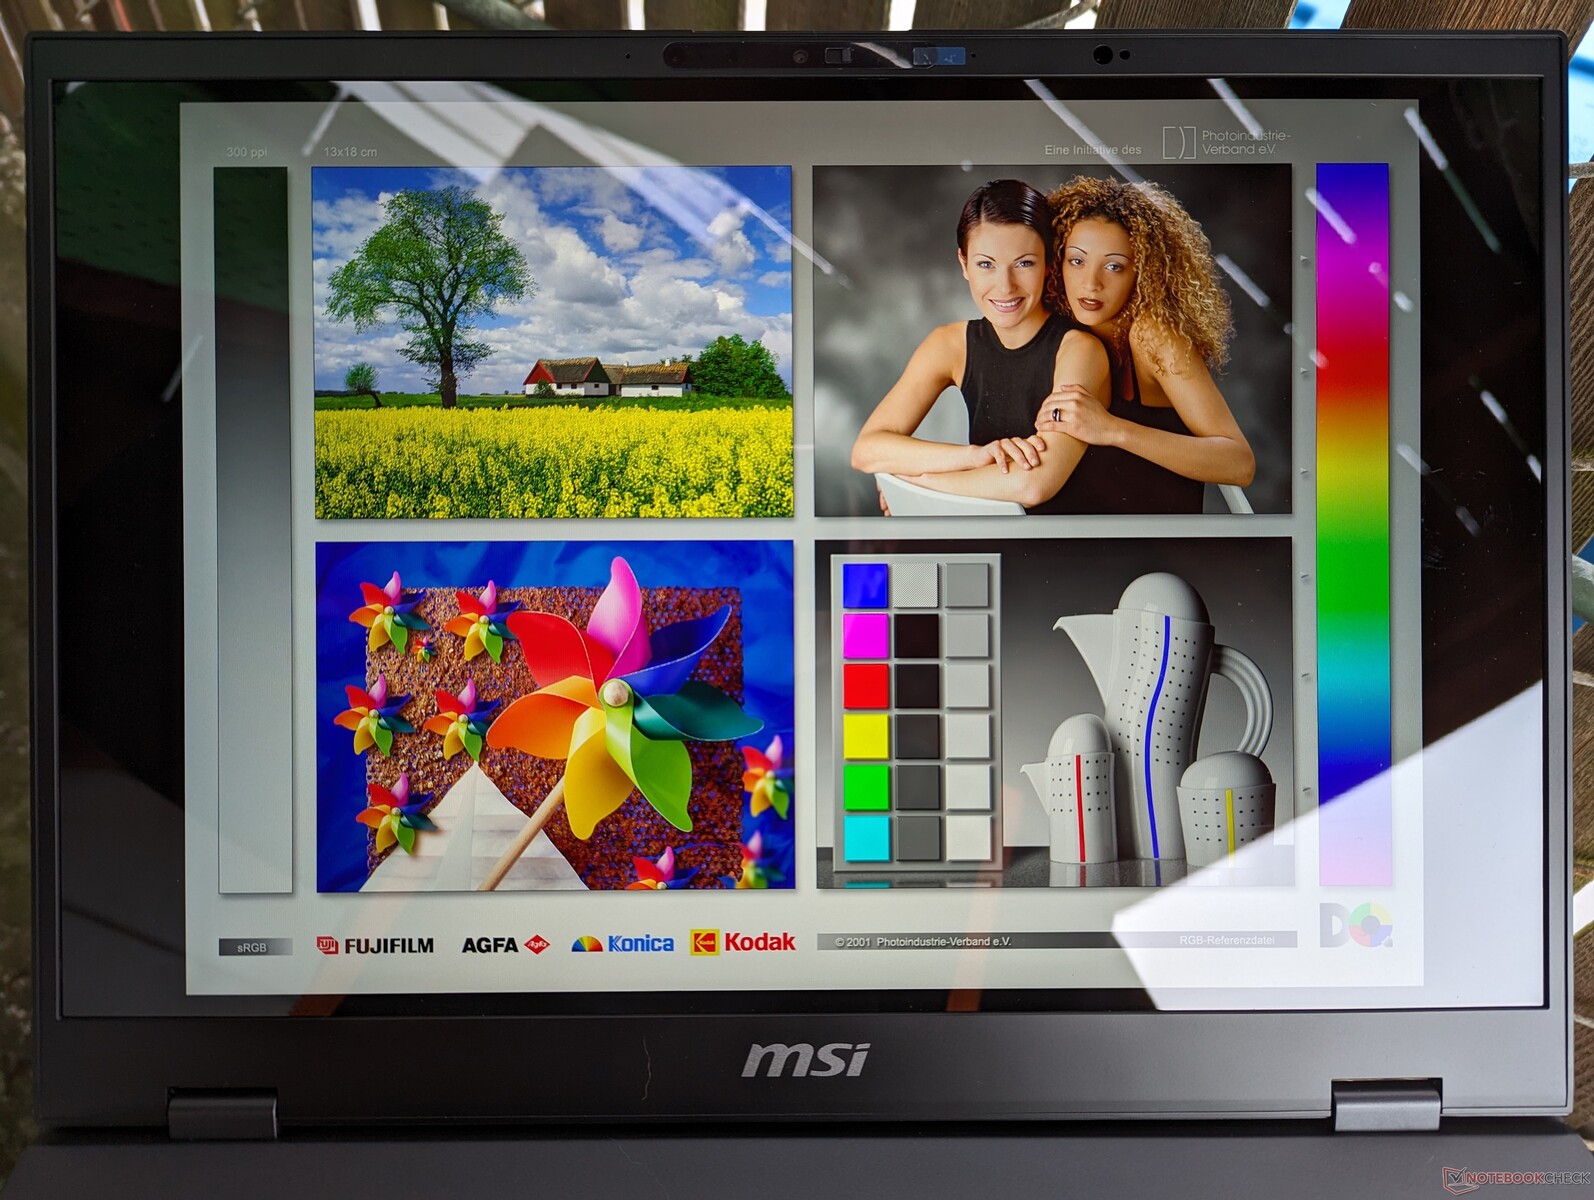
Wyświetlacz - pełne DCI-P3 we wszystkich jednostkach SKU
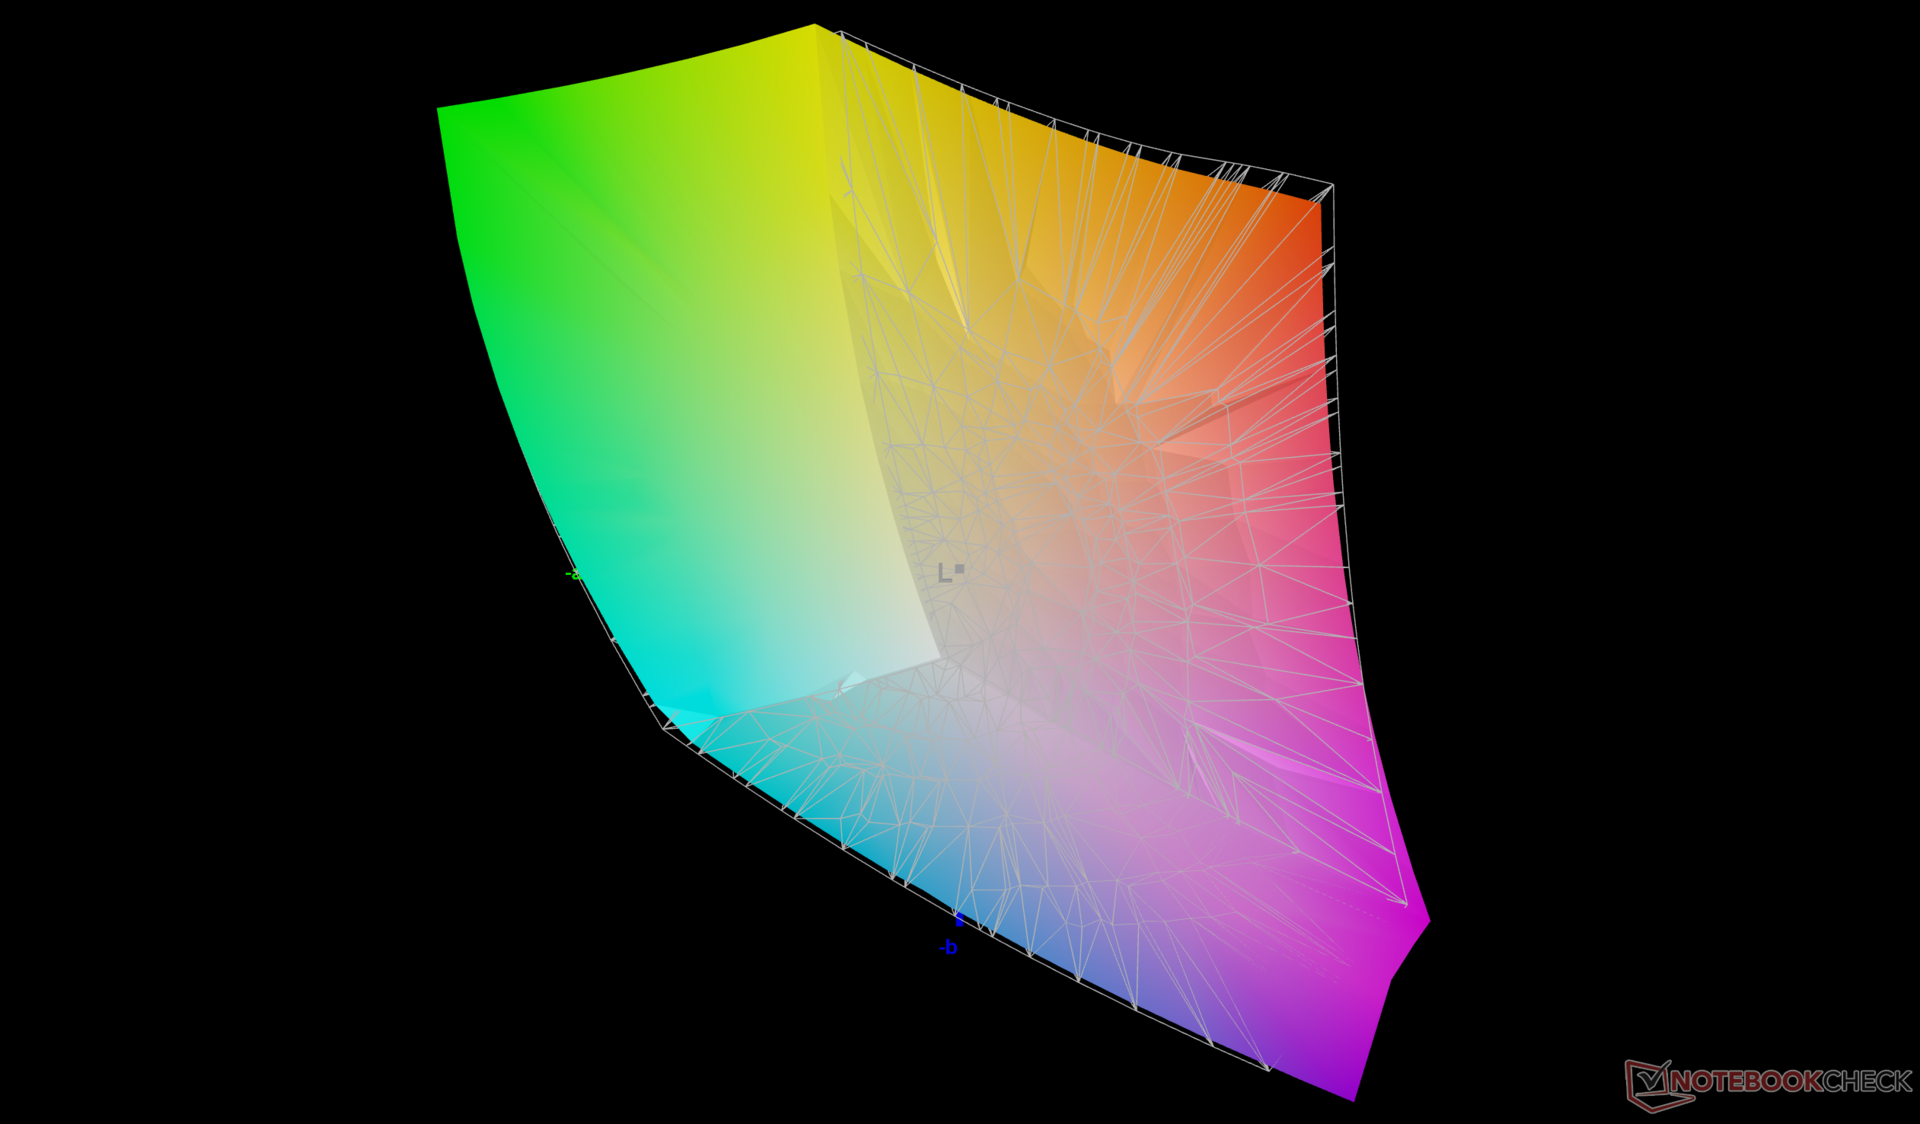
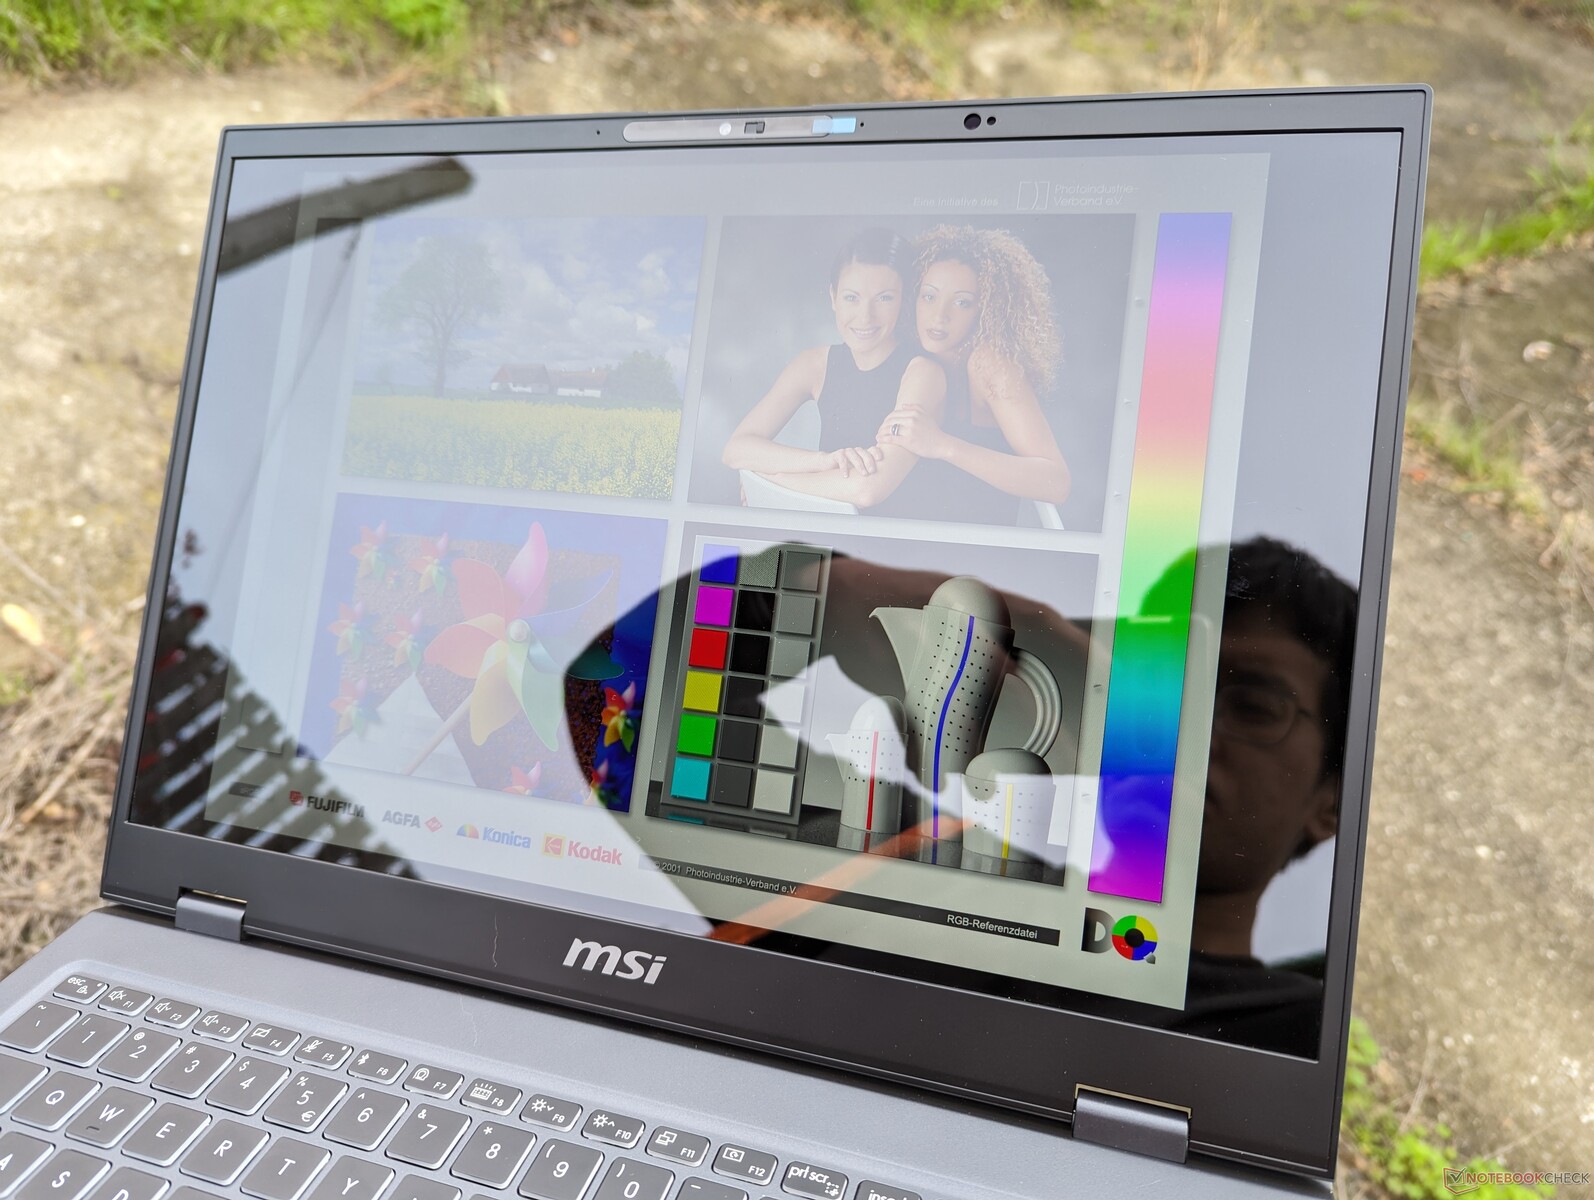
Prestige 16 jest pierwszym monitorem w naszej bazie danych wyposażonym w matrycę AU Optronics B160QAN03.R. Ten jasny i błyszczący panel IPS charakteryzuje się bardzo wysoką jakością z pełnymi kolorami DCI-P3 i brakiem jakichkolwiek problemów z ziarnistością. Jednak powolny czas reakcji czerni i bieli, brak adaptacyjnej synchronizacji i skromna częstotliwość odświeżania 60 Hz sprawiają, że bardziej nadaje się do edycji grafiki niż do gier.
Druga opcja wyświetlacza jest dostępna z matrycą OLED i wyższą rozdzielczością natywną. Żaden z paneli nie obsługuje funkcji ekranu dotykowego.


| |||||||||||||||||||||||||
rozświetlenie: 87 %
na akumulatorze: 473.6 cd/m²
kontrast: 2493:1 (czerń: 0.19 cd/m²)
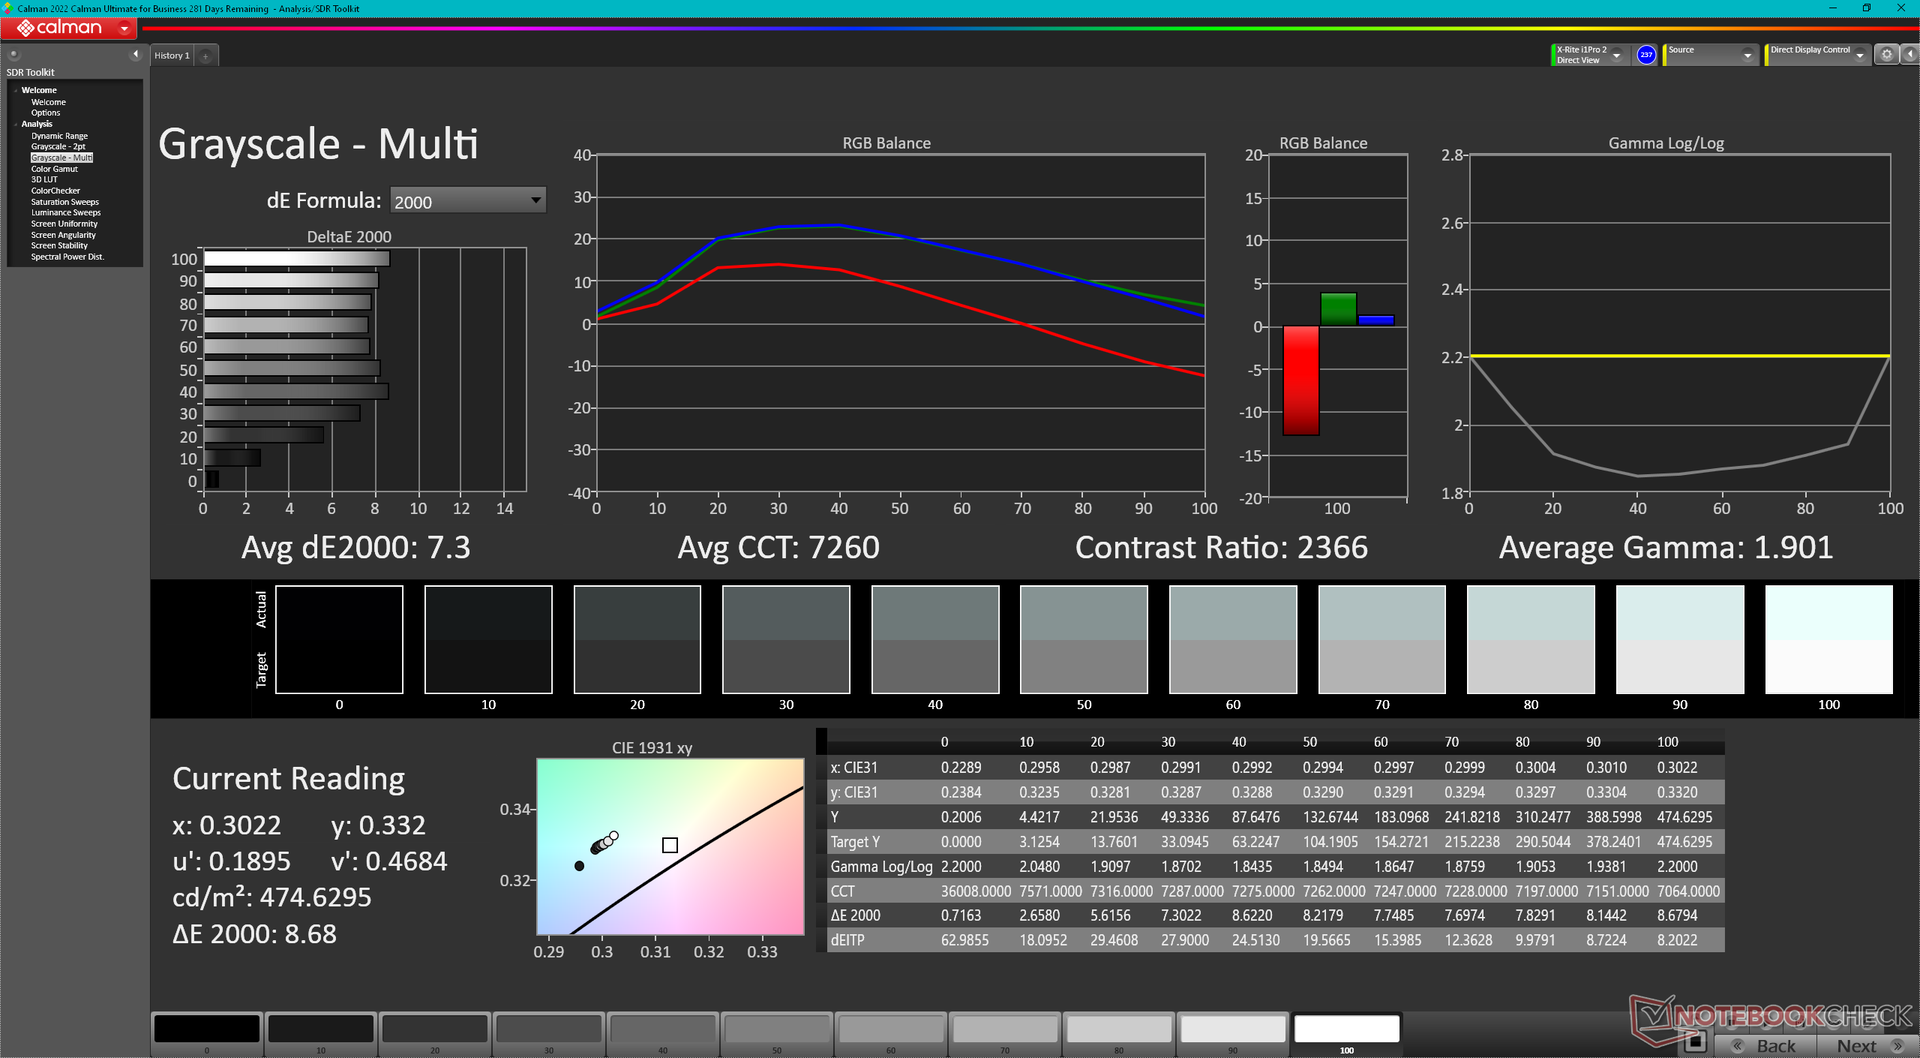
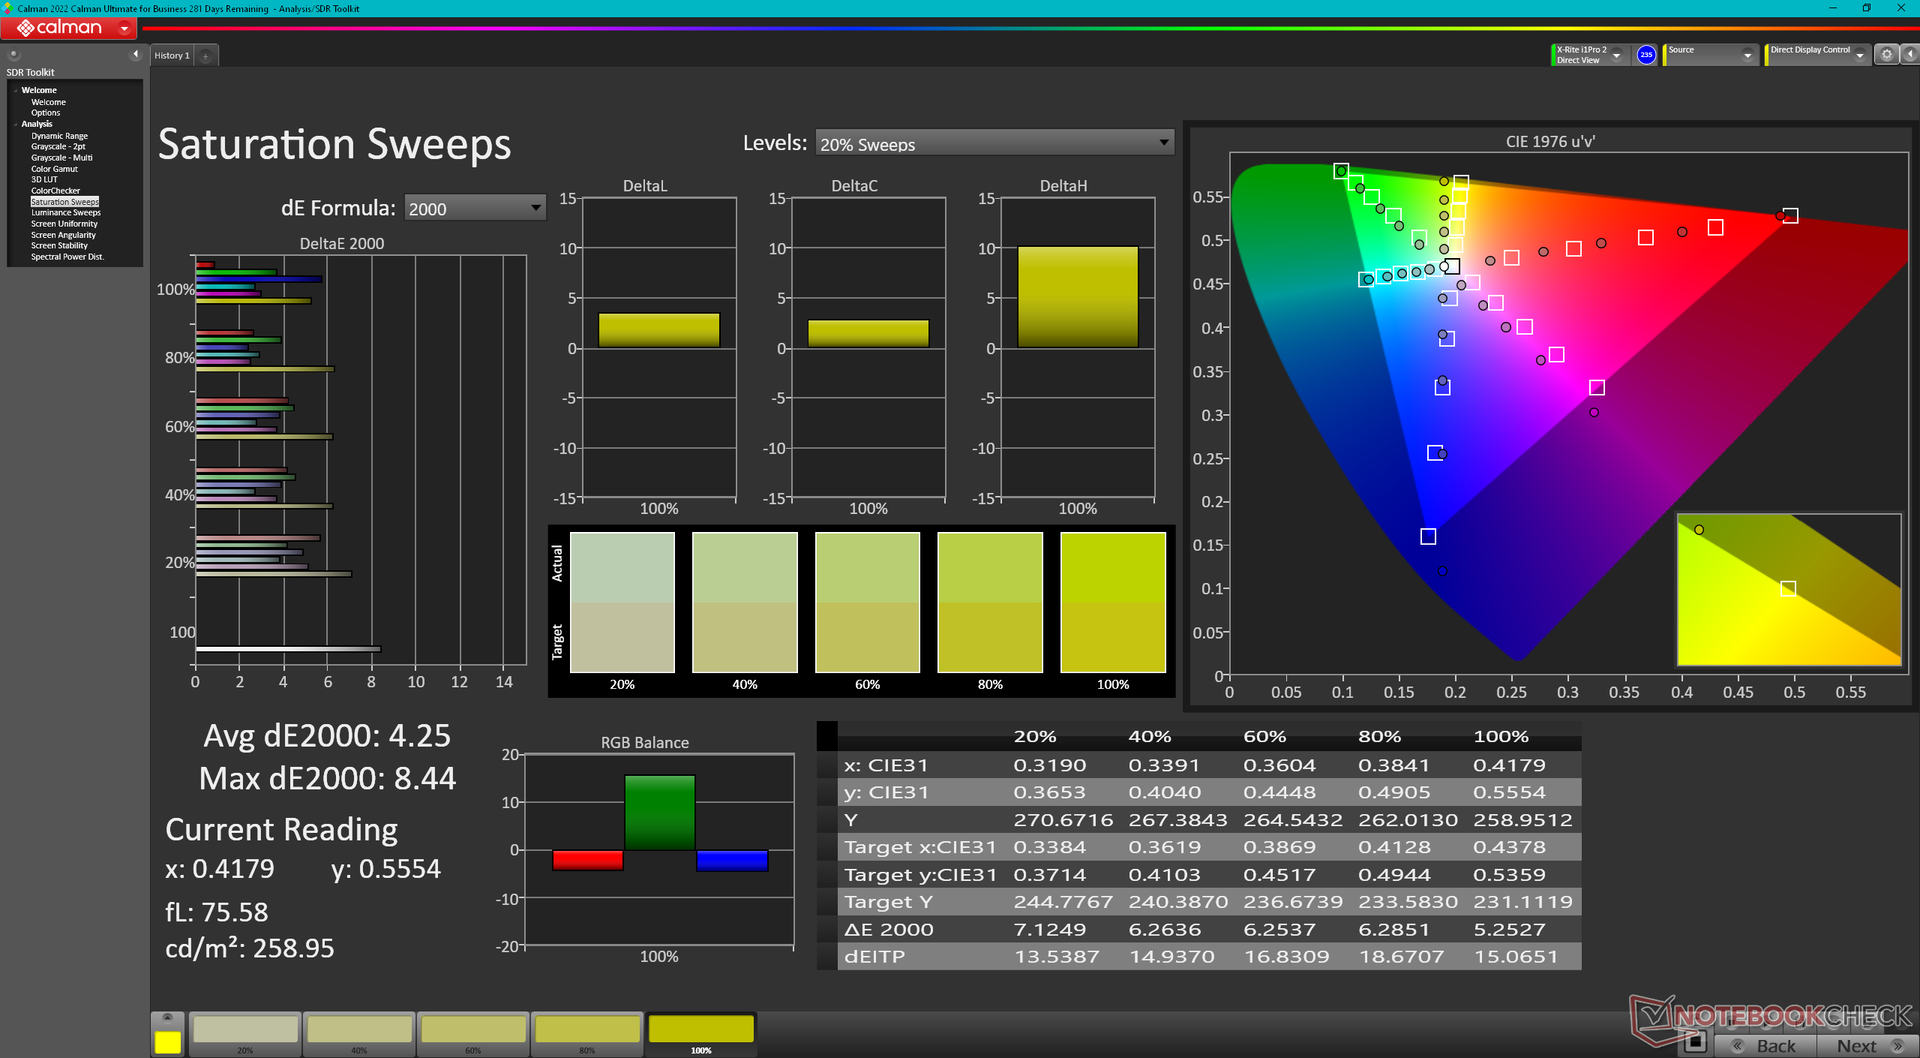
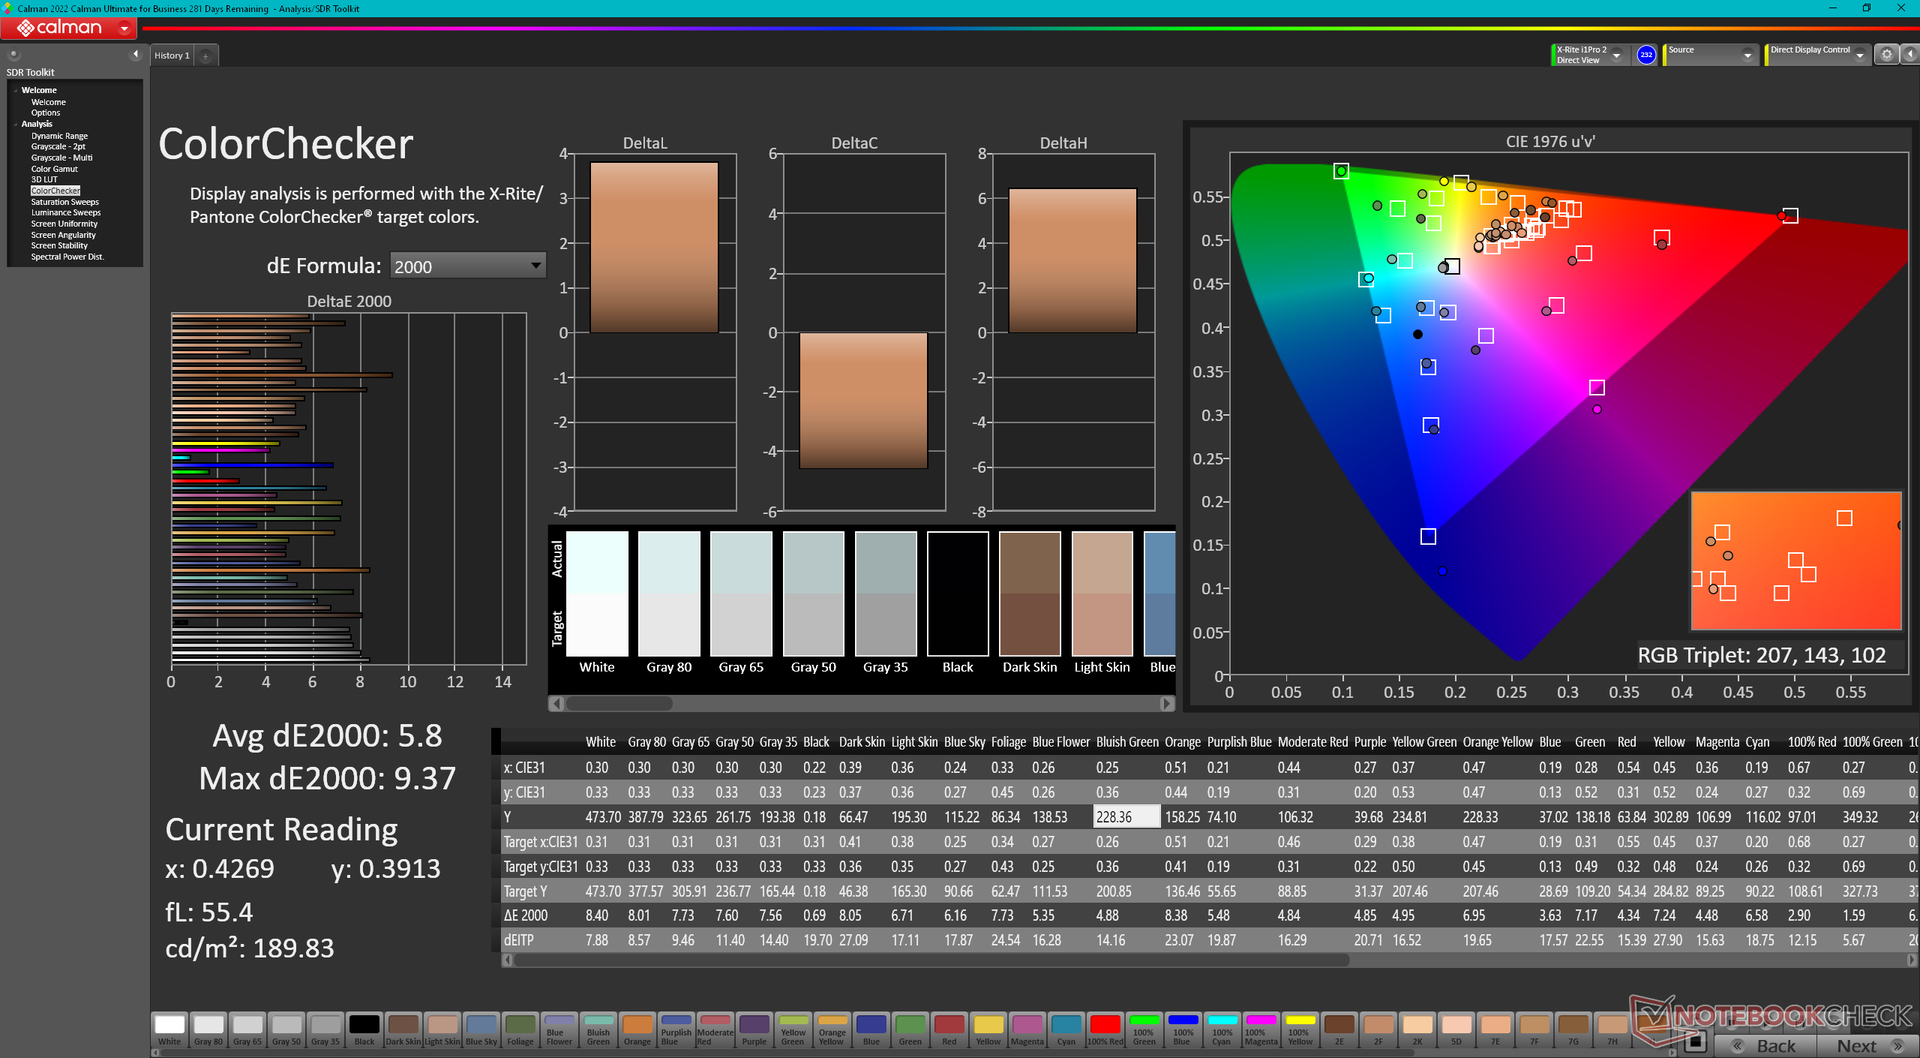
ΔE ColorChecker Calman: 5.9 | ∀{0.5-29.43 Ø4.71}
calibrated: 0.89
ΔE Greyscale Calman: 7.3 | ∀{0.09-98 Ø4.96}
84.6% AdobeRGB 1998 (Argyll 3D)
99.8% sRGB (Argyll 3D)
96.7% Display P3 (Argyll 3D)
Gamma: 1.9
CCT: 7260 K
| MSI Prestige 16 B1MG-001US AU Optronics B160QAN03.R, IPS, 2560x1600, 16" | MSI Prestige 15 A12UD-093 Sharp LQ156D1JW42, IPS, 3840x2160, 15.6" | LG Gram 2in1 16 16T90R - G.AA78G LP160WQ1-SPB2, IPS, 2560x1600, 16" | Lenovo ThinkBook 16 G6 ABP LEN160WUXGA, IPS, 1920x1200, 16" | Asus VivoBook Pro 16 K6602VU Samsung ATNA60BX01-1, OLED, 3200x2000, 16" | Dell Inspiron 16 Plus 7630 LG Philips 160WQ2, IPS, 2560x1600, 16" | |
|---|---|---|---|---|---|---|
| Display | -3% | 0% | -49% | 5% | -14% | |
| Display P3 Coverage (%) | 96.7 | 80.48 -17% | 96.5 0% | 40.4 -58% | 98.7 2% | 70.1 -28% |
| sRGB Coverage (%) | 99.8 | 96.95 -3% | 99.9 0% | 59.8 -40% | 99.7 0% | 99.6 0% |
| AdobeRGB 1998 Coverage (%) | 84.6 | 94.02 11% | 84.6 0% | 42 -50% | 96.5 14% | 72.3 -15% |
| Response Times | 10% | 30% | 32% | 80% | 29% | |
| Response Time Grey 50% / Grey 80% * (ms) | 49.4 ? | 51 ? -3% | 38.4 ? 22% | 32.8 ? 34% | 0.68 ? 99% | 35 ? 29% |
| Response Time Black / White * (ms) | 33.9 ? | 26 ? 23% | 21.4 ? 37% | 23.9 ? 29% | 13.2 ? 61% | 24.2 ? 29% |
| PWM Frequency (Hz) | 240 ? | |||||
| Screen | 27% | -19% | -83% | -13% | 0% | |
| Brightness middle (cd/m²) | 473.6 | 441 -7% | 329 -31% | 310 -35% | 353 -25% | 299.4 -37% |
| Brightness (cd/m²) | 456 | 416 -9% | 310 -32% | 290 -36% | 354 -22% | 290 -36% |
| Brightness Distribution (%) | 87 | 85 -2% | 88 1% | 86 -1% | 98 13% | 92 6% |
| Black Level * (cd/m²) | 0.19 | 0.155 18% | 0.39 -105% | 0.22 -16% | 0.21 -11% | |
| Contrast (:1) | 2493 | 2845 14% | 844 -66% | 1409 -43% | 1426 -43% | |
| Colorchecker dE 2000 * | 5.9 | 1.51 74% | 3.52 40% | 6.2 -5% | 4.23 28% | 4.25 28% |
| Colorchecker dE 2000 max. * | 9.37 | 3.56 62% | 6.96 26% | 24.7 -164% | 7.13 24% | 6.71 28% |
| Colorchecker dE 2000 calibrated * | 0.89 | 1.15 -29% | 5.3 -496% | 2.42 -172% | 0.52 42% | |
| Greyscale dE 2000 * | 7.3 | 2.49 66% | 5.75 21% | 3.8 48% | 2.5 66% | 5.5 25% |
| Gamma | 1.9 116% | 2.17 101% | 2.137 103% | 2.22 99% | 2.4 92% | 2.35 94% |
| CCT | 7260 90% | 6292 103% | 7584 86% | 6011 108% | 6642 98% | 6368 102% |
| Całkowita średnia (program / ustawienia) | 11% /
17% | 4% /
-8% | -33% /
-60% | 24% /
7% | 5% /
1% |
* ... im mniej tym lepiej
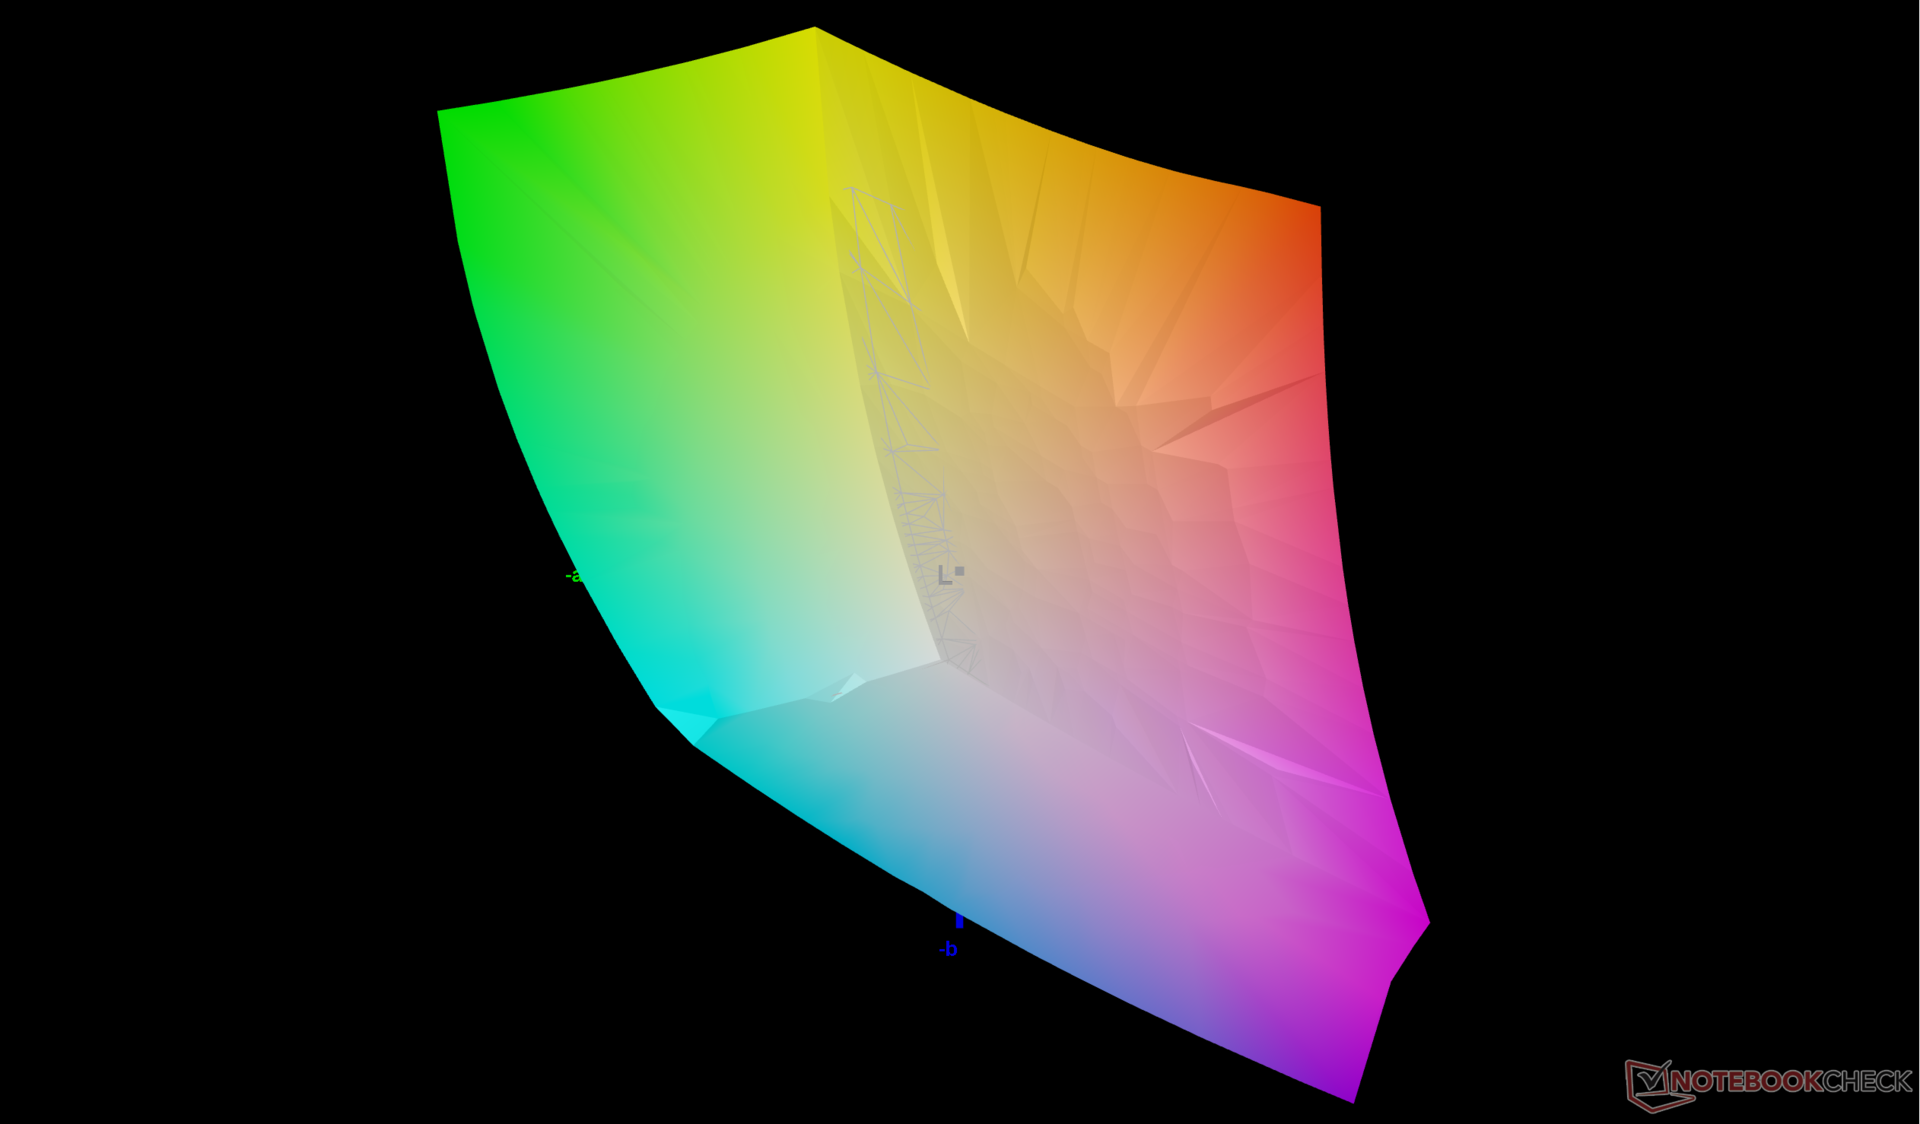
Wyświetlacz nie jest wstępnie skalibrowany, a szkoda, ponieważ wszystkie SKU obsługują kolory DCI-P3. Temperatura barwowa jest zbyt niska przy stosunkowo wysokich średnich wartościach DeltaE dla skali szarości i kolorów, wynoszących odpowiednio 7,3 i 5,8. Samodzielna kalibracja panelu obniżyłaby te średnie wartości do <2. Nasz skalibrowany profil ICM można pobrać bezpłatnie powyżej.
Wyświetl czasy reakcji
| ↔ Czas reakcji od czerni do bieli | ||
|---|---|---|
| 33.9 ms ... wzrost ↗ i spadek ↘ łącznie | ↗ 15.6 ms wzrost | 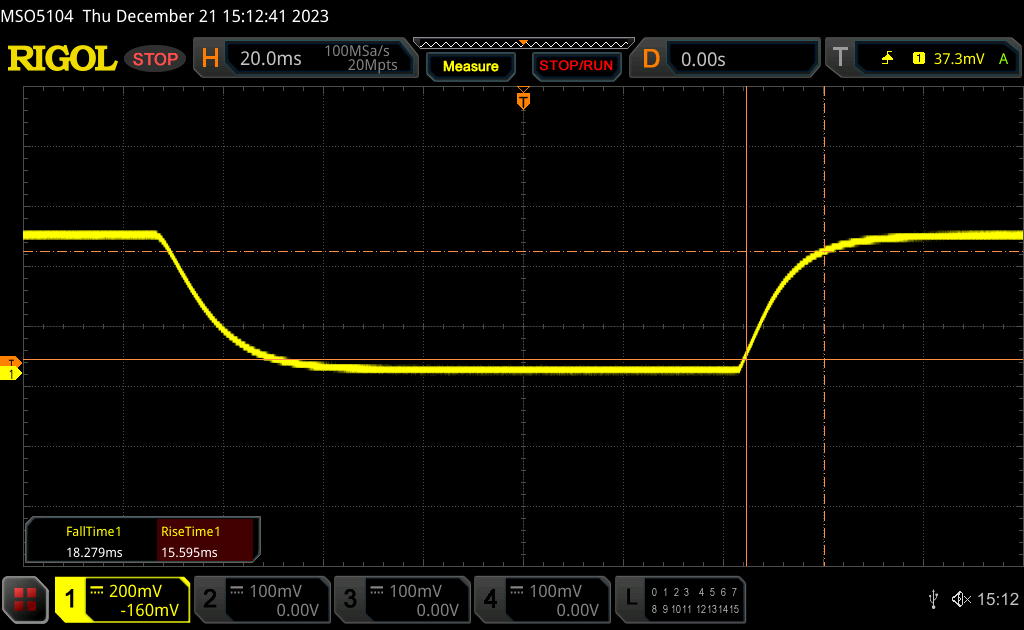 |
| ↘ 18.3 ms upadek | ||
| W naszych testach ekran wykazuje powolne tempo reakcji, co będzie niezadowalające dla graczy. Dla porównania, wszystkie testowane urządzenia wahają się od 0.1 (minimum) do 240 (maksimum) ms. » 91 % wszystkich urządzeń jest lepszych. Oznacza to, że zmierzony czas reakcji jest gorszy od średniej wszystkich testowanych urządzeń (19.8 ms). | ||
| ↔ Czas reakcji 50% szarości do 80% szarości | ||
| 49.4 ms ... wzrost ↗ i spadek ↘ łącznie | ↗ 22.6 ms wzrost | 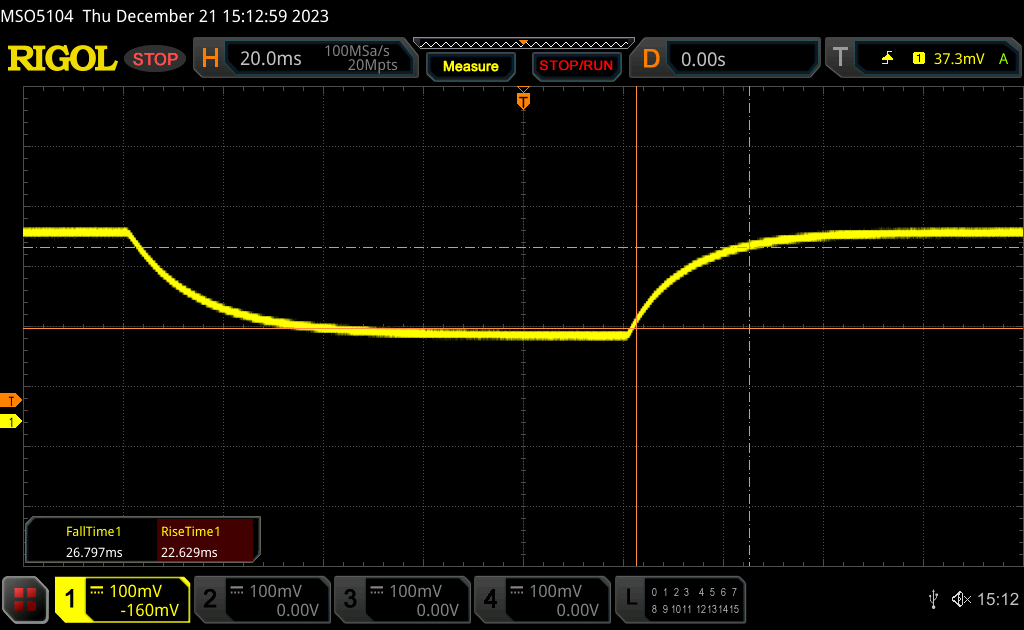 |
| ↘ 26.8 ms upadek | ||
| W naszych testach ekran wykazuje powolne tempo reakcji, co będzie niezadowalające dla graczy. Dla porównania, wszystkie testowane urządzenia wahają się od 0.165 (minimum) do 636 (maksimum) ms. » 85 % wszystkich urządzeń jest lepszych. Oznacza to, że zmierzony czas reakcji jest gorszy od średniej wszystkich testowanych urządzeń (30.9 ms). | ||
Migotanie ekranu / PWM (modulacja szerokości impulsu)
| Migotanie ekranu/nie wykryto PWM | 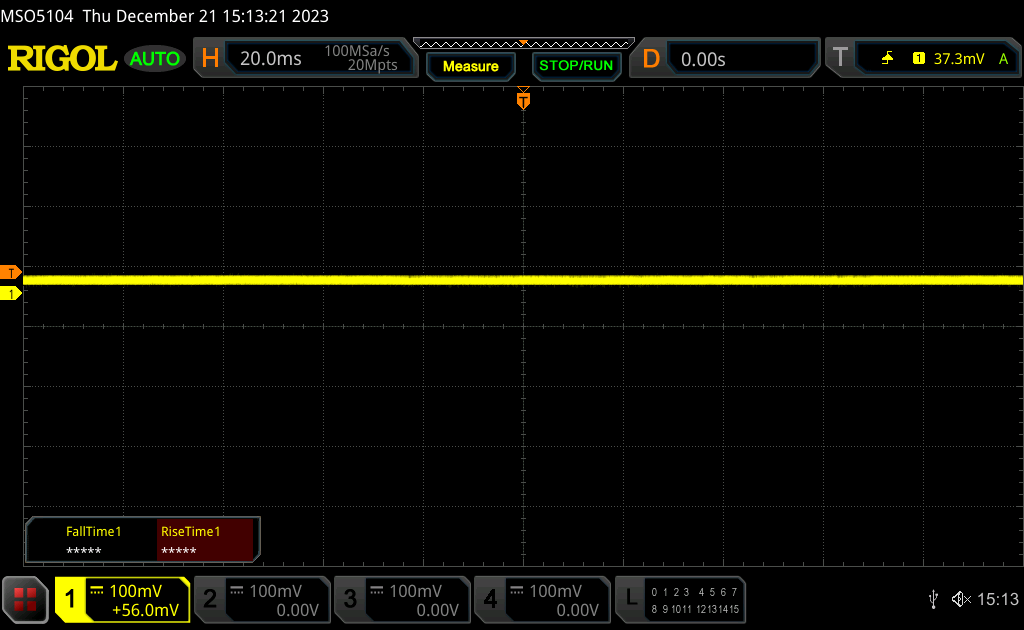 | ||
Dla porównania: 52 % wszystkich testowanych urządzeń nie używa PWM do przyciemniania wyświetlacza. Jeśli wykryto PWM, zmierzono średnio 7744 (minimum: 5 - maksimum: 343500) Hz. | |||
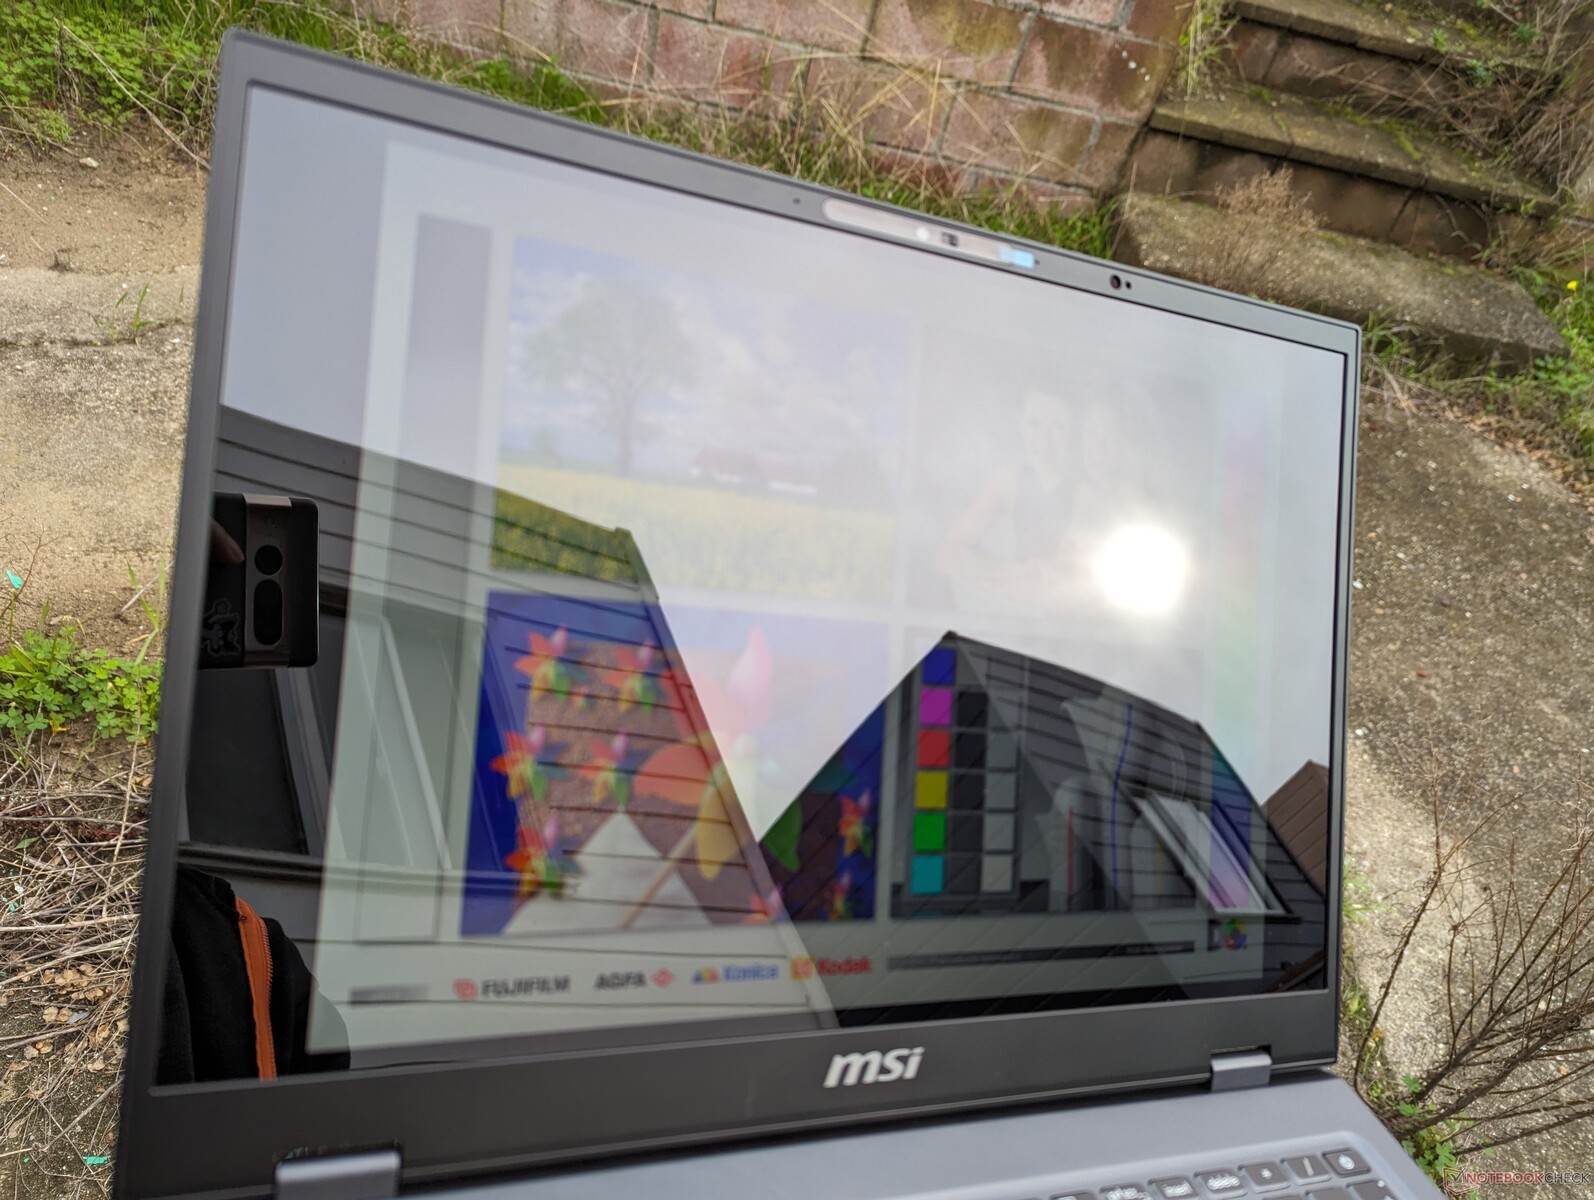
Super błyszczący ekran może przyczynić się do ostrzejszego obrazu, ale przyczynia się również do nadmiernego odblasku w większości scenariuszy użytkowania, zwłaszcza na zewnątrz. Ekran Mini-LED w MacBooka Pro 16 jest o około 30 procent jaśniejszy niż nasz MSI, co zapewnia ogólnie lepszą widoczność przy jasnym oświetleniu otoczenia.

Wydajność - błyskawiczny wzrost
Warunki testowania
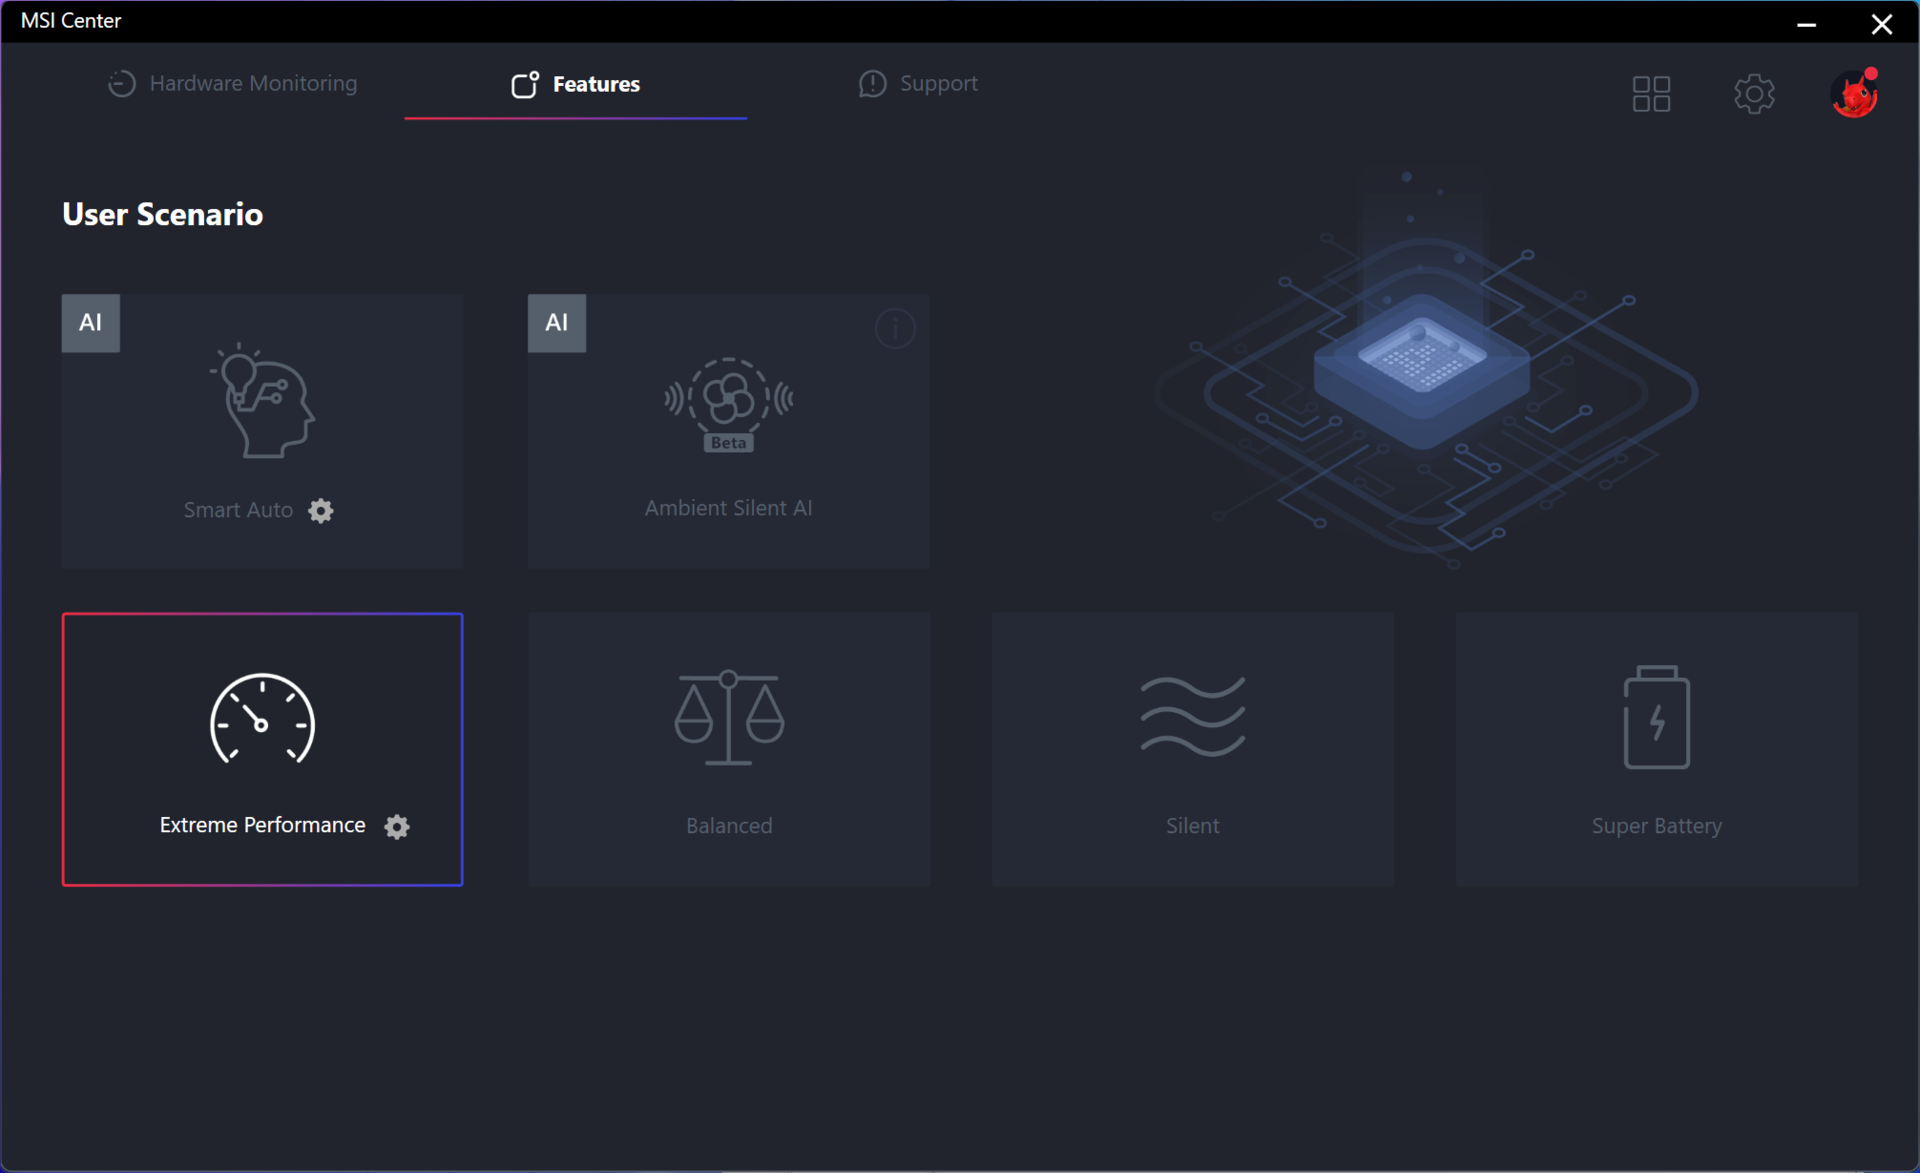
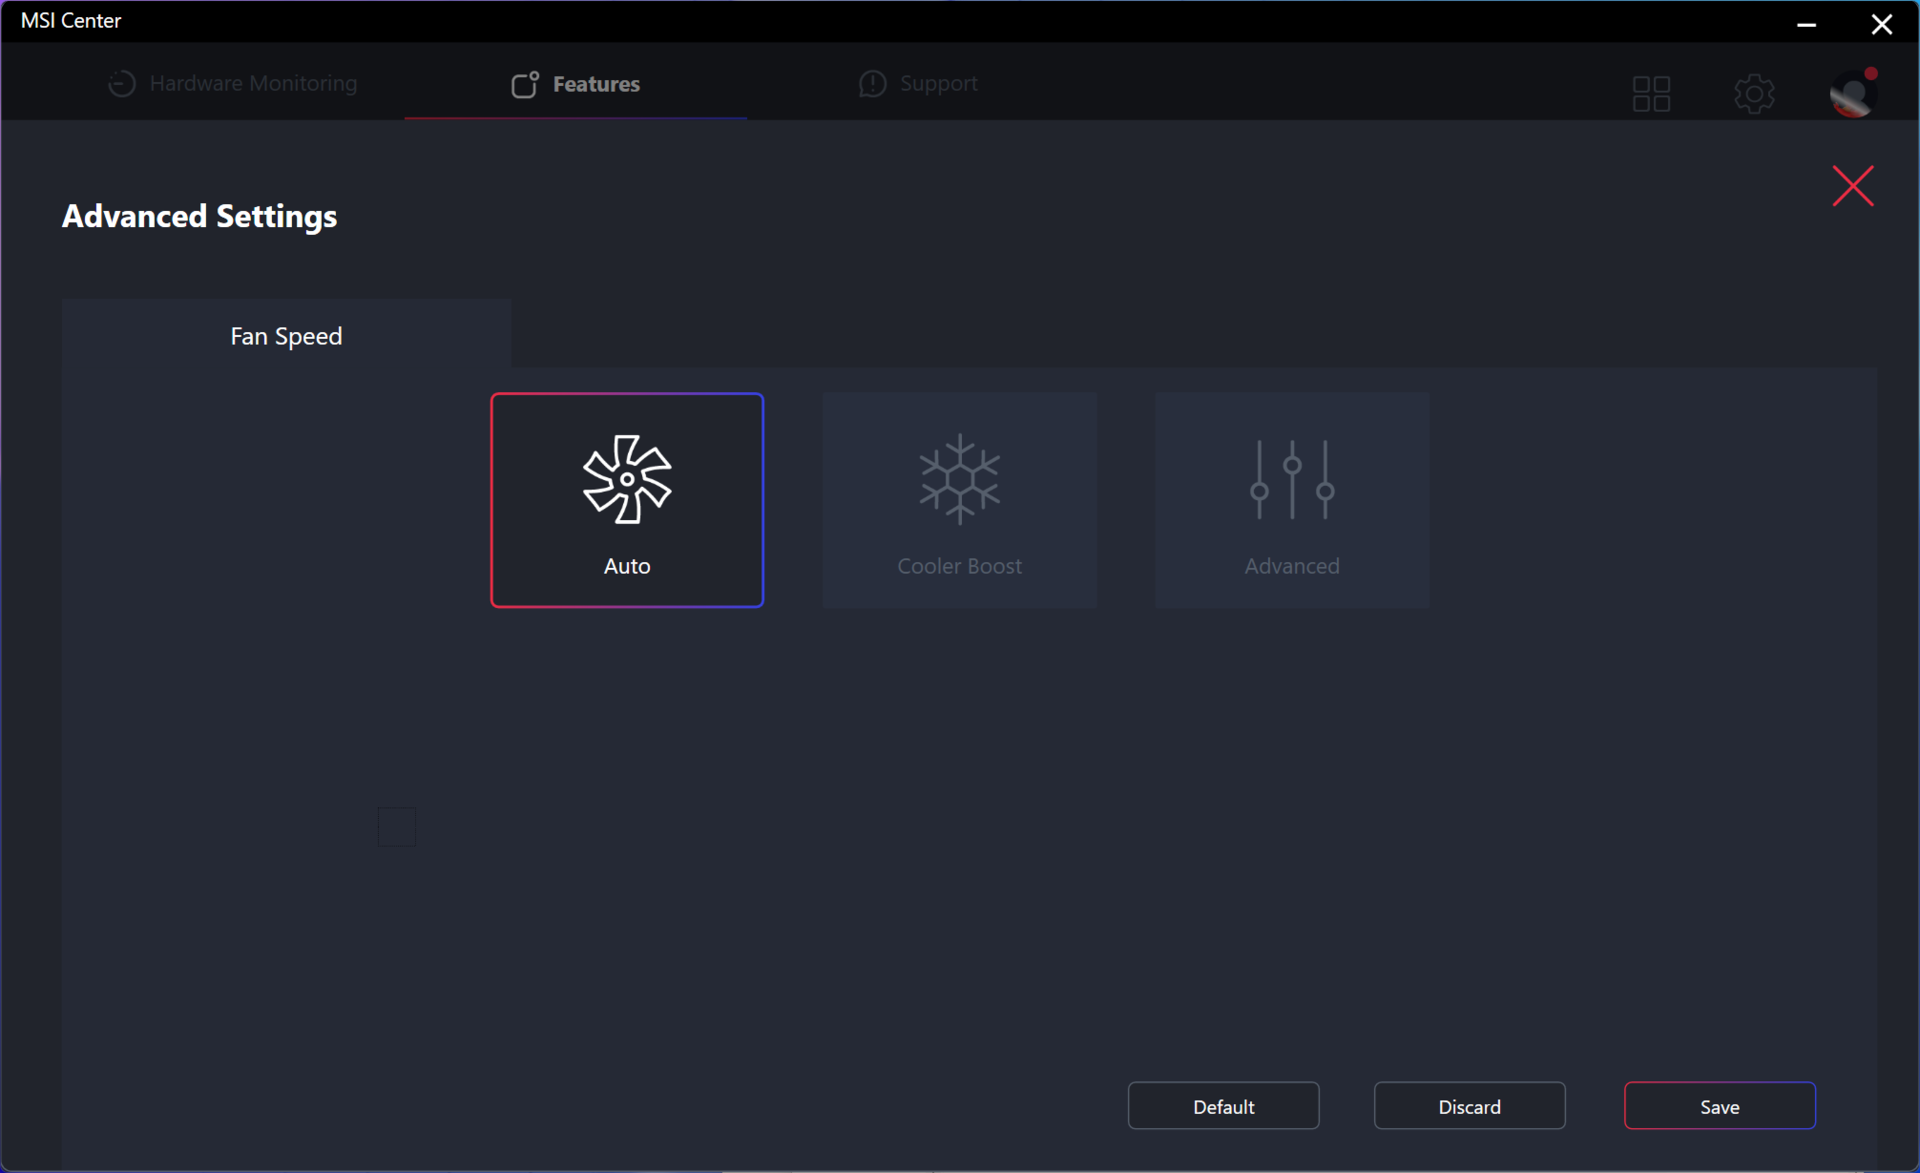
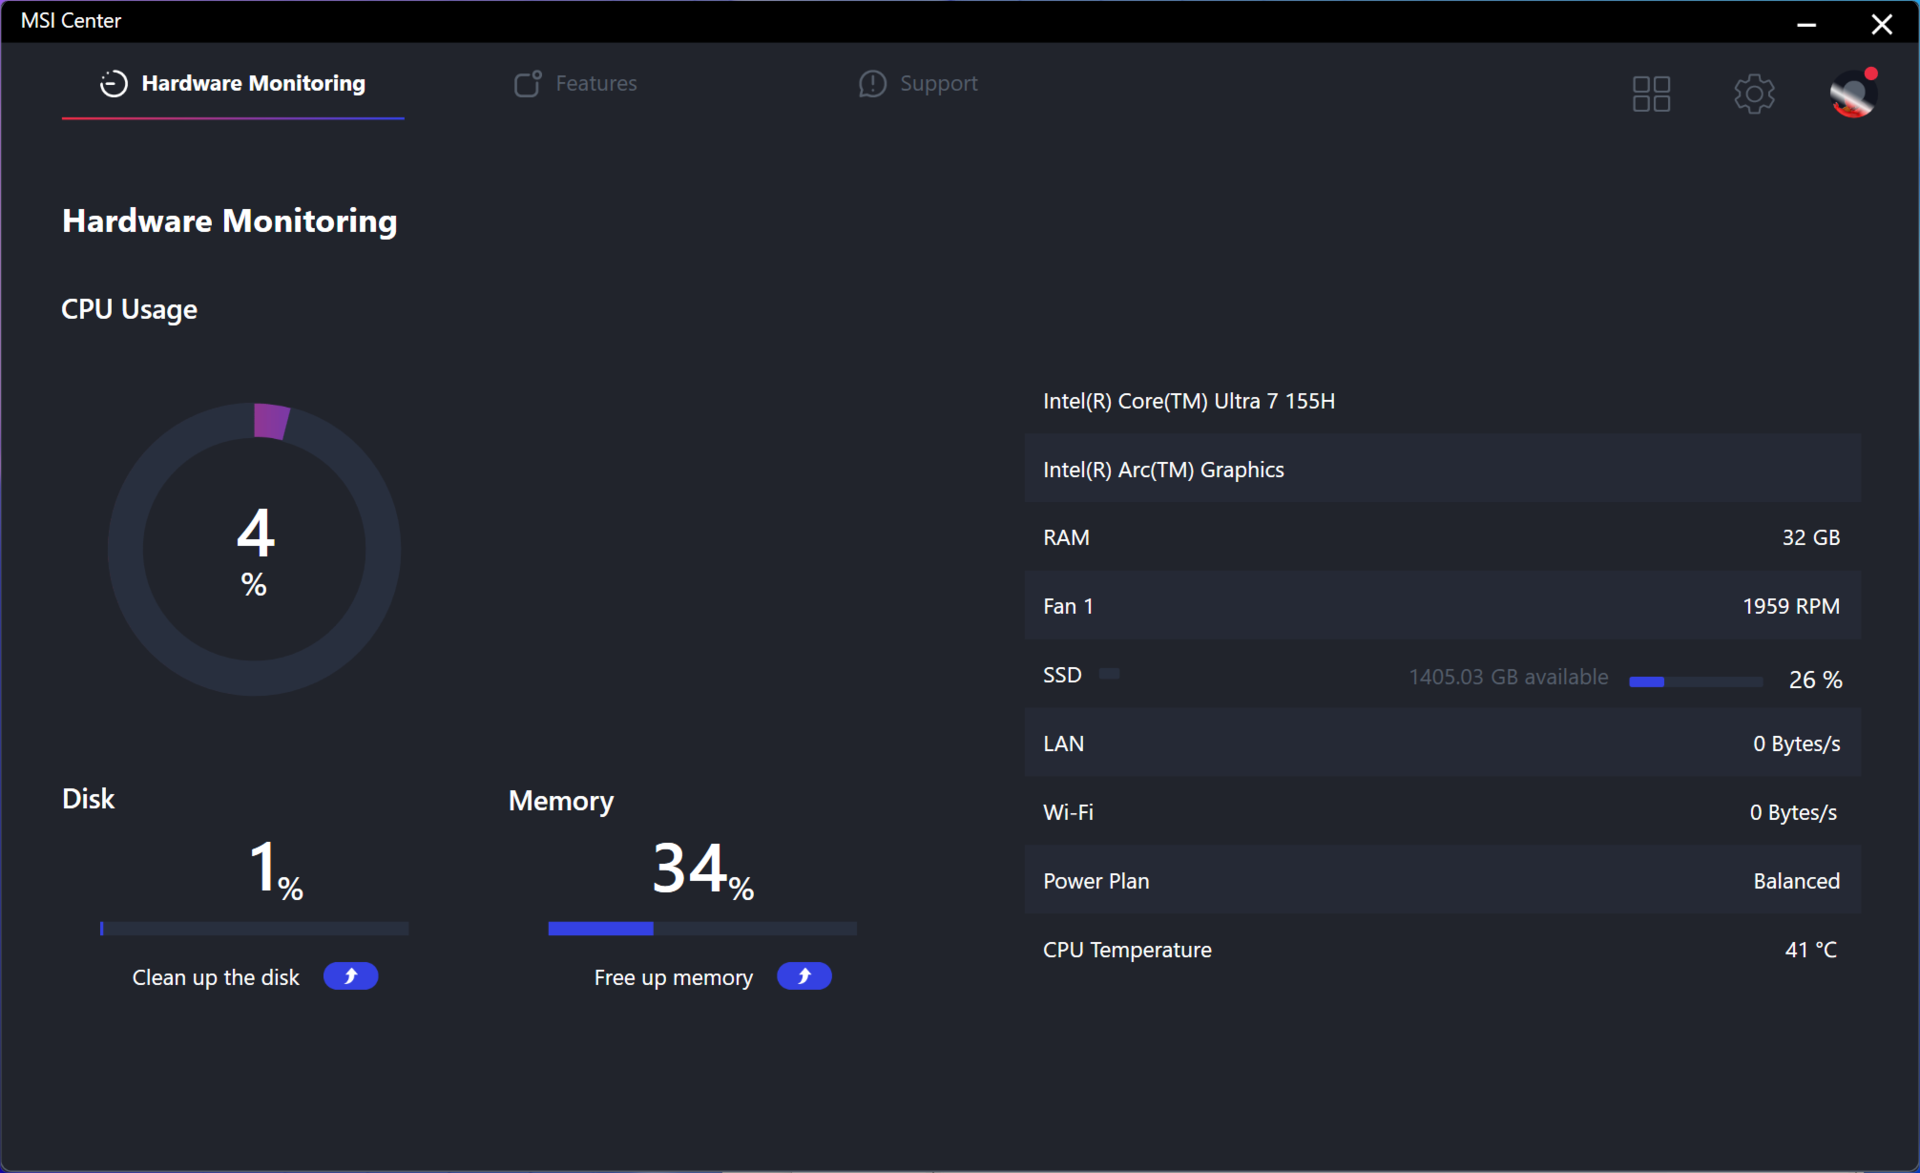
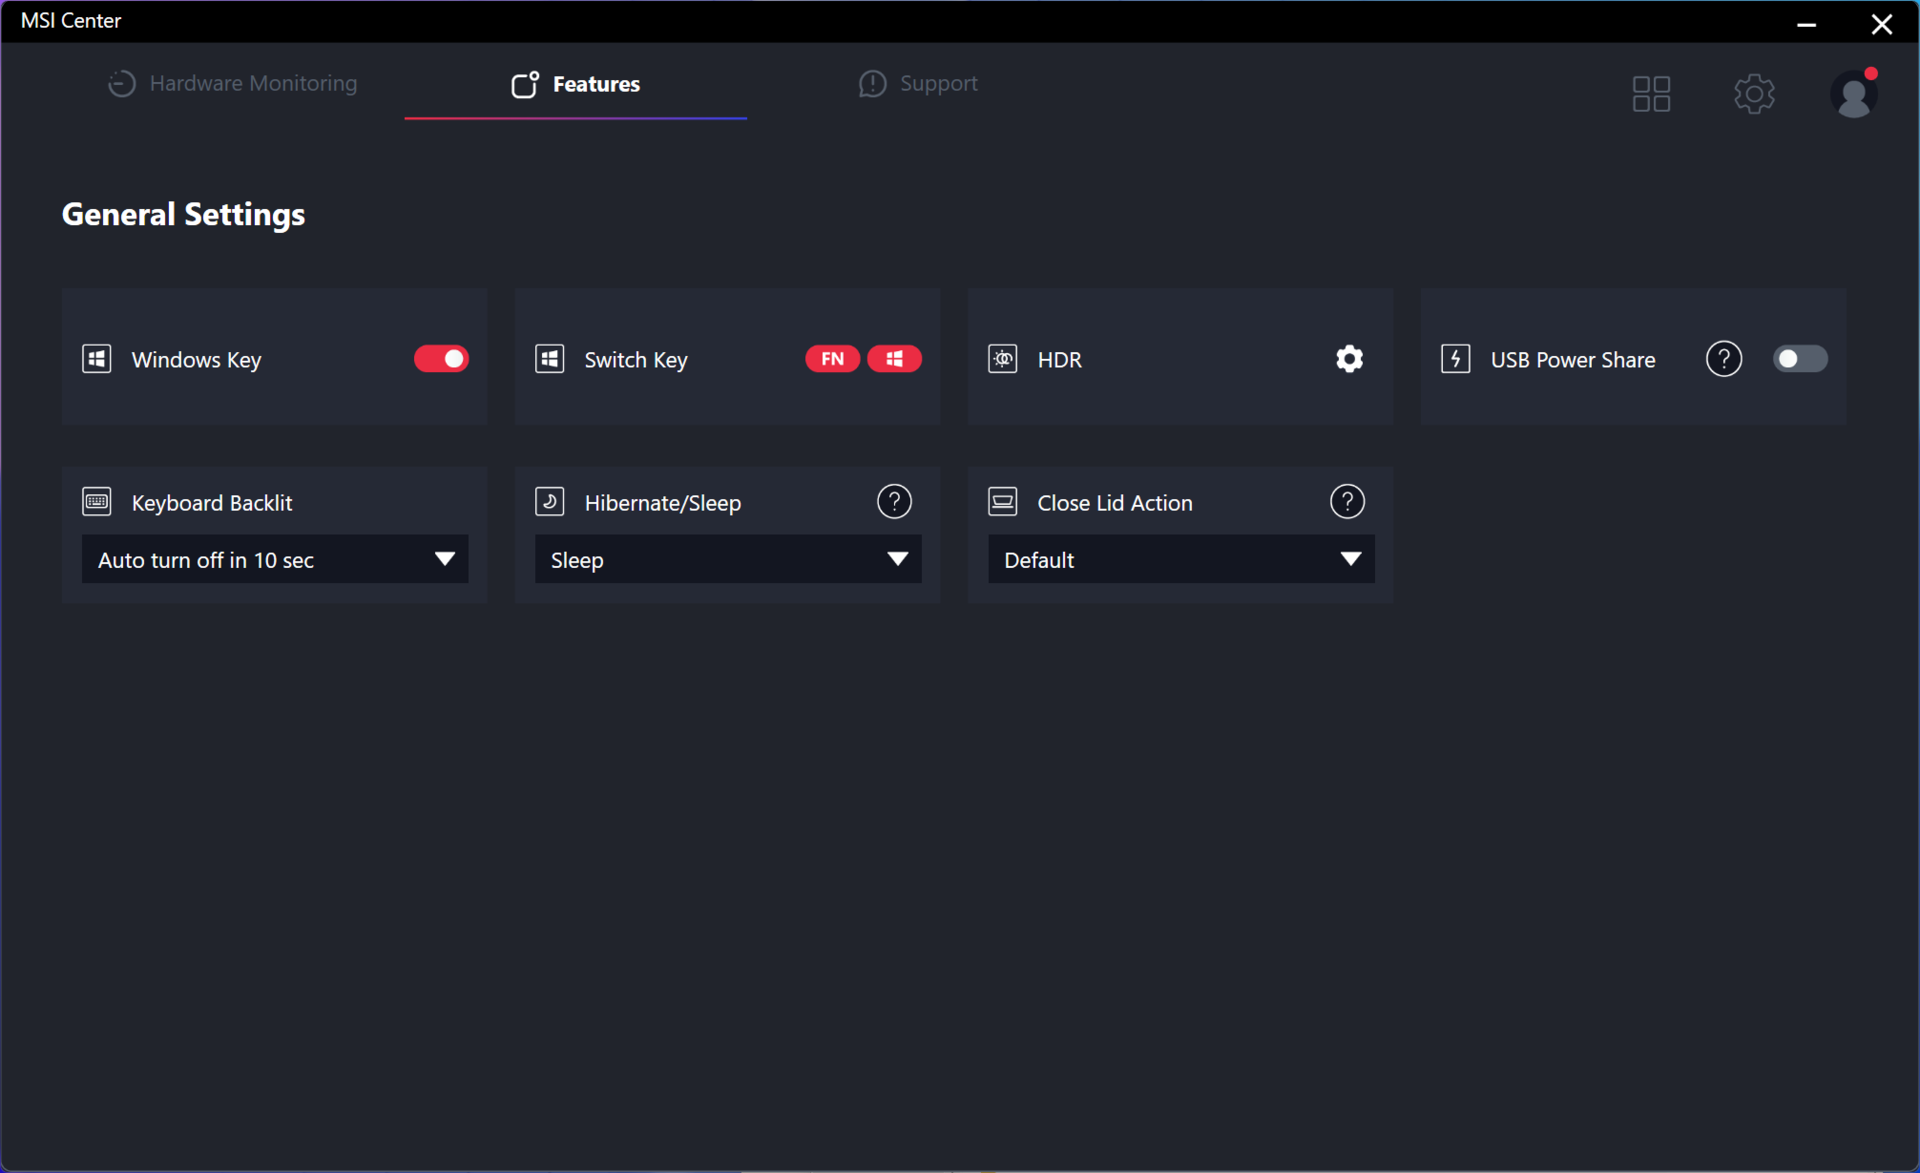
Przed przeprowadzeniem poniższych testów porównawczych ustawiliśmy system Windows na tryb wydajności, a MSI Center na tryb ekstremalnej wydajności. Właściciele powinni zapoznać się z MSI Center, ponieważ jest to centrum aktualizacji i funkcji specyficznych dla MSI.
Procesor
Wydajność procesora jest ogromnym skokiem w porównaniu z opcjami Core U i Core P poprzedniej generacji. Nasz Core Ultra 7 155H utrzymuje komfortową przewagę od 20 do 25 procent nad Core i7-1360P i najszybszą opcją AMD z serii Zen 4 U, czyli Ryzen 7 7840U.
Użytkownicy oczekujący zauważalnego wzrostu w stosunku do opcji Core H 13. generacji mogą nadal być rozczarowani. Na przykład, surowa wydajność jedno- i wielowątkowa jest nieco niższa niż w przypadku Core i7-13700H. Największe różnice pomiędzy Core H 13. i 14. generacji odnoszą się natomiast do ulepszonego iGPU i akceleracji AI w nowszych opcjach.
Wyższej klasy Core Ultra 9 185H SKU jest również dostępny dla Prestige 16, ale nie spodziewamy się, aby działał znacznie szybciej niż nasza konfiguracja Core Ultra 7 155H, ponieważ oba procesory mają dokładnie taką samą liczbę rdzeni z niewielkimi różnicami w częstotliwości taktowania.
Cinebench R15 Multi Loop
Cinebench R23: Multi Core | Single Core
Cinebench R20: CPU (Multi Core) | CPU (Single Core)
Cinebench R15: CPU Multi 64Bit | CPU Single 64Bit
Blender: v2.79 BMW27 CPU
7-Zip 18.03: 7z b 4 | 7z b 4 -mmt1
Geekbench 5.5: Multi-Core | Single-Core
HWBOT x265 Benchmark v2.2: 4k Preset
LibreOffice : 20 Documents To PDF
R Benchmark 2.5: Overall mean
| CPU Performance rating | |
| Dell Inspiron 16 Plus 7630 | |
| MSI Prestige 16 B1MG-001US | |
| Przeciętny Intel Core Ultra 7 155H | |
| Asus VivoBook Pro 16 K6602VU | |
| Acer Swift Edge SFE16 Ryzen 7 7840U | |
| MSI Prestige 15 A12UD-093 -1! | |
| Asus Vivobook Pro 16X-M7600QE | |
| MSI Creator Z16 A11UET-209 -3! | |
| LG Gram 2in1 16 16T90R - G.AA78G | |
| Lenovo ThinkPad T16 G2 21HH003AGE | |
| Acer Swift Edge SFE16-42-R1GM | |
| Lenovo IdeaPad 5 Pro 16ARH7 | |
| Lenovo ThinkBook 16 G6 ABP | |
| LG Gram 16Z90Q | |
| Acer Swift 3 SF316-51 | |
| Asus VivoBook Pro 16X OLED N7600PC-L2026X | |
| Cinebench R23 / Multi Core | |
| Dell Inspiron 16 Plus 7630 | |
| MSI Prestige 16 B1MG-001US | |
| Przeciętny Intel Core Ultra 7 155H (9769 - 19007, n=52) | |
| Asus VivoBook Pro 16 K6602VU | |
| Asus Vivobook Pro 16X-M7600QE | |
| Asus Vivobook Pro 16X-M7600QE | |
| MSI Creator Z16 A11UET-209 | |
| Acer Swift Edge SFE16 Ryzen 7 7840U | |
| MSI Prestige 15 A12UD-093 | |
| LG Gram 2in1 16 16T90R - G.AA78G | |
| Acer Swift Edge SFE16-42-R1GM | |
| Lenovo ThinkPad T16 G2 21HH003AGE | |
| Lenovo ThinkBook 16 G6 ABP | |
| Lenovo IdeaPad 5 Pro 16ARH7 | |
| LG Gram 16Z90Q | |
| Acer Swift 3 SF316-51 | |
| Asus VivoBook Pro 16X OLED N7600PC-L2026X | |
| Cinebench R23 / Single Core | |
| Dell Inspiron 16 Plus 7630 | |
| Lenovo ThinkPad T16 G2 21HH003AGE | |
| MSI Prestige 16 B1MG-001US | |
| Asus VivoBook Pro 16 K6602VU | |
| Przeciętny Intel Core Ultra 7 155H (1496 - 1815, n=52) | |
| Acer Swift Edge SFE16 Ryzen 7 7840U | |
| LG Gram 2in1 16 16T90R - G.AA78G | |
| MSI Prestige 15 A12UD-093 | |
| LG Gram 16Z90Q | |
| Acer Swift 3 SF316-51 | |
| Asus VivoBook Pro 16X OLED N7600PC-L2026X | |
| MSI Creator Z16 A11UET-209 | |
| Asus Vivobook Pro 16X-M7600QE | |
| Asus Vivobook Pro 16X-M7600QE | |
| Acer Swift Edge SFE16-42-R1GM | |
| Lenovo IdeaPad 5 Pro 16ARH7 | |
| Lenovo ThinkBook 16 G6 ABP | |
| Cinebench R20 / CPU (Multi Core) | |
| Dell Inspiron 16 Plus 7630 | |
| Przeciętny Intel Core Ultra 7 155H (3798 - 7409, n=50) | |
| Asus VivoBook Pro 16 K6602VU | |
| MSI Prestige 16 B1MG-001US | |
| MSI Creator Z16 A11UET-209 | |
| Asus Vivobook Pro 16X-M7600QE | |
| Asus Vivobook Pro 16X-M7600QE | |
| Acer Swift Edge SFE16 Ryzen 7 7840U | |
| MSI Prestige 15 A12UD-093 | |
| LG Gram 2in1 16 16T90R - G.AA78G | |
| Lenovo IdeaPad 5 Pro 16ARH7 | |
| Acer Swift Edge SFE16-42-R1GM | |
| Lenovo ThinkPad T16 G2 21HH003AGE | |
| Lenovo ThinkBook 16 G6 ABP | |
| LG Gram 16Z90Q | |
| Acer Swift 3 SF316-51 | |
| Asus VivoBook Pro 16X OLED N7600PC-L2026X | |
| Cinebench R20 / CPU (Single Core) | |
| Dell Inspiron 16 Plus 7630 | |
| Lenovo ThinkPad T16 G2 21HH003AGE | |
| MSI Prestige 15 A12UD-093 | |
| Asus VivoBook Pro 16 K6602VU | |
| MSI Prestige 16 B1MG-001US | |
| Acer Swift Edge SFE16 Ryzen 7 7840U | |
| Przeciętny Intel Core Ultra 7 155H (601 - 696, n=50) | |
| LG Gram 2in1 16 16T90R - G.AA78G | |
| LG Gram 16Z90Q | |
| Acer Swift 3 SF316-51 | |
| Asus VivoBook Pro 16X OLED N7600PC-L2026X | |
| MSI Creator Z16 A11UET-209 | |
| Lenovo IdeaPad 5 Pro 16ARH7 | |
| Asus Vivobook Pro 16X-M7600QE | |
| Asus Vivobook Pro 16X-M7600QE | |
| Lenovo ThinkBook 16 G6 ABP | |
| Acer Swift Edge SFE16-42-R1GM | |
| Cinebench R15 / CPU Multi 64Bit | |
| Asus VivoBook Pro 16 K6602VU | |
| Przeciętny Intel Core Ultra 7 155H (1932 - 2880, n=56) | |
| Dell Inspiron 16 Plus 7630 | |
| MSI Prestige 16 B1MG-001US | |
| MSI Prestige 15 A12UD-093 | |
| LG Gram 2in1 16 16T90R - G.AA78G | |
| Asus Vivobook Pro 16X-M7600QE | |
| Asus Vivobook Pro 16X-M7600QE | |
| Acer Swift Edge SFE16 Ryzen 7 7840U | |
| MSI Creator Z16 A11UET-209 | |
| Acer Swift Edge SFE16-42-R1GM | |
| Lenovo IdeaPad 5 Pro 16ARH7 | |
| Lenovo ThinkPad T16 G2 21HH003AGE | |
| Lenovo ThinkBook 16 G6 ABP | |
| LG Gram 16Z90Q | |
| Asus VivoBook Pro 16X OLED N7600PC-L2026X | |
| Acer Swift 3 SF316-51 | |
| Cinebench R15 / CPU Single 64Bit | |
| Acer Swift Edge SFE16 Ryzen 7 7840U | |
| Dell Inspiron 16 Plus 7630 | |
| Lenovo ThinkPad T16 G2 21HH003AGE | |
| MSI Prestige 16 B1MG-001US | |
| Asus VivoBook Pro 16 K6602VU | |
| Przeciętny Intel Core Ultra 7 155H (99.6 - 268, n=52) | |
| LG Gram 2in1 16 16T90R - G.AA78G | |
| Asus Vivobook Pro 16X-M7600QE | |
| Asus Vivobook Pro 16X-M7600QE | |
| Lenovo IdeaPad 5 Pro 16ARH7 | |
| Acer Swift Edge SFE16-42-R1GM | |
| Lenovo ThinkBook 16 G6 ABP | |
| Acer Swift 3 SF316-51 | |
| Asus VivoBook Pro 16X OLED N7600PC-L2026X | |
| Asus VivoBook Pro 16X OLED N7600PC-L2026X | |
| LG Gram 16Z90Q | |
| MSI Prestige 15 A12UD-093 | |
| MSI Creator Z16 A11UET-209 | |
| Blender / v2.79 BMW27 CPU | |
| Acer Swift 3 SF316-51 | |
| LG Gram 16Z90Q | |
| Asus VivoBook Pro 16X OLED N7600PC-L2026X | |
| Lenovo ThinkPad T16 G2 21HH003AGE | |
| Lenovo ThinkBook 16 G6 ABP | |
| Lenovo IdeaPad 5 Pro 16ARH7 | |
| LG Gram 2in1 16 16T90R - G.AA78G | |
| Acer Swift Edge SFE16-42-R1GM | |
| MSI Prestige 15 A12UD-093 | |
| Acer Swift Edge SFE16 Ryzen 7 7840U | |
| Asus Vivobook Pro 16X-M7600QE | |
| Asus Vivobook Pro 16X-M7600QE | |
| MSI Creator Z16 A11UET-209 | |
| Przeciętny Intel Core Ultra 7 155H (175 - 381, n=47) | |
| Dell Inspiron 16 Plus 7630 | |
| MSI Prestige 16 B1MG-001US | |
| Asus VivoBook Pro 16 K6602VU | |
| 7-Zip 18.03 / 7z b 4 | |
| MSI Prestige 16 B1MG-001US | |
| Asus VivoBook Pro 16 K6602VU | |
| Dell Inspiron 16 Plus 7630 | |
| Przeciętny Intel Core Ultra 7 155H (41739 - 70254, n=50) | |
| Asus Vivobook Pro 16X-M7600QE | |
| Asus Vivobook Pro 16X-M7600QE | |
| Acer Swift Edge SFE16 Ryzen 7 7840U | |
| MSI Prestige 15 A12UD-093 | |
| Acer Swift Edge SFE16-42-R1GM | |
| Lenovo IdeaPad 5 Pro 16ARH7 | |
| LG Gram 2in1 16 16T90R - G.AA78G | |
| Lenovo ThinkBook 16 G6 ABP | |
| Lenovo ThinkPad T16 G2 21HH003AGE | |
| LG Gram 16Z90Q | |
| Asus VivoBook Pro 16X OLED N7600PC-L2026X | |
| Acer Swift 3 SF316-51 | |
| 7-Zip 18.03 / 7z b 4 -mmt1 | |
| Acer Swift Edge SFE16 Ryzen 7 7840U | |
| Asus Vivobook Pro 16X-M7600QE | |
| Asus Vivobook Pro 16X-M7600QE | |
| Lenovo ThinkPad T16 G2 21HH003AGE | |
| Asus VivoBook Pro 16 K6602VU | |
| Dell Inspiron 16 Plus 7630 | |
| Acer Swift Edge SFE16-42-R1GM | |
| MSI Prestige 15 A12UD-093 | |
| Acer Swift 3 SF316-51 | |
| Lenovo ThinkBook 16 G6 ABP | |
| Przeciętny Intel Core Ultra 7 155H (4594 - 5621, n=50) | |
| Lenovo IdeaPad 5 Pro 16ARH7 | |
| Asus VivoBook Pro 16X OLED N7600PC-L2026X | |
| MSI Prestige 16 B1MG-001US | |
| LG Gram 16Z90Q | |
| LG Gram 2in1 16 16T90R - G.AA78G | |
| Geekbench 5.5 / Multi-Core | |
| Dell Inspiron 16 Plus 7630 | |
| MSI Prestige 16 B1MG-001US | |
| Przeciętny Intel Core Ultra 7 155H (10017 - 13556, n=52) | |
| MSI Prestige 15 A12UD-093 | |
| LG Gram 2in1 16 16T90R - G.AA78G | |
| Asus VivoBook Pro 16 K6602VU | |
| Acer Swift Edge SFE16 Ryzen 7 7840U | |
| MSI Creator Z16 A11UET-209 | |
| MSI Creator Z16 A11UET-209 | |
| LG Gram 16Z90Q | |
| Asus Vivobook Pro 16X-M7600QE | |
| Asus Vivobook Pro 16X-M7600QE | |
| Acer Swift Edge SFE16-42-R1GM | |
| Lenovo ThinkPad T16 G2 21HH003AGE | |
| Lenovo IdeaPad 5 Pro 16ARH7 | |
| Lenovo ThinkBook 16 G6 ABP | |
| Acer Swift 3 SF316-51 | |
| Asus VivoBook Pro 16X OLED N7600PC-L2026X | |
| Geekbench 5.5 / Single-Core | |
| Acer Swift Edge SFE16 Ryzen 7 7840U | |
| Dell Inspiron 16 Plus 7630 | |
| Lenovo ThinkPad T16 G2 21HH003AGE | |
| Przeciętny Intel Core Ultra 7 155H (1462 - 1824, n=52) | |
| MSI Prestige 16 B1MG-001US | |
| Asus VivoBook Pro 16 K6602VU | |
| LG Gram 16Z90Q | |
| LG Gram 2in1 16 16T90R - G.AA78G | |
| Acer Swift 3 SF316-51 | |
| MSI Creator Z16 A11UET-209 | |
| MSI Creator Z16 A11UET-209 | |
| MSI Prestige 15 A12UD-093 | |
| Asus Vivobook Pro 16X-M7600QE | |
| Asus Vivobook Pro 16X-M7600QE | |
| Acer Swift Edge SFE16-42-R1GM | |
| Asus VivoBook Pro 16X OLED N7600PC-L2026X | |
| Lenovo ThinkBook 16 G6 ABP | |
| Lenovo IdeaPad 5 Pro 16ARH7 | |
| HWBOT x265 Benchmark v2.2 / 4k Preset | |
| MSI Prestige 16 B1MG-001US | |
| Asus VivoBook Pro 16 K6602VU | |
| Przeciętny Intel Core Ultra 7 155H (9.93 - 21.2, n=50) | |
| Dell Inspiron 16 Plus 7630 | |
| Asus Vivobook Pro 16X-M7600QE | |
| Asus Vivobook Pro 16X-M7600QE | |
| Acer Swift Edge SFE16 Ryzen 7 7840U | |
| MSI Creator Z16 A11UET-209 | |
| Acer Swift Edge SFE16-42-R1GM | |
| Lenovo IdeaPad 5 Pro 16ARH7 | |
| Lenovo ThinkBook 16 G6 ABP | |
| LG Gram 2in1 16 16T90R - G.AA78G | |
| Lenovo ThinkPad T16 G2 21HH003AGE | |
| LG Gram 16Z90Q | |
| Acer Swift 3 SF316-51 | |
| Asus VivoBook Pro 16X OLED N7600PC-L2026X | |
| LibreOffice / 20 Documents To PDF | |
| Lenovo IdeaPad 5 Pro 16ARH7 | |
| MSI Prestige 15 A12UD-093 | |
| MSI Prestige 15 A12UD-093 | |
| Acer Swift Edge SFE16-42-R1GM | |
| LG Gram 2in1 16 16T90R - G.AA78G | |
| Asus VivoBook Pro 16 K6602VU | |
| LG Gram 16Z90Q | |
| Lenovo ThinkBook 16 G6 ABP | |
| Asus Vivobook Pro 16X-M7600QE | |
| Asus Vivobook Pro 16X-M7600QE | |
| Asus VivoBook Pro 16X OLED N7600PC-L2026X | |
| Przeciętny Intel Core Ultra 7 155H (37.5 - 79.2, n=49) | |
| MSI Prestige 16 B1MG-001US | |
| Dell Inspiron 16 Plus 7630 | |
| Lenovo ThinkPad T16 G2 21HH003AGE | |
| Acer Swift Edge SFE16 Ryzen 7 7840U | |
| Acer Swift 3 SF316-51 | |
| R Benchmark 2.5 / Overall mean | |
| LG Gram 2in1 16 16T90R - G.AA78G | |
| MSI Creator Z16 A11UET-209 | |
| Asus VivoBook Pro 16X OLED N7600PC-L2026X | |
| Acer Swift 3 SF316-51 | |
| LG Gram 16Z90Q | |
| Lenovo ThinkBook 16 G6 ABP | |
| Lenovo IdeaPad 5 Pro 16ARH7 | |
| Acer Swift Edge SFE16-42-R1GM | |
| Asus Vivobook Pro 16X-M7600QE | |
| Asus Vivobook Pro 16X-M7600QE | |
| Asus VivoBook Pro 16 K6602VU | |
| Przeciętny Intel Core Ultra 7 155H (0.4457 - 0.53, n=49) | |
| Lenovo ThinkPad T16 G2 21HH003AGE | |
| MSI Prestige 16 B1MG-001US | |
| Acer Swift Edge SFE16 Ryzen 7 7840U | |
| MSI Prestige 15 A12UD-093 | |
| Dell Inspiron 16 Plus 7630 | |
Cinebench R23: Multi Core | Single Core
Cinebench R20: CPU (Multi Core) | CPU (Single Core)
Cinebench R15: CPU Multi 64Bit | CPU Single 64Bit
Blender: v2.79 BMW27 CPU
7-Zip 18.03: 7z b 4 | 7z b 4 -mmt1
Geekbench 5.5: Multi-Core | Single-Core
HWBOT x265 Benchmark v2.2: 4k Preset
LibreOffice : 20 Documents To PDF
R Benchmark 2.5: Overall mean
* ... im mniej tym lepiej
AIDA64: FP32 Ray-Trace | FPU Julia | CPU SHA3 | CPU Queen | FPU SinJulia | FPU Mandel | CPU AES | CPU ZLib | FP64 Ray-Trace | CPU PhotoWorxx
| Performance rating | |
| MSI Prestige 16 B1MG-001US | |
| Asus VivoBook Pro 16 K6602VU | |
| Przeciętny Intel Core Ultra 7 155H | |
| Dell Inspiron 16 Plus 7630 | |
| MSI Prestige 15 A12UD-093 | |
| LG Gram 2in1 16 16T90R - G.AA78G | |
| Lenovo ThinkBook 16 G6 ABP | |
| AIDA64 / FP32 Ray-Trace | |
| MSI Prestige 16 B1MG-001US | |
| Dell Inspiron 16 Plus 7630 | |
| Asus VivoBook Pro 16 K6602VU | |
| Przeciętny Intel Core Ultra 7 155H (6670 - 18470, n=50) | |
| Lenovo ThinkBook 16 G6 ABP | |
| MSI Prestige 15 A12UD-093 | |
| LG Gram 2in1 16 16T90R - G.AA78G | |
| LG Gram 2in1 16 16T90R - G.AA78G | |
| AIDA64 / FPU Julia | |
| MSI Prestige 16 B1MG-001US | |
| Asus VivoBook Pro 16 K6602VU | |
| Przeciętny Intel Core Ultra 7 155H (40905 - 93181, n=50) | |
| Lenovo ThinkBook 16 G6 ABP | |
| Dell Inspiron 16 Plus 7630 | |
| MSI Prestige 15 A12UD-093 | |
| LG Gram 2in1 16 16T90R - G.AA78G | |
| AIDA64 / CPU SHA3 | |
| MSI Prestige 16 B1MG-001US | |
| Asus VivoBook Pro 16 K6602VU | |
| Przeciętny Intel Core Ultra 7 155H (1940 - 4436, n=50) | |
| Dell Inspiron 16 Plus 7630 | |
| MSI Prestige 15 A12UD-093 | |
| LG Gram 2in1 16 16T90R - G.AA78G | |
| Lenovo ThinkBook 16 G6 ABP | |
| AIDA64 / CPU Queen | |
| Dell Inspiron 16 Plus 7630 | |
| Asus VivoBook Pro 16 K6602VU | |
| MSI Prestige 16 B1MG-001US | |
| Przeciętny Intel Core Ultra 7 155H (64698 - 94181, n=50) | |
| LG Gram 2in1 16 16T90R - G.AA78G | |
| MSI Prestige 15 A12UD-093 | |
| Lenovo ThinkBook 16 G6 ABP | |
| AIDA64 / FPU SinJulia | |
| MSI Prestige 16 B1MG-001US | |
| Lenovo ThinkBook 16 G6 ABP | |
| Przeciętny Intel Core Ultra 7 155H (5639 - 10647, n=50) | |
| Dell Inspiron 16 Plus 7630 | |
| Asus VivoBook Pro 16 K6602VU | |
| MSI Prestige 15 A12UD-093 | |
| LG Gram 2in1 16 16T90R - G.AA78G | |
| AIDA64 / FPU Mandel | |
| MSI Prestige 16 B1MG-001US | |
| Lenovo ThinkBook 16 G6 ABP | |
| Przeciętny Intel Core Ultra 7 155H (18236 - 47685, n=50) | |
| Asus VivoBook Pro 16 K6602VU | |
| Dell Inspiron 16 Plus 7630 | |
| MSI Prestige 15 A12UD-093 | |
| LG Gram 2in1 16 16T90R - G.AA78G | |
| AIDA64 / CPU AES | |
| Asus VivoBook Pro 16 K6602VU | |
| MSI Prestige 15 A12UD-093 | |
| LG Gram 2in1 16 16T90R - G.AA78G | |
| Przeciętny Intel Core Ultra 7 155H (45713 - 152179, n=50) | |
| MSI Prestige 16 B1MG-001US | |
| Dell Inspiron 16 Plus 7630 | |
| Lenovo ThinkBook 16 G6 ABP | |
| AIDA64 / CPU ZLib | |
| MSI Prestige 16 B1MG-001US | |
| Asus VivoBook Pro 16 K6602VU | |
| Przeciętny Intel Core Ultra 7 155H (557 - 1250, n=50) | |
| Dell Inspiron 16 Plus 7630 | |
| LG Gram 2in1 16 16T90R - G.AA78G | |
| MSI Prestige 15 A12UD-093 | |
| Lenovo ThinkBook 16 G6 ABP | |
| AIDA64 / FP64 Ray-Trace | |
| MSI Prestige 16 B1MG-001US | |
| Asus VivoBook Pro 16 K6602VU | |
| Dell Inspiron 16 Plus 7630 | |
| Przeciętny Intel Core Ultra 7 155H (3569 - 9802, n=50) | |
| Lenovo ThinkBook 16 G6 ABP | |
| MSI Prestige 15 A12UD-093 | |
| LG Gram 2in1 16 16T90R - G.AA78G | |
| AIDA64 / CPU PhotoWorxx | |
| Przeciętny Intel Core Ultra 7 155H (32719 - 54223, n=50) | |
| MSI Prestige 16 B1MG-001US | |
| MSI Prestige 15 A12UD-093 | |
| LG Gram 2in1 16 16T90R - G.AA78G | |
| Asus VivoBook Pro 16 K6602VU | |
| Dell Inspiron 16 Plus 7630 | |
| Lenovo ThinkBook 16 G6 ABP | |
Wydajność systemu
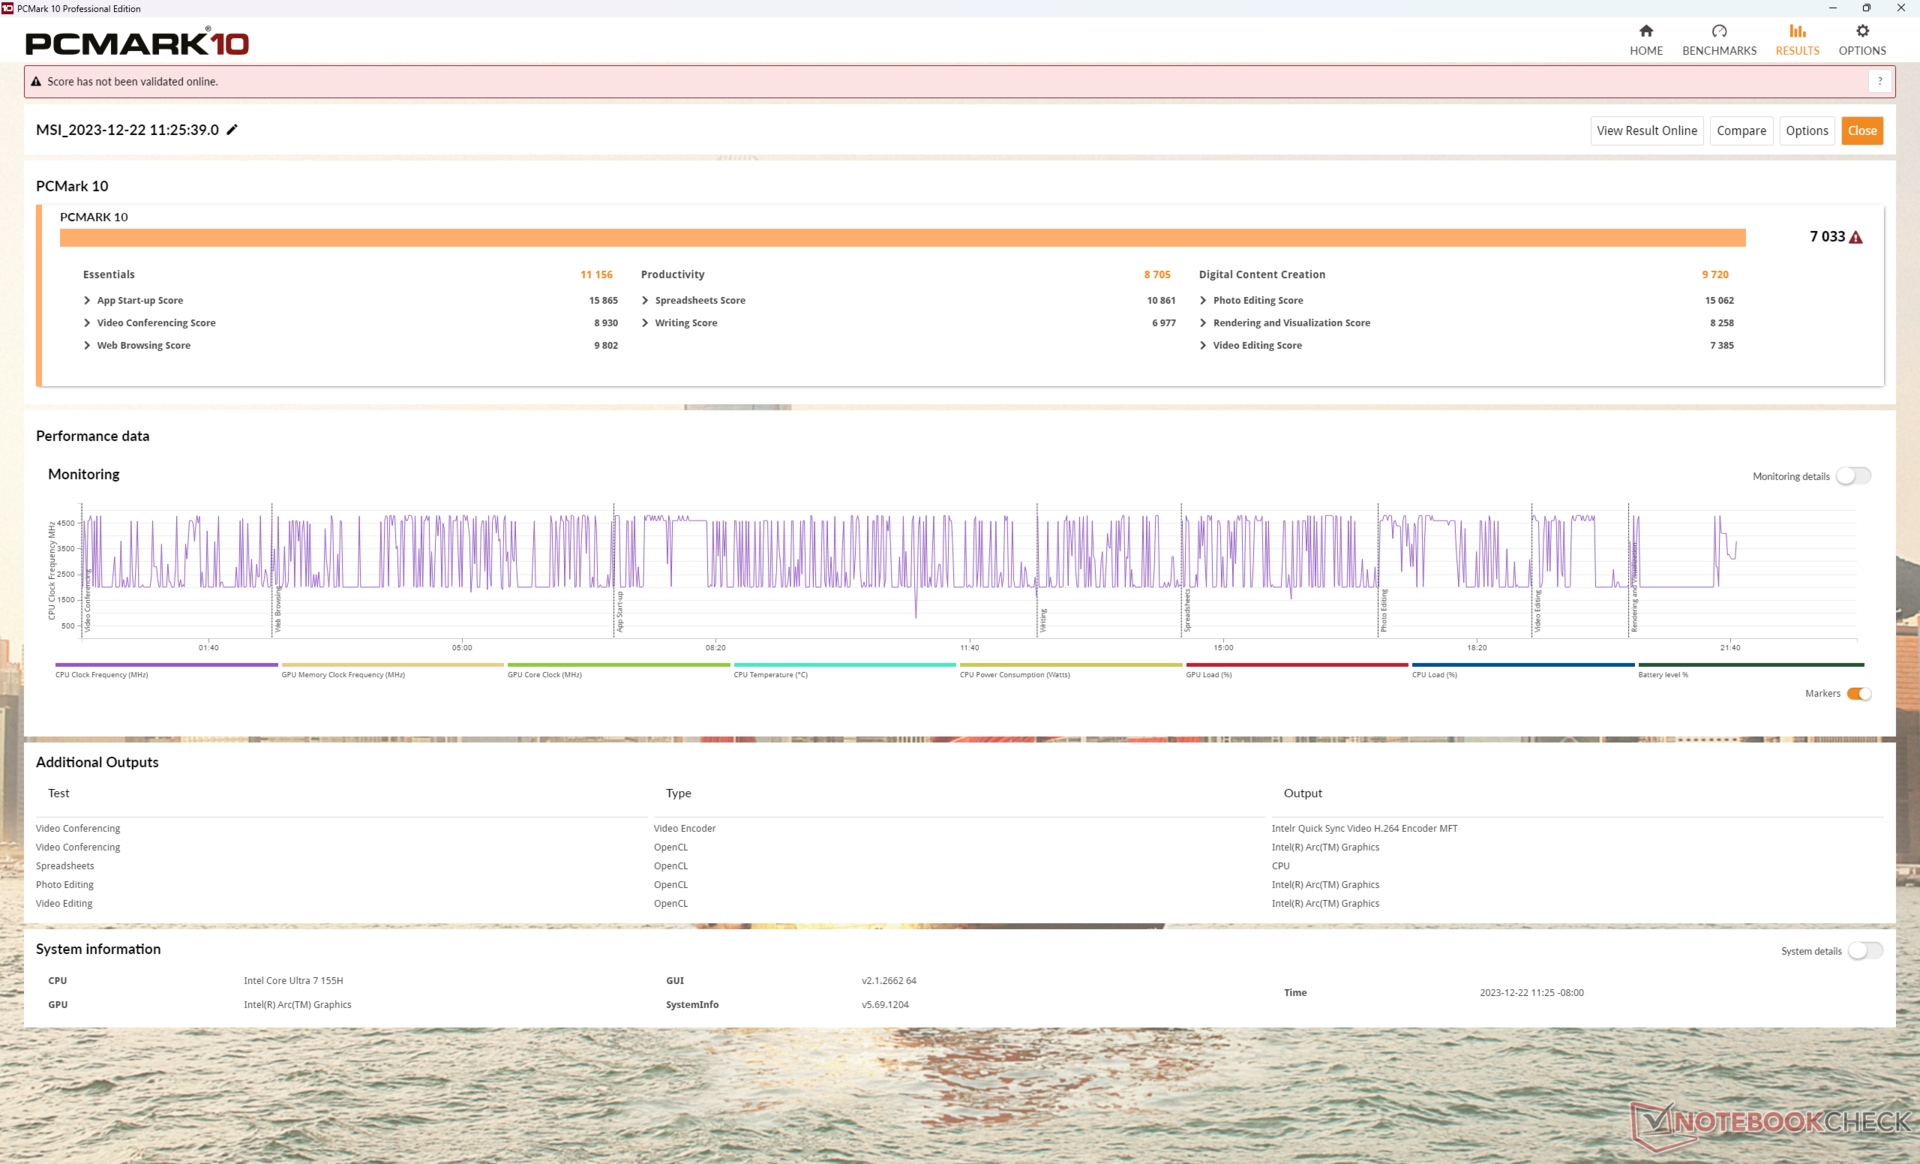
Wyniki PCMark są porównywalne do laptopów multimedialnych z dyskretną grafiką średniej klasy, takich jak Asus VivoBook Pro 16. Znaczenie wyników jest jednak wątpliwe, ponieważ trudno jest bezpośrednio porównać laptopy z iGPU i dGPU.
Warto wspomnieć o szybkiej pamięci systemowej RAM 6400 MHz, zwłaszcza że wydajność iGPU jest ściśle powiązana z wydajnością pamięci RAM.
CrossMark: Overall | Productivity | Creativity | Responsiveness
WebXPRT 3: Overall
WebXPRT 4: Overall
Mozilla Kraken 1.1: Total
| PCMark 10 / Score | |
| Dell Inspiron 16 Plus 7630 | |
| Asus VivoBook Pro 16 K6602VU | |
| MSI Prestige 16 B1MG-001US | |
| Przeciętny Intel Core Ultra 7 155H, Intel Arc 8-Core iGPU (4809 - 7529, n=34) | |
| MSI Prestige 15 A12UD-093 | |
| Lenovo ThinkBook 16 G6 ABP | |
| LG Gram 2in1 16 16T90R - G.AA78G | |
| PCMark 10 / Essentials | |
| LG Gram 2in1 16 16T90R - G.AA78G | |
| Dell Inspiron 16 Plus 7630 | |
| MSI Prestige 16 B1MG-001US | |
| Lenovo ThinkBook 16 G6 ABP | |
| Przeciętny Intel Core Ultra 7 155H, Intel Arc 8-Core iGPU (7605 - 11289, n=34) | |
| Asus VivoBook Pro 16 K6602VU | |
| MSI Prestige 15 A12UD-093 | |
| PCMark 10 / Productivity | |
| Dell Inspiron 16 Plus 7630 | |
| Lenovo ThinkBook 16 G6 ABP | |
| MSI Prestige 15 A12UD-093 | |
| MSI Prestige 16 B1MG-001US | |
| Asus VivoBook Pro 16 K6602VU | |
| Przeciętny Intel Core Ultra 7 155H, Intel Arc 8-Core iGPU (6042 - 10591, n=34) | |
| LG Gram 2in1 16 16T90R - G.AA78G | |
| PCMark 10 / Digital Content Creation | |
| Dell Inspiron 16 Plus 7630 | |
| Asus VivoBook Pro 16 K6602VU | |
| MSI Prestige 16 B1MG-001US | |
| Przeciętny Intel Core Ultra 7 155H, Intel Arc 8-Core iGPU (4985 - 10709, n=34) | |
| MSI Prestige 15 A12UD-093 | |
| LG Gram 2in1 16 16T90R - G.AA78G | |
| Lenovo ThinkBook 16 G6 ABP | |
| CrossMark / Overall | |
| Dell Inspiron 16 Plus 7630 | |
| MSI Prestige 16 B1MG-001US | |
| Asus VivoBook Pro 16 K6602VU | |
| MSI Prestige 15 A12UD-093 | |
| Przeciętny Intel Core Ultra 7 155H, Intel Arc 8-Core iGPU (1366 - 1903, n=34) | |
| LG Gram 2in1 16 16T90R - G.AA78G | |
| Lenovo ThinkBook 16 G6 ABP | |
| CrossMark / Productivity | |
| Dell Inspiron 16 Plus 7630 | |
| MSI Prestige 16 B1MG-001US | |
| Asus VivoBook Pro 16 K6602VU | |
| MSI Prestige 15 A12UD-093 | |
| Przeciętny Intel Core Ultra 7 155H, Intel Arc 8-Core iGPU (1291 - 1798, n=33) | |
| LG Gram 2in1 16 16T90R - G.AA78G | |
| Lenovo ThinkBook 16 G6 ABP | |
| CrossMark / Creativity | |
| Dell Inspiron 16 Plus 7630 | |
| MSI Prestige 16 B1MG-001US | |
| Asus VivoBook Pro 16 K6602VU | |
| Przeciętny Intel Core Ultra 7 155H, Intel Arc 8-Core iGPU (1519 - 1929, n=33) | |
| MSI Prestige 15 A12UD-093 | |
| LG Gram 2in1 16 16T90R - G.AA78G | |
| Lenovo ThinkBook 16 G6 ABP | |
| CrossMark / Responsiveness | |
| MSI Prestige 15 A12UD-093 | |
| Dell Inspiron 16 Plus 7630 | |
| MSI Prestige 16 B1MG-001US | |
| Asus VivoBook Pro 16 K6602VU | |
| LG Gram 2in1 16 16T90R - G.AA78G | |
| Przeciętny Intel Core Ultra 7 155H, Intel Arc 8-Core iGPU (939 - 1802, n=33) | |
| Lenovo ThinkBook 16 G6 ABP | |
| WebXPRT 3 / Overall | |
| Dell Inspiron 16 Plus 7630 | |
| MSI Prestige 16 B1MG-001US | |
| Przeciętny Intel Core Ultra 7 155H, Intel Arc 8-Core iGPU (252 - 299, n=34) | |
| Lenovo ThinkBook 16 G6 ABP | |
| LG Gram 2in1 16 16T90R - G.AA78G | |
| MSI Prestige 15 A12UD-093 | |
| WebXPRT 4 / Overall | |
| Dell Inspiron 16 Plus 7630 | |
| MSI Prestige 16 B1MG-001US | |
| Przeciętny Intel Core Ultra 7 155H, Intel Arc 8-Core iGPU (166.4 - 309, n=29) | |
| Asus VivoBook Pro 16 K6602VU | |
| Lenovo ThinkBook 16 G6 ABP | |
| Mozilla Kraken 1.1 / Total | |
| MSI Prestige 15 A12UD-093 | |
| LG Gram 2in1 16 16T90R - G.AA78G | |
| Lenovo ThinkBook 16 G6 ABP | |
| Asus VivoBook Pro 16 K6602VU | |
| Przeciętny Intel Core Ultra 7 155H, Intel Arc 8-Core iGPU (517 - 614, n=35) | |
| MSI Prestige 16 B1MG-001US | |
| Dell Inspiron 16 Plus 7630 | |
* ... im mniej tym lepiej
| PCMark 10 Score | 7033 pkt. | |
Pomoc | ||
| AIDA64 / Memory Copy | |
| Przeciętny Intel Core Ultra 7 155H (62397 - 96791, n=50) | |
| MSI Prestige 16 B1MG-001US | |
| MSI Prestige 15 A12UD-093 | |
| LG Gram 2in1 16 16T90R - G.AA78G | |
| Dell Inspiron 16 Plus 7630 | |
| Asus VivoBook Pro 16 K6602VU | |
| Lenovo ThinkBook 16 G6 ABP | |
| AIDA64 / Memory Read | |
| Przeciętny Intel Core Ultra 7 155H (60544 - 90647, n=50) | |
| MSI Prestige 16 B1MG-001US | |
| Dell Inspiron 16 Plus 7630 | |
| Asus VivoBook Pro 16 K6602VU | |
| MSI Prestige 15 A12UD-093 | |
| LG Gram 2in1 16 16T90R - G.AA78G | |
| Lenovo ThinkBook 16 G6 ABP | |
| AIDA64 / Memory Write | |
| LG Gram 2in1 16 16T90R - G.AA78G | |
| MSI Prestige 16 B1MG-001US | |
| Przeciętny Intel Core Ultra 7 155H (58692 - 93451, n=50) | |
| MSI Prestige 15 A12UD-093 | |
| Asus VivoBook Pro 16 K6602VU | |
| Dell Inspiron 16 Plus 7630 | |
| Lenovo ThinkBook 16 G6 ABP | |
| AIDA64 / Memory Latency | |
| Przeciętny Intel Core Ultra 7 155H (116.2 - 233, n=50) | |
| MSI Prestige 16 B1MG-001US | |
| LG Gram 2in1 16 16T90R - G.AA78G | |
| MSI Prestige 15 A12UD-093 | |
| Lenovo ThinkBook 16 G6 ABP | |
| Dell Inspiron 16 Plus 7630 | |
| Asus VivoBook Pro 16 K6602VU | |
* ... im mniej tym lepiej
Opóźnienie DPC
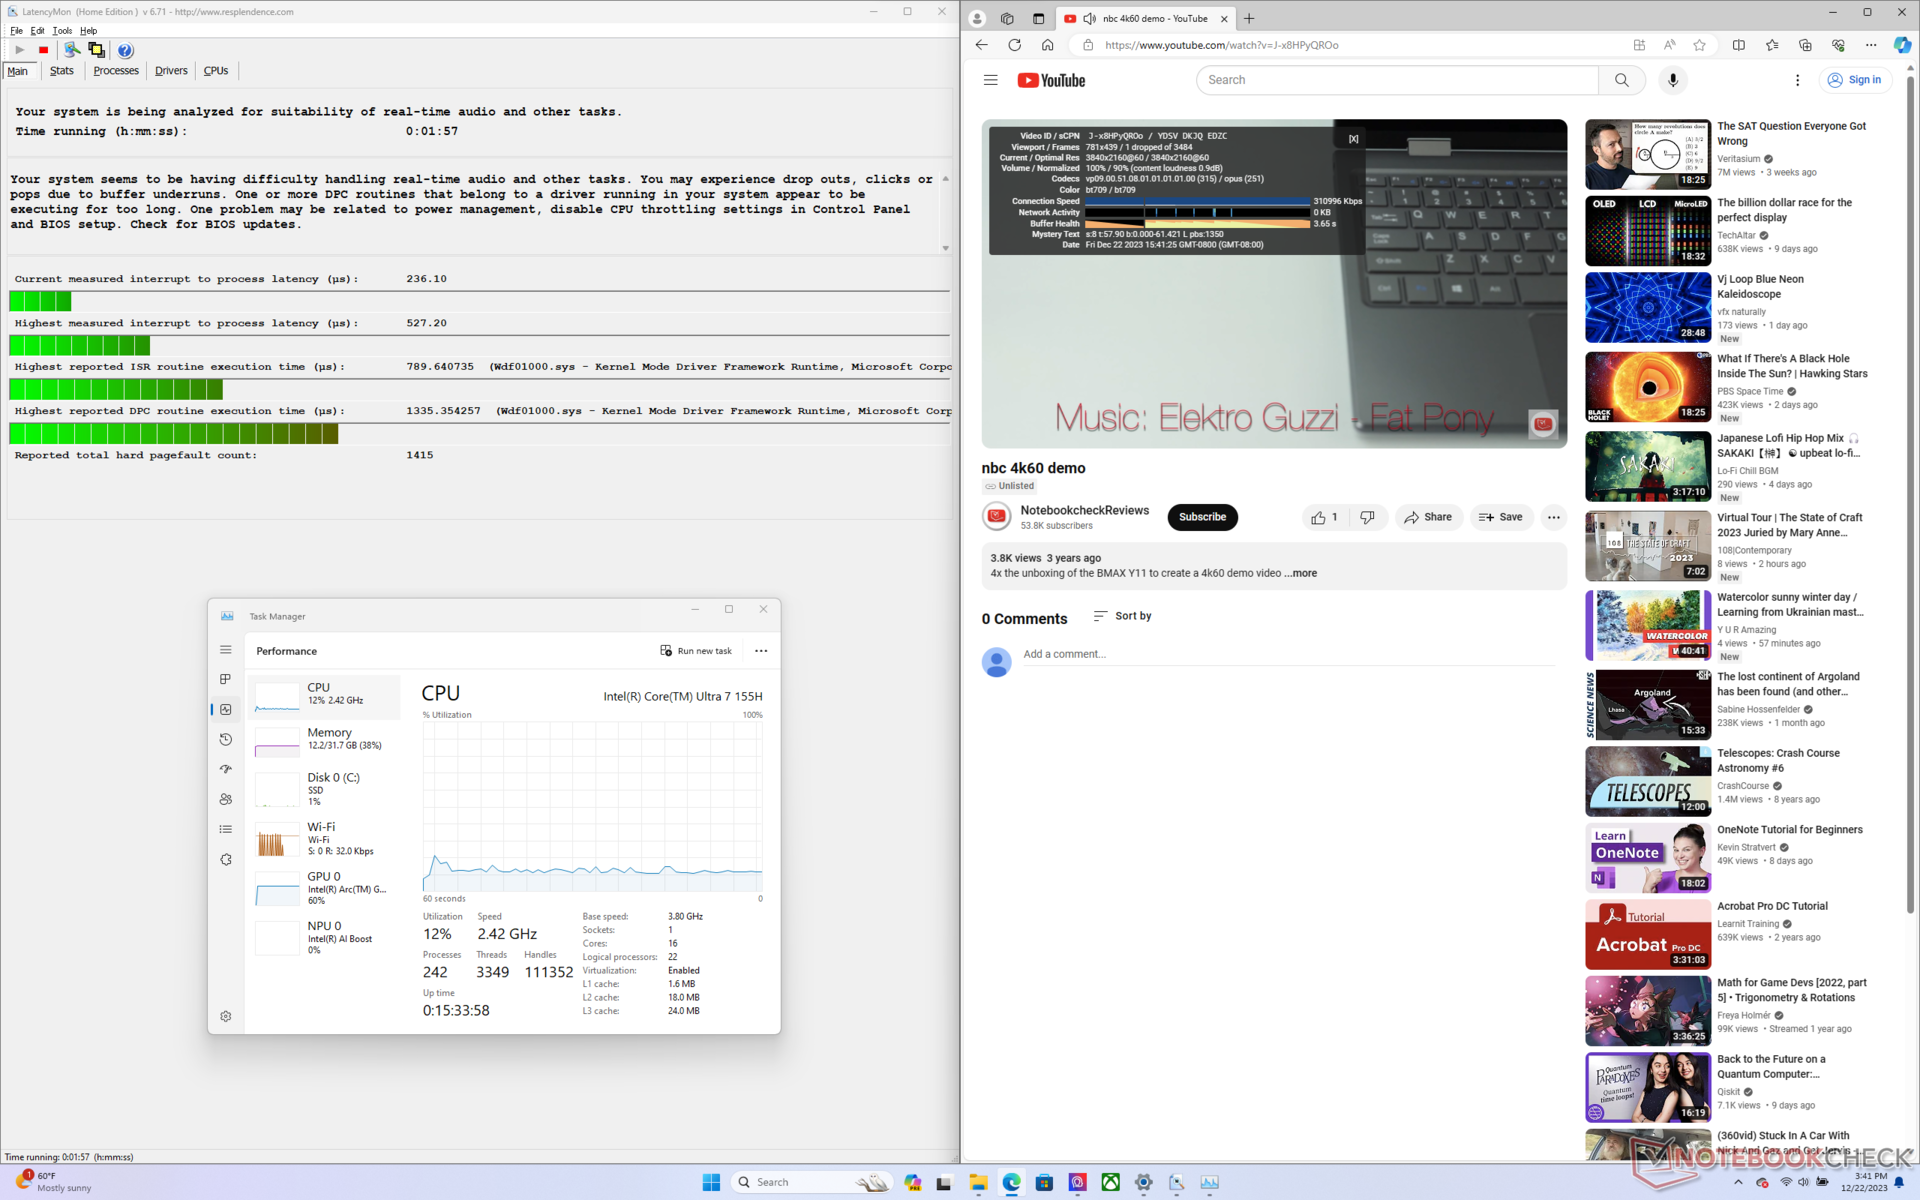
LatencyMon ujawnia tylko niewielkie problemy z DPC podczas otwierania wielu kart przeglądarki na naszej stronie głównej. odtwarzanie wideo 4K przy 60 klatkach na sekundę jest prawie idealne, z zaledwie jedną utraconą klatką zarejestrowaną podczas 60-sekundowego filmu testowego.
| DPC Latencies / LatencyMon - interrupt to process latency (max), Web, Youtube, Prime95 | |
| LG Gram 2in1 16 16T90R - G.AA78G | |
| Asus VivoBook Pro 16 K6602VU | |
| MSI Prestige 15 A12UD-093 | |
| Lenovo ThinkBook 16 G6 ABP | |
| Dell Inspiron 16 Plus 7630 | |
| MSI Prestige 16 B1MG-001US | |
* ... im mniej tym lepiej
Urządzenia pamięci masowej
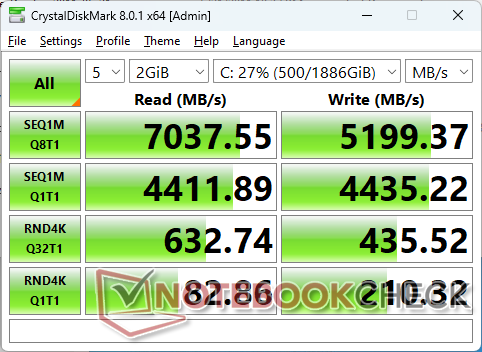
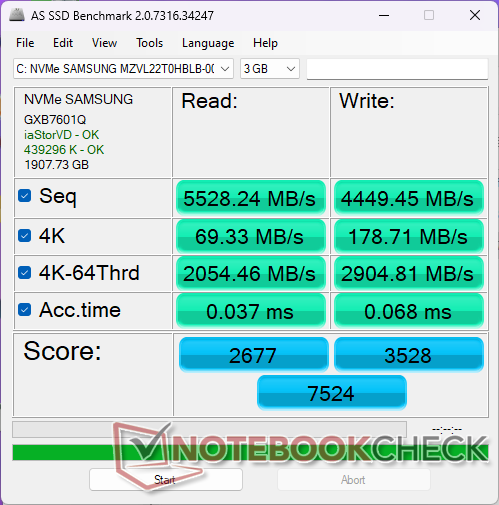
Nasze urządzenie jest wyposażone w dysk 2 TB Samsung PM9A1 który jest jednym z najszybszych dostępnych dysków SSD PCIe4 x4 NVMe klasy konsumenckiej i stanowi ulepszenie w stosunku do Micron 3400 w naszym starszym Prestige 15. Dysk jest w stanie utrzymać prędkość ~7100 MB/s nawet pod obciążeniem, co jest imponujące, biorąc pod uwagę cienkość obudowy.

| Drive Performance rating - Percent | |
| MSI Prestige 16 B1MG-001US | |
| LG Gram 2in1 16 16T90R - G.AA78G | |
| MSI Prestige 15 A12UD-093 | |
| Dell Inspiron 16 Plus 7630 | |
| Lenovo ThinkBook 16 G6 ABP | |
| Asus VivoBook Pro 16 K6602VU | |
* ... im mniej tym lepiej
Disk Throttling: DiskSpd Read Loop, Queue Depth 8
Wydajność GPU - odzyskanie korony zintegrowanych układów graficznych
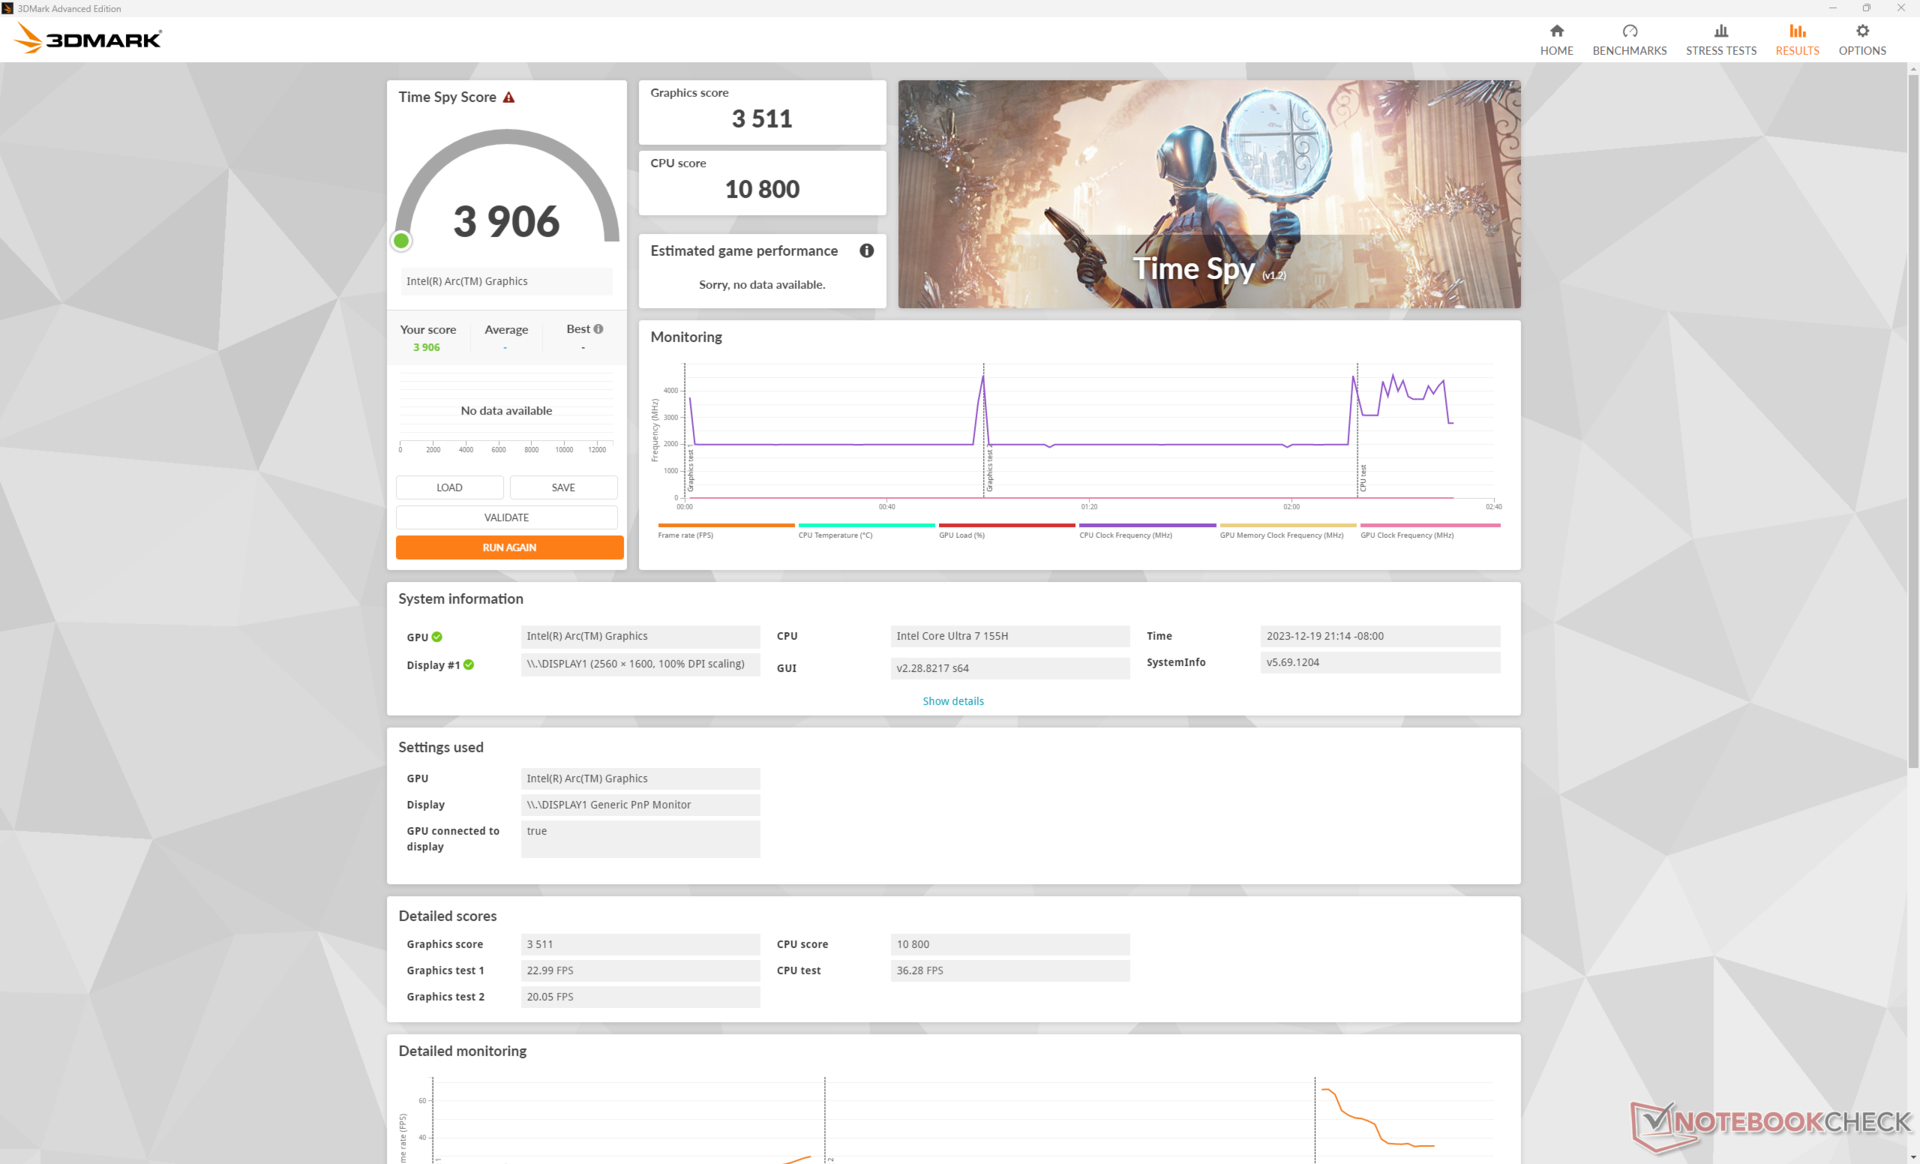
Po kilku ostatnich latach stagnacji, Intel w końcu zmodernizował swój zintegrowany procesor graficzny, aby był bardziej konkurencyjny w stosunku do konkurencyjnego Radeon 680M i 780M i 780M. wyniki 3DMark pokazują, że nasz Arc 8 wyprzedza Radeona 780M o około 20 procent, a nawet do 50 procent w tytułach obsługujących DX12. Użytkownicy przesiadający się z popularnych Iris Xe 96 EUs powinni spodziewać się wzrostu wydajności od 1,5x do 2x. Nie jest to jeszcze poziom GeForce RTX 3050 Ti, ale wyniki zdecydowanie zbliżają się do poziomu GeForce RTX 2050.
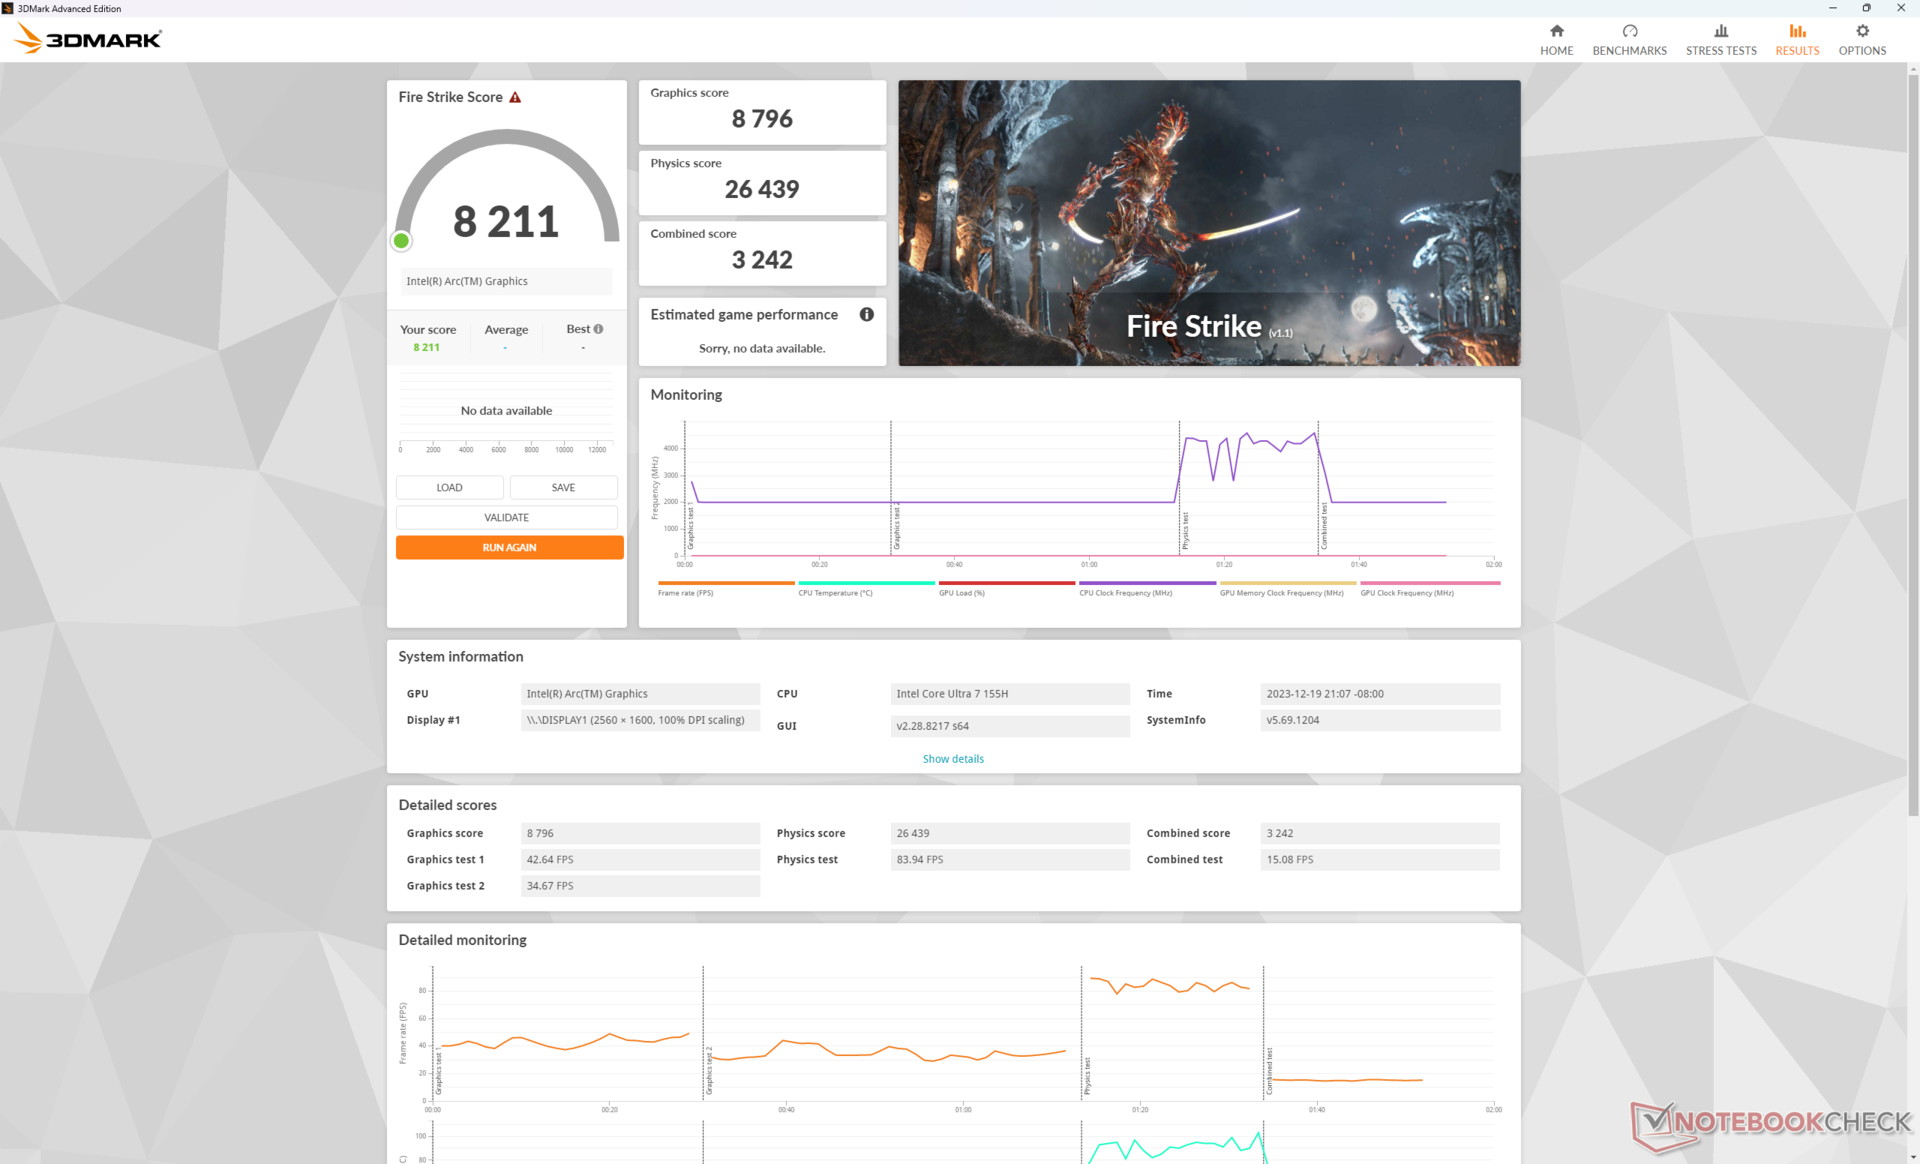
| Profil zasilania | Wynik fizyki | Wynik grafiki | Łączny wynik |
| Ekstremalna wydajność (Cooler Boost włączony) | 26439 | 8796 | 3242 |
| Ekstremalna wydajność (Cooler Boost wyłączony) | 26460 (-0%) | 8614 (-2%) | 3187 (-2%) |
| Tryb zrównoważony | 25110 (-5%) | 8814 (-0%) | 3306 (-0%) |
| Tryb baterii | 21717 (-18%) | 7425 (-16%) | 2761 (-15%) |
Włączenie funkcji Cooler Boost nie wydaje się znacząco wpływać na wydajność, zgodnie z powyższą tabelą wyników Fire Strike. Praca w trybie zrównoważonym wpłynęłaby na wydajność procesora tylko nieznacznie, podczas gdy tryb baterii zmniejszyłby wydajność bardziej znacząco o około 15 procent.
| 3DMark Performance rating - Percent | |
| Dell Inspiron 16 Plus 7630 | |
| Asus VivoBook Pro 16 K6602VU | |
| MSI Creator Z16 A11UET-209 | |
| Asus Vivobook Pro 16X-M7600QE | |
| Asus VivoBook Pro 16X OLED N7600PC-L2026X | |
| MSI Prestige 16 B1MG-001US | |
| HP Envy 17-cr0079ng | |
| Przeciętny Intel Arc 8-Core iGPU | |
| MSI Prestige 15 A12UD-093 | |
| Acer Swift Edge SFE16 Ryzen 7 7840U | |
| Acer Swift Edge SFE16-42-R1GM | |
| Acer Swift 3 SF316-51 | |
| LG Gram 2in1 16 16T90R - G.AA78G | |
| Lenovo IdeaPad 5 Pro 16ARH7 | |
| Lenovo ThinkPad T16 G2 21HH003AGE | |
| LG Gram 16Z90Q | |
| Lenovo ThinkBook 16 G6 ABP | |
| 3DMark 11 - 1280x720 Performance GPU | |
| Dell Inspiron 16 Plus 7630 | |
| Asus VivoBook Pro 16 K6602VU | |
| MSI Creator Z16 A11UET-209 | |
| Asus Vivobook Pro 16X-M7600QE | |
| Asus VivoBook Pro 16X OLED N7600PC-L2026X | |
| MSI Prestige 16 B1MG-001US | |
| HP Envy 17-cr0079ng | |
| Przeciętny Intel Arc 8-Core iGPU (8064 - 13716, n=40) | |
| Acer Swift Edge SFE16 Ryzen 7 7840U | |
| Acer Swift Edge SFE16-42-R1GM | |
| MSI Prestige 15 A12UD-093 | |
| LG Gram 2in1 16 16T90R - G.AA78G | |
| Acer Swift 3 SF316-51 | |
| Lenovo IdeaPad 5 Pro 16ARH7 | |
| Lenovo ThinkPad T16 G2 21HH003AGE | |
| LG Gram 16Z90Q | |
| Lenovo ThinkBook 16 G6 ABP | |
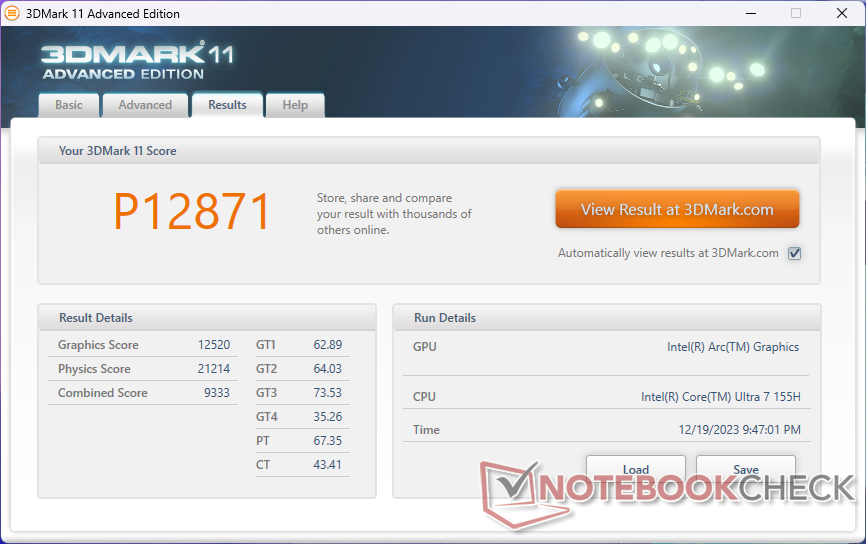
| 3DMark 11 Performance | 12871 pkt. | |
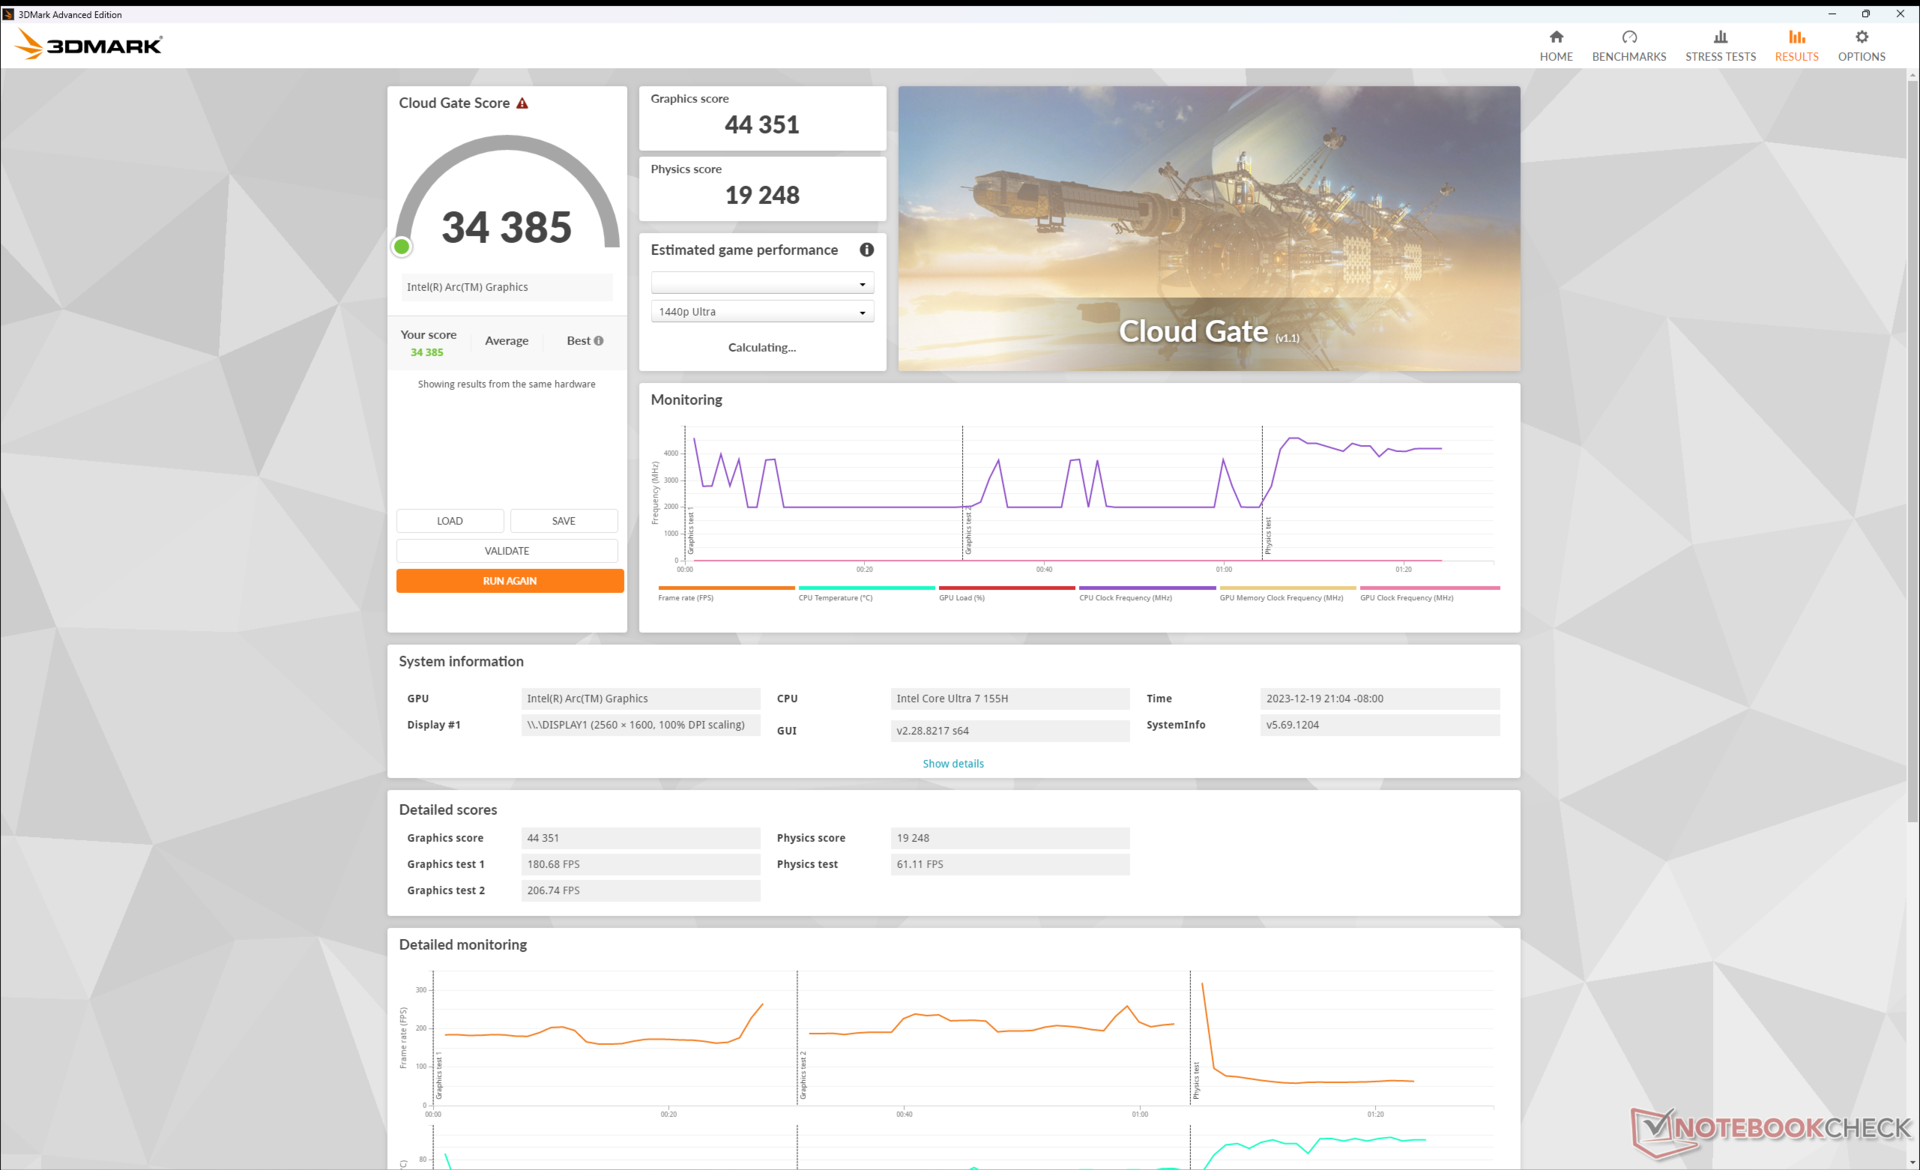
| 3DMark Cloud Gate Standard Score | 34385 pkt. | |
| 3DMark Fire Strike Score | 8211 pkt. | |
| 3DMark Time Spy Score | 3906 pkt. | |
Pomoc | ||
* ... im mniej tym lepiej
Wydajność w grach
Wydajność w świecie rzeczywistym podczas uruchamiania gier jest doskonała, a wyniki rywalizują z kartami GeForce 3050 Ti w zeszłorocznym Prestige 15, na co wskazują powyższe wyniki syntetycznych testów porównawczych. Przykładowo, Far Cry 5 i F1 22 osiągają od 5 do 15 procent wydajności Prestige 15. Proszę pamiętać, że procesor graficzny GeForce w Prestige 15 wykazywał godne uwagi problemy z dławieniem, które znacznie wpływały na jego wydajność; zdecydowana większość innych laptopów GeForce RTX 3050 Ti, takich jak Asus Vivobook Pro 16Xnadal uruchamiała gry znacznie szybciej niż nasz zintegrowany Arc 8.
Ogólna wydajność jest jednak konsekwentnie lepsza od Radeona 780M we wszystkich testowanych grach o około 5 do 20 procent. Kilka gier DX12, takich jak Tiny Tina's Wonderlands i F1 22, działałoby nawet o 50 do 60 procent lepiej na nowym GPU Intela.
| The Witcher 3 - 1920x1080 Ultra Graphics & Postprocessing (HBAO+) | |
| Dell Inspiron 16 Plus 7630 | |
| Asus VivoBook Pro 16 K6602VU | |
| MSI Prestige 16 B1MG-001US | |
| MSI Prestige 15 A12UD-093 | |
| LG Gram 2in1 16 16T90R - G.AA78G | |
| Lenovo ThinkBook 16 G6 ABP | |
| GTA V - 1920x1080 Highest AA:4xMSAA + FX AF:16x | |
| Asus VivoBook Pro 16 K6602VU | |
| MSI Prestige 15 A12UD-093 | |
| Lenovo ThinkBook 16 G6 ABP | |
| LG Gram 2in1 16 16T90R - G.AA78G | |
| Final Fantasy XV Benchmark - 1920x1080 High Quality | |
| Dell Inspiron 16 Plus 7630 | |
| Asus VivoBook Pro 16 K6602VU | |
| MSI Prestige 16 B1MG-001US | |
| MSI Prestige 15 A12UD-093 | |
| LG Gram 2in1 16 16T90R - G.AA78G | |
| Lenovo ThinkBook 16 G6 ABP | |
| Strange Brigade - 1920x1080 ultra AA:ultra AF:16 | |
| Dell Inspiron 16 Plus 7630 | |
| Asus VivoBook Pro 16 K6602VU | |
| MSI Prestige 16 B1MG-001US | |
| MSI Prestige 15 A12UD-093 | |
| LG Gram 2in1 16 16T90R - G.AA78G | |
| Lenovo ThinkBook 16 G6 ABP | |
| Dota 2 Reborn - 1920x1080 ultra (3/3) best looking | |
| Dell Inspiron 16 Plus 7630 | |
| Asus VivoBook Pro 16 K6602VU | |
| MSI Prestige 16 B1MG-001US | |
| MSI Prestige 15 A12UD-093 | |
| LG Gram 2in1 16 16T90R - G.AA78G | |
| Lenovo ThinkBook 16 G6 ABP | |
| X-Plane 11.11 - 1920x1080 high (fps_test=3) | |
| Dell Inspiron 16 Plus 7630 | |
| Asus VivoBook Pro 16 K6602VU | |
| MSI Prestige 15 A12UD-093 | |
| LG Gram 2in1 16 16T90R - G.AA78G | |
| MSI Prestige 16 B1MG-001US | |
| Lenovo ThinkBook 16 G6 ABP | |
| Baldur's Gate 3 | |
| 1280x720 Low Preset AA:SM | |
| MSI Prestige 16 B1MG-001US | |
| Przeciętny Intel Arc 8-Core iGPU (31.8 - 57.6, n=15) | |
| 1920x1080 Low Preset AA:SM | |
| MSI Prestige 16 B1MG-001US | |
| Przeciętny Intel Arc 8-Core iGPU (21 - 40.3, n=27) | |
| 1920x1080 Medium Preset AA:T | |
| MSI Prestige 16 B1MG-001US | |
| Przeciętny Intel Arc 8-Core iGPU (16.3 - 31.1, n=28) | |
| 1920x1080 High Preset AA:T | |
| MSI Prestige 16 B1MG-001US | |
| Przeciętny Intel Arc 8-Core iGPU (15.4 - 27.7, n=27) | |
| 1920x1080 Ultra Preset AA:T | |
| MSI Prestige 16 B1MG-001US | |
| Przeciętny Intel Arc 8-Core iGPU (14.2 - 26.2, n=26) | |
| Cyberpunk 2077 | |
| 1280x720 Low Preset (FSR off) | |
| MSI Prestige 16 B1MG-001US | |
| Przeciętny Intel Arc 8-Core iGPU (34.5 - 58, n=20) | |
| LG Gram 2in1 16 16T90R - G.AA78G | |
| 1920x1080 Low Preset (FSR off) | |
| MSI Prestige 16 B1MG-001US | |
| Przeciętny Intel Arc 8-Core iGPU (11.3 - 38, n=38) | |
| LG Gram 2in1 16 16T90R - G.AA78G | |
| 1920x1080 Medium Preset (FSR off) | |
| MSI Prestige 16 B1MG-001US | |
| Przeciętny Intel Arc 8-Core iGPU (9.42 - 31.4, n=36) | |
| LG Gram 2in1 16 16T90R - G.AA78G | |
| 1920x1080 High Preset (FSR off) | |
| MSI Prestige 16 B1MG-001US | |
| Przeciętny Intel Arc 8-Core iGPU (7.3 - 27.6, n=36) | |
| LG Gram 2in1 16 16T90R - G.AA78G | |
| 1920x1080 Ultra Preset (FSR off) | |
| MSI Prestige 16 B1MG-001US | |
| Przeciętny Intel Arc 8-Core iGPU (13 - 24.7, n=28) | |
| LG Gram 2in1 16 16T90R - G.AA78G | |
Witcher 3 FPS Chart
| low | med. | high | ultra | |
|---|---|---|---|---|
| The Witcher 3 (2015) | 135.6 | 88.2 | 54.1 | 25.2 |
| Dota 2 Reborn (2015) | 101.7 | 92.8 | 79.1 | 75.6 |
| Final Fantasy XV Benchmark (2018) | 61 | 37.3 | 24.6 | |
| X-Plane 11.11 (2018) | 52.2 | 46.7 | 37.8 | |
| Far Cry 5 (2018) | 63 | 39 | 36 | 34 |
| Strange Brigade (2018) | 179.5 | 71 | 57.8 | 46.1 |
| Tiny Tina's Wonderlands (2022) | 53.3 | 41.2 | 30.1 | 25.1 |
| F1 22 (2022) | 77.7 | 71.6 | 53.3 | 15.3 |
| Baldur's Gate 3 (2023) | 31.9 | 28.2 | 24.1 | 23.4 |
| Cyberpunk 2077 (2023) | 35.7 | 29.5 | 25.2 | 22.1 |
Emisje - głośne jak na laptopa ze zintegrowaną grafiką
Hałas systemowy
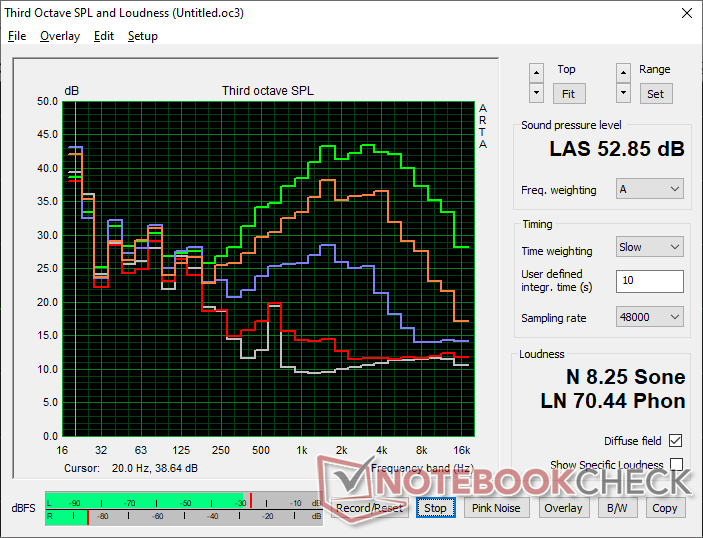
Hałas wentylatora jest cichszy niż Prestige 15 podczas pracy przy niższym obciążeniu, podczas gdy przy wyższym obciążeniu jest odwrotnie. Na przykład podczas przeglądania stron internetowych lub strumieniowania wideo, hałas wentylatora ma tendencję do wahania się między 26 a 37 dB(A) w porównaniu do 31 do 42 dB(A) w starszym modelu. Uruchamianie wymagających obciążeń, takich jak Witcher 3 zwiększyłoby hałas wentylatora do 46 dB(A) lub nawet do 53 dB(A), jeśli Cooler Boost jest aktywny. Średni zakres 40 dB(A) jest raczej głośny dla laptopa działającego tylko na zintegrowanej grafice.
Spodziewamy się, że hałas wentylatorów w jednostkach SKU z dyskretną grafiką będzie zachowywał się inaczej niż to, czego doświadczyliśmy na naszej jednostce testowej iGPU.
Hałas
| luz |
| 24.5 / 26.3 / 26.3 dB |
| obciążenie |
| 36.5 / 52.9 dB |
 | ||
30 dB cichy 40 dB(A) słyszalny 50 dB(A) irytujący |
||
min: | ||
| MSI Prestige 16 B1MG-001US Arc 8-Core, Ultra 7 155H, Samsung PM9A1 MZVL22T0HBLB | MSI Prestige 15 A12UD-093 GeForce RTX 3050 Ti Laptop GPU, i7-1280P, Micron 3400 1TB MTFDKBA1T0TFH | LG Gram 2in1 16 16T90R - G.AA78G Iris Xe G7 96EUs, i7-1360P, Samsung PM9A1 MZVL21T0HCLR | Lenovo ThinkBook 16 G6 ABP Vega 7, R5 7530U, SK hynix HFS512GEJ9X125N | Asus VivoBook Pro 16 K6602VU GeForce RTX 4050 Laptop GPU, i9-13900H, Micron 2400 MTFDKBA1T0QFM | Dell Inspiron 16 Plus 7630 GeForce RTX 4060 Laptop GPU, i7-13700H, WD PC SN740 SDDPTQD-1T00 | |
|---|---|---|---|---|---|---|
| Noise | -6% | 8% | 13% | -4% | 4% | |
| wyłączone / środowisko * (dB) | 24.5 | 26 -6% | 25.1 -2% | 24.3 1% | 20.96 14% | 23.2 5% |
| Idle Minimum * (dB) | 24.5 | 26 -6% | 25.1 -2% | 24.3 1% | 25.28 -3% | 23.2 5% |
| Idle Average * (dB) | 26.3 | 30.7 -17% | 25.1 5% | 24.3 8% | 25.28 4% | 23.2 12% |
| Idle Maximum * (dB) | 26.3 | 30.7 -17% | 26.1 1% | 24.3 8% | 25.28 4% | 23.2 12% |
| Load Average * (dB) | 36.5 | 41.9 -15% | 31.4 14% | 29.7 19% | 51.88 -42% | 35.1 4% |
| Witcher 3 ultra * (dB) | 46.3 | 41.1 11% | 32.1 31% | 49 -6% | 52.5 -13% | |
| Load Maximum * (dB) | 52.9 | 40.7 23% | 36.6 31% | 41.4 22% | 51.8 2% | 52.5 1% |
* ... im mniej tym lepiej
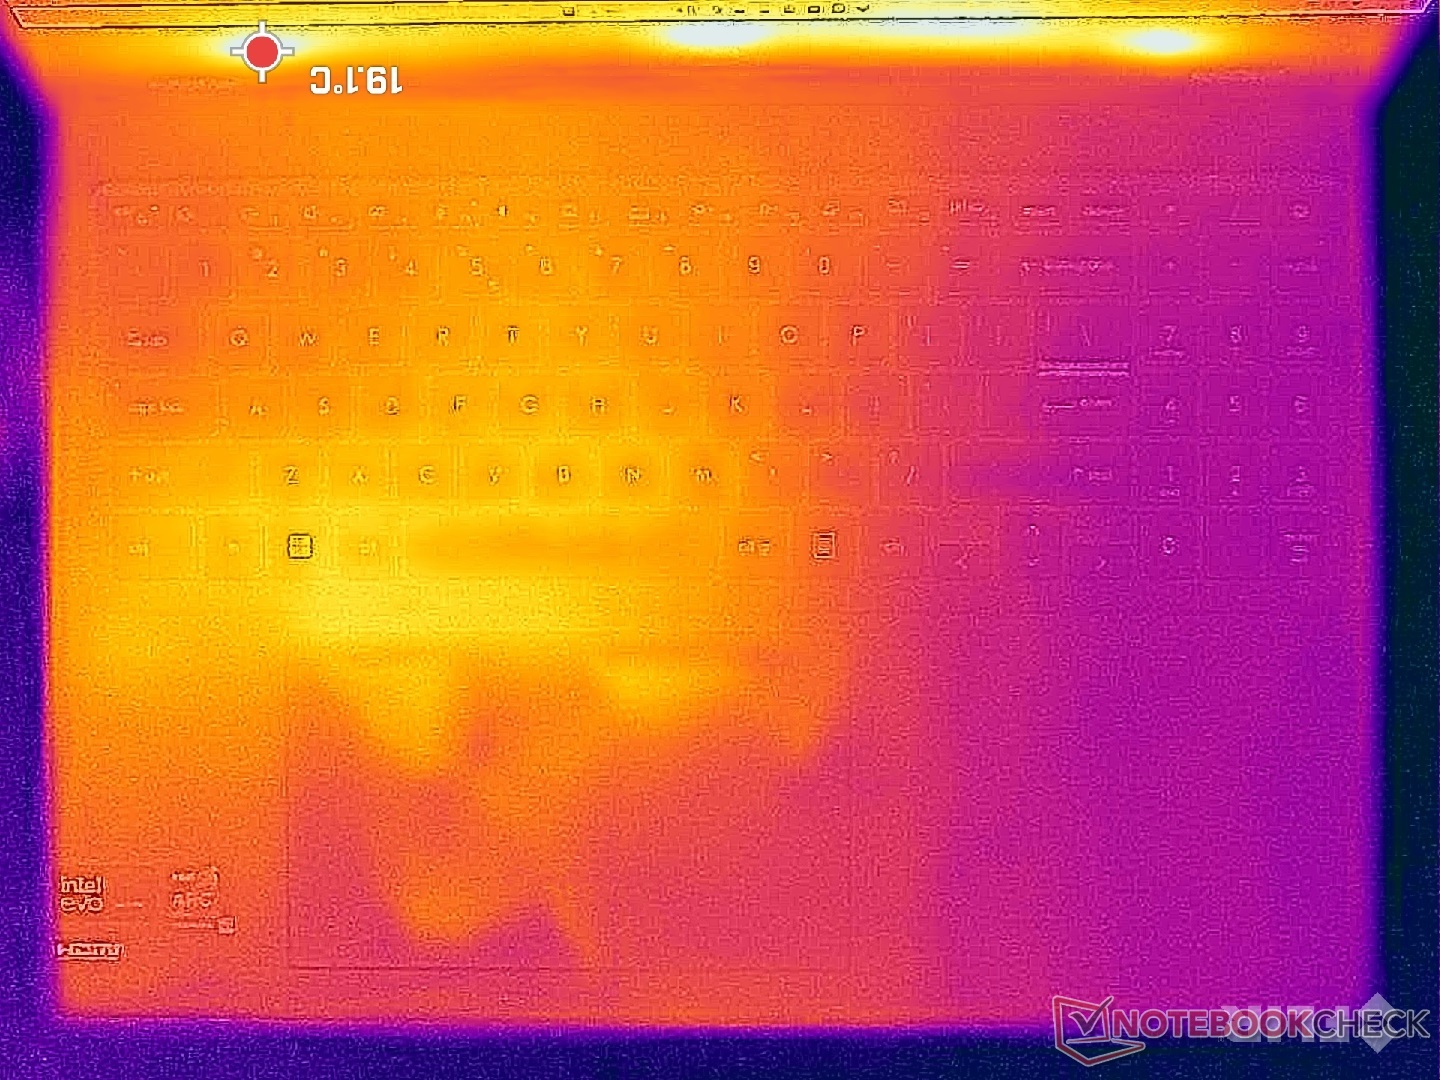
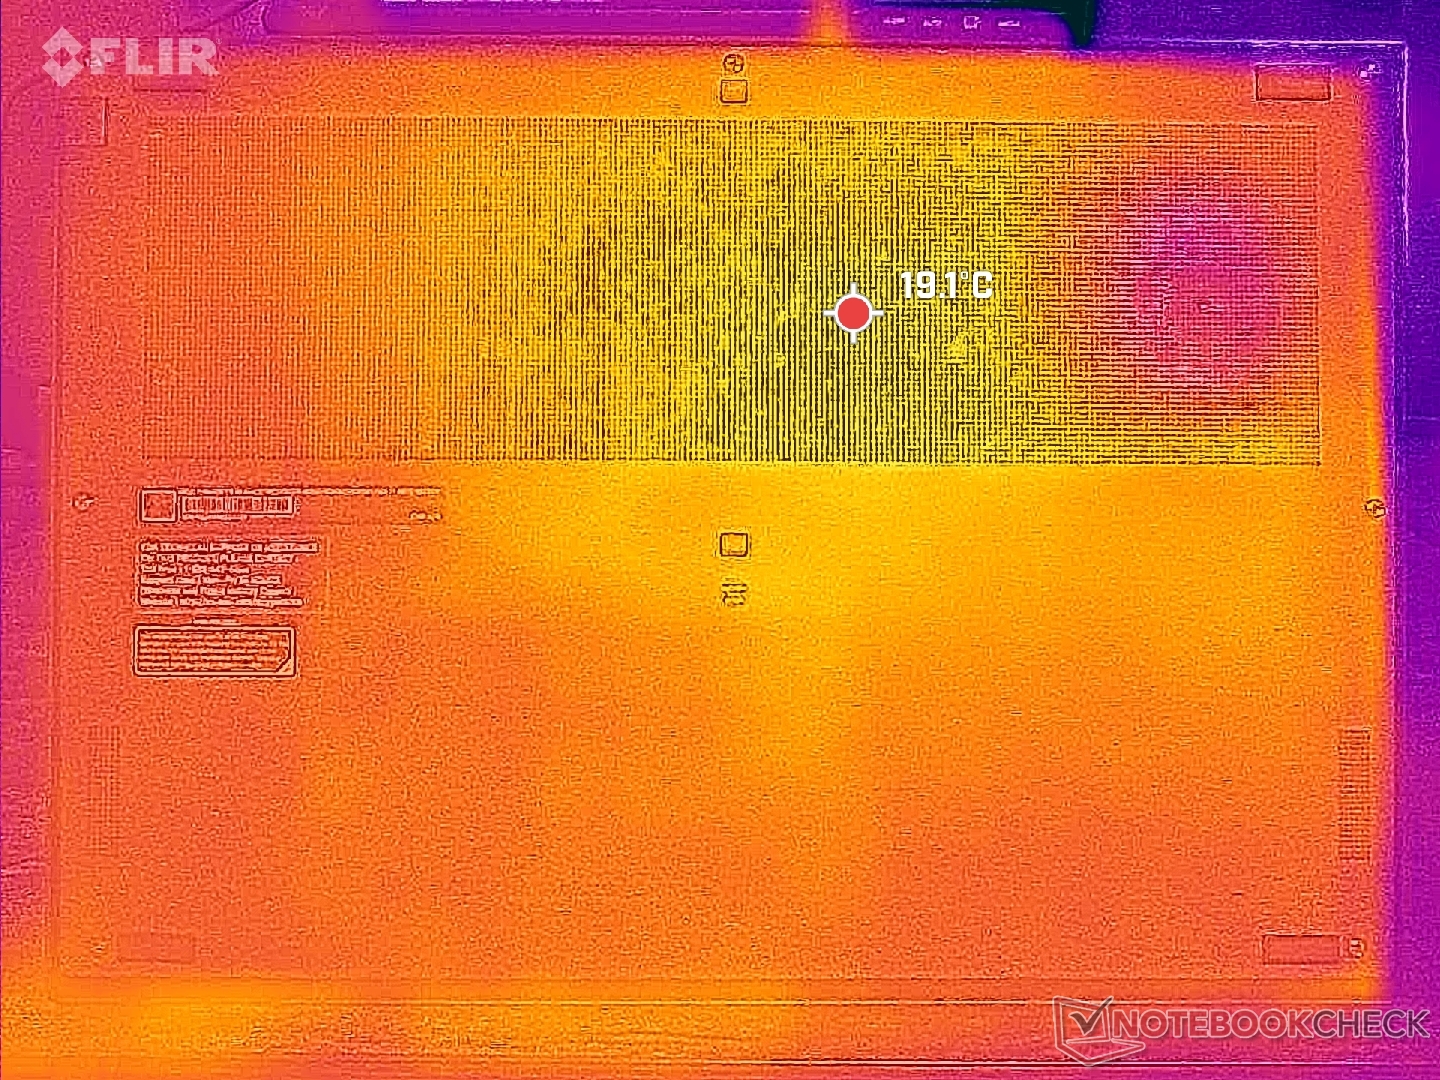
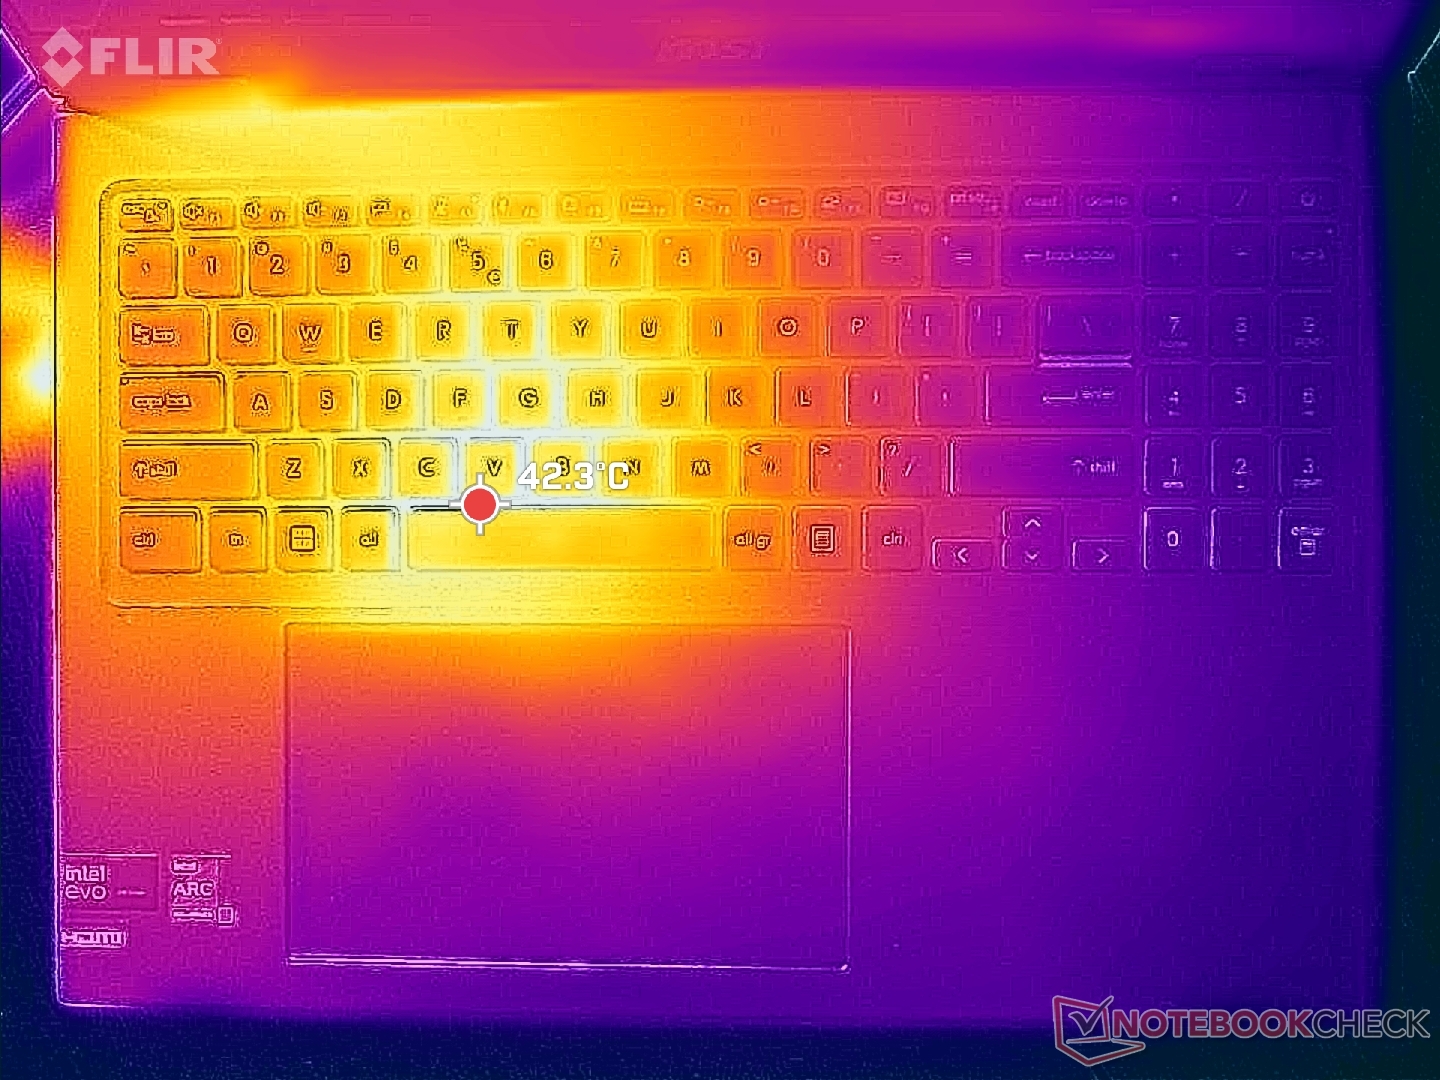
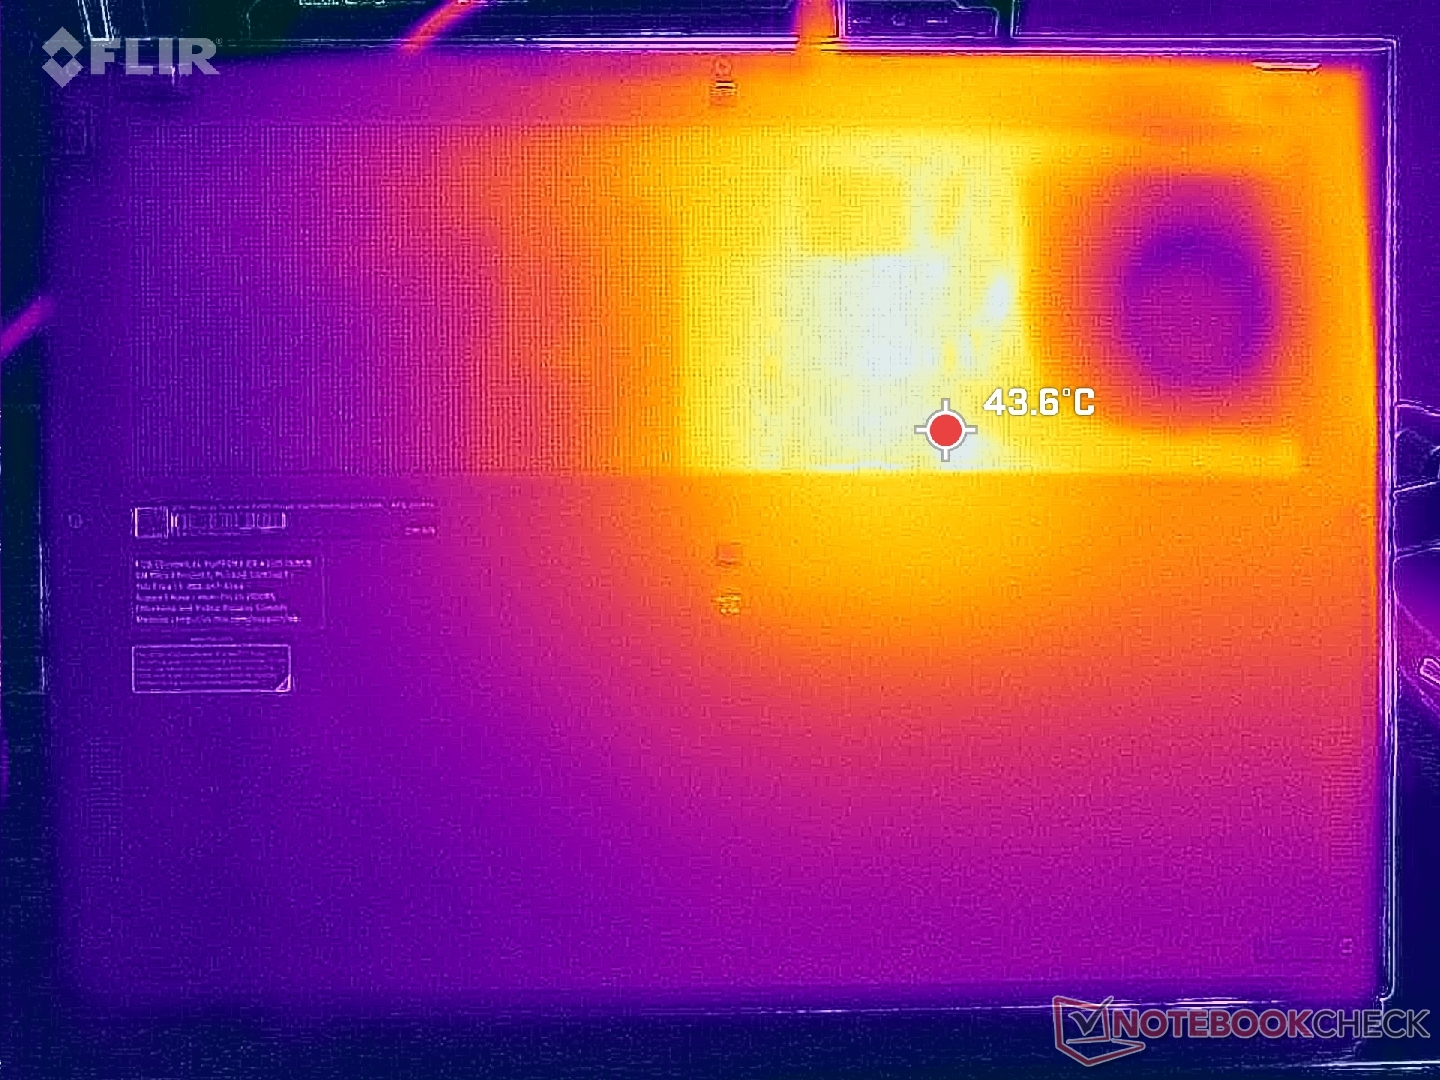
Temperatura
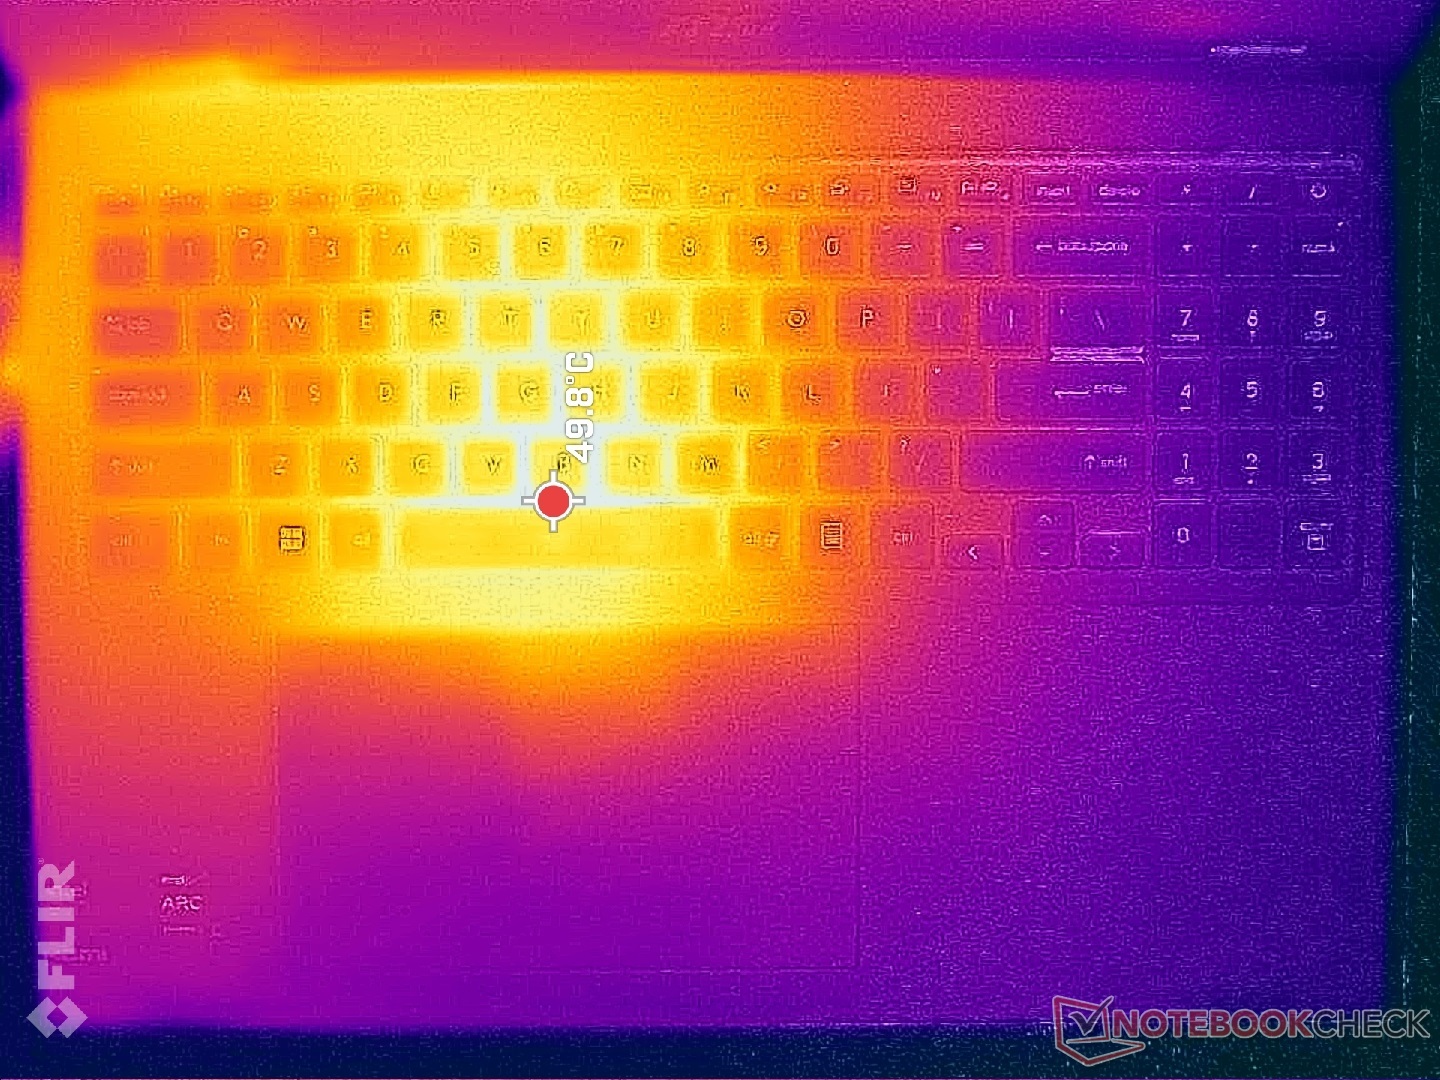
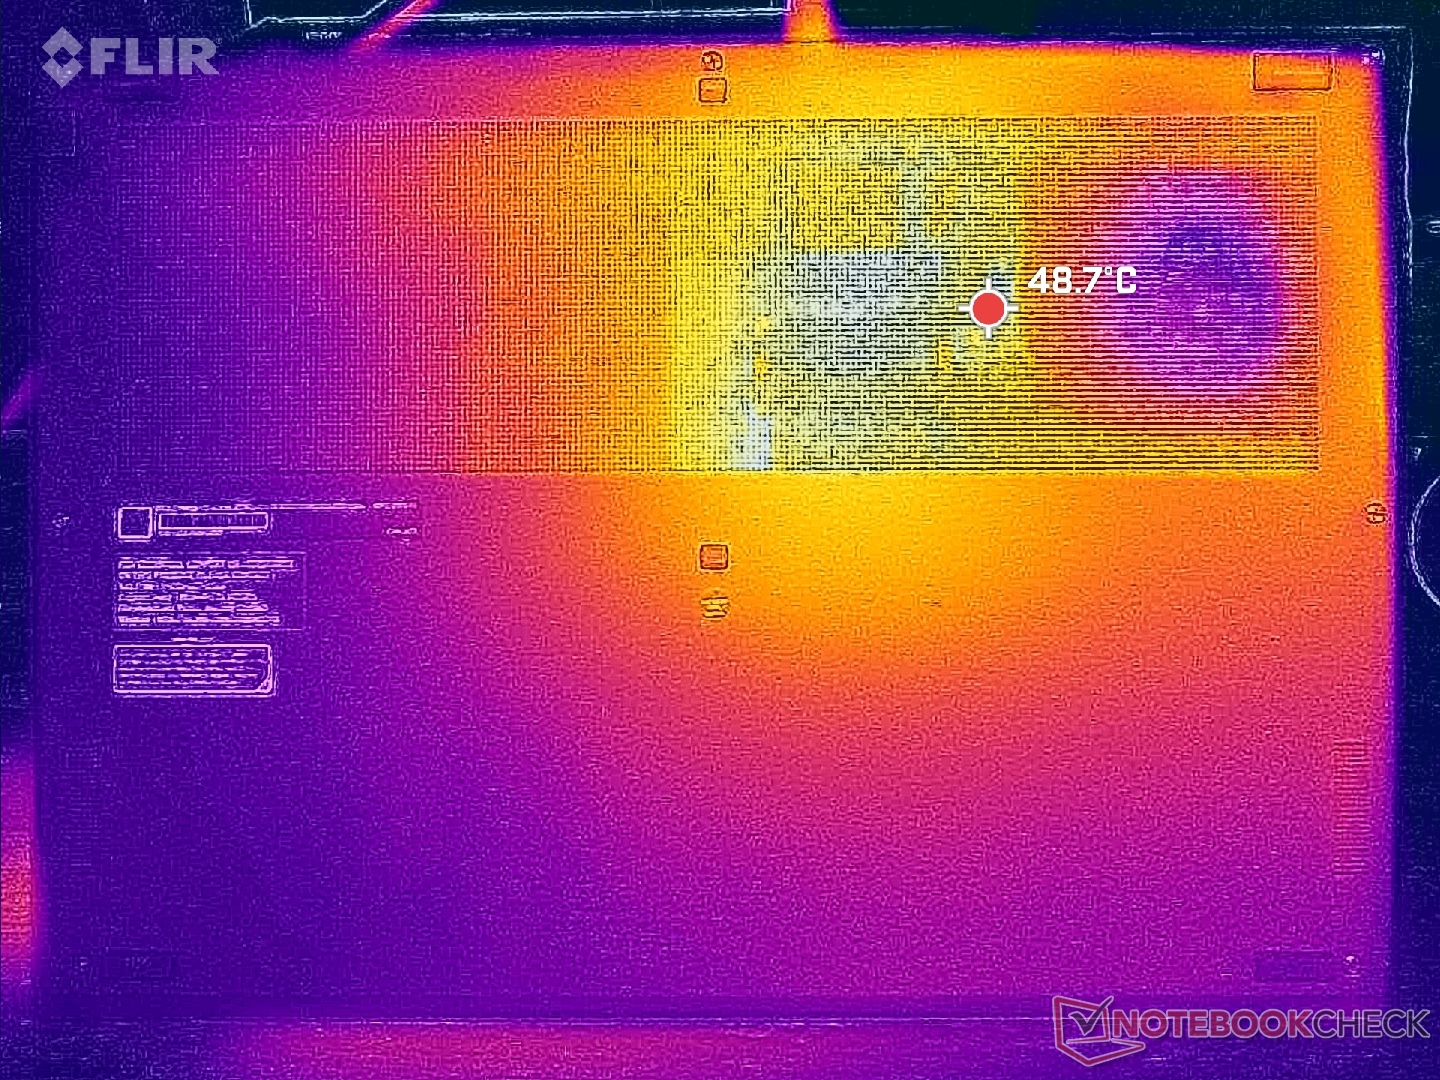
Temperatury powierzchniowe są wyższe na lewej połowie laptopa niż na prawej ze względu na umiejscowienie procesora i rozwiązania chłodzącego wewnątrz. Gorący punkt w pobliżu klawisza spacji może osiągnąć nawet 50 C podczas pracy z wymagającymi obciążeniami, co jest podobne do gorącego punktu w zeszłorocznym Prestige 15 z dedykowanym procesorem graficznym GeForce RTX. W rezultacie klawisze WASD mogą być dość ciepłe podczas grania, ale podpórki pod nadgarstki i klawisze strzałek pozostaną znacznie chłodniejsze. Laptopy Prestige są generalnie cieplejsze niż przeciętny Ultrabook pod obciążeniem ze względu na ich kompaktową konstrukcję, a Prestige 16 nie jest wyjątkiem.
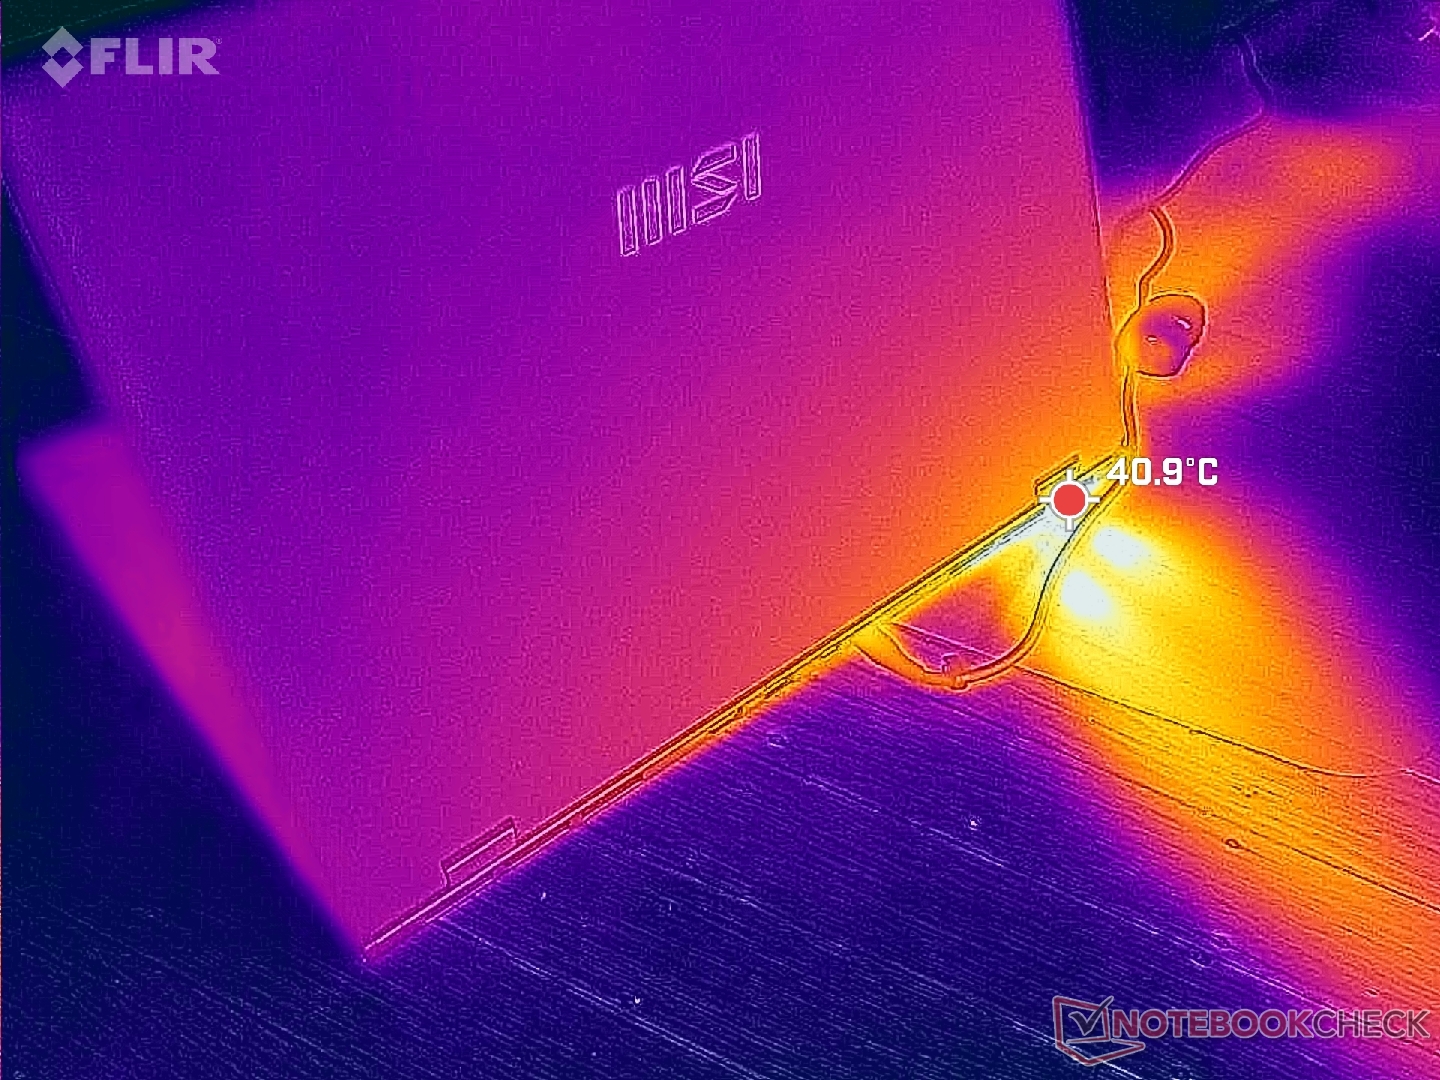
(-) Maksymalna temperatura w górnej części wynosi 48.8 °C / 120 F, w porównaniu do średniej 36.8 °C / 98 F , począwszy od 21 do 71 °C dla klasy Multimedia.
(-) Dno nagrzewa się maksymalnie do 47.6 °C / 118 F, w porównaniu do średniej 39.1 °C / 102 F
(+) W stanie bezczynności średnia temperatura górnej części wynosi 23 °C / 73 F, w porównaniu ze średnią temperaturą urządzenia wynoszącą 31.3 °C / ### class_avg_f### F.
(±) Podczas gry w Wiedźmina 3 średnia temperatura górnej części wynosi 33.3 °C / 92 F, w porównaniu do średniej temperatury urządzenia wynoszącej 31.3 °C / ## #class_avg_f### F.
(+) Podpórki pod nadgarstki i touchpad są chłodniejsze niż temperatura skóry i maksymalnie 30 °C / 86 F i dlatego są chłodne w dotyku.
(±) Średnia temperatura obszaru podparcia dłoni w podobnych urządzeniach wynosiła 28.7 °C / 83.7 F (-1.3 °C / -2.3 F).
| MSI Prestige 16 B1MG-001US Intel Core Ultra 7 155H, Intel Arc 8-Core iGPU | MSI Prestige 15 A12UD-093 Intel Core i7-1280P, NVIDIA GeForce RTX 3050 Ti Laptop GPU | LG Gram 2in1 16 16T90R - G.AA78G Intel Core i7-1360P, Intel Iris Xe Graphics G7 96EUs | Lenovo ThinkBook 16 G6 ABP AMD Ryzen 5 7530U, AMD Radeon RX Vega 7 | Asus VivoBook Pro 16 K6602VU Intel Core i9-13900H, NVIDIA GeForce RTX 4050 Laptop GPU | Dell Inspiron 16 Plus 7630 Intel Core i7-13700H, NVIDIA GeForce RTX 4060 Laptop GPU | |
|---|---|---|---|---|---|---|
| Heat | -16% | -25% | -15% | -30% | -20% | |
| Maximum Upper Side * (°C) | 48.8 | 49 -0% | 55 -13% | 40.8 16% | 42.6 13% | 47.8 2% |
| Maximum Bottom * (°C) | 47.6 | 52.6 -11% | 55.4 -16% | 50.5 -6% | 48.4 -2% | 42.2 11% |
| Idle Upper Side * (°C) | 24.2 | 29.7 -23% | 34.9 -44% | 29.3 -21% | 39.4 -63% | 35.2 -45% |
| Idle Bottom * (°C) | 23.6 | 30.7 -30% | 30 -27% | 35.2 -49% | 39.8 -69% | 35 -48% |
* ... im mniej tym lepiej
Test warunków skrajnych
Moc pakietu CPU wzrosła do 110 W, 2,8 GHz i 96 C przez zaledwie kilka sekund podczas inicjowania stresu Prime95, po czym szybko spadła i ustabilizowała się na poziomie 2,2 GHz, 44 W i 83 C. Ten zakres jest cieplejszy niż przeciętny dla ultrabooka, ale poza tym jest typowy dla modelu Prestige. Acer Swift Edge SFE16 Acer Swift Edge SFE16 z procesorem Ryzen 7 7840U, na przykład, ustabilizowałby się na chłodniejszym poziomie 64 C, podczas gdy zasilany przez Core H Lenovo Slim Pro 9i 16IRP8 ustabilizowałby się na poziomie 77 C w podobnych warunkach.
Praca z aktywną funkcją Cooler Boost nie wydaje się wpływać na wydajność. Na przykład, procesor ustabilizowałby się na poziomie 85 C podczas pracy Witcher 3 przy wyłączonym Cooler Boost w porównaniu do 77 C przy włączonym Cooler Boost, podczas gdy częstotliwości taktowania GPU pozostałyby niezmienione. O ile temperatury rdzenia nie są powodem do niepokoju, tryb Cooler Boost generalnie nie jest potrzebny do uzyskania maksymalnej wydajności. Obserwacja ta pokrywa się z naszymi doświadczeniami z wieloma innymi laptopami MSI wyposażonymi w funkcję Cooler Boost.
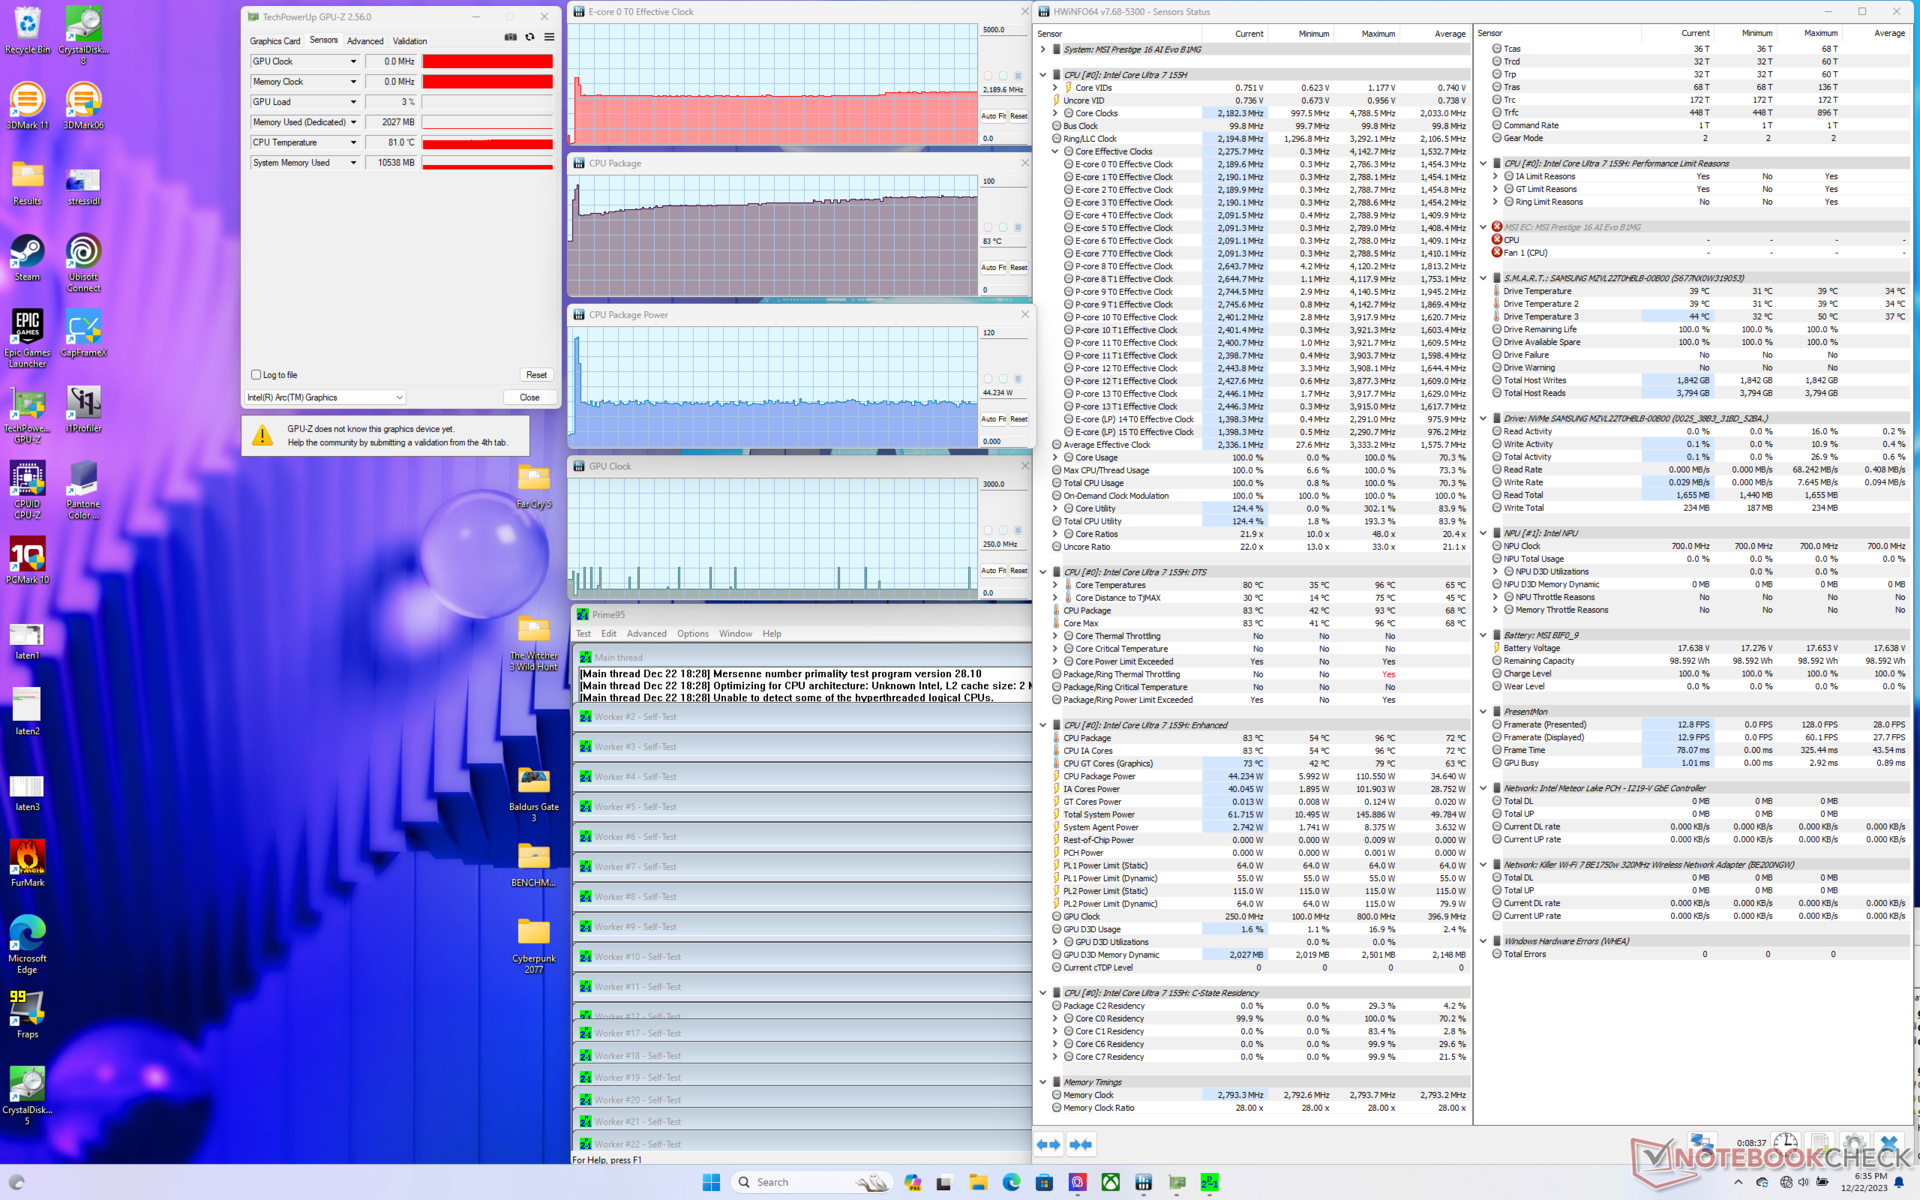
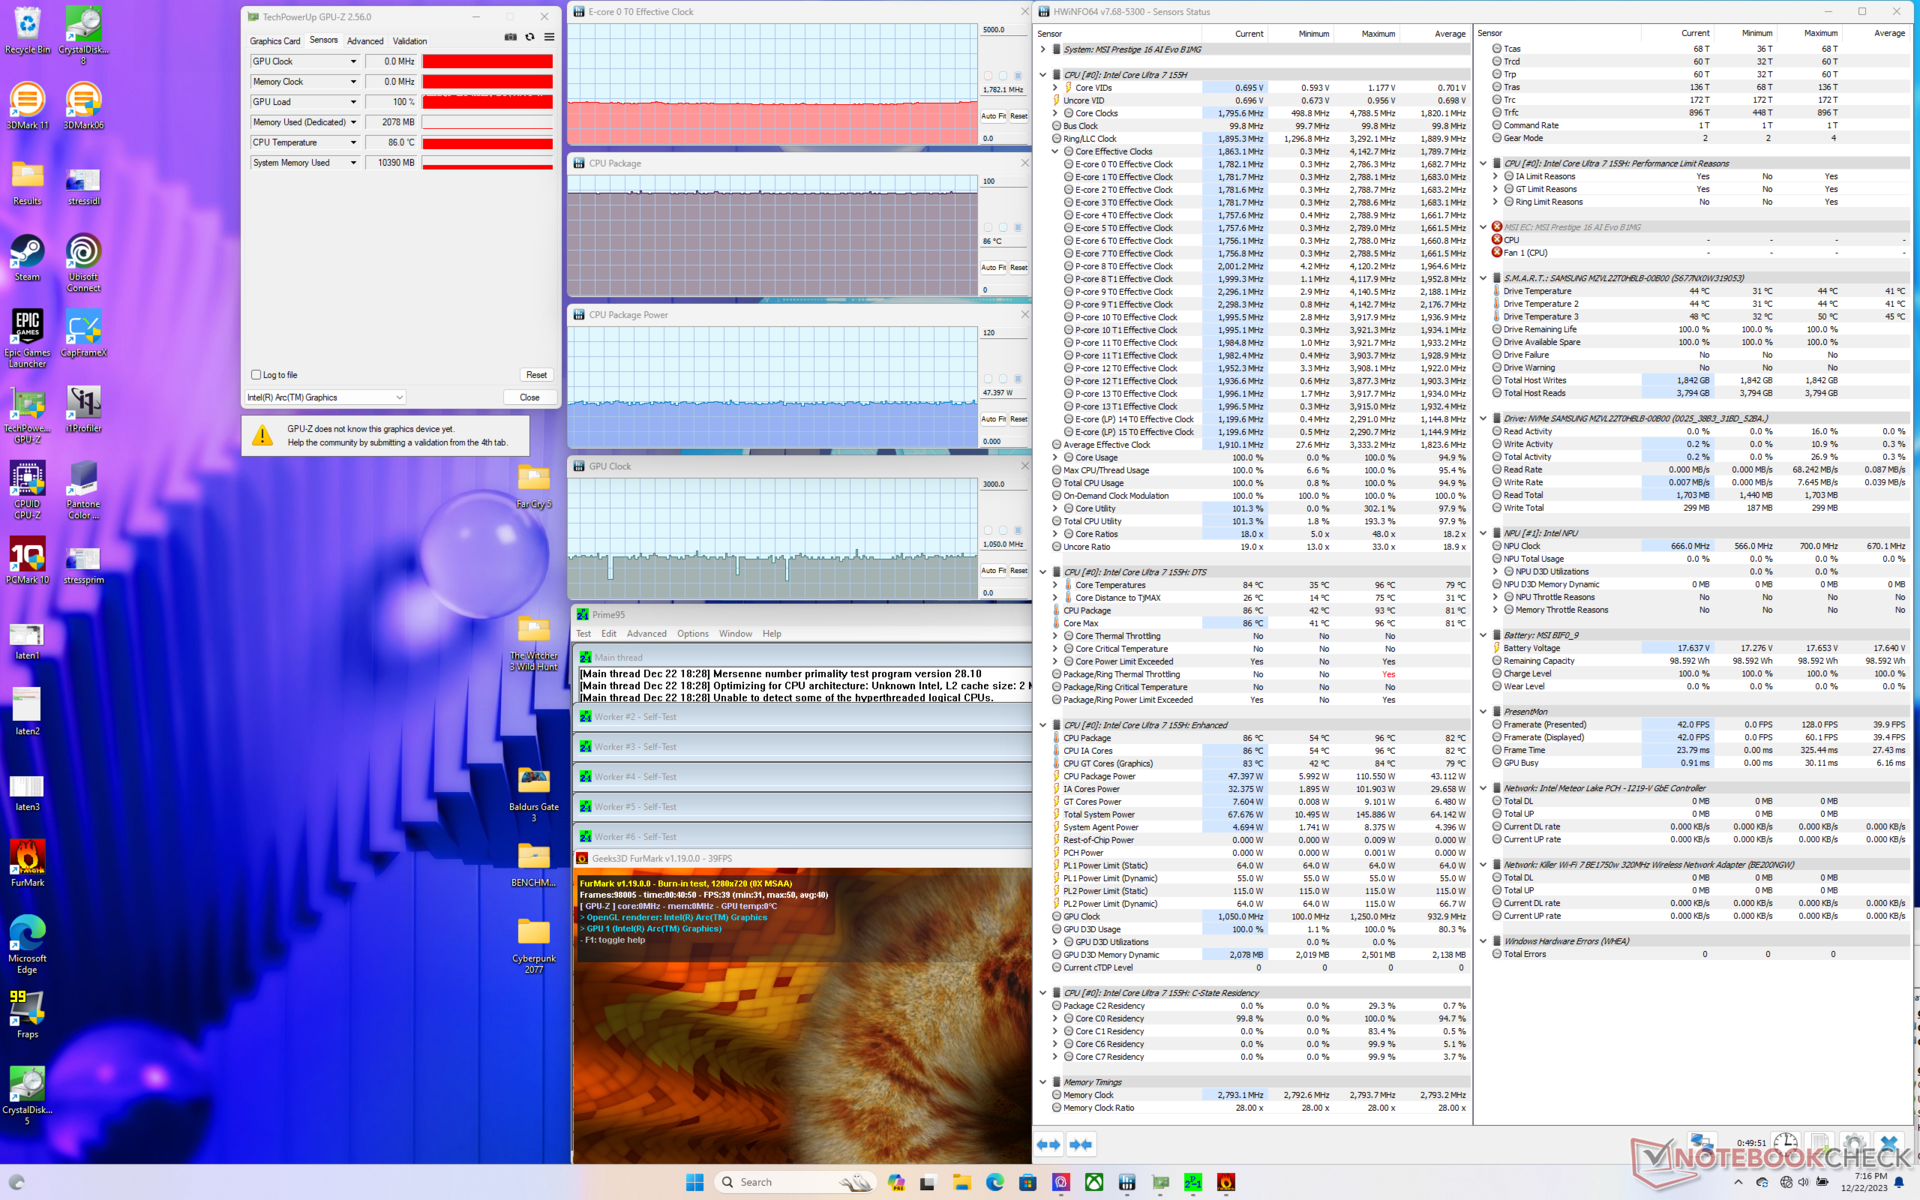
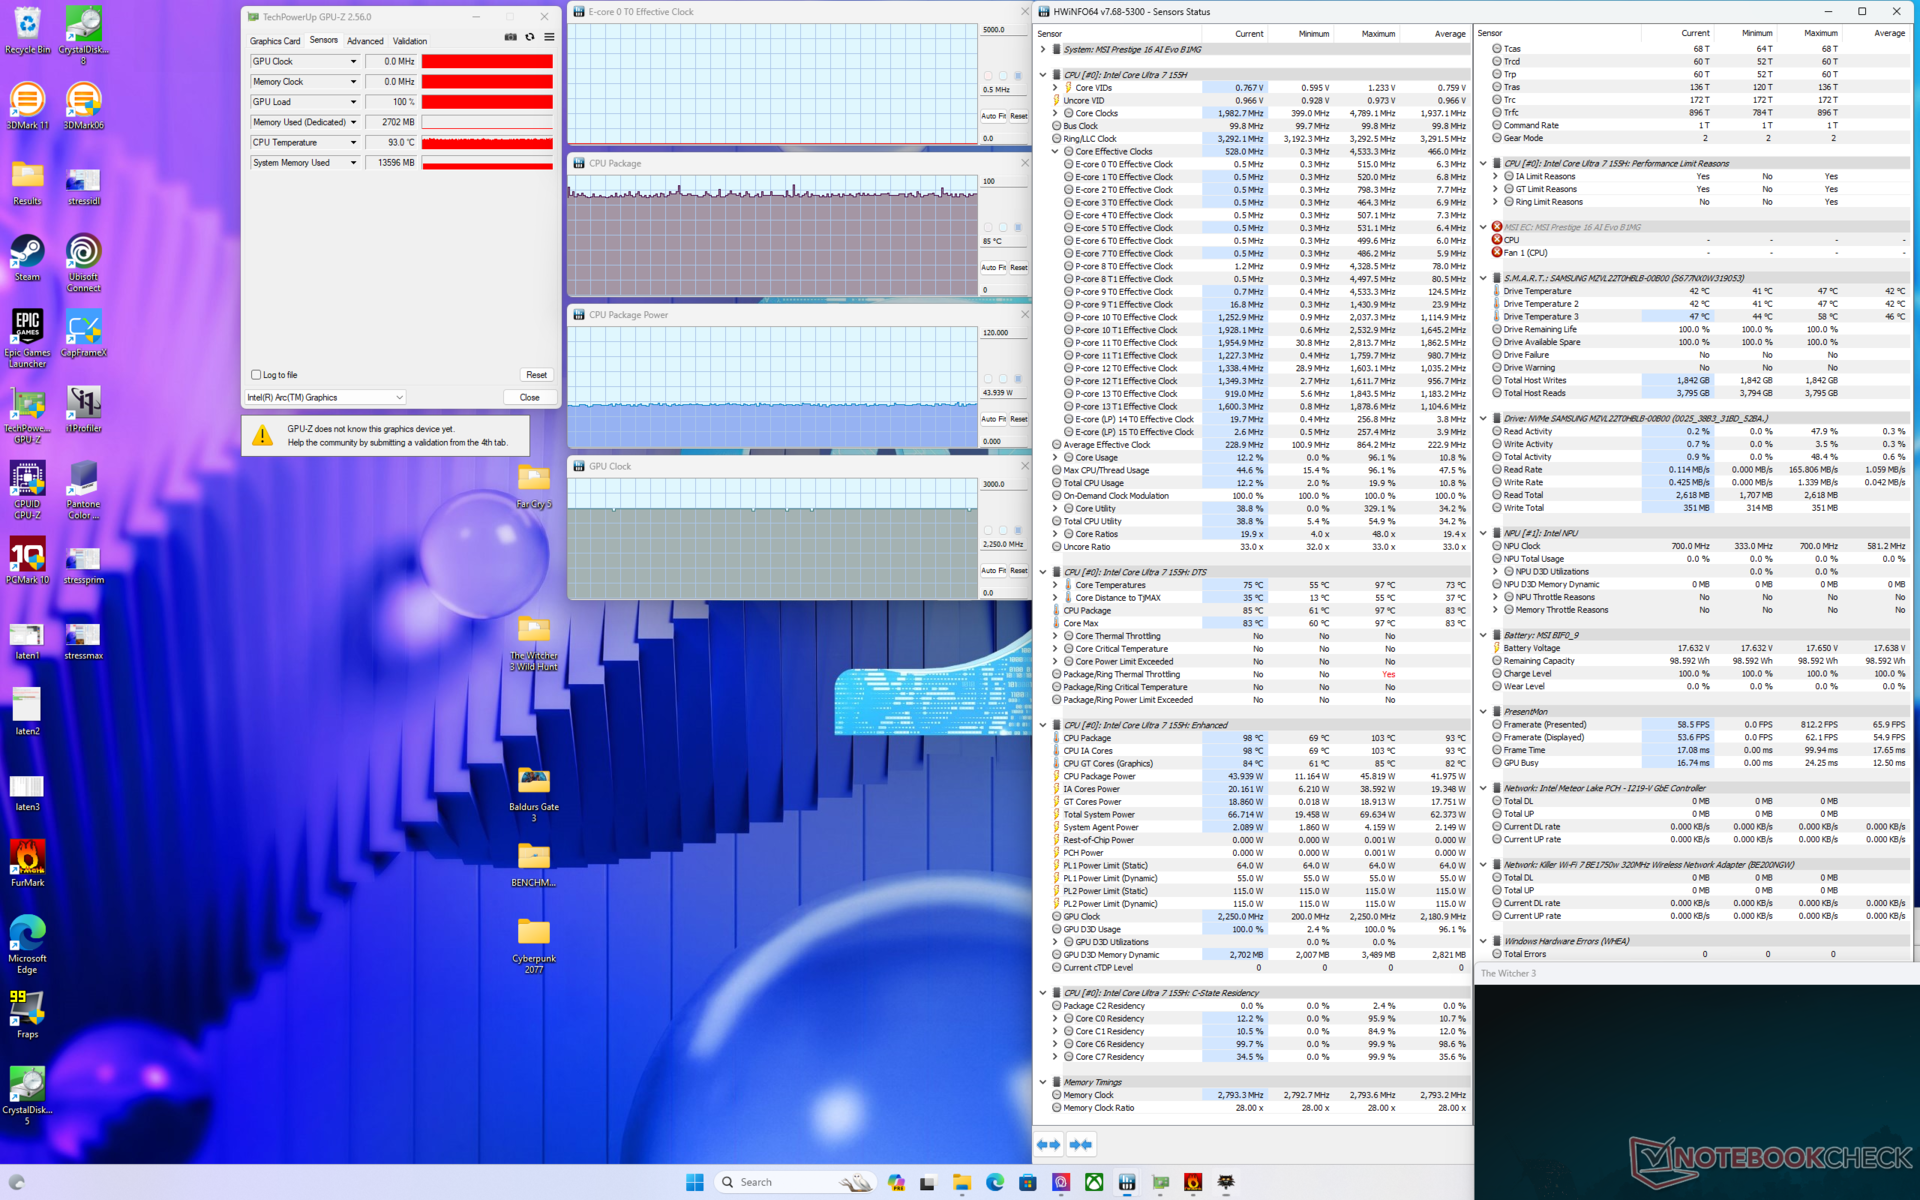

| Taktowanie CPU (GHz) | Taktowanie GPU (MHz) | Średnia temperatura CPU (°C) | |
| System bezczynności | -- | -- | 42 |
| Prime95Stress | 2.2 | -- | 83 |
| Prime95+ FurMark Stress | 1.8 | 1050 | 86 |
| Witcher 3 Stress (Extreme Performance w/Cooler Boost off) | 0.5 | 2250 | 85 |
| Witcher 3 Stress (Extreme Performancew/ Cooler Boost on) | 0.5 | 2250 | 77 |
Głośniki
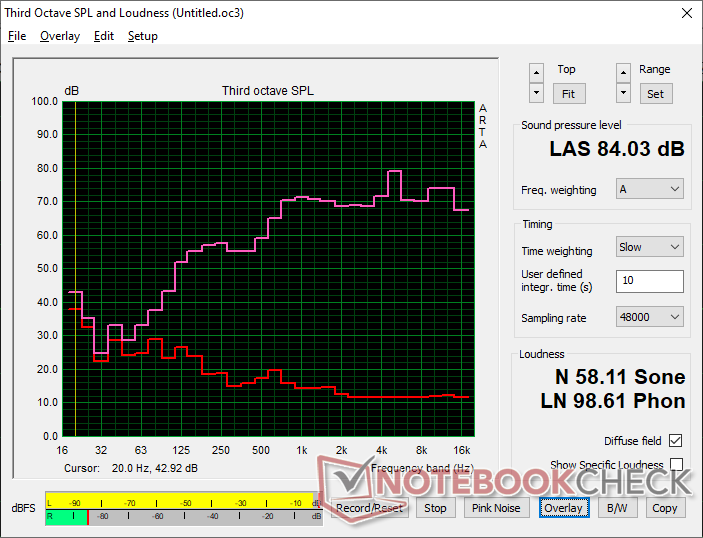
MSI Prestige 16 B1MG-001US analiza dźwięku
(+) | głośniki mogą odtwarzać stosunkowo głośno (84 dB)
Bas 100 - 315 Hz
(-) | prawie brak basu - średnio 15.3% niższa od mediany
(±) | liniowość basu jest średnia (7% delta do poprzedniej częstotliwości)
Średnie 400 - 2000 Hz
(+) | zbalansowane środki średnie - tylko 4.3% od mediany
(+) | średnie są liniowe (4.3% delta do poprzedniej częstotliwości)
Wysokie 2–16 kHz
(+) | zrównoważone maksima - tylko 3.2% od mediany
(+) | wzloty są liniowe (6.5% delta do poprzedniej częstotliwości)
Ogólnie 100 - 16.000 Hz
(+) | ogólny dźwięk jest liniowy (13.3% różnicy w stosunku do mediany)
W porównaniu do tej samej klasy
» 28% wszystkich testowanych urządzeń w tej klasie było lepszych, 4% podobnych, 68% gorszych
» Najlepszy miał deltę 5%, średnia wynosiła ###średnia###%, najgorsza wynosiła 45%
W porównaniu do wszystkich testowanych urządzeń
» 14% wszystkich testowanych urządzeń było lepszych, 3% podobnych, 83% gorszych
» Najlepszy miał deltę 4%, średnia wynosiła ###średnia###%, najgorsza wynosiła 134%
Apple MacBook Pro 16 2021 M1 Pro analiza dźwięku
(+) | głośniki mogą odtwarzać stosunkowo głośno (84.7 dB)
Bas 100 - 315 Hz
(+) | dobry bas - tylko 3.8% od mediany
(+) | bas jest liniowy (5.2% delta do poprzedniej częstotliwości)
Średnie 400 - 2000 Hz
(+) | zbalansowane środki średnie - tylko 1.3% od mediany
(+) | średnie są liniowe (2.1% delta do poprzedniej częstotliwości)
Wysokie 2–16 kHz
(+) | zrównoważone maksima - tylko 1.9% od mediany
(+) | wzloty są liniowe (2.7% delta do poprzedniej częstotliwości)
Ogólnie 100 - 16.000 Hz
(+) | ogólny dźwięk jest liniowy (4.6% różnicy w stosunku do mediany)
W porównaniu do tej samej klasy
» 0% wszystkich testowanych urządzeń w tej klasie było lepszych, 0% podobnych, 100% gorszych
» Najlepszy miał deltę 5%, średnia wynosiła ###średnia###%, najgorsza wynosiła 45%
W porównaniu do wszystkich testowanych urządzeń
» 0% wszystkich testowanych urządzeń było lepszych, 0% podobnych, 100% gorszych
» Najlepszy miał deltę 4%, średnia wynosiła ###średnia###%, najgorsza wynosiła 134%
Zarządzanie energią - niższe dołki i wyższe szczyty
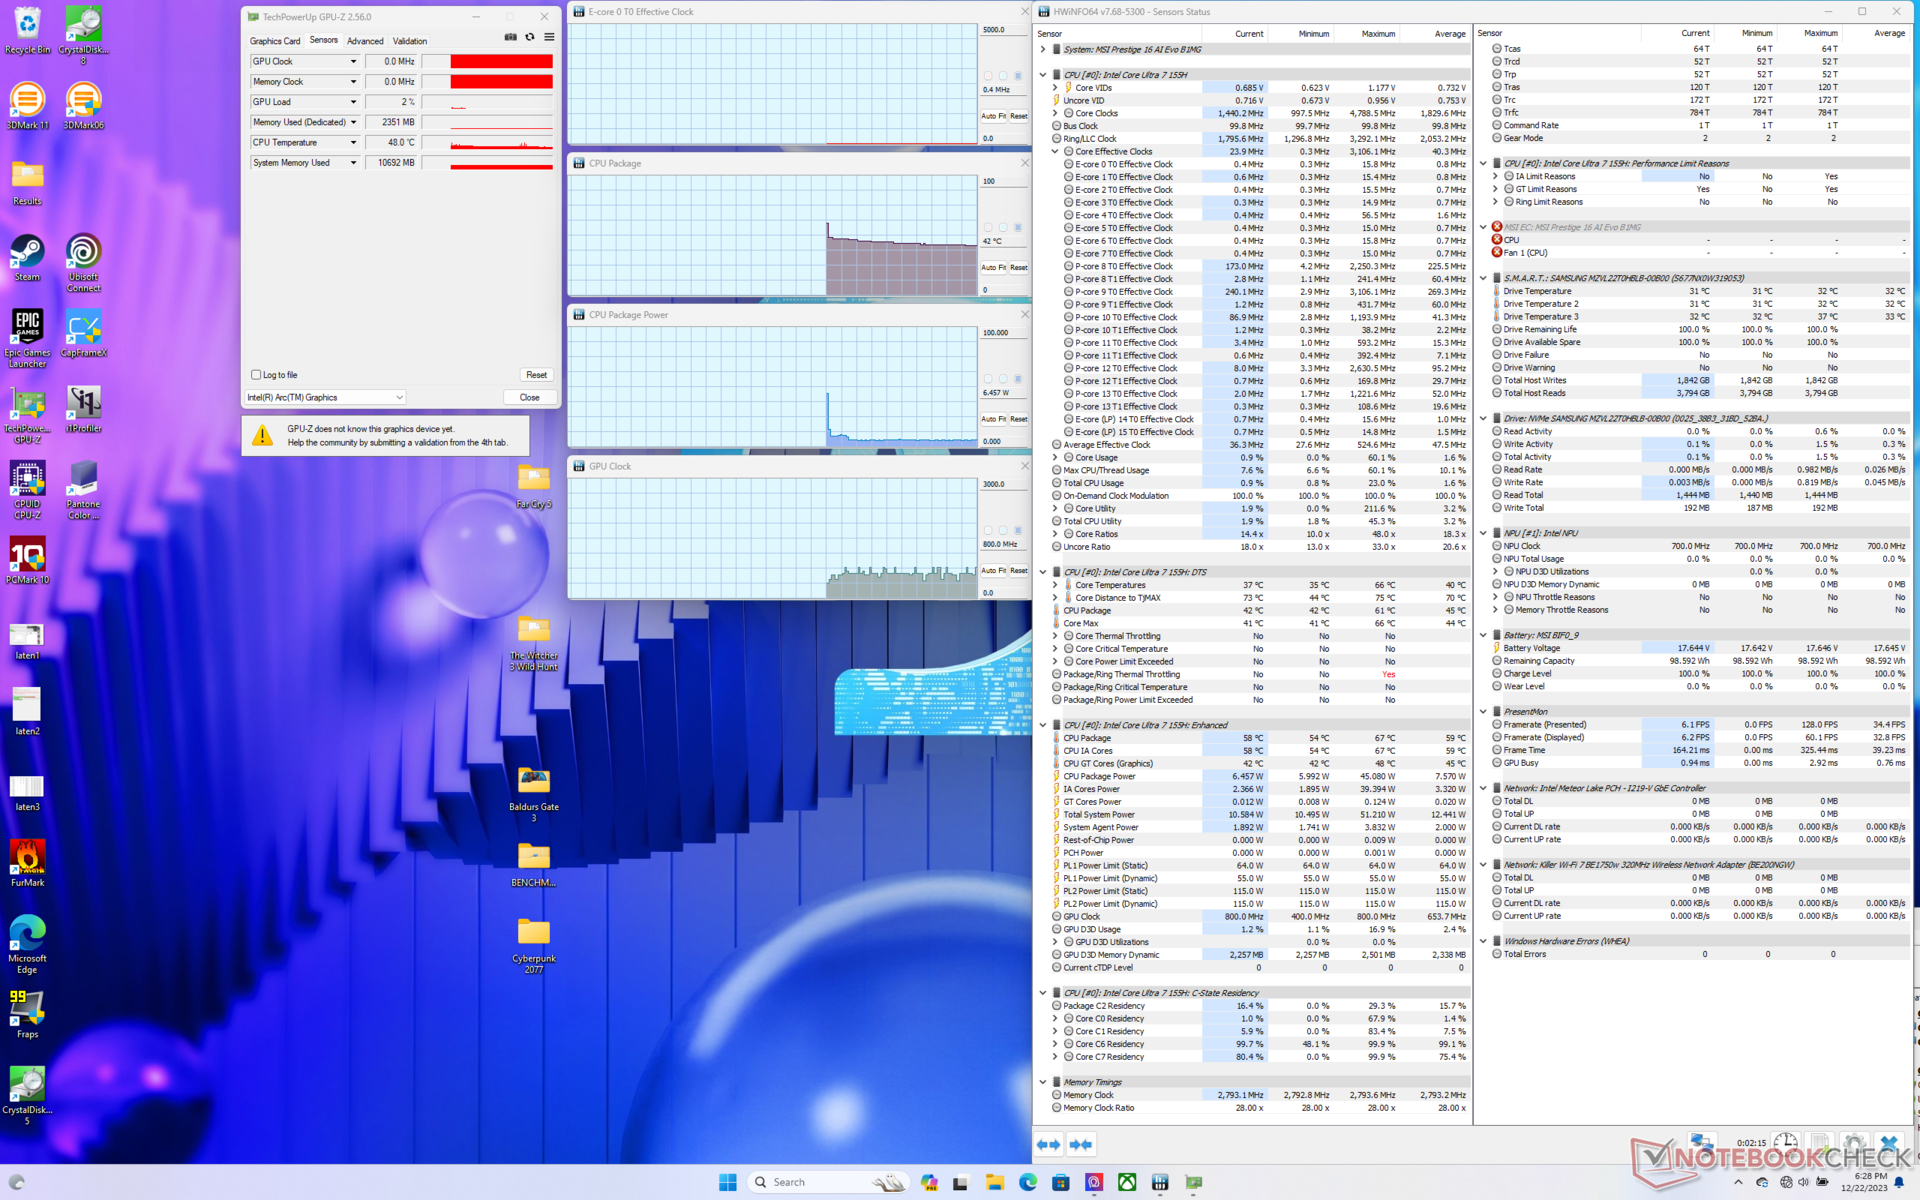
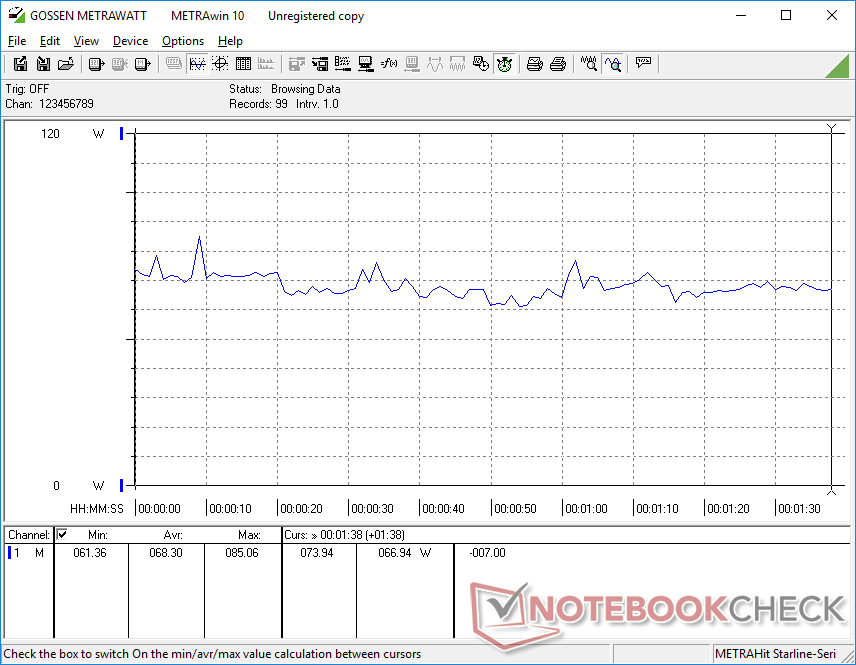
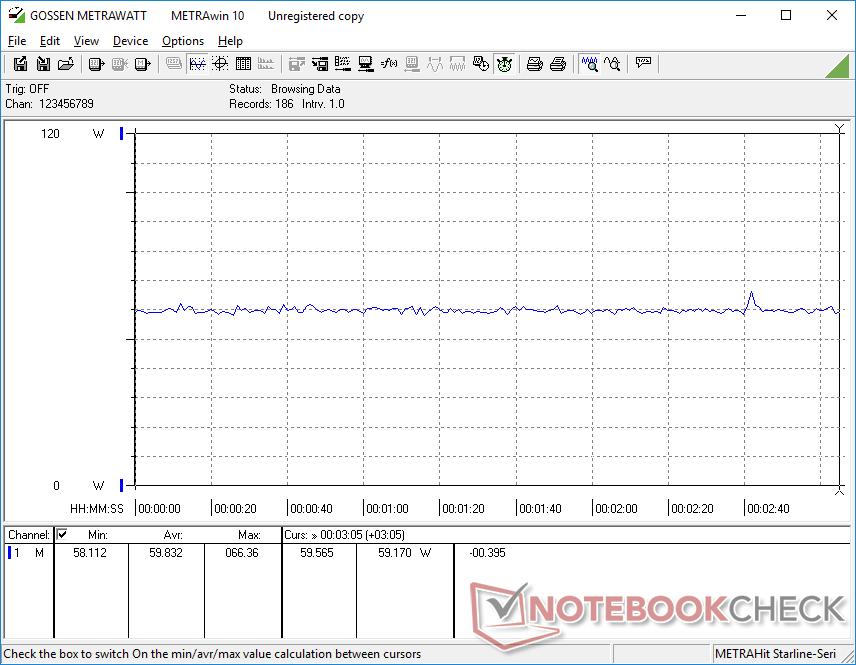
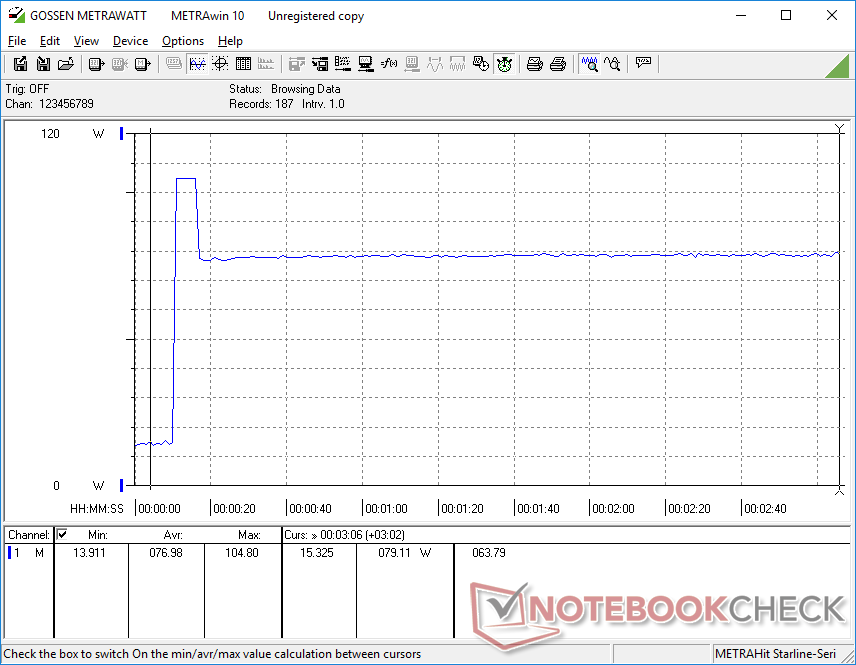
Zużycie energii
Zużycie energii może wynosić zaledwie 3 W na biegu jałowym, co jest jednym z najniższych spośród wszystkich 16-calowych laptopów Intela, które testowaliśmy. Bardzo niski poziom jest prawdopodobnie odpowiedzialny za wyjątkowo długi czas pracy na baterii w następnej sekcji poniżej.
Z drugiej strony, zużycie energii wydaje się być większe niż w przypadku większości innych laptopów z serii U podczas uruchamiania bardziej wymagających obciążeń. Uruchomienie 3DMark 06 lub gier, na przykład, zużyłoby od 60 W do 70 W w porównaniu do 40 W do 55 W na MSI Prestige 15, LG Gram 16 2-w-1acer Swift Edge SFE16 lub napędzanym przez Core H Schenker Vision 14 w podobnych warunkach. Dotyczy to również sytuacji, gdy procesor jest w pełni obciążony przez Prime95. Niemniej jednak, wydajność w przeliczeniu na wat jest nadal na korzyść nowszego procesora 14. generacji, więc wyższy pobór mocy niekoniecznie jest wadą.
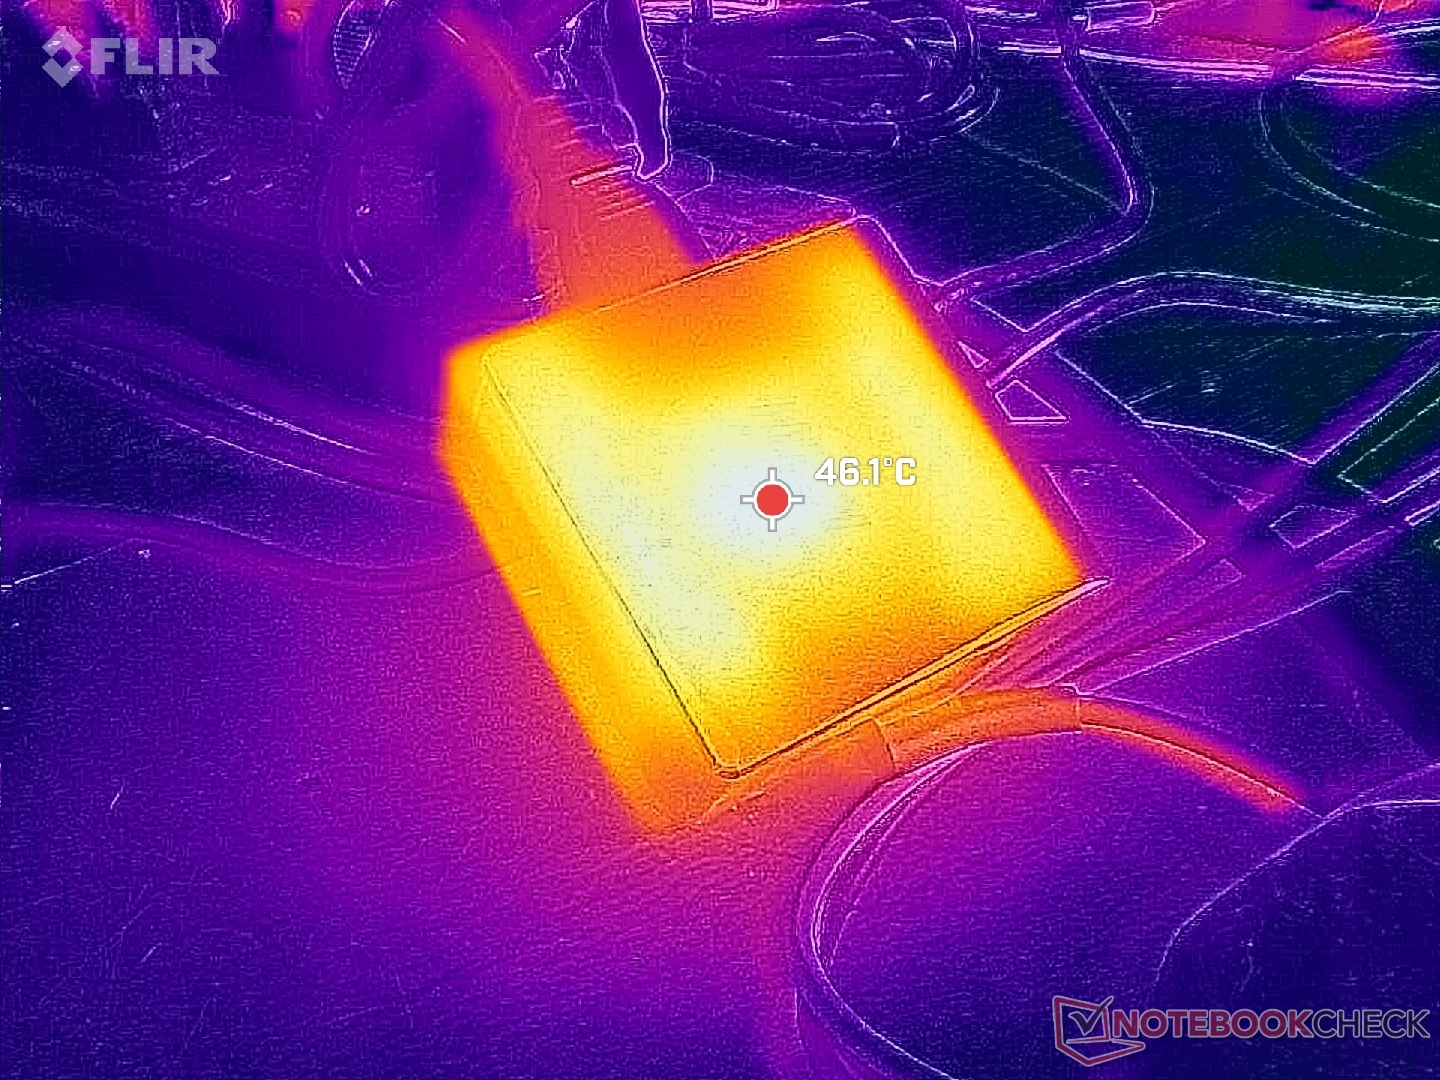
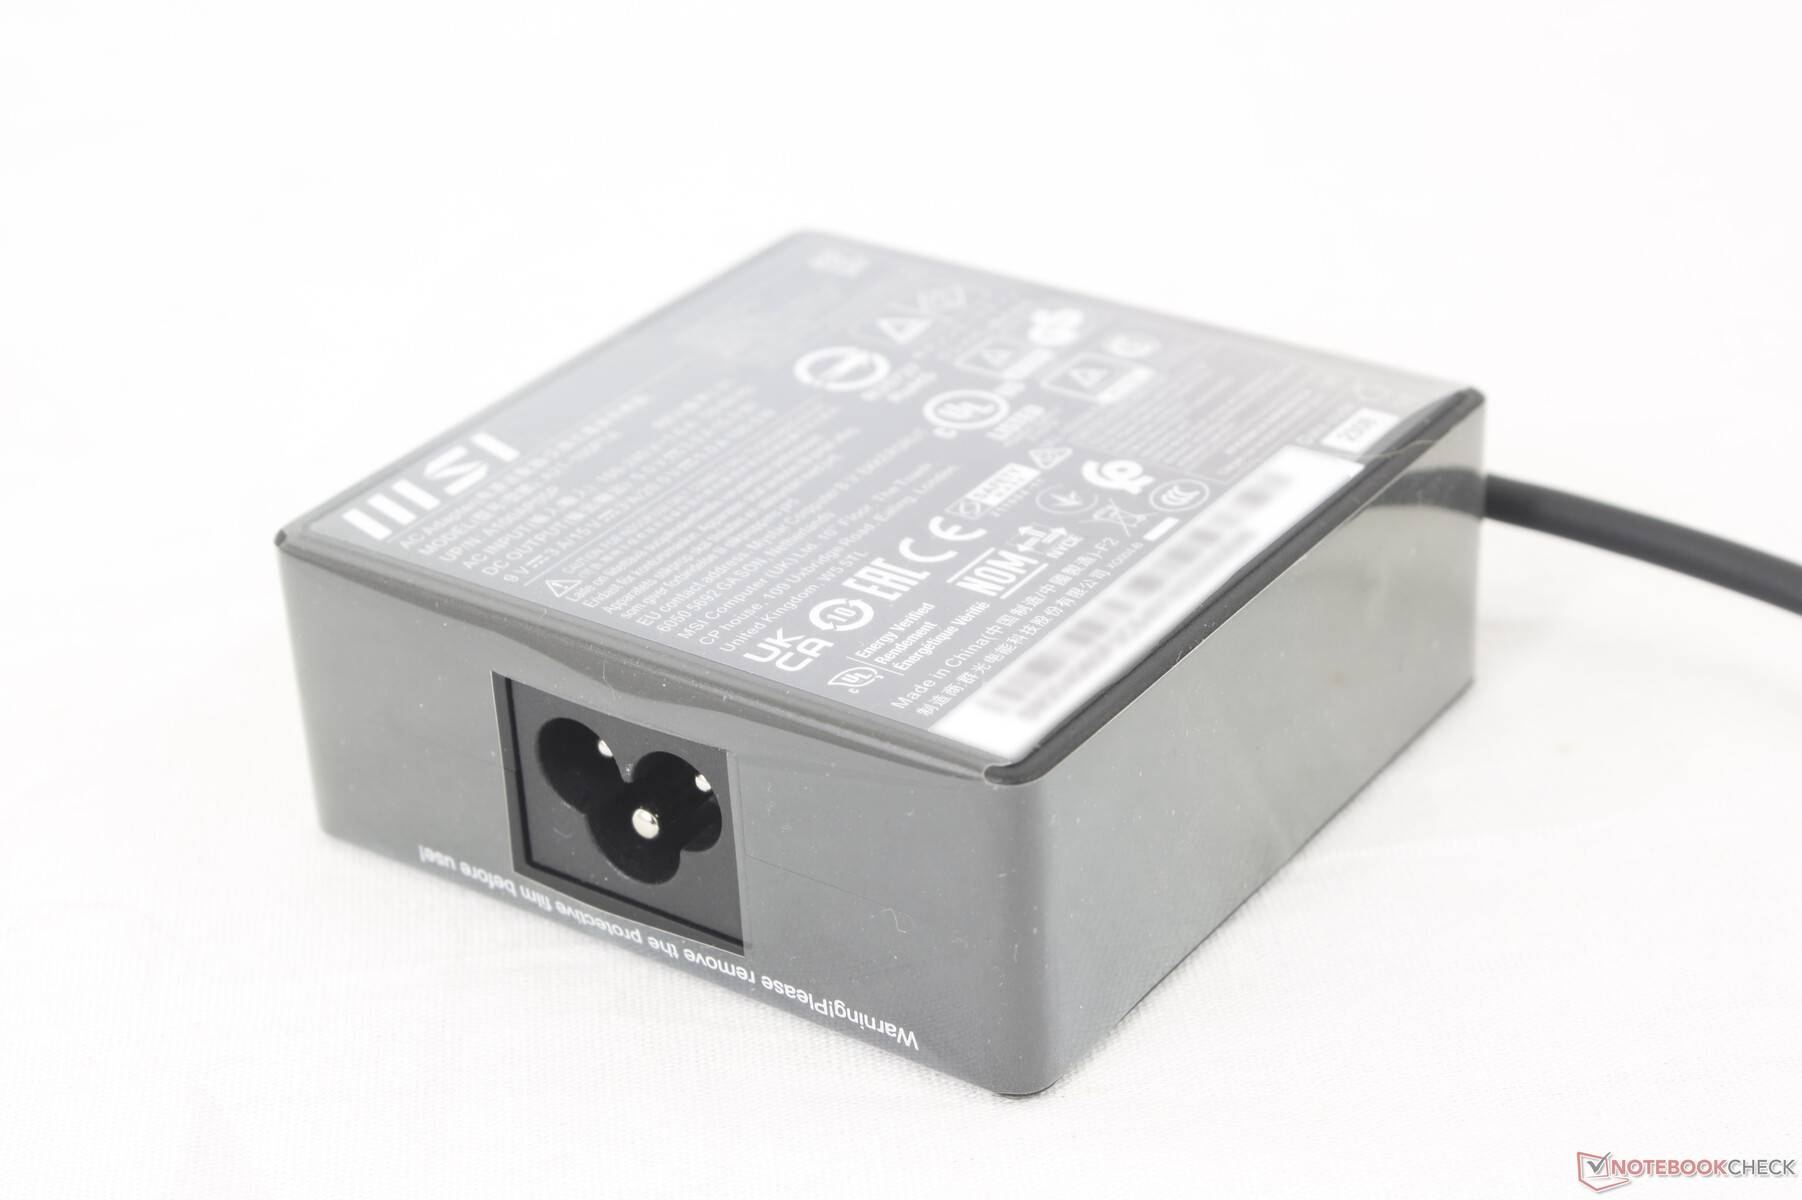
Jesteśmy w stanie zarejestrować maksymalny pobór mocy 105 W z małego (~ 7,5 x 7,5 x 3 cm) zasilacza sieciowego USB-C o mocy 100 W, gdy procesor jest wykorzystywany w 100 procentach. Wskaźnik ten jest tylko tymczasowy ze względu na ograniczony potencjał Turbo Boost, więc ma tendencję do stabilizowania się na poziomie około 70 W przy dużych obciążeniach. Proszę zauważyć, że jednostki SKU z oddzielną grafiką RTX 4060 lub 4070 są dostarczane z większym zasilaczem USB-C AC o mocy 140 W.

| wyłączony / stan wstrzymania | |
| luz | |
| obciążenie |
|
Legenda:
min: | |
| MSI Prestige 16 B1MG-001US Ultra 7 155H, Arc 8-Core, Samsung PM9A1 MZVL22T0HBLB, IPS, 2560x1600, 16" | MSI Prestige 15 A12UD-093 i7-1280P, GeForce RTX 3050 Ti Laptop GPU, Micron 3400 1TB MTFDKBA1T0TFH, IPS, 3840x2160, 15.6" | LG Gram 2in1 16 16T90R - G.AA78G i7-1360P, Iris Xe G7 96EUs, Samsung PM9A1 MZVL21T0HCLR, IPS, 2560x1600, 16" | Lenovo ThinkBook 16 G6 ABP R5 7530U, Vega 7, SK hynix HFS512GEJ9X125N, IPS, 1920x1200, 16" | Asus VivoBook Pro 16 K6602VU i9-13900H, GeForce RTX 4050 Laptop GPU, Micron 2400 MTFDKBA1T0QFM, OLED, 3200x2000, 16" | Dell Inspiron 16 Plus 7630 i7-13700H, GeForce RTX 4060 Laptop GPU, WD PC SN740 SDDPTQD-1T00, IPS, 2560x1600, 16" | |
|---|---|---|---|---|---|---|
| Power Consumption | -2% | 2% | 24% | -161% | -124% | |
| Idle Minimum * (Watt) | 3 | 5.4 -80% | 5.5 -83% | 3.7 -23% | 21.06 -602% | 15.6 -420% |
| Idle Average * (Watt) | 9.5 | 11.8 -24% | 7.2 24% | 7.1 25% | 24.27 -155% | 17.7 -86% |
| Idle Maximum * (Watt) | 12 | 12.7 -6% | 12.9 -8% | 7.7 36% | 25.12 -109% | 20.6 -72% |
| Load Average * (Watt) | 68.3 | 45.9 33% | 55 19% | 43.9 36% | 52.4 23% | 87.4 -28% |
| Witcher 3 ultra * (Watt) | 59.8 | 45.7 24% | 47 21% | 40.8 32% | 110.2 -84% | 121.7 -104% |
| Load Maximum * (Watt) | 104.8 | 63 40% | 63.6 39% | 66.6 36% | 146 -39% | 138 -32% |
* ... im mniej tym lepiej
Power Consumption Witcher 3 / Stresstest
Power Consumption external Monitor
Żywotność baterii
Pojemność baterii wzrosła z 80 Wh w Prestige 15 do 99 Wh w Prestige 16. W połączeniu z wydajnością nowego procesora Intel 14. generacji można uzyskać niezwykle długi czas pracy wynoszący prawie 18,5 godziny przeglądania sieci WLAN w świecie rzeczywistym. Jest to jeden z najdłużej działających laptopów z systemem Windows, jakie testowaliśmy, z wynikami, które rywalizują z serią MacBook.
Ładowanie od pustego akumulatora do pełnej pojemności zajmuje około 90 minut.
| MSI Prestige 16 B1MG-001US Ultra 7 155H, Arc 8-Core, 99.9 Wh | MSI Prestige 15 A12UD-093 i7-1280P, GeForce RTX 3050 Ti Laptop GPU, 80 Wh | LG Gram 2in1 16 16T90R - G.AA78G i7-1360P, Iris Xe G7 96EUs, 80 Wh | Lenovo ThinkBook 16 G6 ABP R5 7530U, Vega 7, 45 Wh | Asus VivoBook Pro 16 K6602VU i9-13900H, GeForce RTX 4050 Laptop GPU, 96 Wh | Dell Inspiron 16 Plus 7630 i7-13700H, GeForce RTX 4060 Laptop GPU, 86 Wh | |
|---|---|---|---|---|---|---|
| Czasy pracy | -51% | -32% | -45% | -45% | -43% | |
| Reader / Idle (h) | 25.1 | 17.6 -30% | ||||
| WiFi v1.3 (h) | 18.3 | 8.9 -51% | 11.9 -35% | 10.1 -45% | 10.1 -45% | 9.4 -49% |
| Load (h) | 2.8 | 1.4 -50% | 2 -29% | 1.4 -50% | ||
| H.264 (h) | 7.1 | 11.6 | 9.8 |
Za
Przeciw
Werdykt - seria Prestige w najlepszym wydaniu
intel 14. generacji powinien okazać się ogromnym dobrodziejstwem dla Ultrabooków takich jak MSI Prestige 16. Podczas gdy surowa wydajność procesora nie jest dużo wyższa niż w poprzedniej generacji, wzrost wydajności zintegrowanej grafiki i żywotności baterii są prawdopodobnie równie ważne dla kategorii Ultrabooków. Intel Arc 8 z powodzeniem wyparł AMD Radeon 780M o znaczny margines do tego stopnia, że większość zwykłych graczy i edytorów zdjęć powinna być zadowolona z jego wydajności.
Kilka aspektów tego modelu można poprawić. Po pierwsze, brak wysokiej częstotliwości odświeżania lub opcji ekranu dotykowego oznacza, że alternatywy, takie jak HP Spectre lub Asus Vivobook nadal mają pewne zalety. Po drugie, ghosting jest bardzo zauważalny w konfiguracji IPS do tego stopnia, że nawet zwykli gracze mogą być zaniepokojeni jego efektami. SKU OLED może być zatem opłacalne pomimo nieuniknionego wpływu na żywotność baterii. Wreszcie, wyższa wydajność iGPU wiąże się z wyższym zużyciem energii i głośniejszym hałasem wentylatora niż w przypadku większości innych ultrabooków z serii U podczas wykonywania zadań wymagających dużej mocy GPU.
W szczególności studenci docenią długi czas pracy na baterii, ostry wyświetlacz DCI-P3 i szeroki wachlarz opcji graficznych Prestige 16, które stanowią wartościową alternatywę dla MacBooka Pro.
Przenośna konstrukcja, kolorowy ekran, długi czas pracy na baterii, szybka zintegrowana grafika i szybki czytnik kart SD to główne zalety Prestige 16. Użytkownicy będą chcieli wykorzystać te atuty, aby w pełni wykorzystać możliwości modelu MSI.
Cena i dostępność
MSI Prestige 16 z procesorem 14. generacji jest już szeroko dostępny na Amazon z OLED za 1650 USD lub Best Buy z dyskretną grafiką Arc A370M za 1400 USD.
MSI Prestige 16 B1MG-001US
- 28/12/2023 v7 (old)
Allen Ngo
Przezroczystość
Wyboru urządzeń do recenzji dokonuje nasza redakcja. Próbkę do badań autor zakupił bezpłatnie na własny koszt. Pożyczkodawca nie miał wpływu na tę recenzję, producent nie otrzymał też kopii tej recenzji przed publikacją. Nie było obowiązku publikowania tej recenzji. Jako niezależna firma medialna, Notebookcheck nie podlega władzy producentów, sprzedawców detalicznych ani wydawców.
Tak testuje Notebookcheck
Każdego roku Notebookcheck niezależnie sprawdza setki laptopów i smartfonów, stosując standardowe procedury, aby zapewnić porównywalność wszystkich wyników. Od około 20 lat stale rozwijamy nasze metody badawcze, ustanawiając przy tym standardy branżowe. W naszych laboratoriach testowych doświadczeni technicy i redaktorzy korzystają z wysokiej jakości sprzętu pomiarowego. Testy te obejmują wieloetapowy proces walidacji. Nasz kompleksowy system ocen opiera się na setkach uzasadnionych pomiarów i benchmarków, co pozwala zachować obiektywizm.Price comparison

