Recenzja Lenovo Legion 5i 16 G9 - Szybki laptop do gier z Raptor Lake-HX i silnikiem AI
Lenovo dopiero co zaprezentowało swojego nowego gracza, Legion 5i 16 G9, na tegorocznych targach CES - a my już mieliśmy okazję go przetestować. Średniej klasy laptop do gier Lenovo plasuje się pomiędzy tańszą serią LOQ a droższym Legion 5 Pro. Dzięki nowemu procesorowi Raptor-Lake-HX, czyli Core i7-14650HXoraz 115-watową wersją RTX 4060 Laptop (w tym Advanced Optimus) i szybkim panelem WQXGA 240 Hz, nowy Legion 5i 16 koncentruje się całkowicie na wydajności, pomijając takie rzeczy, jak rozbudowane oświetlenie obudowy. Co więcej, producent wykorzystuje specjalny układ AI - podobno Lenovo AI Engine+ jeszcze bardziej poprawi wrażenia użytkowników z gier.
Przetestowaliśmy wersję Legion 5i 16IRX G9 z procesorem Core-i7, laptopem RTX 4060, wyświetlaczem 240 Hz, 16 GB pamięci RAM, a także dyskiem SSD PCIe o pojemności 1 TB w cenie 1610 USD.
Potencjalni konkurenci w porównaniu
Ocena | Data | Model | Waga | Wysokość | Rozmiar | Rezolucja | Cena |
|---|---|---|---|---|---|---|---|
| 89.1 % v7 (old) | 02/2024 | Lenovo Legion 5 16IRX G9 i7-14650HX, GeForce RTX 4060 Laptop GPU | 2.4 kg | 25.2 mm | 16.00" | 2560x1600 | |
| 89.2 % v7 (old) | 10/2023 | Schenker XMG CORE 16 (L23) R7 7840HS, GeForce RTX 4070 Laptop GPU | 2.4 kg | 26.1 mm | 16.00" | 2560x1600 | |
| 85.1 % v7 (old) | 09/2023 | HP Victus 16-r0077ng i7-13700H, GeForce RTX 4070 Laptop GPU | 2.4 kg | 24 mm | 16.10" | 1920x1080 | |
| 87.3 % v7 (old) | 09/2023 | Lenovo LOQ 16IRH8 i7-13620H, GeForce RTX 4060 Laptop GPU | 2.7 kg | 25.9 mm | 16.00" | 2560x1600 | |
| 87.7 % v7 (old) | 08/2023 | Lenovo Legion Slim 5 16APH8 R7 7840HS, GeForce RTX 4060 Laptop GPU | 2.4 kg | 25.2 mm | 16.00" | 2560x1600 | |
| 85.6 % v7 (old) | 09/2023 | HP Victus 16-r0076TX i5-13500HX, GeForce RTX 4050 Laptop GPU | 2.3 kg | 22.9 mm | 16.10" | 1920x1080 | |
| 88.3 % v7 (old) | 09/2023 | Alienware m16 R1 Intel i7-13700HX, GeForce RTX 4060 Laptop GPU | 3 kg | 25.4 mm | 16.00" | 2560x1600 | |
| 87.9 % v7 (old) | 05/2023 | Lenovo Legion Pro 5 16IRX8 i7-13700HX, GeForce RTX 4060 Laptop GPU | 2.5 kg | 26.8 mm | 16.00" | 2560x1600 |
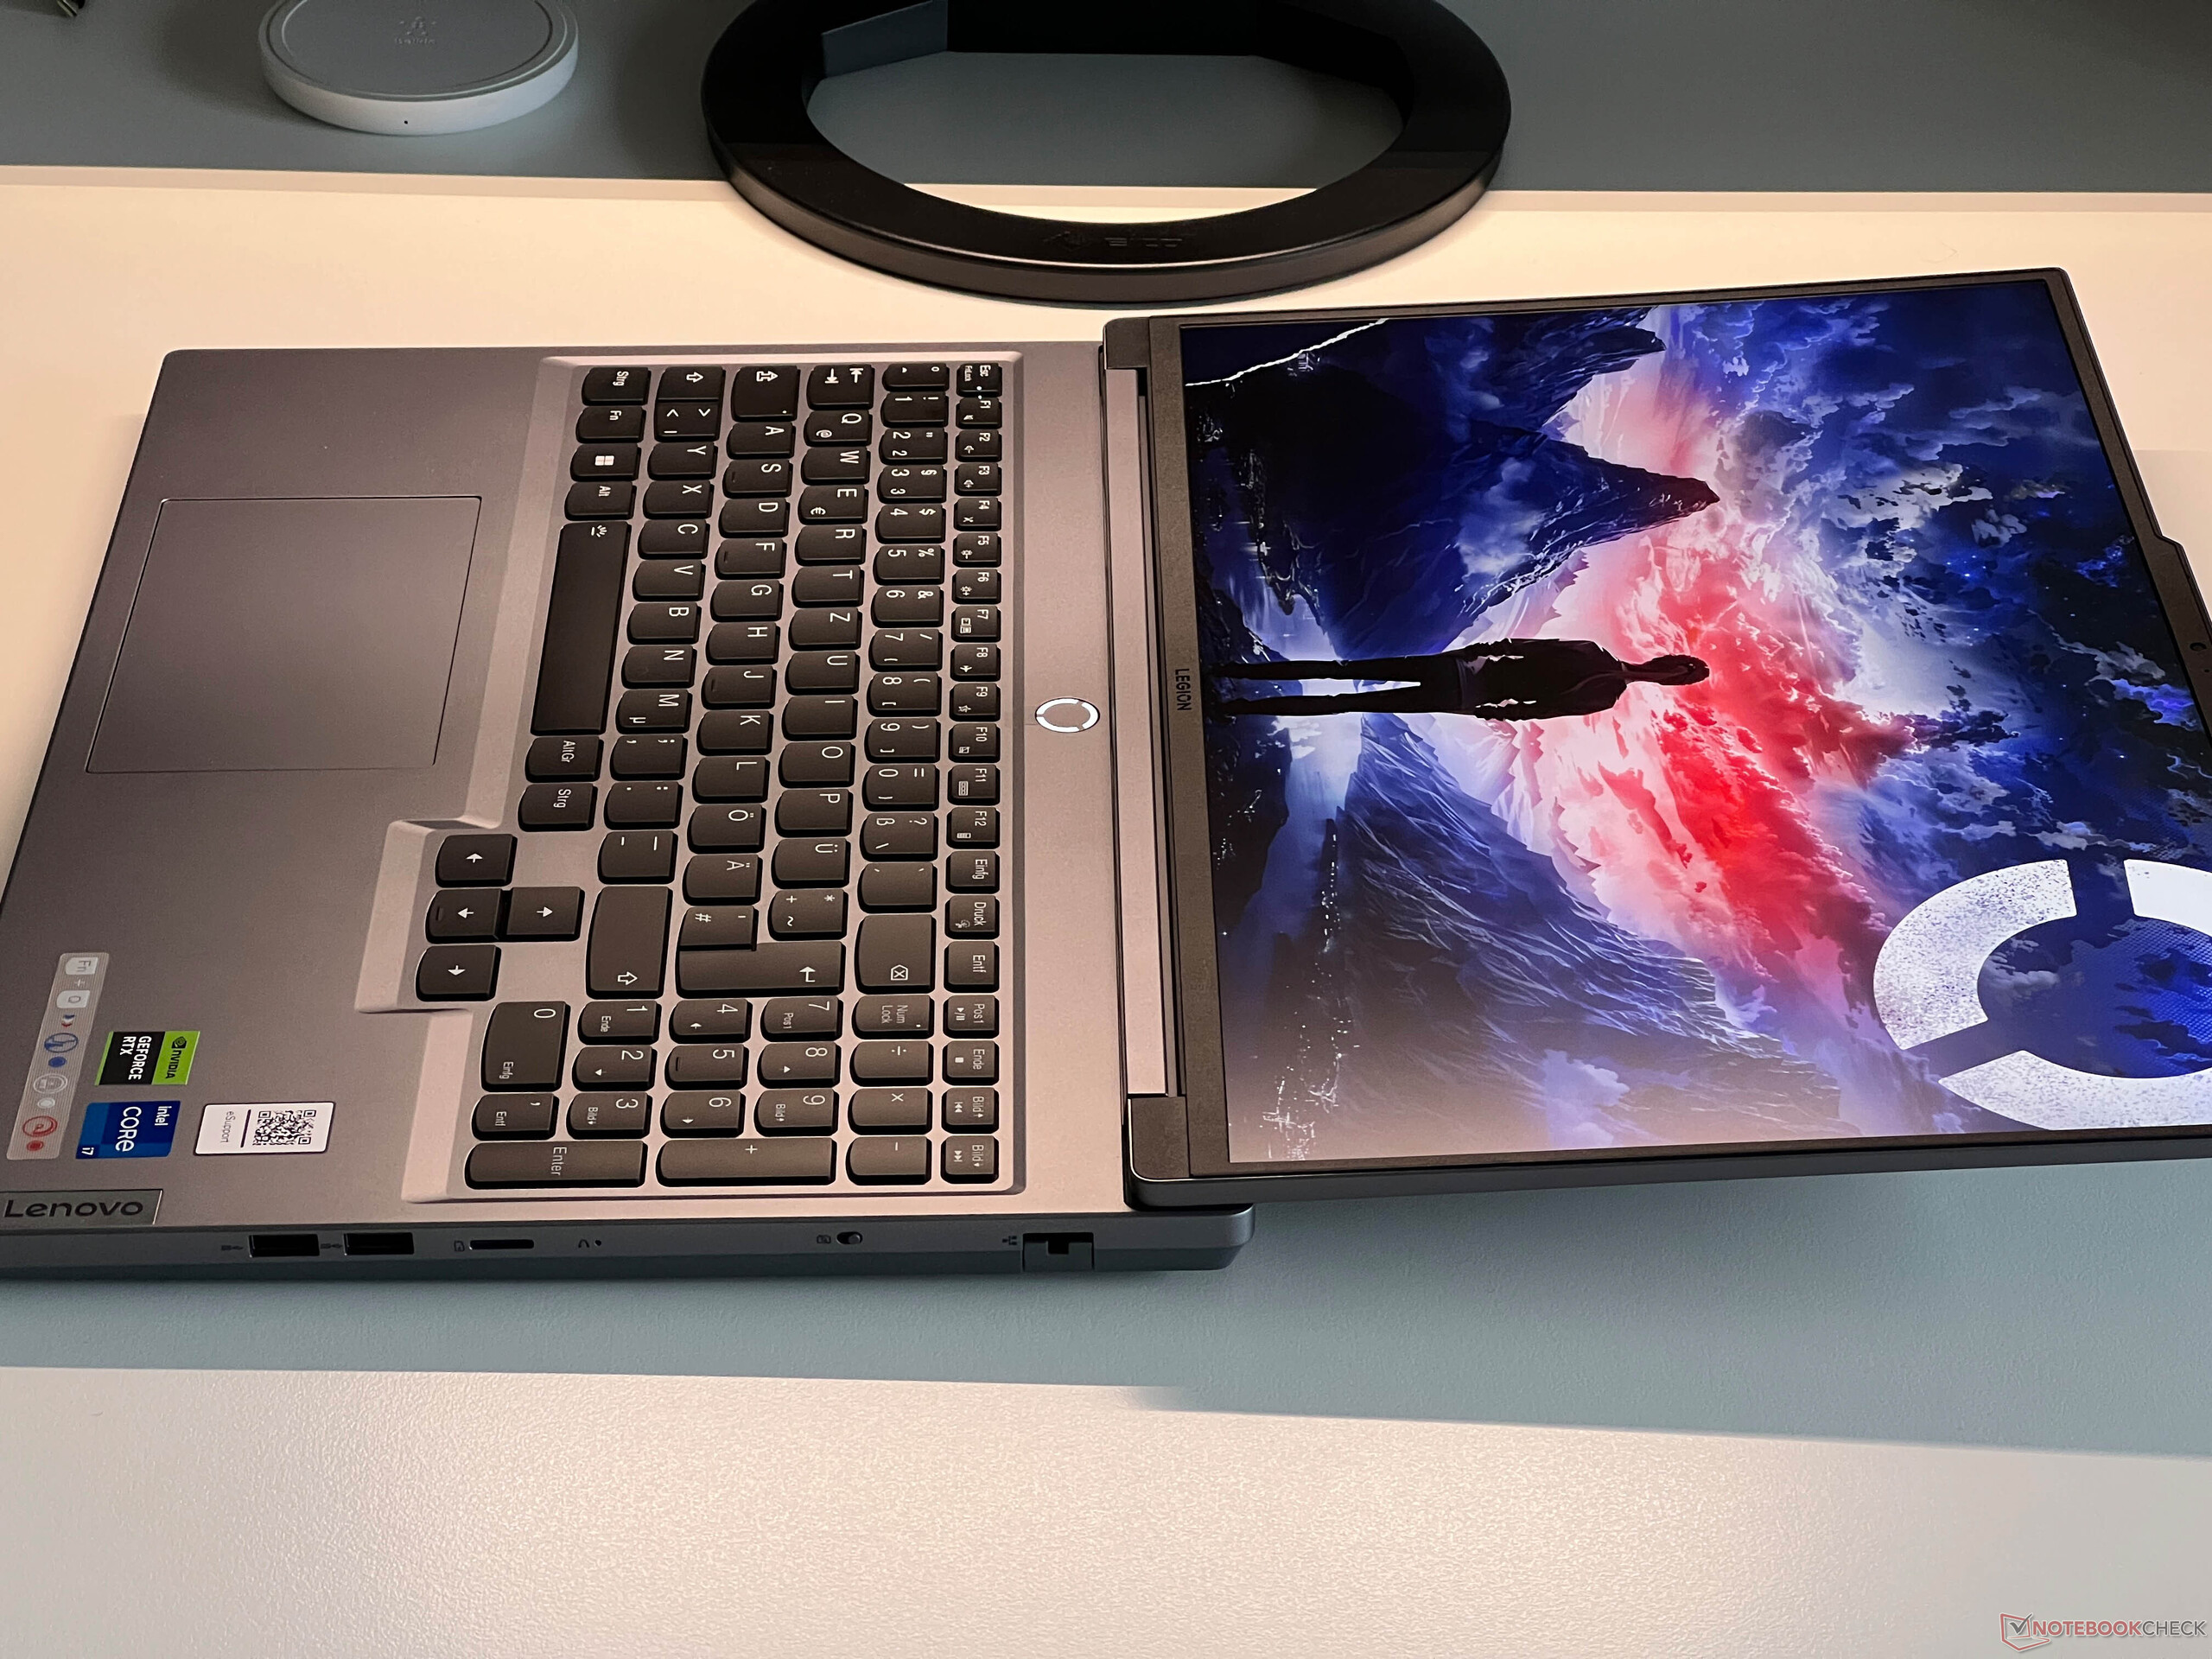
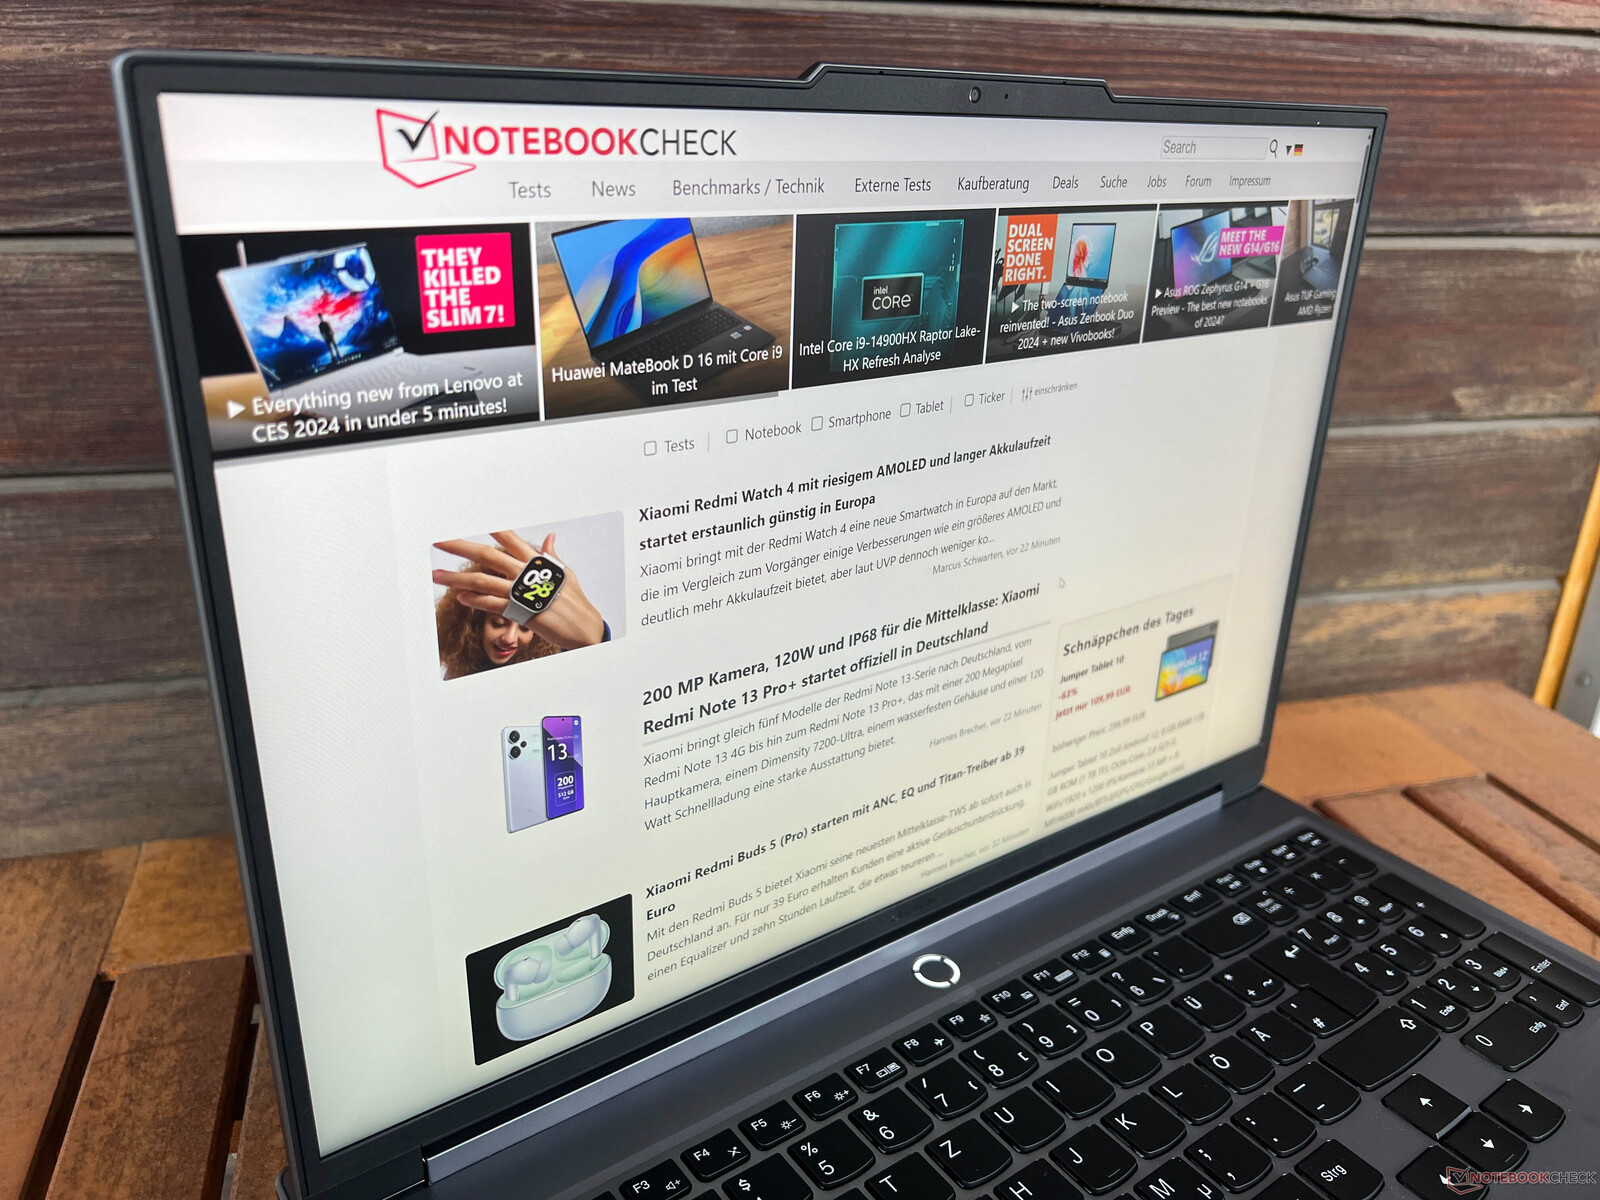
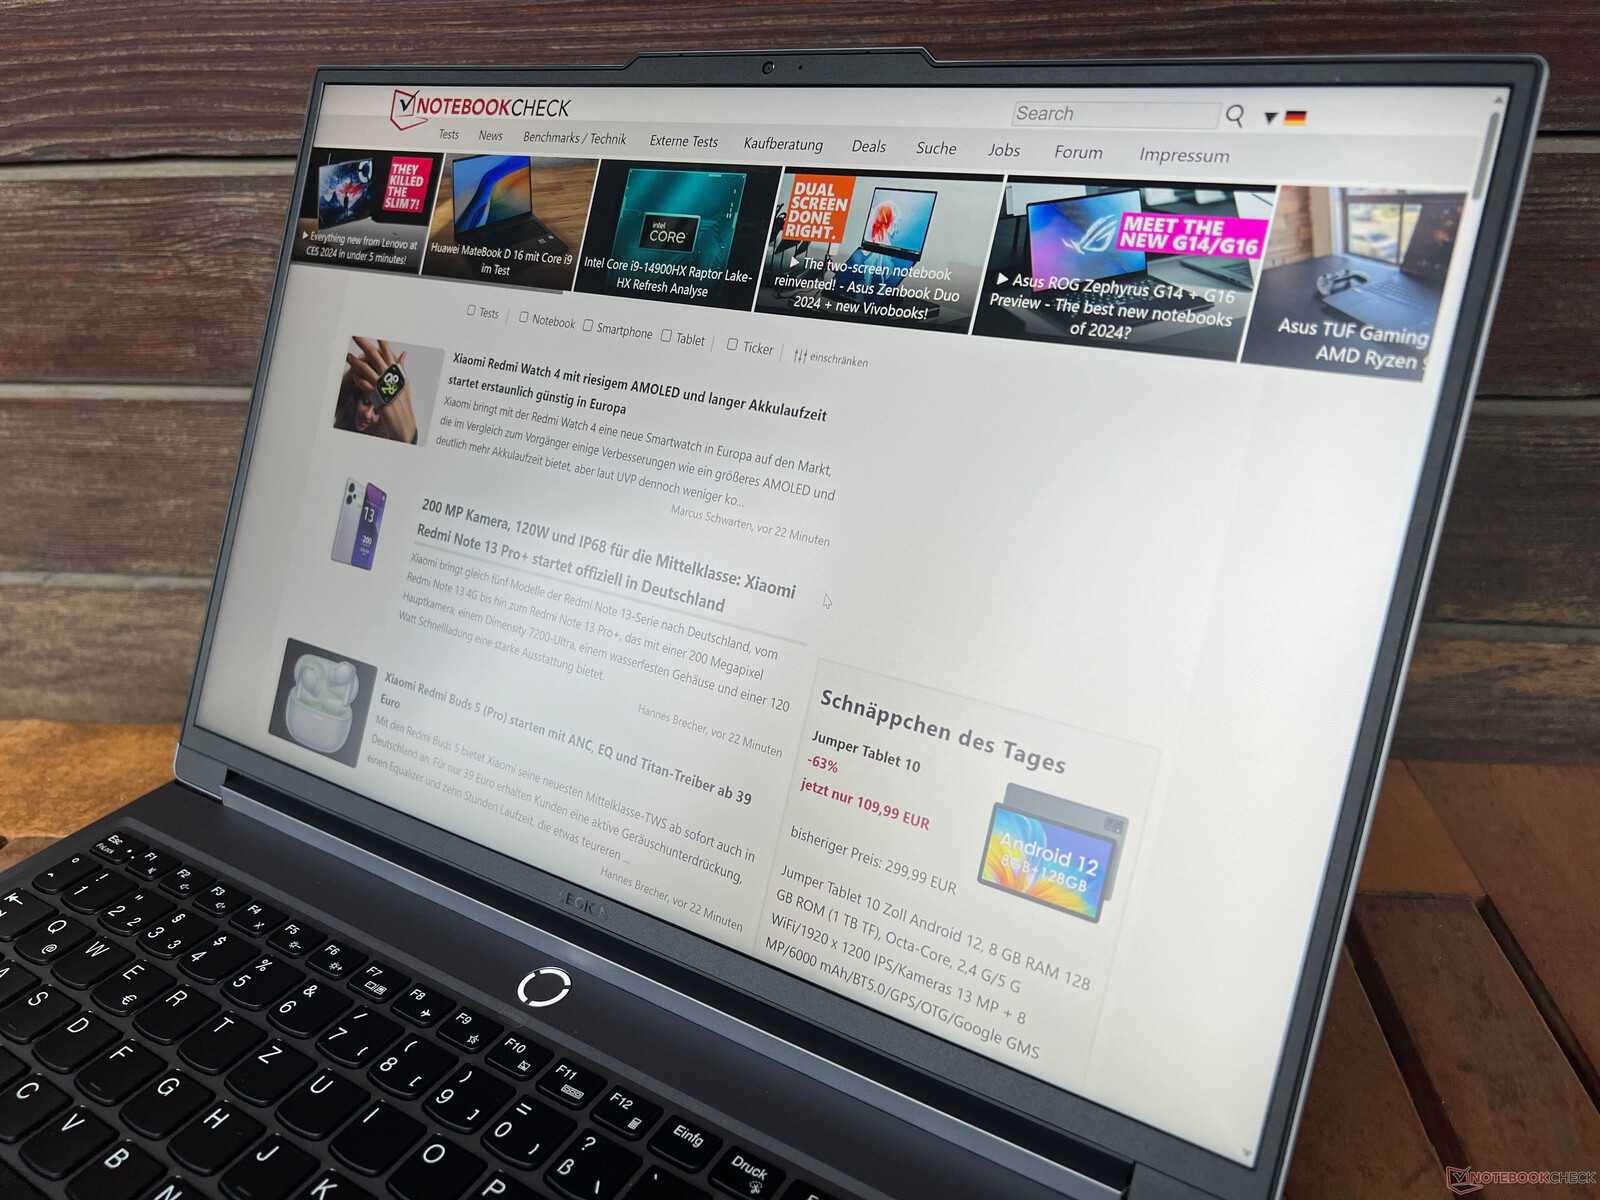
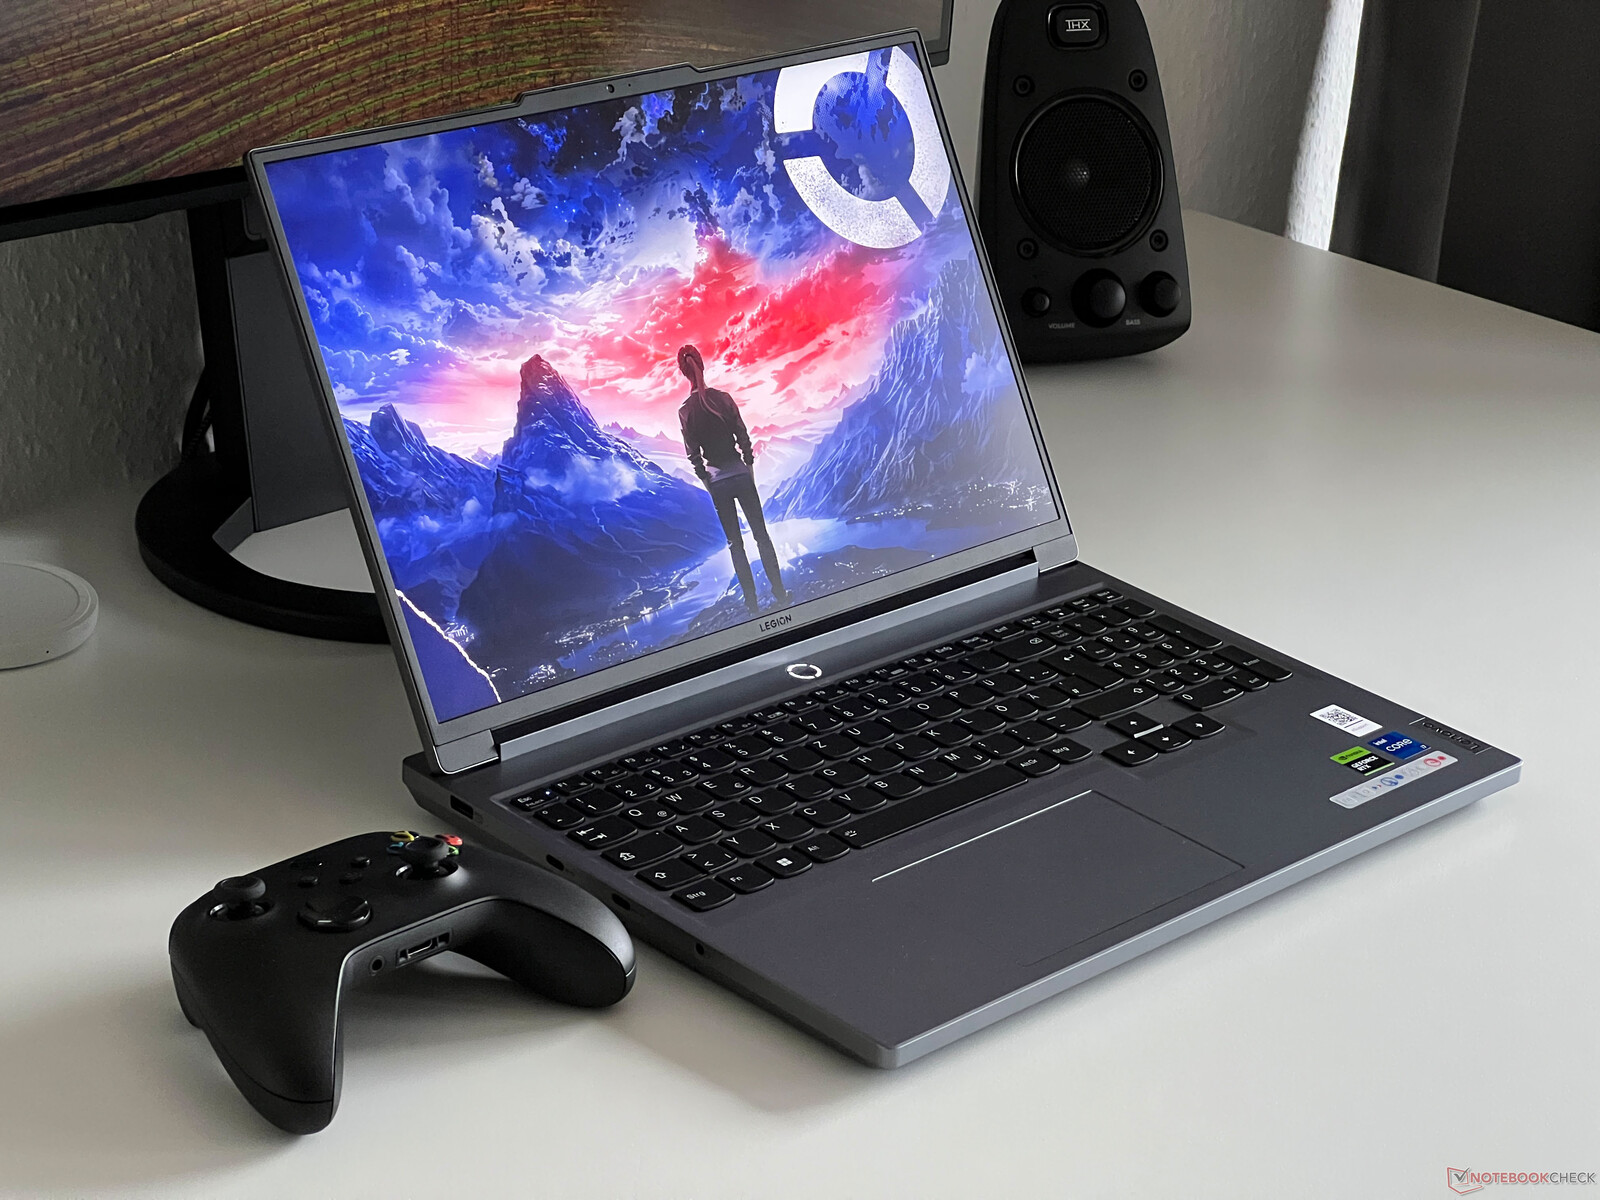
Obudowa - Legion jest częściowo wykonana z aluminium
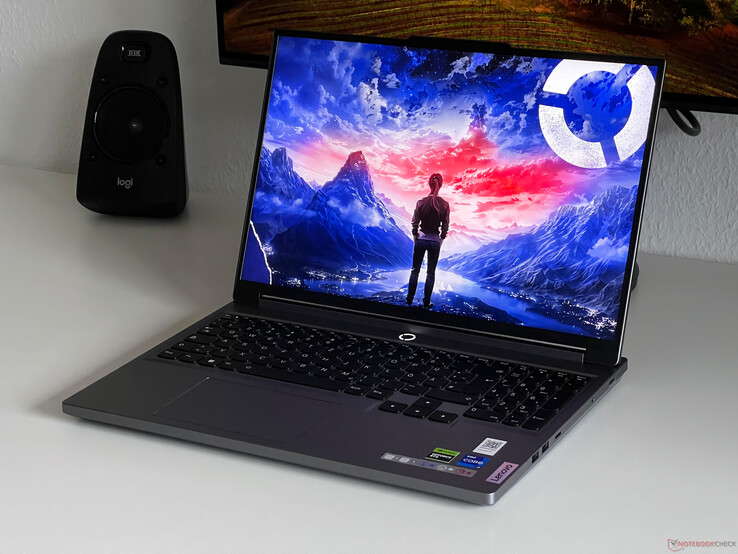
Obudowa urządzenia jest bardzo elegancka jak na laptopa do gier, a jeśli wolą Państwo, aby rzeczy bardziej przyciągały wzrok, to Legion 5i może Państwa rozczarować. Poza czarną klawiaturą i ramkami, nie ma żadnych innych kontrastów kolorystycznych, a ponadto Lenovo zdecydowało się nie instalować żadnego podświetlenia obudowy. Jedynie dioda LED stanu otaczająca przycisk zasilania świeci w czterech kolorach, które zależą od używanego profilu energetycznego. Oznacza to przynajmniej, że z laptopa można korzystać także w bardziej profesjonalnych warunkach, np. na uczelni.
Pod względem jakości, obudowa sprawia wrażenie wysokiej klasy - mimo że tylko pokrywa jest wykonana z aluminium. Podstawa wykonana jest w całości z tworzywa sztucznego, ale górna część jest naprawdę przyjemna w dotyku. Jedynie spód obudowy jest nieco bardziej szorstki, co nadaje jej nieco tańszego charakteru. Jedną z zalet obudowy jest to, że w niewielkim stopniu przyciąga brud i ślady odcisków palców. Jej stabilność jest ogólnie dobra, ale nie jest to zaskoczeniem ze względu na grubość jednostki bazowej (maksymalnie 2 cm z tyłu). Zawiasy wyświetlacza zostały dobrze osadzone i pozwalają na otwarcie laptopa jedną ręką; maksymalny kąt otwarcia wynosi 180 stopni.
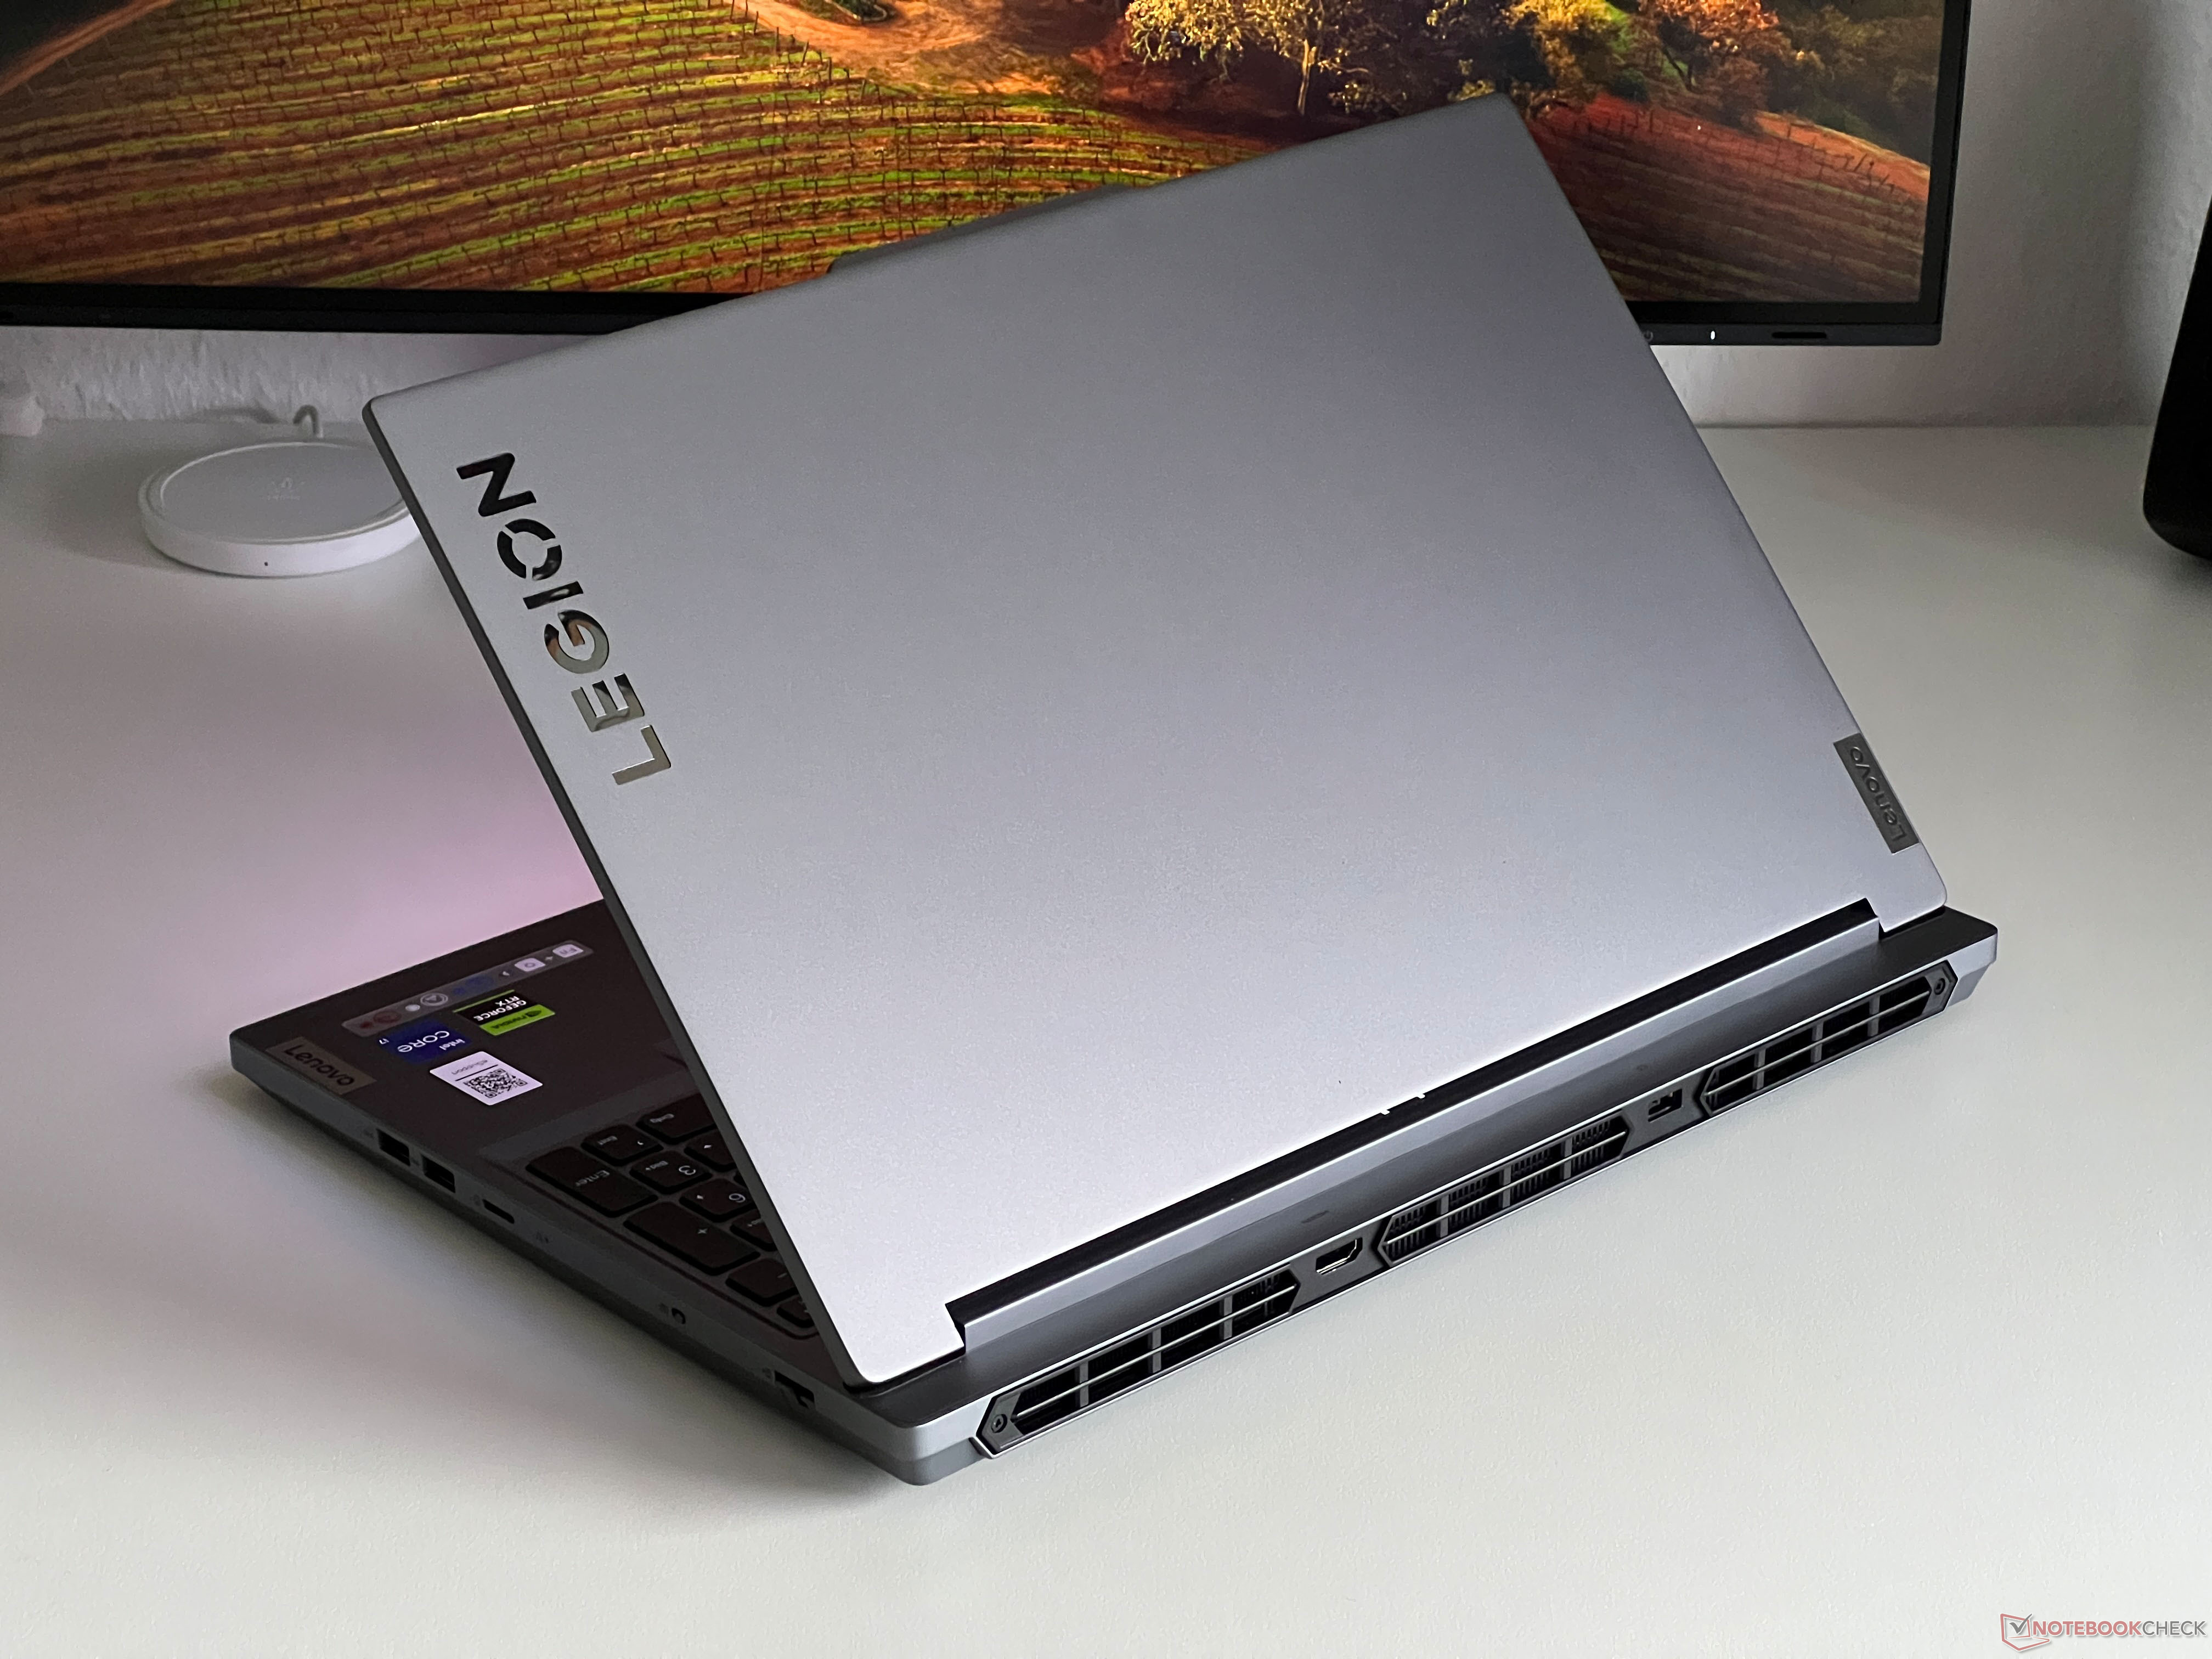
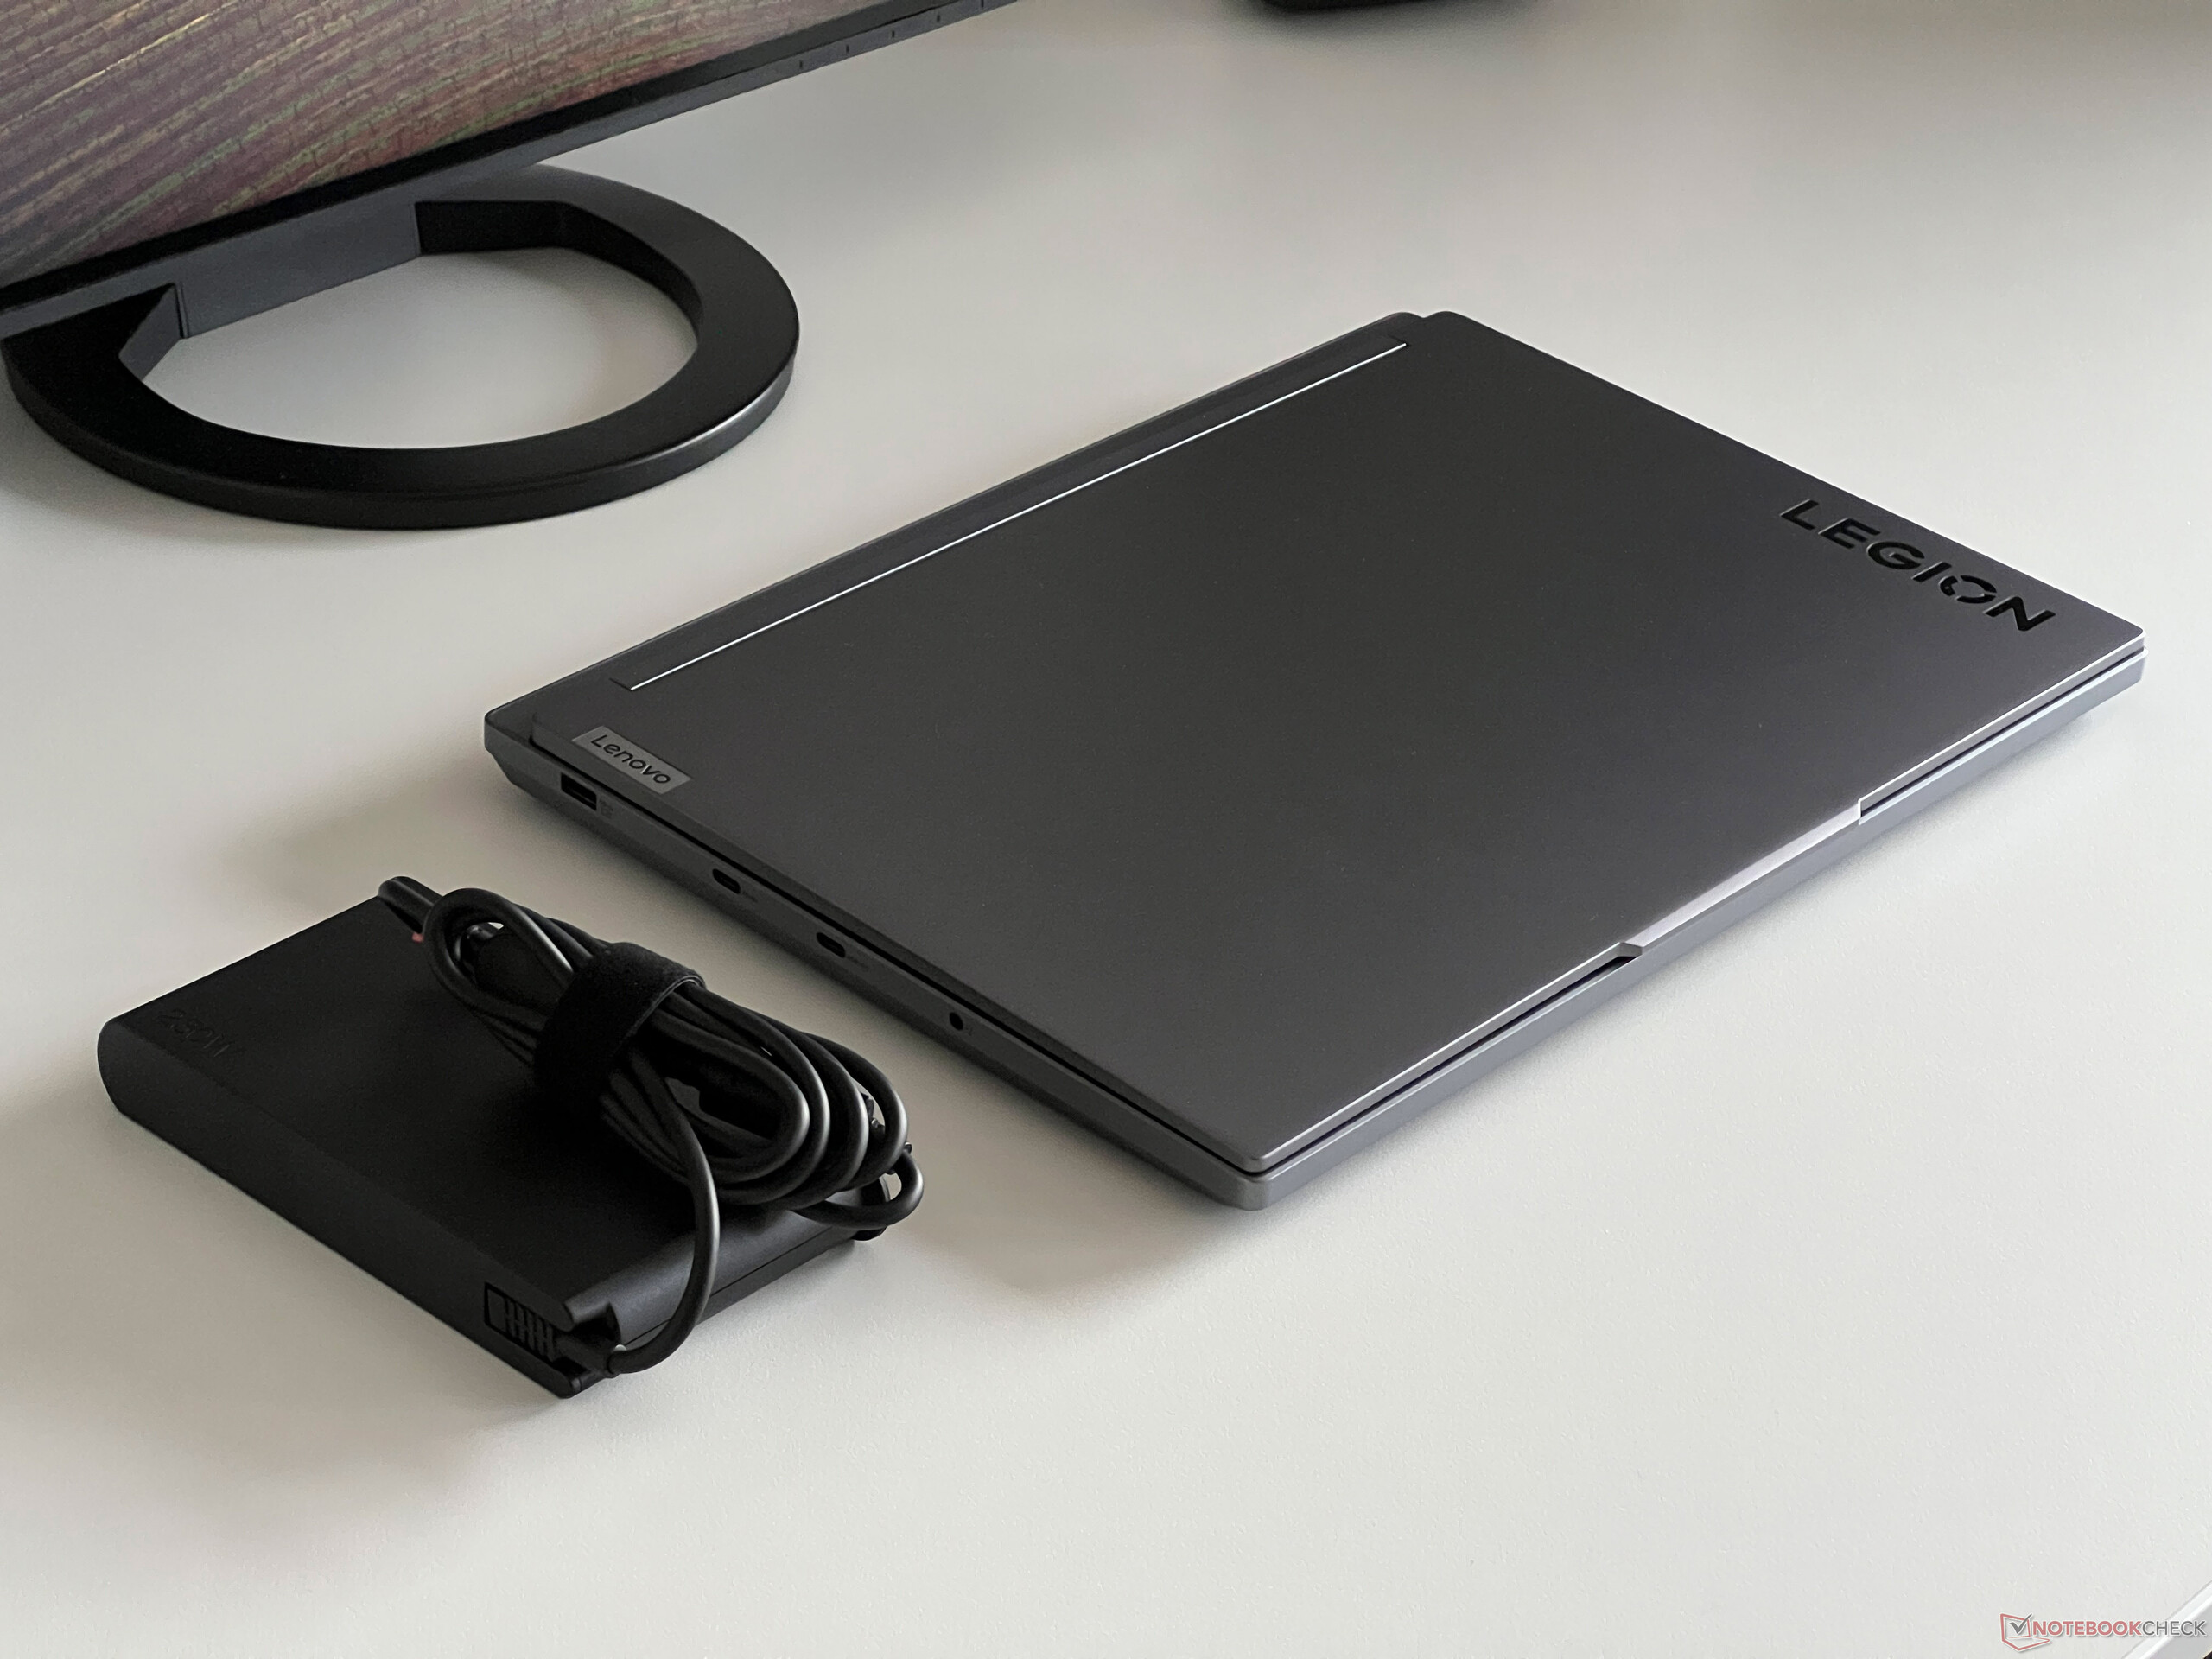
Ważąc 2,4 kg, nie jest w żadnym wypadku lekki jak piórko, ale w polu porównawczym nasza próbka testowa wypada dobrze. Jego wymiary sprawiają, że jest to również jeden z najbardziej kompaktowych modeli. Będą Państwo musieli zaplanować dodatkowe 869 gramów na 230-watowy zasilacz.
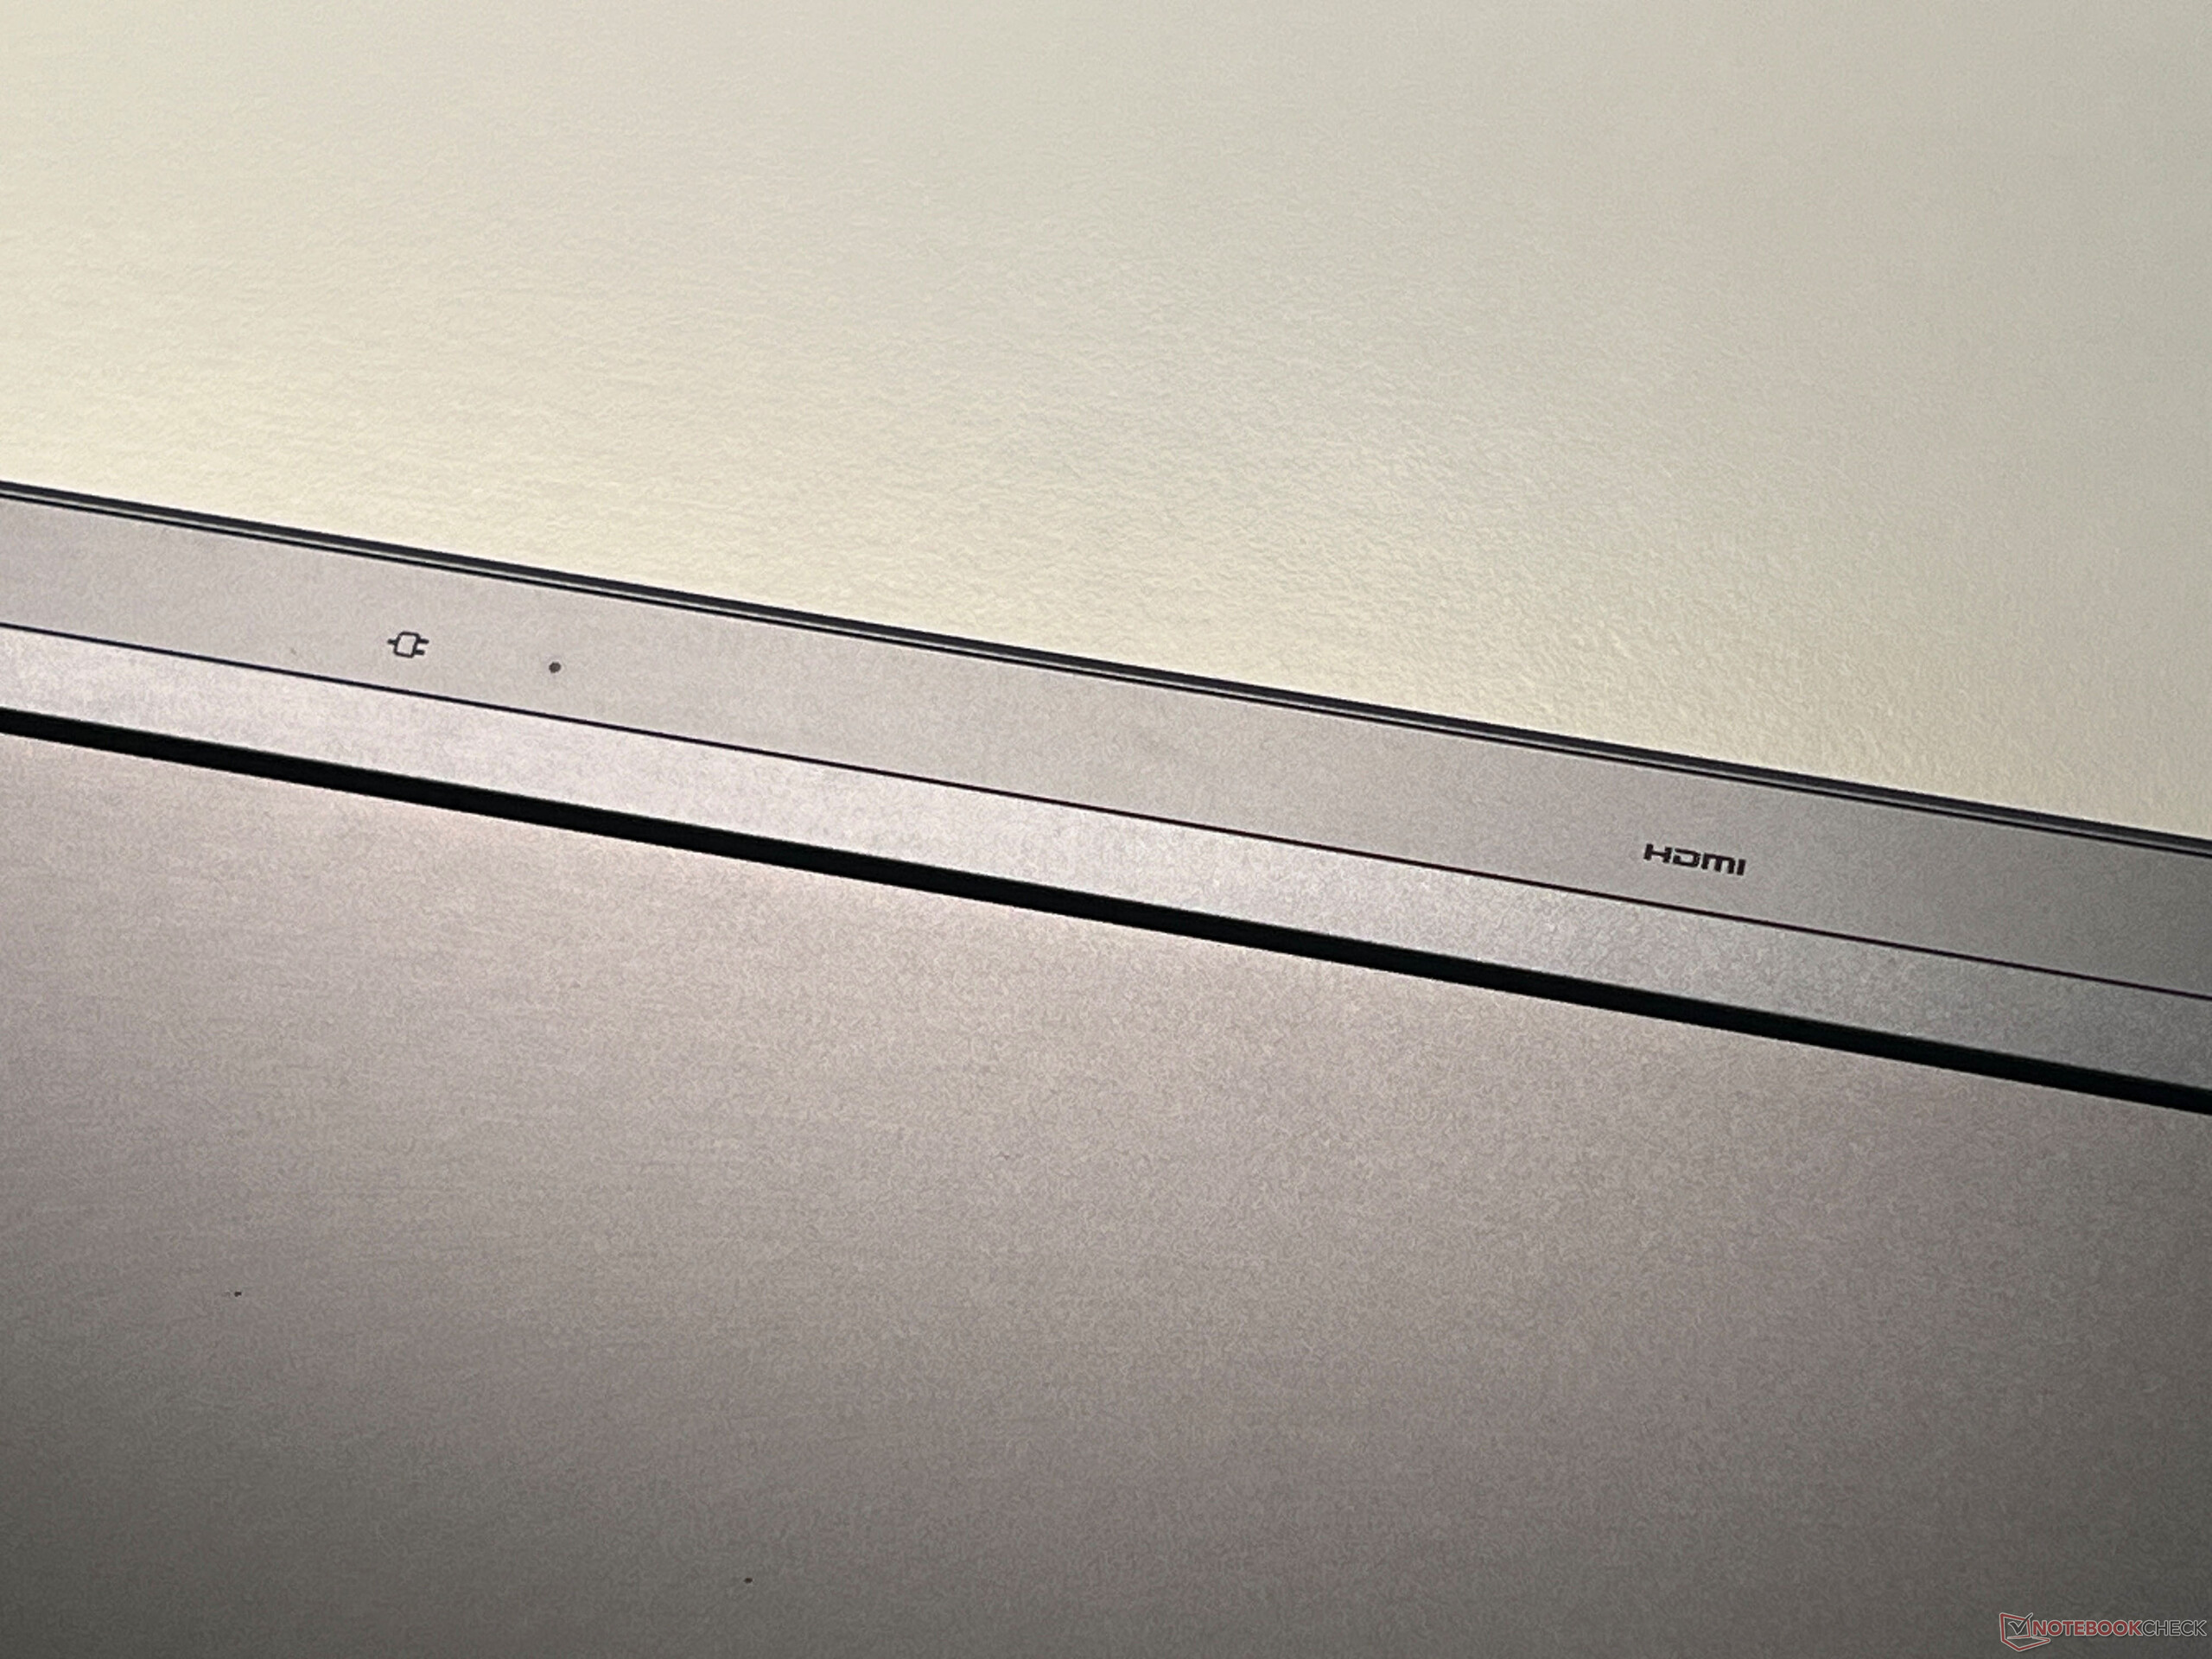
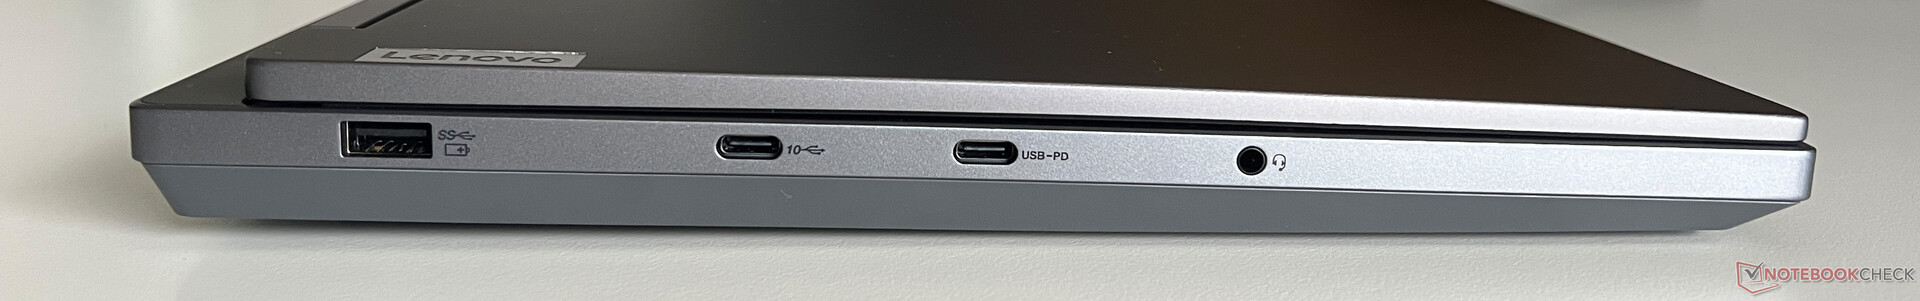
Łączność - Lenovo zrezygnowało z Thunderbolt
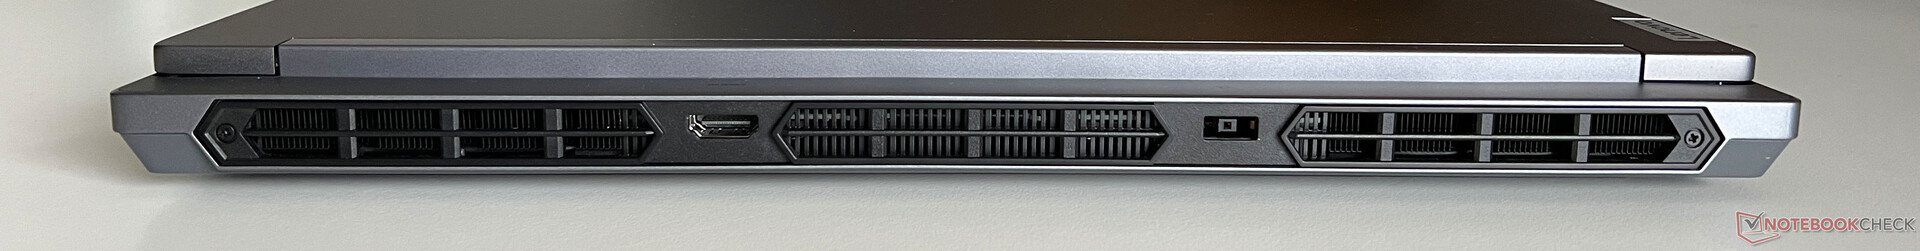
W Legion 5i 16 (jak również w Legion Pro 5i), Lenovo zdecydowało się nie instalować Thunderbolt 4, ale z kolei posiada dobry wybór portów rozmieszczonych wzdłuż wszystkich trzech boków. Z tyłu znajduje się złącze zasilania i port HDMI, po lewej stronie znajdują się trzy porty USB, a po prawej stronie znajdują się dwa kolejne złącza USB. Wszystkie wyjścia wideo są podłączone za pośrednictwem dGPU, co oznacza, że procesor graficzny Nvidii jest zawsze aktywny po podłączeniu zewnętrznego monitora.
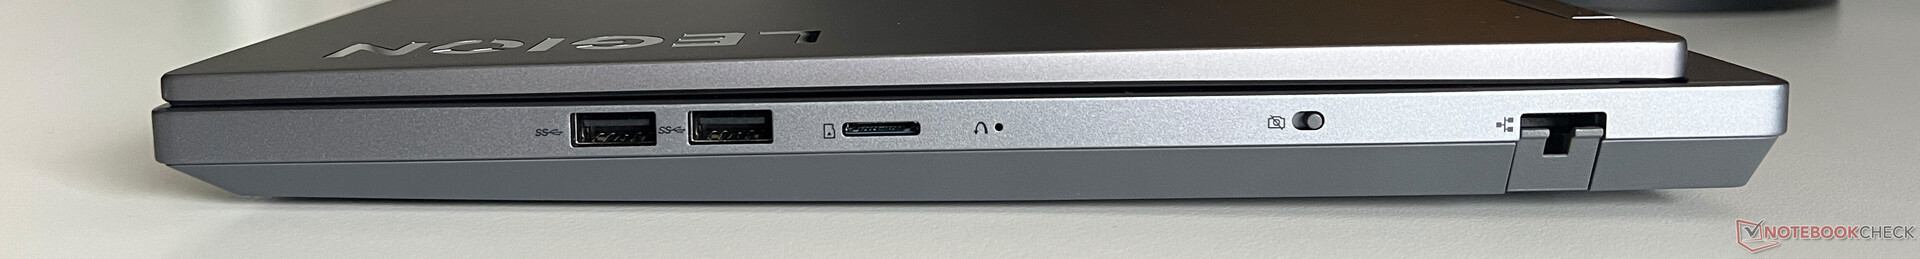
Czytnik kart SD
Czytnik kart microSD po prawej stronie urządzenia nie przyjmuje kart w pełni i nie jest szczególnie szybki. W połączeniu z naszą kartą referencyjną (Angelibird AV Pro V60), zmierzyliśmy niskie prędkości transferu wynoszące około 30 MB/s.
| SD Card Reader | |
| average JPG Copy Test (av. of 3 runs) | |
| Alienware m16 R1 Intel (AV PRO microSD 128 GB V60) | |
| Średnia w klasie Gaming (20.9 - 210, n=54, ostatnie 2 lata) | |
| Lenovo Legion Slim 5 16APH8 (PNY EliteX-Pro60 V60 256 GB) | |
| Schenker XMG CORE 16 (L23) | |
| Lenovo Legion 5 16IRX G9 | |
| maximum AS SSD Seq Read Test (1GB) | |
| Alienware m16 R1 Intel (AV PRO microSD 128 GB V60) | |
| Średnia w klasie Gaming (25.5 - 261, n=51, ostatnie 2 lata) | |
| Lenovo Legion Slim 5 16APH8 (PNY EliteX-Pro60 V60 256 GB) | |
| Schenker XMG CORE 16 (L23) | |
| Lenovo Legion 5 16IRX G9 | |
Komunikacja
Lenovo wyposażyło Legion w moduł AX211 WLAN od Intela, który oprócz Bluetooth 5.3, obsługuje również obecny standard Wi-Fi-6E dla sieci 6 GHz. W połączeniu z naszym routerem referencyjnym od Asusa, jego prędkości transferu były w sumie świetne, chociaż konkurencja była czasami szybsza. Jednak w praktyce nie powinno to być zauważalne, a podczas naszych testów nigdy nie mieliśmy żadnych problemów z jakością sygnału. Ponadto laptop posiada port Gigabit-Ethernet do połączeń przewodowych.
| Networking | |
| Lenovo Legion 5 16IRX G9 | |
| iperf3 transmit AXE11000 | |
| iperf3 receive AXE11000 | |
| Schenker XMG CORE 16 (L23) | |
| iperf3 transmit AXE11000 | |
| iperf3 receive AXE11000 | |
| HP Victus 16-r0077ng | |
| iperf3 transmit AXE11000 | |
| iperf3 receive AXE11000 | |
| Lenovo LOQ 16IRH8 | |
| iperf3 transmit AXE11000 | |
| iperf3 receive AXE11000 | |
| Lenovo Legion Slim 5 16APH8 | |
| iperf3 transmit AXE11000 | |
| iperf3 receive AXE11000 | |
| iperf3 transmit AXE11000 6GHz | |
| iperf3 receive AXE11000 6GHz | |
| HP Victus 16-r0076TX | |
| iperf3 transmit AXE11000 | |
| iperf3 receive AXE11000 | |
| iperf3 transmit AXE11000 6GHz | |
| iperf3 receive AXE11000 6GHz | |
| Alienware m16 R1 Intel | |
| iperf3 transmit AXE11000 | |
| iperf3 receive AXE11000 | |
| Lenovo Legion Pro 5 16IRX8 | |
| iperf3 transmit AXE11000 | |
| iperf3 receive AXE11000 | |
| iperf3 transmit AXE11000 6GHz | |
| iperf3 receive AXE11000 6GHz | |
Kamera internetowa
Kamera internetowa Legion 5i 1080p spełnia swoje zadanie, robiąc przyzwoite zdjęcia w dobrych warunkach oświetleniowych. Z drugiej strony nie obsługuje żadnych dodatkowych efektów studyjnych i nie ma czujnika podczerwieni do rozpoznawania twarzy za pomocą Windows Hello. Po prawej stronie znajduje się przełącznik, który dezaktywuje kamerę internetową.


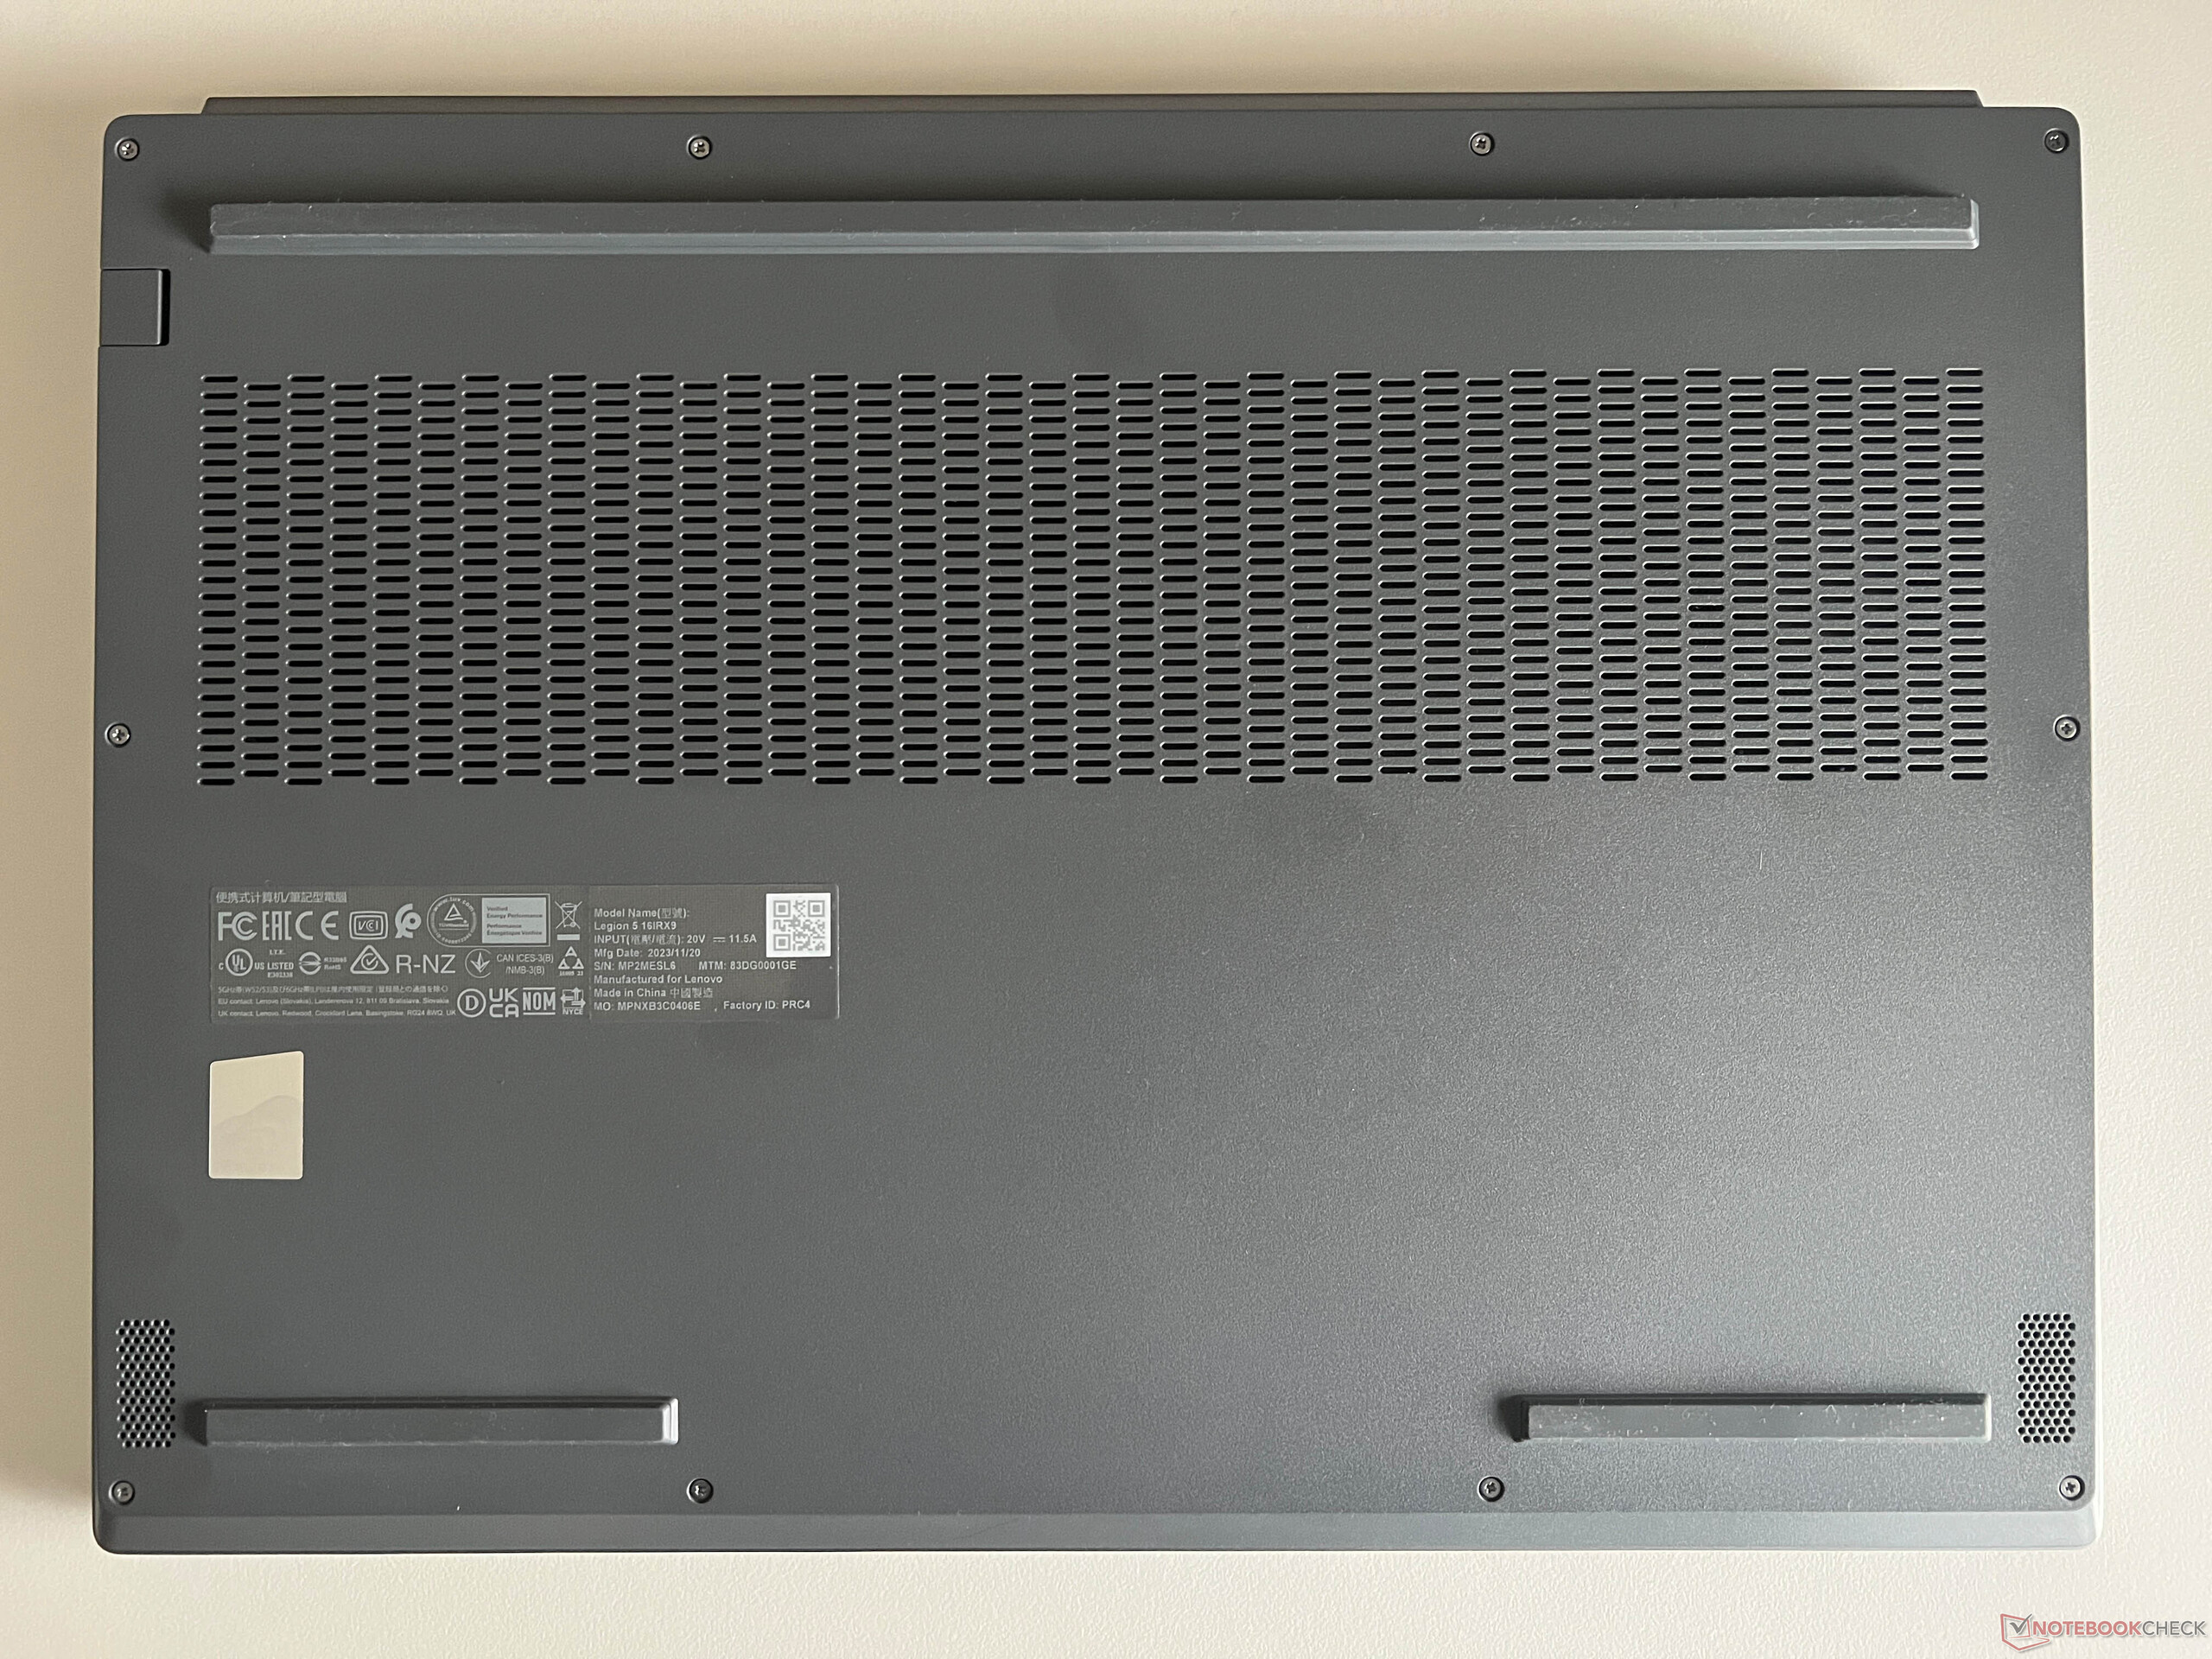
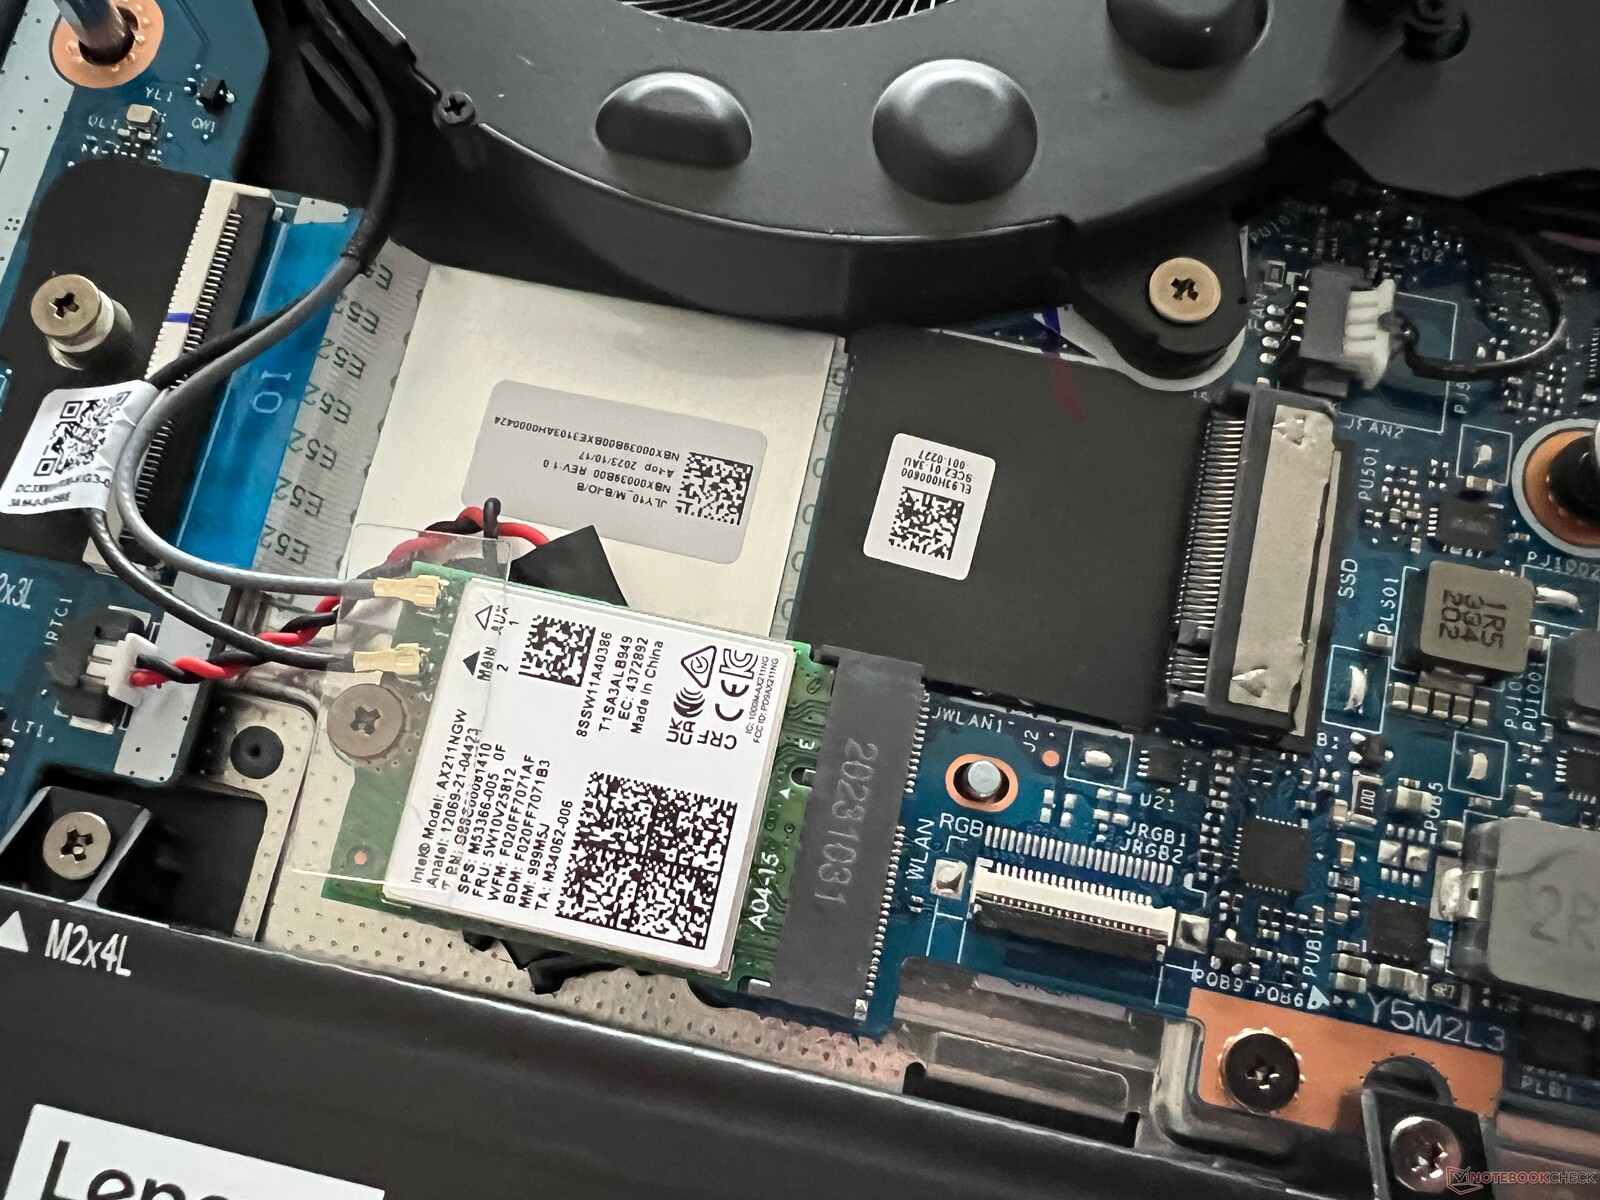
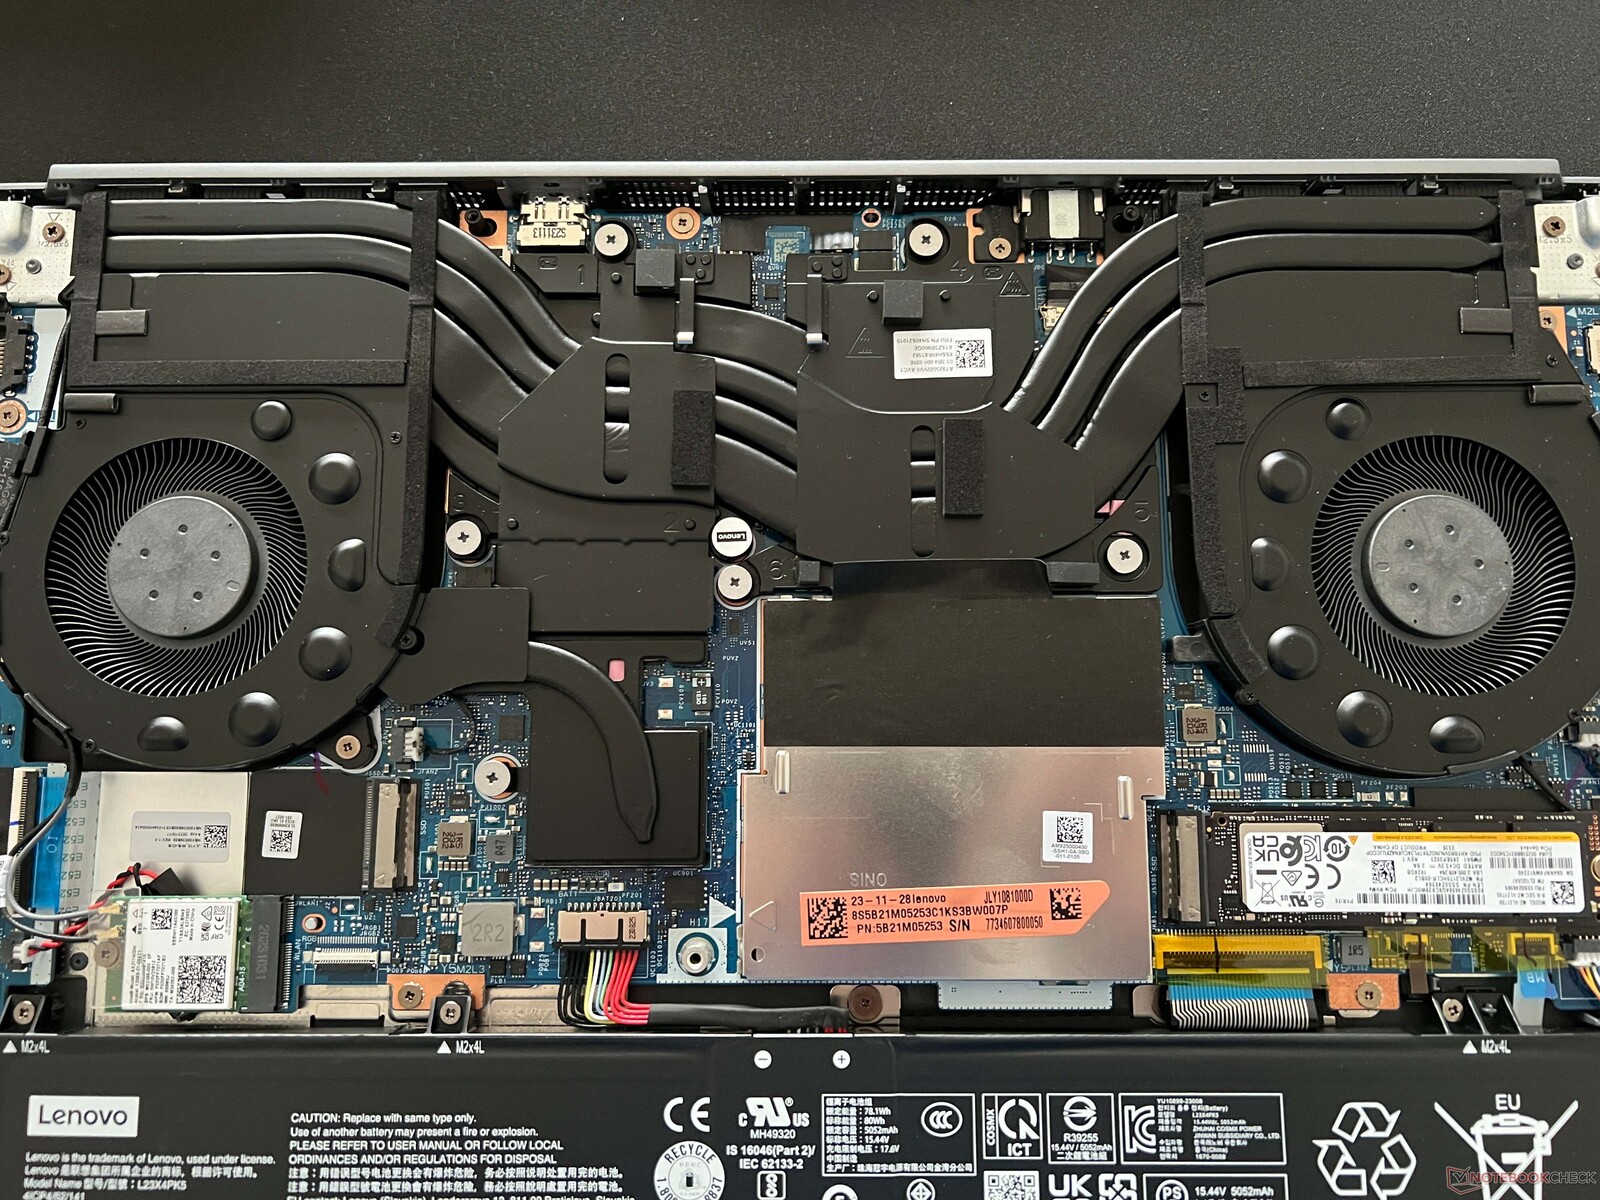
Konserwacja
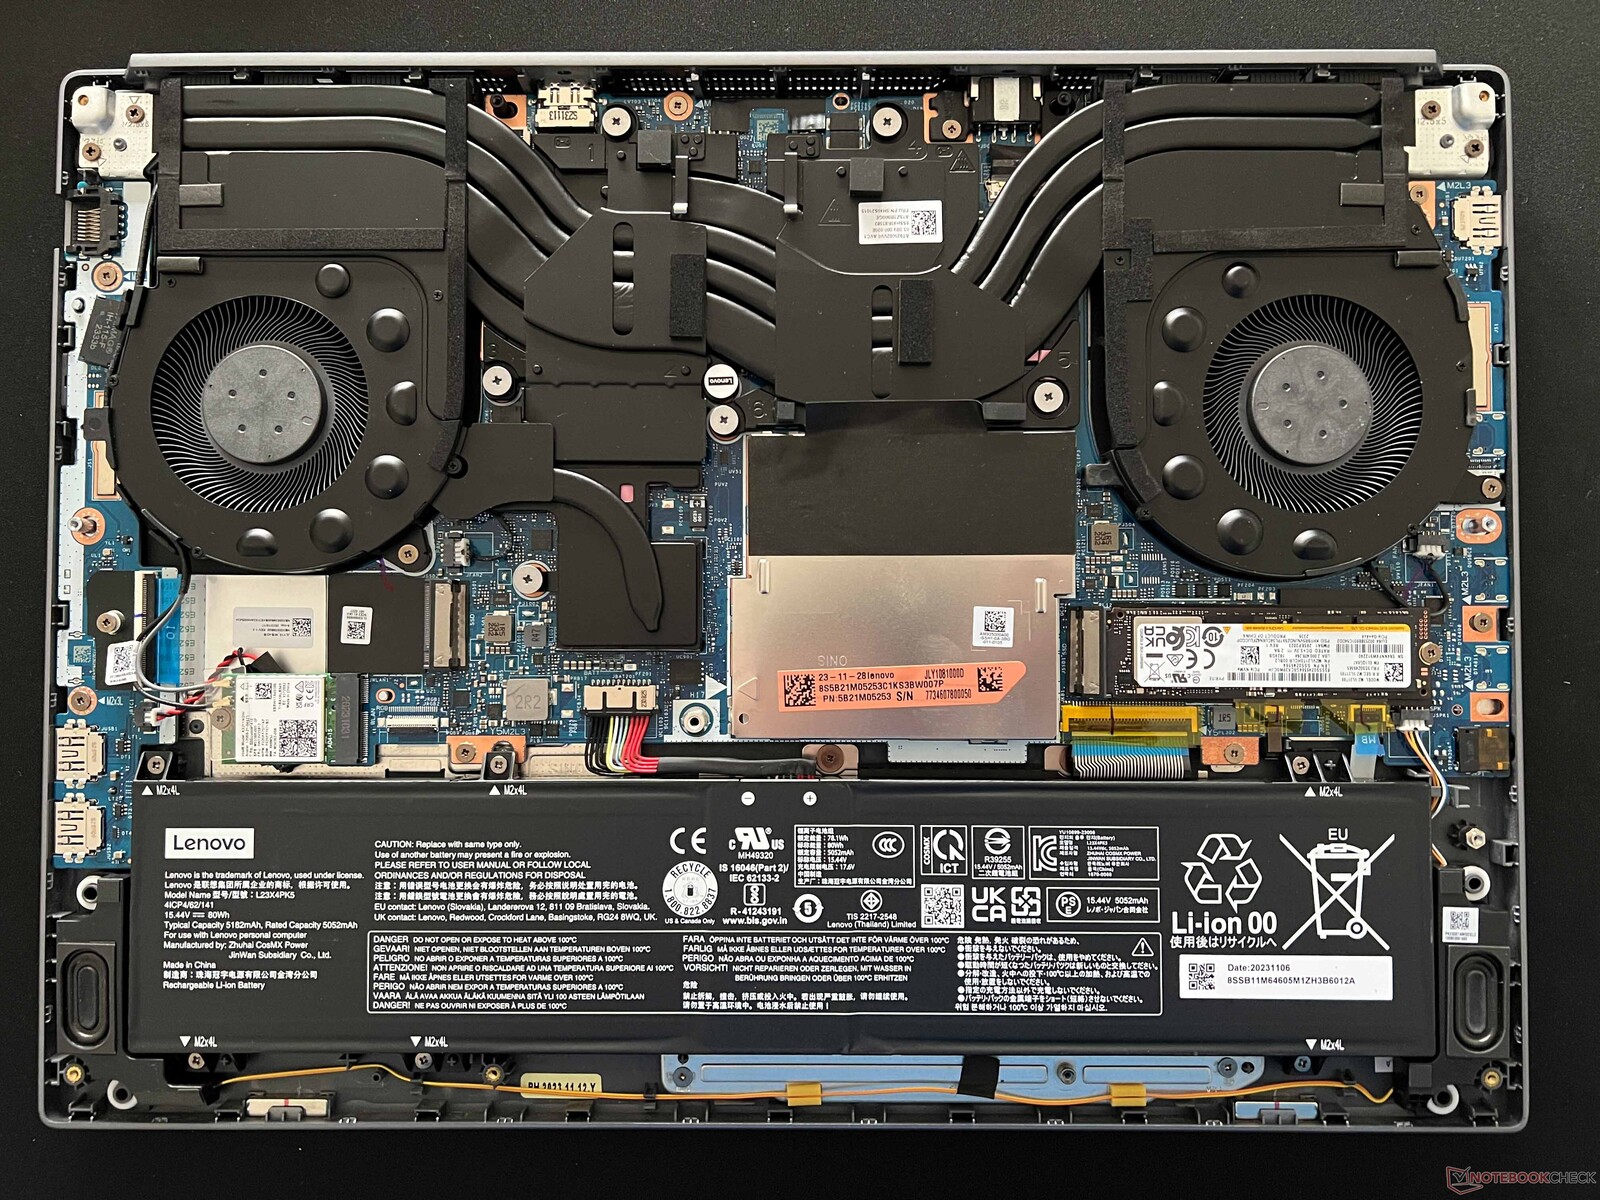
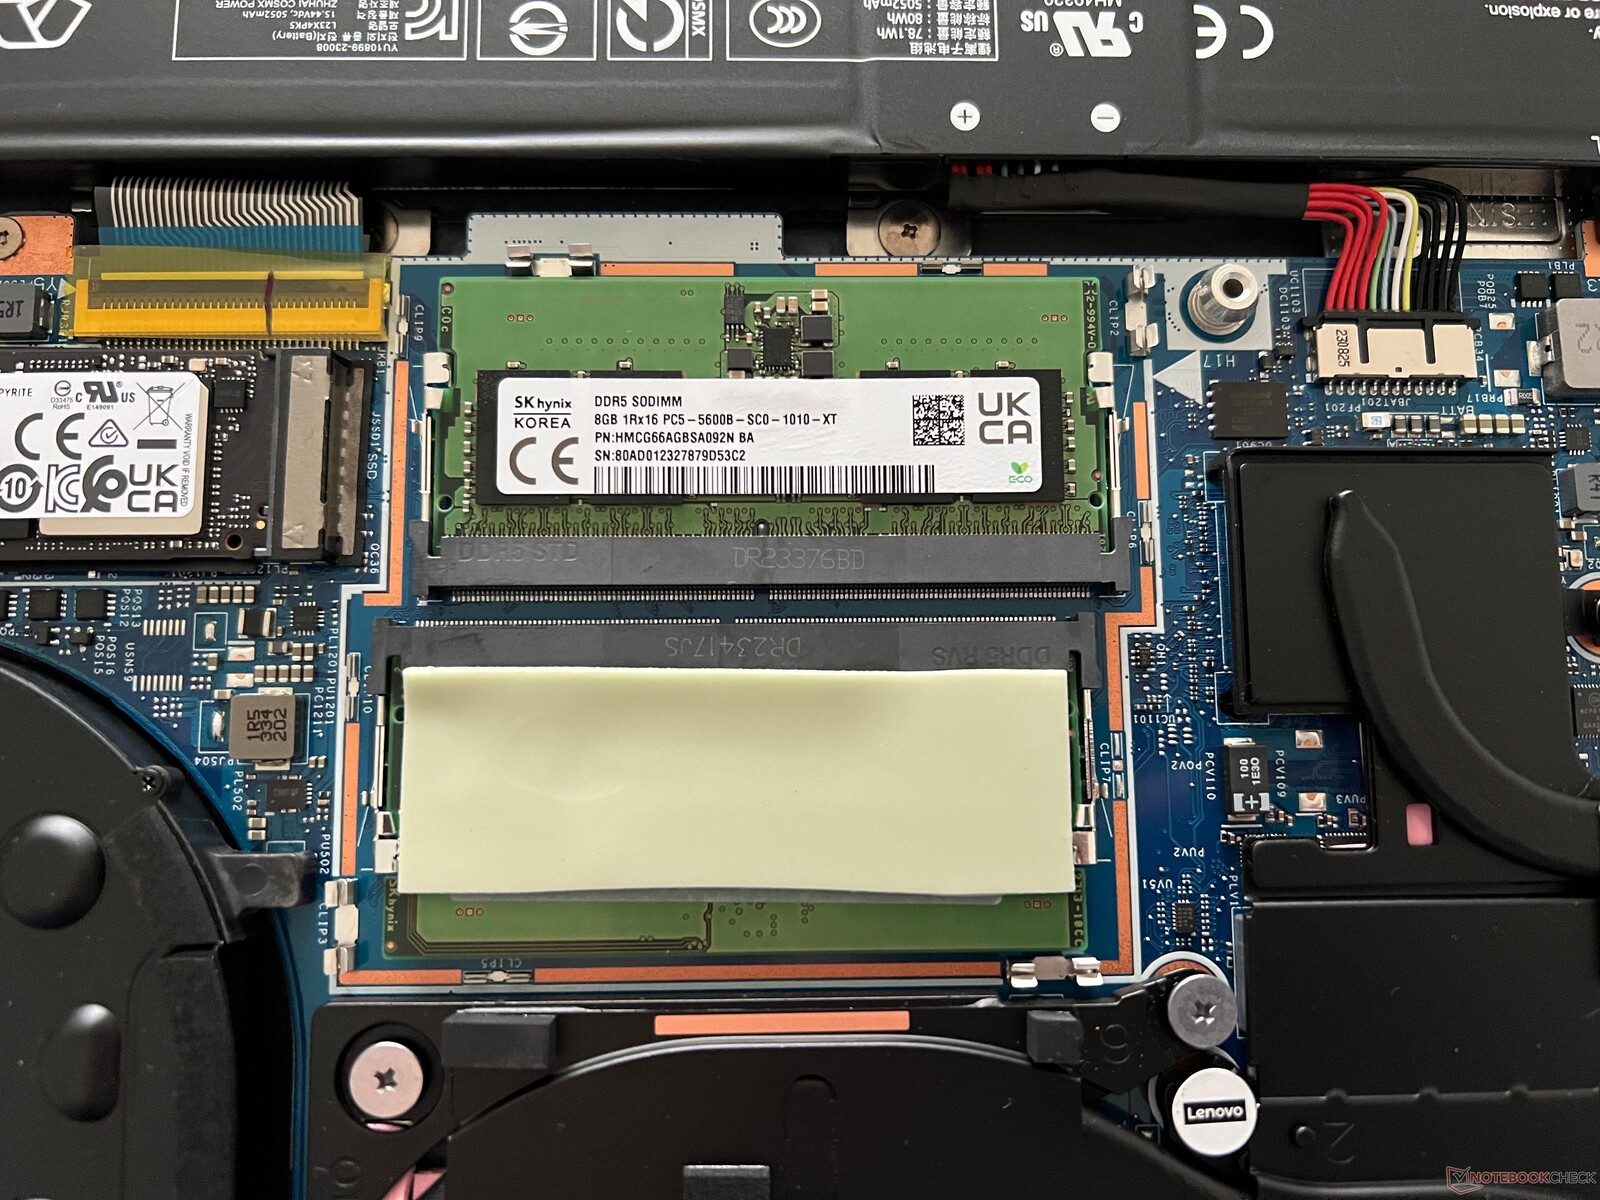
Dolna część obudowy jest połączona za pomocą zwykłych śrub z łbem krzyżakowym, ale po ich usunięciu nadal jest bezpiecznie osadzona. Do jej otwarcia należy użyć odpowiedniego narzędzia. Wewnątrz laptopa opcje konserwacji są dobre, ponieważ oprócz obu gniazd pamięci RAM, posiada również dwa gniazda na dyski SSD M.2-2280. Moduł WLAN i baterię (przykręcaną) można również wymienić.
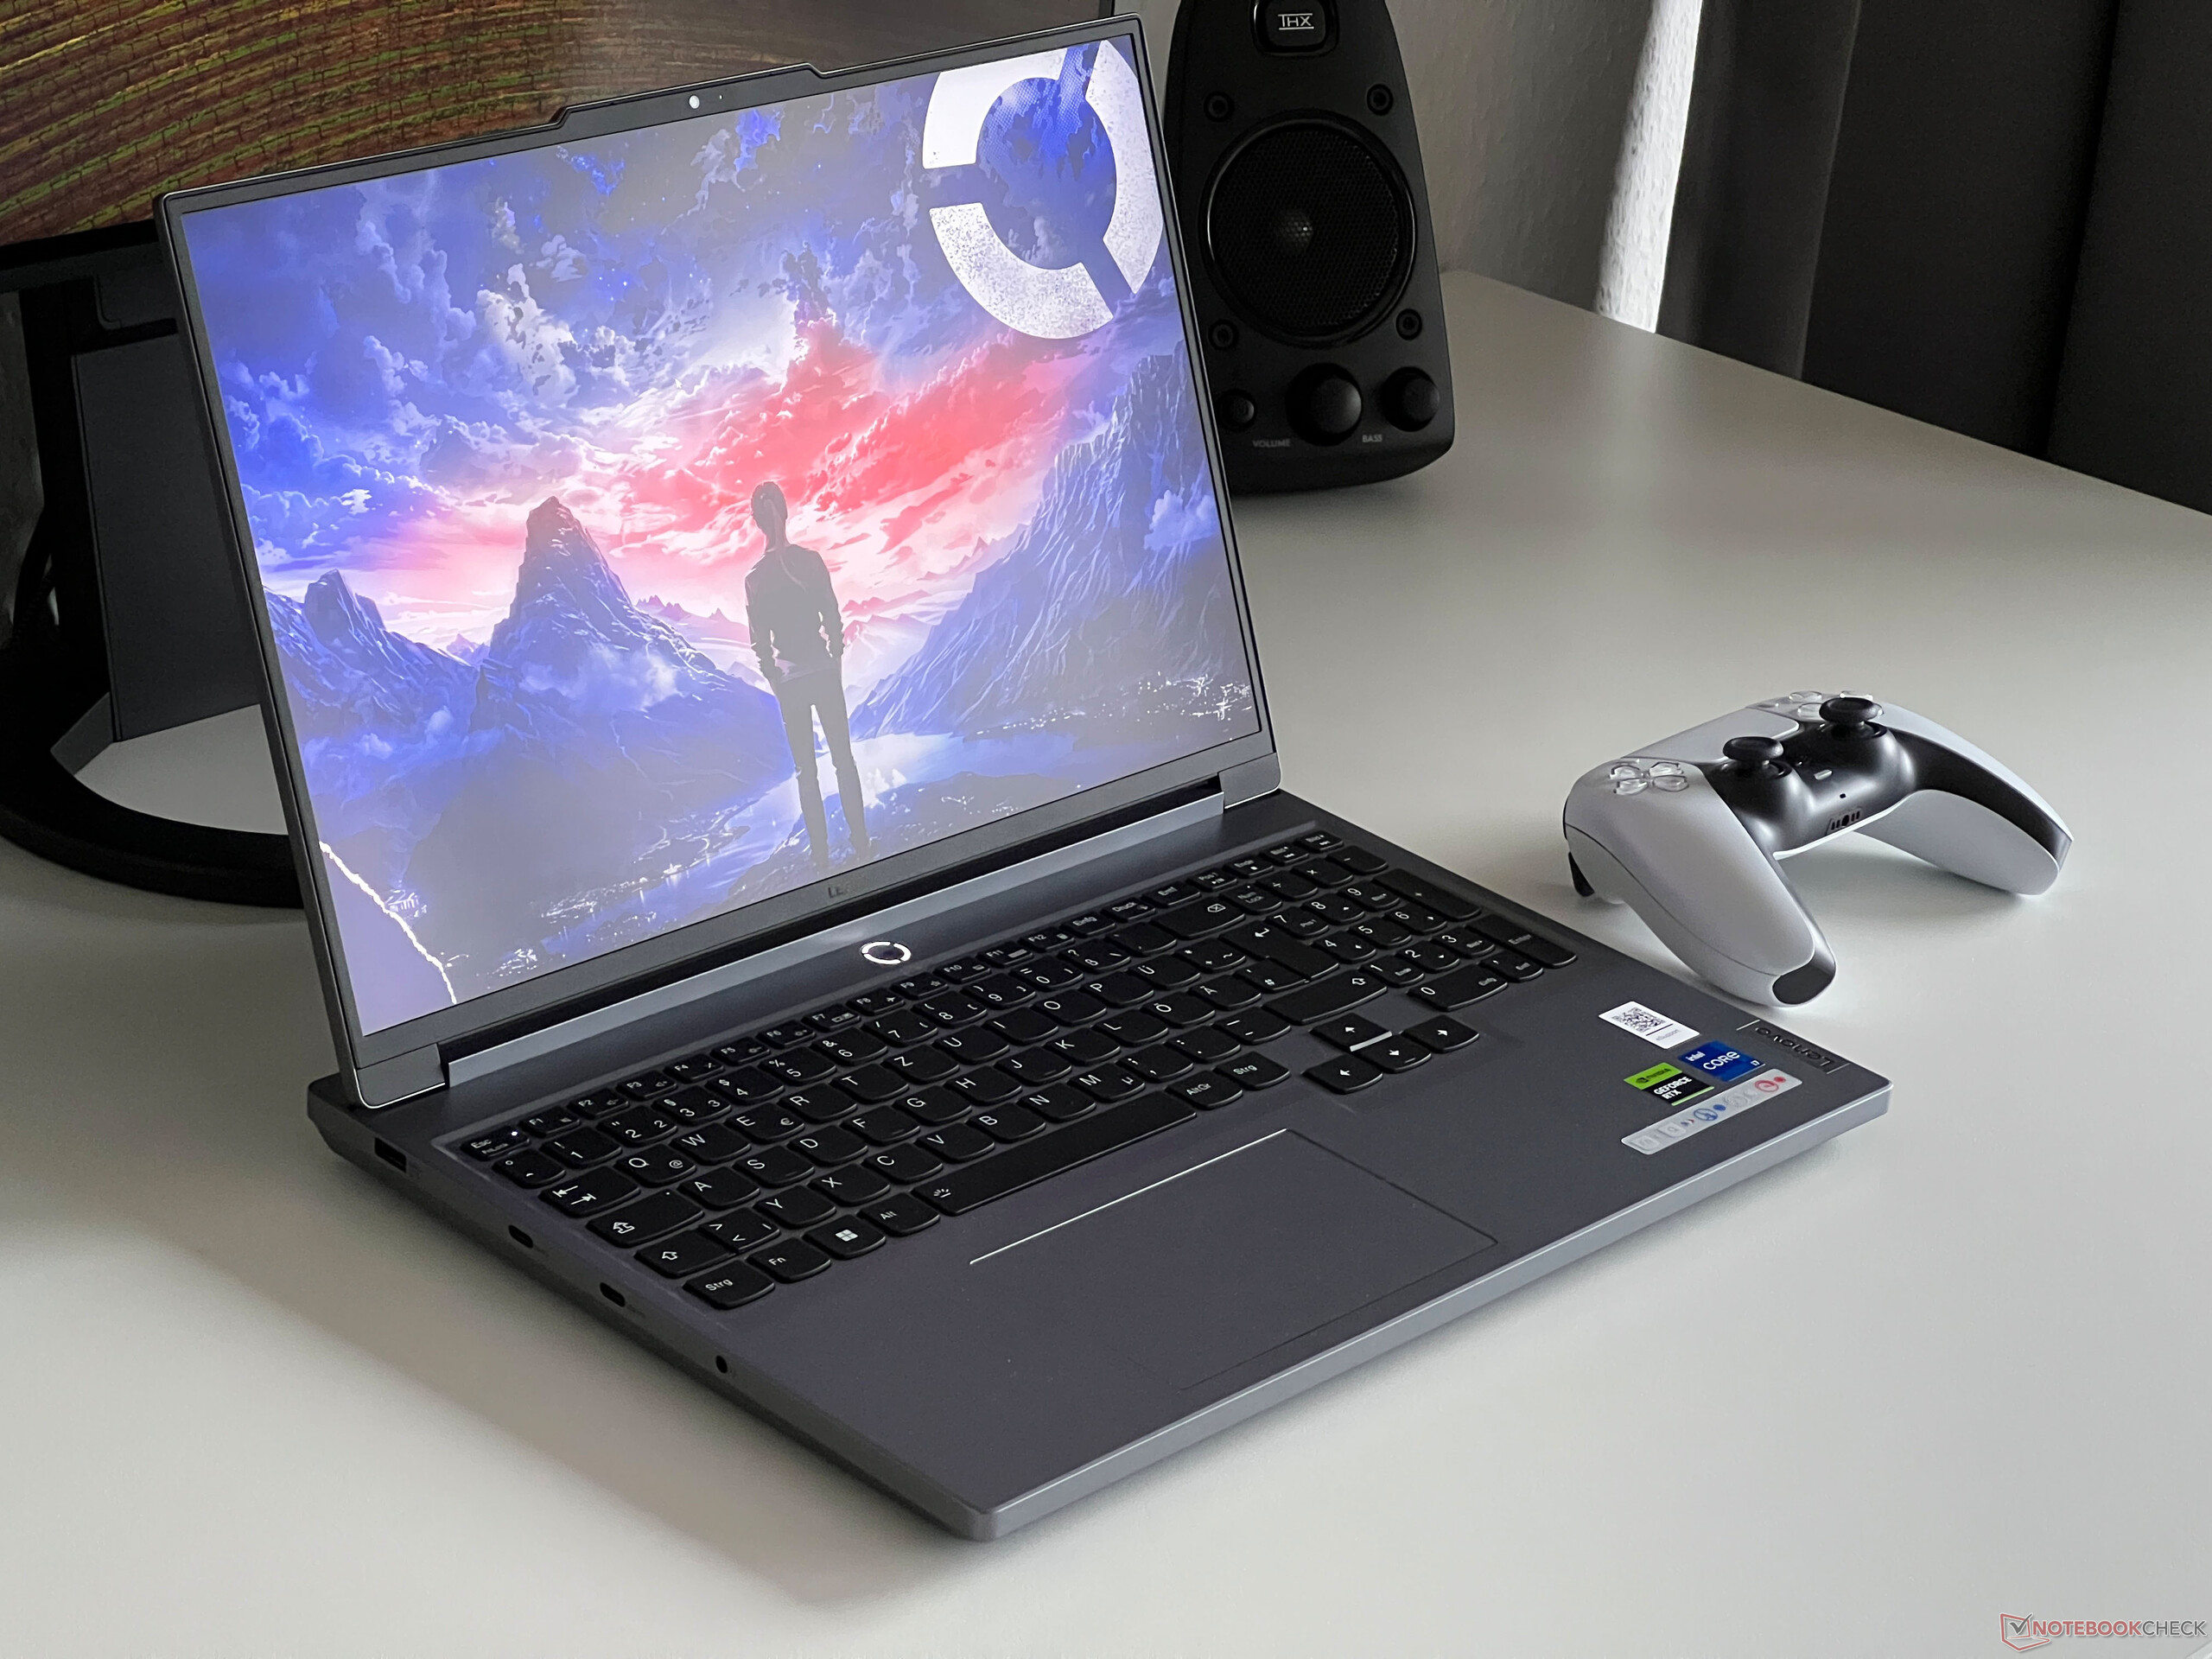
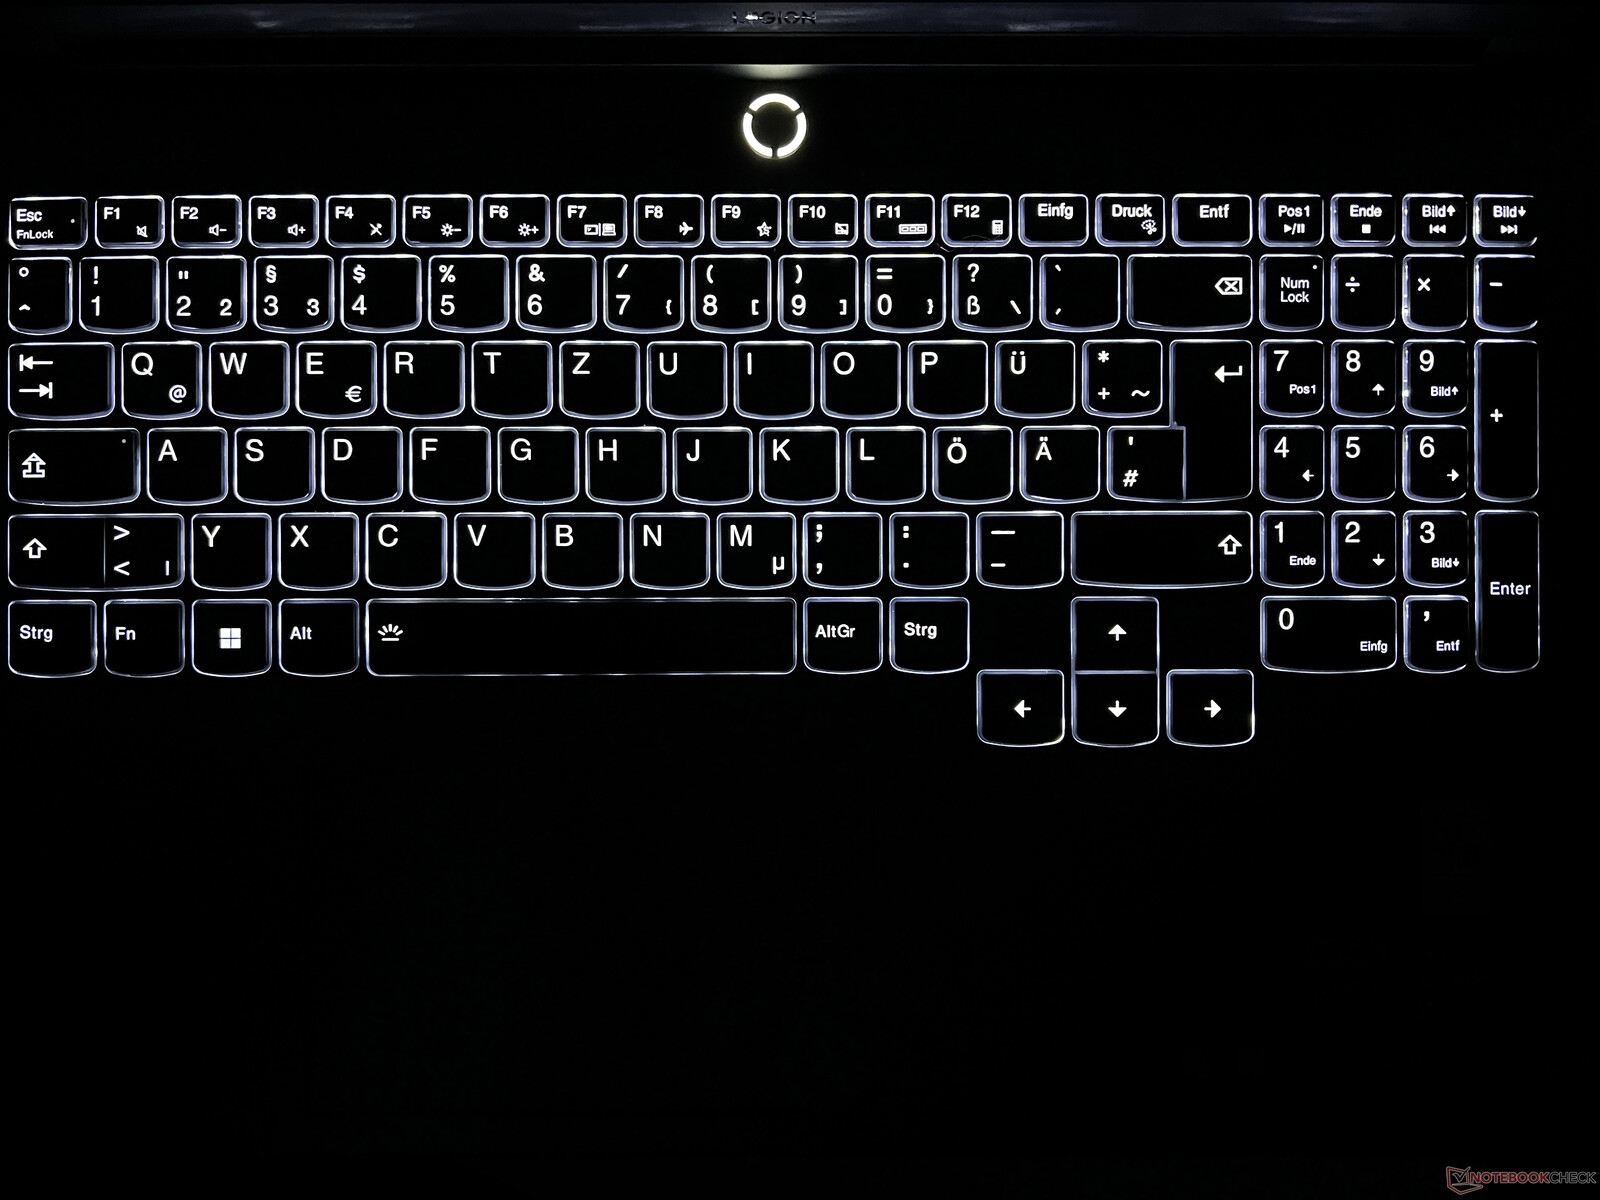
Urządzenia wejściowe - podnośnik 1,5 mm bez podświetlenia RGB
Czarna klawiatura - w tym dedykowana klawiatura numeryczna i przesunięte klawisze strzałek - jest już znana z innych modeli Legion. Jej klawisze mają skok 1,5 mm i w sumie pisze się na nich komfortowo. Poza grami, na tej klawiaturze nie ma również problemu z pisaniem dłuższych tekstów. Nasza testowa konfiguracja została wyposażona w podświetlaną klawiaturę, która posiada dwa ustawienia jasności; opcjonalnie można dodatkowo wybrać taką z kolorowym, 4-strefowym podświetleniem.
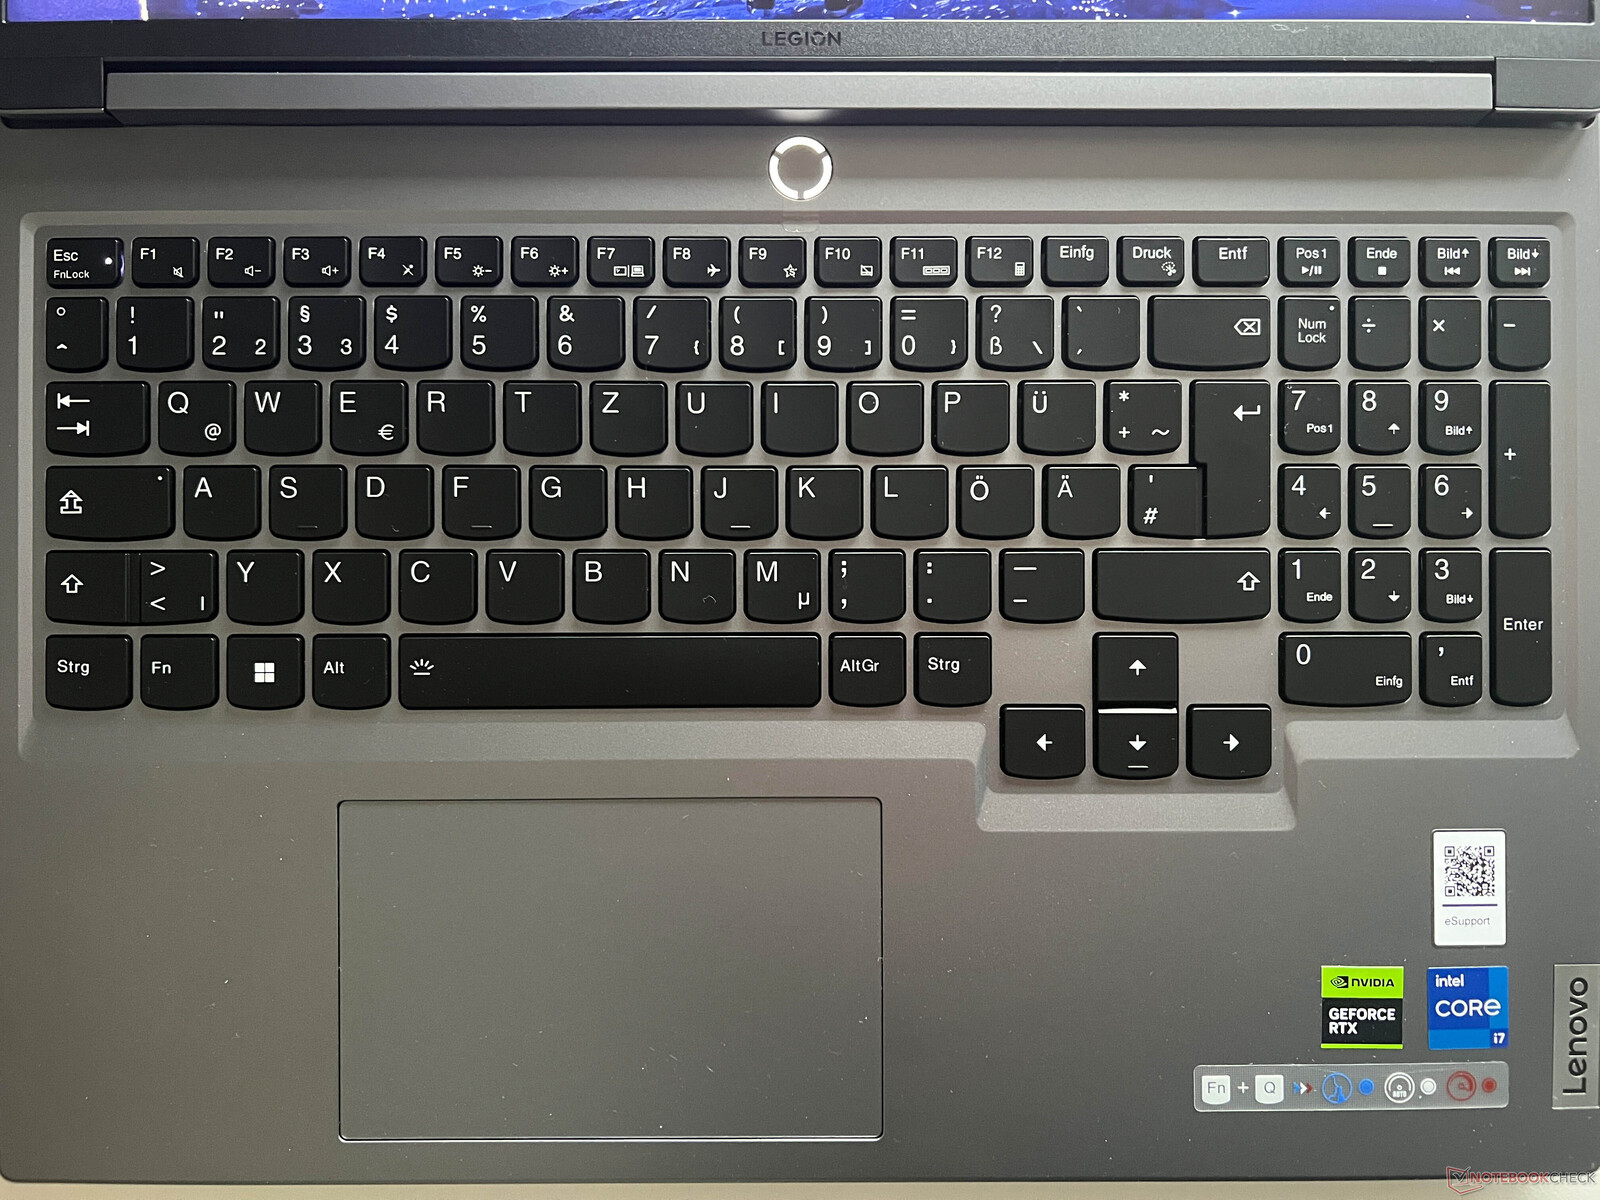
Klawiatura jest umieszczona nieco po lewej stronie, a jej rozmiar (12 x 7,5 cm) jest idealny do normalnej obsługi wskaźnika - który również działa absolutnie dobrze. Dolną część podkładki można nacisnąć, co niestety spotyka się z głośnym hałasem. Podczas grania większość użytkowników i tak sięgnie po gamepada lub myszkę. Te można podłączyć po obu stronach urządzenia.
Wyświetlacz - 240-Hz IPS

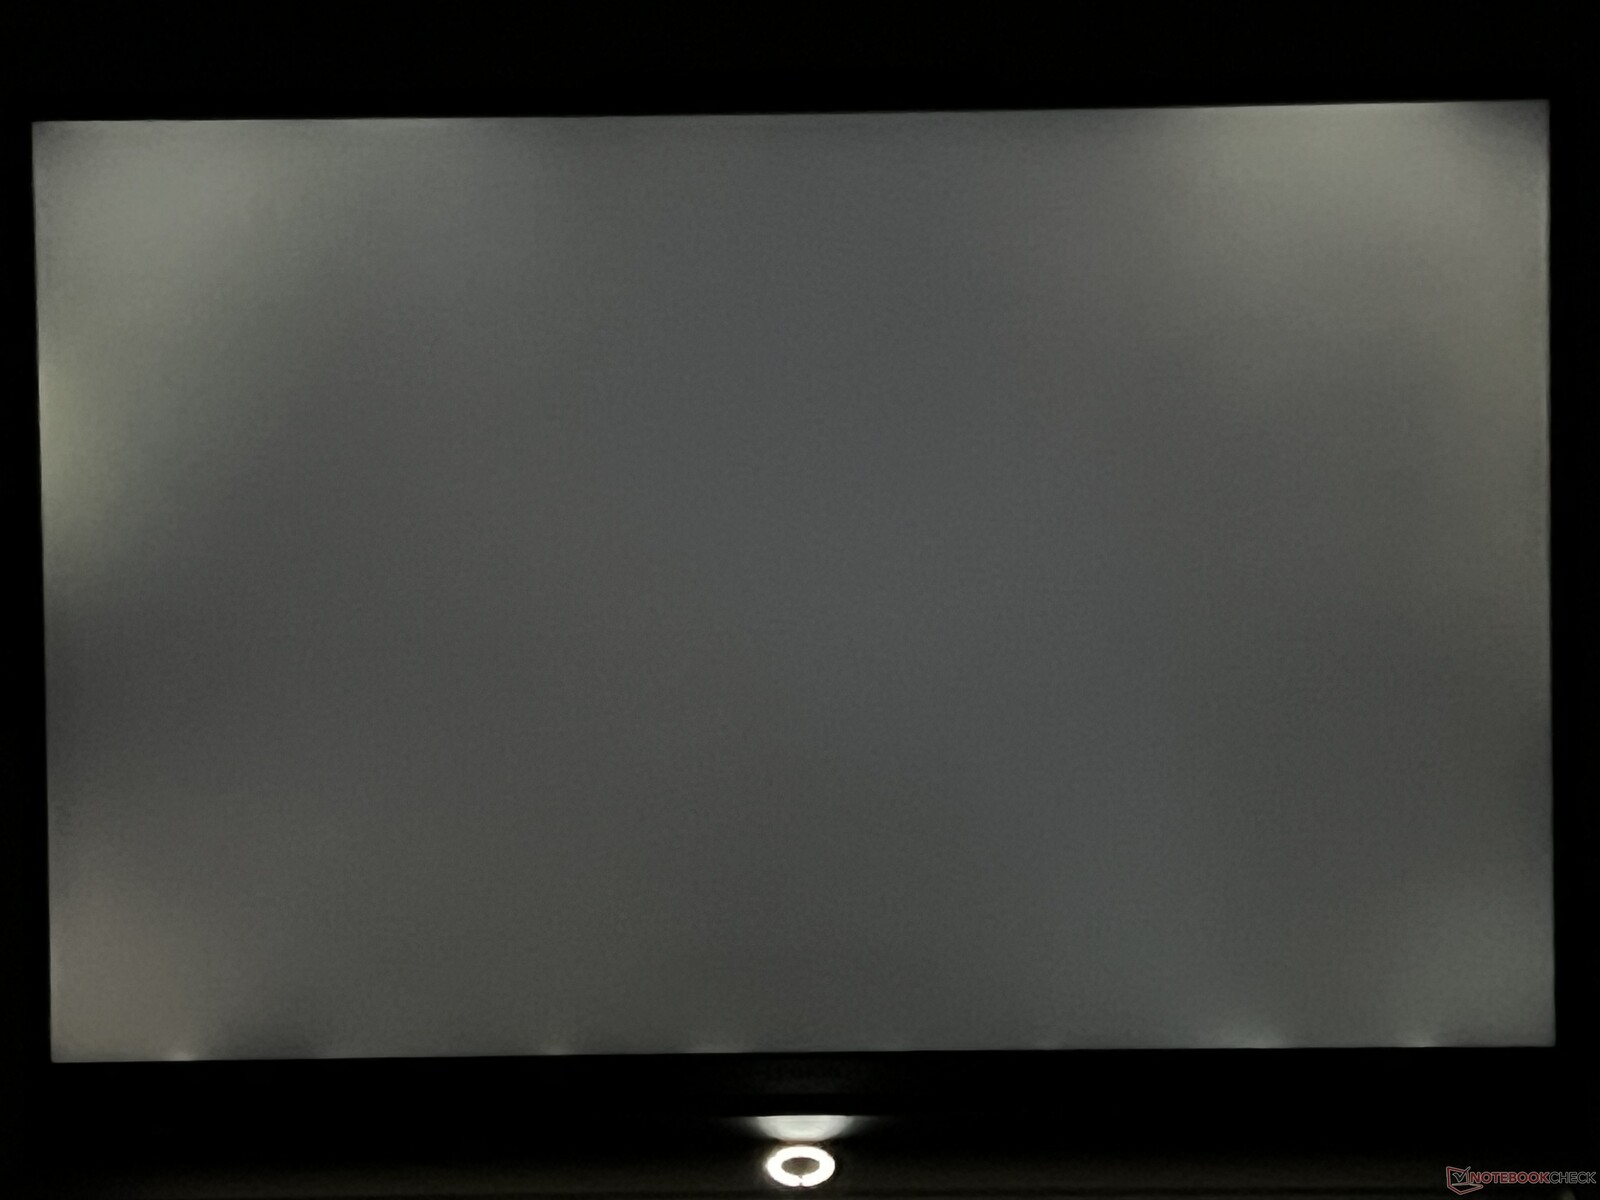
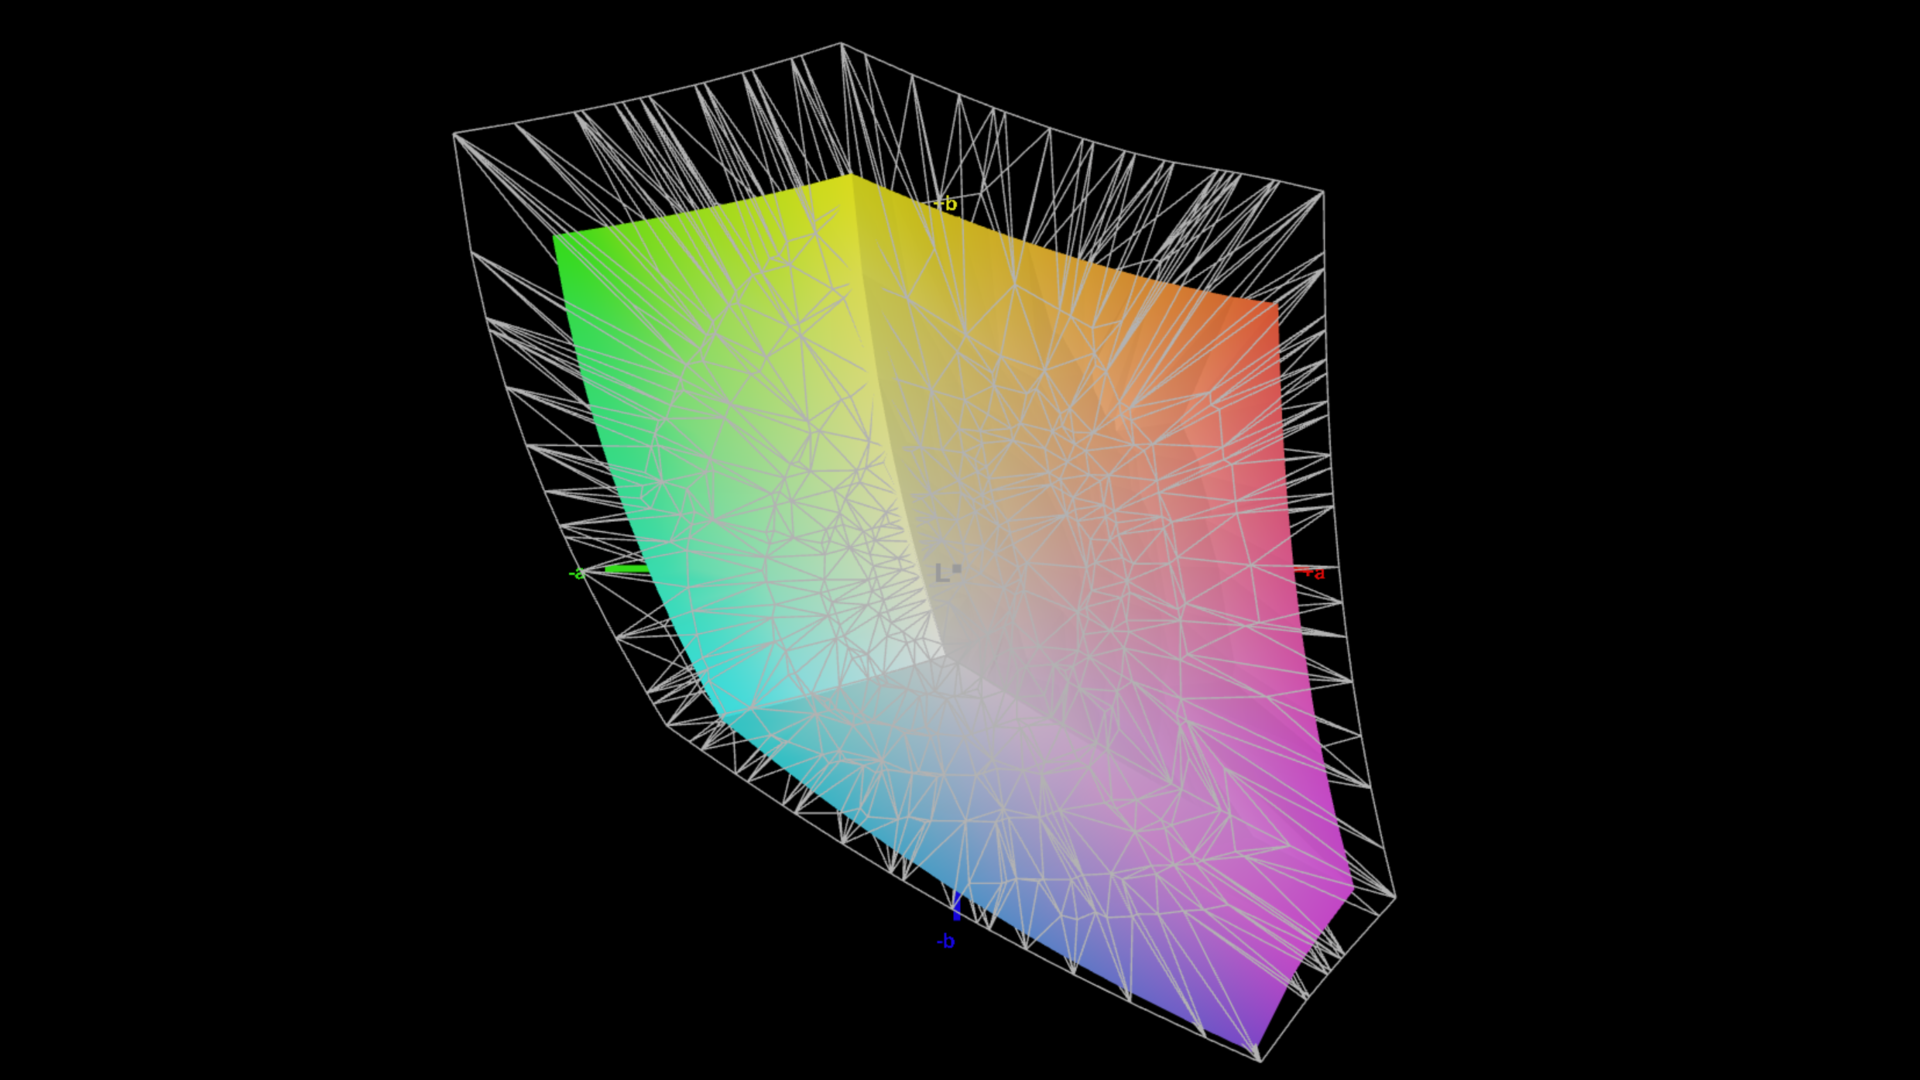
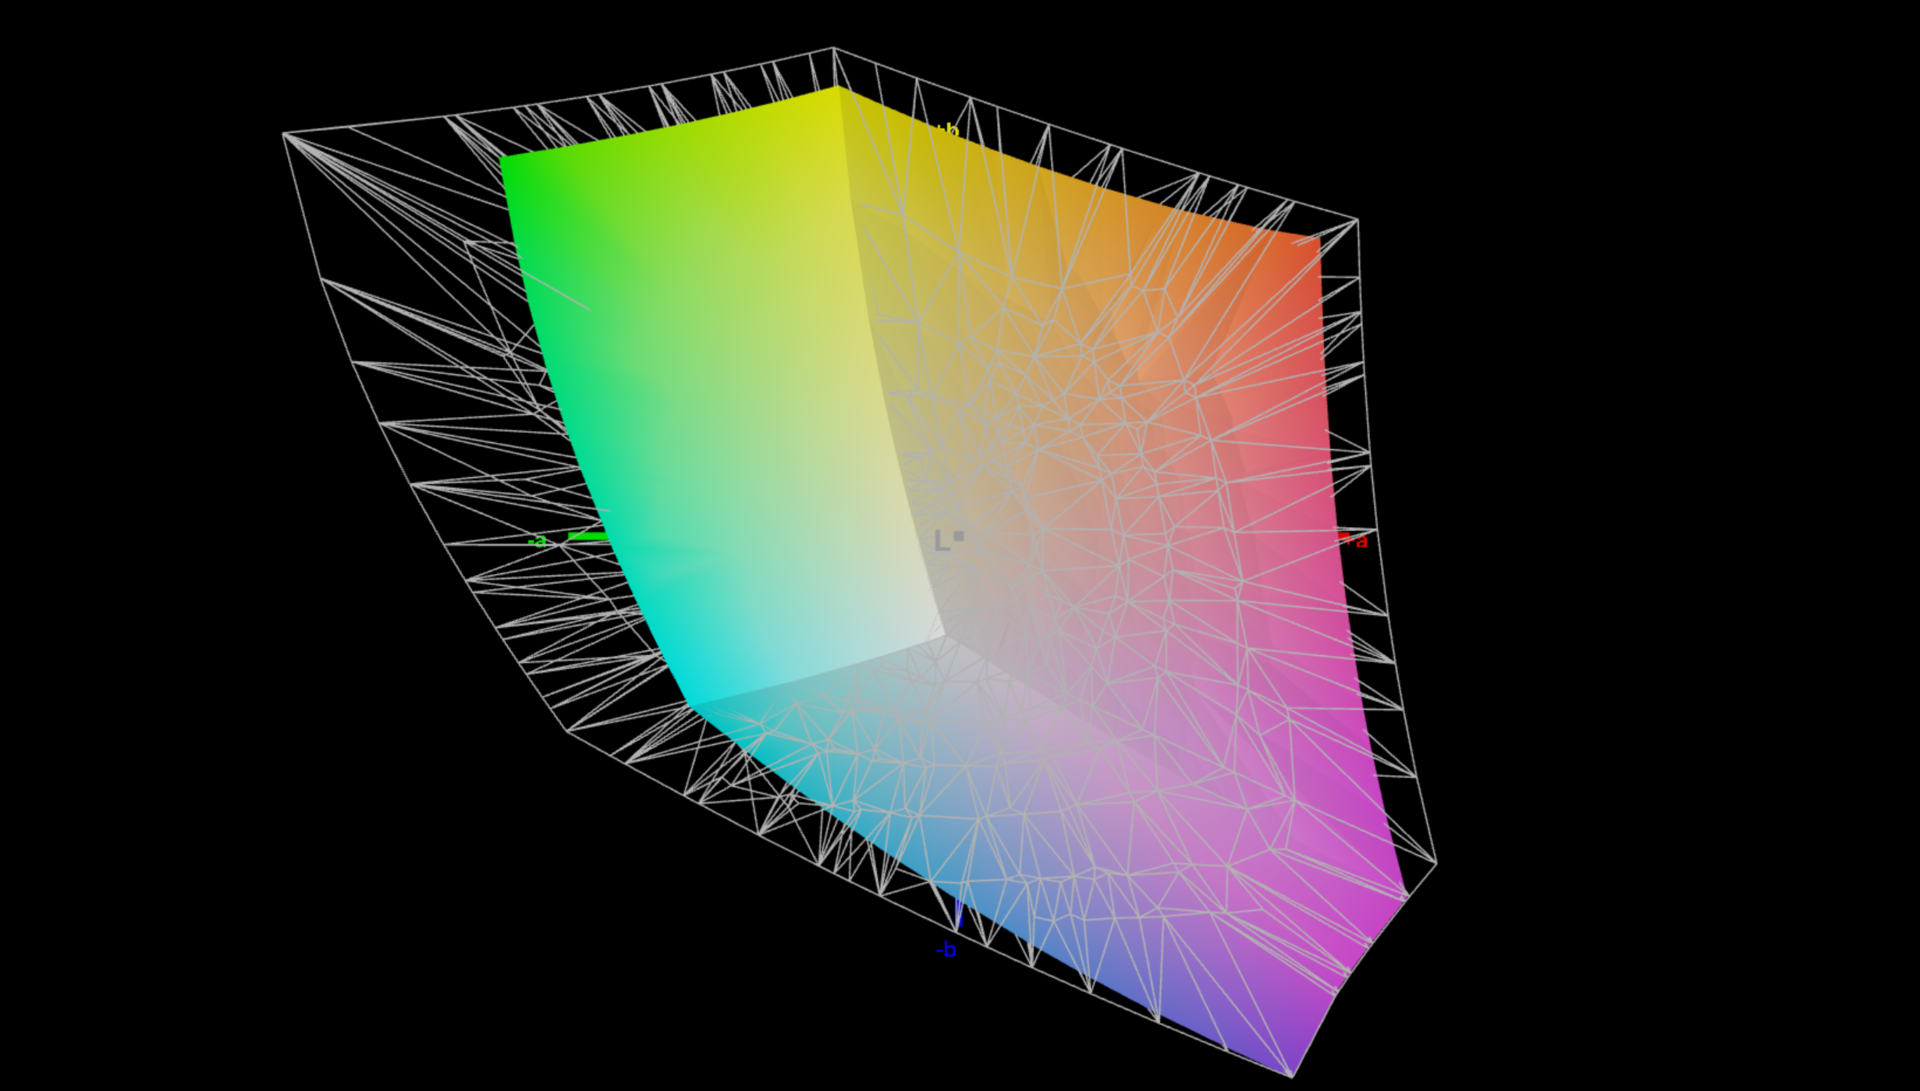
Lenovo oferuje dwa różne matowe wyświetlacze WQXGA o rozdzielczości 2560 x 1600 pikseli. Oprócz wersji o częstotliwości odświeżania 165 Hz i jasności 300 nitów, można również wybrać jaśniejszy wariant 500 nitów z częstotliwością odświeżania 240 Hz. Ten ostatni dodatkowo obsługuje HDR i to właśnie on został zainstalowany w naszym urządzeniu testowym. Subiektywnie, ekran wygląda świetnie; treści są bardzo ostre, kolory żywe, a nawet jaśniejsze obszary nie wydają się ziarniste. Można jednak zauważyć pewne wyraźne aureole podczas oglądania ciemnych obrazów z podkręconą jasnością.
Nasz panel osiągnął maksymalną wartość 528 cd/m² i średnią 500 cd/m², co oznacza, że jego cel został osiągnięty. Jego wartość czerni wynosząca 0,33 jest w porządku, a maksymalny współczynnik kontrastu wynosi ponad 1500:1. Szybkość reakcji wyświetlacza jest szybka i na tym samym poziomie co u innych konkurentów IPS. Podsumowując, ekran dobrze nadaje się do gier, a jego wartości są lepsze niż u konkurencji. Obsługiwana jest również zawartość HDR (ale HDR musi być ręcznie aktywowany za pomocą ustawień systemu Windows).
| |||||||||||||||||||||||||
rozświetlenie: 87 %
na akumulatorze: 519 cd/m²
kontrast: 1594:1 (czerń: 0.33 cd/m²)
ΔE ColorChecker Calman: 1.2 | ∀{0.5-29.43 Ø4.72}
calibrated: 1
ΔE Greyscale Calman: 1.3 | ∀{0.09-98 Ø4.97}
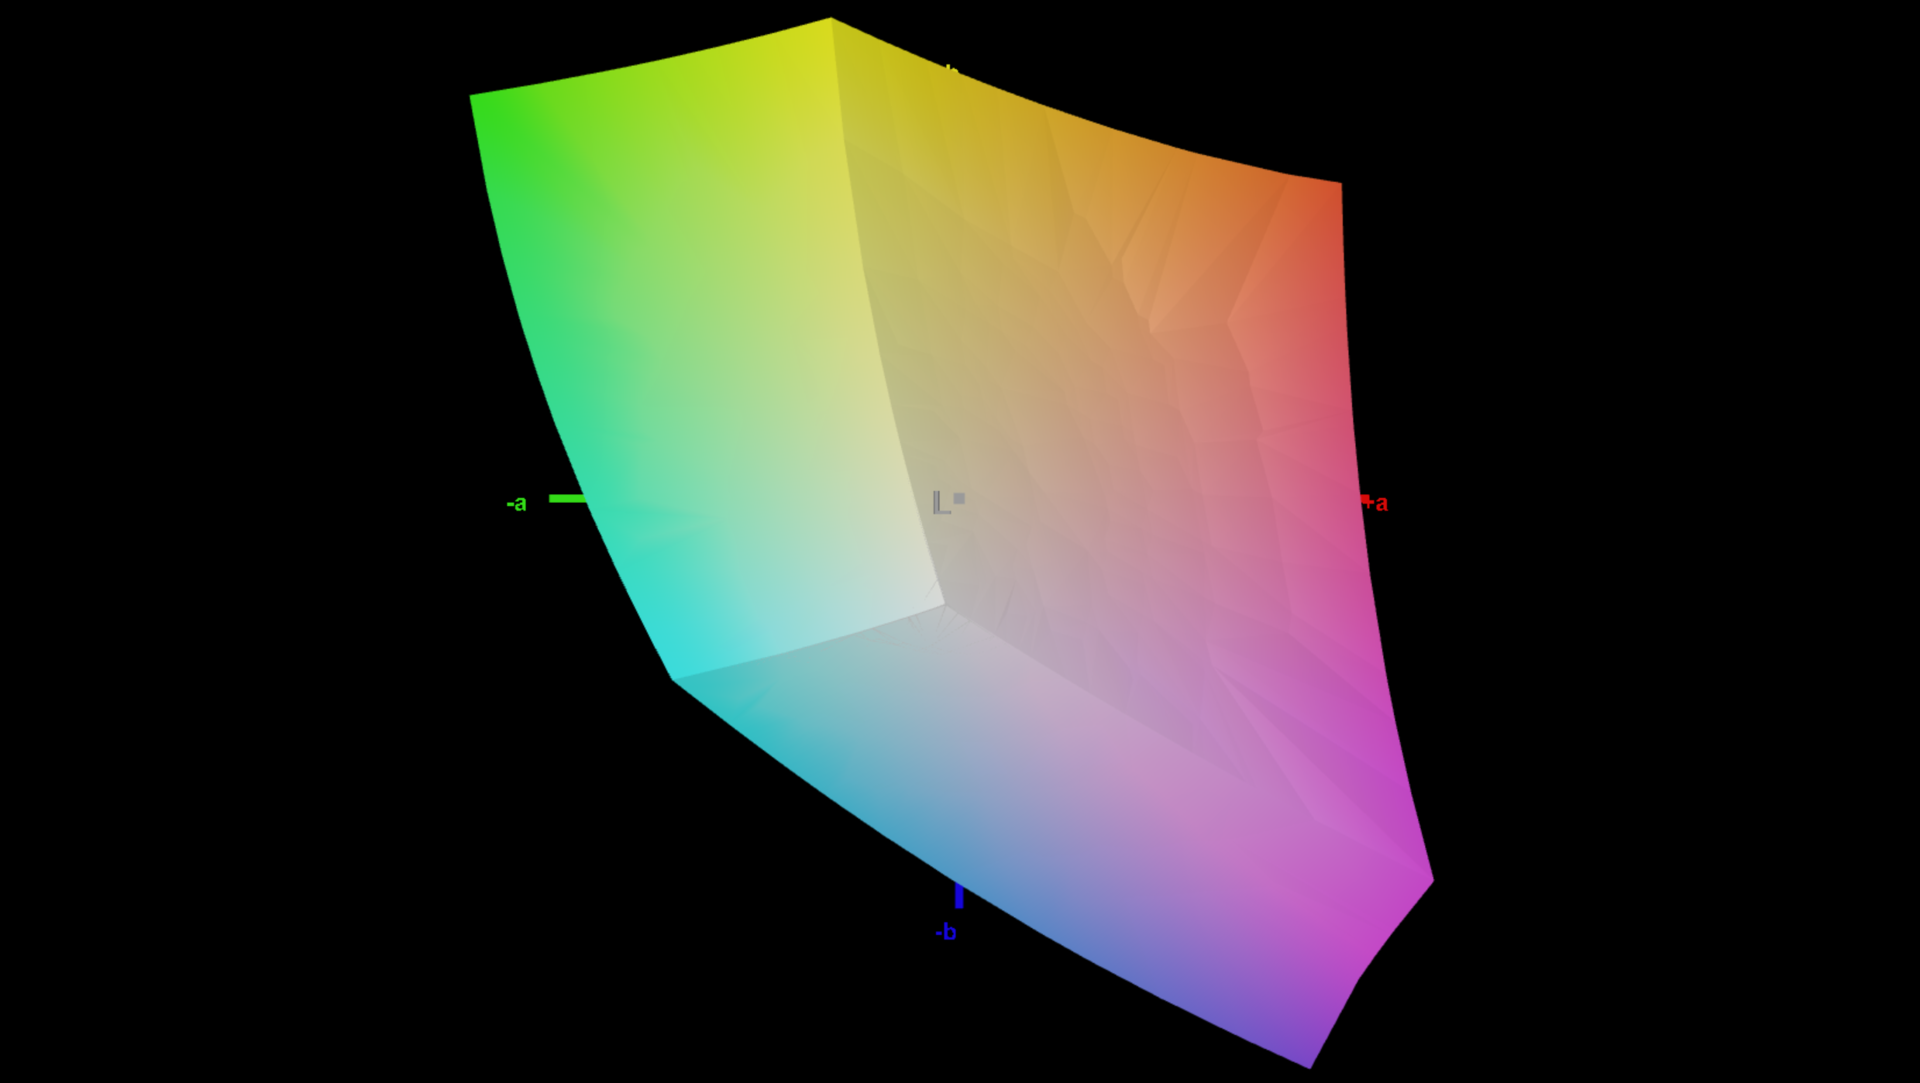
74.1% AdobeRGB 1998 (Argyll 3D)
100% sRGB (Argyll 3D)
72.4% Display P3 (Argyll 3D)
Gamma: 2.23
CCT: 6391 K
| Lenovo Legion 5 16IRX G9 NE160QDM-NZ3, IPS, 2560x1600, 16" | Schenker XMG CORE 16 (L23) BOE0AF0 (), IPS, 2560x1600, 16" | HP Victus 16-r0077ng CMN162D, IPS, 1920x1080, 16.1" | Lenovo LOQ 16IRH8 AUOC1A5 (B160QAN03.L), IPS, 2560x1600, 16" | Lenovo Legion Slim 5 16APH8 BOE NJ NE160QDM-NYC, IPS, 2560x1600, 16" | HP Victus 16-r0076TX Chi Mei CMN1629, IPS, 1920x1080, 16.1" | Alienware m16 R1 Intel BOE NE16NYB, IPS, 2560x1600, 16" | Lenovo Legion Pro 5 16IRX8 AU Optronics B160QAN03.1, IPS, 2560x1600, 16" | |
|---|---|---|---|---|---|---|---|---|
| Display | -4% | -6% | -2% | -3% | -5% | -5% | -1% | |
| Display P3 Coverage (%) | 72.4 | 68.3 -6% | 66.7 -8% | 70.5 -3% | 69.3 -4% | 67.5 -7% | 67.7 -6% | 71.2 -2% |
| sRGB Coverage (%) | 100 | 98.6 -1% | 98 -2% | 98.9 -1% | 100 0% | 97.5 -2% | 97.2 -3% | 98.8 -1% |
| AdobeRGB 1998 Coverage (%) | 74.1 | 69.6 -6% | 69 -7% | 72.6 -2% | 70 -6% | 69.7 -6% | 70 -6% | 73.3 -1% |
| Response Times | 9% | 0% | 29% | 12% | 32% | 42% | -18% | |
| Response Time Grey 50% / Grey 80% * (ms) | 12.5 ? | 13.2 ? -6% | 13.3 ? -6% | 7.2 ? 42% | 10.7 ? 14% | 6.18 ? 51% | 4 ? 68% | 14.5 ? -16% |
| Response Time Black / White * (ms) | 8.7 ? | 6.6 ? 24% | 8.2 ? 6% | 7.4 ? 15% | 7.8 ? 10% | 7.62 ? 12% | 7.3 ? 16% | 10.4 ? -20% |
| PWM Frequency (Hz) | ||||||||
| Screen | -67% | -16% | -24% | -14% | -21% | -51% | -20% | |
| Brightness middle (cd/m²) | 526 | 376 -29% | 308 -41% | 407 -23% | 371.6 -29% | 290 -45% | 306 -42% | 405.7 -23% |
| Brightness (cd/m²) | 500 | 358 -28% | 285 -43% | 369 -26% | 343 -31% | 275 -45% | 302 -40% | 368 -26% |
| Brightness Distribution (%) | 87 | 88 1% | 85 -2% | 85 -2% | 84 -3% | 82 -6% | 89 2% | 87 0% |
| Black Level * (cd/m²) | 0.33 | 0.33 -0% | 0.25 24% | 0.45 -36% | 0.44 -33% | 0.21 36% | 0.3 9% | 0.38 -15% |
| Contrast (:1) | 1594 | 1139 -29% | 1232 -23% | 904 -43% | 845 -47% | 1381 -13% | 1020 -36% | 1068 -33% |
| Colorchecker dE 2000 * | 1.2 | 2.74 -128% | 1.3 -8% | 1.43 -19% | 1.52 -27% | 1.7 -42% | 2.57 -114% | 1.65 -38% |
| Colorchecker dE 2000 max. * | 2.1 | 6.78 -223% | 2.76 -31% | 3.58 -70% | 2.68 -28% | 3.57 -70% | 4.26 -103% | 4.2 -100% |
| Colorchecker dE 2000 calibrated * | 1 | 0.88 12% | 0.92 8% | 1.07 -7% | 0.33 67% | 0.93 7% | 0.85 15% | 0.53 47% |
| Greyscale dE 2000 * | 1.3 | 3.57 -175% | 1.7 -31% | 1.13 13% | 1.2 8% | 1.5 -15% | 3.3 -154% | 1.2 8% |
| Gamma | 2.23 99% | 2.4 92% | 2.167 102% | 2.5 88% | 2.1 105% | 2.1 105% | 1.997 110% | 2.3 96% |
| CCT | 6391 102% | 7246 90% | 6767 96% | 6526 100% | 6503 100% | 6538 99% | 6895 94% | 6453 101% |
| Całkowita średnia (program / ustawienia) | -21% /
-42% | -7% /
-12% | 1% /
-12% | -2% /
-8% | 2% /
-10% | -5% /
-28% | -13% /
-16% |
* ... im mniej tym lepiej
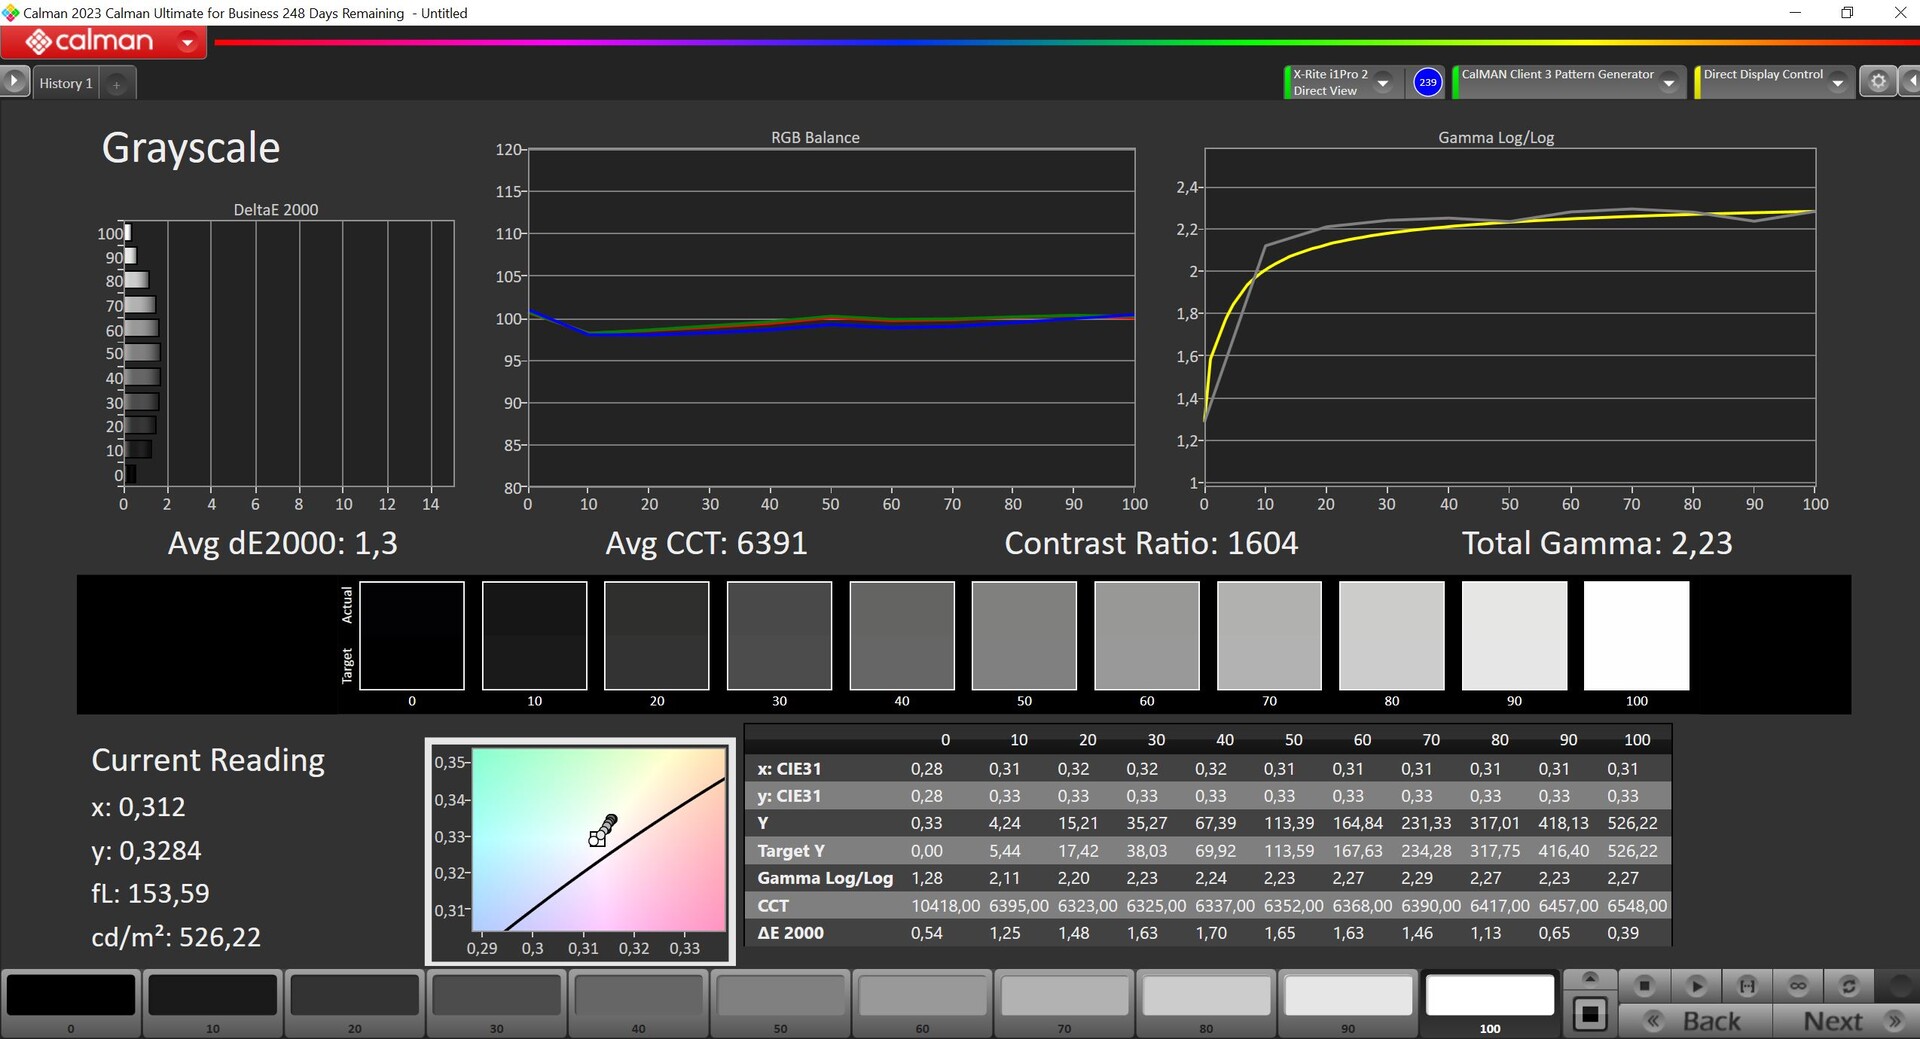
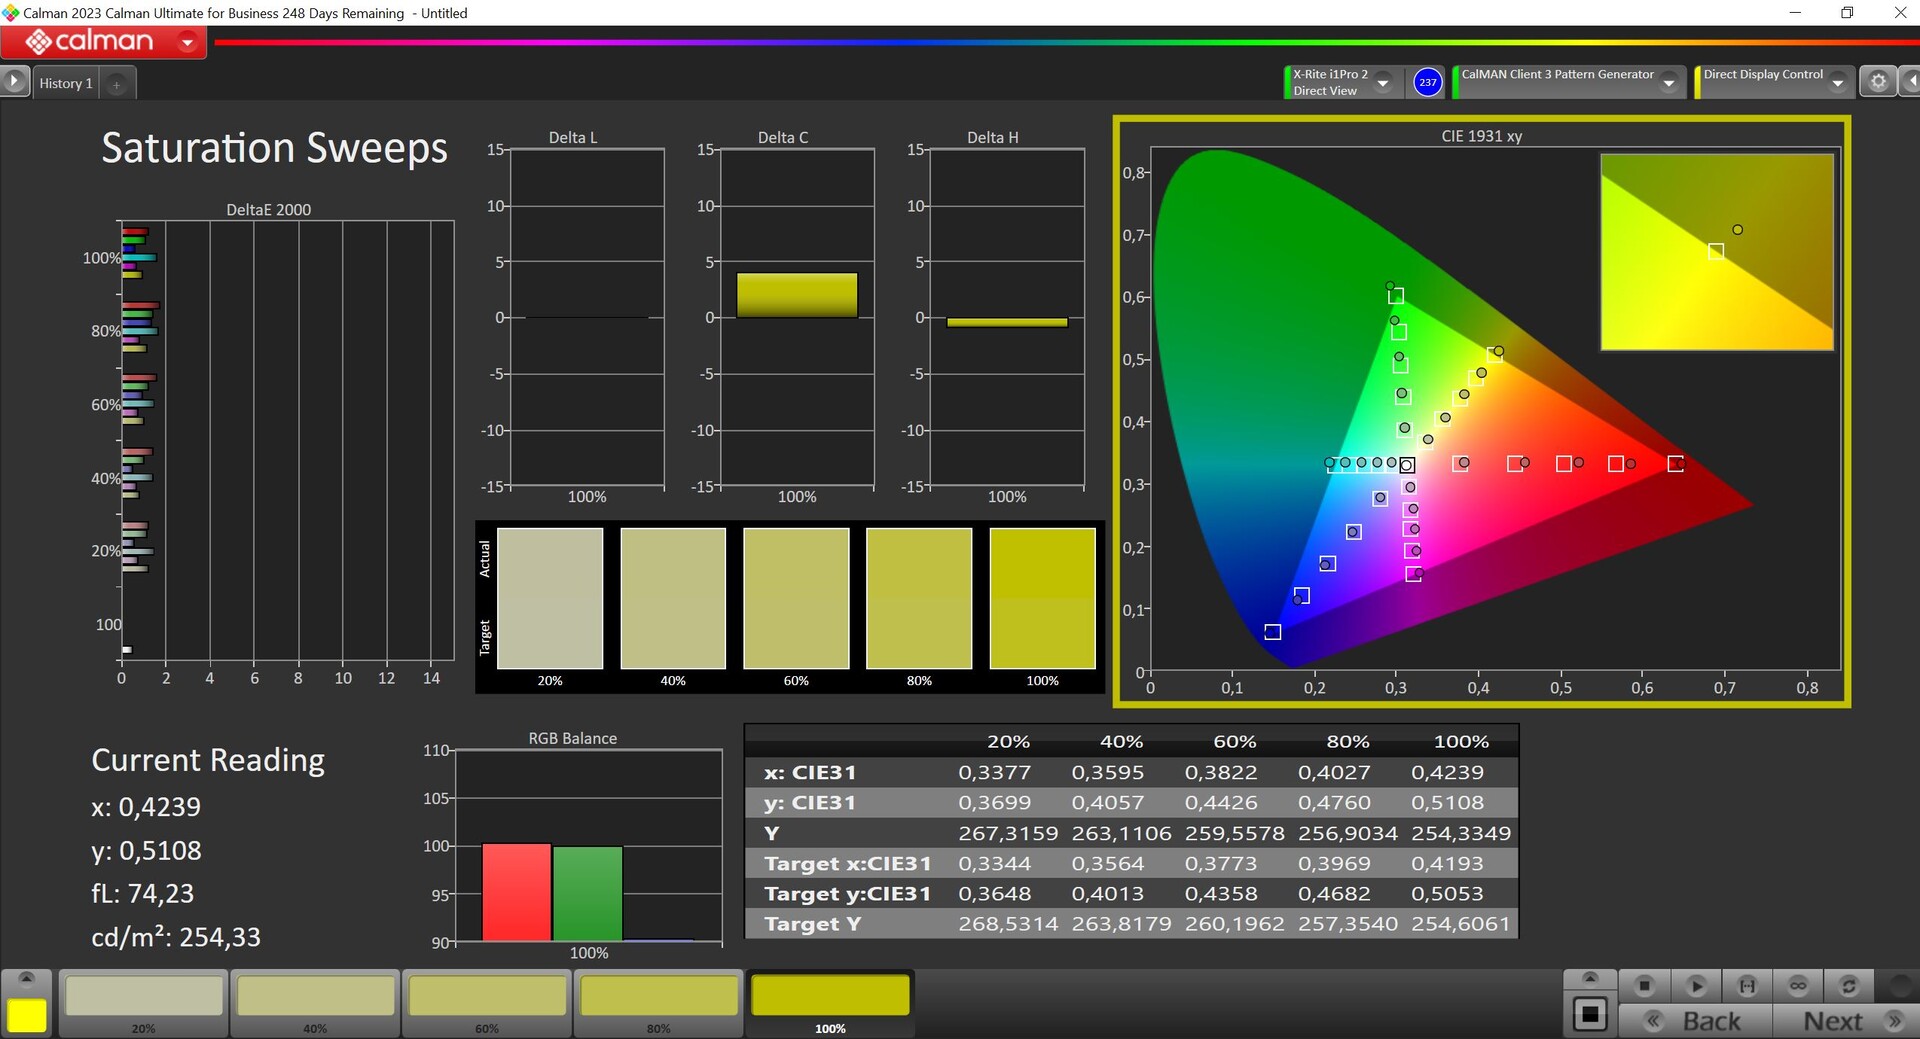


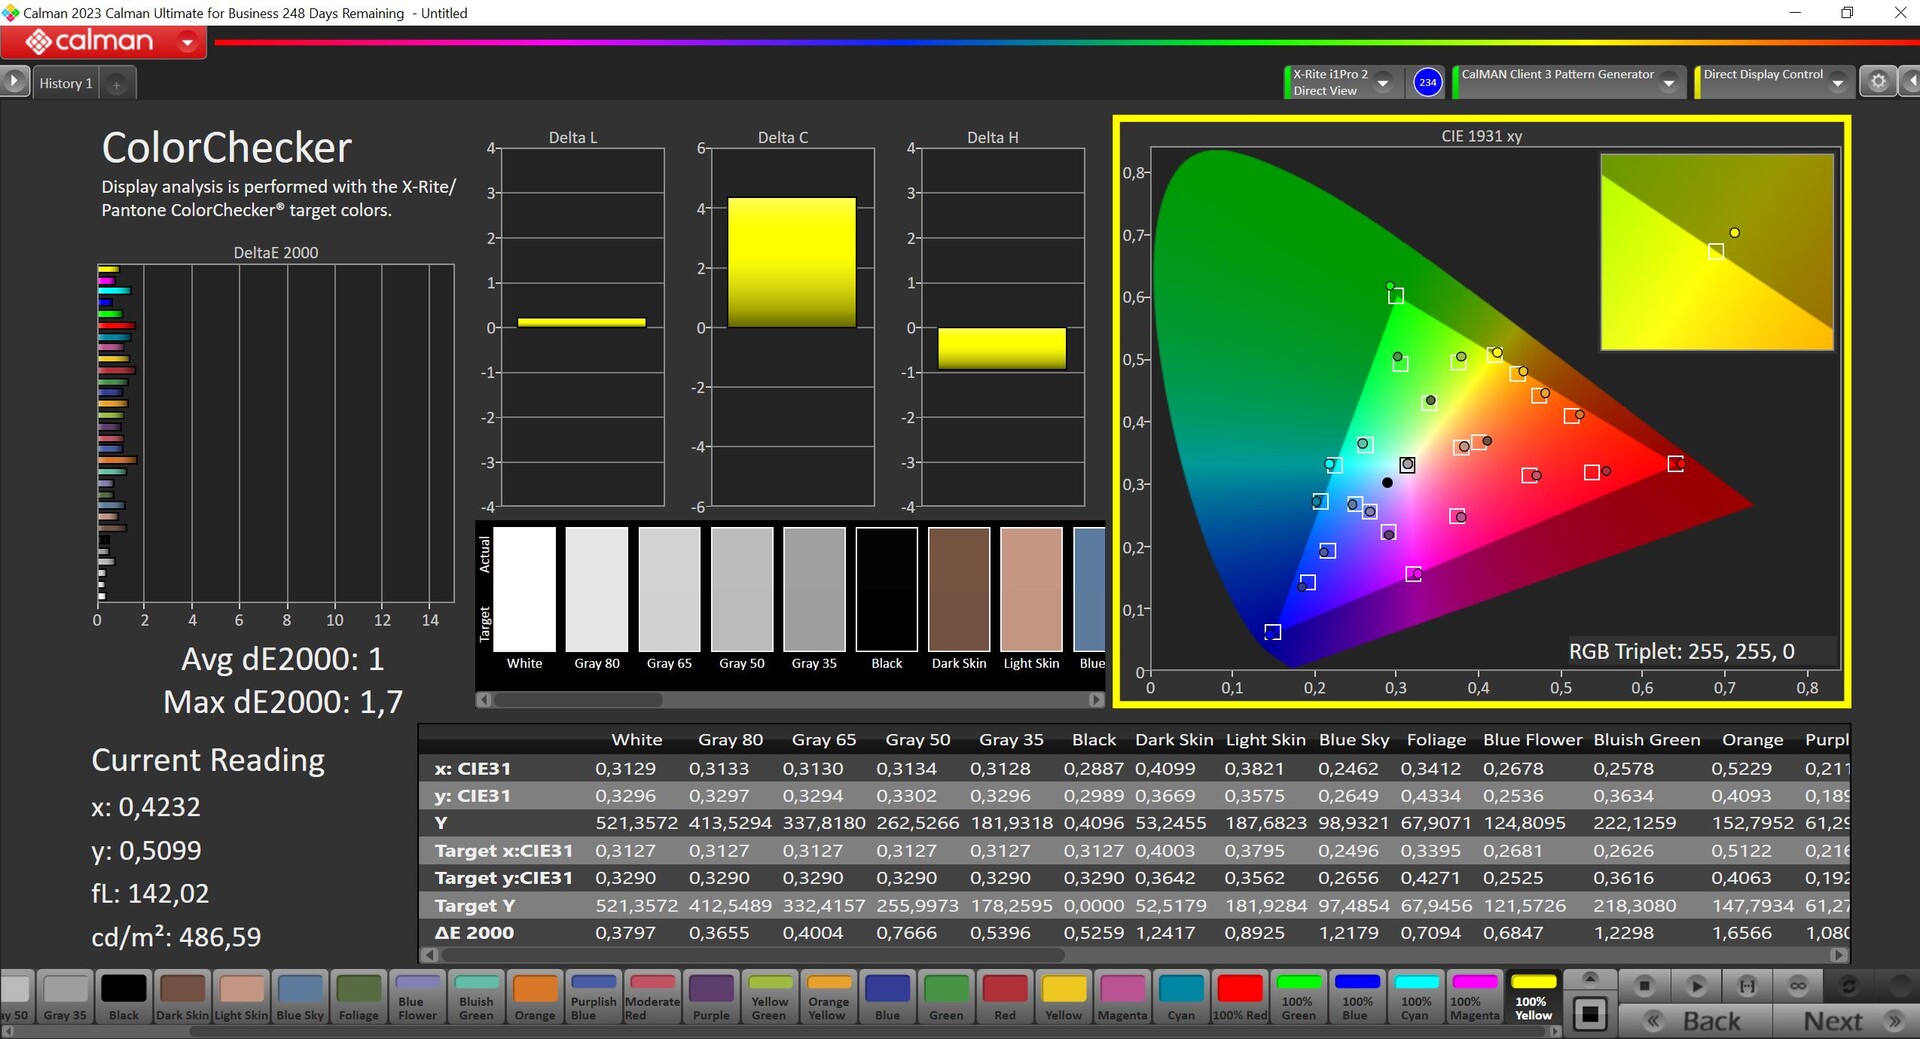
Ex działa, wyświetlacz Legion 5i jest wstępnie skalibrowany i dostępnych jest kilka różnych profili kolorów. Przeanalizowaliśmy go za pomocą profesjonalnego oprogramowania CalMAN (X-Rite i1 Pro2) przy użyciu profilu "natywnego". Jego odwzorowanie jest już znakomite, ponieważ ani skala szarości, ani kolory nie wykazują odchyleń DeltaE-2000 powyżej 3. Ponadto nie zauważyliśmy zabarwienia kolorów, a kalibracja użytkownika mogłaby być nawet zbędna. Być może byliśmy w stanie poprawić jakość obrazu poprzez naszą własną kalibrację (można ją pobrać za darmo powyżej), ale jest to tylko mierzalne - nie widoczne. Wraz z pełnym pokryciem palety sRGB, panel może być śmiało wykorzystywany do edycji zdjęć lub wideo.
Wyświetl czasy reakcji
| ↔ Czas reakcji od czerni do bieli | ||
|---|---|---|
| 8.7 ms ... wzrost ↗ i spadek ↘ łącznie | ↗ 4.6 ms wzrost | 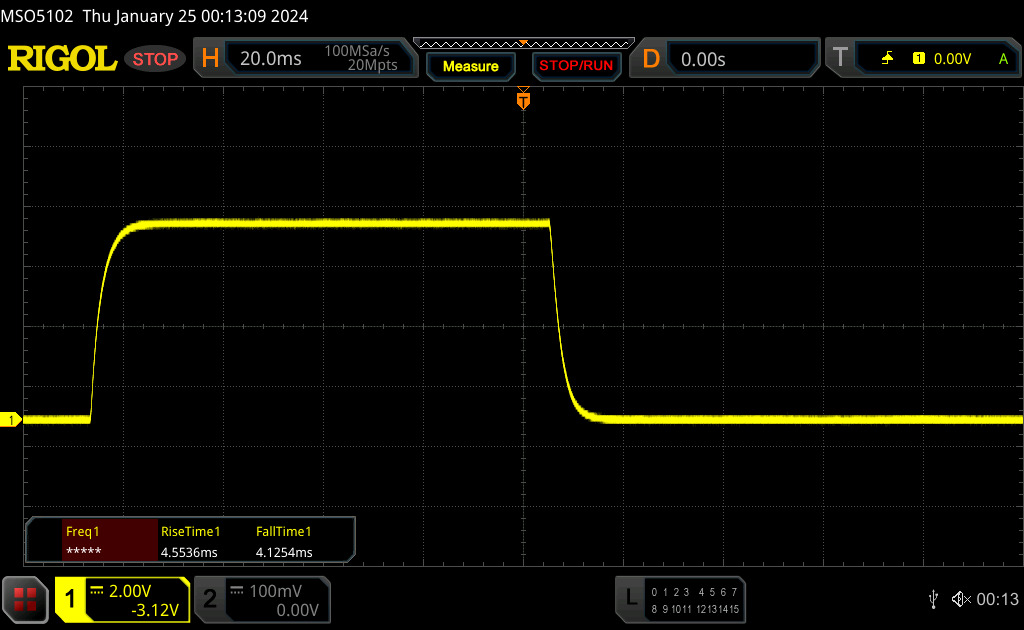 |
| ↘ 4.1 ms upadek | ||
| W naszych testach ekran wykazuje szybki czas reakcji i powinien nadawać się do gier. Dla porównania, wszystkie testowane urządzenia wahają się od 0.1 (minimum) do 240 (maksimum) ms. » 24 % wszystkich urządzeń jest lepszych. Oznacza to, że zmierzony czas reakcji jest lepszy od średniej wszystkich testowanych urządzeń (19.8 ms). | ||
| ↔ Czas reakcji 50% szarości do 80% szarości | ||
| 12.5 ms ... wzrost ↗ i spadek ↘ łącznie | ↗ 6.1 ms wzrost | 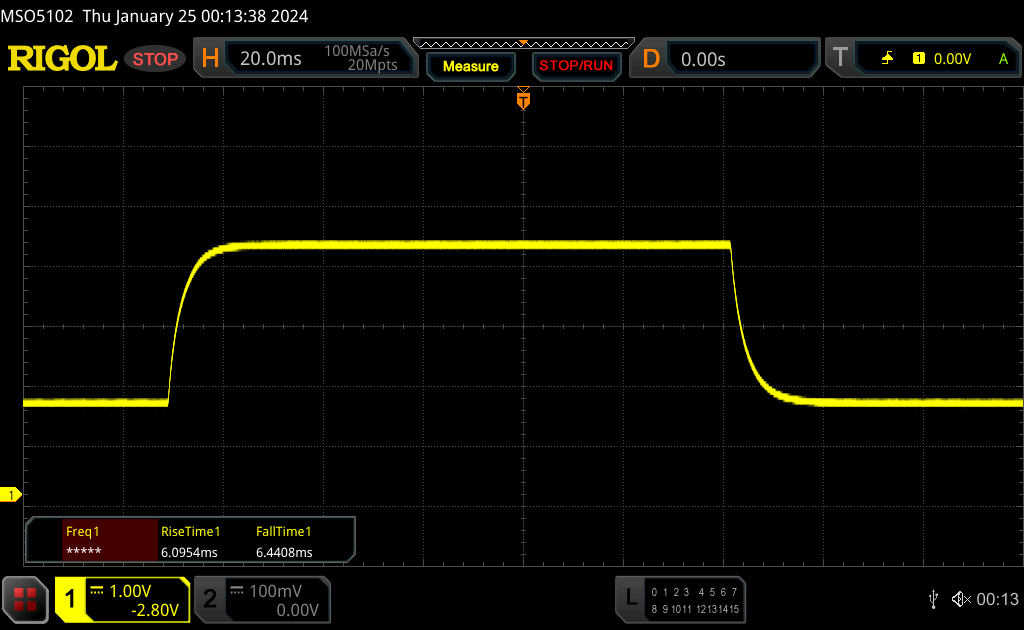 |
| ↘ 6.4 ms upadek | ||
| W naszych testach ekran wykazuje dobry współczynnik reakcji, ale może być zbyt wolny dla graczy rywalizujących ze sobą. Dla porównania, wszystkie testowane urządzenia wahają się od 0.165 (minimum) do 636 (maksimum) ms. » 26 % wszystkich urządzeń jest lepszych. Oznacza to, że zmierzony czas reakcji jest lepszy od średniej wszystkich testowanych urządzeń (31 ms). | ||
Migotanie ekranu / PWM (modulacja szerokości impulsu)
| Migotanie ekranu/nie wykryto PWM |  | ||
Dla porównania: 52 % wszystkich testowanych urządzeń nie używa PWM do przyciemniania wyświetlacza. Jeśli wykryto PWM, zmierzono średnio 7747 (minimum: 5 - maksimum: 343500) Hz. | |||

Dzięki wysokiej jasności wyświetlacza i matowej powierzchni, Legion 5i 16 może być bardzo dobrze używany na zewnątrz lub w jasnym otoczeniu. Stabilność kąta widzenia IPS jest w porządku, ale oglądanie go z przekątnej powyżej prowadzi do znacznego rozjaśnienia obrazu.

Wydajność - Raptor Lake-HX Refresh & Ada Lovelace
Lenovo oferuje Legion 5i 16 G9 z pięcioma różnymi procesorami HX od Intela, choć dwa słabsze warianty wciąż należą do zeszłorocznej 13. generacji. Flagowiec może być wyposażony w Core i9-14900HX w najlepszym przypadku, a nasza próbka testowa zawiera Core i7-14650HX. Dostępne karty graficzne obejmują aktualne modele Nvidii GeForce RTX 4050 Laptop, 4060 Laptop i 4070 Laptop z maksymalnym TGP 115 W i przełącznikiem MUX do przełączania grafiki Advanced Optimus.
Warunki testowania
Lenovo oferuje trzy różne tryby wydajności w ramach preinstalowanej aplikacji Vantage, a także tryb niestandardowy, który użytkownik może dostosować w szerokim zakresie (limity mocy CPU / GPU, limit temperatury CPU / GPU, dynamiczne przyspieszenie CPU / GPU). Można więc bawić się nimi do woli. W poniższej tabeli wymieniliśmy odpowiednie parametry trzech predefiniowanych ustawień(tryb cichy, tryb zrównoważony i tryb wydajności).
| Profil energetyczny | Obciążenie CPU | CB R23 Multi | Obciążenie GPU | Time Spy grafika | Cyberpunk 2077 QHD Ultra | maks. emisja wentylatora |
|---|---|---|---|---|---|---|
| Tryb cichy | 65->55 watów | 16 720 punktów | 65 watów | 8 443 punktów | 35,4 fps | 34,6 dB(A) |
| Tryb zrównoważony | 120->70 watów | 19 897 punktów | 80 watów | 9 749 punktów | 43,4 fps | 49,8 dB(A) |
| Tryb wydajności | 140->100 watów | 24 455 punktów | 125 watów | 11 267 punktów | 49,7 fps | 55,7 dB(A) |
Poniższe testy porównawcze i pomiary przeprowadziliśmy przy użyciu trybu wydajności, ponieważ w szczególności wydajność urządzenia w grach jest znacznie wyższa w tym trybie. Oczywiście wentylatory są również głośniejsze, ale nawet w trybie zrównoważonym wentylatory mogą być bardzo głośne podczas grania i prawdopodobnie będziesz potrzebować zestawu słuchawkowego, więc równie dobrze możesz użyć trybu wydajności. Profile można wybierać za pomocą kombinacji klawiszy Fn+Q, a kolorowa dioda LED stanu na przycisku zasilania pokazuje, który tryb jest aktualnie używany (czerwony: wydajność, biały: zrównoważony, niebieski: cichy, fioletowy: dostosowany). Podczas prostych codziennych zadań można z łatwością korzystać z trybu cichego, często ciesząc się całkowicie bezgłośnym urządzeniem. Podczas korzystania z baterii nie można używać trybu wydajności.
Lenovo wyposażyło Legion 5i 16 w silnik AI Engine+ z własnym układem LA1 AI, który można aktywować w połączeniu z trybem zrównoważonym. Podobno automatycznie rozpoznaje on gry i optymalizuje wydajność laptopa, przez co temperatury i emisja hałasu wentylatora mogą wzrosnąć. Ogólnie rzecz biorąc, nie jest to jednak nic nowego i podobną funkcję można było już zaobserwować we wcześniejszych modelach, gdzie granie w gry powodowało automatyczne przełączenie na tryb wydajności. Z drugiej strony, nie zauważyliśmy żadnej różnicy w porównaniu do trybu zrównoważonego podczas korzystania z nowego silnika AI Engine+, a wydajność urządzenia była często taka sama lub nawet gorsza niż w trybie wydajności.
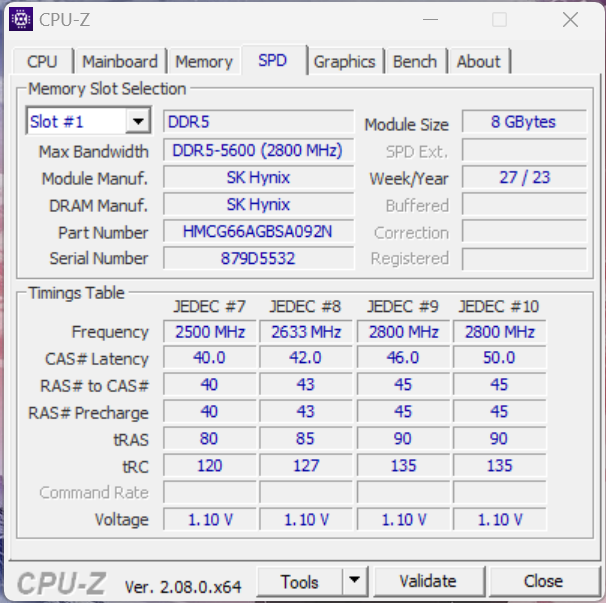
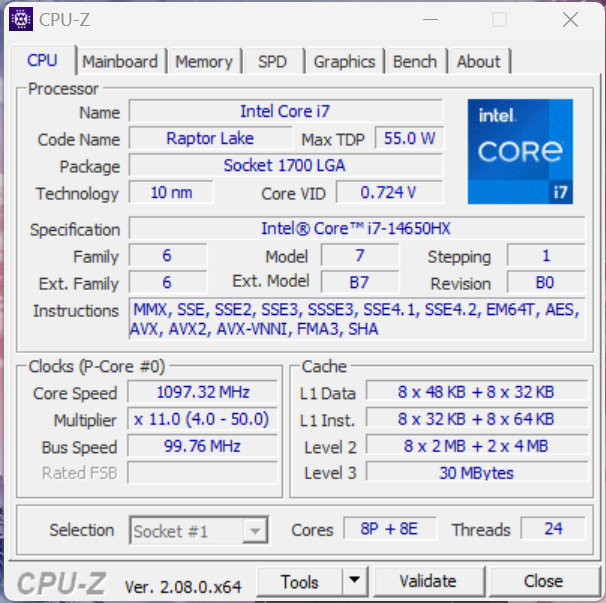
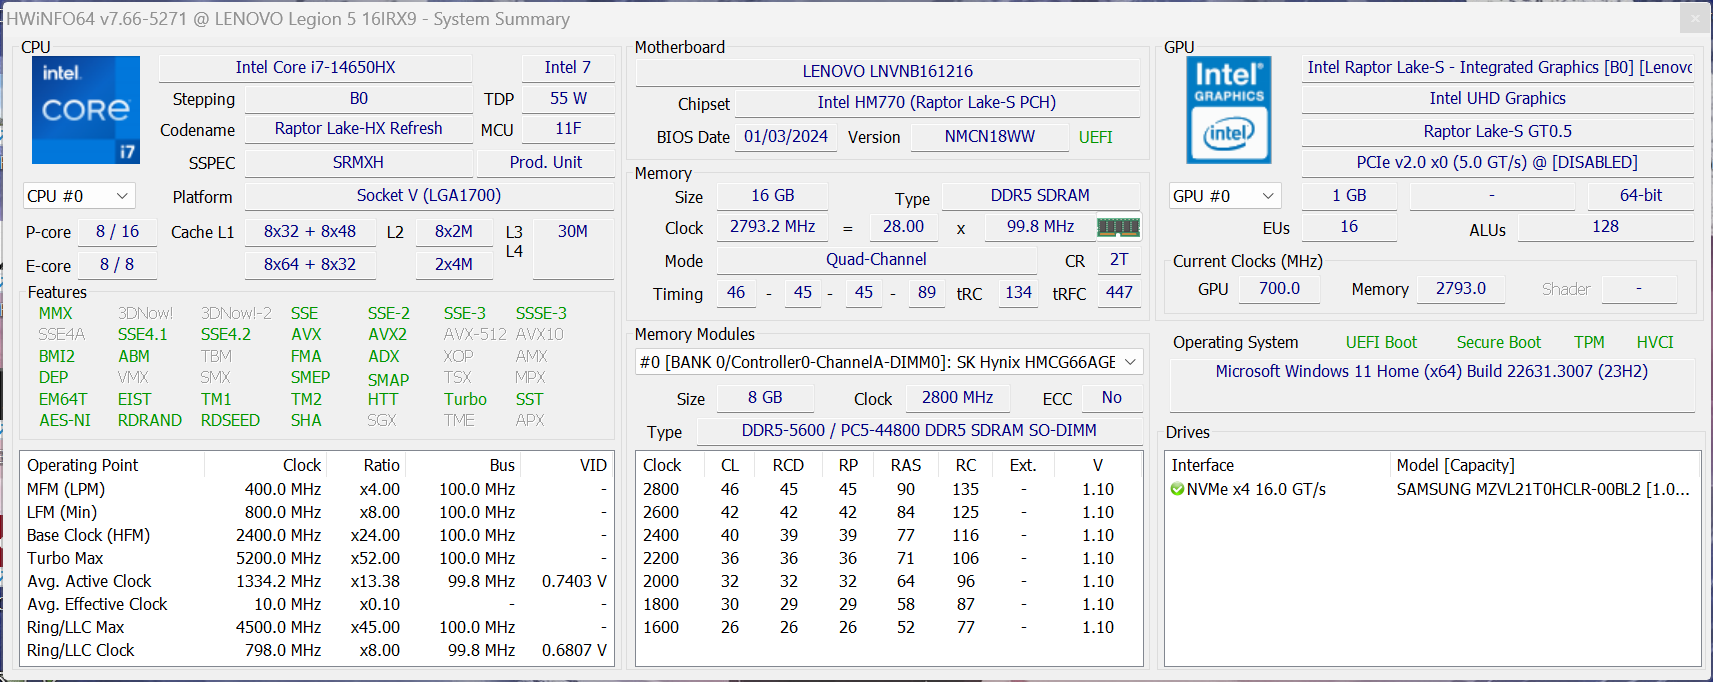
Procesor - Core i7-14650HX
Nowy Core i7-14650HX jest następcą starszego modelu Core i7-13700HXoferując tę samą konfigurację rdzeni (8x wydajność + 8x efektywność) z nieco wyższymi częstotliwościami taktowania (do 5,2 GHz) - ale pod względem ogólnej architektury nic się nie zmieniło. W ramach Legion 5i 16, nowy procesor HX zużywa 140 watów przez krótki okres czasu, zanim zrównoważy się na poziomie 100 watów. Wynikająca z tego wydajność jest doskonała, co prowadzi do 10% przewagi nad starym 13700HX. Modele AMD również radziły sobie zauważalnie gorzej. Podczas testów jednordzeniowych, Legion również wyszedł na prowadzenie. W trybie bateryjnym jego pobór mocy jest ograniczony do 50 W, dlatego też jego wydajność wielordzeniowa spadła o około 40% (CB R23 Multi: 14 202 punktów).
Więcej testów porównawczych procesorów można znaleźć w naszej sekcji technicznej Mobile Processors - Benchmark List .
Cinebench R15 Multi continuous test
Cinebench R23: Multi Core | Single Core
Cinebench R20: CPU (Multi Core) | CPU (Single Core)
Cinebench R15: CPU Multi 64Bit | CPU Single 64Bit
Blender: v2.79 BMW27 CPU
7-Zip 18.03: 7z b 4 | 7z b 4 -mmt1
Geekbench 6.7: Multi-Core | Single-Core
Geekbench 5.5: Multi-Core | Single-Core
HWBOT x265 Benchmark v2.2: 4k Preset
LibreOffice : 20 Documents To PDF
R Benchmark 2.5: Overall mean
| CPU Performance rating | |
| Średnia w klasie Gaming | |
| Lenovo Legion 5 16IRX G9 | |
| Alienware m16 R1 Intel | |
| Przeciętny Intel Core i7-14650HX | |
| Lenovo Legion Pro 5 16IRX8 -2! | |
| Lenovo Legion Slim 5 16APH8 -2! | |
| Schenker XMG CORE 16 (L23) | |
| HP Victus 16-r0076TX -3! | |
| Lenovo LOQ 16IRH8 | |
| HP Victus 16-r0077ng | |
| Cinebench R23 / Multi Core | |
| Średnia w klasie Gaming (10488 - 40970, n=106, ostatnie 2 lata) | |
| Lenovo Legion 5 16IRX G9 | |
| Alienware m16 R1 Intel | |
| Przeciętny Intel Core i7-14650HX (16453 - 24455, n=2) | |
| Lenovo Legion Pro 5 16IRX8 | |
| HP Victus 16-r0076TX | |
| Schenker XMG CORE 16 (L23) | |
| Lenovo Legion Slim 5 16APH8 | |
| HP Victus 16-r0077ng | |
| Lenovo LOQ 16IRH8 | |
| Cinebench R23 / Single Core | |
| Średnia w klasie Gaming (1166 - 2387, n=106, ostatnie 2 lata) | |
| Przeciętny Intel Core i7-14650HX (1963 - 1975, n=2) | |
| Lenovo Legion 5 16IRX G9 | |
| Alienware m16 R1 Intel | |
| Lenovo LOQ 16IRH8 | |
| Lenovo Legion Slim 5 16APH8 | |
| Schenker XMG CORE 16 (L23) | |
| HP Victus 16-r0076TX | |
| HP Victus 16-r0077ng | |
| Lenovo Legion Pro 5 16IRX8 | |
| Cinebench R20 / CPU (Multi Core) | |
| Średnia w klasie Gaming (4029 - 16108, n=105, ostatnie 2 lata) | |
| Lenovo Legion 5 16IRX G9 | |
| Alienware m16 R1 Intel | |
| Przeciętny Intel Core i7-14650HX (6236 - 9349, n=2) | |
| HP Victus 16-r0076TX | |
| Lenovo Legion Pro 5 16IRX8 | |
| Lenovo Legion Slim 5 16APH8 | |
| Schenker XMG CORE 16 (L23) | |
| HP Victus 16-r0077ng | |
| Lenovo LOQ 16IRH8 | |
| Cinebench R20 / CPU (Single Core) | |
| Średnia w klasie Gaming (442 - 904, n=105, ostatnie 2 lata) | |
| Przeciętny Intel Core i7-14650HX (754 - 762, n=2) | |
| Lenovo Legion 5 16IRX G9 | |
| Alienware m16 R1 Intel | |
| Lenovo LOQ 16IRH8 | |
| Lenovo Legion Slim 5 16APH8 | |
| Schenker XMG CORE 16 (L23) | |
| Lenovo Legion Pro 5 16IRX8 | |
| HP Victus 16-r0077ng | |
| HP Victus 16-r0076TX | |
| Cinebench R15 / CPU Multi 64Bit | |
| Średnia w klasie Gaming (1578 - 6271, n=104, ostatnie 2 lata) | |
| Lenovo Legion 5 16IRX G9 | |
| Przeciętny Intel Core i7-14650HX (3142 - 3799, n=2) | |
| Lenovo Legion Pro 5 16IRX8 | |
| Alienware m16 R1 Intel | |
| HP Victus 16-r0076TX | |
| Lenovo Legion Slim 5 16APH8 | |
| Schenker XMG CORE 16 (L23) | |
| Lenovo LOQ 16IRH8 | |
| HP Victus 16-r0077ng | |
| Cinebench R15 / CPU Single 64Bit | |
| Średnia w klasie Gaming (188.8 - 344, n=105, ostatnie 2 lata) | |
| Lenovo Legion 5 16IRX G9 | |
| Przeciętny Intel Core i7-14650HX (284 - 287, n=2) | |
| Lenovo Legion Slim 5 16APH8 | |
| Alienware m16 R1 Intel | |
| Schenker XMG CORE 16 (L23) | |
| Lenovo Legion Pro 5 16IRX8 | |
| Lenovo LOQ 16IRH8 | |
| HP Victus 16-r0077ng | |
| HP Victus 16-r0076TX | |
| Blender / v2.79 BMW27 CPU | |
| Lenovo LOQ 16IRH8 | |
| HP Victus 16-r0077ng | |
| HP Victus 16-r0076TX | |
| Schenker XMG CORE 16 (L23) | |
| Lenovo Legion Slim 5 16APH8 | |
| Przeciętny Intel Core i7-14650HX (141 - 206, n=2) | |
| Alienware m16 R1 Intel | |
| Lenovo Legion Pro 5 16IRX8 | |
| Średnia w klasie Gaming (80 - 330, n=103, ostatnie 2 lata) | |
| Lenovo Legion 5 16IRX G9 | |
| 7-Zip 18.03 / 7z b 4 | |
| Lenovo Legion 5 16IRX G9 | |
| Średnia w klasie Gaming (33491 - 148086, n=104, ostatnie 2 lata) | |
| Alienware m16 R1 Intel | |
| Przeciętny Intel Core i7-14650HX (68711 - 93686, n=2) | |
| Lenovo Legion Pro 5 16IRX8 | |
| Schenker XMG CORE 16 (L23) | |
| HP Victus 16-r0076TX | |
| Lenovo Legion Slim 5 16APH8 | |
| HP Victus 16-r0077ng | |
| Lenovo LOQ 16IRH8 | |
| 7-Zip 18.03 / 7z b 4 -mmt1 | |
| Lenovo Legion 5 16IRX G9 | |
| Schenker XMG CORE 16 (L23) | |
| Przeciętny Intel Core i7-14650HX (6364 - 6695, n=2) | |
| Lenovo Legion Slim 5 16APH8 | |
| Średnia w klasie Gaming (4199 - 7436, n=104, ostatnie 2 lata) | |
| Alienware m16 R1 Intel | |
| Lenovo LOQ 16IRH8 | |
| Lenovo Legion Pro 5 16IRX8 | |
| HP Victus 16-r0077ng | |
| HP Victus 16-r0076TX | |
| Geekbench 6.7 / Multi-Core | |
| Lenovo Legion 5 16IRX G9 | |
| Średnia w klasie Gaming (6625 - 22104, n=105, ostatnie 2 lata) | |
| Przeciętny Intel Core i7-14650HX (12892 - 16010, n=2) | |
| Alienware m16 R1 Intel | |
| Schenker XMG CORE 16 (L23) | |
| Lenovo LOQ 16IRH8 | |
| HP Victus 16-r0077ng | |
| Geekbench 6.7 / Single-Core | |
| Średnia w klasie Gaming (1490 - 3259, n=105, ostatnie 2 lata) | |
| Lenovo Legion 5 16IRX G9 | |
| Przeciętny Intel Core i7-14650HX (2744 - 2761, n=2) | |
| Schenker XMG CORE 16 (L23) | |
| Alienware m16 R1 Intel | |
| Lenovo LOQ 16IRH8 | |
| HP Victus 16-r0077ng | |
| Geekbench 5.5 / Multi-Core | |
| Średnia w klasie Gaming (6460 - 27010, n=104, ostatnie 2 lata) | |
| Lenovo Legion 5 16IRX G9 | |
| Przeciętny Intel Core i7-14650HX (12584 - 16810, n=2) | |
| Alienware m16 R1 Intel | |
| Lenovo Legion Pro 5 16IRX8 | |
| HP Victus 16-r0076TX | |
| Lenovo LOQ 16IRH8 | |
| Schenker XMG CORE 16 (L23) | |
| Lenovo Legion Slim 5 16APH8 | |
| HP Victus 16-r0077ng | |
| Geekbench 5.5 / Single-Core | |
| Średnia w klasie Gaming (986 - 2474, n=104, ostatnie 2 lata) | |
| Lenovo Legion Slim 5 16APH8 | |
| Schenker XMG CORE 16 (L23) | |
| Przeciętny Intel Core i7-14650HX (1933 - 1940, n=2) | |
| Lenovo Legion 5 16IRX G9 | |
| Alienware m16 R1 Intel | |
| Lenovo LOQ 16IRH8 | |
| Lenovo Legion Pro 5 16IRX8 | |
| HP Victus 16-r0076TX | |
| HP Victus 16-r0077ng | |
| HWBOT x265 Benchmark v2.2 / 4k Preset | |
| Średnia w klasie Gaming (11.5 - 44.3, n=104, ostatnie 2 lata) | |
| Lenovo Legion 5 16IRX G9 | |
| Lenovo Legion Pro 5 16IRX8 | |
| Alienware m16 R1 Intel | |
| Lenovo Legion Slim 5 16APH8 | |
| Schenker XMG CORE 16 (L23) | |
| HP Victus 16-r0076TX | |
| Przeciętny Intel Core i7-14650HX (12.6 - 25.6, n=2) | |
| Lenovo LOQ 16IRH8 | |
| HP Victus 16-r0077ng | |
| LibreOffice / 20 Documents To PDF | |
| Schenker XMG CORE 16 (L23) | |
| HP Victus 16-r0077ng | |
| Przeciętny Intel Core i7-14650HX (43.8 - 55.6, n=2) | |
| Średnia w klasie Gaming (33.2 - 88.8, n=104, ostatnie 2 lata) | |
| Lenovo LOQ 16IRH8 | |
| Alienware m16 R1 Intel | |
| Lenovo Legion 5 16IRX G9 | |
| Lenovo Legion Slim 5 16APH8 | |
| Lenovo Legion Pro 5 16IRX8 | |
| R Benchmark 2.5 / Overall mean | |
| HP Victus 16-r0077ng | |
| HP Victus 16-r0076TX | |
| Lenovo Legion Pro 5 16IRX8 | |
| Lenovo LOQ 16IRH8 | |
| Alienware m16 R1 Intel | |
| Schenker XMG CORE 16 (L23) | |
| Lenovo Legion Slim 5 16APH8 | |
| Średnia w klasie Gaming (0.3439 - 0.759, n=105, ostatnie 2 lata) | |
| Przeciętny Intel Core i7-14650HX (0.4195 - 0.4244, n=2) | |
| Lenovo Legion 5 16IRX G9 | |
* ... im mniej tym lepiej
AIDA64: FP32 Ray-Trace | FPU Julia | CPU SHA3 | CPU Queen | FPU SinJulia | FPU Mandel | CPU AES | CPU ZLib | FP64 Ray-Trace | CPU PhotoWorxx
| Performance rating | |
| Średnia w klasie Gaming | |
| Schenker XMG CORE 16 (L23) | |
| Lenovo Legion Slim 5 16APH8 | |
| Alienware m16 R1 Intel | |
| Lenovo Legion Pro 5 16IRX8 | |
| Lenovo Legion 5 16IRX G9 | |
| HP Victus 16-r0076TX | |
| Przeciętny Intel Core i7-14650HX | |
| HP Victus 16-r0077ng | |
| Lenovo LOQ 16IRH8 | |
| AIDA64 / FP32 Ray-Trace | |
| Średnia w klasie Gaming (10227 - 85542, n=103, ostatnie 2 lata) | |
| Lenovo Legion Slim 5 16APH8 | |
| Schenker XMG CORE 16 (L23) | |
| Lenovo Legion Pro 5 16IRX8 | |
| Alienware m16 R1 Intel | |
| Lenovo Legion 5 16IRX G9 | |
| Przeciętny Intel Core i7-14650HX (13096 - 19044, n=2) | |
| HP Victus 16-r0076TX | |
| HP Victus 16-r0077ng | |
| Lenovo LOQ 16IRH8 | |
| AIDA64 / FPU Julia | |
| Średnia w klasie Gaming (51376 - 238426, n=103, ostatnie 2 lata) | |
| Lenovo Legion Slim 5 16APH8 | |
| Schenker XMG CORE 16 (L23) | |
| Lenovo Legion Pro 5 16IRX8 | |
| Alienware m16 R1 Intel | |
| Lenovo Legion 5 16IRX G9 | |
| HP Victus 16-r0076TX | |
| Przeciętny Intel Core i7-14650HX (67335 - 95271, n=2) | |
| HP Victus 16-r0077ng | |
| Lenovo LOQ 16IRH8 | |
| AIDA64 / CPU SHA3 | |
| Średnia w klasie Gaming (2180 - 9817, n=103, ostatnie 2 lata) | |
| Schenker XMG CORE 16 (L23) | |
| Lenovo Legion Slim 5 16APH8 | |
| Alienware m16 R1 Intel | |
| Lenovo Legion Pro 5 16IRX8 | |
| Lenovo Legion 5 16IRX G9 | |
| HP Victus 16-r0076TX | |
| Przeciętny Intel Core i7-14650HX (3109 - 4214, n=2) | |
| HP Victus 16-r0077ng | |
| Lenovo LOQ 16IRH8 | |
| AIDA64 / CPU Queen | |
| Lenovo Legion Slim 5 16APH8 | |
| Średnia w klasie Gaming (49785 - 173351, n=89, ostatnie 2 lata) | |
| Alienware m16 R1 Intel | |
| Lenovo Legion Pro 5 16IRX8 | |
| HP Victus 16-r0076TX | |
| Schenker XMG CORE 16 (L23) | |
| Lenovo Legion 5 16IRX G9 | |
| Przeciętny Intel Core i7-14650HX (89907 - 101500, n=2) | |
| HP Victus 16-r0077ng | |
| Lenovo LOQ 16IRH8 | |
| AIDA64 / FPU SinJulia | |
| Schenker XMG CORE 16 (L23) | |
| Lenovo Legion Slim 5 16APH8 | |
| Średnia w klasie Gaming (4424 - 33636, n=103, ostatnie 2 lata) | |
| Alienware m16 R1 Intel | |
| Lenovo Legion Pro 5 16IRX8 | |
| Lenovo Legion 5 16IRX G9 | |
| Przeciętny Intel Core i7-14650HX (9159 - 11913, n=2) | |
| HP Victus 16-r0076TX | |
| HP Victus 16-r0077ng | |
| Lenovo LOQ 16IRH8 | |
| AIDA64 / FPU Mandel | |
| Średnia w klasie Gaming (25115 - 128721, n=103, ostatnie 2 lata) | |
| Lenovo Legion Slim 5 16APH8 | |
| Schenker XMG CORE 16 (L23) | |
| Lenovo Legion Pro 5 16IRX8 | |
| Alienware m16 R1 Intel | |
| Lenovo Legion 5 16IRX G9 | |
| Przeciętny Intel Core i7-14650HX (32747 - 47097, n=2) | |
| HP Victus 16-r0076TX | |
| HP Victus 16-r0077ng | |
| Lenovo LOQ 16IRH8 | |
| AIDA64 / CPU AES | |
| Alienware m16 R1 Intel | |
| Średnia w klasie Gaming (39258 - 247074, n=103, ostatnie 2 lata) | |
| Lenovo Legion Pro 5 16IRX8 | |
| Schenker XMG CORE 16 (L23) | |
| Lenovo Legion 5 16IRX G9 | |
| HP Victus 16-r0076TX | |
| Przeciętny Intel Core i7-14650HX (63627 - 86485, n=2) | |
| Lenovo Legion Slim 5 16APH8 | |
| HP Victus 16-r0077ng | |
| Lenovo LOQ 16IRH8 | |
| AIDA64 / CPU ZLib | |
| Średnia w klasie Gaming (574 - 2531, n=103, ostatnie 2 lata) | |
| Alienware m16 R1 Intel | |
| Lenovo Legion Pro 5 16IRX8 | |
| Lenovo Legion 5 16IRX G9 | |
| Przeciętny Intel Core i7-14650HX (924 - 1289, n=2) | |
| Lenovo Legion Slim 5 16APH8 | |
| HP Victus 16-r0076TX | |
| Schenker XMG CORE 16 (L23) | |
| HP Victus 16-r0077ng | |
| Lenovo LOQ 16IRH8 | |
| AIDA64 / FP64 Ray-Trace | |
| Średnia w klasie Gaming (5509 - 45446, n=103, ostatnie 2 lata) | |
| Lenovo Legion Slim 5 16APH8 | |
| Schenker XMG CORE 16 (L23) | |
| Lenovo Legion Pro 5 16IRX8 | |
| Alienware m16 R1 Intel | |
| Lenovo Legion 5 16IRX G9 | |
| Przeciętny Intel Core i7-14650HX (7064 - 10316, n=2) | |
| HP Victus 16-r0076TX | |
| HP Victus 16-r0077ng | |
| Lenovo LOQ 16IRH8 | |
| AIDA64 / CPU PhotoWorxx | |
| Średnia w klasie Gaming (12271 - 89891, n=103, ostatnie 2 lata) | |
| Schenker XMG CORE 16 (L23) | |
| HP Victus 16-r0077ng | |
| HP Victus 16-r0076TX | |
| Lenovo Legion Pro 5 16IRX8 | |
| Alienware m16 R1 Intel | |
| Przeciętny Intel Core i7-14650HX (33763 - 34470, n=2) | |
| Lenovo Legion 5 16IRX G9 | |
| Lenovo LOQ 16IRH8 | |
| Lenovo Legion Slim 5 16APH8 | |
Wydajność systemu
Nic dziwnego, że nowy Legion 5i 16 jest bardzo szybko reagującym urządzeniem, a wszystkie wejścia są realizowane bez wahania. System zawiesza się tylko na chwilę podczas uruchamiania gier, ale ma to związek z zaawansowanym przełączaniem grafiki Optimus. Można tego uniknąć, aktywując normalne przełączanie Optimus, ale wtedy nie uzyskuje się najlepszej wydajności. Podczas testów nie mieliśmy żadnych problemów z naszym urządzeniem testowym (zawieszanie się itp.).
CrossMark: Overall | Productivity | Creativity | Responsiveness
WebXPRT 3: Overall
WebXPRT 4: Overall
Mozilla Kraken 1.1: Total
| PCMark 10 / Score | |
| Średnia w klasie Gaming (5828 - 11730, n=92, ostatnie 2 lata) | |
| Schenker XMG CORE 16 (L23) | |
| Lenovo Legion Slim 5 16APH8 | |
| Lenovo Legion Pro 5 16IRX8 | |
| Lenovo Legion 5 16IRX G9 | |
| Przeciętny Intel Core i7-14650HX, NVIDIA GeForce RTX 4060 Laptop GPU (n=1) | |
| Alienware m16 R1 Intel | |
| HP Victus 16-r0077ng | |
| Lenovo LOQ 16IRH8 | |
| HP Victus 16-r0076TX | |
| PCMark 10 / Essentials | |
| Lenovo Legion Slim 5 16APH8 | |
| Schenker XMG CORE 16 (L23) | |
| Lenovo Legion Pro 5 16IRX8 | |
| Lenovo Legion 5 16IRX G9 | |
| Przeciętny Intel Core i7-14650HX, NVIDIA GeForce RTX 4060 Laptop GPU (n=1) | |
| Alienware m16 R1 Intel | |
| HP Victus 16-r0077ng | |
| Średnia w klasie Gaming (8810 - 11935, n=96, ostatnie 2 lata) | |
| Lenovo LOQ 16IRH8 | |
| HP Victus 16-r0076TX | |
| PCMark 10 / Productivity | |
| Średnia w klasie Gaming (6845 - 21327, n=94, ostatnie 2 lata) | |
| Schenker XMG CORE 16 (L23) | |
| Lenovo Legion Slim 5 16APH8 | |
| Alienware m16 R1 Intel | |
| Lenovo Legion 5 16IRX G9 | |
| Przeciętny Intel Core i7-14650HX, NVIDIA GeForce RTX 4060 Laptop GPU (n=1) | |
| Lenovo Legion Pro 5 16IRX8 | |
| HP Victus 16-r0077ng | |
| Lenovo LOQ 16IRH8 | |
| HP Victus 16-r0076TX | |
| PCMark 10 / Digital Content Creation | |
| Średnia w klasie Gaming (7602 - 19954, n=94, ostatnie 2 lata) | |
| Schenker XMG CORE 16 (L23) | |
| Lenovo Legion Pro 5 16IRX8 | |
| Lenovo Legion 5 16IRX G9 | |
| Przeciętny Intel Core i7-14650HX, NVIDIA GeForce RTX 4060 Laptop GPU (n=1) | |
| Lenovo Legion Slim 5 16APH8 | |
| HP Victus 16-r0077ng | |
| Alienware m16 R1 Intel | |
| Lenovo LOQ 16IRH8 | |
| HP Victus 16-r0076TX | |
| CrossMark / Overall | |
| Lenovo Legion 5 16IRX G9 | |
| Przeciętny Intel Core i7-14650HX, NVIDIA GeForce RTX 4060 Laptop GPU (n=1) | |
| Alienware m16 R1 Intel | |
| Średnia w klasie Gaming (1366 - 2409, n=93, ostatnie 2 lata) | |
| Lenovo LOQ 16IRH8 | |
| Lenovo Legion Slim 5 16APH8 | |
| HP Victus 16-r0076TX | |
| Schenker XMG CORE 16 (L23) | |
| Lenovo Legion Pro 5 16IRX8 | |
| CrossMark / Productivity | |
| Alienware m16 R1 Intel | |
| Lenovo Legion 5 16IRX G9 | |
| Przeciętny Intel Core i7-14650HX, NVIDIA GeForce RTX 4060 Laptop GPU (n=1) | |
| Lenovo LOQ 16IRH8 | |
| Średnia w klasie Gaming (1386 - 2254, n=93, ostatnie 2 lata) | |
| Lenovo Legion Slim 5 16APH8 | |
| Schenker XMG CORE 16 (L23) | |
| Lenovo Legion Pro 5 16IRX8 | |
| HP Victus 16-r0076TX | |
| CrossMark / Creativity | |
| Lenovo Legion 5 16IRX G9 | |
| Przeciętny Intel Core i7-14650HX, NVIDIA GeForce RTX 4060 Laptop GPU (n=1) | |
| Średnia w klasie Gaming (1343 - 2729, n=93, ostatnie 2 lata) | |
| Alienware m16 R1 Intel | |
| Lenovo LOQ 16IRH8 | |
| Lenovo Legion Slim 5 16APH8 | |
| HP Victus 16-r0076TX | |
| Schenker XMG CORE 16 (L23) | |
| Lenovo Legion Pro 5 16IRX8 | |
| CrossMark / Responsiveness | |
| Lenovo Legion 5 16IRX G9 | |
| Przeciętny Intel Core i7-14650HX, NVIDIA GeForce RTX 4060 Laptop GPU (n=1) | |
| Alienware m16 R1 Intel | |
| Lenovo LOQ 16IRH8 | |
| Średnia w klasie Gaming (1226 - 2334, n=93, ostatnie 2 lata) | |
| Lenovo Legion Pro 5 16IRX8 | |
| Lenovo Legion Slim 5 16APH8 | |
| HP Victus 16-r0076TX | |
| Schenker XMG CORE 16 (L23) | |
| WebXPRT 3 / Overall | |
| Lenovo Legion Slim 5 16APH8 | |
| Lenovo LOQ 16IRH8 | |
| Lenovo LOQ 16IRH8 | |
| Średnia w klasie Gaming (220 - 532, n=97, ostatnie 2 lata) | |
| Lenovo Legion 5 16IRX G9 | |
| Przeciętny Intel Core i7-14650HX, NVIDIA GeForce RTX 4060 Laptop GPU (n=1) | |
| Alienware m16 R1 Intel | |
| Schenker XMG CORE 16 (L23) | |
| HP Victus 16-r0077ng | |
| HP Victus 16-r0077ng | |
| HP Victus 16-r0076TX | |
| Lenovo Legion Pro 5 16IRX8 | |
| WebXPRT 4 / Overall | |
| Średnia w klasie Gaming (165 - 354, n=97, ostatnie 2 lata) | |
| Lenovo Legion 5 16IRX G9 | |
| Przeciętny Intel Core i7-14650HX, NVIDIA GeForce RTX 4060 Laptop GPU (n=1) | |
| Alienware m16 R1 Intel | |
| Lenovo Legion Slim 5 16APH8 | |
| Lenovo Legion Pro 5 16IRX8 | |
| HP Victus 16-r0077ng | |
| HP Victus 16-r0077ng | |
| HP Victus 16-r0076TX | |
| Mozilla Kraken 1.1 / Total | |
| HP Victus 16-r0076TX | |
| HP Victus 16-r0077ng | |
| HP Victus 16-r0077ng | |
| Lenovo Legion Pro 5 16IRX8 | |
| Schenker XMG CORE 16 (L23) | |
| Lenovo LOQ 16IRH8 | |
| Lenovo LOQ 16IRH8 | |
| Alienware m16 R1 Intel | |
| Lenovo Legion Slim 5 16APH8 | |
| Lenovo Legion 5 16IRX G9 | |
| Przeciętny Intel Core i7-14650HX, NVIDIA GeForce RTX 4060 Laptop GPU (n=1) | |
| Średnia w klasie Gaming (391 - 590, n=99, ostatnie 2 lata) | |
* ... im mniej tym lepiej
| PCMark 10 Score | 7645 pkt. | |
Pomoc | ||
| AIDA64 / Memory Copy | |
| Średnia w klasie Gaming (21750 - 129946, n=103, ostatnie 2 lata) | |
| Schenker XMG CORE 16 (L23) | |
| Lenovo Legion Slim 5 16APH8 | |
| HP Victus 16-r0077ng | |
| Lenovo Legion 5 16IRX G9 | |
| Przeciętny Intel Core i7-14650HX (58978 - 59727, n=2) | |
| Lenovo Legion Pro 5 16IRX8 | |
| Alienware m16 R1 Intel | |
| HP Victus 16-r0076TX | |
| Lenovo LOQ 16IRH8 | |
| AIDA64 / Memory Read | |
| Średnia w klasie Gaming (22956 - 118858, n=103, ostatnie 2 lata) | |
| Lenovo Legion 5 16IRX G9 | |
| Przeciętny Intel Core i7-14650HX (70720 - 71455, n=2) | |
| HP Victus 16-r0077ng | |
| Lenovo Legion Pro 5 16IRX8 | |
| Alienware m16 R1 Intel | |
| HP Victus 16-r0076TX | |
| Lenovo LOQ 16IRH8 | |
| Lenovo Legion Slim 5 16APH8 | |
| Schenker XMG CORE 16 (L23) | |
| AIDA64 / Memory Write | |
| Schenker XMG CORE 16 (L23) | |
| Lenovo Legion Slim 5 16APH8 | |
| Średnia w klasie Gaming (22297 - 135096, n=103, ostatnie 2 lata) | |
| Lenovo Legion Pro 5 16IRX8 | |
| HP Victus 16-r0077ng | |
| Alienware m16 R1 Intel | |
| HP Victus 16-r0076TX | |
| Przeciętny Intel Core i7-14650HX (51138 - 56811, n=2) | |
| Lenovo LOQ 16IRH8 | |
| Lenovo Legion 5 16IRX G9 | |
| AIDA64 / Memory Latency | |
| Lenovo LOQ 16IRH8 | |
| Średnia w klasie Gaming (75.3 - 259, n=103, ostatnie 2 lata) | |
| HP Victus 16-r0076TX | |
| HP Victus 16-r0077ng | |
| Lenovo Legion Slim 5 16APH8 | |
| Przeciętny Intel Core i7-14650HX (89.8 - 95.2, n=2) | |
| Lenovo Legion 5 16IRX G9 | |
| Alienware m16 R1 Intel | |
| Schenker XMG CORE 16 (L23) | |
| Lenovo Legion Pro 5 16IRX8 | |
* ... im mniej tym lepiej
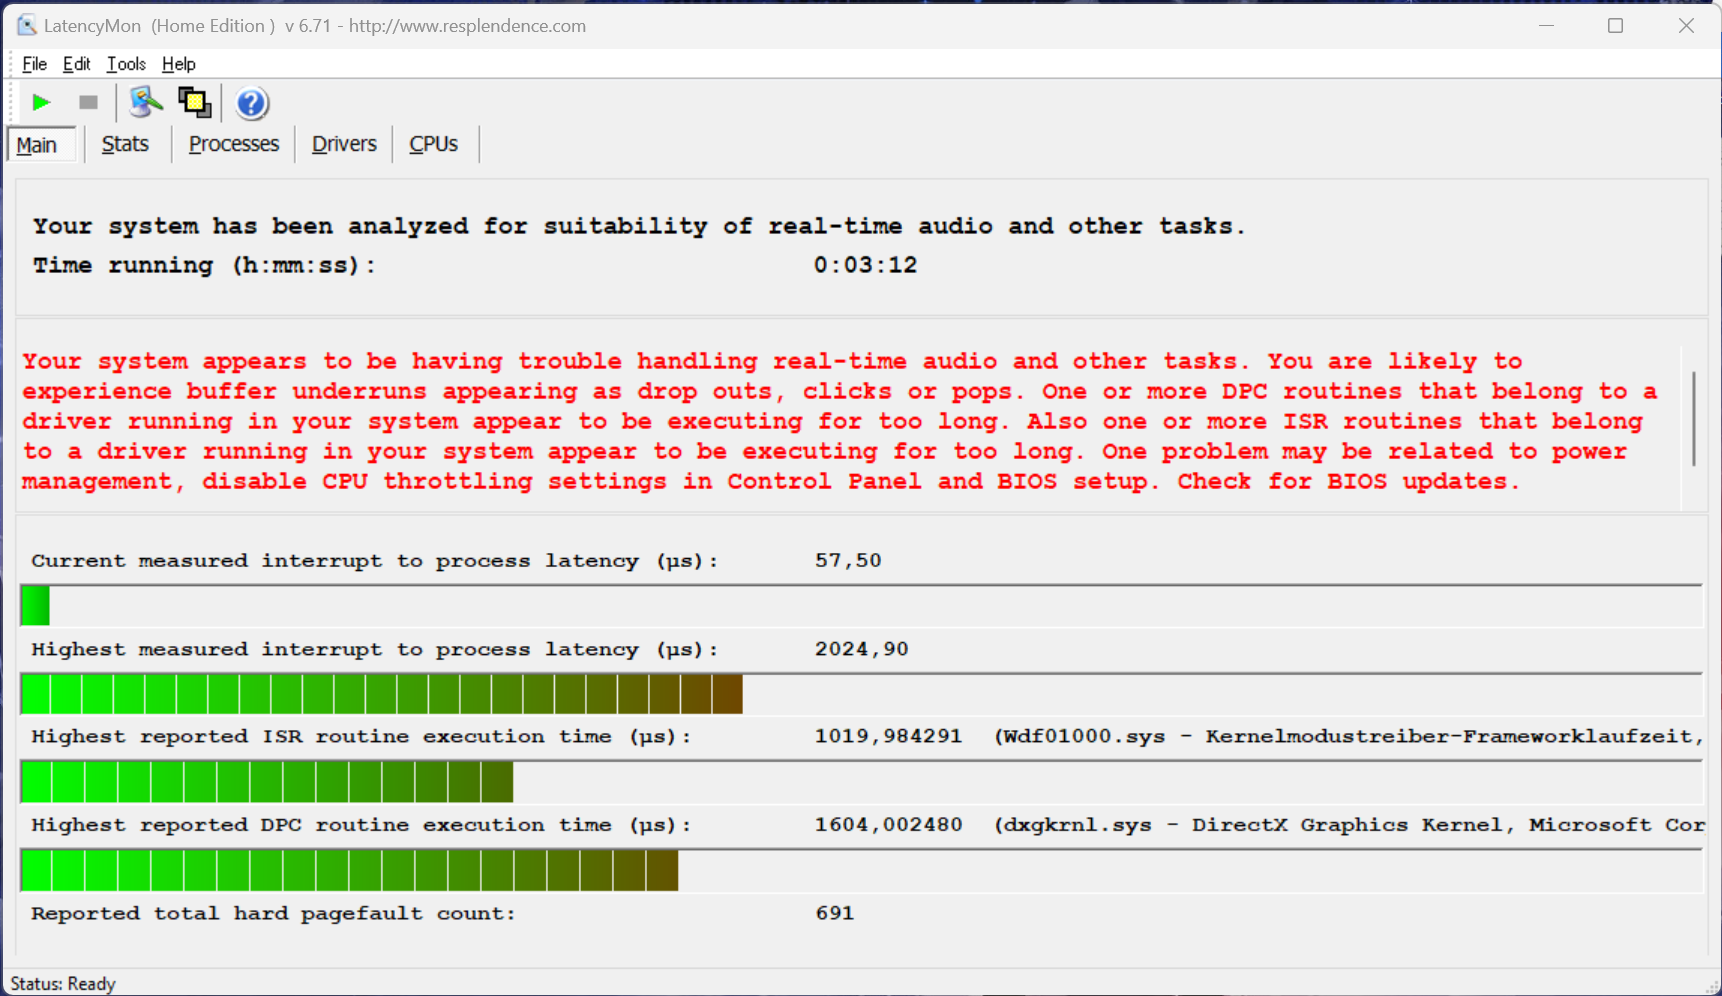
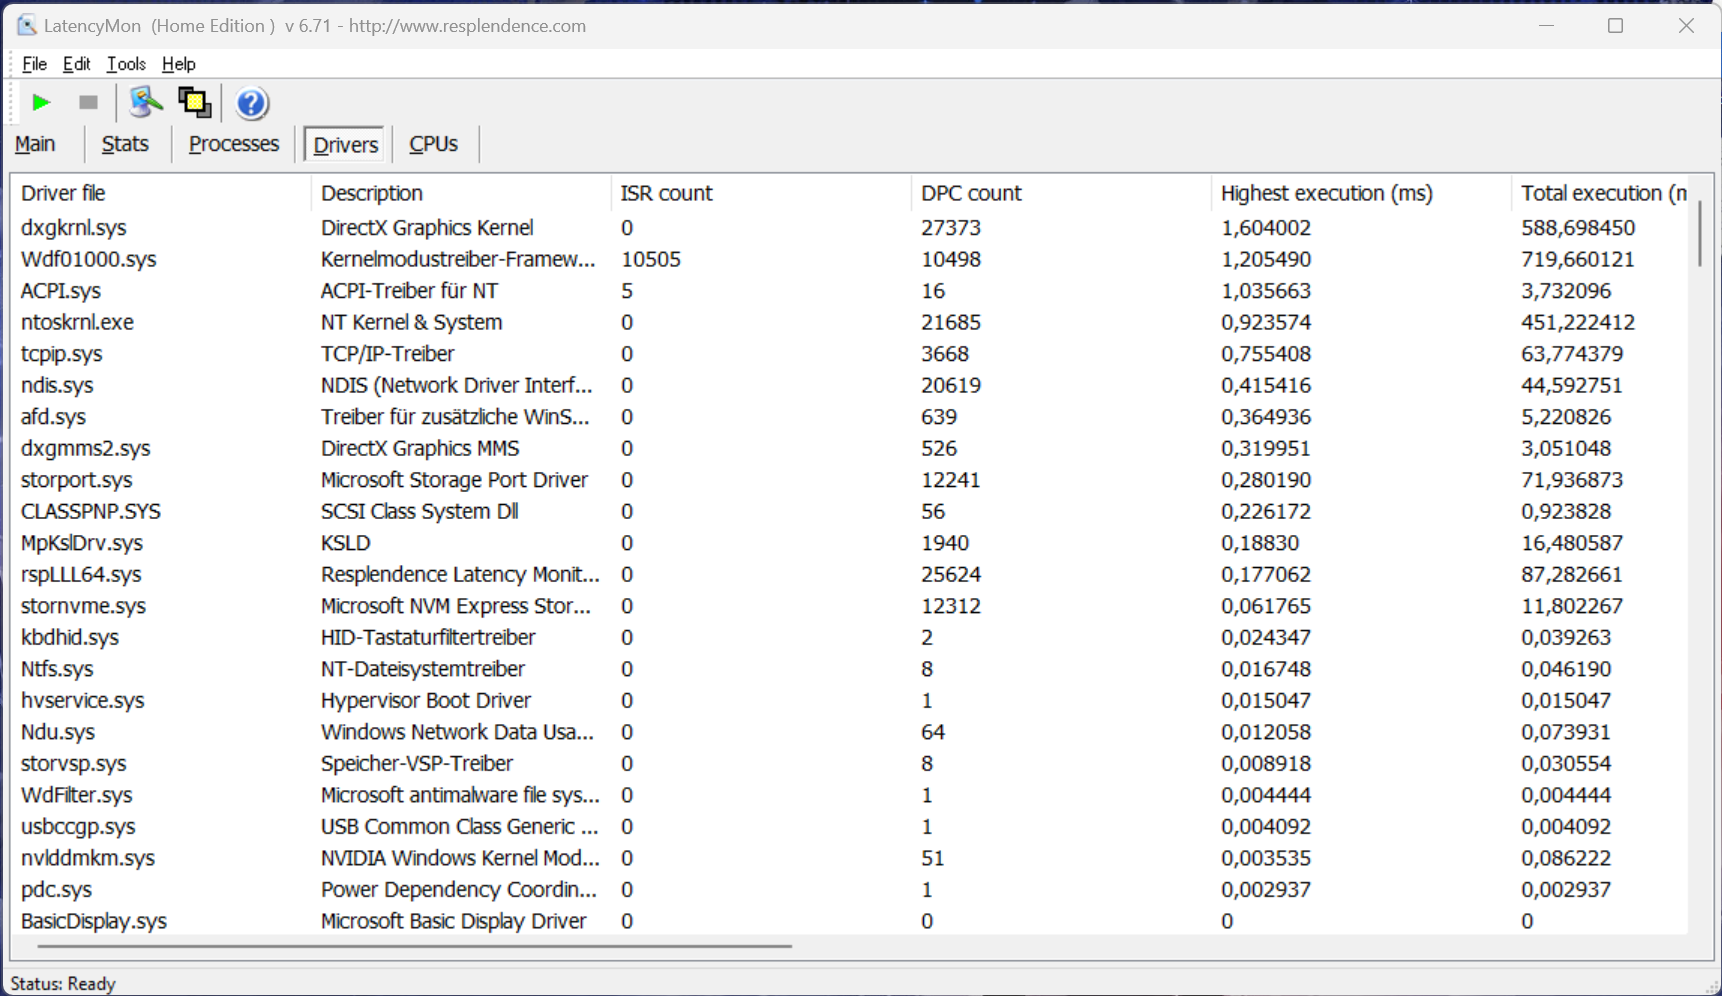
Opóźnienie DPC
W naszym ustandaryzowanym teście opóźnień (surfowanie po sieci, odtwarzanie YouTube w 4K, obciążenie CPU), urządzenie testowe z aktualną wersją BIOS-u wykazało pewne ograniczenia podczas korzystania z aplikacji audio w czasie rzeczywistym.
| DPC Latencies / LatencyMon - interrupt to process latency (max), Web, Youtube, Prime95 | |
| Alienware m16 R1 Intel | |
| Lenovo Legion 5 16IRX G9 | |
| HP Victus 16-r0076TX | |
| HP Victus 16-r0077ng | |
| Lenovo LOQ 16IRH8 | |
| Lenovo Legion Slim 5 16APH8 | |
| Lenovo Legion Pro 5 16IRX8 | |
| Schenker XMG CORE 16 (L23) | |
* ... im mniej tym lepiej
Urządzenia pamięci masowej
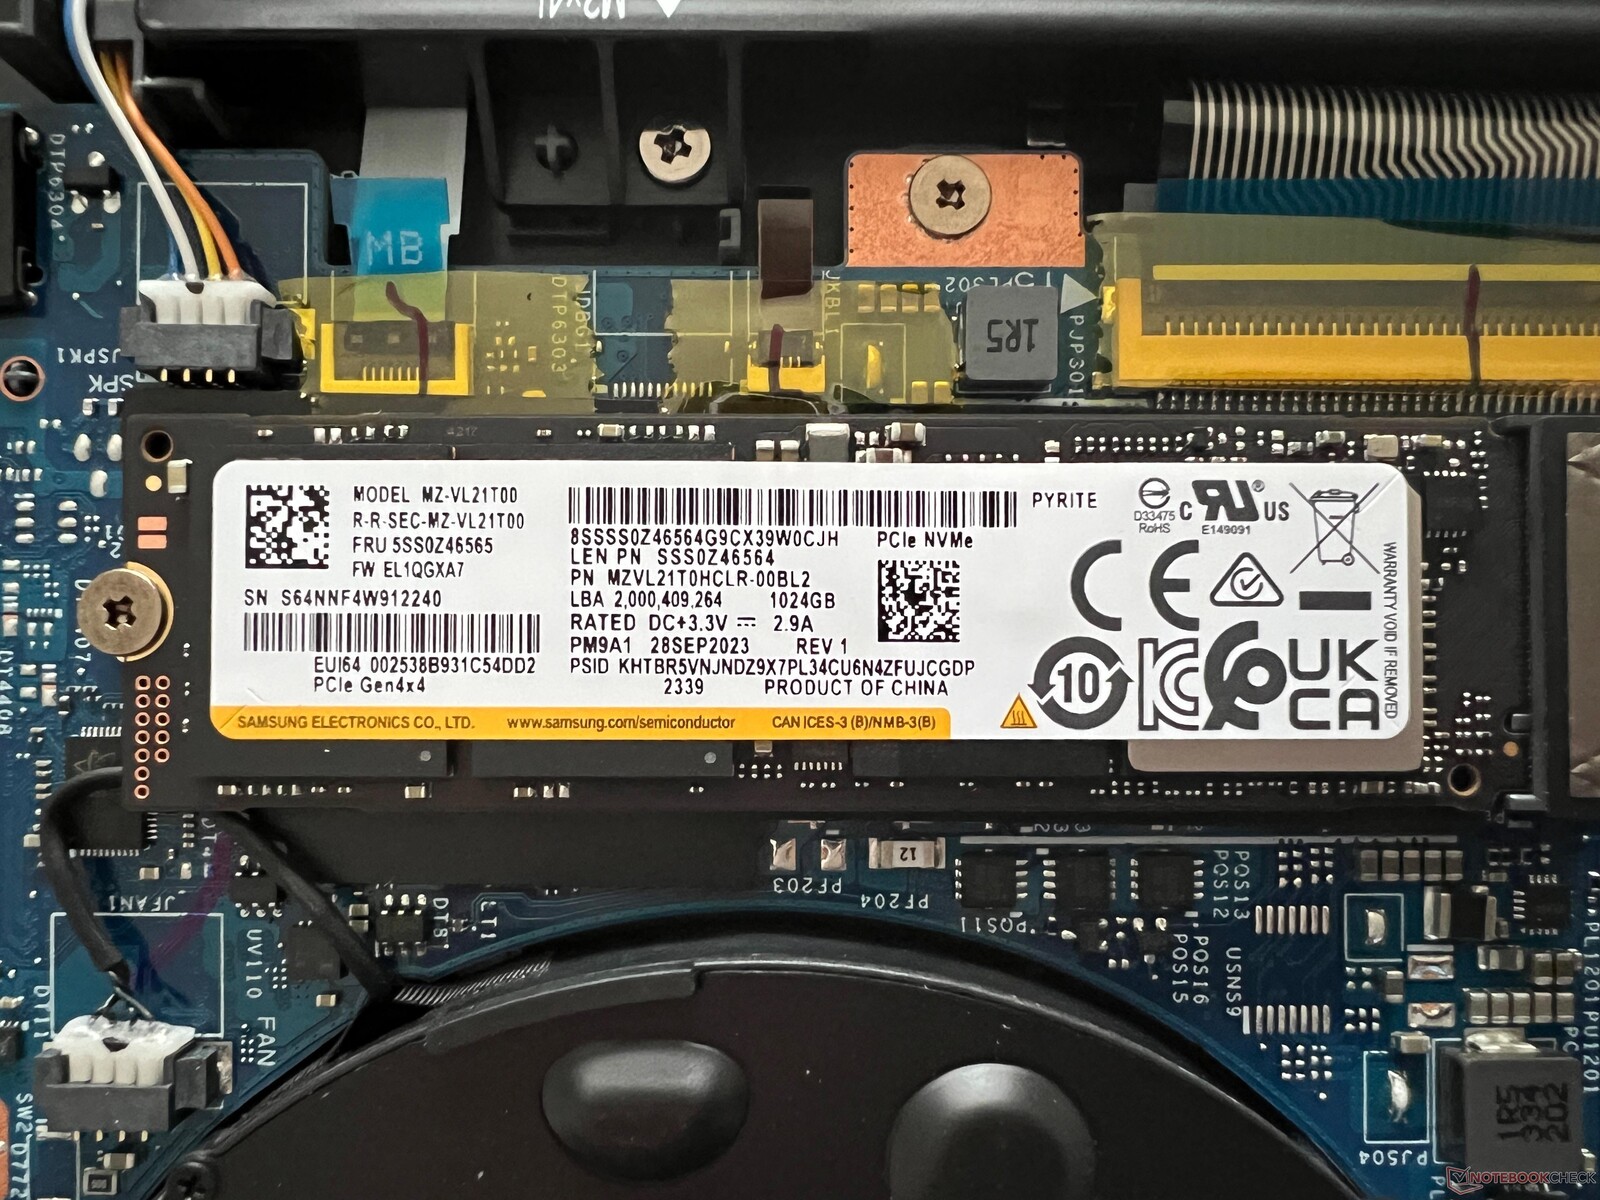
Jak już wspomniano, Legion posiada dwa sloty na dyski SSD, a nasze urządzenie testowe zostało wyposażone w wersję 1-TB dysku Samsung PM9A1 (wersja OEM modelu 980 Pro), pozostawiając użytkownikom 888 GB do wykorzystania po pierwszym uruchomieniu laptopa. Wydajność dysku SSD PCIe-4.0 jest ogólnie świetna, ale pod stałym obciążeniem nie pozostaje stabilna. W codziennym użytkowaniu nie powinno to powodować żadnych ograniczeń, ale dodatkowa chłodnica (lub radiator) mogłaby rozwiązać ten problem. Więcej testów porównawczych dysków SSD można znaleźć tutaj.

* ... im mniej tym lepiej
Reading continuous performance: DiskSpd Read Loop, Queue Depth 8
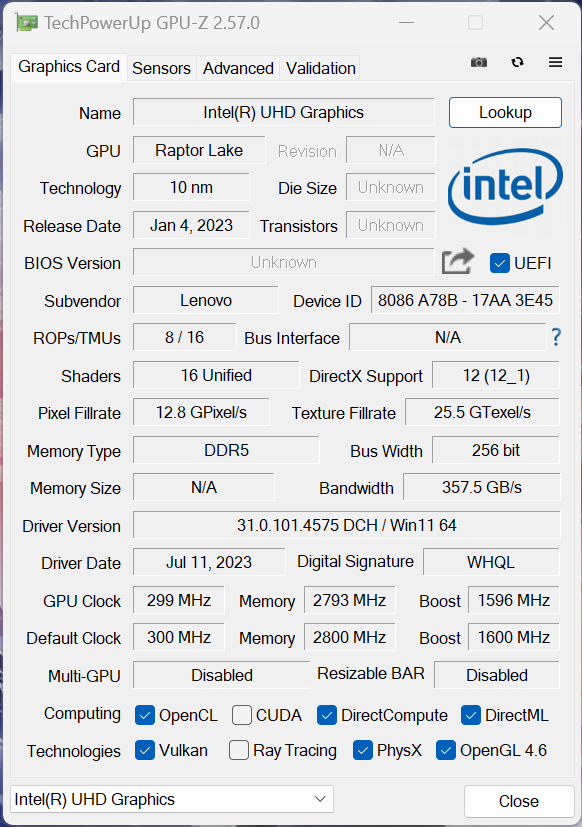
Karta graficzna
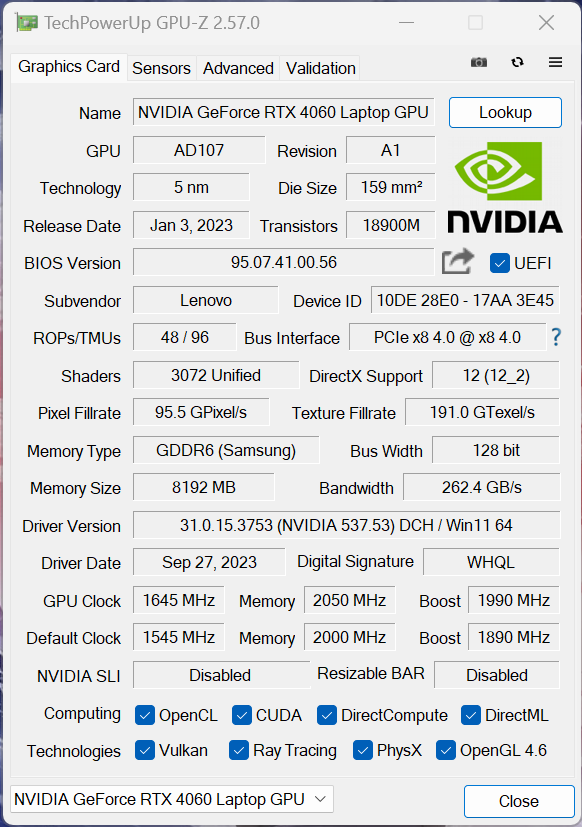
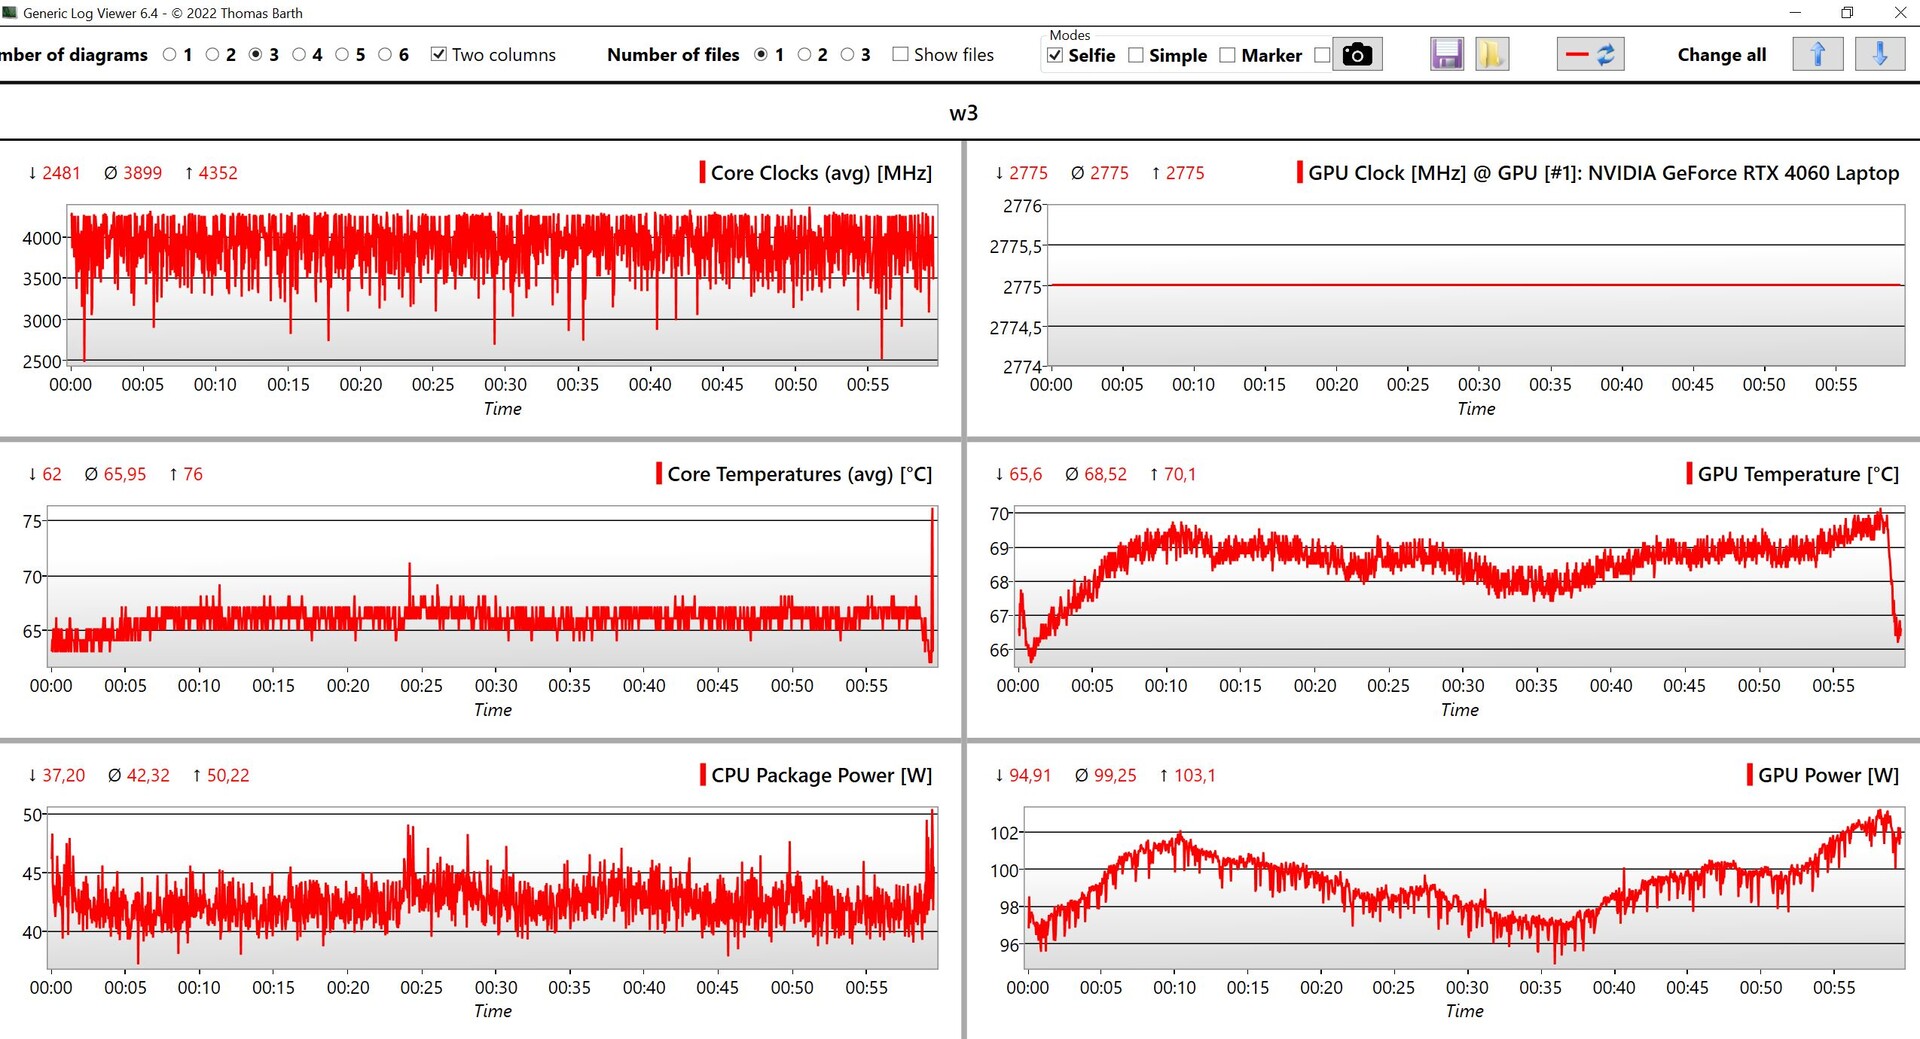
W urządzeniu testowym Lenovo zainstalowało aktualną wersję Laptop Nvidia GeForce RTX 4060 z TGP wynoszącym 115 watów - w rzeczywistości można nawet podkręcić GPU za pomocą aplikacji Vantage. Podczas naszego testu jego maksymalne taktowanie wynosiło 2430 MHz. Obsługiwany jest zaawansowany Optimus za pośrednictwem przełącznika MUX, który działał niezawodnie podczas naszego testu, ale można również całkowicie dezaktywować iGPU procesora.
Laptop RTX 4060 poradził sobie naprawdę dobrze w testach porównawczych, przegrywając jedynie z oboma modelami RTX-4070- choć różnica w stosunku do HP Victus nie jest wcale duża. Wydajność GPU pozostaje całkowicie stabilna pod stałym obciążeniem, ale podczas korzystania z baterii GPU może zużywać tylko 50 watów. Prowadzi to do spadku wydajności o nieco ponad 30%. Więcej testów porównawczych GPU można znaleźć na stronie tutaj.
| 3DMark 11 Performance | 32891 pkt. | |
| 3DMark Fire Strike Score | 25376 pkt. | |
| 3DMark Time Spy Score | 11731 pkt. | |
Pomoc | ||
| Blender / v3.3 Classroom OPTIX/RTX | |
| HP Victus 16-r0076TX | |
| Alienware m16 R1 Intel | |
| HP Victus 16-r0077ng | |
| Lenovo Legion 5 16IRX G9 | |
| Przeciętny NVIDIA GeForce RTX 4060 Laptop GPU (19 - 28, n=53) | |
| Lenovo Legion Slim 5 16APH8 | |
| Lenovo LOQ 16IRH8 | |
| Lenovo Legion Pro 5 16IRX8 | |
| Schenker XMG CORE 16 (L23) | |
| Średnia w klasie Gaming (9 - 32, n=105, ostatnie 2 lata) | |
| Blender / v3.3 Classroom CUDA | |
| HP Victus 16-r0076TX | |
| Lenovo Legion Slim 5 16APH8 | |
| Przeciętny NVIDIA GeForce RTX 4060 Laptop GPU (39 - 53, n=53) | |
| Lenovo LOQ 16IRH8 | |
| Lenovo Legion 5 16IRX G9 | |
| Lenovo Legion Pro 5 16IRX8 | |
| Alienware m16 R1 Intel | |
| HP Victus 16-r0077ng | |
| Średnia w klasie Gaming (15 - 228, n=105, ostatnie 2 lata) | |
| Schenker XMG CORE 16 (L23) | |
| Blender / v3.3 Classroom CPU | |
| Lenovo LOQ 16IRH8 | |
| HP Victus 16-r0077ng | |
| HP Victus 16-r0076TX | |
| Przeciętny NVIDIA GeForce RTX 4060 Laptop GPU (189 - 452, n=53) | |
| Lenovo Legion Slim 5 16APH8 | |
| Schenker XMG CORE 16 (L23) | |
| Lenovo Legion Pro 5 16IRX8 | |
| Alienware m16 R1 Intel | |
| Średnia w klasie Gaming (122 - 565, n=101, ostatnie 2 lata) | |
| Lenovo Legion 5 16IRX G9 | |
* ... im mniej tym lepiej
Wydajność w grach
Ogólnie rzecz biorąc, wydajność laptopa w grach jest świetna i plasuje się w górnej granicy dla laptopa RTX 4060. Wszystkie obecne gry można płynnie uruchomić w rozdzielczości QHD i przy maksymalnych detalach - nawet tak wymagające tytuły jak Cyberpunk 2077 czy Modern Warfare 3. Jedynie raytracing może prowadzić do pewnych problemów i rozsądnie byłoby skorzystać z technologii skalowania w górę, takiej jak DLSS. Ponadto, jego wydajność w grach pozostaje całkowicie stabilna, nawet podczas dłuższych sesji. Więcej testów porównawczych można znaleźć tutaj.
| The Witcher 3 - 1920x1080 Ultra Graphics & Postprocessing (HBAO+) | |
| Średnia w klasie Gaming (104.7 - 240, n=6, ostatnie 2 lata) | |
| Schenker XMG CORE 16 (L23) | |
| HP Victus 16-r0077ng | |
| Lenovo Legion Pro 5 16IRX8 | |
| Alienware m16 R1 Intel | |
| Lenovo LOQ 16IRH8 | |
| Lenovo Legion 5 16IRX G9 | |
| HP Victus 16-r0076TX | |
| Lenovo Legion Slim 5 16APH8 | |
| GTA V - 1920x1080 Highest AA:4xMSAA + FX AF:16x | |
| Średnia w klasie Gaming (48.3 - 186.9, n=93, ostatnie 2 lata) | |
| Lenovo Legion 5 16IRX G9 | |
| Lenovo Legion Pro 5 16IRX8 | |
| Schenker XMG CORE 16 (L23) | |
| Lenovo LOQ 16IRH8 | |
| HP Victus 16-r0077ng | |
| Lenovo Legion Slim 5 16APH8 | |
Witcher 3 FPS diagram
| low | med. | high | ultra | QHD | |
|---|---|---|---|---|---|
| GTA V (2015) | 186 | 182.8 | 120.2 | 89 | |
| The Witcher 3 (2015) | 229 | 97.2 | 83 | ||
| Dota 2 Reborn (2015) | 209 | 189.7 | 179.9 | 168.7 | |
| Final Fantasy XV Benchmark (2018) | 154.2 | 106.3 | 77.5 | ||
| X-Plane 11.11 (2018) | 180.8 | 171 | 130.9 | ||
| Far Cry 5 (2018) | 161 | 155 | 147 | 111 | |
| Strange Brigade (2018) | 243 | 210 | 130 | ||
| F1 2021 (2021) | 464 | 380 | 292 | 146.7 | 104.6 |
| F1 22 (2022) | 296 | 287 | 217 | 71.4 | 45.2 |
| F1 23 (2023) | 306 | 292 | 207 | 63.7 | 39.4 |
| Cyberpunk 2077 (2023) | 133.1 | 110.4 | 95.3 | 81.8 | 49.7 |
| Assassin's Creed Mirage (2023) | 93 | 72 | |||
| Call of Duty Modern Warfare 3 2023 (2023) | 134 | 121 | 92 | 86 | 58 |
Emisje - głośne, ale fajne
Emisja hałasu
Oba wentylatory Legion 5i 16 mają dużo pracy do wykonania i jeśli nie używasz trybu cichego, często będą się obracać podczas prostych zadań. Pod dużym obciążeniem urządzenie staje się bardzo głośne przy 55 dB(A), ale szczerze mówiąc, prawie 50 dB(A), które zmierzyliśmy w trybie zrównoważonym, jest po prostu zbyt głośne, aby prawidłowo grać w gry bez zestawu słuchawkowego. Tak więc, w zależności od gry, sensowne może być sprawdzenie wydajności w trybie cichym, ponieważ jego 35 dB(A) jest znacznie bardziej komfortowe. Nie odnotowaliśmy żadnych innych odgłosów elektronicznych dochodzących z naszego urządzenia testowego.
| Profil energetyczny | 3DMark 06 | Witcher 3 | Cyberpunk 2077 Phantom Liberty | Stress test |
|---|---|---|---|---|
| Tryb cichy | 34,6 dB(A) | 34,6 dB(A) | 30,4 dB(A) | 34,6 dB(A) |
| Tryb zrównoważony | 34,6 dB(A) | 49,8 dB(A) | 49,8 dB(A) | 49,8 dB(A) |
| Tryb wydajności | 45,5 dB(A) | 55,7 dB(A) | 53,1 dB(A) | 55,7 dB(A) |
Hałas
| luz |
| 24 / 28.8 / 32 dB |
| obciążenie |
| 45.5 / 55.7 dB |
 | ||
30 dB cichy 40 dB(A) słyszalny 50 dB(A) irytujący |
||
min: | ||
| Lenovo Legion 5 16IRX G9 GeForce RTX 4060 Laptop GPU, i7-14650HX, Samsung PM9A1 MZVL21T0HCLR | Schenker XMG CORE 16 (L23) GeForce RTX 4070 Laptop GPU, R7 7840HS, Samsung 990 Pro 1 TB | HP Victus 16-r0077ng GeForce RTX 4070 Laptop GPU, i7-13700H, Kioxia XG8 KXG80ZNV1T02 | Lenovo LOQ 16IRH8 GeForce RTX 4060 Laptop GPU, i7-13620H, Solidigm SSDPFINW512GZL | Lenovo Legion Slim 5 16APH8 GeForce RTX 4060 Laptop GPU, R7 7840HS, SK hynix PC801 HFS512GEJ9X115N | HP Victus 16-r0076TX GeForce RTX 4050 Laptop GPU, i5-13500HX, SK hynix PC801 HFS512GEJ9X101N BF | Alienware m16 R1 Intel GeForce RTX 4060 Laptop GPU, i7-13700HX, Kioxia KXG70ZNV512G | Lenovo Legion Pro 5 16IRX8 GeForce RTX 4060 Laptop GPU, i7-13700HX, SK hynix PC801 HFS512GEJ9X115N | |
|---|---|---|---|---|---|---|---|---|
| Noise | 8% | 2% | 4% | 10% | 9% | 2% | 12% | |
| wyłączone / środowisko * (dB) | 24 | 23 4% | 25 -4% | 23 4% | 22.9 5% | 21.57 10% | 25 -4% | 23 4% |
| Idle Minimum * (dB) | 24 | 23 4% | 28 -17% | 23 4% | 23.1 4% | 23.68 1% | 25 -4% | 23.1 4% |
| Idle Average * (dB) | 28.8 | 28.48 1% | 29 -1% | 23 20% | 23.1 20% | 23.68 18% | 26 10% | 23.1 20% |
| Idle Maximum * (dB) | 32 | 28.48 11% | 30 6% | 27.66 14% | 27.7 13% | 23.68 26% | 27 16% | 26.6 17% |
| Load Average * (dB) | 45.5 | 30 34% | 43 5% | 53.62 -18% | 33.3 27% | 39.44 13% | 52 -14% | 34.7 24% |
| Witcher 3 ultra * (dB) | 53.1 | 54.12 -2% | 46 13% | 53.5 -1% | 54 -2% | 55.4 -4% | 51 4% | 47.6 10% |
| Load Maximum * (dB) | 55.7 | 54.12 3% | 48 14% | 53.5 4% | 54 3% | 55.37 1% | 53 5% | 54.8 2% |
* ... im mniej tym lepiej
Temperatura
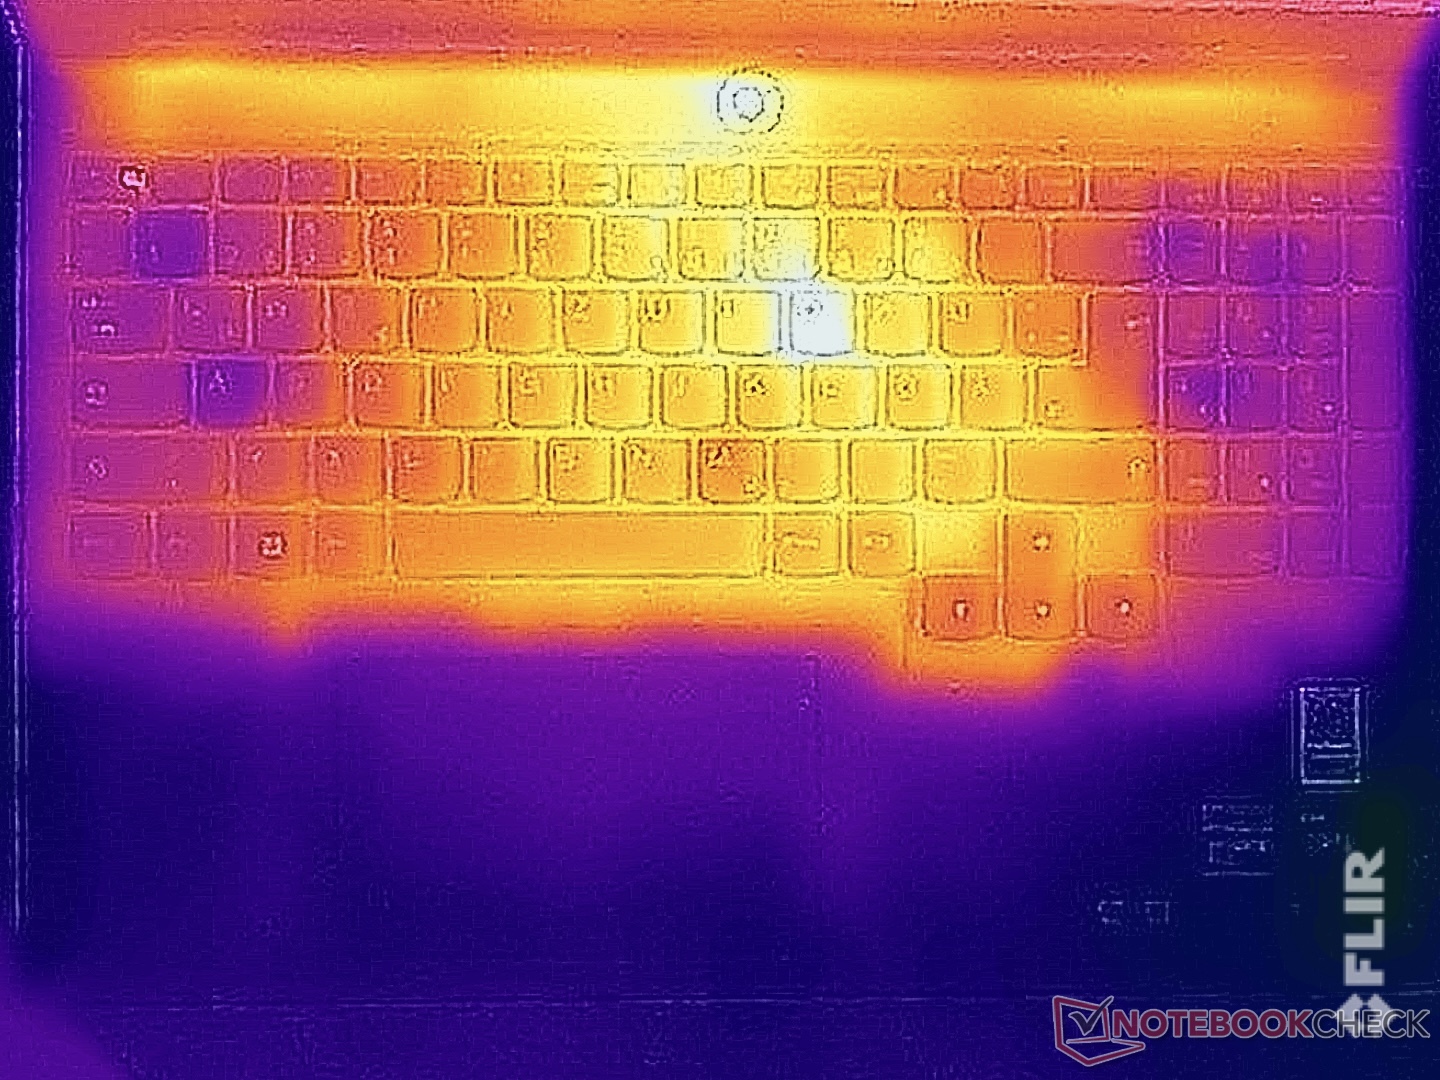
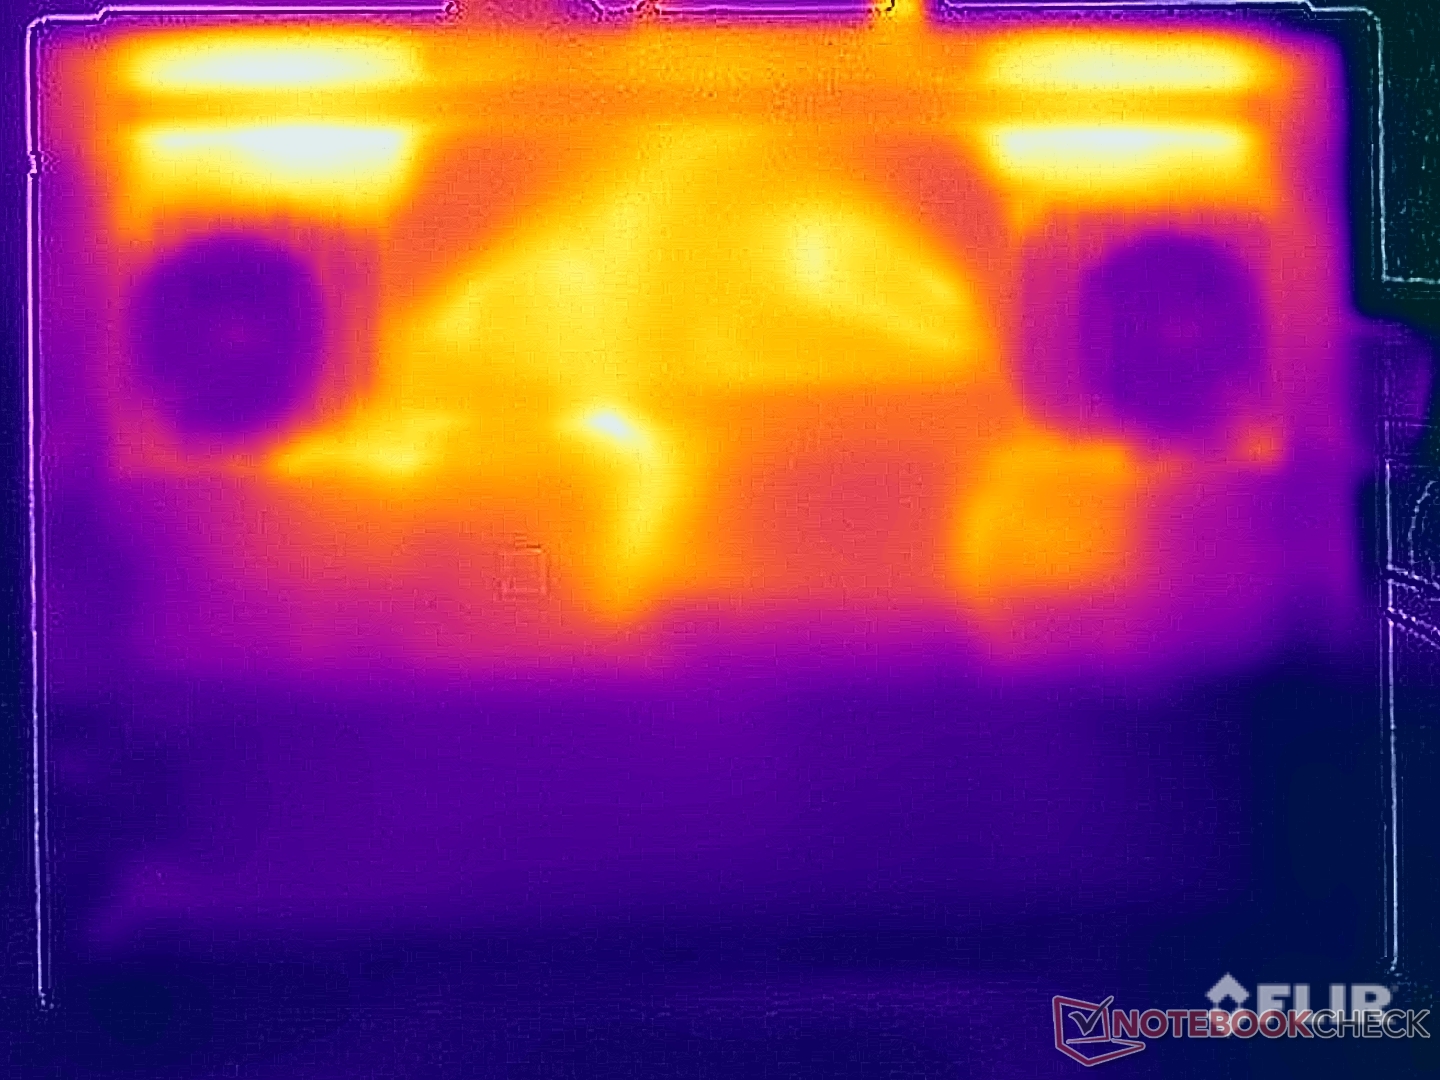
Kilka miejsc na Legion nagrzewa się zauważalnie już w trybie bezczynności, ale z kolei niskie temperatury powierzchni pod obciążeniem nas zaskoczyły. Nawet podczas testu obciążeniowego zmierzyliśmy tylko nieco ponad 40 °C na górze, a na spodzie jednostki bazowej odnotowaliśmy nieco ponad 43 °C. Są to znakomite wyniki i nie ma żadnych ograniczeń, jeśli chodzi o obsługę urządzenia.
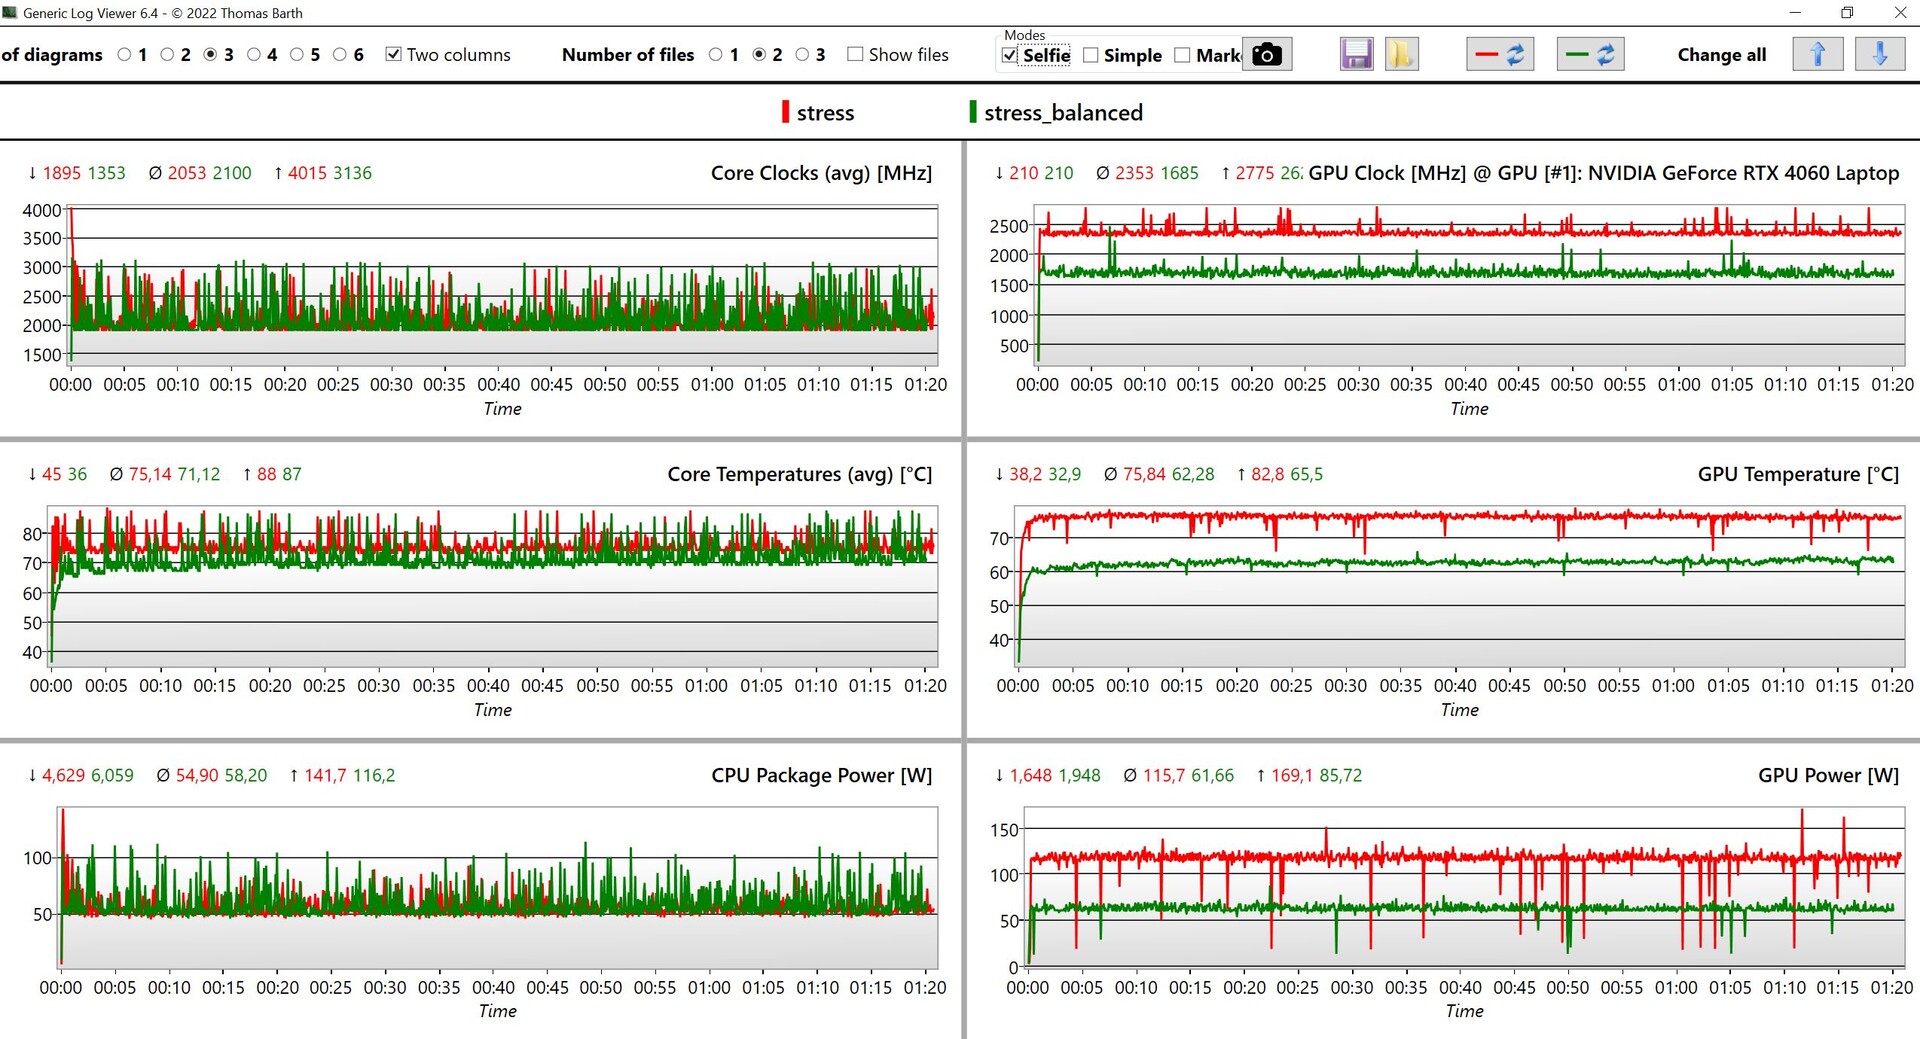
Oprócz korzystania z trybu wydajności, przeprowadziliśmy również test obciążeniowy w trybie zrównoważonym i zebraliśmy wyniki na poniższym wykresie. W obu profilach można zobaczyć, jak bardzo zmienia się zużycie procesora, ale GPU pozostaje na stałym poziomie i tutaj widać wyraźną różnicę między tymi dwoma profilami. W trybie wydajności, GPU działa z mocą 115 W, a w trybie zrównoważonym zmierzyliśmy nieco ponad 60 W.
(±) Maksymalna temperatura w górnej części wynosi 40.4 °C / 105 F, w porównaniu do średniej 40.4 °C / 105 F , począwszy od 21.2 do 68.8 °C dla klasy Gaming.
(±) Dno nagrzewa się maksymalnie do 43.8 °C / 111 F, w porównaniu do średniej 43.2 °C / 110 F
(+) W stanie bezczynności średnia temperatura górnej części wynosi 28 °C / 82 F, w porównaniu ze średnią temperaturą urządzenia wynoszącą 33.9 °C / ### class_avg_f### F.
(±) Podczas gry w Wiedźmina 3 średnia temperatura górnej części wynosi 33.2 °C / 92 F, w porównaniu do średniej temperatury urządzenia wynoszącej 33.9 °C / ## #class_avg_f### F.
(+) Podpórki pod nadgarstki i touchpad są chłodniejsze niż temperatura skóry i maksymalnie 26.9 °C / 80.4 F i dlatego są chłodne w dotyku.
(±) Średnia temperatura obszaru podparcia dłoni w podobnych urządzeniach wynosiła 28.8 °C / 83.8 F (+1.9 °C / 3.4 F).
| Lenovo Legion 5 16IRX G9 Intel Core i7-14650HX, NVIDIA GeForce RTX 4060 Laptop GPU | Schenker XMG CORE 16 (L23) AMD Ryzen 7 7840HS, NVIDIA GeForce RTX 4070 Laptop GPU | HP Victus 16-r0077ng Intel Core i7-13700H, NVIDIA GeForce RTX 4070 Laptop GPU | Lenovo LOQ 16IRH8 Intel Core i7-13620H, NVIDIA GeForce RTX 4060 Laptop GPU | Lenovo Legion Slim 5 16APH8 AMD Ryzen 7 7840HS, NVIDIA GeForce RTX 4060 Laptop GPU | HP Victus 16-r0076TX Intel Core i5-13500HX, NVIDIA GeForce RTX 4050 Laptop GPU | Alienware m16 R1 Intel Intel Core i7-13700HX, NVIDIA GeForce RTX 4060 Laptop GPU | Lenovo Legion Pro 5 16IRX8 Intel Core i7-13700HX, NVIDIA GeForce RTX 4060 Laptop GPU | |
|---|---|---|---|---|---|---|---|---|
| Heat | -3% | -13% | -6% | 9% | -3% | -18% | -4% | |
| Maximum Upper Side * (°C) | 40.4 | 46 -14% | 51 -26% | 48 -19% | 40.6 -0% | 48 -19% | 49 -21% | 42.8 -6% |
| Maximum Bottom * (°C) | 43.8 | 44 -0% | 54 -23% | 59 -35% | 42 4% | 48 -10% | 48 -10% | 50 -14% |
| Idle Upper Side * (°C) | 30.3 | 32 -6% | 37 -22% | 28 8% | 27.8 8% | 29.6 2% | 40 -32% | 29.6 2% |
| Idle Bottom * (°C) | 35.3 | 33 7% | 29 18% | 28 21% | 26.6 25% | 30.2 14% | 39 -10% | 34 4% |
* ... im mniej tym lepiej
Głośniki
Dwa głośniki stereo (2 W każdy) zapewniają jedynie przeciętny dźwięk wystarczający do odtwarzania niektórych filmów i muzyki w tle. Jednak i tak nie skorzystają Państwo z głośników podczas grania w gry, ponieważ wentylatory są zbyt głośne.
Lenovo Legion 5 16IRX G9 analiza dźwięku
(+) | głośniki mogą odtwarzać stosunkowo głośno (84.4 dB)
Bas 100 - 315 Hz
(-) | prawie brak basu - średnio 25.7% niższa od mediany
(±) | liniowość basu jest średnia (8.3% delta do poprzedniej częstotliwości)
Średnie 400 - 2000 Hz
(+) | zbalansowane środki średnie - tylko 4.3% od mediany
(+) | średnie są liniowe (5.2% delta do poprzedniej częstotliwości)
Wysokie 2–16 kHz
(+) | zrównoważone maksima - tylko 1.9% od mediany
(+) | wzloty są liniowe (2.1% delta do poprzedniej częstotliwości)
Ogólnie 100 - 16.000 Hz
(±) | liniowość ogólnego dźwięku jest średnia (16.1% różnicy w stosunku do mediany)
W porównaniu do tej samej klasy
» 39% wszystkich testowanych urządzeń w tej klasie było lepszych, 6% podobnych, 54% gorszych
» Najlepszy miał deltę 6%, średnia wynosiła ###średnia###%, najgorsza wynosiła 132%
W porównaniu do wszystkich testowanych urządzeń
» 26% wszystkich testowanych urządzeń było lepszych, 5% podobnych, 69% gorszych
» Najlepszy miał deltę 4%, średnia wynosiła ###średnia###%, najgorsza wynosiła 134%
Schenker XMG CORE 16 (L23) analiza dźwięku
(±) | głośność głośnika jest średnia, ale dobra (79.4 dB)
Bas 100 - 315 Hz
(-) | prawie brak basu - średnio 21.6% niższa od mediany
(±) | liniowość basu jest średnia (11.4% delta do poprzedniej częstotliwości)
Średnie 400 - 2000 Hz
(±) | wyższe średnie - średnio 5.4% wyższe niż mediana
(+) | średnie są liniowe (6.7% delta do poprzedniej częstotliwości)
Wysokie 2–16 kHz
(+) | zrównoważone maksima - tylko 2.3% od mediany
(+) | wzloty są liniowe (6.6% delta do poprzedniej częstotliwości)
Ogólnie 100 - 16.000 Hz
(±) | liniowość ogólnego dźwięku jest średnia (17.1% różnicy w stosunku do mediany)
W porównaniu do tej samej klasy
» 46% wszystkich testowanych urządzeń w tej klasie było lepszych, 12% podobnych, 43% gorszych
» Najlepszy miał deltę 6%, średnia wynosiła ###średnia###%, najgorsza wynosiła 132%
W porównaniu do wszystkich testowanych urządzeń
» 31% wszystkich testowanych urządzeń było lepszych, 8% podobnych, 61% gorszych
» Najlepszy miał deltę 4%, średnia wynosiła ###średnia###%, najgorsza wynosiła 134%
Alienware m16 R1 Intel analiza dźwięku
(+) | głośniki mogą odtwarzać stosunkowo głośno (87 dB)
Bas 100 - 315 Hz
(-) | prawie brak basu - średnio 24% niższa od mediany
(±) | liniowość basu jest średnia (13.5% delta do poprzedniej częstotliwości)
Średnie 400 - 2000 Hz
(+) | zbalansowane środki średnie - tylko 1.4% od mediany
(+) | średnie są liniowe (3.3% delta do poprzedniej częstotliwości)
Wysokie 2–16 kHz
(+) | zrównoważone maksima - tylko 3.5% od mediany
(+) | wzloty są liniowe (4.6% delta do poprzedniej częstotliwości)
Ogólnie 100 - 16.000 Hz
(+) | ogólny dźwięk jest liniowy (13.4% różnicy w stosunku do mediany)
W porównaniu do tej samej klasy
» 19% wszystkich testowanych urządzeń w tej klasie było lepszych, 7% podobnych, 74% gorszych
» Najlepszy miał deltę 6%, średnia wynosiła ###średnia###%, najgorsza wynosiła 132%
W porównaniu do wszystkich testowanych urządzeń
» 14% wszystkich testowanych urządzeń było lepszych, 4% podobnych, 83% gorszych
» Najlepszy miał deltę 4%, średnia wynosiła ###średnia###%, najgorsza wynosiła 134%
Zarządzanie energią
Zużycie energii
Nie odnotowaliśmy większych niespodzianek, jeśli chodzi o zużycie energii przez urządzenie i zmierzyliśmy maksymalnie około 20 watów w trybie bezczynności - jest to akceptowalne, biorąc pod uwagę duży wyświetlacz i wysoką jasność. Podczas testu obciążeniowego maksymalny pobór mocy wyniósł na krótko ~247 watów, ale natychmiast ustabilizował się na poziomie 230 watów. W rezultacie 230-watowy zasilacz będzie na granicy swoich możliwości, jeśli będą Państwo korzystać z trybu wydajności. W trybie zrównoważonym zużycie energii przez laptopa wyrównało się do około 180 watów.
| wyłączony / stan wstrzymania | |
| luz | |
| obciążenie |
|
Legenda:
min: | |
| Lenovo Legion 5 16IRX G9 i7-14650HX, GeForce RTX 4060 Laptop GPU, Samsung PM9A1 MZVL21T0HCLR, IPS, 2560x1600, 16" | Schenker XMG CORE 16 (L23) R7 7840HS, GeForce RTX 4070 Laptop GPU, Samsung 990 Pro 1 TB, IPS, 2560x1600, 16" | HP Victus 16-r0077ng i7-13700H, GeForce RTX 4070 Laptop GPU, Kioxia XG8 KXG80ZNV1T02, IPS, 1920x1080, 16.1" | Lenovo LOQ 16IRH8 i7-13620H, GeForce RTX 4060 Laptop GPU, Solidigm SSDPFINW512GZL, IPS, 2560x1600, 16" | Lenovo Legion Slim 5 16APH8 R7 7840HS, GeForce RTX 4060 Laptop GPU, SK hynix PC801 HFS512GEJ9X115N, IPS, 2560x1600, 16" | HP Victus 16-r0076TX i5-13500HX, GeForce RTX 4050 Laptop GPU, SK hynix PC801 HFS512GEJ9X101N BF, IPS, 1920x1080, 16.1" | Alienware m16 R1 Intel i7-13700HX, GeForce RTX 4060 Laptop GPU, Kioxia KXG70ZNV512G, IPS, 2560x1600, 16" | Lenovo Legion Pro 5 16IRX8 i7-13700HX, GeForce RTX 4060 Laptop GPU, SK hynix PC801 HFS512GEJ9X115N, IPS, 2560x1600, 16" | Przeciętny NVIDIA GeForce RTX 4060 Laptop GPU | Średnia w klasie Gaming | |
|---|---|---|---|---|---|---|---|---|---|---|
| Power Consumption | 18% | 21% | 4% | 21% | 2% | 3% | -27% | 14% | -2% | |
| Idle Minimum * (Watt) | 15.4 | 11 29% | 8 48% | 17.2 -12% | 9.4 39% | 16.12 -5% | 10 35% | 24.5 -59% | 11.5 ? 25% | 13 ? 16% |
| Idle Average * (Watt) | 19.7 | 15.2 23% | 13 34% | 19.3 2% | 15.5 21% | 20.47 -4% | 14 29% | 29.2 -48% | 16 ? 19% | 18.7 ? 5% |
| Idle Maximum * (Watt) | 20.7 | 16 23% | 22 -6% | 21.2 -2% | 24.4 -18% | 22.11 -7% | 21 -1% | 34.3 -66% | 20.3 ? 2% | 24.3 ? -17% |
| Load Average * (Watt) | 102.6 | 64 38% | 86 16% | 90 12% | 74.1 28% | 94.8 8% | 119 -16% | 98.7 4% | 92.9 ? 9% | 110.2 ? -7% |
| Witcher 3 ultra * (Watt) | 191.3 | 179 6% | 141.8 26% | 168 12% | 112.9 41% | 166.9 13% | 186.7 2% | 178.6 7% | ||
| Load Maximum * (Watt) | 246.6 | 280 -14% | 233 6% | 211 14% | 206.5 16% | 237 4% | 323 -31% | 249.6 -1% | 210 ? 15% | 258 ? -5% |
* ... im mniej tym lepiej
Power consumption Witcher 3 / stress test
Power consumption with external monitor
Czas trwania
Legion 5i 16 ma baterię o pojemności 80 Wh, co jest najmniejszą pojemnością w naszym polu porównawczym. Z kolei jego wyniki nie są w rzeczywistości złe i przy 150 cd/m² (61% pełnej jasności naszego urządzenia testowego) wideo działało przez około 9,5 godziny, a nasz test WLAN trwał około 7,5 godziny (~ 5,5 godziny przy maksymalnej jasności). Pod obciążeniem laptop wyłącza się już po 46 minutach, a film HDR był odtwarzany tylko przez 2:14 godziny przy maksymalnej jasności. Przy wybranej częstotliwości 240 Hz, czas pracy w teście WLAN spadł do 5:27 godzin (150 cd/m²) i 4:33 godzin (pełna jasność).
Pełne ładowanie trwa 106 minut przy włączonym urządzeniu, przy czym 80% osiąga się po około 60 minutach. W aplikacji Vantage dostępna jest również opcja o nazwie "ładowanie ekspresowe", która powoduje szybsze ładowanie pierwszych 60%. Pełne ładowanie w tym trybie trwa tylko 69 minut (80% po 31 minutach).
| Lenovo Legion 5 16IRX G9 i7-14650HX, GeForce RTX 4060 Laptop GPU, 80 Wh | Schenker XMG CORE 16 (L23) R7 7840HS, GeForce RTX 4070 Laptop GPU, 99 Wh | HP Victus 16-r0077ng i7-13700H, GeForce RTX 4070 Laptop GPU, 83 Wh | Lenovo LOQ 16IRH8 i7-13620H, GeForce RTX 4060 Laptop GPU, 80 Wh | Lenovo Legion Slim 5 16APH8 R7 7840HS, GeForce RTX 4060 Laptop GPU, 80 Wh | HP Victus 16-r0076TX i5-13500HX, GeForce RTX 4050 Laptop GPU, 83 Wh | Alienware m16 R1 Intel i7-13700HX, GeForce RTX 4060 Laptop GPU, 86 Wh | Lenovo Legion Pro 5 16IRX8 i7-13700HX, GeForce RTX 4060 Laptop GPU, 80 Wh | Średnia w klasie Gaming | |
|---|---|---|---|---|---|---|---|---|---|
| Czasy pracy | 73% | -4% | 13% | 23% | 17% | -17% | -34% | 25% | |
| H.264 (h) | 9.6 | 10.2 6% | 6.4 -33% | 7.7 -20% | 5.6 -42% | 8.64 ? -10% | |||
| WiFi v1.3 (h) | 7.4 | 8.4 14% | 7.1 -4% | 6.3 -15% | 7.1 -4% | 8.9 20% | 4.8 -35% | 3.4 -54% | 7.15 ? -3% |
| Load (h) | 0.8 | 2.4 200% | 1.5 88% | 1.2 50% | 1.2 50% | 1 25% | 0.7 -13% | 1.502 ? 88% | |
| Witcher 3 ultra (h) | 1.5 |
Za
Przeciw
Werdykt - Legion 5i 16 to przede wszystkim wydajność

Podsumowując, nowy Lenovo Legion 5i 16 zrobił bardzo dobre wrażenie podczas naszego testu. Lenovo skoncentrowało się na najważniejszych cechach, oferując szybkie podzespoły w połączeniu z doskonałym wyświetlaczem IPS 240 Hz, który już po wyjęciu z pudełka dokładnie odwzorowuje kolory i radzi sobie bez PWM. Jego wydajność w grach jest świetna i można uruchomić obecne gry w najwyższych rozdzielczościach i ustawieniach - po prostu nie obejdzie się bez skalowania DLSS, jeśli chodzi o ray tracing. Nowy procesor Raptor-Lake-HX nie jest bynajmniej cudem wydajności, ale jego osiągi są dobre.
Jednocześnie jednostka chłodząca laptopa zapewnia, że jego wydajność może być wykorzystywana przez cały czas. Co więcej, spodobał nam się rozrzut we wszystkich różnych profilach energetycznych, a Lenovo daje użytkownikom wiele opcji dostosowywania, jeśli chodzi o ustawienia CPU i GPU. Podczas grania w gry urządzenie pozostaje zaskakująco chłodne, ale z kolei oba wentylatory są dość głośne, co oznacza, że zestaw słuchawkowy jest nieco niezbędny podczas sesji gier.
Świetna wydajność i imponujący wyświetlacz 240 Hz: Lenovo Legion 5i 16 to szybki gracz średniej klasy, który stawia wydajność na pierwszym miejscu. Jednak jego funkcje AI są jak dotąd tylko sztuczką.
Nowy silnik Lenovo AI Engine+, który ma poprawić wydajność w grach za pomocą układu AI, nie działał podczas naszych testów. Być może zostanie to poprawione poprzez aktualizację, ale na razie warto aktywować ręczny tryb wydajności. Jest kilka punktów, które jasno pokazują, że Lenovo zaoszczędziło trochę pieniędzy, ponieważ laptop nie jest wyposażony w port Thunderbolt ani 2,5-GBit/s Ethernet.
Przy cenie 1610 USD, nowy Legion 5i 16 nie jest okazją i w tej cenie można już dostać modele wyposażone w RTX 4070 Laptop (zwłaszcza laptopy z 2023 roku), ale nawet w tym przypadku nie można uniknąć konieczności pójścia na pewne kompromisy w zakresie wyświetlania.
Cena i dostępność
Nowy Lenovo Legion 5i 16IRX G9 można nabyć bezpośrednio na stronie internetowej Lenovo w cenie 1 609,99 USD.
Lenovo Legion 5 16IRX G9
- 29/01/2024 v7 (old)
Andreas Osthoff
Przezroczystość
Wyboru urządzeń do recenzji dokonuje nasza redakcja. Próbka testowa została udostępniona autorowi jako pożyczka od producenta lub sprzedawcy detalicznego na potrzeby tej recenzji. Pożyczkodawca nie miał wpływu na tę recenzję, producent nie otrzymał też kopii tej recenzji przed publikacją. Nie było obowiązku publikowania tej recenzji. Jako niezależna firma medialna, Notebookcheck nie podlega władzy producentów, sprzedawców detalicznych ani wydawców.
Tak testuje Notebookcheck
Każdego roku Notebookcheck niezależnie sprawdza setki laptopów i smartfonów, stosując standardowe procedury, aby zapewnić porównywalność wszystkich wyników. Od około 20 lat stale rozwijamy nasze metody badawcze, ustanawiając przy tym standardy branżowe. W naszych laboratoriach testowych doświadczeni technicy i redaktorzy korzystają z wysokiej jakości sprzętu pomiarowego. Testy te obejmują wieloetapowy proces walidacji. Nasz kompleksowy system ocen opiera się na setkach uzasadnionych pomiarów i benchmarków, co pozwala zachować obiektywizm.Price comparison

