Recenzja gamingowego laptopa Lenovo LOQ 16: Gdzie jest haczyk w porównaniu do droższego Legion?
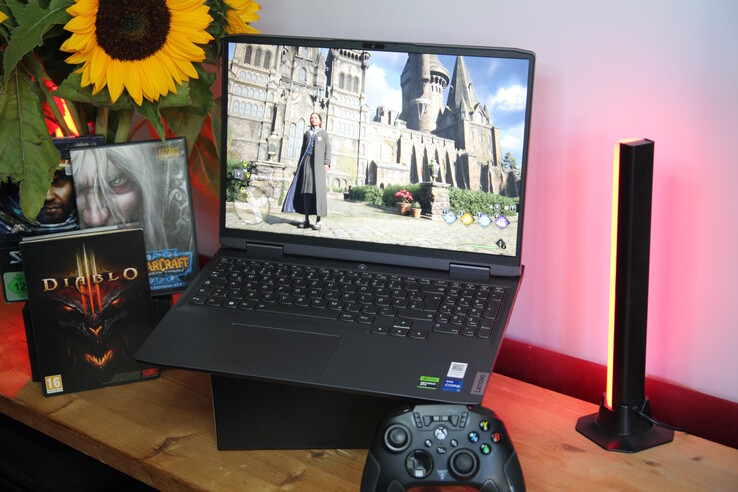
Wraz z nową serią LOQ, Lenovo oferuje szczególnie przystępne cenowo laptopy do gier, które zastępują serię IdeaPad Gaming z poprzednich lat. Mieliśmy już okazję przetestować 15-calowy model LOQ 15z procesorem AMD, a teraz przyglądamy się nieco większemu LOQ 16 z procesorem Intel, 16-calowym wyświetlaczem i proporcjami 16:10. Jak laptop wypada na tle konkurencji i czy gracze otrzymują tutaj prawdziwą okazję?
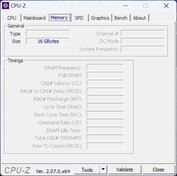
Zasadniczo przechodzimy o jedną kategorię wyżej niż w przypadku LOQ 15, ponieważ zamiastRTX 4050nasz model testowy wykorzystuje kartę RTX 4060zamiast tylko 8 GB pamięci RAM mamy 16 GB, a zamiast wyświetlacza Full-HD otrzymujemy teraz QHD.
Konkurenci obejmują inne budżetowe laptopy do gier z podobną kartą graficzną, takie jak Dell Inspiron 16 Plus 7630czyAcer Nitro 16 AN16-41 (niestety tylko z RTX 4050), a także Captiva Advanced Gaming I74-121. Sprawy stają się nieco droższe dziękiLegion Slim 5 16APH8wewnętrzny konkurent i Asus TUF Gaming A16 Advantage Edition FA617XS.
Potencjalni konkurenci w porównaniu
Ocena | Data | Model | Waga | Wysokość | Rozmiar | Rezolucja | Cena |
|---|---|---|---|---|---|---|---|
| 87.3 % v7 (old) | 09/2023 | Lenovo LOQ 16IRH8 i7-13620H, GeForce RTX 4060 Laptop GPU | 2.7 kg | 25.9 mm | 16.00" | 2560x1600 | |
| 87.1 % v7 (old) | 08/2023 | Dell Inspiron 16 Plus 7630 i7-13700H, GeForce RTX 4060 Laptop GPU | 2.2 kg | 19.95 mm | 16.00" | 2560x1600 | |
| 86.7 % v7 (old) | 08/2023 | Acer Nitro 16 AN16-41-R7YE R5 7535HS, GeForce RTX 4050 Laptop GPU | 2.6 kg | 27.9 mm | 16.00" | 1920x1200 | |
| 85.7 % v7 (old) | 09/2023 | Captiva Advanced Gaming I74-121 i5-13500H, GeForce RTX 4060 Laptop GPU | 2.3 kg | 29 mm | 15.60" | 1920x1080 | |
| 87.7 % v7 (old) | 08/2023 | Lenovo Legion Slim 5 16APH8 R7 7840HS, GeForce RTX 4060 Laptop GPU | 2.4 kg | 25.2 mm | 16.00" | 2560x1600 | |
| 86.9 % v7 (old) | 06/2023 | Asus TUF Gaming A16 FA617XS R9 7940HS, Radeon RX 7600S | 2.2 kg | 22.1 mm | 16.00" | 1920x1200 |
Przypadek - duże i ciężkie LOQ 16
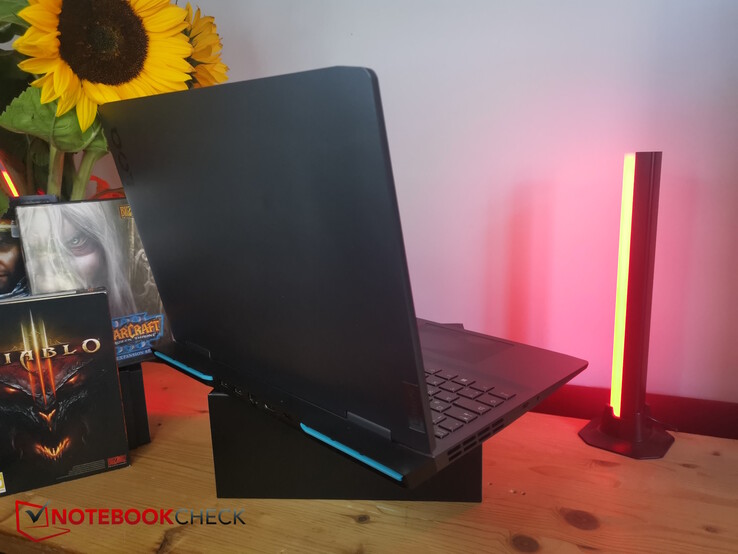
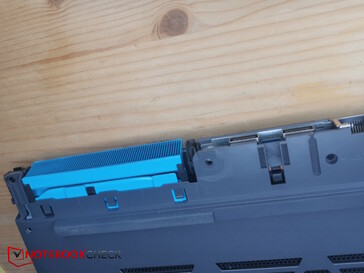
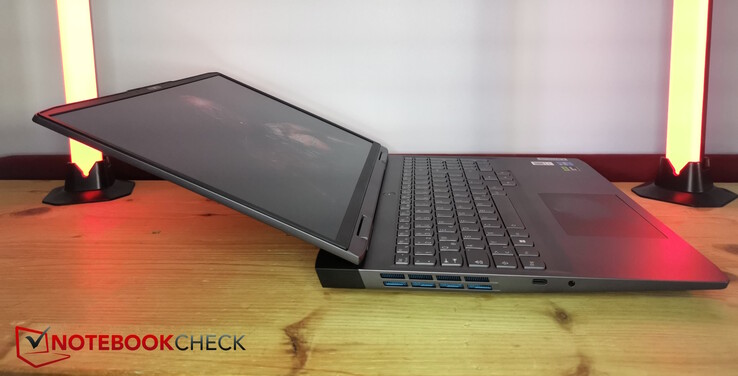
Seria Lenovo LOQ wygląda na bardziej nieporęczną i masywną niż droższa seria Legion. Wynika to nie tylko z wystającego z tyłu systemu chłodzenia, który przypomina nam modele Alienware. Tylny otwór wentylacyjny posiada również jedyne kolorowe akcenty, które wyróżniają się jasnoniebieskim kolorem na tle szarej konstrukcji. Przednia krawędź jest lekko zaokrąglona, a na górze widnieje logo Lenovo i LOQ. Powierzchnie są bardzo gładkie i nie ma metalowych elementów, takich jak w Legion.
Podczas gdy laptop można łatwo otworzyć jedną ręką do maksymalnego kąta otwarcia 160 stopni, dwa zawiasy nadal dość dobrze utrzymują wyświetlacz na miejscu. Podpórki pod nadgarstki i powierzchnia klawiatury składają się z pojedynczej płyty, przy czym ta ostatnia jest minimalnie obniżona.
Chociaż podstawa wydaje kilka skrzypiących dźwięków, gdy próbujemy ją wypaczyć, wszystko jest wystarczająco solidne. Jakość wykonania jest przyzwoita i nie zauważyliśmy żadnych większych szczelin między materiałami.
W naszym porównaniu LOQ 16 jest jednym z największych i przede wszystkim najcięższych 16-calowych urządzeń. Ze względu na system chłodzenia wystający z tyłu, laptop jest znacznie głębszy niż większość konkurentów. Tylko Acer Nitro 16 ma podobny rozmiar, ale nadal waży 100 gramów (~ 3,5 uncji) mniej niż nasza jednostka testowa LOQ. Wszystkie pozostałe modele są lżejsze.
Wyposażenie - bez Thunderbolt lub czytnika kart SD
Jeśli chodzi o sprzęt połączeniowy, ten budżetowy laptop do gier oferuje tylko to, co najpotrzebniejsze. Otrzymujesz w sumie cztery porty USB, z których trzy działają z prędkością 10 Gbit / s. Chociaż jest jeden port USB-C, brakuje mu Thunderbolt. Na próżno też szukać czytnika kart SD.
Podoba nam się rozmieszczenie portów, które są umieszczone z trzech stron, oferując wystarczającą przestrzeń pomiędzy nimi. Większość portów znajduje się z tyłu, z dwoma portami po lewej stronie i jednym portem po prawej stronie, pozostawiając dużo miejsca na dłoń myszy.
Komunikacja
Chociaż moduł Intel AX203 zapewnia Wi-Fi 6, jego prędkość przewyższa AX211 używany przez większość konkurentów. Nie jest również w stanie połączyć się z siecią 6 GHz.
Podczas gdy szybkość transferu jest stała i wynosi około 800 MB/s, pozostaje ona w tyle za konkurencją, która często osiąga ponad 1 GB/s.
Kamera internetowa
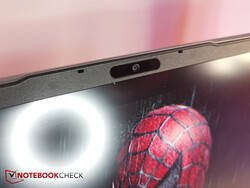
Lenovo umieściło kamerę Full-HD w górnej krawędzi ramki wyświetlacza. Doceniamy istnienie (elektronicznej) migawki prywatności po prawej stronie.
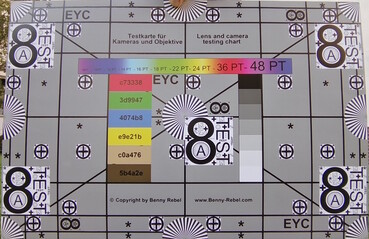
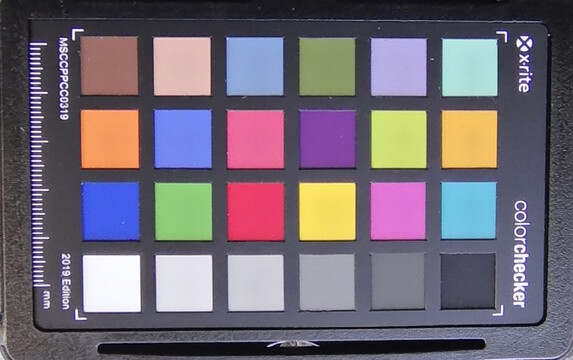
Sama kamera generuje dość duże odchylenia kolorów, ale nadal jest wystarczająca do wykonywania okazjonalnych połączeń wideo w dobrych warunkach oświetleniowych.
Bezpieczeństwo
TPM jest oczywiście dołączony, chociaż LOQ nie ma czujnika odcisków palców ani blokady Kensington.
Akcesoria i gwarancja
Ci, którzy oczekują jakichś akcesoriów, powinni spojrzeć kilka klas cenowych wyżej. Poza samym laptopem i ładowarką, pudełko zawiera jedynie trochę papierkowej roboty.
W Europie Lenovo oferuje dwa lata gwarancji z odbiorem kurierem lub wysyłką przez klienta. Za dodatkową opłatą można również wykupić usługę Lenovo Premium Care (Plus) z całodobową obsługą klienta.
Konserwacja
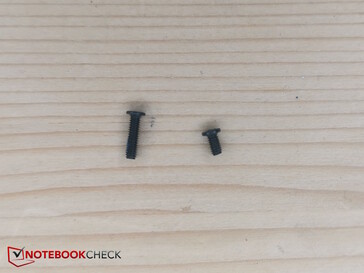
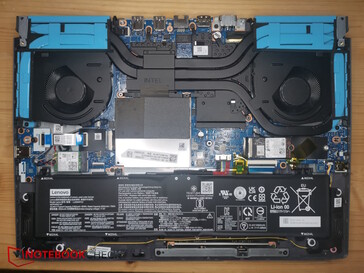
Wystający z tyłu układ chłodzenia sprawia, że demontaż spodu obudowy jest nieco trudniejszy niż w innych laptopach. Najpierw trzeba odkręcić dziesięć śrubek Philipsa. Trzeba jednak uważać: Cztery śrubki z przodu są znacznie krótsze i ustawione pod kątem, więc nie należy popełnić błędu próbując użyć jednej z dłuższych śrubek w tym miejscu.
Przed zdjęciem dolnej płyty należy najpierw przesunąć pokrywę wystającego układu chłodzenia do tyłu, ponieważ poniżej dolna płyta jest przymocowana trzema dodatkowymi śrubami. Po ich usunięciu można podważyć dolną płytę, zaczynając od przodu, bez konieczności używania dodatkowych narzędzi.
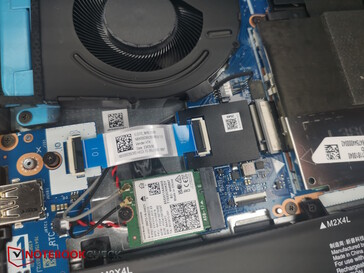
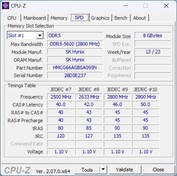
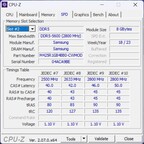
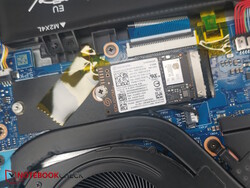
Wewnątrz uzyskujemy dostęp do wentylatorów, baterii, modułu Wi-Fi, dwóch gniazd pamięci RAM, które są zakryte folią, dysku SSD i drugiego gniazda SSD. Co ciekawe, Lenovo wykorzystuje krótki dysk SSD w formacie M.2 2230, mimo że byłoby wystarczająco dużo miejsca na dysk SSD M.2 2280 o regularnym rozmiarze, a ramka do jego przykręcenia również już tam jest.
Urządzenia wejściowe - Solidne i z 2-stopniowym podświetleniem
Klawiatura
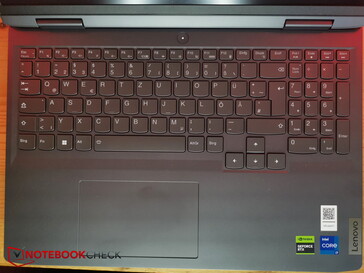
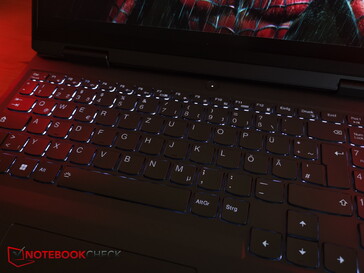
Pomimo nowej nazwy, LOQ quasi dziedziczy klawiaturę z modelu IdeaPad Gaming 3. Układ wygląda czysto, a klawisze strzałek są oddzielone i przesunięte w dół, dzięki czemu mają pełny rozmiar. Wąska klawiatura numeryczna jest wciśnięta po prawej stronie.
Zwykłe klawisze mają dobry rozmiar i są zaokrąglone na dolnych krawędziach. Skok klawiszy nie jest szczególnie długi, a sprzężenie zwrotne mogłoby być nieco mocniejsze, choć nadal jest w porządku. Klawiatura pozwala na szybkie pisanie, ale niektórzy użytkownicy mogą uznać skok za nieco miękki. Hałas podczas pisania jest bardzo umiarkowany.
W ciemnym otoczeniu pomaga białe, dwupoziomowe podświetlenie klawiatury, ale nie ma efektów świetlnych, oddzielnych stref ani RGB.
Touchpad
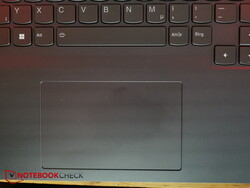
Touchpad ma dobry rozmiar około 12 x 7,5 cm (~ 4,7 x 3 cale). Oferuje dobre właściwości ślizgowe dla suchych palców, ale ruch wilgotnych palców może się łatwo zacinać.
Obszary klikania zintegrowane na dole są raczej twarde, z bardzo krótkim skokiem. Sprzężenie zwrotne jest jednak wyraźne. Odgłosy klikania są głośniejsze niż podczas pisania, ale nadal akceptowalne.
Wyświetlacz - solidna rozdzielczość QHD z 165 Hz
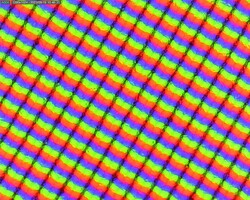
Matowy wyświetlacz IPS 16:10 w naszej jednostce testowej pochodzi od AU Optronics, oferuje rozdzielczość 2560 x 1600 pikseli i obsługuje 165 Hz. Warto jednak przyjrzeć mu się bliżej przed zakupem, ponieważ istnieje również alternatywna wersja, która oferuje tylko rozdzielczość 1,920 x 1,200 pikseli i częstotliwość odświeżania 144 Hz.
Jasność wynosi średnio 369 nitów, ale przy 85% rozkład jasności nie jest zbyt równomierny i mierzymy ponad 400 nitów w centrum.
Niestety, wartość czerni jest nieco wysoka, co uniemożliwia uzyskanie wyższych wartości kontrastu.
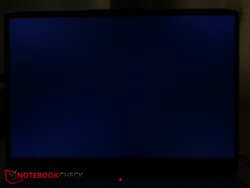
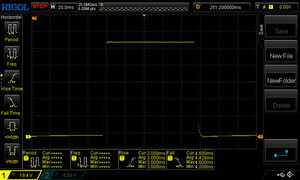
Ale ogólnie wyświetlacz jest przyzwoity. Czasy reakcji są dość szybkie, a PWM nie jest używany do kontroli jasności. Krwawienie podświetlenia również nie wydaje się być problemem w naszej jednostce testowej.
| |||||||||||||||||||||||||
rozświetlenie: 85 %
na akumulatorze: 407 cd/m²
kontrast: 904:1 (czerń: 0.45 cd/m²)
ΔE ColorChecker Calman: 1.43 | ∀{0.5-29.43 Ø4.77}
calibrated: 1.07
ΔE Greyscale Calman: 1.13 | ∀{0.09-98 Ø5}
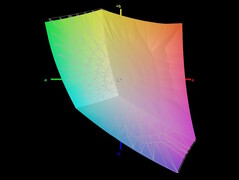
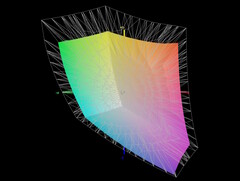
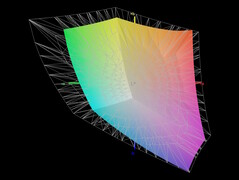
72.6% AdobeRGB 1998 (Argyll 3D)
98.9% sRGB (Argyll 3D)
70.5% Display P3 (Argyll 3D)
Gamma: 2.5
CCT: 6526 K
| Lenovo LOQ 16IRH8 AUOC1A5 (B160QAN03.L), IPS, 2560x1600, 16" | Dell Inspiron 16 Plus 7630 LG Philips 160WQ2, IPS, 2560x1600, 16" | Acer Nitro 16 AN16-41-R7YE AU Optronics B160UAN01.Q, IPS, 1920x1200, 16" | Captiva Advanced Gaming I74-121 BOE08B3, IPS, 1920x1080, 15.6" | Lenovo Legion Slim 5 16APH8 BOE NJ NE160QDM-NYC, IPS, 2560x1600, 16" | Asus TUF Gaming A16 FA617XS BOE NE160WUM-NX2, IPS, 1920x1200, 16" | |
|---|---|---|---|---|---|---|
| Display | 0% | 7% | -8% | -2% | -2% | |
| Display P3 Coverage (%) | 70.5 | 70.1 -1% | 80 13% | 64 -9% | 69.3 -2% | 69.3 -2% |
| sRGB Coverage (%) | 98.9 | 99.6 1% | 99.4 1% | 93.2 -6% | 100 1% | 97.3 -2% |
| AdobeRGB 1998 Coverage (%) | 72.6 | 72.3 0% | 77.4 7% | 66 -9% | 70 -4% | 70.7 -3% |
| Response Times | -307% | -13% | 15% | -27% | -76% | |
| Response Time Grey 50% / Grey 80% * (ms) | 7.2 ? | 35 ? -386% | 11.2 ? -56% | 5 ? 31% | 10.7 ? -49% | 15.6 ? -117% |
| Response Time Black / White * (ms) | 7.4 ? | 24.2 ? -227% | 5.2 ? 30% | 7.55 ? -2% | 7.8 ? -5% | 10 ? -35% |
| PWM Frequency (Hz) | ||||||
| Screen | -61% | -71% | -71% | 7% | -9% | |
| Brightness middle (cd/m²) | 407 | 299.4 -26% | 415 2% | 346 -15% | 371.6 -9% | 301 -26% |
| Brightness (cd/m²) | 369 | 290 -21% | 380 3% | 324 -12% | 343 -7% | 294 -20% |
| Brightness Distribution (%) | 85 | 92 8% | 84 -1% | 90 6% | 84 -1% | 94 11% |
| Black Level * (cd/m²) | 0.45 | 0.21 53% | 0.36 20% | 0.35 22% | 0.44 2% | 0.21 53% |
| Contrast (:1) | 904 | 1426 58% | 1153 28% | 989 9% | 845 -7% | 1433 59% |
| Colorchecker dE 2000 * | 1.43 | 4.25 -197% | 4.71 -229% | 4.12 -188% | 1.52 -6% | 1.79 -25% |
| Colorchecker dE 2000 max. * | 3.58 | 6.71 -87% | 6.98 -95% | 7.78 -117% | 2.68 25% | 3.48 3% |
| Colorchecker dE 2000 calibrated * | 1.07 | 0.52 51% | 2.68 -150% | 1.22 -14% | 0.33 69% | 1.2 -12% |
| Greyscale dE 2000 * | 1.13 | 5.5 -387% | 3.6 -219% | 4.81 -326% | 1.2 -6% | 2.5 -121% |
| Gamma | 2.5 88% | 2.35 94% | 2.182 101% | 2.31 95% | 2.1 105% | 2.265 97% |
| CCT | 6526 100% | 6368 102% | 7153 91% | 7633 85% | 6503 100% | 6157 106% |
| Całkowita średnia (program / ustawienia) | -123% /
-83% | -26% /
-46% | -21% /
-45% | -7% /
0% | -29% /
-17% |
* ... im mniej tym lepiej
Wyświetlacz oferuje już przyzwoitą kalibrację w stanie dostawy, a my mierzymy tylko niewielkie odchylenia w kolorach i skali szarości. Dodatkowa kalibracja przy użyciu naszego urządzenia do pomiaru kolorów Xrite i oprogramowania Calman jest w stanie jeszcze bardziej zmniejszyć odchylenia DeltaE.
Nasz skalibrowany profil kolorów ICC można pobrać bezpłatnie, korzystając z powyższego łącza.
Wyświetl czasy reakcji
| ↔ Czas reakcji od czerni do bieli | ||
|---|---|---|
| 7.4 ms ... wzrost ↗ i spadek ↘ łącznie | ↗ 3 ms wzrost | |
| ↘ 4.4 ms upadek | ||
| W naszych testach ekran wykazuje bardzo szybką reakcję i powinien bardzo dobrze nadawać się do szybkich gier. Dla porównania, wszystkie testowane urządzenia wahają się od 0.1 (minimum) do 240 (maksimum) ms. » 21 % wszystkich urządzeń jest lepszych. Oznacza to, że zmierzony czas reakcji jest lepszy od średniej wszystkich testowanych urządzeń (20.1 ms). | ||
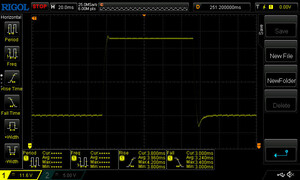
| ↔ Czas reakcji 50% szarości do 80% szarości | ||
| 7.2 ms ... wzrost ↗ i spadek ↘ łącznie | ↗ 4 ms wzrost | |
| ↘ 3.2 ms upadek | ||
| W naszych testach ekran wykazuje bardzo szybką reakcję i powinien bardzo dobrze nadawać się do szybkich gier. Dla porównania, wszystkie testowane urządzenia wahają się od 0.165 (minimum) do 636 (maksimum) ms. » 19 % wszystkich urządzeń jest lepszych. Oznacza to, że zmierzony czas reakcji jest lepszy od średniej wszystkich testowanych urządzeń (31.5 ms). | ||
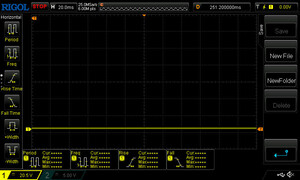
Migotanie ekranu / PWM (modulacja szerokości impulsu)
| Migotanie ekranu/nie wykryto PWM | |||
Dla porównania: 53 % wszystkich testowanych urządzeń nie używa PWM do przyciemniania wyświetlacza. Jeśli wykryto PWM, zmierzono średnio 8042 (minimum: 5 - maksimum: 343500) Hz. | |||
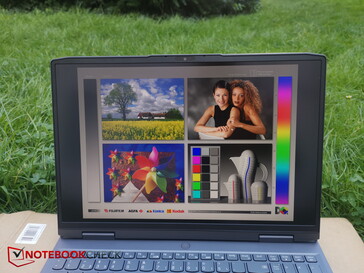
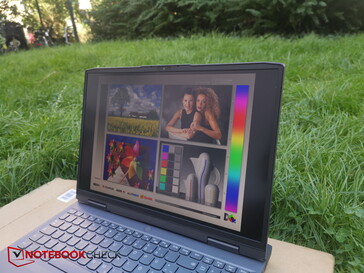
Ze względu na matową powierzchnię wyświetlacza i co najmniej przyzwoitą jasność, można również łatwo zobaczyć zawartość wyświetlacza na zewnątrz. Wymagane jest jednak zacienione miejsce i unikanie bezpośredniego światła słonecznego lub bardzo stromych kątów widzenia.
Wydajność - Potężny RTX 4060 pomimo 115 W
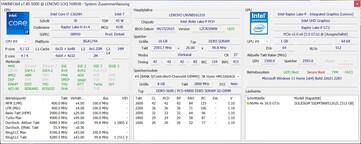
ProcesorCore i7-13620H w połączeniu z kartą graficzną RTX 4060 identyfikuje urządzenie jako laptop gamingowy, który powinien pozwolić na granie w niemal wszystkie obecne gry w rozdzielczości co najmniej Full-HD, a także na pełnych ustawieniach detali. Nawet w natywnej rozdzielczości QHD laptop nie powinien zacząć tracić oddechu w wielu grach. 16 GB pamięci operacyjnej to odpowiednia ilość dla niedrogiego laptopa do gier.
Jednak przy 512 GB pamięci masowej jest nieco ciasno, biorąc pod uwagę ogromne wymagania przestrzenne obecnych gier AAA, ale na szczęście można ją później zaktualizować.
Warunki testu
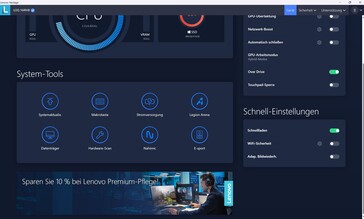
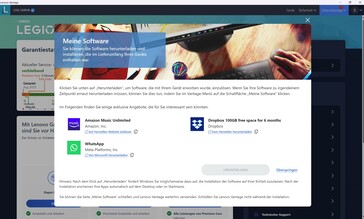
Producent naszej testowej jednostki nazywa swoje centrum sterowania Lenovo Vantage. Lenovo przesadziło tutaj, ponieważ oprócz ważnych opcji wydajności i dodatkowych ustawień, oprogramowanie zawiera wiele reklam. Reklamy obejmują nie tylko wewnętrzne reklamy dotyczące przedłużenia gwarancji, innych usług, takich jak "rozwiązania bezpieczeństwa oparte na chmurze" oraz ubezpieczenia na wypadek zalania, uszkodzenia w wyniku upadku i tak dalej, ale także oprogramowania od zewnętrznych dostawców, takich jak Spotify, Amazon, YouTube, dla Legion Games Shop, dla McAffee - lista jest długa.
Ponadto istnieją różne preinstalowane aplikacje, takie jak Lenovo Arena, Lenovo Hotkeys, Lenovo Now, wersje próbne pakietu Office i McAffee itp.
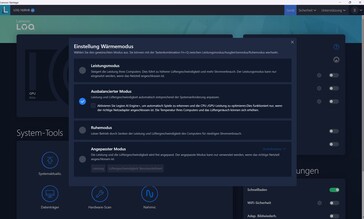
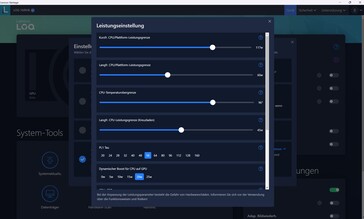
Przy tych wszystkich niepotrzebnych rzeczach prawie zapomina się, że producent oczywiście używa oprogramowania centrum sterowania, aby zaoferować obowiązkowe ustawienia wydajności i inne ważne opcje uzasadniające jego istnienie. LOQ 16 posiada trzy tryby zasilania: Quiet Mode, Balanced (z i bez AI) oraz Performance Mode. Ponadto dostępny jest również tryb ręczny, który umożliwia indywidualne dostosowanie wielu parametrów. Wszystkie testy porównawcze przeprowadziliśmy w trybie wydajności.
Procesor
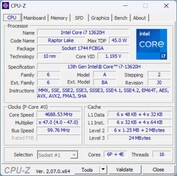
ProcesorCore i7-13620Hpochodzi z obecnej generacji Raptor Lake i oferuje wszystkie sześć rdzeni P, ale tylko cztery z ośmiu rdzeni E w porównaniu do i7-13700H. Ponadto w 13620H aktywowane są tylko 64 z 96 EU, oferując taktowanie do 1,5 GHz. W konfiguratorze Lenovo, i7-13700H kosztuje tylko 20 euro (~21 USD) więcej, podczas gdy z drugiej strony, i5-13500H kosztuje 110 euro (~117 USD) mniej, a i5-13420H120 euro (~127 USD).
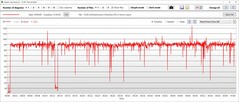
W pętli Cinebench R15 wydajność spada po pierwszych dwóch przebiegach, zanim się ustabilizuje. We wszystkich testach LOQ 16 wypada niemal dokładnie na oczekiwanym poziomie. TDP w trybie wydajności tylko na chwilę osiąga 135 W w pierwszym uruchomieniu. W pozostałych uruchomieniach na krótko wynosi 120 W, po czym spada do 70 W przez resztę uruchomienia.
W trybie zrównoważonym z obsługą AI, początkowe TDP wynosi 110 W, a następnie spada do prawie 60 W przez resztę uruchomienia. Tryb cichy zaczyna się od prawie 60 W, a następnie spada do 45 W.
W porównaniu, nasza jednostka testowa plasuje się w środku stawki. Co ciekawe, wydajność jest na poziomie i7-13700H w Inspironie 16 w Cinebench R15, podczas gdy w tym samym czasie i5-13500Hosiąga lepsze wyniki w Captivie.
Po odłączeniu laptopa od zasilania, TDP pozostaje stabilnie między 40 a 50 W, co skutkuje wynikiem 1,704 zamiast 2,492, co odpowiada spadkowi wydajności o około 38%.
Cinebench R15 Multi Constant Load Test
Cinebench R23: Multi Core | Single Core
Cinebench R20: CPU (Multi Core) | CPU (Single Core)
Cinebench R15: CPU Multi 64Bit | CPU Single 64Bit
Blender: v2.79 BMW27 CPU
7-Zip 18.03: 7z b 4 | 7z b 4 -mmt1
Geekbench 5.5: Multi-Core | Single-Core
HWBOT x265 Benchmark v2.2: 4k Preset
LibreOffice : 20 Documents To PDF
R Benchmark 2.5: Overall mean
| CPU Performance rating | |
| Średnia w klasie Gaming | |
| Lenovo Legion Slim 5 16APH8 | |
| Asus TUF Gaming A16 FA617XS | |
| Dell Inspiron 16 Plus 7630 | |
| Lenovo LOQ 16IRH8 | |
| Captiva Advanced Gaming I74-121 | |
| Przeciętny Intel Core i7-13620H | |
| Acer Nitro 16 AN16-41-R7YE | |
| Cinebench R23 / Multi Core | |
| Średnia w klasie Gaming (5668 - 40970, n=139, ostatnie 2 lata) | |
| Lenovo Legion Slim 5 16APH8 | |
| Asus TUF Gaming A16 FA617XS | |
| Captiva Advanced Gaming I74-121 | |
| Dell Inspiron 16 Plus 7630 | |
| Lenovo LOQ 16IRH8 | |
| Przeciętny Intel Core i7-13620H (10819 - 15496, n=6) | |
| Acer Nitro 16 AN16-41-R7YE | |
| Cinebench R23 / Single Core | |
| Średnia w klasie Gaming (1136 - 2267, n=139, ostatnie 2 lata) | |
| Dell Inspiron 16 Plus 7630 | |
| Lenovo LOQ 16IRH8 | |
| Przeciętny Intel Core i7-13620H (1805 - 1871, n=6) | |
| Lenovo Legion Slim 5 16APH8 | |
| Asus TUF Gaming A16 FA617XS | |
| Captiva Advanced Gaming I74-121 | |
| Acer Nitro 16 AN16-41-R7YE | |
| Cinebench R20 / CPU (Multi Core) | |
| Średnia w klasie Gaming (2179 - 16108, n=138, ostatnie 2 lata) | |
| Lenovo Legion Slim 5 16APH8 | |
| Asus TUF Gaming A16 FA617XS | |
| Captiva Advanced Gaming I74-121 | |
| Dell Inspiron 16 Plus 7630 | |
| Lenovo LOQ 16IRH8 | |
| Przeciętny Intel Core i7-13620H (4214 - 5905, n=6) | |
| Acer Nitro 16 AN16-41-R7YE | |
| Cinebench R20 / CPU (Single Core) | |
| Średnia w klasie Gaming (439 - 870, n=138, ostatnie 2 lata) | |
| Dell Inspiron 16 Plus 7630 | |
| Lenovo LOQ 16IRH8 | |
| Przeciętny Intel Core i7-13620H (693 - 719, n=6) | |
| Asus TUF Gaming A16 FA617XS | |
| Lenovo Legion Slim 5 16APH8 | |
| Captiva Advanced Gaming I74-121 | |
| Acer Nitro 16 AN16-41-R7YE | |
| Cinebench R15 / CPU Multi 64Bit | |
| Średnia w klasie Gaming (1537 - 6271, n=138, ostatnie 2 lata) | |
| Lenovo Legion Slim 5 16APH8 | |
| Asus TUF Gaming A16 FA617XS | |
| Lenovo LOQ 16IRH8 | |
| Captiva Advanced Gaming I74-121 | |
| Dell Inspiron 16 Plus 7630 | |
| Przeciętny Intel Core i7-13620H (1681 - 2492, n=6) | |
| Acer Nitro 16 AN16-41-R7YE | |
| Cinebench R15 / CPU Single 64Bit | |
| Średnia w klasie Gaming (188.8 - 343, n=137, ostatnie 2 lata) | |
| Asus TUF Gaming A16 FA617XS | |
| Lenovo Legion Slim 5 16APH8 | |
| Dell Inspiron 16 Plus 7630 | |
| Lenovo LOQ 16IRH8 | |
| Przeciętny Intel Core i7-13620H (258 - 269, n=6) | |
| Captiva Advanced Gaming I74-121 | |
| Acer Nitro 16 AN16-41-R7YE | |
| Blender / v2.79 BMW27 CPU | |
| Acer Nitro 16 AN16-41-R7YE | |
| Przeciętny Intel Core i7-13620H (215 - 289, n=6) | |
| Lenovo LOQ 16IRH8 | |
| Dell Inspiron 16 Plus 7630 | |
| Captiva Advanced Gaming I74-121 | |
| Asus TUF Gaming A16 FA617XS | |
| Lenovo Legion Slim 5 16APH8 | |
| Średnia w klasie Gaming (80 - 517, n=134, ostatnie 2 lata) | |
| 7-Zip 18.03 / 7z b 4 | |
| Średnia w klasie Gaming (23795 - 148086, n=136, ostatnie 2 lata) | |
| Asus TUF Gaming A16 FA617XS | |
| Lenovo Legion Slim 5 16APH8 | |
| Dell Inspiron 16 Plus 7630 | |
| Lenovo LOQ 16IRH8 | |
| Captiva Advanced Gaming I74-121 | |
| Przeciętny Intel Core i7-13620H (45983 - 62324, n=6) | |
| Acer Nitro 16 AN16-41-R7YE | |
| 7-Zip 18.03 / 7z b 4 -mmt1 | |
| Asus TUF Gaming A16 FA617XS | |
| Lenovo Legion Slim 5 16APH8 | |
| Średnia w klasie Gaming (4199 - 7508, n=136, ostatnie 2 lata) | |
| Przeciętny Intel Core i7-13620H (5742 - 6326, n=6) | |
| Lenovo LOQ 16IRH8 | |
| Captiva Advanced Gaming I74-121 | |
| Dell Inspiron 16 Plus 7630 | |
| Acer Nitro 16 AN16-41-R7YE | |
| Geekbench 5.5 / Multi-Core | |
| Średnia w klasie Gaming (4557 - 27010, n=136, ostatnie 2 lata) | |
| Dell Inspiron 16 Plus 7630 | |
| Lenovo LOQ 16IRH8 | |
| Asus TUF Gaming A16 FA617XS | |
| Lenovo Legion Slim 5 16APH8 | |
| Przeciętny Intel Core i7-13620H (8357 - 12223, n=6) | |
| Captiva Advanced Gaming I74-121 | |
| Acer Nitro 16 AN16-41-R7YE | |
| Geekbench 5.5 / Single-Core | |
| Asus TUF Gaming A16 FA617XS | |
| Średnia w klasie Gaming (986 - 2474, n=136, ostatnie 2 lata) | |
| Lenovo Legion Slim 5 16APH8 | |
| Dell Inspiron 16 Plus 7630 | |
| Lenovo LOQ 16IRH8 | |
| Przeciętny Intel Core i7-13620H (1785 - 1865, n=6) | |
| Captiva Advanced Gaming I74-121 | |
| Acer Nitro 16 AN16-41-R7YE | |
| HWBOT x265 Benchmark v2.2 / 4k Preset | |
| Średnia w klasie Gaming (7.7 - 44.3, n=136, ostatnie 2 lata) | |
| Lenovo Legion Slim 5 16APH8 | |
| Asus TUF Gaming A16 FA617XS | |
| Captiva Advanced Gaming I74-121 | |
| Lenovo LOQ 16IRH8 | |
| Przeciętny Intel Core i7-13620H (12.9 - 17.7, n=6) | |
| Dell Inspiron 16 Plus 7630 | |
| Acer Nitro 16 AN16-41-R7YE | |
| LibreOffice / 20 Documents To PDF | |
| Captiva Advanced Gaming I74-121 | |
| Przeciętny Intel Core i7-13620H (41.5 - 56.8, n=6) | |
| Średnia w klasie Gaming (19 - 88.8, n=135, ostatnie 2 lata) | |
| Acer Nitro 16 AN16-41-R7YE | |
| Lenovo LOQ 16IRH8 | |
| Dell Inspiron 16 Plus 7630 | |
| Asus TUF Gaming A16 FA617XS | |
| Lenovo Legion Slim 5 16APH8 | |
| R Benchmark 2.5 / Overall mean | |
| Acer Nitro 16 AN16-41-R7YE | |
| Captiva Advanced Gaming I74-121 | |
| Przeciętny Intel Core i7-13620H (0.4438 - 0.4545, n=6) | |
| Lenovo LOQ 16IRH8 | |
| Dell Inspiron 16 Plus 7630 | |
| Lenovo Legion Slim 5 16APH8 | |
| Średnia w klasie Gaming (0.3439 - 0.759, n=136, ostatnie 2 lata) | |
| Asus TUF Gaming A16 FA617XS | |
* ... im mniej tym lepiej
AIDA64: FP32 Ray-Trace | FPU Julia | CPU SHA3 | CPU Queen | FPU SinJulia | FPU Mandel | CPU AES | CPU ZLib | FP64 Ray-Trace | CPU PhotoWorxx
| Performance rating | |
| Średnia w klasie Gaming | |
| Lenovo Legion Slim 5 16APH8 | |
| Asus TUF Gaming A16 FA617XS | |
| Captiva Advanced Gaming I74-121 | |
| Acer Nitro 16 AN16-41-R7YE | |
| Dell Inspiron 16 Plus 7630 | |
| Lenovo LOQ 16IRH8 | |
| Przeciętny Intel Core i7-13620H | |
| AIDA64 / FP32 Ray-Trace | |
| Średnia w klasie Gaming (7192 - 85542, n=135, ostatnie 2 lata) | |
| Lenovo Legion Slim 5 16APH8 | |
| Asus TUF Gaming A16 FA617XS | |
| Captiva Advanced Gaming I74-121 | |
| Dell Inspiron 16 Plus 7630 | |
| Acer Nitro 16 AN16-41-R7YE | |
| Lenovo LOQ 16IRH8 | |
| Przeciętny Intel Core i7-13620H (10779 - 13601, n=6) | |
| AIDA64 / FPU Julia | |
| Średnia w klasie Gaming (35040 - 238426, n=135, ostatnie 2 lata) | |
| Asus TUF Gaming A16 FA617XS | |
| Lenovo Legion Slim 5 16APH8 | |
| Acer Nitro 16 AN16-41-R7YE | |
| Captiva Advanced Gaming I74-121 | |
| Dell Inspiron 16 Plus 7630 | |
| Lenovo LOQ 16IRH8 | |
| Przeciętny Intel Core i7-13620H (54287 - 67187, n=6) | |
| AIDA64 / CPU SHA3 | |
| Średnia w klasie Gaming (1728 - 9817, n=135, ostatnie 2 lata) | |
| Lenovo Legion Slim 5 16APH8 | |
| Asus TUF Gaming A16 FA617XS | |
| Captiva Advanced Gaming I74-121 | |
| Dell Inspiron 16 Plus 7630 | |
| Acer Nitro 16 AN16-41-R7YE | |
| Lenovo LOQ 16IRH8 | |
| Przeciętny Intel Core i7-13620H (2357 - 2773, n=6) | |
| AIDA64 / CPU Queen | |
| Asus TUF Gaming A16 FA617XS | |
| Lenovo Legion Slim 5 16APH8 | |
| Średnia w klasie Gaming (49785 - 173351, n=135, ostatnie 2 lata) | |
| Dell Inspiron 16 Plus 7630 | |
| Captiva Advanced Gaming I74-121 | |
| Acer Nitro 16 AN16-41-R7YE | |
| Lenovo LOQ 16IRH8 | |
| Przeciętny Intel Core i7-13620H (66885 - 78867, n=6) | |
| AIDA64 / FPU SinJulia | |
| Asus TUF Gaming A16 FA617XS | |
| Lenovo Legion Slim 5 16APH8 | |
| Średnia w klasie Gaming (4424 - 33636, n=135, ostatnie 2 lata) | |
| Acer Nitro 16 AN16-41-R7YE | |
| Dell Inspiron 16 Plus 7630 | |
| Lenovo LOQ 16IRH8 | |
| Captiva Advanced Gaming I74-121 | |
| Przeciętny Intel Core i7-13620H (6737 - 8421, n=6) | |
| AIDA64 / FPU Mandel | |
| Średnia w klasie Gaming (17585 - 128721, n=135, ostatnie 2 lata) | |
| Lenovo Legion Slim 5 16APH8 | |
| Asus TUF Gaming A16 FA617XS | |
| Acer Nitro 16 AN16-41-R7YE | |
| Captiva Advanced Gaming I74-121 | |
| Dell Inspiron 16 Plus 7630 | |
| Lenovo LOQ 16IRH8 | |
| Przeciętny Intel Core i7-13620H (27242 - 32787, n=6) | |
| AIDA64 / CPU AES | |
| Captiva Advanced Gaming I74-121 | |
| Średnia w klasie Gaming (19065 - 247074, n=135, ostatnie 2 lata) | |
| Acer Nitro 16 AN16-41-R7YE | |
| Asus TUF Gaming A16 FA617XS | |
| Lenovo Legion Slim 5 16APH8 | |
| Dell Inspiron 16 Plus 7630 | |
| Przeciętny Intel Core i7-13620H (52697 - 85895, n=6) | |
| Lenovo LOQ 16IRH8 | |
| AIDA64 / CPU ZLib | |
| Średnia w klasie Gaming (373 - 2531, n=135, ostatnie 2 lata) | |
| Lenovo Legion Slim 5 16APH8 | |
| Asus TUF Gaming A16 FA617XS | |
| Captiva Advanced Gaming I74-121 | |
| Lenovo LOQ 16IRH8 | |
| Dell Inspiron 16 Plus 7630 | |
| Przeciętny Intel Core i7-13620H (697 - 835, n=6) | |
| Acer Nitro 16 AN16-41-R7YE | |
| AIDA64 / FP64 Ray-Trace | |
| Średnia w klasie Gaming (3856 - 45446, n=135, ostatnie 2 lata) | |
| Lenovo Legion Slim 5 16APH8 | |
| Asus TUF Gaming A16 FA617XS | |
| Captiva Advanced Gaming I74-121 | |
| Dell Inspiron 16 Plus 7630 | |
| Lenovo LOQ 16IRH8 | |
| Acer Nitro 16 AN16-41-R7YE | |
| Przeciętny Intel Core i7-13620H (6077 - 7364, n=6) | |
| AIDA64 / CPU PhotoWorxx | |
| Średnia w klasie Gaming (10805 - 62916, n=135, ostatnie 2 lata) | |
| Dell Inspiron 16 Plus 7630 | |
| Lenovo LOQ 16IRH8 | |
| Lenovo Legion Slim 5 16APH8 | |
| Asus TUF Gaming A16 FA617XS | |
| Przeciętny Intel Core i7-13620H (19421 - 34544, n=6) | |
| Acer Nitro 16 AN16-41-R7YE | |
| Captiva Advanced Gaming I74-121 | |
Wydajność systemu
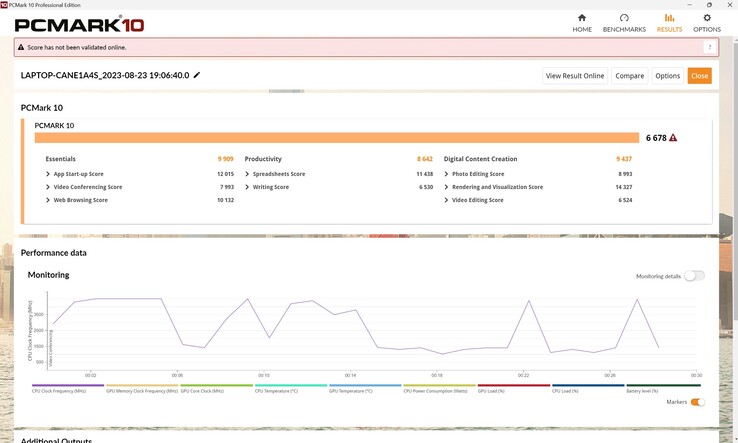
Chociaż wydajność laptopa jest tylko minimalnie niższa od średniej w PCMark 10, wszystkie porównywane urządzenia plasują się przed LOQ 16. Pokazuje to, że i7-13620Hbrakuje kilku wątków w porównaniu do i7-13700H.
Subiektywnie, system działa płynnie i szybko, a my nie zauważyliśmy żadnych nietypowych opóźnień.
CrossMark: Overall | Productivity | Creativity | Responsiveness
| PCMark 10 / Score | |
| Średnia w klasie Gaming (5776 - 10060, n=114, ostatnie 2 lata) | |
| Lenovo Legion Slim 5 16APH8 | |
| Asus TUF Gaming A16 FA617XS | |
| Dell Inspiron 16 Plus 7630 | |
| Captiva Advanced Gaming I74-121 | |
| Przeciętny Intel Core i7-13620H, NVIDIA GeForce RTX 4060 Laptop GPU (6678 - 7256, n=3) | |
| Acer Nitro 16 AN16-41-R7YE | |
| Lenovo LOQ 16IRH8 | |
| PCMark 10 / Essentials | |
| Captiva Advanced Gaming I74-121 | |
| Dell Inspiron 16 Plus 7630 | |
| Lenovo Legion Slim 5 16APH8 | |
| Asus TUF Gaming A16 FA617XS | |
| Średnia w klasie Gaming (8810 - 12600, n=118, ostatnie 2 lata) | |
| Przeciętny Intel Core i7-13620H, NVIDIA GeForce RTX 4060 Laptop GPU (9909 - 10809, n=3) | |
| Lenovo LOQ 16IRH8 | |
| Acer Nitro 16 AN16-41-R7YE | |
| PCMark 10 / Productivity | |
| Asus TUF Gaming A16 FA617XS | |
| Lenovo Legion Slim 5 16APH8 | |
| Średnia w klasie Gaming (6662 - 16716, n=116, ostatnie 2 lata) | |
| Dell Inspiron 16 Plus 7630 | |
| Przeciętny Intel Core i7-13620H, NVIDIA GeForce RTX 4060 Laptop GPU (8642 - 9781, n=3) | |
| Captiva Advanced Gaming I74-121 | |
| Lenovo LOQ 16IRH8 | |
| Acer Nitro 16 AN16-41-R7YE | |
| PCMark 10 / Digital Content Creation | |
| Średnia w klasie Gaming (7440 - 19351, n=116, ostatnie 2 lata) | |
| Asus TUF Gaming A16 FA617XS | |
| Lenovo Legion Slim 5 16APH8 | |
| Dell Inspiron 16 Plus 7630 | |
| Captiva Advanced Gaming I74-121 | |
| Acer Nitro 16 AN16-41-R7YE | |
| Przeciętny Intel Core i7-13620H, NVIDIA GeForce RTX 4060 Laptop GPU (9437 - 10204, n=3) | |
| Lenovo LOQ 16IRH8 | |
| CrossMark / Overall | |
| Średnia w klasie Gaming (1247 - 2344, n=114, ostatnie 2 lata) | |
| Lenovo LOQ 16IRH8 | |
| Przeciętny Intel Core i7-13620H, NVIDIA GeForce RTX 4060 Laptop GPU (1857 - 1986, n=3) | |
| Dell Inspiron 16 Plus 7630 | |
| Lenovo Legion Slim 5 16APH8 | |
| Asus TUF Gaming A16 FA617XS | |
| Captiva Advanced Gaming I74-121 | |
| Acer Nitro 16 AN16-41-R7YE | |
| CrossMark / Productivity | |
| Lenovo LOQ 16IRH8 | |
| Średnia w klasie Gaming (1299 - 2211, n=114, ostatnie 2 lata) | |
| Przeciętny Intel Core i7-13620H, NVIDIA GeForce RTX 4060 Laptop GPU (1765 - 1908, n=3) | |
| Lenovo Legion Slim 5 16APH8 | |
| Dell Inspiron 16 Plus 7630 | |
| Asus TUF Gaming A16 FA617XS | |
| Captiva Advanced Gaming I74-121 | |
| Acer Nitro 16 AN16-41-R7YE | |
| CrossMark / Creativity | |
| Średnia w klasie Gaming (1275 - 2729, n=114, ostatnie 2 lata) | |
| Dell Inspiron 16 Plus 7630 | |
| Lenovo LOQ 16IRH8 | |
| Przeciętny Intel Core i7-13620H, NVIDIA GeForce RTX 4060 Laptop GPU (2013 - 2067, n=3) | |
| Asus TUF Gaming A16 FA617XS | |
| Lenovo Legion Slim 5 16APH8 | |
| Captiva Advanced Gaming I74-121 | |
| Acer Nitro 16 AN16-41-R7YE | |
| CrossMark / Responsiveness | |
| Lenovo LOQ 16IRH8 | |
| Przeciętny Intel Core i7-13620H, NVIDIA GeForce RTX 4060 Laptop GPU (1734 - 1989, n=3) | |
| Średnia w klasie Gaming (1030 - 2330, n=114, ostatnie 2 lata) | |
| Captiva Advanced Gaming I74-121 | |
| Dell Inspiron 16 Plus 7630 | |
| Lenovo Legion Slim 5 16APH8 | |
| Asus TUF Gaming A16 FA617XS | |
| Acer Nitro 16 AN16-41-R7YE | |
| PCMark 10 Score | 6678 pkt. | |
Pomoc | ||
| AIDA64 / Memory Copy | |
| Średnia w klasie Gaming (21750 - 108104, n=135, ostatnie 2 lata) | |
| Lenovo Legion Slim 5 16APH8 | |
| Asus TUF Gaming A16 FA617XS | |
| Dell Inspiron 16 Plus 7630 | |
| Lenovo LOQ 16IRH8 | |
| Acer Nitro 16 AN16-41-R7YE | |
| Przeciętny Intel Core i7-13620H (31629 - 53927, n=6) | |
| Captiva Advanced Gaming I74-121 | |
| AIDA64 / Memory Read | |
| Średnia w klasie Gaming (22956 - 104349, n=135, ostatnie 2 lata) | |
| Dell Inspiron 16 Plus 7630 | |
| Lenovo LOQ 16IRH8 | |
| Asus TUF Gaming A16 FA617XS | |
| Lenovo Legion Slim 5 16APH8 | |
| Przeciętny Intel Core i7-13620H (35115 - 61853, n=6) | |
| Acer Nitro 16 AN16-41-R7YE | |
| Captiva Advanced Gaming I74-121 | |
| AIDA64 / Memory Write | |
| Lenovo Legion Slim 5 16APH8 | |
| Średnia w klasie Gaming (22297 - 133486, n=135, ostatnie 2 lata) | |
| Asus TUF Gaming A16 FA617XS | |
| Dell Inspiron 16 Plus 7630 | |
| Acer Nitro 16 AN16-41-R7YE | |
| Lenovo LOQ 16IRH8 | |
| Przeciętny Intel Core i7-13620H (30611 - 54111, n=6) | |
| Captiva Advanced Gaming I74-121 | |
| AIDA64 / Memory Latency | |
| Lenovo LOQ 16IRH8 | |
| Średnia w klasie Gaming (59.5 - 259, n=135, ostatnie 2 lata) | |
| Przeciętny Intel Core i7-13620H (75.9 - 108.2, n=6) | |
| Lenovo Legion Slim 5 16APH8 | |
| Dell Inspiron 16 Plus 7630 | |
| Asus TUF Gaming A16 FA617XS | |
| Acer Nitro 16 AN16-41-R7YE | |
| Captiva Advanced Gaming I74-121 | |
* ... im mniej tym lepiej
Opóźnienia DPC
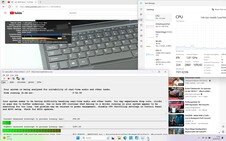
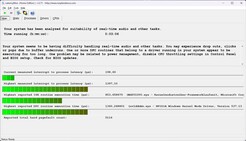
LOQ 16 nie ma żadnych problemów z otwieraniem przeglądarki, a jedynie z otwieraniem kilku kart przeglądarki na naszej stronie głównej, a narzędzie LatencyMon odnotowuje tutaj pierwsze opóźnienia.
Odtwarzając nasze filmy 4K/60 klatek na sekundę na YouTube, są one ponownie zwiększone. Ale przynajmniej nie możemy narzekać na spadki klatek. Prime95 nie zwiększa dalej opóźnień. Podczas gdy konkurenci mają wartości opóźnień, które są podobnie wysokie, LOQ 16 zajmuje niestety pierwsze miejsce w tej kategorii.
| DPC Latencies / LatencyMon - interrupt to process latency (max), Web, Youtube, Prime95 | |
| Lenovo LOQ 16IRH8 | |
| Asus TUF Gaming A16 FA617XS | |
| Captiva Advanced Gaming I74-121 | |
| Lenovo Legion Slim 5 16APH8 | |
| Dell Inspiron 16 Plus 7630 | |
| Acer Nitro 16 AN16-41-R7YE | |
* ... im mniej tym lepiej
Rozwiązanie pamięci masowej
Lenovo wykorzystuje dość nieznany dysk SSD z 512 GB przestrzeni dyskowej w małej obudowie M.2 2230.
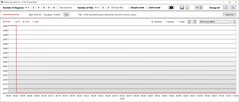
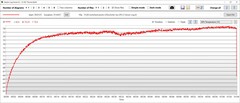
Chociaż dostępne są szybsze moduły pamięci masowej, szczególnie w porównaniu z dyskiem SSD w Legion Slim 5, wydajność jest nadal w porządku, zwłaszcza biorąc pod uwagę, że pozostaje stała przez dłuższy czas.
* ... im mniej tym lepiej
Disk Throttling: DiskSpd Read Loop, Queue Depth 8
Karta graficzna
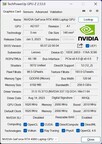
Masz wybór pomiędzyRTX 4050iRTX 4060nasza jednostka testowa korzysta z tego drugiego i może zużywać maksymalnie 115 W, w tym Dynamic Boost, co nie jest dużo. Na przykład ten sam procesor graficzny może zużywać 140 W wCaptiva Advanced Gaming.
Jednak GPU w LOQ 16 nadal jest w stanie zrobić to, co musi, a nawet więcej. W porównaniu do konkurencji, osiąga drugie miejsce w 3DMarks za Captivą.
| 3DMark 11 Performance | 30250 pkt. | |
| 3DMark Cloud Gate Standard Score | 56287 pkt. | |
| 3DMark Fire Strike Score | 22013 pkt. | |
| 3DMark Time Spy Score | 10608 pkt. | |
Pomoc | ||
* ... im mniej tym lepiej
Wydajność w grach
W grach LOQ 16 radzi sobie jeszcze lepiej, przewyższając nawet Captivę ze 140-watowym RTX-4060 i ledwo osiągając pierwsze miejsce. Nawet droższy Legion Slim 5 został pokonany o około 14%.
Przystępna cena LOQ 16 nie ma żadnego negatywnego wpływu na wydajność w grach. Obecne gry powinny działać płynnie w rozdzielczości Full-HD nawet przy użyciu najwyższych ustawień jakości, a częściowo dotyczy to również natywnej rozdzielczości QHD.
| The Witcher 3 - 1920x1080 Ultra Graphics & Postprocessing (HBAO+) | |
| Średnia w klasie Gaming (29.6 - 240, n=40, ostatnie 2 lata) | |
| Lenovo LOQ 16IRH8 | |
| Captiva Advanced Gaming I74-121 | |
| Asus TUF Gaming A16 FA617XS | |
| Lenovo Legion Slim 5 16APH8 | |
| Dell Inspiron 16 Plus 7630 | |
| Acer Nitro 16 AN16-41-R7YE | |
| GTA V - 1920x1080 Highest AA:4xMSAA + FX AF:16x | |
| Średnia w klasie Gaming (26.8 - 186.9, n=121, ostatnie 2 lata) | |
| Captiva Advanced Gaming I74-121 | |
| Lenovo LOQ 16IRH8 | |
| Lenovo Legion Slim 5 16APH8 | |
| Asus TUF Gaming A16 FA617XS | |
| Final Fantasy XV Benchmark - 1920x1080 High Quality | |
| Średnia w klasie Gaming (28.2 - 215, n=130, ostatnie 2 lata) | |
| Captiva Advanced Gaming I74-121 | |
| Lenovo LOQ 16IRH8 | |
| Lenovo Legion Slim 5 16APH8 | |
| Dell Inspiron 16 Plus 7630 | |
| Asus TUF Gaming A16 FA617XS | |
| Acer Nitro 16 AN16-41-R7YE | |
| Dota 2 Reborn - 1920x1080 ultra (3/3) best looking | |
| Średnia w klasie Gaming (65.1 - 248, n=136, ostatnie 2 lata) | |
| Lenovo LOQ 16IRH8 | |
| Dell Inspiron 16 Plus 7630 | |
| Captiva Advanced Gaming I74-121 | |
| Lenovo Legion Slim 5 16APH8 | |
| Acer Nitro 16 AN16-41-R7YE | |
| Asus TUF Gaming A16 FA617XS | |
| The Witcher 3 | |
| 1920x1080 High Graphics & Postprocessing (Nvidia HairWorks Off) | |
| Średnia w klasie Gaming (138 - 424, n=26, ostatnie 2 lata) | |
| Captiva Advanced Gaming I74-121 | |
| Lenovo LOQ 16IRH8 | |
| Przeciętny NVIDIA GeForce RTX 4060 Laptop GPU (110 - 229, n=36) | |
| Lenovo Legion Slim 5 16APH8 | |
| Dell Inspiron 16 Plus 7630 | |
| Asus TUF Gaming A16 FA617XS | |
| Acer Nitro 16 AN16-41-R7YE | |
| 1920x1080 Ultra Graphics & Postprocessing (HBAO+) | |
| Średnia w klasie Gaming (29.6 - 240, n=40, ostatnie 2 lata) | |
| Lenovo LOQ 16IRH8 | |
| Captiva Advanced Gaming I74-121 | |
| Przeciętny NVIDIA GeForce RTX 4060 Laptop GPU (77 - 159.7, n=42) | |
| Asus TUF Gaming A16 FA617XS | |
| Lenovo Legion Slim 5 16APH8 | |
| Dell Inspiron 16 Plus 7630 | |
| Acer Nitro 16 AN16-41-R7YE | |
| Hogwarts Legacy | |
| 1920x1080 High Preset AA:High T | |
| Przeciętny NVIDIA GeForce RTX 4060 Laptop GPU (70.8 - 107.7, n=6) | |
| Lenovo LOQ 16IRH8 | |
| Asus TUF Gaming A16 FA617XS | |
| Średnia w klasie Gaming (47.6 - 87, n=3, ostatnie 2 lata) | |
| 1920x1080 Ultra Preset AA:High T | |
| Przeciętny NVIDIA GeForce RTX 4060 Laptop GPU (61.9 - 91.9, n=6) | |
| Średnia w klasie Gaming (35.4 - 108.3, n=4, ostatnie 2 lata) | |
| Lenovo LOQ 16IRH8 | |
| Asus TUF Gaming A16 FA617XS | |
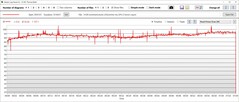
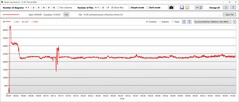
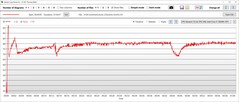
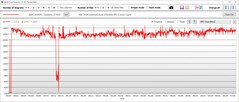
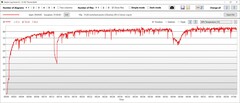
Liczba klatek na sekundę w grze The Witcher 3 pozostaje na bardzo stałym poziomie przez godzinę, wykazując jedynie zwykłe wahania dzień/noc w trakcie rozgrywki.
TDP procesora wynosi średnio 35 W i osiąga temperaturę około 75 °C (167 °F).
W trybie zrównoważonym, taktowanie GPU stale spada w ciągu godziny, ale całkowity spadek wynosi tylko 100 MHz, z 2,4 do 2,3 GHz. Temperatury stale rosną, aż do 72 °C (162 °F) na koniec. Średnie osiągnięte TGP wynosi 80 W.
W trybie cichym taktowanie GPU zaczyna się tylko nieznacznie powyżej 2 GHz, ale nie spada poniżej tej wartości. W tym samym czasie temperatura wzrasta tylko do 65 °C (149 °F), przy TGP około 45 W. Jednak poziom hałasu jest znacznie niższy, jak widać w poniższej tabeli:
| Tryb zasilania | Prędkość taktowania GPU (MHz) | Temperatura | Pobór mocy | Średnia liczba klatek na sekundę | Poziom hałasu |
|---|---|---|---|---|---|
| Tryb cichy | 2,050 | do 65 °C (149 °F) | 45 W | 83 fps | 37,29 dB |
| Tryb zrównoważony | 2,340 | do 72 °C (162 °F) | 80 W | 91 fps | 46.81 dB |
| Tryb wydajności | 2,475 | do 78 °C (172 °F) | 95 W | 95 fps | 53,50 dB |
The Witcher 3 FPS Chart
| low | med. | high | ultra | QHD | 4K | |
|---|---|---|---|---|---|---|
| GTA V (2015) | 184.3 | 179.6 | 114.5 | |||
| The Witcher 3 (2015) | 427.7 | 301.1 | 195.3 | 103.7 | 78.3 | |
| Dota 2 Reborn (2015) | 188.7 | 171.4 | 167.2 | 153.1 | 125.3 | |
| Final Fantasy XV Benchmark (2018) | 203 | 143.4 | 101.4 | 74.8 | ||
| X-Plane 11.11 (2018) | 159.7 | 139.3 | 109.2 | 100.9 | ||
| Far Cry 5 (2018) | 180 | 152 | 143 | 133 | 104 | |
| Strange Brigade (2018) | 511 | 274 | 218 | 186.9 | ||
| Hogwarts Legacy (2023) | 116 | 96.7 | 75.7 | 61.9 | 44.1 |
Emisje - szybko robi się głośno
Poziomy hałasu
Podczas pracy na biegu jałowym wentylatory często - ale nie zawsze - pozostają ciche. Pod obciążeniem zachowanie wentylatorów jest mniej niż optymalne. Już w 3DMark 06 wentylatory ryczą z pełną głośnością pod koniec uruchomienia, a nawet nie stają się głośniejsze podczas godzinnego testu warunków skrajnych. Inne laptopy radzą sobie tutaj lepiej, wytwarzając mniej niż maksymalny poziom hałasu przy średnim obciążeniu.
Jednak maksymalny poziom hałasu nie jest niezwykle wysoki, a poza cichszym Acer Nitro 16konkurenci wytwarzają podobny maksymalny poziom hałasu. Różnica polega na tym, że pozostają cichsze dłużej.
Hałas
| luz |
| 23 / 23 / 27.66 dB |
| obciążenie |
| 53.62 / 53.5 dB |
 | ||
30 dB cichy 40 dB(A) słyszalny 50 dB(A) irytujący |
||
min: | ||
| Lenovo LOQ 16IRH8 GeForce RTX 4060 Laptop GPU, i7-13620H, Solidigm SSDPFINW512GZL | Dell Inspiron 16 Plus 7630 GeForce RTX 4060 Laptop GPU, i7-13700H, WD PC SN740 SDDPTQD-1T00 | Acer Nitro 16 AN16-41-R7YE GeForce RTX 4050 Laptop GPU, R5 7535HS, SK hynix HFS512GEJ9X125N | Captiva Advanced Gaming I74-121 GeForce RTX 4060 Laptop GPU, i5-13500H, Samsung SSD 980 1TB MZ-V8V1T0BW | Lenovo Legion Slim 5 16APH8 GeForce RTX 4060 Laptop GPU, R7 7840HS, SK hynix PC801 HFS512GEJ9X115N | Asus TUF Gaming A16 FA617XS Radeon RX 7600S, R9 7940HS, Micron 2400 MTFDKBA512QFM | |
|---|---|---|---|---|---|---|
| Noise | 7% | 5% | 3% | 5% | -1% | |
| wyłączone / środowisko * (dB) | 23 | 23.2 -1% | 24 -4% | 23 -0% | 22.9 -0% | 25 -9% |
| Idle Minimum * (dB) | 23 | 23.2 -1% | 25 -9% | 23 -0% | 23.1 -0% | 25 -9% |
| Idle Average * (dB) | 23 | 23.2 -1% | 26 -13% | 25.67 -12% | 23.1 -0% | 26 -13% |
| Idle Maximum * (dB) | 27.66 | 23.2 16% | 27 2% | 25.67 7% | 27.7 -0% | 28 -1% |
| Load Average * (dB) | 53.62 | 35.1 35% | 42 22% | 38.52 28% | 33.3 38% | 43 20% |
| Witcher 3 ultra * (dB) | 53.5 | 52.5 2% | 43 20% | 54.17 -1% | 54 -1% | 51 5% |
| Load Maximum * (dB) | 53.5 | 52.5 2% | 45 16% | 54.17 -1% | 54 -1% | 53 1% |
* ... im mniej tym lepiej
Temperatury
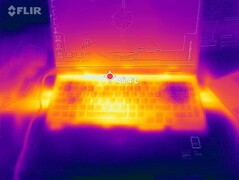
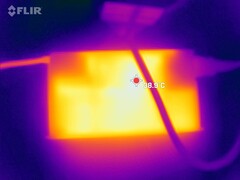
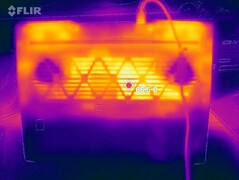
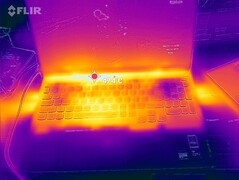
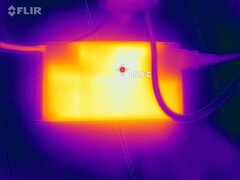
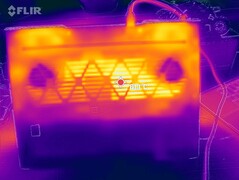
Najgorętsze miejsce w LOQ 16 znajduje się na dole, gdzie zmierzyliśmy prawie 60 °C (140 °F) podczas testu warunków skrajnych w centralnym obszarze w kierunku wyświetlacza. Góra pozostaje co najmniej 10 stopni chłodniejsza (do 122 °F). Gorące punkty znajdują się również na środku w kierunku wyświetlacza. Klawisze WASD nagrzewają się do 40°C (104°F), podczas gdy podpórki pod nadgarstki pozostają chłodne.
(-) Maksymalna temperatura w górnej części wynosi 48 °C / 118 F, w porównaniu do średniej 40.4 °C / 105 F , począwszy od 21.2 do 68.8 °C dla klasy Gaming.
(-) Dno nagrzewa się maksymalnie do 59 °C / 138 F, w porównaniu do średniej 43.3 °C / 110 F
(+) W stanie bezczynności średnia temperatura górnej części wynosi 25.6 °C / 78 F, w porównaniu ze średnią temperaturą urządzenia wynoszącą 33.9 °C / ### class_avg_f### F.
(±) Podczas gry w Wiedźmina 3 średnia temperatura górnej części wynosi 37.3 °C / 99 F, w porównaniu do średniej temperatury urządzenia wynoszącej 33.9 °C / ## #class_avg_f### F.
(+) Podpórki pod nadgarstki i touchpad są chłodniejsze niż temperatura skóry i maksymalnie 31 °C / 87.8 F i dlatego są chłodne w dotyku.
(-) Średnia temperatura obszaru podparcia dłoni w podobnych urządzeniach wynosiła 28.8 °C / 83.8 F (-2.2 °C / -4 F).
| Lenovo LOQ 16IRH8 Intel Core i7-13620H, NVIDIA GeForce RTX 4060 Laptop GPU | Dell Inspiron 16 Plus 7630 Intel Core i7-13700H, NVIDIA GeForce RTX 4060 Laptop GPU | Acer Nitro 16 AN16-41-R7YE AMD Ryzen 5 7535HS, NVIDIA GeForce RTX 4050 Laptop GPU | Captiva Advanced Gaming I74-121 Intel Core i5-13500H, NVIDIA GeForce RTX 4060 Laptop GPU | Lenovo Legion Slim 5 16APH8 AMD Ryzen 7 7840HS, NVIDIA GeForce RTX 4060 Laptop GPU | Asus TUF Gaming A16 FA617XS AMD Ryzen 9 7940HS, AMD Radeon RX 7600S | |
|---|---|---|---|---|---|---|
| Heat | -6% | -12% | 1% | 13% | -1% | |
| Maximum Upper Side * (°C) | 48 | 47.8 -0% | 51 -6% | 41 15% | 40.6 15% | 53 -10% |
| Maximum Bottom * (°C) | 59 | 42.2 28% | 63 -7% | 42 29% | 42 29% | 48 19% |
| Idle Upper Side * (°C) | 28 | 35.2 -26% | 34 -21% | 32 -14% | 27.8 1% | 30 -7% |
| Idle Bottom * (°C) | 28 | 35 -25% | 32 -14% | 35 -25% | 26.6 5% | 30 -7% |
* ... im mniej tym lepiej
Test warunków skrajnych
Rdzenie CPU rozpoczynają godzinny test obciążeniowy z Prime95 i Furmark działającymi jednocześnie przez krótki czas z taktowaniem powyżej 4 GHz. Po około 30 sekundach taktowanie spada, by po około 3 minutach ustabilizować się na poziomie 2300 MHz. W tym samym czasie TDP spada ze 135 do ostatecznie stałych 45 W. Procesor nagrzewa się do około 80ºC (176ºF).
Z drugiej strony, prędkość taktowania GPU pozostaje na względnie stałym poziomie 2200 MHz przez cały okres testu, a prędkość pamięci wynosi 2 GHz. W tym czasie GPU nagrzewa się maksymalnie do 84ºC (183ºF). Pobór mocy wynosi średnio 87 W.
| Taktowanie CPU (MHz) | Taktowanie GPU (MHz) | Średnia temperatura CPU (°C) | Średnia temperatura GPU (°C) | |
| Prime95 + FurMark Stress | 2,300 | 2,200 | 80 | 84 |
| The Witcher 3 Stress | 540 | 2,475 | 75 | 78 |
Głośniki
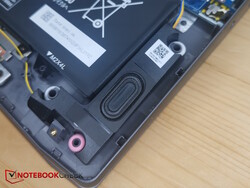
Głośniki cierpią na typowe objawy niedrogich modeli laptopów: są zbyt ciche, prawie nie mają basów, a wysokie tony są jedynymi częstotliwościami, które można nazwać liniowymi i zrównoważonymi.
Rozwiązaniem jest między innymi podłączenie słuchawek lub innych zewnętrznych urządzeń audio za pośrednictwem połączonego portu audio.
Lenovo LOQ 16IRH8 analiza dźwięku
(±) | głośność głośnika jest średnia, ale dobra (81.33 dB)
Bas 100 - 315 Hz
(-) | prawie brak basu - średnio 15% niższa od mediany
(±) | liniowość basu jest średnia (10% delta do poprzedniej częstotliwości)
Średnie 400 - 2000 Hz
(±) | wyższe średnie - średnio 11.8% wyższe niż mediana
(±) | liniowość środka jest średnia (7.3% delta do poprzedniej częstotliwości)
Wysokie 2–16 kHz
(+) | zrównoważone maksima - tylko 4.9% od mediany
(+) | wzloty są liniowe (5.7% delta do poprzedniej częstotliwości)
Ogólnie 100 - 16.000 Hz
(±) | liniowość ogólnego dźwięku jest średnia (22.8% różnicy w stosunku do mediany)
W porównaniu do tej samej klasy
» 82% wszystkich testowanych urządzeń w tej klasie było lepszych, 5% podobnych, 13% gorszych
» Najlepszy miał deltę 6%, średnia wynosiła ###średnia###%, najgorsza wynosiła 132%
W porównaniu do wszystkich testowanych urządzeń
» 67% wszystkich testowanych urządzeń było lepszych, 6% podobnych, 27% gorszych
» Najlepszy miał deltę 4%, średnia wynosiła ###średnia###%, najgorsza wynosiła 134%
Acer Nitro 16 AN16-41-R7YE analiza dźwięku
(+) | głośniki mogą odtwarzać stosunkowo głośno (82 dB)
Bas 100 - 315 Hz
(-) | prawie brak basu - średnio 28.2% niższa od mediany
(±) | liniowość basu jest średnia (12.9% delta do poprzedniej częstotliwości)
Średnie 400 - 2000 Hz
(+) | zbalansowane środki średnie - tylko 2.2% od mediany
(+) | średnie są liniowe (3.8% delta do poprzedniej częstotliwości)
Wysokie 2–16 kHz
(+) | zrównoważone maksima - tylko 3.5% od mediany
(+) | wzloty są liniowe (4.6% delta do poprzedniej częstotliwości)
Ogólnie 100 - 16.000 Hz
(±) | liniowość ogólnego dźwięku jest średnia (17.3% różnicy w stosunku do mediany)
W porównaniu do tej samej klasy
» 47% wszystkich testowanych urządzeń w tej klasie było lepszych, 12% podobnych, 41% gorszych
» Najlepszy miał deltę 6%, średnia wynosiła ###średnia###%, najgorsza wynosiła 132%
W porównaniu do wszystkich testowanych urządzeń
» 32% wszystkich testowanych urządzeń było lepszych, 8% podobnych, 60% gorszych
» Najlepszy miał deltę 4%, średnia wynosiła ###średnia###%, najgorsza wynosiła 134%
Zarządzanie energią - Wysokie zużycie energii w trybie bezczynności i mniej niż optymalna żywotność baterii
Zużycie energii
LOQ 16 nie jest wydajnym laptopem i szczególnie podczas bezczynności zużycie energii jest zbyt wysokie. Pod obciążeniem zużycie jest odpowiednie, biorąc pod uwagę wydajność.
Przy podobnej wydajności Captiva zużywa tyle samo energii, podobnie jak Asus TUF. Podczas grania Dell Inspiron 16, Acer Nitro 16 i Legion Slim 5 zużywają znacznie mniej energii, ale mają też niższą wydajność 3D.
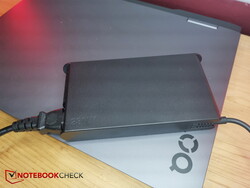
Zmierzyliśmy tymczasowy maksymalny szczyt 211 W, z którym dołączony zasilacz 230 W nie ma problemów.
| wyłączony / stan wstrzymania | |
| luz | |
| obciążenie |
|
Legenda:
min: | |
| Lenovo LOQ 16IRH8 i7-13620H, GeForce RTX 4060 Laptop GPU, Solidigm SSDPFINW512GZL, IPS, 2560x1600, 16" | Dell Inspiron 16 Plus 7630 i7-13700H, GeForce RTX 4060 Laptop GPU, WD PC SN740 SDDPTQD-1T00, IPS, 2560x1600, 16" | Acer Nitro 16 AN16-41-R7YE R5 7535HS, GeForce RTX 4050 Laptop GPU, SK hynix HFS512GEJ9X125N, IPS, 1920x1200, 16" | Captiva Advanced Gaming I74-121 i5-13500H, GeForce RTX 4060 Laptop GPU, Samsung SSD 980 1TB MZ-V8V1T0BW, IPS, 1920x1080, 15.6" | Lenovo Legion Slim 5 16APH8 R7 7840HS, GeForce RTX 4060 Laptop GPU, SK hynix PC801 HFS512GEJ9X115N, IPS, 2560x1600, 16" | Asus TUF Gaming A16 FA617XS R9 7940HS, Radeon RX 7600S, Micron 2400 MTFDKBA512QFM, IPS, 1920x1200, 16" | Przeciętny NVIDIA GeForce RTX 4060 Laptop GPU | Średnia w klasie Gaming | |
|---|---|---|---|---|---|---|---|---|
| Power Consumption | 14% | 5% | -1% | 17% | 27% | 10% | -9% | |
| Idle Minimum * (Watt) | 17.2 | 15.6 9% | 19 -10% | 18.4 -7% | 9.4 45% | 7 59% | 11.5 ? 33% | 13.8 ? 20% |
| Idle Average * (Watt) | 19.3 | 17.7 8% | 20 -4% | 20 -4% | 15.5 20% | 10 48% | 16 ? 17% | 19.5 ? -1% |
| Idle Maximum * (Watt) | 21.2 | 20.6 3% | 23 -8% | 20.7 2% | 24.4 -15% | 15 29% | 20.3 ? 4% | 25.7 ? -21% |
| Load Average * (Watt) | 90 | 87.4 3% | 80 11% | 85 6% | 74.1 18% | 86 4% | 92.9 ? -3% | 109.9 ? -22% |
| Witcher 3 ultra * (Watt) | 168 | 121.7 28% | 125.8 25% | 164 2% | 112.9 33% | 160.6 4% | ||
| Load Maximum * (Watt) | 211 | 138 35% | 184 13% | 219 -4% | 206.5 2% | 172 18% | 210 ? -0% | 257 ? -22% |
* ... im mniej tym lepiej
Power Consumption The Witcher 3 / Stress Test
Power Consumption With External Monitor
Żywotność baterii
Nasza jednostka testowa zawiera baterię o pojemności 80 Wh, ale Lenovo stosuje również baterię o pojemności tylko 60 Wh, więc trzeba być ostrożnym. W konfiguratorze większa bateria kosztuje tylko kilka euro więcej.
Dzięki większej baterii LOQ wytrzymuje ponad 6 godzin w naszych testach Wi-Fi i wideo przy dostosowanej jasności. Przy pełnej jasności wyświetlacza wytrzymuje tylko 5,5 godziny. To zaskakująco krótko, ponieważ niektórzy konkurenci z podobnie dużymi bateriami działają znacznie dłużej. Tylko Legion Slim 5 jest podobnie słaby. Najwyraźniej mechanizmy oszczędzania energii nie są jeszcze doskonałe w Lenovo. Szczególnie zużycie energii w trybie bezczynności musi być jeszcze niższe. Być może przeciążone Centrum Sterowania, na które narzekaliśmy wcześniej, ma w tym swój udział.
| Lenovo LOQ 16IRH8 i7-13620H, GeForce RTX 4060 Laptop GPU, 80 Wh | Dell Inspiron 16 Plus 7630 i7-13700H, GeForce RTX 4060 Laptop GPU, 86 Wh | Acer Nitro 16 AN16-41-R7YE R5 7535HS, GeForce RTX 4050 Laptop GPU, 90 Wh | Captiva Advanced Gaming I74-121 i5-13500H, GeForce RTX 4060 Laptop GPU, 53 Wh | Lenovo Legion Slim 5 16APH8 R7 7840HS, GeForce RTX 4060 Laptop GPU, 80 Wh | Asus TUF Gaming A16 FA617XS R9 7940HS, Radeon RX 7600S, 90 Wh | Średnia w klasie Gaming | |
|---|---|---|---|---|---|---|---|
| Czasy pracy | 21% | 64% | -11% | -4% | 50% | 10% | |
| H.264 (h) | 6.4 | 10.8 69% | 4.9 -23% | 12.4 94% | 8.05 ? 26% | ||
| WiFi v1.3 (h) | 6.3 | 9.4 49% | 11 75% | 5.3 -16% | 7.1 13% | 12.4 97% | 6.74 ? 7% |
| Load (h) | 1.5 | 1.4 -7% | 2.2 47% | 1.6 7% | 1.2 -20% | 0.9 -40% | 1.458 ? -3% |
| Reader / Idle (h) | 17.6 | 12 | 11.7 | 20.3 | 9.17 ? |
Za
Przeciw
Werdykt - wydajny budżetowy laptop do gier
Laptopy do gier z RTX 4060 są dostępne już od około 1000 euro (~1 060 USD), nawet w formacie 16-calowym. W przypadku rzekomo przystępnego cenowo Lenovo LOQ 16 (1500 euro, ~1591 USD), producent szczególnie oszczędza na wyposażeniu i materiałach w porównaniu do droższej serii Legion. Ponadto LOQ jest nieco cięższy i bardziej nieporęczny.
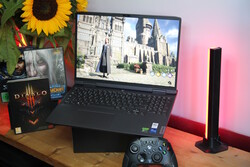
Nie jest to jednak laptop pełen trudnych kompromisów. Zamiast tego jest to więcej niż solidny laptop do gier, który koncentruje się na wydajności 3D. Podczas gdy wyświetlacz QHD jest również w stanie dotrzymać kroku serii Legion, wersja Full-HD jest mniej zdolna do tego.
Zachowanie wentylatorów i żywotność baterii dają powody do narzekań: Wentylatory szybko zaczynają ryczeć na maksymalnym poziomie hałasu nawet przy średnim obciążeniu. I pomimo dość dużej baterii, uzyskujemy tylko czasy pracy poniżej średniej. Być może Lenovo powinno pozbyć się reklam w swoim Centrum sterowania i preinstalować mniej bloatware.
Lenovo LOQ 16 z wyświetlaczem QHD to wydajny i stosunkowo niedrogi laptop do gier, któremu prawie nic nie brakuje w tym przedziale cenowym, ale który nadal wymaga pewnych optymalizacji baterii, zachowania wentylatora lub Centrum sterowania.
Dostępne są również pewne alternatywy: Dell Inspiron 16 Plus 7630 Dell Inspiron 16 Plus 7630kosztuje tyle samo i choć jego wydajność jest nieco niższa, to jest on bardziej wydajny i oferuje dłuższy czas pracy na baterii oraz wyświetlacz o rozdzielczości 1600p. Nieco bardziej przystępny cenowo Acer Nitro 16 jest również nieco wolniejszy, ale wyróżnia się dobrym czasem pracy na baterii, a jego wyświetlacz obsługuje G-Sync.
Cena i dostępność
Lenovo LOQ 16 można kupić bezpośrednio od Lenovo za ~1,160 USD. Różne wersje są dostępne od 880 USD, a Amazon oferuje również wiele konfiguracji.
Lenovo LOQ 16IRH8
- 27/09/2023 v7 (old)
Christian Hintze
Przezroczystość
Wyboru urządzeń do recenzji dokonuje nasza redakcja. Próbka testowa została udostępniona autorowi jako pożyczka od producenta lub sprzedawcy detalicznego na potrzeby tej recenzji. Pożyczkodawca nie miał wpływu na tę recenzję, producent nie otrzymał też kopii tej recenzji przed publikacją. Nie było obowiązku publikowania tej recenzji. Jako niezależna firma medialna, Notebookcheck nie podlega władzy producentów, sprzedawców detalicznych ani wydawców.
Tak testuje Notebookcheck
Każdego roku Notebookcheck niezależnie sprawdza setki laptopów i smartfonów, stosując standardowe procedury, aby zapewnić porównywalność wszystkich wyników. Od około 20 lat stale rozwijamy nasze metody badawcze, ustanawiając przy tym standardy branżowe. W naszych laboratoriach testowych doświadczeni technicy i redaktorzy korzystają z wysokiej jakości sprzętu pomiarowego. Testy te obejmują wieloetapowy proces walidacji. Nasz kompleksowy system ocen opiera się na setkach uzasadnionych pomiarów i benchmarków, co pozwala zachować obiektywizm.

