Recenzja MSI Cyborg 15 A12VF: Gamingowy laptop z mało wydajnym RTX 4060

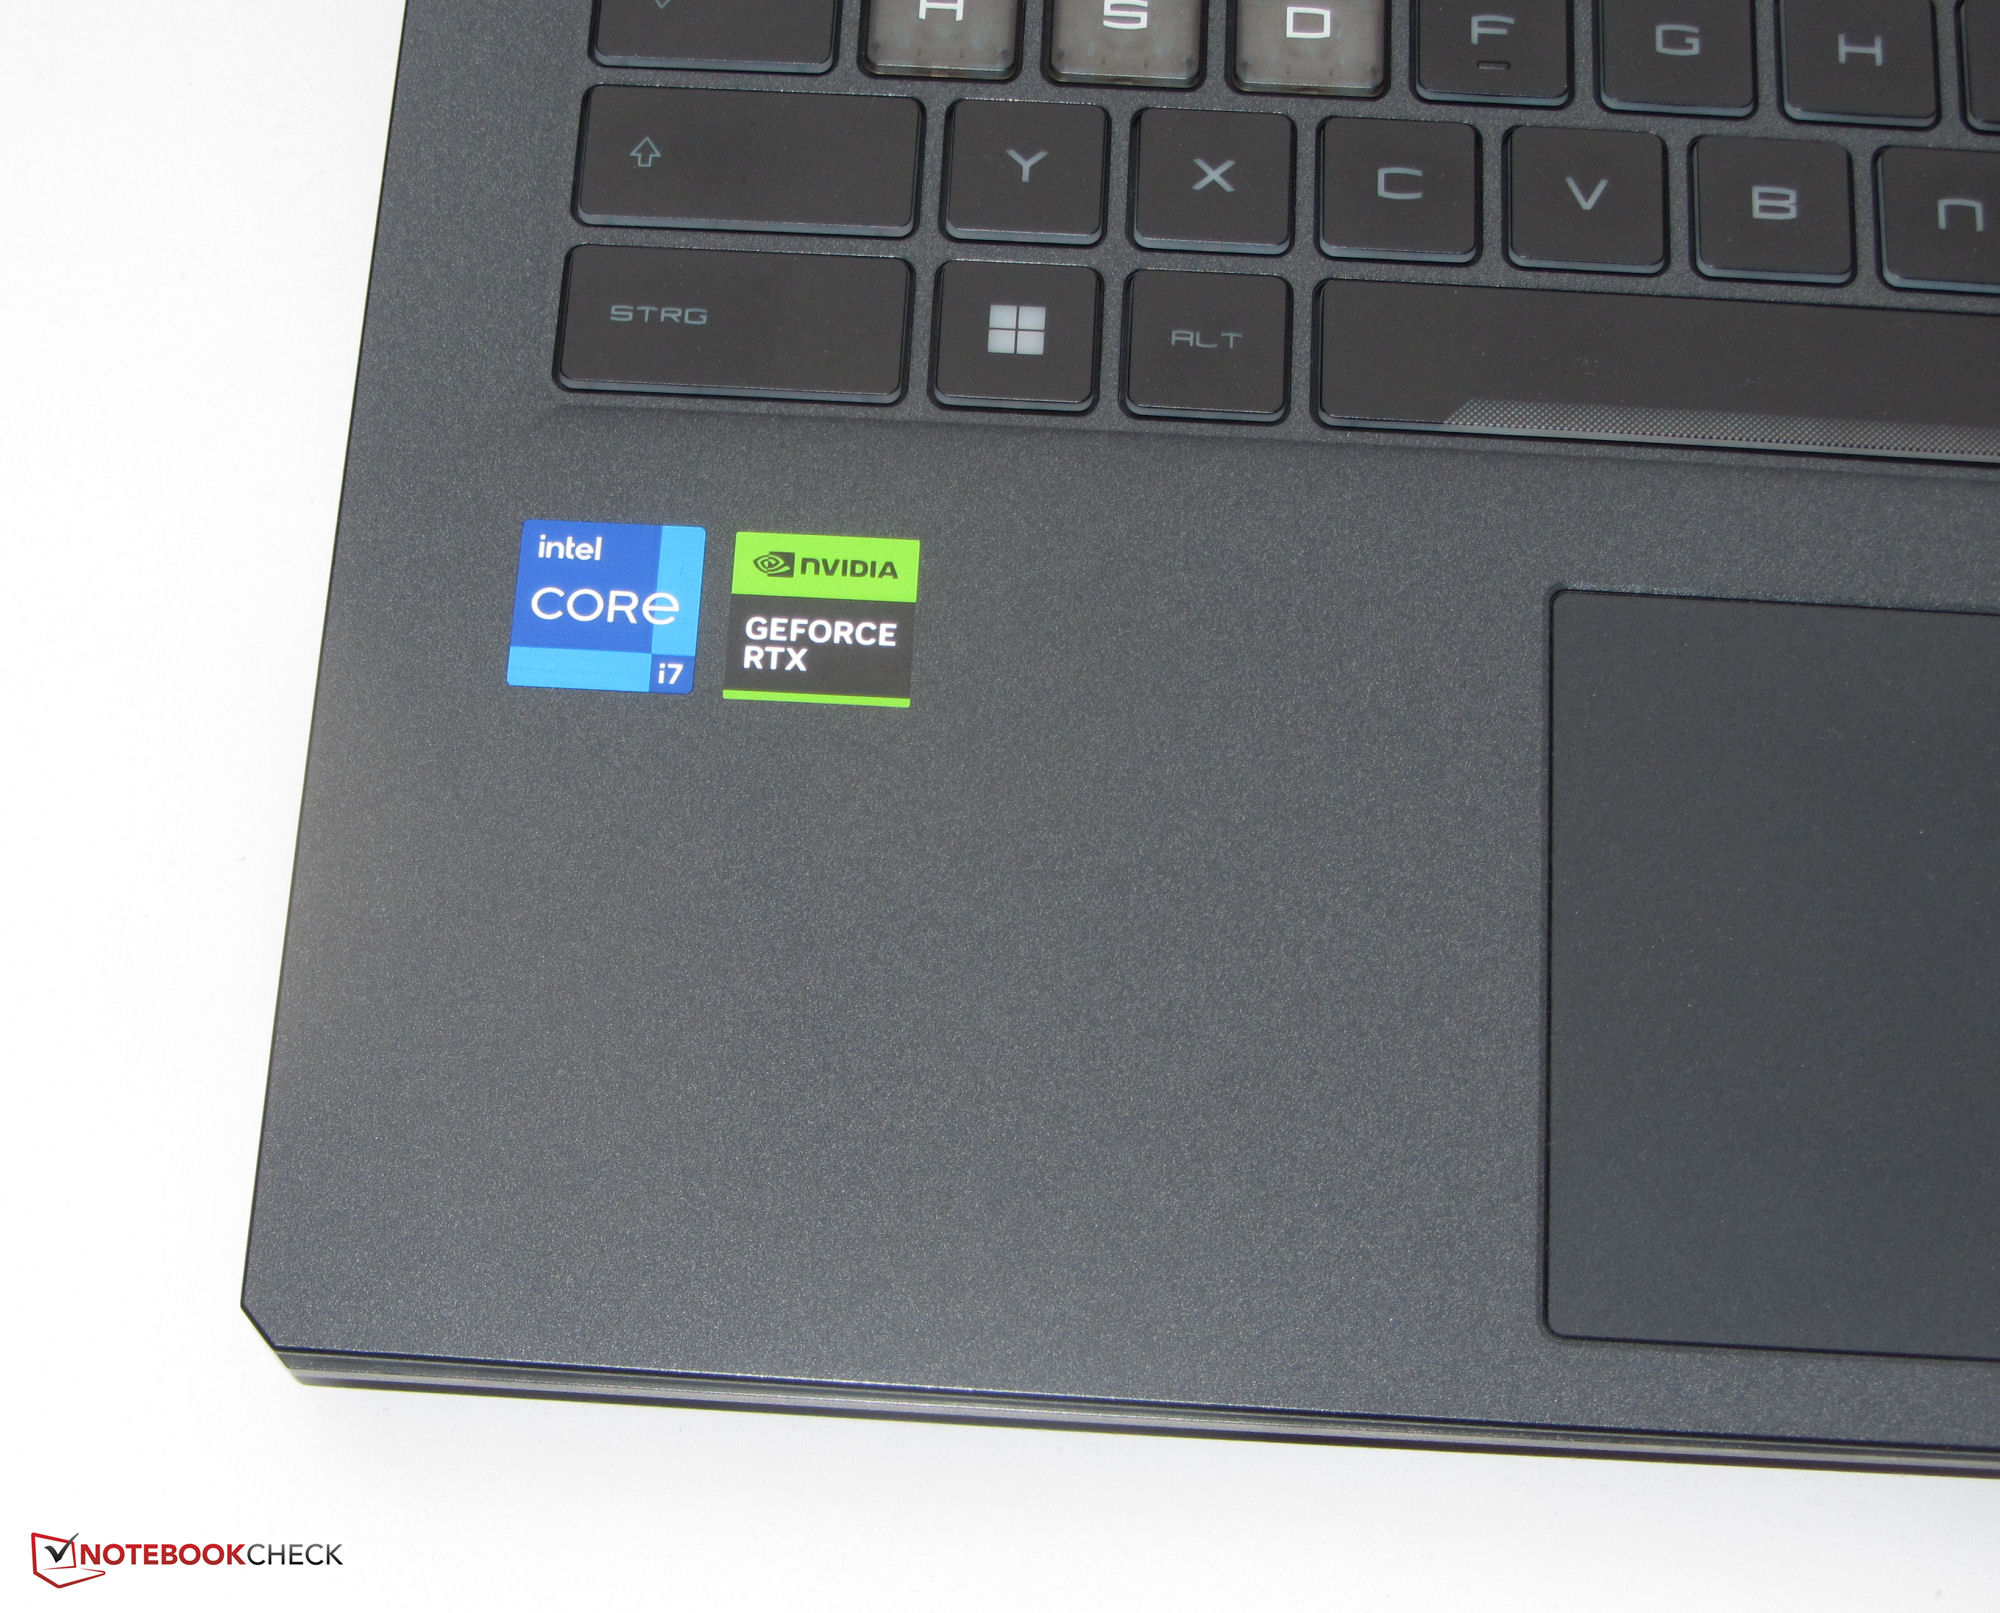
Mobilny laptop do gier od MSI nie chce - a także nie jest w stanie - ustanowić żadnych nowych rekordów wydajności. Na stronieCore i7-12650Horaz GeForce RTX 4060są uruchamiane z konserwatywnymi limitami mocy i niskim TGP (45 W), co skutkuje dość niskim zużyciem energii. Do laptopa wystarczy zasilacz o mocy 120 W. Do konkurencji należą takie laptopy jak np Asus TUF Gaming A16 FA617, theAorus 15 XE5, theMSI Katana 15 B12VEK,HP Victus 15, oraz Schenker XMG Fusion 15.
Potencjalni konkurenci w porównaniu
Ocena | Data | Model | Waga | Wysokość | Rozmiar | Rezolucja | Cena |
|---|---|---|---|---|---|---|---|
| 82.4 % v7 (old) | 04/2023 | MSI Cyborg 15 A12VF i7-12650H, GeForce RTX 4060 Laptop GPU | 2 kg | 22.9 mm | 15.60" | 1920x1080 | |
| 86.2 % v7 (old) | 02/2023 | Asus TUF Gaming A16 FA617 R7 7735HS, Radeon RX 7600S | 2.2 kg | 27 mm | 16.00" | 1920x1200 | |
| 85.5 % v7 (old) | 12/2022 | Aorus 15 XE5 i7-12700H, GeForce RTX 3070 Ti Laptop GPU | 2.3 kg | 24 mm | 15.60" | 2560x1440 | |
| 87.4 % v7 (old) | Schenker XMG Fusion 15 (Mid 22) i7-11800H, GeForce RTX 3070 Laptop GPU | 1.9 kg | 21.65 mm | 15.60" | 2560x1440 | ||
| 82.9 % v7 (old) | 03/2023 | MSI Katana 15 B12VEK i7-12650H, GeForce RTX 4050 Laptop GPU | 2.3 kg | 24.9 mm | 15.60" | 1920x1080 | |
| 81 % v7 (old) | 01/2023 | HP Victus 15 fa0020nr i7-12700H, GeForce RTX 3050 Ti Laptop GPU | 2.3 kg | 23.6 mm | 15.60" | 1920x1080 |
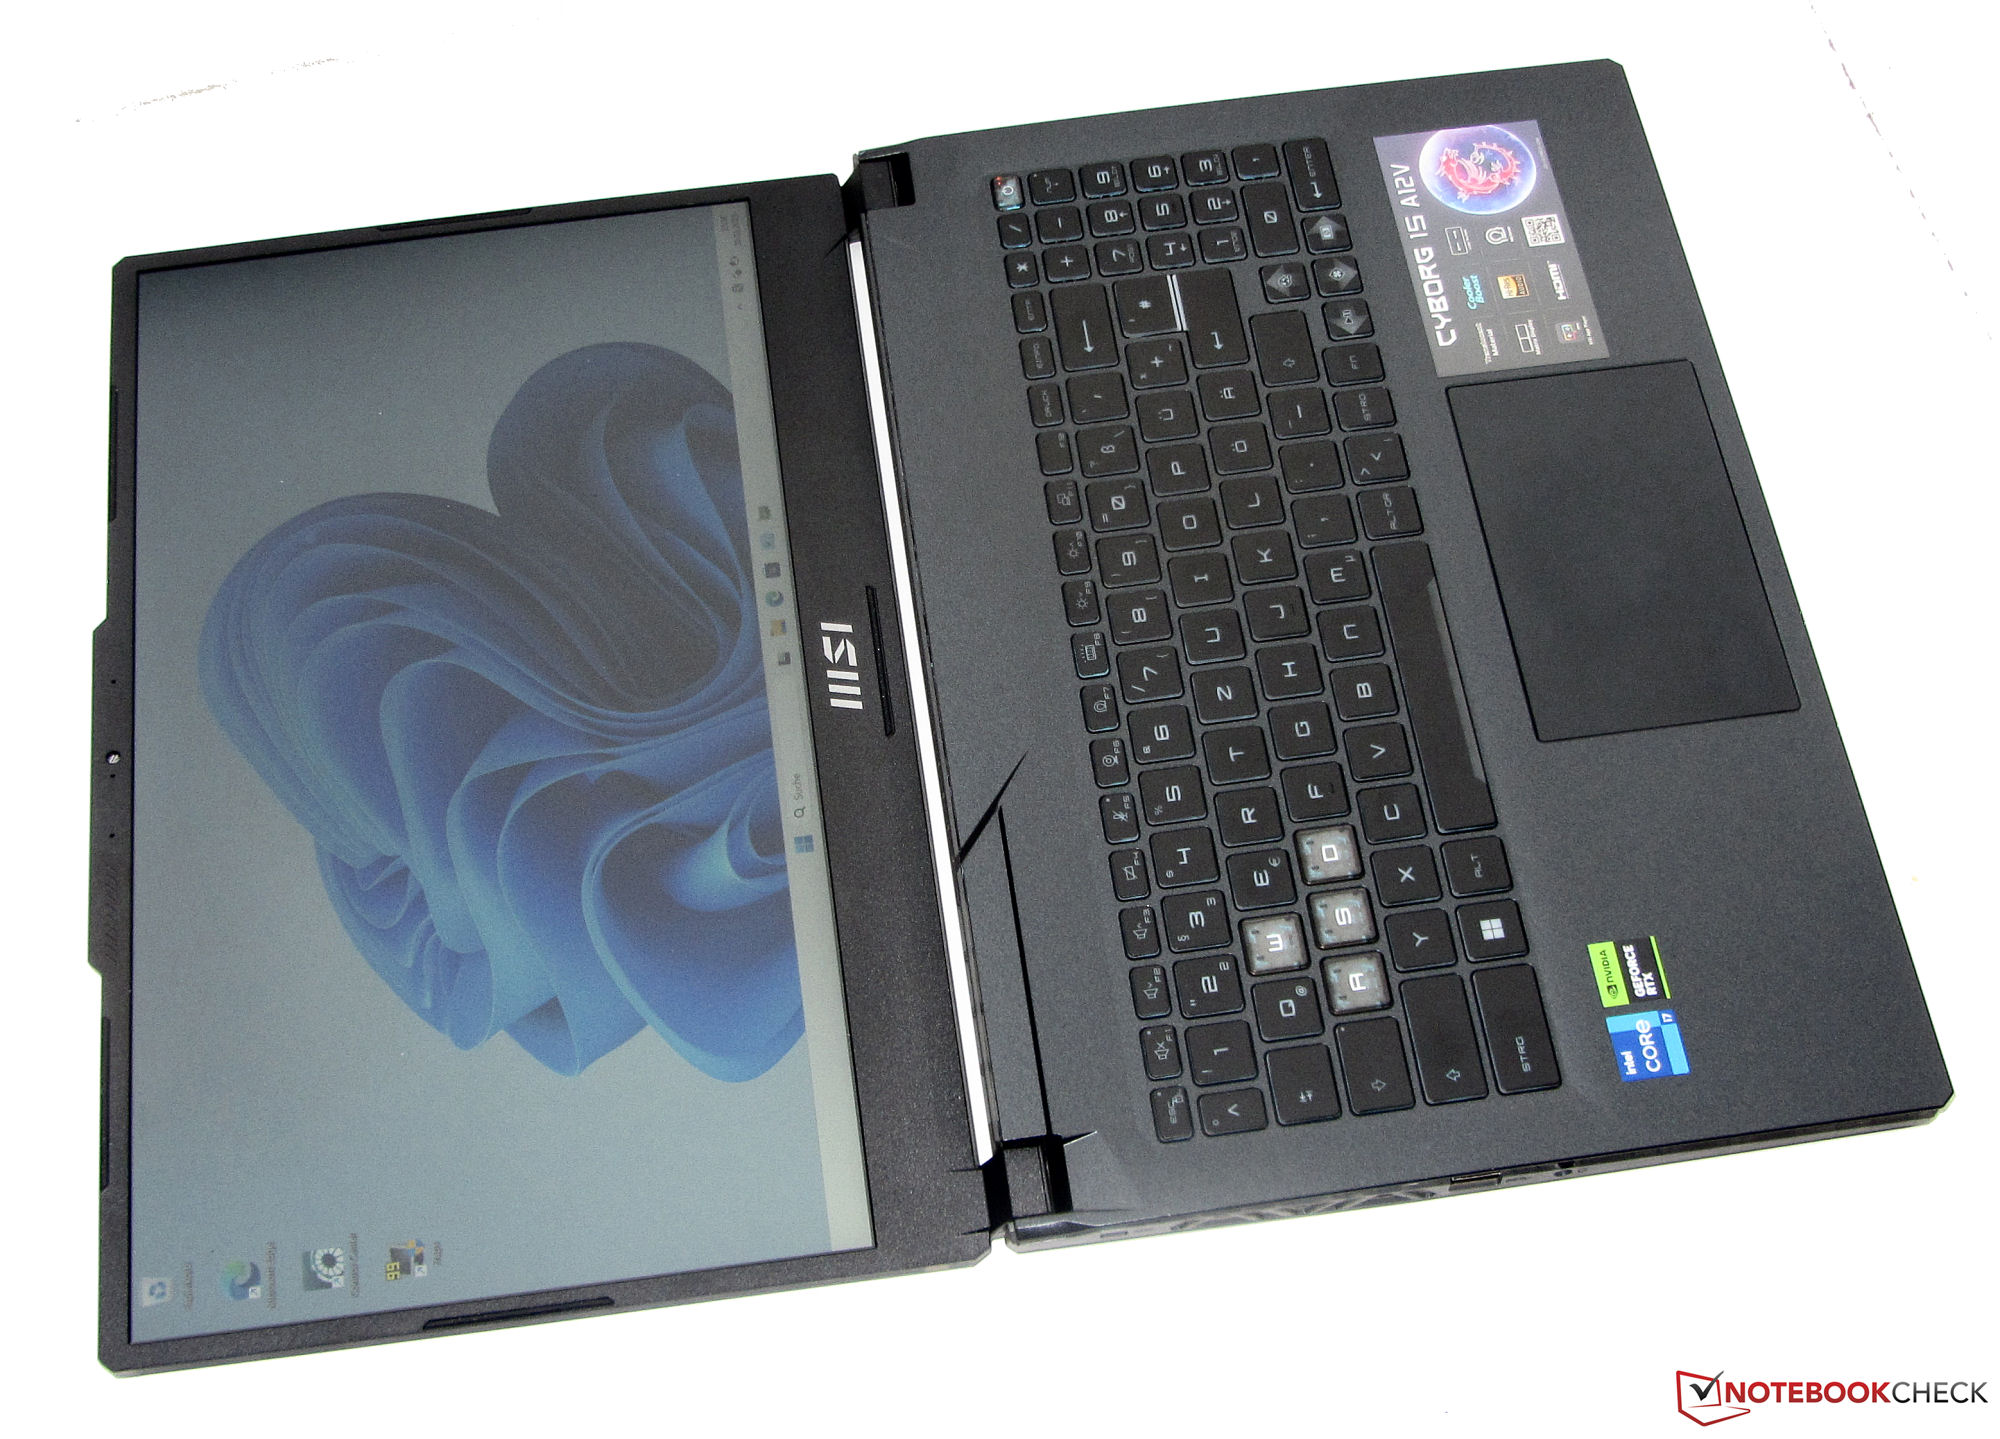
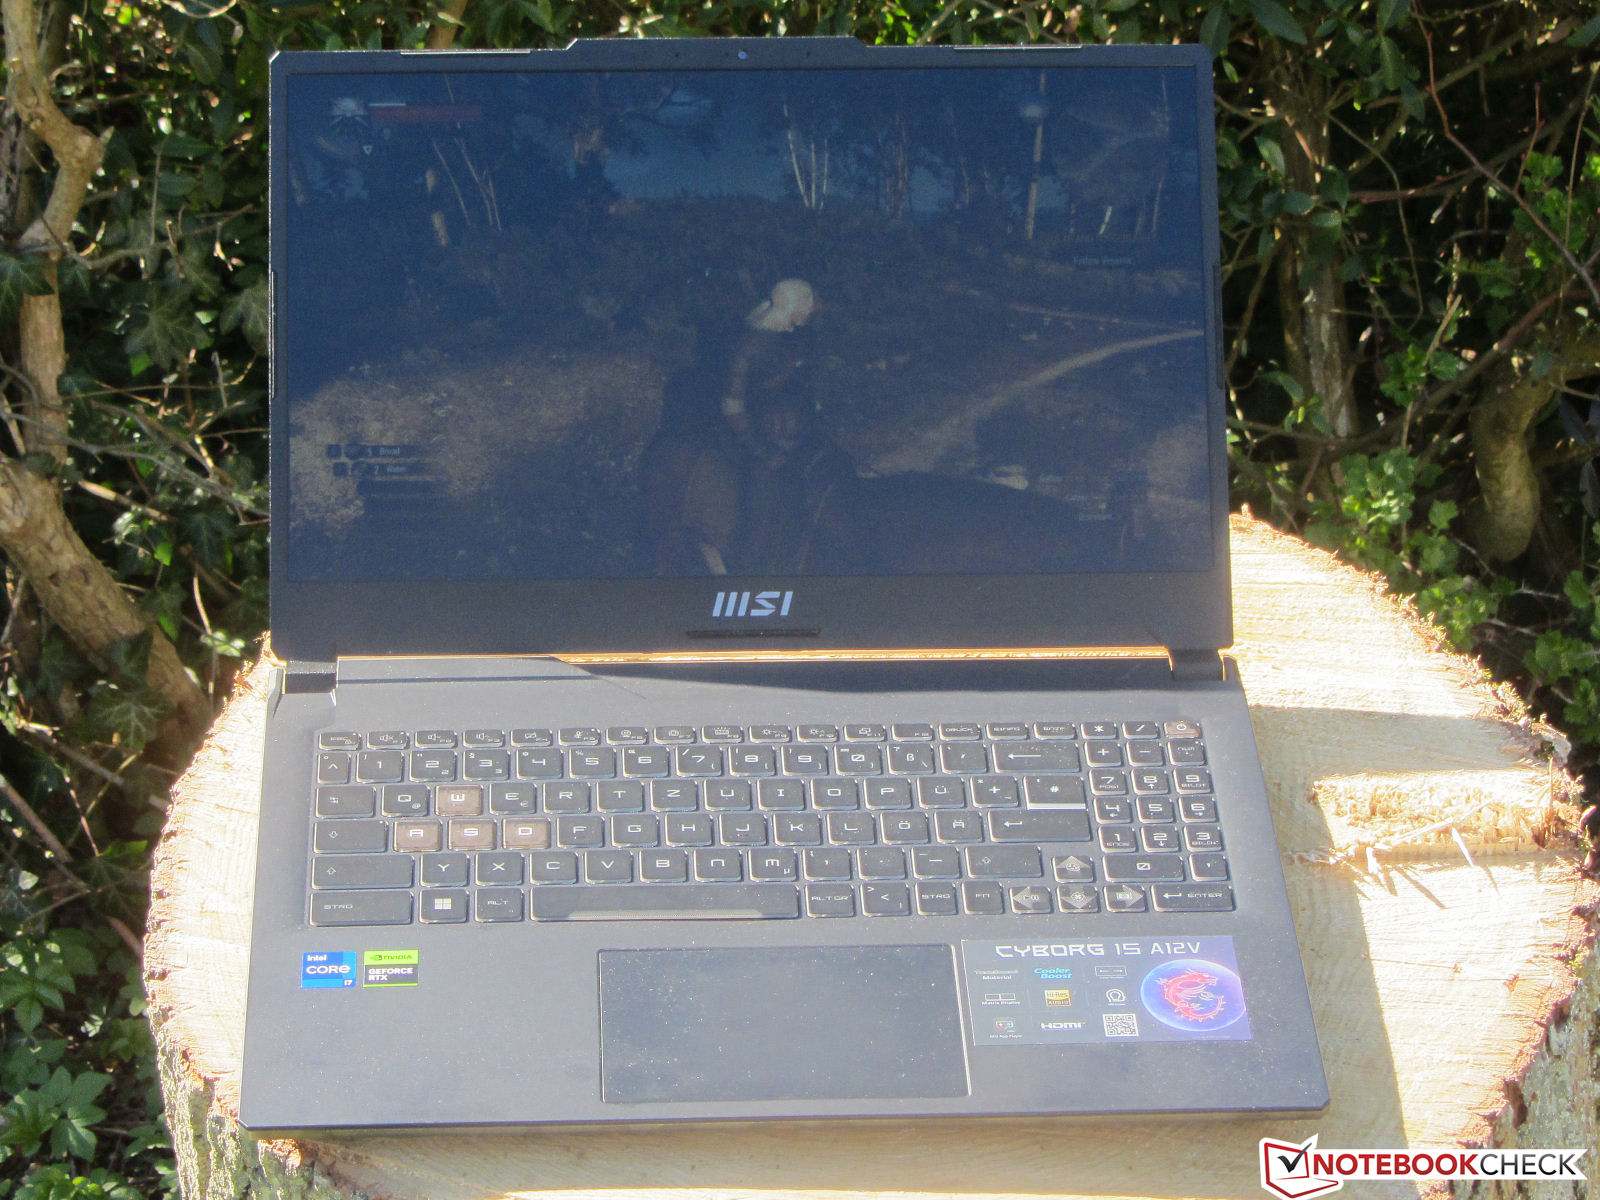
Obudowa - A12VF z kątem otwarcia 180 stopni
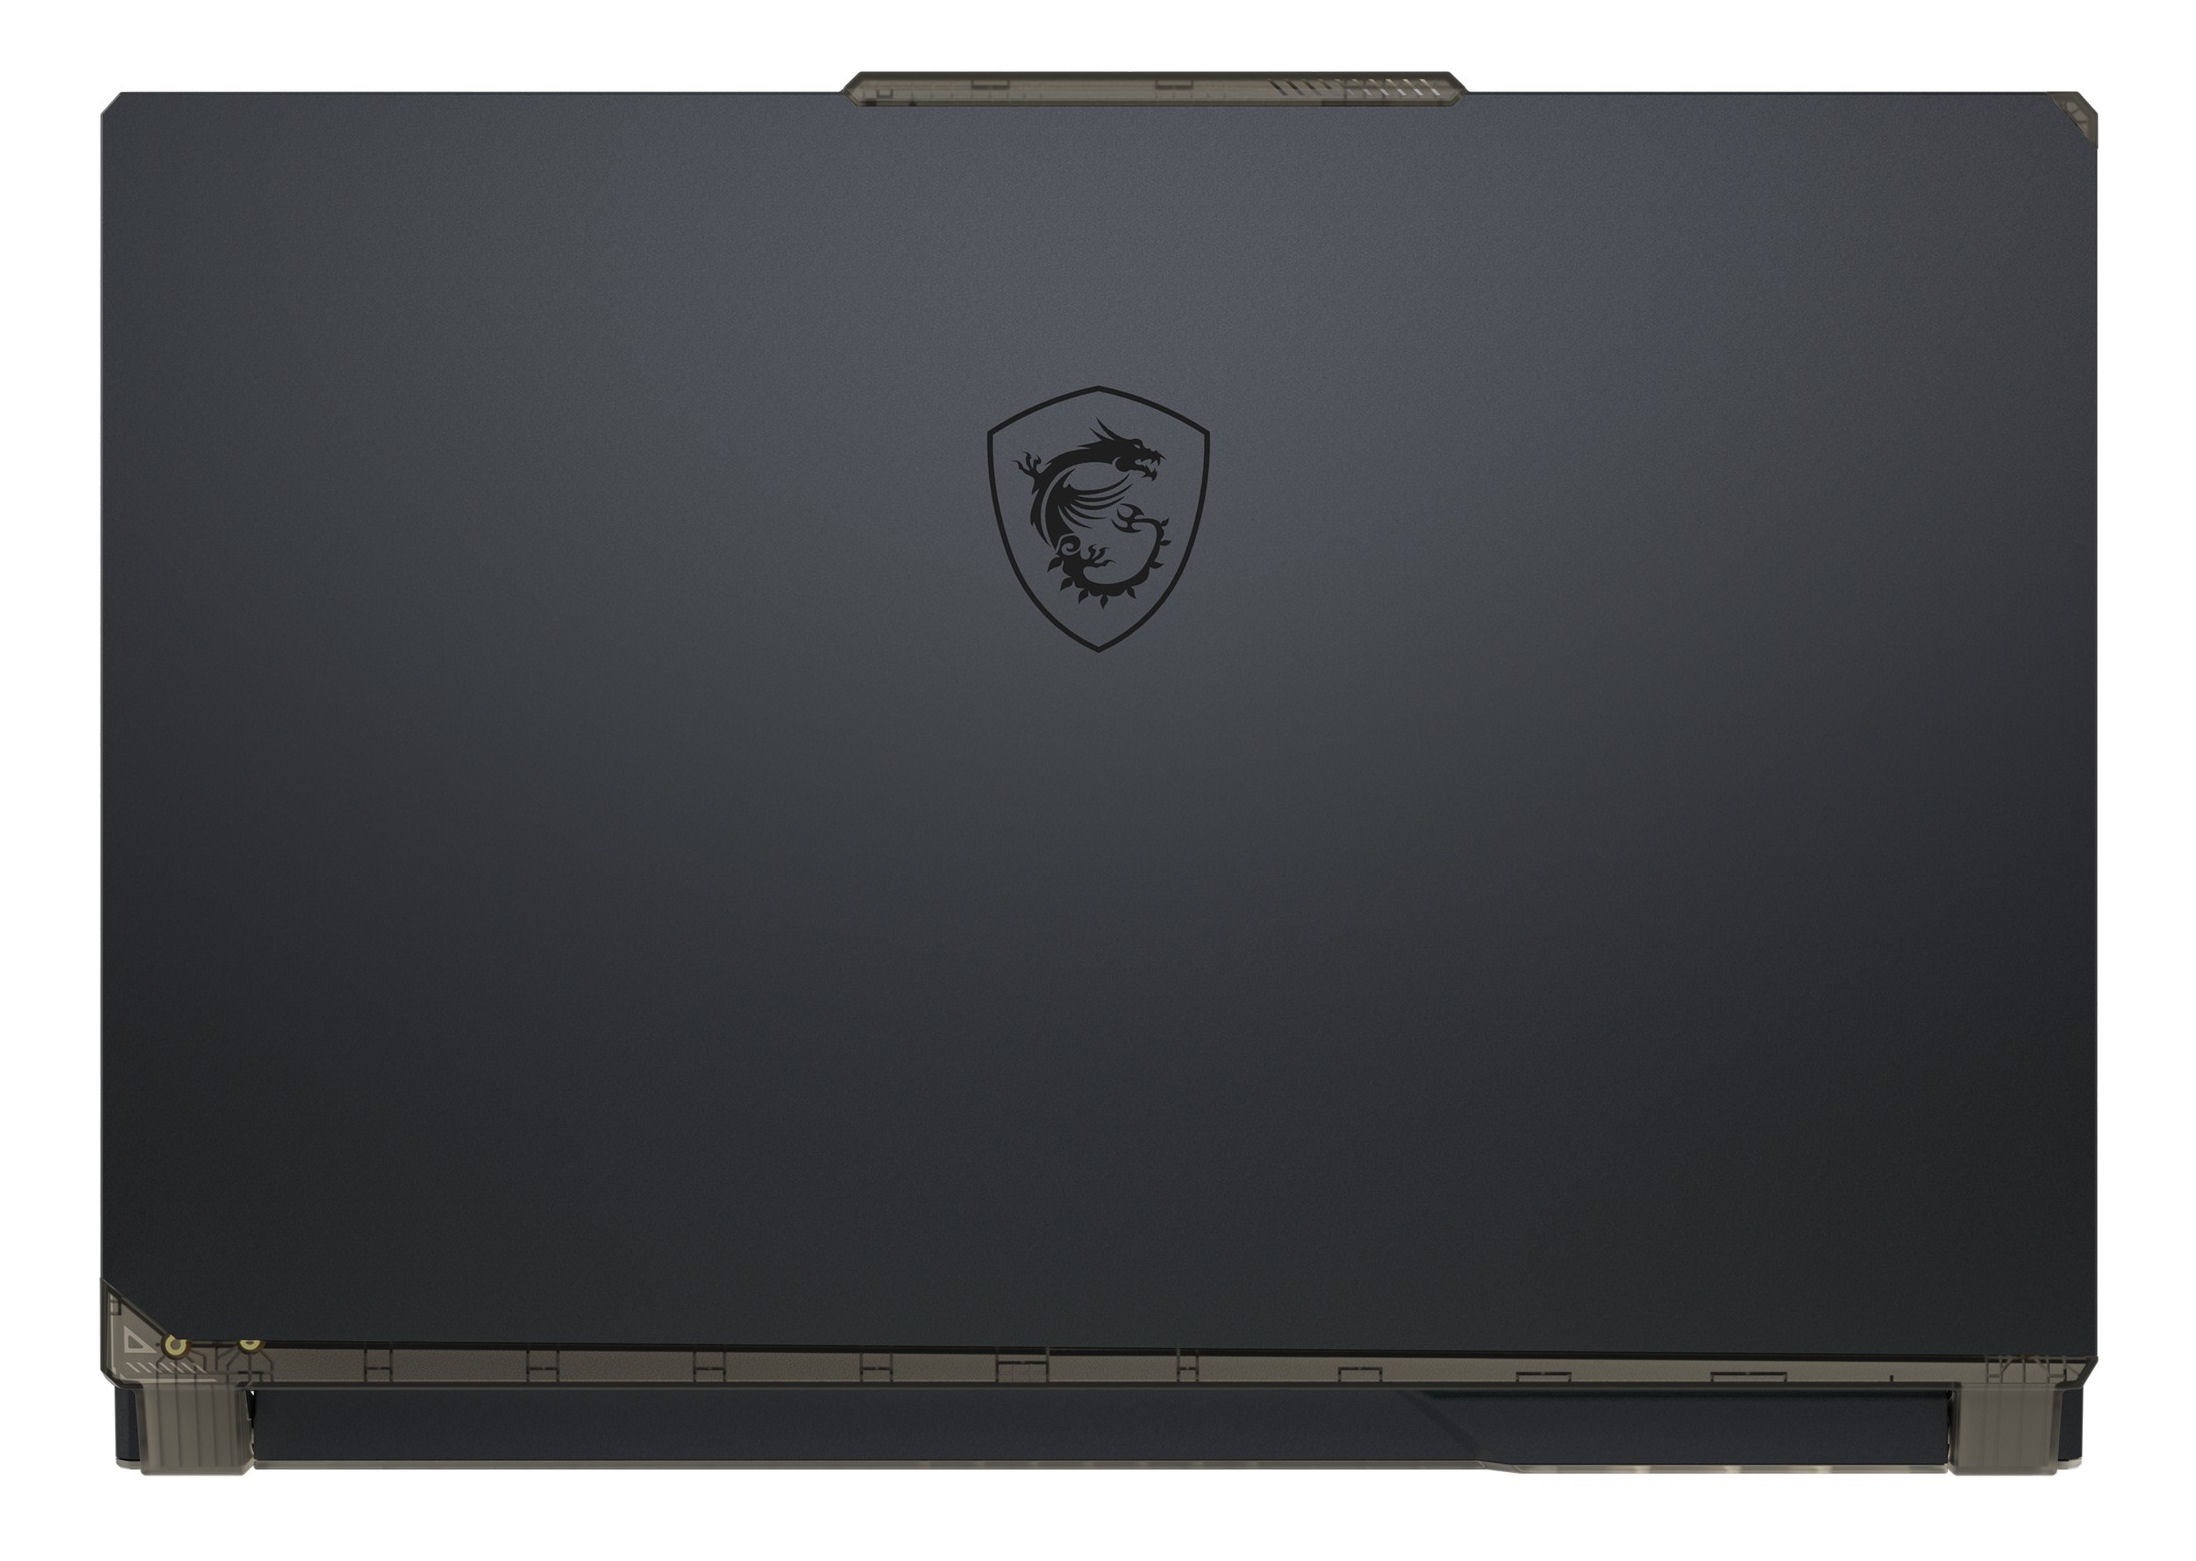
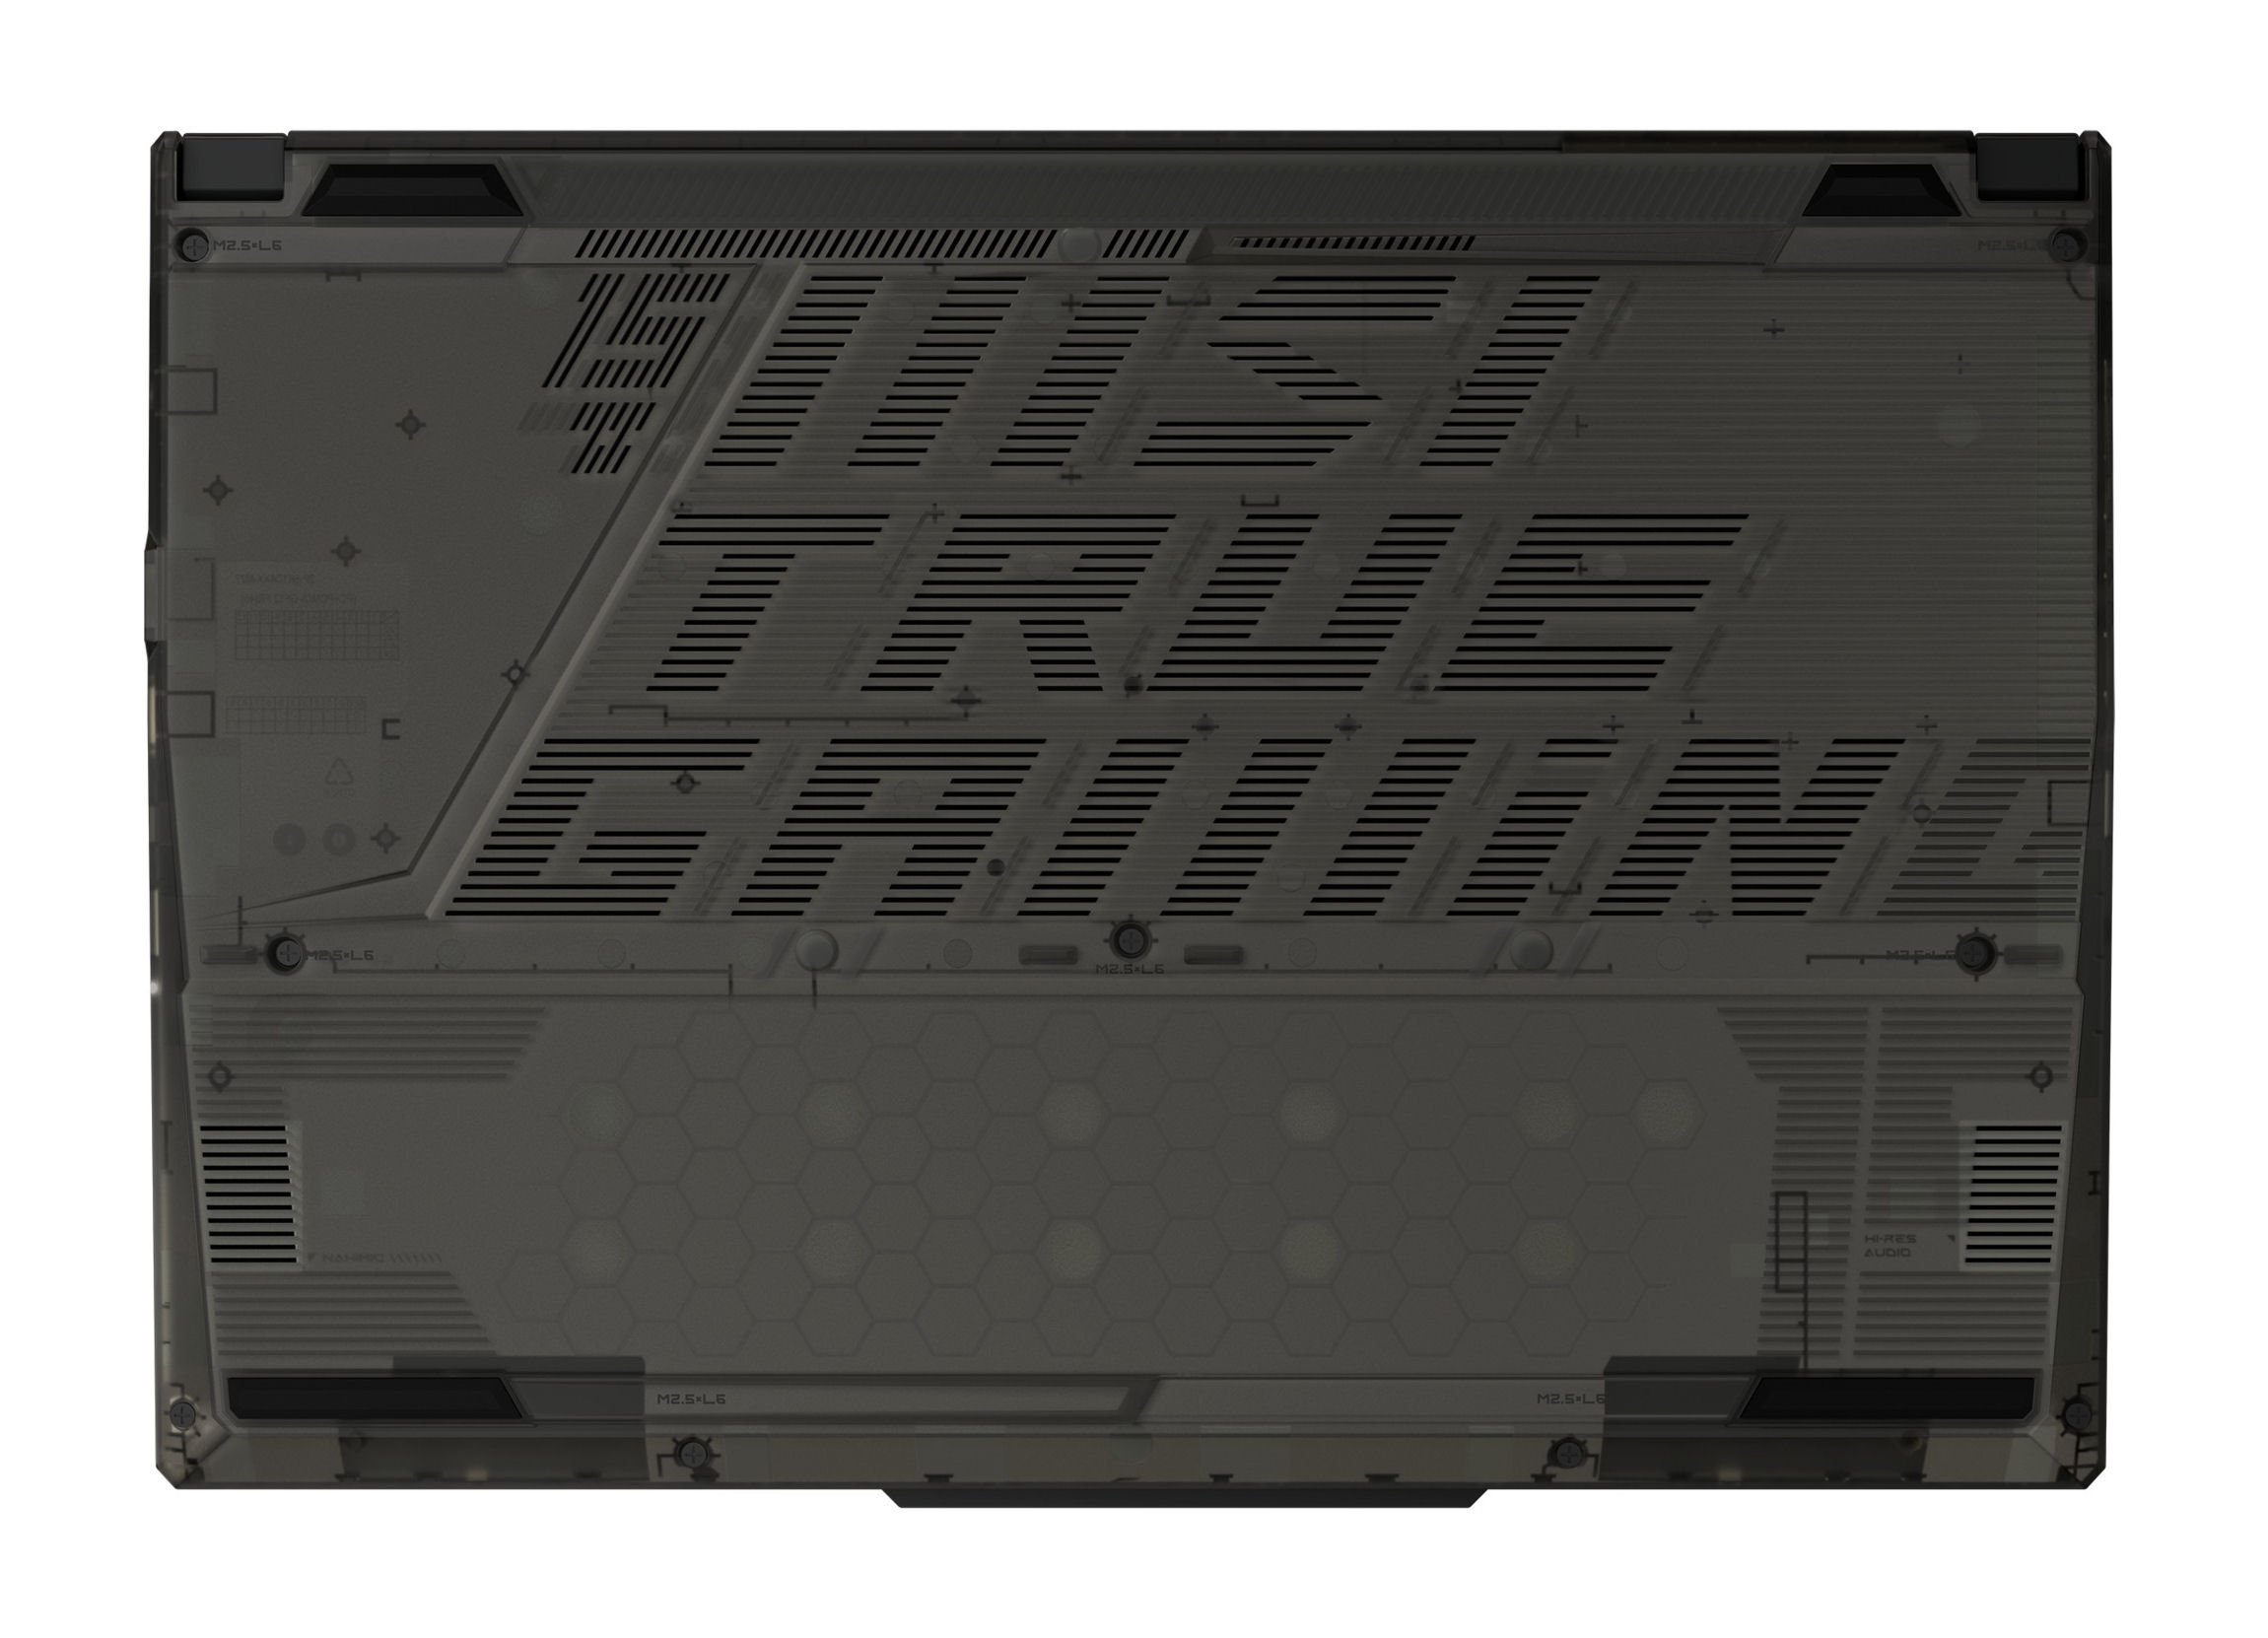
Większość elementów kompaktowej obudowy wykonano z plastiku, a metal zastosowano jedynie w tylnej części pokrywy obudowy. MSI stosuje głównie dyskretne wzornictwo, a laptop nie wyglądałby nie na miejscu w profesjonalnym otoczeniu biurowym. Czarny kolor bazowy jest rozluźniony przez niektóre przezroczyste elementy obudowy, takie jak spód obudowy, a podświetlenie klawiatury w kolorze turkusowo-niebieskim również dodaje trochę koloru.
Laptop nie zdradza żadnych wad wykonania. Szczeliny są równe, nie zauważamy też żadnych wypukłości materiału. Jednostka zasadnicza i wieko mogą się wprawdzie wykrzywiać, ale pozostaje to w granicach rozsądku. Zawiasy mocno trzymają wieko, a maksymalny kąt otwarcia wynosi 180 stopni. Laptop można otworzyć przy użyciu jednej ręki.
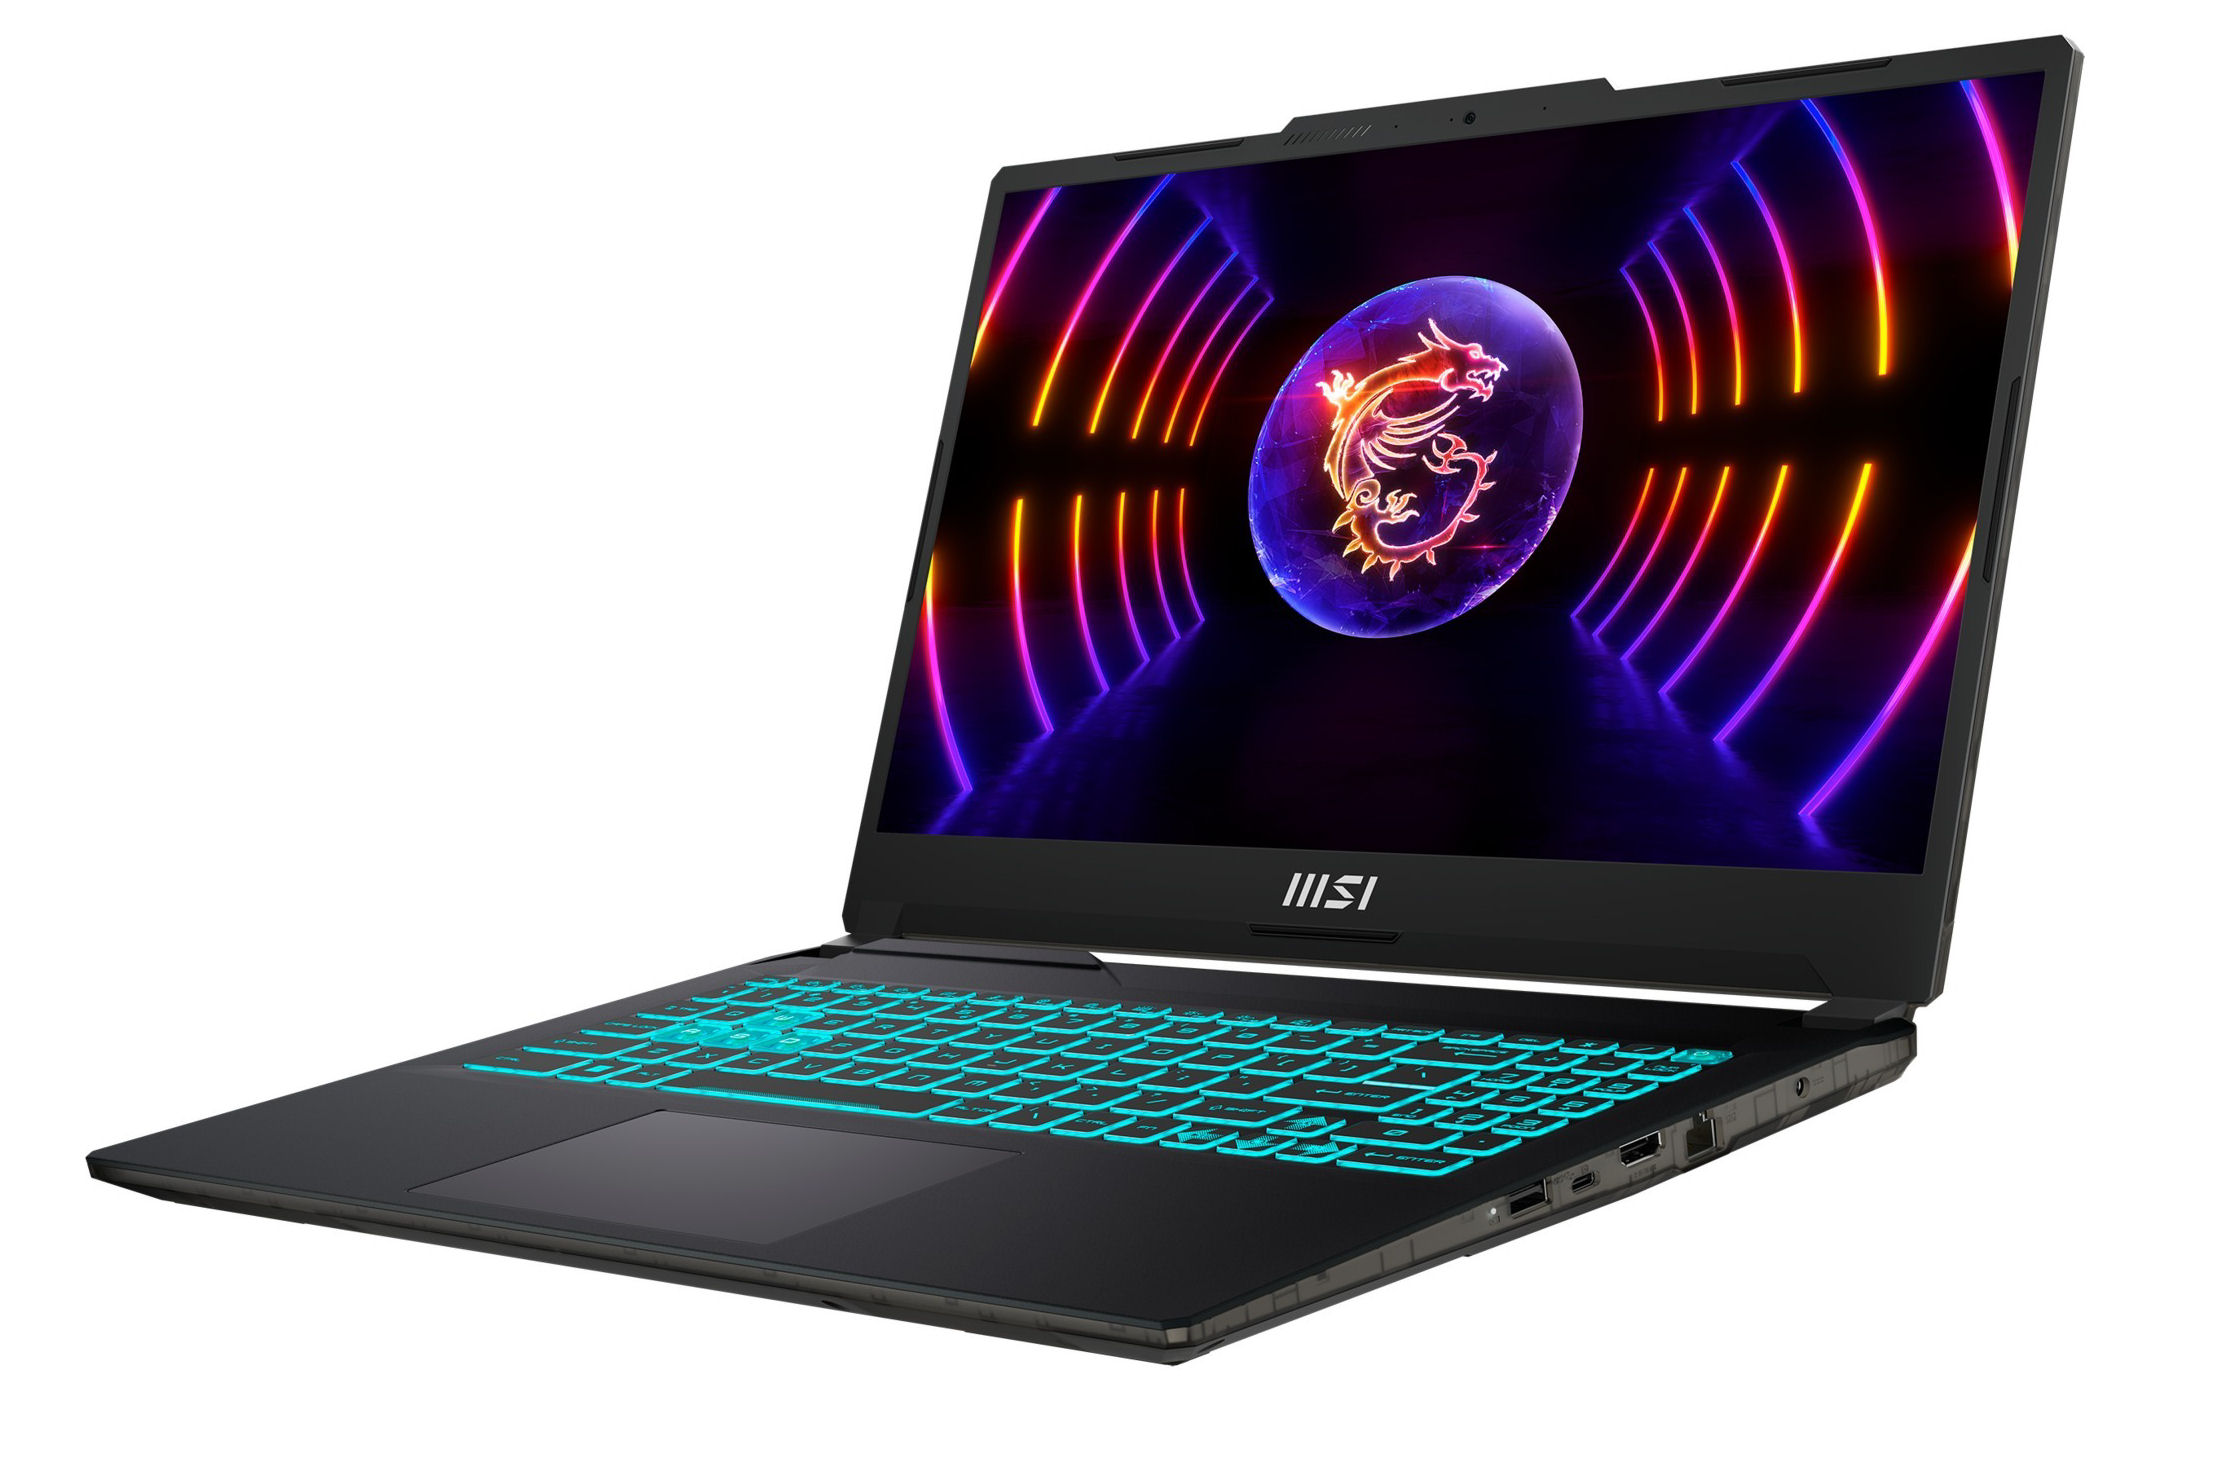
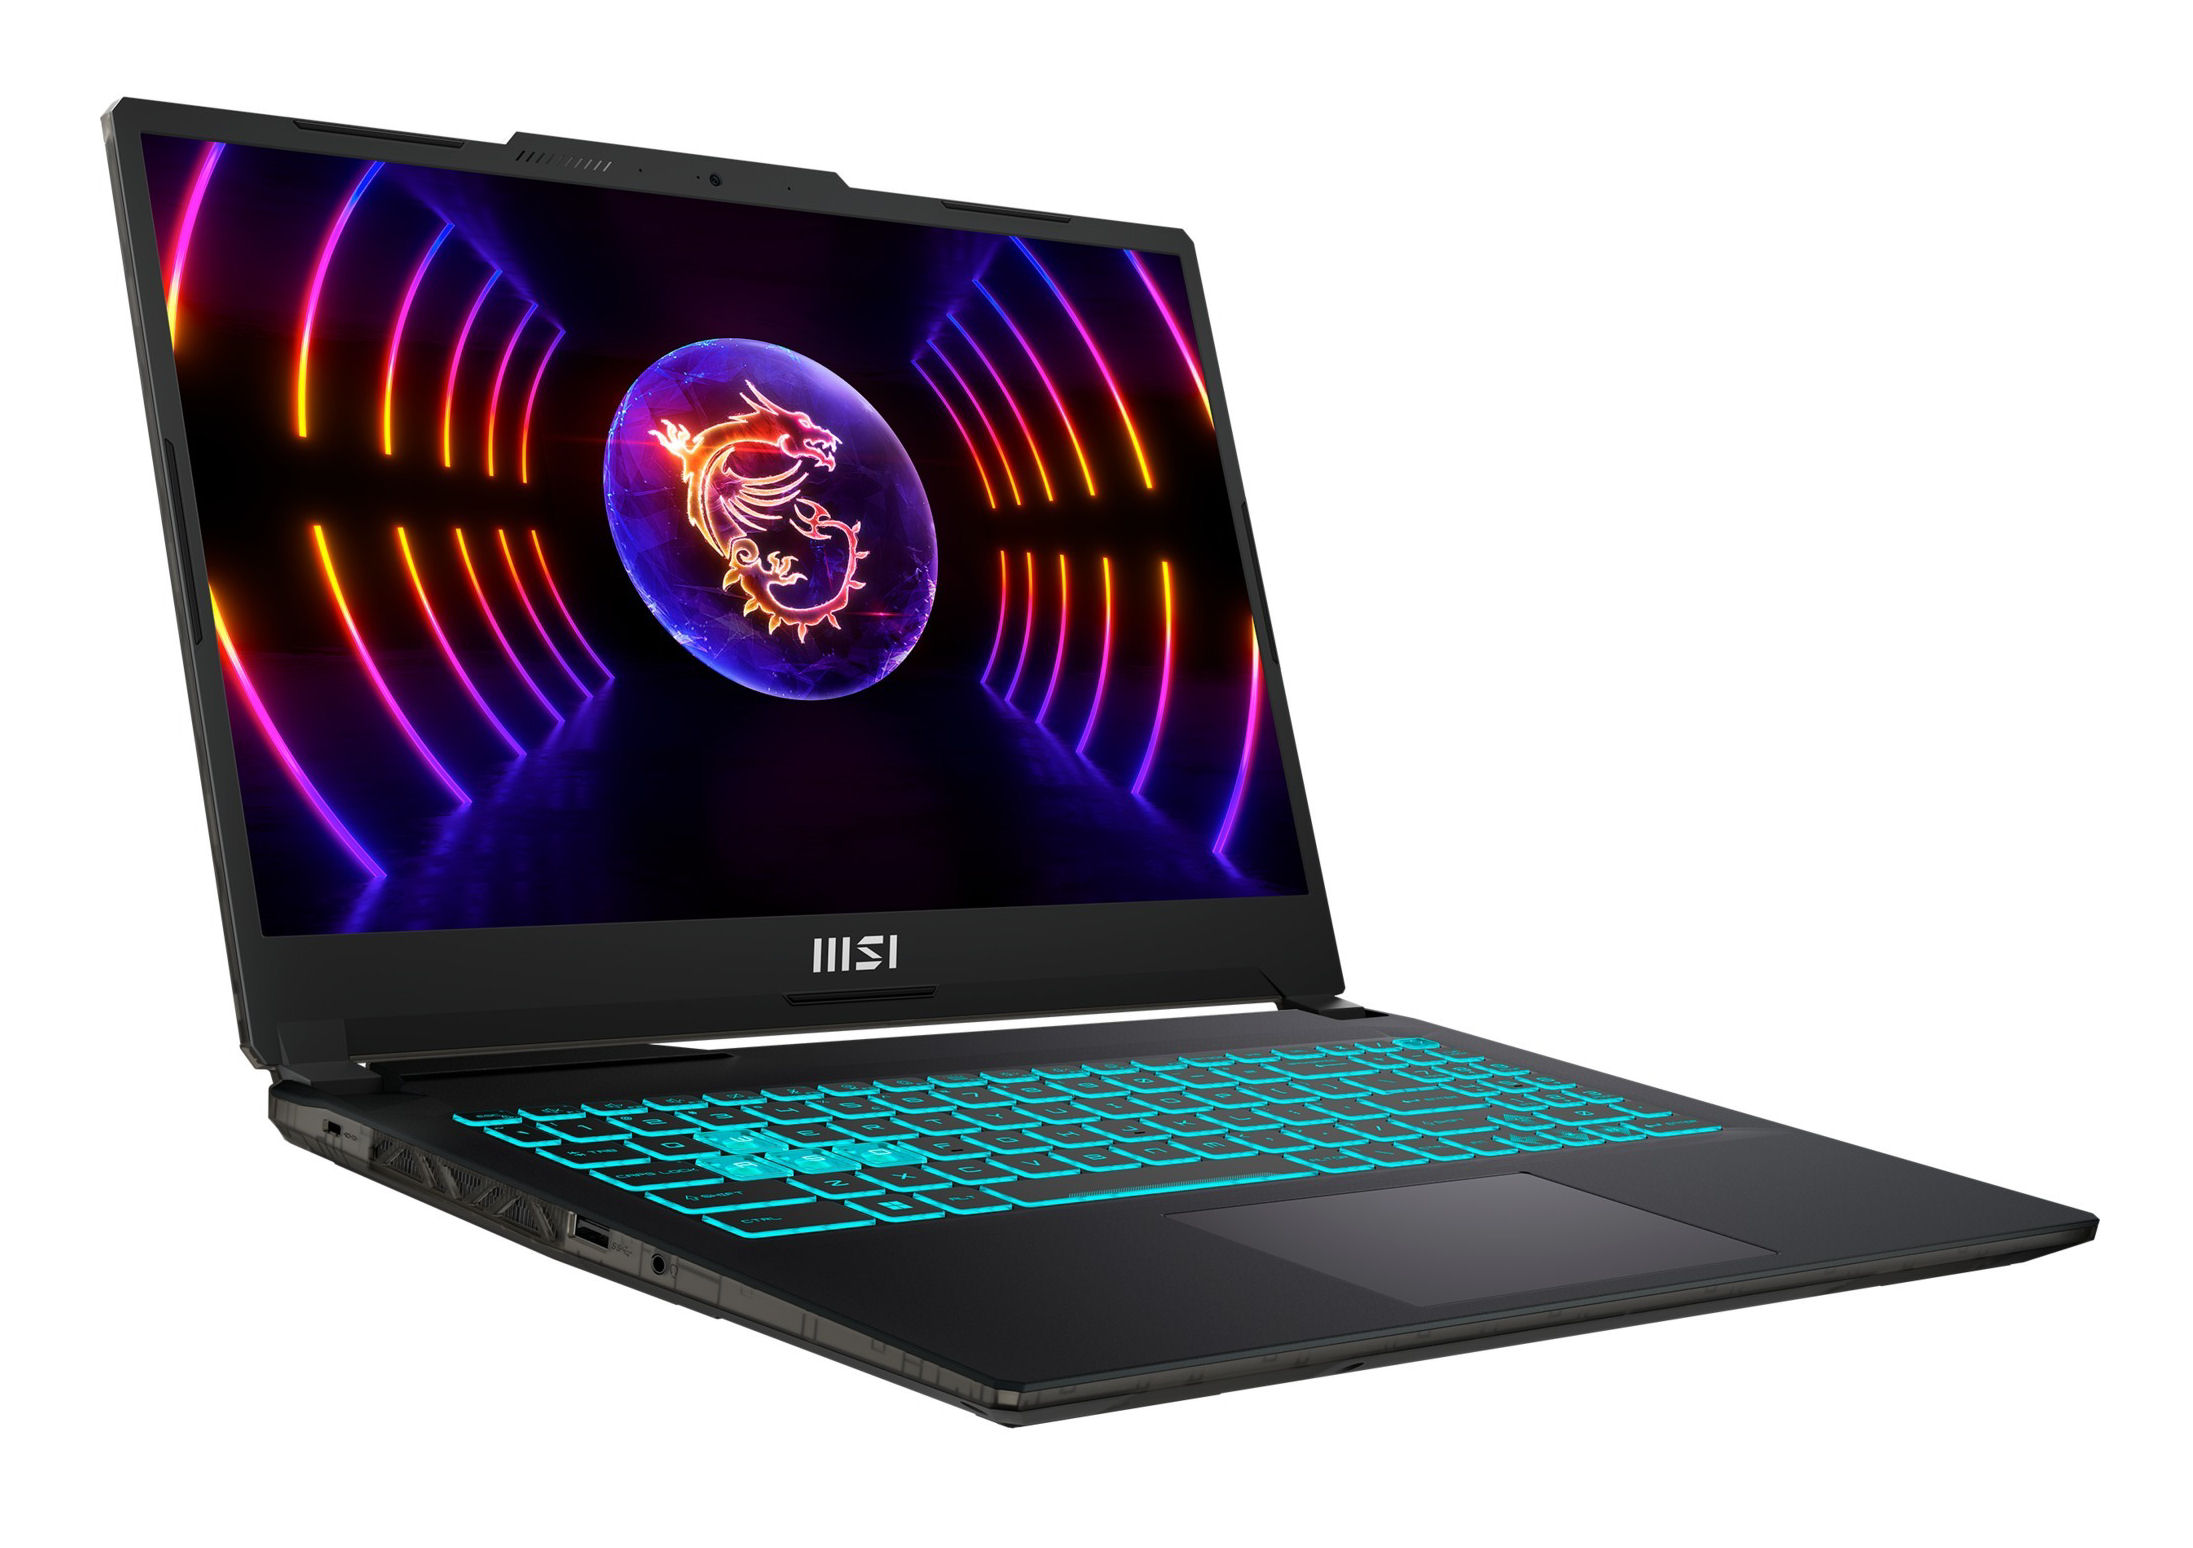
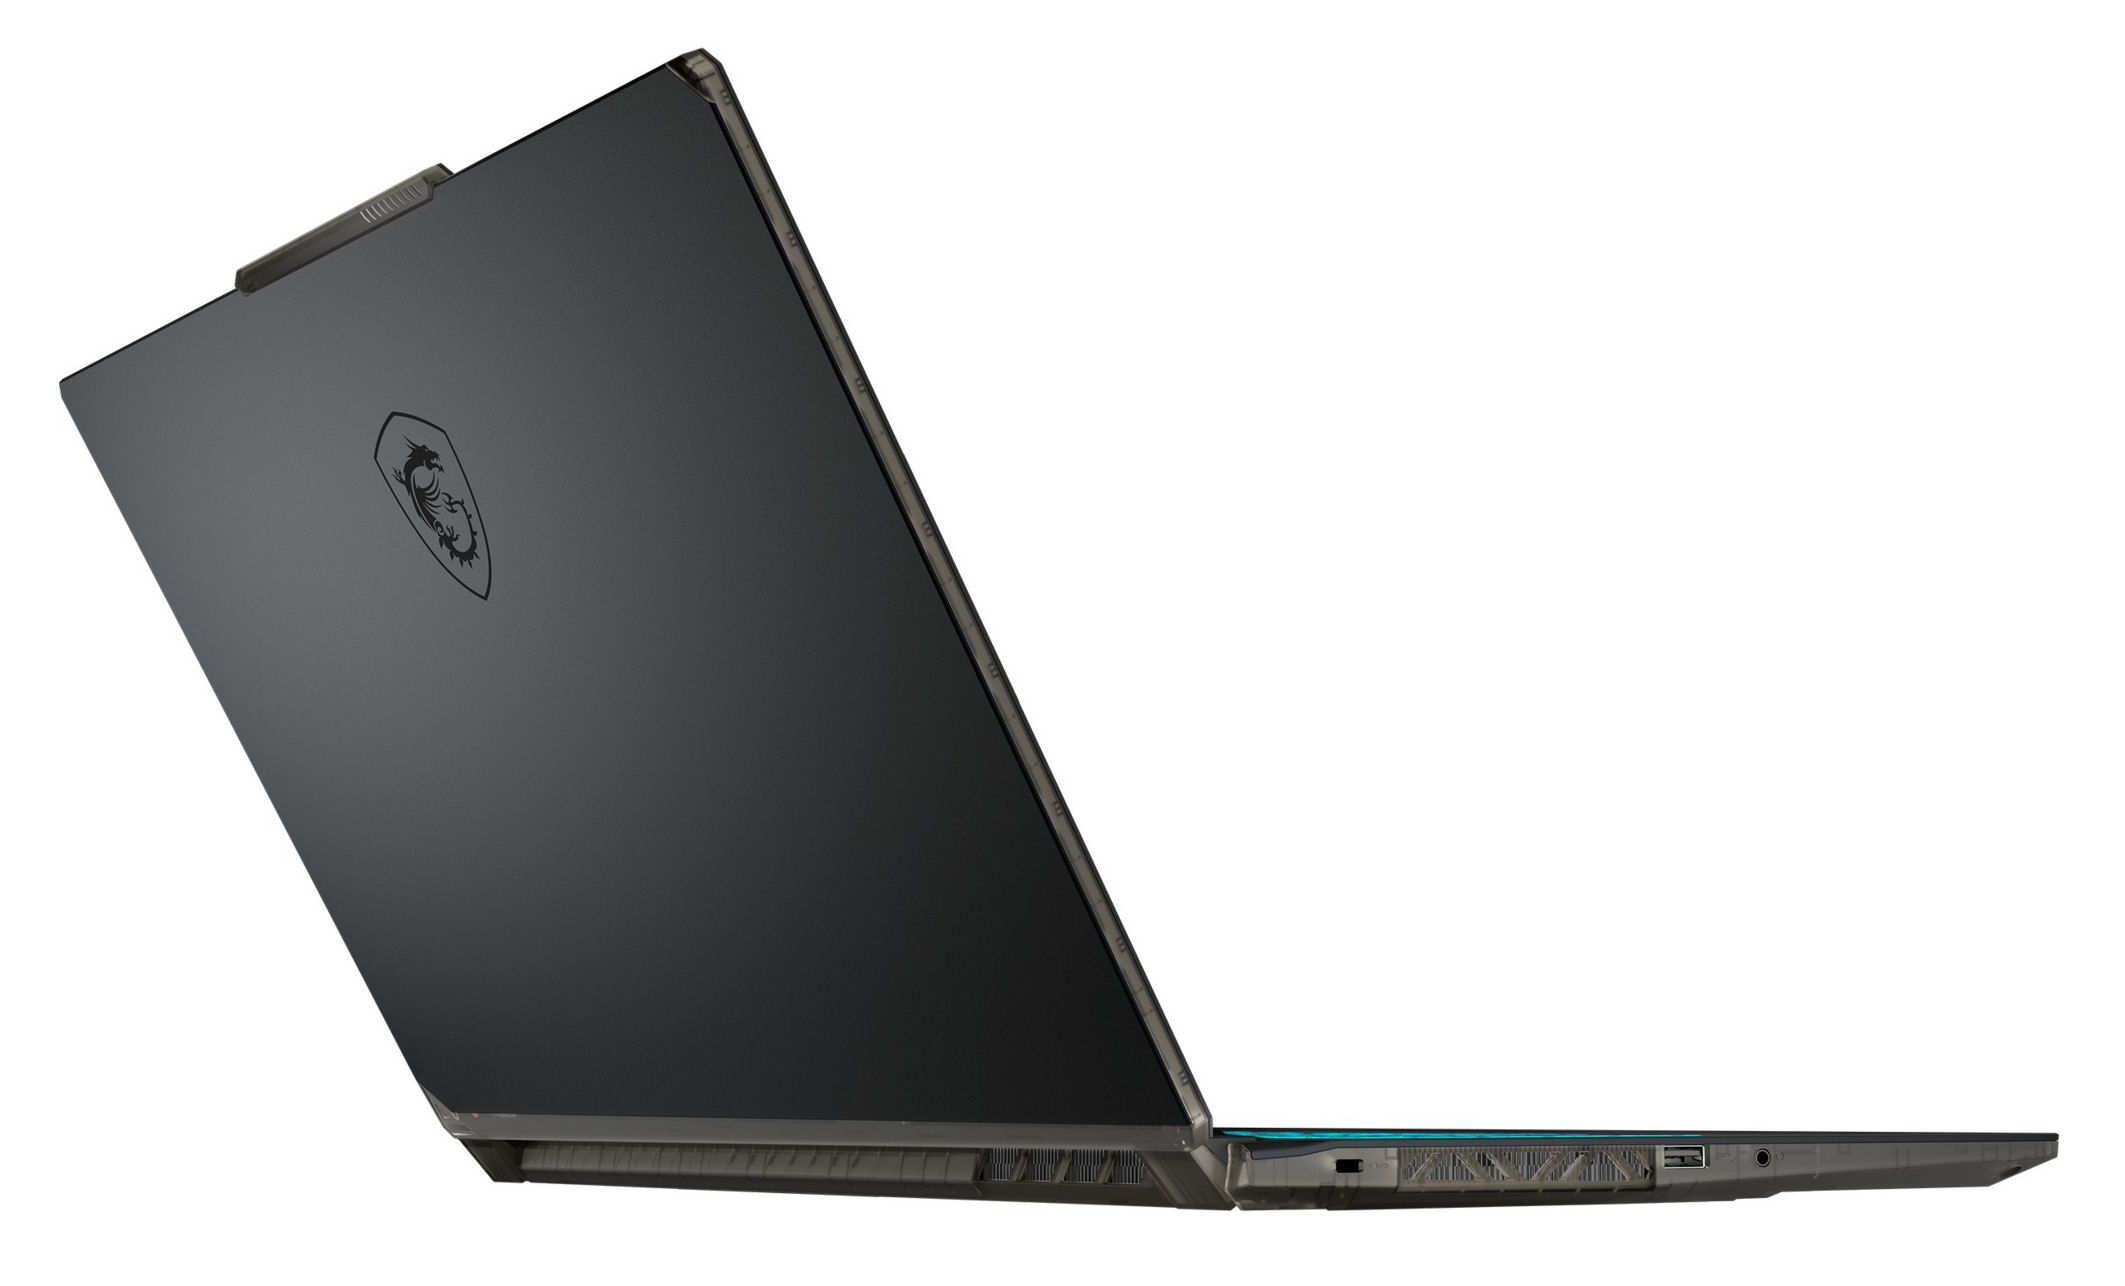
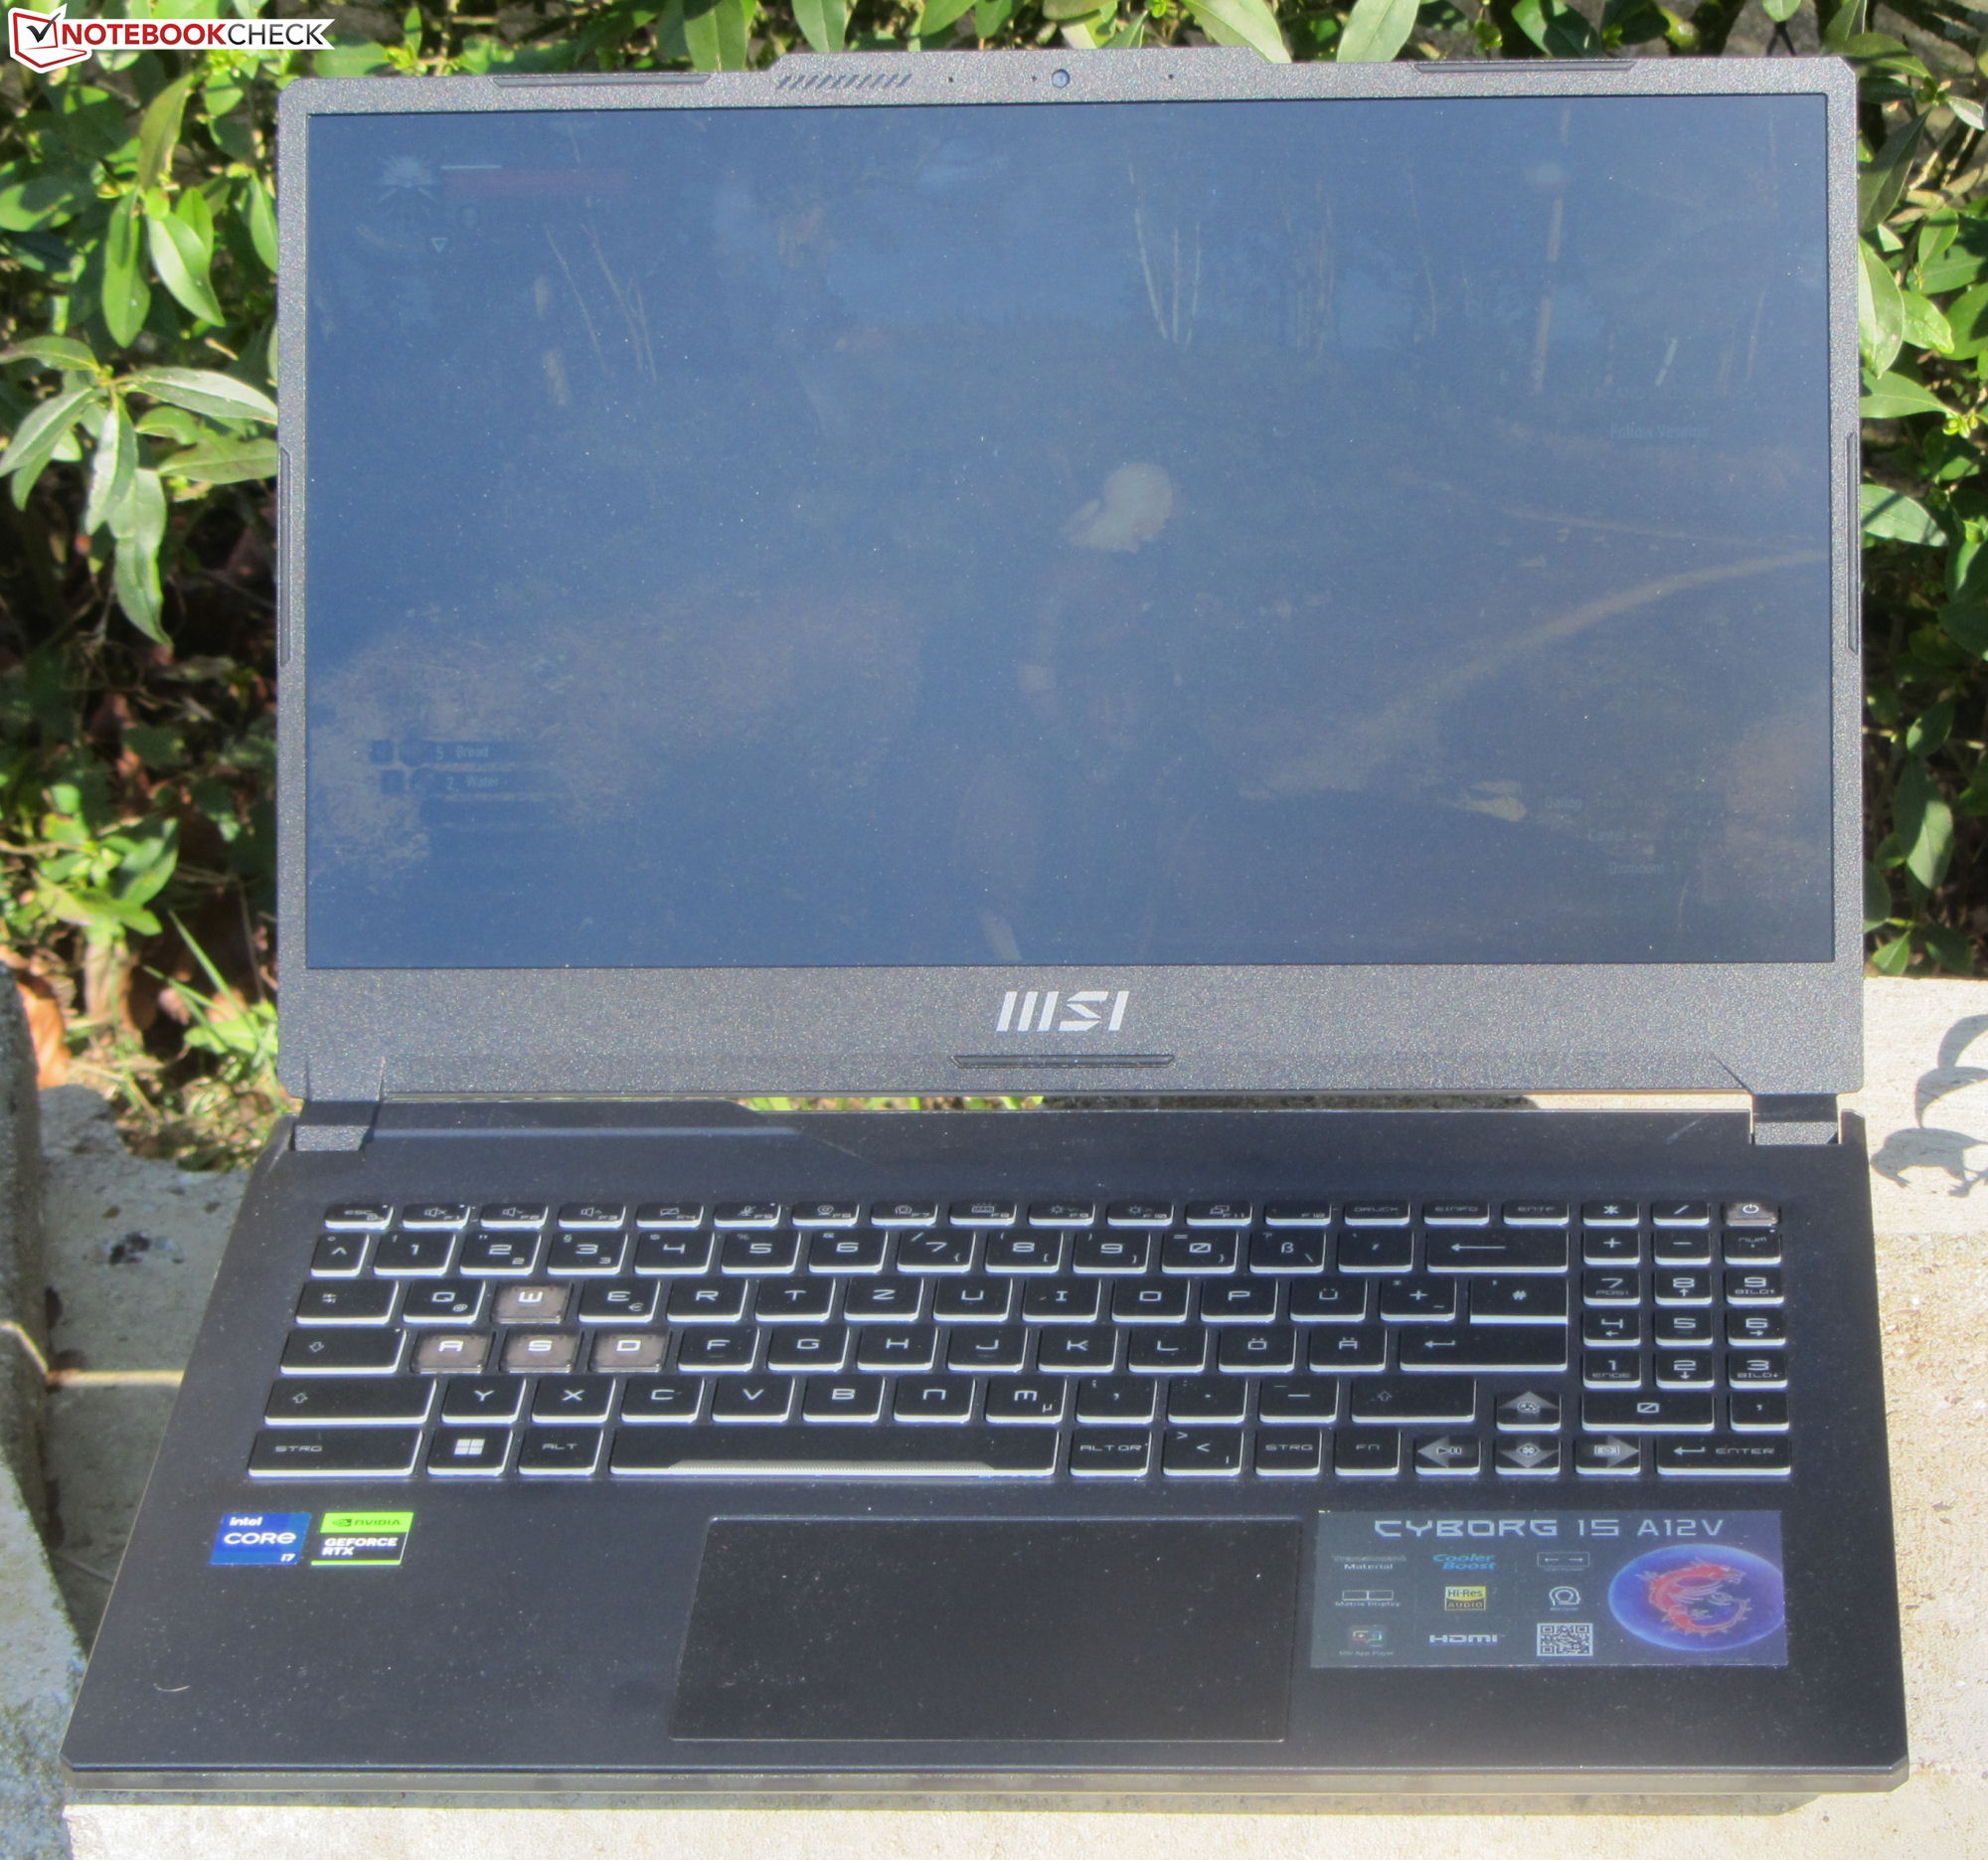
Choć wymiary laptopa MSI są zbliżone do wymiarów konkurencji, jest to jeden z lżejszych laptopów gamingowych w formacie 15,6 cala.
Wyposażenie - laptop MSI nie oferuje Thunderbolt
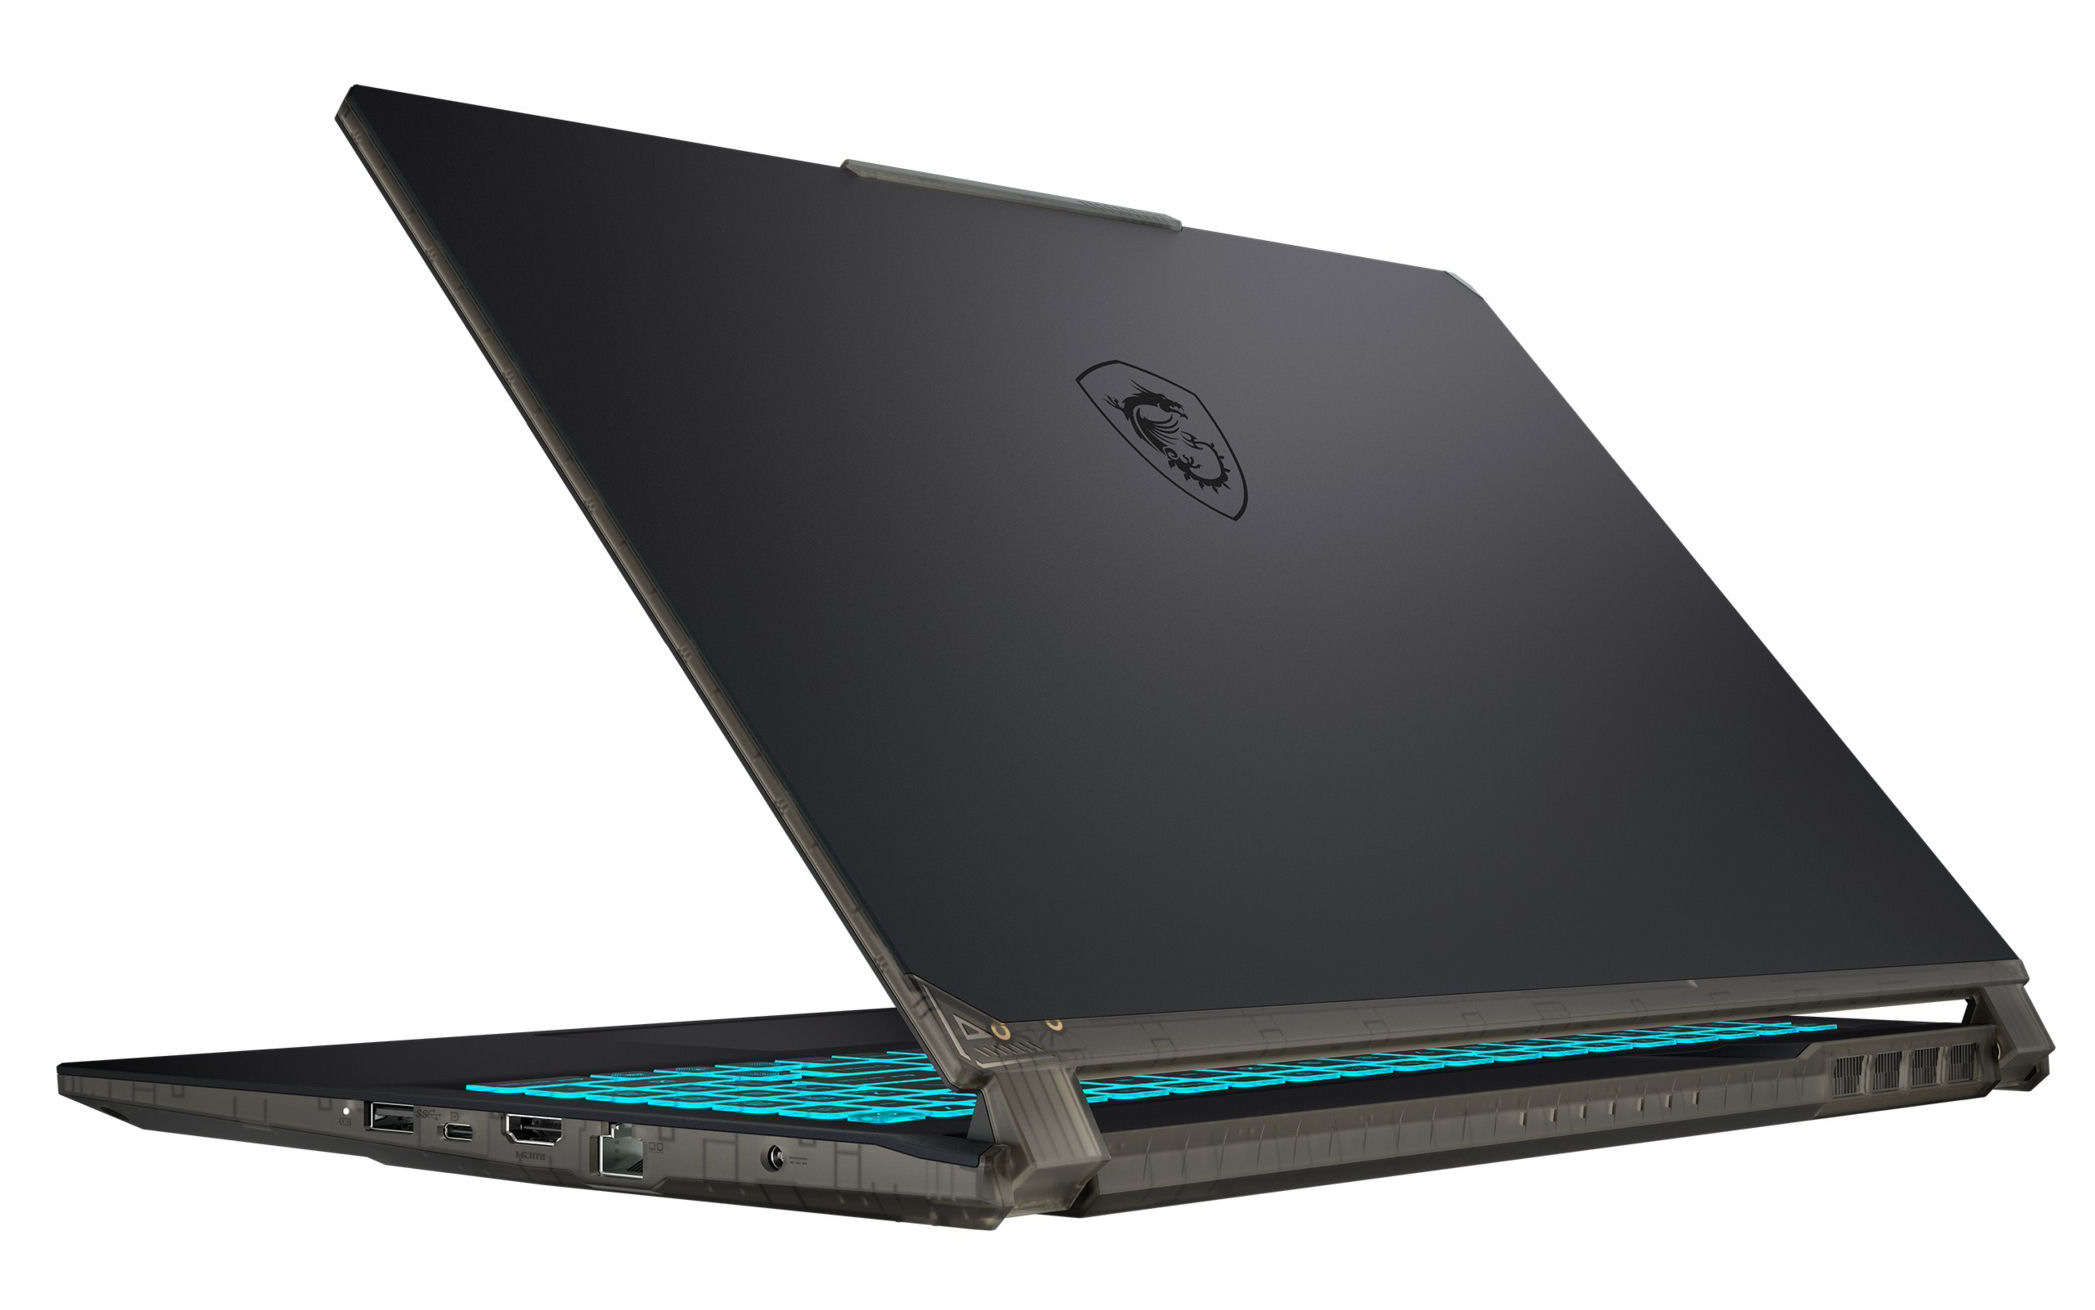
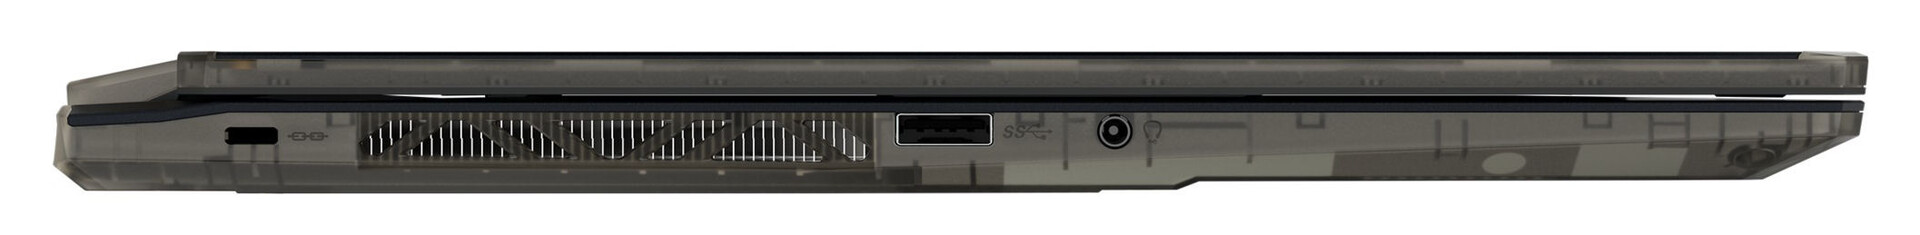
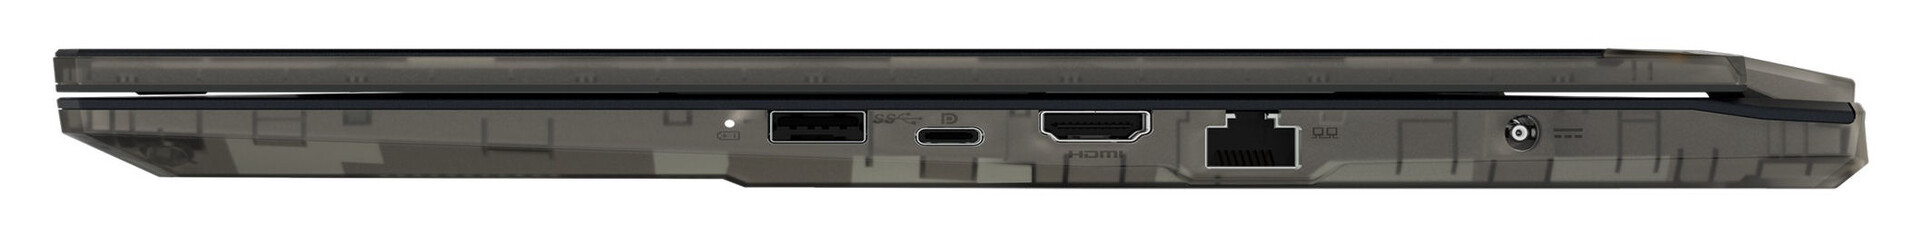
Wyposażenie w złącza jest ograniczone i obejmuje dwa dostępne porty USB-A (USB 3.2 Gen 1) oraz jeden port USB-C (USB 3.2 Gen 1). Ten ostatni obsługuje również DisplayPort. Razem są dwie opcje wyjścia wideo (1x DP, 1x HDMI). Ponadto jest łączony port audio, port Gigabit Ethernet oraz otwór na blokadę kabli. Czytnik kart pamięci masowej nie jest dostępny.
Komunikacja
Prędkości transferu WLAN wyznaczone w optymalnych warunkach (przy braku dodatkowych urządzeń WLAN w bliskim sąsiedztwie i niewielkiej odległości między laptopem a komputerem serwerowym) okazują się znakomite i odpowiadają możliwościom układu Wi-Fi (Intel AX201). Za połączenia sieci przewodowej odpowiada układ Gigabit Ethernet (RTL8168/8111; 1 Gbit/s) firmy Realtek.
| Networking | |
| iperf3 transmit AXE11000 | |
| MSI Cyborg 15 A12VF | |
| MSI Katana 15 B12VEK | |
| Przeciętny Intel Wi-Fi 6 AX201 (438 - 1715, n=74) | |
| Średnia w klasie Gaming (560 - 1862, n=95, ostatnie 2 lata) | |
| Schenker XMG Fusion 15 (Mid 22) | |
| Asus TUF Gaming A16 FA617 | |
| HP Victus 15 fa0020nr | |
| iperf3 receive AXE11000 | |
| MSI Cyborg 15 A12VF | |
| MSI Katana 15 B12VEK | |
| Schenker XMG Fusion 15 (Mid 22) | |
| Średnia w klasie Gaming (680 - 1745, n=95, ostatnie 2 lata) | |
| Przeciętny Intel Wi-Fi 6 AX201 (390 - 1734, n=79) | |
| Asus TUF Gaming A16 FA617 | |
| HP Victus 15 fa0020nr | |
| iperf3 receive AXE11000 6GHz | |
| Aorus 15 XE5 | |
| Średnia w klasie Gaming (975 - 1775, n=37, ostatnie 2 lata) | |
| Przeciętny Intel Wi-Fi 6 AX201 (390 - 1670, n=3) | |
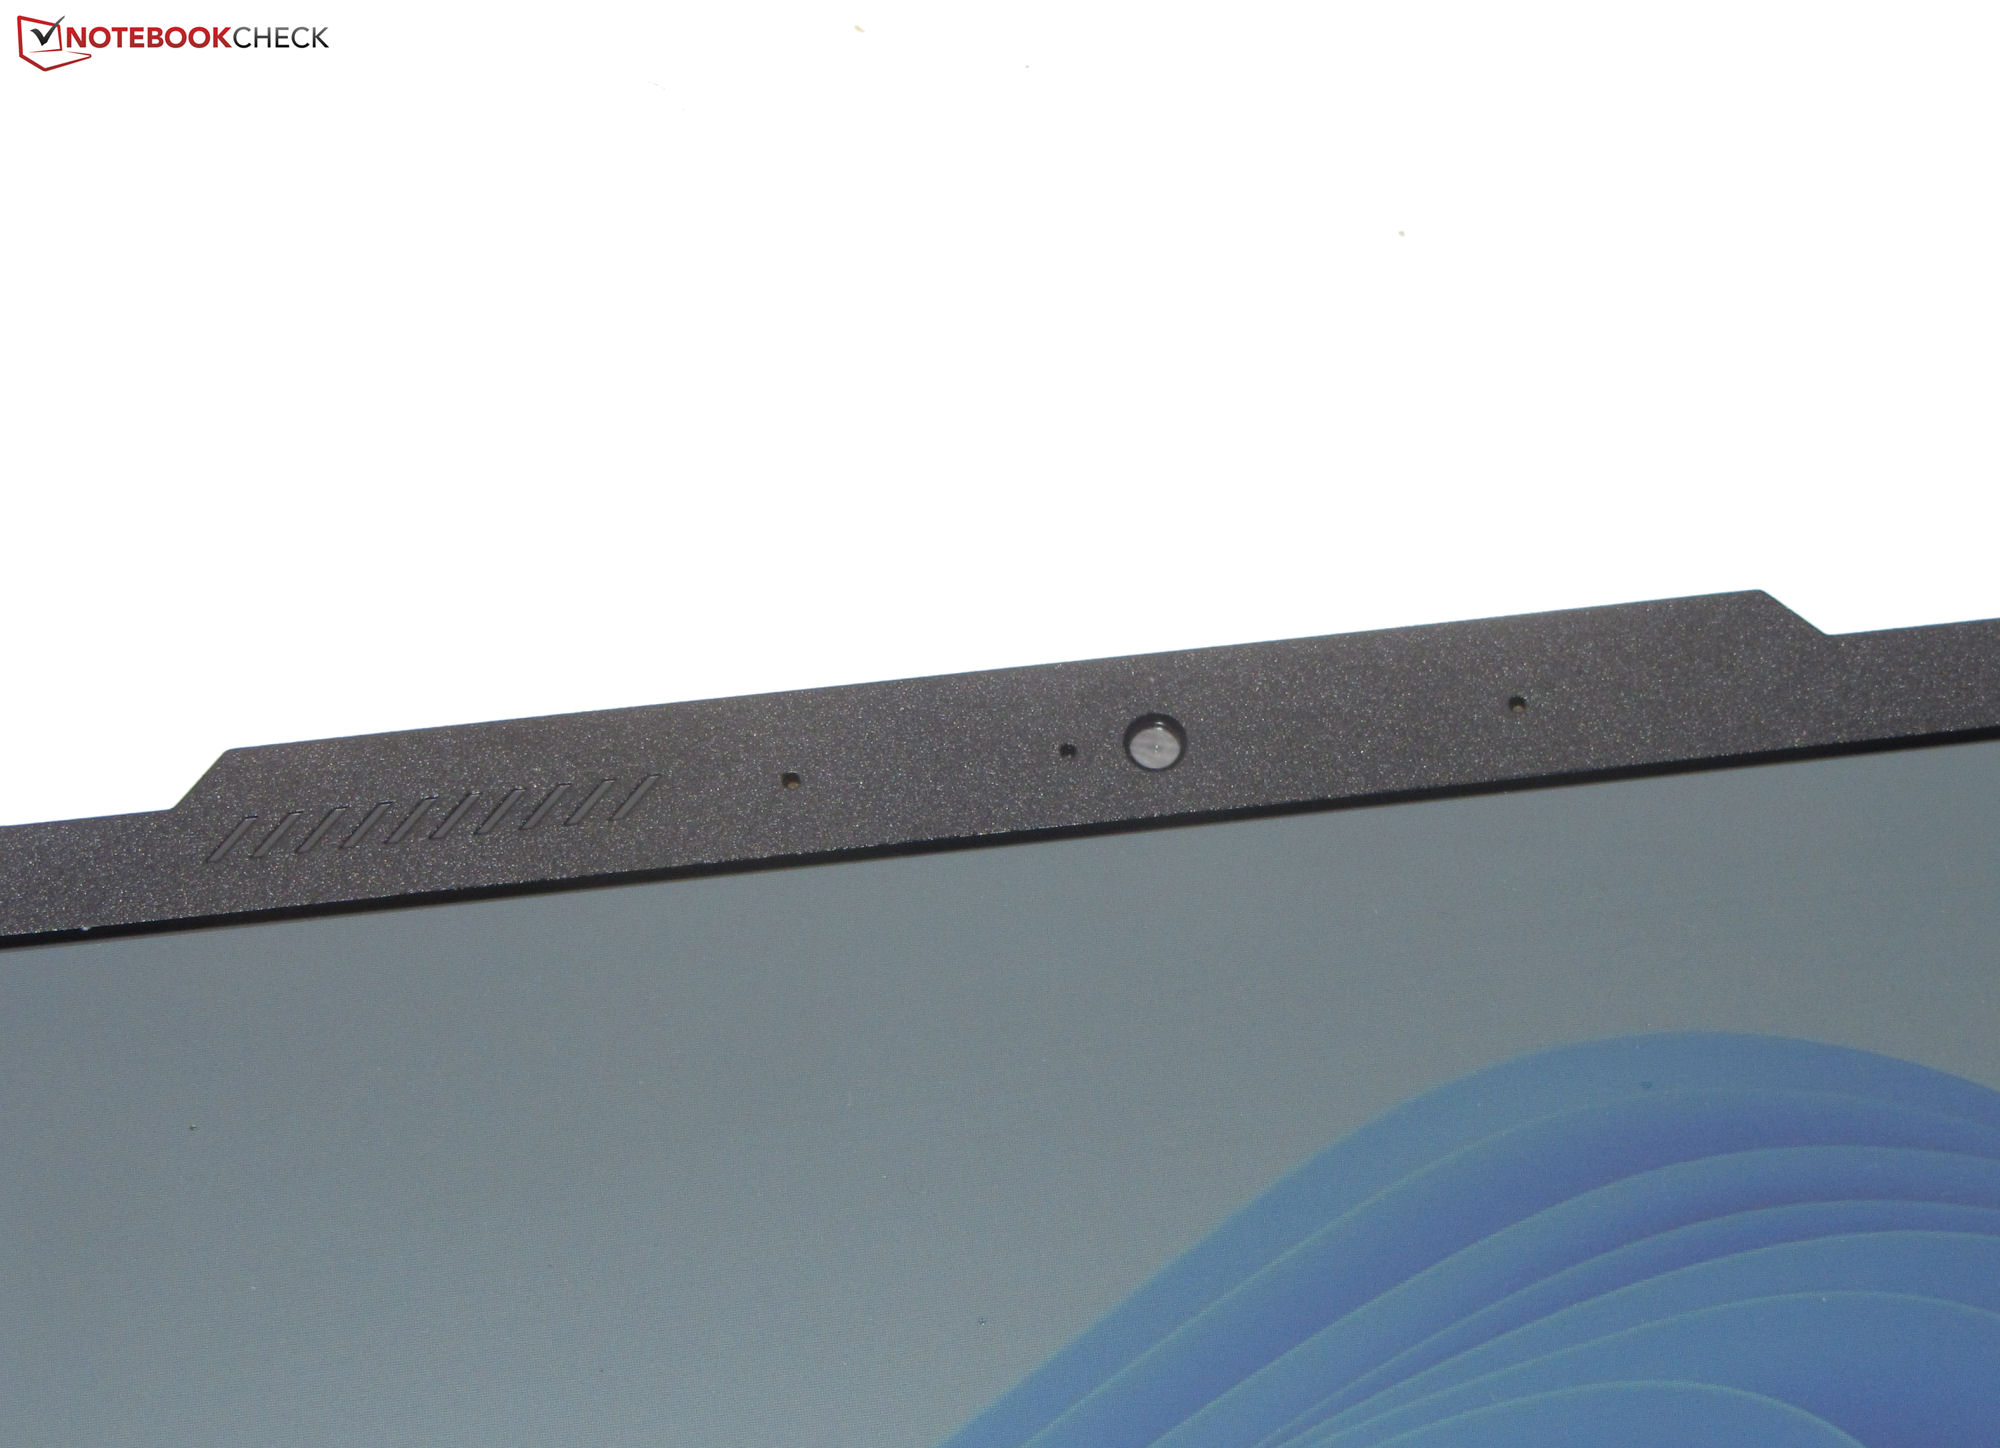
Kamera internetowa
Kamera internetowa (0,9 MP, maks. 1,280 x 720 pikseli) nie oferuje mechanicznej osłony. Jakość, którą zapewnia, jest standardowa. Brakuje dokładności kolorów, a przy odchyleniu kolorów wynoszącym około 16, cel DeltaE < 3 nie został osiągnięty.


Akcesoria
Laptop nie zawiera żadnych dodatkowych akcesoriów poza zwykłą dokumentacją (instrukcja szybkiego startu i informacje o gwarancji).
Konserwacja
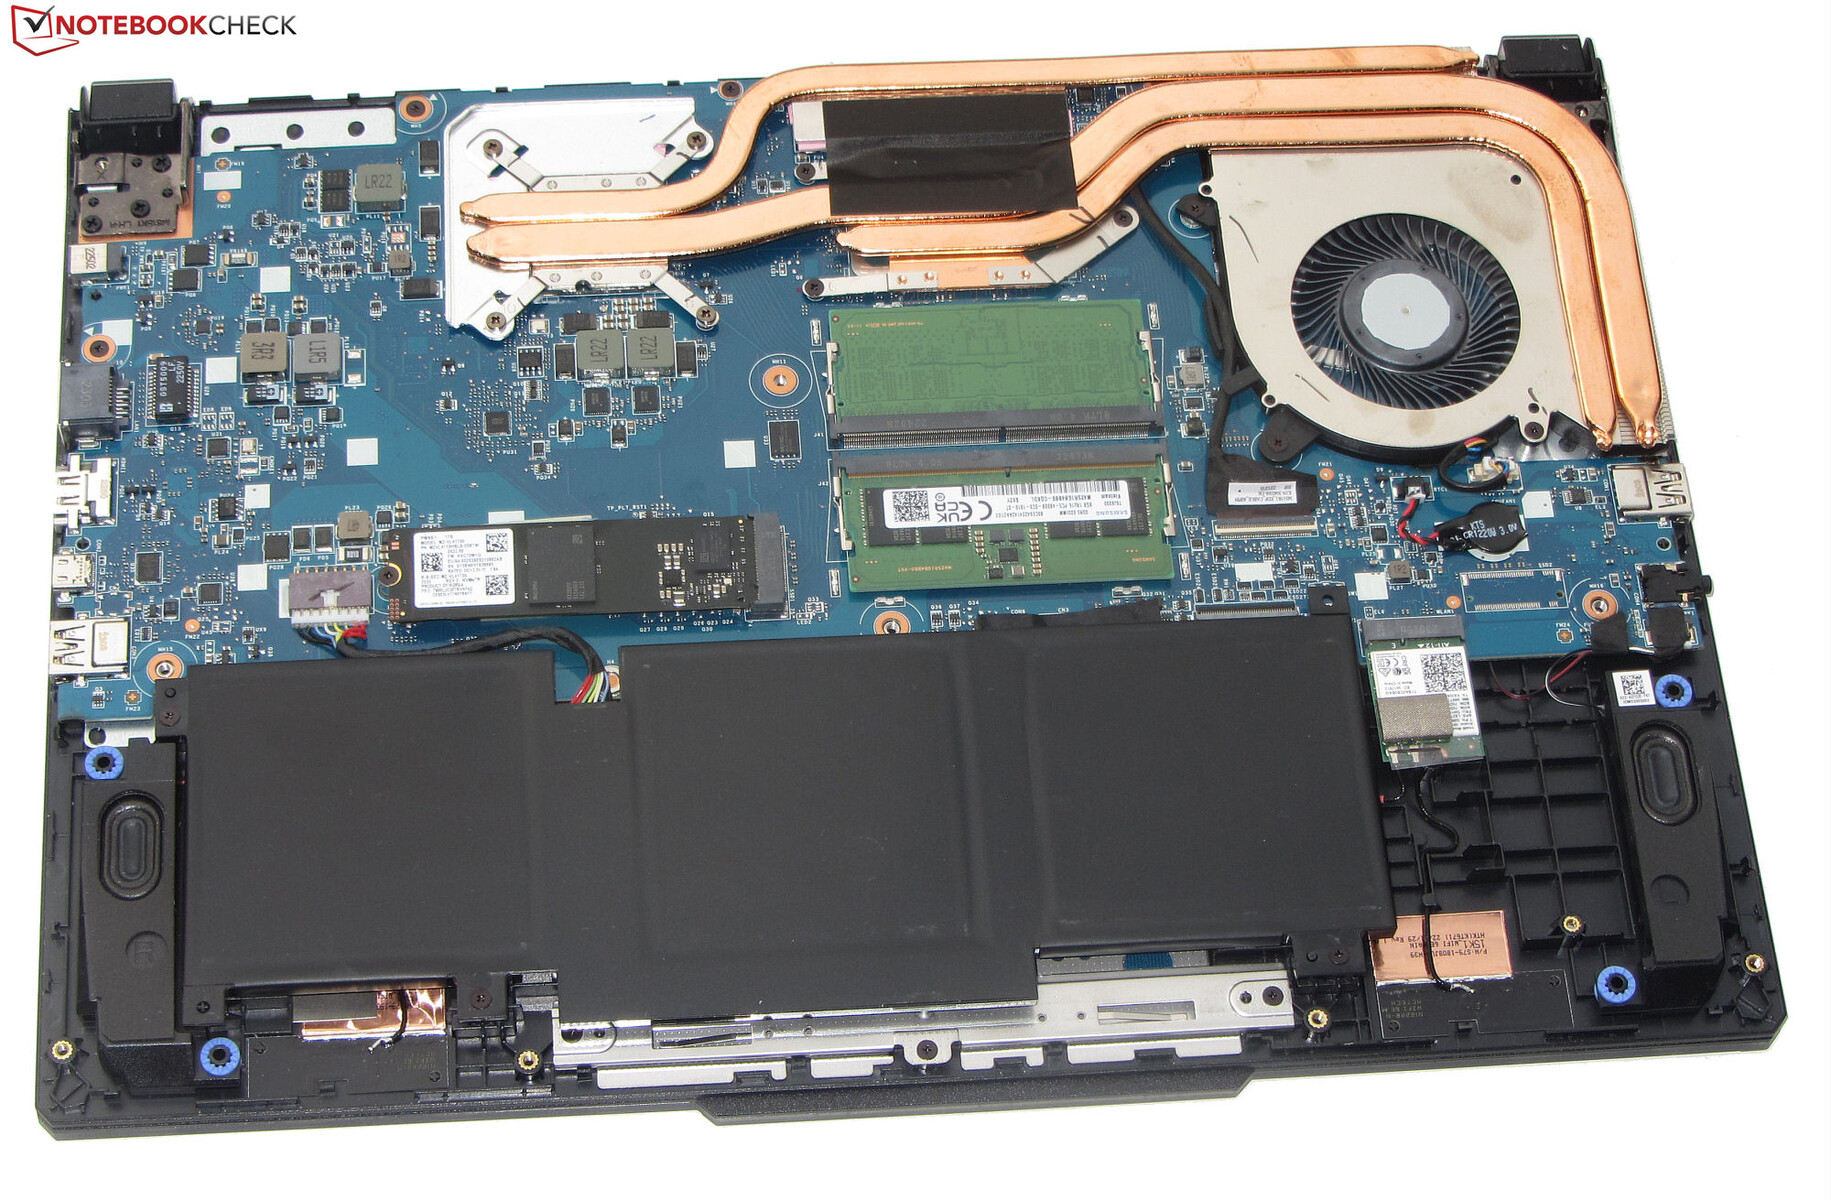
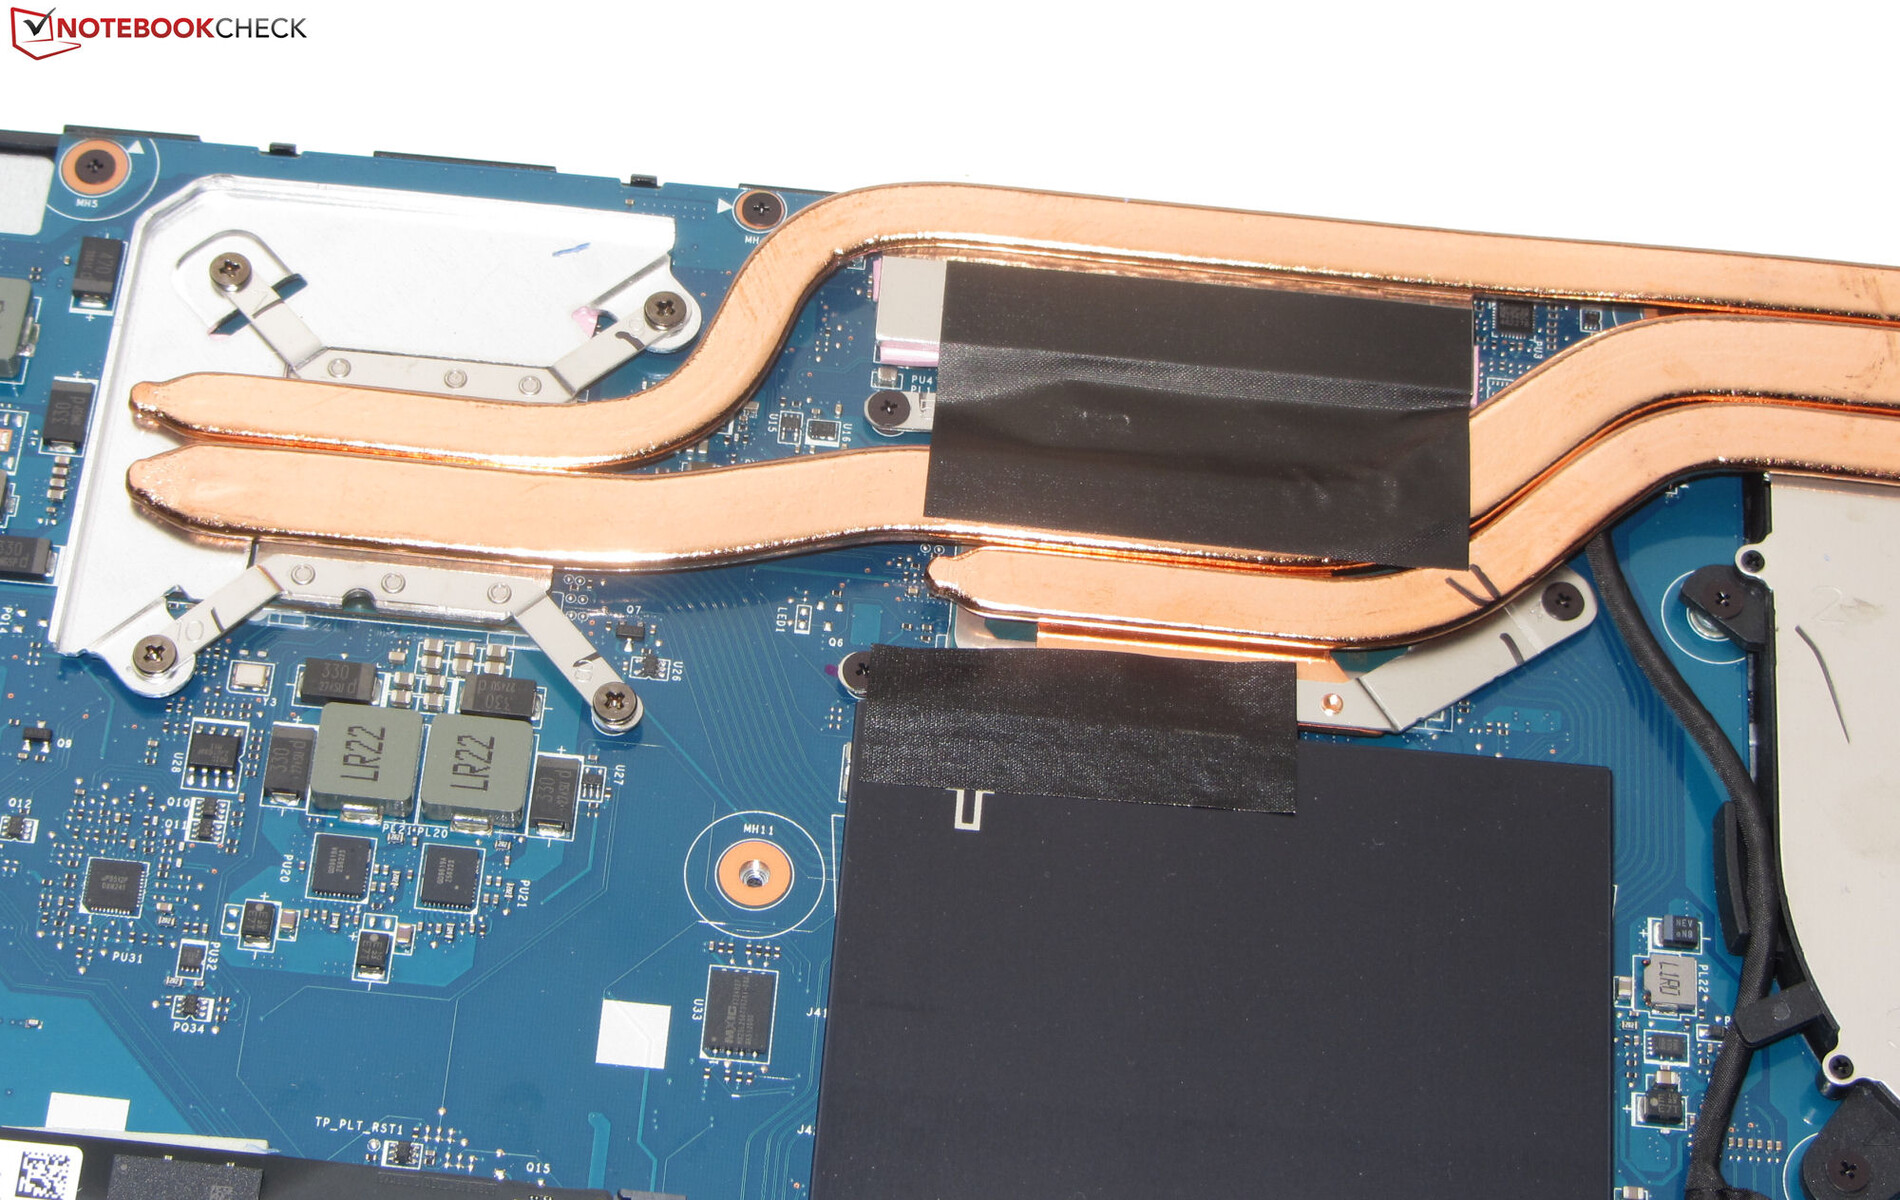
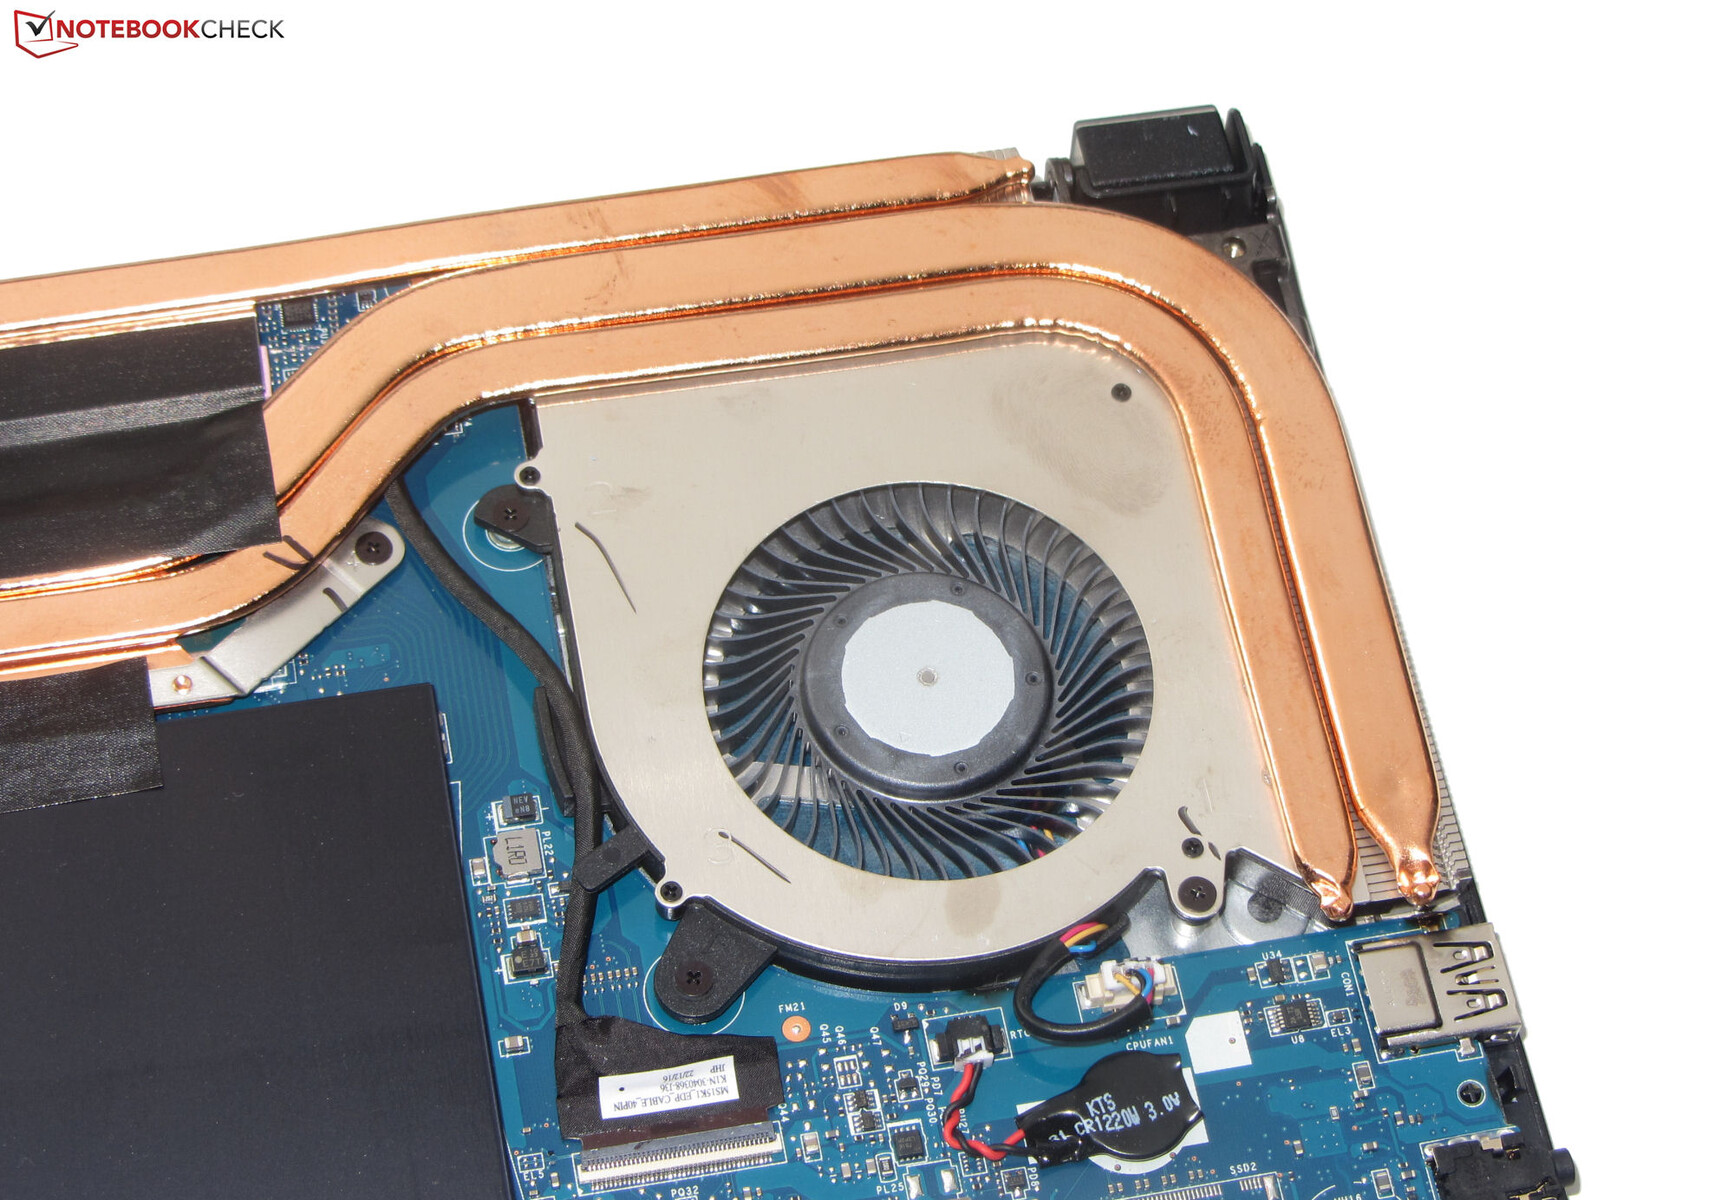
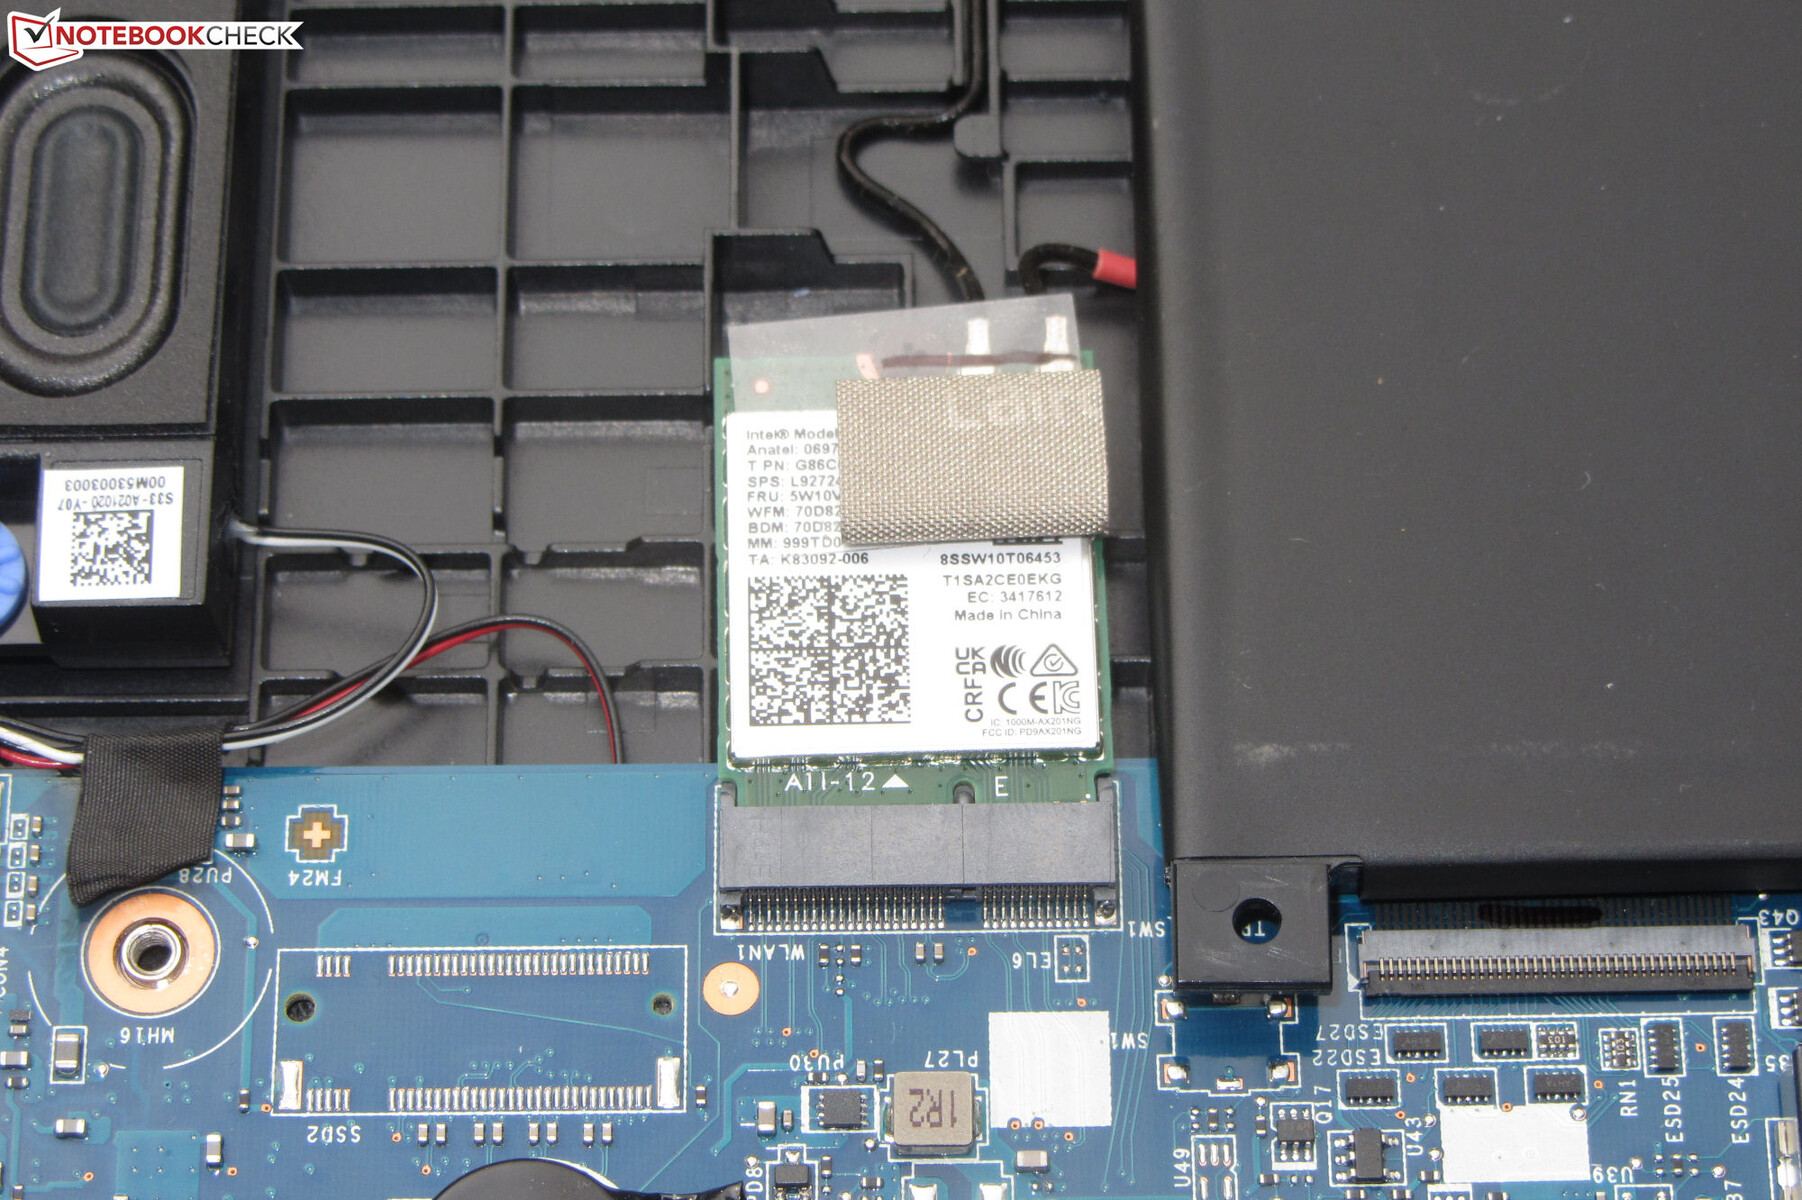
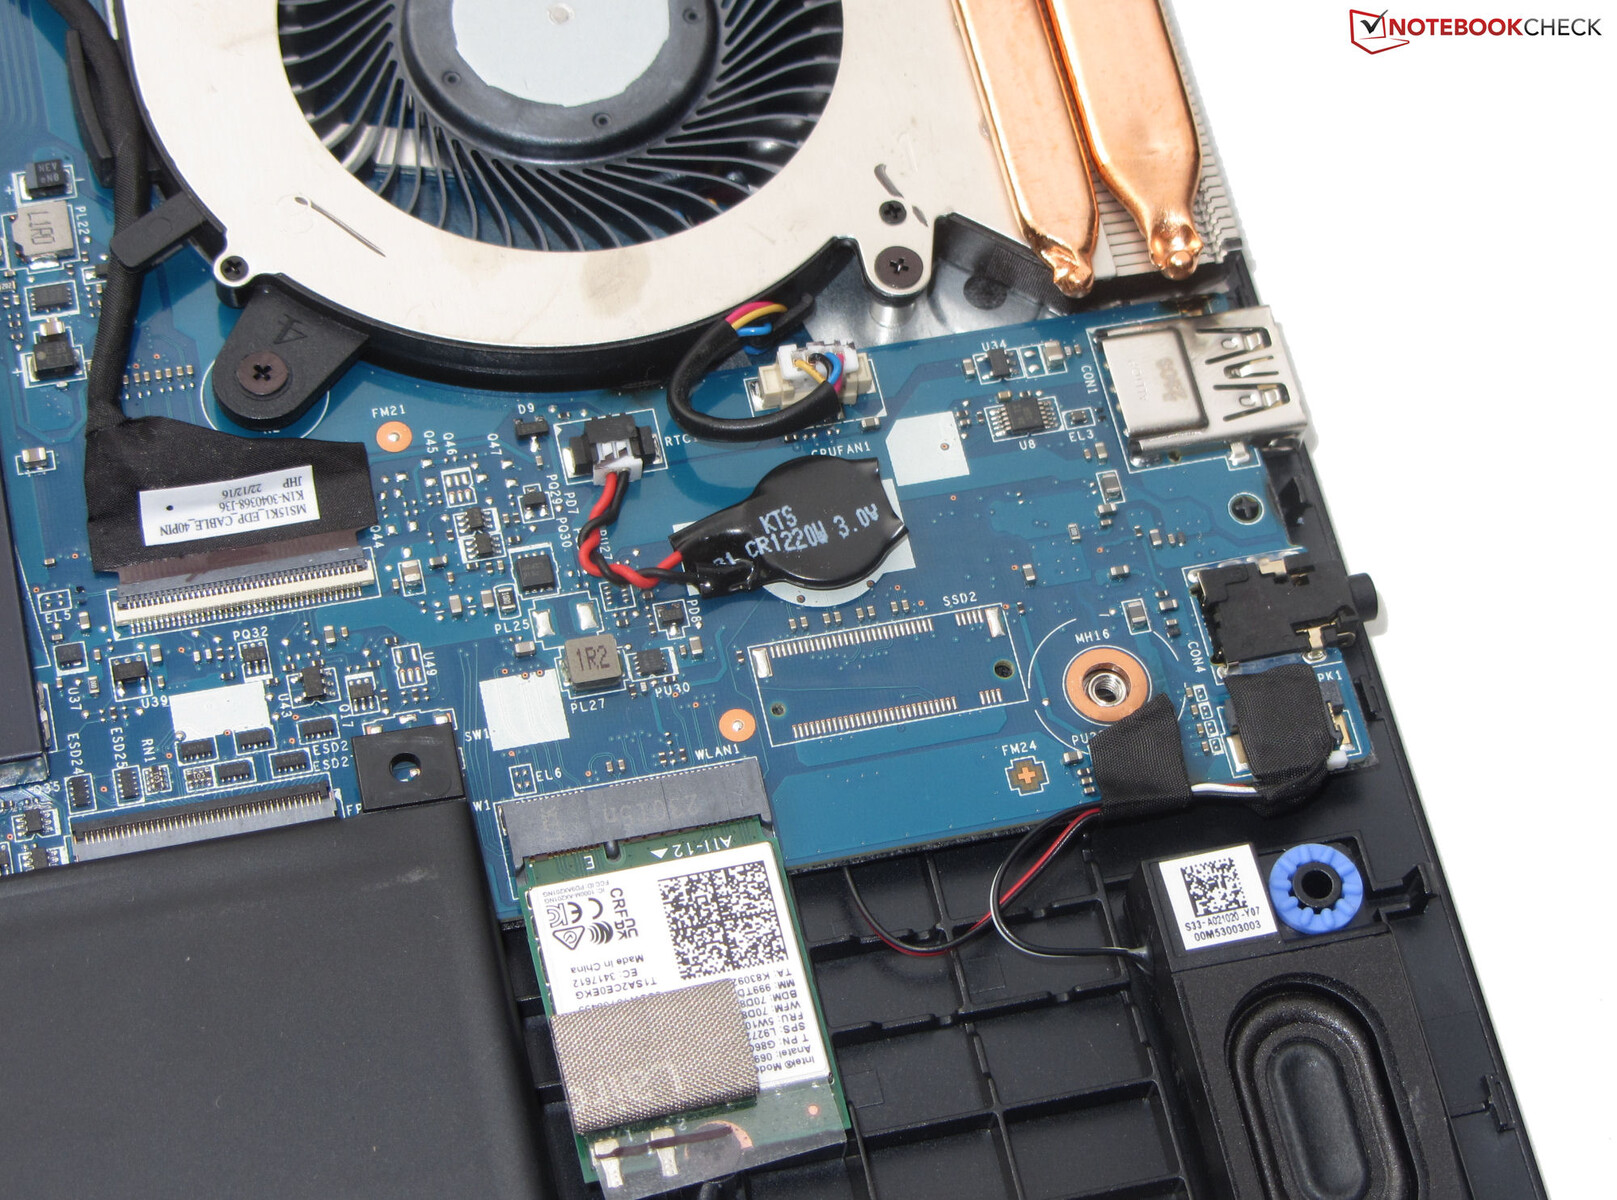
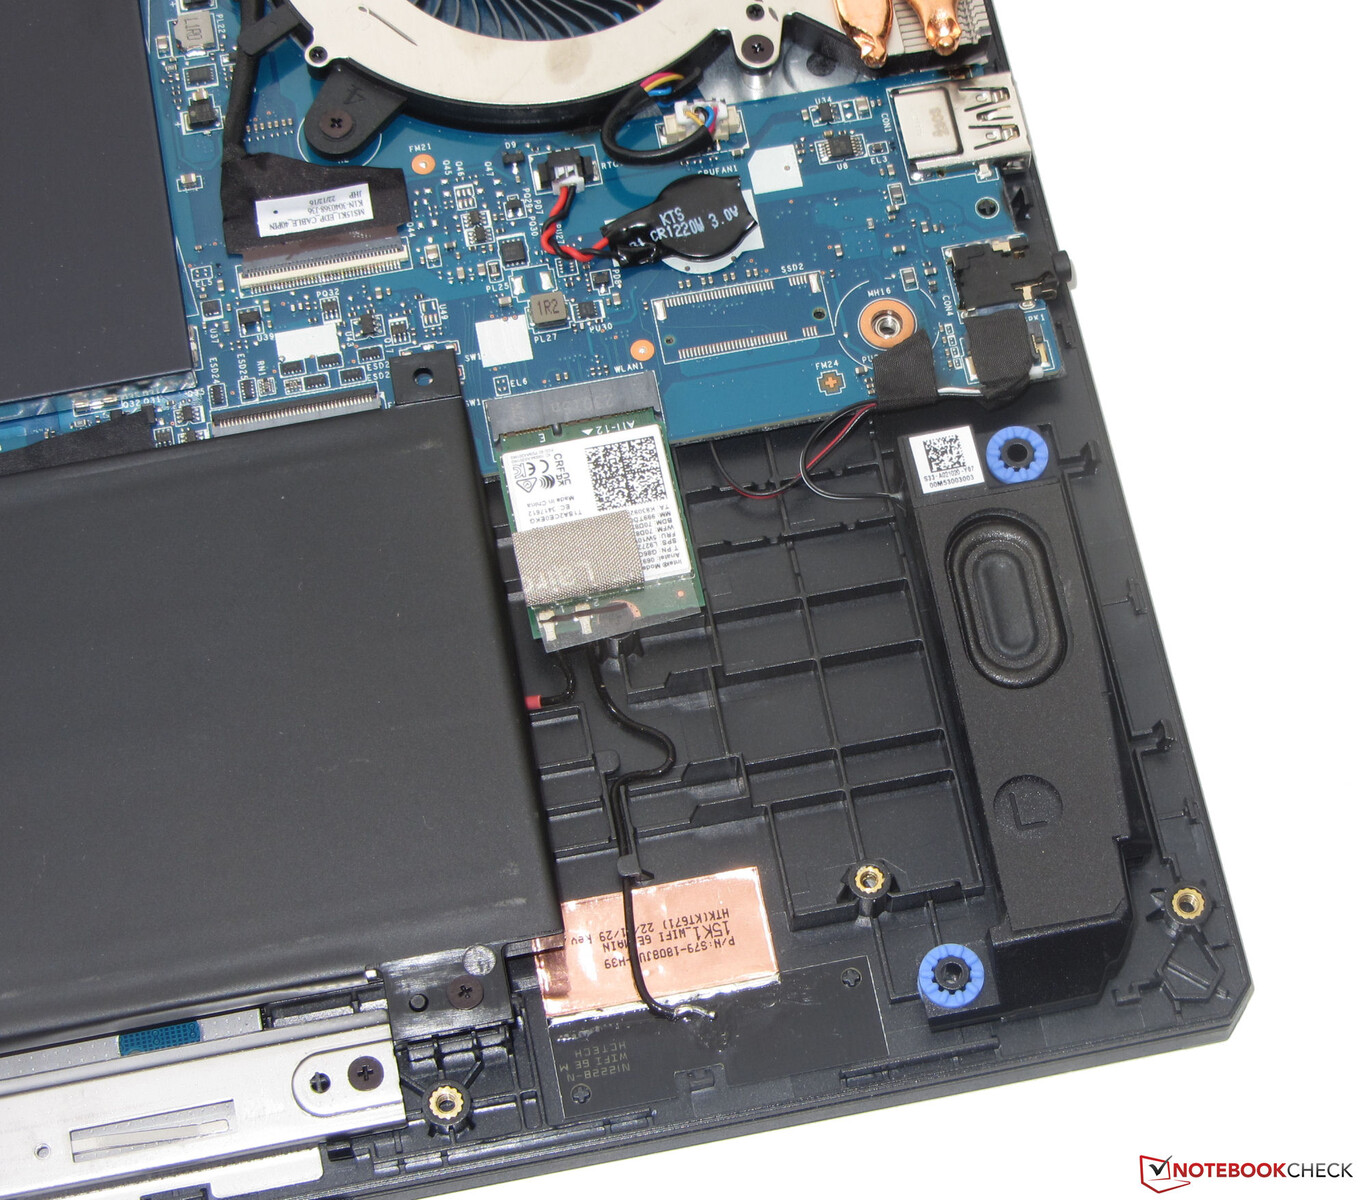
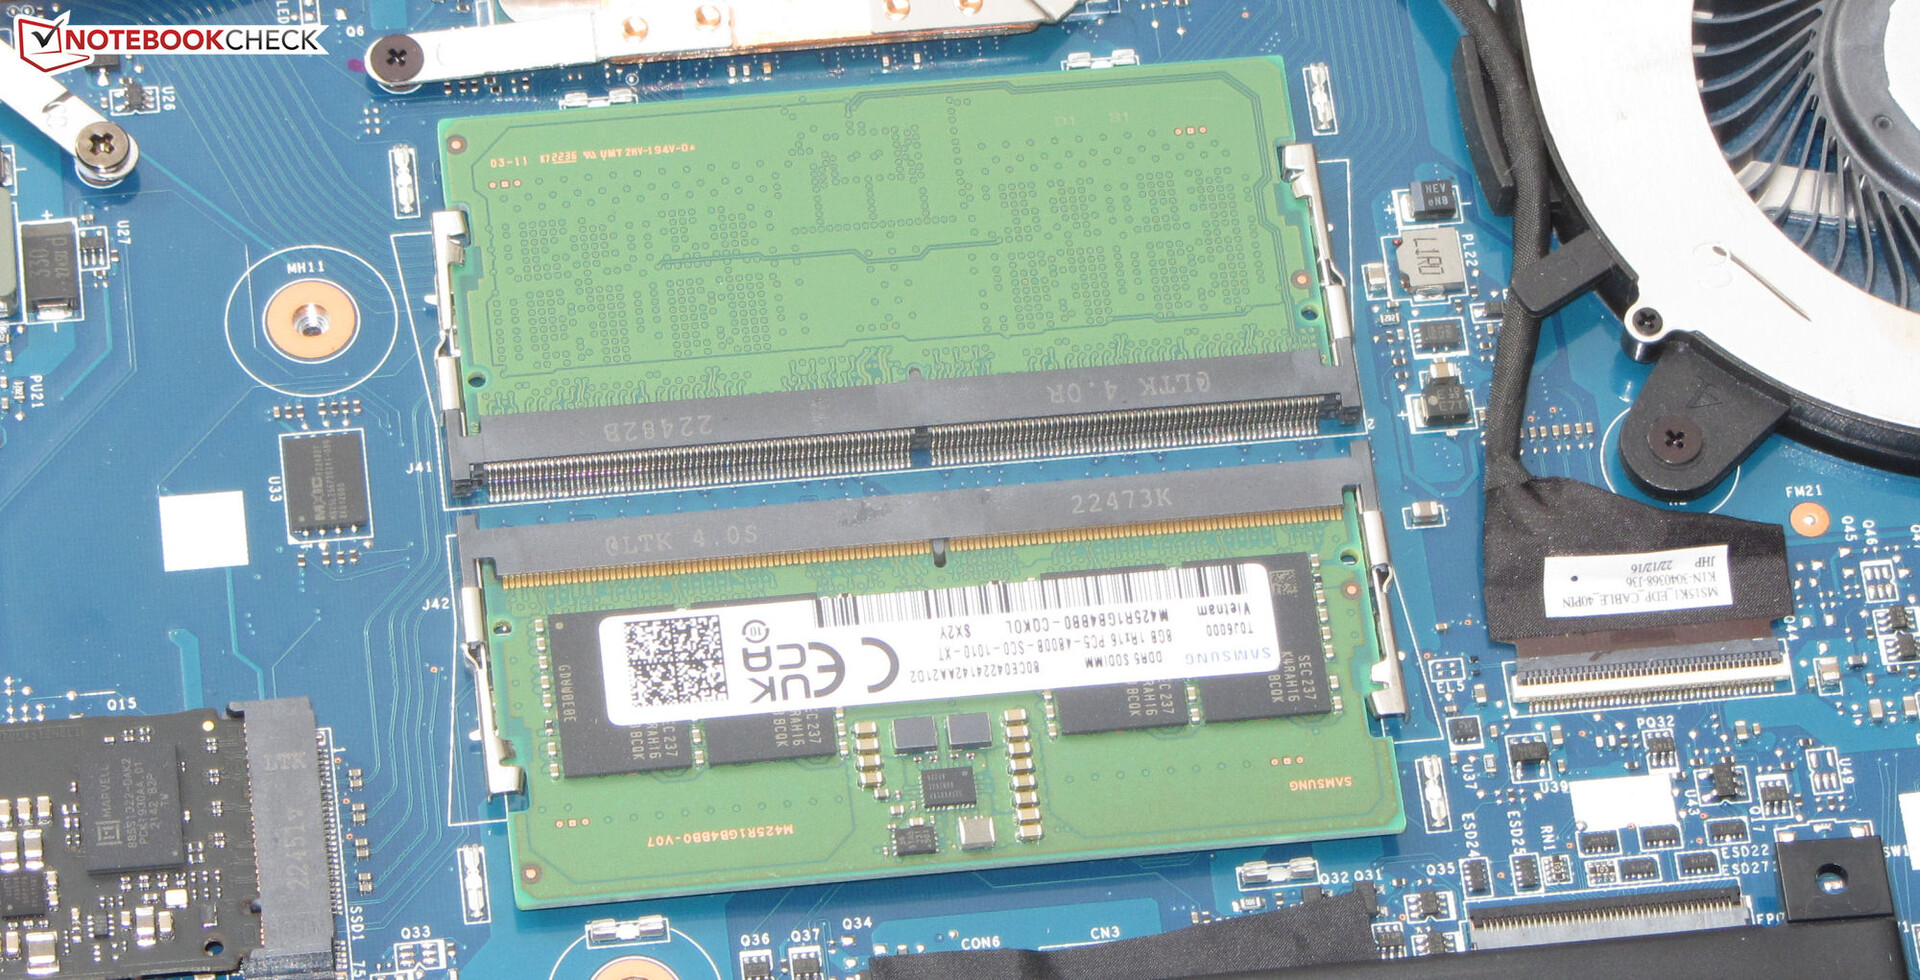
Po odkręceniu wszystkich śrubek na spodzie, spód obudowy można zdjąć przy pomocy małego wazonu lub szpachelki. Trzeba jednak uważać, gdyż jest on trzymany przez dość ciasne plastikowe zaczepy. Po zdjęciu spodu uzyskujemy dostęp do banków pamięci roboczej (oba zajęte), dysku SSD (PCIe 4), baterii BIOS-u, modułu WLAN, wentylatora, głośników i akumulatora.

Gwarancja
MSI oferuje w Niemczech 2-letni okres gwarancji na 15,6-calowy laptop. Można też wykupić przedłużenie gwarancji o rok lub dwa lata za odpowiednio około 120 i 250 euro (~133 i 276 dolarów).
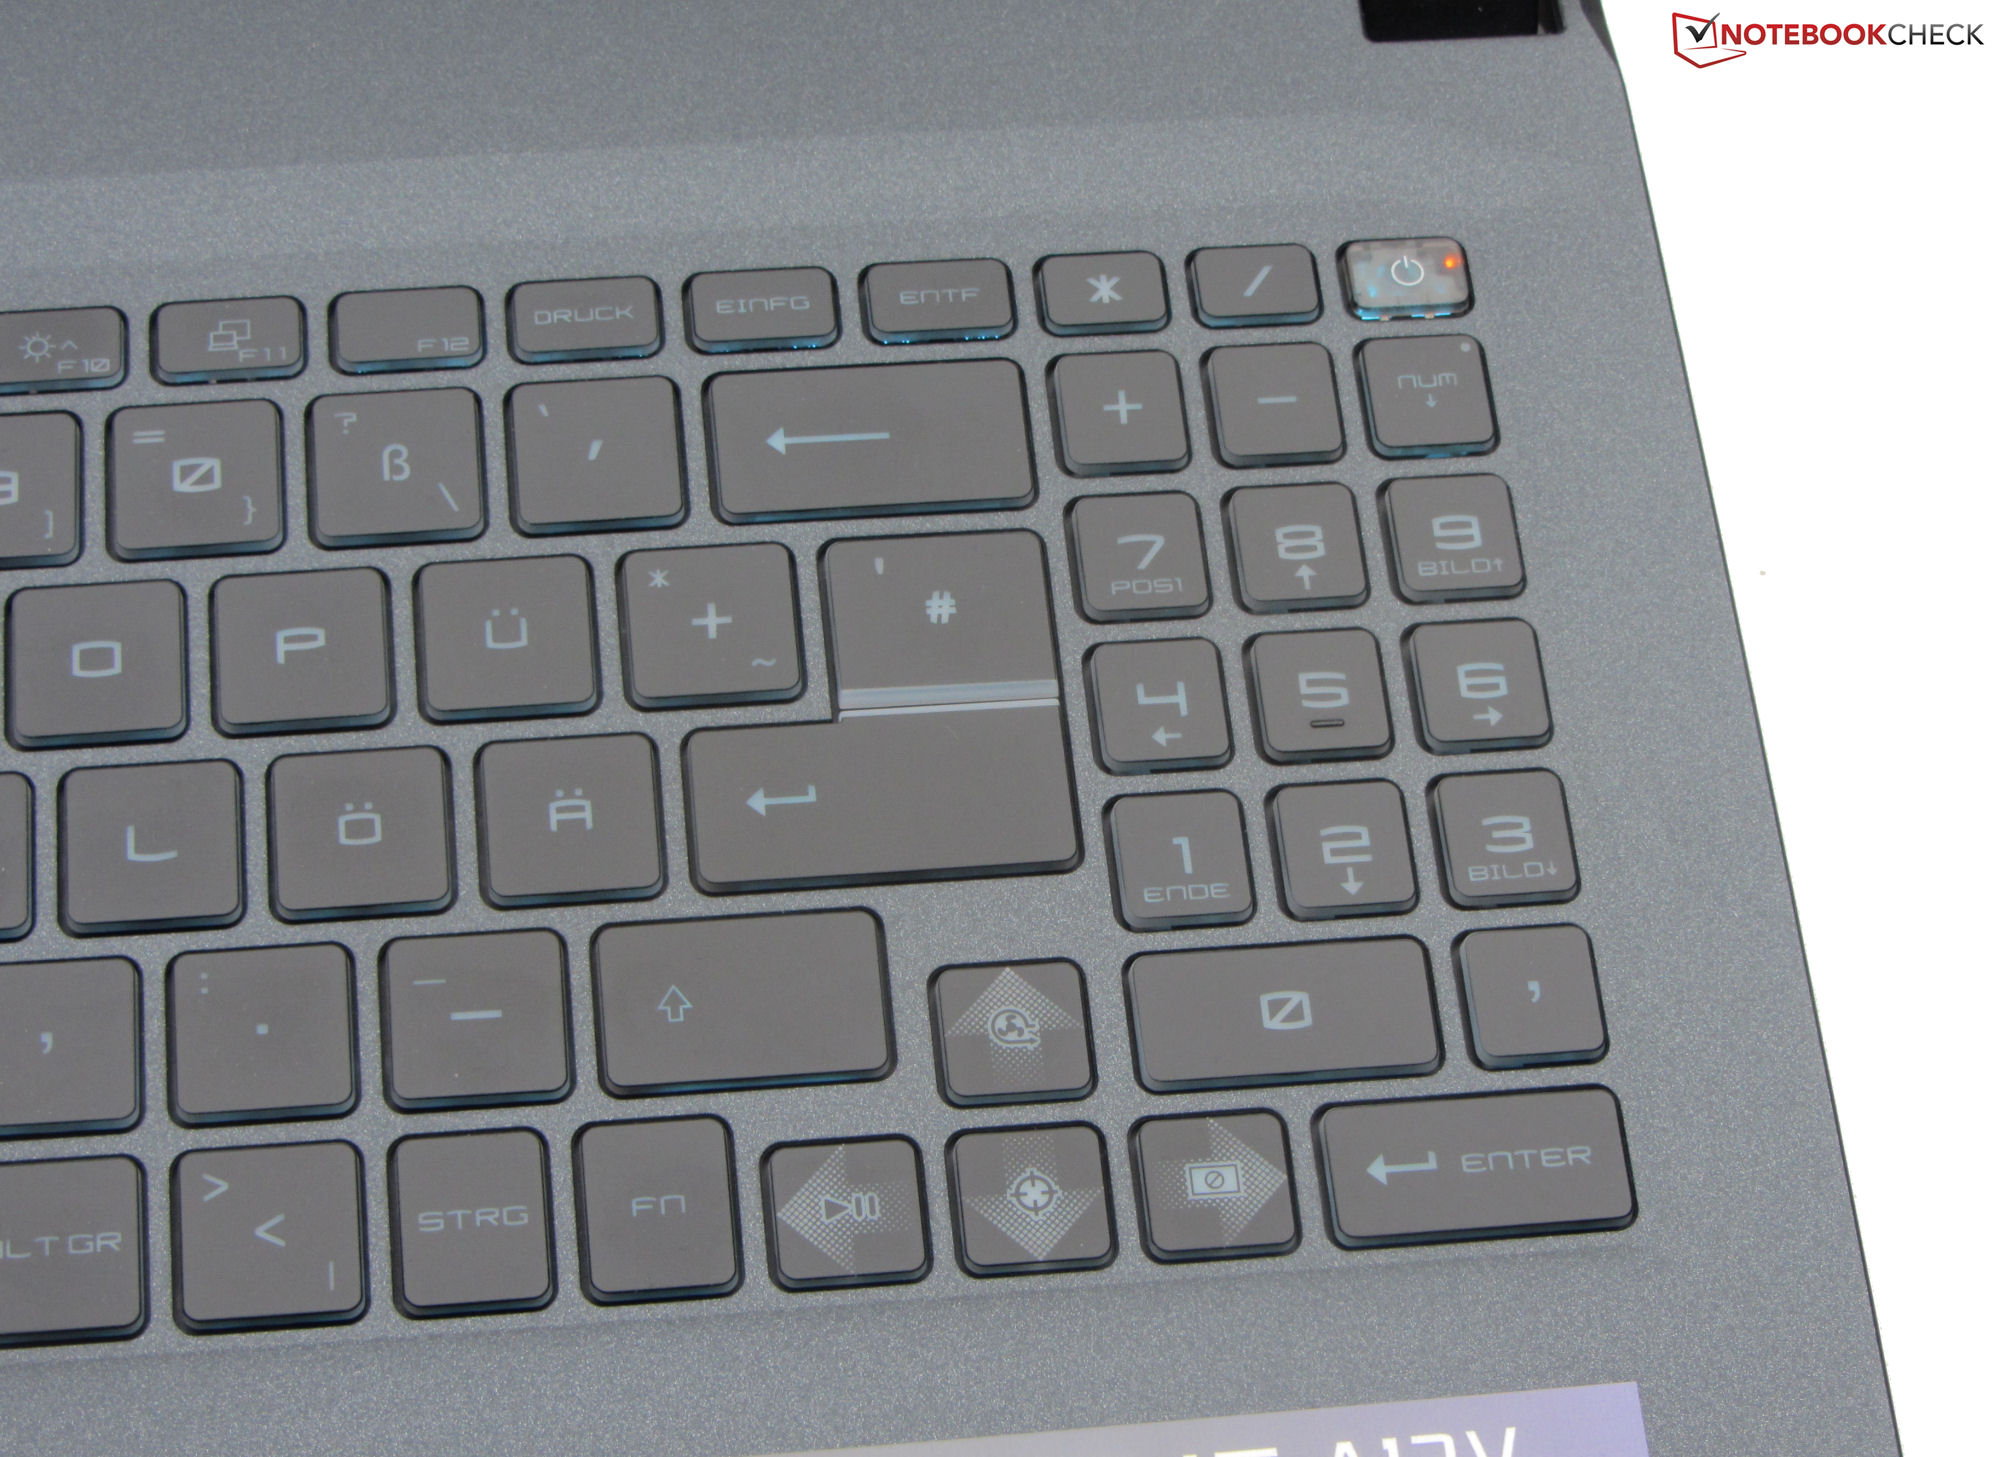
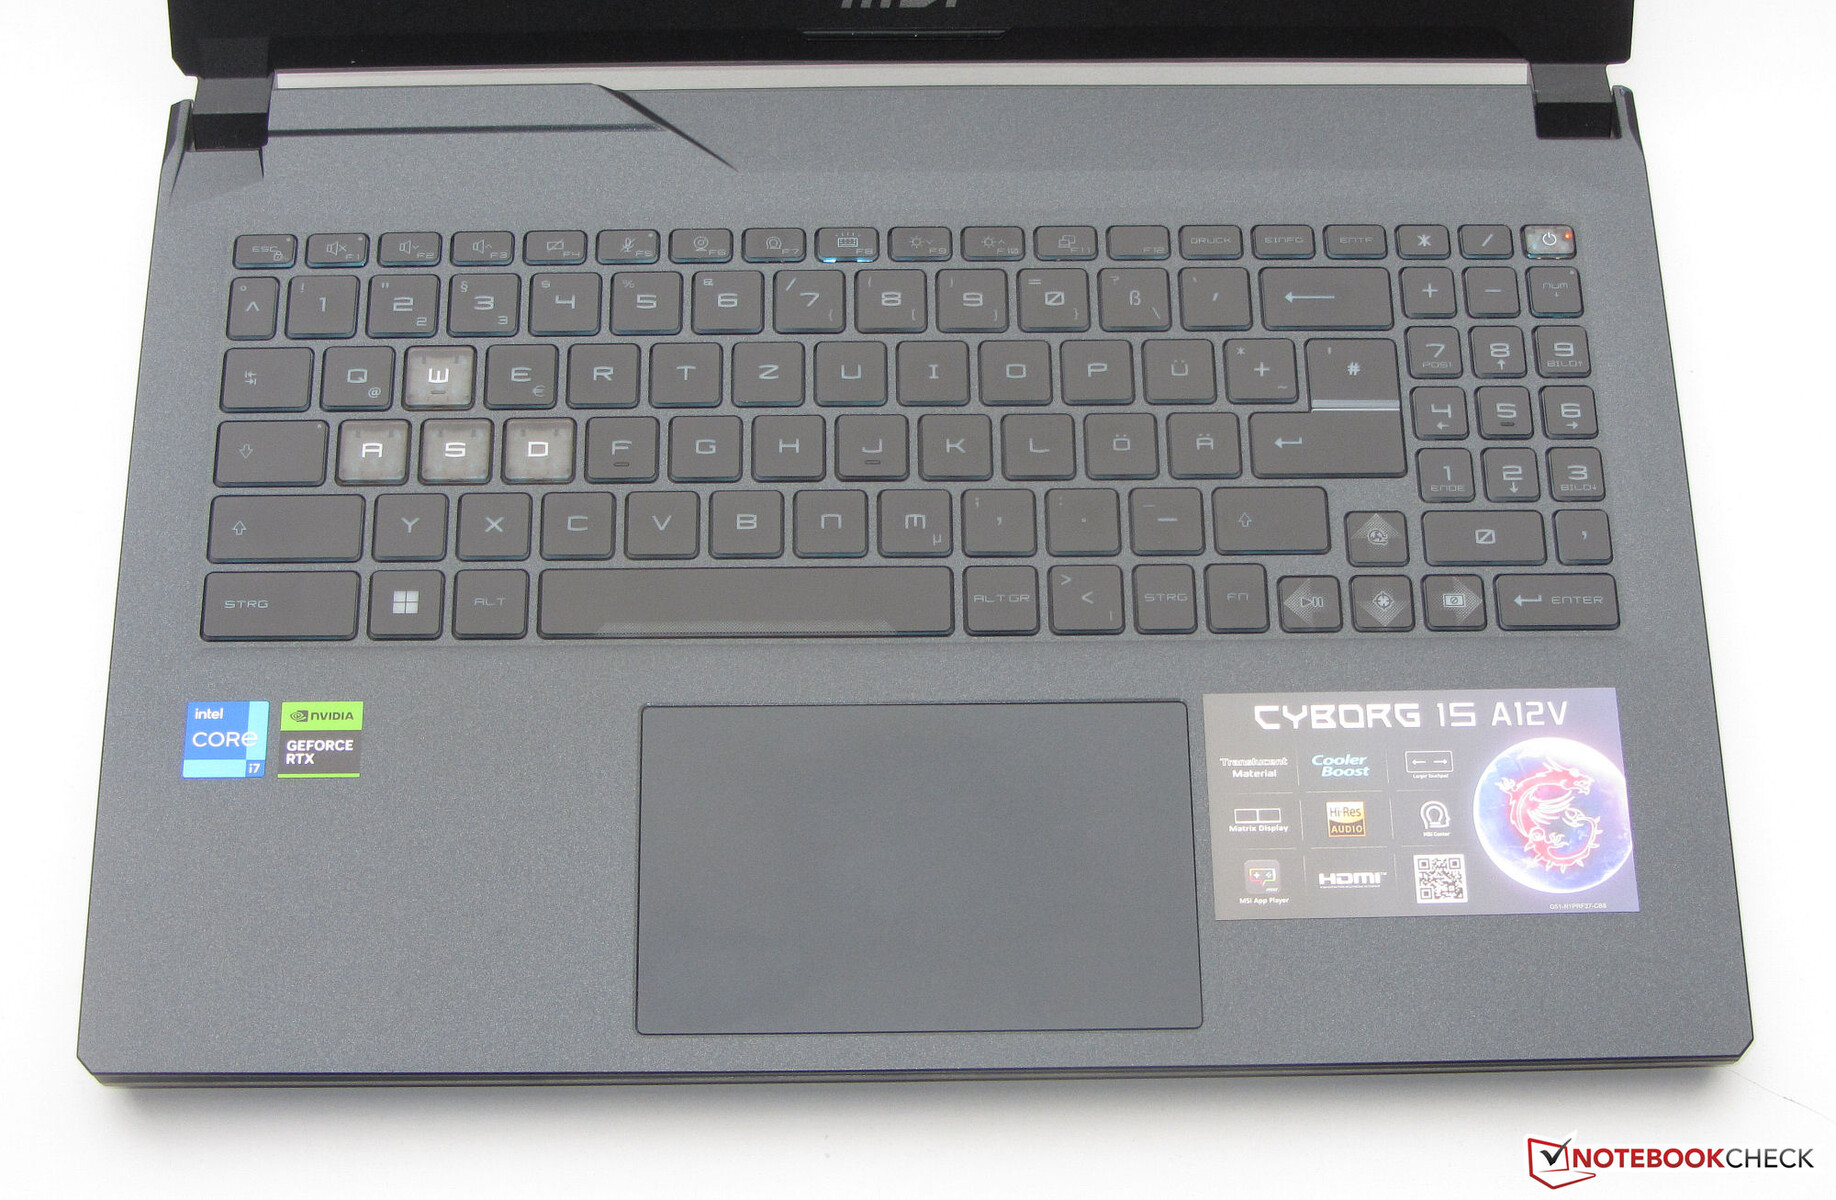
Urządzenia wejściowe - Cyborg wyróżnia klawisze WASD do gier
Klawiatura
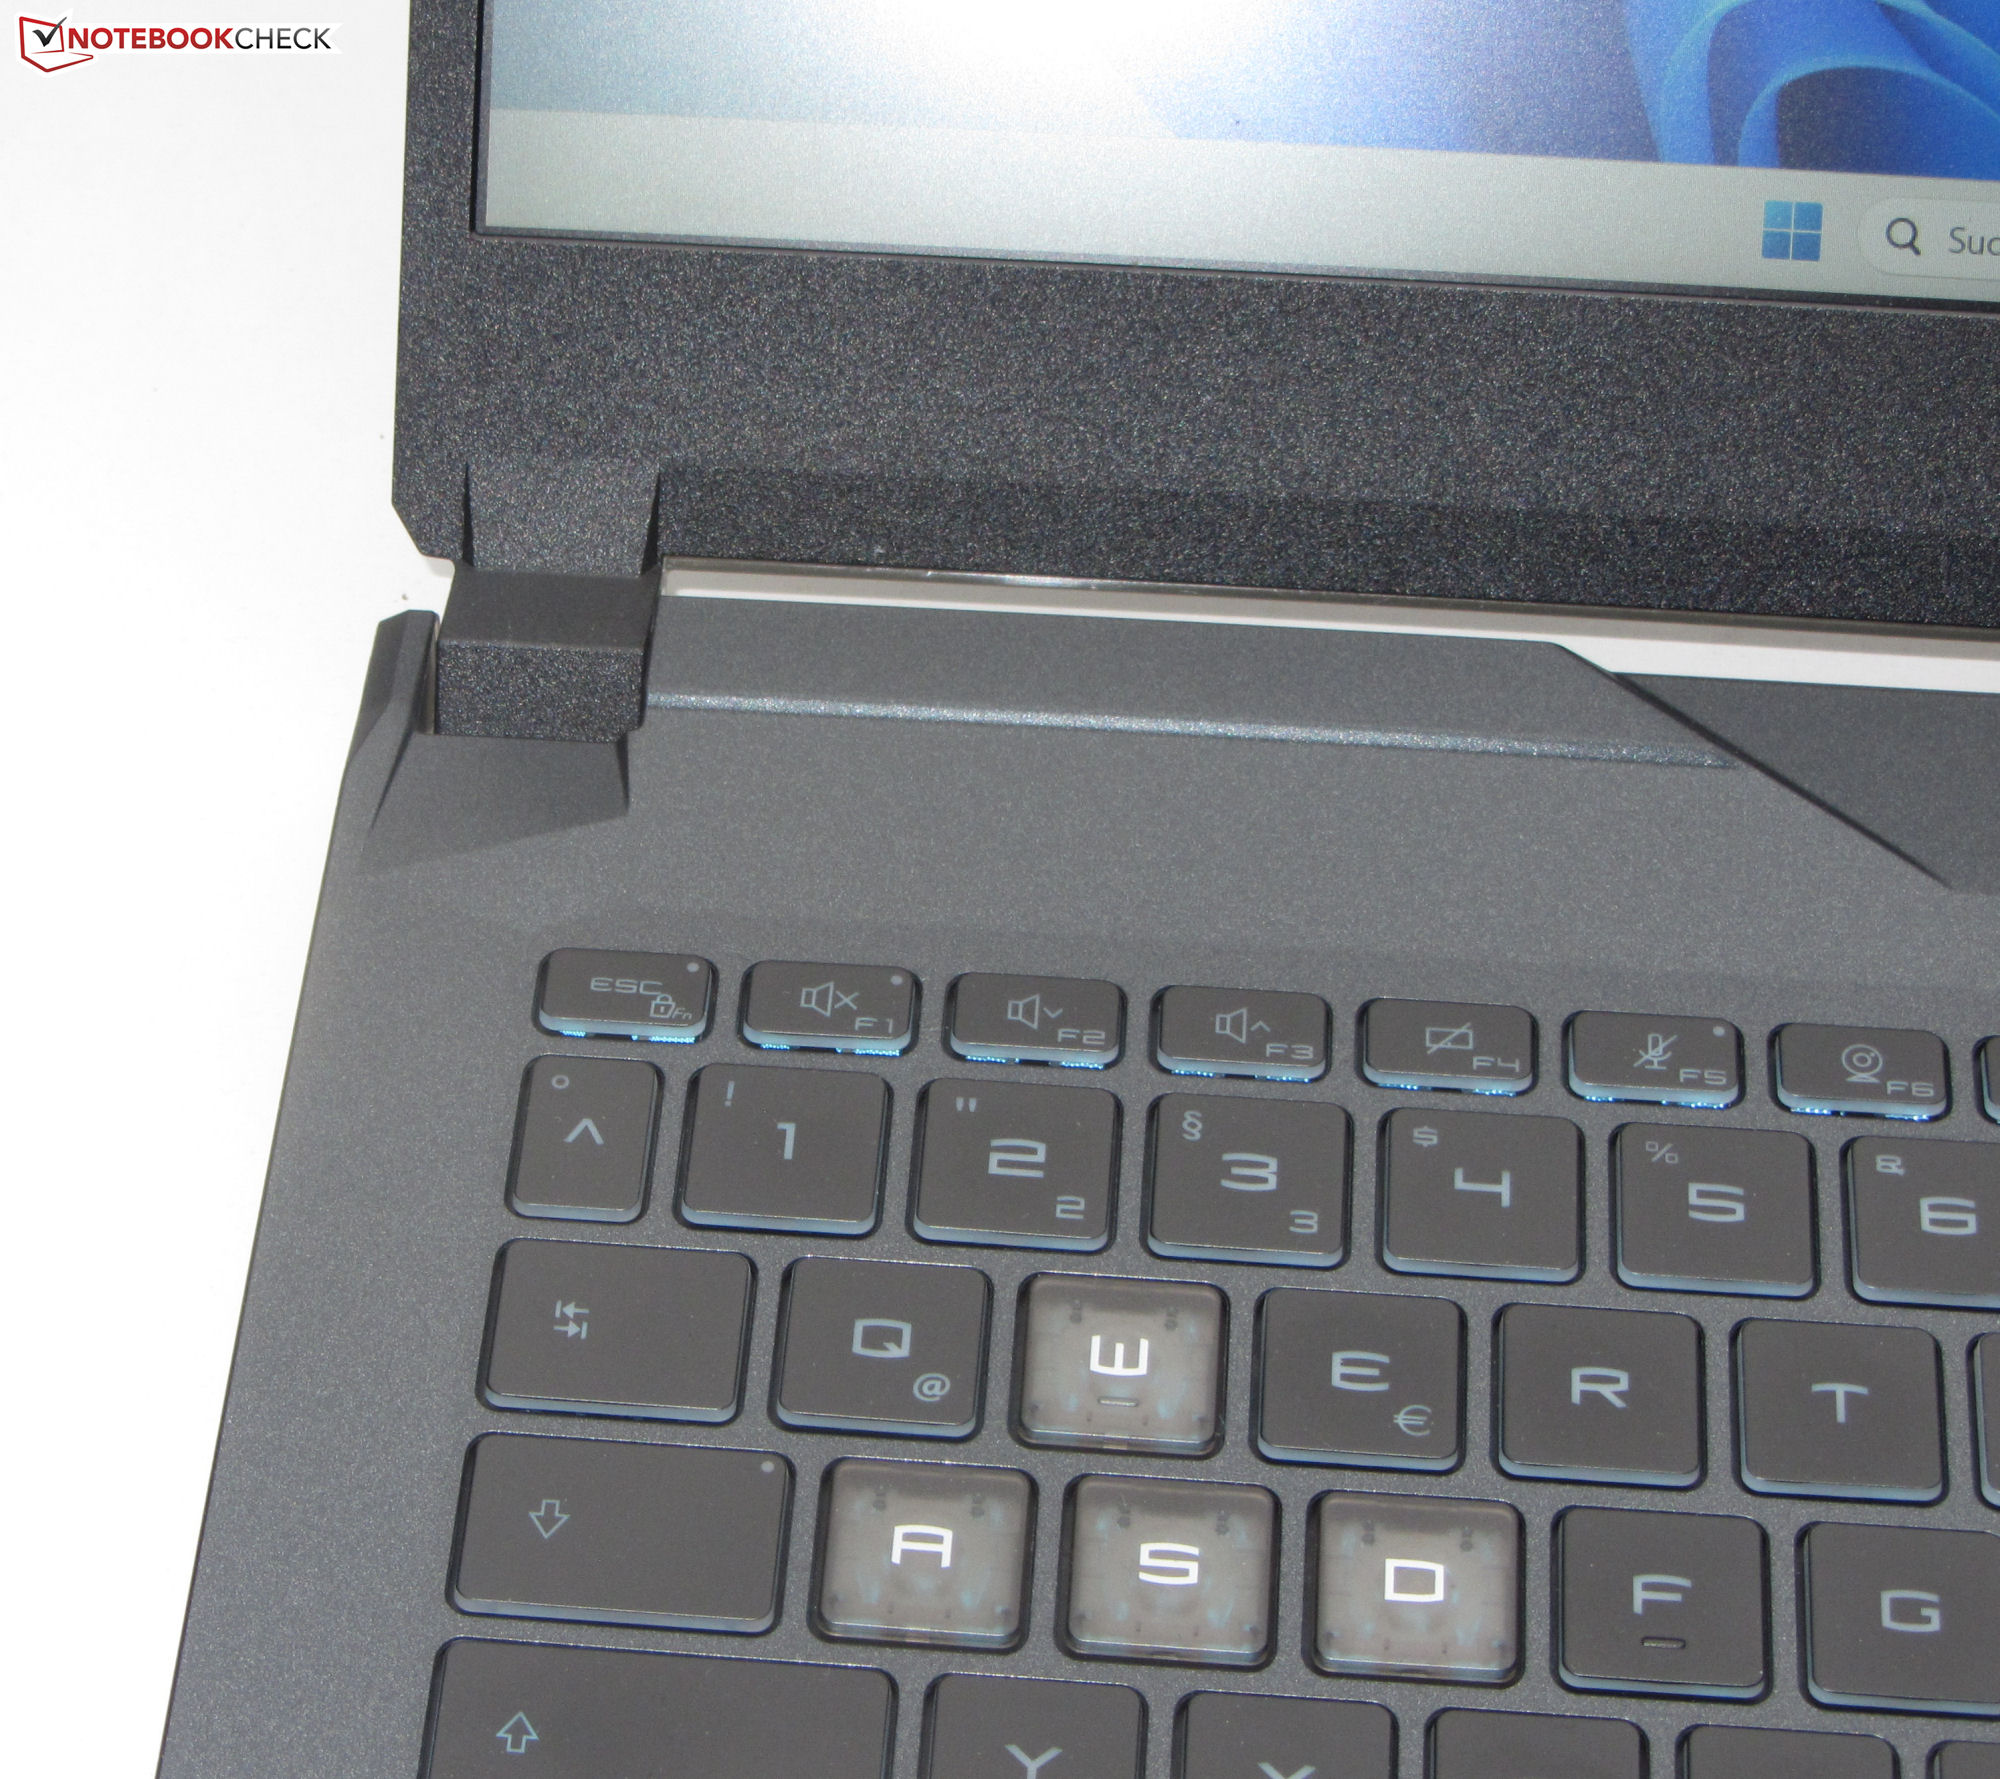
Płaskie i gładkie klawisze podświetlanej klawiatury typu chiclet oferują krótki skok i wyraźny punkt nacisku. Opór stawiany przez klawisze jest przyzwoity. Klawiatura ma pewne lekkie danie podczas pisania, ale nie okazuje się to denerwujące. Typowy dla urządzeń MSI klawisz "Fn" nie jest umieszczony w tym samym miejscu, co zwykle w innych klawiaturach laptopów. Jednokolorowe podświetlenie klawiatury oferuje trzy stopnie jasności i jest sterowane za pomocą klawisza funkcyjnego. Ogólnie rzecz biorąc, MSI dostarcza klawiaturę, która nadaje się do codziennej pracy.
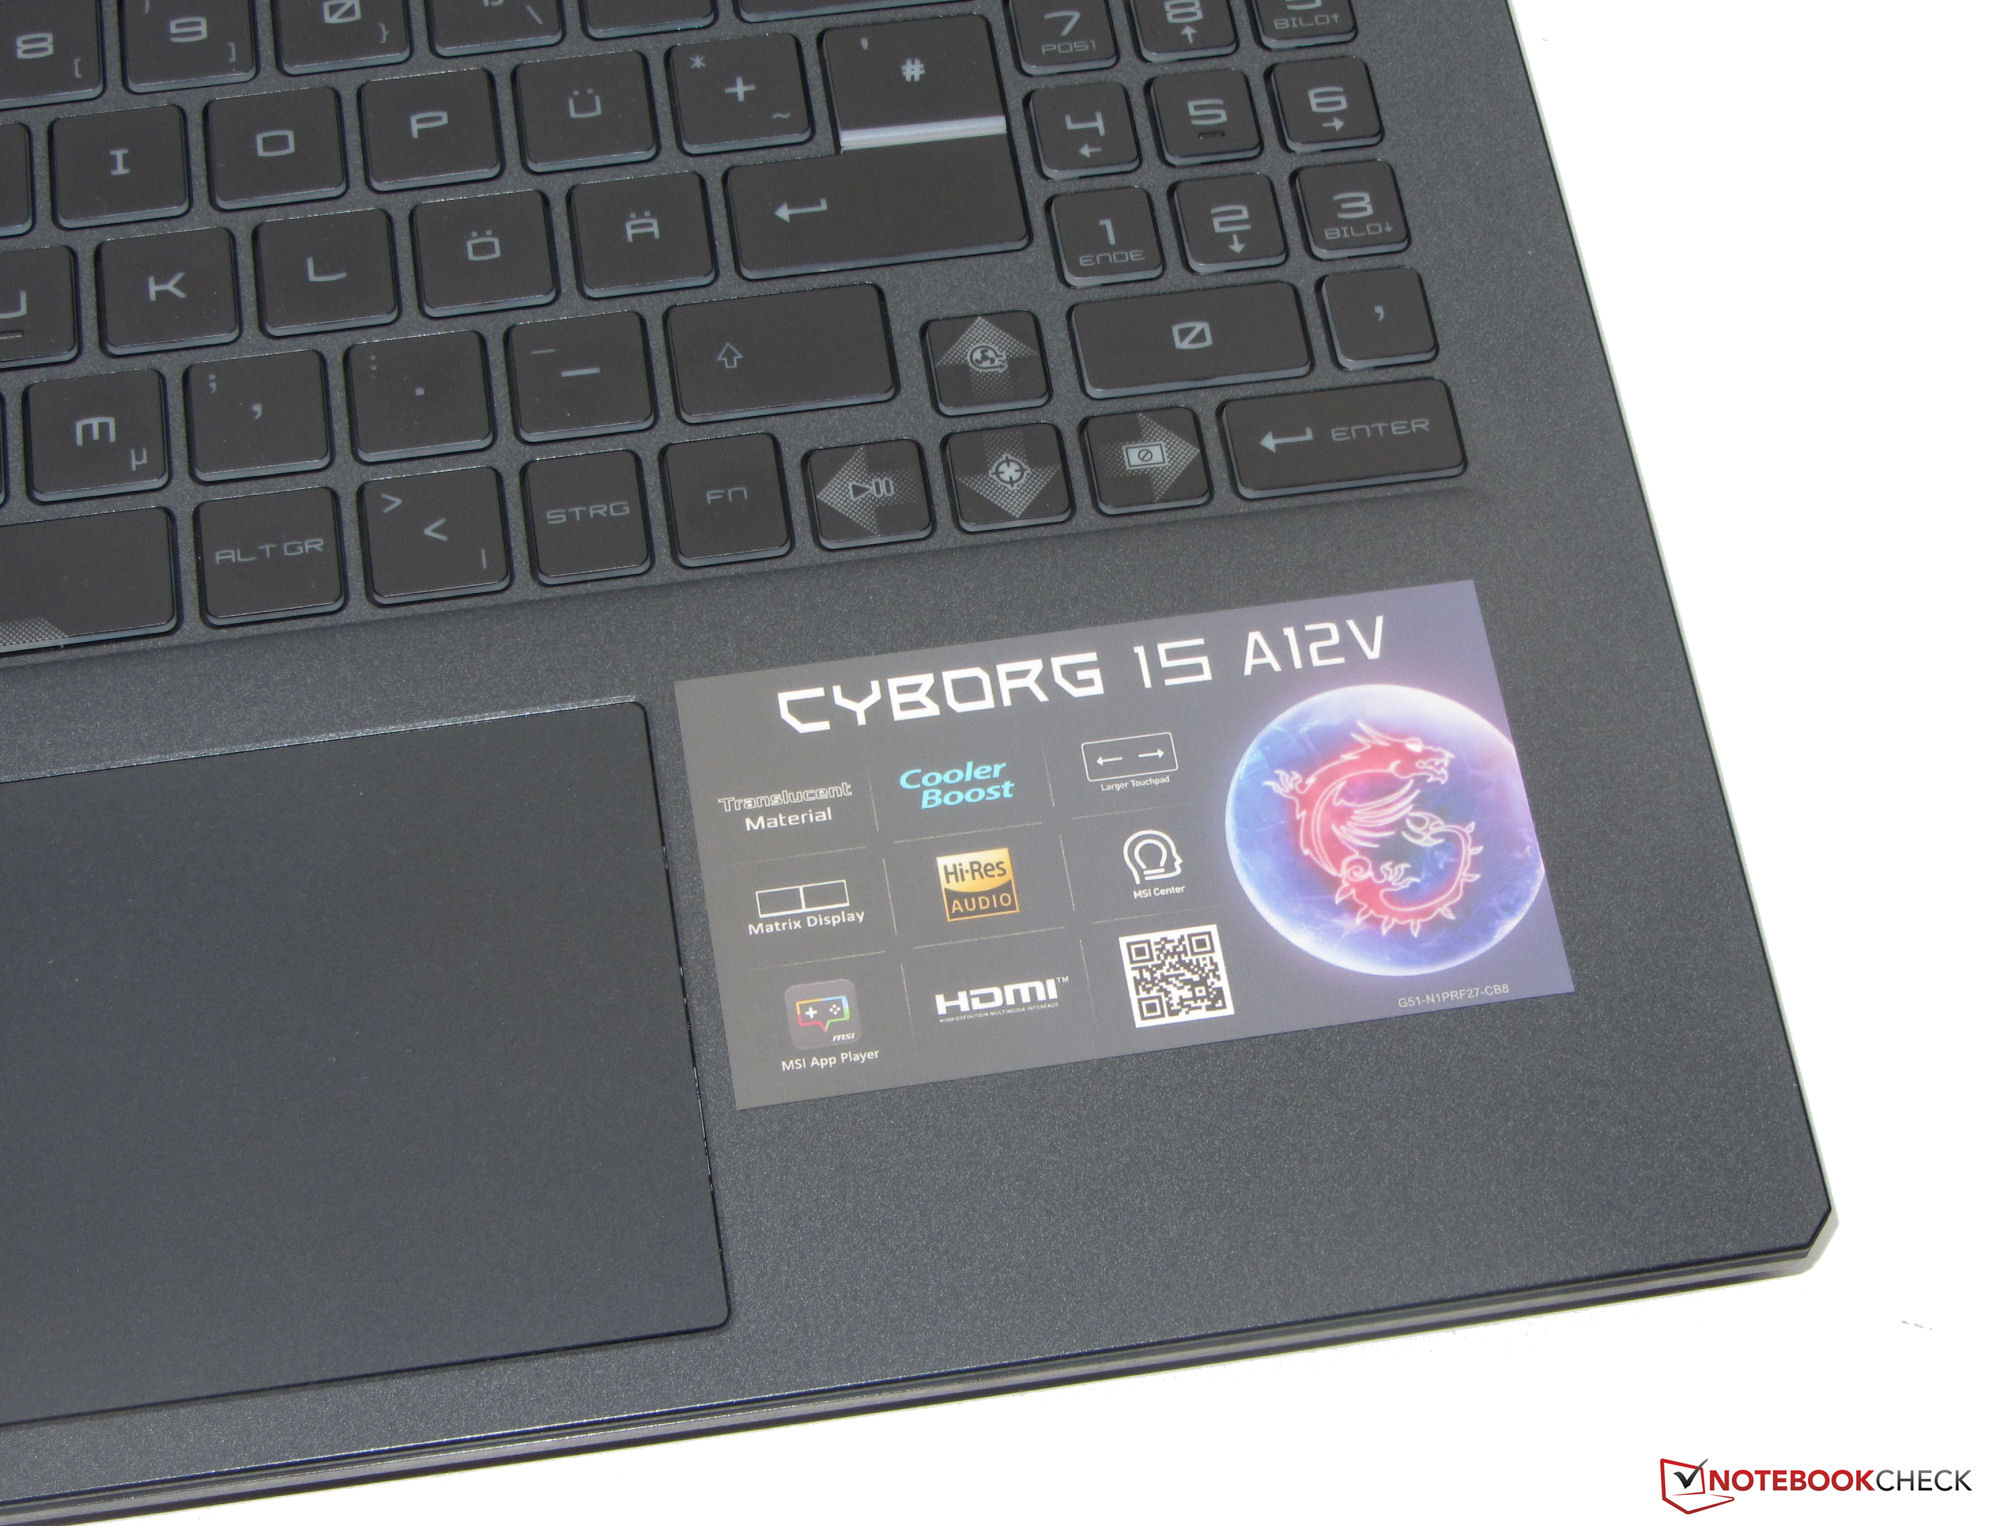
Touchpad
Gładka powierzchnia wielodotykowego Clickpada (~12 x 7,5 cm, ~4,7 x 2,8 cala) ułatwia przesuwanie palców. Reaguje on na wejścia w narożnikach, a także oferuje krótki skok i wyraźny punkt nacisku.
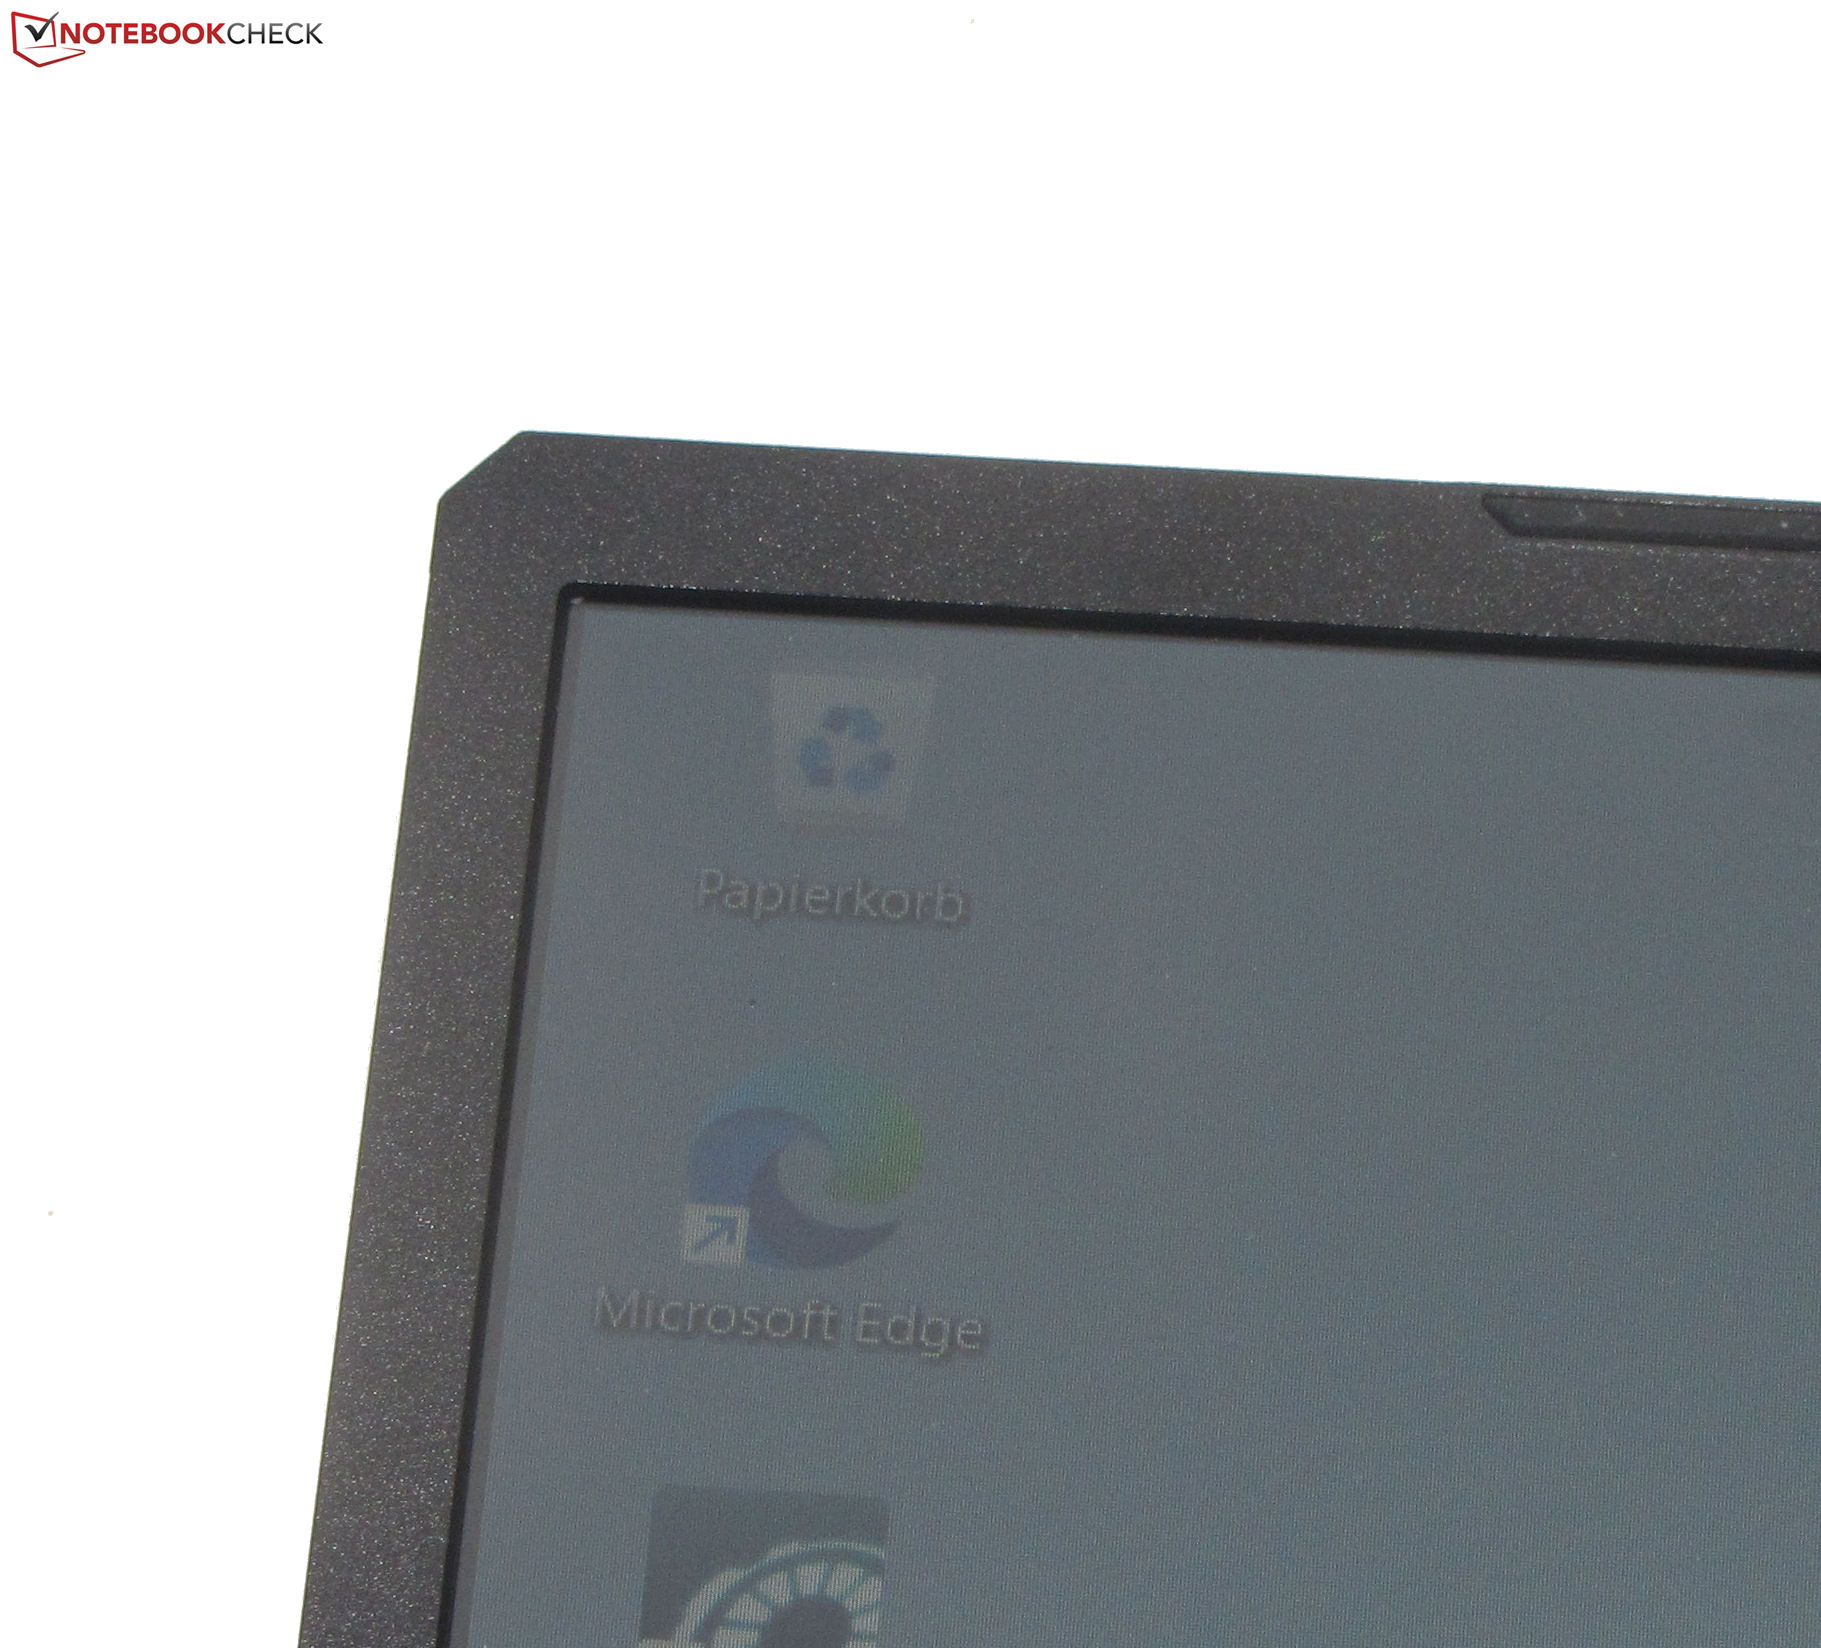
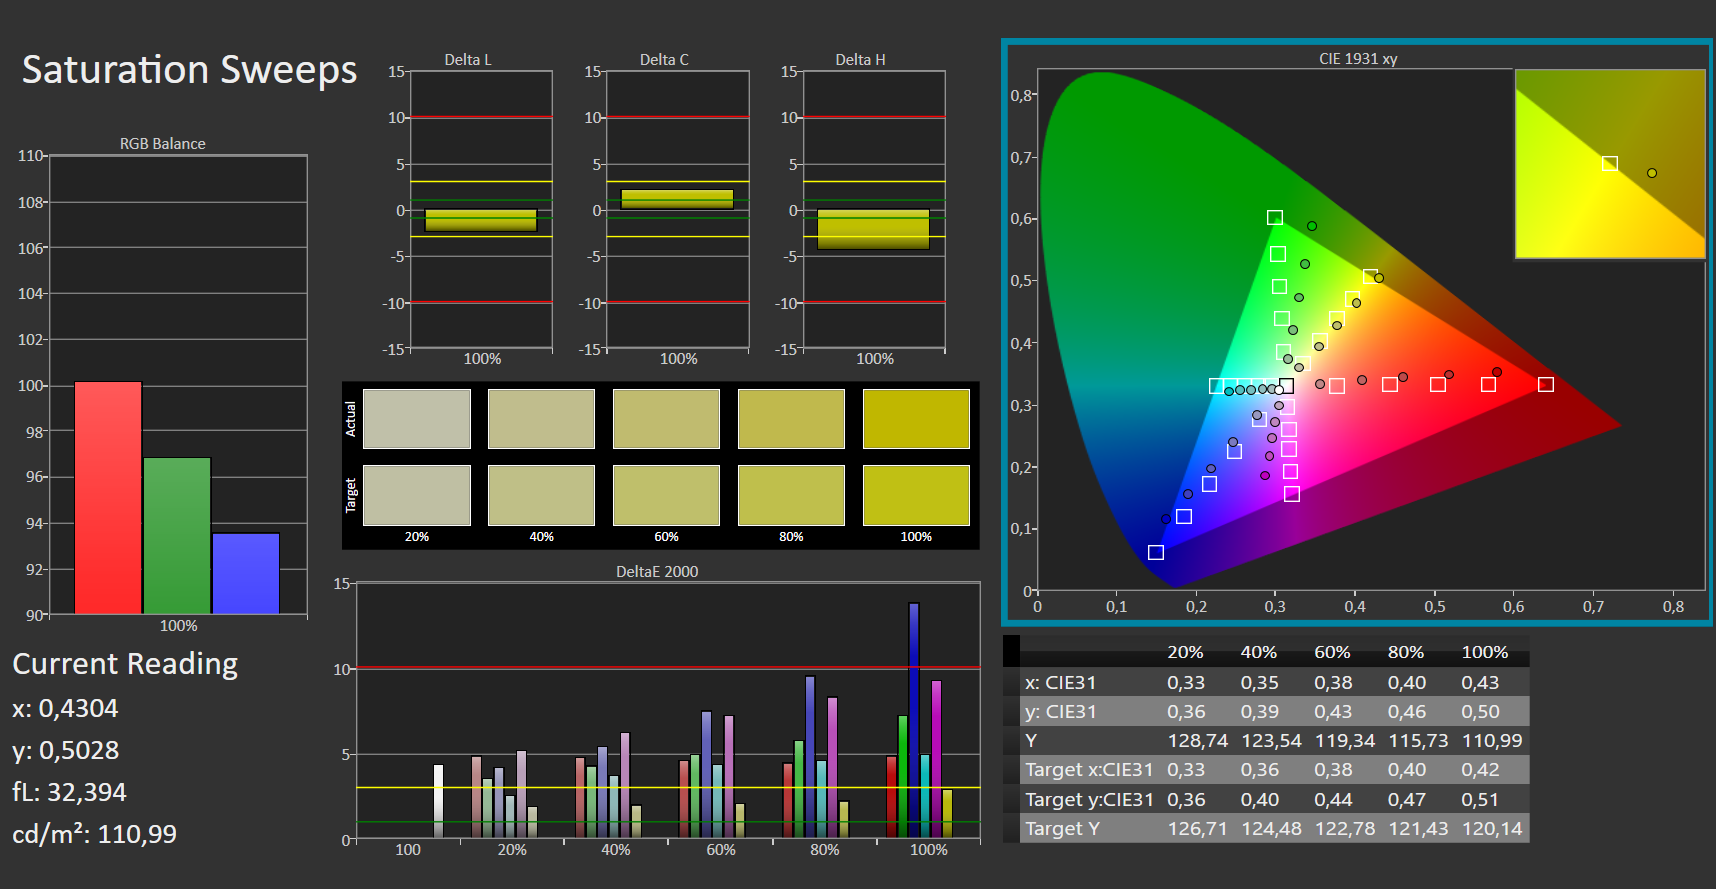
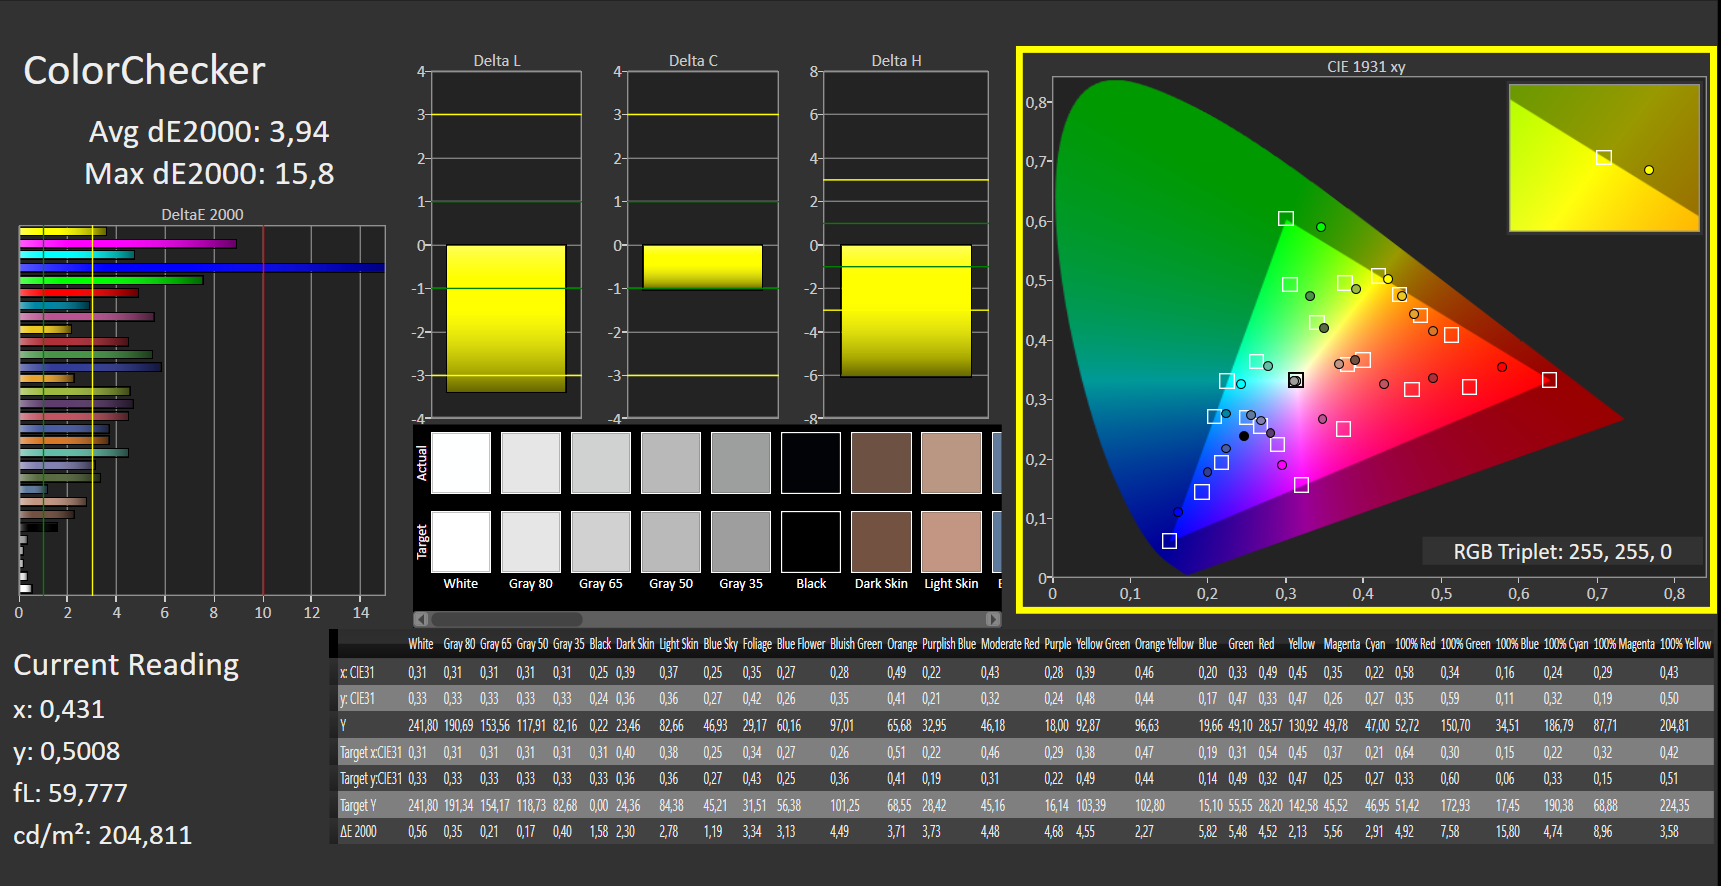
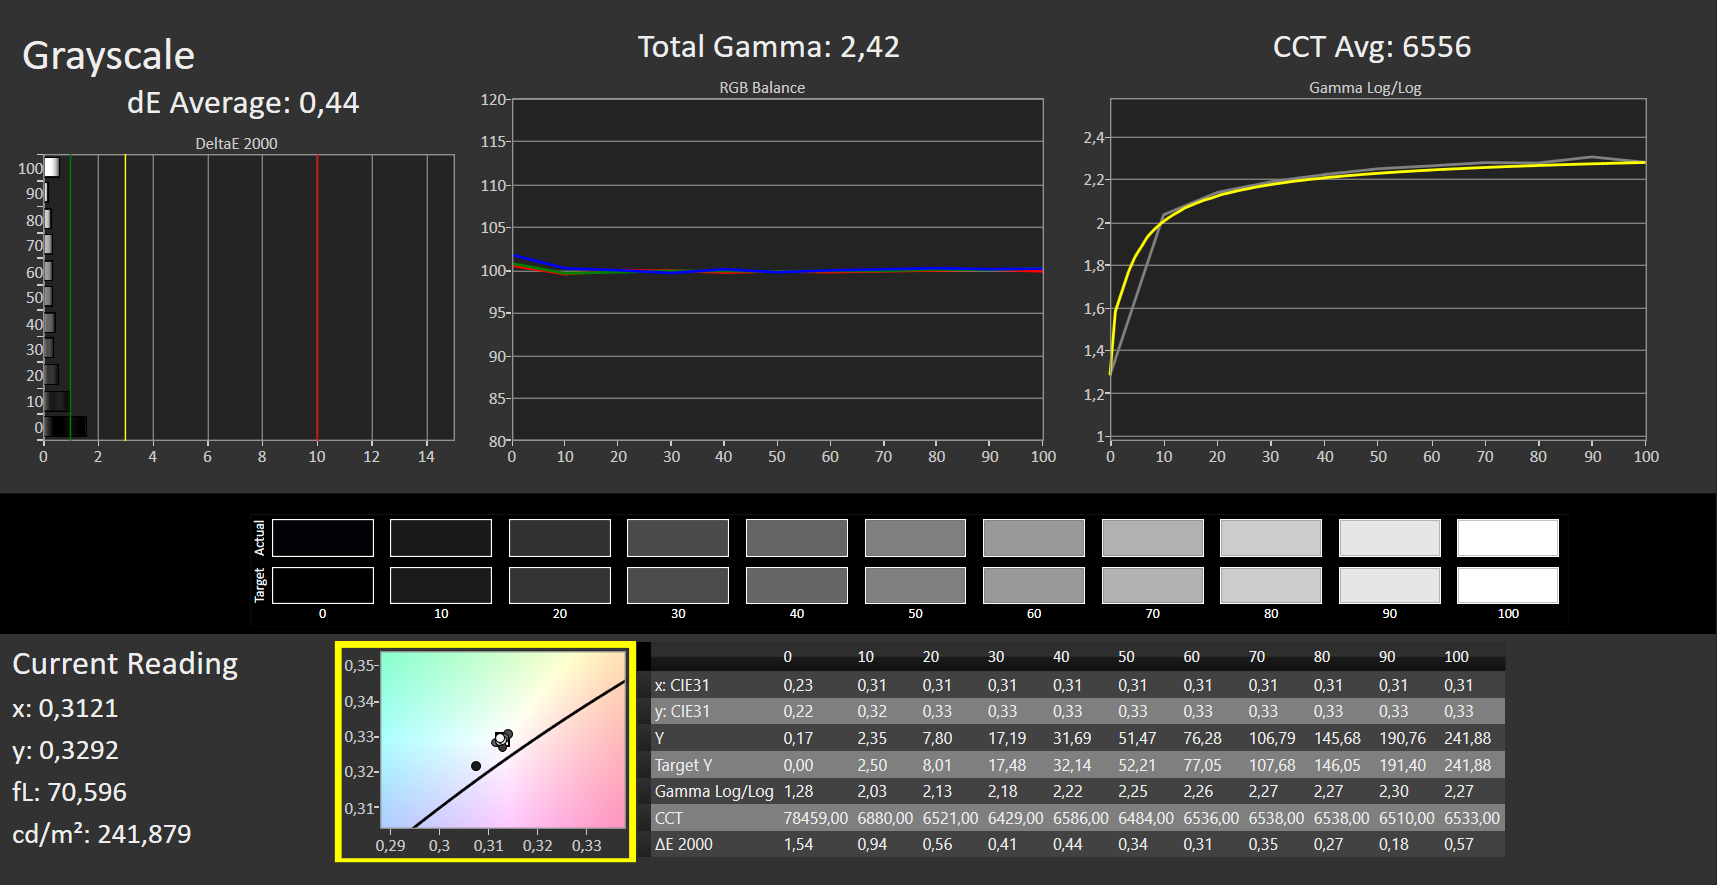
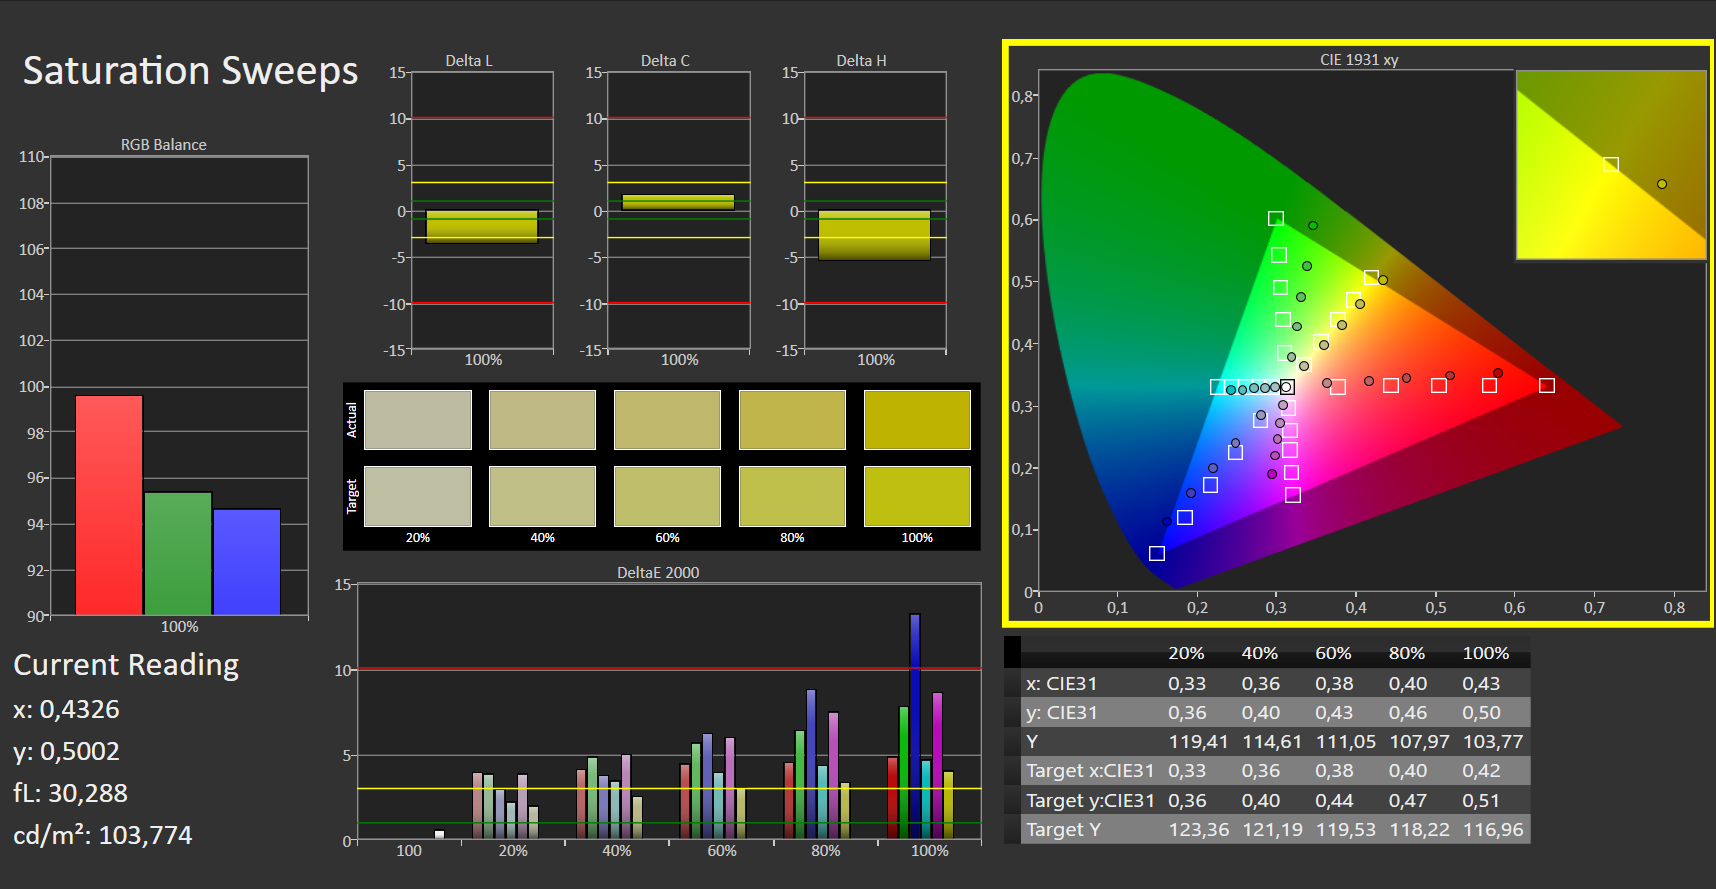
Wyświetlacz - Panel FHD z niskim pokryciem przestrzeni barw

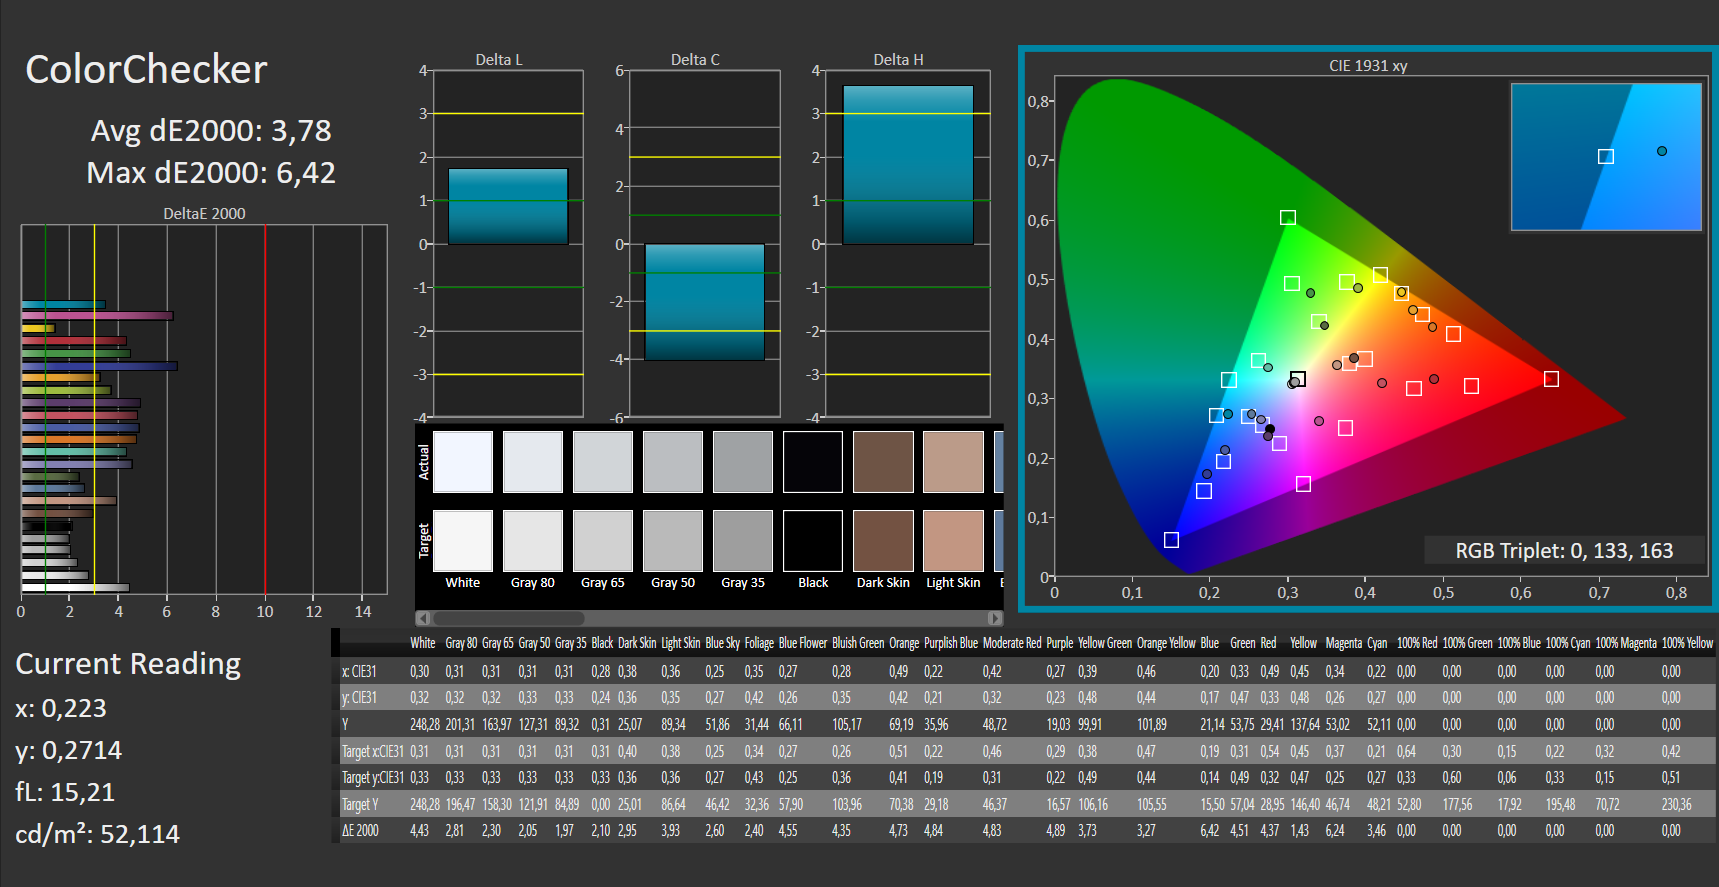
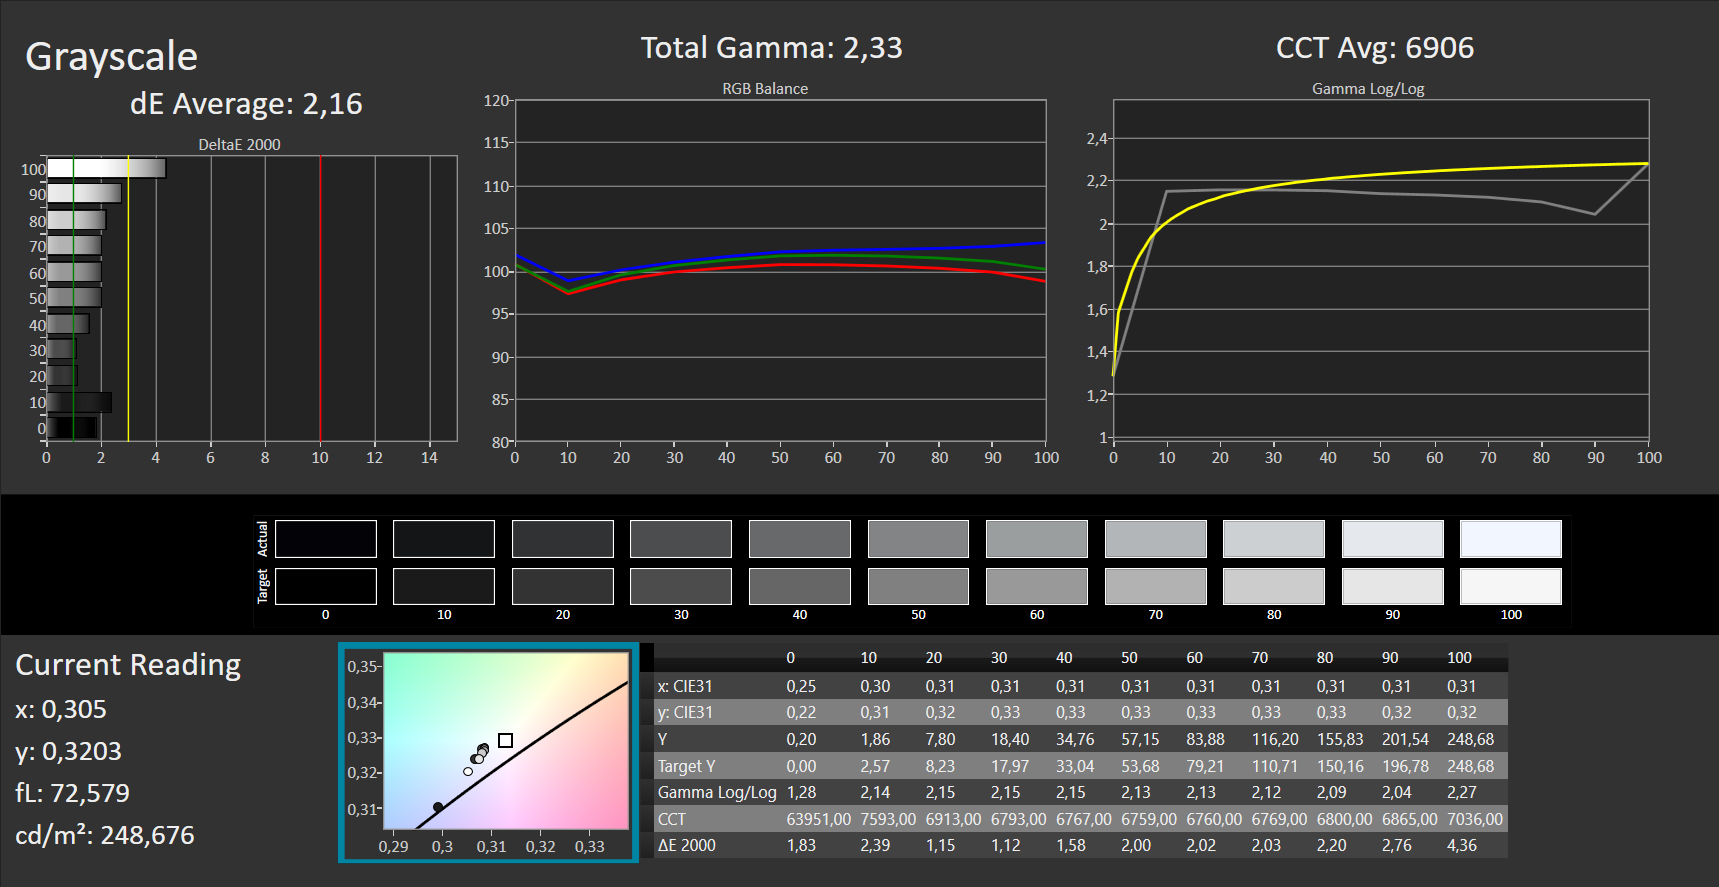
Panel 144-Hz w formacie 16:9 oferuje jedynie przeciętne czasy reakcji. Pozytywnym punktem jest natomiast fakt, że nie wykazuje on migotania PWM na żadnym poziomie jasności. Jasność i kontrast matowego 15,6-calowego wyświetlacza FHD mijają się z odpowiednimi celami, jakimi są odpowiednio >1000:1 i 300 cd/m², choć kontrast jest bliski.
Konkurenci spisują się tu lepiej, a reszta urządzeń z naszego pola porównawczego ma jaśniejsze wyświetlacze.
| |||||||||||||||||||||||||
rozświetlenie: 89 %
na akumulatorze: 250 cd/m²
kontrast: 988:1 (czerń: 0.25 cd/m²)
ΔE ColorChecker Calman: 3.78 | ∀{0.5-29.43 Ø4.73}
calibrated: 3.94
ΔE Greyscale Calman: 2.16 | ∀{0.09-98 Ø4.97}
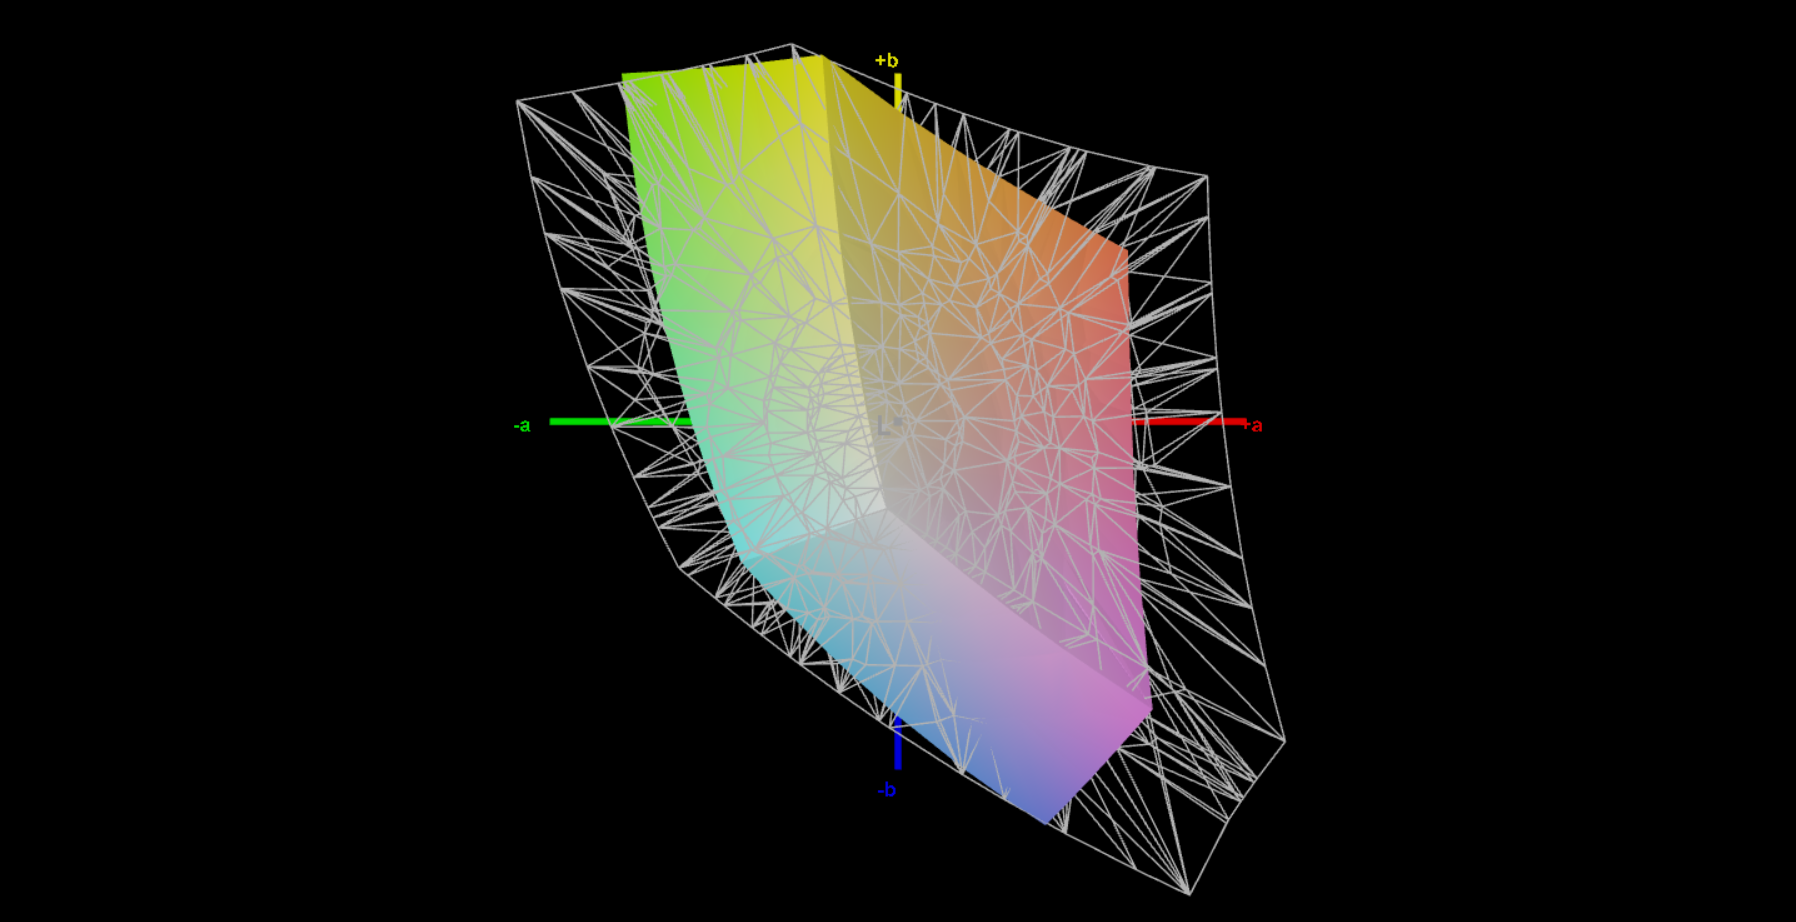
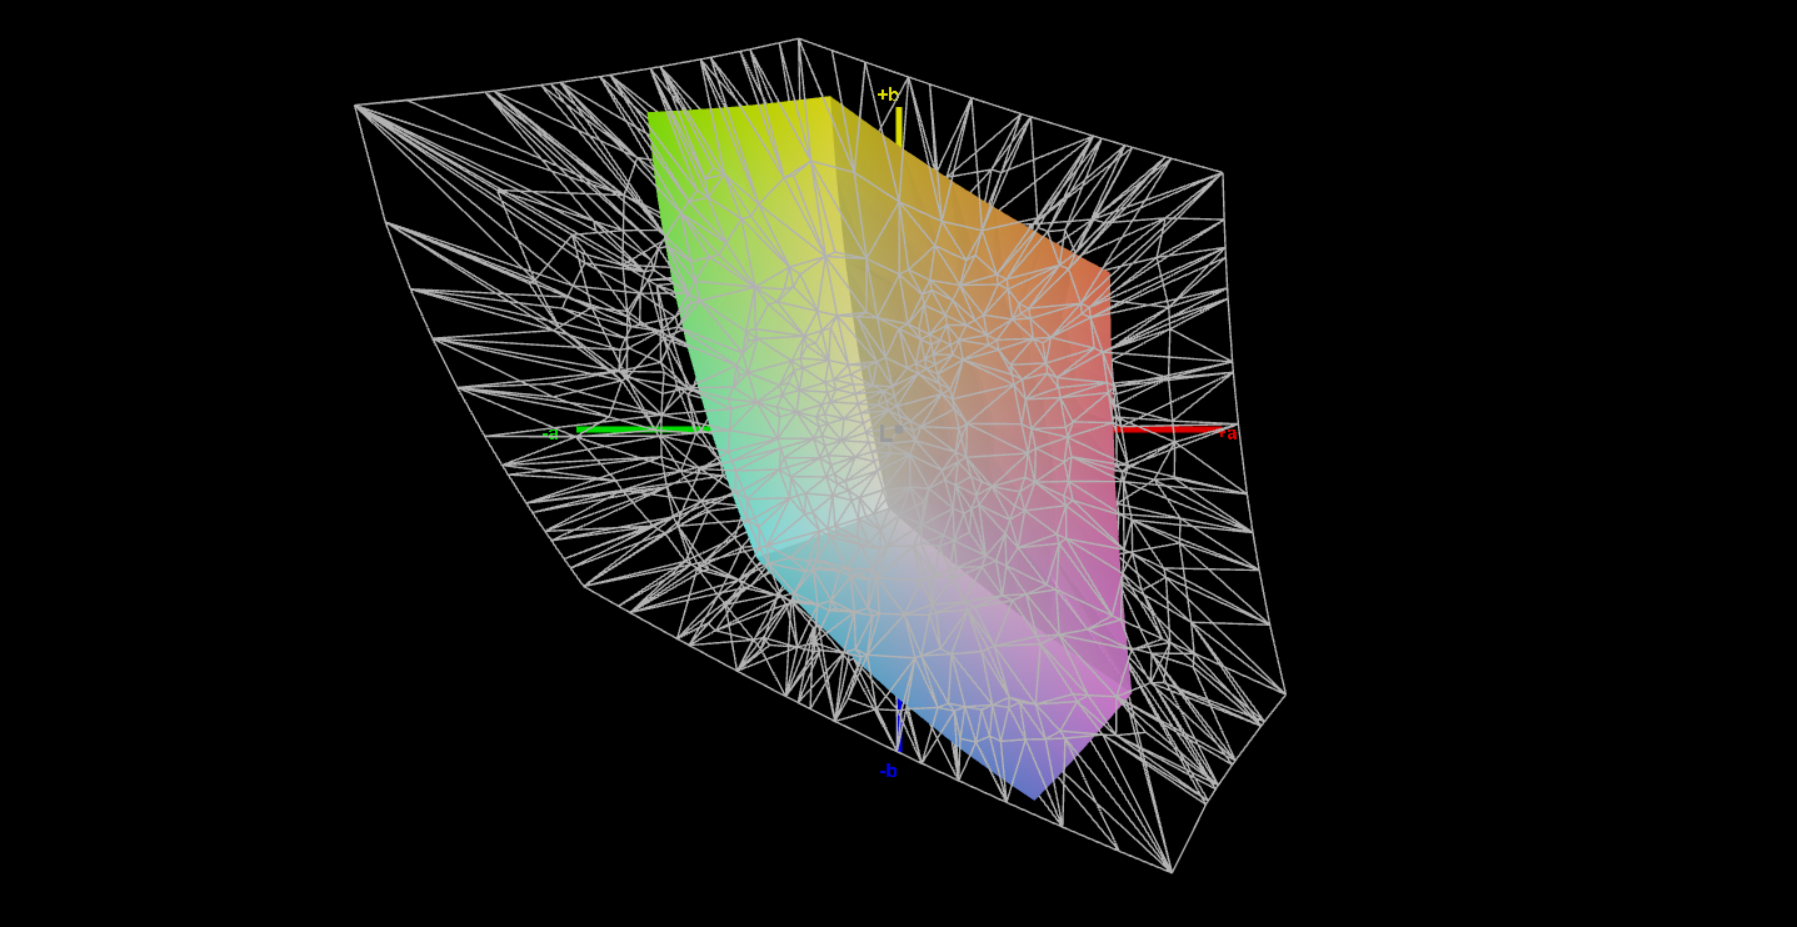
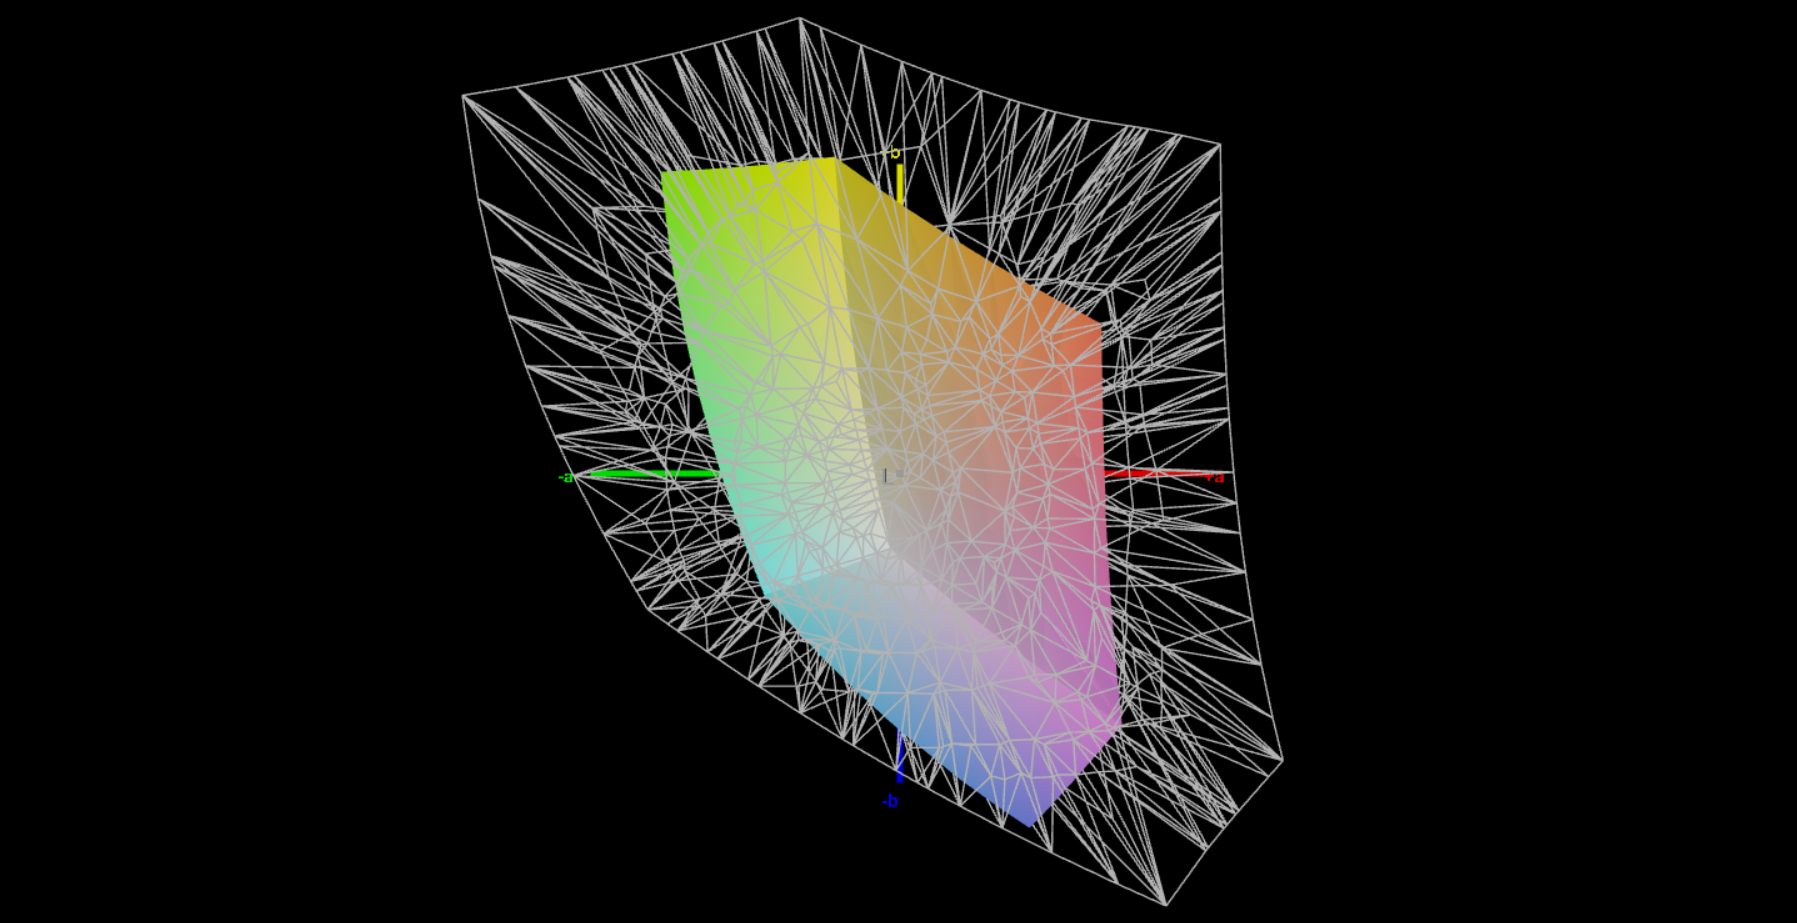
43.7% AdobeRGB 1998 (Argyll 3D)
62.6% sRGB (Argyll 3D)
42.3% Display P3 (Argyll 3D)
Gamma: 2.33
CCT: 6906 K
| MSI Cyborg 15 A12VF AU Optronics B156HAN15.1, IPS, 1920x1080, 15.6" | Asus TUF Gaming A16 FA617 NE160WUM-NX2 (BOE0B33), IPS-Level, 1920x1200, 16" | Aorus 15 XE5 Chi Mei N156KME-GNA, IPS, 2560x1440, 15.6" | Schenker XMG Fusion 15 (Mid 22) BOE CQ NE156QHM-NY2, IPS, 2560x1440, 15.6" | MSI Katana 15 B12VEK AUOAF90 (B156HAN08.4), IPS, 1920x1080, 15.6" | HP Victus 15 fa0020nr CMN1521, IPS, 1920x1080, 15.6" | |
|---|---|---|---|---|---|---|
| Display | 61% | 93% | 56% | -10% | -1% | |
| Display P3 Coverage (%) | 42.3 | 69.4 64% | 95.2 125% | 67.3 59% | 38.1 -10% | 42 -1% |
| sRGB Coverage (%) | 62.6 | 97.8 56% | 99.9 60% | 96.7 54% | 56.8 -9% | 62.7 0% |
| AdobeRGB 1998 Coverage (%) | 43.7 | 70.9 62% | 84.5 93% | 68.2 56% | 39.3 -10% | 43.4 -1% |
| Response Times | 26% | 37% | 49% | -84% | -77% | |
| Response Time Grey 50% / Grey 80% * (ms) | 22 ? | 17 ? 23% | 14.4 ? 35% | 11.6 ? 47% | 38.8 ? -76% | 35.2 ? -60% |
| Response Time Black / White * (ms) | 14 ? | 10.1 ? 28% | 8.6 ? 39% | 7 ? 50% | 26.8 ? -91% | 27.2 ? -94% |
| PWM Frequency (Hz) | ||||||
| Screen | 31% | 1% | -8% | -28% | -13% | |
| Brightness middle (cd/m²) | 247 | 308 25% | 336 36% | 326 32% | 261 6% | 284.3 15% |
| Brightness (cd/m²) | 234 | 293 25% | 316 35% | 303 29% | 258 10% | 262 12% |
| Brightness Distribution (%) | 89 | 90 1% | 89 0% | 89 0% | 92 3% | 87 -2% |
| Black Level * (cd/m²) | 0.25 | 0.23 8% | 0.34 -36% | 0.33 -32% | 0.19 24% | 0.17 32% |
| Contrast (:1) | 988 | 1339 36% | 988 0% | 988 0% | 1374 39% | 1672 69% |
| Colorchecker dE 2000 * | 3.78 | 1.47 61% | 3.36 11% | 2.73 28% | 5.57 -47% | 4.52 -20% |
| Colorchecker dE 2000 max. * | 6.42 | 2.98 54% | 6.67 -4% | 9.54 -49% | 20.6 -221% | 18.67 -191% |
| Colorchecker dE 2000 calibrated * | 3.94 | 1.02 74% | 0.74 81% | 1.36 65% | 4.63 -18% | 1.55 61% |
| Greyscale dE 2000 * | 2.16 | 2.2 -2% | 4.7 -118% | 5.2 -141% | 3.19 -48% | 4.1 -90% |
| Gamma | 2.33 94% | 2.228 99% | 2.244 98% | 2.074 106% | 2.45 90% | 2.3 96% |
| CCT | 6906 94% | 6228 104% | 6897 94% | 6911 94% | 6146 106% | 6529 100% |
| Całkowita średnia (program / ustawienia) | 39% /
37% | 44% /
26% | 32% /
14% | -41% /
-32% | -30% /
-19% |
* ... im mniej tym lepiej
W stanie dostawy odwzorowanie kolorów przez wyświetlacz jest bardzo przyzwoite, przy czym odchylenie 3,8 ledwie mija się z celem DeltaE < 3. Kalibracja zwiększa wprawdzie odchylenie kolorów, ale zapewnia też bardziej zrównoważoną skalę szarości.
Panel nie jest w stanie pokryć przestrzeni barw AdobeRGB (44%), sRGB (63%) i DCI-P3 (42%). Nie nadaje się więc do scenariuszy aplikacji, w których zależy na dokładności kolorów. Konkurenci tacy jak np Asus TUF Gaming A16 FA617oraz XMG Fusion 15są tutaj bardziej odpowiednie, a ich wyświetlacze są w stanie pokryć przestrzeń kolorów sRGB.
Wyświetl czasy reakcji
| ↔ Czas reakcji od czerni do bieli | ||
|---|---|---|
| 14 ms ... wzrost ↗ i spadek ↘ łącznie | ↗ 7 ms wzrost |  |
| ↘ 7 ms upadek | ||
| W naszych testach ekran wykazuje dobry współczynnik reakcji, ale może być zbyt wolny dla graczy rywalizujących ze sobą. Dla porównania, wszystkie testowane urządzenia wahają się od 0.1 (minimum) do 240 (maksimum) ms. » 34 % wszystkich urządzeń jest lepszych. Oznacza to, że zmierzony czas reakcji jest lepszy od średniej wszystkich testowanych urządzeń (19.9 ms). | ||
| ↔ Czas reakcji 50% szarości do 80% szarości | ||
| 22 ms ... wzrost ↗ i spadek ↘ łącznie | ↗ 9 ms wzrost |  |
| ↘ 13 ms upadek | ||
| W naszych testach ekran wykazuje dobry współczynnik reakcji, ale może być zbyt wolny dla graczy rywalizujących ze sobą. Dla porównania, wszystkie testowane urządzenia wahają się od 0.165 (minimum) do 636 (maksimum) ms. » 33 % wszystkich urządzeń jest lepszych. Oznacza to, że zmierzony czas reakcji jest lepszy od średniej wszystkich testowanych urządzeń (31.1 ms). | ||
Migotanie ekranu / PWM (modulacja szerokości impulsu)
| Migotanie ekranu/nie wykryto PWM |  | ||
Dla porównania: 52 % wszystkich testowanych urządzeń nie używa PWM do przyciemniania wyświetlacza. Jeśli wykryto PWM, zmierzono średnio 7794 (minimum: 5 - maksimum: 343500) Hz. | |||
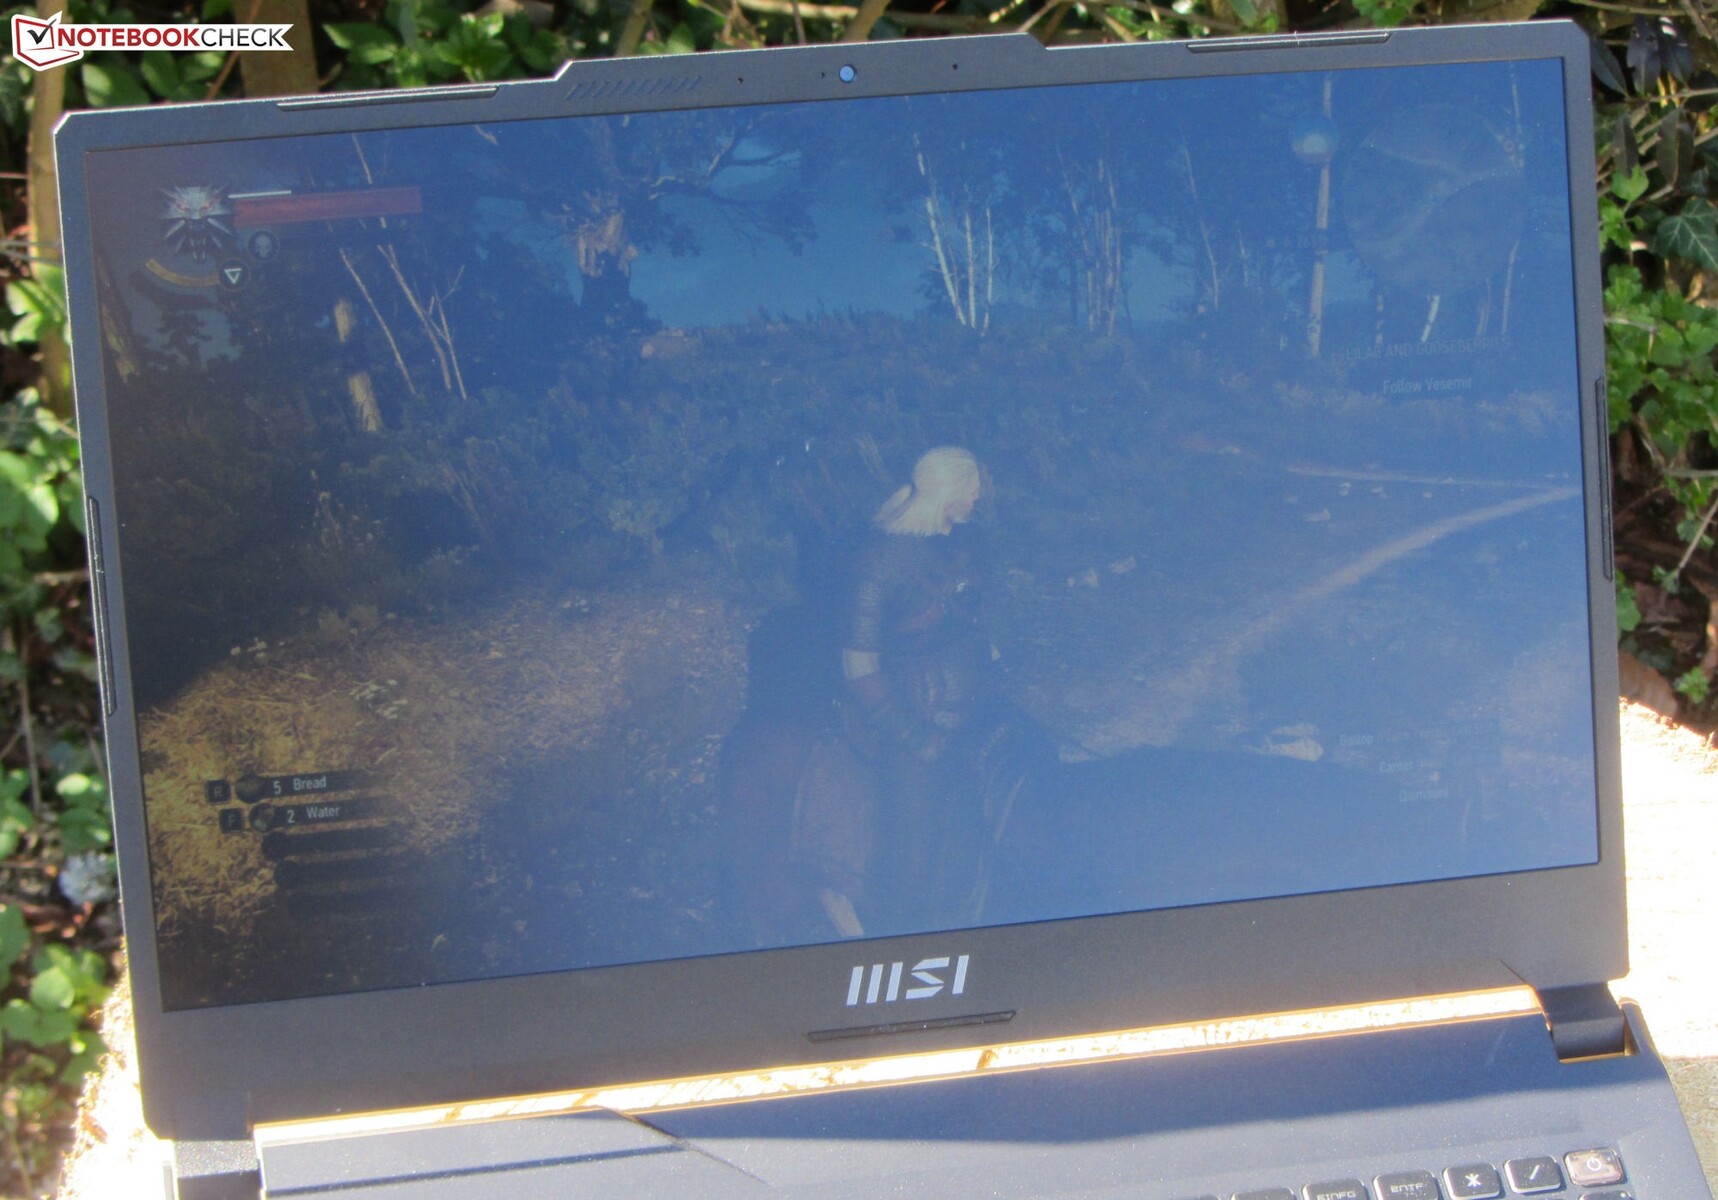
Kąty widzenia panelu IPS są stabilne i można go bez problemu odczytać pod każdym kątem. Na zewnątrz zawartość wyświetlacza można odczytać, gdy słońce nie jest zbyt jasne.

Performance - Alder Lake i Ada Lovelace na napiętej smyczy
Wraz z serią Cyborg 15 A12VF, MSI oferuje mobilne laptopy dla graczy, które wykorzystują m.in GeForce RTX 4060 Laptoprdzeń graficzny w konfiguracji o niższej mocy, z TGP na poziomie 45 W. Towarzyszą temu procesory Alder Lake od Intela. Punkty cenowe modeli A12VF dostępnych w momencie przeprowadzania tego testu mieszczą się w przedziale od około 1250 do 1800 euro (~1 382 - 989 dolarów). Cena naszego testowego egzemplarza leży w górnej części tej skali.
Warunki badania
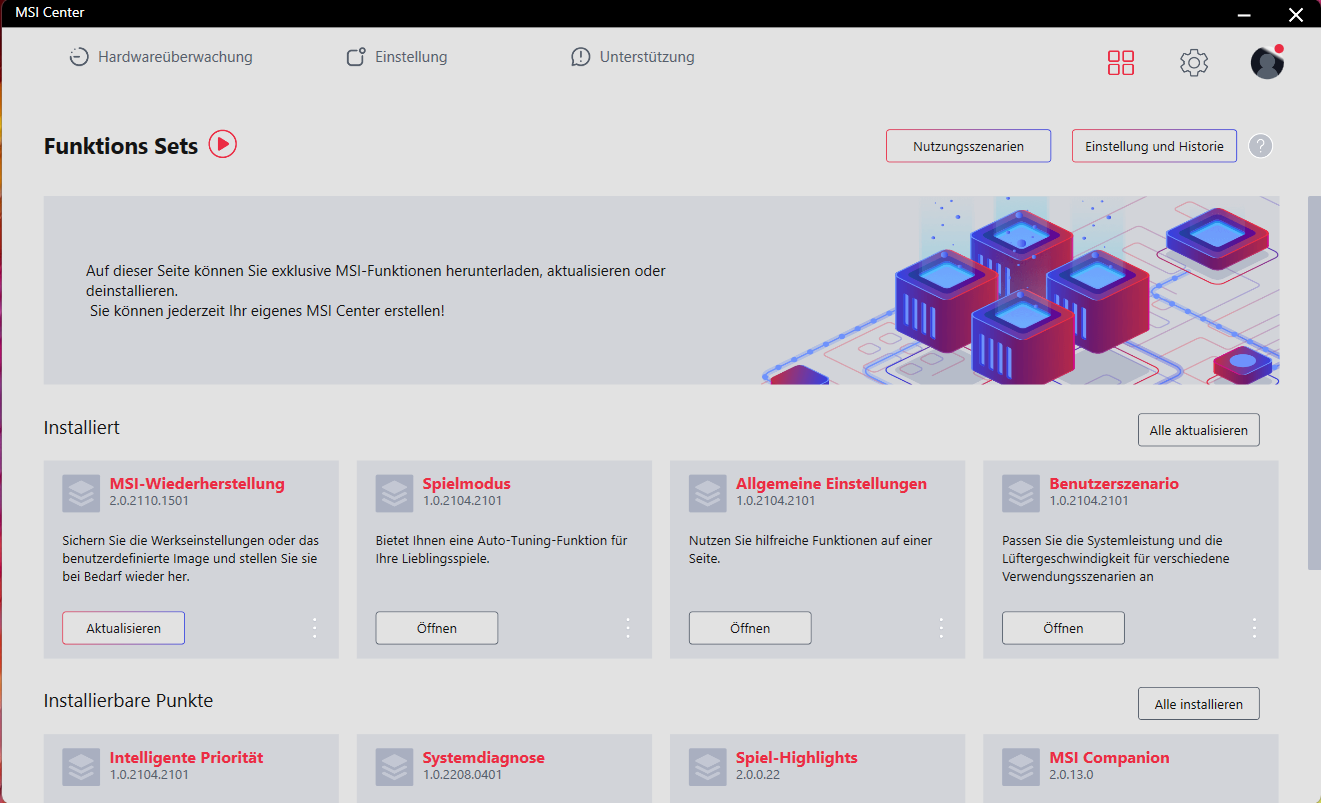
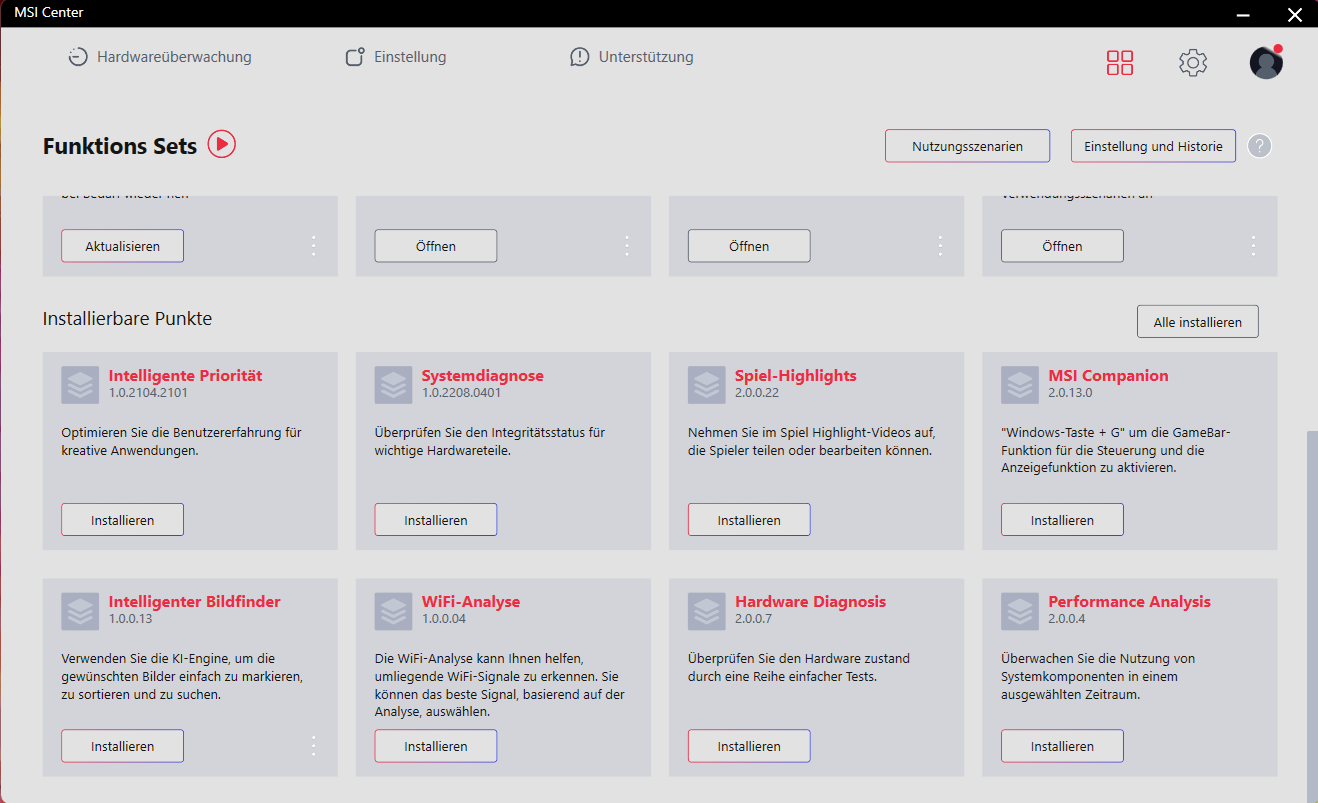
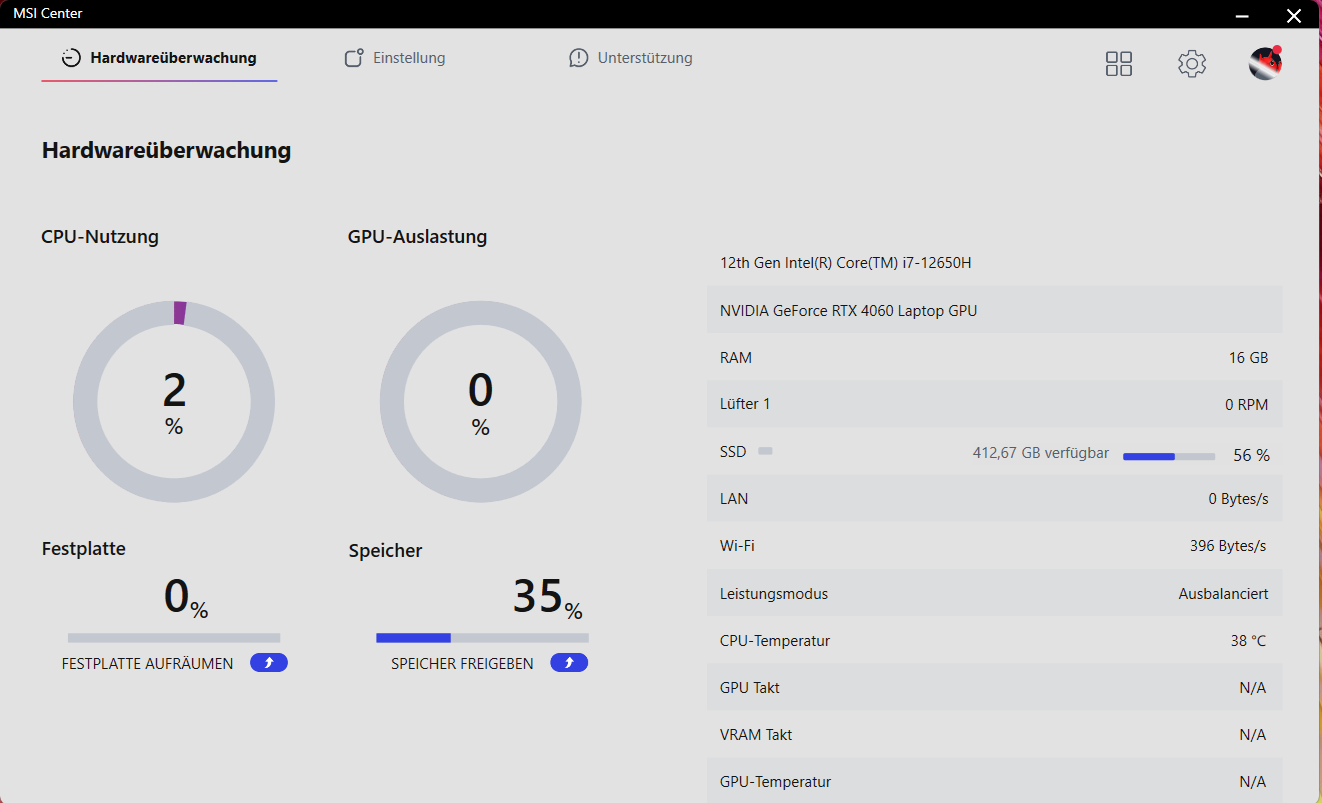
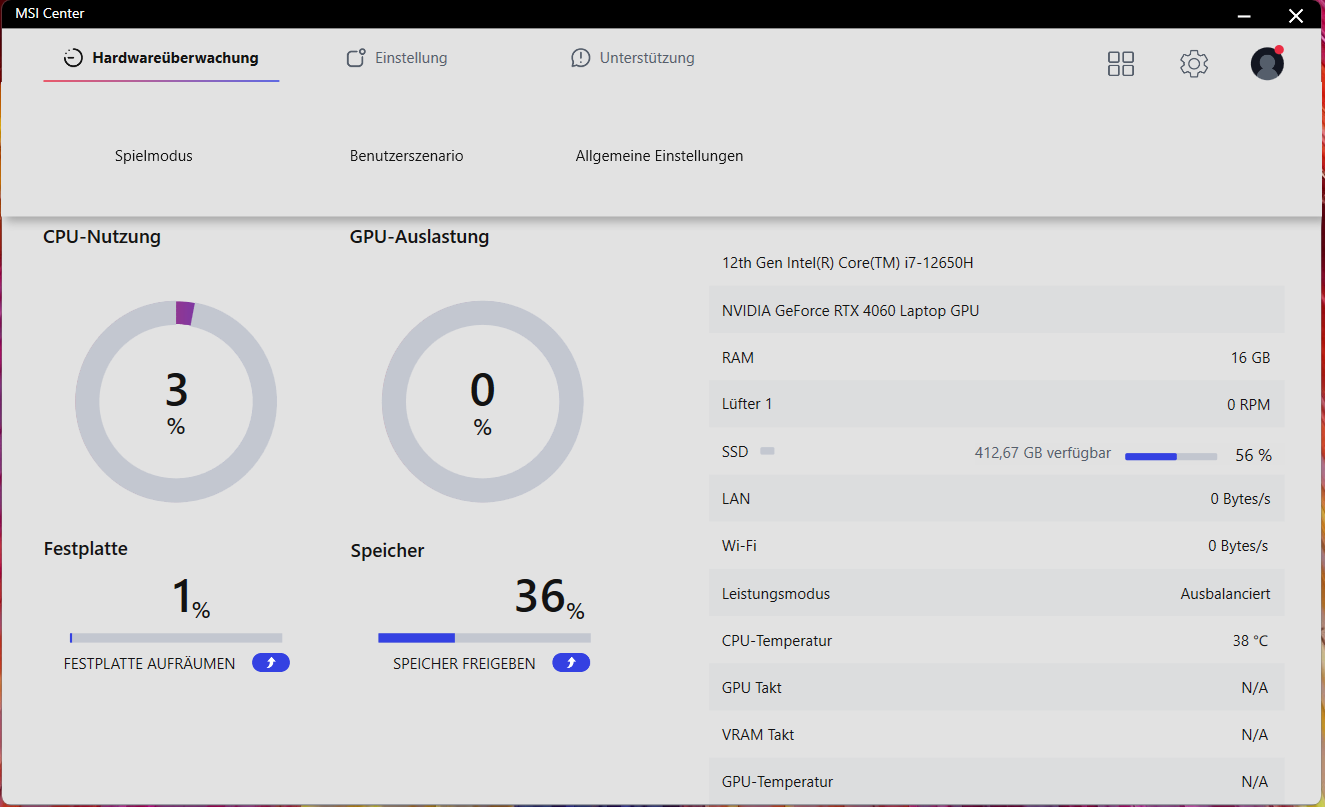
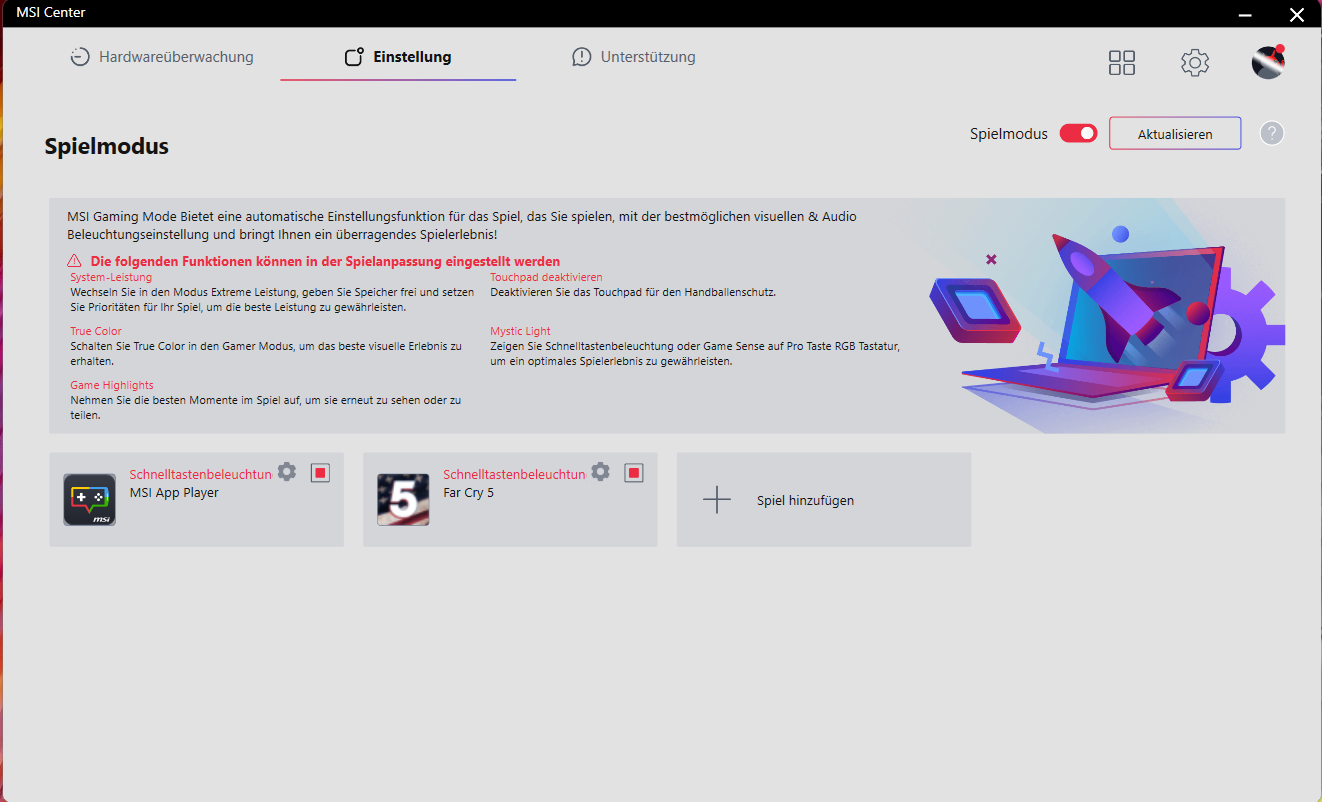
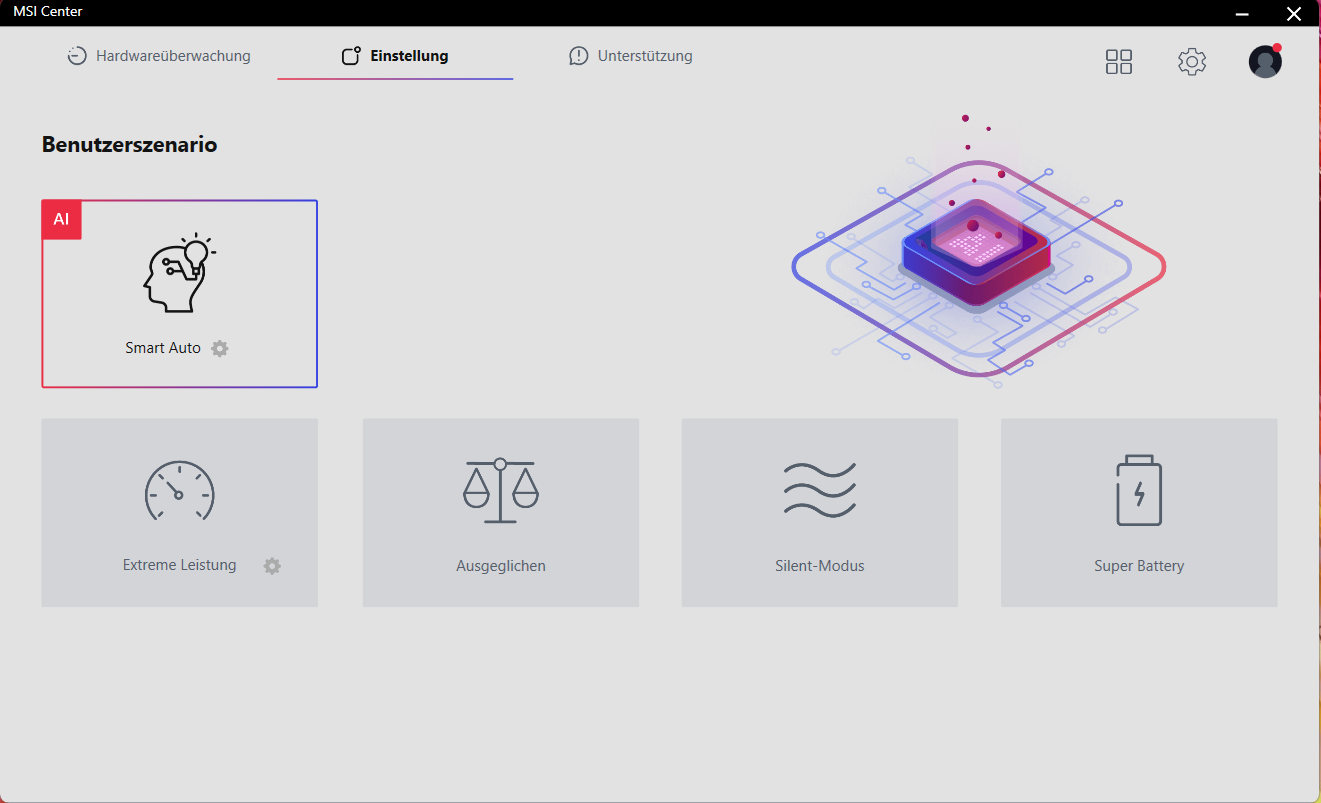
Preinstalowane oprogramowanie MSI Center (patrz zdjęcia) lub kombinacja klawiszy "Fn" + "F7" pozwala na przełączanie się pomiędzy czterema profilami wydajności (patrz tabela poniżej). Do benchmarków użyliśmy profilu "Extreme Performance", a do testów baterii - "Super Battery". Alternatywnie dostępna jest również oparta na sztucznej inteligencji funkcja "Smart Auto", która automatycznie wybiera profil, który najlepiej pasuje do aktualnego scenariusza użytkowania.
| Extreme Performance | Balanced | Silent Mode | Super Battery | |
|---|---|---|---|---|
| Limit mocy 1 | 55 Watt | 45 Watt | 20 Watt | 15 Watt |
| Limit mocy 2 | 78 Watt | 70 Watt | 20 Watt | 15 Watt |

Procesor
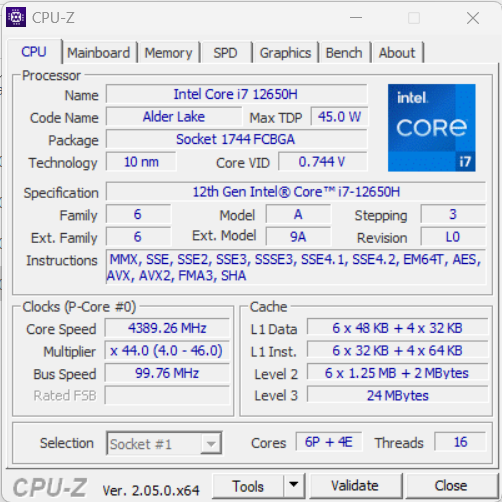
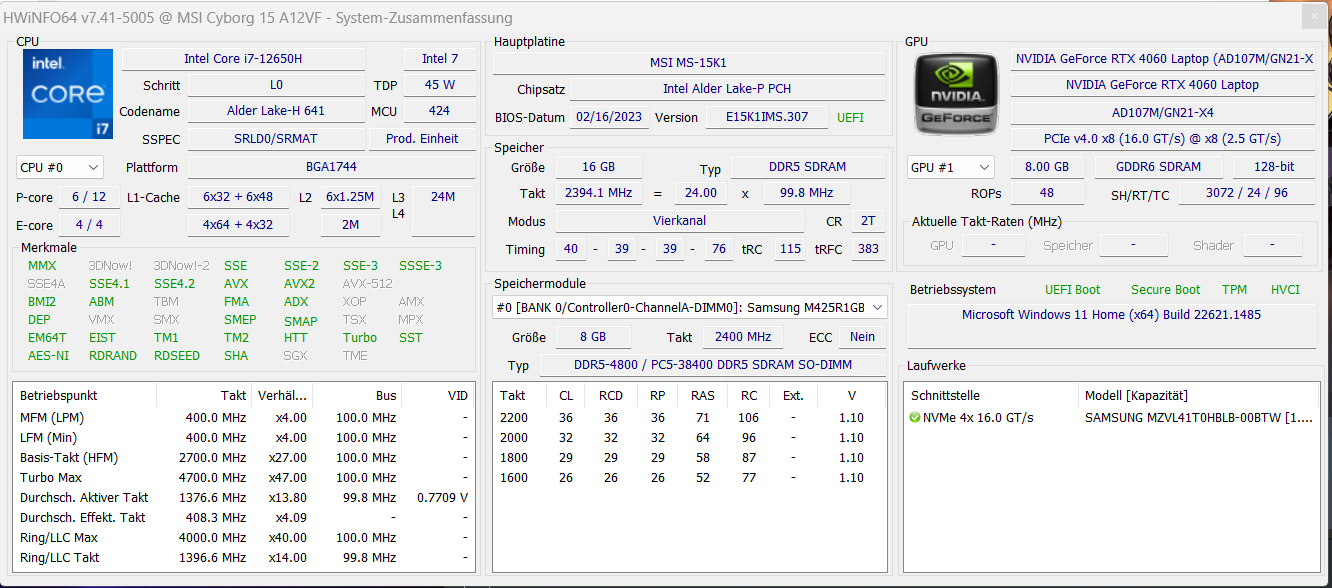
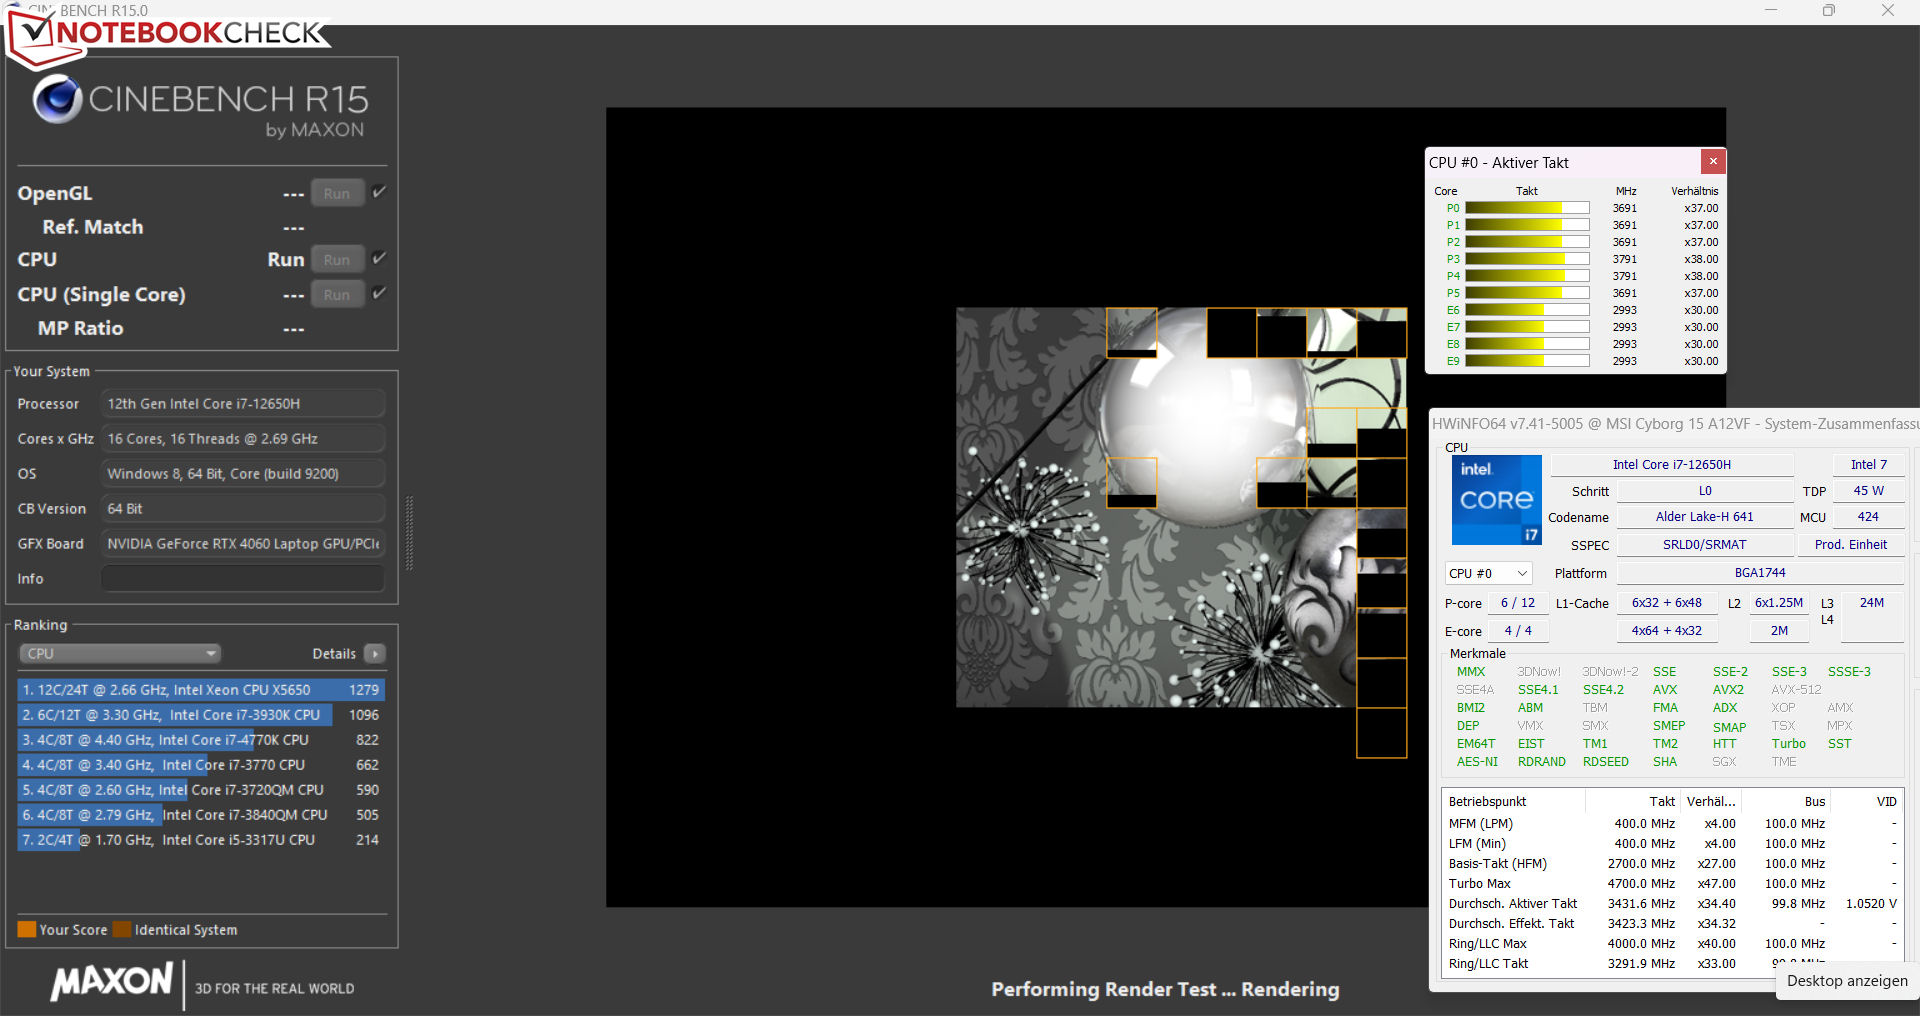
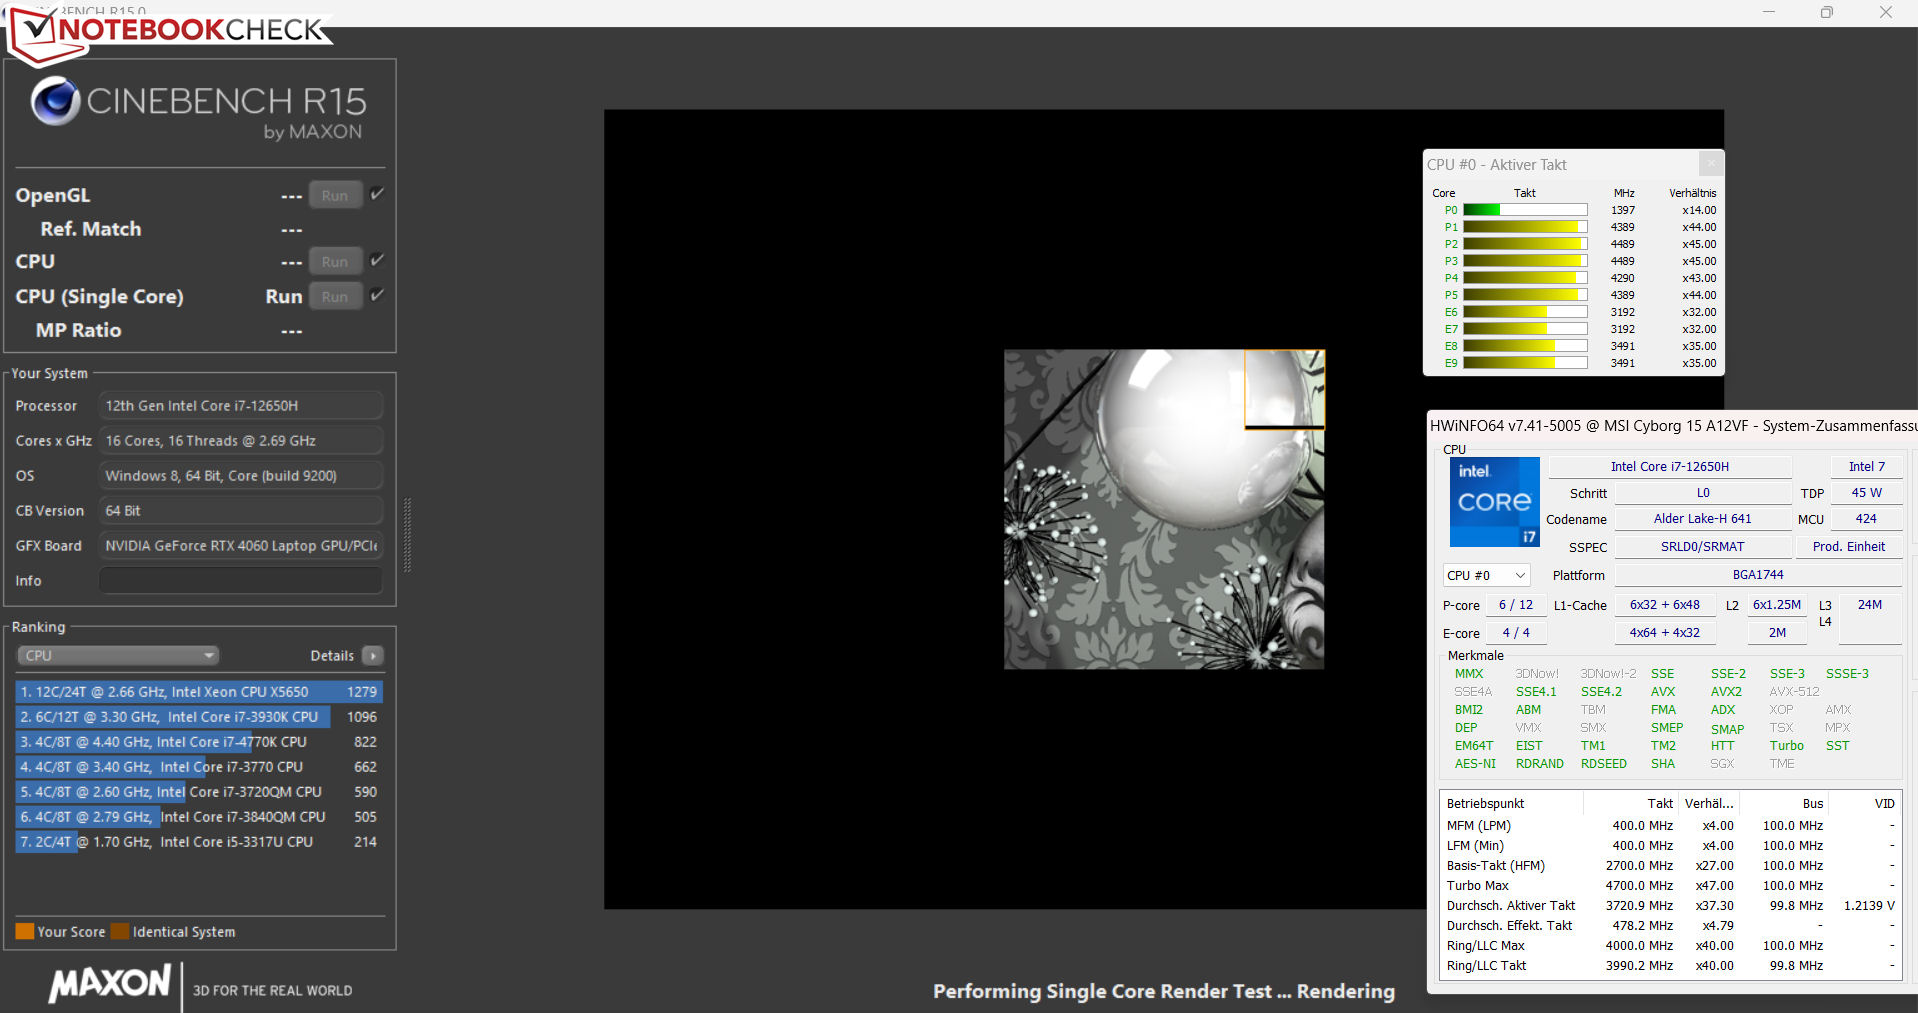
Na stronie .Core i7-12650Hprocesor Alder Lake składa się z sześciu rdzeni Performance (hyperthreading, od 2,3 do 4,7 GHz) i czterech rdzeni Efficiency (bez hyperthreadingu, od 1,7 do 3,5 GHz), co daje łącznie szesnaście logicznych rdzeni CPU.
W trybie zasilania sieciowego procesor przechodzi testy CPU w benchmarku Cinebench R15 ze średnim lub wysokim (wielowątkowym) i wysokim lub maksymalnym (jednowątkowym) taktowaniem zegara. Na zasilaniu akumulatorowym wydajność jednowątkowa spada nieznacznie (205 pkt.), a wielowątkowa - bardziej znacząco (994 pkt.). Ogólnie rzecz biorąc, wyniki benchmarku oscylują nieco powyżej średniej dla procesora, którą ustaliliśmy do tej pory.
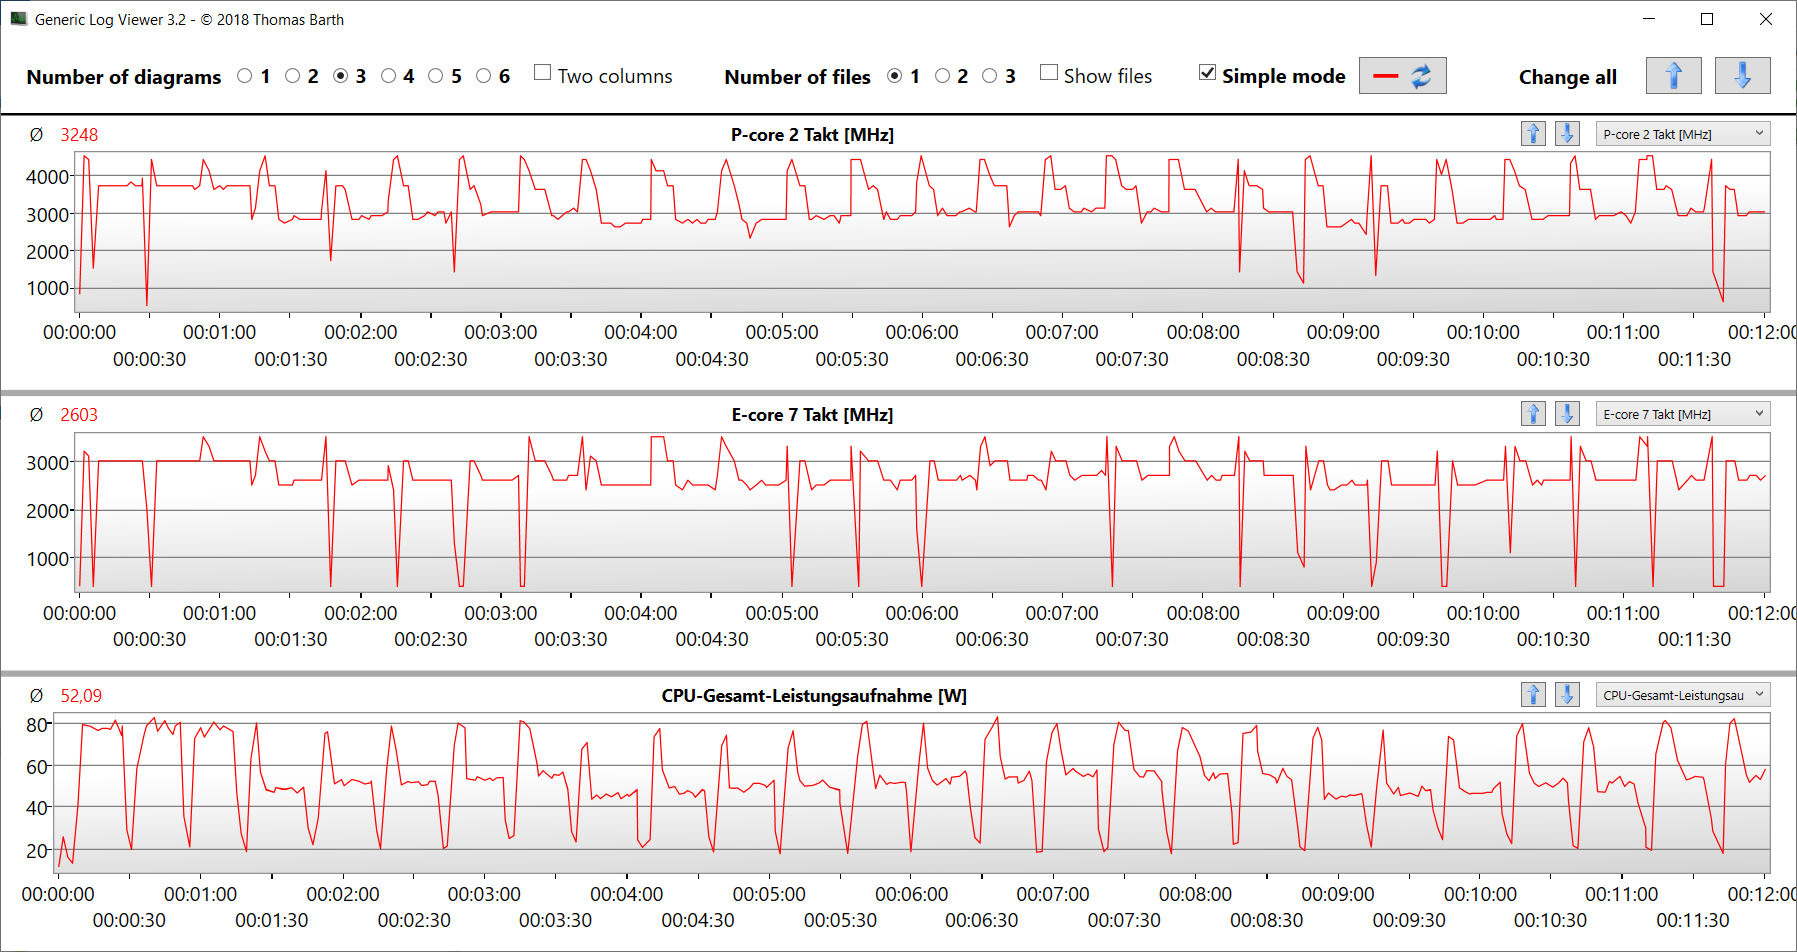
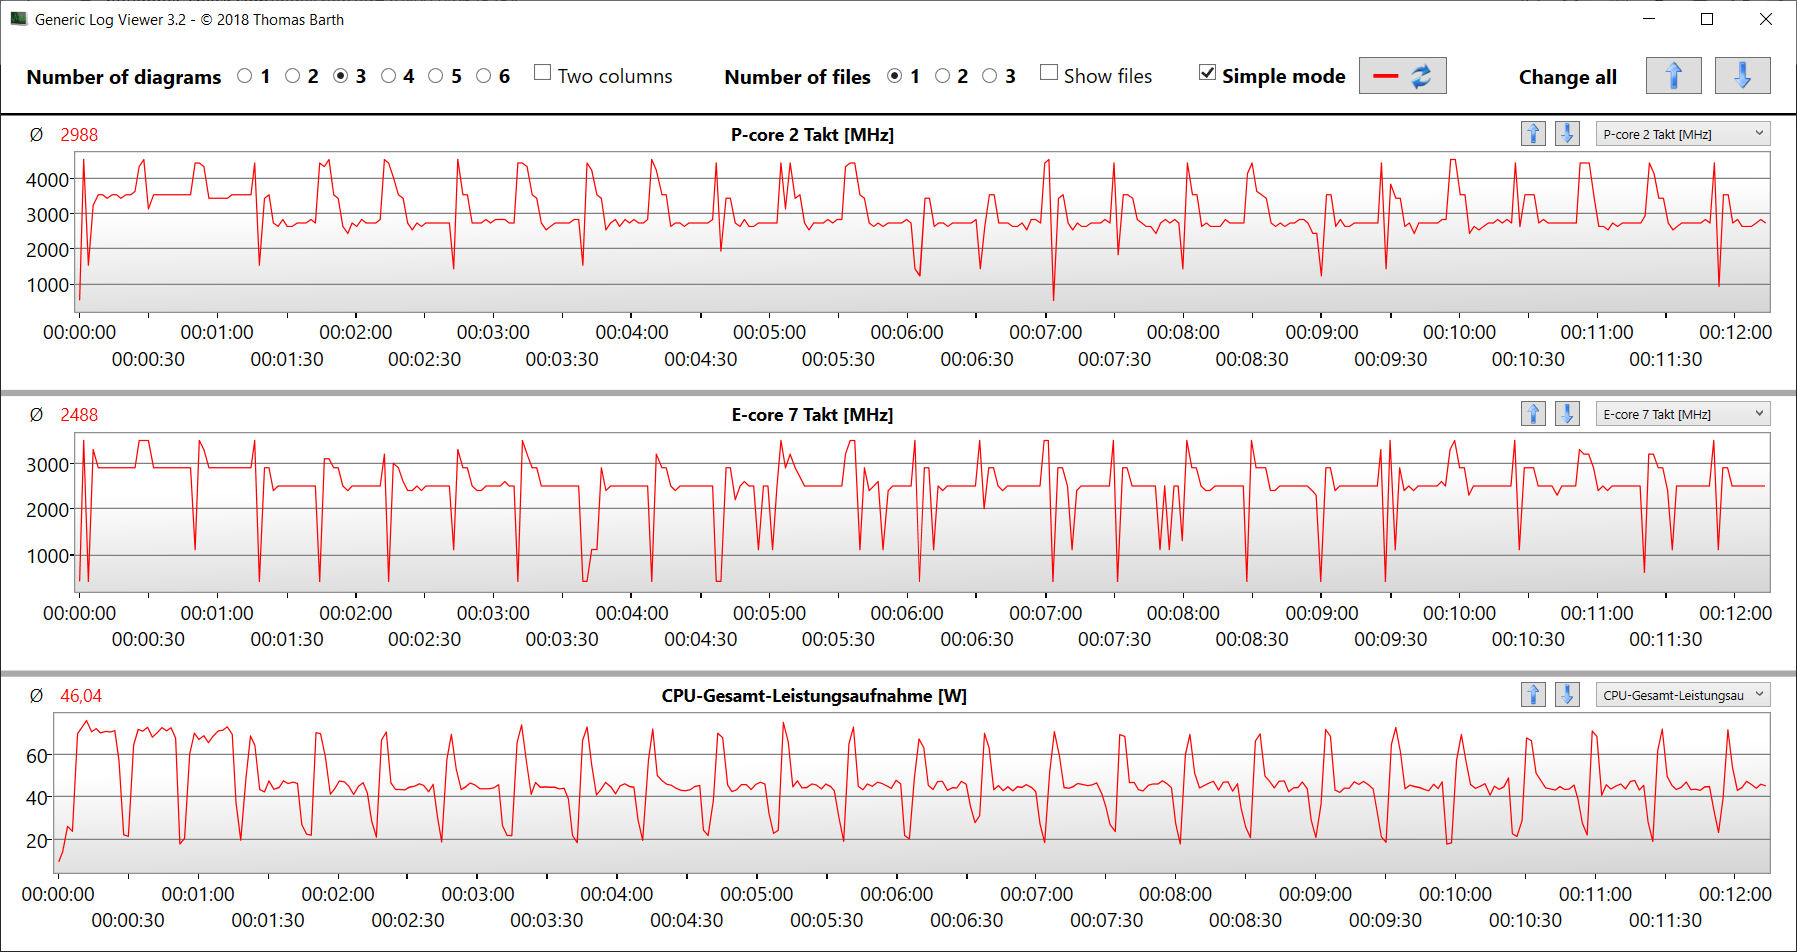
Test pętli CB15 pokazuje, że stałe obciążenie wielowątkowe powoduje, że po drugim przebiegu prędkość Turbo nieco spada, a procesor nie jest w stanie utrzymać stałego poziomu.
Cinebench R15 Multi Constant Load Test
| CPU Performance rating - Percent | |
| Średnia w klasie Gaming | |
| Aorus 15 XE5 | |
| HP Victus 15 fa0020nr | |
| MSI Cyborg 15 A12VF | |
| MSI Katana 15 B12VEK | |
| Asus TUF Gaming A16 FA617 | |
| Przeciętny Intel Core i7-12650H | |
| Schenker XMG Fusion 15 (Mid 22) | |
| Cinebench R23 | |
| Multi Core | |
| Średnia w klasie Gaming (10488 - 40970, n=112, ostatnie 2 lata) | |
| Aorus 15 XE5 | |
| MSI Katana 15 B12VEK | |
| HP Victus 15 fa0020nr | |
| MSI Cyborg 15 A12VF | |
| Asus TUF Gaming A16 FA617 | |
| Przeciętny Intel Core i7-12650H (5362 - 15537, n=14) | |
| Schenker XMG Fusion 15 (Mid 22) | |
| Single Core | |
| Średnia w klasie Gaming (1166 - 2356, n=112, ostatnie 2 lata) | |
| Aorus 15 XE5 | |
| MSI Cyborg 15 A12VF | |
| HP Victus 15 fa0020nr | |
| Przeciętny Intel Core i7-12650H (1428 - 1808, n=14) | |
| MSI Katana 15 B12VEK | |
| Asus TUF Gaming A16 FA617 | |
| Schenker XMG Fusion 15 (Mid 22) | |
| Cinebench R20 | |
| CPU (Multi Core) | |
| Średnia w klasie Gaming (4029 - 16108, n=111, ostatnie 2 lata) | |
| Aorus 15 XE5 | |
| MSI Katana 15 B12VEK | |
| HP Victus 15 fa0020nr | |
| MSI Cyborg 15 A12VF | |
| Asus TUF Gaming A16 FA617 | |
| Przeciętny Intel Core i7-12650H (2106 - 6009, n=14) | |
| Schenker XMG Fusion 15 (Mid 22) | |
| CPU (Single Core) | |
| Średnia w klasie Gaming (442 - 895, n=111, ostatnie 2 lata) | |
| Aorus 15 XE5 | |
| HP Victus 15 fa0020nr | |
| MSI Cyborg 15 A12VF | |
| Przeciętny Intel Core i7-12650H (552 - 696, n=14) | |
| MSI Katana 15 B12VEK | |
| Asus TUF Gaming A16 FA617 | |
| Schenker XMG Fusion 15 (Mid 22) | |
| Cinebench R15 | |
| CPU Multi 64Bit | |
| Średnia w klasie Gaming (1578 - 6271, n=111, ostatnie 2 lata) | |
| Aorus 15 XE5 | |
| HP Victus 15 fa0020nr | |
| Asus TUF Gaming A16 FA617 | |
| MSI Katana 15 B12VEK | |
| MSI Cyborg 15 A12VF | |
| Przeciętny Intel Core i7-12650H (753 - 2253, n=14) | |
| Schenker XMG Fusion 15 (Mid 22) | |
| CPU Single 64Bit | |
| Średnia w klasie Gaming (188.8 - 343, n=111, ostatnie 2 lata) | |
| Aorus 15 XE5 | |
| HP Victus 15 fa0020nr | |
| Asus TUF Gaming A16 FA617 | |
| MSI Katana 15 B12VEK | |
| Przeciętny Intel Core i7-12650H (206 - 261, n=14) | |
| MSI Cyborg 15 A12VF | |
| Schenker XMG Fusion 15 (Mid 22) | |
| Blender - v2.79 BMW27 CPU | |
| Schenker XMG Fusion 15 (Mid 22) | |
| Przeciętny Intel Core i7-12650H (222 - 553, n=15) | |
| MSI Cyborg 15 A12VF | |
| Aorus 15 XE5 | |
| HP Victus 15 fa0020nr | |
| MSI Katana 15 B12VEK | |
| Asus TUF Gaming A16 FA617 | |
| Średnia w klasie Gaming (80 - 330, n=109, ostatnie 2 lata) | |
| 7-Zip 18.03 | |
| 7z b 4 | |
| Średnia w klasie Gaming (33491 - 148086, n=110, ostatnie 2 lata) | |
| Asus TUF Gaming A16 FA617 | |
| MSI Katana 15 B12VEK | |
| Aorus 15 XE5 | |
| MSI Cyborg 15 A12VF | |
| HP Victus 15 fa0020nr | |
| Schenker XMG Fusion 15 (Mid 22) | |
| Przeciętny Intel Core i7-12650H (27053 - 59034, n=14) | |
| 7z b 4 -mmt1 | |
| Średnia w klasie Gaming (4199 - 7436, n=110, ostatnie 2 lata) | |
| HP Victus 15 fa0020nr | |
| Asus TUF Gaming A16 FA617 | |
| MSI Cyborg 15 A12VF | |
| Aorus 15 XE5 | |
| Przeciętny Intel Core i7-12650H (5265 - 6116, n=14) | |
| MSI Katana 15 B12VEK | |
| Schenker XMG Fusion 15 (Mid 22) | |
| Geekbench 5.5 | |
| Multi-Core | |
| Średnia w klasie Gaming (6460 - 27010, n=110, ostatnie 2 lata) | |
| Aorus 15 XE5 | |
| MSI Katana 15 B12VEK | |
| MSI Cyborg 15 A12VF | |
| HP Victus 15 fa0020nr | |
| Asus TUF Gaming A16 FA617 | |
| Przeciętny Intel Core i7-12650H (6478 - 11284, n=16) | |
| Schenker XMG Fusion 15 (Mid 22) | |
| Single-Core | |
| Średnia w klasie Gaming (986 - 2474, n=110, ostatnie 2 lata) | |
| HP Victus 15 fa0020nr | |
| MSI Cyborg 15 A12VF | |
| Przeciętny Intel Core i7-12650H (1590 - 1797, n=16) | |
| Aorus 15 XE5 | |
| MSI Katana 15 B12VEK | |
| Schenker XMG Fusion 15 (Mid 22) | |
| Asus TUF Gaming A16 FA617 | |
| HWBOT x265 Benchmark v2.2 - 4k Preset | |
| Średnia w klasie Gaming (11.5 - 44.3, n=110, ostatnie 2 lata) | |
| Asus TUF Gaming A16 FA617 | |
| MSI Katana 15 B12VEK | |
| Aorus 15 XE5 | |
| MSI Cyborg 15 A12VF | |
| MSI Cyborg 15 A12VF | |
| HP Victus 15 fa0020nr | |
| Przeciętny Intel Core i7-12650H (6.62 - 17.4, n=16) | |
| Schenker XMG Fusion 15 (Mid 22) | |
| LibreOffice - 20 Documents To PDF | |
| Asus TUF Gaming A16 FA617 | |
| HP Victus 15 fa0020nr | |
| Średnia w klasie Gaming (19 - 88.8, n=110, ostatnie 2 lata) | |
| Schenker XMG Fusion 15 (Mid 22) | |
| MSI Katana 15 B12VEK | |
| Przeciętny Intel Core i7-12650H (35.1 - 58.5, n=14) | |
| MSI Cyborg 15 A12VF | |
| Aorus 15 XE5 | |
| R Benchmark 2.5 - Overall mean | |
| Schenker XMG Fusion 15 (Mid 22) | |
| Asus TUF Gaming A16 FA617 | |
| MSI Katana 15 B12VEK | |
| Przeciętny Intel Core i7-12650H (0.4584 - 0.515, n=14) | |
| HP Victus 15 fa0020nr | |
| MSI Cyborg 15 A12VF | |
| Aorus 15 XE5 | |
| Średnia w klasie Gaming (0.3439 - 0.759, n=111, ostatnie 2 lata) | |
* ... im mniej tym lepiej
AIDA64: FP32 Ray-Trace | FPU Julia | CPU SHA3 | CPU Queen | FPU SinJulia | FPU Mandel | CPU AES | CPU ZLib | FP64 Ray-Trace | CPU PhotoWorxx
| Performance rating | |
| Średnia w klasie Gaming | |
| Asus TUF Gaming A16 FA617 | |
| Aorus 15 XE5 | |
| MSI Katana 15 B12VEK | |
| Schenker XMG Fusion 15 (Mid 22) | |
| MSI Cyborg 15 A12VF | |
| HP Victus 15 fa0020nr | |
| Przeciętny Intel Core i7-12650H | |
| AIDA64 / FP32 Ray-Trace | |
| Średnia w klasie Gaming (10227 - 85542, n=109, ostatnie 2 lata) | |
| Asus TUF Gaming A16 FA617 | |
| MSI Katana 15 B12VEK | |
| Aorus 15 XE5 | |
| HP Victus 15 fa0020nr | |
| Schenker XMG Fusion 15 (Mid 22) | |
| MSI Cyborg 15 A12VF | |
| Przeciętny Intel Core i7-12650H (5422 - 15620, n=14) | |
| AIDA64 / FPU Julia | |
| Średnia w klasie Gaming (51376 - 238426, n=109, ostatnie 2 lata) | |
| Asus TUF Gaming A16 FA617 | |
| MSI Katana 15 B12VEK | |
| MSI Cyborg 15 A12VF | |
| Aorus 15 XE5 | |
| HP Victus 15 fa0020nr | |
| Schenker XMG Fusion 15 (Mid 22) | |
| Przeciętny Intel Core i7-12650H (26386 - 76434, n=14) | |
| AIDA64 / CPU SHA3 | |
| Średnia w klasie Gaming (2180 - 9817, n=109, ostatnie 2 lata) | |
| Schenker XMG Fusion 15 (Mid 22) | |
| Asus TUF Gaming A16 FA617 | |
| MSI Katana 15 B12VEK | |
| Aorus 15 XE5 | |
| MSI Cyborg 15 A12VF | |
| HP Victus 15 fa0020nr | |
| Przeciętny Intel Core i7-12650H (1479 - 3244, n=14) | |
| AIDA64 / CPU Queen | |
| Średnia w klasie Gaming (49785 - 173351, n=100, ostatnie 2 lata) | |
| Asus TUF Gaming A16 FA617 | |
| Aorus 15 XE5 | |
| HP Victus 15 fa0020nr | |
| MSI Katana 15 B12VEK | |
| Schenker XMG Fusion 15 (Mid 22) | |
| MSI Cyborg 15 A12VF | |
| Przeciętny Intel Core i7-12650H (59278 - 89537, n=14) | |
| AIDA64 / FPU SinJulia | |
| Średnia w klasie Gaming (4424 - 33636, n=109, ostatnie 2 lata) | |
| Asus TUF Gaming A16 FA617 | |
| Schenker XMG Fusion 15 (Mid 22) | |
| MSI Katana 15 B12VEK | |
| Aorus 15 XE5 | |
| MSI Cyborg 15 A12VF | |
| HP Victus 15 fa0020nr | |
| Przeciętny Intel Core i7-12650H (4690 - 8726, n=14) | |
| AIDA64 / FPU Mandel | |
| Średnia w klasie Gaming (25115 - 128721, n=109, ostatnie 2 lata) | |
| Asus TUF Gaming A16 FA617 | |
| MSI Katana 15 B12VEK | |
| Schenker XMG Fusion 15 (Mid 22) | |
| HP Victus 15 fa0020nr | |
| MSI Cyborg 15 A12VF | |
| Aorus 15 XE5 | |
| Przeciętny Intel Core i7-12650H (15001 - 37738, n=14) | |
| AIDA64 / CPU AES | |
| Schenker XMG Fusion 15 (Mid 22) | |
| Aorus 15 XE5 | |
| Średnia w klasie Gaming (39258 - 247074, n=109, ostatnie 2 lata) | |
| MSI Katana 15 B12VEK | |
| MSI Cyborg 15 A12VF | |
| Asus TUF Gaming A16 FA617 | |
| HP Victus 15 fa0020nr | |
| Przeciętny Intel Core i7-12650H (32702 - 92530, n=14) | |
| AIDA64 / CPU ZLib | |
| Średnia w klasie Gaming (574 - 2531, n=109, ostatnie 2 lata) | |
| MSI Cyborg 15 A12VF | |
| Asus TUF Gaming A16 FA617 | |
| MSI Katana 15 B12VEK | |
| Aorus 15 XE5 | |
| HP Victus 15 fa0020nr | |
| Przeciętny Intel Core i7-12650H (443 - 891, n=14) | |
| Schenker XMG Fusion 15 (Mid 22) | |
| AIDA64 / FP64 Ray-Trace | |
| Średnia w klasie Gaming (5509 - 45446, n=109, ostatnie 2 lata) | |
| Asus TUF Gaming A16 FA617 | |
| MSI Katana 15 B12VEK | |
| Schenker XMG Fusion 15 (Mid 22) | |
| Aorus 15 XE5 | |
| HP Victus 15 fa0020nr | |
| MSI Cyborg 15 A12VF | |
| Przeciętny Intel Core i7-12650H (3096 - 8448, n=14) | |
| AIDA64 / CPU PhotoWorxx | |
| Średnia w klasie Gaming (12271 - 89891, n=109, ostatnie 2 lata) | |
| MSI Katana 15 B12VEK | |
| MSI Cyborg 15 A12VF | |
| Aorus 15 XE5 | |
| Przeciętny Intel Core i7-12650H (22046 - 44164, n=14) | |
| Asus TUF Gaming A16 FA617 | |
| Schenker XMG Fusion 15 (Mid 22) | |
| HP Victus 15 fa0020nr | |
Wydajność systemu
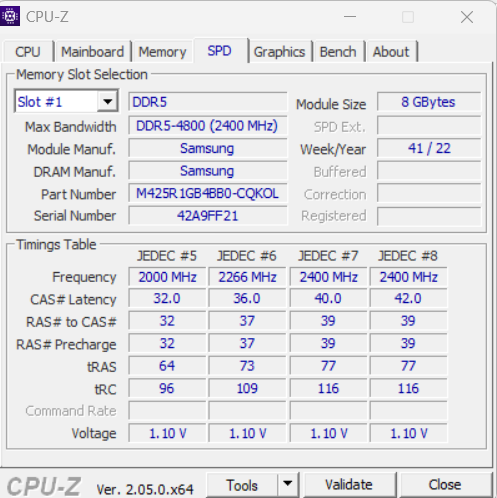
Nie można oczekiwać ekstremalnej wydajności od płynnie działającego systemu, ponieważ skupia się on bardziej na innych aspektach, takich jak kompaktowe rozmiary, mobilność i niskie zużycie energii. Niemniej jednak zastosowany sprzęt jest w stanie poradzić sobie z wymagającymi obszarami zastosowań, takimi jak renderowanie, przetwarzanie wideo i gry. Prędkości transferu pamięci roboczej są na normalnym poziomie dla pamięci RAM DDR5-4800. Towarzyszą im dobre wyniki w programie PC-Mark.
CrossMark: Overall | Productivity | Creativity | Responsiveness
| PCMark 10 / Score | |
| Średnia w klasie Gaming (5828 - 11574, n=95, ostatnie 2 lata) | |
| Aorus 15 XE5 | |
| Asus TUF Gaming A16 FA617 | |
| MSI Cyborg 15 A12VF | |
| Przeciętny Intel Core i7-12650H, NVIDIA GeForce RTX 4060 Laptop GPU (n=1) | |
| HP Victus 15 fa0020nr | |
| MSI Katana 15 B12VEK | |
| Schenker XMG Fusion 15 (Mid 22) | |
| PCMark 10 / Essentials | |
| Aorus 15 XE5 | |
| MSI Cyborg 15 A12VF | |
| Przeciętny Intel Core i7-12650H, NVIDIA GeForce RTX 4060 Laptop GPU (n=1) | |
| Średnia w klasie Gaming (8810 - 12600, n=99, ostatnie 2 lata) | |
| Asus TUF Gaming A16 FA617 | |
| HP Victus 15 fa0020nr | |
| MSI Katana 15 B12VEK | |
| Schenker XMG Fusion 15 (Mid 22) | |
| PCMark 10 / Productivity | |
| Średnia w klasie Gaming (6845 - 18766, n=97, ostatnie 2 lata) | |
| Aorus 15 XE5 | |
| MSI Cyborg 15 A12VF | |
| Przeciętny Intel Core i7-12650H, NVIDIA GeForce RTX 4060 Laptop GPU (n=1) | |
| MSI Katana 15 B12VEK | |
| Asus TUF Gaming A16 FA617 | |
| HP Victus 15 fa0020nr | |
| Schenker XMG Fusion 15 (Mid 22) | |
| PCMark 10 / Digital Content Creation | |
| Średnia w klasie Gaming (7602 - 19657, n=97, ostatnie 2 lata) | |
| Aorus 15 XE5 | |
| Asus TUF Gaming A16 FA617 | |
| HP Victus 15 fa0020nr | |
| MSI Cyborg 15 A12VF | |
| Przeciętny Intel Core i7-12650H, NVIDIA GeForce RTX 4060 Laptop GPU (n=1) | |
| MSI Katana 15 B12VEK | |
| Schenker XMG Fusion 15 (Mid 22) | |
| CrossMark / Overall | |
| Średnia w klasie Gaming (1366 - 2409, n=97, ostatnie 2 lata) | |
| Aorus 15 XE5 | |
| MSI Cyborg 15 A12VF | |
| Przeciętny Intel Core i7-12650H, NVIDIA GeForce RTX 4060 Laptop GPU (n=1) | |
| MSI Katana 15 B12VEK | |
| Schenker XMG Fusion 15 (Mid 22) | |
| HP Victus 15 fa0020nr | |
| CrossMark / Productivity | |
| Aorus 15 XE5 | |
| Średnia w klasie Gaming (1386 - 2254, n=97, ostatnie 2 lata) | |
| MSI Cyborg 15 A12VF | |
| Przeciętny Intel Core i7-12650H, NVIDIA GeForce RTX 4060 Laptop GPU (n=1) | |
| MSI Katana 15 B12VEK | |
| Schenker XMG Fusion 15 (Mid 22) | |
| HP Victus 15 fa0020nr | |
| CrossMark / Creativity | |
| Średnia w klasie Gaming (1343 - 2729, n=97, ostatnie 2 lata) | |
| Aorus 15 XE5 | |
| MSI Cyborg 15 A12VF | |
| Przeciętny Intel Core i7-12650H, NVIDIA GeForce RTX 4060 Laptop GPU (n=1) | |
| MSI Katana 15 B12VEK | |
| HP Victus 15 fa0020nr | |
| Schenker XMG Fusion 15 (Mid 22) | |
| CrossMark / Responsiveness | |
| Aorus 15 XE5 | |
| Średnia w klasie Gaming (1226 - 2334, n=97, ostatnie 2 lata) | |
| MSI Cyborg 15 A12VF | |
| Przeciętny Intel Core i7-12650H, NVIDIA GeForce RTX 4060 Laptop GPU (n=1) | |
| Schenker XMG Fusion 15 (Mid 22) | |
| MSI Katana 15 B12VEK | |
| HP Victus 15 fa0020nr | |
| PCMark 8 Home Score Accelerated v2 | 5364 pkt. | |
| PCMark 8 Work Score Accelerated v2 | 6432 pkt. | |
| PCMark 10 Score | 7098 pkt. | |
Pomoc | ||
| AIDA64 / Memory Copy | |
| Średnia w klasie Gaming (21750 - 129946, n=109, ostatnie 2 lata) | |
| MSI Cyborg 15 A12VF | |
| MSI Katana 15 B12VEK | |
| Przeciętny Intel Core i7-12650H (43261 - 69735, n=14) | |
| Aorus 15 XE5 | |
| Asus TUF Gaming A16 FA617 | |
| Schenker XMG Fusion 15 (Mid 22) | |
| HP Victus 15 fa0020nr | |
| AIDA64 / Memory Read | |
| Średnia w klasie Gaming (22956 - 118858, n=109, ostatnie 2 lata) | |
| MSI Katana 15 B12VEK | |
| MSI Cyborg 15 A12VF | |
| Aorus 15 XE5 | |
| Przeciętny Intel Core i7-12650H (47313 - 67412, n=14) | |
| Asus TUF Gaming A16 FA617 | |
| Schenker XMG Fusion 15 (Mid 22) | |
| HP Victus 15 fa0020nr | |
| AIDA64 / Memory Write | |
| Średnia w klasie Gaming (22297 - 135096, n=109, ostatnie 2 lata) | |
| Aorus 15 XE5 | |
| MSI Katana 15 B12VEK | |
| MSI Cyborg 15 A12VF | |
| Asus TUF Gaming A16 FA617 | |
| Przeciętny Intel Core i7-12650H (45617 - 59361, n=14) | |
| Schenker XMG Fusion 15 (Mid 22) | |
| HP Victus 15 fa0020nr | |
| AIDA64 / Memory Latency | |
| Średnia w klasie Gaming (75.3 - 259, n=109, ostatnie 2 lata) | |
| Aorus 15 XE5 | |
| MSI Katana 15 B12VEK | |
| Schenker XMG Fusion 15 (Mid 22) | |
| MSI Cyborg 15 A12VF | |
| Asus TUF Gaming A16 FA617 | |
| Przeciętny Intel Core i7-12650H (71.6 - 103.9, n=14) | |
| HP Victus 15 fa0020nr | |
* ... im mniej tym lepiej
Opóźnienia DPC
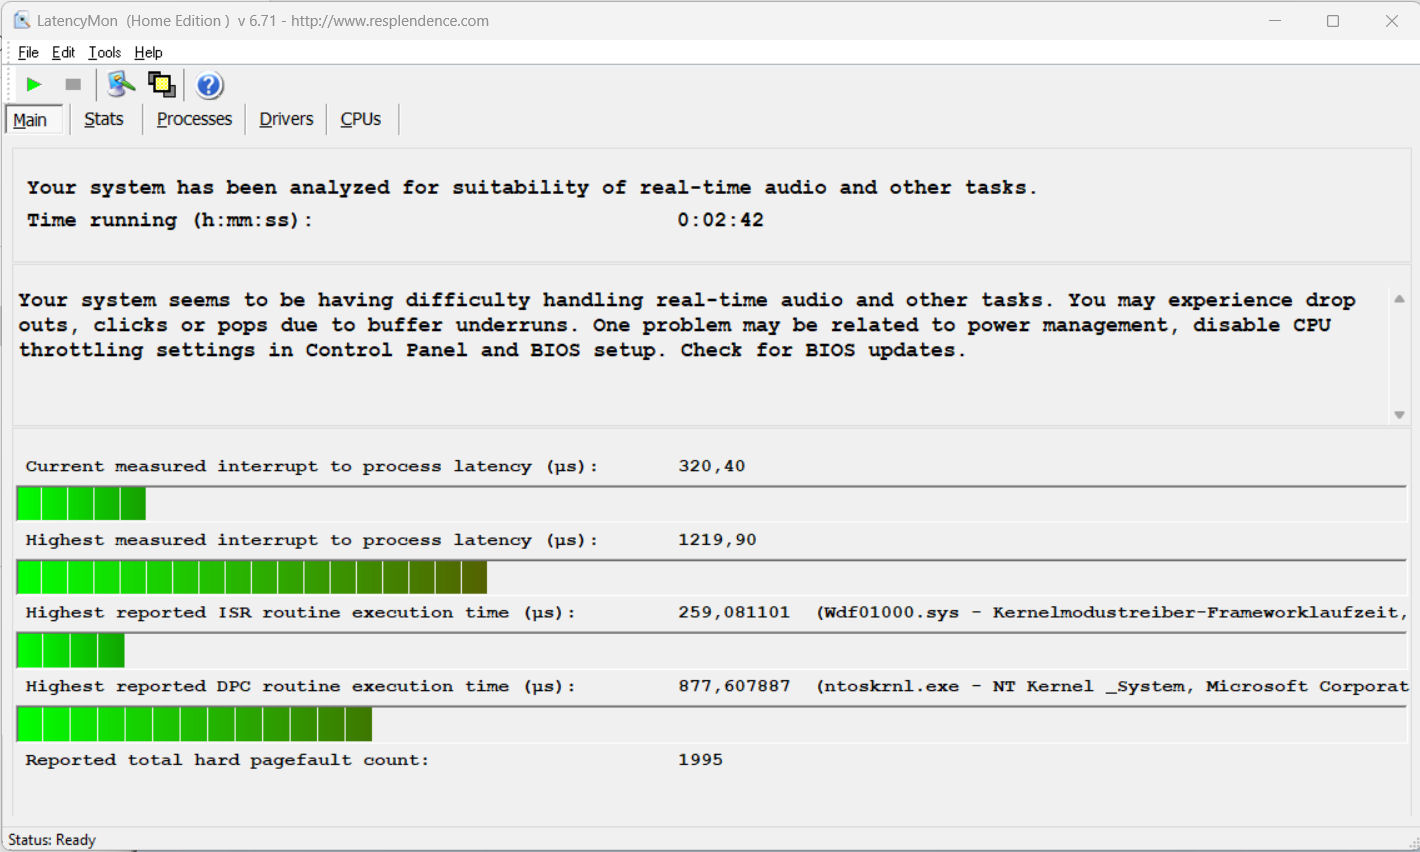
Standardowy test Latency Monitor (przeglądanie stron internetowych, odtwarzanie wideo w rozdzielczości 4k, wysokie obciążenie Prime95) ujawnił pewne rzucające się w oczy opóźnienia, a system nie wydaje się przystosowany do przetwarzania wideo i dźwięku w czasie rzeczywistym. Przyszłe aktualizacje oprogramowania mogą przynieść pewne usprawnienia lub nawet pogorszyć sytuację.
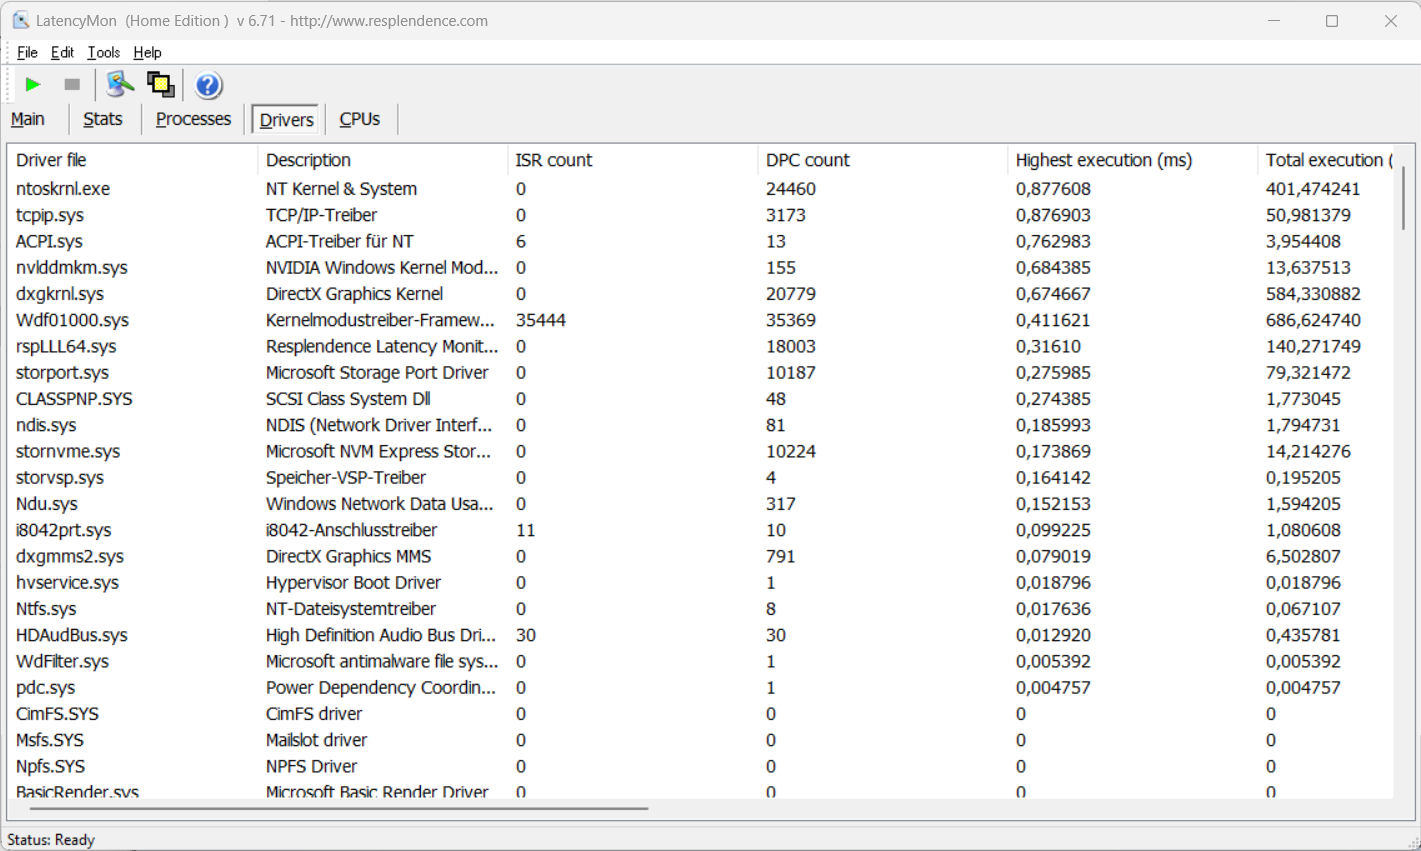
| DPC Latencies / LatencyMon - interrupt to process latency (max), Web, Youtube, Prime95 | |
| MSI Katana 15 B12VEK | |
| Schenker XMG Fusion 15 (Mid 22) | |
| HP Victus 15 fa0020nr | |
| MSI Cyborg 15 A12VF | |
| Aorus 15 XE5 | |
| Asus TUF Gaming A16 FA617 | |
* ... im mniej tym lepiej
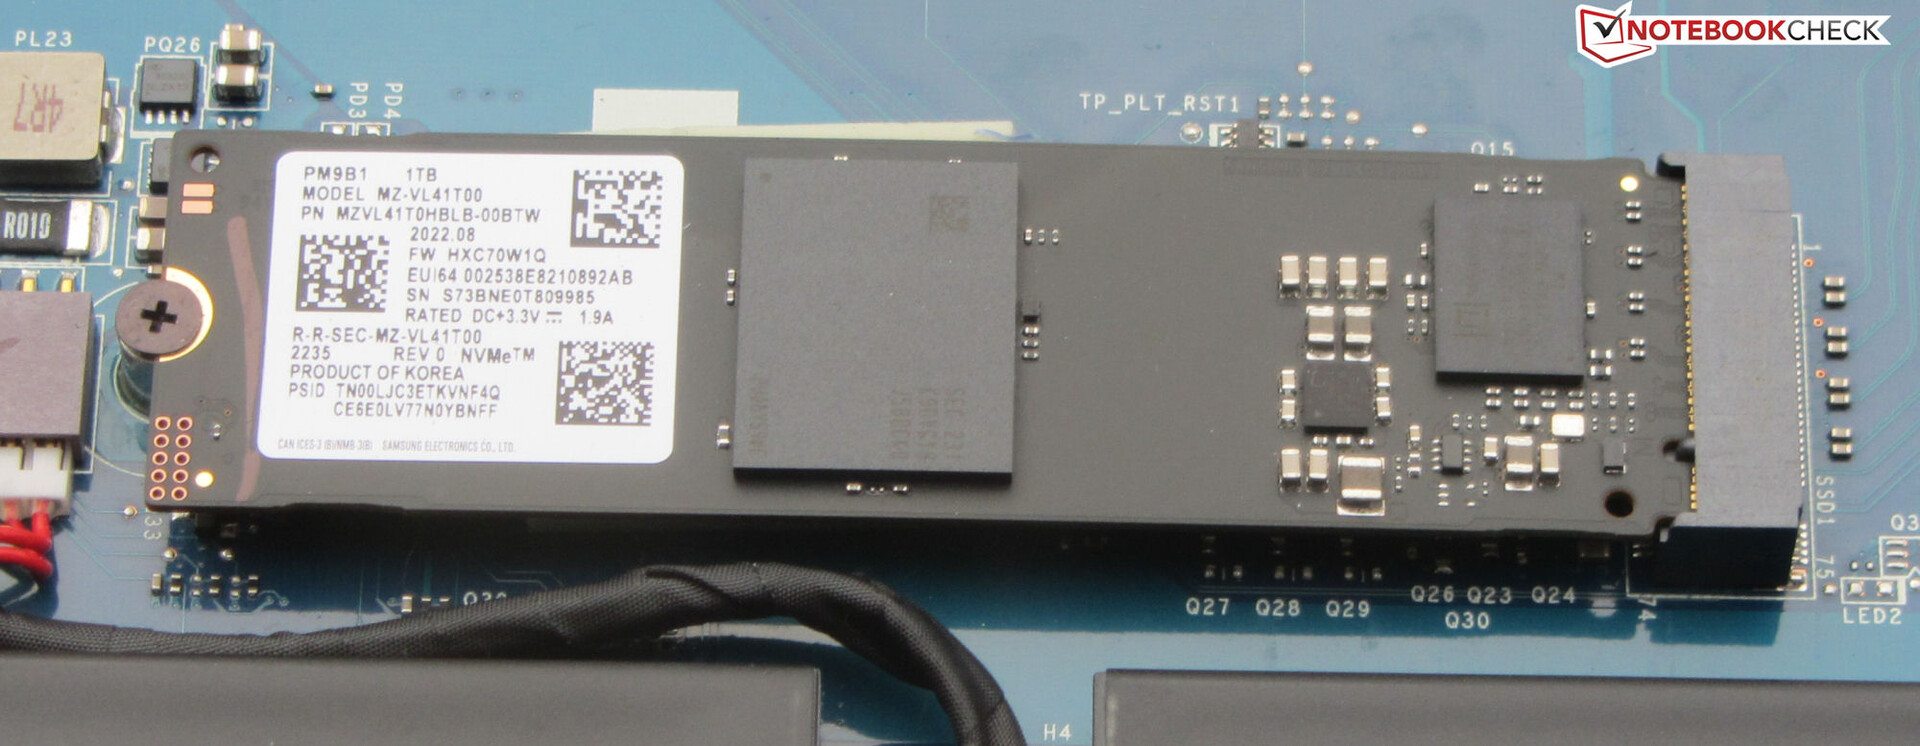
Rozwiązanie w zakresie przechowywania
MSI wyposażyło Cyborga w dysk SSD PCIe 4 (M.2-2280) firmy Samsung, który oferuje pojemność 1 TB. Choć zapewnia on dobre transfery, nie należy do czołowych modeli wśród dysków SSD.
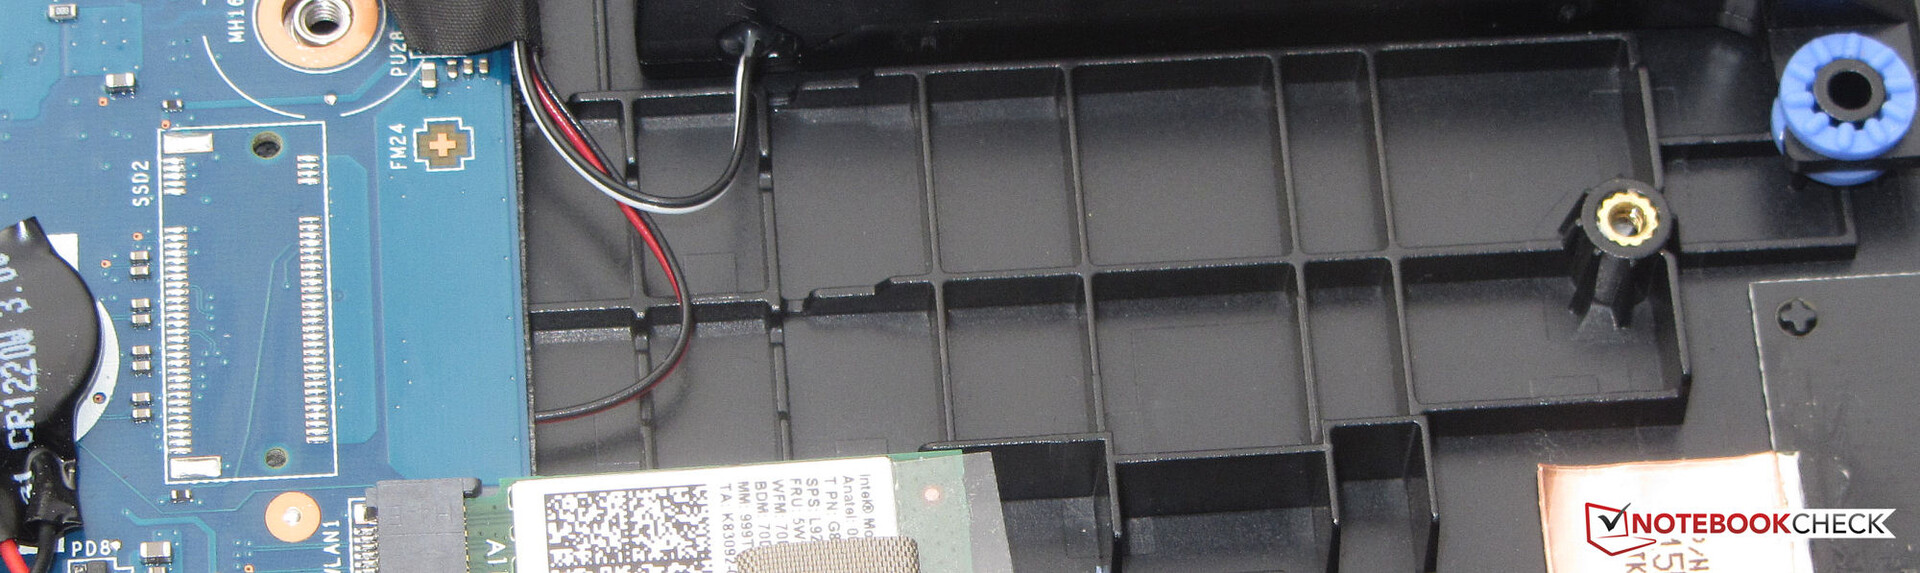
Choć w laptopie jest miejsce na drugi dysk SSD, MSI oszczędza na niezbędnym gnieździe do jego podłączenia. Trudno uzasadnić tę decyzję w laptopie tej klasy cenowej. Opcja dodania drugiego modułu pamięci masowej stała się w tym momencie standardem, szczególnie w przypadku laptopa do gier.

| Drive Performance rating - Percent | |
| Aorus 15 XE5 | |
| Schenker XMG Fusion 15 (Mid 22) | |
| Średnia w klasie Gaming | |
| HP Victus 15 fa0020nr | |
| MSI Cyborg 15 A12VF | |
| Asus TUF Gaming A16 FA617 | |
| MSI Katana 15 B12VEK | |
| Przeciętny Samsung PM9B1 1024GB MZVL41T0HBLB | |
* ... im mniej tym lepiej
Disk Throttling: DiskSpd Read Loop, Queue Depth 8
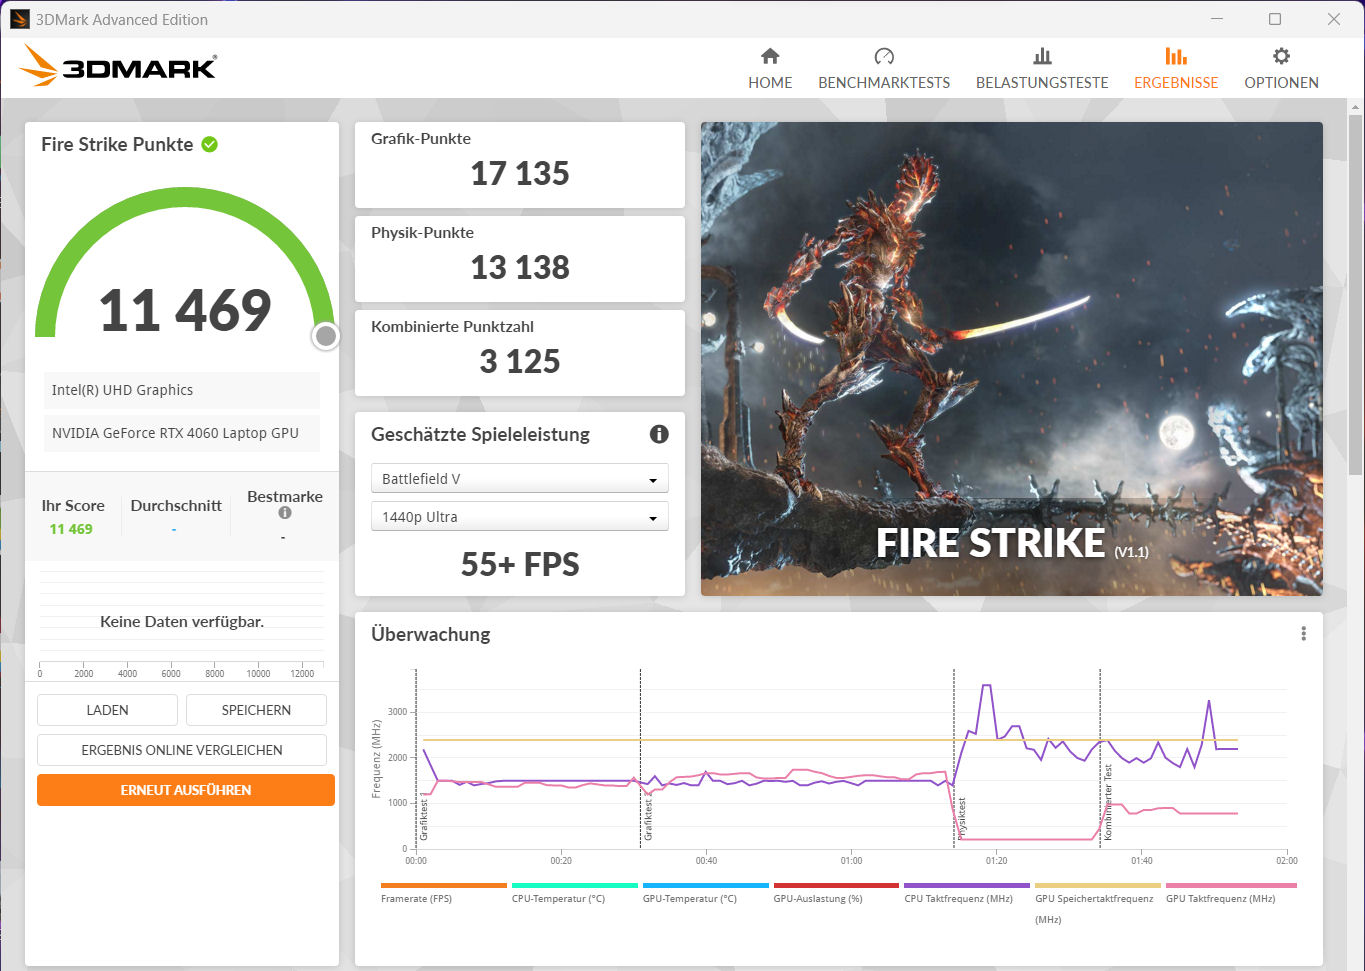
Karta graficzna
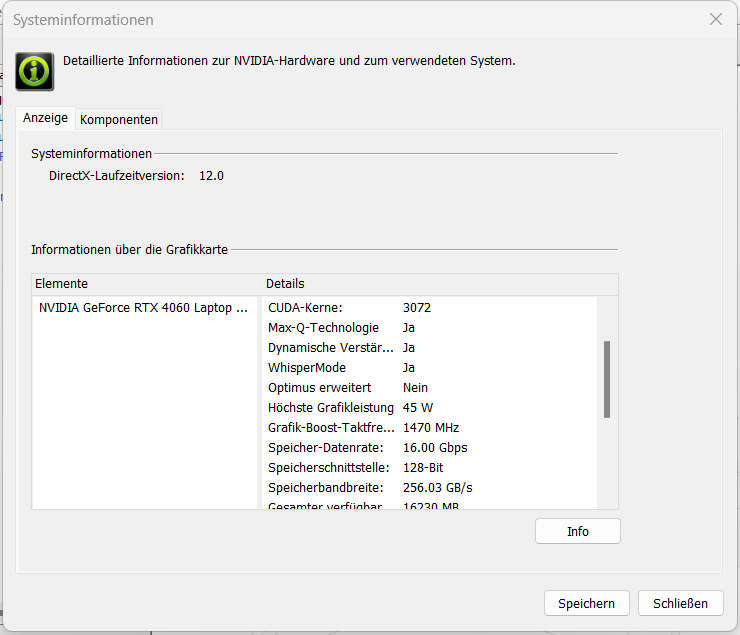
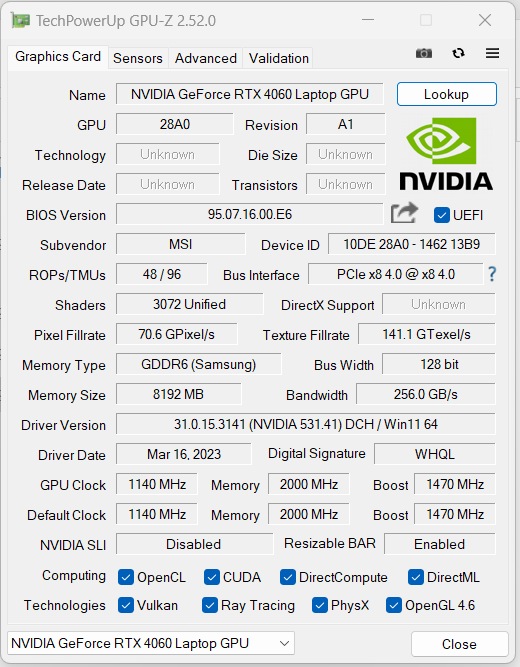
Na stronie .GeForce RTX 4060 LaptopgPU oferuje 3 072 shadery, 128-bitową szynę oraz 8 192 MB szybkiej pamięci GDDR6. MSI konfiguruje TGP na poziomie 45 W (35 Watt + 10 Watt Dynamic), co jest wartością na dolnym krańcu jego możliwości. Ale przynajmniej TGP jest w pełni wykorzystywane, jak wynika z naszego testu The Witcher 3. Omawiany laptop nie oferuje trybu dGPU.
Nie jest zaskakujące, że wyniki benchmarku oscylują poniżej obecnej średniej dla GPU RTX 4060, ale musimy je rozpatrywać w powiązaniu z poborem mocy. Przy ponad dwukrotnie wyższym TGP, GPU RTX 4060 (TGP: 105 W) z m.in.MSI Katana 17osiąga wyniki średnio "tylko" o 30 do 40% wyższe. Oznacza to, że 45-watowy RTX 4060 działa tu bardzo wydajnie.
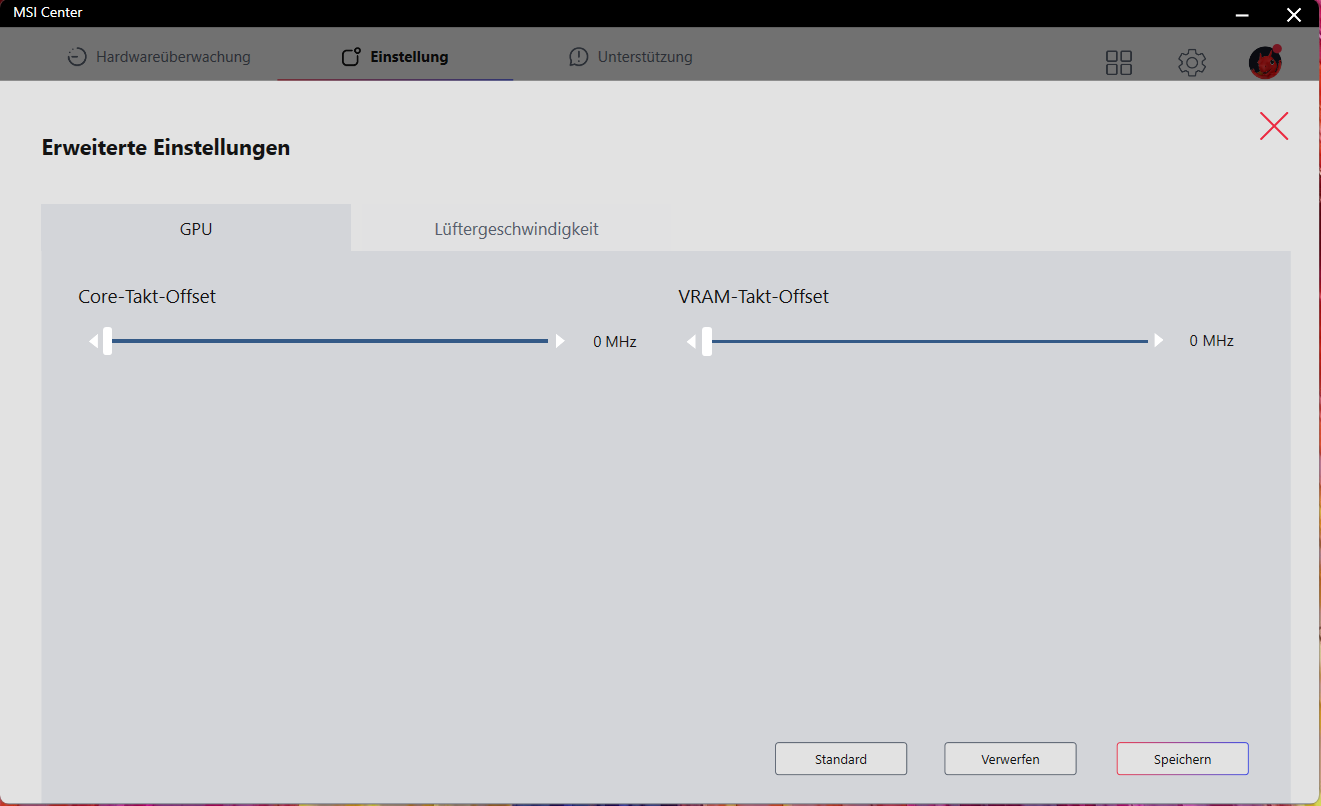
Centrum MSI oferuje opcje podkręcania dla GPU i pamięci graficznej, ale tylko po aktywowaniu profilu "Extreme Performance" (trzeba kliknąć symbol koła zębatego). Z tej opcji zawsze korzystacie na własne ryzyko, a w razie wystąpienia jakichś problemów czy niestabilności, trzeba usunąć podkręcanie.

| 3DMark Performance rating - Percent | |
| Średnia w klasie Gaming | |
| MSI Katana 17 B13VFK | |
| Aorus 15 XE5 -1! | |
| Przeciętny NVIDIA GeForce RTX 4060 Laptop GPU | |
| Asus TUF Gaming A16 FA617 | |
| MSI Katana 15 B12VEK | |
| Schenker XMG Fusion 15 (Mid 22) | |
| MSI Cyborg 15 A12VF | |
| HP Victus 15 fa0020nr | |
| 3DMark 11 - 1280x720 Performance GPU | |
| Średnia w klasie Gaming (21841 - 80022, n=108, ostatnie 2 lata) | |
| Aorus 15 XE5 | |
| MSI Katana 17 B13VFK | |
| Przeciętny NVIDIA GeForce RTX 4060 Laptop GPU (28136 - 38912, n=57) | |
| Asus TUF Gaming A16 FA617 | |
| Schenker XMG Fusion 15 (Mid 22) | |
| MSI Katana 15 B12VEK | |
| MSI Cyborg 15 A12VF | |
| HP Victus 15 fa0020nr | |
| 3DMark | |
| 1280x720 Cloud Gate Standard Graphics | |
| MSI Katana 17 B13VFK | |
| MSI Katana 15 B12VEK | |
| Asus TUF Gaming A16 FA617 | |
| Przeciętny NVIDIA GeForce RTX 4060 Laptop GPU (81407 - 180228, n=29) | |
| Średnia w klasie Gaming (86886 - 223650, n=61, ostatnie 2 lata) | |
| MSI Cyborg 15 A12VF | |
| Schenker XMG Fusion 15 (Mid 22) | |
| HP Victus 15 fa0020nr | |
| 1920x1080 Fire Strike Graphics | |
| Średnia w klasie Gaming (12242 - 62849, n=120, ostatnie 2 lata) | |
| Aorus 15 XE5 | |
| MSI Katana 17 B13VFK | |
| Przeciętny NVIDIA GeForce RTX 4060 Laptop GPU (20533 - 29656, n=54) | |
| Asus TUF Gaming A16 FA617 | |
| Schenker XMG Fusion 15 (Mid 22) | |
| MSI Katana 15 B12VEK | |
| MSI Cyborg 15 A12VF | |
| HP Victus 15 fa0020nr | |
| 2560x1440 Time Spy Graphics | |
| Średnia w klasie Gaming (5012 - 26212, n=119, ostatnie 2 lata) | |
| Aorus 15 XE5 | |
| MSI Katana 17 B13VFK | |
| Przeciętny NVIDIA GeForce RTX 4060 Laptop GPU (7484 - 11451, n=56) | |
| Asus TUF Gaming A16 FA617 | |
| Schenker XMG Fusion 15 (Mid 22) | |
| MSI Katana 15 B12VEK | |
| MSI Cyborg 15 A12VF | |
| HP Victus 15 fa0020nr | |
| 3DMark 06 Standard Score | 48240 pkt. | |
| 3DMark 11 Performance | 26146 pkt. | |
| 3DMark Cloud Gate Standard Score | 57304 pkt. | |
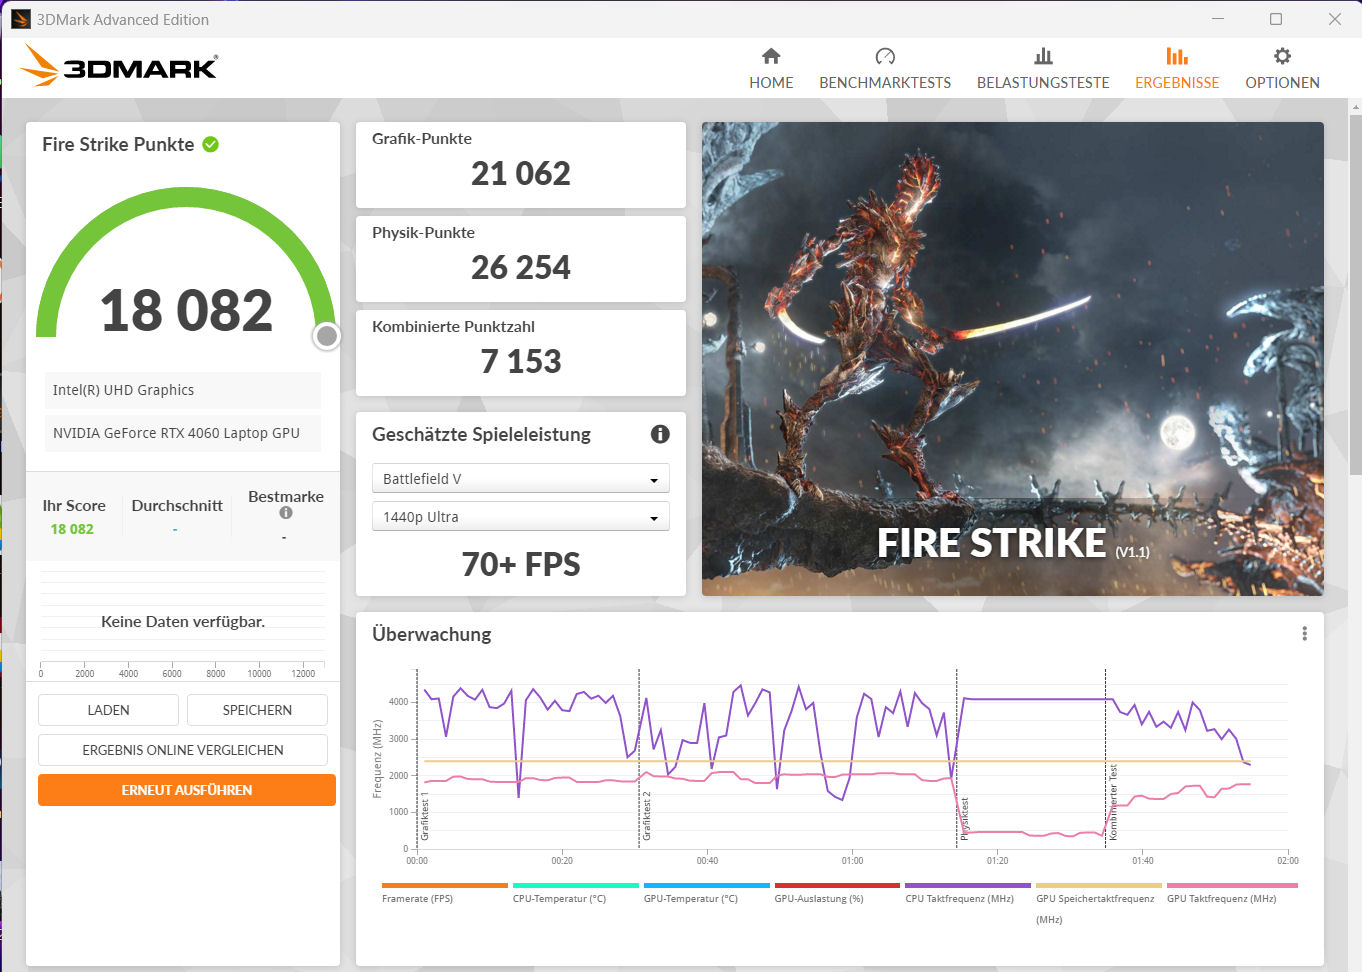
| 3DMark Fire Strike Score | 18086 pkt. | |
| 3DMark Time Spy Score | 7918 pkt. | |
Pomoc | ||
| V-Ray 5 Benchmark | |
| GPU RTX | |
| Średnia w klasie Gaming (1146 - 4363, n=37, ostatnie 2 lata) | |
| Aorus 15 XE5 | |
| Przeciętny NVIDIA GeForce RTX 4060 Laptop GPU (1387 - 1817, n=28) | |
| Schenker XMG Fusion 15 (Mid 22) | |
| MSI Cyborg 15 A12VF | |
| HP Victus 15 fa0020nr | |
| GPU CUDA | |
| Średnia w klasie Gaming (887 - 3288, n=37, ostatnie 2 lata) | |
| Aorus 15 XE5 | |
| Schenker XMG Fusion 15 (Mid 22) | |
| Przeciętny NVIDIA GeForce RTX 4060 Laptop GPU (957 - 1294, n=29) | |
| MSI Cyborg 15 A12VF | |
| HP Victus 15 fa0020nr | |
| CPU | |
| Średnia w klasie Gaming (5864 - 30302, n=36, ostatnie 2 lata) | |
| Przeciętny NVIDIA GeForce RTX 4060 Laptop GPU (8364 - 21065, n=28) | |
| HP Victus 15 fa0020nr | |
| MSI Cyborg 15 A12VF | |
| Aorus 15 XE5 | |
| Schenker XMG Fusion 15 (Mid 22) | |
| V-Ray Benchmark Next 4.10 | |
| GPU | |
| Średnia w klasie Gaming (427 - 1333, n=105, ostatnie 2 lata) | |
| Przeciętny NVIDIA GeForce RTX 4060 Laptop GPU (483 - 715, n=46) | |
| Aorus 15 XE5 | |
| MSI Cyborg 15 A12VF | |
| MSI Katana 15 B12VEK | |
| Schenker XMG Fusion 15 (Mid 22) | |
| Asus TUF Gaming A16 FA617 | |
| CPU | |
| Średnia w klasie Gaming (10048 - 45327, n=104, ostatnie 2 lata) | |
| Przeciętny NVIDIA GeForce RTX 4060 Laptop GPU (12680 - 32360, n=46) | |
| MSI Cyborg 15 A12VF | |
| Asus TUF Gaming A16 FA617 | |
| Aorus 15 XE5 | |
| MSI Katana 15 B12VEK | |
| Schenker XMG Fusion 15 (Mid 22) | |
* ... im mniej tym lepiej
Wydajność w grach
Omawiany laptop jest przeznaczony do gier w rozdzielczości FHD na ustawieniach wysokich do maksymalnych. Z wyższych rozdzielczości można by korzystać, gdyby podłączyć odpowiedni monitor - ale tylko na częściowo obniżonych ustawieniach. Liczba klatek na sekundę w testowanych przez nas grach oscyluje poniżej średniej, którą wyznaczyliśmy dla kart graficznych RTX 4060.
| Performance rating - Percent | |
| Średnia w klasie Gaming | |
| MSI Katana 17 B13VFK | |
| Aorus 15 XE5 | |
| Przeciętny NVIDIA GeForce RTX 4060 Laptop GPU | |
| Schenker XMG Fusion 15 (Mid 22) | |
| MSI Katana 15 B12VEK | |
| MSI Cyborg 15 A12VF | |
| Asus TUF Gaming A16 FA617 | |
| HP Victus 15 fa0020nr | |
| The Witcher 3 - 1920x1080 Ultra Graphics & Postprocessing (HBAO+) | |
| Średnia w klasie Gaming (95 - 240, n=8, ostatnie 2 lata) | |
| MSI Katana 17 B13VFK | |
| Przeciętny NVIDIA GeForce RTX 4060 Laptop GPU (77 - 159.7, n=42) | |
| Aorus 15 XE5 | |
| Schenker XMG Fusion 15 (Mid 22) | |
| Asus TUF Gaming A16 FA617 | |
| MSI Katana 15 B12VEK | |
| MSI Cyborg 15 A12VF | |
| HP Victus 15 fa0020nr | |
| GTA V - 1920x1080 Highest AA:4xMSAA + FX AF:16x | |
| Średnia w klasie Gaming (48.3 - 186.9, n=102, ostatnie 2 lata) | |
| Aorus 15 XE5 | |
| MSI Katana 17 B13VFK | |
| Przeciętny NVIDIA GeForce RTX 4060 Laptop GPU (76.9 - 126.3, n=48) | |
| Schenker XMG Fusion 15 (Mid 22) | |
| MSI Katana 15 B12VEK | |
| MSI Cyborg 15 A12VF | |
| Asus TUF Gaming A16 FA617 | |
| HP Victus 15 fa0020nr | |
| Final Fantasy XV Benchmark - 1920x1080 High Quality | |
| Średnia w klasie Gaming (41 - 215, n=103, ostatnie 2 lata) | |
| Aorus 15 XE5 | |
| Przeciętny NVIDIA GeForce RTX 4060 Laptop GPU (75.1 - 109.8, n=51) | |
| MSI Katana 17 B13VFK | |
| Schenker XMG Fusion 15 (Mid 22) | |
| MSI Katana 15 B12VEK | |
| Asus TUF Gaming A16 FA617 | |
| MSI Cyborg 15 A12VF | |
| HP Victus 15 fa0020nr | |
| Strange Brigade - 1920x1080 ultra AA:ultra AF:16 | |
| Średnia w klasie Gaming (76.3 - 456, n=93, ostatnie 2 lata) | |
| Aorus 15 XE5 | |
| MSI Katana 17 B13VFK | |
| Przeciętny NVIDIA GeForce RTX 4060 Laptop GPU (135.3 - 210, n=50) | |
| Schenker XMG Fusion 15 (Mid 22) | |
| Asus TUF Gaming A16 FA617 | |
| MSI Katana 15 B12VEK | |
| MSI Cyborg 15 A12VF | |
| HP Victus 15 fa0020nr | |
| Dota 2 Reborn - 1920x1080 ultra (3/3) best looking | |
| MSI Katana 17 B13VFK | |
| Średnia w klasie Gaming (84.8 - 248, n=112, ostatnie 2 lata) | |
| Przeciętny NVIDIA GeForce RTX 4060 Laptop GPU (115 - 183.8, n=53) | |
| MSI Katana 15 B12VEK | |
| Aorus 15 XE5 | |
| MSI Cyborg 15 A12VF | |
| Schenker XMG Fusion 15 (Mid 22) | |
| HP Victus 15 fa0020nr | |
| Asus TUF Gaming A16 FA617 | |
| X-Plane 11.11 - 1920x1080 high (fps_test=3) | |
| MSI Katana 17 B13VFK | |
| Aorus 15 XE5 | |
| Przeciętny NVIDIA GeForce RTX 4060 Laptop GPU (60.7 - 141.1, n=54) | |
| Średnia w klasie Gaming (52.1 - 143.5, n=115, ostatnie 2 lata) | |
| MSI Katana 15 B12VEK | |
| MSI Cyborg 15 A12VF | |
| HP Victus 15 fa0020nr | |
| Schenker XMG Fusion 15 (Mid 22) | |
| Asus TUF Gaming A16 FA617 | |
Aby ocenić, czy liczba klatek na sekundę pozostaje w dużej mierze stała przez dłuższy czas, uruchomiliśmy grę "The Witcher 3" przez około 60 minut w rozdzielczości Full-HD i przy maksymalnych ustawieniach jakości. Postać gracza nie jest poruszana. Nie zauważamy żadnego spadku liczby klatek na sekundę.
The Witcher 3 FPS Chart
| low | med. | high | ultra | |
|---|---|---|---|---|
| GTA V (2015) | 185.8 | 181.5 | 164.9 | 89.3 |
| The Witcher 3 (2015) | 321.6 | 235.7 | 140.7 | 77.4 |
| Dota 2 Reborn (2015) | 161.7 | 152.6 | 140 | 135.4 |
| Final Fantasy XV Benchmark (2018) | 172.8 | 105.6 | 76.9 | |
| X-Plane 11.11 (2018) | 141.3 | 120.8 | 96.8 | |
| Far Cry 5 (2018) | 168 | 116 | 109 | 102 |
| Strange Brigade (2018) | 395 | 206 | 160.5 | 137.3 |
| God of War (2022) | 57.5 | 52 | 41.8 | |
| Rainbow Six Extraction (2022) | 186 | 145 | 141 | 108 |
| Cyberpunk 2077 1.6 (2022) | 88.5 | 72.3 | 63.5 | 57.9 |
| Ghostwire Tokyo (2022) | 114.4 | 113.7 | 112.7 | 108.4 |
| F1 22 (2022) | 169.8 | 162.3 | 124.7 | 48.7 |
| The Quarry (2022) | 116.9 | 88.1 | 72.7 | 57.2 |
| Uncharted Legacy of Thieves Collection (2022) | 71.1 | 70.3 | 67.7 | 65.6 |
| Call of Duty Modern Warfare 2 2022 (2022) | 103 | 93 | 70 | 68 |
| Spider-Man Miles Morales (2022) | 89.2 | 82 | 72.5 | 66.4 |
| The Callisto Protocol (2022) | 112.8 | 82.4 | 77.8 | 54.4 |
| Need for Speed Unbound (2022) | 104.9 | 92.6 | 74.9 | 65 |
| High On Life (2023) | 163.2 | 123 | 92.1 | 71.2 |
| The Witcher 3 v4 (2023) | 148.6 | 117.9 | 59.2 | 50.3 |
| Dead Space Remake (2023) | 62.8 | 61 | 53.7 | 53.3 |
| Hogwarts Legacy (2023) | 108 | 87.7 | 74.2 | 62.5 |
| Returnal (2023) | 84 | 80 | 72 | 62 |
| Atomic Heart (2023) | 133.9 | 103.3 | 62.8 | 49.6 |
| Company of Heroes 3 (2023) | 152.3 | 136.9 | 101.6 | 100 |
| Sons of the Forest (2023) | 78.2 | 61.5 | 59.5 | 58.5 |
| Resident Evil 4 Remake (2023) | 106.9 | 75.9 | 69.4 | 50.9 |
| The Last of Us (2023) | 74.6 | 62.5 | 55.4 | 45.2 |
Emisja - laptop MSI nagrzewa się tylko umiarkowanie
Poziomy hałasu
Sprzęt w Cyborgu został skonfigurowany pod kątem niskiego poboru mocy, a wraz z tym również niskiego wydzielania ciepła. O ile powinniśmy spodziewać się tutaj spokojnie działającego systemu chłodzenia, to w tej kwestii znajdujemy pewne pole do poprawy.
Przeciętnie rozwój hałasu podczas pracy w grach oscyluje na umiarkowanym poziomie. Pod szczytowym obciążeniem laptop potrafi jednak stać się bardzo głośny. W trybie "Extreme Performance" maksymalne natężenie hałasu może wzrosnąć do 56,3 dB(A). Pod względem rozwoju hałasu może się polecić profil "Balanced".
Bardziej irytujące okazuje się zachowanie podczas pracy w trybie jałowym oraz w codziennej eksploatacji (Biuro, Internet): Wentylator pracuje stale w wyraźnie słyszalnym zakresie, a my mierzymy poziom hałasu do 38 dB(A). Dotyczy to wszystkich profili wydajności z wyjątkiem profilu "Super Battery", w którym wentylator jest często wyłączony.
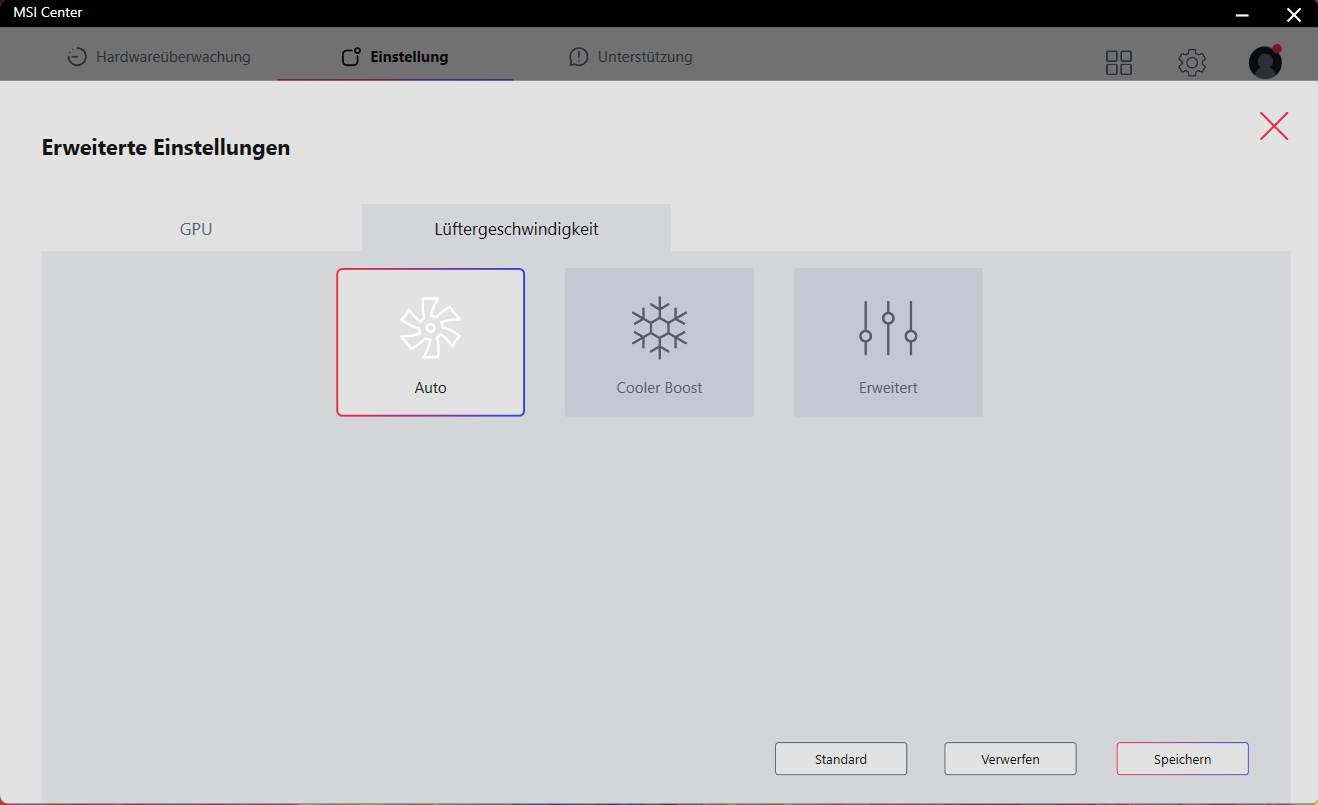
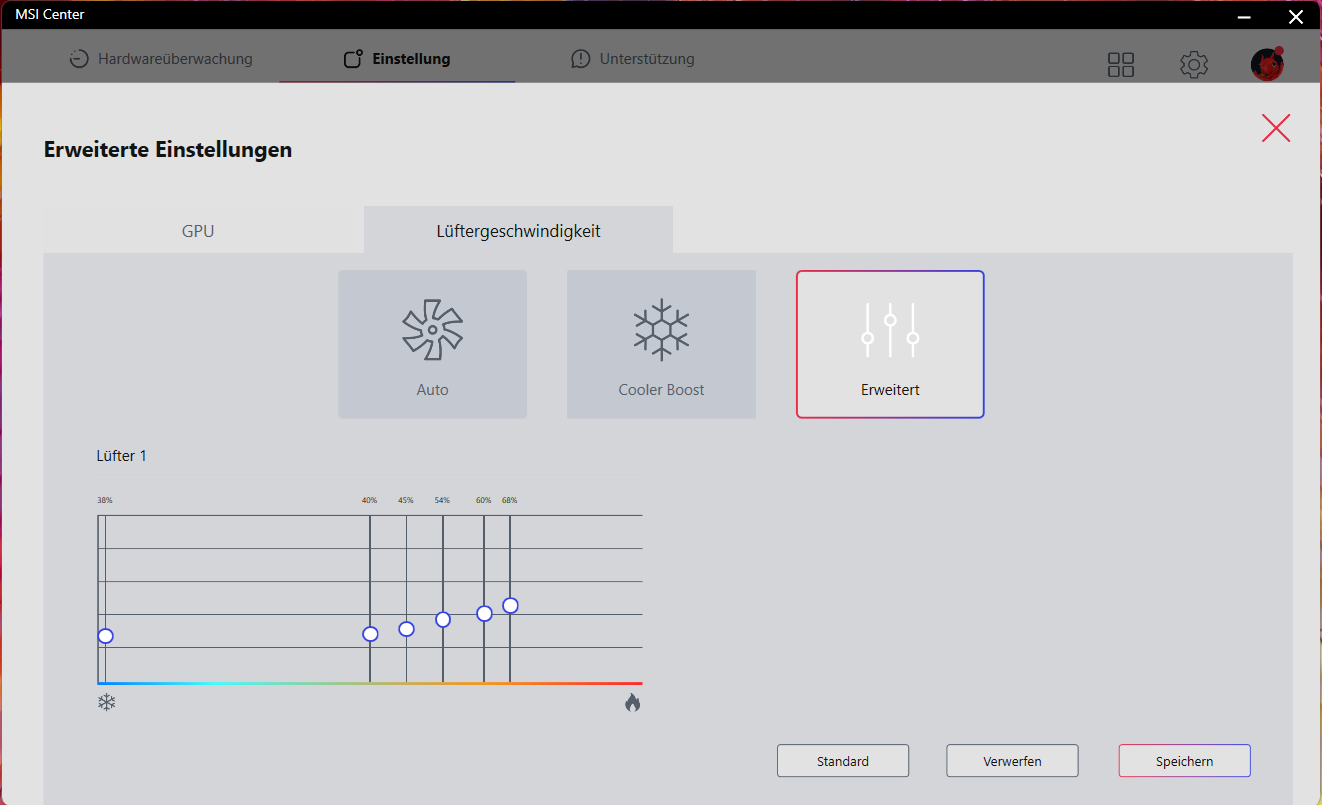
Centrum MSI umożliwia pewien ograniczony dostęp do kontroli wentylatora, ale tylko przy aktywnym profilu "Extreme Performance" (trzeba kliknąć na symbol koła zębatego). Dostępne są profile "Auto" i "Cooler Boost" (z wentylatorem pracującym stale na pełnych obrotach). Dodatkowo można też dostosować krzywą wentylatora.
Hałas
| luz |
| 27 / 37.5 / 38 dB |
| obciążenie |
| 56.3 / 56.3 dB |
 | ||
30 dB cichy 40 dB(A) słyszalny 50 dB(A) irytujący |
||
min: | ||
| MSI Cyborg 15 A12VF GeForce RTX 4060 Laptop GPU, i7-12650H, Samsung PM9B1 1024GB MZVL41T0HBLB | Asus TUF Gaming A16 FA617 Radeon RX 7600S, R7 7735HS, Micron 2400 MTFDKBA1T0QFM | Aorus 15 XE5 GeForce RTX 3070 Ti Laptop GPU, i7-12700H, Gigabyte AG470S1TB-SI B10 | Schenker XMG Fusion 15 (Mid 22) GeForce RTX 3070 Laptop GPU, i7-11800H, Samsung SSD 980 Pro 1TB MZ-V8P1T0BW | MSI Katana 15 B12VEK GeForce RTX 4050 Laptop GPU, i7-12650H, Micron 2400 MTFDKBA1T0QFM | HP Victus 15 fa0020nr GeForce RTX 3050 Ti Laptop GPU, i7-12700H, Samsung PM9A1 MZVL2512HCJQ | |
|---|---|---|---|---|---|---|
| Noise | 20% | 14% | 14% | 22% | 20% | |
| wyłączone / środowisko * (dB) | 27 | 24 11% | 24 11% | 26 4% | 24 11% | 24.8 8% |
| Idle Minimum * (dB) | 27 | 24 11% | 26 4% | 26 4% | 24 11% | 26.2 3% |
| Idle Average * (dB) | 37.5 | 25 33% | 28 25% | 28 25% | 24 36% | 29.2 22% |
| Idle Maximum * (dB) | 38 | 28 26% | 30 21% | 31 18% | 24 37% | 29.4 23% |
| Load Average * (dB) | 56.3 | 42 25% | 48 15% | 45 20% | 37.71 33% | 29.9 47% |
| Load Maximum * (dB) | 56.3 | 50 11% | 52 8% | 48 15% | 54.55 3% | 45.5 19% |
| Witcher 3 ultra * (dB) | 50 | 52 | 46 | 45.75 | 41.1 |
* ... im mniej tym lepiej
Temperatury
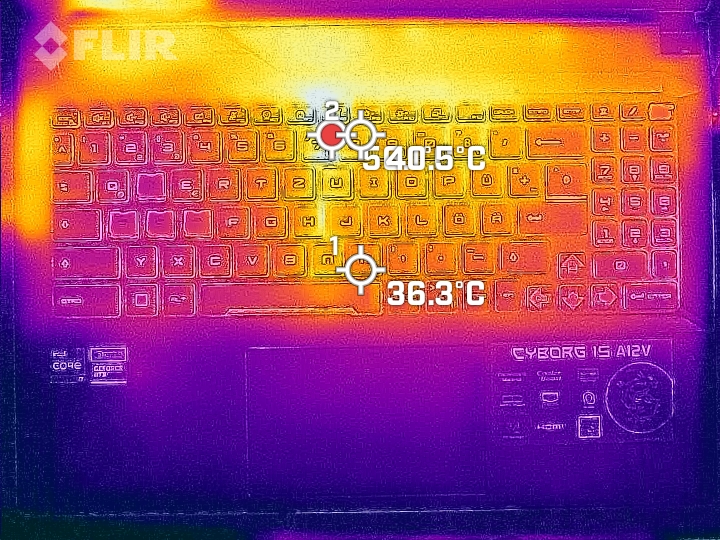
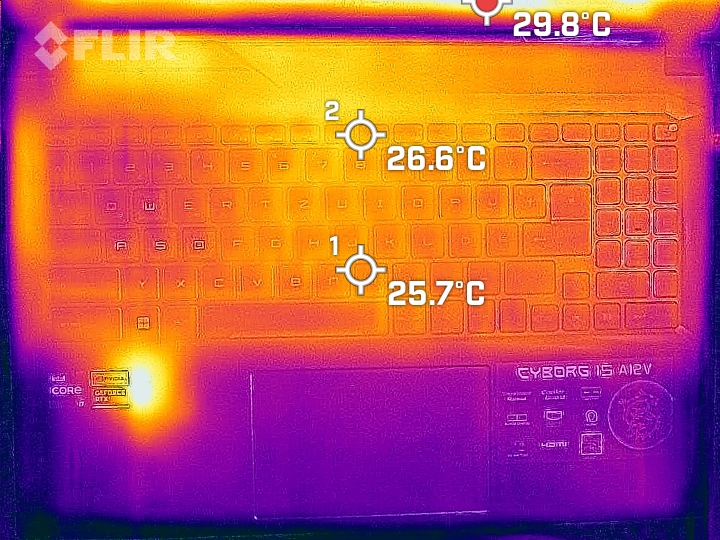
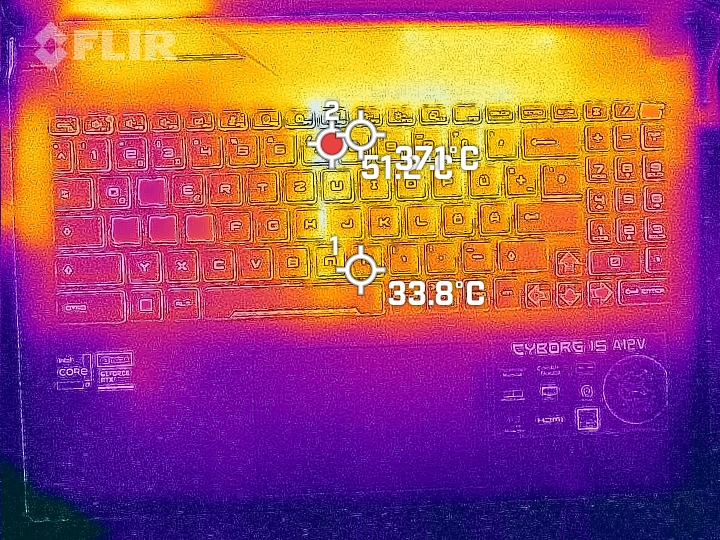
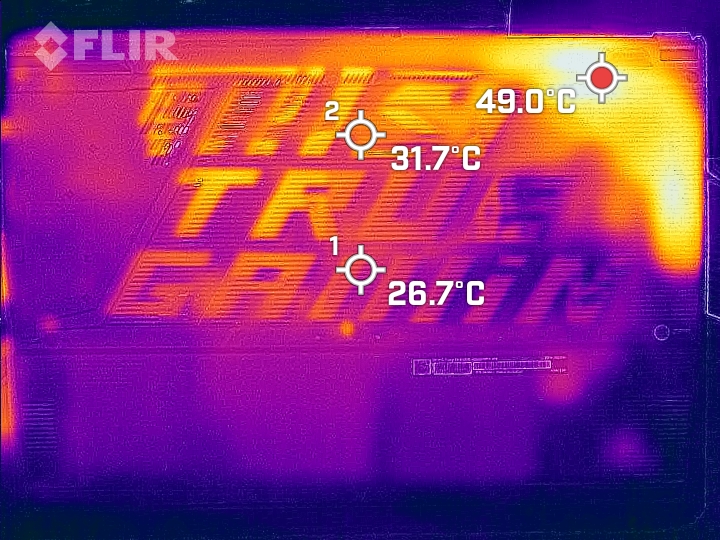
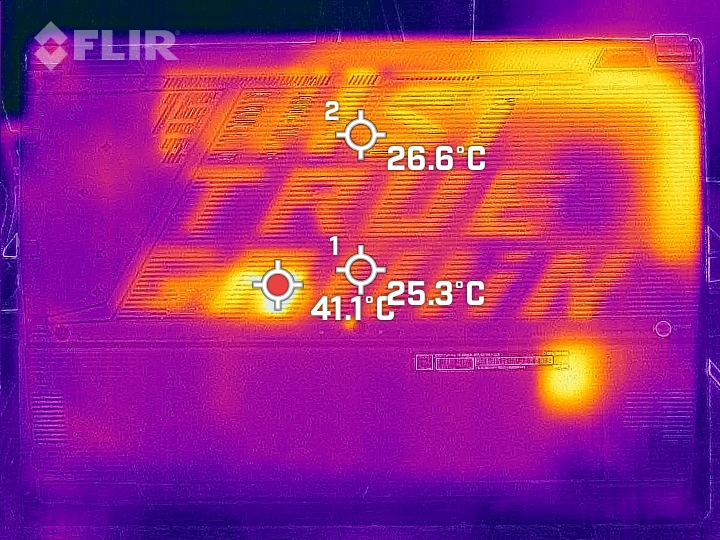
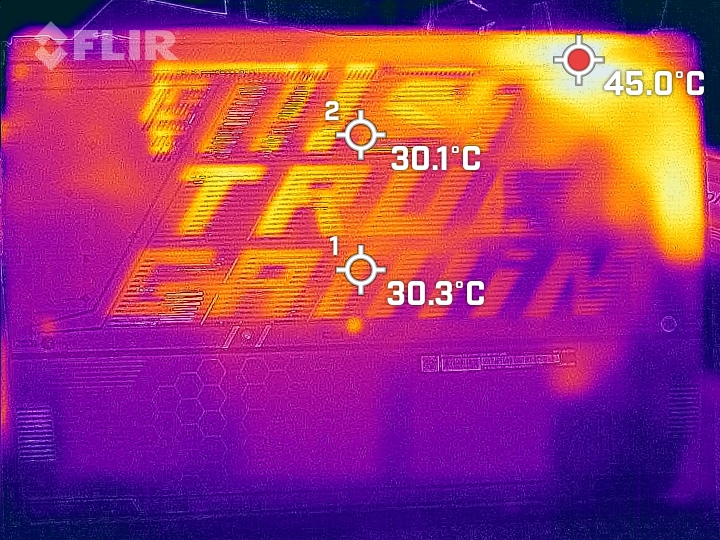
Laptop nagrzewa się w najlepszym razie umiarkowanie. Najwyższe temperatury (40 do 47,5°C, 104 do 117,5°F) zostały osiągnięte w trzech punktach pomiarowych podczas testu obciążeniowego. W codziennej pracy temperatury utrzymują się w zielonym zakresie.
(-) Maksymalna temperatura w górnej części wynosi 47.5 °C / 118 F, w porównaniu do średniej 40.4 °C / 105 F , począwszy od 21.2 do 68.8 °C dla klasy Gaming.
(+) Dno nagrzewa się maksymalnie do 35.5 °C / 96 F, w porównaniu do średniej 43.2 °C / 110 F
(+) W stanie bezczynności średnia temperatura górnej części wynosi 25.9 °C / 79 F, w porównaniu ze średnią temperaturą urządzenia wynoszącą 33.9 °C / ### class_avg_f### F.
(±) Podczas gry w Wiedźmina 3 średnia temperatura górnej części wynosi 35.6 °C / 96 F, w porównaniu do średniej temperatury urządzenia wynoszącej 33.9 °C / ## #class_avg_f### F.
(+) Podpórki pod nadgarstki i touchpad są chłodniejsze niż temperatura skóry i maksymalnie 27.8 °C / 82 F i dlatego są chłodne w dotyku.
(±) Średnia temperatura obszaru podparcia dłoni w podobnych urządzeniach wynosiła 28.8 °C / 83.8 F (+1 °C / 1.8 F).
| MSI Cyborg 15 A12VF Intel Core i7-12650H, NVIDIA GeForce RTX 4060 Laptop GPU | Asus TUF Gaming A16 FA617 AMD Ryzen 7 7735HS, AMD Radeon RX 7600S | Aorus 15 XE5 Intel Core i7-12700H, NVIDIA GeForce RTX 3070 Ti Laptop GPU | Schenker XMG Fusion 15 (Mid 22) Intel Core i7-11800H, NVIDIA GeForce RTX 3070 Laptop GPU | MSI Katana 15 B12VEK Intel Core i7-12650H, NVIDIA GeForce RTX 4050 Laptop GPU | HP Victus 15 fa0020nr Intel Core i7-12700H, NVIDIA GeForce RTX 3050 Ti Laptop GPU | |
|---|---|---|---|---|---|---|
| Heat | -32% | -34% | -37% | -22% | 16% | |
| Maximum Upper Side * (°C) | 47.5 | 54 -14% | 46 3% | 52 -9% | 47 1% | 37.2 22% |
| Maximum Bottom * (°C) | 35.5 | 47 -32% | 57 -61% | 63 -77% | 48 -35% | 35.4 -0% |
| Idle Upper Side * (°C) | 27.7 | 40 -44% | 38 -37% | 37 -34% | 35 -26% | 22.4 19% |
| Idle Bottom * (°C) | 29.5 | 40 -36% | 42 -42% | 38 -29% | 38 -29% | 22.6 23% |
* ... im mniej tym lepiej
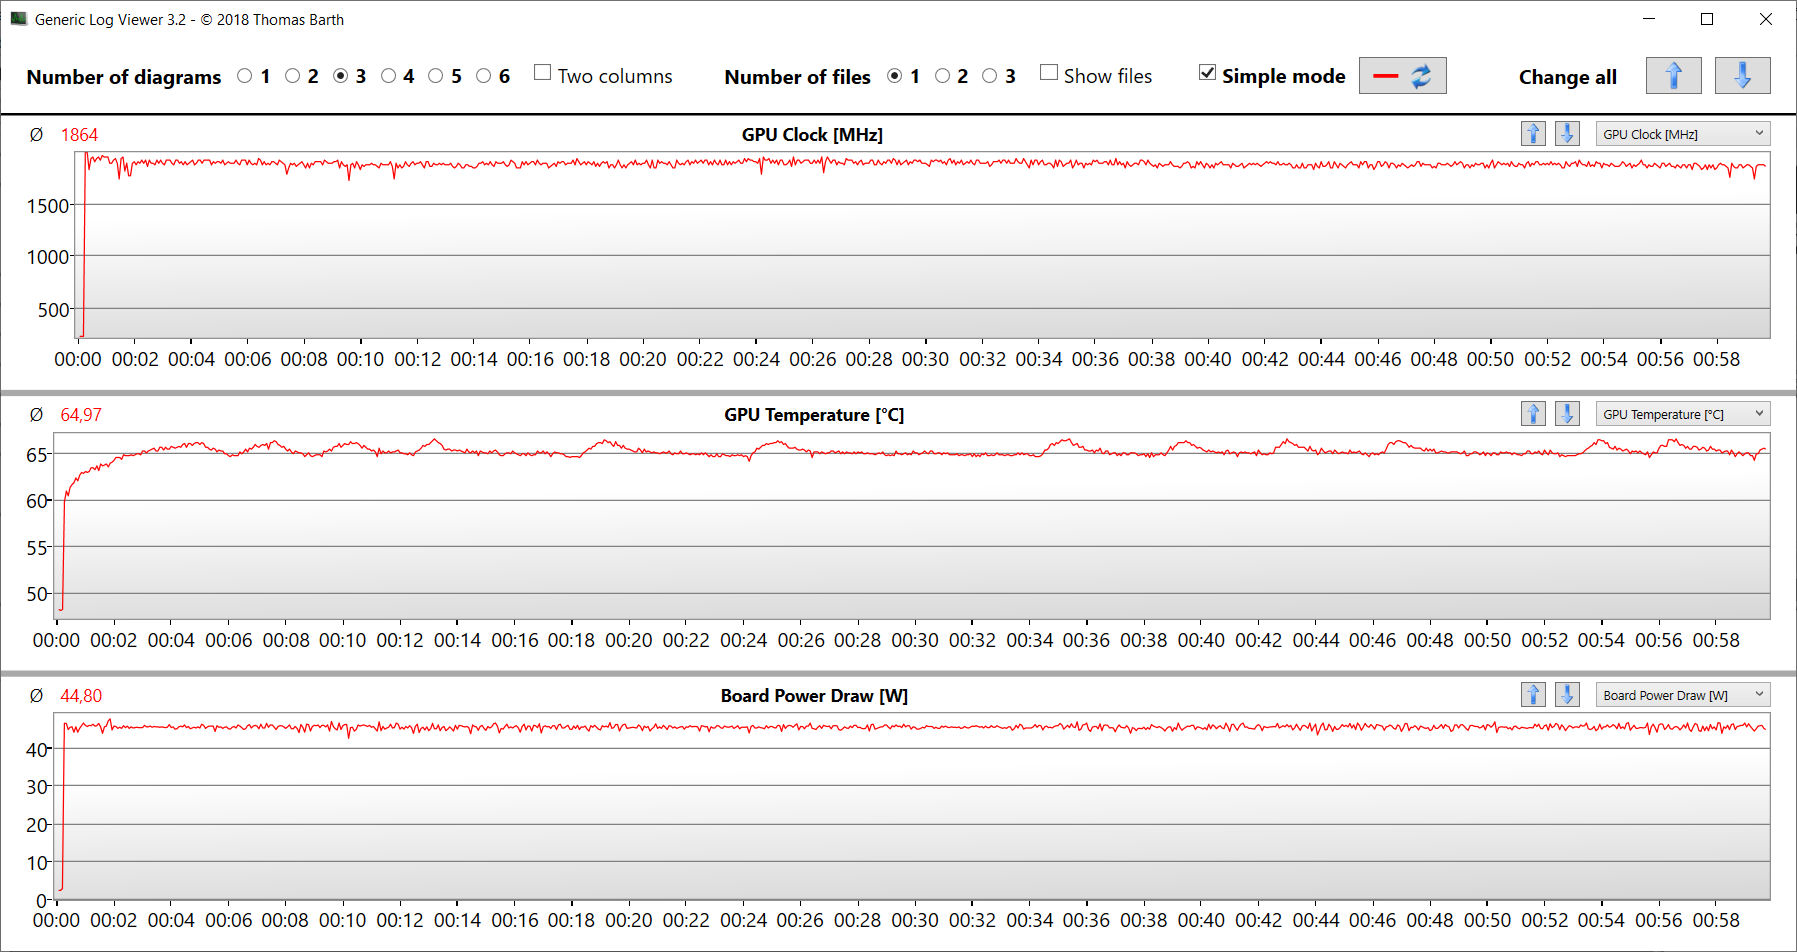
Stress Test
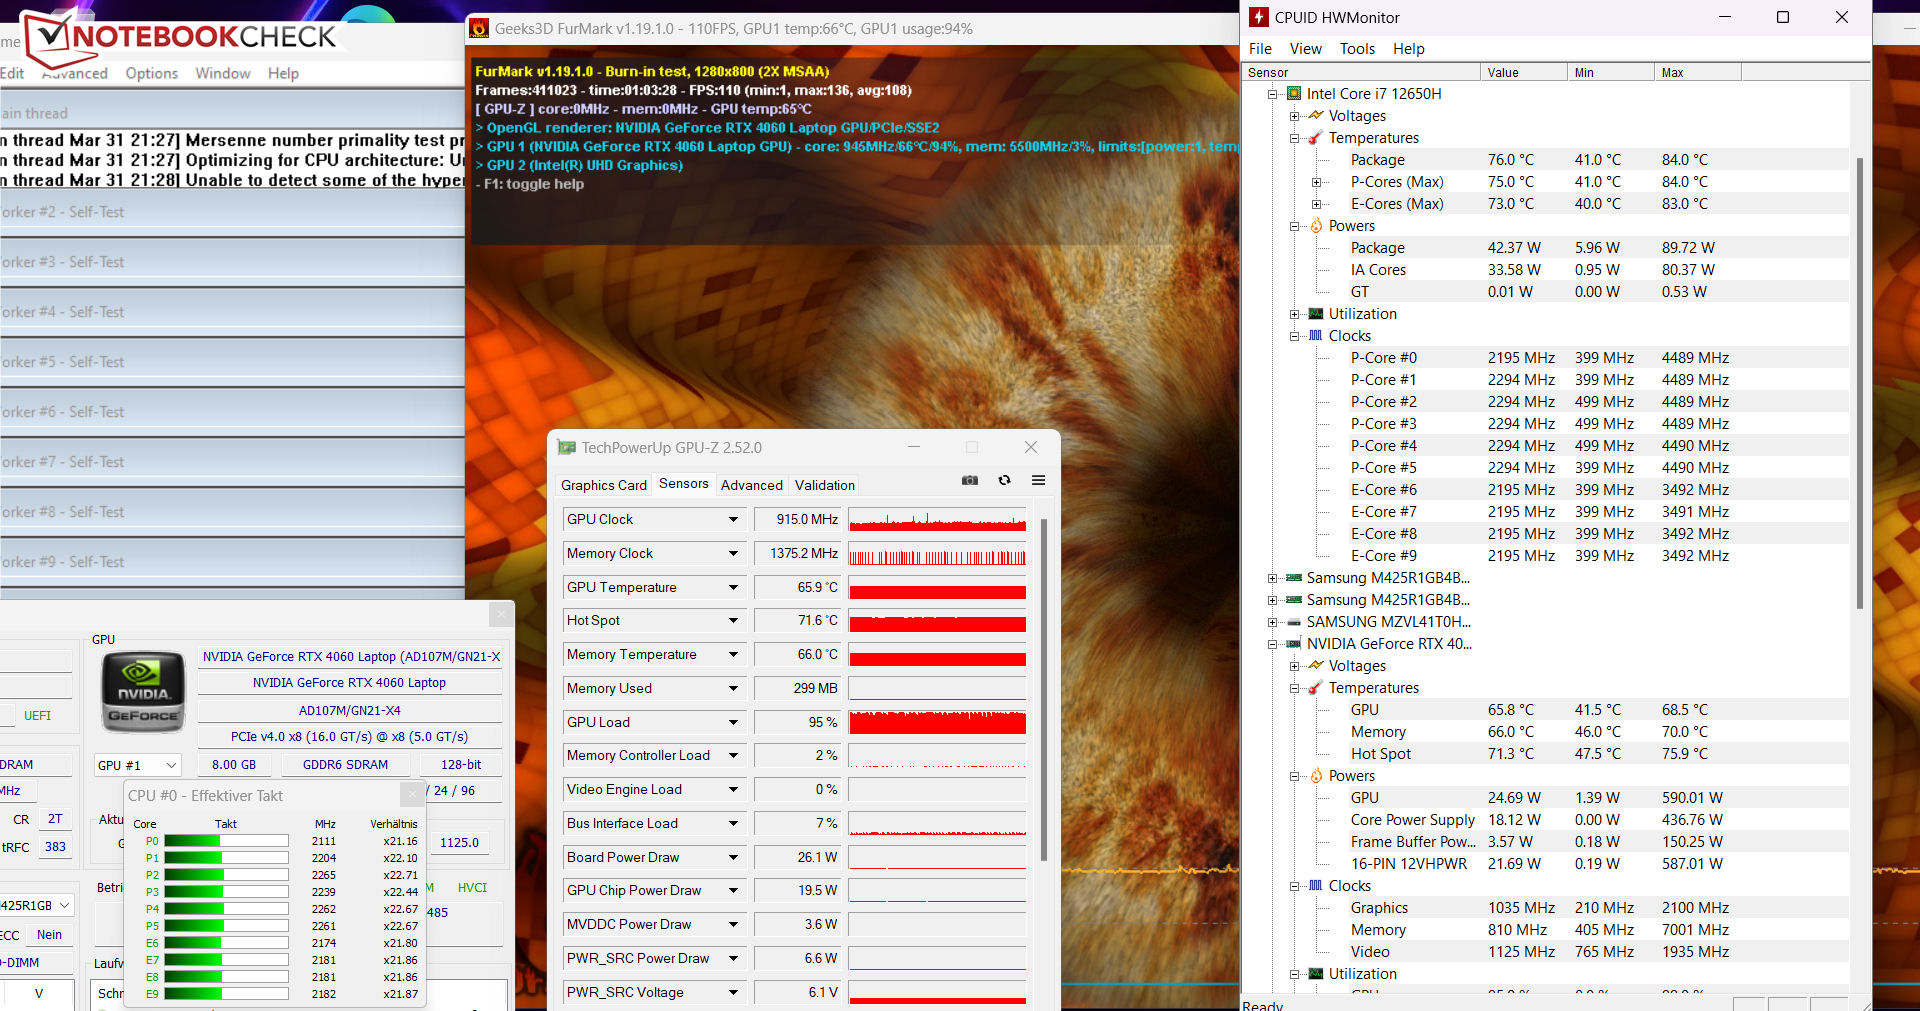
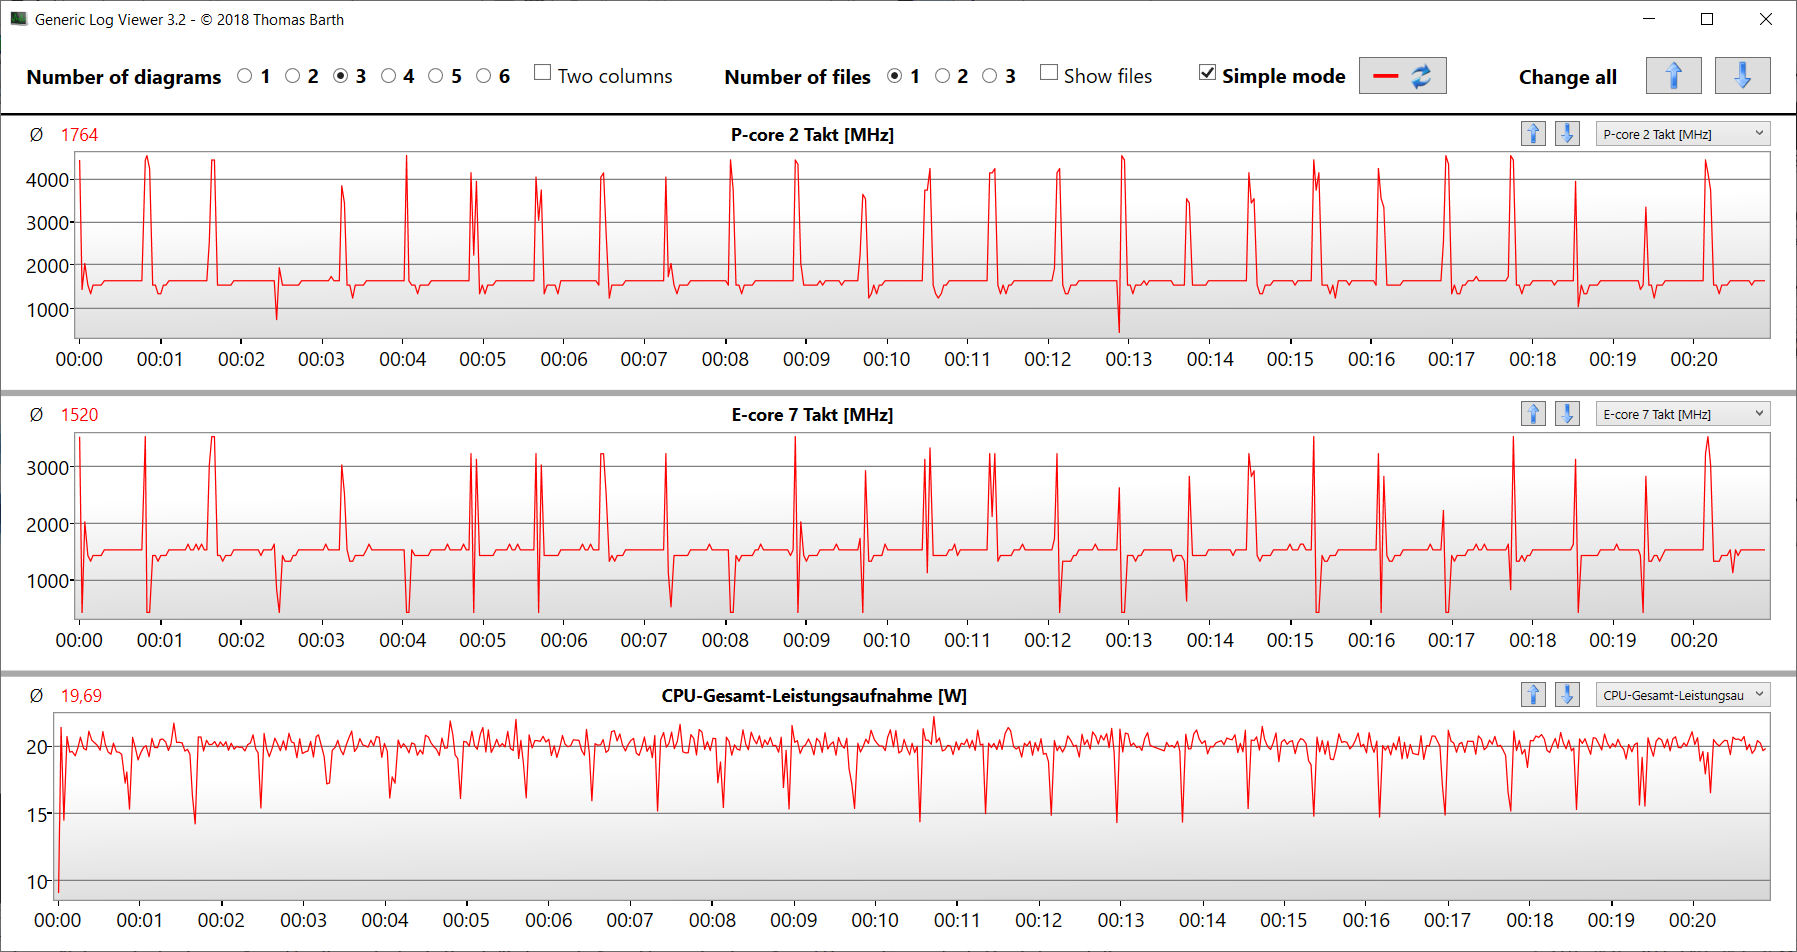
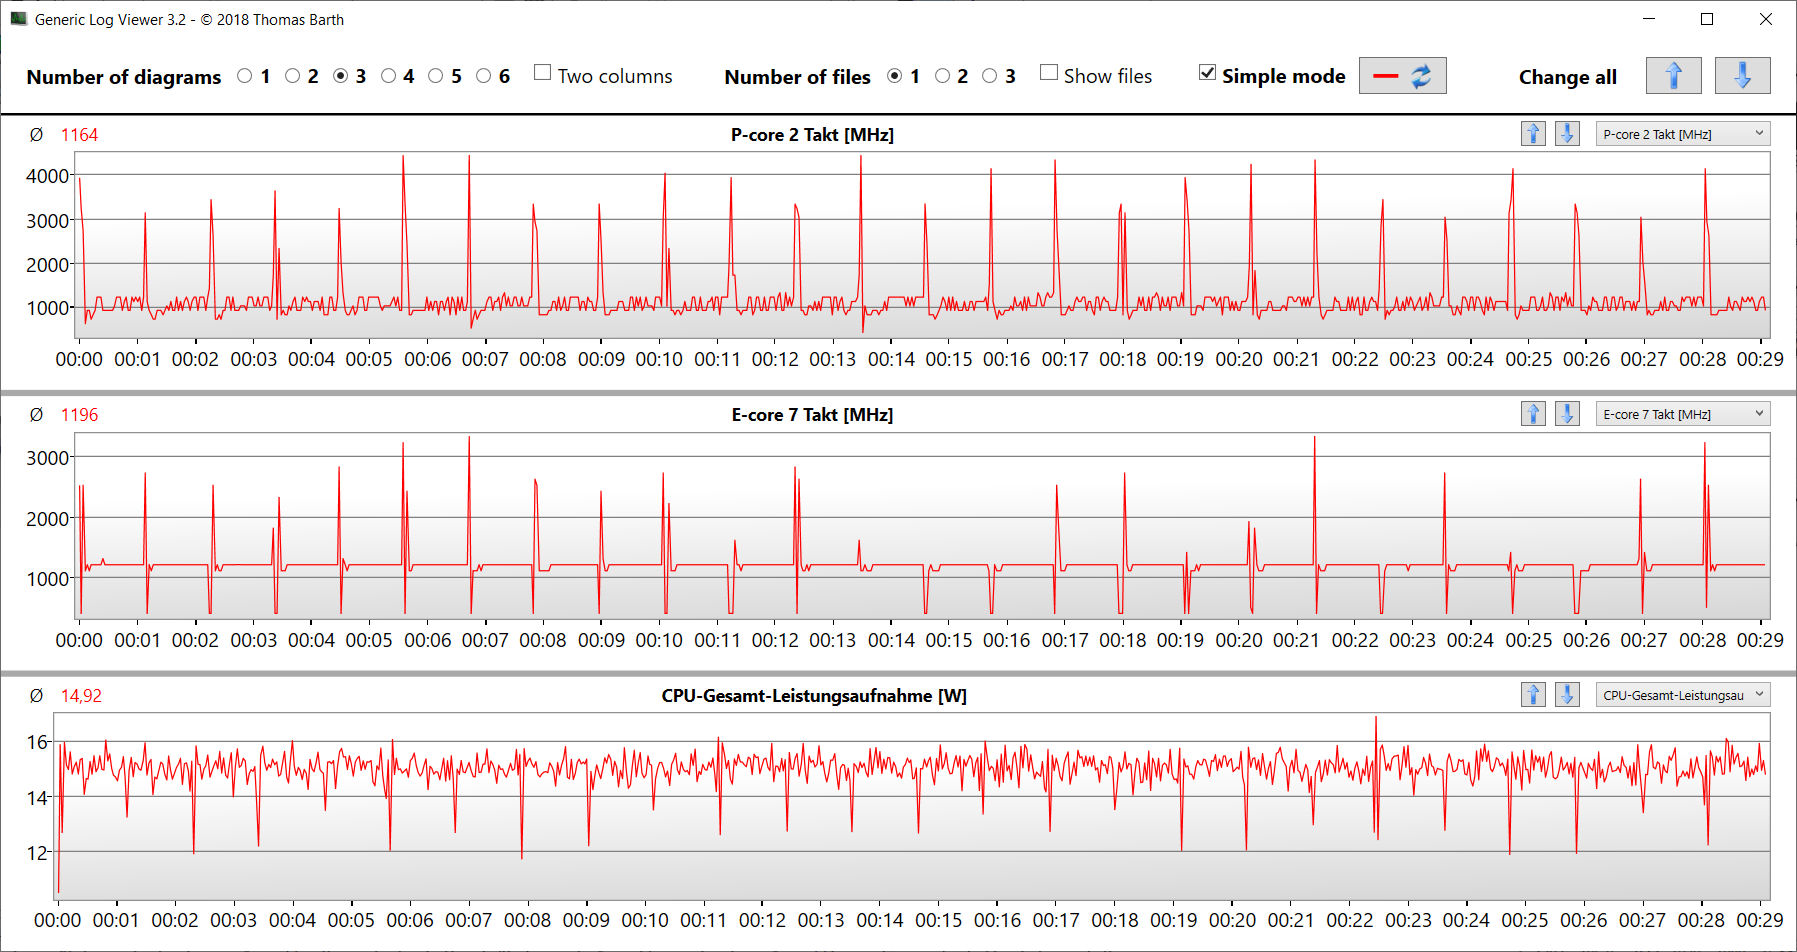
Test obciążeniowy (z ciągle działającymi aplikacjami Prime95 i Furmark) stanowi ekstremalny scenariusz pozwalający ocenić stabilność systemu pod pełnym obciążeniem. CPU (P: 3,3 do 3,5 GHz, E: 2,8 GHz) i GPU (1 000 do 1 500 MHz) rozpoczynają test ze średnio wysokimi taktowaniami, przy czym wartości te spadają w trakcie jego trwania.
Mówcy
Głośniki stereo wytwarzają przyzwoity dźwięk, ale prawie nie zawiera on basów. Aby uzyskać lepsze wrażenia dźwiękowe, zaleca się stosowanie słuchawek lub głośników zewnętrznych.
MSI Cyborg 15 A12VF analiza dźwięku
(±) | głośność głośnika jest średnia, ale dobra (77.79 dB)
Bas 100 - 315 Hz
(-) | prawie brak basu - średnio 19.8% niższa od mediany
(±) | liniowość basu jest średnia (12.2% delta do poprzedniej częstotliwości)
Średnie 400 - 2000 Hz
(+) | zbalansowane środki średnie - tylko 1.8% od mediany
(+) | średnie są liniowe (5% delta do poprzedniej częstotliwości)
Wysokie 2–16 kHz
(+) | zrównoważone maksima - tylko 4.2% od mediany
(+) | wzloty są liniowe (3.9% delta do poprzedniej częstotliwości)
Ogólnie 100 - 16.000 Hz
(+) | ogólny dźwięk jest liniowy (14.2% różnicy w stosunku do mediany)
W porównaniu do tej samej klasy
» 25% wszystkich testowanych urządzeń w tej klasie było lepszych, 7% podobnych, 68% gorszych
» Najlepszy miał deltę 6%, średnia wynosiła ###średnia###%, najgorsza wynosiła 132%
W porównaniu do wszystkich testowanych urządzeń
» 17% wszystkich testowanych urządzeń było lepszych, 4% podobnych, 79% gorszych
» Najlepszy miał deltę 4%, średnia wynosiła ###średnia###%, najgorsza wynosiła 134%
Asus TUF Gaming A16 FA617 analiza dźwięku
(+) | głośniki mogą odtwarzać stosunkowo głośno (82 dB)
Bas 100 - 315 Hz
(±) | zredukowany bas - średnio 14.4% niższy od mediany
(±) | liniowość basu jest średnia (8.3% delta do poprzedniej częstotliwości)
Średnie 400 - 2000 Hz
(±) | wyższe średnie - średnio 6.5% wyższe niż mediana
(+) | średnie są liniowe (3.8% delta do poprzedniej częstotliwości)
Wysokie 2–16 kHz
(±) | obniżone maksima - średnio 6% niższe od mediany
(±) | liniowość wysokich wartości jest średnia (10.4% delta do poprzedniej częstotliwości)
Ogólnie 100 - 16.000 Hz
(±) | liniowość ogólnego dźwięku jest średnia (18.8% różnicy w stosunku do mediany)
W porównaniu do tej samej klasy
» 62% wszystkich testowanych urządzeń w tej klasie było lepszych, 8% podobnych, 30% gorszych
» Najlepszy miał deltę 6%, średnia wynosiła ###średnia###%, najgorsza wynosiła 132%
W porównaniu do wszystkich testowanych urządzeń
» 43% wszystkich testowanych urządzeń było lepszych, 8% podobnych, 49% gorszych
» Najlepszy miał deltę 4%, średnia wynosiła ###średnia###%, najgorsza wynosiła 134%
Zarządzanie energią - Gamingowy laptop z dobrym czasem pracy na baterii
Pobór mocy
Ogólnie rzecz biorąc, laptop MSI okazuje się bardzo wydajny pod względem zużycia energii. W całym zakresie obciążeń zużycie pozostaje niższe niż u konkurencji. Przebiega przez nasze testy The Witcher 3 i stress testy z relatywnie stałym poborem mocy. Zasilacz ma wystarczającą wielkość 120 watów.
| wyłączony / stan wstrzymania | |
| luz | |
| obciążenie |
|
Legenda:
min: | |
| MSI Cyborg 15 A12VF i7-12650H, GeForce RTX 4060 Laptop GPU, Samsung PM9B1 1024GB MZVL41T0HBLB, IPS, 1920x1080, 15.6" | Asus TUF Gaming A16 FA617 R7 7735HS, Radeon RX 7600S, Micron 2400 MTFDKBA1T0QFM, IPS-Level, 1920x1200, 16" | Aorus 15 XE5 i7-12700H, GeForce RTX 3070 Ti Laptop GPU, Gigabyte AG470S1TB-SI B10, IPS, 2560x1440, 15.6" | Schenker XMG Fusion 15 (Mid 22) i7-11800H, GeForce RTX 3070 Laptop GPU, Samsung SSD 980 Pro 1TB MZ-V8P1T0BW, IPS, 2560x1440, 15.6" | MSI Katana 15 B12VEK i7-12650H, GeForce RTX 4050 Laptop GPU, Micron 2400 MTFDKBA1T0QFM, IPS, 1920x1080, 15.6" | HP Victus 15 fa0020nr i7-12700H, GeForce RTX 3050 Ti Laptop GPU, Samsung PM9A1 MZVL2512HCJQ, IPS, 1920x1080, 15.6" | Przeciętny NVIDIA GeForce RTX 4060 Laptop GPU | Średnia w klasie Gaming | |
|---|---|---|---|---|---|---|---|---|
| Power Consumption | -42% | -222% | -84% | -30% | -40% | -72% | -103% | |
| Idle Minimum * (Watt) | 6 | 8 -33% | 31 -417% | 12 -100% | 8.5 -42% | 5.1 15% | 11.5 ? -92% | 13.2 ? -120% |
| Idle Average * (Watt) | 8.8 | 11 -25% | 35 -298% | 17 -93% | 10.2 -16% | 15.1 -72% | 16 ? -82% | 18.9 ? -115% |
| Idle Maximum * (Watt) | 11.9 | 16 -34% | 46 -287% | 24 -102% | 11.3 5% | 18.9 -59% | 20.3 ? -71% | 24.3 ? -104% |
| Load Average * (Watt) | 89 | 97 -9% | 120 -35% | 106 -19% | 84 6% | 114.5 -29% | 92.9 ? -4% | 108 ? -21% |
| Witcher 3 ultra * (Watt) | 90.3 | 161.5 -79% | 202 -124% | 159.9 -77% | 128 -42% | 113.9 -26% | ||
| Load Maximum * (Watt) | 99 | 168 -70% | 268 -171% | 208 -110% | 189 -91% | 165.8 -67% | 210 ? -112% | 254 ? -157% |
* ... im mniej tym lepiej
Power Consumption The Witcher 3 / Stress Test
Power Consumption With External Monitor
Czas pracy na baterii
W teście WLAN, w którym strony internetowe są ładowane przez skrypt, oraz w teście wideo z działającym w pętli filmem krótkometrażowym Big Buck Bunny (kodowanie H.264, FHD) 15,6-calowy laptop osiągnął czasy pracy odpowiednio 7:32 h i 8:00 h. Podczas obu testów funkcje oszczędzania energii w laptopie są wyłączone, a jasność wyświetlacza jest zmniejszona do około 150 cd/m². By przeprowadzić test wideo, dezaktywowane są również moduły komunikacji bezprzewodowej.
Laptop MSI oferuje ogólnie dobre czasy pracy na akumulatorze, mimo że jego pojemność jest stosunkowo niewielka i wynosi 53,5 Wh. Fakt, że nie jest on w stanie dotrzymać kroku m.in TUF Gaming A16wynika z połączenia dużego akumulatora o pojemności 90 Wh i energooszczędnego APU AMD oferowanego przez ten laptop. Jeżeli przeliczymy czas pracy na Watthour, Cyborg wychodzi na prowadzenie.
| MSI Cyborg 15 A12VF i7-12650H, GeForce RTX 4060 Laptop GPU, 53.5 Wh | Asus TUF Gaming A16 FA617 R7 7735HS, Radeon RX 7600S, 90 Wh | Aorus 15 XE5 i7-12700H, GeForce RTX 3070 Ti Laptop GPU, 99 Wh | Schenker XMG Fusion 15 (Mid 22) i7-11800H, GeForce RTX 3070 Laptop GPU, 93.48 Wh | MSI Katana 15 B12VEK i7-12650H, GeForce RTX 4050 Laptop GPU, 53.5 Wh | HP Victus 15 fa0020nr i7-12700H, GeForce RTX 3050 Ti Laptop GPU, 70 Wh | Średnia w klasie Gaming | |
|---|---|---|---|---|---|---|---|
| Czasy pracy | 25% | -19% | -4% | -41% | -68% | -19% | |
| Reader / Idle (h) | 13.6 | 20.2 49% | 10 -26% | 15.5 14% | 2.6 -81% | 8.71 ? -36% | |
| H.264 (h) | 8 | 6.2 -22% | 7.5 -6% | 4.4 -45% | 8.26 ? 3% | ||
| WiFi v1.3 (h) | 7.5 | 12.1 61% | 6.8 -9% | 7.4 -1% | 4.3 -43% | 2.1 -72% | 7.02 ? -6% |
| Load (h) | 2.3 | 1.5 -35% | 1.9 -17% | 1.8 -22% | 1.5 -35% | 1.1 -52% | 1.47 ? -36% |
Za
Przeciw
Werdykt - Gamingowy laptop o niskim poborze mocy
W MSI Cyborg 15 nacisk położono na kompromis pomiędzy wydajnością, mobilnością i zużyciem energii. Ze względu na obniżone ustawienia wydajności, procesor Core i7-12650Horaz GeForce RTX 4060spisują się poniżej swoich możliwości. Niemniej jednak ich moc obliczeniowa nawet wtedy jest wystarczająca do gier w rozdzielczości FHD na ustawieniach wysokich do maksymalnych.
Choć podoba nam się koncepcja Cyborg 15, to jej implementacja wciąż pozostawia pole do poprawy. Obecny high-endowy GPU wciąż oferuje wystarczającą wydajność do gier FHD nawet przy niskim TGP na poziomie 45 watów.
Pobór mocy, który jest niski jak na laptop do gier, można przełożyć na dobry czas pracy na baterii. Realne wartości od 7 do 8 h są wciąż możliwe, mimo stosunkowo niewielkiej pojemności akumulatora - 53,5 Wh. Niestety port USB-C nie oferuje wsparcia dla Power Delivery, co w przypadku Cyborga byłoby sensowną funkcją.
Choć laptop nie nagrzewa się szczególnie mocno, jego maksymalny poziom hałasu jest na typowym dla tej klasy laptopów wysokim poziomie. W dodatku podczas pracy w stanie spoczynku wentylator pozostaje stale słyszalny. Oczekiwalibyśmy tutaj czegoś więcej. Być może jest to cena rezygnacji z drugiego wentylatora wraz z odpowiednią rurką cieplną. Poza układem chłodzenia wyświetlacz (FHD, 144 Hz, IPS) stanowi kolejny słaby punkt laptopa, przy czym jasność i pokrycie przestrzeni barwnej okazały się zbyt niskie.
Alternatywą może być np Asus TUF Gaming A16 FA617. Oferuje on porównywalną wydajność obliczeniową, ale punktuje znacznie dłuższym czasem pracy na akumulatorze, lepszym ekranem i niższym maksymalnym poziomem hałasu. Z drugiej strony laptop ten pobiera pod obciążeniem wyraźnie więcej energii niż Cyborg 15.
Cena i dostępność
MSI Cyborg 15 A12VF
- 09/04/2023 v7 (old)
Sascha Mölck
Przezroczystość
Wyboru urządzeń do recenzji dokonuje nasza redakcja. Próbka testowa została udostępniona autorowi jako pożyczka od producenta lub sprzedawcy detalicznego na potrzeby tej recenzji. Pożyczkodawca nie miał wpływu na tę recenzję, producent nie otrzymał też kopii tej recenzji przed publikacją. Nie było obowiązku publikowania tej recenzji. Jako niezależna firma medialna, Notebookcheck nie podlega władzy producentów, sprzedawców detalicznych ani wydawców.
Tak testuje Notebookcheck
Każdego roku Notebookcheck niezależnie sprawdza setki laptopów i smartfonów, stosując standardowe procedury, aby zapewnić porównywalność wszystkich wyników. Od około 20 lat stale rozwijamy nasze metody badawcze, ustanawiając przy tym standardy branżowe. W naszych laboratoriach testowych doświadczeni technicy i redaktorzy korzystają z wysokiej jakości sprzętu pomiarowego. Testy te obejmują wieloetapowy proces walidacji. Nasz kompleksowy system ocen opiera się na setkach uzasadnionych pomiarów i benchmarków, co pozwala zachować obiektywizm.Price comparison

