Recenzja laptopa MSI Katana 15: Budżetowy gracz z RTX 4050 i procesorem Alder Lake
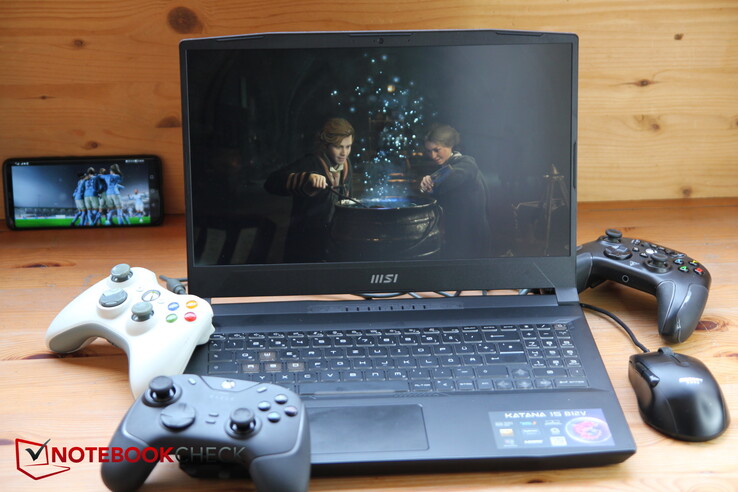
MSI ma linię laptopów, które wizualnie wydają się bardzo podobne. W zeszłym roku recenzowaliśmy 15,6-calowego quasi-poprzednika, tj.MSI Katana GF66 12UGSale Pulse GL66czy MSI Sword również uderzają w tę samą wizualną nutę. Nasza dzisiejsza konfiguracja recenzencka jest o tyle ciekawa, że MSI postanowiło połączyć "stary" procesor Alder Lake z nowym RTX 4050 aby ewentualnie jako jeden z pierwszych wydać laptop gamingowy z kartą RTX 40xx. Oznaczenie to Katana 15 B12, natomiast Katana 15 B13 posiada już Intel Gen13 i RTX 40xx. Przyjrzymy się, jak wypada porównanie tych dwóch generacji CPU/GPU w naszym modelu B12.
Ponieważ Katana 15 jest jednym z pierwszych laptopów z RTX 4050 do zrecenzowania, w dużej mierze padło na poprzednią generację dla graczy z segmentu entry-level i mid-range zRTX 3060dla porównania. Należą do nich m.in Lenovo Legion 5Schenker XMG Core 15, the MSI Pulse GL66 oraz Asus TUF Gaming F15w zestawieniu uwzględniono również poprzednika, ale czytelnicy powinni zauważyć, że był on wyposażony w mocniejszy RTX 3070 Ti.
Potencjalni konkurenci w porównaniu
Ocena | Data | Model | Waga | Wysokość | Rozmiar | Rezolucja | Cena |
|---|---|---|---|---|---|---|---|
| 82.9 % v7 (old) | 03/2023 | MSI Katana 15 B12VEK i7-12650H, GeForce RTX 4050 Laptop GPU | 2.3 kg | 24.9 mm | 15.60" | 1920x1080 | |
| 80.3 % v7 (old) | MSI Katana GF66 12UGS i7-12700H, GeForce RTX 3070 Ti Laptop GPU | 2.3 kg | 27.5 mm | 15.60" | 1920x1080 | ||
| 80.7 % v7 (old) | MSI Pulse GL66 12UEK i9-12900H, GeForce RTX 3060 Laptop GPU | 2.3 kg | 25 mm | 15.60" | 1920x1080 | ||
| 87.5 % v7 (old) | 11/2022 | Lenovo Legion 5 15IAH7H 82RB i7-12700H, GeForce RTX 3060 Laptop GPU | 2.4 kg | 19.99 mm | 15.60" | 1920x1080 | |
| 87.2 % v7 (old) | Asus TUF Gaming F15 FX507ZM i7-12700H, GeForce RTX 3060 Laptop GPU | 2.1 kg | 24.95 mm | 15.60" | 1920x1080 | ||
| 87.9 % v7 (old) | 01/2023 | Schenker XMG Core 15 (M22) R7 6800H, GeForce RTX 3060 Laptop GPU | 2.1 kg | 23 mm | 15.60" | 2560x1440 |
Walizka - Plastikowa Katana
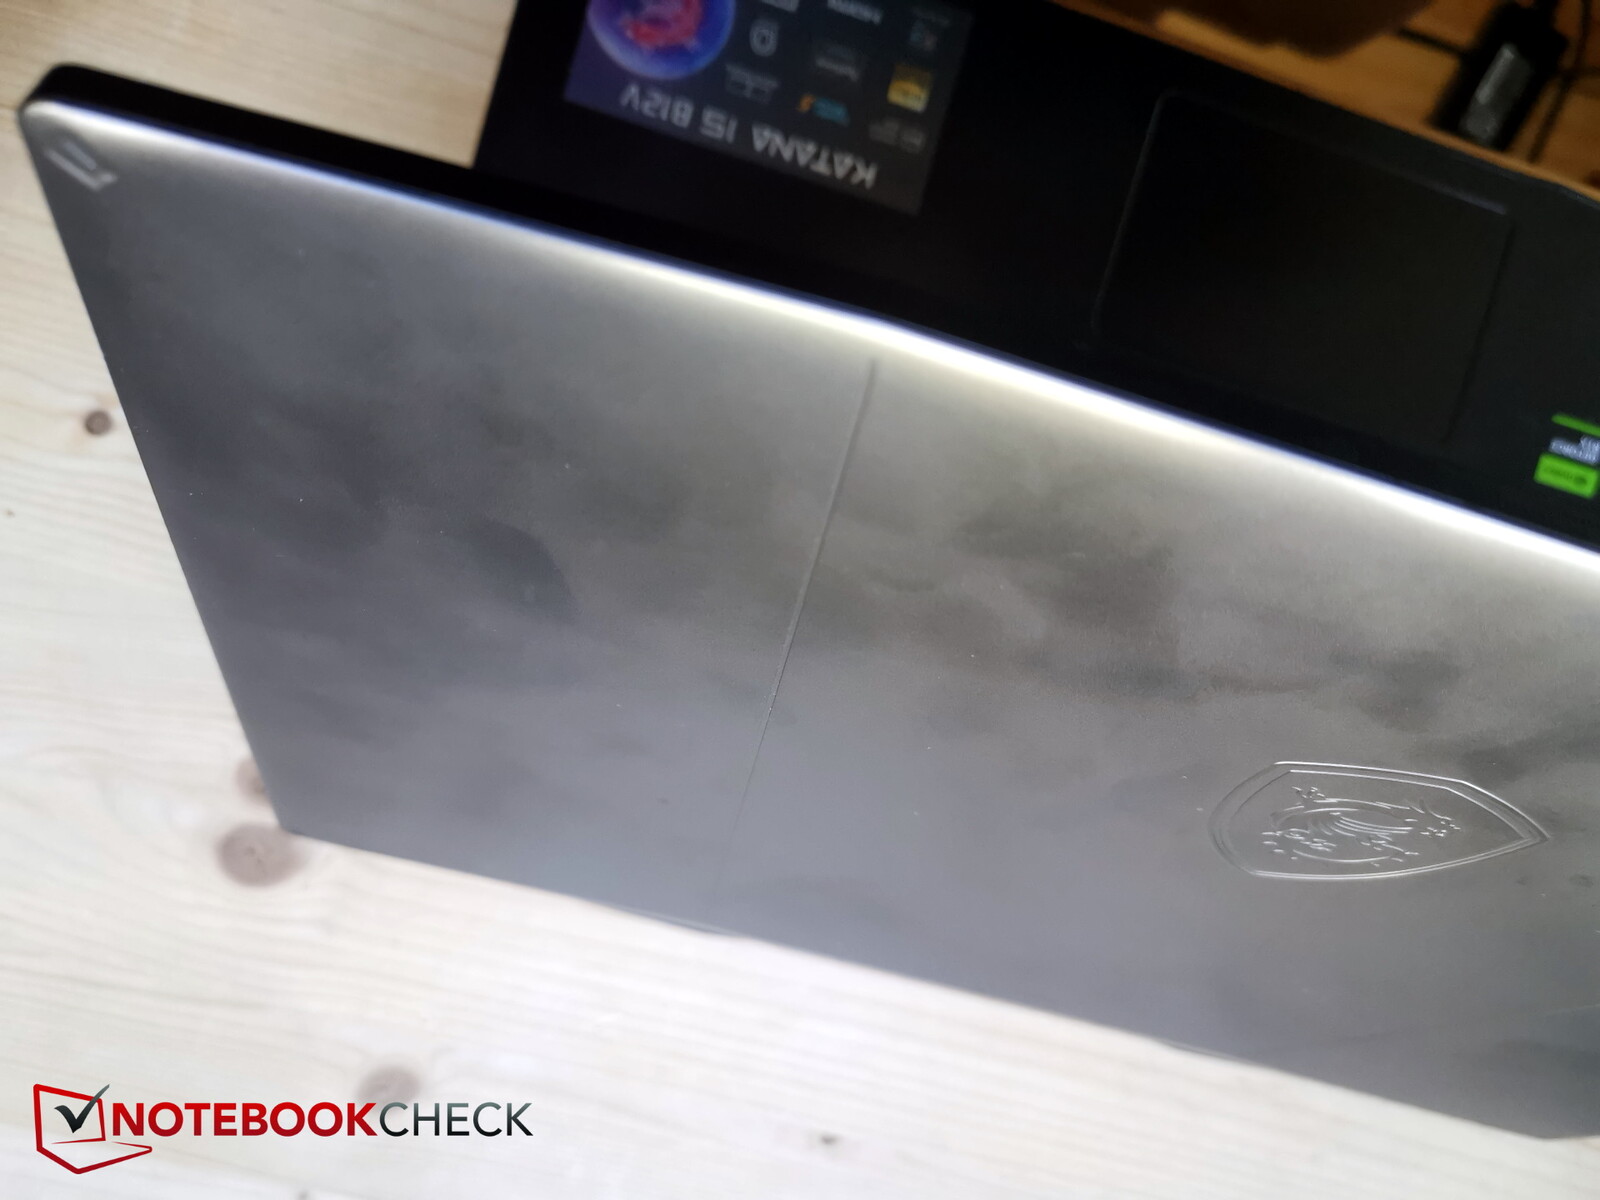
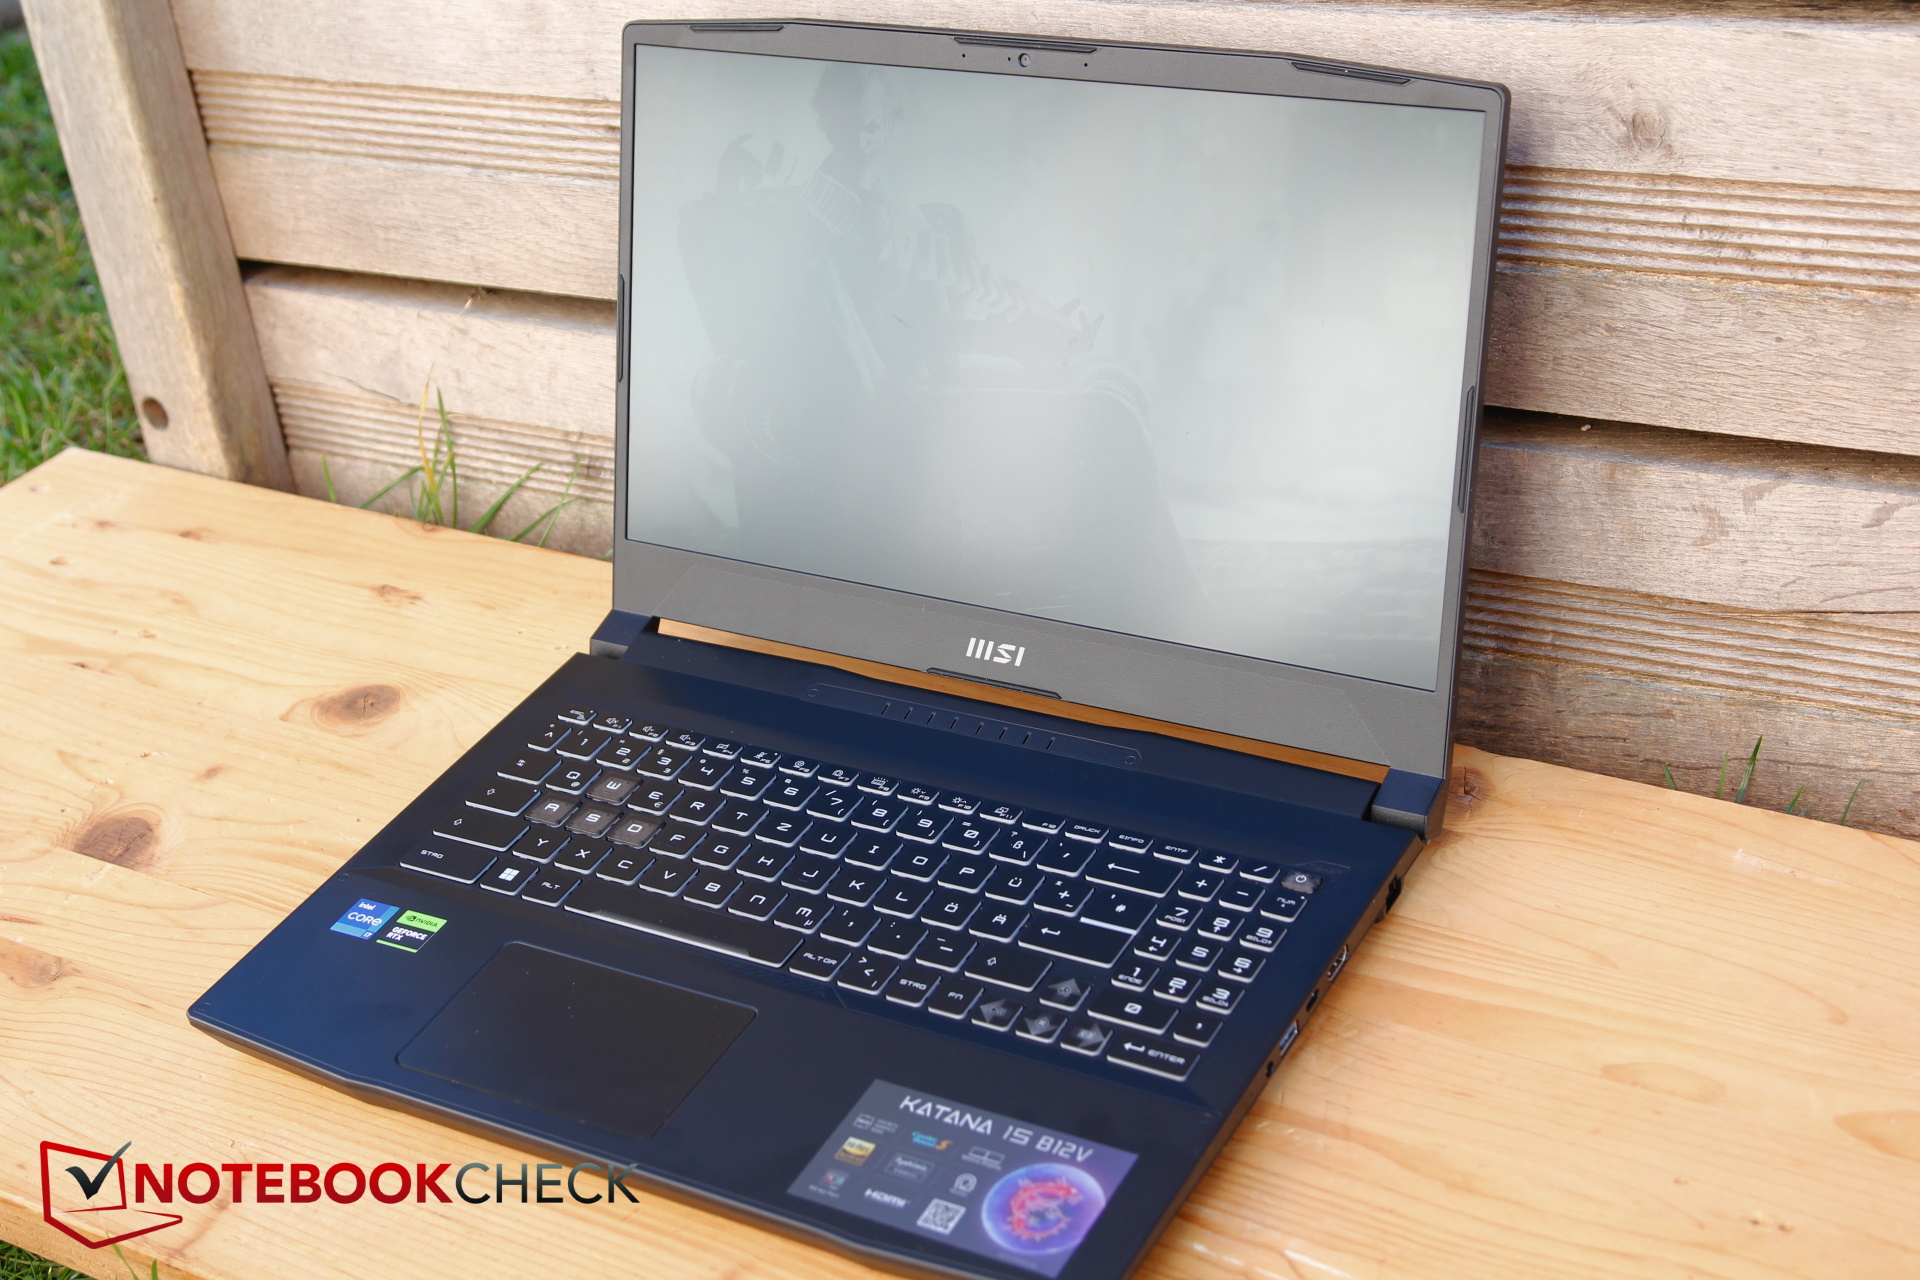
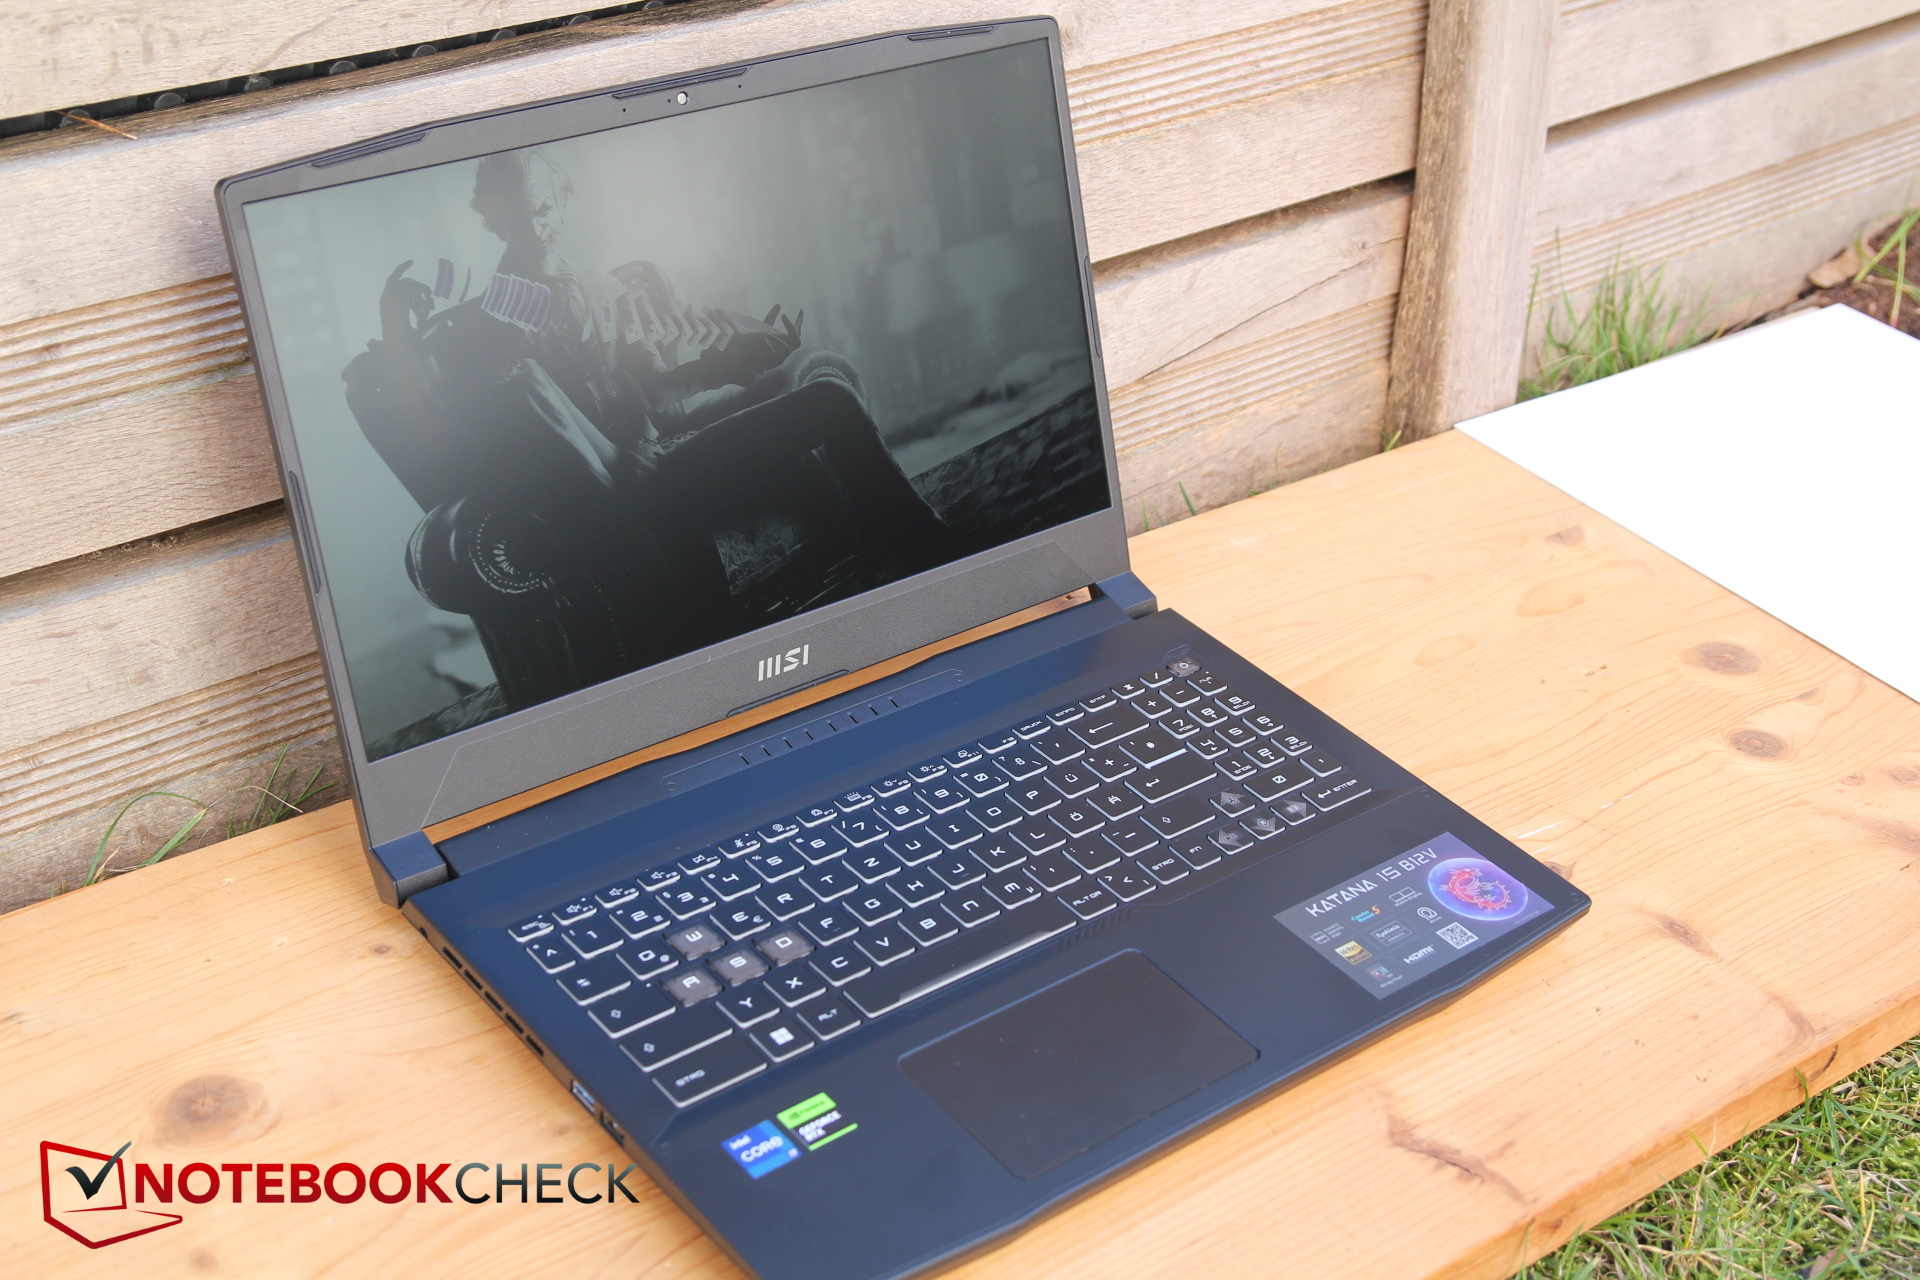
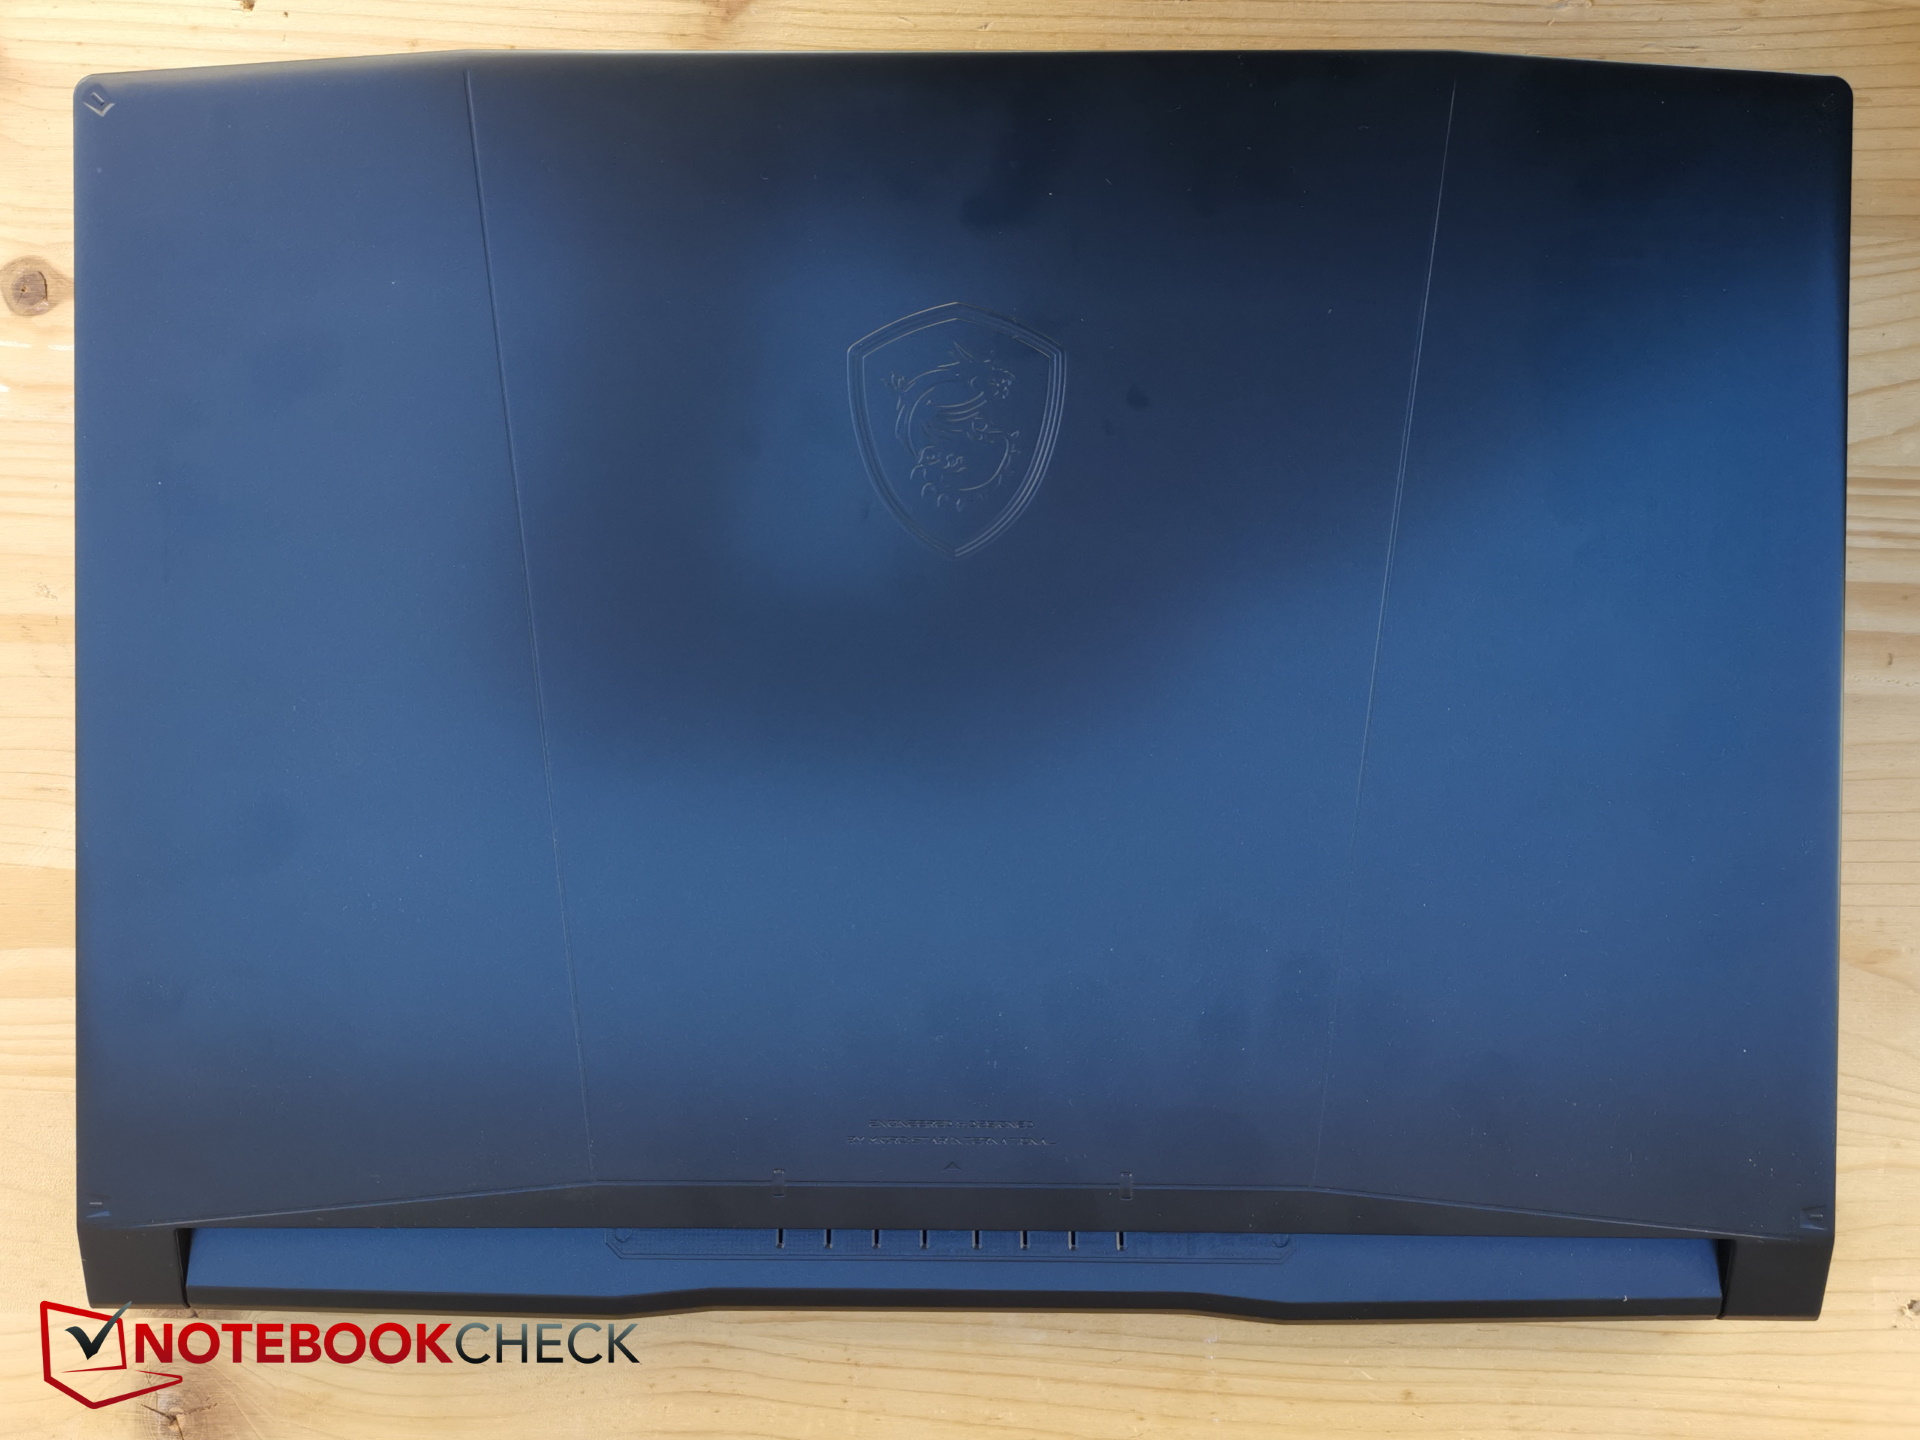
Obudowa Katany 15 jest wykonana w całości z tworzywa sztucznego, nawet jeśli gładkie materiały wierzchnie pokrywy wyświetlacza i podstawy sprawiają wrażenie niemal metalowych. Na bokach widać teraz czarno-szary wzór. Niestety, obudowa okazuje się również bardzo podatna na odciski palców
Kąt otwarcia wynosi 180 stopni. Obok logo, kilka linii i wykrojów zdobi błyszczącą, czarną powierzchnię pokrywy. Po otwarciu lub regulacji kąta nachylenia wyświetlacz chwieje się dłużej niż zwykle
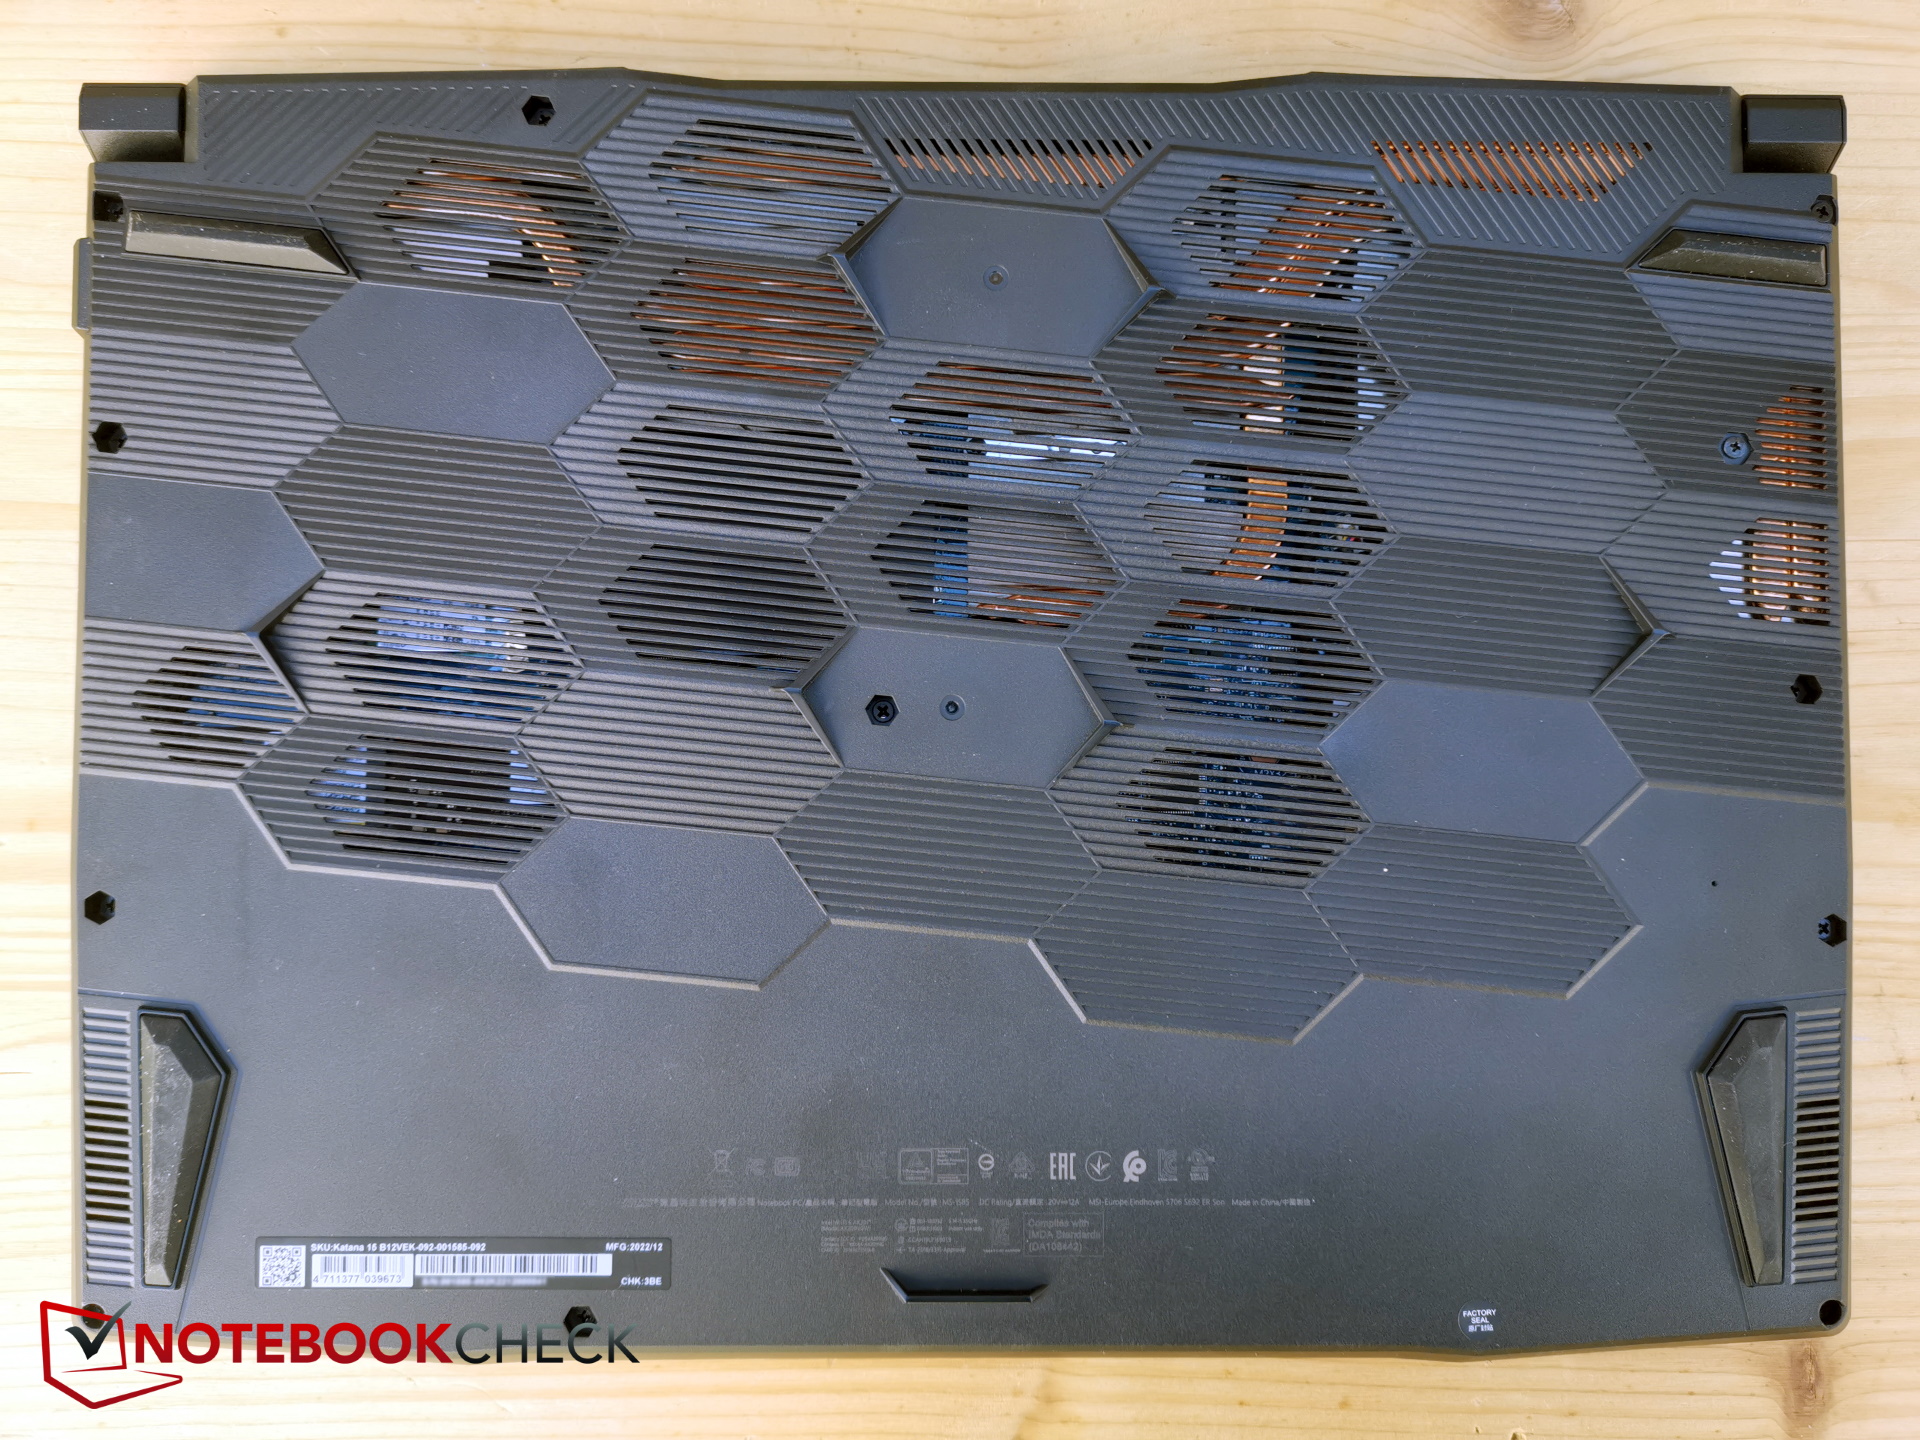
Spód jest wykonany z bardziej miękkiego tworzywa sztucznego. Podstawa jest stosunkowo odporna na skręcanie, ale wydaje trochę trzeszczących dźwięków. W przeciwieństwie do niej pokrywa jest dużo łatwiejsza do wygięcia i wydaje skrzypiący dźwięk. Krawędzie wyświetlacza są wąskie po bokach, ale dość szerokie na górze i na dole jak na dzisiejsze standardy.
Katana 15 z 2023 roku jest nieco cieńsza od zeszłorocznej Katana GF66a wymiary i wagę odziedziczyła po Pulse GL66. Legion 5 jest znów jeszcze cieńsza, ale podobnie jak Core 15, choć minimalnie.
Sprzęt - ostatni gen
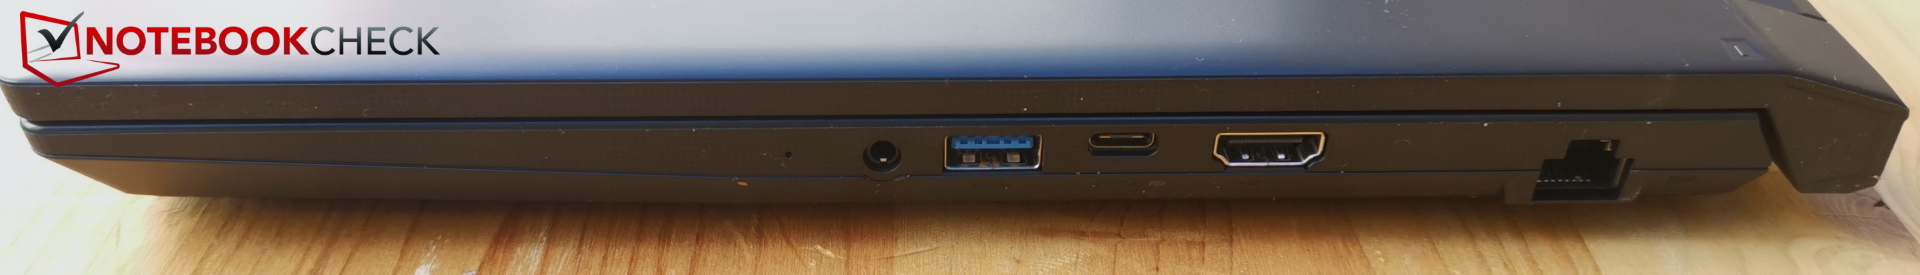
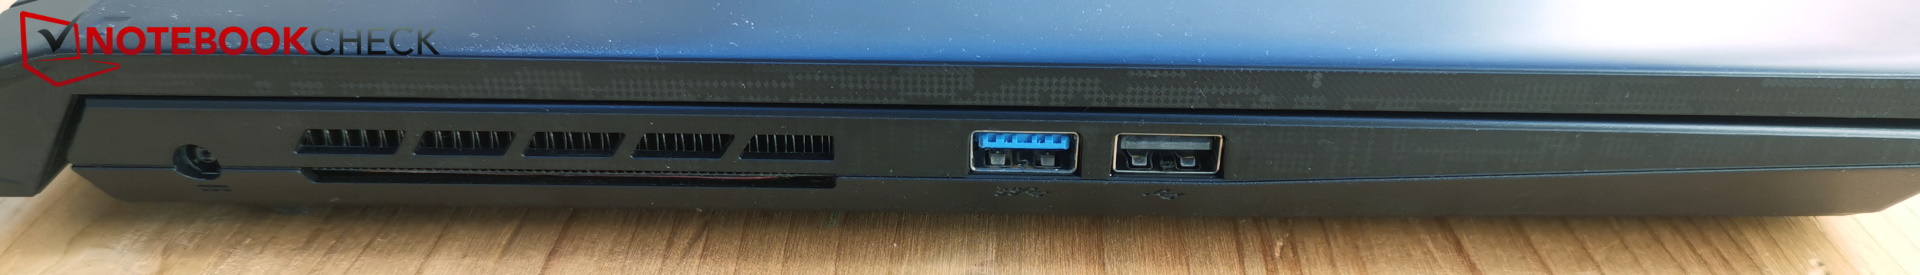
Układ portów jest taki sam we wszystkich trzech modelach MSI. Tak naprawdę jeden z trzech portów USB-A to wciąż typ 2.0, który w obecnych czasach nie ma racji bytu. To samo dotyczy jednego gniazda USB-C, które nie obsługuje Thunderbolt i oferuje jedynie prędkość 3.0.
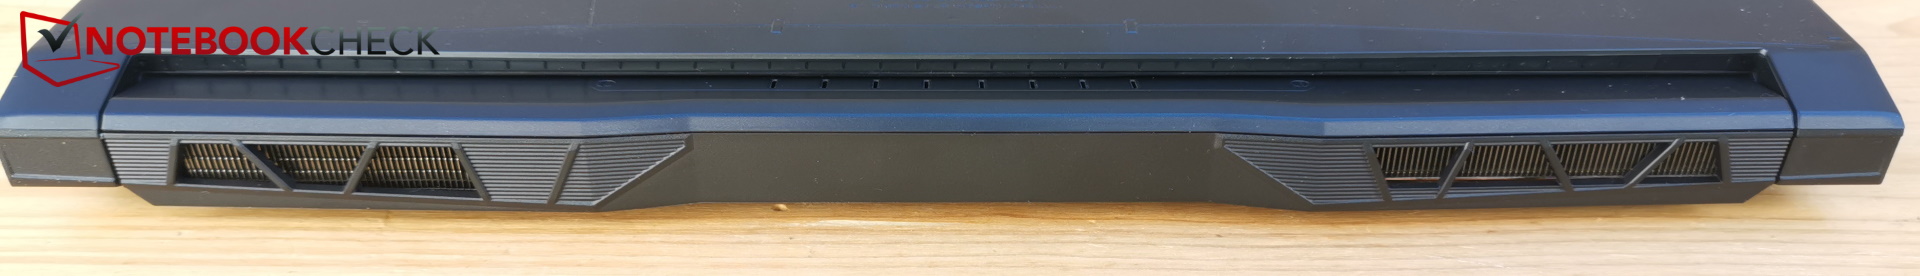
Brakuje czytnika SD, ale przynajmniej LAN i HDMI są na pokładzie. Gniazdo słuchawkowe znajduje się nietypowo na prawym boku, podobnie jak port HDMI - oba te elementy mogą przeszkadzać w obsłudze myszki. Mimo wystarczającej ilości miejsca, z tyłu nie ma żadnych portów.
Komunikacja
MSI zainstalowało moduł WLAN Intel Wi-Fi 6 AX201, który nie obsługuje jeszcze Wi-Fi 6E, więc połączenie z siecią 6 GHz nie jest obecnie możliwe. Działa jednak w zakresie 5 GHz (i oczywiście 2,4 GHz) i to jeszcze dość szybko.
| Networking | |
| iperf3 transmit AXE11000 | |
| MSI Katana 15 B12VEK | |
| MSI Katana GF66 12UGS | |
| Przeciętny Intel Wi-Fi 6 AX201 (438 - 1715, n=74) | |
| Średnia w klasie Gaming (560 - 1862, n=88, ostatnie 2 lata) | |
| Lenovo Legion 5 15IAH7H 82RB | |
| Schenker XMG Core 15 (M22) | |
| iperf3 receive AXE11000 | |
| MSI Katana GF66 12UGS | |
| MSI Katana 15 B12VEK | |
| Średnia w klasie Gaming (680 - 1745, n=88, ostatnie 2 lata) | |
| Przeciętny Intel Wi-Fi 6 AX201 (390 - 1734, n=79) | |
| Lenovo Legion 5 15IAH7H 82RB | |
| Schenker XMG Core 15 (M22) | |
| iperf3 transmit AXE11000 6GHz | |
| Średnia w klasie Gaming (723 - 1868, n=36, ostatnie 2 lata) | |
| Lenovo Legion 5 15IAH7H 82RB | |
| Przeciętny Intel Wi-Fi 6 AX201 (745 - 1252, n=3) | |
| Schenker XMG Core 15 (M22) | |
| iperf3 receive AXE11000 6GHz | |
| Średnia w klasie Gaming (975 - 1775, n=35, ostatnie 2 lata) | |
| Lenovo Legion 5 15IAH7H 82RB | |
| Przeciętny Intel Wi-Fi 6 AX201 (390 - 1670, n=3) | |
| Schenker XMG Core 15 (M22) | |
Kamera internetowa
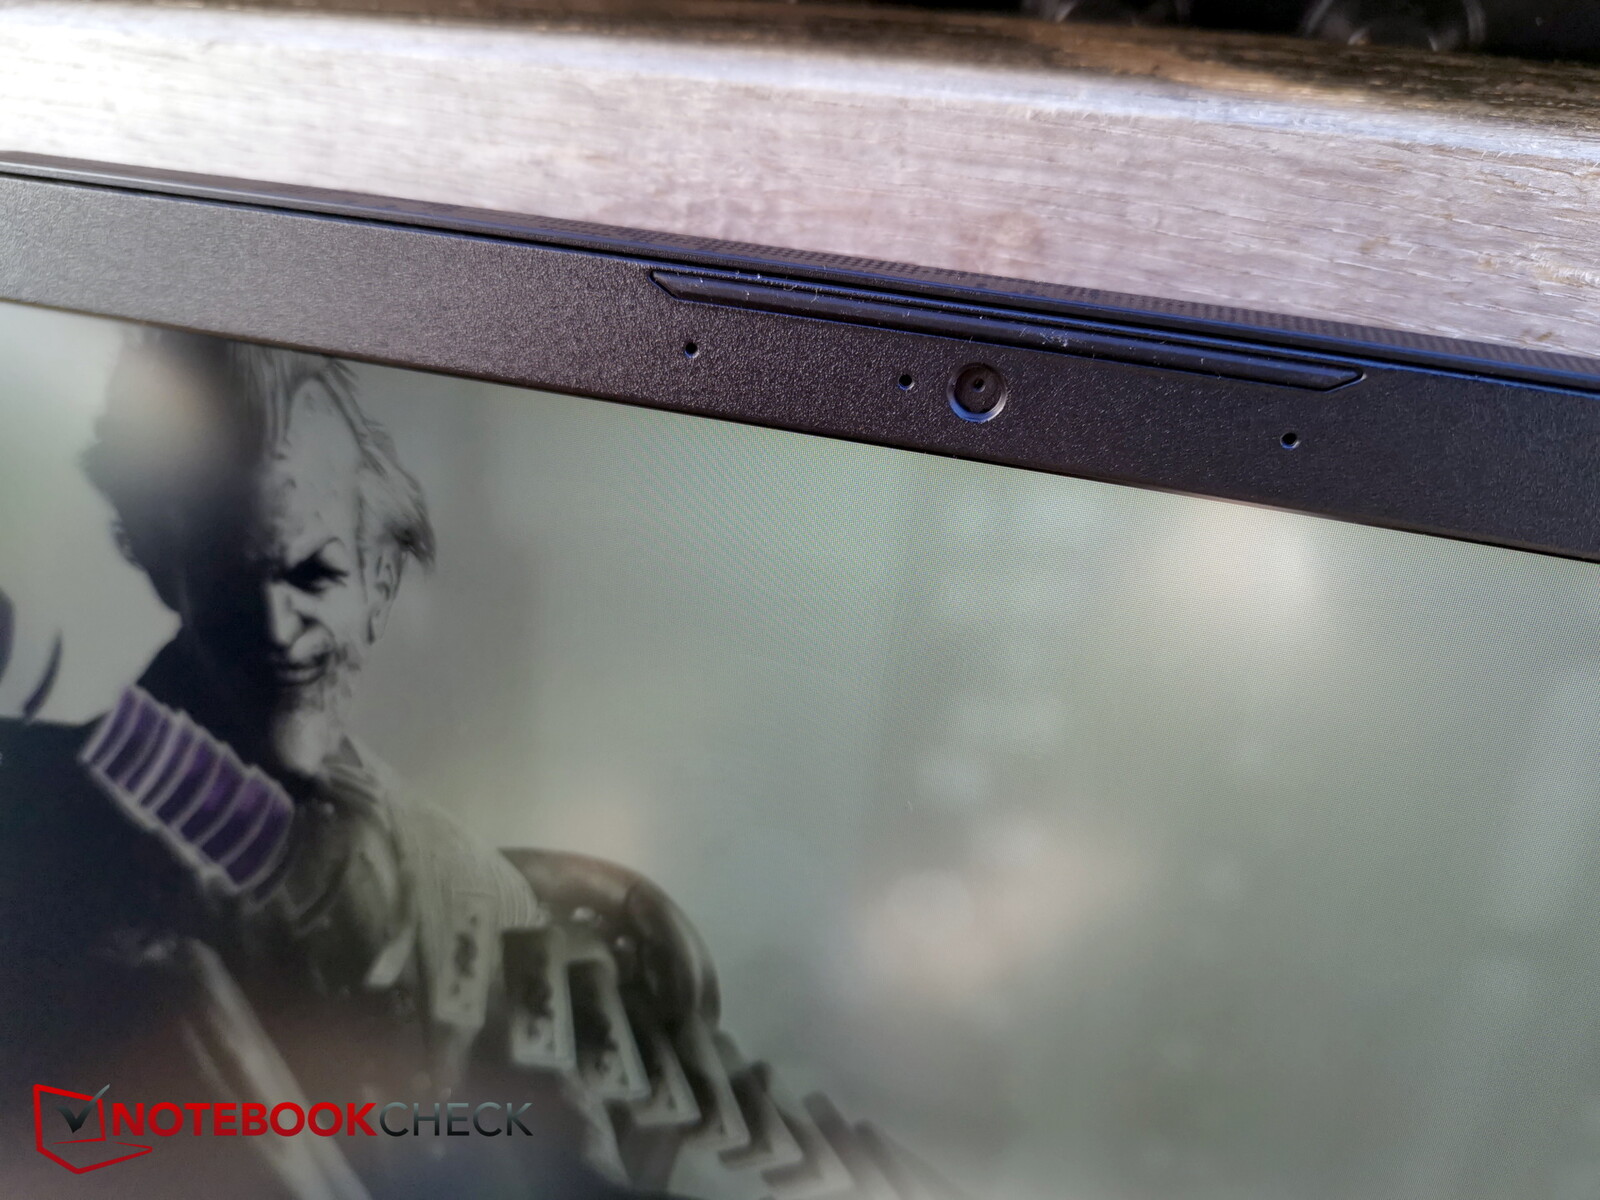
Kamera internetowa jest również last gen z jej rozdzielczością 720p. Nawet nowszy B13 nadal ma kamerę 720p. Można ją włączyć i wyłączyć poprzez fn+F6.
Odchylenia kolorów są ogólnie dość duże, a jakość obrazu raczej nieoptymalna.


Bezpieczeństwo
TPM jest na pokładzie, poza tym brakuje gniazda Kensington. Nie ma też czujnika linii papilarnych.
Akcesoria i gwarancja
Niedrogie laptopy zazwyczaj nie są wyposażone w żadne dodatki. Tak jest również w przypadku modelu Katana 15.
MSI oferuje 24-miesięczną gwarancję, a w zestawie znajduje się usługa pick-up & return.
Konserwacja
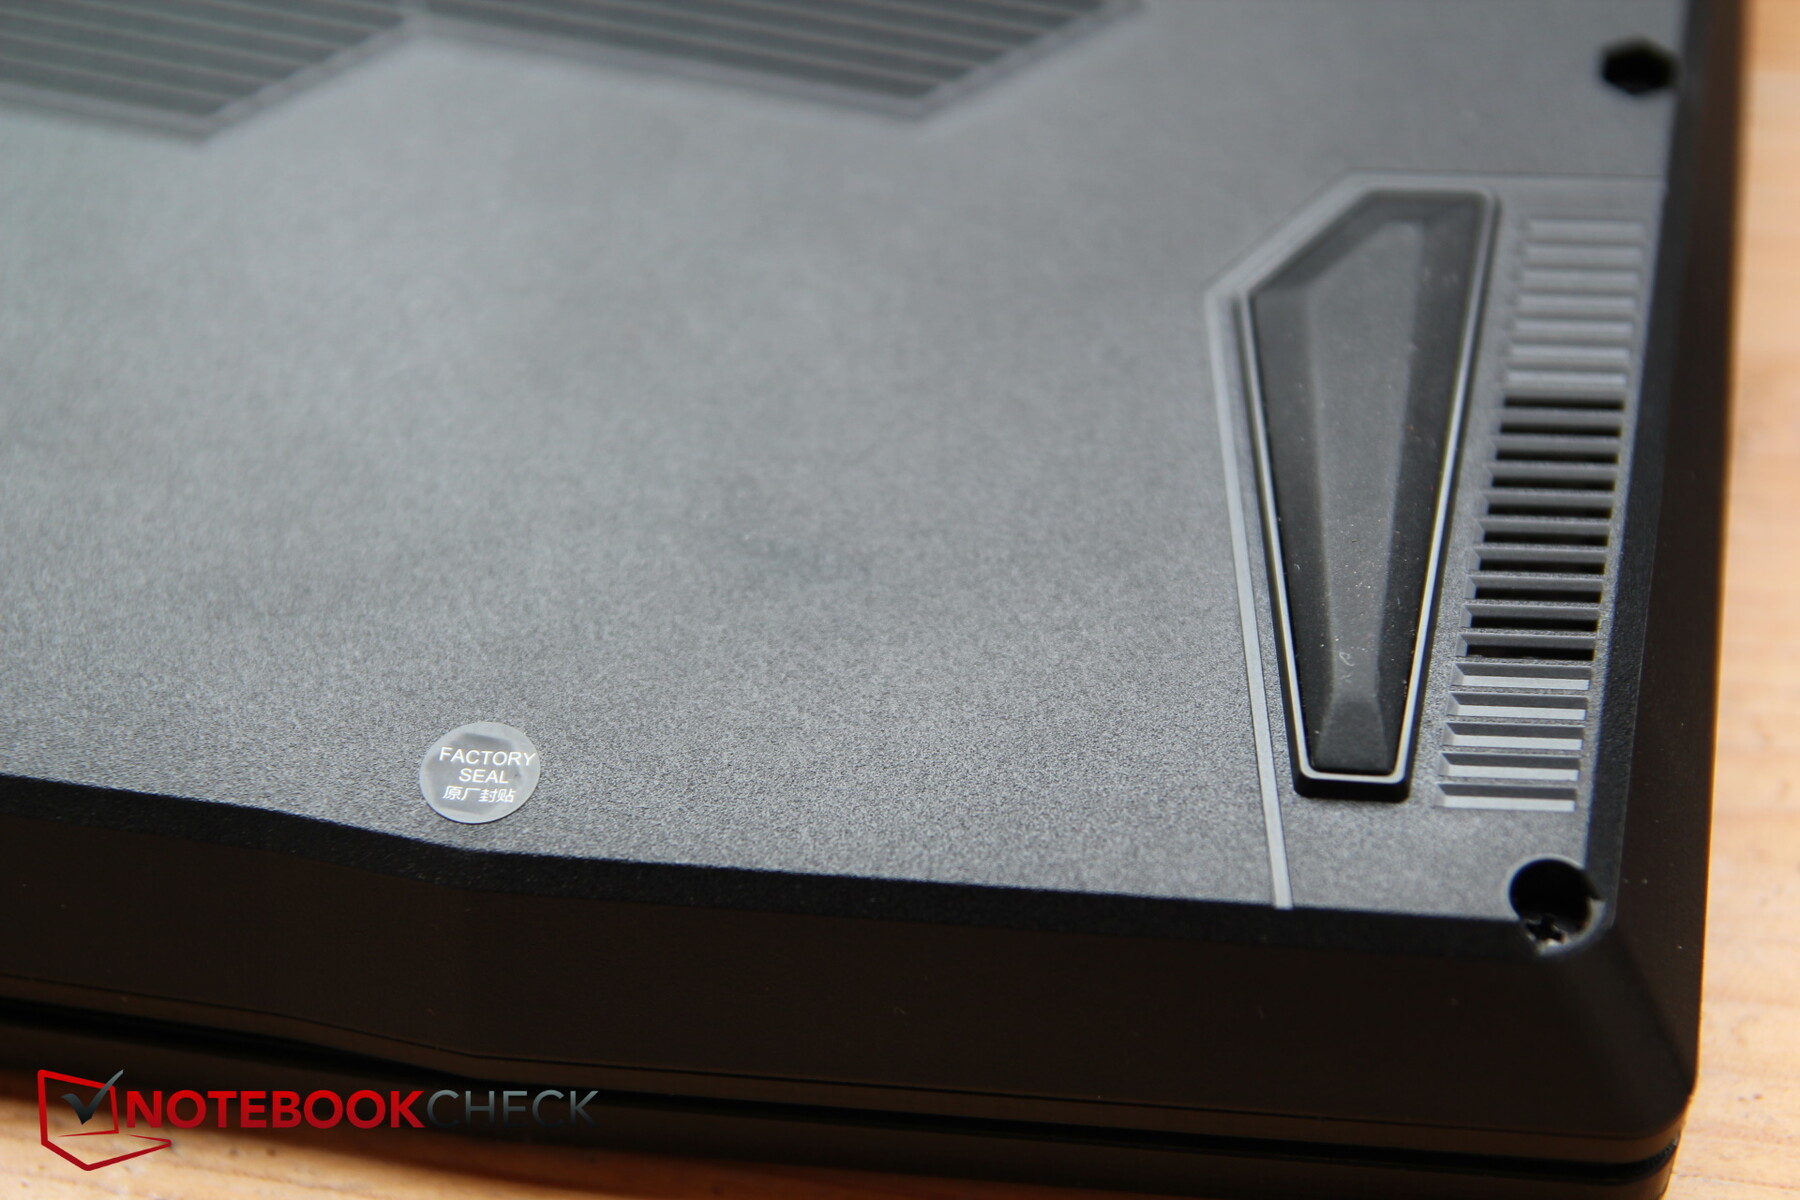
Niestety, MSI używa naklejki plombowej, aby określić, czy użytkownicy sami otworzyli już urządzenie. Ponieważ nasz model testowy pochodzi z Cyberportu, powstrzymaliśmy się od otwierania go, aby nie uszkodzić urządzenia dla naszego pożyczającego.
Według MSI, urządzenie może być również otwierane przez właściciela w celach konserwacyjnych. Dopóki jest to robione "profesjonalnie", gwarancja urządzenia pozostaje nienaruszona.
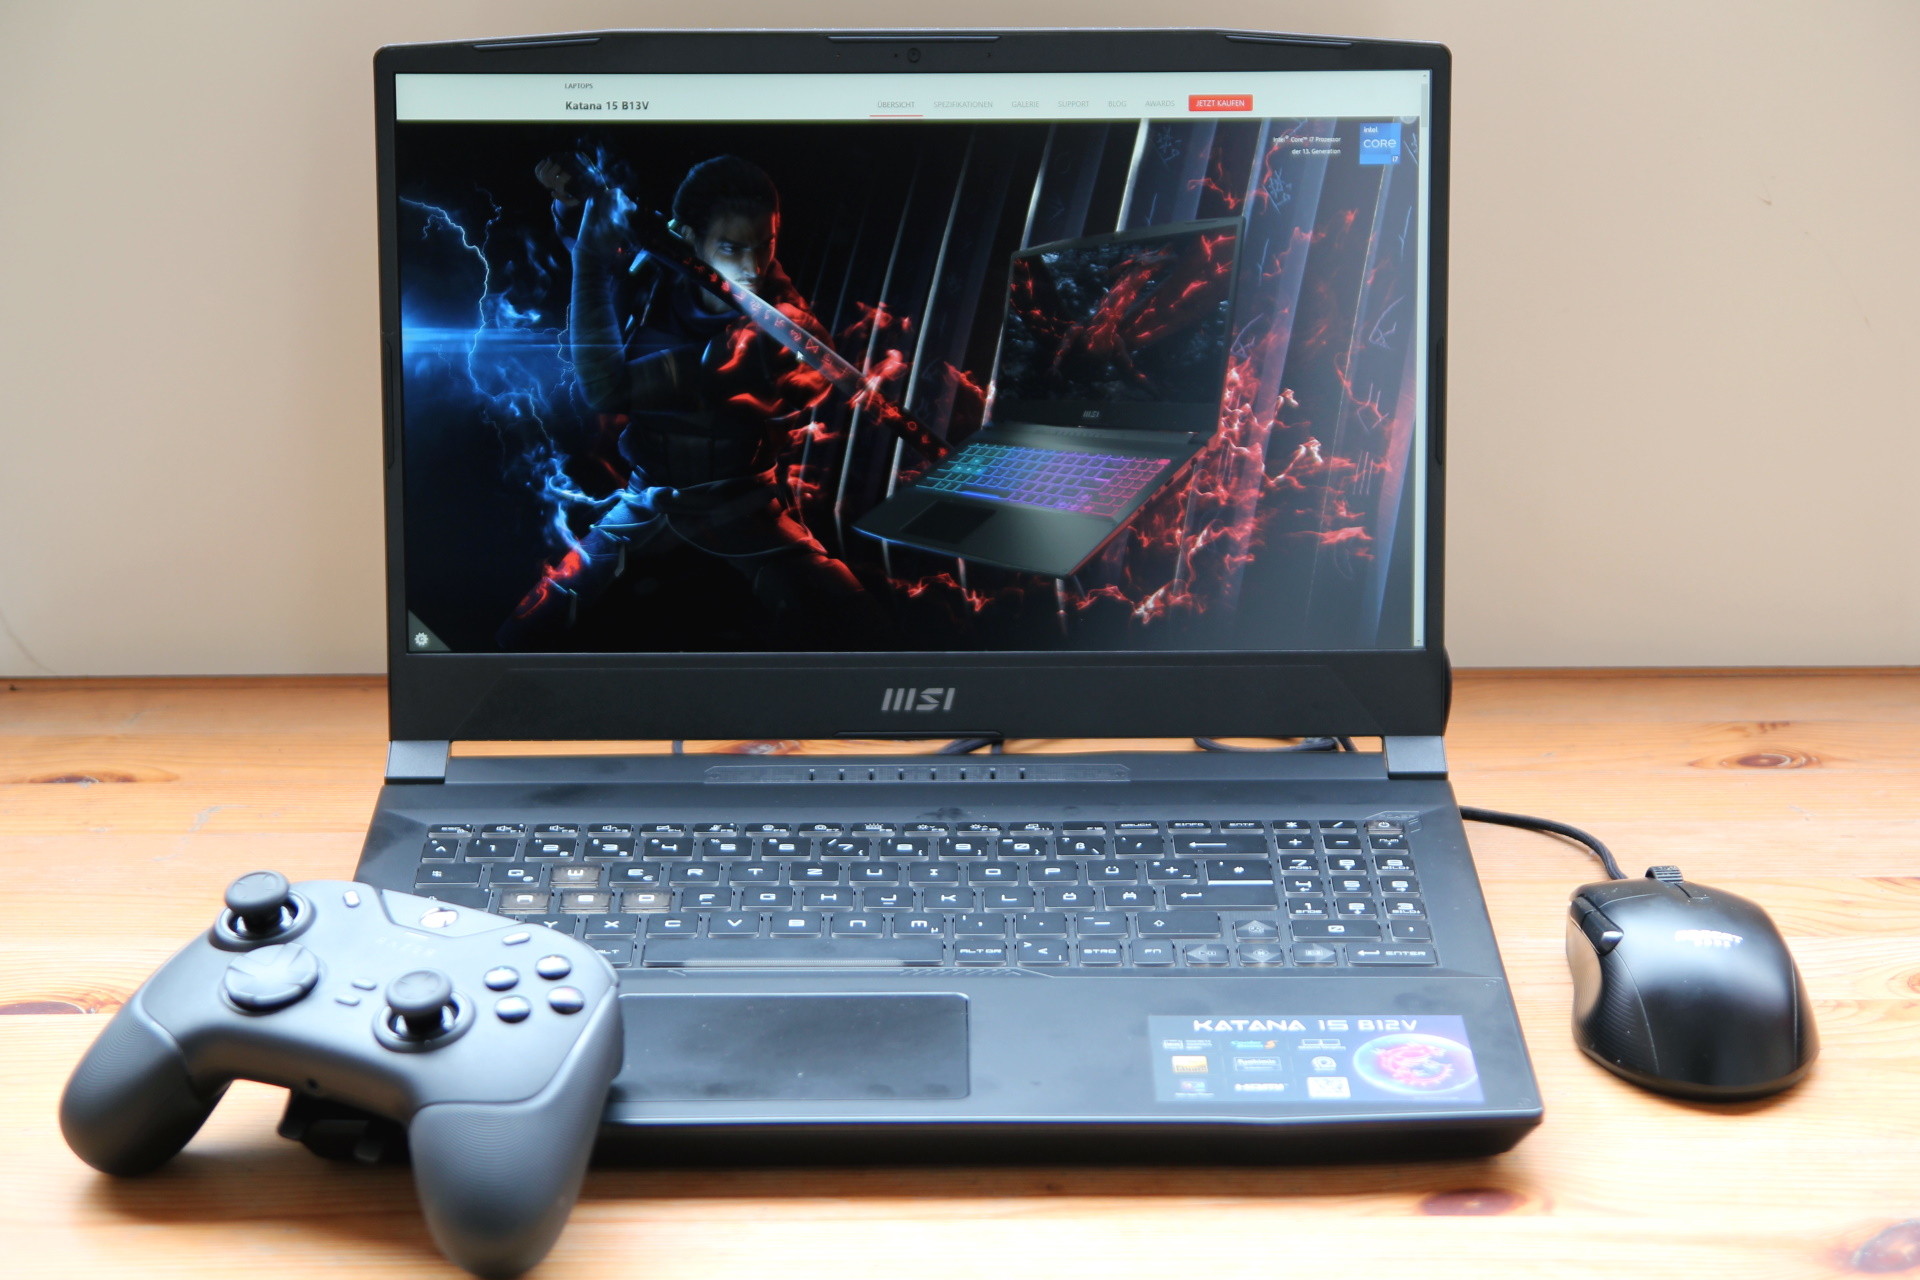
Urządzenia wejściowe - Przyzwoita klawiatura, mały touchpad
Klawiatura
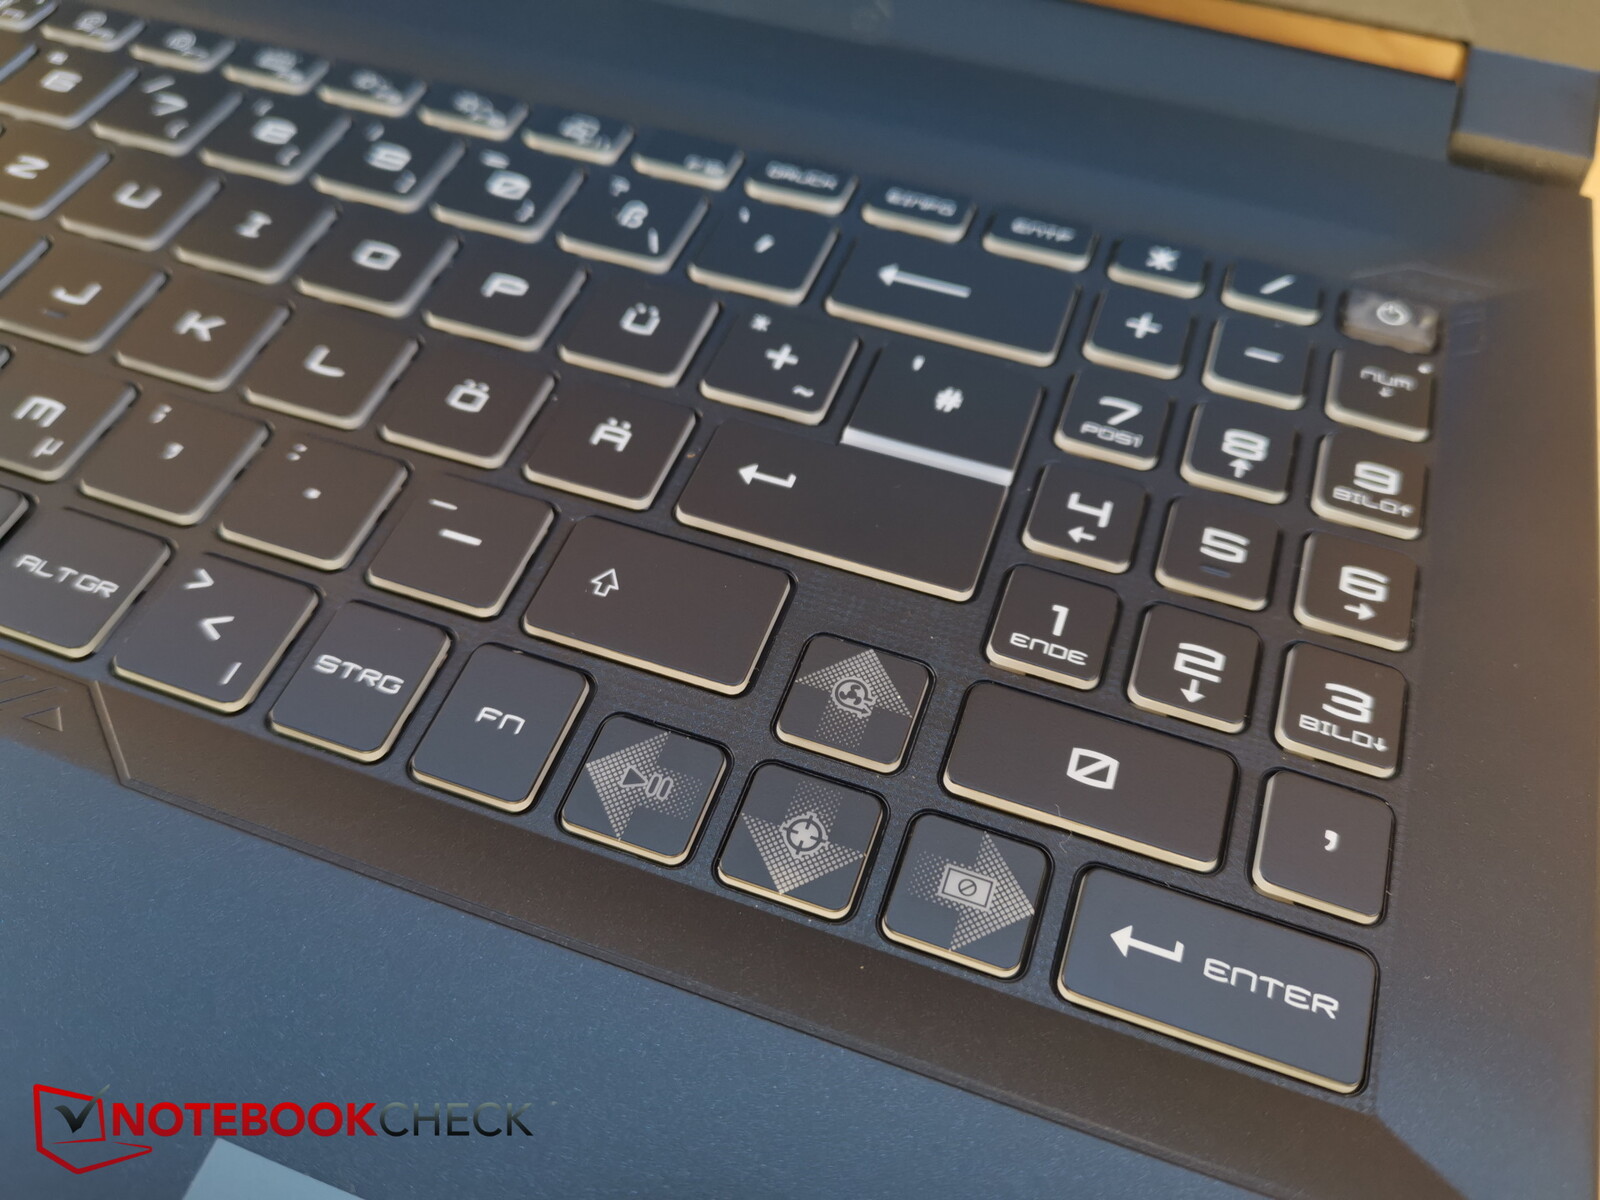
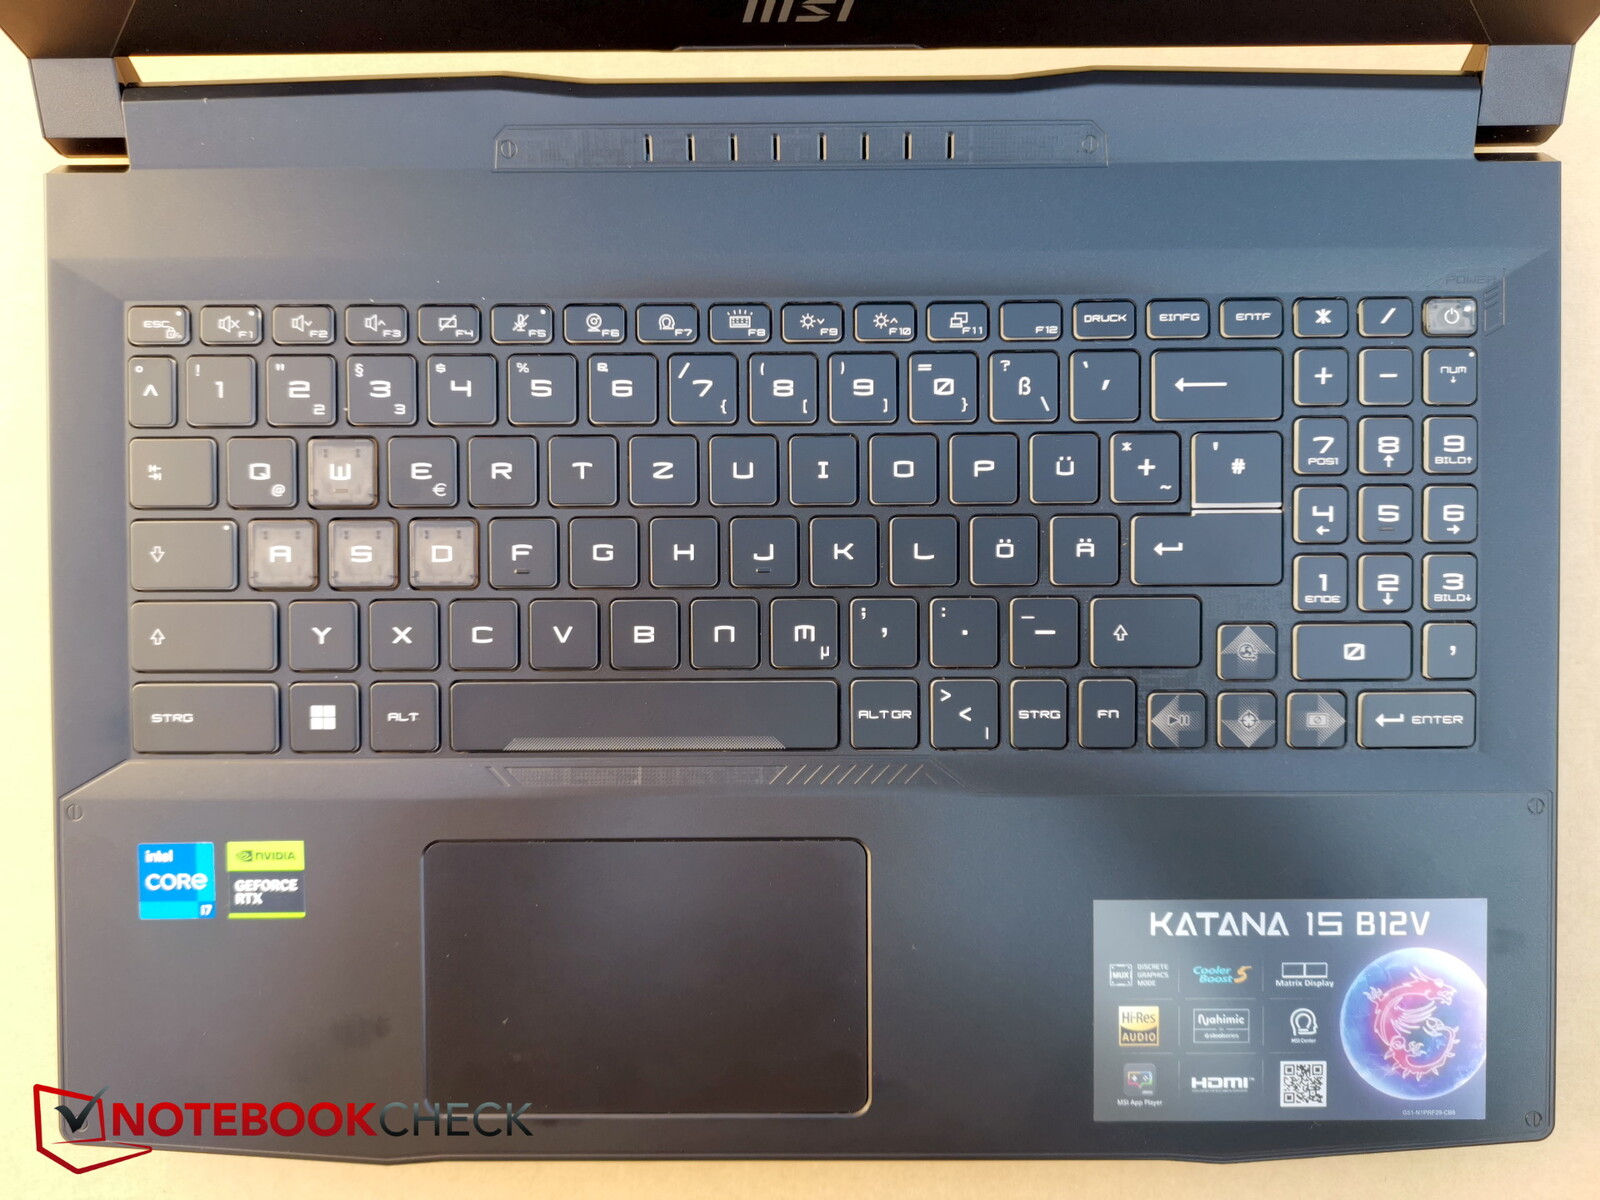
Układ jest bardzo podobny dla wszystkich modeli Katany: wygląda bardzo schludnie, ale numpad po prawej stronie wygląda na źle wciśnięty, ale przynajmniej jest.
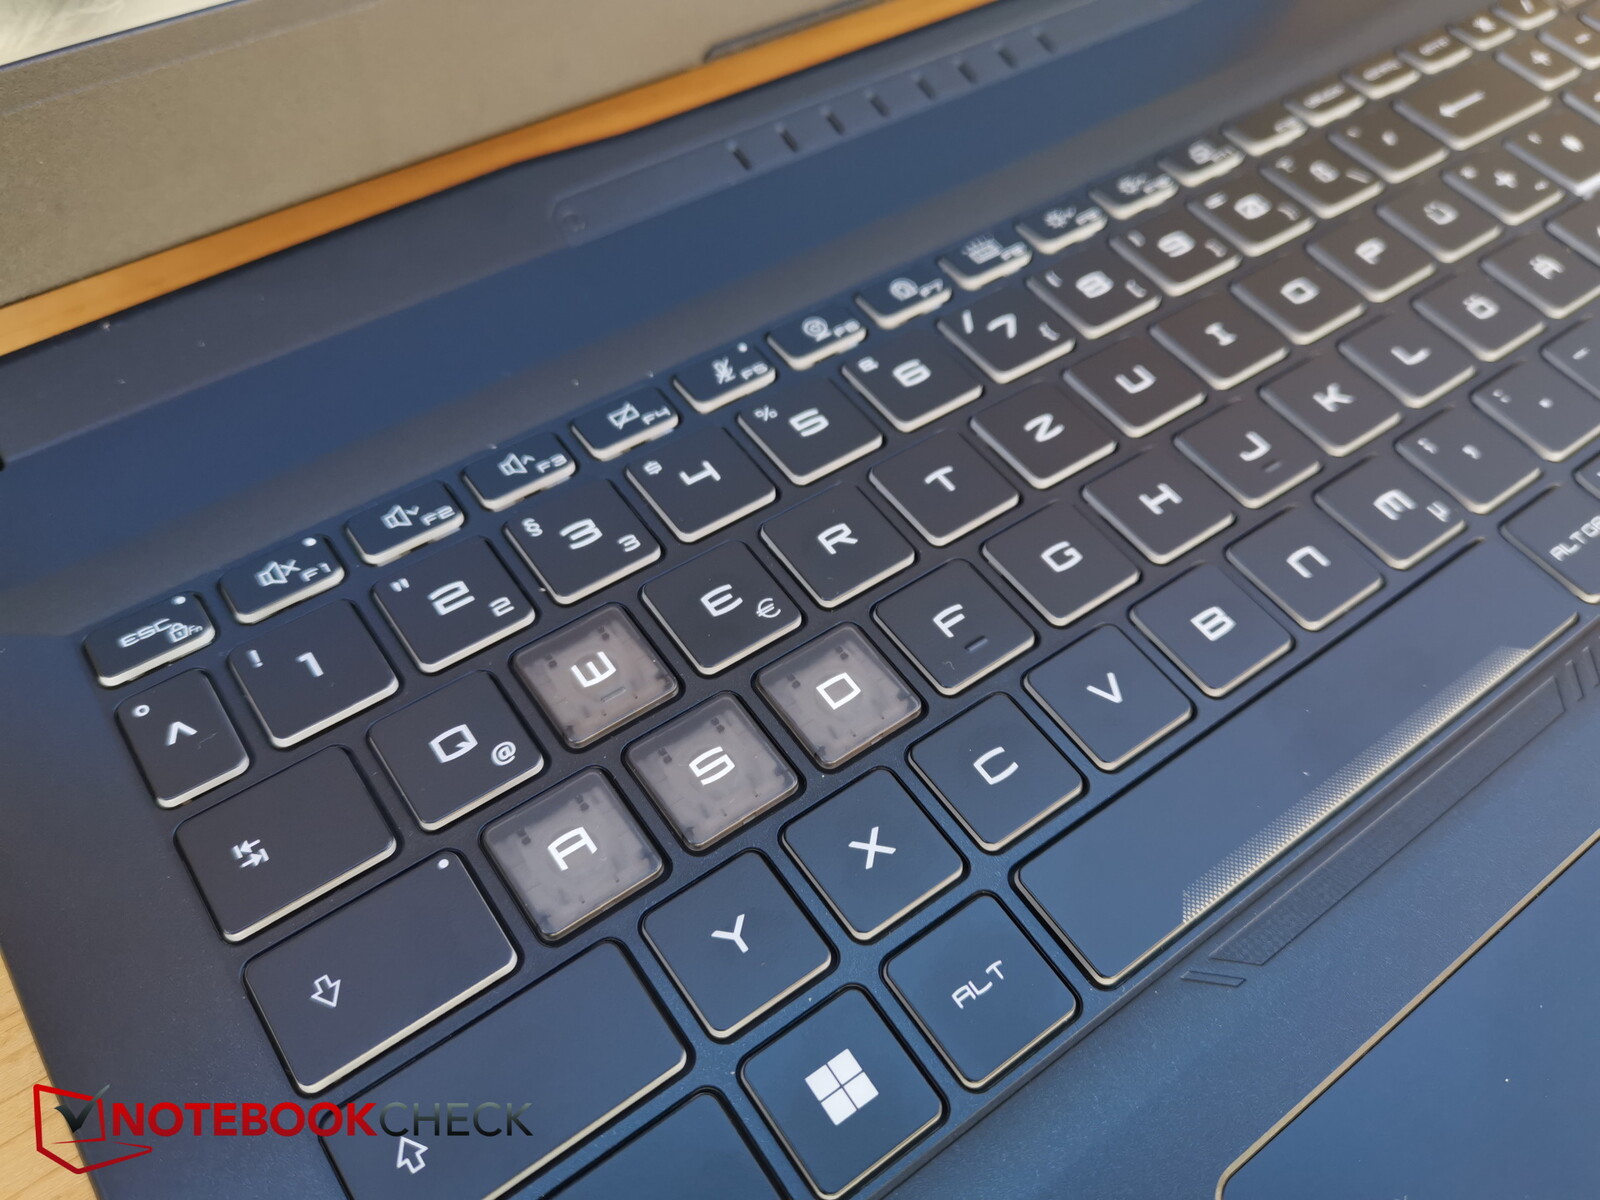
Klawisze strzałek pomiędzy nimi nie są zmniejszone o połowę, jak to często bywa, ale są nieco mniejsze ogólnie na długości i wysokości. Klawisze WASD są przezroczyste, przez co wyróżniają się kolorystycznie. Klawisze F i specjalne są również bardzo małe.
MSI niestety ponownie przesunęło klawisz fn na prawą stronę spacji, co wymaga pewnego przyzwyczajenia. Aż dziw bierze, dlaczego MSI dalej idzie własną drogą. W razie potrzeby można zamienić funkcje klawiszy fn i Windows, ale wtedy mamy ten sam problem z klawiszem Windows, który jest po prawej stronie zamiast klawisza fn.
Skok klawiszy jest raczej krótki, ale sprzężenie zwrotne jest wyraźnie wyczuwalne, dzięki czemu pisanie czuje się dość szybko. Odgłos uderzeń klawiszy jest umiarkowany, a podstawa pozostaje stabilna i nie ugina się podczas pisania.
Podświetlenie klawiatury oferuje cztery strefy, a każda z nich ma cztery poziomy regulowanej jasności.
Touchpad
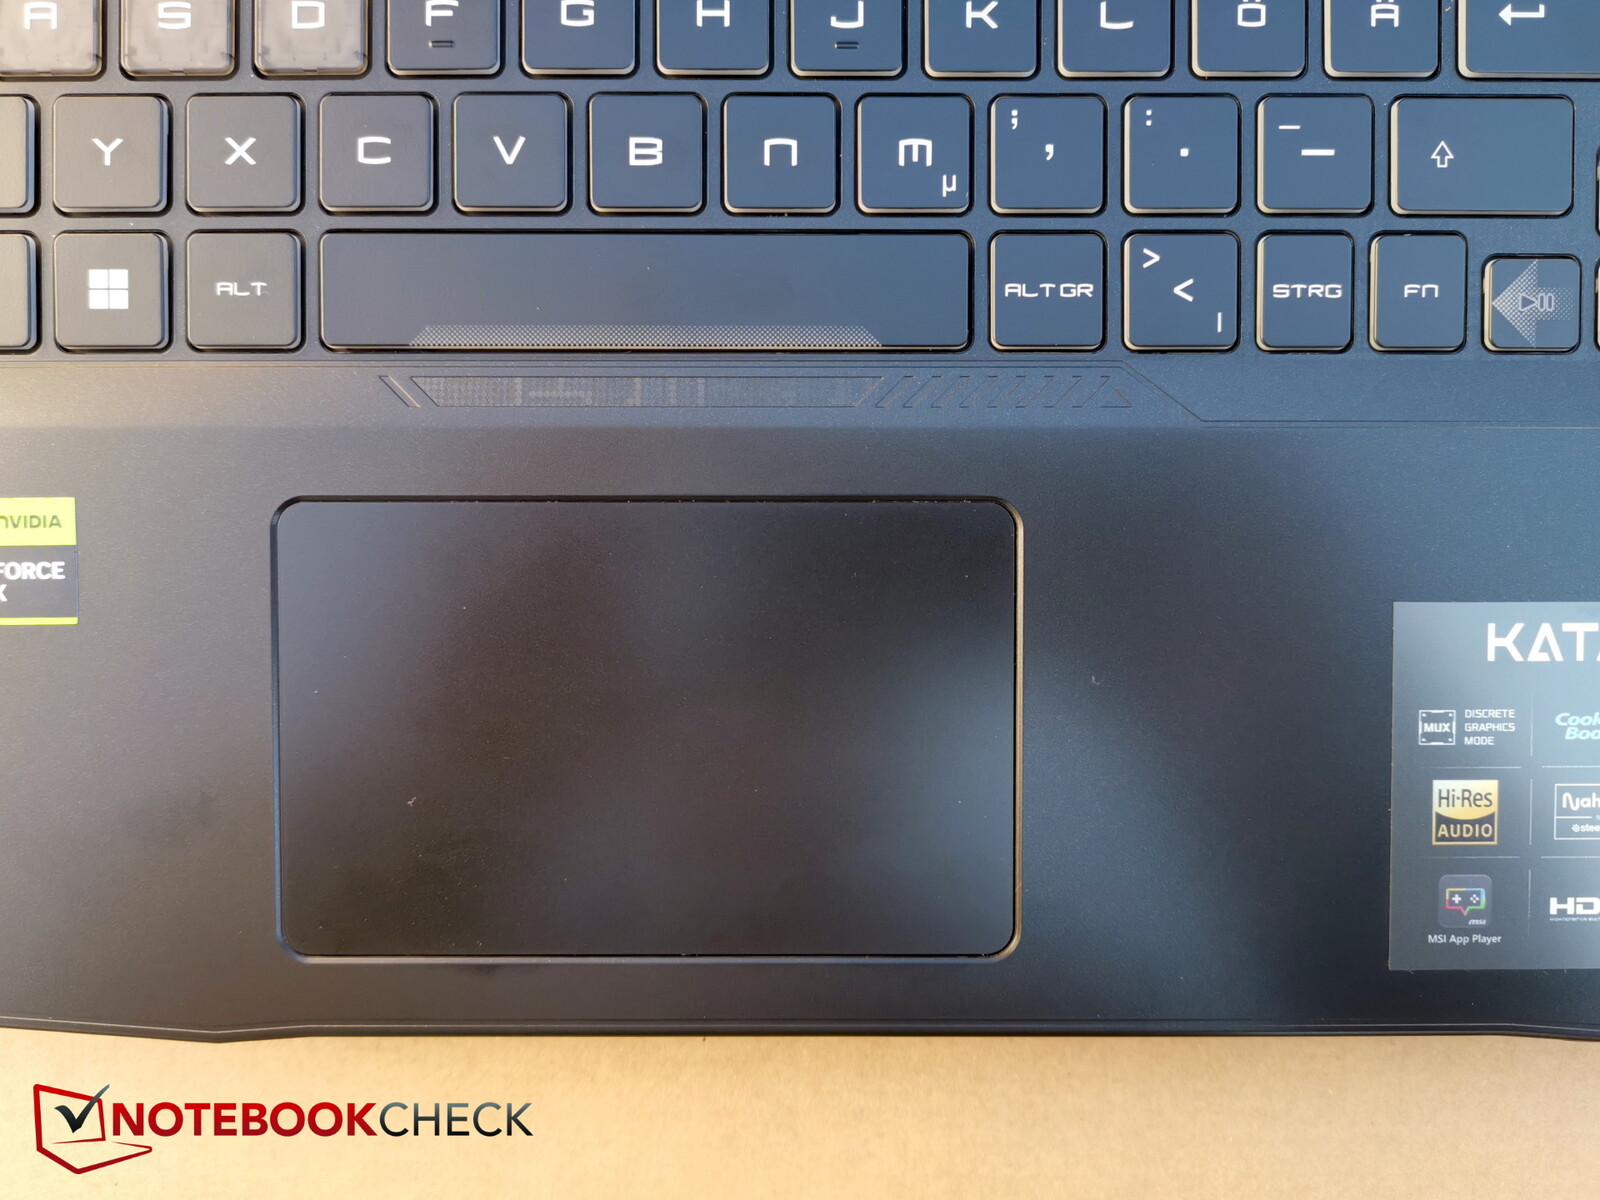
Katana 15 ma, jak się wydaje, jeden z najmniejszych touchpadów na rynku. Wygląda to trochę retro. Jasne, gracze i tak zwykle podłączają mysz, ale większy touchpad jest po prostu wygodniejszy w podróży
Touchpad znajduje się tuż pod spacją, a więc bardzo daleko po lewej stronie układu. Korzystniejsze byłoby nieco bardziej centralne umieszczenie
Kliki zintegrowanych klawiszy są nieco głośniejsze i nie wydają się zbyt wysokiej jakości, ale reagują pewnie i precyzyjnie.
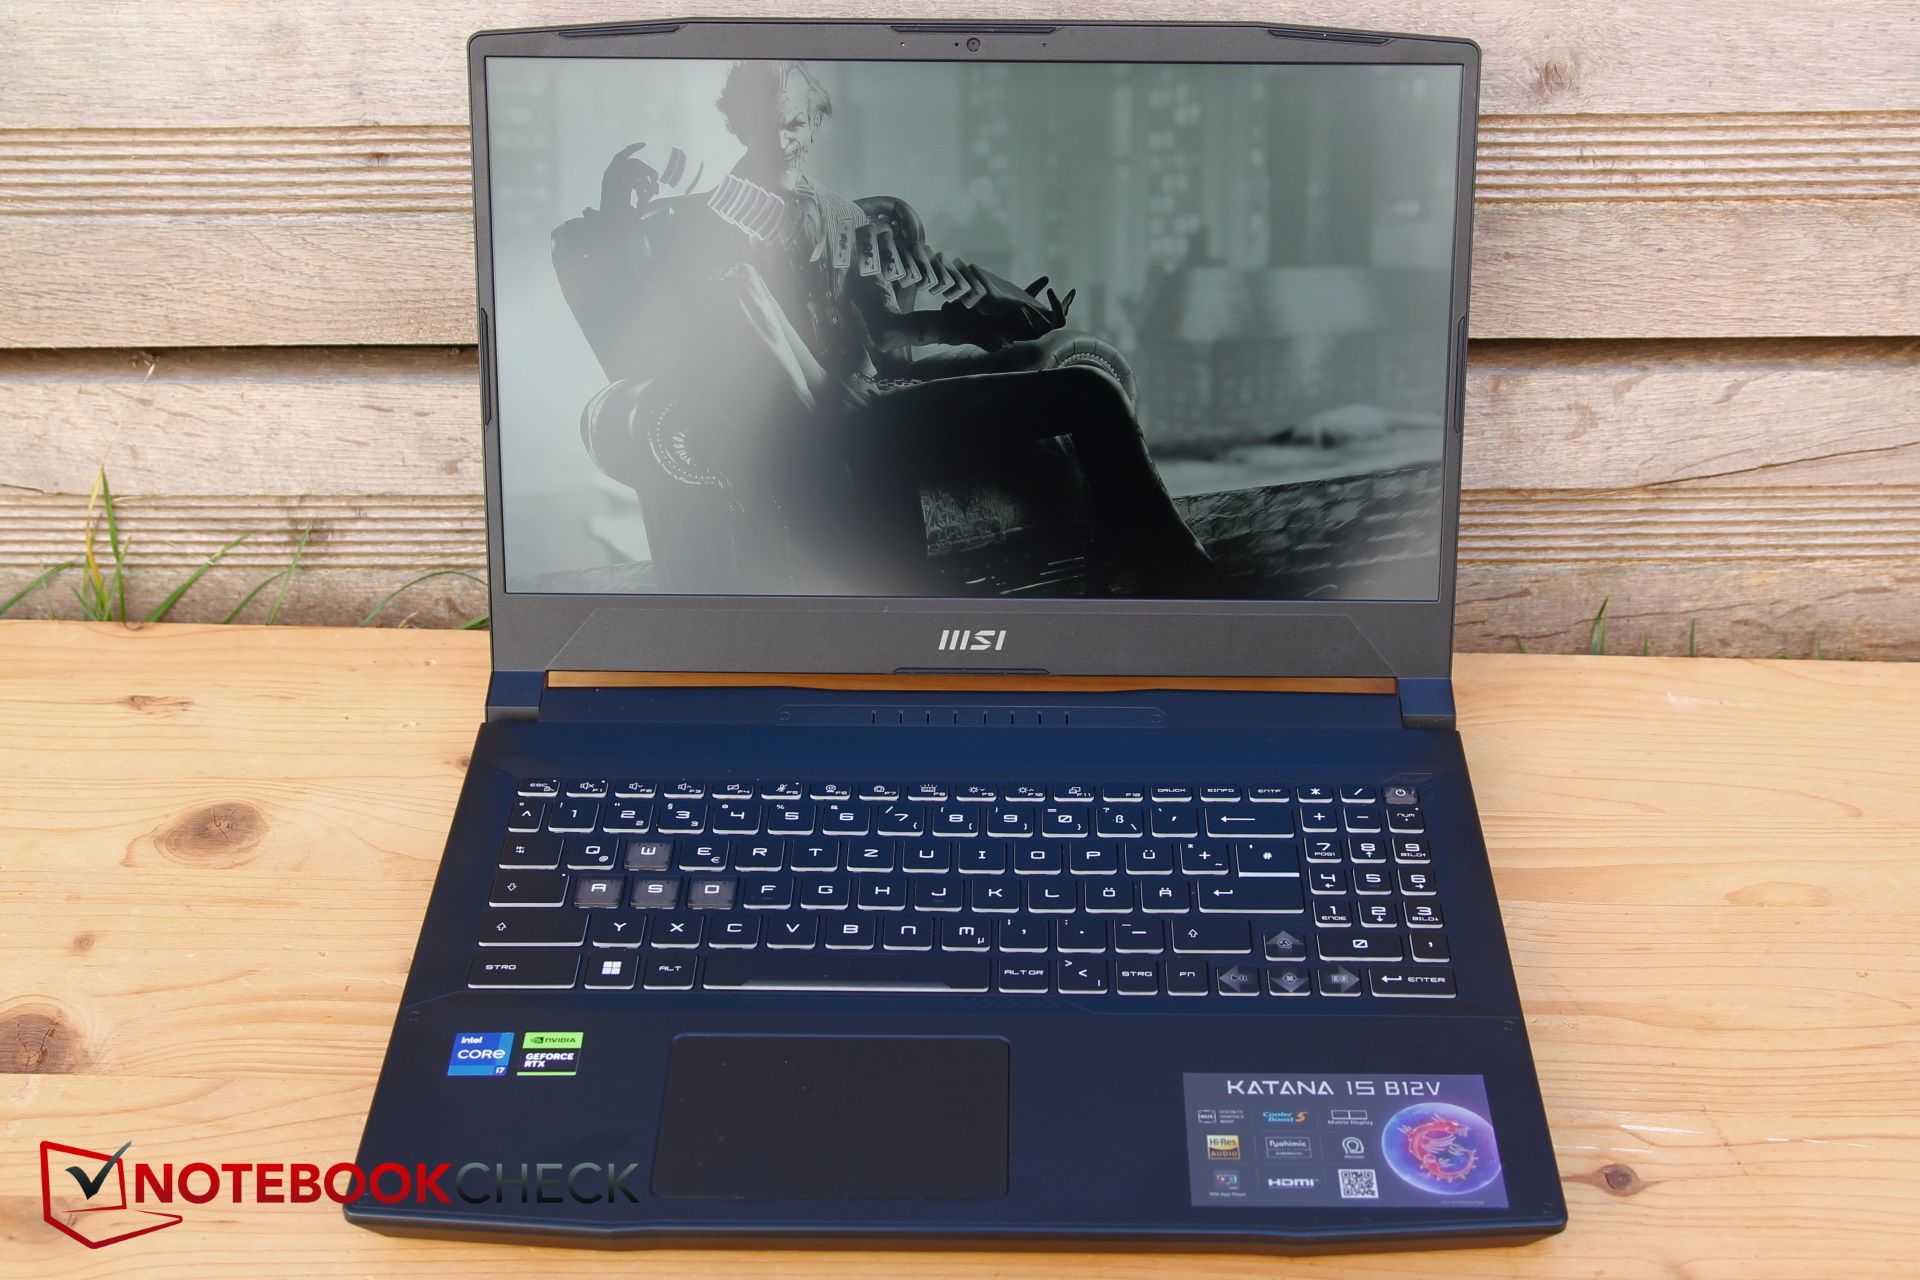
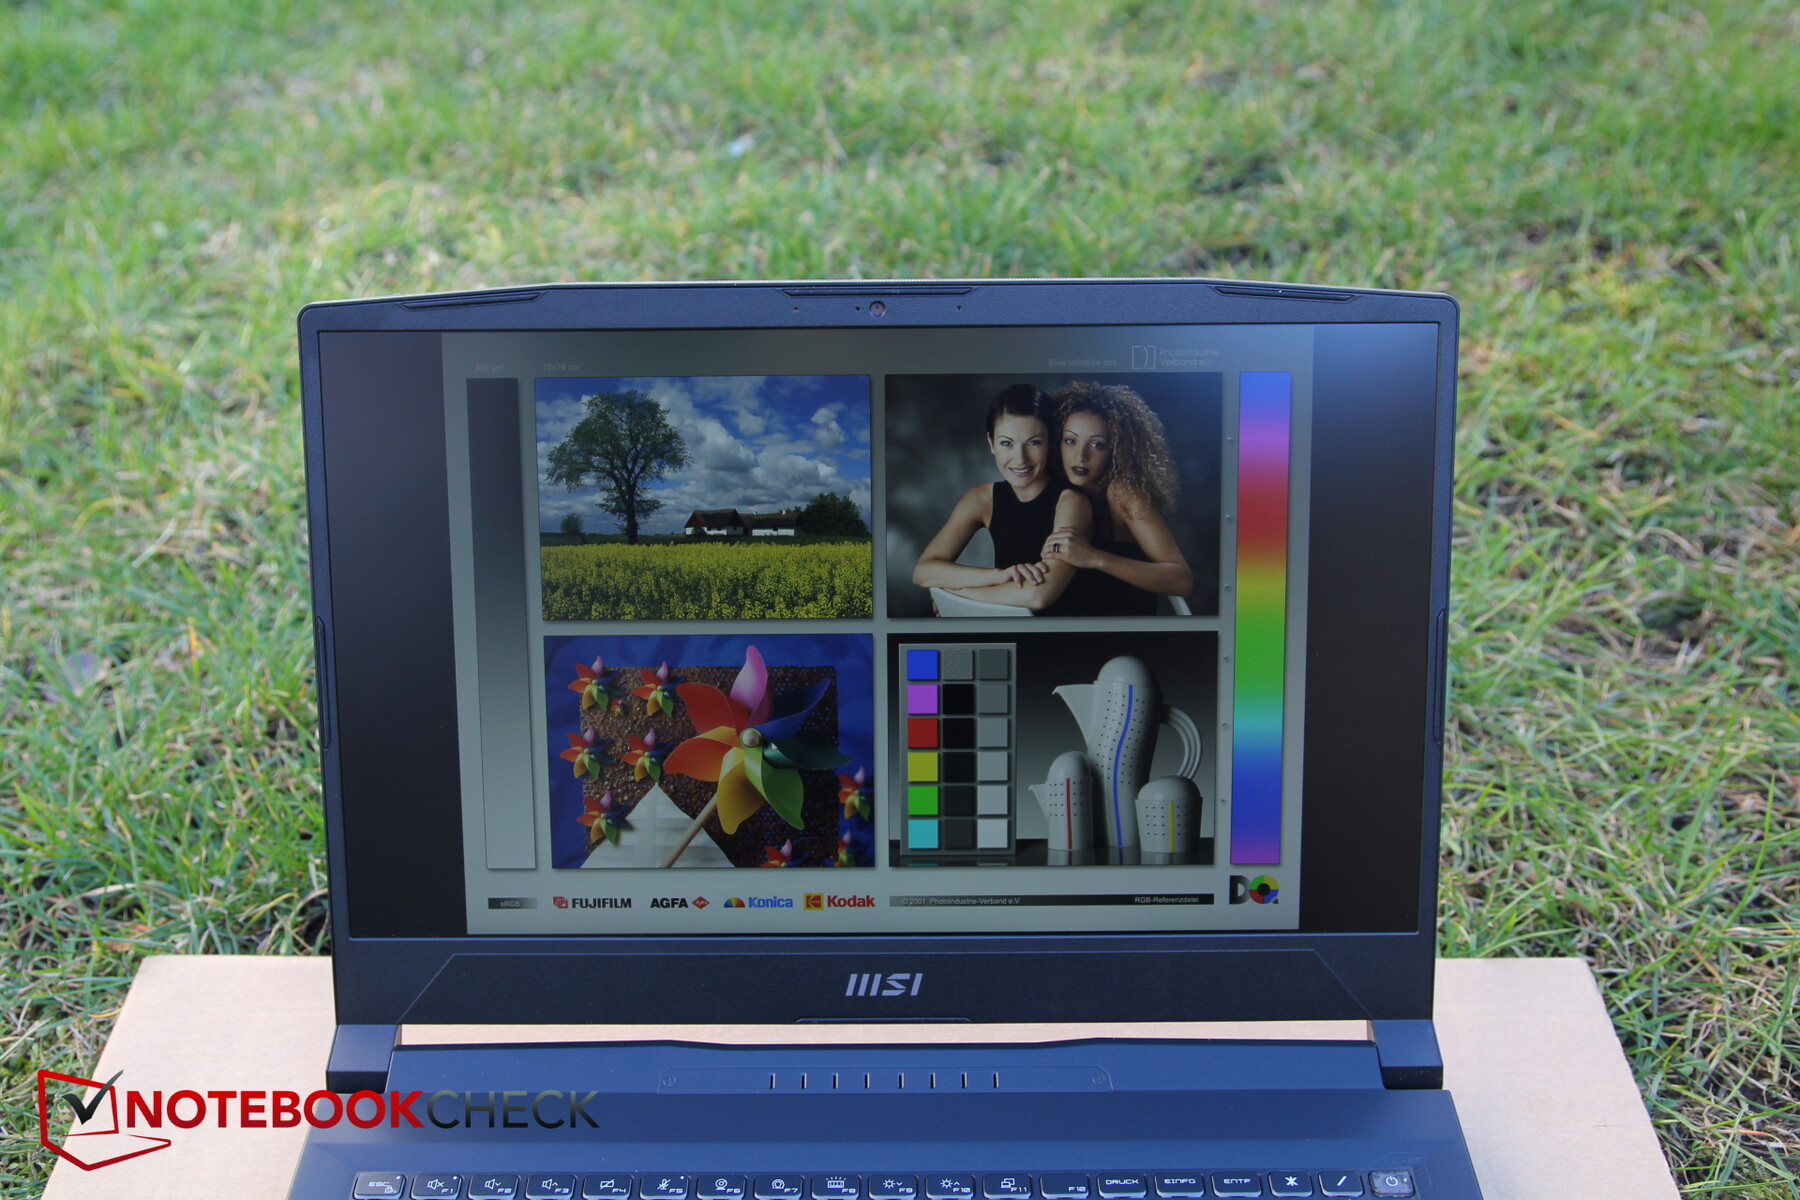
Wyświetlacz - 250 nitów i 57% sRGB to wartości budżetowe
MSI nadal stosuje w Katanie wyświetlacz o rozdzielczości Full HD, podczas gdy wielu konkurentów stosuje już QHD i wyższe. Niekoniecznie jest to problem, bo rozdzielczość i 144 Hz powinny dobrze współgrać z RTX 4050. Jak na razie nie wydaje się też, by istniały jakieś alternatywne opcje wyświetlacza dla B13. Ostatecznie jest to ten sam panel, co w modelach Katana GF66 oraz Pulse GL66.
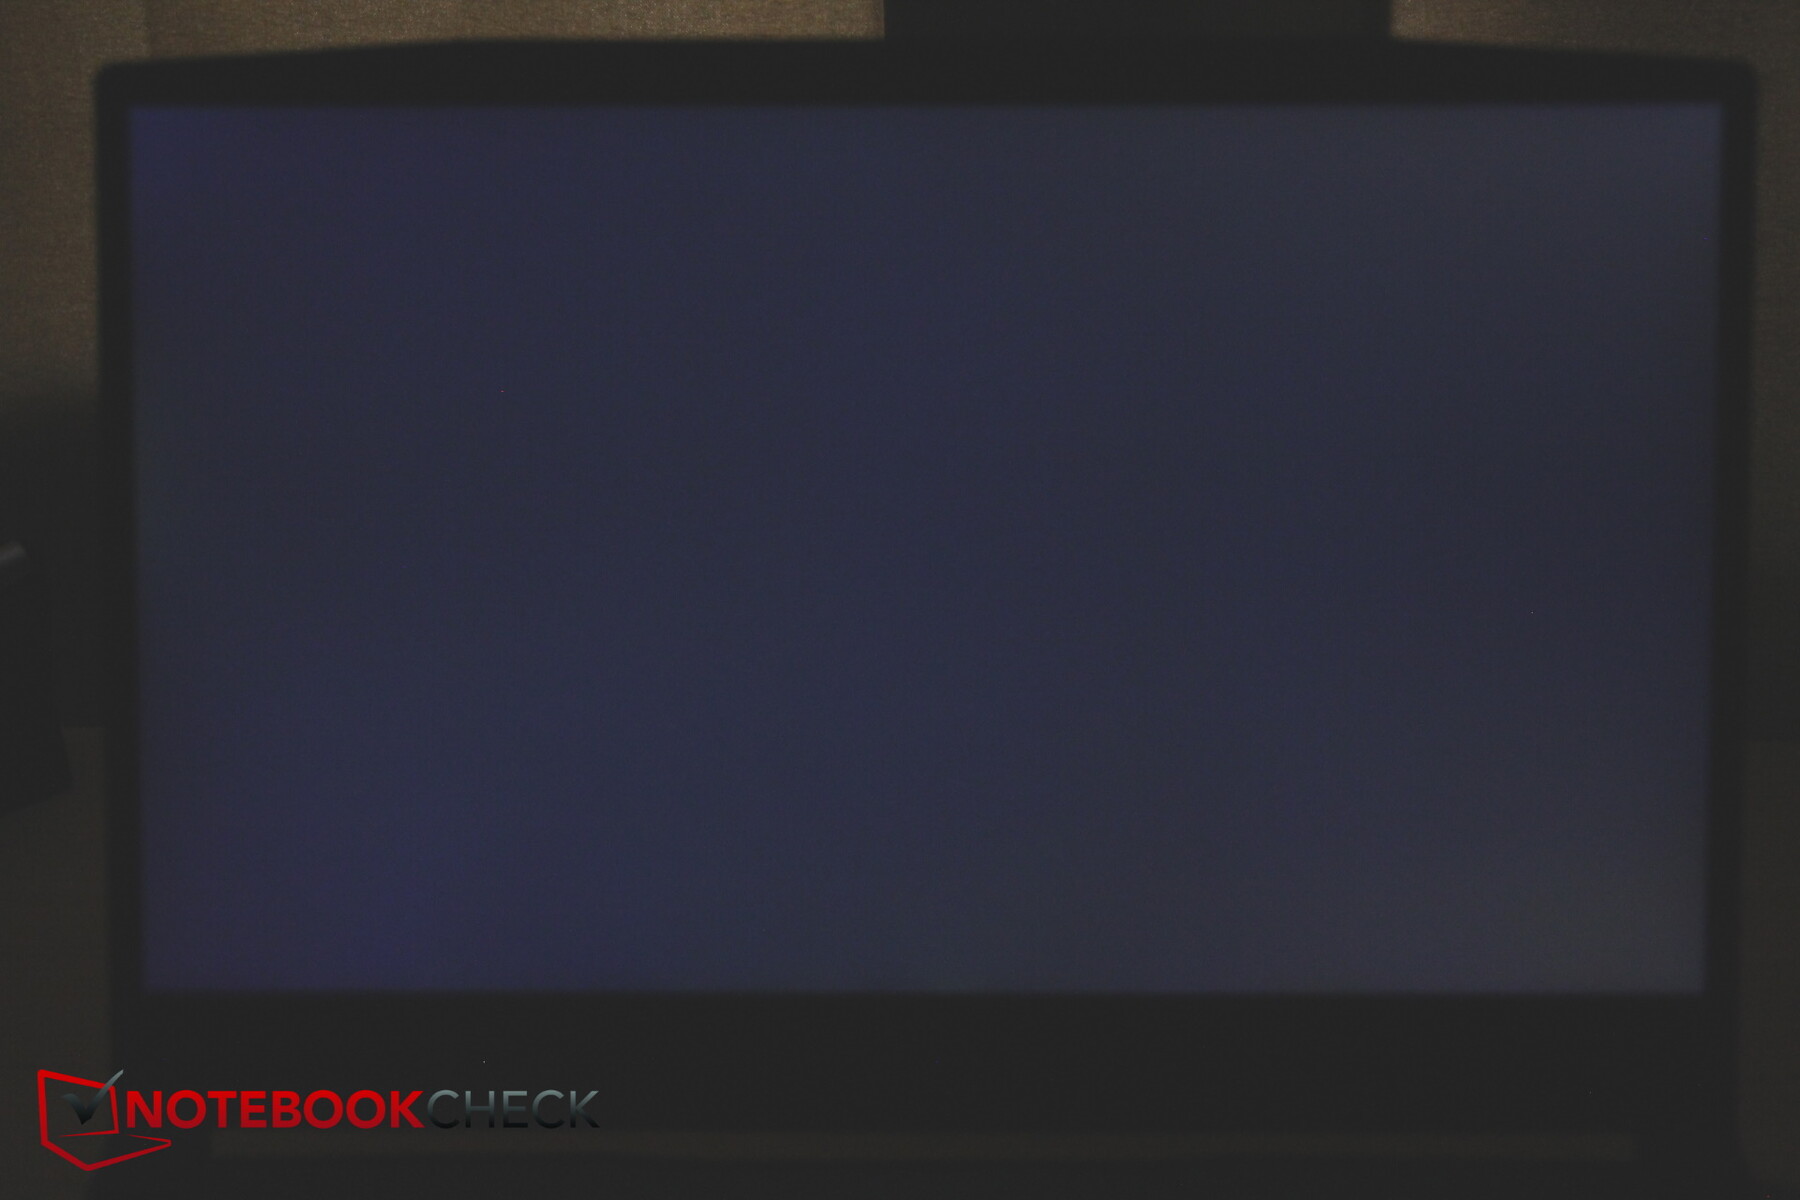
Niestety średnia jasność 258 nitów jest w dzisiejszych czasach raczej poniżej średniej, gdyż większość konkurencyjnych laptopów oferuje jaśniejsze wyświetlacze. Przynajmniej podświetlenie na poziomie 92 procent jest dość równomierne, a jasność spada nieco w kierunku prawej dolnej części
Czasy reakcji są raczej nieoptymalne do przeciętnych dla gracza. Przynajmniej PWM nie jest problemem w naszym modelu. Screen bleeding jest tylko niewielki i niezauważalny w większości sytuacji.
| |||||||||||||||||||||||||
rozświetlenie: 92 %
na akumulatorze: 257 cd/m²
kontrast: 1374:1 (czerń: 0.19 cd/m²)
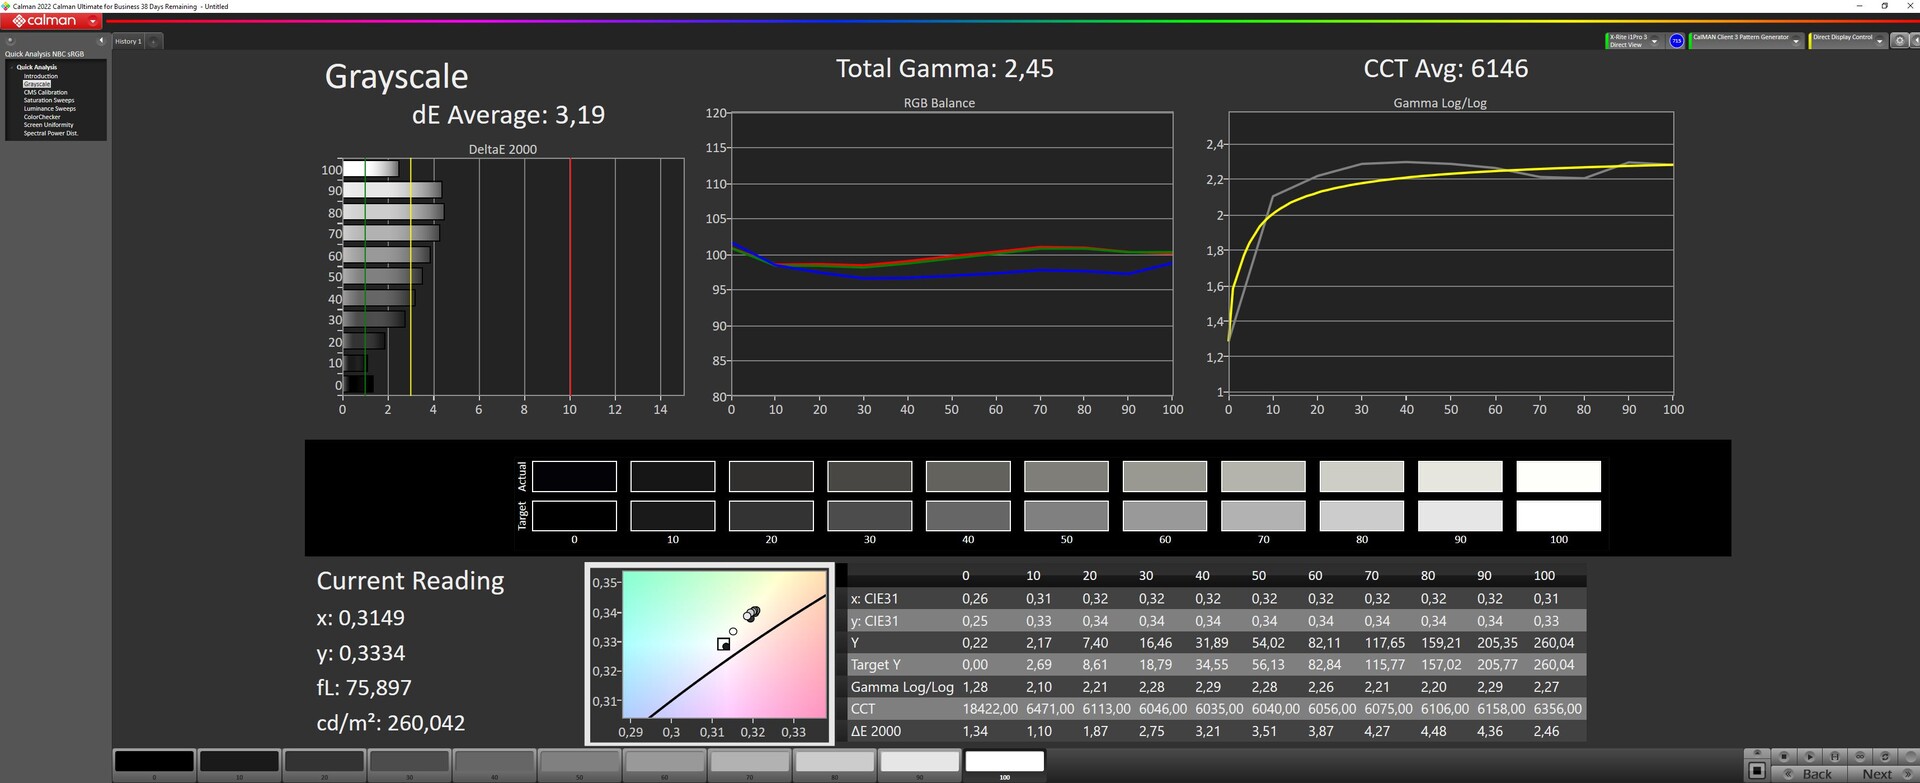
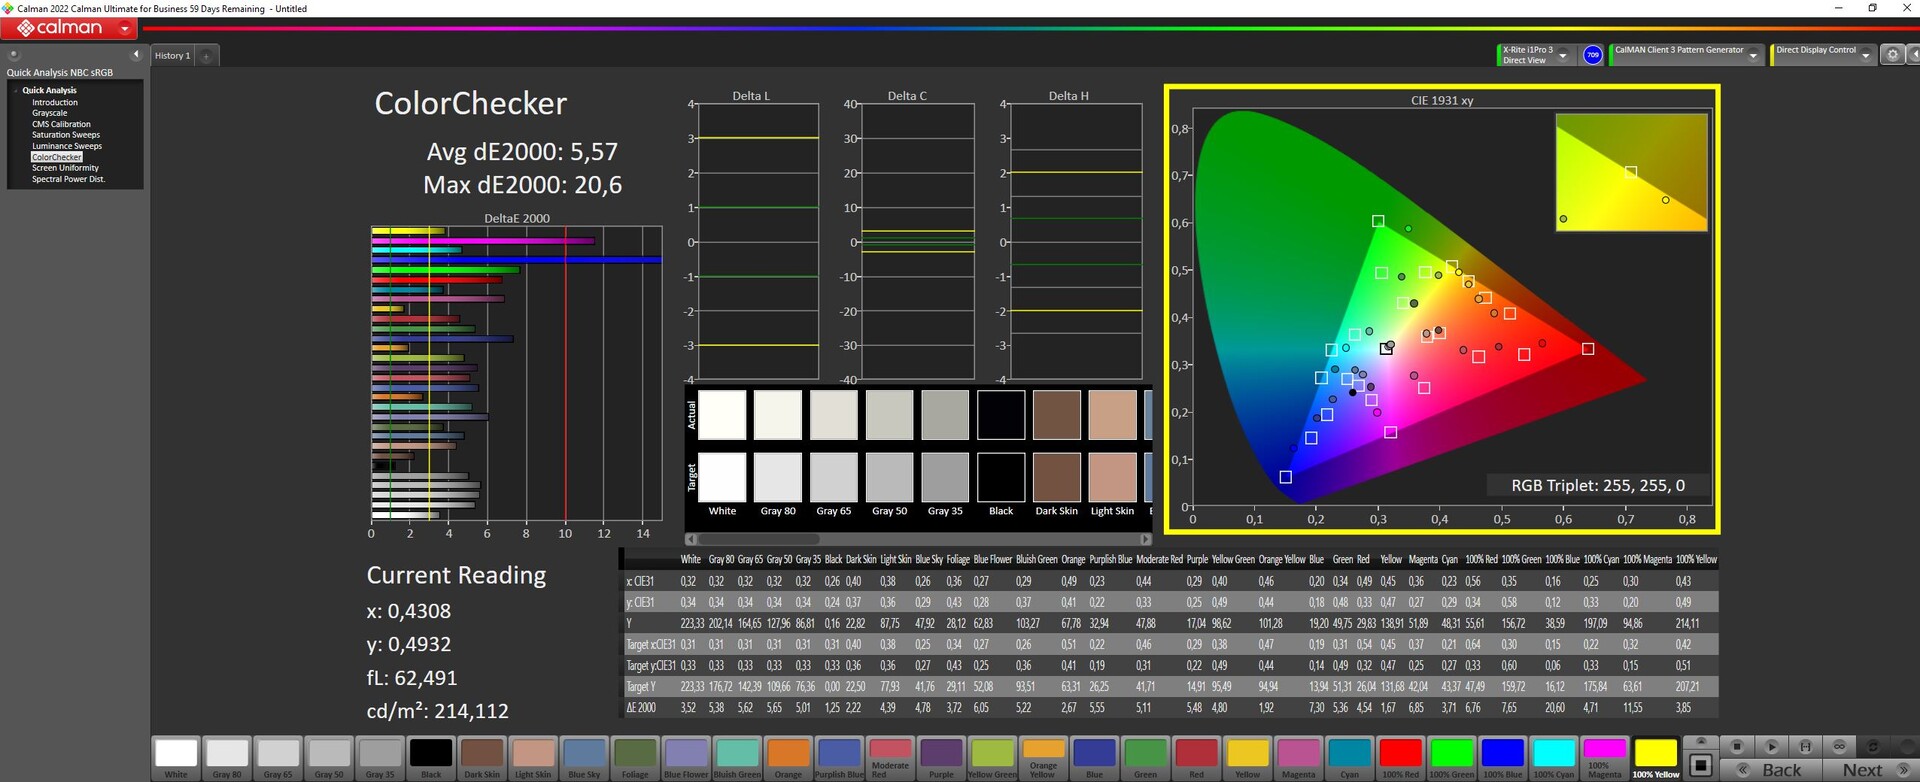
ΔE ColorChecker Calman: 5.57 | ∀{0.5-29.43 Ø4.71}
calibrated: 4.63
ΔE Greyscale Calman: 3.19 | ∀{0.09-98 Ø4.96}
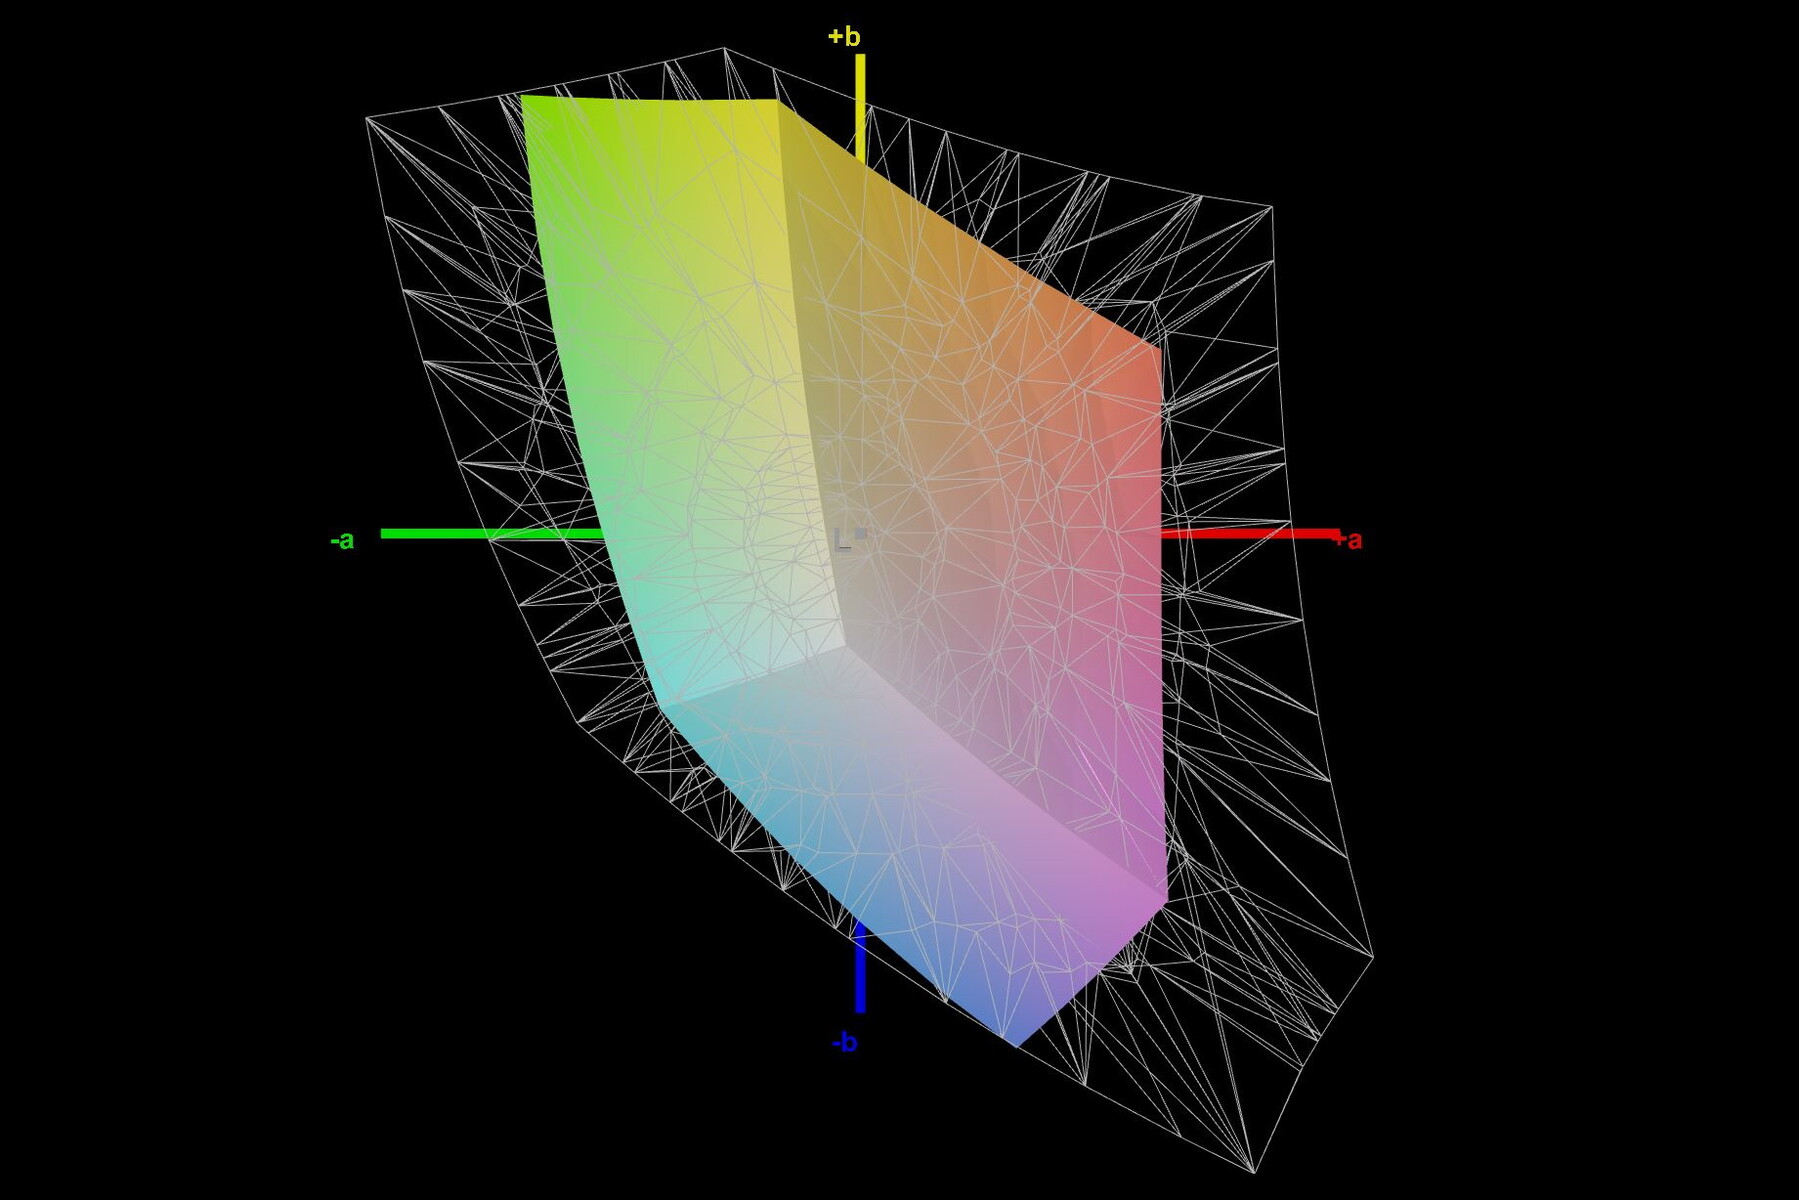
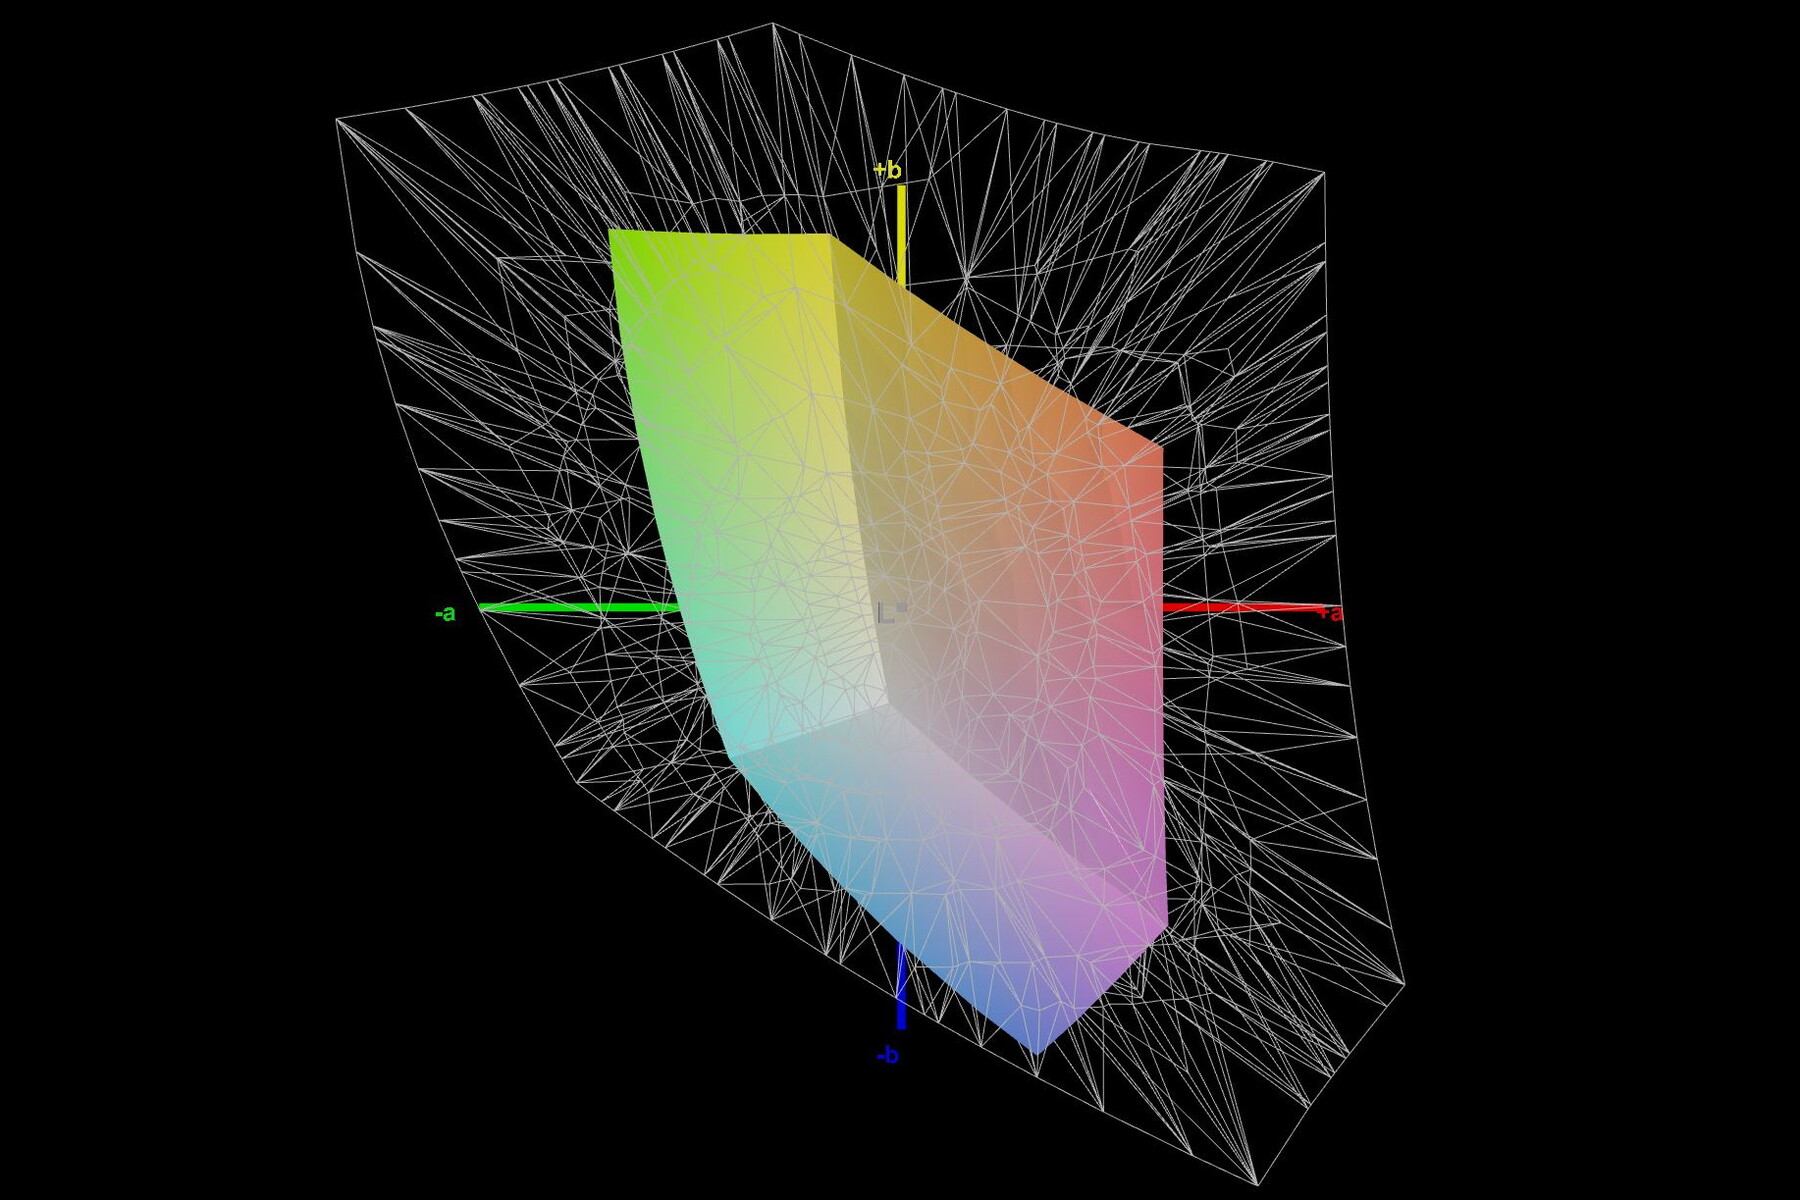
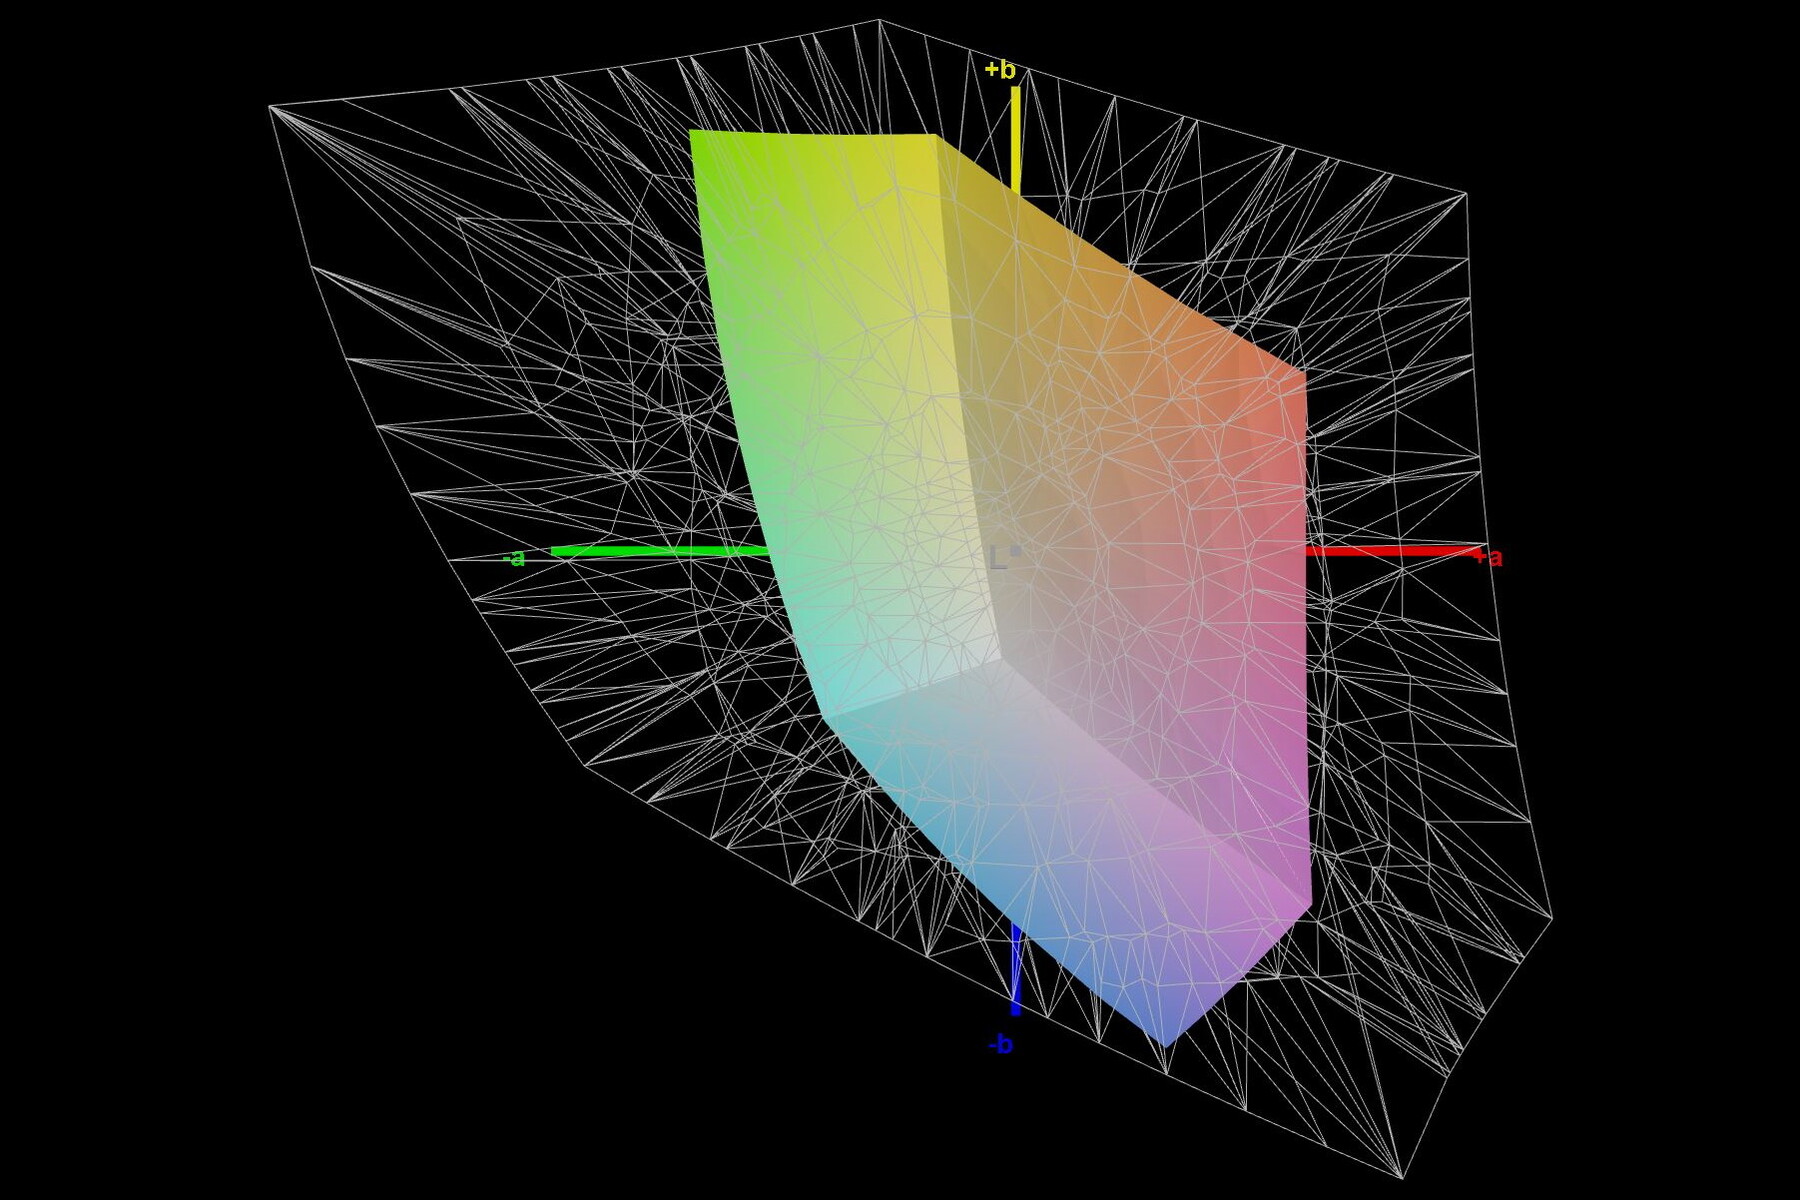
39.3% AdobeRGB 1998 (Argyll 3D)
56.8% sRGB (Argyll 3D)
38.1% Display P3 (Argyll 3D)
Gamma: 2.45
CCT: 6146 K
| MSI Katana 15 B12VEK AUOAF90 (B156HAN08.4), IPS, 1920x1080, 15.6" | MSI Katana GF66 12UGS AU Optronics AUOAF90, IPS, 1920x1080, 15.6" | MSI Pulse GL66 12UEK AU Optronics B156HAN08.4 (AUOAF90), IPS, 1920x1080, 15.6" | Lenovo Legion 5 15IAH7H 82RB CSOT MNF601CA1-3, IPS, 1920x1080, 15.6" | Asus TUF Gaming F15 FX507ZM TL156VDXP0101, IPS, 1920x1080, 15.6" | Schenker XMG Core 15 (M22) CSOT MNF601CA1-1, IPS, 2560x1440, 15.6" | |
|---|---|---|---|---|---|---|
| Display | 3% | 3% | 78% | 73% | 78% | |
| Display P3 Coverage (%) | 38.1 | 39.1 3% | 39 2% | 69.1 81% | 66.4 74% | 68.8 81% |
| sRGB Coverage (%) | 56.8 | 58.3 3% | 58.4 3% | 99.5 75% | 97 71% | 99.3 75% |
| AdobeRGB 1998 Coverage (%) | 39.3 | 40.4 3% | 40.3 3% | 70 78% | 68.5 74% | 69.9 78% |
| Response Times | -5% | -2% | 59% | 69% | 66% | |
| Response Time Grey 50% / Grey 80% * (ms) | 38.8 ? | 40 ? -3% | 38.8 ? -0% | 14.8 ? 62% | 5.6 ? 86% | 16 ? 59% |
| Response Time Black / White * (ms) | 26.8 ? | 28.4 ? -6% | 28 ? -4% | 12 ? 55% | 12.8 ? 52% | 7.6 ? 72% |
| PWM Frequency (Hz) | ||||||
| Screen | 1% | 29% | 1% | 26% | 15% | |
| Brightness middle (cd/m²) | 261 | 227 -13% | 248 -5% | 363.5 39% | 353.7 36% | 378 45% |
| Brightness (cd/m²) | 258 | 225 -13% | 245 -5% | 350 36% | 340 32% | 371 44% |
| Brightness Distribution (%) | 92 | 90 -2% | 86 -7% | 89 -3% | 89 -3% | 93 1% |
| Black Level * (cd/m²) | 0.19 | 0.21 -11% | 0.13 32% | 0.39 -105% | 0.34 -79% | 0.33 -74% |
| Contrast (:1) | 1374 | 1081 -21% | 1908 39% | 932 -32% | 1040 -24% | 1145 -17% |
| Colorchecker dE 2000 * | 5.57 | 4.19 25% | 3.14 44% | 3.68 34% | 1.74 69% | 2.84 49% |
| Colorchecker dE 2000 max. * | 20.6 | 17.45 15% | 5.82 72% | 8.92 57% | 3.63 82% | 5.51 73% |
| Colorchecker dE 2000 calibrated * | 4.63 | 3.81 18% | 3.14 32% | 0.53 89% | 0.5 89% | 2.75 41% |
| Greyscale dE 2000 * | 3.19 | 2.7 15% | 1.2 62% | 6.5 -104% | 2.1 34% | 4.08 -28% |
| Gamma | 2.45 90% | 2.208 100% | 2.49 88% | 2.2 100% | 2.3 96% | 2.4 92% |
| CCT | 6146 106% | 6176 105% | 6468 100% | 5995 108% | 6257 104% | 5841 111% |
| Całkowita średnia (program / ustawienia) | -0% /
1% | 10% /
19% | 46% /
26% | 56% /
42% | 53% /
36% |
* ... im mniej tym lepiej
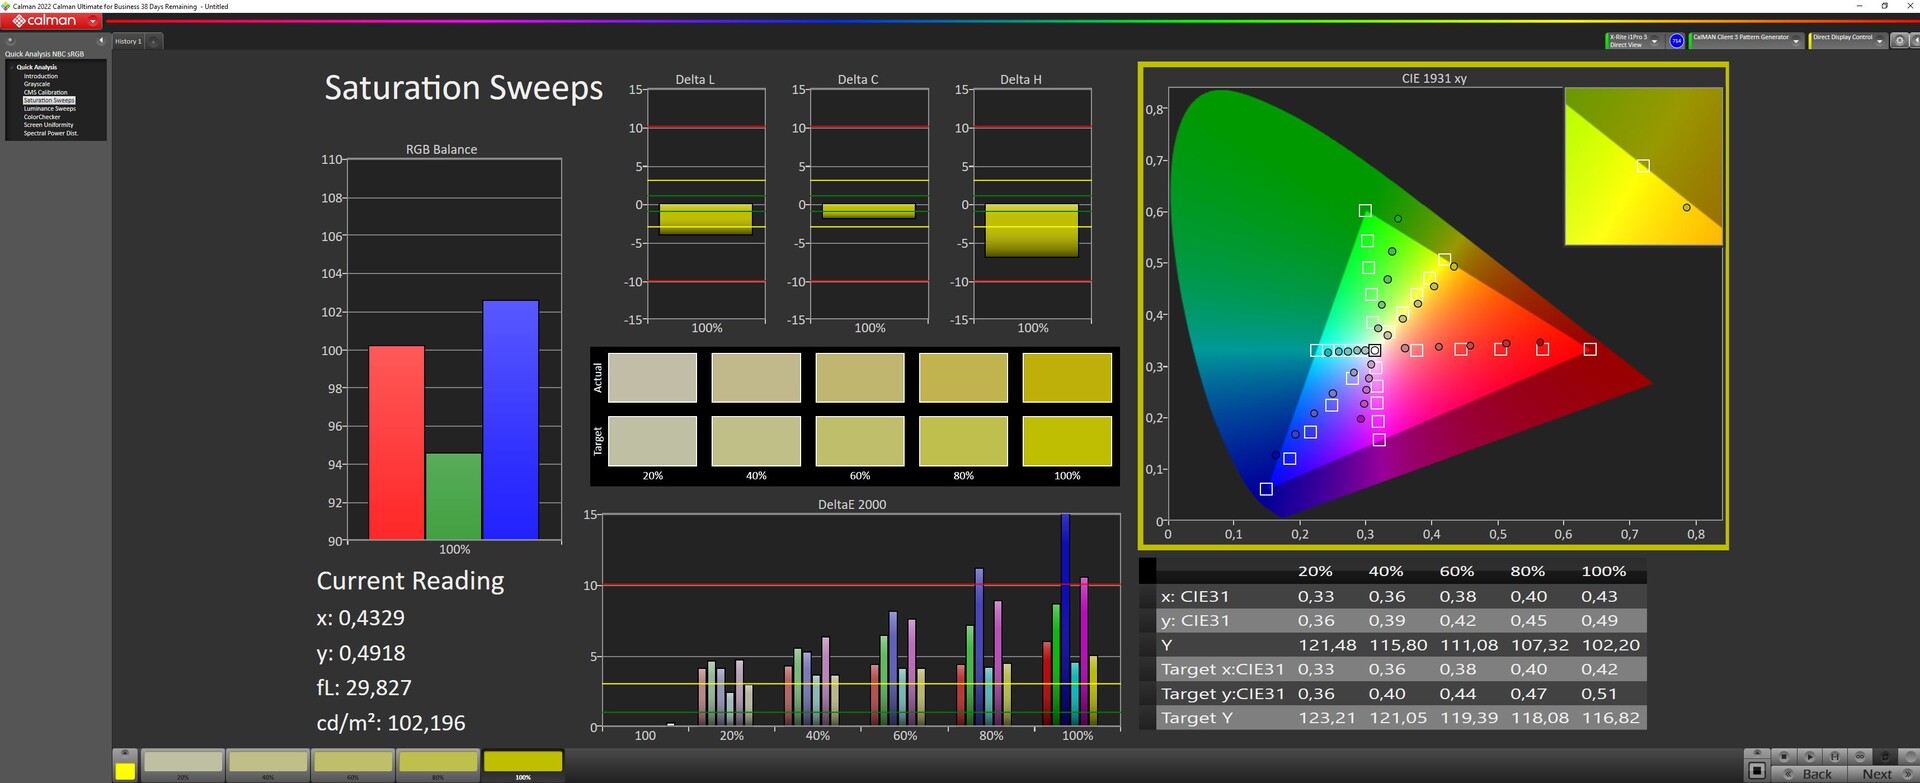
Producent nie podaje żadnych informacji o pokryciu przestrzeni barw. Zmierzyliśmy nieco poniżej 57 procent w sRGB i około 39 procent w AdobeRGB i DisplayP3. Tutaj również widać budżetowy charakter Katany 15; konkurencja zapewnia wyższe pokrycie przestrzeni barwnej.
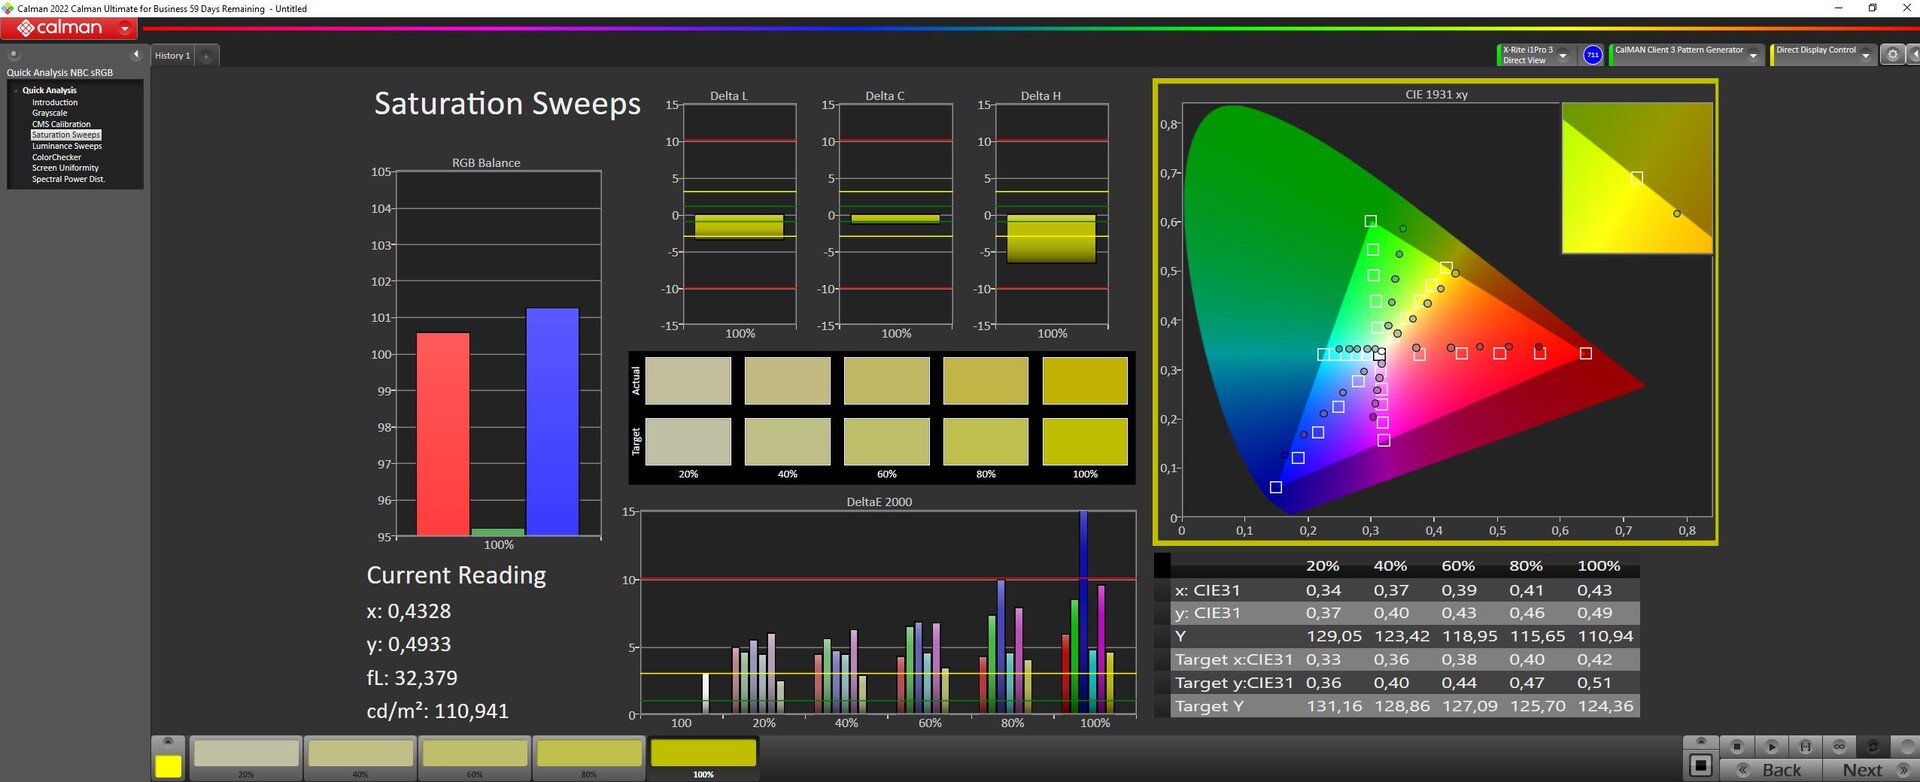
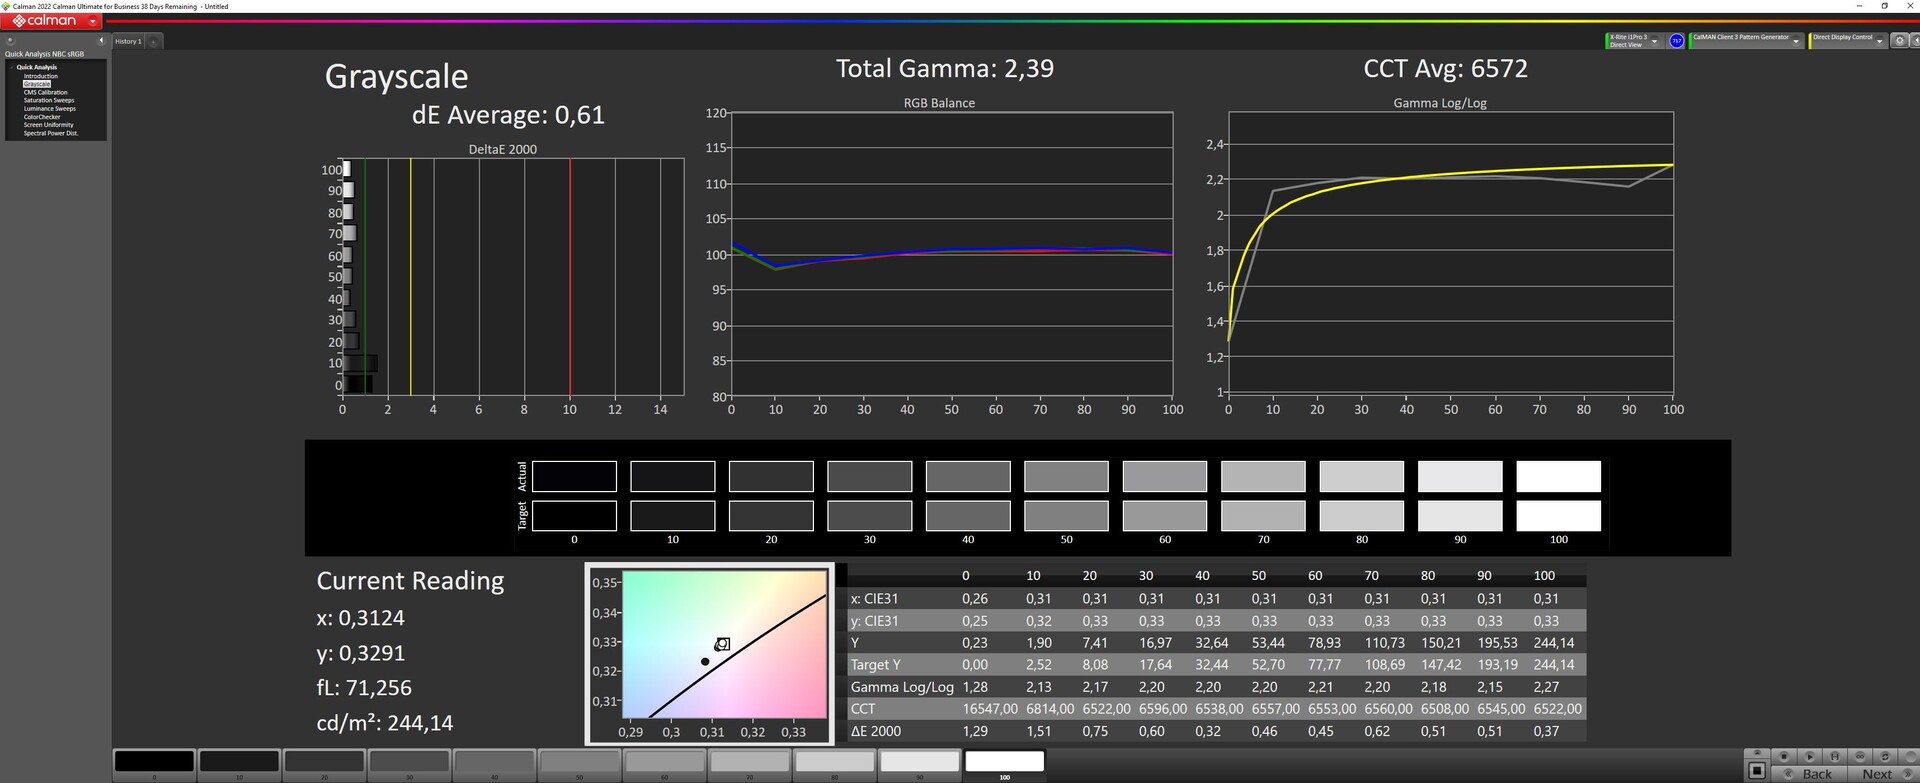
Wyświetlacz nie jest tak dobrze wyregulowany ex factory. Mierzyliśmy tu tylko w stosunku do standardu sRGB. Zmniejszenie jasności tylko nieznacznie obniża wartość DeltaE dla poziomów szarości, ale nadal pozostaje ona nieco poniżej 3. Calman ColorChecker wykazuje jednak wysokie odchylenia kolorów.
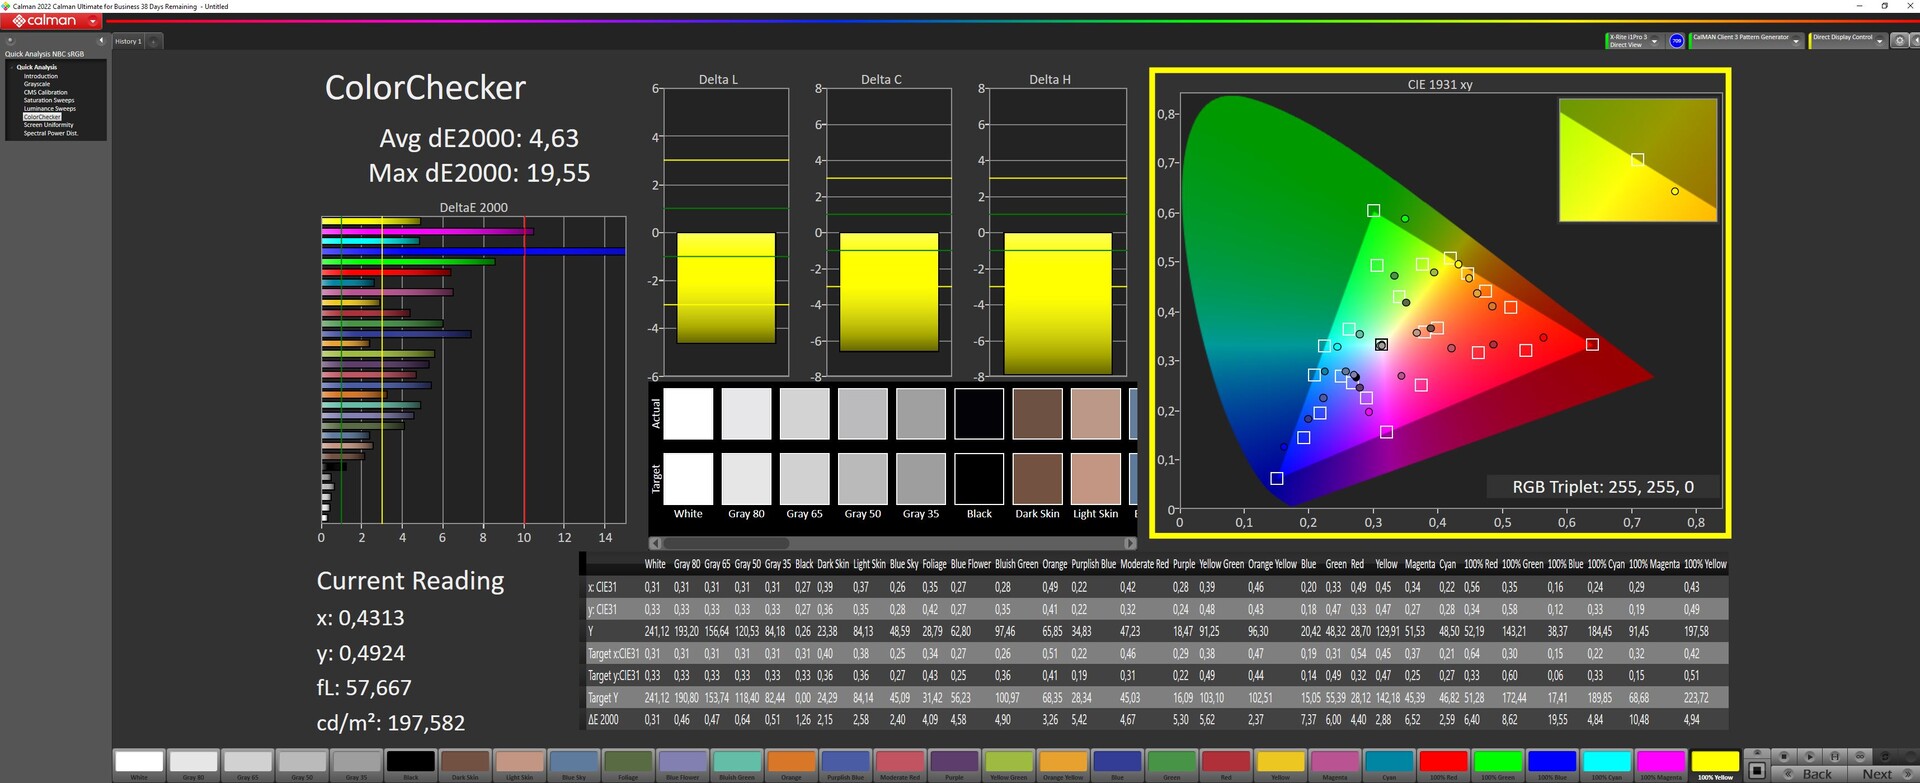
Ręczna kalibracja minimalizuje odchylenia w skali szarości do dobrego poziomu 0,61, ale wartość DeltaE ColorCheckera wynosząca 4,63 pozostaje zdecydowanie za wysoka. Wyświetlacz nie wydaje się być zdolny do czegoś więcej. Nasz skalibrowany profil kolorów icc można pobrać powyżej.
Wyświetl czasy reakcji
| ↔ Czas reakcji od czerni do bieli | ||
|---|---|---|
| 26.8 ms ... wzrost ↗ i spadek ↘ łącznie | ↗ 14.2 ms wzrost | 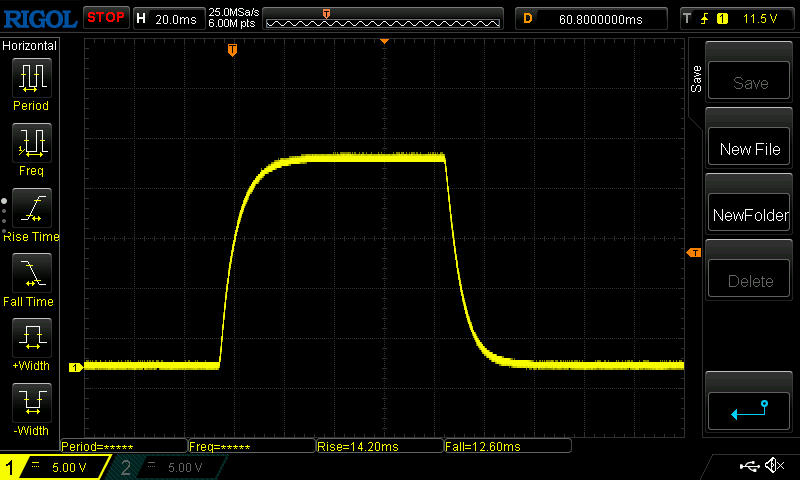 |
| ↘ 12.6 ms upadek | ||
| W naszych testach ekran wykazuje stosunkowo powolne tempo reakcji i może być zbyt wolny dla graczy. Dla porównania, wszystkie testowane urządzenia wahają się od 0.1 (minimum) do 240 (maksimum) ms. » 67 % wszystkich urządzeń jest lepszych. Oznacza to, że zmierzony czas reakcji jest gorszy od średniej wszystkich testowanych urządzeń (19.8 ms). | ||
| ↔ Czas reakcji 50% szarości do 80% szarości | ||
| 38.8 ms ... wzrost ↗ i spadek ↘ łącznie | ↗ 18.6 ms wzrost | 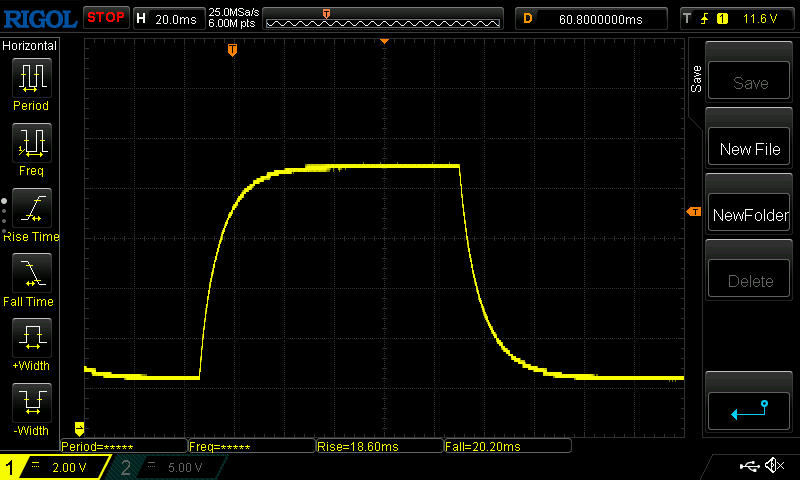 |
| ↘ 20.2 ms upadek | ||
| W naszych testach ekran wykazuje powolne tempo reakcji, co będzie niezadowalające dla graczy. Dla porównania, wszystkie testowane urządzenia wahają się od 0.165 (minimum) do 636 (maksimum) ms. » 58 % wszystkich urządzeń jest lepszych. Oznacza to, że zmierzony czas reakcji jest gorszy od średniej wszystkich testowanych urządzeń (31 ms). | ||
Migotanie ekranu / PWM (modulacja szerokości impulsu)
| Migotanie ekranu/nie wykryto PWM | 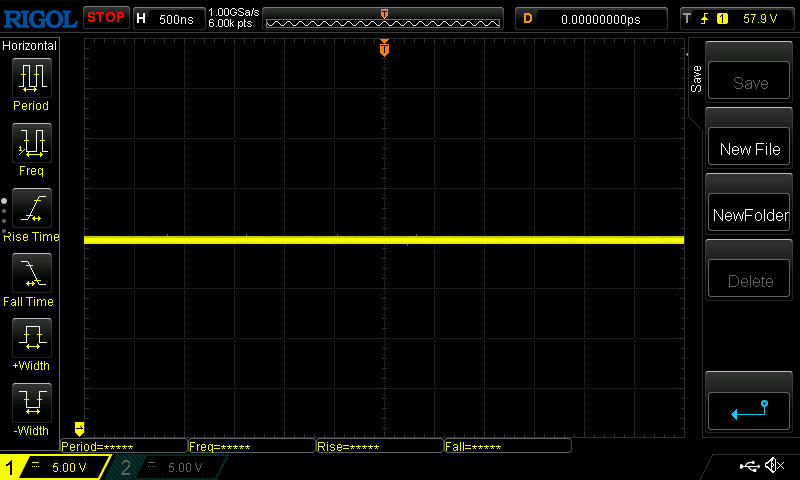 | ||
Dla porównania: 52 % wszystkich testowanych urządzeń nie używa PWM do przyciemniania wyświetlacza. Jeśli wykryto PWM, zmierzono średnio 7747 (minimum: 5 - maksimum: 343500) Hz. | |||
Matowa powierzchnia filtruje agresywne odbicia na zewnątrz. Jednak słaba jasność panelu zdecydowanie wymaga miejsca w cieniu.
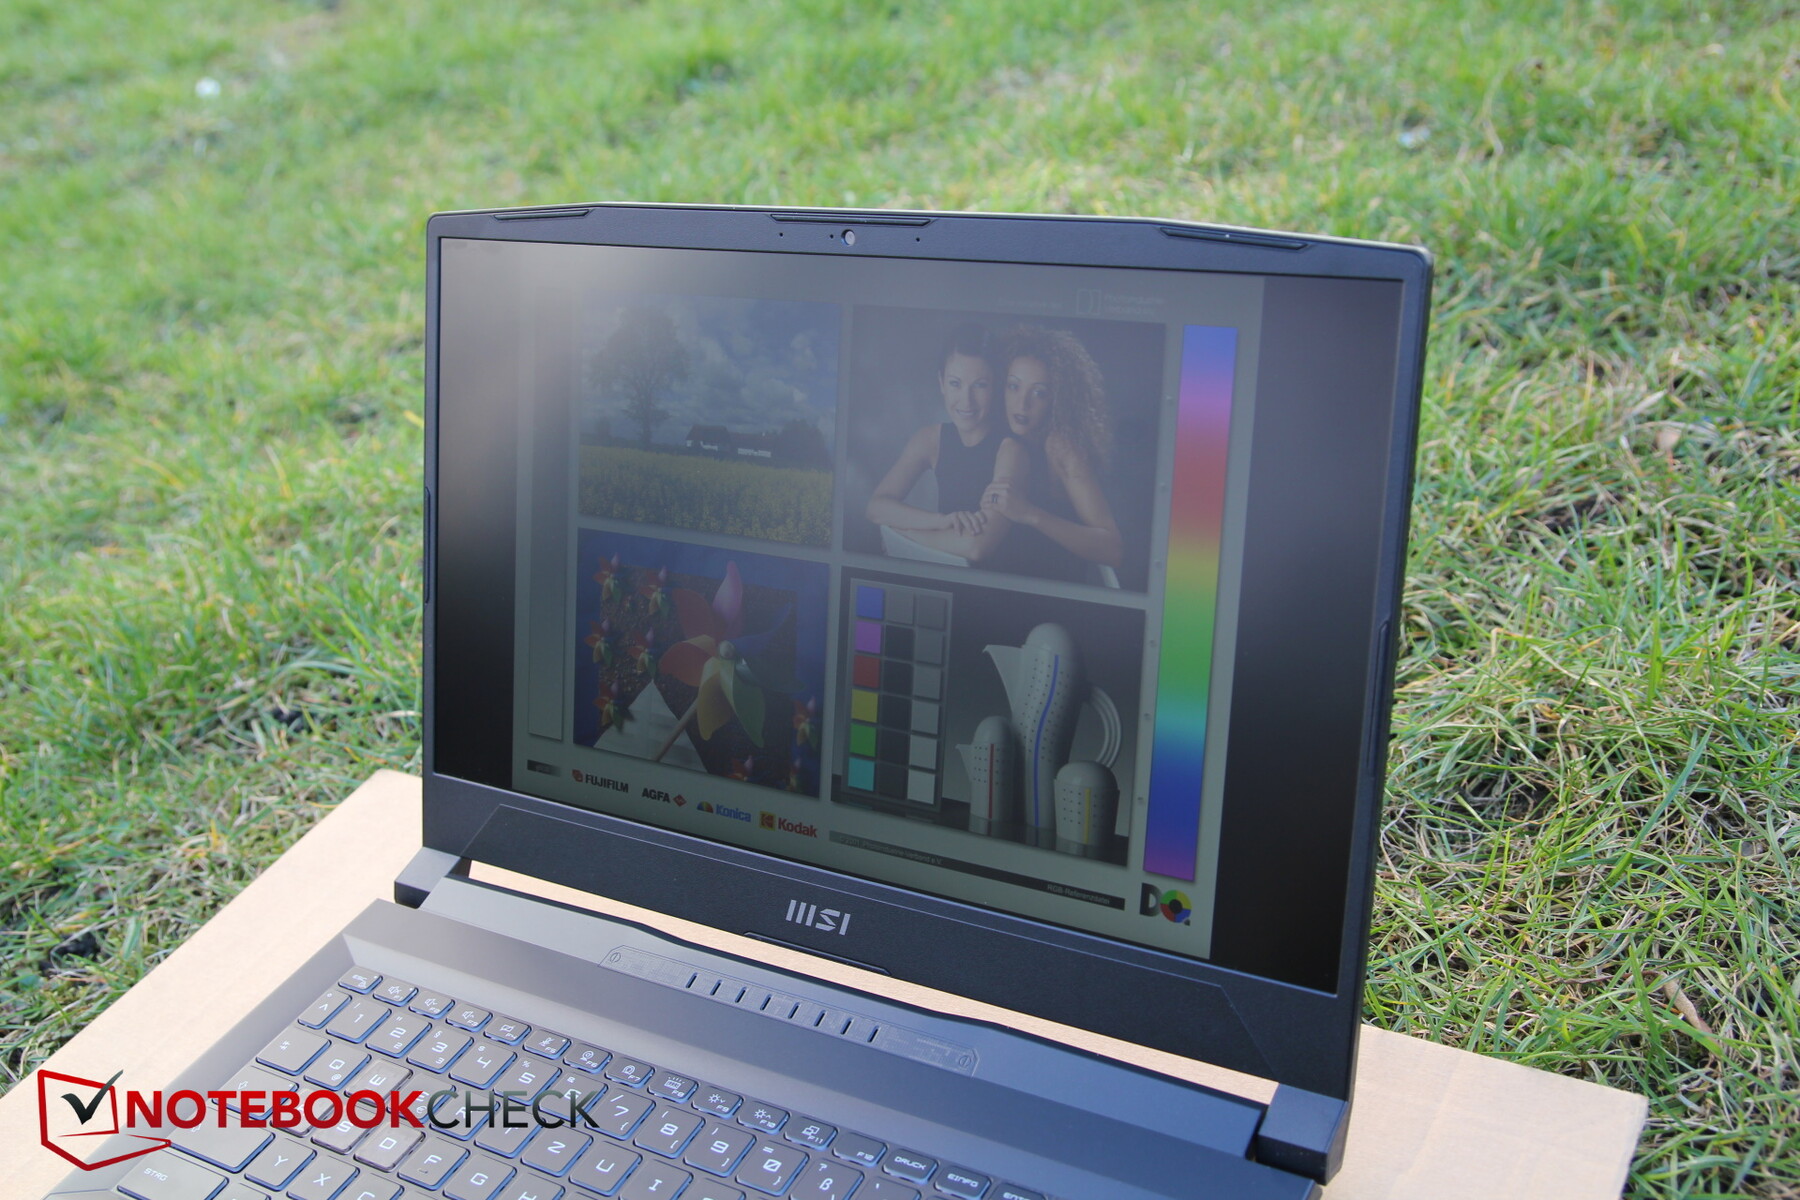
Stabilność kątów widzenia jest w porządku. Spadek jasności jest widoczny tylko przy ekstremalnych kątach widzenia.

Wydajność - Katana 15 na poziomie RTX 3060
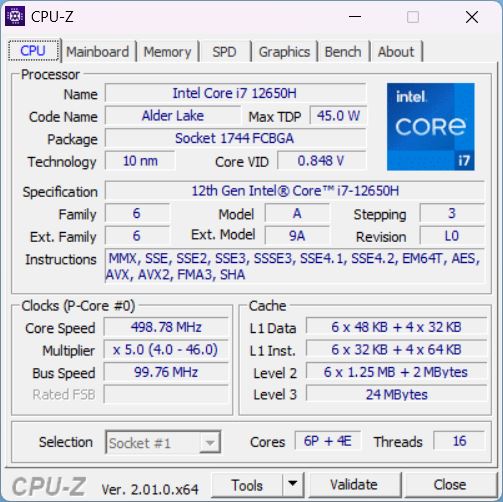
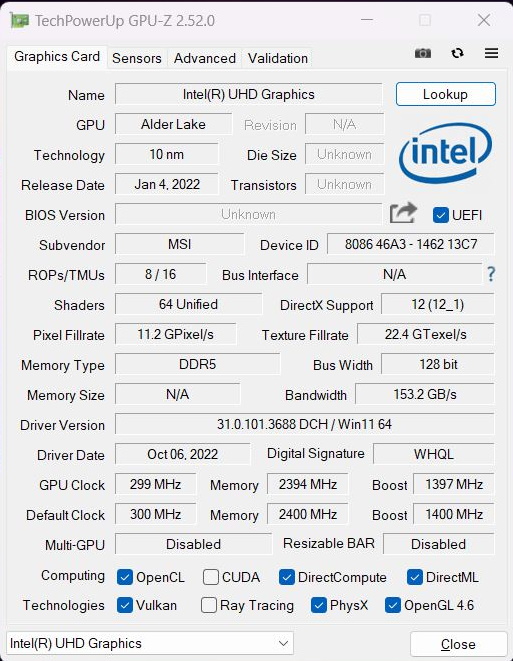
MSI Katana 15 jest reklamowany jako laptop do gier i choć jegoCore i7-12650Hnależy do ubiegłorocznej serii Alder Lake, to zdecydowanie należy do niższej klasy wyższej.
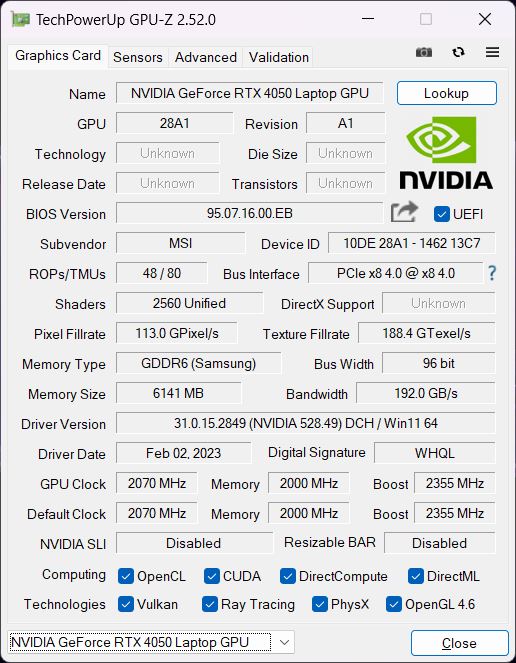
Procesor połączony jest z kartą graficznąNvidia RTX 4050, czyli podstawową kartą wśród nowych modeli RTX 40xx. W Katanie może ona zużywać do 105 W. 16 GB RAM to w dzisiejszych czasach (niższy) standard dla gracza.
Warunki badania
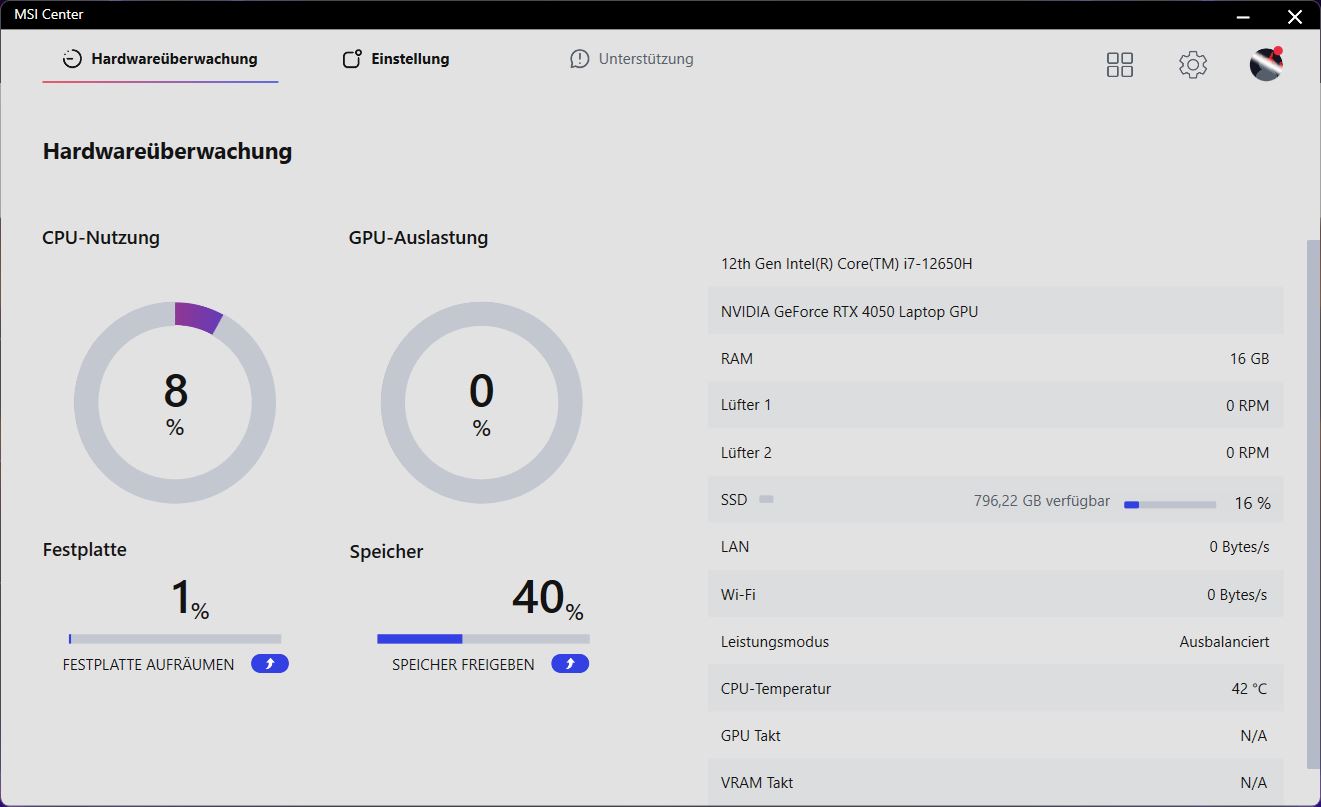
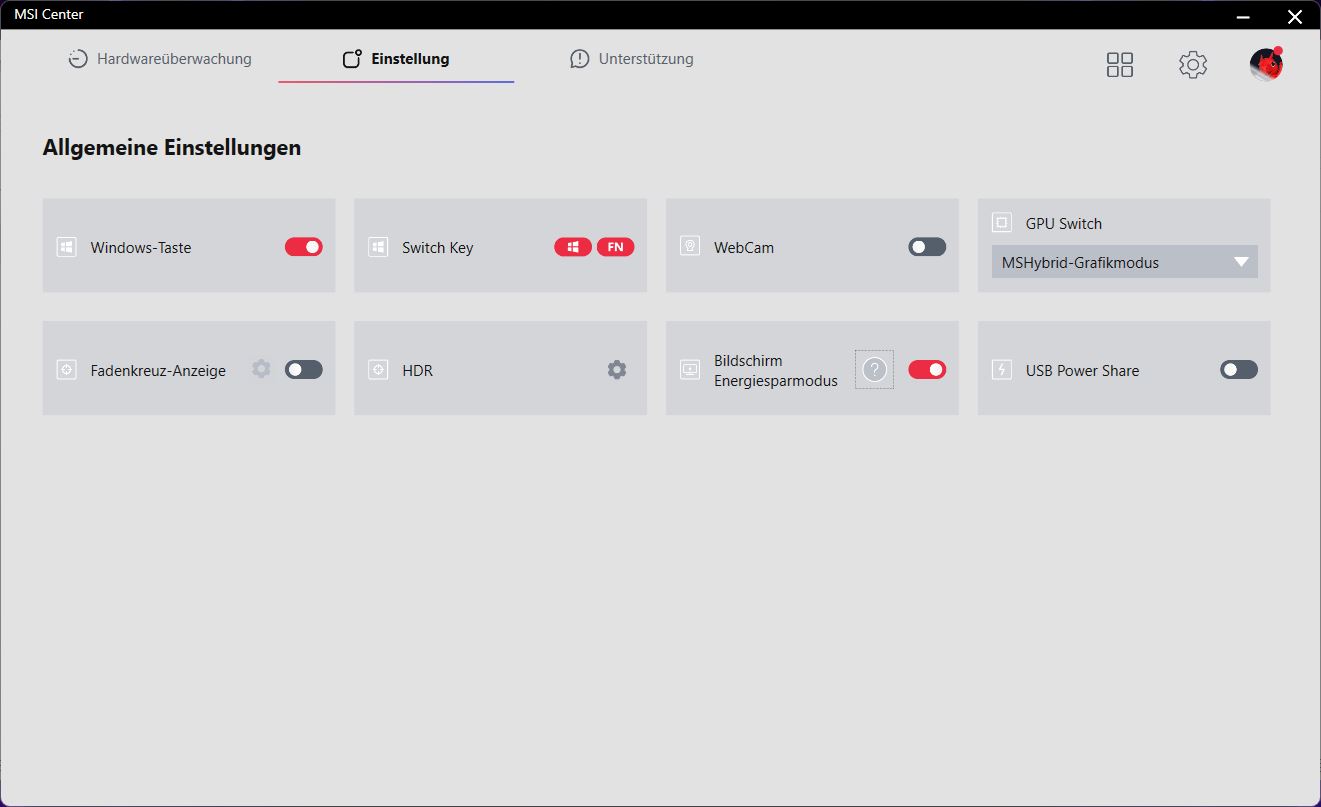
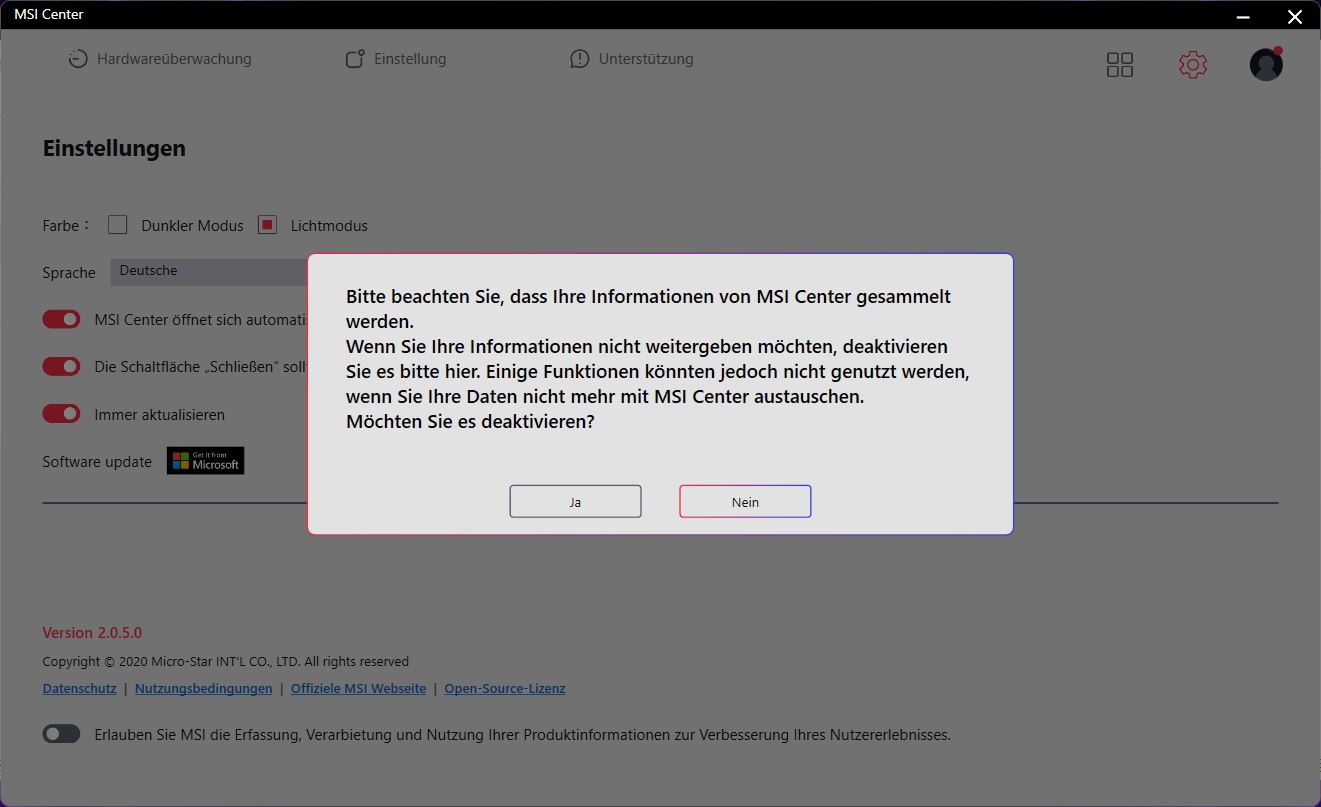
MSI Center to centrum sterowania, które producent wykorzystuje oczywiście do zbierania różnego rodzaju danych. Między innymi reguluje się tutaj ustawienia wydajności. Domyślnie ustawiony jest tutaj tryb AI, który automatycznie dostosowuje wartości wydajności w zależności od zastosowanego obciążenia. My pokładaliśmy wiarę w kompetencje AI i wszystkie benchmarki przeprowadziliśmy w tym trybie.
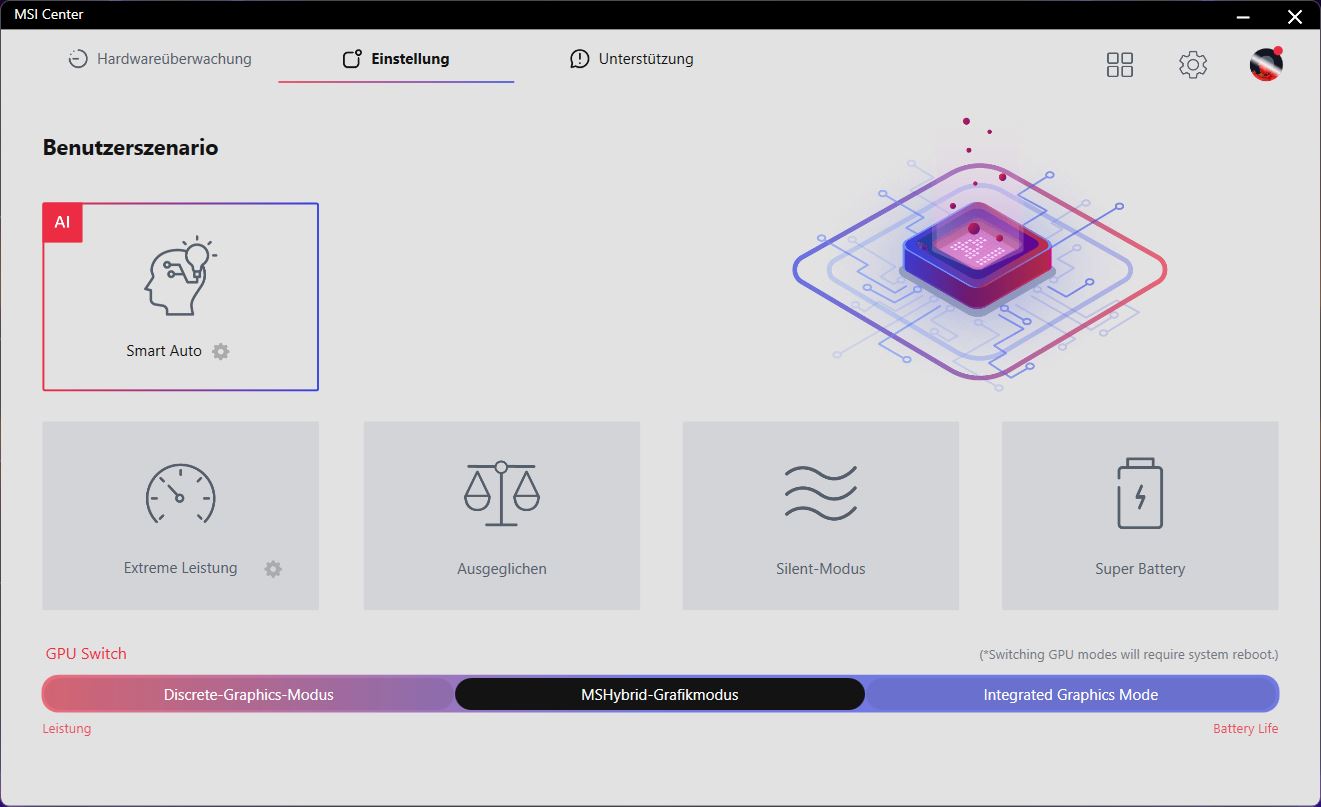
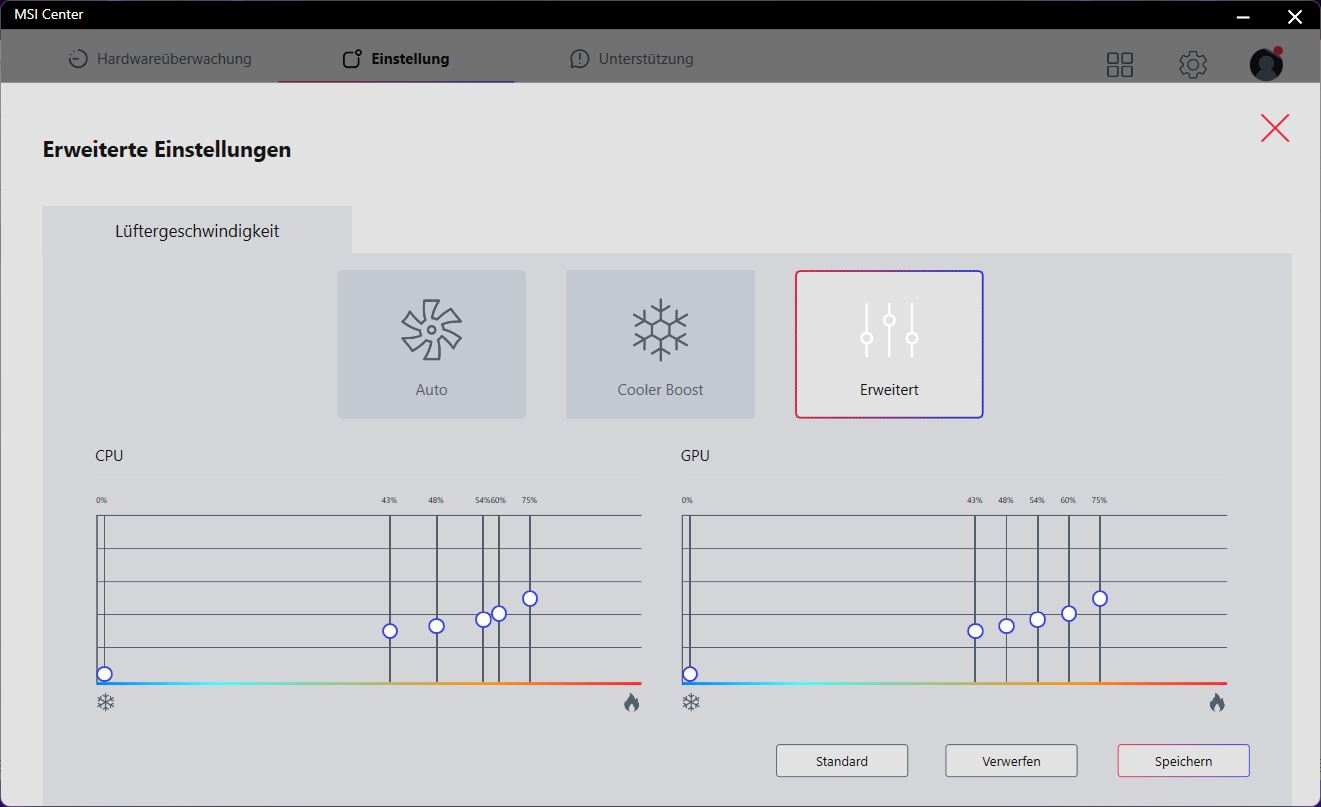
Oprócz wydajności, w Centrum MSI można dostosować inne ustawienia. Na przykład zamieniamy funkcje klawiszy fn i Windows, ręcznie ustawiamy krzywe wentylatorów w trybie Extreme Performance lub przełączamy iGPU i dGPU. Narzędzie ma problemy z niektórymi rozdzielczościami
Przez większość czasu w MSI Center włączony był tryb hybrydowy GPU, który automatycznie przełącza się między iGPU i dGPU. W naszych benchmarkach nie działało to jednak niezawodnie. Na przykład musieliśmy ręcznie aktywować dGPU dla Blendera, ponieważ test automatycznie działał tylko z iGPU i dawał bardzo słabe wyniki.
Procesor
W przeciwieństwie do powszechnie stosowanychi7-12700H, i7-12650H ma tylko 4 z 8 rdzeni E, ale 6 rdzeni P jest takich samych. Te ostatnie taktowane są z częstotliwością do 4,7 GHz. Procesor ten należy do niższej klasy high-end najnowszej generacji Intela. Alternatywą jest obecnie także Katana 15 B13 z procesorem Gen13 od Intela, którego cena będzie prawdopodobnie wyższa.
W pętli Cinebench obserwujemy niewielki spadek wydajności w pierwszych dwóch przebiegach. Później wydajność jest w dużej mierze stała, ale ogólnie nie jest przesadnie wysoka. Nasza Katana wypada niekorzystnie na tle konkurencji z i7-12700H, a pokonuje ją także Ryzen 7 6800H.
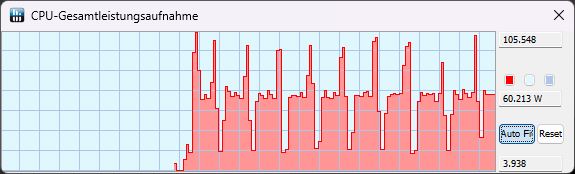
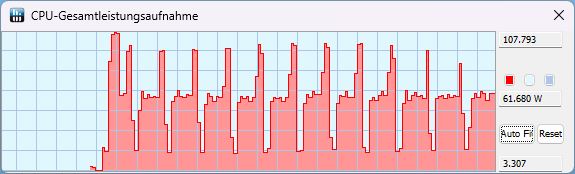
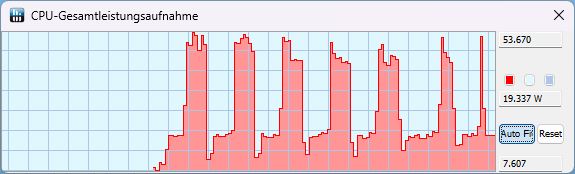
TDP pozostaje niemal takie samo zarówno w trybie KI, jak i Extreme: zmierzyliśmy odpowiednio około 105 W na początku i na końcu biegu, a w trakcie biegu pobór mocy spada do 60 W. W trybie bateryjnym szczytowa wartość to tylko 53 W, w pozostałych przypadkach do dyspozycji jest tylko 19 W
Ogólnie rzecz biorąc, wydajność procesora jest na oczekiwanym poziomie, ale wydajność jednordzeniowa Katany jest nieco słabsza.
Cinebench R15 Multi Sustained Load
Cinebench R23: Multi Core | Single Core
Cinebench R20: CPU (Multi Core) | CPU (Single Core)
Cinebench R15: CPU Multi 64Bit | CPU Single 64Bit
Blender: v2.79 BMW27 CPU
7-Zip 18.03: 7z b 4 | 7z b 4 -mmt1
Geekbench 5.5: Multi-Core | Single-Core
HWBOT x265 Benchmark v2.2: 4k Preset
LibreOffice : 20 Documents To PDF
R Benchmark 2.5: Overall mean
| CPU Performance rating | |
| Średnia w klasie Gaming | |
| Lenovo Legion 5 15IAH7H 82RB | |
| MSI Pulse GL66 12UEK | |
| Asus TUF Gaming F15 FX507ZM | |
| MSI Katana GF66 12UGS | |
| MSI Katana 15 B12VEK | |
| Schenker XMG Core 15 (M22) | |
| Przeciętny Intel Core i7-12650H | |
| Cinebench R23 / Multi Core | |
| Średnia w klasie Gaming (10488 - 42661, n=107, ostatnie 2 lata) | |
| Lenovo Legion 5 15IAH7H 82RB | |
| Asus TUF Gaming F15 FX507ZM | |
| MSI Pulse GL66 12UEK | |
| MSI Katana GF66 12UGS | |
| MSI Katana 15 B12VEK | |
| Schenker XMG Core 15 (M22) | |
| Przeciętny Intel Core i7-12650H (5362 - 15537, n=14) | |
| Cinebench R23 / Single Core | |
| Średnia w klasie Gaming (1166 - 2415, n=107, ostatnie 2 lata) | |
| MSI Pulse GL66 12UEK | |
| MSI Katana GF66 12UGS | |
| Lenovo Legion 5 15IAH7H 82RB | |
| Asus TUF Gaming F15 FX507ZM | |
| Przeciętny Intel Core i7-12650H (1428 - 1808, n=14) | |
| MSI Katana 15 B12VEK | |
| Schenker XMG Core 15 (M22) | |
| Cinebench R20 / CPU (Multi Core) | |
| Średnia w klasie Gaming (4029 - 16433, n=106, ostatnie 2 lata) | |
| Lenovo Legion 5 15IAH7H 82RB | |
| Asus TUF Gaming F15 FX507ZM | |
| MSI Pulse GL66 12UEK | |
| MSI Katana GF66 12UGS | |
| MSI Katana 15 B12VEK | |
| Schenker XMG Core 15 (M22) | |
| Przeciętny Intel Core i7-12650H (2106 - 6009, n=14) | |
| Cinebench R20 / CPU (Single Core) | |
| Średnia w klasie Gaming (442 - 913, n=106, ostatnie 2 lata) | |
| MSI Pulse GL66 12UEK | |
| MSI Katana GF66 12UGS | |
| Lenovo Legion 5 15IAH7H 82RB | |
| Asus TUF Gaming F15 FX507ZM | |
| Przeciętny Intel Core i7-12650H (552 - 696, n=14) | |
| MSI Katana 15 B12VEK | |
| Schenker XMG Core 15 (M22) | |
| Cinebench R15 / CPU Multi 64Bit | |
| Średnia w klasie Gaming (1578 - 6330, n=105, ostatnie 2 lata) | |
| Lenovo Legion 5 15IAH7H 82RB | |
| Asus TUF Gaming F15 FX507ZM | |
| MSI Pulse GL66 12UEK | |
| MSI Katana GF66 12UGS | |
| MSI Katana GF66 12UGS | |
| Schenker XMG Core 15 (M22) | |
| MSI Katana 15 B12VEK | |
| Przeciętny Intel Core i7-12650H (753 - 2253, n=14) | |
| Cinebench R15 / CPU Single 64Bit | |
| Średnia w klasie Gaming (188.8 - 350, n=106, ostatnie 2 lata) | |
| MSI Pulse GL66 12UEK | |
| MSI Katana GF66 12UGS | |
| MSI Katana GF66 12UGS | |
| Lenovo Legion 5 15IAH7H 82RB | |
| Asus TUF Gaming F15 FX507ZM | |
| Schenker XMG Core 15 (M22) | |
| MSI Katana 15 B12VEK | |
| Przeciętny Intel Core i7-12650H (206 - 261, n=14) | |
| Blender / v2.79 BMW27 CPU | |
| Przeciętny Intel Core i7-12650H (222 - 553, n=15) | |
| MSI Katana GF66 12UGS | |
| MSI Katana 15 B12VEK | |
| Schenker XMG Core 15 (M22) | |
| MSI Pulse GL66 12UEK | |
| Asus TUF Gaming F15 FX507ZM | |
| Lenovo Legion 5 15IAH7H 82RB | |
| Średnia w klasie Gaming (79 - 330, n=104, ostatnie 2 lata) | |
| 7-Zip 18.03 / 7z b 4 | |
| Średnia w klasie Gaming (33491 - 148086, n=105, ostatnie 2 lata) | |
| Lenovo Legion 5 15IAH7H 82RB | |
| Asus TUF Gaming F15 FX507ZM | |
| MSI Pulse GL66 12UEK | |
| Schenker XMG Core 15 (M22) | |
| MSI Katana 15 B12VEK | |
| MSI Katana GF66 12UGS | |
| Przeciętny Intel Core i7-12650H (27053 - 59034, n=14) | |
| 7-Zip 18.03 / 7z b 4 -mmt1 | |
| Średnia w klasie Gaming (4199 - 7436, n=105, ostatnie 2 lata) | |
| MSI Pulse GL66 12UEK | |
| MSI Katana GF66 12UGS | |
| Lenovo Legion 5 15IAH7H 82RB | |
| Schenker XMG Core 15 (M22) | |
| Przeciętny Intel Core i7-12650H (5265 - 6116, n=14) | |
| MSI Katana 15 B12VEK | |
| Asus TUF Gaming F15 FX507ZM | |
| Geekbench 5.5 / Multi-Core | |
| Średnia w klasie Gaming (6460 - 28263, n=105, ostatnie 2 lata) | |
| Lenovo Legion 5 15IAH7H 82RB | |
| Asus TUF Gaming F15 FX507ZM | |
| MSI Pulse GL66 12UEK | |
| MSI Katana GF66 12UGS | |
| MSI Katana 15 B12VEK | |
| Schenker XMG Core 15 (M22) | |
| Przeciętny Intel Core i7-12650H (6478 - 11284, n=16) | |
| Geekbench 5.5 / Single-Core | |
| Średnia w klasie Gaming (986 - 2474, n=105, ostatnie 2 lata) | |
| MSI Pulse GL66 12UEK | |
| MSI Katana GF66 12UGS | |
| Lenovo Legion 5 15IAH7H 82RB | |
| Asus TUF Gaming F15 FX507ZM | |
| Przeciętny Intel Core i7-12650H (1590 - 1797, n=16) | |
| MSI Katana 15 B12VEK | |
| Schenker XMG Core 15 (M22) | |
| HWBOT x265 Benchmark v2.2 / 4k Preset | |
| Średnia w klasie Gaming (11.5 - 44.4, n=105, ostatnie 2 lata) | |
| Lenovo Legion 5 15IAH7H 82RB | |
| Asus TUF Gaming F15 FX507ZM | |
| MSI Pulse GL66 12UEK | |
| Schenker XMG Core 15 (M22) | |
| MSI Katana 15 B12VEK | |
| Przeciętny Intel Core i7-12650H (6.62 - 17.4, n=16) | |
| MSI Katana GF66 12UGS | |
| LibreOffice / 20 Documents To PDF | |
| Schenker XMG Core 15 (M22) | |
| Asus TUF Gaming F15 FX507ZM | |
| Średnia w klasie Gaming (33.2 - 88.8, n=105, ostatnie 2 lata) | |
| MSI Katana 15 B12VEK | |
| Przeciętny Intel Core i7-12650H (35.1 - 58.5, n=14) | |
| MSI Pulse GL66 12UEK | |
| Lenovo Legion 5 15IAH7H 82RB | |
| MSI Katana GF66 12UGS | |
| R Benchmark 2.5 / Overall mean | |
| MSI Katana 15 B12VEK | |
| Schenker XMG Core 15 (M22) | |
| Przeciętny Intel Core i7-12650H (0.4584 - 0.515, n=14) | |
| Asus TUF Gaming F15 FX507ZM | |
| Lenovo Legion 5 15IAH7H 82RB | |
| MSI Katana GF66 12UGS | |
| Średnia w klasie Gaming (0.3439 - 0.759, n=106, ostatnie 2 lata) | |
| MSI Pulse GL66 12UEK | |
* ... im mniej tym lepiej
AIDA64: FP32 Ray-Trace | FPU Julia | CPU SHA3 | CPU Queen | FPU SinJulia | FPU Mandel | CPU AES | CPU ZLib | FP64 Ray-Trace | CPU PhotoWorxx
| Performance rating | |
| Średnia w klasie Gaming | |
| Lenovo Legion 5 15IAH7H 82RB | |
| Schenker XMG Core 15 (M22) | |
| MSI Katana 15 B12VEK | |
| MSI Pulse GL66 12UEK | |
| Asus TUF Gaming F15 FX507ZM | |
| MSI Katana GF66 12UGS | |
| Przeciętny Intel Core i7-12650H | |
| AIDA64 / FP32 Ray-Trace | |
| Średnia w klasie Gaming (10227 - 85542, n=105, ostatnie 2 lata) | |
| Lenovo Legion 5 15IAH7H 82RB | |
| Schenker XMG Core 15 (M22) | |
| MSI Katana 15 B12VEK | |
| Przeciętny Intel Core i7-12650H (5422 - 15620, n=14) | |
| Asus TUF Gaming F15 FX507ZM | |
| MSI Pulse GL66 12UEK | |
| MSI Katana GF66 12UGS | |
| AIDA64 / FPU Julia | |
| Średnia w klasie Gaming (51376 - 238426, n=105, ostatnie 2 lata) | |
| Schenker XMG Core 15 (M22) | |
| Lenovo Legion 5 15IAH7H 82RB | |
| MSI Katana 15 B12VEK | |
| Przeciętny Intel Core i7-12650H (26386 - 76434, n=14) | |
| Asus TUF Gaming F15 FX507ZM | |
| MSI Pulse GL66 12UEK | |
| MSI Katana GF66 12UGS | |
| AIDA64 / CPU SHA3 | |
| Średnia w klasie Gaming (2180 - 10115, n=105, ostatnie 2 lata) | |
| Lenovo Legion 5 15IAH7H 82RB | |
| Schenker XMG Core 15 (M22) | |
| Asus TUF Gaming F15 FX507ZM | |
| MSI Katana 15 B12VEK | |
| MSI Pulse GL66 12UEK | |
| MSI Katana GF66 12UGS | |
| Przeciętny Intel Core i7-12650H (1479 - 3244, n=14) | |
| AIDA64 / CPU Queen | |
| Średnia w klasie Gaming (49785 - 173351, n=90, ostatnie 2 lata) | |
| MSI Pulse GL66 12UEK | |
| Lenovo Legion 5 15IAH7H 82RB | |
| MSI Katana GF66 12UGS | |
| Asus TUF Gaming F15 FX507ZM | |
| Schenker XMG Core 15 (M22) | |
| MSI Katana 15 B12VEK | |
| Przeciętny Intel Core i7-12650H (59278 - 89537, n=14) | |
| AIDA64 / FPU SinJulia | |
| Średnia w klasie Gaming (4424 - 33636, n=105, ostatnie 2 lata) | |
| Schenker XMG Core 15 (M22) | |
| Lenovo Legion 5 15IAH7H 82RB | |
| MSI Pulse GL66 12UEK | |
| Asus TUF Gaming F15 FX507ZM | |
| MSI Katana GF66 12UGS | |
| MSI Katana 15 B12VEK | |
| Przeciętny Intel Core i7-12650H (4690 - 8726, n=14) | |
| AIDA64 / FPU Mandel | |
| Średnia w klasie Gaming (25115 - 128721, n=105, ostatnie 2 lata) | |
| Schenker XMG Core 15 (M22) | |
| Lenovo Legion 5 15IAH7H 82RB | |
| MSI Katana 15 B12VEK | |
| Przeciętny Intel Core i7-12650H (15001 - 37738, n=14) | |
| Asus TUF Gaming F15 FX507ZM | |
| MSI Pulse GL66 12UEK | |
| MSI Katana GF66 12UGS | |
| AIDA64 / CPU AES | |
| Lenovo Legion 5 15IAH7H 82RB | |
| Średnia w klasie Gaming (39258 - 247074, n=105, ostatnie 2 lata) | |
| MSI Pulse GL66 12UEK | |
| MSI Katana GF66 12UGS | |
| Schenker XMG Core 15 (M22) | |
| MSI Katana 15 B12VEK | |
| Asus TUF Gaming F15 FX507ZM | |
| Przeciętny Intel Core i7-12650H (32702 - 92530, n=14) | |
| AIDA64 / CPU ZLib | |
| Średnia w klasie Gaming (574 - 2531, n=105, ostatnie 2 lata) | |
| Asus TUF Gaming F15 FX507ZM | |
| Lenovo Legion 5 15IAH7H 82RB | |
| MSI Pulse GL66 12UEK | |
| MSI Katana GF66 12UGS | |
| Schenker XMG Core 15 (M22) | |
| MSI Katana 15 B12VEK | |
| Przeciętny Intel Core i7-12650H (443 - 891, n=14) | |
| AIDA64 / FP64 Ray-Trace | |
| Średnia w klasie Gaming (5509 - 45446, n=105, ostatnie 2 lata) | |
| Lenovo Legion 5 15IAH7H 82RB | |
| Schenker XMG Core 15 (M22) | |
| MSI Katana 15 B12VEK | |
| Przeciętny Intel Core i7-12650H (3096 - 8448, n=14) | |
| Asus TUF Gaming F15 FX507ZM | |
| MSI Pulse GL66 12UEK | |
| MSI Katana GF66 12UGS | |
| AIDA64 / CPU PhotoWorxx | |
| Średnia w klasie Gaming (12271 - 89891, n=105, ostatnie 2 lata) | |
| MSI Katana 15 B12VEK | |
| Lenovo Legion 5 15IAH7H 82RB | |
| Asus TUF Gaming F15 FX507ZM | |
| Przeciętny Intel Core i7-12650H (22046 - 44164, n=14) | |
| Schenker XMG Core 15 (M22) | |
| MSI Katana GF66 12UGS | |
| MSI Pulse GL66 12UEK | |
Wydajność systemu
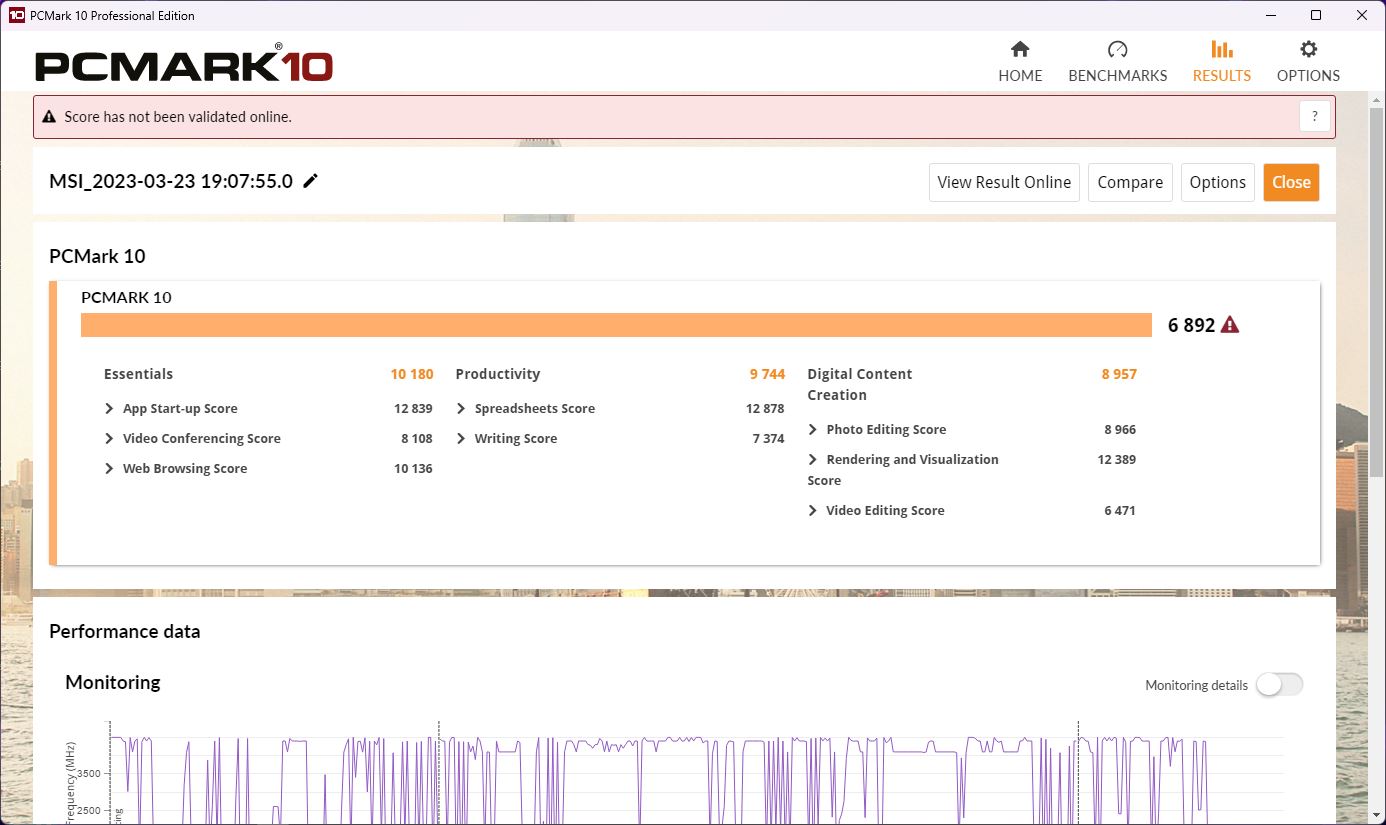
Nie dziwi więc fakt, że Katana nie jest w stanie odróżnić się od swoich siostrzanych modeliGF66 lub GL66 również pod względem wydajności systemowej. W porównaniu z nimi osiąga raczej niższy wynik. Wynik jest lepszy przy dGPU aktywowanym ręcznie, ale nie we wszystkich podtestach.

CrossMark: Overall | Productivity | Creativity | Responsiveness
| PCMark 10 / Score | |
| Średnia w klasie Gaming (5828 - 12414, n=93, ostatnie 2 lata) | |
| Lenovo Legion 5 15IAH7H 82RB | |
| MSI Katana GF66 12UGS | |
| Asus TUF Gaming F15 FX507ZM | |
| Schenker XMG Core 15 (M22) | |
| MSI Pulse GL66 12UEK | |
| MSI Katana 15 B12VEK | |
| Przeciętny Intel Core i7-12650H, NVIDIA GeForce RTX 4050 Laptop GPU (n=1) | |
| PCMark 10 / Essentials | |
| Lenovo Legion 5 15IAH7H 82RB | |
| Schenker XMG Core 15 (M22) | |
| Średnia w klasie Gaming (8810 - 11935, n=97, ostatnie 2 lata) | |
| Asus TUF Gaming F15 FX507ZM | |
| MSI Pulse GL66 12UEK | |
| MSI Katana GF66 12UGS | |
| MSI Katana 15 B12VEK | |
| Przeciętny Intel Core i7-12650H, NVIDIA GeForce RTX 4050 Laptop GPU (n=1) | |
| PCMark 10 / Productivity | |
| Średnia w klasie Gaming (6845 - 25323, n=95, ostatnie 2 lata) | |
| Lenovo Legion 5 15IAH7H 82RB | |
| MSI Katana GF66 12UGS | |
| MSI Pulse GL66 12UEK | |
| MSI Katana 15 B12VEK | |
| Przeciętny Intel Core i7-12650H, NVIDIA GeForce RTX 4050 Laptop GPU (n=1) | |
| Schenker XMG Core 15 (M22) | |
| Asus TUF Gaming F15 FX507ZM | |
| PCMark 10 / Digital Content Creation | |
| Średnia w klasie Gaming (7602 - 19954, n=95, ostatnie 2 lata) | |
| Lenovo Legion 5 15IAH7H 82RB | |
| Asus TUF Gaming F15 FX507ZM | |
| MSI Katana GF66 12UGS | |
| Schenker XMG Core 15 (M22) | |
| MSI Pulse GL66 12UEK | |
| MSI Katana 15 B12VEK | |
| Przeciętny Intel Core i7-12650H, NVIDIA GeForce RTX 4050 Laptop GPU (n=1) | |
| CrossMark / Overall | |
| MSI Pulse GL66 12UEK | |
| Lenovo Legion 5 15IAH7H 82RB | |
| Średnia w klasie Gaming (1366 - 2409, n=94, ostatnie 2 lata) | |
| MSI Katana GF66 12UGS | |
| MSI Katana 15 B12VEK | |
| Przeciętny Intel Core i7-12650H, NVIDIA GeForce RTX 4050 Laptop GPU (n=1) | |
| Schenker XMG Core 15 (M22) | |
| CrossMark / Productivity | |
| MSI Pulse GL66 12UEK | |
| Lenovo Legion 5 15IAH7H 82RB | |
| MSI Katana GF66 12UGS | |
| Średnia w klasie Gaming (1386 - 2254, n=94, ostatnie 2 lata) | |
| MSI Katana 15 B12VEK | |
| Przeciętny Intel Core i7-12650H, NVIDIA GeForce RTX 4050 Laptop GPU (n=1) | |
| Schenker XMG Core 15 (M22) | |
| CrossMark / Creativity | |
| Średnia w klasie Gaming (1343 - 2786, n=94, ostatnie 2 lata) | |
| MSI Pulse GL66 12UEK | |
| Lenovo Legion 5 15IAH7H 82RB | |
| MSI Katana GF66 12UGS | |
| MSI Katana 15 B12VEK | |
| Przeciętny Intel Core i7-12650H, NVIDIA GeForce RTX 4050 Laptop GPU (n=1) | |
| Schenker XMG Core 15 (M22) | |
| CrossMark / Responsiveness | |
| MSI Pulse GL66 12UEK | |
| Lenovo Legion 5 15IAH7H 82RB | |
| MSI Katana GF66 12UGS | |
| Średnia w klasie Gaming (1226 - 2334, n=94, ostatnie 2 lata) | |
| MSI Katana 15 B12VEK | |
| Przeciętny Intel Core i7-12650H, NVIDIA GeForce RTX 4050 Laptop GPU (n=1) | |
| Schenker XMG Core 15 (M22) | |
| PCMark 10 Score | 6892 pkt. | |
Pomoc | ||
| AIDA64 / Memory Copy | |
| Średnia w klasie Gaming (21750 - 129946, n=105, ostatnie 2 lata) | |
| MSI Katana 15 B12VEK | |
| Asus TUF Gaming F15 FX507ZM | |
| Lenovo Legion 5 15IAH7H 82RB | |
| Przeciętny Intel Core i7-12650H (43261 - 69735, n=14) | |
| Schenker XMG Core 15 (M22) | |
| MSI Katana GF66 12UGS | |
| MSI Pulse GL66 12UEK | |
| AIDA64 / Memory Read | |
| Średnia w klasie Gaming (22956 - 118858, n=105, ostatnie 2 lata) | |
| MSI Katana 15 B12VEK | |
| Lenovo Legion 5 15IAH7H 82RB | |
| Asus TUF Gaming F15 FX507ZM | |
| Przeciętny Intel Core i7-12650H (47313 - 67412, n=14) | |
| Schenker XMG Core 15 (M22) | |
| MSI Pulse GL66 12UEK | |
| MSI Katana GF66 12UGS | |
| AIDA64 / Memory Write | |
| Średnia w klasie Gaming (22297 - 135096, n=105, ostatnie 2 lata) | |
| Lenovo Legion 5 15IAH7H 82RB | |
| Asus TUF Gaming F15 FX507ZM | |
| MSI Katana 15 B12VEK | |
| Schenker XMG Core 15 (M22) | |
| Przeciętny Intel Core i7-12650H (45617 - 59361, n=14) | |
| MSI Katana GF66 12UGS | |
| MSI Pulse GL66 12UEK | |
| AIDA64 / Memory Latency | |
| Średnia w klasie Gaming (75.3 - 259, n=105, ostatnie 2 lata) | |
| Lenovo Legion 5 15IAH7H 82RB | |
| MSI Katana GF66 12UGS | |
| MSI Katana 15 B12VEK | |
| MSI Pulse GL66 12UEK | |
| Schenker XMG Core 15 (M22) | |
| Przeciętny Intel Core i7-12650H (71.6 - 103.9, n=14) | |
| Asus TUF Gaming F15 FX507ZM | |
* ... im mniej tym lepiej
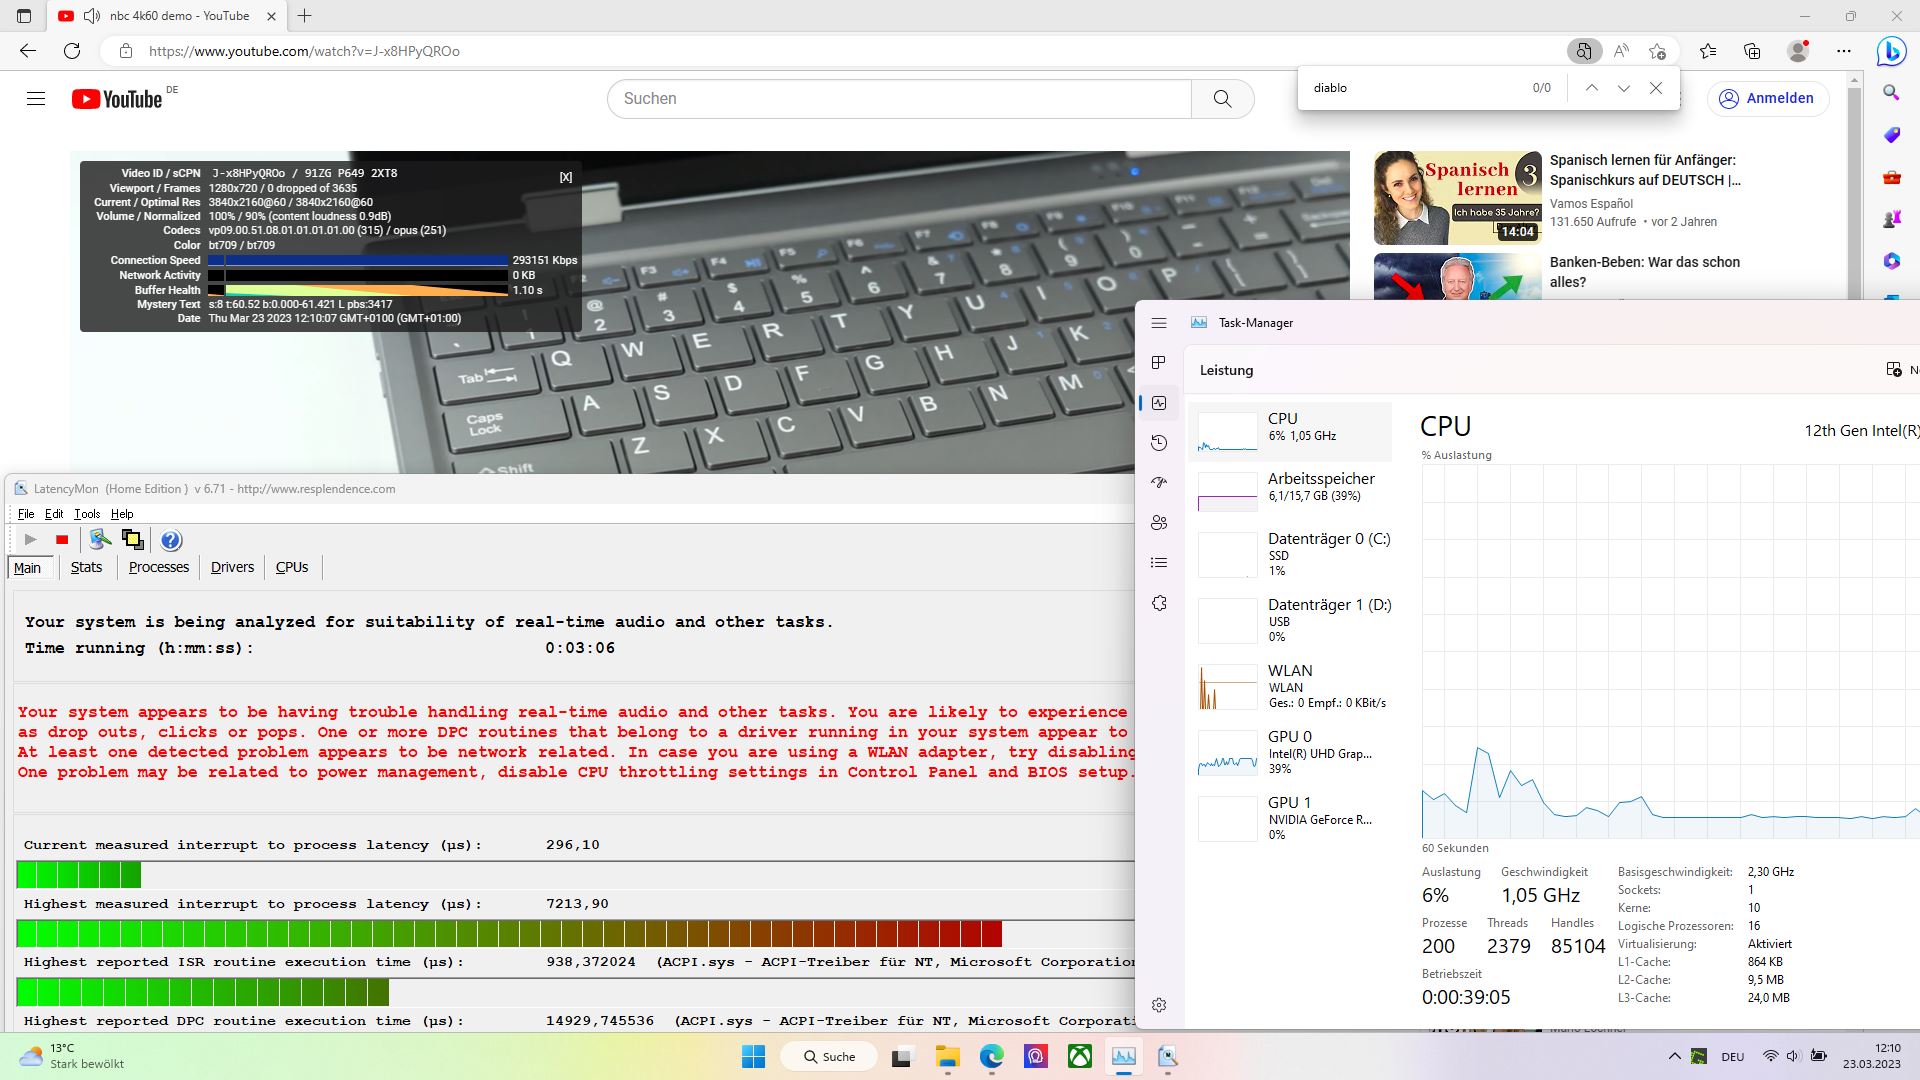
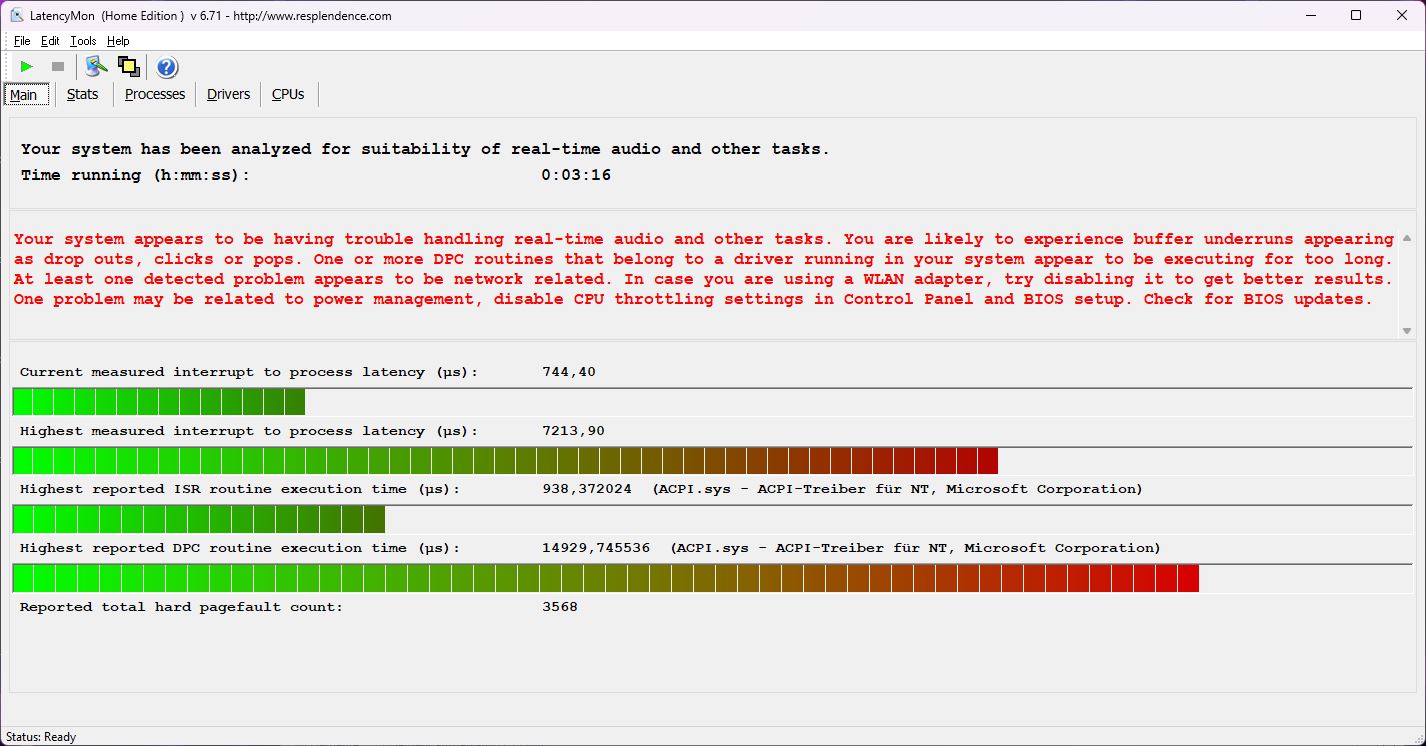
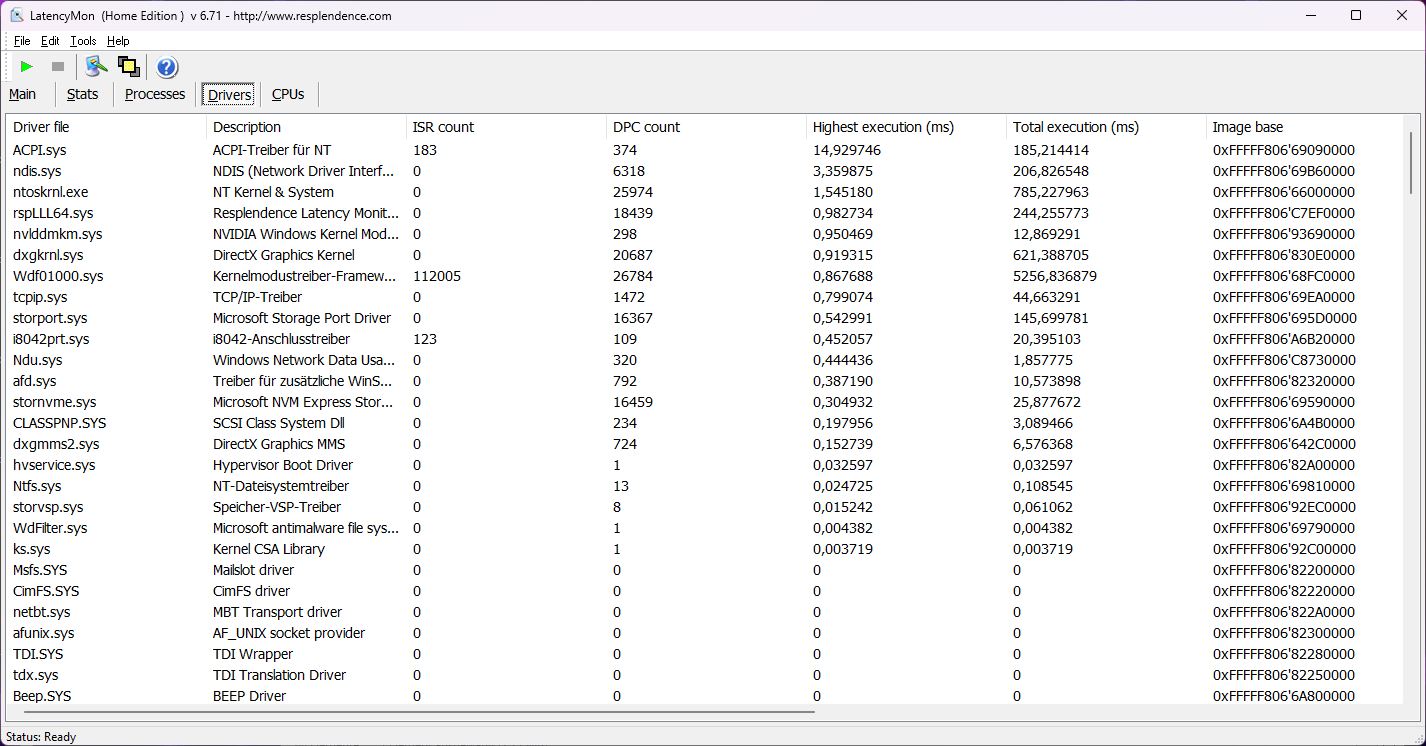
Opóźnienie DPC
Obecnie sterowniki Nvidii dla laptopów z kartą RTX 40xx wciąż mają bardzo wysokie latencje pod LatencyMon i nasza Katana nie jest wyjątkiem. Pierwsze latencje pojawiają się zaraz po uruchomieniu narzędzia. Otwarcie kilku zakładek przeglądarki i odtworzenie naszego filmu na YouTube w 4K/60 fps pcha wartość ostro w górę. Nie było jednak żadnych pominiętych klatek.
| DPC Latencies / LatencyMon - interrupt to process latency (max), Web, Youtube, Prime95 | |
| MSI Katana 15 B12VEK | |
| Schenker XMG Core 15 (M22) | |
| MSI Pulse GL66 12UEK | |
| Lenovo Legion 5 15IAH7H 82RB | |
| Asus TUF Gaming F15 FX507ZM | |
| MSI Katana GF66 12UGS | |
* ... im mniej tym lepiej
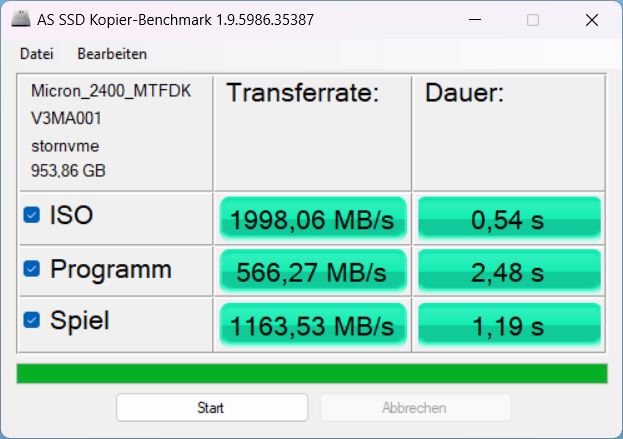
Urządzenia do przechowywania danych
Jako główna pamięć masowa służy dysk SSD 1 TB PCIe 4.0 x4 NVMe od Microna. W Katanie nie wykorzystuje on w pełni swojego potencjału wydajnościowego i wypada znacznie gorzej od modeli Micron 2450 w...Katana GF66 czy też Pulse GL66.
Przynajmniej jego wydajność jest w miarę stała, minimalnie spada dopiero po dłuższym czasie. Więcej informacji o tym modelu znajdziecie w naszym Lista bestsellerów w dziedzinie dysków SSD.


| Drive Performance rating - Percent | |
| Lenovo Legion 5 15IAH7H 82RB | |
| Średnia w klasie Gaming | |
| MSI Katana GF66 12UGS | |
| Asus TUF Gaming F15 FX507ZM | |
| MSI Pulse GL66 12UEK | |
| Schenker XMG Core 15 (M22) | |
| MSI Katana 15 B12VEK | |
| Przeciętny Micron 2400 MTFDKBA1T0QFM | |
* ... im mniej tym lepiej
Sustained Read Performance: DiskSpd Read Loop, Queue Depth 8
Karta graficzna
Na stronie Nvidia Geforce RTX 4050to karta wejściowa nowej generacji RTX 40xx. Jej wydajność powinna być mniej więcej taka sama jak starszego RTX 3060w zależności od wybranego TGP (tutaj 105 W), choć aktualne benchmarki sugerują, że karta prawie nie korzysta z więcej niż 100 W.
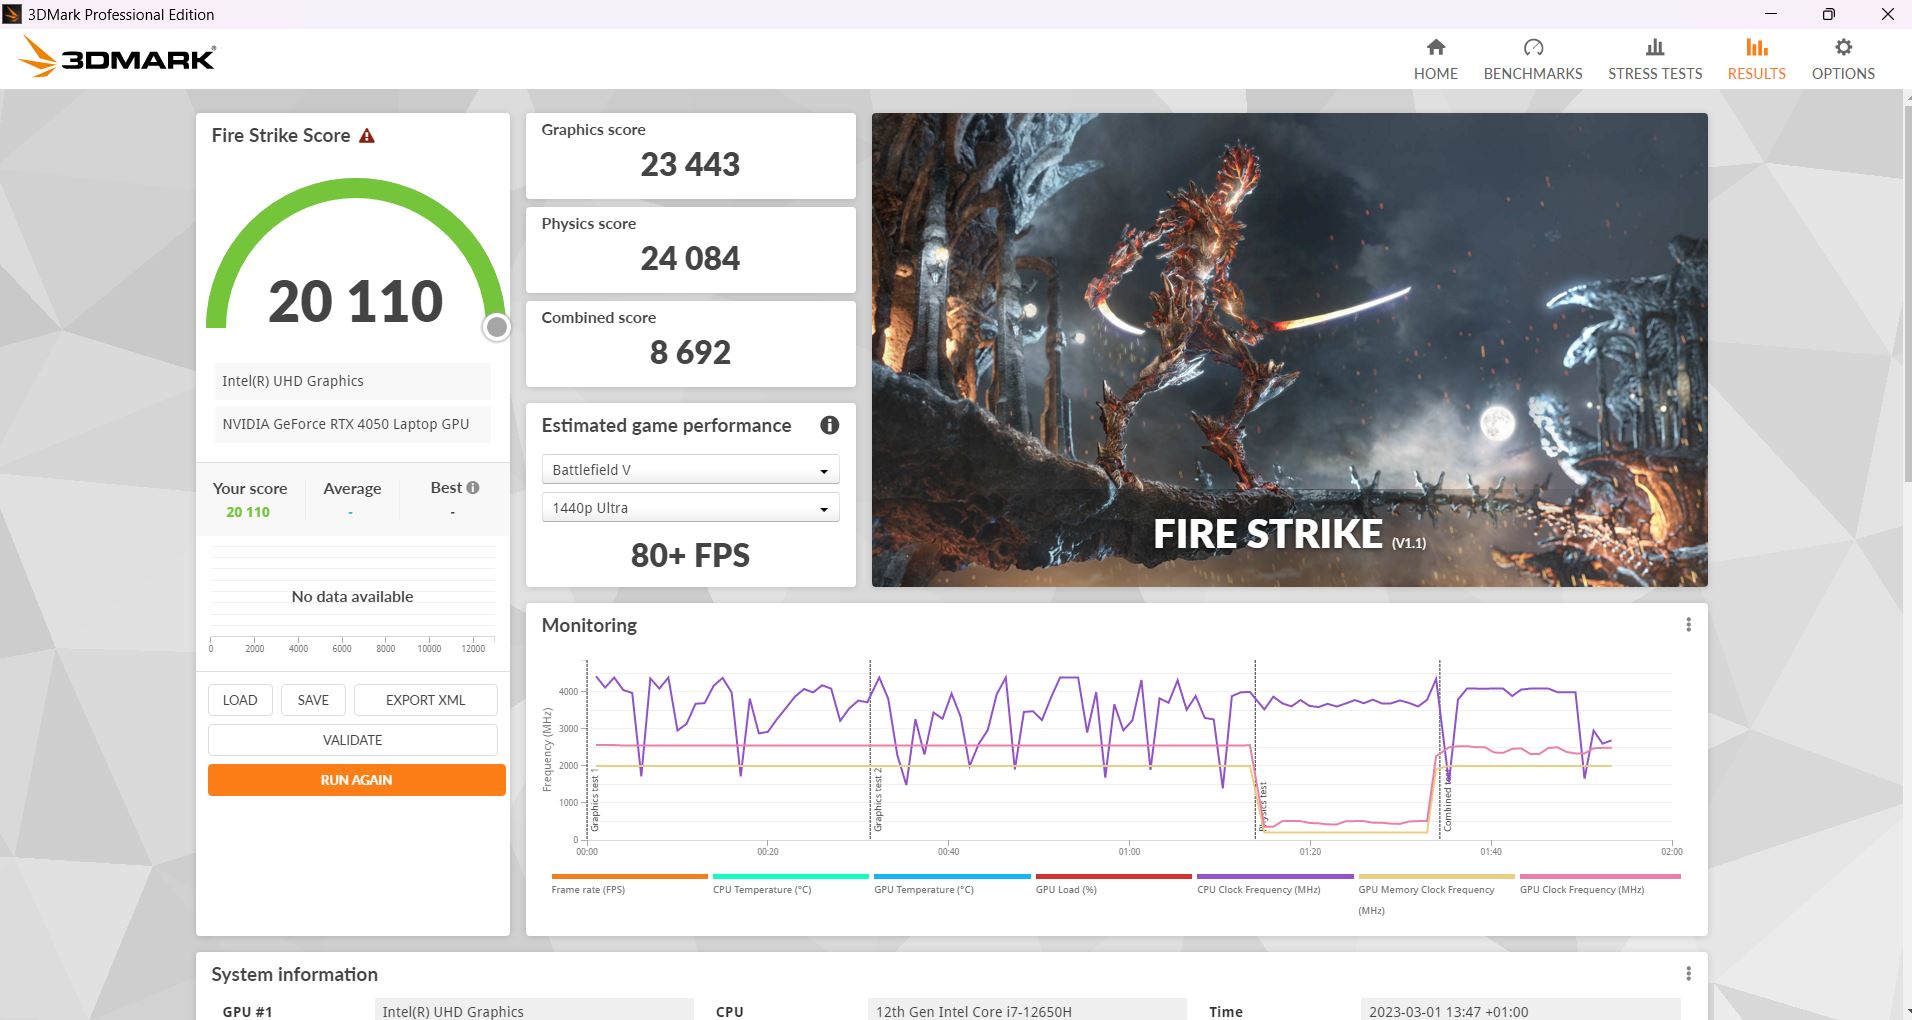
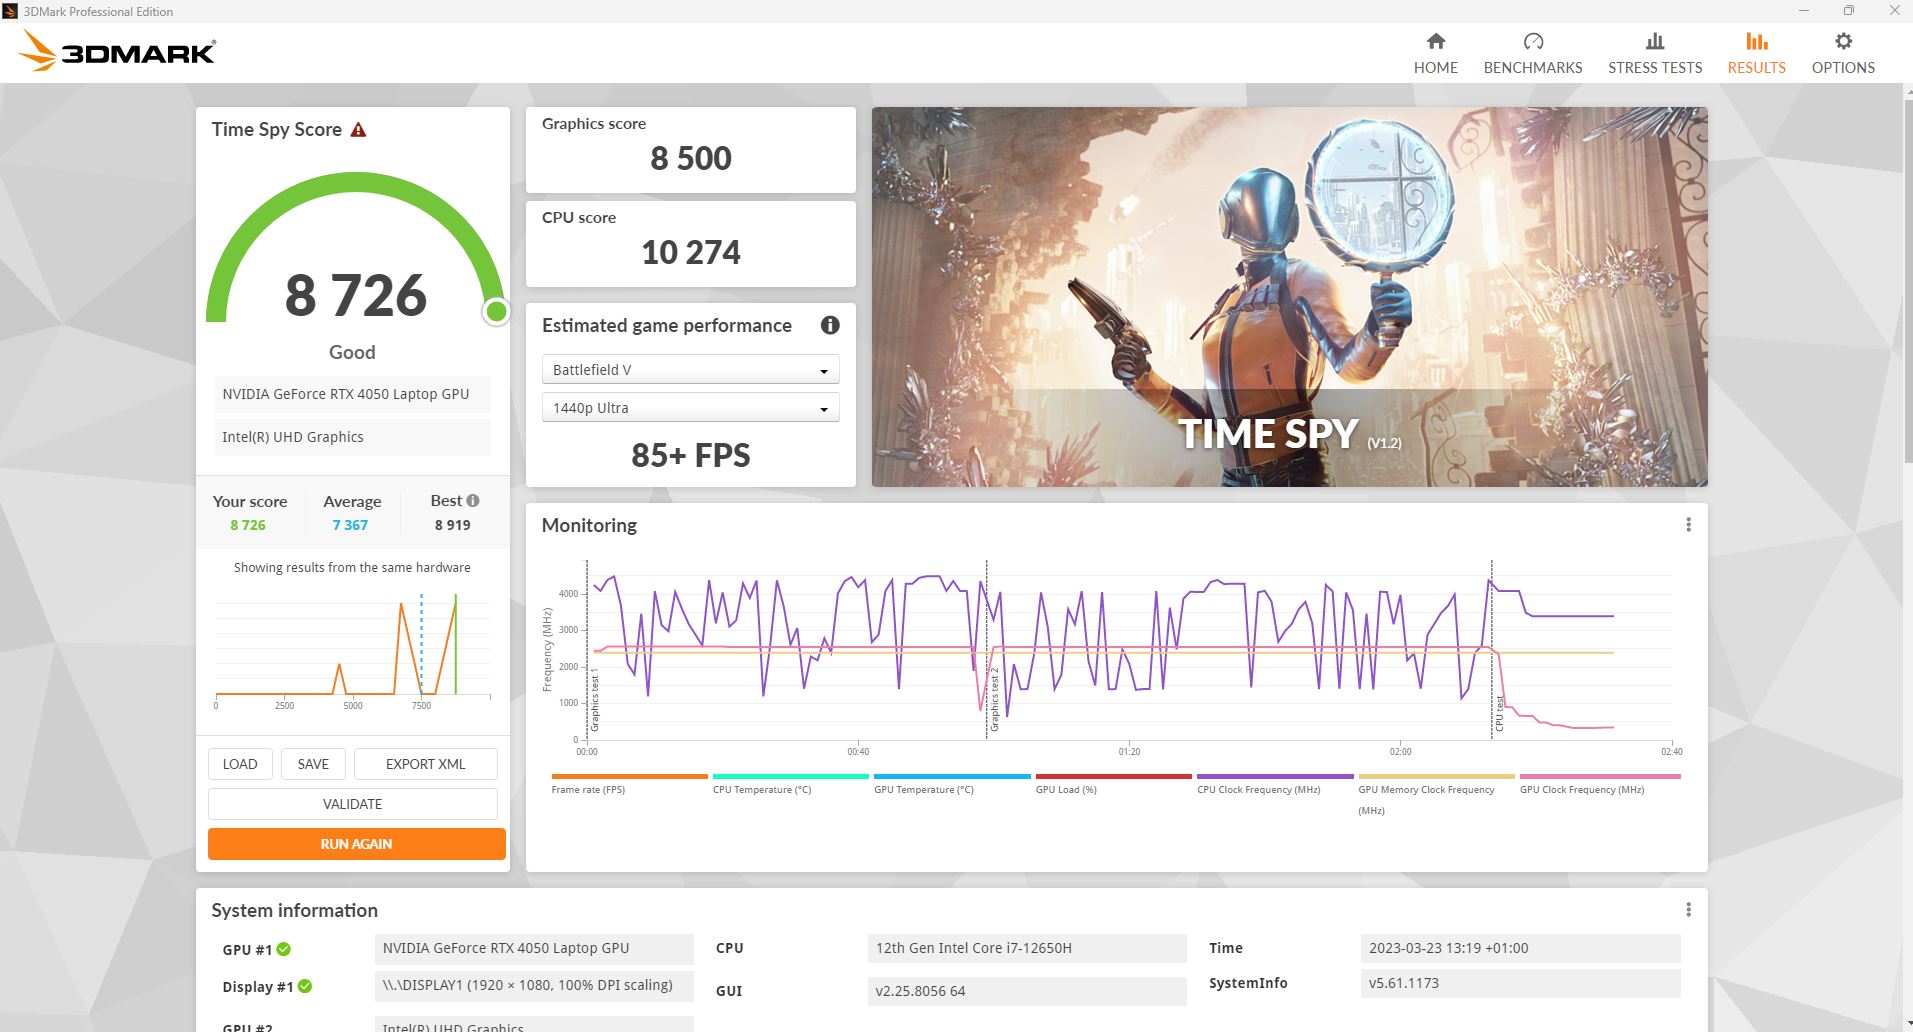
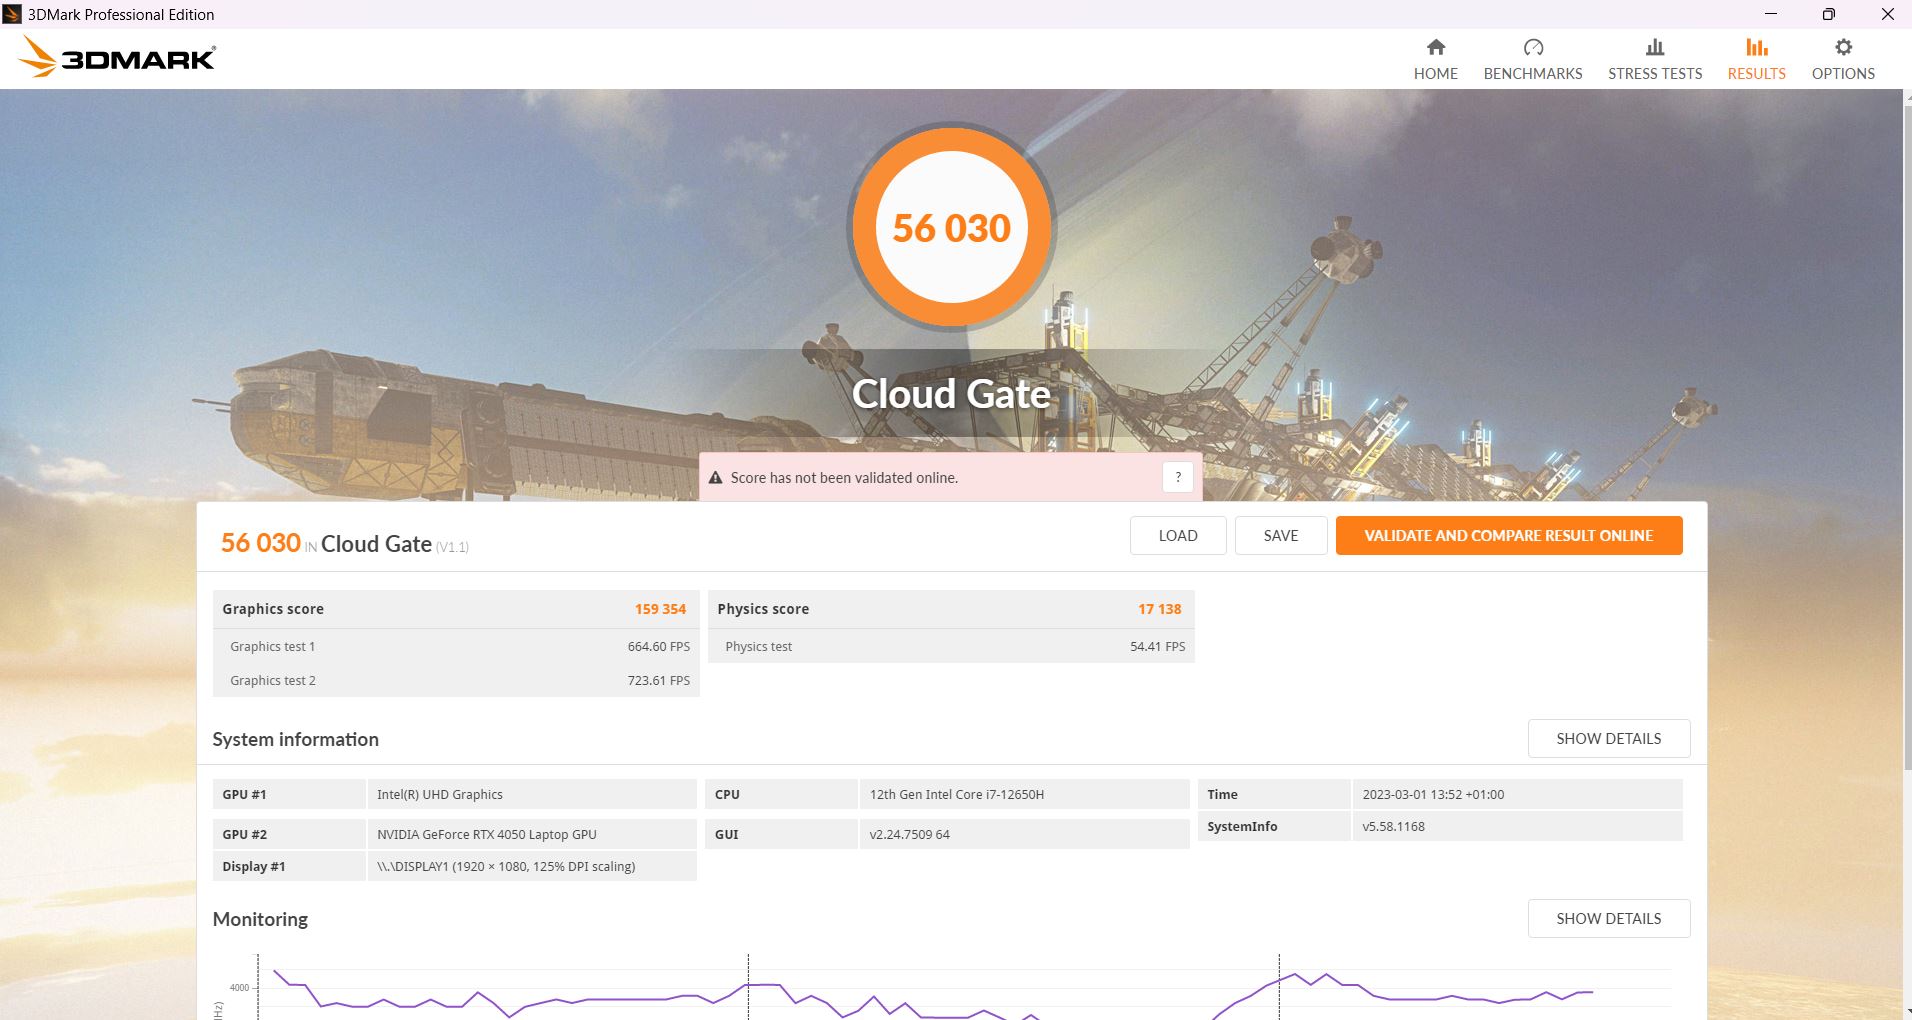
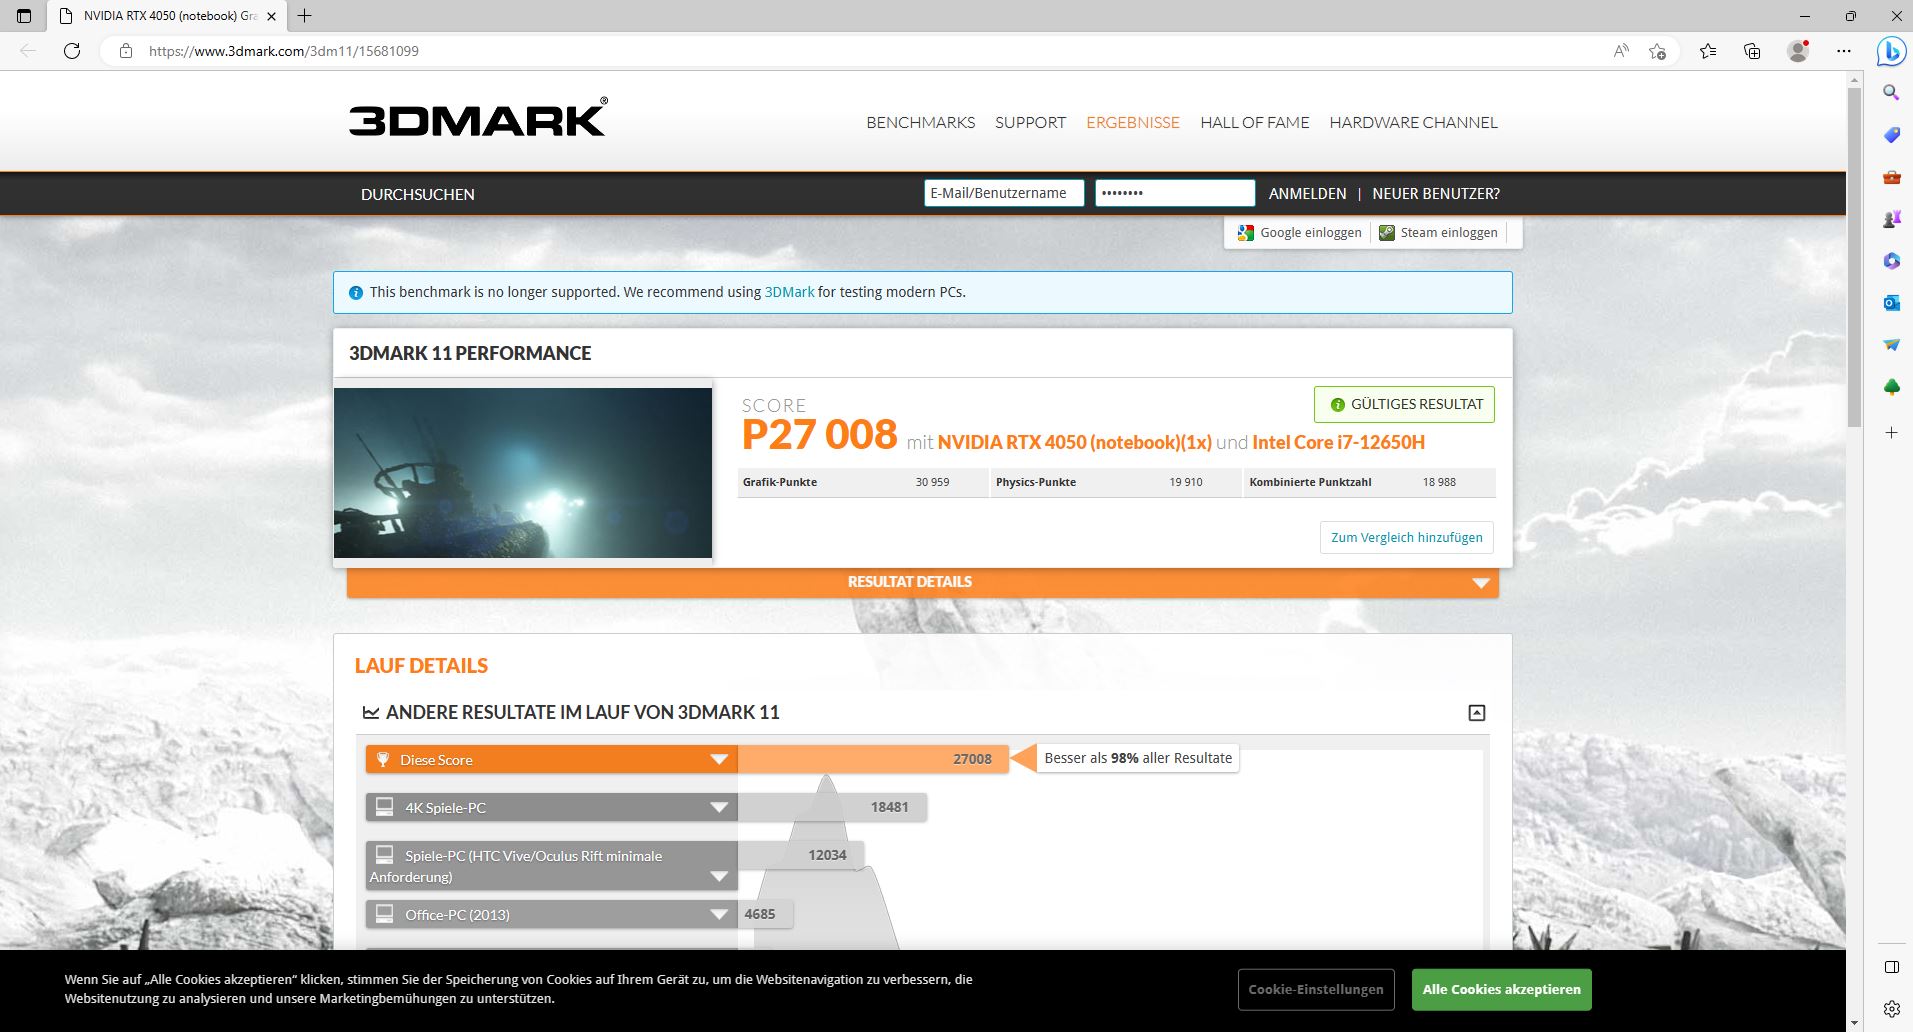
W syntetycznych 3DMarkach GPU radzi sobie całkiem nieźle, na oczekiwanym poziomie i wyprzedza tylko zeszłoroczną konkurencję w postaci RTX 3060. StronaKatana GF66 z RTX 3070 Tiwyprzedza tylko o około 10 procent.
Z dala od gniazdka cierpi oczywiście wydajność. W kolejnym uruchomieniu Fire Strike w trybie bateryjnym Katana uzyskała tylko 14 446 punktów graficznych zamiast 23 443 punktów po podłączeniu.
| 3DMark Performance rating - Percent | |
| Średnia w klasie Gaming | |
| MSI Katana 15 B12VEK | |
| MSI Katana GF66 12UGS -1! | |
| Asus TUF Gaming F15 FX507ZM | |
| Schenker XMG Core 15 (M22) | |
| Przeciętny NVIDIA GeForce RTX 4050 Laptop GPU | |
| Lenovo Legion 5 15IAH7H 82RB -1! | |
| MSI Pulse GL66 12UEK | |
| 3DMark 11 - 1280x720 Performance GPU | |
| Średnia w klasie Gaming (21841 - 80022, n=104, ostatnie 2 lata) | |
| MSI Katana GF66 12UGS | |
| MSI Katana 15 B12VEK | |
| Asus TUF Gaming F15 FX507ZM | |
| Lenovo Legion 5 15IAH7H 82RB | |
| Schenker XMG Core 15 (M22) | |
| Przeciętny NVIDIA GeForce RTX 4050 Laptop GPU (13339 - 32642, n=41) | |
| MSI Pulse GL66 12UEK | |
| 3DMark | |
| 1280x720 Cloud Gate Standard Graphics | |
| MSI Katana 15 B12VEK | |
| Średnia w klasie Gaming (86886 - 223650, n=60, ostatnie 2 lata) | |
| Przeciętny NVIDIA GeForce RTX 4050 Laptop GPU (51138 - 161152, n=26) | |
| Asus TUF Gaming F15 FX507ZM | |
| Schenker XMG Core 15 (M22) | |
| MSI Pulse GL66 12UEK | |
| 1920x1080 Fire Strike Graphics | |
| Średnia w klasie Gaming (12242 - 62849, n=115, ostatnie 2 lata) | |
| MSI Katana GF66 12UGS | |
| MSI Katana 15 B12VEK | |
| Asus TUF Gaming F15 FX507ZM | |
| Schenker XMG Core 15 (M22) | |
| Lenovo Legion 5 15IAH7H 82RB | |
| Przeciętny NVIDIA GeForce RTX 4050 Laptop GPU (13591 - 24007, n=41) | |
| MSI Pulse GL66 12UEK | |
| 2560x1440 Time Spy Graphics | |
| Średnia w klasie Gaming (5012 - 26212, n=115, ostatnie 2 lata) | |
| MSI Katana GF66 12UGS | |
| Asus TUF Gaming F15 FX507ZM | |
| Lenovo Legion 5 15IAH7H 82RB | |
| Schenker XMG Core 15 (M22) | |
| MSI Katana 15 B12VEK | |
| MSI Pulse GL66 12UEK | |
| Przeciętny NVIDIA GeForce RTX 4050 Laptop GPU (5107 - 9040, n=41) | |
| 3DMark 11 Performance | 27008 pkt. | |
| 3DMark Cloud Gate Standard Score | 56030 pkt. | |
| 3DMark Fire Strike Score | 20110 pkt. | |
| 3DMark Time Spy Score | 8726 pkt. | |
Pomoc | ||
* ... im mniej tym lepiej
Wydajność w grach
W benchmarkach gamingowych Katana 15 ma tendencję do przyjmowania niższej rangi w porównaniu z bezpośrednią konkurencją. TylkoXMG Core 15 z jego RTX 3060jest nieco wolniejszy, podczas gdy np Pulse GL66 z RTX 3060 jest mniej więcej tak samo szybki. Na stronie Legion 5 w szczególności, także z RTX 3060, jest zauważalnie szybszy.
Z kolei w Far Cry 5, Katana nawet nieznacznie wyprzedza konkurencję. Tak więc dużo zależy też od gry, w którą się gra.
| Performance rating - Percent | |
| Średnia w klasie Gaming | |
| Lenovo Legion 5 15IAH7H 82RB | |
| MSI Pulse GL66 12UEK -3! | |
| Asus TUF Gaming F15 FX507ZM | |
| MSI Katana GF66 12UGS | |
| MSI Katana 15 B12VEK | |
| Schenker XMG Core 15 (M22) | |
| The Witcher 3 - 1920x1080 Ultra Graphics & Postprocessing (HBAO+) | |
| Średnia w klasie Gaming (104.7 - 240, n=6, ostatnie 2 lata) | |
| MSI Katana GF66 12UGS | |
| Asus TUF Gaming F15 FX507ZM | |
| Lenovo Legion 5 15IAH7H 82RB | |
| MSI Katana 15 B12VEK | |
| Schenker XMG Core 15 (M22) | |
| MSI Pulse GL66 12UEK | |
| GTA V - 1920x1080 Highest AA:4xMSAA + FX AF:16x | |
| Średnia w klasie Gaming (48.3 - 186.9, n=93, ostatnie 2 lata) | |
| Lenovo Legion 5 15IAH7H 82RB | |
| MSI Katana GF66 12UGS | |
| Asus TUF Gaming F15 FX507ZM | |
| Schenker XMG Core 15 (M22) | |
| MSI Katana 15 B12VEK | |
| Final Fantasy XV Benchmark - 1920x1080 High Quality | |
| Średnia w klasie Gaming (41 - 215, n=95, ostatnie 2 lata) | |
| Lenovo Legion 5 15IAH7H 82RB | |
| Asus TUF Gaming F15 FX507ZM | |
| Schenker XMG Core 15 (M22) | |
| MSI Katana GF66 12UGS | |
| MSI Katana 15 B12VEK | |
| Strange Brigade - 1920x1080 ultra AA:ultra AF:16 | |
| Średnia w klasie Gaming (76.3 - 456, n=86, ostatnie 2 lata) | |
| MSI Katana GF66 12UGS | |
| Lenovo Legion 5 15IAH7H 82RB | |
| Asus TUF Gaming F15 FX507ZM | |
| Schenker XMG Core 15 (M22) | |
| MSI Katana 15 B12VEK | |
| Dota 2 Reborn - 1920x1080 ultra (3/3) best looking | |
| Lenovo Legion 5 15IAH7H 82RB | |
| Średnia w klasie Gaming (84.8 - 248, n=107, ostatnie 2 lata) | |
| Asus TUF Gaming F15 FX507ZM | |
| MSI Pulse GL66 12UEK | |
| MSI Katana 15 B12VEK | |
| MSI Katana GF66 12UGS | |
| Schenker XMG Core 15 (M22) | |
| X-Plane 11.11 - 1920x1080 high (fps_test=3) | |
| Lenovo Legion 5 15IAH7H 82RB | |
| Asus TUF Gaming F15 FX507ZM | |
| MSI Katana GF66 12UGS | |
| MSI Pulse GL66 12UEK | |
| Średnia w klasie Gaming (55.5 - 143.5, n=109, ostatnie 2 lata) | |
| MSI Katana 15 B12VEK | |
| Schenker XMG Core 15 (M22) | |
| Far Cry 5 | |
| 1920x1080 Ultra Preset AA:T | |
| MSI Katana 15 B12VEK | |
| MSI Katana GF66 12UGS | |
| Średnia w klasie Gaming (70 - 151, n=6, ostatnie 2 lata) | |
| Asus TUF Gaming F15 FX507ZM | |
| MSI Pulse GL66 12UEK | |
| Schenker XMG Core 15 (M22) | |
| Przeciętny NVIDIA GeForce RTX 4050 Laptop GPU (50 - 127, n=24) | |
| 1920x1080 High Preset AA:T | |
| MSI Katana 15 B12VEK | |
| Średnia w klasie Gaming (82 - 163, n=6, ostatnie 2 lata) | |
| MSI Katana GF66 12UGS | |
| MSI Pulse GL66 12UEK | |
| Schenker XMG Core 15 (M22) | |
| Asus TUF Gaming F15 FX507ZM | |
| Przeciętny NVIDIA GeForce RTX 4050 Laptop GPU (51 - 135, n=24) | |
Dostępny jest przełącznik MUX, który pozwala na wybór iGPU lub dGPU w MSI Center, co zawsze wiąże się z restartem.
Liczba klatek na sekundę Witcher 3 pozostaje stabilna w ramach zwykłych wahań (cykl dzień/noc w grze). Konkurencyjne laptopy są jednak często nieco szybsze, nawet te z RTX 3060.
Częstotliwość taktowania GPU jest dość stabilna i wynosi 2,4 GHz, a taktowanie pamięci jest również stałe i wynosi 2 GHz. Temperatury GPU nie przekraczają 76°C i średnio wynoszą około 75°C. Pobór mocy wynoszący średnio 76 W jest daleki od podanych 105 W.
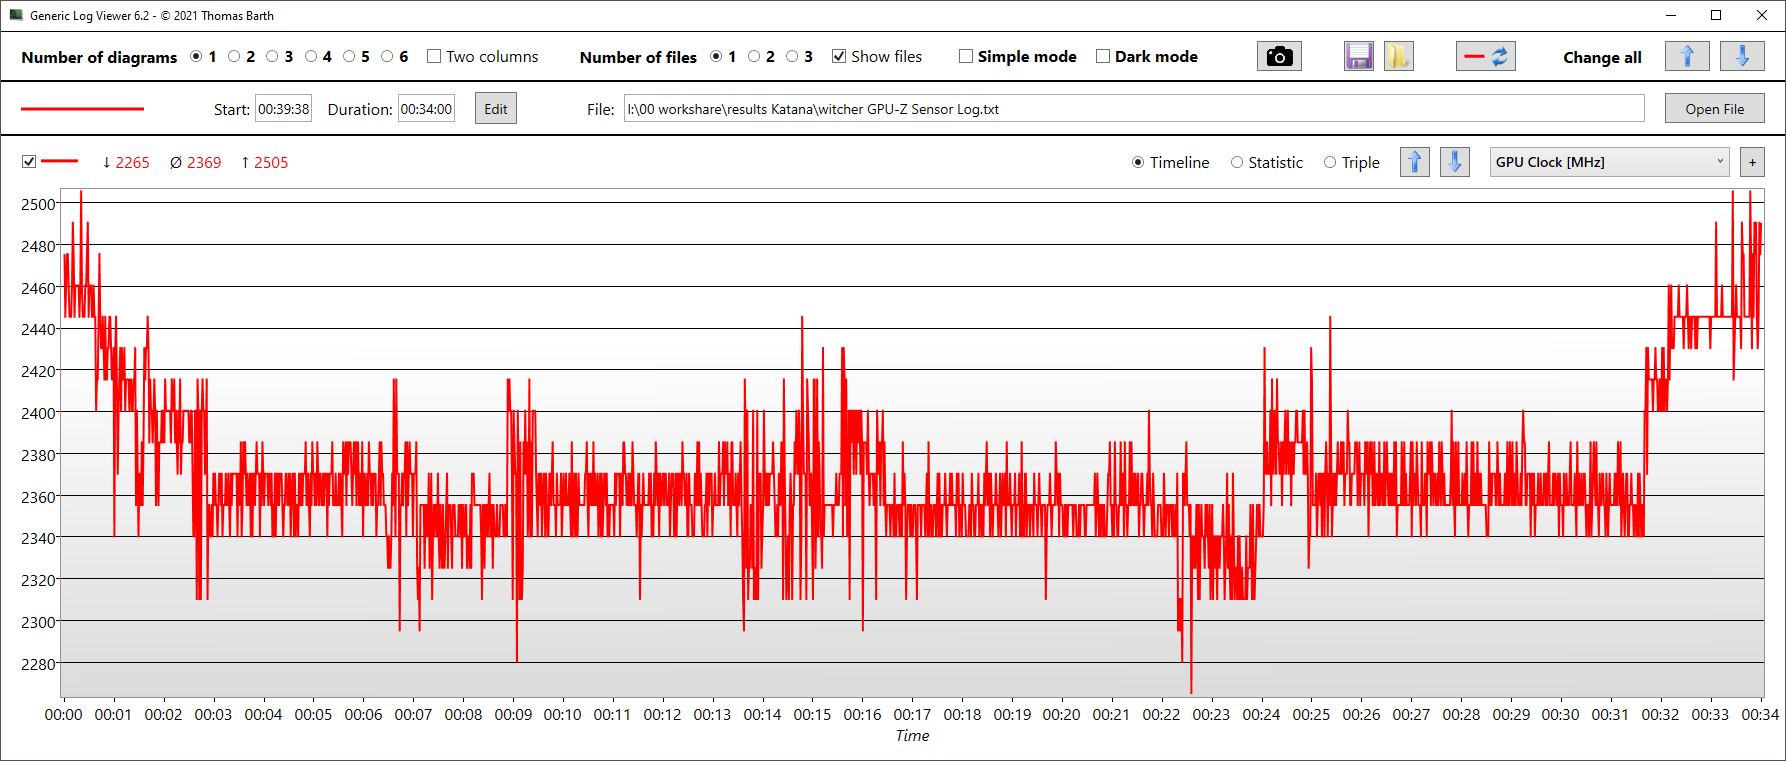
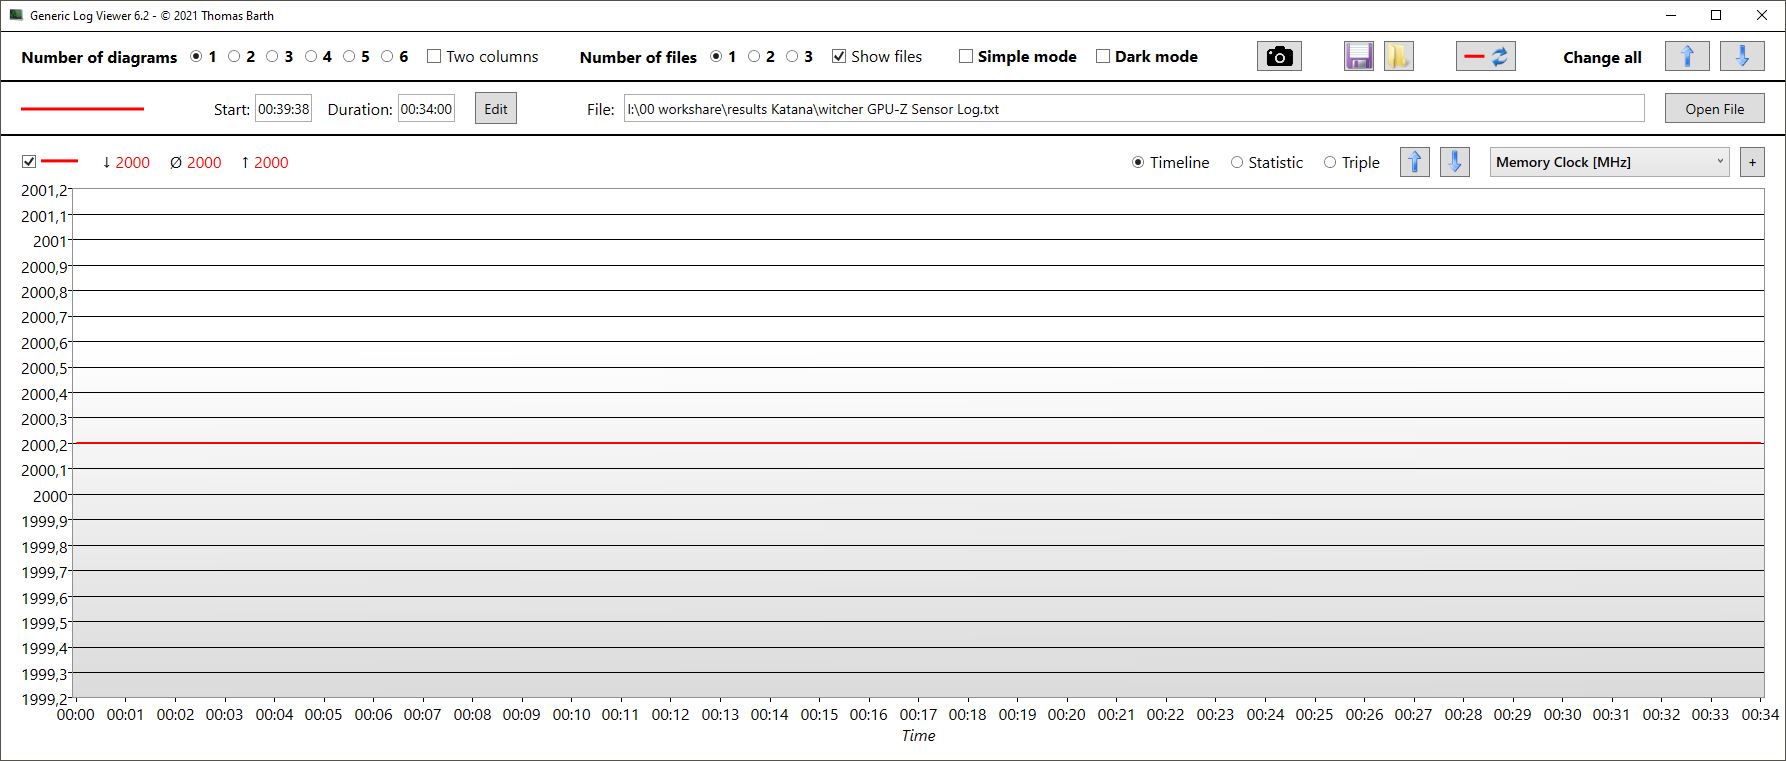
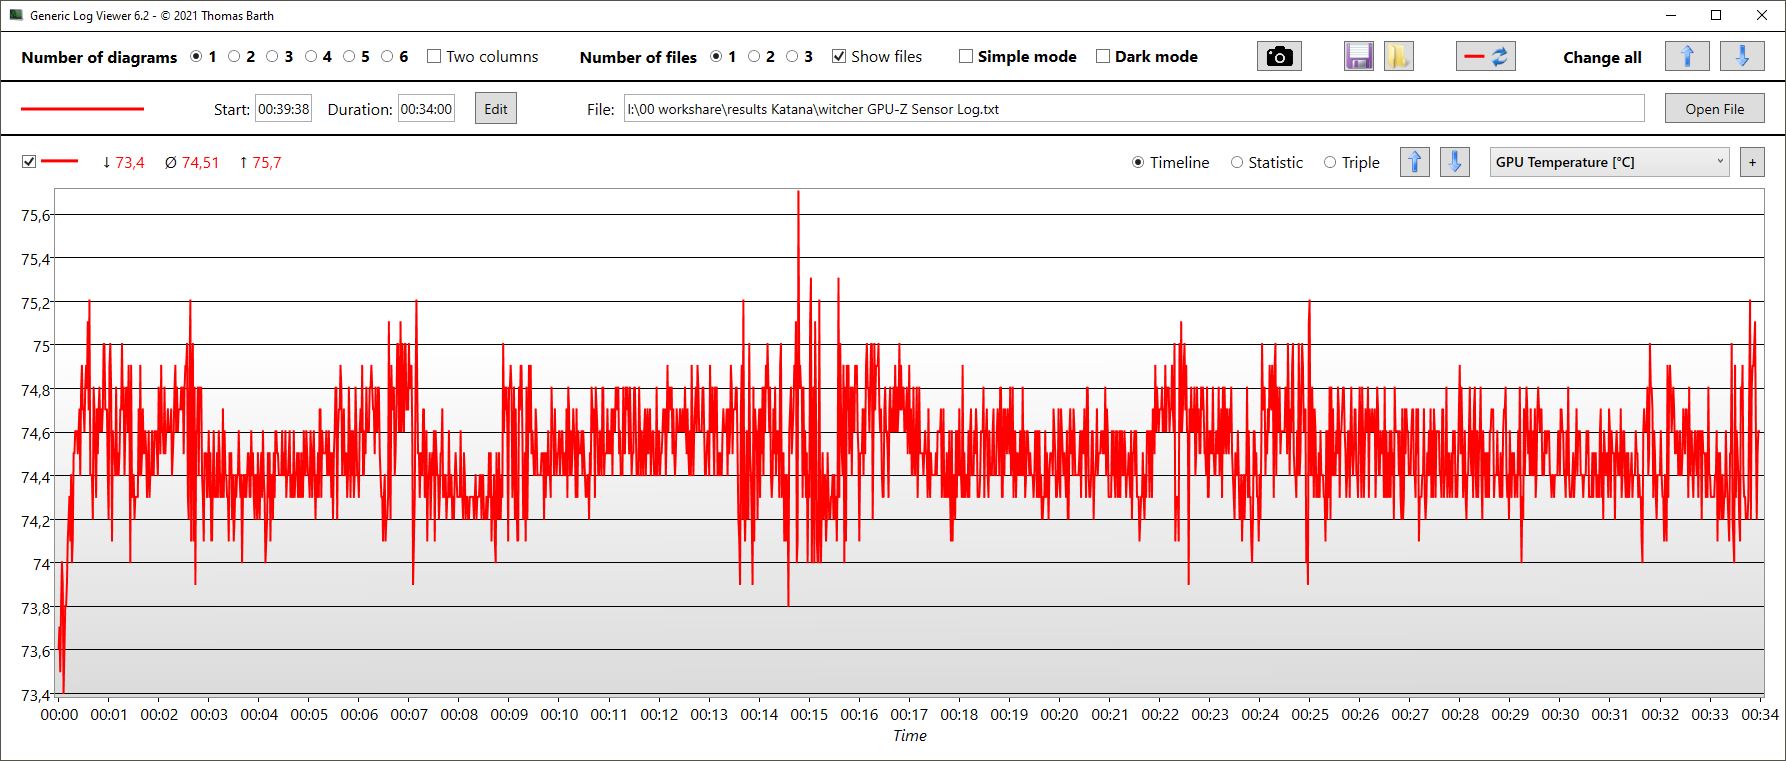
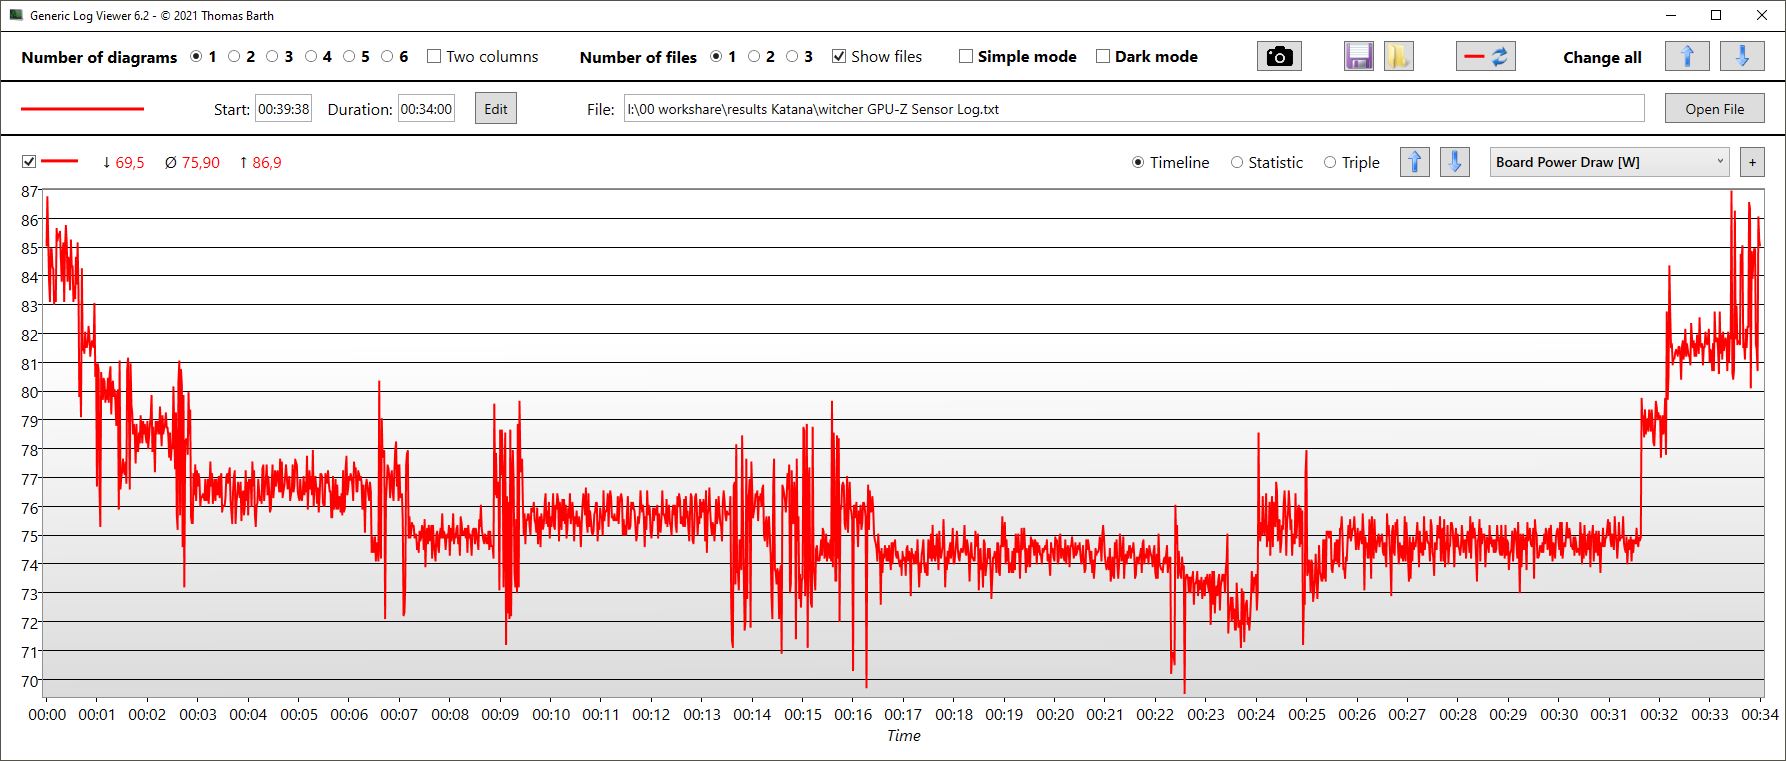
Witcher 3 FPS Chart
| low | med. | high | ultra | |
|---|---|---|---|---|
| GTA V (2015) | 183.5 | 176.6 | 172.7 | 92.2 |
| The Witcher 3 (2015) | 395 | 293 | 161 | 83 |
| Dota 2 Reborn (2015) | 175.1 | 158.1 | 150.5 | 142.5 |
| Final Fantasy XV Benchmark (2018) | 188 | 120.7 | 82.8 | |
| X-Plane 11.11 (2018) | 139.9 | 122.4 | 97 | |
| Far Cry 5 (2018) | 170 | 135 | 126 | 119 |
| Strange Brigade (2018) | 214 | 173 | 148.7 | |
| Dying Light 2 (2022) | 122.1 | 75.2 | 62.4 |
Emisje - W spokoju leży siła miecza
Hałas
W stanie spoczynku na pulpicie wentylatory są w większości przypadków bezgłośne, nawet w trybie Extreme Performance, co jest ewenementem. A nawet w 3DMarku06 wentylatory uruchamiają się stosunkowo późno i pod koniec pierwszego scenariusza benchmarku osiągają tylko 37,7 dB. Tylko Legion 5jest cichszy, a Asus TUF Gaming jest podobnie cichy, a siostrzane modele i XMG Core są głośniejsze.
Umiarkowany rozwój hałasu jest widoczny także w grach (tryb AI), a Katana staje się głośna tylko podczas łącznego obciążenia CPU/GPU.
Hałas
| luz |
| 24 / 24 / 24 dB |
| obciążenie |
| 37.71 / 54.55 dB |
 | ||
30 dB cichy 40 dB(A) słyszalny 50 dB(A) irytujący |
||
min: | ||
| MSI Katana 15 B12VEK GeForce RTX 4050 Laptop GPU, i7-12650H, Micron 2400 MTFDKBA1T0QFM | MSI Katana GF66 12UGS GeForce RTX 3070 Ti Laptop GPU, i7-12700H, Micron 2450 1TB MTFDKBA1T0TFK | MSI Pulse GL66 12UEK GeForce RTX 3060 Laptop GPU, i9-12900H, Micron 2450 512GB MTFDKBA512TFK | Lenovo Legion 5 15IAH7H 82RB GeForce RTX 3060 Laptop GPU, i7-12700H | Asus TUF Gaming F15 FX507ZM GeForce RTX 3060 Laptop GPU, i7-12700H, SK Hynix HFM001TD3JX013N | Schenker XMG Core 15 (M22) GeForce RTX 3060 Laptop GPU, R7 6800H, Samsung SSD 980 Pro 1TB MZ-V8P1T0BW | |
|---|---|---|---|---|---|---|
| Noise | -9% | -11% | 1% | -3% | -2% | |
| wyłączone / środowisko * (dB) | 24 | 26 -8% | 23 4% | 23.3 3% | 23.2 3% | 23 4% |
| Idle Minimum * (dB) | 24 | 27 -13% | 23 4% | 23.5 2% | 23.6 2% | 23 4% |
| Idle Average * (dB) | 24 | 28 -17% | 27 -13% | 23.5 2% | 23.6 2% | 23 4% |
| Idle Maximum * (dB) | 24 | 31 -29% | 27 -13% | 26.8 -12% | 25.4 -6% | 23 4% |
| Load Average * (dB) | 37.71 | 44 -17% | 48.2 -28% | 29.3 22% | 38 -1% | 42.41 -12% |
| Witcher 3 ultra * (dB) | 45.75 | 44 4% | 56.9 -24% | 51.4 -12% | 54.1 -18% | 54.71 -20% |
| Load Maximum * (dB) | 54.55 | 45 18% | 56.94 -4% | 53 3% | 57.2 -5% | 55.05 -1% |
* ... im mniej tym lepiej
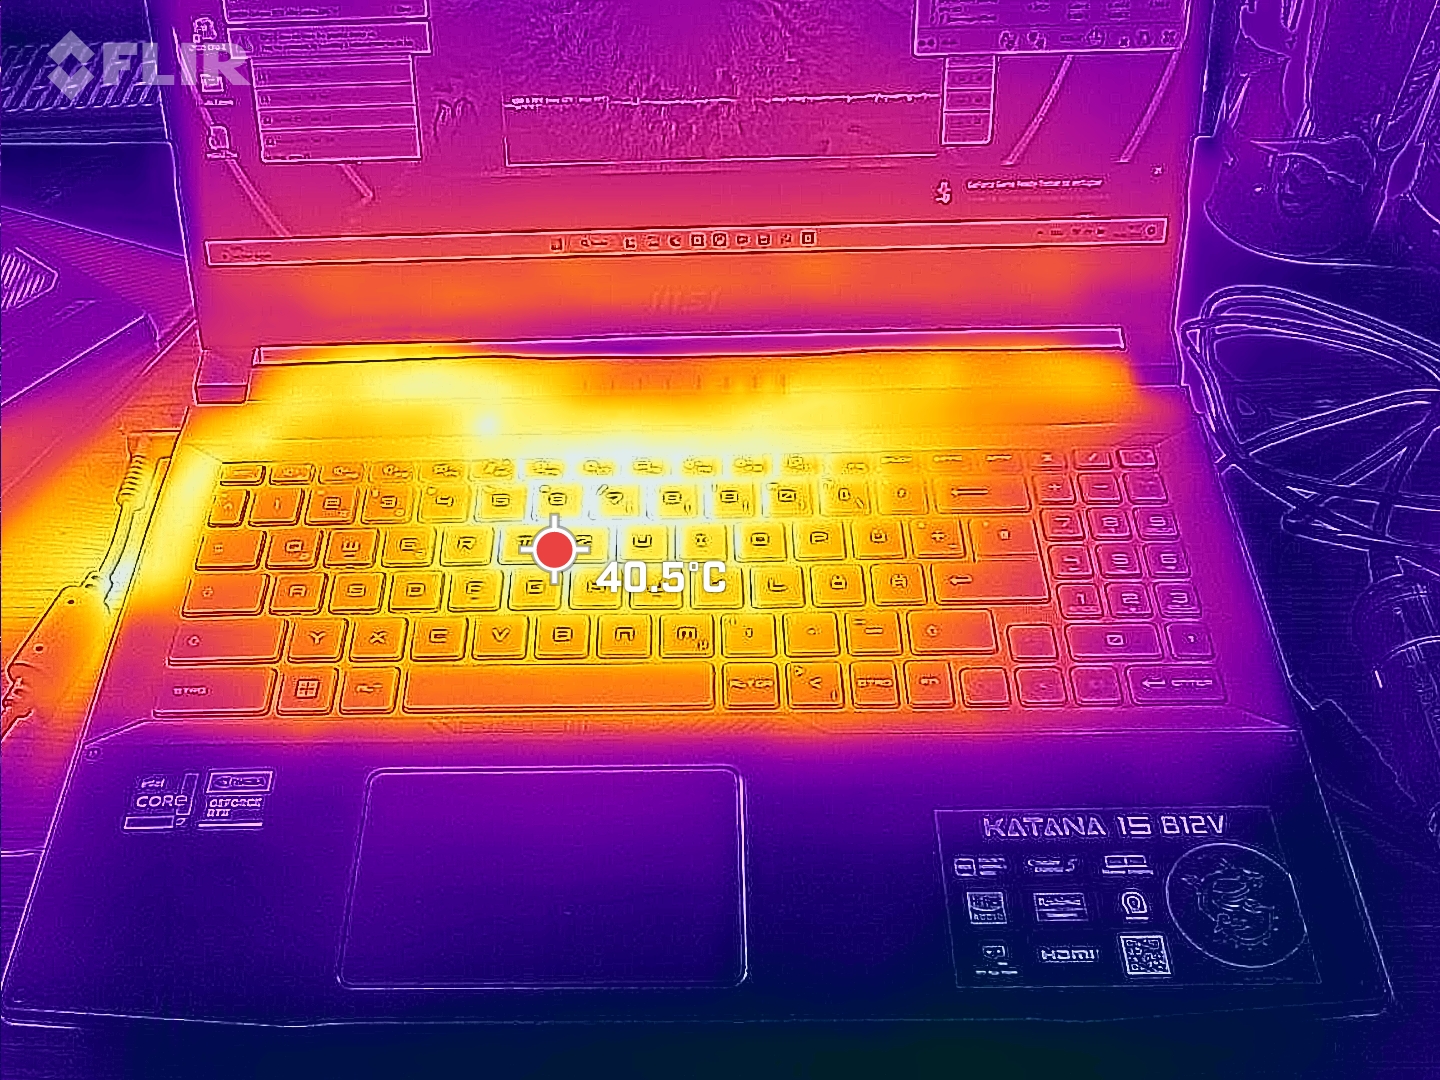
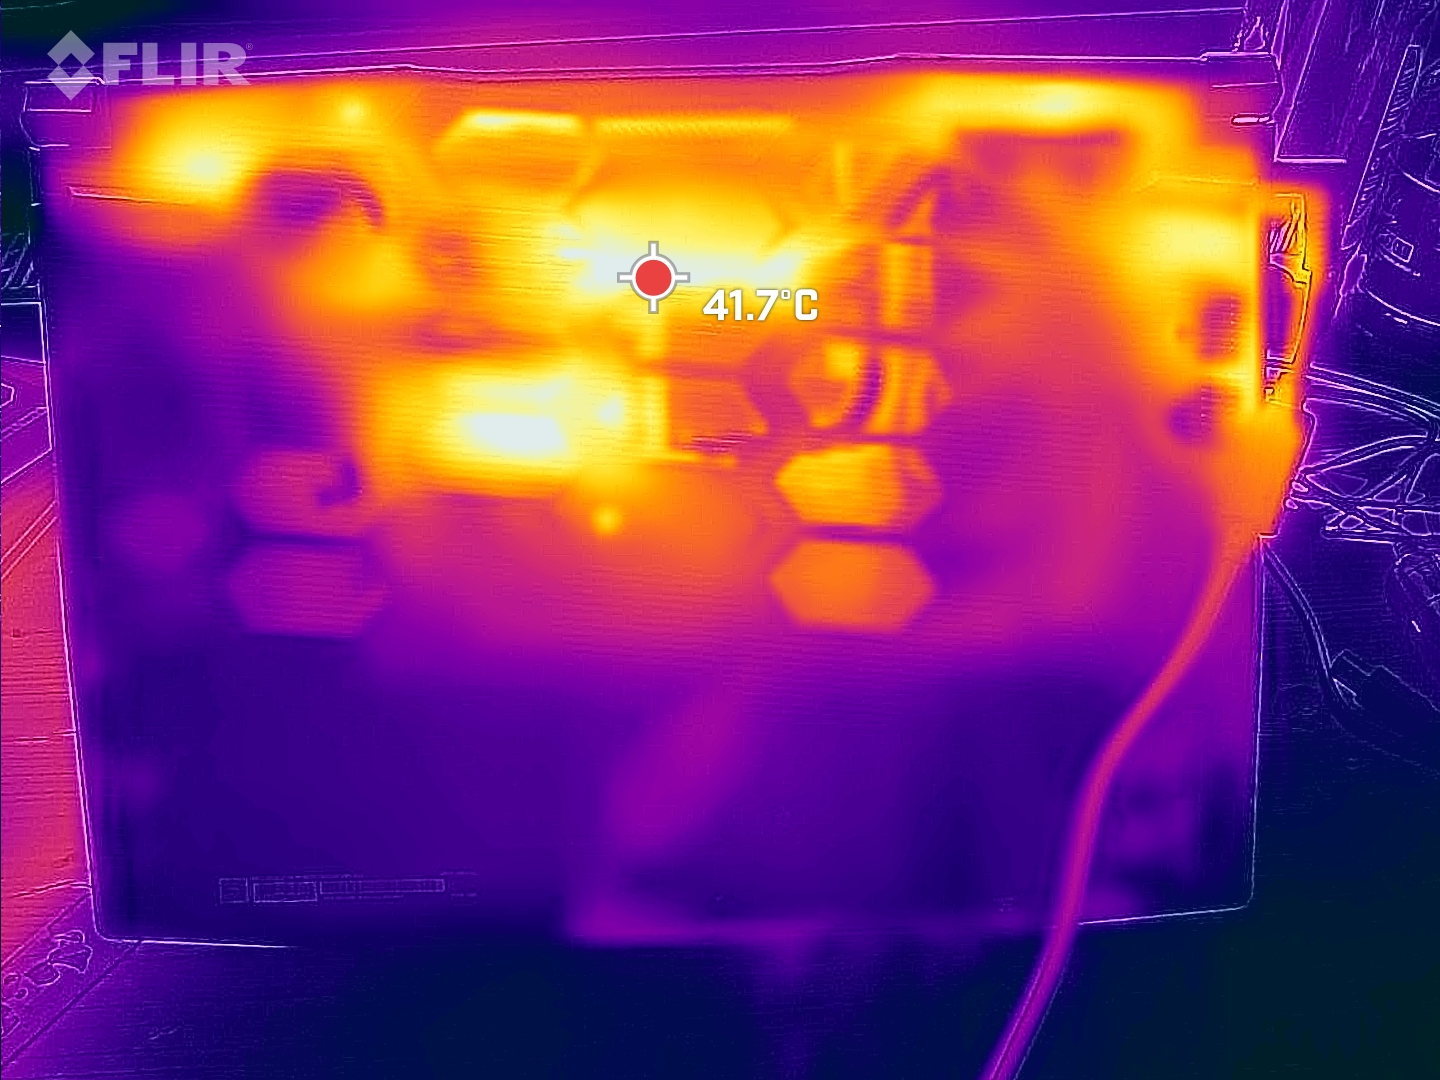
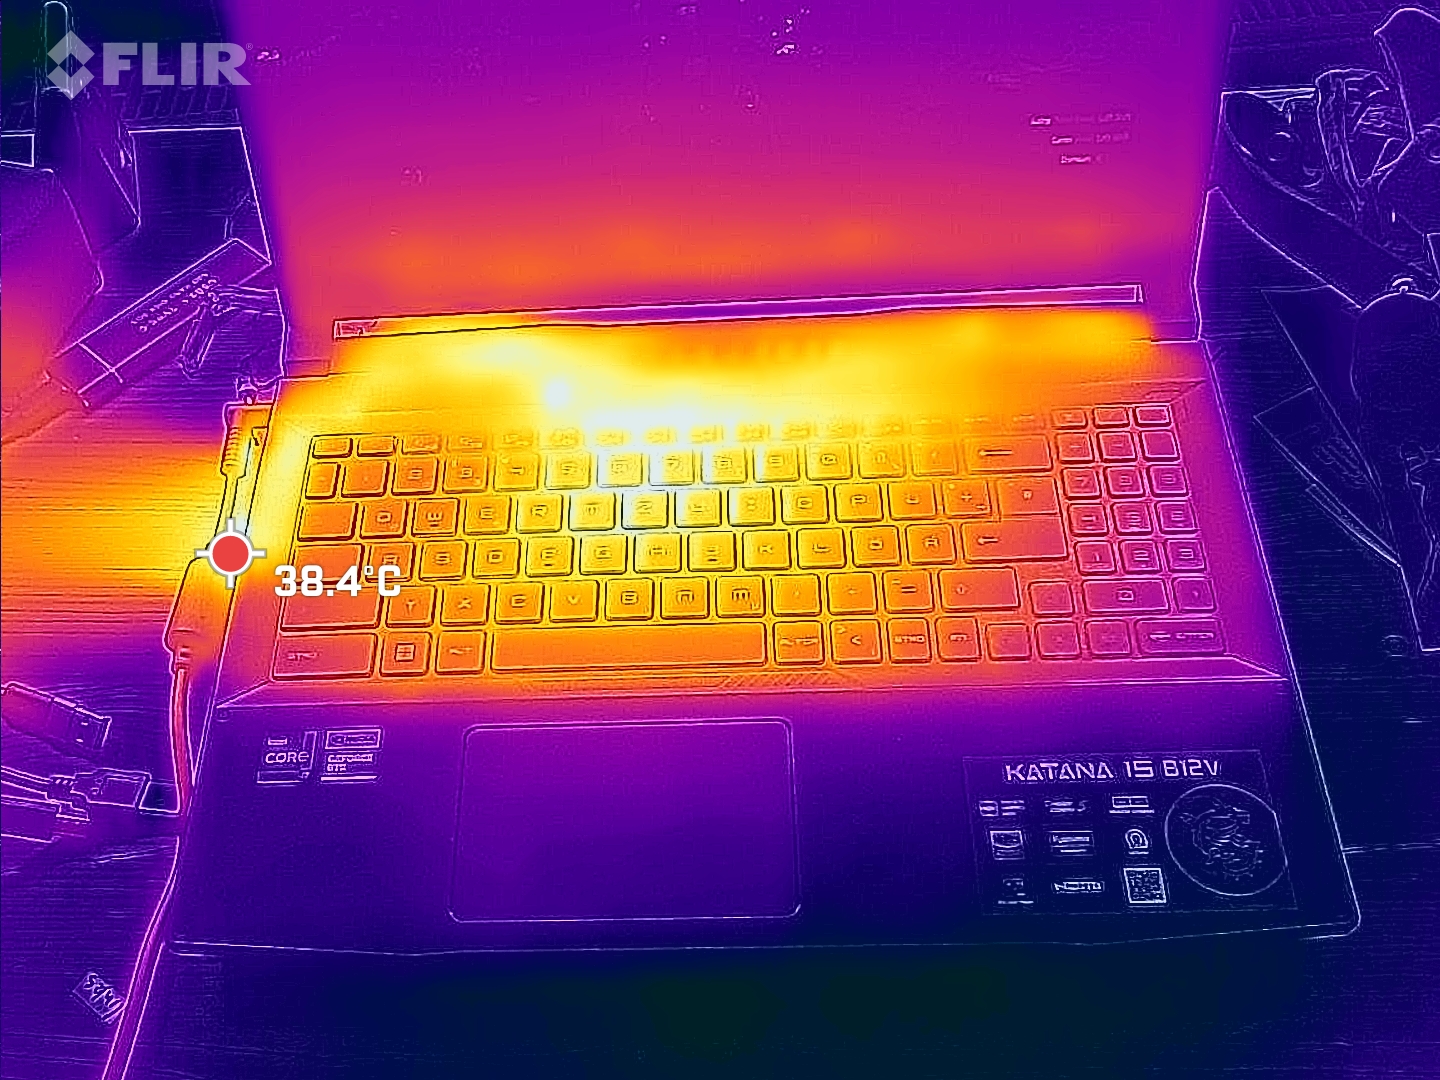
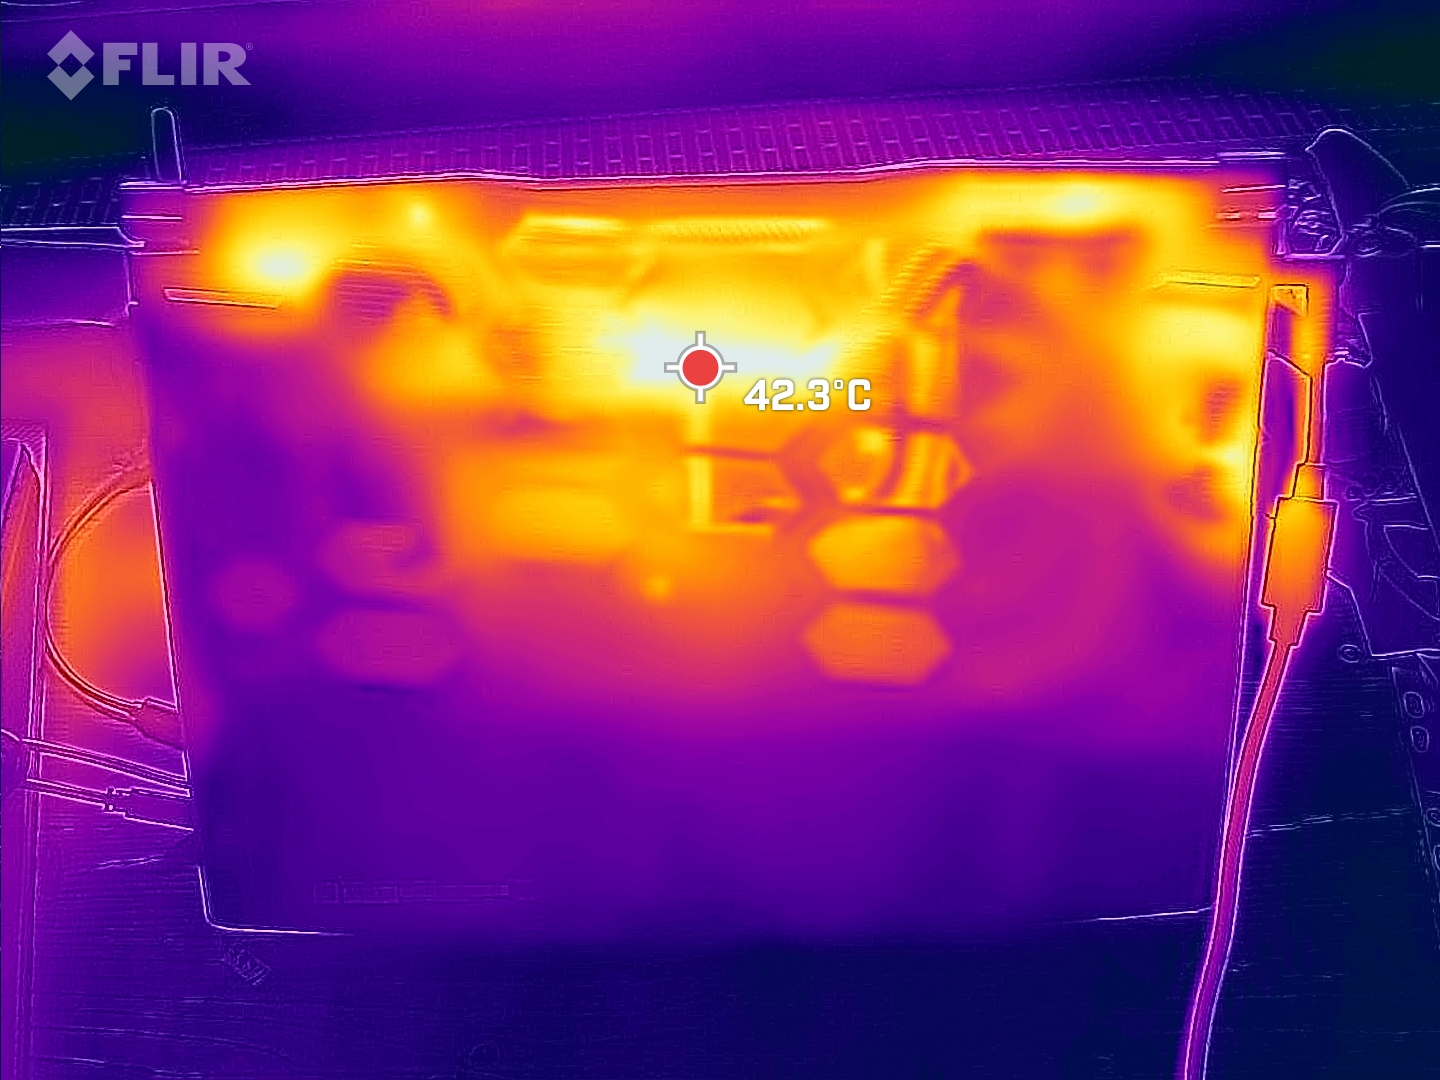
Temperatura
Gorące punkty mają nieco poniżej 50°C na środku, w kierunku tyłu. Miejsca oparcia dłoni pozostają cały czas chłodne, ale klawisze WASD mogą się trochę nagrzewać pod dużym naciskiem.
(-) Maksymalna temperatura w górnej części wynosi 47 °C / 117 F, w porównaniu do średniej 40.4 °C / 105 F , począwszy od 21.2 do 68.8 °C dla klasy Gaming.
(-) Dno nagrzewa się maksymalnie do 48 °C / 118 F, w porównaniu do średniej 43.2 °C / 110 F
(+) W stanie bezczynności średnia temperatura górnej części wynosi 29 °C / 84 F, w porównaniu ze średnią temperaturą urządzenia wynoszącą 33.9 °C / ### class_avg_f### F.
(±) Podczas gry w Wiedźmina 3 średnia temperatura górnej części wynosi 35 °C / 95 F, w porównaniu do średniej temperatury urządzenia wynoszącej 33.9 °C / ## #class_avg_f### F.
(+) Podpórki pod nadgarstki i touchpad są chłodniejsze niż temperatura skóry i maksymalnie 23 °C / 73.4 F i dlatego są chłodne w dotyku.
(+) Średnia temperatura obszaru podparcia dłoni w podobnych urządzeniach wynosiła 28.8 °C / 83.8 F (+5.8 °C / 10.4 F).
| MSI Katana 15 B12VEK Intel Core i7-12650H, NVIDIA GeForce RTX 4050 Laptop GPU | MSI Katana GF66 12UGS Intel Core i7-12700H, NVIDIA GeForce RTX 3070 Ti Laptop GPU | MSI Pulse GL66 12UEK Intel Core i9-12900H, NVIDIA GeForce RTX 3060 Laptop GPU | Lenovo Legion 5 15IAH7H 82RB Intel Core i7-12700H, NVIDIA GeForce RTX 3060 Laptop GPU | Asus TUF Gaming F15 FX507ZM Intel Core i7-12700H, NVIDIA GeForce RTX 3060 Laptop GPU | Schenker XMG Core 15 (M22) AMD Ryzen 7 6800H, NVIDIA GeForce RTX 3060 Laptop GPU | |
|---|---|---|---|---|---|---|
| Heat | -17% | -2% | 16% | -2% | 6% | |
| Maximum Upper Side * (°C) | 47 | 61 -30% | 50 -6% | 37.8 20% | 44.4 6% | 48 -2% |
| Maximum Bottom * (°C) | 48 | 55 -15% | 47 2% | 51 -6% | 48.8 -2% | 51 -6% |
| Idle Upper Side * (°C) | 35 | 43 -23% | 36 -3% | 25.8 26% | 37.8 -8% | 28 20% |
| Idle Bottom * (°C) | 38 | 38 -0% | 38 -0% | 28.8 24% | 39.6 -4% | 33 13% |
* ... im mniej tym lepiej
Stress Test
Rdzenie bardzo krótko rozpoczynają nasz stress test z częstotliwością 3,1 GHz. Po kilku sekundach temperatury rdzeni rosną do 89°C, po czym częstotliwości taktowania spadają i osiągają średnio stabilne 2,5 GHz. Pobór mocy wynosi średnio 50 W. Temperatury stabilizują się na poziomie około 82 °C
Taktowanie GPU waha się między 2 a 2,5 GHz. Osiągane są średnie temperatury 75 °C, a pobór mocy wynosi tylko około 62 W.
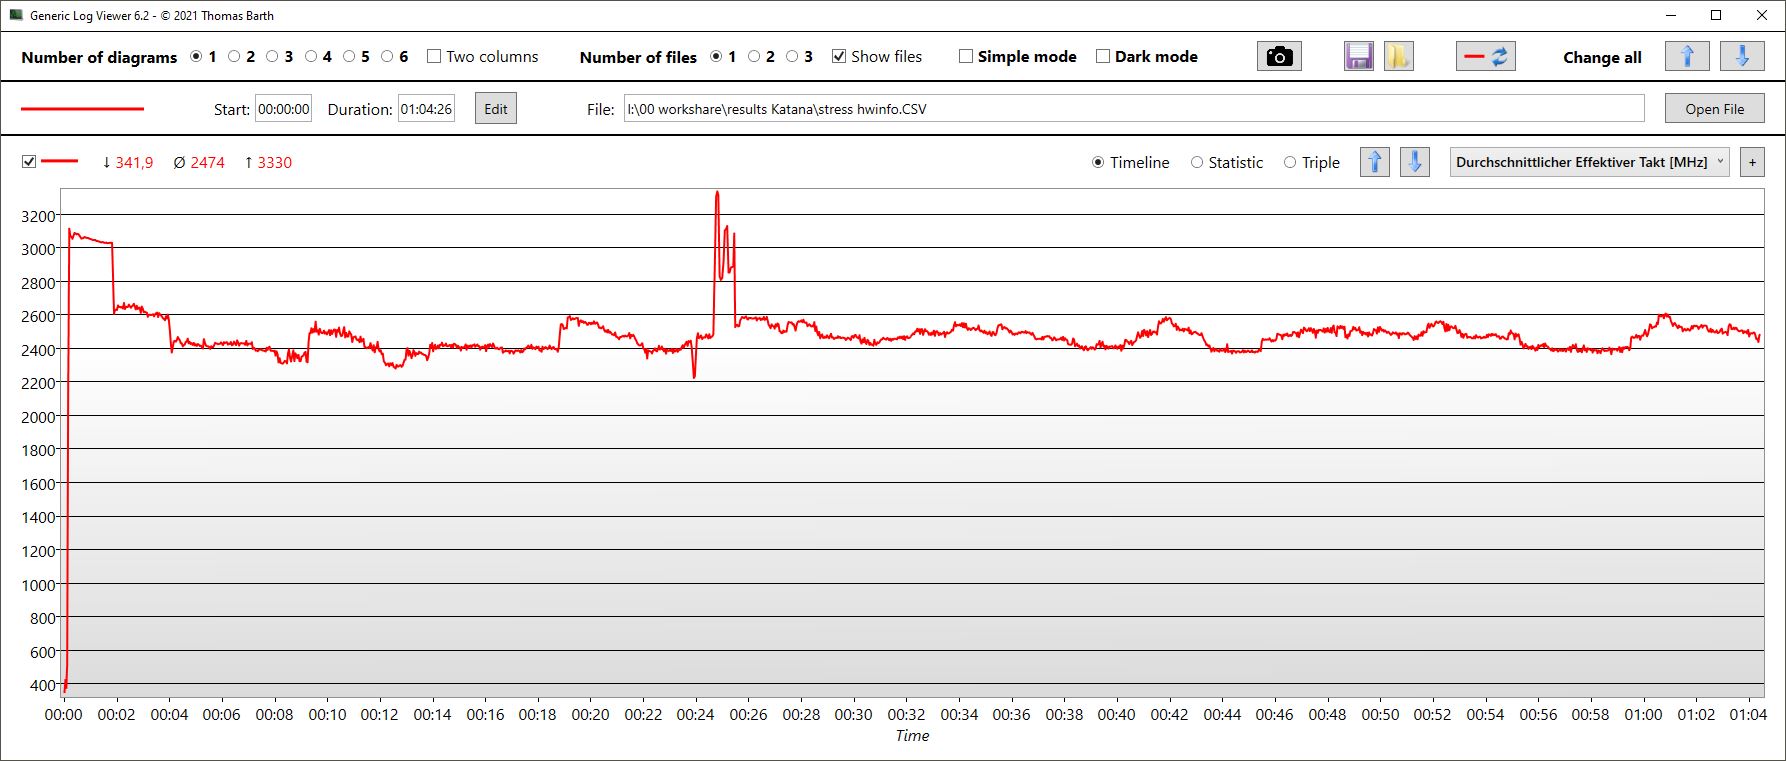
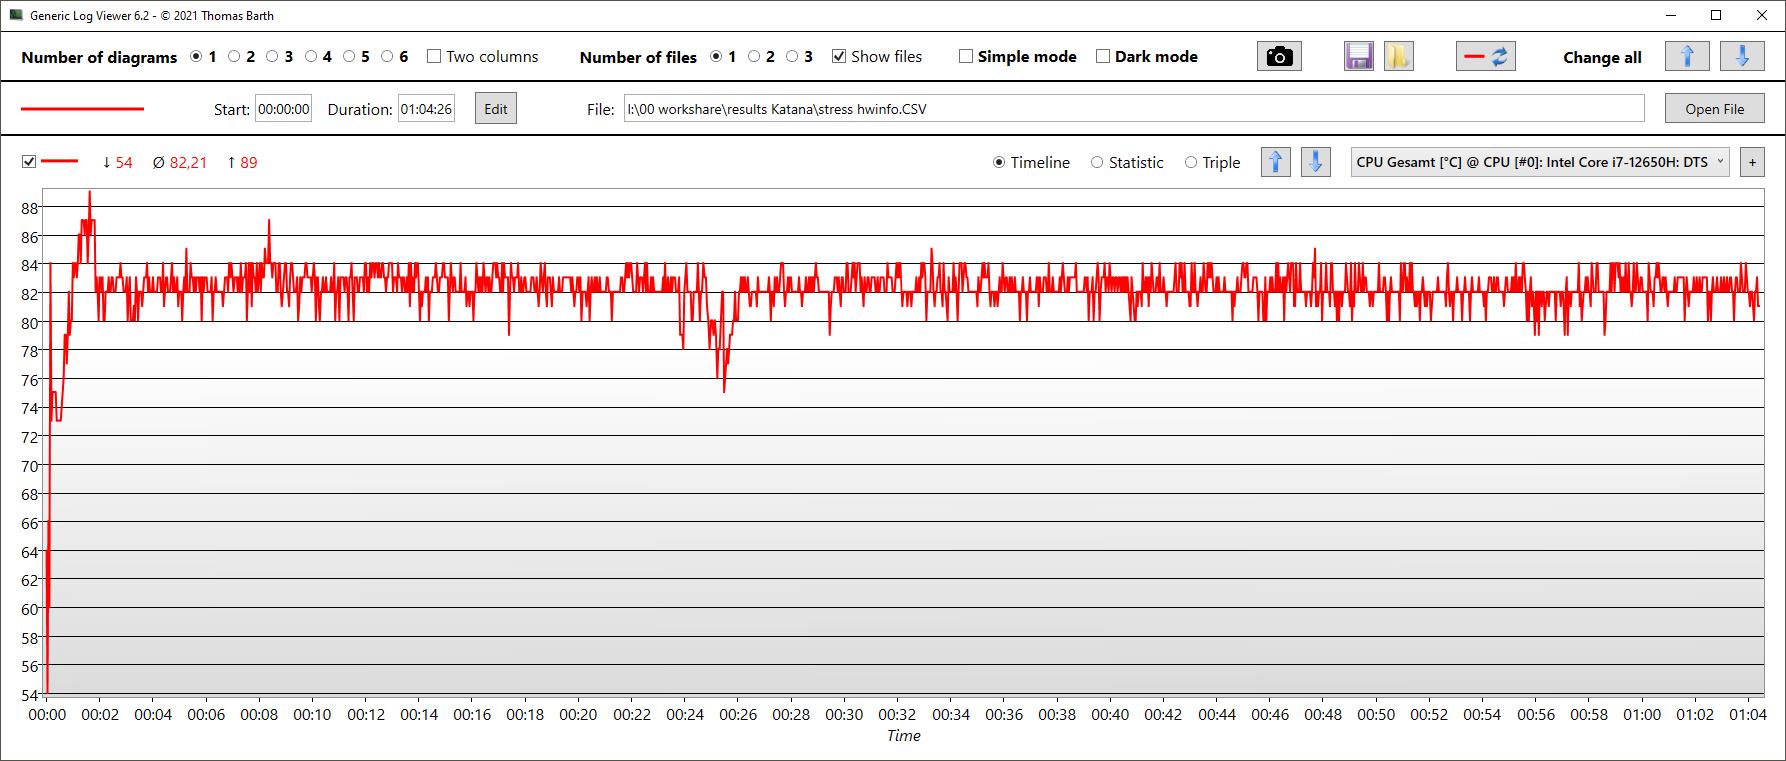
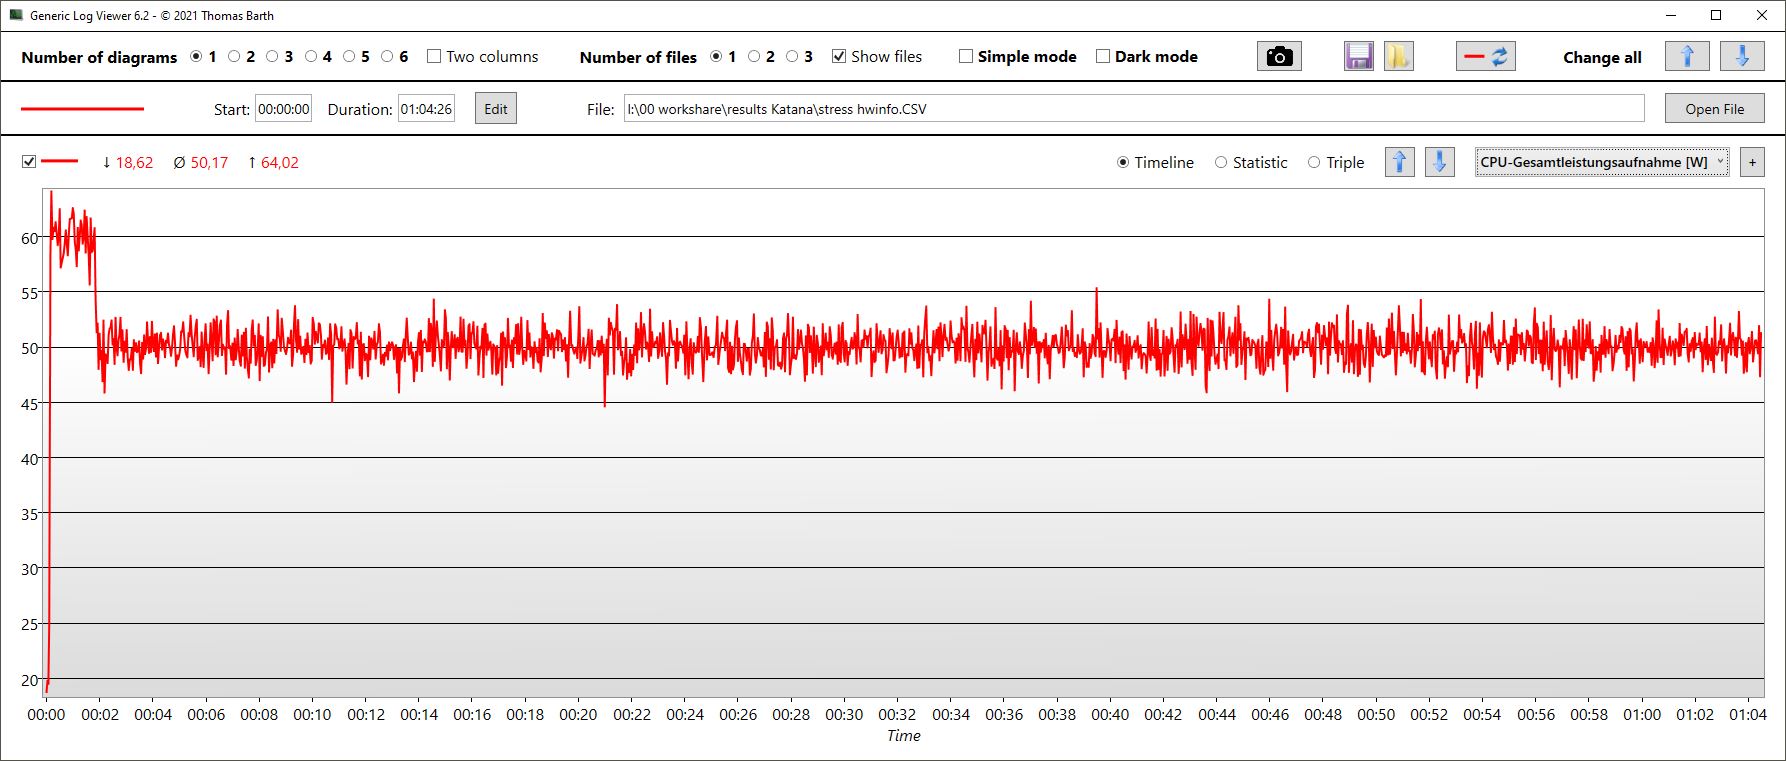
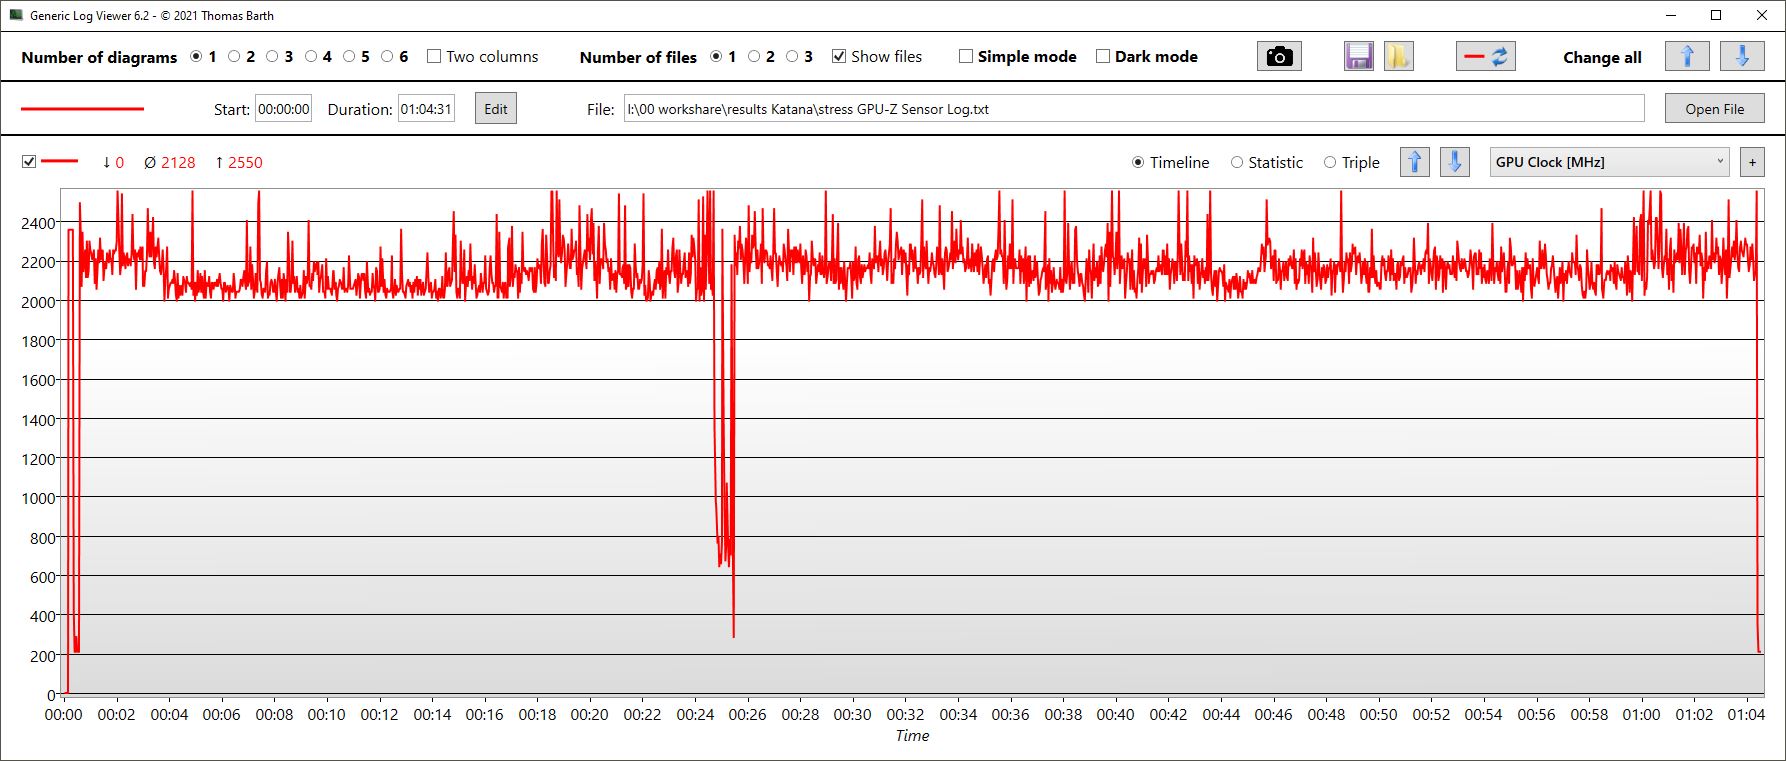
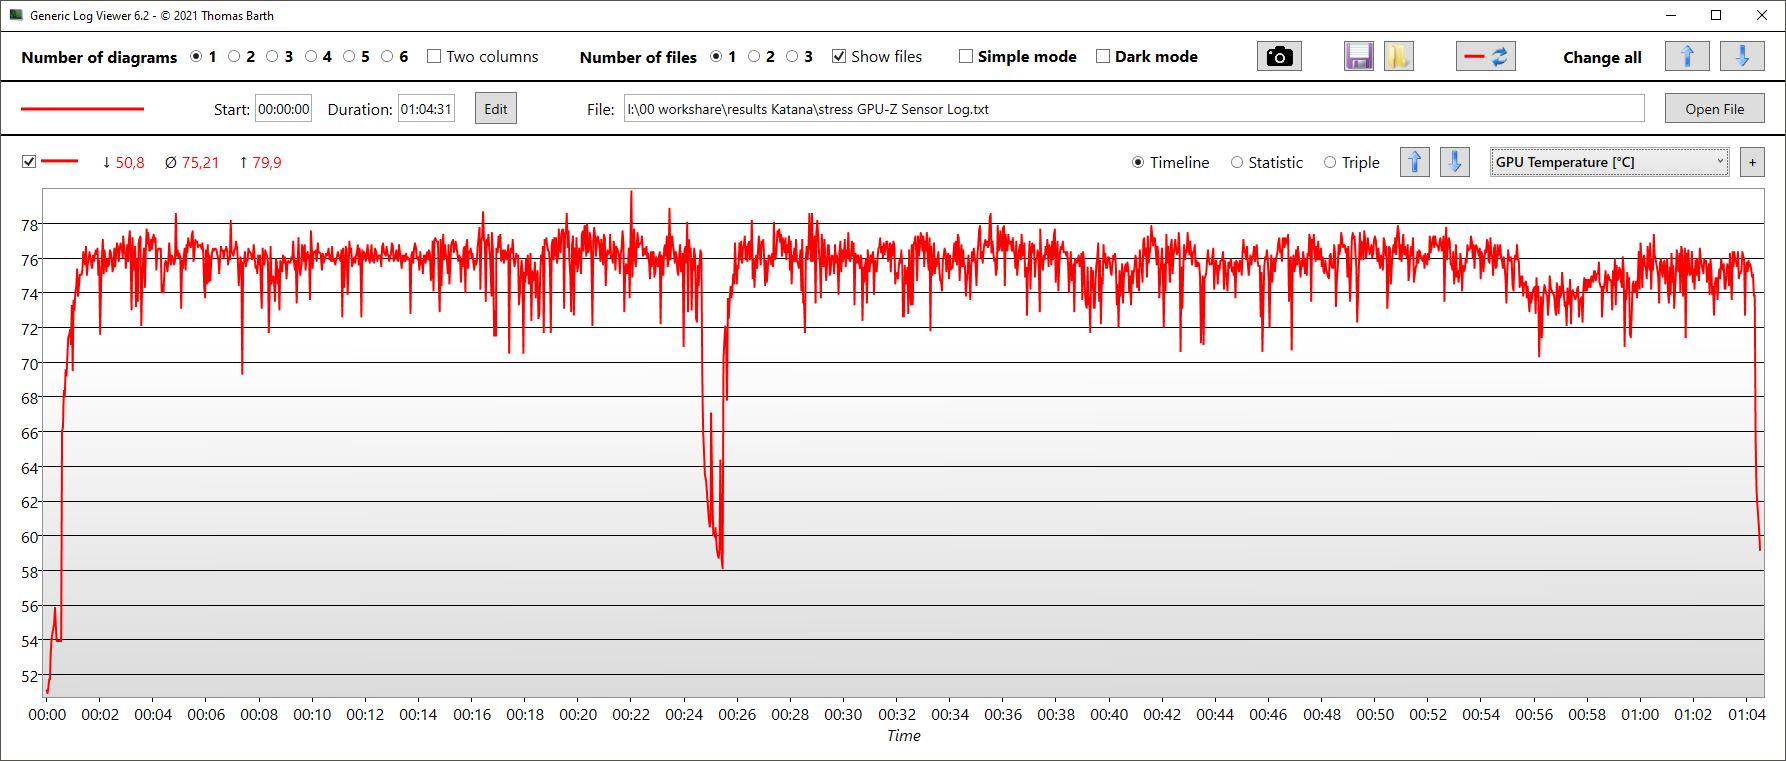
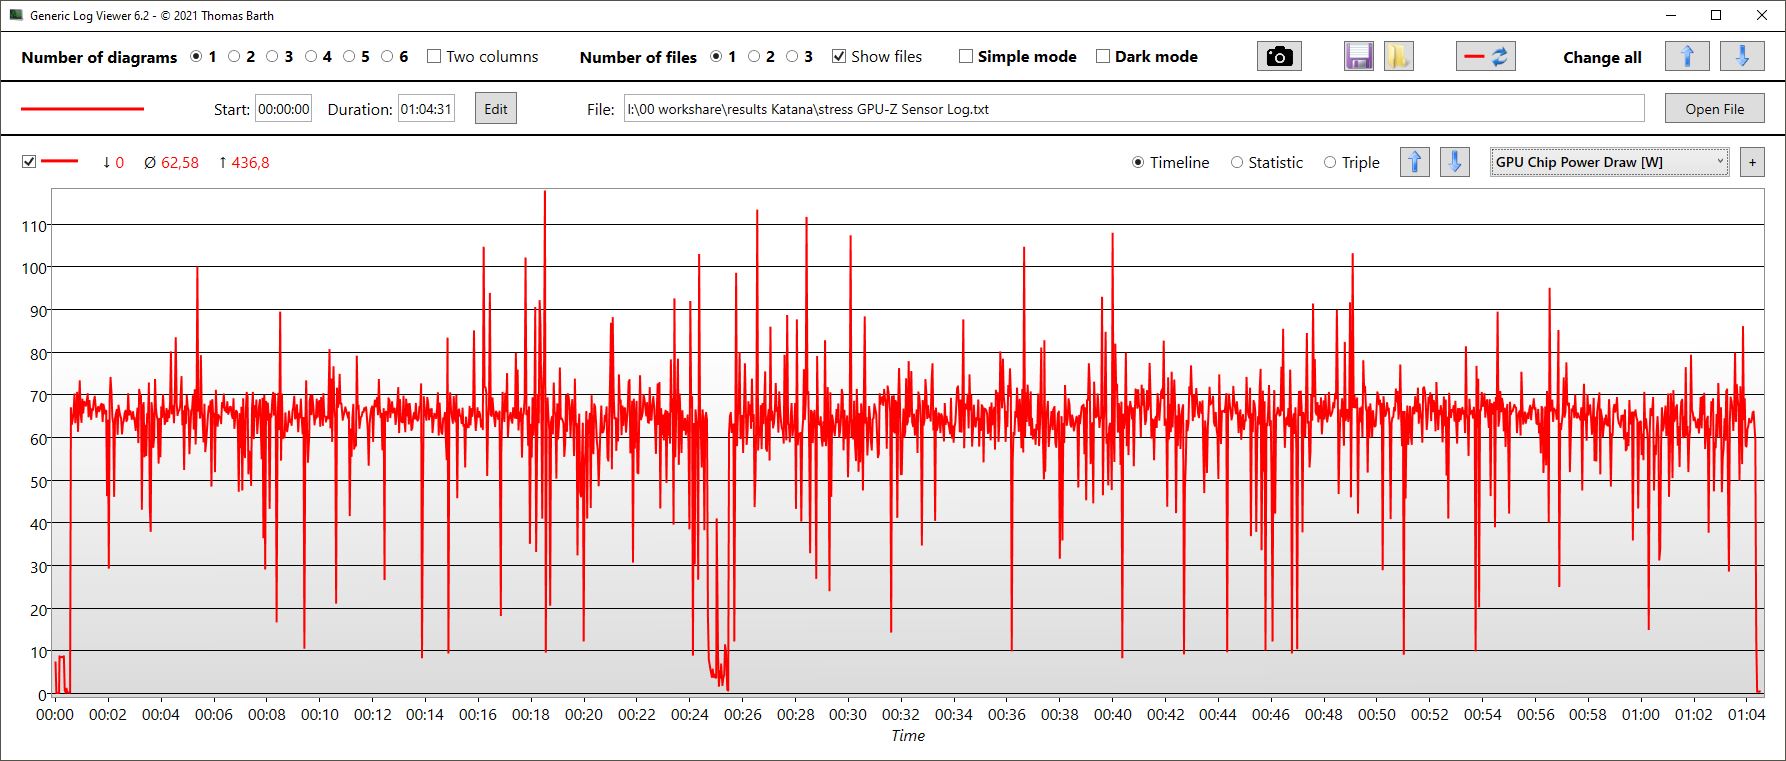
| ZegarCPU (GHz) | Zegar GPU (MHz) | Średnia temperatura CPU (°C) | Średnia temperatura GPU (°C) | |
| Prime95 + FurMark Stress | 2,5 | 2.121 | 82 | 75 |
| Witcher 3 Stres | 0,6 | 2,400 | 75 | 75 |
Mówcy
Głośniki stereo oferują zrównoważone średnie i wysokie tony, ale prawie żadnych basów i co najwyżej średnią głośność. Gniazdo słuchawkowe jest idealne dla urządzeń analogowych.
MSI Katana 15 B12VEK analiza dźwięku
(±) | głośność głośnika jest średnia, ale dobra (75.69 dB)
Bas 100 - 315 Hz
(-) | prawie brak basu - średnio 21.5% niższa od mediany
(±) | liniowość basu jest średnia (8.8% delta do poprzedniej częstotliwości)
Średnie 400 - 2000 Hz
(+) | zbalansowane środki średnie - tylko 4.1% od mediany
(+) | średnie są liniowe (4.8% delta do poprzedniej częstotliwości)
Wysokie 2–16 kHz
(+) | zrównoważone maksima - tylko 2.3% od mediany
(+) | wzloty są liniowe (4% delta do poprzedniej częstotliwości)
Ogólnie 100 - 16.000 Hz
(±) | liniowość ogólnego dźwięku jest średnia (17.3% różnicy w stosunku do mediany)
W porównaniu do tej samej klasy
» 47% wszystkich testowanych urządzeń w tej klasie było lepszych, 12% podobnych, 41% gorszych
» Najlepszy miał deltę 6%, średnia wynosiła ###średnia###%, najgorsza wynosiła 132%
W porównaniu do wszystkich testowanych urządzeń
» 32% wszystkich testowanych urządzeń było lepszych, 8% podobnych, 59% gorszych
» Najlepszy miał deltę 4%, średnia wynosiła ###średnia###%, najgorsza wynosiła 134%
Lenovo Legion 5 15IAH7H 82RB analiza dźwięku
(+) | głośniki mogą odtwarzać stosunkowo głośno (83.3 dB)
Bas 100 - 315 Hz
(-) | prawie brak basu - średnio 28.2% niższa od mediany
(±) | liniowość basu jest średnia (12.9% delta do poprzedniej częstotliwości)
Średnie 400 - 2000 Hz
(±) | wyższe średnie - średnio 5.7% wyższe niż mediana
(±) | liniowość środka jest średnia (7.4% delta do poprzedniej częstotliwości)
Wysokie 2–16 kHz
(+) | zrównoważone maksima - tylko 3.3% od mediany
(+) | wzloty są liniowe (6.4% delta do poprzedniej częstotliwości)
Ogólnie 100 - 16.000 Hz
(±) | liniowość ogólnego dźwięku jest średnia (23.6% różnicy w stosunku do mediany)
W porównaniu do tej samej klasy
» 86% wszystkich testowanych urządzeń w tej klasie było lepszych, 4% podobnych, 10% gorszych
» Najlepszy miał deltę 6%, średnia wynosiła ###średnia###%, najgorsza wynosiła 132%
W porównaniu do wszystkich testowanych urządzeń
» 71% wszystkich testowanych urządzeń było lepszych, 6% podobnych, 23% gorszych
» Najlepszy miał deltę 4%, średnia wynosiła ###średnia###%, najgorsza wynosiła 134%
Zarządzanie energią - wydajny RTX 4050 w MSI Katana
Pobór mocy
Pod względem zużycia energii nowa Katana 15 jest bardziej oszczędna od konkurencji z GPU ostatniej generacji. Nasz model testowy ma dobre wskaźniki podczas biegu jałowego i pozostają one takie nawet podczas grania lub w dużym stresie. Choć wydajność 3D jest również nieco niższa, różnica w zużyciu energii jest znacznie większa niż różnica w wydajności.
Na przykład zarówno Legion 5 jak i XMG Core 15 aż do Asus TUF Gaming F15 zużywają prawie 50 procent więcej podczas gry z Witcher 3 niż nasza Katana 15! Ale Katana GF66 ze swoim RTX 3070 Ti również zużywa w grach tylko 16 procent więcej.
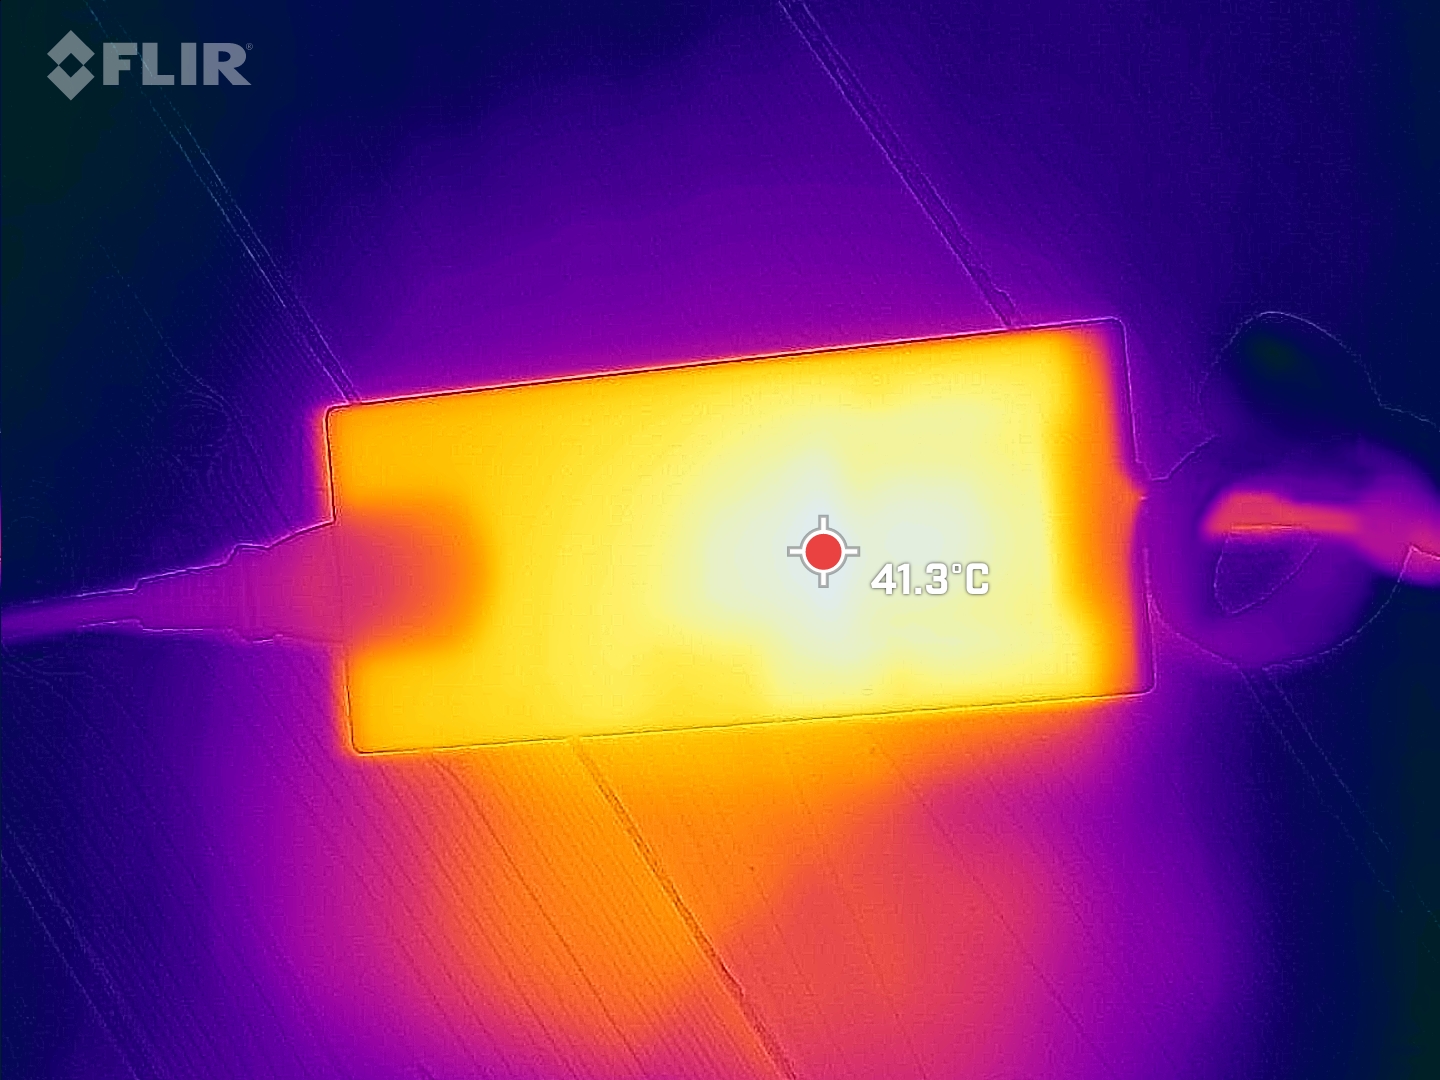
Zmierzyliśmy krótkotrwały maksymalny pobór do 189 W. Standardowy zasilacz Chicony, który jest przeznaczony do 240 W, powinien poradzić sobie z tym bardzo dobrze.
| wyłączony / stan wstrzymania | |
| luz | |
| obciążenie |
|
Legenda:
min: | |
| MSI Katana 15 B12VEK i7-12650H, GeForce RTX 4050 Laptop GPU, Micron 2400 MTFDKBA1T0QFM, IPS, 1920x1080, 15.6" | MSI Katana GF66 12UGS i7-12700H, GeForce RTX 3070 Ti Laptop GPU, Micron 2450 1TB MTFDKBA1T0TFK, IPS, 1920x1080, 15.6" | MSI Pulse GL66 12UEK i9-12900H, GeForce RTX 3060 Laptop GPU, Micron 2450 512GB MTFDKBA512TFK, IPS, 1920x1080, 15.6" | Lenovo Legion 5 15IAH7H 82RB i7-12700H, GeForce RTX 3060 Laptop GPU, , IPS, 1920x1080, 15.6" | Asus TUF Gaming F15 FX507ZM i7-12700H, GeForce RTX 3060 Laptop GPU, SK Hynix HFM001TD3JX013N, IPS, 1920x1080, 15.6" | Schenker XMG Core 15 (M22) R7 6800H, GeForce RTX 3060 Laptop GPU, Samsung SSD 980 Pro 1TB MZ-V8P1T0BW, IPS, 2560x1440, 15.6" | Przeciętny NVIDIA GeForce RTX 4050 Laptop GPU | Średnia w klasie Gaming | |
|---|---|---|---|---|---|---|---|---|
| Power Consumption | -26% | -6% | -121% | -34% | -34% | -30% | -64% | |
| Idle Minimum * (Watt) | 8.5 | 9 -6% | 7 18% | 19.8 -133% | 6.3 26% | 11.8 -39% | 9.95 ? -17% | 13 ? -53% |
| Idle Average * (Watt) | 10.2 | 13 -27% | 13 -27% | 26.2 -157% | 9.8 4% | 14.7 -44% | 15.8 ? -55% | 18.7 ? -83% |
| Idle Maximum * (Watt) | 11.3 | 20 -77% | 13.7 -21% | 48.2 -327% | 26.5 -135% | 15 -33% | 20.1 ? -78% | 24.3 ? -115% |
| Load Average * (Watt) | 84 | 100 -19% | 48.4 42% | 102.9 -23% | 103.8 -24% | 100 -19% | 88 ? -5% | 110.2 ? -31% |
| Witcher 3 ultra * (Watt) | 128 | 149 -16% | 148 -16% | 186.7 -46% | 189 -48% | 184 -44% | ||
| Load Maximum * (Watt) | 189 | 212 -12% | 244 -29% | 268 -42% | 241.9 -28% | 237 -25% | 176.3 ? 7% | 258 ? -37% |
* ... im mniej tym lepiej
Power Consumption Witcher 3 / Stresstest
Power Consumption with an External Monitor
Czas pracy na baterii
Gdzie jeszcze budżetowe laptopy oszczędzają? Prawidłowo, na akumulatorze. Model w Katanie 15 ma tylko 53 Wh, co jest standardem w Katanie czy Pulse. Reszta konkurencji ma baterie o pojemności od 62 do 90 Wh. Odpowiednio, czasy pracy są raczej przeciętne, mimo stosunkowo dobrej wydajności energetycznej.
Wieczór filmowy można zaplanować na około 4 godziny i 20 minut. W naszym teście WLAN uzyskaliśmy znacząco różne wyniki w zależności od wybranego trybu. W trybie Balanced przy maksymalnej jasności (258 nitów) akumulator wytrzymuje tylko 2 godziny i 20 minut. Z kolei w Power Saver przy 150 nitach zmierzyliśmy mniej więcej taki sam czas, jak w teście wideo.
| MSI Katana 15 B12VEK i7-12650H, GeForce RTX 4050 Laptop GPU, 53.5 Wh | MSI Katana GF66 12UGS i7-12700H, GeForce RTX 3070 Ti Laptop GPU, 52 Wh | MSI Pulse GL66 12UEK i9-12900H, GeForce RTX 3060 Laptop GPU, 53.5 Wh | Lenovo Legion 5 15IAH7H 82RB i7-12700H, GeForce RTX 3060 Laptop GPU, 80 Wh | Asus TUF Gaming F15 FX507ZM i7-12700H, GeForce RTX 3060 Laptop GPU, 90 Wh | Schenker XMG Core 15 (M22) R7 6800H, GeForce RTX 3060 Laptop GPU, 62 Wh | Średnia w klasie Gaming | |
|---|---|---|---|---|---|---|---|
| Czasy pracy | -26% | 9% | -6% | -8% | 27% | 54% | |
| H.264 (h) | 4.4 | 4 -9% | 8.64 ? 96% | ||||
| WiFi v1.3 (h) | 4.3 | 2.4 -44% | 5 16% | 4.8 12% | 7.8 81% | 7.11 ? 65% | |
| Load (h) | 1.5 | 1.4 -7% | 1.9 27% | 1.1 -27% | 1.1 -27% | 1.1 -27% | 1.502 ? 0% |
| Reader / Idle (h) | 8.1 | 15.8 | 8.71 ? |
Za
Przeciw
Werdykt - budżetowy RTX 4050 wciąż jest za drogi

MSI Katana 15 B12 łączy procesor Gen12 z RTX 4050, co w zasadzie nie jest złym pomysłem dla budżetowego gracza. Procesor jest cokolwiek zły, a GPU w Katanie 15 okazuje się znacznie wydajniejsze od zeszłorocznych modeli.
Jednak naszym głównym punktem krytyki dla graczy budżetowych jest cena: podczas gdy można dostać budżetowe laptopy z RTX 3060 od około 800 USD, tutaj płacimy całe 1499,99 USD! Zalety wydajnościowe RTX 4050 nie uzasadniają takiej dopłaty do ceny. Tym bardziej, że niemal wszystkie inne komponenty w Katanie 15 są wyraźnie klasy budżetowej, począwszy od częściowo przestarzałych portów, przez dość ciemny wyświetlacz Full HD, aż po stosunkowo niewielki akumulator. Do tego dochodzi fakt, że wydajność laptopa ma tendencję do pozostawania w tyle za większością graczy z RTX 3060, a RTX 4050 wyraźnie mija się z celem TGP, jakim jest 105.
MSI Katana 15 B12 łączy dobry procesor last-gen z aktualnym RTX 4050, ale nie udaje się ustalić ceny rozsądnej dla wielu budżetowych podzespołów. Obecnie Katana 15 jest po prostu zbyt droga.
W końcu jest mnóstwo alternatyw. Jeśli chcesz większej wydajności i mniejszej liczby budżetowych komponentów w jeszcze niższej cenie, najlepszym wyborem jest np Lenovo Legion 5 ze swoim RTX 3060. Ale większość innych gier z RTX 3060 powinna być również tańsza, lepiej wyposażona i przede wszystkim szybsza.
Cena i dostępność
W oficjalnym sklepie internetowym MSI US, Katana 15 B12VGK-082 wyceniona jest na 1 499,99 USD. Zainteresowani nabywcy (w zależności od lokalizacji) mogą znaleźć ten sam model w tańszych cenach w innych miejscach na resellerach takich jak Amazon.
MSI Katana 15 B12VEK
- 28/03/2023 v7 (old)
Christian Hintze
Przezroczystość
Wyboru urządzeń do recenzji dokonuje nasza redakcja. Próbka testowa została udostępniona autorowi jako pożyczka od producenta lub sprzedawcy detalicznego na potrzeby tej recenzji. Pożyczkodawca nie miał wpływu na tę recenzję, producent nie otrzymał też kopii tej recenzji przed publikacją. Nie było obowiązku publikowania tej recenzji. Jako niezależna firma medialna, Notebookcheck nie podlega władzy producentów, sprzedawców detalicznych ani wydawców.
Tak testuje Notebookcheck
Każdego roku Notebookcheck niezależnie sprawdza setki laptopów i smartfonów, stosując standardowe procedury, aby zapewnić porównywalność wszystkich wyników. Od około 20 lat stale rozwijamy nasze metody badawcze, ustanawiając przy tym standardy branżowe. W naszych laboratoriach testowych doświadczeni technicy i redaktorzy korzystają z wysokiej jakości sprzętu pomiarowego. Testy te obejmują wieloetapowy proces walidacji. Nasz kompleksowy system ocen opiera się na setkach uzasadnionych pomiarów i benchmarków, co pozwala zachować obiektywizm.Price comparison

