Werdykt — nowy, profesjonalny wygląd
W przeciwieństwie do zeszłorocznego modelu ThinkPad X1 2-w-1 10. generacji może zbytnio przypominać modele z serii IdeaPad lub Yoga, to zaktualizowany ThinkPad X1 2-w-1 11. generacji zawiera więcej elementów wizualnych charakterystycznych dla serii ThinkPad, co nadaje mu bardziej profesjonalny wygląd. Zmiany dotyczące przycisku zasilania, panelu dotykowego, ładowania pióra oraz ogólnych wymiarów i wagi sprawiają, że ThinkPad X1 2-in-1 Gen 11 jest łatwiejszy w obsłudze we wszystkich trybach pracy.
Nowe gniazdo do ładowania pióra budzi jednak mieszane odczucia. Chociaż jest to rozwiązanie bardziej estetyczne i bezpieczniejsze niż w zeszłorocznym modelu, nowe pióro musi być w zamian cieńsze. Mały rysik Slim Pen 2 może zatem być mniej wygodny w trzymaniu niż grubszy rysik Yoga Pen, który był dostarczany wraz z modelem ThinkPad X1 2-w-1 11. generacji. Innymi słowy, choć preferujemy konstrukcję obudowy 11. generacji w porównaniu z 10. generacją, w przypadku rysików sytuacja wygląda odwrotnie.
Jeśli chodzi o wydajność, nie należy oczekiwać, że tegoroczny model będzie działał znacznie szybciej od zeszłorocznego, chyba że zostanie wyposażony w najwyższej klasy procesor Core Ultra X7 z znacznie bardziej imponującym procesorem graficznym Arc B390.
Za
Przeciw
Cena i dostępność
Firma Lenovo rozpoczęła już sprzedaż modelu ThinkPad X1 2-w-1 11. generacji w cenie od 2400 dolarów.
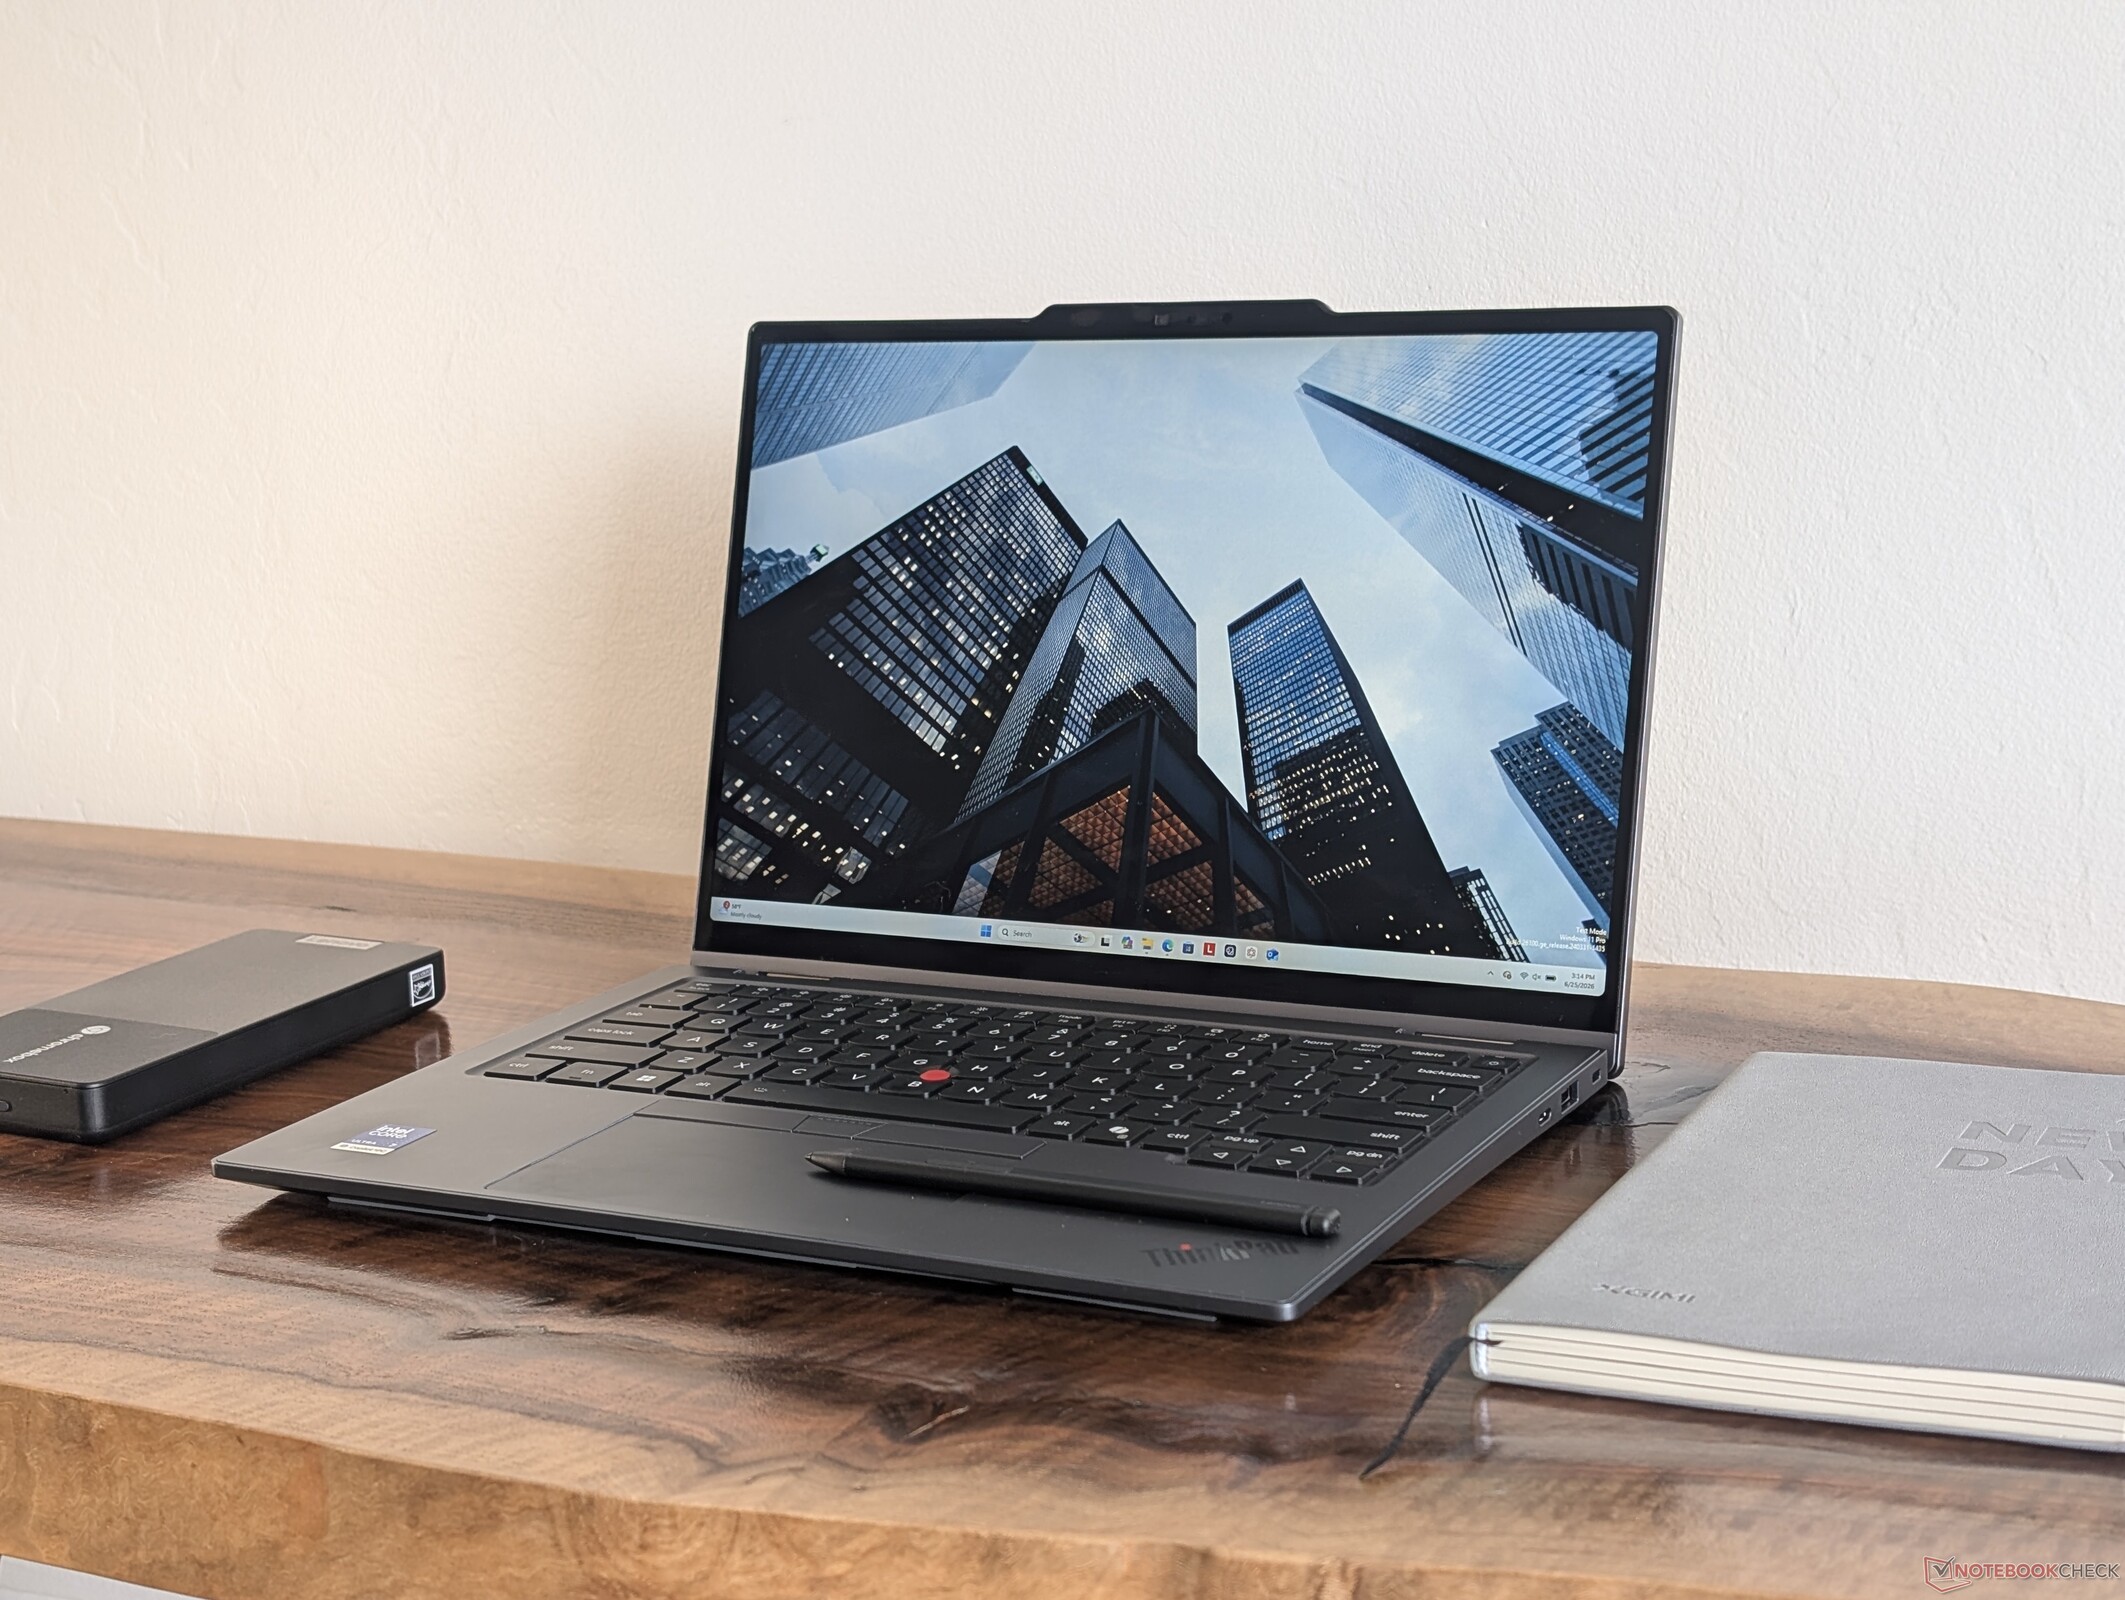
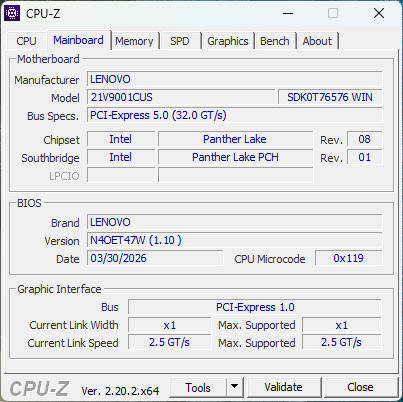
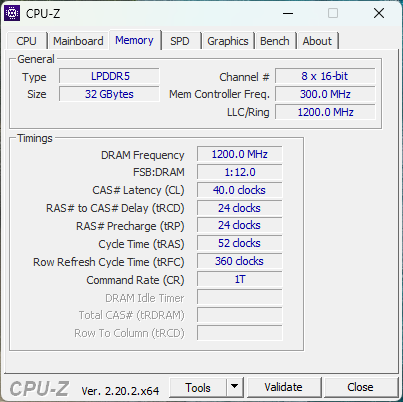
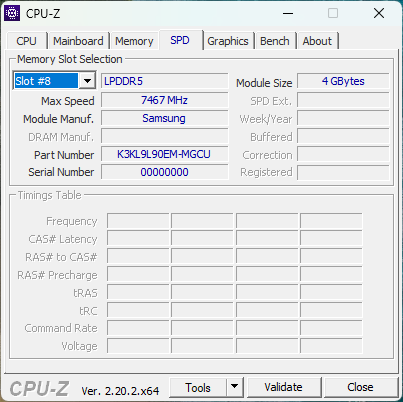
ThinkPad X1 2-w-1 11. generacji jest bezpośrednim następcą zeszłorocznego modelu ThinkPad X1 2-w-1 10. generacji. Podczas gdy dwa poprzednie modele były identyczne pod względem wyglądu, tegoroczna generacja 11 została całkowicie przeprojektowana i oferuje zarówno nowe procesory Intel Panther Lake, jak i odświeżoną stylistykę.
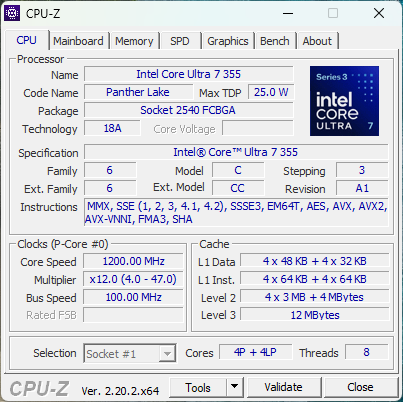
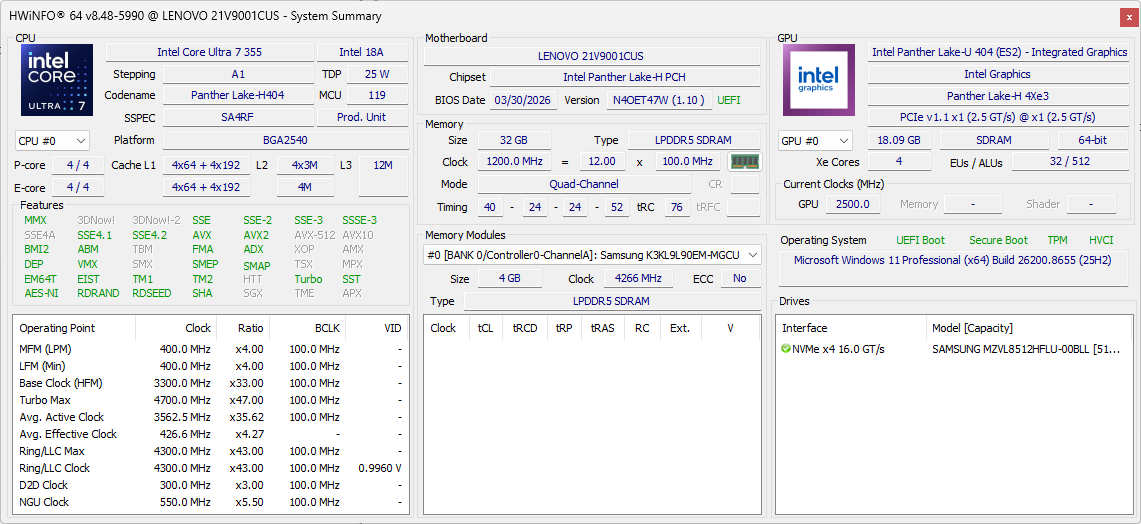
Nasz egzemplarz testowy to wersja o średniej konfiguracji, wyposażona w procesor Core Ultra 7 355 oraz ekran dotykowy IPS o rozdzielczości 1200p60, dostępna w cenie około 2700 dolarów. Tańsze wersje są wyposażone w procesor Core Ultra 5 325, natomiast wersja z najwyższej półki posiada znacznie szybszy procesor Core Ultra X7 368H oraz ekran dotykowy OLED o rozdzielczości 1800p120.
Konkurentami w tym segmencie są inne urządzenia konwertowalne przeznaczone dla biznesu, takie jak Latitude 7450 2-w-1 firmy Dell, HP EliteBook X Flip G1i 14lub seria MSI Prestige 14 Flip.
Więcej recenzji produktów Lenovo:
Dane techniczne
Sprawa
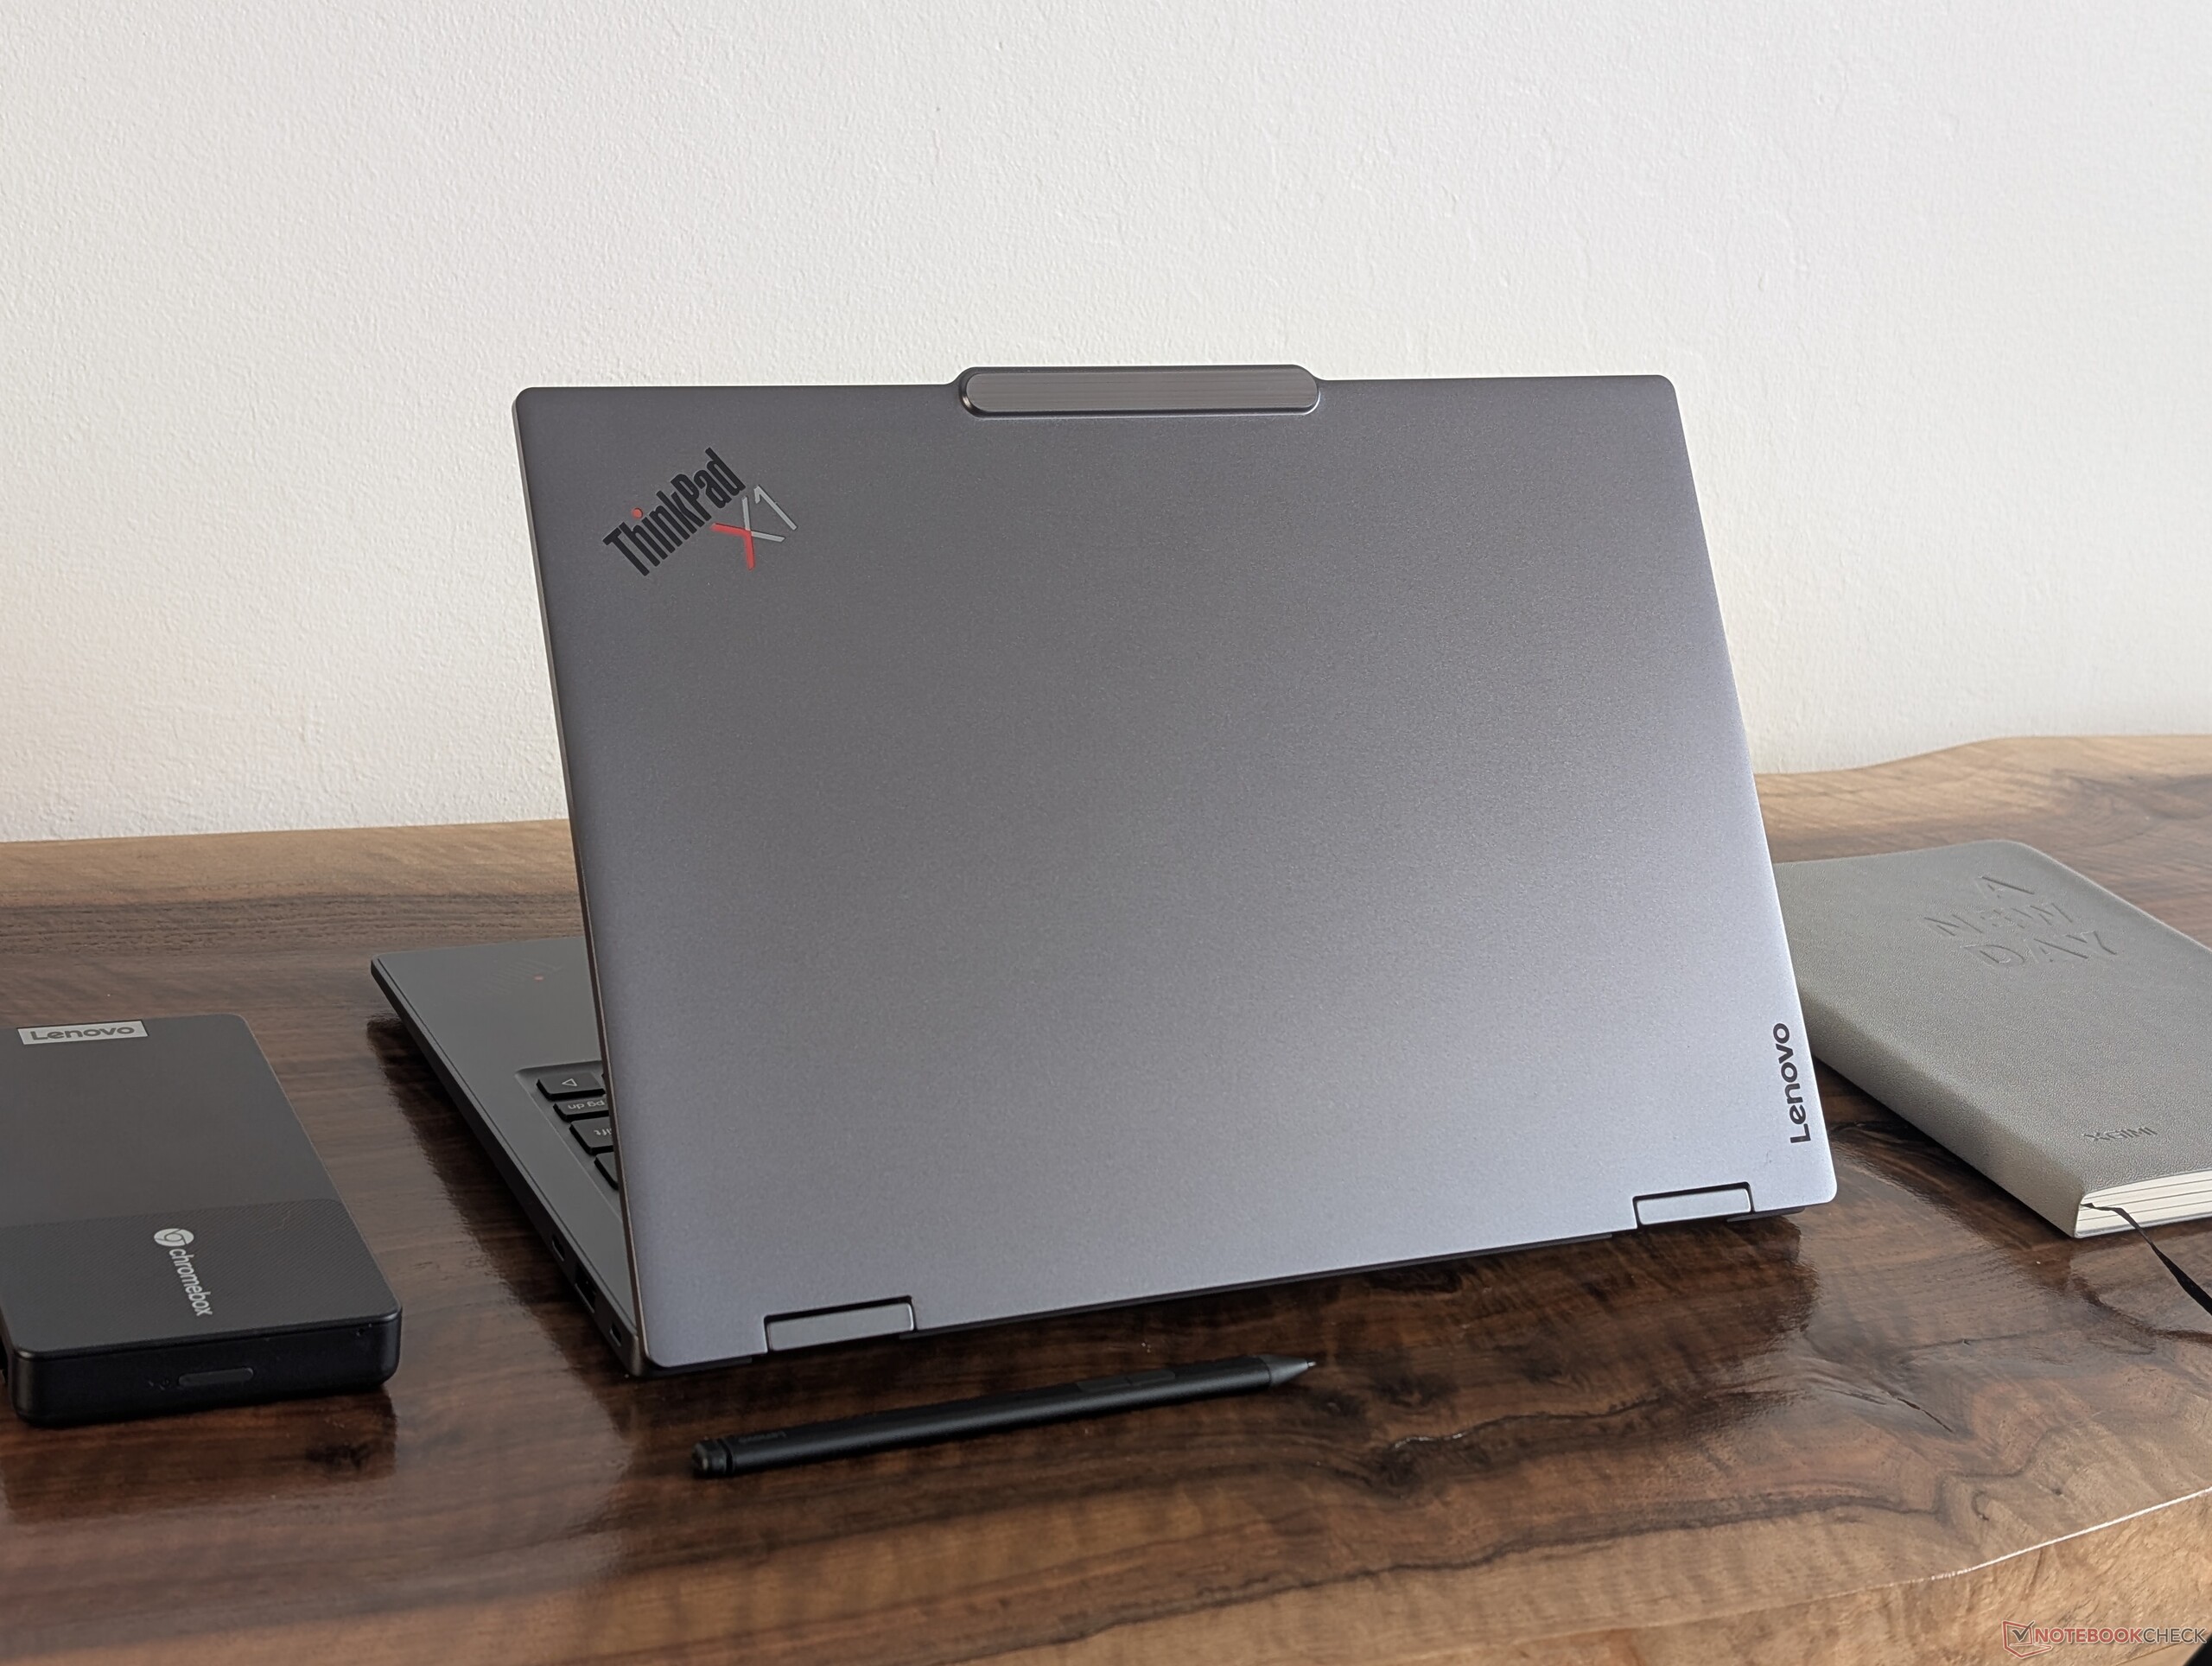
Nowa obudowa jest nieznacznie cieńsza i lżejsza niż poprzednia – odpowiednio o około 100 gramów i ułamek milimetra – nie sprawiając przy tym wrażenia mniej wytrzymałej ani tańszej. W rzeczywistości wiele zmian wizualnych – od logo po ogólną, ciemniejszą kolorystykę – nadaje urządzeniu bardziej profesjonalny wygląd, podczas gdy starszy model ThinkPad X1 2-w-1 10. generacji sprawiał wrażenie bardziej zorientowanego na rynek konsumencki lub przypominającego serię IdeaPad.
Najbardziej zauważalnym elementem nowej konstrukcji jest wgłębienie w dolnym panelu w pobliżu przedniej krawędzi, służące do przechowywania i ładowania rysika Slim Pen 2. Wgłębienie to zabezpiecza rysik znacznie pewniej niż typowe magnesy umieszczone wzdłuż zewnętrznych krawędzi większości innych urządzeń konwertowalnych, w tym zeszłorocznego modelu.
Łączność
Konfiguracja portów jest identyczna jak w zeszłorocznym modelu, choć jest o jeden port USB-A mniej. Przeniesienie przycisku zasilania sprawia również, że przypadkowe naciśnięcia są mniej uciążliwe podczas korzystania z urządzenia w trybie tabletu.


Komunikacja
Kamera internetowa
W standardzie dostarczana jest kamera internetowa o rozdzielczości 5 MP, z możliwością rozbudowy do 10 MP.


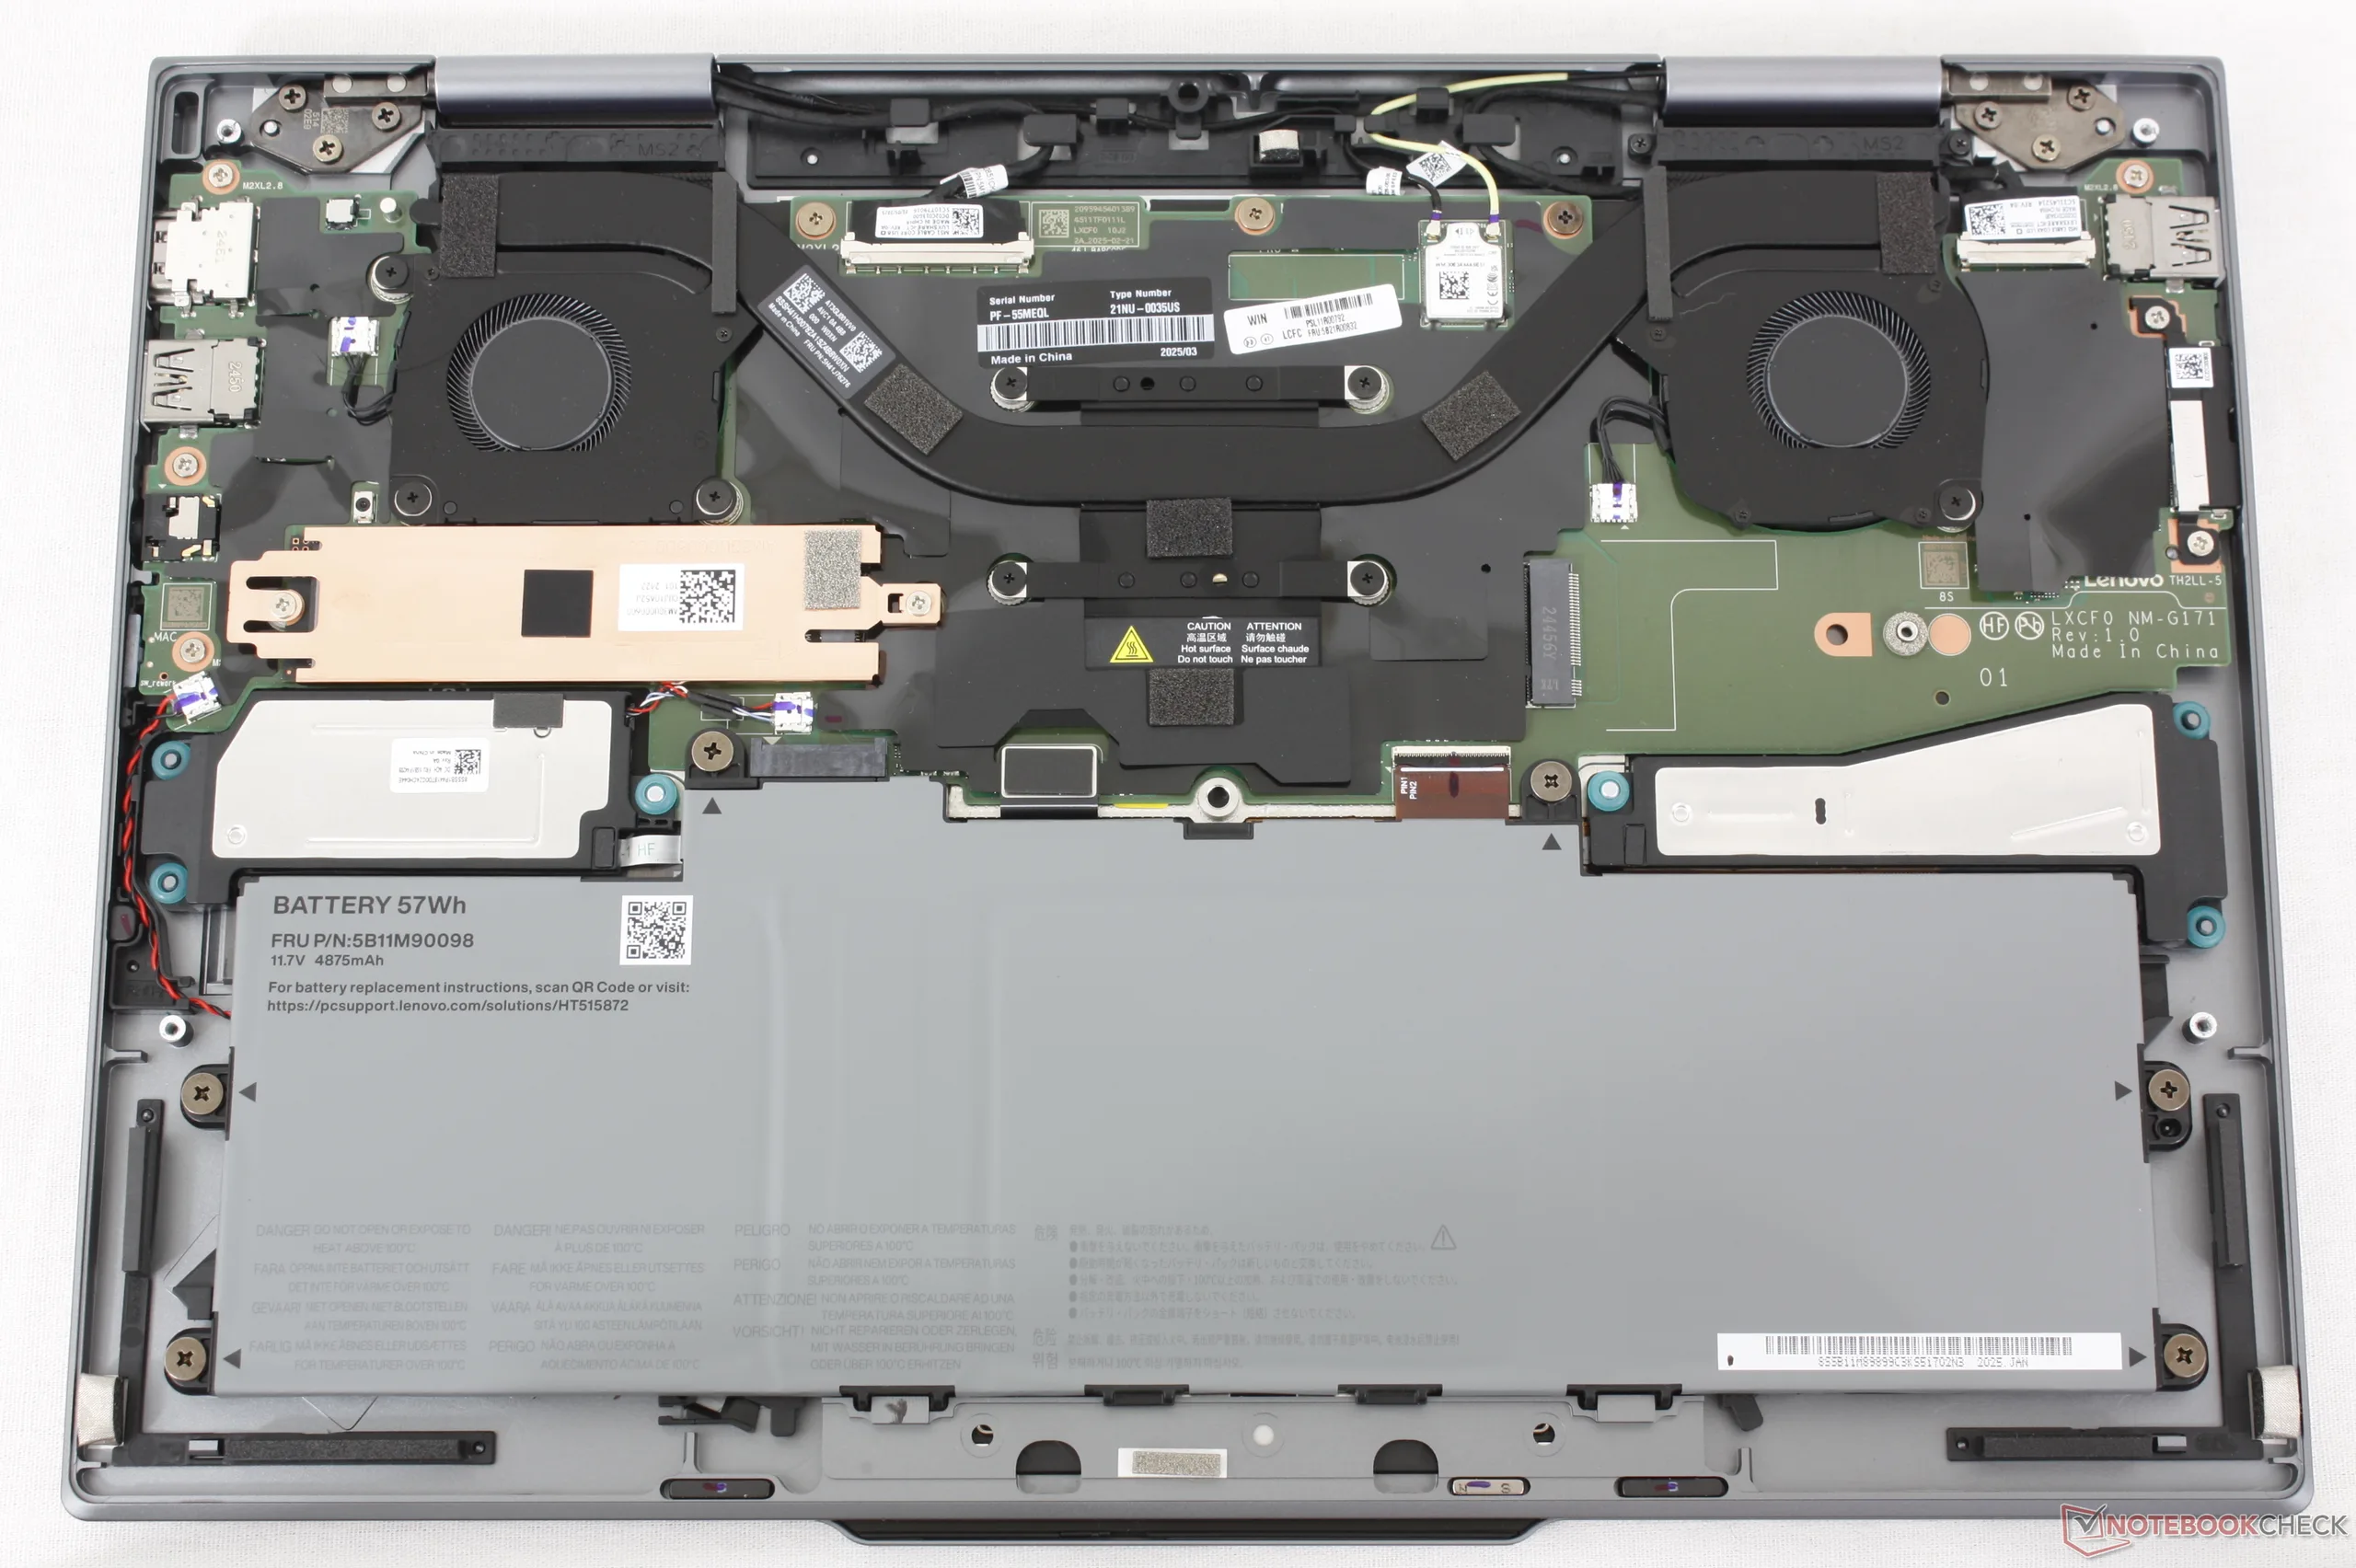
Konserwacja
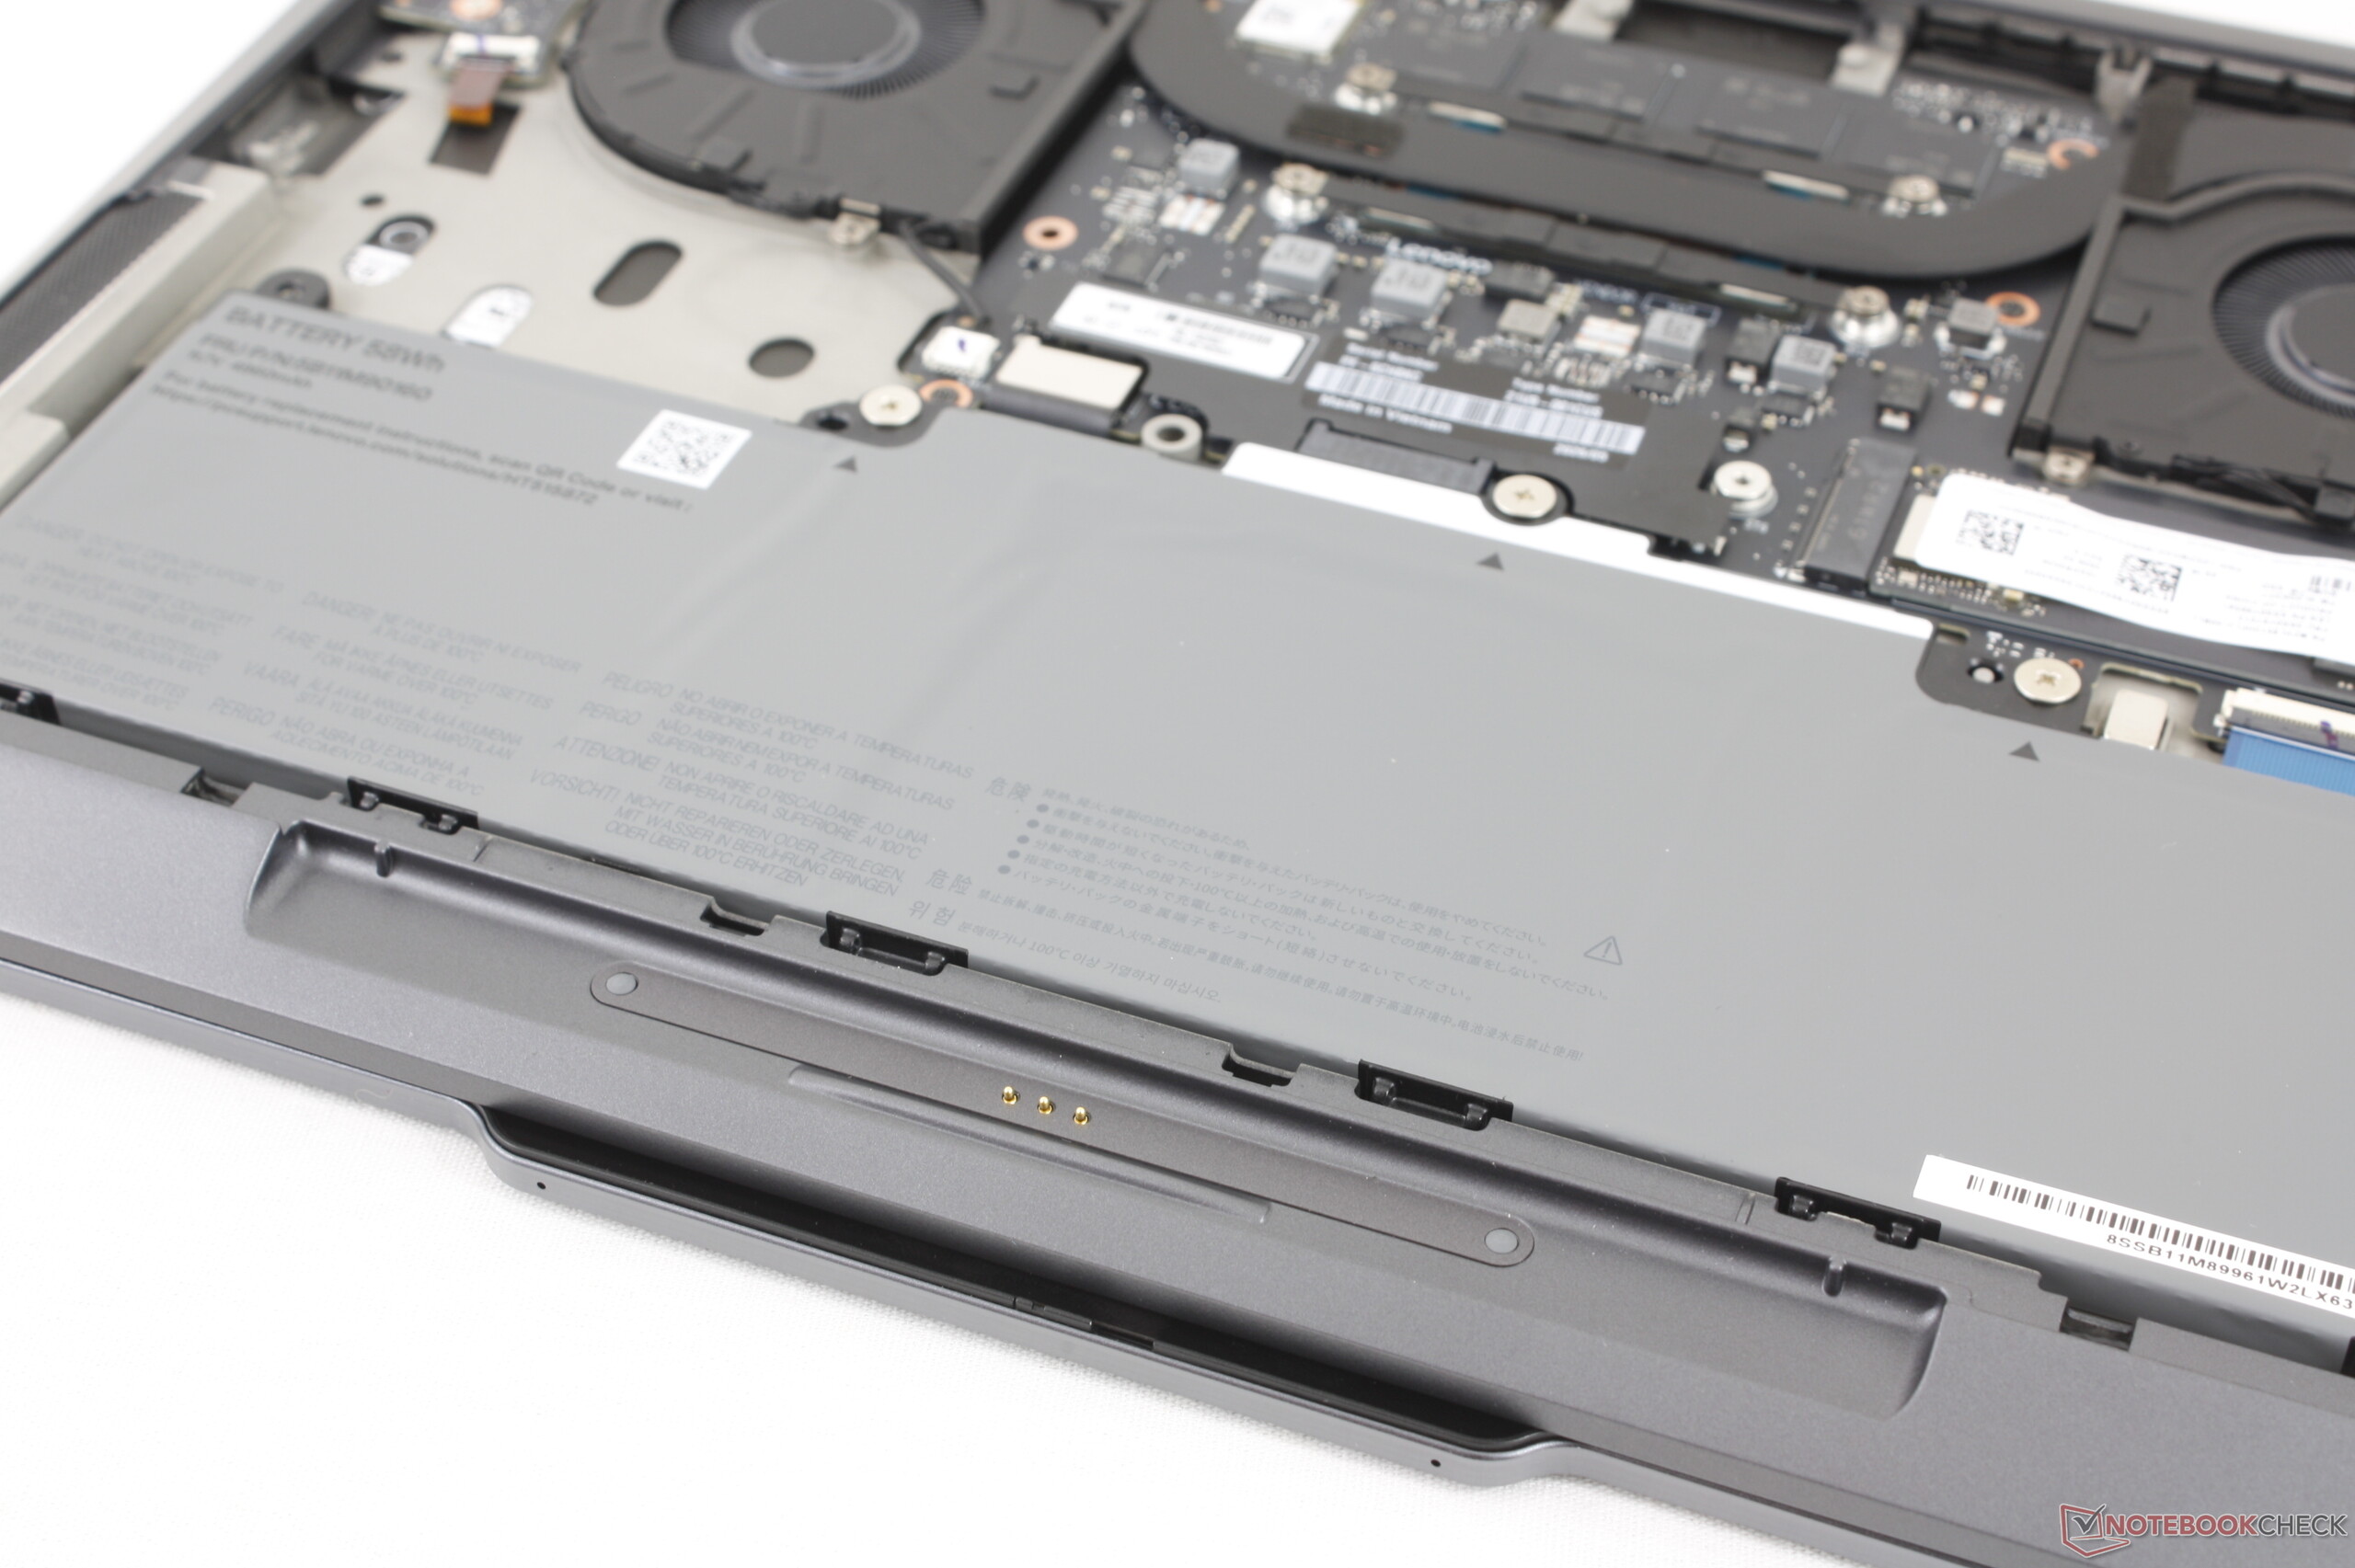
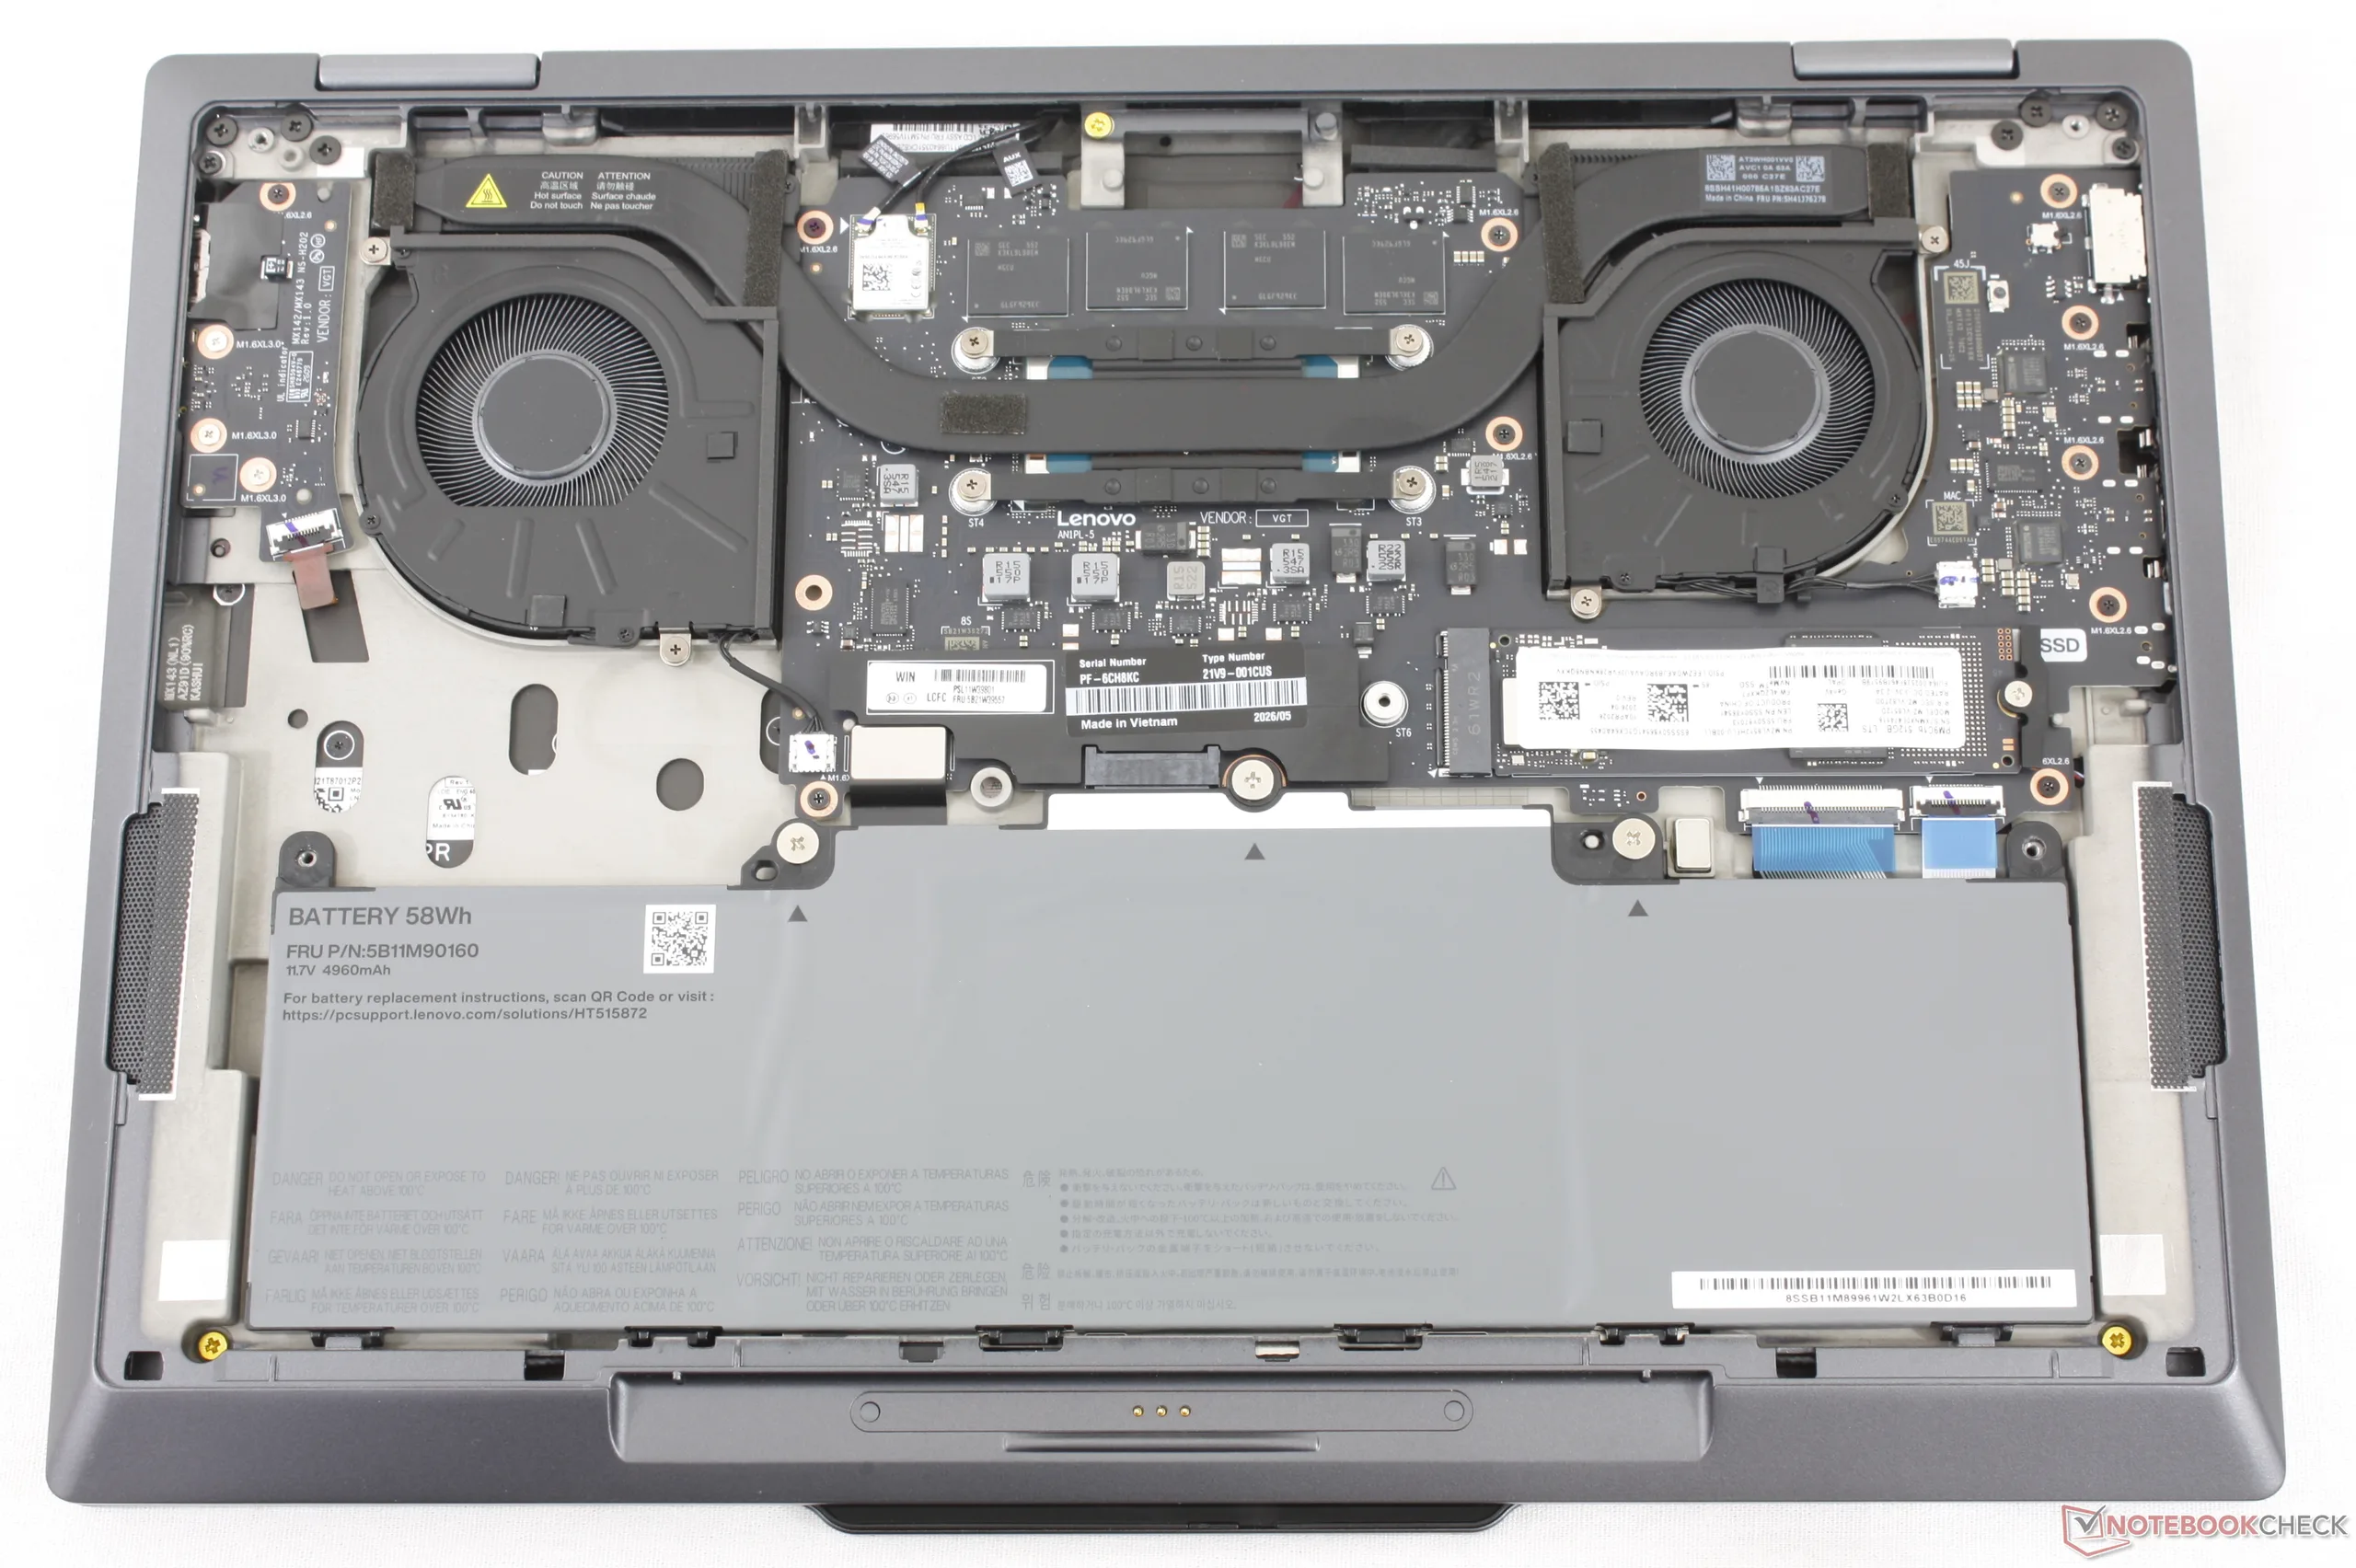
Dostęp do dolnego panelu jest łatwy i wymaga jedynie śrubokręta krzyżakowego. Możliwości rozbudowy ograniczają się do jednego gniazda SSD typu M.2 2280.
Zrównoważony rozwój
W modelu tym szeroko wykorzystano materiały pochodzące z recyklingu, w tym – w zależności od części – nawet 90 procent aluminium, stali i magnezu pochodzących z recyklingu oraz nawet 65 procent tworzyw sztucznych typu PCC. Sam akumulator składa się w 100 procentach z kobaltu pochodzącego z recyklingu, a opakowanie nie zawiera tworzyw sztucznych.
Akcesoria i gwarancja
Opcjonalny rysik Lenovo Slim Pen 2 jest cieńszy niż rysik Yoga Pen dostarczany wraz z zeszłorocznym modelem ThinkPad X1 2-w-1 10. generacji. Zintegrowane gniazdo do ładowania rysika Slim Pen 2 nie jest zatem kompatybilne z zeszłorocznym rysikiem.
Obowiązuje standardowa roczna ograniczona gwarancja producenta.
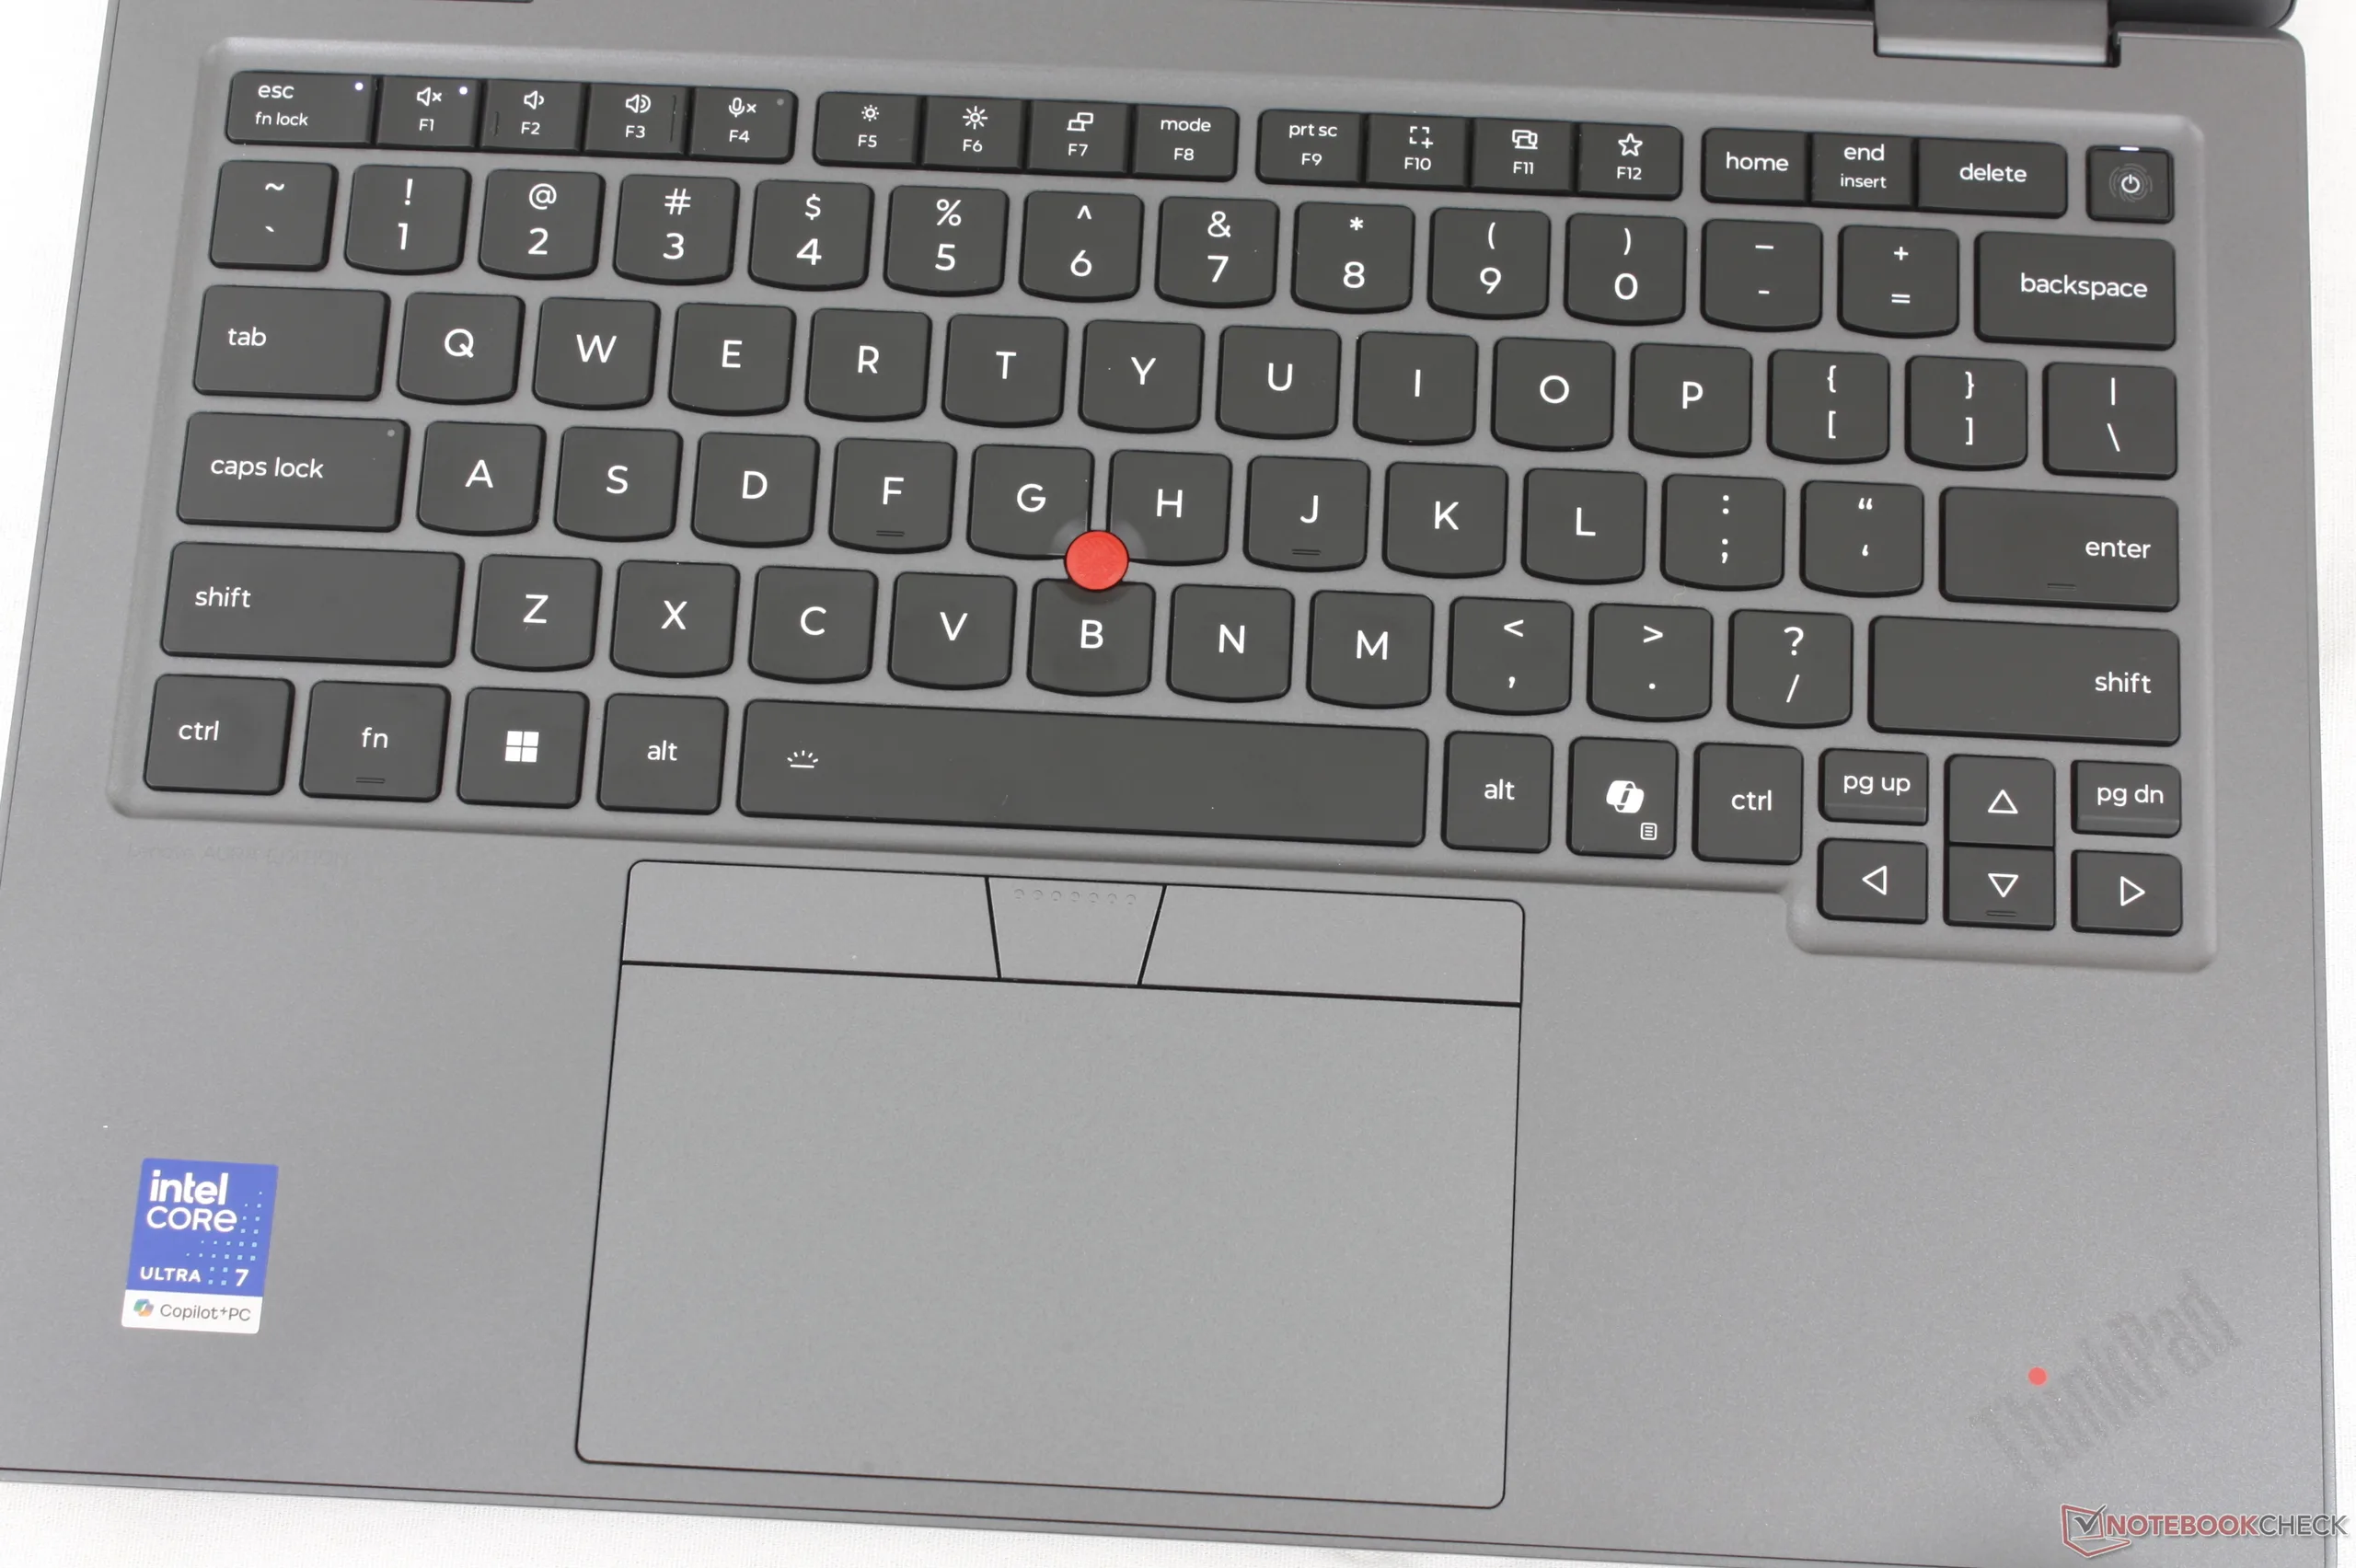
Urządzenia wejściowe
W najnowszej wersji tego modelu usunięto dedykowany czytnik odcisków palców, który znajdował się w zeszłorocznym modelu, zastępując go niewielkim przyciskiem zasilania z funkcją skanowania odcisków palców.
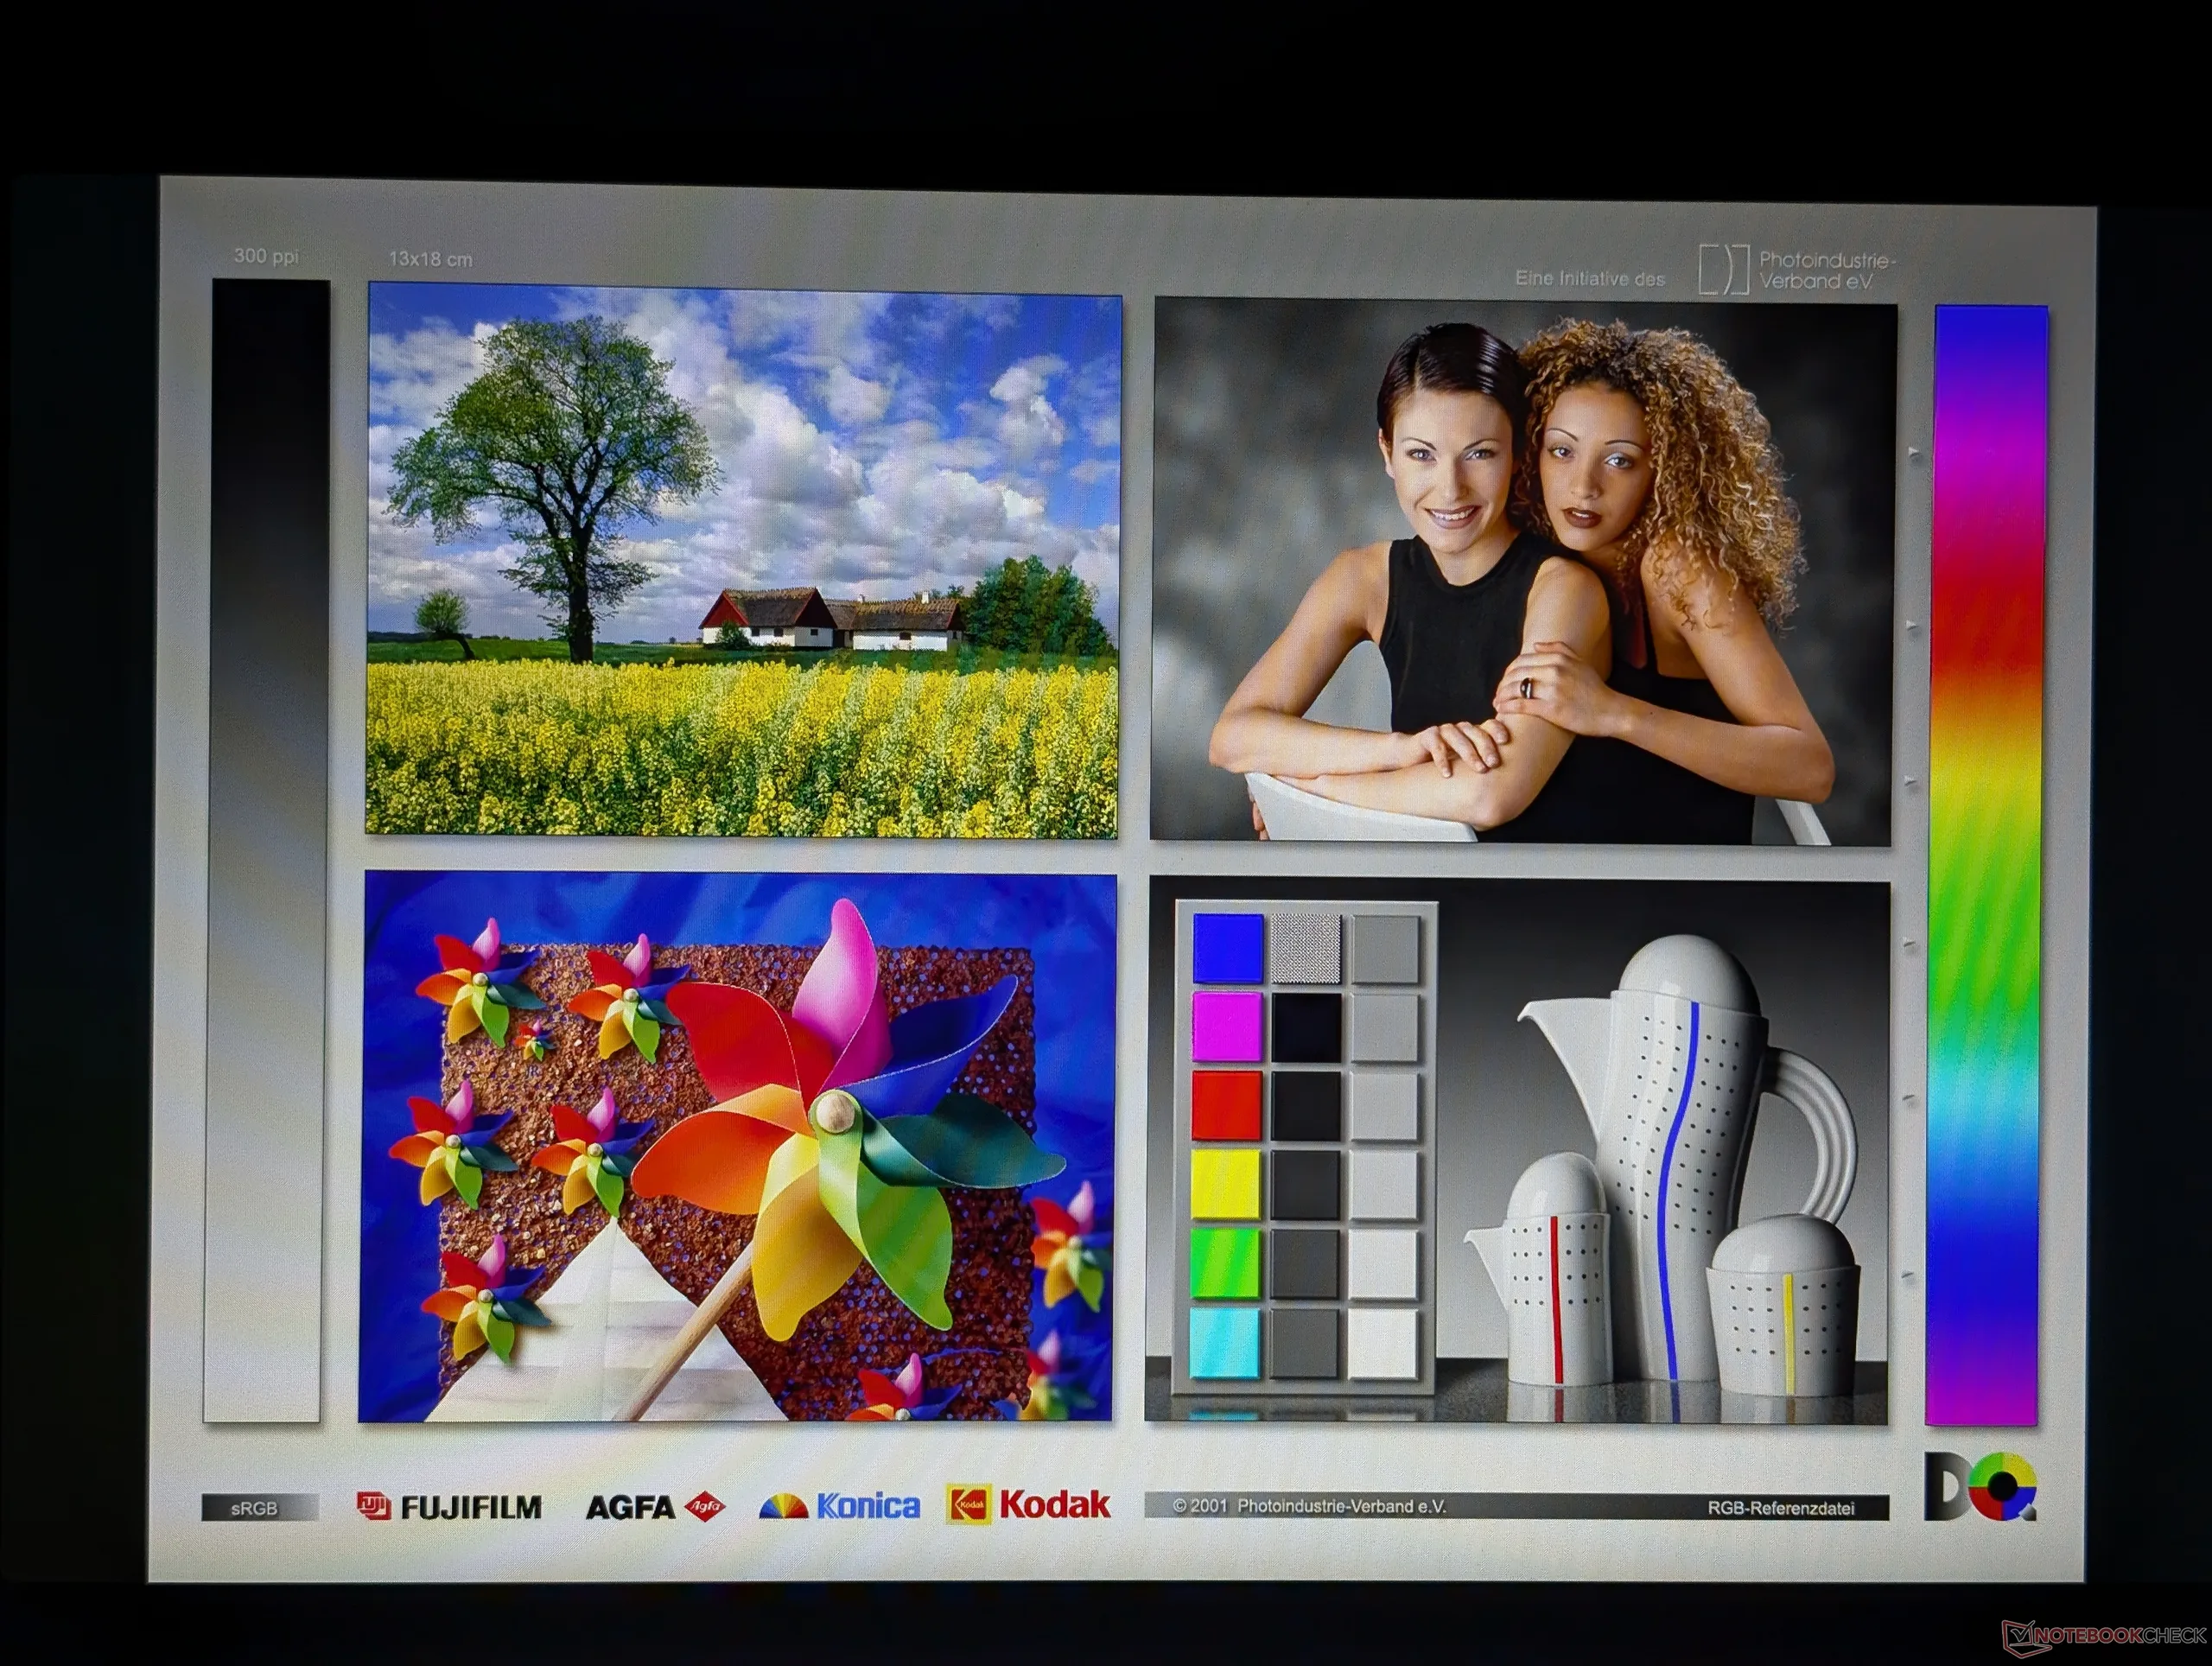
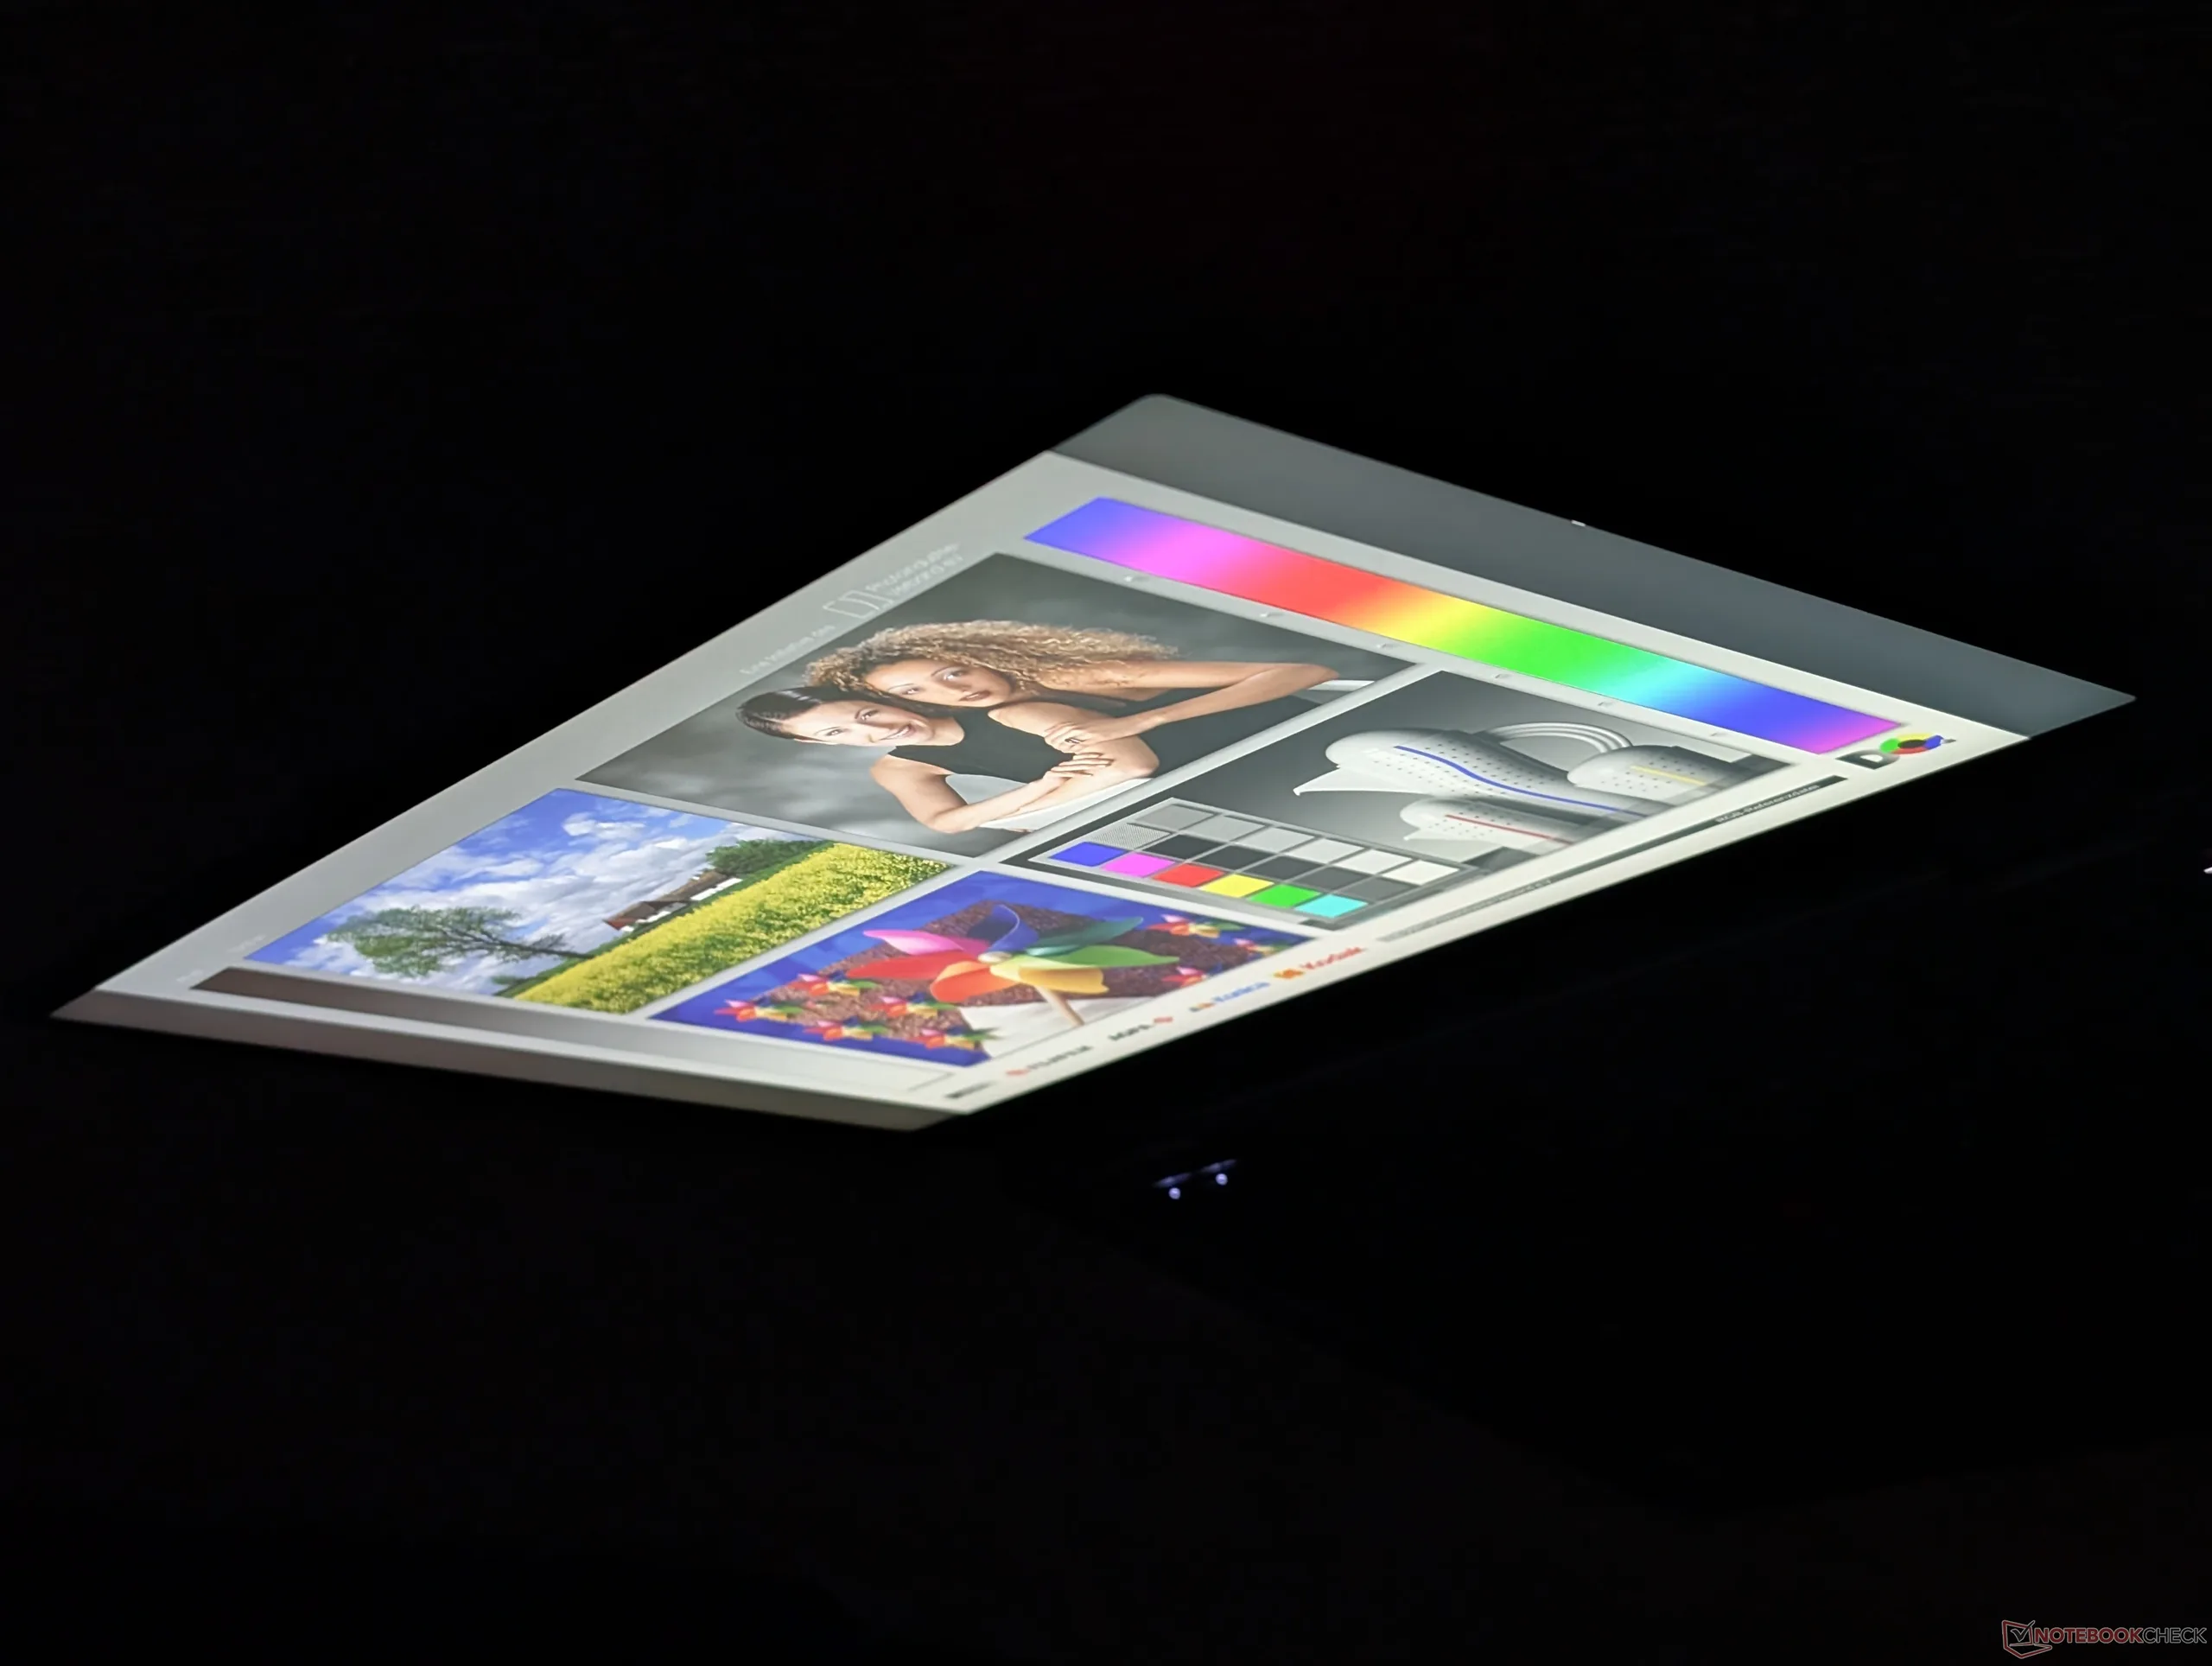
Wyświetlacz

Firma Lenovo oferuje dwie główne opcje ekranów dotykowych, podobnie jak w przypadku modelu poprzedniej generacji:
- 1920 x 1200, IPS, 60 Hz, 100% sRGB, 500 nitów, matowy lub błyszczący
- 2880 x 1800, OLED, 120 Hz, 100% DCI-P3, 500 nitów, ekran błyszczący
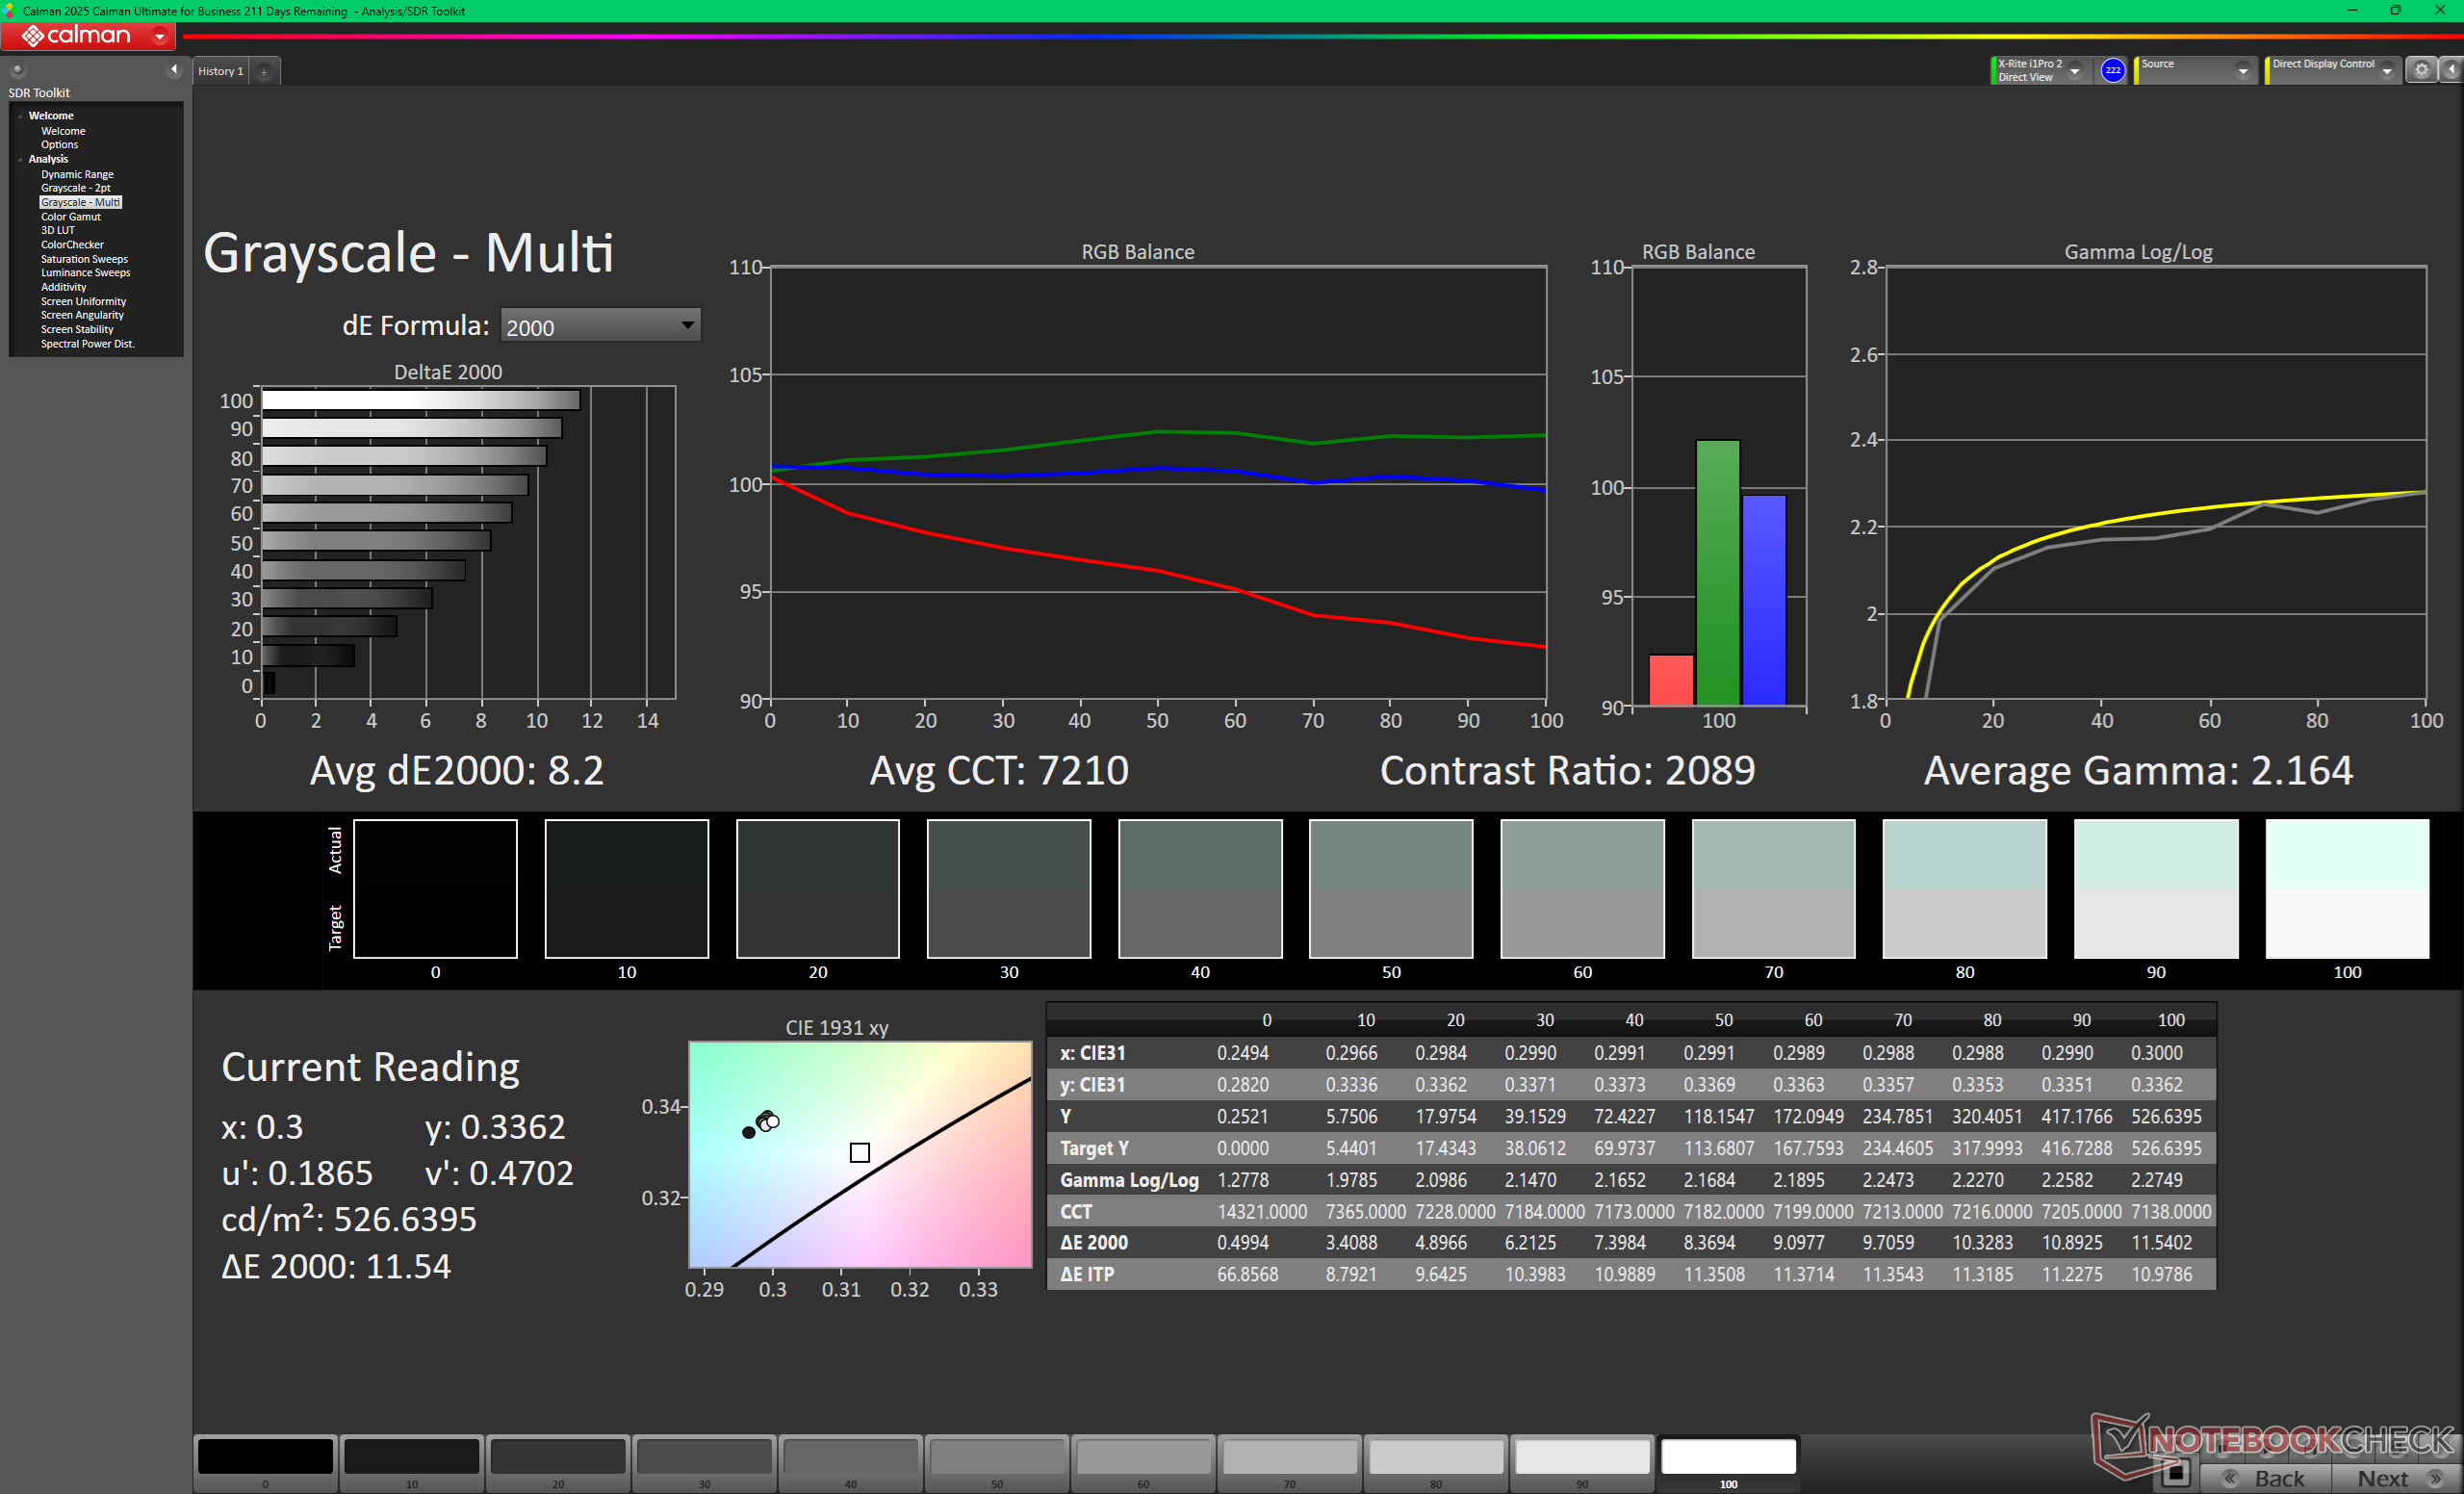
W przypadku naszego egzemplarza testowego o rozdzielczości 1200p firma Lenovo zastąpiła panel Innolux N140JLG-GT3, stosowany w zeszłorocznym modelu, panelem AUO B140UAN10.0. Pozostałe kluczowe parametry są niemal identyczne, w tym przyzwoite czasy reakcji i współczynniki kontrastu.
| |||||||||||||||||||||||||
rozświetlenie: 86 %
na akumulatorze: 527.7 cd/m²
kontrast: 1885:1 (czerń: 0.28 cd/m²)
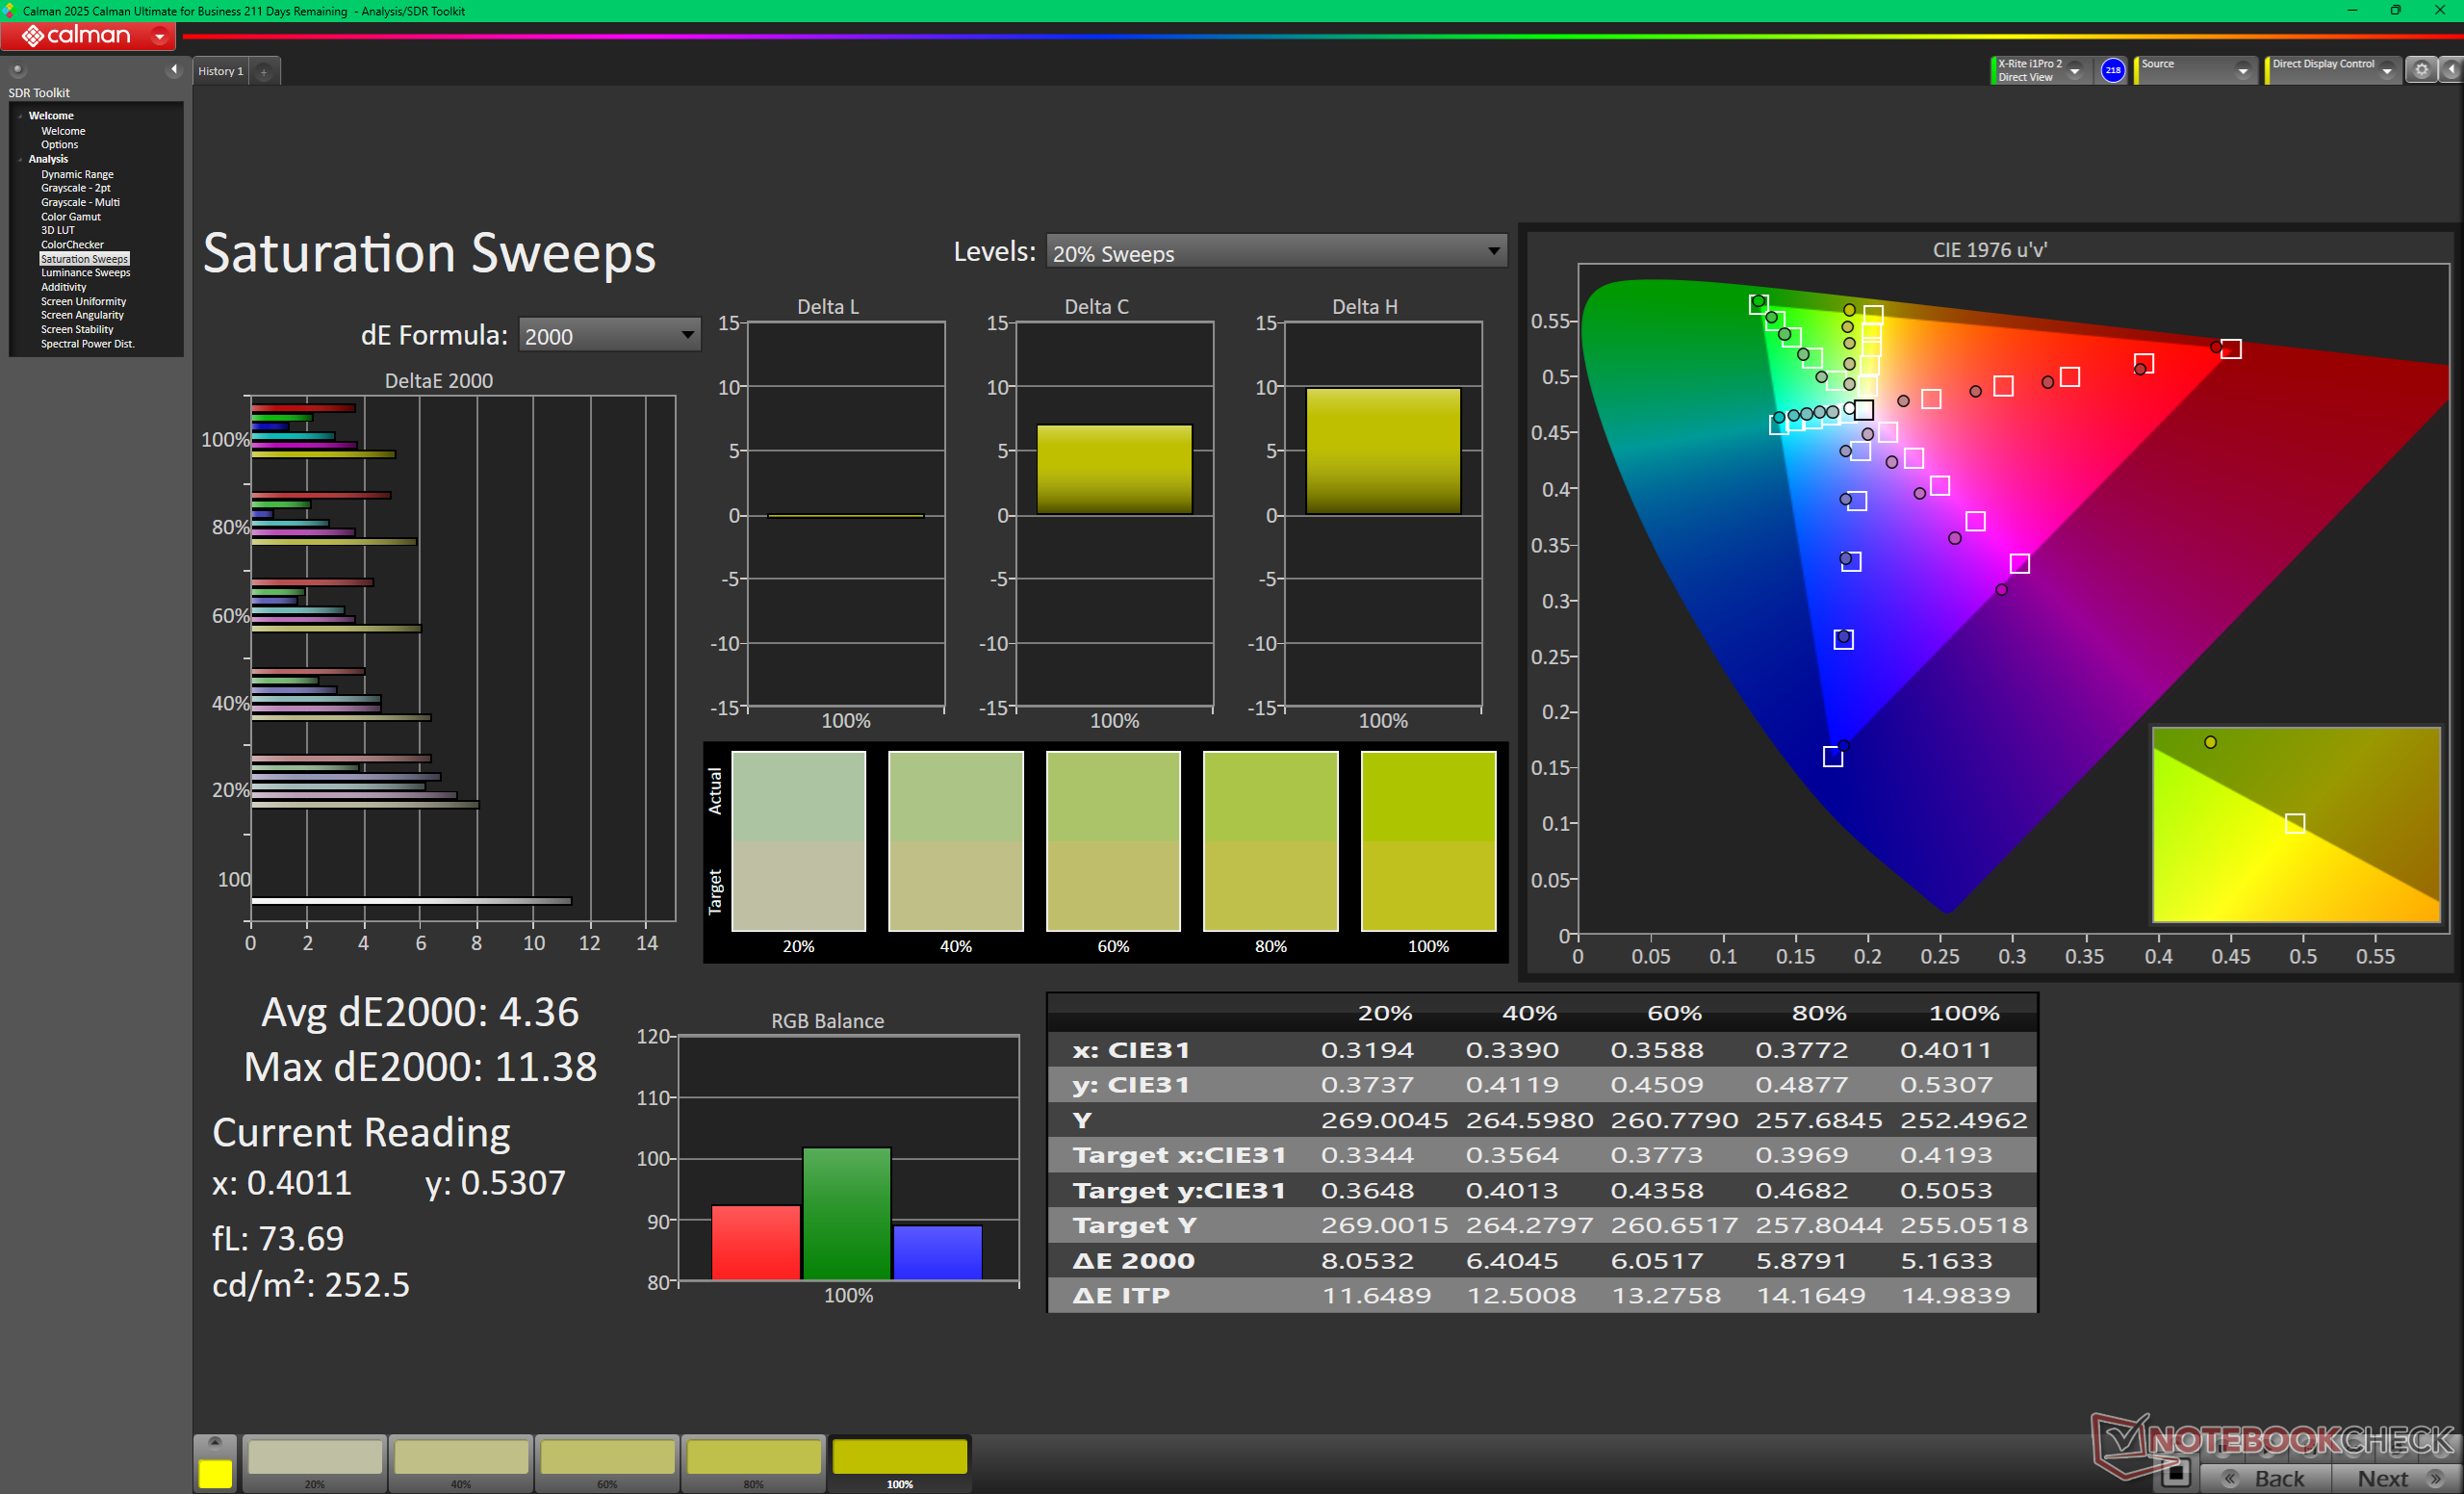
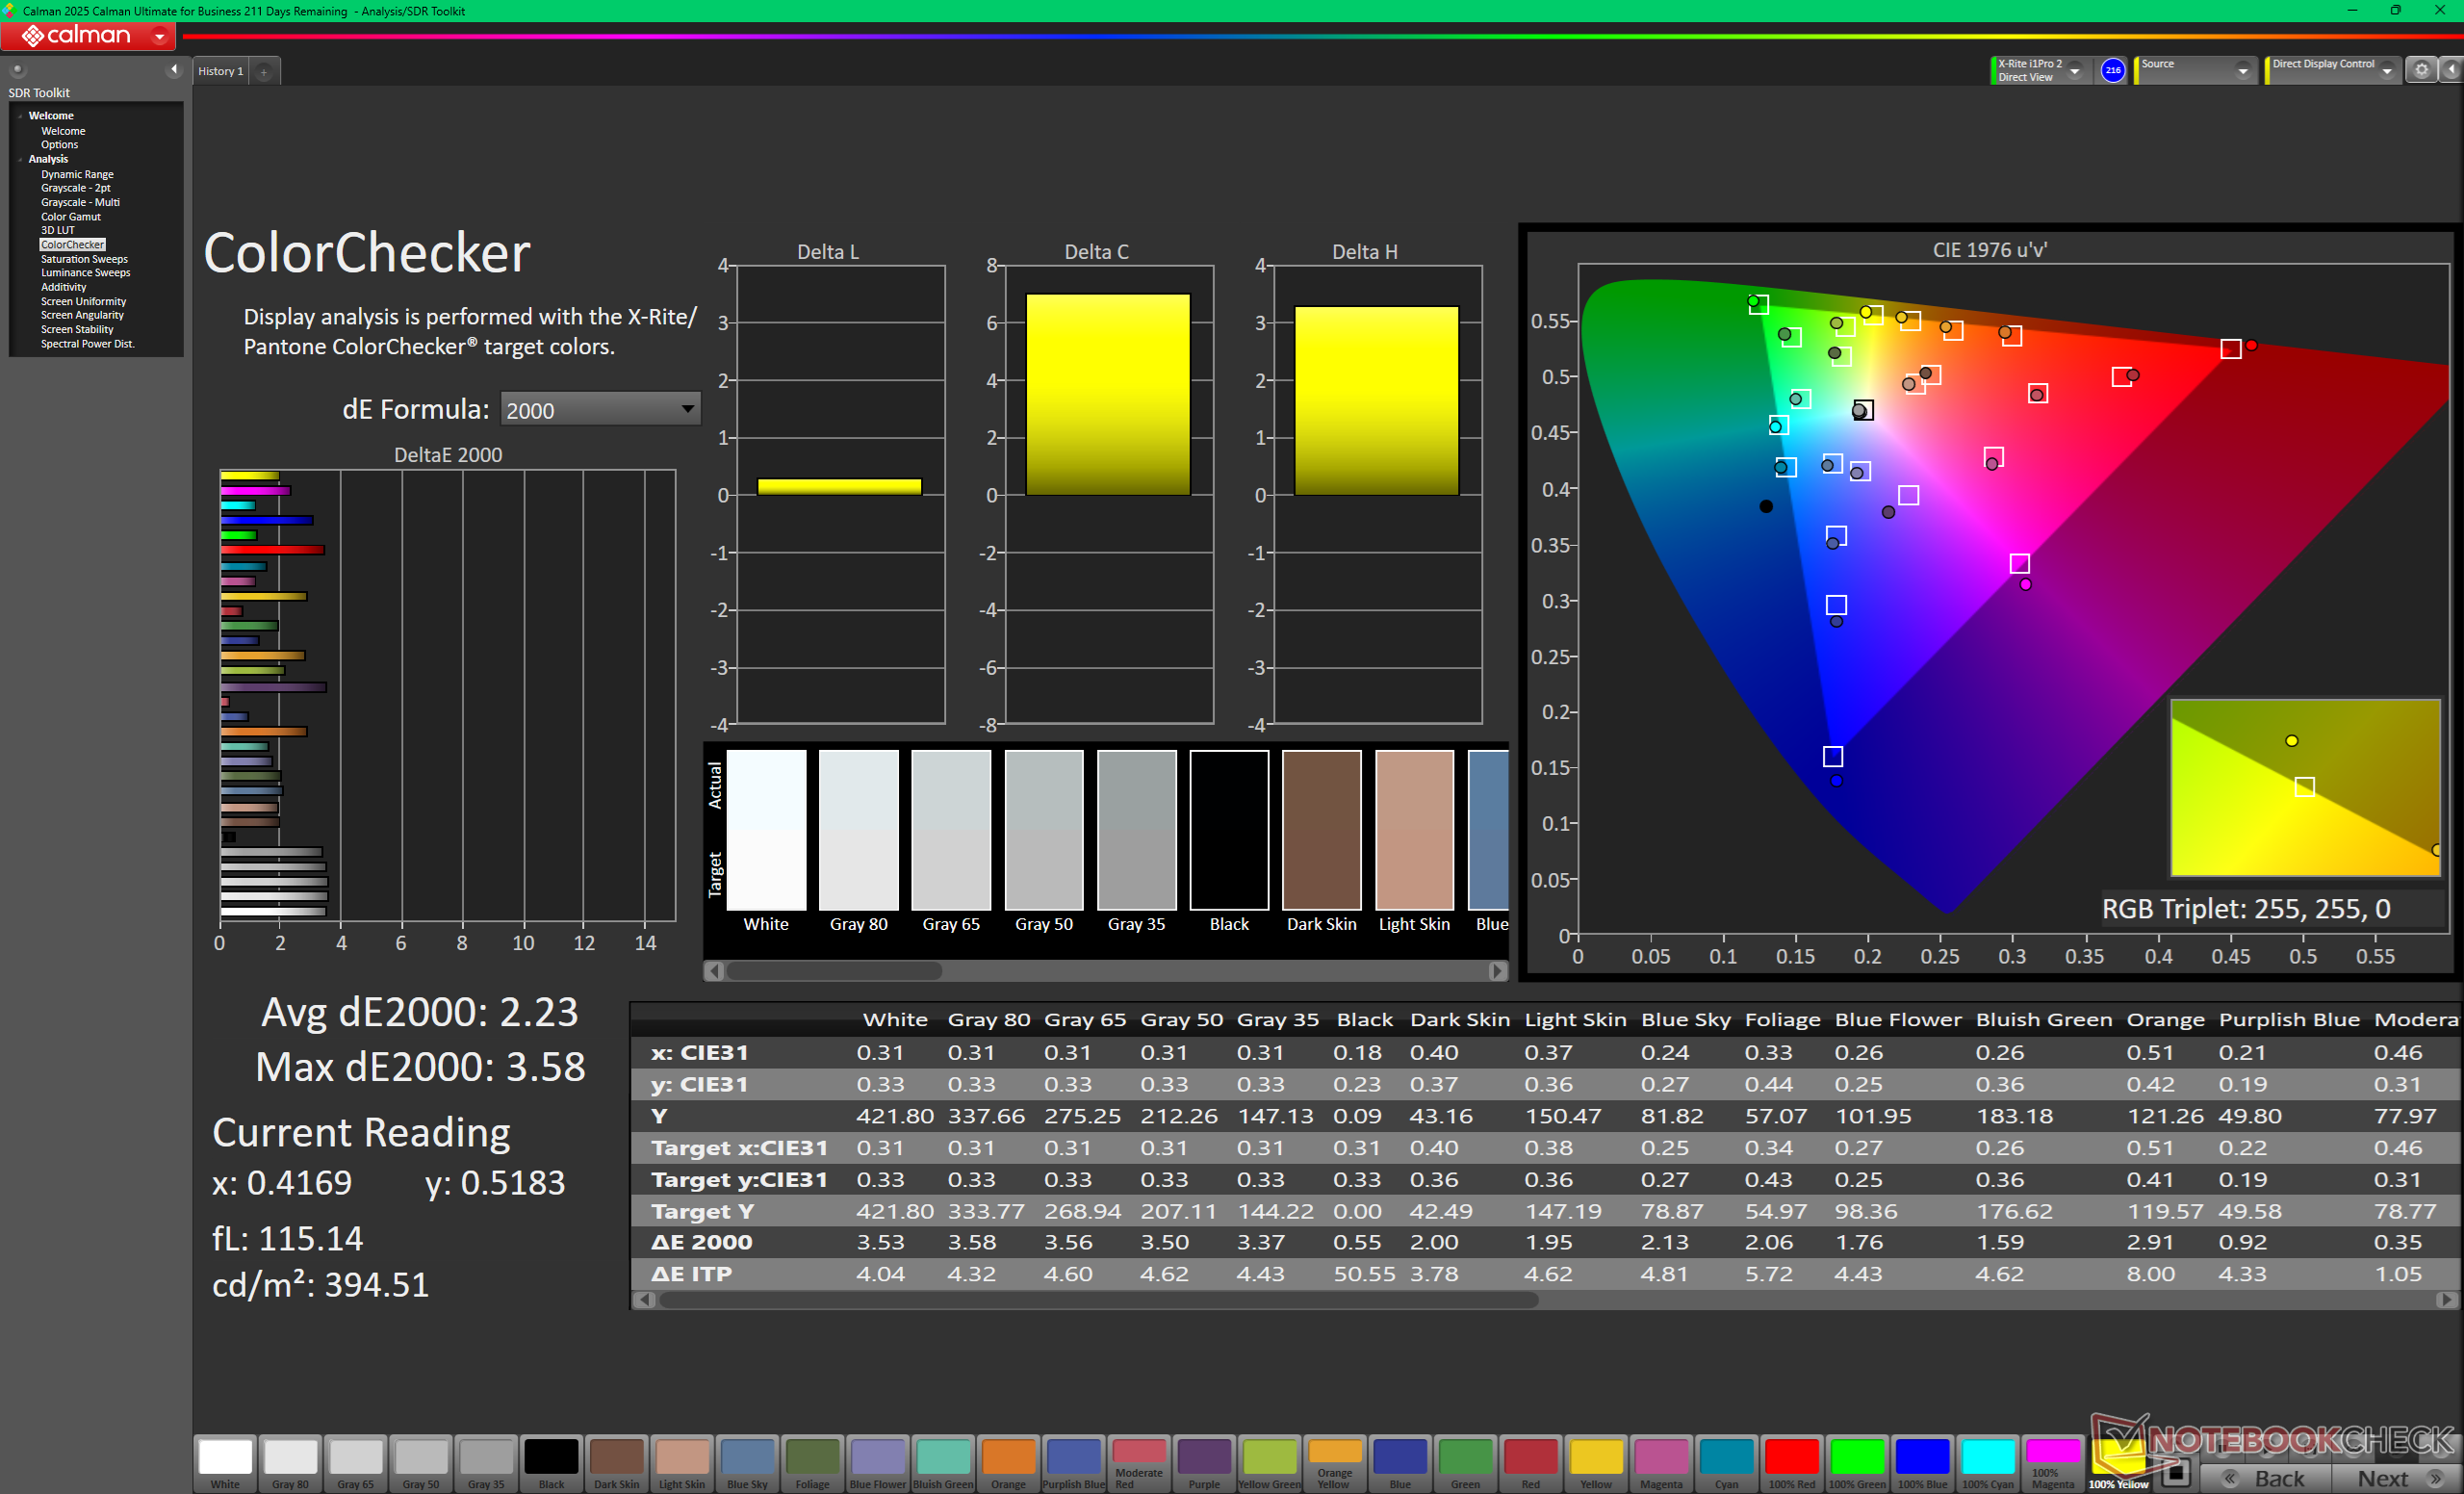
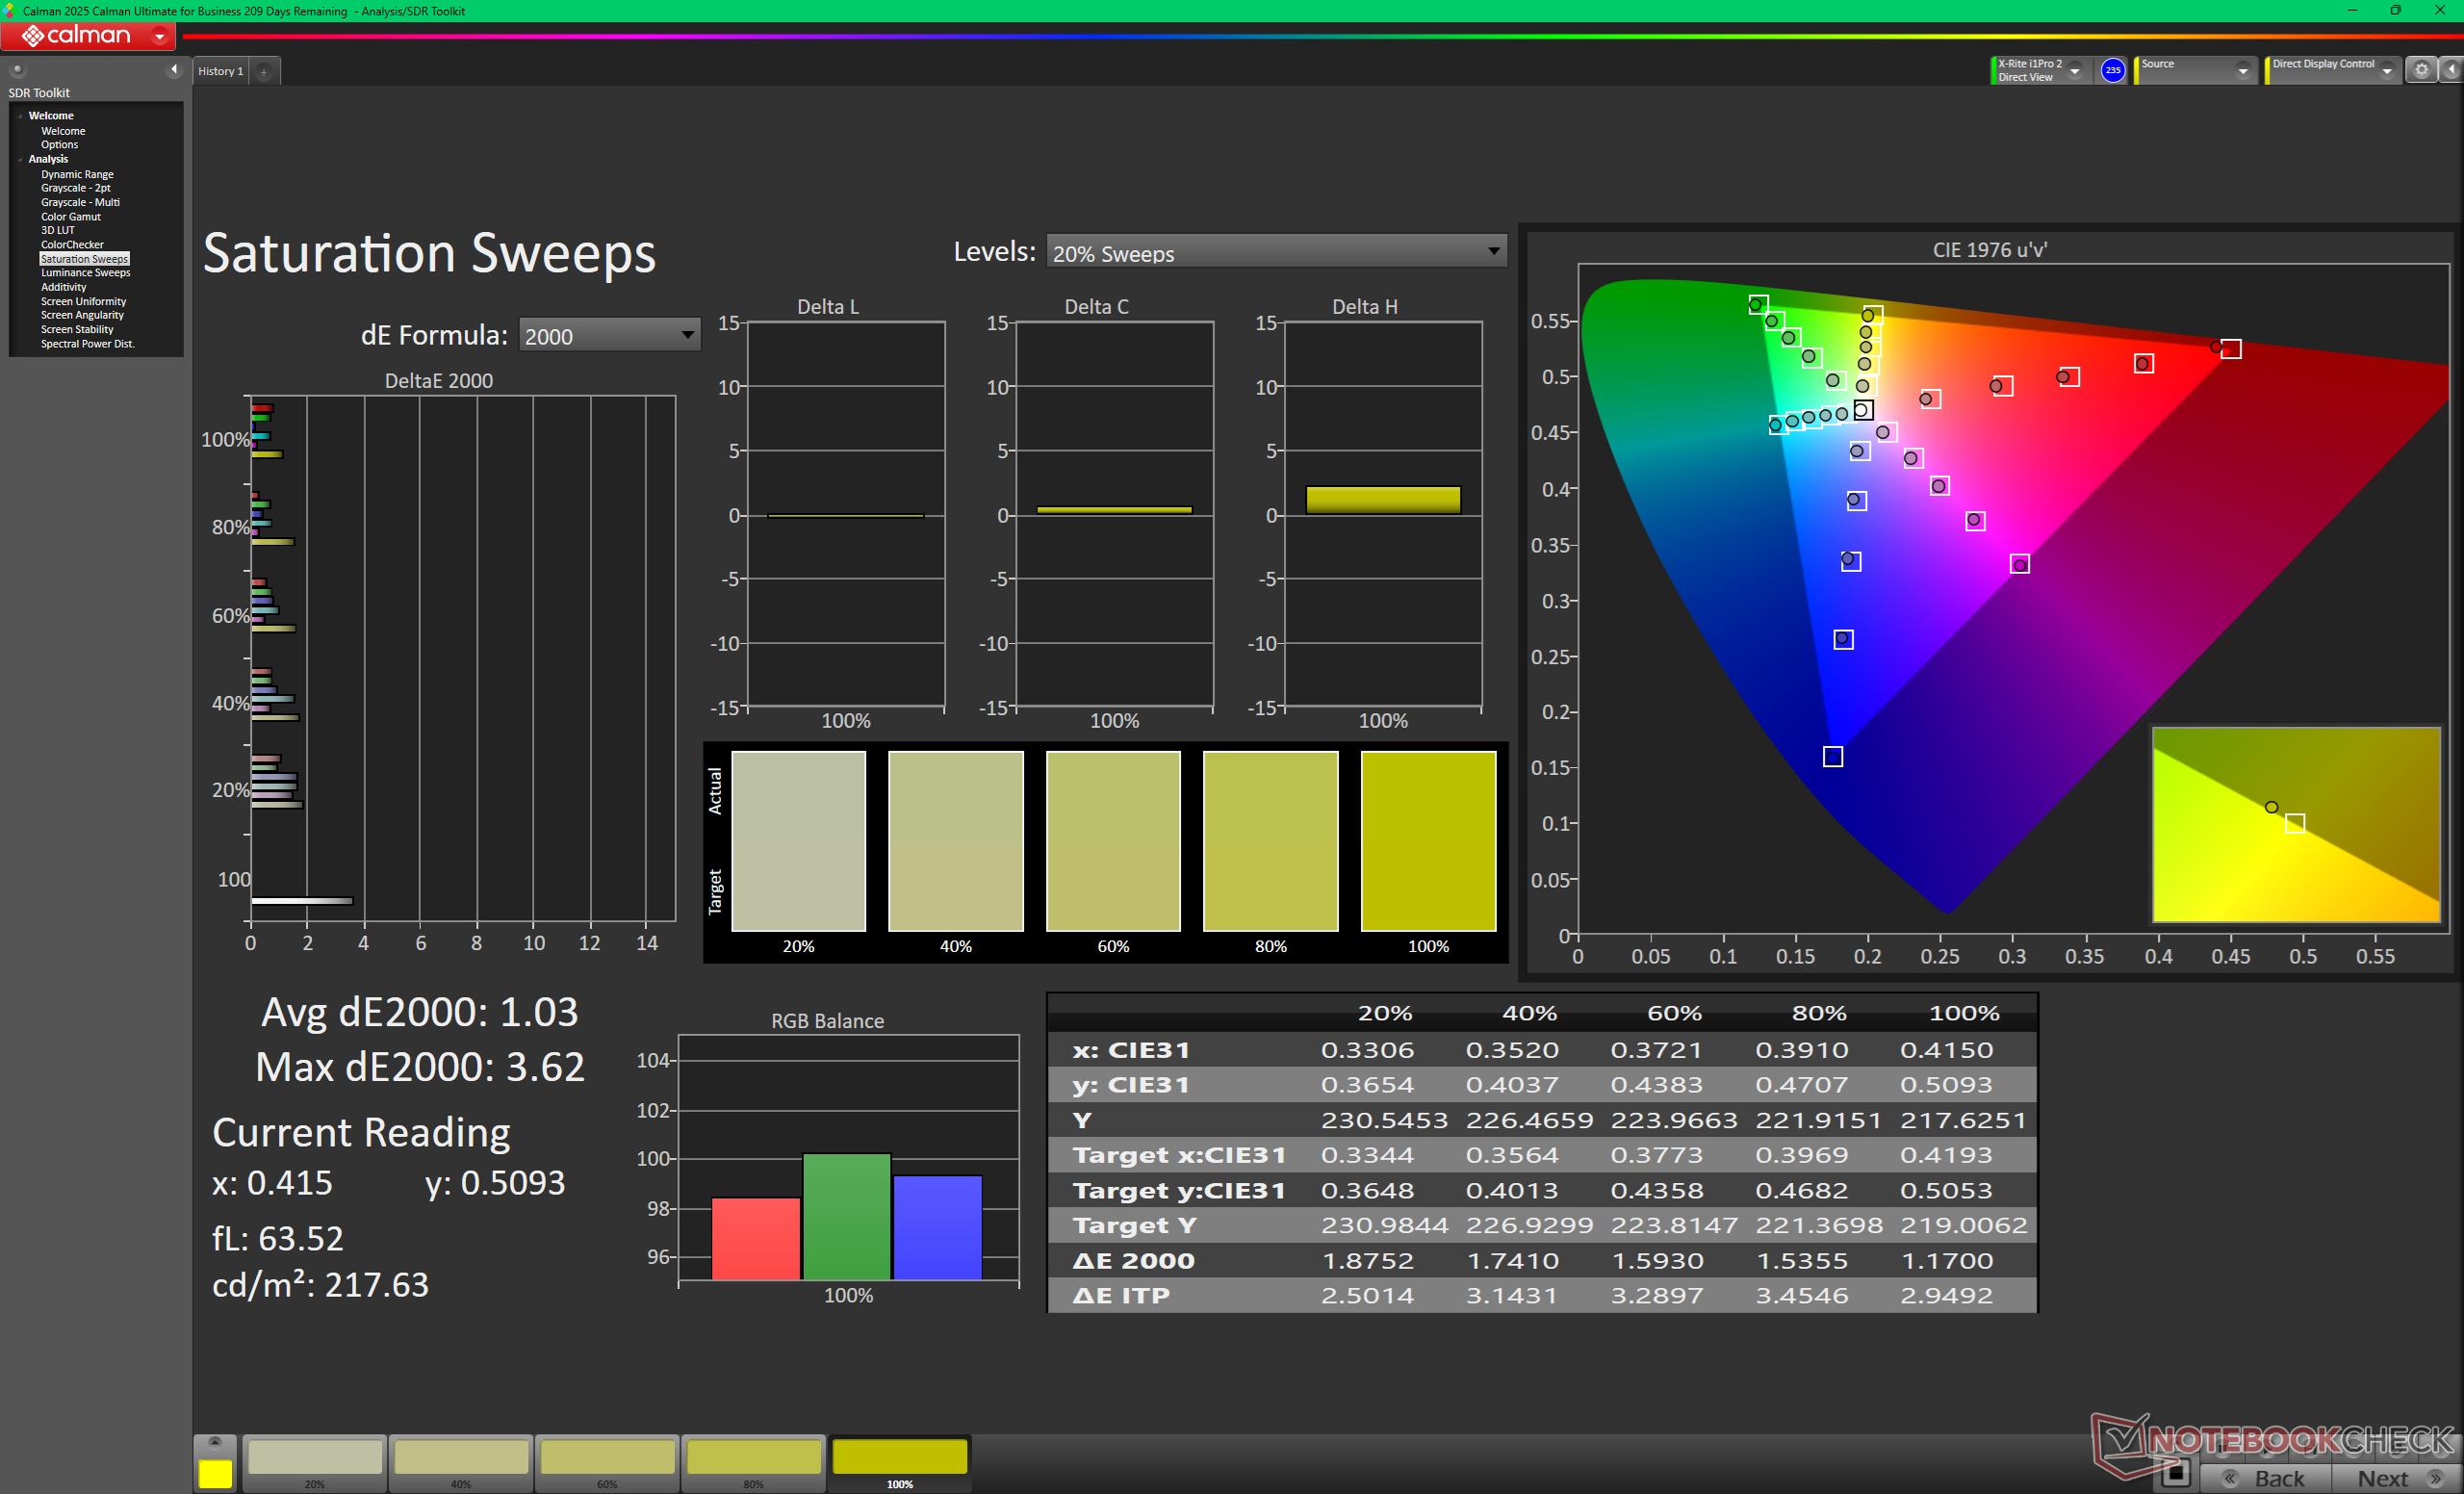
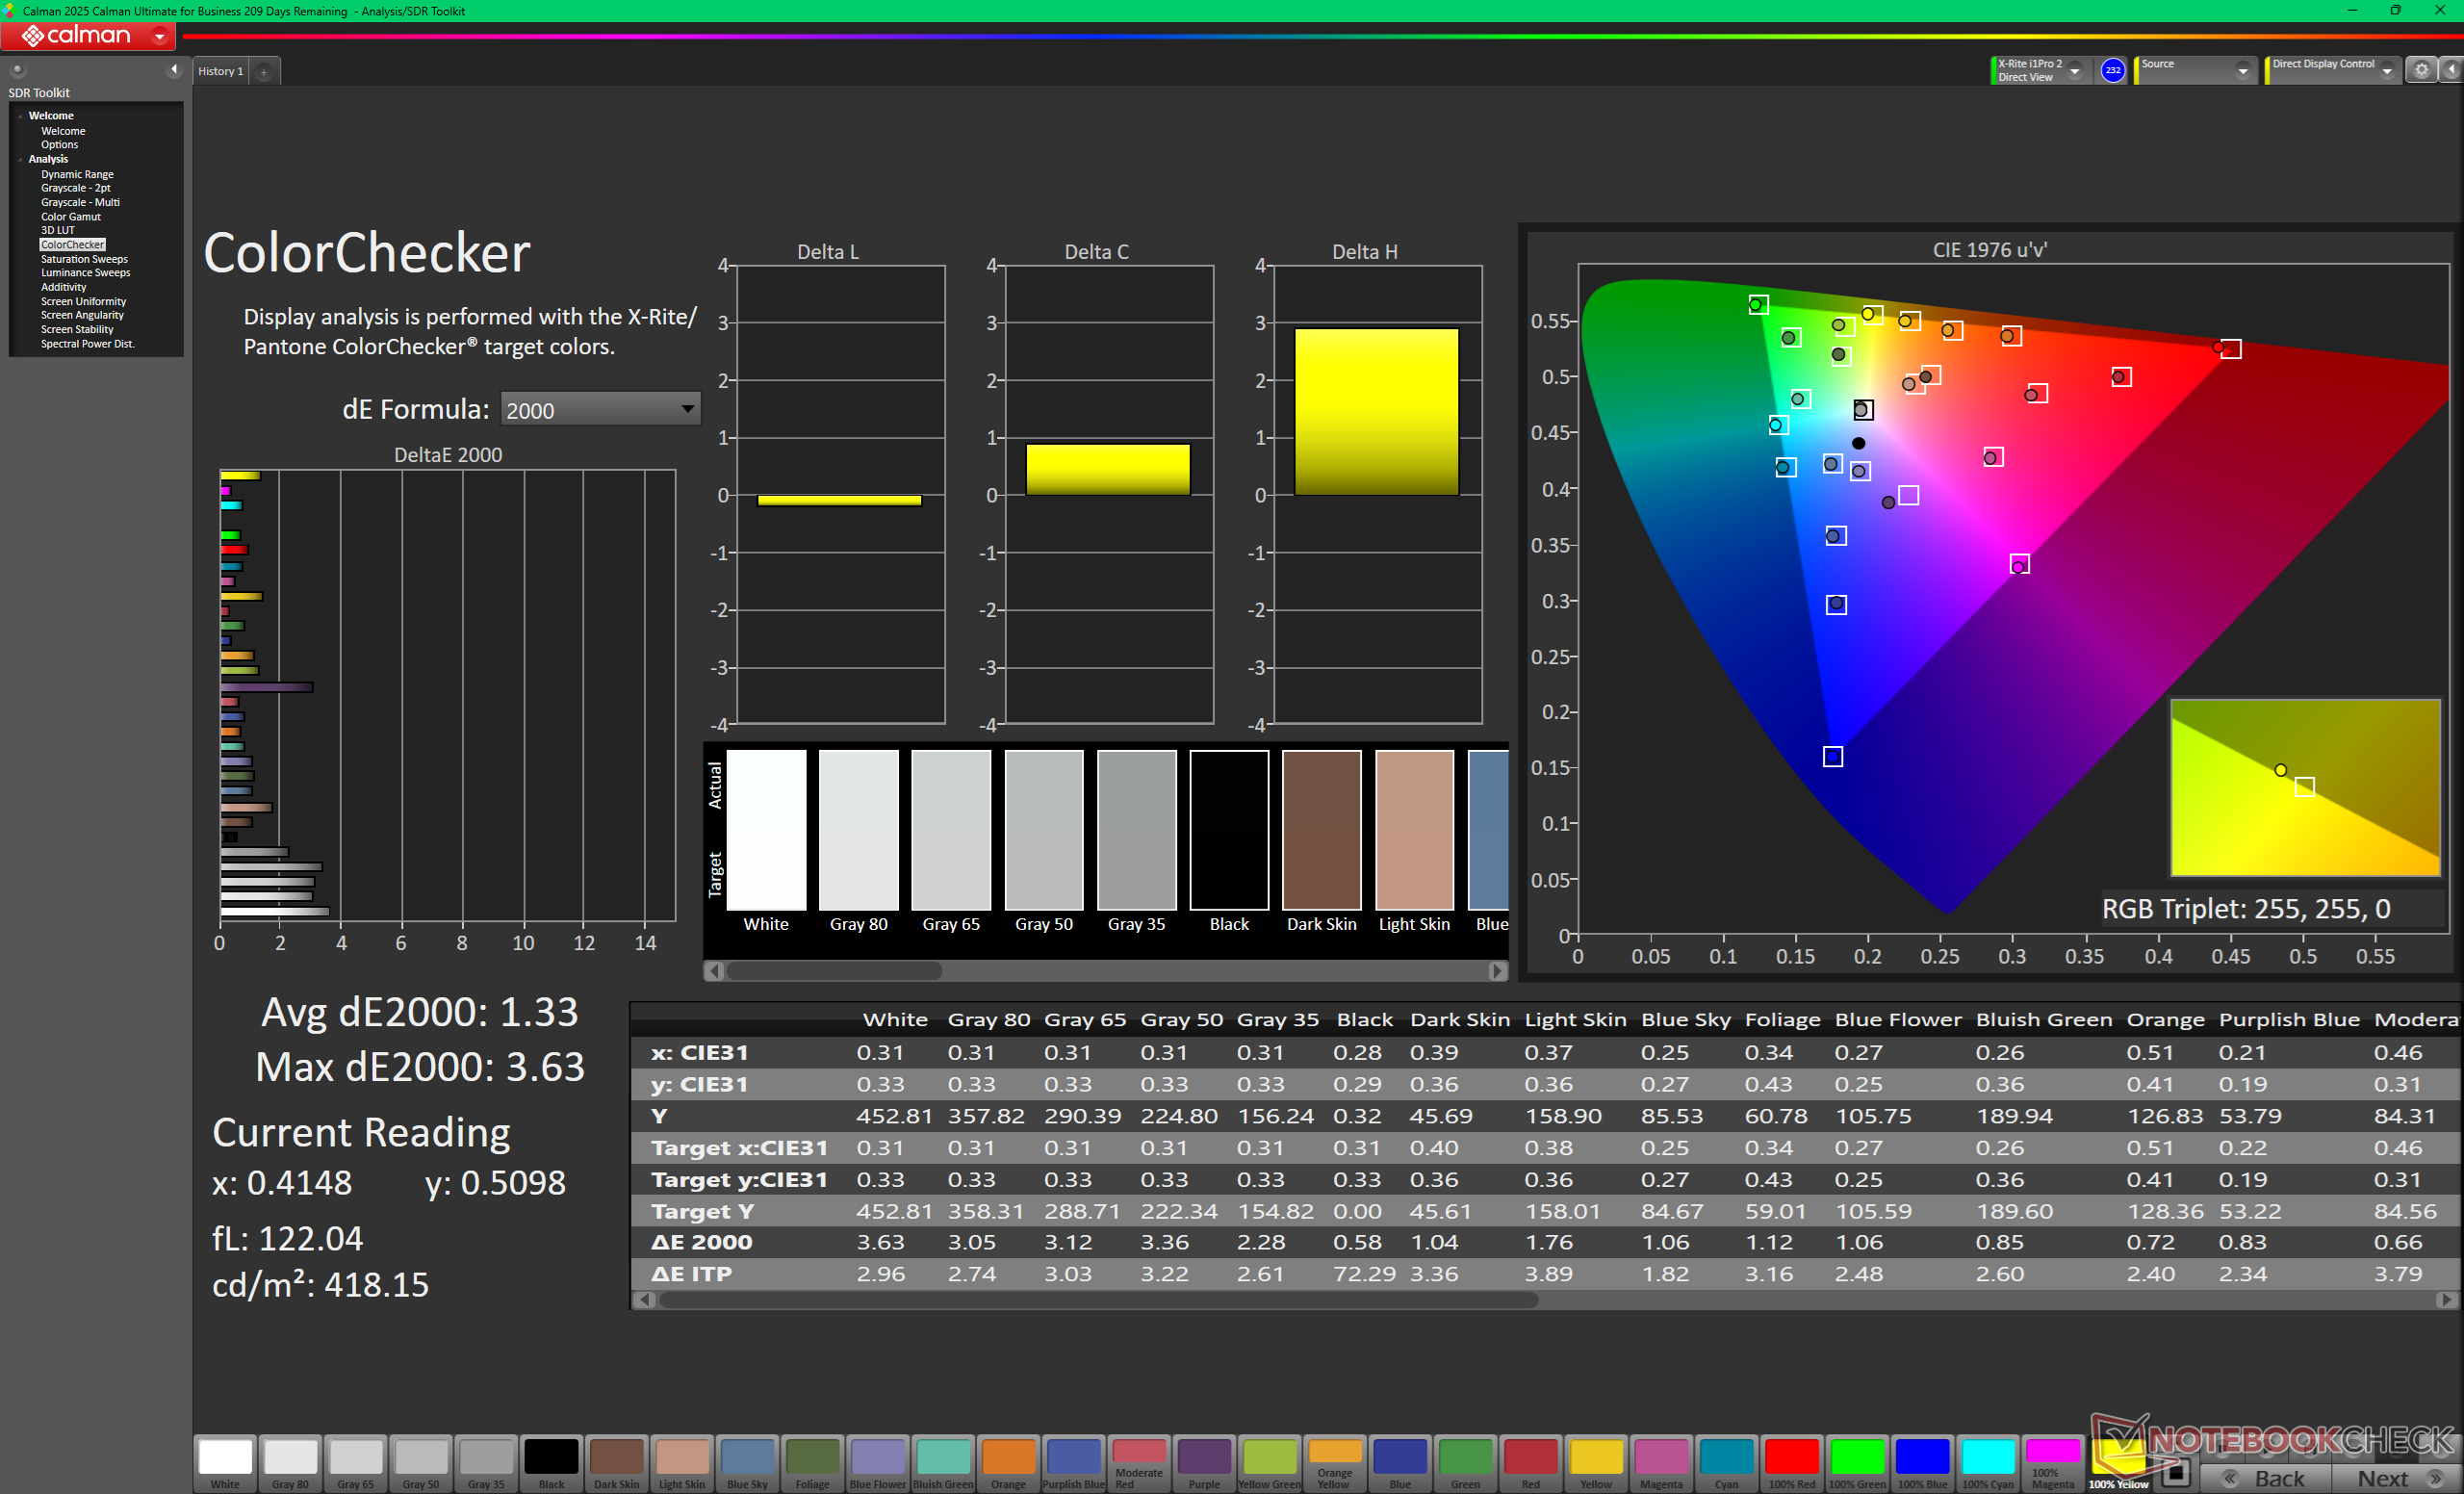
ΔE ColorChecker Calman: 2.23 | ∀{0.5-29.43 Ø4.73}
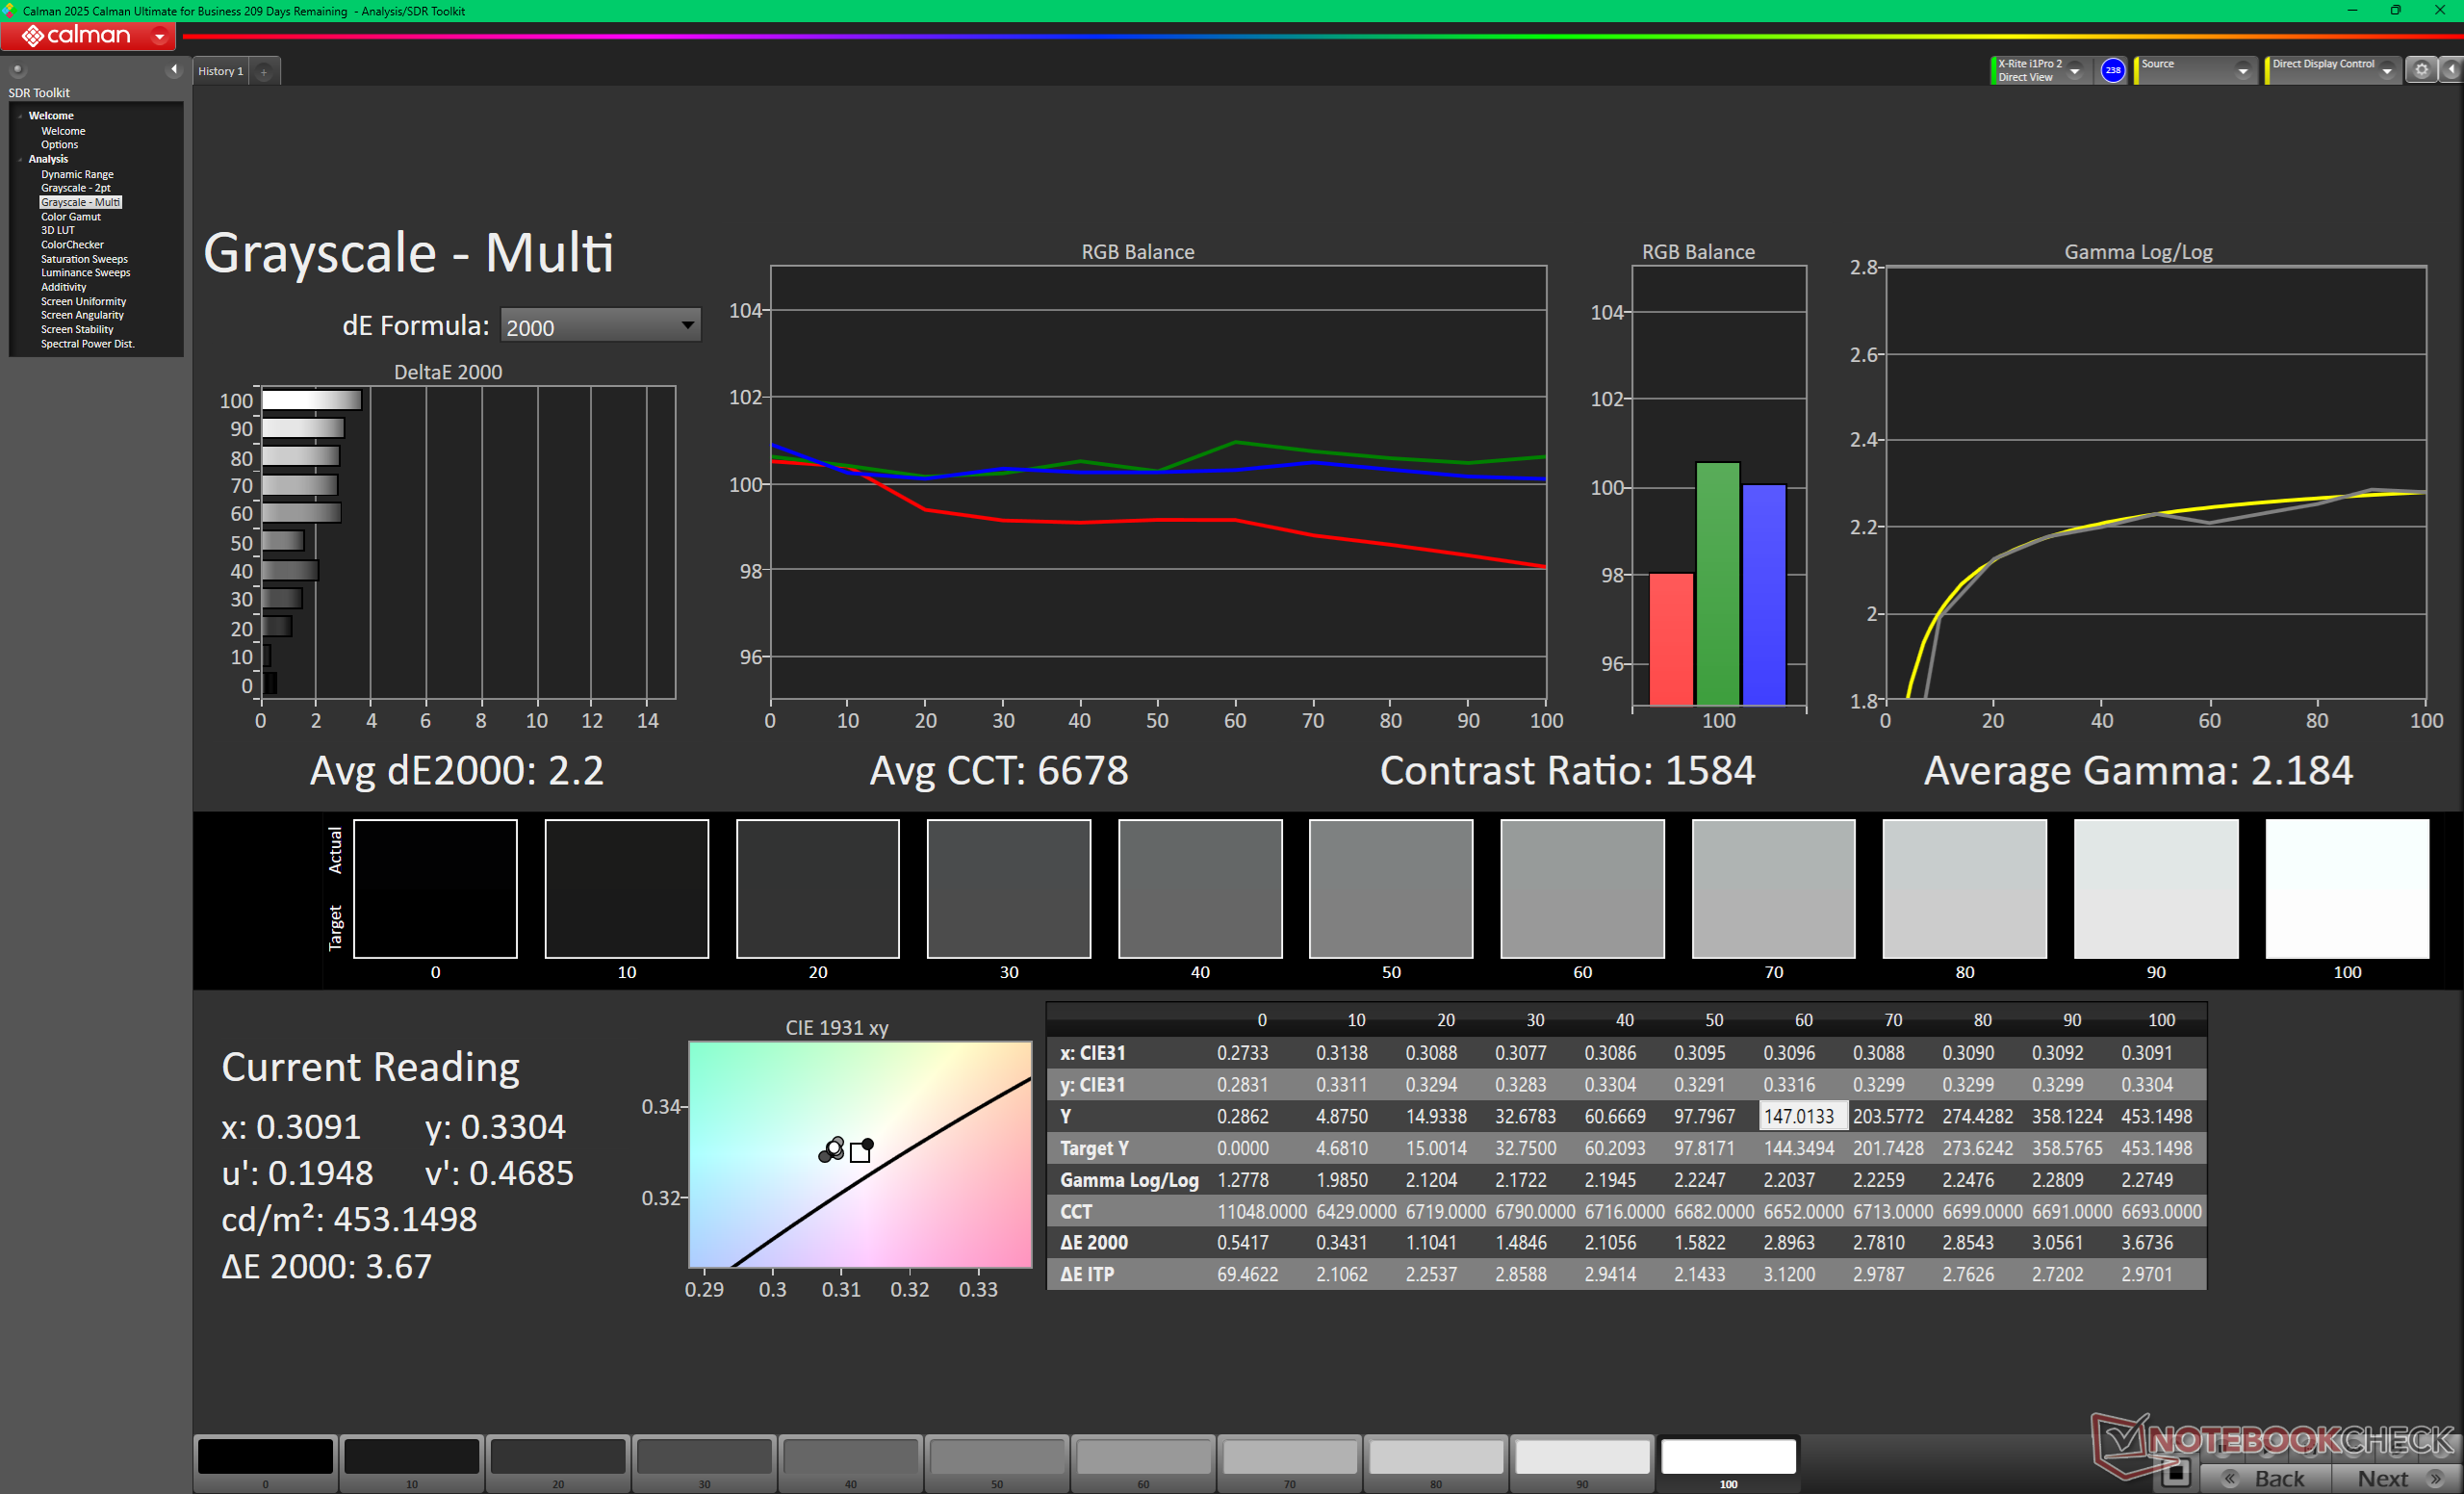
calibrated: 1.33
ΔE Greyscale Calman: 8.2 | ∀{0.09-98 Ø4.97}
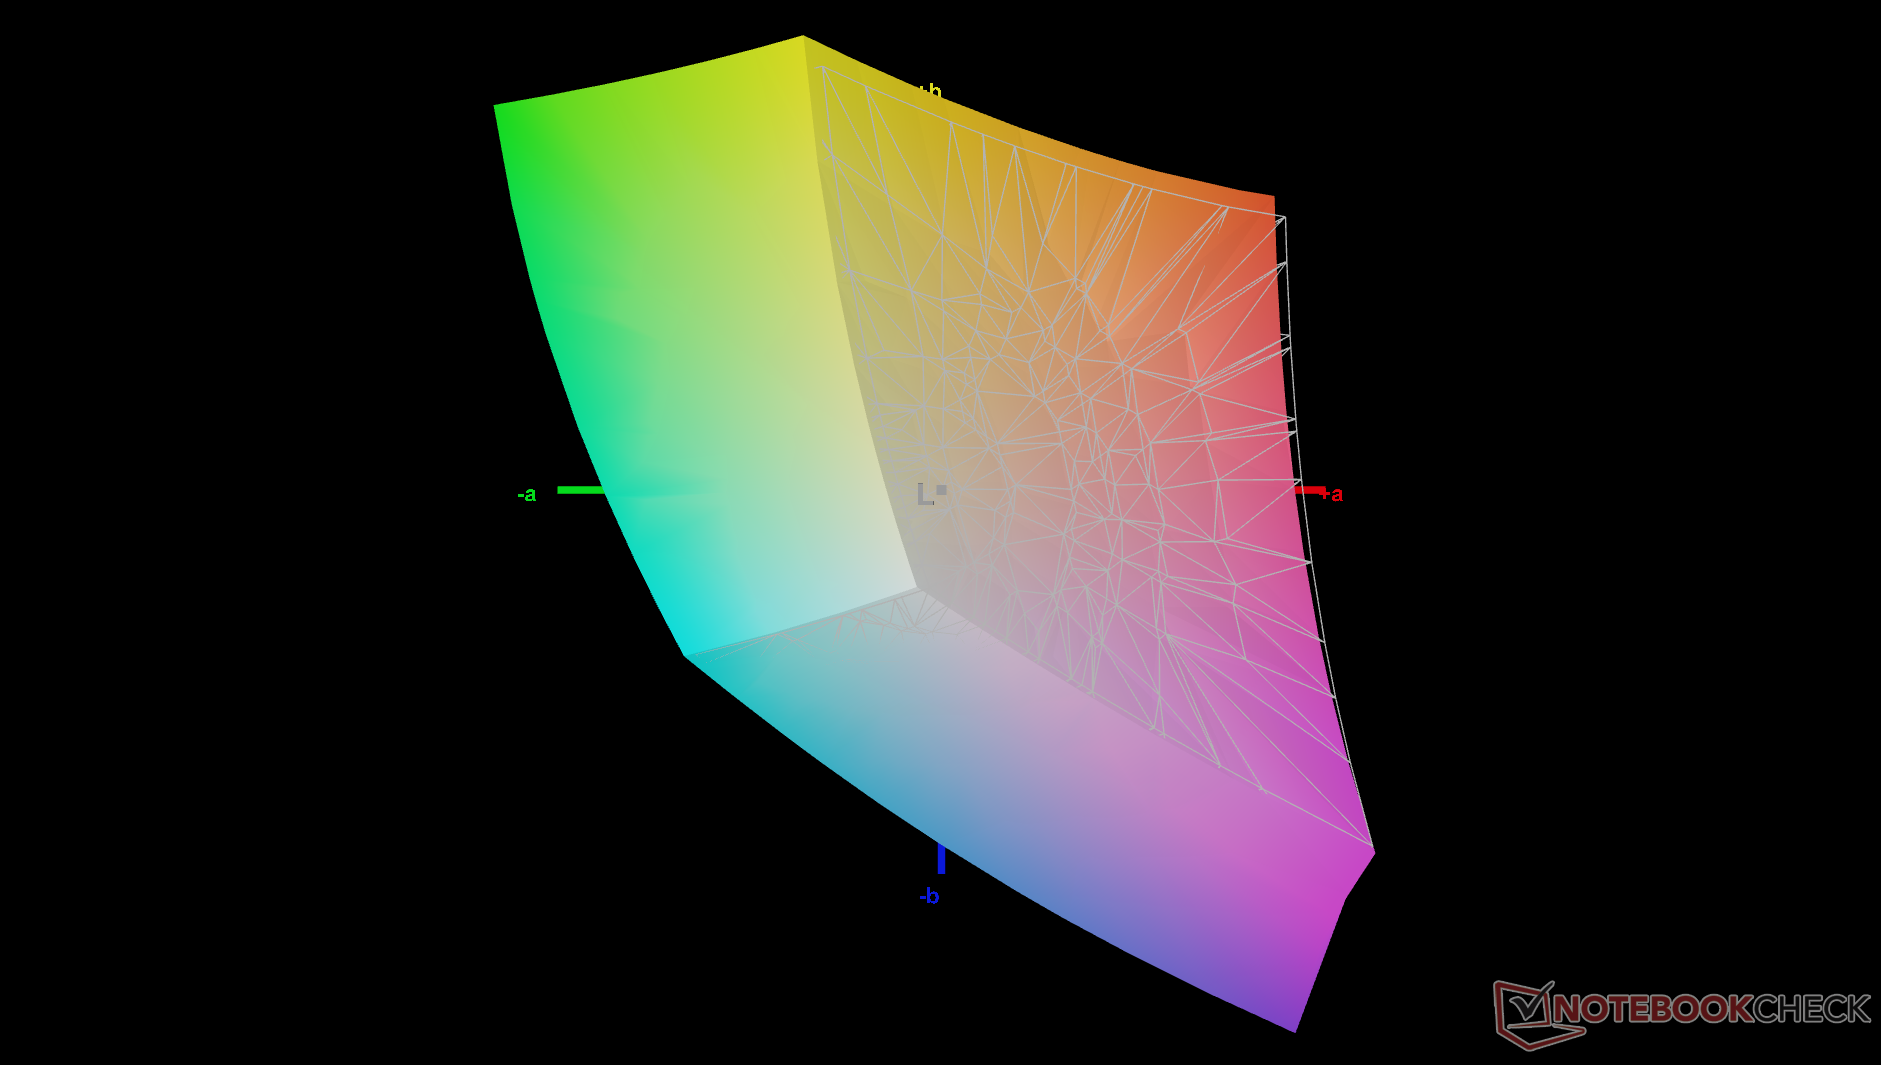
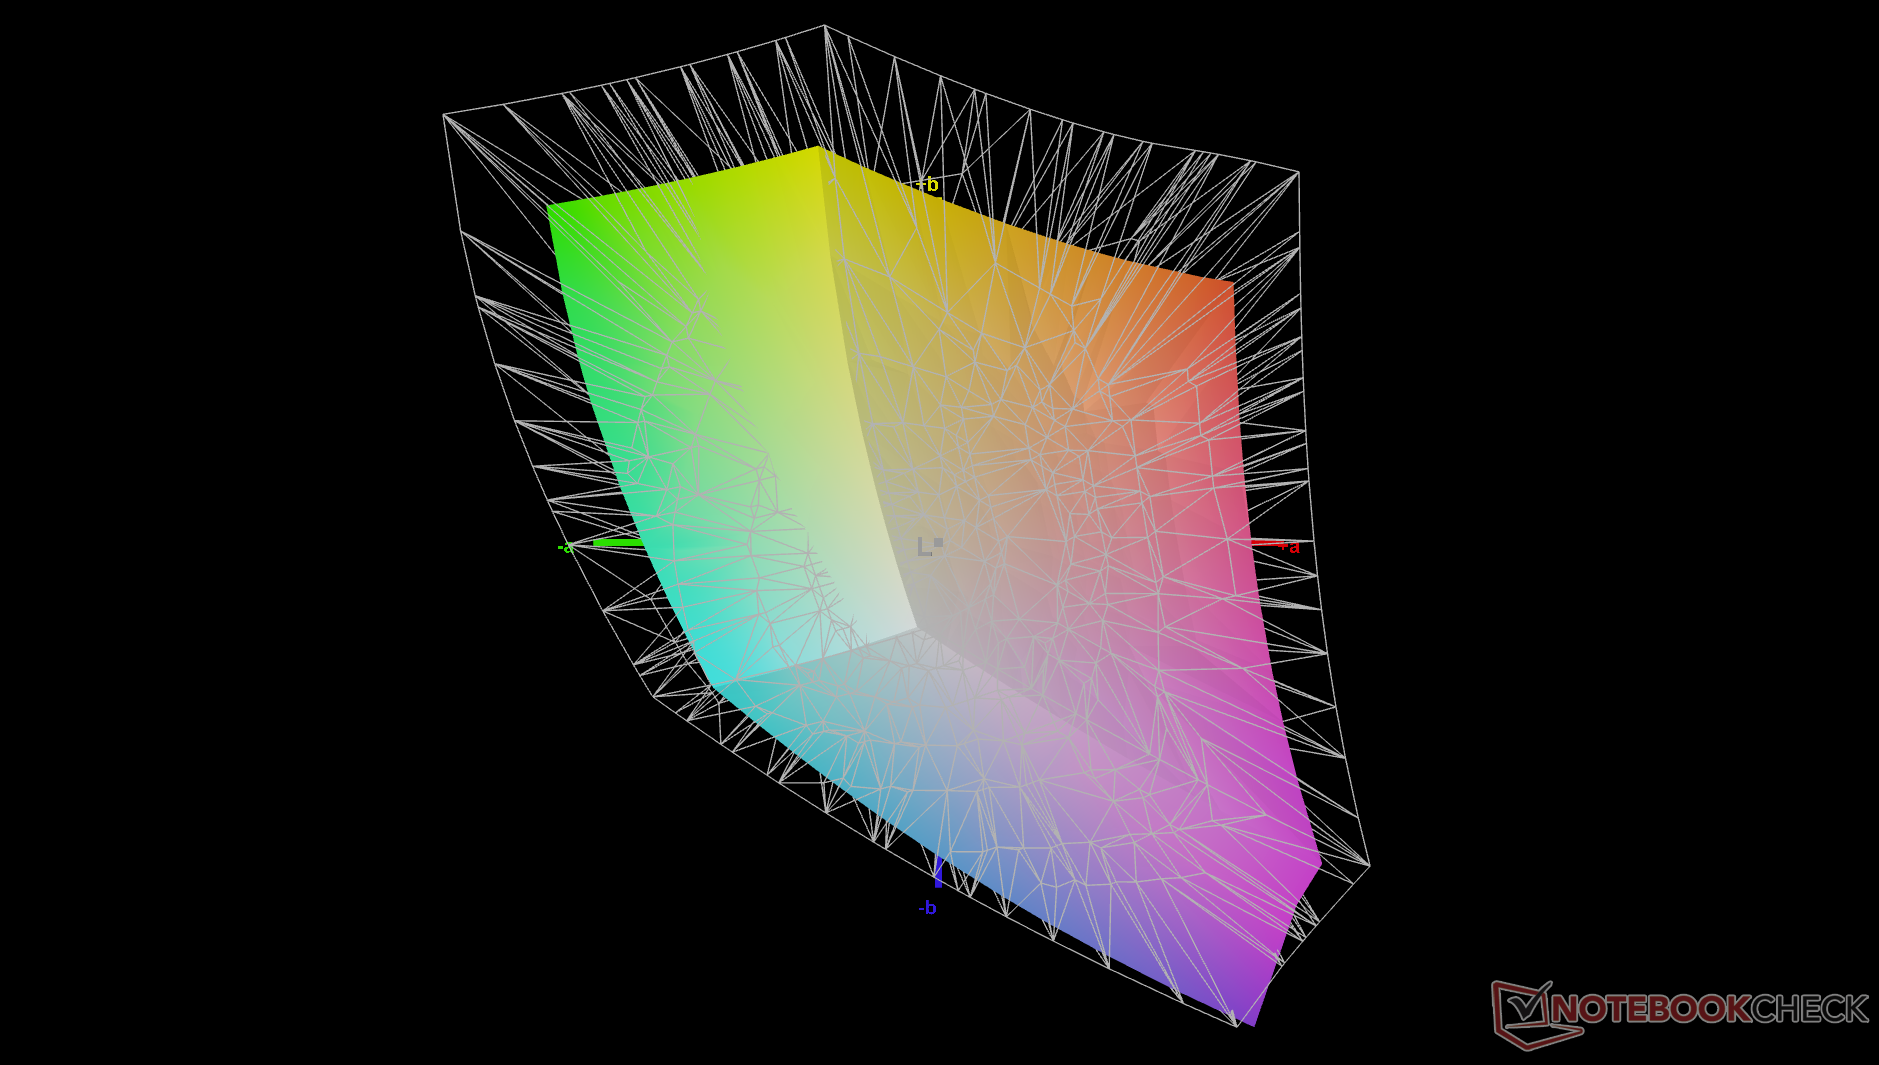
71.3% AdobeRGB 1998 (Argyll 3D)
98.5% sRGB (Argyll 3D)
69.8% Display P3 (Argyll 3D)
Gamma: 2.16
CCT: 7210 K
| Lenovo ThinkPad X1 2-in-1 Gen 11 AUO B140UAN10.0, IPS, 1920x1200, 14", 60 Hz | Lenovo ThinkPad X1 2-in-1 Gen 10 N140JLG-GT3, IPS, 1920x1200, 14", 60 Hz | Lenovo Yoga Book 9 14IAH10 LEN140WQ+, 2x, OLED, 2880x1800, 14", 120 Hz | HP EliteBook X Flip G1i 14 AI AUO8FB5, IPS, 1920x1200, 14", 60 Hz | Dell Latitude 7450 2-in-1 BOE NV140WU, IPS, 1920x1200, 14", 60 Hz | Asus ExpertBook Ultra B9406CAA Samsung ATNA40LE01-0, OLED, 2880x1800, 14", 120 Hz | |
|---|---|---|---|---|---|---|
| Display | -2% | 25% | 7% | 6% | 21% | |
| Display P3 Coverage (%) | 69.8 | 67.8 -3% | 99.9 43% | 76.7 10% | 76.5 10% | 96.2 38% |
| sRGB Coverage (%) | 98.5 | 97.2 -1% | 100 2% | 98.2 0% | 100 2% | 100 2% |
| AdobeRGB 1998 Coverage (%) | 71.3 | 69.8 -2% | 92.2 29% | 78.2 10% | 76 7% | 86.7 22% |
| Response Times | -17% | 97% | -17% | 3% | 97% | |
| Response Time Grey 50% / Grey 80% * (ms) | 41.2 ? | 44.6 ? -8% | 0.6 ? 99% | 49.2 ? -19% | 35.65 ? 13% | 0.71 ? 98% |
| Response Time Black / White * (ms) | 21.6 ? | 27.1 ? -25% | 1 ? 95% | 24.8 ? -15% | 23.35 ? -8% | 0.94 ? 96% |
| PWM Frequency (Hz) | 480 ? | 968.8 ? | ||||
| PWM Amplitude * (%) | 43 | 20 | ||||
| Screen | -2% | 1% | -19% | -7% | 34% | |
| Brightness middle (cd/m²) | 527.7 | 459 -13% | 381.7 -28% | 572 8% | 333 -37% | 600.5 14% |
| Brightness (cd/m²) | 490 | 455 -7% | 398 -19% | 541 10% | 326 -33% | 612 25% |
| Brightness Distribution (%) | 86 | 89 3% | 94 9% | 78 -9% | 85 -1% | 96 12% |
| Black Level * (cd/m²) | 0.28 | 0.24 14% | 0.2 29% | 0.27 4% | ||
| Contrast (:1) | 1885 | 1913 1% | 2860 52% | 1233 -35% | ||
| Colorchecker dE 2000 * | 2.23 | 3.14 -41% | 2.93 -31% | 4.19 -88% | 2.46 -10% | 1.18 47% |
| Colorchecker dE 2000 max. * | 3.58 | 6.55 -83% | 5.93 -66% | 8.65 -142% | 4.58 -28% | 3.4 5% |
| Colorchecker dE 2000 calibrated * | 1.33 | 0.58 56% | 0.61 54% | 2.11 -59% | 1.31 2% | 0.73 45% |
| Greyscale dE 2000 * | 8.2 | 3.9 52% | 0.8 90% | 5.65 31% | 2.1 74% | 1 88% |
| Gamma | 2.16 102% | 2.16 102% | 2.16 102% | 2.45 90% | 2.2 100% | 2.27 97% |
| CCT | 7210 90% | 5867 111% | 6404 101% | 5959 109% | 6578 99% | 6567 99% |
| Całkowita średnia (program / ustawienia) | -7% /
-4% | 41% /
23% | -10% /
-13% | 1% /
-3% | 51% /
41% |
* ... im mniej tym lepiej
Temperatura barwowa wyniosła fabrycznie 7200 K, co jest wartością zdecydowanie zbyt niską. Kalibracja wyświetlacza za pomocą naszego kolorymetru X-Rite pozwoliłaby znacznie poprawić średnie wartości deltaE dla skali szarości i kolorów – z odpowiednio 8,2 i 2,23 do zaledwie 2,2 i 1,33.
Wyświetl czasy reakcji
| ↔ Czas reakcji od czerni do bieli | ||
|---|---|---|
| 21.6 ms ... wzrost ↗ i spadek ↘ łącznie | ↗ 10.7 ms wzrost | 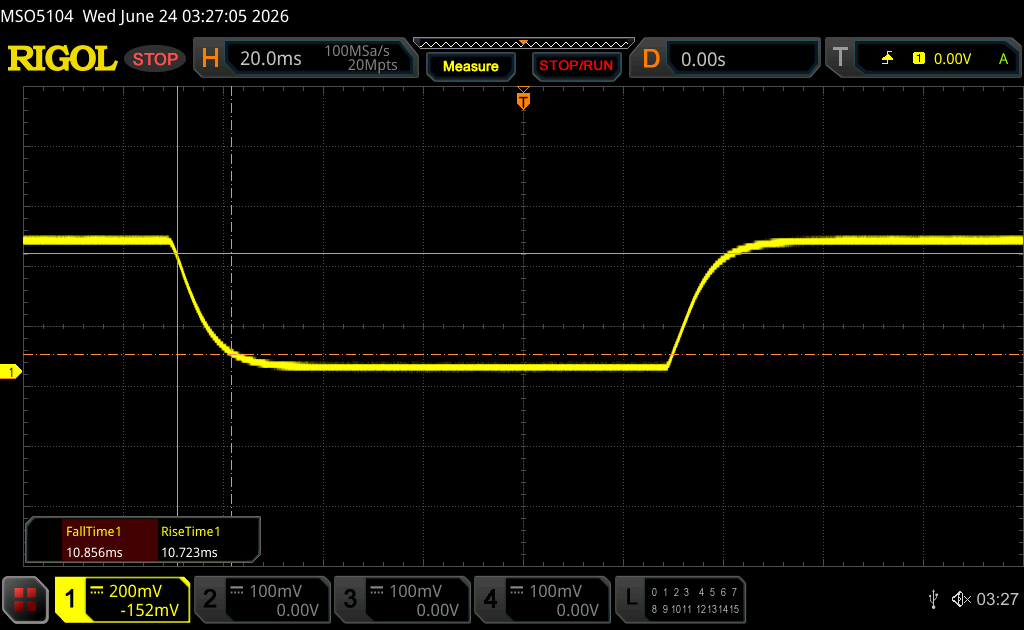 |
| ↘ 10.9 ms upadek | ||
| W naszych testach ekran wykazuje dobry współczynnik reakcji, ale może być zbyt wolny dla graczy rywalizujących ze sobą. Dla porównania, wszystkie testowane urządzenia wahają się od 0.1 (minimum) do 240 (maksimum) ms. » 48 % wszystkich urządzeń jest lepszych. Oznacza to, że zmierzony czas reakcji jest zbliżony do średniej wszystkich testowanych urządzeń (19.9 ms). | ||
| ↔ Czas reakcji 50% szarości do 80% szarości | ||
| 41.2 ms ... wzrost ↗ i spadek ↘ łącznie | ↗ 18.8 ms wzrost | 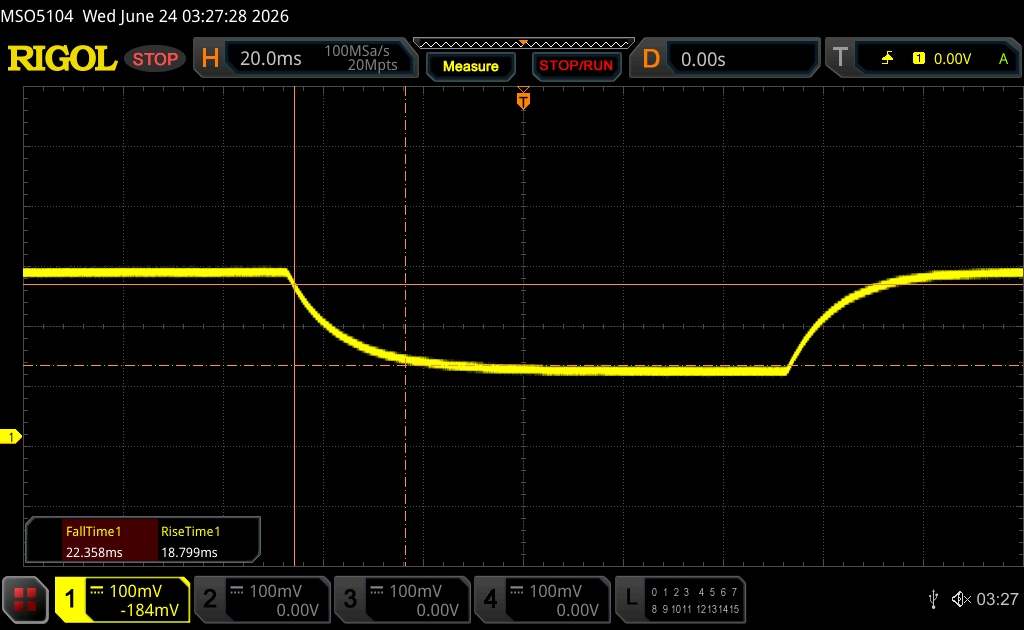 |
| ↘ 22.4 ms upadek | ||
| W naszych testach ekran wykazuje powolne tempo reakcji, co będzie niezadowalające dla graczy. Dla porównania, wszystkie testowane urządzenia wahają się od 0.165 (minimum) do 636 (maksimum) ms. » 66 % wszystkich urządzeń jest lepszych. Oznacza to, że zmierzony czas reakcji jest gorszy od średniej wszystkich testowanych urządzeń (31.1 ms). | ||
Migotanie ekranu / PWM (modulacja szerokości impulsu)
| Migotanie ekranu/nie wykryto PWM | 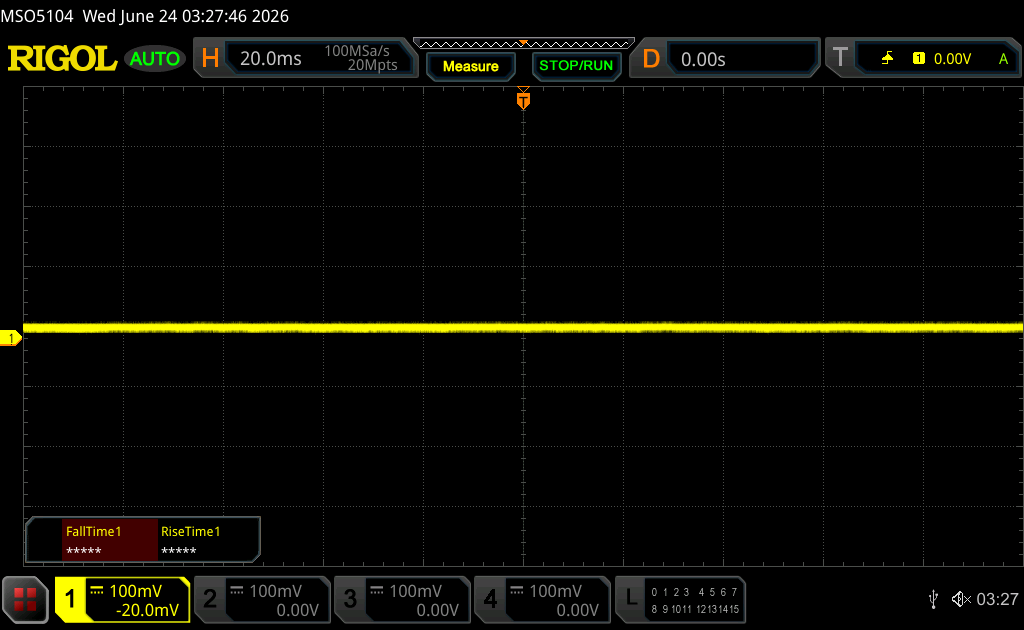 | ||
Dla porównania: 52 % wszystkich testowanych urządzeń nie używa PWM do przyciemniania wyświetlacza. Jeśli wykryto PWM, zmierzono średnio 7784 (minimum: 5 - maksimum: 343500) Hz. | |||


Wydajność
Warunki testowania
Przed uruchomieniem poniższych testów porównawczych ustawiliśmy system Windows w trybie wydajności.
Wydajność procesora
Model Core Ultra 7 355 jest o około 10–15 procent szybszy i charakteryzuje się bardziej stabilną wydajnością niż model Core Ultra 7 258V w zeszłorocznym modelu. Przejście na najwyższej klasy model Core Ultra X7 368H może zwiększyć wydajność wielowątkową nawet o 70 procent. Wydajność procesora NPU pozostaje jednak niemal taka sama we wszystkich aktualnych wersjach modelu ThinkPad X1 2-w-1 11. generacji.
Cinebench R15 – test wielopętlowy
Cinebench R23: Multi Core | Single Core
Cinebench R20: CPU (Multi Core) | CPU (Single Core)
Cinebench R15: CPU Multi 64Bit | CPU Single 64Bit
Blender: v2.79 BMW27 CPU
7-Zip 18.03: 7z b 4 | 7z b 4 -mmt1
Geekbench 6.7: Multi-Core | Single-Core
Geekbench 5.5: Multi-Core | Single-Core
HWBOT x265 Benchmark v2.2: 4k Preset
LibreOffice : 20 Documents To PDF
R Benchmark 2.5: Overall mean
* ... im mniej tym lepiej
AIDA64: FP32 Ray-Trace | FPU Julia | CPU SHA3 | CPU Queen | FPU SinJulia | FPU Mandel | CPU AES | CPU ZLib | FP64 Ray-Trace | CPU PhotoWorxx | CPU CheckMate
| Performance rating | |
| Lenovo Yoga Book 9 14IAH10 -1! | |
| Lenovo ThinkPad X1 2-in-1 Gen 11 -1! | |
| Przeciętny Intel Core Ultra 7 355 | |
| Lenovo ThinkPad X1 2-in-1 Gen 10 -1! | |
| HP EliteBook X Flip G1i 14 AI -1! | |
| Dell Latitude 7450 2-in-1 -1! | |
| Asus ExpertBook Ultra B9406CAA -1! | |
| AIDA64 / FP32 Ray-Trace | |
| Lenovo Yoga Book 9 14IAH10 (v6.92.6600) | |
| Lenovo ThinkPad X1 2-in-1 Gen 11 (v8.20.8100) | |
| Przeciętny Intel Core Ultra 7 355 (12228 - 12838, n=3) | |
| Asus ExpertBook Ultra B9406CAA (v6.92.6600) | |
| Lenovo ThinkPad X1 2-in-1 Gen 10 (v6.92.6600) | |
| HP EliteBook X Flip G1i 14 AI (v6.92.6600) | |
| Dell Latitude 7450 2-in-1 (v6.92.6600) | |
| AIDA64 / FPU Julia | |
| Lenovo Yoga Book 9 14IAH10 (v6.92.6600) | |
| Lenovo ThinkPad X1 2-in-1 Gen 11 (v8.20.8100) | |
| Przeciętny Intel Core Ultra 7 355 (60741 - 65963, n=3) | |
| Lenovo ThinkPad X1 2-in-1 Gen 10 (v6.92.6600) | |
| HP EliteBook X Flip G1i 14 AI (v6.92.6600) | |
| Dell Latitude 7450 2-in-1 (v6.92.6600) | |
| Asus ExpertBook Ultra B9406CAA (v6.92.6600) | |
| AIDA64 / CPU SHA3 | |
| Asus ExpertBook Ultra B9406CAA (v6.92.6600) | |
| Lenovo Yoga Book 9 14IAH10 (v6.92.6600) | |
| Lenovo ThinkPad X1 2-in-1 Gen 11 (v8.20.8100) | |
| Przeciętny Intel Core Ultra 7 355 (2763 - 2845, n=3) | |
| Dell Latitude 7450 2-in-1 (v6.92.6600) | |
| Lenovo ThinkPad X1 2-in-1 Gen 10 (v6.92.6600) | |
| HP EliteBook X Flip G1i 14 AI (v6.92.6600) | |
| AIDA64 / CPU Queen | |
| Asus ExpertBook Ultra B9406CAA (v6.92.6600) | |
| Lenovo Yoga Book 9 14IAH10 (v6.92.6600) | |
| Lenovo ThinkPad X1 2-in-1 Gen 10 (v6.92.6600) | |
| HP EliteBook X Flip G1i 14 AI (v6.92.6600) | |
| Dell Latitude 7450 2-in-1 (v6.92.6600) | |
| Przeciętny Intel Core Ultra 7 355 (n=1) | |
| AIDA64 / FPU SinJulia | |
| Lenovo Yoga Book 9 14IAH10 (v6.92.6600) | |
| Dell Latitude 7450 2-in-1 (v6.92.6600) | |
| Asus ExpertBook Ultra B9406CAA (v6.92.6600) | |
| Lenovo ThinkPad X1 2-in-1 Gen 11 (v8.20.8100) | |
| Przeciętny Intel Core Ultra 7 355 (4597 - 4601, n=3) | |
| Lenovo ThinkPad X1 2-in-1 Gen 10 (v6.92.6600) | |
| HP EliteBook X Flip G1i 14 AI (v6.92.6600) | |
| AIDA64 / FPU Mandel | |
| Lenovo Yoga Book 9 14IAH10 (v6.92.6600) | |
| Lenovo ThinkPad X1 2-in-1 Gen 11 (v8.20.8100) | |
| Przeciętny Intel Core Ultra 7 355 (32404 - 35293, n=3) | |
| HP EliteBook X Flip G1i 14 AI (v6.92.6600) | |
| Lenovo ThinkPad X1 2-in-1 Gen 10 (v6.92.6600) | |
| Dell Latitude 7450 2-in-1 (v6.92.6600) | |
| Asus ExpertBook Ultra B9406CAA (v6.92.6600) | |
| AIDA64 / CPU AES | |
| Lenovo Yoga Book 9 14IAH10 (v6.92.6600) | |
| Dell Latitude 7450 2-in-1 (v6.92.6600) | |
| Lenovo ThinkPad X1 2-in-1 Gen 10 (v6.92.6600) | |
| Lenovo ThinkPad X1 2-in-1 Gen 11 (v8.20.8100) | |
| Przeciętny Intel Core Ultra 7 355 (39050 - 39424, n=3) | |
| HP EliteBook X Flip G1i 14 AI (v6.92.6600) | |
| Asus ExpertBook Ultra B9406CAA (v6.92.6600) | |
| AIDA64 / CPU ZLib | |
| Asus ExpertBook Ultra B9406CAA (v6.92.6600) | |
| Lenovo Yoga Book 9 14IAH10 (v6.92.6600) | |
| Dell Latitude 7450 2-in-1 (v6.92.6600) | |
| Lenovo ThinkPad X1 2-in-1 Gen 11 (v8.20.8100) | |
| Przeciętny Intel Core Ultra 7 355 (635 - 646, n=3) | |
| Lenovo ThinkPad X1 2-in-1 Gen 10 (v6.92.6600) | |
| HP EliteBook X Flip G1i 14 AI (v6.92.6600) | |
| AIDA64 / FP64 Ray-Trace | |
| Lenovo Yoga Book 9 14IAH10 (v6.92.6600) | |
| Lenovo ThinkPad X1 2-in-1 Gen 11 (v8.20.8100) | |
| Przeciętny Intel Core Ultra 7 355 (6147 - 6833, n=3) | |
| Asus ExpertBook Ultra B9406CAA (v6.92.6600) | |
| Lenovo ThinkPad X1 2-in-1 Gen 10 (v6.92.6600) | |
| HP EliteBook X Flip G1i 14 AI (v6.92.6600) | |
| Dell Latitude 7450 2-in-1 (v6.92.6600) | |
| AIDA64 / CPU PhotoWorxx | |
| Lenovo ThinkPad X1 2-in-1 Gen 11 (v8.20.8100) | |
| Lenovo Yoga Book 9 14IAH10 (v6.92.6600) | |
| Przeciętny Intel Core Ultra 7 355 (57998 - 60440, n=3) | |
| Lenovo ThinkPad X1 2-in-1 Gen 10 (v6.92.6600) | |
| HP EliteBook X Flip G1i 14 AI (v6.92.6600) | |
| Dell Latitude 7450 2-in-1 (v6.92.6600) | |
| Asus ExpertBook Ultra B9406CAA (v6.92.6600) | |
| AIDA64 / CPU CheckMate | |
| Lenovo ThinkPad X1 2-in-1 Gen 11 (v8.20.8100) | |
| Przeciętny Intel Core Ultra 7 355 (2790 - 2813, n=3) | |
Wydajność systemu
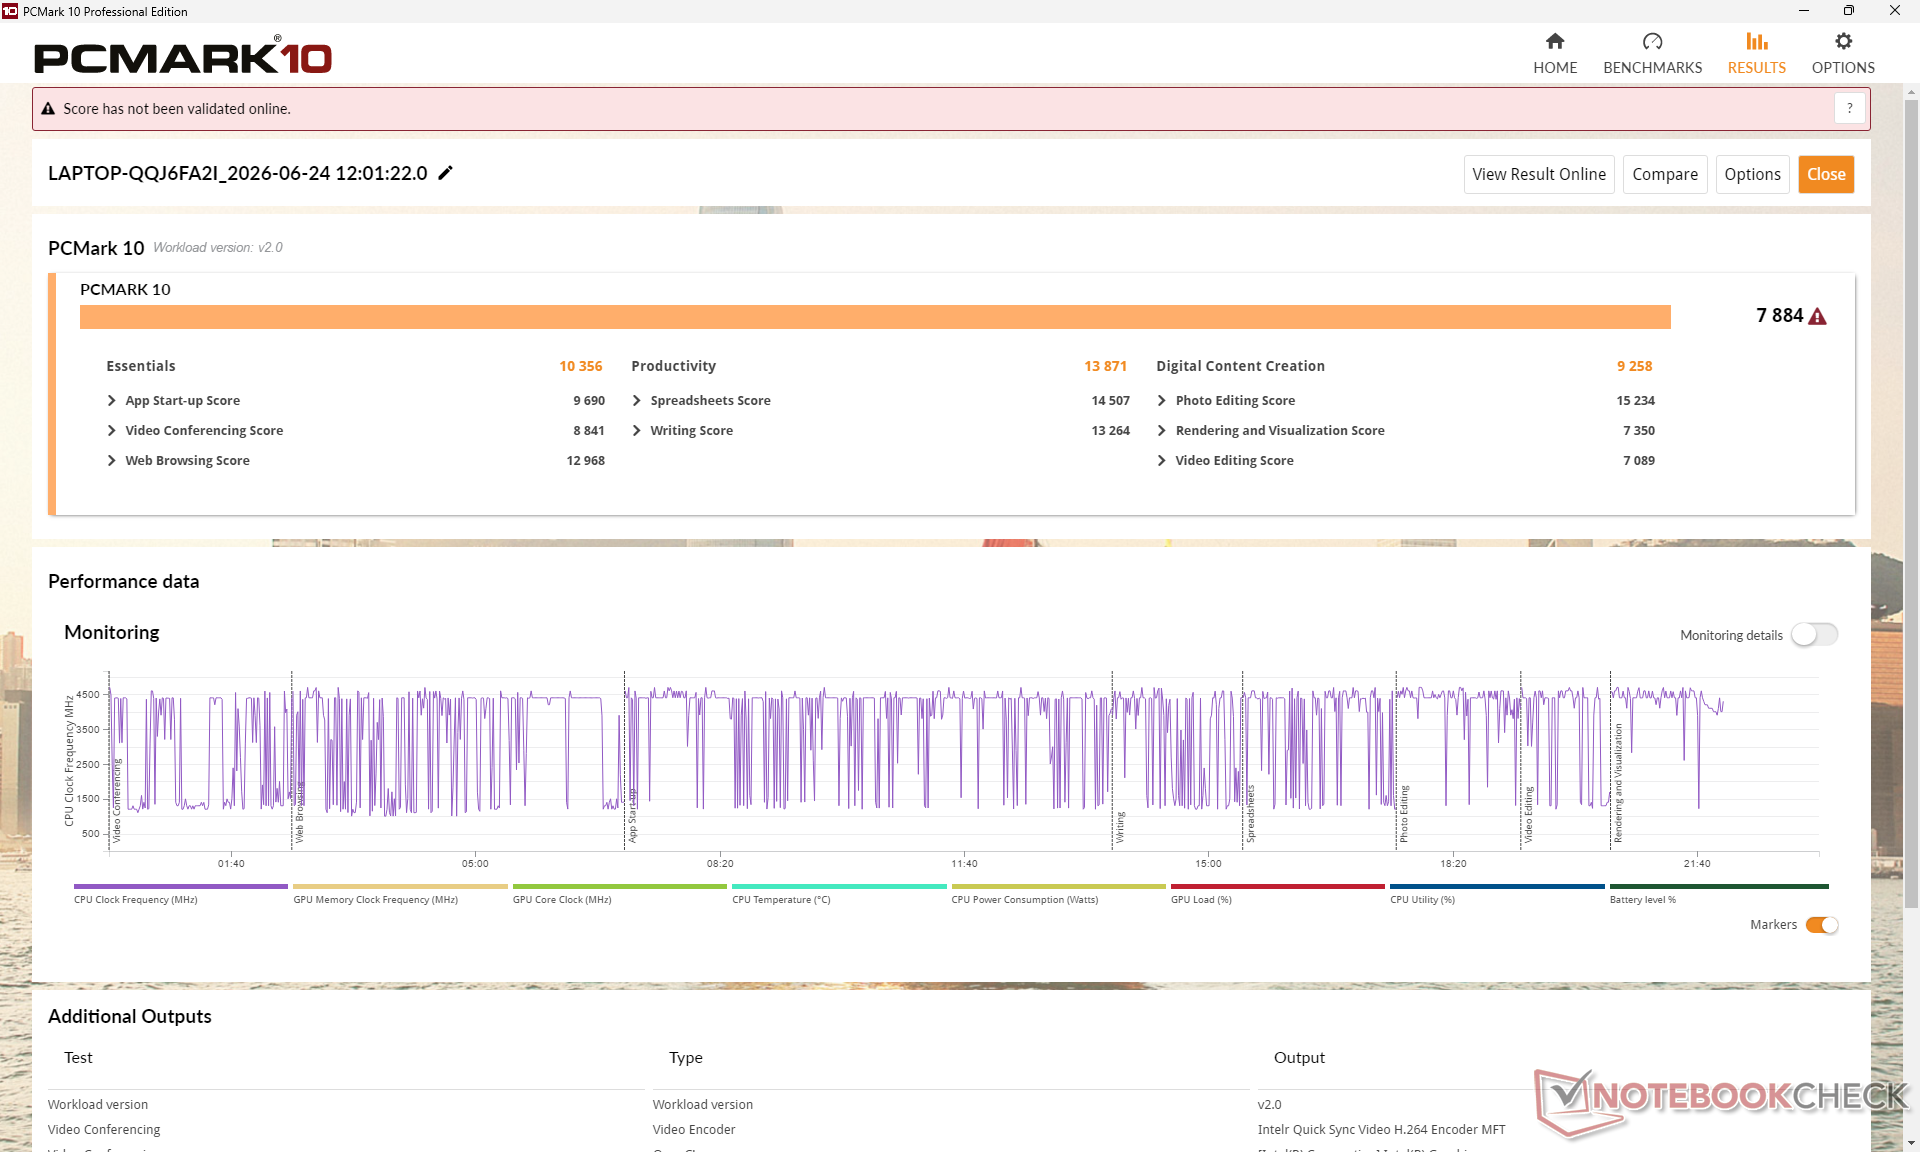
PCMark 10: Score | Essentials | Productivity | Digital Content Creation
CrossMark: Overall | Productivity | Creativity | Responsiveness
WebXPRT 3: Overall
WebXPRT 4: Overall
Mozilla Kraken 1.1: Total
Geekbench AI: Quantized GPU 1.7 | Half Precision GPU 1.7 | Single Precision GPU 1.7
| Performance rating | |
| Asus ExpertBook Ultra B9406CAA | |
| Lenovo Yoga Book 9 14IAH10 | |
| Lenovo ThinkPad X1 2-in-1 Gen 11 | |
| Dell Latitude 7450 2-in-1 -3! | |
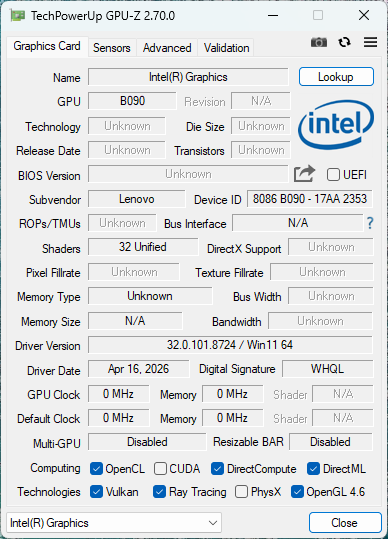
| Przeciętny Intel Core Ultra 7 355, Intel Graphics 4 Xe3 Panther Lake iGPU | |
| Lenovo ThinkPad X1 2-in-1 Gen 10 -1! | |
| HP EliteBook X Flip G1i 14 AI -3! | |
| PCMark 10 / Score | |
| Asus ExpertBook Ultra B9406CAA | |
| Przeciętny Intel Core Ultra 7 355, Intel Graphics 4 Xe3 Panther Lake iGPU (7884 - 8185, n=3) | |
| Lenovo ThinkPad X1 2-in-1 Gen 11 | |
| Lenovo Yoga Book 9 14IAH10 | |
| Lenovo ThinkPad X1 2-in-1 Gen 10 | |
| HP EliteBook X Flip G1i 14 AI | |
| Dell Latitude 7450 2-in-1 | |
| PCMark 10 / Essentials | |
| Lenovo Yoga Book 9 14IAH10 | |
| Dell Latitude 7450 2-in-1 | |
| Lenovo ThinkPad X1 2-in-1 Gen 10 | |
| Asus ExpertBook Ultra B9406CAA | |
| Przeciętny Intel Core Ultra 7 355, Intel Graphics 4 Xe3 Panther Lake iGPU (10356 - 10820, n=3) | |
| HP EliteBook X Flip G1i 14 AI | |
| Lenovo ThinkPad X1 2-in-1 Gen 11 | |
| PCMark 10 / Productivity | |
| Asus ExpertBook Ultra B9406CAA | |
| Przeciętny Intel Core Ultra 7 355, Intel Graphics 4 Xe3 Panther Lake iGPU (13871 - 14685, n=3) | |
| Lenovo ThinkPad X1 2-in-1 Gen 11 | |
| HP EliteBook X Flip G1i 14 AI | |
| Lenovo Yoga Book 9 14IAH10 | |
| Lenovo ThinkPad X1 2-in-1 Gen 10 | |
| Dell Latitude 7450 2-in-1 | |
| PCMark 10 / Digital Content Creation | |
| Asus ExpertBook Ultra B9406CAA | |
| Lenovo Yoga Book 9 14IAH10 | |
| Lenovo ThinkPad X1 2-in-1 Gen 10 | |
| HP EliteBook X Flip G1i 14 AI | |
| Przeciętny Intel Core Ultra 7 355, Intel Graphics 4 Xe3 Panther Lake iGPU (9258 - 9368, n=3) | |
| Lenovo ThinkPad X1 2-in-1 Gen 11 | |
| Dell Latitude 7450 2-in-1 | |
| CrossMark / Overall | |
| Lenovo Yoga Book 9 14IAH10 | |
| Asus ExpertBook Ultra B9406CAA | |
| Lenovo ThinkPad X1 2-in-1 Gen 11 | |
| Przeciętny Intel Core Ultra 7 355, Intel Graphics 4 Xe3 Panther Lake iGPU (1627 - 1818, n=3) | |
| Lenovo ThinkPad X1 2-in-1 Gen 10 | |
| HP EliteBook X Flip G1i 14 AI | |
| Dell Latitude 7450 2-in-1 | |
| CrossMark / Productivity | |
| Lenovo Yoga Book 9 14IAH10 | |
| Lenovo ThinkPad X1 2-in-1 Gen 11 | |
| Przeciętny Intel Core Ultra 7 355, Intel Graphics 4 Xe3 Panther Lake iGPU (1561 - 1755, n=3) | |
| Asus ExpertBook Ultra B9406CAA | |
| Lenovo ThinkPad X1 2-in-1 Gen 10 | |
| HP EliteBook X Flip G1i 14 AI | |
| Dell Latitude 7450 2-in-1 | |
| CrossMark / Creativity | |
| Lenovo Yoga Book 9 14IAH10 | |
| Asus ExpertBook Ultra B9406CAA | |
| Lenovo ThinkPad X1 2-in-1 Gen 11 | |
| Lenovo ThinkPad X1 2-in-1 Gen 10 | |
| Przeciętny Intel Core Ultra 7 355, Intel Graphics 4 Xe3 Panther Lake iGPU (1761 - 2045, n=3) | |
| HP EliteBook X Flip G1i 14 AI | |
| Dell Latitude 7450 2-in-1 | |
| CrossMark / Responsiveness | |
| Asus ExpertBook Ultra B9406CAA | |
| Lenovo ThinkPad X1 2-in-1 Gen 11 | |
| Lenovo Yoga Book 9 14IAH10 | |
| Przeciętny Intel Core Ultra 7 355, Intel Graphics 4 Xe3 Panther Lake iGPU (1458 - 1543, n=3) | |
| Dell Latitude 7450 2-in-1 | |
| Lenovo ThinkPad X1 2-in-1 Gen 10 | |
| HP EliteBook X Flip G1i 14 AI | |
| WebXPRT 3 / Overall | |
| Dell Latitude 7450 2-in-1 | |
| Lenovo Yoga Book 9 14IAH10 | |
| Lenovo ThinkPad X1 2-in-1 Gen 10 | |
| Asus ExpertBook Ultra B9406CAA | |
| Lenovo ThinkPad X1 2-in-1 Gen 11 | |
| Przeciętny Intel Core Ultra 7 355, Intel Graphics 4 Xe3 Panther Lake iGPU (302 - 303, n=3) | |
| HP EliteBook X Flip G1i 14 AI | |
| WebXPRT 4 / Overall | |
| Dell Latitude 7450 2-in-1 | |
| Lenovo Yoga Book 9 14IAH10 | |
| Lenovo ThinkPad X1 2-in-1 Gen 11 | |
| Przeciętny Intel Core Ultra 7 355, Intel Graphics 4 Xe3 Panther Lake iGPU (279 - 284, n=3) | |
| Asus ExpertBook Ultra B9406CAA | |
| HP EliteBook X Flip G1i 14 AI | |
| Mozilla Kraken 1.1 / Total | |
| HP EliteBook X Flip G1i 14 AI | |
| Przeciętny Intel Core Ultra 7 355, Intel Graphics 4 Xe3 Panther Lake iGPU (474 - 487, n=3) | |
| Lenovo ThinkPad X1 2-in-1 Gen 11 | |
| Lenovo ThinkPad X1 2-in-1 Gen 10 | |
| Asus ExpertBook Ultra B9406CAA | |
| Lenovo Yoga Book 9 14IAH10 | |
| Dell Latitude 7450 2-in-1 | |
| Geekbench AI / Quantized GPU 1.7 | |
| Asus ExpertBook Ultra B9406CAA | |
| Lenovo ThinkPad X1 2-in-1 Gen 10 | |
| Lenovo Yoga Book 9 14IAH10 | |
| Przeciętny Intel Core Ultra 7 355, Intel Graphics 4 Xe3 Panther Lake iGPU (4302 - 4449, n=3) | |
| Lenovo ThinkPad X1 2-in-1 Gen 11 | |
| Geekbench AI / Half Precision GPU 1.7 | |
| Asus ExpertBook Ultra B9406CAA | |
| Lenovo ThinkPad X1 2-in-1 Gen 10 | |
| Przeciętny Intel Core Ultra 7 355, Intel Graphics 4 Xe3 Panther Lake iGPU (12274 - 12681, n=3) | |
| Lenovo ThinkPad X1 2-in-1 Gen 11 | |
| Lenovo Yoga Book 9 14IAH10 | |
| Geekbench AI / Single Precision GPU 1.7 | |
| Asus ExpertBook Ultra B9406CAA | |
| Lenovo ThinkPad X1 2-in-1 Gen 10 | |
| Lenovo Yoga Book 9 14IAH10 | |
| Przeciętny Intel Core Ultra 7 355, Intel Graphics 4 Xe3 Panther Lake iGPU (6316 - 6555, n=3) | |
| Lenovo ThinkPad X1 2-in-1 Gen 11 | |
* ... im mniej tym lepiej
| PCMark 10 Score | 7884 pkt. | |
Pomoc | ||
| AIDA64 / Memory Copy | |
| HP EliteBook X Flip G1i 14 AI | |
| Lenovo ThinkPad X1 2-in-1 Gen 10 | |
| Lenovo ThinkPad X1 2-in-1 Gen 11 | |
| Przeciętny Intel Core Ultra 7 355 (97301 - 105135, n=3) | |
| Lenovo Yoga Book 9 14IAH10 | |
| Dell Latitude 7450 2-in-1 | |
| AIDA64 / Memory Read | |
| Asus ExpertBook Ultra B9406CAA | |
| Lenovo ThinkPad X1 2-in-1 Gen 10 | |
| HP EliteBook X Flip G1i 14 AI | |
| Lenovo ThinkPad X1 2-in-1 Gen 11 | |
| Lenovo Yoga Book 9 14IAH10 | |
| Przeciętny Intel Core Ultra 7 355 (79551 - 85021, n=3) | |
| Dell Latitude 7450 2-in-1 | |
| AIDA64 / Memory Write | |
| Asus ExpertBook Ultra B9406CAA | |
| Lenovo ThinkPad X1 2-in-1 Gen 10 | |
| HP EliteBook X Flip G1i 14 AI | |
| Lenovo ThinkPad X1 2-in-1 Gen 11 | |
| Przeciętny Intel Core Ultra 7 355 (103056 - 108621, n=3) | |
| Lenovo Yoga Book 9 14IAH10 | |
| Dell Latitude 7450 2-in-1 | |
| AIDA64 / Memory Latency | |
| Dell Latitude 7450 2-in-1 | |
| Lenovo Yoga Book 9 14IAH10 | |
| Przeciętny Intel Core Ultra 7 355 (99.7 - 105.8, n=3) | |
| Lenovo ThinkPad X1 2-in-1 Gen 11 | |
| HP EliteBook X Flip G1i 14 AI | |
| Lenovo ThinkPad X1 2-in-1 Gen 10 | |
* ... im mniej tym lepiej
Opóźnienie DPC
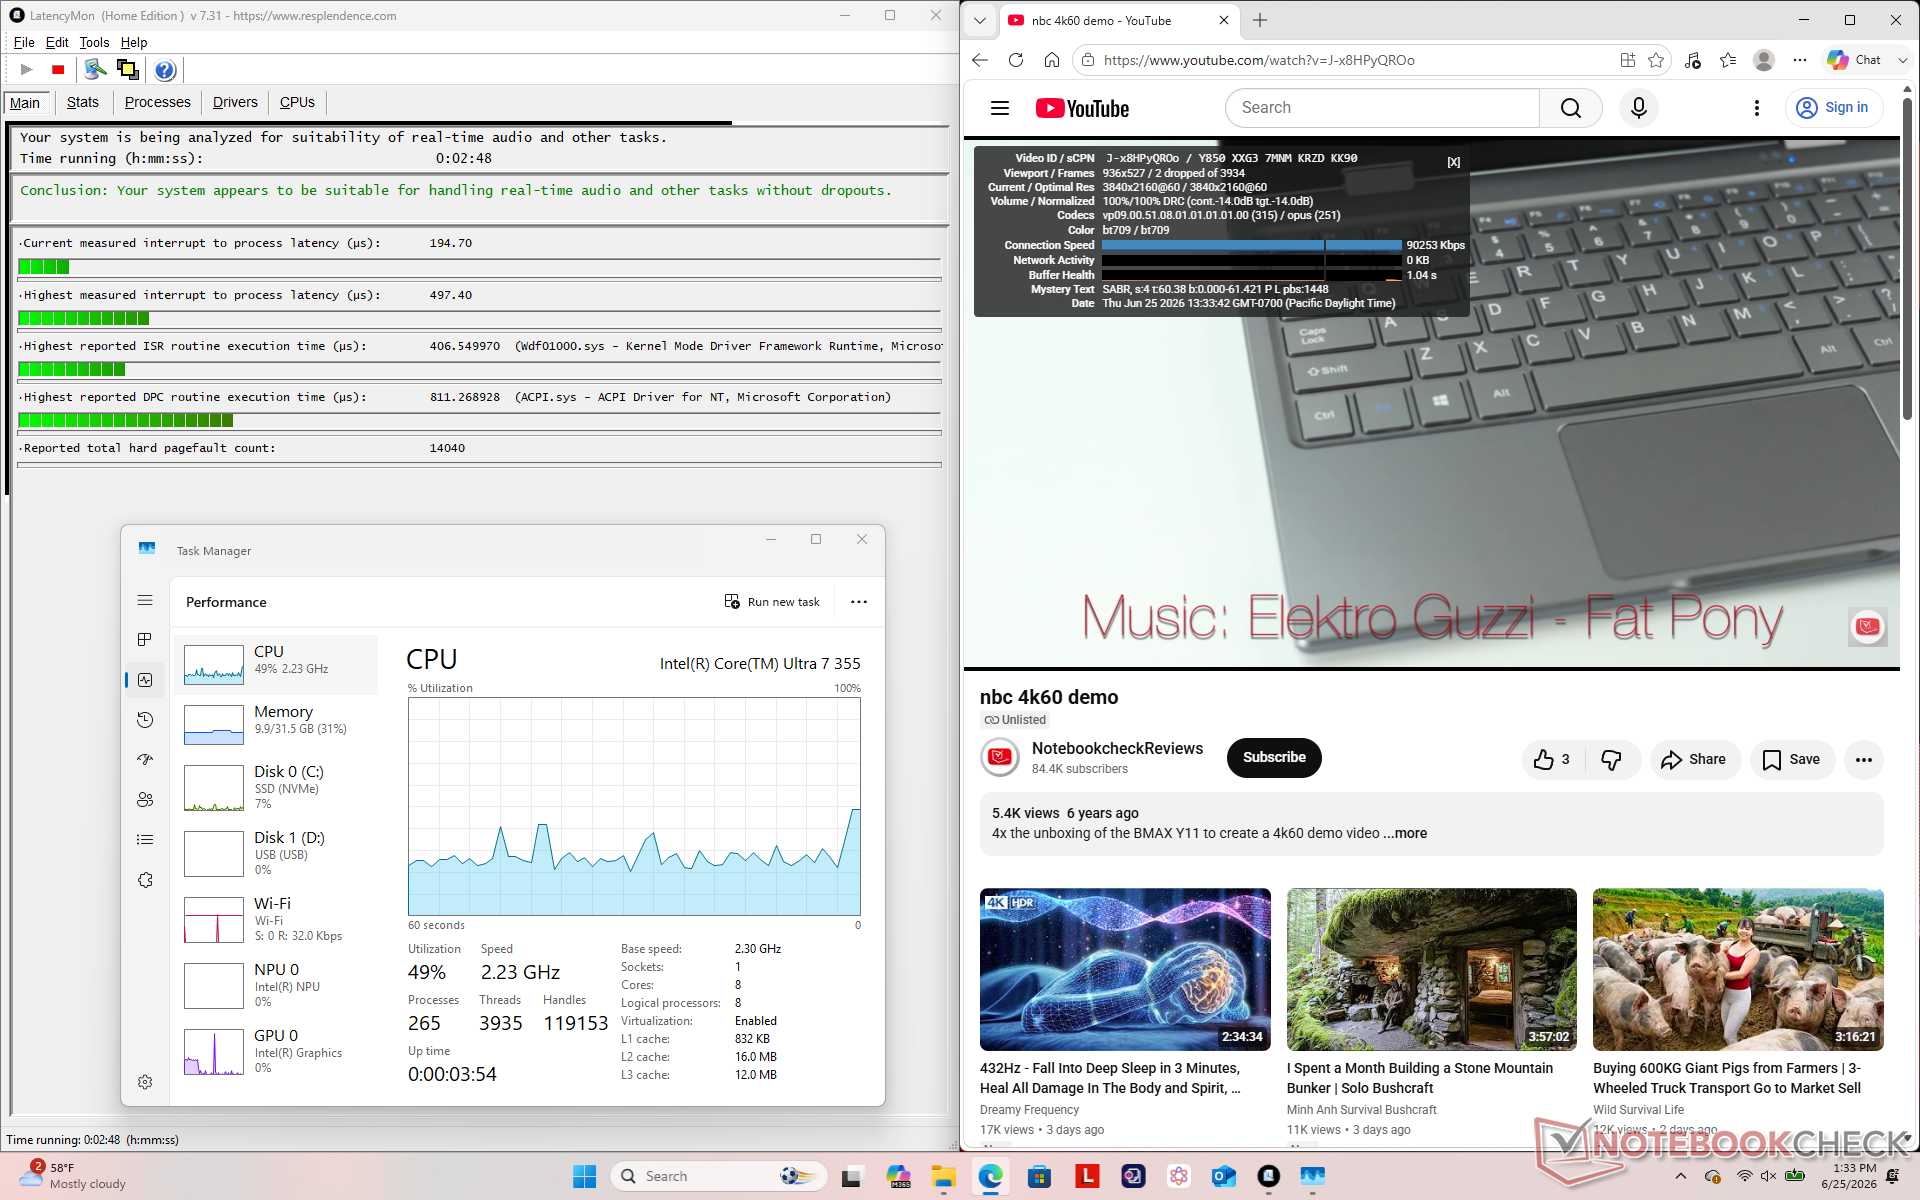
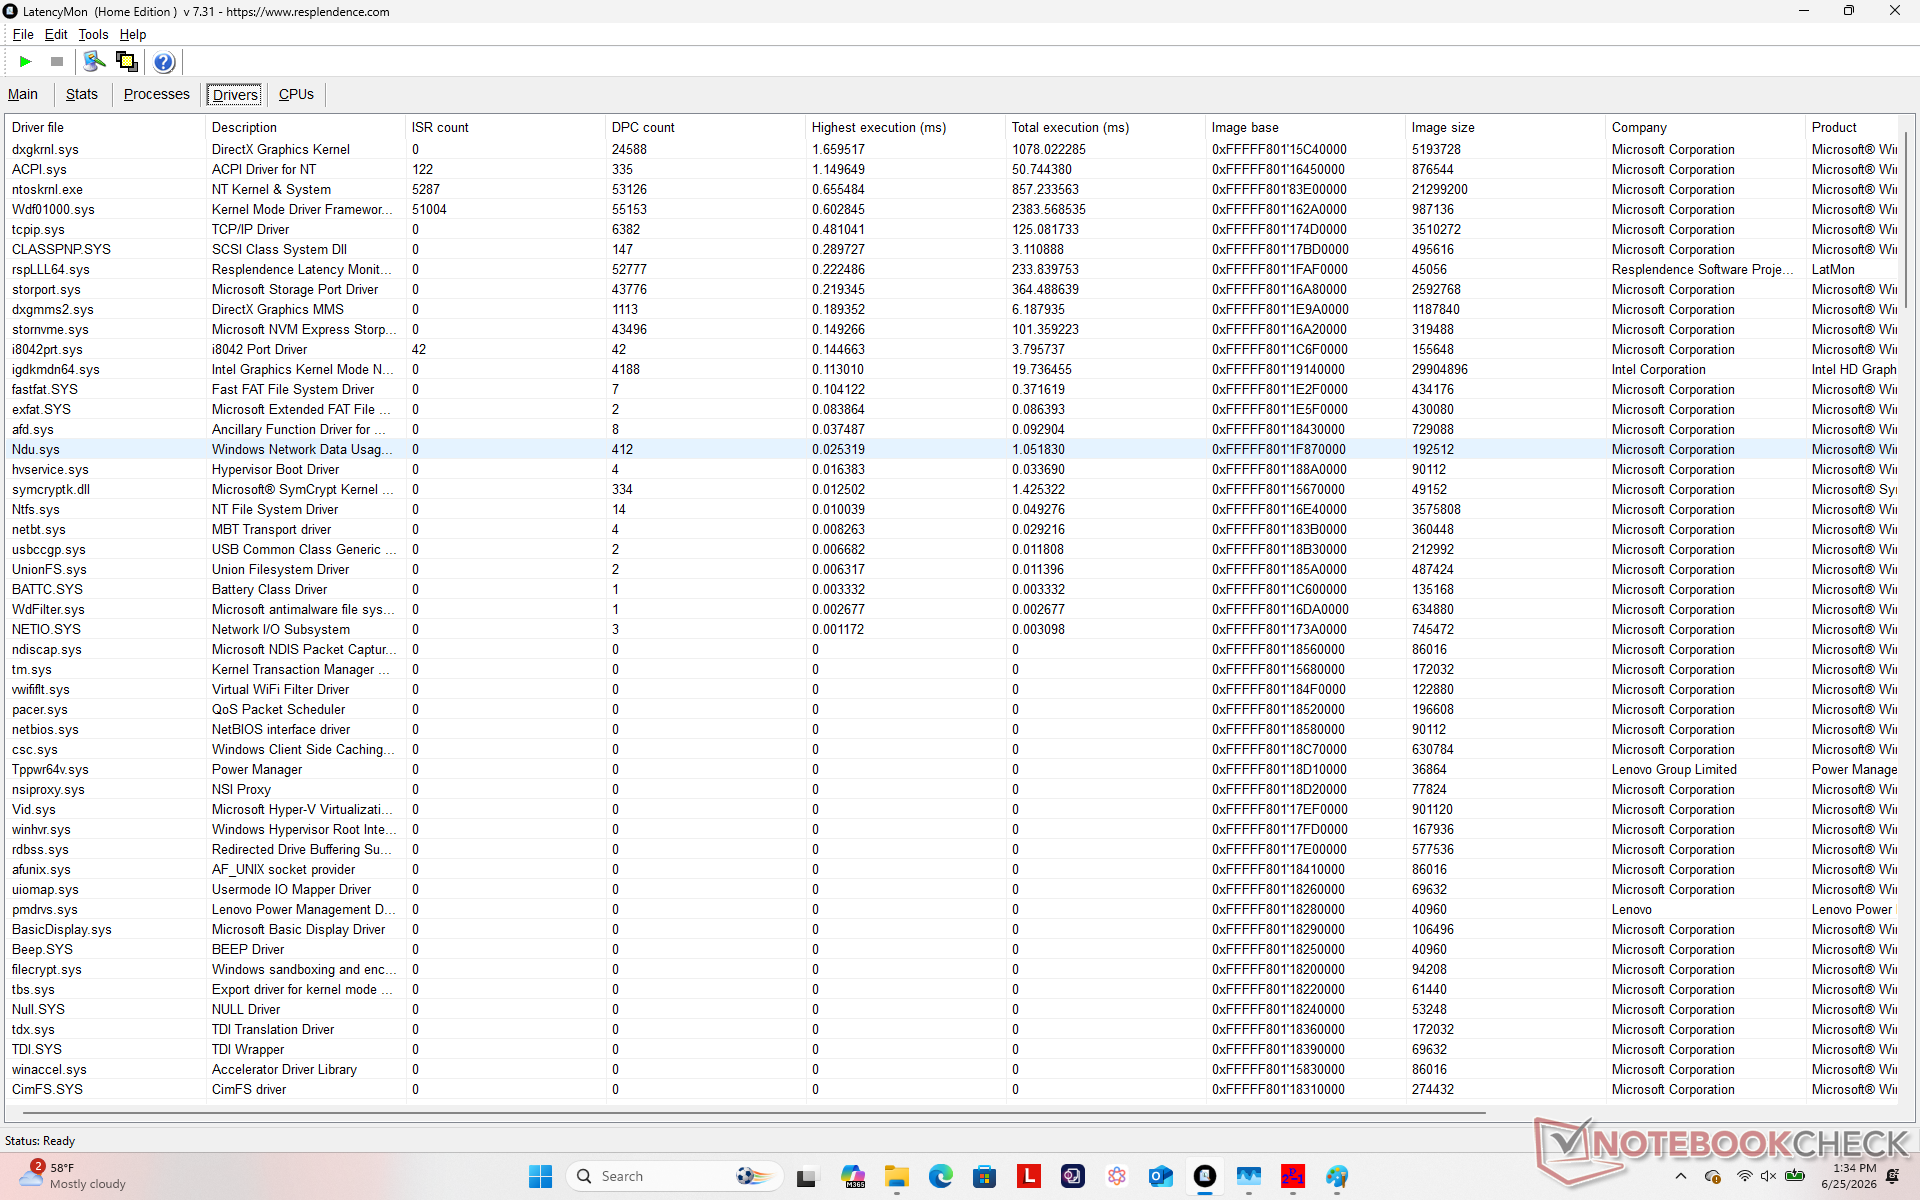
| DPC Latencies / LatencyMon - interrupt to process latency (max), Web, Youtube, Prime95 | |
| Lenovo Yoga Book 9 14IAH10 | |
| HP EliteBook X Flip G1i 14 AI | |
| Dell Latitude 7450 2-in-1 | |
| Lenovo ThinkPad X1 2-in-1 Gen 10 | |
| Asus ExpertBook Ultra B9406CAA | |
* ... im mniej tym lepiej
Urządzenia pamięci masowej
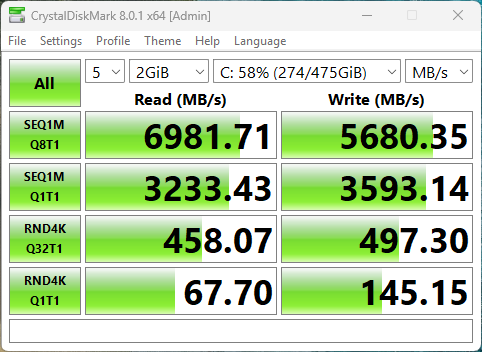
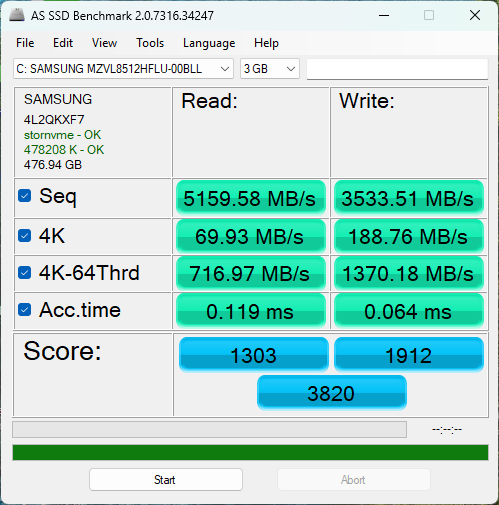

* ... im mniej tym lepiej
Ograniczanie przepustowości dysku: pętla odczytu DiskSpd, głębokość kolejki 8
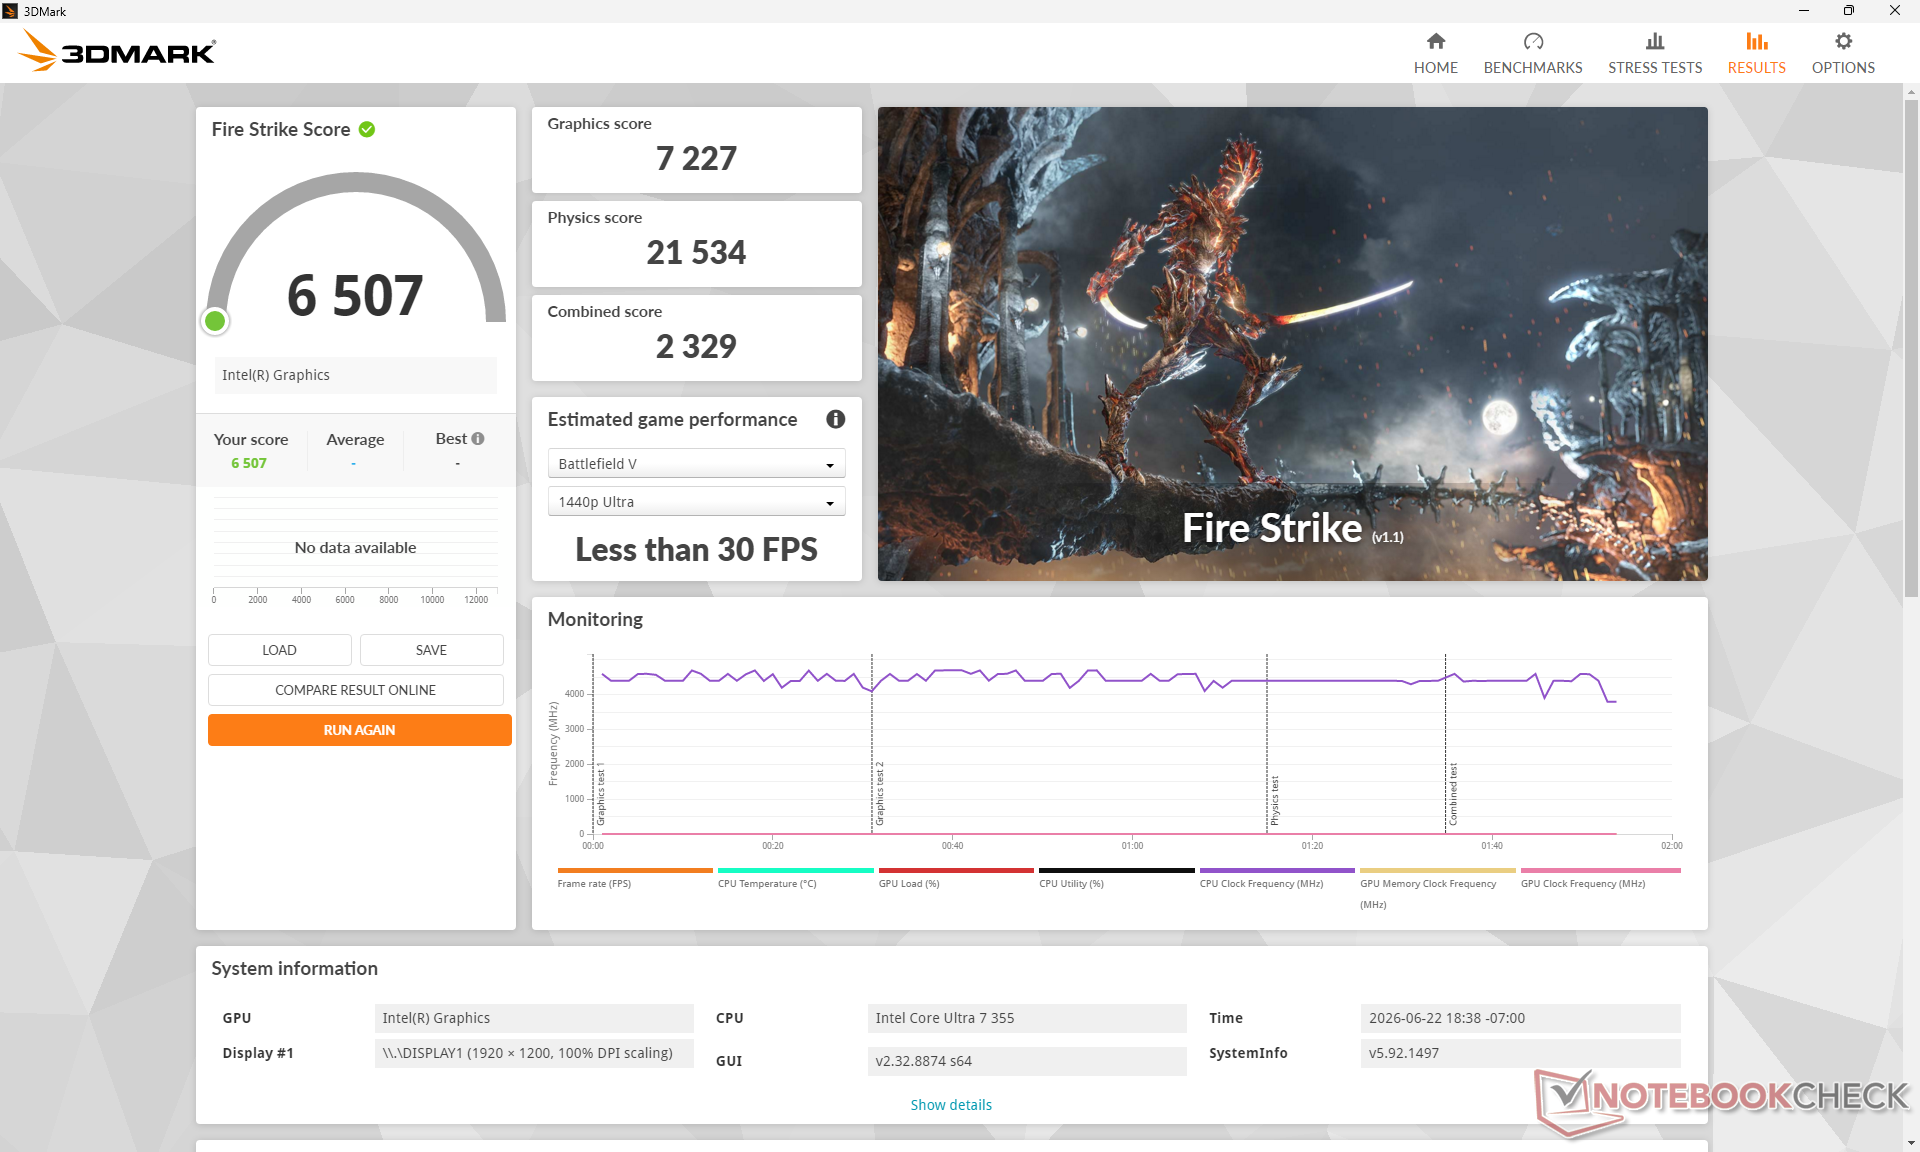
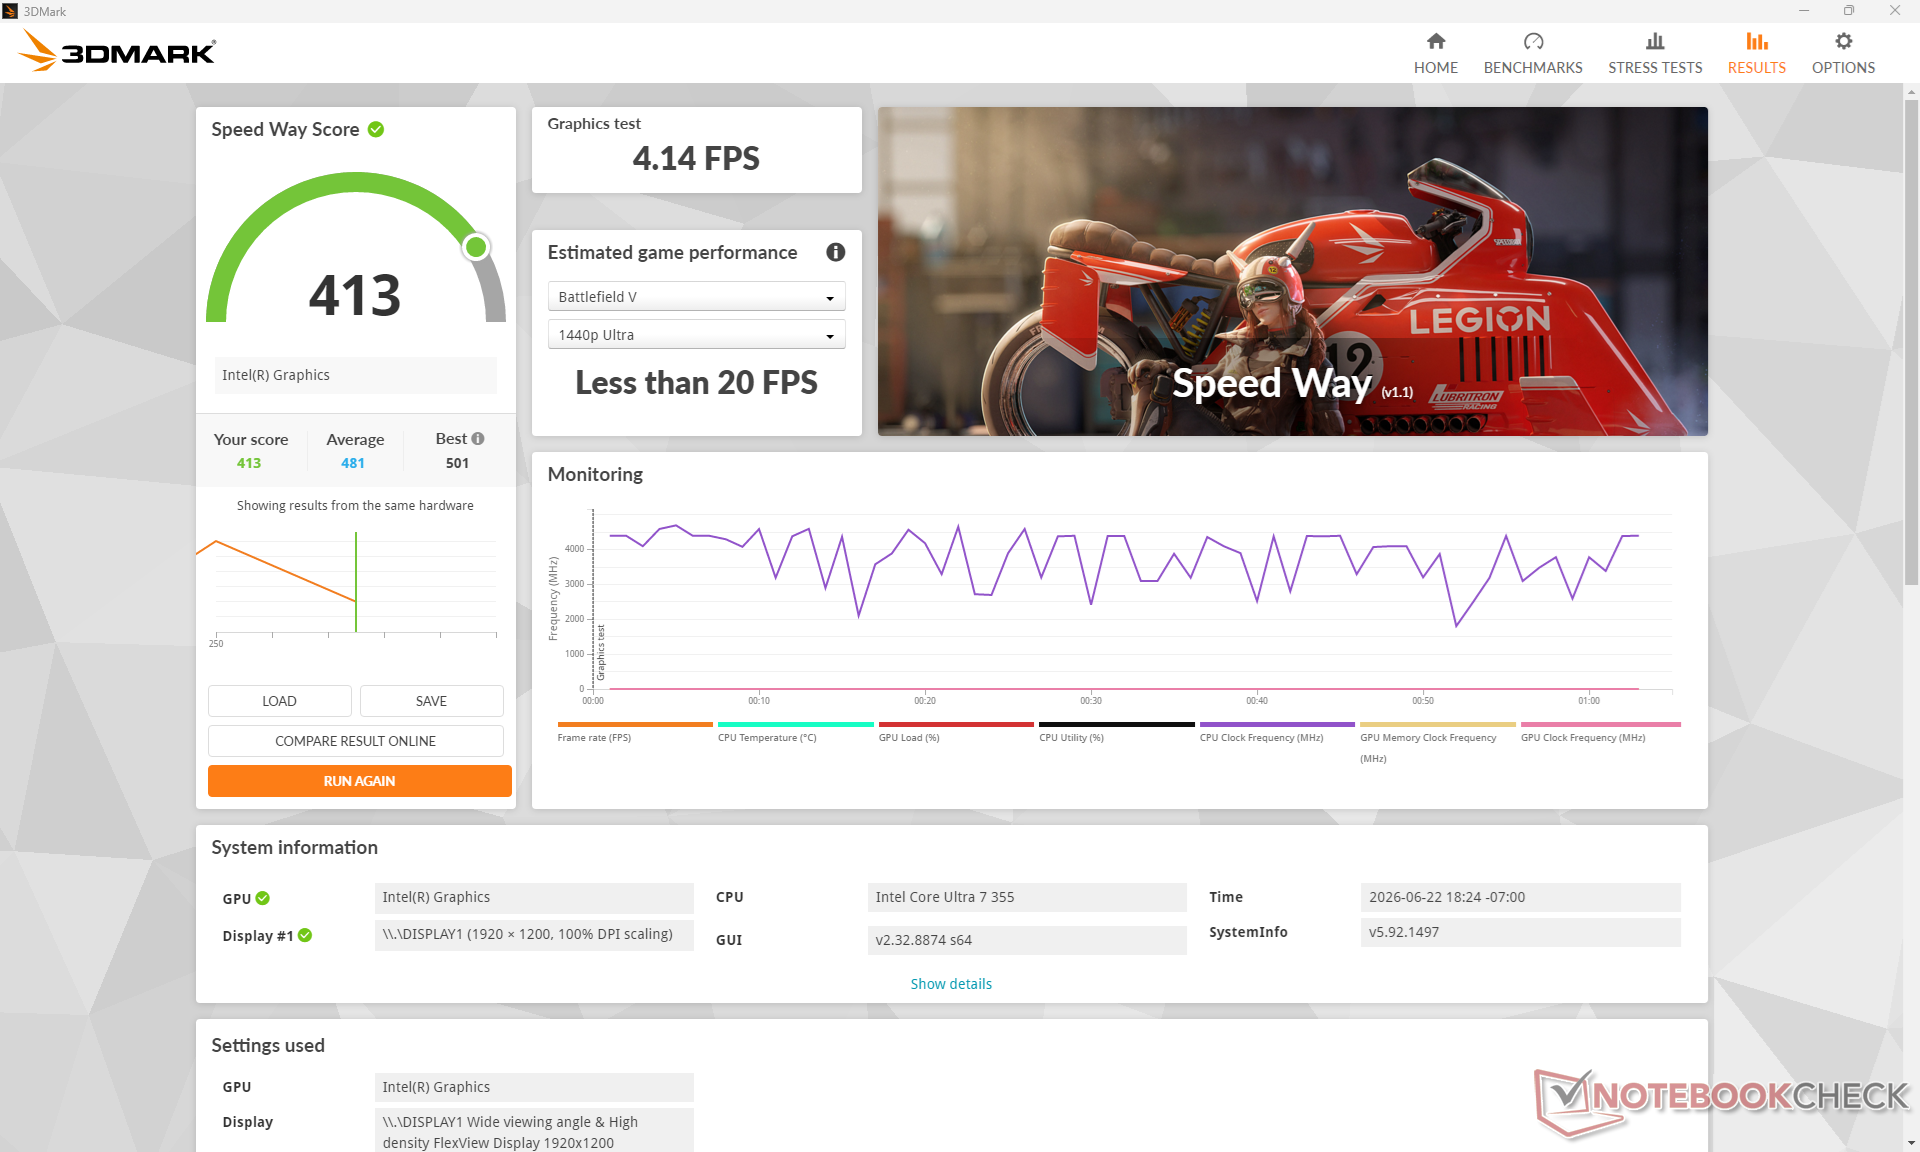
Wydajność procesora graficznego
Zintegrowana karta graficzna karta graficzna Intel Graphics 4 Xe3 działa wolniej niż Arc 140V w zeszłorocznym modelu, jednak ogólna wydajność jest bardziej stabilna, co pokazuje poniższy wykres z gry „Cyberpunk 2077 ”. Użytkownicy wymagający ponad dwukrotnie większej wydajności graficznej mogą zdecydować się na model Core Ultra X7 368H, wyposażony w cieszącą się dużym uznaniem kartę graficzną Arc B390.
| Profil zasilania | Wynik grafiki | Wynik fizyki | Wynik łączny |
| Tryb wydajności | 7227 | 21534 | 2329 |
| Tryb zrównoważony | 7093 (-2%) | 21207 (-2%) | 2351 |
| Zasilanie akumulatorowe | 7003 (-3%) | 21193 (-2%) | 2336 |
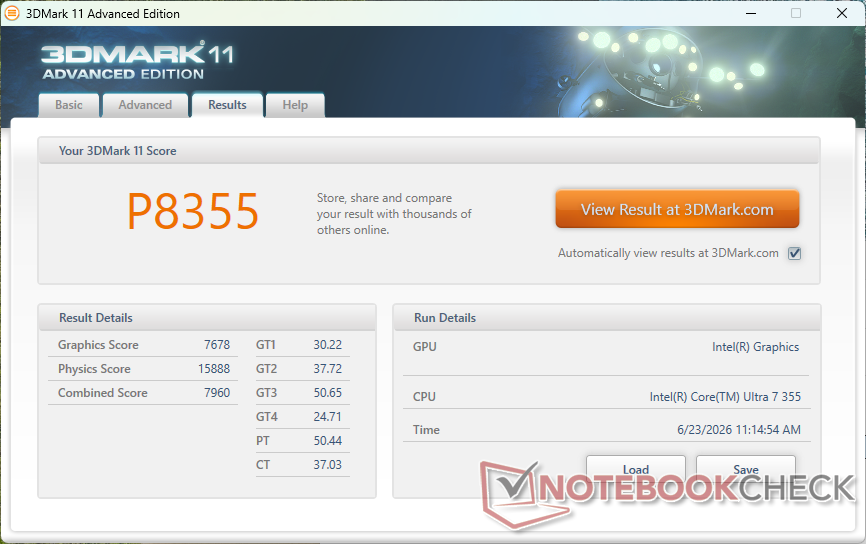
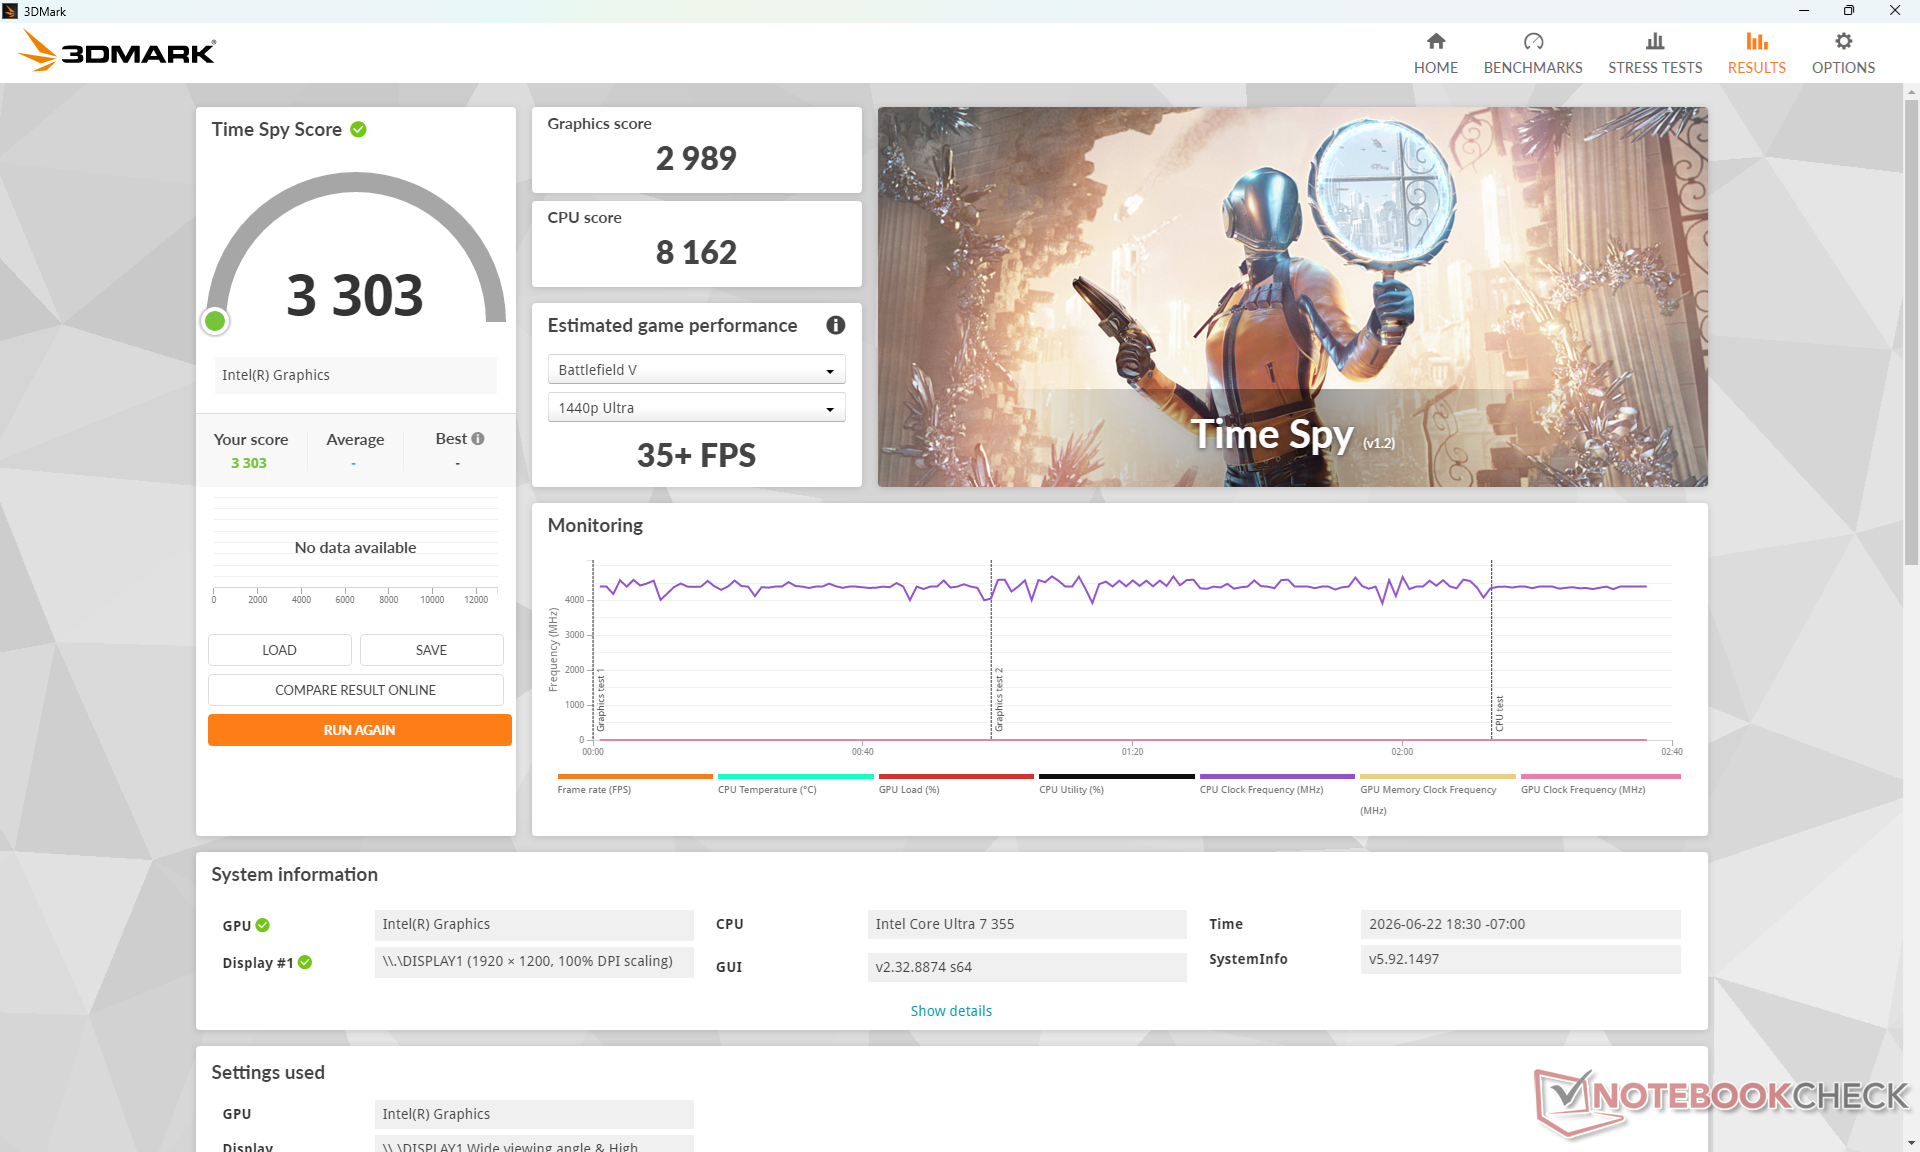
| 3DMark 11 Performance | 8355 pkt. | |
| 3DMark Cloud Gate Standard Score | 29665 pkt. | |
| 3DMark Fire Strike Score | 6507 pkt. | |
| 3DMark Time Spy Score | 3303 pkt. | |
Pomoc | ||
* ... im mniej tym lepiej
| Cyberpunk 2077 - 1920x1080 Ultra Preset (FSR off) | |
| Asus ExpertBook Ultra B9406CAA | |
| HP EliteBook X Flip G1i 14 AI | |
| Lenovo ThinkPad X1 2-in-1 Gen 10 | |
| Lenovo Yoga Book 9 14IAH10 | |
| Lenovo ThinkPad X1 2-in-1 Gen 11 | |
| Dell Latitude 7450 2-in-1 | |
| Baldur's Gate 3 - 1920x1080 Ultra Preset AA:T | |
| Asus ExpertBook Ultra B9406CAA | |
| HP EliteBook X Flip G1i 14 AI | |
| Lenovo ThinkPad X1 2-in-1 Gen 10 | |
| Lenovo Yoga Book 9 14IAH10 | |
| Lenovo ThinkPad X1 2-in-1 Gen 11 | |
| Dell Latitude 7450 2-in-1 | |
| Final Fantasy XV Benchmark - 1920x1080 High Quality | |
| Asus ExpertBook Ultra B9406CAA | |
| HP EliteBook X Flip G1i 14 AI | |
| Lenovo ThinkPad X1 2-in-1 Gen 10 | |
| Lenovo Yoga Book 9 14IAH10 | |
| Lenovo ThinkPad X1 2-in-1 Gen 11 | |
| Dell Latitude 7450 2-in-1 | |
| Strange Brigade - 1920x1080 ultra AA:ultra AF:16 | |
| Asus ExpertBook Ultra B9406CAA | |
| Lenovo ThinkPad X1 2-in-1 Gen 10 | |
| HP EliteBook X Flip G1i 14 AI | |
| Lenovo ThinkPad X1 2-in-1 Gen 11 | |
| Lenovo Yoga Book 9 14IAH10 | |
| Dell Latitude 7450 2-in-1 | |
| Dota 2 Reborn - 1920x1080 ultra (3/3) best looking | |
| Asus ExpertBook Ultra B9406CAA | |
| Lenovo ThinkPad X1 2-in-1 Gen 11 | |
| HP EliteBook X Flip G1i 14 AI | |
| Lenovo Yoga Book 9 14IAH10 | |
| Lenovo ThinkPad X1 2-in-1 Gen 10 | |
| Dell Latitude 7450 2-in-1 | |
| X-Plane 11.11 - 1920x1080 high (fps_test=3) | |
| Asus ExpertBook Ultra B9406CAA | |
| Lenovo Yoga Book 9 14IAH10 | |
| Lenovo ThinkPad X1 2-in-1 Gen 10 | |
| HP EliteBook X Flip G1i 14 AI | |
| Dell Latitude 7450 2-in-1 | |
| Lenovo ThinkPad X1 2-in-1 Gen 11 | |
Wykres liczby klatek na sekundę w trybie Ultra w grze Cyberpunk 2077
| low | med. | high | ultra | |
|---|---|---|---|---|
| GTA V (2015) | 169.3 | 161.6 | 54.8 | 21.8 |
| Dota 2 Reborn (2015) | 128.1 | 99.2 | 82.1 | 84.9 |
| Final Fantasy XV Benchmark (2018) | 69 | 36.3 | 25.9 | |
| X-Plane 11.11 (2018) | 33 | 27.2 | 24.7 | |
| Strange Brigade (2018) | 192.1 | 76.2 | 62.1 | 53 |
| Baldur's Gate 3 (2023) | 32.5 | 27 | 23.7 | 23.1 |
| Cyberpunk 2077 (2023) | 39.4 | 29.8 | 26.1 | 21.8 |
| F1 24 (2024) | 68 | 63.8 | 46.7 | 14.8 |
Emisje
Hałas systemowy
Hałas generowany przez wentylatory oraz ich działanie pozostają w dużej mierze niezmienione w porównaniu z zeszłoroczną konstrukcją o podobnych parametrach.
Hałas
| luz |
| 23.3 / 23.3 / 23.3 dB |
| obciążenie |
| 38.1 / 38.1 dB |
 | ||
30 dB cichy 40 dB(A) słyszalny 50 dB(A) irytujący |
||
min: | ||
| Lenovo ThinkPad X1 2-in-1 Gen 11 Ultra 7 355, Intel Graphics 4 Xe3 PTL | Lenovo ThinkPad X1 2-in-1 Gen 10 Core Ultra 7 258V, Arc 140V | Lenovo Yoga Book 9 14IAH10 Ultra 7 255H, Arc 140T | HP EliteBook X Flip G1i 14 AI Core Ultra 7 258V, Arc 140V | Dell Latitude 7450 2-in-1 Ultra 7 165U, Graphics 4-Core iGPU (Arrow Lake) | Asus ExpertBook Ultra B9406CAA Ultra X7 358H, Arc B390 Panther Lake iGPU | |
|---|---|---|---|---|---|---|
| Noise | -1% | -6% | 10% | -0% | -1% | |
| wyłączone / środowisko * (dB) | 23.3 | 23.3 -0% | 23.9 -3% | 23 1% | 23.03 1% | 22.9 2% |
| Idle Minimum * (dB) | 23.3 | 23.3 -0% | 23.9 -3% | 23 1% | 23.53 -1% | 23.4 -0% |
| Idle Average * (dB) | 23.3 | 23.3 -0% | 23.9 -3% | 23 1% | 23.53 -1% | 23.4 -0% |
| Idle Maximum * (dB) | 23.3 | 23.3 -0% | 23.9 -3% | 23 1% | 23.53 -1% | 23.4 -0% |
| Load Average * (dB) | 38.1 | 38 -0% | 39.1 -3% | 27.14 29% | 38.54 -1% | 28.6 25% |
| Cyberpunk 2077 ultra * (dB) | 38.1 | 37.8 1% | 42 -10% | 31.65 17% | 38.2 -0% | 42.8 -12% |
| Load Maximum * (dB) | 38.1 | 40.6 -7% | 44.5 -17% | 31.65 17% | 38.21 -0% | 45.2 -19% |
* ... im mniej tym lepiej
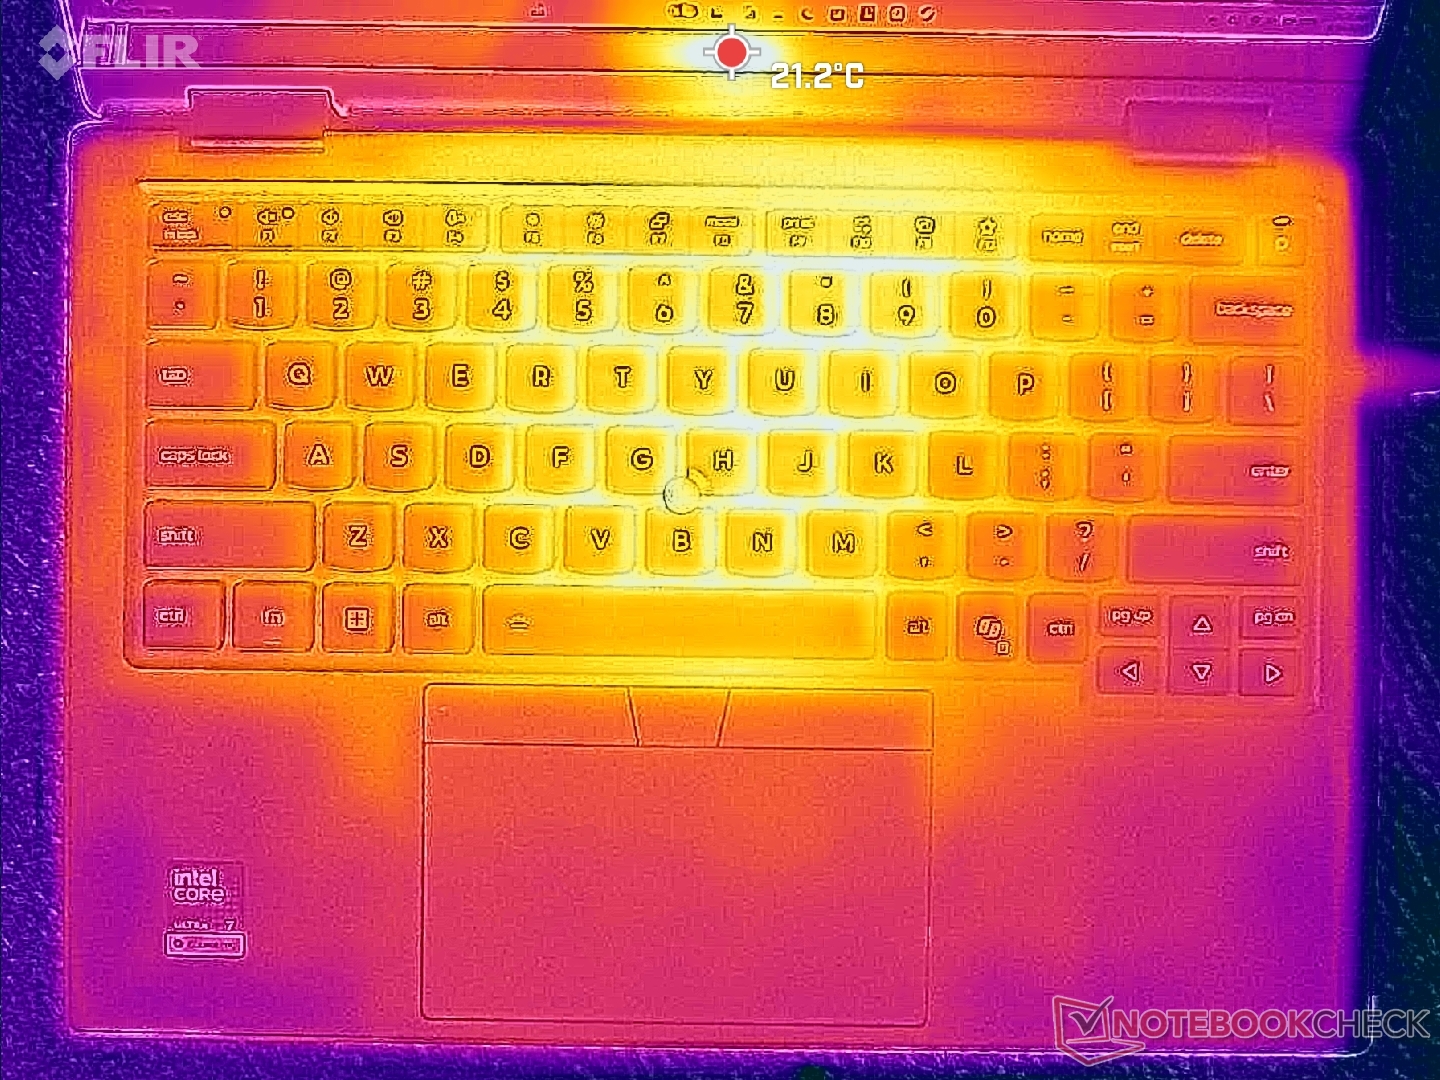
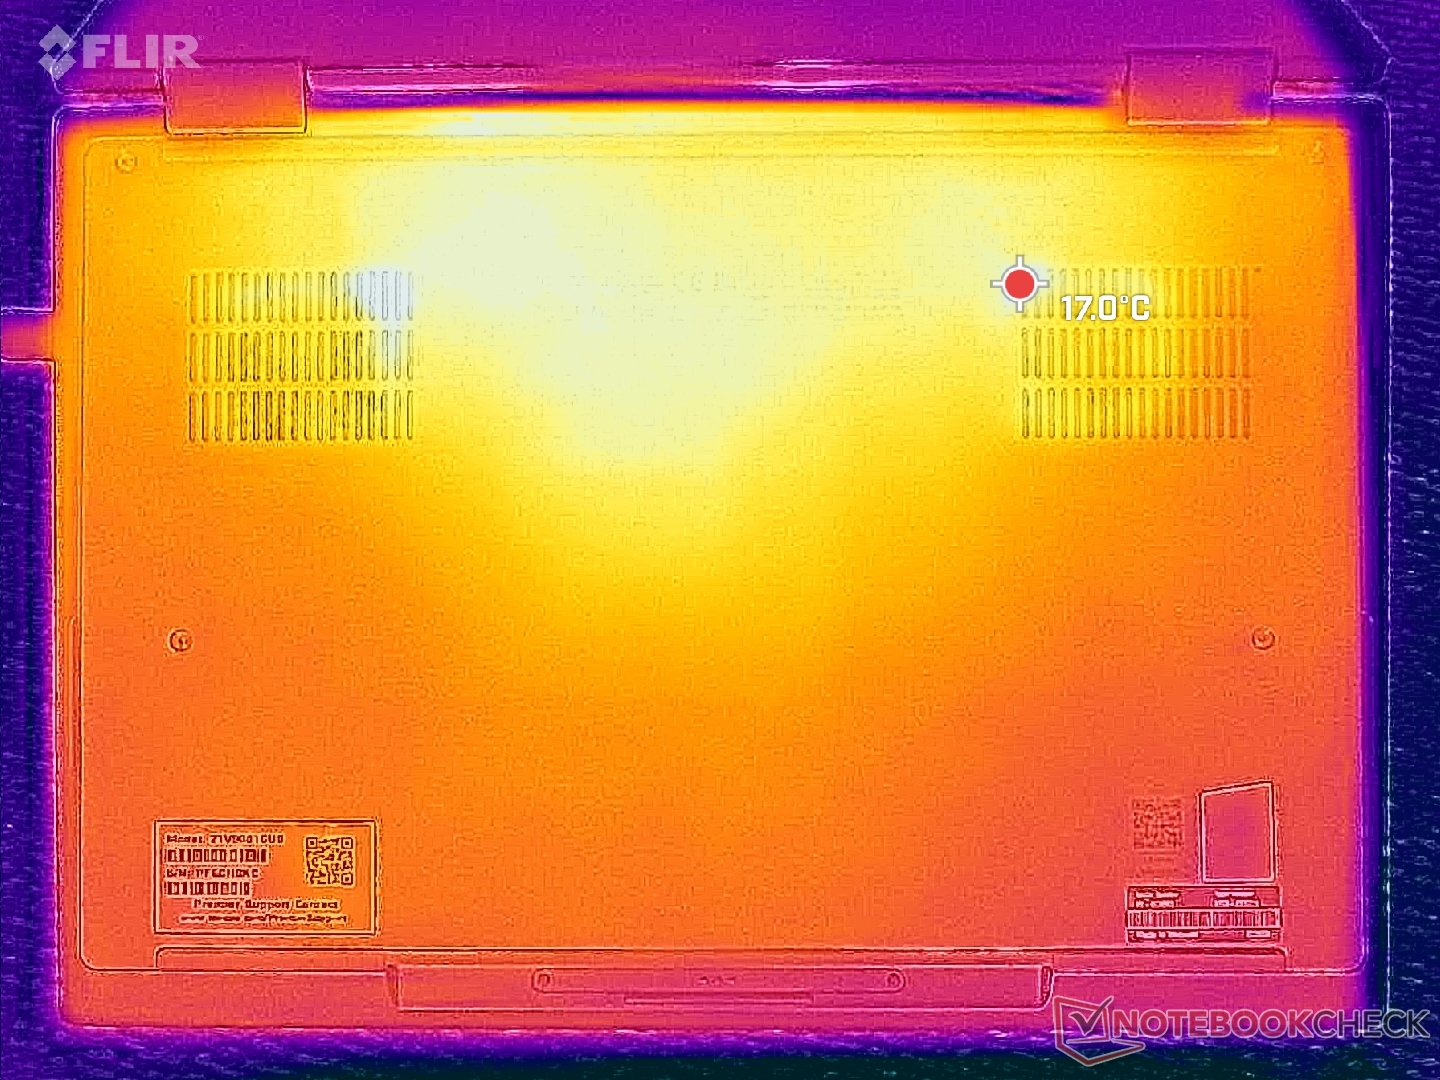
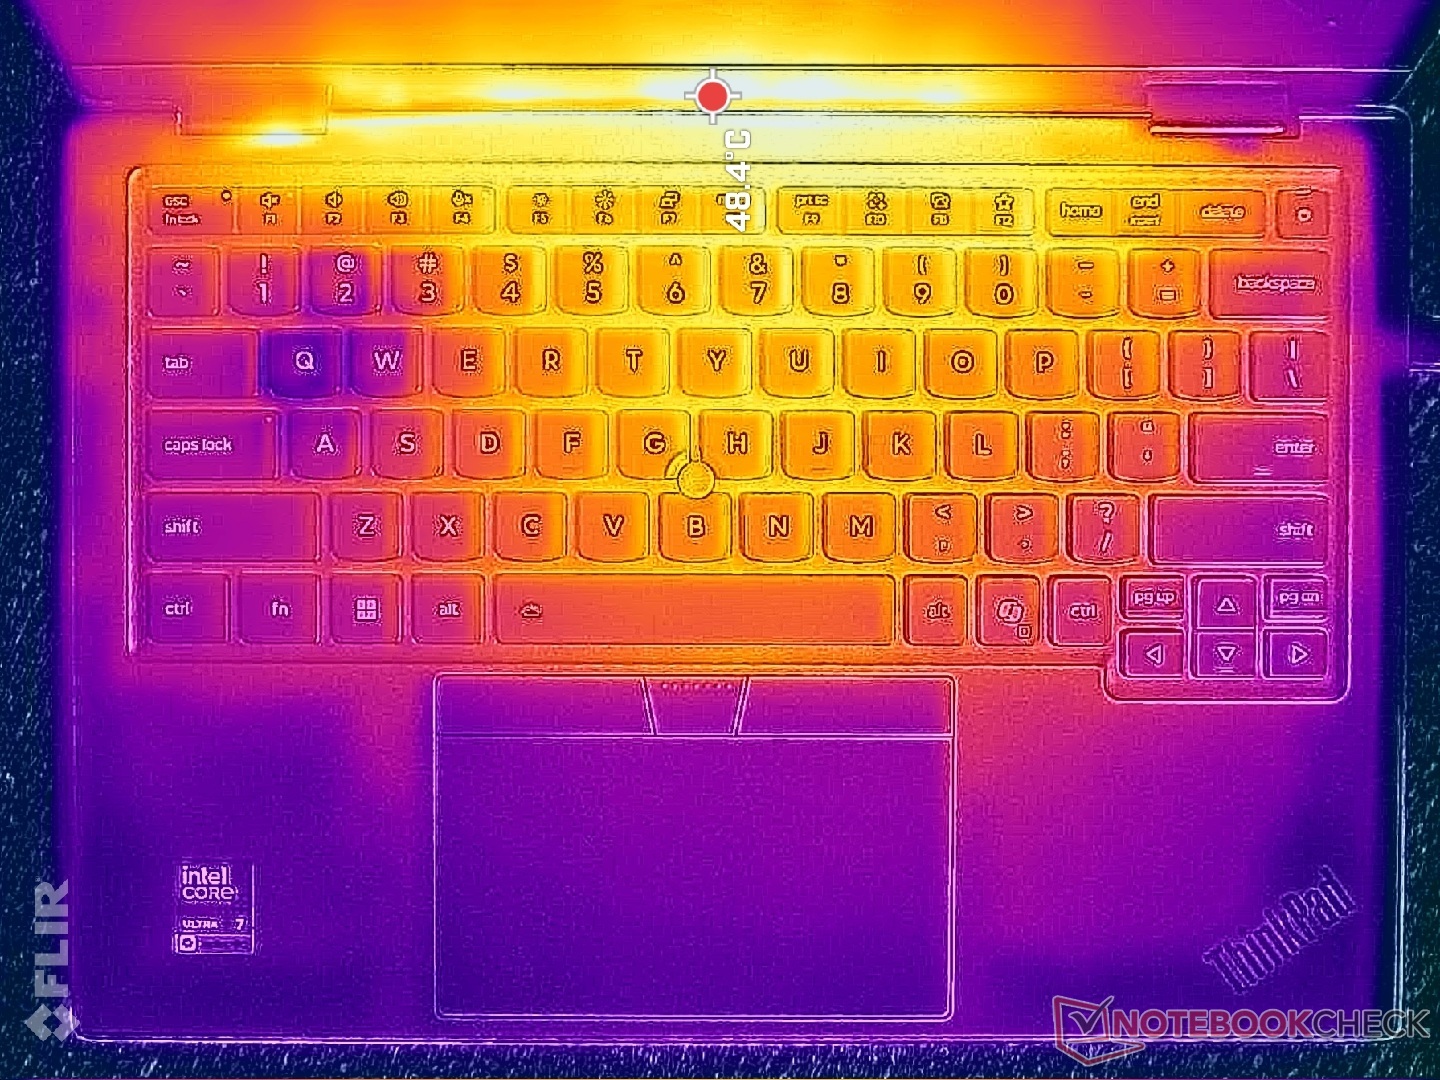
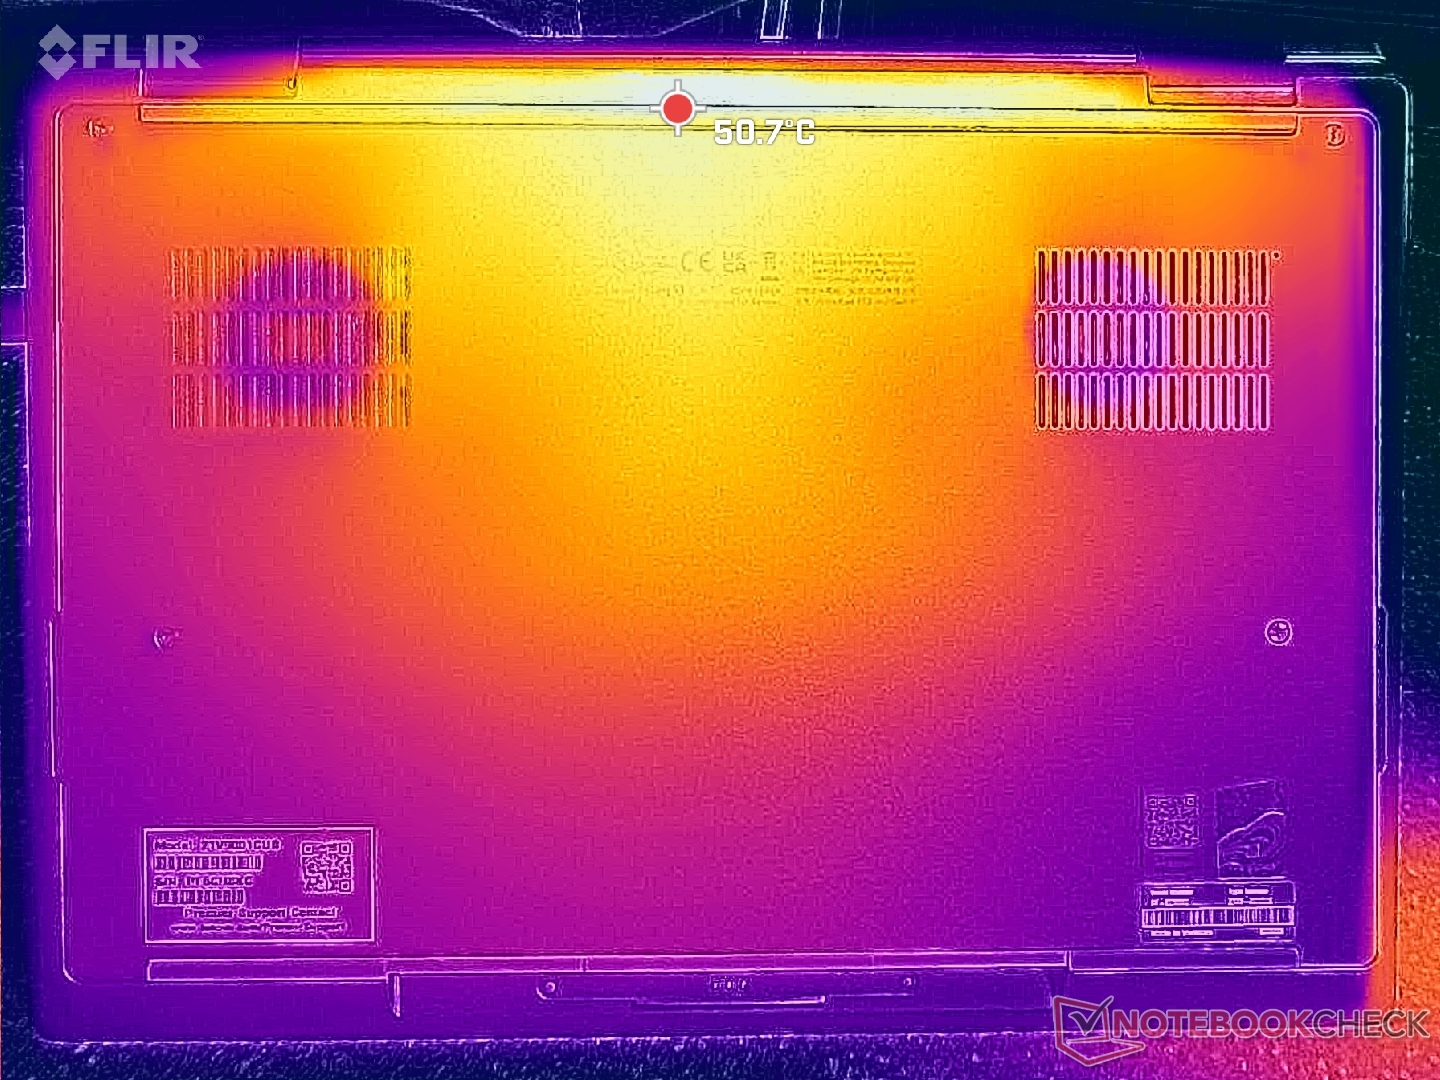
Temperatura
Temperatury powierzchniowe są ponownie bardzo zbliżone do tych z zeszłorocznego modelu, pomimo wprowadzonych zmian zarówno zewnętrznych, jak i wewnętrznych.
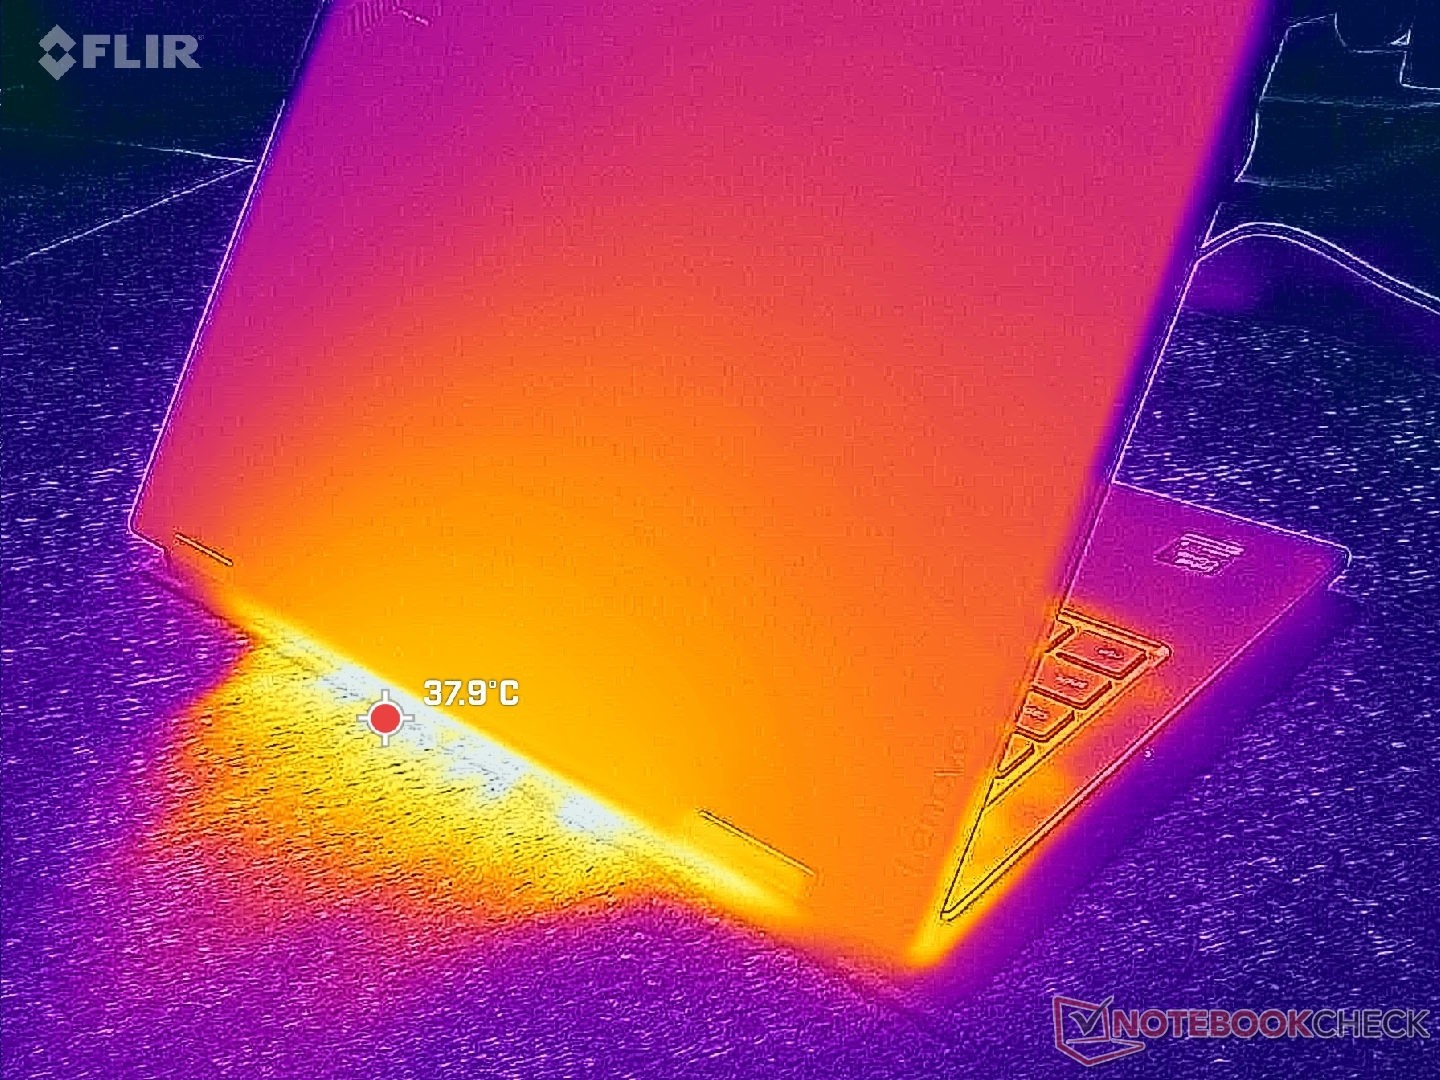
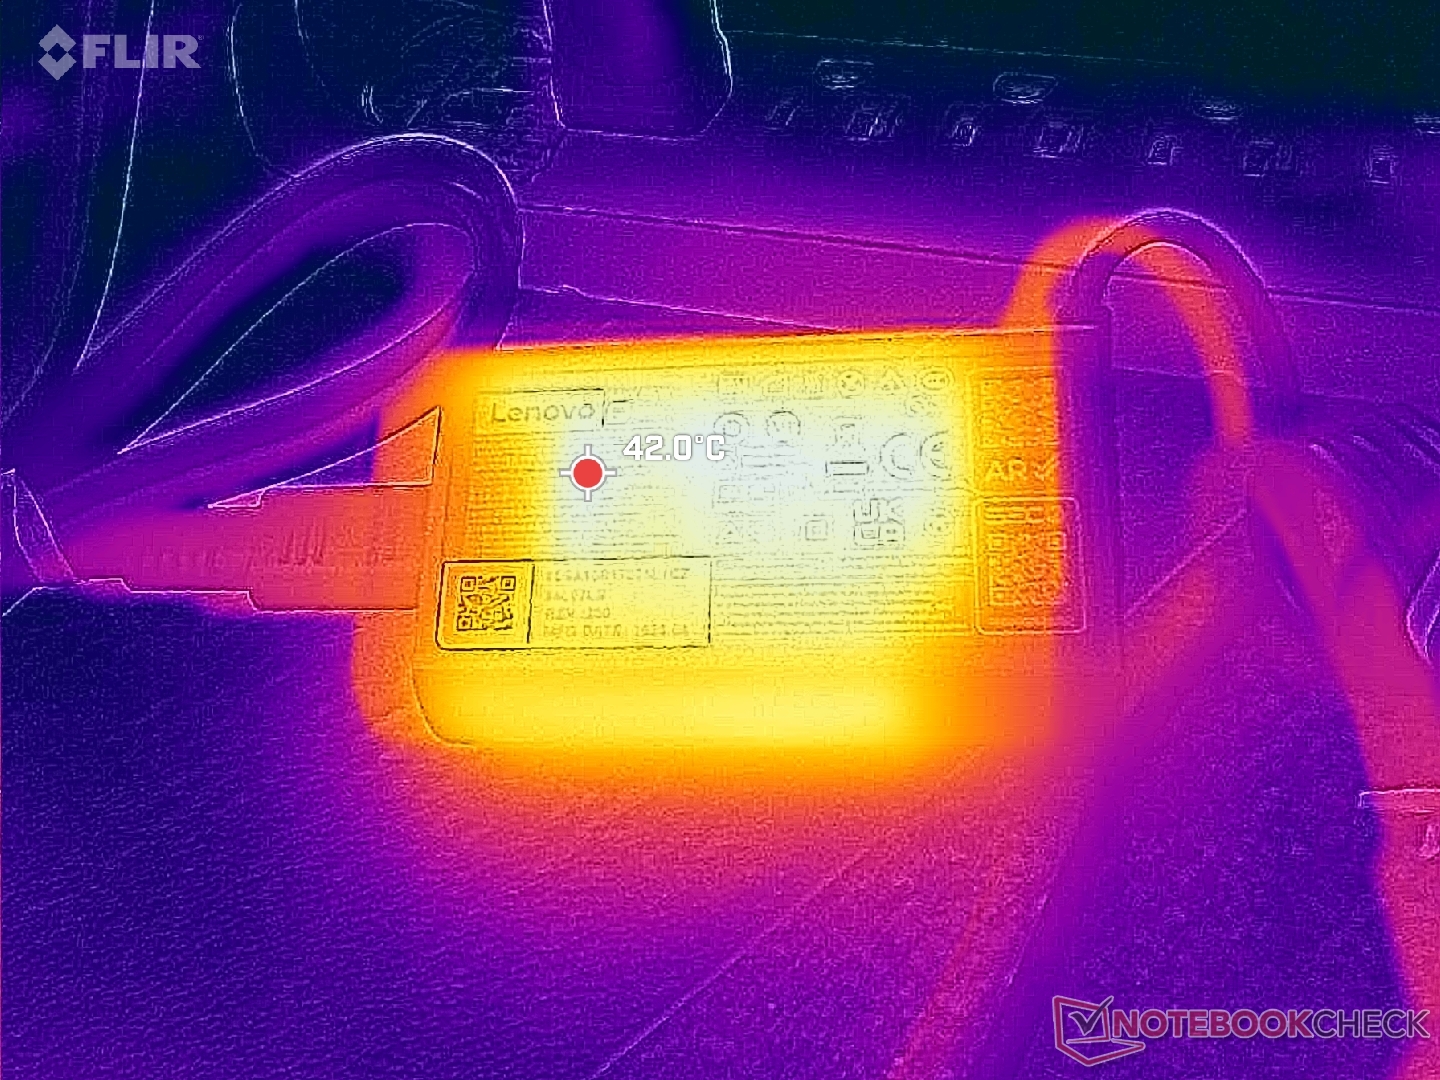
(±) Maksymalna temperatura w górnej części wynosi 44.2 °C / 112 F, w porównaniu do średniej 35.4 °C / 96 F , począwszy od 19.6 do 60 °C dla klasy Convertible.
(+) Dno nagrzewa się maksymalnie do 34.6 °C / 94 F, w porównaniu do średniej 36.9 °C / 98 F
(+) W stanie bezczynności średnia temperatura górnej części wynosi 24.7 °C / 76 F, w porównaniu ze średnią temperaturą urządzenia wynoszącą 30.3 °C / ### class_avg_f### F.
(+) Podpórki pod nadgarstki i touchpad są chłodniejsze niż temperatura skóry i maksymalnie 28 °C / 82.4 F i dlatego są chłodne w dotyku.
(±) Średnia temperatura obszaru podparcia dłoni w podobnych urządzeniach wynosiła 28 °C / 82.4 F (0 °C / 0 F).
| Lenovo ThinkPad X1 2-in-1 Gen 11 Ultra 7 355, Intel Graphics 4 Xe3 PTL | Lenovo ThinkPad X1 2-in-1 Gen 10 Core Ultra 7 258V, Arc 140V | Lenovo Yoga Book 9 14IAH10 Ultra 7 255H, Arc 140T | HP EliteBook X Flip G1i 14 AI Core Ultra 7 258V, Arc 140V | Dell Latitude 7450 2-in-1 Ultra 7 165U, Graphics 4-Core iGPU (Arrow Lake) | Asus ExpertBook Ultra B9406CAA Ultra X7 358H, Arc B390 Panther Lake iGPU | |
|---|---|---|---|---|---|---|
| Heat | 2% | -11% | 1% | -5% | 4% | |
| Maximum Upper Side * (°C) | 44.2 | 40 10% | 38.2 14% | 36 19% | 41.2 7% | 38.6 13% |
| Maximum Bottom * (°C) | 34.6 | 38.6 -12% | 38.8 -12% | 41 -18% | 45 -30% | 38.4 -11% |
| Idle Upper Side * (°C) | 26.2 | 25 5% | 32.6 -24% | 26 1% | 27.2 -4% | 24.6 6% |
| Idle Bottom * (°C) | 27.8 | 26.6 4% | 33.8 -22% | 27 3% | 26.2 6% | 26 6% |
* ... im mniej tym lepiej
Test warunków skrajnych
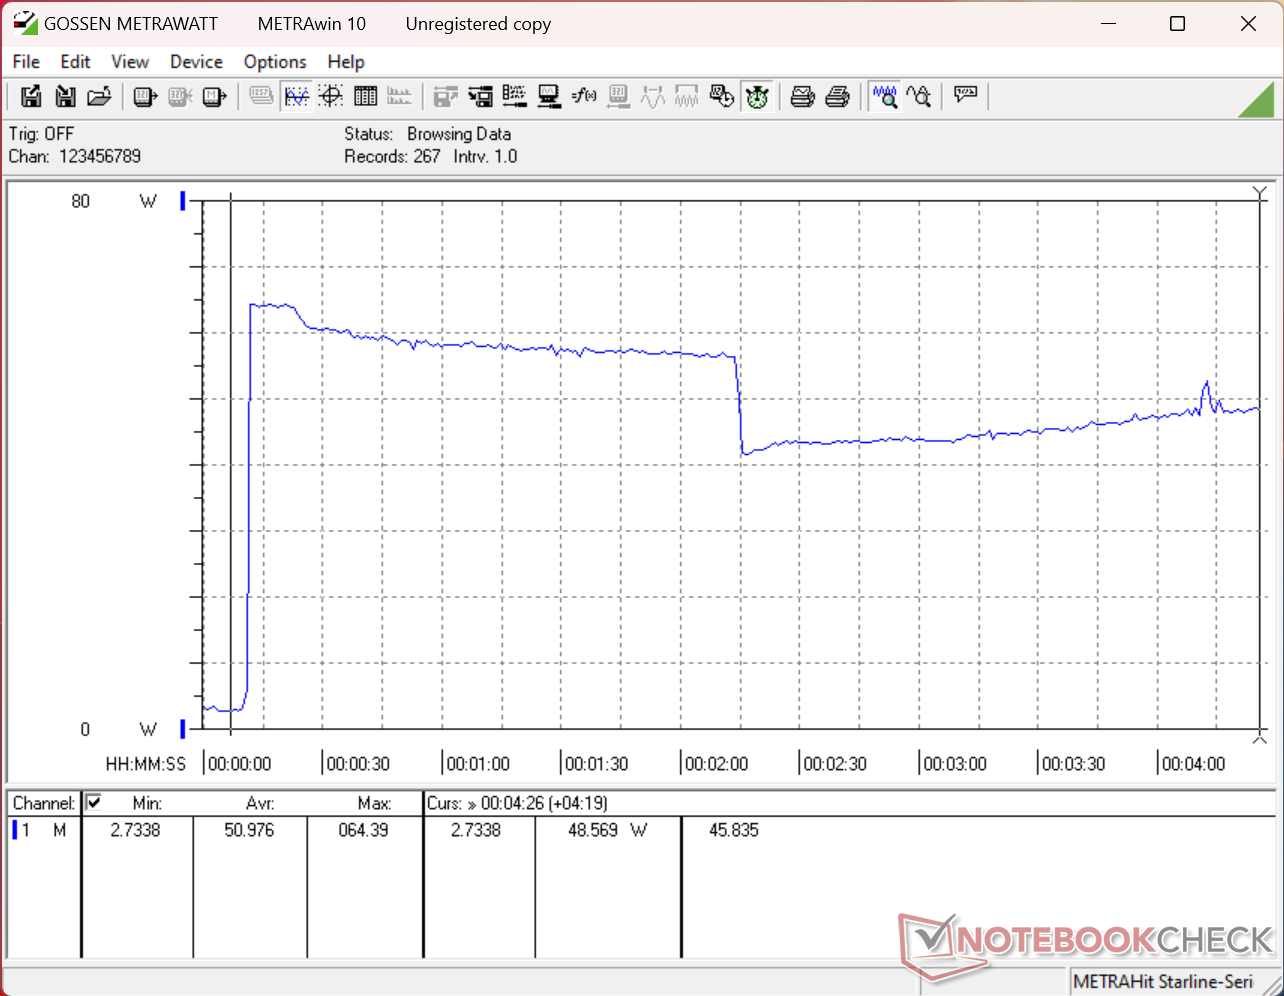
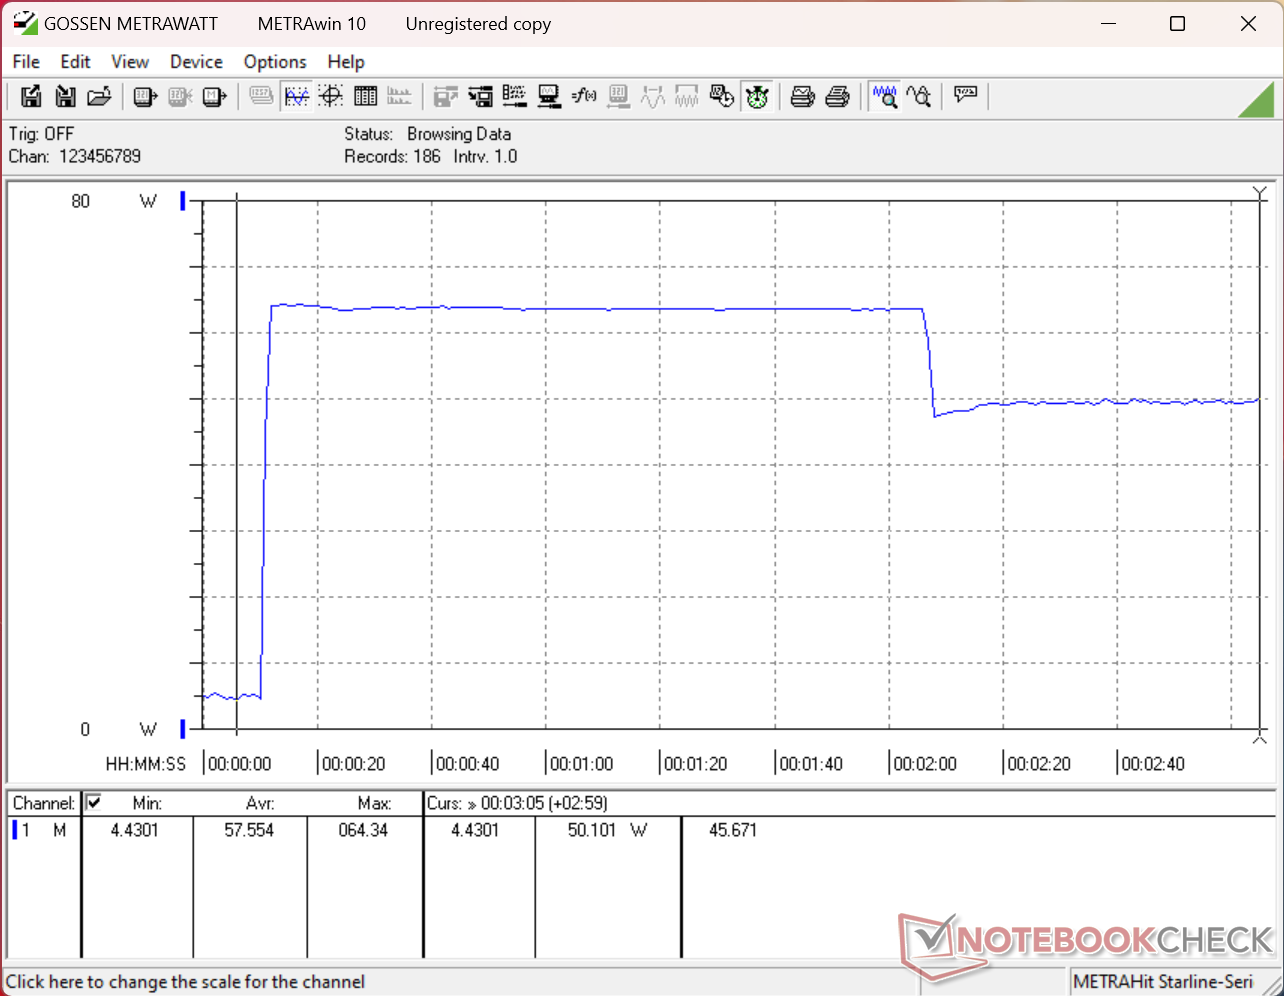
Procesor osiągał częstotliwość 3,7 GHz, pobór mocy 64 W i temperaturę 96 °C, utrzymując te wartości przez zaledwie kilka sekund, po czym wartości te nieznacznie spadały do 3,5 GHz i 45 W. Temperatura rdzenia pod obciążeniem utrzymywała się w przedziale od wysokich wartości 80 °C do 90 °C.
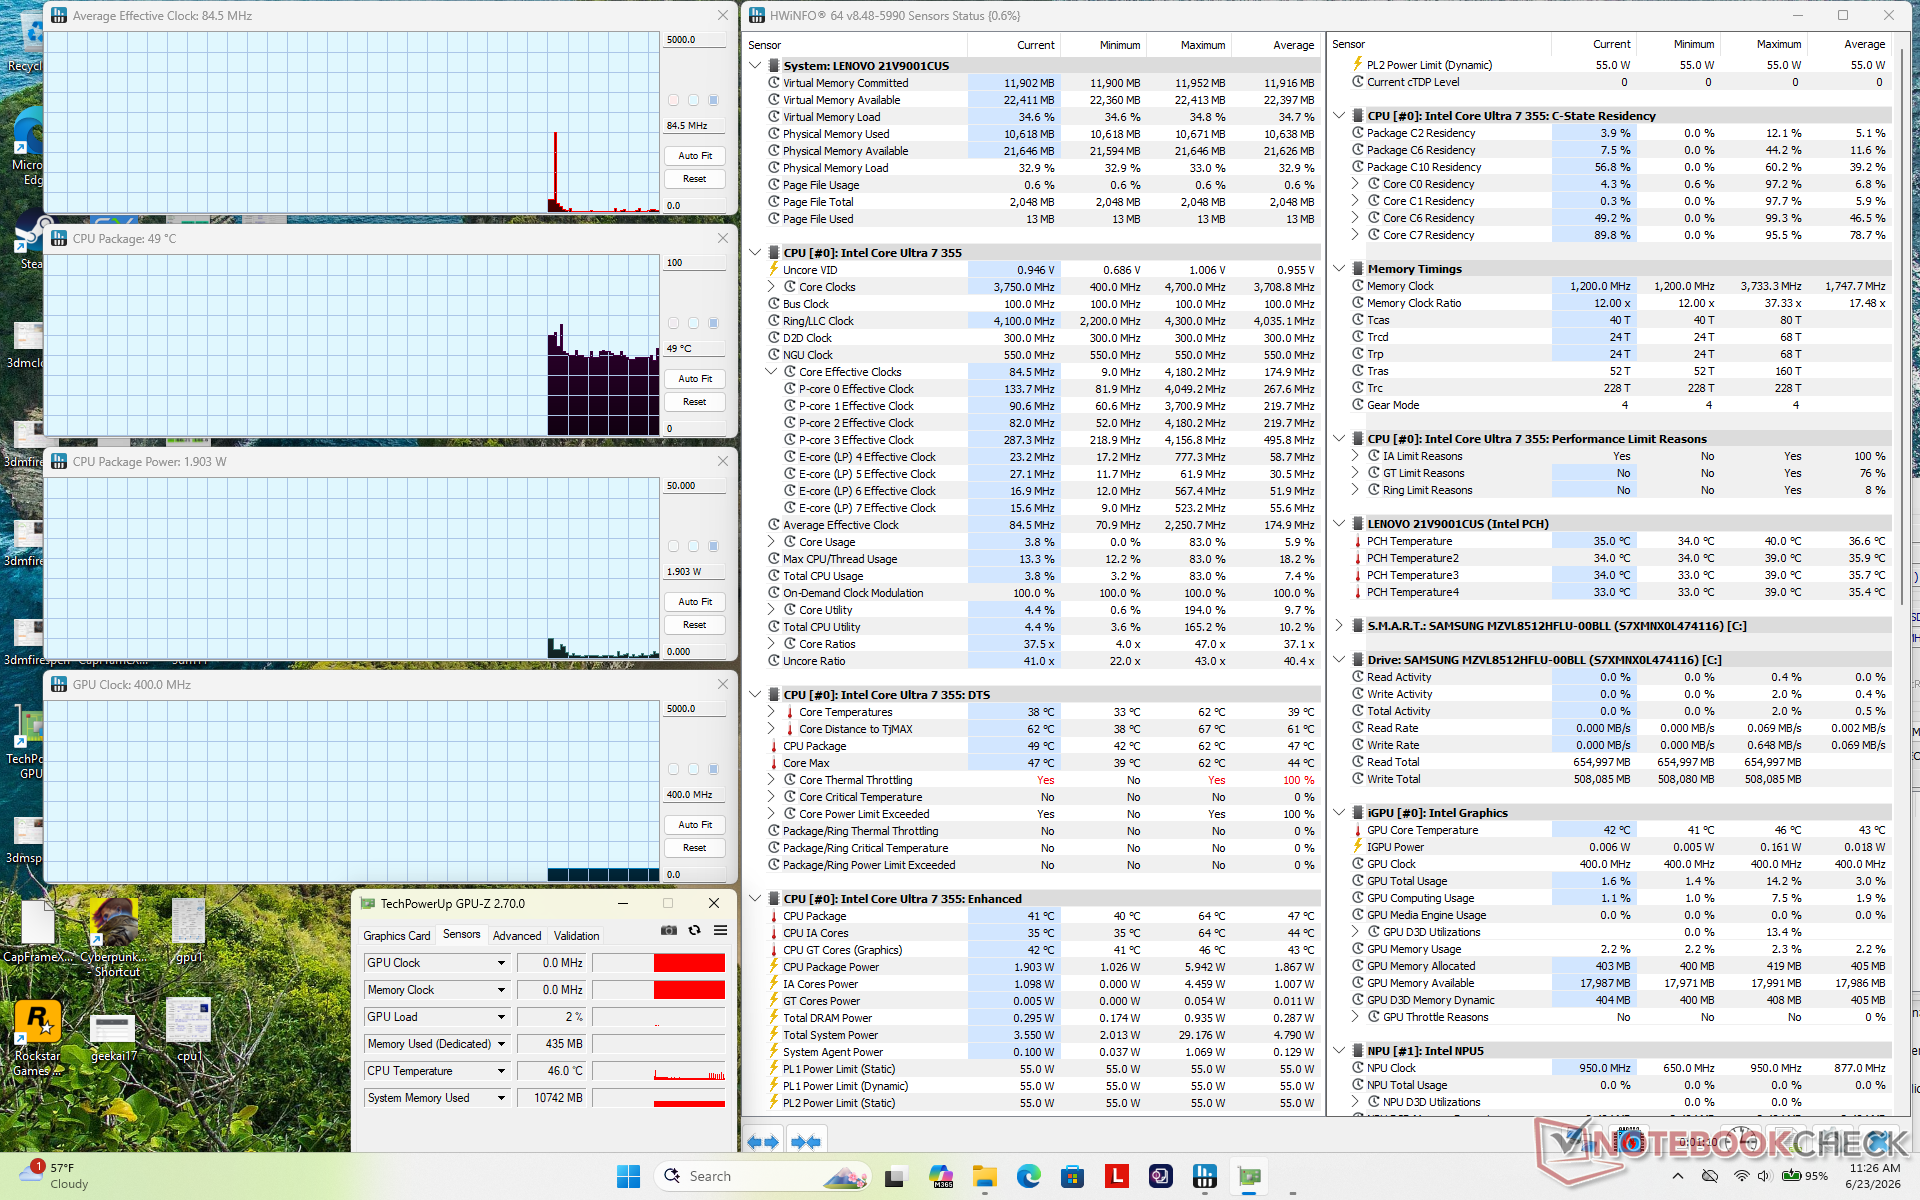
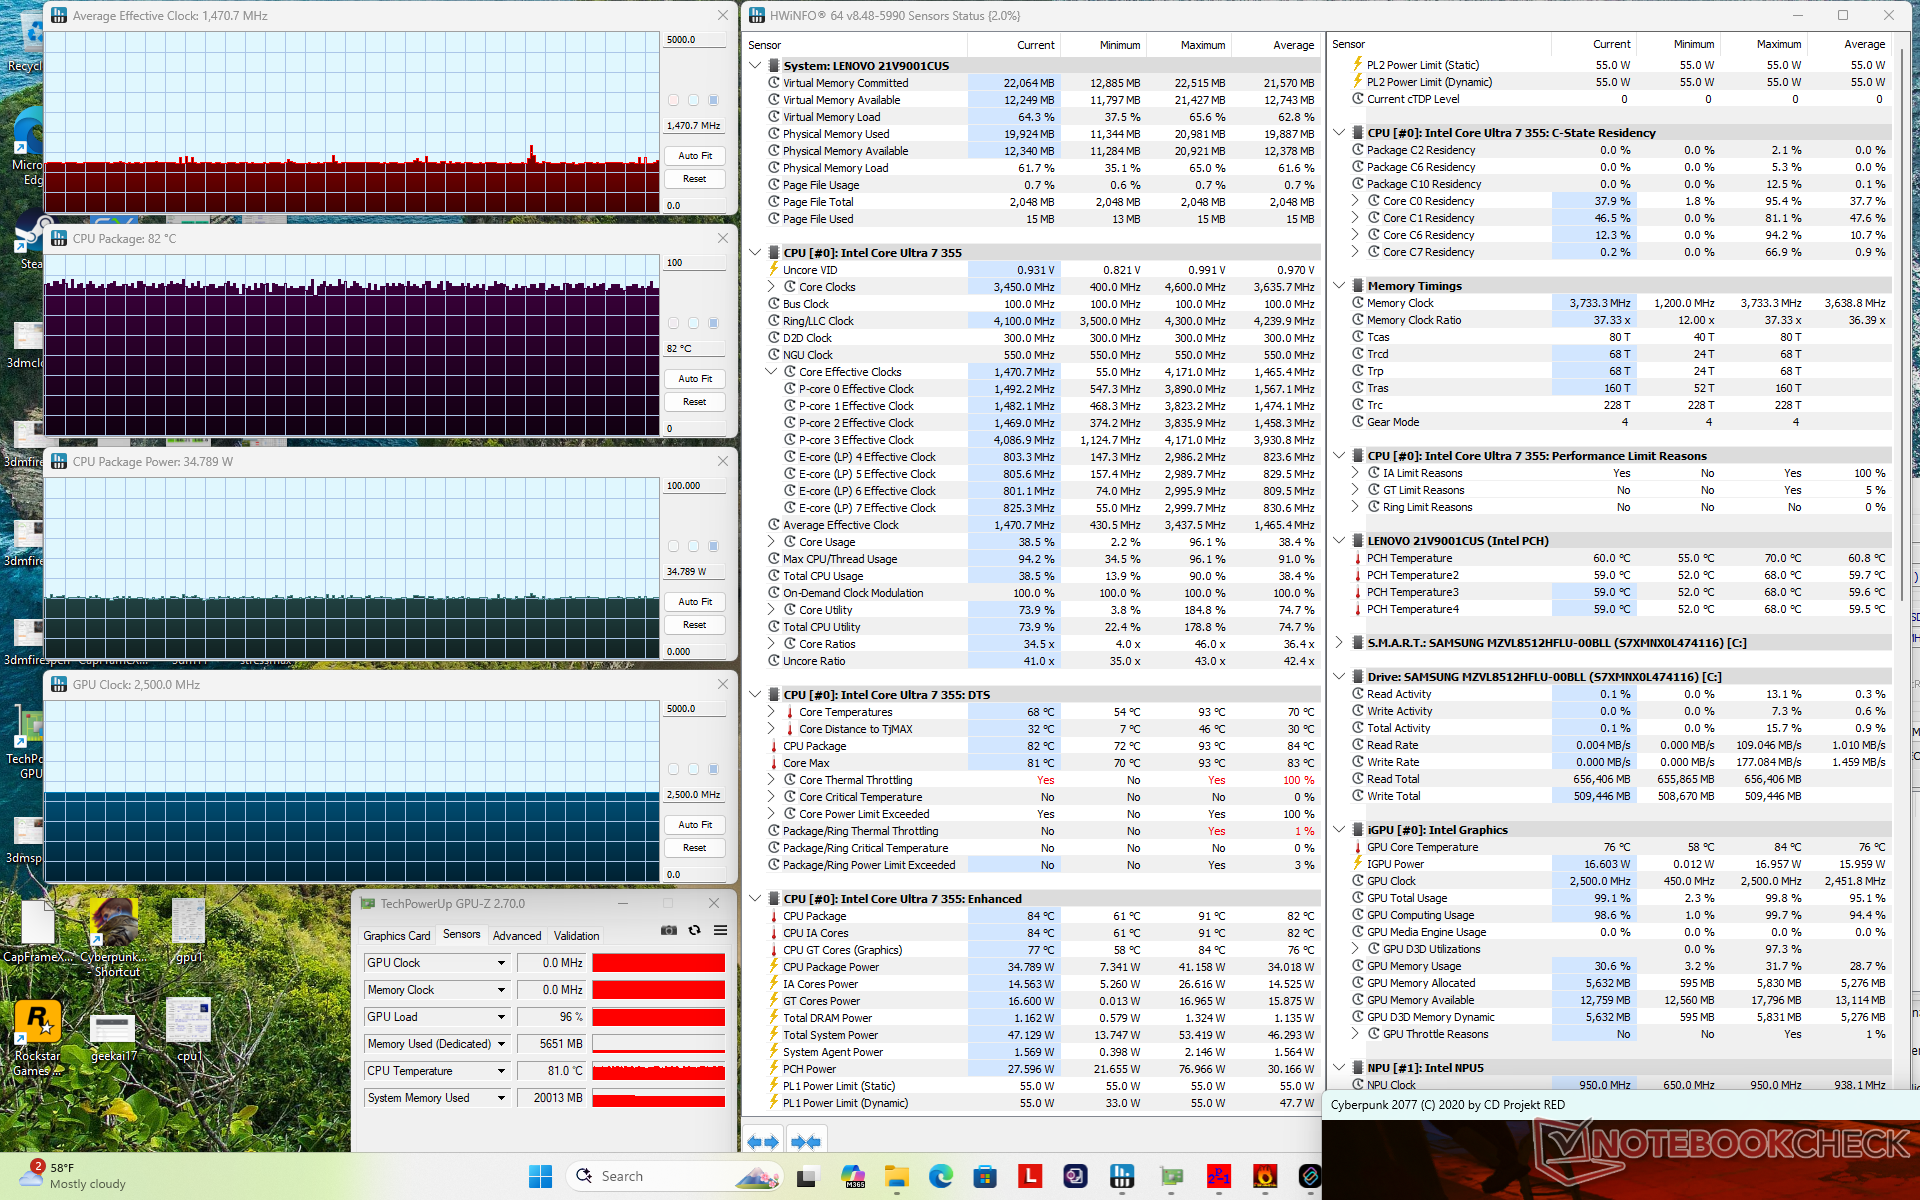
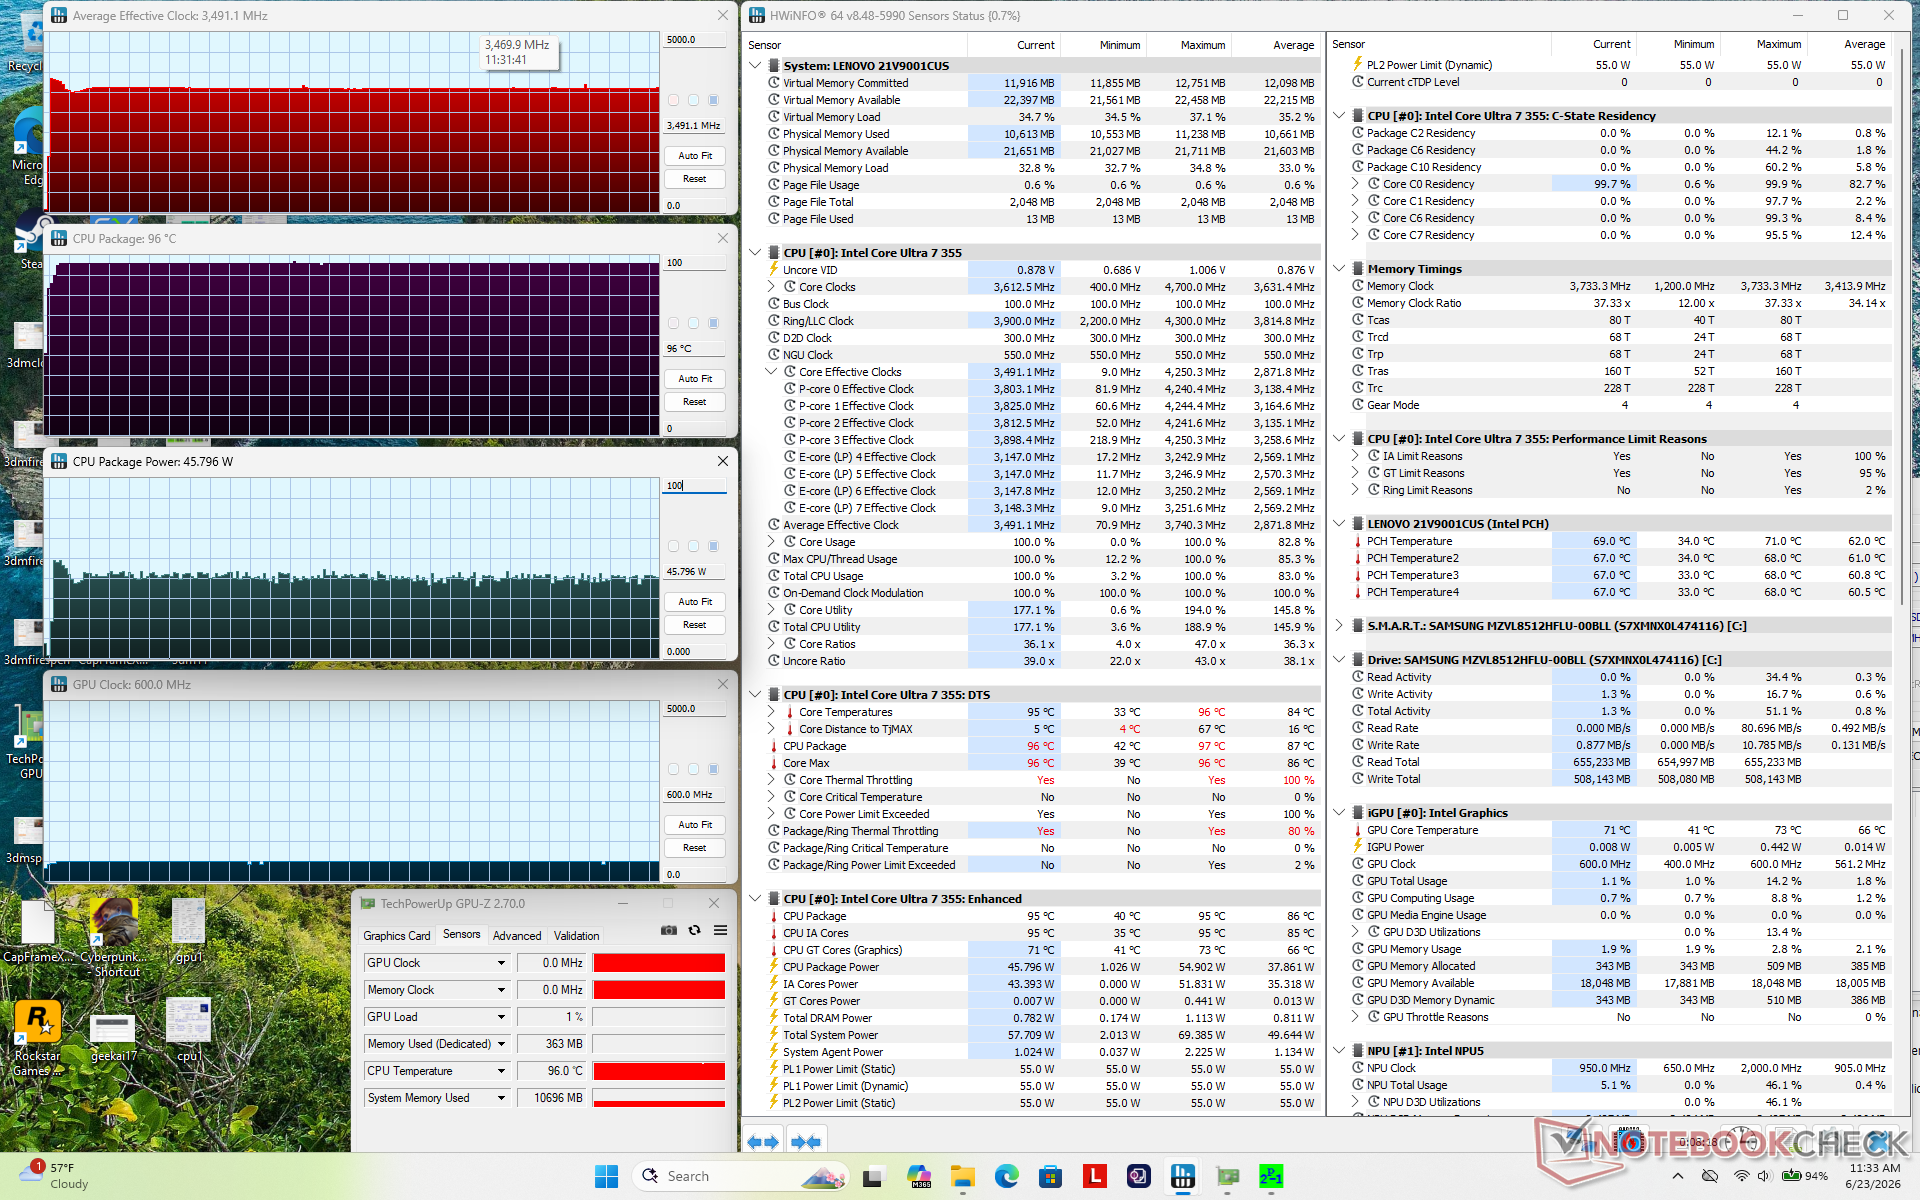
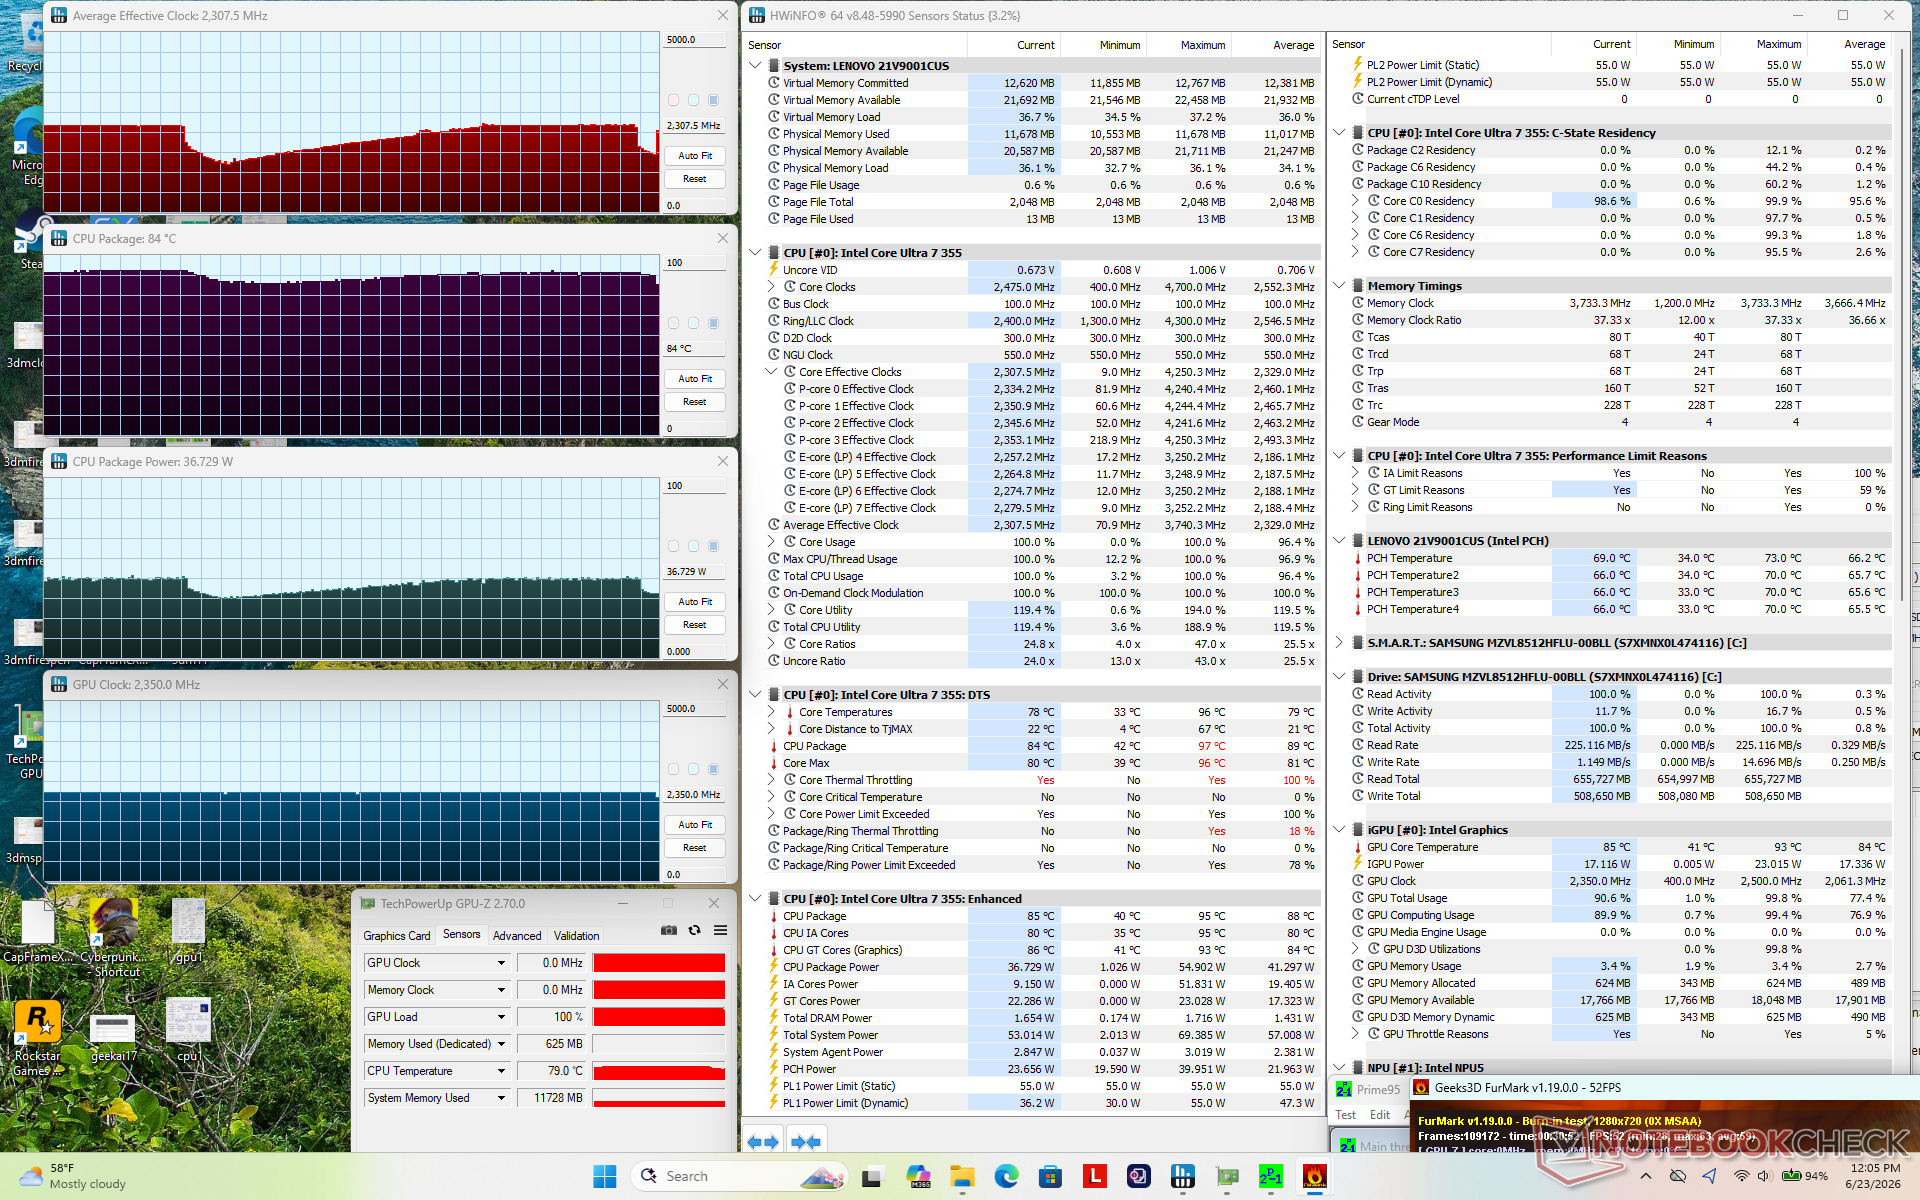
| Średnia częstotliwość taktowania procesora (GHz) | Częstotliwość taktowania karty graficznej (MHz) | Średnia temperatura procesora (°C) | |
| Tryb bezczynności systemu | -- | -- | 49 |
| Obciążenie programem Prime95 | 3,5 | -- | 96 |
| Obciążenie programami Prime95 i FurMark | 1,4 – 2,5 | 2500 | 84 – 91 |
| Obciążenie grą Cyberpunk 2077 | 1,5 | 2500 | 82 |
Prelegenci
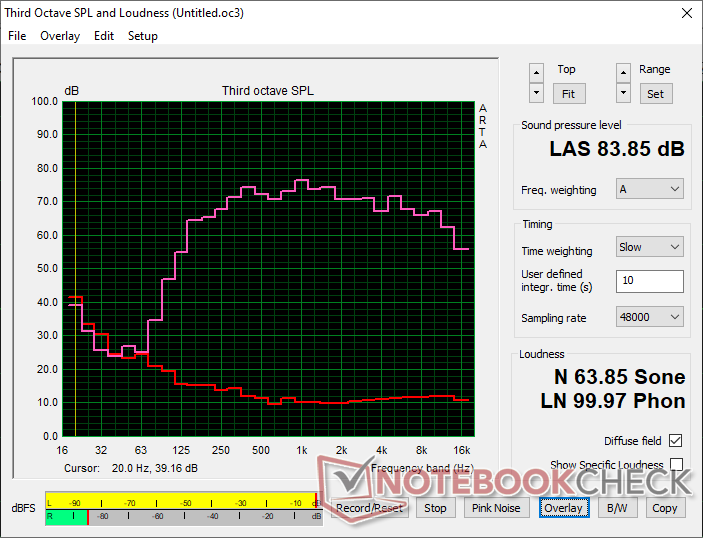
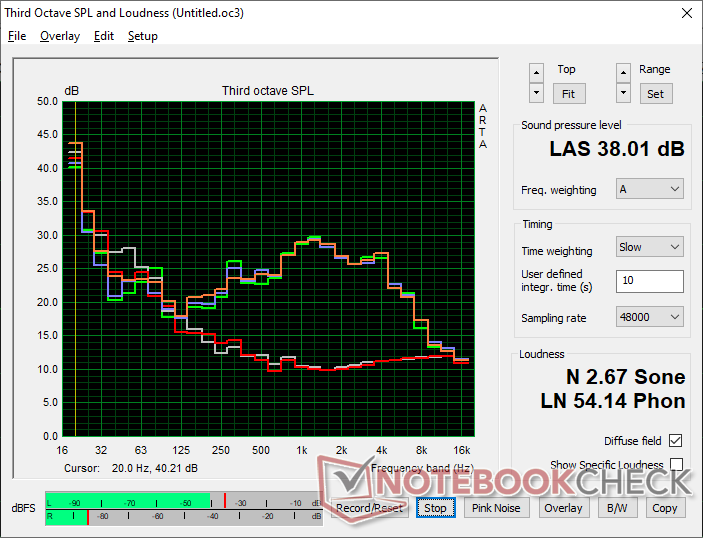
Lenovo ThinkPad X1 2-in-1 Gen 11 analiza dźwięku
(+) | głośniki mogą odtwarzać stosunkowo głośno (83.9 dB)
Bas 100 - 315 Hz
(±) | zredukowany bas - średnio 9.2% niższy od mediany
(±) | liniowość basu jest średnia (10.3% delta do poprzedniej częstotliwości)
Średnie 400 - 2000 Hz
(+) | zbalansowane środki średnie - tylko 2.5% od mediany
(+) | średnie są liniowe (4.1% delta do poprzedniej częstotliwości)
Wysokie 2–16 kHz
(+) | zrównoważone maksima - tylko 2.3% od mediany
(+) | wzloty są liniowe (3.7% delta do poprzedniej częstotliwości)
Ogólnie 100 - 16.000 Hz
(+) | ogólny dźwięk jest liniowy (9% różnicy w stosunku do mediany)
W porównaniu do tej samej klasy
» 4% wszystkich testowanych urządzeń w tej klasie było lepszych, 1% podobnych, 95% gorszych
» Najlepszy miał deltę 6%, średnia wynosiła ###średnia###%, najgorsza wynosiła 57%
W porównaniu do wszystkich testowanych urządzeń
» 3% wszystkich testowanych urządzeń było lepszych, 1% podobnych, 96% gorszych
» Najlepszy miał deltę 4%, średnia wynosiła ###średnia###%, najgorsza wynosiła 134%
Apple MacBook Pro 16 2021 M1 Pro analiza dźwięku
(+) | głośniki mogą odtwarzać stosunkowo głośno (84.7 dB)
Bas 100 - 315 Hz
(+) | dobry bas - tylko 3.8% od mediany
(+) | bas jest liniowy (5.2% delta do poprzedniej częstotliwości)
Średnie 400 - 2000 Hz
(+) | zbalansowane środki średnie - tylko 1.3% od mediany
(+) | średnie są liniowe (2.1% delta do poprzedniej częstotliwości)
Wysokie 2–16 kHz
(+) | zrównoważone maksima - tylko 1.9% od mediany
(+) | wzloty są liniowe (2.7% delta do poprzedniej częstotliwości)
Ogólnie 100 - 16.000 Hz
(+) | ogólny dźwięk jest liniowy (4.6% różnicy w stosunku do mediany)
W porównaniu do tej samej klasy
» 0% wszystkich testowanych urządzeń w tej klasie było lepszych, 0% podobnych, 100% gorszych
» Najlepszy miał deltę 5%, średnia wynosiła ###średnia###%, najgorsza wynosiła 45%
W porównaniu do wszystkich testowanych urządzeń
» 0% wszystkich testowanych urządzeń było lepszych, 0% podobnych, 100% gorszych
» Najlepszy miał deltę 4%, średnia wynosiła ###średnia###%, najgorsza wynosiła 134%
Zarządzanie energią
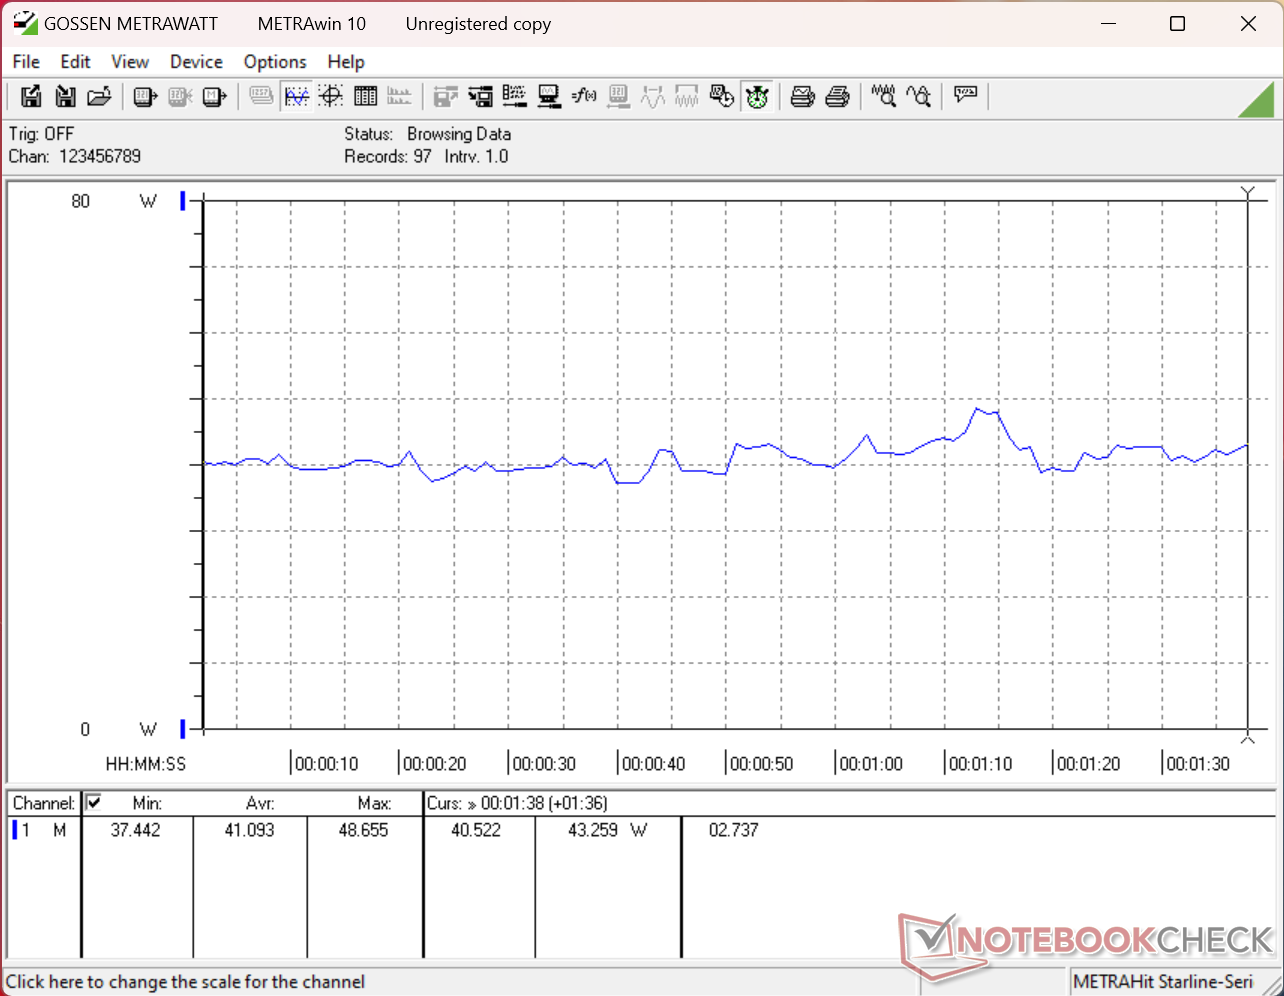
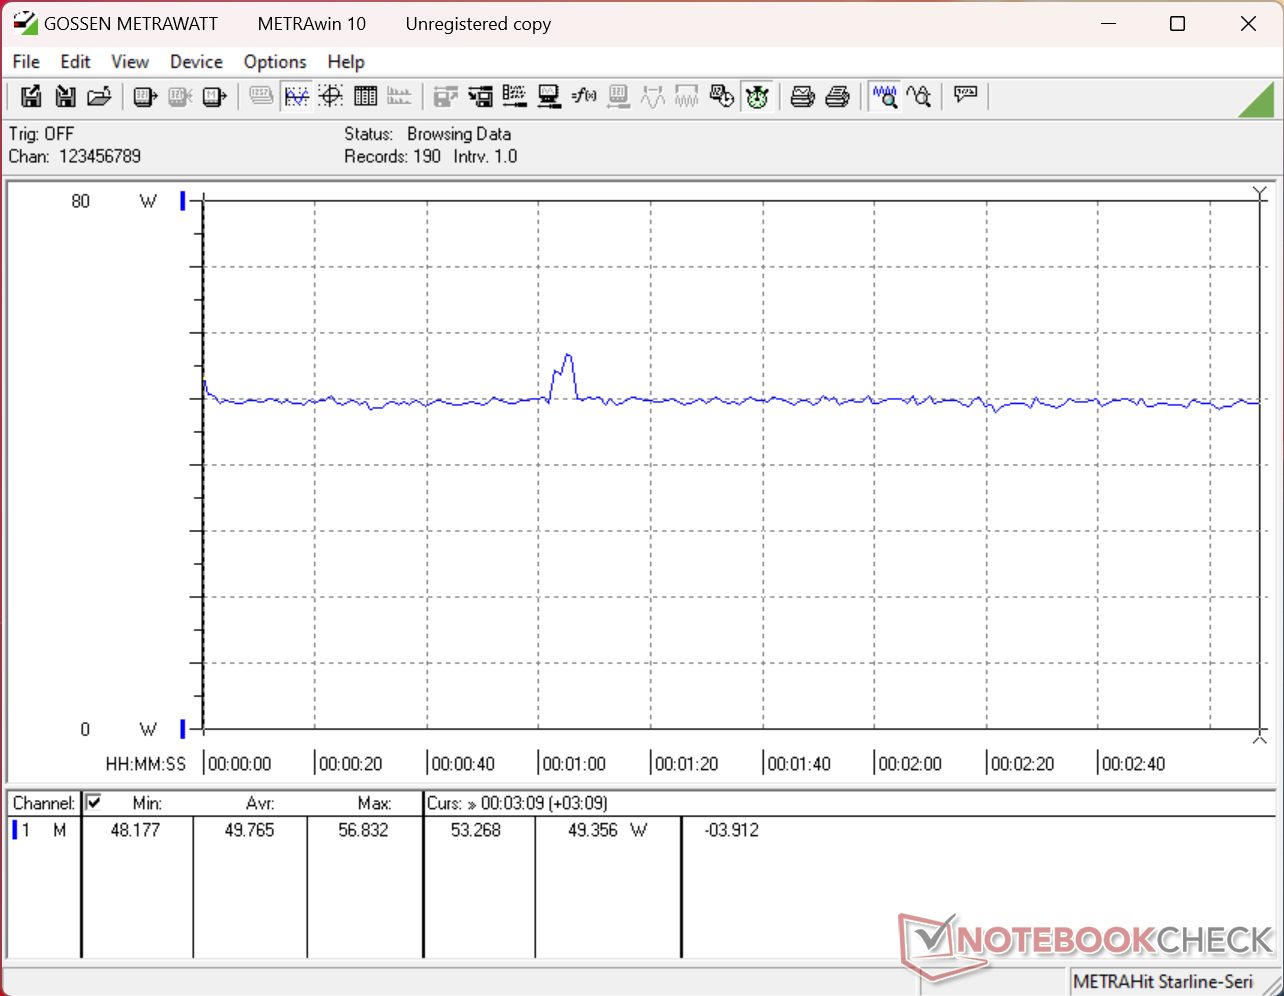
Pobór mocy
Zużycie energii pod obciążeniem jest wyższe, choć bardziej stabilne niż w przypadku modelu z zeszłego roku, co wynika z szybszego i bardziej stabilnego działania procesora oraz karty graficznej, o czym wspomniano powyżej. Średnie zużycie energii jest jednak dość podobne podczas wykonywania mało wymagających zadań, przy porównywalnym czasie pracy w sieci WLAN.
| wyłączony / stan wstrzymania | |
| luz | |
| obciążenie |
|
Legenda:
min: | |
| Lenovo ThinkPad X1 2-in-1 Gen 11 Ultra 7 355, Intel Graphics 4 Xe3 PTL, Samsung PM9C1b MZVL8512HFLU-00BLL, IPS, 1920x1200, 14" | Lenovo ThinkPad X1 2-in-1 Gen 10 Core Ultra 7 258V, Arc 140V, , IPS, 1920x1200, 14" | Lenovo Yoga Book 9 14IAH10 Ultra 7 255H, Arc 140T, Samsung PM9C1a MZAL81T0HDLB, OLED, 2880x1800, 14" | HP EliteBook X Flip G1i 14 AI Core Ultra 7 258V, Arc 140V, Western Digital PC SN5000S SDEPNSJ-1T00-1006, IPS, 1920x1200, 14" | Dell Latitude 7450 2-in-1 Ultra 7 165U, Graphics 4-Core iGPU (Arrow Lake), Micron 2550 512GB, IPS, 1920x1200, 14" | Asus ExpertBook Ultra B9406CAA Ultra X7 358H, Arc B390 Panther Lake iGPU, Samsung PM9E1 MZVLC2T0HBLD, OLED, 2880x1800, 14" | |
|---|---|---|---|---|---|---|
| Power Consumption | 5% | -146% | -24% | -5% | -19% | |
| Idle Minimum * (Watt) | 1.9 | 1.5 21% | 9.9 -421% | 2.9 -53% | 2.23 -17% | 3.5 -84% |
| Idle Average * (Watt) | 4.7 | 4.8 -2% | 11.6 -147% | 8.2 -74% | 5.36 -14% | 4 15% |
| Idle Maximum * (Watt) | 5 | 5 -0% | 23.2 -364% | 8.6 -72% | 6.8 -36% | 5.3 -6% |
| Load Average * (Watt) | 41 | 44.2 -8% | 58.5 -43% | 39.6 3% | 51.2 -25% | 43.7 -7% |
| Cyberpunk 2077 ultra * (Watt) | 49.8 | 47.8 4% | 58.5 -17% | 41.9 16% | 29.5 41% | 61.3 -23% |
| Cyberpunk 2077 ultra external monitor * (Watt) | 47.4 | 39.3 17% | 56.6 -19% | 36.4 23% | 34.6 27% | 61.4 -30% |
| Load Maximum * (Watt) | 64.3 | 60.2 6% | 70.1 -9% | 70 -9% | 69.9 -9% | 63.4 1% |
* ... im mniej tym lepiej
Zużycie energii w grze „Cyberpunk” / Test obciążeniowy
Pobór mocy przez monitor zewnętrzny
Żywotność baterii
| Lenovo ThinkPad X1 2-in-1 Gen 11 Ultra 7 355, Intel Graphics 4 Xe3 PTL, 58 Wh | Lenovo ThinkPad X1 2-in-1 Gen 10 Core Ultra 7 258V, Arc 140V, 57 Wh | Lenovo Yoga Book 9 14IAH10 Ultra 7 255H, Arc 140T, 88 Wh | HP EliteBook X Flip G1i 14 AI Core Ultra 7 258V, Arc 140V, 68 Wh | Dell Latitude 7450 2-in-1 Ultra 7 165U, Graphics 4-Core iGPU (Arrow Lake), 57 Wh | Asus ExpertBook Ultra B9406CAA Ultra X7 358H, Arc B390 Panther Lake iGPU, 70 Wh | |
|---|---|---|---|---|---|---|
| Czasy pracy | 0% | -72% | -16% | -50% | -26% | |
| WiFi v1.3 (h) | 21.9 | 22 0% | 6.1 -72% | 18.4 -16% | 11 -50% | 16.1 -26% |
| H.264 (h) | 20.6 | 12.4 | ||||
| Load (h) | 2.1 |
Ocena serwisu Notebookcheck
Przeprojektowany ThinkPad X1 2-w-1 11. generacji prezentuje się bardziej profesjonalnie i, w zależności od konfiguracji, może działać znacznie szybciej niż dotychczas. Jednak ten cienki rysik nie jest idealnym rozwiązaniem z ergonomicznego punktu widzenia.
Lenovo ThinkPad X1 2-in-1 Gen 11
- 27/06/2026 v8
Allen Ngo
 Total Sustainability Score:
 Porównanie potencjalnych konkurentów
Obraz | Model / recenzja | Cena | Waga | Wysokość | Ekran |
|---|---|---|---|---|---|
1. 89.5%  | Lenovo ThinkPad X1 2-in-1 Gen 11 Intel Core Ultra 7 355 ⎘ Intel Graphics 4 Xe3 Panther Lake iGPU ⎘ 32 GB Pamięć, 512 GB SSD | Amazon: Cena katalogowa: 2700 USD | 1.3 kg | 17.9 mm | 14.00" 1920x1200 162 PPI IPS |
2. 88.8%  | Lenovo ThinkPad X1 2-in-1 Gen 10 Intel Core Ultra 7 258V ⎘ Intel Arc Graphics 140V ⎘ 32 GB Pamięć | Amazon: Cena katalogowa: 2300 USD | 1.4 kg | 18.3 mm | 14.00" 1920x1200 162 PPI IPS |
3. 83.4%  | Lenovo Yoga Book 9 14IAH10 Intel Core Ultra 7 255H ⎘ Intel Arc Graphics 140T ⎘ 16 GB Pamięć, 1024 GB SSD | Amazon: | 1.2 kg | 15.5 mm | 14.00" 2880x1800 243 PPI OLED |
4. 89.9%  | HP EliteBook X Flip G1i 14 AI Intel Core Ultra 7 258V ⎘ Intel Arc Graphics 140V ⎘ 32 GB Pamięć, 1000 GB SSD | Amazon: Cena katalogowa: 2889 Euro | 1.5 kg | 14.7 mm | 14.00" 1920x1200 162 PPI IPS |
5. 87.7%  | Dell Latitude 7450 2-in-1 Intel Core Ultra 7 165U ⎘ Intel Graphics 4-Core iGPU (Meteor / Arrow Lake) ⎘ 32 GB Pamięć, 512 GB SSD | Amazon: $1,019.95 Cena katalogowa: 2279 USD | 1.5 kg | 17.1 mm | 14.00" 1920x1200 162 PPI IPS |
6. 87.6%  | Asus ExpertBook Ultra B9406CAA Intel Core Ultra X7 358H ⎘ Intel Arc B390 12 Xe3 Panther Lake iGPU ⎘ 32 GB Pamięć, 2048 GB SSD | Amazon: | 1.1 kg | 15.9 mm | 14.00" 2880x1800 243 PPI OLED |
Przezroczystość
Wyboru urządzeń do recenzji dokonuje nasza redakcja. Próbka testowa została udostępniona autorowi jako pożyczka od producenta lub sprzedawcy detalicznego na potrzeby tej recenzji. Pożyczkodawca nie miał wpływu na tę recenzję, producent nie otrzymał też kopii tej recenzji przed publikacją. Nie było obowiązku publikowania tej recenzji. Jako niezależna firma medialna, Notebookcheck nie podlega władzy producentów, sprzedawców detalicznych ani wydawców.
Tak testuje Notebookcheck
Każdego roku Notebookcheck niezależnie sprawdza setki laptopów i smartfonów, stosując standardowe procedury, aby zapewnić porównywalność wszystkich wyników. Od około 20 lat stale rozwijamy nasze metody badawcze, ustanawiając przy tym standardy branżowe. W naszych laboratoriach testowych doświadczeni technicy i redaktorzy korzystają z wysokiej jakości sprzętu pomiarowego. Testy te obejmują wieloetapowy proces walidacji. Nasz kompleksowy system ocen opiera się na setkach uzasadnionych pomiarów i benchmarków, co pozwala zachować obiektywizm.
