Werdykt - jeden z najbardziej wydajnych subnotebooków dostępnych na rynku
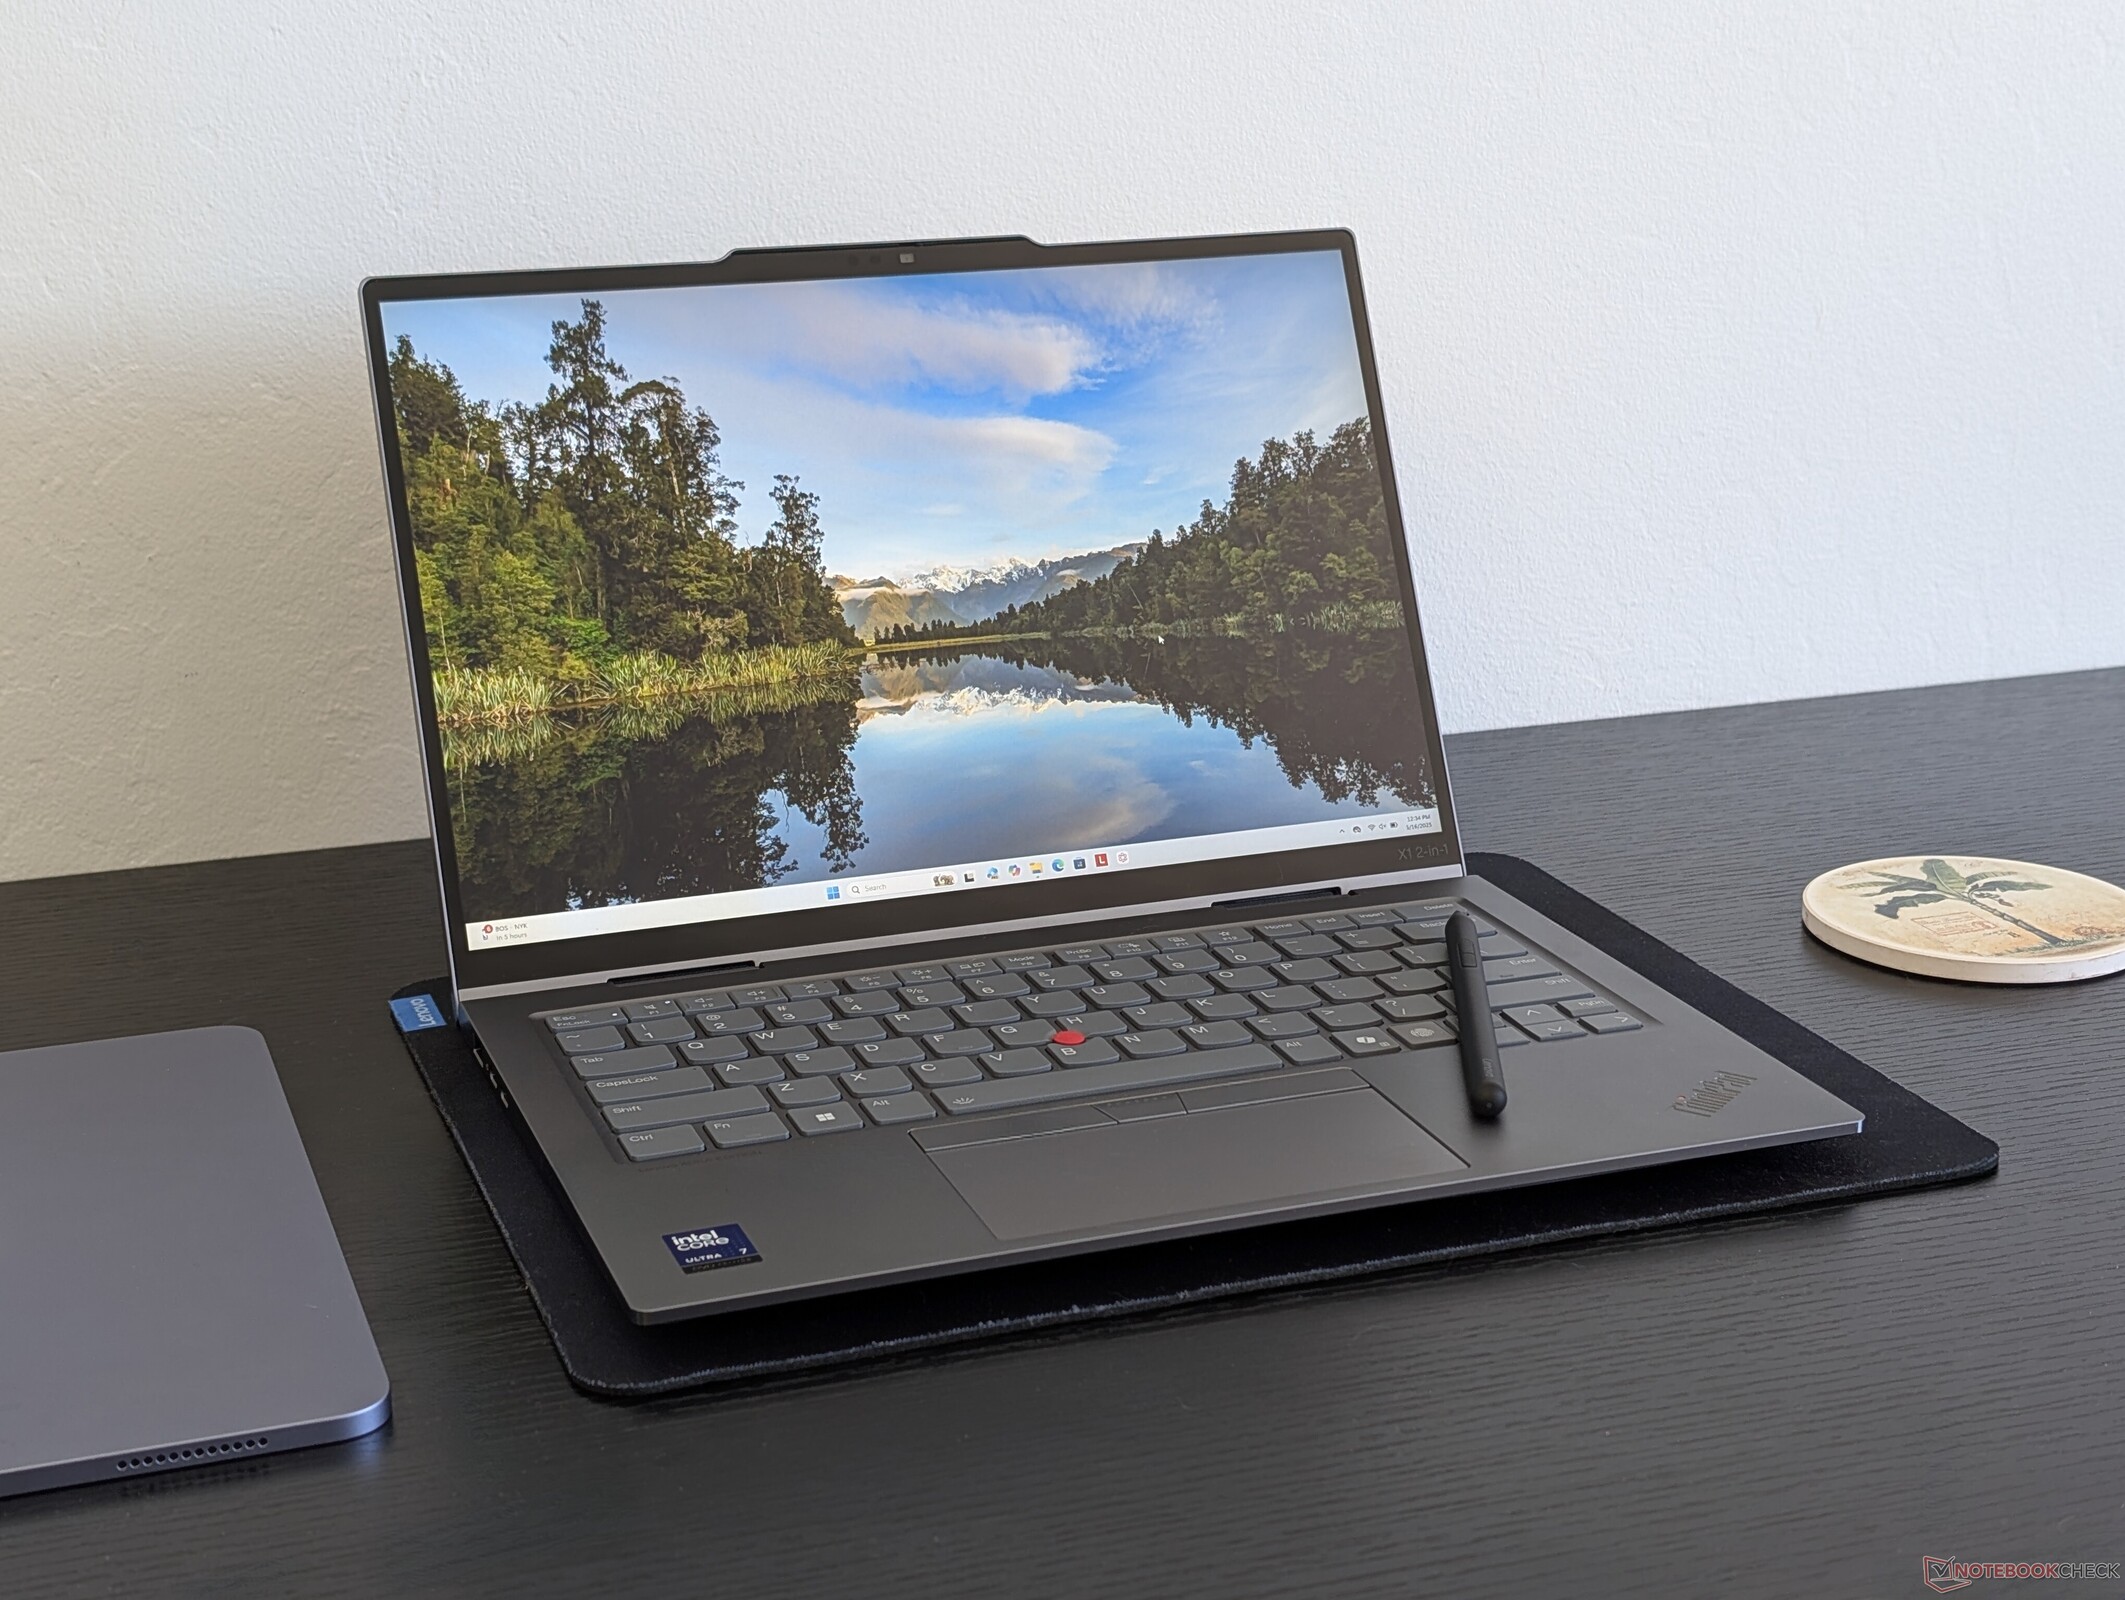
Z zewnątrz może nie wyglądać inaczej, ale ThinkPad X1 2-w-1 Gen 10 oferuje znaczące ulepszenia w stosunku do ThinkPad X1 2-w-1 Gen 9 na kilka sposobów. Najbardziej zauważalny jest czas pracy na baterii, który może być o kilka godzin dłuższy niż wcześniej, przy jednoczesnym cichszym działaniu i znacznie szybszej wydajności graficznej. Ulepszenia te są w dużej mierze przypisywane nowemu procesorowi Lunar Lake.
Główną wadą najnowszego modelu jest niezdolność do utrzymania wysokich częstotliwości taktowania Turbo Boost przez dłuższy czas, ponieważ temperatura rdzenia może osiągnąć nawet 96 stopni Celsjusza pod obciążeniem. W rezultacie częstotliwość taktowania ulega wahaniom, co prowadzi do niestabilnej liczby klatek na sekundę lub nieco wolniejszego czasu kodowania. Konsekwencje są niewielkie w przypadku czynności ogólnego przeznaczenia, takich jak przeglądanie stron internetowych lub odtwarzanie wideo, ale zaawansowani użytkownicy, którzy często obciążają procesor lub kartę graficzną, mogą chcieć rozważyć większe modele z lepszymi rozwiązaniami chłodzącymi, takimi jak HP EliteBook x360 1040 G11 lub konsumencki Asus ZenBook Duo.
Za
Przeciw
Cena i dostępność
Lenovo dostarcza obecnie konfigurację ThinkPad X1 2-w-1 Gen 10 z procesorem Core Ultra 7 258V i ekranem dotykowym 1200p w cenie 2300 USD.
- $1,999.99Lenovo ThinkPad X1 2-in-1 Gen 10 Aura Edition Laptop with Intel Core Ultra 7 268V vPro Processor, 14” WUXGA IPS Touchscreen Display, 32GB LPDDR5X-8533MT/s Memory, 1TB SSD, Wi-Fi 7 and Windows 11 Pro
- $2,185.00Lenovo ThinkPad X1 2-in-1 Gen 10 Aura Edition Laptop with Intel Core Ultra 7 268V vPro Processor, 14” WUXGA 2.8K OLED Touchscreen Display, 32GB LPDDR5X-8533MT/s, 1TB SSD, 8MP IR Cam, Pen, and Win11Pro
- $2,399.00Lenovo ThinkPad X1 2-in-1 Gen 10 Aura Edition, Intel Ultra 7 268V vPro, 14" OLED 2.8K (2880x1800) 500 nits, AR, Touchscreen, 32GB DDR5, 2TB SSD, Yoga Pen, 8MP IR Camera, Wi-Fi 7, Win 11 Pro - Grey
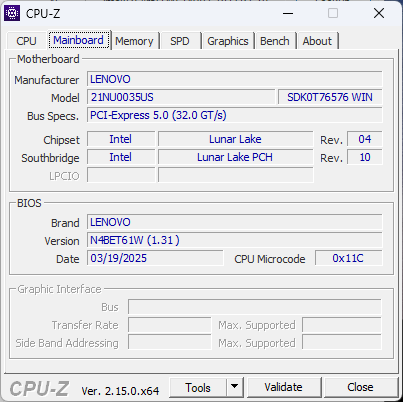
ThinkPad X1 2-w-1 Gen 10 z 2025 roku jest następcą zeszłorocznego modelu 2024 ThinkPad X1 2-w-1 Gen 9 wymieniając starsze opcje procesorów Meteor Lake-U na nowsze Lunar Lake-V. Chociaż poza tym nie ma żadnych zewnętrznych różnic między tymi dwoma modelami, sama aktualizacja procesora zmieniła kilka aspektów modelu, które szczegółowo omówimy w tej recenzji.
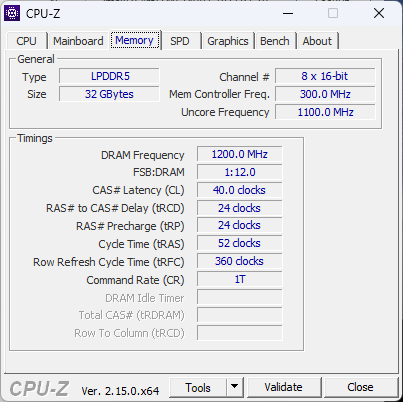
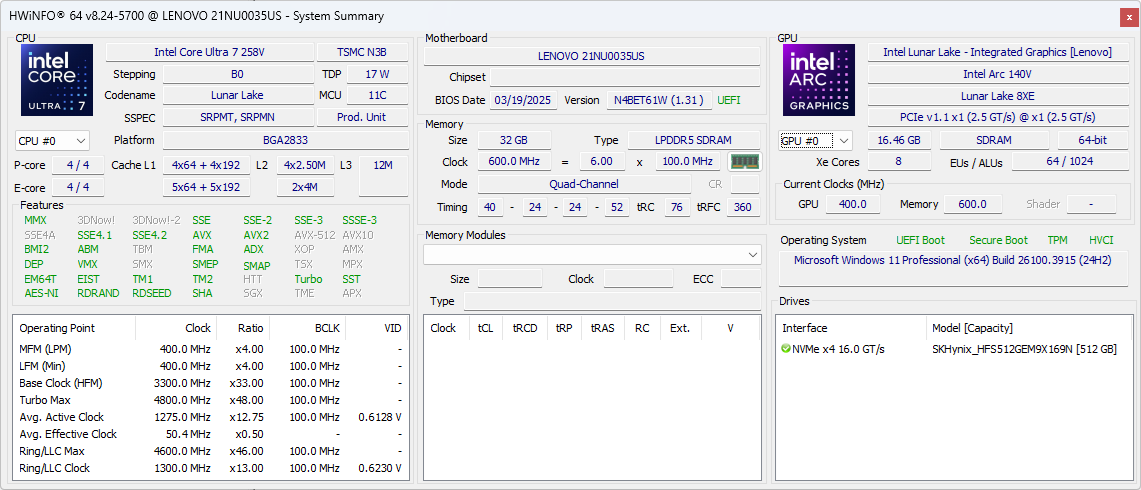
Nasza jednostka testowa to środkowa konfiguracja wyposażona w Core Ultra 7 258V, zintegrowaną grafikę Arc 140V i ekran dotykowy IPS 1200p w cenie detalicznej około 2300 USD. Inne SKU zaczynają się od Core Ultra 5 225U do Core Ultra 7 265H z ekranem dotykowym OLED 1800p. Jest to jeden z niewielu 14-calowych konwertowalnych laptopów, które są dostępne z opcjami Core Ultra-U, Core Ultra-H i Core Ultra-U.
Alternatywy dla ThinkPada X1 2 w 1 Gen 10 obejmują inne biznesowe komputery konwertowalne, takie jak Dell Latitude 9440 2-w-1, HP EliteBook X Flip G1i 14 AIlub Acer TravelMate P4 14.
Więcej recenzji Lenovo:
Specyfikacje
Przypadek
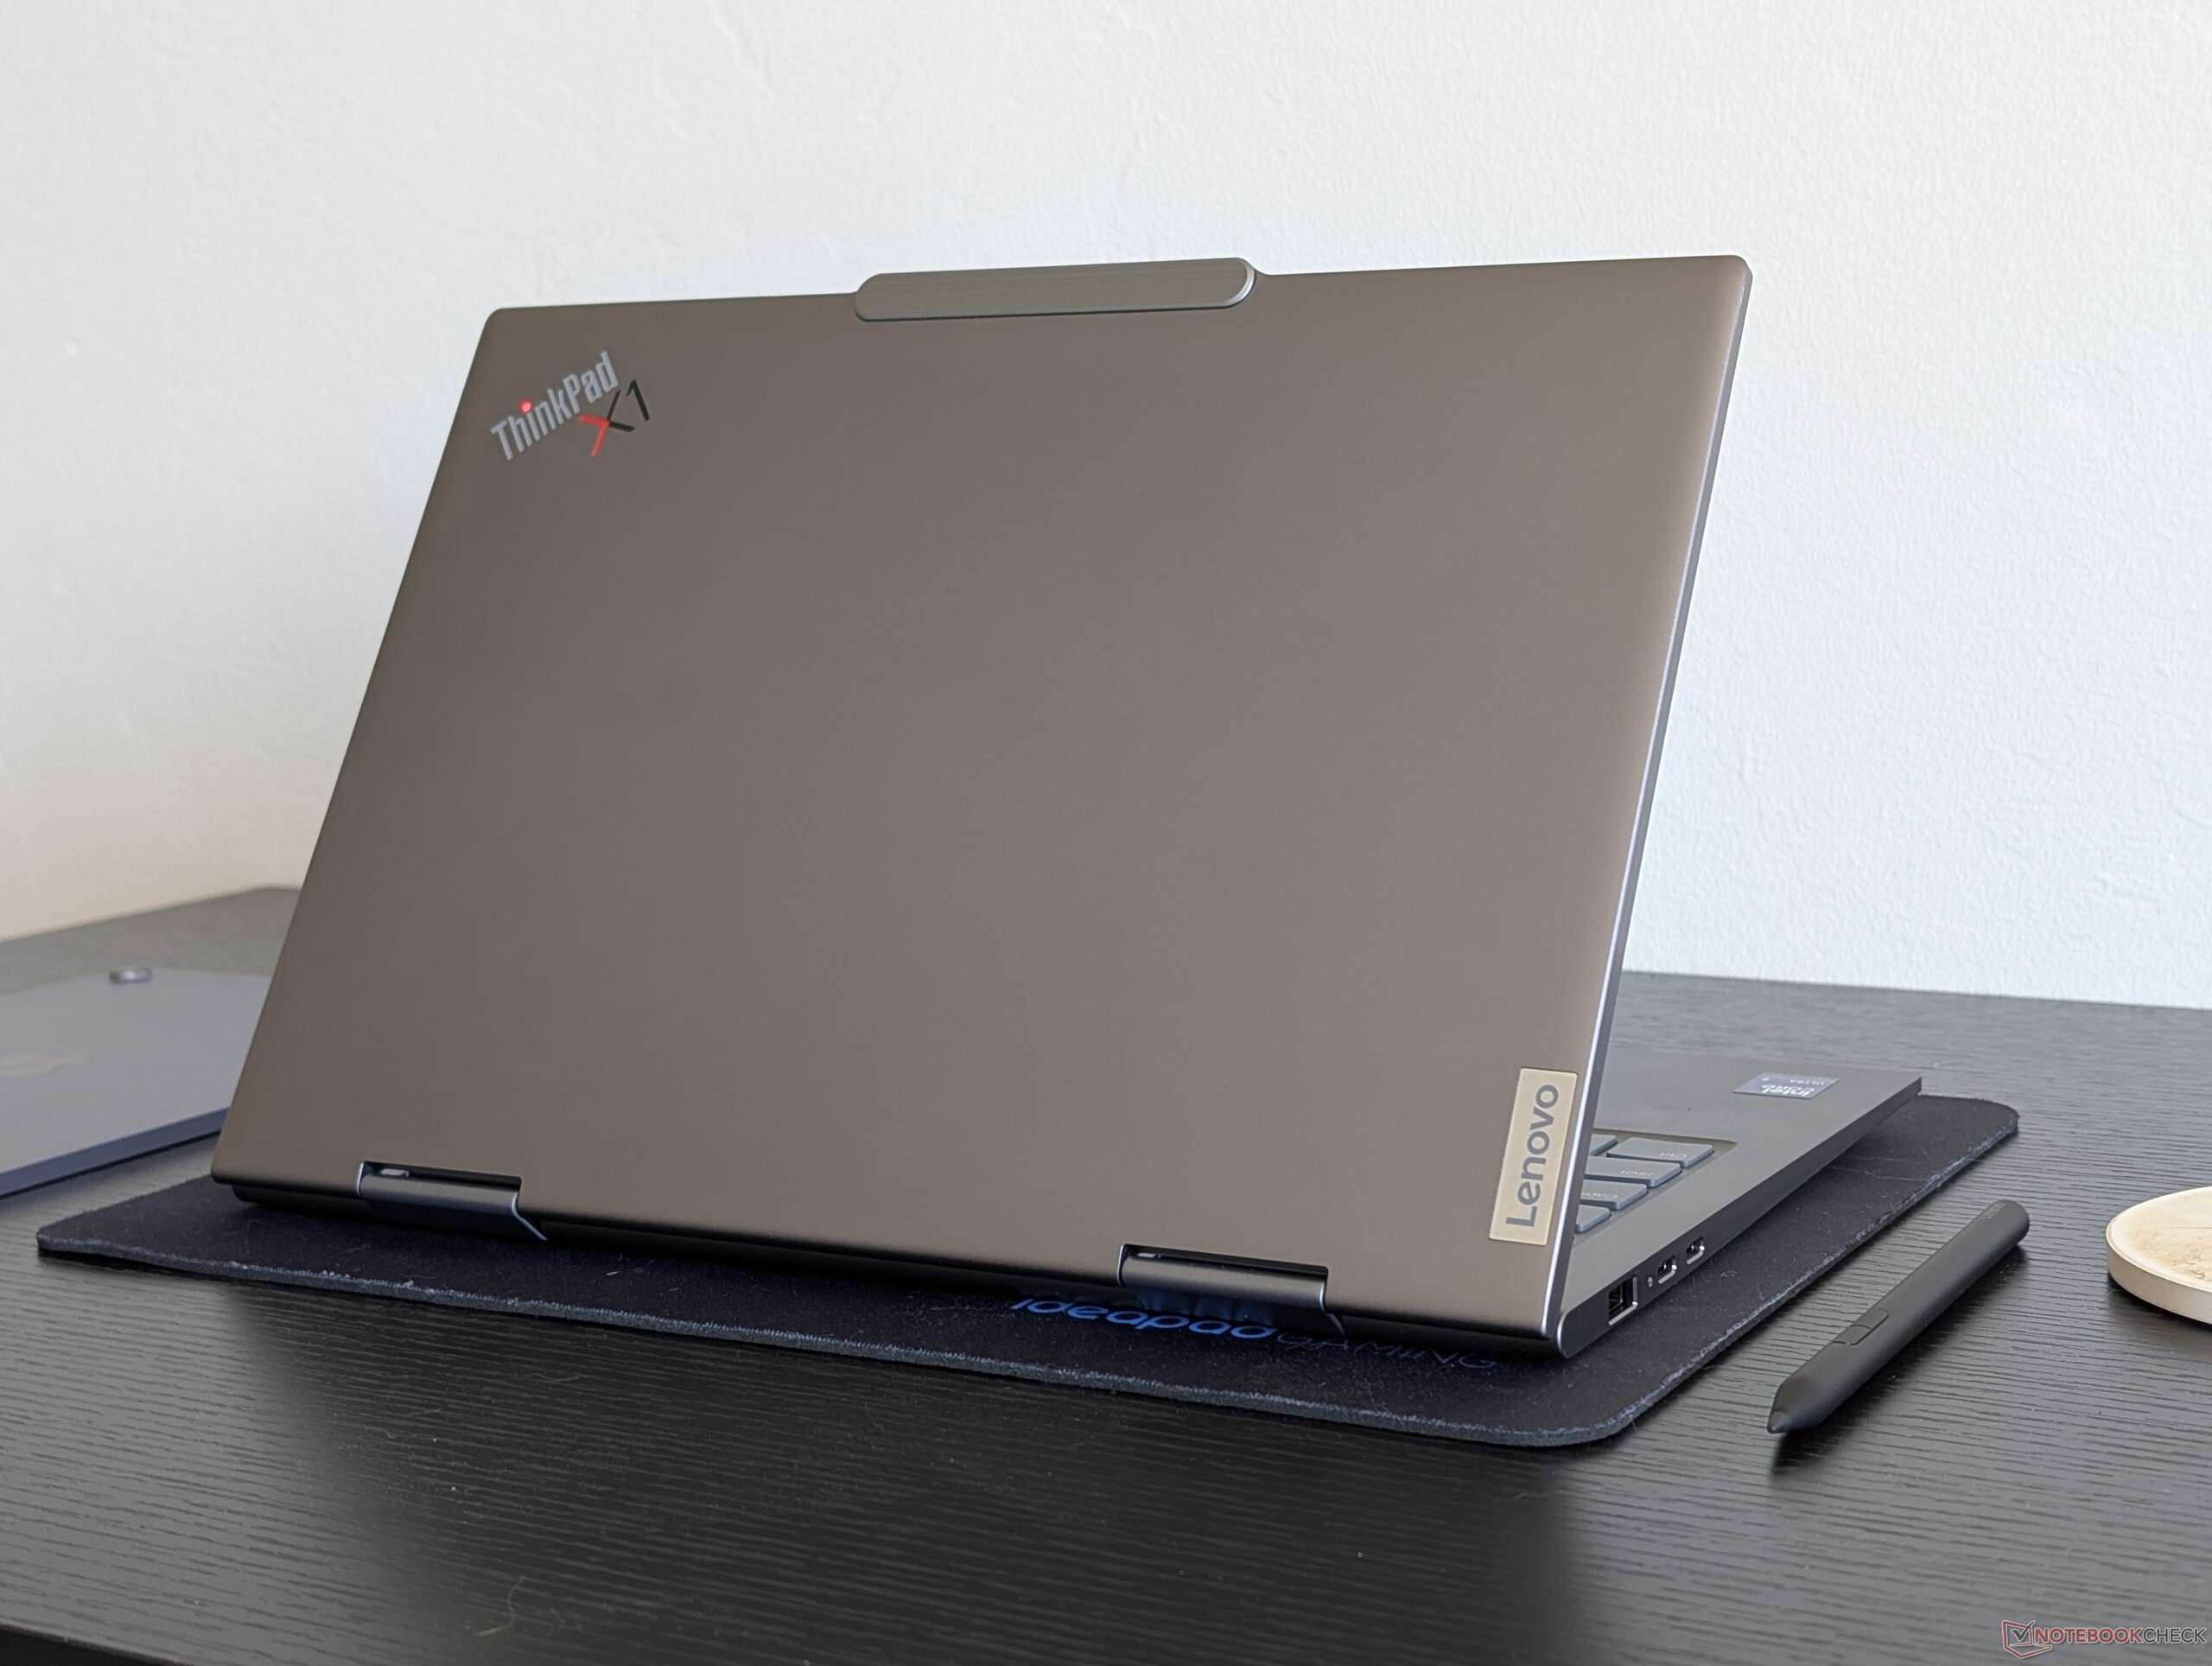
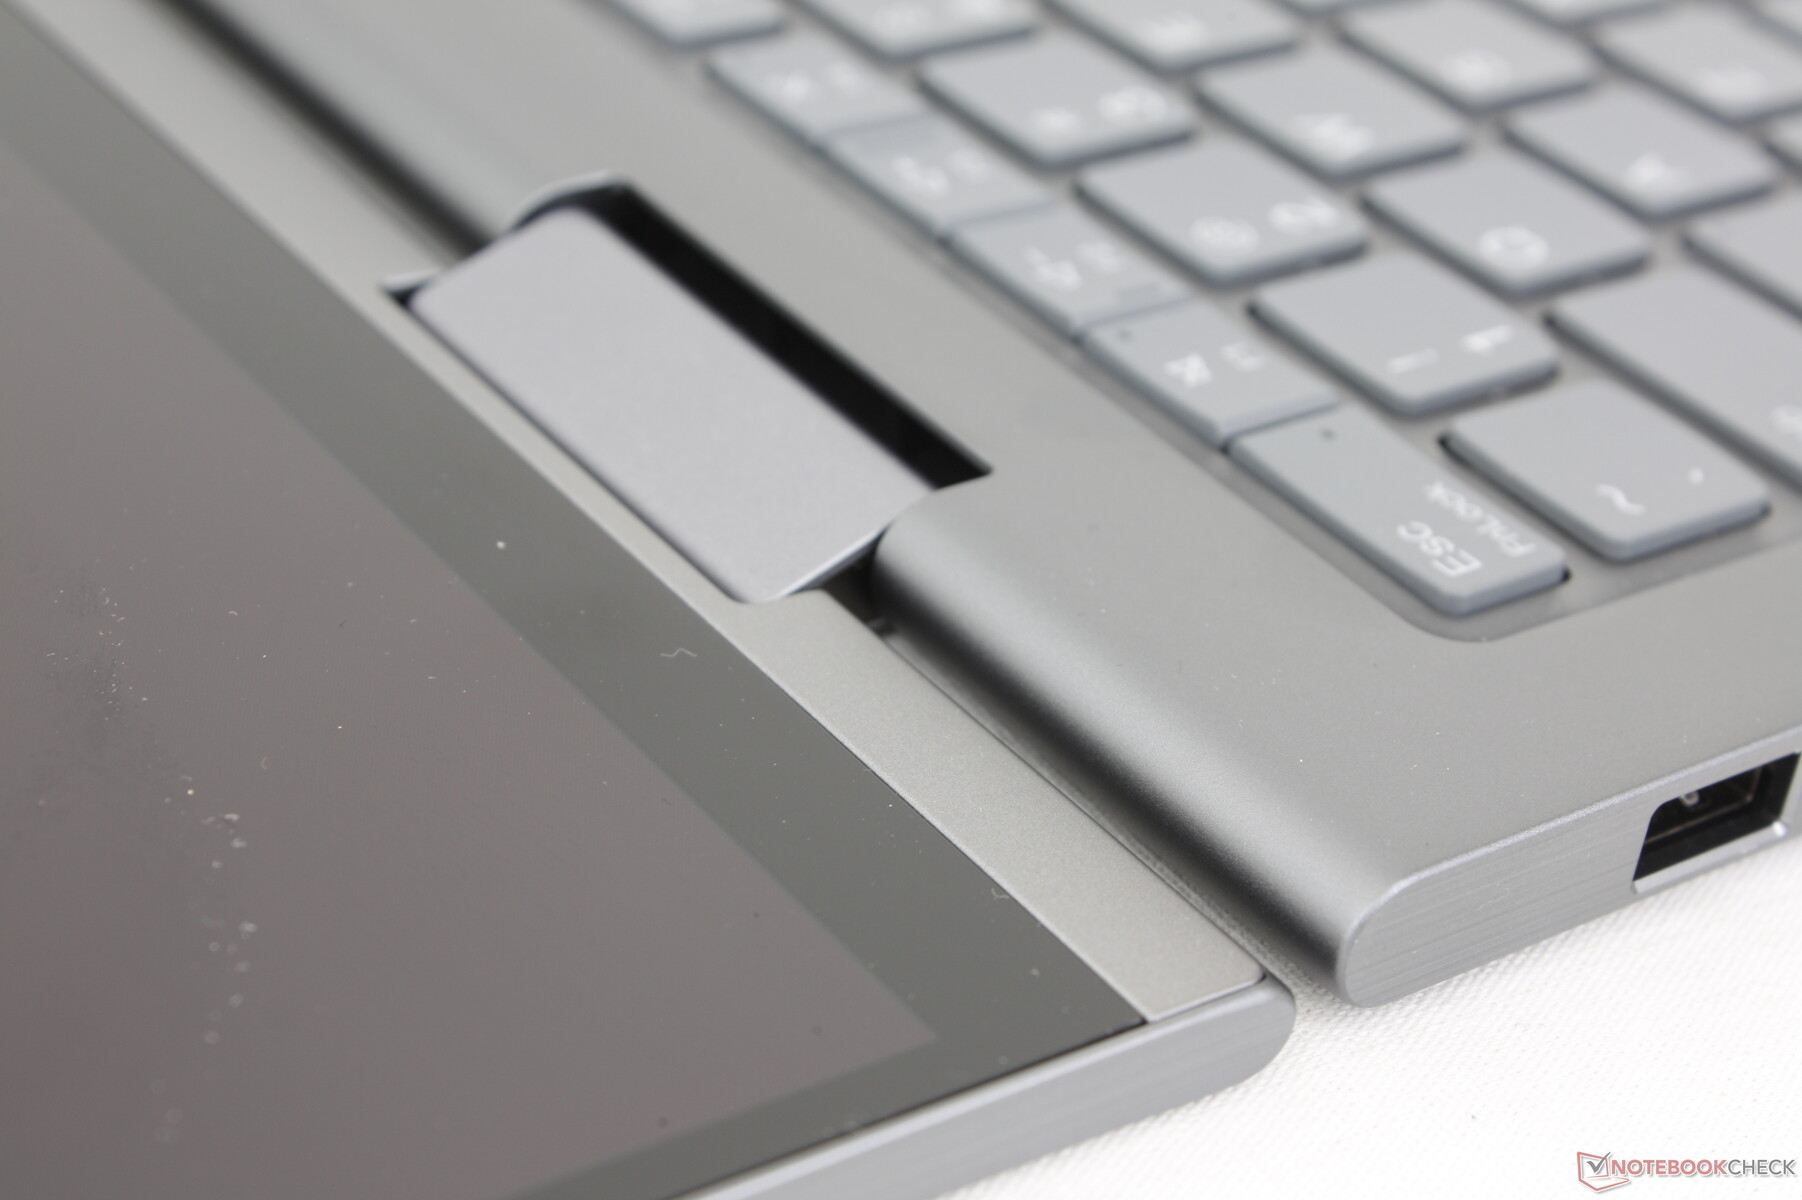
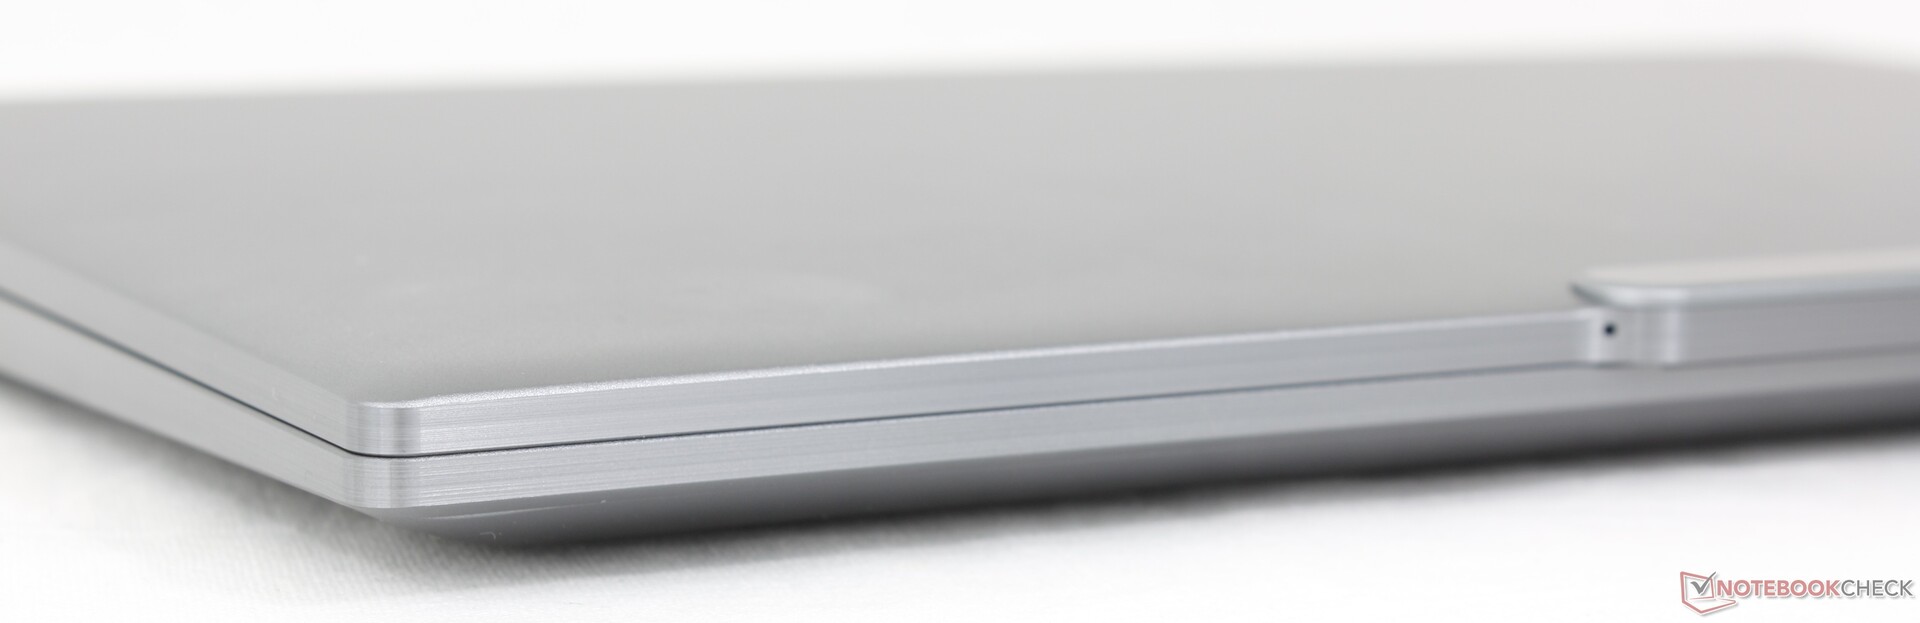
Nie ma żadnych zewnętrznych różnic między modelami 2024 i 2025, a zatem nasze istniejące uwagi dotyczące modelu 2024 mają zastosowanie tutaj. Niekoniecznie jest to zła rzecz, ponieważ uznaliśmy, że konstrukcja 2024 jest doskonała od góry do dołu, z wyjątkiem braku poręcznego garażu na pióro do przechowywania rysika. Mimo to znacznie wolimy nowe, większe pióro, ponieważ nie musi być już wystarczająco małe, aby zmieścić się w obudowie.
Łączność
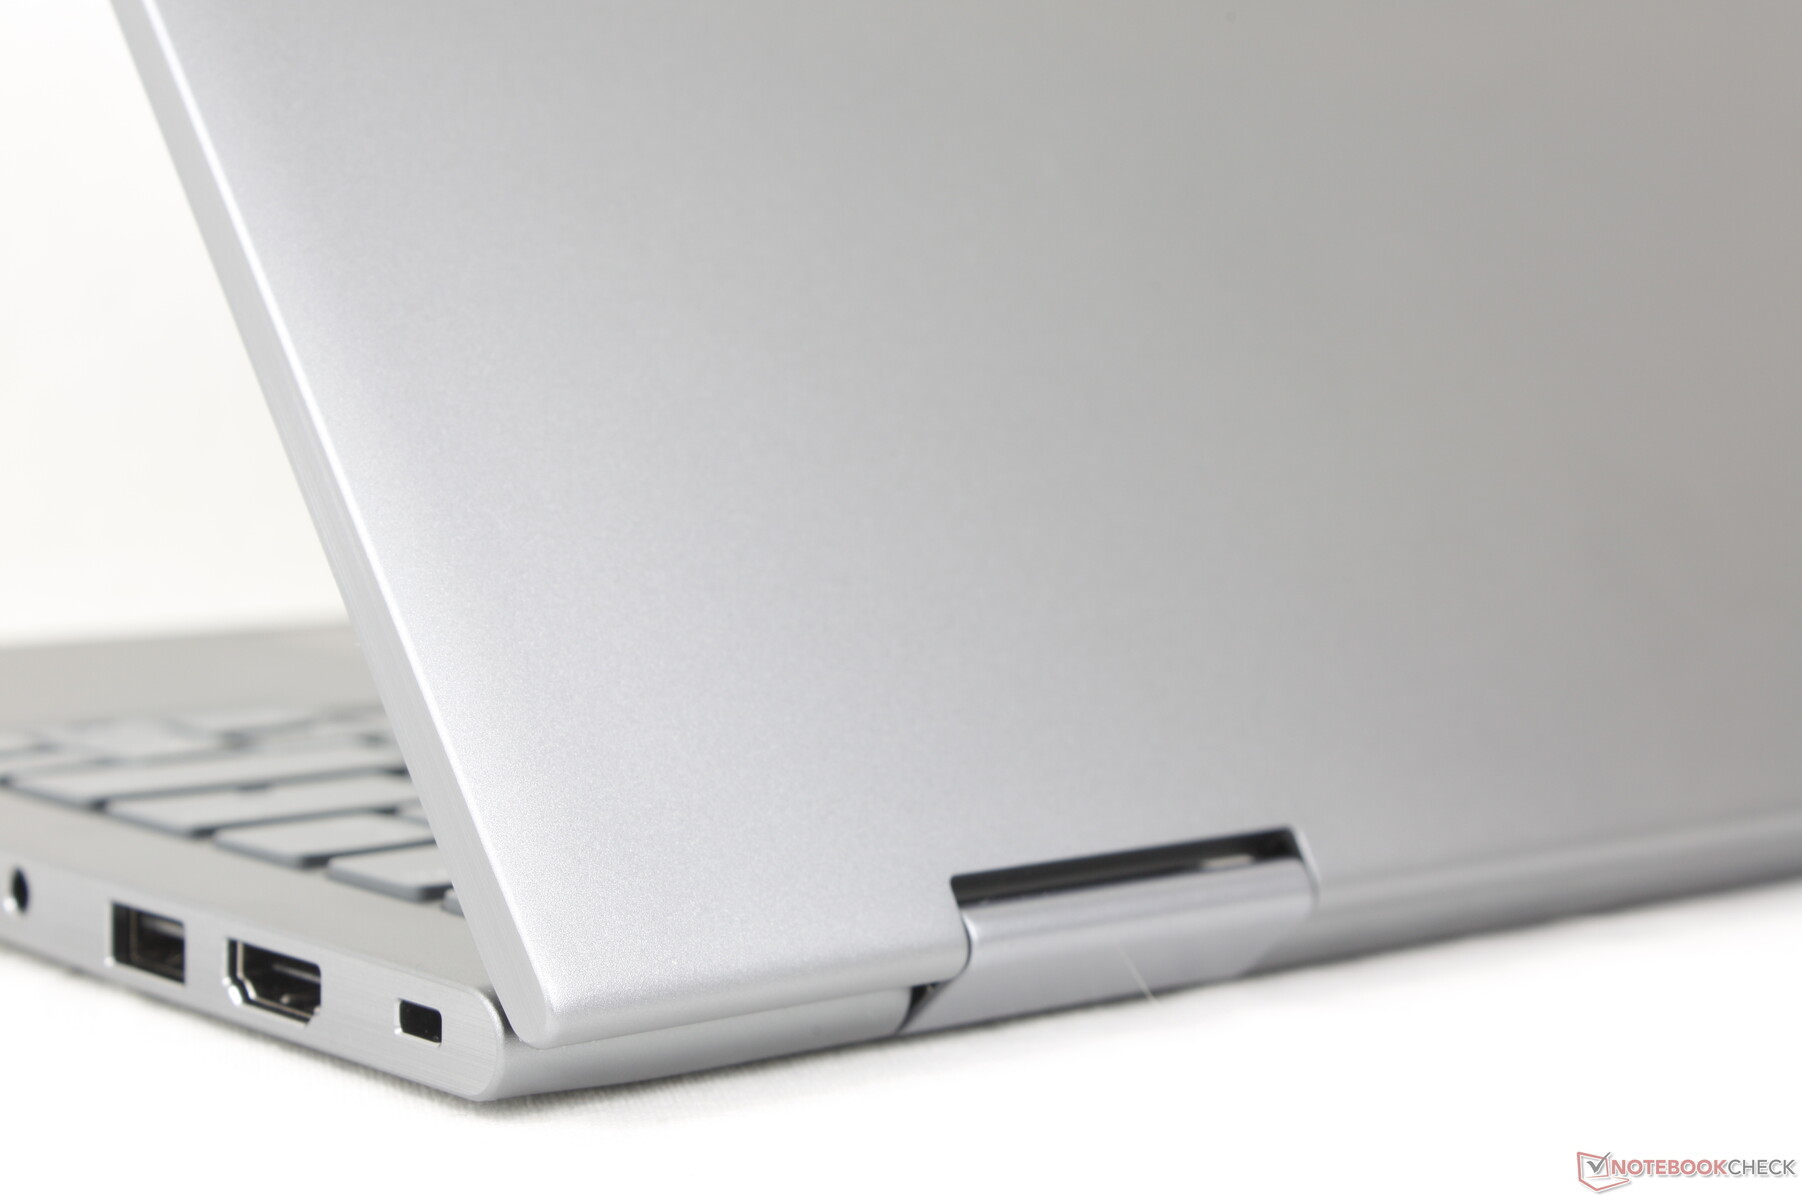
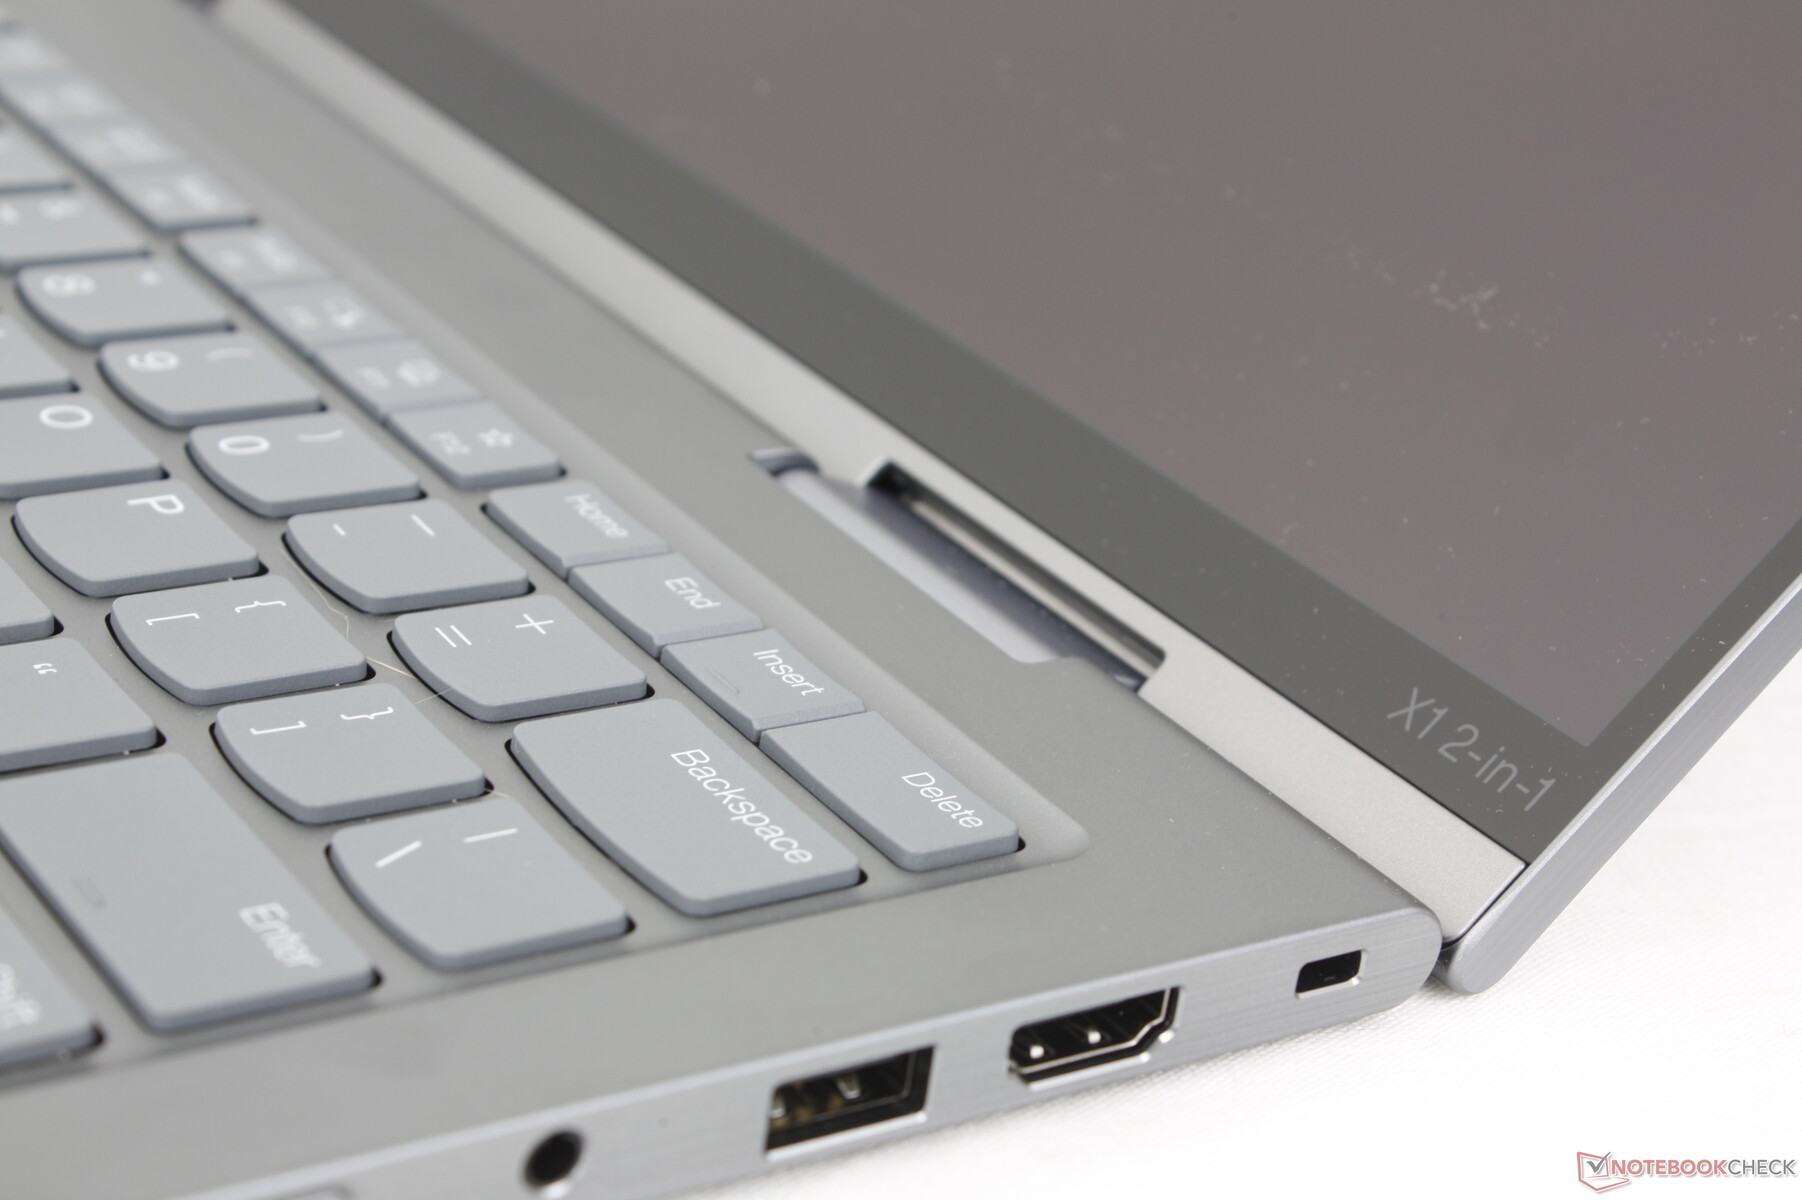
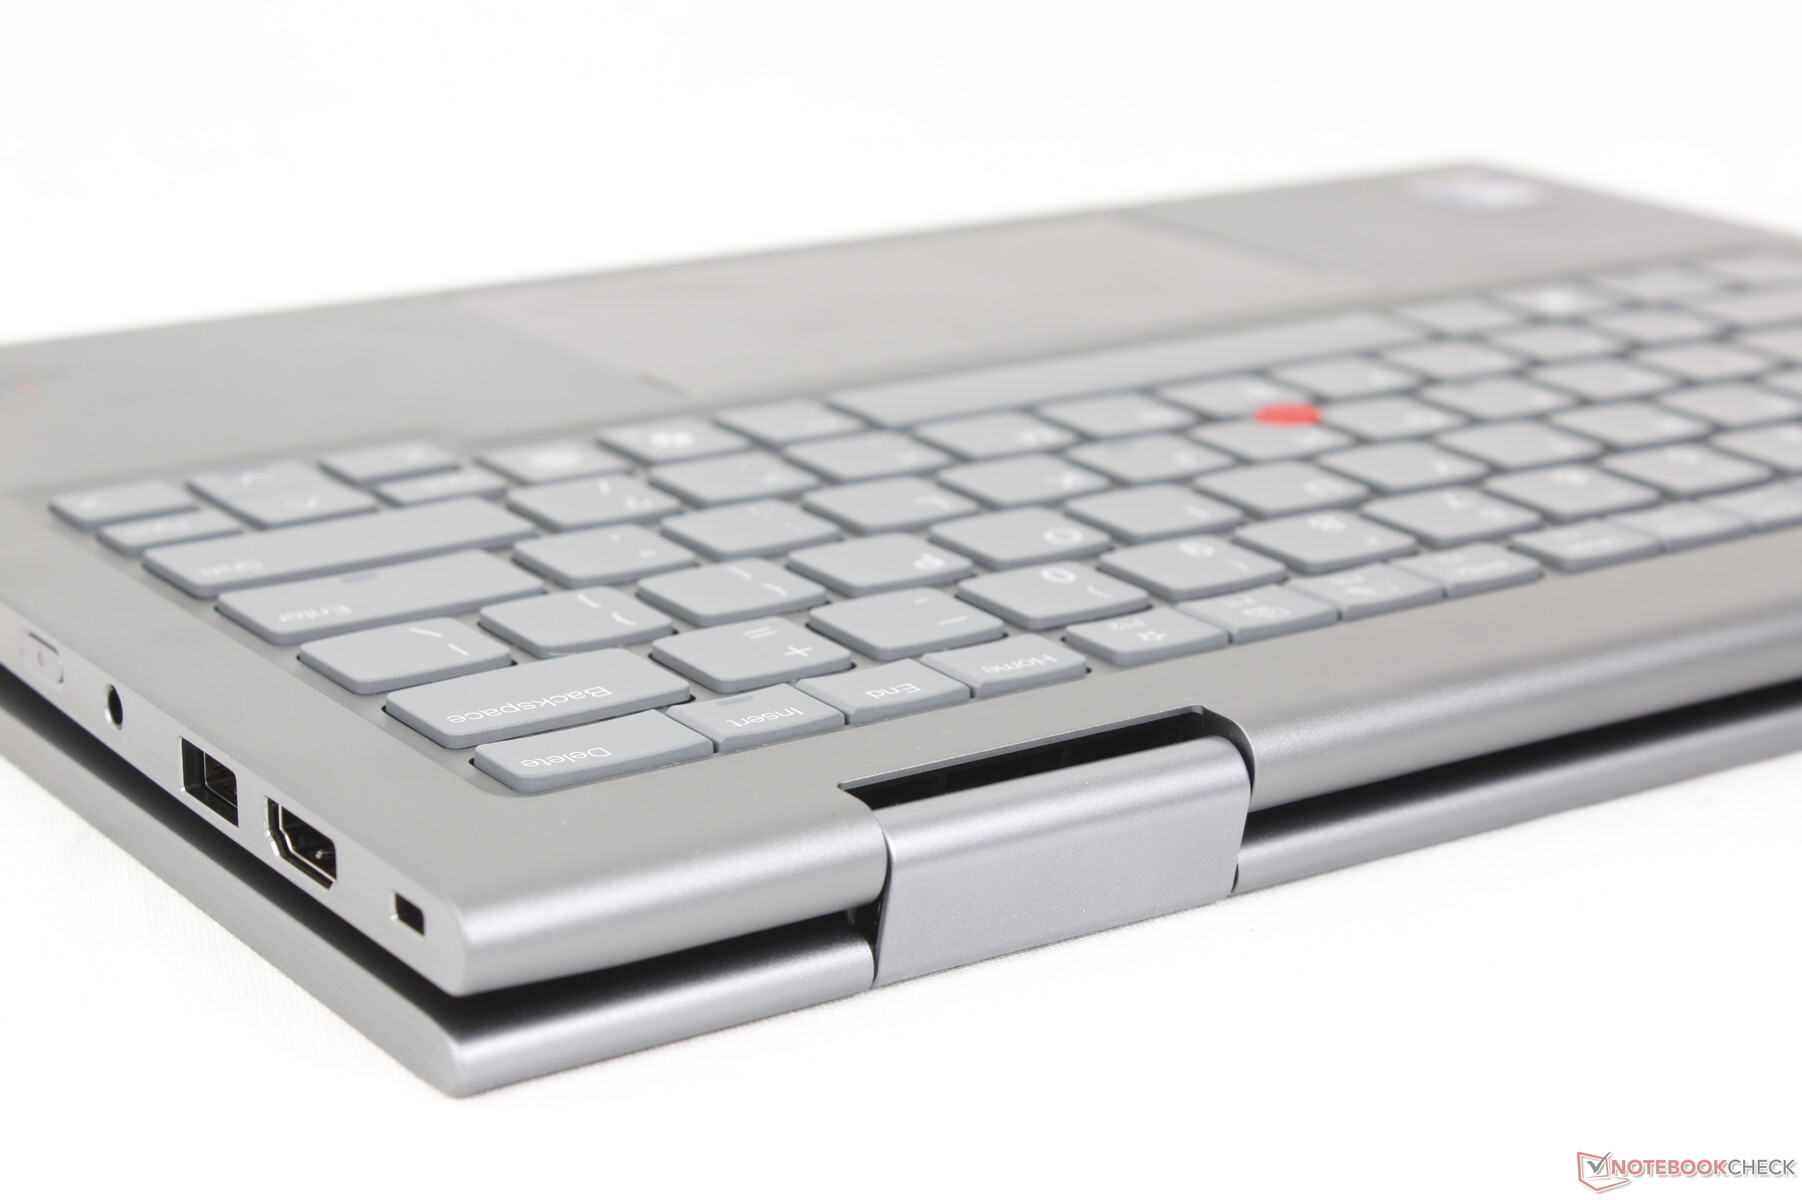
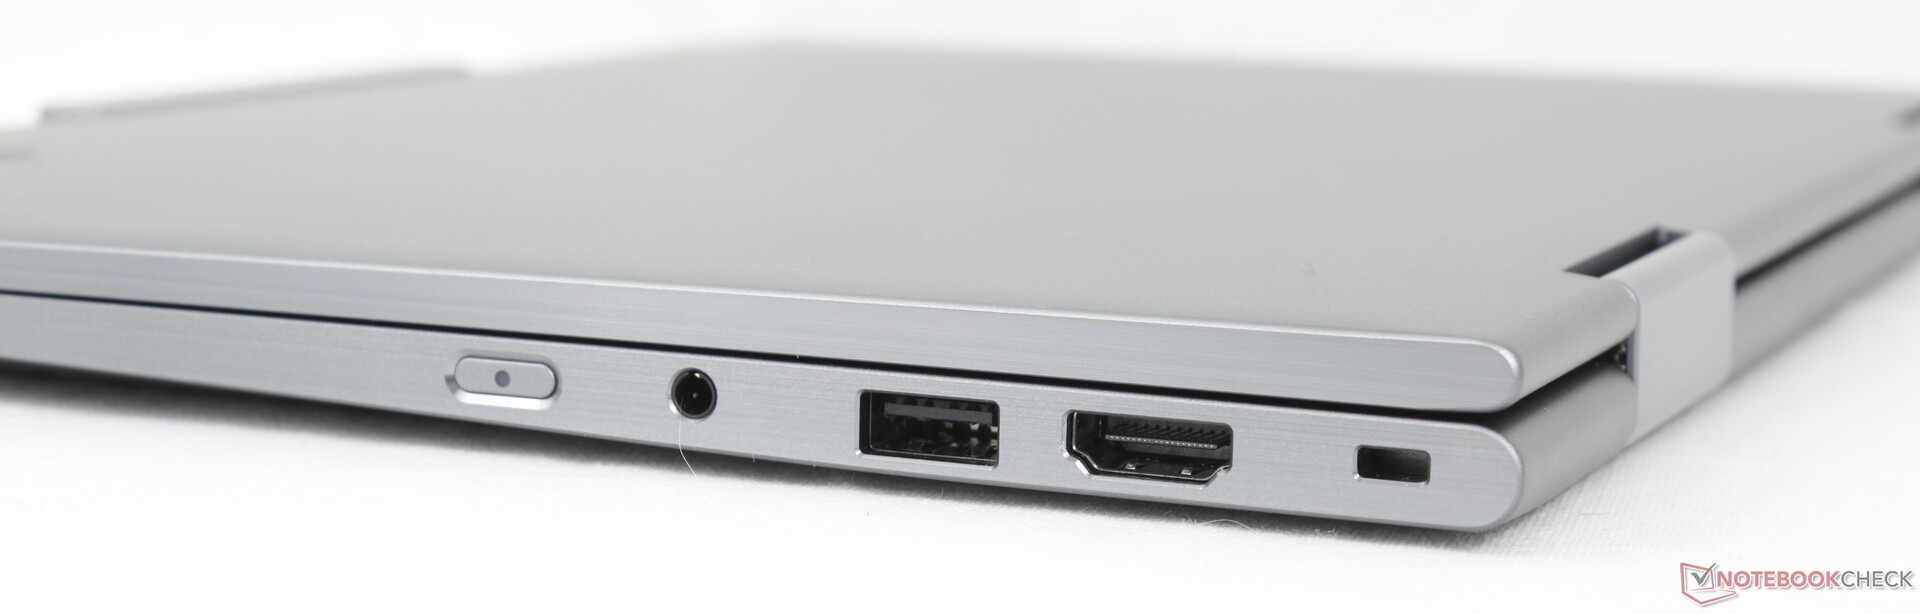
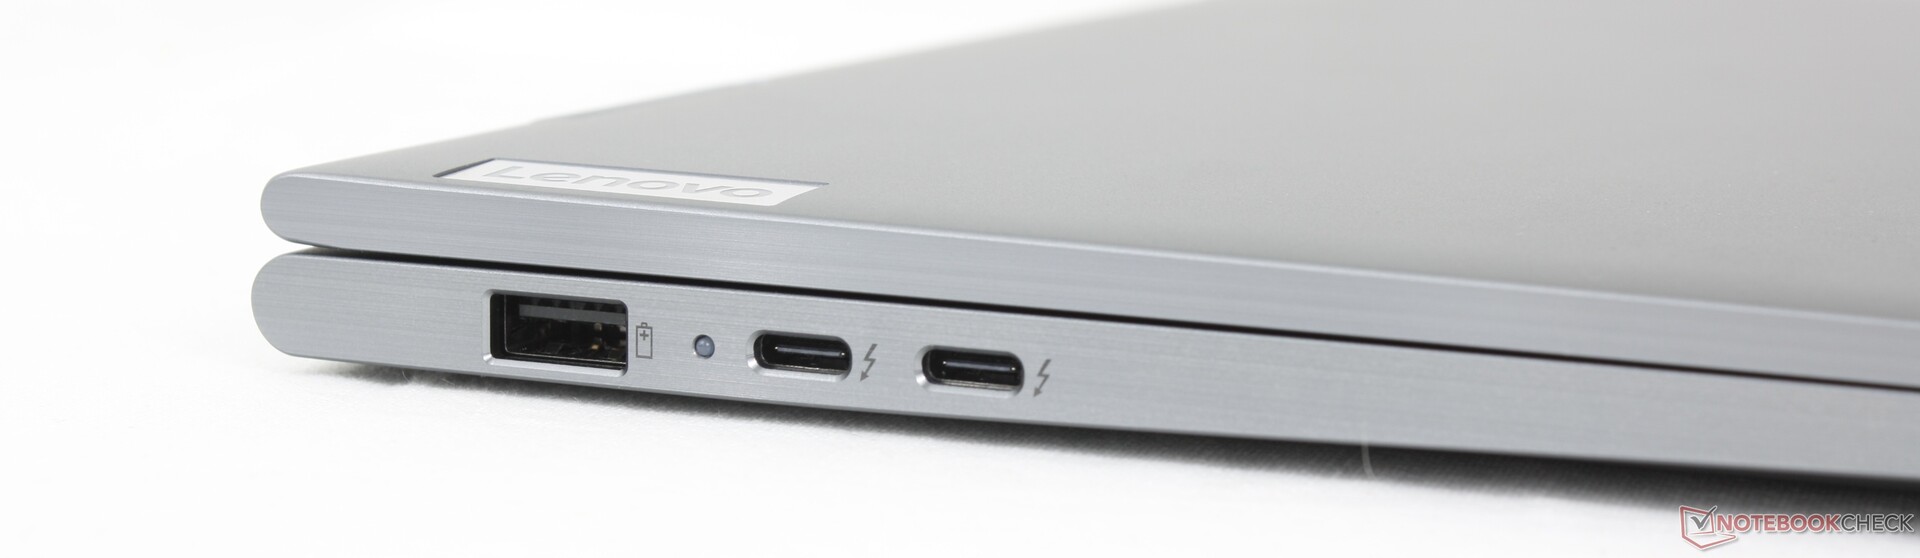
Opcje portów i ich rozmieszczenie nie uległy zmianie w stosunku do zeszłorocznego modelu. Niemniej jednak lepiej byłoby przenieść jeden z dwóch portów USB-C na prawą krawędź urządzenia, aby zwiększyć wszechstronność, jeśli chodzi o ładowanie i podłączanie urządzeń. Ostatni Yoga 7 16 2-w-1wprowadzono dokładnie taką zmianę.

Komunikacja
Użytkownicy mogą wybrać pomiędzy Intel AX211 Wi-Fi 6E z Bluetooth 5.3 lub BE201 Wi-Fi 7 z Bluetooth 5.4. WAN jest również opcjonalny z eSIM do 5G sub 6 GHz, aby pomóc odróżnić model od zorientowanej na konsumenta serii Yoga.
Kamera internetowa
Kamera internetowa o rozdzielczości 2 MP jest standardem z opcją rozszerzenia do 8 MP. Podczerwień i fizyczna migawka są standardem.


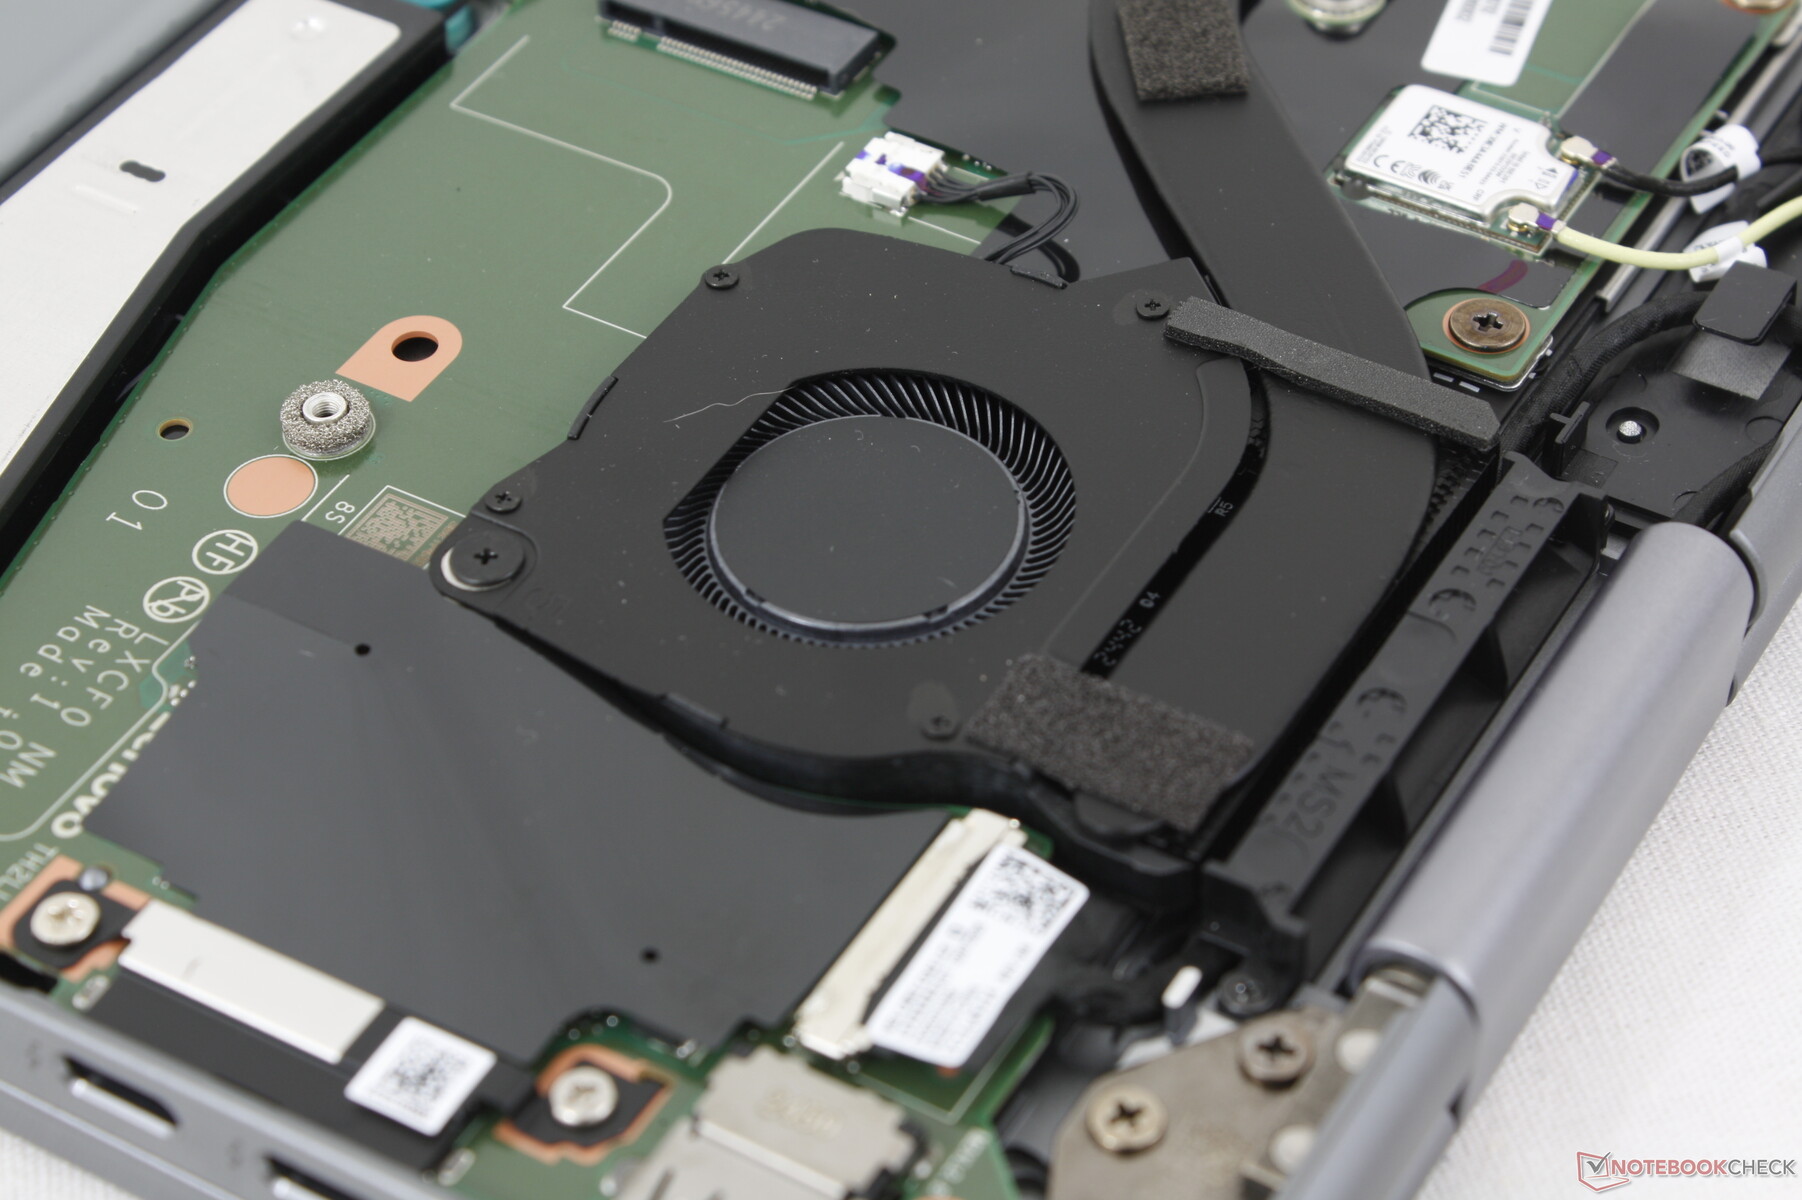
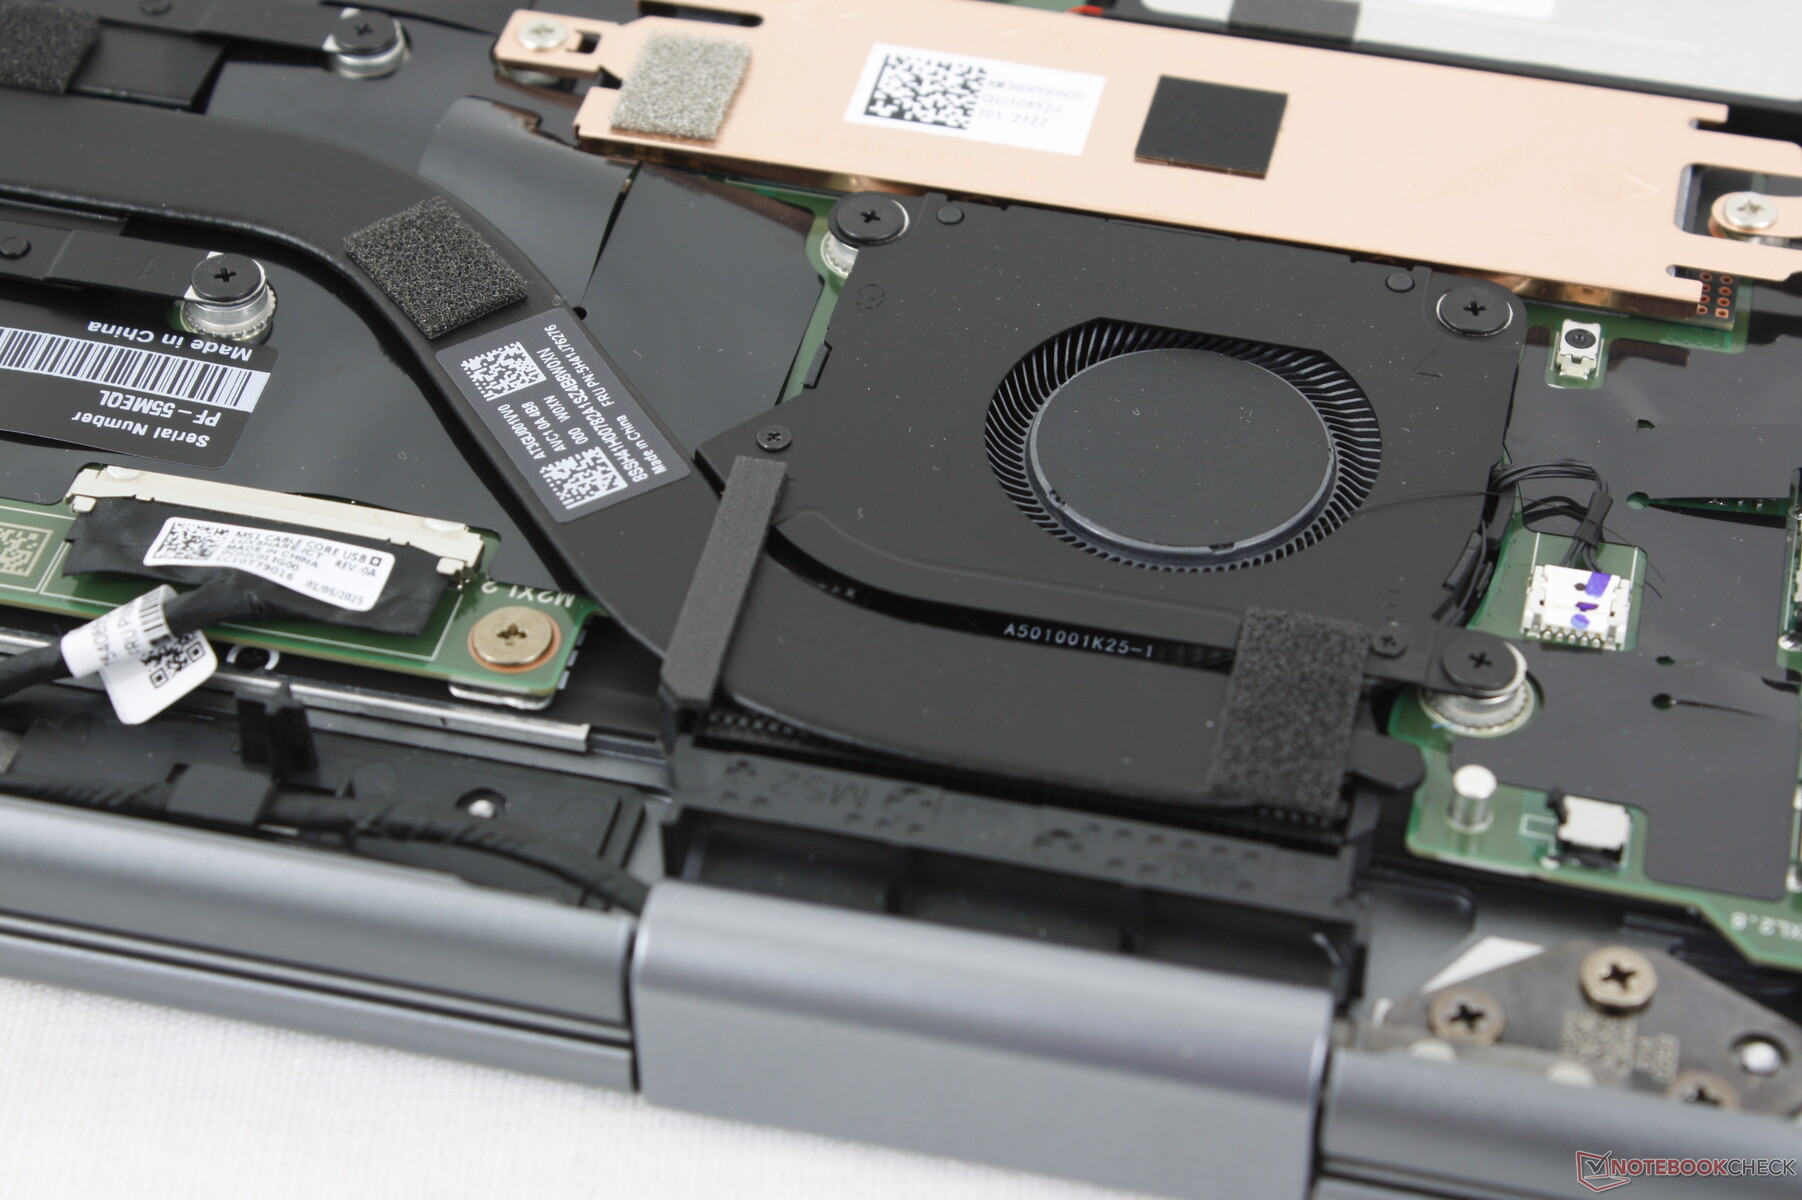
Konserwacja
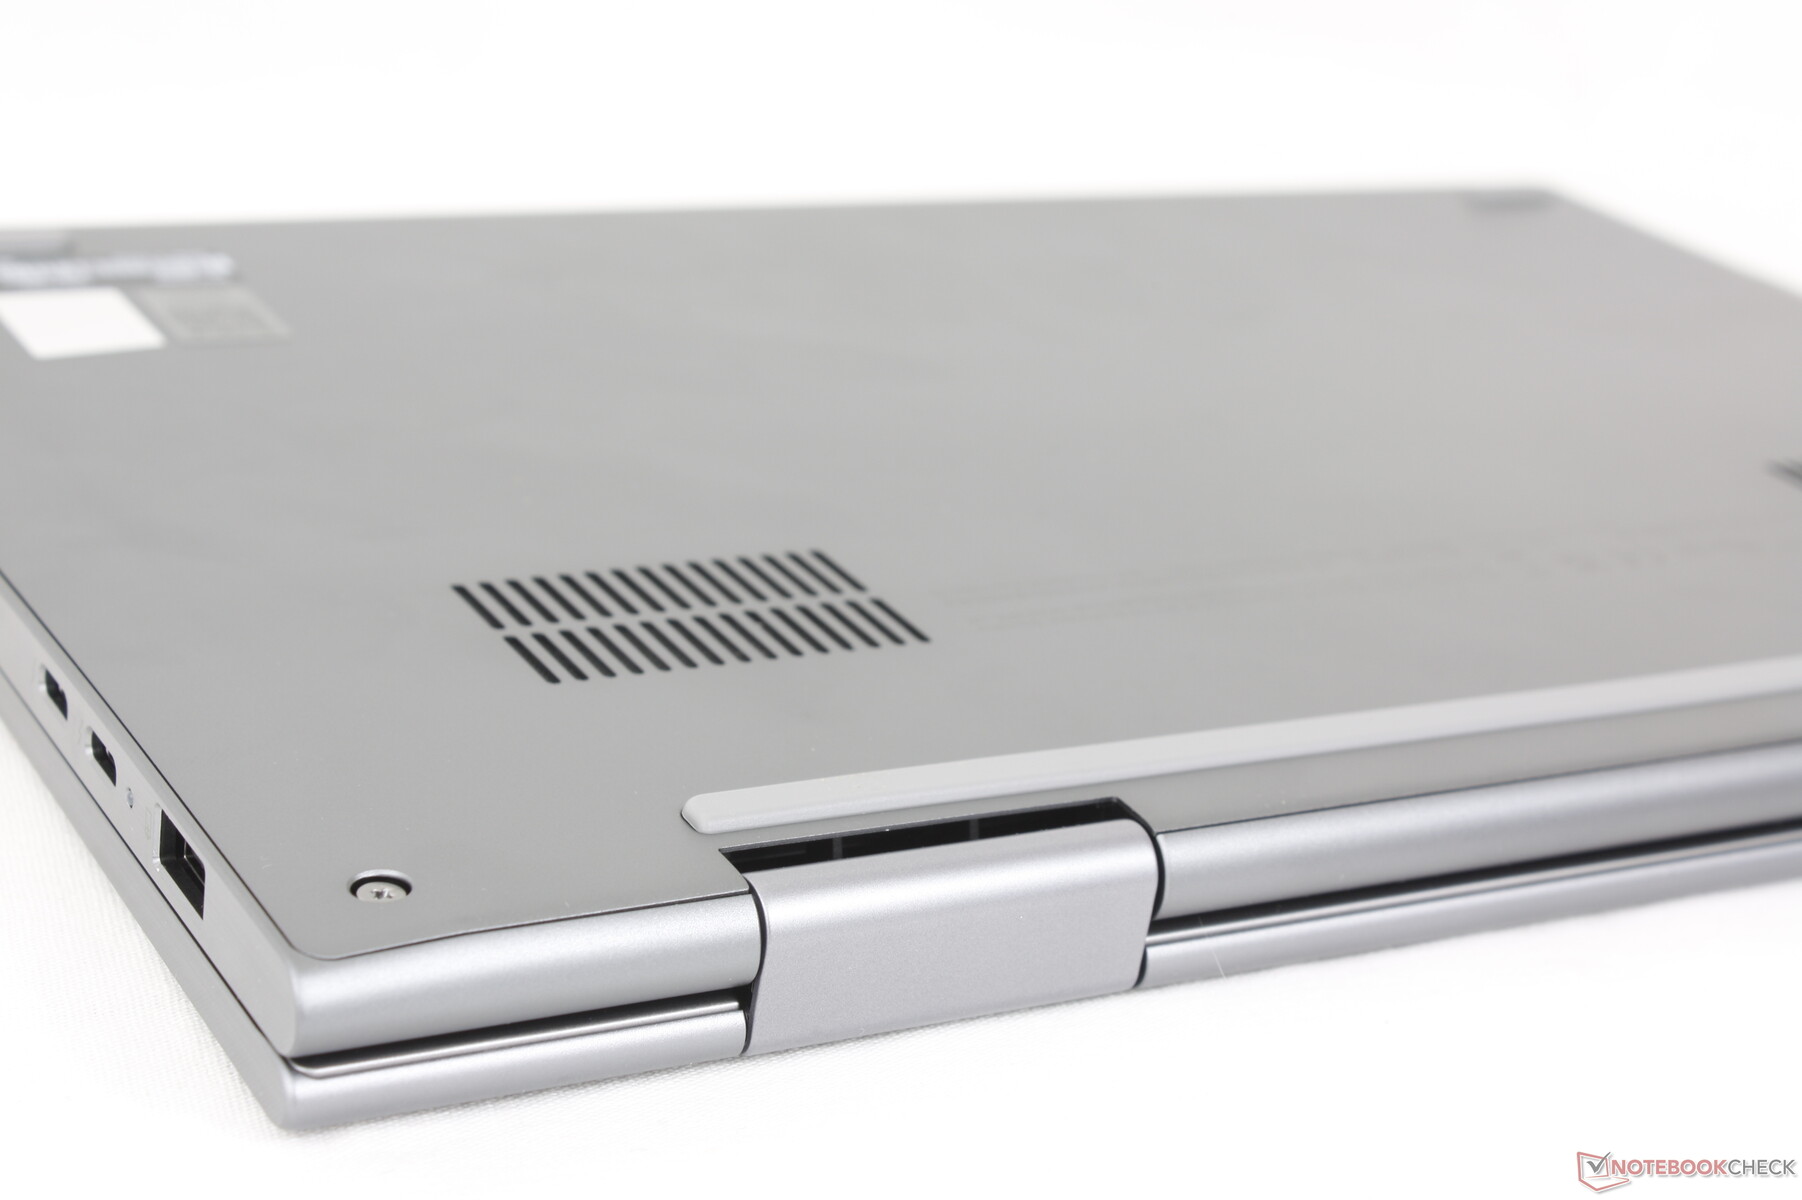
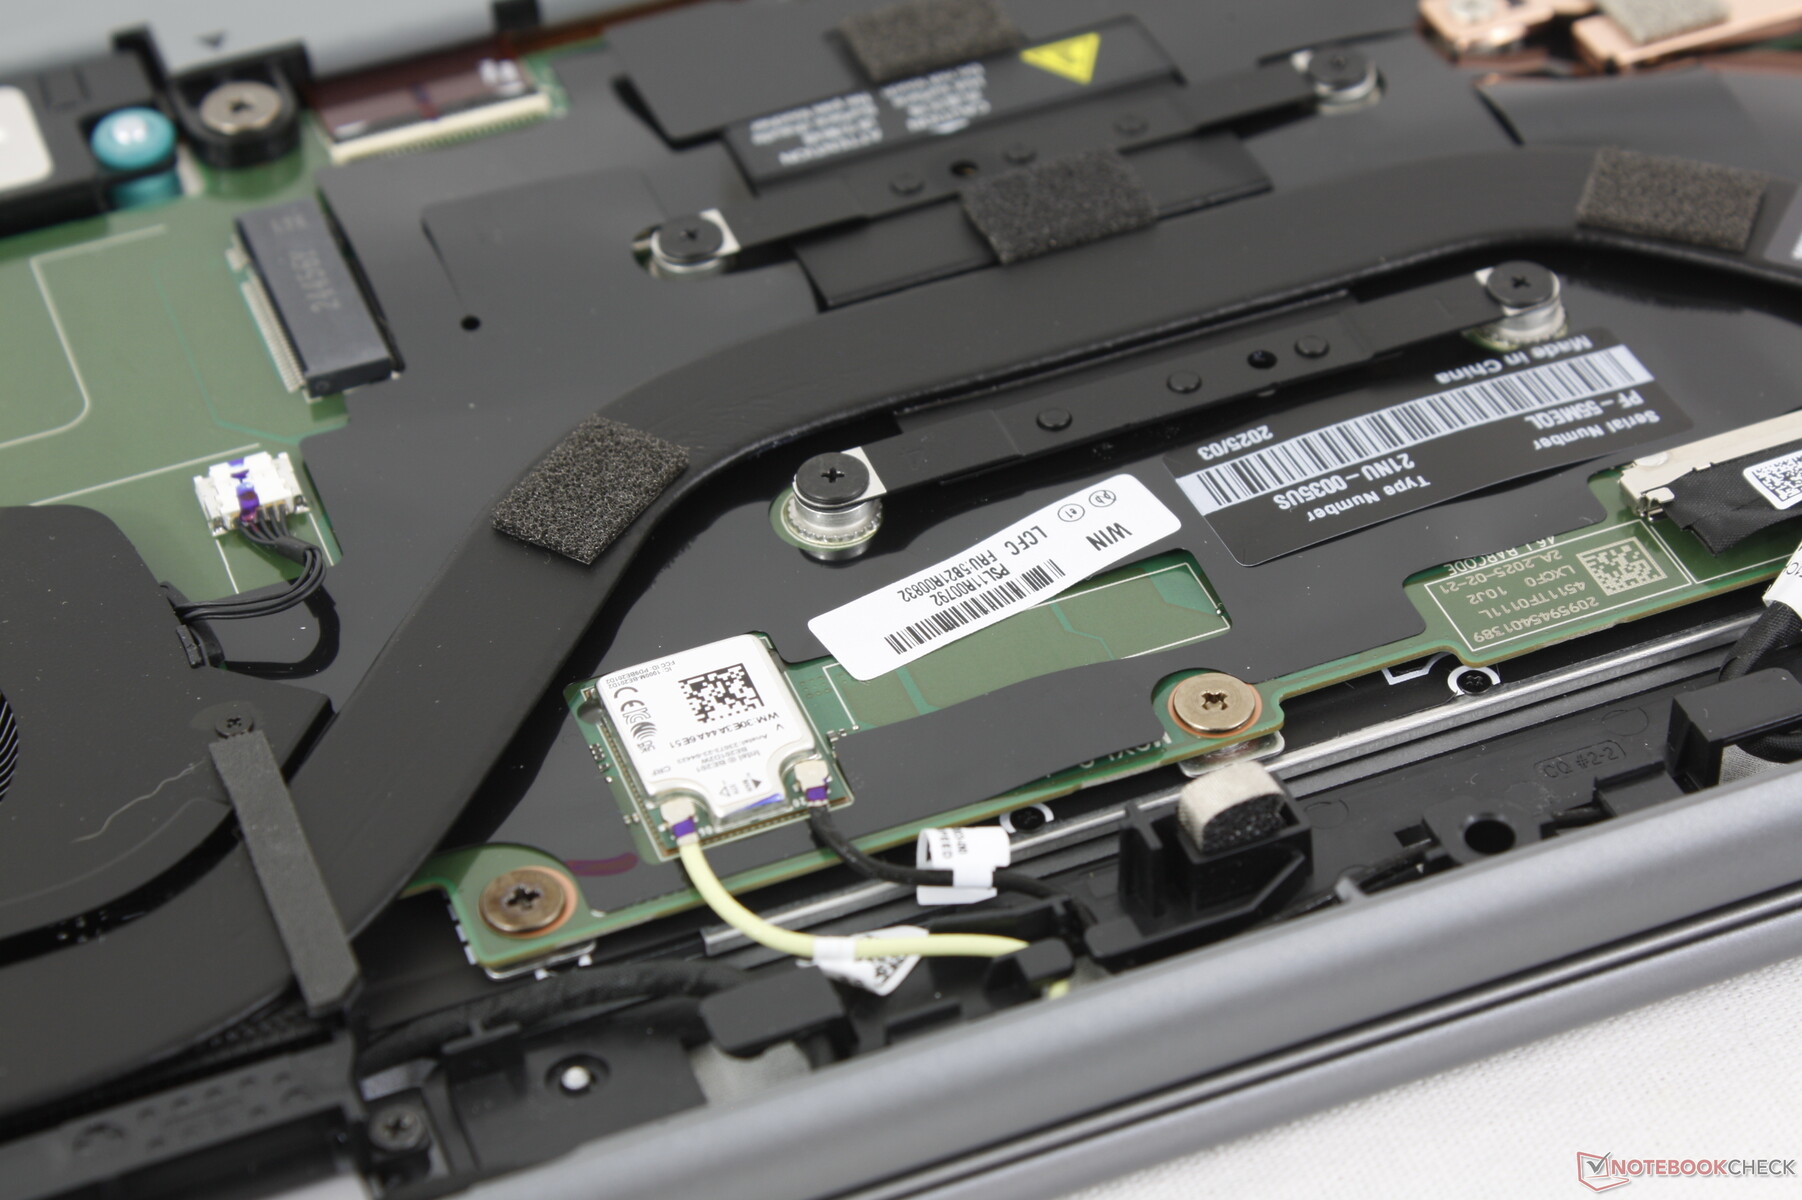
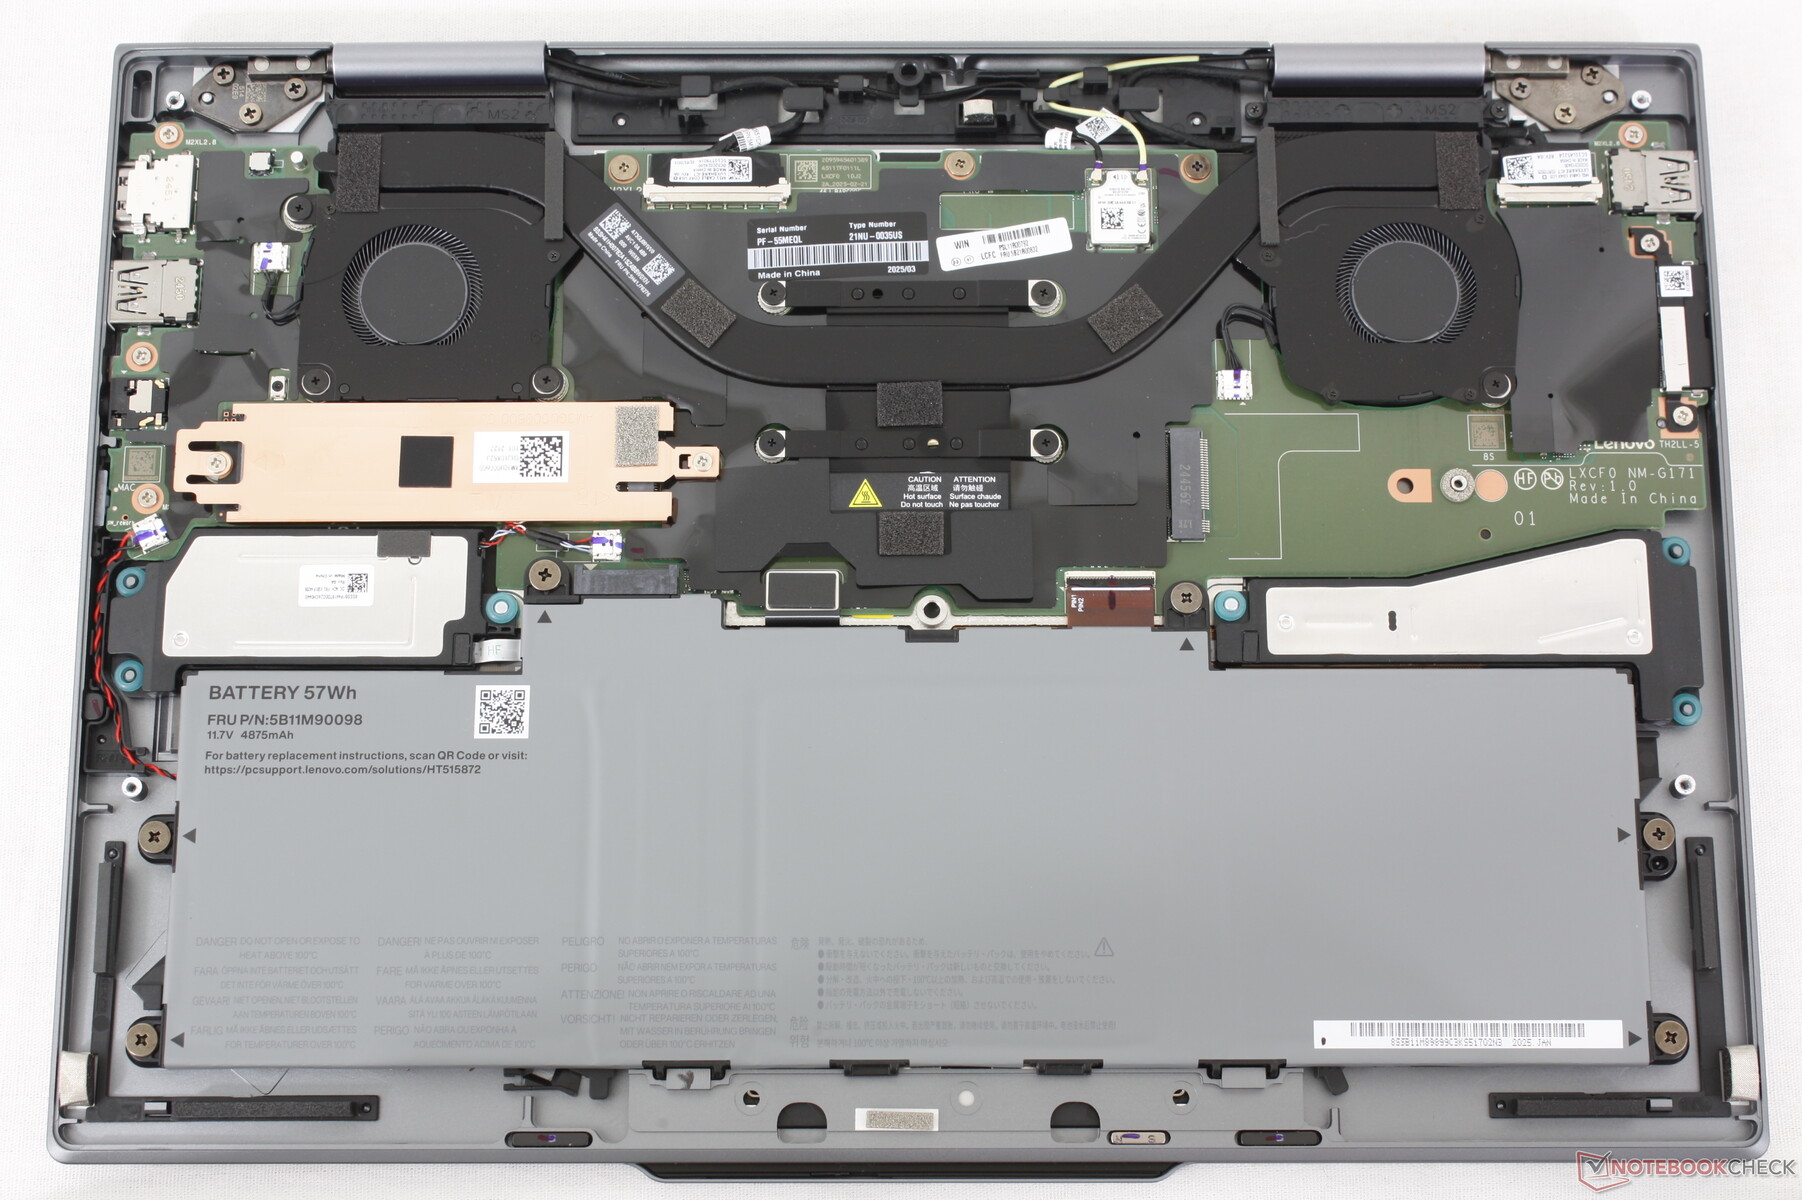
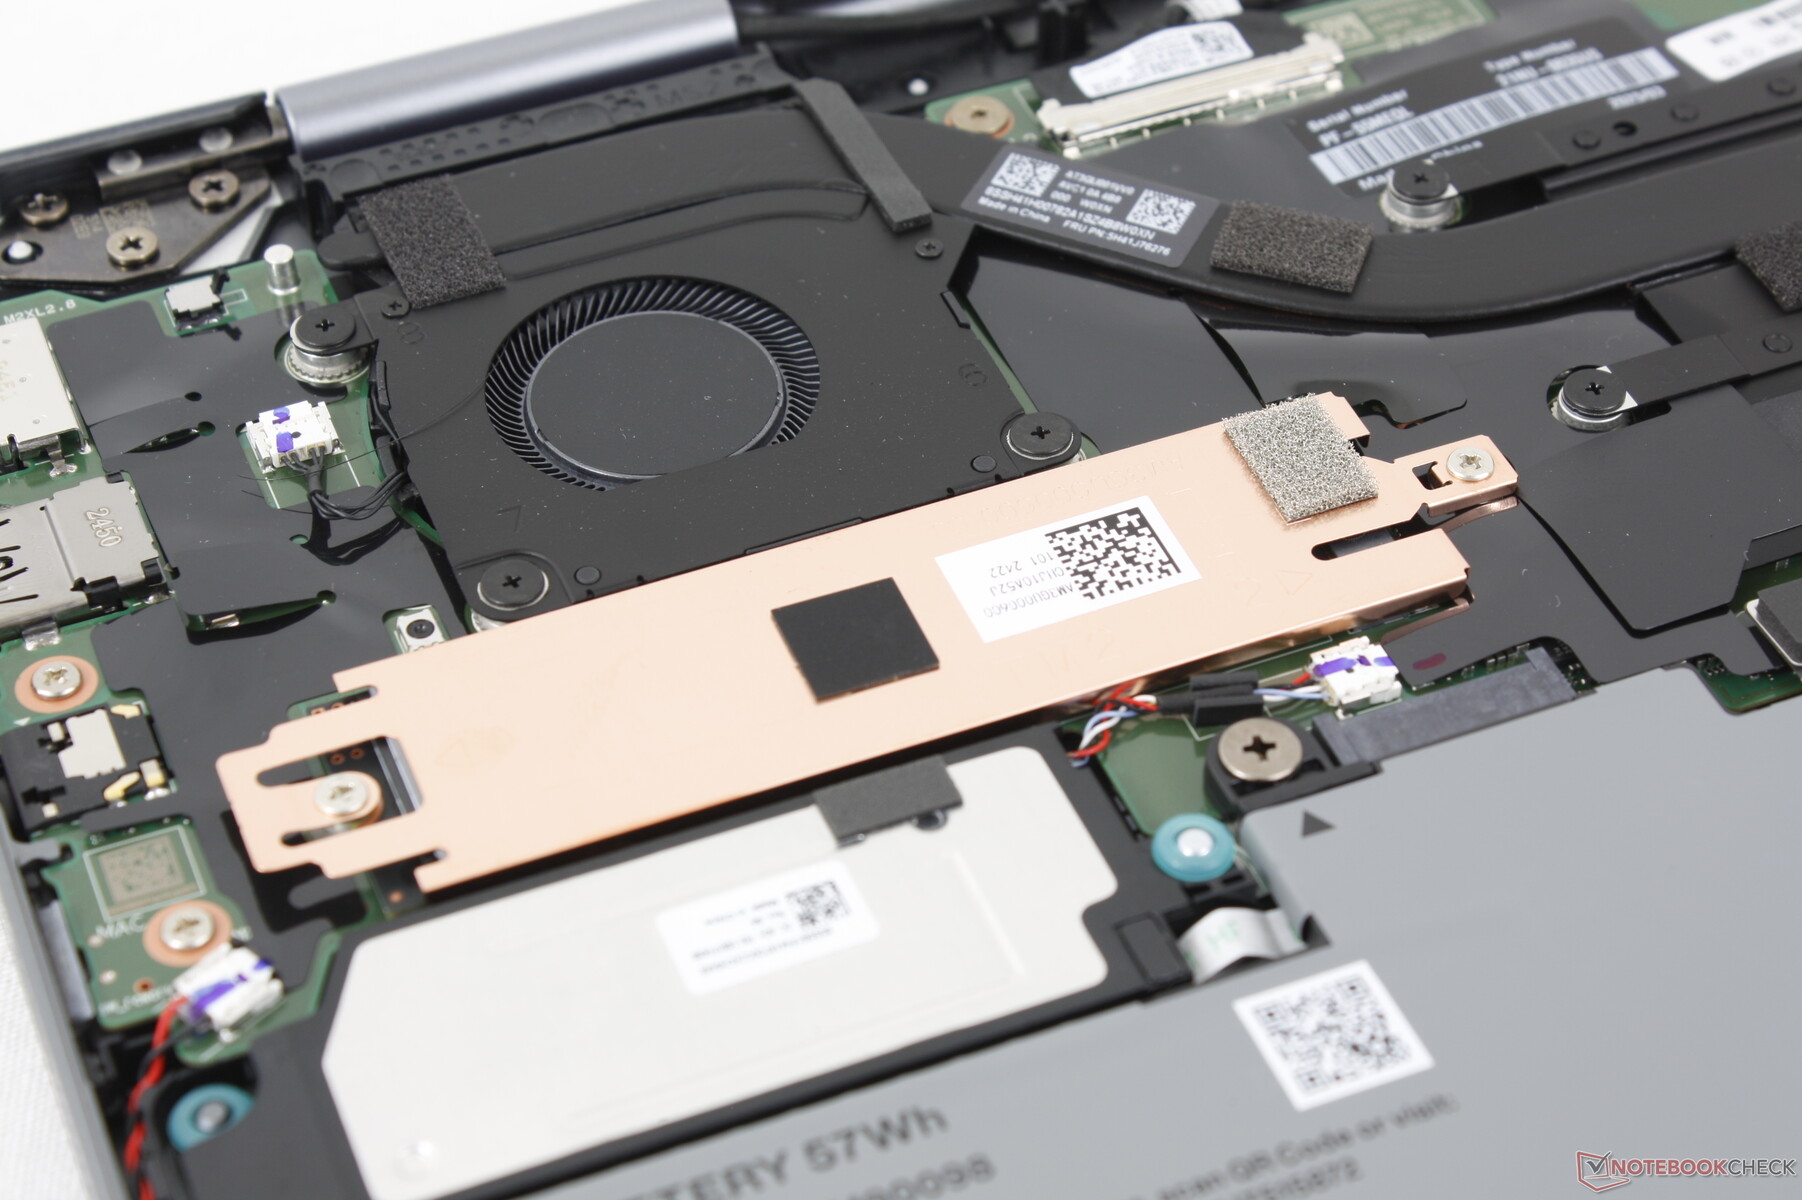
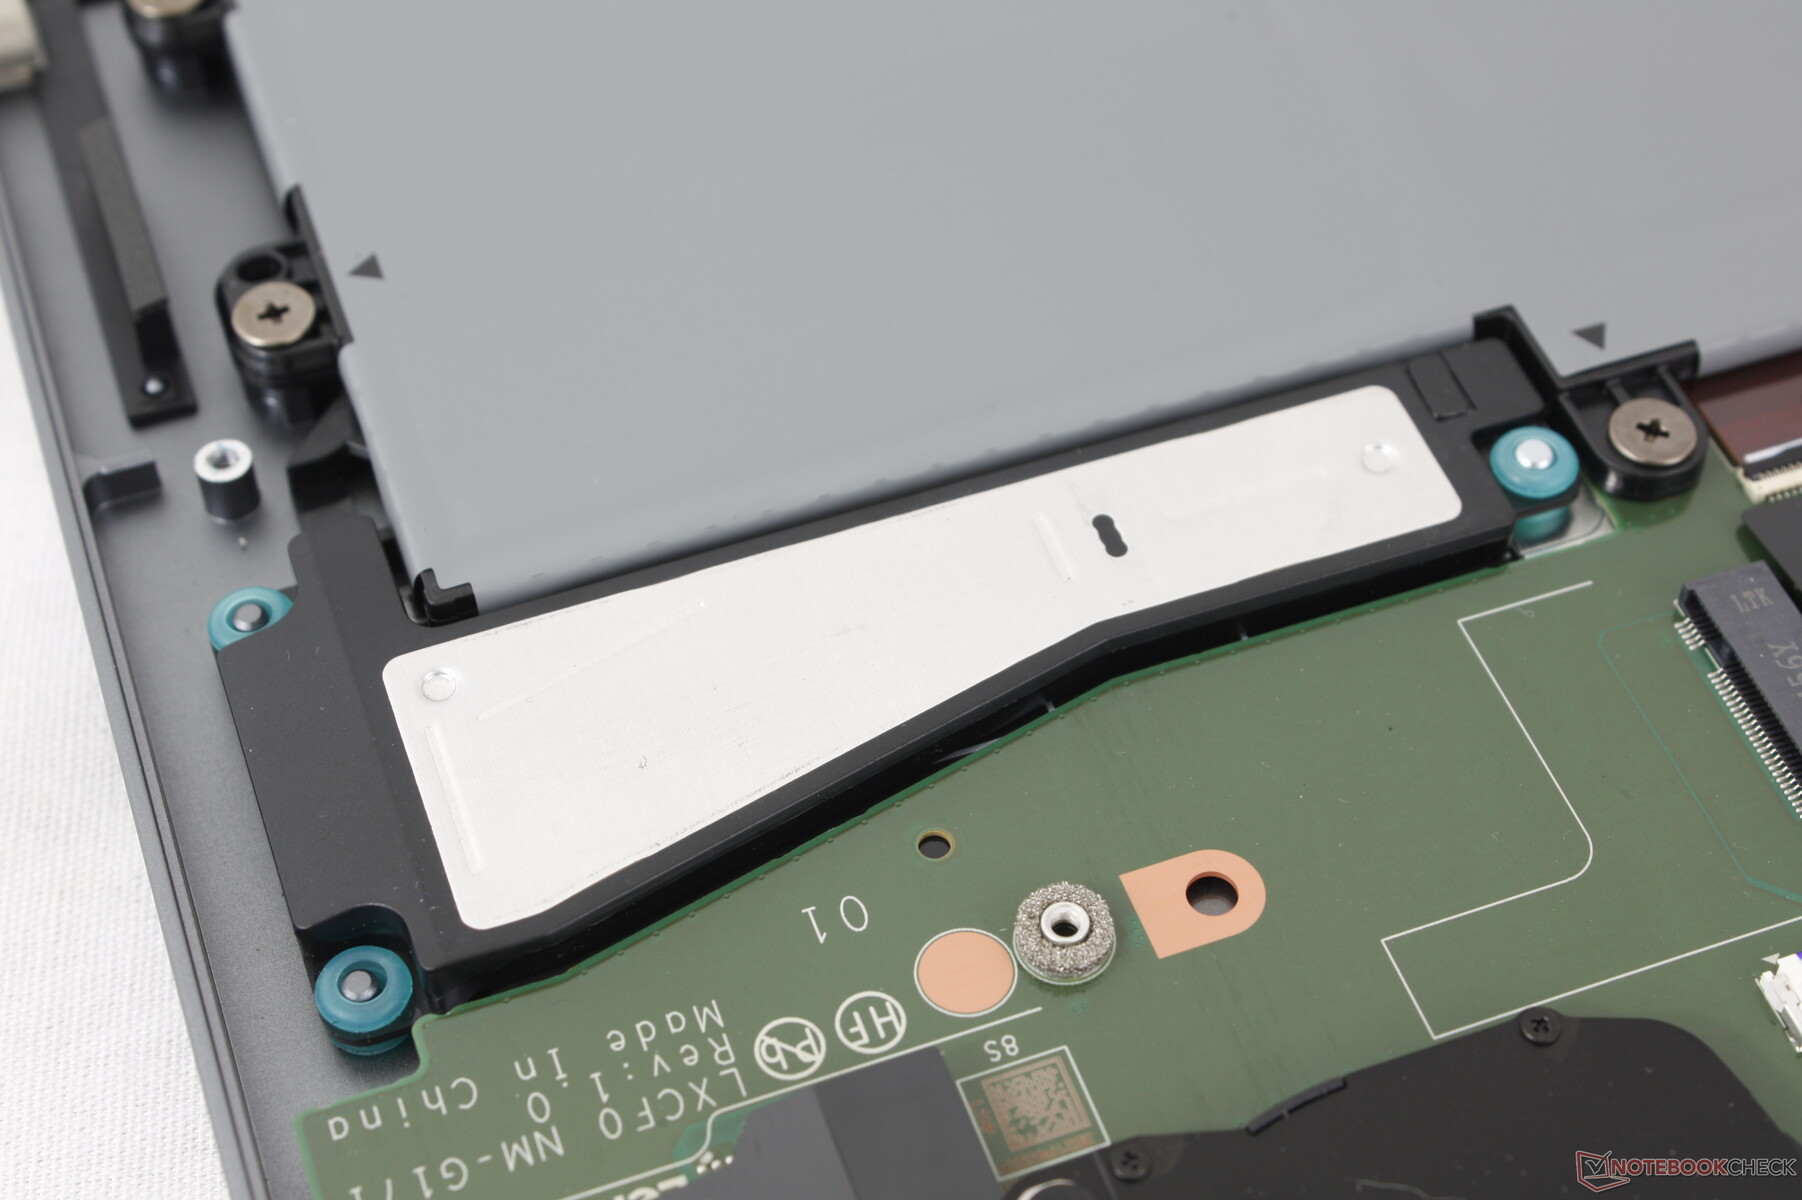
Dolny panel jest zabezpieczony tylko czterema śrubami krzyżakowymi, co ułatwia serwisowanie. Chociaż istnieją minimalne różnice między modelami ThinkPad X1 2-w-1 2024 i 2025, w naszej jednostce testowej bez WAN brakuje anteny niezbędnej do łączności WAN, jak pokazano na poniższym zdjęciu. Dodatkowe dyski SSD można potencjalnie zainstalować w tym miejscu zamiast karty WAN.
Zrównoważony rozwój
Model ten został wyprodukowany z większej ilości materiałów pochodzących z recyklingu niż większość innych laptopów, w tym od 55 do 75 procent aluminium pochodzącego z recyklingu dla górnej pokrywy, ramy klawiatury i dolnej pokrywy oraz od 25 do 90 procent plastiku pochodzącego z recyklingu dla zasilacza sieciowego, obudowy głośnika, klawiszy, kabli i innych.
Opakowanie jest całkowicie wolne od plastiku.
Akcesoria i gwarancja
Pudełko detaliczne zawiera aktywny rysik Yoga Pen oprócz zwykłej dokumentacji i zasilacza sieciowego. Chociaż pióro nie jest niewygodne do trzymania, jego zintegrowane przyciski są trudne do naciśnięcia.
Podstawowa gwarancja wynosi tylko 12 miesięcy w przypadku zakupu w Stanach Zjednoczonych, zamiast zwykłych 36 miesięcy, których oczekujemy od większości innych wysokiej klasy systemów biznesowych.
Urządzenia wejściowe
Klawiatura i panel dotykowy
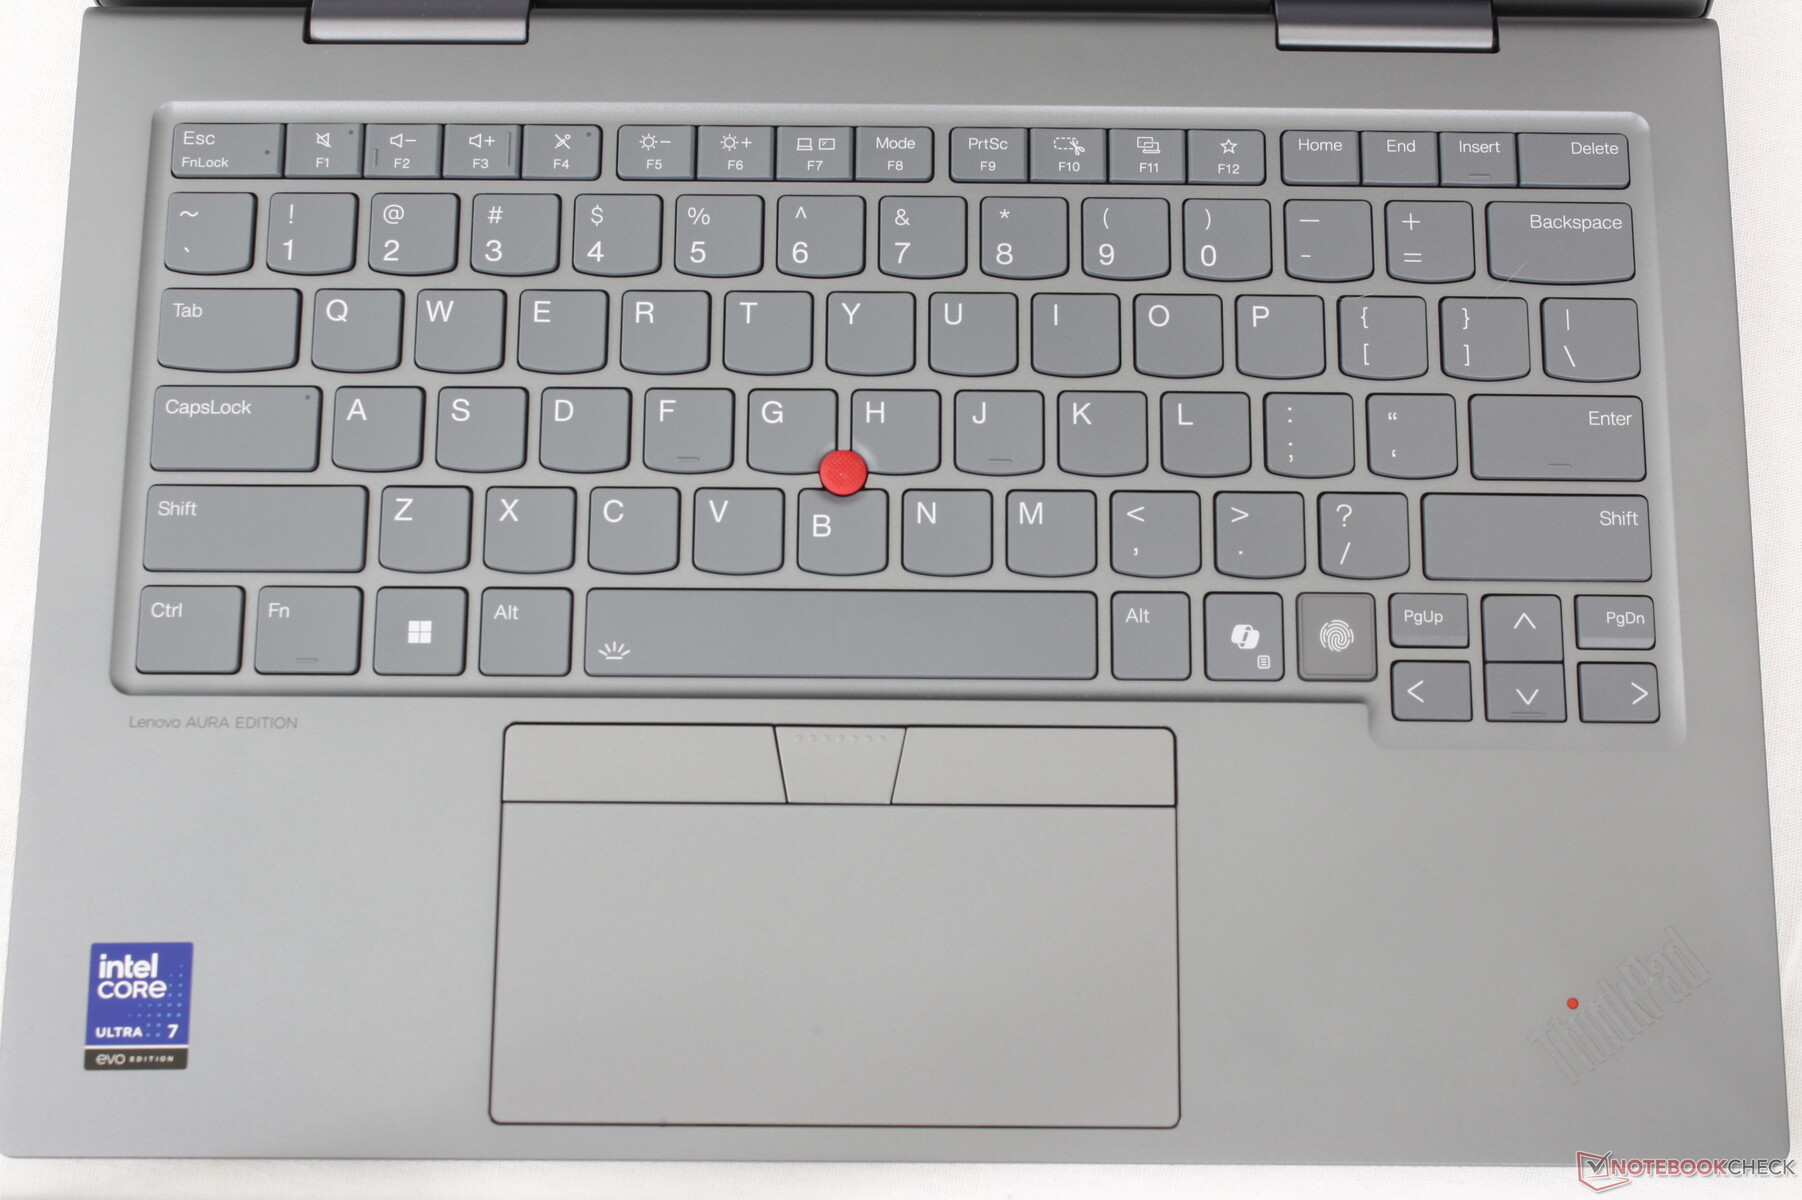
Model 2025 oferuje dwie różne opcje touchpada, podobnie jak w modelu 2024: touchpad tylko haptyczny lub touchpad z trzema przyciskami. Podczas gdy nasza jednostka testowa 2024 była wyposażona w ten pierwszy, nasza jednostka 2025 jest wyposażona w ten drugi. W rezultacie powierzchnia do sterowania kursorem jest nieco mniejsza (12 x 5,6 cm vs. 12 x 7,5 cm), ale dedykowane przyciski mogą być lepsze do dokładniejszego wprowadzania danych wielodotykowych. Lenovo oferuje obie opcje, aby przemówić do użytkowników, którzy mogą preferować jeden styl touchpada nad drugim. Poza tym nie wprowadzono żadnych zmian w klawiaturze lub panelu dotykowym.


Wyświetlacz
Dostępne są cztery opcje ekranu dotykowego. Nasza jednostka testowa została wyposażona w pogrubiony panel poniżej.
- 1920 x 1200, IPS, 100% sRGB, 60 Hz, kontrast 1000:1, matowy
- 1920 x 1200, IPS, 100% sRGB, 60 Hz, kontrast 1000:1, błyszczący
- 1920 x 1200, IPS, 100% sRGB, 60 Hz, kontrast 1500:1, matowy
- 2880 x 1800, OLED, 100% DCI-P3, 120 Hz, DisplayHDR 500, błyszczący
Na szczęście nie ma tutaj tanich opcji 60% sRGB, co oznacza, że każda konfiguracja ThinkPad X1 2-w-1 Gen 10 może zaoferować co najmniej pełne kolory sRGB. P3 i wyższe częstotliwości odświeżania są jednak ograniczone do opcji OLED. Opcja OLED w tym roku to prawdopodobnie ten sam panel, który widzieliśmy w modelu 2024.
Czasy reakcji czerni i bieli są wolniejsze, co powoduje zauważalny ghosting, szczególnie w grach. Oczywiście nie powinno to stanowić dużego problemu dla docelowych odbiorców ThinkPadów.


| |||||||||||||||||||||||||
rozświetlenie: 89 %
na akumulatorze: 459 cd/m²
kontrast: 1913:1 (czerń: 0.24 cd/m²)
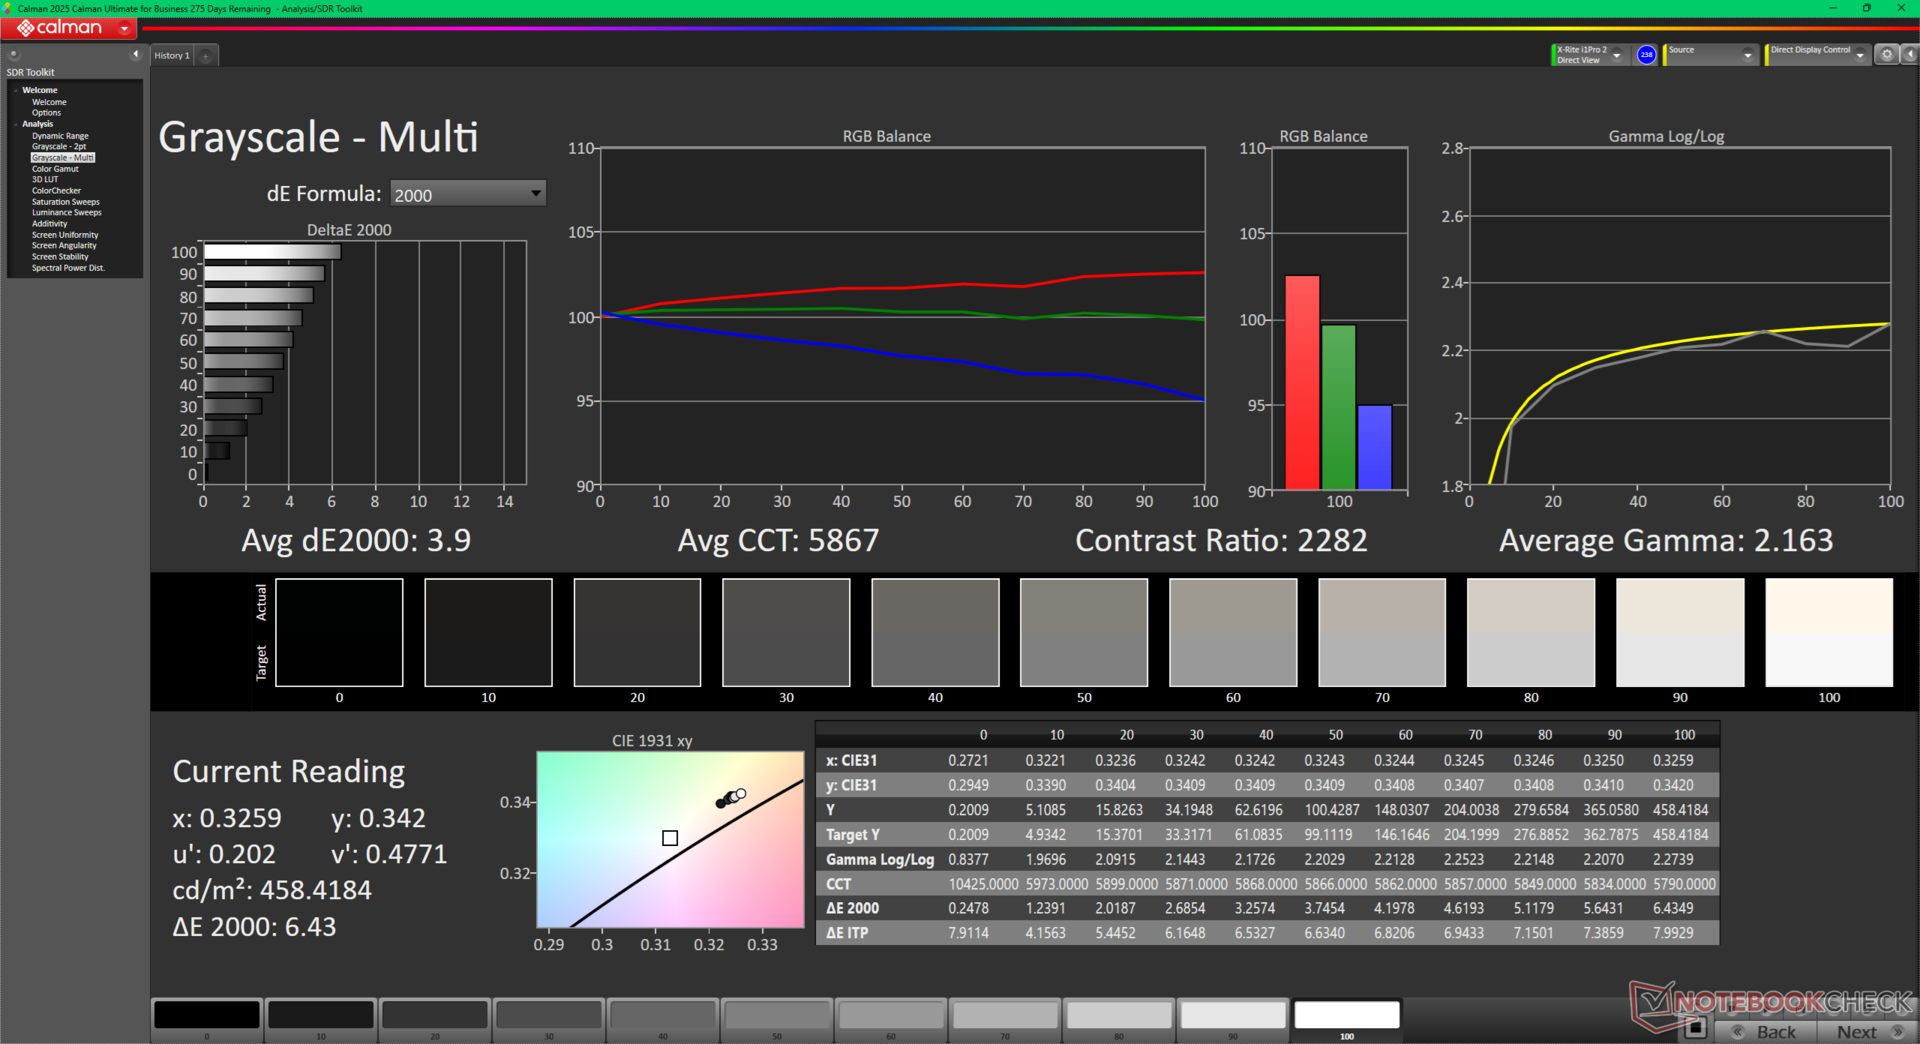
ΔE ColorChecker Calman: 3.14 | ∀{0.5-29.43 Ø4.72}
calibrated: 0.58
ΔE Greyscale Calman: 3.9 | ∀{0.09-98 Ø4.97}
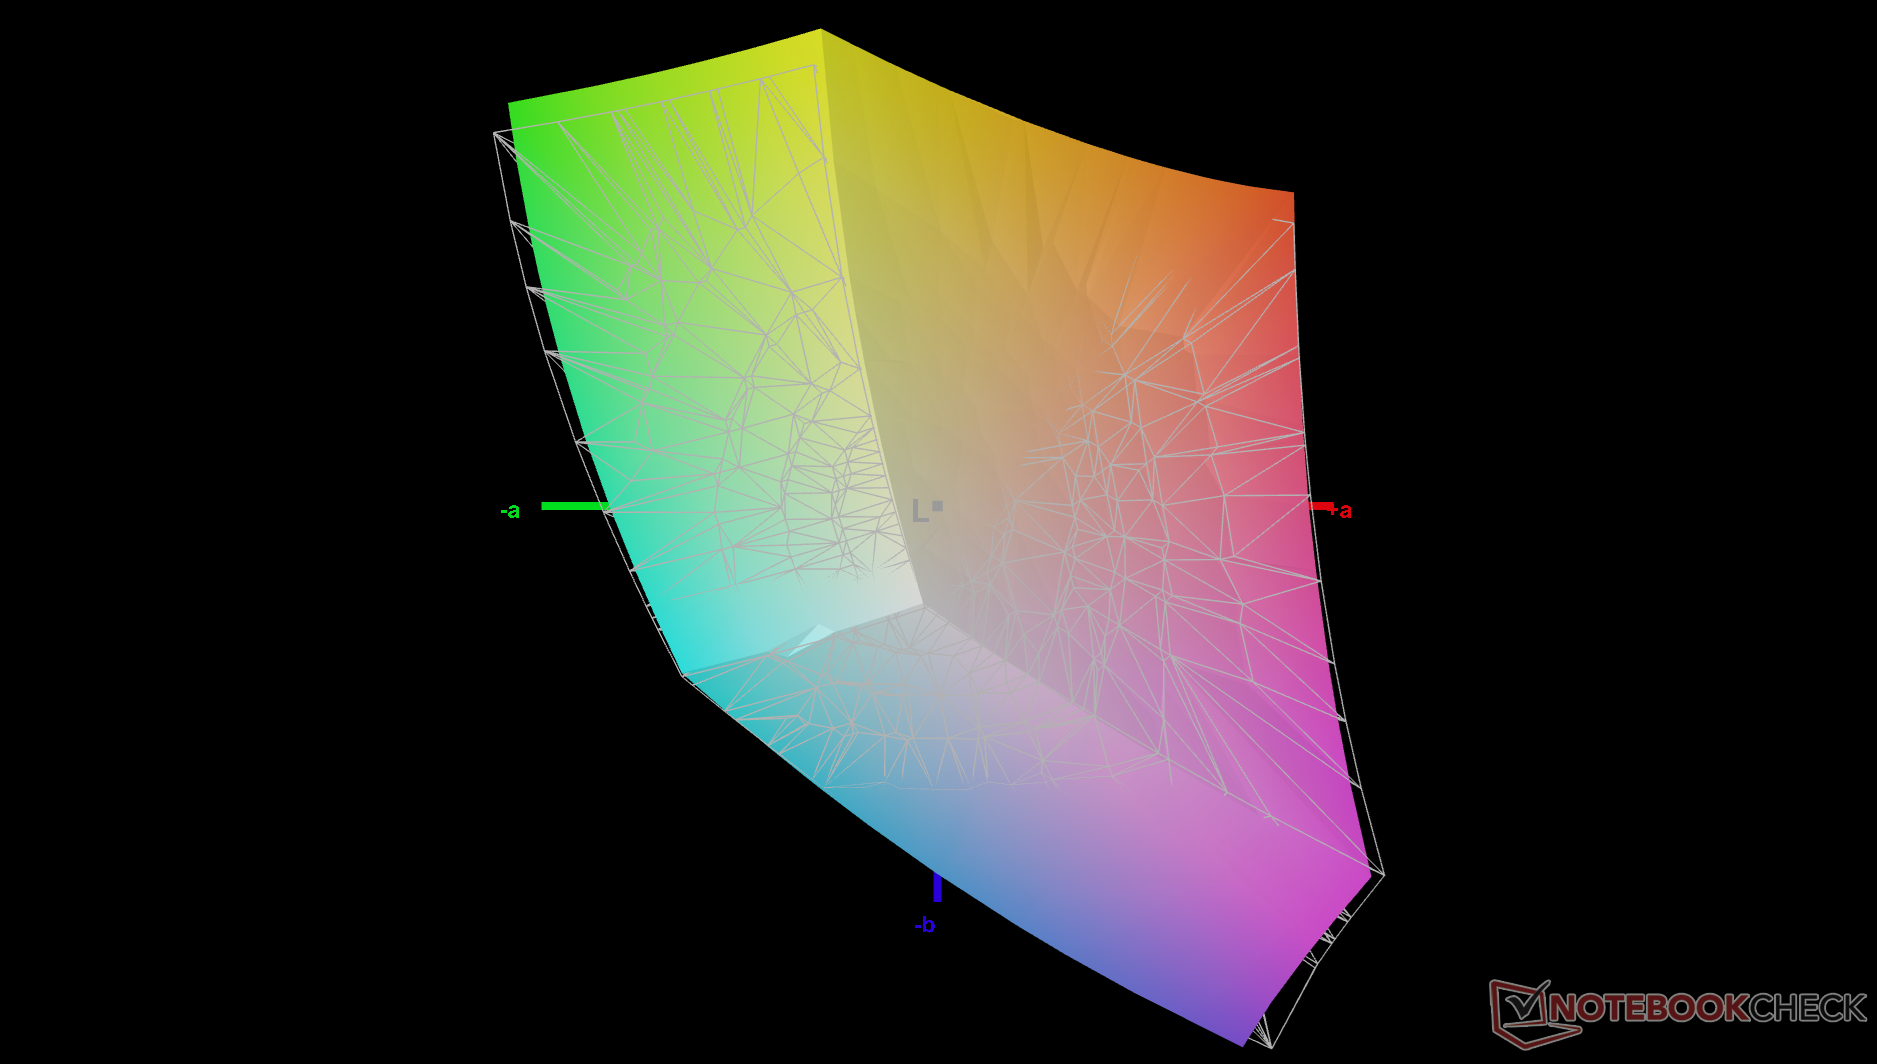
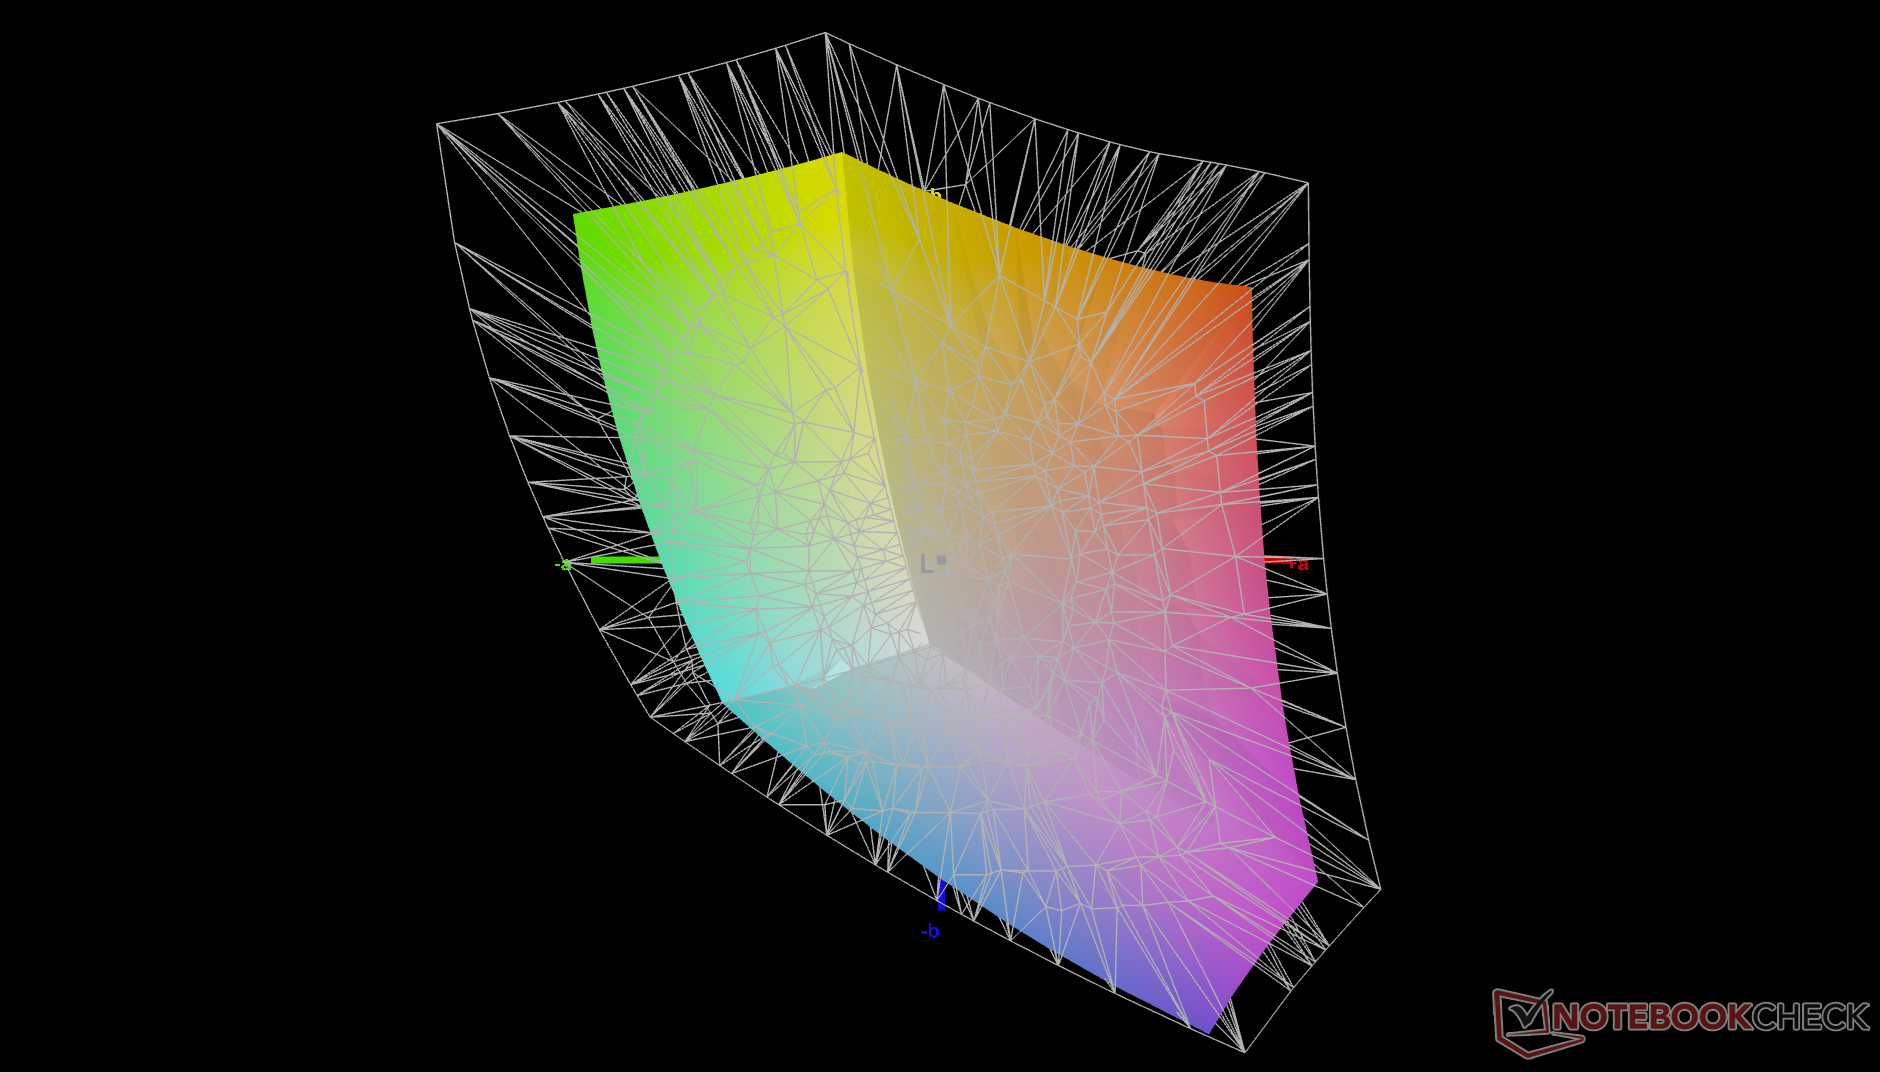
69.8% AdobeRGB 1998 (Argyll 3D)
97.2% sRGB (Argyll 3D)
67.8% Display P3 (Argyll 3D)
Gamma: 2.16
CCT: 5867 K
| Lenovo ThinkPad X1 2-in-1 Gen 10 N140JLG-GT3, IPS, 1920x1200, 14", 60 Hz | Lenovo ThinkPad X1 2in1 G9 21KE004AGE ATNA4ßYK20-0, OLED, 2880x1800, 14", 120 Hz | Lenovo Yoga 7 2-in-1 14AKP10 Lenovo LEN140WUXGA, OLED, 1920x1200, 14", 60 Hz | Dell Latitude 9440 2-in-1 AU Optronics B140QAN, IPS, 2560x1600, 14", 60 Hz | HP EliteBook X Flip G1i 14 AI AUO8FB5, IPS, 1920x1200, 14", 60 Hz | Asus ZenBook Duo OLED UX8406CA ATNA40CT02-0, OLED, 1920x1200, 14", 60 Hz | |
|---|---|---|---|---|---|---|
| Display | 30% | 30% | 9% | 9% | 24% | |
| Display P3 Coverage (%) | 67.8 | 99.9 47% | 98.5 45% | 77.2 14% | 76.7 13% | 98.4 45% |
| sRGB Coverage (%) | 97.2 | 100 3% | 100 3% | 99.6 2% | 98.2 1% | 99.8 3% |
| AdobeRGB 1998 Coverage (%) | 69.8 | 97.6 40% | 99.9 43% | 77.4 11% | 78.2 12% | 86.7 24% |
| Response Times | 98% | 96% | -21% | -1% | 96% | |
| Response Time Grey 50% / Grey 80% * (ms) | 44.6 ? | 0.61 ? 99% | 1.5 ? 97% | 53.5 ? -20% | 49.2 ? -10% | 1.51 ? 97% |
| Response Time Black / White * (ms) | 27.1 ? | 0.69 ? 97% | 1.4 ? 95% | 33 ? -22% | 24.8 ? 8% | 1.36 ? 95% |
| PWM Frequency (Hz) | 240 ? | 240 ? | 480 ? | |||
| PWM Amplitude * (%) | 20 | 14 | ||||
| Screen | -12% | 2076% | -9% | -31% | 21% | |
| Brightness middle (cd/m²) | 459 | 412 -10% | 360 -22% | 532.4 16% | 572 25% | 359 -22% |
| Brightness (cd/m²) | 455 | 411 -10% | 357 -22% | 502 10% | 541 19% | 362 -20% |
| Brightness Distribution (%) | 89 | 98 10% | 97 9% | 91 2% | 78 -12% | 98 10% |
| Black Level * (cd/m²) | 0.24 | 0.001 100% | 0.48 -100% | 0.2 17% | ||
| Contrast (:1) | 1913 | 360000 18719% | 1109 -42% | 2860 50% | ||
| Colorchecker dE 2000 * | 3.14 | 1.9 39% | 2.12 32% | 2.33 26% | 4.19 -33% | 1.2 62% |
| Colorchecker dE 2000 max. * | 6.55 | 3.9 40% | 4.59 30% | 5.99 9% | 8.65 -32% | 3.2 51% |
| Colorchecker dE 2000 calibrated * | 0.58 | 1.9 -228% | 1.9 -228% | 0.92 -59% | 2.11 -264% | |
| Greyscale dE 2000 * | 3.9 | 1 74% | 1.4 64% | 1.6 59% | 5.65 -45% | 2.1 46% |
| Gamma | 2.16 102% | 2.21 100% | 2.187 101% | 2.17 101% | 2.45 90% | 2.24 98% |
| CCT | 5867 111% | 6361 102% | 6366 102% | 6314 103% | 5959 109% | 6433 101% |
| Całkowita średnia (program / ustawienia) | 39% /
17% | 734% /
1355% | -7% /
-7% | -8% /
-18% | 47% /
36% |
* ... im mniej tym lepiej
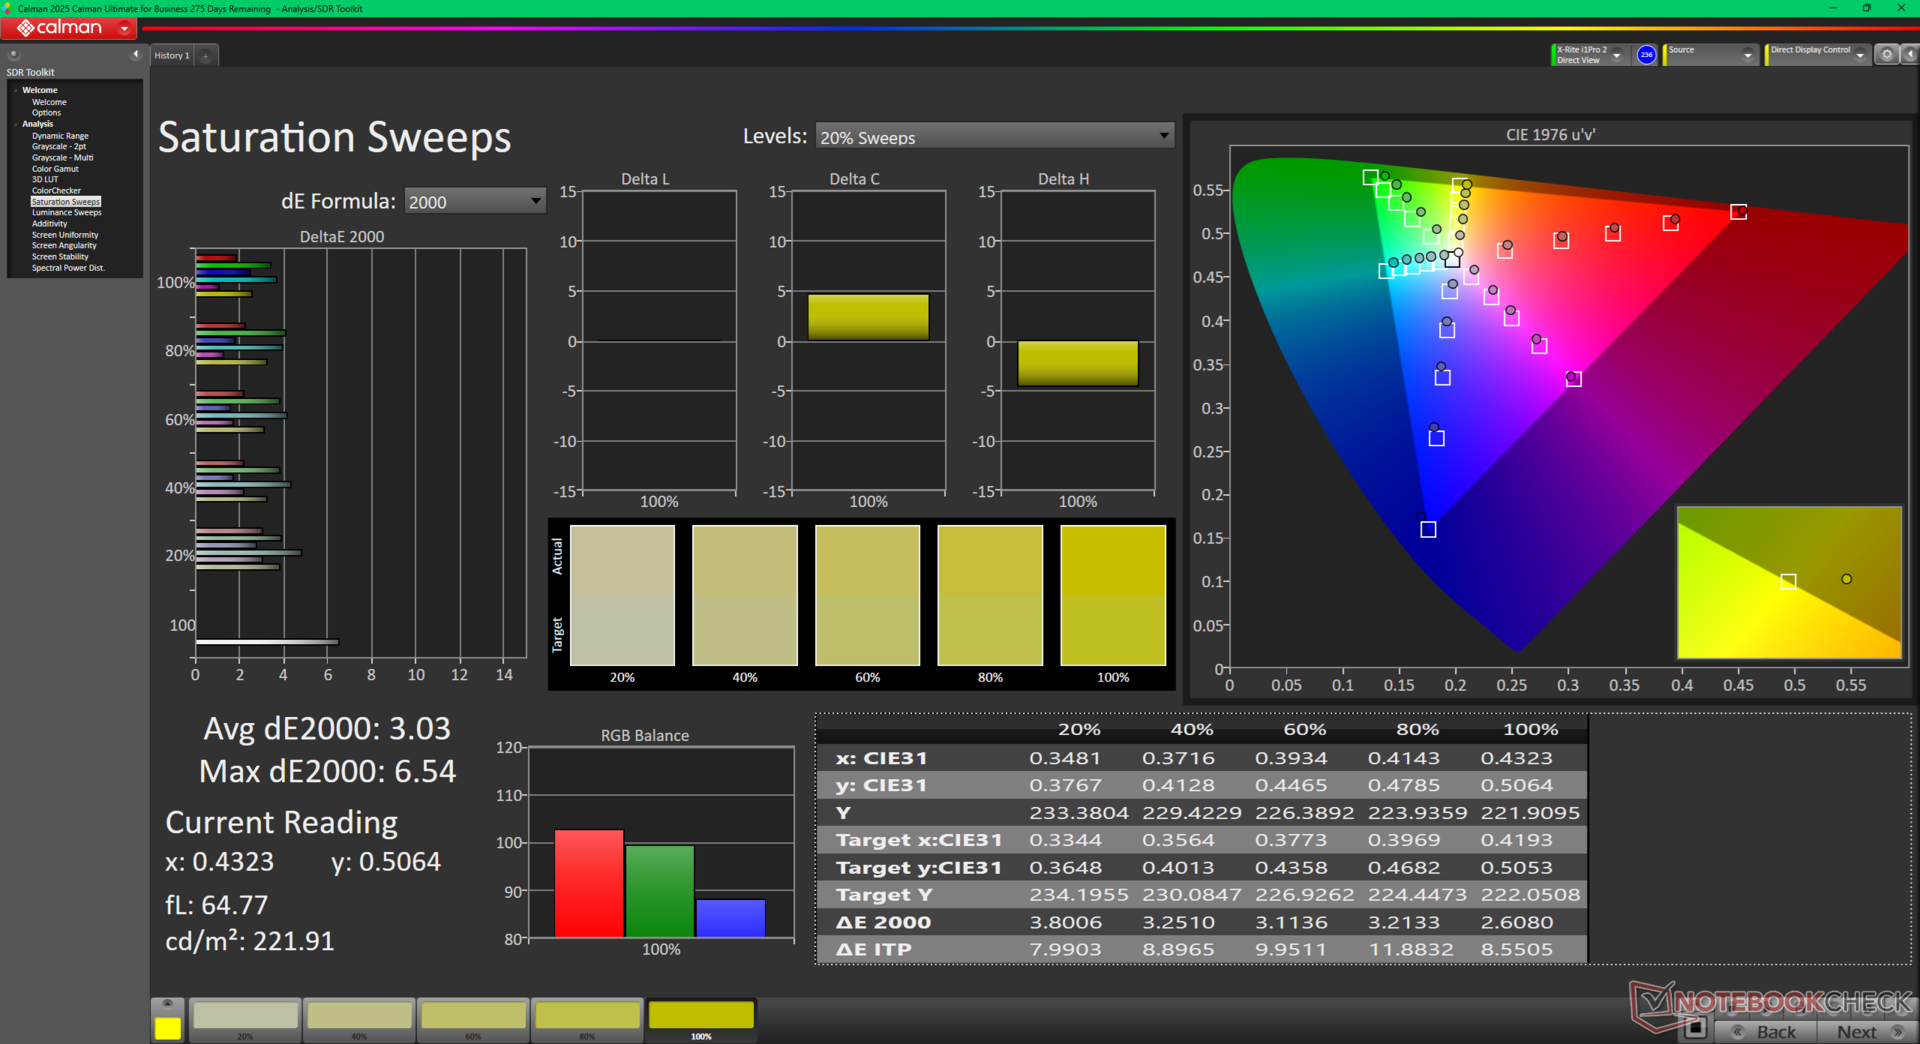
Pomimo tego, że wyświetlacz nie jest skalibrowany po wyjęciu z pudełka, średnie wartości deltaE dla skali szarości i kolorów są nadal dość niskie i wynoszą odpowiednio 3,9 i 3,14. Kalibracja przez użytkownika końcowego może jednak jeszcze bardziej poprawić średnie wartości do zaledwie <0,1, jak pokazują poniższe zrzuty ekranu. Nasz skalibrowany profil ICM jest dostępny do pobrania za darmo powyżej.


Wyświetl czasy reakcji
| ↔ Czas reakcji od czerni do bieli | ||
|---|---|---|
| 27.1 ms ... wzrost ↗ i spadek ↘ łącznie | ↗ 13.1 ms wzrost | 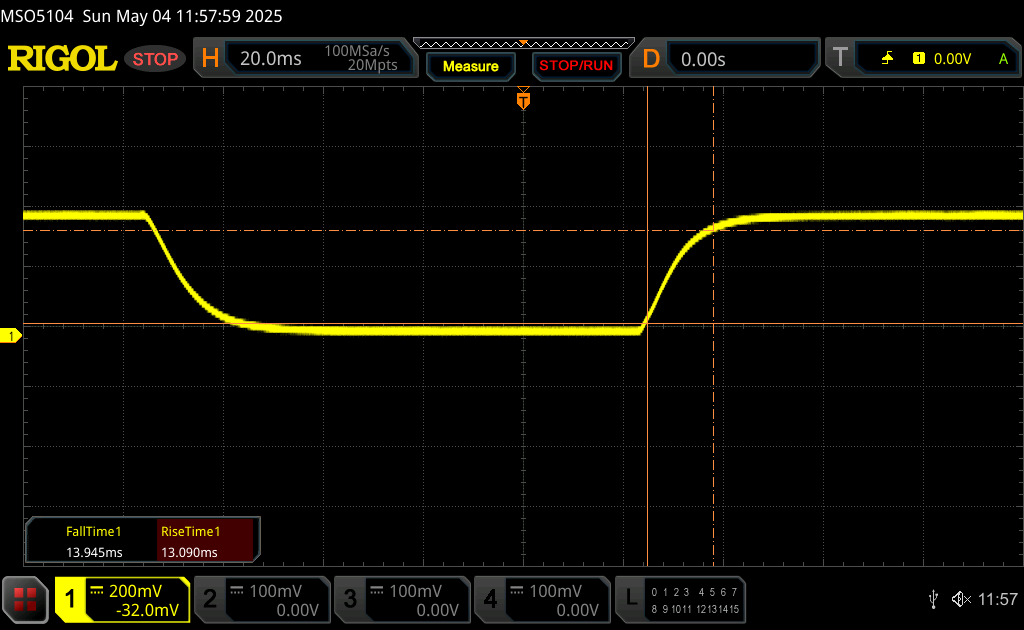 |
| ↘ 14 ms upadek | ||
| W naszych testach ekran wykazuje stosunkowo powolne tempo reakcji i może być zbyt wolny dla graczy. Dla porównania, wszystkie testowane urządzenia wahają się od 0.1 (minimum) do 240 (maksimum) ms. » 69 % wszystkich urządzeń jest lepszych. Oznacza to, że zmierzony czas reakcji jest gorszy od średniej wszystkich testowanych urządzeń (19.8 ms). | ||
| ↔ Czas reakcji 50% szarości do 80% szarości | ||
| 44.6 ms ... wzrost ↗ i spadek ↘ łącznie | ↗ 19.2 ms wzrost | 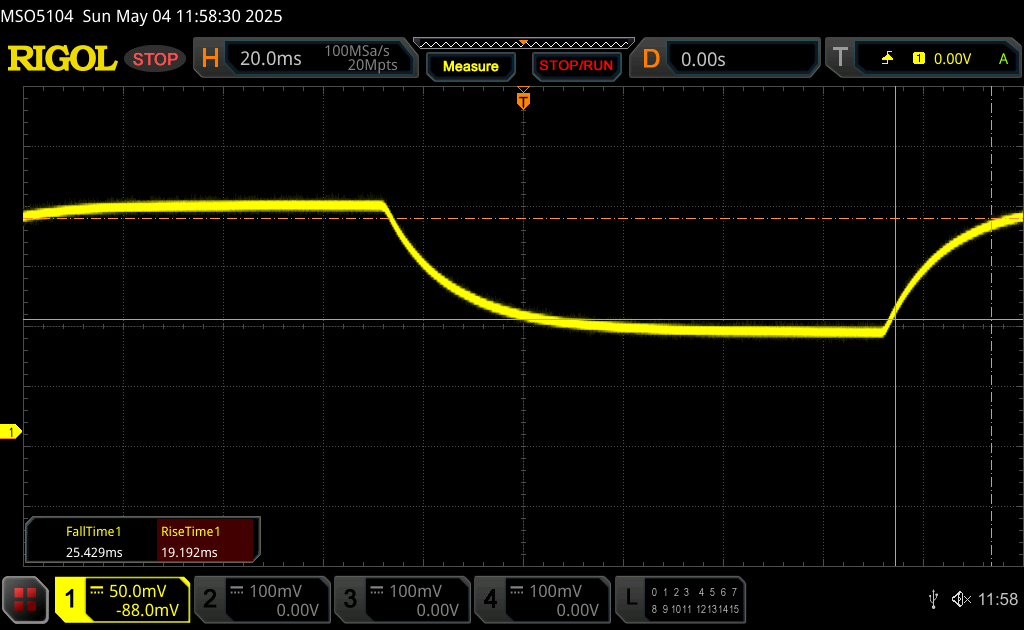 |
| ↘ 25.4 ms upadek | ||
| W naszych testach ekran wykazuje powolne tempo reakcji, co będzie niezadowalające dla graczy. Dla porównania, wszystkie testowane urządzenia wahają się od 0.165 (minimum) do 636 (maksimum) ms. » 76 % wszystkich urządzeń jest lepszych. Oznacza to, że zmierzony czas reakcji jest gorszy od średniej wszystkich testowanych urządzeń (31 ms). | ||
Migotanie ekranu / PWM (modulacja szerokości impulsu)
| Migotanie ekranu/nie wykryto PWM | 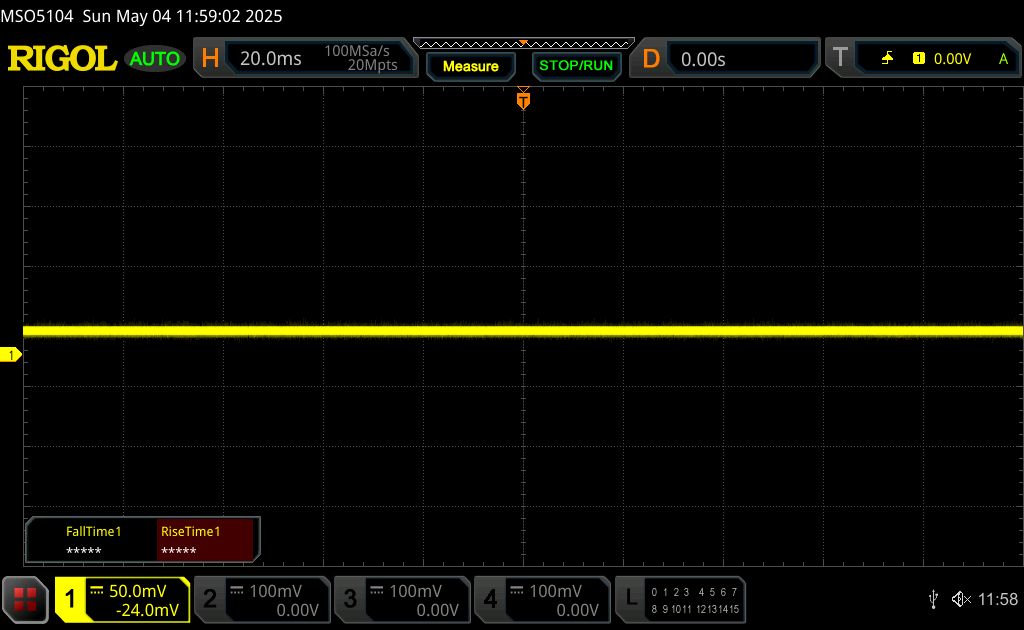 | ||
Dla porównania: 52 % wszystkich testowanych urządzeń nie używa PWM do przyciemniania wyświetlacza. Jeśli wykryto PWM, zmierzono średnio 7772 (minimum: 5 - maksimum: 343500) Hz. | |||
Widoczność na zewnątrz jest przyzwoita w cieniu z naszym 500-nitowym wyświetlaczem, ale poza tym poniżej średniej w świetle słonecznym. Aby uzyskać coś znacznie jaśniejszego, HP oferuje opcje paneli o jasności 1000 nitów dla niektórych modeli EliteBook jeśli widoczność na zewnątrz jest najważniejsza.


Wydajność
Warunki testowania
Przed uruchomieniem poniższych testów porównawczych ustawiliśmy system Windows na tryb wydajności. Lenovo Commercial Advantage nie ma dodatkowych trybów zasilania, aby wybór był prosty.
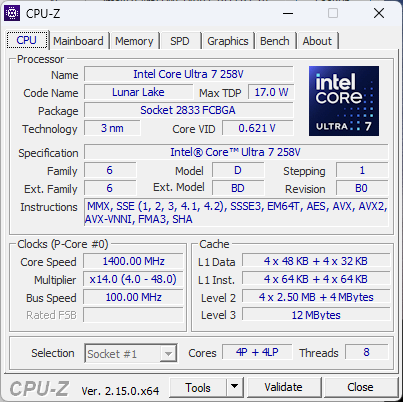
Procesor
The Core Ultra 7 258V w naszym Lenovo osiąga wyniki, których oczekujemy w porównaniu do przeciętnego laptopa w naszej bazie danych z tym samym procesorem. Kluczową różnicą jest jednak to, że częstotliwości taktowania mają tendencję do łatwiejszych wahań w Lenovo, co znajduje odzwierciedlenie w falujących wynikach wydajności w naszym teście pętli CineBench R15 xT poniżej. Takie zachowanie niesie za sobą konsekwencje związane z grami i zużyciem energii.
Wahania wydajności procesora w naszej konfiguracji z serii V również poddają w wątpliwość, jak dobrze ThinkPad X1 2-w-1 Gen 10 może działać, jeśli jest wyposażony w bardziej wymagający procesor z serii H. Jeśli rozwiązanie chłodzące ma już trudności z uruchomieniem Core Ultra 7 258V na częstotliwościach taktowania Turbo Boost, to Core Ultra 7 265H może również zmagać się z trudnościami, prowadząc do wolniejszej niż przeciętna wydajności.
Surowa wydajność procesora Core Ultra 7 258V jest poza tym dość podobna do wieloletniego Core i7-1365U ponieważ platforma Lunar Lake została zaprojektowana tak, aby zmaksymalizować wydajność w przeliczeniu na wat w stosunku do surowej mocy.
Cinebench R15 Multi Loop
Cinebench R23: Multi Core | Single Core
Cinebench R20: CPU (Multi Core) | CPU (Single Core)
Cinebench R15: CPU Multi 64Bit | CPU Single 64Bit
Blender: v2.79 BMW27 CPU
7-Zip 18.03: 7z b 4 | 7z b 4 -mmt1
Geekbench 6.7: Multi-Core | Single-Core
Geekbench 5.5: Multi-Core | Single-Core
HWBOT x265 Benchmark v2.2: 4k Preset
LibreOffice : 20 Documents To PDF
R Benchmark 2.5: Overall mean
* ... im mniej tym lepiej
AIDA64: FP32 Ray-Trace | FPU Julia | CPU SHA3 | CPU Queen | FPU SinJulia | FPU Mandel | CPU AES | CPU ZLib | FP64 Ray-Trace | CPU PhotoWorxx
| Performance rating | |
| Asus ZenBook Duo OLED UX8406CA | |
| Lenovo Yoga 7 2-in-1 14AKP10 | |
| Lenovo ThinkPad X1 2-in-1 Gen 10 | |
| Przeciętny Intel Core Ultra 7 258V | |
| HP EliteBook X Flip G1i 14 AI | |
| Lenovo ThinkPad X1 2in1 G9 21KE004AGE | |
| Dell Latitude 9440 2-in-1 | |
| AIDA64 / FP32 Ray-Trace | |
| Lenovo Yoga 7 2-in-1 14AKP10 | |
| Asus ZenBook Duo OLED UX8406CA | |
| Lenovo ThinkPad X1 2-in-1 Gen 10 | |
| HP EliteBook X Flip G1i 14 AI | |
| Przeciętny Intel Core Ultra 7 258V (8454 - 12781, n=26) | |
| Lenovo ThinkPad X1 2in1 G9 21KE004AGE | |
| Dell Latitude 9440 2-in-1 | |
| AIDA64 / FPU Julia | |
| Asus ZenBook Duo OLED UX8406CA | |
| Lenovo Yoga 7 2-in-1 14AKP10 | |
| Lenovo ThinkPad X1 2-in-1 Gen 10 | |
| Przeciętny Intel Core Ultra 7 258V (40875 - 63401, n=26) | |
| HP EliteBook X Flip G1i 14 AI | |
| Lenovo ThinkPad X1 2in1 G9 21KE004AGE | |
| Dell Latitude 9440 2-in-1 | |
| AIDA64 / CPU SHA3 | |
| Asus ZenBook Duo OLED UX8406CA | |
| Lenovo Yoga 7 2-in-1 14AKP10 | |
| Lenovo ThinkPad X1 2-in-1 Gen 10 | |
| Lenovo ThinkPad X1 2in1 G9 21KE004AGE | |
| Przeciętny Intel Core Ultra 7 258V (1930 - 2817, n=26) | |
| HP EliteBook X Flip G1i 14 AI | |
| Dell Latitude 9440 2-in-1 | |
| AIDA64 / CPU Queen | |
| Dell Latitude 9440 2-in-1 | |
| Asus ZenBook Duo OLED UX8406CA | |
| Lenovo Yoga 7 2-in-1 14AKP10 | |
| Lenovo ThinkPad X1 2-in-1 Gen 10 | |
| Przeciętny Intel Core Ultra 7 258V (48816 - 49818, n=24) | |
| HP EliteBook X Flip G1i 14 AI | |
| Lenovo ThinkPad X1 2in1 G9 21KE004AGE | |
| AIDA64 / FPU SinJulia | |
| Lenovo Yoga 7 2-in-1 14AKP10 | |
| Asus ZenBook Duo OLED UX8406CA | |
| Lenovo ThinkPad X1 2in1 G9 21KE004AGE | |
| Dell Latitude 9440 2-in-1 | |
| Lenovo ThinkPad X1 2-in-1 Gen 10 | |
| HP EliteBook X Flip G1i 14 AI | |
| Przeciętny Intel Core Ultra 7 258V (3817 - 4440, n=26) | |
| AIDA64 / FPU Mandel | |
| Asus ZenBook Duo OLED UX8406CA | |
| Lenovo Yoga 7 2-in-1 14AKP10 | |
| Przeciętny Intel Core Ultra 7 258V (21670 - 33565, n=26) | |
| HP EliteBook X Flip G1i 14 AI | |
| Lenovo ThinkPad X1 2-in-1 Gen 10 | |
| Lenovo ThinkPad X1 2in1 G9 21KE004AGE | |
| Dell Latitude 9440 2-in-1 | |
| AIDA64 / CPU AES | |
| Lenovo Yoga 7 2-in-1 14AKP10 | |
| Asus ZenBook Duo OLED UX8406CA | |
| Lenovo ThinkPad X1 2in1 G9 21KE004AGE | |
| Dell Latitude 9440 2-in-1 | |
| Lenovo ThinkPad X1 2-in-1 Gen 10 | |
| Przeciętny Intel Core Ultra 7 258V (30957 - 40753, n=26) | |
| HP EliteBook X Flip G1i 14 AI | |
| AIDA64 / CPU ZLib | |
| Asus ZenBook Duo OLED UX8406CA | |
| Lenovo Yoga 7 2-in-1 14AKP10 | |
| Lenovo ThinkPad X1 2in1 G9 21KE004AGE | |
| Dell Latitude 9440 2-in-1 | |
| Lenovo ThinkPad X1 2-in-1 Gen 10 | |
| Przeciętny Intel Core Ultra 7 258V (422 - 632, n=26) | |
| HP EliteBook X Flip G1i 14 AI | |
| AIDA64 / FP64 Ray-Trace | |
| Lenovo Yoga 7 2-in-1 14AKP10 | |
| Asus ZenBook Duo OLED UX8406CA | |
| Lenovo ThinkPad X1 2-in-1 Gen 10 | |
| Przeciętny Intel Core Ultra 7 258V (4258 - 6930, n=26) | |
| HP EliteBook X Flip G1i 14 AI | |
| Lenovo ThinkPad X1 2in1 G9 21KE004AGE | |
| Dell Latitude 9440 2-in-1 | |
| AIDA64 / CPU PhotoWorxx | |
| Asus ZenBook Duo OLED UX8406CA | |
| Lenovo ThinkPad X1 2-in-1 Gen 10 | |
| HP EliteBook X Flip G1i 14 AI | |
| Przeciętny Intel Core Ultra 7 258V (44223 - 59245, n=26) | |
| Lenovo ThinkPad X1 2in1 G9 21KE004AGE | |
| Dell Latitude 9440 2-in-1 | |
| Lenovo Yoga 7 2-in-1 14AKP10 | |
Test warunków skrajnych
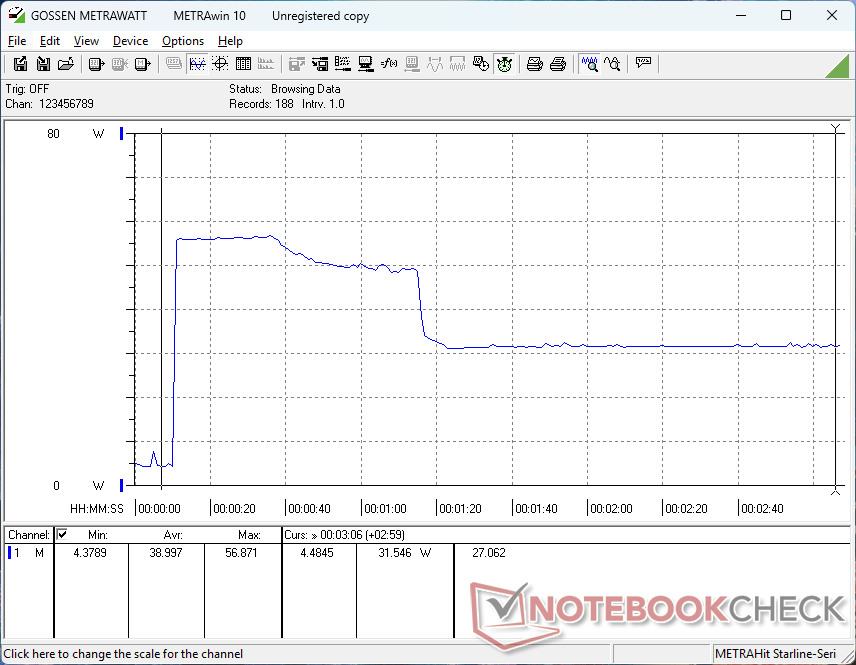
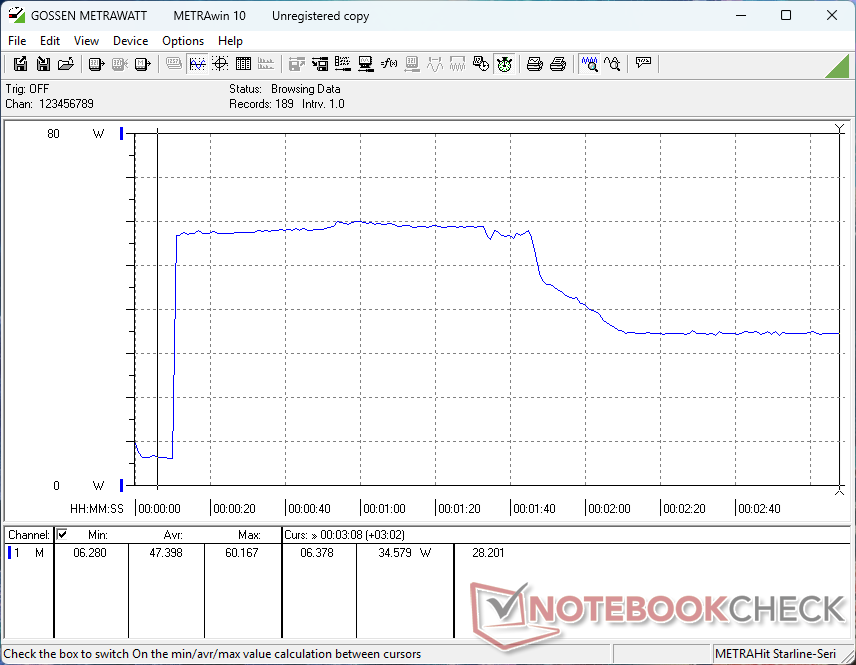
Po uruchomieniu stresu Prime95, procesor osiągnął 39 W i 3,3 GHz, a następnie osiągnął temperaturę rdzenia 96 C kilka chwil później. Następnie procesor powoli zmieniał taktowanie w zakresie od 2,3 do 32 GHz, od 20 W do 39 W i od 77 C do 96 C, jak pokazano na poniższym zrzucie ekranu. To zachowanie naśladuje nasze obserwacje CineBench R15 xT powyżej. W przeciwieństwie do tego, nasza jednostka 2024 ze starszą platformą Meteor Lake-U nie wykazywała żadnego zachowania cyklicznego.
CPU i GPU kontynuowały cykl podczas uruchamiania Cyberpunk 2077, co przyczyniało się do wahań liczby klatek na sekundę. Procesor działał w zakresie od 0,9 GHz do 1,6 GHz, od 20 W do 35 W i od 72 C do 96 C, podczas gdy GPU działał w zakresie od 1600 MHz do 1950 MHz. Lepsza byłaby stabilniejsza wydajność.
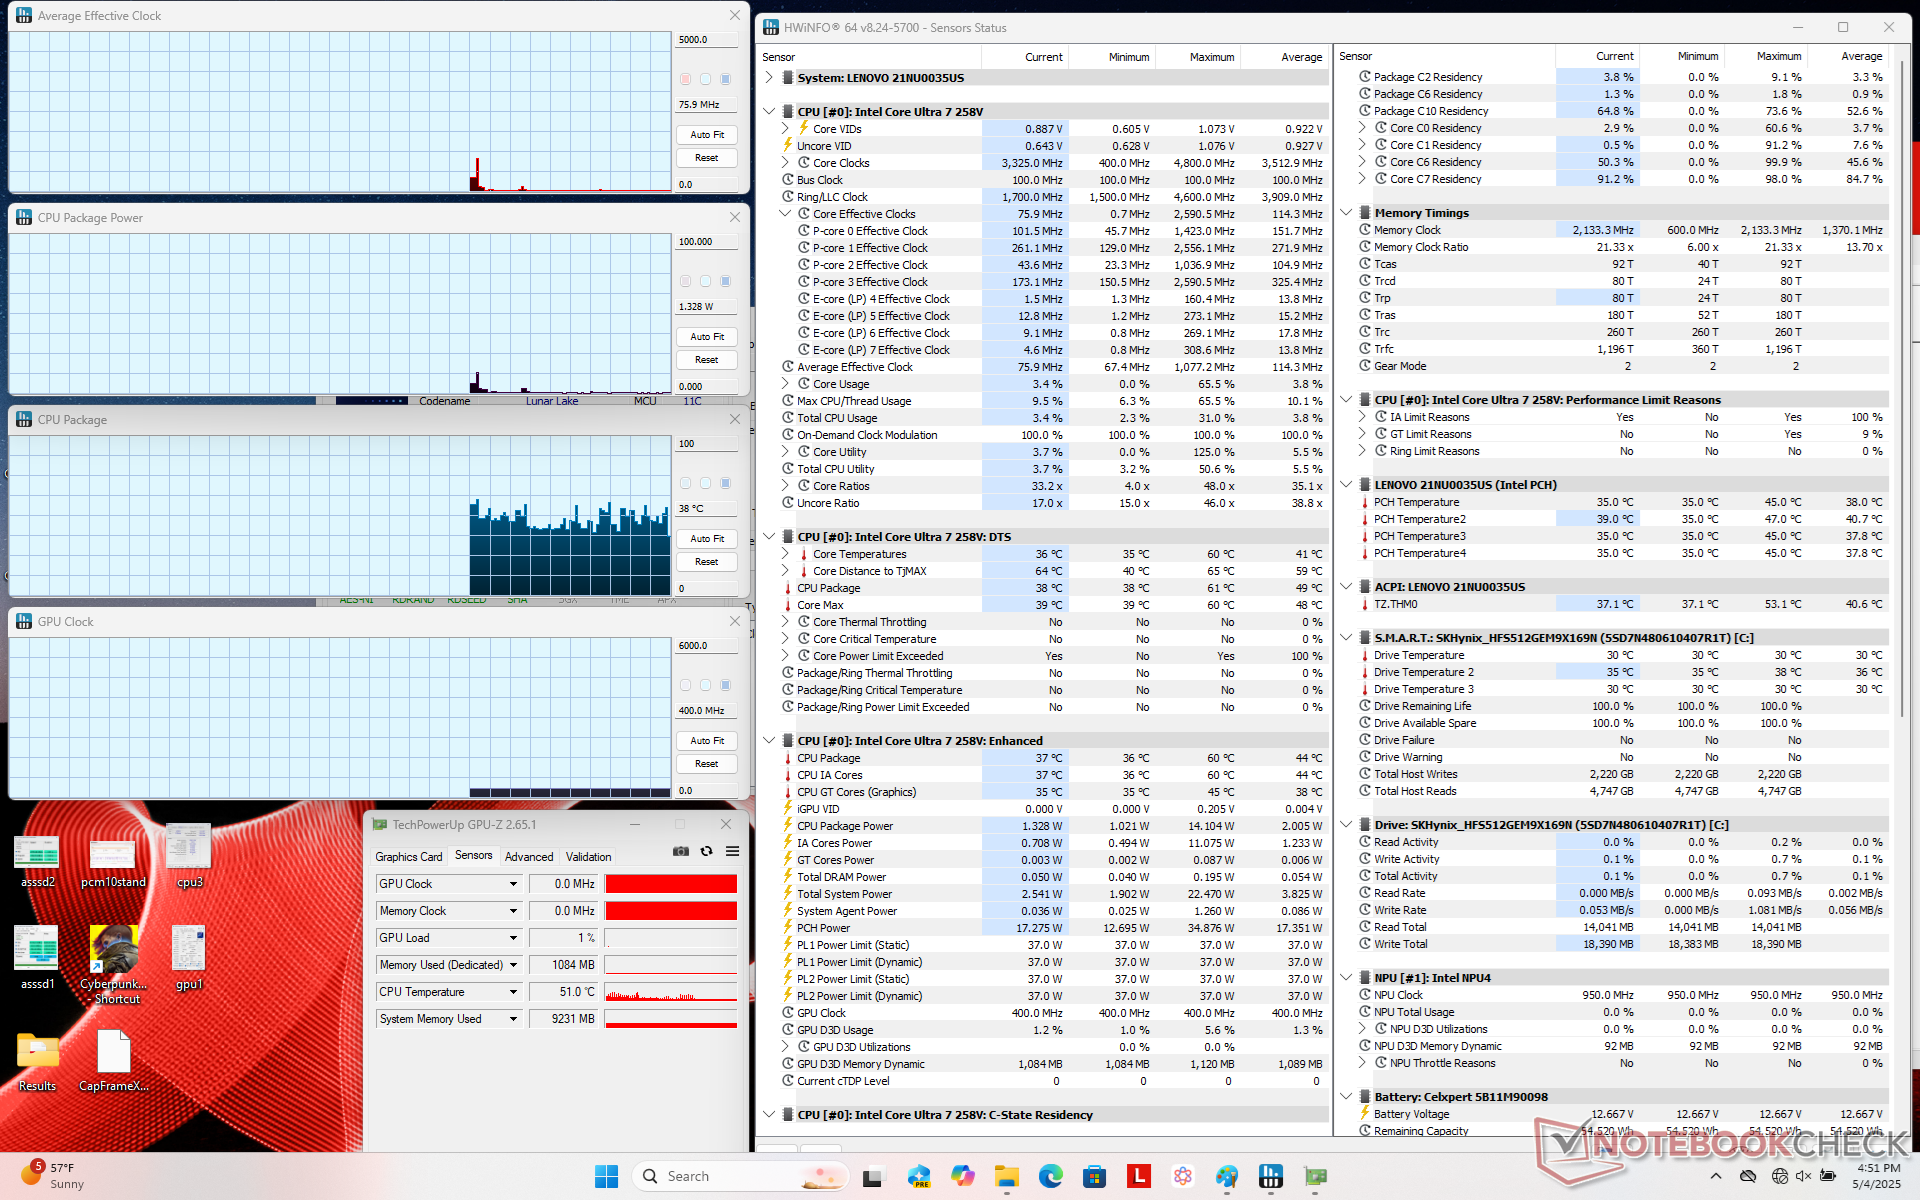
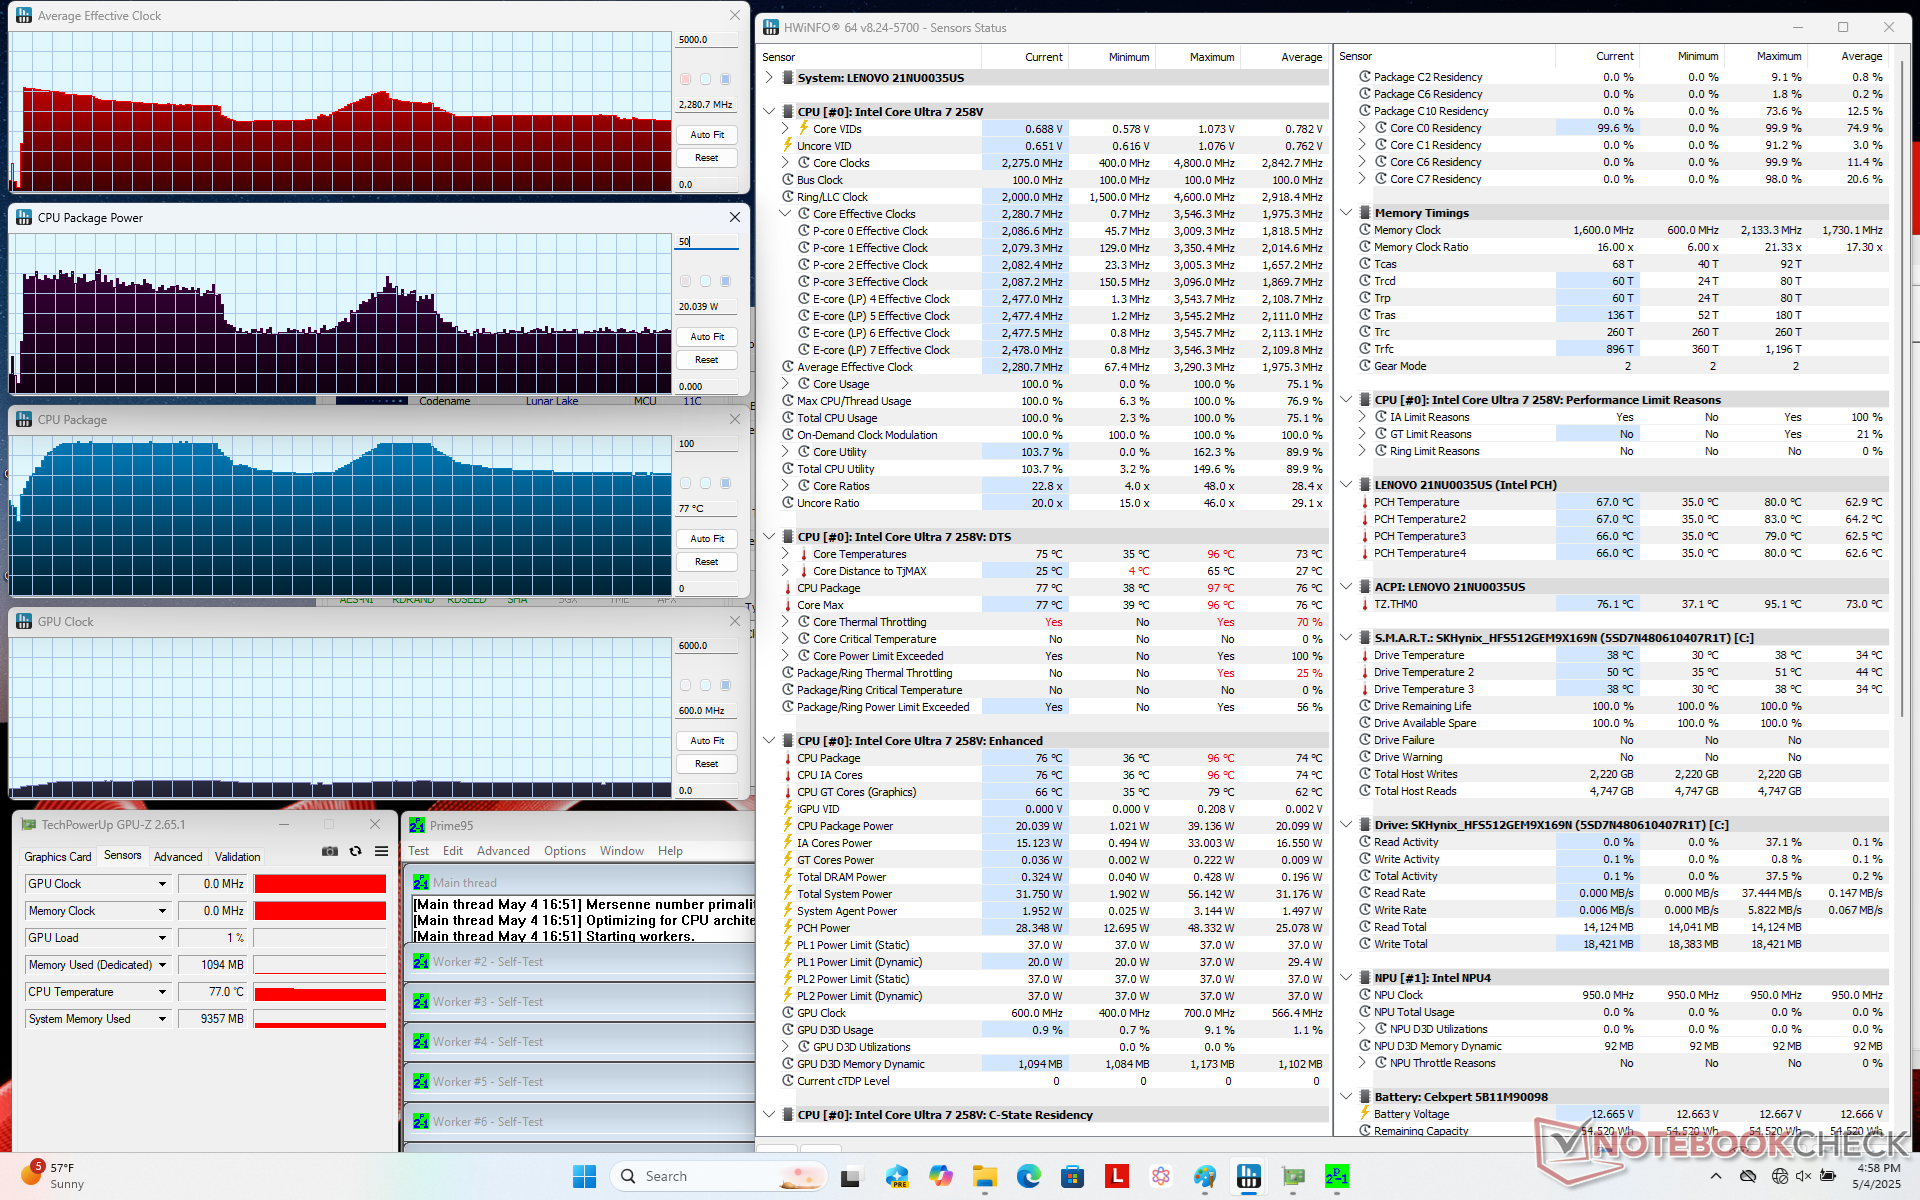
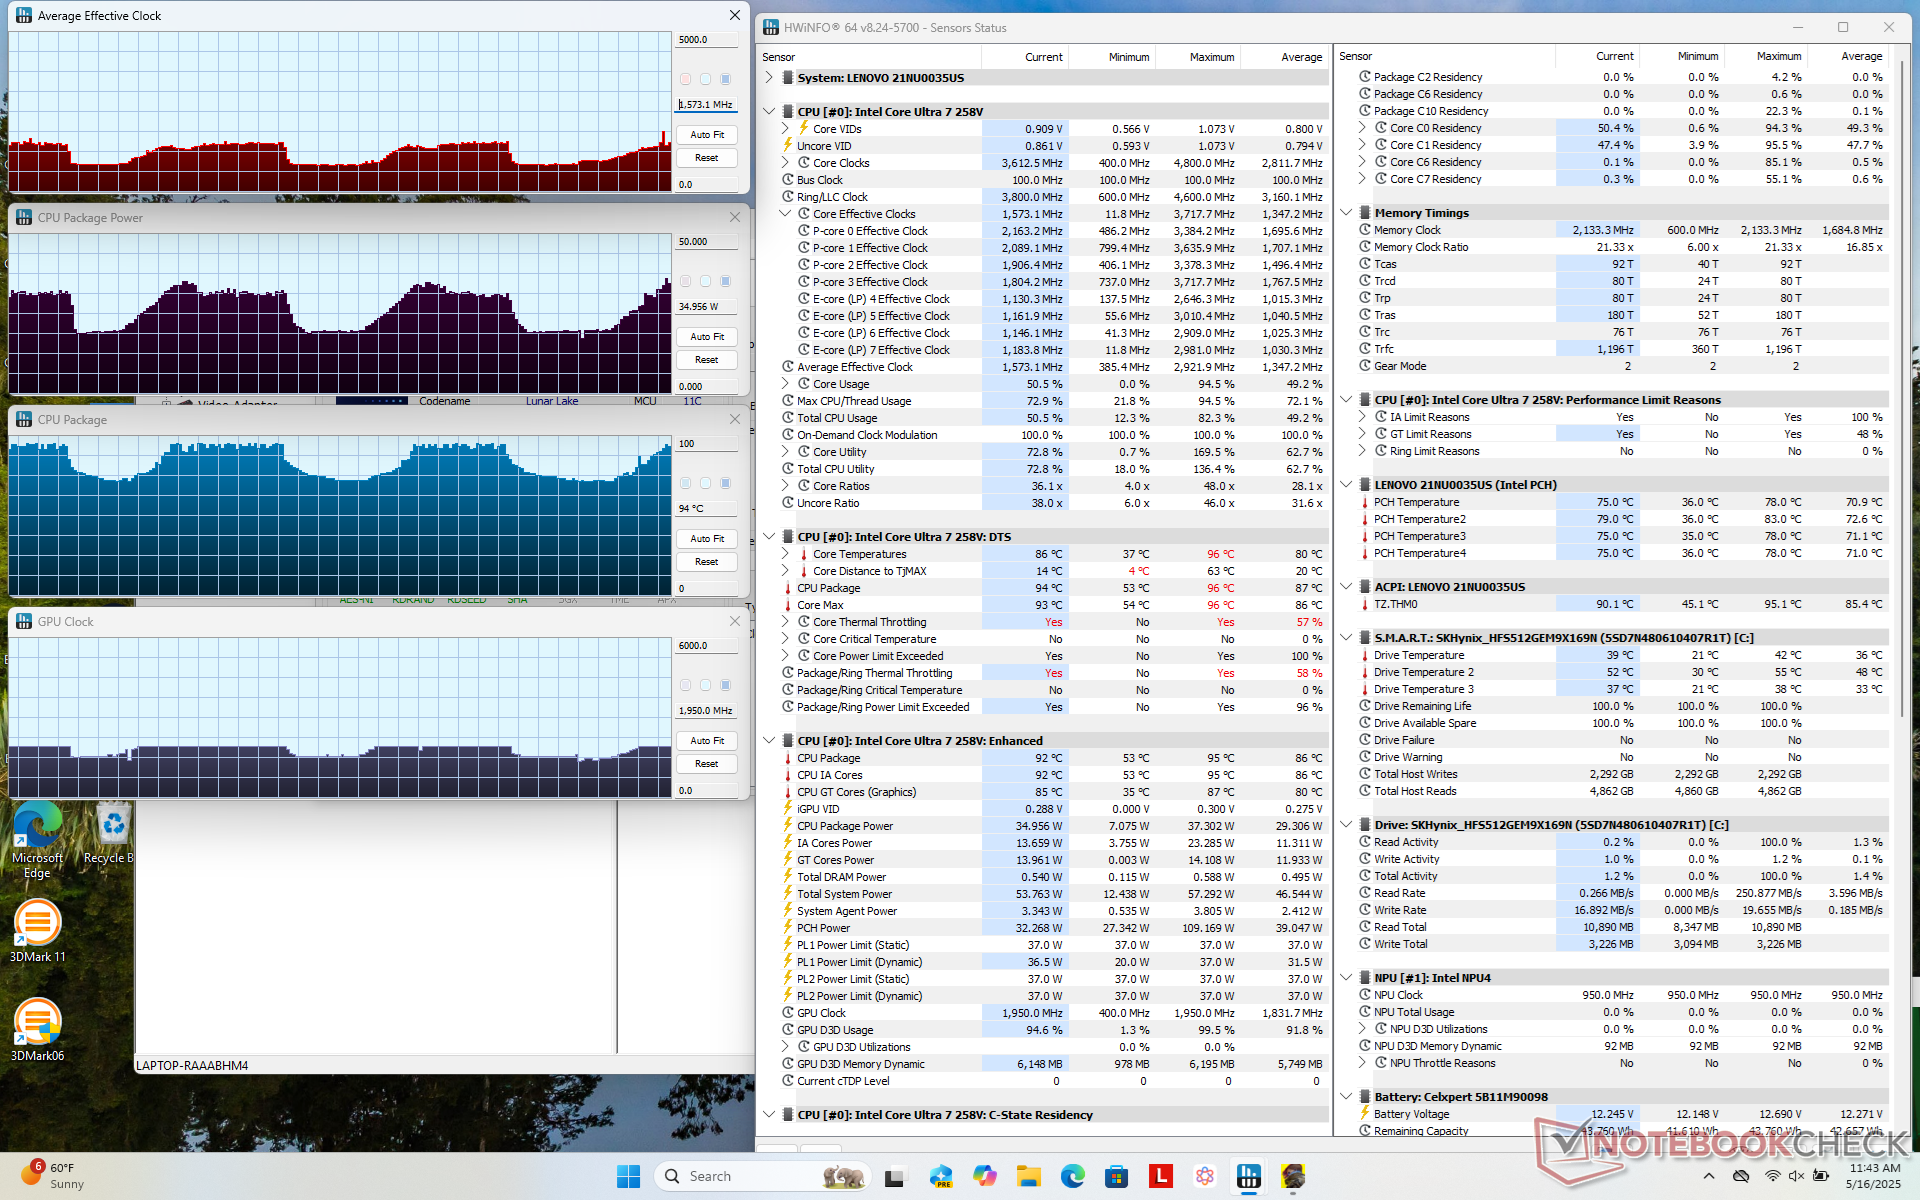
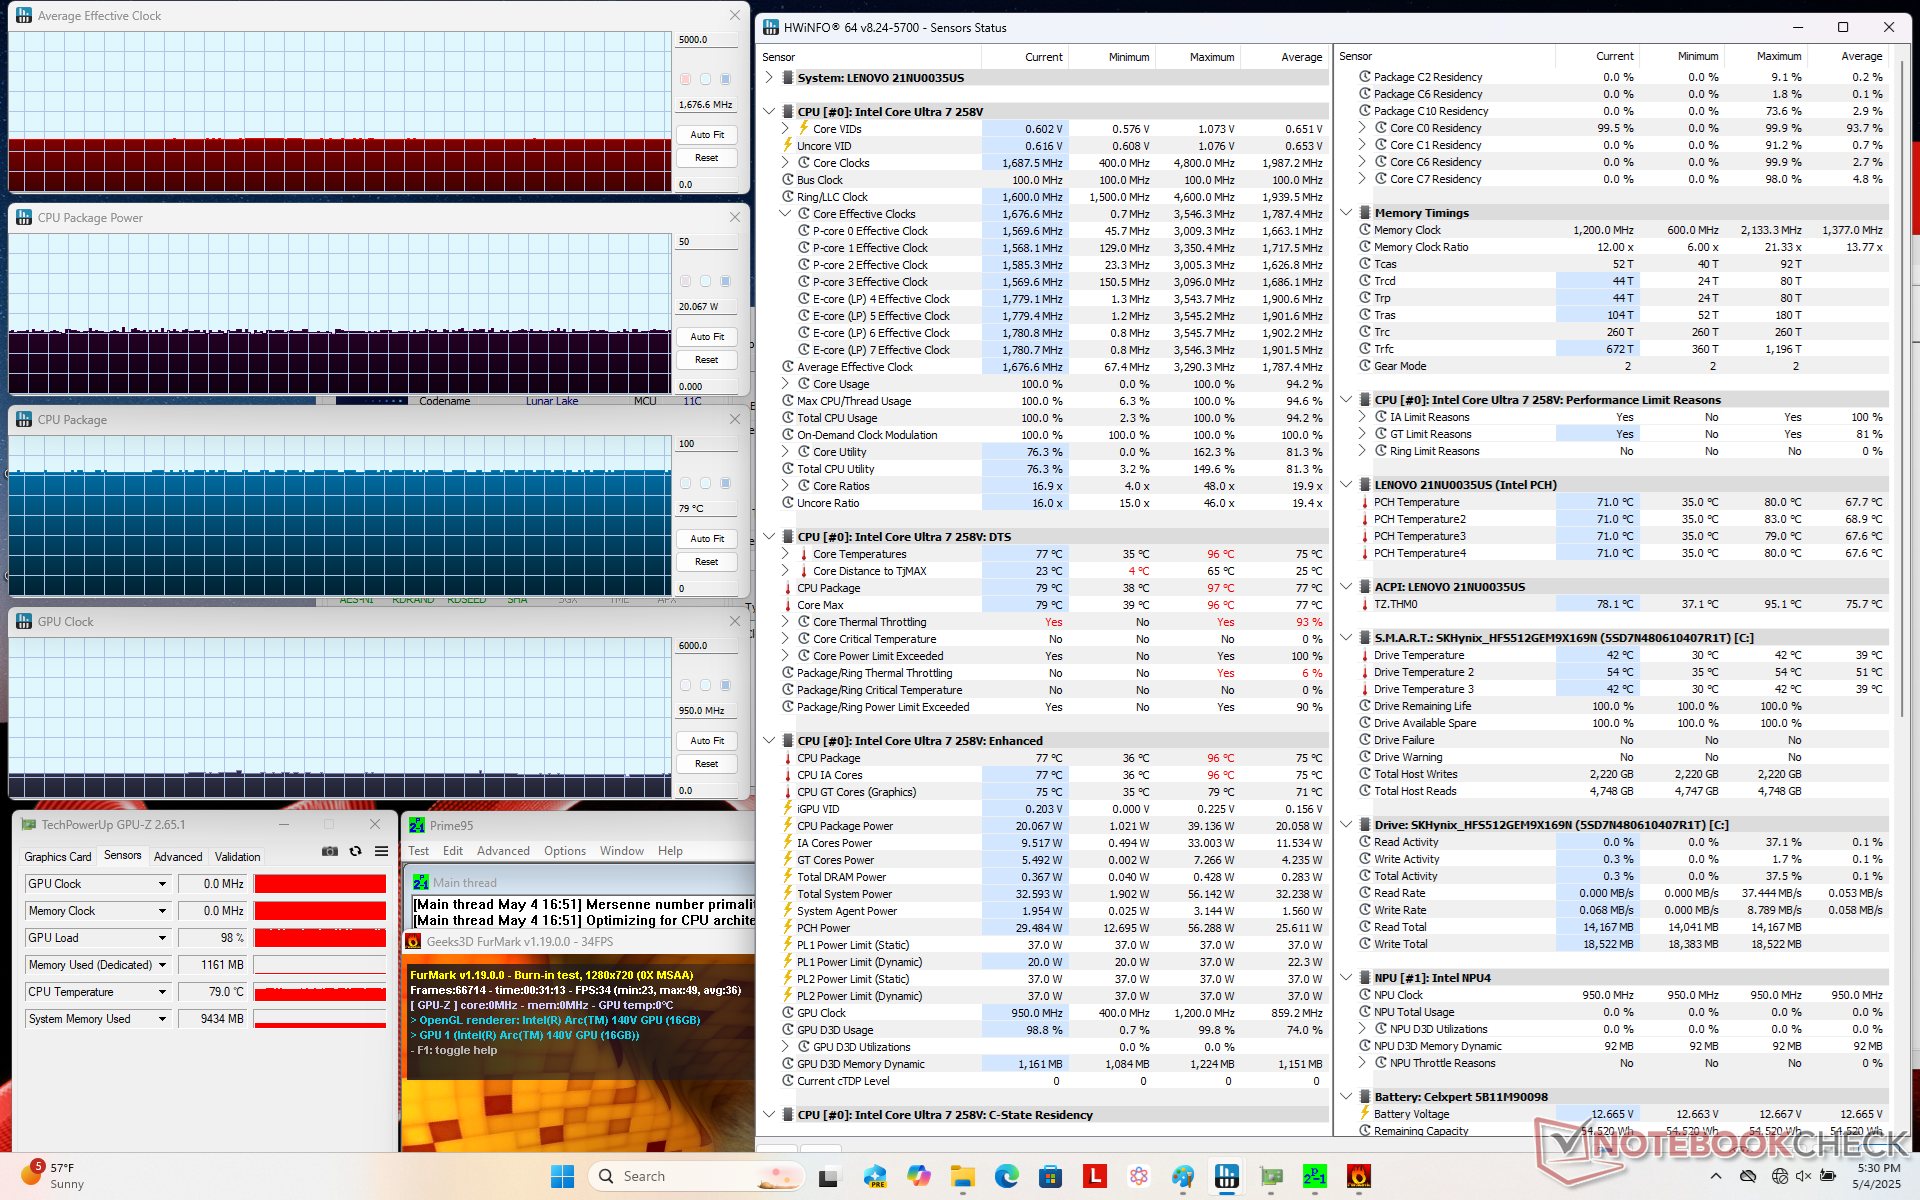
| Średnie taktowanie CPU (GHz) | Taktowanie GPU (MHz) | Średnia temperatura CPU (°C) | |
| System w stanie spoczynku | -- | -- | 39 |
| Prime95 Stress | 2.2 - 3.1 | 600 | 77 |
| Prime95 + FurMark Stress | 1.7 | 950 | 79 |
| Cyberpunk 2077 Stress | 0.9 - 1.6 | 1600 - 1950 | 72 - 96 |
Wydajność systemu
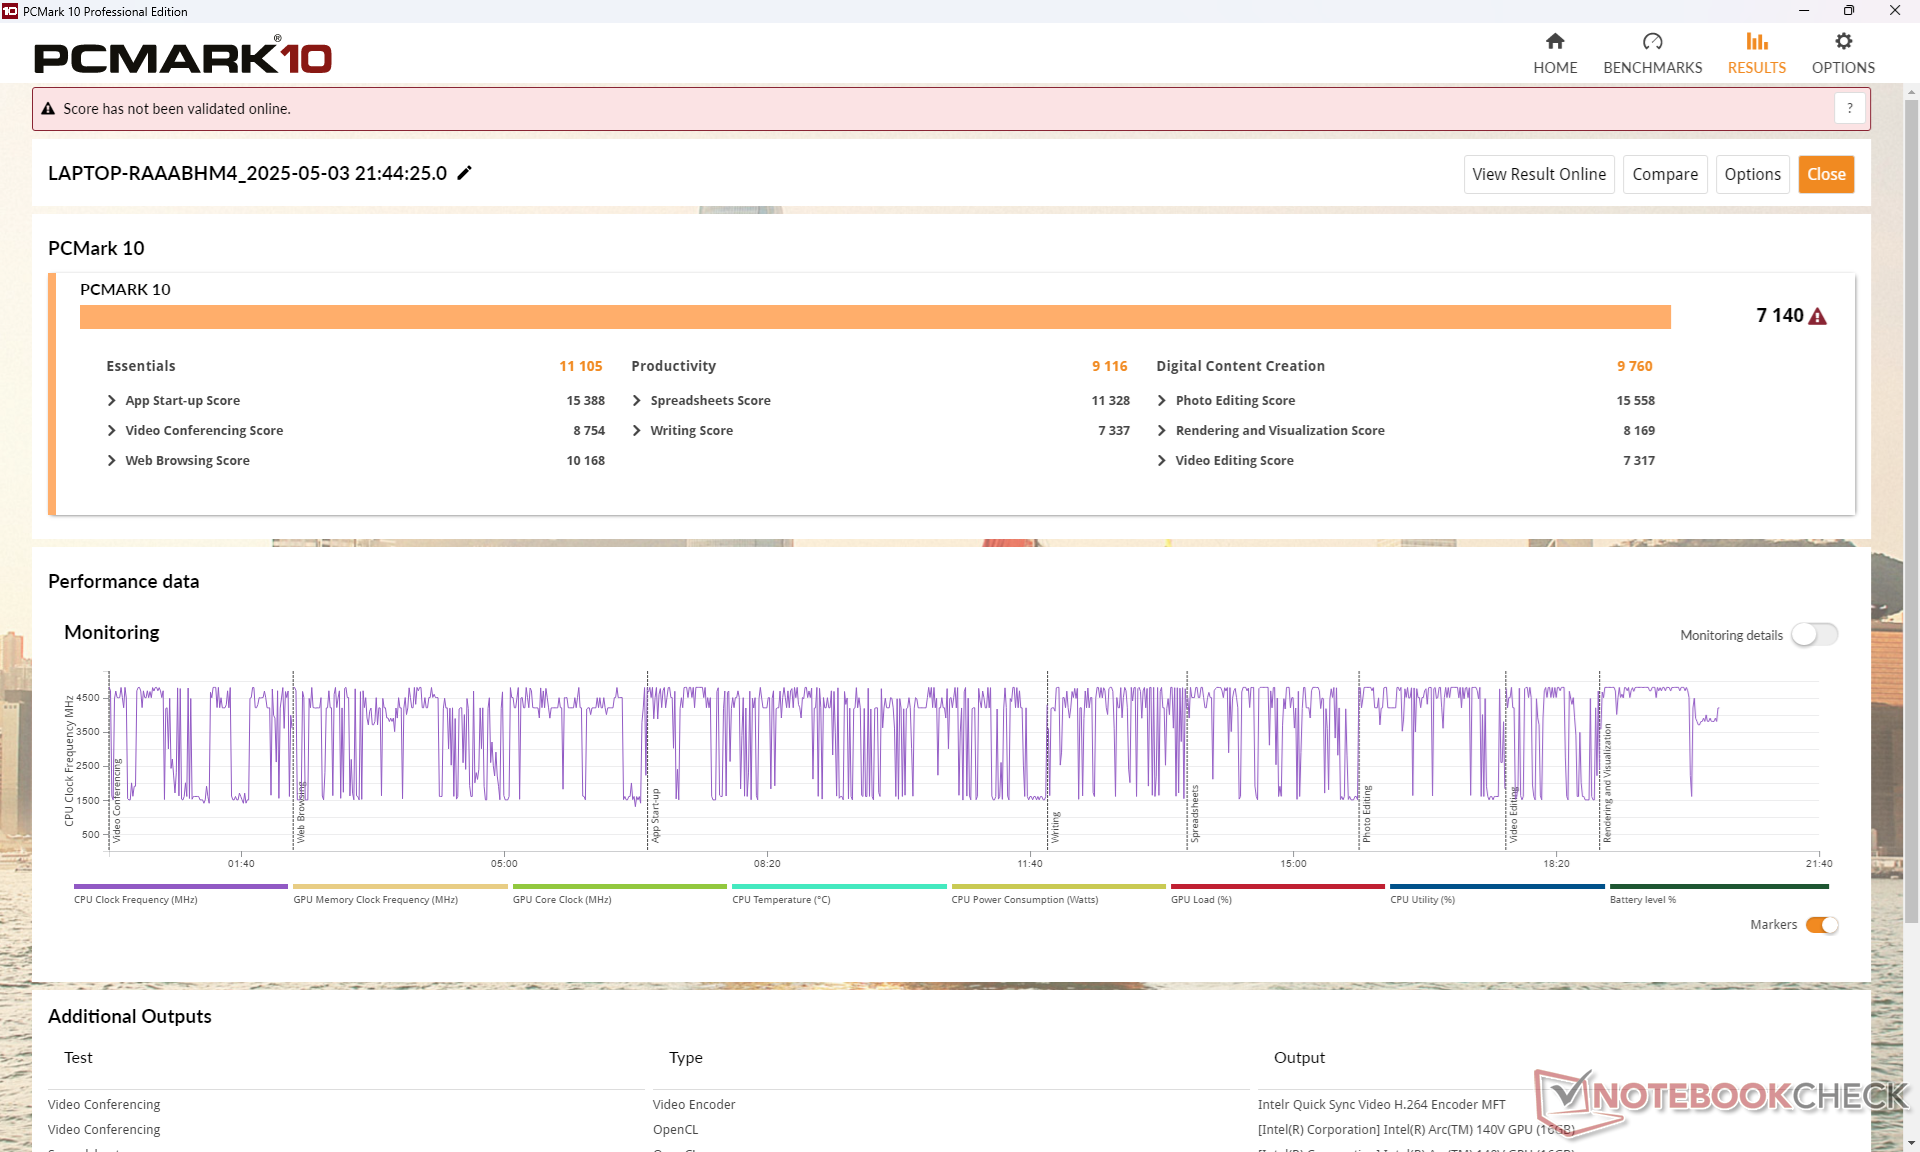
Wyniki PCMark są konsekwentnie wyższe niż w zeszłorocznym ThinkPadzie X1 2-w-1 Gen 9, pomimo wahań wydajności procesora wspomnianych powyżej. Sugeruje to, że niestabilne częstotliwości taktowania powinny mieć minimalny wpływ na większość codziennych obciążeń biurowych lub lekkich czynności edycyjnych. Oczywiście znacznie ulepszony zintegrowany procesor graficzny i szybsza pamięć RAM w porównaniu z zeszłoroczną platformą Meteor Lake-U również odgrywają ogromną rolę w lepszych wynikach PCMark.
PCMark 10: Score | Essentials | Productivity | Digital Content Creation
CrossMark: Overall | Productivity | Creativity | Responsiveness
WebXPRT 3: Overall
WebXPRT 4: Overall
Mozilla Kraken 1.1: Total
| Performance rating | |
| Asus ZenBook Duo OLED UX8406CA | |
| Lenovo ThinkPad X1 2-in-1 Gen 10 -1! | |
| Przeciętny Intel Core Ultra 7 258V, Intel Arc Graphics 140V | |
| Lenovo Yoga 7 2-in-1 14AKP10 -2! | |
| Dell Latitude 9440 2-in-1 | |
| HP EliteBook X Flip G1i 14 AI | |
| Lenovo ThinkPad X1 2in1 G9 21KE004AGE | |
| PCMark 10 / Score | |
| Asus ZenBook Duo OLED UX8406CA | |
| Lenovo ThinkPad X1 2-in-1 Gen 10 | |
| Przeciętny Intel Core Ultra 7 258V, Intel Arc Graphics 140V (6265 - 7420, n=23) | |
| HP EliteBook X Flip G1i 14 AI | |
| Lenovo Yoga 7 2-in-1 14AKP10 | |
| Dell Latitude 9440 2-in-1 | |
| Lenovo ThinkPad X1 2in1 G9 21KE004AGE | |
| PCMark 10 / Essentials | |
| Dell Latitude 9440 2-in-1 | |
| Lenovo Yoga 7 2-in-1 14AKP10 | |
| Lenovo ThinkPad X1 2-in-1 Gen 10 | |
| Lenovo ThinkPad X1 2in1 G9 21KE004AGE | |
| Asus ZenBook Duo OLED UX8406CA | |
| HP EliteBook X Flip G1i 14 AI | |
| Przeciętny Intel Core Ultra 7 258V, Intel Arc Graphics 140V (9295 - 11467, n=23) | |
| PCMark 10 / Productivity | |
| Lenovo Yoga 7 2-in-1 14AKP10 | |
| HP EliteBook X Flip G1i 14 AI | |
| Przeciętny Intel Core Ultra 7 258V, Intel Arc Graphics 140V (7357 - 13600, n=23) | |
| Lenovo ThinkPad X1 2-in-1 Gen 10 | |
| Asus ZenBook Duo OLED UX8406CA | |
| Lenovo ThinkPad X1 2in1 G9 21KE004AGE | |
| Dell Latitude 9440 2-in-1 | |
| PCMark 10 / Digital Content Creation | |
| Asus ZenBook Duo OLED UX8406CA | |
| Lenovo ThinkPad X1 2-in-1 Gen 10 | |
| Przeciętny Intel Core Ultra 7 258V, Intel Arc Graphics 140V (8160 - 10308, n=23) | |
| HP EliteBook X Flip G1i 14 AI | |
| Lenovo Yoga 7 2-in-1 14AKP10 | |
| Lenovo ThinkPad X1 2in1 G9 21KE004AGE | |
| Dell Latitude 9440 2-in-1 | |
| CrossMark / Overall | |
| Asus ZenBook Duo OLED UX8406CA | |
| Lenovo ThinkPad X1 2-in-1 Gen 10 | |
| Przeciętny Intel Core Ultra 7 258V, Intel Arc Graphics 140V (1275 - 1742, n=22) | |
| Lenovo Yoga 7 2-in-1 14AKP10 | |
| Dell Latitude 9440 2-in-1 | |
| HP EliteBook X Flip G1i 14 AI | |
| Lenovo ThinkPad X1 2in1 G9 21KE004AGE | |
| CrossMark / Productivity | |
| Asus ZenBook Duo OLED UX8406CA | |
| Lenovo ThinkPad X1 2-in-1 Gen 10 | |
| Dell Latitude 9440 2-in-1 | |
| Przeciętny Intel Core Ultra 7 258V, Intel Arc Graphics 140V (1267 - 1684, n=22) | |
| HP EliteBook X Flip G1i 14 AI | |
| Lenovo Yoga 7 2-in-1 14AKP10 | |
| Lenovo ThinkPad X1 2in1 G9 21KE004AGE | |
| CrossMark / Creativity | |
| Asus ZenBook Duo OLED UX8406CA | |
| Lenovo ThinkPad X1 2-in-1 Gen 10 | |
| Przeciętny Intel Core Ultra 7 258V, Intel Arc Graphics 140V (1393 - 1977, n=22) | |
| Lenovo Yoga 7 2-in-1 14AKP10 | |
| Dell Latitude 9440 2-in-1 | |
| HP EliteBook X Flip G1i 14 AI | |
| Lenovo ThinkPad X1 2in1 G9 21KE004AGE | |
| CrossMark / Responsiveness | |
| Dell Latitude 9440 2-in-1 | |
| Asus ZenBook Duo OLED UX8406CA | |
| Lenovo Yoga 7 2-in-1 14AKP10 | |
| Lenovo ThinkPad X1 2-in-1 Gen 10 | |
| Lenovo ThinkPad X1 2in1 G9 21KE004AGE | |
| Przeciętny Intel Core Ultra 7 258V, Intel Arc Graphics 140V (999 - 1411, n=22) | |
| HP EliteBook X Flip G1i 14 AI | |
| WebXPRT 3 / Overall | |
| Lenovo ThinkPad X1 2-in-1 Gen 10 | |
| Dell Latitude 9440 2-in-1 | |
| Przeciętny Intel Core Ultra 7 258V, Intel Arc Graphics 140V (219 - 317, n=22) | |
| Asus ZenBook Duo OLED UX8406CA | |
| Lenovo ThinkPad X1 2in1 G9 21KE004AGE | |
| HP EliteBook X Flip G1i 14 AI | |
| WebXPRT 4 / Overall | |
| Przeciętny Intel Core Ultra 7 258V, Intel Arc Graphics 140V (199.5 - 291, n=22) | |
| Dell Latitude 9440 2-in-1 | |
| Asus ZenBook Duo OLED UX8406CA | |
| Lenovo ThinkPad X1 2in1 G9 21KE004AGE | |
| HP EliteBook X Flip G1i 14 AI | |
| Mozilla Kraken 1.1 / Total | |
| Lenovo ThinkPad X1 2in1 G9 21KE004AGE | |
| Dell Latitude 9440 2-in-1 | |
| Przeciętny Intel Core Ultra 7 258V, Intel Arc Graphics 140V (468 - 559, n=24) | |
| HP EliteBook X Flip G1i 14 AI | |
| Lenovo ThinkPad X1 2-in-1 Gen 10 | |
| Asus ZenBook Duo OLED UX8406CA | |
| Lenovo Yoga 7 2-in-1 14AKP10 | |
* ... im mniej tym lepiej
| PCMark 10 Score | 7140 pkt. | |
Pomoc | ||
| AIDA64 / Memory Copy | |
| HP EliteBook X Flip G1i 14 AI | |
| Lenovo ThinkPad X1 2-in-1 Gen 10 | |
| Przeciętny Intel Core Ultra 7 258V (104408 - 114336, n=24) | |
| Asus ZenBook Duo OLED UX8406CA | |
| Lenovo Yoga 7 2-in-1 14AKP10 | |
| Lenovo ThinkPad X1 2in1 G9 21KE004AGE | |
| Dell Latitude 9440 2-in-1 | |
| AIDA64 / Memory Read | |
| Lenovo ThinkPad X1 2-in-1 Gen 10 | |
| Przeciętny Intel Core Ultra 7 258V (82846 - 89417, n=24) | |
| HP EliteBook X Flip G1i 14 AI | |
| Asus ZenBook Duo OLED UX8406CA | |
| Lenovo Yoga 7 2-in-1 14AKP10 | |
| Lenovo ThinkPad X1 2in1 G9 21KE004AGE | |
| Dell Latitude 9440 2-in-1 | |
| AIDA64 / Memory Write | |
| Lenovo ThinkPad X1 2-in-1 Gen 10 | |
| Przeciętny Intel Core Ultra 7 258V (108824 - 117989, n=24) | |
| HP EliteBook X Flip G1i 14 AI | |
| Lenovo Yoga 7 2-in-1 14AKP10 | |
| Dell Latitude 9440 2-in-1 | |
| Asus ZenBook Duo OLED UX8406CA | |
| Lenovo ThinkPad X1 2in1 G9 21KE004AGE | |
| AIDA64 / Memory Latency | |
| Lenovo ThinkPad X1 2in1 G9 21KE004AGE | |
| Asus ZenBook Duo OLED UX8406CA | |
| Lenovo Yoga 7 2-in-1 14AKP10 | |
| HP EliteBook X Flip G1i 14 AI | |
| Przeciętny Intel Core Ultra 7 258V (95 - 101.7, n=24) | |
| Lenovo ThinkPad X1 2-in-1 Gen 10 | |
| Dell Latitude 9440 2-in-1 | |
* ... im mniej tym lepiej
Opóźnienie DPC
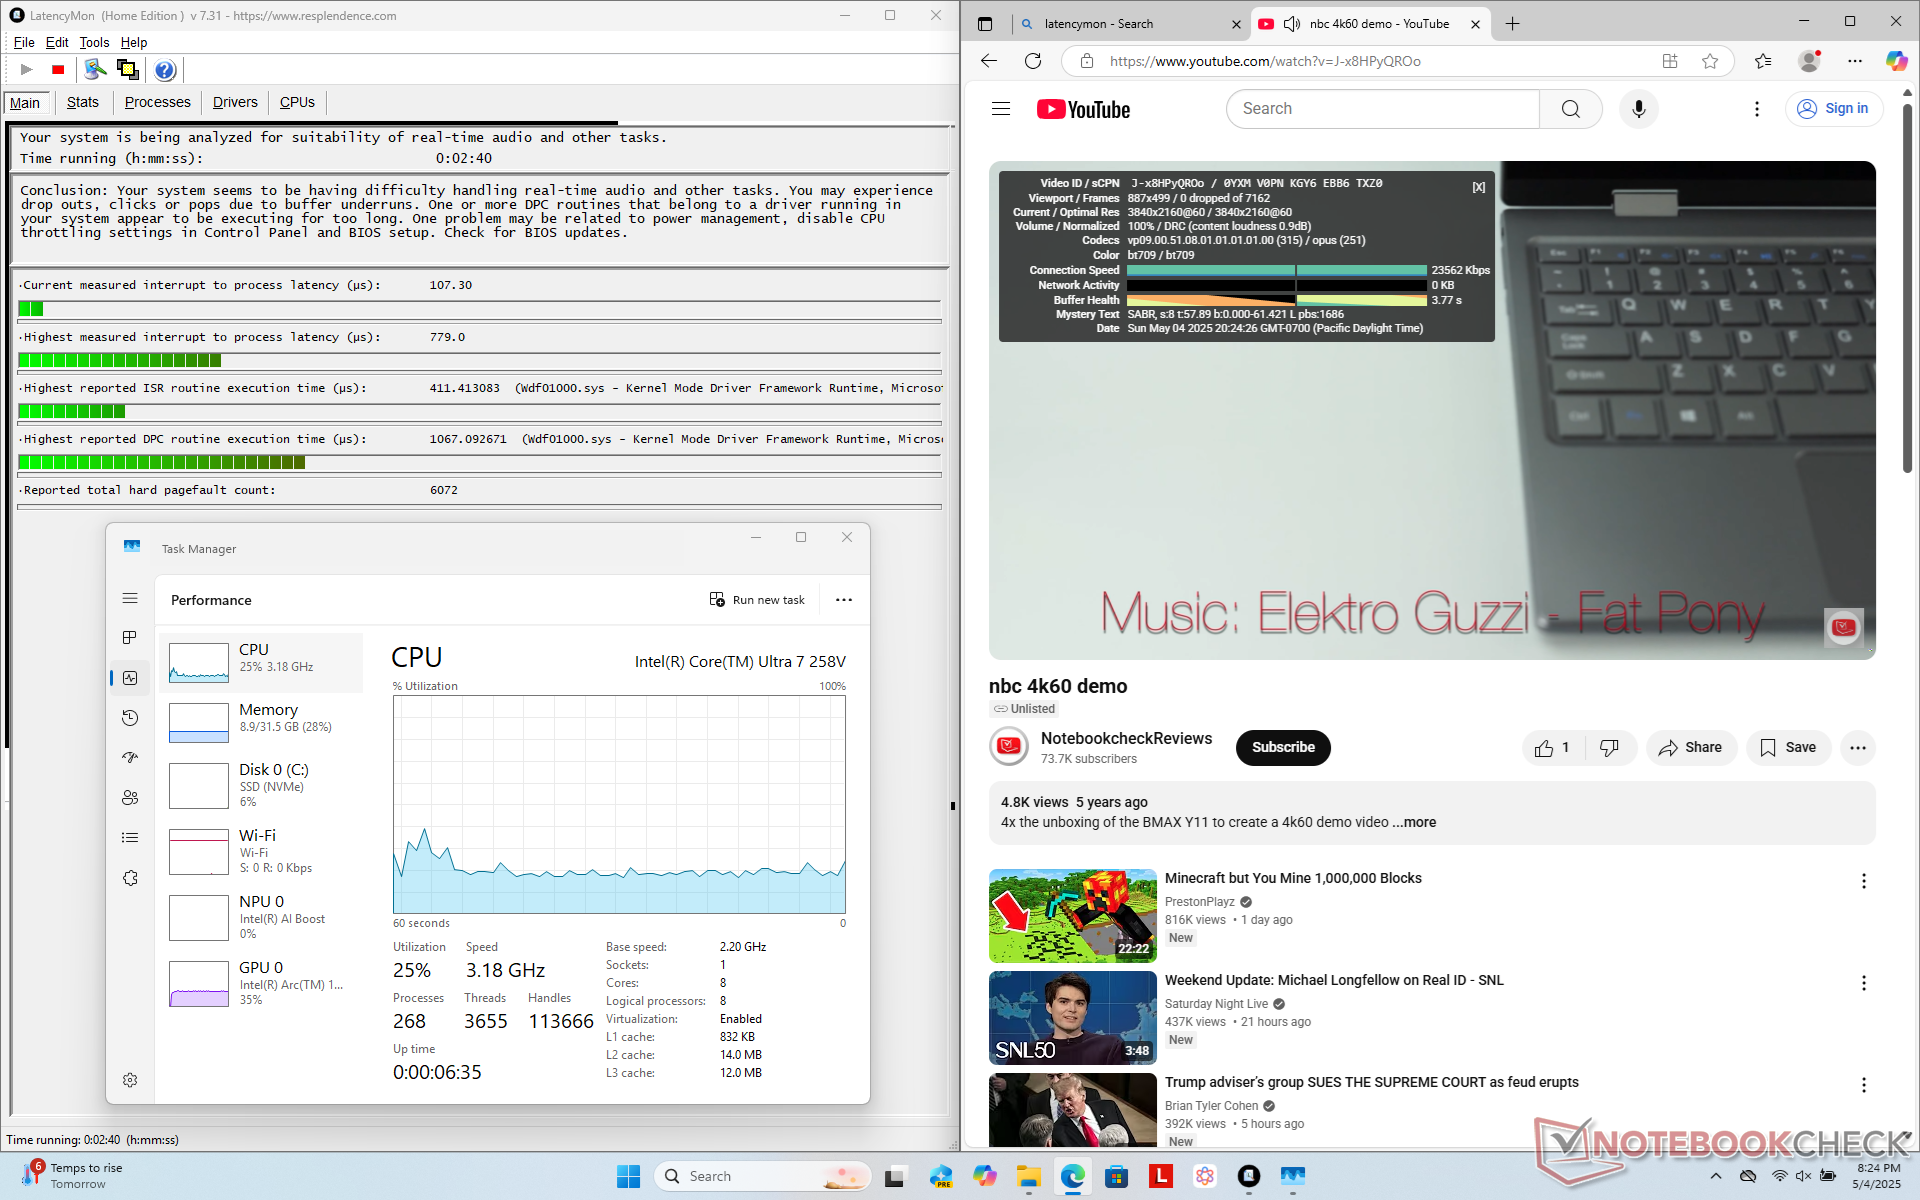
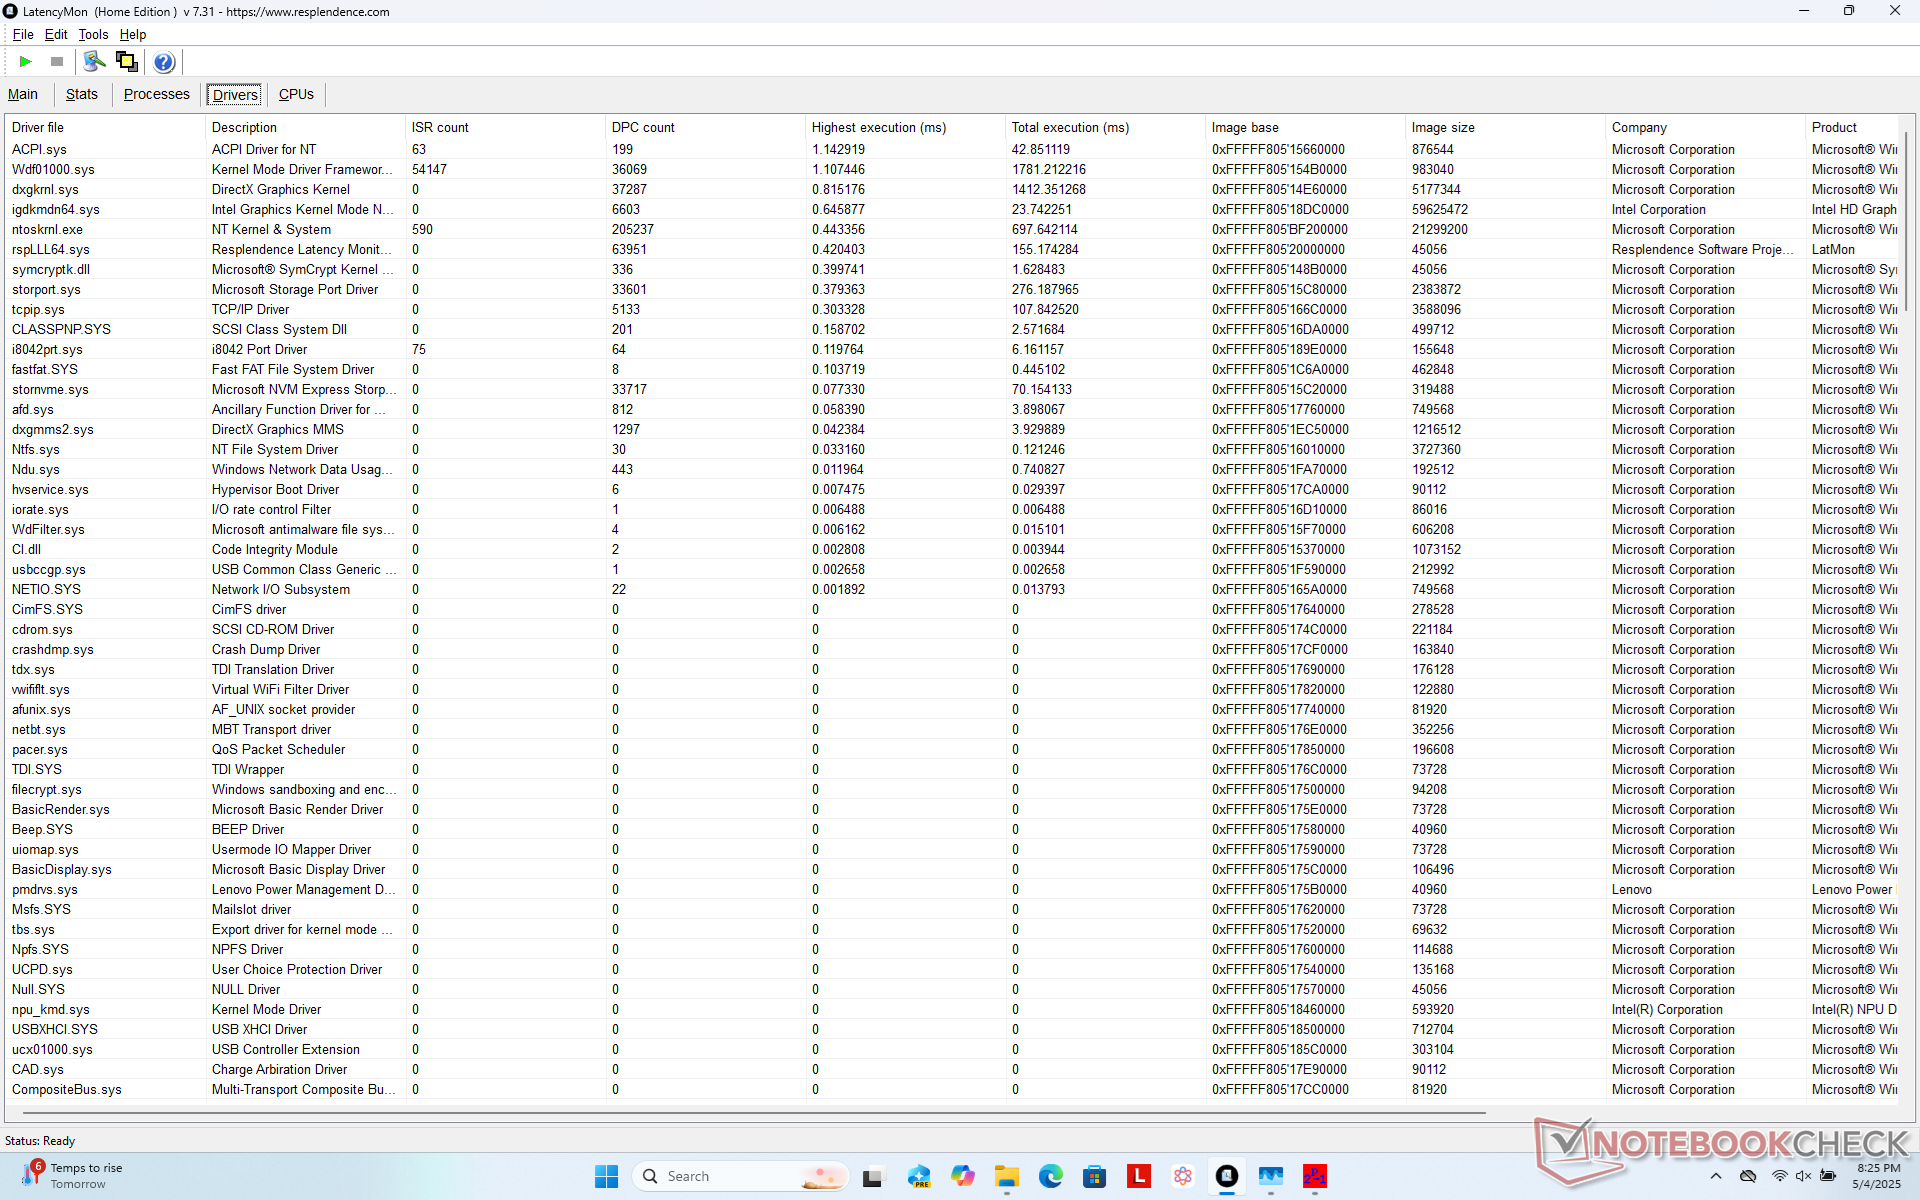
LatencyMon pokazuje tylko niewielkie problemy z DPC i brak jakichkolwiek spadków klatek podczas naszego testu wideo 4K60.
| DPC Latencies / LatencyMon - interrupt to process latency (max), Web, Youtube, Prime95 | |
| Lenovo Yoga 7 2-in-1 14AKP10 | |
| Dell Latitude 9440 2-in-1 | |
| HP EliteBook X Flip G1i 14 AI | |
| Lenovo ThinkPad X1 2in1 G9 21KE004AGE | |
| Lenovo ThinkPad X1 2-in-1 Gen 10 | |
| Asus ZenBook Duo OLED UX8406CA | |
* ... im mniej tym lepiej
Urządzenia pamięci masowej
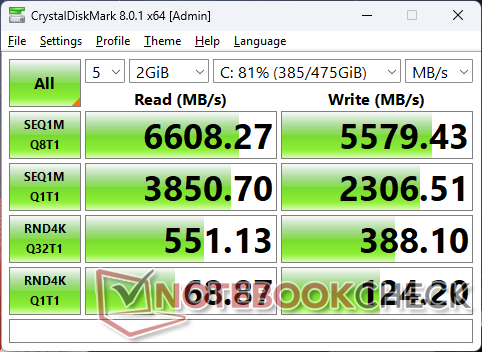
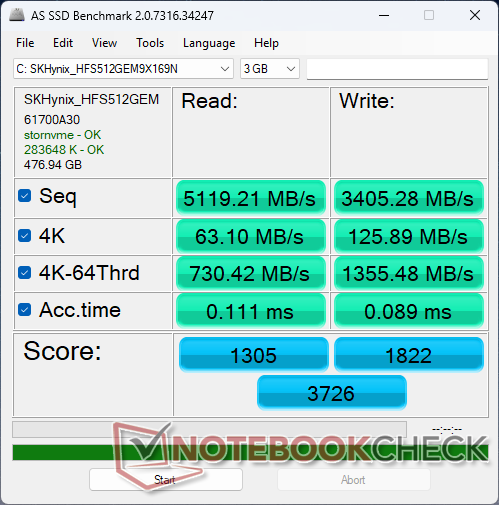
Nasza jednostka testowa jest dostarczana z SK Hynix HFS512GEM9X169N zamiast Kioxia, który znalazł się w naszym modelu 2024. Wydajność jest stabilna, bez dławienia przy obciążeniu, jak pokazują poniższe wyniki pętli DiskSpd, ale szybkość zapisu jest jednak wolniejsza niż w przypadku Kioxia.
Konfiguracje Core Ultra-H w pełni obsługują dyski PCIe5 x4. W przeciwnym razie nasza konfiguracja Core Ultra-V obsługuje tylko PCIe4 x4.

* ... im mniej tym lepiej
Disk Throttling: DiskSpd Read Loop, Queue Depth 8
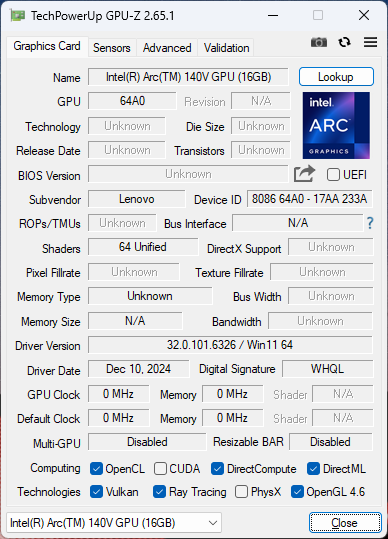
Wydajność GPU
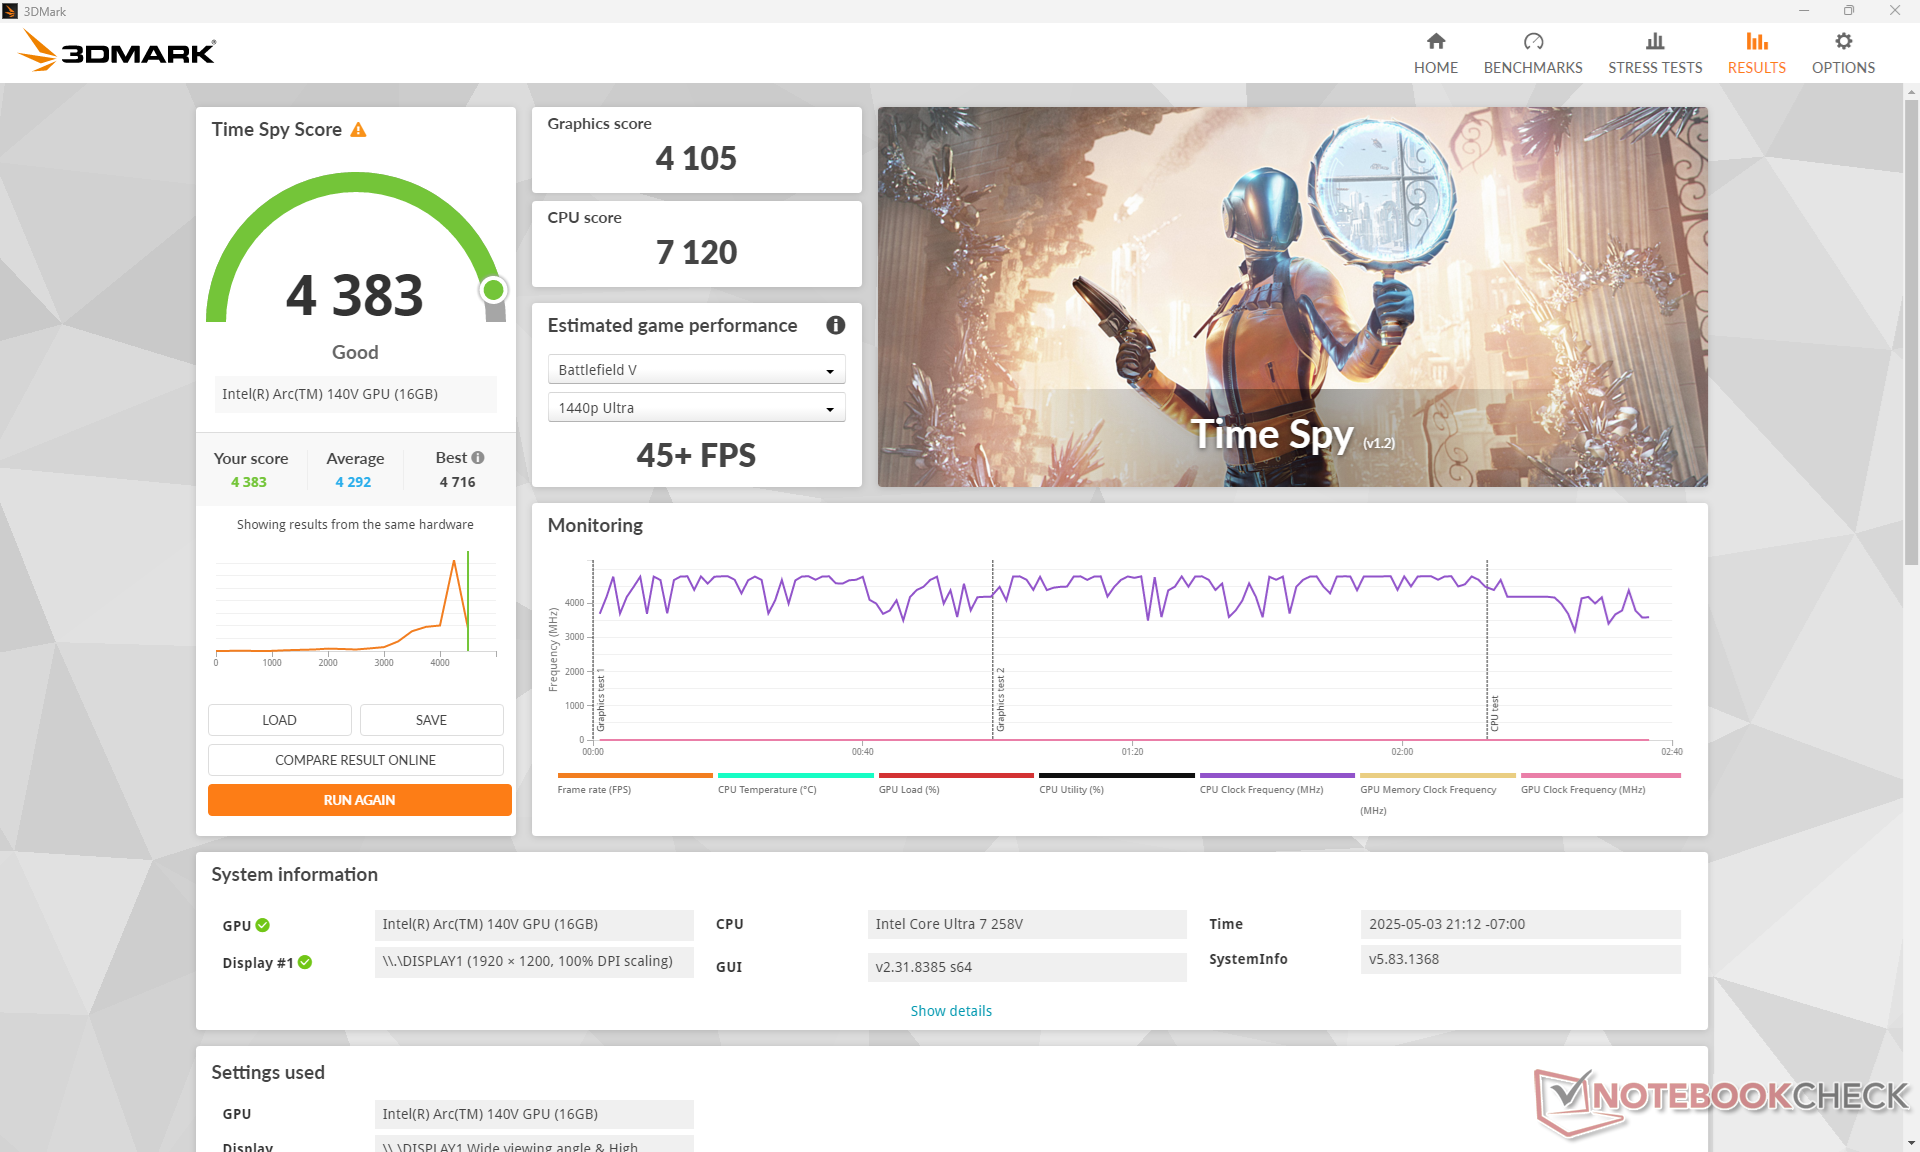
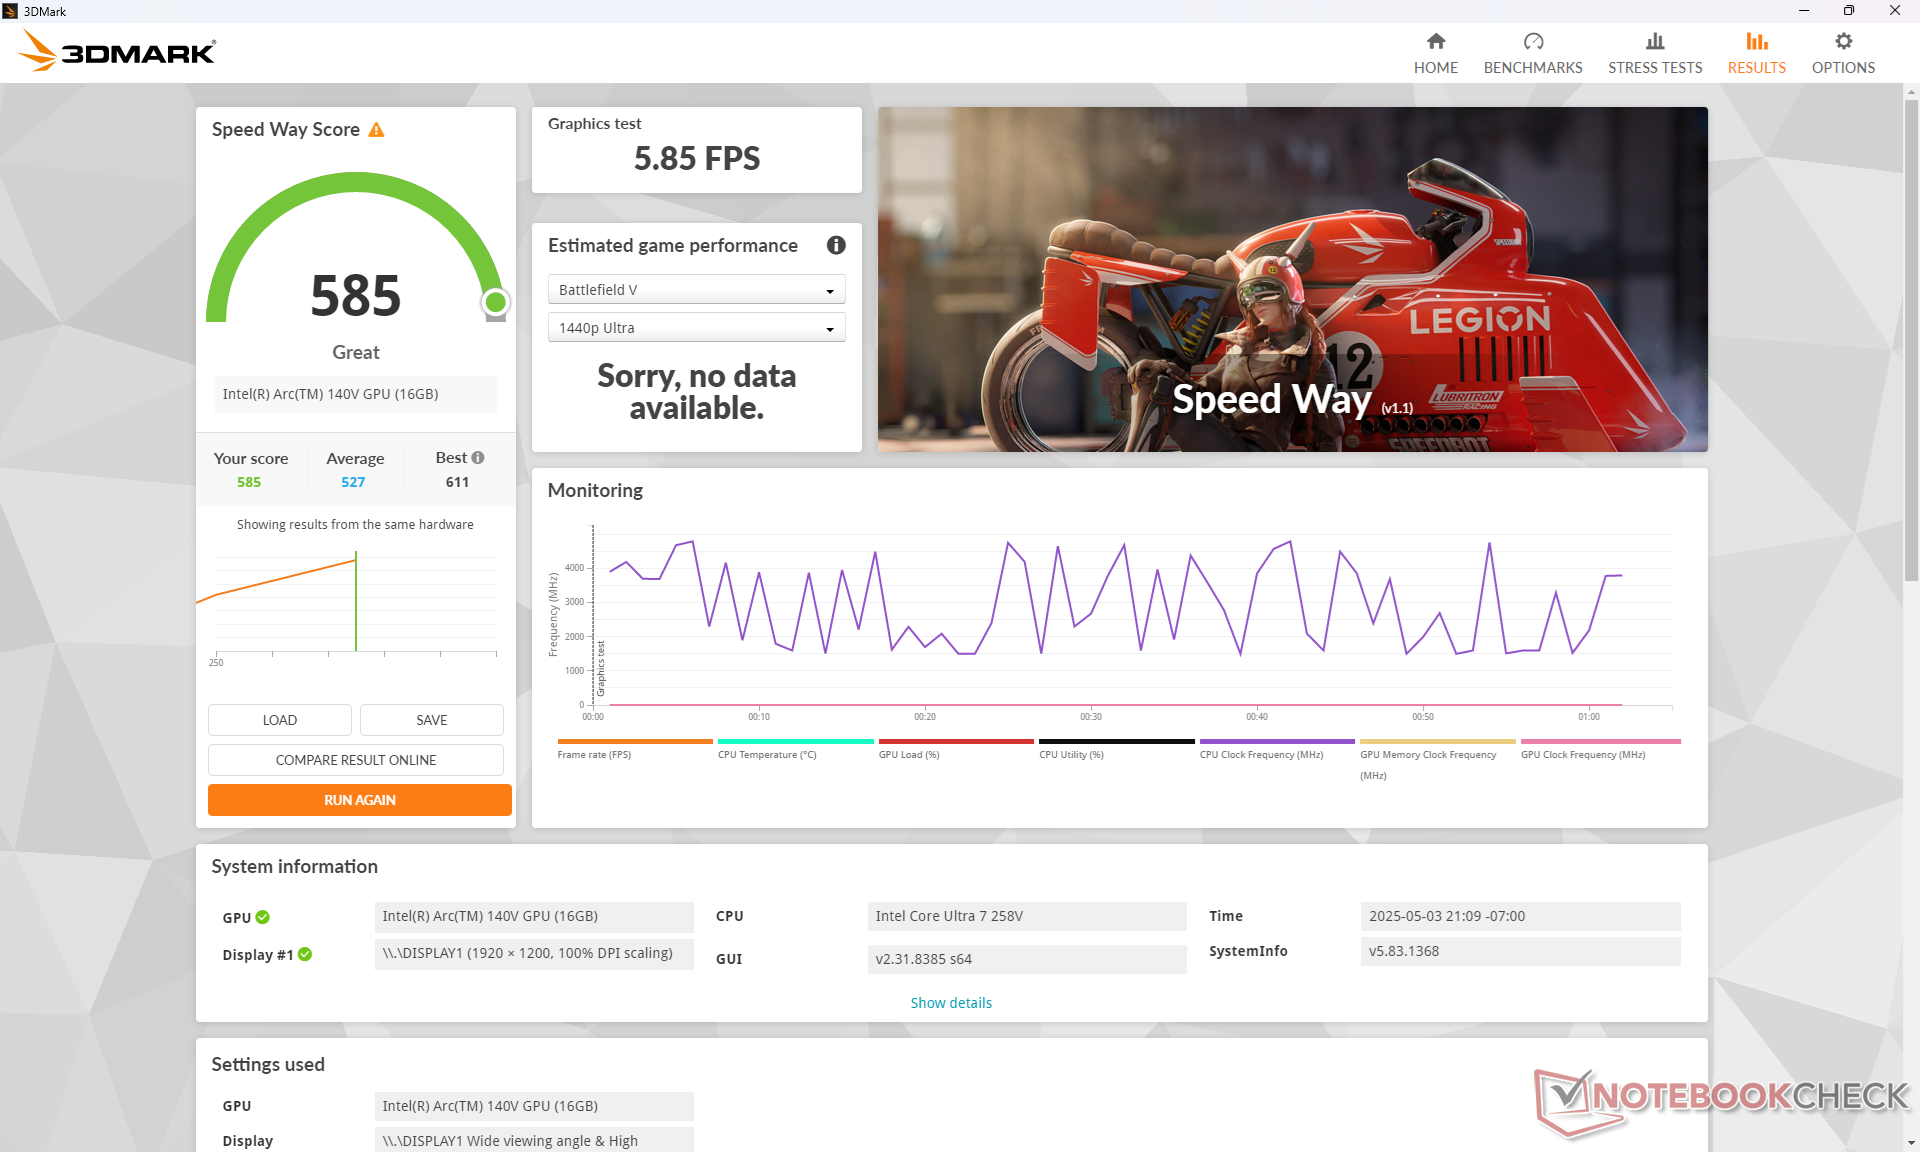
Podczas gdy surowa wydajność procesora pozostaje niezmieniona w stosunku do ThinkPada X1 2-w-1 Gen 9, wydajność grafiki znacznie wzrosła po przeskoczeniu z Arc 4 do Arc 140V. wyniki 3DMark pokazują nawet 2-krotny wzrost wydajności lub około 10 do 20 procent w porównaniu z rocznym modelem Arc 8. Jest to jedno z najszybszych zintegrowanych rozwiązań dostępnych dla 14-calowej konwertowalnej obudowy.
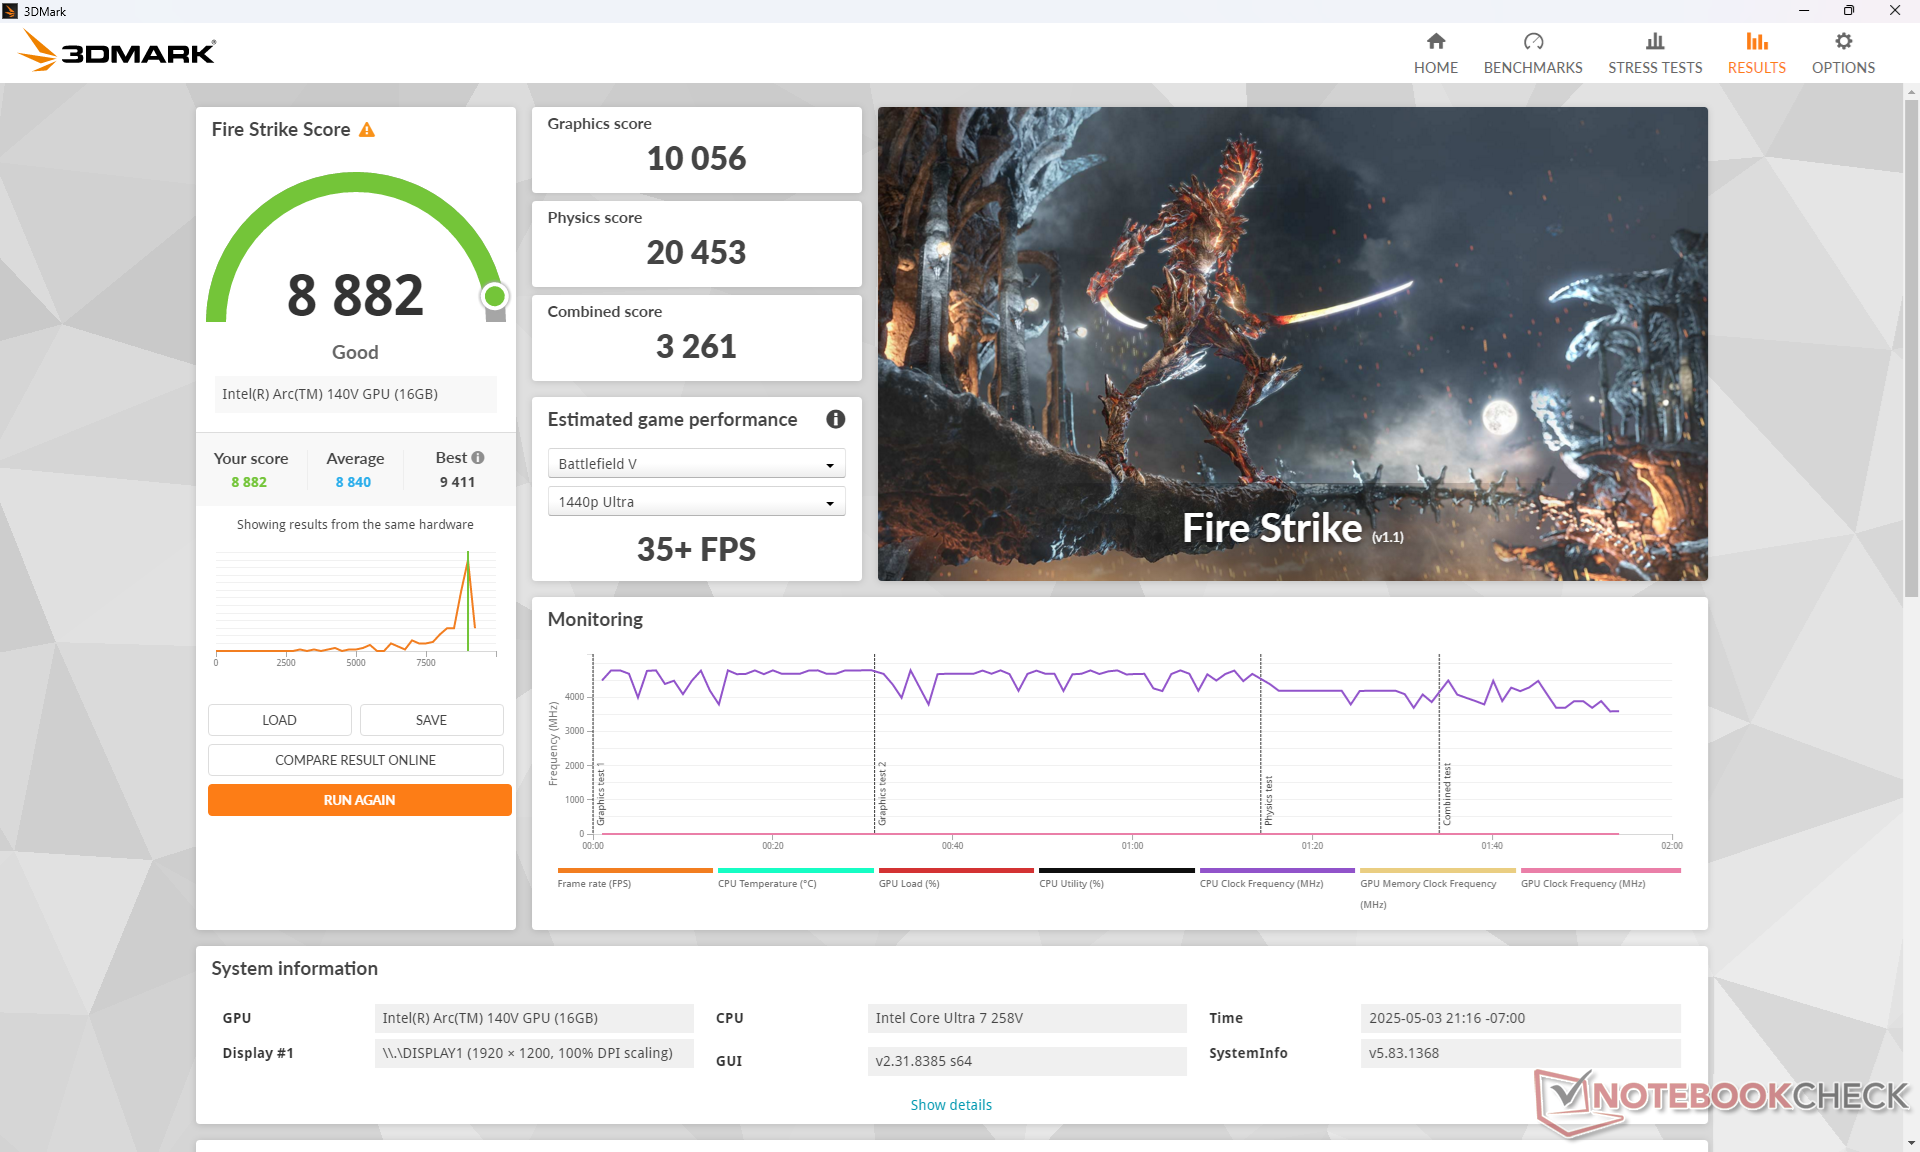
Głównym zastrzeżeniem jest jednak to, że wydajność GPU może być niestabilna, podobnie jak wydajność procesora wspomniana powyżej. Podczas uruchamiania Fire Strike, na przykład, wynik graficzny może się wahać niezależnie od profilu zasilania, jak pokazano w poniższej tabeli.
| Profil zasilania | Wynik grafiki | Wynik fizyki | Wynik łączny |
| Tryb wydajności | 10056 | 20453 | 3261 |
| Tryb zrównoważony | 6736 (-33%) | 16281 (-20%) | 2236 (-31%) |
| Zasilanie bateryjne | 9701 (-4%) | 20608 (-0%) | 3474 (-0%) |
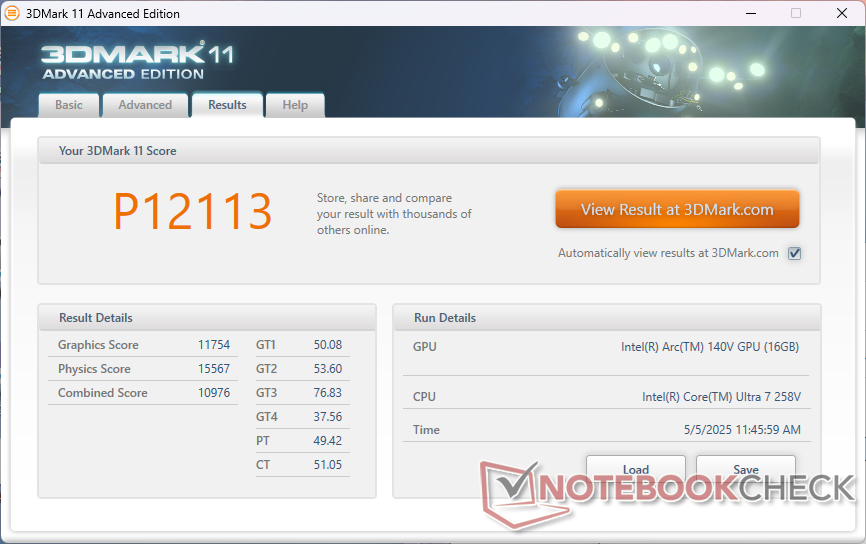
| 3DMark 11 Performance | 12113 pkt. | |
| 3DMark Fire Strike Score | 8882 pkt. | |
| 3DMark Time Spy Score | 4383 pkt. | |
Pomoc | ||
* ... im mniej tym lepiej
Wydajność w grach
Wspomniana powyżej zmienna wydajność GPU prowadzi niestety do wahań liczby klatek na sekundę. Na przykład podczas bezczynności w Cyberpunk 2077 przy ustawieniach 1080p Ultra liczba klatek na sekundę wahała się między 22 a 26 FPS w porównaniu do stałych 26 FPS na Lenovo Yoga 7 14 2-w-1 G10 wyposażonym w dokładnie ten sam procesor i kartę graficzną. ThinkPad X1 2 w 1 Gen 10 nie jest zatem idealny do gier, mimo że jego iGPU jest w pełni zdolny do uruchamiania większości tytułów.
Cyberpunk 2077 ultra FPS Chart
| low | med. | high | ultra | |
|---|---|---|---|---|
| Dota 2 Reborn (2015) | 96 | 64.4 | 66.2 | 65.6 |
| Final Fantasy XV Benchmark (2018) | 72.3 | 41.5 | 30.3 | |
| X-Plane 11.11 (2018) | 44.1 | 35.6 | 37.1 | |
| Strange Brigade (2018) | 225 | 86.8 | 72.8 | 60.5 |
| Baldur's Gate 3 (2023) | 41.8 | 30.3 | 28.8 | 25.8 |
| Cyberpunk 2077 (2023) | 41.3 | 35.6 | 31.7 | 26.5 |
| F1 24 (2024) | 75.7 | 76.8 | 56.7 | 17.6 |
Emisje
Hałas systemowy
Hałas wentylatorów jest zauważalnie cichszy niż w zeszłorocznym modelu, pomimo braku większych zmian w rozwiązaniu chłodzącym. Wewnętrzne wentylatory pracują na biegu jałowym dłużej, gdy wprowadzane są wyższe obciążenia, co oznacza mniejsze pulsowanie podczas przeglądania stron internetowych lub odtwarzania wideo. Pułap hałasu wentylatorów jest poza tym podobny do zeszłorocznego modelu i wynosi około 41 dB(A) przy bardzo wymagających obciążeniach - po prostu osiągnięcie tego pułapu zajmuje więcej czasu w nowszym modelu.
Lenovo jest generalnie cichszy w porównaniu do innych 14-calowych konwertowalnych laptopów, w tym do Latitude 9440 2-w-1.
Hałas
| luz |
| 23.3 / 23.3 / 23.3 dB |
| obciążenie |
| 38 / 40.6 dB |
 | ||
30 dB cichy 40 dB(A) słyszalny 50 dB(A) irytujący |
||
min: | ||
| Lenovo ThinkPad X1 2-in-1 Gen 10 Arc 140V, Core Ultra 7 258V | Lenovo ThinkPad X1 2in1 G9 21KE004AGE Graphics 4-Core iGPU (Arrow Lake), Ultra 7 165U, Kioxia XG8 KXG8AZNV1T02 | Lenovo Yoga 7 2-in-1 14AKP10 Radeon 840M, Ryzen AI 5 340, WD PC SN7100S SDFPMSL-512G-1101 | Dell Latitude 9440 2-in-1 Iris Xe G7 96EUs, i7-1365U, Samsung PM9B1 1024GB MZAL41T0HBLB | HP EliteBook X Flip G1i 14 AI Arc 140V, Core Ultra 7 258V, Western Digital PC SN5000S SDEPNSJ-1T00-1006 | Asus ZenBook Duo OLED UX8406CA Arc 140T, Ultra 9 285H, Western Digital PC SN5000S SDEQNSJ-1T00 | |
|---|---|---|---|---|---|---|
| Noise | -12% | -13% | -4% | 10% | -2% | |
| wyłączone / środowisko * (dB) | 23.3 | 24.5 -5% | 25 -7% | 24.1 -3% | 23 1% | 23.6 -1% |
| Idle Minimum * (dB) | 23.3 | 24.5 -5% | 25 -7% | 24.3 -4% | 23 1% | 23.6 -1% |
| Idle Average * (dB) | 23.3 | 28 -20% | 27 -16% | 24.3 -4% | 23 1% | 23.6 -1% |
| Idle Maximum * (dB) | 23.3 | 29.8 -28% | 30 -29% | 24.3 -4% | 23 1% | 23.6 -1% |
| Load Average * (dB) | 38 | 41.7 -10% | 43 -13% | 36.3 4% | 27.14 29% | 39.8 -5% |
| Cyberpunk 2077 ultra * (dB) | 37.8 | 42 -11% | 31.65 16% | 39.8 -5% | ||
| Load Maximum * (dB) | 40.6 | 41.7 -3% | 44 -8% | 44.5 -10% | 31.65 22% | 39.8 2% |
| Witcher 3 ultra * (dB) | 41.7 | 44.5 |
* ... im mniej tym lepiej
Temperatura
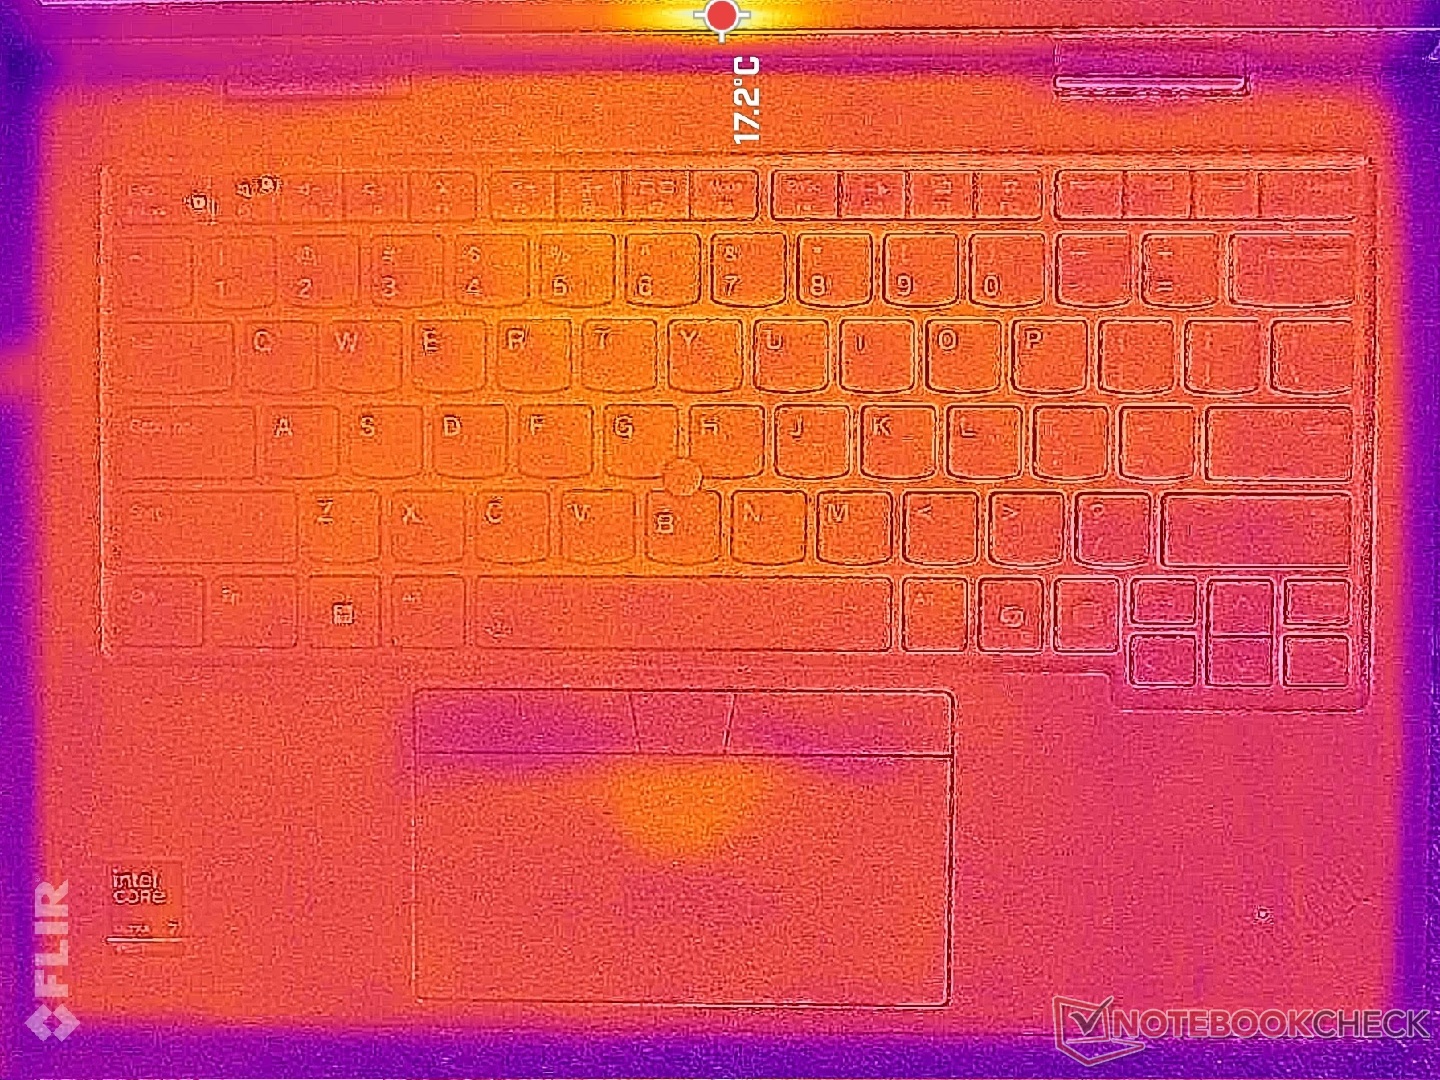
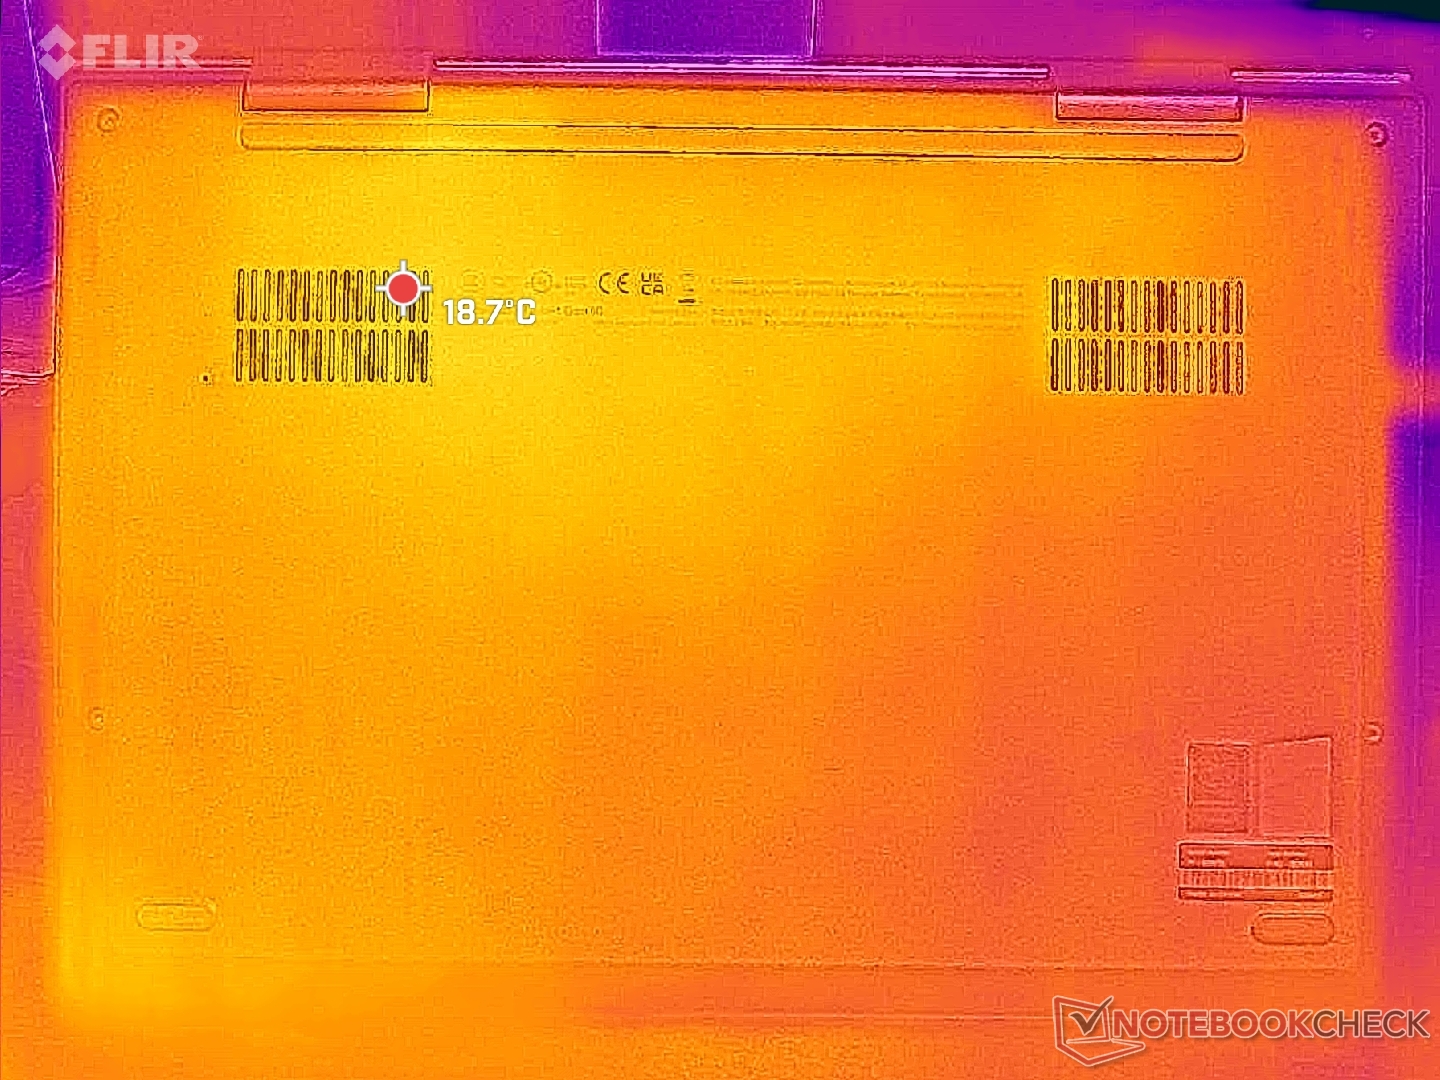
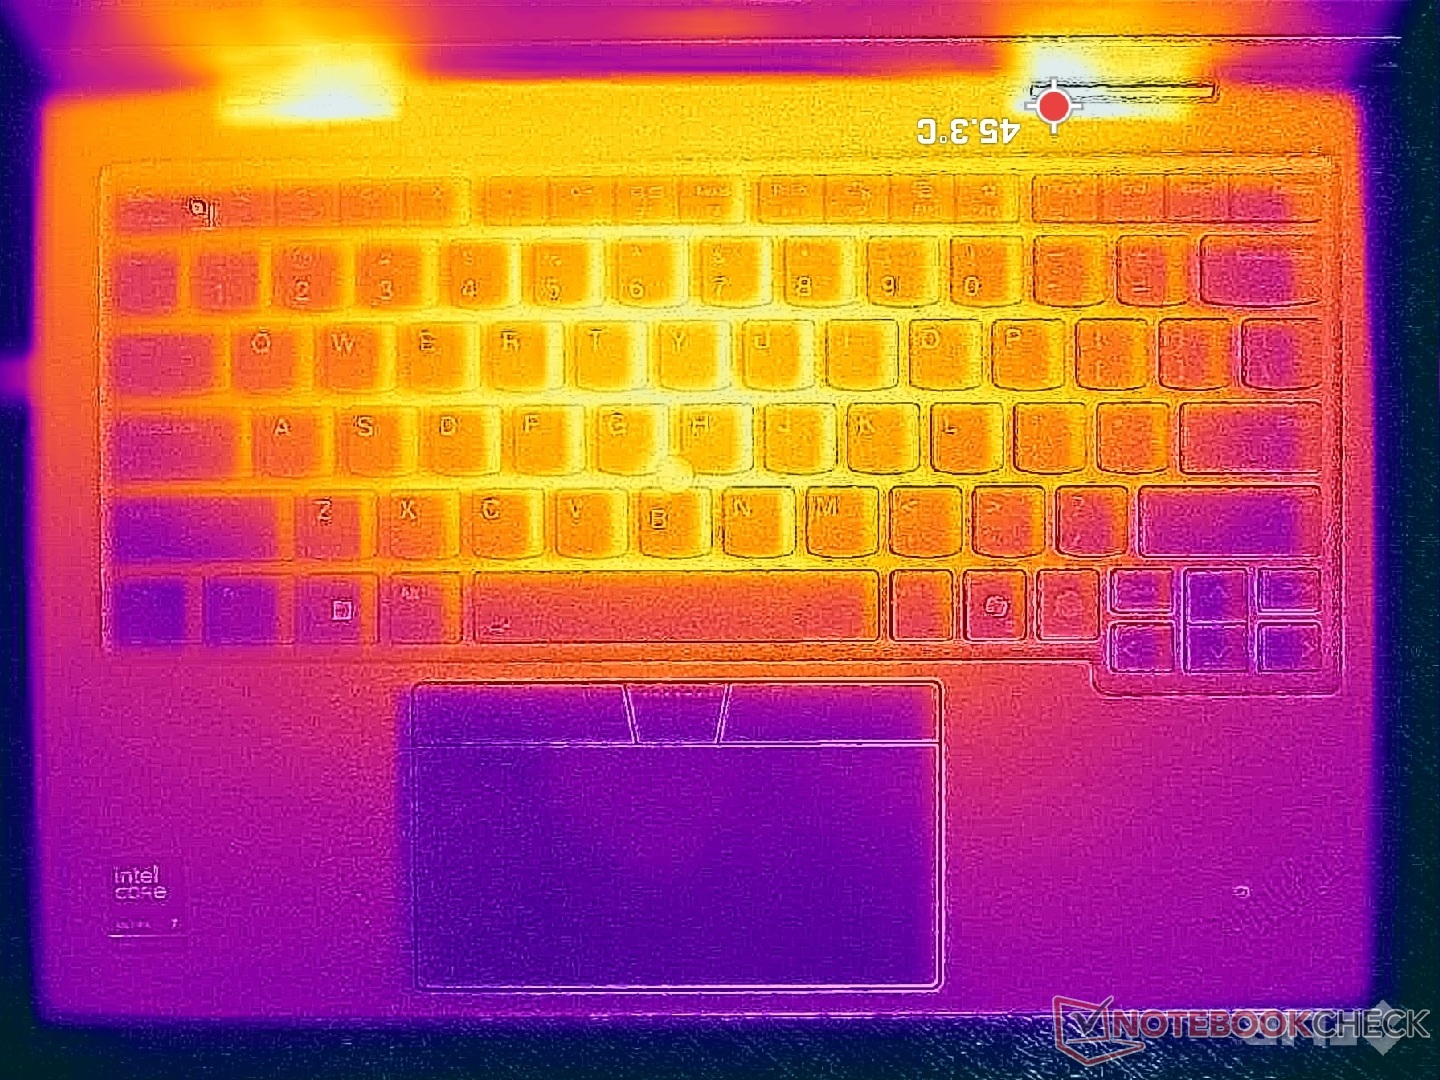
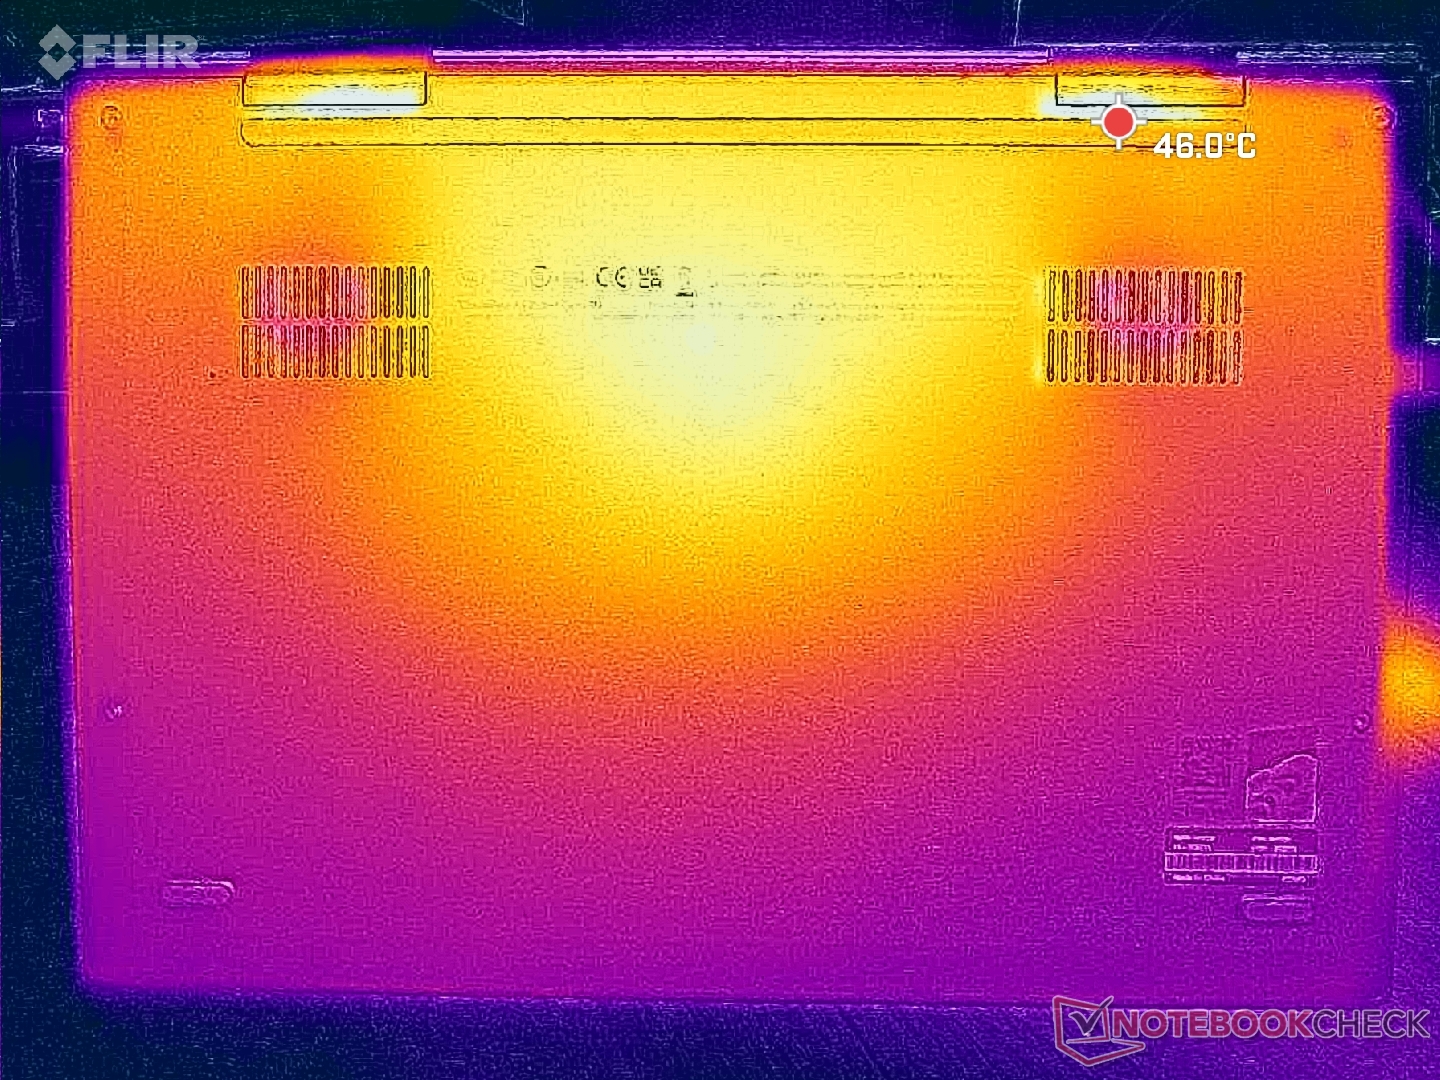
Temperatura powierzchni jest najcieplejsza w kierunku środka, gdzie gorące punkty mogą osiągnąć 39 C lub średnio o kilka stopni niższą niż ta, którą odnotowaliśmy w modelu 2024. Chłodniejsze powierzchnie są mile widziane, ponieważ okazało się, że ustępujący model był cieplejszy niż byśmy chcieli podczas pracy z wymagającymi obciążeniami.
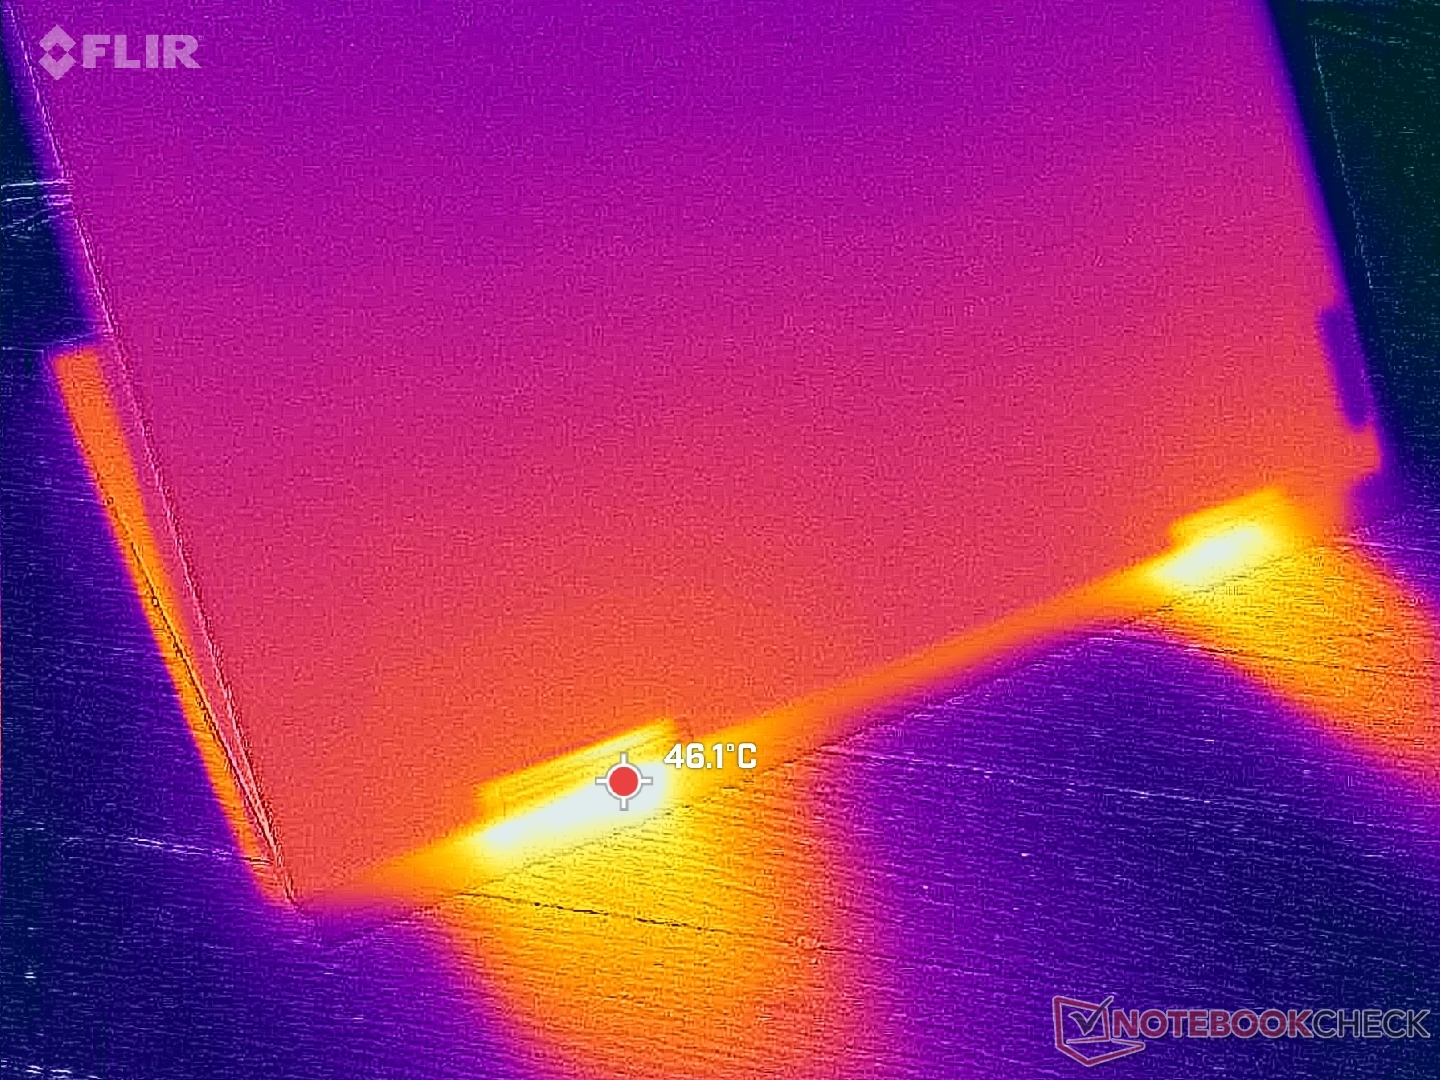
(±) Maksymalna temperatura w górnej części wynosi 40 °C / 104 F, w porównaniu do średniej 35.4 °C / 96 F , począwszy od 19.6 do 60 °C dla klasy Convertible.
(+) Dno nagrzewa się maksymalnie do 38.6 °C / 101 F, w porównaniu do średniej 36.9 °C / 98 F
(+) W stanie bezczynności średnia temperatura górnej części wynosi 24.4 °C / 76 F, w porównaniu ze średnią temperaturą urządzenia wynoszącą 30.3 °C / ### class_avg_f### F.
(+) Podpórki pod nadgarstki i touchpad są chłodniejsze niż temperatura skóry i maksymalnie 28.4 °C / 83.1 F i dlatego są chłodne w dotyku.
(±) Średnia temperatura obszaru podparcia dłoni w podobnych urządzeniach wynosiła 28 °C / 82.4 F (-0.4 °C / -0.7 F).
| Lenovo ThinkPad X1 2-in-1 Gen 10 Intel Core Ultra 7 258V, Intel Arc Graphics 140V | Lenovo ThinkPad X1 2in1 G9 21KE004AGE Intel Core Ultra 7 165U, Intel Graphics 4-Core iGPU (Meteor / Arrow Lake) | Lenovo Yoga 7 2-in-1 14AKP10 AMD Ryzen AI 5 340, AMD Radeon 840M | Dell Latitude 9440 2-in-1 Intel Core i7-1365U, Intel Iris Xe Graphics G7 96EUs | HP EliteBook X Flip G1i 14 AI Intel Core Ultra 7 258V, Intel Arc Graphics 140V | Asus ZenBook Duo OLED UX8406CA Intel Core Ultra 9 285H, Intel Arc Graphics 140T | |
|---|---|---|---|---|---|---|
| Heat | -3% | -17% | -13% | -1% | -2% | |
| Maximum Upper Side * (°C) | 40 | 42.9 -7% | 47 -18% | 40.8 -2% | 36 10% | 35.3 12% |
| Maximum Bottom * (°C) | 38.6 | 43.6 -13% | 49 -27% | 40 -4% | 41 -6% | 47.2 -22% |
| Idle Upper Side * (°C) | 25 | 24.4 2% | 28 -12% | 30.4 -22% | 26 -4% | 24.8 1% |
| Idle Bottom * (°C) | 26.6 | 24.9 6% | 29 -9% | 32.8 -23% | 27 -2% | 26.2 2% |
* ... im mniej tym lepiej
Głośniki
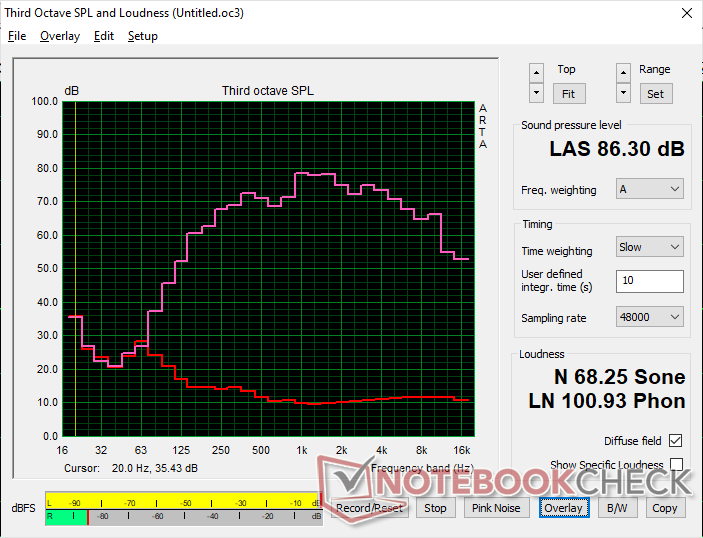
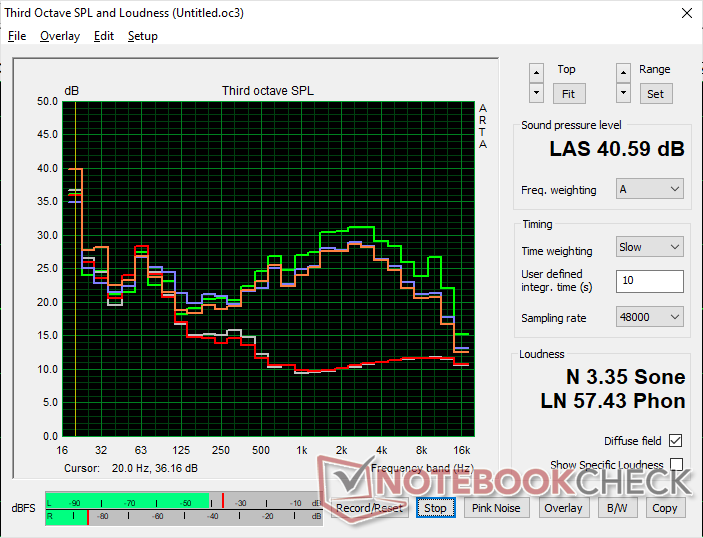
Lenovo ThinkPad X1 2-in-1 Gen 10 analiza dźwięku
(+) | głośniki mogą odtwarzać stosunkowo głośno (86.3 dB)
Bas 100 - 315 Hz
(±) | zredukowany bas - średnio 9.2% niższy od mediany
(±) | liniowość basu jest średnia (9.2% delta do poprzedniej częstotliwości)
Średnie 400 - 2000 Hz
(±) | wyższe średnie - średnio 5.3% wyższe niż mediana
(+) | średnie są liniowe (4.7% delta do poprzedniej częstotliwości)
Wysokie 2–16 kHz
(+) | zrównoważone maksima - tylko 3.4% od mediany
(+) | wzloty są liniowe (4.3% delta do poprzedniej częstotliwości)
Ogólnie 100 - 16.000 Hz
(+) | ogólny dźwięk jest liniowy (11.9% różnicy w stosunku do mediany)
W porównaniu do tej samej klasy
» 11% wszystkich testowanych urządzeń w tej klasie było lepszych, 3% podobnych, 85% gorszych
» Najlepszy miał deltę 6%, średnia wynosiła ###średnia###%, najgorsza wynosiła 57%
W porównaniu do wszystkich testowanych urządzeń
» 9% wszystkich testowanych urządzeń było lepszych, 2% podobnych, 89% gorszych
» Najlepszy miał deltę 4%, średnia wynosiła ###średnia###%, najgorsza wynosiła 134%
Apple MacBook Pro 16 2021 M1 Pro analiza dźwięku
(+) | głośniki mogą odtwarzać stosunkowo głośno (84.7 dB)
Bas 100 - 315 Hz
(+) | dobry bas - tylko 3.8% od mediany
(+) | bas jest liniowy (5.2% delta do poprzedniej częstotliwości)
Średnie 400 - 2000 Hz
(+) | zbalansowane środki średnie - tylko 1.3% od mediany
(+) | średnie są liniowe (2.1% delta do poprzedniej częstotliwości)
Wysokie 2–16 kHz
(+) | zrównoważone maksima - tylko 1.9% od mediany
(+) | wzloty są liniowe (2.7% delta do poprzedniej częstotliwości)
Ogólnie 100 - 16.000 Hz
(+) | ogólny dźwięk jest liniowy (4.6% różnicy w stosunku do mediany)
W porównaniu do tej samej klasy
» 0% wszystkich testowanych urządzeń w tej klasie było lepszych, 0% podobnych, 100% gorszych
» Najlepszy miał deltę 5%, średnia wynosiła ###średnia###%, najgorsza wynosiła 45%
W porównaniu do wszystkich testowanych urządzeń
» 0% wszystkich testowanych urządzeń było lepszych, 0% podobnych, 100% gorszych
» Najlepszy miał deltę 4%, średnia wynosiła ###średnia###%, najgorsza wynosiła 134%
Zarządzanie energią
Zużycie energii
System pobiera zaledwie od 1,5 W do 5 W podczas pracy na biegu jałowym na komputerze stacjonarnym, co jest wartością znacznie niższą niż w przypadku konkurencji, a nawet zeszłorocznego modelu Meteor Lake-U. Ten wysoki poziom wydajności jest w dużej mierze odpowiedzialny za wydłużony czas pracy na baterii w poniższej sekcji.
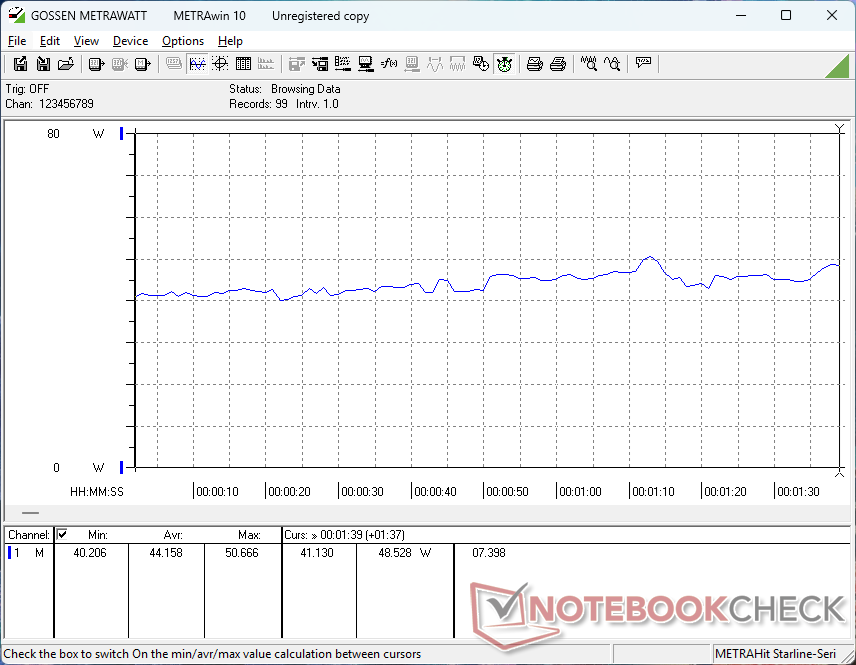
Po uruchomieniu Prime95 system pobiera nieco mniej energii niż jego poprzednik, zapewniając jednocześnie nieco szybszą wydajność procesora, co zwiększa wydajność w przeliczeniu na wat. Z drugiej strony, uruchomienie FurMark wymaga kilku watów więcej niż jego poprzednik, ale surowy wzrost wydajności graficznej z nawiązką to rekompensuje.
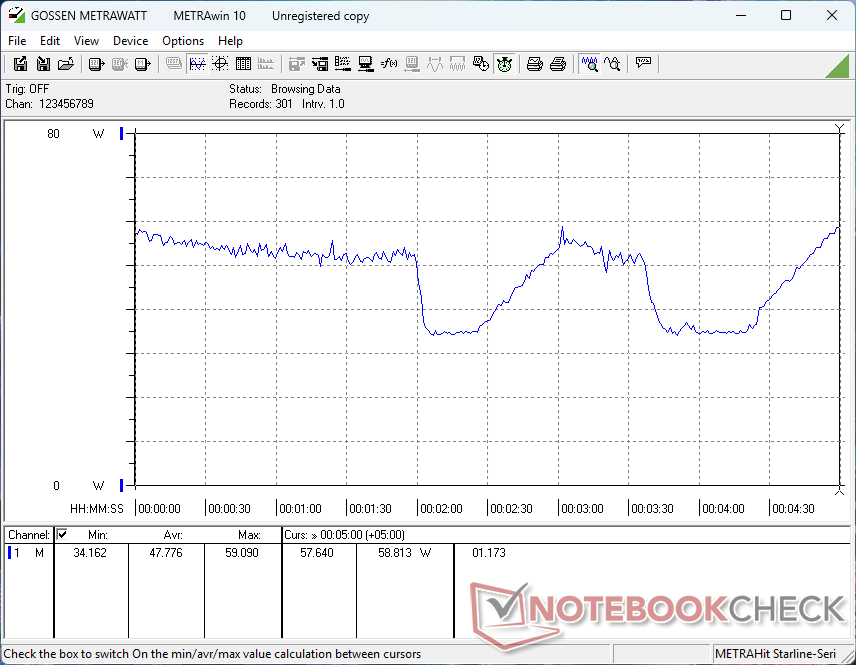
Zużycie energii wahało się między 35 W a 60 W podczas uruchamiania Cyberpunk 2077, zamiast pozostawać na stałym poziomie, jak w przypadku większości innych laptopów.
| wyłączony / stan wstrzymania | |
| luz | |
| obciążenie |
|
Legenda:
min: | |
| Lenovo ThinkPad X1 2-in-1 Gen 10 Core Ultra 7 258V, Arc 140V, , IPS, 1920x1200, 14" | Lenovo ThinkPad X1 2in1 G9 21KE004AGE Ultra 7 165U, Graphics 4-Core iGPU (Arrow Lake), Kioxia XG8 KXG8AZNV1T02, OLED, 2880x1800, 14" | Lenovo Yoga 7 2-in-1 14AKP10 Ryzen AI 5 340, Radeon 840M, WD PC SN7100S SDFPMSL-512G-1101, OLED, 1920x1200, 14" | Dell Latitude 9440 2-in-1 i7-1365U, Iris Xe G7 96EUs, Samsung PM9B1 1024GB MZAL41T0HBLB, IPS, 2560x1600, 14" | HP EliteBook X Flip G1i 14 AI Core Ultra 7 258V, Arc 140V, Western Digital PC SN5000S SDEPNSJ-1T00-1006, IPS, 1920x1200, 14" | Asus ZenBook Duo OLED UX8406CA Ultra 9 285H, Arc 140T, Western Digital PC SN5000S SDEQNSJ-1T00, OLED, 1920x1200, 14" | |
|---|---|---|---|---|---|---|
| Power Consumption | -123% | -42% | -59% | -32% | -54% | |
| Idle Minimum * (Watt) | 1.5 | 7.3 -387% | 4 -167% | 4.2 -180% | 2.9 -93% | 4.1 -173% |
| Idle Average * (Watt) | 4.8 | 10.1 -110% | 5 -4% | 6.9 -44% | 8.2 -71% | 8.2 -71% |
| Idle Maximum * (Watt) | 5 | 10.4 -108% | 7 -40% | 7.8 -56% | 8.6 -72% | 8.7 -74% |
| Load Average * (Watt) | 44.2 | 45.7 -3% | 52 -18% | 46 -4% | 39.6 10% | 56.7 -28% |
| Cyberpunk 2077 ultra external monitor * (Watt) | 39.3 | 52.6 -34% | 36.4 7% | 47 -20% | ||
| Cyberpunk 2077 ultra * (Watt) | 47.8 | 54.8 -15% | 41.9 12% | 48.7 -2% | ||
| Load Maximum * (Watt) | 60.2 | 64.1 -6% | 68 -13% | 68.2 -13% | 70 -16% | 65.1 -8% |
| Witcher 3 ultra * (Watt) | 35.2 | 51.9 |
* ... im mniej tym lepiej
Power Consumption Cyberpunk / Stress Test
Power Consumption external Monitor
Żywotność baterii

Czas pracy został znacznie poprawiony, głównie dzięki nowej architekturze Lunar Lake. Jesteśmy w stanie zarejestrować prawie 22 godziny ciągłego przeglądania sieci WLAN w porównaniu do "tylko" 8,5 godziny w zeszłorocznym modelu, mimo że pojemność baterii pozostała niezmieniona. Aktualizacja do konfiguracji OLED skróci żywotność baterii, ale nadal będzie znacznie dłuższa niż to, co zarejestrowaliśmy na naszej jednostce 2024 OLED.
Konkurencyjne modele z Lunar Lake, takie jak HP EliteBook X Flip G1i 14 AI są w stanie zaoferować podobnie długi czas pracy.
Ładowanie od pustego akumulatora do pełnej pojemności trwa od 90 do 120 minut.
| Lenovo ThinkPad X1 2-in-1 Gen 10 Core Ultra 7 258V, Arc 140V, 57 Wh | Lenovo ThinkPad X1 2in1 G9 21KE004AGE Ultra 7 165U, Graphics 4-Core iGPU (Arrow Lake), 57 Wh | Lenovo Yoga 7 2-in-1 14AKP10 Ryzen AI 5 340, Radeon 840M, 70 Wh | Dell Latitude 9440 2-in-1 i7-1365U, Iris Xe G7 96EUs, 60 Wh | HP EliteBook X Flip G1i 14 AI Core Ultra 7 258V, Arc 140V, 68 Wh | Asus ZenBook Duo OLED UX8406CA Ultra 9 285H, Arc 140T, 75 Wh | |
|---|---|---|---|---|---|---|
| Czasy pracy | -61% | -48% | -58% | -16% | -50% | |
| WiFi v1.3 (h) | 22 | 8.5 -61% | 11.4 -48% | 9.3 -58% | 18.4 -16% | 11.1 -50% |
| H.264 (h) | 9 | 20.6 | 16.9 | |||
| Load (h) | 1.5 | 1.2 | 2.1 | |||
| Reader / Idle (h) | 23.7 |
Ocena Notebookcheck
Lenovo ThinkPad X1 2-in-1 Gen 10
- 16/05/2025 v8
Allen Ngo
 Total Sustainability Score:
 Potential Competitors in Comparison
Obraz | Model / recenzja | Cena | Waga | Wysokość | Ekran |
|---|---|---|---|---|---|
1. 88.8%  | Lenovo ThinkPad X1 2-in-1 Gen 10 Intel Core Ultra 7 258V ⎘ Intel Arc Graphics 140V ⎘ 32 GB Pamięć | Amazon: Cena katalogowa: 2300 USD | 1.4 kg | 18.3 mm | 14.00" 1920x1200 162 PPI IPS |
2. 88.4% v7 (old)  | Lenovo ThinkPad X1 2in1 G9 21KE004AGE Intel Core Ultra 7 165U ⎘ Intel Graphics 4-Core iGPU (Meteor / Arrow Lake) ⎘ 32 GB Pamięć, 1024 GB SSD | Amazon: Cena katalogowa: 3350€ | 1.3 kg | 15.5 mm | 14.00" 2880x1800 243 PPI OLED |
3. 84.8%  | Lenovo Yoga 7 2-in-1 14AKP10 AMD Ryzen AI 5 340 ⎘ AMD Radeon 840M ⎘ 16 GB Pamięć, 512 GB SSD | Amazon: Cena katalogowa: 1000 EUR | 1.4 kg | 16.5 mm | 14.00" 1920x1200 162 PPI OLED |
4. 87.9% v7 (old)  | Dell Latitude 9440 2-in-1 Intel Core i7-1365U ⎘ Intel Iris Xe Graphics G7 96EUs ⎘ 32 GB Pamięć, 1024 GB SSD | Amazon: 1. $1,296.99 Dell Latitude 9000 9440 14" ... 2. $1,075.63 Dell Latitude 9440 2-in-1 La... 3. $1,199.99 Dell Latitude 7450 7000, 2-i... Cena katalogowa: 2900 USD | 1.6 kg | 16.28 mm | 14.00" 2560x1600 216 PPI IPS |
5. 89.9%  | HP EliteBook X Flip G1i 14 AI Intel Core Ultra 7 258V ⎘ Intel Arc Graphics 140V ⎘ 32 GB Pamięć, 1000 GB SSD | Amazon: Cena katalogowa: 2889 Euro | 1.5 kg | 14.7 mm | 14.00" 1920x1200 162 PPI IPS |
6. 86.5%  | Asus ZenBook Duo OLED UX8406CA Intel Core Ultra 9 285H ⎘ Intel Arc Graphics 140T ⎘ 32 GB Pamięć, 1024 GB SSD | Amazon: Cena katalogowa: 2099€ | 1.8 kg | 19.9 mm | 14.00" 1920x1200 162 PPI OLED |
Przezroczystość
Wyboru urządzeń do recenzji dokonuje nasza redakcja. Próbka testowa została udostępniona autorowi jako pożyczka od producenta lub sprzedawcy detalicznego na potrzeby tej recenzji. Pożyczkodawca nie miał wpływu na tę recenzję, producent nie otrzymał też kopii tej recenzji przed publikacją. Nie było obowiązku publikowania tej recenzji. Jako niezależna firma medialna, Notebookcheck nie podlega władzy producentów, sprzedawców detalicznych ani wydawców.
Tak testuje Notebookcheck
Każdego roku Notebookcheck niezależnie sprawdza setki laptopów i smartfonów, stosując standardowe procedury, aby zapewnić porównywalność wszystkich wyników. Od około 20 lat stale rozwijamy nasze metody badawcze, ustanawiając przy tym standardy branżowe. W naszych laboratoriach testowych doświadczeni technicy i redaktorzy korzystają z wysokiej jakości sprzętu pomiarowego. Testy te obejmują wieloetapowy proces walidacji. Nasz kompleksowy system ocen opiera się na setkach uzasadnionych pomiarów i benchmarków, co pozwala zachować obiektywizm.
