Recenzja laptopa HP Victus 15: Drogo jak na budżetowego gracza
Seria HP Victus składa się z budżetowych laptopów do gier, które mają stanowić kontrast dla wyższej serii Omen producenta. W związku z tym modele Victus mają niższą specyfikację i ograniczone opcje konfiguracji, aby utrzymać niskie i konkurencyjne ceny. Jak na razie serię tworzą dwa modele: 15,6-calowy Victus 15 i 16,1-calowy Victus 16.
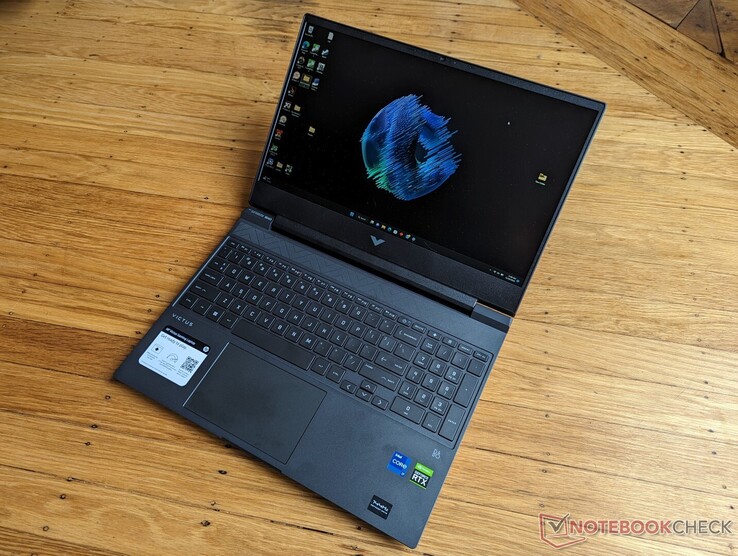
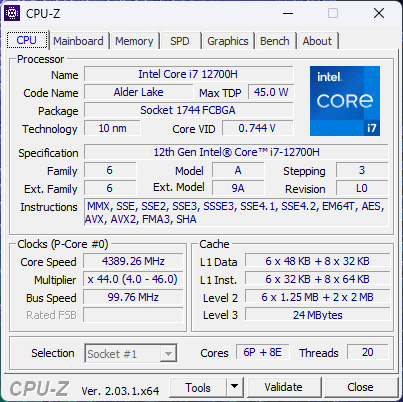
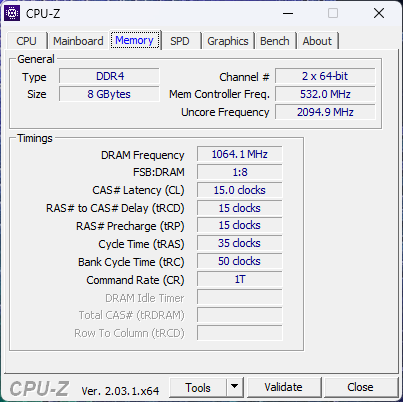
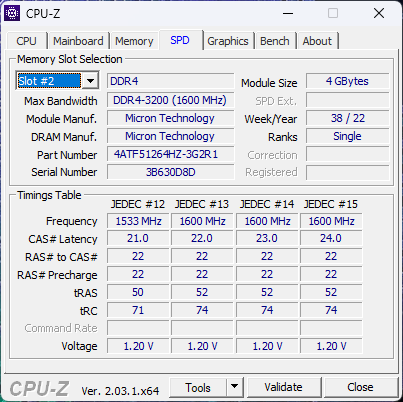
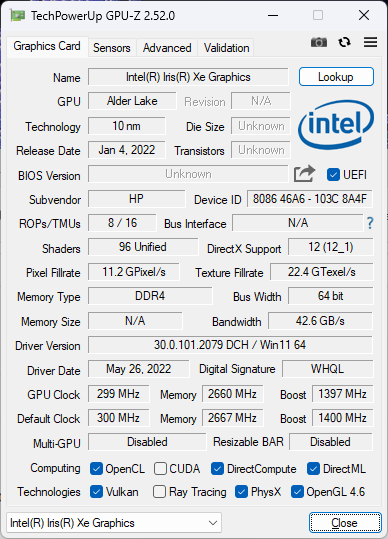
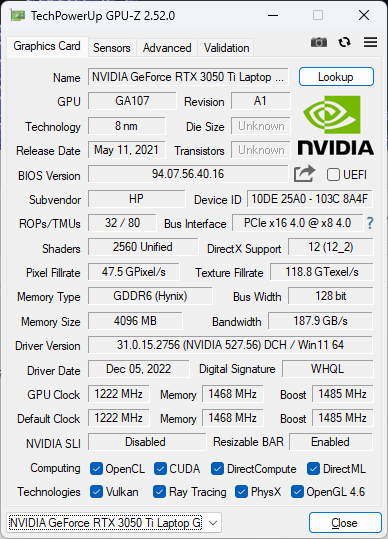
Naszą jednostką testową jest Victus 15 wyposażony w procesor Intel 12th gen Core i7-12700H, GeForce RTX 3050 Ti, wyświetlacz 144 Hz 1080p IPS i tylko 8 GB pamięci RAM w cenie detalicznej około 1200 - 1300 USD. Mniejsze SKU są dostępne z Core i7-12650H, AMD Ryzen 7 5800H, RTX 3050 lub wyświetlaczem 60 Hz 1080p za kilkaset dolarów mniej, ale nasza konfiguracja CPU i GPU jest najwyższa dla tego modelu.
Do konkurentów Victusa 15 należą inne podstawowe 15,6-calowe laptopy do gier, jak np Dell G5 15, Lenovo IdeaPad Gaming 3, MSI GF lub Seria GPlub Asus TUF.
Więcej recenzji HP:
Potencjalni konkurenci w porównaniu
Ocena | Data | Model | Waga | Wysokość | Rozmiar | Rezolucja | Cena |
|---|---|---|---|---|---|---|---|
| 81 % v7 (old) | 01/2023 | HP Victus 15 fa0020nr i7-12700H, GeForce RTX 3050 Ti Laptop GPU | 2.3 kg | 23.6 mm | 15.60" | 1920x1080 | |
| 82.8 % v7 (old) | HP Omen 15-en0375ng R7 4800H, GeForce RTX 2060 Mobile | 2.2 kg | 23 mm | 15.60" | 1920x1080 | ||
| 82.7 % v7 (old) | Dell G15 5515 R7 5800H, GeForce RTX 3050 Ti Laptop GPU | 2.4 kg | 24.9 mm | 15.60" | 1920x1080 | ||
| 84.9 % v7 (old) | Asus TUF Dash F15 FX517ZC i7-12650H, GeForce RTX 3050 4GB Laptop GPU | 1.9 kg | 20.7 mm | 15.60" | 2560x1440 | ||
| 78.2 % v7 (old) | 03/2026 | MSI Bravo 15 B5DD-010US R5 5600H, Radeon RX 5500M | 2.3 kg | 24.95 mm | 15.60" | 1920x1080 | |
| 87.5 % v7 (old) | 11/2022 | Lenovo Legion 5 15IAH7H 82RB i7-12700H, GeForce RTX 3060 Laptop GPU | 2.4 kg | 19.99 mm | 15.60" | 1920x1080 |
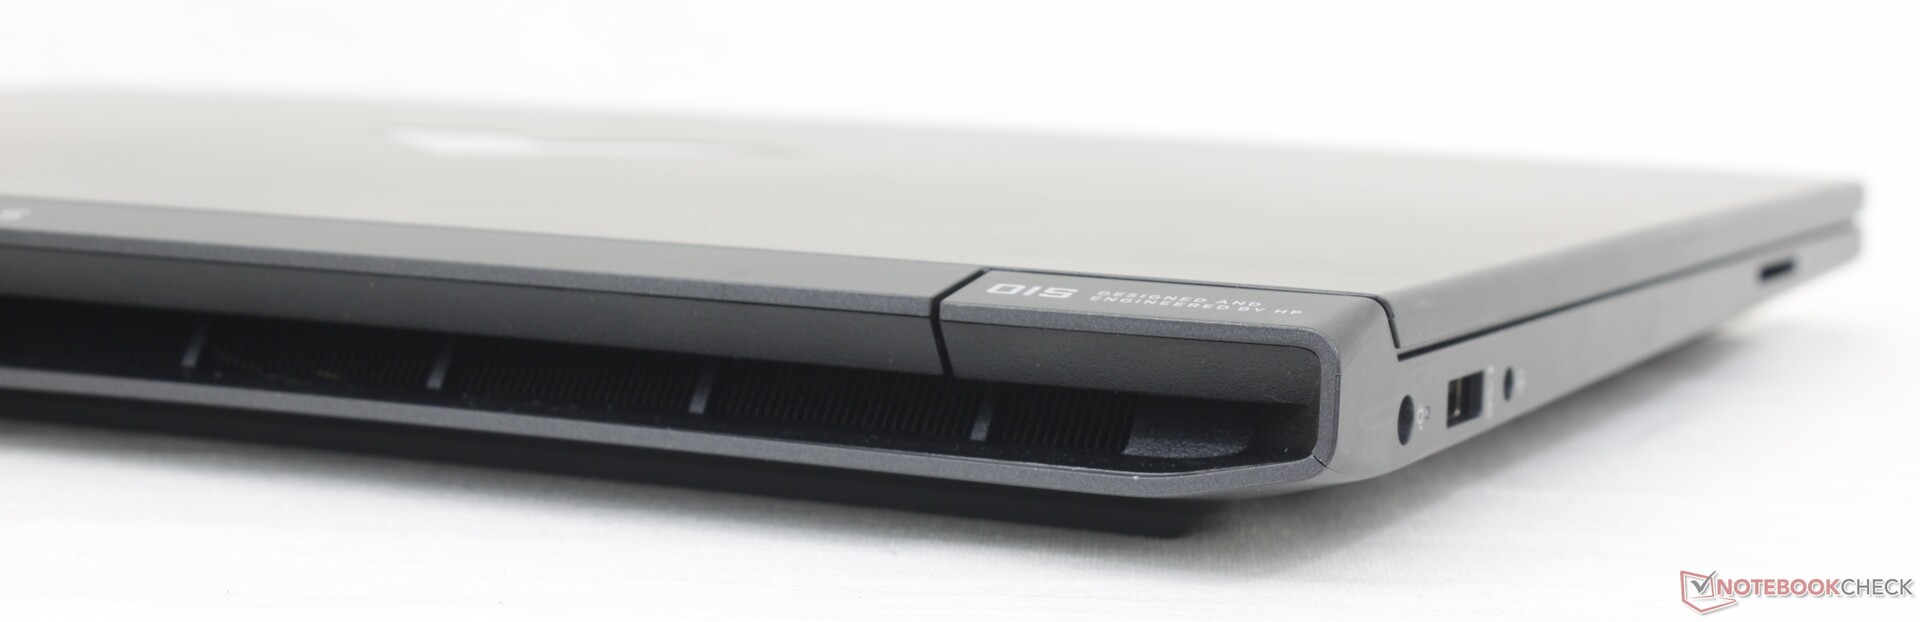
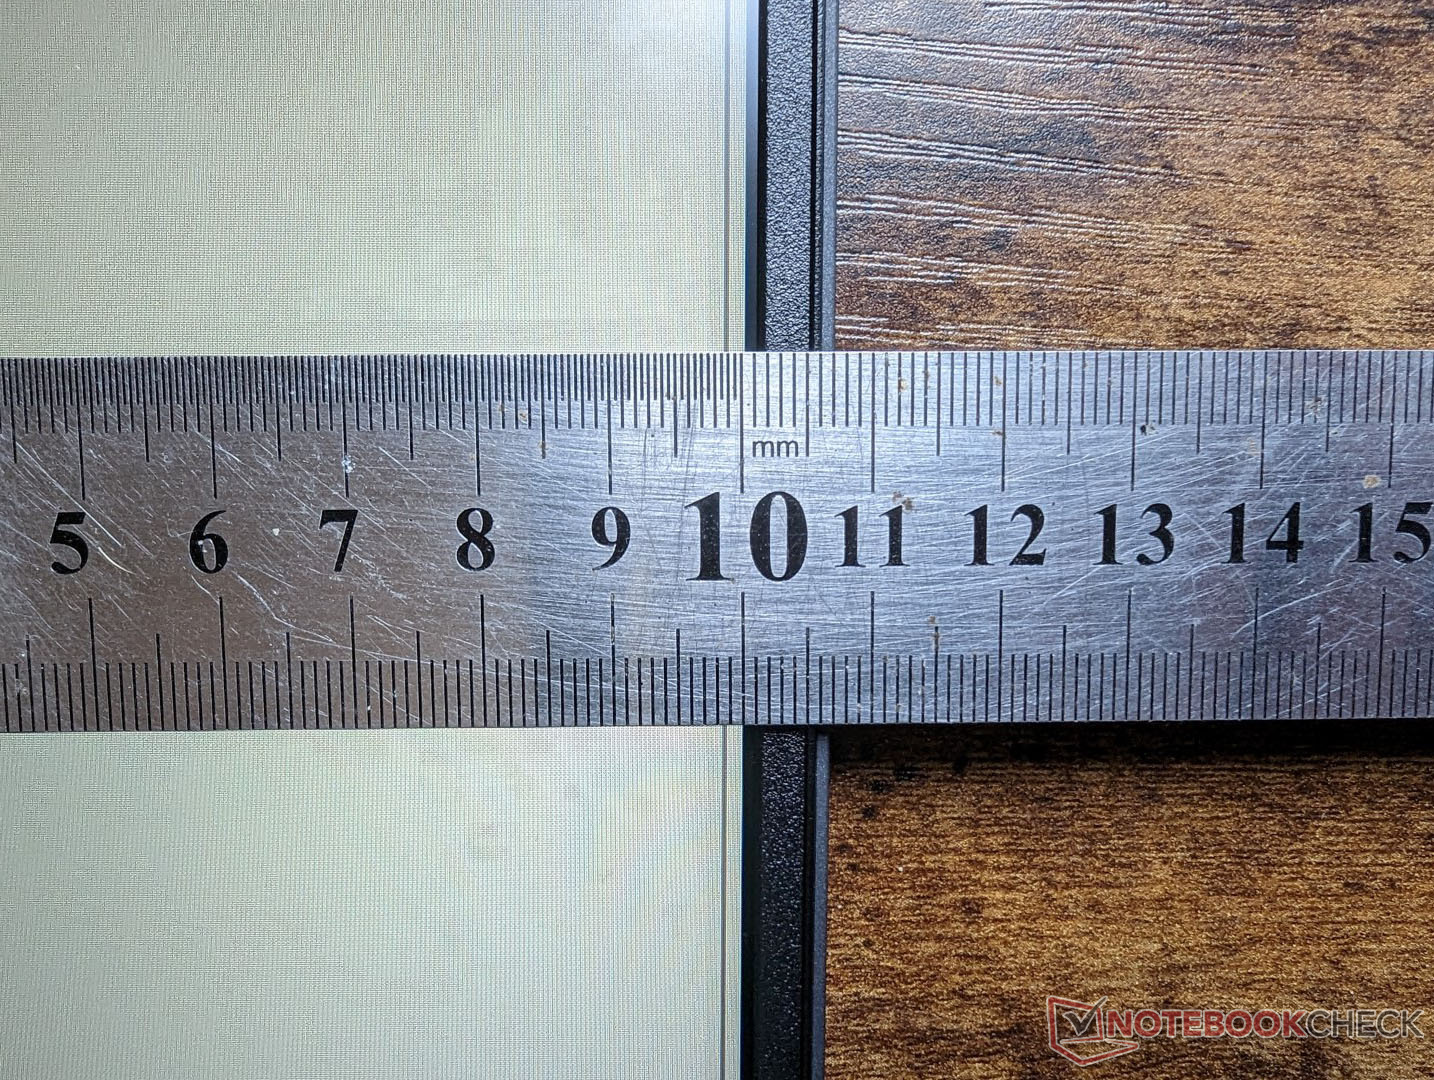
Case - Dobry wygląd w budżecie
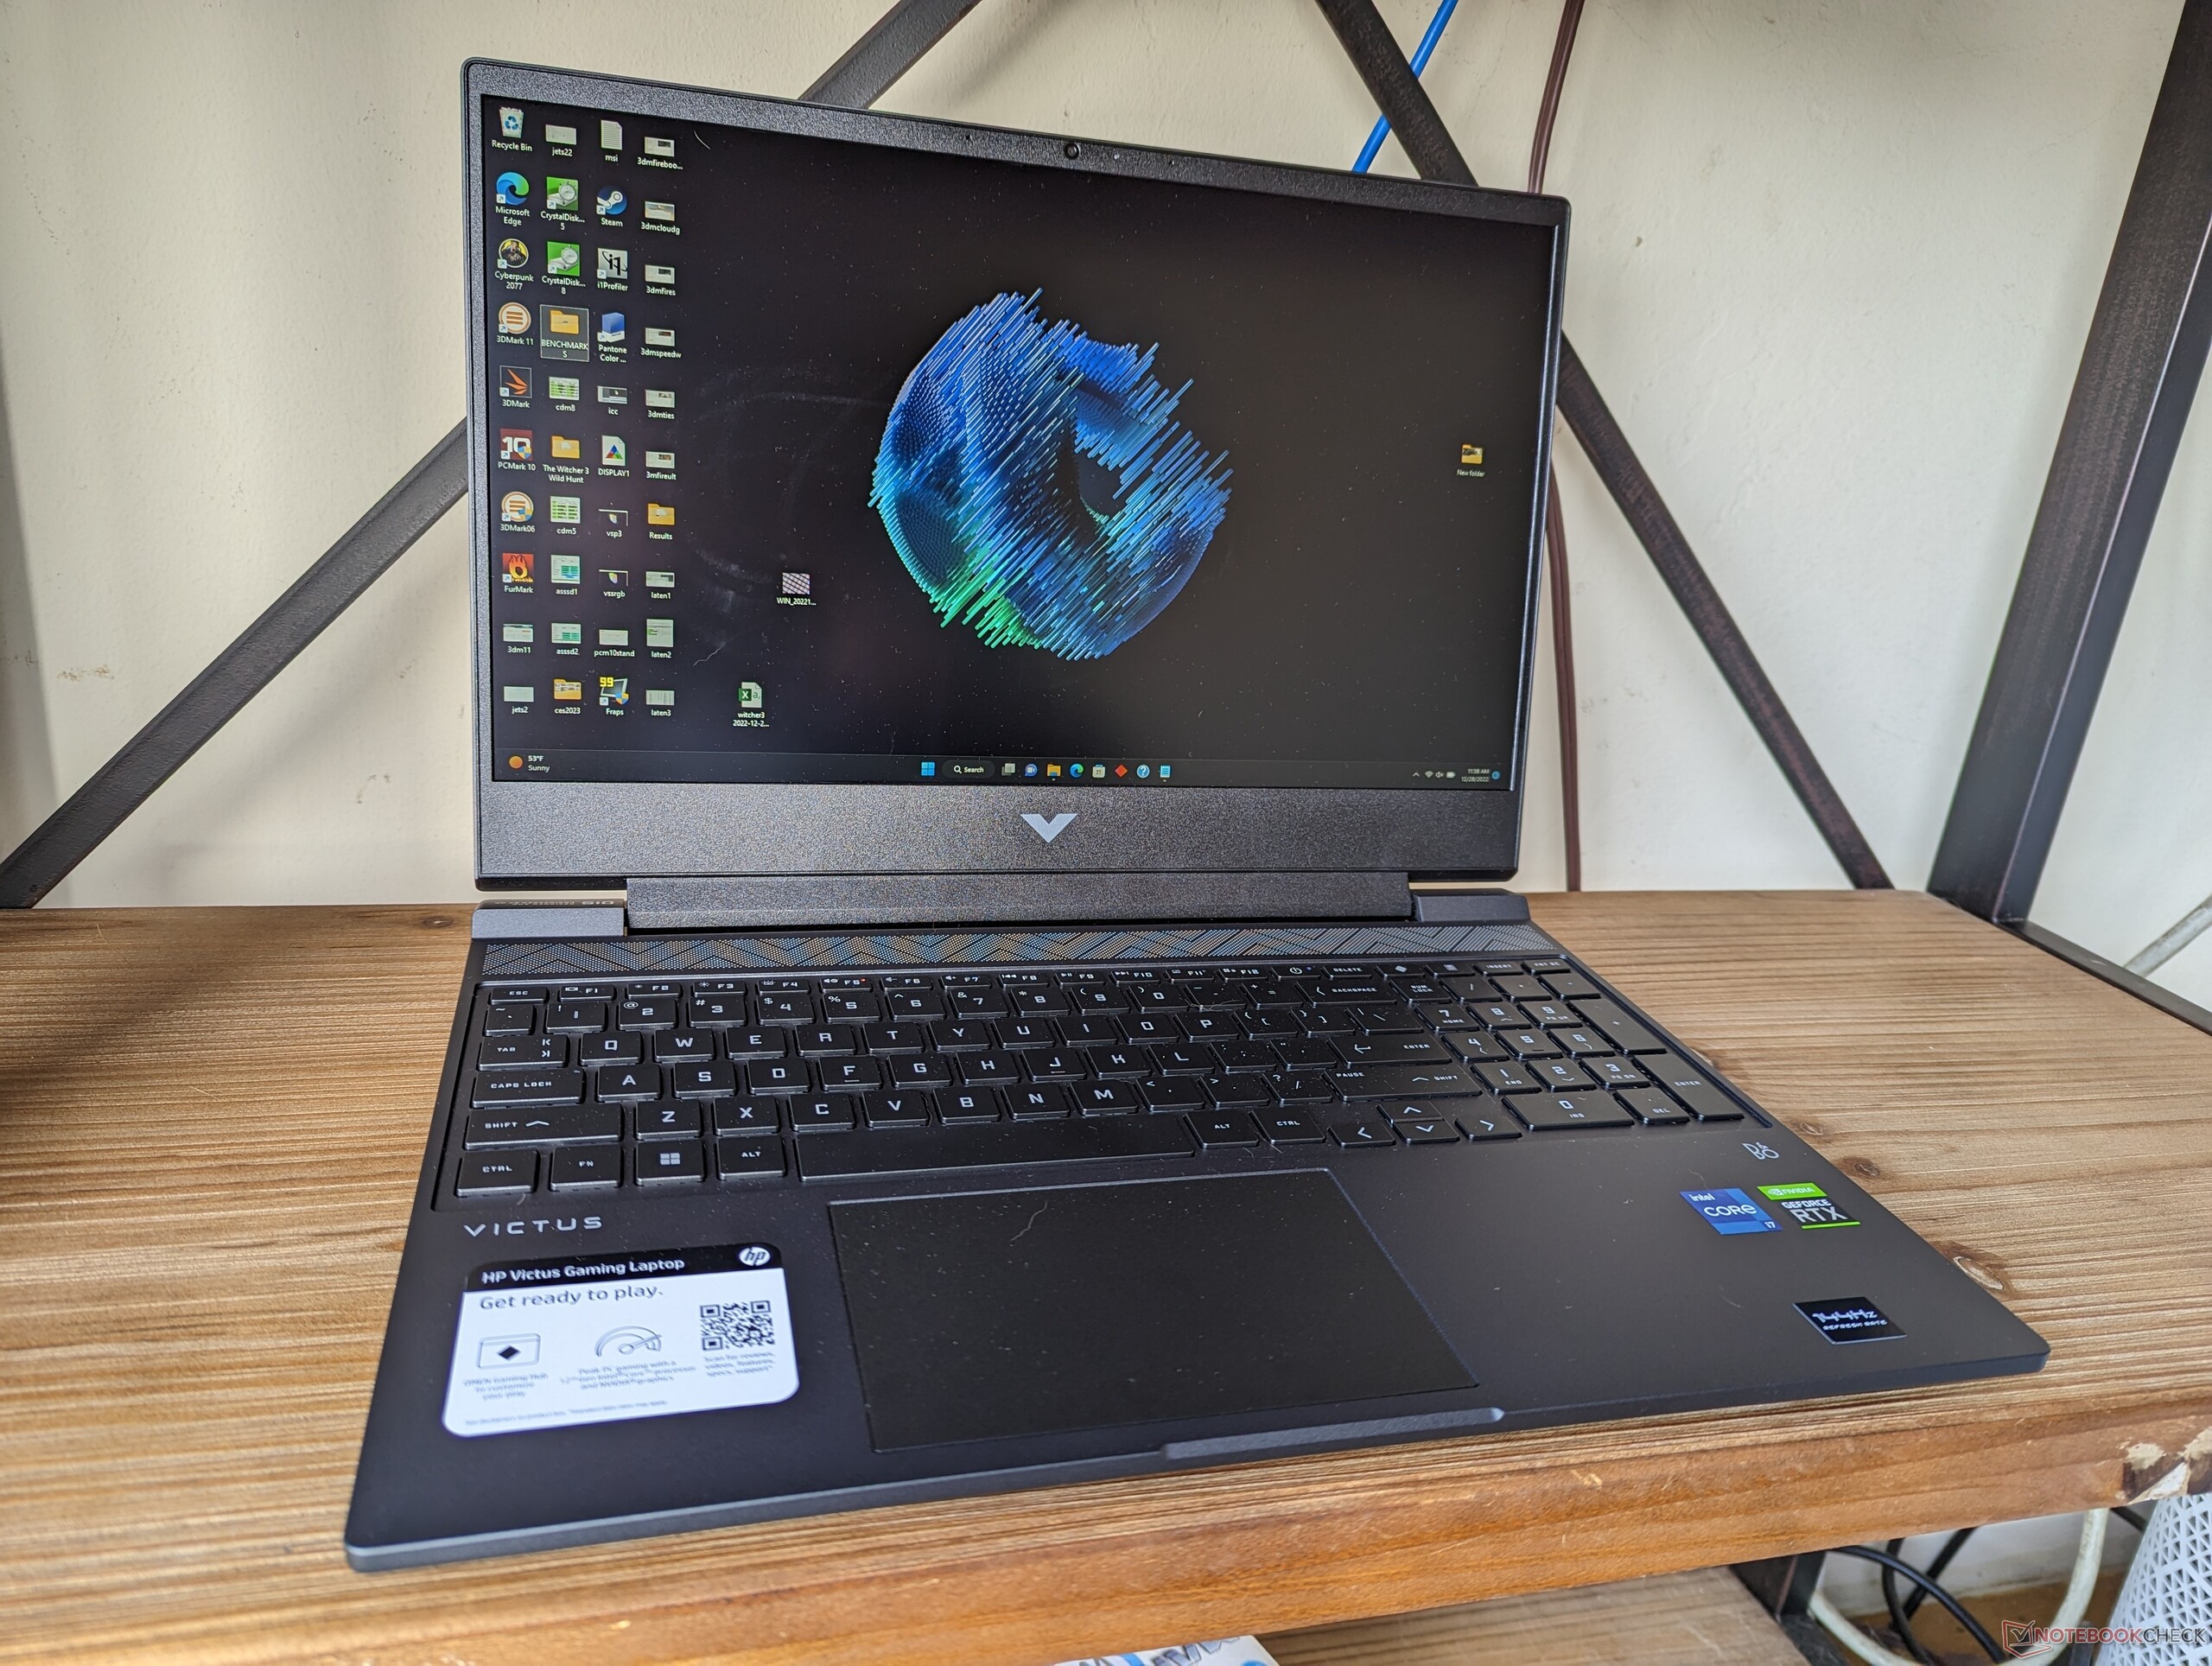
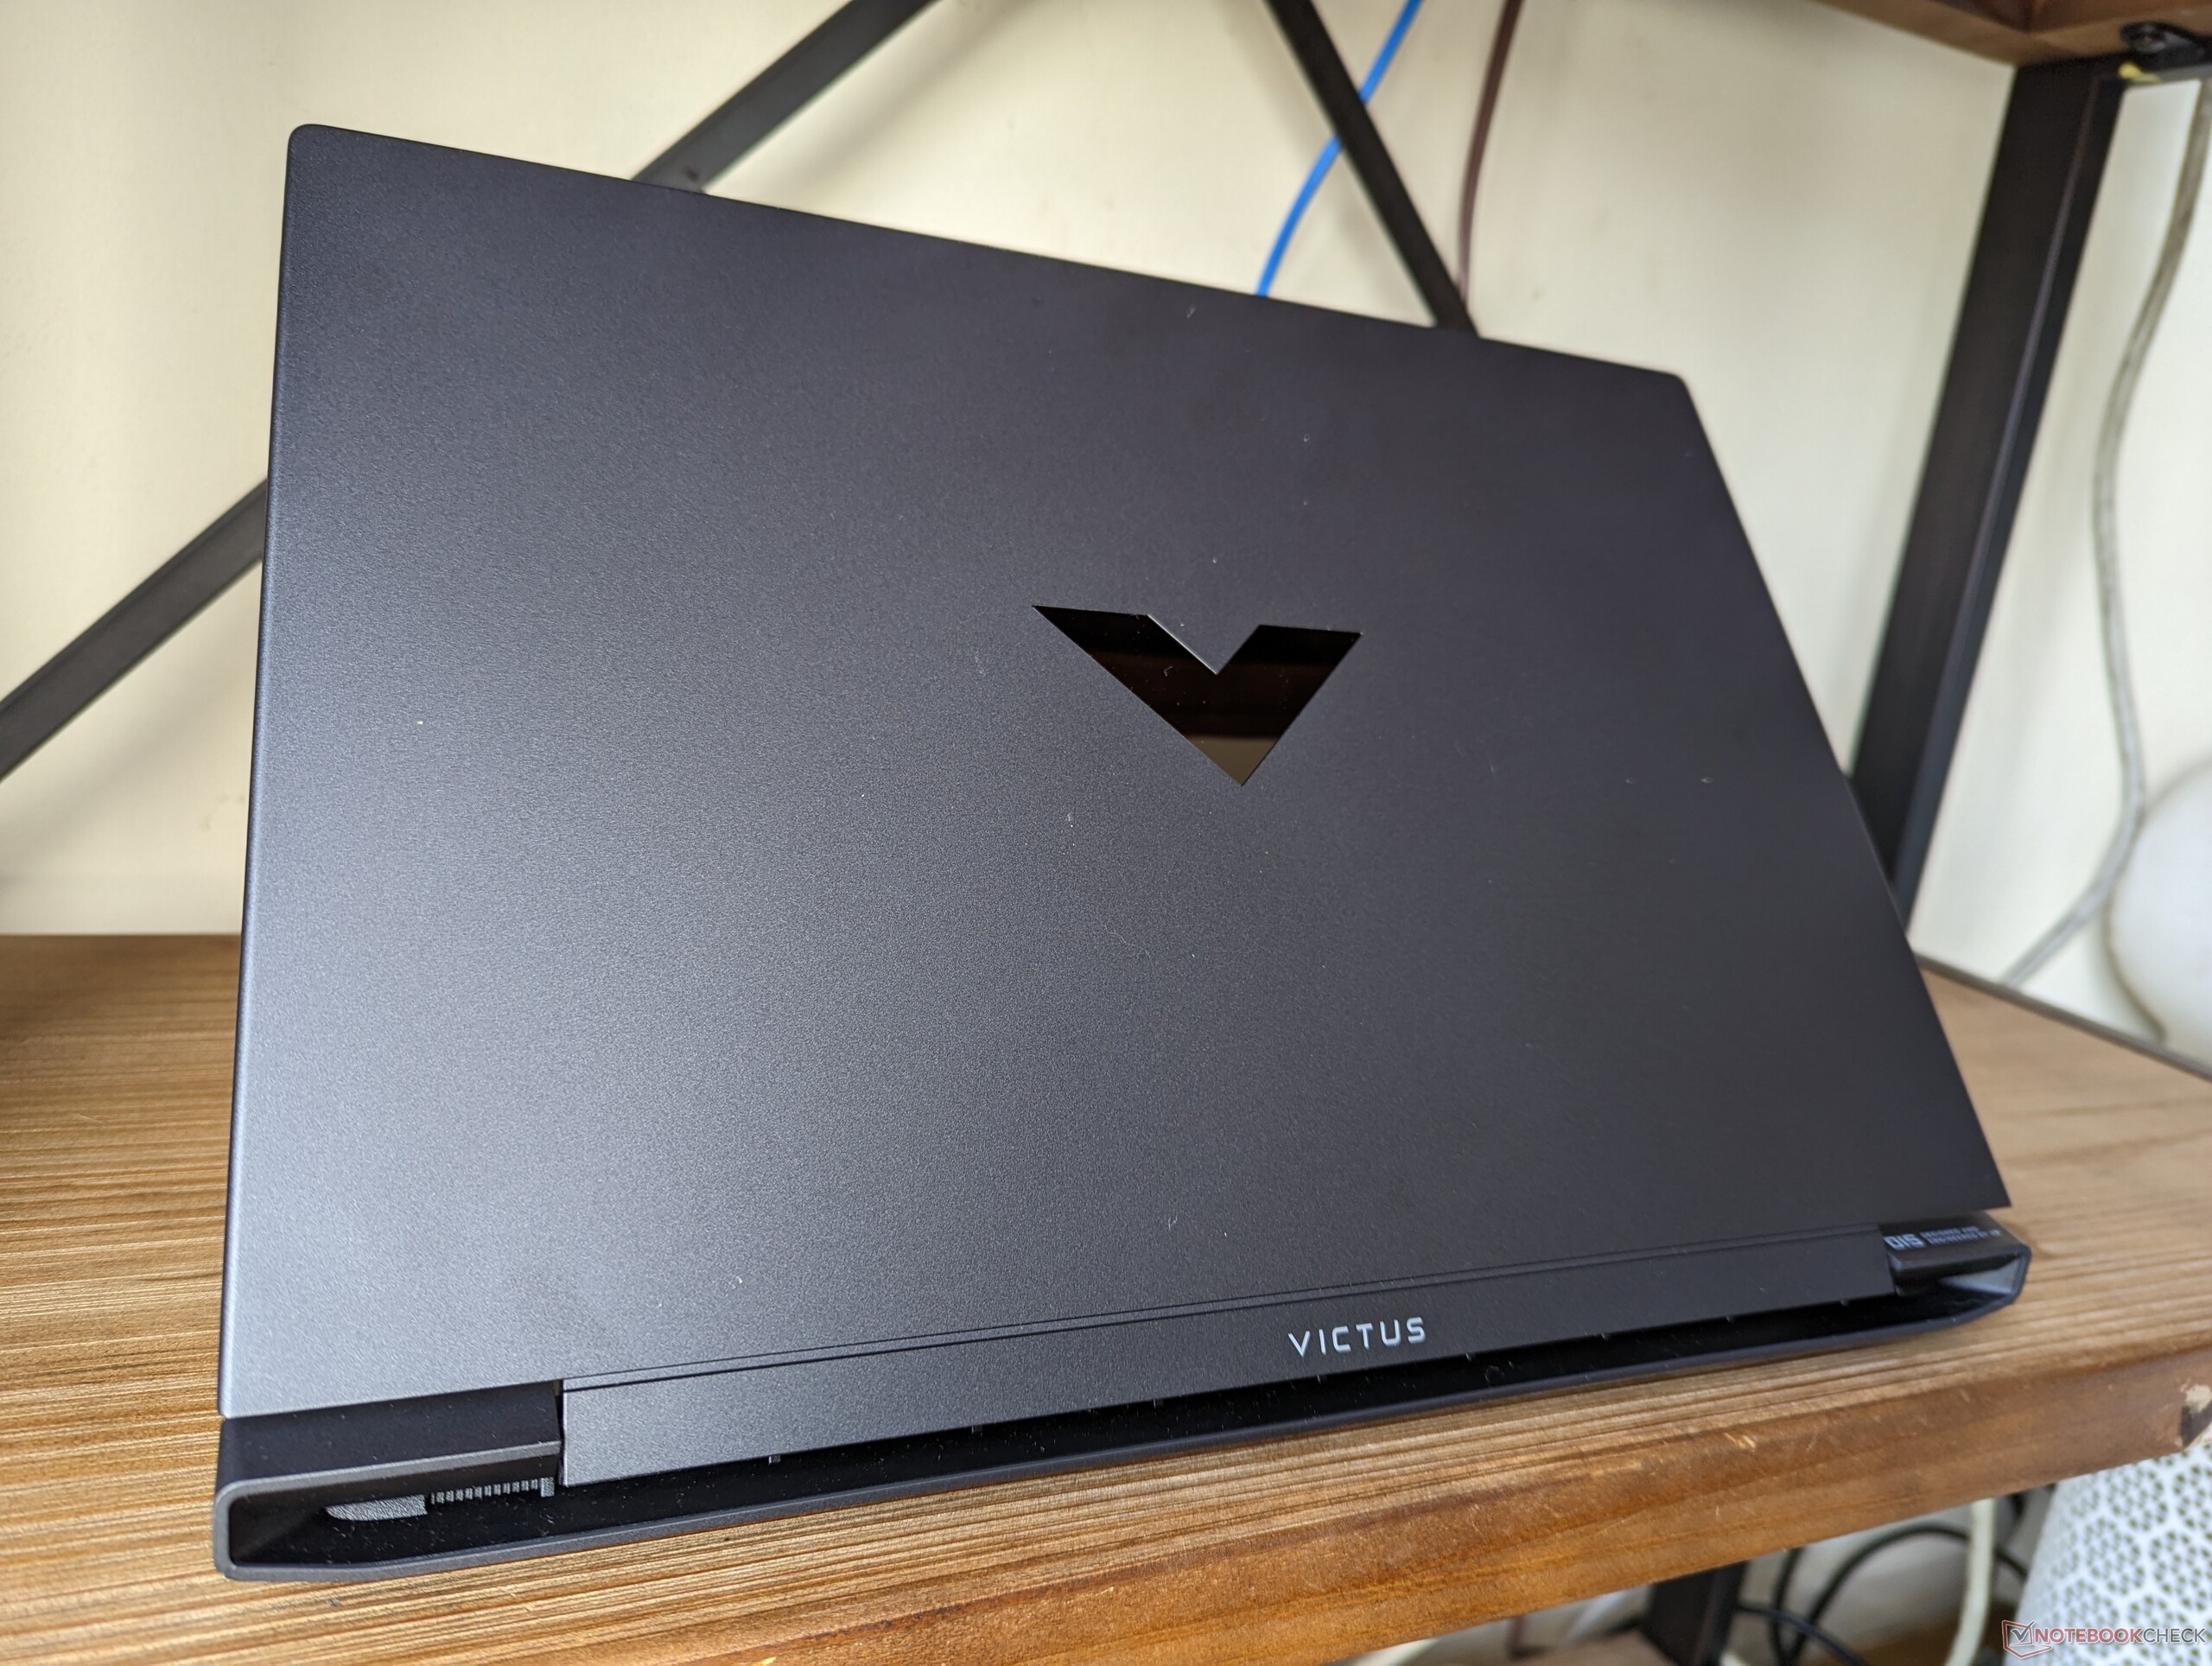
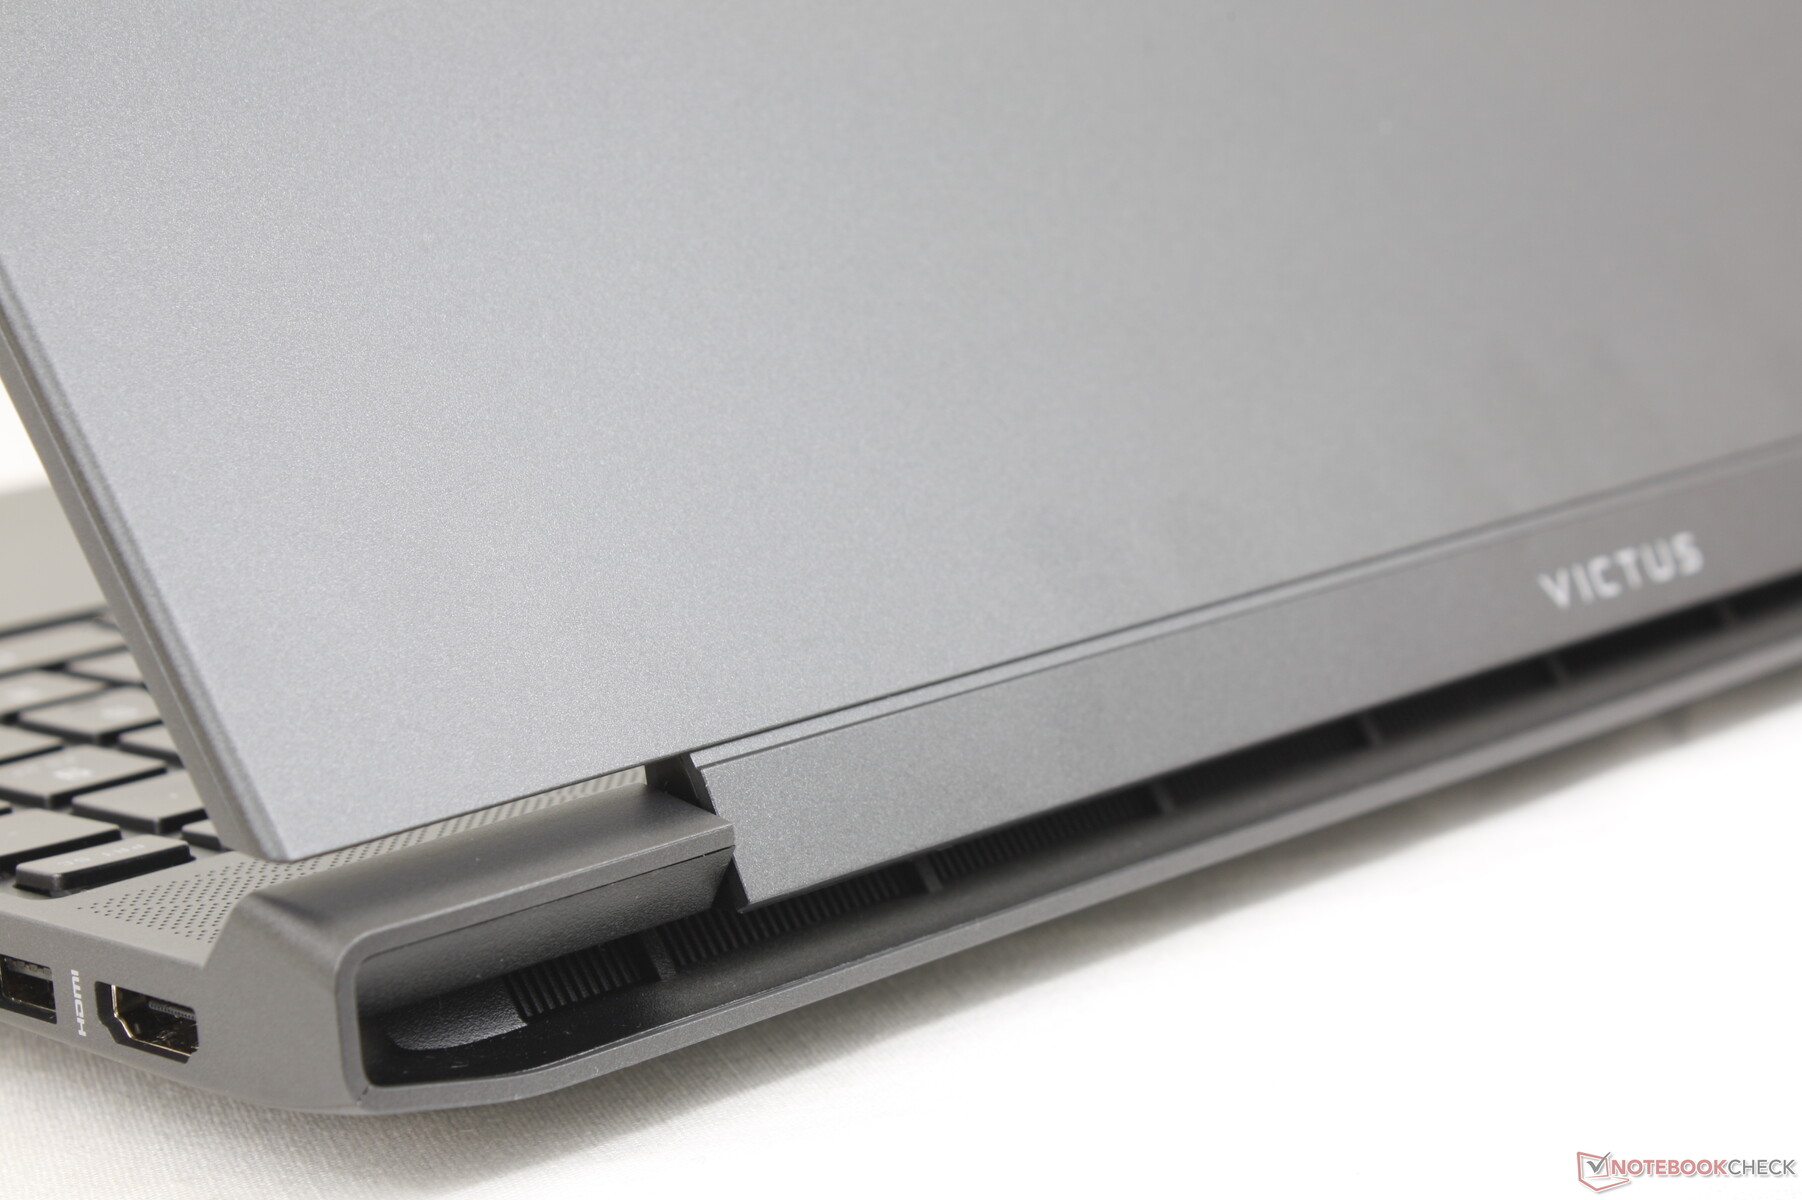
Obudowa składa się z ostrzejszych konturów i większego tyłu, co kontrastuje z prostszym i bardziej kwadratowym wyglądem modelu Omen 15 lub 16. Jest to nienachalna, całkowicie czarna konstrukcja bez żadnych zbędnych, powierzchownych akcentów lub oczywistej "gamingowej" estetyki, którą mają inne podstawowe laptopy do gier.
Sztywność obudowy to krok w dół w stosunku do serii Omen, zwłaszcza jeśli chodzi o zawiasy. Wyświetlacz ma tendencję do skrzypienia podczas regulacji kątów, a zawiasy nie sprawiają wrażenia zbyt solidnych, kiedy są otwarte do końca. Podstawa jest jednak całkiem niezła jak na budżetowy system, a przy próbie jej skręcenia pojawiają się jedynie niewielkie odkształcenia.
System jest zarówno większy jak i cięższy od droższego Omen 15 mimo że Victus 15 jest wolniejszym laptopem. Na szczęście nie jest tak nieporęczny jak konkurencyjny Dell G15, ale wciąż jest ciężki - 2,3 kg. Na stronie Asus TUF Dash F15 jest w porównaniu z nim o kilkaset gramów lżejszy.

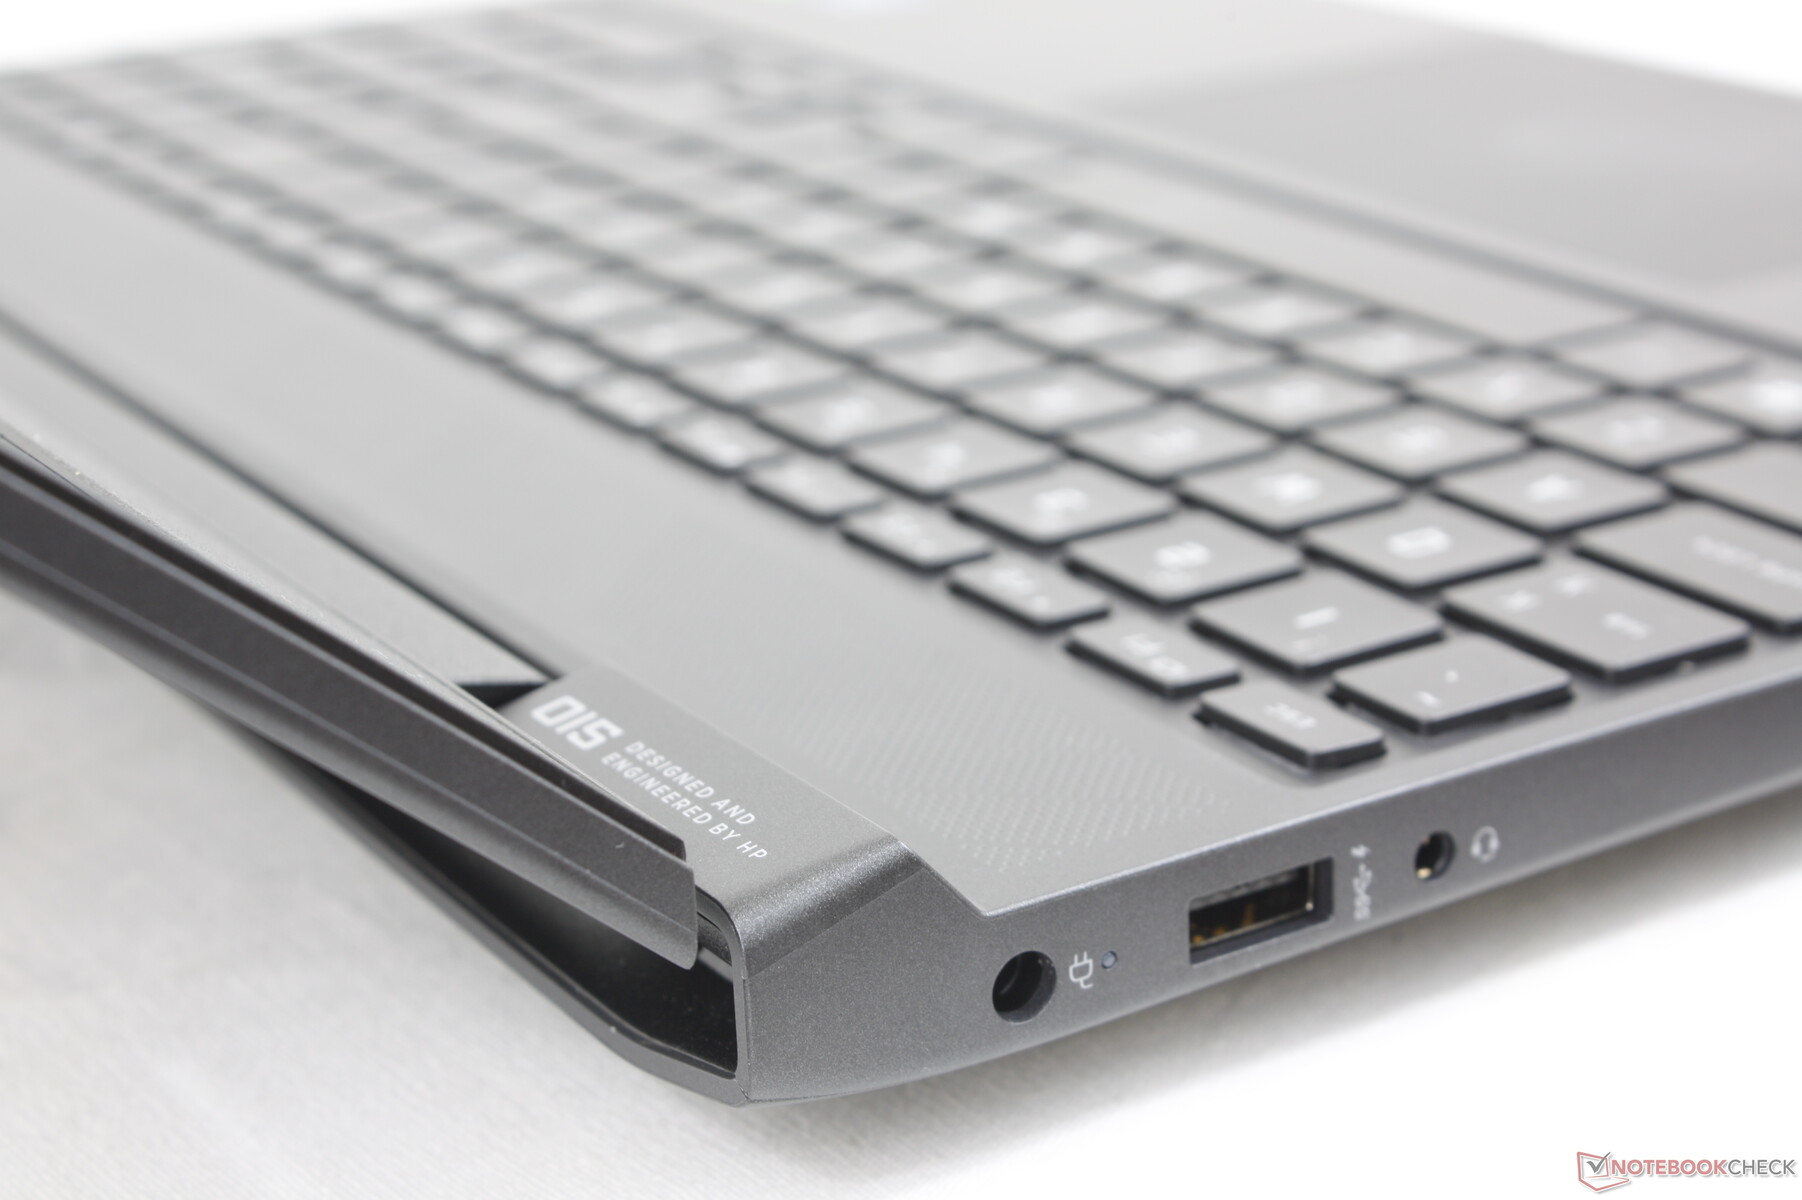
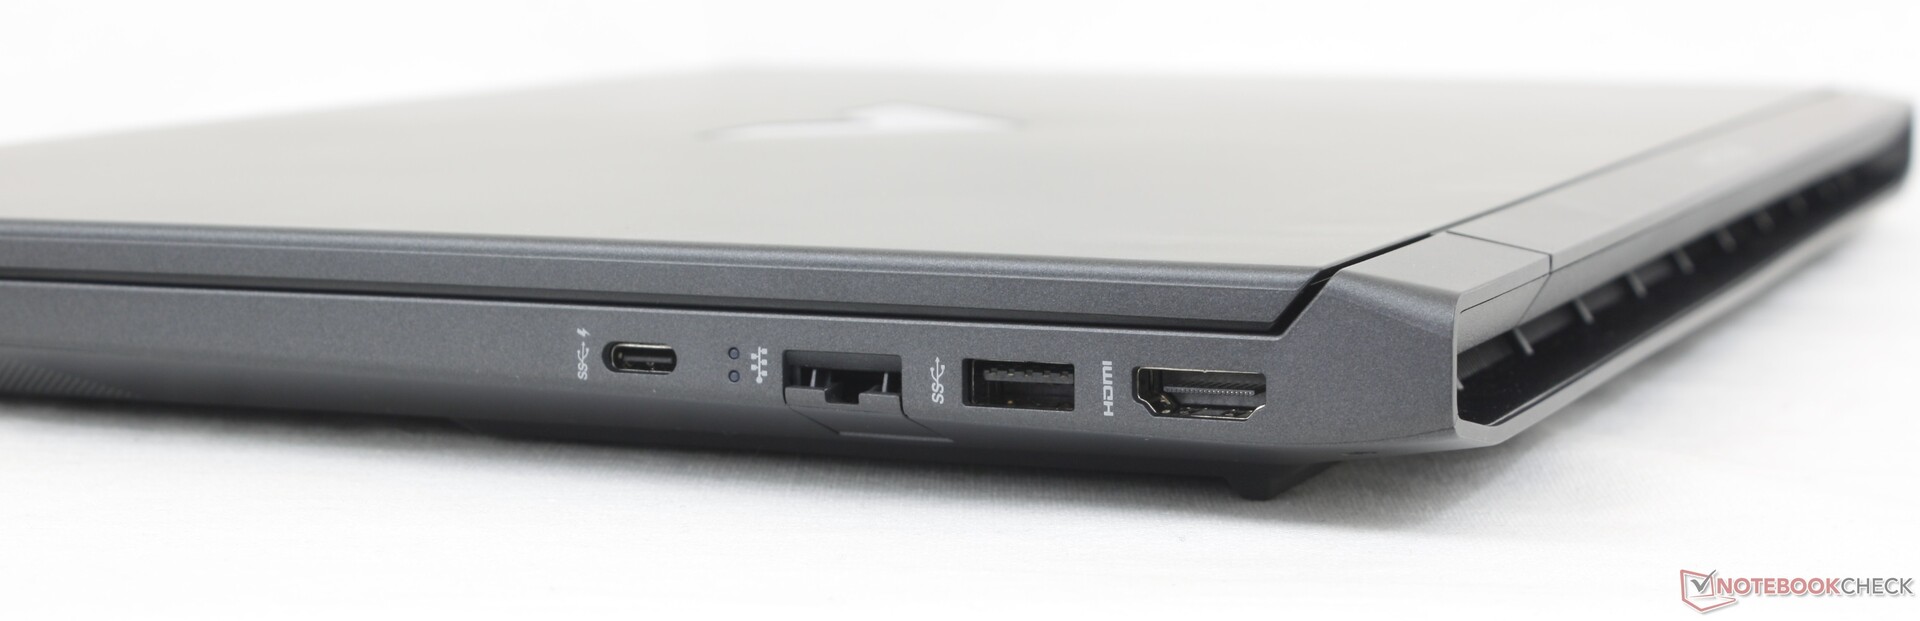
Łączność - Brak obsługi Thunderbolt
Wszystkie porty z Omena 15 są obecne w Victusie 15 z wyjątkiem jednego portu USB-A. Thunderbolt nie jest tu obsługiwany prawdopodobnie w celu zaoszczędzenia kosztów.
Rozmieszczenie portów jest prawdopodobnie lepsze, niż w Dellu G15 czy Lenovo Legion 5 15 gdyż nie ma portów wzdłuż tylnej części HP, co ułatwia dostęp do nich.
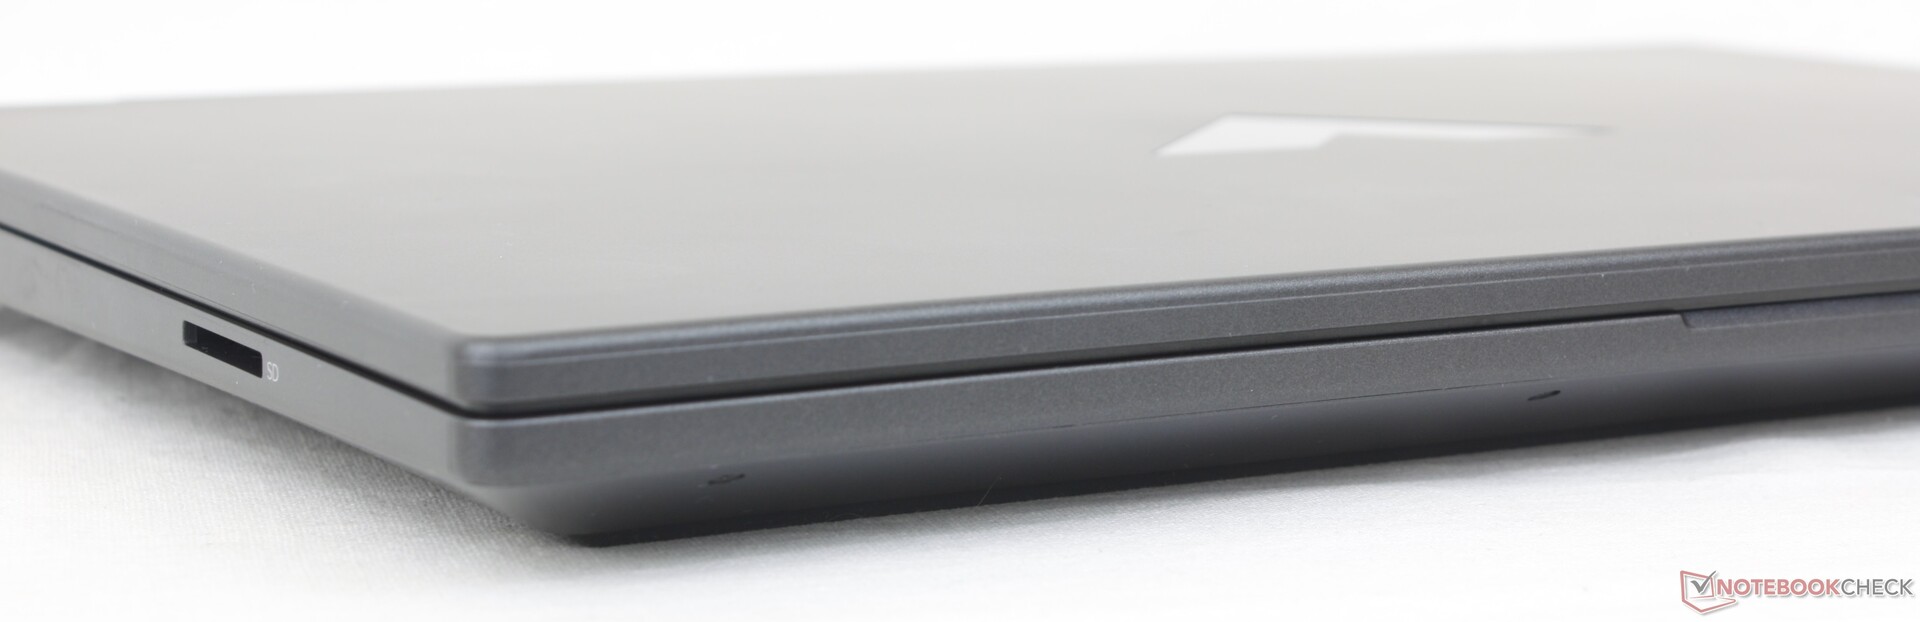
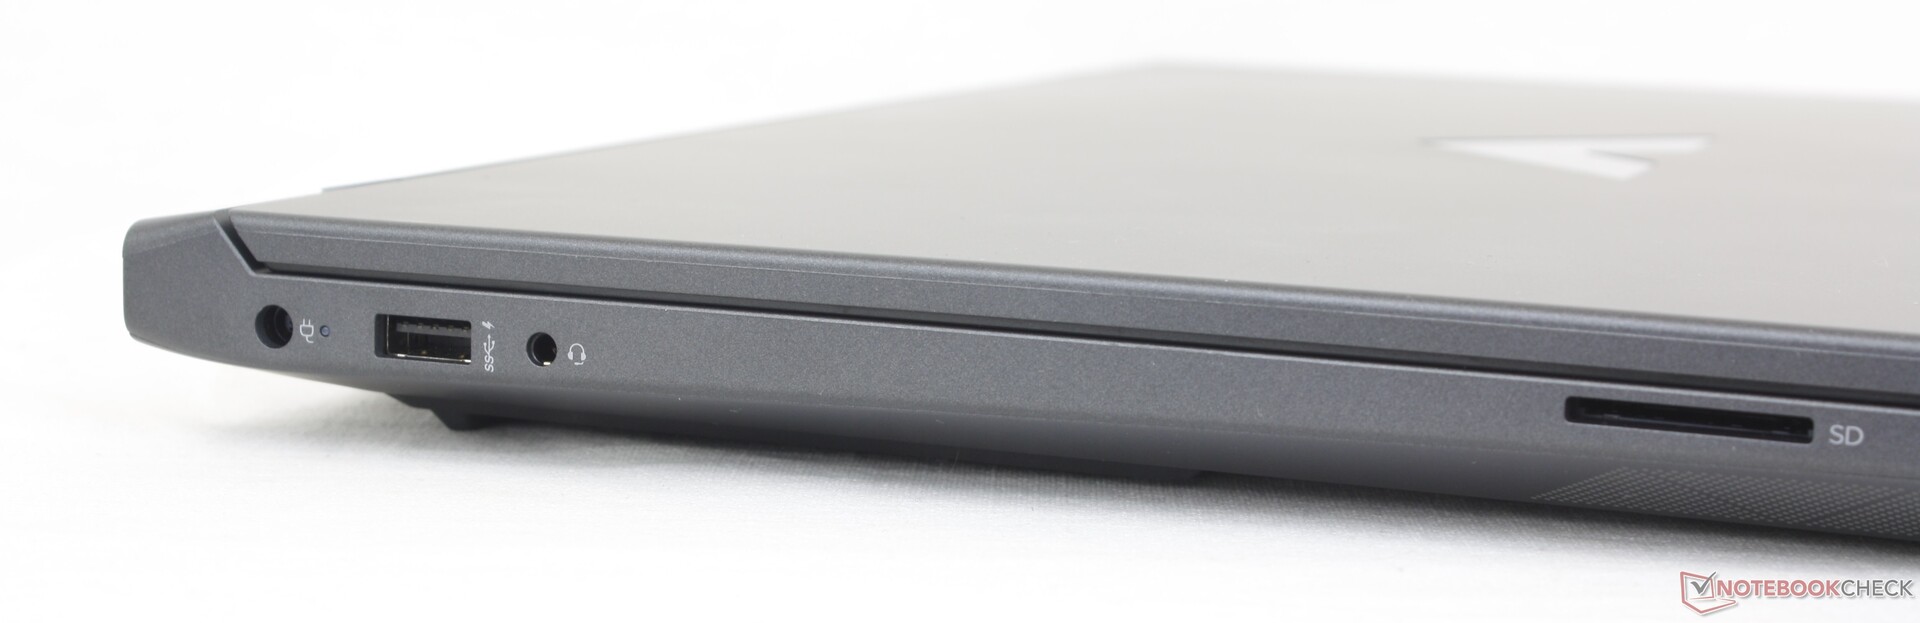
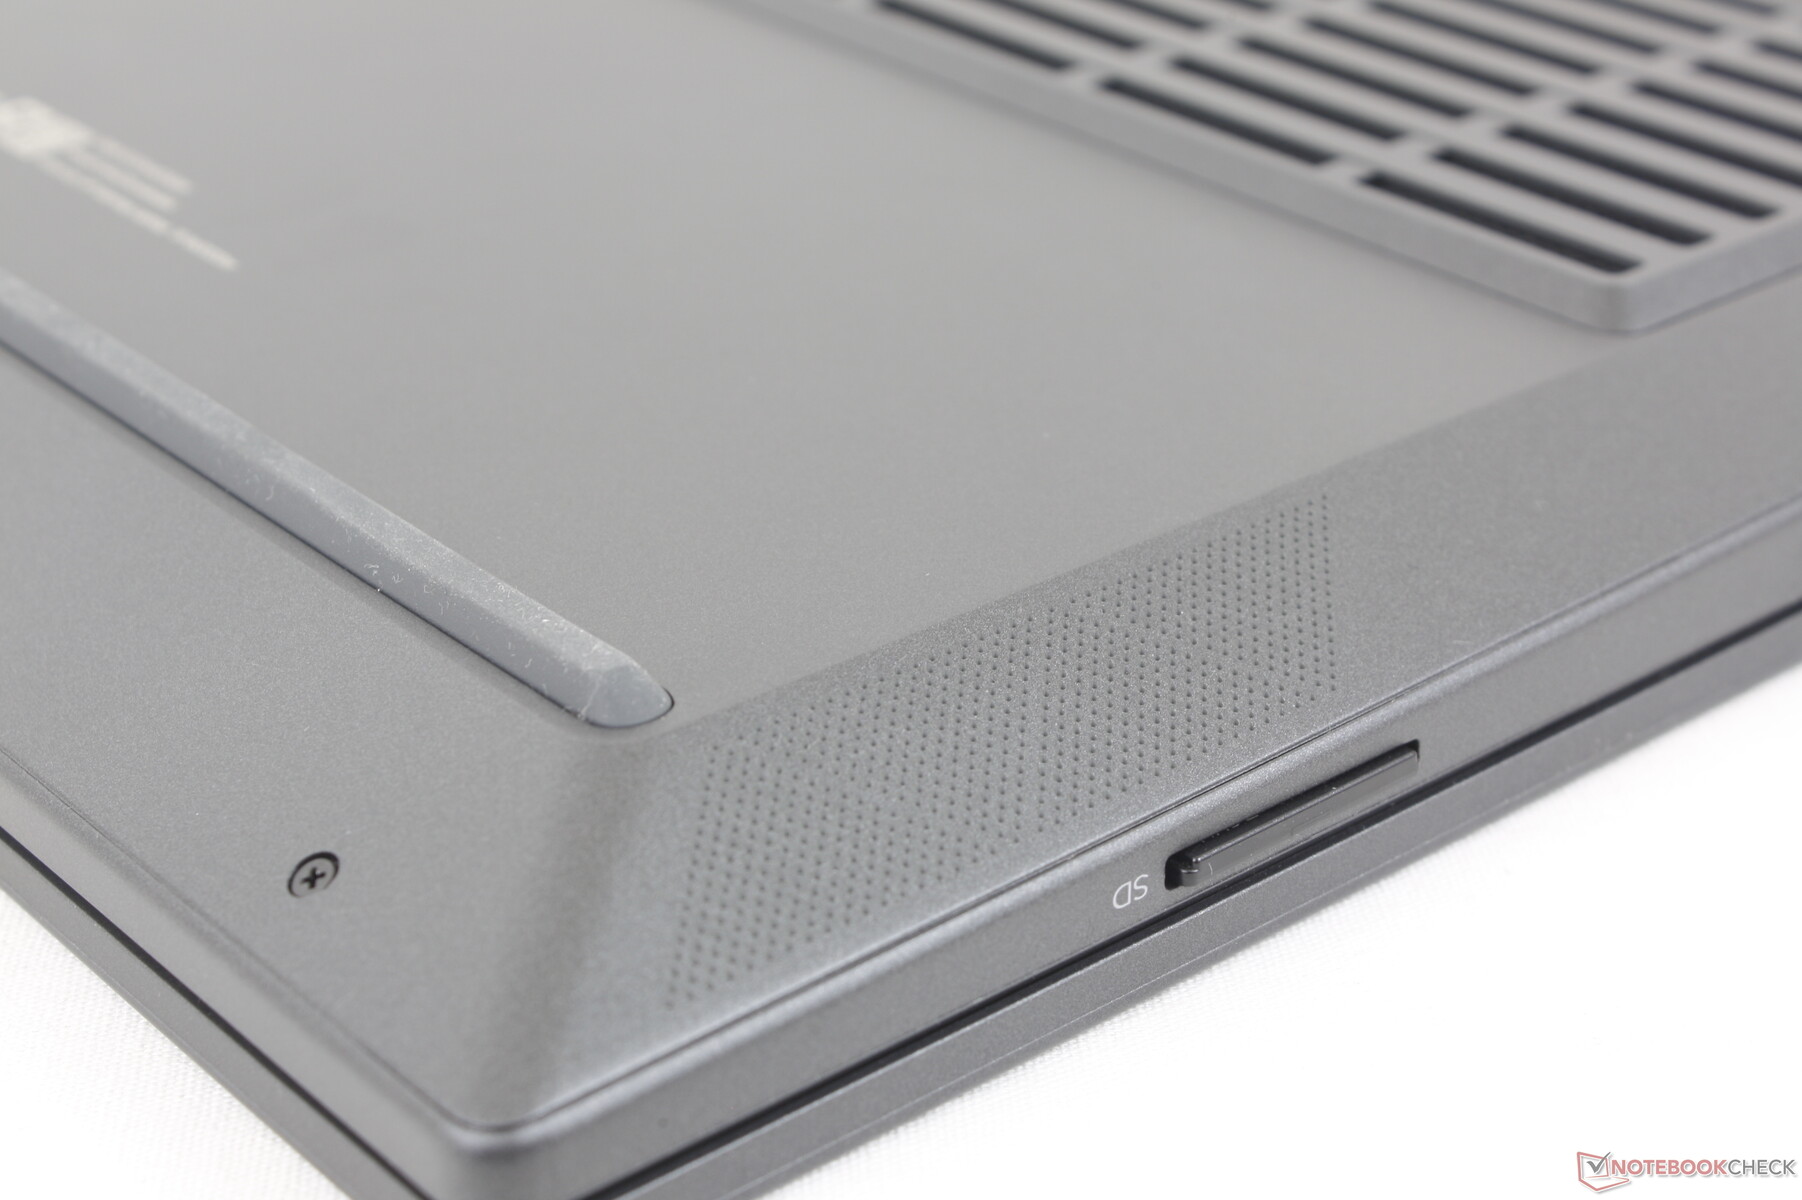
Czytnik kart SD
Jesteśmy zaskoczeni, że widzimy zintegrowany czytnik kart SD, gdyż wiele budżetowych laptopów do gier go pomija. Szybkość transferu jest tylko o połowę mniejsza niż w przypadku czytników kart w Alienware x15 lub Razer Blade, ale to lepsze niż brak czytnika kart w ogóle.
| SD Card Reader | |
| average JPG Copy Test (av. of 3 runs) | |
| Alienware x15 R2 P111F (AV PRO microSD 128 GB V60) | |
| Razer Blade 17 (i7-12800H, RTX 3070 Ti) | |
| MSI GE67 HX 12UGS (Toshiba Exceria Pro SDXC 64 GB UHS-II) | |
| HP Victus 15 fa0020nr (Toshiba Exceria Pro SDXC 64 GB UHS-II) | |
| HP Omen 15-en0375ng (Toshiba Exceria Pro SDXC 64 GB UHS-II) | |
| HP Omen 15-ek0456ng (Toshiba Exceria Pro SDXC 64 GB UHS-II) | |
| maximum AS SSD Seq Read Test (1GB) | |
| Alienware x15 R2 P111F (AV PRO microSD 128 GB V60) | |
| Razer Blade 17 (i7-12800H, RTX 3070 Ti) | |
| HP Omen 15-en0375ng (Toshiba Exceria Pro SDXC 64 GB UHS-II) | |
| HP Victus 15 fa0020nr (Toshiba Exceria Pro SDXC 64 GB UHS-II) | |
| MSI GE67 HX 12UGS (Toshiba Exceria Pro SDXC 64 GB UHS-II) | |
| HP Omen 15-ek0456ng (Toshiba Exceria Pro SDXC 64 GB UHS-II) | |
Komunikacja
Do łączności 2x2 Wi-Fi 6 i Bluetooth 5.2 dołączono układ MediaTek MT7921. Opcjonalnie, za dodatkową opłatą, dostępny jest Intel AX211 dla Wi-Fi 6E. W naszych testach szybkość transferu jest jednak stała, choć wydajność pozostaje w tyle za większością innych laptopów z rozwiązaniem Intel AX.
| Networking | |
| iperf3 transmit AX12 | |
| Dell G15 5515 | |
| MSI Bravo 15 B5DD-010US | |
| HP Omen 15-en0375ng | |
| iperf3 receive AX12 | |
| Dell G15 5515 | |
| MSI Bravo 15 B5DD-010US | |
| HP Omen 15-en0375ng | |
| iperf3 receive AXE11000 6GHz | |
| Lenovo Legion 5 15IAH7H 82RB | |
| iperf3 receive AXE11000 | |
| Asus TUF Dash F15 FX517ZC | |
| Lenovo Legion 5 15IAH7H 82RB | |
| HP Victus 15 fa0020nr | |
| iperf3 transmit AXE11000 | |
| Asus TUF Dash F15 FX517ZC | |
| Lenovo Legion 5 15IAH7H 82RB | |
| HP Victus 15 fa0020nr | |
| iperf3 transmit AXE11000 6GHz | |
| Lenovo Legion 5 15IAH7H 82RB | |
Kamera internetowa
Kamera internetowa jest podstawowym 1 MP czujnik bez IR lub nawet migawki prywatności. HP ma jedne z najlepszych kamer internetowych w laptopach, co widać w najnowszym Spectre i EliteBook a więc nieostra kamerka w naszym Victusie jest najwyraźniej zabiegiem mającym na celu cięcie kosztów.


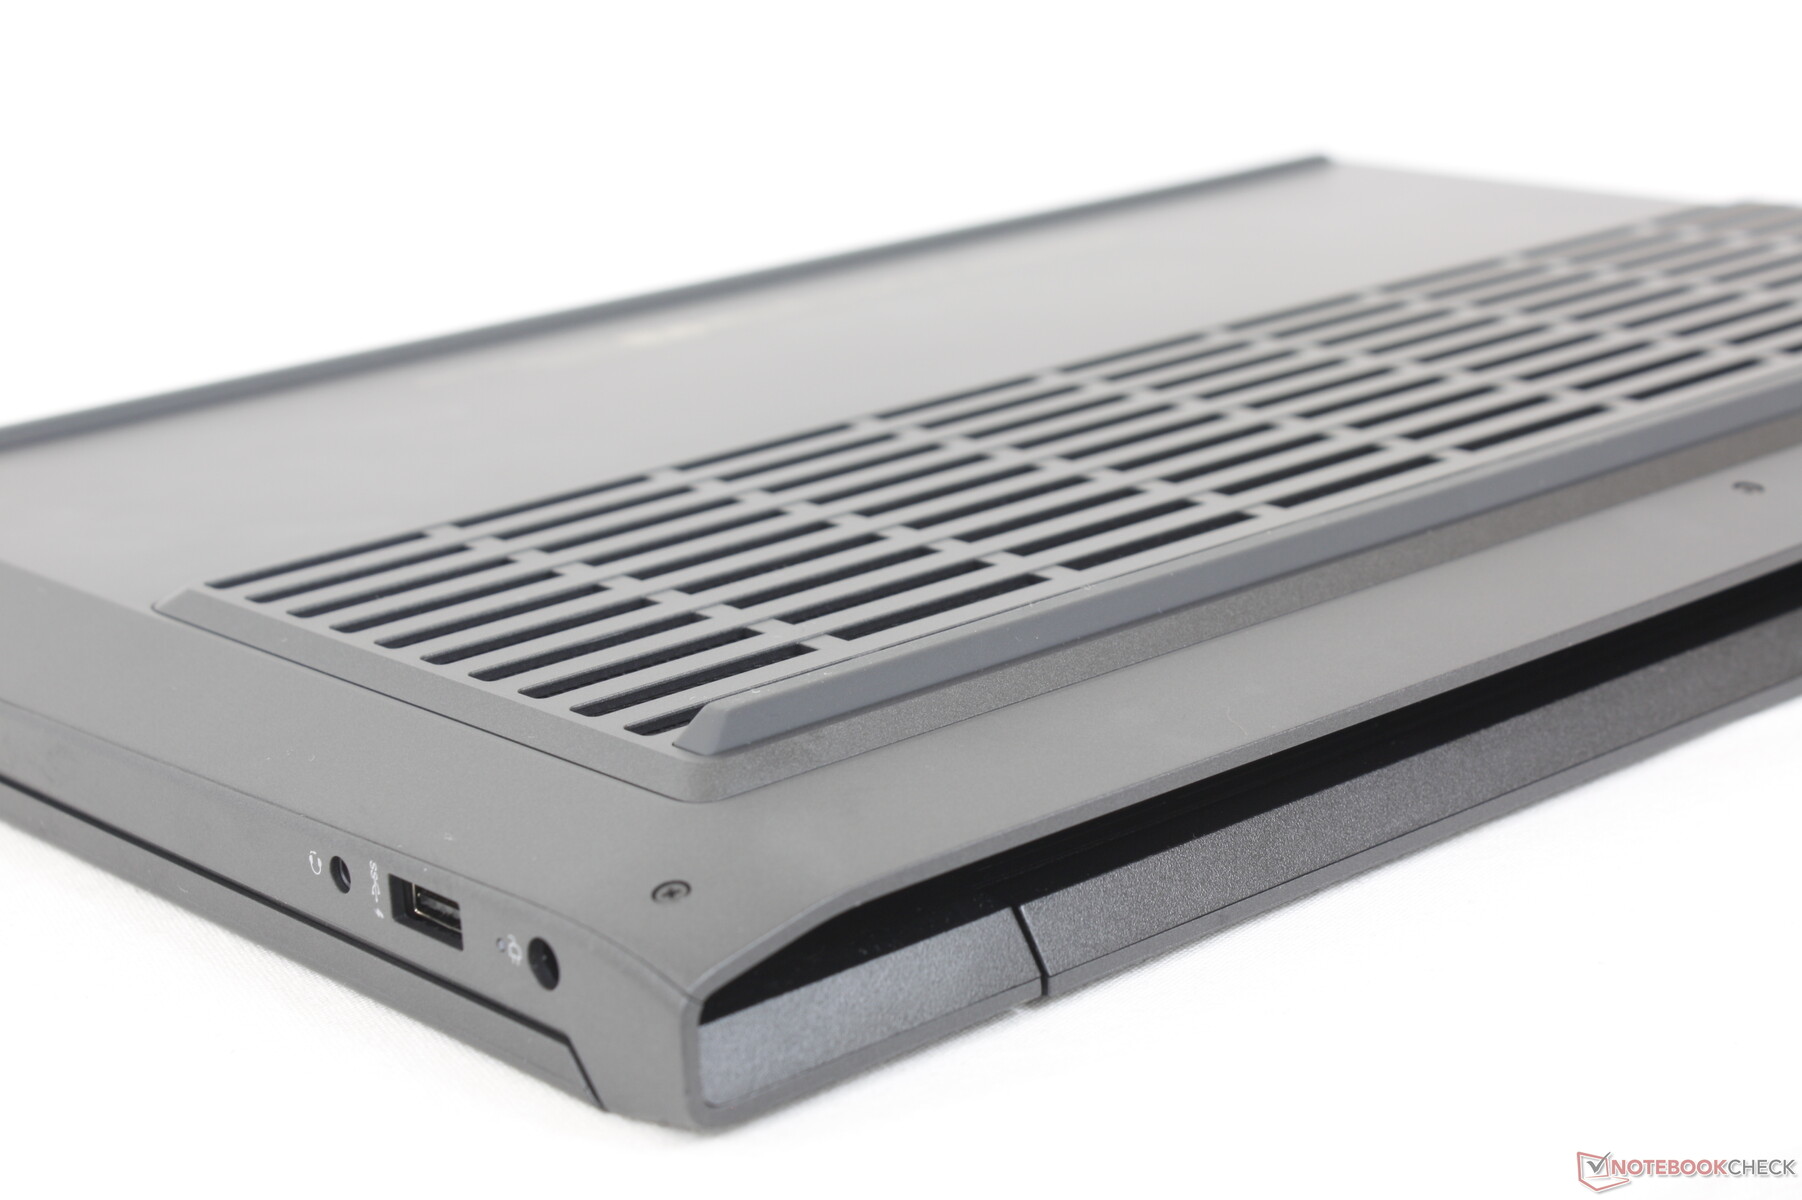
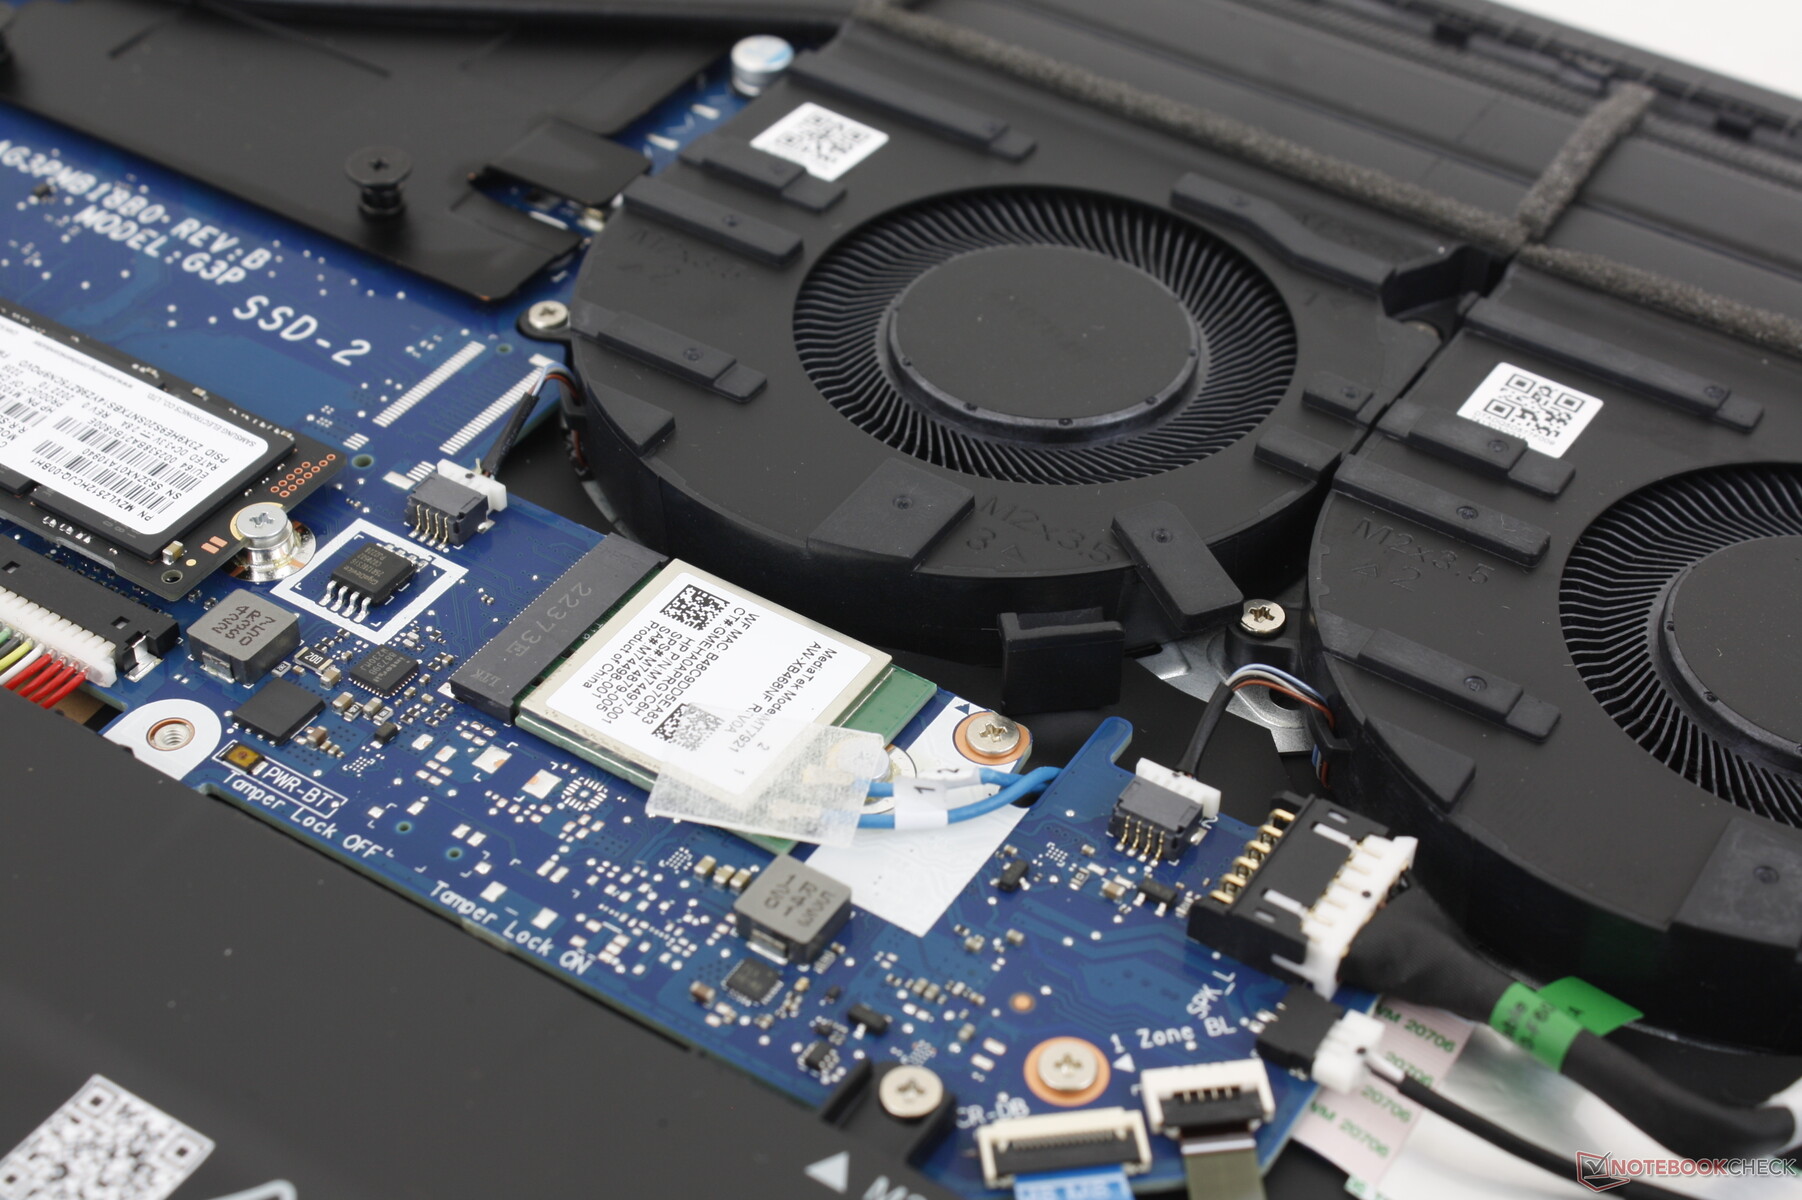
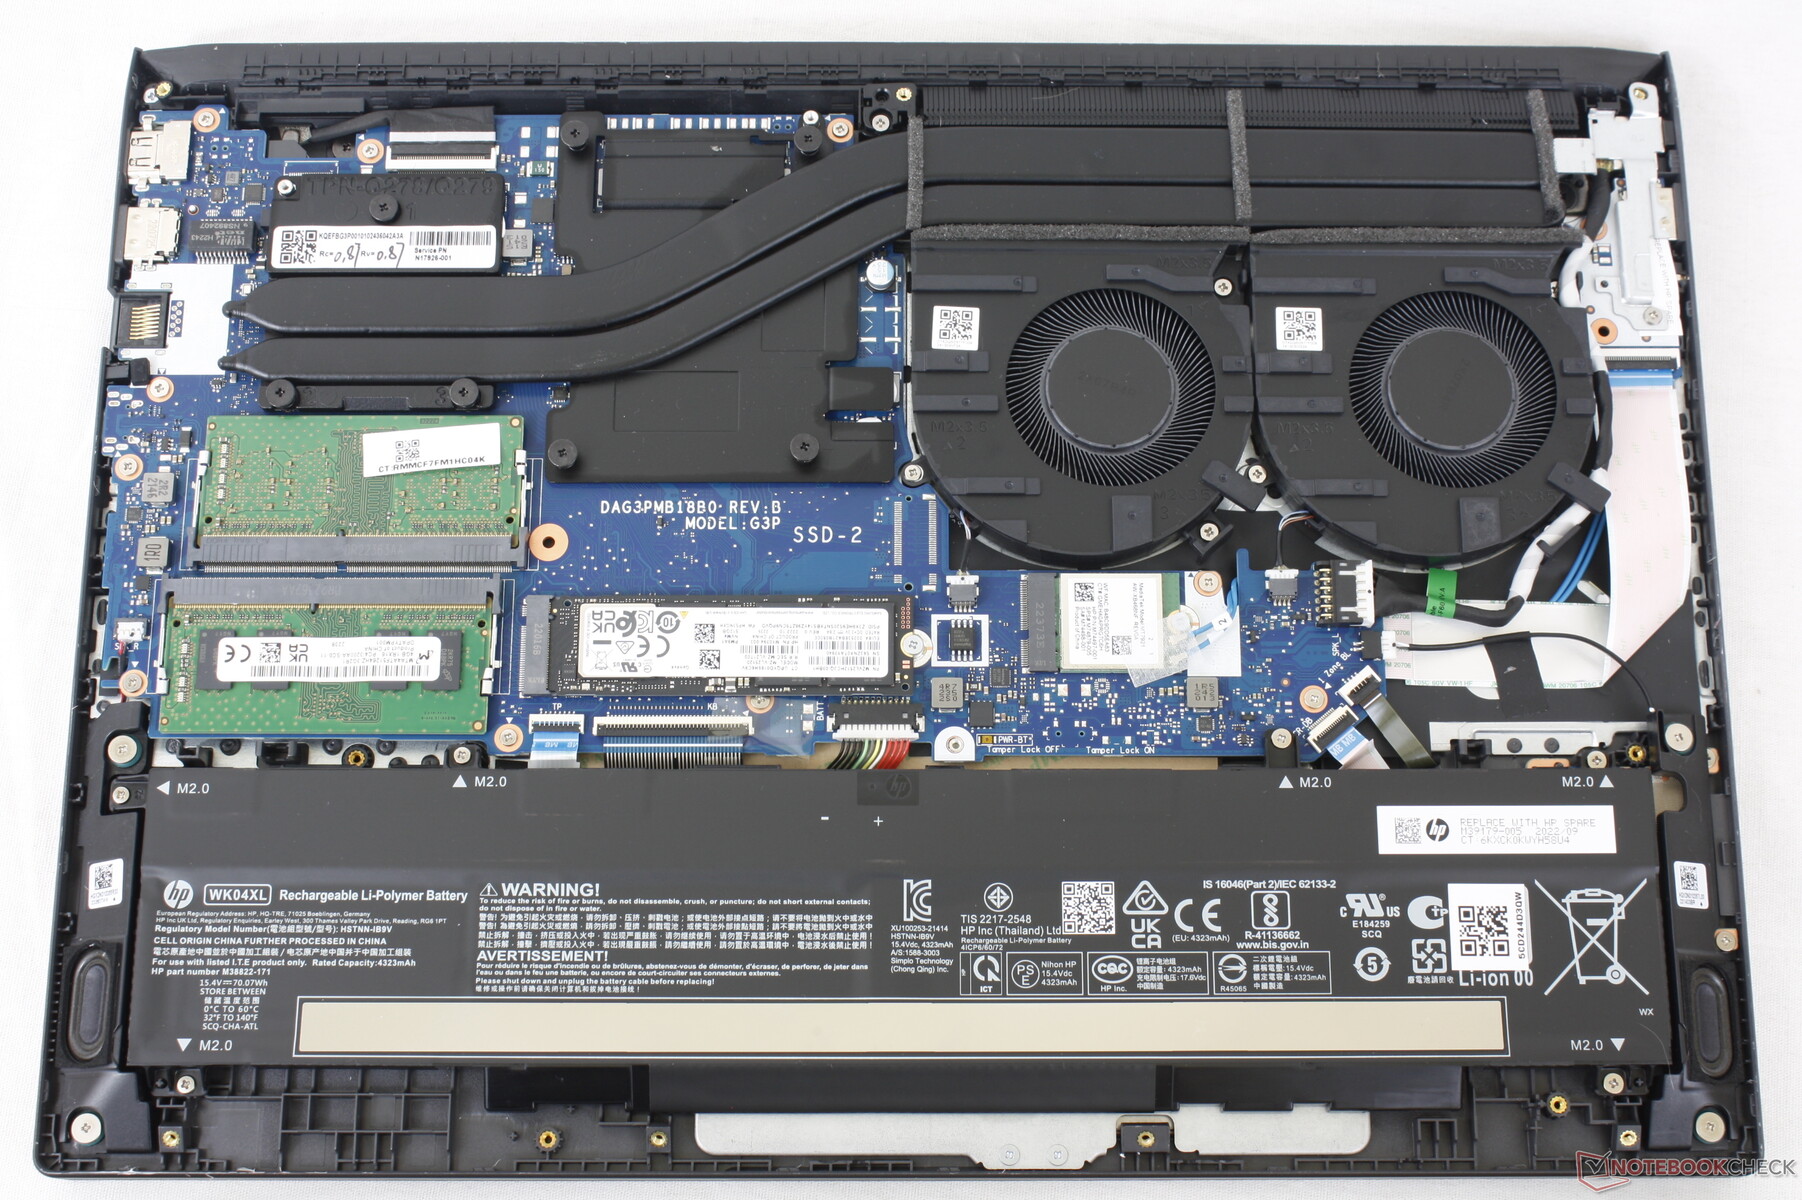
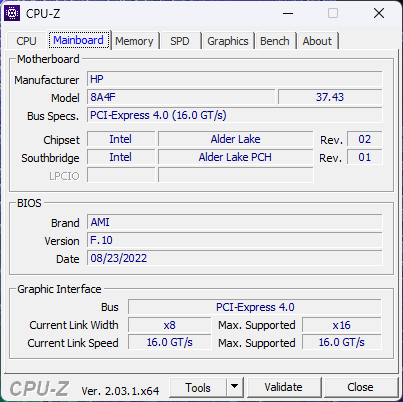
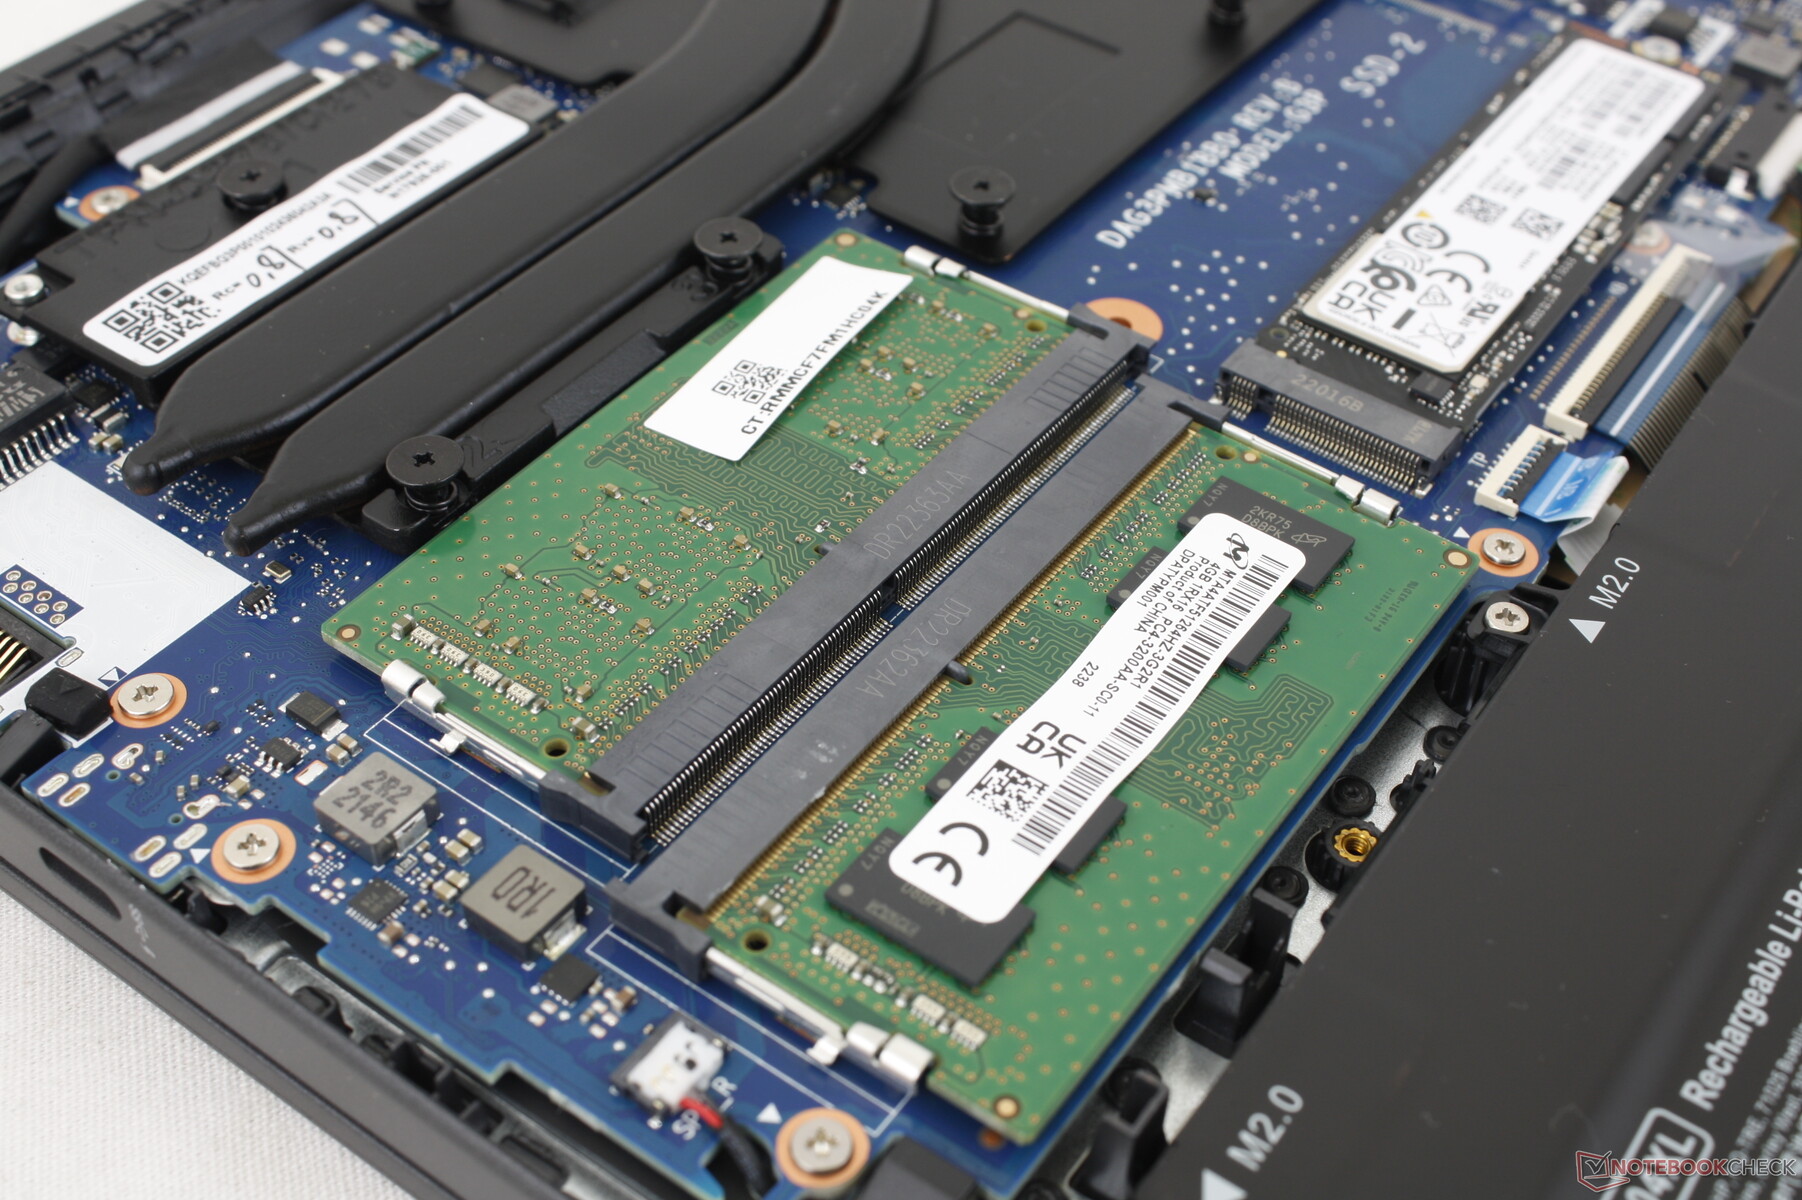
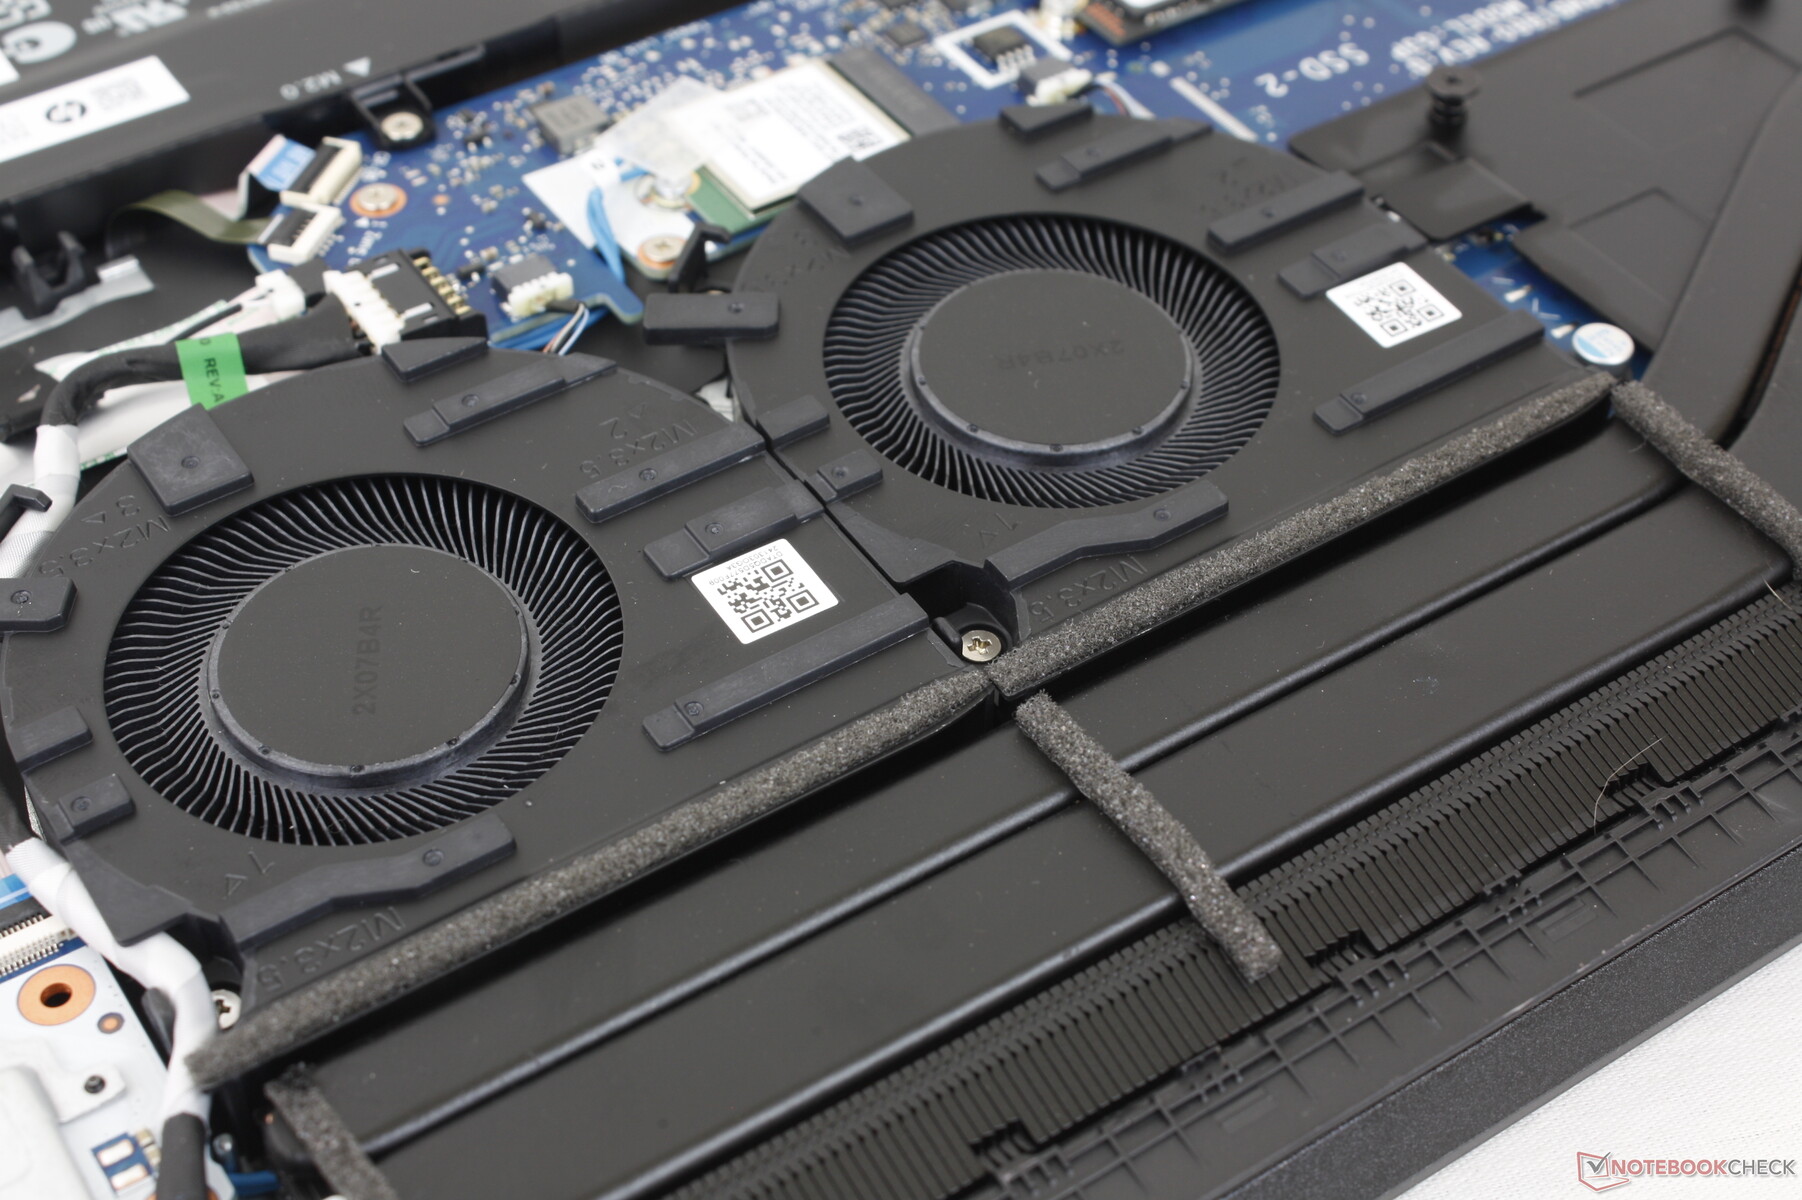
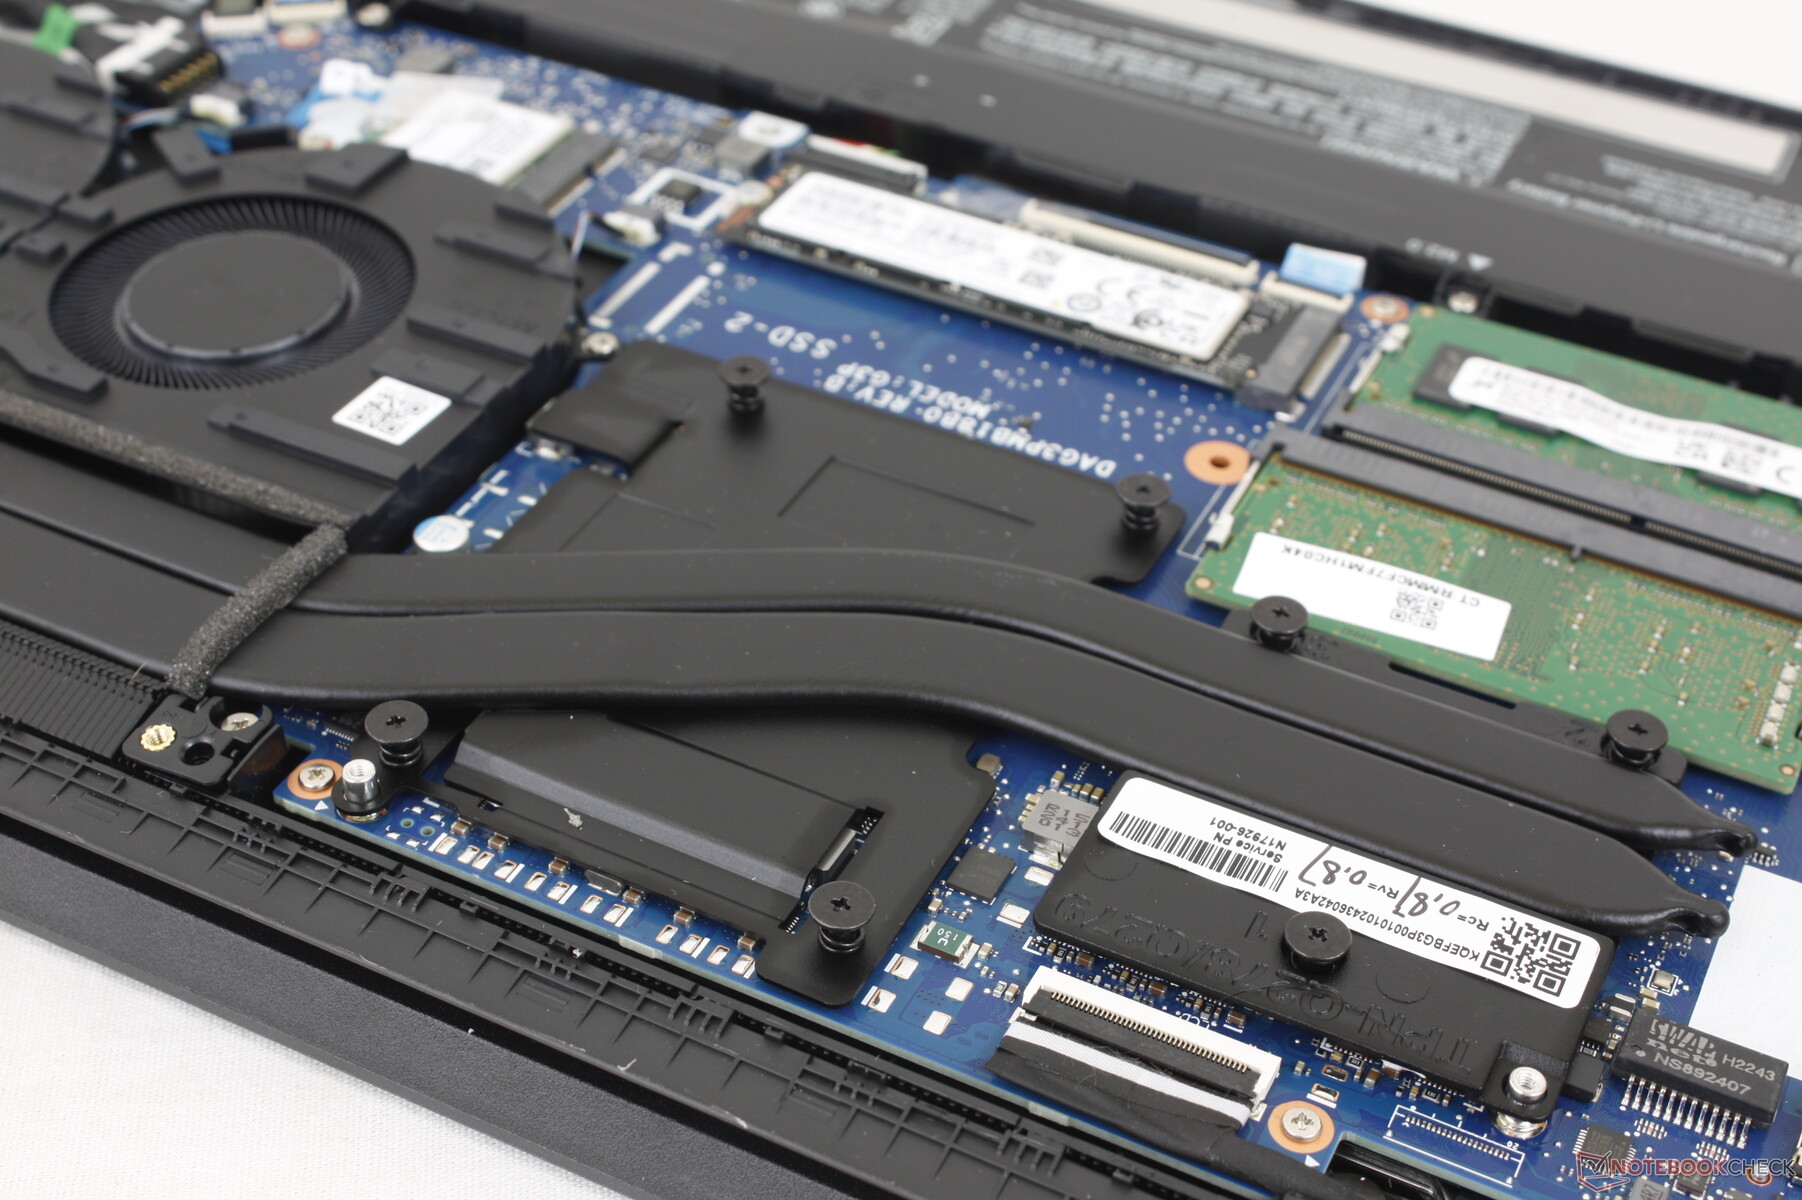
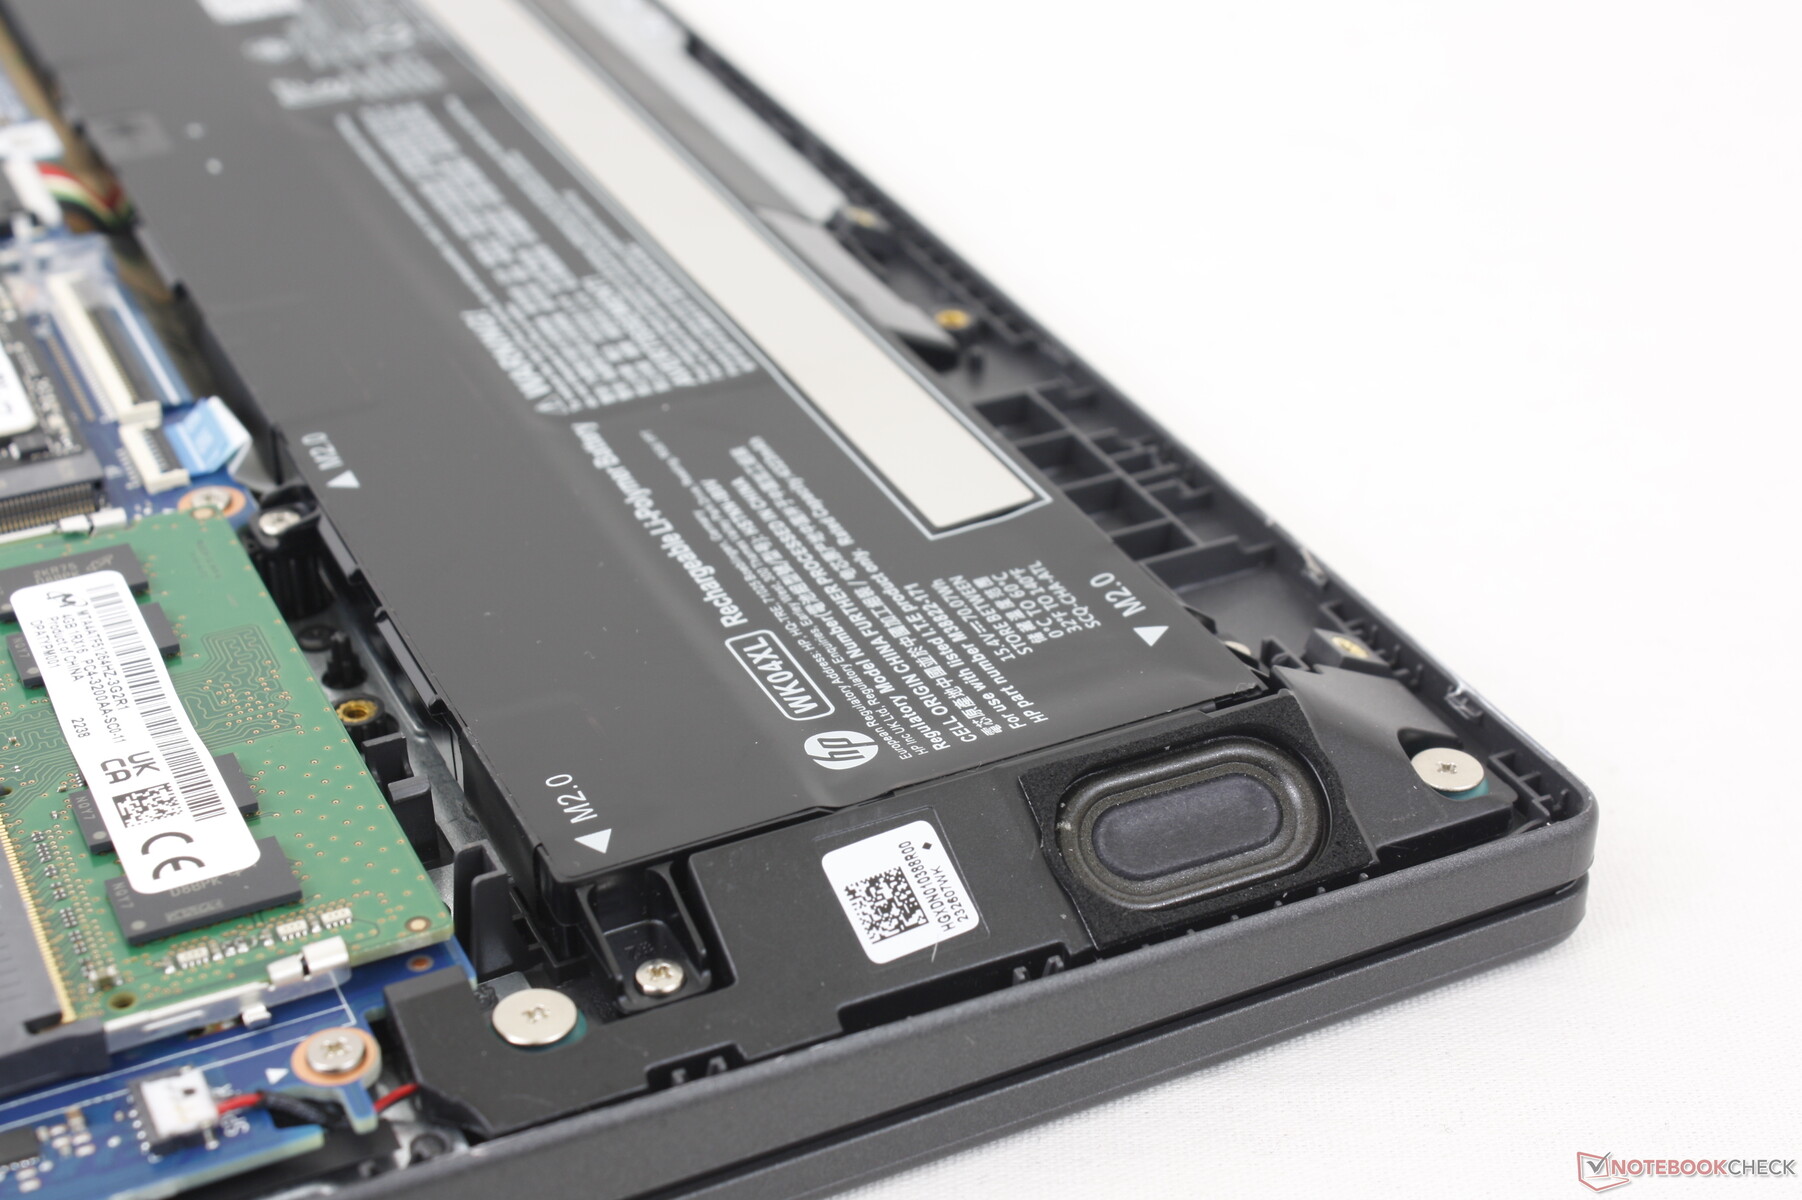
Konserwacja
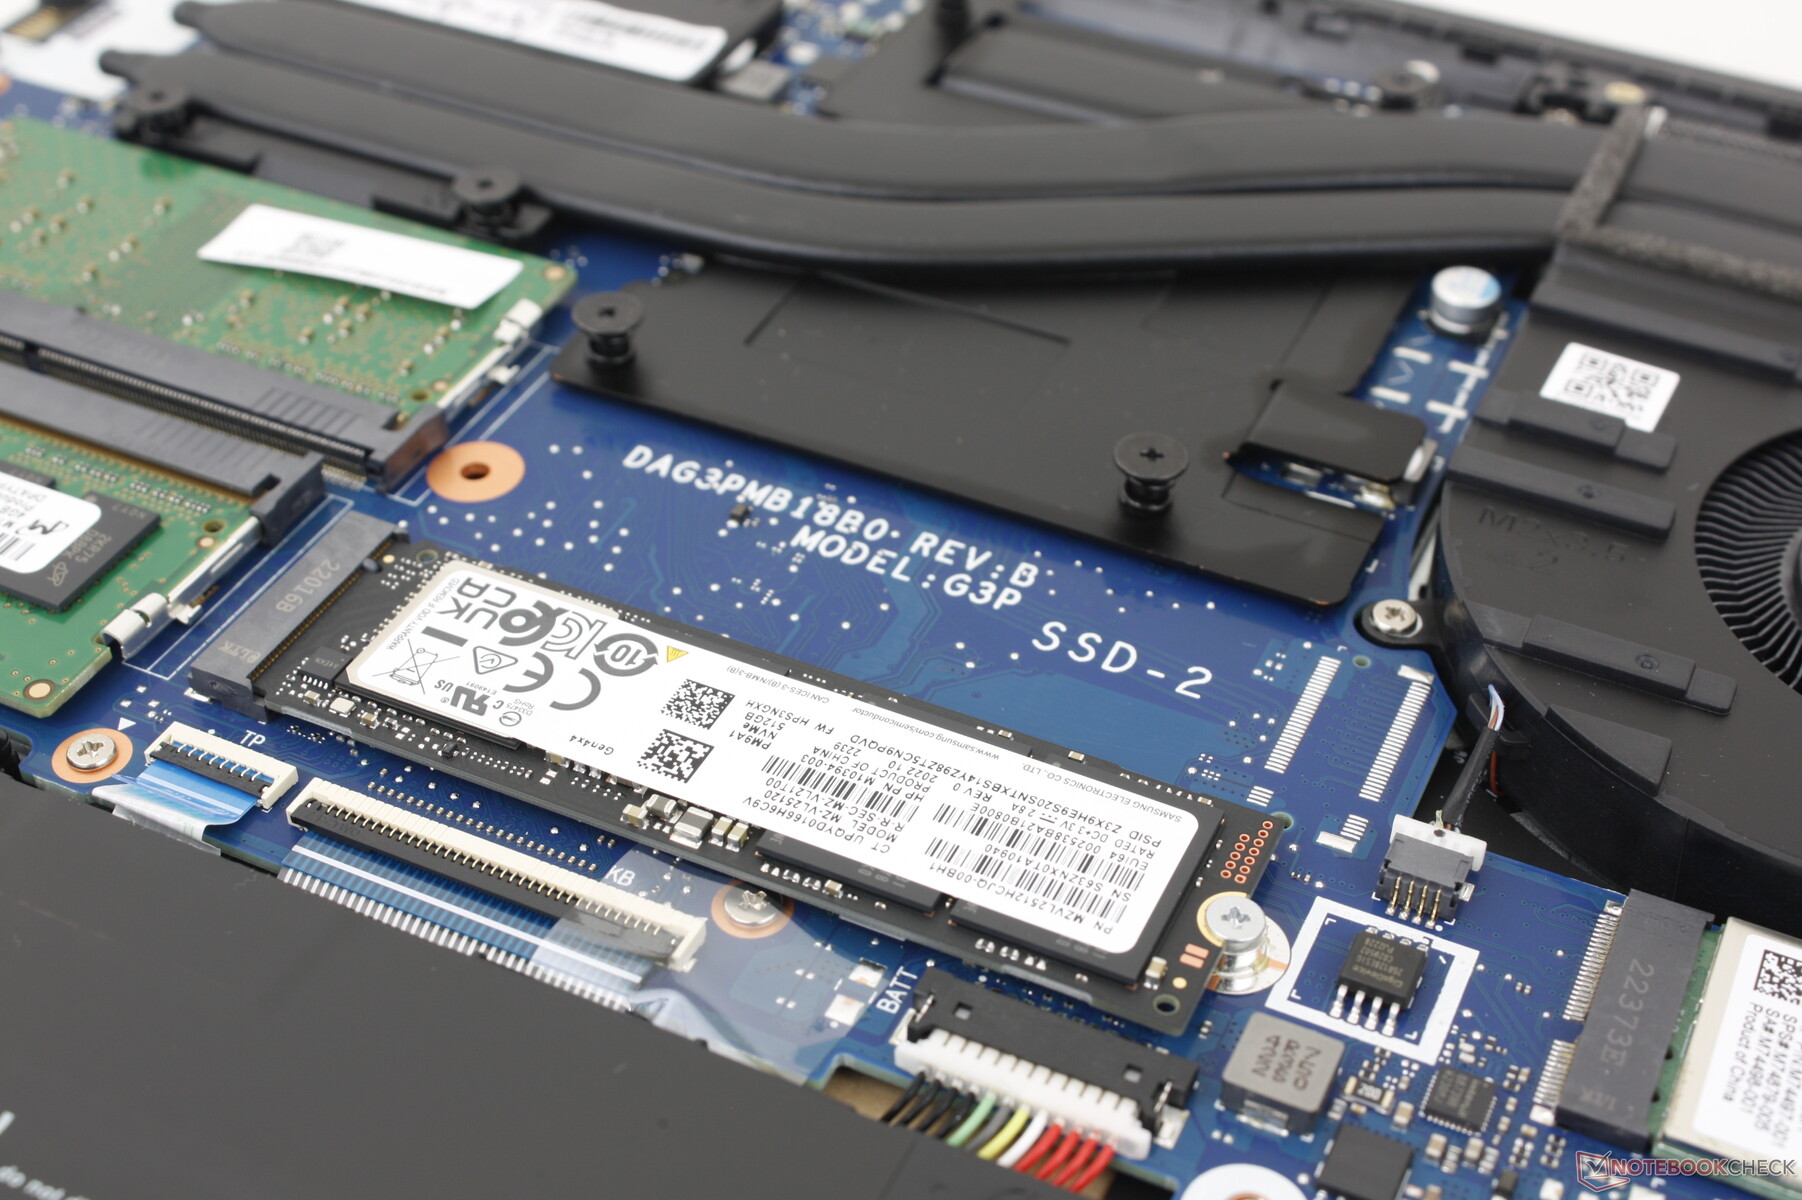
Dolny panel jest zabezpieczony siedmioma śrubkami Philipsa, co pozwala na stosunkowo łatwe serwisowanie. Właściciele mają bezpośredni dostęp do pojedynczego gniazda M.2 PCIe4 x4 2280, wymiennego modułu WLAN oraz 2x gniazd SODIMM. Konkurencyjny Asus TUF Dash F15 FX517ZC obsługuje do dwóch dysków SSD M.2, podczas gdy nasz HP może obsłużyć tylko jeden.
Akcesoria i gwarancja
W pudełku nie ma żadnych dodatków poza zasilaczem sieciowym i dokumentacją. W przypadku zakupu w USA obowiązuje roczna ograniczona gwarancja producenta.
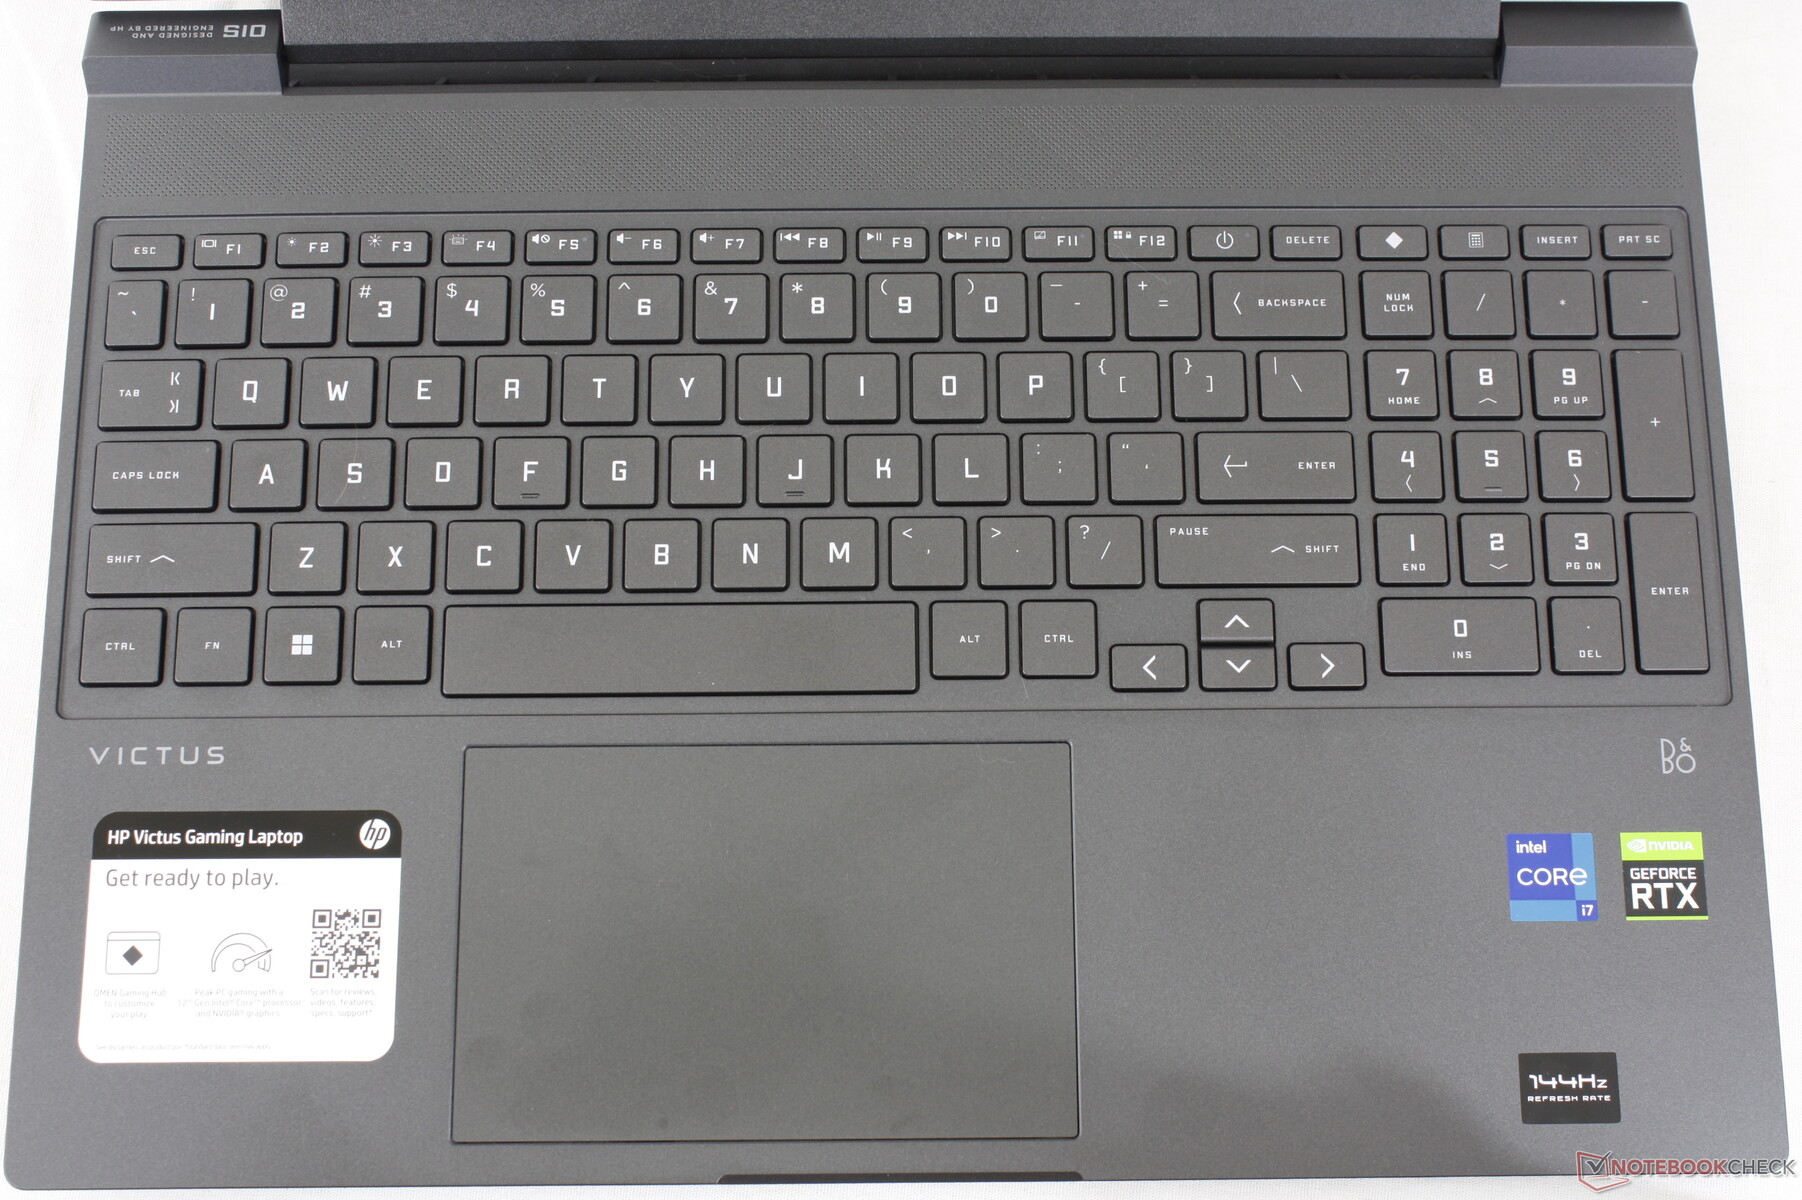
Urządzenia wejściowe - Obszerna klawiatura i ClickPad
Klawiatura
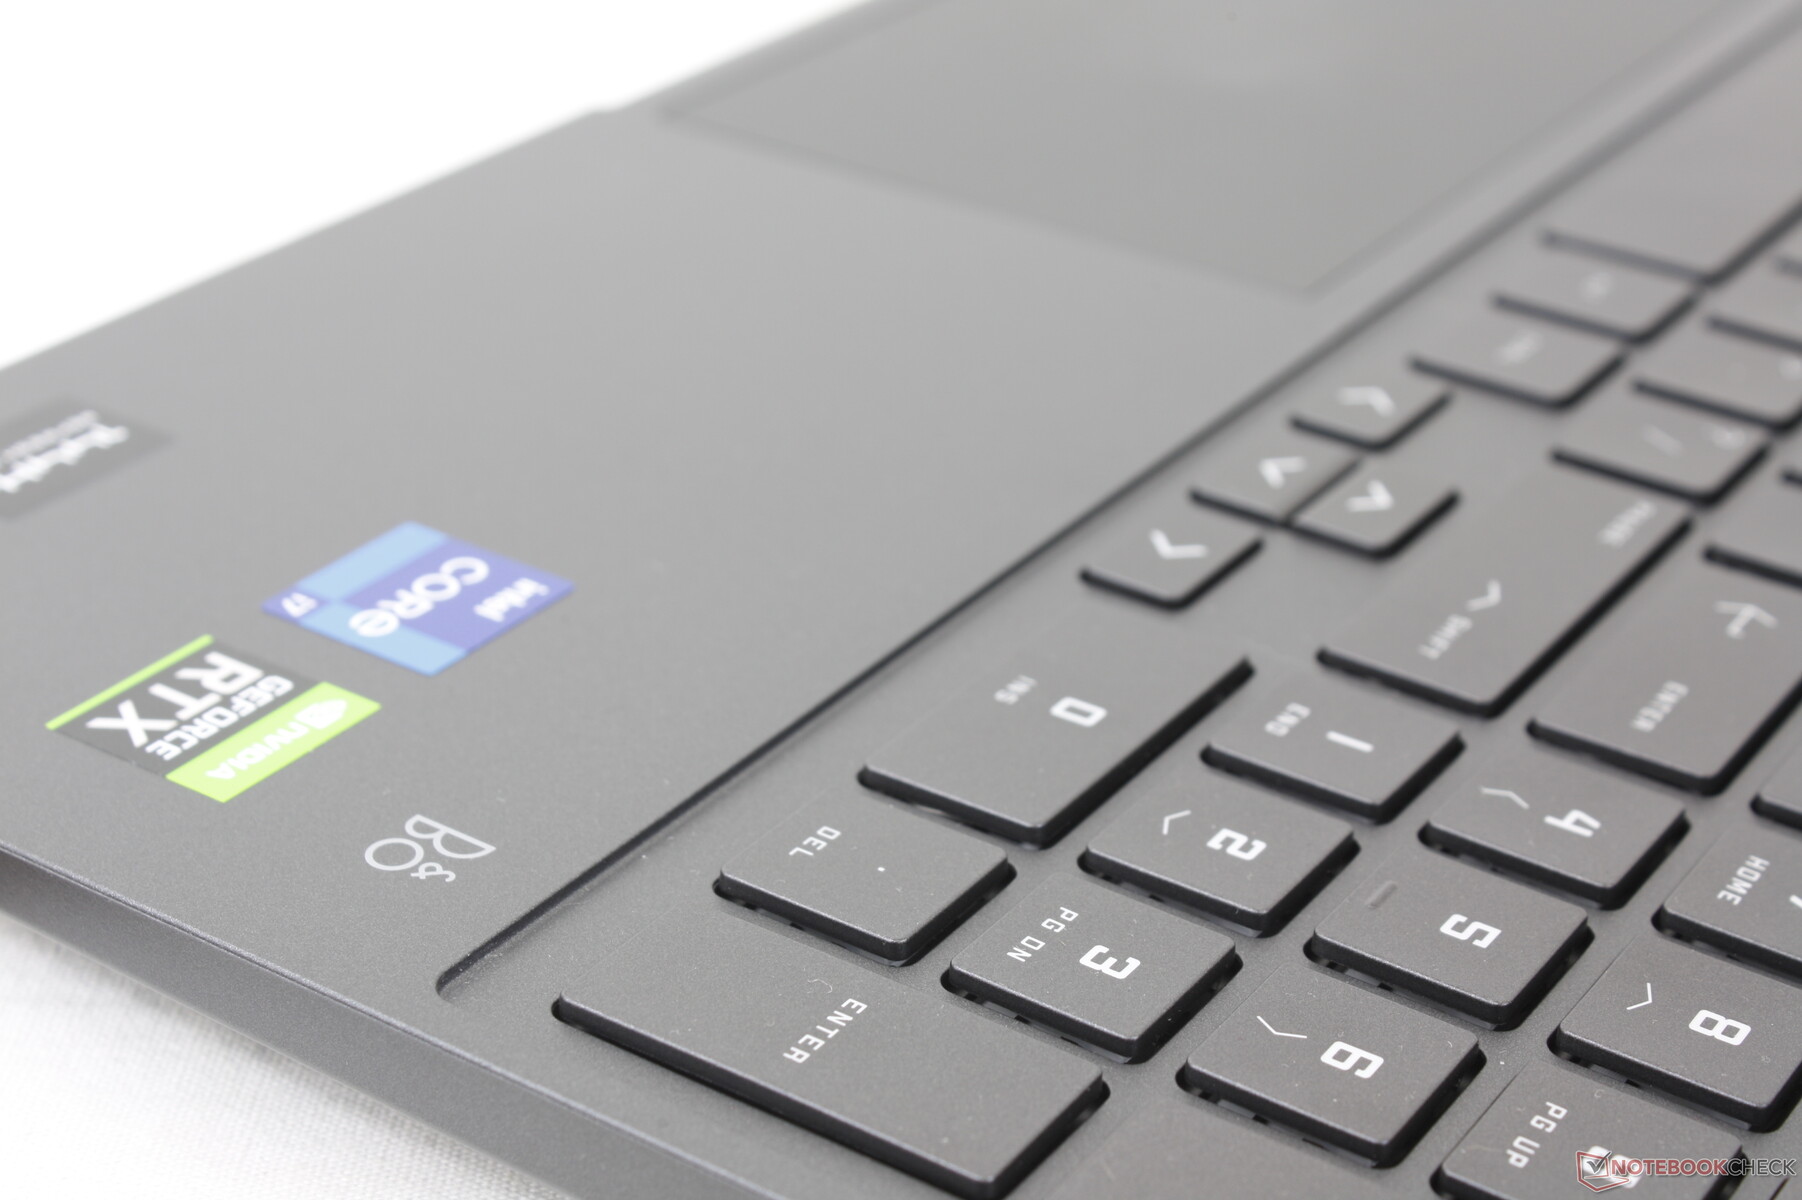
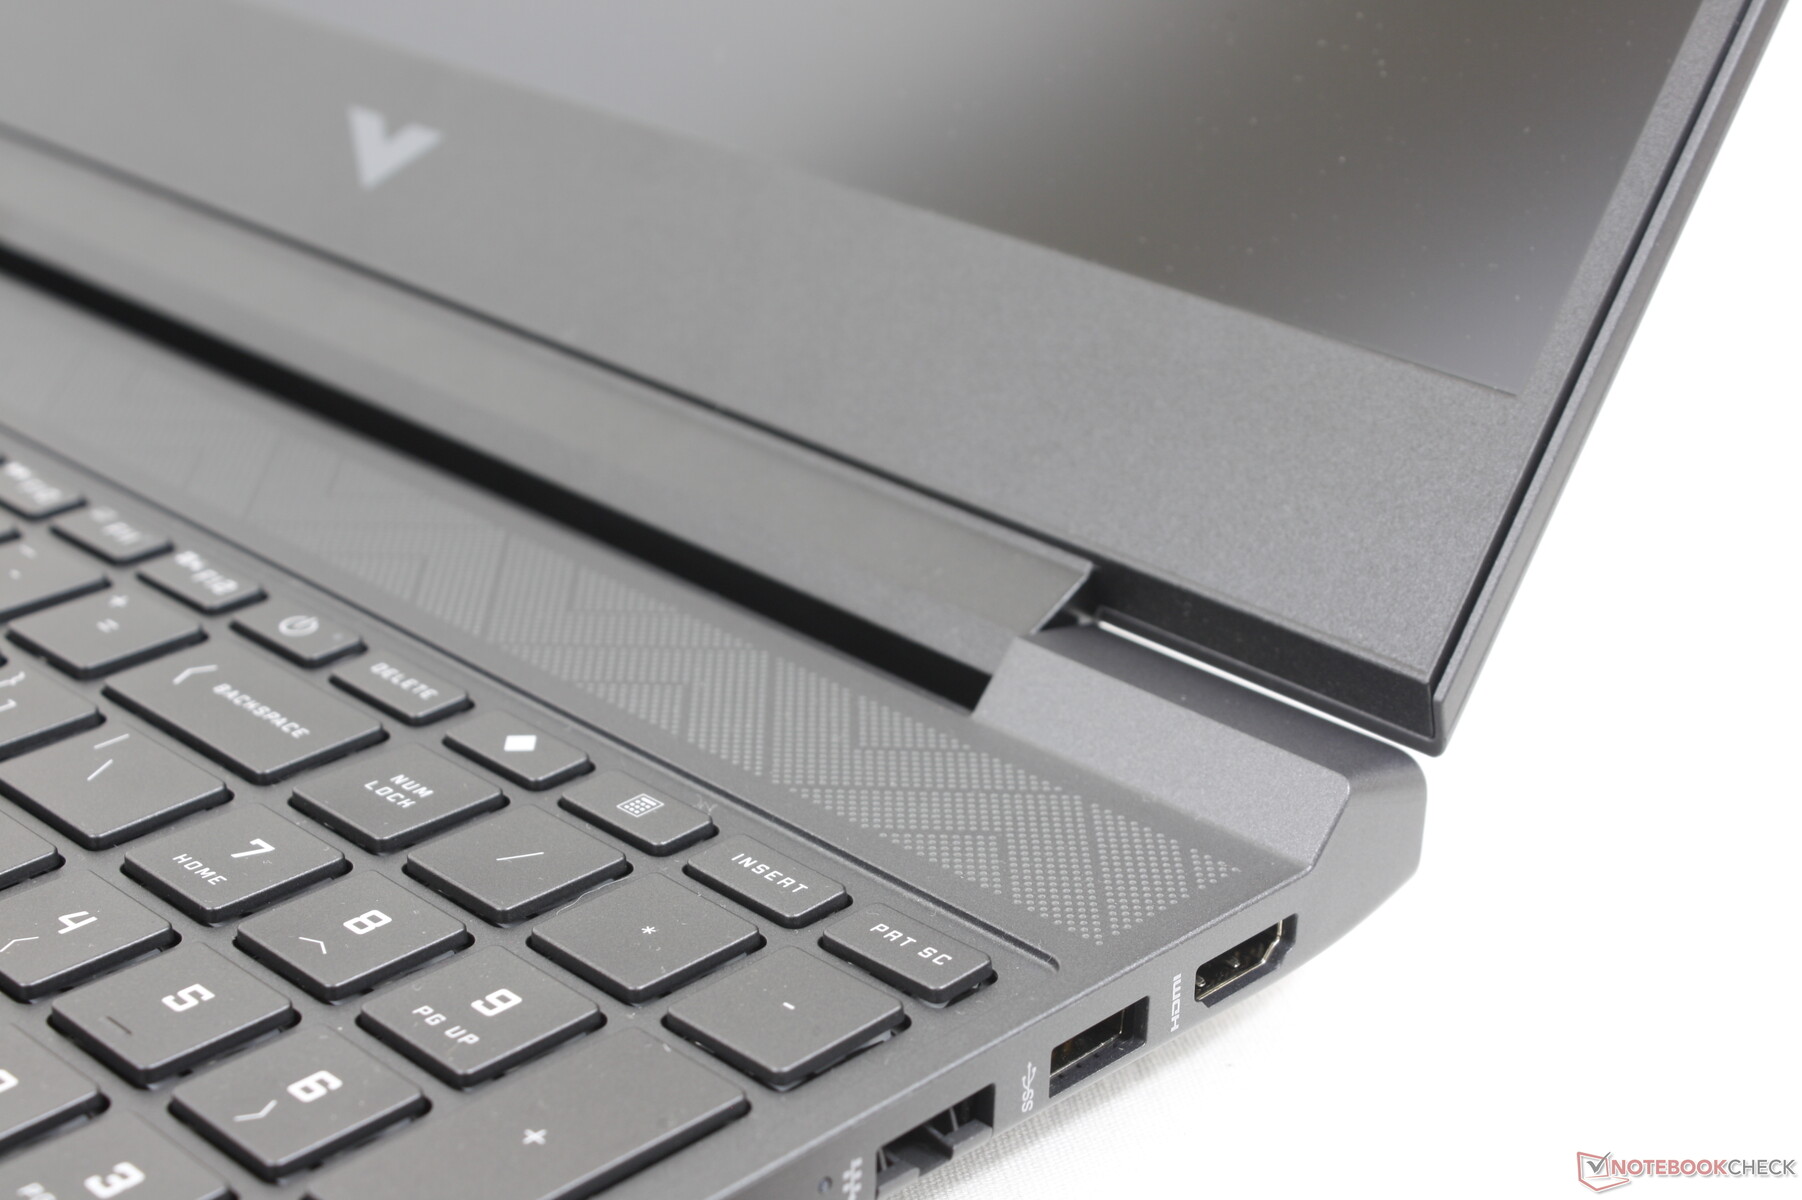
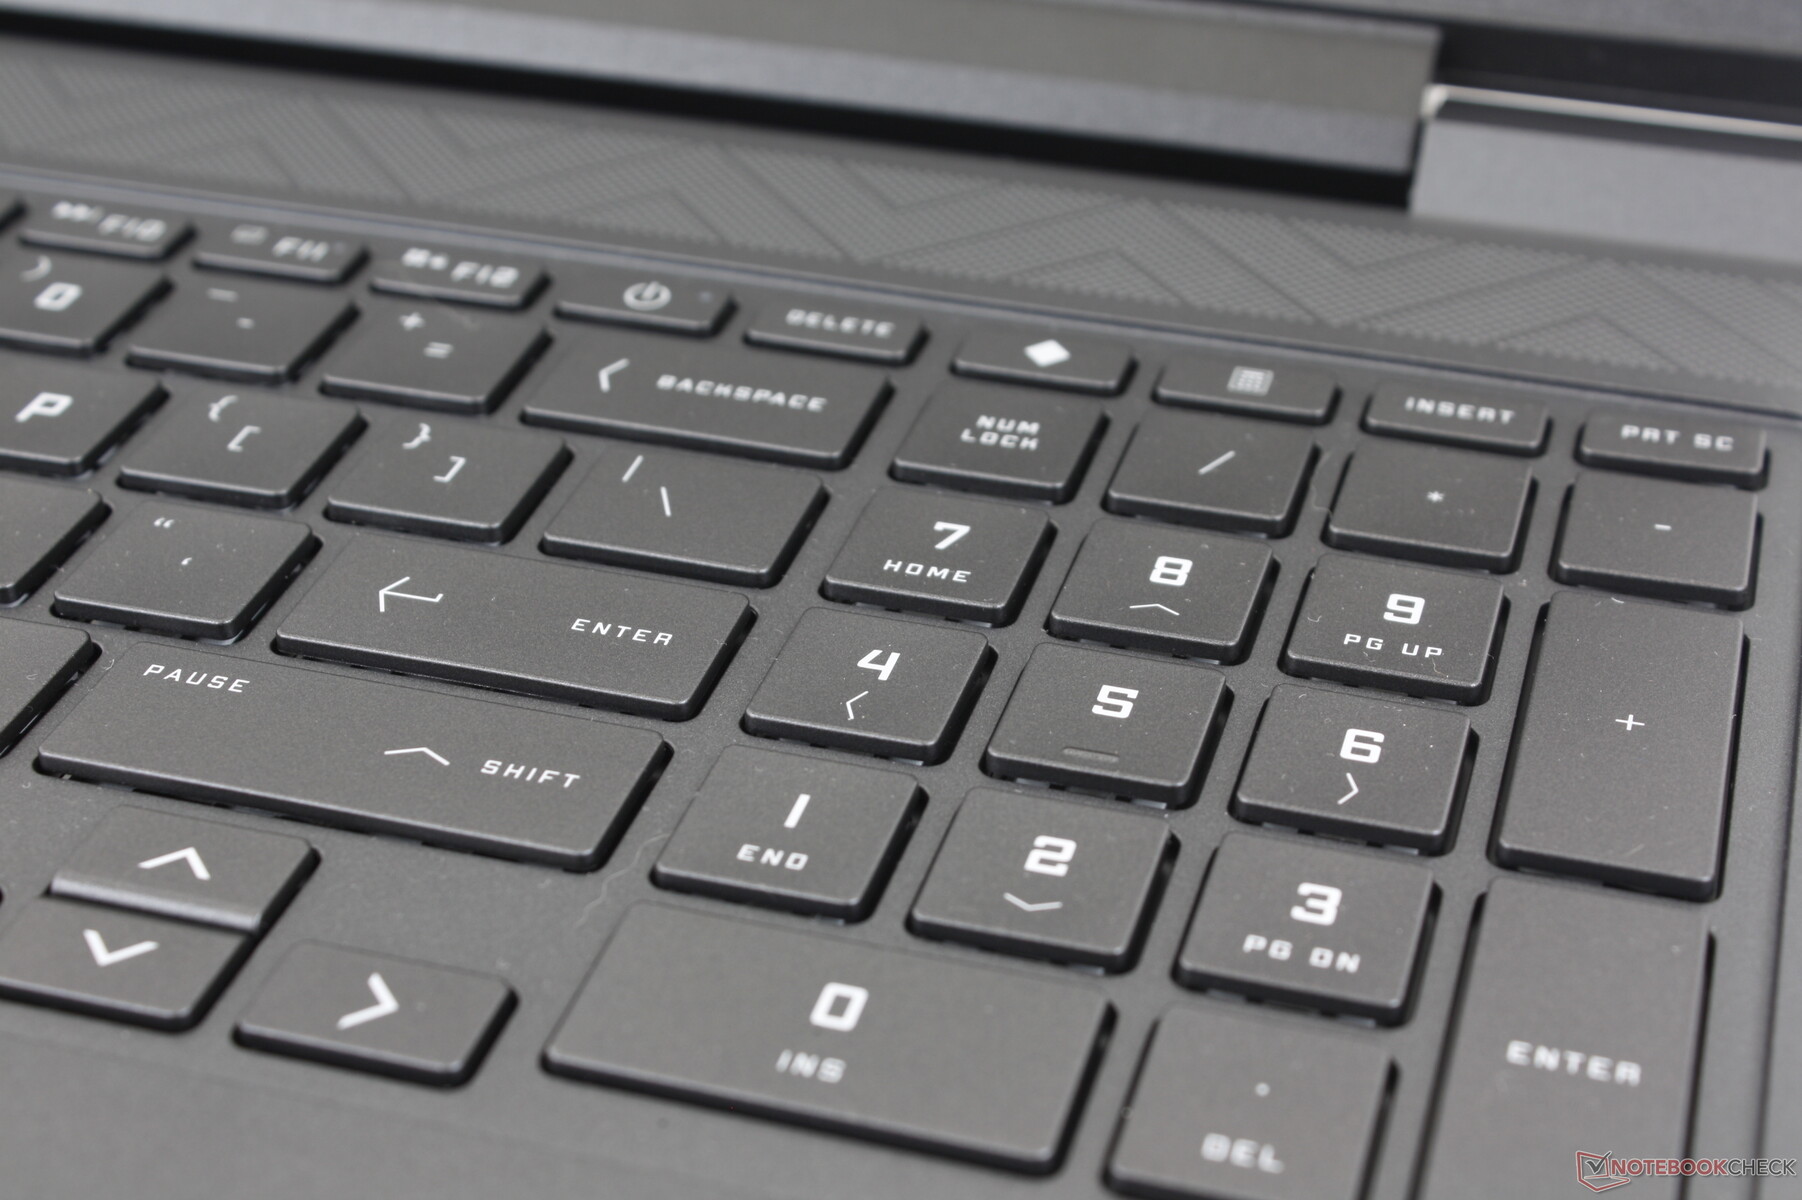
Więcej laptopów do gier zaczyna integrować numpad i Victus 15 nie jest wyjątkiem. Szczególnie doceniamy to, że klawisze numpadu nie są węższe niż główne klawisze QWERTY, w przeciwieństwie do ciasnych numpadów w Dellu G15 lub Asusie TUF Dash F15
Reakcje klawiszy podczas pisania są w Victusie nieco bardziej miękkie i przez to cichsze. Klawisze Enter i Backspace są jednak trochę zbyt miękkie i przydałoby się im twardsze sprzężenie zwrotne.
W standardzie jest jednostrefowe białe podświetlenie wszystkich klawiszy i symboli, podczas gdy większość innych laptopów do gier ma opcje RGB. Nie ma tu nawet ustawienia jasności podświetlenia - jest ono albo włączone, albo wyłączone i nie ma nic pomiędzy.
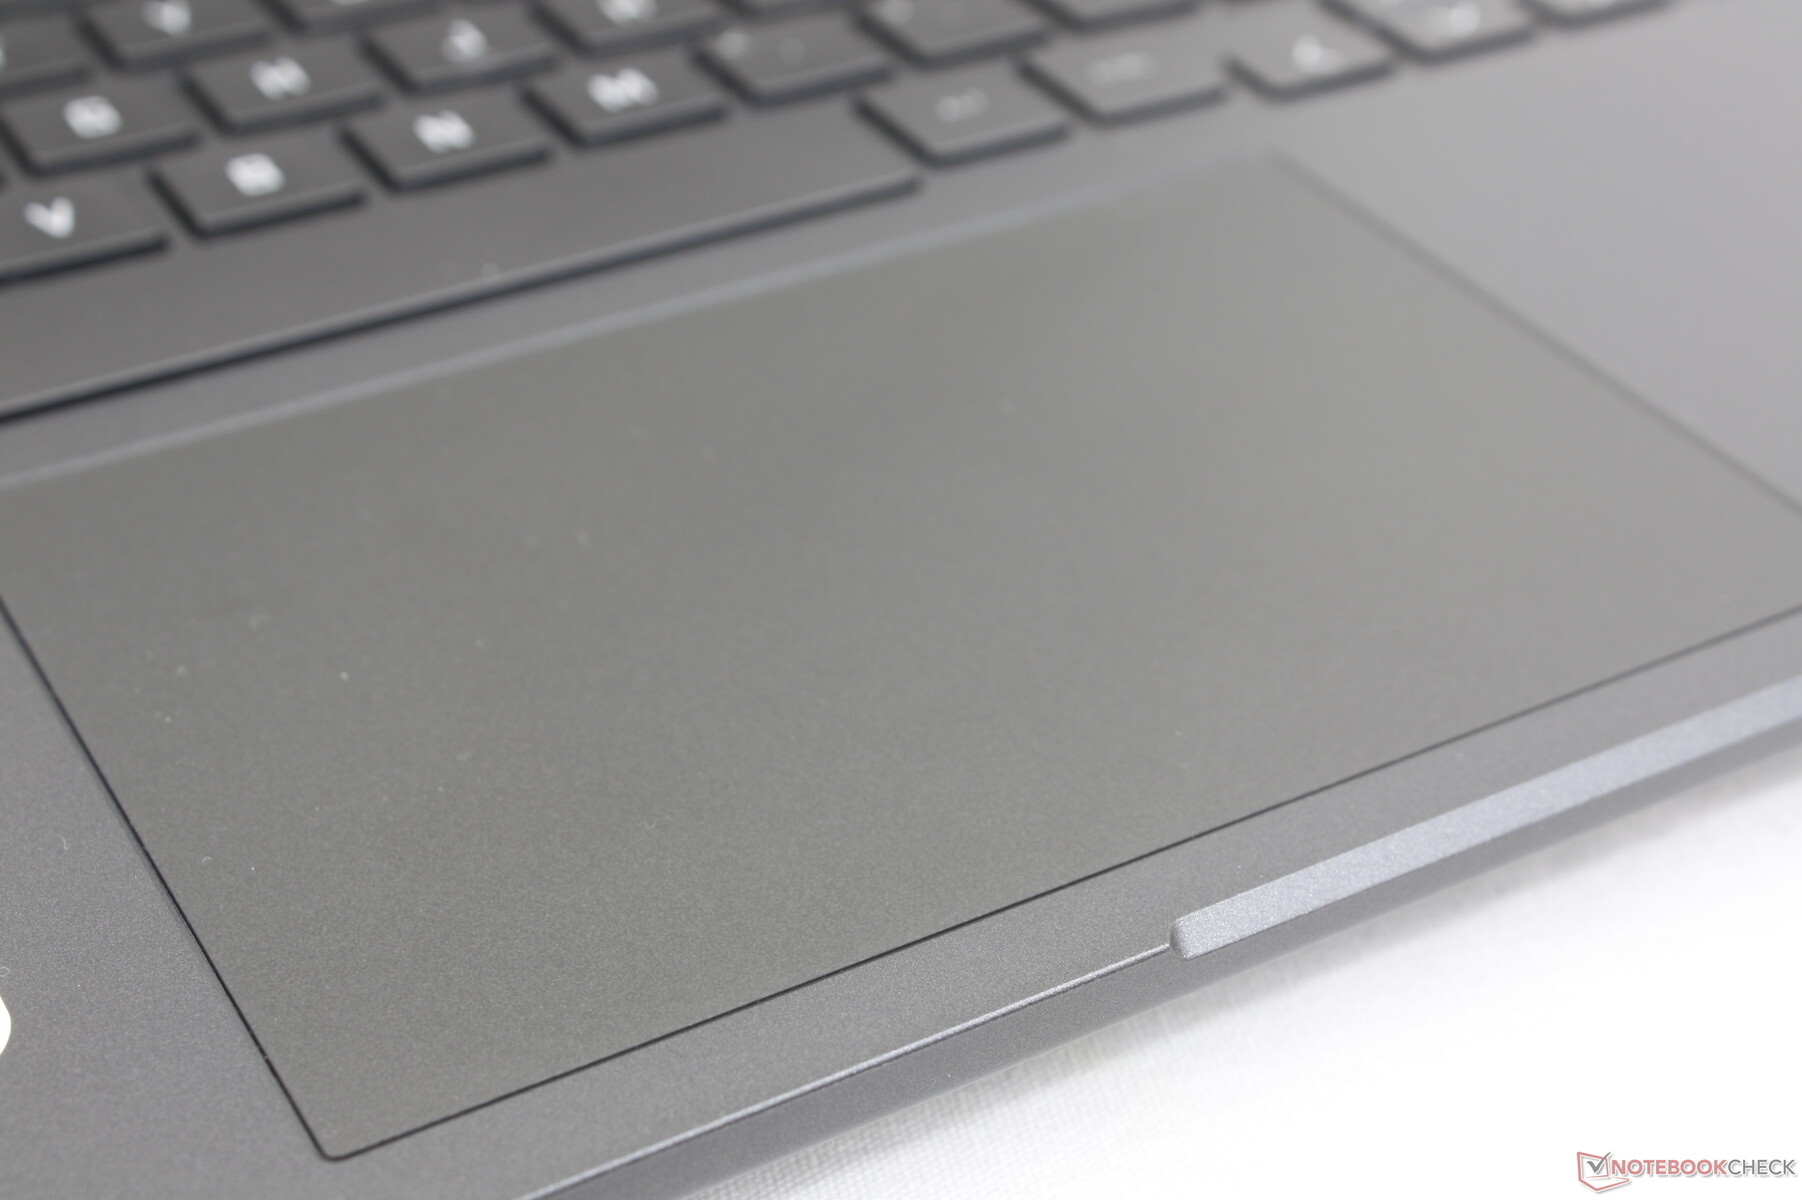
Touchpad
Obszerny gładzik jest tylko nieco większy od tego z Legion 5 15 (12,5 x 8 cm vs. 12,5 x 7,5 cm). Trakcja na plastikowej powierzchni jest gładka, a przy wolniejszych prędkościach tylko trochę się klei, co pozwala na dokładniejsze wprowadzanie danych. Zintegrowane klawisze są również klikalne i nie są zbyt gąbczaste.
Dwie największe wady gładzika to głośne sprzężenie zwrotne przy naciskaniu i ogólna tendencja do zbierania odcisków palców. Spodziewaj się, że w krótkim czasie oparcia dłoni, klawisze i gładzik będą wyglądać na błyszczące i tłuste.

Wyświetlacz - tylko 1080p
Dostępne są cztery opcje wyświetlania w następujący sposób:
- 1920 x 1080, 60 Hz, 250 nitów, TN
- 1920 x 1080, 60 Hz, 250 nitów, IPS
- 1920 x 1080, 144 Hz, 250 nitów, IPS
- 1920 x 1080, 60 Hz, 300 nitów, IPS
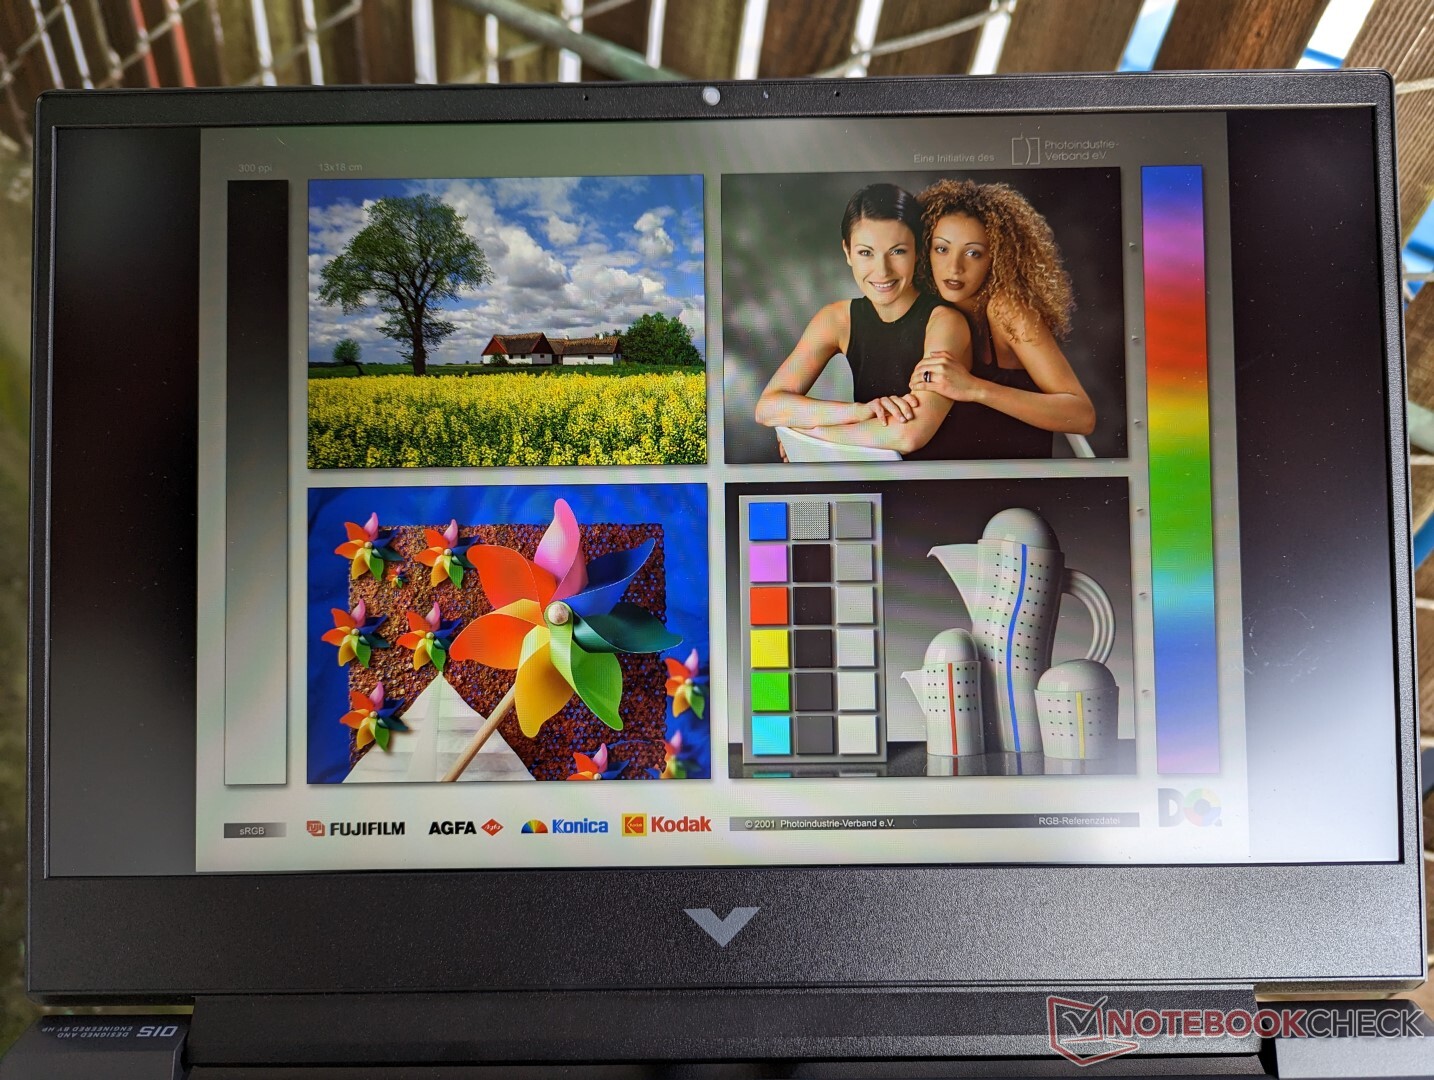
Wszystkie opcje są matowe bez paneli OLED lub o wyższej rozdzielczości do wyboru. Nasz konkretny egzemplarz recenzencki jest wyposażony w pogrubioną opcję powyżej, co zapewnia płynniejsze wrażenia użytkownika, ale słabe kolory i przeciętne czasy reakcji to główne czynniki odróżniające Victusa 15 od droższych laptopów do gier z lepszymi wyświetlaczami. Na stronie Seria Omen 16, oferuje na przykład pełne pokrycie sRGB i szybsze czasy reakcji.
Współczynnik kontrastu jest co najmniej bardzo dobry jak na budżetowy laptop do gier na poziomie około 1500:1. Mimo to kolory i treści nie rzucają się w oczy z powodu ograniczonego gamutu panelu.


| |||||||||||||||||||||||||
rozświetlenie: 87 %
na akumulatorze: 284.3 cd/m²
kontrast: 1672:1 (czerń: 0.17 cd/m²)
ΔE ColorChecker Calman: 4.52 | ∀{0.5-29.43 Ø4.73}
calibrated: 1.55
ΔE Greyscale Calman: 4.1 | ∀{0.09-98 Ø4.97}
43.4% AdobeRGB 1998 (Argyll 3D)
62.7% sRGB (Argyll 3D)
42% Display P3 (Argyll 3D)
Gamma: 2.3
CCT: 6529 K
| HP Victus 15 fa0020nr CMN1521, IPS, 1920x1080, 15.6" | HP Omen 15-en0375ng BOE0852, IPS, 1920x1080, 15.6" | Dell G15 5515 BOE092A, IPS, 1920x1080, 15.6" | Asus TUF Dash F15 FX517ZC BOE CQ NE156QHM-NY1, IPS, 2560x1440, 15.6" | MSI Bravo 15 B5DD-010US Chi Mei N156HRA-EA1, IPS, 1920x1080, 15.6" | Lenovo Legion 5 15IAH7H 82RB CSOT MNF601CA1-3, IPS, 1920x1080, 15.6" | |
|---|---|---|---|---|---|---|
| Display | -7% | -8% | 94% | 0% | 62% | |
| Display P3 Coverage (%) | 42 | 39.12 -7% | 39.1 -7% | 95.8 128% | 42.1 0% | 69.1 65% |
| sRGB Coverage (%) | 62.7 | 57.6 -8% | 56.9 -9% | 99.9 59% | 62.8 0% | 99.5 59% |
| AdobeRGB 1998 Coverage (%) | 43.4 | 40.42 -7% | 40.4 -7% | 85.1 96% | 43.6 0% | 70 61% |
| Response Times | 19% | 33% | 69% | 22% | 57% | |
| Response Time Grey 50% / Grey 80% * (ms) | 35.2 ? | 30.4 ? 14% | 25.2 ? 28% | 8.4 ? 76% | 25.6 ? 27% | 14.8 ? 58% |
| Response Time Black / White * (ms) | 27.2 ? | 20.8 ? 24% | 16.8 ? 38% | 10.4 ? 62% | 22.8 ? 16% | 12 ? 56% |
| PWM Frequency (Hz) | 200 ? | 200 ? | ||||
| Screen | -31% | -43% | -9% | -37% | -3% | |
| Brightness middle (cd/m²) | 284.3 | 297 4% | 278 -2% | 354.2 25% | 265.1 -7% | 363.5 28% |
| Brightness (cd/m²) | 262 | 275 5% | 262 0% | 330 26% | 245 -6% | 350 34% |
| Brightness Distribution (%) | 87 | 88 1% | 83 -5% | 88 1% | 87 0% | 89 2% |
| Black Level * (cd/m²) | 0.17 | 0.33 -94% | 0.36 -112% | 0.32 -88% | 0.35 -106% | 0.39 -129% |
| Contrast (:1) | 1672 | 900 -46% | 772 -54% | 1107 -34% | 757 -55% | 932 -44% |
| Colorchecker dE 2000 * | 4.52 | 4.54 -0% | 5.74 -27% | 4.06 10% | 4.68 -4% | 3.68 19% |
| Colorchecker dE 2000 max. * | 18.67 | 18.92 -1% | 19.63 -5% | 8.81 53% | 19.96 -7% | 8.92 52% |
| Colorchecker dE 2000 calibrated * | 1.55 | 4.66 -201% | 4.7 -203% | 3.7 -139% | 0.53 66% | |
| Greyscale dE 2000 * | 4.1 | 2.1 49% | 3.1 24% | 6.7 -63% | 4.5 -10% | 6.5 -59% |
| Gamma | 2.3 96% | 2.066 106% | 2.011 109% | 2.12 104% | 2.22 99% | 2.2 100% |
| CCT | 6529 100% | 6291 103% | 6207 105% | 6731 97% | 6632 98% | 5995 108% |
| Color Space (Percent of AdobeRGB 1998) (%) | 40 | |||||
| Color Space (Percent of sRGB) (%) | 58 | |||||
| Całkowita średnia (program / ustawienia) | -6% /
-19% | -6% /
-24% | 51% /
27% | -5% /
-21% | 39% /
19% |
* ... im mniej tym lepiej
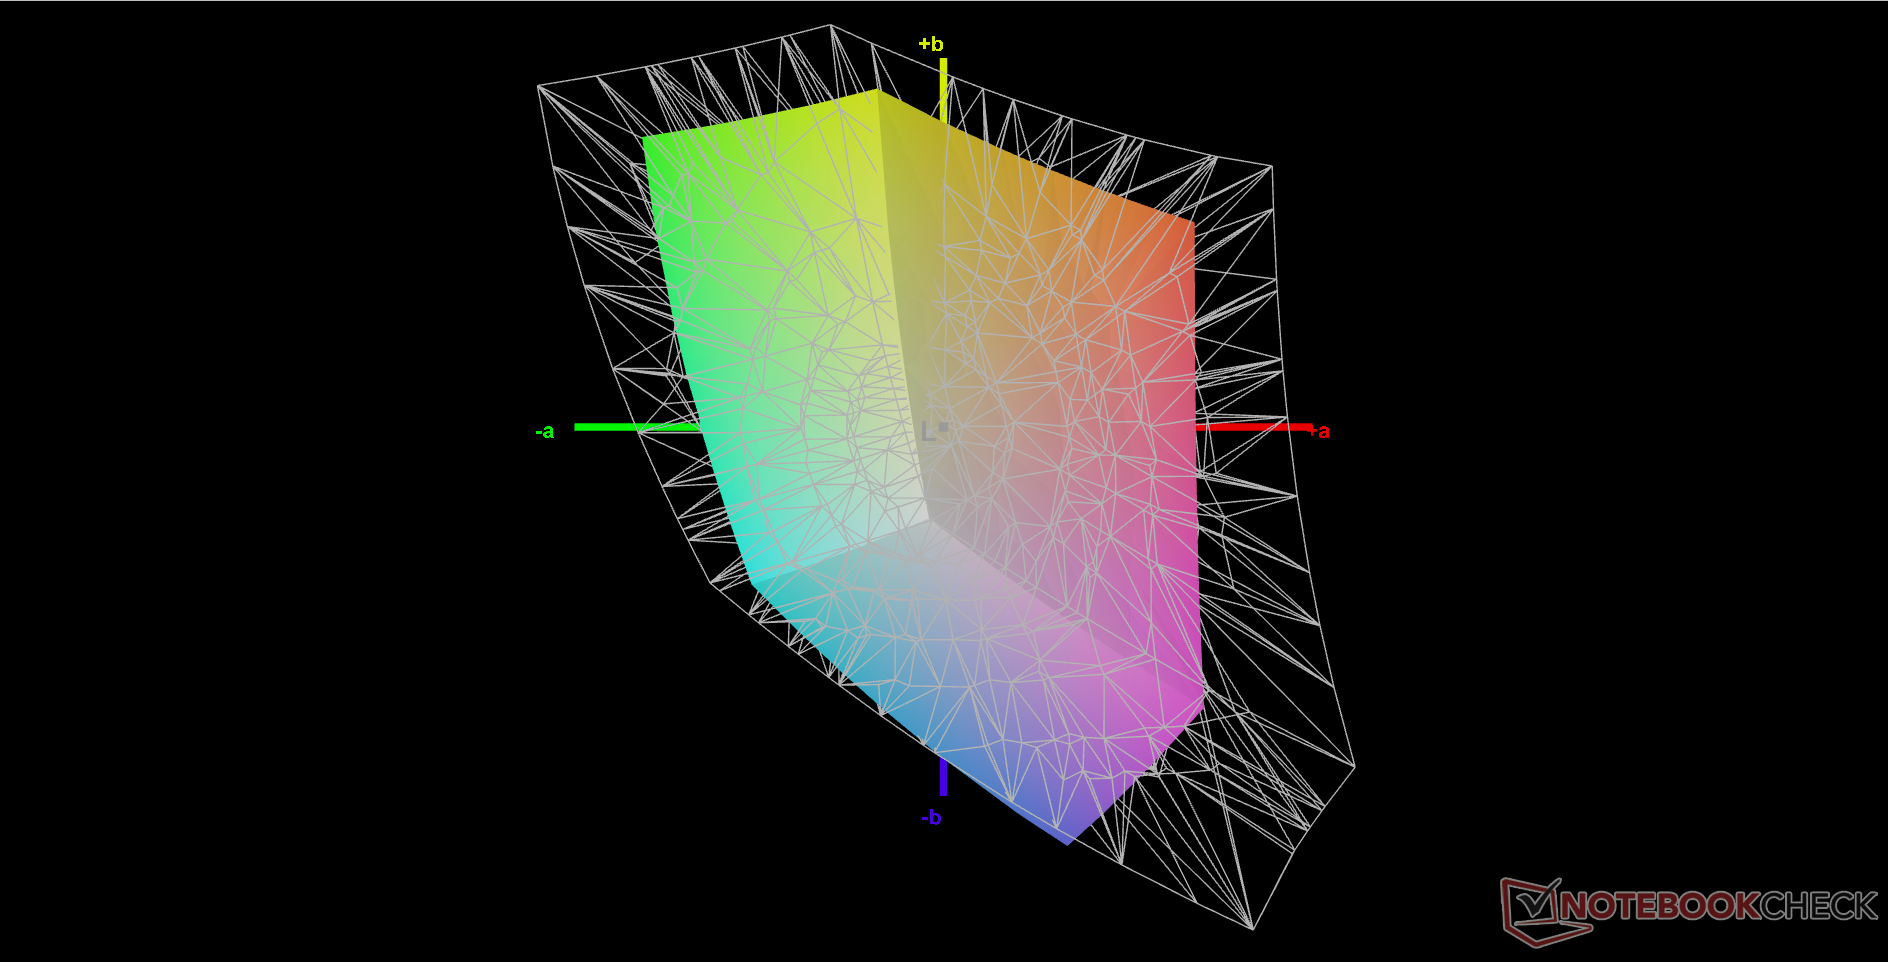
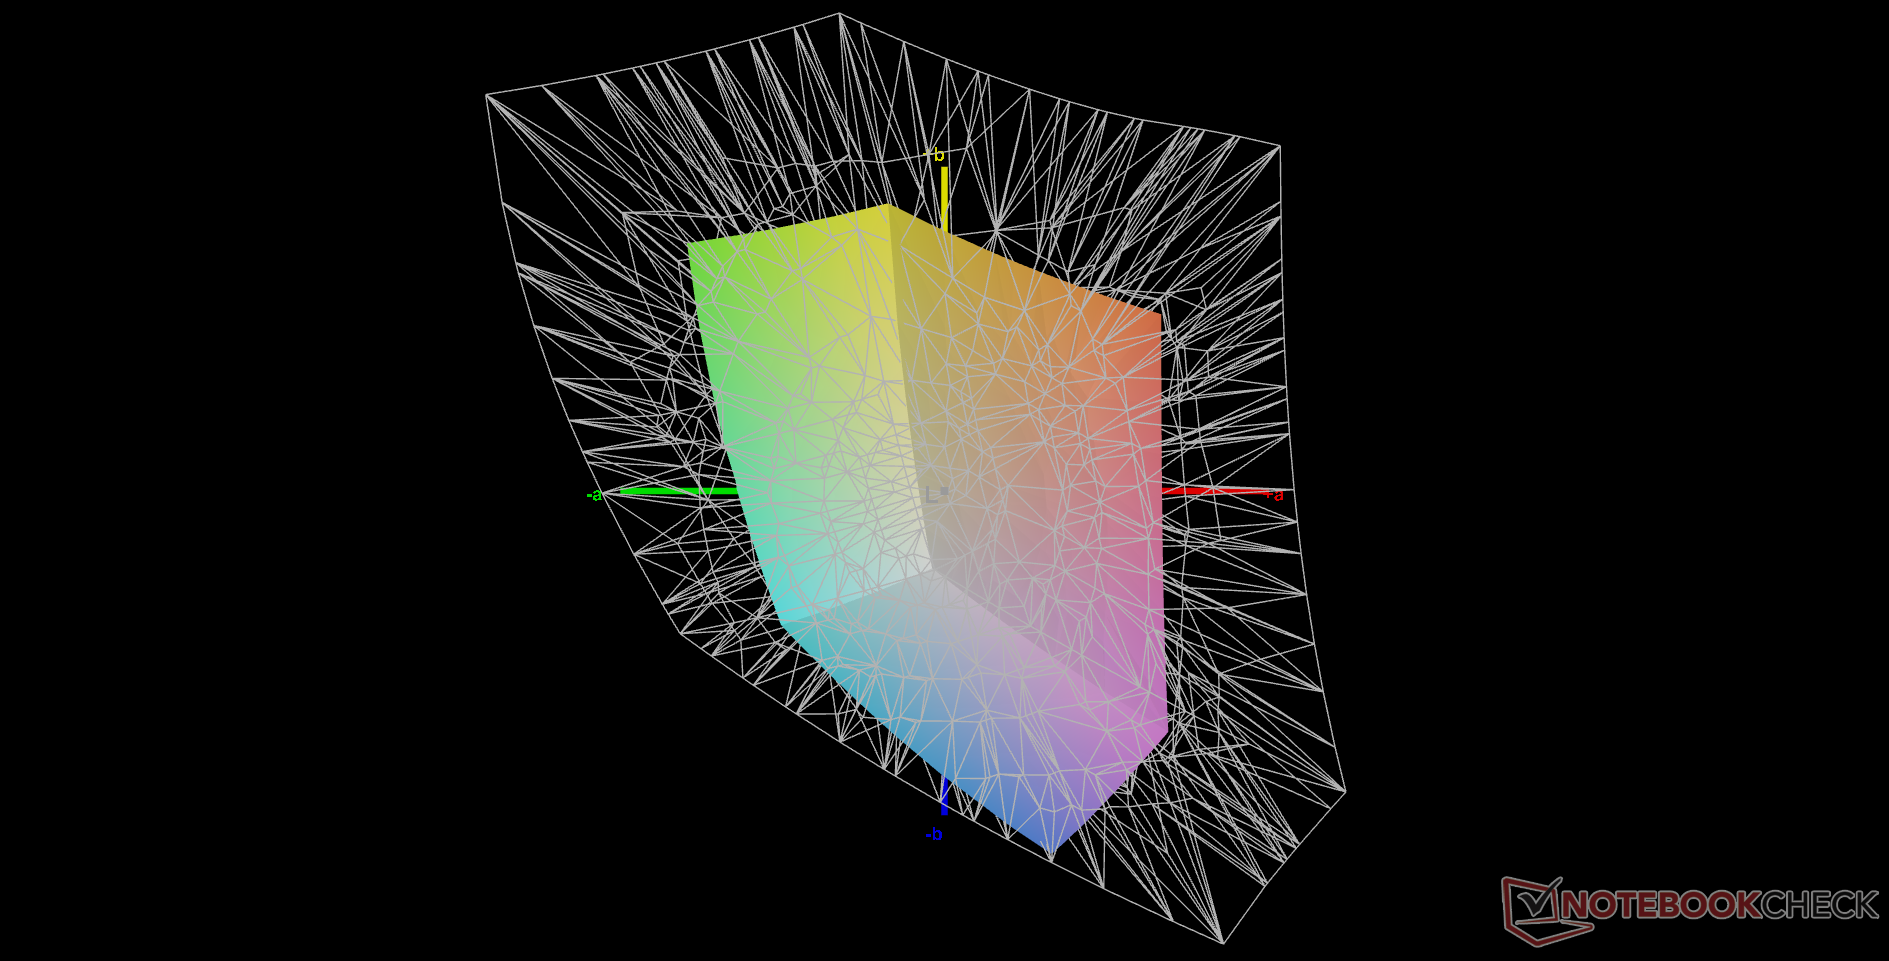
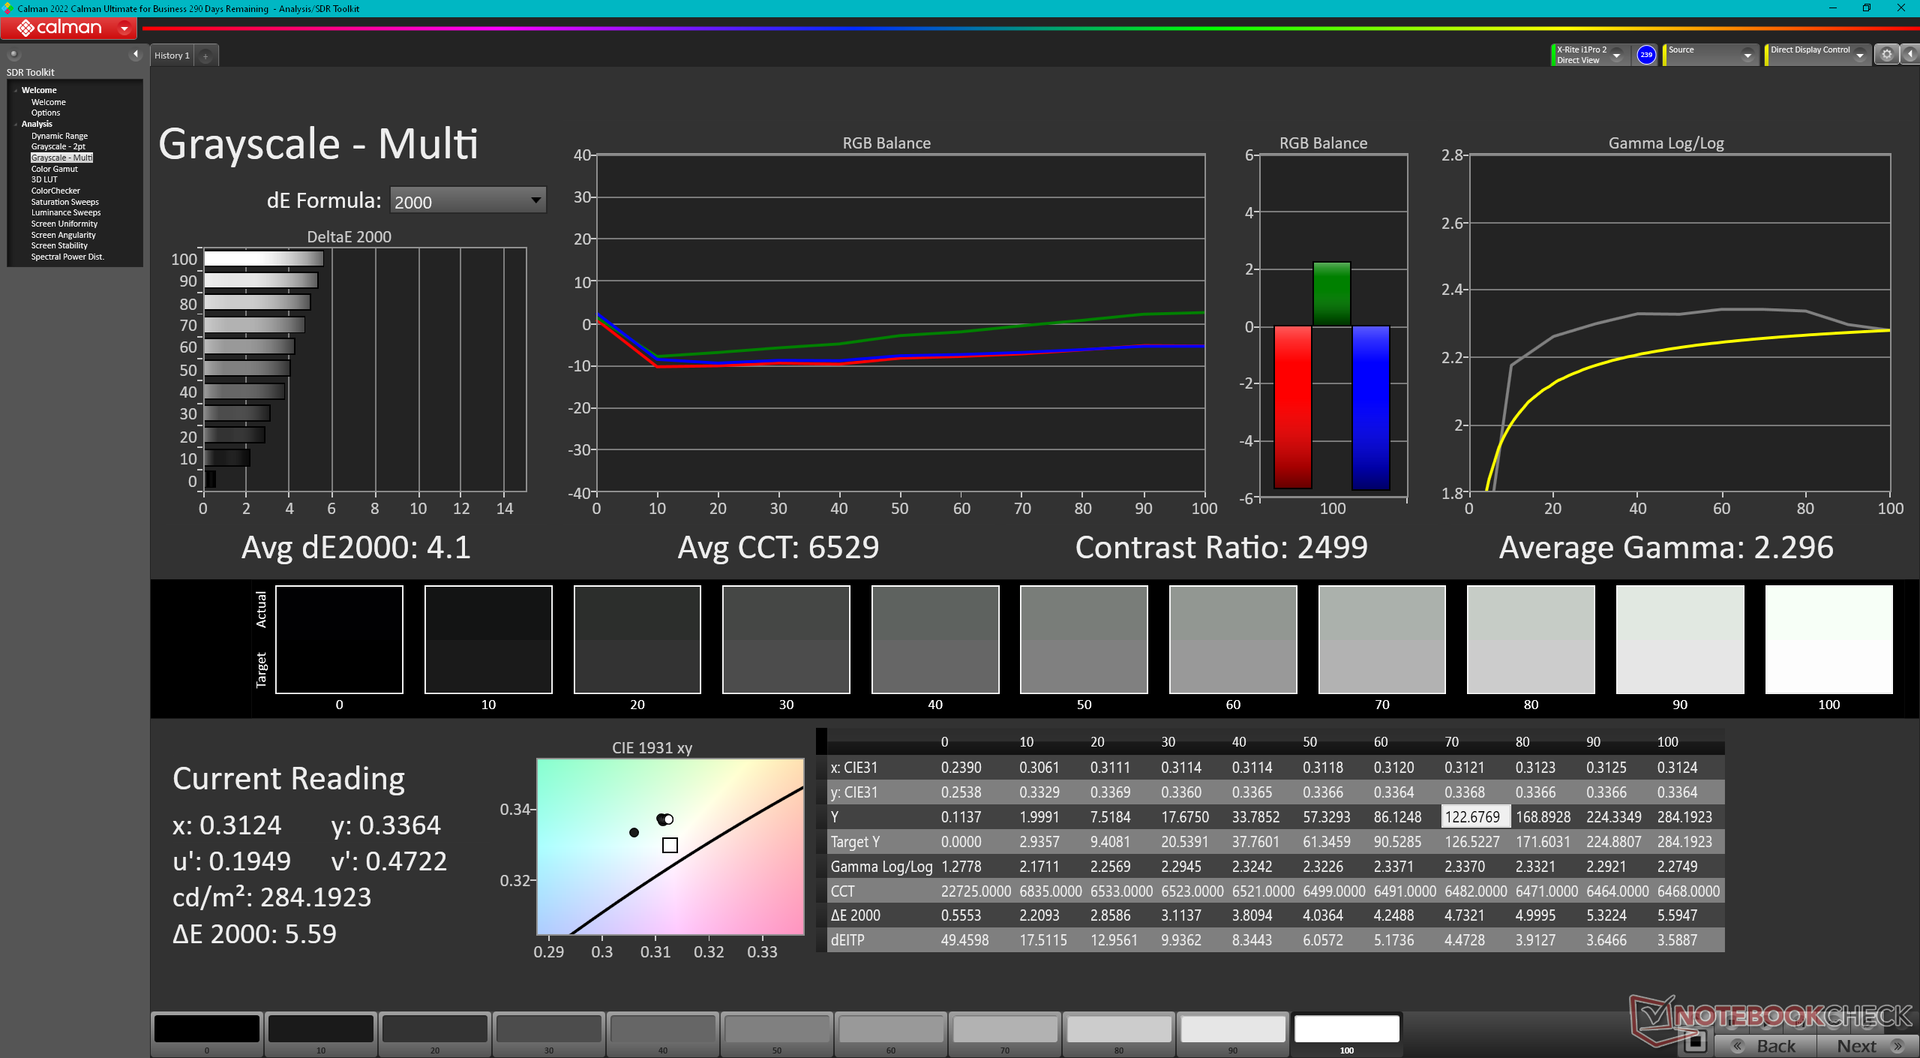
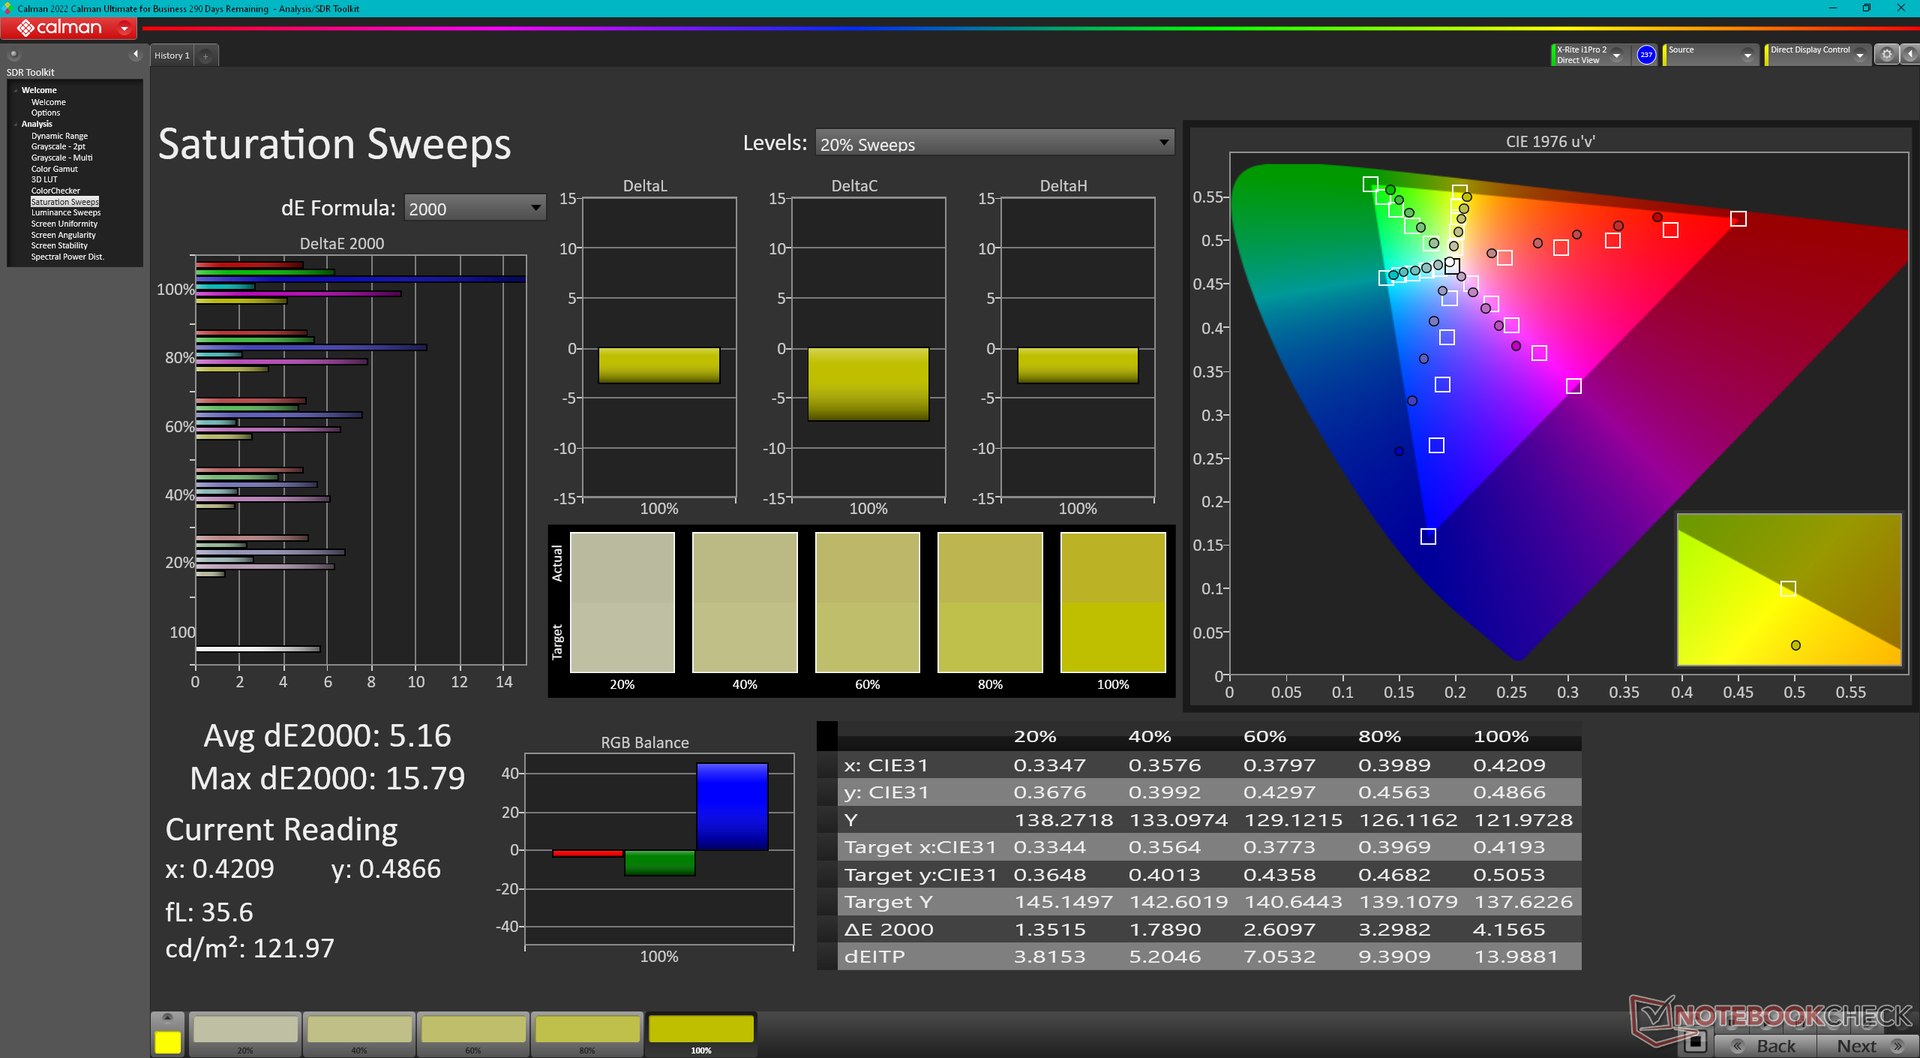
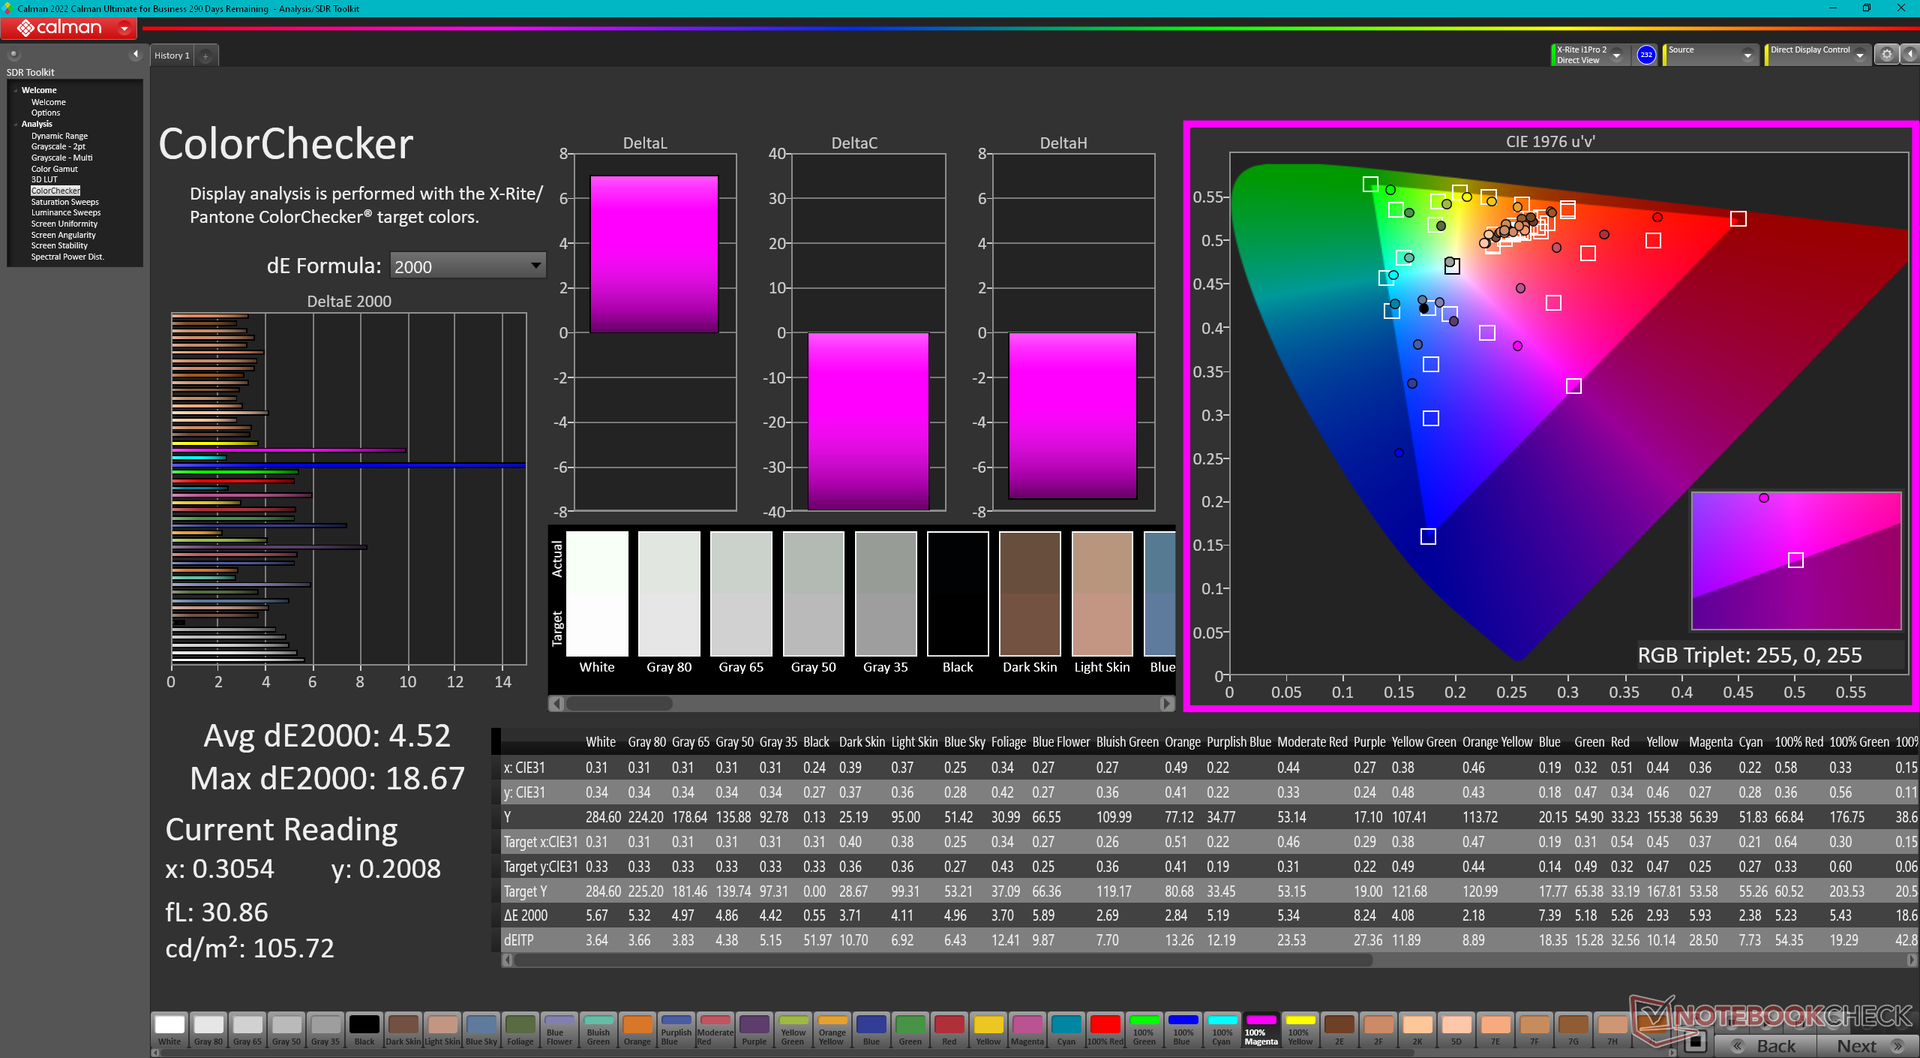
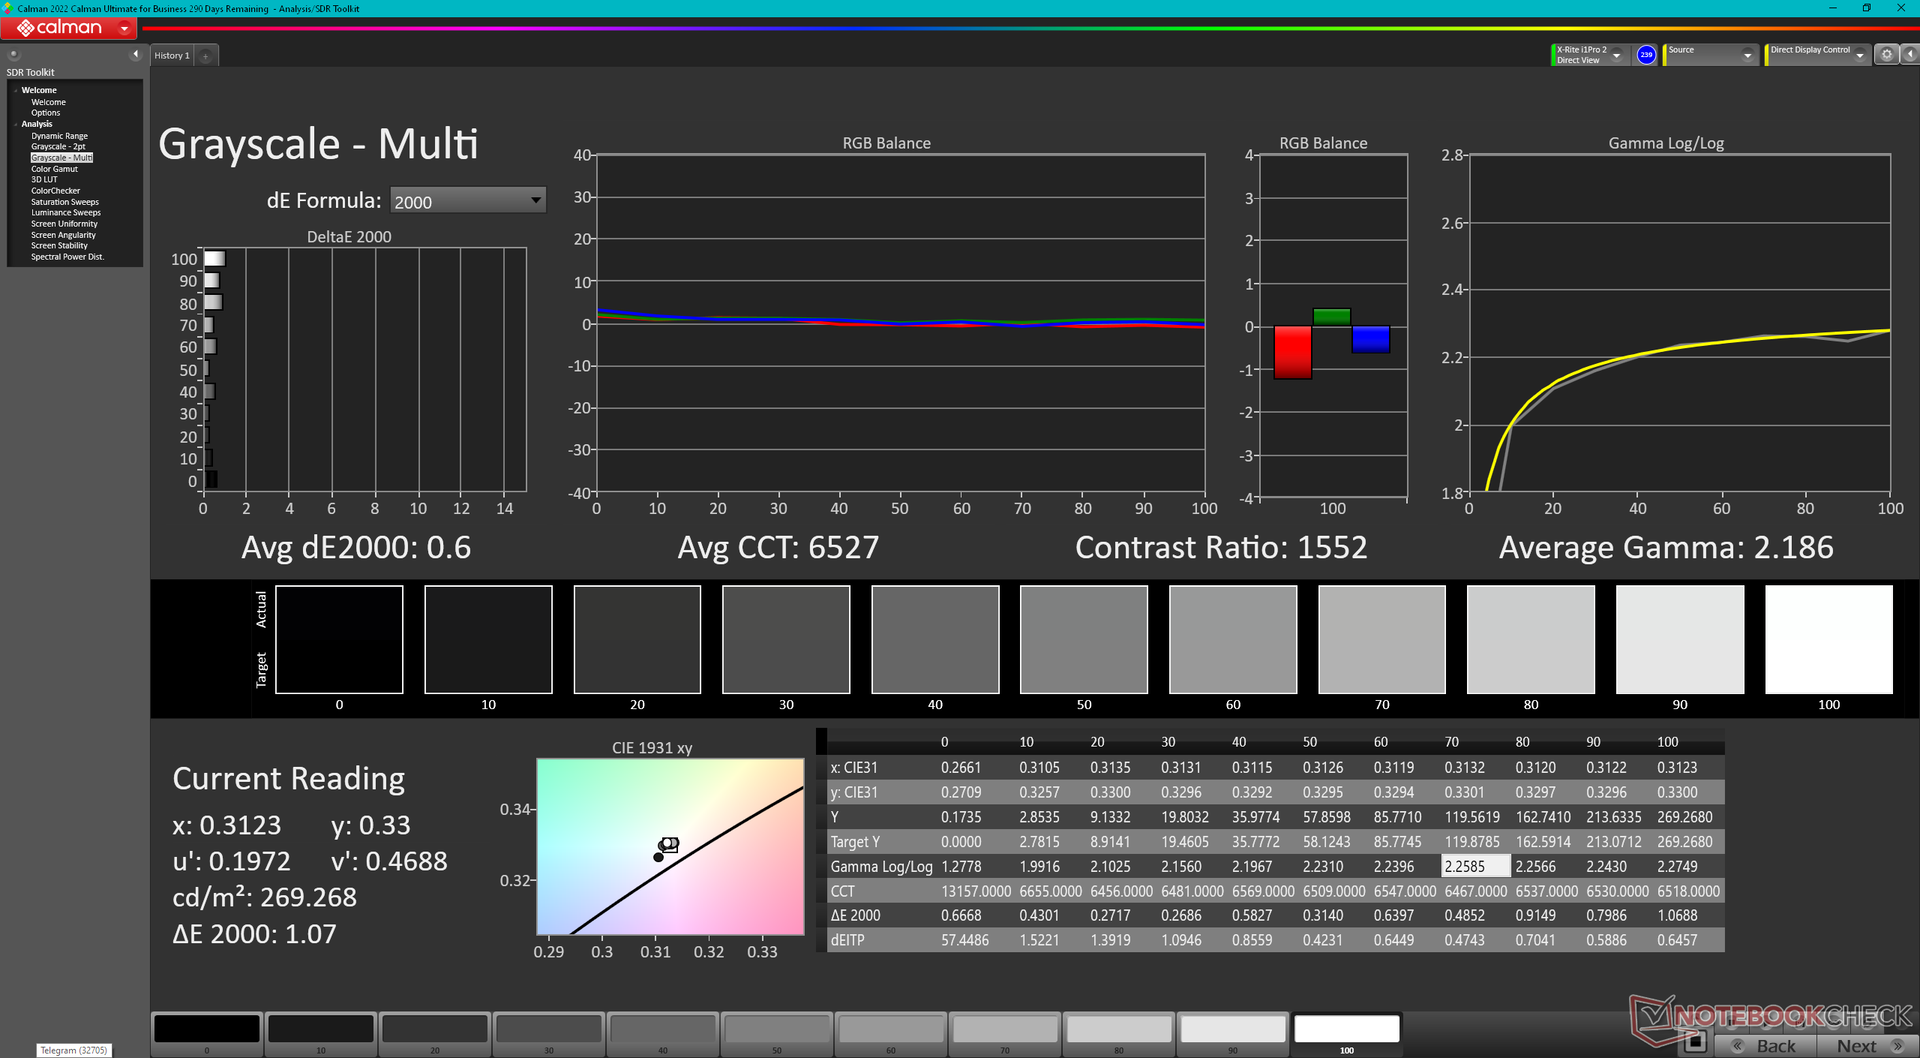
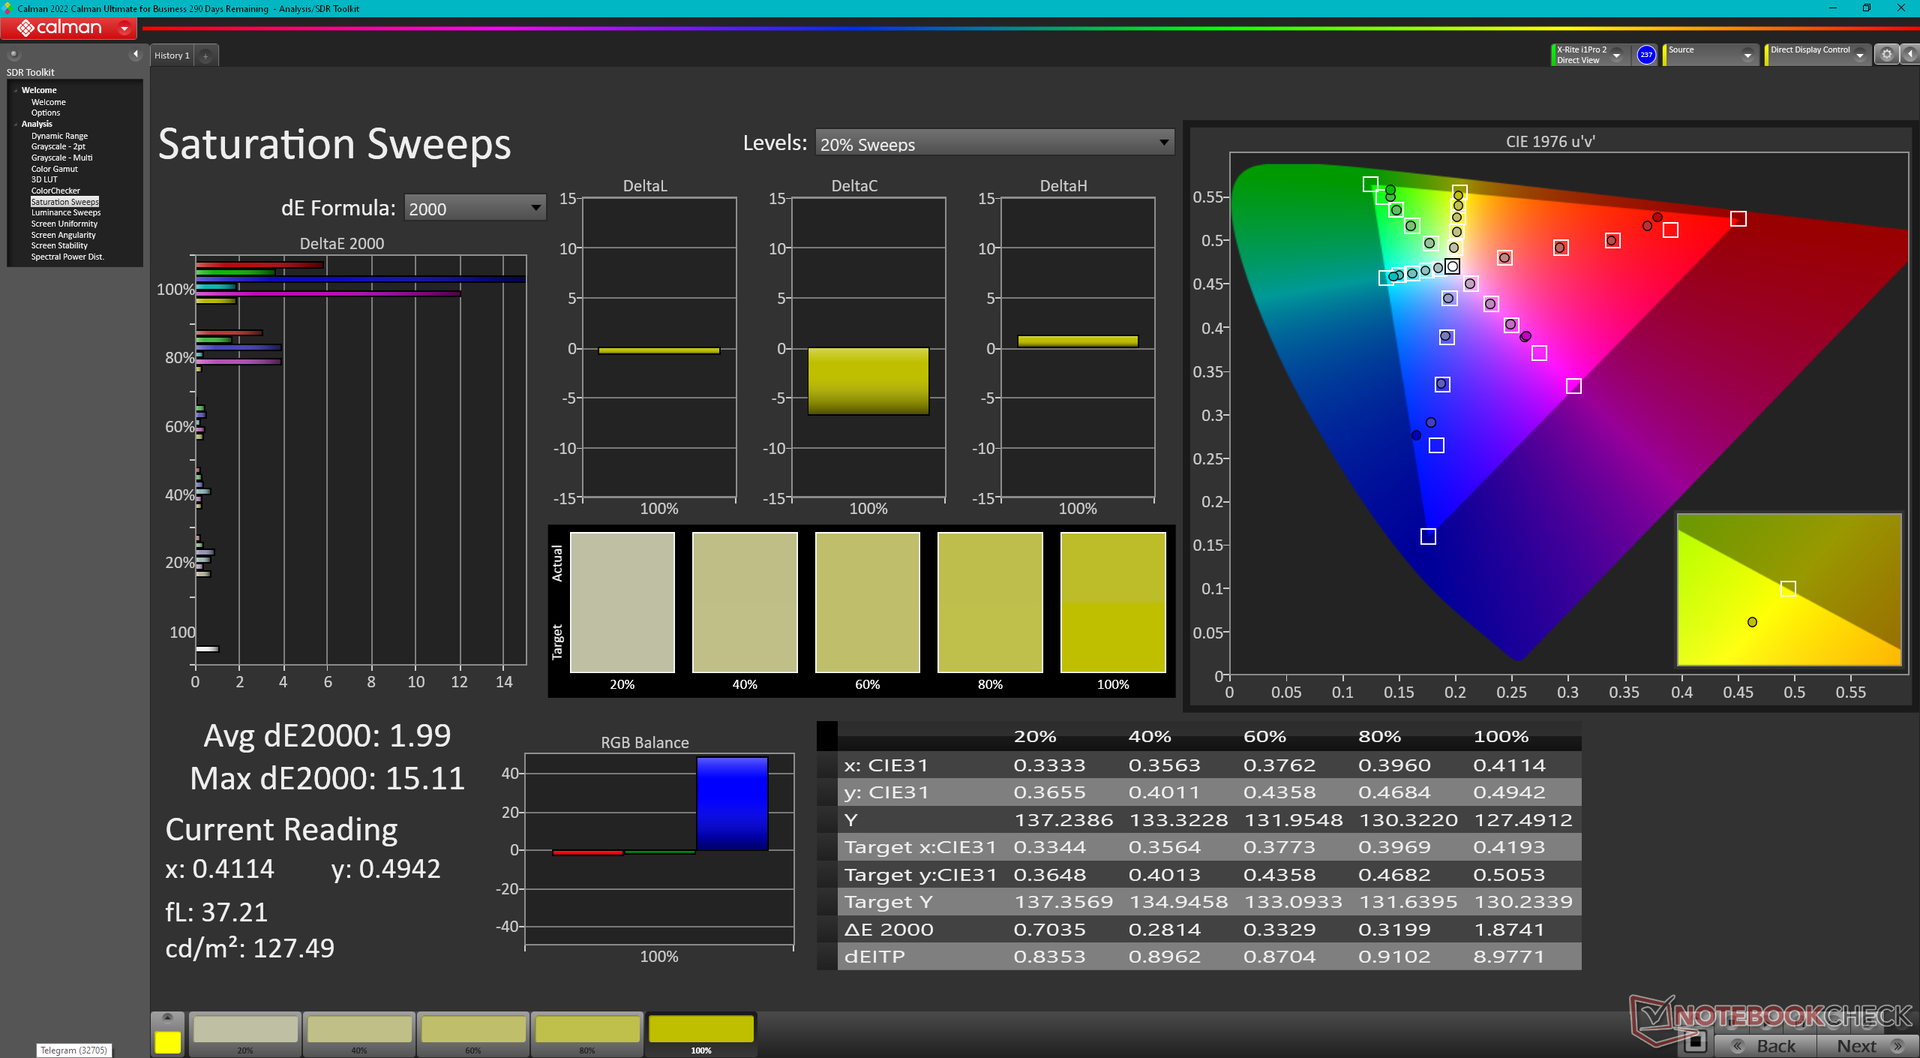
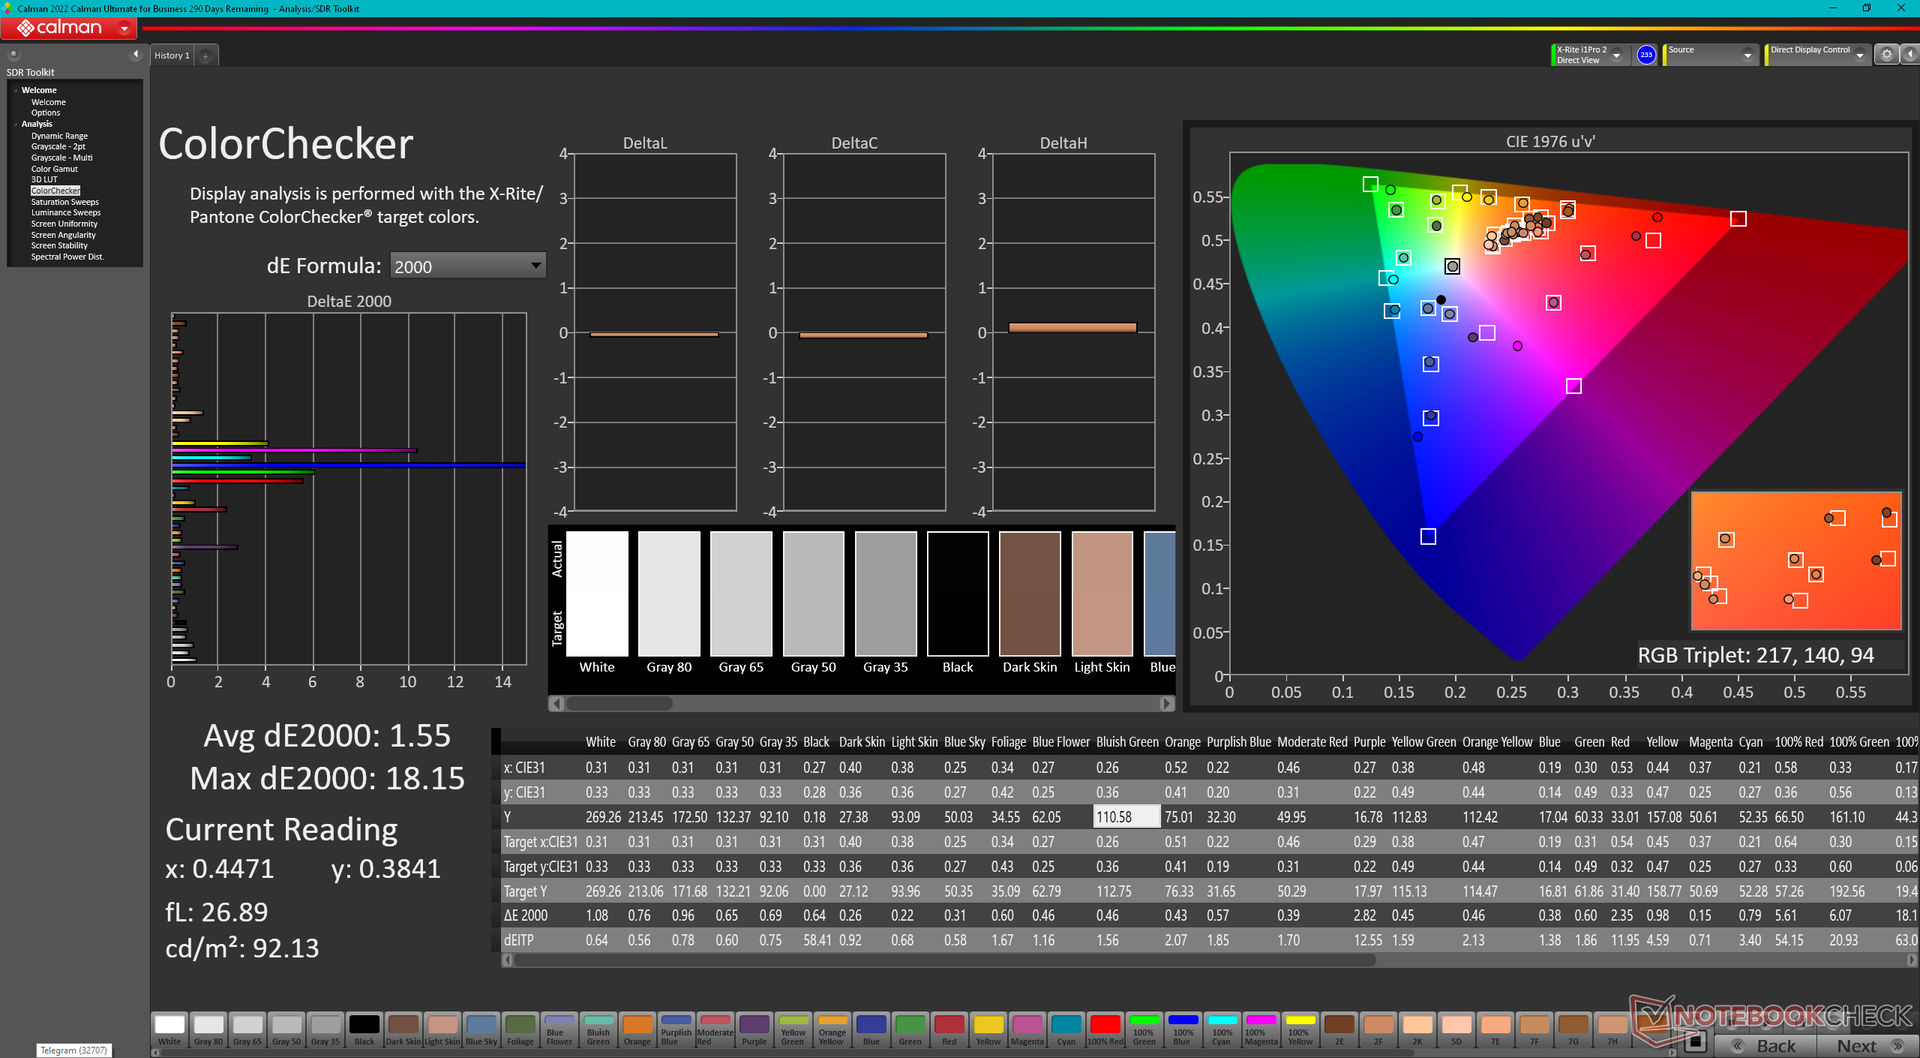
Wyświetlacz nie jest skalibrowany po wyjęciu z pudełka, a średnie wartości deltaE w skali szarości i kolorze wynoszą odpowiednio 4,1 i 4,52. Samodzielna kalibracja panelu obniżyłaby te wartości do zaledwie 0,6 i 1,55, ale wyższe poziomy nasycenia są nadal bardzo niedokładne ze względu na wspomniane wcześniej wąskie pokrycie sRGB. Nasze zrzuty ekranu z Calmana poniżej pokazują, że zwłaszcza kolory niebieski i magenta są znacznie bardziej niedokładne niż inne.
Zalecamy zastosowanie naszego skalibrowanego profilu ICM powyżej, który może pomóc poprawić dokładność kolorów na niższych poziomach nasycenia.
Wyświetl czasy reakcji
| ↔ Czas reakcji od czerni do bieli | ||
|---|---|---|
| 27.2 ms ... wzrost ↗ i spadek ↘ łącznie | ↗ 15.6 ms wzrost | 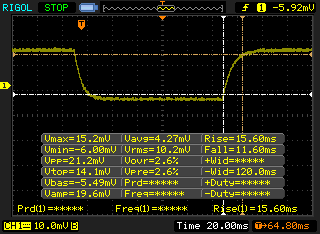 |
| ↘ 11.6 ms upadek | ||
| W naszych testach ekran wykazuje stosunkowo powolne tempo reakcji i może być zbyt wolny dla graczy. Dla porównania, wszystkie testowane urządzenia wahają się od 0.1 (minimum) do 240 (maksimum) ms. » 69 % wszystkich urządzeń jest lepszych. Oznacza to, że zmierzony czas reakcji jest gorszy od średniej wszystkich testowanych urządzeń (19.9 ms). | ||
| ↔ Czas reakcji 50% szarości do 80% szarości | ||
| 35.2 ms ... wzrost ↗ i spadek ↘ łącznie | ↗ 18 ms wzrost | 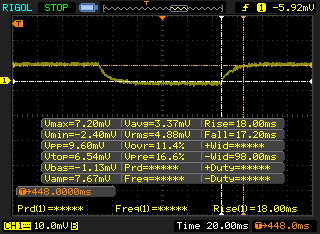 |
| ↘ 17.2 ms upadek | ||
| W naszych testach ekran wykazuje powolne tempo reakcji, co będzie niezadowalające dla graczy. Dla porównania, wszystkie testowane urządzenia wahają się od 0.165 (minimum) do 636 (maksimum) ms. » 49 % wszystkich urządzeń jest lepszych. Oznacza to, że zmierzony czas reakcji jest gorszy od średniej wszystkich testowanych urządzeń (31.1 ms). | ||
Migotanie ekranu / PWM (modulacja szerokości impulsu)
| Migotanie ekranu/nie wykryto PWM | 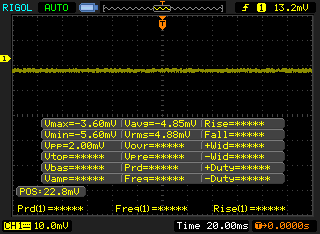 | ||
Dla porównania: 52 % wszystkich testowanych urządzeń nie używa PWM do przyciemniania wyświetlacza. Jeśli wykryto PWM, zmierzono średnio 7791 (minimum: 5 - maksimum: 343500) Hz. | |||
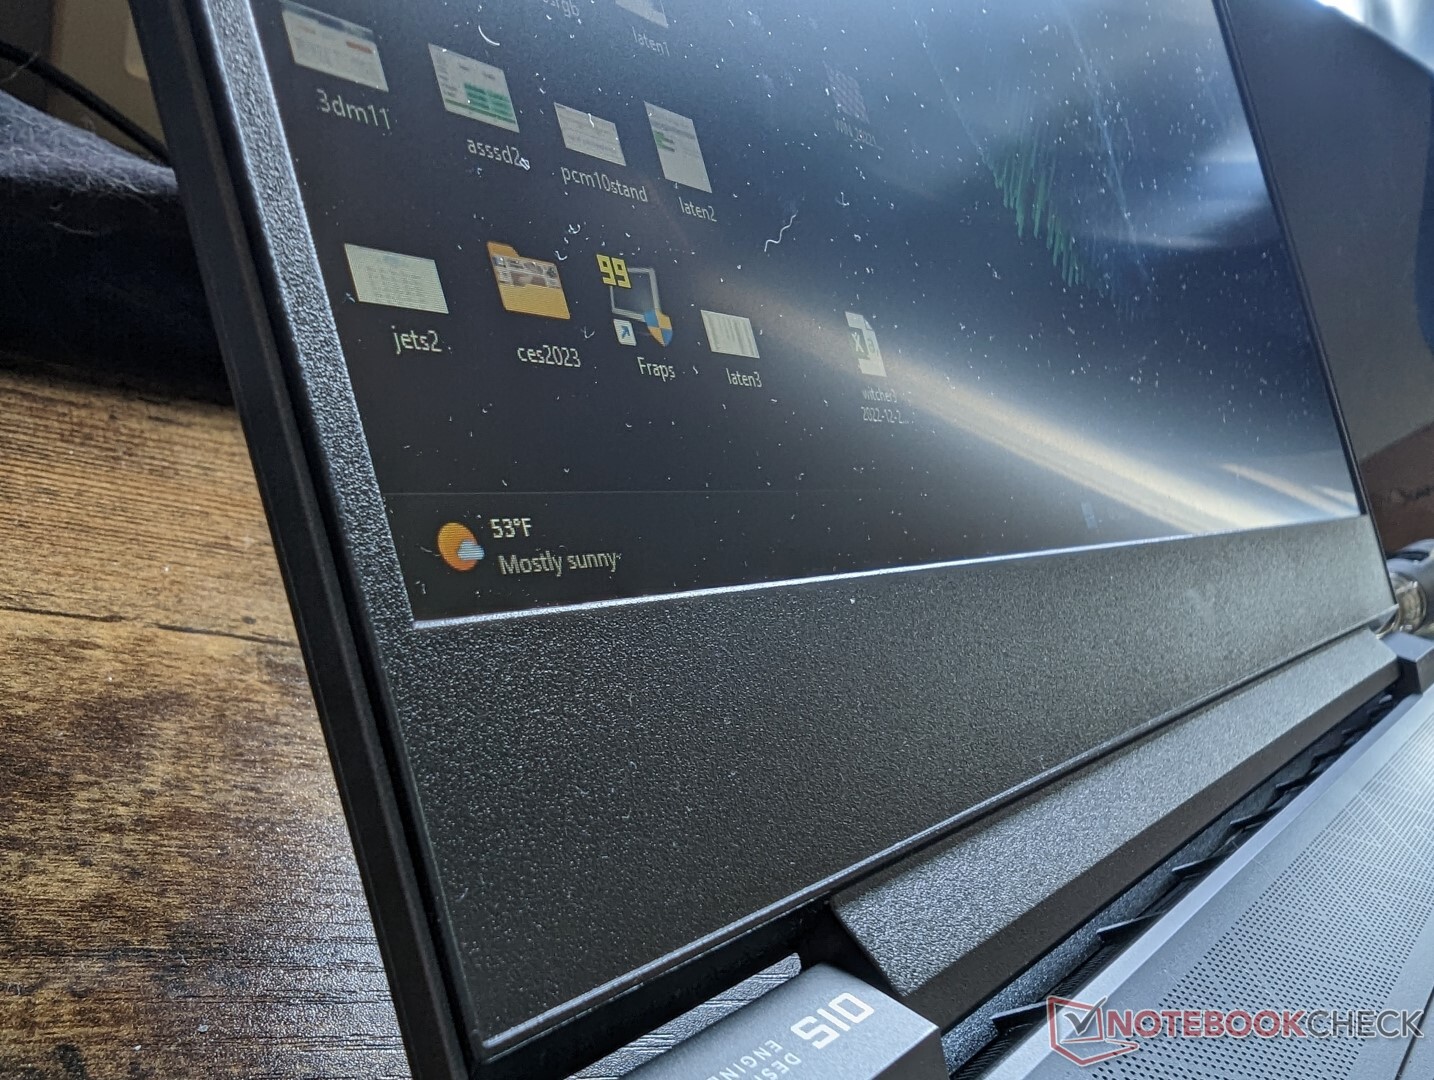
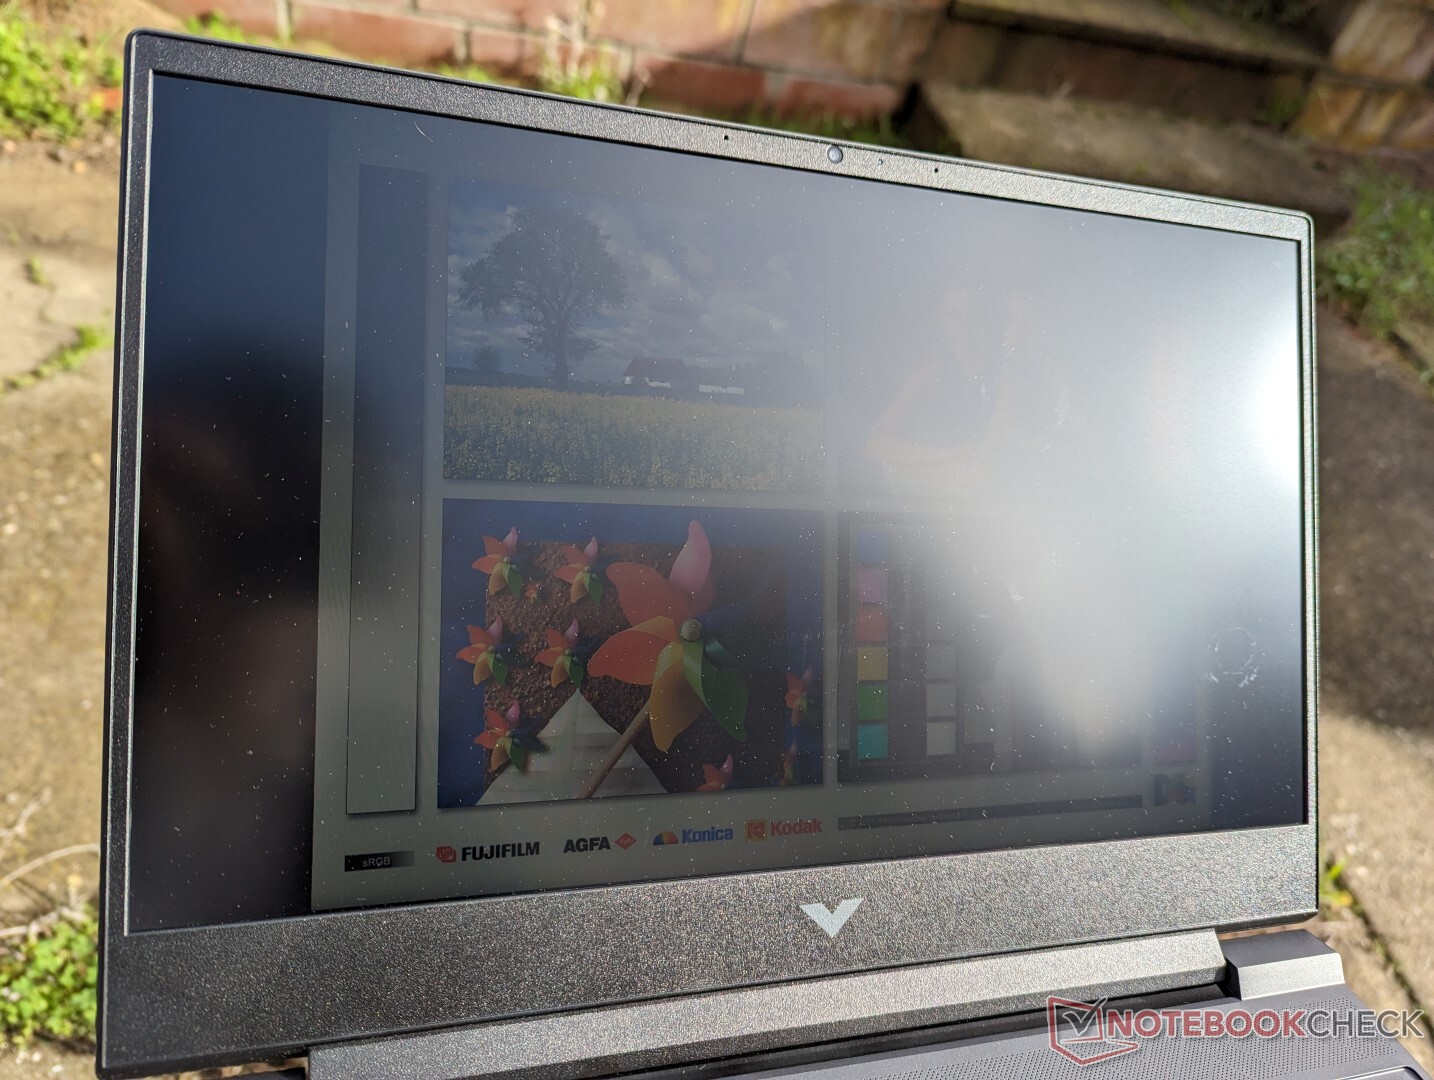
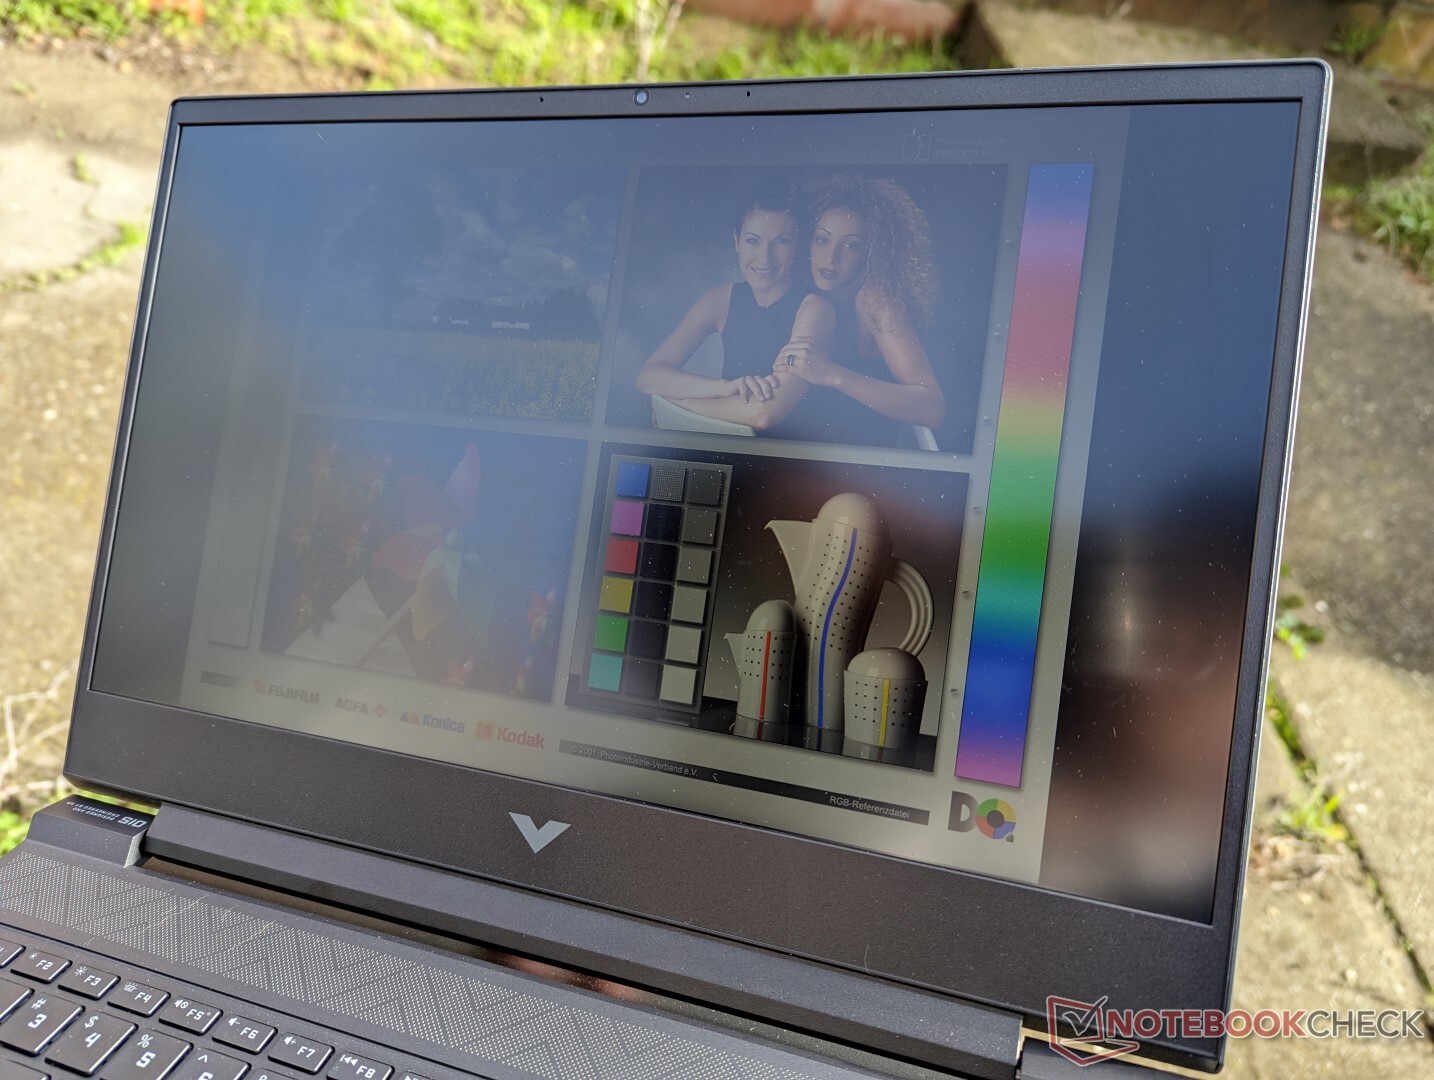
Matowy panel nie jest wystarczająco jasny do komfortowego oglądania na zewnątrz. Odblaski są zawsze obecne, a kolory stają się w rezultacie wyprane. Będziesz musiał zainwestować w droższy laptop do gier z jaśniejszymi wyświetlaczami, takimi jak Razer Blade 15 dla łatwiejszego czasu na zewnątrz.

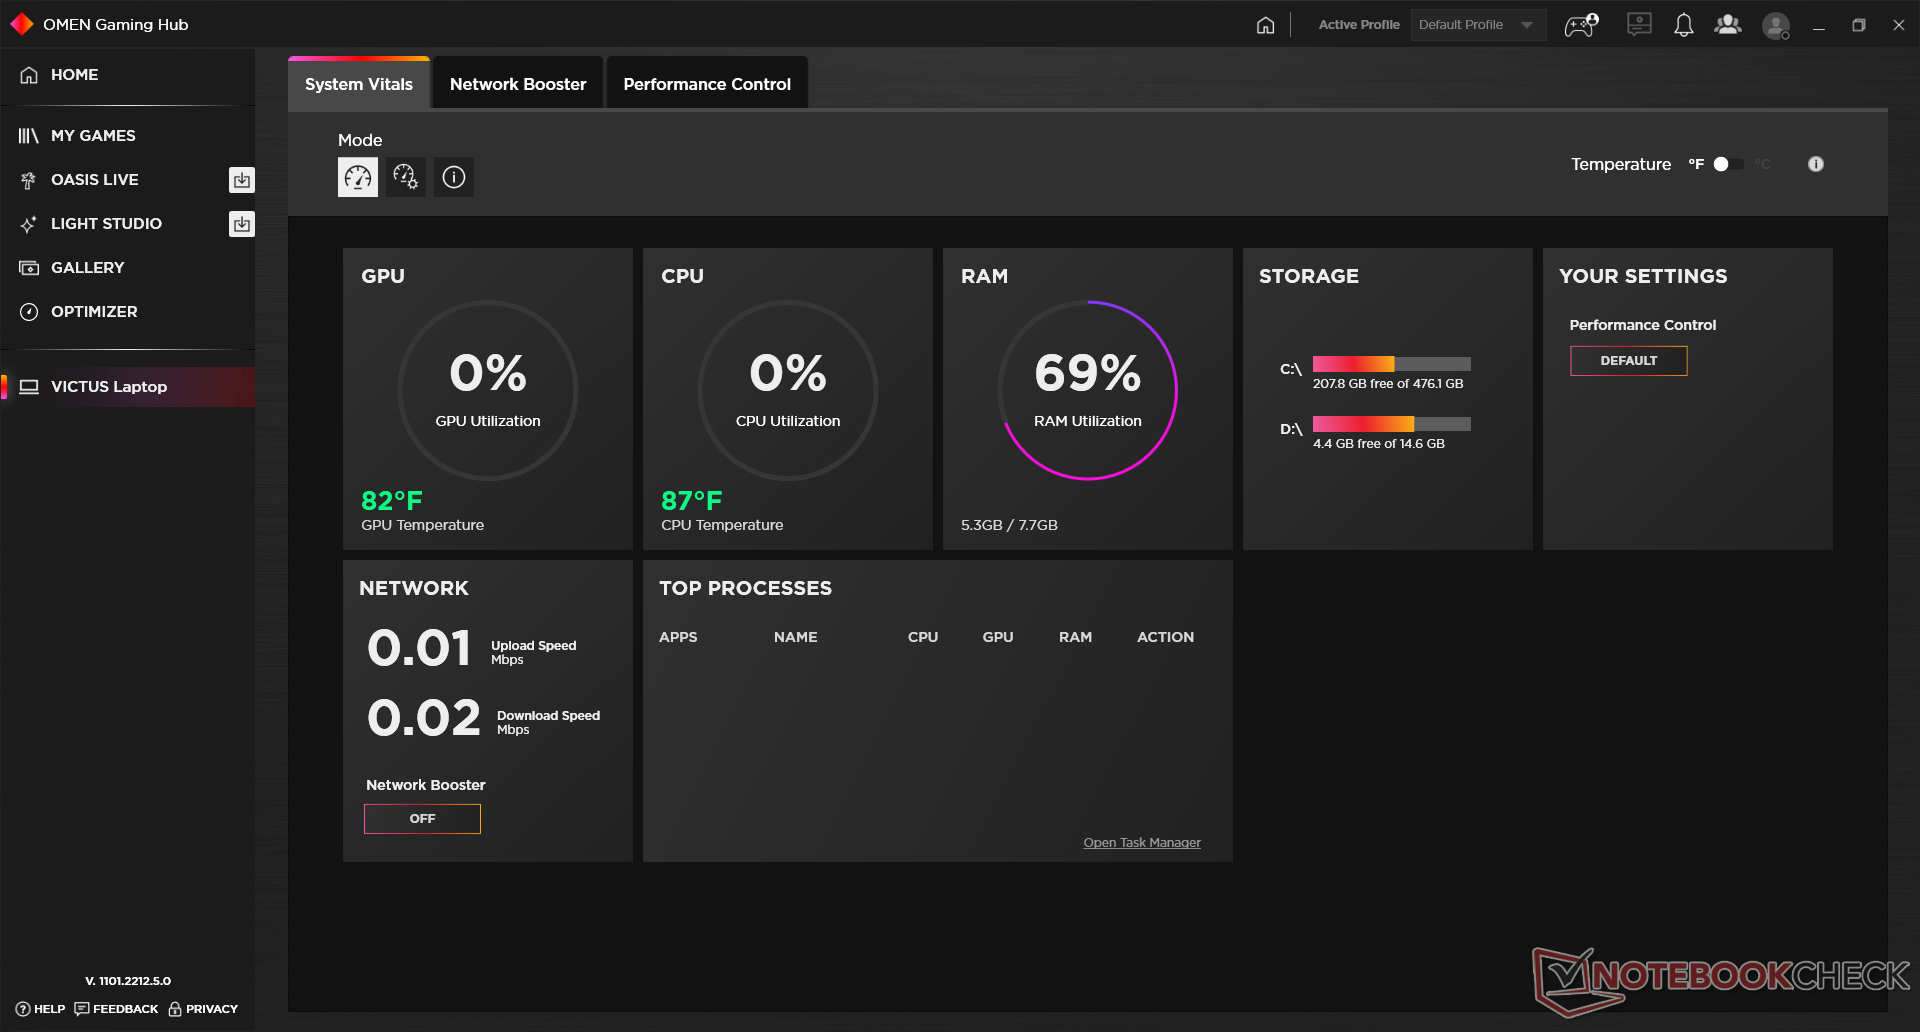
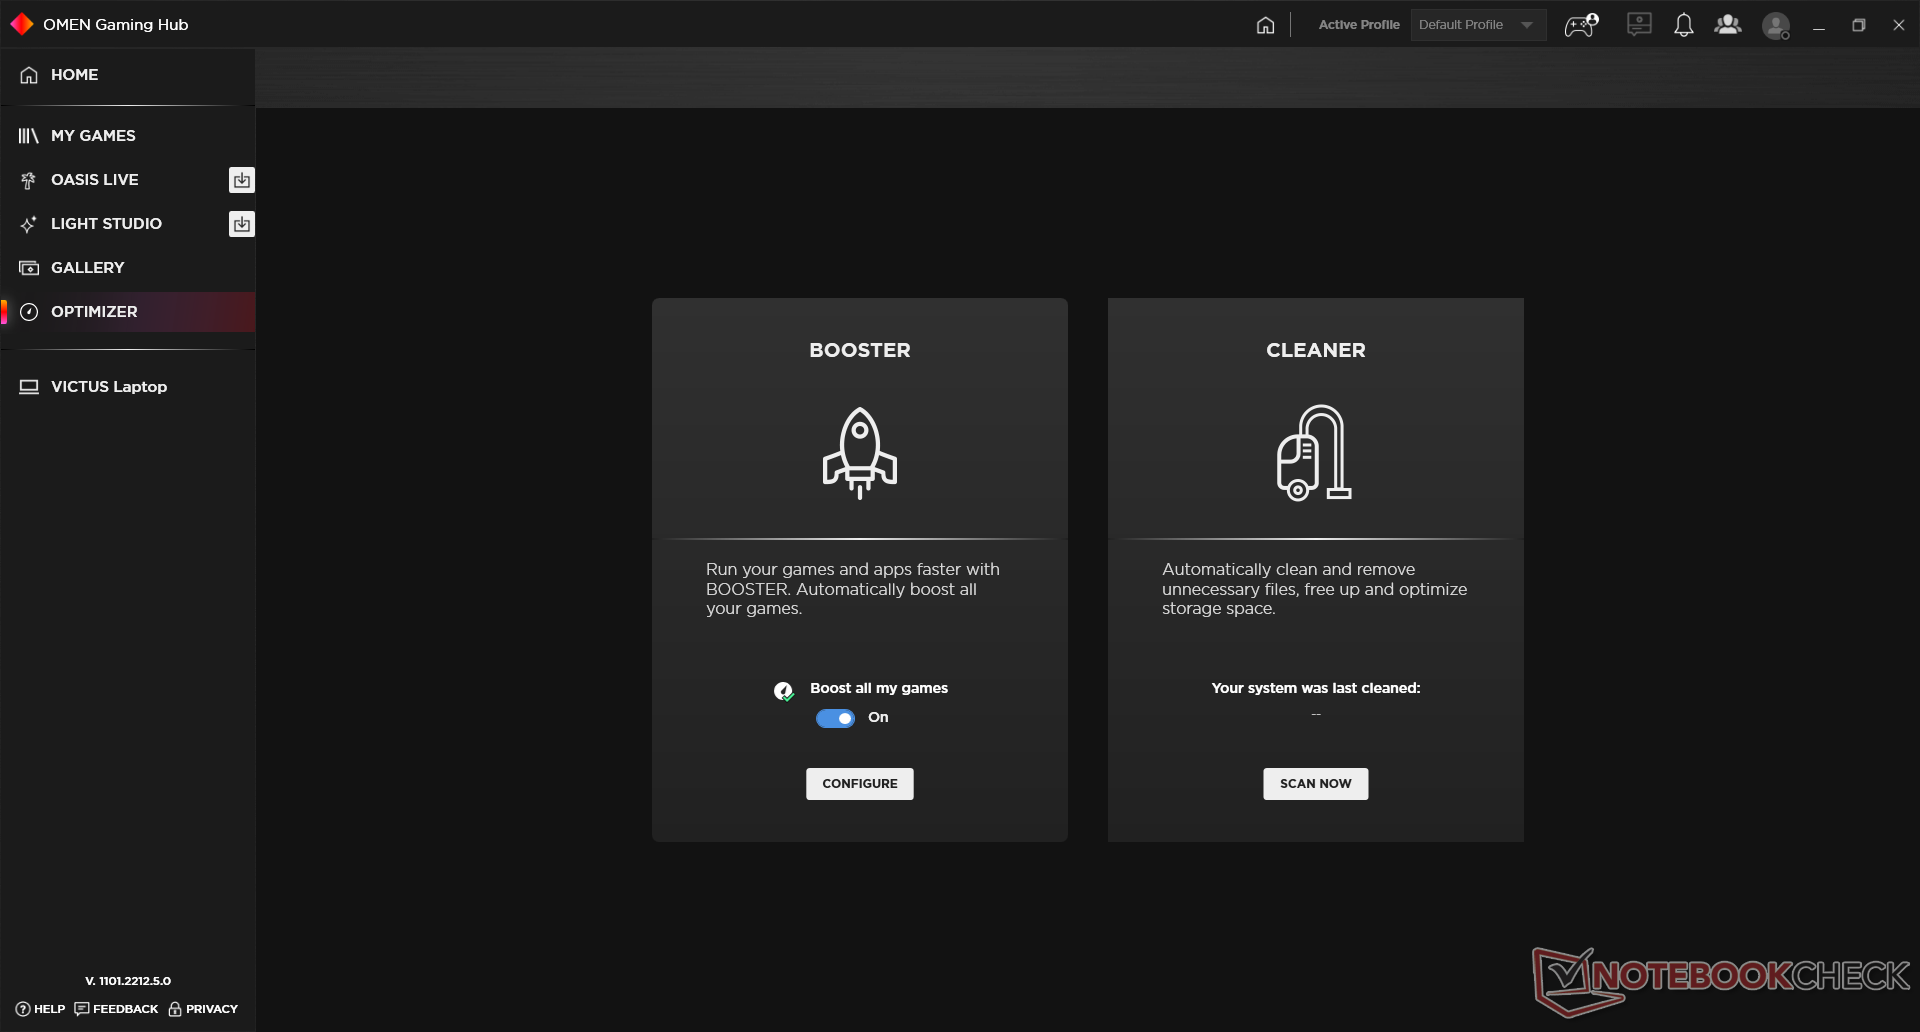
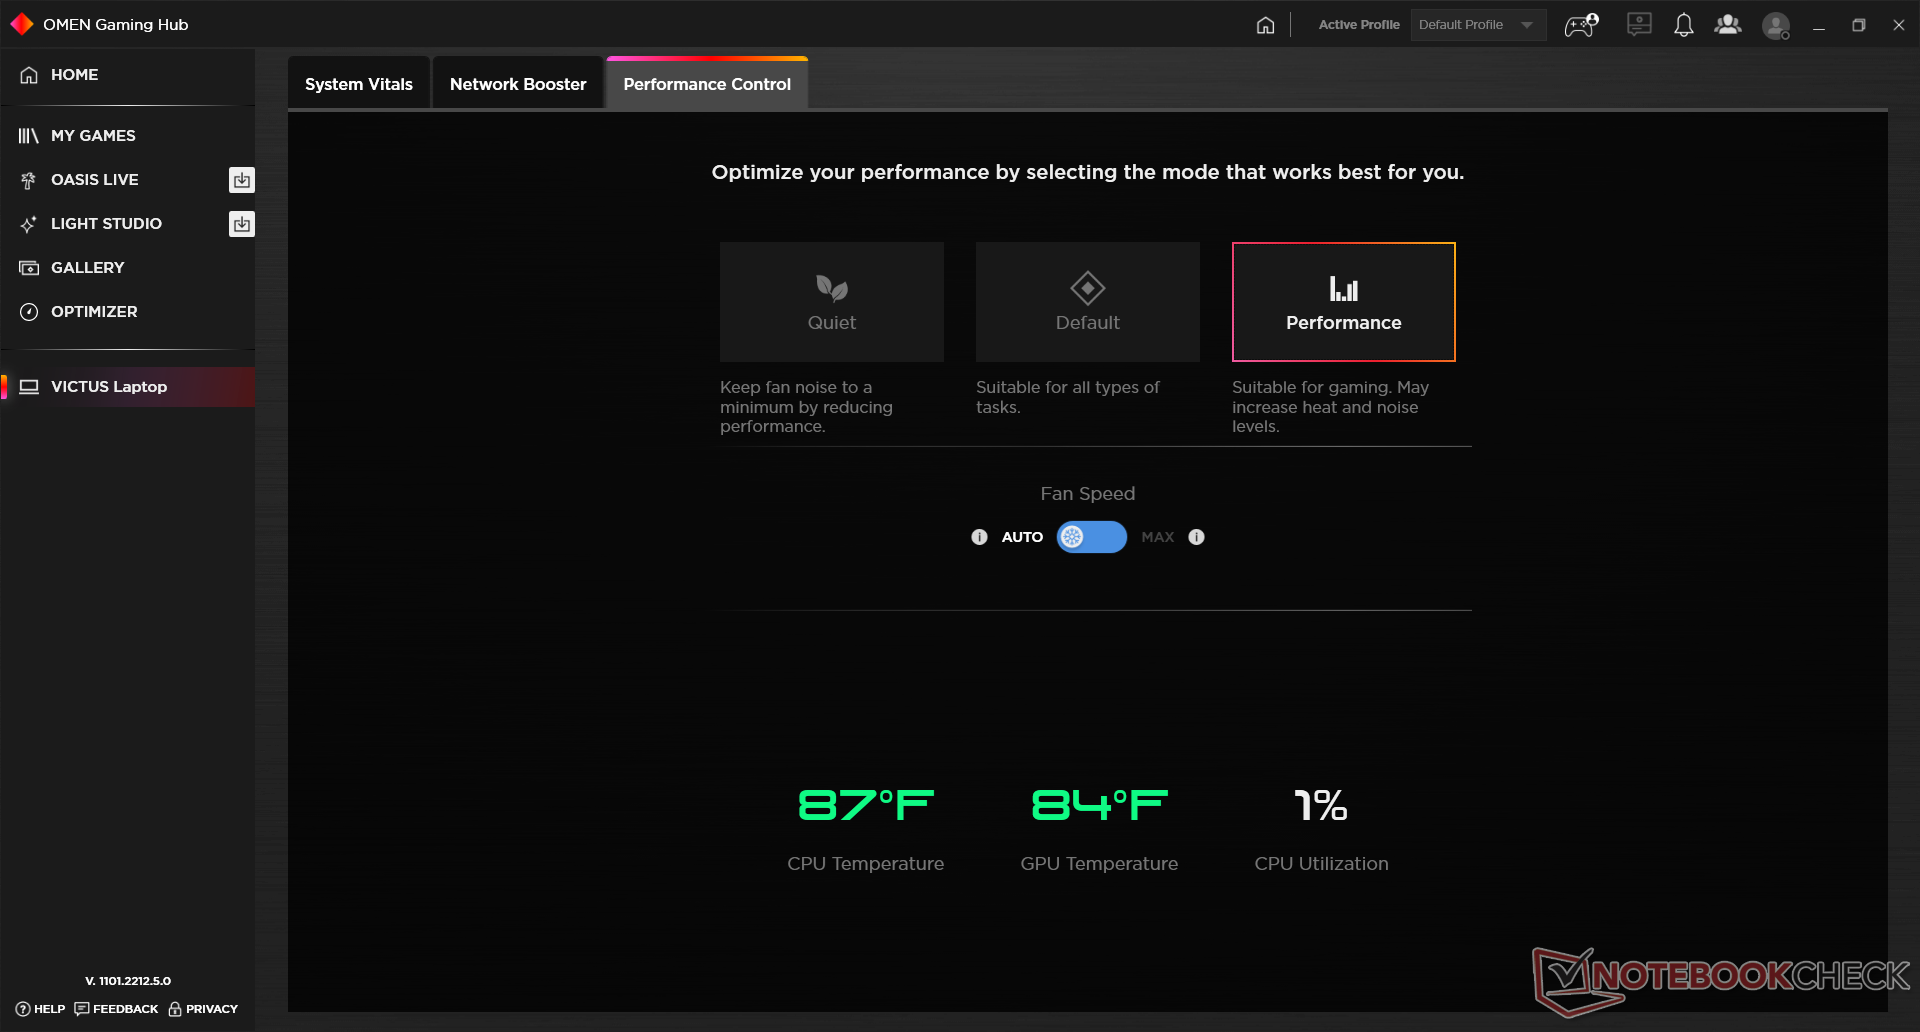
Wydajność - Intel Alder Lake-H 12th Gen
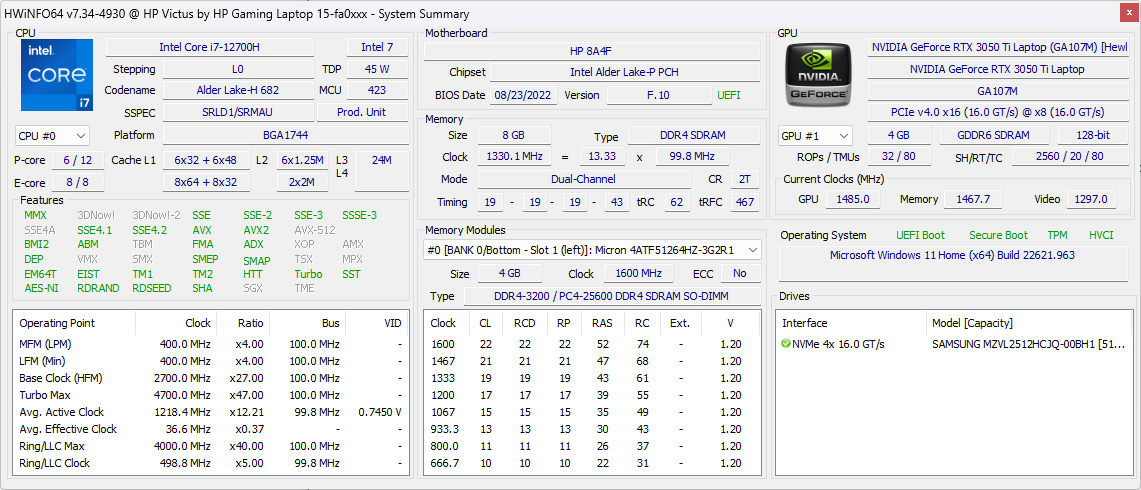
Warunki badania
Przed uruchomieniem poniższych benchmarków ustawiliśmy nasz sprzęt w trybie Performance zarówno przez system Windows, jak i preinstalowane oprogramowanie Omen Gaming Hub. Upewniliśmy się również, że włączony jest tryb HP Boost oraz GPU Nvidii, co widać na poniższych zrzutach ekranu. Fakt, że istnieje tak wiele indywidualnych ustawień zasilania ukrytych pod wieloma menu może być frustrujący, zwłaszcza jeśli ciągle przełączasz się pomiędzy niższymi i wyższymi poziomami wydajności.

Procesor - ograniczone Turbo Boost
Wydajność procesora jest dobra, ale zrównoważenie wydajności mogłoby być lepsze. Podczas pracy w pętli CineBench R15 xT wydajność spadała nawet o 28%, co widać na poniższym wykresie porównawczym. Spadek ten wystąpiłby nawet w trybie Performance z aktywnym HP Boost, co jest rozczarowujące w laptopie do gier. Na stronie Lenovo Legion 5 15który jest wyposażony w ten sam Core i7-12700H Jak nasz Victus 15, może zaoferować o 46% szybszą wydajność wielowątkową, ponieważ jego procesor nie dławi się tak mocno.
Decydując się na tańszy AMD Ryzen 5800H W Victusie 15 spowoduje spadek wydajności o około 20-25% w porównaniu z naszym Core i7-12700H.
Cinebench R15 Multi Loop
Cinebench R23: Multi Core | Single Core
Cinebench R20: CPU (Multi Core) | CPU (Single Core)
Cinebench R15: CPU Multi 64Bit | CPU Single 64Bit
Blender: v2.79 BMW27 CPU
7-Zip 18.03: 7z b 4 | 7z b 4 -mmt1
Geekbench 5.5: Multi-Core | Single-Core
HWBOT x265 Benchmark v2.2: 4k Preset
LibreOffice : 20 Documents To PDF
R Benchmark 2.5: Overall mean
| CPU Performance rating | |
| MSI GE67 HX 12UGS | |
| Lenovo Legion 5 15IAH7H 82RB | |
| Alienware x15 R2 P111F | |
| Razer Blade 17 (i7-12800H, RTX 3070 Ti) | |
| Przeciętny Intel Core i7-12700H | |
| HP Victus 15 fa0020nr | |
| Asus TUF Dash F15 FX517ZC | |
| Asus ROG Strix G15 G513QY | |
| Dell G15 5515 | |
| MSI Bravo 15 B5DD-010US | |
| HP Omen 15-en0375ng | |
| HP Omen 15-ek0456ng -2! | |
| Cinebench R23 / Multi Core | |
| MSI GE67 HX 12UGS | |
| Lenovo Legion 5 15IAH7H 82RB | |
| Alienware x15 R2 P111F | |
| Przeciętny Intel Core i7-12700H (4032 - 19330, n=64) | |
| Razer Blade 17 (i7-12800H, RTX 3070 Ti) | |
| HP Victus 15 fa0020nr | |
| Asus ROG Strix G15 G513QY | |
| Asus TUF Dash F15 FX517ZC | |
| Dell G15 5515 | |
| HP Omen 15-en0375ng | |
| MSI Bravo 15 B5DD-010US | |
| Cinebench R23 / Single Core | |
| Alienware x15 R2 P111F | |
| Razer Blade 17 (i7-12800H, RTX 3070 Ti) | |
| MSI GE67 HX 12UGS | |
| Lenovo Legion 5 15IAH7H 82RB | |
| Asus TUF Dash F15 FX517ZC | |
| Przeciętny Intel Core i7-12700H (778 - 1826, n=63) | |
| HP Victus 15 fa0020nr | |
| Asus ROG Strix G15 G513QY | |
| Dell G15 5515 | |
| MSI Bravo 15 B5DD-010US | |
| HP Omen 15-en0375ng | |
| Cinebench R20 / CPU (Multi Core) | |
| MSI GE67 HX 12UGS | |
| Lenovo Legion 5 15IAH7H 82RB | |
| Alienware x15 R2 P111F | |
| HP Victus 15 fa0020nr | |
| Przeciętny Intel Core i7-12700H (1576 - 7407, n=64) | |
| Razer Blade 17 (i7-12800H, RTX 3070 Ti) | |
| Asus ROG Strix G15 G513QY | |
| Asus TUF Dash F15 FX517ZC | |
| Dell G15 5515 | |
| HP Omen 15-en0375ng | |
| MSI Bravo 15 B5DD-010US | |
| HP Omen 15-ek0456ng | |
| Cinebench R20 / CPU (Single Core) | |
| Alienware x15 R2 P111F | |
| Razer Blade 17 (i7-12800H, RTX 3070 Ti) | |
| Lenovo Legion 5 15IAH7H 82RB | |
| HP Victus 15 fa0020nr | |
| Asus TUF Dash F15 FX517ZC | |
| Przeciętny Intel Core i7-12700H (300 - 704, n=64) | |
| MSI GE67 HX 12UGS | |
| Asus ROG Strix G15 G513QY | |
| Dell G15 5515 | |
| MSI Bravo 15 B5DD-010US | |
| HP Omen 15-en0375ng | |
| HP Omen 15-ek0456ng | |
| Cinebench R15 / CPU Multi 64Bit | |
| MSI GE67 HX 12UGS | |
| Lenovo Legion 5 15IAH7H 82RB | |
| Alienware x15 R2 P111F | |
| Razer Blade 17 (i7-12800H, RTX 3070 Ti) | |
| HP Victus 15 fa0020nr | |
| Przeciętny Intel Core i7-12700H (1379 - 2916, n=70) | |
| Asus ROG Strix G15 G513QY | |
| Dell G15 5515 | |
| HP Omen 15-en0375ng | |
| Asus TUF Dash F15 FX517ZC | |
| MSI Bravo 15 B5DD-010US | |
| HP Omen 15-ek0456ng | |
| Cinebench R15 / CPU Single 64Bit | |
| Alienware x15 R2 P111F | |
| Razer Blade 17 (i7-12800H, RTX 3070 Ti) | |
| Lenovo Legion 5 15IAH7H 82RB | |
| MSI GE67 HX 12UGS | |
| HP Victus 15 fa0020nr | |
| Przeciętny Intel Core i7-12700H (113 - 263, n=65) | |
| Asus TUF Dash F15 FX517ZC | |
| Asus ROG Strix G15 G513QY | |
| Dell G15 5515 | |
| MSI Bravo 15 B5DD-010US | |
| HP Omen 15-ek0456ng | |
| HP Omen 15-en0375ng | |
| Blender / v2.79 BMW27 CPU | |
| HP Omen 15-ek0456ng | |
| MSI Bravo 15 B5DD-010US | |
| Asus TUF Dash F15 FX517ZC | |
| HP Omen 15-en0375ng | |
| Dell G15 5515 | |
| HP Victus 15 fa0020nr | |
| Asus ROG Strix G15 G513QY | |
| Przeciętny Intel Core i7-12700H (168 - 732, n=63) | |
| Razer Blade 17 (i7-12800H, RTX 3070 Ti) | |
| Alienware x15 R2 P111F | |
| Lenovo Legion 5 15IAH7H 82RB | |
| MSI GE67 HX 12UGS | |
| 7-Zip 18.03 / 7z b 4 | |
| MSI GE67 HX 12UGS | |
| Alienware x15 R2 P111F | |
| Lenovo Legion 5 15IAH7H 82RB | |
| Razer Blade 17 (i7-12800H, RTX 3070 Ti) | |
| Przeciętny Intel Core i7-12700H (22844 - 73067, n=63) | |
| Asus ROG Strix G15 G513QY | |
| Dell G15 5515 | |
| HP Victus 15 fa0020nr | |
| HP Omen 15-en0375ng | |
| Asus TUF Dash F15 FX517ZC | |
| MSI Bravo 15 B5DD-010US | |
| HP Omen 15-ek0456ng | |
| 7-Zip 18.03 / 7z b 4 -mmt1 | |
| Alienware x15 R2 P111F | |
| HP Victus 15 fa0020nr | |
| Lenovo Legion 5 15IAH7H 82RB | |
| Razer Blade 17 (i7-12800H, RTX 3070 Ti) | |
| Asus ROG Strix G15 G513QY | |
| Przeciętny Intel Core i7-12700H (2743 - 5972, n=63) | |
| MSI GE67 HX 12UGS | |
| Dell G15 5515 | |
| Asus TUF Dash F15 FX517ZC | |
| MSI Bravo 15 B5DD-010US | |
| HP Omen 15-ek0456ng | |
| HP Omen 15-en0375ng | |
| Geekbench 5.5 / Multi-Core | |
| MSI GE67 HX 12UGS | |
| Alienware x15 R2 P111F | |
| Lenovo Legion 5 15IAH7H 82RB | |
| Razer Blade 17 (i7-12800H, RTX 3070 Ti) | |
| Przeciętny Intel Core i7-12700H (5144 - 13745, n=64) | |
| HP Victus 15 fa0020nr | |
| Asus TUF Dash F15 FX517ZC | |
| HP Omen 15-en0375ng | |
| Asus ROG Strix G15 G513QY | |
| Dell G15 5515 | |
| MSI Bravo 15 B5DD-010US | |
| HP Omen 15-ek0456ng | |
| HP Omen 15-ek0456ng | |
| Geekbench 5.5 / Single-Core | |
| Alienware x15 R2 P111F | |
| HP Victus 15 fa0020nr | |
| Razer Blade 17 (i7-12800H, RTX 3070 Ti) | |
| MSI GE67 HX 12UGS | |
| Lenovo Legion 5 15IAH7H 82RB | |
| Asus TUF Dash F15 FX517ZC | |
| Przeciętny Intel Core i7-12700H (803 - 1851, n=64) | |
| Asus ROG Strix G15 G513QY | |
| Dell G15 5515 | |
| MSI Bravo 15 B5DD-010US | |
| HP Omen 15-ek0456ng | |
| HP Omen 15-ek0456ng | |
| HP Omen 15-en0375ng | |
| HWBOT x265 Benchmark v2.2 / 4k Preset | |
| MSI GE67 HX 12UGS | |
| Lenovo Legion 5 15IAH7H 82RB | |
| Alienware x15 R2 P111F | |
| Przeciętny Intel Core i7-12700H (4.67 - 21.8, n=64) | |
| Razer Blade 17 (i7-12800H, RTX 3070 Ti) | |
| HP Victus 15 fa0020nr | |
| Asus ROG Strix G15 G513QY | |
| Dell G15 5515 | |
| Asus TUF Dash F15 FX517ZC | |
| HP Omen 15-en0375ng | |
| MSI Bravo 15 B5DD-010US | |
| HP Omen 15-ek0456ng | |
| LibreOffice / 20 Documents To PDF | |
| Dell G15 5515 | |
| HP Omen 15-en0375ng | |
| MSI Bravo 15 B5DD-010US | |
| Asus ROG Strix G15 G513QY | |
| Asus TUF Dash F15 FX517ZC | |
| HP Victus 15 fa0020nr | |
| Alienware x15 R2 P111F | |
| Przeciętny Intel Core i7-12700H (34.2 - 95.3, n=63) | |
| MSI GE67 HX 12UGS | |
| Razer Blade 17 (i7-12800H, RTX 3070 Ti) | |
| Lenovo Legion 5 15IAH7H 82RB | |
| HP Omen 15-ek0456ng | |
| R Benchmark 2.5 / Overall mean | |
| HP Omen 15-ek0456ng | |
| HP Omen 15-en0375ng | |
| MSI Bravo 15 B5DD-010US | |
| Dell G15 5515 | |
| Asus ROG Strix G15 G513QY | |
| Asus TUF Dash F15 FX517ZC | |
| Przeciętny Intel Core i7-12700H (0.4441 - 1.052, n=63) | |
| HP Victus 15 fa0020nr | |
| MSI GE67 HX 12UGS | |
| Lenovo Legion 5 15IAH7H 82RB | |
| Razer Blade 17 (i7-12800H, RTX 3070 Ti) | |
| Alienware x15 R2 P111F | |
* ... im mniej tym lepiej
AIDA64: FP32 Ray-Trace | FPU Julia | CPU SHA3 | CPU Queen | FPU SinJulia | FPU Mandel | CPU AES | CPU ZLib | FP64 Ray-Trace | CPU PhotoWorxx
| Performance rating | |
| Lenovo Legion 5 15IAH7H 82RB | |
| Dell G15 5515 | |
| HP Omen 15-en0375ng | |
| Przeciętny Intel Core i7-12700H | |
| HP Victus 15 fa0020nr | |
| MSI Bravo 15 B5DD-010US | |
| Asus TUF Dash F15 FX517ZC | |
| AIDA64 / FP32 Ray-Trace | |
| Lenovo Legion 5 15IAH7H 82RB | |
| HP Omen 15-en0375ng | |
| Dell G15 5515 | |
| HP Victus 15 fa0020nr | |
| Przeciętny Intel Core i7-12700H (2585 - 17957, n=64) | |
| MSI Bravo 15 B5DD-010US | |
| Asus TUF Dash F15 FX517ZC | |
| AIDA64 / FPU Julia | |
| Dell G15 5515 | |
| Lenovo Legion 5 15IAH7H 82RB | |
| HP Omen 15-en0375ng | |
| MSI Bravo 15 B5DD-010US | |
| HP Victus 15 fa0020nr | |
| Przeciętny Intel Core i7-12700H (12439 - 90760, n=64) | |
| Asus TUF Dash F15 FX517ZC | |
| AIDA64 / CPU SHA3 | |
| Lenovo Legion 5 15IAH7H 82RB | |
| Przeciętny Intel Core i7-12700H (833 - 4242, n=64) | |
| Dell G15 5515 | |
| HP Victus 15 fa0020nr | |
| HP Omen 15-en0375ng | |
| MSI Bravo 15 B5DD-010US | |
| Asus TUF Dash F15 FX517ZC | |
| AIDA64 / CPU Queen | |
| Lenovo Legion 5 15IAH7H 82RB | |
| HP Victus 15 fa0020nr | |
| HP Omen 15-en0375ng | |
| Przeciętny Intel Core i7-12700H (57923 - 103202, n=63) | |
| Dell G15 5515 | |
| MSI Bravo 15 B5DD-010US | |
| Asus TUF Dash F15 FX517ZC | |
| AIDA64 / FPU SinJulia | |
| HP Omen 15-en0375ng | |
| Dell G15 5515 | |
| Lenovo Legion 5 15IAH7H 82RB | |
| MSI Bravo 15 B5DD-010US | |
| Przeciętny Intel Core i7-12700H (3249 - 9939, n=64) | |
| HP Victus 15 fa0020nr | |
| Asus TUF Dash F15 FX517ZC | |
| AIDA64 / FPU Mandel | |
| Dell G15 5515 | |
| Lenovo Legion 5 15IAH7H 82RB | |
| HP Omen 15-en0375ng | |
| MSI Bravo 15 B5DD-010US | |
| HP Victus 15 fa0020nr | |
| Przeciętny Intel Core i7-12700H (7135 - 44760, n=64) | |
| Asus TUF Dash F15 FX517ZC | |
| AIDA64 / CPU AES | |
| Lenovo Legion 5 15IAH7H 82RB | |
| Dell G15 5515 | |
| MSI Bravo 15 B5DD-010US | |
| Przeciętny Intel Core i7-12700H (31839 - 144360, n=64) | |
| HP Omen 15-en0375ng | |
| HP Victus 15 fa0020nr | |
| Asus TUF Dash F15 FX517ZC | |
| AIDA64 / CPU ZLib | |
| Lenovo Legion 5 15IAH7H 82RB | |
| Przeciętny Intel Core i7-12700H (305 - 1171, n=64) | |
| HP Omen 15-en0375ng | |
| HP Victus 15 fa0020nr | |
| Dell G15 5515 | |
| Asus TUF Dash F15 FX517ZC | |
| MSI Bravo 15 B5DD-010US | |
| AIDA64 / FP64 Ray-Trace | |
| Lenovo Legion 5 15IAH7H 82RB | |
| HP Omen 15-en0375ng | |
| Dell G15 5515 | |
| HP Victus 15 fa0020nr | |
| Przeciętny Intel Core i7-12700H (1437 - 9692, n=64) | |
| MSI Bravo 15 B5DD-010US | |
| Asus TUF Dash F15 FX517ZC | |
| AIDA64 / CPU PhotoWorxx | |
| Lenovo Legion 5 15IAH7H 82RB | |
| Przeciętny Intel Core i7-12700H (12863 - 52207, n=64) | |
| Asus TUF Dash F15 FX517ZC | |
| HP Omen 15-en0375ng | |
| MSI Bravo 15 B5DD-010US | |
| HP Victus 15 fa0020nr | |
| Dell G15 5515 | |
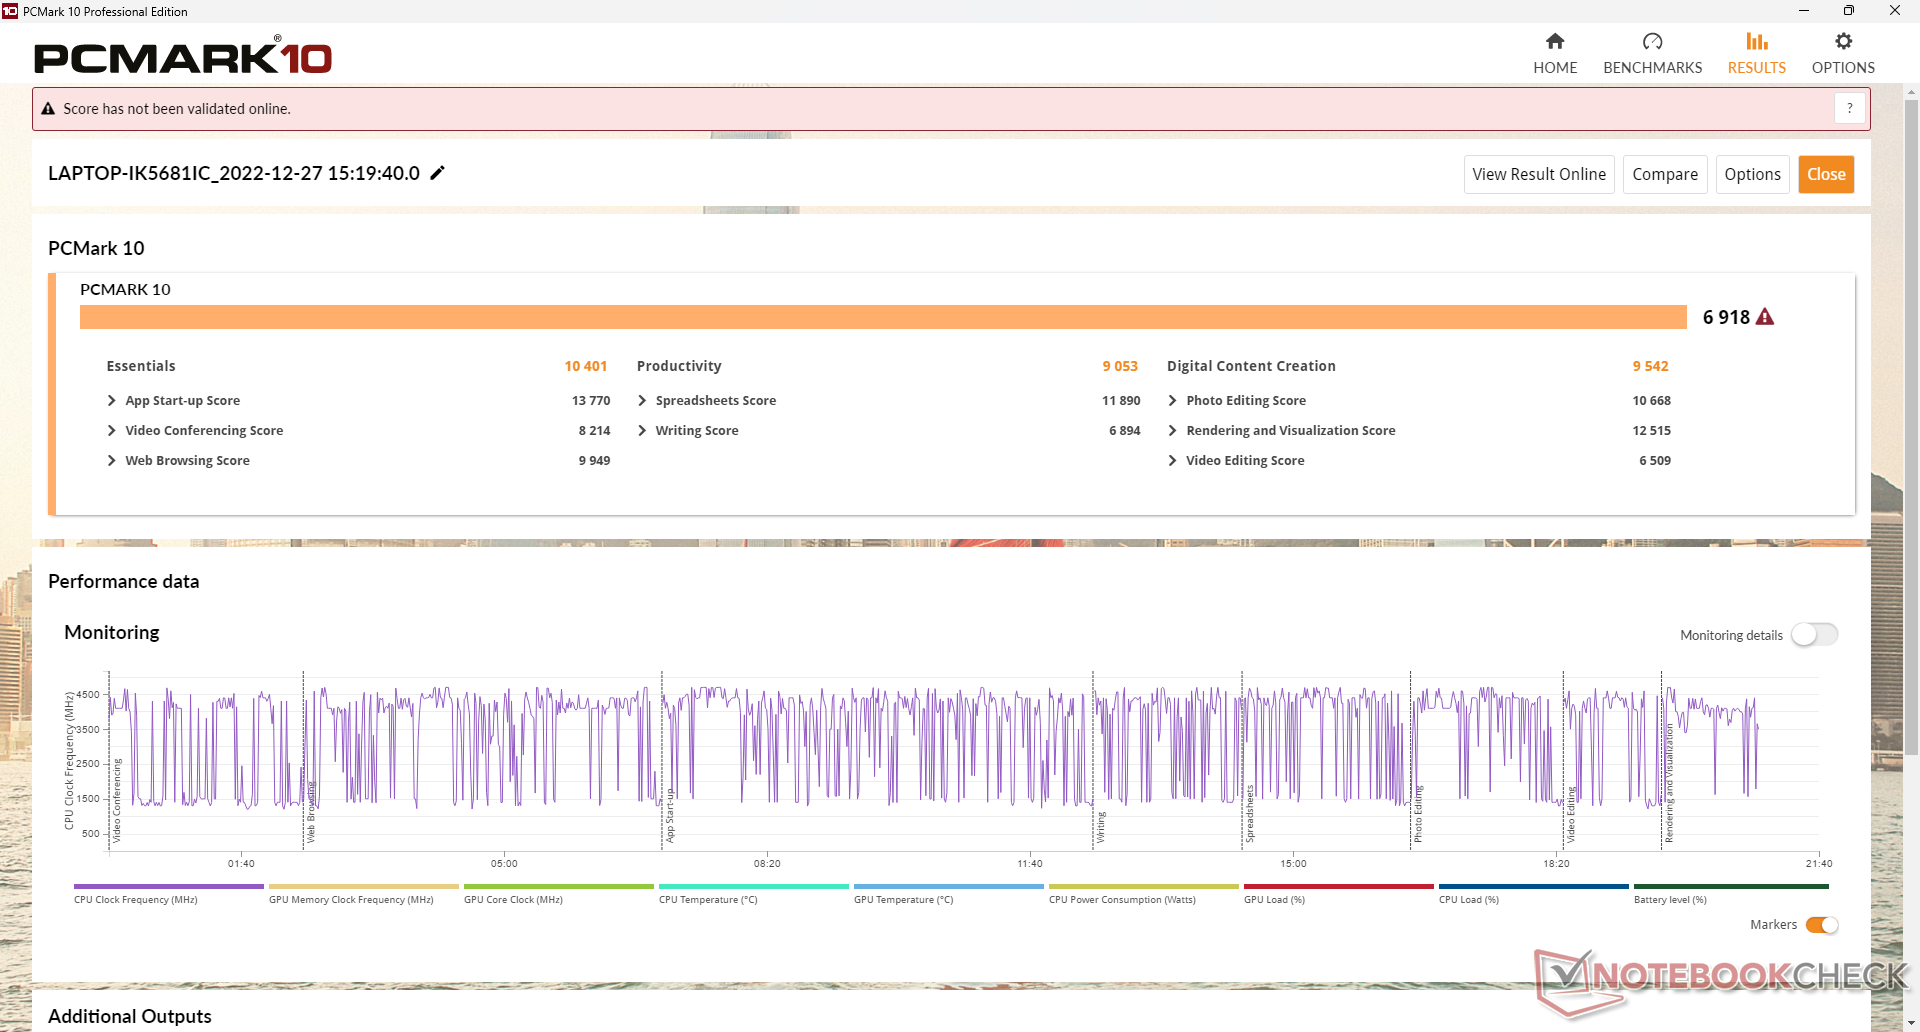
Wydajność systemu
Wyniki PCMark są wyższe niż w przypadku wielu innych starszych lub budżetowych laptopów do gier ze względu na znacznie szybszy procesor Intel 12. generacji i dysk SSD PCIe4 x4 NVMe. Mimo to nadal pozostaje w tyle za laptopami z szybszym GPU RTX 3060, takimi jak Lenovo Legion 5 15.
CrossMark: Overall | Productivity | Creativity | Responsiveness
| PCMark 10 / Score | |
| Lenovo Legion 5 15IAH7H 82RB | |
| HP Victus 15 fa0020nr | |
| Asus TUF Dash F15 FX517ZC | |
| Przeciętny Intel Core i7-12700H, NVIDIA GeForce RTX 3050 Ti Laptop GPU (6623 - 7075, n=5) | |
| MSI Bravo 15 B5DD-010US | |
| Dell G15 5515 | |
| HP Omen 15-en0375ng | |
| PCMark 10 / Essentials | |
| Lenovo Legion 5 15IAH7H 82RB | |
| Asus TUF Dash F15 FX517ZC | |
| HP Victus 15 fa0020nr | |
| Przeciętny Intel Core i7-12700H, NVIDIA GeForce RTX 3050 Ti Laptop GPU (9540 - 10970, n=5) | |
| MSI Bravo 15 B5DD-010US | |
| Dell G15 5515 | |
| HP Omen 15-en0375ng | |
| PCMark 10 / Productivity | |
| Lenovo Legion 5 15IAH7H 82RB | |
| Asus TUF Dash F15 FX517ZC | |
| HP Victus 15 fa0020nr | |
| Przeciętny Intel Core i7-12700H, NVIDIA GeForce RTX 3050 Ti Laptop GPU (8530 - 9555, n=5) | |
| MSI Bravo 15 B5DD-010US | |
| Dell G15 5515 | |
| HP Omen 15-en0375ng | |
| PCMark 10 / Digital Content Creation | |
| Lenovo Legion 5 15IAH7H 82RB | |
| HP Victus 15 fa0020nr | |
| Przeciętny Intel Core i7-12700H, NVIDIA GeForce RTX 3050 Ti Laptop GPU (8855 - 9542, n=5) | |
| Asus TUF Dash F15 FX517ZC | |
| HP Omen 15-en0375ng | |
| MSI Bravo 15 B5DD-010US | |
| Dell G15 5515 | |
| CrossMark / Overall | |
| Lenovo Legion 5 15IAH7H 82RB | |
| Asus TUF Dash F15 FX517ZC | |
| Przeciętny Intel Core i7-12700H, NVIDIA GeForce RTX 3050 Ti Laptop GPU (1654 - 1872, n=5) | |
| HP Victus 15 fa0020nr | |
| CrossMark / Productivity | |
| Lenovo Legion 5 15IAH7H 82RB | |
| Asus TUF Dash F15 FX517ZC | |
| Przeciętny Intel Core i7-12700H, NVIDIA GeForce RTX 3050 Ti Laptop GPU (1595 - 1792, n=5) | |
| HP Victus 15 fa0020nr | |
| CrossMark / Creativity | |
| Lenovo Legion 5 15IAH7H 82RB | |
| Asus TUF Dash F15 FX517ZC | |
| Przeciętny Intel Core i7-12700H, NVIDIA GeForce RTX 3050 Ti Laptop GPU (1699 - 1993, n=5) | |
| HP Victus 15 fa0020nr | |
| CrossMark / Responsiveness | |
| Lenovo Legion 5 15IAH7H 82RB | |
| Asus TUF Dash F15 FX517ZC | |
| Przeciętny Intel Core i7-12700H, NVIDIA GeForce RTX 3050 Ti Laptop GPU (1383 - 1768, n=5) | |
| HP Victus 15 fa0020nr | |
| PCMark 10 Score | 6918 pkt. | |
Pomoc | ||
| AIDA64 / Memory Copy | |
| Przeciętny Intel Core i7-12700H (25615 - 80511, n=64) | |
| Lenovo Legion 5 15IAH7H 82RB | |
| Asus TUF Dash F15 FX517ZC | |
| MSI Bravo 15 B5DD-010US | |
| HP Victus 15 fa0020nr | |
| HP Omen 15-en0375ng | |
| Dell G15 5515 | |
| AIDA64 / Memory Read | |
| Lenovo Legion 5 15IAH7H 82RB | |
| Przeciętny Intel Core i7-12700H (25586 - 79442, n=64) | |
| Asus TUF Dash F15 FX517ZC | |
| MSI Bravo 15 B5DD-010US | |
| HP Victus 15 fa0020nr | |
| HP Omen 15-en0375ng | |
| Dell G15 5515 | |
| AIDA64 / Memory Write | |
| Lenovo Legion 5 15IAH7H 82RB | |
| Przeciętny Intel Core i7-12700H (23679 - 88660, n=64) | |
| Asus TUF Dash F15 FX517ZC | |
| HP Omen 15-en0375ng | |
| HP Victus 15 fa0020nr | |
| MSI Bravo 15 B5DD-010US | |
| Dell G15 5515 | |
| AIDA64 / Memory Latency | |
| Lenovo Legion 5 15IAH7H 82RB | |
| HP Omen 15-en0375ng | |
| HP Victus 15 fa0020nr | |
| Przeciętny Intel Core i7-12700H (76.2 - 133.9, n=62) | |
| Dell G15 5515 | |
| MSI Bravo 15 B5DD-010US | |
| Asus TUF Dash F15 FX517ZC | |
* ... im mniej tym lepiej
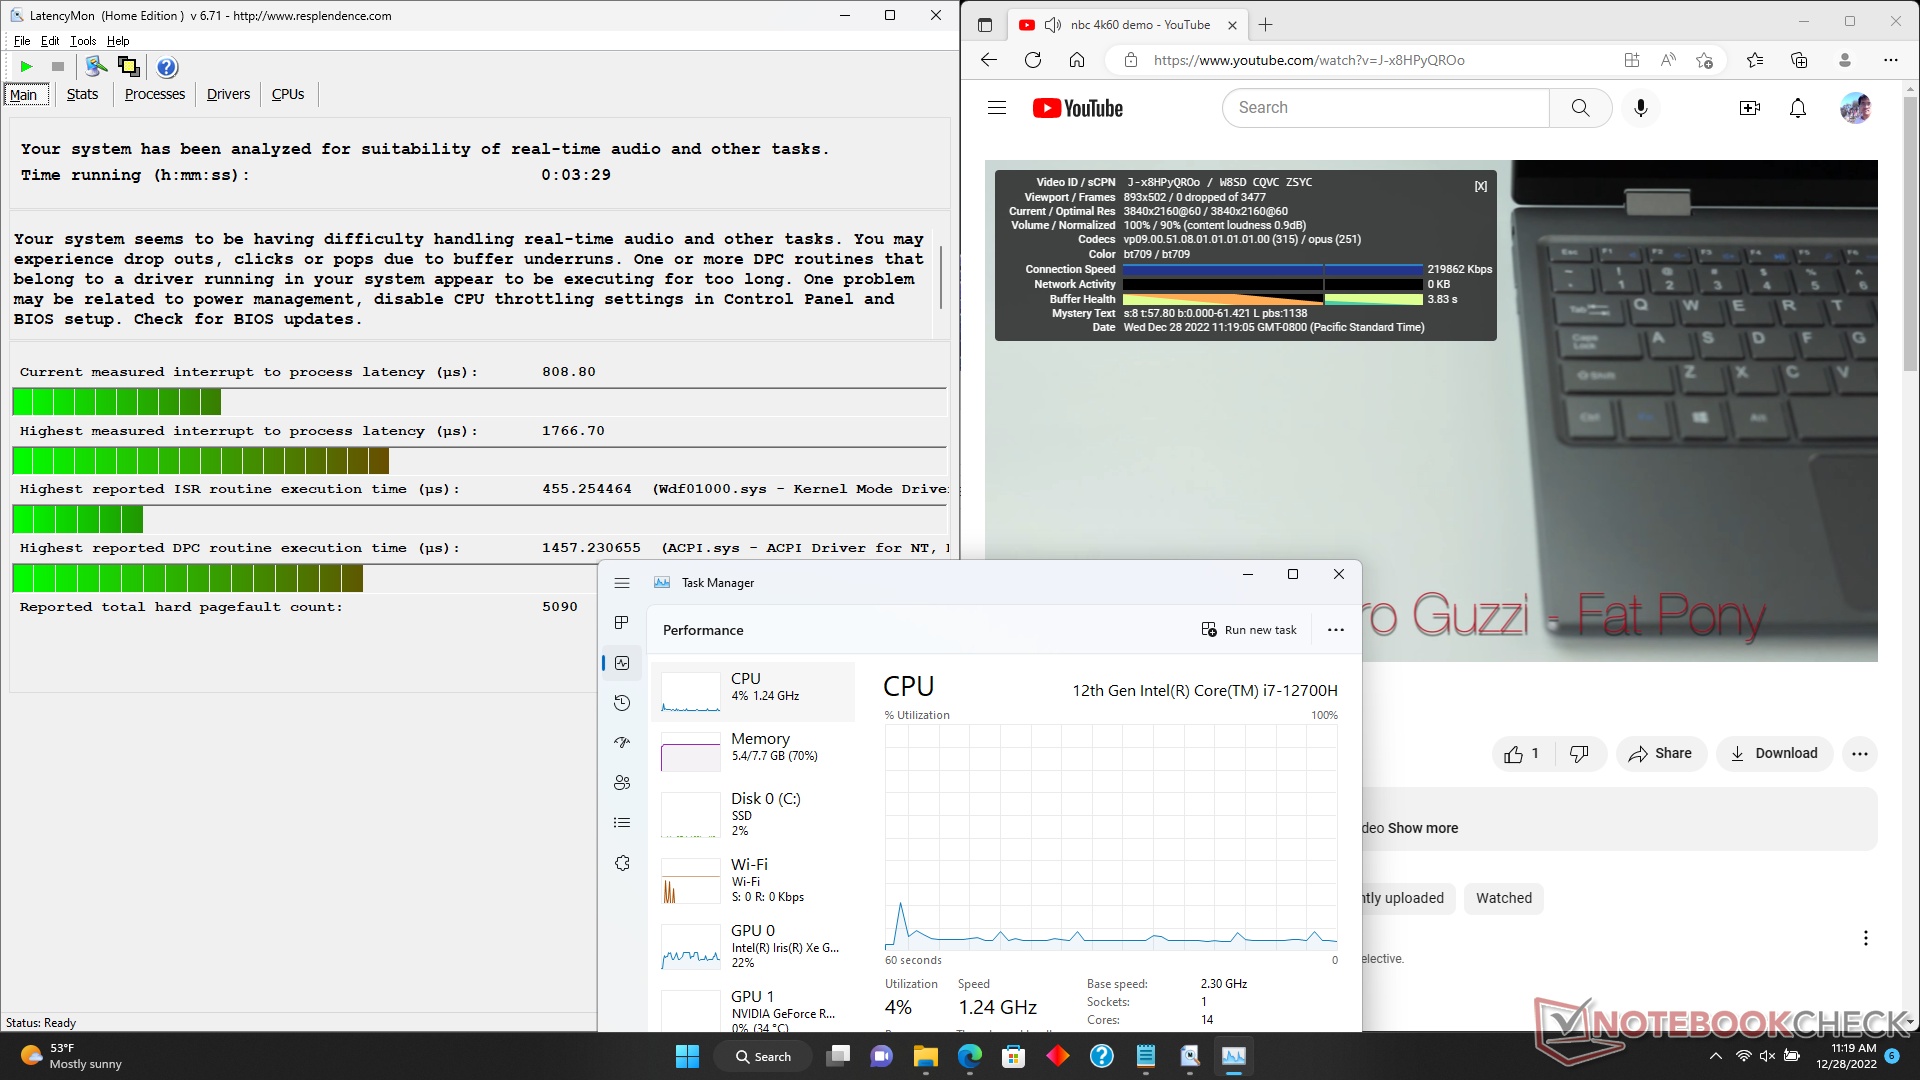
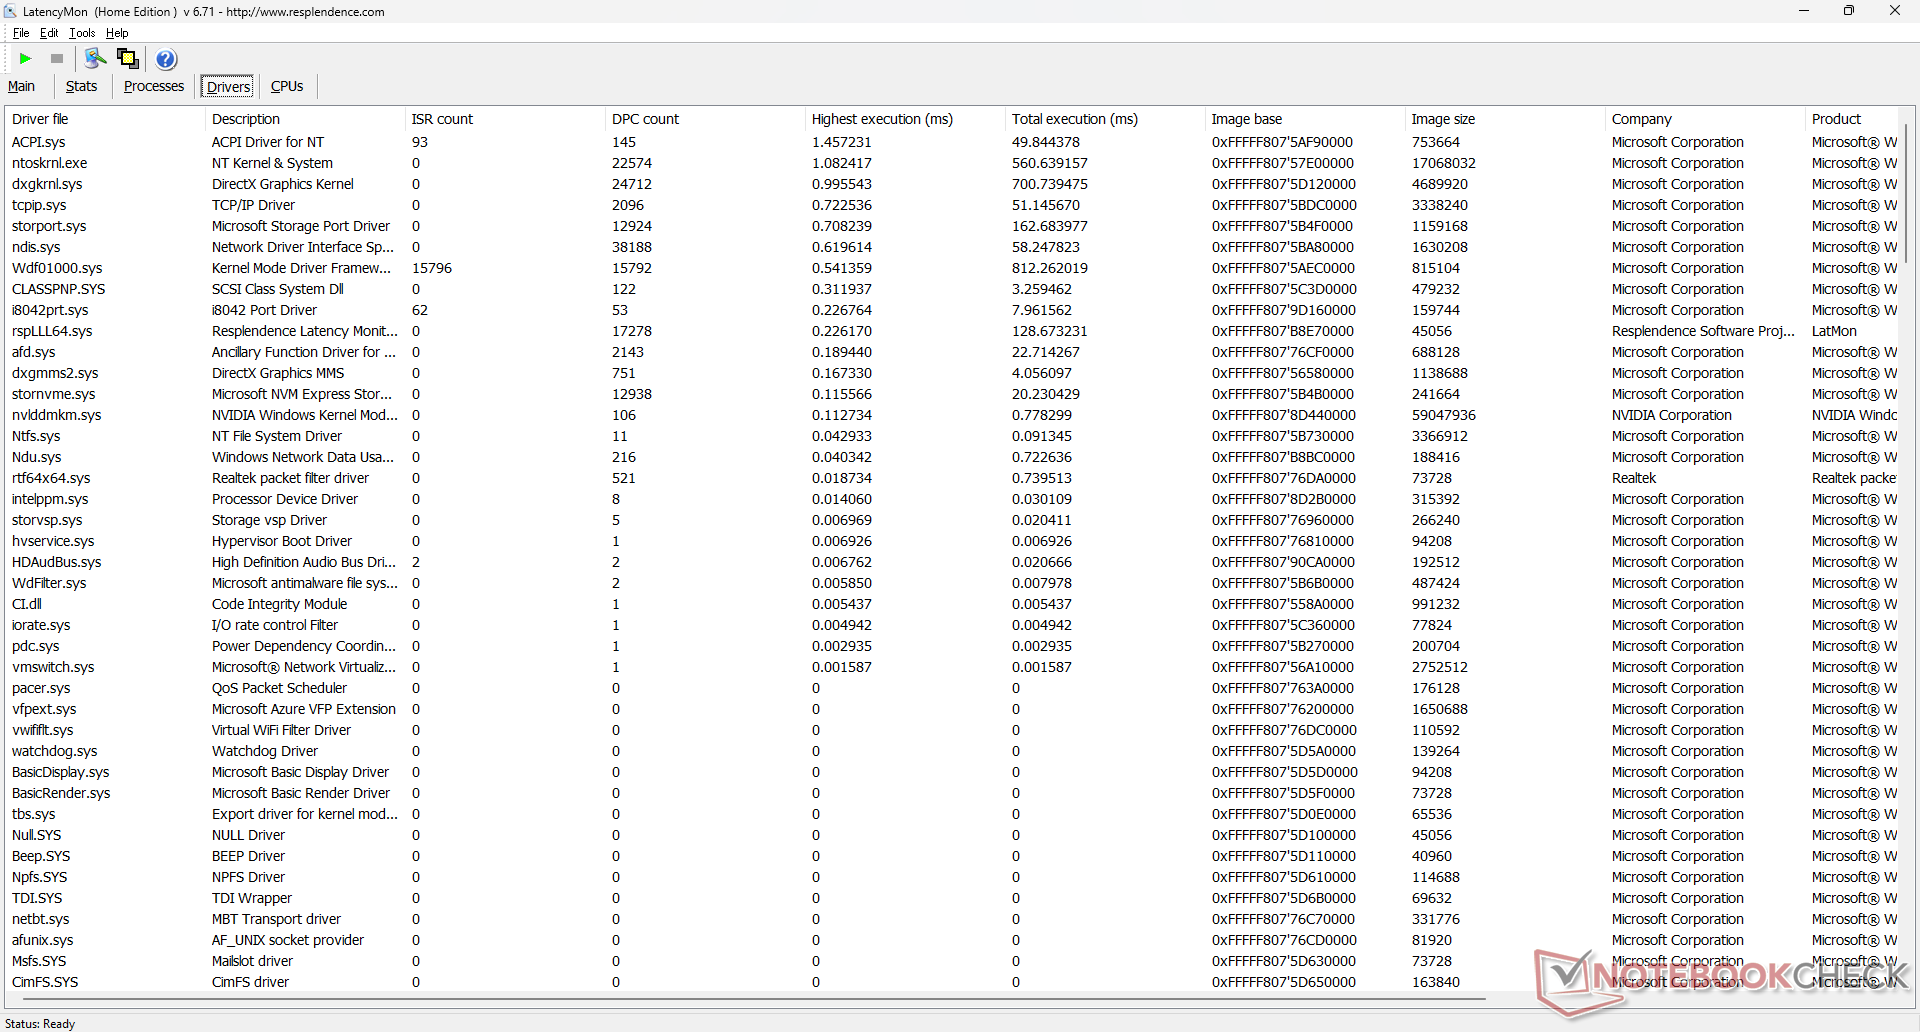
Opóźnienie DPC
LatencyMon ujawnia problemy z DPC podczas otwierania wielu kart przeglądarki na naszej stronie głównej. odtwarzanie wideo 4K przy 60 FPS jest poza tym perfekcyjne i nie ma żadnych zrzuconych klatek.
| DPC Latencies / LatencyMon - interrupt to process latency (max), Web, Youtube, Prime95 | |
| HP Victus 15 fa0020nr | |
| MSI Bravo 15 B5DD-010US | |
| Asus TUF Dash F15 FX517ZC | |
| Lenovo Legion 5 15IAH7H 82RB | |
| HP Omen 15-en0375ng | |
| Dell G15 5515 | |
* ... im mniej tym lepiej
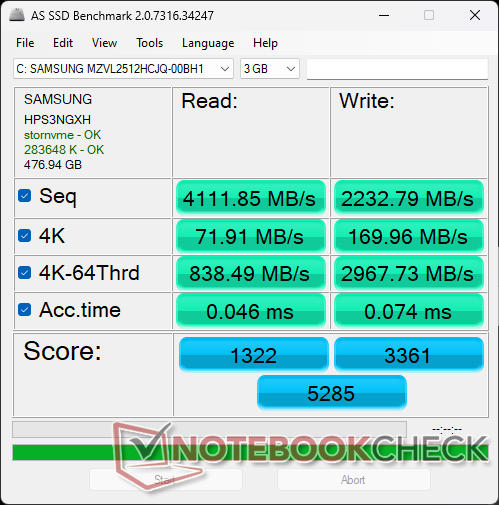
Urządzenia pamięci masowej - tylko jeden dysk
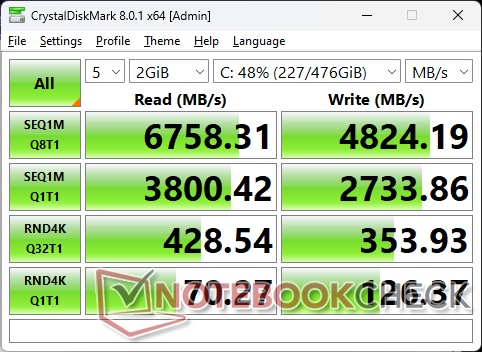
Nasz testowy egzemplarz zawiera szybki Samsung PM9A1 PCIe4 x4 NVMe SSD obiecujący sekwencyjny odczyt i zapis na poziomie odpowiednio 6900 MB/s i 5000 MB/s. Wydajność dławi się jednak po około 5 minutach obciążenia, co pokazują wyniki naszego testu w pętli DiskSpd poniżej. Choć preferowany jest brak dławienia, opóźniony spadek wydajności raczej nie wpłynie na wrażenia użytkownika.

| Drive Performance rating - Percent | |
| Lenovo Legion 5 15IAH7H 82RB | |
| HP Victus 15 fa0020nr | |
| HP Omen 15-en0375ng | |
| Asus TUF Dash F15 FX517ZC | |
| Dell G15 5515 | |
| MSI Bravo 15 B5DD-010US | |
| DiskSpd | |
| seq read | |
| Lenovo Legion 5 15IAH7H 82RB | |
| HP Victus 15 fa0020nr | |
| Asus TUF Dash F15 FX517ZC | |
| HP Omen 15-en0375ng | |
| Dell G15 5515 | |
| MSI Bravo 15 B5DD-010US | |
| seq write | |
| Lenovo Legion 5 15IAH7H 82RB | |
| HP Victus 15 fa0020nr | |
| HP Omen 15-en0375ng | |
| Asus TUF Dash F15 FX517ZC | |
| Dell G15 5515 | |
| MSI Bravo 15 B5DD-010US | |
| seq q8 t1 read | |
| Lenovo Legion 5 15IAH7H 82RB | |
| HP Victus 15 fa0020nr | |
| Dell G15 5515 | |
| HP Omen 15-en0375ng | |
| Asus TUF Dash F15 FX517ZC | |
| MSI Bravo 15 B5DD-010US | |
| seq q8 t1 write | |
| HP Victus 15 fa0020nr | |
| HP Omen 15-en0375ng | |
| Dell G15 5515 | |
| Asus TUF Dash F15 FX517ZC | |
| Lenovo Legion 5 15IAH7H 82RB | |
| MSI Bravo 15 B5DD-010US | |
| 4k q1 t1 read | |
| Asus TUF Dash F15 FX517ZC | |
| HP Victus 15 fa0020nr | |
| Lenovo Legion 5 15IAH7H 82RB | |
| HP Omen 15-en0375ng | |
| MSI Bravo 15 B5DD-010US | |
| Dell G15 5515 | |
| 4k q1 t1 write | |
| Lenovo Legion 5 15IAH7H 82RB | |
| Asus TUF Dash F15 FX517ZC | |
| HP Omen 15-en0375ng | |
| MSI Bravo 15 B5DD-010US | |
| HP Victus 15 fa0020nr | |
| Dell G15 5515 | |
| 4k q32 t16 read | |
| Lenovo Legion 5 15IAH7H 82RB | |
| HP Omen 15-en0375ng | |
| Dell G15 5515 | |
| HP Victus 15 fa0020nr | |
| Asus TUF Dash F15 FX517ZC | |
| MSI Bravo 15 B5DD-010US | |
| 4k q32 t16 write | |
| Lenovo Legion 5 15IAH7H 82RB | |
| HP Omen 15-en0375ng | |
| Asus TUF Dash F15 FX517ZC | |
| Dell G15 5515 | |
| MSI Bravo 15 B5DD-010US | |
| HP Victus 15 fa0020nr | |
* ... im mniej tym lepiej
Disk Throttling: DiskSpd Read Loop, Queue Depth 8
Wydajność GPU - 75 W TGP
Wydajność graficzna jest porównywalna do starszego GeForce GTX 1660 Ti lub mobilnego RTX 2060 a jednocześnie jest o około 10 procent szybsza od standardowego mobilny RTX 3050. Seria RTX 3050 była nieco rozczarowująca, ponieważ konkurencyjny Radeon RX 6600M sprzedaje się za mniej więcej tę samą cenę, ale z nawet o 50 procent szybszą wydajnością. Mimo to większość tytułów pozostaje grywalna w natywnej rozdzielczości 1080p, w tym Cyberpunk 2077.
Jesteśmy zaskoczeni, że większość gier nadal działa bardzo dobrze pomimo ograniczonej ilości 8 GB pamięci RAM. Średnia liczba klatek na sekundę jest taka, jakiej oczekujemy od innych laptopów z tym samym procesorem graficznym, z wyjątkiem bardzo wymagających tytułów, takich jak Cyberpunk 2077, gdzie wydajność może być o około 10 procent niższa w ustawieniach Ultra
Zaawansowane funkcje graficzne, takie jak Optimus 2.0, zintegrowany G-Sync czy MUX nie są obsługiwane przez tę budżetową maszynę. Nie ma też GeForce RTX 3060 lub wyższych opcji.

| 3DMark 11 - 1280x720 Performance GPU | |
| MSI GE67 HX 12UGS | |
| Asus ROG Strix G15 G513QY | |
| Alienware x15 R2 P111F | |
| Lenovo Legion 5 15IAH7H 82RB | |
| MSI Alpha 15 B5EEK-008 | |
| HP Omen 15-en0375ng | |
| HP Omen 15-ek0456ng | |
| HP Victus 15 fa0020nr | |
| Asus TUF Dash F15 FX517ZC | |
| Przeciętny NVIDIA GeForce RTX 3050 Ti Laptop GPU (7952 - 20905, n=27) | |
| MSI Bravo 15 B5DD-010US | |
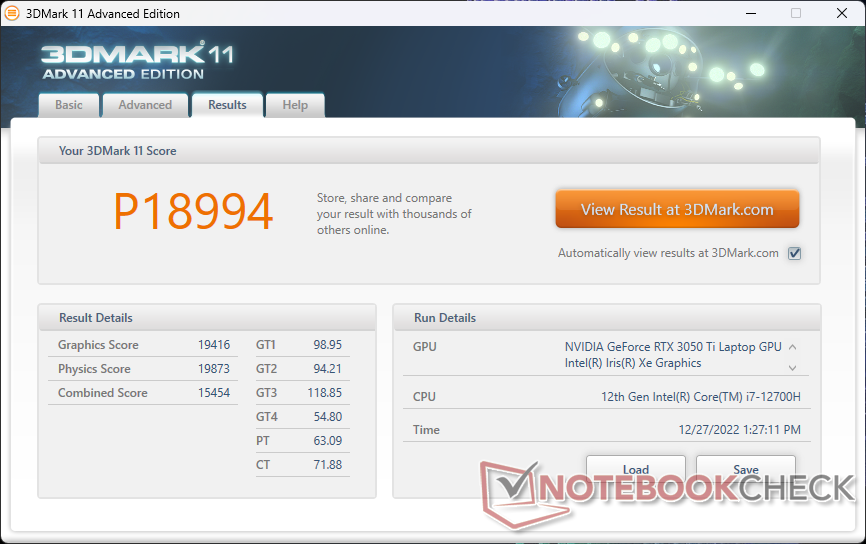
| 3DMark 11 Performance | 18994 pkt. | |
| 3DMark Cloud Gate Standard Score | 50957 pkt. | |
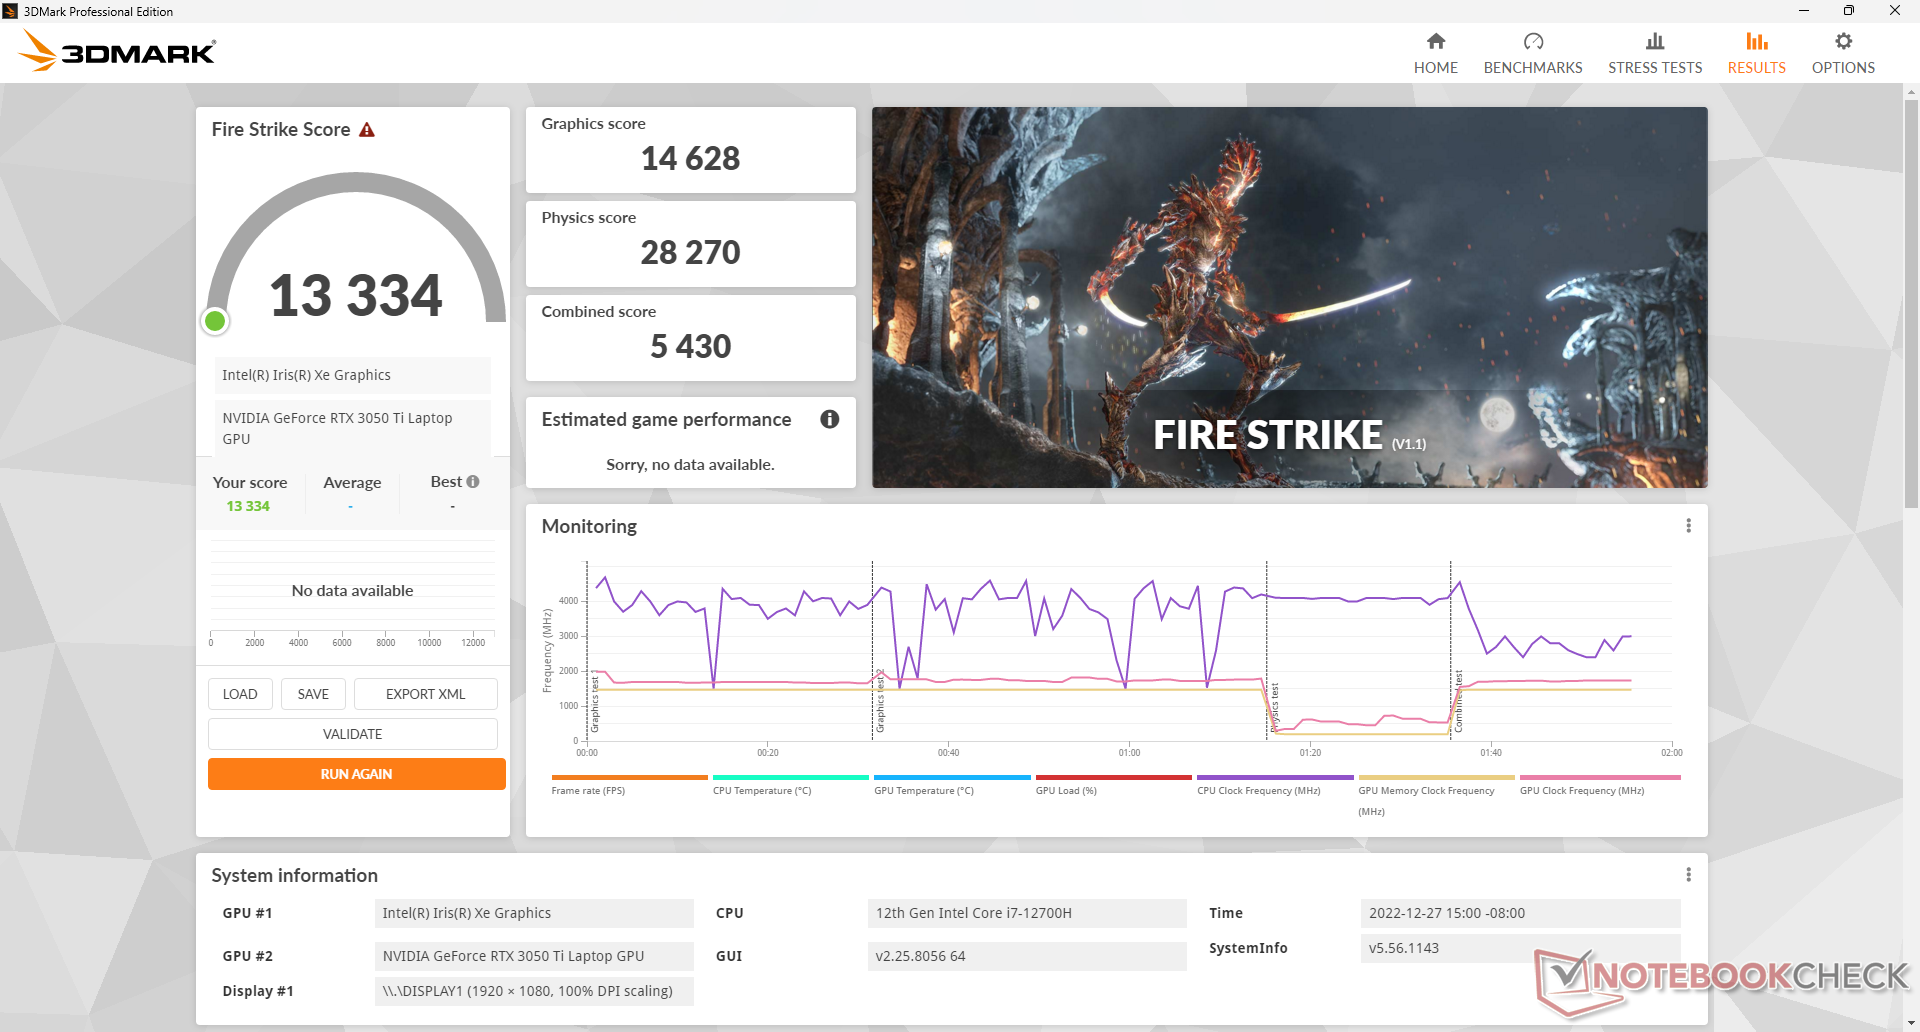
| 3DMark Fire Strike Score | 13334 pkt. | |
| 3DMark Time Spy Score | 5921 pkt. | |
Pomoc | ||
* ... im mniej tym lepiej
| The Witcher 3 - 1920x1080 Ultra Graphics & Postprocessing (HBAO+) | |
| Średnia w klasie Gaming (95 - 240, n=8, ostatnie 2 lata) | |
| Przeciętny NVIDIA GeForce RTX 3060 Laptop GPU (58.2 - 91.5, n=48) | |
| Przeciętny NVIDIA GeForce RTX 2060 Mobile (50.6 - 74, n=40) | |
| HP Victus 15 fa0020nr | |
| Przeciętny NVIDIA GeForce RTX 3050 Ti Laptop GPU (19 - 58.5, n=29) | |
| Przeciętny NVIDIA GeForce RTX 3050 4GB Laptop GPU (31.5 - 55.8, n=21) | |
| Cyberpunk 2077 1.6 - 1920x1080 Ultra Preset | |
| Przeciętny NVIDIA GeForce RTX 3060 Laptop GPU (40 - 78.8, n=16) | |
| Przeciętny NVIDIA GeForce RTX 3050 Ti Laptop GPU (31 - 50.5, n=9) | |
| HP Victus 15 fa0020nr | |
| Przeciętny NVIDIA GeForce RTX 3050 4GB Laptop GPU (25.3 - 36.5, n=7) | |
| The Witcher 3 | |
| 1024x768 Low Graphics & Postprocessing | |
| Lenovo Legion 5 15IAH7H 82RB | |
| MSI GE67 HX 12UGS | |
| Alienware x15 R2 P111F | |
| HP Victus 15 fa0020nr | |
| Asus TUF Dash F15 FX517ZC | |
| Asus ROG Strix G15 G513QY | |
| HP Omen 15-ek0456ng | |
| Lenovo Legion 5 15ACH6A-82NW0010GE | |
| MSI Bravo 15 B5DD-010US | |
| Przeciętny NVIDIA GeForce RTX 3050 Ti Laptop GPU (75 - 297, n=20) | |
| 1366x768 Medium Graphics & Postprocessing | |
| Alienware x15 R2 P111F | |
| MSI GE67 HX 12UGS | |
| Lenovo Legion 5 15IAH7H 82RB | |
| Lenovo Legion 5 15ACH6A-82NW0010GE | |
| HP Victus 15 fa0020nr | |
| HP Omen 15-ek0456ng | |
| Asus TUF Dash F15 FX517ZC | |
| Asus ROG Strix G15 G513QY | |
| Przeciętny NVIDIA GeForce RTX 3050 Ti Laptop GPU (48 - 264, n=24) | |
| 1920x1080 High Graphics & Postprocessing (Nvidia HairWorks Off) | |
| Alienware x15 R2 P111F | |
| MSI GE67 HX 12UGS | |
| Asus ROG Strix G15 G513QY | |
| Lenovo Legion 5 15IAH7H 82RB | |
| Lenovo Legion 5 15ACH6A-82NW0010GE | |
| HP Omen 15-en0375ng | |
| HP Victus 15 fa0020nr | |
| HP Omen 15-ek0456ng | |
| Asus TUF Dash F15 FX517ZC | |
| Przeciętny NVIDIA GeForce RTX 3050 Ti Laptop GPU (30 - 110, n=26) | |
| MSI Bravo 15 B5DD-010US | |
| 1920x1080 Ultra Graphics & Postprocessing (HBAO+) | |
| Alienware x15 R2 P111F | |
| MSI GE67 HX 12UGS | |
| Asus ROG Strix G15 G513QY | |
| Lenovo Legion 5 15IAH7H 82RB | |
| Lenovo Legion 5 15ACH6A-82NW0010GE | |
| HP Omen 15-en0375ng | |
| HP Victus 15 fa0020nr | |
| HP Omen 15-ek0456ng | |
| Asus TUF Dash F15 FX517ZC | |
| Przeciętny NVIDIA GeForce RTX 3050 Ti Laptop GPU (19 - 58.5, n=29) | |
| MSI Bravo 15 B5DD-010US | |
| Final Fantasy XV Benchmark | |
| 1280x720 Lite Quality | |
| Lenovo Legion 5 15IAH7H 82RB | |
| Alienware x15 R2 P111F | |
| MSI GE67 HX 12UGS | |
| Asus TUF Dash F15 FX517ZC | |
| Asus ROG Strix G15 G513QY | |
| Lenovo Legion 5 15ACH6A-82NW0010GE | |
| HP Victus 15 fa0020nr | |
| HP Omen 15-ek0456ng | |
| MSI Bravo 15 B5DD-010US | |
| Przeciętny NVIDIA GeForce RTX 3050 Ti Laptop GPU (55.9 - 138.9, n=18) | |
| 1920x1080 Standard Quality | |
| MSI GE67 HX 12UGS | |
| Alienware x15 R2 P111F | |
| Lenovo Legion 5 15IAH7H 82RB | |
| Asus ROG Strix G15 G513QY | |
| Lenovo Legion 5 15ACH6A-82NW0010GE | |
| HP Victus 15 fa0020nr | |
| HP Omen 15-ek0456ng | |
| Asus TUF Dash F15 FX517ZC | |
| Przeciętny NVIDIA GeForce RTX 3050 Ti Laptop GPU (33.4 - 106, n=24) | |
| MSI Bravo 15 B5DD-010US | |
| 1920x1080 High Quality | |
| MSI GE67 HX 12UGS | |
| Alienware x15 R2 P111F | |
| Lenovo Legion 5 15IAH7H 82RB | |
| Asus ROG Strix G15 G513QY | |
| Lenovo Legion 5 15ACH6A-82NW0010GE | |
| HP Omen 15-ek0456ng | |
| HP Victus 15 fa0020nr | |
| Przeciętny NVIDIA GeForce RTX 3050 Ti Laptop GPU (23.5 - 106, n=24) | |
| Asus TUF Dash F15 FX517ZC | |
| MSI Bravo 15 B5DD-010US | |
| X-Plane 11.11 | |
| 1280x720 low (fps_test=1) | |
| Lenovo Legion 5 15IAH7H 82RB | |
| Asus TUF Dash F15 FX517ZC | |
| Alienware x15 R2 P111F | |
| MSI GE67 HX 12UGS | |
| HP Victus 15 fa0020nr | |
| Przeciętny NVIDIA GeForce RTX 3050 Ti Laptop GPU (64.9 - 137.6, n=27) | |
| HP Omen 15-en0375ng | |
| HP Omen 15-ek0456ng | |
| Asus ROG Strix G15 G513QY | |
| Lenovo Legion 5 15ACH6A-82NW0010GE | |
| MSI Bravo 15 B5DD-010US | |
| 1920x1080 med (fps_test=2) | |
| Lenovo Legion 5 15IAH7H 82RB | |
| Alienware x15 R2 P111F | |
| MSI GE67 HX 12UGS | |
| Asus TUF Dash F15 FX517ZC | |
| HP Victus 15 fa0020nr | |
| Przeciętny NVIDIA GeForce RTX 3050 Ti Laptop GPU (54.6 - 117, n=27) | |
| HP Omen 15-en0375ng | |
| HP Omen 15-ek0456ng | |
| Asus ROG Strix G15 G513QY | |
| Lenovo Legion 5 15ACH6A-82NW0010GE | |
| MSI Bravo 15 B5DD-010US | |
| 1920x1080 high (fps_test=3) | |
| Lenovo Legion 5 15IAH7H 82RB | |
| MSI GE67 HX 12UGS | |
| Alienware x15 R2 P111F | |
| Asus TUF Dash F15 FX517ZC | |
| HP Victus 15 fa0020nr | |
| Przeciętny NVIDIA GeForce RTX 3050 Ti Laptop GPU (48.8 - 100.6, n=27) | |
| HP Omen 15-en0375ng | |
| HP Omen 15-ek0456ng | |
| Asus ROG Strix G15 G513QY | |
| Lenovo Legion 5 15ACH6A-82NW0010GE | |
| MSI Bravo 15 B5DD-010US | |
| GTA V | |
| 1024x768 Lowest Settings possible | |
| MSI GE67 HX 12UGS | |
| Lenovo Legion 5 15IAH7H 82RB | |
| Asus TUF Dash F15 FX517ZC | |
| HP Victus 15 fa0020nr | |
| MSI Bravo 15 B5DD-010US | |
| Przeciętny NVIDIA GeForce RTX 3050 Ti Laptop GPU (102.7 - 185, n=21) | |
| Lenovo Legion 5 15ACH6A-82NW0010GE | |
| Asus ROG Strix G15 G513QY | |
| HP Omen 15-en0375ng | |
| 1920x1080 Lowest Settings possible | |
| MSI GE67 HX 12UGS | |
| Lenovo Legion 5 15IAH7H 82RB | |
| Asus TUF Dash F15 FX517ZC | |
| HP Victus 15 fa0020nr | |
| Przeciętny NVIDIA GeForce RTX 3050 Ti Laptop GPU (110.7 - 181.1, n=13) | |
| HP Omen 15-ek0456ng | |
| Lenovo Legion 5 15ACH6A-82NW0010GE | |
| HP Omen 15-en0375ng | |
| Asus ROG Strix G15 G513QY | |
| MSI Bravo 15 B5DD-010US | |
| 1366x768 Normal/Off AF:4x | |
| MSI GE67 HX 12UGS | |
| Lenovo Legion 5 15IAH7H 82RB | |
| Asus TUF Dash F15 FX517ZC | |
| HP Victus 15 fa0020nr | |
| HP Omen 15-ek0456ng | |
| Przeciętny NVIDIA GeForce RTX 3050 Ti Laptop GPU (88.4 - 181.3, n=23) | |
| HP Omen 15-en0375ng | |
| Lenovo Legion 5 15ACH6A-82NW0010GE | |
| Asus ROG Strix G15 G513QY | |
| 1920x1080 Normal/Off AF:4x | |
| MSI GE67 HX 12UGS | |
| Lenovo Legion 5 15IAH7H 82RB | |
| Asus TUF Dash F15 FX517ZC | |
| HP Victus 15 fa0020nr | |
| MSI Bravo 15 B5DD-010US | |
| Przeciętny NVIDIA GeForce RTX 3050 Ti Laptop GPU (108.2 - 180.2, n=19) | |
| HP Omen 15-ek0456ng | |
| Lenovo Legion 5 15ACH6A-82NW0010GE | |
| HP Omen 15-en0375ng | |
| Asus ROG Strix G15 G513QY | |
| 1920x1080 High/On (Advanced Graphics Off) AA:2xMSAA + FX AF:8x | |
| Lenovo Legion 5 15IAH7H 82RB | |
| MSI GE67 HX 12UGS | |
| Asus TUF Dash F15 FX517ZC | |
| HP Victus 15 fa0020nr | |
| HP Omen 15-ek0456ng | |
| Lenovo Legion 5 15ACH6A-82NW0010GE | |
| HP Omen 15-en0375ng | |
| Asus ROG Strix G15 G513QY | |
| Przeciętny NVIDIA GeForce RTX 3050 Ti Laptop GPU (53.8 - 149, n=25) | |
| MSI Bravo 15 B5DD-010US | |
| 1920x1080 Highest AA:4xMSAA + FX AF:16x | |
| MSI GE67 HX 12UGS | |
| Lenovo Legion 5 15IAH7H 82RB | |
| Asus ROG Strix G15 G513QY | |
| Lenovo Legion 5 15ACH6A-82NW0010GE | |
| HP Victus 15 fa0020nr | |
| HP Omen 15-ek0456ng | |
| Asus TUF Dash F15 FX517ZC | |
| HP Omen 15-en0375ng | |
| Przeciętny NVIDIA GeForce RTX 3050 Ti Laptop GPU (27.8 - 75.6, n=26) | |
| MSI Bravo 15 B5DD-010US | |
Witcher 3 FPS Chart
| low | med. | high | ultra | |
|---|---|---|---|---|
| GTA V (2015) | 179.5 | 173 | 144.7 | 73.1 |
| The Witcher 3 (2015) | 284.4 | 186.2 | 106.5 | 54.7 |
| Dota 2 Reborn (2015) | 161.7 | 140.3 | 132.2 | 123.8 |
| Final Fantasy XV Benchmark (2018) | 138.1 | 81.7 | 54.7 | |
| X-Plane 11.11 (2018) | 127.1 | 115.6 | 92.9 | |
| Strange Brigade (2018) | 297 | 138.8 | 112.2 | 97.4 |
| Cyberpunk 2077 1.6 (2022) | 78.3 | 65.7 | 46.9 | 36.8 |
Emisje
Hałas systemowy - głośniejszy w trybie cichym
Hałas wentylatora jest powiązany z trzema ustawieniami wydajności HP: Quiet, Default i Performance. Co dziwne, hałas wentylatorów jest głośniejszy w trybie Quiet niż w Default (29,2 dB(A) vs. 26,2 dB(A)) podczas pracy na biegu jałowym na pulpicie, co podejrzewamy o błąd. Niezależnie od tego, rozczarowujące jest to, że wentylatory są zawsze aktywne, niezależnie od obciążenia ekranu, więc system nigdy nie jest naprawdę cichy.
Dobrą wiadomością jest to, że podczas gdy hałas wentylatora jest stosunkowo głośny podczas niższych obciążeń, jest on cichszy niż w przypadku wielu innych laptopów do gier podczas pracy przy wyższych obciążeniach, takich jak gry. Szum wentylatora ustabilizował się na poziomie nieco ponad 41 dB(A) podczas korzystania z witryny Witcher 3 w trybie Performance, w porównaniu z 48 dB(A) i 44 dB(A) odpowiednio w HP Omen 15 i Dellu G5 15. Wentylatory są bardziej ospałe i dłużej się rozpędzają.
W naszym teście wystąpiły też lekkie wycie cewki lub szumy elektroniczne.
Hałas
| luz |
| 26.2 / 29.2 / 29.4 dB |
| obciążenie |
| 29.9 / 45.5 dB |
 | ||
30 dB cichy 40 dB(A) słyszalny 50 dB(A) irytujący |
||
min: | ||
| HP Victus 15 fa0020nr GeForce RTX 3050 Ti Laptop GPU, i7-12700H, Samsung PM9A1 MZVL2512HCJQ | HP Omen 15-en0375ng GeForce RTX 2060 Mobile, R7 4800H, WDC PC SN730 SDBPNTY-512G | Dell G15 5515 GeForce RTX 3050 Ti Laptop GPU, R7 5800H, Samsung PM991a MZ9LQ512HBLU-00BD1 | Asus TUF Dash F15 FX517ZC GeForce RTX 3050 4GB Laptop GPU, i7-12650H, Intel SSD 670p SSDPEKNU512GZ | MSI Bravo 15 B5DD-010US Radeon RX 5500M, R5 5600H, Kingston OM8PCP3512F-AB | Lenovo Legion 5 15IAH7H 82RB GeForce RTX 3060 Laptop GPU, i7-12700H | |
|---|---|---|---|---|---|---|
| Noise | -12% | -6% | -11% | -9% | 1% | |
| wyłączone / środowisko * (dB) | 24.8 | 24 3% | 24 3% | 23.9 4% | 24.5 1% | 23.3 6% |
| Idle Minimum * (dB) | 26.2 | 24 8% | 25 5% | 24 8% | 24.5 6% | 23.5 10% |
| Idle Average * (dB) | 29.2 | 25 14% | 26 11% | 24 18% | 32.8 -12% | 23.5 20% |
| Idle Maximum * (dB) | 29.4 | 37 -26% | 30 -2% | 32.3 -10% | 32.8 -12% | 26.8 9% |
| Load Average * (dB) | 29.9 | 45 -51% | 44 -47% | 43.7 -46% | 34.5 -15% | 29.3 2% |
| Witcher 3 ultra * (dB) | 41.1 | 48 -17% | 44 -7% | 53.4 -30% | 42.5 -3% | 51.4 -25% |
| Load Maximum * (dB) | 45.5 | 51 -12% | 48 -5% | 53.6 -18% | 58.5 -29% | 53 -16% |
* ... im mniej tym lepiej
Temperatura
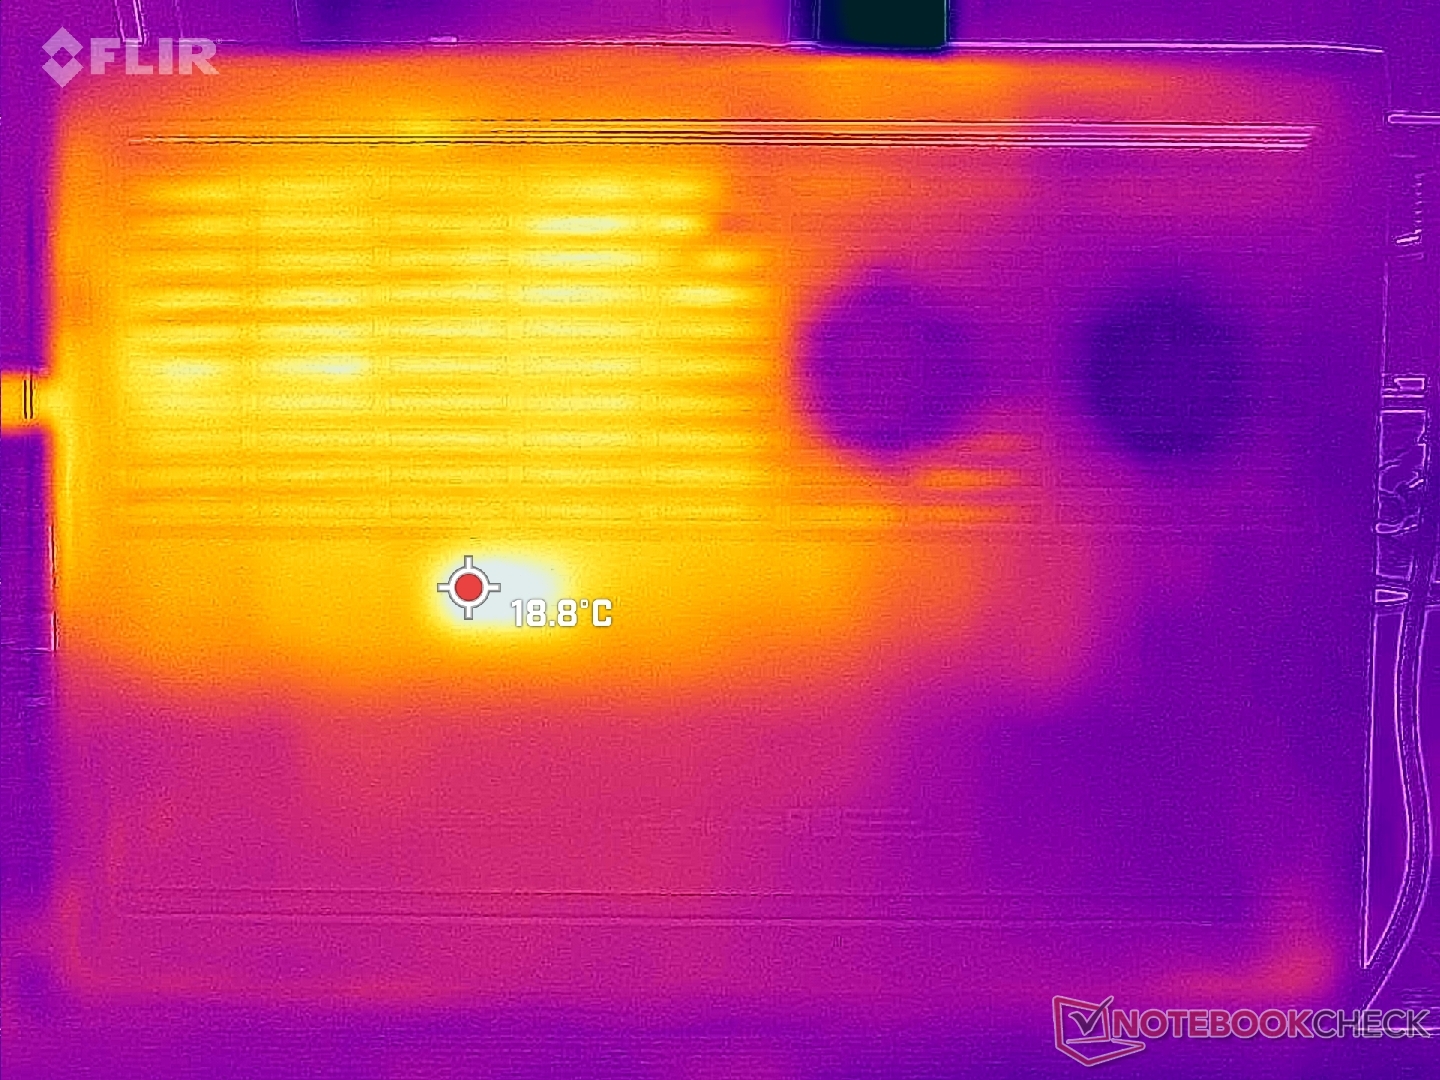
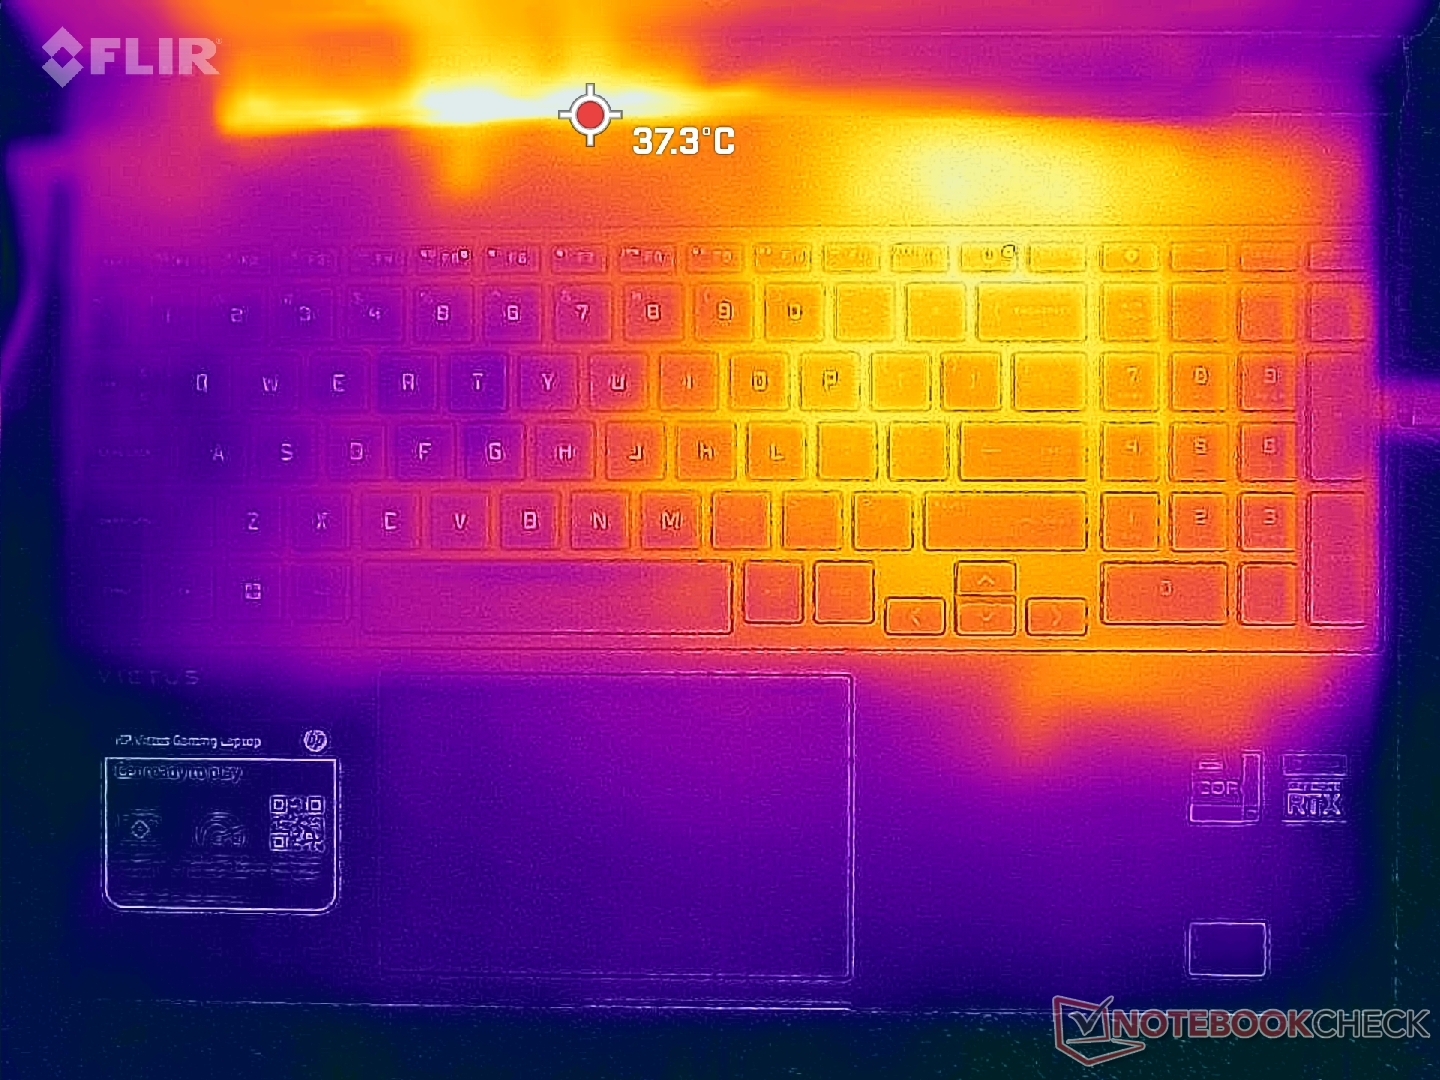
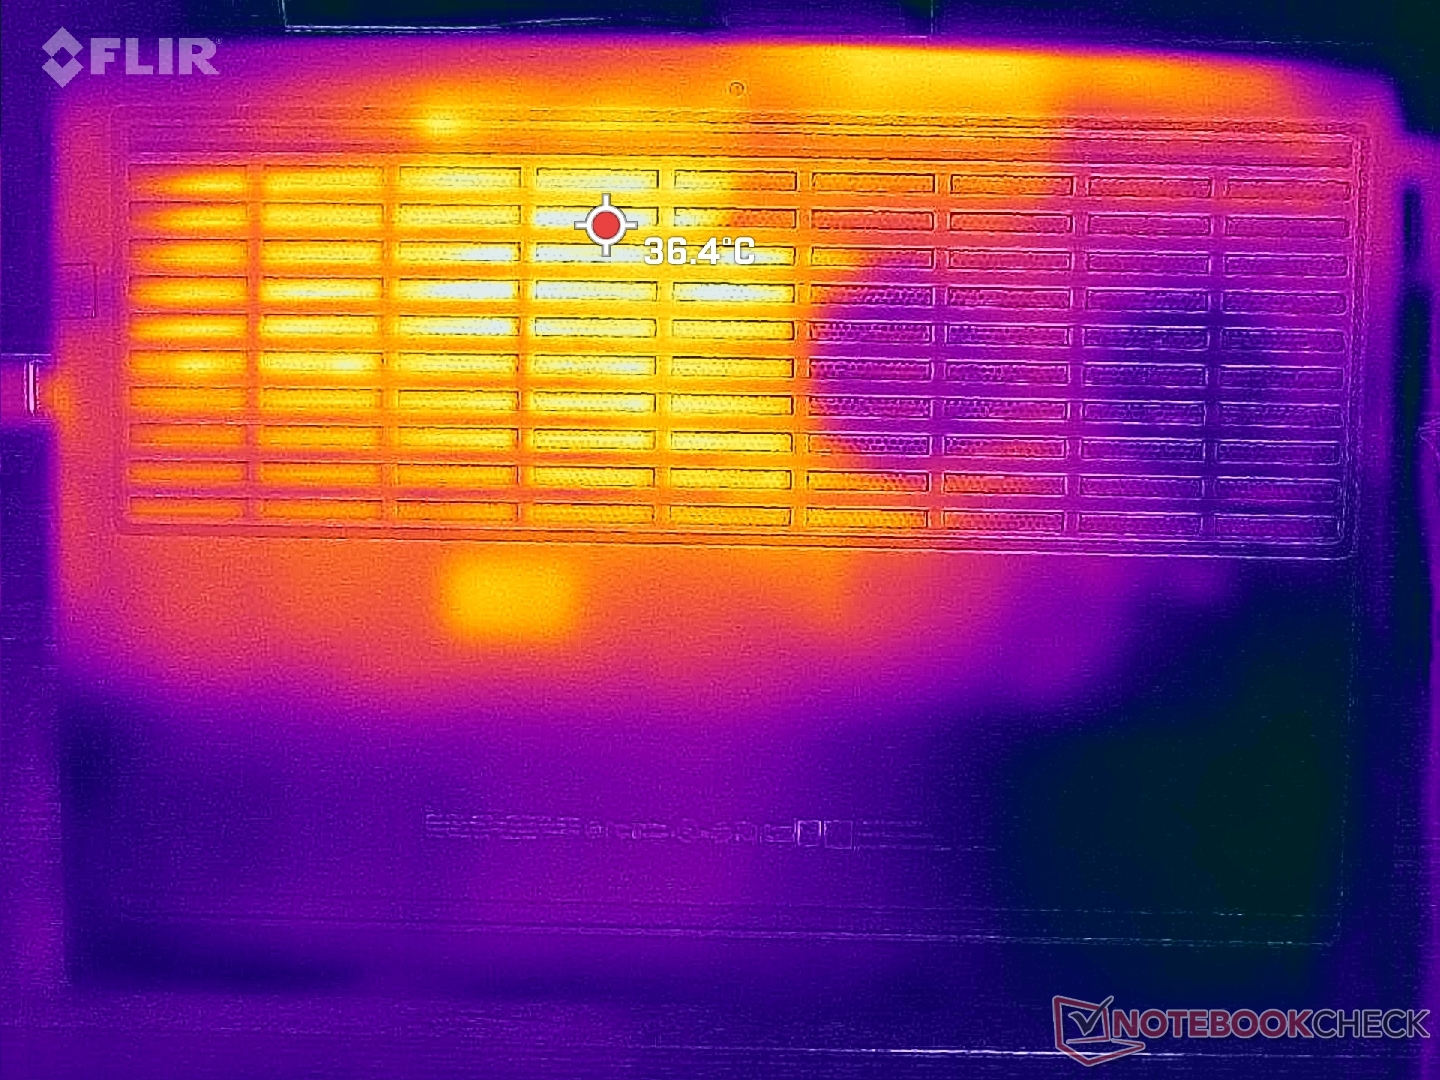
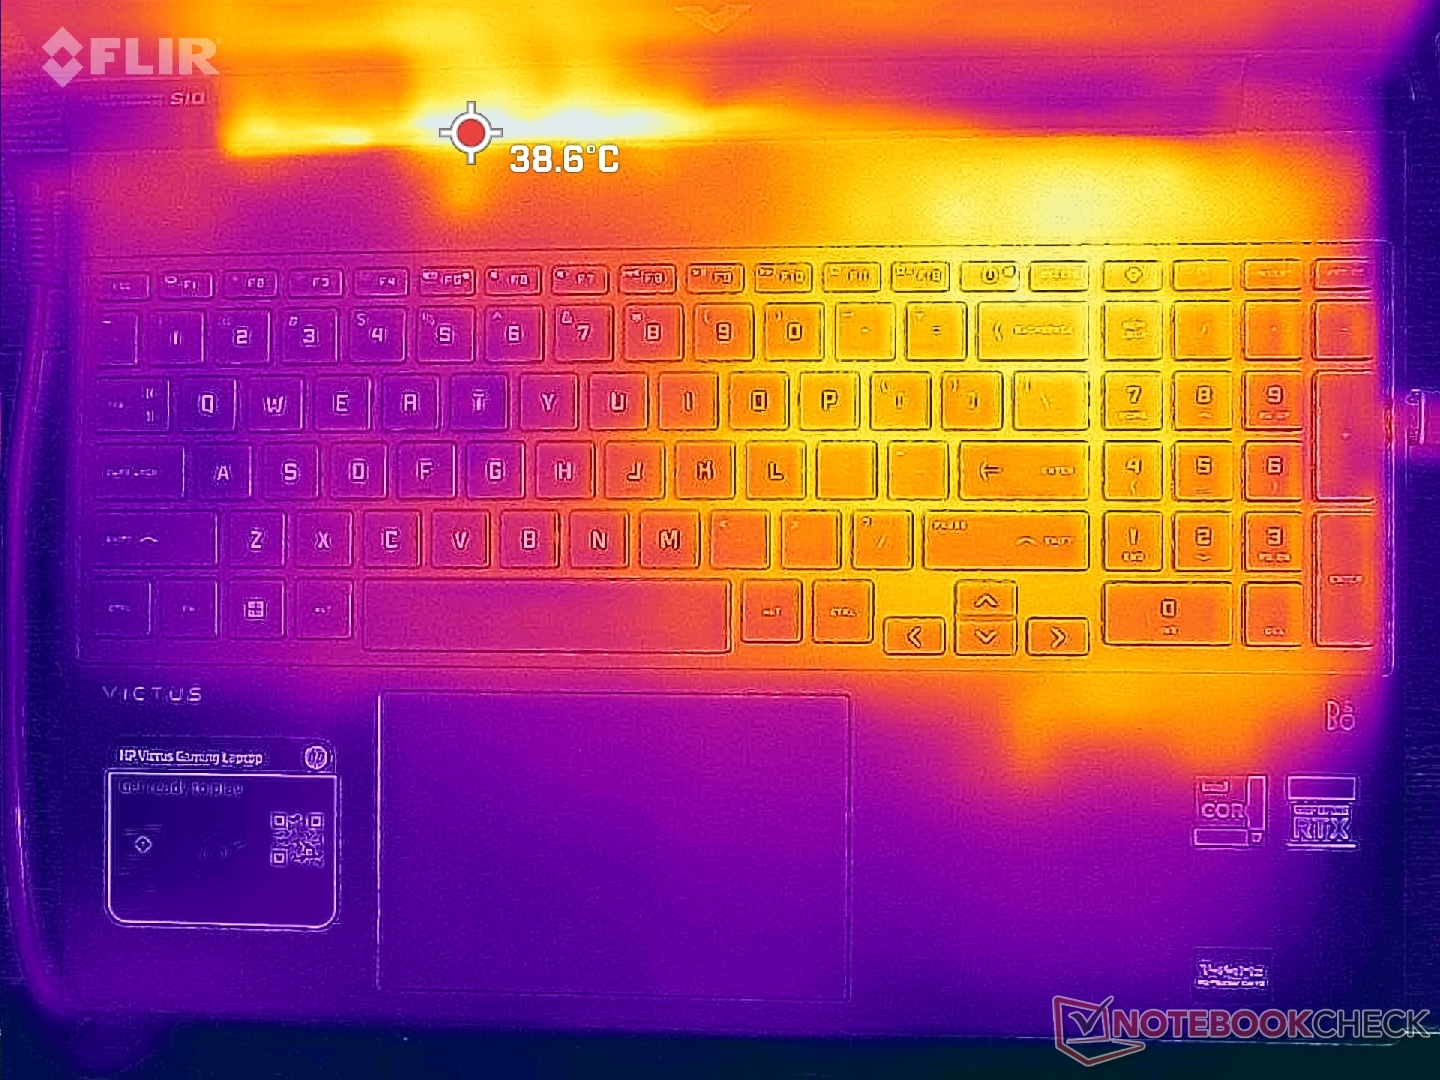
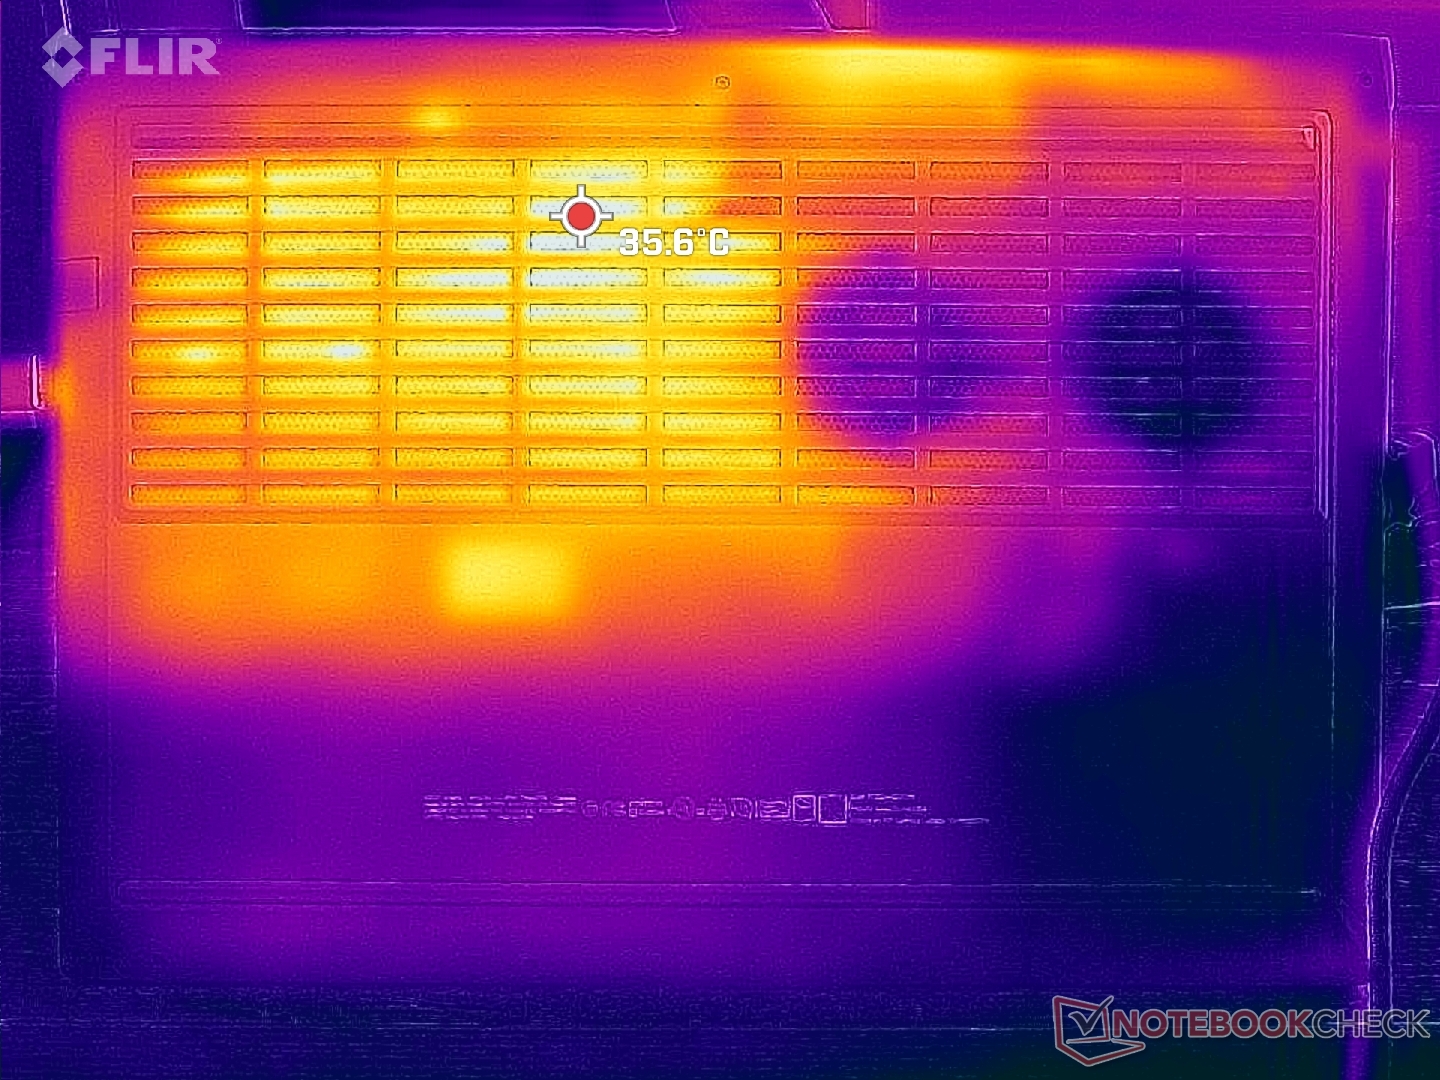
Rozwiązanie chłodzenia nie jest symetryczne w przeciwieństwie do większości laptopów do gier. Dlatego jedna połowa obudowy Victus 15 będzie zawsze cieplejsza niż druga, co pokazują nasze mapy temperatur poniżej. Gorące punkty nie są na szczęście aż tak złe i wynoszą nieco ponad 38 C na wierzchu i 36 C na spodzie w porównaniu z prawie 50 C w modelu Dell G5 15 Dell G5 15 wyposażonym w ten sam procesor graficzny Nvidii. Miejsca oparcia dłoni i lewa połowa klawiatury pozostają względnie chłodne bez względu na obciążenie ekranu.
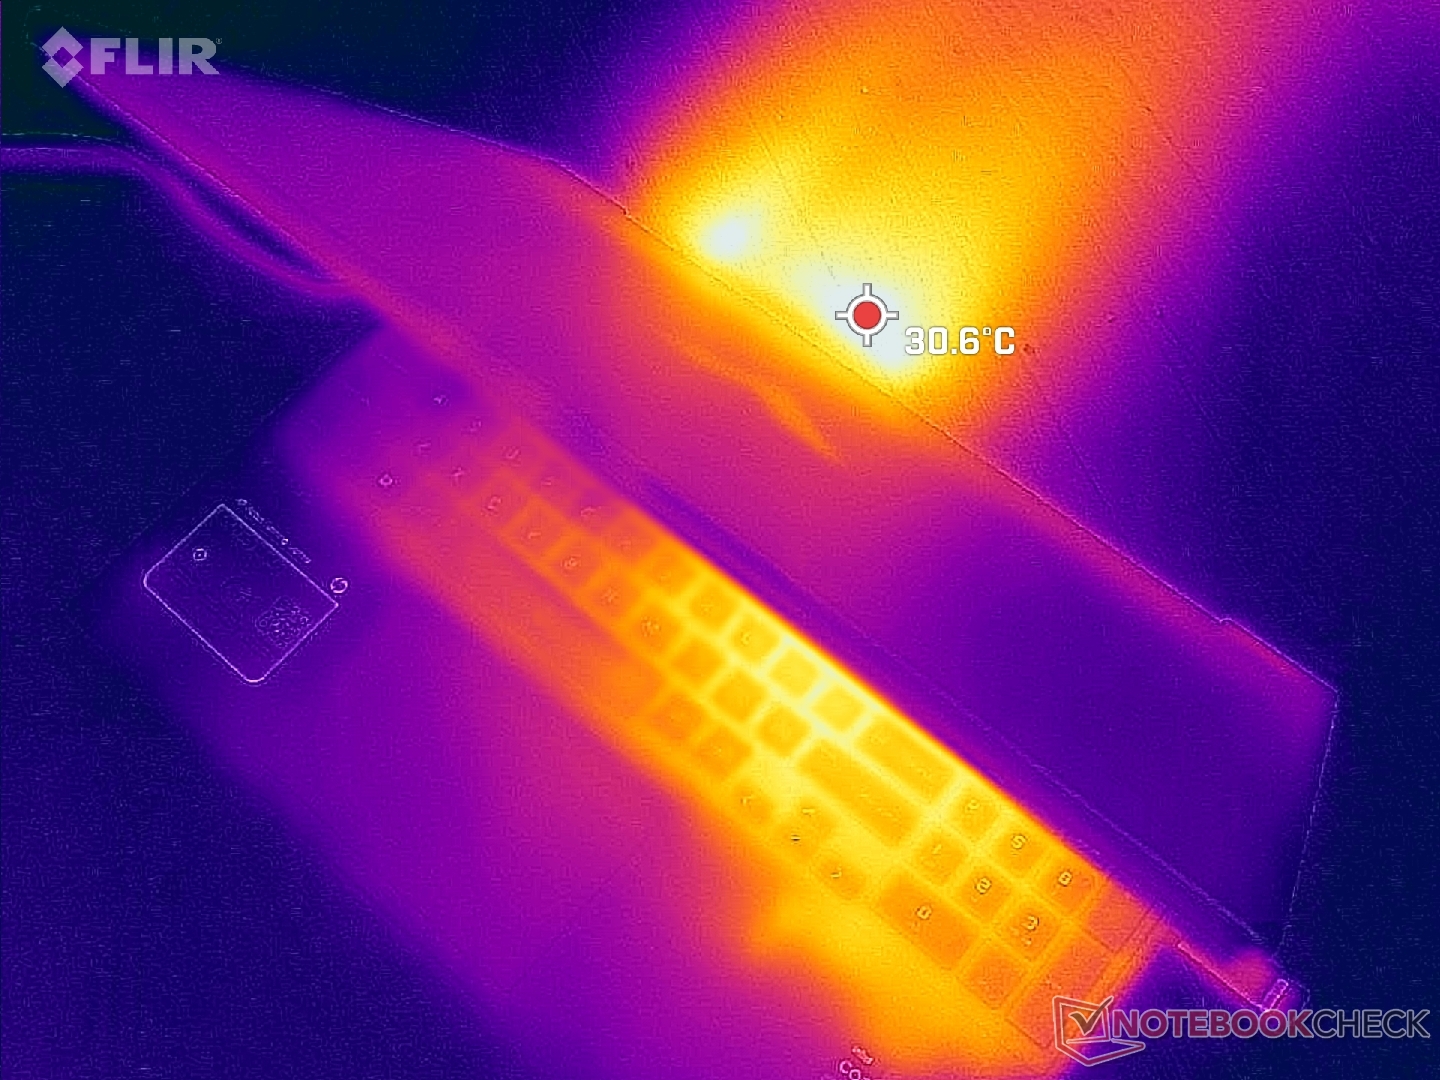
(+) Maksymalna temperatura w górnej części wynosi 37.2 °C / 99 F, w porównaniu do średniej 40.4 °C / 105 F , począwszy od 21.2 do 68.8 °C dla klasy Gaming.
(+) Dno nagrzewa się maksymalnie do 35.4 °C / 96 F, w porównaniu do średniej 43.2 °C / 110 F
(+) W stanie bezczynności średnia temperatura górnej części wynosi 20.4 °C / 69 F, w porównaniu ze średnią temperaturą urządzenia wynoszącą 33.9 °C / ### class_avg_f### F.
(+) Podczas gry w Wiedźmina 3 średnia temperatura górnej części wynosi 27.2 °C / 81 F, w porównaniu do średniej temperatury urządzenia wynoszącej 33.9 °C / ## #class_avg_f### F.
(+) Podpórki pod nadgarstki i touchpad są chłodniejsze niż temperatura skóry i maksymalnie 23.2 °C / 73.8 F i dlatego są chłodne w dotyku.
(+) Średnia temperatura obszaru podparcia dłoni w podobnych urządzeniach wynosiła 28.8 °C / 83.8 F (+5.6 °C / 10 F).

| HP Victus 15 fa0020nr Intel Core i7-12700H, NVIDIA GeForce RTX 3050 Ti Laptop GPU | HP Omen 15-en0375ng AMD Ryzen 7 4800H, NVIDIA GeForce RTX 2060 Mobile | Dell G15 5515 AMD Ryzen 7 5800H, NVIDIA GeForce RTX 3050 Ti Laptop GPU | Asus TUF Dash F15 FX517ZC Intel Core i7-12650H, NVIDIA GeForce RTX 3050 4GB Laptop GPU | MSI Bravo 15 B5DD-010US AMD Ryzen 5 5600H, AMD Radeon RX 5500M | Lenovo Legion 5 15IAH7H 82RB Intel Core i7-12700H, NVIDIA GeForce RTX 3060 Laptop GPU | |
|---|---|---|---|---|---|---|
| Heat | -30% | -26% | -11% | -43% | -22% | |
| Maximum Upper Side * (°C) | 37.2 | 42 -13% | 50 -34% | 43.4 -17% | 52.2 -40% | 37.8 -2% |
| Maximum Bottom * (°C) | 35.4 | 54 -53% | 49 -38% | 44.4 -25% | 48.6 -37% | 51 -44% |
| Idle Upper Side * (°C) | 22.4 | 28 -25% | 26 -16% | 21.2 5% | 38 -70% | 25.8 -15% |
| Idle Bottom * (°C) | 22.6 | 29 -28% | 26 -15% | 24 -6% | 28.4 -26% | 28.8 -27% |
* ... im mniej tym lepiej
Stress Test
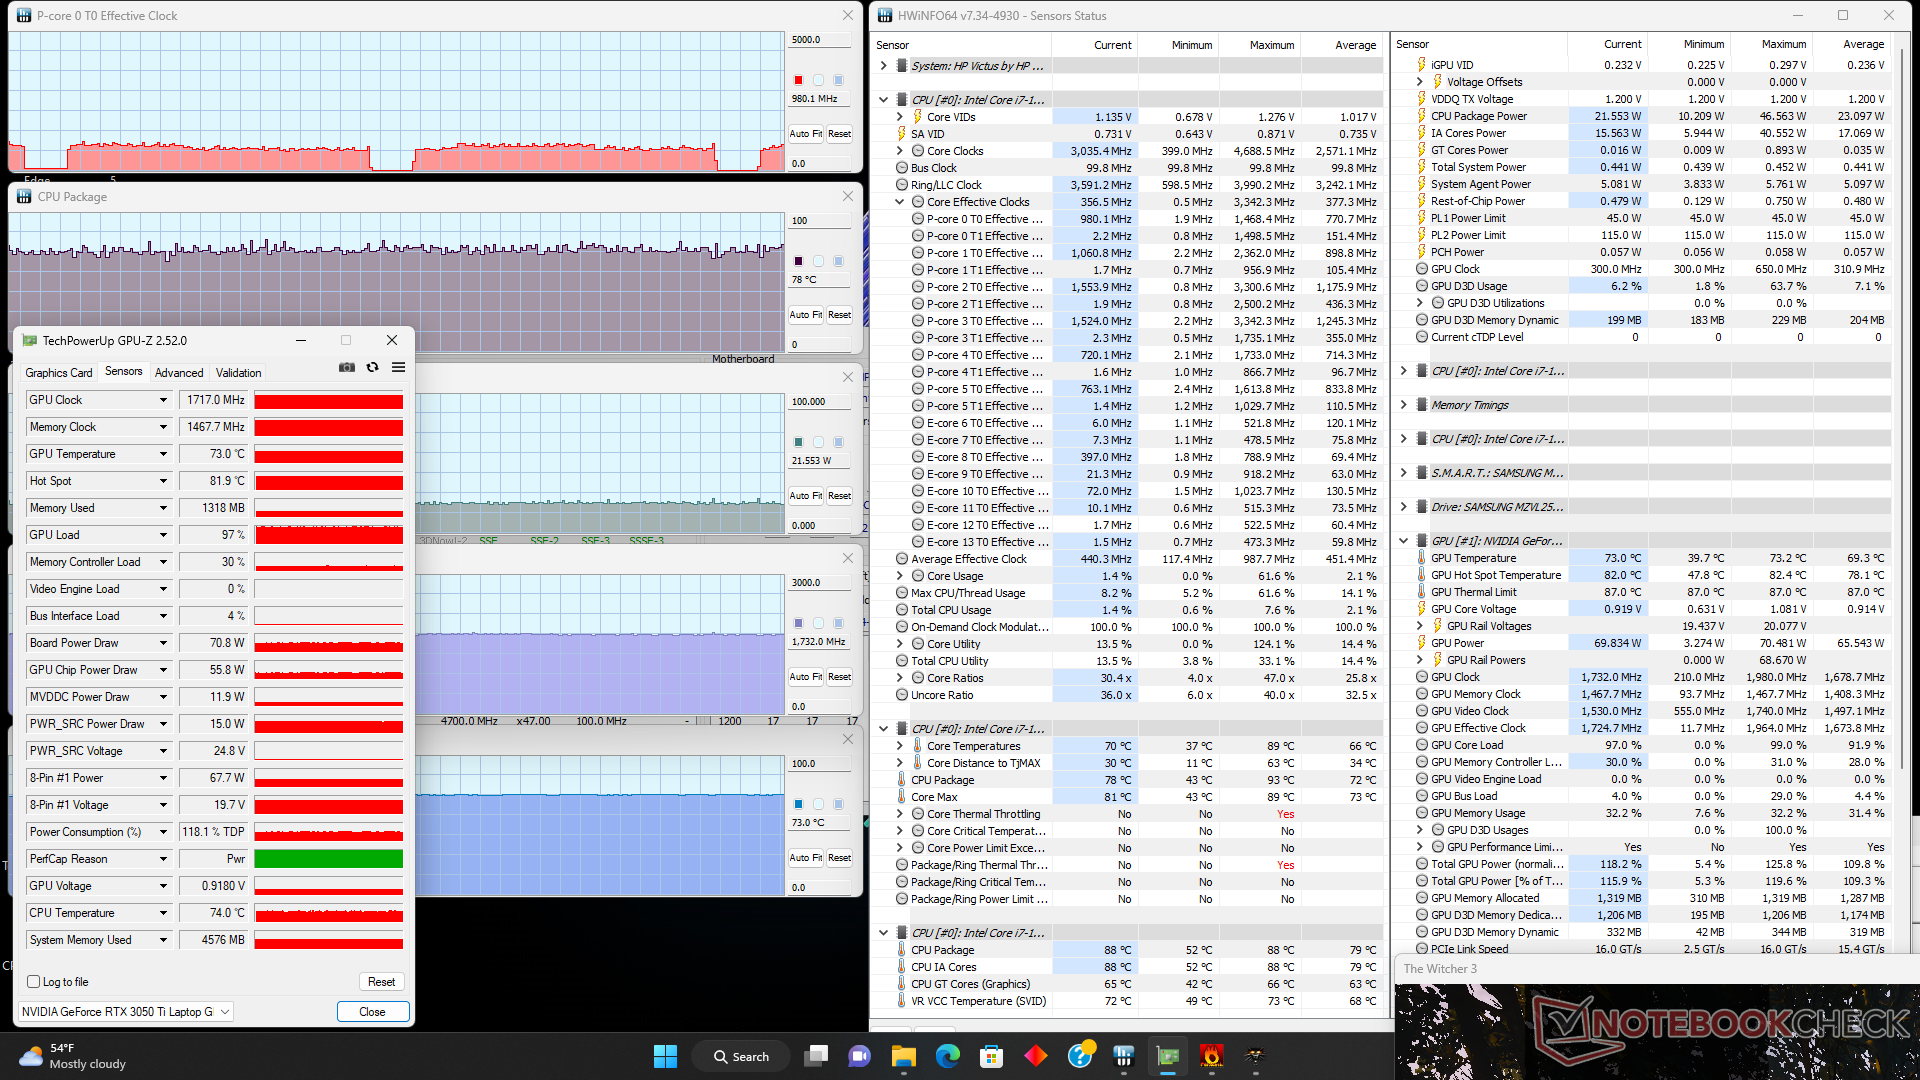
W teście Prime95 można zaobserwować wzrost częstotliwości taktowania zegara i poboru mocy do 4,1 GHz i 93 W. Temperatura rdzenia osiąga 97 stopni Celsjusza. Kiedy temperatura rdzenia osiągnie 97 C około 30 sekund później, taktowanie zegara i pobór mocy na płycie spadną do zaledwie ~2,4 GHz i 45 W, odpowiednio, aby utrzymać chłodniejszą temperaturę rdzenia około 76 C. Dla porównania, powtarzając ten sam test na Lenovo Legion 5 15 z tym samym procesorem skutkowałoby szybszym stabilnym taktowaniem 3,6 GHz i cieplejszą temperaturą rdzenia 97 C. Victus 15 gra więc zachowawczo nawet przy najwyższych ustawieniach wydajnościowych.
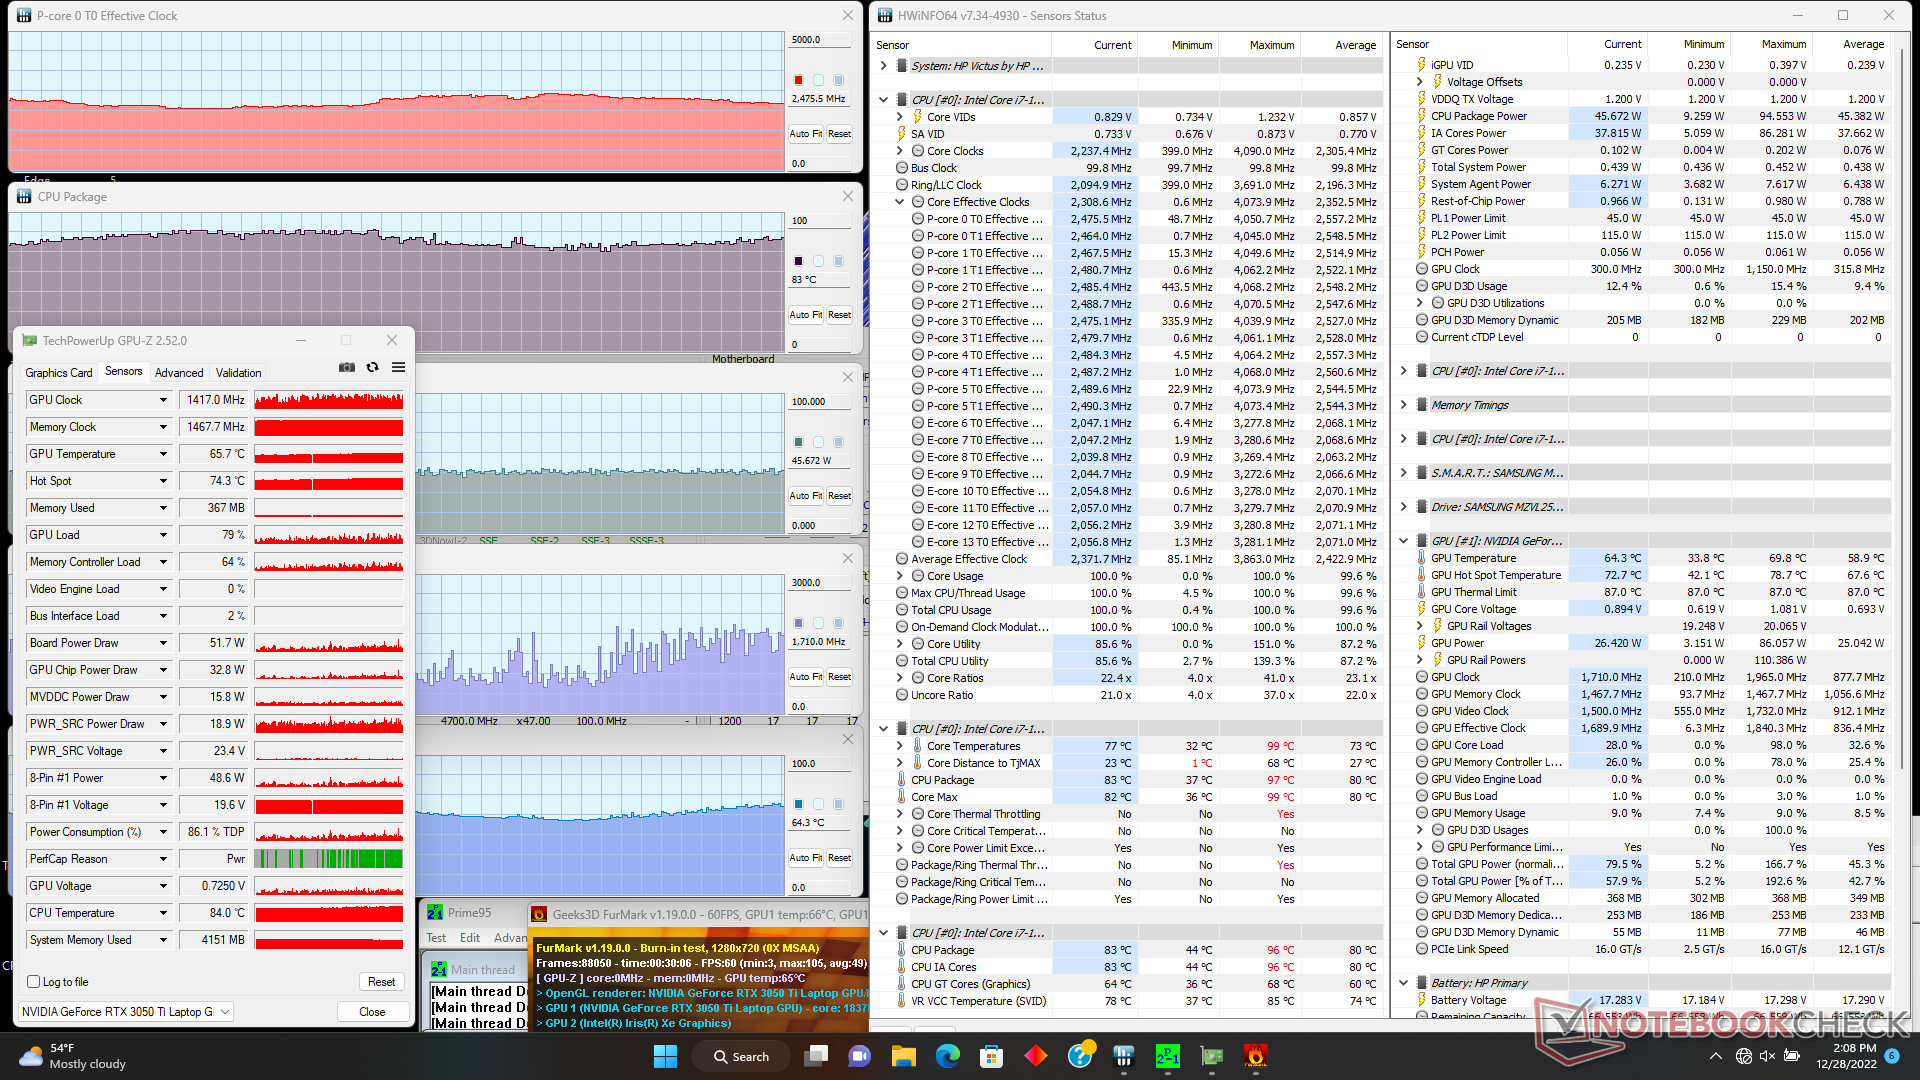
Częstotliwość taktowania GPU, temperatura i pobór mocy na płycie głównej ustabilizowałyby się odpowiednio na poziomie 1717 MHz, 73 C i 71 W podczas pracy Witcher 3. TGP ma moc znamionową 75 W, więc rzeczywisty pobór mocy 71 W jest dość zbliżony. Powtórzenie tego testu na Dellu G5 z tym samym GPU dało nieco wyższe wartości (taktowanie rdzenia 1845 MHz, taktowanie pamięci 1500 MHz, 79 C i pobór mocy 80 W). Ogólnie niższe temperatury rdzenia w HP pod obciążeniem przyczyniają się do wspomnianych wyżej chłodniejszych temperatur powierzchni.
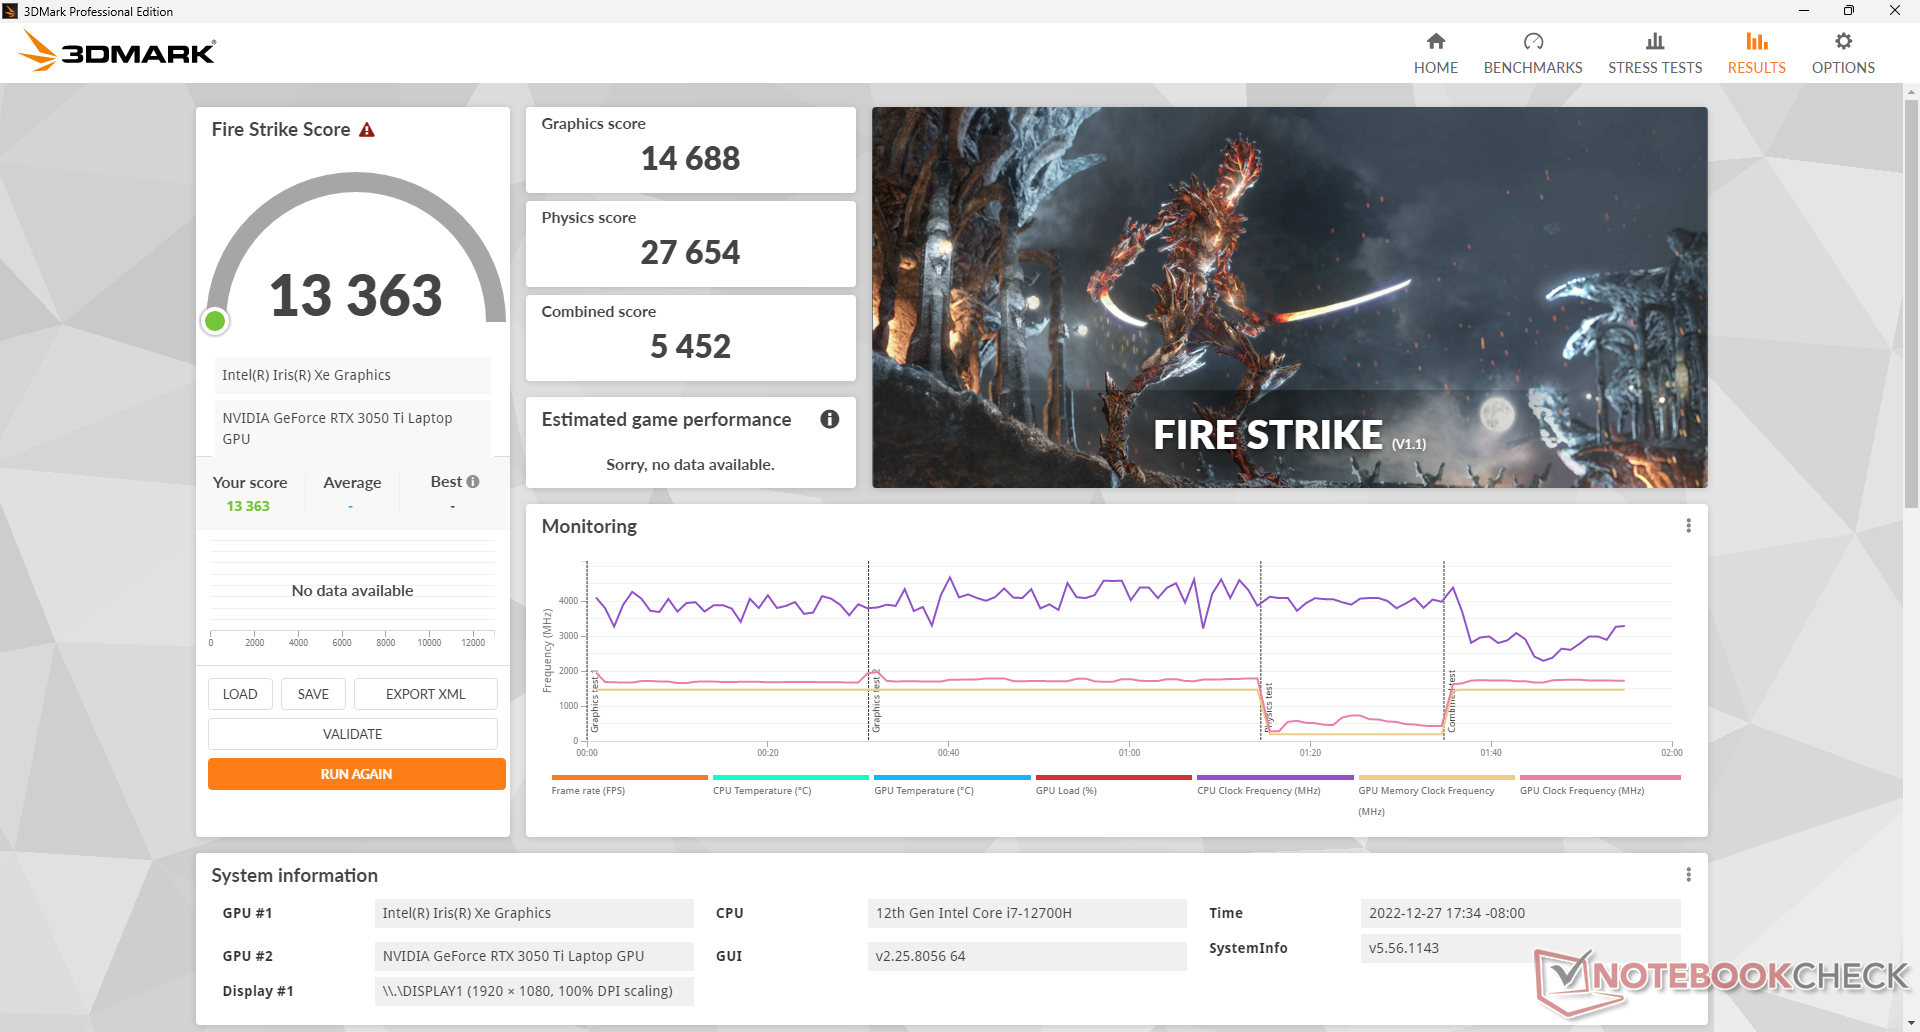
Praca na zasilaniu akumulatorowym ogranicza wydajność. Test 3DMark Fire Strike na zasilaniu bateryjnym przyniósł wyniki w zakresie fizyki i grafiki na poziomie odpowiednio 22703 i 9496 punktów, w porównaniu do 28270 i 14628 punktów na zasilaniu sieciowym.
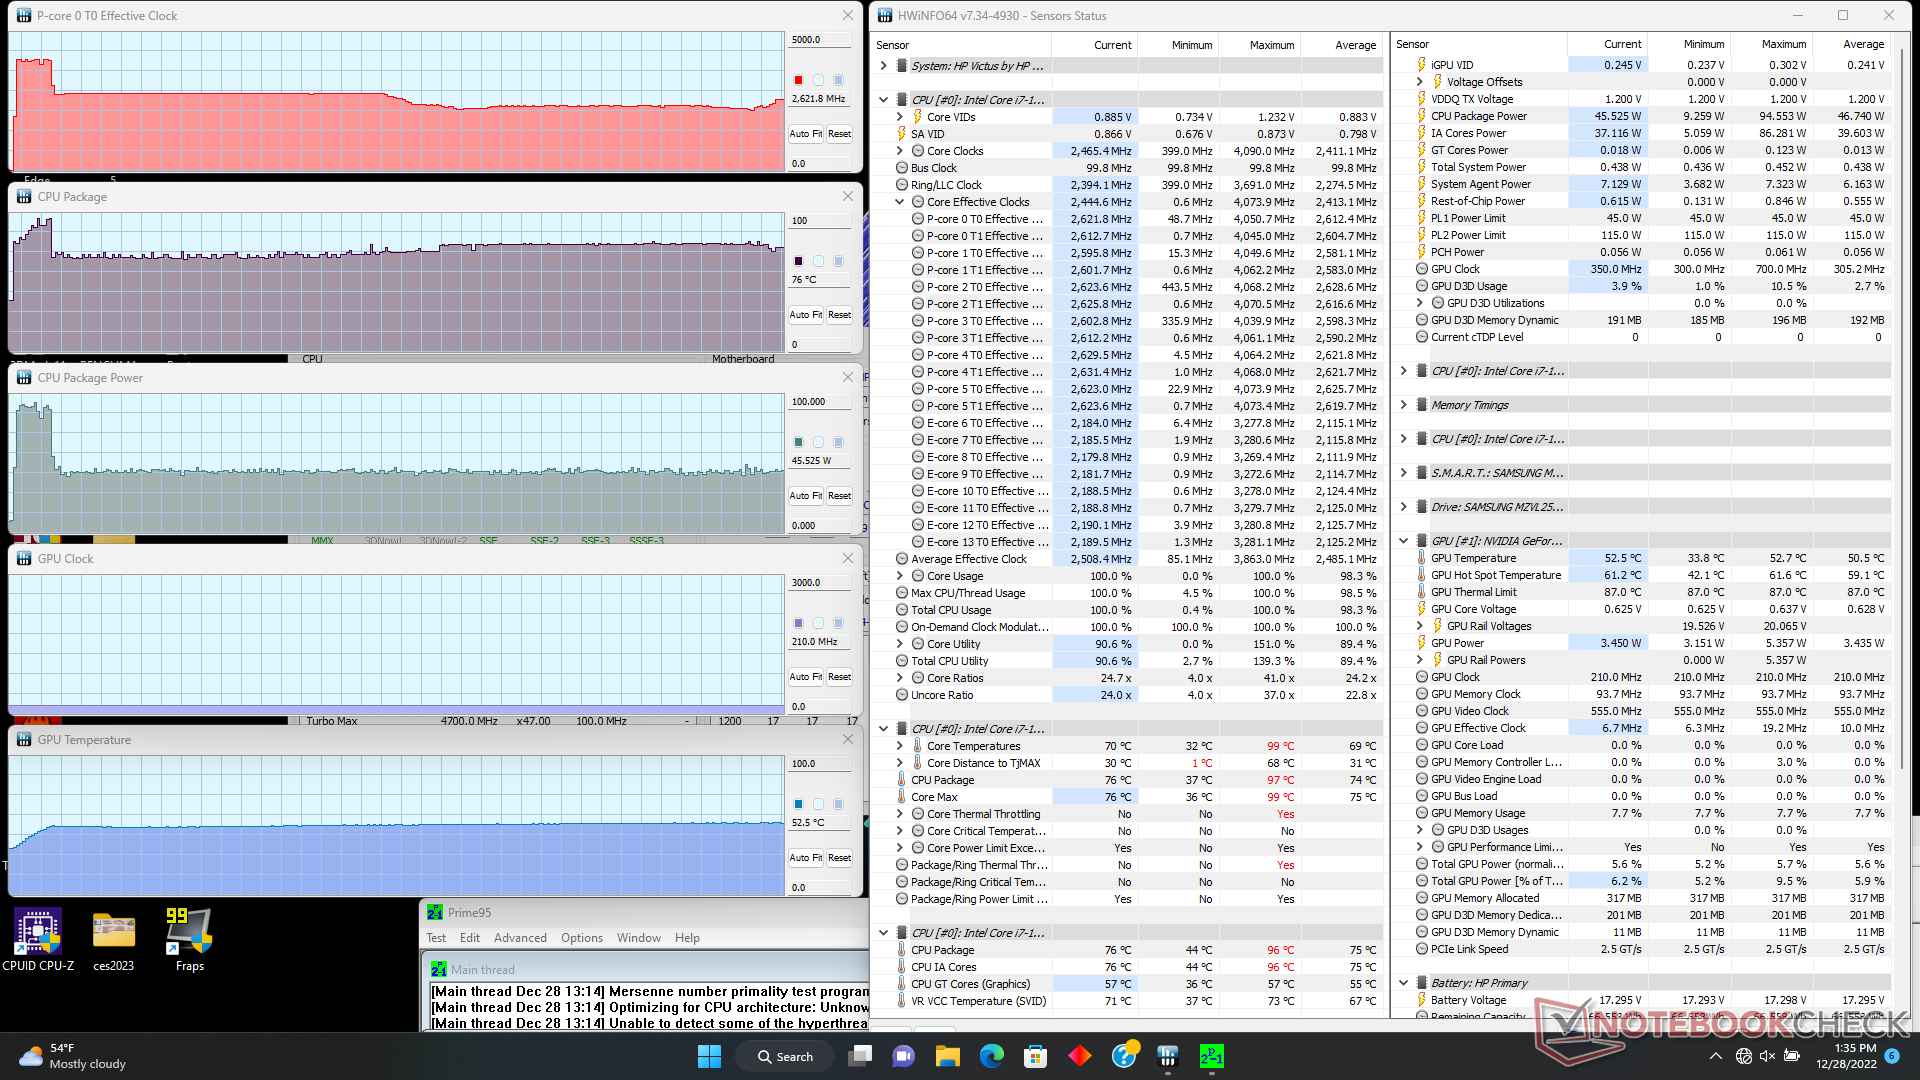
| ZegarCPU (GHz) | Zegar GPU (MHz) | Średnia temperatura CPU (°C) | Średnia temperatura GPU (°C) | |
| System w stanie bezczynności | -- | -- | 29 | 28 |
| Prime95 Stress | 2.2 - 2.6 | -- | 76 | 53 |
| Prime95 + FurMark Stress | 2.2 - 2.8 | ~1417 - 1710 | 70 - 90 | 54 - 69 |
| Witcher 3 Stress | ~1.0 | 1717 | 78 | 73 |
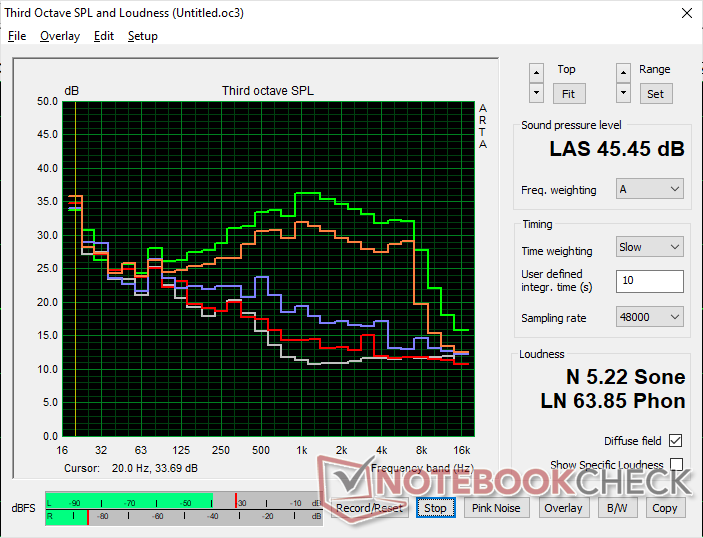
Mówcy
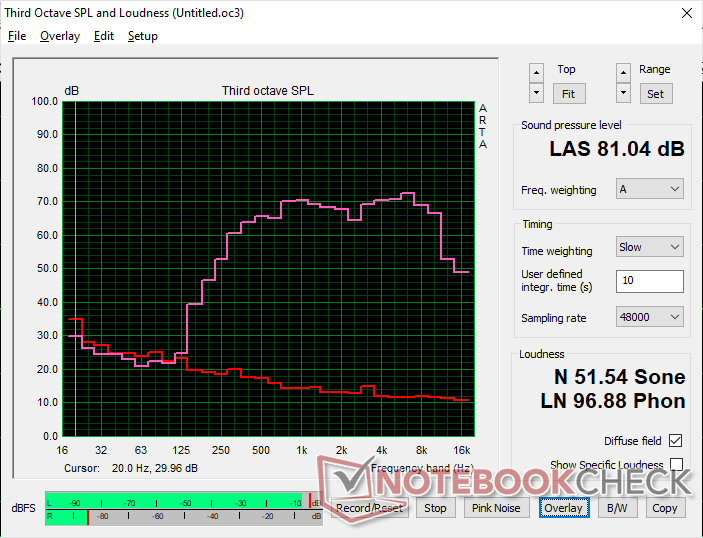
HP Victus 15 fa0020nr analiza dźwięku
(±) | głośność głośnika jest średnia, ale dobra (81 dB)
Bas 100 - 315 Hz
(-) | prawie brak basu - średnio 24.6% niższa od mediany
(±) | liniowość basu jest średnia (12.8% delta do poprzedniej częstotliwości)
Średnie 400 - 2000 Hz
(+) | zbalansowane środki średnie - tylko 2.5% od mediany
(+) | średnie są liniowe (3.4% delta do poprzedniej częstotliwości)
Wysokie 2–16 kHz
(+) | zrównoważone maksima - tylko 3.7% od mediany
(+) | wzloty są liniowe (4.9% delta do poprzedniej częstotliwości)
Ogólnie 100 - 16.000 Hz
(±) | liniowość ogólnego dźwięku jest średnia (19.7% różnicy w stosunku do mediany)
W porównaniu do tej samej klasy
» 69% wszystkich testowanych urządzeń w tej klasie było lepszych, 6% podobnych, 25% gorszych
» Najlepszy miał deltę 6%, średnia wynosiła ###średnia###%, najgorsza wynosiła 132%
W porównaniu do wszystkich testowanych urządzeń
» 50% wszystkich testowanych urządzeń było lepszych, 7% podobnych, 43% gorszych
» Najlepszy miał deltę 4%, średnia wynosiła ###średnia###%, najgorsza wynosiła 134%
Apple MacBook Pro 16 2021 M1 Pro analiza dźwięku
(+) | głośniki mogą odtwarzać stosunkowo głośno (84.7 dB)
Bas 100 - 315 Hz
(+) | dobry bas - tylko 3.8% od mediany
(+) | bas jest liniowy (5.2% delta do poprzedniej częstotliwości)
Średnie 400 - 2000 Hz
(+) | zbalansowane środki średnie - tylko 1.3% od mediany
(+) | średnie są liniowe (2.1% delta do poprzedniej częstotliwości)
Wysokie 2–16 kHz
(+) | zrównoważone maksima - tylko 1.9% od mediany
(+) | wzloty są liniowe (2.7% delta do poprzedniej częstotliwości)
Ogólnie 100 - 16.000 Hz
(+) | ogólny dźwięk jest liniowy (4.6% różnicy w stosunku do mediany)
W porównaniu do tej samej klasy
» 0% wszystkich testowanych urządzeń w tej klasie było lepszych, 0% podobnych, 100% gorszych
» Najlepszy miał deltę 5%, średnia wynosiła ###średnia###%, najgorsza wynosiła 45%
W porównaniu do wszystkich testowanych urządzeń
» 0% wszystkich testowanych urządzeń było lepszych, 0% podobnych, 100% gorszych
» Najlepszy miał deltę 4%, średnia wynosiła ###średnia###%, najgorsza wynosiła 134%
Zarządzanie energią
Pobór mocy - podobny do GeForce RTX 2060
Praca na biegu jałowym na pulpicie pochłania od 5 do 19 W w zależności od profilu zasilania, poziomu jasności i ustawienia Optimus. W grach ogólne zużycie staje się bardzo zbliżone do Omen 15 ze starszym RTX 2060. To rozczarowujące, że wydajność na wat RTX 3050 Ti nie jest dużo lepsza od RTX 2060, mimo że dzieli je cała generacja i mają podobne poziomy wydajności.
Laptopy z konkurencyjnym Radeonem RX 6600M, jak np MSI Alpha 15 mogą zużywać około 15 procent więcej energii niż nasz HP w grach, ale odczuwalny 30-50 procentowy wzrost wydajności grafiki sprawia, że jest to dobry kompromis.
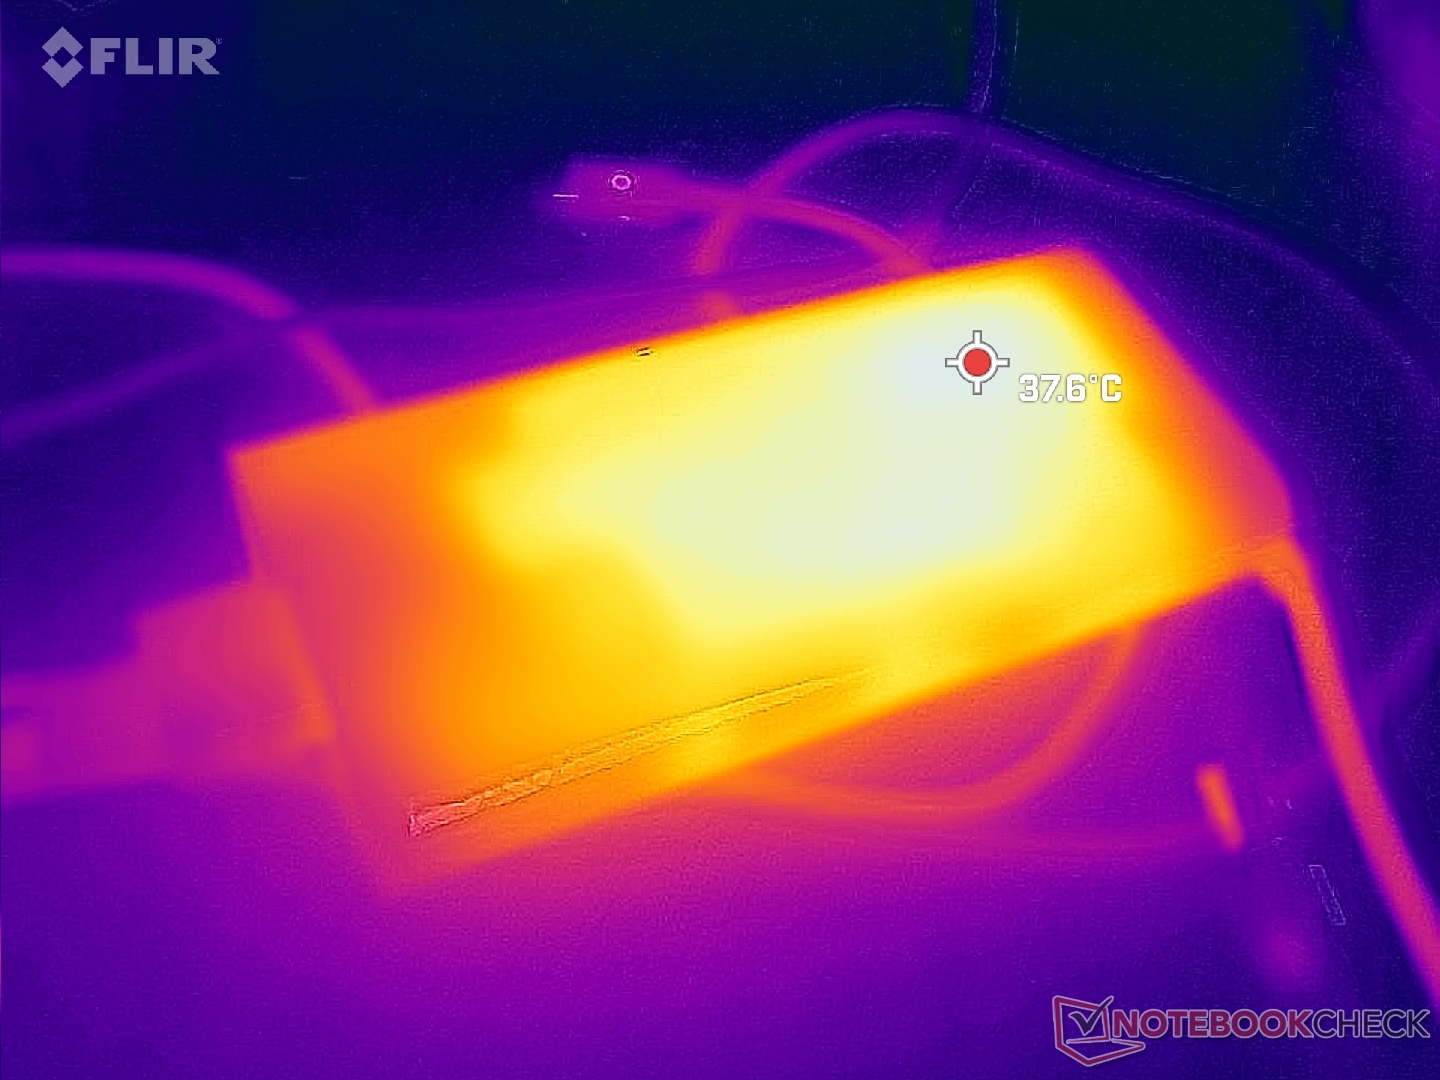
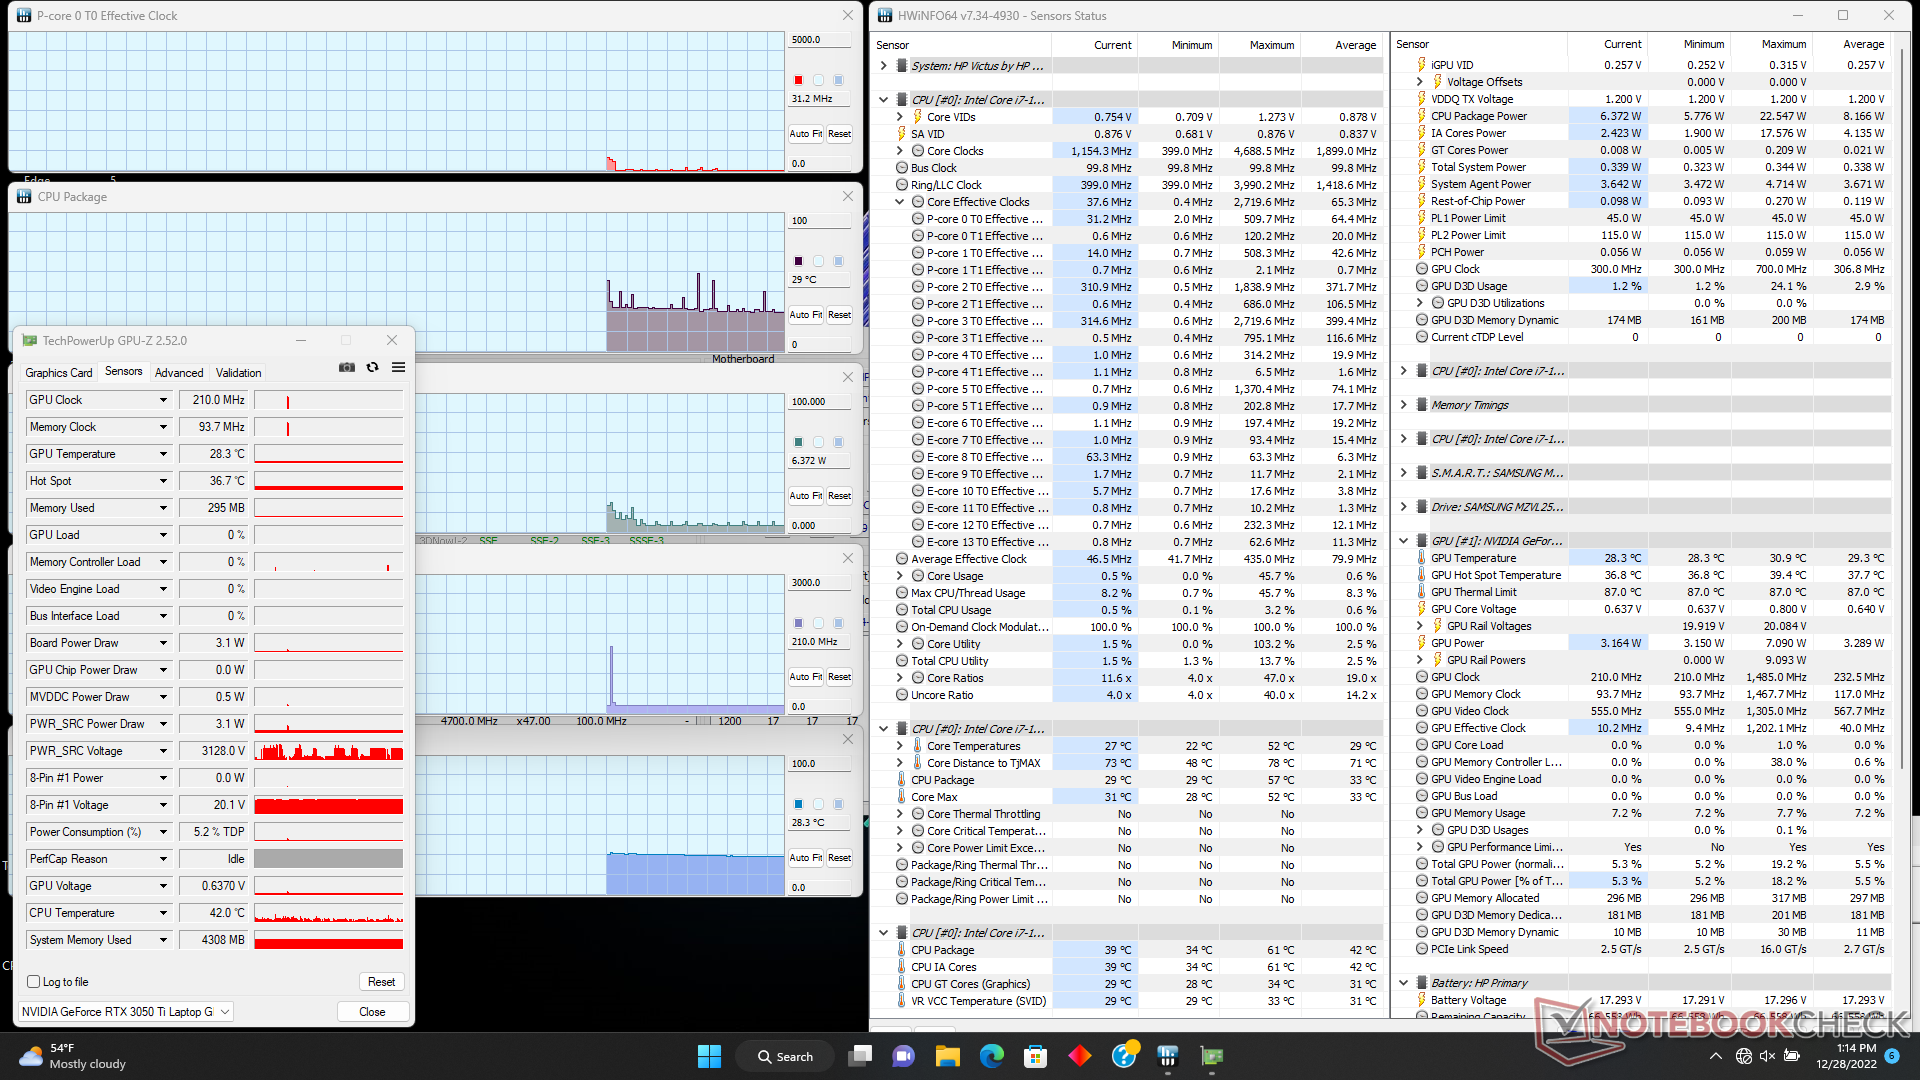
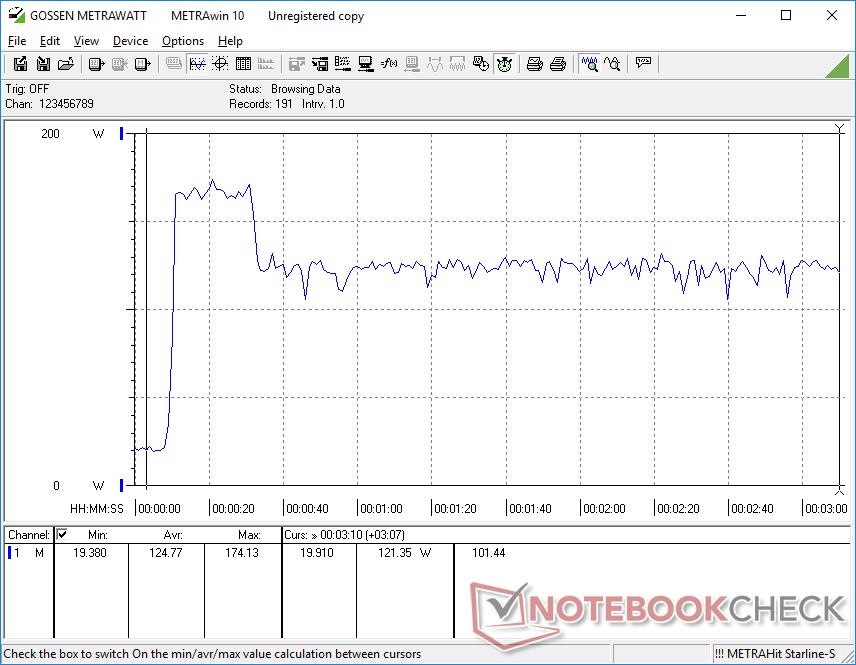
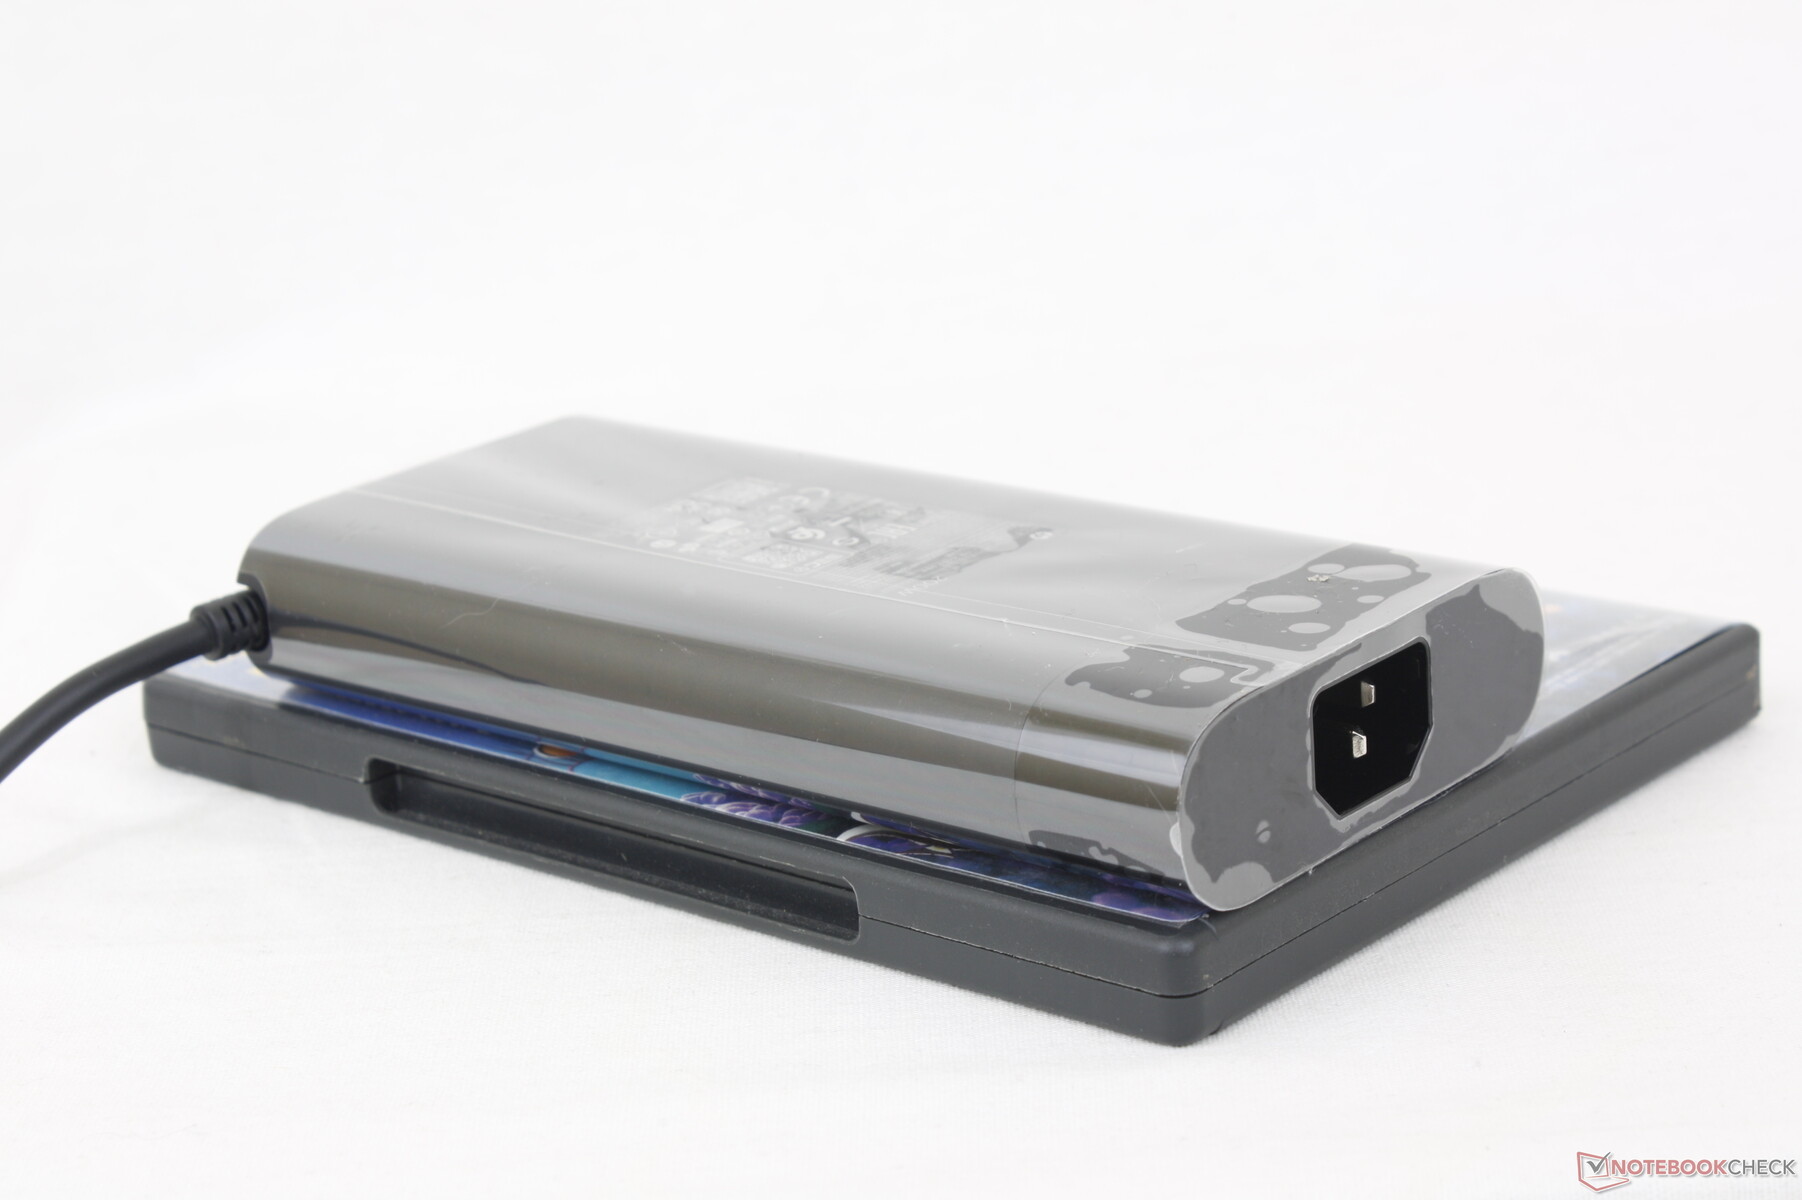
Ze średniej wielkości (~16,5 x 7,8 x 2,5 cm) zasilacza sieciowego o mocy 200 W jesteśmy w stanie zmierzyć maksymalny pobór mocy 175 W przy maksymalnym wykorzystaniu, jak pokazuje poniższy zrzut ekranu. Ten wskaźnik jest tymczasowy, ponieważ rozwiązanie chłodzące nie jest w stanie wystarczająco schłodzić procesora przy nieokreślonym użyciu Turbo Boost.

| wyłączony / stan wstrzymania | |
| luz | |
| obciążenie |
|
Legenda:
min: | |
| HP Victus 15 fa0020nr i7-12700H, GeForce RTX 3050 Ti Laptop GPU, Samsung PM9A1 MZVL2512HCJQ, IPS, 1920x1080, 15.6" | HP Omen 15-en0375ng R7 4800H, GeForce RTX 2060 Mobile, WDC PC SN730 SDBPNTY-512G, IPS, 1920x1080, 15.6" | Dell G15 5515 R7 5800H, GeForce RTX 3050 Ti Laptop GPU, Samsung PM991a MZ9LQ512HBLU-00BD1, IPS, 1920x1080, 15.6" | Asus TUF Dash F15 FX517ZC i7-12650H, GeForce RTX 3050 4GB Laptop GPU, Intel SSD 670p SSDPEKNU512GZ, IPS, 2560x1440, 15.6" | MSI Bravo 15 B5DD-010US R5 5600H, Radeon RX 5500M, Kingston OM8PCP3512F-AB, IPS, 1920x1080, 15.6" | Lenovo Legion 5 15IAH7H 82RB i7-12700H, GeForce RTX 3060 Laptop GPU, , IPS, 1920x1080, 15.6" | |
|---|---|---|---|---|---|---|
| Power Consumption | 7% | 7% | -29% | 15% | -106% | |
| Idle Minimum * (Watt) | 5.1 | 4 22% | 5 2% | 9.2 -80% | 6.6 -29% | 19.8 -288% |
| Idle Average * (Watt) | 15.1 | 9 40% | 9 40% | 15.9 -5% | 9.8 35% | 26.2 -74% |
| Idle Maximum * (Watt) | 18.9 | 22 -16% | 20 -6% | 29.5 -56% | 10.8 43% | 48.2 -155% |
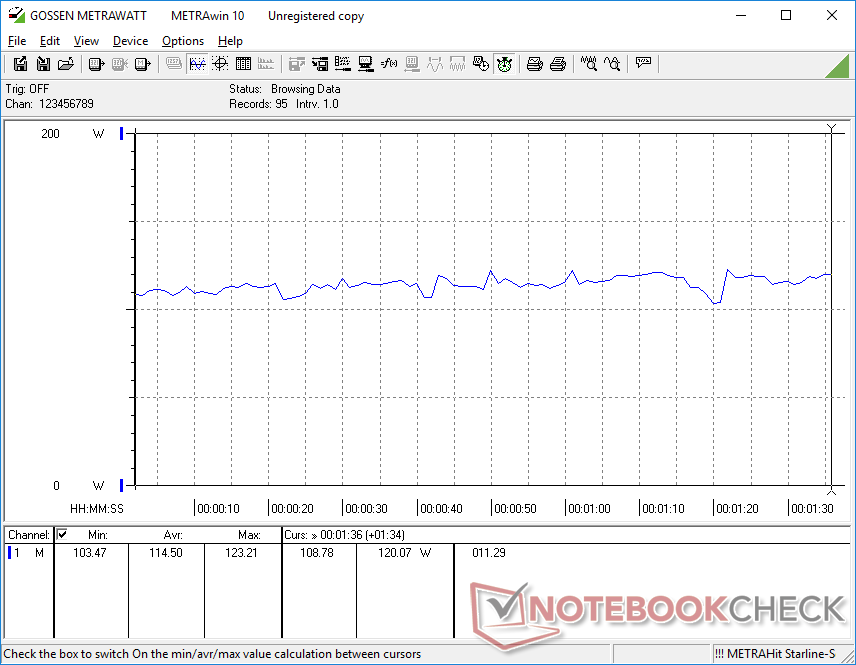
| Load Average * (Watt) | 114.5 | 102 11% | 94 18% | 124.8 -9% | 70.5 38% | 102.9 10% |
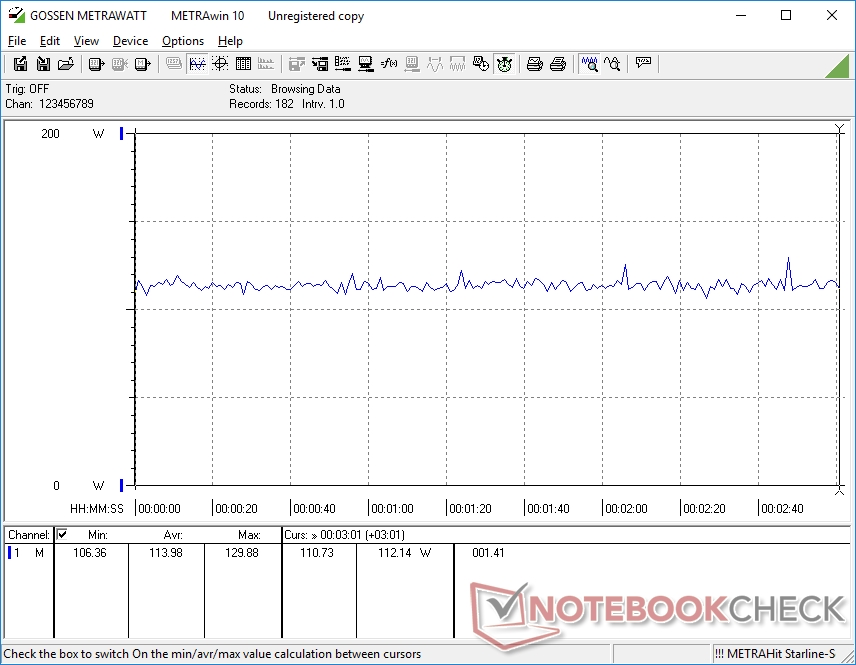
| Witcher 3 ultra * (Watt) | 113.9 | 119 -4% | 123 -8% | 129.2 -13% | 103.2 9% | 186.7 -64% |
| Load Maximum * (Watt) | 165.8 | 182 -10% | 172 -4% | 178.4 -8% | 175 -6% | 268 -62% |
* ... im mniej tym lepiej
Power Consumption Witcher 3 / Stresstest
Power Consumption external Monitor
Czas pracy na baterii - słaby na wszystkich ustawieniach
Czasy pracy są tak złe, że podejrzewamy, iż może to być błąd oprogramowania w naszej konfiguracji lub w całym modelu. Udało nam się wycisnąć zaledwie 2,5 godziny pracy na akumulatorze w stanie spoczynku na pulpicie przy najniższym ustawieniu jasności, z aktywnym iGPU i wyłączonym WLAN. Dla pewności powtórzyliśmy test i wyniki nie uległy poprawie. Menedżer zadań nie pokazał żadnej konkretnej aplikacji obciążającej zasoby. Konkurencyjne Dell G5 czyMSI Bravo 15 mogą działać o kilka godzin dłużej, mimo że mają mniejsze wewnętrzne akumulatory
Ładowanie od pustego do pełnego trwa od 1,5 do 2 godzin. Systemu nie da się naładować przez USB-C.
| HP Victus 15 fa0020nr i7-12700H, GeForce RTX 3050 Ti Laptop GPU, 70 Wh | HP Omen 15-en0375ng R7 4800H, GeForce RTX 2060 Mobile, 70.9 Wh | Dell G15 5515 R7 5800H, GeForce RTX 3050 Ti Laptop GPU, 56 Wh | Asus TUF Dash F15 FX517ZC i7-12650H, GeForce RTX 3050 4GB Laptop GPU, 76 Wh | MSI Bravo 15 B5DD-010US R5 5600H, Radeon RX 5500M, 53 Wh | Lenovo Legion 5 15IAH7H 82RB i7-12700H, GeForce RTX 3060 Laptop GPU, 80 Wh | |
|---|---|---|---|---|---|---|
| Czasy pracy | 378% | 245% | 90% | 148% | 117% | |
| Reader / Idle (h) | 2.6 | 20 669% | 13.5 419% | 9.2 254% | 8.1 212% | |
| WiFi v1.3 (h) | 2.1 | 10.5 400% | 8 281% | 4 90% | 6.3 200% | 5 138% |
| Load (h) | 1.1 | 1.8 64% | 1.5 36% | 1 -9% | 1.1 0% | |
| H.264 (h) | 8.8 |
Za
Przeciw
Werdykt - Drogi i zabałaganiony
W cenie 1200-1300 USD HP Victus 15 nie oferuje wystarczająco dużo jak na swój przedział cenowy. Konkurencyjny Lenovo Legion 5 15 jest obecnie dostępny z procesorem AMD Ryzen 6800H i znacznie szybszym procesorem graficznym GeForce RTX 3060 za 1280 USD, co zawstydza nasz model HP. Aby nasz model HP był konkurencyjny, musiałby kosztować bliżej 1000 USD lub mniej, zwłaszcza że GeForce RTX 3050 Ti działa tak podobnie do starszych RTX 2060 i GTX 1660 Ti.
HP Victus 15 byłby solidnym laptopem do gier, gdyby był sprzedawany za 1000 USD lub mniej. Jednak w cenie od 1200 USD wzwyż jego procesor graficzny GeForce RTX 3050 Ti po prostu nie daje rady, gdy dostępne są alternatywy w postaci RTX 3060
.
Co więcej, zauważalne błędy osłabiły nasze ogólne wrażenia nawet po aktualizacji do najnowszych wersji sterowników i oprogramowania HP w momencie publikacji. Łatwiej jest wybaczyć drobne błędy tu i tam, ale kluczowe aspekty, takie jak czas pracy na baterii i hałas wentylatora, powinny być bezproblemowe po wyjęciu z pudełka.
Jest kilka rzeczy, które Victus 15 robi dobrze. Na przykład jego ogólny design jest atrakcyjny wizualnie, a modernizacja dysków SSD i pamięci RAM jest stosunkowo prosta. Pełnowymiarowy numpad jest świetny, a temperatury rdzenia są całkiem niezłe. Niemniej jednak słaba wydajność w stosunku do ceny i błędy odbierają wiele z tego atrakcyjnego systemu.
Cena i dostępność
HP Victus 15 fa0020nr
- 31/12/2022 v7 (old)
Allen Ngo
Price comparison

