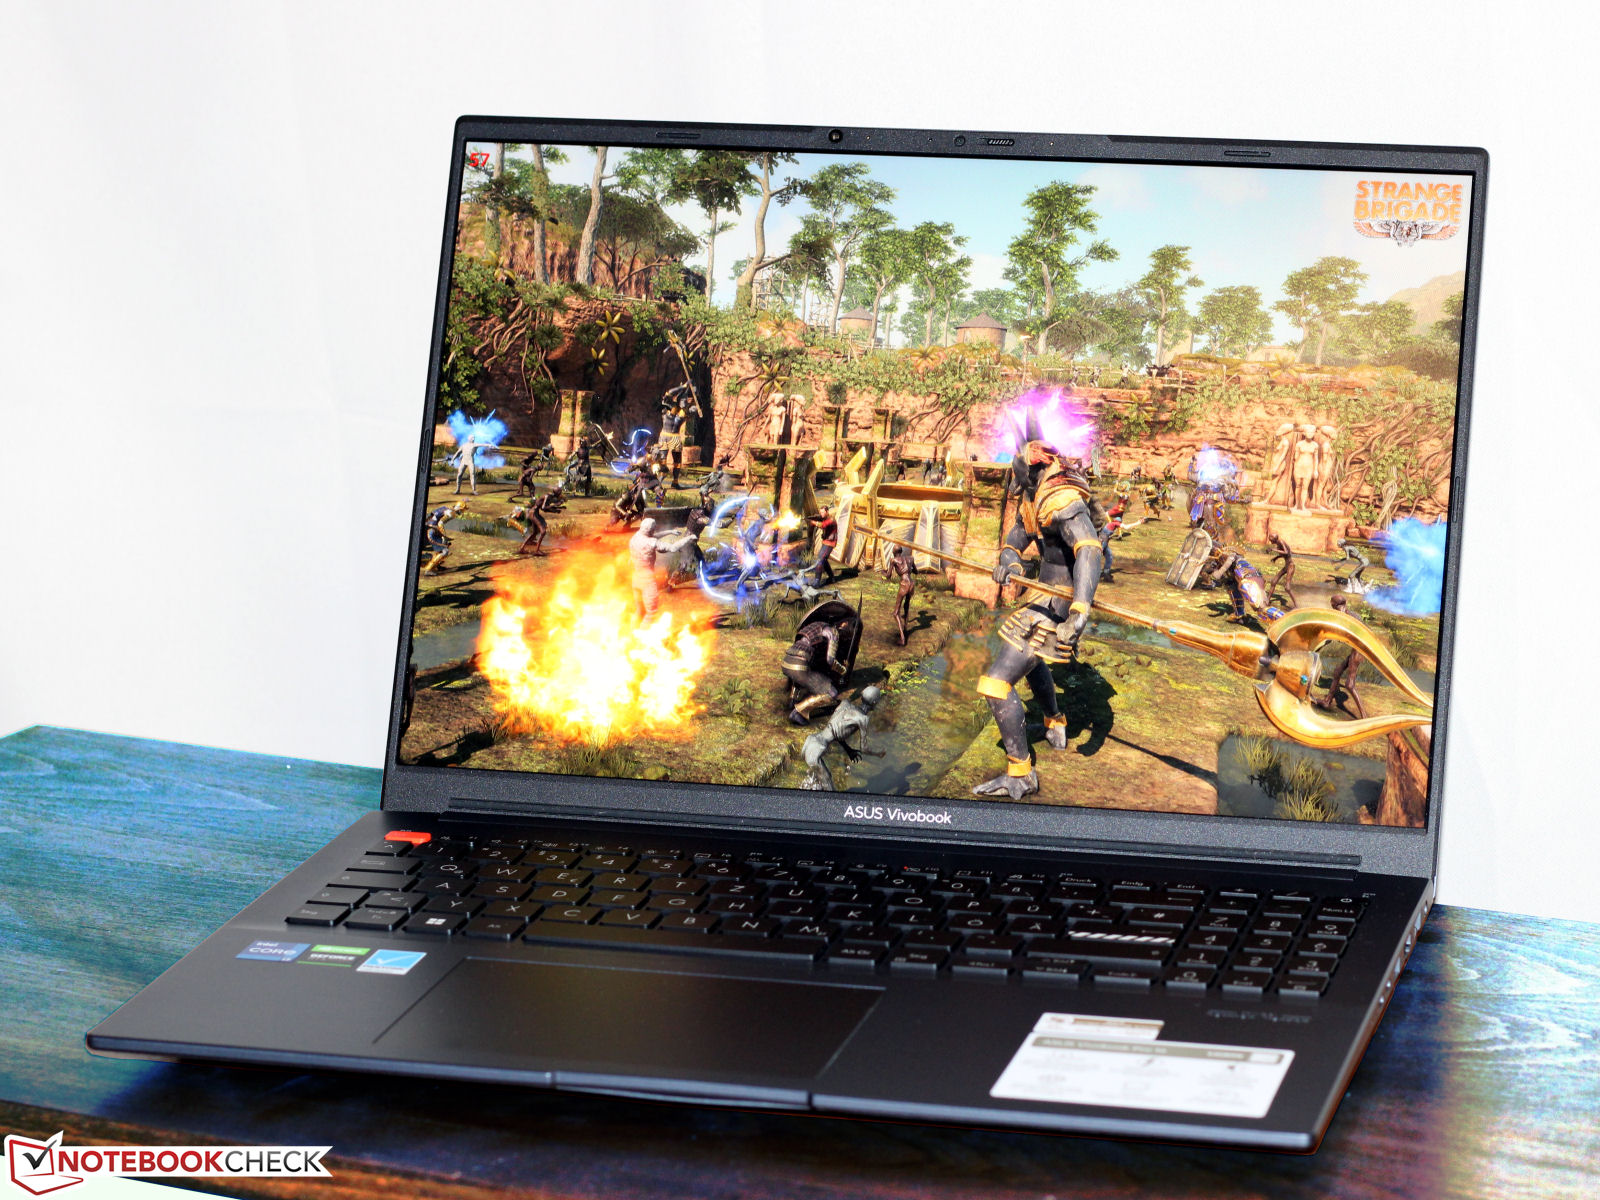
Recenzja Asus VivoBook Pro 16: Multimedialny laptop z Core i7, RTX 3050 Ti i DCI-P3
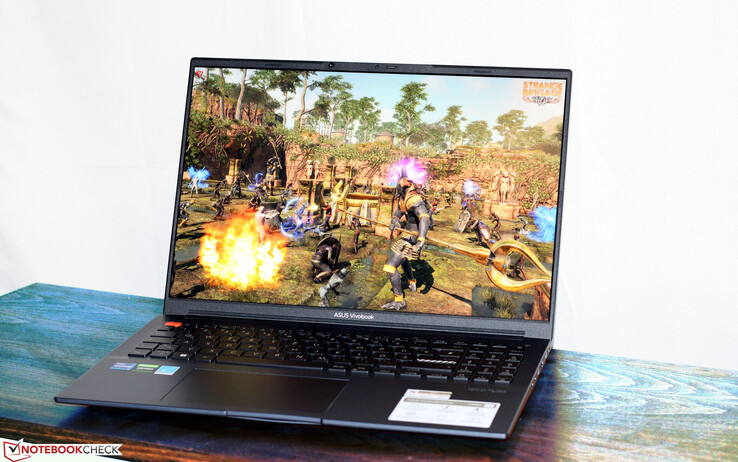
Asus VivoBook to przenośny 16-calowy laptop dla graczy i kreatywnych pracowników. Laptop jest wyposażony w odpowiedni sprzęt: ACore i7-12700H,GeForce RTX 3050 Tii jasny wyświetlacz IPS w formacie 16:10, który ma świetną dokładność kolorów. Ten laptop jest podobny doVivoBook Pro 16X który wcześniej testowaliśmy - ale nie są one zbudowane identycznie. Konkurenci tego laptopa to między innymi Dell Inspiron 16 Plus 7620iXMG Fusion 15 (Mid 22)iAcer Swift X 16.
Potencjalni konkurenci w porównaniu
Ocena | Data | Model | Waga | Wysokość | Rozmiar | Rezolucja | Cena |
|---|---|---|---|---|---|---|---|
| 86.3 % v7 (old) | 05/2023 | Asus VivoBook Pro 16 i7-12700H, GeForce RTX 3050 Ti Laptop GPU | 1.9 kg | 20 mm | 16.00" | 2560x1600 | |
| 86.4 % v7 (old) | 11/2022 | Acer Swift X SFX16-52G-77RX i7-1260P, A370M | 1.8 kg | 21.2 mm | 16.00" | 2560x1600 | |
| 87.4 % v7 (old) | Dell Inspiron 16 Plus 7620 i7-12700H, GeForce RTX 3050 Ti Laptop GPU | 2.1 kg | 18.99 mm | 16.00" | 3072x1920 | ||
| 87.4 % v7 (old) | Schenker XMG Fusion 15 (Mid 22) i7-11800H, GeForce RTX 3070 Laptop GPU | 1.9 kg | 21.65 mm | 15.60" | 2560x1440 |
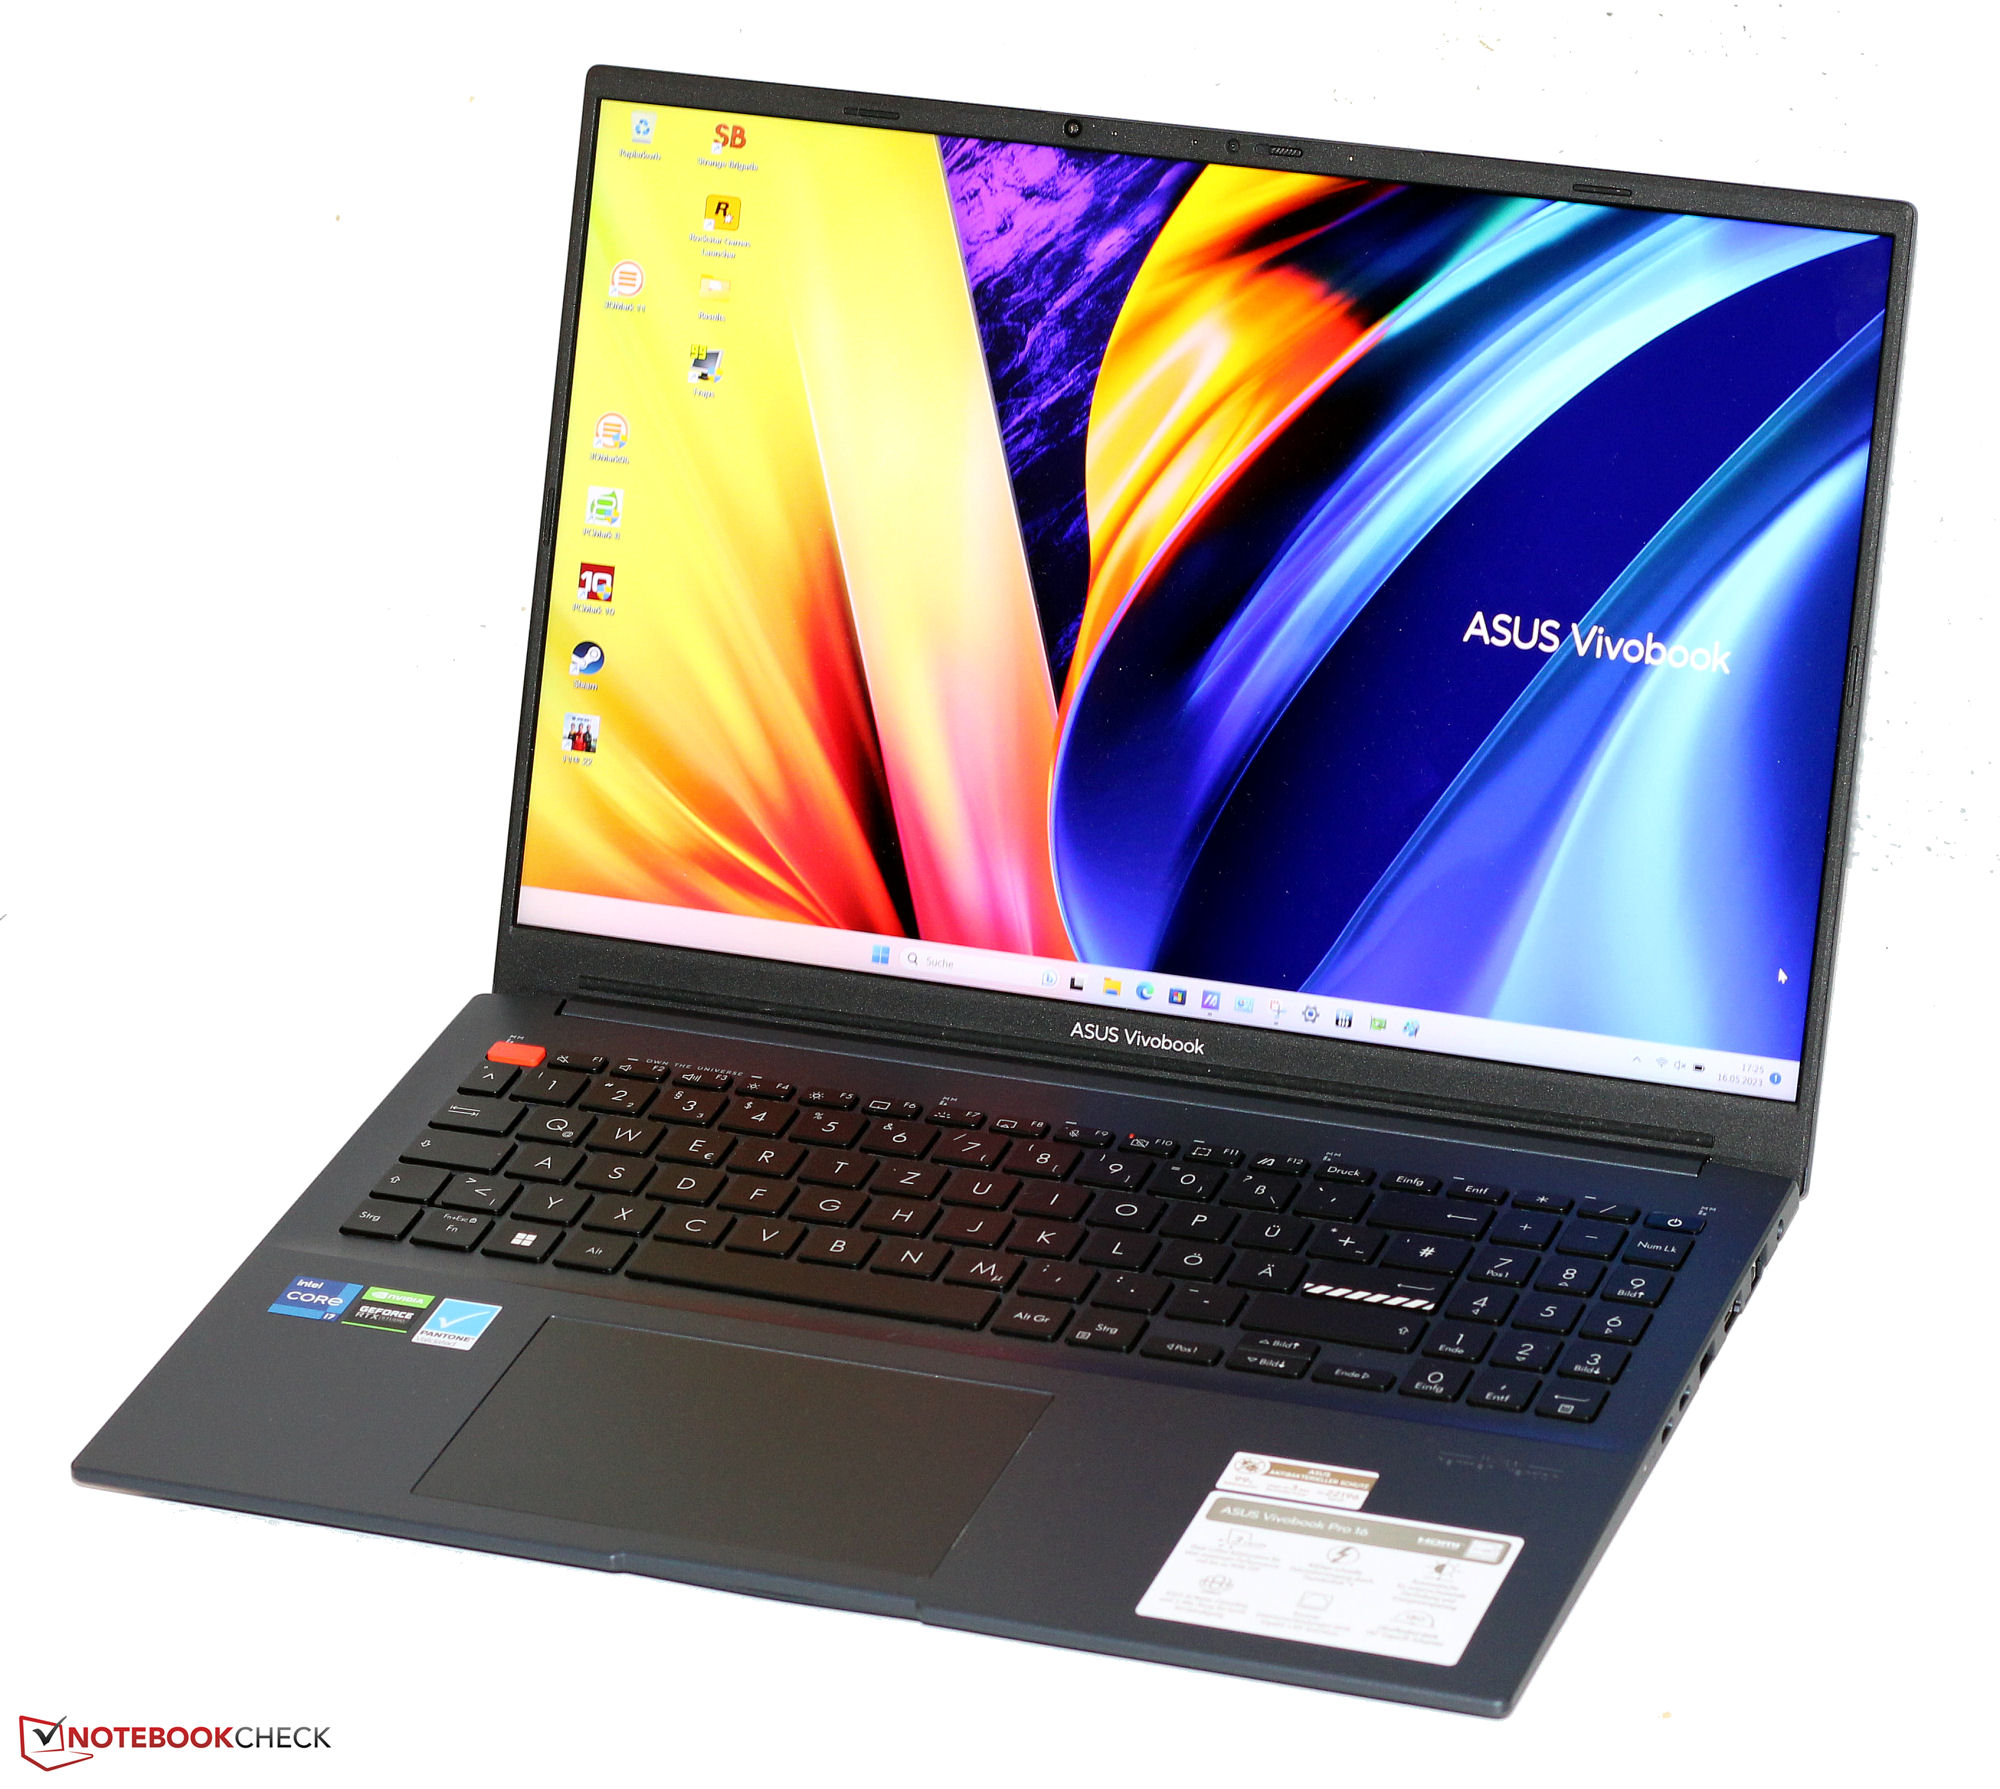
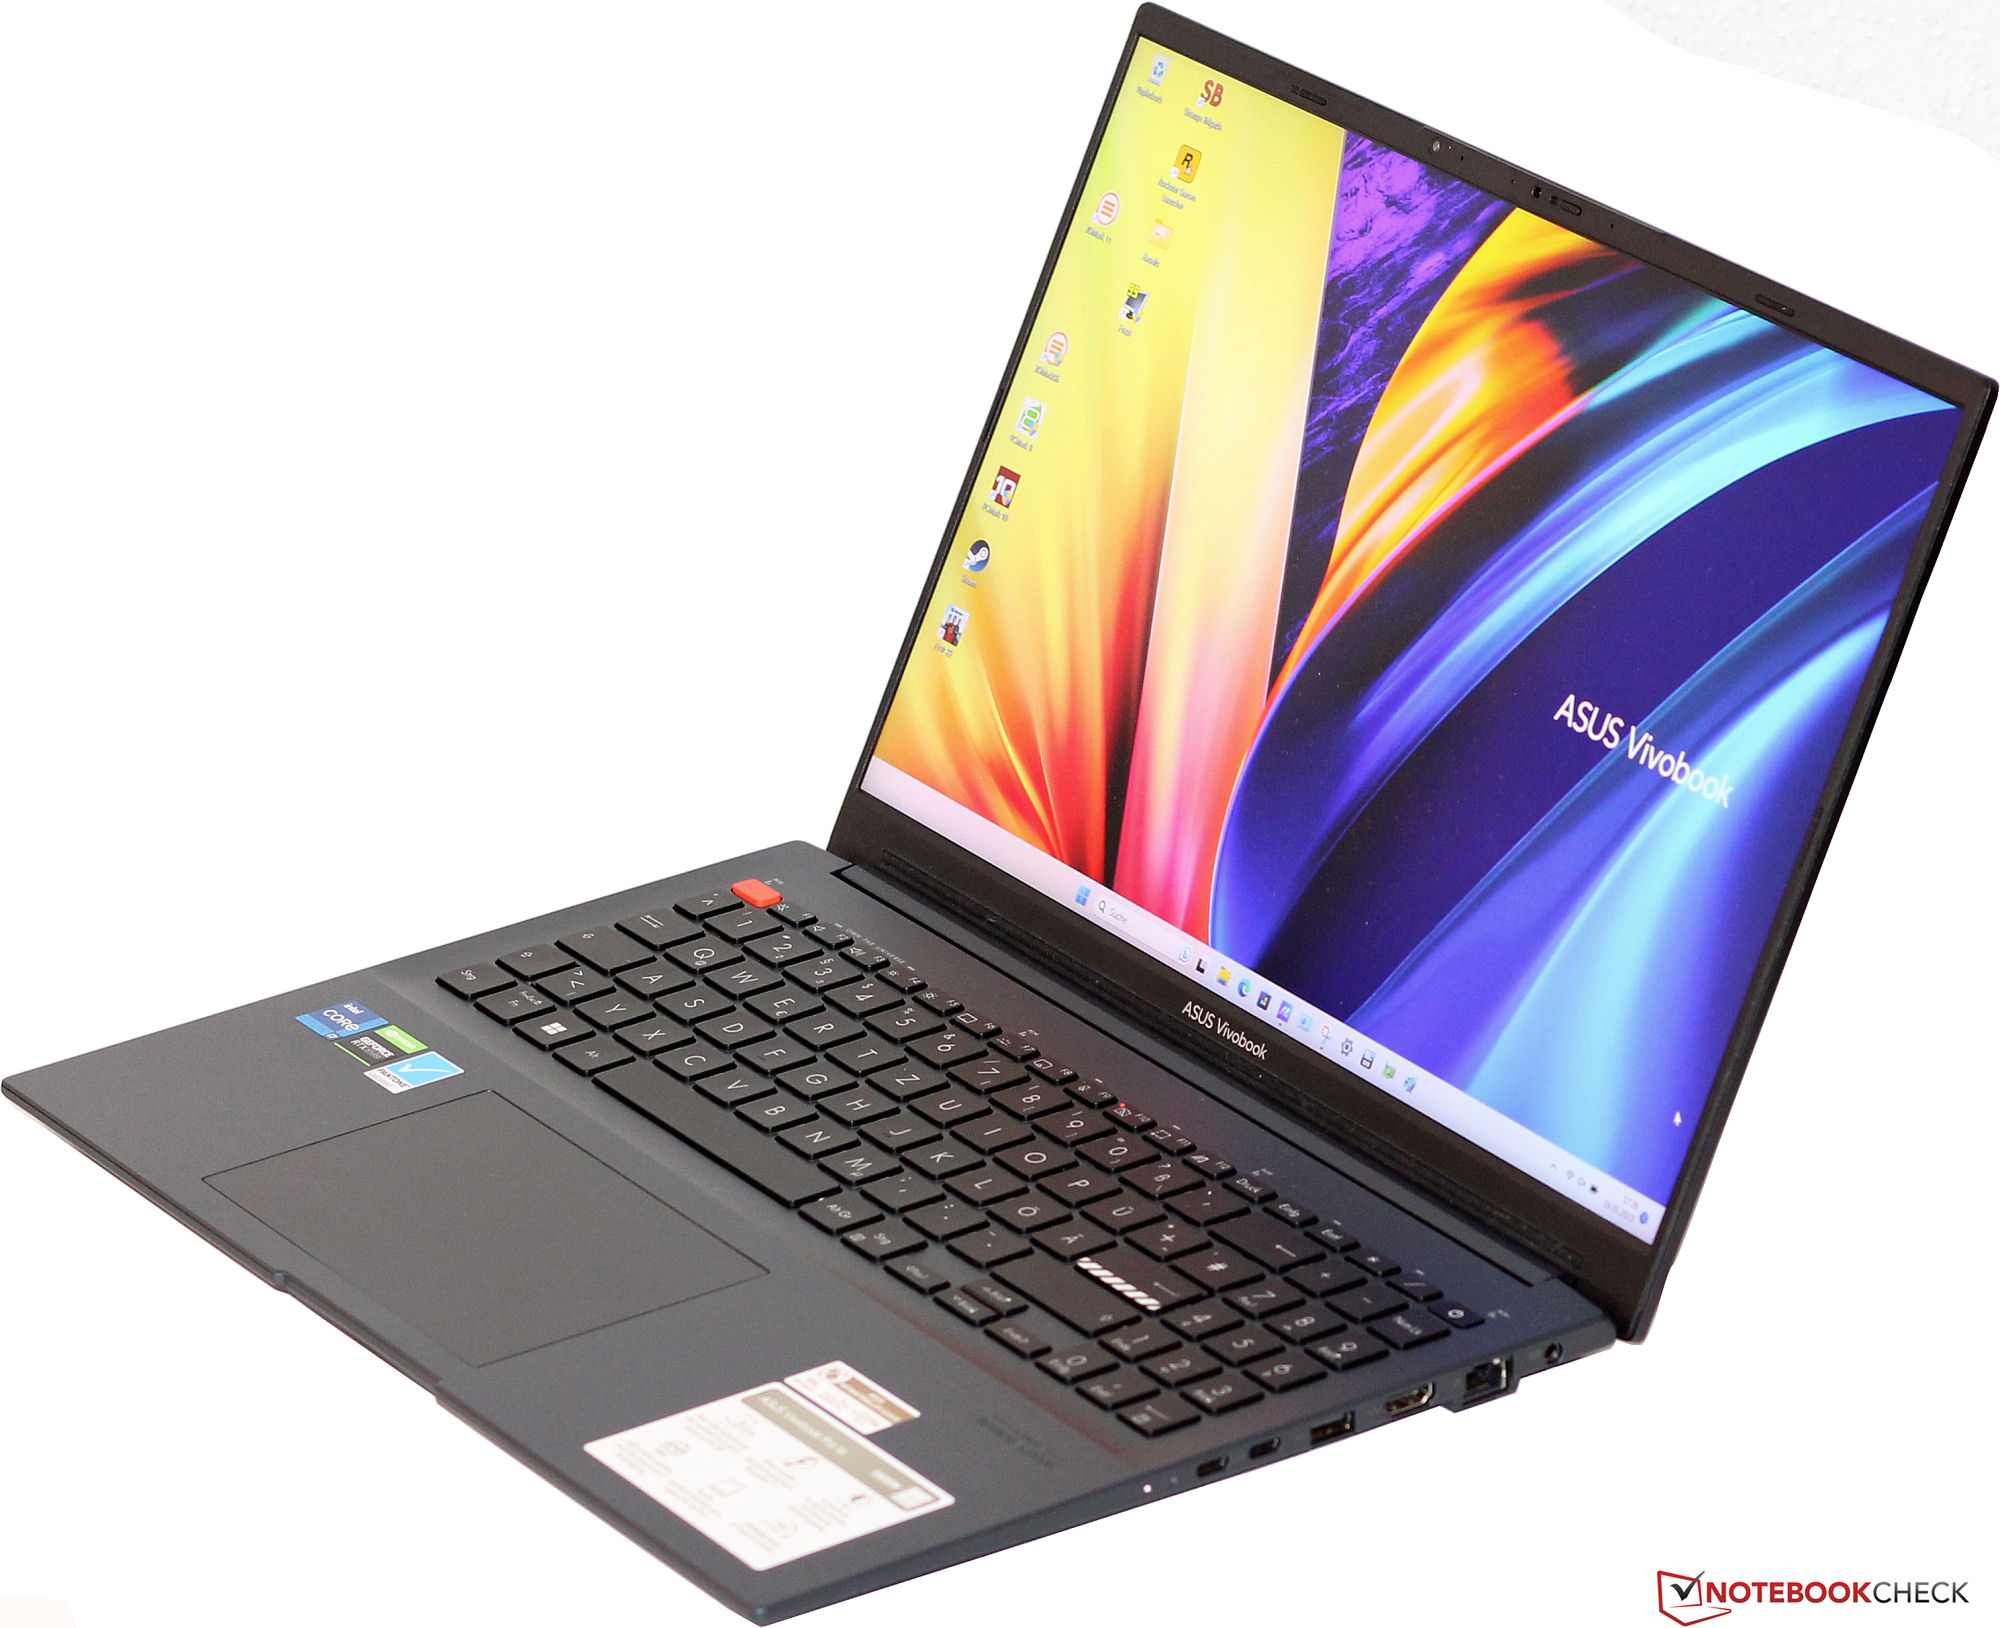
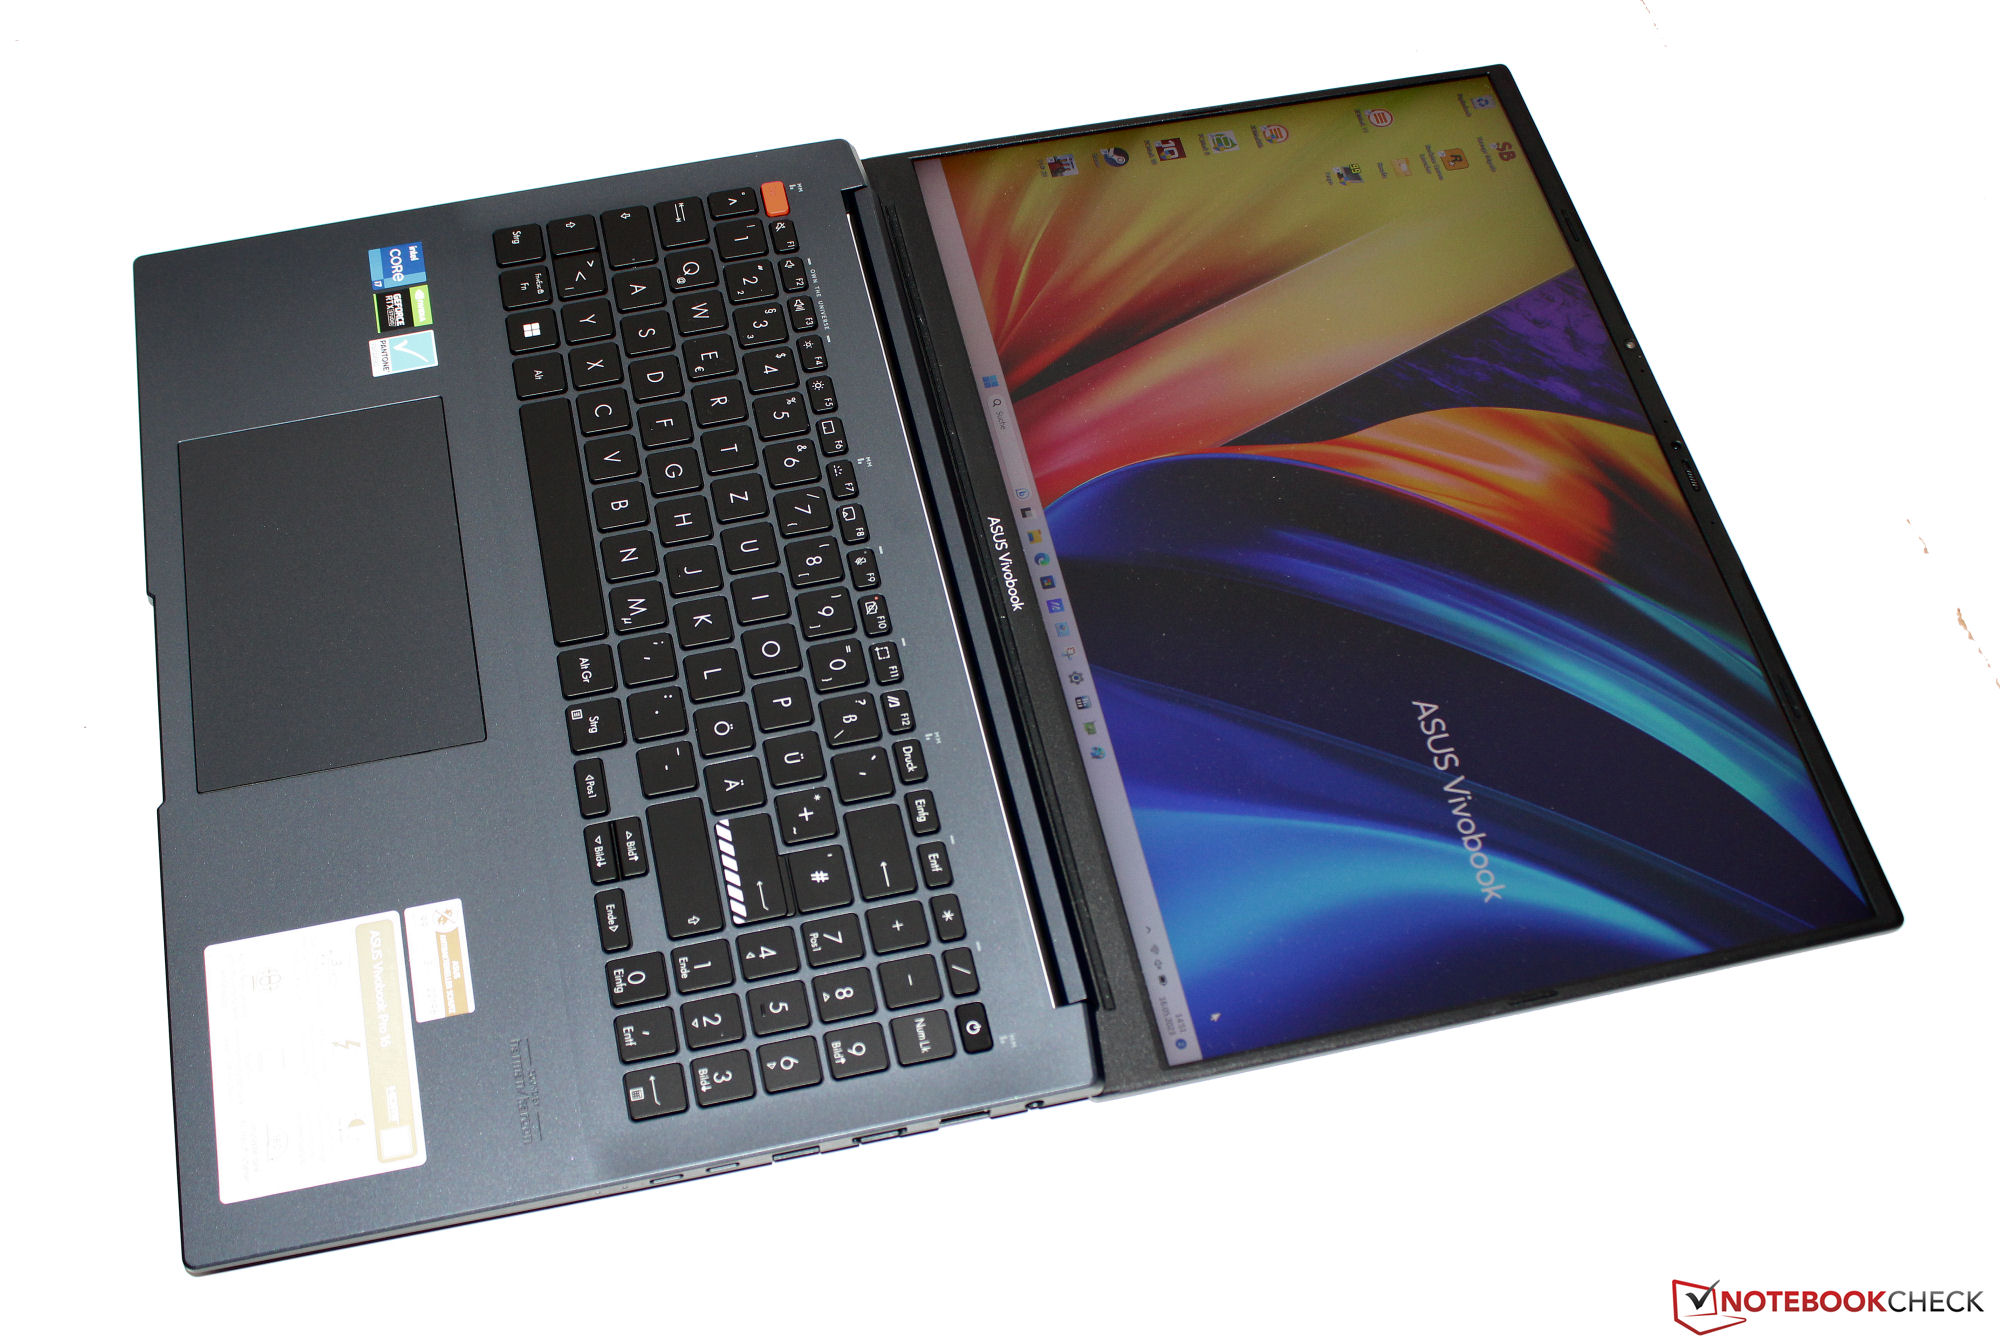
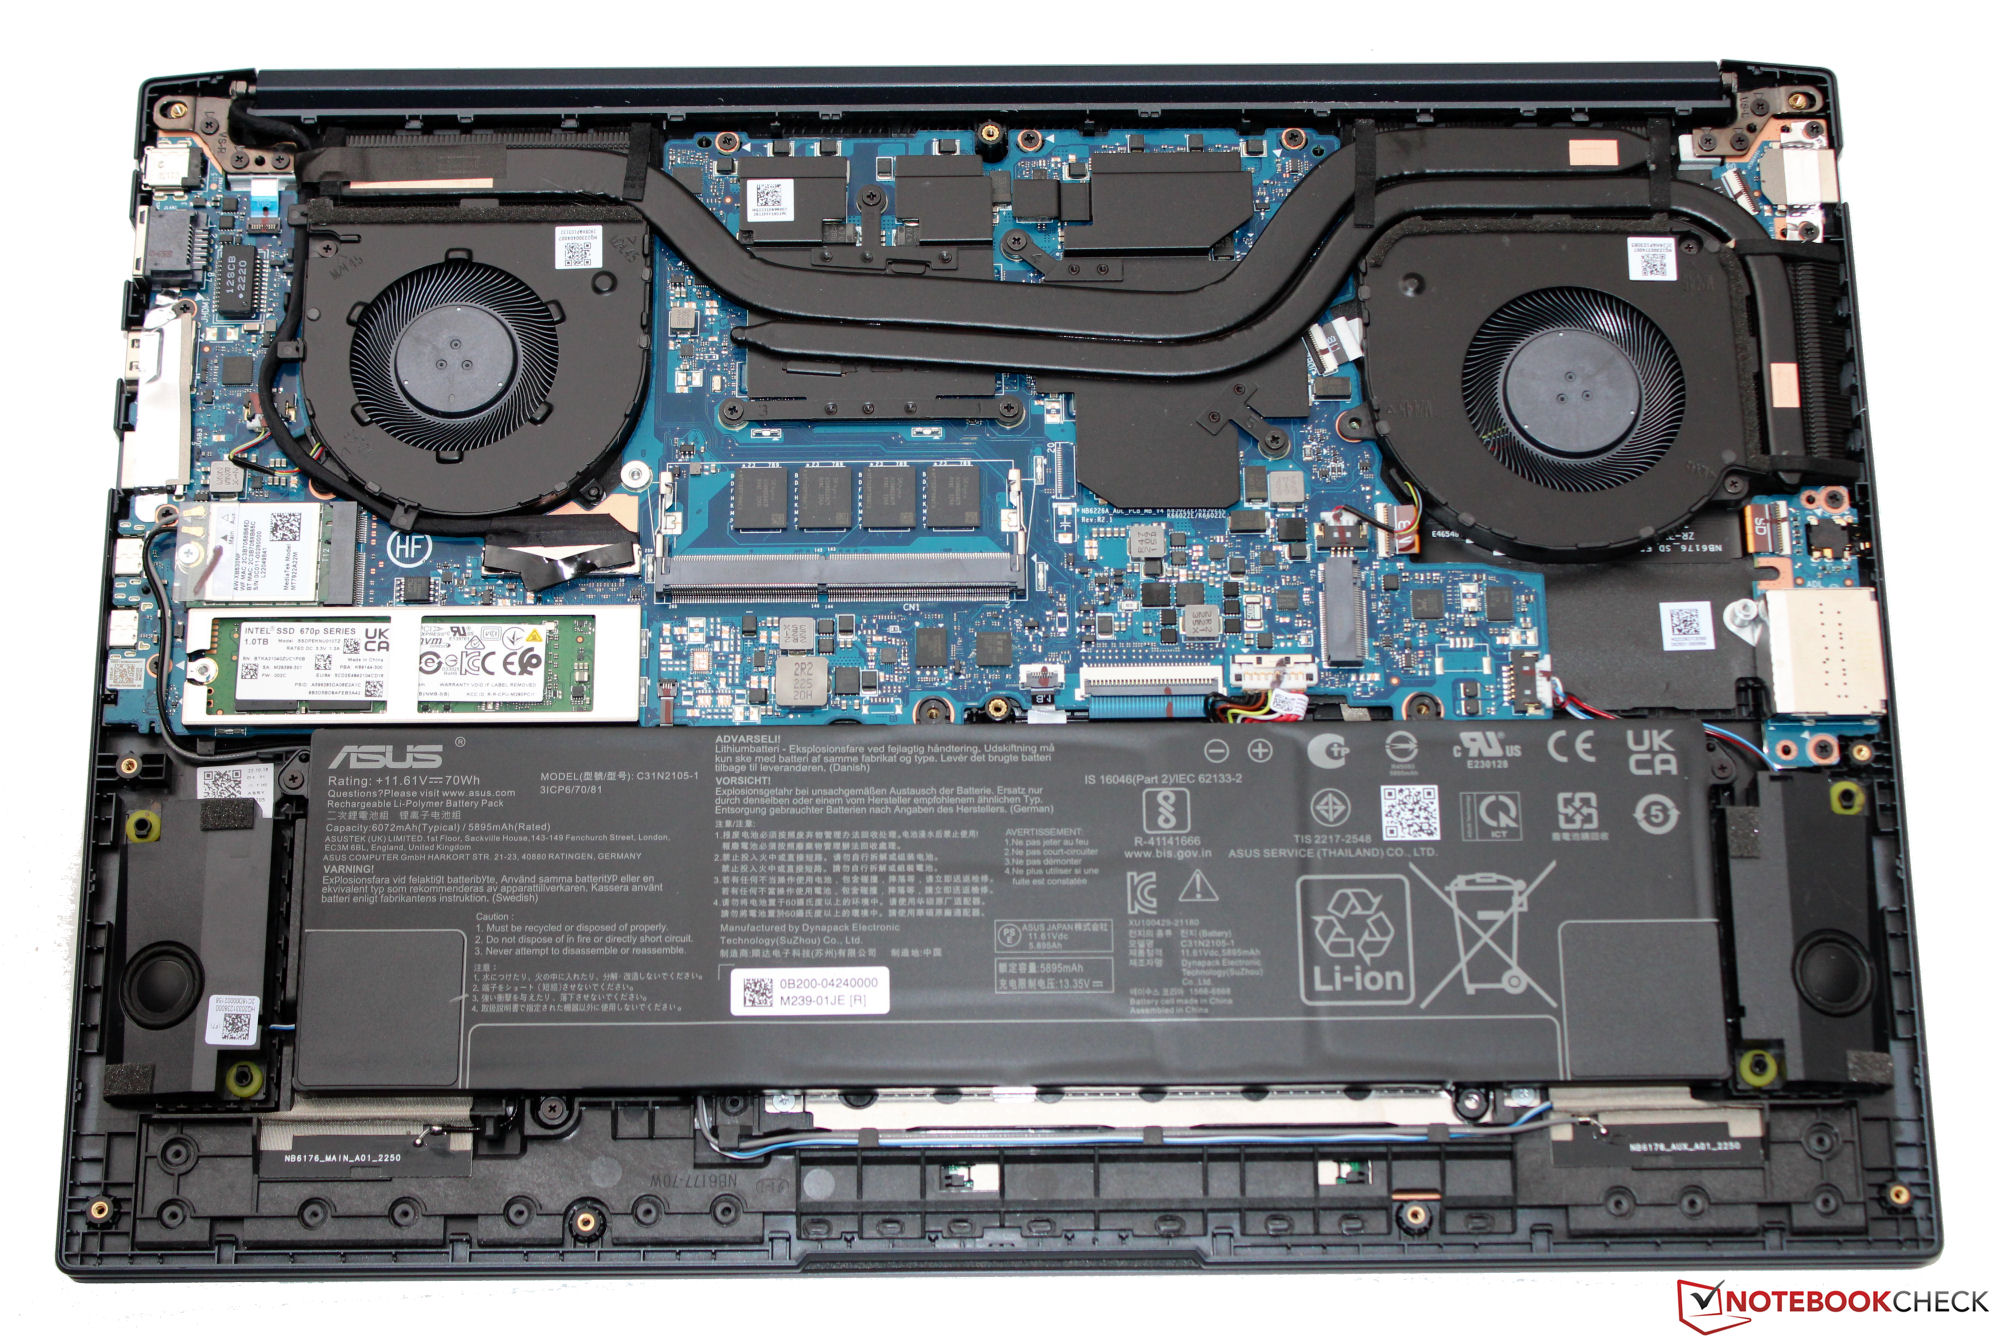
Obudowa i funkcje - VivoBook z Thunderbolt 4
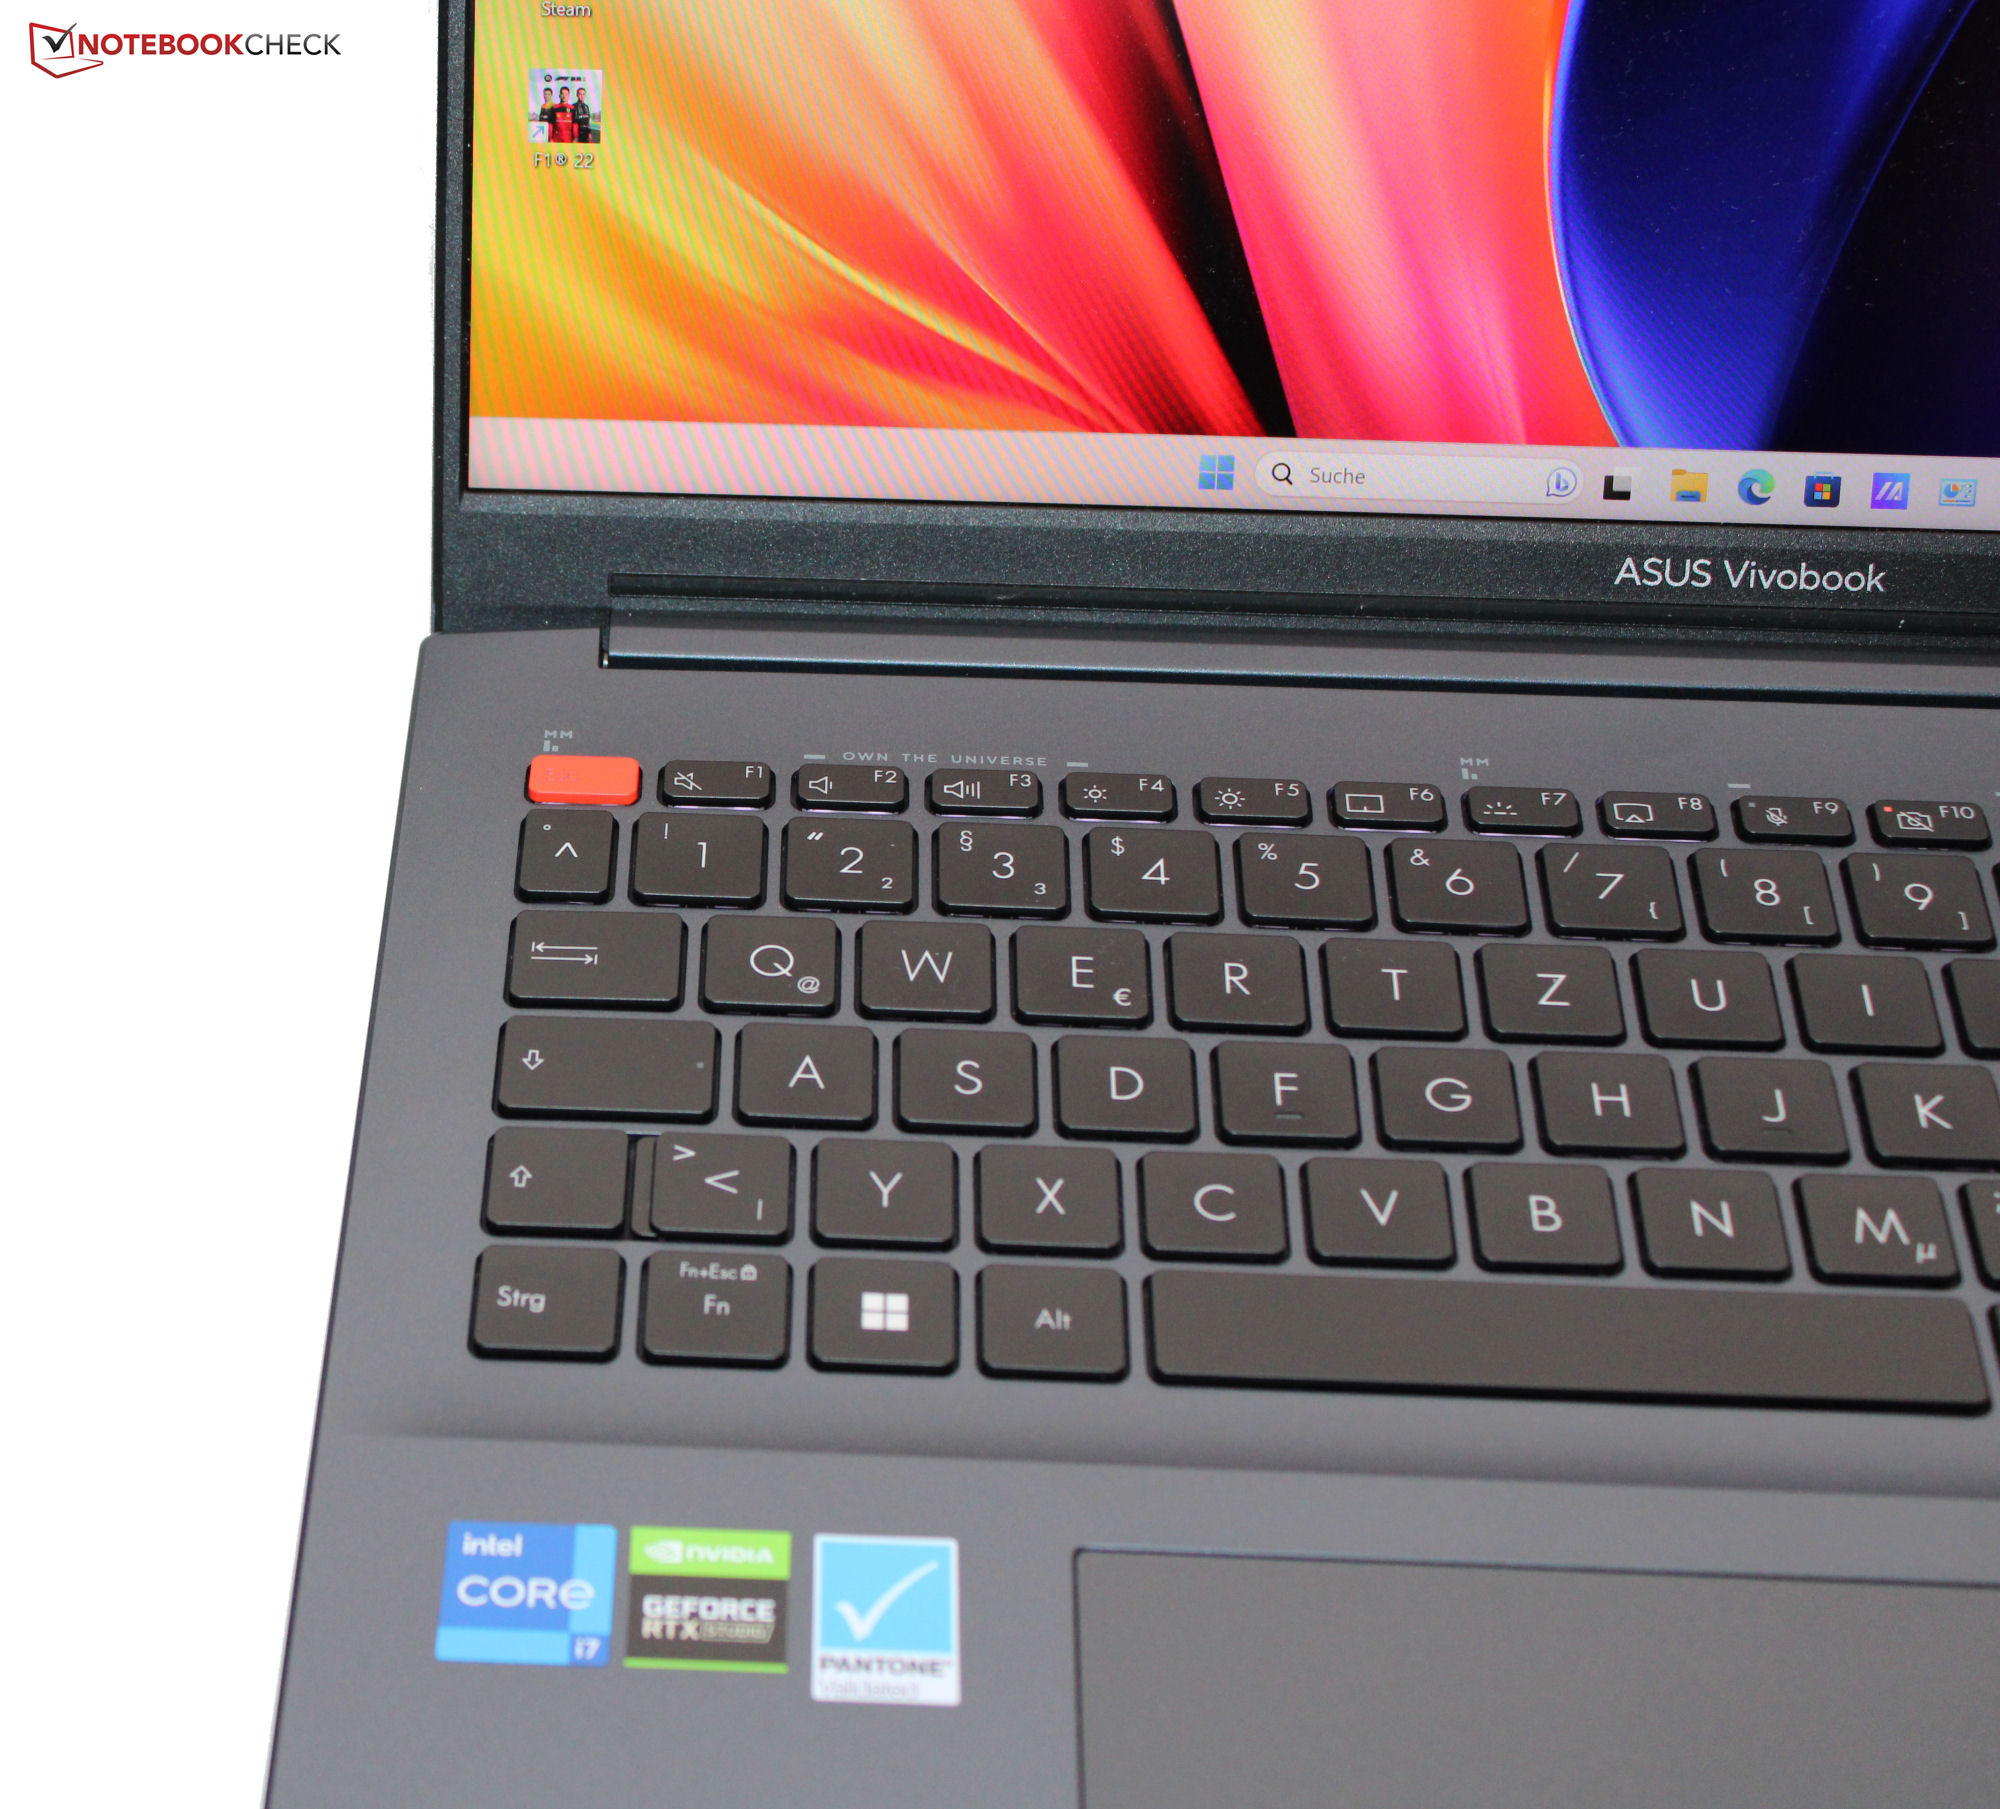
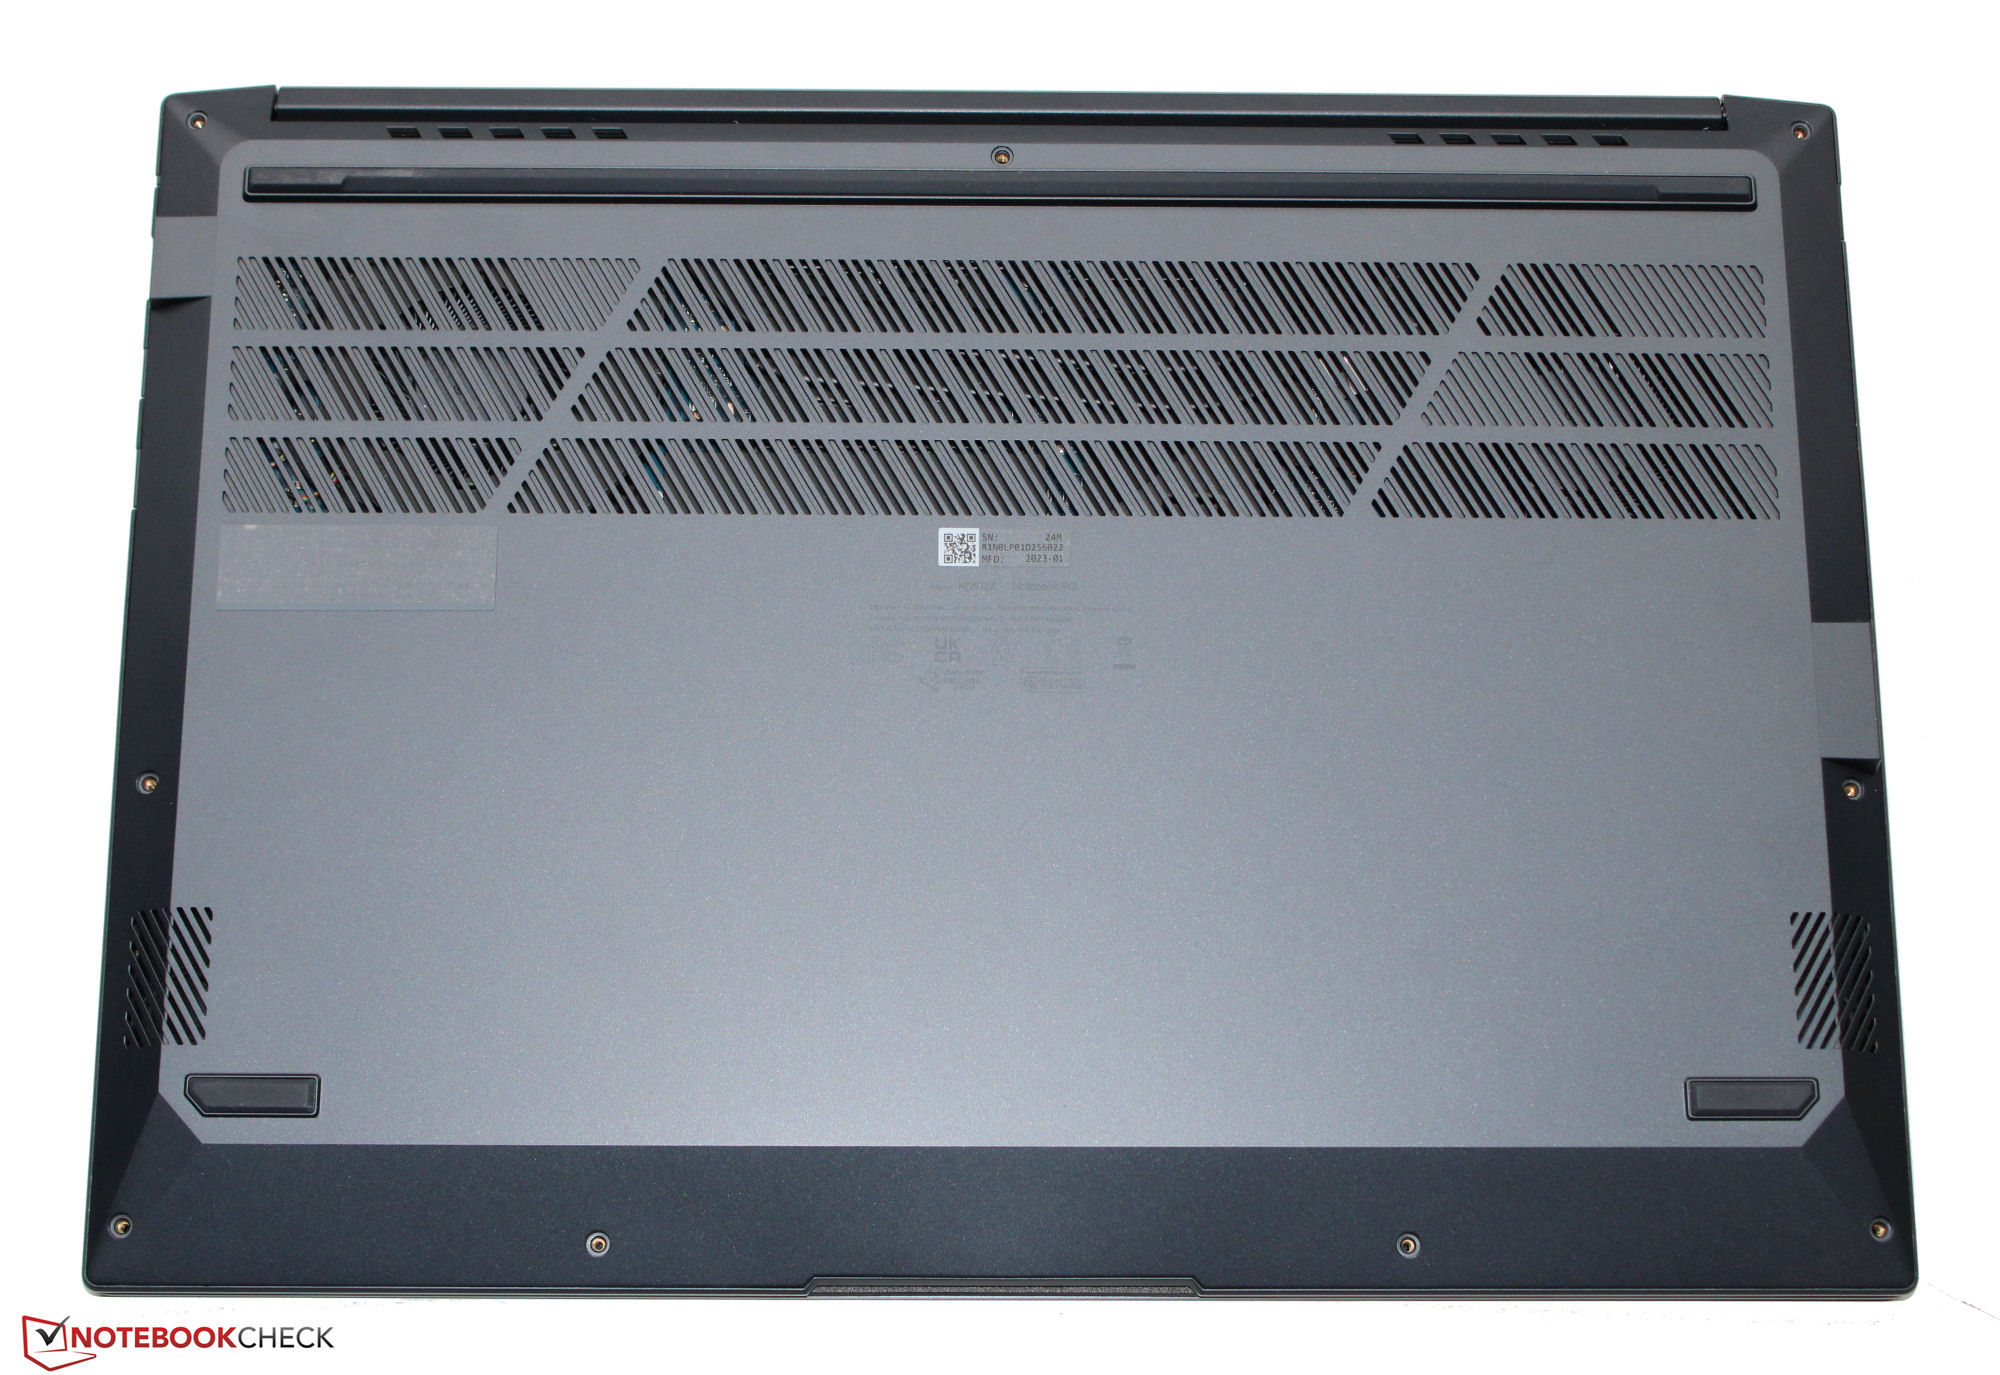
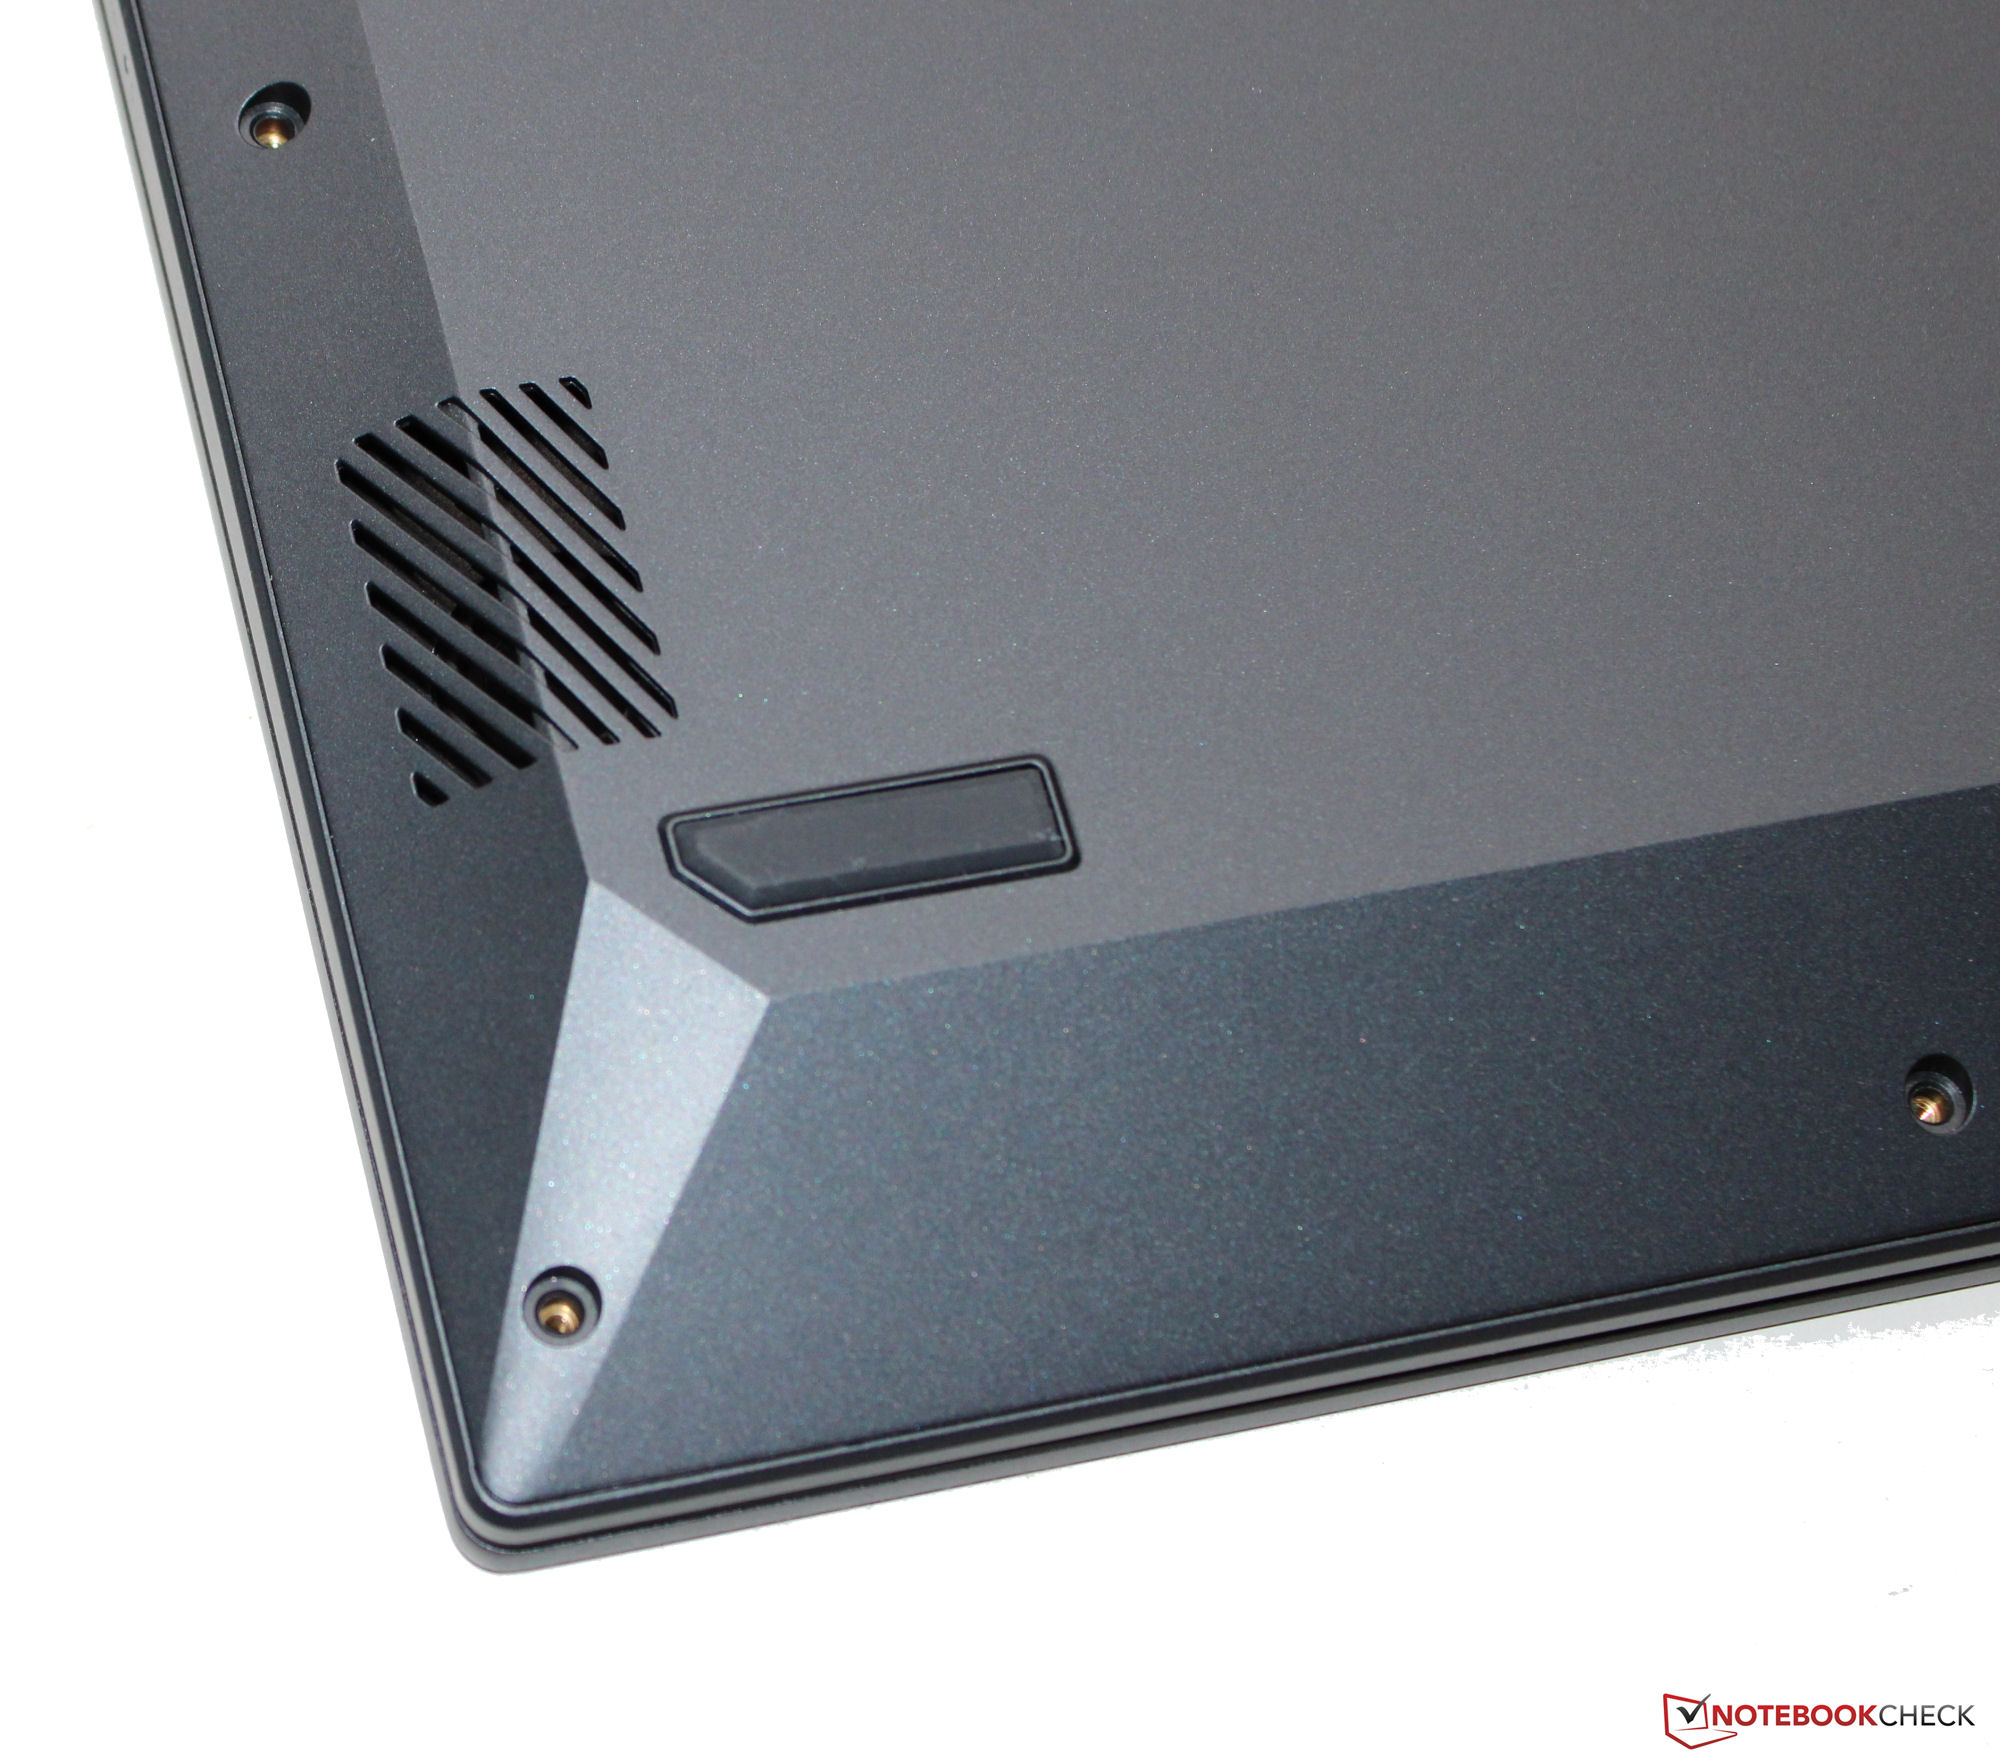
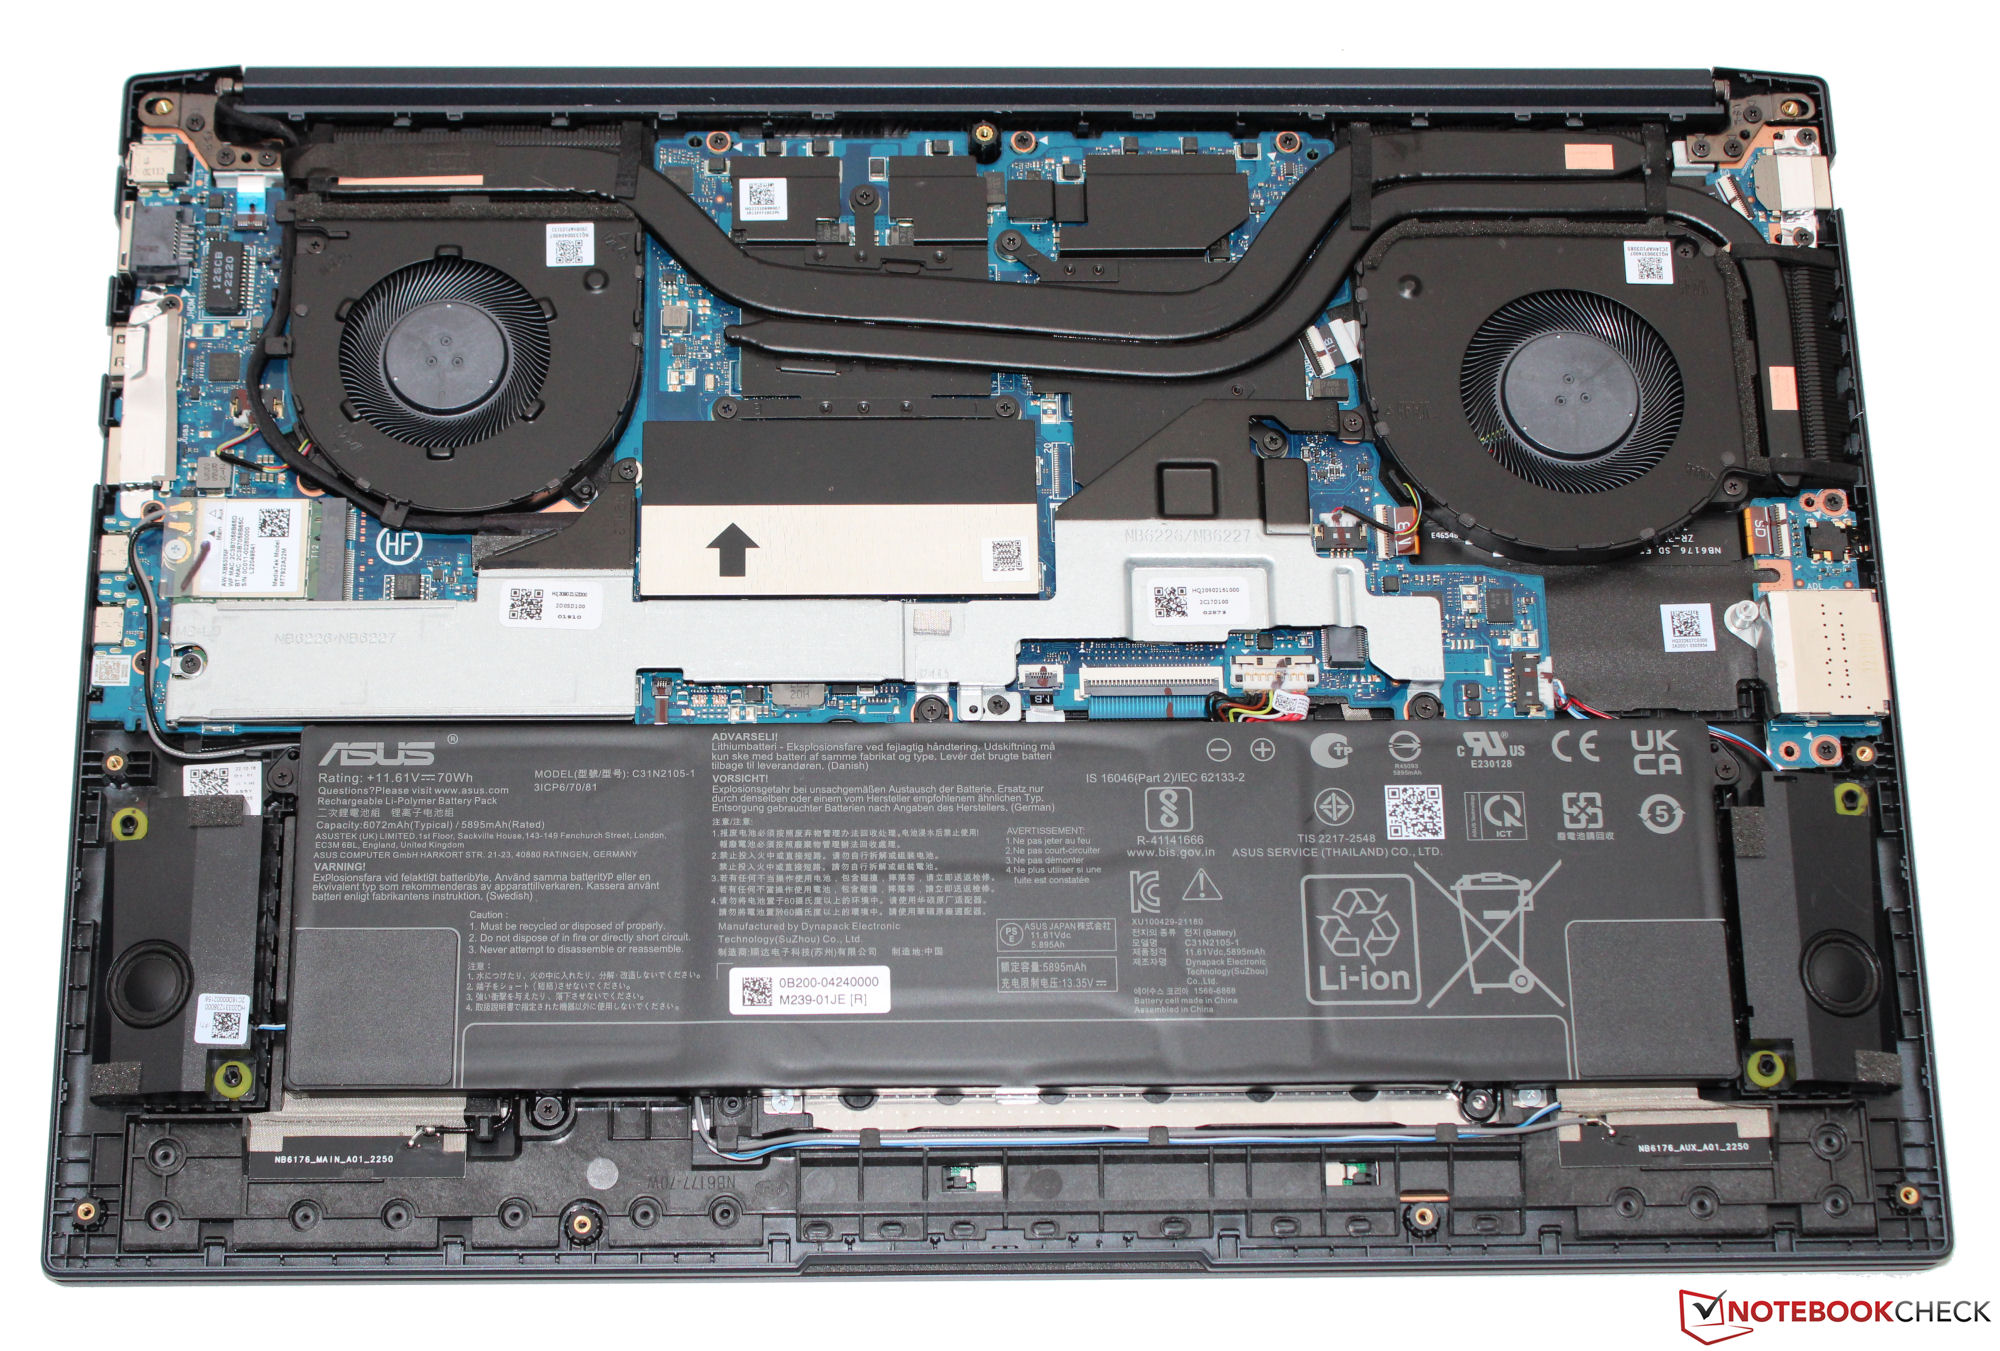
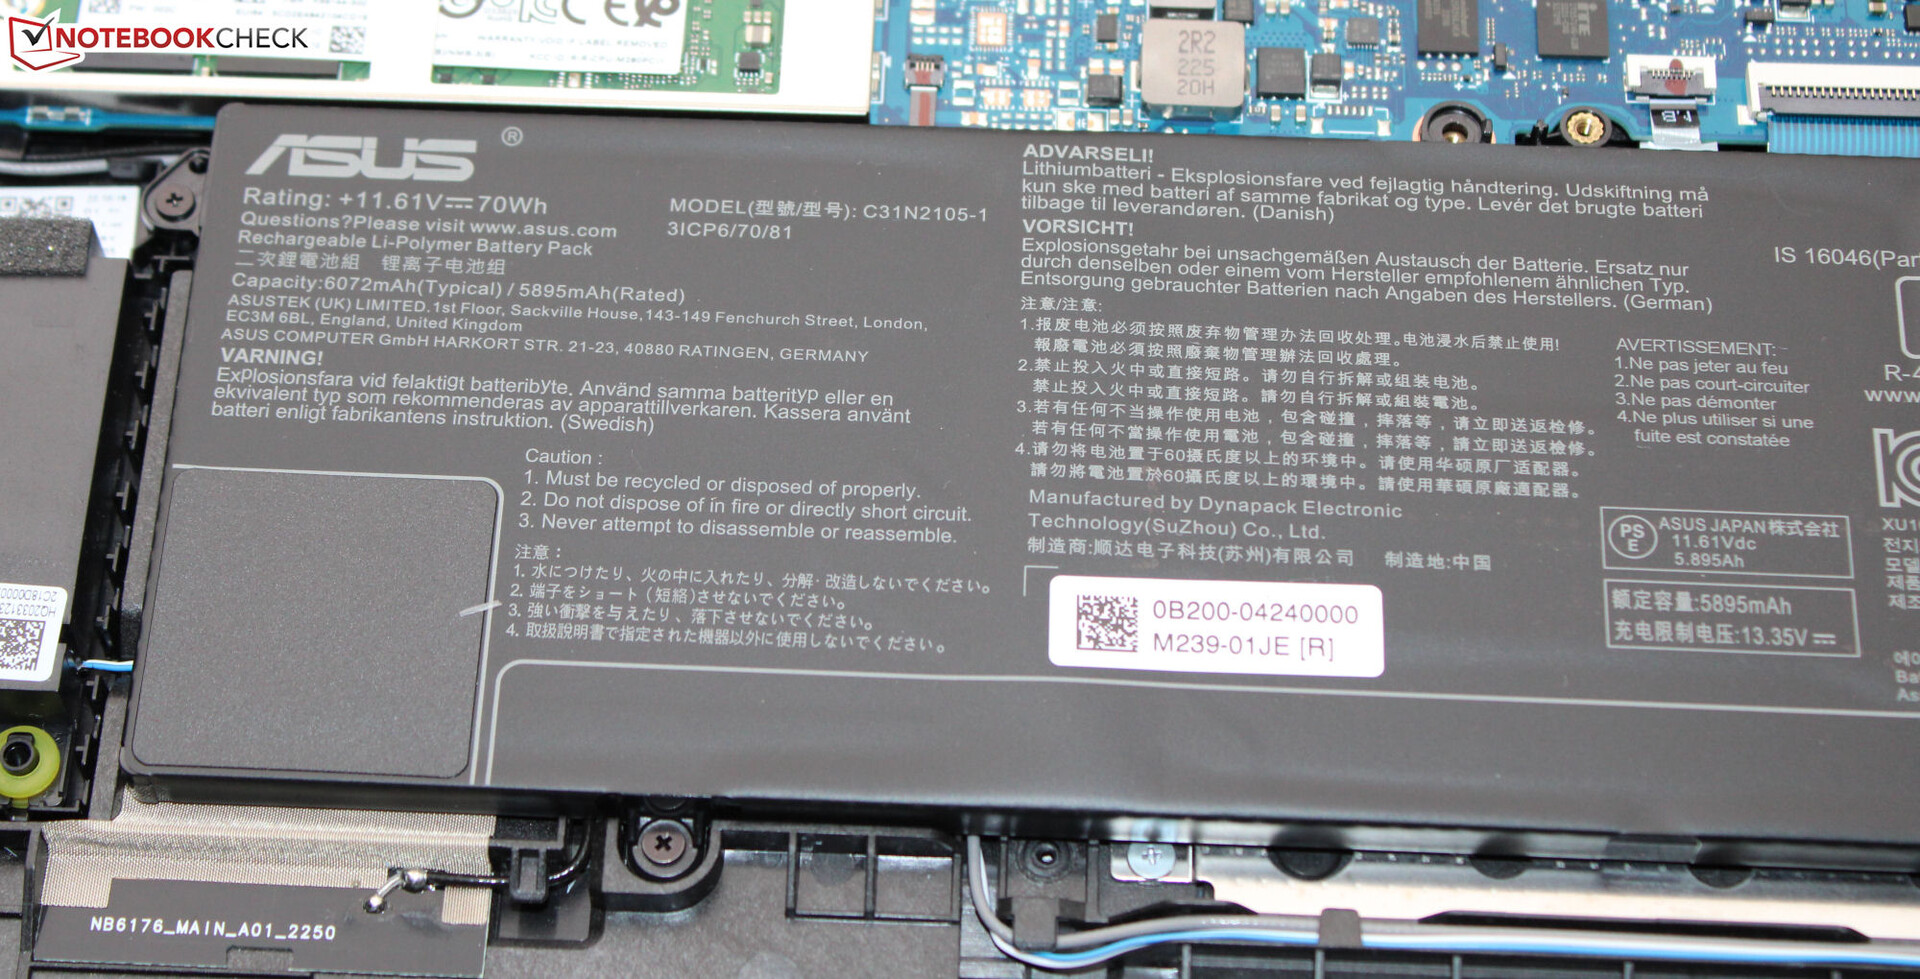
VivoBook jest ciemnoniebieski (Quiet Blue) i ma gładkie, matowe powierzchnie. Jego podstawę (tworzywo sztuczne) i pokrywę (aluminiowy tył) można nieco zbyt łatwo przekręcić. Maksymalny kąt, pod jakim można otworzyć pokrywę, wynosi 180 stopni. Dostęp do akumulatora (wkręcanego, a nie przyklejanego) oraz reszty wnętrza laptopa jest możliwy po zdjęciu spodu obudowy.
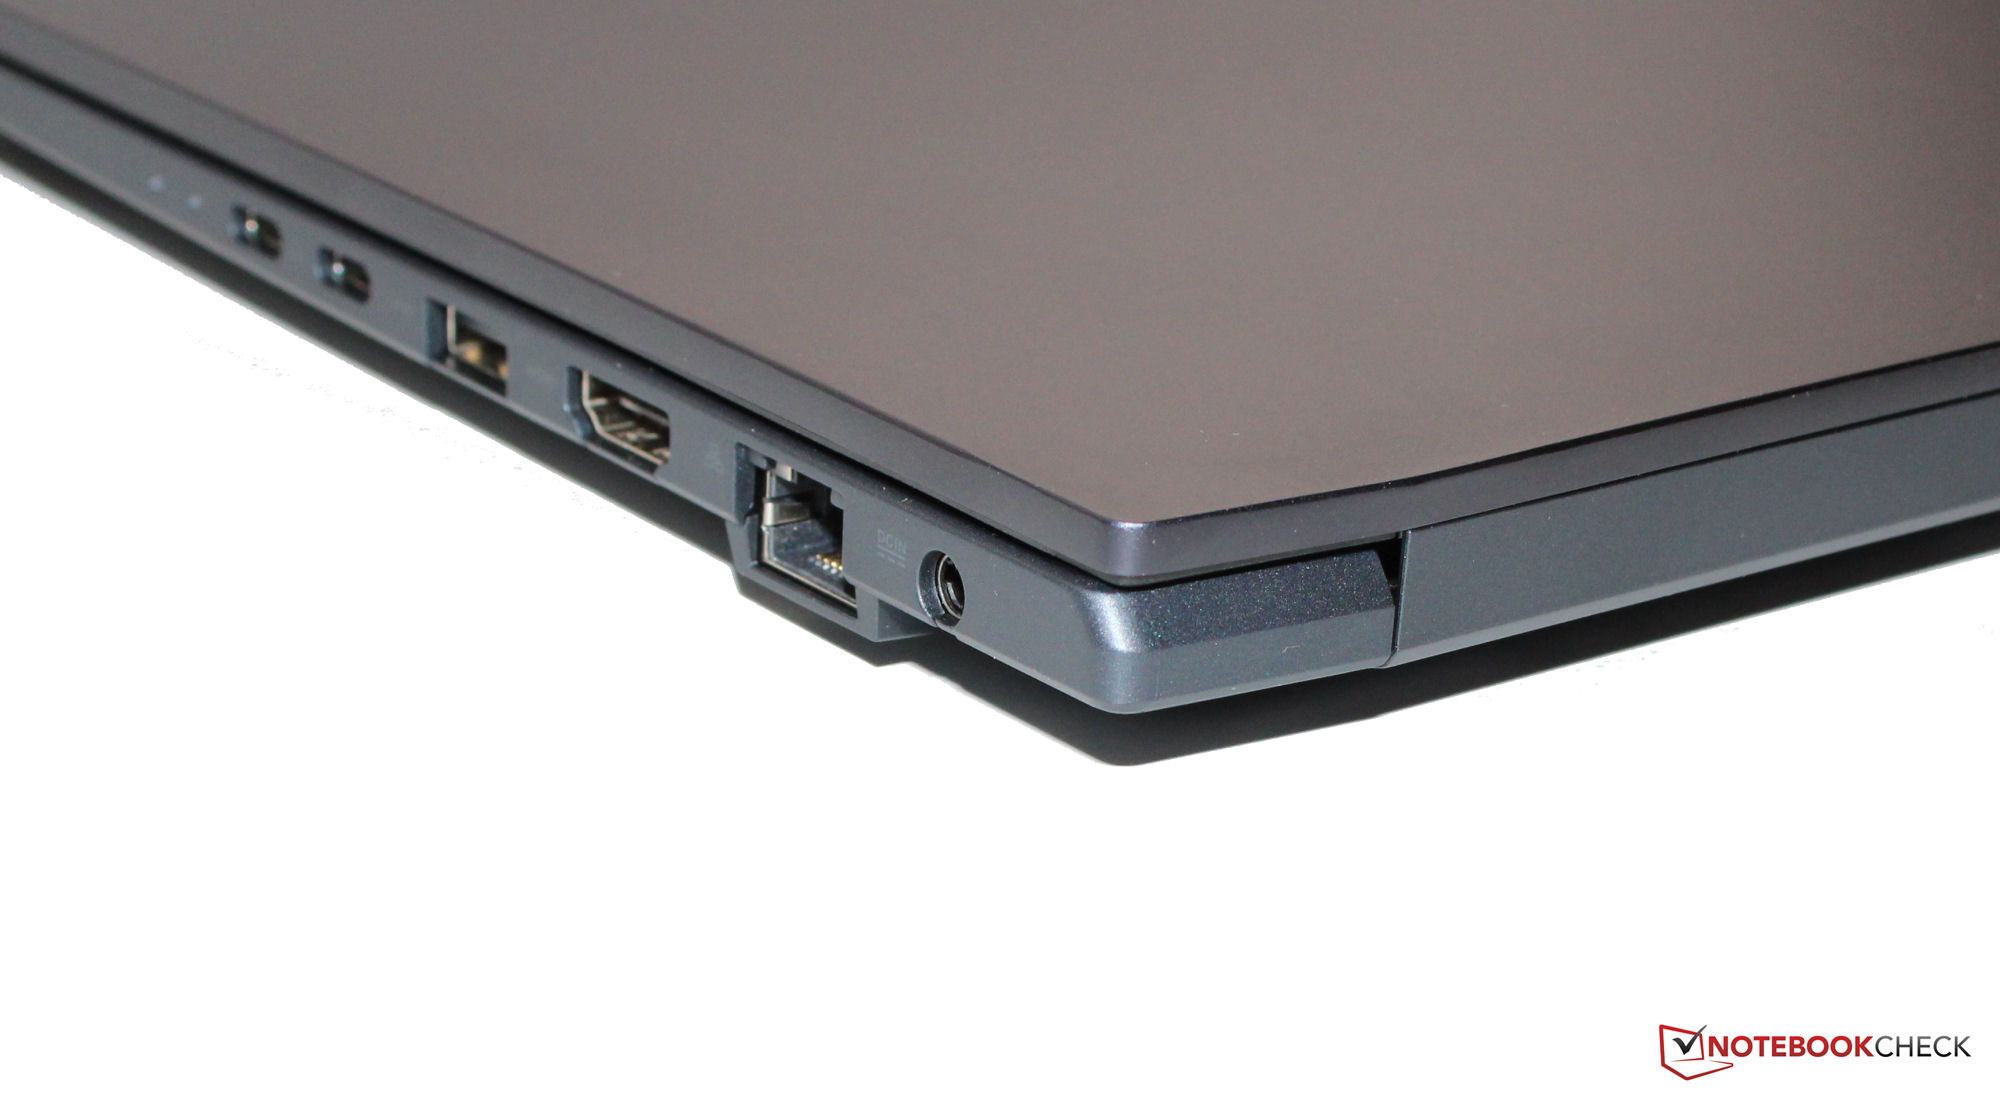
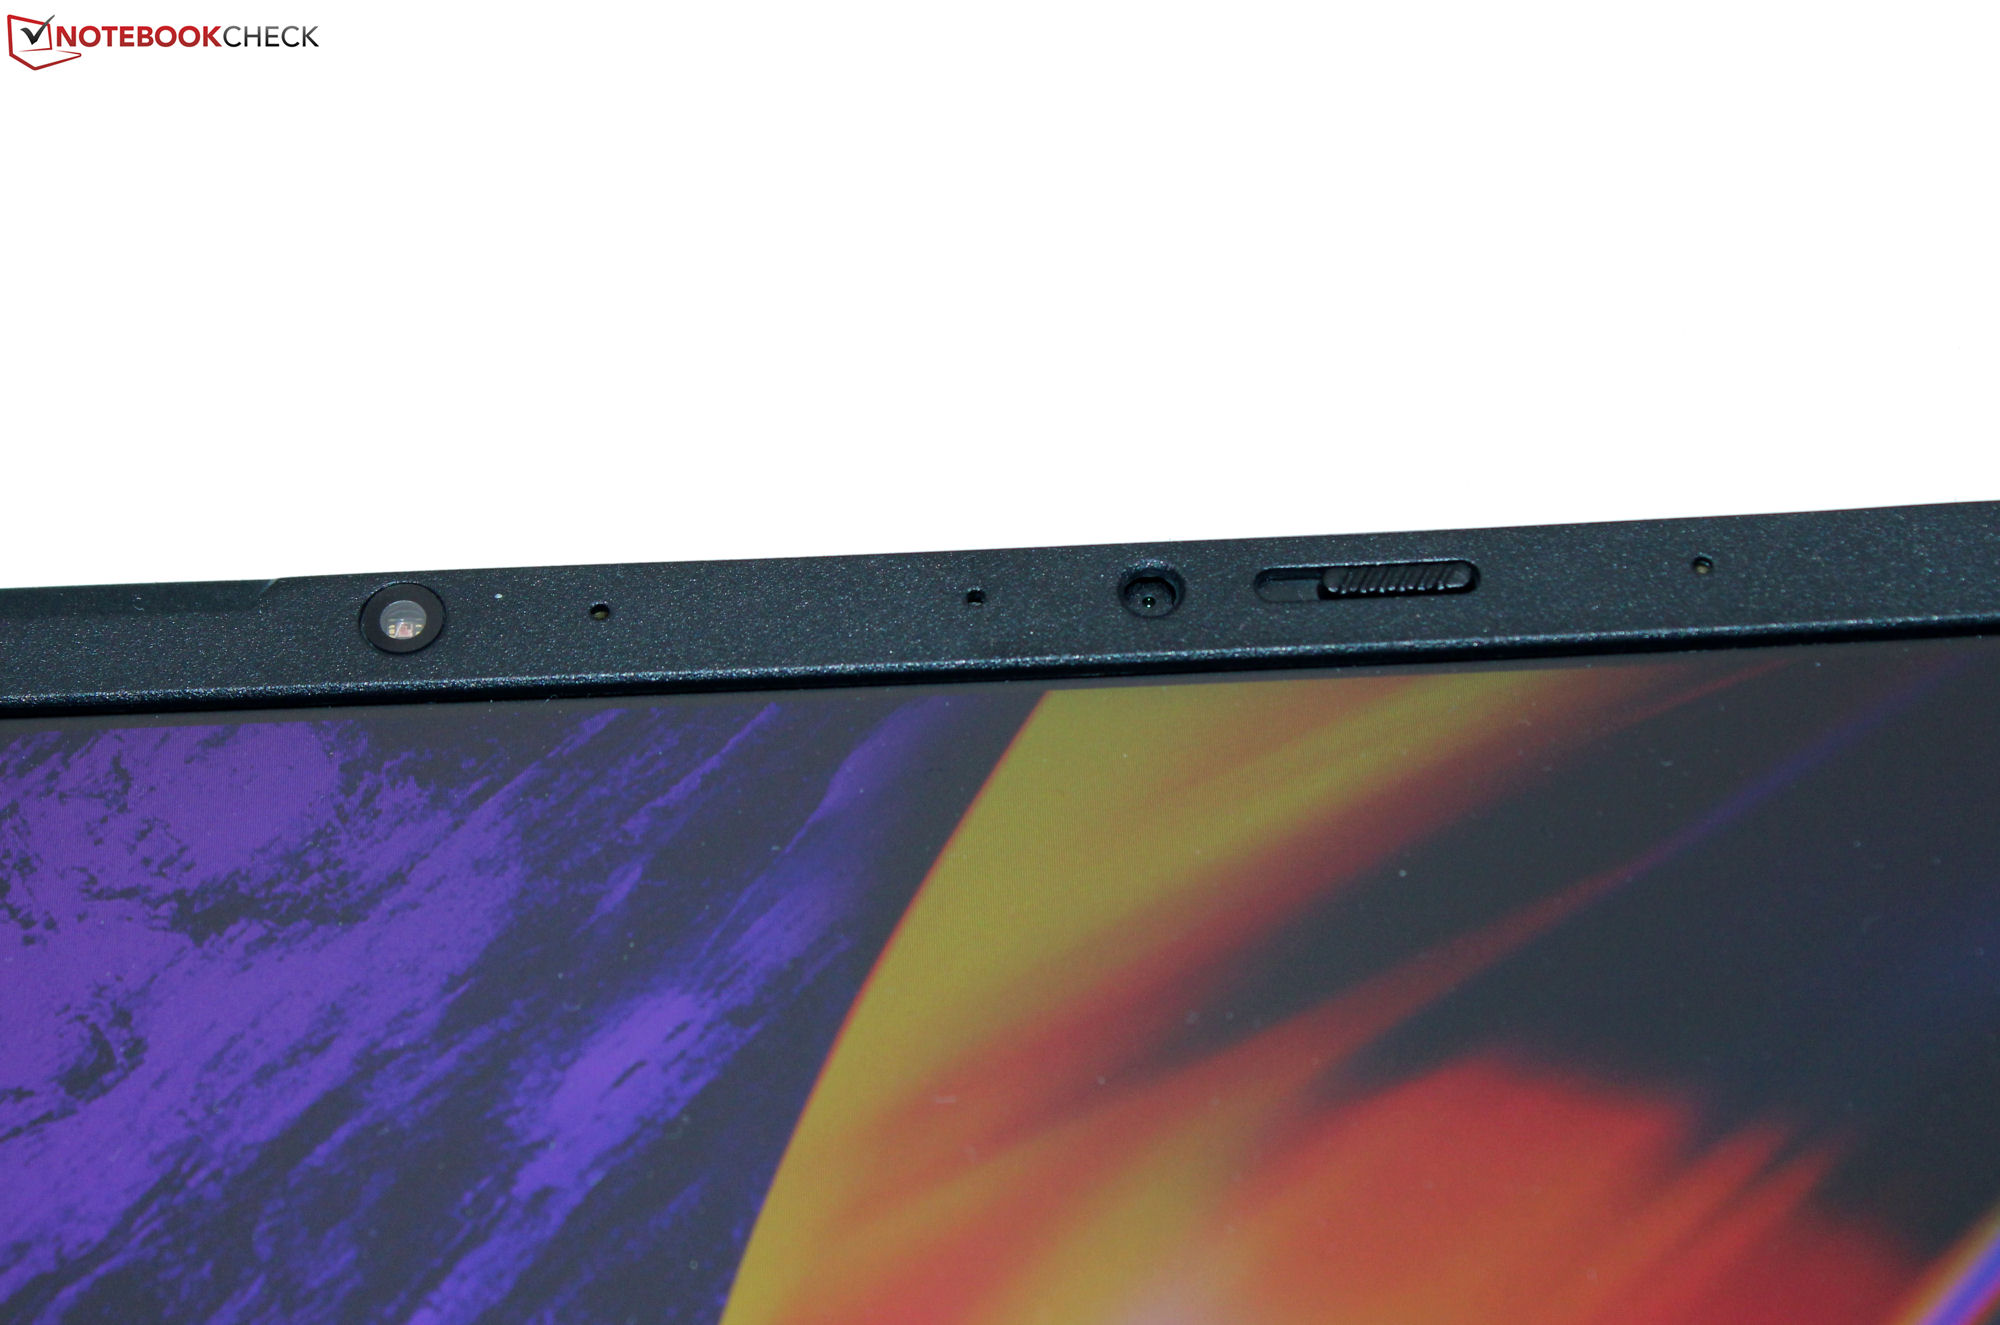
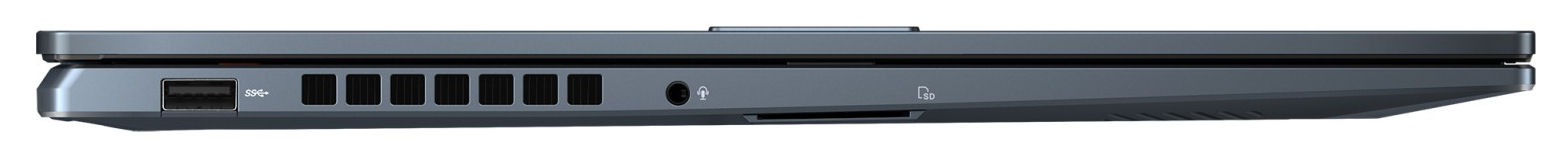
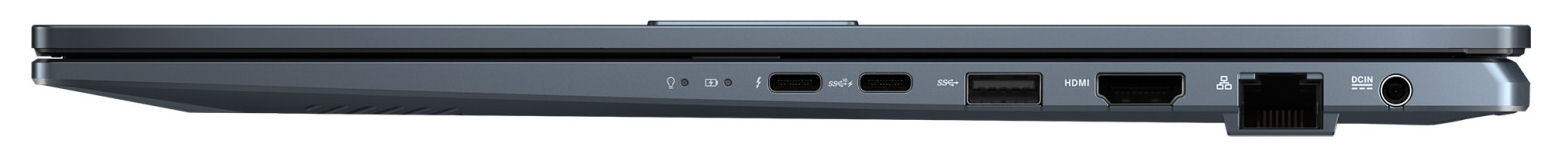
Urządzenie posiada dwa porty USB-A (USB 3.2 Gen 1), a także dwa porty USB-C (1x Thunderbolt 4, 1x USB 3.2 Gen 2). Te ostatnie obsługują dostarczanie zasilania, a port TB4 może również wyprowadzać sygnał DisplayPort. W sumie dostępne są dwa wyjścia wideo (1x DP, 1x HDMI). Czytnik kart SD (karta referencyjna: AV PRO microSD 128 GB V60) zapewnia około średnich prędkości. Pozytyw: Kamerka internetowa (2,1 MP, maks. 1 920 x 1 080 pikseli) posiada mechaniczną osłonę.
W optymalnych warunkach (brak urządzeń WiFi w bliskim sąsiedztwie, niewielka odległość między laptopem a serwerem PC) można osiągnąć świetne prędkości transmisji danych WiFi. Laptop wykorzystuje układ WiFi 6E (Mediatek MT7922). Za połączenia przewodowe odpowiada układ Realtek (RTL 816878111; 1 GBit/s).
| SD Card Reader | |
| average JPG Copy Test (av. of 3 runs) | |
| Średnia w klasie Multimedia (23 - 531, n=37, ostatnie 2 lata) | |
| Schenker XMG Fusion 15 (Mid 22) (AV PRO microSD 128 GB V60) | |
| Asus VivoBook Pro 16 (AV Pro SD microSD 128 GB V60) | |
| Dell Inspiron 16 Plus 7620 (Toshiba Exceria Pro SDXC 64 GB UHS-II) | |
| maximum AS SSD Seq Read Test (1GB) | |
| Średnia w klasie Multimedia (37.3 - 1455, n=36, ostatnie 2 lata) | |
| Asus VivoBook Pro 16 (AV Pro SD microSD 128 GB V60) | |
| Dell Inspiron 16 Plus 7620 (Toshiba Exceria Pro SDXC 64 GB UHS-II) | |
| Networking | |
| iperf3 transmit AXE11000 | |
| Acer Swift X SFX16-52G-77RX | |
| Asus VivoBook Pro 16 | |
| Przeciętny MediaTek Wi-Fi 6E MT7922 160MHz Wireless LAN Card (358 - 1785, n=86) | |
| Średnia w klasie Multimedia (606 - 1978, n=54, ostatnie 2 lata) | |
| Schenker XMG Fusion 15 (Mid 22) | |
| iperf3 receive AXE11000 | |
| Acer Swift X SFX16-52G-77RX | |
| Schenker XMG Fusion 15 (Mid 22) | |
| Przeciętny MediaTek Wi-Fi 6E MT7922 160MHz Wireless LAN Card (644 - 1775, n=87) | |
| Średnia w klasie Multimedia (682 - 1818, n=54, ostatnie 2 lata) | |
| iperf3 transmit AXE11000 6GHz | |
| Średnia w klasie Multimedia (869 - 2373, n=23, ostatnie 2 lata) | |
| Przeciętny MediaTek Wi-Fi 6E MT7922 160MHz Wireless LAN Card (394 - 1890, n=61) | |
| Dell Inspiron 16 Plus 7620 | |
| iperf3 receive AXE11000 6GHz | |
| Asus VivoBook Pro 16 | |
| Średnia w klasie Multimedia (1212 - 2361, n=23, ostatnie 2 lata) | |
| Przeciętny MediaTek Wi-Fi 6E MT7922 160MHz Wireless LAN Card (684 - 1779, n=63) | |
| Dell Inspiron 16 Plus 7620 | |


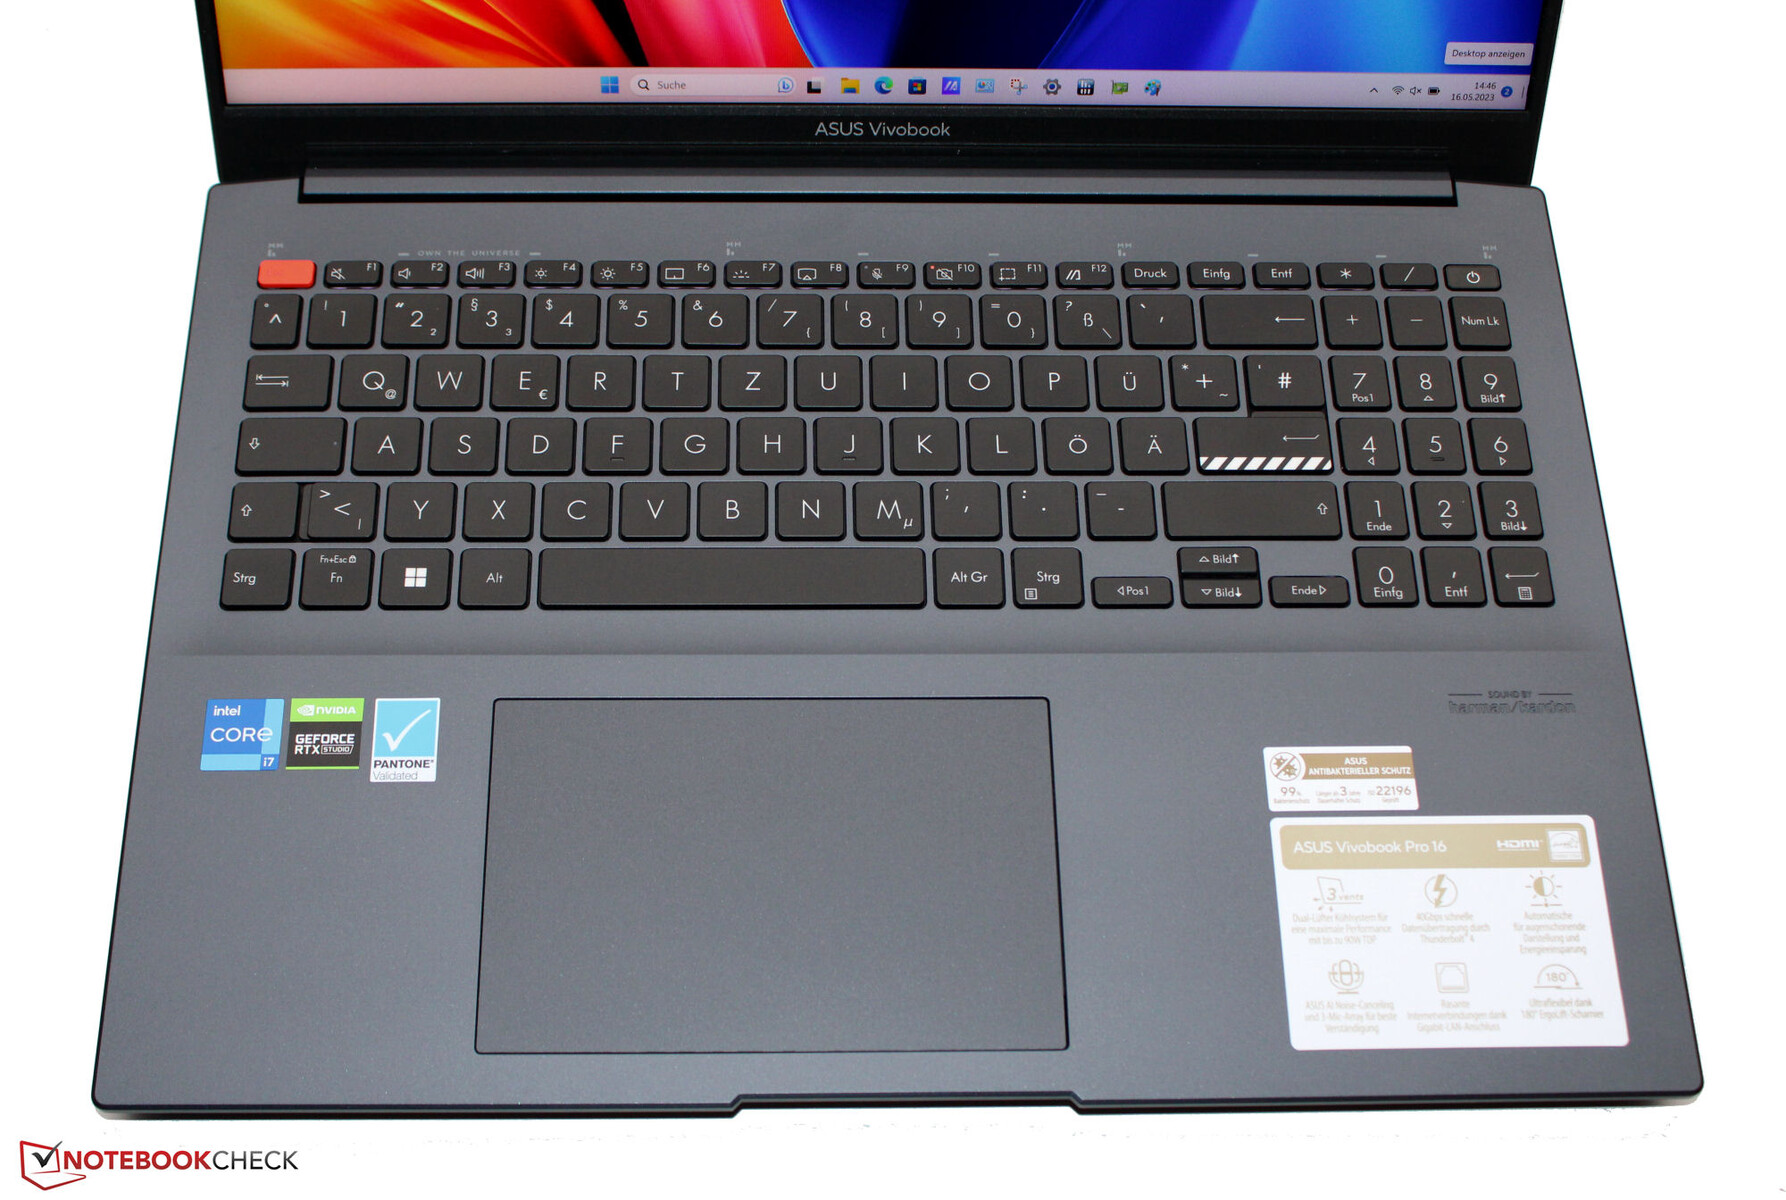
Urządzenia wejściowe - komputer Asus z podświetlaną klawiaturą
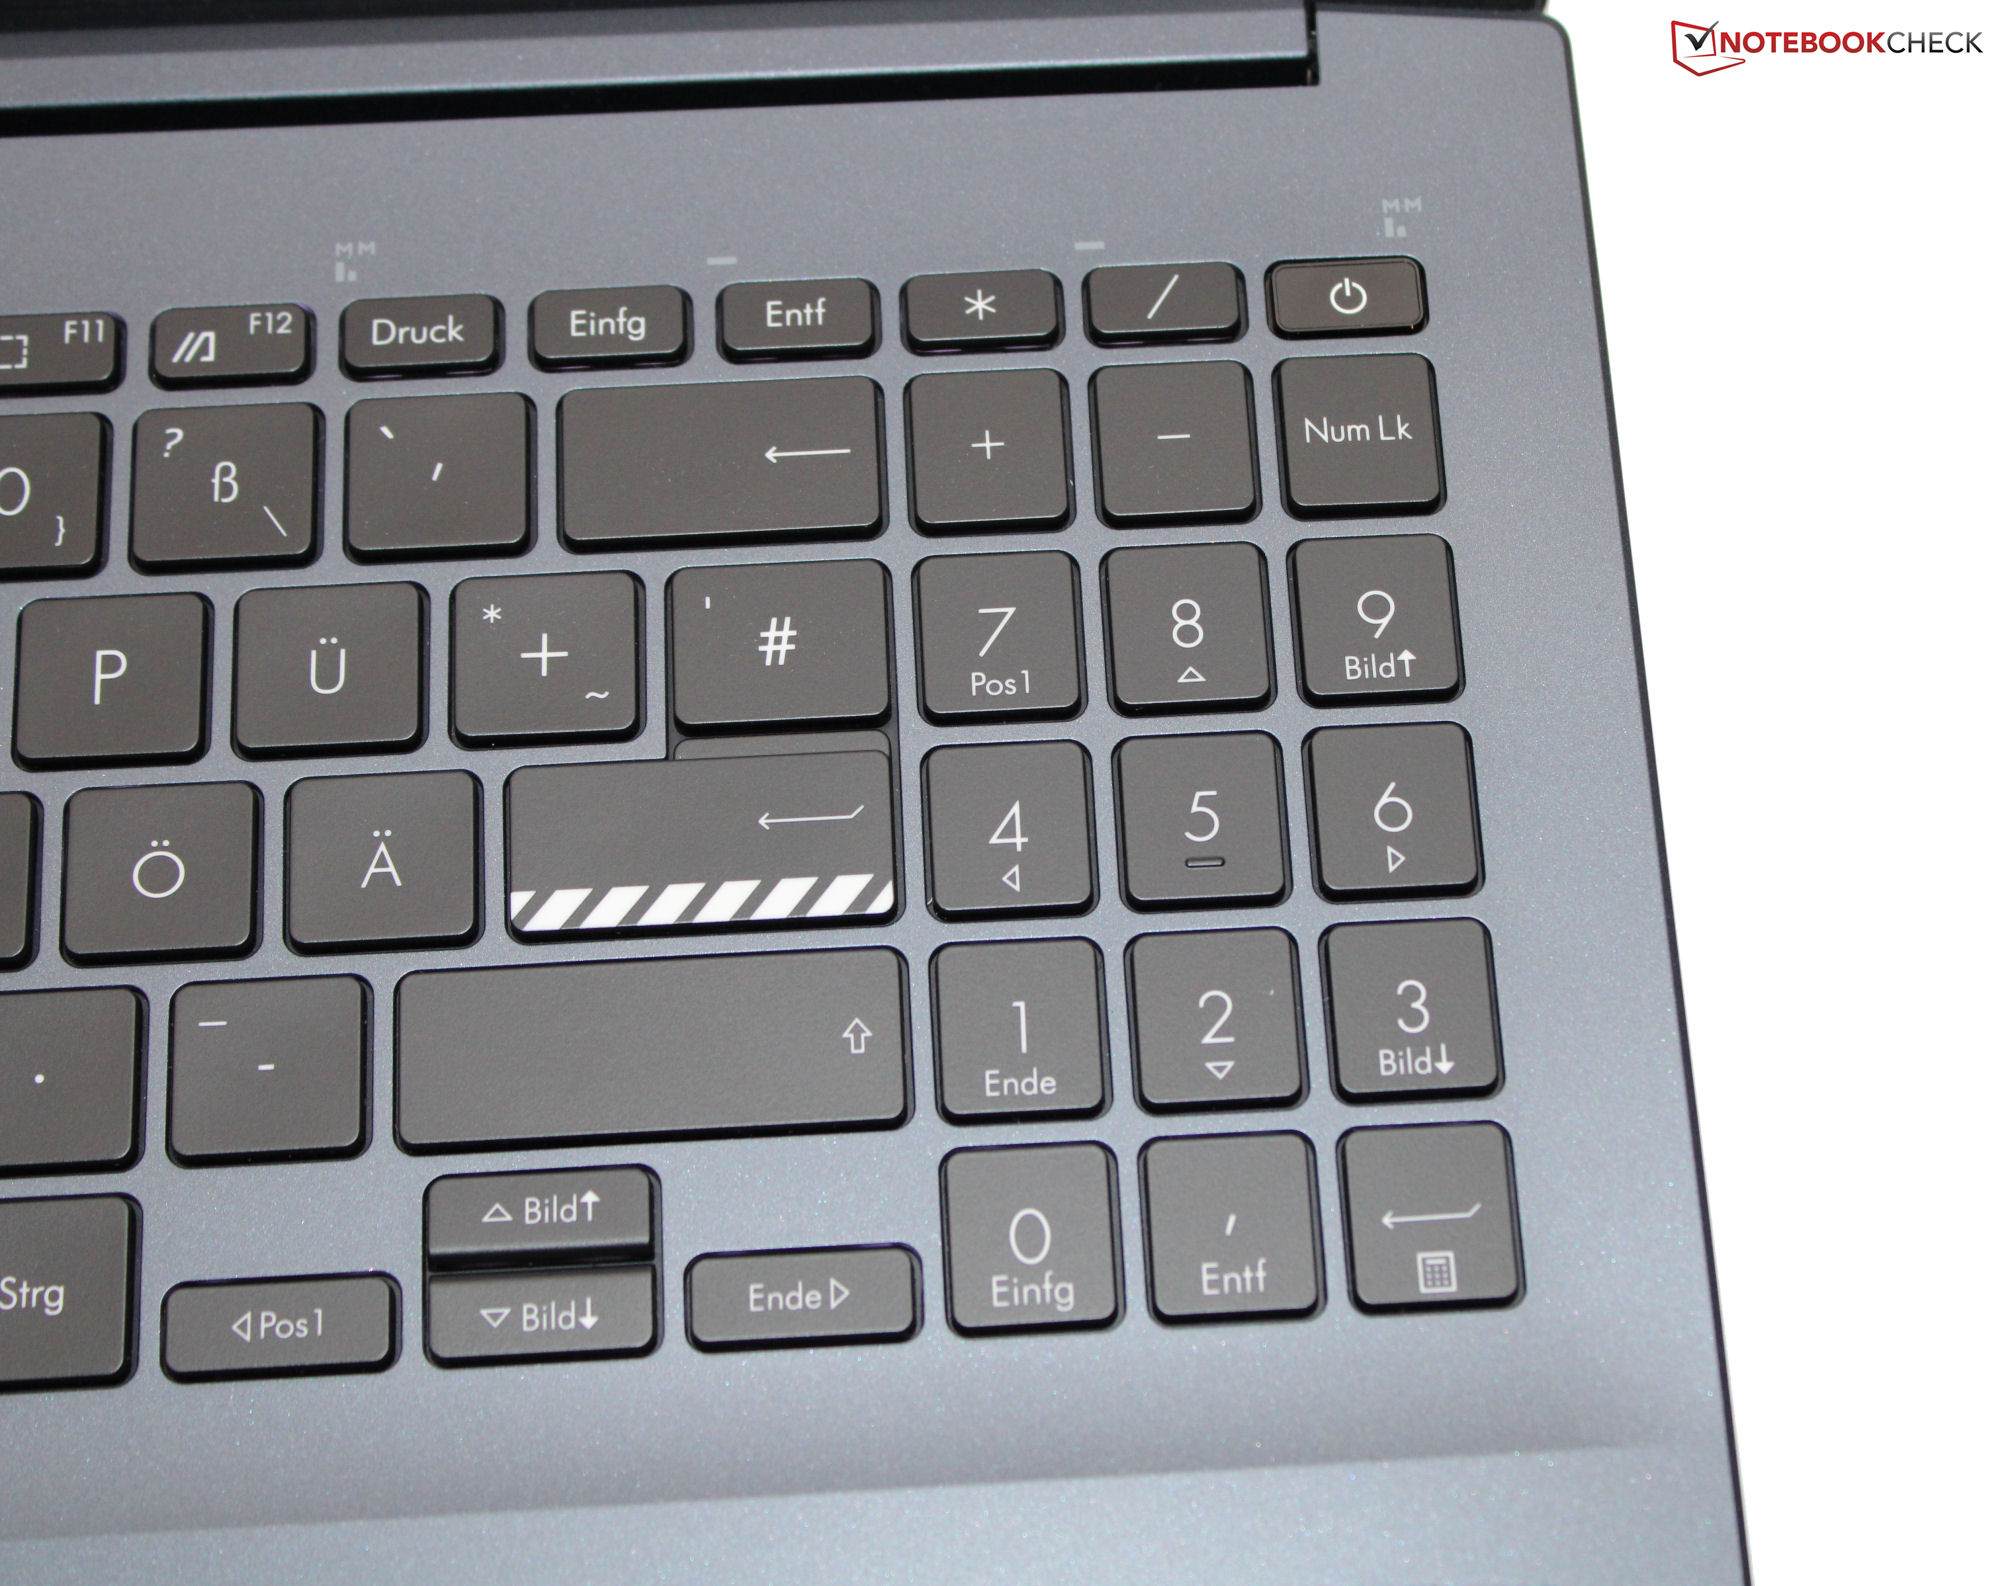
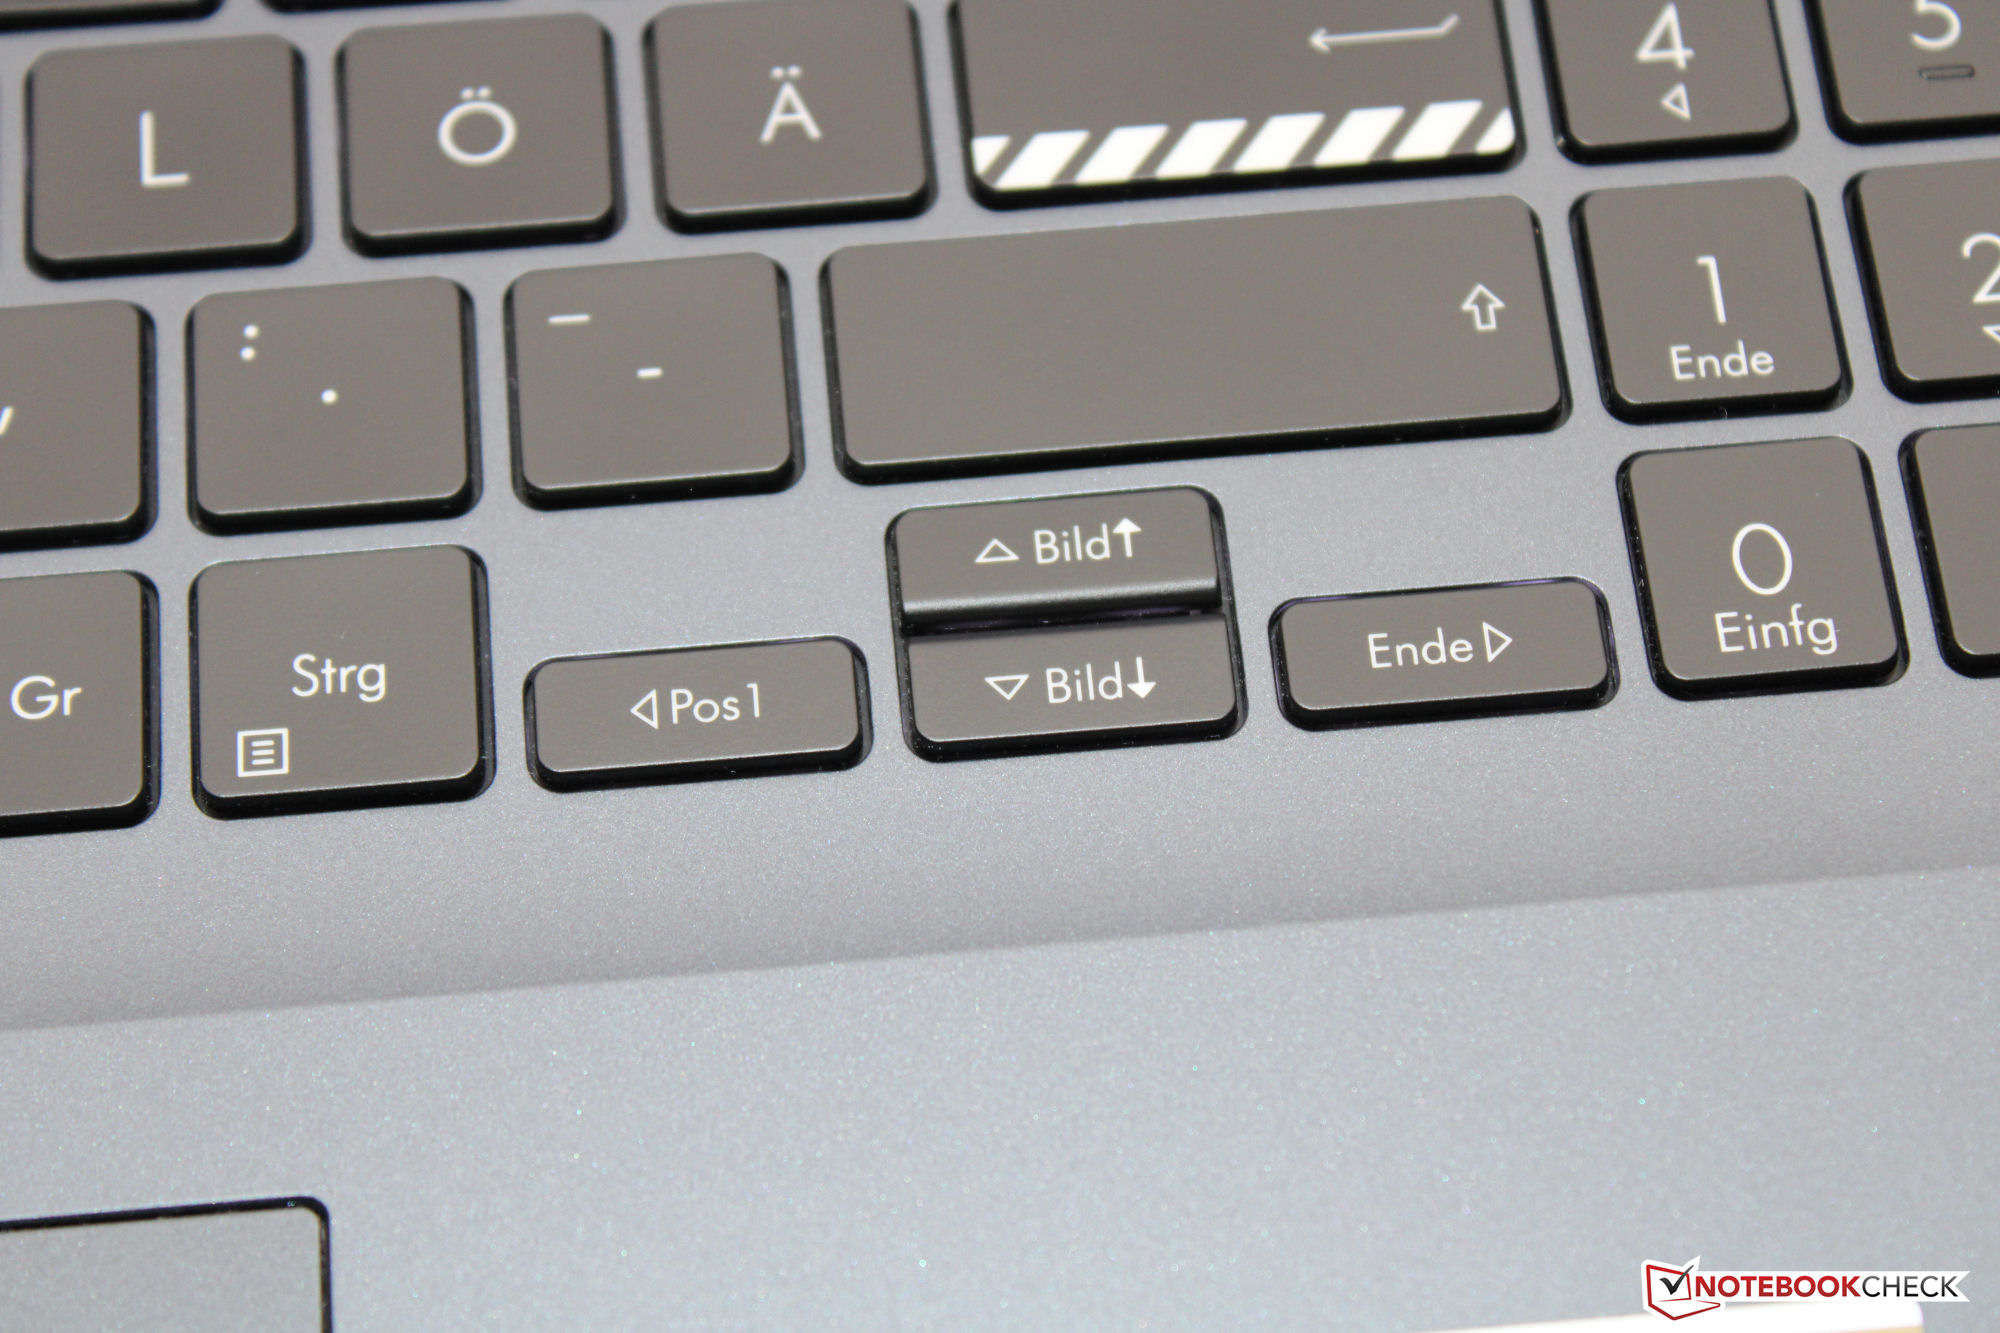
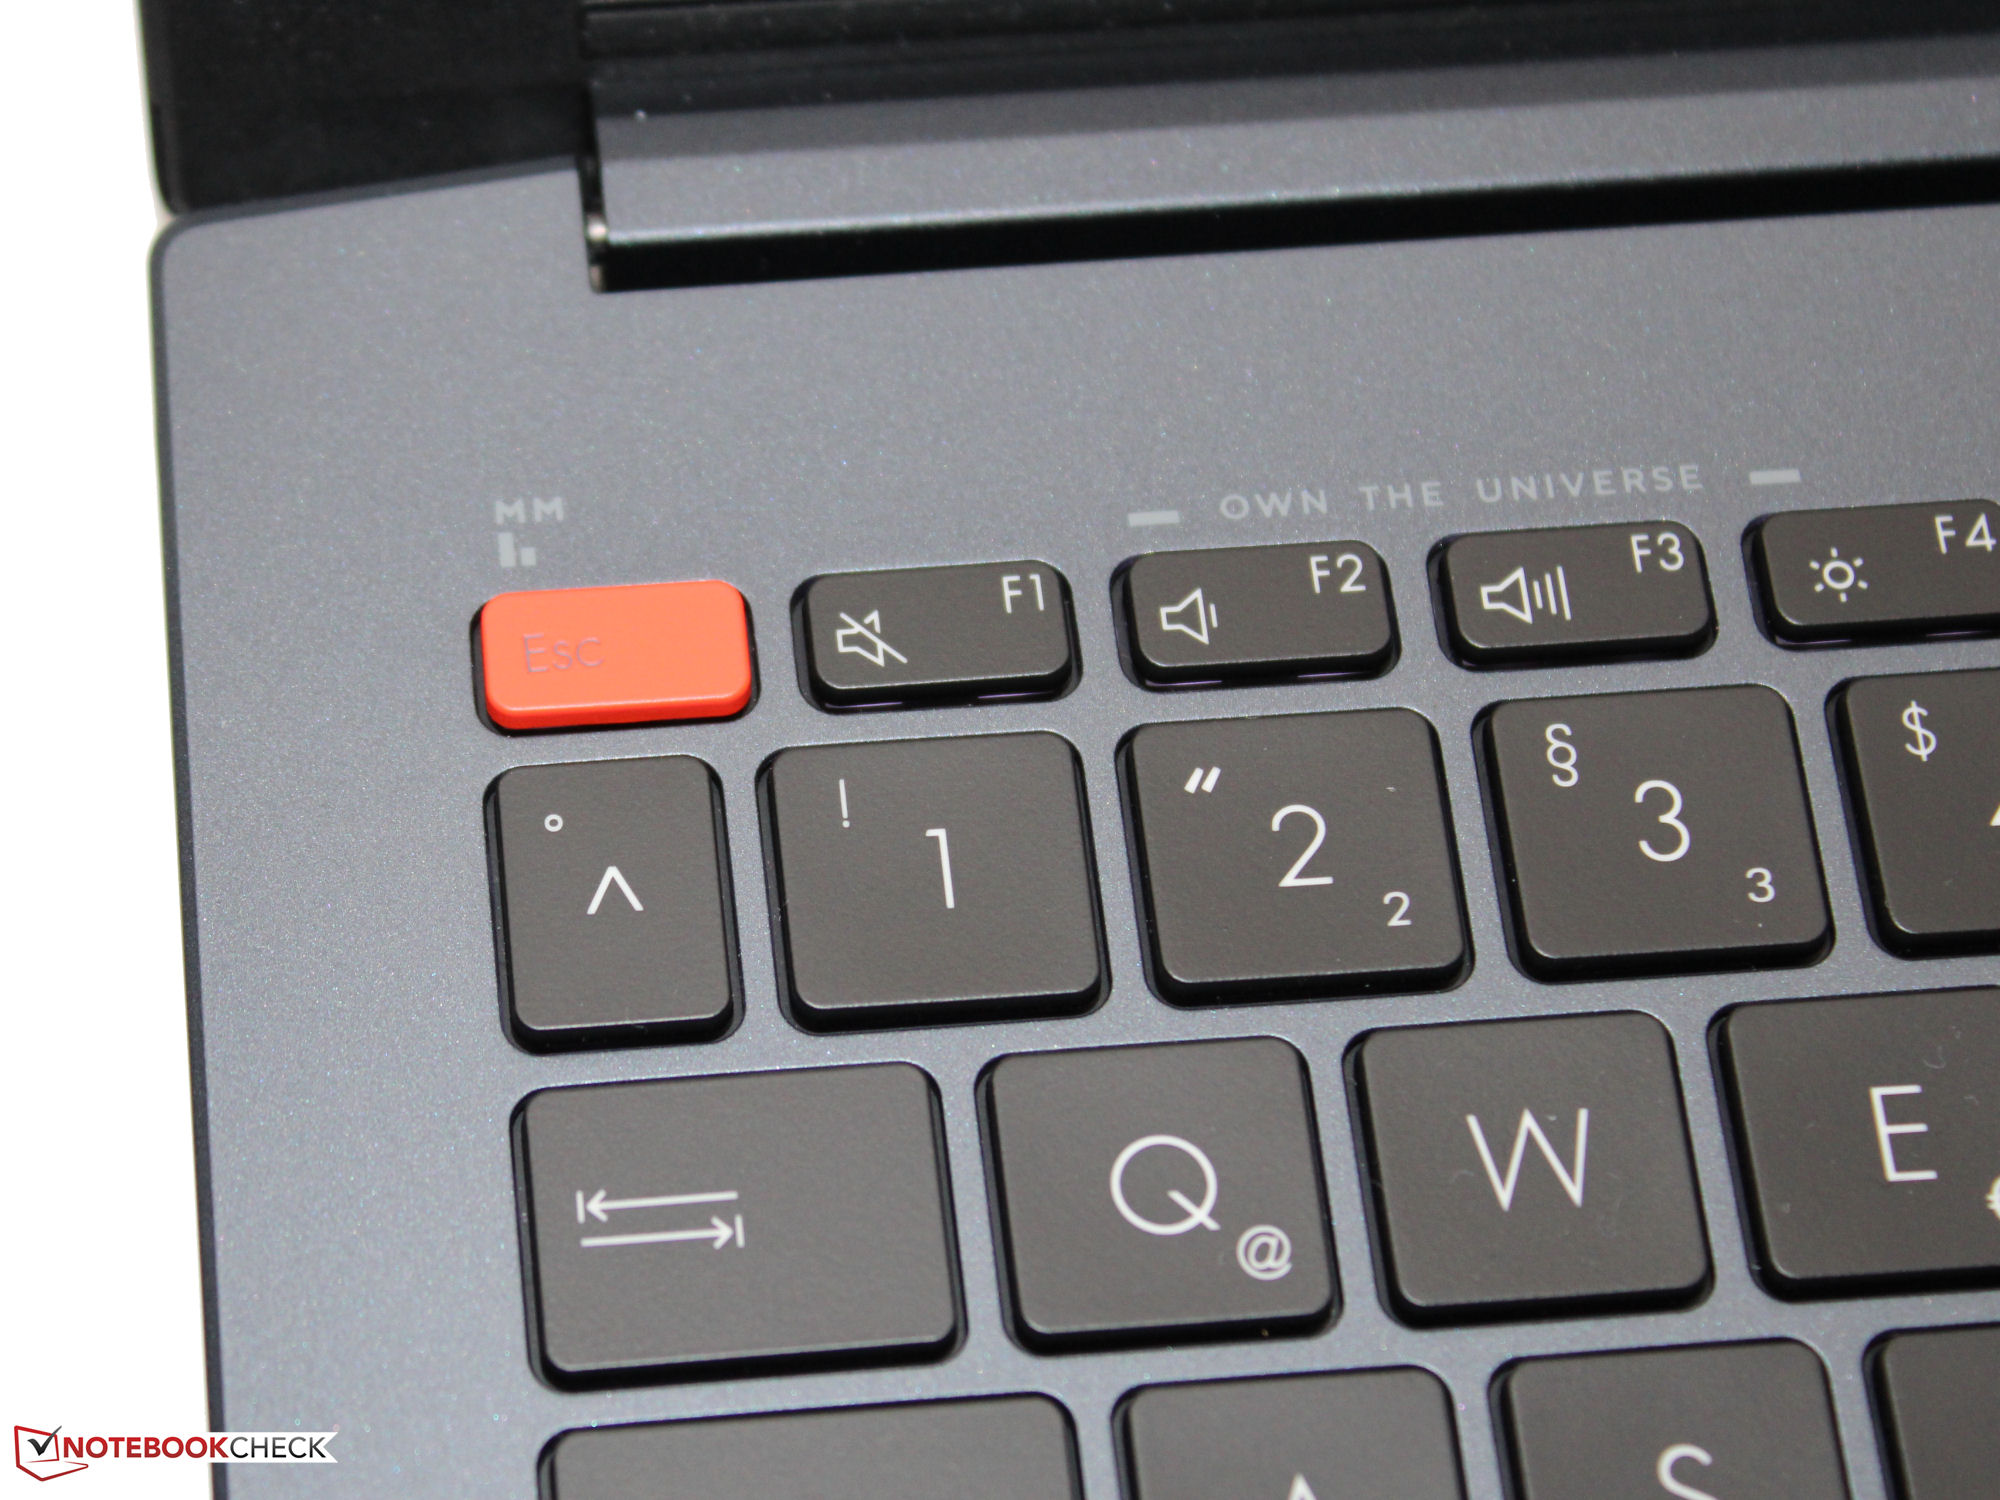
Klawisze klawiatury typu chiclet (częściowo zakrzywione i z trzema trybami podświetlenia) mają średni skok i wyraźny punkt nacisku. Mają przyjemny poziom oporu - ale mogłyby być nieco bardziej wyraziste. Podczas pisania klawiatura lekko się ugina - nie jest to jednak nic negatywnego. Ogólnie rzecz biorąc, klawiatura laptopa Asus nadaje się do codziennego użytku.
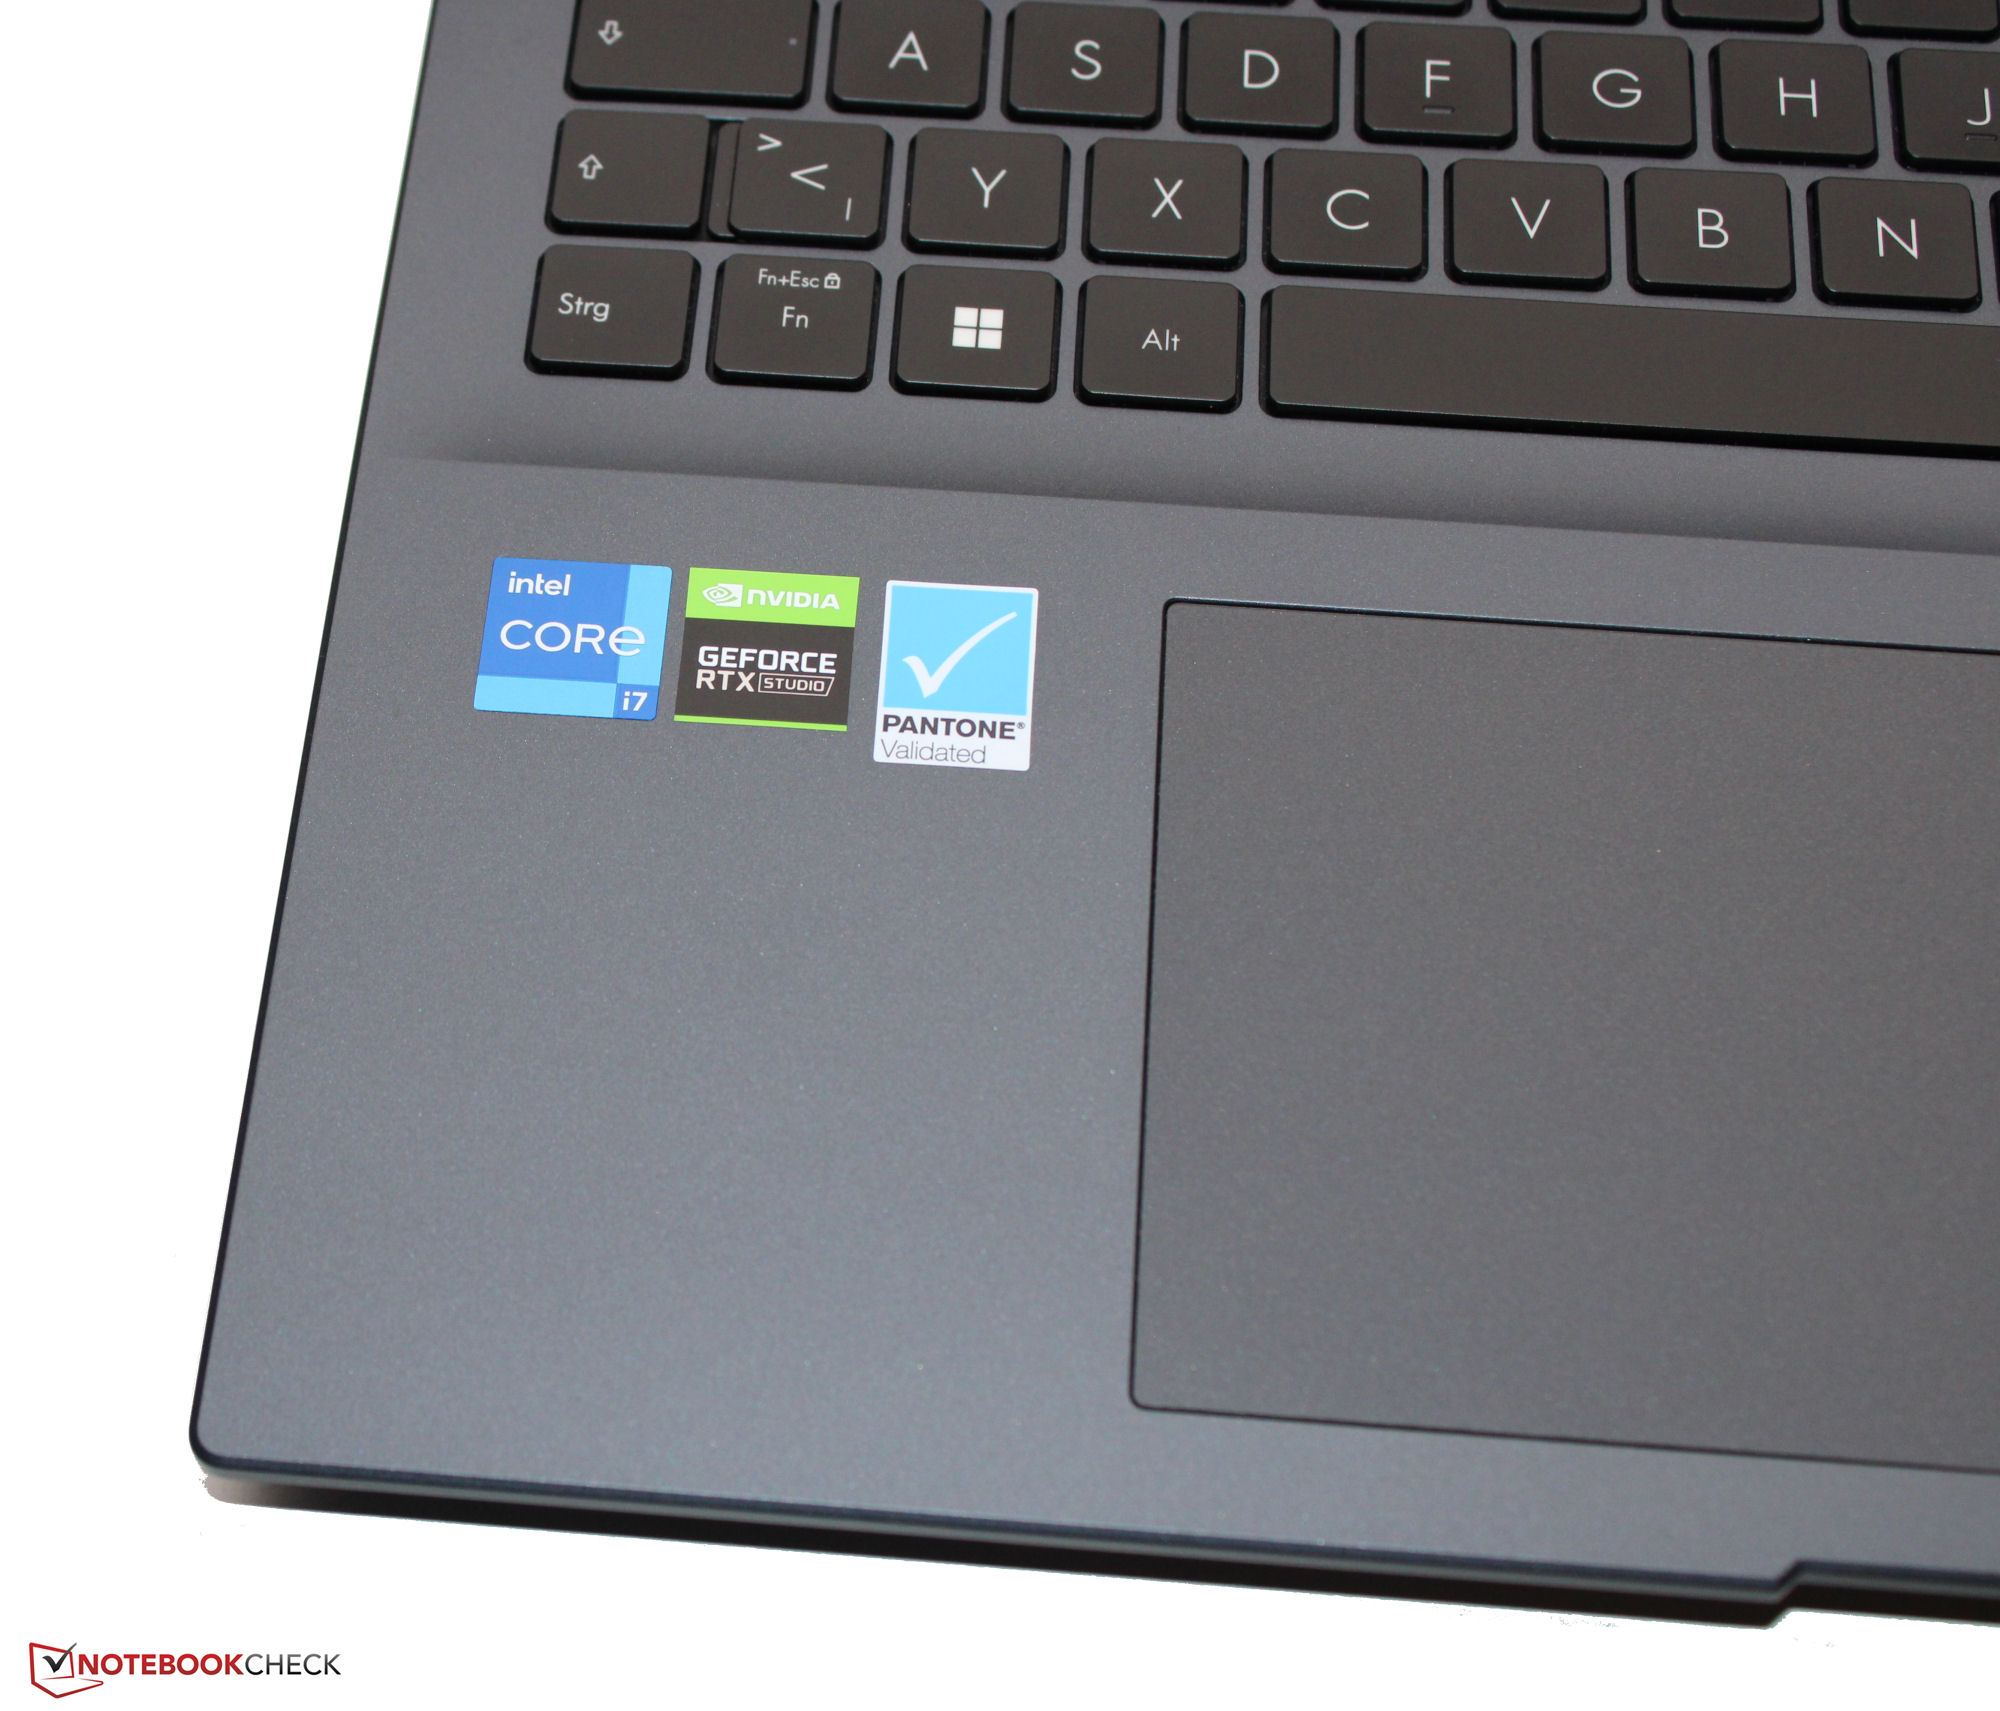
Podkładka pod kliknięcia (13 x 8,5 cm) zastępuje mysz, a jej gładka powierzchnia sprawia, że palce przesuwają się po niej wygodnie. Reaguje na polecenia aż do krawędzi, ma minimalny skok i wyraźny punkt nacisku.
Wyświetlacz - panel 16:10 z pokryciem DCI-P3

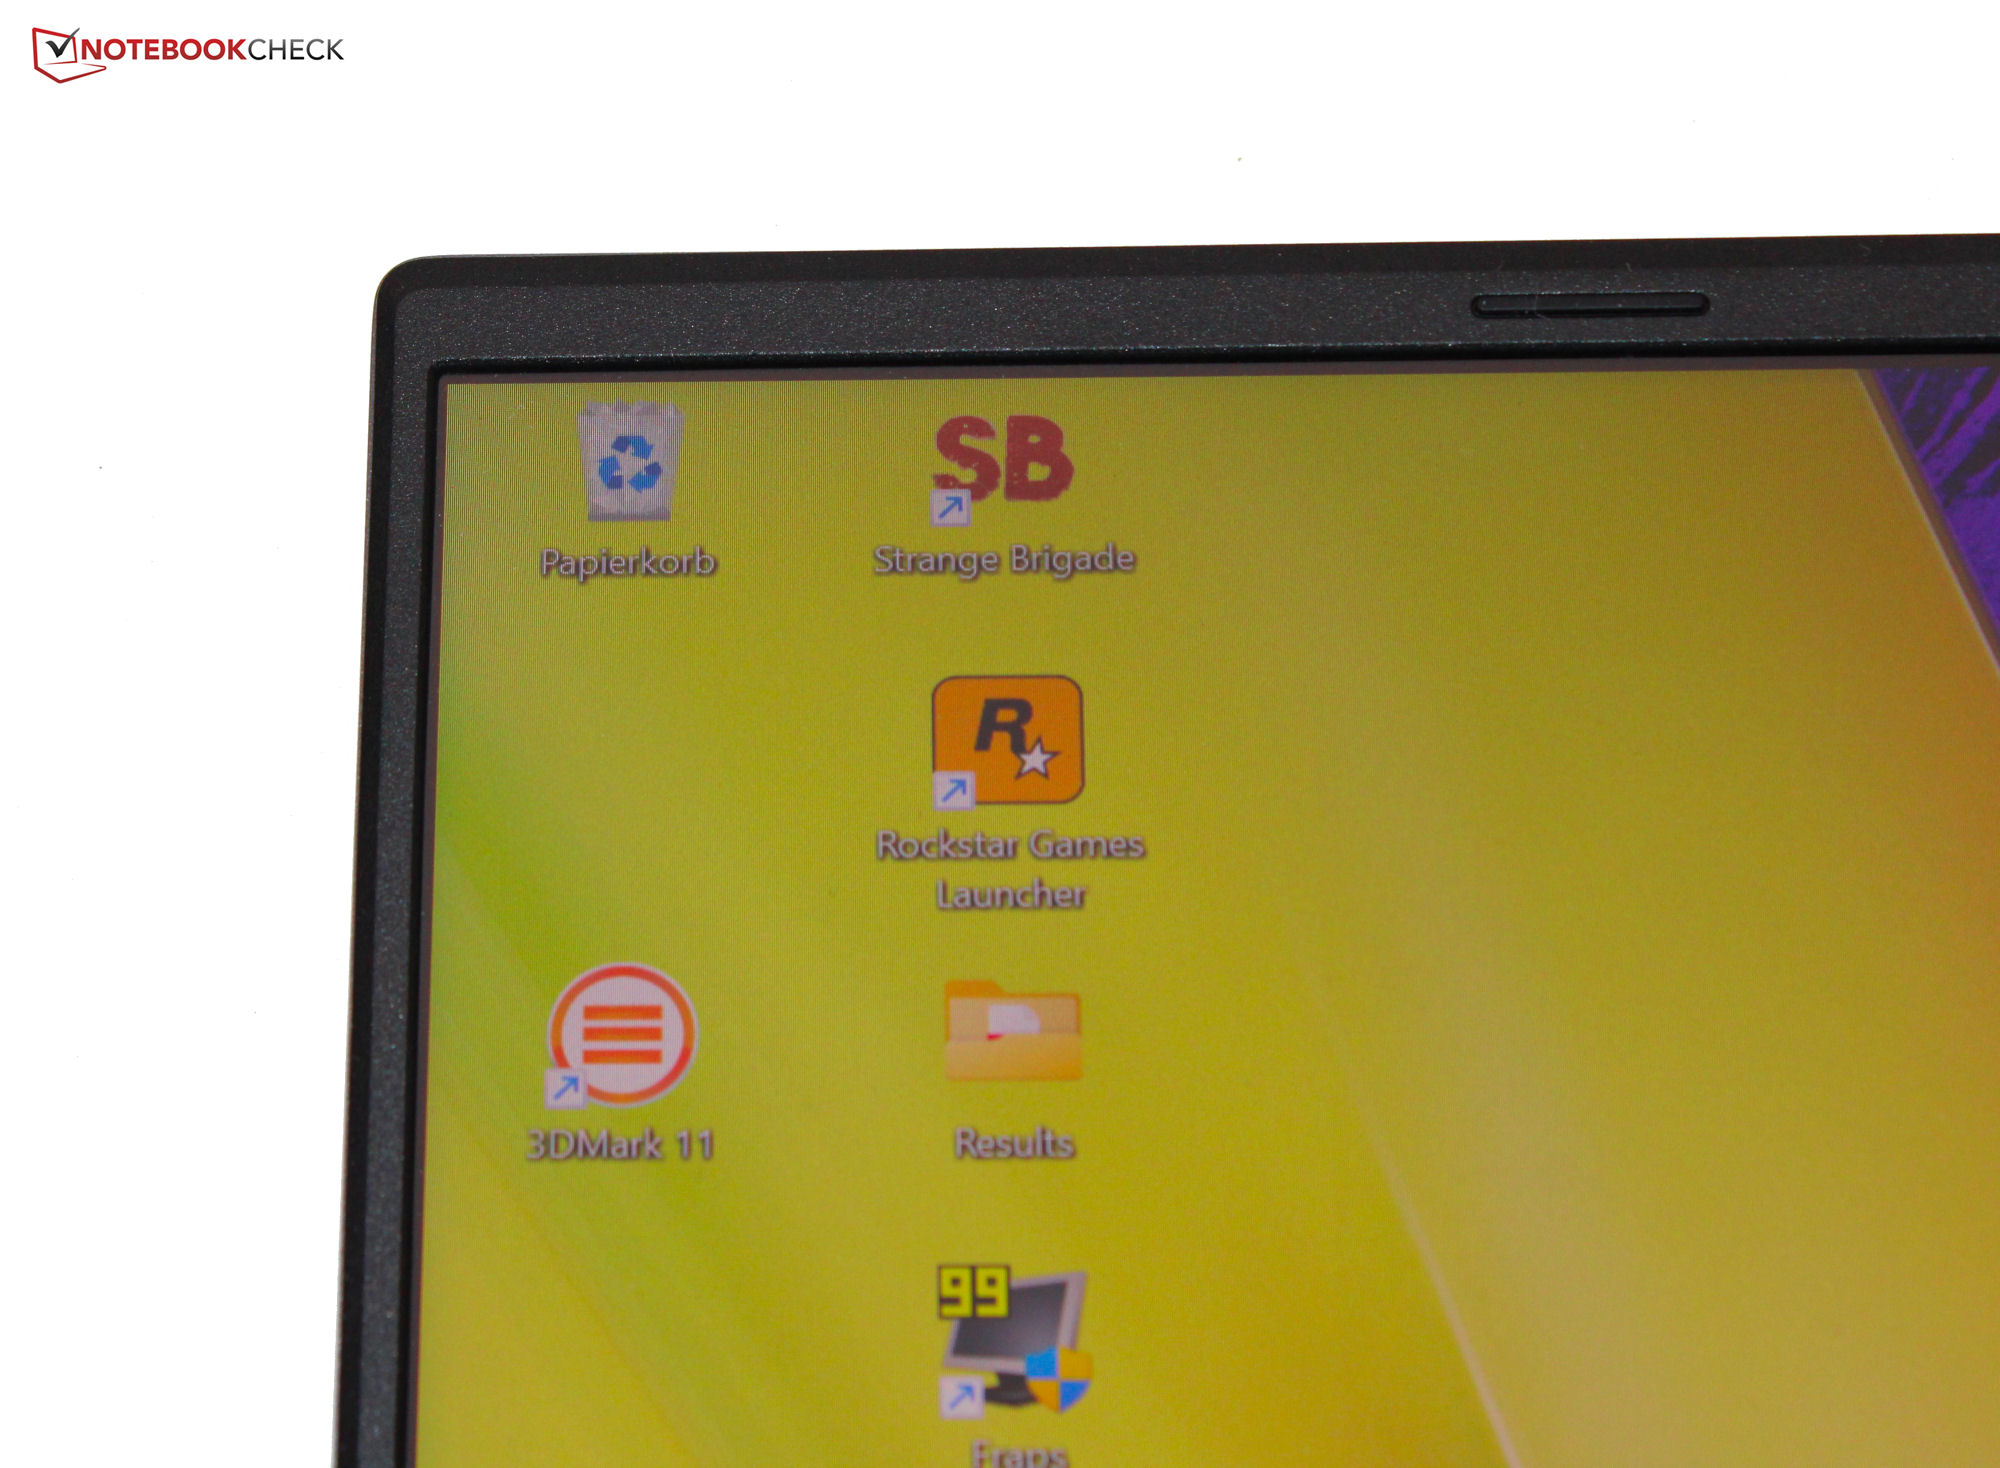
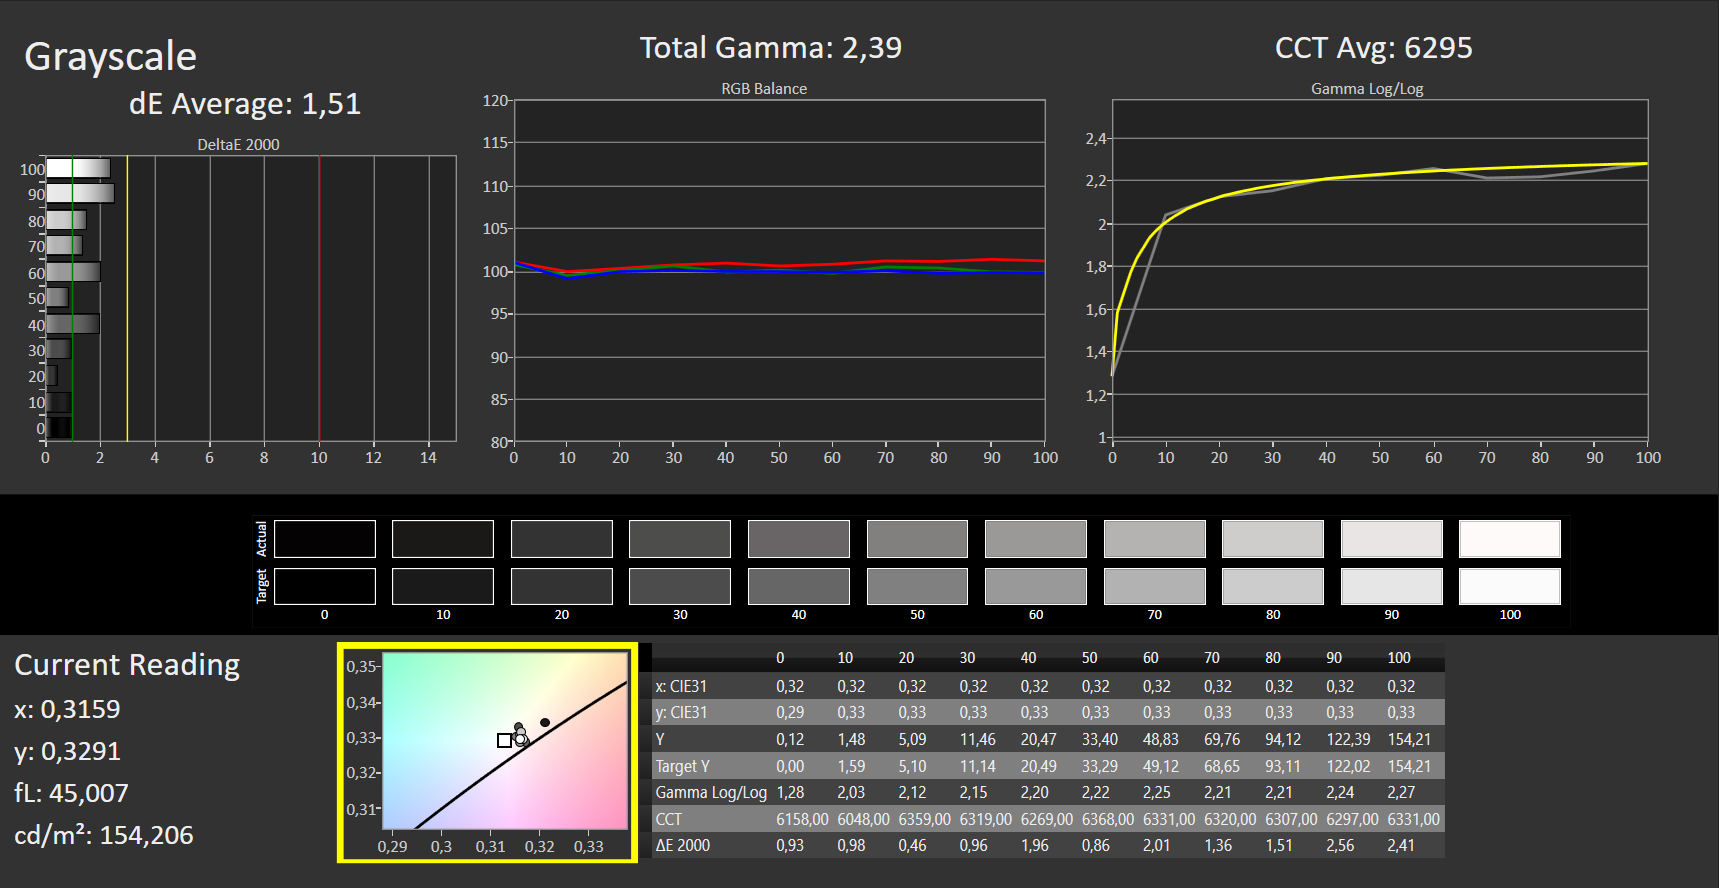
Szybko reagujący panel 120 Hz w formacie 16:10 nie wykazuje żadnych oznak migotania PWM na wszystkich poziomach jasności. Jasność i kontrast na matowym, 16-calowym wyświetlaczu (2560 x 1600 pikseli) są dokładnie takie, jak być powinny (> 300 cd/m² lub 1.000:1).
| |||||||||||||||||||||||||
rozświetlenie: 87 %
na akumulatorze: 509 cd/m²
kontrast: 1440:1 (czerń: 0.35 cd/m²)
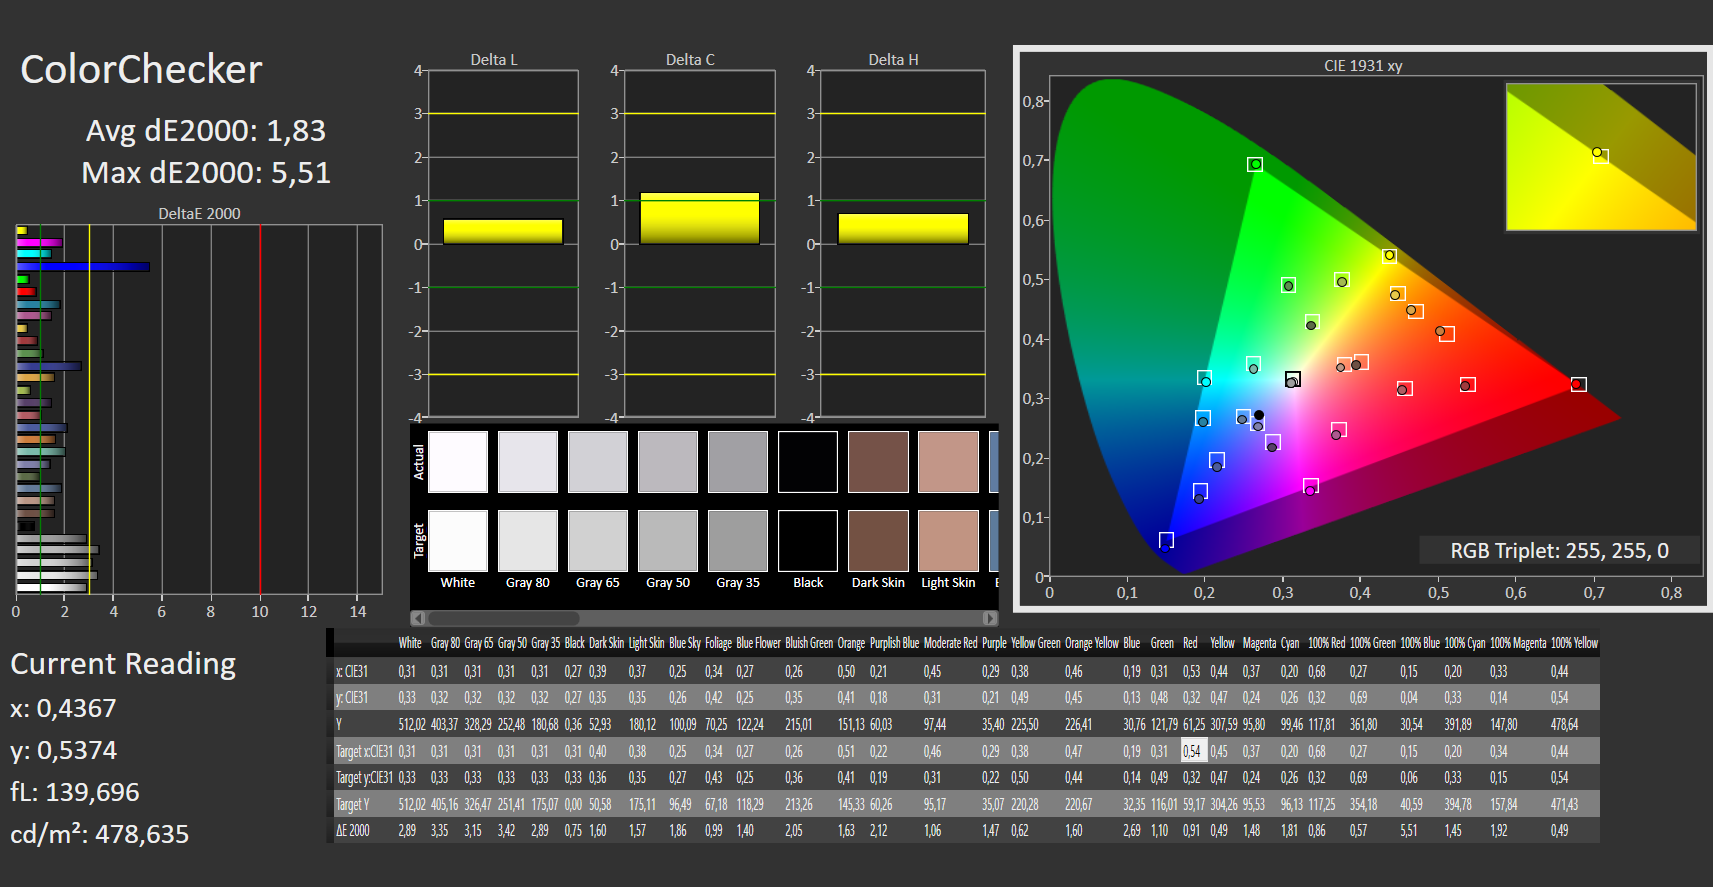
ΔE ColorChecker Calman: 1.83 | ∀{0.5-29.43 Ø4.71}
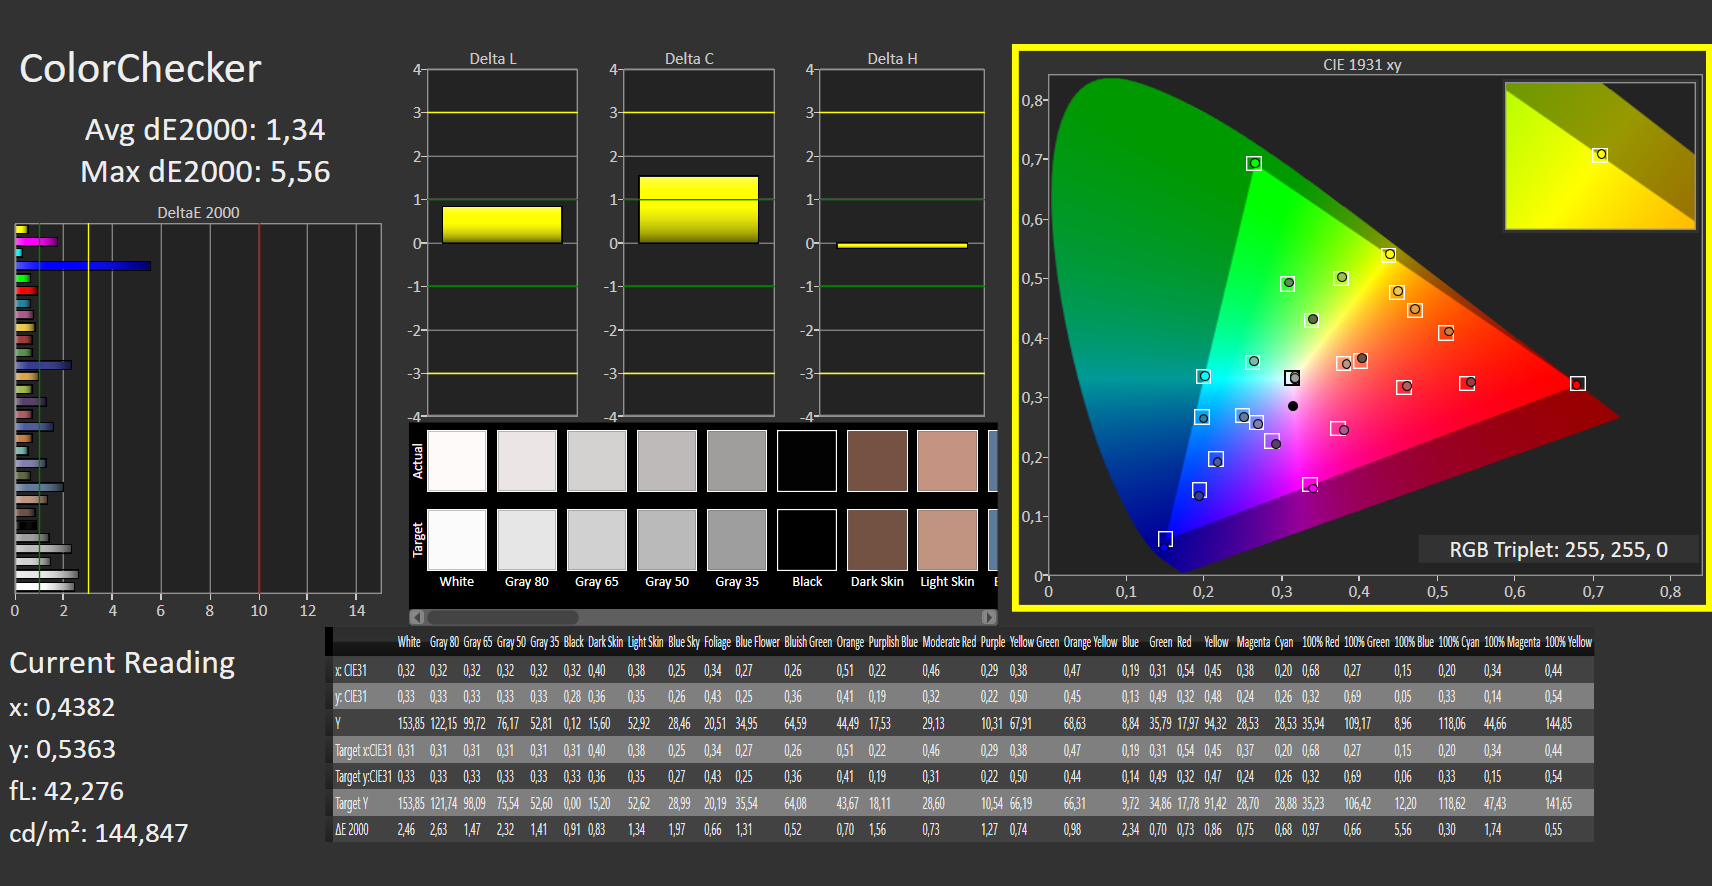
calibrated: 1.34
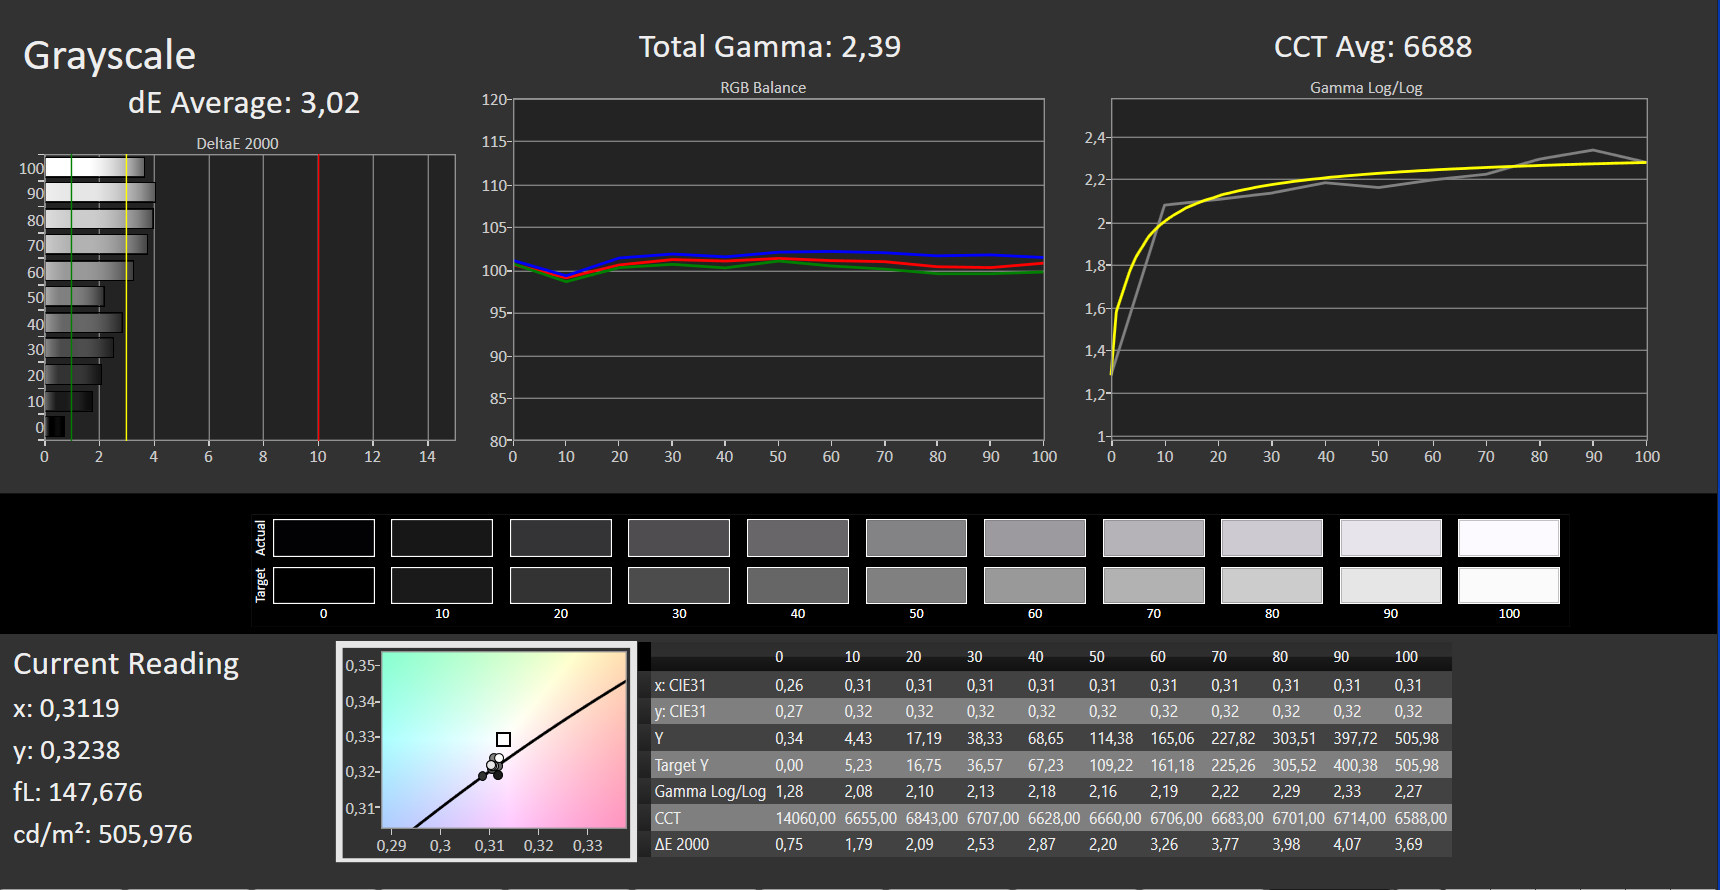
ΔE Greyscale Calman: 3.02 | ∀{0.09-98 Ø4.96}
86.1% AdobeRGB 1998 (Argyll 3D)
99.9% sRGB (Argyll 3D)
98.5% Display P3 (Argyll 3D)
Gamma: 2.39
CCT: 6688 K
| Asus VivoBook Pro 16 Au Optronics B160QAN02.L, IPS, 2560x1600, 16" | Dell Inspiron 16 Plus 7620 BOE NE16N41, IPS, 3072x1920, 16" | Schenker XMG Fusion 15 (Mid 22) BOE CQ NE156QHM-NY2, IPS, 2560x1440, 15.6" | Acer Swift X SFX16-52G-77RX B160QAN02.M, IPS-LED, 2560x1600, 16" | |
|---|---|---|---|---|
| Display | -14% | -19% | -11% | |
| Display P3 Coverage (%) | 98.5 | 70.8 -28% | 67.3 -32% | 76.4 -22% |
| sRGB Coverage (%) | 99.9 | 99.5 0% | 96.7 -3% | 100 0% |
| AdobeRGB 1998 Coverage (%) | 86.1 | 73.2 -15% | 68.2 -21% | 76.6 -11% |
| Response Times | -1025% | -234% | -819% | |
| Response Time Grey 50% / Grey 80% * (ms) | 2 ? | 38 ? -1800% | 11.6 ? -480% | 33 ? -1550% |
| Response Time Black / White * (ms) | 8 ? | 28 ? -250% | 7 ? 12% | 15 ? -88% |
| PWM Frequency (Hz) | ||||
| Screen | 7% | -32% | -4% | |
| Brightness middle (cd/m²) | 504 | 288.9 -43% | 326 -35% | 411 -18% |
| Brightness (cd/m²) | 465 | 276 -41% | 303 -35% | 378 -19% |
| Brightness Distribution (%) | 87 | 92 6% | 89 2% | 83 -5% |
| Black Level * (cd/m²) | 0.35 | 0.26 26% | 0.33 6% | 0.29 17% |
| Contrast (:1) | 1440 | 1111 -23% | 988 -31% | 1417 -2% |
| Colorchecker dE 2000 * | 1.83 | 1.88 -3% | 2.73 -49% | 2.18 -19% |
| Colorchecker dE 2000 max. * | 5.51 | 4.37 21% | 9.54 -73% | 4.84 12% |
| Colorchecker dE 2000 calibrated * | 1.34 | 0.42 69% | 1.36 -1% | 1.48 -10% |
| Greyscale dE 2000 * | 3.02 | 1.4 54% | 5.2 -72% | 2.68 11% |
| Gamma | 2.39 92% | 2.3 96% | 2.074 106% | 2.43 91% |
| CCT | 6688 97% | 6634 98% | 6911 94% | 6717 97% |
| Całkowita średnia (program / ustawienia) | -344% /
-145% | -95% /
-58% | -278% /
-122% |
* ... im mniej tym lepiej
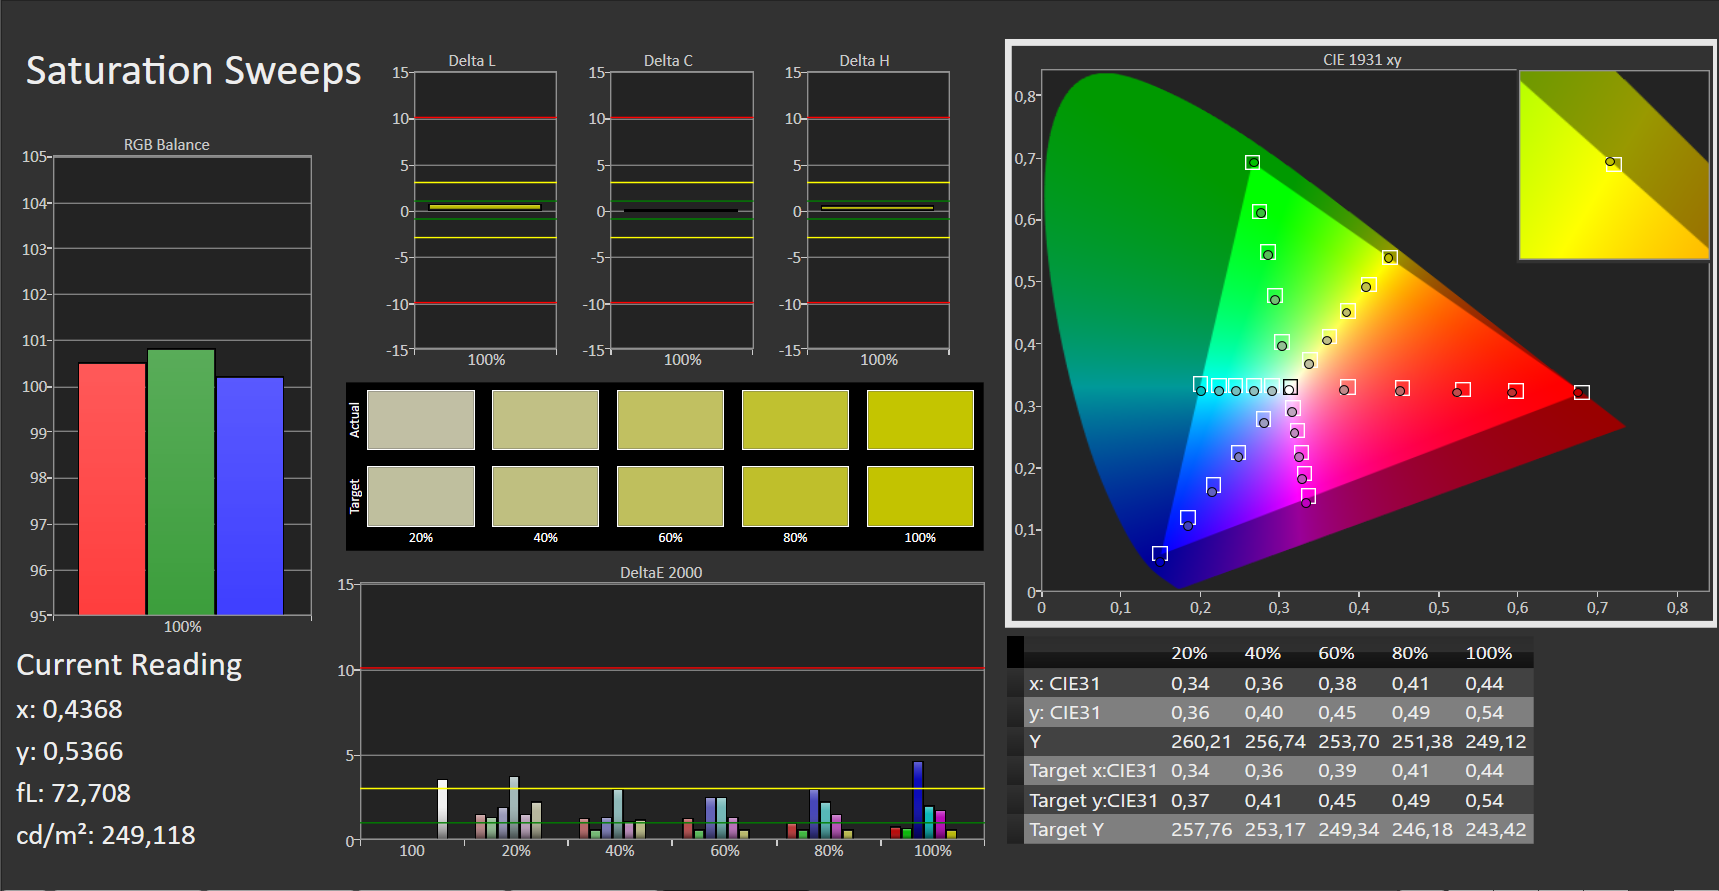
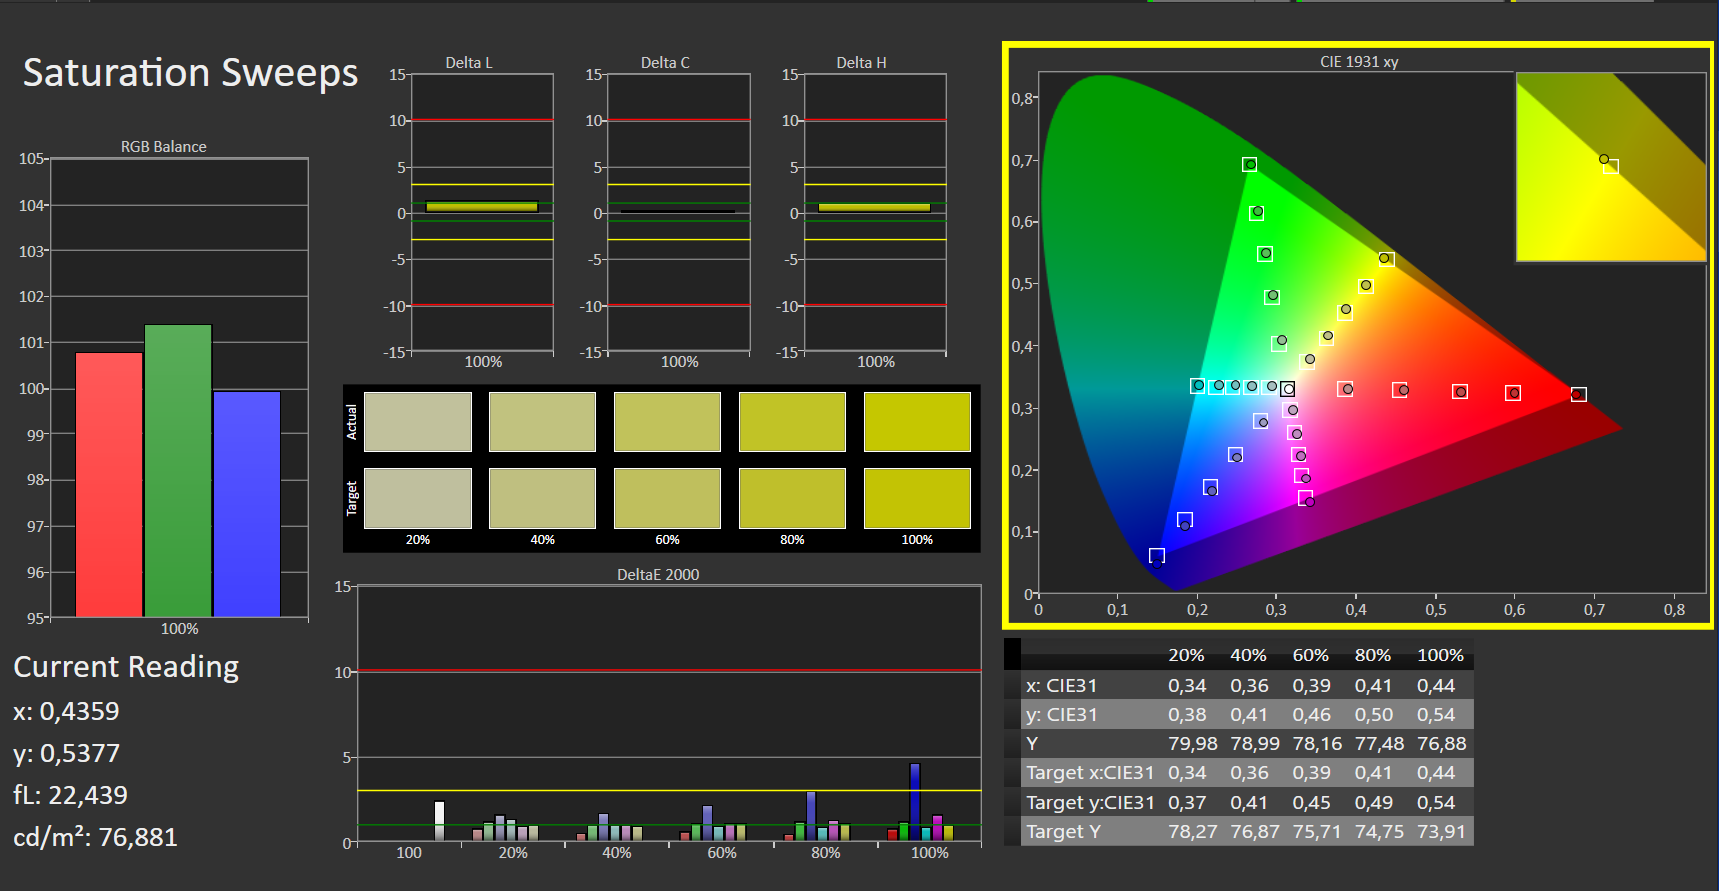
Certyfikat X Rite Pantone oznacza, że ekran ma bardzo naturalne odwzorowanie kolorów: Przy odchyleniach wynoszących około 1,8 zapewnia akceptowalne wyniki (DeltaE < 3) zaraz po wyjęciu z pudełka. Kalibracja prowadzi do mniejszego odchylenia 1,3 i bardziej zrównoważonych odcieni szarości. Dokładność odwzorowania kolorów nie stanowi problemu: panel jest w stanie odwzorować całą przestrzeń barw DCI P3 i 86 procent przestrzeni Adobe RGB.
Wyświetl czasy reakcji
| ↔ Czas reakcji od czerni do bieli | ||
|---|---|---|
| 8 ms ... wzrost ↗ i spadek ↘ łącznie | ↗ 1 ms wzrost |  |
| ↘ 7 ms upadek | ||
| W naszych testach ekran wykazuje szybki czas reakcji i powinien nadawać się do gier. Dla porównania, wszystkie testowane urządzenia wahają się od 0.1 (minimum) do 240 (maksimum) ms. » 22 % wszystkich urządzeń jest lepszych. Oznacza to, że zmierzony czas reakcji jest lepszy od średniej wszystkich testowanych urządzeń (19.8 ms). | ||
| ↔ Czas reakcji 50% szarości do 80% szarości | ||
| 2 ms ... wzrost ↗ i spadek ↘ łącznie | ↗ 1 ms wzrost |  |
| ↘ 1 ms upadek | ||
| W naszych testach ekran wykazuje bardzo szybką reakcję i powinien bardzo dobrze nadawać się do szybkich gier. Dla porównania, wszystkie testowane urządzenia wahają się od 0.165 (minimum) do 636 (maksimum) ms. » 10 % wszystkich urządzeń jest lepszych. Oznacza to, że zmierzony czas reakcji jest lepszy od średniej wszystkich testowanych urządzeń (31 ms). | ||
Migotanie ekranu / PWM (modulacja szerokości impulsu)
| Migotanie ekranu/nie wykryto PWM |     | ||
Dla porównania: 52 % wszystkich testowanych urządzeń nie używa PWM do przyciemniania wyświetlacza. Jeśli wykryto PWM, zmierzono średnio 7754 (minimum: 5 - maksimum: 343500) Hz. | |||
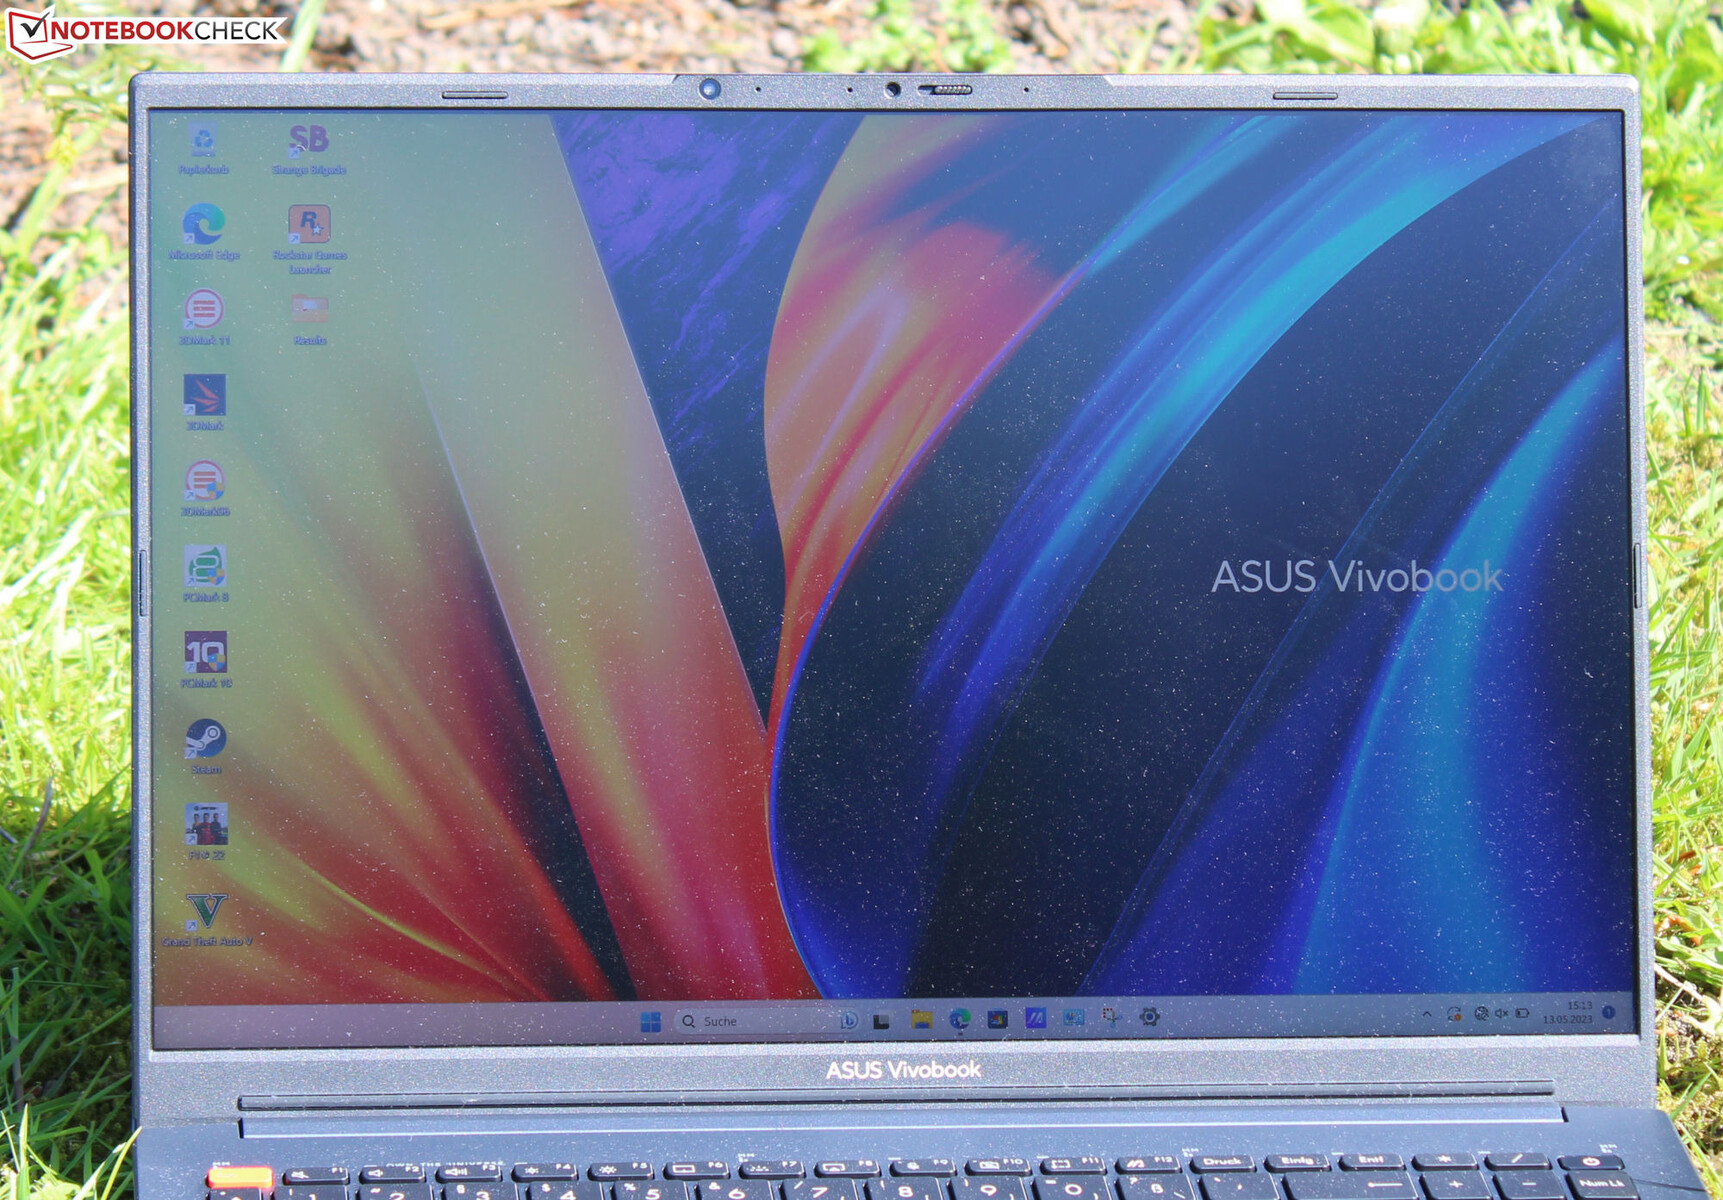
Panel IPS o stabilnym kącie widzenia można łatwo odczytać pod dowolnym kątem. Na zewnątrz wyświetlacz pozostaje czytelny, o ile słońce nie świeci zbyt mocno.
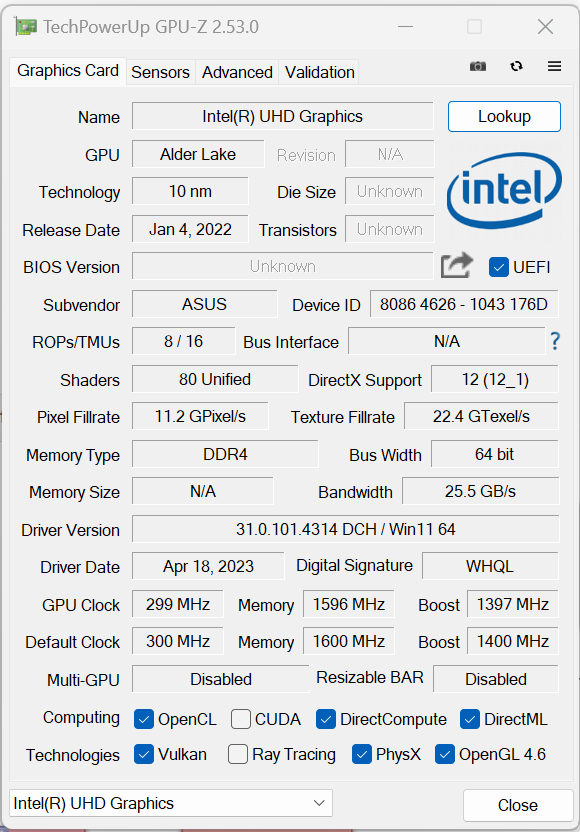
Wydajność - Alder Lake i Ampere
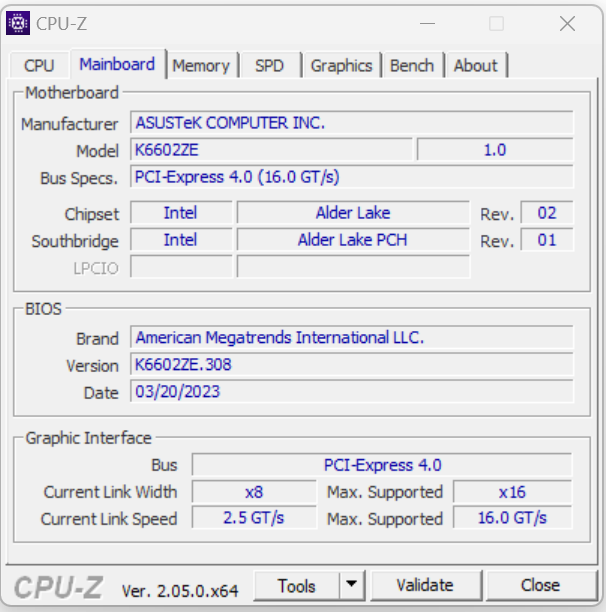
Seria VivoBook Pro 16 składa się z 5 modeli (patrz numer modelu), które bazują na różnych generacjach CPU i GPU. Obecny model K6602ZE wykorzystuje procesory Alder Lake i kartę graficznąGeForce-RTX-3050-TgPU. MRSP naszego urządzenia testowego wynosi 1 247 USD. Inne warianty nie były dostępne w momencie przeprowadzania testów.
Warunki testowania
Możesz przełączać się między trzema trybami chłodzenia specyficznymi dla producenta (patrz tabela) za pomocą kombinacji klawiszy "Fn" + "F". Użyliśmy "trybu standardowego" (testy porównawcze) i "trybu szeptanego" (test baterii).
| Tryb wydajności | Tryb standardowy | Tryb cichy | |
|---|---|---|---|
| Limit mocy 1 (HWInfo) | 80 watów | 50 watów | 28 watów |
| Limit mocy 2 (HWInfo) | 120 watów | 120 watów | 120 watów |
| TGP (Witcher 3) | 65 watów | 50 watów | 25 watów |
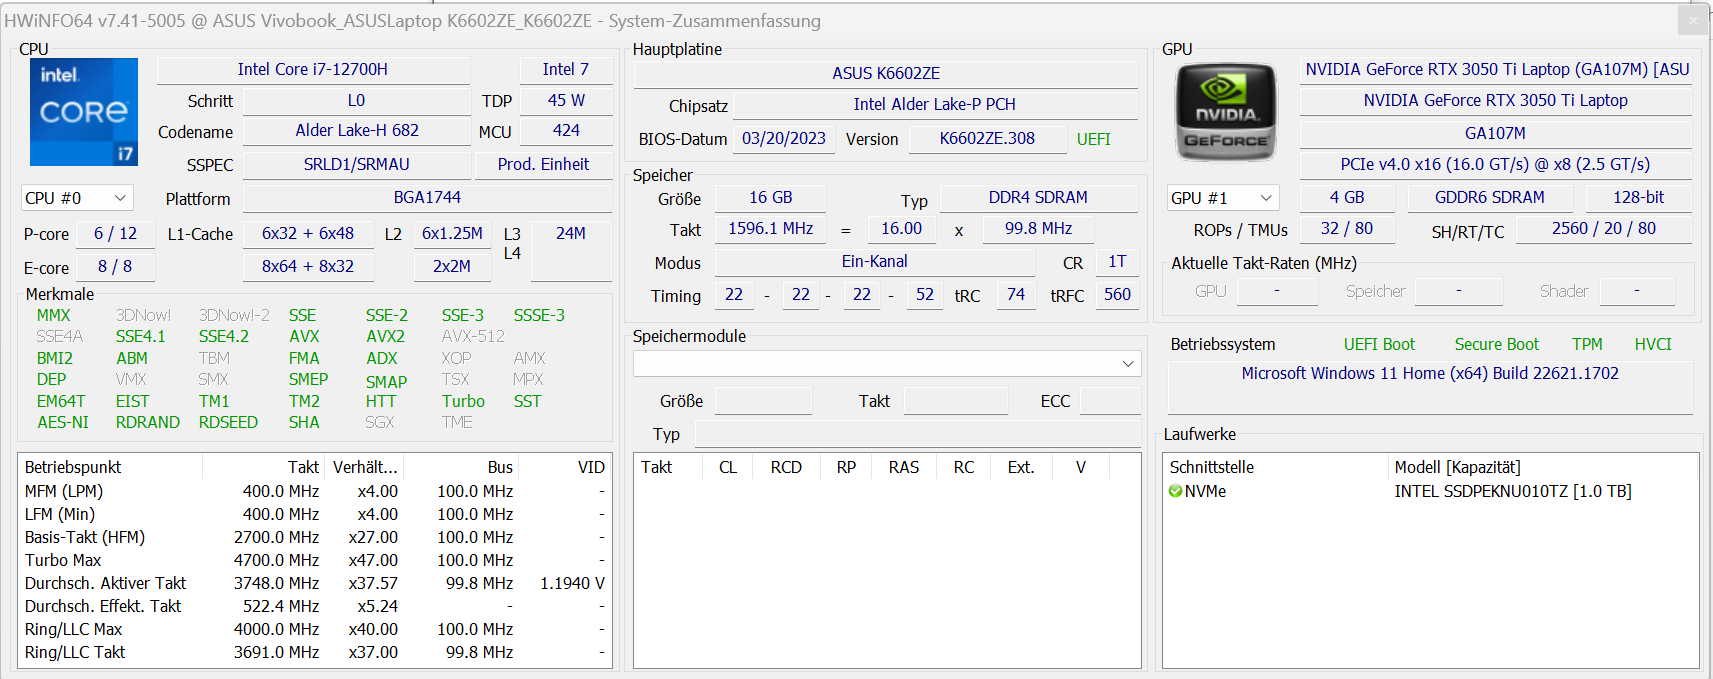
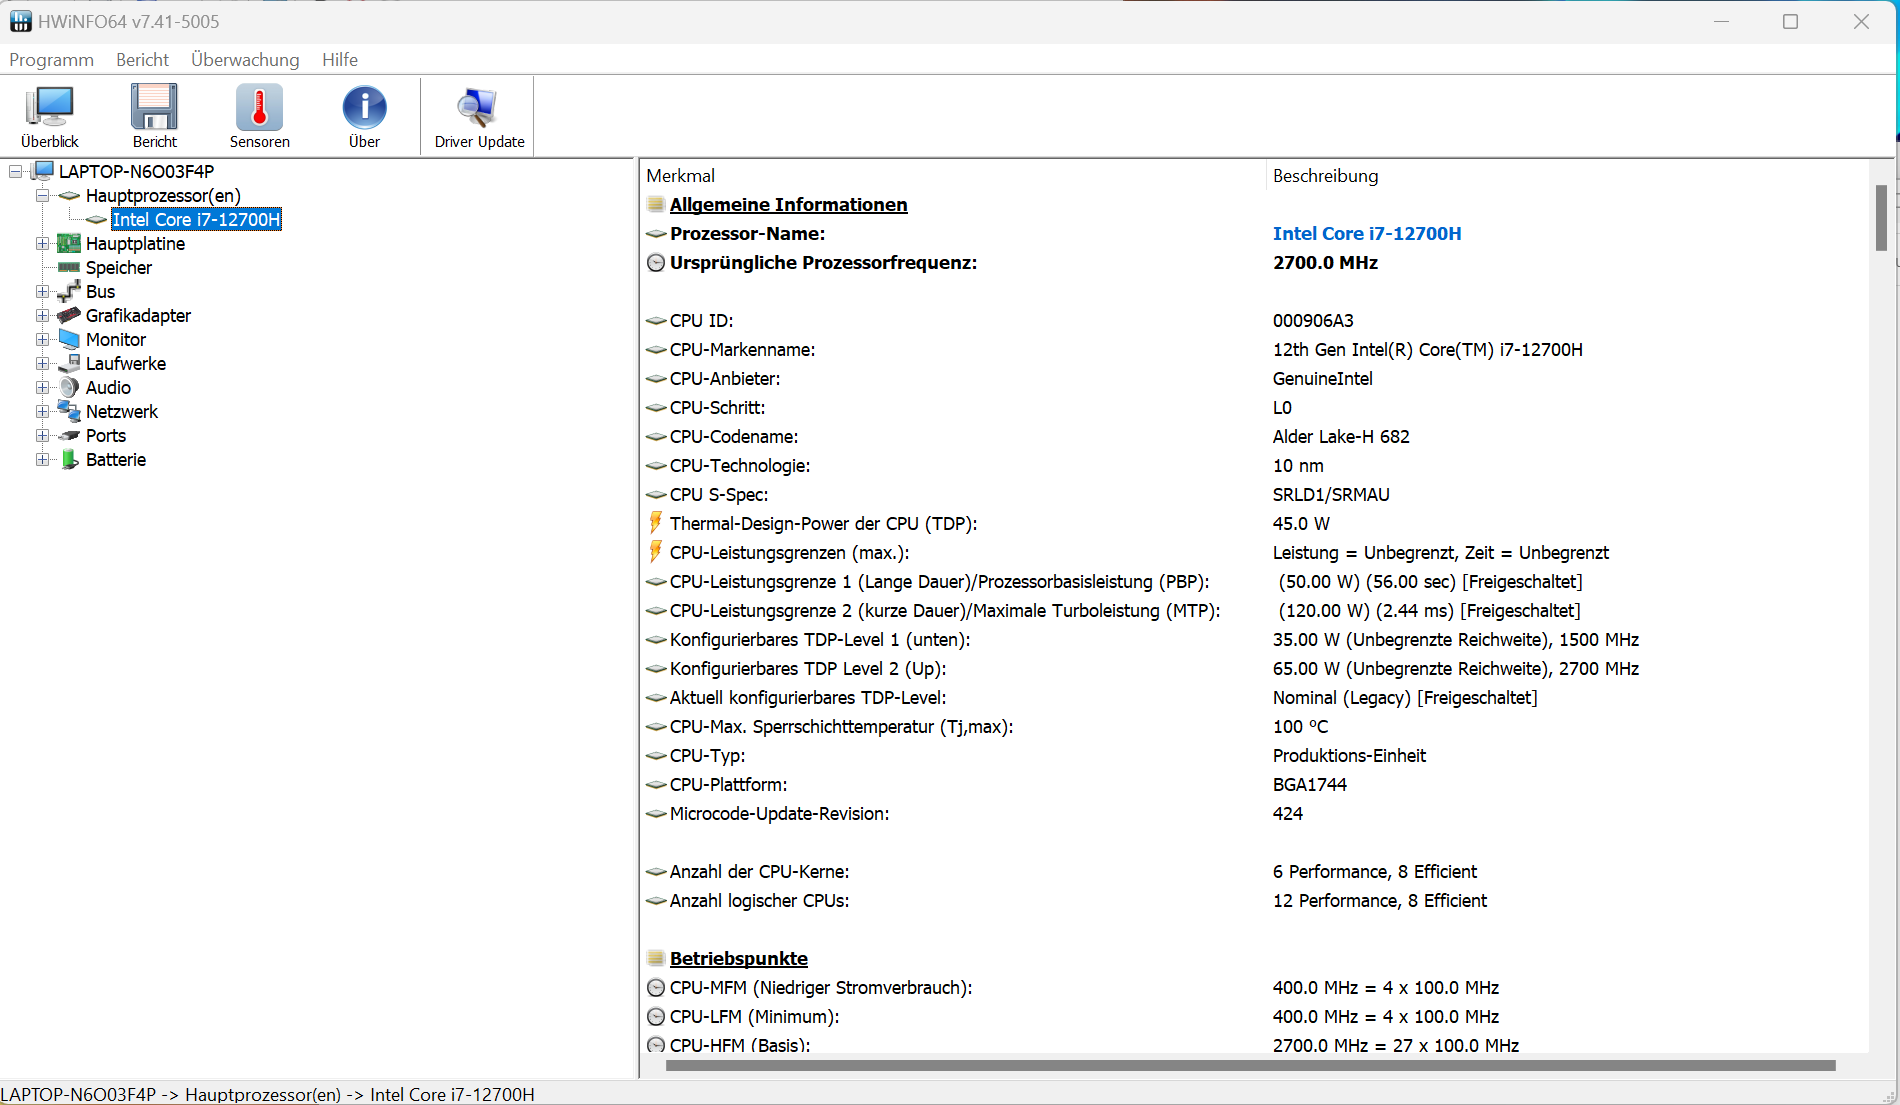
Procesor
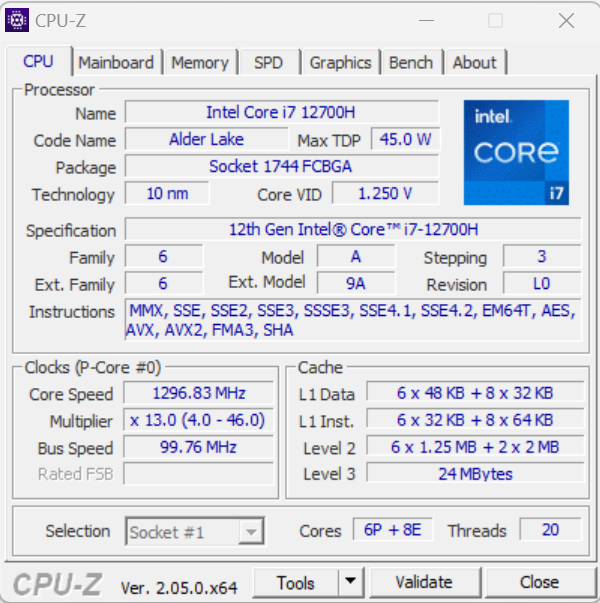
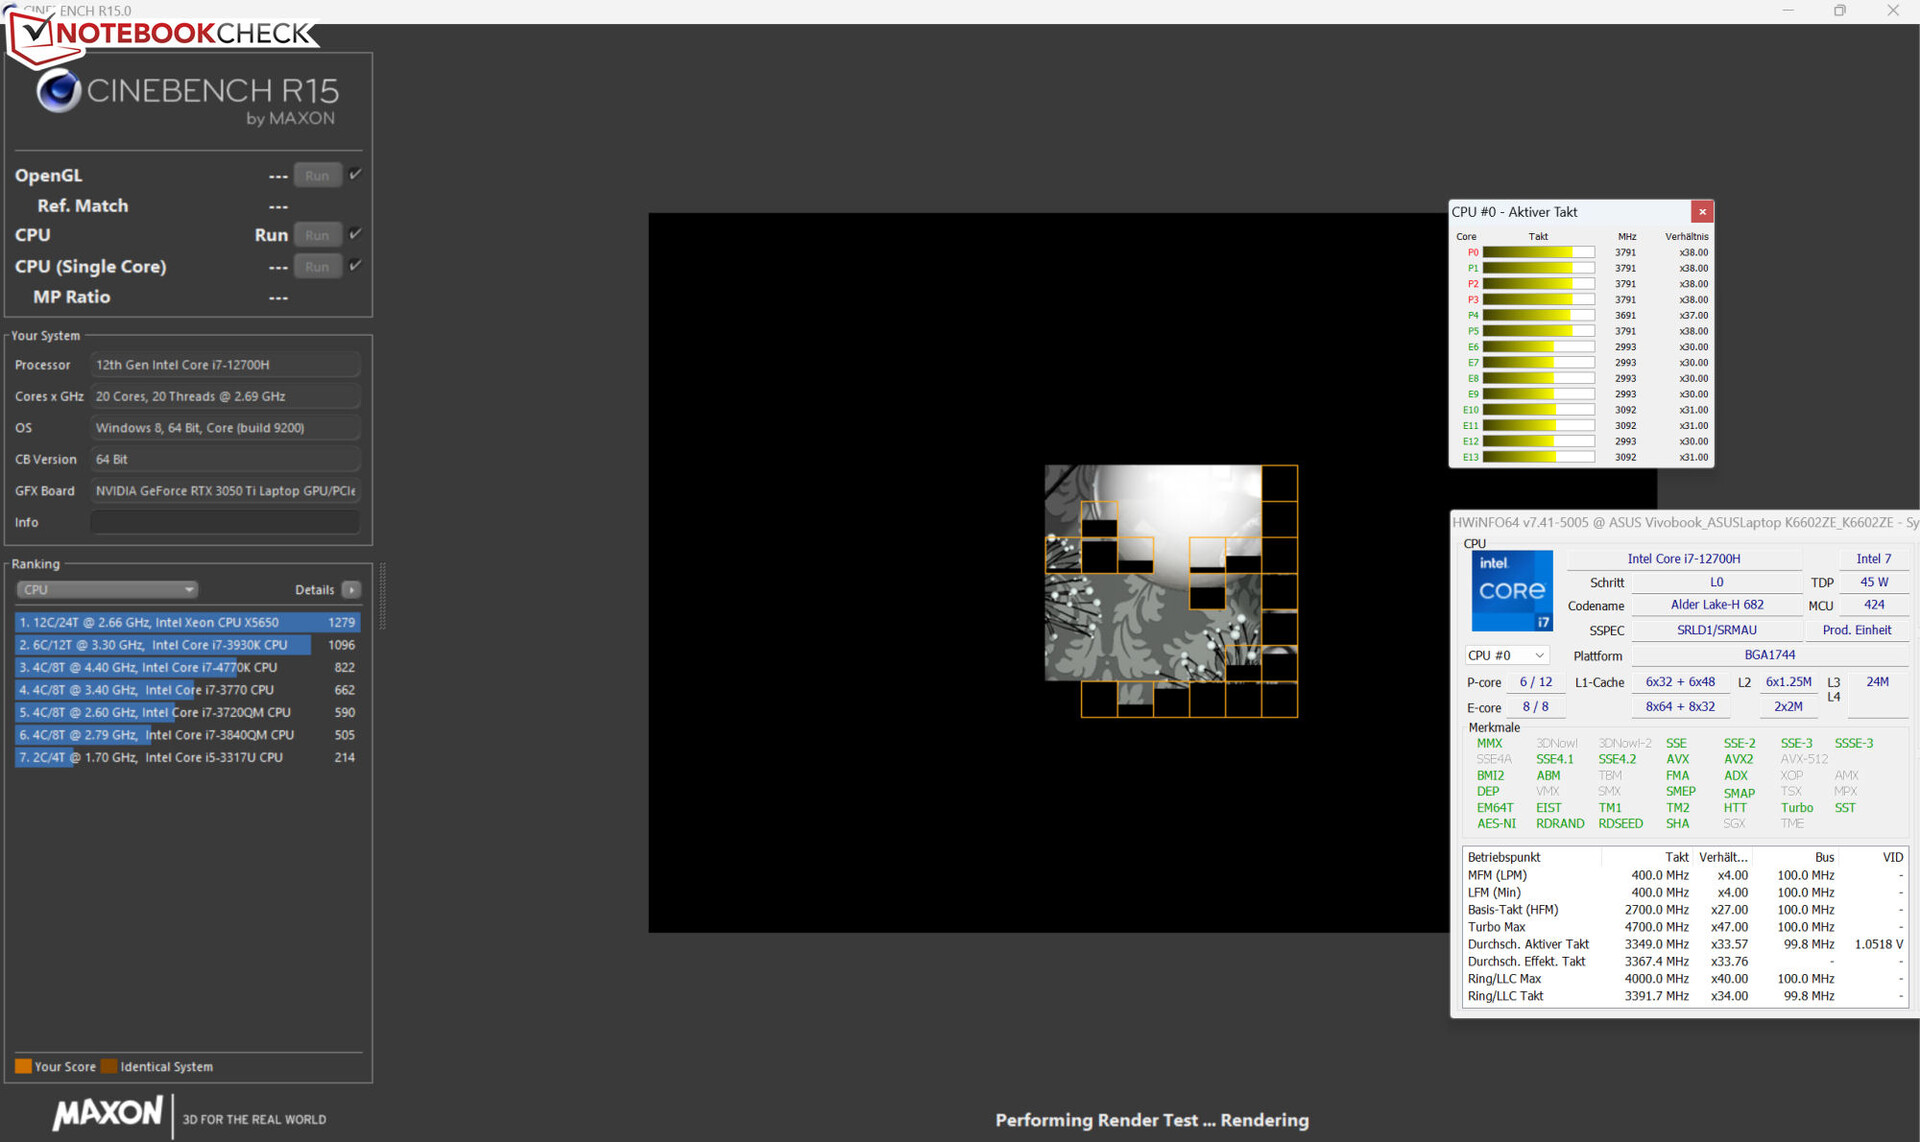
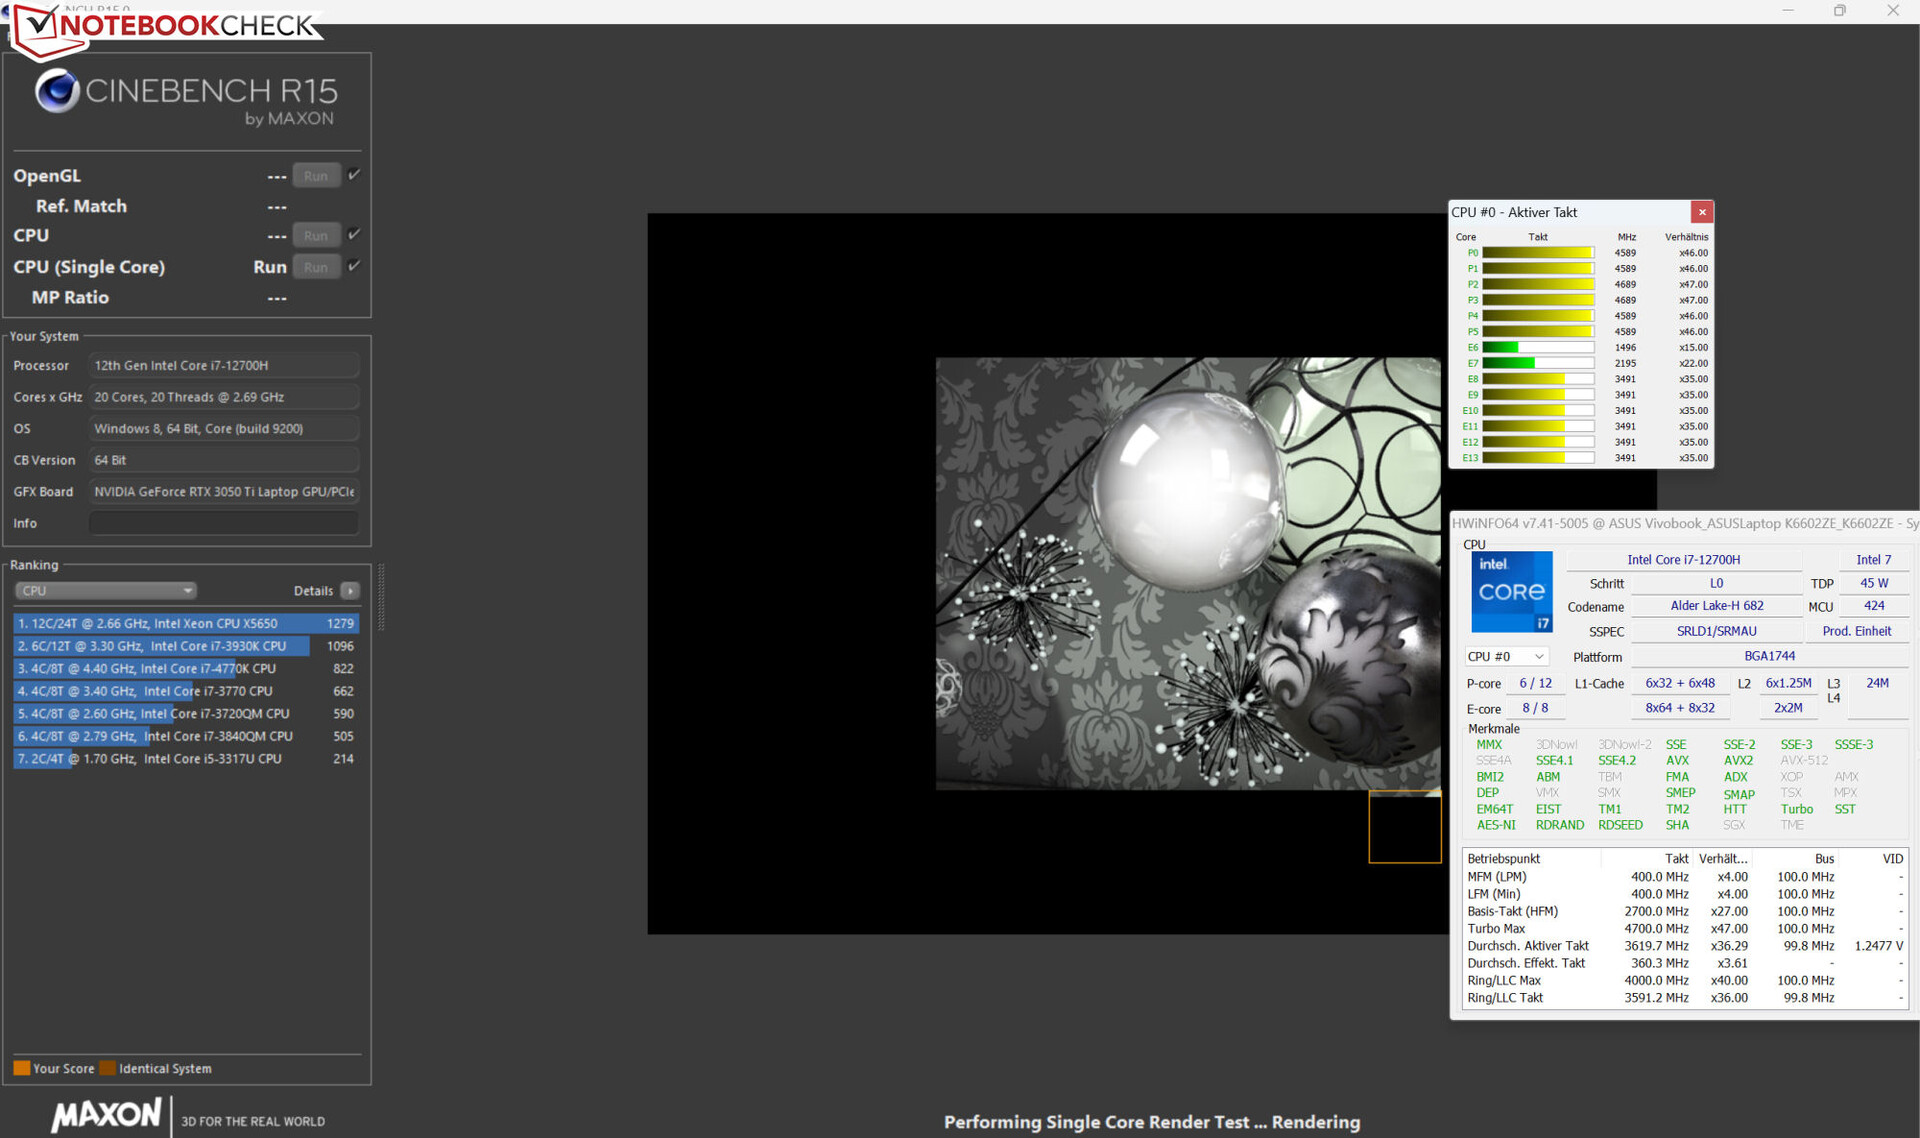
Procesor laptopaCore-i7-12700H(Alder Lake) składa się z 6 rdzeni wydajnościowych (hyper threading, 2,4 - 4,7 GHz) i 8 rdzeni wydajnościowych (bez hyper threading, 1,8 - 3,5 GHz). Łącznie daje to 20 logicznych rdzeni CPU.
Najlepsze wyniki benchmarków uzyskaliśmy w aktywnym "trybie wydajności" - choć dystans do "trybu standardowego" był minimalny. Tak czy inaczej, wartości te plasują się poniżej średniej CPU. W trybie bateryjnym jego wydajność jednowątkowa (127 punktów) była obniżona w większym stopniu niż wielowątkowa (1695 punktów).
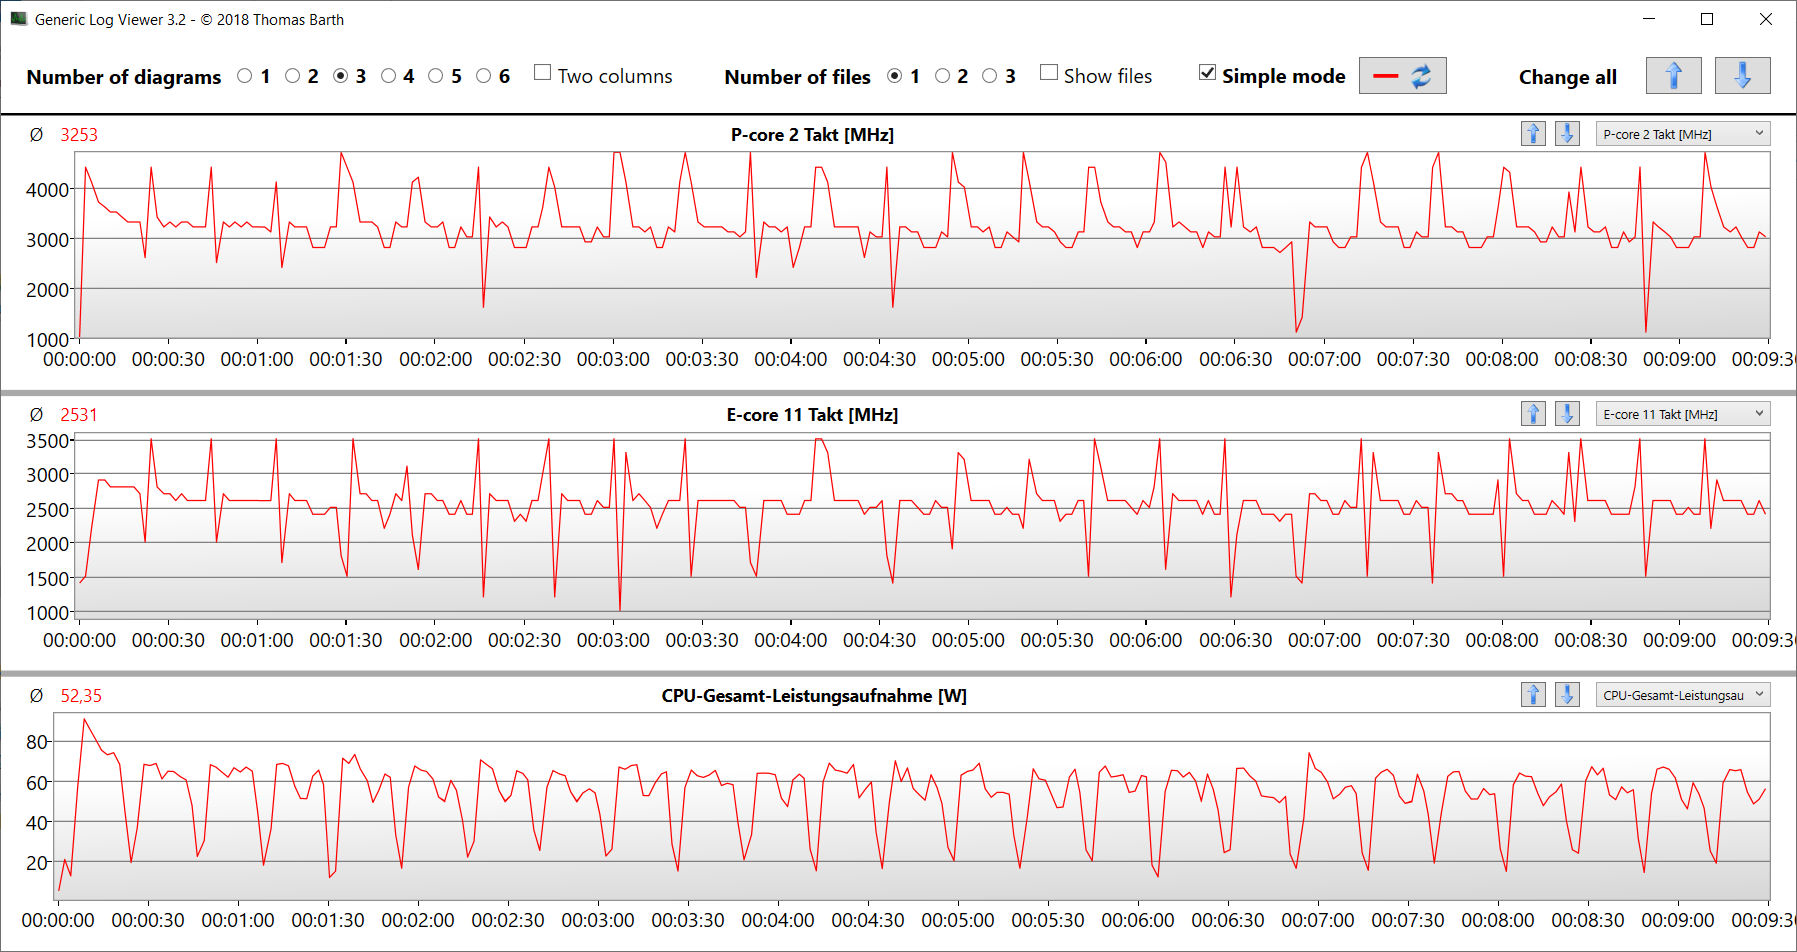
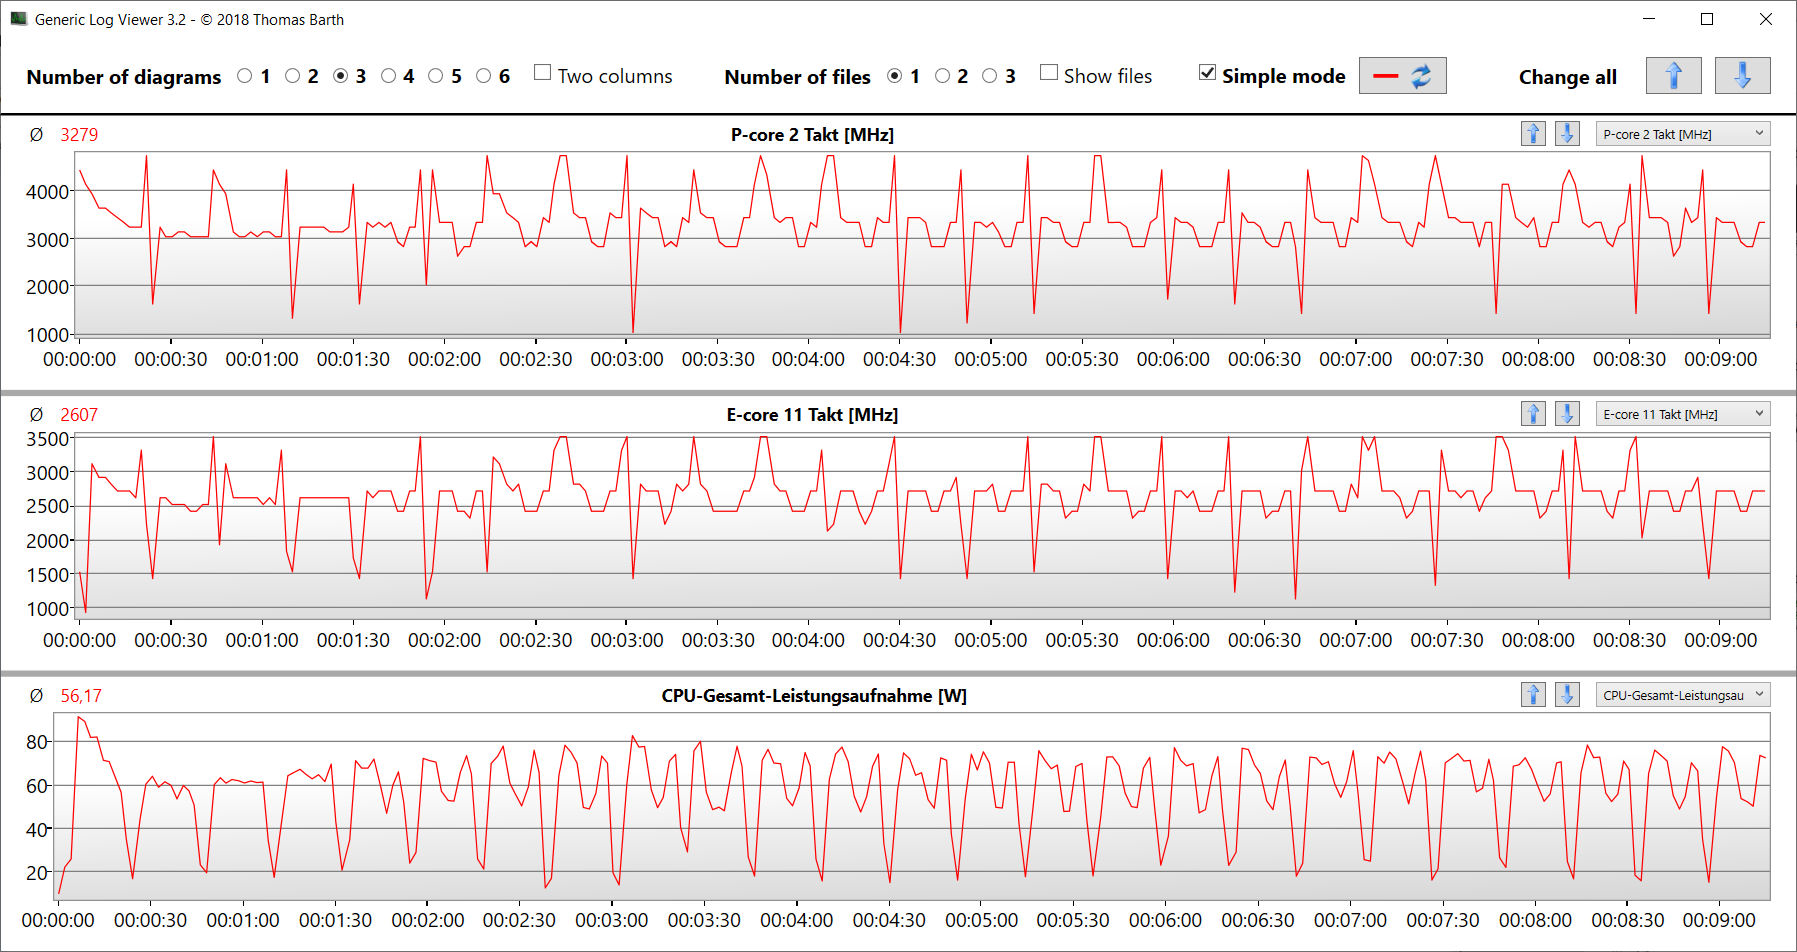
Test pętli CB15 wykazał: Ciągłe obciążenie wielowątkowe doprowadziło do spadku częstotliwości taktowania turbo od pierwszego do czwartego uruchomienia. Następnie taktowanie utrzymywało się na stałym poziomie. Korzystanie z "trybu wydajności" nie doprowadziło do poprawy wydajności.
Cinebench R15 Multi continuous test
| CPU Performance rating - Percent | |
| Średnia w klasie Multimedia | |
| Przeciętny Intel Core i7-12700H | |
| Dell Inspiron 16 Plus 7620 | |
| Asus VivoBook Pro 16 | |
| Acer Swift X SFX16-52G-77RX | |
| Schenker XMG Fusion 15 (Mid 22) | |
| Cinebench R23 | |
| Multi Core | |
| Średnia w klasie Multimedia (4861 - 33362, n=74, ostatnie 2 lata) | |
| Przeciętny Intel Core i7-12700H (4032 - 19330, n=64) | |
| Dell Inspiron 16 Plus 7620 | |
| Asus VivoBook Pro 16 | |
| Acer Swift X SFX16-52G-77RX | |
| Schenker XMG Fusion 15 (Mid 22) | |
| Single Core | |
| Średnia w klasie Multimedia (1128 - 2459, n=66, ostatnie 2 lata) | |
| Dell Inspiron 16 Plus 7620 | |
| Acer Swift X SFX16-52G-77RX | |
| Przeciętny Intel Core i7-12700H (778 - 1826, n=63) | |
| Asus VivoBook Pro 16 | |
| Schenker XMG Fusion 15 (Mid 22) | |
| Cinebench R20 | |
| CPU (Multi Core) | |
| Średnia w klasie Multimedia (1887 - 12912, n=57, ostatnie 2 lata) | |
| Przeciętny Intel Core i7-12700H (1576 - 7407, n=64) | |
| Dell Inspiron 16 Plus 7620 | |
| Asus VivoBook Pro 16 | |
| Acer Swift X SFX16-52G-77RX | |
| Schenker XMG Fusion 15 (Mid 22) | |
| CPU (Single Core) | |
| Średnia w klasie Multimedia (425 - 853, n=57, ostatnie 2 lata) | |
| Dell Inspiron 16 Plus 7620 | |
| Przeciętny Intel Core i7-12700H (300 - 704, n=64) | |
| Acer Swift X SFX16-52G-77RX | |
| Asus VivoBook Pro 16 | |
| Schenker XMG Fusion 15 (Mid 22) | |
| Cinebench R15 | |
| CPU Multi 64Bit | |
| Średnia w klasie Multimedia (856 - 5224, n=61, ostatnie 2 lata) | |
| Przeciętny Intel Core i7-12700H (1379 - 2916, n=70) | |
| Asus VivoBook Pro 16 | |
| Dell Inspiron 16 Plus 7620 | |
| Acer Swift X SFX16-52G-77RX | |
| Schenker XMG Fusion 15 (Mid 22) | |
| CPU Single 64Bit | |
| Średnia w klasie Multimedia (184.8 - 326, n=59, ostatnie 2 lata) | |
| Dell Inspiron 16 Plus 7620 | |
| Przeciętny Intel Core i7-12700H (113 - 263, n=65) | |
| Asus VivoBook Pro 16 | |
| Acer Swift X SFX16-52G-77RX | |
| Schenker XMG Fusion 15 (Mid 22) | |
| Blender - v2.79 BMW27 CPU | |
| Schenker XMG Fusion 15 (Mid 22) | |
| Acer Swift X SFX16-52G-77RX | |
| Średnia w klasie Multimedia (100 - 557, n=58, ostatnie 2 lata) | |
| Dell Inspiron 16 Plus 7620 | |
| Asus VivoBook Pro 16 | |
| Przeciętny Intel Core i7-12700H (168 - 732, n=63) | |
| 7-Zip 18.03 | |
| 7z b 4 | |
| Przeciętny Intel Core i7-12700H (22844 - 73067, n=63) | |
| Dell Inspiron 16 Plus 7620 | |
| Średnia w klasie Multimedia (26062 - 130368, n=55, ostatnie 2 lata) | |
| Asus VivoBook Pro 16 | |
| Schenker XMG Fusion 15 (Mid 22) | |
| Acer Swift X SFX16-52G-77RX | |
| 7z b 4 -mmt1 | |
| Średnia w klasie Multimedia (3666 - 7545, n=56, ostatnie 2 lata) | |
| Przeciętny Intel Core i7-12700H (2743 - 5972, n=63) | |
| Asus VivoBook Pro 16 | |
| Dell Inspiron 16 Plus 7620 | |
| Schenker XMG Fusion 15 (Mid 22) | |
| Acer Swift X SFX16-52G-77RX | |
| Geekbench 5.5 | |
| Multi-Core | |
| Średnia w klasie Multimedia (4652 - 20422, n=56, ostatnie 2 lata) | |
| Dell Inspiron 16 Plus 7620 | |
| Przeciętny Intel Core i7-12700H (5144 - 13745, n=64) | |
| Acer Swift X SFX16-52G-77RX | |
| Asus VivoBook Pro 16 | |
| Schenker XMG Fusion 15 (Mid 22) | |
| Single-Core | |
| Średnia w klasie Multimedia (805 - 2974, n=56, ostatnie 2 lata) | |
| Acer Swift X SFX16-52G-77RX | |
| Dell Inspiron 16 Plus 7620 | |
| Przeciętny Intel Core i7-12700H (803 - 1851, n=64) | |
| Asus VivoBook Pro 16 | |
| Schenker XMG Fusion 15 (Mid 22) | |
| HWBOT x265 Benchmark v2.2 - 4k Preset | |
| Średnia w klasie Multimedia (5.26 - 36.1, n=56, ostatnie 2 lata) | |
| Przeciętny Intel Core i7-12700H (4.67 - 21.8, n=64) | |
| Dell Inspiron 16 Plus 7620 | |
| Asus VivoBook Pro 16 | |
| Acer Swift X SFX16-52G-77RX | |
| Schenker XMG Fusion 15 (Mid 22) | |
| LibreOffice - 20 Documents To PDF | |
| Acer Swift X SFX16-52G-77RX | |
| Średnia w klasie Multimedia (23.9 - 146.7, n=57, ostatnie 2 lata) | |
| Schenker XMG Fusion 15 (Mid 22) | |
| Asus VivoBook Pro 16 | |
| Dell Inspiron 16 Plus 7620 | |
| Przeciętny Intel Core i7-12700H (34.2 - 95.3, n=63) | |
| R Benchmark 2.5 - Overall mean | |
| Schenker XMG Fusion 15 (Mid 22) | |
| Asus VivoBook Pro 16 | |
| Dell Inspiron 16 Plus 7620 | |
| Przeciętny Intel Core i7-12700H (0.4441 - 1.052, n=63) | |
| Acer Swift X SFX16-52G-77RX | |
| Średnia w klasie Multimedia (0.3604 - 0.947, n=56, ostatnie 2 lata) | |
* ... im mniej tym lepiej
AIDA64: FP32 Ray-Trace | FPU Julia | CPU SHA3 | CPU Queen | FPU SinJulia | FPU Mandel | CPU AES | CPU ZLib | FP64 Ray-Trace | CPU PhotoWorxx
| Performance rating | |
| Średnia w klasie Multimedia | |
| Schenker XMG Fusion 15 (Mid 22) | |
| Asus VivoBook Pro 16 | |
| Dell Inspiron 16 Plus 7620 | |
| Przeciętny Intel Core i7-12700H | |
| Acer Swift X SFX16-52G-77RX | |
| AIDA64 / FP32 Ray-Trace | |
| Średnia w klasie Multimedia (2214 - 50388, n=53, ostatnie 2 lata) | |
| Asus VivoBook Pro 16 (v6.75.6100) | |
| Dell Inspiron 16 Plus 7620 (v6.70.6000) | |
| Schenker XMG Fusion 15 (Mid 22) (v6.70.6000) | |
| Przeciętny Intel Core i7-12700H (2585 - 17957, n=64) | |
| Acer Swift X SFX16-52G-77RX (v6.70.6000) | |
| AIDA64 / FPU Julia | |
| Średnia w klasie Multimedia (12867 - 201874, n=54, ostatnie 2 lata) | |
| Asus VivoBook Pro 16 (v6.75.6100) | |
| Dell Inspiron 16 Plus 7620 (v6.70.6000) | |
| Schenker XMG Fusion 15 (Mid 22) (v6.70.6000) | |
| Przeciętny Intel Core i7-12700H (12439 - 90760, n=64) | |
| Acer Swift X SFX16-52G-77RX (v6.70.6000) | |
| AIDA64 / CPU SHA3 | |
| Schenker XMG Fusion 15 (Mid 22) (v6.70.6000) | |
| Średnia w klasie Multimedia (626 - 8623, n=54, ostatnie 2 lata) | |
| Asus VivoBook Pro 16 (v6.75.6100) | |
| Przeciętny Intel Core i7-12700H (833 - 4242, n=64) | |
| Dell Inspiron 16 Plus 7620 (v6.70.6000) | |
| Acer Swift X SFX16-52G-77RX (v6.70.6000) | |
| AIDA64 / CPU Queen | |
| Asus VivoBook Pro 16 (v6.75.6100) | |
| Przeciętny Intel Core i7-12700H (57923 - 103202, n=63) | |
| Dell Inspiron 16 Plus 7620 (v6.70.6000) | |
| Schenker XMG Fusion 15 (Mid 22) | |
| Acer Swift X SFX16-52G-77RX (v6.70.6000) | |
| Średnia w klasie Multimedia (13483 - 181505, n=41, ostatnie 2 lata) | |
| AIDA64 / FPU SinJulia | |
| Przeciętny Intel Core i7-12700H (3249 - 9939, n=64) | |
| Asus VivoBook Pro 16 (v6.75.6100) | |
| Schenker XMG Fusion 15 (Mid 22) (v6.70.6000) | |
| Średnia w klasie Multimedia (886 - 28794, n=54, ostatnie 2 lata) | |
| Dell Inspiron 16 Plus 7620 (v6.70.6000) | |
| Acer Swift X SFX16-52G-77RX (v6.70.6000) | |
| AIDA64 / FPU Mandel | |
| Średnia w klasie Multimedia (6395 - 105740, n=53, ostatnie 2 lata) | |
| Schenker XMG Fusion 15 (Mid 22) (v6.70.6000) | |
| Asus VivoBook Pro 16 (v6.75.6100) | |
| Dell Inspiron 16 Plus 7620 (v6.70.6000) | |
| Przeciętny Intel Core i7-12700H (7135 - 44760, n=64) | |
| Acer Swift X SFX16-52G-77RX (v6.70.6000) | |
| AIDA64 / CPU AES | |
| Schenker XMG Fusion 15 (Mid 22) (v6.70.6000) | |
| Przeciętny Intel Core i7-12700H (31839 - 144360, n=64) | |
| Asus VivoBook Pro 16 (v6.75.6100) | |
| Dell Inspiron 16 Plus 7620 (v6.70.6000) | |
| Średnia w klasie Multimedia (8171 - 126790, n=54, ostatnie 2 lata) | |
| Acer Swift X SFX16-52G-77RX (v6.70.6000) | |
| AIDA64 / CPU ZLib | |
| Średnia w klasie Multimedia (143.8 - 2022, n=54, ostatnie 2 lata) | |
| Dell Inspiron 16 Plus 7620 (v6.70.6000) | |
| Przeciętny Intel Core i7-12700H (305 - 1171, n=64) | |
| Asus VivoBook Pro 16 (v6.75.6100) | |
| Schenker XMG Fusion 15 (Mid 22) (v6.70.6000) | |
| Acer Swift X SFX16-52G-77RX (v6.70.6000) | |
| AIDA64 / FP64 Ray-Trace | |
| Średnia w klasie Multimedia (1014 - 26875, n=54, ostatnie 2 lata) | |
| Asus VivoBook Pro 16 (v6.75.6100) | |
| Schenker XMG Fusion 15 (Mid 22) (v6.70.6000) | |
| Dell Inspiron 16 Plus 7620 (v6.70.6000) | |
| Przeciętny Intel Core i7-12700H (1437 - 9692, n=64) | |
| Acer Swift X SFX16-52G-77RX (v6.70.6000) | |
| AIDA64 / CPU PhotoWorxx | |
| Średnia w klasie Multimedia (8187 - 88154, n=54, ostatnie 2 lata) | |
| Acer Swift X SFX16-52G-77RX (v6.70.6000) | |
| Dell Inspiron 16 Plus 7620 (v6.70.6000) | |
| Przeciętny Intel Core i7-12700H (12863 - 52207, n=64) | |
| Schenker XMG Fusion 15 (Mid 22) (v6.70.6000) | |
| Asus VivoBook Pro 16 (v6.75.6100) | |
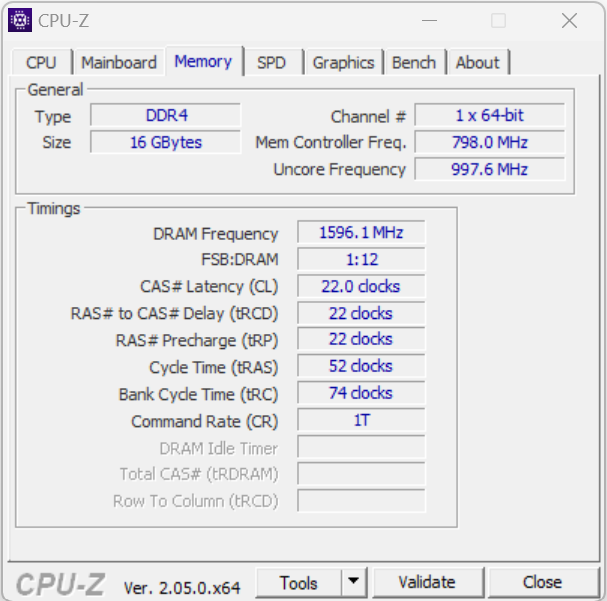
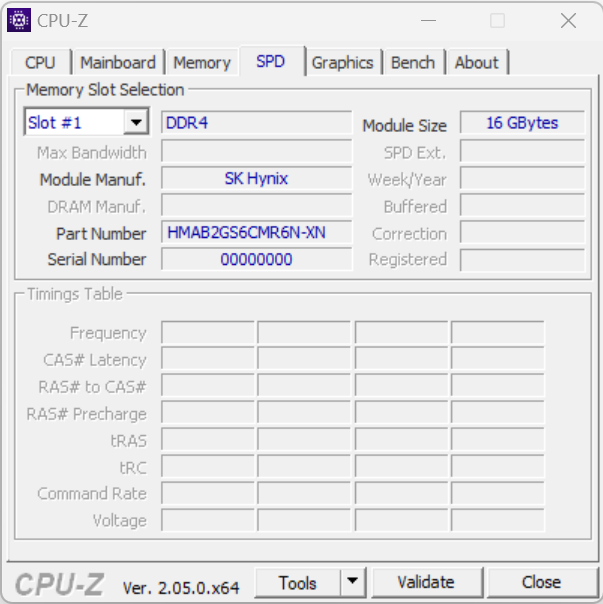
Wydajność systemu
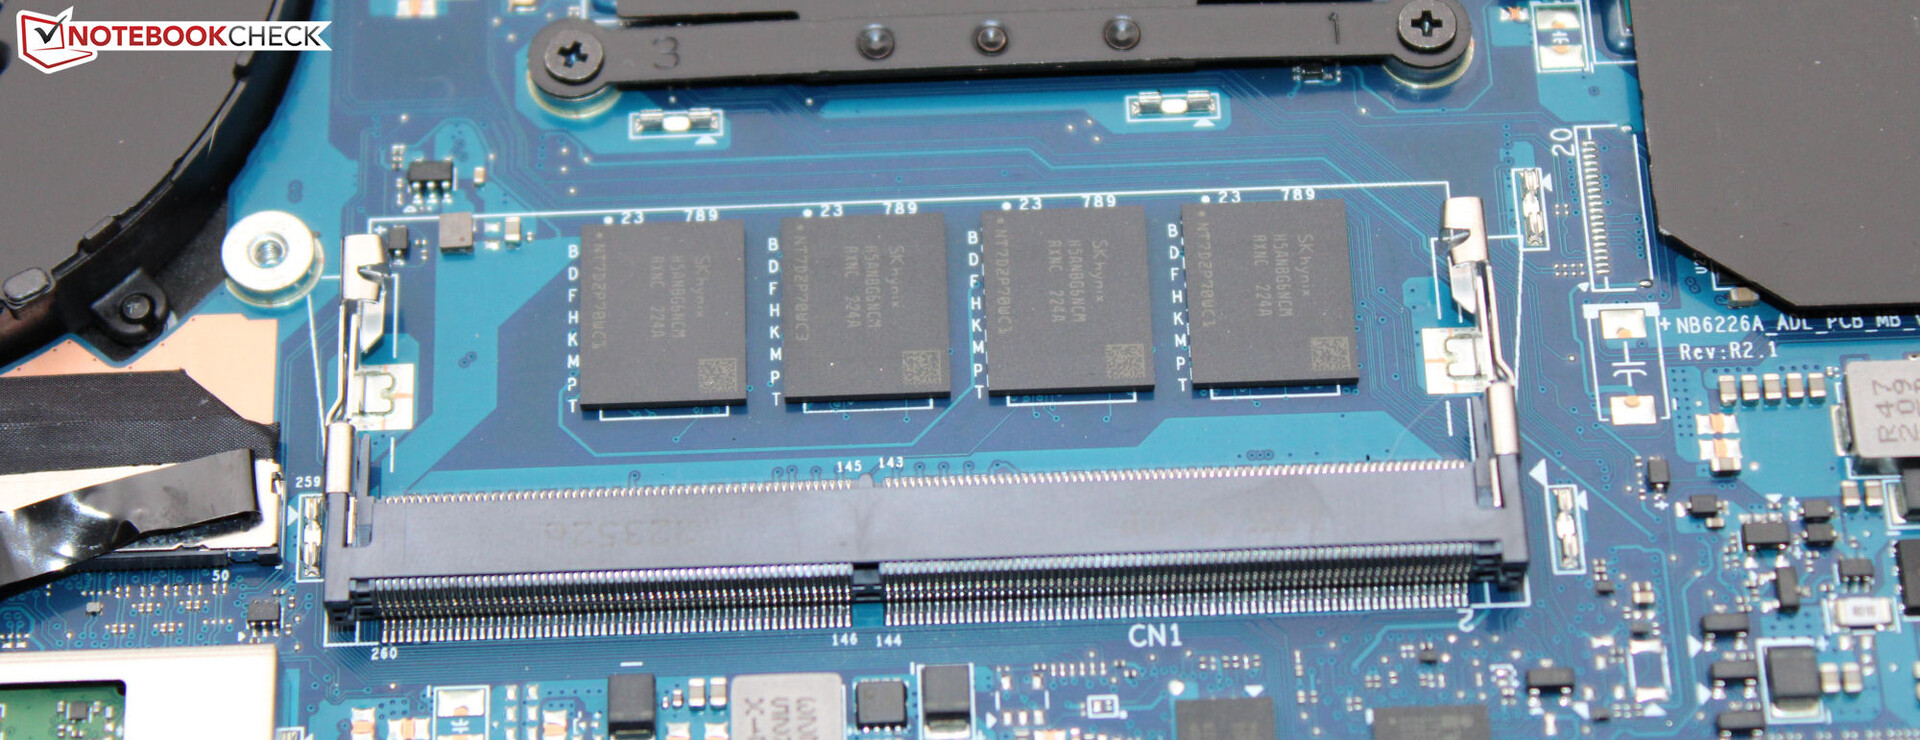
Jego płynnie działający system radzi sobie z grami, streamingiem i renderowaniem. Jedna część jego mocy obliczeniowej pozostała niewykorzystana, ponieważ pamięć RAM (16 GB, DDR4-3200, wbudowana) działa tylko w trybie jednokanałowym. Zainstalowanie modułu pamięci (= aktywny tryb dwukanałowy) rozwiązałoby ten problem - a także zwiększyłoby szybkość transmisji danych do podobnego poziomu w porównaniu do konkurentów z tą samą pamięcią masową.
CrossMark: Overall | Productivity | Creativity | Responsiveness
| PCMark 10 / Score | |
| Średnia w klasie Multimedia (4325 - 10386, n=52, ostatnie 2 lata) | |
| Dell Inspiron 16 Plus 7620 | |
| Przeciętny Intel Core i7-12700H, NVIDIA GeForce RTX 3050 Ti Laptop GPU (6623 - 7075, n=5) | |
| Asus VivoBook Pro 16 | |
| Schenker XMG Fusion 15 (Mid 22) | |
| Acer Swift X SFX16-52G-77RX | |
| PCMark 10 / Essentials | |
| Acer Swift X SFX16-52G-77RX | |
| Średnia w klasie Multimedia (8025 - 11664, n=51, ostatnie 2 lata) | |
| Przeciętny Intel Core i7-12700H, NVIDIA GeForce RTX 3050 Ti Laptop GPU (9540 - 10970, n=5) | |
| Dell Inspiron 16 Plus 7620 | |
| Schenker XMG Fusion 15 (Mid 22) | |
| Asus VivoBook Pro 16 | |
| PCMark 10 / Productivity | |
| Średnia w klasie Multimedia (7323 - 18233, n=51, ostatnie 2 lata) | |
| Dell Inspiron 16 Plus 7620 | |
| Przeciętny Intel Core i7-12700H, NVIDIA GeForce RTX 3050 Ti Laptop GPU (8530 - 9555, n=5) | |
| Asus VivoBook Pro 16 | |
| Schenker XMG Fusion 15 (Mid 22) | |
| Acer Swift X SFX16-52G-77RX | |
| PCMark 10 / Digital Content Creation | |
| Średnia w klasie Multimedia (3651 - 16240, n=51, ostatnie 2 lata) | |
| Dell Inspiron 16 Plus 7620 | |
| Asus VivoBook Pro 16 | |
| Przeciętny Intel Core i7-12700H, NVIDIA GeForce RTX 3050 Ti Laptop GPU (8855 - 9542, n=5) | |
| Acer Swift X SFX16-52G-77RX | |
| Schenker XMG Fusion 15 (Mid 22) | |
| CrossMark / Overall | |
| Średnia w klasie Multimedia (866 - 2728, n=60, ostatnie 2 lata) | |
| Dell Inspiron 16 Plus 7620 | |
| Acer Swift X SFX16-52G-77RX | |
| Przeciętny Intel Core i7-12700H, NVIDIA GeForce RTX 3050 Ti Laptop GPU (1654 - 1872, n=5) | |
| Asus VivoBook Pro 16 | |
| Schenker XMG Fusion 15 (Mid 22) | |
| CrossMark / Productivity | |
| Średnia w klasie Multimedia (931 - 2489, n=60, ostatnie 2 lata) | |
| Acer Swift X SFX16-52G-77RX | |
| Asus VivoBook Pro 16 | |
| Przeciętny Intel Core i7-12700H, NVIDIA GeForce RTX 3050 Ti Laptop GPU (1595 - 1792, n=5) | |
| Dell Inspiron 16 Plus 7620 | |
| Schenker XMG Fusion 15 (Mid 22) | |
| CrossMark / Creativity | |
| Średnia w klasie Multimedia (907 - 3465, n=60, ostatnie 2 lata) | |
| Dell Inspiron 16 Plus 7620 | |
| Przeciętny Intel Core i7-12700H, NVIDIA GeForce RTX 3050 Ti Laptop GPU (1699 - 1993, n=5) | |
| Acer Swift X SFX16-52G-77RX | |
| Asus VivoBook Pro 16 | |
| Schenker XMG Fusion 15 (Mid 22) | |
| CrossMark / Responsiveness | |
| Asus VivoBook Pro 16 | |
| Acer Swift X SFX16-52G-77RX | |
| Schenker XMG Fusion 15 (Mid 22) | |
| Przeciętny Intel Core i7-12700H, NVIDIA GeForce RTX 3050 Ti Laptop GPU (1383 - 1768, n=5) | |
| Średnia w klasie Multimedia (605 - 2024, n=60, ostatnie 2 lata) | |
| Dell Inspiron 16 Plus 7620 | |
| PCMark 8 Home Score Accelerated v2 | 4565 pkt. | |
| PCMark 8 Work Score Accelerated v2 | 5386 pkt. | |
| PCMark 10 Score | 6652 pkt. | |
Pomoc | ||
| AIDA64 / Memory Copy | |
| Średnia w klasie Multimedia (11299 - 132135, n=54, ostatnie 2 lata) | |
| Acer Swift X SFX16-52G-77RX | |
| Dell Inspiron 16 Plus 7620 | |
| Przeciętny Intel Core i7-12700H (25615 - 80511, n=64) | |
| Schenker XMG Fusion 15 (Mid 22) | |
| Asus VivoBook Pro 16 | |
| AIDA64 / Memory Read | |
| Średnia w klasie Multimedia (11624 - 174586, n=54, ostatnie 2 lata) | |
| Acer Swift X SFX16-52G-77RX | |
| Dell Inspiron 16 Plus 7620 | |
| Przeciętny Intel Core i7-12700H (25586 - 79442, n=64) | |
| Schenker XMG Fusion 15 (Mid 22) | |
| Asus VivoBook Pro 16 | |
| AIDA64 / Memory Write | |
| Średnia w klasie Multimedia (11755 - 134998, n=54, ostatnie 2 lata) | |
| Acer Swift X SFX16-52G-77RX | |
| Dell Inspiron 16 Plus 7620 | |
| Przeciętny Intel Core i7-12700H (23679 - 88660, n=64) | |
| Schenker XMG Fusion 15 (Mid 22) | |
| Asus VivoBook Pro 16 | |
| AIDA64 / Memory Latency | |
| Średnia w klasie Multimedia (7 - 535, n=53, ostatnie 2 lata) | |
| Acer Swift X SFX16-52G-77RX | |
| Dell Inspiron 16 Plus 7620 | |
| Schenker XMG Fusion 15 (Mid 22) | |
| Asus VivoBook Pro 16 | |
| Przeciętny Intel Core i7-12700H (76.2 - 133.9, n=62) | |
* ... im mniej tym lepiej
Opóźnienie DPC
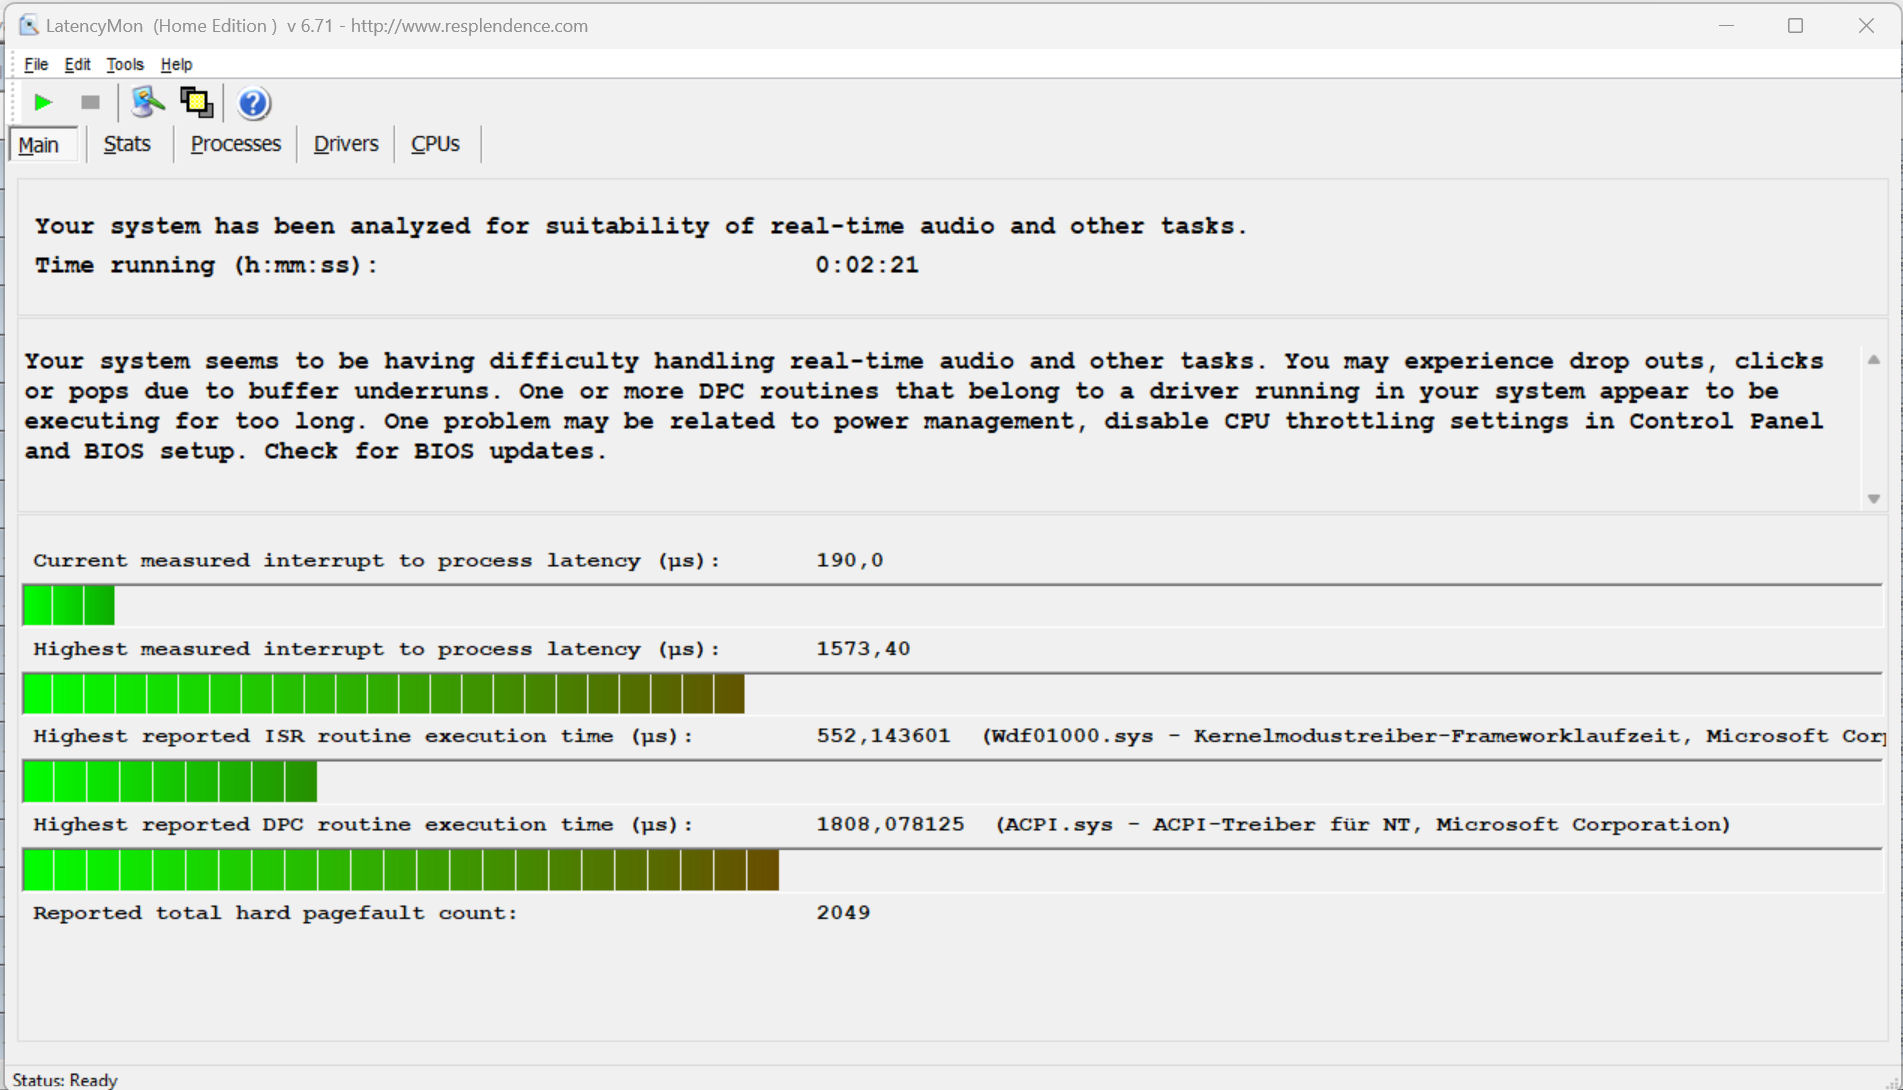
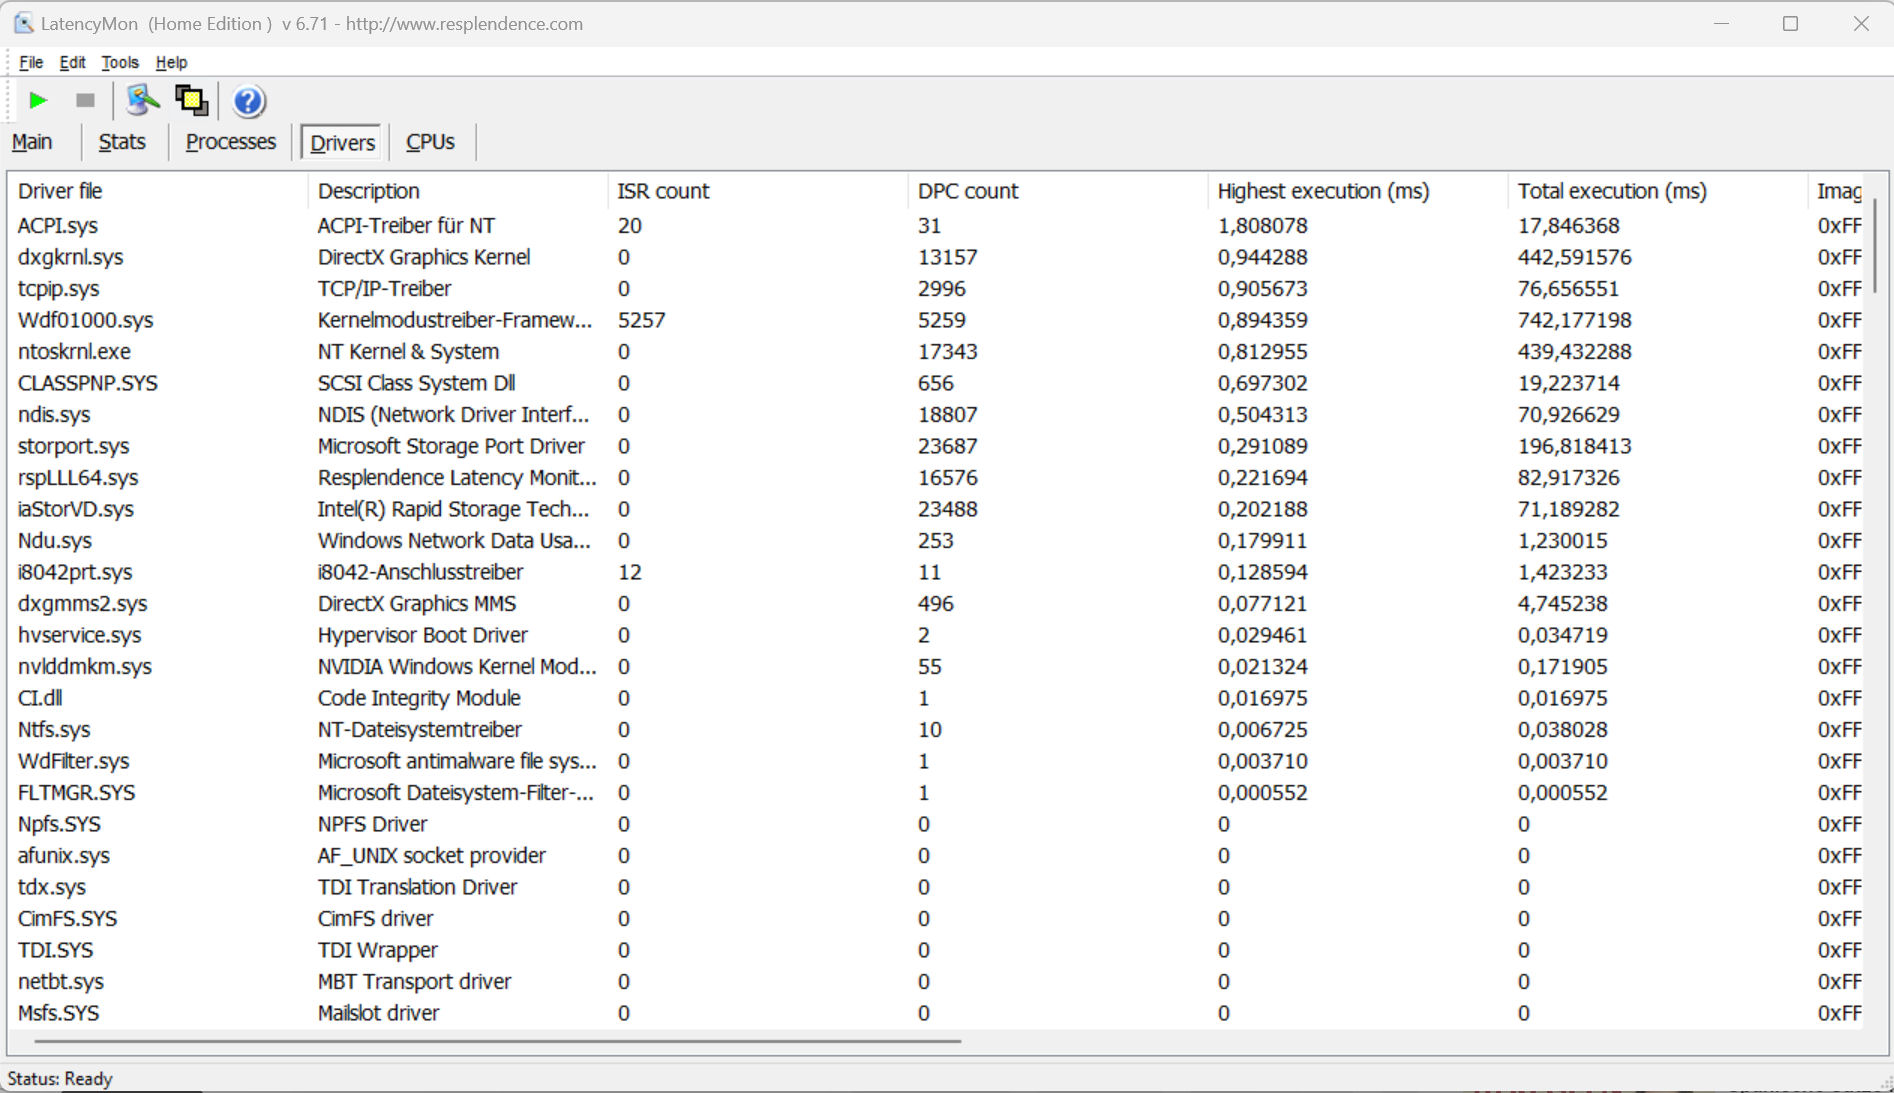
Standardowy test monitora opóźnień (surfowanie po sieci, odtwarzanie wideo 4k, wysokie obciążenie Prime95) ujawnił pewne anomalie. System nie wydaje się być odpowiedni do edycji wideo i audio w czasie rzeczywistym. Przyszłe aktualizacje oprogramowania mogą doprowadzić do poprawy lub nawet pogorszenia wydajności.
| DPC Latencies / LatencyMon - interrupt to process latency (max), Web, Youtube, Prime95 | |
| Schenker XMG Fusion 15 (Mid 22) | |
| Asus VivoBook Pro 16 | |
| Dell Inspiron 16 Plus 7620 | |
| Acer Swift X SFX16-52G-77RX | |
* ... im mniej tym lepiej
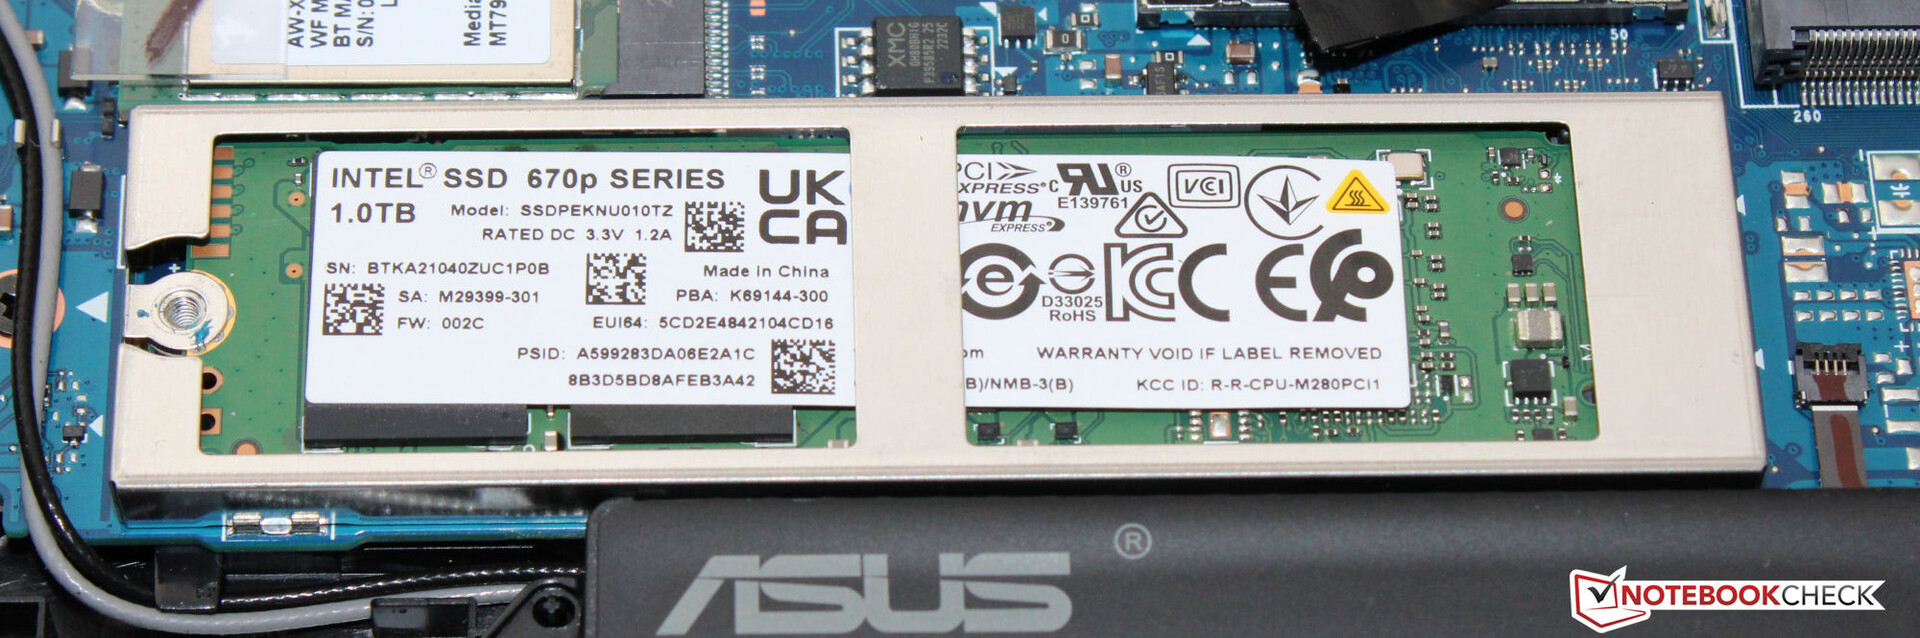
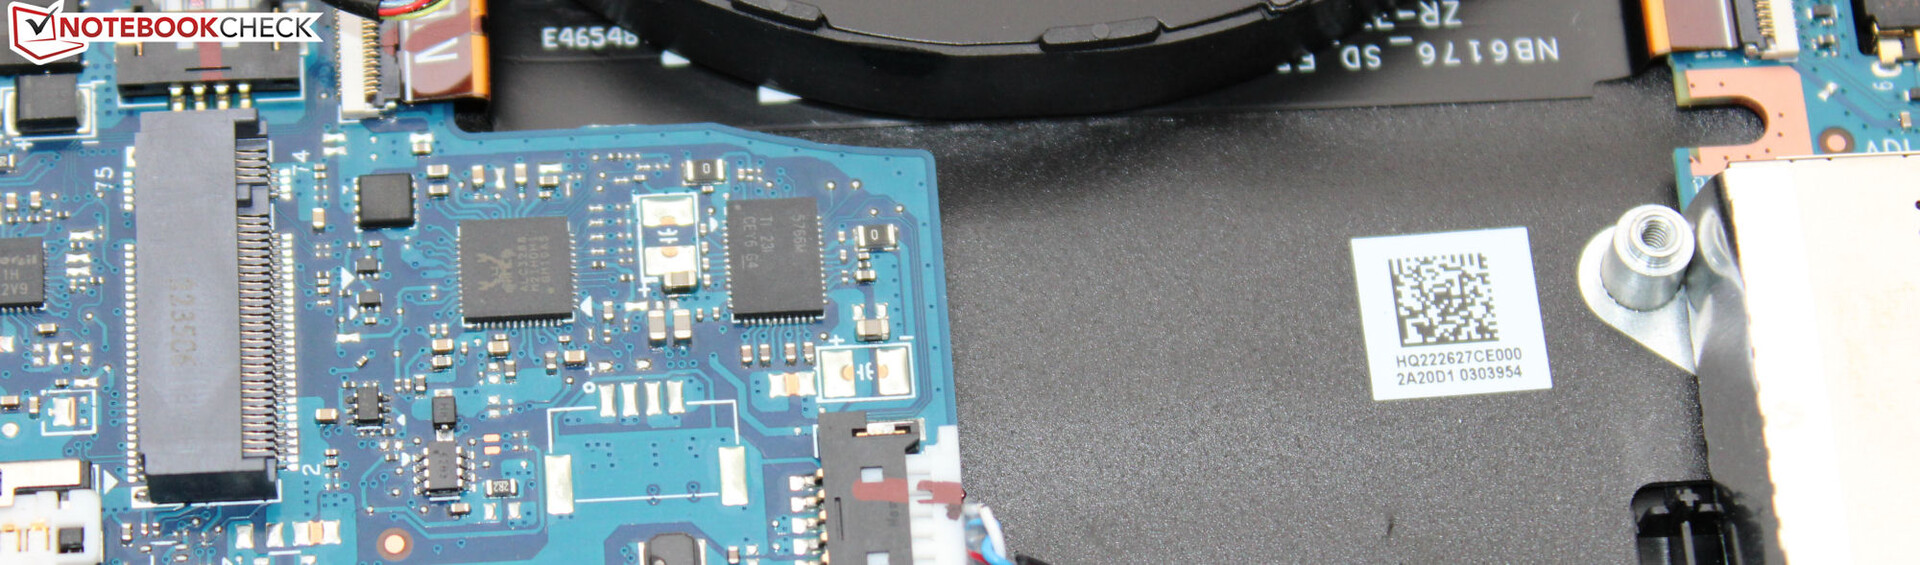
Urządzenia pamięci masowej
Asus wyposażył notebooka w dysk SSD PCIe-3 (M.2-2280) firmy Intel o pojemności 1 TB. Zapewnia on dobre prędkości przesyłu danych, ale nie można go zaliczyć do elity dysków SSD. Komputer oferuje miejsce na drugi dysk SSD.

| Drive Performance rating - Percent | |
| Acer Swift X SFX16-52G-77RX | |
| Schenker XMG Fusion 15 (Mid 22) | |
| Średnia w klasie Multimedia | |
| Asus VivoBook Pro 16 | |
| Przeciętny Intel SSD 670p SSDPEKNU010TZ | |
| Dell Inspiron 16 Plus 7620 | |
* ... im mniej tym lepiej
reading continuous performance: DiskSpd Read Loop, Queue Depth 8
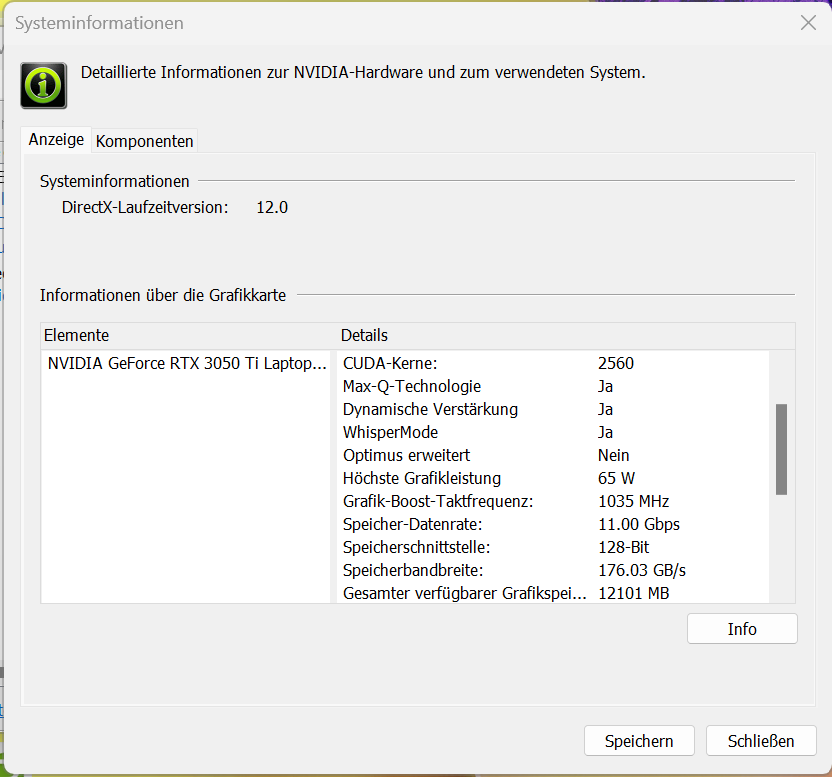
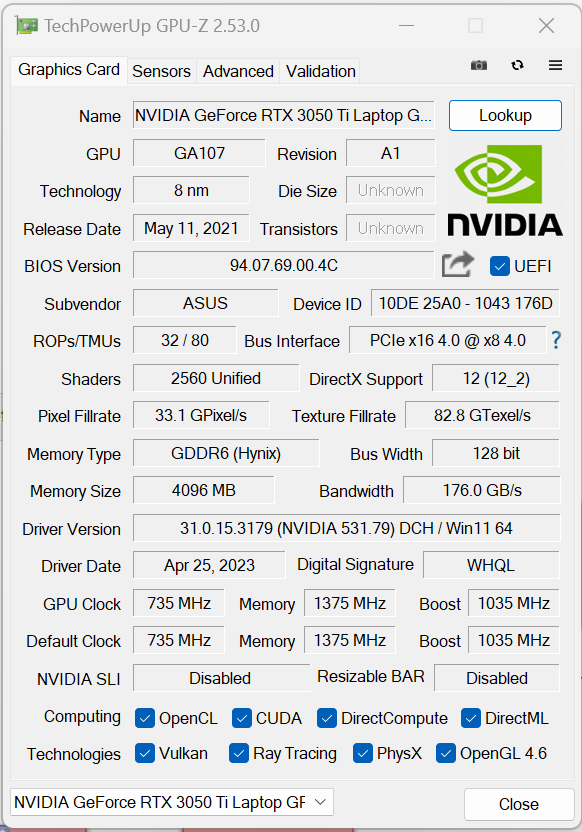
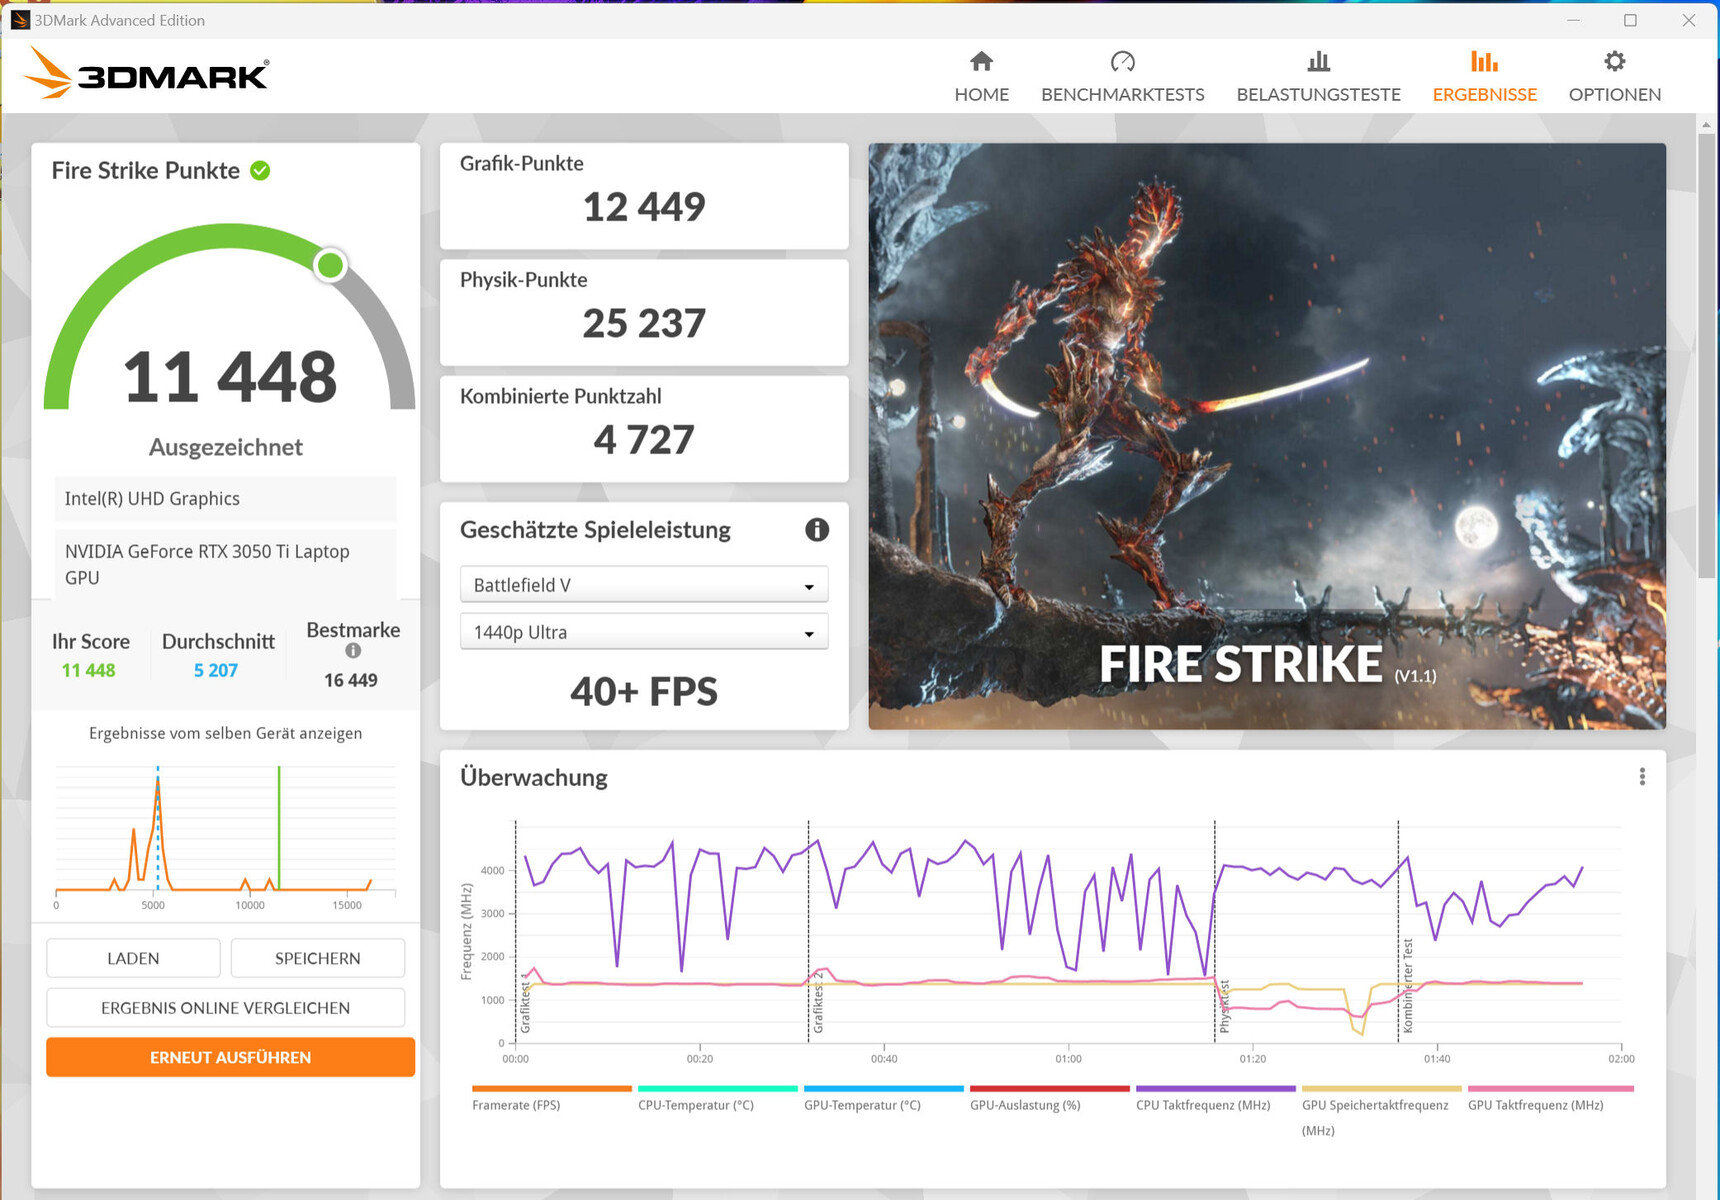
Karta graficzna
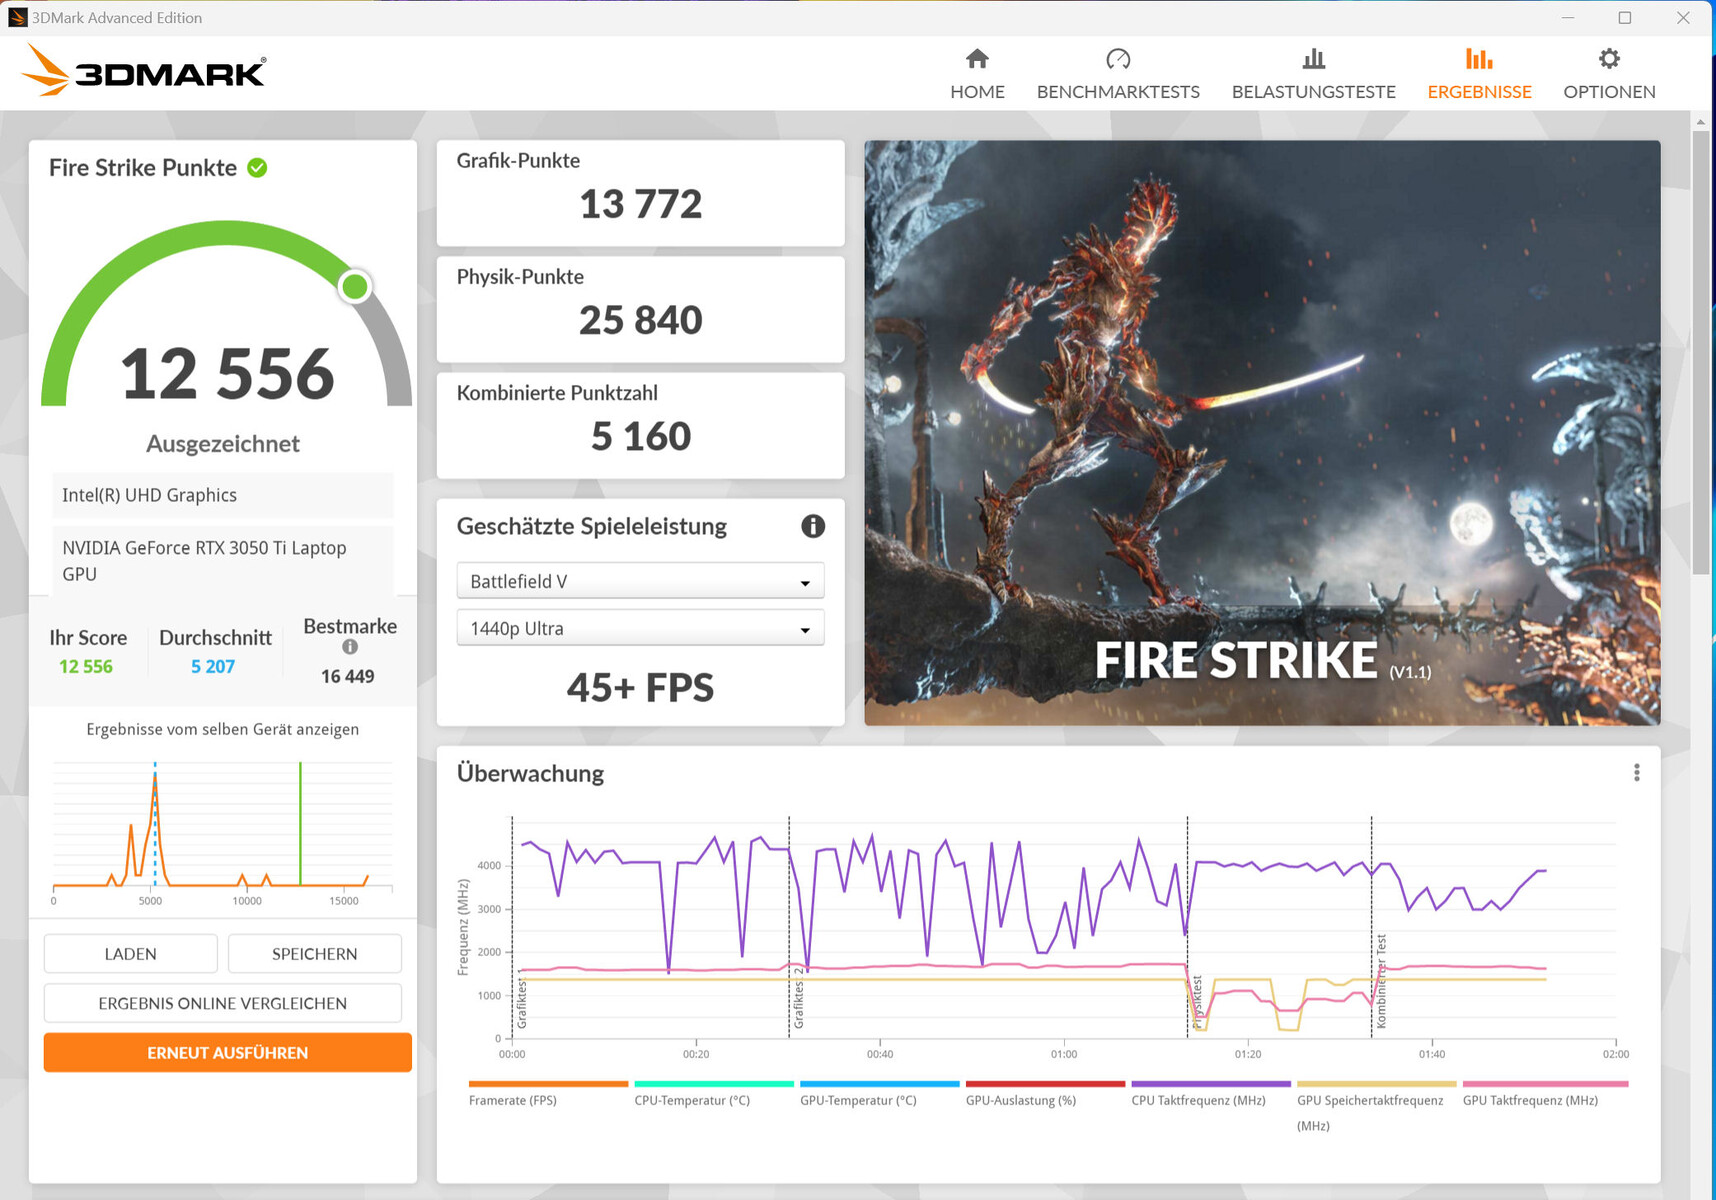
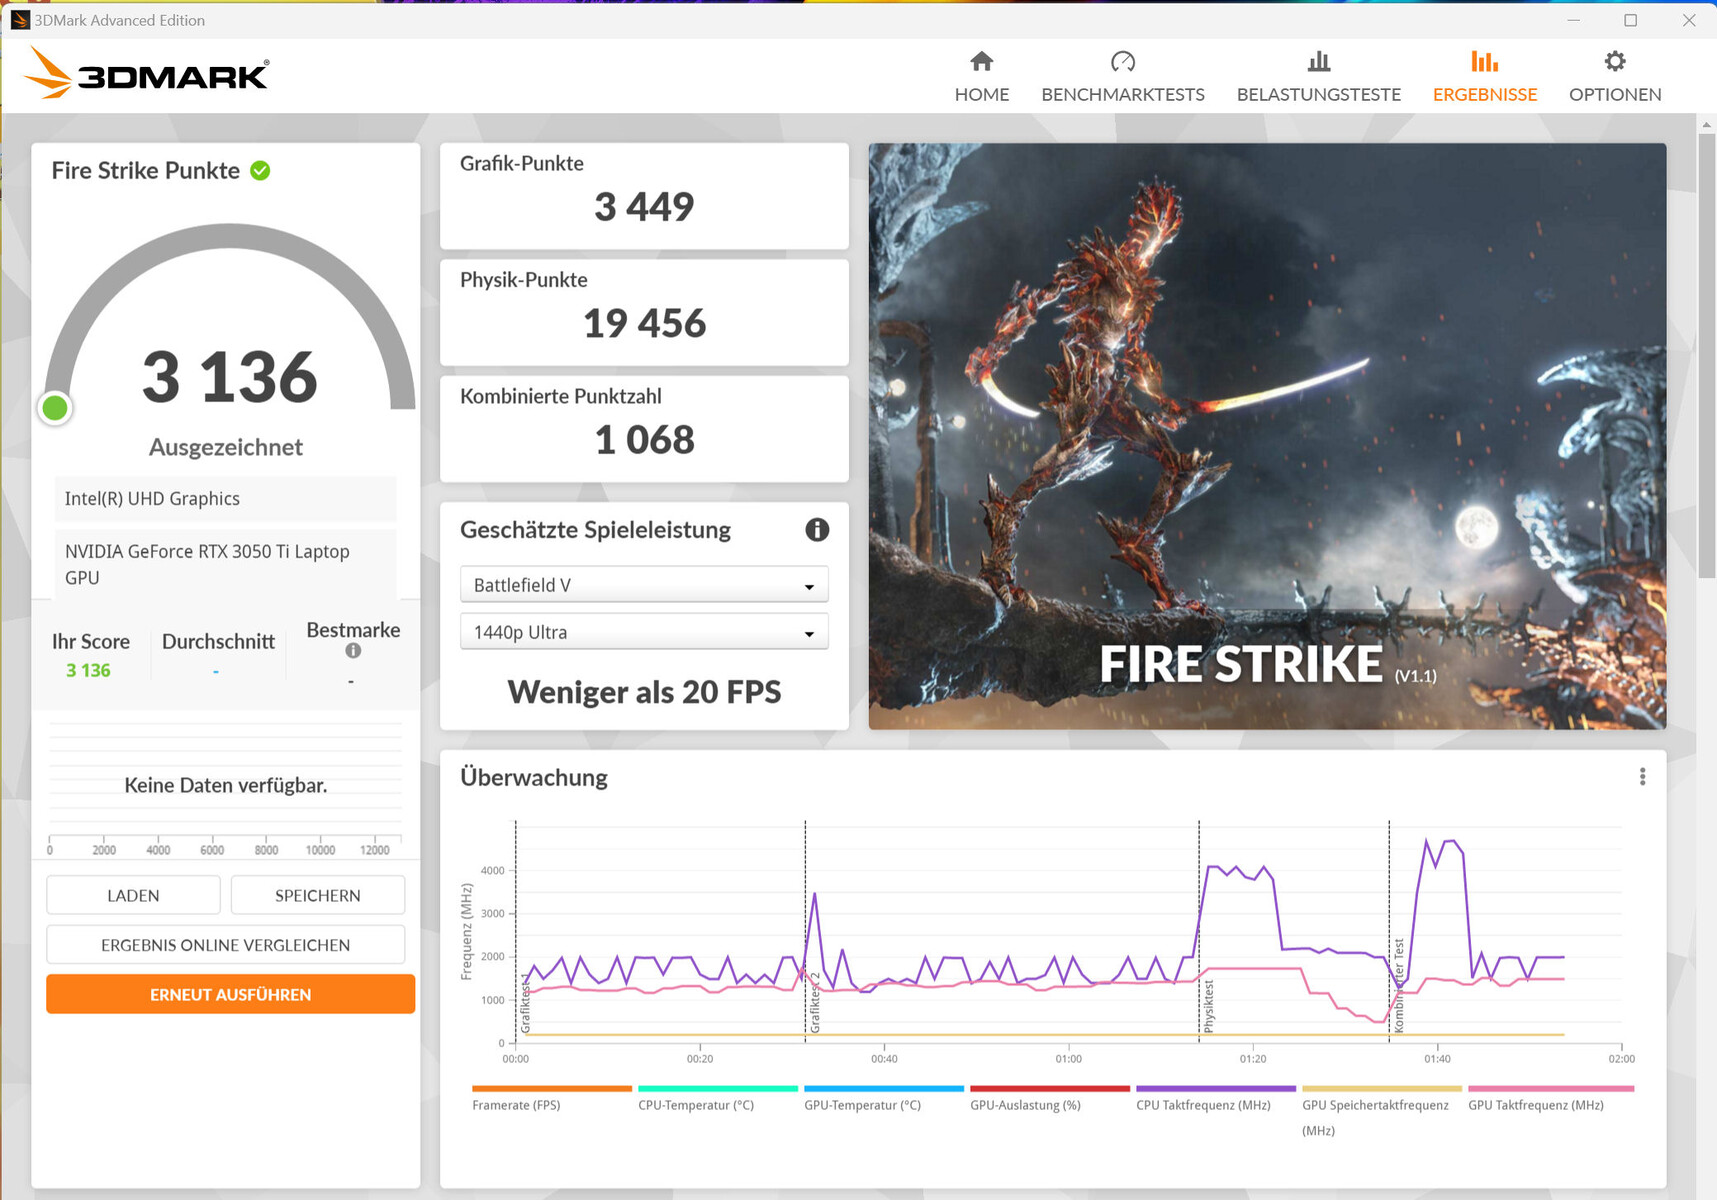
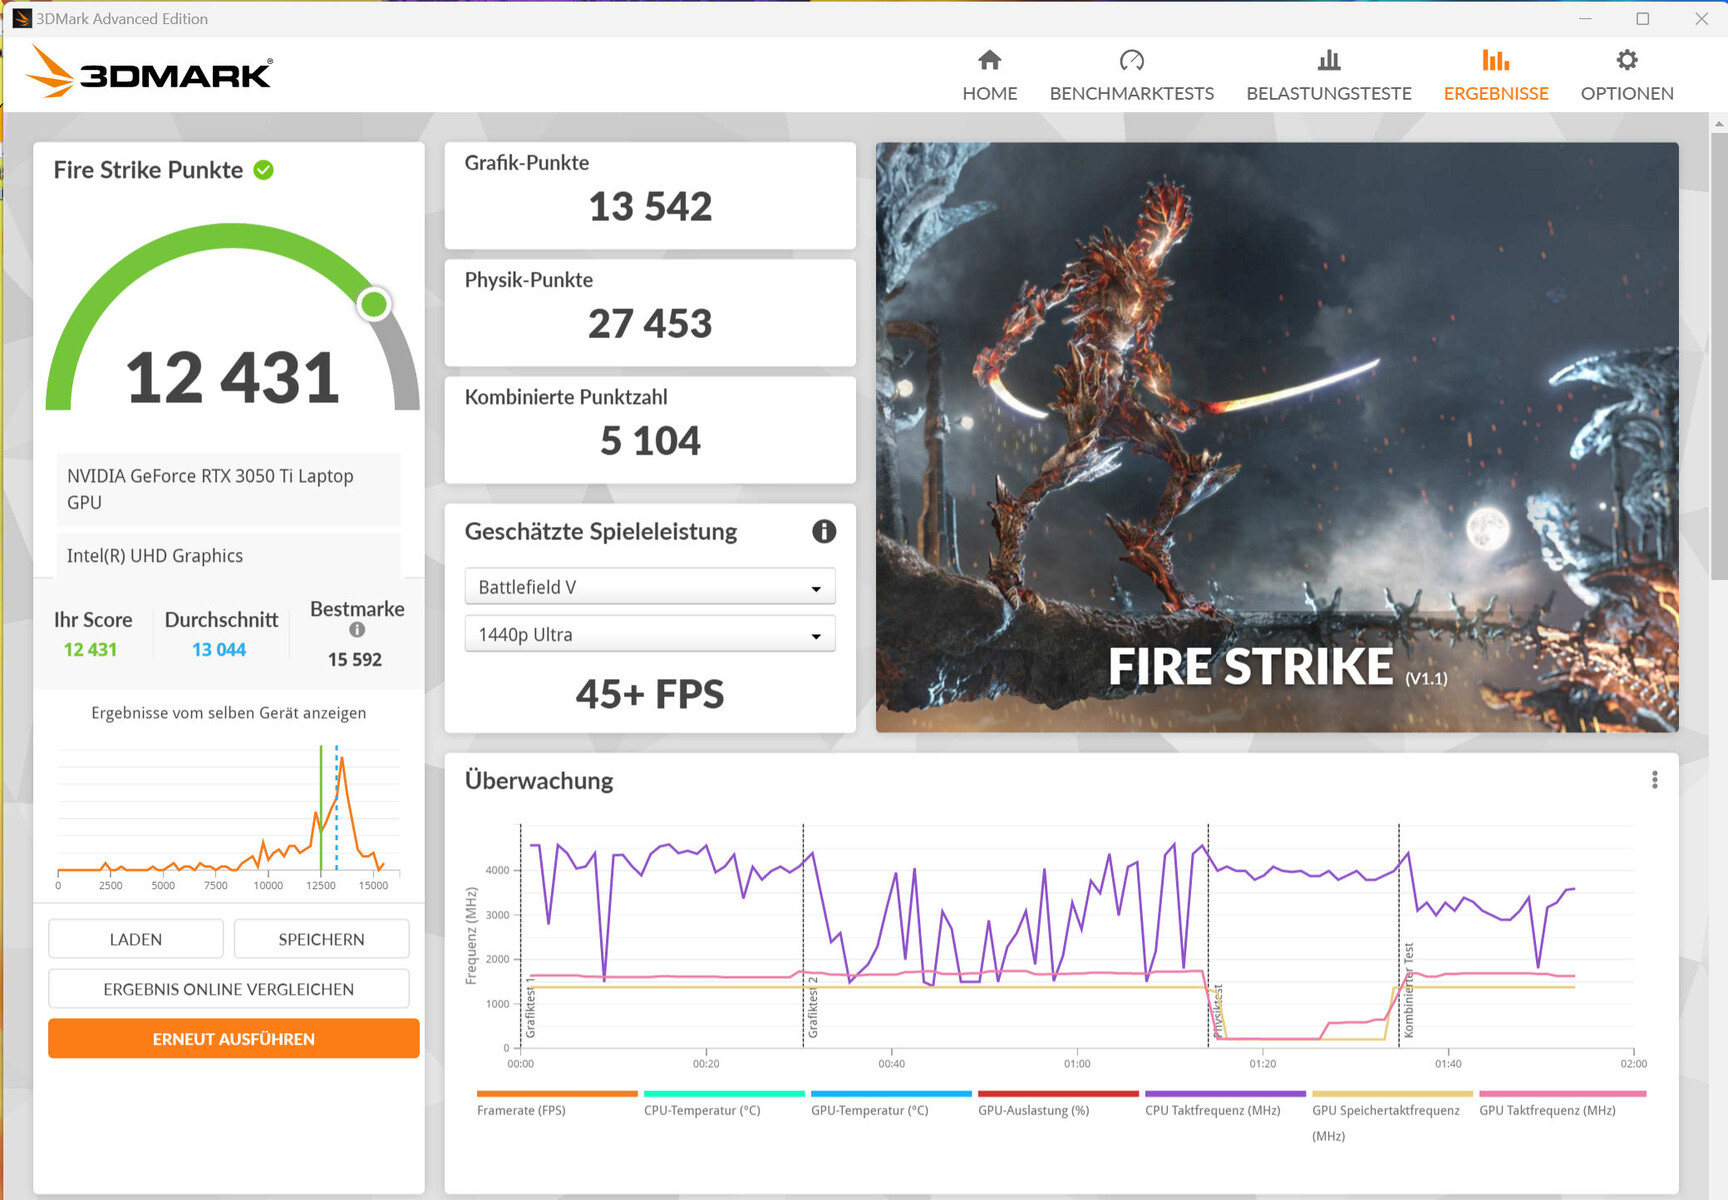
Nasze testy porównawcze i testy gier wykazały, że GeForce RTX 3050 Tilaptop GPU (TGP: 65 W) spadł nieco poniżej średniej wydajności GPU ("tryb standardowy"). Korzystanie z "trybu wydajności" doprowadziło do 10-15 procent wyższych wskaźników - zgodnie z testem Witcher 3, TGP został wyczerpany. Korzystanie z trybu dGPU (za pośrednictwem aplikacji MyAsus) nie doprowadziło do poprawy wydajności.
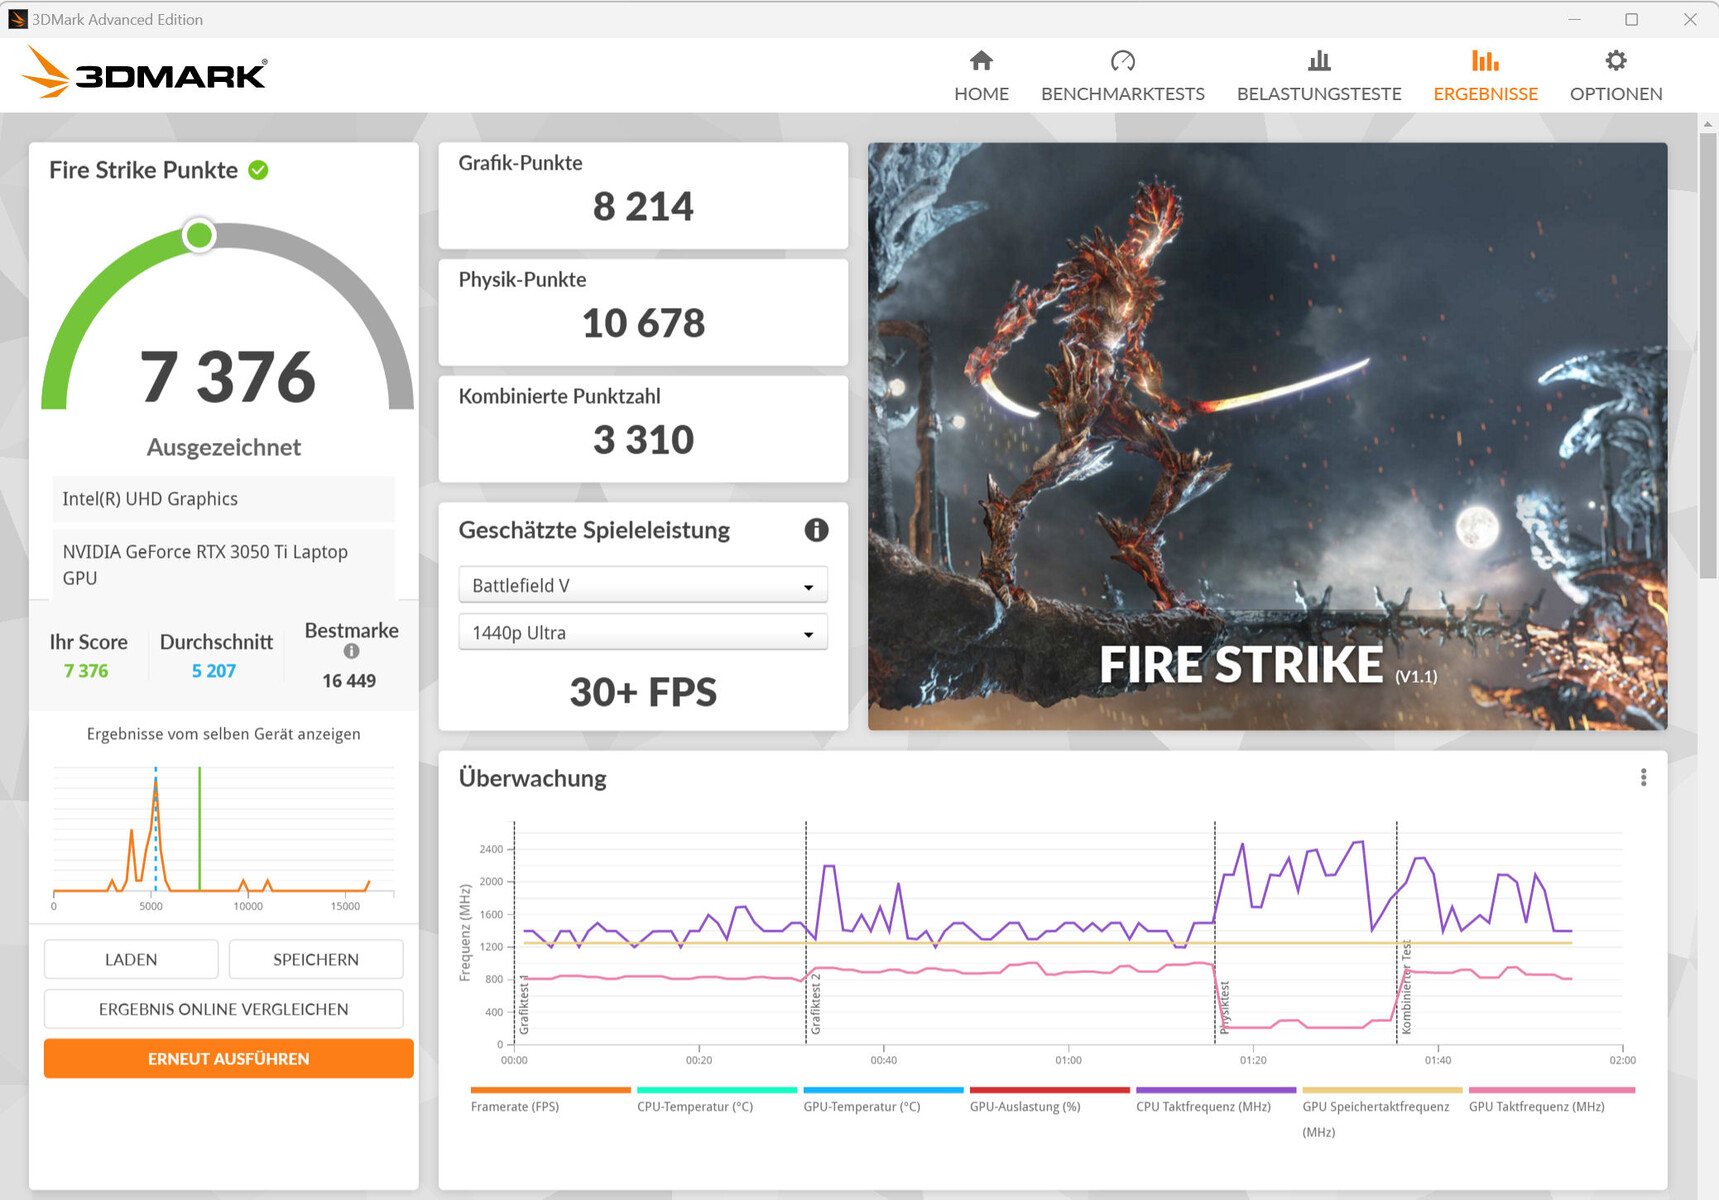
Komputer pozwala na granie w rozdzielczości FHD przy ustawieniach od niskich do wysokich oraz w rozdzielczości HD przy ustawieniach od niskich do średnich (tryb szeptany). Ten ostatni obniżył TGP do 25 watów, co zaowocowało niższą emisją hałasu.
| 3DMark Performance rating - Percent | |
| Schenker XMG Fusion 15 (Mid 22) | |
| Średnia w klasie Multimedia | |
| Dell Inspiron 16 Plus 7620 | |
| Przeciętny NVIDIA GeForce RTX 3050 Ti Laptop GPU | |
| Asus VivoBook Pro 16 | |
| Acer Swift X SFX16-52G-77RX | |
| 3DMark 11 - 1280x720 Performance GPU | |
| Schenker XMG Fusion 15 (Mid 22) | |
| Średnia w klasie Multimedia (3749 - 60002, n=55, ostatnie 2 lata) | |
| Dell Inspiron 16 Plus 7620 | |
| Przeciętny NVIDIA GeForce RTX 3050 Ti Laptop GPU (7952 - 20905, n=27) | |
| Asus VivoBook Pro 16 | |
| Acer Swift X SFX16-52G-77RX | |
| 3DMark | |
| 1280x720 Cloud Gate Standard Graphics | |
| Schenker XMG Fusion 15 (Mid 22) | |
| Asus VivoBook Pro 16 | |
| Przeciętny NVIDIA GeForce RTX 3050 Ti Laptop GPU (30158 - 102432, n=23) | |
| Dell Inspiron 16 Plus 7620 | |
| Średnia w klasie Multimedia (16765 - 143501, n=32, ostatnie 2 lata) | |
| Acer Swift X SFX16-52G-77RX | |
| 1920x1080 Fire Strike Graphics | |
| Schenker XMG Fusion 15 (Mid 22) | |
| Średnia w klasie Multimedia (2328 - 48907, n=58, ostatnie 2 lata) | |
| Dell Inspiron 16 Plus 7620 | |
| Przeciętny NVIDIA GeForce RTX 3050 Ti Laptop GPU (7917 - 15611, n=26) | |
| Asus VivoBook Pro 16 | |
| Acer Swift X SFX16-52G-77RX | |
| 2560x1440 Time Spy Graphics | |
| Schenker XMG Fusion 15 (Mid 22) | |
| Średnia w klasie Multimedia (696 - 19403, n=59, ostatnie 2 lata) | |
| Dell Inspiron 16 Plus 7620 | |
| Przeciętny NVIDIA GeForce RTX 3050 Ti Laptop GPU (3744 - 6122, n=27) | |
| Asus VivoBook Pro 16 | |
| Acer Swift X SFX16-52G-77RX | |
| 3DMark 06 Standard Score | 45370 pkt. | |
| 3DMark 11 Performance | 16180 pkt. | |
| 3DMark Cloud Gate Standard Score | 45033 pkt. | |
| 3DMark Fire Strike Score | 11448 pkt. | |
| 3DMark Time Spy Score | 4969 pkt. | |
Pomoc | ||
| Blender | |
| v3.3 Classroom OPTIX/RTX | |
| Asus VivoBook Pro 16 (3.3.3) | |
| Przeciętny NVIDIA GeForce RTX 3050 Ti Laptop GPU (48 - 60, n=7) | |
| Dell Inspiron 16 Plus 7620 | |
| Średnia w klasie Multimedia (12 - 105, n=22, ostatnie 2 lata) | |
| v3.3 Classroom CUDA | |
| Asus VivoBook Pro 16 (3.3.3) | |
| Przeciętny NVIDIA GeForce RTX 3050 Ti Laptop GPU (83 - 104, n=7) | |
| Dell Inspiron 16 Plus 7620 | |
| Średnia w klasie Multimedia (20 - 186, n=22, ostatnie 2 lata) | |
| v3.3 Classroom CPU | |
| Acer Swift X SFX16-52G-77RX (3.2.0) | |
| Schenker XMG Fusion 15 (Mid 22) | |
| Przeciętny NVIDIA GeForce RTX 3050 Ti Laptop GPU (379 - 557, n=7) | |
| Dell Inspiron 16 Plus 7620 | |
| Średnia w klasie Multimedia (134.5 - 1042, n=62, ostatnie 2 lata) | |
| Asus VivoBook Pro 16 (3.3.3) | |
| v3.3 Classroom oneAPI/Intel | |
| Średnia w klasie Multimedia (105 - 492, n=17, ostatnie 2 lata) | |
| Acer Swift X SFX16-52G-77RX | |
| Geekbench 5.5 | |
| OpenCL Score | |
| Schenker XMG Fusion 15 (Mid 22) | |
| Dell Inspiron 16 Plus 7620 | |
| Przeciętny NVIDIA GeForce RTX 3050 Ti Laptop GPU (53719 - 71459, n=26) | |
| Średnia w klasie Multimedia (11562 - 217159, n=56, ostatnie 2 lata) | |
| Asus VivoBook Pro 16 | |
| Acer Swift X SFX16-52G-77RX | |
| Vulkan Score 5.5 | |
| Przeciętny NVIDIA GeForce RTX 3050 Ti Laptop GPU (43084 - 51428, n=6) | |
| Dell Inspiron 16 Plus 7620 | |
| Średnia w klasie Multimedia (9837 - 161655, n=49, ostatnie 2 lata) | |
| Acer Swift X SFX16-52G-77RX | |
| Geekbench 6.0 | |
| GPU Vulkan 6.0 | |
| Asus VivoBook Pro 16 | |
| Przeciętny NVIDIA GeForce RTX 3050 Ti Laptop GPU (n=1) | |
| GPU OpenCL 6.0 | |
| Asus VivoBook Pro 16 | |
| Przeciętny NVIDIA GeForce RTX 3050 Ti Laptop GPU (n=1) | |
| V-Ray 5 Benchmark | |
| GPU RTX | |
| Średnia w klasie Multimedia (370 - 1956, n=5, ostatnie 2 lata) | |
| Schenker XMG Fusion 15 (Mid 22) (5.0.1) | |
| Przeciętny NVIDIA GeForce RTX 3050 Ti Laptop GPU (628 - 679, n=5) | |
| Asus VivoBook Pro 16 | |
| GPU CUDA | |
| Schenker XMG Fusion 15 (Mid 22) (5.0.1) | |
| Średnia w klasie Multimedia (335 - 1482, n=5, ostatnie 2 lata) | |
| Przeciętny NVIDIA GeForce RTX 3050 Ti Laptop GPU (495 - 552, n=5) | |
| Asus VivoBook Pro 16 (5.0.1) | |
| Acer Swift X SFX16-52G-77RX (5.0.1) | |
| CPU | |
| Dell Inspiron 16 Plus 7620 (5.0.1) | |
| Asus VivoBook Pro 16 (5.0.1) | |
| Przeciętny NVIDIA GeForce RTX 3050 Ti Laptop GPU (7250 - 10101, n=8) | |
| Średnia w klasie Multimedia (3126 - 14552, n=24, ostatnie 2 lata) | |
| Schenker XMG Fusion 15 (Mid 22) (5.0.1) | |
| Acer Swift X SFX16-52G-77RX (5.0.1) | |
| V-Ray Benchmark Next 4.10 | |
| GPU | |
| Schenker XMG Fusion 15 (Mid 22) (v4.10.07 ) | |
| Średnia w klasie Multimedia (32 - 1191, n=53, ostatnie 2 lata) | |
| Przeciętny NVIDIA GeForce RTX 3050 Ti Laptop GPU (171 - 216, n=22) | |
| Asus VivoBook Pro 16 (v4.10.07 ) | |
| Acer Swift X SFX16-52G-77RX (v4.10.07 ) | |
| CPU | |
| Średnia w klasie Multimedia (4772 - 35165, n=53, ostatnie 2 lata) | |
| Asus VivoBook Pro 16 (v4.10.07 ) | |
| Acer Swift X SFX16-52G-77RX (v4.10.07 ) | |
| Schenker XMG Fusion 15 (Mid 22) (v4.10.07 ) | |
| Przeciętny NVIDIA GeForce RTX 3050 Ti Laptop GPU (5796 - 16665, n=22) | |
* ... im mniej tym lepiej
| Performance rating - Percent | |
| Schenker XMG Fusion 15 (Mid 22) | |
| Dell Inspiron 16 Plus 7620 | |
| Przeciętny NVIDIA GeForce RTX 3050 Ti Laptop GPU | |
| Asus VivoBook Pro 16 | |
| Średnia w klasie Multimedia | |
| Acer Swift X SFX16-52G-77RX | |
| The Witcher 3 - 1920x1080 Ultra Graphics & Postprocessing (HBAO+) | |
| Schenker XMG Fusion 15 (Mid 22) | |
| Dell Inspiron 16 Plus 7620 | |
| Średnia w klasie Multimedia (11 - 121, n=7, ostatnie 2 lata) | |
| Przeciętny NVIDIA GeForce RTX 3050 Ti Laptop GPU (19 - 58.5, n=29) | |
| Asus VivoBook Pro 16 | |
| Acer Swift X SFX16-52G-77RX | |
| GTA V - 1920x1080 Highest AA:4xMSAA + FX AF:16x | |
| Schenker XMG Fusion 15 (Mid 22) | |
| Dell Inspiron 16 Plus 7620 | |
| Przeciętny NVIDIA GeForce RTX 3050 Ti Laptop GPU (27.8 - 75.6, n=26) | |
| Średnia w klasie Multimedia (7.92 - 141.6, n=55, ostatnie 2 lata) | |
| Asus VivoBook Pro 16 | |
| Acer Swift X SFX16-52G-77RX | |
| Final Fantasy XV Benchmark - 1920x1080 High Quality | |
| Schenker XMG Fusion 15 (Mid 22) (1.3) | |
| Średnia w klasie Multimedia (7.61 - 144.4, n=57, ostatnie 2 lata) | |
| Dell Inspiron 16 Plus 7620 (1.3) | |
| Przeciętny NVIDIA GeForce RTX 3050 Ti Laptop GPU (23.5 - 106, n=24) | |
| Asus VivoBook Pro 16 (1.3) | |
| Acer Swift X SFX16-52G-77RX (1.3) | |
| Strange Brigade - 1920x1080 ultra AA:ultra AF:16 | |
| Schenker XMG Fusion 15 (Mid 22) (1.47.22.14 D3D12) | |
| Średnia w klasie Multimedia (13.3 - 303, n=57, ostatnie 2 lata) | |
| Dell Inspiron 16 Plus 7620 (1.47.22.14 D3D12) | |
| Przeciętny NVIDIA GeForce RTX 3050 Ti Laptop GPU (34.8 - 101.3, n=25) | |
| Asus VivoBook Pro 16 (1.47.22.14 D3D12) | |
| Acer Swift X SFX16-52G-77RX (1.47.22.14 D3D12) | |
| Dota 2 Reborn - 1920x1080 ultra (3/3) best looking | |
| Dell Inspiron 16 Plus 7620 | |
| Schenker XMG Fusion 15 (Mid 22) | |
| Przeciętny NVIDIA GeForce RTX 3050 Ti Laptop GPU (67.3 - 145, n=27) | |
| Asus VivoBook Pro 16 | |
| Średnia w klasie Multimedia (29 - 179.9, n=59, ostatnie 2 lata) | |
| Acer Swift X SFX16-52G-77RX | |
| X-Plane 11.11 - 1920x1080 high (fps_test=3) | |
| Dell Inspiron 16 Plus 7620 | |
| Asus VivoBook Pro 16 | |
| Schenker XMG Fusion 15 (Mid 22) | |
| Przeciętny NVIDIA GeForce RTX 3050 Ti Laptop GPU (48.8 - 100.6, n=27) | |
| Średnia w klasie Multimedia (16.9 - 141.1, n=54, ostatnie 2 lata) | |
| Acer Swift X SFX16-52G-77RX | |
Witcher 3 FPS diagram
| low | med. | high | ultra | QHD | |
|---|---|---|---|---|---|
| GTA V (2015) | 175.1 | 170.9 | 111.9 | 53.8 | 39 |
| The Witcher 3 (2015) | 218.5 | 150.8 | 87.6 | 47.1 | |
| Dota 2 Reborn (2015) | 134.6 | 118.9 | 108.5 | 101.6 | |
| Final Fantasy XV Benchmark (2018) | 112.7 | 65 | 46.2 | 32 | |
| X-Plane 11.11 (2018) | 125.4 | 110.2 | 90.5 | ||
| Strange Brigade (2018) | 241 | 121.2 | 98.3 | 84.5 | 61 |
| Doom Eternal (2020) | 188.1 | 120 | |||
| Flight Simulator 2020 (2020) | 99 | 52.1 | 38.4 | 26.4 | 19.6 |
| F1 22 (2022) | 127.5 | 115.3 | 73.1 | 24.3 | 17.4 |
| FIFA 23 (2022) | 78.2 | ||||
| Uncharted Legacy of Thieves Collection (2022) | 48.4 | 30.5 | 20.6 | 20 | 14.1 |
| Call of Duty Modern Warfare 2 2022 (2022) | 63 | 58 | 44 | 36 | |
| Spider-Man Miles Morales (2022) | 66.6 | 53.6 | 44.8 | 36.8 | 26.3 |
| The Callisto Protocol (2022) | 82.5 | 62.2 | 58.3 | 31.7 | 21.4 |
| Need for Speed Unbound (2022) | 73.9 | 62.6 | 35.5 | 27.9 | 15.6 |
| High On Life (2023) | 104.7 | 77.5 | 60.3 | 50.8 | 31.8 |
| The Witcher 3 v4 (2023) | 88.4 | 75.6 | 36.8 | 32.4 | 19.6 |
| Dead Space Remake (2023) | 37.2 | 35.1 | 28.2 | 24.6 | 9.81 |
| Hogwarts Legacy (2023) | 63.9 | 50 | 40.2 | 32.8 | 25 |
| Returnal (2023) | 52 | 50 | 45 | 34 | 27 |
| Atomic Heart (2023) | 94.3 | 71.4 | 41.6 | 32.3 | 24.5 |
| Company of Heroes 3 (2023) | 106.2 | 91.1 | 68.4 | 68.5 | 48.8 |
| Sons of the Forest (2023) | 54.9 | 38.8 | 35.4 | 33.3 | 25.6 |
| Resident Evil 4 Remake (2023) | 74.6 | 47.4 | 41 | 8.97 | 7.82 |
| The Last of Us (2023) | 44.9 | 32.9 | 25.6 | ||
| Dead Island 2 (2023) | 95.7 | 75.7 | 64.1 | 58 | 45.9 |
| Star Wars Jedi Survivor (2023) | 36.9 | 31 | 28.9 | 25.8 | 15.4 |
Emisje i zasilanie - komputer Asus jest głośny
Emisja hałasu
Zarówno w trybie bezczynności, jak i w codziennym użytkowaniu (biuro, internet) laptop generalnie pracuje cicho - momentami nawet bezgłośnie. Przy pełnym obciążeniu zmierzyliśmy emisję hałasu do 61,5 dB(A) ("tryb wydajności") - zdecydowanie zbyt wysoką. Korzystanie z "trybu standardowego" doprowadziło do bardziej zrównoważonego stosunku hałasu do wydajności - mimo to cooler robił sporo hałasu.
"Tryb szeptu" będzie prawdopodobnie pierwszym wyborem większości użytkowników - robi dokładnie to, co mówi na puszce. Wentylatory pracują z niską prędkością nawet pod obciążeniem i są ledwo słyszalne - kosztem mocy obliczeniowej. Granie nadal jest możliwe, ale tylko w rozdzielczości HD.
Hałas
| luz |
| 25.2 / 25.2 / 25.2 dB |
| obciążenie |
| 55.1 / 61.5 dB |
 | ||
30 dB cichy 40 dB(A) słyszalny 50 dB(A) irytujący |
||
min: | ||
| Asus VivoBook Pro 16 GeForce RTX 3050 Ti Laptop GPU, i7-12700H, Intel SSD 670p SSDPEKNU010TZ | Dell Inspiron 16 Plus 7620 GeForce RTX 3050 Ti Laptop GPU, i7-12700H, Kioxia BG5 KBG50ZNS512G | Schenker XMG Fusion 15 (Mid 22) GeForce RTX 3070 Laptop GPU, i7-11800H, Samsung SSD 980 Pro 1TB MZ-V8P1T0BW | Acer Swift X SFX16-52G-77RX A370M, i7-1260P, WDC PC SN810 1TB | |
|---|---|---|---|---|
| Noise | 3% | 0% | 8% | |
| wyłączone / środowisko * (dB) | 25.2 | 23.3 8% | 26 -3% | 25 1% |
| Idle Minimum * (dB) | 25.2 | 25.7 -2% | 26 -3% | 25 1% |
| Idle Average * (dB) | 25.2 | 26.1 -4% | 28 -11% | 25 1% |
| Idle Maximum * (dB) | 25.2 | 30.6 -21% | 31 -23% | 25 1% |
| Load Average * (dB) | 55.1 | 46.2 16% | 45 18% | 44.7 19% |
| Load Maximum * (dB) | 61.5 | 49.4 20% | 48 22% | 45.6 26% |
| Witcher 3 ultra * (dB) | 49.2 | 46 |
* ... im mniej tym lepiej
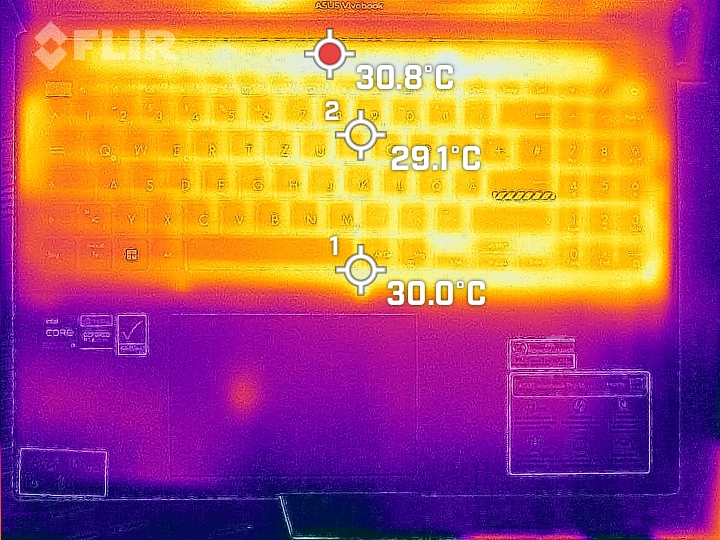
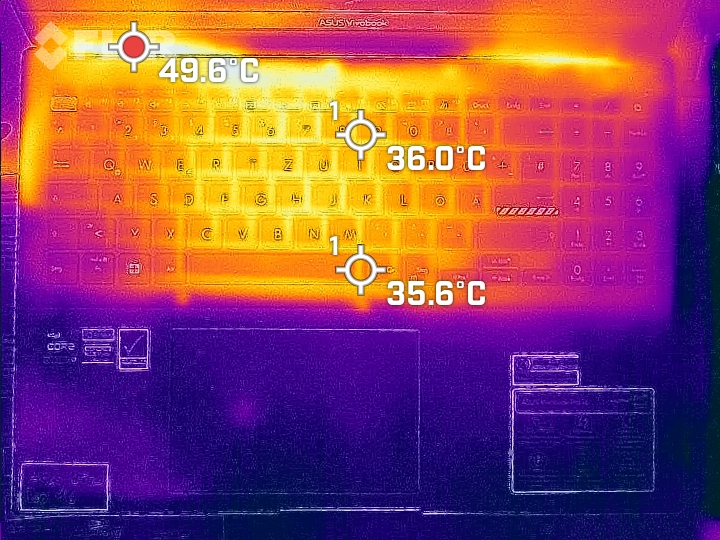
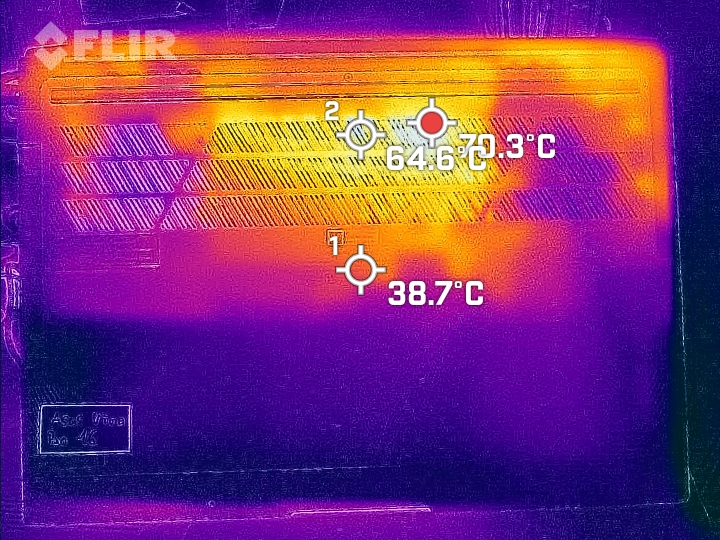
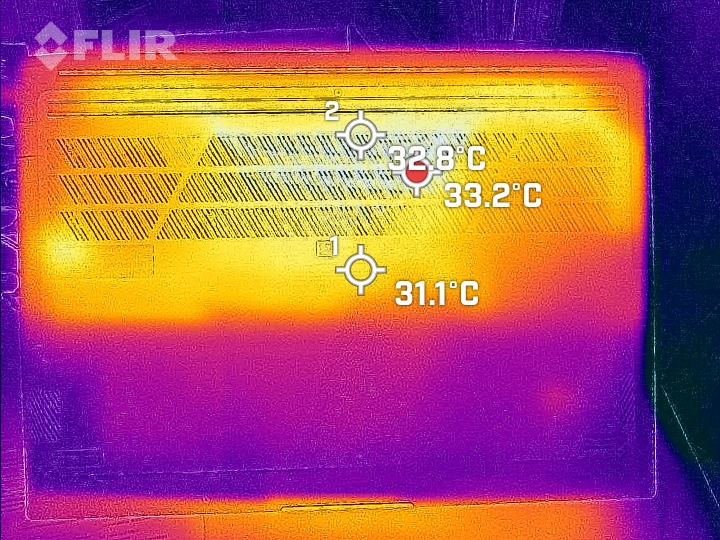
Temperatura
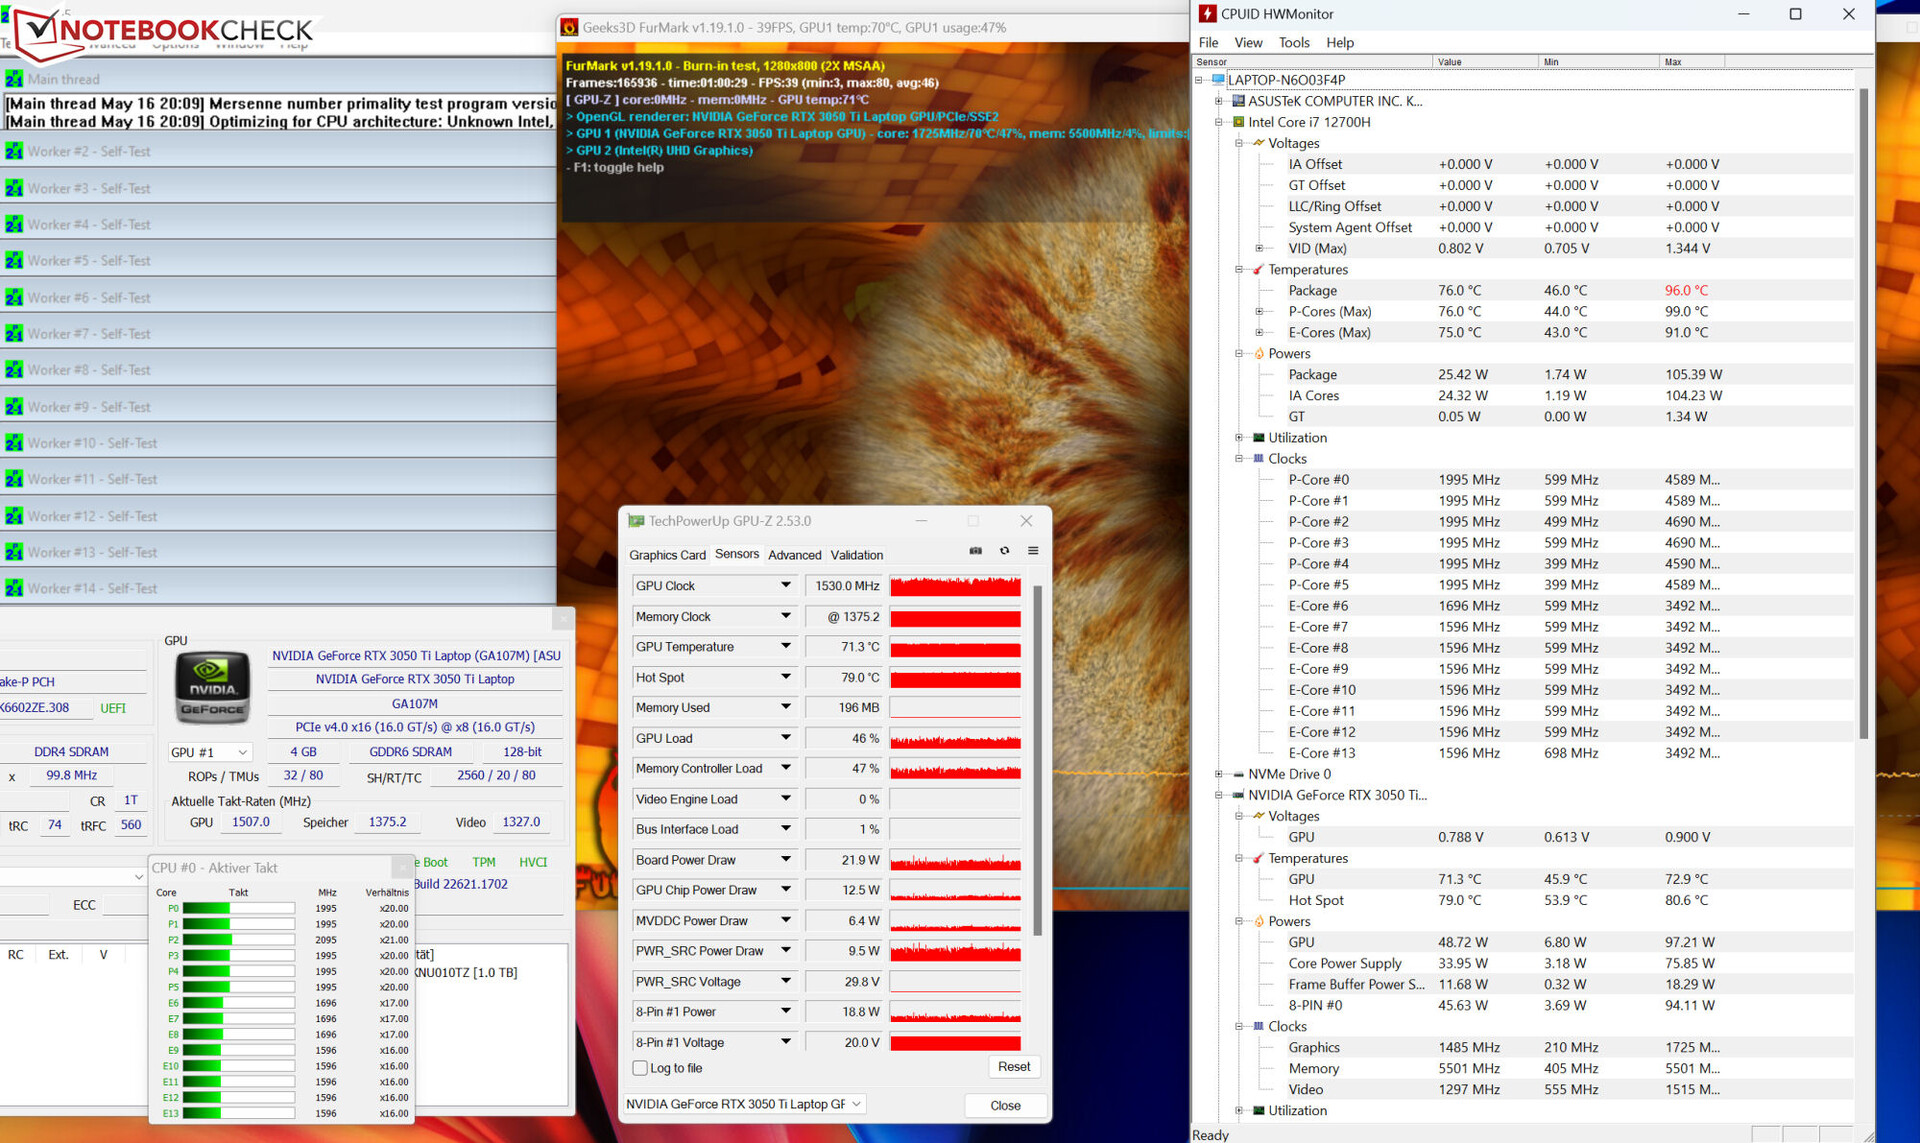
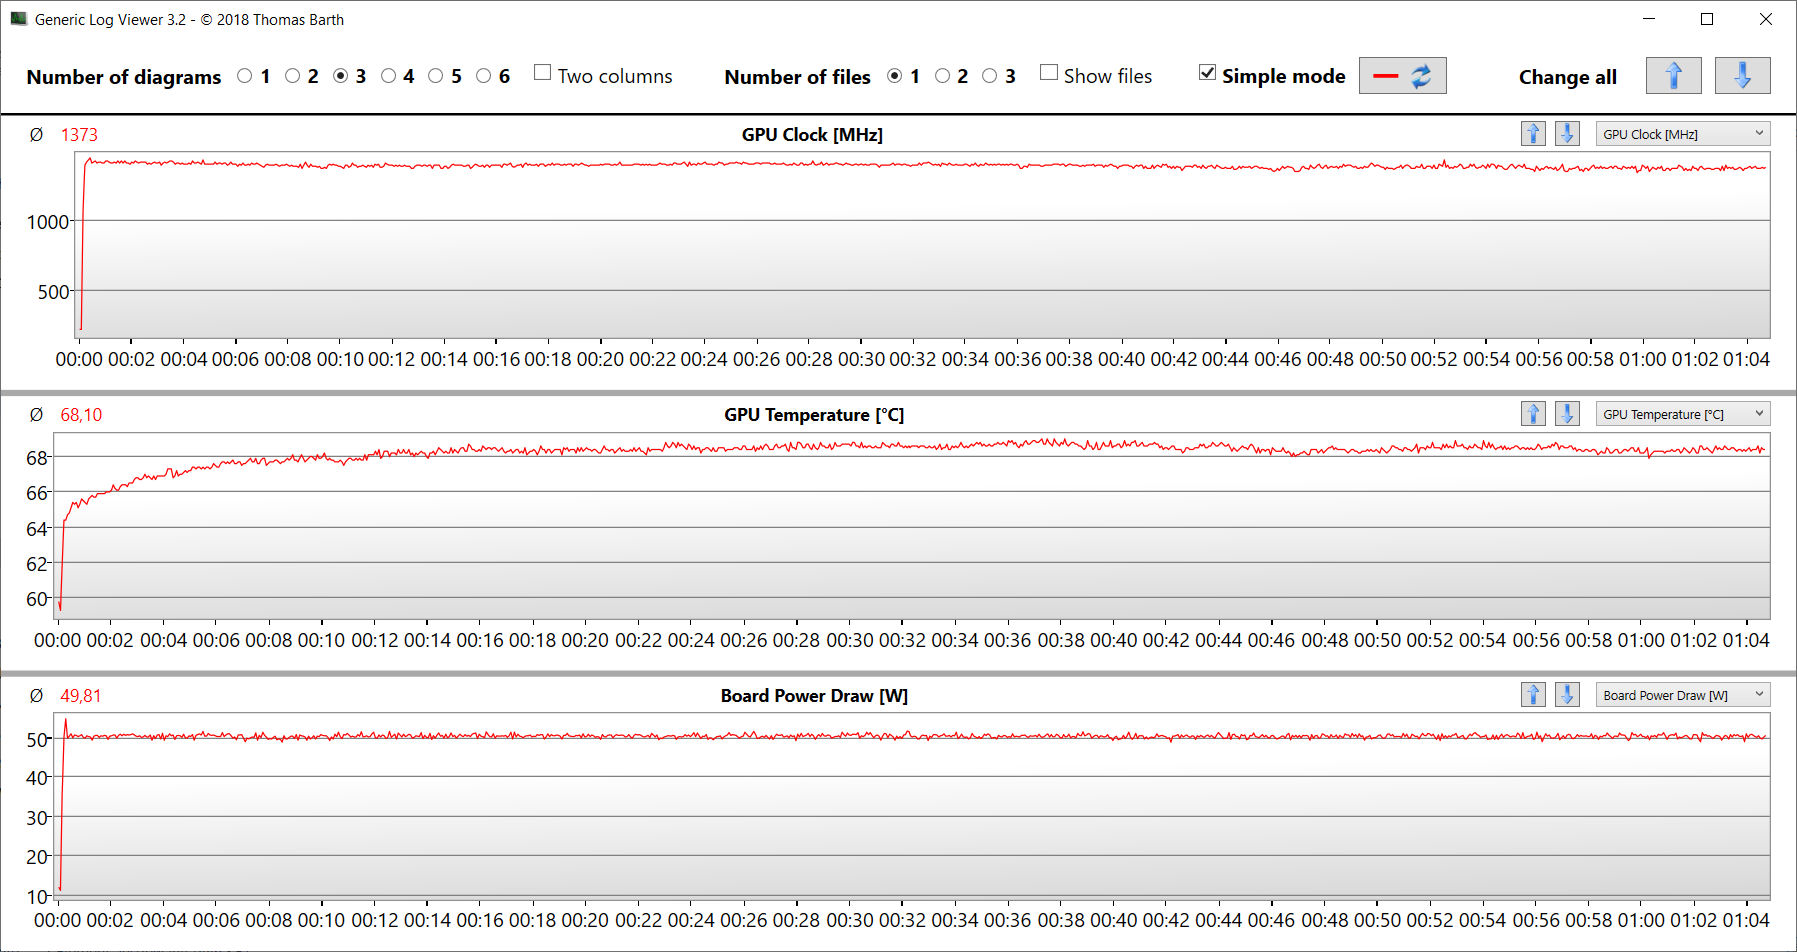
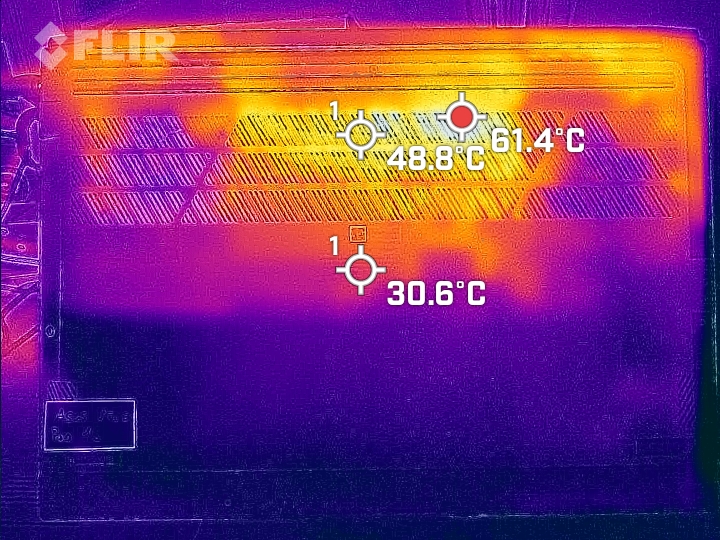
Pod obciążeniem laptop osiągał dość wysokie temperatury, ale średnio jego temperatury osiągały umiarkowane poziomy. Oznacza to, że podczas naszego testu obciążeniowego zmierzyliśmy maksymalnie 55,5 °C. Jednak w codziennym użytkowaniu temperatury zazwyczaj mieszczą się w akceptowalnym zakresie.
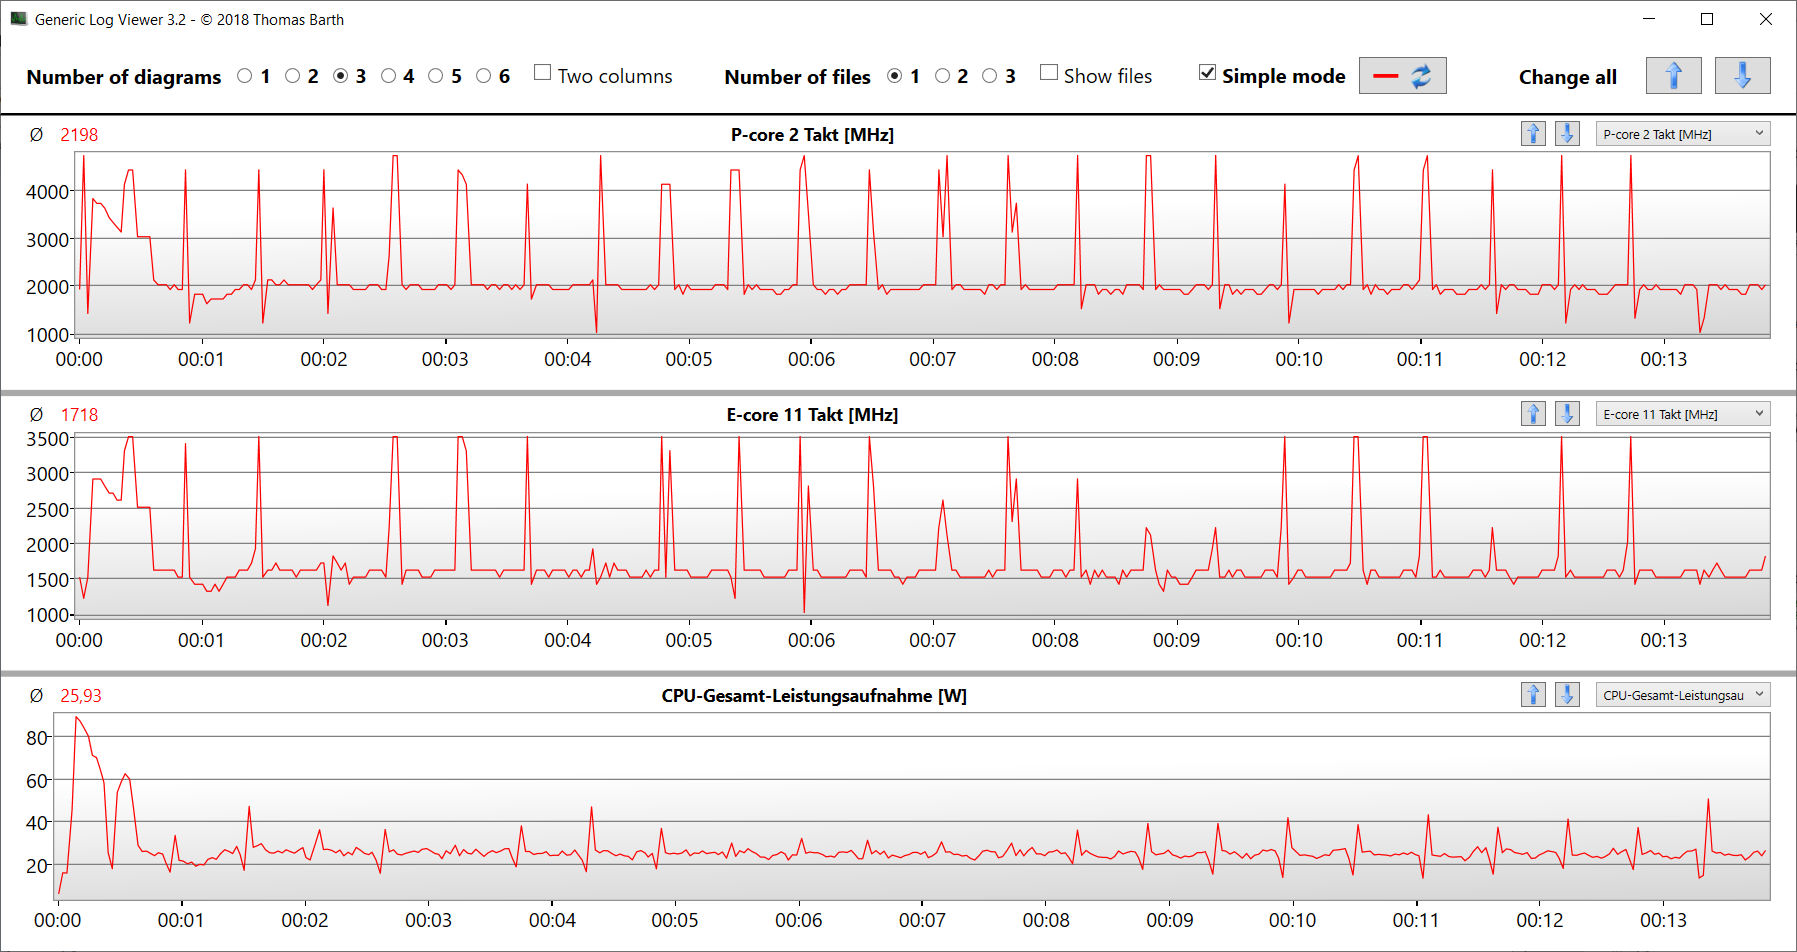
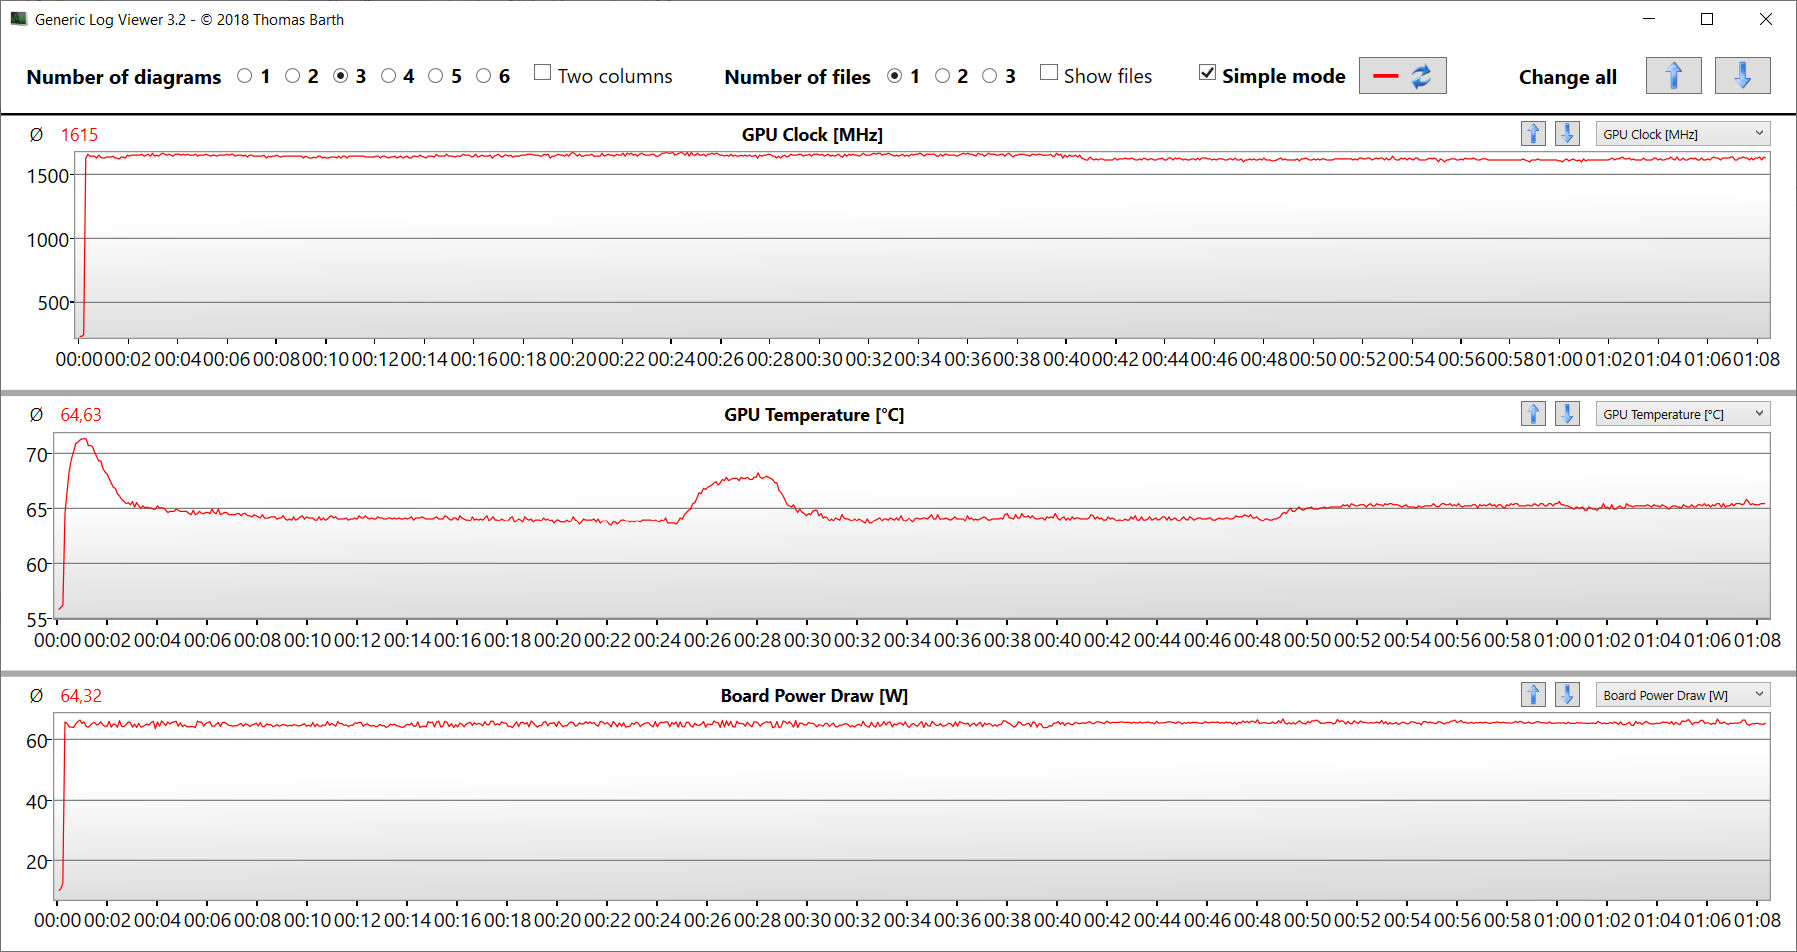
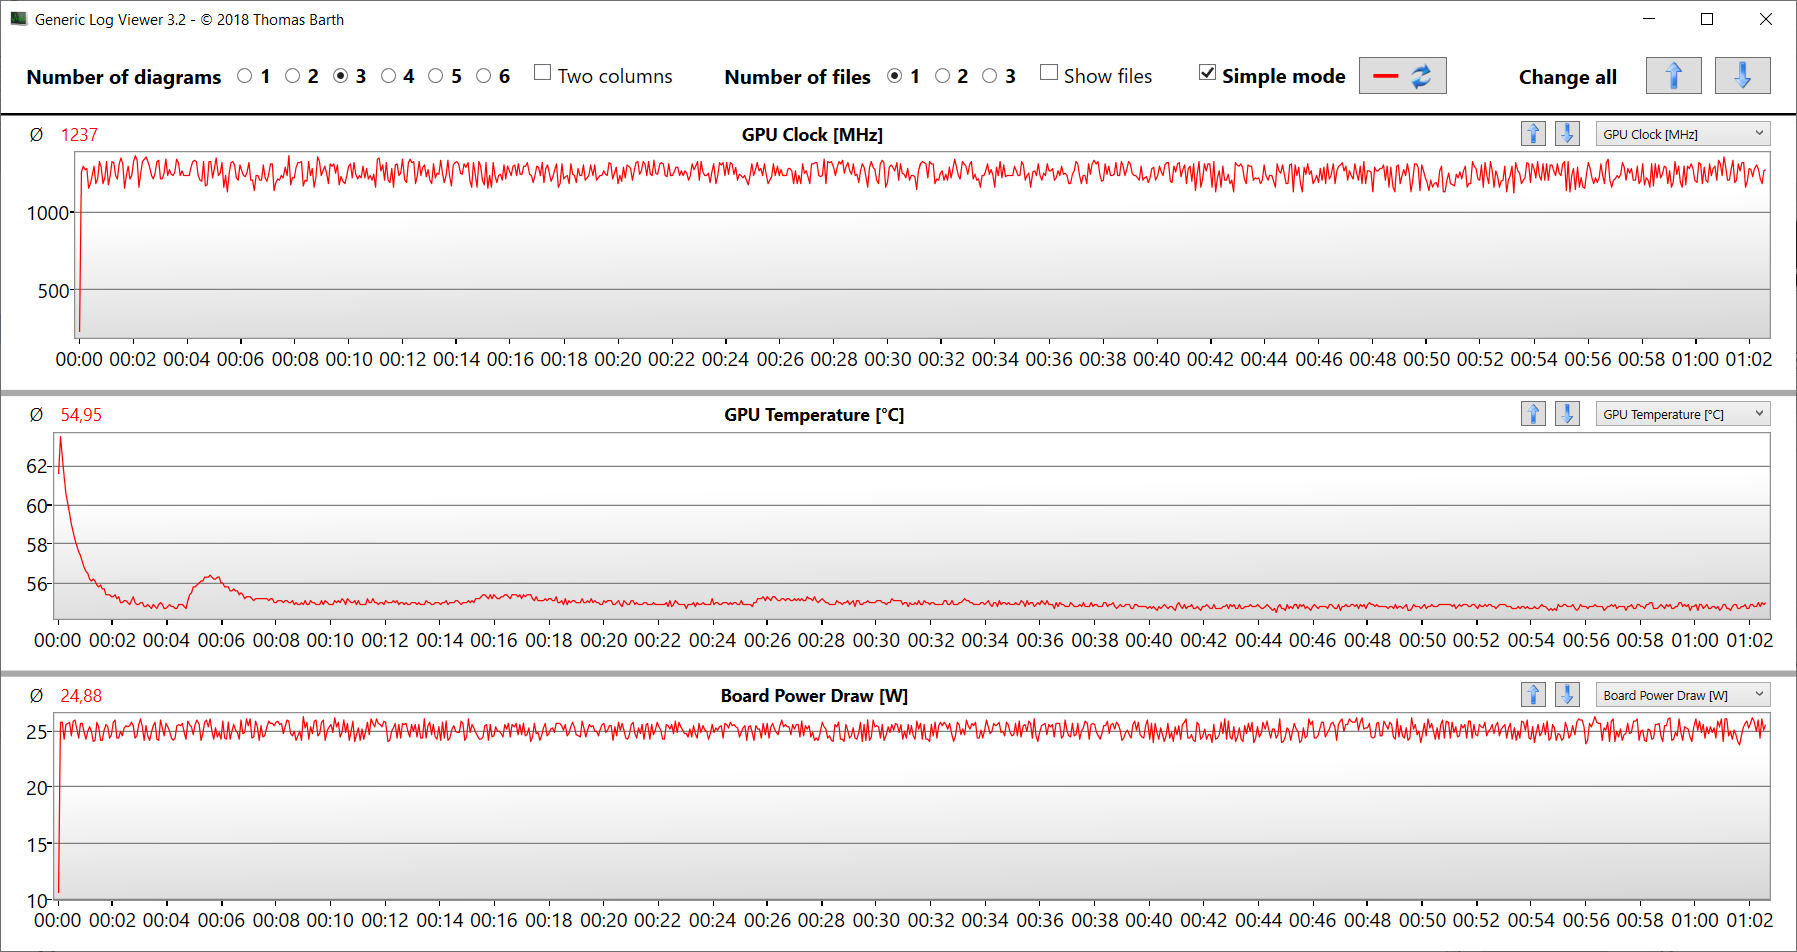
Test obciążeniowy (Prime95 i Furmark w trybie ciągłym) symuluje ekstremalny scenariusz w celu sprawdzenia, jak stabilny pozostaje system przy pełnym obciążeniu. Procesor rozpoczął test obciążeniowy ze średnimi częstotliwościami taktowania (P: 3,2 - 3,3 GHz; E: 2,7 GHz), a rdzeń graficzny miał częstotliwość 1,1 - 1,4 GHz. Podczas gdy częstotliwość taktowania CPU spadła w trakcie testu, częstotliwość taktowania GPU nieco wzrosła.
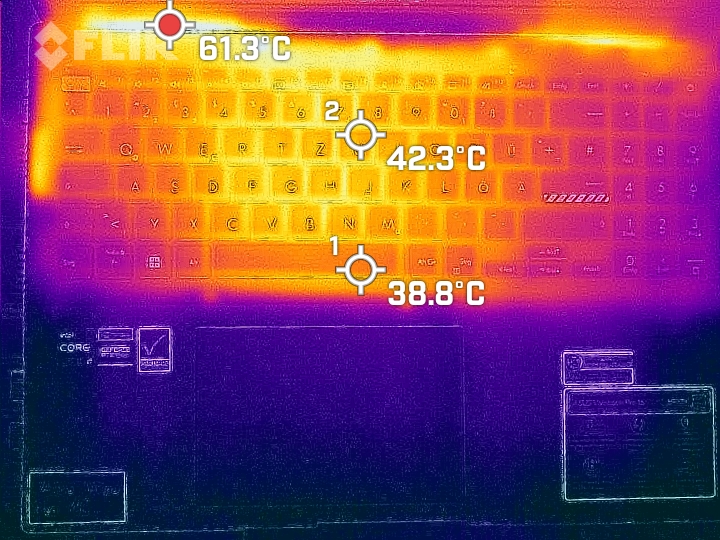
(±) Maksymalna temperatura w górnej części wynosi 44.2 °C / 112 F, w porównaniu do średniej 36.8 °C / 98 F , począwszy od 21 do 71 °C dla klasy Multimedia.
(-) Dno nagrzewa się maksymalnie do 53 °C / 127 F, w porównaniu do średniej 39.1 °C / 102 F
(+) W stanie bezczynności średnia temperatura górnej części wynosi 27.9 °C / 82 F, w porównaniu ze średnią temperaturą urządzenia wynoszącą 31.3 °C / ### class_avg_f### F.
(±) Podczas gry w Wiedźmina 3 średnia temperatura górnej części wynosi 33.3 °C / 92 F, w porównaniu do średniej temperatury urządzenia wynoszącej 31.3 °C / ## #class_avg_f### F.
(+) Podpórki pod nadgarstki i touchpad są chłodniejsze niż temperatura skóry i maksymalnie 23.7 °C / 74.7 F i dlatego są chłodne w dotyku.
(+) Średnia temperatura obszaru podparcia dłoni w podobnych urządzeniach wynosiła 28.7 °C / 83.7 F (+5 °C / 9 F).
| Asus VivoBook Pro 16 Intel Core i7-12700H, NVIDIA GeForce RTX 3050 Ti Laptop GPU | Dell Inspiron 16 Plus 7620 Intel Core i7-12700H, NVIDIA GeForce RTX 3050 Ti Laptop GPU | Schenker XMG Fusion 15 (Mid 22) Intel Core i7-11800H, NVIDIA GeForce RTX 3070 Laptop GPU | Acer Swift X SFX16-52G-77RX Intel Core i7-1260P, Intel Arc A370M | |
|---|---|---|---|---|
| Heat | 10% | -13% | 3% | |
| Maximum Upper Side * (°C) | 44.2 | 46 -4% | 52 -18% | 49.4 -12% |
| Maximum Bottom * (°C) | 53 | 45.8 14% | 63 -19% | 55.5 -5% |
| Idle Upper Side * (°C) | 32.1 | 29.2 9% | 37 -15% | 28.4 12% |
| Idle Bottom * (°C) | 38.4 | 31 19% | 38 1% | 32.6 15% |
* ... im mniej tym lepiej
Głośniki
Głośniki stereo generują przyzwoity dźwięk, ale prawie nie mają basów.
Asus VivoBook Pro 16 analiza dźwięku
(+) | głośniki mogą odtwarzać stosunkowo głośno (88.5 dB)
Bas 100 - 315 Hz
(-) | prawie brak basu - średnio 20.8% niższa od mediany
(±) | liniowość basu jest średnia (12.8% delta do poprzedniej częstotliwości)
Średnie 400 - 2000 Hz
(+) | zbalansowane środki średnie - tylko 2.2% od mediany
(+) | średnie są liniowe (4.7% delta do poprzedniej częstotliwości)
Wysokie 2–16 kHz
(±) | wyższe maksima - średnio 7.4% wyższe od mediany
(+) | wzloty są liniowe (5.9% delta do poprzedniej częstotliwości)
Ogólnie 100 - 16.000 Hz
(±) | liniowość ogólnego dźwięku jest średnia (16.2% różnicy w stosunku do mediany)
W porównaniu do tej samej klasy
» 41% wszystkich testowanych urządzeń w tej klasie było lepszych, 7% podobnych, 51% gorszych
» Najlepszy miał deltę 5%, średnia wynosiła ###średnia###%, najgorsza wynosiła 45%
W porównaniu do wszystkich testowanych urządzeń
» 26% wszystkich testowanych urządzeń było lepszych, 6% podobnych, 68% gorszych
» Najlepszy miał deltę 4%, średnia wynosiła ###średnia###%, najgorsza wynosiła 134%
Dell Inspiron 16 Plus 7620 analiza dźwięku
(+) | głośniki mogą odtwarzać stosunkowo głośno (87.8 dB)
Bas 100 - 315 Hz
(-) | prawie brak basu - średnio 22.2% niższa od mediany
(±) | liniowość basu jest średnia (9.7% delta do poprzedniej częstotliwości)
Średnie 400 - 2000 Hz
(+) | zbalansowane środki średnie - tylko 3.3% od mediany
(+) | średnie są liniowe (5.3% delta do poprzedniej częstotliwości)
Wysokie 2–16 kHz
(+) | zrównoważone maksima - tylko 2.5% od mediany
(+) | wzloty są liniowe (4.7% delta do poprzedniej częstotliwości)
Ogólnie 100 - 16.000 Hz
(+) | ogólny dźwięk jest liniowy (13.4% różnicy w stosunku do mediany)
W porównaniu do tej samej klasy
» 28% wszystkich testowanych urządzeń w tej klasie było lepszych, 5% podobnych, 68% gorszych
» Najlepszy miał deltę 5%, średnia wynosiła ###średnia###%, najgorsza wynosiła 45%
W porównaniu do wszystkich testowanych urządzeń
» 14% wszystkich testowanych urządzeń było lepszych, 4% podobnych, 82% gorszych
» Najlepszy miał deltę 4%, średnia wynosiła ###średnia###%, najgorsza wynosiła 134%
Zużycie energii
Laptop nie wykazał żadnych widocznych wskaźników zużycia energii. Zmierzone wartości są na normalnym poziomie dla zainstalowanego sprzętu. Test Witcher 3 został przeprowadzony przy stałym poborze mocy. Jego zasilacz (150 W) jest wystarczającej wielkości.
| wyłączony / stan wstrzymania | |
| luz | |
| obciążenie |
|
Legenda:
min: | |
| Asus VivoBook Pro 16 i7-12700H, GeForce RTX 3050 Ti Laptop GPU, Intel SSD 670p SSDPEKNU010TZ, IPS, 2560x1600, 16" | Dell Inspiron 16 Plus 7620 i7-12700H, GeForce RTX 3050 Ti Laptop GPU, Kioxia BG5 KBG50ZNS512G, IPS, 3072x1920, 16" | Schenker XMG Fusion 15 (Mid 22) i7-11800H, GeForce RTX 3070 Laptop GPU, Samsung SSD 980 Pro 1TB MZ-V8P1T0BW, IPS, 2560x1440, 15.6" | Acer Swift X SFX16-52G-77RX i7-1260P, A370M, WDC PC SN810 1TB, IPS-LED, 2560x1600, 16" | Przeciętny NVIDIA GeForce RTX 3050 Ti Laptop GPU | Średnia w klasie Multimedia | |
|---|---|---|---|---|---|---|
| Power Consumption | 12% | -26% | 42% | 10% | 33% | |
| Idle Minimum * (Watt) | 8.7 | 6.8 22% | 12 -38% | 3.7 57% | 8.2 ? 6% | 5.66 ? 35% |
| Idle Average * (Watt) | 13.1 | 9.6 27% | 17 -30% | 7.6 42% | 12.6 ? 4% | 10.2 ? 22% |
| Idle Maximum * (Watt) | 18.3 | 17 7% | 24 -31% | 11.1 39% | 17.2 ? 6% | 12.5 ? 32% |
| Load Average * (Watt) | 116 | 117.5 -1% | 106 9% | 70 40% | 92 ? 21% | 65.2 ? 44% |
| Witcher 3 ultra * (Watt) | 117.6 | 113.1 4% | 159.9 -36% | 68.8 41% | ||
| Load Maximum * (Watt) | 162 | 137.4 15% | 208 -28% | 108 33% | 139.1 ? 14% | 113.5 ? 30% |
* ... im mniej tym lepiej
power consumption Witcher 3 / stress test
Power consumption with external monitor
Żywotność baterii
16-calowy laptop osiągnął czas pracy 7:14 h w naszym praktycznym teście WLAN (mapowanie obciążenia podczas wywoływania stron internetowych za pomocą skryptu) - przyzwoita, ale nie rewelacyjna wartość. W polu porównawczym VivoBook zajmuje ostatnie miejsce.
| Battery Runtime - WiFi Websurfing | |
| Średnia w klasie Multimedia (4.37 - 26.6, n=64, ostatnie 2 lata) | |
| Dell Inspiron 16 Plus 7620 | |
| Acer Swift X SFX16-52G-77RX | |
| Schenker XMG Fusion 15 (Mid 22) | |
| Asus VivoBook Pro 16 | |
Za
Przeciw
Werdykt - Wszechstronne urządzenie multimedialne z imponującym ekranem
Edycja wideo i zdjęć, strumieniowanie, renderowanie i granie: Wszystko to należy do głównych zalet VivoBook Pro 16. JegoCore 7-12700HiGeForce RTX 3050 Ti Laptopzapewniają całą niezbędną moc - oba komponenty konsekwentnie pracują z wysokimi częstotliwościami taktowania. Nie jest ona jednak w pełni wykorzystywana, gdyż pamięć RAM działa tylko w trybie jednokanałowym.
Asus VivoBook Pro 16 to laptop dla graczy i twórców, którzy nie przywiązują zbyt dużej wagi do posiadania najnowszego sprzętu.
Laptop nagrzewa się tylko nieznacznie pod obciążeniem, ale może być bardzo głośny - a nawet zbyt głośny. Pozytyw: Urządzenie oferuje tryb szeptu, który może obniżyć emisję hałasu wytwarzanego przez laptopa kosztem jego wydajności - co może przynajmniej pozwolić na nieco bardziej zrelaksowaną pracę.
Kompaktowa budowa, stosunkowo niewielka waga (1,9 kg) i przyzwoite czasy pracy (WLAN: 7:15 h) czynią z VivoBooka całkiem mobilne urządzenie. Pozytyw: Akumulator można ładować za pomocą zasilacza USB-C (min. 65 W, 20 V) - oba porty USB-C obsługują dostarczanie energii. Nie trzeba więc nadal korzystać z dołączonego, firmowego zasilacza.
Nasz testowy egzemplarz nie został wyposażony w ekran OLED, ale jest on ogólnie dostępny w serii VivoBook Pro 16. Nie powinieneś go przegapić: Zainstalowany ekran IPS (16 cali, 2560 x 1600 pikseli) w formacie 16:10 imponuje jasnością, dobrym kontrastem, stabilnymi kątami widzenia, krótkimi czasami reakcji, świetnym odwzorowaniem kolorów i doskonałym pokryciem przestrzeni barw.
alternatywnie, można spojrzeć naDell Inspiron 16 Plus 7620: Przy porównywalnej wydajności oferuje znacznie lepsze czasy pracy. Przyjazną dla budżetu alternatywą jestAcer Swift X 16który zapewnia niższą wydajność graficzną - ale może zaoferować bardzo dobre czasy pracy i cenę około 1000 USD.
Cena i dostępność
Testowaną przez nas wersję Asus VivoBook Pro 16 można kupić na Amazon za 1 247 USD.
Asus VivoBook Pro 16
- 22/05/2023 v7 (old)
Sascha Mölck
Przezroczystość
Wyboru urządzeń do recenzji dokonuje nasza redakcja. Próbka testowa została udostępniona autorowi jako pożyczka od producenta lub sprzedawcy detalicznego na potrzeby tej recenzji. Pożyczkodawca nie miał wpływu na tę recenzję, producent nie otrzymał też kopii tej recenzji przed publikacją. Nie było obowiązku publikowania tej recenzji. Jako niezależna firma medialna, Notebookcheck nie podlega władzy producentów, sprzedawców detalicznych ani wydawców.
Tak testuje Notebookcheck
Każdego roku Notebookcheck niezależnie sprawdza setki laptopów i smartfonów, stosując standardowe procedury, aby zapewnić porównywalność wszystkich wyników. Od około 20 lat stale rozwijamy nasze metody badawcze, ustanawiając przy tym standardy branżowe. W naszych laboratoriach testowych doświadczeni technicy i redaktorzy korzystają z wysokiej jakości sprzętu pomiarowego. Testy te obejmują wieloetapowy proces walidacji. Nasz kompleksowy system ocen opiera się na setkach uzasadnionych pomiarów i benchmarków, co pozwala zachować obiektywizm.Price comparison

