Recenzja laptopa Lenovo ThinkPad Z16 G1: Wydajny flagowiec AMD z hiciorkiem
ThinkPad i AMD - połączenie, które od dawna nie było zbyt często spotykane. Jednak w ostatnich latach zdecydowanie się to zmieniło, czego zwieńczeniem jest teraz seria Lenovo ThinkPad Z, czyli pierwsza high-endowa seria z układami Ryzen. Na początku roku Lenovo zapowiedziało dwa modele i rozmiary. Mieliśmy już możliwość przetestowania mniejszegoLenovo ThinkPad Z13, a teraz następuje model z dużym 16-calowym wyświetlaczem, Lenovo ThinkPad Z16.
Podczas gdy Z13 wyraźnie stawia na mobilność, Z16 celuje w sektor multimedialny i ma konkurować z laptopami takimi jak Dell XPS 15 i Apple MacBook Pro 16, a nawet z Lenovo ThinkPad X1 Extreme, obecnym topowym psem Lenovo dla klientów multimedialnych.
Potencjalni konkurenci w porównaniu
Ocena | Data | Model | Waga | Wysokość | Rozmiar | Rezolucja | Cena |
|---|---|---|---|---|---|---|---|
| 87.3 % v7 (old) | 10/2022 | Lenovo ThinkPad Z16 G1 21D5S00T00 R7 PRO 6850H, Radeon RX 6500M | 1.9 kg | 15.8 mm | 16.00" | 1920x1200 | |
| 89 % v7 (old) | Lenovo ThinkPad X1 Extreme G4-20Y5CTO1WW (3050 Ti) i7-11800H, GeForce RTX 3050 Ti Laptop GPU | 2 kg | 18.2 mm | 16.00" | 3840x2400 | ||
| 88.3 % v7 (old) | Lenovo ThinkPad X1 Extreme G4-20Y50040GE i9-11950H, GeForce RTX 3080 Laptop GPU | 1.9 kg | 18.2 mm | 16.00" | 3840x2400 | ||
| 89.5 % v7 (old) | Dell XPS 15 9520 RTX 3050 Ti i7-12700H, GeForce RTX 3050 Ti Laptop GPU | 1.9 kg | 18 mm | 15.60" | 3456x2160 | ||
| 89.3 % v7 (old) | 02/2023 | Dell XPS 17 9720 i7-12700H, GeForce RTX 3050 4GB Laptop GPU | 2.5 kg | 19.5 mm | 17.00" | 3840x2400 | |
| 93.2 % v7 (old) | Apple MacBook Pro 16 2021 M1 Pro M1 Pro, M1 Pro 16-Core GPU | 2.2 kg | 16.8 mm | 16.20" | 3456x2234 | ||
| 92.5 % v7 (old) | Apple MacBook Pro 16 2021 M1 Max M1 Max, M1 Max 32-Core GPU | 2.2 kg | 16.8 mm | 16.20" | 3456x2234 |
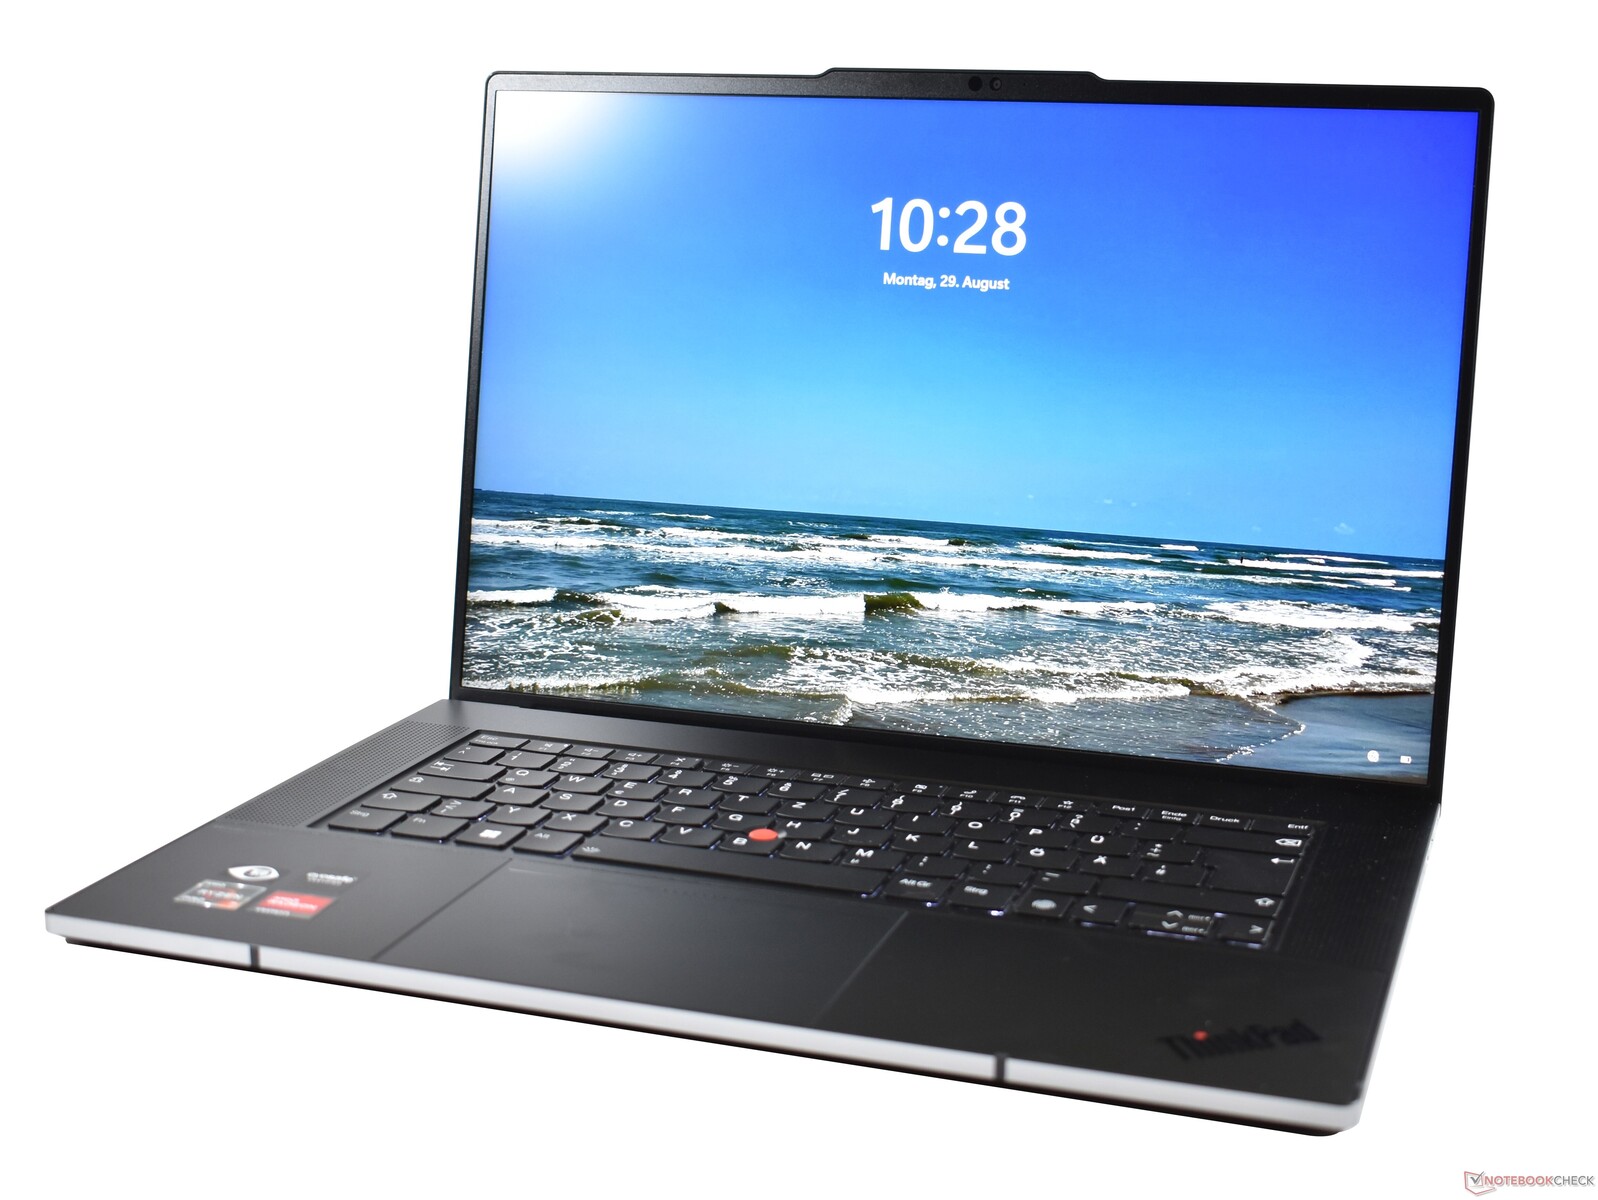
Kompaktowa aluminiowa obudowa: Lenovo ThinkPad Z16 G1
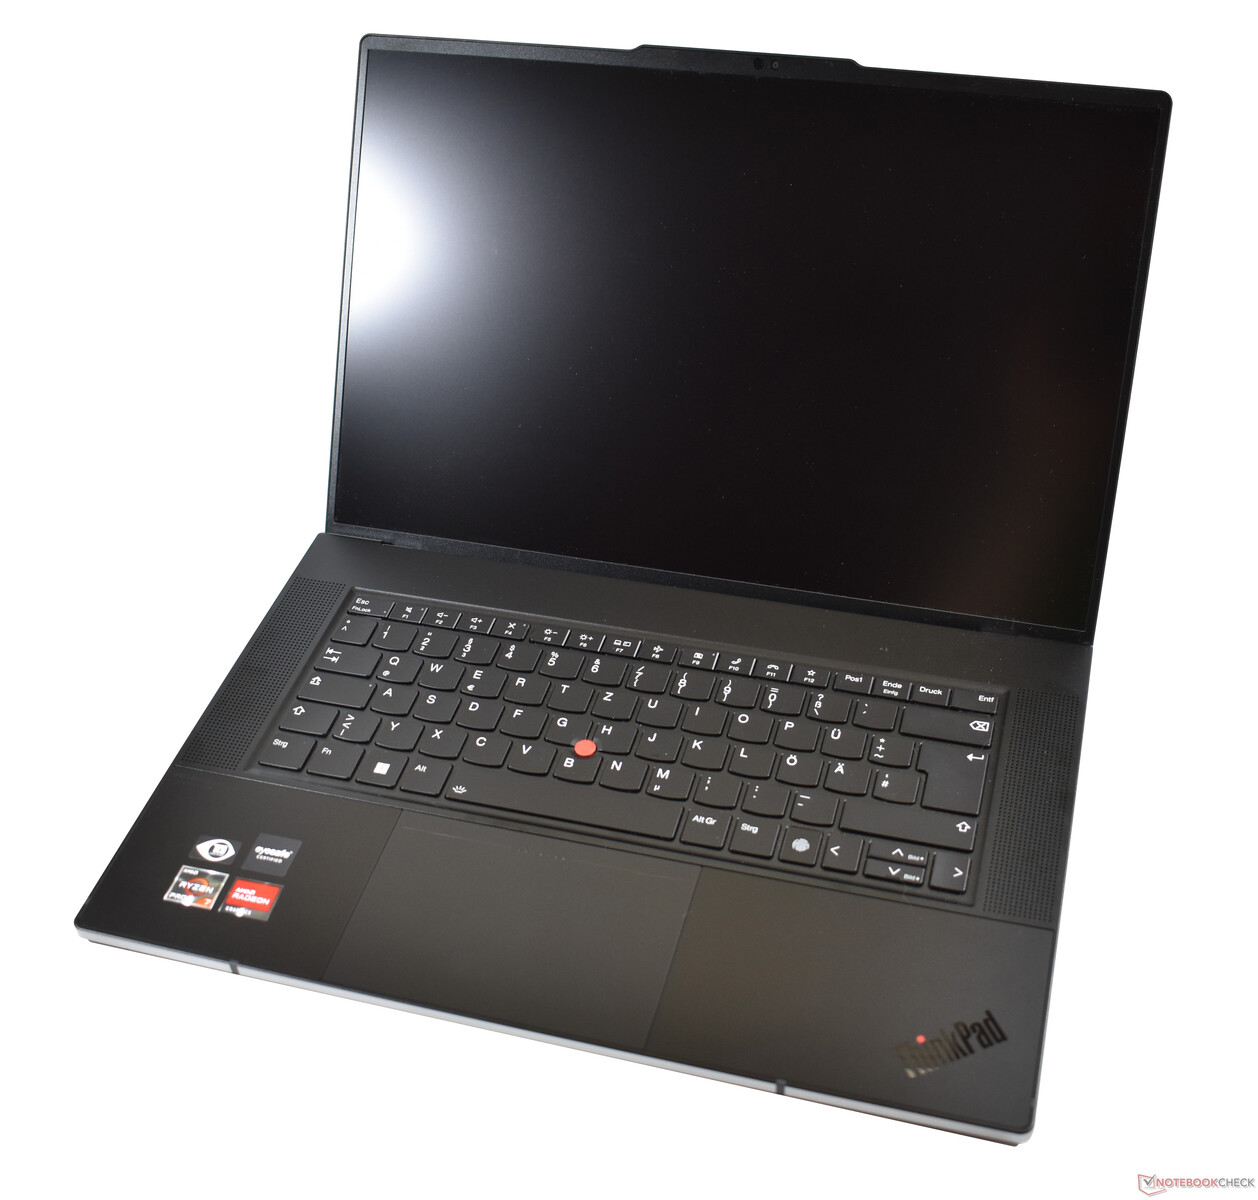
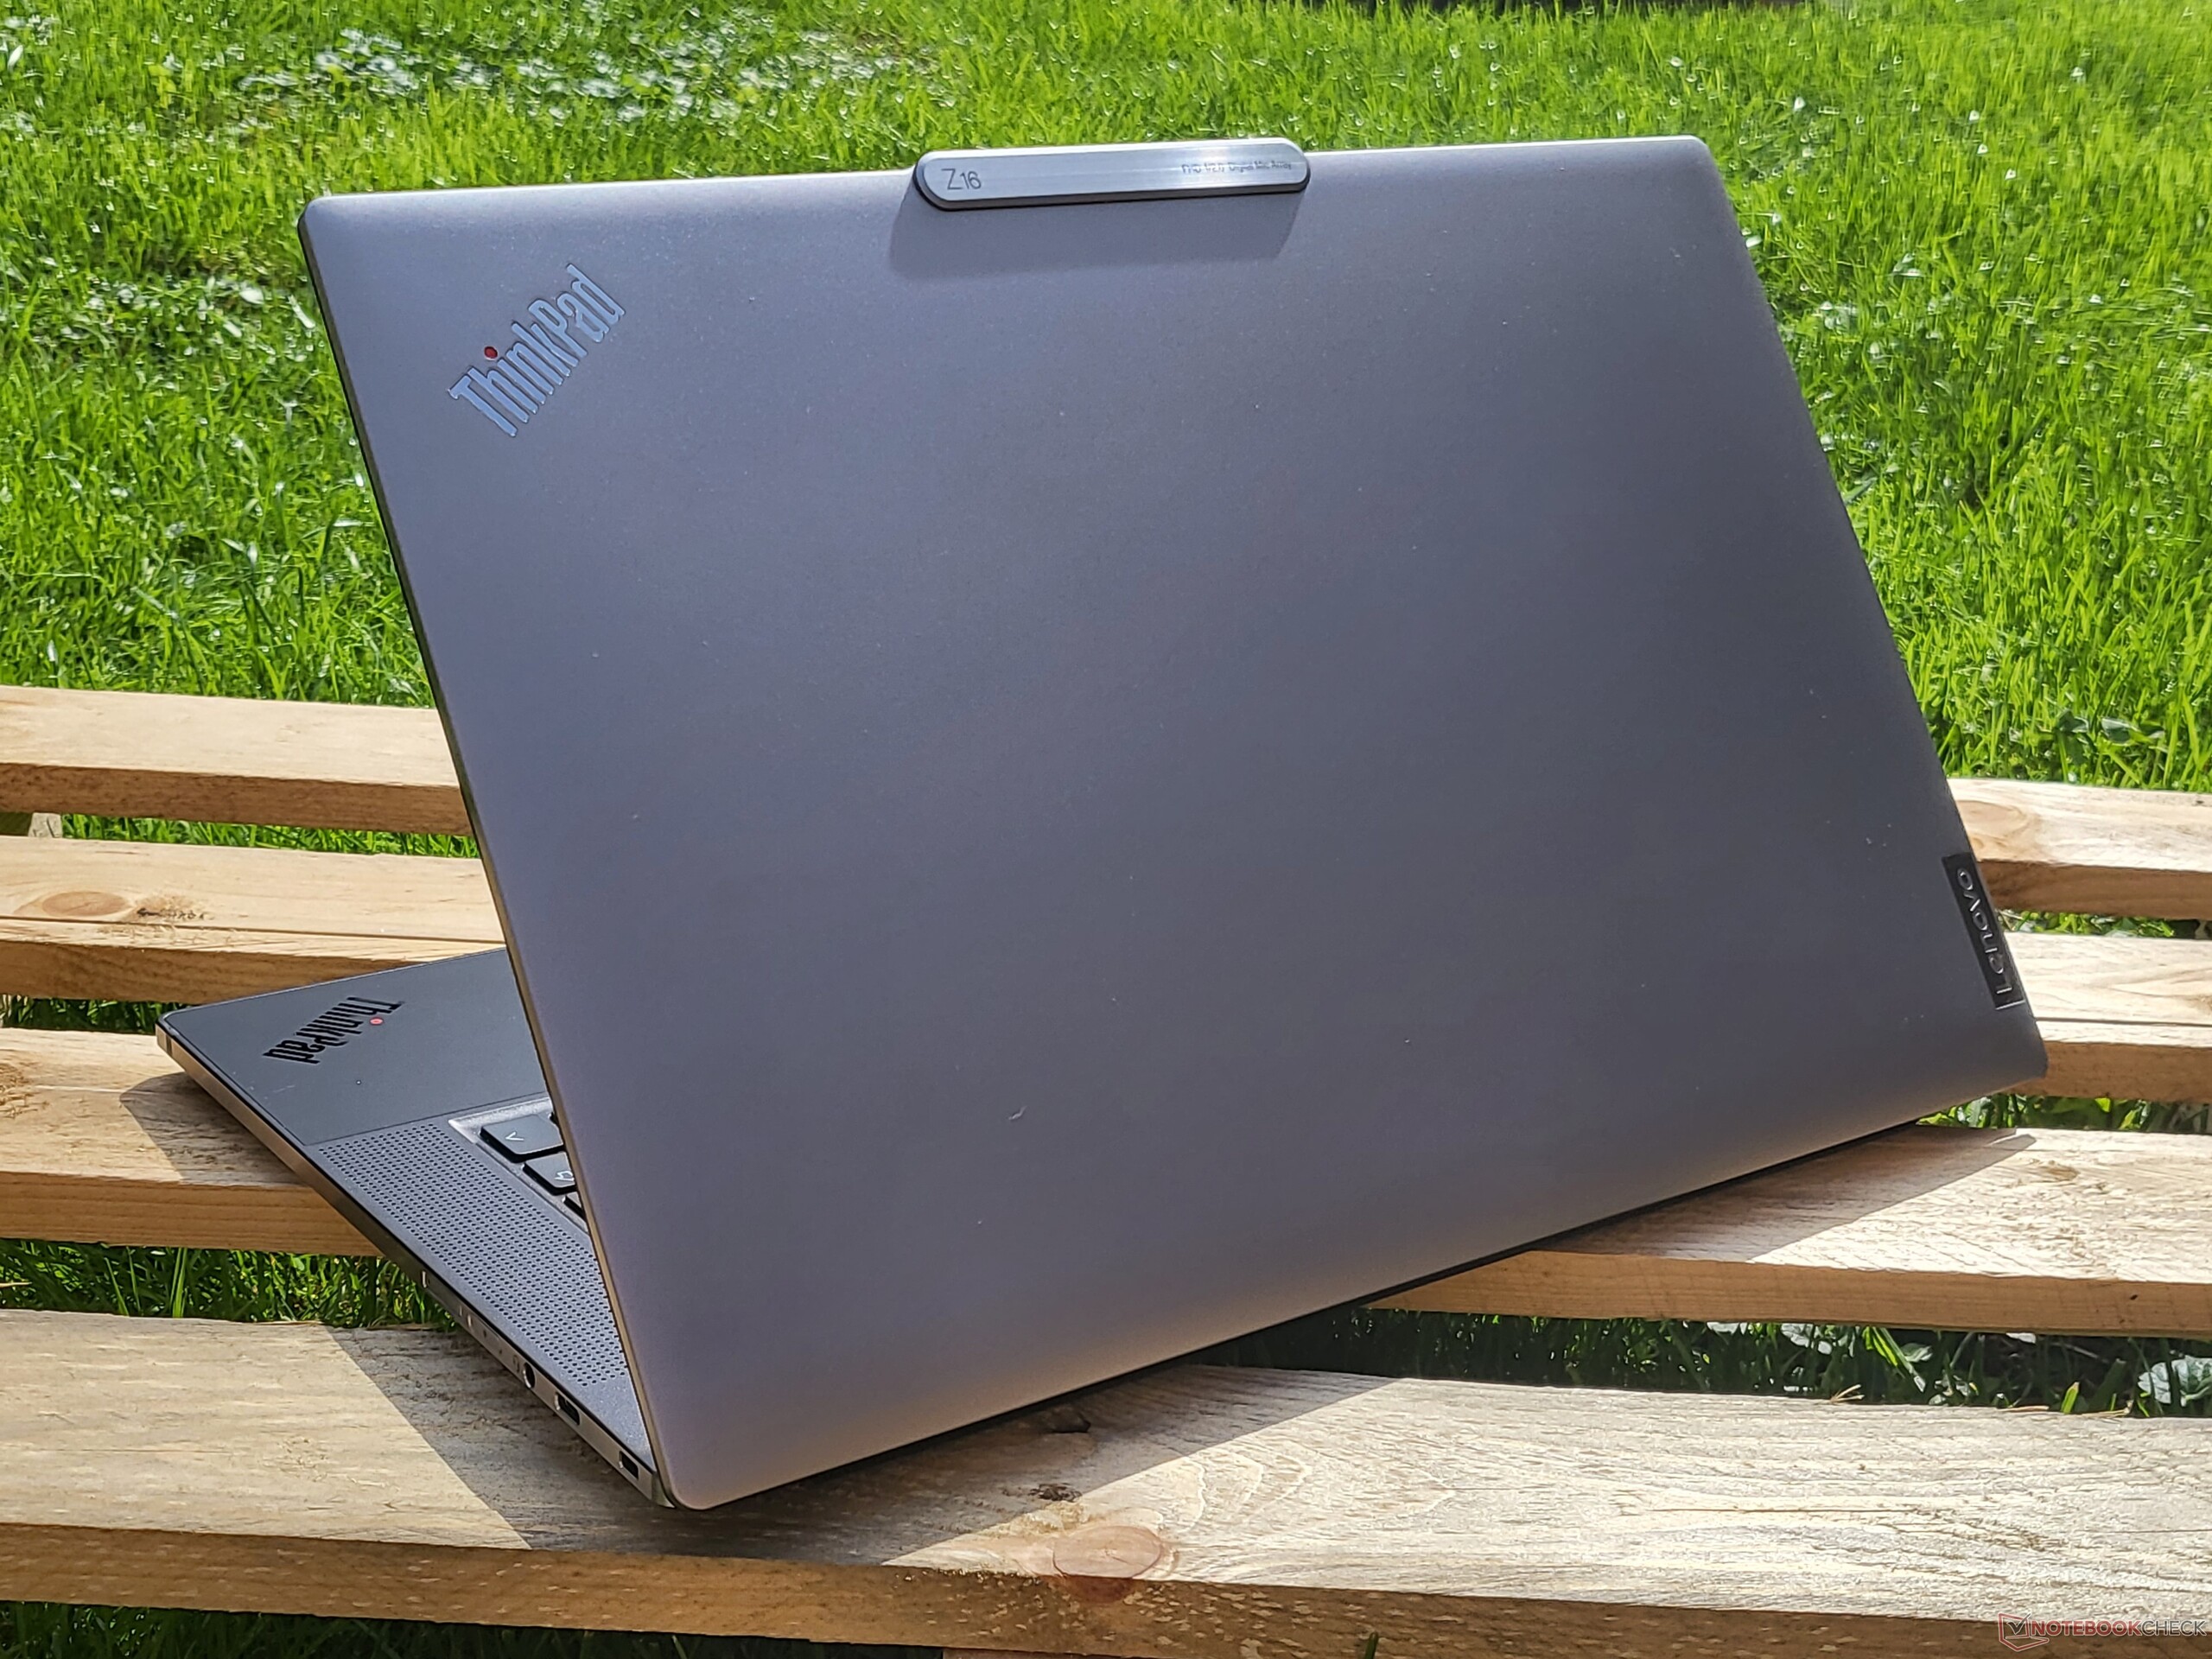
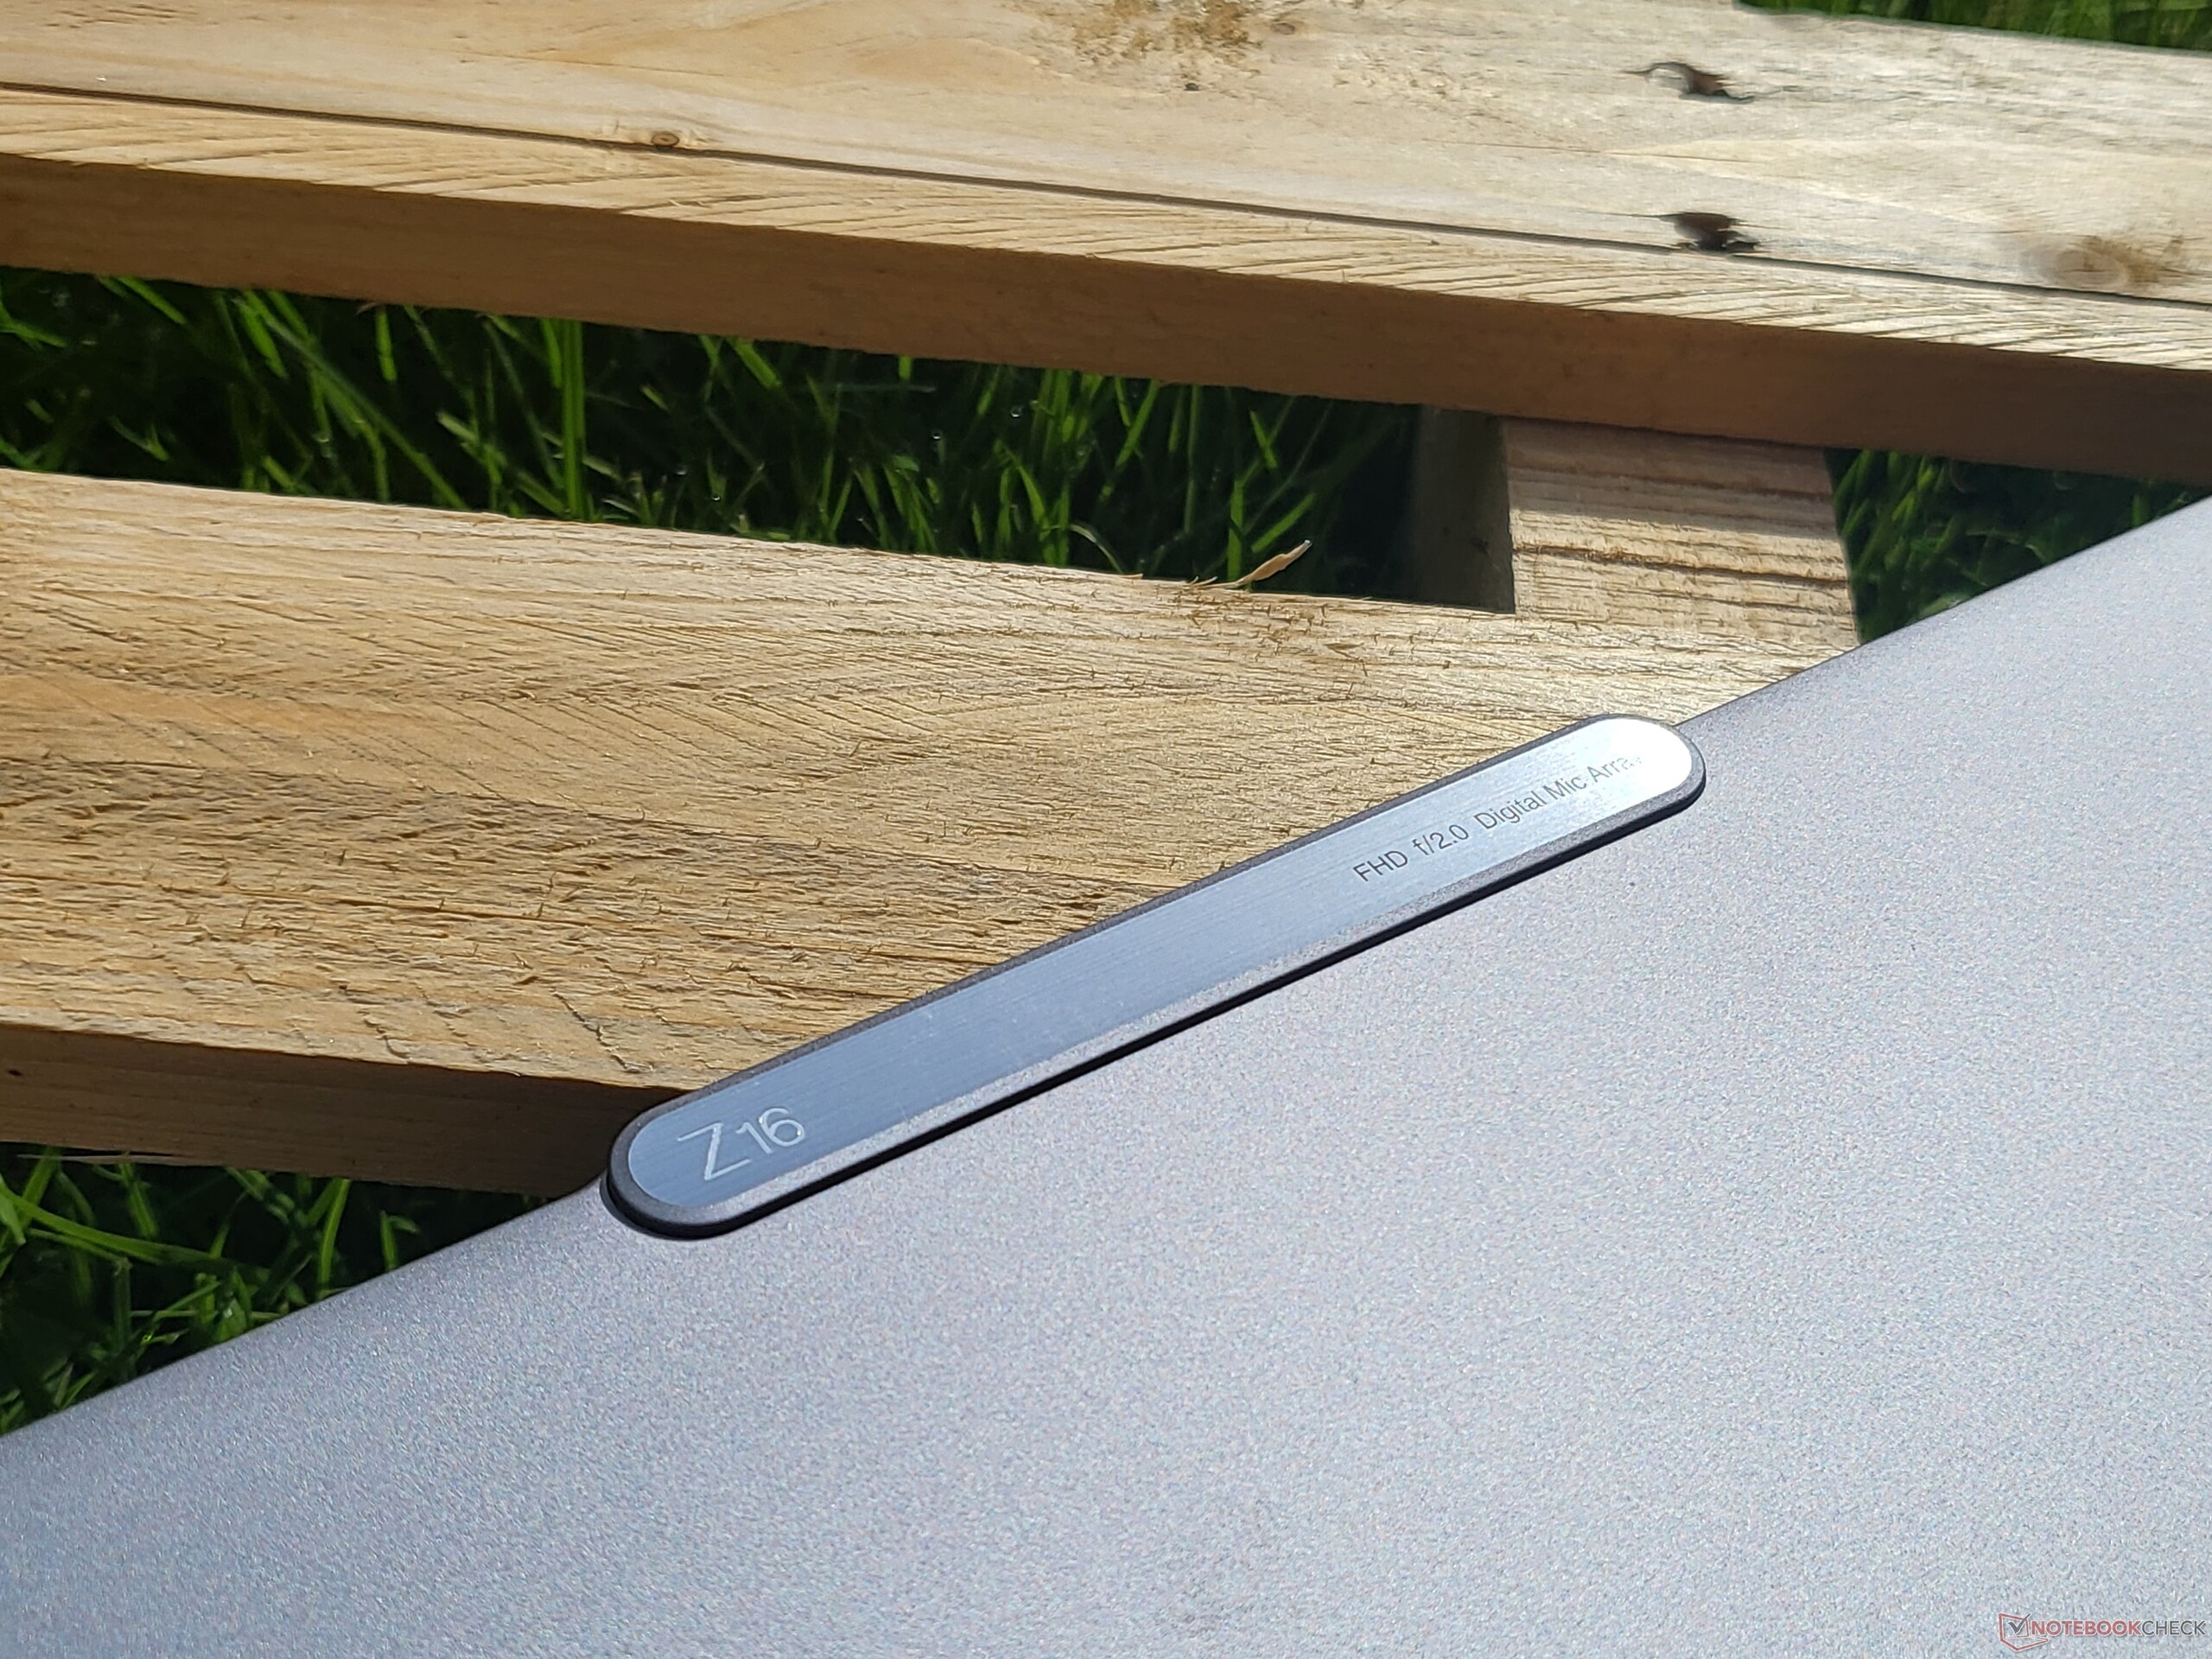
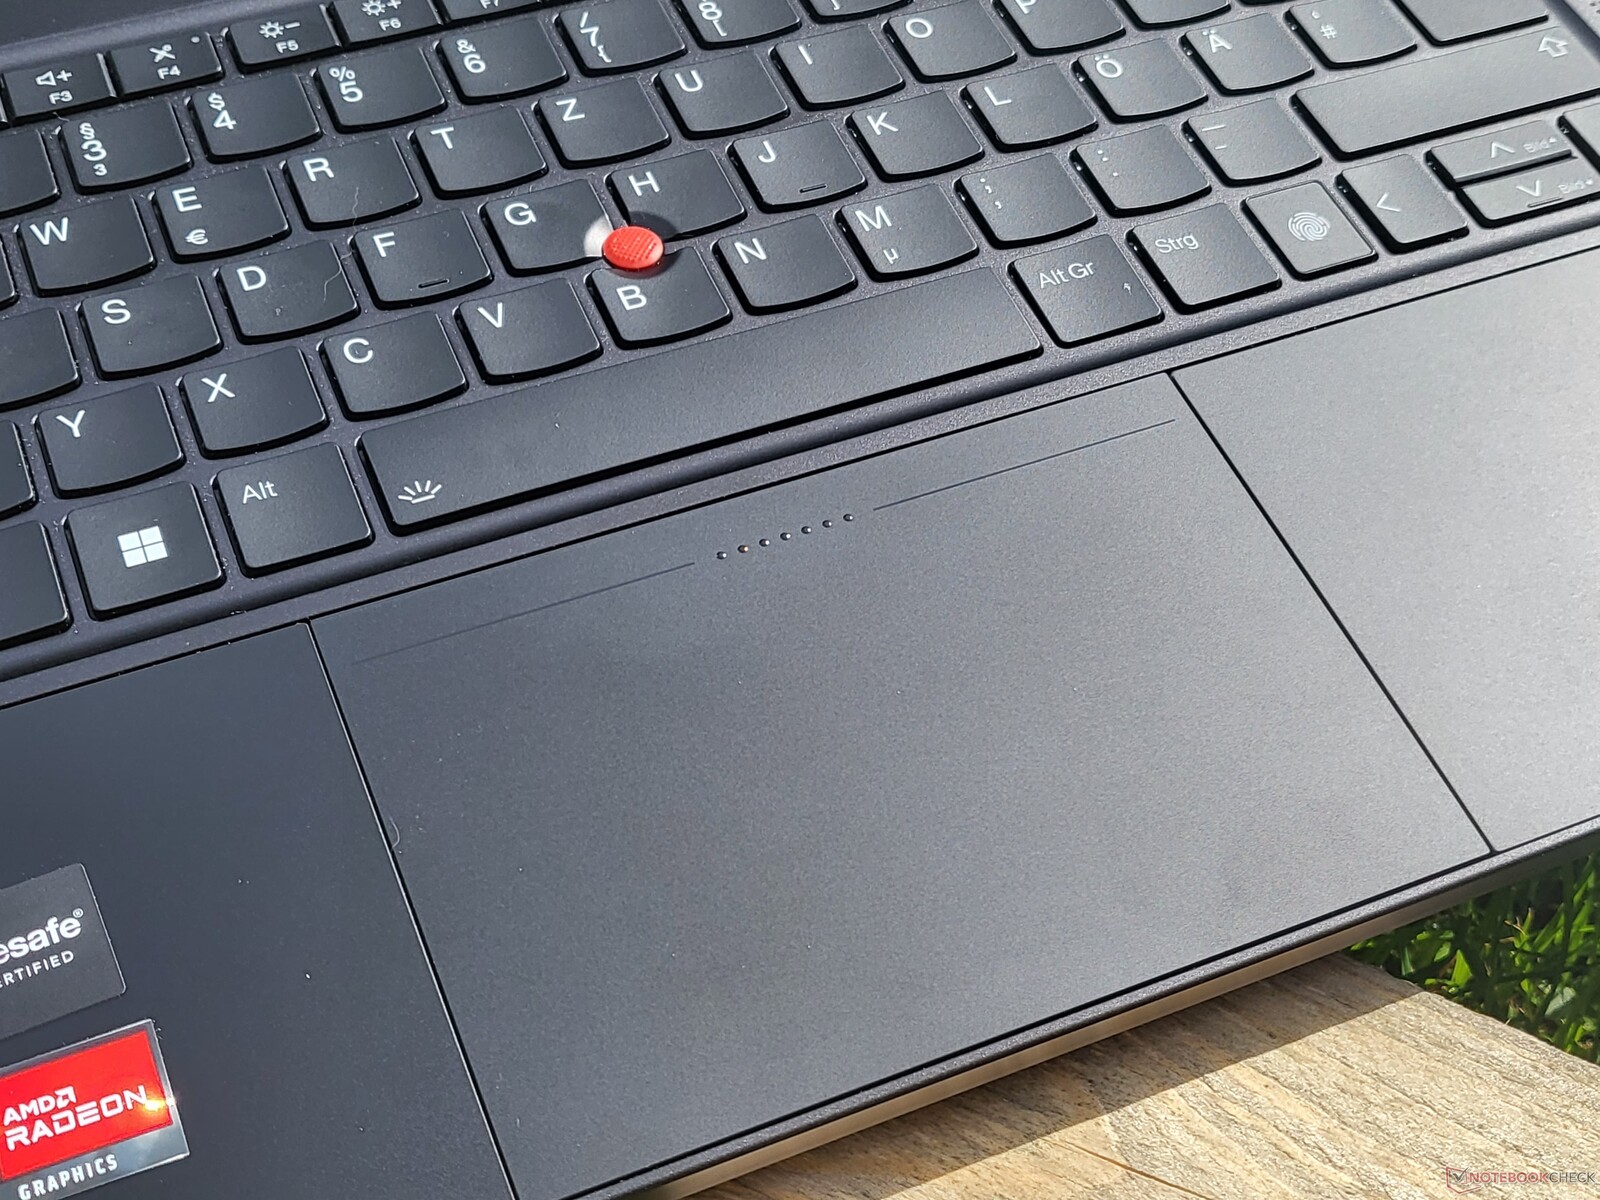
Największa różnica w stosunku do uznanej serii ThinkPad X1 Extreme dotyczy wzornictwa: Podczas gdy np X1 Extremewykorzystuje klasyczne atrybuty ThinkPada, wygląd ThinkPada Z16 jest znacznie bliższy głównemu nurtowi rynku laptopów. Z dużym touchpadem, prostokątną klawiaturą i srebrną pokrywą wyświetlacza wygląda jak hybryda między XPS-em lub MacBookiem a ThinkPadem. Oczywiście Lenovo umieści też swoje własne akcenty, takie jak na przykład wybrzuszenie kamery na pokrywie wyświetlacza, które jest też bardzo praktyczne w użyciu do podnoszenia pokrywy. Można to zrobić bez problemu jedną ręką, ale tylko do kąta otwarcia około 135 stopni. 180 stopni, podobnie jak w innych ThinkPadach, nie jest tu możliwe.
Pod względem doboru materiałów Lenovo również obiera inną drogę niż w przypadku serii X1. Pokrywa wyświetlacza jest wykonana ze srebrnego aluminium, ramka klawiatury jest anodyzowana na czarno, a spód to czarny lakier. Tylko ramka wyświetlacza jest wykonana z tworzywa sztucznego. Kolejną ciekawostką są podpórki pod dłonie, gdyż są one wykonane z matowego szkła. Tworzy to pewne haptyki dla Z16, które są o poziom wyżej od X1 Extreme, ale to może być też kwestia gustu. W każdym razie Z16 na pewno będzie miał mniej problemów z tłustymi powierzchniami. Stabilność obudowy również stoi na bardzo wysokim poziomie, choć naturalnie cienka pokrywa wyświetlacza jest słabsza od podstawy.
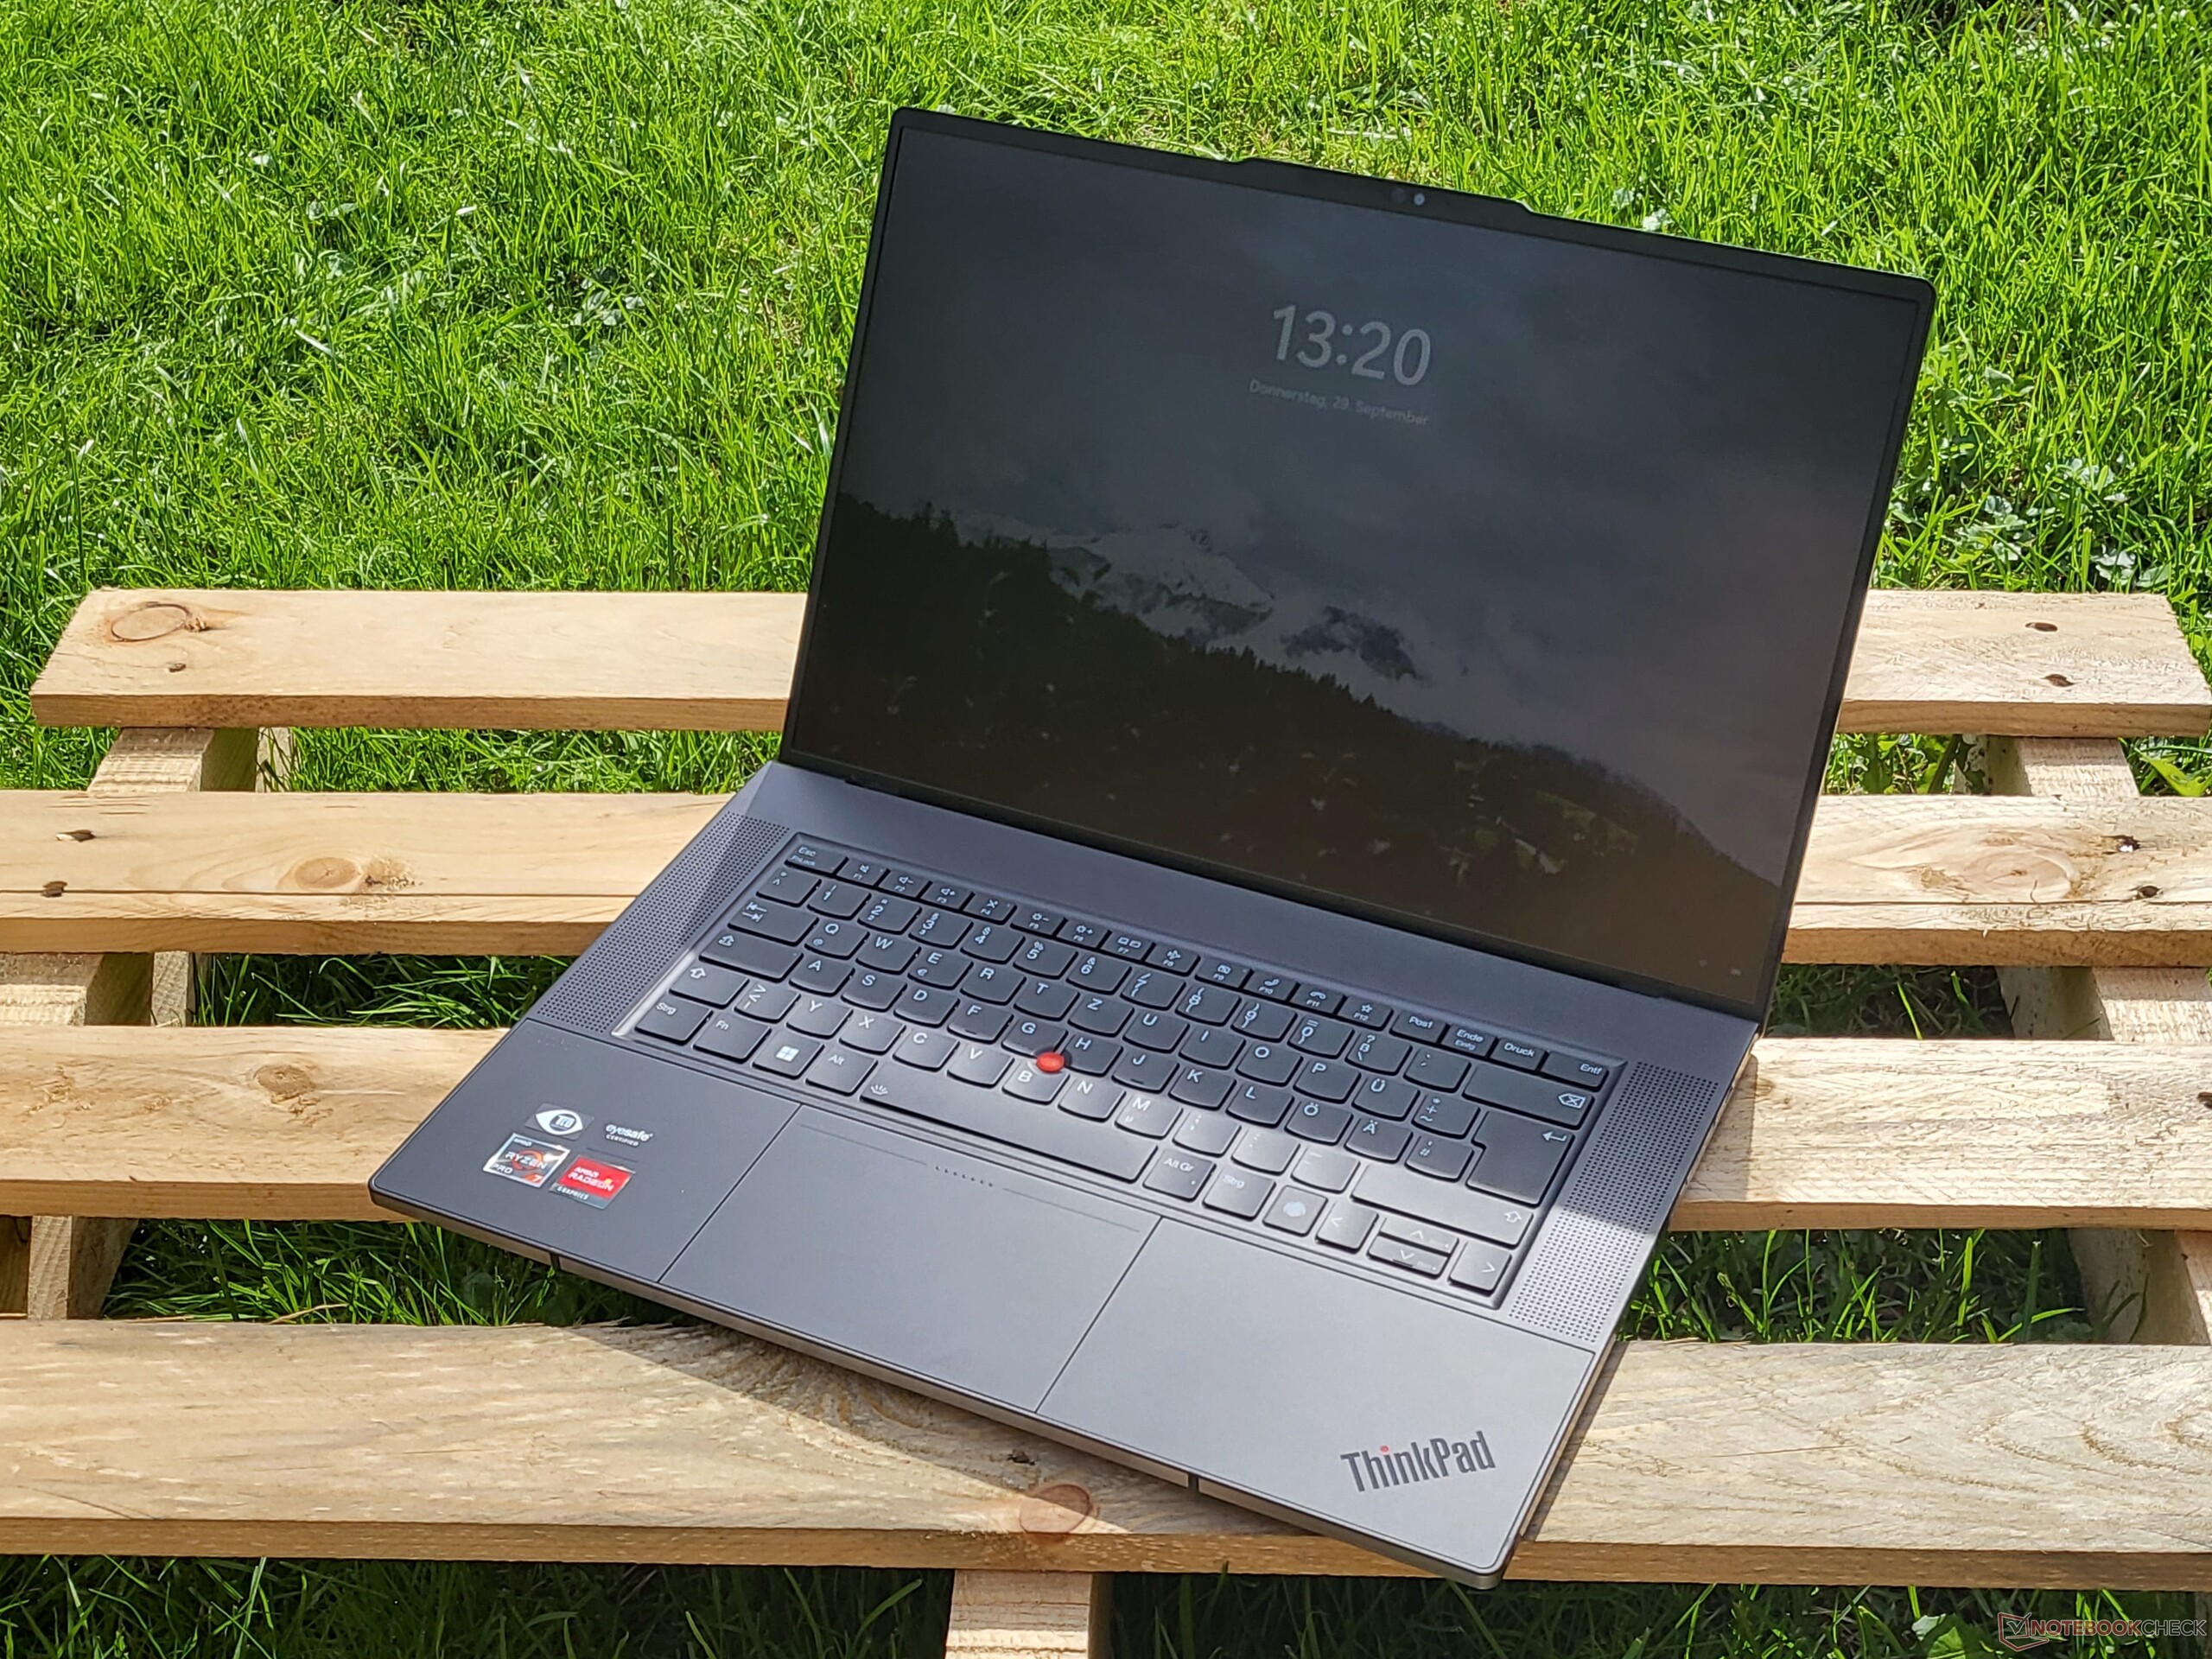
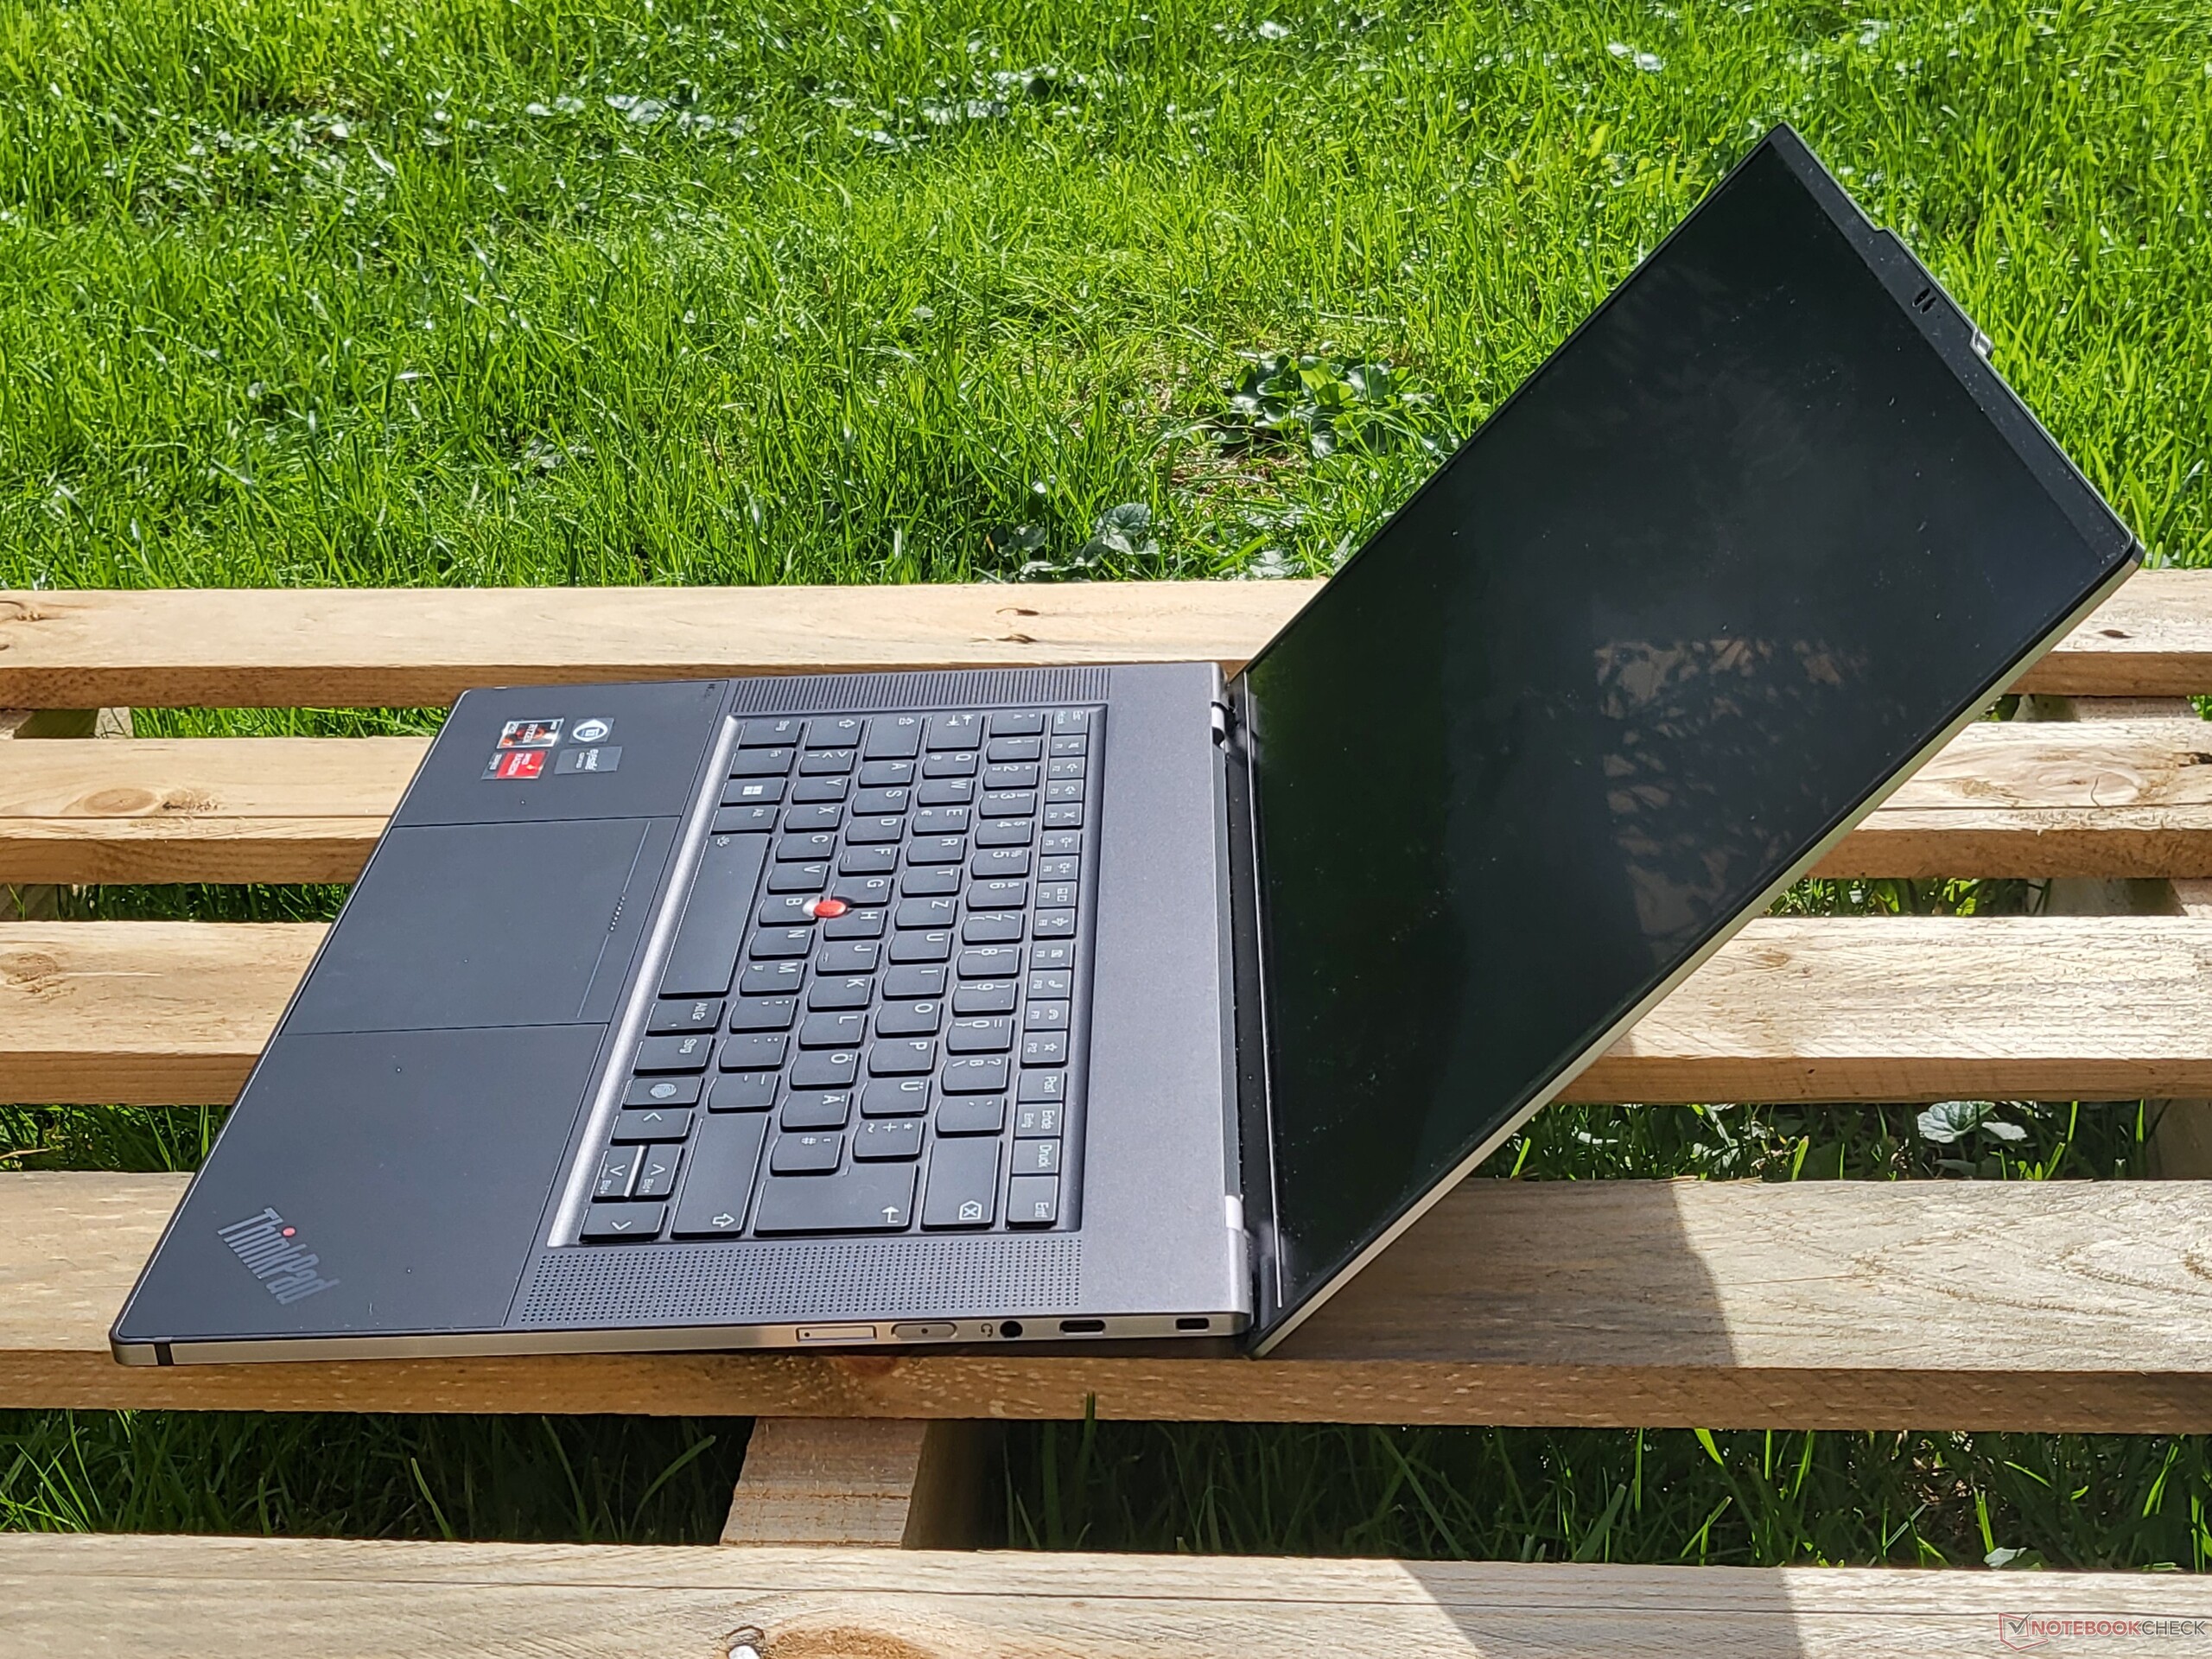
ThinkPad Z16 to najbardziej kompaktowy 16-calowy laptop w naszym zestawieniu. Na stronie Dell XPS 15 jest mniejszy, ale oferuje "tylko" 15,6-calowy wyświetlacz LCD. Pod względem grubości Z16 również wyprzedza, gdyż jest smuklejszy od wszystkich pozostałych konkurentów. Pod względem wagi wszyscy konkurenci są do siebie wyjątkowo zbliżeni.
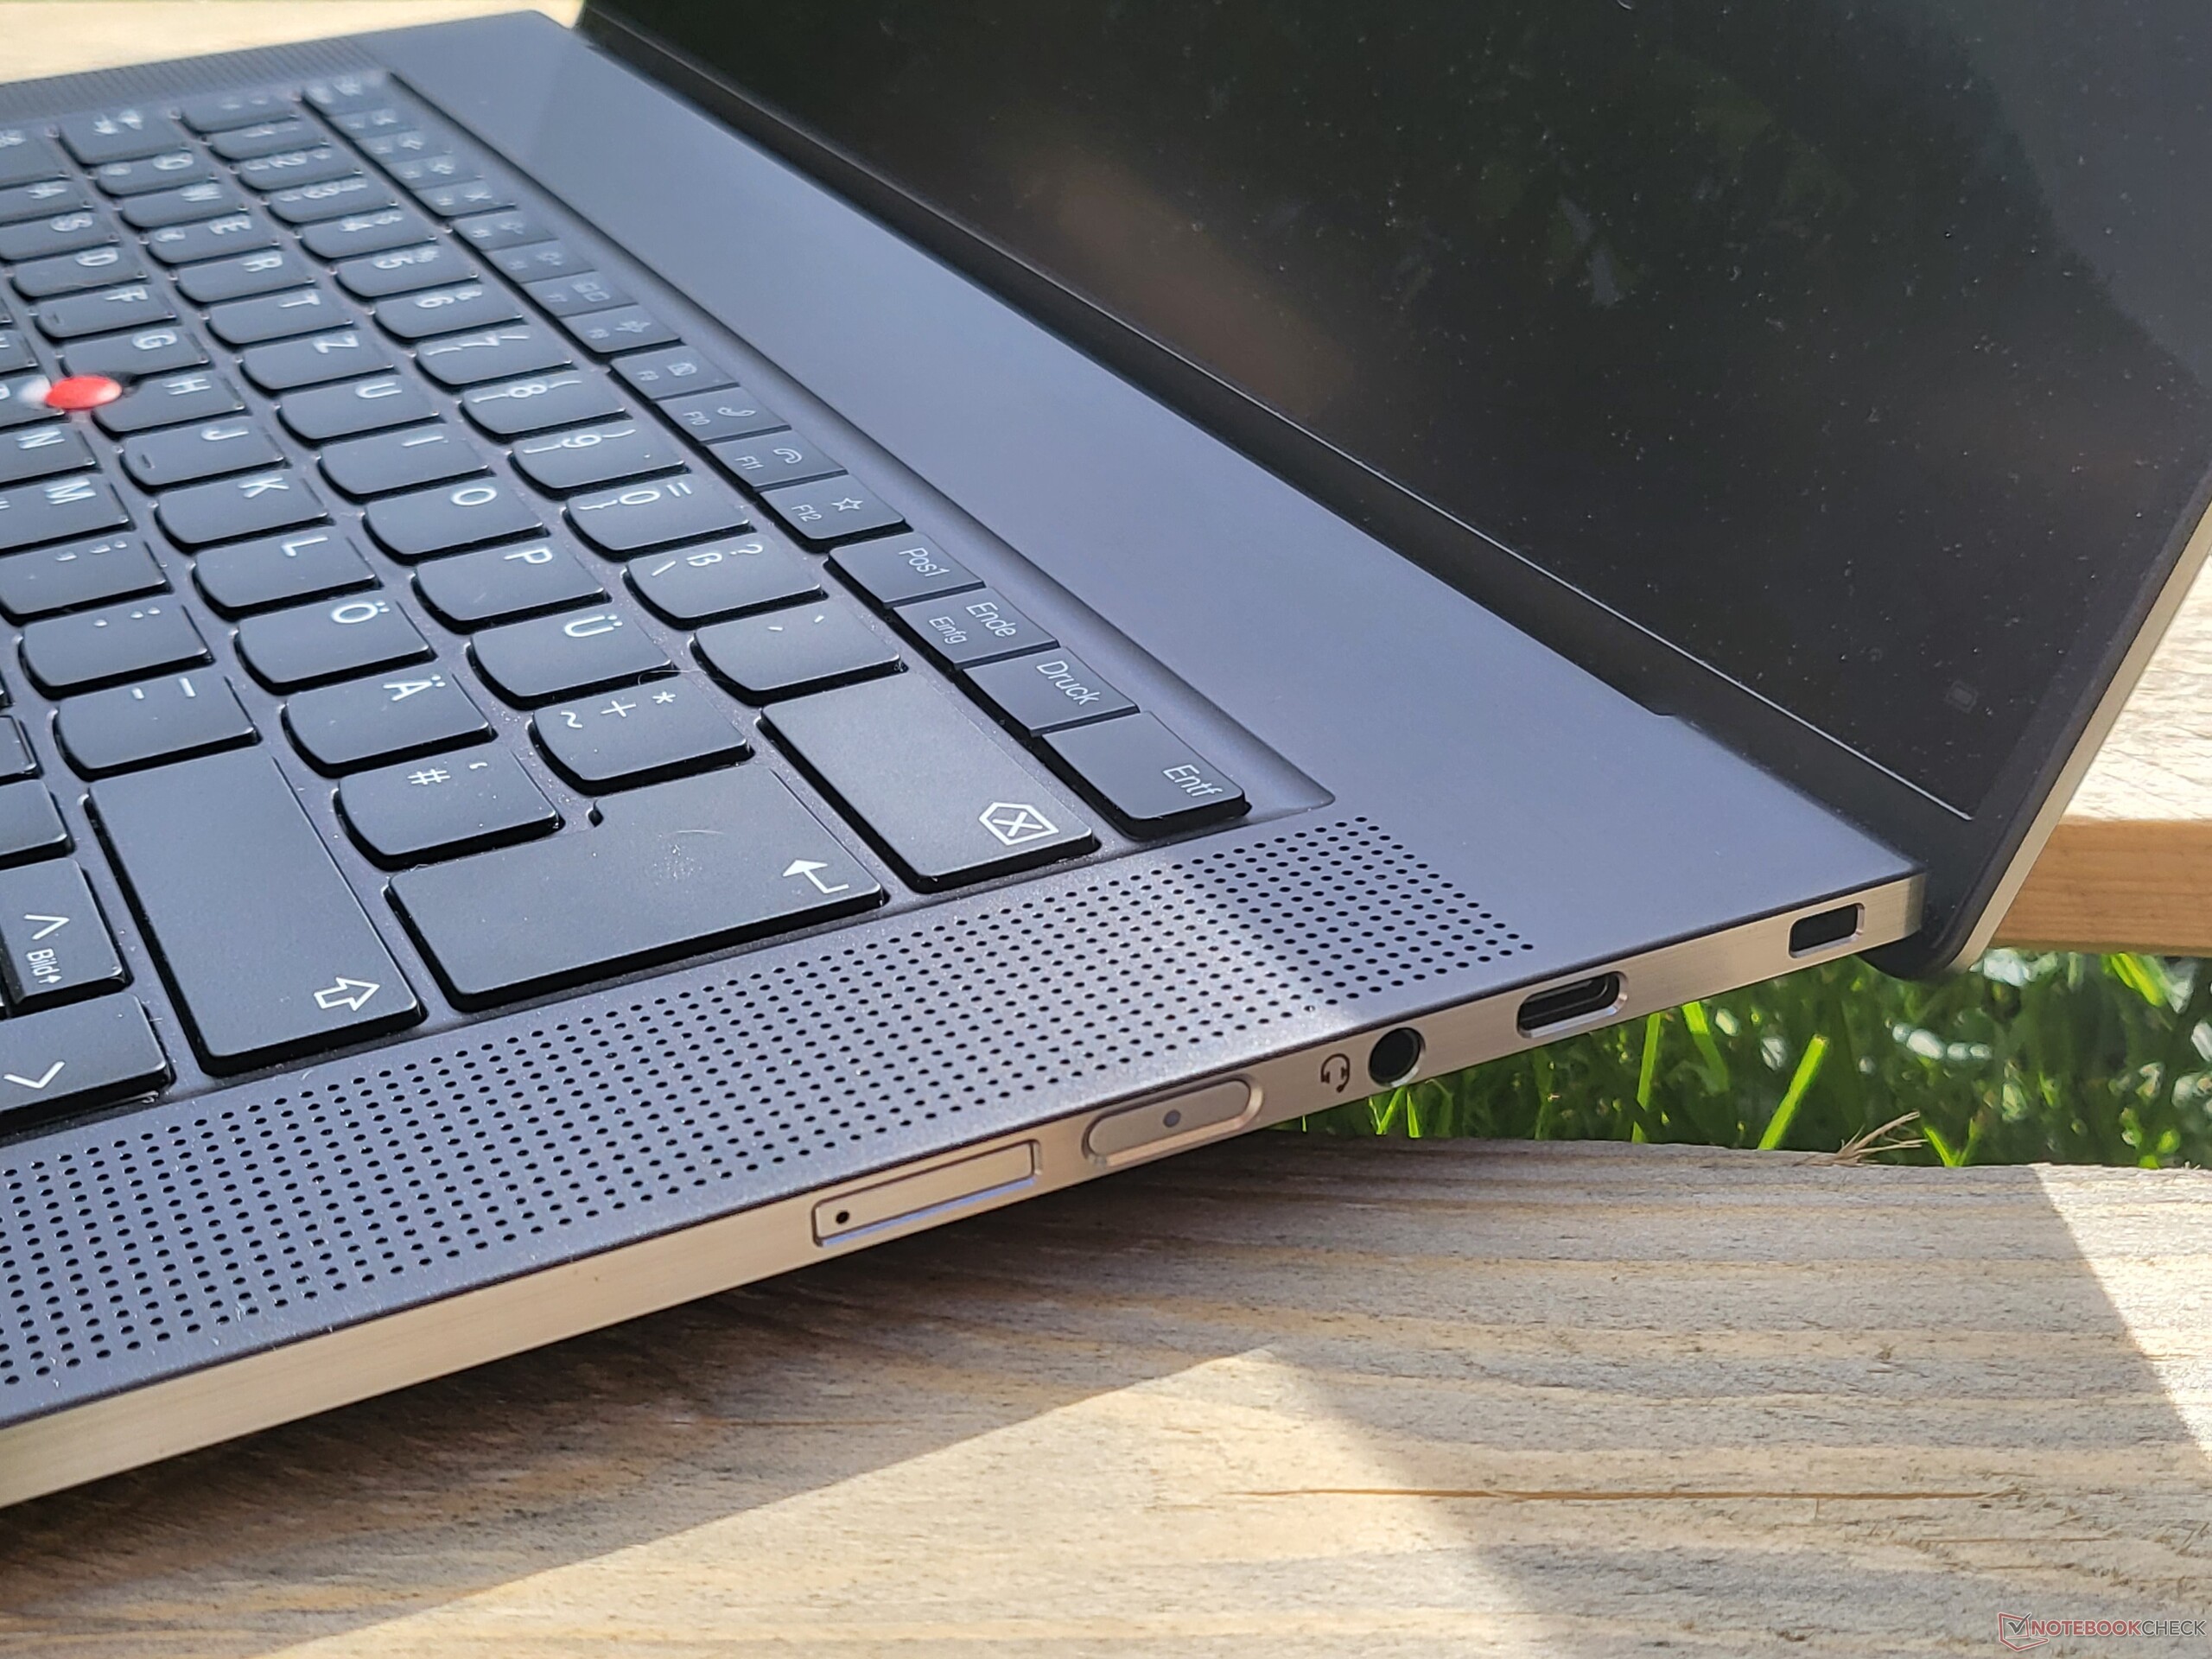
Sprzęt: Lenovo ze skąpym wyborem portów
Wyposażenie w złącza jest identyczne jak w Dellu XPS 15 9520, co czyni je jednym z najsłabszych na naszym polu testowym. W tym punkcie Z16 wyraźnie pozostaje w tyle za ThinkPadem X1 Extreme, a nawet m.in Apple MacBookiem Pro 16przynajmniej oferuje HDMI.
W przeciwieństwie do laptopów Intela, w przypadku AMD nie ma Thunderbolt 4. Z drugiej strony ThinkPad Z16 zawiera USB 4, które oferuje taki sam zestaw funkcji jak Thunderbolt 3. Kompatybilność z akcesoriami Thunderbolt nie jest jednak gwarantowana i trzeba ją ustalić indywidualnie.
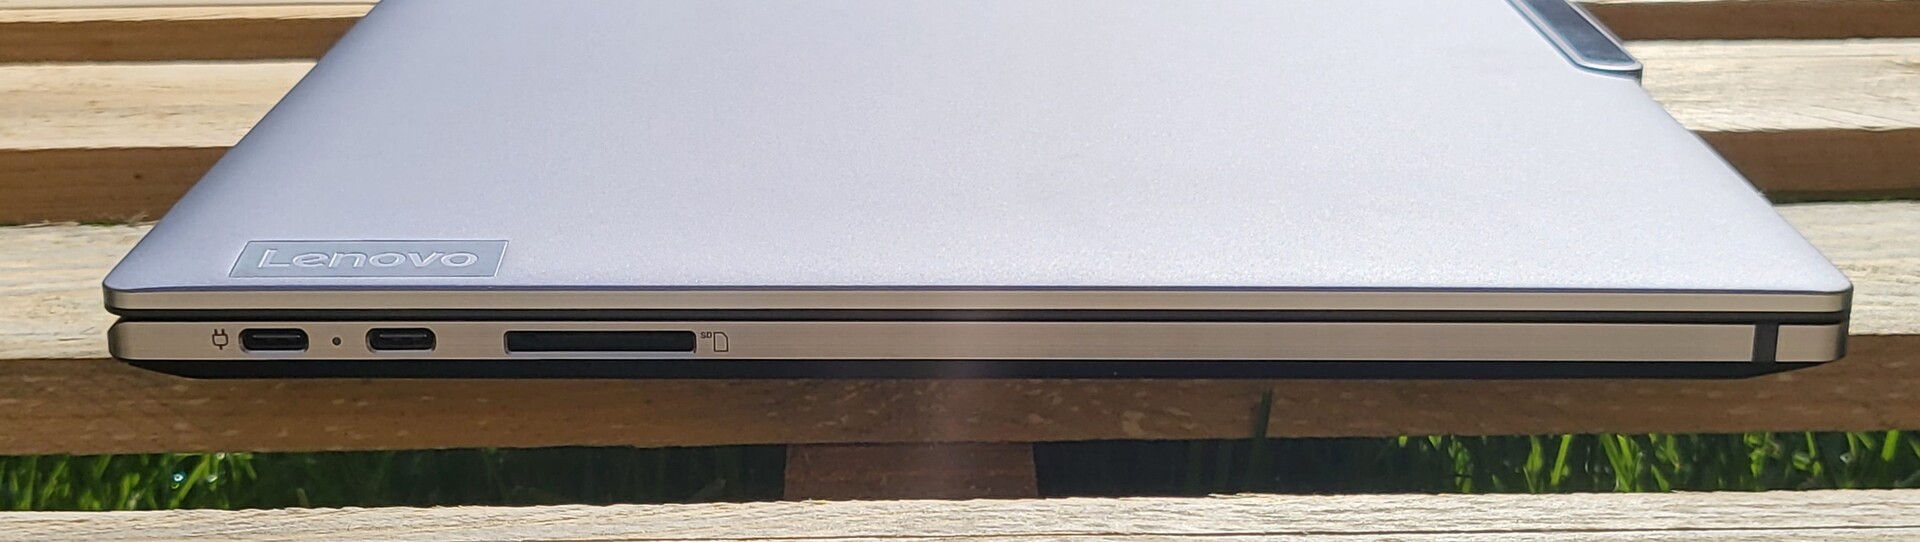
Czytnik kart SD
Lenovo ThinkPad Z16 G1 zawiera pełnowymiarowy czytnik kart SD, ale kart SD nie da się włożyć do końca. Czytnik kart jest niezwykle szybki, szczególnie podczas odczytu danych. Przetestowaliśmy to z naszą 128-GB kartą referencyjną AV Pro microSD.
| SD Card Reader | |
| average JPG Copy Test (av. of 3 runs) | |
| Dell XPS 17 9720 (Toshiba Exceria Pro SDXC 64 GB UHS-II) | |
| Lenovo ThinkPad X1 Extreme G4-20Y5CTO1WW (3050 Ti) (AV Pro V60) | |
| Dell XPS 15 9520 RTX 3050 Ti (Toshiba Exceria Pro SDXC 64 GB UHS-II) | |
| Średnia w klasie Multimedia (23 - 531, n=43, ostatnie 2 lata) | |
| Apple MacBook Pro 16 2021 M1 Pro (Angelbird AV Pro V60) | |
| Lenovo ThinkPad Z16 G1 21D5S00T00 | |
| maximum AS SSD Seq Read Test (1GB) | |
| Lenovo ThinkPad Z16 G1 21D5S00T00 | |
| Dell XPS 17 9720 (Toshiba Exceria Pro SDXC 64 GB UHS-II) | |
| Średnia w klasie Multimedia (27.9 - 1455, n=42, ostatnie 2 lata) | |
| Dell XPS 15 9520 RTX 3050 Ti (Toshiba Exceria Pro SDXC 64 GB UHS-II) | |
| Lenovo ThinkPad X1 Extreme G4-20Y5CTO1WW (3050 Ti) (AV Pro V60) | |
Komunikacja
Lenovo oznacza wbudowany układ Qualcomm WCN685x (2x2) jako "Qualcomm NFA-725A" Jest to karta Wi-Fi 6E. Przy niewielkich różnicach ThinkPad Z16 osiąga z tym modułem Wi-Fi bardzo dobre wyniki.
W naszym egzemplarzu testowym znalazł się też moduł 4G firmy Quectel. Jeżeli potrzebujemy WWAN, musi on być już uwzględniony w zamówieniu, gdyż nie można go później zainstalować.
| Networking | |
| Lenovo ThinkPad Z16 G1 21D5S00T00 | |
| iperf3 receive AXE11000 6GHz | |
| iperf3 receive AXE11000 | |
| iperf3 transmit AXE11000 6GHz | |
| iperf3 transmit AXE11000 | |
| Lenovo ThinkPad X1 Extreme G4-20Y5CTO1WW (3050 Ti) | |
| iperf3 transmit AX12 | |
| iperf3 receive AX12 | |
| Dell XPS 15 9520 RTX 3050 Ti | |
| iperf3 receive AXE11000 | |
| iperf3 transmit AXE11000 | |
| Dell XPS 17 9720 | |
| iperf3 receive AXE11000 | |
| iperf3 transmit AXE11000 | |
| Apple MacBook Pro 16 2021 M1 Pro | |
| iperf3 transmit AX12 | |
| iperf3 receive AX12 | |
| iperf3 receive AXE11000 | |
| iperf3 transmit AXE11000 | |
Kamera internetowa
Lenovo daje sporo miejsca kamerce pod względem designu, a aparat 1080p jest też stosunkowo dobry jak na laptopa. Wciąż jednak jest sporo miejsca na poprawę, a selfie shooter w smartfonie jest wciąż znacznie lepszy.


Bezpieczeństwo
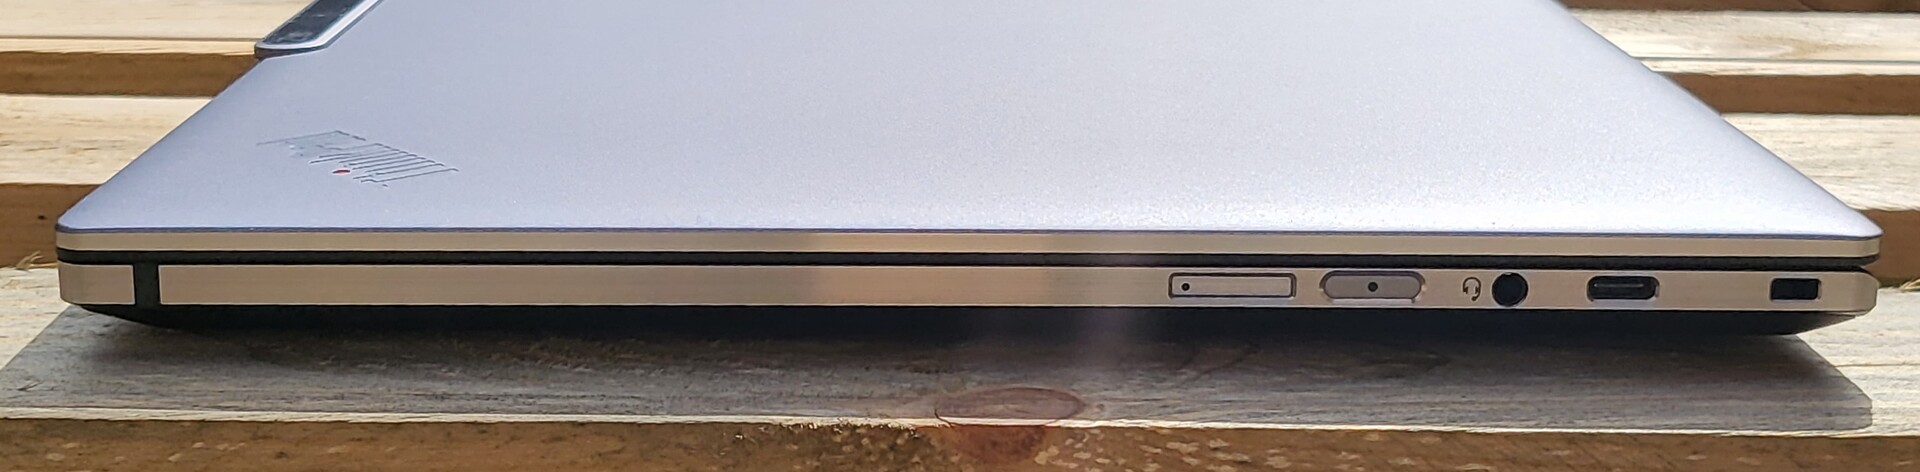
Oprócz dTMP, Lenovo ThinkPad Z16 posiada również czytnik linii papilarnych w klawiaturze, kamerę na podczerwień dla Windows Hello oraz Kensington Lock. Nie ma natomiast czytnika kart inteligentnych i fizycznej migawki kamery internetowej, ale można ją wyłączyć elektronicznie, naciskając zamiast tego klawisz F9.
Akcesoria
Poza 135-watową ładowarką ze złączem USB-C, w zestawie nie ma żadnych innych akcesoriów.
Konserwacja
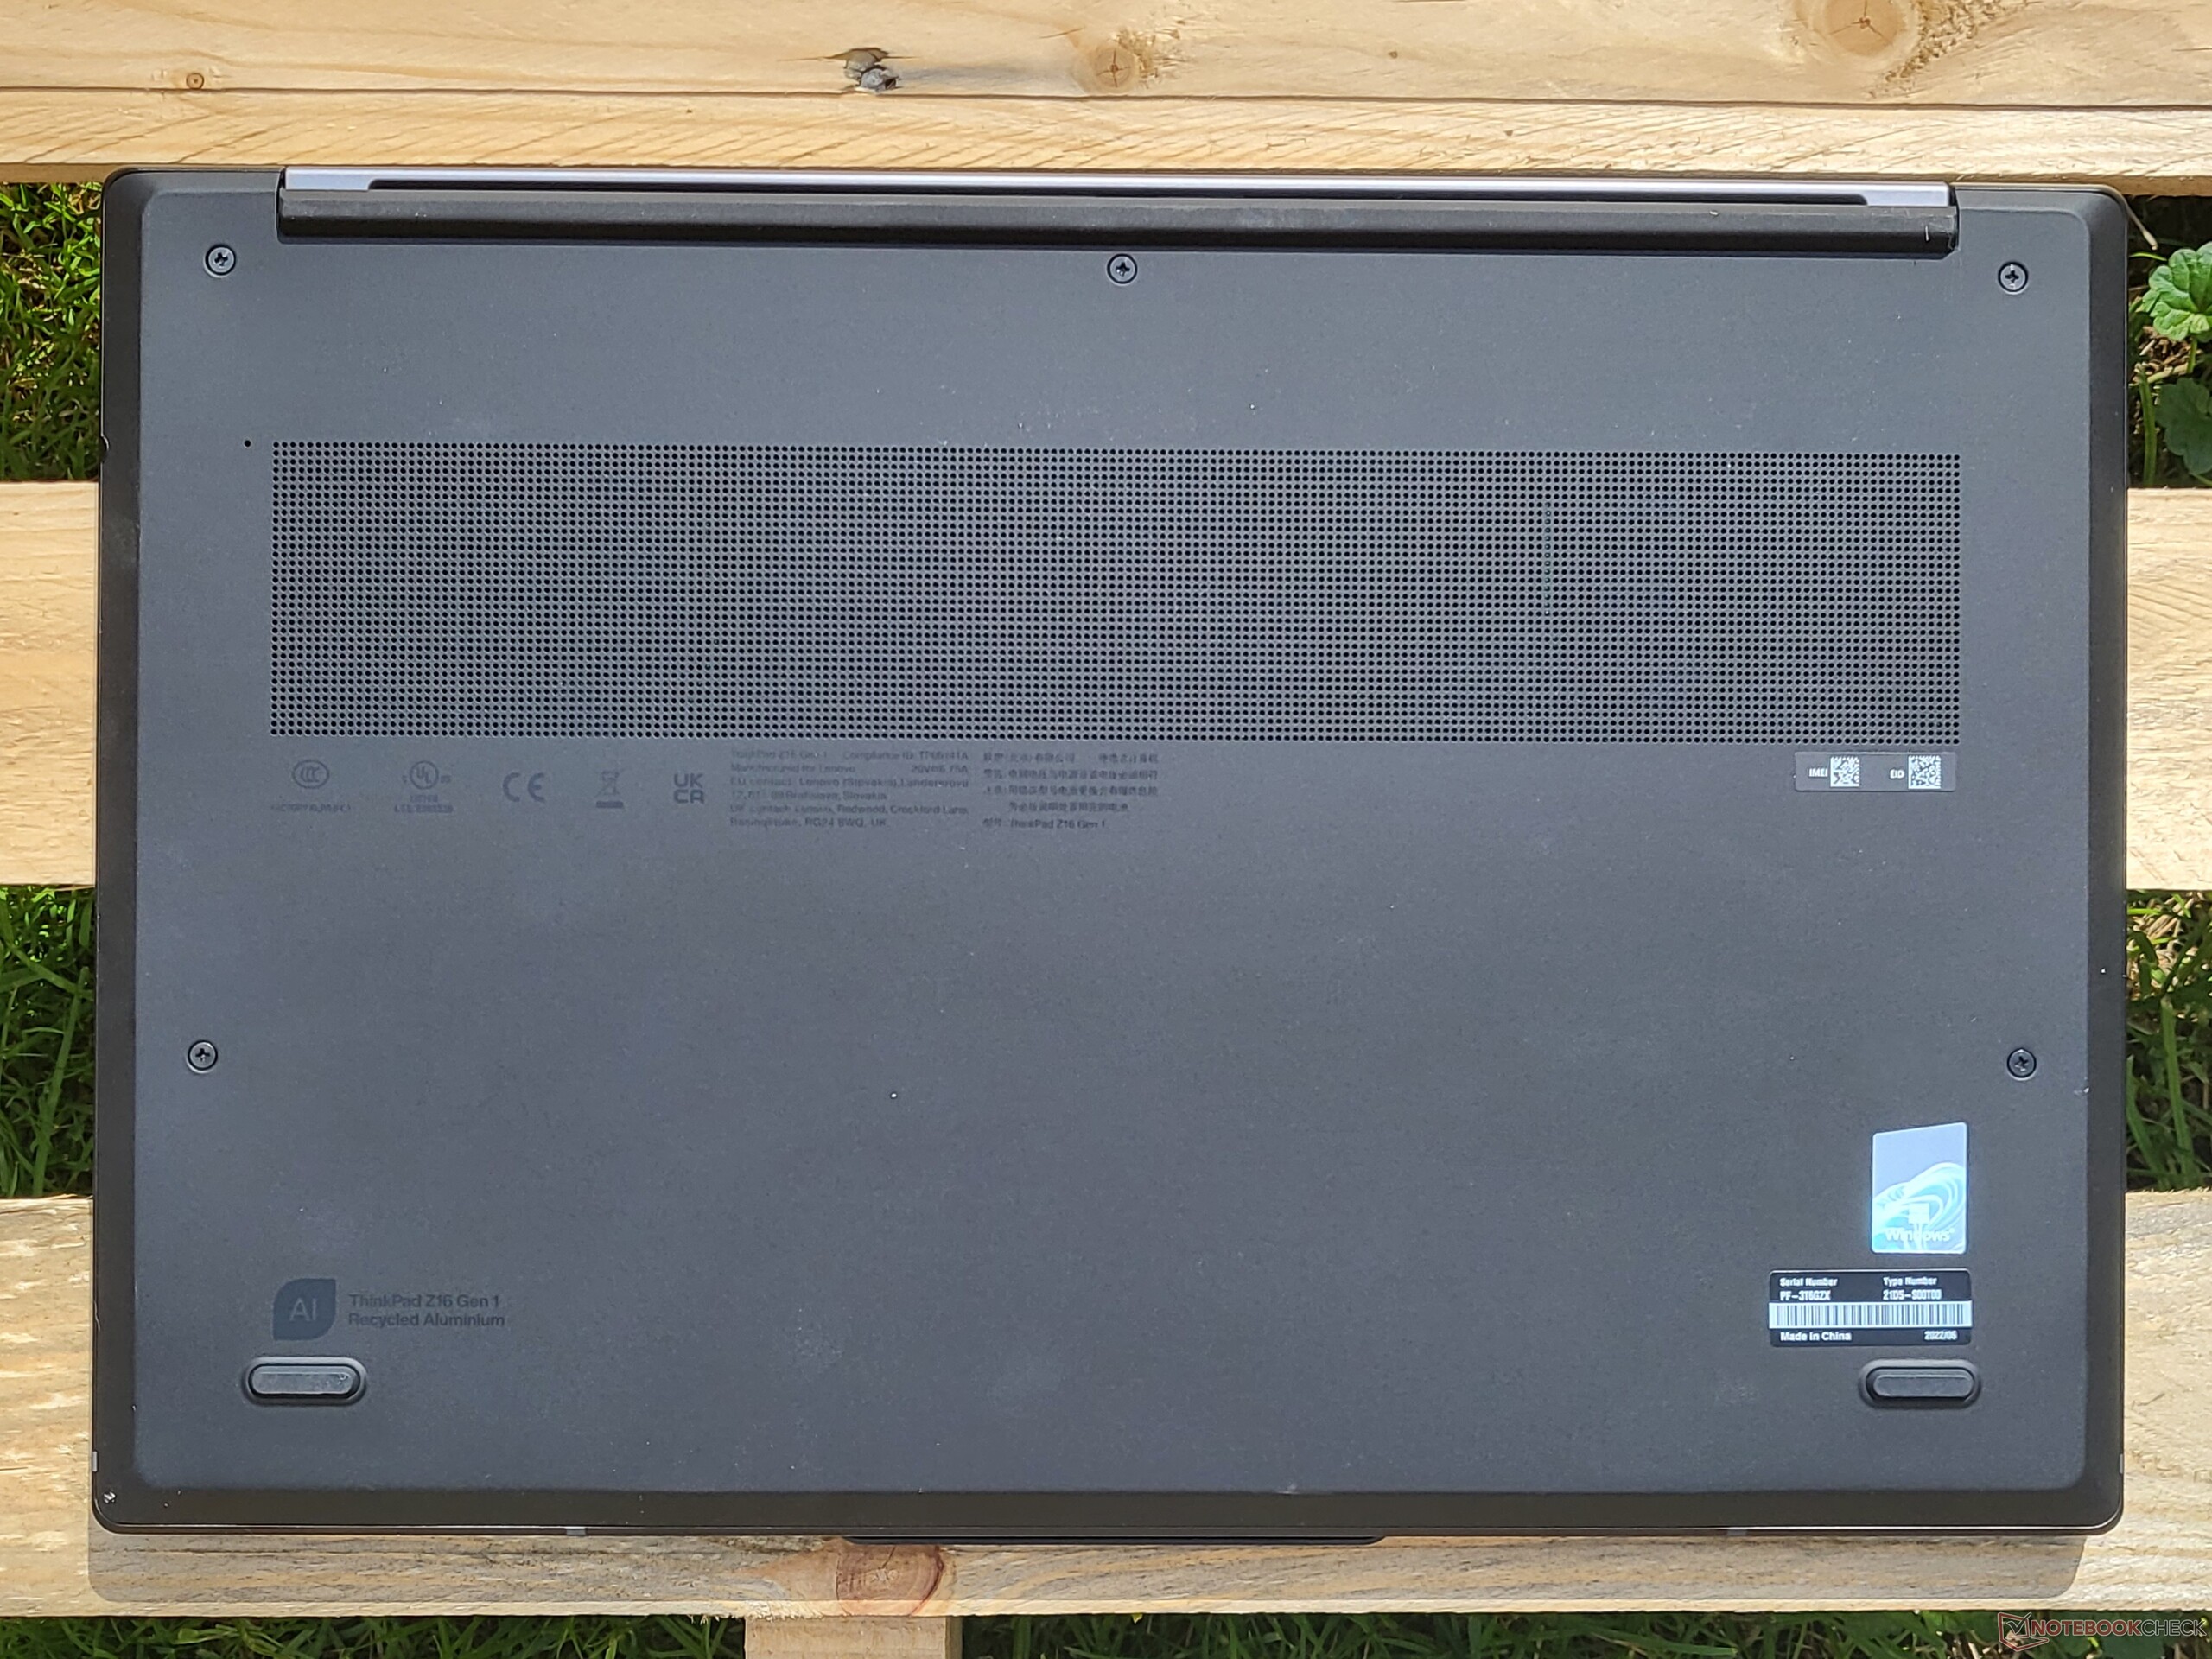
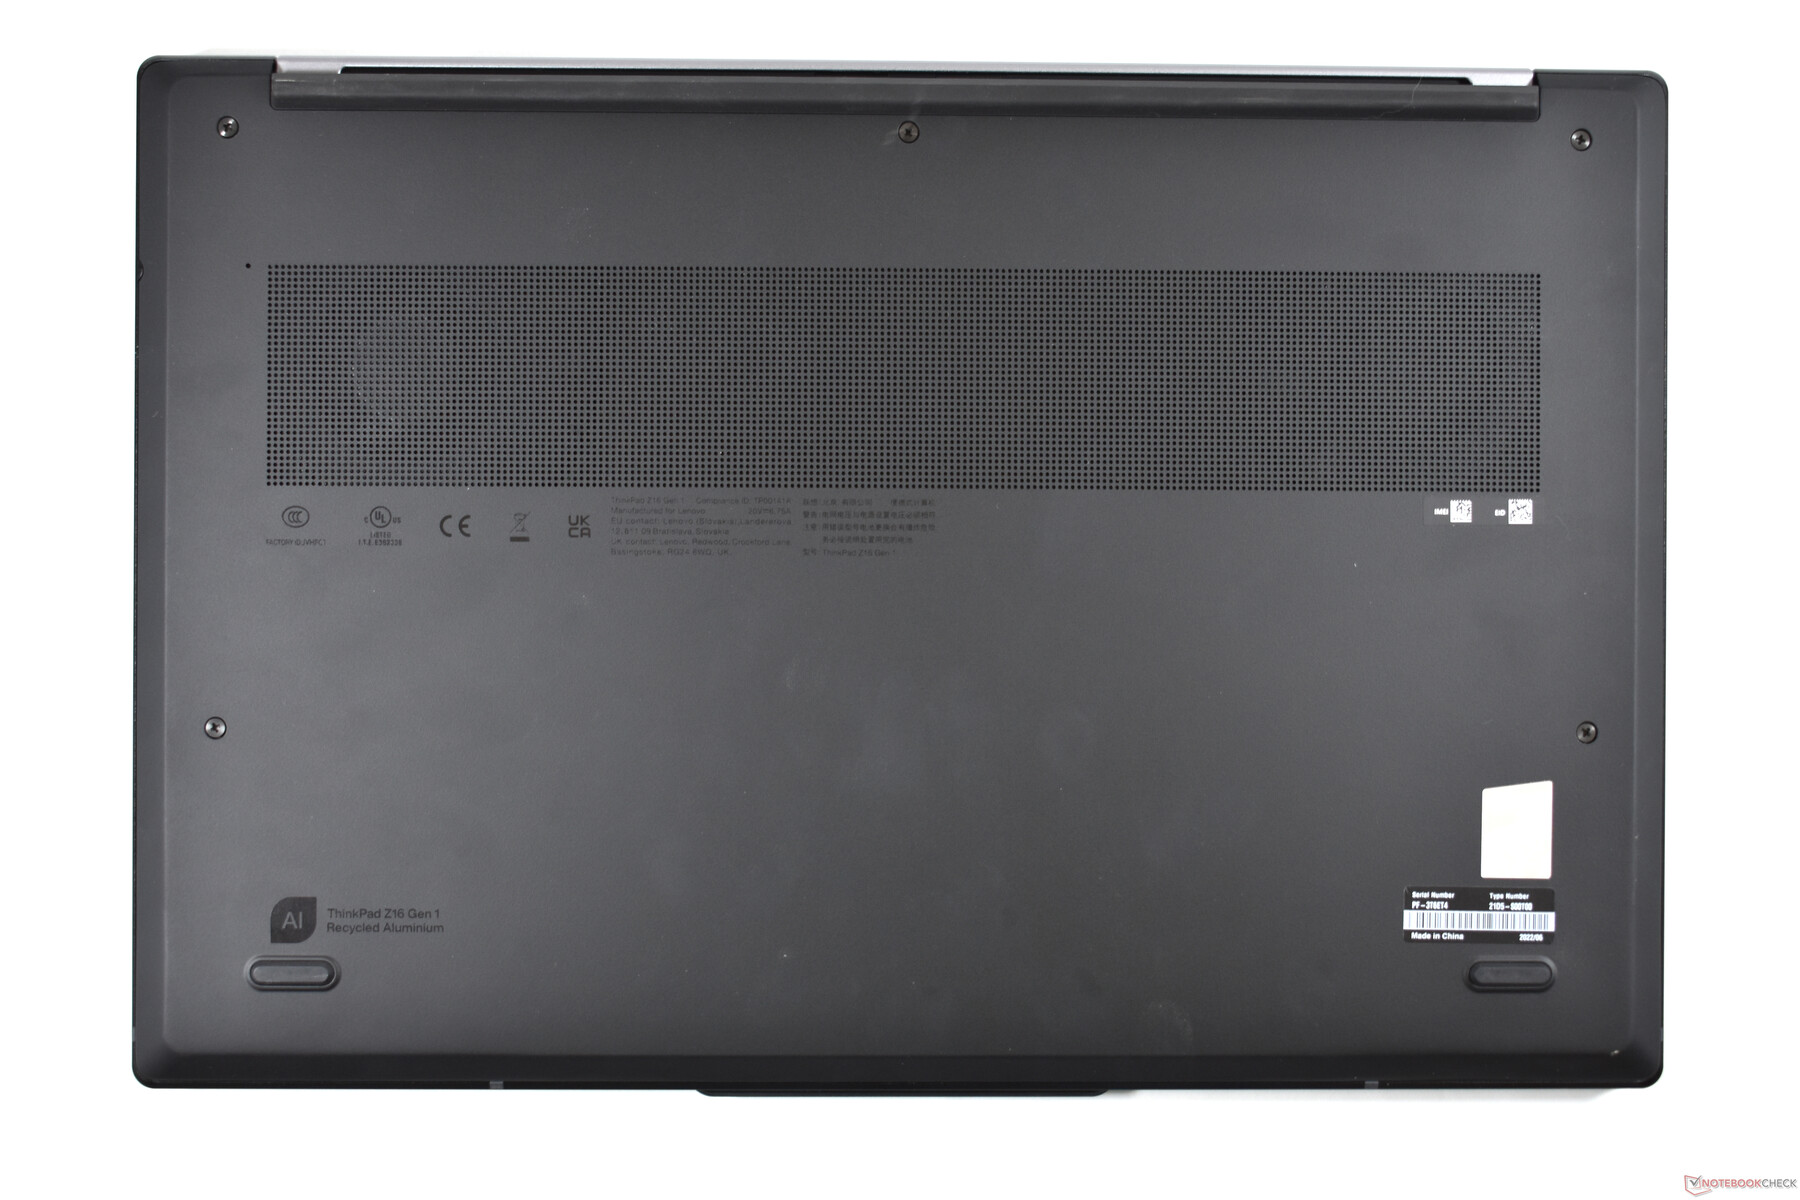
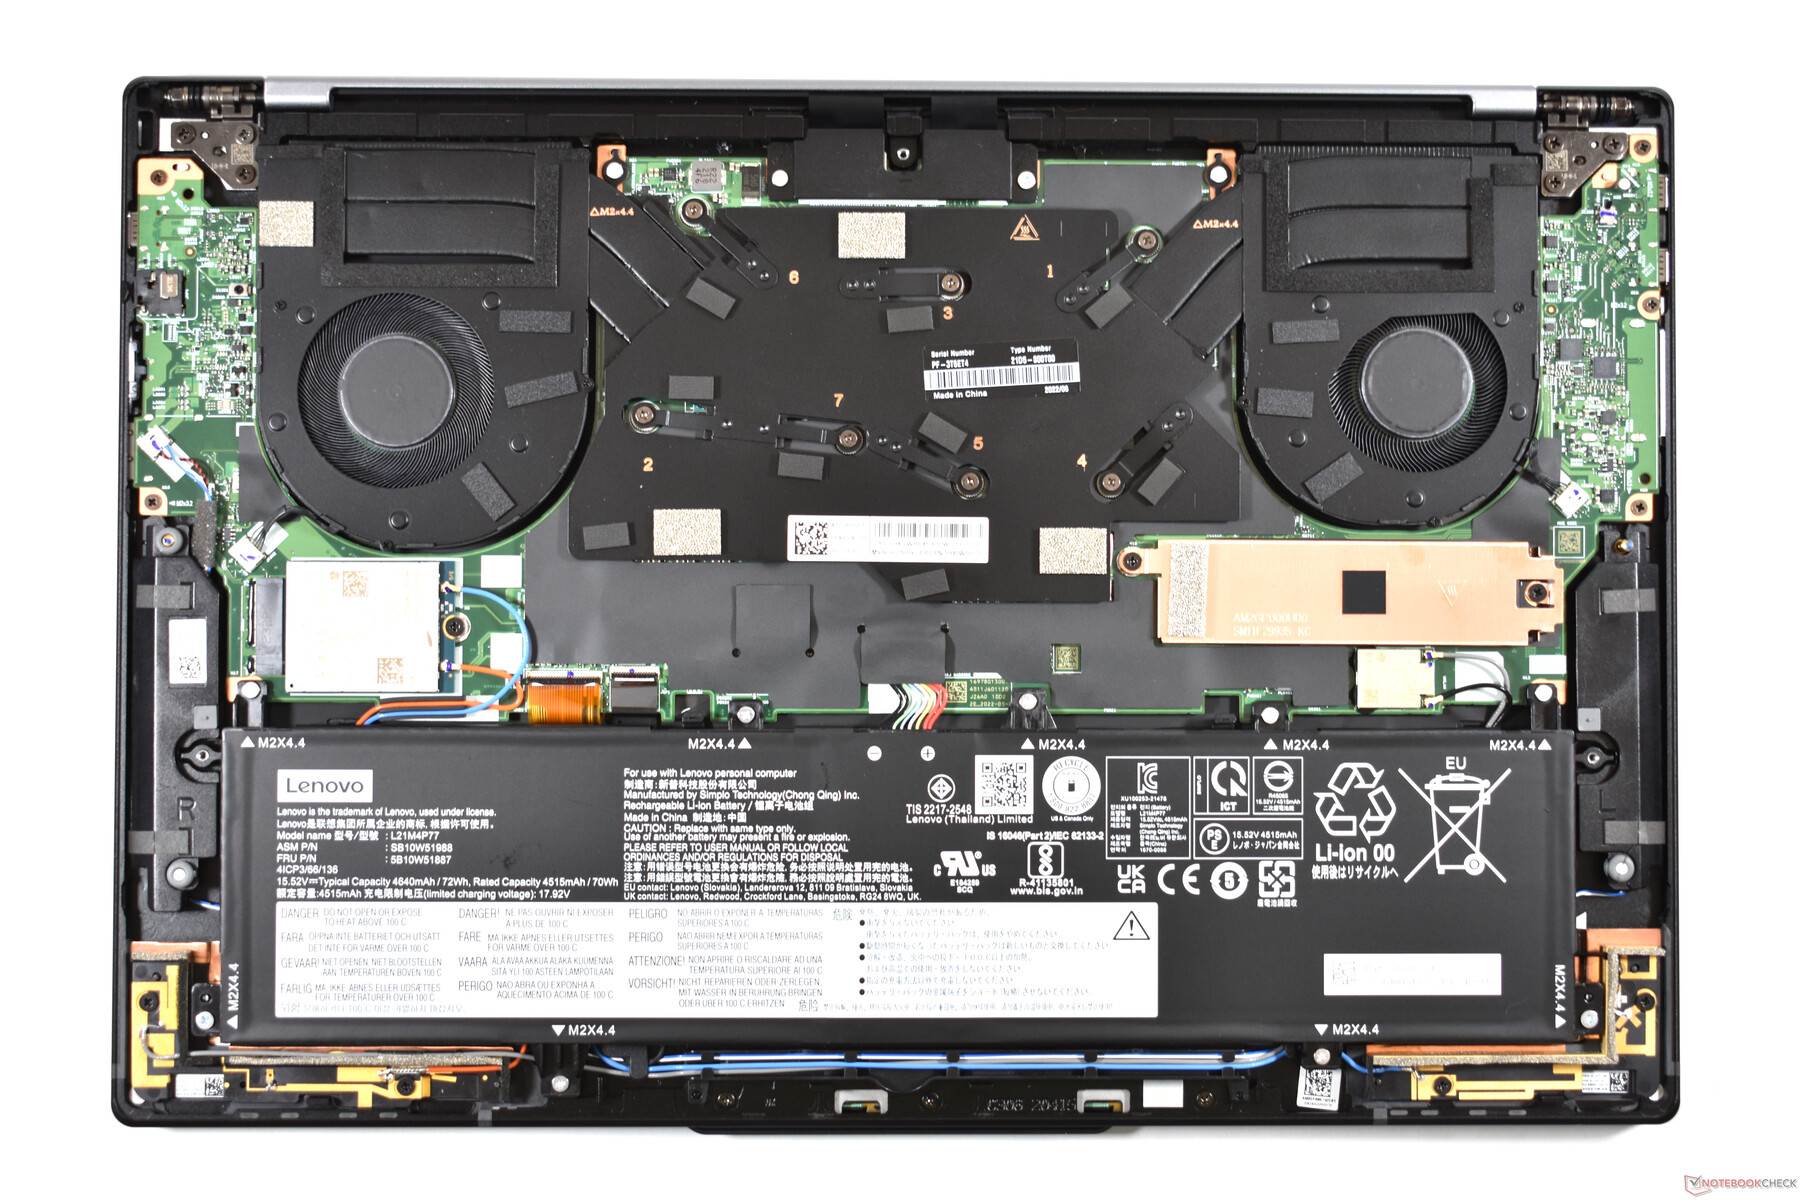
Lenovo bardzo ułatwia dostęp do wnętrza ThinkPada Z16 Gen 1. Po odkręceniu pięciu śrubek Philipsa można bezpośrednio zdjąć tylną pokrywę. Niestety nie ma zbyt wielu opcji rozbudowy i ThinkPad Z16 nie jest w ogóle zbyt modularny jak na tak duży laptop. Pamięć RAM i moduł Wi-Fi są wlutowane i jest tylko jedno gniazdo M.2-2280. Karta WWAN zajmuje gniazdo M.2-2242
Można oczywiście wyczyścić wentylatory czy wymienić akumulator, ale laptop ThinkPad wyraźnie rozczarowuje nas pod względem możliwości rozbudowy. Zarówno modele Dell XPS, jak i np ThinkPad X1 Extremesą znacznie bardziej modułowe.
Gwarancja
Nasz testowy egzemplarz to specjalny model firmy Campuspoint, oferujący bardzo hojny pakiet gwarancyjny: 36 miesięcy serwisu na miejscu i "Premier Support" Gwarancja różni się w zależności od kraju, a w USA ThinkPady są często sprzedawane tylko z roczną gwarancją. We wszystkich przypadkach gwarancję można jednak rozszerzyć do pięciu lat, a także wzbogacić o takie usługi jak wymiana zintegrowanego akumulatora. Ponadto Z16 obejmuje również międzynarodową gwarancję jako ThinkPad, ale nie ma usługi na miejscu poza krajem zakupu.
Urządzenia wejściowe: Najlepszy touchpad w Lenovo ThinkPad
Klawiatura
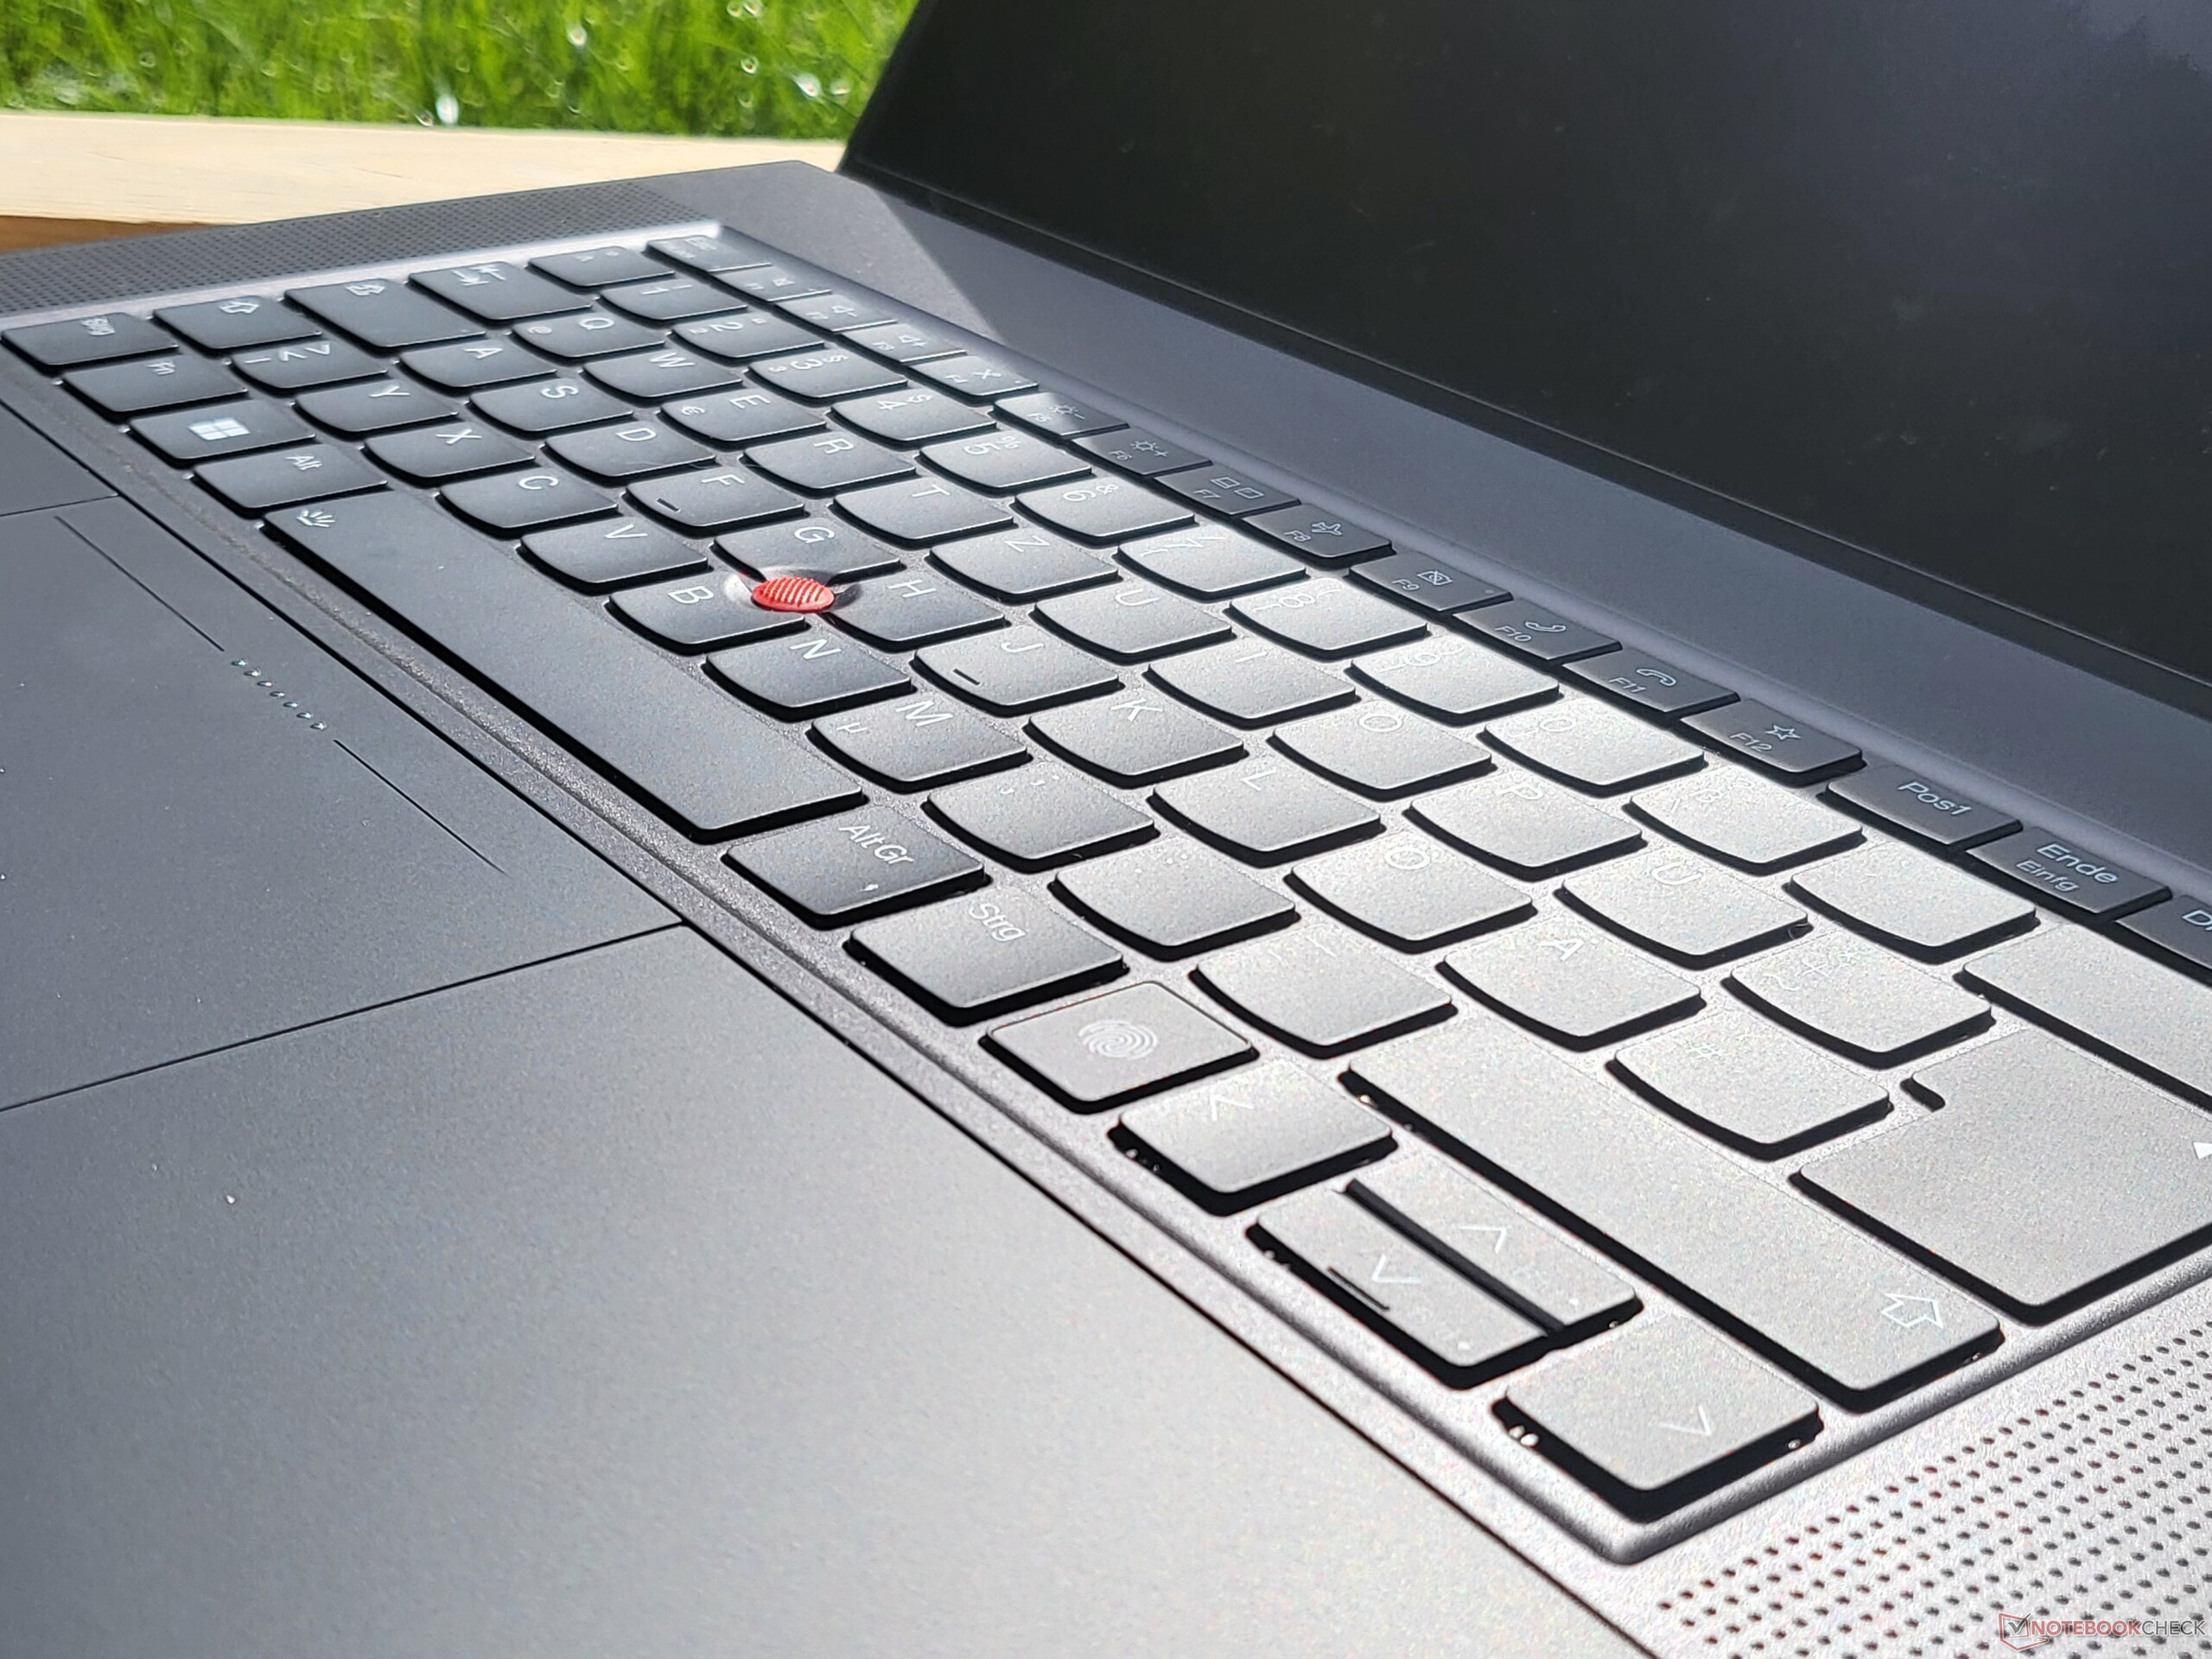
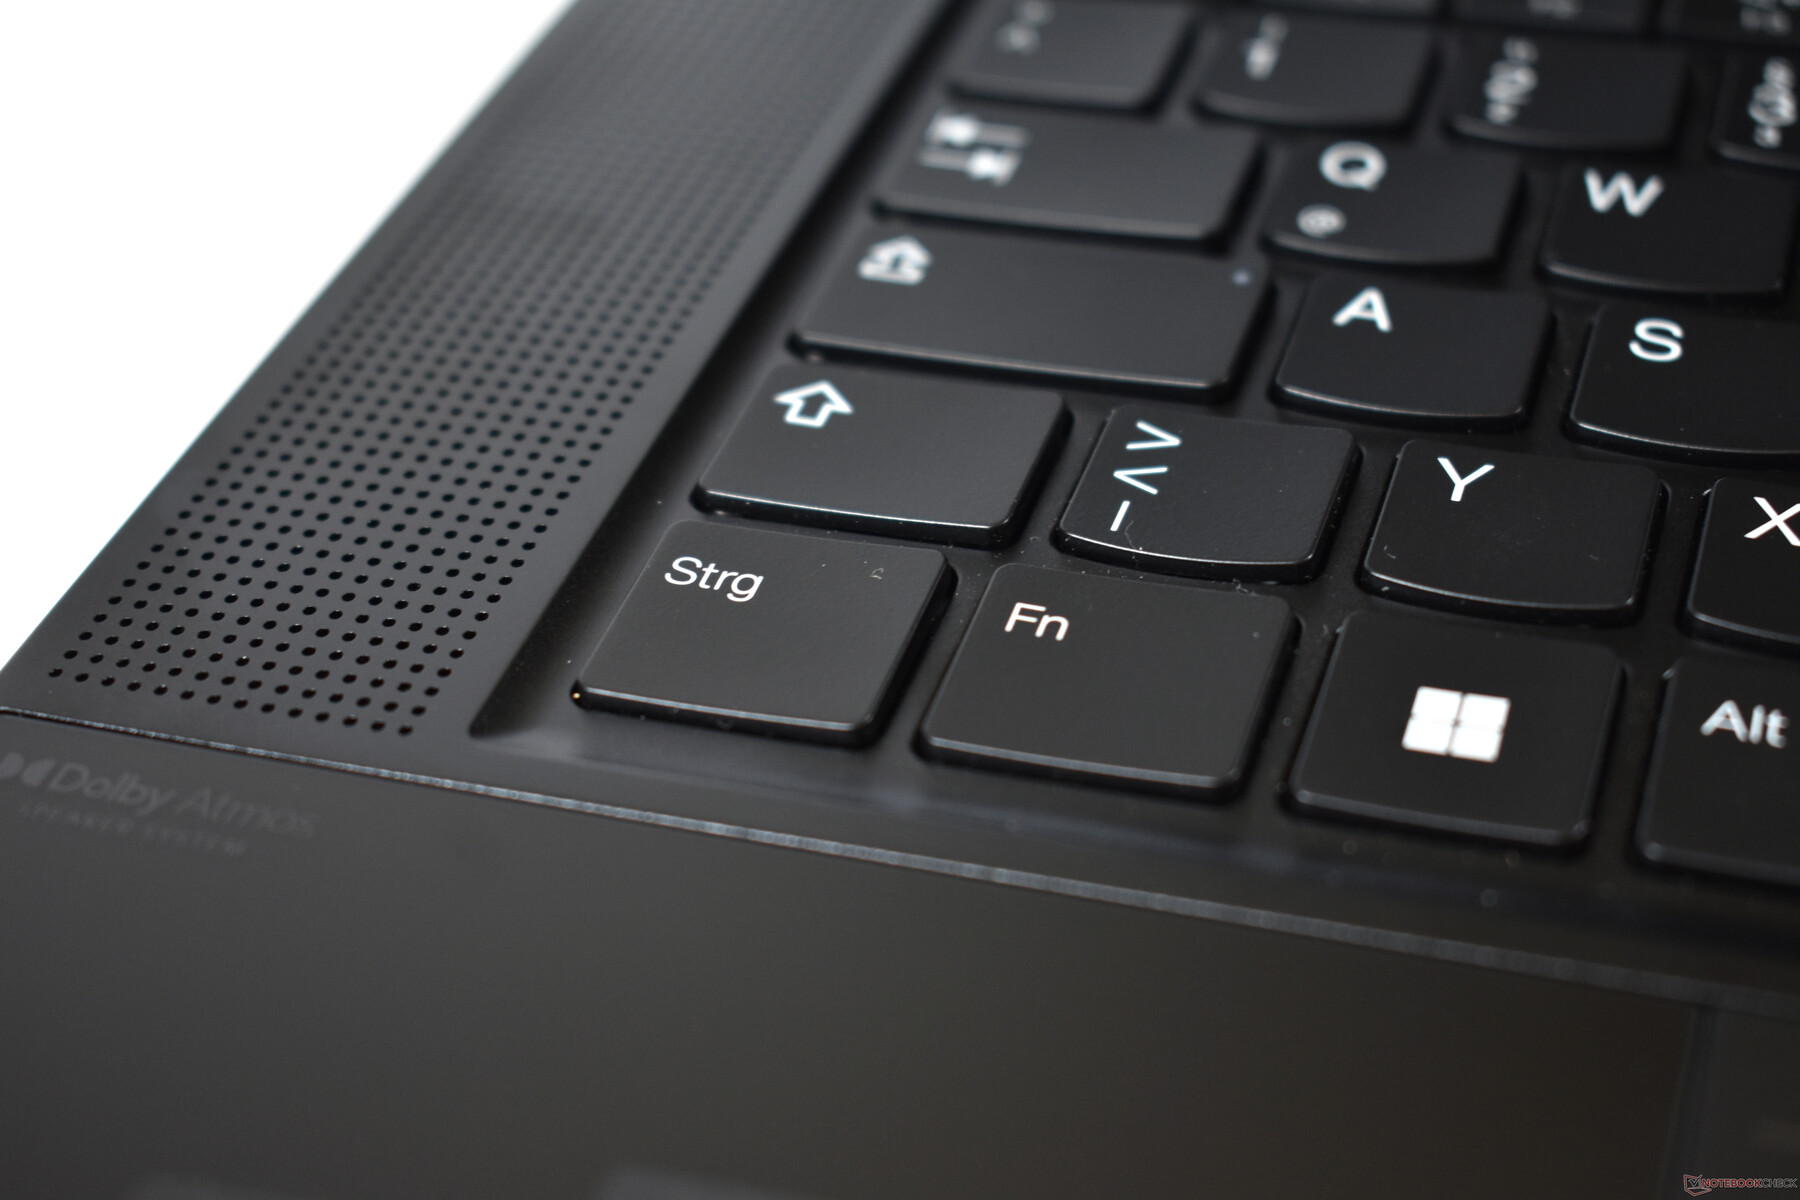
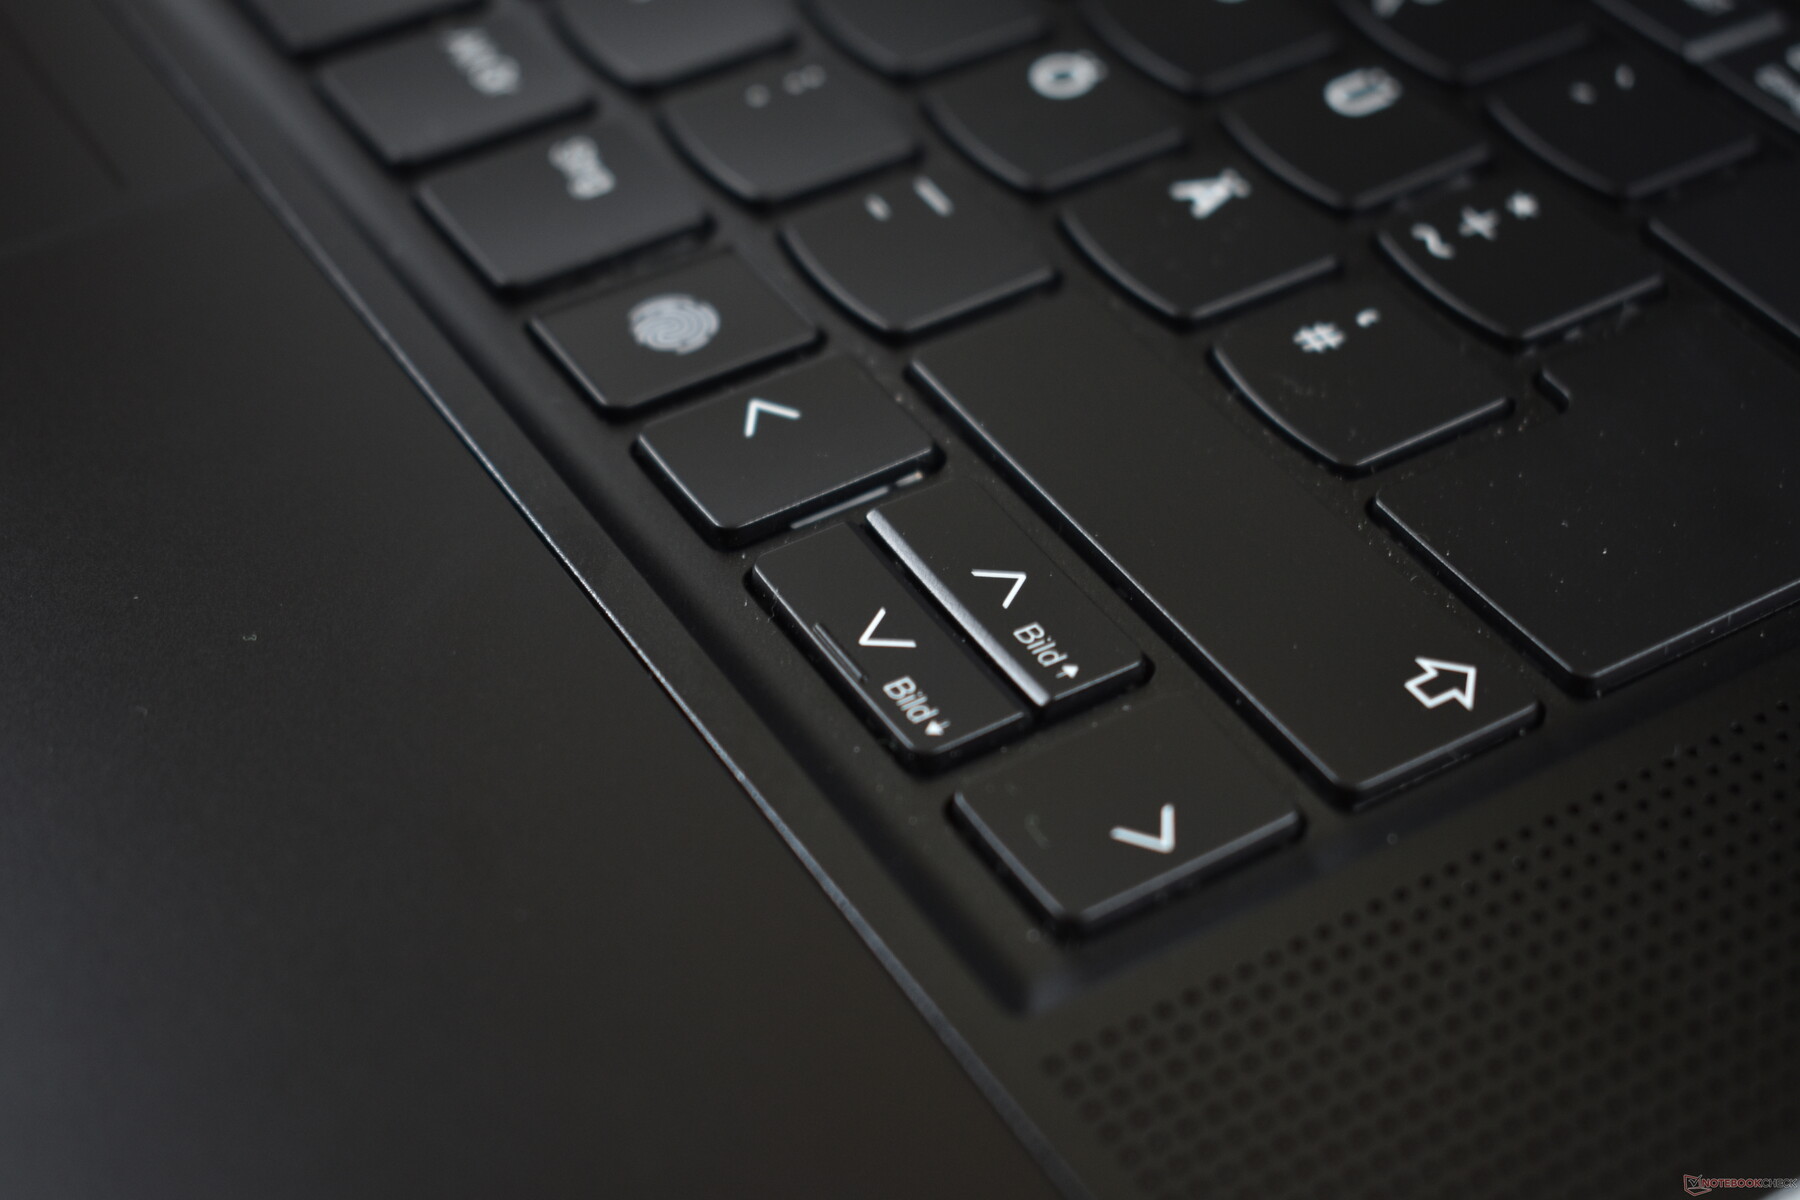
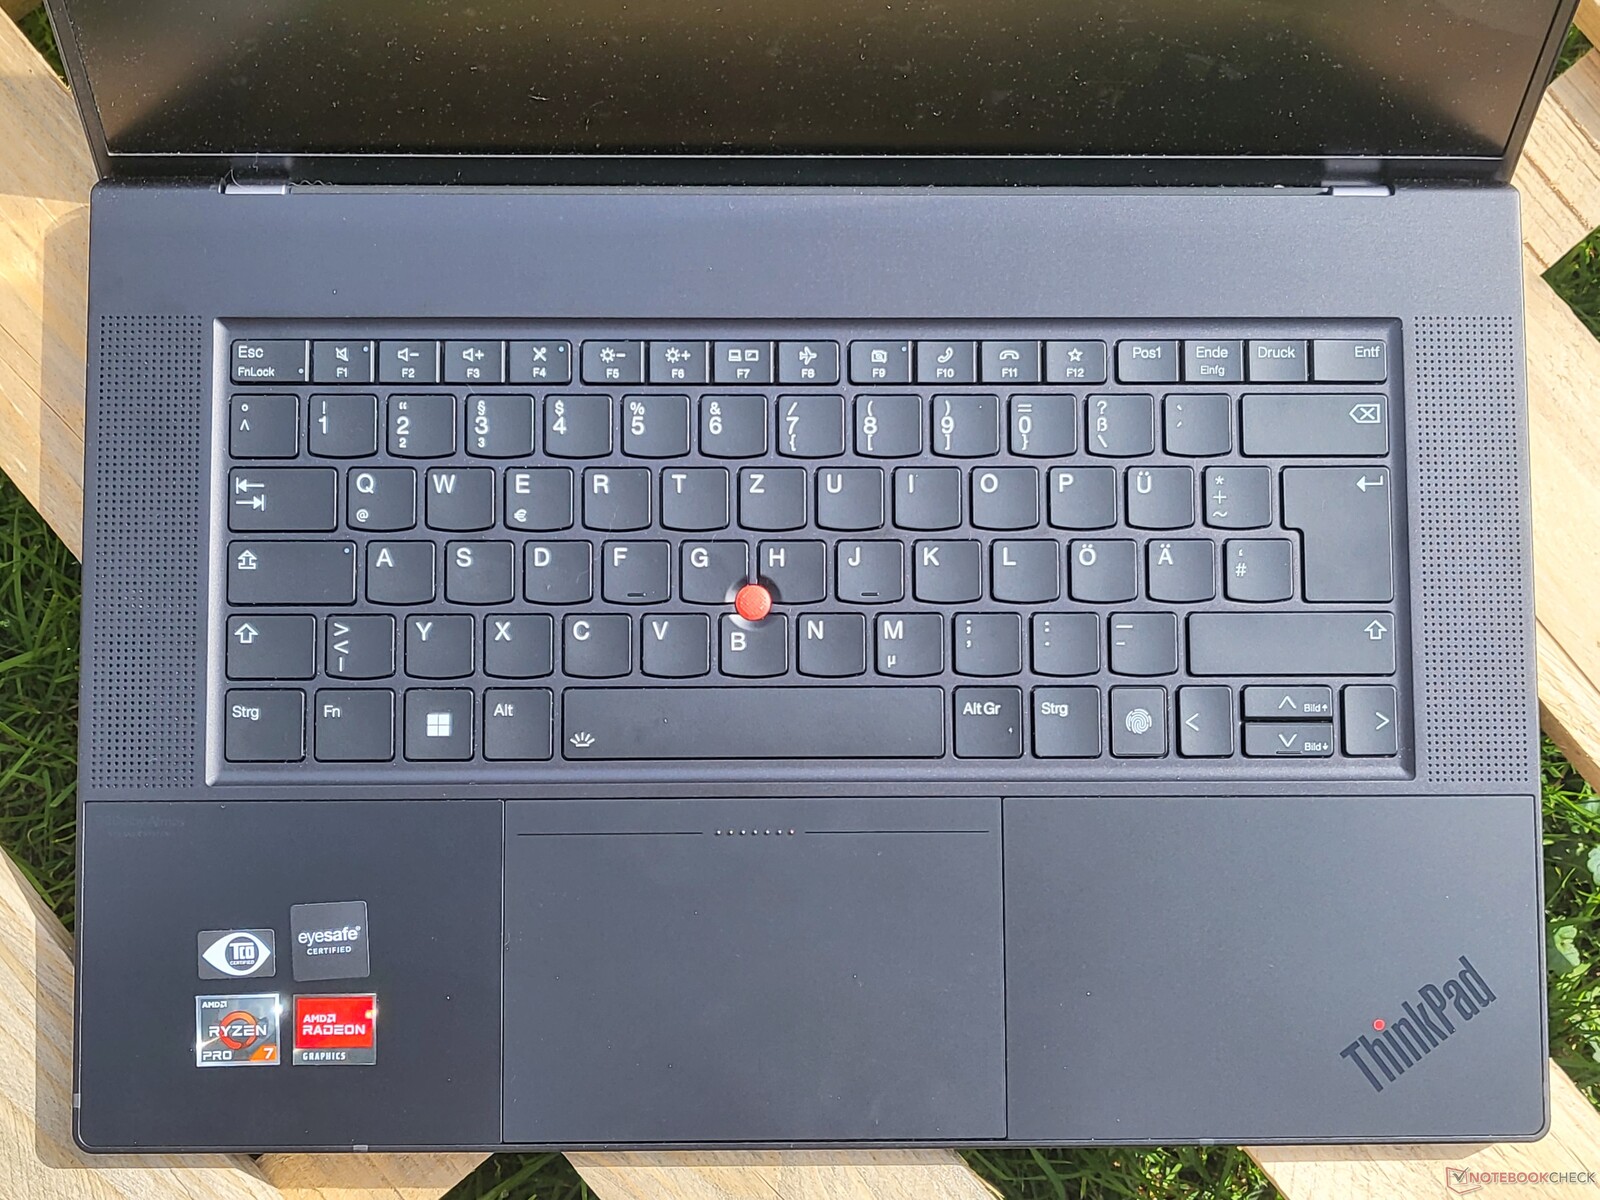
Dwupoziomowa podświetlana klawiatura jest też bliższa głównemu nurtowi laptopów, a zewnętrzne klawisze nie mają już typowego dla ThinkPadów kształtu litery U. Lenovo zmusiło też klawiaturę ogólną do przyjęcia formy prostokątnej i usunęło wgłębienie na klawisze strzałek, które skądinąd jest zwyczajem ThinkPadów. Wraz z tą zmianą, usunięto także klawisze zwiększania i zmniejszania obrazu. Wreszcie Lenovo zamieniło także klawisze Ctrl i Fn, przy czym klawisz Ctrl znajduje się teraz na zewnątrz.
Oferując skok klawiszy wynoszący zaledwie 1,35 mm (~0,053 cala), klawisze są ponownie smuklejsze niż w wielu innych obecnych laptopach ThinkPad. Na przykład model X1 Extreme oferuje 1,5 mm (~0,059 cala). Ponadto wierzchy klawiszy są bardziej płaskie. Skutkuje to wrażeniem, że pisanie na klawiaturze jest mniej luksusowe i niezbyt typowe dla ThinkPada. W porównaniu z Dellem XPS i MacBookiem Pro klawiatura jest jednak wciąż lepsza, oferując wyraźny i wyrazisty punkt nacisku oraz opór, który jest w sam raz. Przy 28,5 cm (~11,2 in) klawiatura ma też pełną standardową szerokość.
TrackPad i TrackPoint
Bez dalszych ceregieli: Z16 ma najlepszy i zarazem największy TrackPad (12 x 8 cm) ze wszystkich obecnych ThinkPadów. Powierzchnia jest wykonana z matowego szkła, podobnie jak podpórka pod dłonie. Ma to niezwykle wysoką jakość, a także zapewnia idealne właściwości ślizgowe. Bardzo dobry jest też silnik haptyczny ClickPada, który symuluje prawdziwe kliknięcia. ClickPad może być klikany równomiernie wszędzie, w przeciwieństwie do zwykłych mechanicznych TrackPadów, których można używać tylko do klikania w dolnym obszarze. Dzięki wysokiej jakości haptyce, implementacji oprogramowania i przestronnym rozmiarom laptop ThinkPad może być obsługiwany niezwykle komfortowo przy użyciu touchpada.
W porównaniu z innymi ThinkPadami nieco mniej komfortowy jest TrackPoint bez dedykowanych klawiszy. Z drugiej strony TrackPoint nadal jest świetną opcją, jeśli trzeba szybko przesunąć kursor myszy podczas pisania. W tym rozwiązaniu haptycznym, zintegrowane klawisze TrackPoint są lepsze niż byśmy wcześniej przypuszczali.
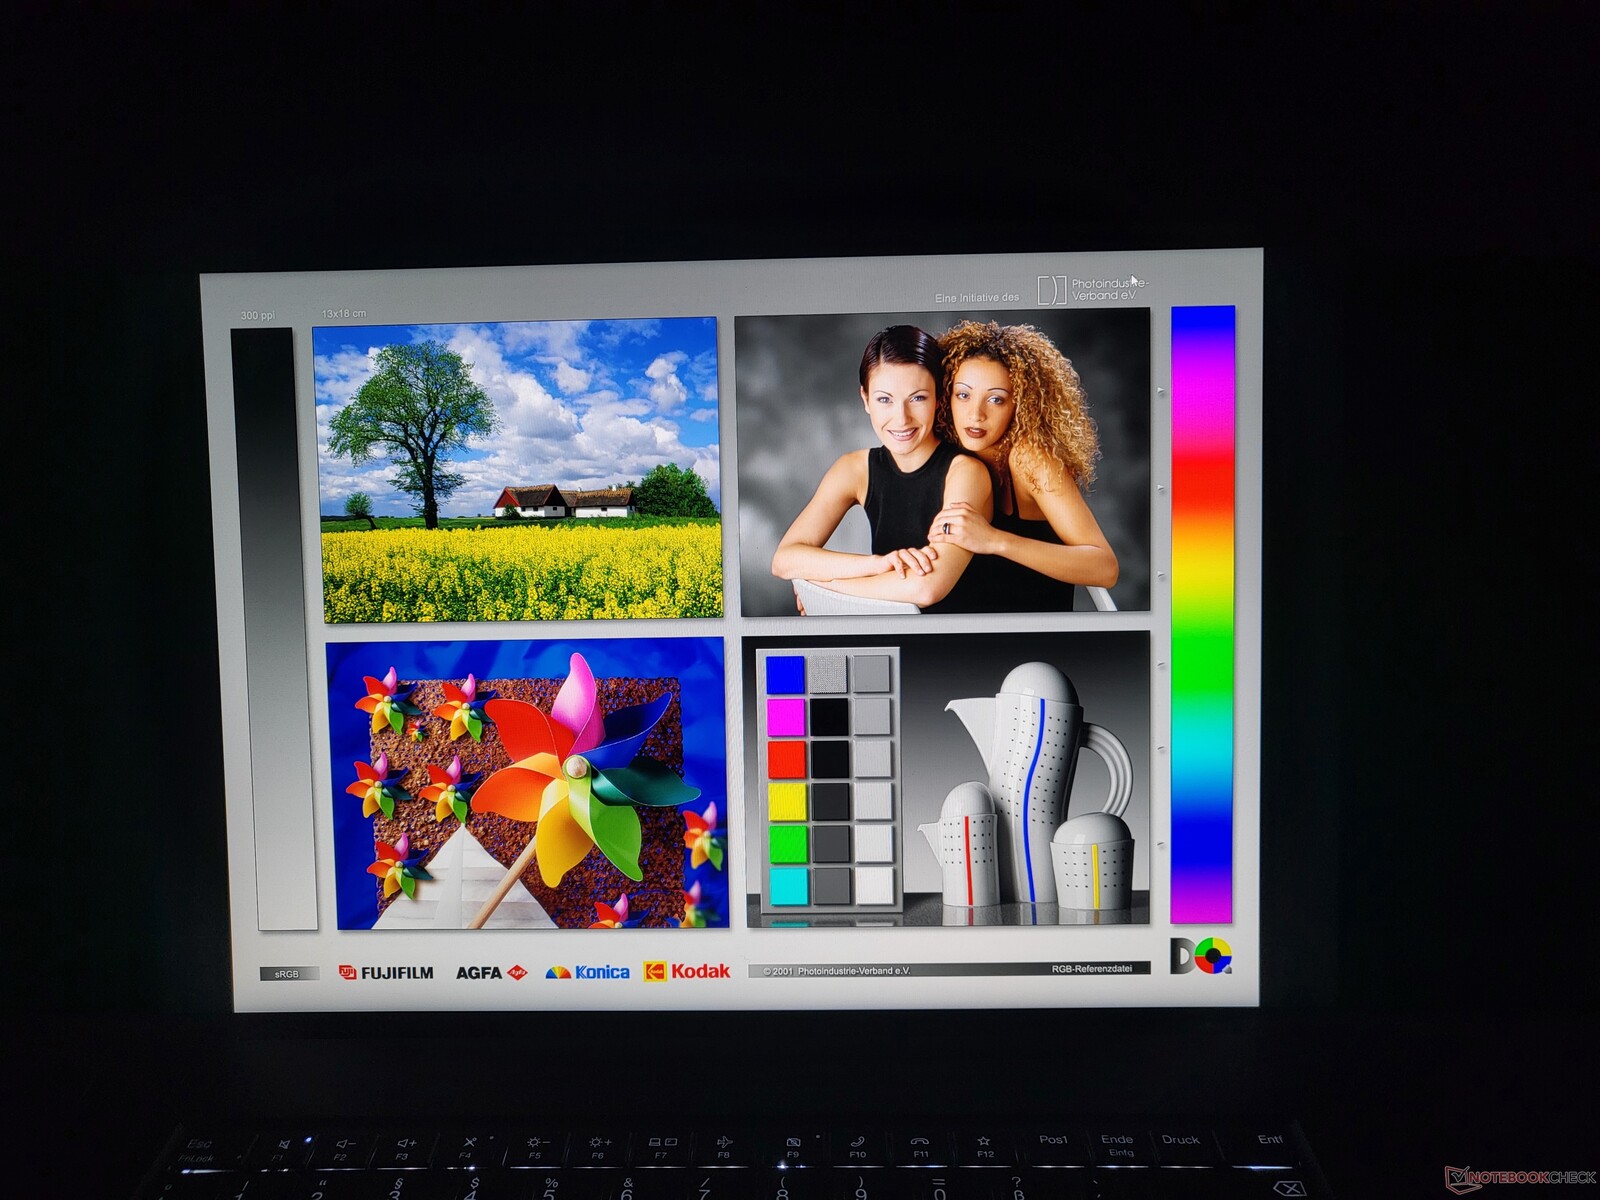
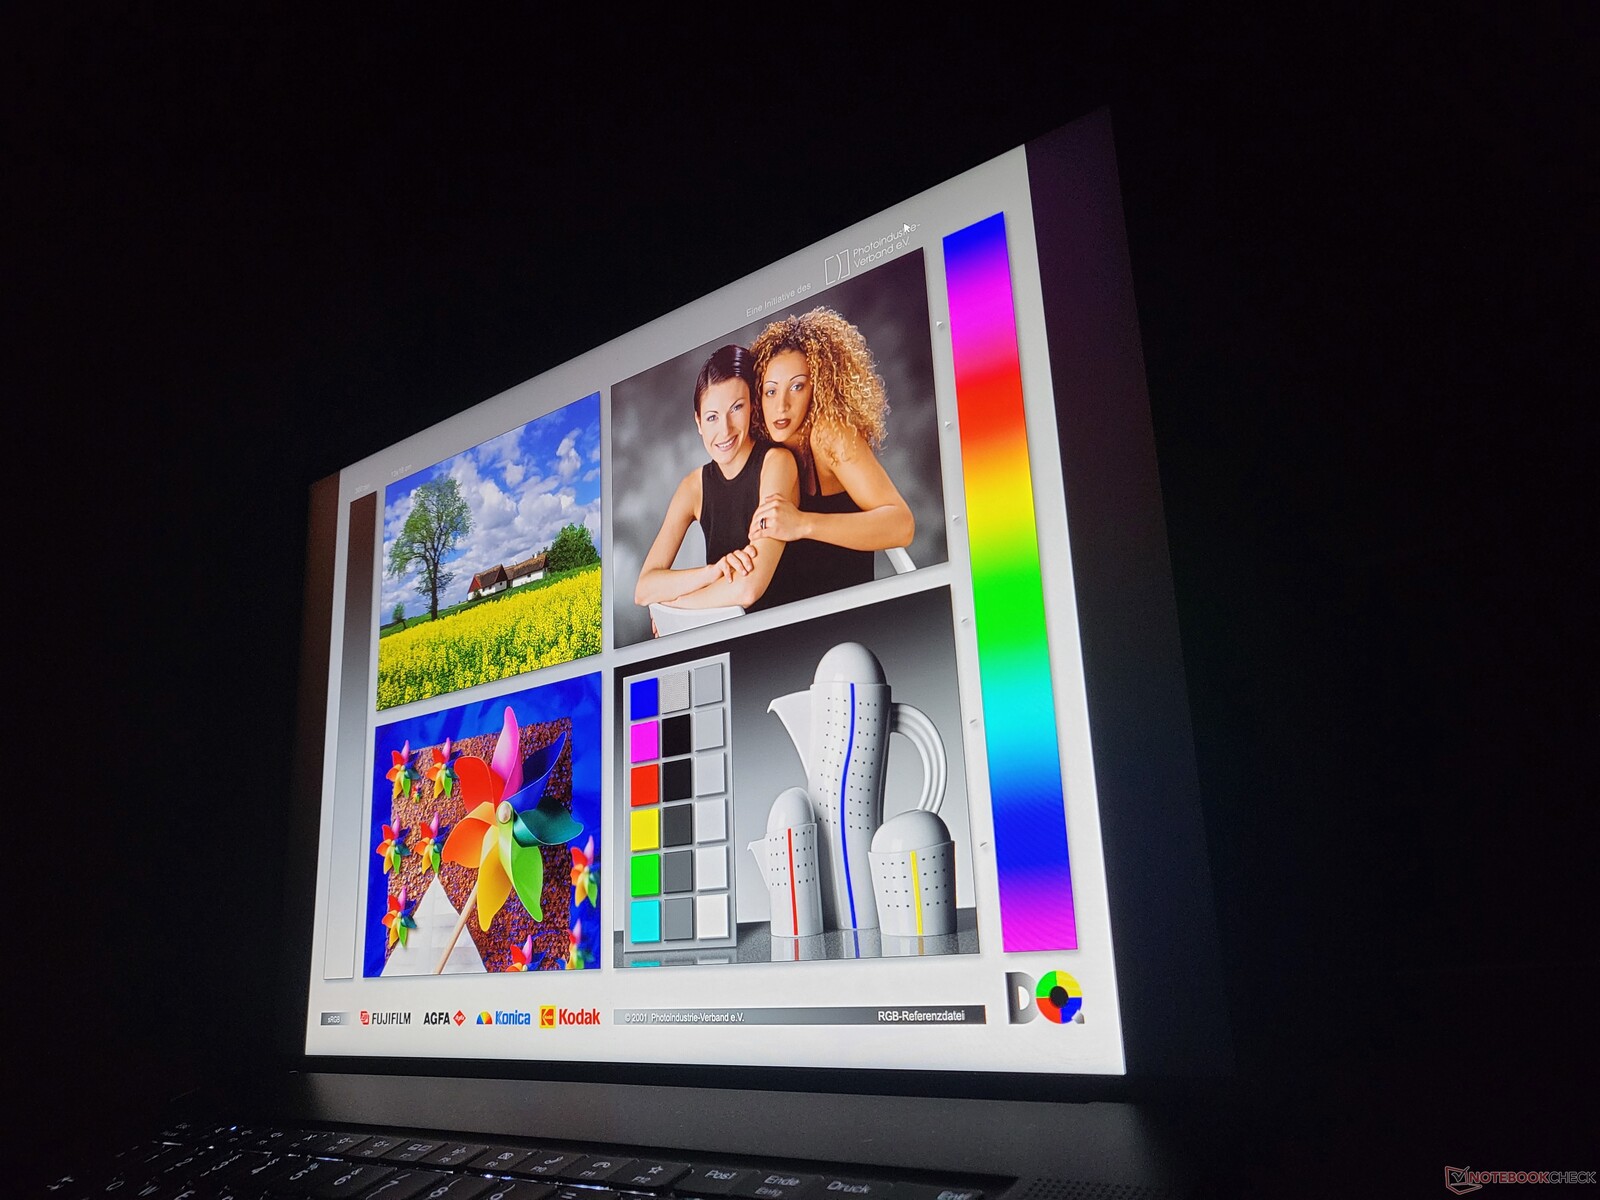
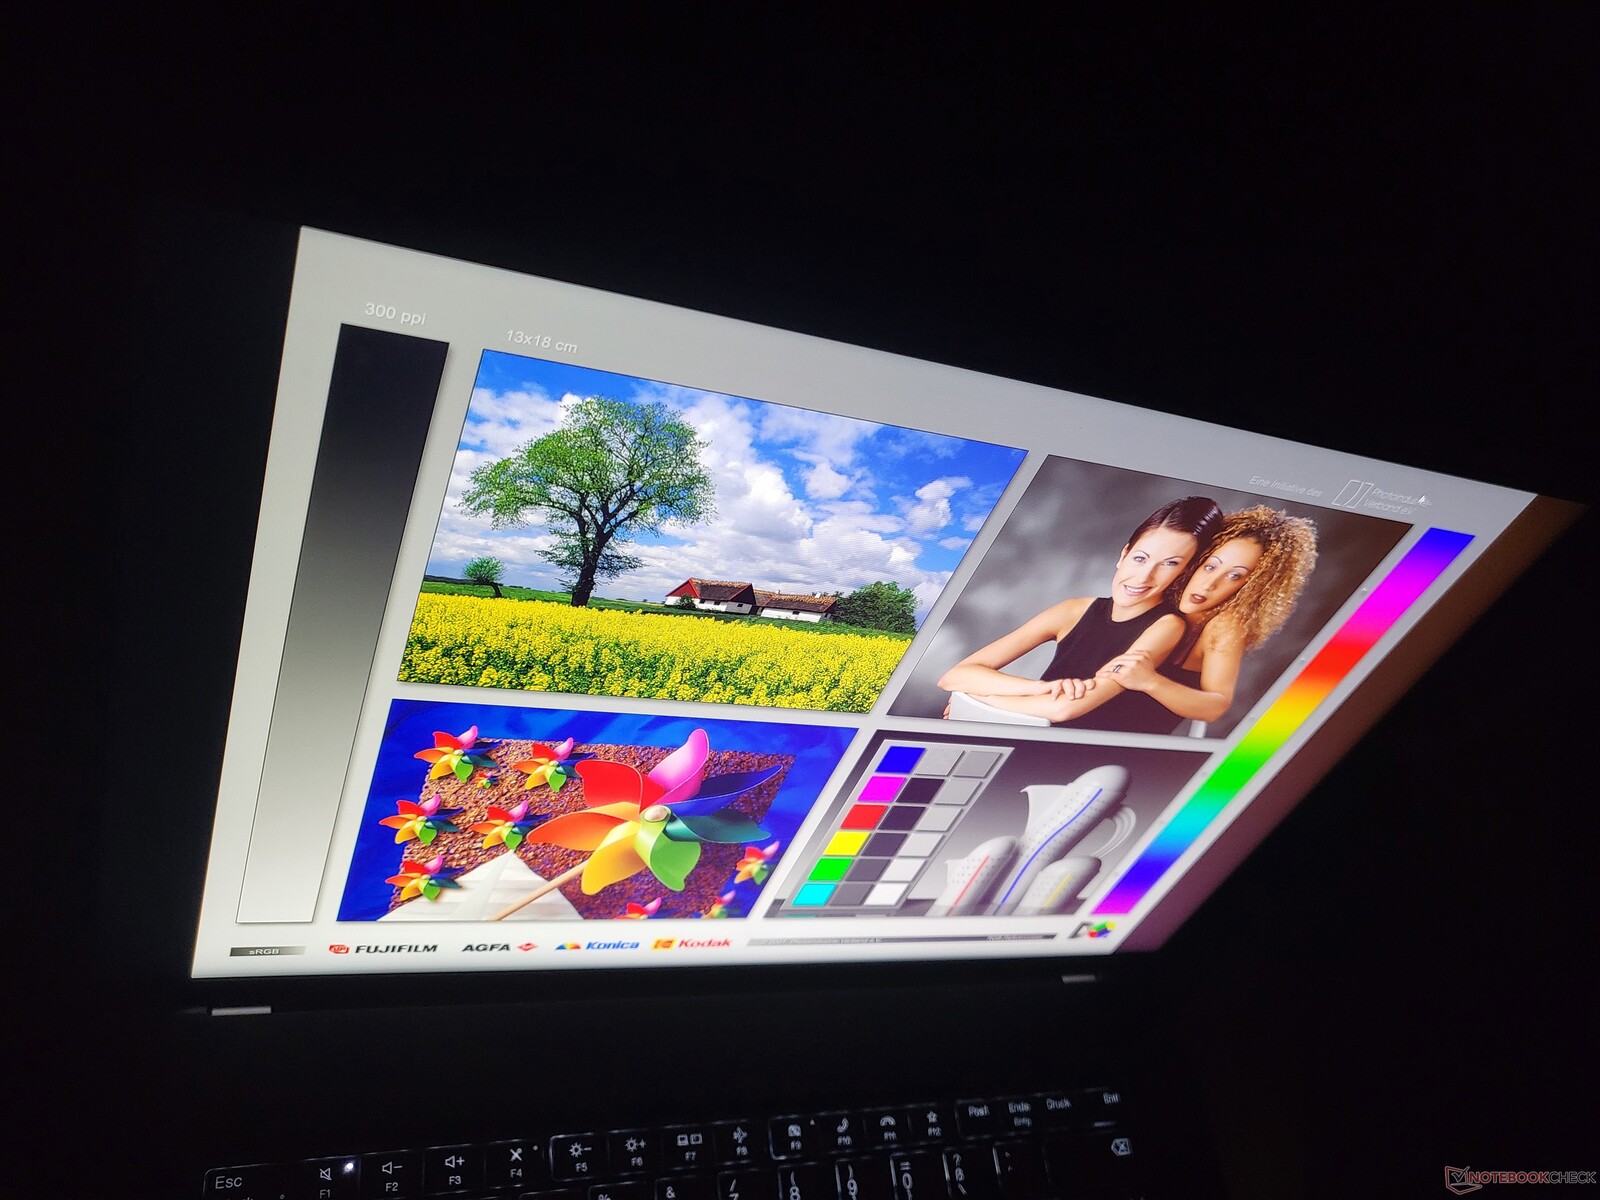
ThinkPad Z16 Gen 1: matowy wyświetlacz WUXGA o dobrej jasności
Lenovo niemal zawsze oferuje kilka opcji wyświetlaczy ze swoimi laptopami ThinkPad i Lenovo ThinkPad Z16 Gen 1 nie jest wyjątkiem od tej reguły. Nabywcy mogą wybierać spośród następujących wyświetlaczy, których wspólną cechą jest format 16:10 i przekątna 16 cali
- IPS WUXGA (1,920 x 1,200), 400 cd/m², matowy, 100% sRGB, Low Power
- IPS WUXGA (1,920 x 1,200), 400 cd/m², półbłyszczący, 100% sRGB, Low Power, Touch
- OLED WQUXGA (3.840 x 2.400), 400 cd/m² (SDR), półbłyszczący, 100% DCI-P3, Touch, Dolby Vision
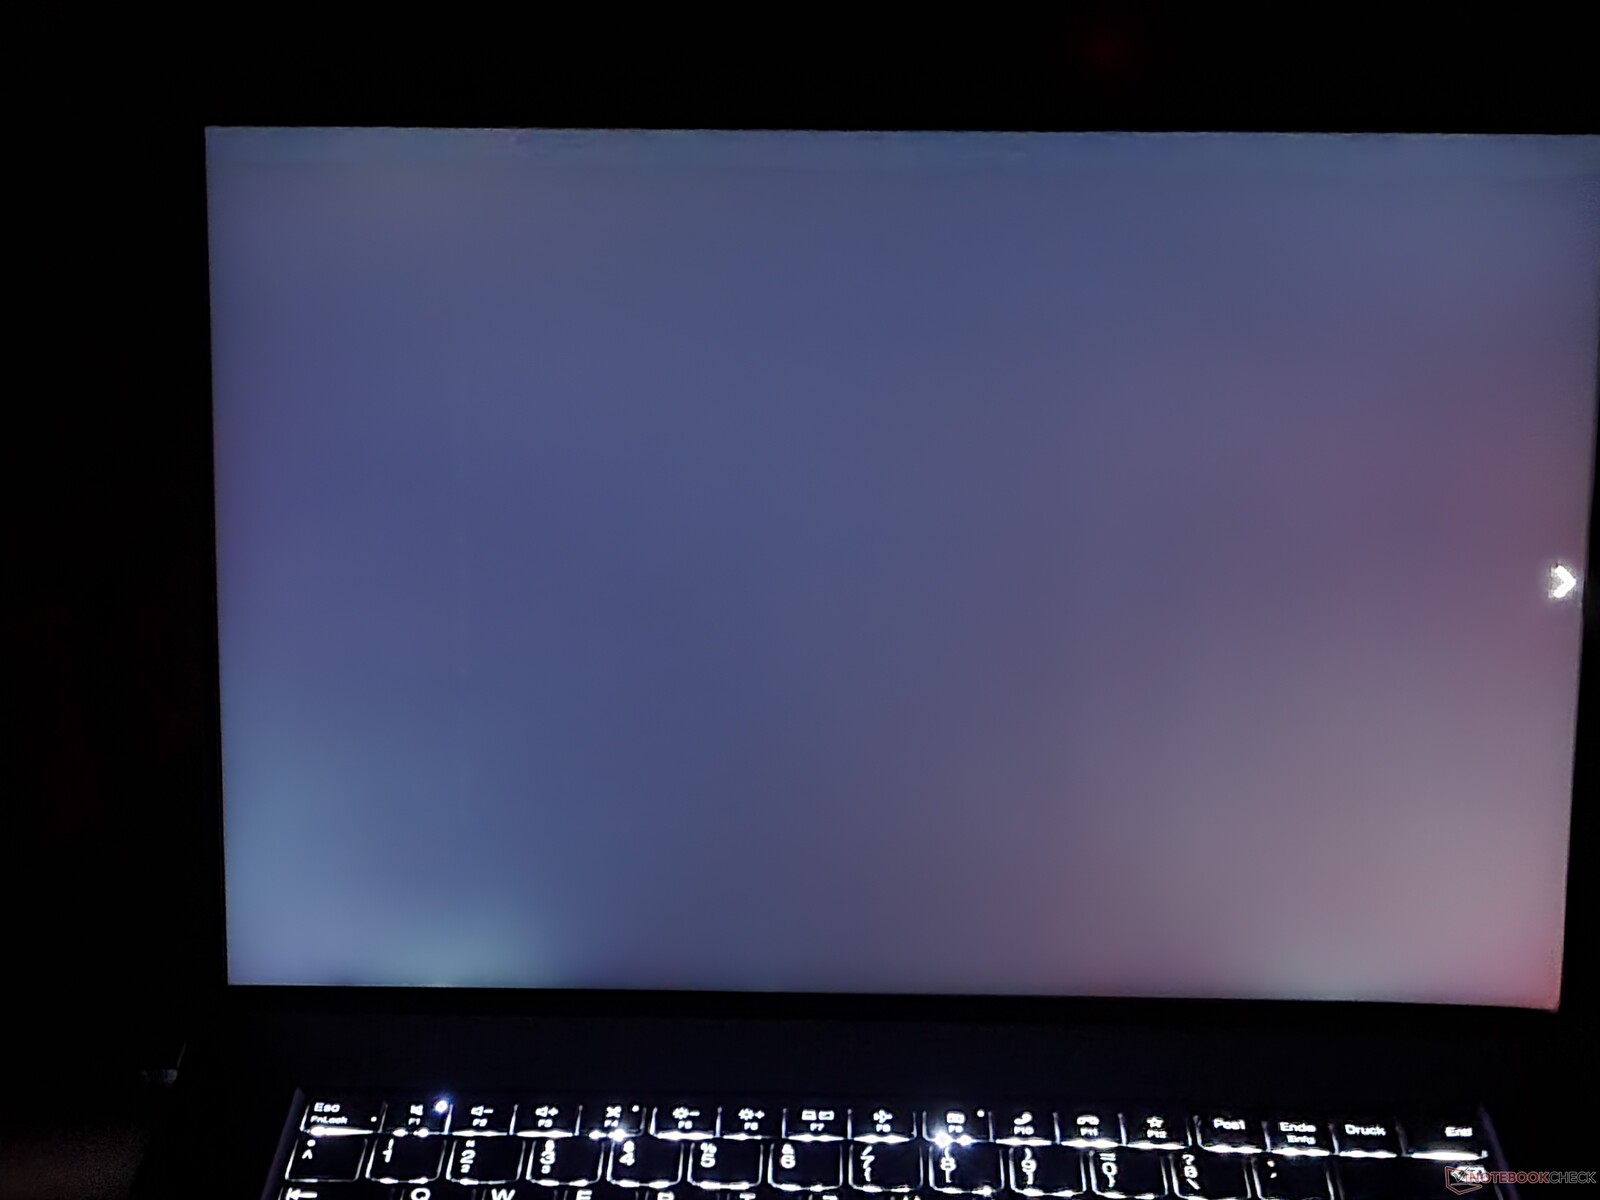
To co wyróżnia się na tle ThinkPad X1 Extreme to brak opcji 2,5K (2560 x 1600). Użytkownicy muszą wybierać między dość niską a bardzo wysoką rozdzielczością. W przypadku naszego testowego egzemplarza mamy opcję podstawową. To z nawiązką spełnia obiecane 400 cd/m², gdyż średnia jasność wynosi 446 cd/m².
| |||||||||||||||||||||||||
rozświetlenie: 83 %
na akumulatorze: 487 cd/m²
kontrast: 1571:1 (czerń: 0.31 cd/m²)
ΔE ColorChecker Calman: 1.8 | ∀{0.5-29.43 Ø4.72}
calibrated: 0.8
ΔE Greyscale Calman: 2.3 | ∀{0.09-98 Ø4.97}
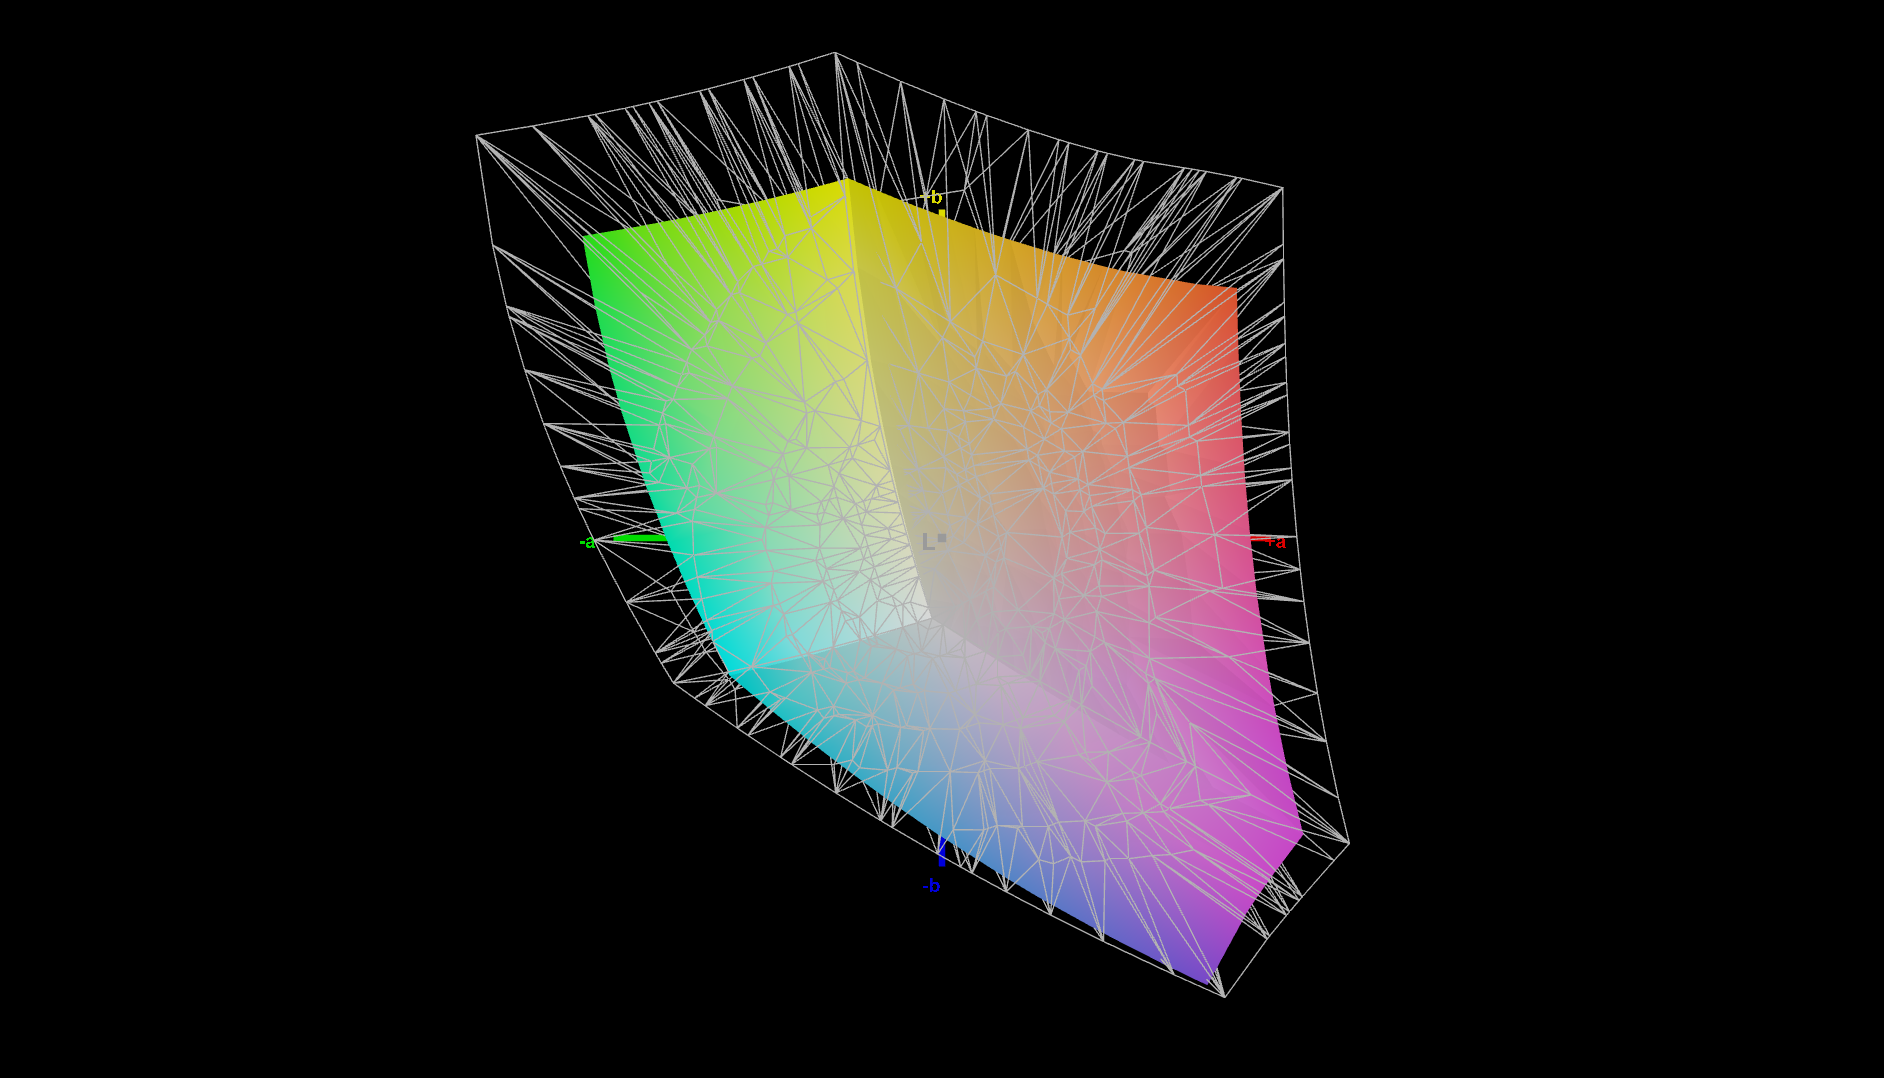
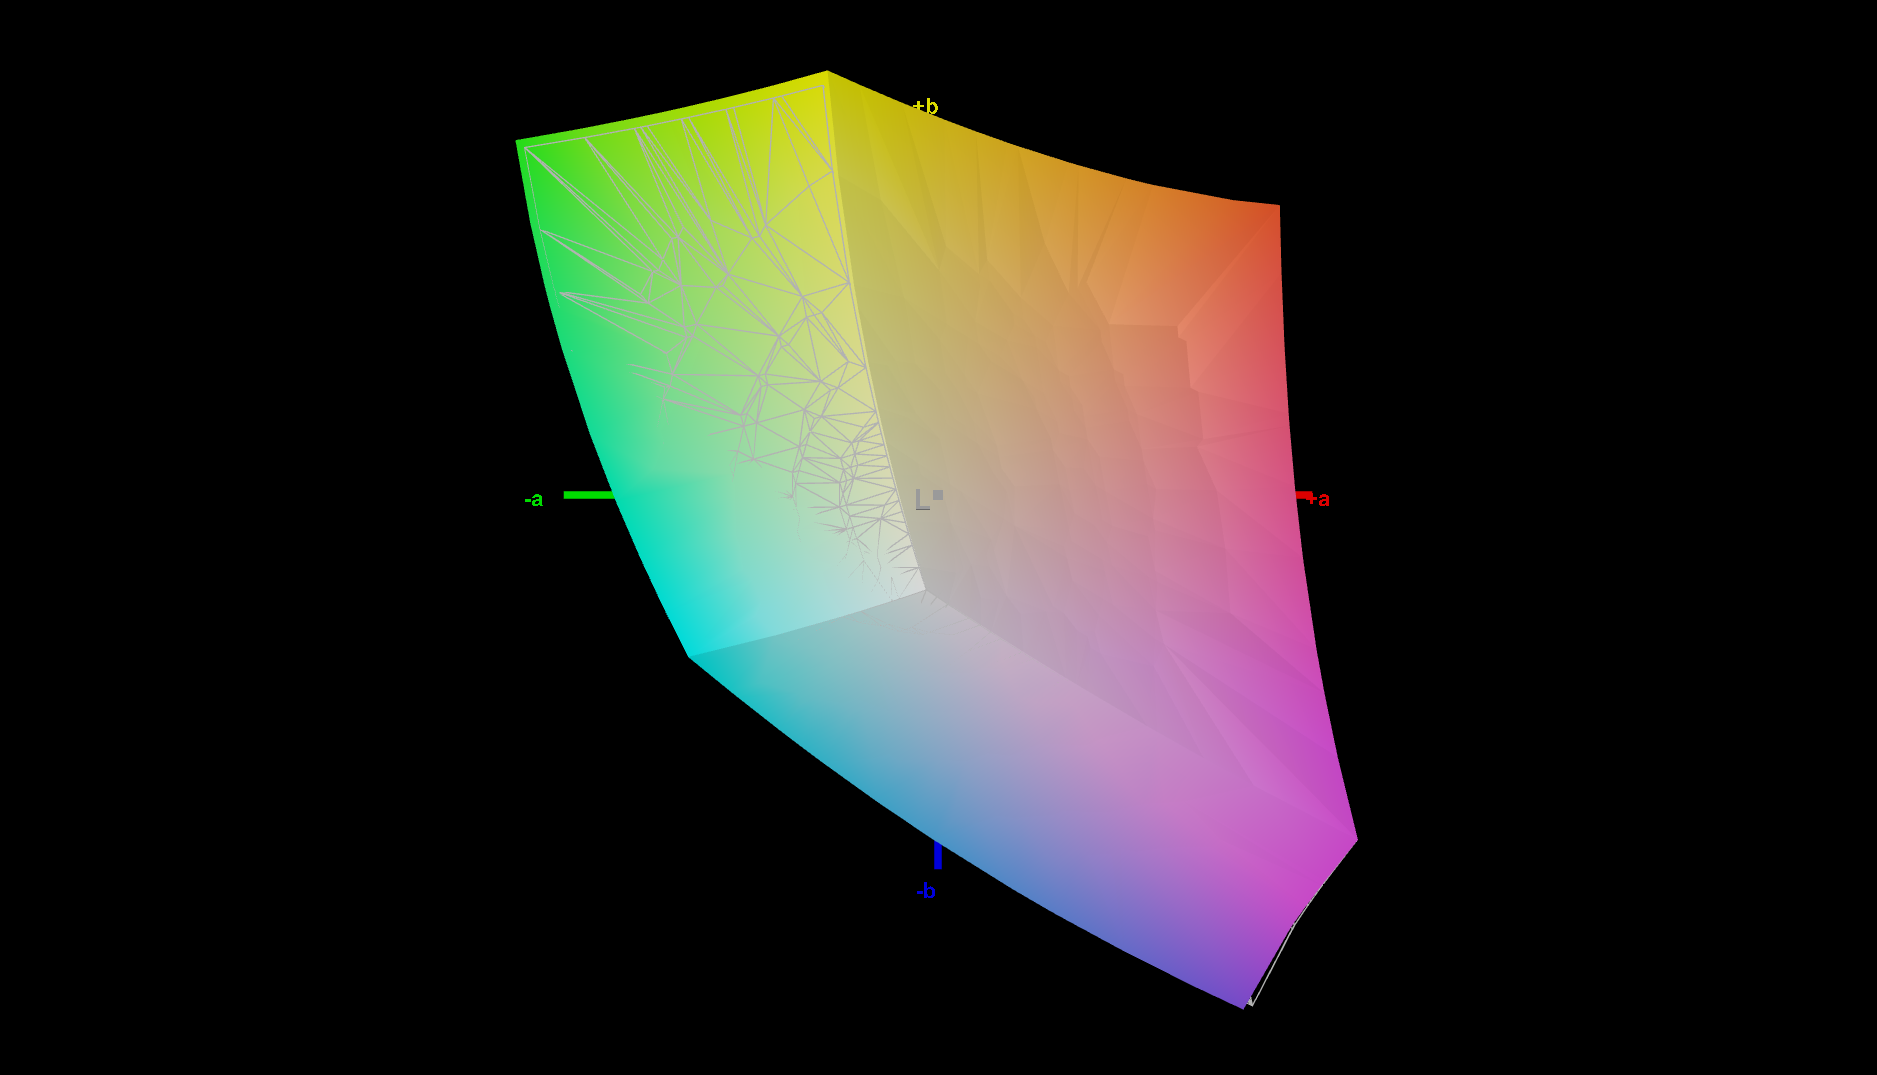
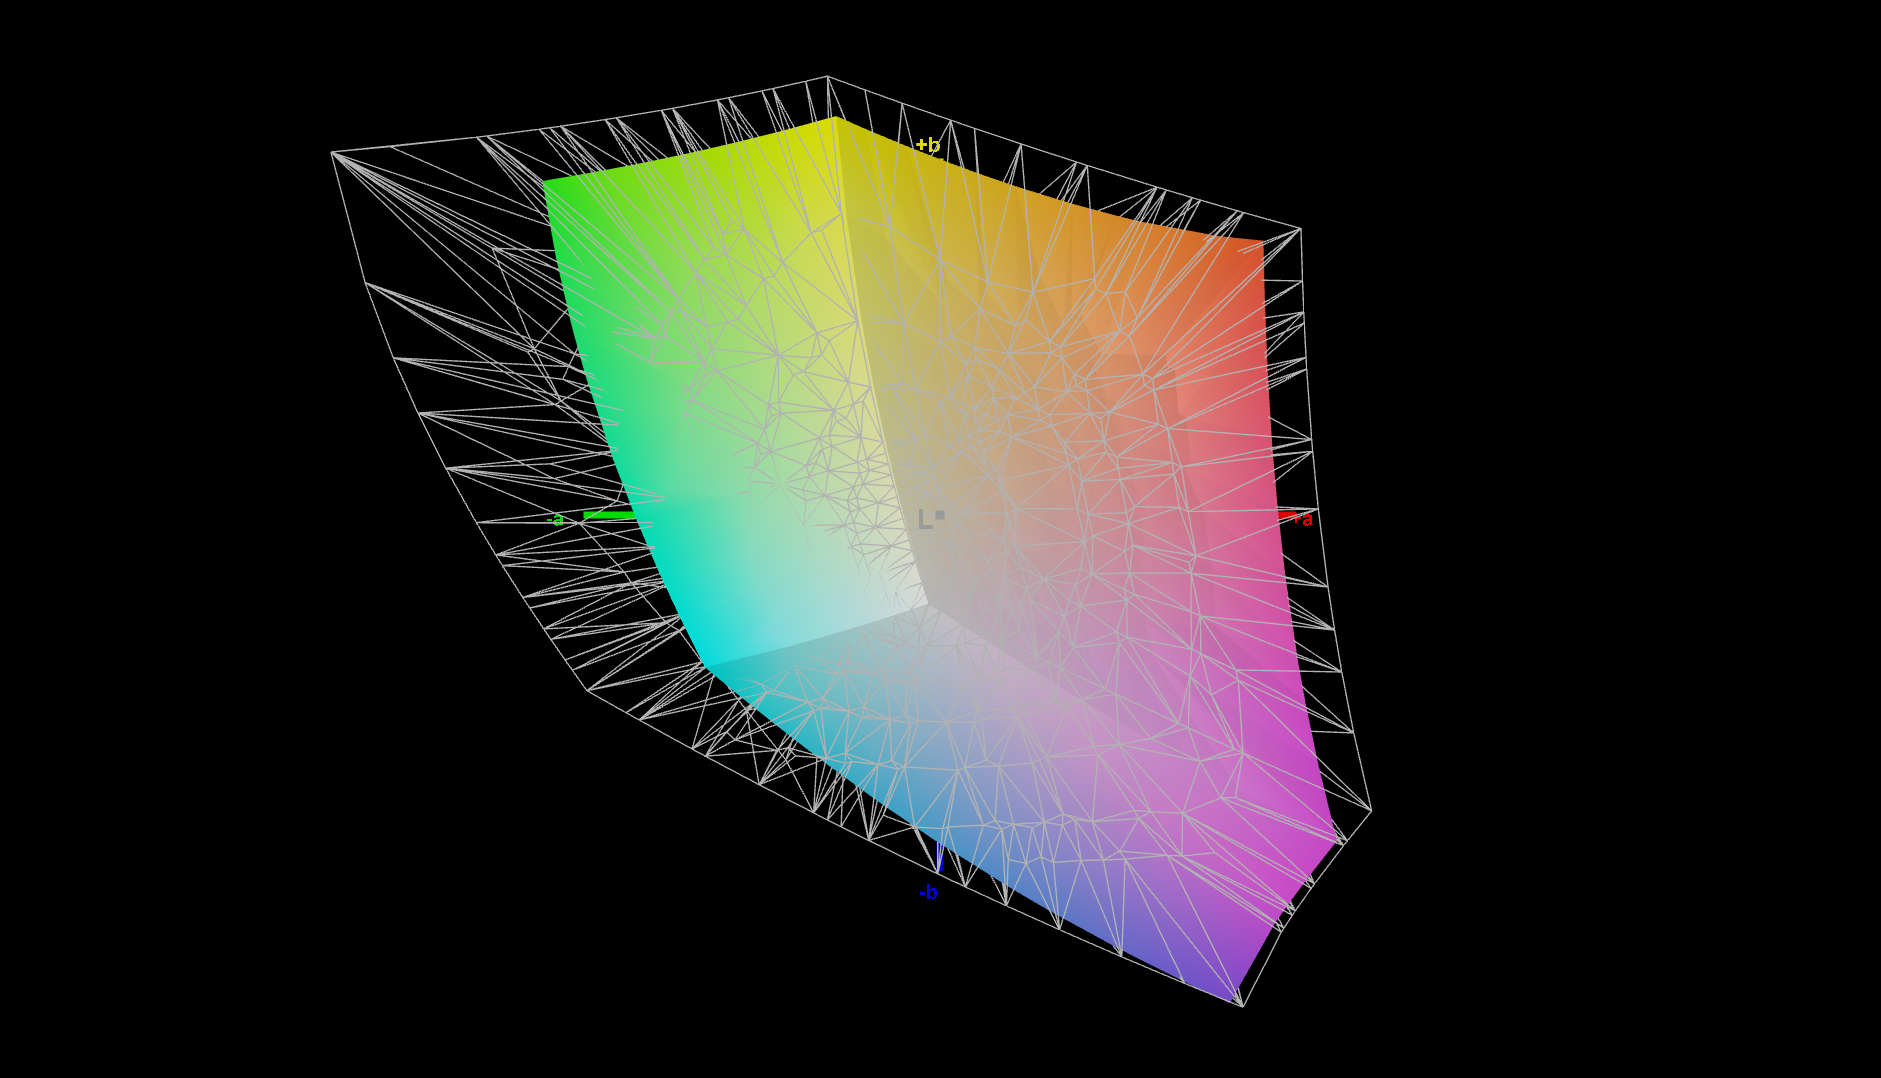
72.1% AdobeRGB 1998 (Argyll 3D)
99.7% sRGB (Argyll 3D)
70% Display P3 (Argyll 3D)
Gamma: 2.16
CCT: 6867 K
| Lenovo ThinkPad Z16 G1 21D5S00T00 NE160WUM-N62 , IPS LED, 1920x1200, 16" | Lenovo ThinkPad X1 Extreme G4-20Y5CTO1WW (3050 Ti) LP160UQ1-SPB1, IPS LED, 3840x2400, 16" | Dell XPS 15 9520 RTX 3050 Ti Samsung 156XG01, OLED, 3456x2160, 15.6" | Dell XPS 17 9720 Sharp LQ170R1, IPS, 3840x2400, 17" | Apple MacBook Pro 16 2021 M1 Pro Liquid Retina XDR, Mini-LED, 3456x2234, 16.2" | |
|---|---|---|---|---|---|
| Display | 18% | 20% | 25% | 21% | |
| Display P3 Coverage (%) | 70 | 84.3 20% | 97.8 40% | 94.8 35% | 99.1 42% |
| sRGB Coverage (%) | 99.7 | 98.3 -1% | 99.9 0% | 100 0% | 100 0% |
| AdobeRGB 1998 Coverage (%) | 72.1 | 97.8 36% | 86 19% | 100 39% | 88 22% |
| Response Times | -59% | 94% | -24% | -137% | |
| Response Time Grey 50% / Grey 80% * (ms) | 40 ? | 60 ? -50% | 1.9 ? 95% | 53.2 ? -33% | 42.8 ? -7% |
| Response Time Black / White * (ms) | 25 ? | 42 ? -68% | 1.9 ? 92% | 28.4 ? -14% | 91.6 ? -266% |
| PWM Frequency (Hz) | 59.52 ? | 17990 ? | 14880 | ||
| Screen | -14% | -55% | -23% | 212% | |
| Brightness middle (cd/m²) | 487 | 639 31% | 381.4 -22% | 438 -10% | 514 6% |
| Brightness (cd/m²) | 446 | 612 37% | 384 -14% | 411 -8% | 497 11% |
| Brightness Distribution (%) | 83 | 84 1% | 95 14% | 86 4% | 95 14% |
| Black Level * (cd/m²) | 0.31 | 0.47 -52% | 0.27 13% | 0.02 94% | |
| Contrast (:1) | 1571 | 1360 -13% | 1622 3% | 25700 1536% | |
| Colorchecker dE 2000 * | 1.8 | 2.2 -22% | 4.34 -141% | 2.5 -39% | 1.4 22% |
| Colorchecker dE 2000 max. * | 3.3 | 5.3 -61% | 9.24 -180% | 6.3 -91% | 2.8 15% |
| Colorchecker dE 2000 calibrated * | 0.8 | 1.4 -75% | 0.8 -0% | ||
| Greyscale dE 2000 * | 2.3 | 1.7 26% | 2 13% | 4.2 -83% | 2.3 -0% |
| Gamma | 2.16 102% | 2.31 95% | 2.13 103% | 2.22 99% | 2.27 97% |
| CCT | 6867 95% | 6390 102% | 6210 105% | 7034 92% | 6792 96% |
| Całkowita średnia (program / ustawienia) | -18% /
-14% | 20% /
-8% | -7% /
-13% | 32% /
115% |
* ... im mniej tym lepiej
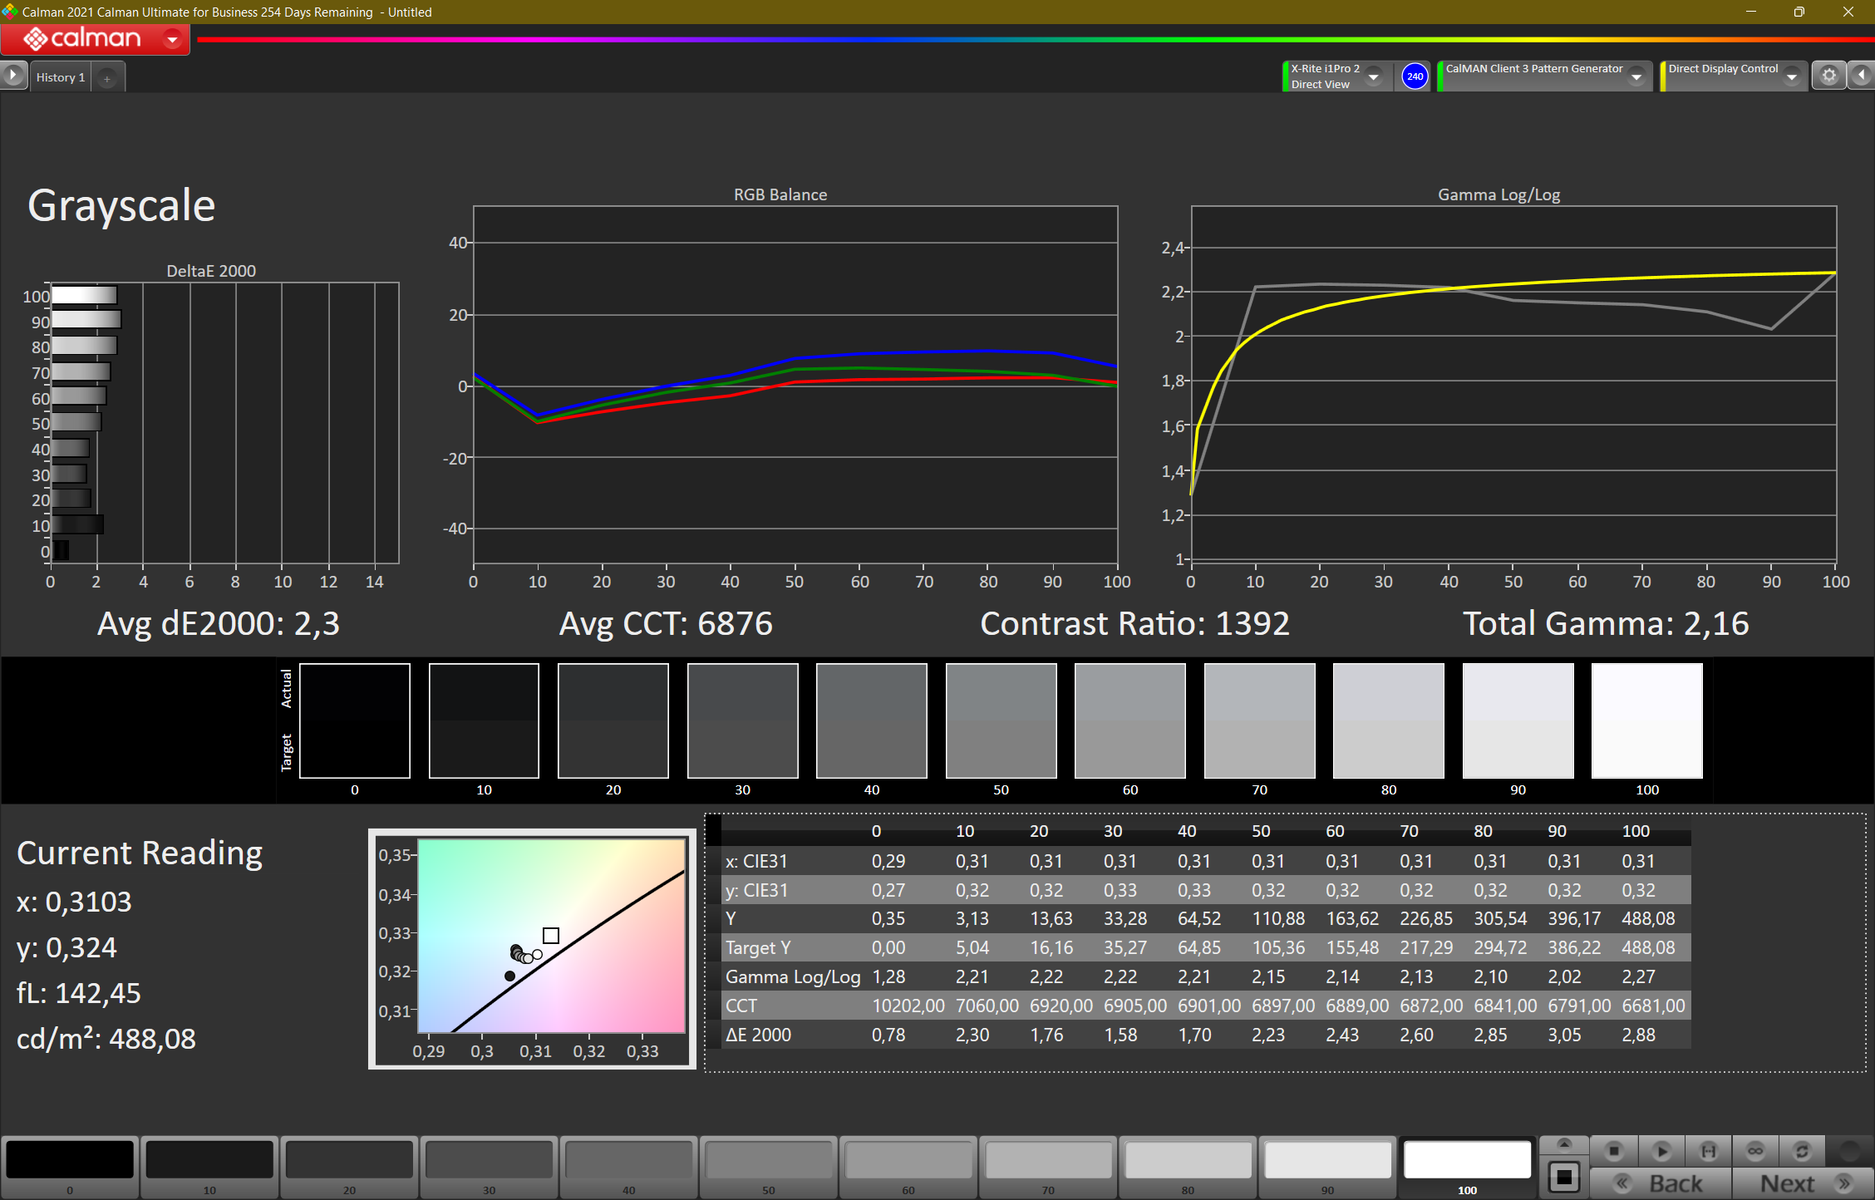
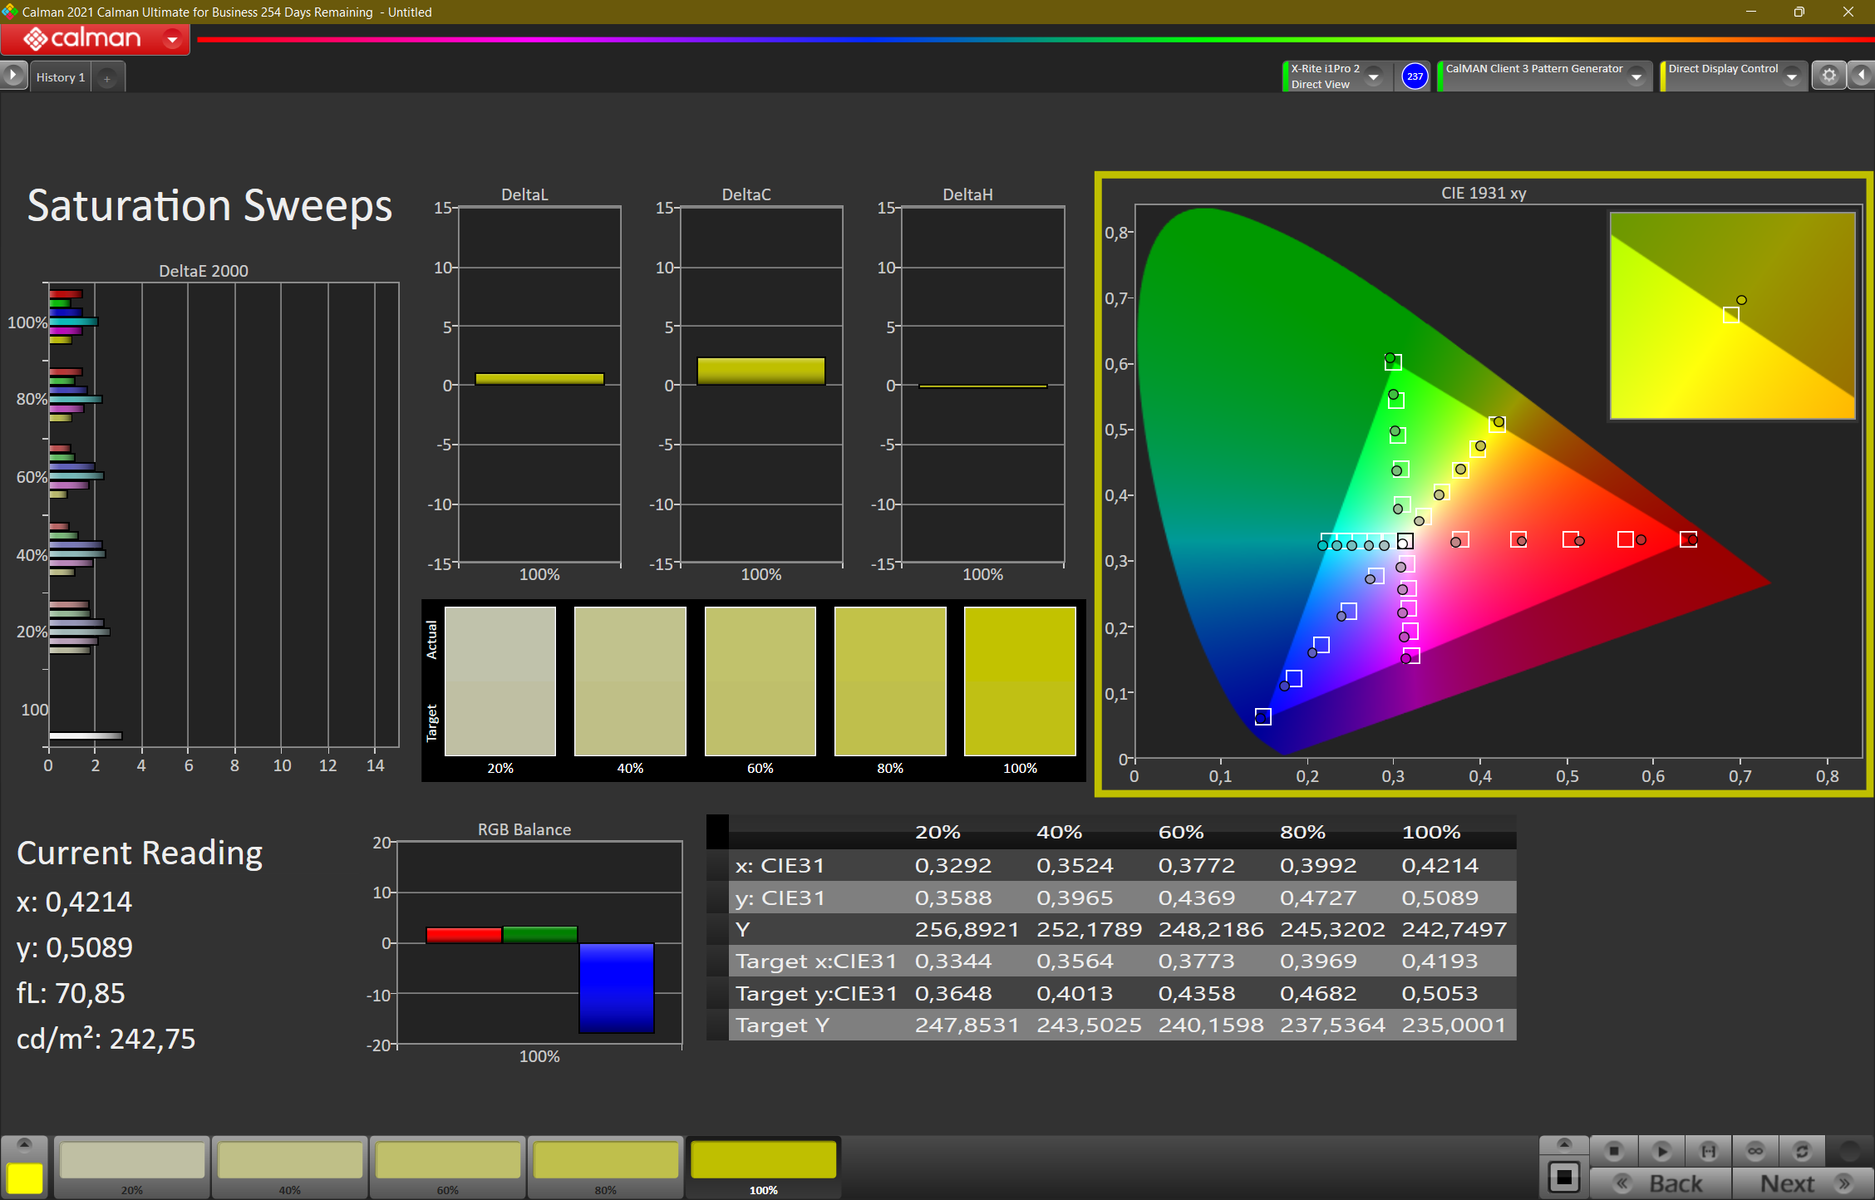
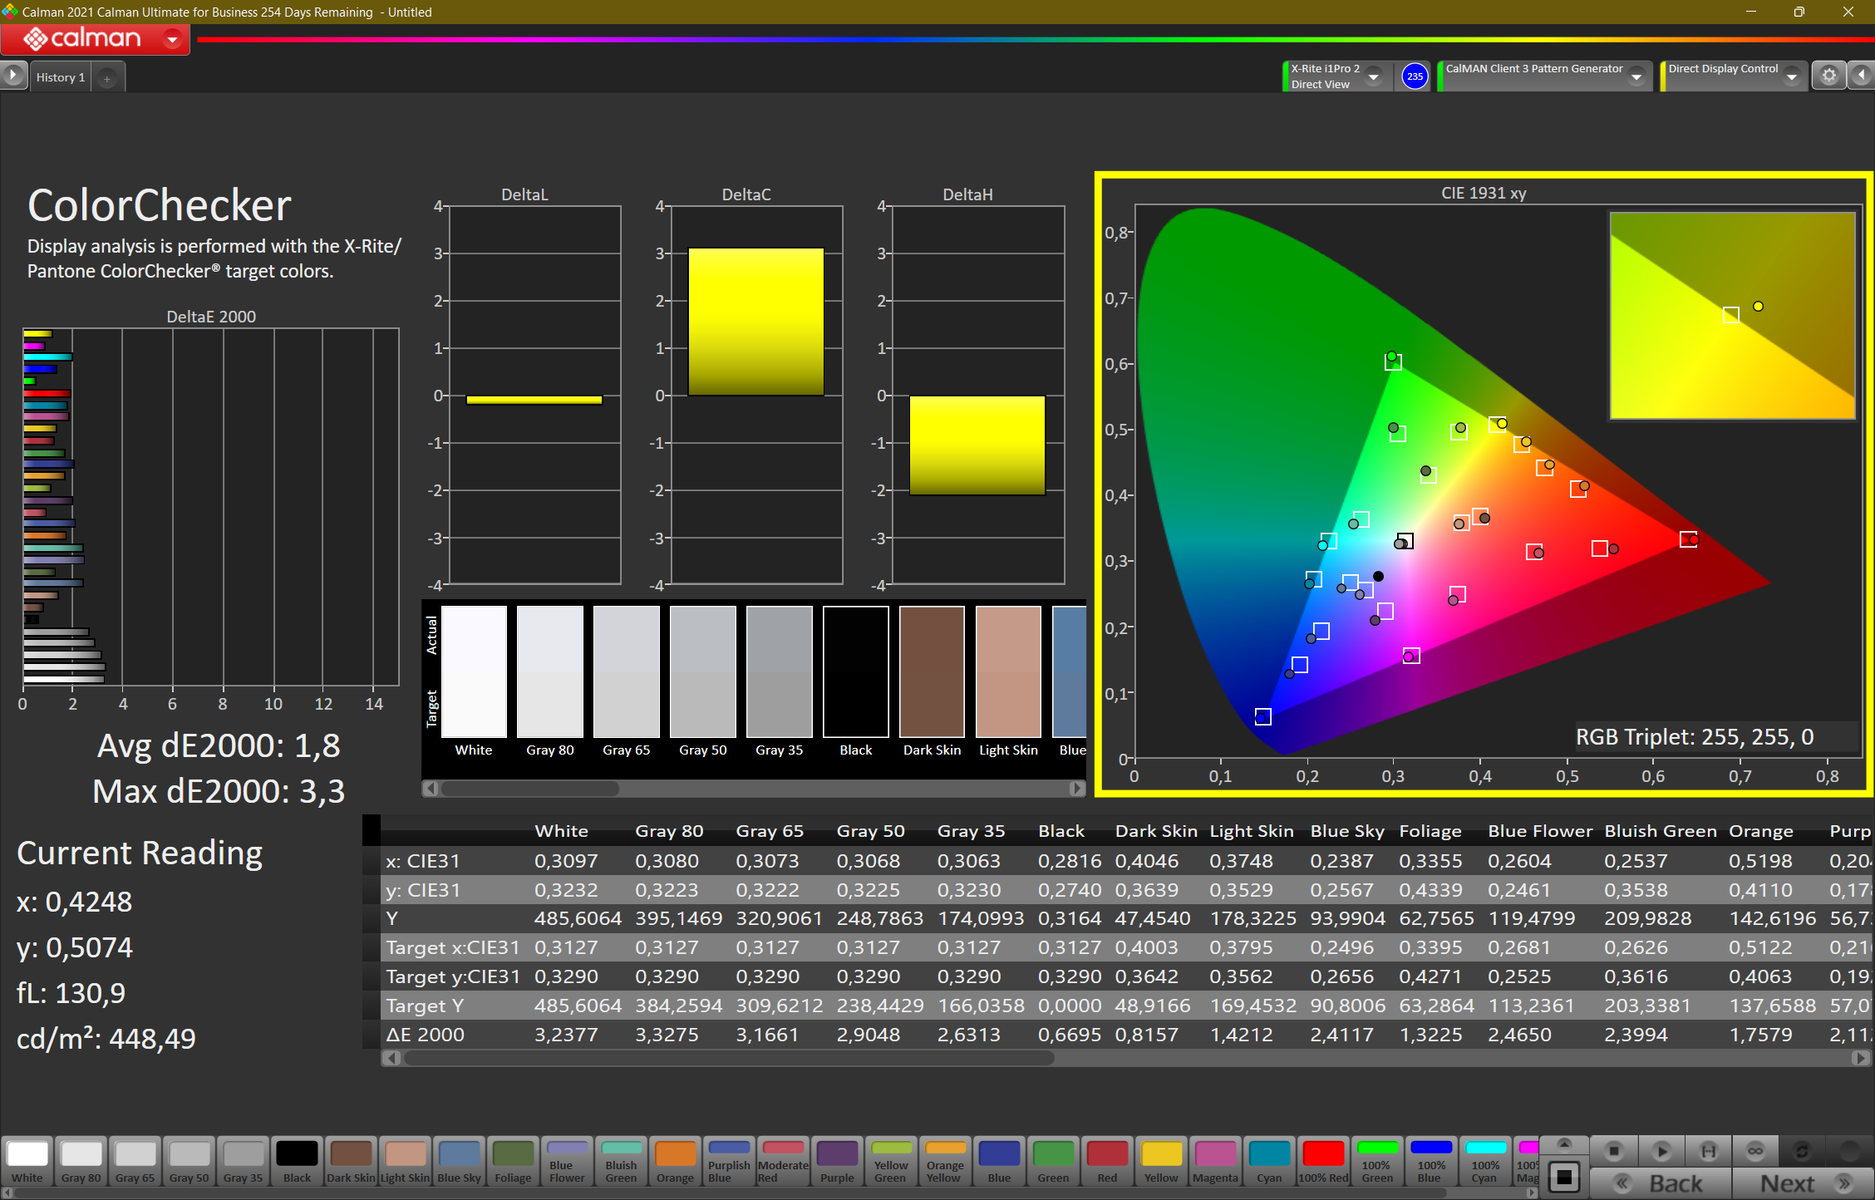
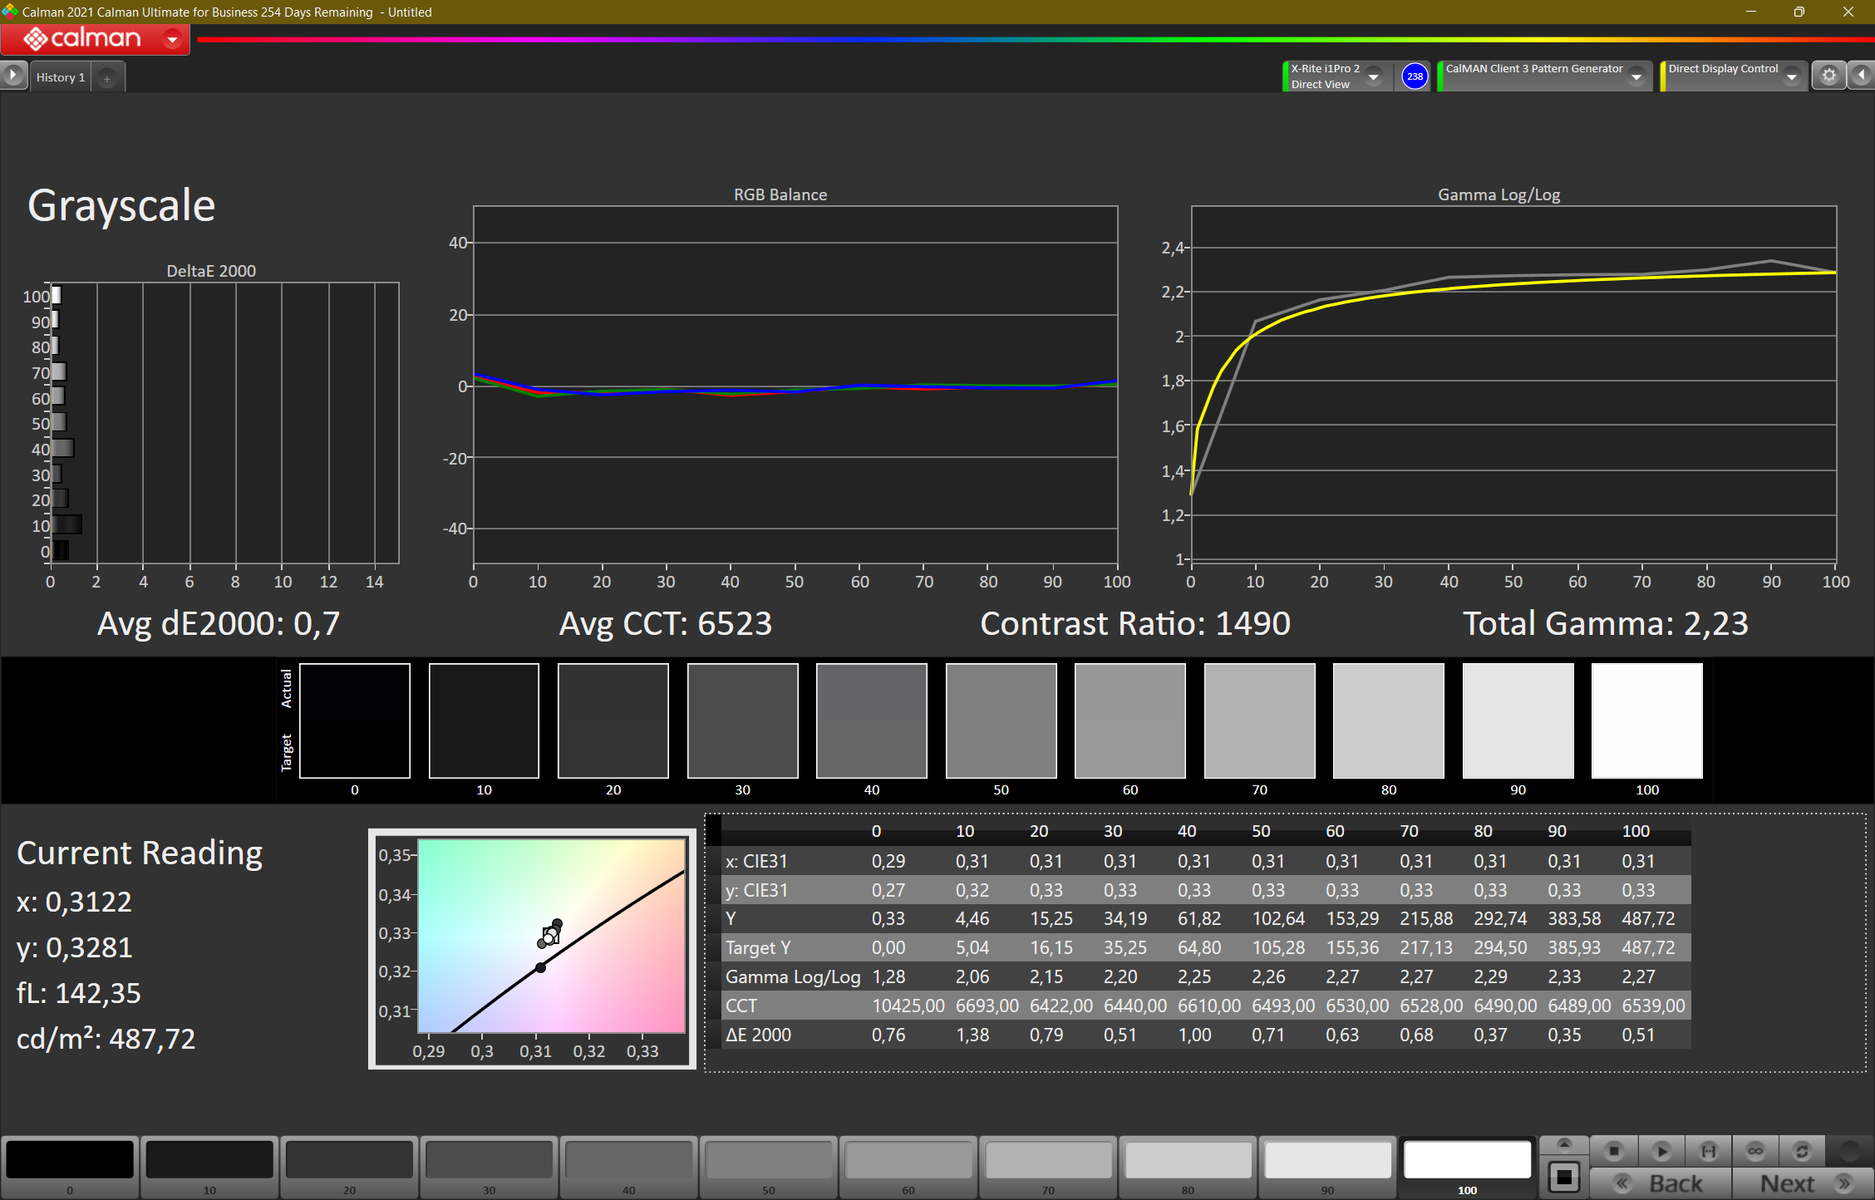
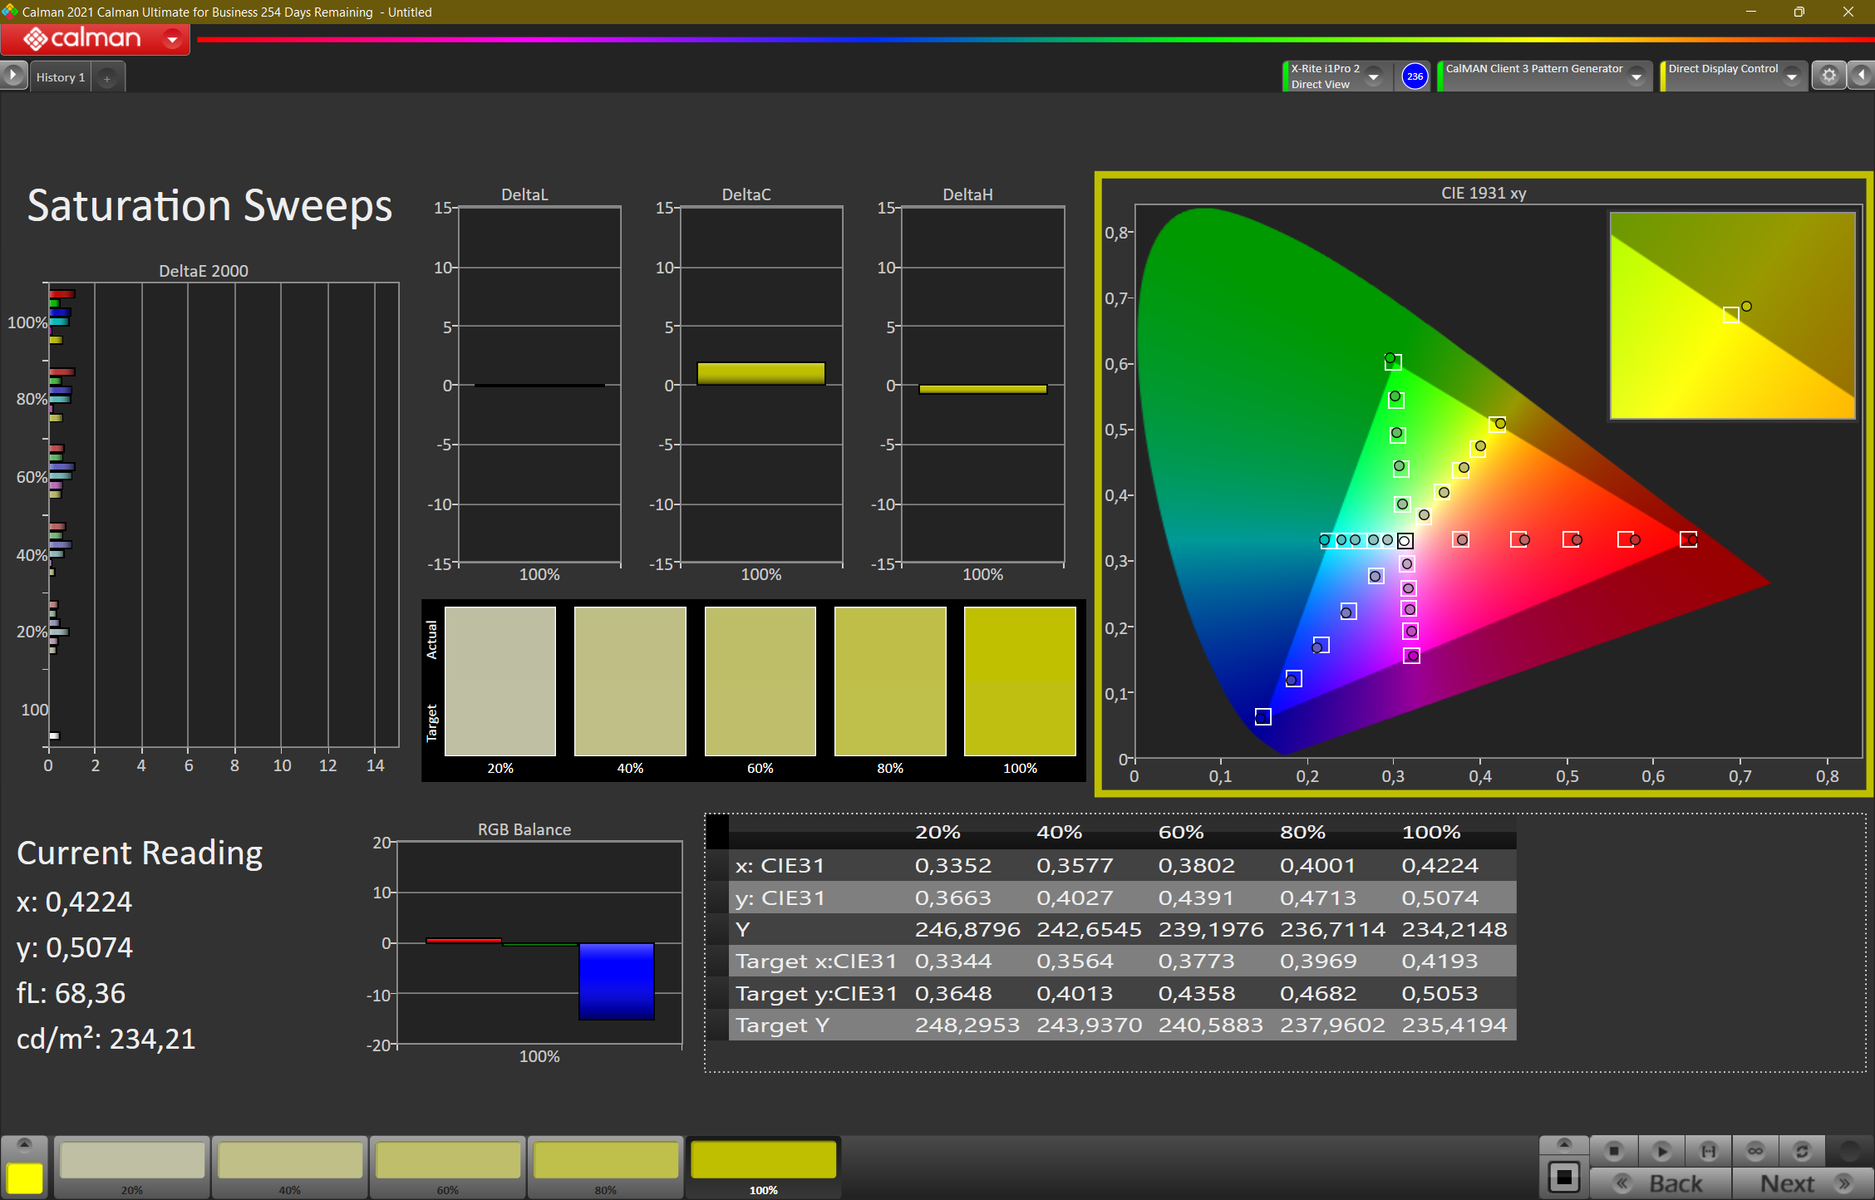

Wyświetlacz w Lenovo ThinkPad Z16 G1 jest już w stanie dostawy stosunkowo dobrze wyregulowany, co widać po jego niskich odchyleniach Delta-E. Zmierzyliśmy wyświetlacz przy użyciu programu CalMan oraz kolorymetru X-Rite i1 Pro 2. Kalibracja przy użyciu Profiler i1 pozwoliła jeszcze bardziej obniżyć wartość Delta-E, co doprowadziło do dość dokładnego odwzorowania kolorów. Jak zawsze, stworzony profil kolorów jest dostępny do pobrania za darmo powyżej.
Marketing Lenovo obiecuje 100% pokrycie przestrzeni kolorów sRGB, a my zmierzyliśmy 99,7%. Dzięki temu wyświetlacz LCD nadaje się do prostej obróbki zdjęć. Aby uzyskać jeszcze szersze pokrycie przestrzeni barw, trzeba by wybrać opcjonalny panel OLED.
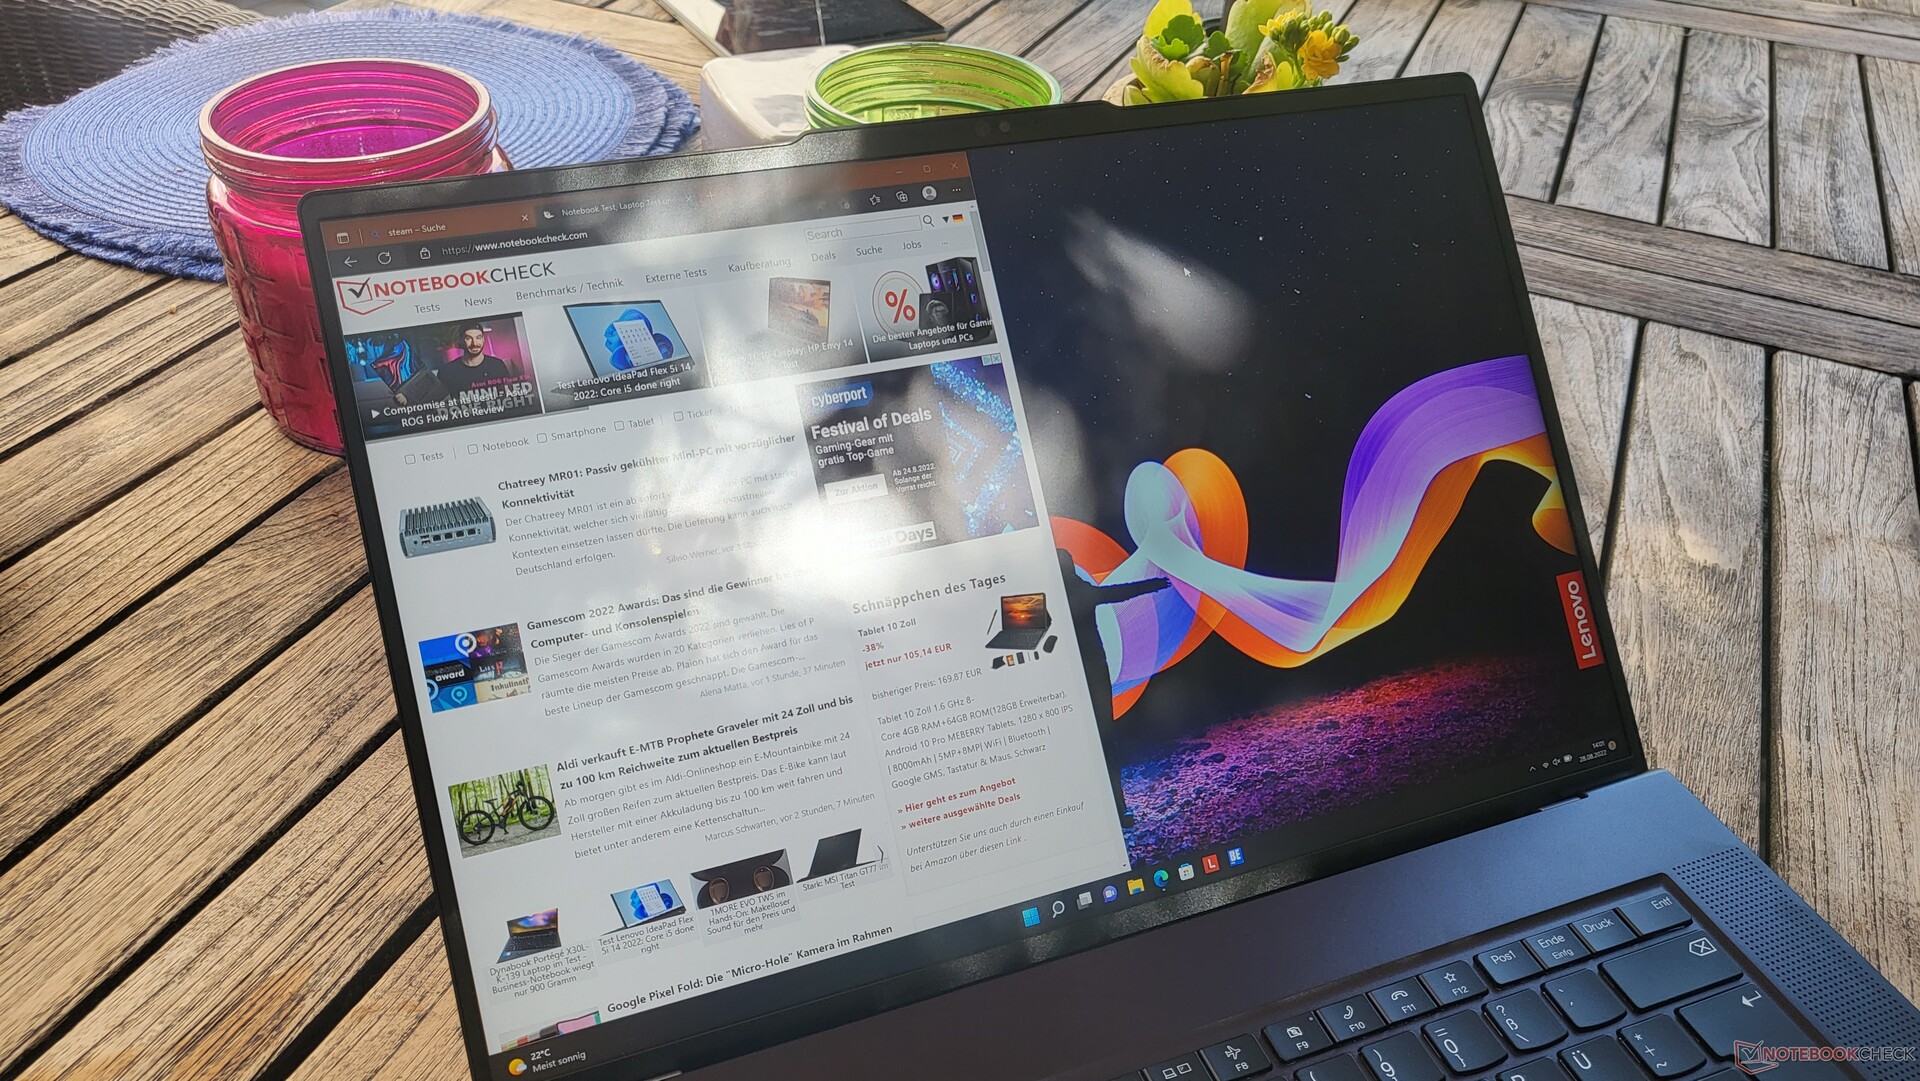
Ze względu na stosunkowo wysoką jasność i matową powierzchnię wyświetlacza laptop ThinkPad Z16 może być bez problemu używany na dworze, o ile unikniemy bezpośredniego działania promieni słonecznych.
Wyświetl czasy reakcji
| ↔ Czas reakcji od czerni do bieli | ||
|---|---|---|
| 25 ms ... wzrost ↗ i spadek ↘ łącznie | ↗ 12 ms wzrost | 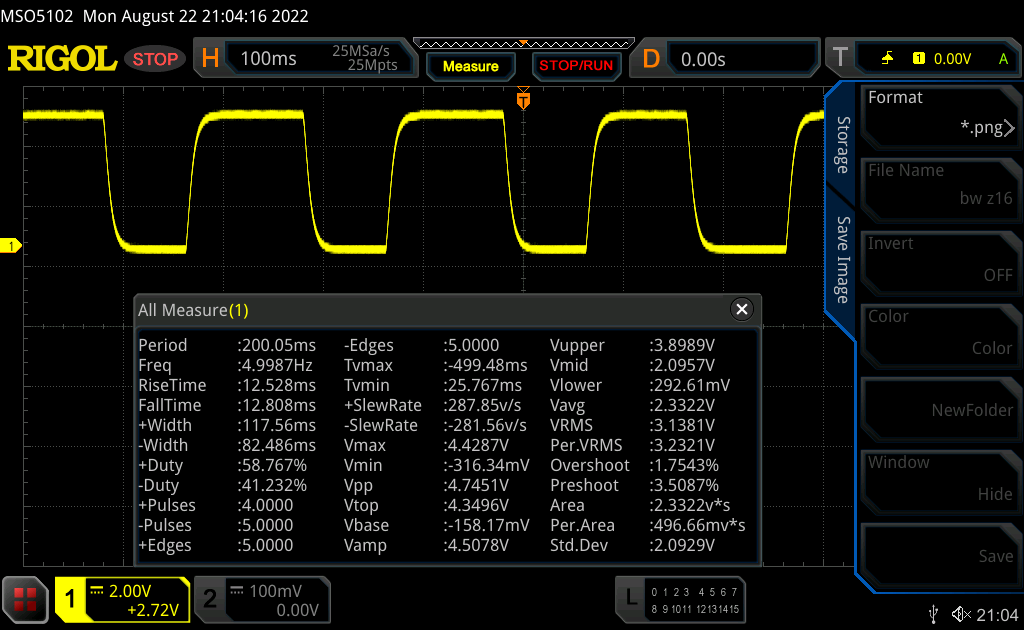 |
| ↘ 13 ms upadek | ||
| W naszych testach ekran wykazuje stosunkowo powolne tempo reakcji i może być zbyt wolny dla graczy. Dla porównania, wszystkie testowane urządzenia wahają się od 0.1 (minimum) do 240 (maksimum) ms. » 59 % wszystkich urządzeń jest lepszych. Oznacza to, że zmierzony czas reakcji jest gorszy od średniej wszystkich testowanych urządzeń (19.8 ms). | ||
| ↔ Czas reakcji 50% szarości do 80% szarości | ||
| 40 ms ... wzrost ↗ i spadek ↘ łącznie | ↗ 17 ms wzrost | 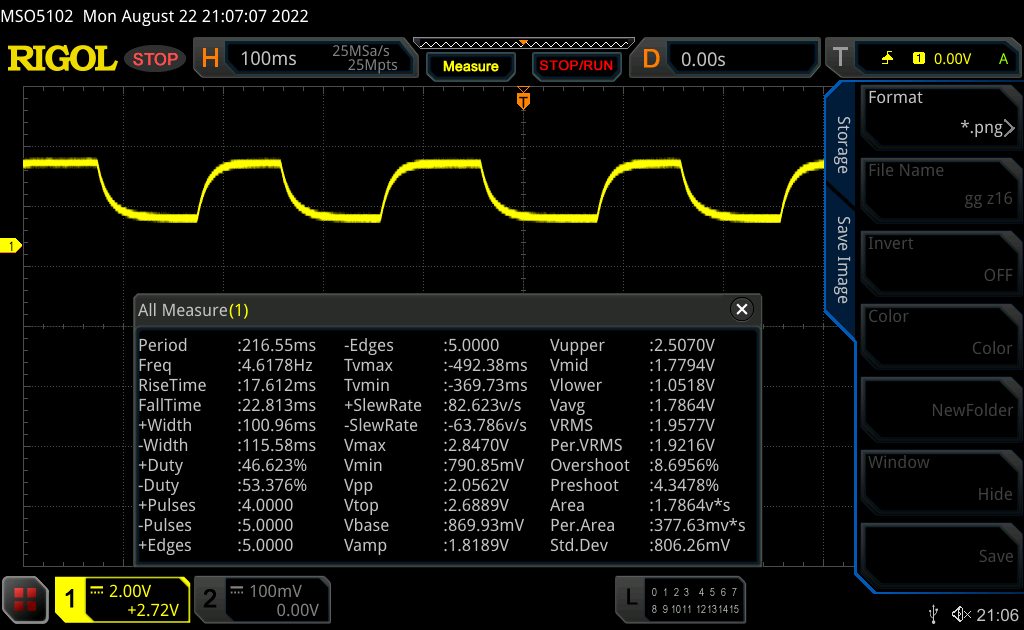 |
| ↘ 23 ms upadek | ||
| W naszych testach ekran wykazuje powolne tempo reakcji, co będzie niezadowalające dla graczy. Dla porównania, wszystkie testowane urządzenia wahają się od 0.165 (minimum) do 636 (maksimum) ms. » 61 % wszystkich urządzeń jest lepszych. Oznacza to, że zmierzony czas reakcji jest gorszy od średniej wszystkich testowanych urządzeń (31 ms). | ||
Migotanie ekranu / PWM (modulacja szerokości impulsu)
| Migotanie ekranu/nie wykryto PWM | 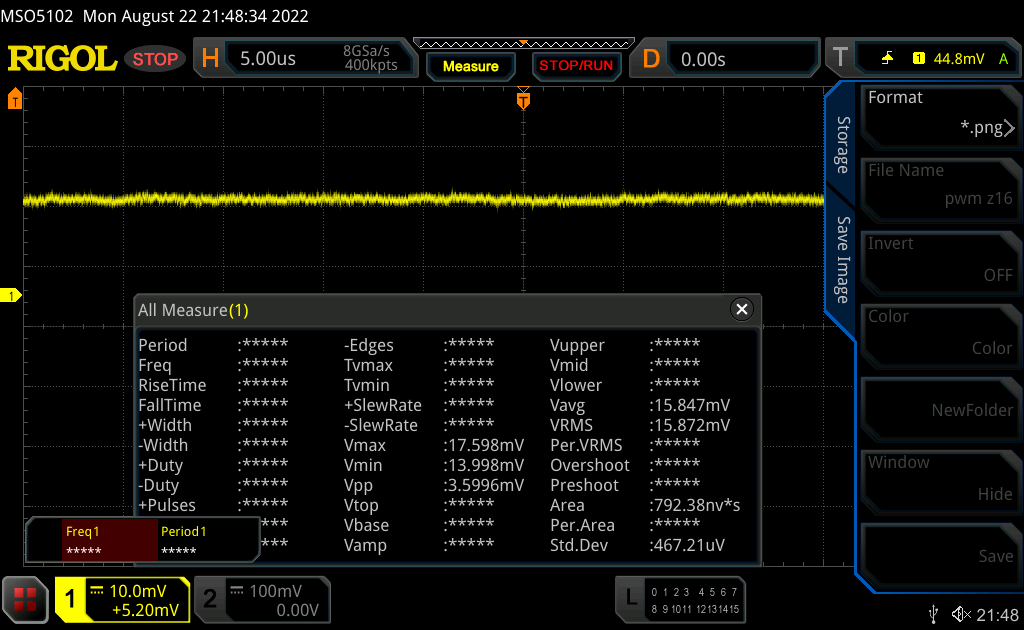 | ||
Dla porównania: 52 % wszystkich testowanych urządzeń nie używa PWM do przyciemniania wyświetlacza. Jeśli wykryto PWM, zmierzono średnio 7781 (minimum: 5 - maksimum: 343500) Hz. | |||
Wydajność: AMD Ryzen 6000H spotyka Radeona RX 6500M
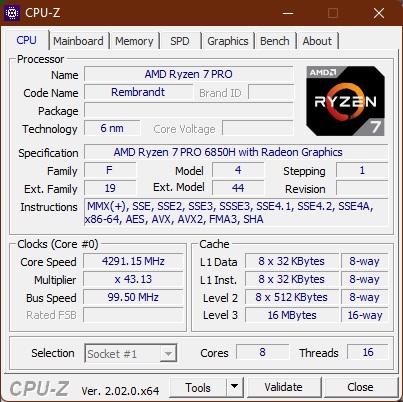
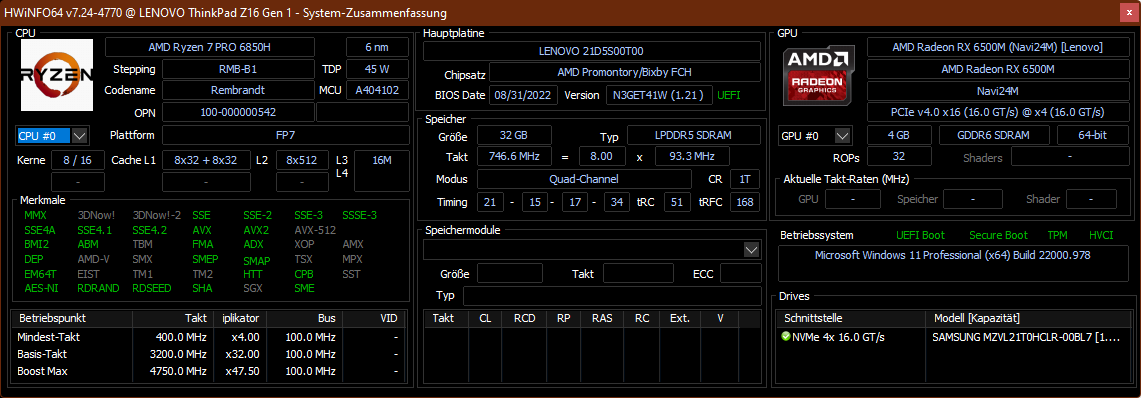
Procesory dla ThinkPad Z16 Gen 1 są dostępne w trzech wersjach, przy czym wszystkie należą do linii Ryzen Pro firmy AMD przeznaczonej dla klientów biznesowych.AMD Ryzen 5 Pro 6650Hz sześcioma rdzeniami to podstawowy model, można też kupić model Ryzen 7 Pro 6850HorazRyzen 9 Pro 6950H, oba z ośmioma rdzeniami. Jako układ graficzny, można użyć zintegrowanego GPU Radeon lub opcjonalnie uzyskać AMD Radeon RX 6500M. Lenovo ThinkPad Z16 to pierwszy ThinkPad, którego można kupić z połączeniem procesora AMD i AMD dGPU.
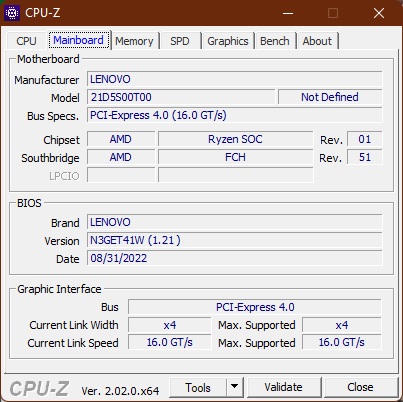
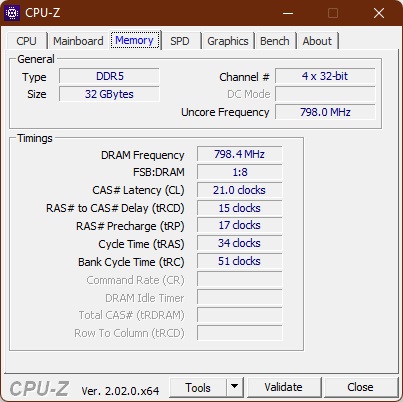
W serii ThinkPad Z Lenovo stosuje lutowaną pamięć LPDDR5-6400, przy czym model Z16 oferuje 16 lub 32 GB RAM. Jako pamięć masowa służy pojedynczy dysk SSD M.2-2280.
Warunki badania
Nasz test został przeprowadzony w trudnych warunkach, ponieważ Z16 stworzył nam kilka dużych problemów. Nasz pierwszy testowy egzemplarz stale restartował się po włączeniu Wi-Fi. Następnie otrzymaliśmy urządzenie na wymianę, co w dużym stopniu rozwiązało problemy, a zastępczy ThinkPad był znacznie stabilniejszy.
W trybie Windows "Best Performance" procesor ThinkPada Z16 ma krótkoterminowy limit mocy na poziomie 65 W, a w dłuższym okresie procesor może zużywać 47 W.
Procesor
Na stronie .AMD Ryzen 7 Pro 6850H to procesor generacji 2022 Rembrandt, który jako układ z serii H ma typowe TDP na poziomie 45 W. Jego osiem rdzeni (16 wątków z Hyperthreadingiem) ma podstawowe taktowanie 3,2 GHz i maksymalne 4,7 GHz. Dla kilku dodatkowych porównań z innymi procesorami polecamy nasze Zestawienie porównawcze procesorów.
Lenovo ThinkPad Z16 Gen 1 to pierwszy ThinkPad z procesorem z serii AMD-H. W testach benchmarkowych osiąga bardzo dobre wyniki, choć w kilku dyscyplinach pozostaje za konkurentami. Procesory Intel Core-i 12. generacji są lepsze zarówno w wydajności jedno-, jak i wielordzeniowej, choć w wydajności wielordzeniowej przewaga nie utrzymuje się długo. Procesory M1 Pro i Max również mają przewagę, pomijając emulowane benchmarki
Choć tryb "Ultra Performance" nie jest dostępny na zasilaniu akumulatorowym, wydajność procesora pozostaje mimo to niemal niezmienna na zasilaniu bateryjnym (11 963 pkt. w teście Cinebench R23 Multicore).
Cinebench R15 Multi Constant Load Test
Cinebench R23: Multi Core | Single Core
Cinebench R20: CPU (Multi Core) | CPU (Single Core)
Cinebench R15: CPU Multi 64Bit | CPU Single 64Bit
Blender: v2.79 BMW27 CPU
7-Zip 18.03: 7z b 4 | 7z b 4 -mmt1
Geekbench 5.5: Multi-Core | Single-Core
HWBOT x265 Benchmark v2.2: 4k Preset
LibreOffice : 20 Documents To PDF
R Benchmark 2.5: Overall mean
| CPU Performance rating | |
| Średnia w klasie Multimedia | |
| Dell XPS 17 9720 | |
| Dell XPS 15 9520 RTX 3050 Ti | |
| Lenovo ThinkPad X1 Extreme G4-20Y50040GE -3! | |
| Apple MacBook Pro 16 2021 M1 Pro -5! | |
| Lenovo ThinkPad Z16 G1 21D5S00T00 | |
| Apple MacBook Pro 16 2021 M1 Max -5! | |
| Lenovo ThinkPad X1 Extreme G4-20Y5CTO1WW (3050 Ti) | |
| Przeciętny AMD Ryzen 7 PRO 6850H | |
| Cinebench R23 / Multi Core | |
| Średnia w klasie Multimedia (4861 - 33362, n=80, ostatnie 2 lata) | |
| Dell XPS 17 9720 | |
| Dell XPS 15 9520 RTX 3050 Ti | |
| Lenovo ThinkPad X1 Extreme G4-20Y5CTO1WW (3050 Ti) | |
| Przeciętny AMD Ryzen 7 PRO 6850H (12016 - 12770, n=2) | |
| Apple MacBook Pro 16 2021 M1 Max | |
| Apple MacBook Pro 16 2021 M1 Pro | |
| Lenovo ThinkPad X1 Extreme G4-20Y50040GE | |
| Lenovo ThinkPad Z16 G1 21D5S00T00 | |
| Cinebench R23 / Single Core | |
| Średnia w klasie Multimedia (1128 - 2459, n=72, ostatnie 2 lata) | |
| Dell XPS 15 9520 RTX 3050 Ti | |
| Dell XPS 17 9720 | |
| Lenovo ThinkPad X1 Extreme G4-20Y50040GE | |
| Apple MacBook Pro 16 2021 M1 Pro | |
| Apple MacBook Pro 16 2021 M1 Max | |
| Lenovo ThinkPad X1 Extreme G4-20Y5CTO1WW (3050 Ti) | |
| Lenovo ThinkPad Z16 G1 21D5S00T00 | |
| Przeciętny AMD Ryzen 7 PRO 6850H (1469 - 1491, n=2) | |
| Cinebench R20 / CPU (Multi Core) | |
| Średnia w klasie Multimedia (1887 - 12912, n=63, ostatnie 2 lata) | |
| Dell XPS 15 9520 RTX 3050 Ti | |
| Lenovo ThinkPad Z16 G1 21D5S00T00 | |
| Dell XPS 17 9720 | |
| Lenovo ThinkPad X1 Extreme G4-20Y5CTO1WW (3050 Ti) | |
| Lenovo ThinkPad X1 Extreme G4-20Y50040GE | |
| Przeciętny AMD Ryzen 7 PRO 6850H (2990 - 4946, n=3) | |
| Apple MacBook Pro 16 2021 M1 Max | |
| Apple MacBook Pro 16 2021 M1 Pro | |
| Cinebench R20 / CPU (Single Core) | |
| Średnia w klasie Multimedia (425 - 853, n=63, ostatnie 2 lata) | |
| Dell XPS 15 9520 RTX 3050 Ti | |
| Dell XPS 17 9720 | |
| Lenovo ThinkPad X1 Extreme G4-20Y50040GE | |
| Lenovo ThinkPad X1 Extreme G4-20Y5CTO1WW (3050 Ti) | |
| Lenovo ThinkPad Z16 G1 21D5S00T00 | |
| Przeciętny AMD Ryzen 7 PRO 6850H (564 - 583, n=3) | |
| Apple MacBook Pro 16 2021 M1 Pro | |
| Apple MacBook Pro 16 2021 M1 Max | |
| Cinebench R15 / CPU Multi 64Bit | |
| Dell XPS 17 9720 | |
| Dell XPS 17 9720 | |
| Średnia w klasie Multimedia (856 - 5224, n=67, ostatnie 2 lata) | |
| Dell XPS 15 9520 RTX 3050 Ti | |
| Lenovo ThinkPad X1 Extreme G4-20Y50040GE | |
| Lenovo ThinkPad X1 Extreme G4-20Y50040GE | |
| Przeciętny AMD Ryzen 7 PRO 6850H (2081 - 2090, n=2) | |
| Lenovo ThinkPad Z16 G1 21D5S00T00 | |
| Lenovo ThinkPad X1 Extreme G4-20Y5CTO1WW (3050 Ti) | |
| Apple MacBook Pro 16 2021 M1 Max | |
| Apple MacBook Pro 16 2021 M1 Pro | |
| Cinebench R15 / CPU Single 64Bit | |
| Średnia w klasie Multimedia (184.8 - 326, n=65, ostatnie 2 lata) | |
| Dell XPS 17 9720 | |
| Dell XPS 15 9520 RTX 3050 Ti | |
| Lenovo ThinkPad X1 Extreme G4-20Y50040GE | |
| Lenovo ThinkPad Z16 G1 21D5S00T00 | |
| Lenovo ThinkPad X1 Extreme G4-20Y5CTO1WW (3050 Ti) | |
| Apple MacBook Pro 16 2021 M1 Pro | |
| Przeciętny AMD Ryzen 7 PRO 6850H (166.2 - 244, n=2) | |
| Apple MacBook Pro 16 2021 M1 Max | |
| Blender / v2.79 BMW27 CPU | |
| Lenovo ThinkPad X1 Extreme G4-20Y5CTO1WW (3050 Ti) | |
| Średnia w klasie Multimedia (100 - 557, n=64, ostatnie 2 lata) | |
| Przeciętny AMD Ryzen 7 PRO 6850H (235 - 248, n=2) | |
| Dell XPS 17 9720 | |
| Lenovo ThinkPad Z16 G1 21D5S00T00 | |
| Dell XPS 15 9520 RTX 3050 Ti | |
| Apple MacBook Pro 16 2021 M1 Max | |
| Apple MacBook Pro 16 2021 M1 Pro | |
| 7-Zip 18.03 / 7z b 4 | |
| Dell XPS 15 9520 RTX 3050 Ti | |
| Dell XPS 17 9720 | |
| Średnia w klasie Multimedia (29095 - 130368, n=61, ostatnie 2 lata) | |
| Lenovo ThinkPad Z16 G1 21D5S00T00 | |
| Przeciętny AMD Ryzen 7 PRO 6850H (52391 - 56498, n=2) | |
| Lenovo ThinkPad X1 Extreme G4-20Y5CTO1WW (3050 Ti) | |
| 7-Zip 18.03 / 7z b 4 -mmt1 | |
| Średnia w klasie Multimedia (3666 - 7545, n=62, ostatnie 2 lata) | |
| Dell XPS 17 9720 | |
| Dell XPS 15 9520 RTX 3050 Ti | |
| Lenovo ThinkPad X1 Extreme G4-20Y5CTO1WW (3050 Ti) | |
| Przeciętny AMD Ryzen 7 PRO 6850H (5374 - 5460, n=2) | |
| Lenovo ThinkPad Z16 G1 21D5S00T00 | |
| Geekbench 5.5 / Multi-Core | |
| Dell XPS 17 9720 | |
| Średnia w klasie Multimedia (4652 - 20422, n=61, ostatnie 2 lata) | |
| Apple MacBook Pro 16 2021 M1 Max | |
| Apple MacBook Pro 16 2021 M1 Pro | |
| Dell XPS 15 9520 RTX 3050 Ti | |
| Lenovo ThinkPad Z16 G1 21D5S00T00 | |
| Przeciętny AMD Ryzen 7 PRO 6850H (8093 - 8851, n=2) | |
| Lenovo ThinkPad X1 Extreme G4-20Y5CTO1WW (3050 Ti) | |
| Lenovo ThinkPad X1 Extreme G4-20Y50040GE | |
| Geekbench 5.5 / Single-Core | |
| Średnia w klasie Multimedia (805 - 2974, n=61, ostatnie 2 lata) | |
| Apple MacBook Pro 16 2021 M1 Max | |
| Dell XPS 15 9520 RTX 3050 Ti | |
| Apple MacBook Pro 16 2021 M1 Pro | |
| Dell XPS 17 9720 | |
| Lenovo ThinkPad X1 Extreme G4-20Y50040GE | |
| Lenovo ThinkPad X1 Extreme G4-20Y5CTO1WW (3050 Ti) | |
| Lenovo ThinkPad Z16 G1 21D5S00T00 | |
| Przeciętny AMD Ryzen 7 PRO 6850H (1474 - 1481, n=2) | |
| HWBOT x265 Benchmark v2.2 / 4k Preset | |
| Średnia w klasie Multimedia (5.26 - 36.1, n=62, ostatnie 2 lata) | |
| Lenovo ThinkPad Z16 G1 21D5S00T00 | |
| Dell XPS 15 9520 RTX 3050 Ti | |
| Dell XPS 17 9720 | |
| Przeciętny AMD Ryzen 7 PRO 6850H (12.7 - 15.9, n=2) | |
| Lenovo ThinkPad X1 Extreme G4-20Y50040GE | |
| Lenovo ThinkPad X1 Extreme G4-20Y5CTO1WW (3050 Ti) | |
| LibreOffice / 20 Documents To PDF | |
| Przeciętny AMD Ryzen 7 PRO 6850H (50.7 - 95.2, n=2) | |
| Lenovo ThinkPad Z16 G1 21D5S00T00 | |
| Średnia w klasie Multimedia (23.9 - 146.7, n=63, ostatnie 2 lata) | |
| Dell XPS 17 9720 | |
| Lenovo ThinkPad X1 Extreme G4-20Y5CTO1WW (3050 Ti) | |
| Dell XPS 15 9520 RTX 3050 Ti | |
| Lenovo ThinkPad X1 Extreme G4-20Y50040GE | |
| R Benchmark 2.5 / Overall mean | |
| Lenovo ThinkPad X1 Extreme G4-20Y5CTO1WW (3050 Ti) | |
| Lenovo ThinkPad X1 Extreme G4-20Y50040GE | |
| Przeciętny AMD Ryzen 7 PRO 6850H (0.516 - 0.524, n=2) | |
| Lenovo ThinkPad Z16 G1 21D5S00T00 | |
| Średnia w klasie Multimedia (0.3604 - 0.947, n=62, ostatnie 2 lata) | |
| Dell XPS 15 9520 RTX 3050 Ti | |
| Dell XPS 17 9720 | |
* ... im mniej tym lepiej
AIDA64: FP32 Ray-Trace | FPU Julia | CPU SHA3 | CPU Queen | FPU SinJulia | FPU Mandel | CPU AES | CPU ZLib | FP64 Ray-Trace | CPU PhotoWorxx
| Performance rating | |
| Średnia w klasie Multimedia | |
| Przeciętny AMD Ryzen 7 PRO 6850H | |
| Lenovo ThinkPad Z16 G1 21D5S00T00 | |
| Lenovo ThinkPad X1 Extreme G4-20Y50040GE | |
| Lenovo ThinkPad X1 Extreme G4-20Y5CTO1WW (3050 Ti) | |
| Dell XPS 15 9520 RTX 3050 Ti | |
| Dell XPS 17 9720 | |
| AIDA64 / FP32 Ray-Trace | |
| Średnia w klasie Multimedia (2214 - 50388, n=59, ostatnie 2 lata) | |
| Lenovo ThinkPad Z16 G1 21D5S00T00 | |
| Lenovo ThinkPad X1 Extreme G4-20Y50040GE | |
| Przeciętny AMD Ryzen 7 PRO 6850H (15009 - 15301, n=2) | |
| Lenovo ThinkPad X1 Extreme G4-20Y5CTO1WW (3050 Ti) | |
| Dell XPS 15 9520 RTX 3050 Ti | |
| Dell XPS 17 9720 | |
| AIDA64 / FPU Julia | |
| Lenovo ThinkPad Z16 G1 21D5S00T00 | |
| Przeciętny AMD Ryzen 7 PRO 6850H (93021 - 94997, n=2) | |
| Średnia w klasie Multimedia (12867 - 201874, n=60, ostatnie 2 lata) | |
| Lenovo ThinkPad X1 Extreme G4-20Y50040GE | |
| Lenovo ThinkPad X1 Extreme G4-20Y5CTO1WW (3050 Ti) | |
| Dell XPS 15 9520 RTX 3050 Ti | |
| Dell XPS 17 9720 | |
| AIDA64 / CPU SHA3 | |
| Lenovo ThinkPad X1 Extreme G4-20Y50040GE | |
| Lenovo ThinkPad X1 Extreme G4-20Y5CTO1WW (3050 Ti) | |
| Średnia w klasie Multimedia (653 - 8623, n=60, ostatnie 2 lata) | |
| Lenovo ThinkPad Z16 G1 21D5S00T00 | |
| Przeciętny AMD Ryzen 7 PRO 6850H (3155 - 3169, n=2) | |
| Dell XPS 15 9520 RTX 3050 Ti | |
| Dell XPS 17 9720 | |
| AIDA64 / CPU Queen | |
| Lenovo ThinkPad Z16 G1 21D5S00T00 | |
| Przeciętny AMD Ryzen 7 PRO 6850H (100724 - 102905, n=2) | |
| Dell XPS 17 9720 | |
| Dell XPS 15 9520 RTX 3050 Ti | |
| Lenovo ThinkPad X1 Extreme G4-20Y50040GE | |
| Lenovo ThinkPad X1 Extreme G4-20Y5CTO1WW (3050 Ti) | |
| Średnia w klasie Multimedia (13483 - 181505, n=48, ostatnie 2 lata) | |
| AIDA64 / FPU SinJulia | |
| Lenovo ThinkPad Z16 G1 21D5S00T00 | |
| Przeciętny AMD Ryzen 7 PRO 6850H (12309 - 12638, n=2) | |
| Lenovo ThinkPad X1 Extreme G4-20Y50040GE | |
| Lenovo ThinkPad X1 Extreme G4-20Y5CTO1WW (3050 Ti) | |
| Średnia w klasie Multimedia (1240 - 28794, n=60, ostatnie 2 lata) | |
| Dell XPS 15 9520 RTX 3050 Ti | |
| Dell XPS 17 9720 | |
| AIDA64 / FPU Mandel | |
| Lenovo ThinkPad Z16 G1 21D5S00T00 | |
| Przeciętny AMD Ryzen 7 PRO 6850H (51299 - 51802, n=2) | |
| Średnia w klasie Multimedia (6395 - 105740, n=59, ostatnie 2 lata) | |
| Lenovo ThinkPad X1 Extreme G4-20Y50040GE | |
| Lenovo ThinkPad X1 Extreme G4-20Y5CTO1WW (3050 Ti) | |
| Dell XPS 15 9520 RTX 3050 Ti | |
| Dell XPS 17 9720 | |
| AIDA64 / CPU AES | |
| Lenovo ThinkPad X1 Extreme G4-20Y50040GE | |
| Lenovo ThinkPad X1 Extreme G4-20Y5CTO1WW (3050 Ti) | |
| Przeciętny AMD Ryzen 7 PRO 6850H (60476 - 128243, n=2) | |
| Dell XPS 15 9520 RTX 3050 Ti | |
| Dell XPS 17 9720 | |
| Średnia w klasie Multimedia (13243 - 126790, n=60, ostatnie 2 lata) | |
| Lenovo ThinkPad Z16 G1 21D5S00T00 | |
| AIDA64 / CPU ZLib | |
| Średnia w klasie Multimedia (167.2 - 2022, n=60, ostatnie 2 lata) | |
| Dell XPS 17 9720 | |
| Dell XPS 15 9520 RTX 3050 Ti | |
| Lenovo ThinkPad X1 Extreme G4-20Y50040GE | |
| Przeciętny AMD Ryzen 7 PRO 6850H (806 - 809, n=2) | |
| Lenovo ThinkPad Z16 G1 21D5S00T00 | |
| Lenovo ThinkPad X1 Extreme G4-20Y5CTO1WW (3050 Ti) | |
| AIDA64 / FP64 Ray-Trace | |
| Średnia w klasie Multimedia (1014 - 26875, n=60, ostatnie 2 lata) | |
| Lenovo ThinkPad X1 Extreme G4-20Y50040GE | |
| Lenovo ThinkPad Z16 G1 21D5S00T00 | |
| Przeciętny AMD Ryzen 7 PRO 6850H (7876 - 8104, n=2) | |
| Lenovo ThinkPad X1 Extreme G4-20Y5CTO1WW (3050 Ti) | |
| Dell XPS 15 9520 RTX 3050 Ti | |
| Dell XPS 17 9720 | |
| AIDA64 / CPU PhotoWorxx | |
| Średnia w klasie Multimedia (12860 - 88154, n=60, ostatnie 2 lata) | |
| Dell XPS 17 9720 | |
| Dell XPS 15 9520 RTX 3050 Ti | |
| Lenovo ThinkPad Z16 G1 21D5S00T00 | |
| Przeciętny AMD Ryzen 7 PRO 6850H (18157 - 26176, n=2) | |
| Lenovo ThinkPad X1 Extreme G4-20Y5CTO1WW (3050 Ti) | |
| Lenovo ThinkPad X1 Extreme G4-20Y50040GE | |
Wydajność systemu
W PCMarku 10 Lenovo ThinkPad Z16 G1 plasuje się w środku pola, ale w Crossmarku bardziej w dolnej części pola porównawczego. W codziennej eksploatacji Lenovo ThinkPad Z16 G1 działa absolutnie płynnie i szybko.
CrossMark: Overall | Productivity | Creativity | Responsiveness
| PCMark 10 / Score | |
| Średnia w klasie Multimedia (4325 - 10386, n=57, ostatnie 2 lata) | |
| Dell XPS 15 9520 RTX 3050 Ti | |
| Lenovo ThinkPad X1 Extreme G4-20Y50040GE | |
| Dell XPS 17 9720 | |
| Lenovo ThinkPad Z16 G1 21D5S00T00 | |
| Przeciętny AMD Ryzen 7 PRO 6850H, AMD Radeon RX 6500M (n=1) | |
| Lenovo ThinkPad X1 Extreme G4-20Y5CTO1WW (3050 Ti) | |
| PCMark 10 / Essentials | |
| Dell XPS 15 9520 RTX 3050 Ti | |
| Lenovo ThinkPad X1 Extreme G4-20Y5CTO1WW (3050 Ti) | |
| Średnia w klasie Multimedia (8025 - 11664, n=56, ostatnie 2 lata) | |
| Lenovo ThinkPad X1 Extreme G4-20Y50040GE | |
| Dell XPS 17 9720 | |
| Lenovo ThinkPad Z16 G1 21D5S00T00 | |
| Przeciętny AMD Ryzen 7 PRO 6850H, AMD Radeon RX 6500M (n=1) | |
| PCMark 10 / Productivity | |
| Średnia w klasie Multimedia (7323 - 18233, n=56, ostatnie 2 lata) | |
| Dell XPS 15 9520 RTX 3050 Ti | |
| Dell XPS 17 9720 | |
| Lenovo ThinkPad X1 Extreme G4-20Y50040GE | |
| Lenovo ThinkPad X1 Extreme G4-20Y5CTO1WW (3050 Ti) | |
| Lenovo ThinkPad Z16 G1 21D5S00T00 | |
| Przeciętny AMD Ryzen 7 PRO 6850H, AMD Radeon RX 6500M (n=1) | |
| PCMark 10 / Digital Content Creation | |
| Średnia w klasie Multimedia (3651 - 16240, n=56, ostatnie 2 lata) | |
| Lenovo ThinkPad X1 Extreme G4-20Y50040GE | |
| Dell XPS 17 9720 | |
| Dell XPS 15 9520 RTX 3050 Ti | |
| Lenovo ThinkPad Z16 G1 21D5S00T00 | |
| Przeciętny AMD Ryzen 7 PRO 6850H, AMD Radeon RX 6500M (n=1) | |
| Lenovo ThinkPad X1 Extreme G4-20Y5CTO1WW (3050 Ti) | |
| CrossMark / Overall | |
| Dell XPS 15 9520 RTX 3050 Ti | |
| Średnia w klasie Multimedia (866 - 2728, n=66, ostatnie 2 lata) | |
| Dell XPS 17 9720 | |
| Lenovo ThinkPad X1 Extreme G4-20Y50040GE | |
| Apple MacBook Pro 16 2021 M1 Max | |
| Apple MacBook Pro 16 2021 M1 Pro | |
| Lenovo ThinkPad Z16 G1 21D5S00T00 | |
| Przeciętny AMD Ryzen 7 PRO 6850H, AMD Radeon RX 6500M (n=1) | |
| CrossMark / Productivity | |
| Dell XPS 15 9520 RTX 3050 Ti | |
| Średnia w klasie Multimedia (931 - 2489, n=66, ostatnie 2 lata) | |
| Dell XPS 17 9720 | |
| Lenovo ThinkPad X1 Extreme G4-20Y50040GE | |
| Lenovo ThinkPad Z16 G1 21D5S00T00 | |
| Przeciętny AMD Ryzen 7 PRO 6850H, AMD Radeon RX 6500M (n=1) | |
| Apple MacBook Pro 16 2021 M1 Max | |
| Apple MacBook Pro 16 2021 M1 Pro | |
| CrossMark / Creativity | |
| Średnia w klasie Multimedia (907 - 3465, n=66, ostatnie 2 lata) | |
| Apple MacBook Pro 16 2021 M1 Max | |
| Dell XPS 17 9720 | |
| Apple MacBook Pro 16 2021 M1 Pro | |
| Dell XPS 15 9520 RTX 3050 Ti | |
| Lenovo ThinkPad X1 Extreme G4-20Y50040GE | |
| Lenovo ThinkPad Z16 G1 21D5S00T00 | |
| Przeciętny AMD Ryzen 7 PRO 6850H, AMD Radeon RX 6500M (n=1) | |
| CrossMark / Responsiveness | |
| Dell XPS 15 9520 RTX 3050 Ti | |
| Dell XPS 17 9720 | |
| Lenovo ThinkPad X1 Extreme G4-20Y50040GE | |
| Średnia w klasie Multimedia (605 - 2024, n=66, ostatnie 2 lata) | |
| Lenovo ThinkPad Z16 G1 21D5S00T00 | |
| Przeciętny AMD Ryzen 7 PRO 6850H, AMD Radeon RX 6500M (n=1) | |
| Apple MacBook Pro 16 2021 M1 Max | |
| Apple MacBook Pro 16 2021 M1 Pro | |
| PCMark 10 Score | 6530 pkt. | |
Pomoc | ||
| AIDA64 / Memory Copy | |
| Średnia w klasie Multimedia (21158 - 132135, n=60, ostatnie 2 lata) | |
| Dell XPS 17 9720 | |
| Dell XPS 15 9520 RTX 3050 Ti | |
| Lenovo ThinkPad Z16 G1 21D5S00T00 | |
| Przeciętny AMD Ryzen 7 PRO 6850H (30324 - 48504, n=2) | |
| Lenovo ThinkPad X1 Extreme G4-20Y5CTO1WW (3050 Ti) | |
| Lenovo ThinkPad X1 Extreme G4-20Y50040GE | |
| AIDA64 / Memory Read | |
| Średnia w klasie Multimedia (19699 - 174586, n=60, ostatnie 2 lata) | |
| Dell XPS 17 9720 | |
| Dell XPS 15 9520 RTX 3050 Ti | |
| Lenovo ThinkPad Z16 G1 21D5S00T00 | |
| Lenovo ThinkPad X1 Extreme G4-20Y5CTO1WW (3050 Ti) | |
| Przeciętny AMD Ryzen 7 PRO 6850H (33791 - 42736, n=2) | |
| Lenovo ThinkPad X1 Extreme G4-20Y50040GE | |
| AIDA64 / Memory Write | |
| Średnia w klasie Multimedia (17733 - 134998, n=60, ostatnie 2 lata) | |
| Dell XPS 17 9720 | |
| Dell XPS 15 9520 RTX 3050 Ti | |
| Lenovo ThinkPad Z16 G1 21D5S00T00 | |
| Przeciętny AMD Ryzen 7 PRO 6850H (32728 - 51157, n=2) | |
| Lenovo ThinkPad X1 Extreme G4-20Y5CTO1WW (3050 Ti) | |
| Lenovo ThinkPad X1 Extreme G4-20Y50040GE | |
| AIDA64 / Memory Latency | |
| Lenovo ThinkPad Z16 G1 21D5S00T00 | |
| Średnia w klasie Multimedia (7 - 535, n=59, ostatnie 2 lata) | |
| Przeciętny AMD Ryzen 7 PRO 6850H (93.5 - 132.1, n=2) | |
| Dell XPS 15 9520 RTX 3050 Ti | |
| Dell XPS 17 9720 | |
| Lenovo ThinkPad X1 Extreme G4-20Y50040GE | |
| Lenovo ThinkPad X1 Extreme G4-20Y5CTO1WW (3050 Ti) | |
* ... im mniej tym lepiej
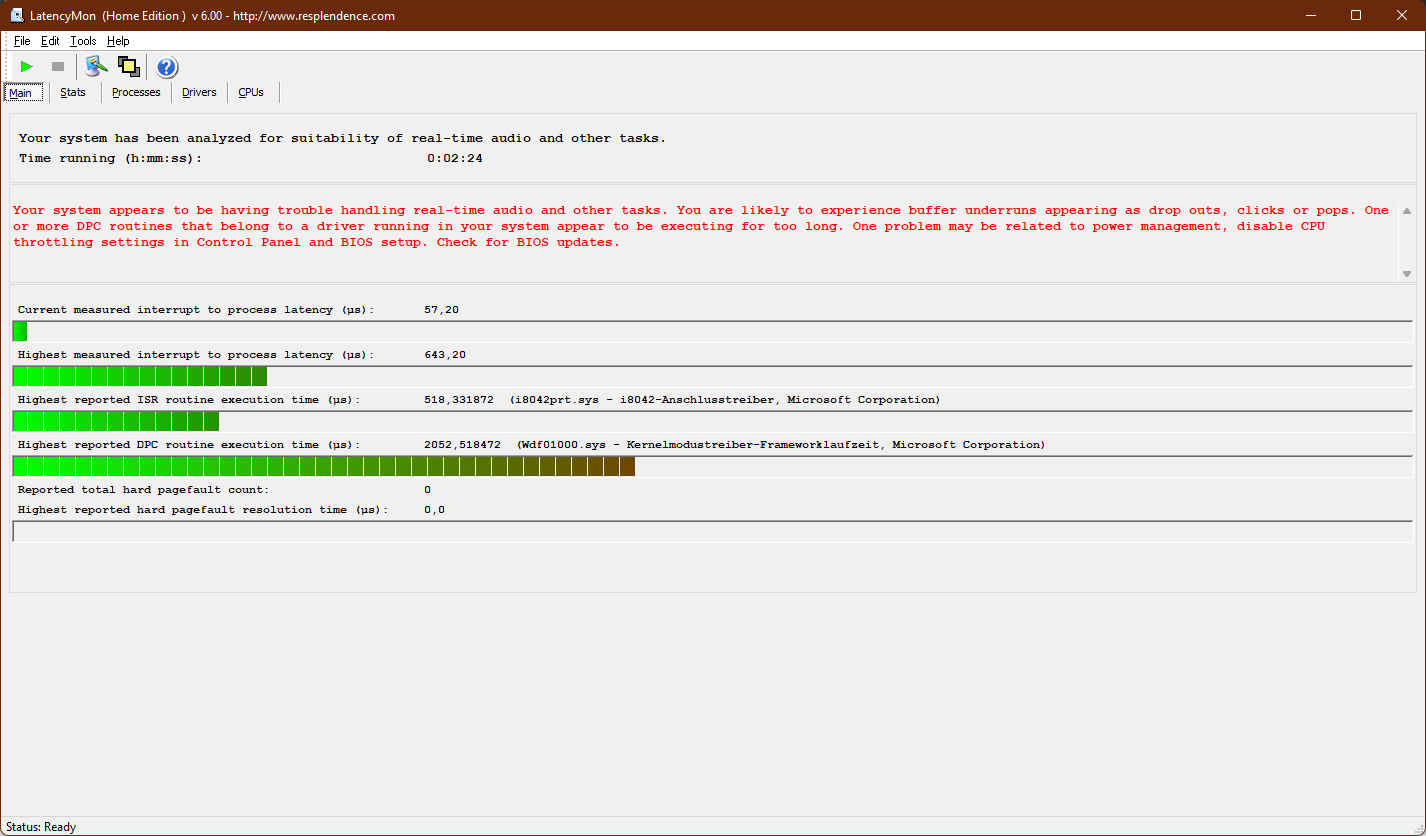
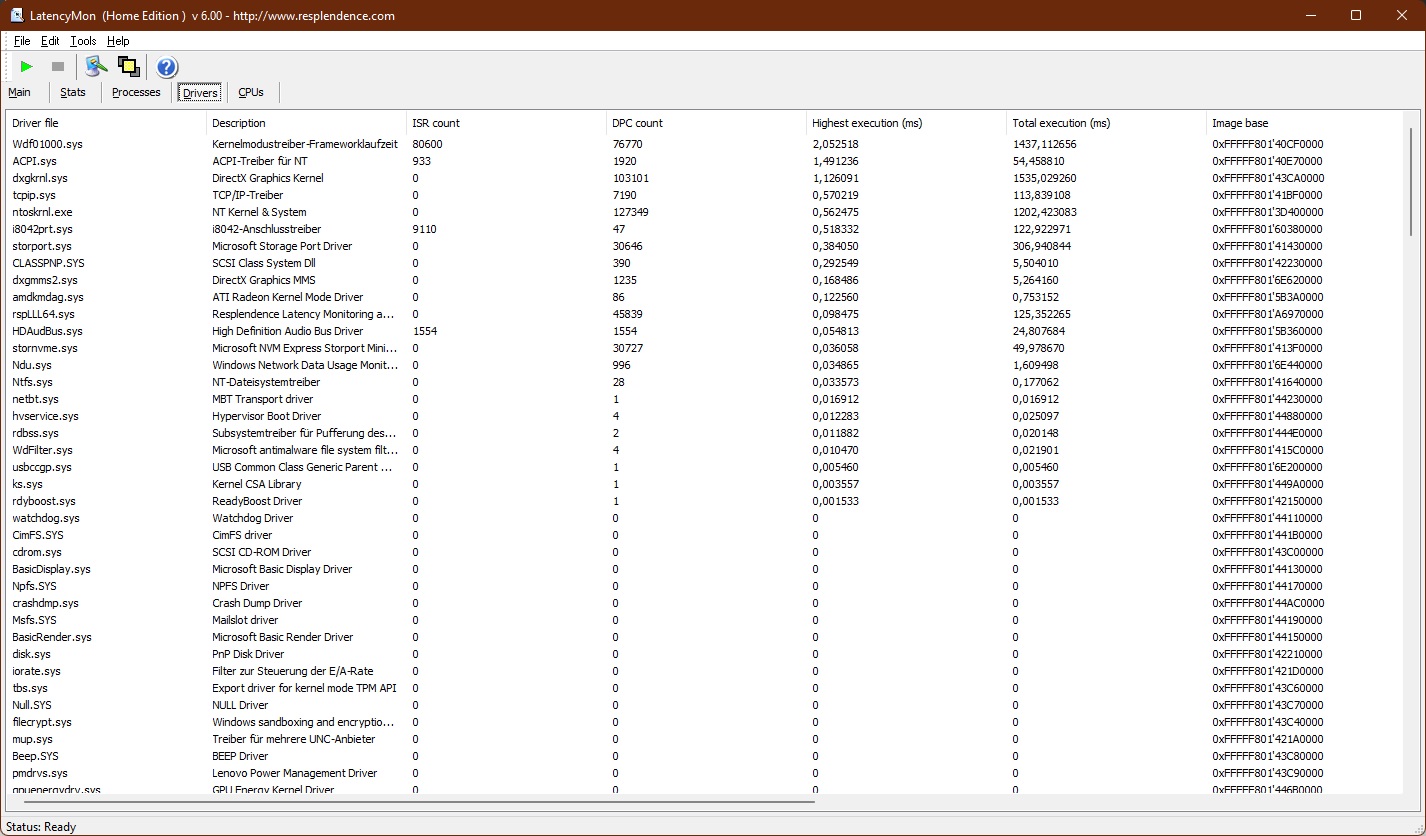
Opóźnienia DPC
Nasz testowy egzemplarz Lenovo ThinkPad Z16 G1 ma problemy z opóźnieniami DPC, które mogą prowadzić do spadków podczas przetwarzania dźwięku i obrazu. Problemy te można rozwiązać za pomocą aktualizacji sterowników lub firmware'u i mogą się one różnić w zależności od jednostki.
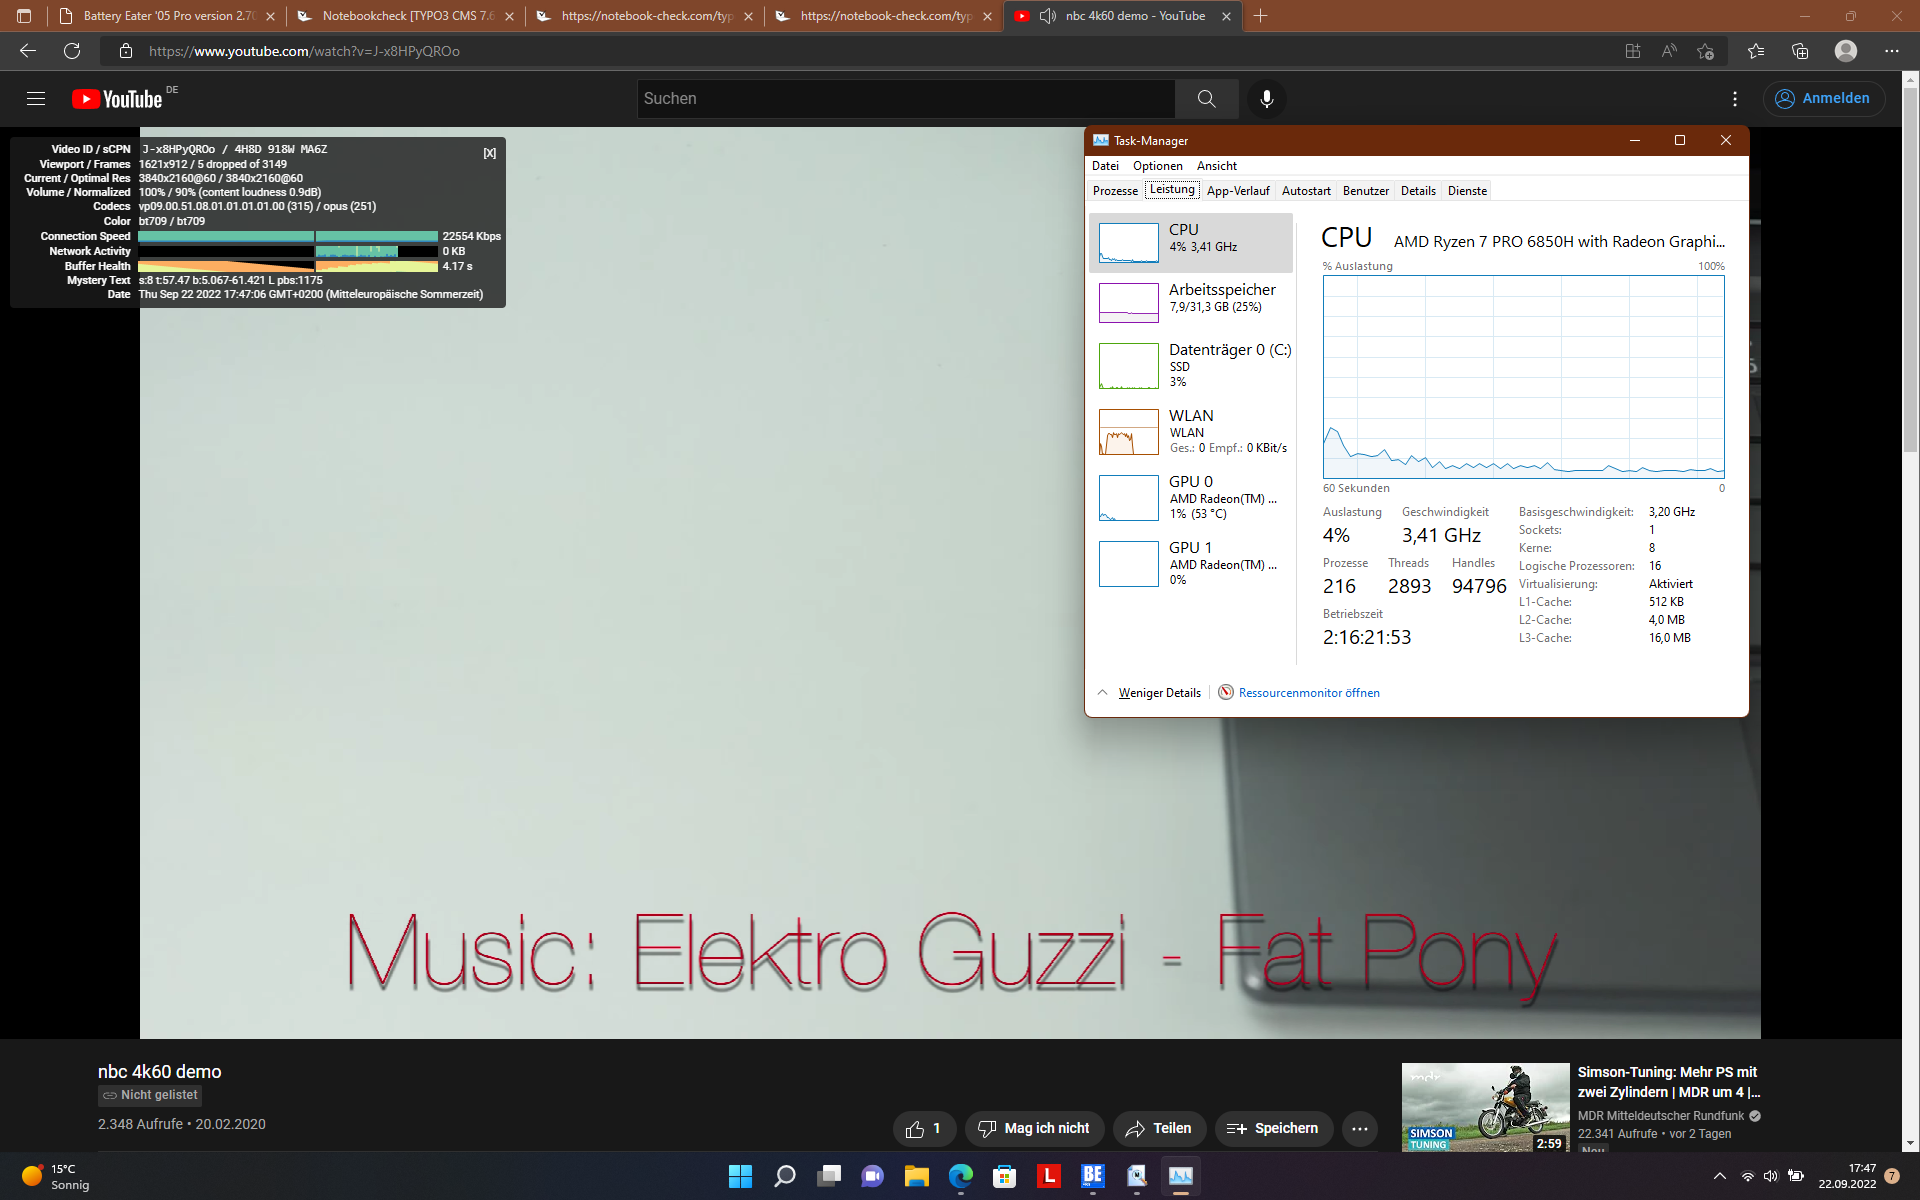
Prawie nie ma spadków w teście YouTube, w którym obciążenia CPU i GPU również pozostają wyjątkowo niskie.
| DPC Latencies / LatencyMon - interrupt to process latency (max), Web, Youtube, Prime95 | |
| Lenovo ThinkPad X1 Extreme G4-20Y50040GE | |
| Dell XPS 17 9720 | |
| Lenovo ThinkPad X1 Extreme G4-20Y5CTO1WW (3050 Ti) | |
| Dell XPS 15 9520 RTX 3050 Ti | |
| Lenovo ThinkPad Z16 G1 21D5S00T00 | |
* ... im mniej tym lepiej
Rozwiązanie w zakresie przechowywania
Dysk SSD Samsung PM9A1 w Lenovo ThinkPad Z16 Gen 1 oferuje pojemność pamięci masowej na poziomie 1 terrabajta. Jest to dysk SSD M.2-2280, który jest połączony z najnowszym standardem NVMe PCIe-4.0. Wyniki w naszym teście porównawczym malują mieszany obraz: Patrząc na prędkość bezwzględną, jest to bardzo szybki dysk SSD, ale wszystkie inne laptopy w naszym porównaniu są szybsze, nawet jeśli różnica nie jest bardzo duża. Ponadto różna jest też wydajność pod stałym obciążeniem.

| Drive Performance rating - Percent | |
| Przeciętny Samsung PM9A1 MZVL21T0HCLR | |
| Lenovo ThinkPad X1 Extreme G4-20Y5CTO1WW (3050 Ti) | |
| Dell XPS 15 9520 RTX 3050 Ti | |
| Dell XPS 17 9720 | |
| Lenovo ThinkPad Z16 G1 21D5S00T00 | |
| Średnia w klasie Multimedia | |
* ... im mniej tym lepiej
Constant Performance Reading: DiskSpd Read Loop, Queue Depth 8
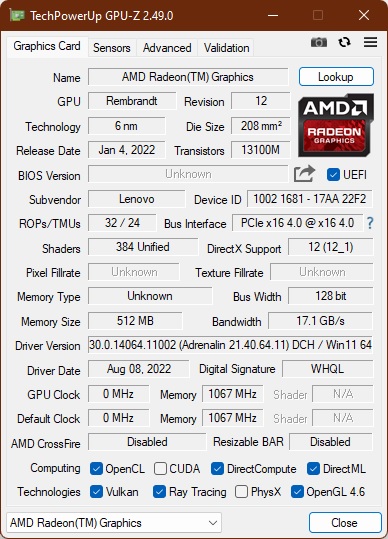
Karta graficzna
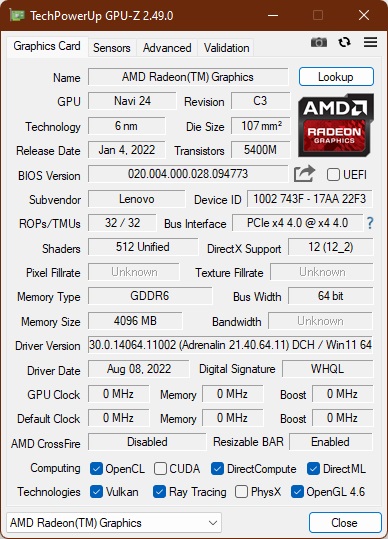
Ostatni raz Lenovo zastosowało w ThinkPadzie dedykowany układ graficzny od AMD (wówczas w ThinkPad T500który wciąż używał marki ATi), iPhone miał zaledwie rok. Oczywiście Lenovo nie wybrało bardzo mocnego układu graficznego z AMD Radeon RX 6500M. Typowy pobór mocy tego układu klasy podstawowej wynosi 50 watów, choć w ThinkPadzie Z16 potrafi on pobierać 55 watów.
Dzięki temu ThinkPad Z16 G1 osiąga wyniki w tym samym zakresie, co podstawowe modele m.in ThinkPad X1 ExtremezNvidia GeForce RTX 3050 Tii Dell XPS 15z tym samym GPU. Dotyczy to również samej wydajności graficznej, a w benchmarkach graficznych 3DMark Time Spy i Fire Strike RX 6500M plasuje się na tym samym poziomie co RTX 3050 Ti.
Podczas pracy na akumulatorze wydajność grafiki okazuje się nieco niższa, o około 23% w 3DMarku Time Spy (3429 pkt.).
| 3DMark Performance rating - Percent | |
| Lenovo ThinkPad X1 Extreme G4-20Y50040GE -1! | |
| Lenovo ThinkPad Z16 G1 21D5S00T00 | |
| Przeciętny AMD Radeon RX 6500M | |
| Średnia w klasie Multimedia | |
| Dell XPS 17 9720 | |
| Lenovo ThinkPad X1 Extreme G4-20Y5CTO1WW (3050 Ti) -1! | |
| Dell XPS 15 9520 RTX 3050 Ti | |
| Lenovo ThinkPad Z13 21D2CTO1WW | |
| 3DMark 11 - 1280x720 Performance GPU | |
| Lenovo ThinkPad X1 Extreme G4-20Y50040GE | |
| Średnia w klasie Multimedia (3765 - 60002, n=61, ostatnie 2 lata) | |
| Przeciętny AMD Radeon RX 6500M (16290 - 19488, n=2) | |
| Lenovo ThinkPad X1 Extreme G4-20Y5CTO1WW (3050 Ti) | |
| Dell XPS 17 9720 | |
| Lenovo ThinkPad Z16 G1 21D5S00T00 | |
| Dell XPS 15 9520 RTX 3050 Ti | |
| Lenovo ThinkPad Z13 21D2CTO1WW | |
| 3DMark | |
| 1280x720 Cloud Gate Standard Graphics | |
| Lenovo ThinkPad Z16 G1 21D5S00T00 | |
| Przeciętny AMD Radeon RX 6500M (84648 - 92553, n=2) | |
| Dell XPS 15 9520 RTX 3050 Ti | |
| Dell XPS 17 9720 | |
| Średnia w klasie Multimedia (16765 - 143501, n=34, ostatnie 2 lata) | |
| Lenovo ThinkPad Z13 21D2CTO1WW | |
| 1920x1080 Fire Strike Graphics | |
| Lenovo ThinkPad X1 Extreme G4-20Y50040GE | |
| Średnia w klasie Multimedia (2328 - 48907, n=65, ostatnie 2 lata) | |
| Przeciętny AMD Radeon RX 6500M (13980 - 14055, n=2) | |
| Lenovo ThinkPad Z16 G1 21D5S00T00 | |
| Lenovo ThinkPad X1 Extreme G4-20Y5CTO1WW (3050 Ti) | |
| Dell XPS 17 9720 | |
| Dell XPS 15 9520 RTX 3050 Ti | |
| Lenovo ThinkPad Z13 21D2CTO1WW | |
| 2560x1440 Time Spy Graphics | |
| Lenovo ThinkPad X1 Extreme G4-20Y50040GE | |
| Średnia w klasie Multimedia (696 - 19403, n=66, ostatnie 2 lata) | |
| Lenovo ThinkPad X1 Extreme G4-20Y5CTO1WW (3050 Ti) | |
| Dell XPS 17 9720 | |
| Dell XPS 15 9520 RTX 3050 Ti | |
| Lenovo ThinkPad Z16 G1 21D5S00T00 | |
| Przeciętny AMD Radeon RX 6500M (4310 - 4434, n=2) | |
| Lenovo ThinkPad Z13 21D2CTO1WW | |
| 3DMark 06 Standard Score | 35958 pkt. | |
| 3DMark Vantage P Result | 51599 pkt. | |
| 3DMark 11 Performance | 17548 pkt. | |
| 3DMark Ice Storm Standard Score | 116884 pkt. | |
| 3DMark Cloud Gate Standard Score | 92553 pkt. | |
| 3DMark Fire Strike Score | 12287 pkt. | |
| 3DMark Time Spy Score | 4795 pkt. | |
Pomoc | ||
W naszych raportach z testów test Blendera 3.3 jest stosunkowo nowy. W benchmarku Classroom w trybie HIP ThinkPad Z16 z Radeon RX 6500Mosiąga podobne wyniki, jak np Dell Inspiron 14 Plus 7420zRTX 3050 w trybie CUDA. Na stronie RTX 3050 Ti wDell Inspiron 16 Plus 7620osiąga w tym teście wyniki o około 30% lepsze. W każdym razie czas renderowania jest znacznie krótszy w porównaniu z trybem CPU.
| Blender | |
| v3.3 Classroom HIP/AMD | |
| Lenovo ThinkPad Z13 21D2CTO1WW | |
| Lenovo ThinkPad Z16 G1 21D5S00T00 | |
| v3.3 Classroom OPTIX/RTX | |
| Dell Inspiron 14 Plus 7420 | |
| Dell Inspiron 16 Plus 7620 | |
| Średnia w klasie Multimedia (12 - 105, n=24, ostatnie 2 lata) | |
| v3.3 Classroom CUDA | |
| Dell Inspiron 14 Plus 7420 | |
| Dell Inspiron 16 Plus 7620 | |
| Średnia w klasie Multimedia (20 - 186, n=24, ostatnie 2 lata) | |
| v3.3 Classroom CPU | |
| Lenovo ThinkPad Z13 21D2CTO1WW | |
| Lenovo ThinkPad Z16 G1 21D5S00T00 | |
| Dell Inspiron 14 Plus 7420 | |
| Dell Inspiron 16 Plus 7620 | |
| Średnia w klasie Multimedia (134.5 - 1042, n=67, ostatnie 2 lata) | |
* ... im mniej tym lepiej
Wydajność w grach
Podobnie jak w benchmarkach syntetycznych, wydajność w grach jest mniej więcej na poziomie m.in Dell XPS 15 9520z RTX 3050 Ti, przy czym X1 Extreme, który posiada ten sam układ Nvidii, ma tendencję do okazywania się w grach nieco lepszym. Nawet nowsze gry można odtworzyć w wysokich lub najwyższych ustawieniach detali, ale tylko w rozdzielczości Full-HD. Wydajność AMD Radeon według wszelkiego prawdopodobieństwa nie będzie wystarczająca do gier w 4K.
Należy zauważyć, że wydajność GPU cierpi z powodu dławienia. W naszej pętli The Witcher 3 liczba FPS spada z początkowych 45 do zaledwie 35 FPS.
| The Witcher 3 - 1920x1080 High Graphics & Postprocessing (Nvidia HairWorks Off) | |
| Lenovo ThinkPad X1 Extreme G4-20Y50040GE | |
| Dell XPS 17 9720 | |
| Lenovo ThinkPad X1 Extreme G4-20Y5CTO1WW (3050 Ti) | |
| Średnia w klasie Multimedia (22 - 224, n=13, ostatnie 2 lata) | |
| Dell XPS 15 9520 RTX 3050 Ti | |
| Lenovo ThinkPad Z16 G1 21D5S00T00 | |
| Przeciętny AMD Radeon RX 6500M (n=1) | |
| F1 2021 - 1920x1080 Ultra High Preset + Raytracing AA:T AF:16x | |
| Dell XPS 17 9720 | |
| Lenovo ThinkPad Z16 G1 21D5S00T00 | |
| Przeciętny AMD Radeon RX 6500M (n=1) | |
| GTA V - 1920x1080 High/On (Advanced Graphics Off) AA:2xMSAA + FX AF:8x | |
| Dell XPS 17 9720 | |
| Lenovo ThinkPad X1 Extreme G4-20Y5CTO1WW (3050 Ti) | |
| Lenovo ThinkPad Z16 G1 21D5S00T00 | |
| Przeciętny AMD Radeon RX 6500M (90 - 96.6, n=2) | |
| Dell XPS 15 9520 RTX 3050 Ti | |
| Średnia w klasie Multimedia (19.5 - 186.1, n=55, ostatnie 2 lata) | |
| Strange Brigade - 1920x1080 ultra AA:ultra AF:16 | |
| Średnia w klasie Multimedia (13.3 - 303, n=65, ostatnie 2 lata) | |
| Dell XPS 17 9720 | |
| Lenovo ThinkPad X1 Extreme G4-20Y5CTO1WW (3050 Ti) | |
| Lenovo ThinkPad Z16 G1 21D5S00T00 | |
| Przeciętny AMD Radeon RX 6500M (80.5 - 86.3, n=2) | |
| Dell XPS 15 9520 RTX 3050 Ti | |
The Witcher 3 FPS Chart
| low | med. | high | ultra | |
|---|---|---|---|---|
| GTA V (2015) | 154.7 | 144.8 | 96.6 | 41.8 |
| The Witcher 3 (2015) | 195 | 136.2 | 57.4 | 39.1 |
| Dota 2 Reborn (2015) | 121.5 | 106.1 | 102.2 | 94.8 |
| Final Fantasy XV Benchmark (2018) | 126.6 | 65.8 | 46.9 | |
| X-Plane 11.11 (2018) | 47.7 | 40.7 | 36.8 | |
| Far Cry 5 (2018) | 90 | 75 | 71 | 66 |
| Strange Brigade (2018) | 266 | 119.1 | 98.8 | 86.3 |
| Metro Exodus (2019) | 137.4 | 66.7 | 46.7 | 37 |
| The Division 2 (2019) | 129 | 82 | 67 | 47 |
| Borderlands 3 (2019) | 78.2 | 66.6 | 47.1 | 34.5 |
| Hunt Showdown (2020) | 124.8 | 68.9 | 57.3 | |
| Doom Eternal (2020) | 232 | 101.2 | 57.5 | |
| Gears Tactics (2020) | 257.8 | 125.2 | 82.4 | 56.6 |
| Death Stranding (2020) | 130.4 | 89.3 | 82.2 | 78.9 |
| Horizon Zero Dawn (2020) | 103 | 71 | 59 | 54 |
| Crysis Remastered (2020) | 185.6 | 88.7 | 26.3 | 19.6 |
| Mafia Definitive Edition (2020) | 91.4 | 53 | 48.7 | |
| Star Wars Squadrons (2020) | 267 | 150.5 | 131.7 | 119.6 |
| Watch Dogs Legion (2020) | 81.1 | 70 | 59.1 | 24.6 |
| Dirt 5 (2020) | 159.4 | 72.9 | 56.3 | 37.4 |
| Assassin´s Creed Valhalla (2020) | 113 | 62 | 45 | 39 |
| Yakuza Like a Dragon (2020) | 80.3 | 60.6 | 58.4 | 54.5 |
| Immortals Fenyx Rising (2020) | 89 | 68 | 47 | 41 |
| Hitman 3 (2021) | 157.2 | 102.1 | 88.7 | 80.5 |
| Mass Effect Legendary Edition (2021) | 82.2 | 75.6 | ||
| Days Gone (2021) | 116.3 | 70.6 | 62.7 | 44.2 |
| F1 2021 (2021) | 245 | 139 | 105.1 | 42.9 |
| New World (2021) | 70.3 | 53 | 46.2 | 40.4 |
| Far Cry 6 (2021) | 91.7 | 69.8 | 62.5 | 54.5 |
| Back 4 Blood (2021) | 116 | 95.3 | 92.7 | |
| Guardians of the Galaxy (2021) | 83 | 48 | 47 | 44 |
| Riders Republic (2021) | 71 | 68 | 58 | 43 |
| Forza Horizon 5 (2021) | 152 | 101 | 81 | 27 |
| Battlefield 2042 (2021) | 129.7 | 71.2 | 53.3 | 23.3 |
| Farming Simulator 22 (2021) | 96.6 | 86 | ||
| Halo Infinite (2021) | 62.4 | 43.6 | 42.4 | |
| God of War (2022) | 64.5 | 54.1 | 39.6 | 11.9 |
| Rainbow Six Extraction (2022) | 96 | 69 | 61 | 34 |
| Dying Light 2 (2022) | 58.4 | 46.6 | 37 | |
| GRID Legends (2022) | 146.9 | 105 | 75.9 | 59.9 |
| Cyberpunk 2077 1.6 (2022) | 66.2 | 66.5 | 32.3 | 29.2 |
| Elex 2 (2022) | 53.4 | 51 | 44 | 37.6 |
| Ghostwire Tokyo (2022) | 72.7 | 71 | 65.5 | 66.3 |
| Tiny Tina's Wonderlands (2022) | 118.1 | 88.5 | 45.8 | 29.8 |
| Vampire Bloodhunt (2022) | 142.7 | 115 | 106.7 | 98.1 |
| F1 22 (2022) | 116.3 | 97.2 | 75.6 | 13.9 |
| The Quarry (2022) | 64.1 | 48.3 | 38.9 | 25.4 |
Emisje: Wentylator pozostaje cichy, ale ThinkPad Z16 działa na gorąco
Emisja hałasu
Pod małym obciążeniem wentylator Lenovo ThinkPad Z16 G1 pracuje bardzo cicho, tak że praktycznie nie da się go zauważyć. Nawet MacBook Pro 16 mit M1 jest w tym momencie minimalnie głośniejszy. Zmienia się to pod maksymalnym obciążeniem, gdyż MacBook jest wtedy cichszy, nawet w mocniejszej wersji z M1 Max. ThinkPad Z16 nadal nie jest jednak laptopem głośnym, a maksymalne natężenie hałasu wentylatorów pozostaje znacznie niższe, niż w przypadku m.in Lenovo ThinkPad X1 Extreme G4.
Nie zauważamy w Z16 żadnego wycieku cewek.
Hałas
| luz |
| 23.7 / 23.7 / 23.7 dB |
| obciążenie |
| 25.9 / 46.9 dB |
 | ||
30 dB cichy 40 dB(A) słyszalny 50 dB(A) irytujący |
||
min: | ||
| Lenovo ThinkPad Z16 G1 21D5S00T00 Radeon RX 6500M, R7 PRO 6850H, Samsung PM9A1 MZVL21T0HCLR | Lenovo ThinkPad X1 Extreme G4-20Y5CTO1WW (3050 Ti) GeForce RTX 3050 Ti Laptop GPU, i7-11800H, Samsung PM9A1 MZVL21T0HCLR | Lenovo ThinkPad X1 Extreme G4-20Y50040GE GeForce RTX 3080 Laptop GPU, i9-11950H, Kioxia XG7 KXG7AZNV1T02 | Dell XPS 15 9520 RTX 3050 Ti GeForce RTX 3050 Ti Laptop GPU, i7-12700H, WDC PC SN810 512GB | Dell XPS 17 9720 GeForce RTX 3050 4GB Laptop GPU, i7-12700H, Micron 3400 MTFDKBA512TFH 512GB | Apple MacBook Pro 16 2021 M1 Pro M1 Pro 16-Core GPU, M1 Pro, Apple SSD AP1024R | Apple MacBook Pro 16 2021 M1 Max M1 Max 32-Core GPU, M1 Max, Apple SSD AP2048R | |
|---|---|---|---|---|---|---|---|
| Noise | -12% | -15% | 3% | -11% | 1% | -7% | |
| wyłączone / środowisko * (dB) | 23.7 | 23.52 1% | 24.7 -4% | 22.8 4% | 24 -1% | 24.7 -4% | 24.2 -2% |
| Idle Minimum * (dB) | 23.7 | 23.52 1% | 24.7 -4% | 22.9 3% | 24 -1% | 24.7 -4% | 24.2 -2% |
| Idle Average * (dB) | 23.7 | 23.52 1% | 24.7 -4% | 22.9 3% | 24 -1% | 24.7 -4% | 24.2 -2% |
| Idle Maximum * (dB) | 23.7 | 23.52 1% | 28.1 -19% | 22.9 3% | 24 -1% | 24.7 -4% | 24.2 -2% |
| Load Average * (dB) | 25.9 | 42.9 -66% | 42.5 -64% | 30.9 -19% | 43.9 -69% | 26.1 -1% | 42.9 -66% |
| Witcher 3 ultra * (dB) | 46.9 | 52.5 -12% | 46.4 1% | 37.8 19% | 48.4 -3% | 39.5 16% | |
| Load Maximum * (dB) | 46.9 | 52.45 -12% | 52.1 -11% | 44.7 5% | 48.4 -3% | 37.4 20% | 42.9 9% |
* ... im mniej tym lepiej
Temperatury
Lenovo ThinkPad Z16 Gen 1 pozostaje całkowicie chłodny podczas pracy w stanie spoczynku. Z drugiej strony ThinkPad Z16 działa dość gorąco pod obciążeniem, czy to podczas testu stresu, czy testu Witcher 3. Zmierzyliśmy maksymalną temperaturę nad klawiaturą na poziomie 56,8 ºC (~134 ºF). Choć można łatwo uniknąć dotykania tego obszaru, reszta obudowy również znacznie się nagrzewa. Podkładka pod nadgarstki osiąga maksymalną temperaturę 36,5ºC (~98 ºF), co jest odczuwalne i może prowadzić do spocenia się dłoni
Podczas testu obciążeniowego nasz zastępczy egzemplarz testowy również nie zachowuje stabilności. Zarówno Prime95 jak i FurMark prowadzą do częstych nagłych restartów. Z tego powodu nie możemy zaliczyć godzinnego testu obciążeniowego.
(-) Maksymalna temperatura w górnej części wynosi 56.8 °C / 134 F, w porównaniu do średniej 36.8 °C / 98 F , począwszy od 21 do 71 °C dla klasy Multimedia.
(-) Dno nagrzewa się maksymalnie do 53.3 °C / 128 F, w porównaniu do średniej 39.1 °C / 102 F
(+) W stanie bezczynności średnia temperatura górnej części wynosi 27 °C / 81 F, w porównaniu ze średnią temperaturą urządzenia wynoszącą 31.3 °C / ### class_avg_f### F.
(-) Podczas gry w Wiedźmina 3 średnia temperatura górnej części wynosi 43.8 °C / 111 F, w porównaniu do średniej temperatury urządzenia wynoszącej 31.3 °C / ## #class_avg_f### F.
(±) Podpórki pod nadgarstki i touchpad mogą się bardzo nagrzać w dotyku, maksymalnie do 36.6 °C / 97.9 F.
(-) Średnia temperatura obszaru podparcia dłoni w podobnych urządzeniach wynosiła 28.7 °C / 83.7 F (-7.9 °C / -14.2 F).
| Lenovo ThinkPad Z16 G1 21D5S00T00 AMD Ryzen 7 PRO 6850H, AMD Radeon RX 6500M | Lenovo ThinkPad X1 Extreme G4-20Y5CTO1WW (3050 Ti) Intel Core i7-11800H, NVIDIA GeForce RTX 3050 Ti Laptop GPU | Lenovo ThinkPad X1 Extreme G4-20Y50040GE Intel Core i9-11950H, NVIDIA GeForce RTX 3080 Laptop GPU | Dell XPS 15 9520 RTX 3050 Ti Intel Core i7-12700H, NVIDIA GeForce RTX 3050 Ti Laptop GPU | Dell XPS 17 9720 Intel Core i7-12700H, NVIDIA GeForce RTX 3050 4GB Laptop GPU | Apple MacBook Pro 16 2021 M1 Pro Apple M1 Pro, Apple M1 Pro 16-Core GPU | Apple MacBook Pro 16 2021 M1 Max Apple M1 Max, Apple M1 Max 32-Core GPU | |
|---|---|---|---|---|---|---|---|
| Heat | 4% | 3% | -1% | 12% | 22% | 21% | |
| Maximum Upper Side * (°C) | 56.8 | 49 14% | 51.4 10% | 51.4 10% | 49.5 13% | 41 28% | 42.3 26% |
| Maximum Bottom * (°C) | 53.3 | 44.4 17% | 55.9 -5% | 51 4% | 38.4 28% | 39 27% | 41.7 22% |
| Idle Upper Side * (°C) | 28.2 | 32.1 -14% | 27.2 4% | 30 -6% | 28 1% | 24 15% | 23.9 15% |
| Idle Bottom * (°C) | 29.4 | 29.8 -1% | 28.8 2% | 33 -12% | 27.8 5% | 24 18% | 23.9 19% |
* ... im mniej tym lepiej
Mówca
Po obu stronach klawiatury znajdują się głośniki stereo Lenovo ThinkPad Z16. Są one dość głośne i mają nawet trochę basów, ale i tak przegrywają w porównaniu z tymi z Apple MacBooka Pro 16. MacBook oferuje po prostu więcej basów i głośności.
Lenovo ThinkPad Z16 G1 21D5S00T00 analiza dźwięku
(±) | głośność głośnika jest średnia, ale dobra (75.56 dB)
Bas 100 - 315 Hz
(±) | zredukowany bas - średnio 11.3% niższy od mediany
(±) | liniowość basu jest średnia (13% delta do poprzedniej częstotliwości)
Średnie 400 - 2000 Hz
(+) | zbalansowane środki średnie - tylko 2.6% od mediany
(+) | średnie są liniowe (3.2% delta do poprzedniej częstotliwości)
Wysokie 2–16 kHz
(+) | zrównoważone maksima - tylko 2.6% od mediany
(+) | wzloty są liniowe (5.7% delta do poprzedniej częstotliwości)
Ogólnie 100 - 16.000 Hz
(+) | ogólny dźwięk jest liniowy (12.5% różnicy w stosunku do mediany)
W porównaniu do tej samej klasy
» 24% wszystkich testowanych urządzeń w tej klasie było lepszych, 3% podobnych, 73% gorszych
» Najlepszy miał deltę 5%, średnia wynosiła ###średnia###%, najgorsza wynosiła 45%
W porównaniu do wszystkich testowanych urządzeń
» 11% wszystkich testowanych urządzeń było lepszych, 2% podobnych, 87% gorszych
» Najlepszy miał deltę 4%, średnia wynosiła ###średnia###%, najgorsza wynosiła 134%
Dell XPS 17 9720 analiza dźwięku
(+) | głośniki mogą odtwarzać stosunkowo głośno (83.6 dB)
Bas 100 - 315 Hz
(±) | zredukowany bas - średnio 7.3% niższy od mediany
(±) | liniowość basu jest średnia (11.4% delta do poprzedniej częstotliwości)
Średnie 400 - 2000 Hz
(+) | zbalansowane środki średnie - tylko 3.4% od mediany
(±) | liniowość środka jest średnia (7.6% delta do poprzedniej częstotliwości)
Wysokie 2–16 kHz
(+) | zrównoważone maksima - tylko 3.7% od mediany
(±) | liniowość wysokich wartości jest średnia (7.1% delta do poprzedniej częstotliwości)
Ogólnie 100 - 16.000 Hz
(+) | ogólny dźwięk jest liniowy (8.8% różnicy w stosunku do mediany)
W porównaniu do tej samej klasy
» 11% wszystkich testowanych urządzeń w tej klasie było lepszych, 2% podobnych, 87% gorszych
» Najlepszy miał deltę 5%, średnia wynosiła ###średnia###%, najgorsza wynosiła 45%
W porównaniu do wszystkich testowanych urządzeń
» 3% wszystkich testowanych urządzeń było lepszych, 1% podobnych, 97% gorszych
» Najlepszy miał deltę 4%, średnia wynosiła ###średnia###%, najgorsza wynosiła 134%
Apple MacBook Pro 16 2021 M1 Pro analiza dźwięku
(+) | głośniki mogą odtwarzać stosunkowo głośno (84.7 dB)
Bas 100 - 315 Hz
(+) | dobry bas - tylko 3.8% od mediany
(+) | bas jest liniowy (5.2% delta do poprzedniej częstotliwości)
Średnie 400 - 2000 Hz
(+) | zbalansowane środki średnie - tylko 1.3% od mediany
(+) | średnie są liniowe (2.1% delta do poprzedniej częstotliwości)
Wysokie 2–16 kHz
(+) | zrównoważone maksima - tylko 1.9% od mediany
(+) | wzloty są liniowe (2.7% delta do poprzedniej częstotliwości)
Ogólnie 100 - 16.000 Hz
(+) | ogólny dźwięk jest liniowy (4.6% różnicy w stosunku do mediany)
W porównaniu do tej samej klasy
» 0% wszystkich testowanych urządzeń w tej klasie było lepszych, 0% podobnych, 100% gorszych
» Najlepszy miał deltę 5%, średnia wynosiła ###średnia###%, najgorsza wynosiła 45%
W porównaniu do wszystkich testowanych urządzeń
» 0% wszystkich testowanych urządzeń było lepszych, 0% podobnych, 100% gorszych
» Najlepszy miał deltę 4%, średnia wynosiła ###średnia###%, najgorsza wynosiła 134%
Zarządzanie energią: ThinkPad z dobrym czasem pracy na baterii mimo niewielkiego akumulatora
Pobór mocy
W tej kategorii Lenovo ThinkPad Z16 G1 jest naprawdę najlepszy w swojej klasie i żaden z jego bezpośrednich konkurentów nie działa wydajniej. Jedynie Apple MacBook Pro 16 z M1 Pro jest nieco wydajniejszy pod względem minimalnego zużycia energii w stanie spoczynku. Trzeba tu jednak wspomnieć, że wyświetlacz ThinkPada Z16 Gen 1 ma znacznie niższą rozdzielczość niż te w urządzeniach porównawczych.
135-watowy zasilacz jest akurat wystarczająco duży, by zapewnić maksymalny pobór około 133 W
| wyłączony / stan wstrzymania | |
| luz | |
| obciążenie |
|
Legenda:
min: | |
| Lenovo ThinkPad Z16 G1 21D5S00T00 R7 PRO 6850H, Radeon RX 6500M, Samsung PM9A1 MZVL21T0HCLR, IPS LED, 1920x1200, 16" | Lenovo ThinkPad X1 Extreme G4-20Y5CTO1WW (3050 Ti) i7-11800H, GeForce RTX 3050 Ti Laptop GPU, Samsung PM9A1 MZVL21T0HCLR, IPS LED, 3840x2400, 16" | Lenovo ThinkPad X1 Extreme G4-20Y50040GE i9-11950H, GeForce RTX 3080 Laptop GPU, Kioxia XG7 KXG7AZNV1T02, IPS, 3840x2400, 16" | Dell XPS 15 9520 RTX 3050 Ti i7-12700H, GeForce RTX 3050 Ti Laptop GPU, WDC PC SN810 512GB, OLED, 3456x2160, 15.6" | Dell XPS 17 9720 i7-12700H, GeForce RTX 3050 4GB Laptop GPU, Micron 3400 MTFDKBA512TFH 512GB, IPS, 3840x2400, 17" | Apple MacBook Pro 16 2021 M1 Pro M1 Pro, M1 Pro 16-Core GPU, Apple SSD AP1024R, Mini-LED, 3456x2234, 16.2" | Apple MacBook Pro 16 2021 M1 Max M1 Max, M1 Max 32-Core GPU, Apple SSD AP2048R, Mini-LED, 3456x2234, 16.2" | Przeciętny AMD Radeon RX 6500M | Średnia w klasie Multimedia | |
|---|---|---|---|---|---|---|---|---|---|
| Power Consumption | -79% | -80% | -13% | -50% | -17% | -38% | 0% | -7% | |
| Idle Minimum * (Watt) | 5.3 | 10.3 -94% | 12.3 -132% | 5.5 -4% | 7.8 -47% | 5 6% | 5.4 -2% | 5.3 ? -0% | 5.69 ? -7% |
| Idle Average * (Watt) | 8.6 | 22.06 -157% | 22.8 -165% | 7.2 16% | 15.1 -76% | 15.1 -76% | 16.4 -91% | 8.6 ? -0% | 10.1 ? -17% |
| Idle Maximum * (Watt) | 9.5 | 23 -142% | 13.9 -46% | 16 -68% | 17 -79% | 15.5 -63% | 16.7 -76% | 9.5 ? -0% | 12.3 ? -29% |
| Load Average * (Watt) | 65.2 | 102.57 -57% | 95.4 -46% | 91.8 -41% | 114 -75% | 54 17% | 94 -44% | 65.2 ? -0% | 65.3 ? -0% |
| Witcher 3 ultra * (Watt) | 93.6 | 106 -13% | 154 -65% | 74.6 20% | 115.2 -23% | 104 -11% | |||
| Load Maximum * (Watt) | 133.81 | 147.8 -10% | 170.7 -28% | 134.7 -1% | 135.6 -1% | 90 33% | 135 -1% | 133.8 ? -0% | 112.5 ? 16% |
* ... im mniej tym lepiej
Power Consumption The Witcher 3 / Stress Test
Power Consumption With External Monitor
Czas pracy na baterii
Pod względem pojemności akumulatora Lenovo ThinkPad Z16 G1 prezentuje się stosunkowo mizernie, mając tylko 72 watogodziny. Mimo to czasy pracy na baterii w laptopie ThinkPad są i tak lepsze, przynajmniej w porównaniu z konkurencją z Windowsem. Z drugiej strony, nie zbliża się nawet do osiągnięcia wartości Apple's MacBook Pro 16, ale ten również ma największy akumulator w naszym polu porównawczym
Przy około 10 godzinach w teście Wi-Fi (przy jasności 150 cd/m²) Z16 nie musi się ukrywać. Przy maksymalnej jasności wytrzymuje jeszcze 8 godzin w naszym zautomatyzowanym teście Wi-Fi. Dotyczy to jednak tylko wersji WUXGA modelu Z16, a opcjonalny wyświetlacz 4K UHD powinien znacznie skrócić czas pracy na baterii.
| Lenovo ThinkPad Z16 G1 21D5S00T00 R7 PRO 6850H, Radeon RX 6500M, 72 Wh | Lenovo ThinkPad X1 Extreme G4-20Y5CTO1WW (3050 Ti) i7-11800H, GeForce RTX 3050 Ti Laptop GPU, 90 Wh | Lenovo ThinkPad X1 Extreme G4-20Y50040GE i9-11950H, GeForce RTX 3080 Laptop GPU, 90 Wh | Dell XPS 15 9520 RTX 3050 Ti i7-12700H, GeForce RTX 3050 Ti Laptop GPU, 86 Wh | Apple MacBook Pro 16 2021 M1 Pro M1 Pro, M1 Pro 16-Core GPU, 99.6 Wh | Apple MacBook Pro 16 2021 M1 Max M1 Max, M1 Max 32-Core GPU, 99.6 Wh | Średnia w klasie Multimedia | |
|---|---|---|---|---|---|---|---|
| Czasy pracy | -40% | -40% | 21% | 59% | 15% | 13% | |
| H.264 (h) | 11.9 | 6.7 -44% | 6.9 -42% | 17.5 47% | 17 43% | 16.4 ? 38% | |
| WiFi v1.3 (h) | 9.9 | 6.6 -33% | 6.8 -31% | 8.8 -11% | 16.9 71% | 14.9 51% | 12 ? 21% |
| Load (h) | 2.1 | 1.2 -43% | 1.1 -48% | 3.2 52% | 1.1 -48% | 1.675 ? -20% |
Za
Przeciw
Werdykt: Lenovo ThinkPad Z16 G1 to świetny laptop, ale...

Lenovo ThinkPad Z16 Gen 1 naprawdę przyprawił nas o ból głowy. Na papierze może to być bardzo dobry laptop i w naszym teście również okazało się to prawdą. Nadal jednak nie jesteśmy w stanie przyznać mu rekomendacji "bardzo dobry".
Najpierw powinniśmy wymienić wszystkie pozytywne aspekty laptopa ThinkPad: ThinkPad Z16 G1 oferuje bardzo dobrą wydajność w stosunkowo kompaktowej obudowie. Jakość wykonania obudowy jest znakomita, a dzięki połączeniu dużej ilości aluminium i szklanej podpórki pod dłonie, Lenovo robi pod tym względem wiele dobrego. Producent wykonuje też dobrą robotę z touchpadem, który jest znacznie lepszy niż w pozostałych ThinkPadach. Klawiatura również jest dobra, nawet jeśli nie jest tak dobra jak w innych ThinkPadach. ThinkPad Z16 zawiera matowy, jasny wyświetlacz i oferuje dobre czasy pracy na baterii, mimo że akumulator jest stosunkowo niewielki.
Pierwszym dużym problemem Z16 są jego złącza. ThinkPad Z16 to 16-calowy laptop i urządzenie biznesowe. Fakt, że takie urządzenie nie oferuje żadnego portu USB-A, a zwłaszcza nie ma też HDMI, jest mało akceptowalny. Zarządzanie temperaturą również stwarza pewne trudności, gdyż ThinkPad Z16 robi się dość gorący. Lepiej nie dotykać obszaru nad klawiaturą pod obciążeniem. W stosunkowo dużym ThinkPadzie wlutowana pamięć RAM jest naszym zdaniem niepotrzebnym ograniczeniem. Znacznie mniej ważny, ale wciąż istotny punkt skargi: W Z16 brakuje opcji wyświetlacza 2,5K, nie ma też wyświetlacza o wyższej częstotliwości odświeżania.
To mógłby być bardzo dobry laptop, gdyby tylko nie było problemów z ponownym uruchamianiem, bo poza tym widzimy w Lenovo ThinkPad Z16 Gen 1 wiele pozytywnych aspektów.
Wszystkie te narzekania nie były jednak tym, co przyprawiło nas o ból głowy - był to wspomniany już problem z restartami, który skłonił nas do poproszenia o nowy egzemplarz testowy. Na szczęście w naszej zastępczej jednostce testowej problem był znacznie mniej wyraźny, ale niestety nadal się zdarzał.
Prowadzi to do znacznie gorszej oceny ThinkPada Z16 niż musiałaby być w przeciwnym razie. Jest to niefortunne, gdyż w przeciwnym razie naprawdę nie znielubimy tego ThinkPada, nawet jeśli jego brak wyposażenia w złącza jest mniej przekonujący dla jego rynku docelowego niż w przypadku kompaktowego ThinkPada Z13. Pod względem portów, Lenovo ThinkPad X1 Extreme G4 jest znacznie bardziej elastyczny. Nawet MacBook Pro 16 oferuje jeszcze przynajmniej HDMI, ale z drugiej strony brakuje mu opcji WWAN z ThinkPada Z16.
Uwaga: Ze względu na problem ze stabilnością systemu ocena ThinkPada Z16 okazała się o 3 punkty procentowe niższa.
Cena i dostępność
Lenovo ThinkPad Z16 Gen 1 jest dostępny w cenie od 1 975 USDw sklepie internetowym firmy Lenovo. Amazon wymienia również różne konfiguracje ThinkPad Z16 w cenie od 1850 USD (link partnerski).
Lenovo ThinkPad Z16 G1 21D5S00T00
- 29/09/2022 v7 (old)
Benjamin Herzig
Price comparison

