Werdykt - wypada nieco słabiej niż Dell
HP ZBook Fury G1i 18 ma kilka znaczących zalet w porównaniu do Dell Pro Max 18 Plus. Działa chłodniej, jest nieco cieńszy i lżejszy, zawiera podświetlenie RGB na klawisze i rzeczywiste przyciski myszy, a także jest dostarczany z szybszym wyświetlaczem 165 Hz z mniej zauważalnym ghostingiem. Tymczasem sprzęt jest równie wytrzymały, jeśli nie prawdopodobnie bardziej wszechstronny, dzięki szerszym zawiasom i "beznarzędziowemu" dolnemu panelowi ułatwiającemu serwisowanie.
Niestety, kilka wad sprawia, że HP nie jest najlepszą 18-calową mobilną stacją roboczą. Być może najważniejszą z nich jest to, że jego CPU i GPU działają nieco wolniej niż w Dellu, gdy oba są skonfigurowane z identycznymi procesorami. Dell Pro Max 18 Plus działa cieplej, jednocześnie celując w wyższe TGP 175 W dla większej wydajności. Żywotność baterii i hałas wentylatora w przypadku HP niekoniecznie są odpowiednio dłuższe lub cichsze, pomimo różnic w wydajności między tymi dwoma modelami. Maszyna Dell jest również bardziej zoptymalizowana pod kątem obciążeń związanych ze sztuczną inteligencją dzięki większej pojemności pamięci RAM CAMM2 i wymiennej pamięci DGFF, którą można zamienić na dyskretną jednostkę NPU firmy Qualcomm. Łowcy wydajności mogą zatem znaleźć więcej korzyści z maszyny Dell.
Za
Przeciw
Cena i dostępność
HP dostarcza obecnie ZBook Fury G1i 18 w cenie od 5660 USD za konfigurację podstawową do ponad 10000 USD w przypadku konfiguracji z procesorem Core Ultra 9 285HX i kartą graficzną Nvidia RTX Pro 5000 Blackwell.
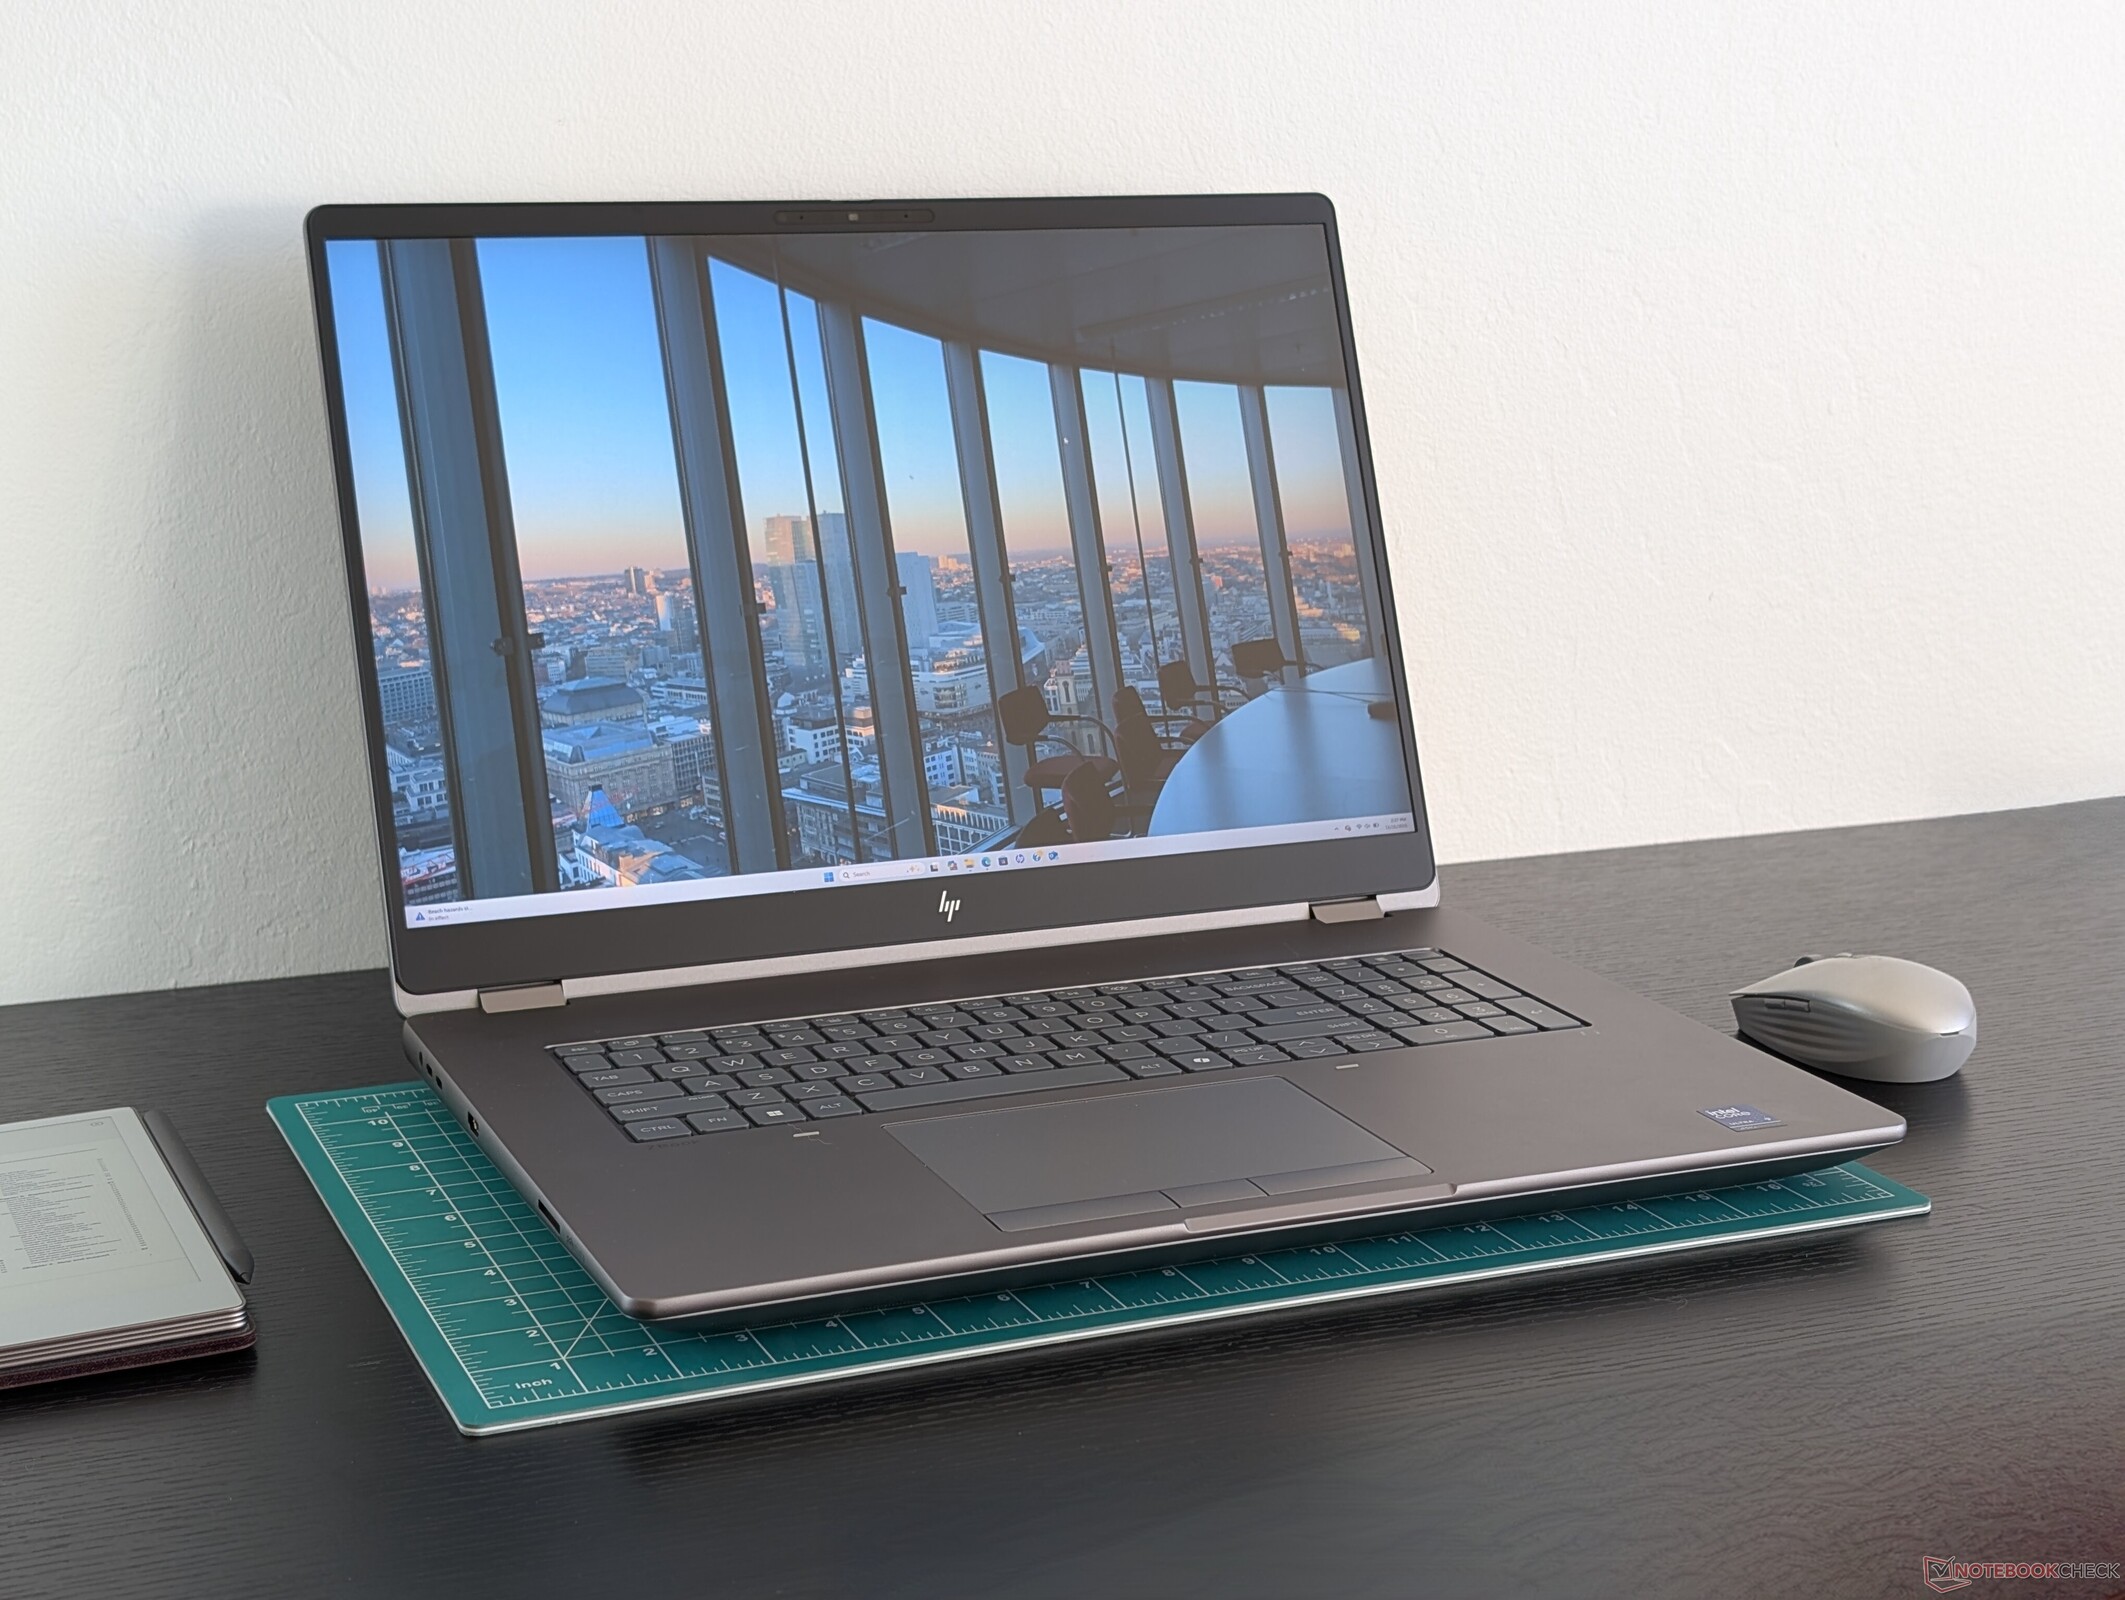
ZBook Fury G1i 18 to pierwszy 18-calowy model z rodziny wysokowydajnych mobilnych stacji roboczych Fury. Jest on wyposażony w najnowsze procesory Intel Arrow Lake-HX i karty graficzne Nvidia Pro Blackwell, dzięki czemu jest jednym z najpotężniejszych w swojej kategorii.
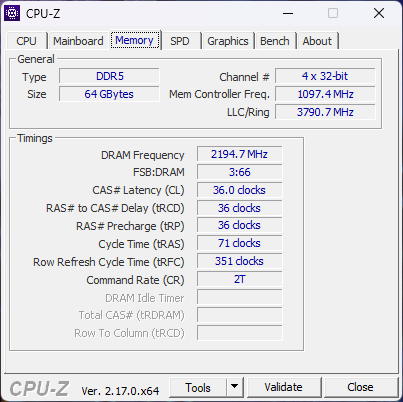
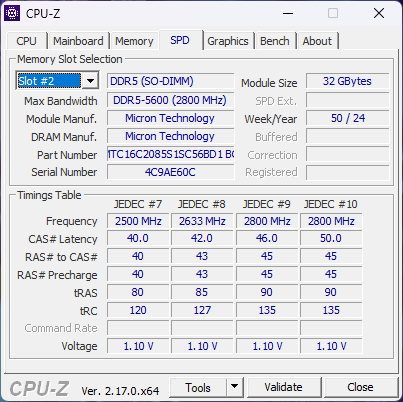
Nasza konkretna jednostka testowa została skonfigurowana po brzegi z procesorem Core Ultra 9 285HX, 150 W GPU Nvidia RTX Pro 5000 Blackwell i 64 GB pamięci RAM DDR5-5600 w cenie detalicznej około 9000 USD. Wszystkie jednostki SKU są obecnie dostarczane z tym samym wyświetlaczem IPS 2560 x 1600p 165 Hz.
Konkurencyjne 18-calowe stacje robocze są daleko i nieliczne z Dell Pro Max 18 Plus jest jedynym bezpośrednim konkurentem w chwili pisania tego tekstu. Lenovo, na przykład, nie oferuje jeszcze 18-calowego ThinkPada z profesjonalnymi opcjami GPU Nvidia.
Więcej recenzji HP:
Specyfikacje
Przypadek
Chociaż obudowa ze stopu aluminium nie jest zauważalnie słabsza lub mocniejsza niż w Dell Pro Max 18 Plus, jest nieco cieńsza i lżejsza niż Dell, a jednocześnie ma większą długość i szerokość. Jedną z zauważalnych zalet HP jest jednak to, że jego wyświetlacz można otworzyć o pełne 180 stopni, co zapewnia nieco większą wszechstronność.
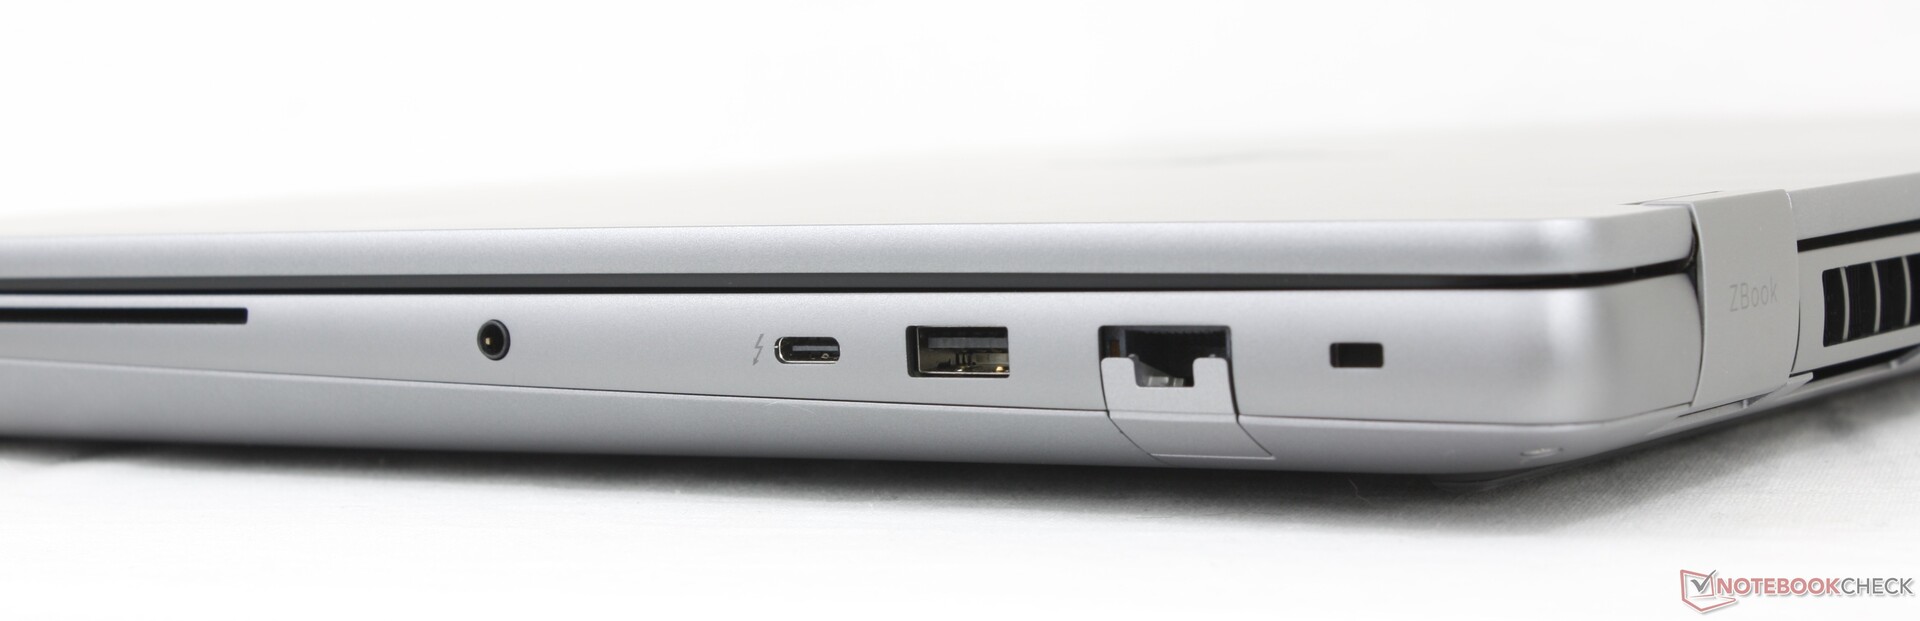
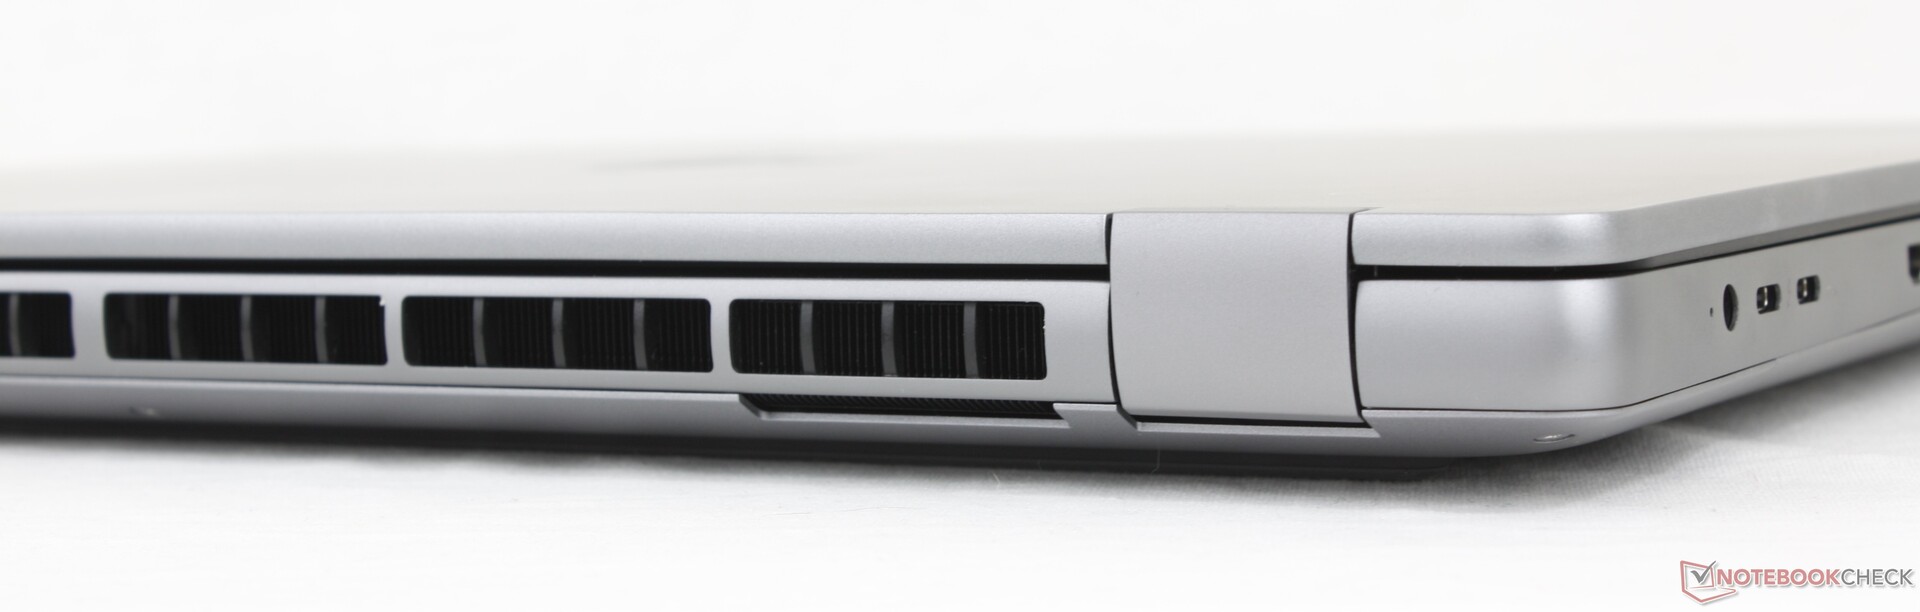
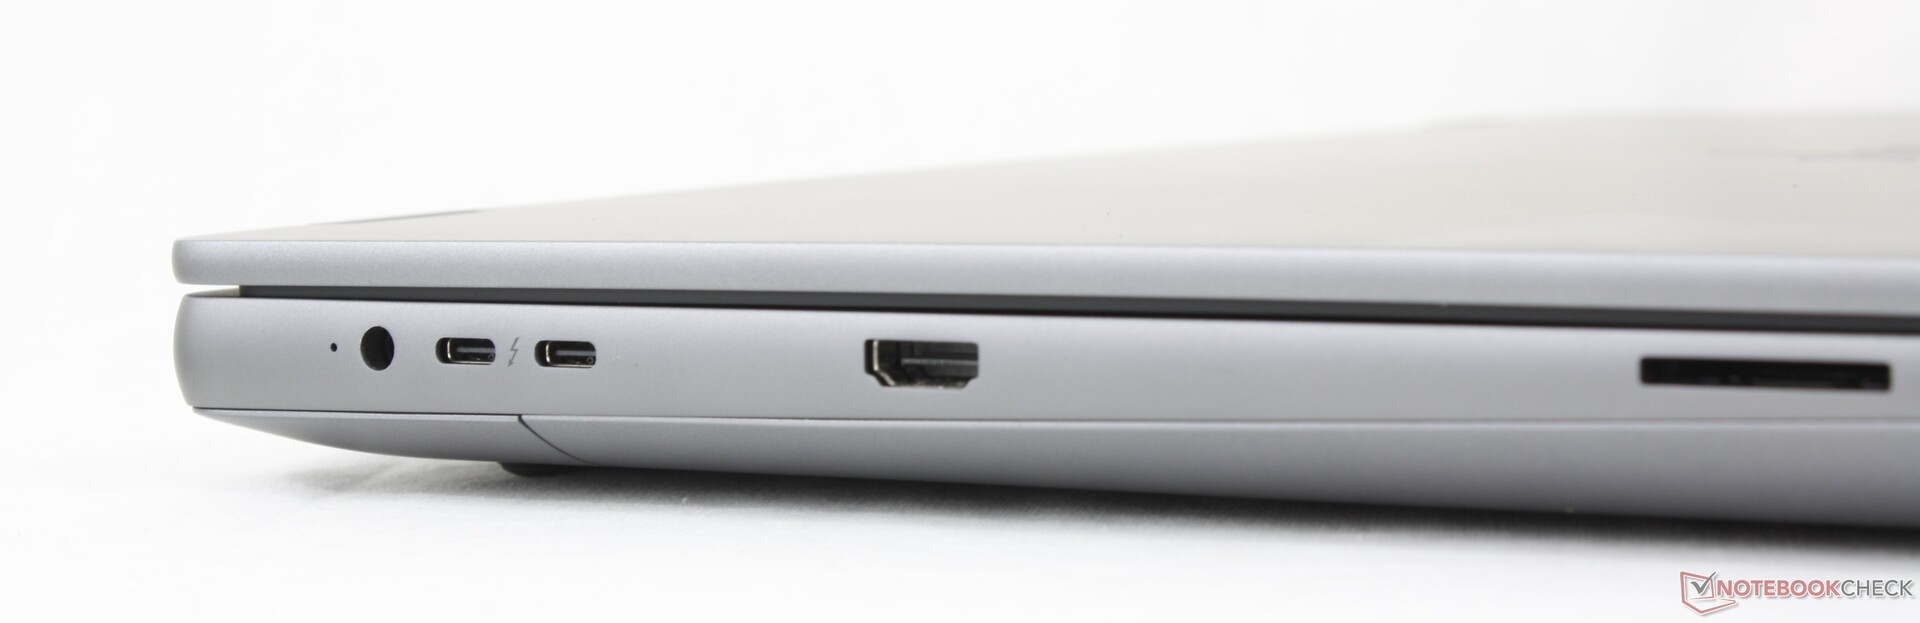
Łączność
Model ten posiada wszystkie porty znajdujące się w Dell Pro Max 18 Plus, aczkolwiek z jednym portem USB-A mniej. Naszym głównym zarzutem jest to, że dwa porty USB-C wzdłuż lewej krawędzi znajdują się zbyt blisko portu zasilacza sieciowego. W rezultacie podłączanie wielu kabli może być ciasne.
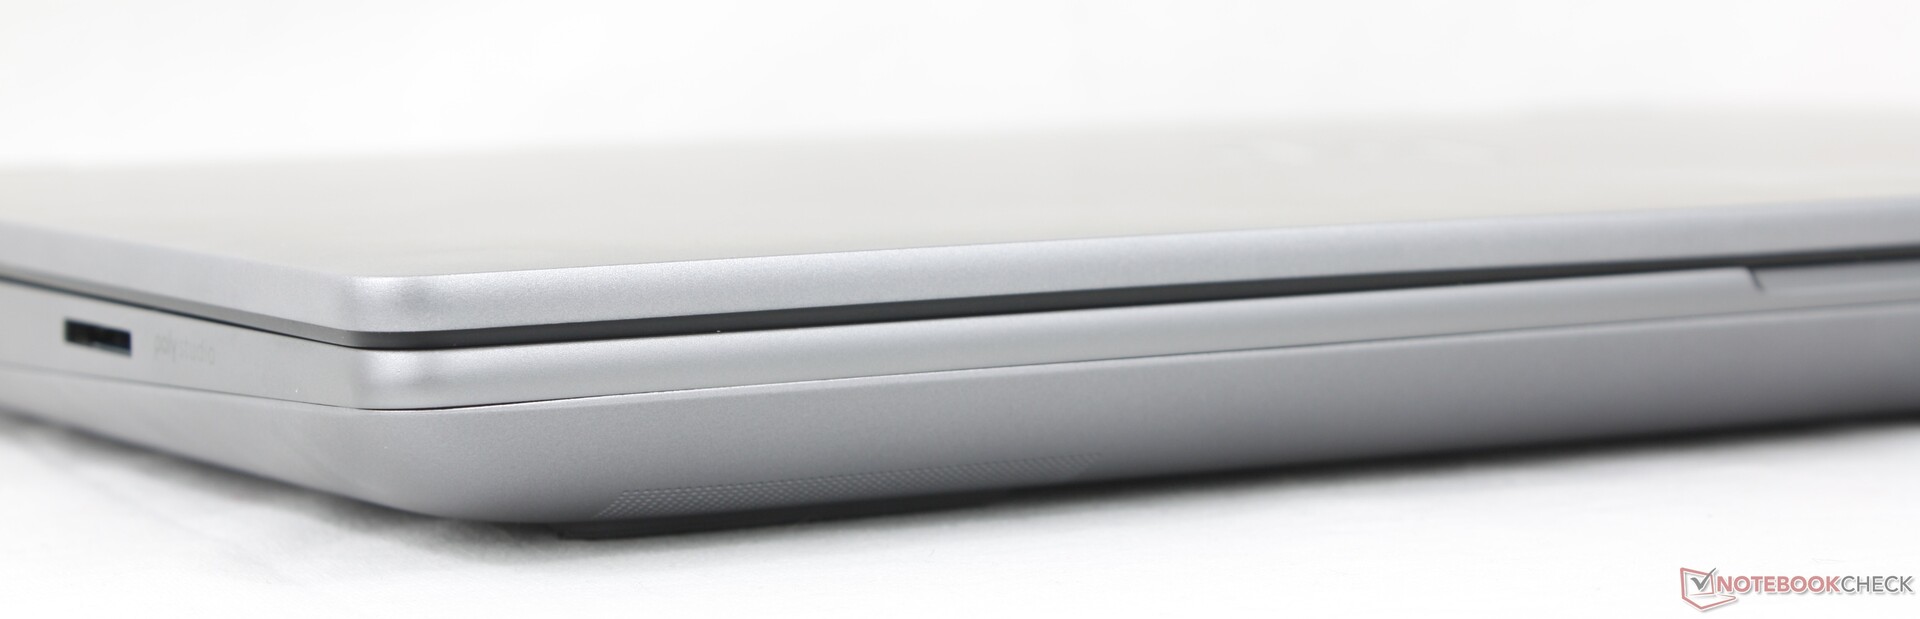
Czytnik kart SD
| SD Card Reader | |
| average JPG Copy Test (av. of 3 runs) | |
| HP ZBook X G1i 16 (Toshiba Exceria Pro SDXC 64 GB UHS-II) | |
| Dell Pro Max 18 Plus MB18250 (Toshiba Exceria Pro SDXC 64 GB UHS-II) | |
| HP ZBook Fury G1i 18 (Toshiba Exceria Pro SDXC 64 GB UHS-II) | |
| Lenovo ThinkPad P16 Gen 2 (Toshiba Exceria Pro SDXC 64 GB UHS-II) | |
| Schenker Key 18 Pro M25 RTX 5090 (Angelbird AV Pro V60) | |
| maximum AS SSD Seq Read Test (1GB) | |
| HP ZBook X G1i 16 (Toshiba Exceria Pro SDXC 64 GB UHS-II) | |
| Dell Pro Max 18 Plus MB18250 (Toshiba Exceria Pro SDXC 64 GB UHS-II) | |
| HP ZBook Fury G1i 18 (Toshiba Exceria Pro SDXC 64 GB UHS-II) | |
| Schenker Key 18 Pro M25 RTX 5090 (Angelbird AV Pro V60) | |
| Lenovo ThinkPad P16 Gen 2 (Toshiba Exceria Pro SDXC 64 GB UHS-II) | |
Komunikacja
Kamera internetowa
Kamera 5 MP jest standardowo wyposażona w podczerwień i fizyczną migawkę. Oprogramowanie Poly Camera Pro, które jest również zawarte w większości innych laptopów HP, jest fabrycznie zainstalowane na ZBook Fury w celu zapewnienia dodatkowych funkcji wideokonferencji.


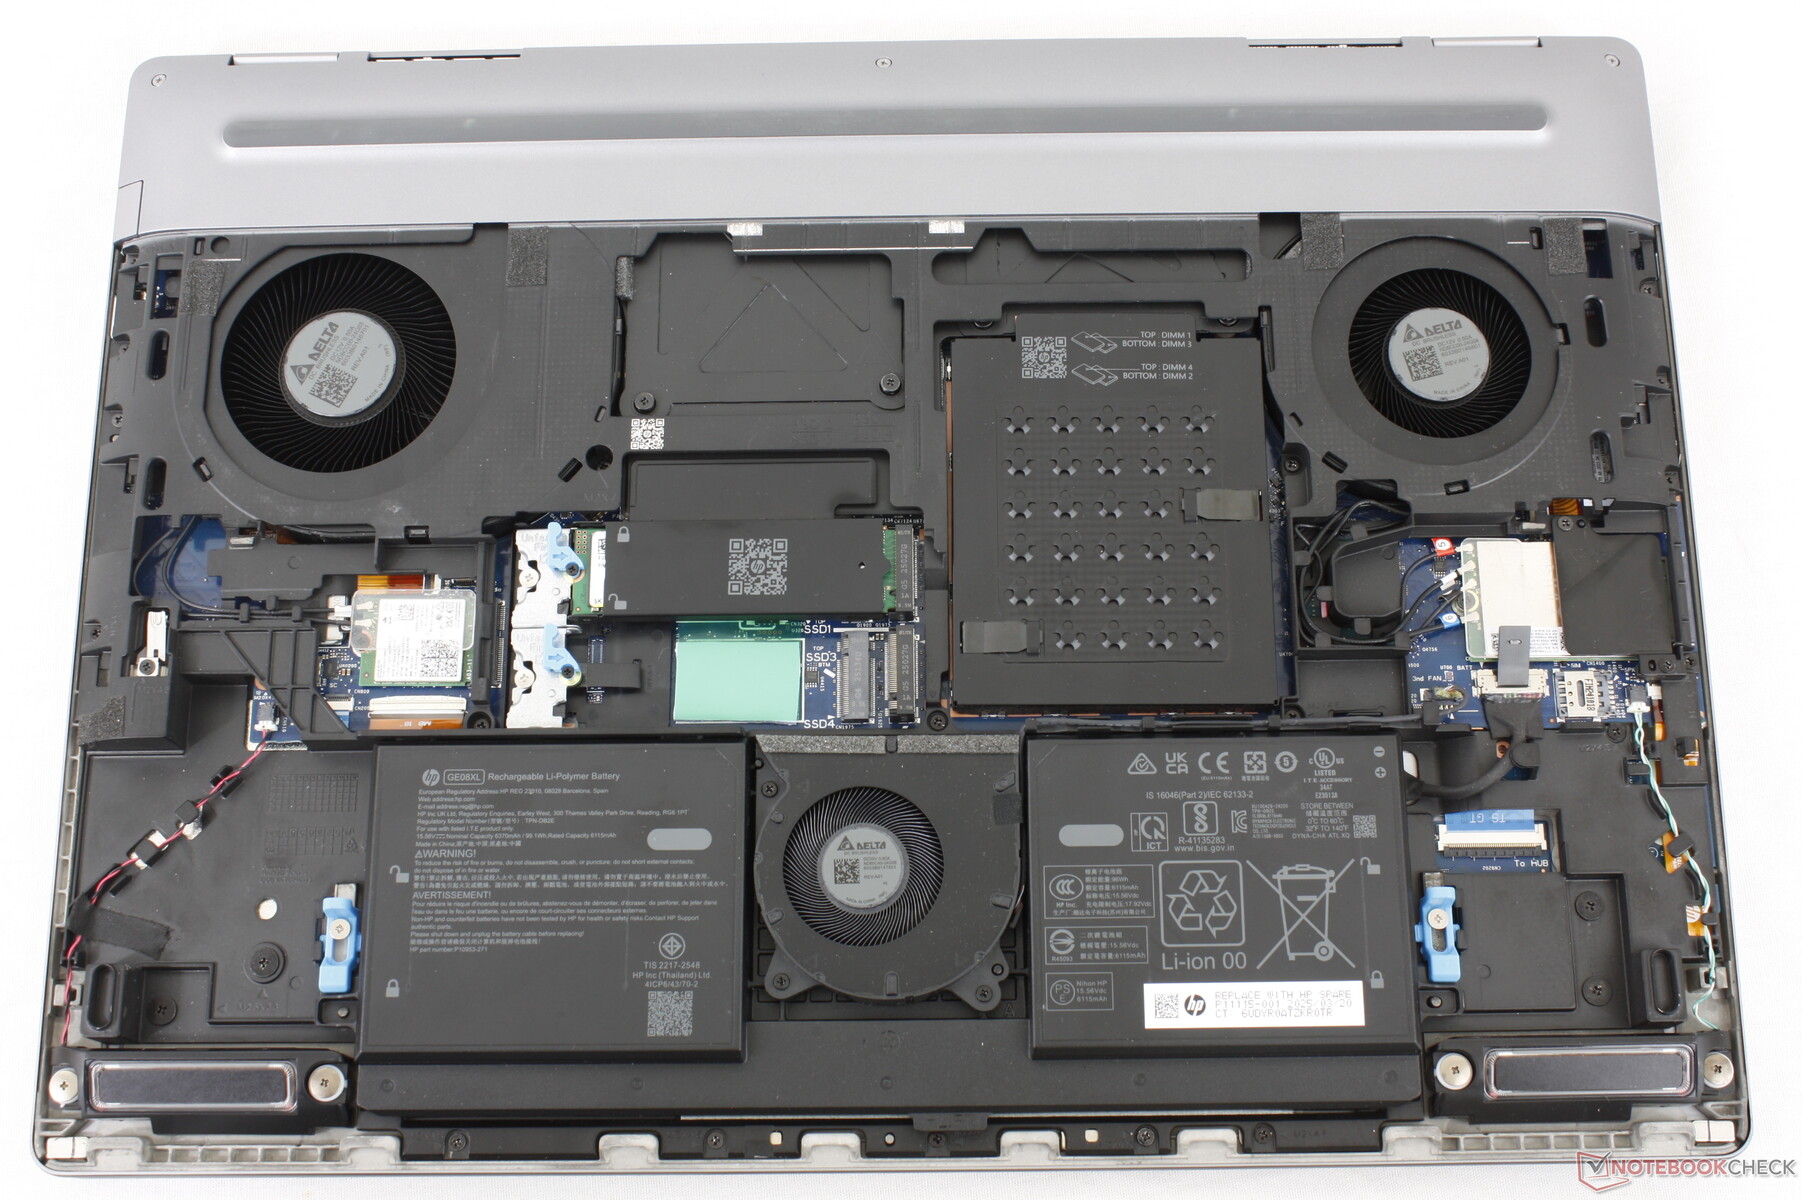
Konserwacja
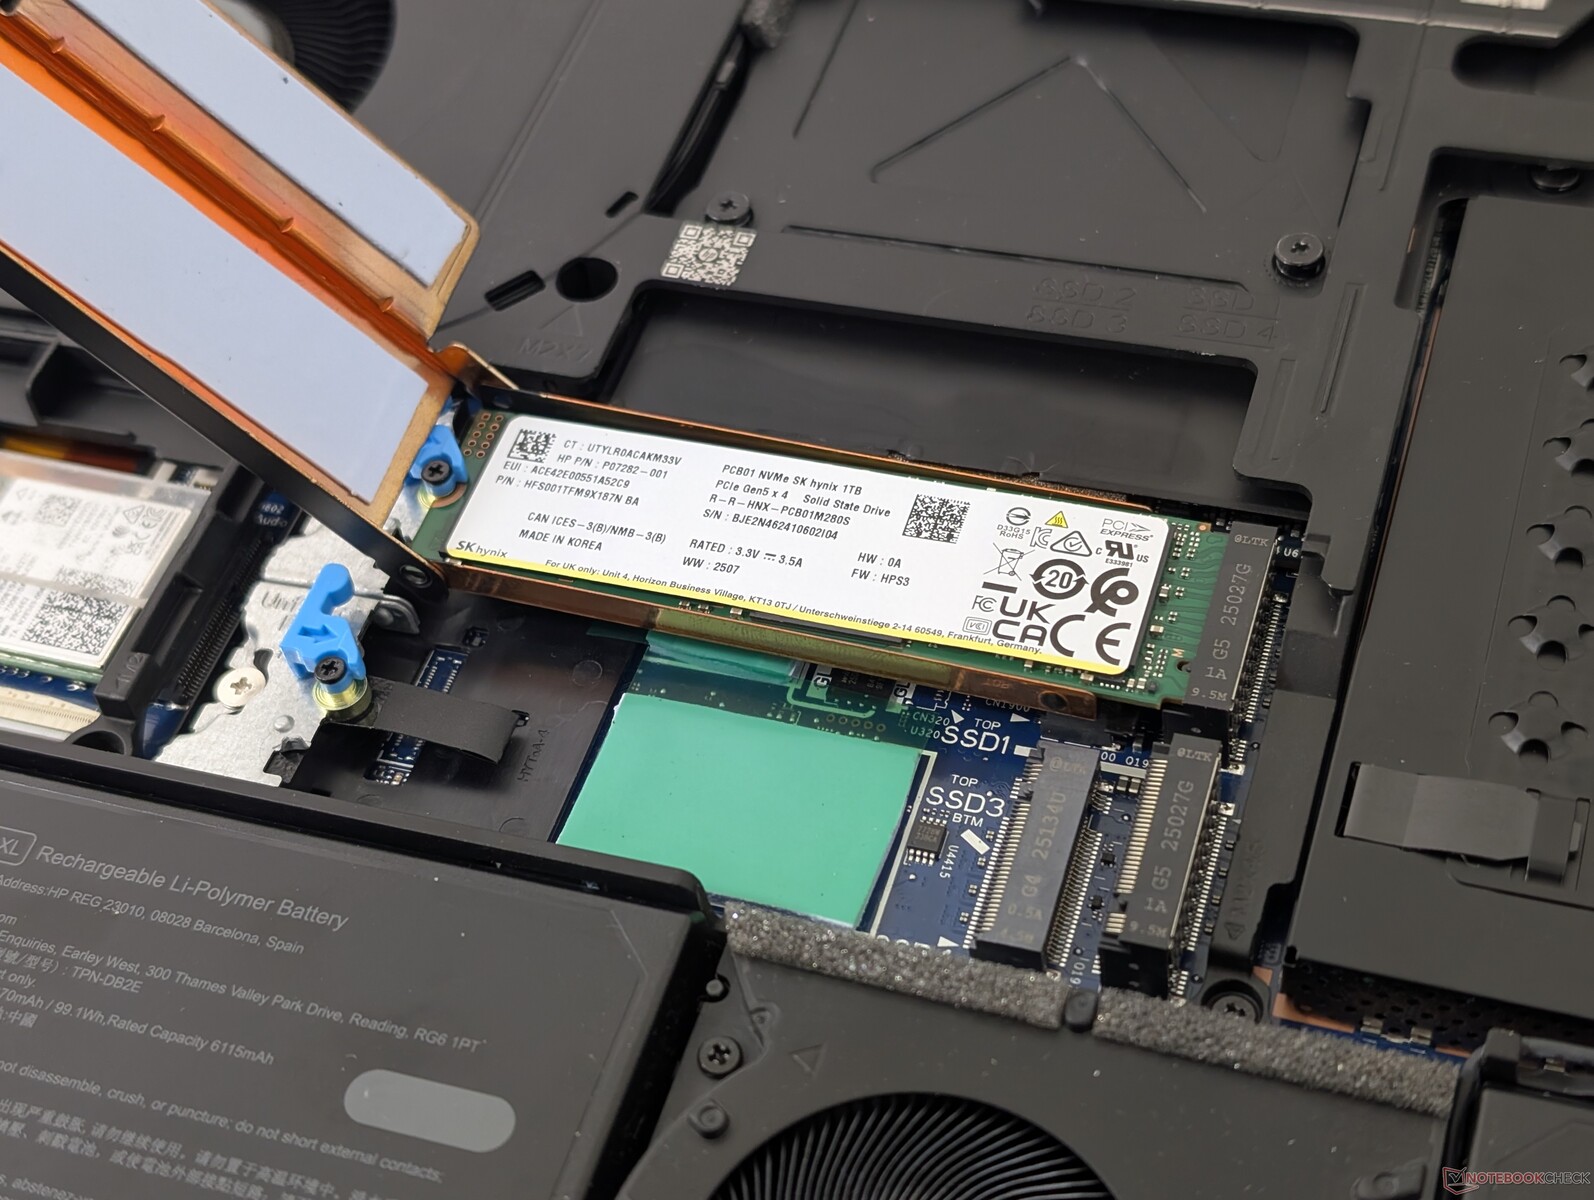
Dolny panel jest "beznarzędziowy" i można go zdjąć bez użycia śrubokrętów. Mimo to, większość komponentów jest przykręcona do płyty głównej, więc do serwisowania nadal wymagany jest śrubokręt.
Zrównoważony rozwój
40 procent tworzyw sztucznych wokół obudowy pochodzi z recyklingu poużytkowego, podczas gdy opakowanie to głównie masa papierowa z plastikowym opakowaniem zasilacza sieciowego.
Akcesoria i gwarancja
W pudełku nie ma żadnych dodatków poza zasilaczem sieciowym i dokumentacją. Rozczarowujące jest to, że przy zamówieniu na oficjalnej stronie HP, system objęty jest tylko roczną ograniczoną gwarancją producenta, zamiast typowych trzech lat dla wysokiej klasy stacji roboczych.
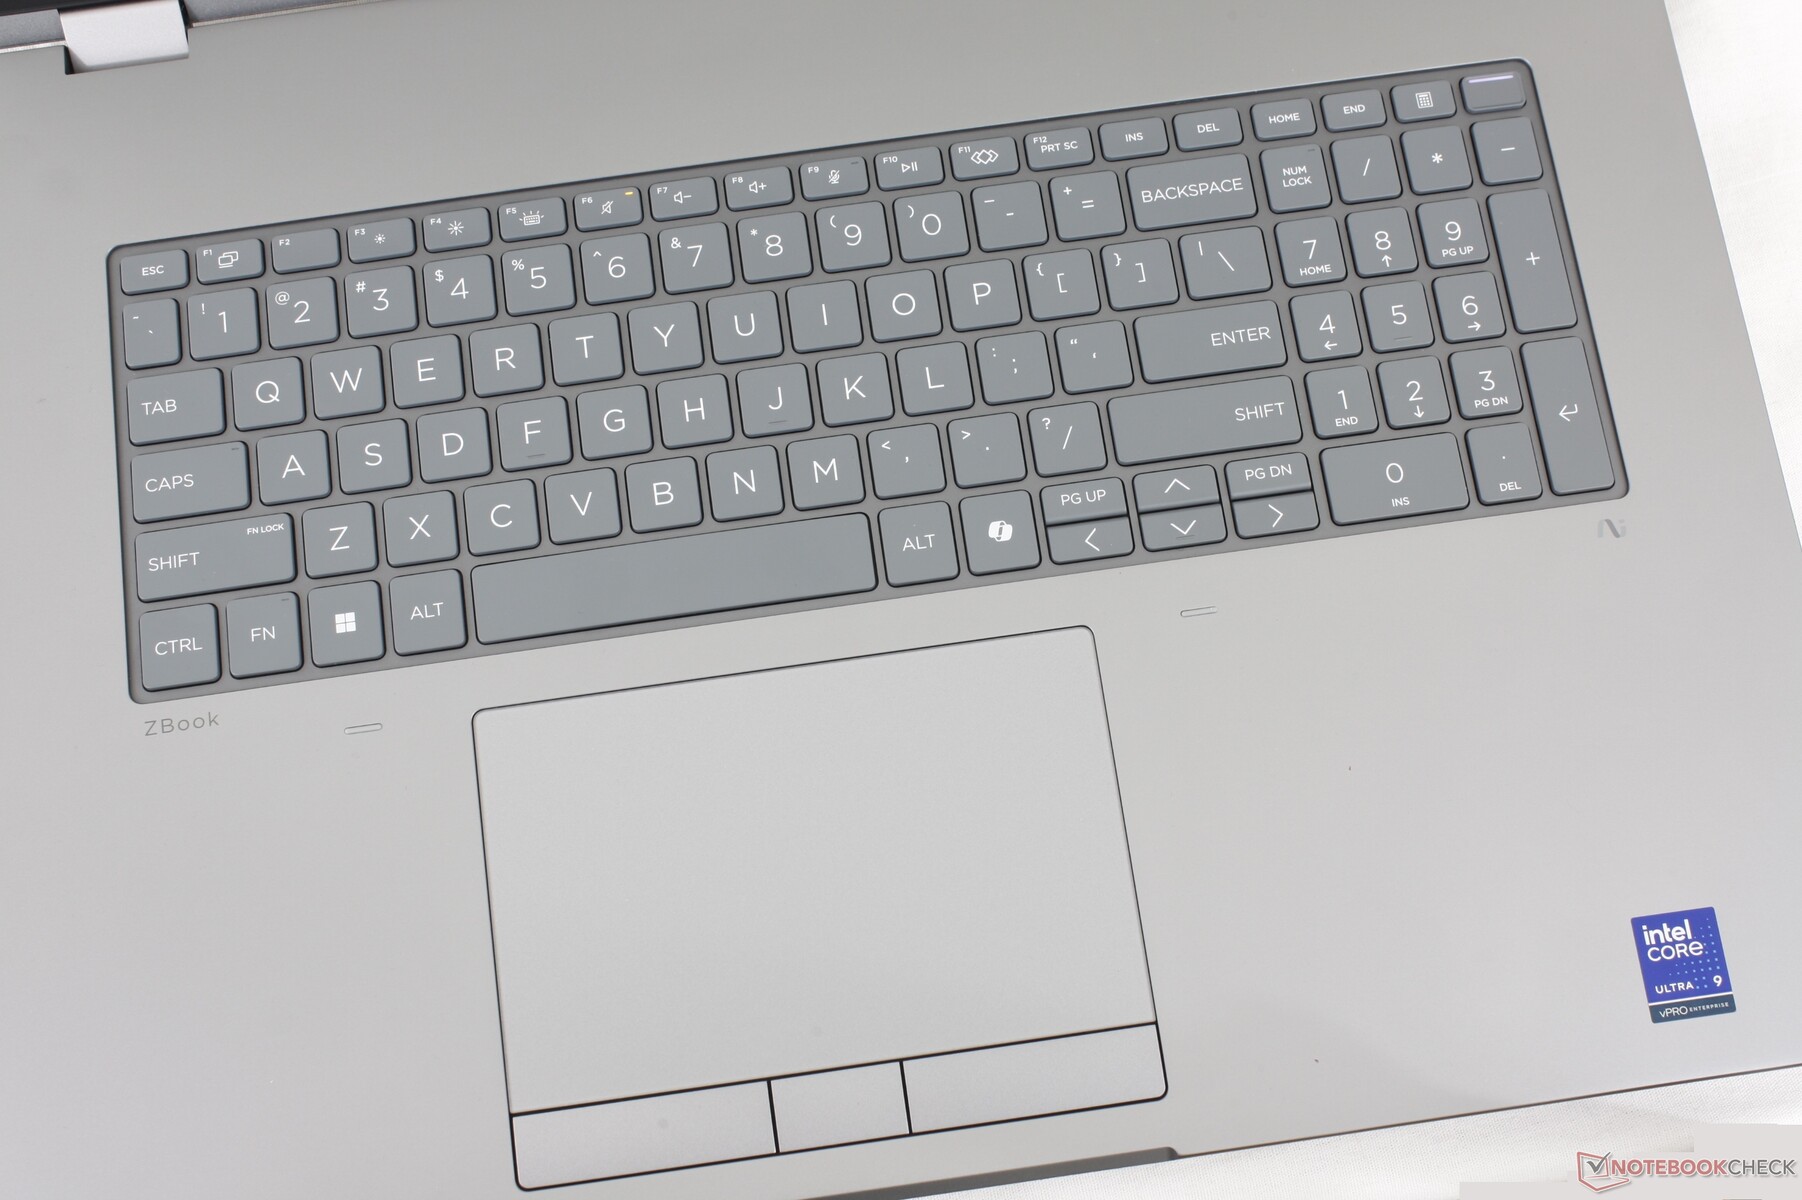
Urządzenia wejściowe
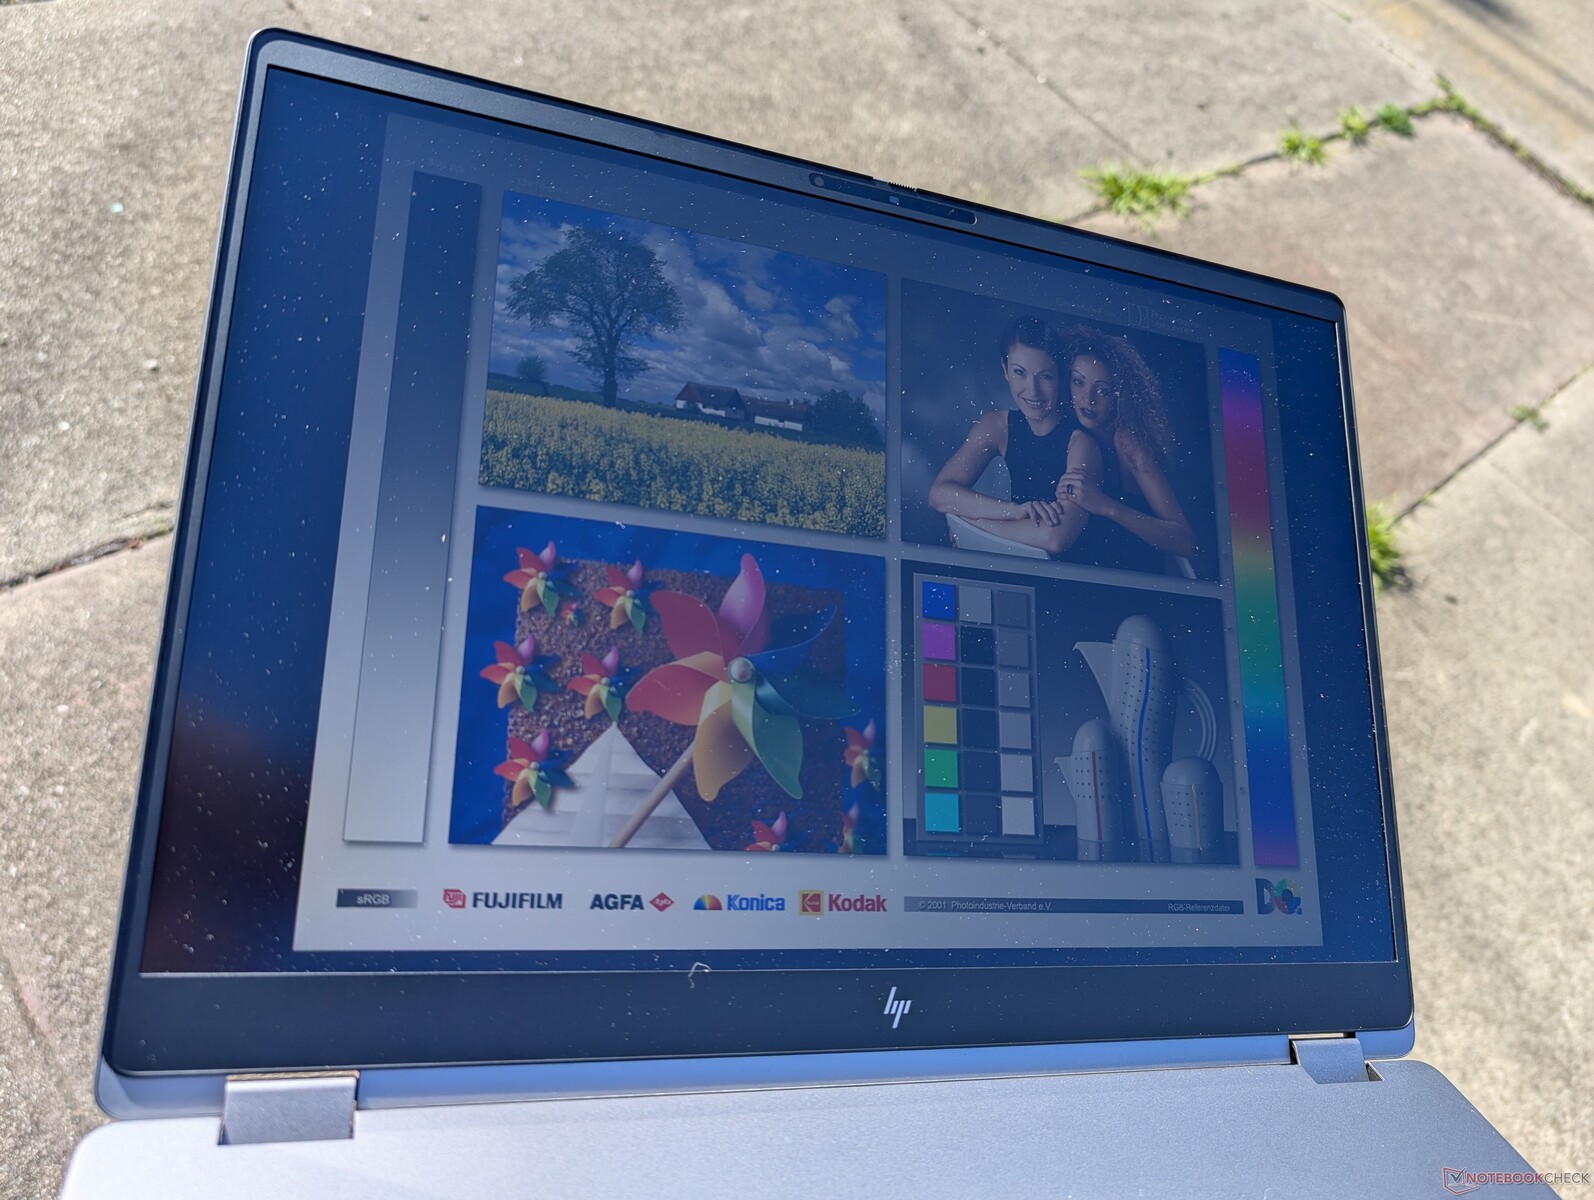
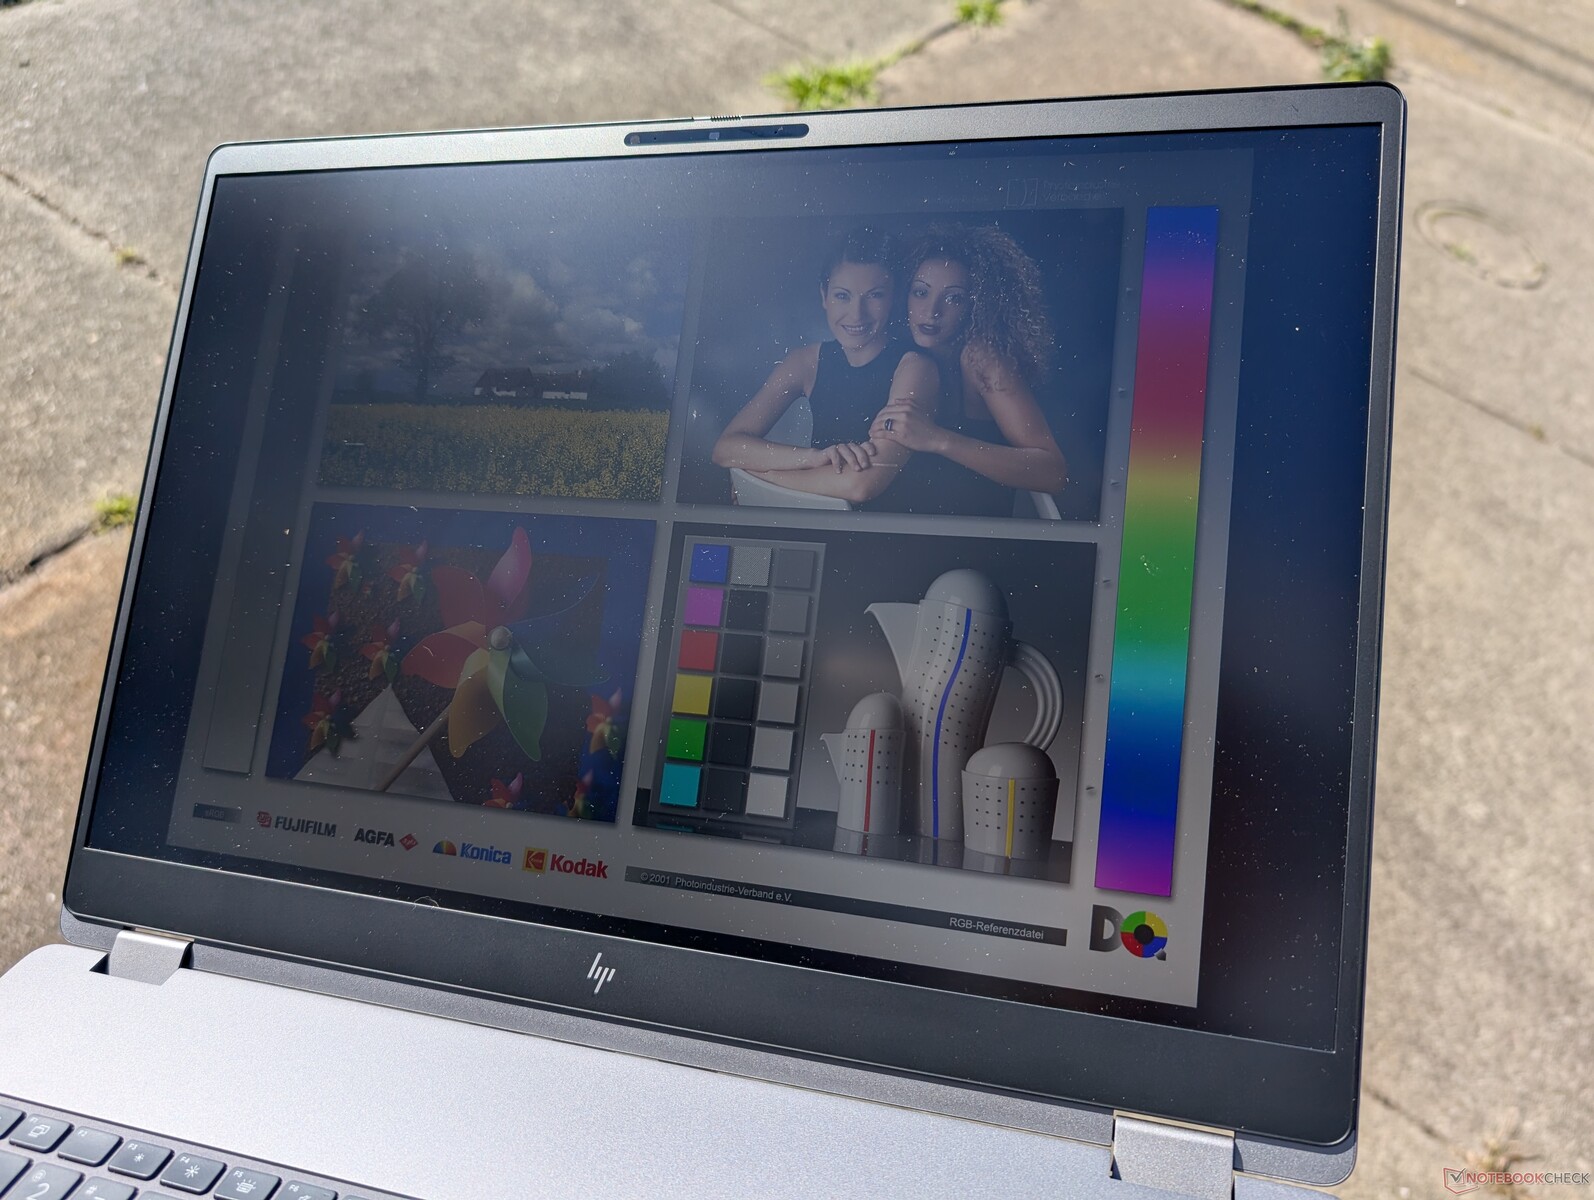
Wyświetlacz - na razie nie 4K ani OLED
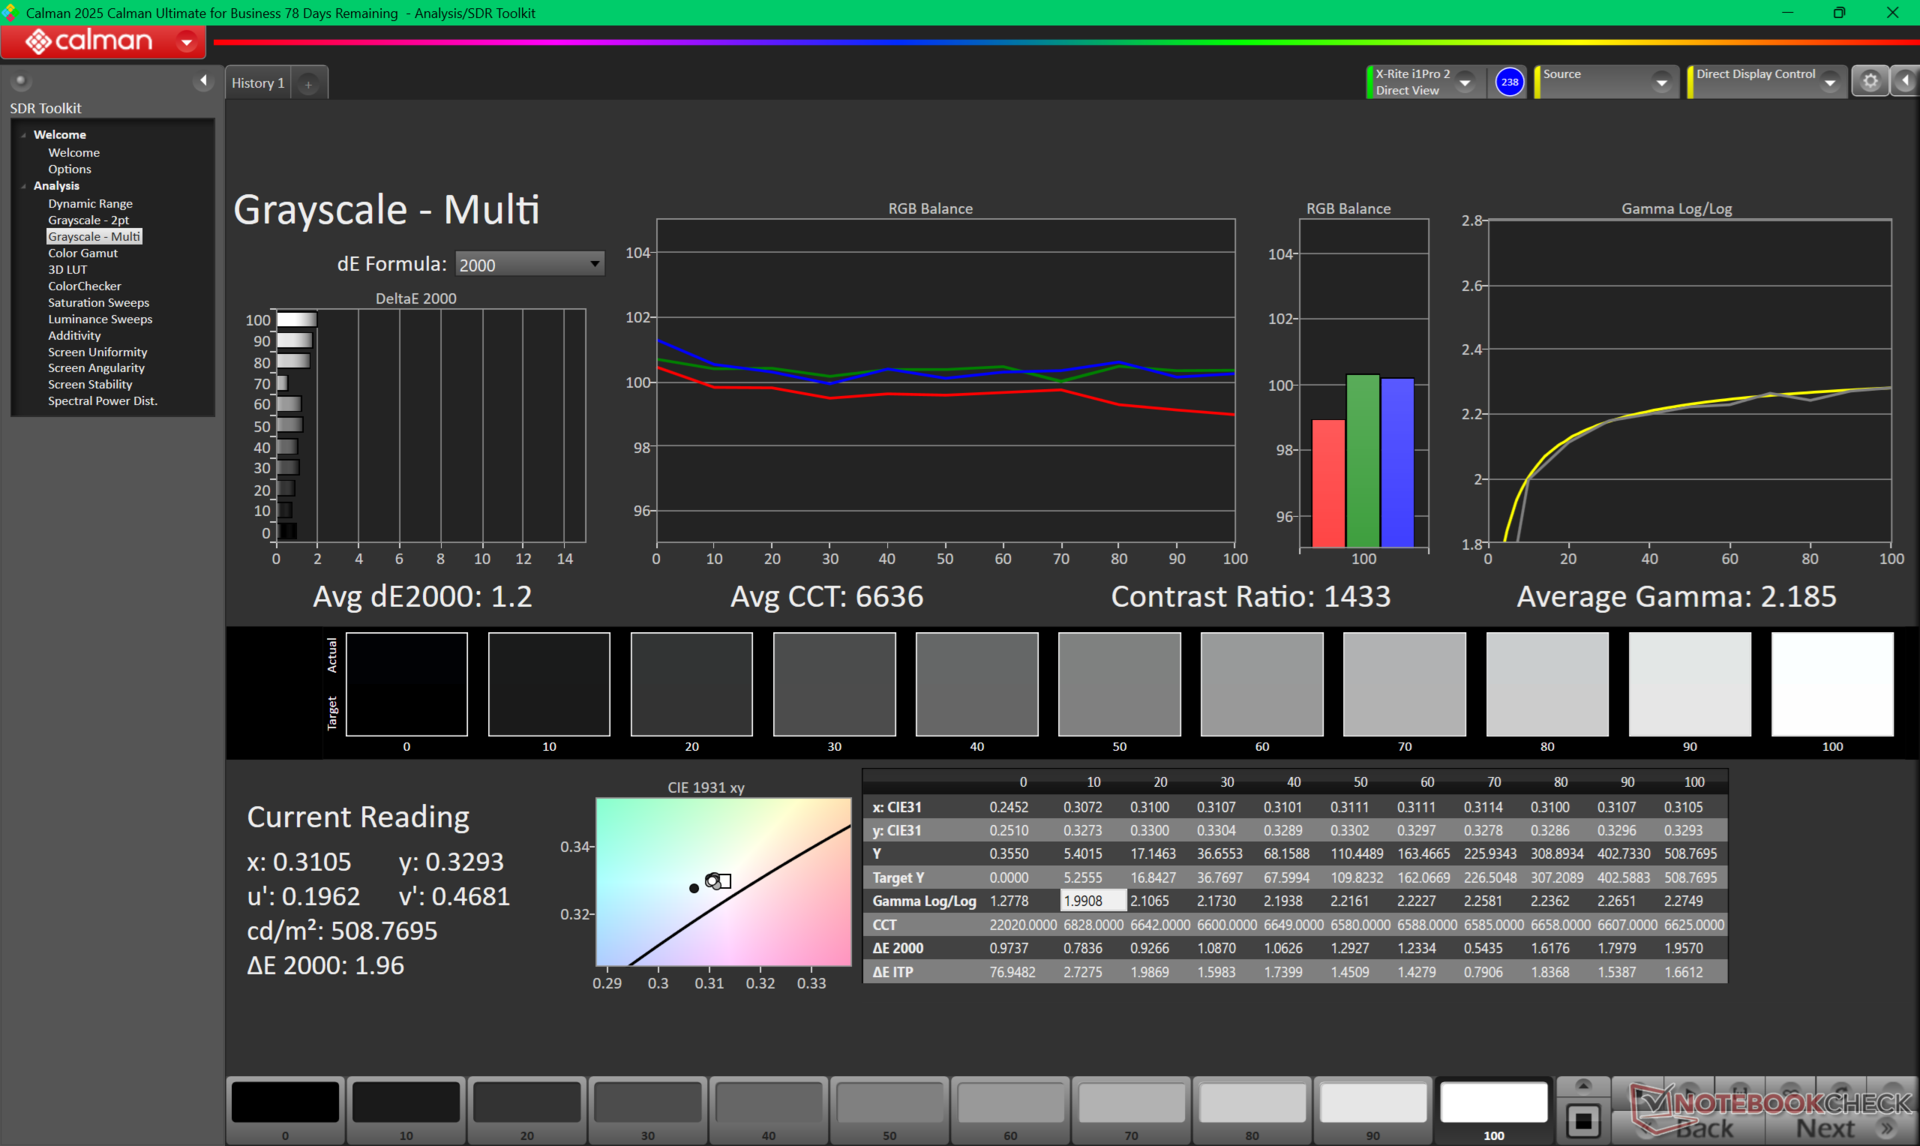
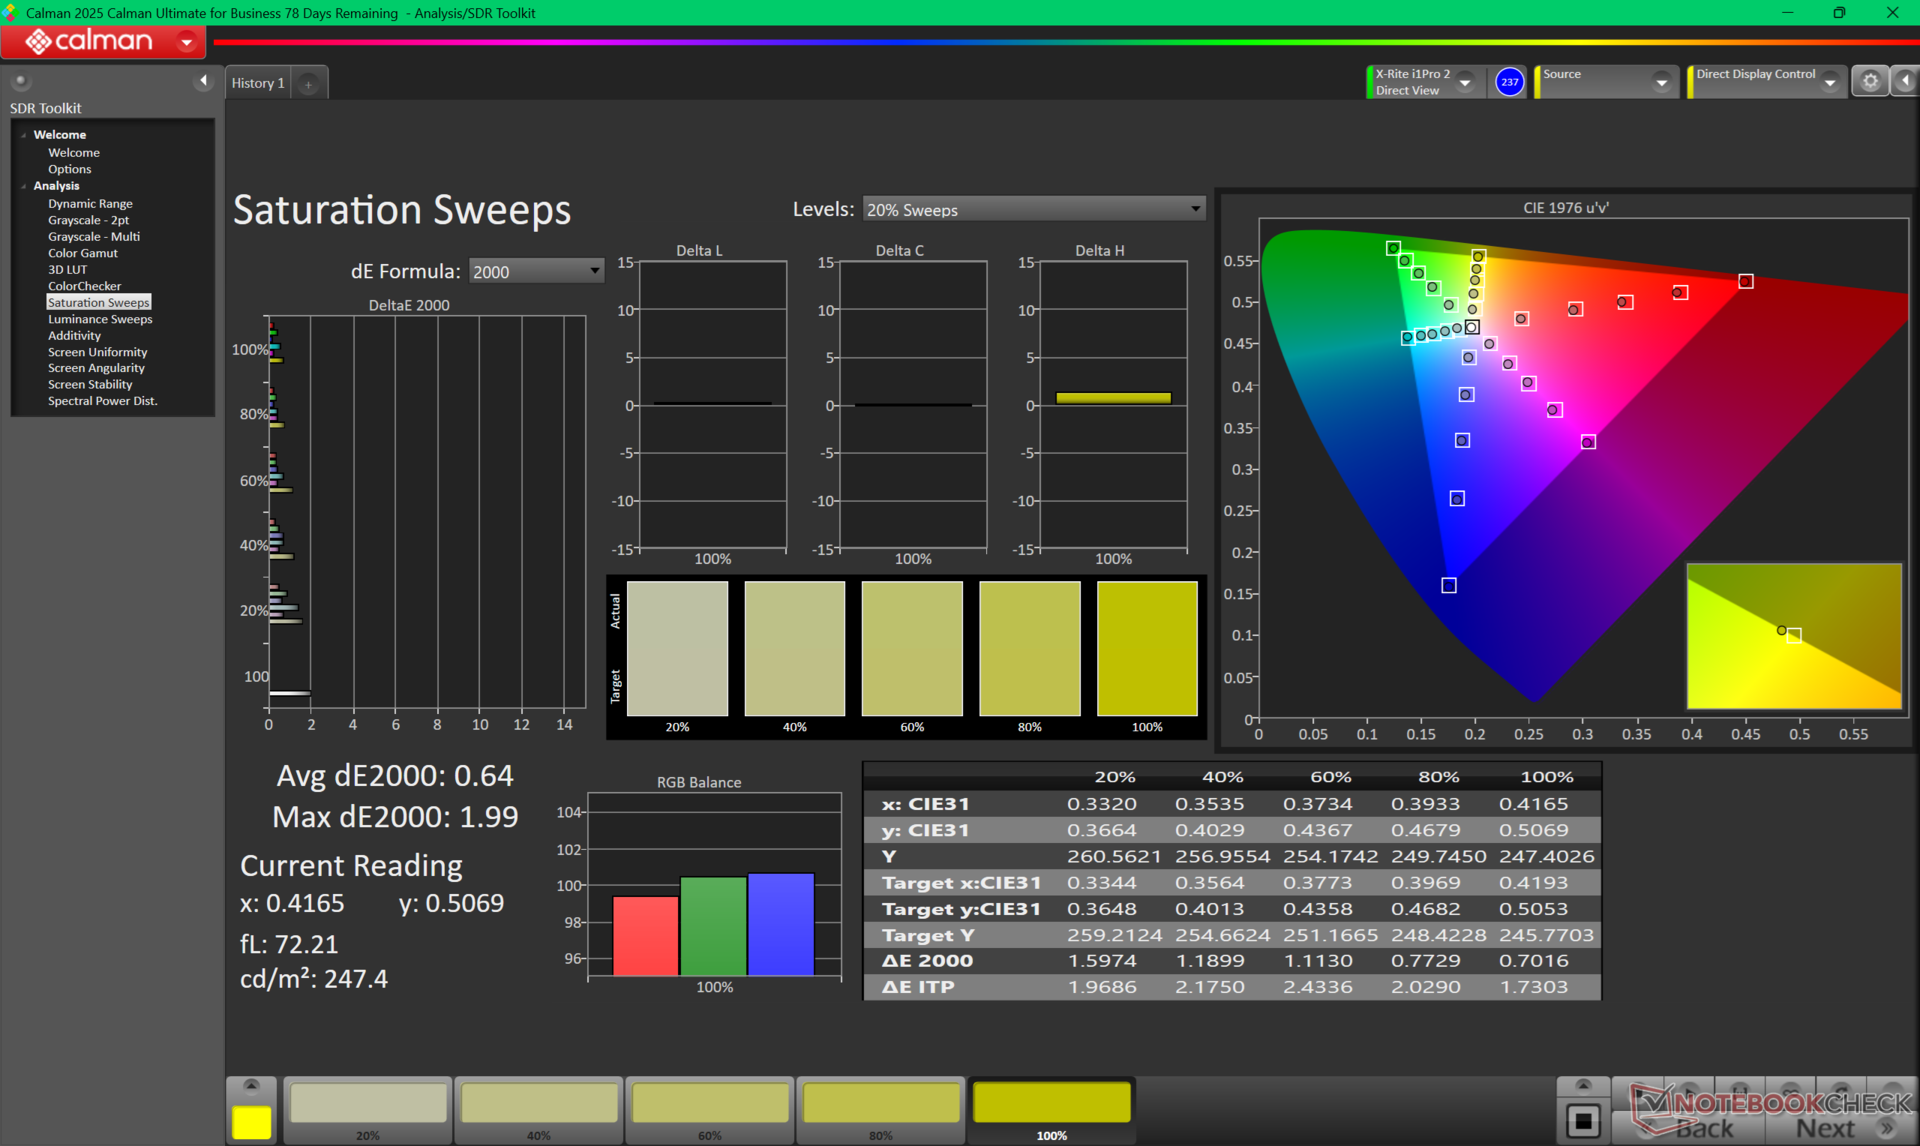
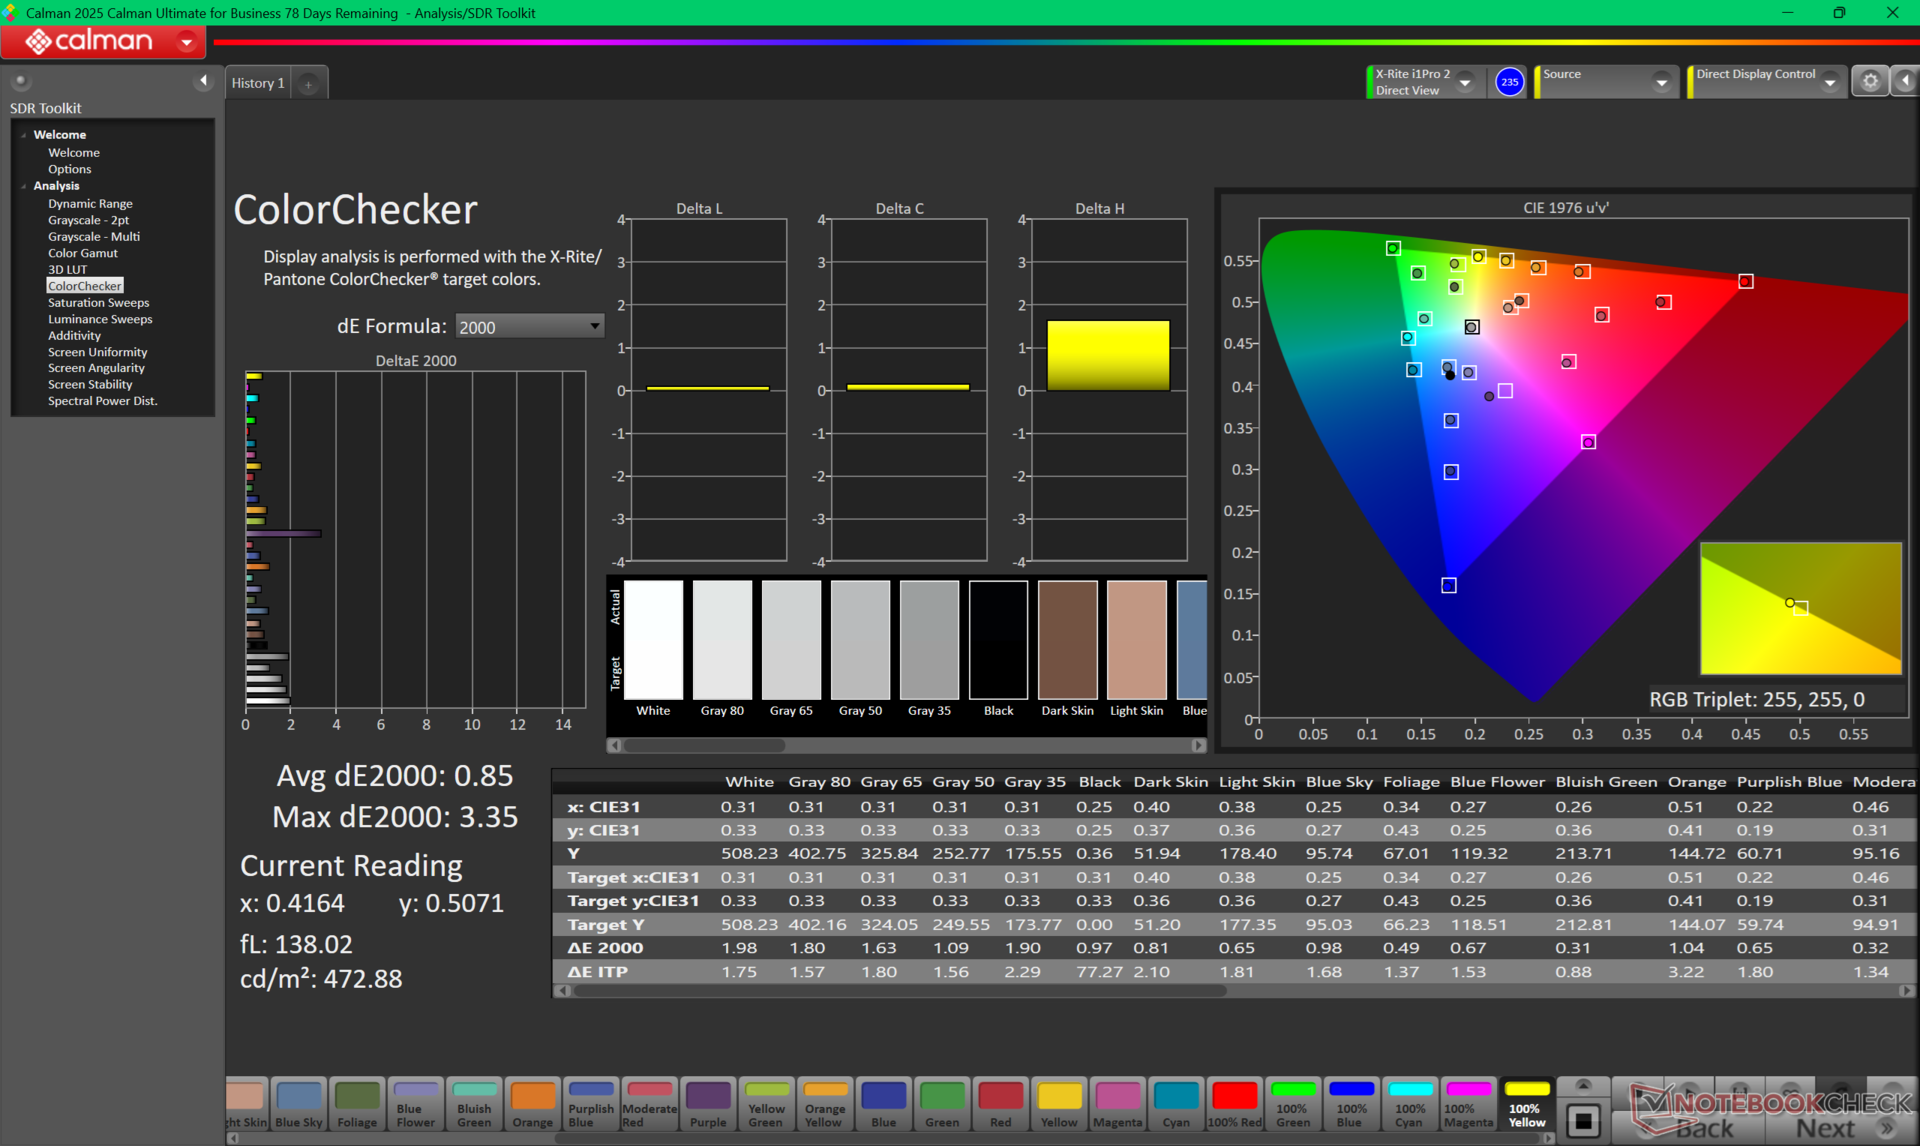
Na przykład Dell Pro Max 18 Plusnasz HP ZBook Fury G1i 18 jest również ograniczony do pojedynczej opcji bezdotykowej 2560 x 1600 IPS. HP wykorzystuje jednak inny panel od AU Optronics zamiast BOE, który oferuje podobne kolory P3 i poziomy jasności, ale z krótszym czasem reakcji czerni i bieli, szybszą natywną częstotliwością odświeżania, obsługą PSR2 i nieco niższymi poziomami kontrastu.
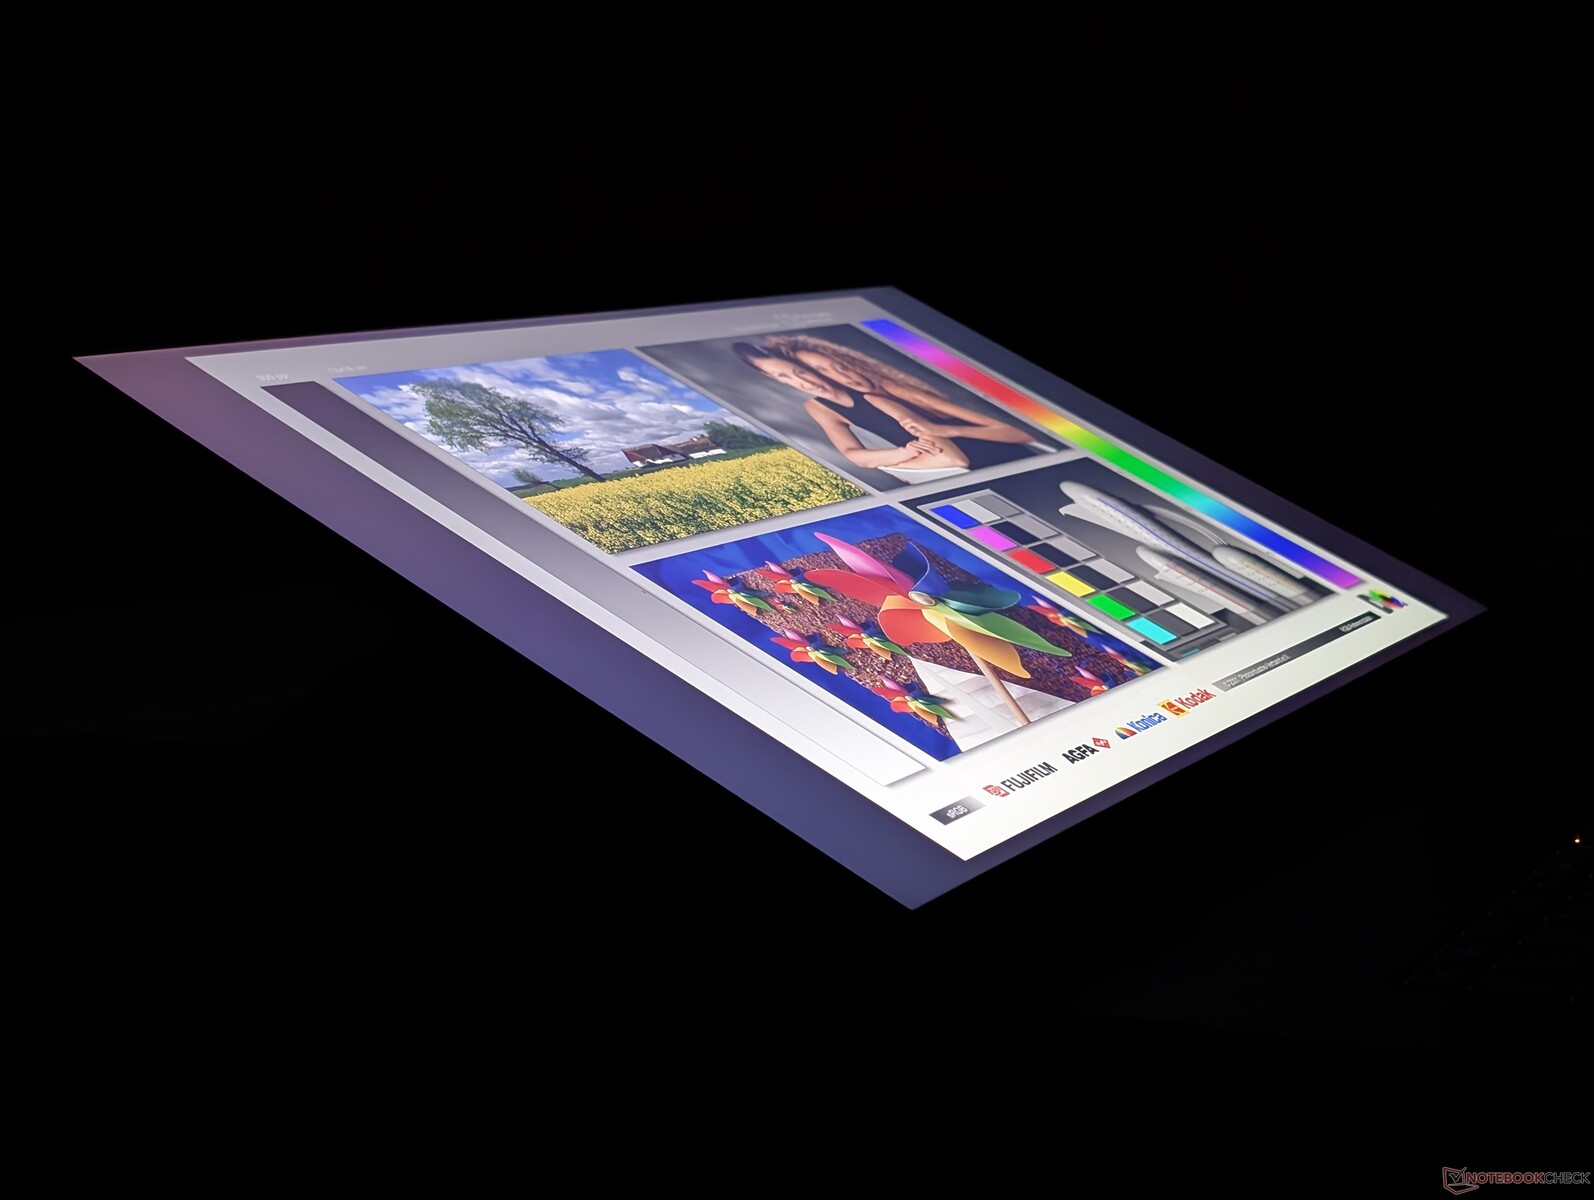
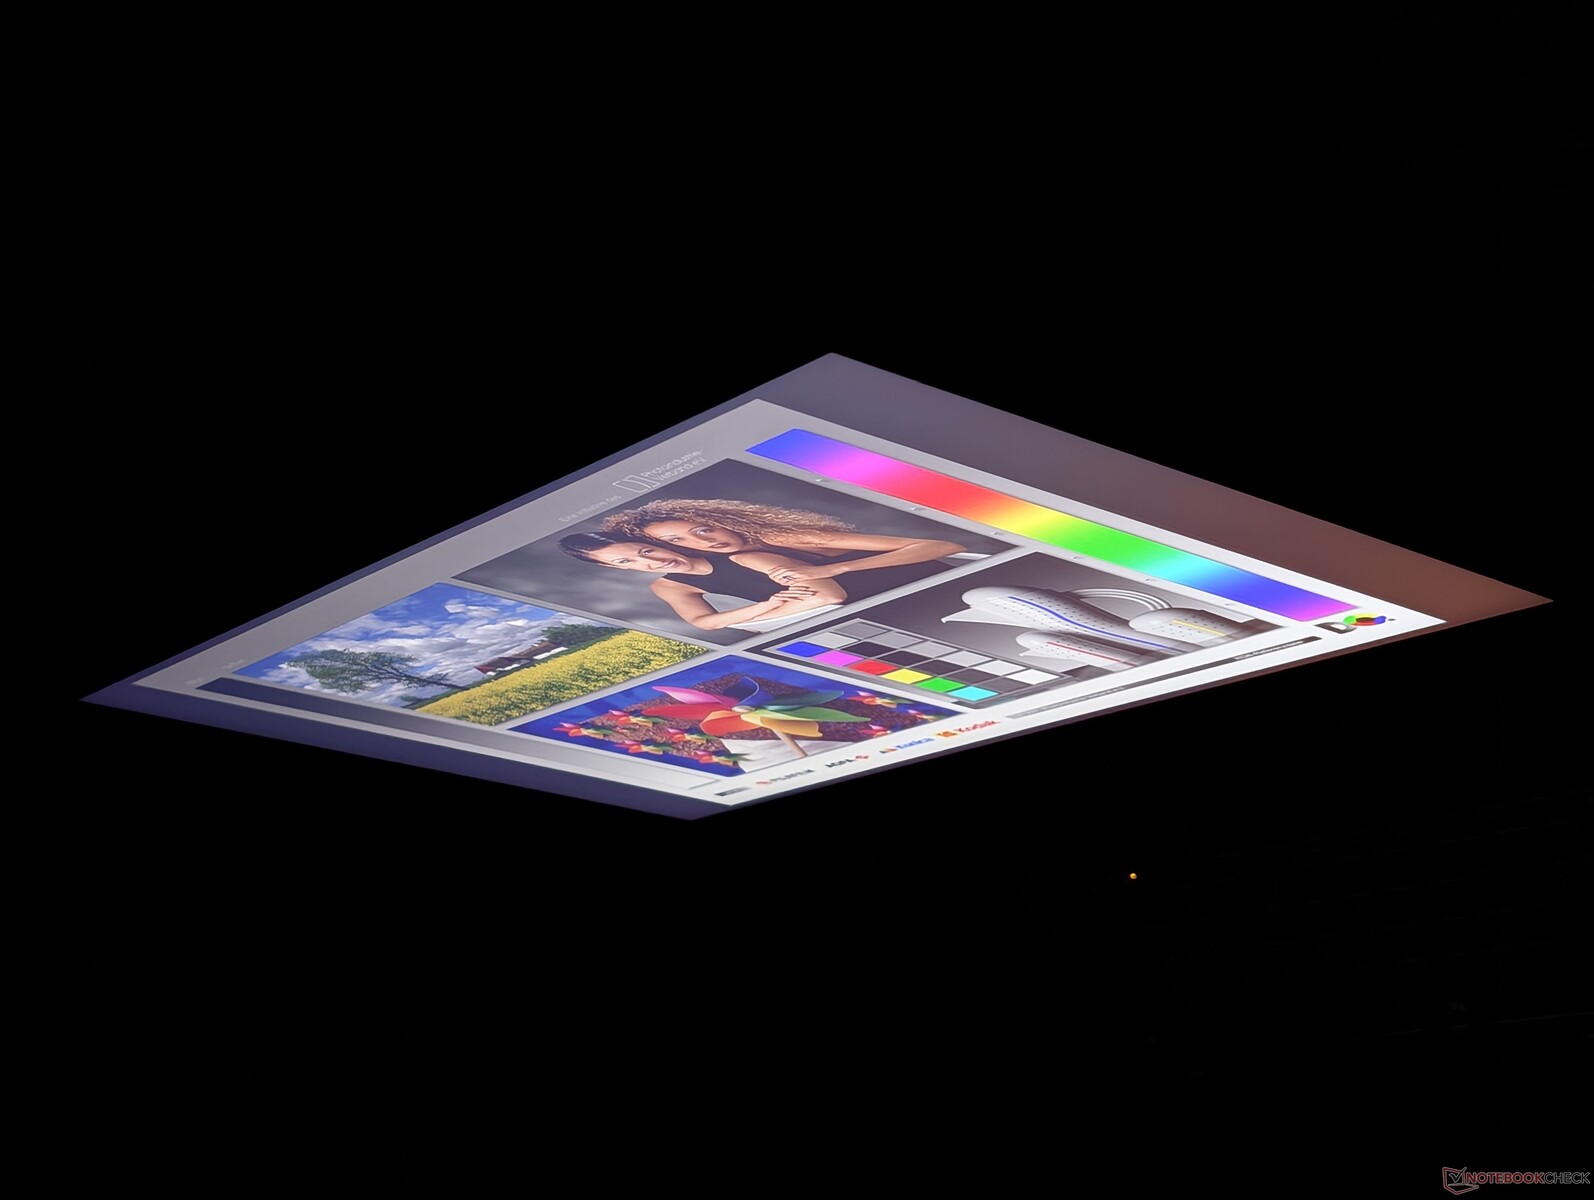
Nasza jednostka testowa cierpi na umiarkowanie nierównomierne podświetlenie w rogach, jak pokazano na poniższym zdjęciu. O ile jest to akceptowalne w przypadku tańszych laptopów, to w przypadku najlepszych stacji roboczych, takich jak ZBook, jest to nieco rozczarowujące.


| |||||||||||||||||||||||||
rozświetlenie: 92 %
na akumulatorze: 517.5 cd/m²
kontrast: 1617:1 (czerń: 0.32 cd/m²)
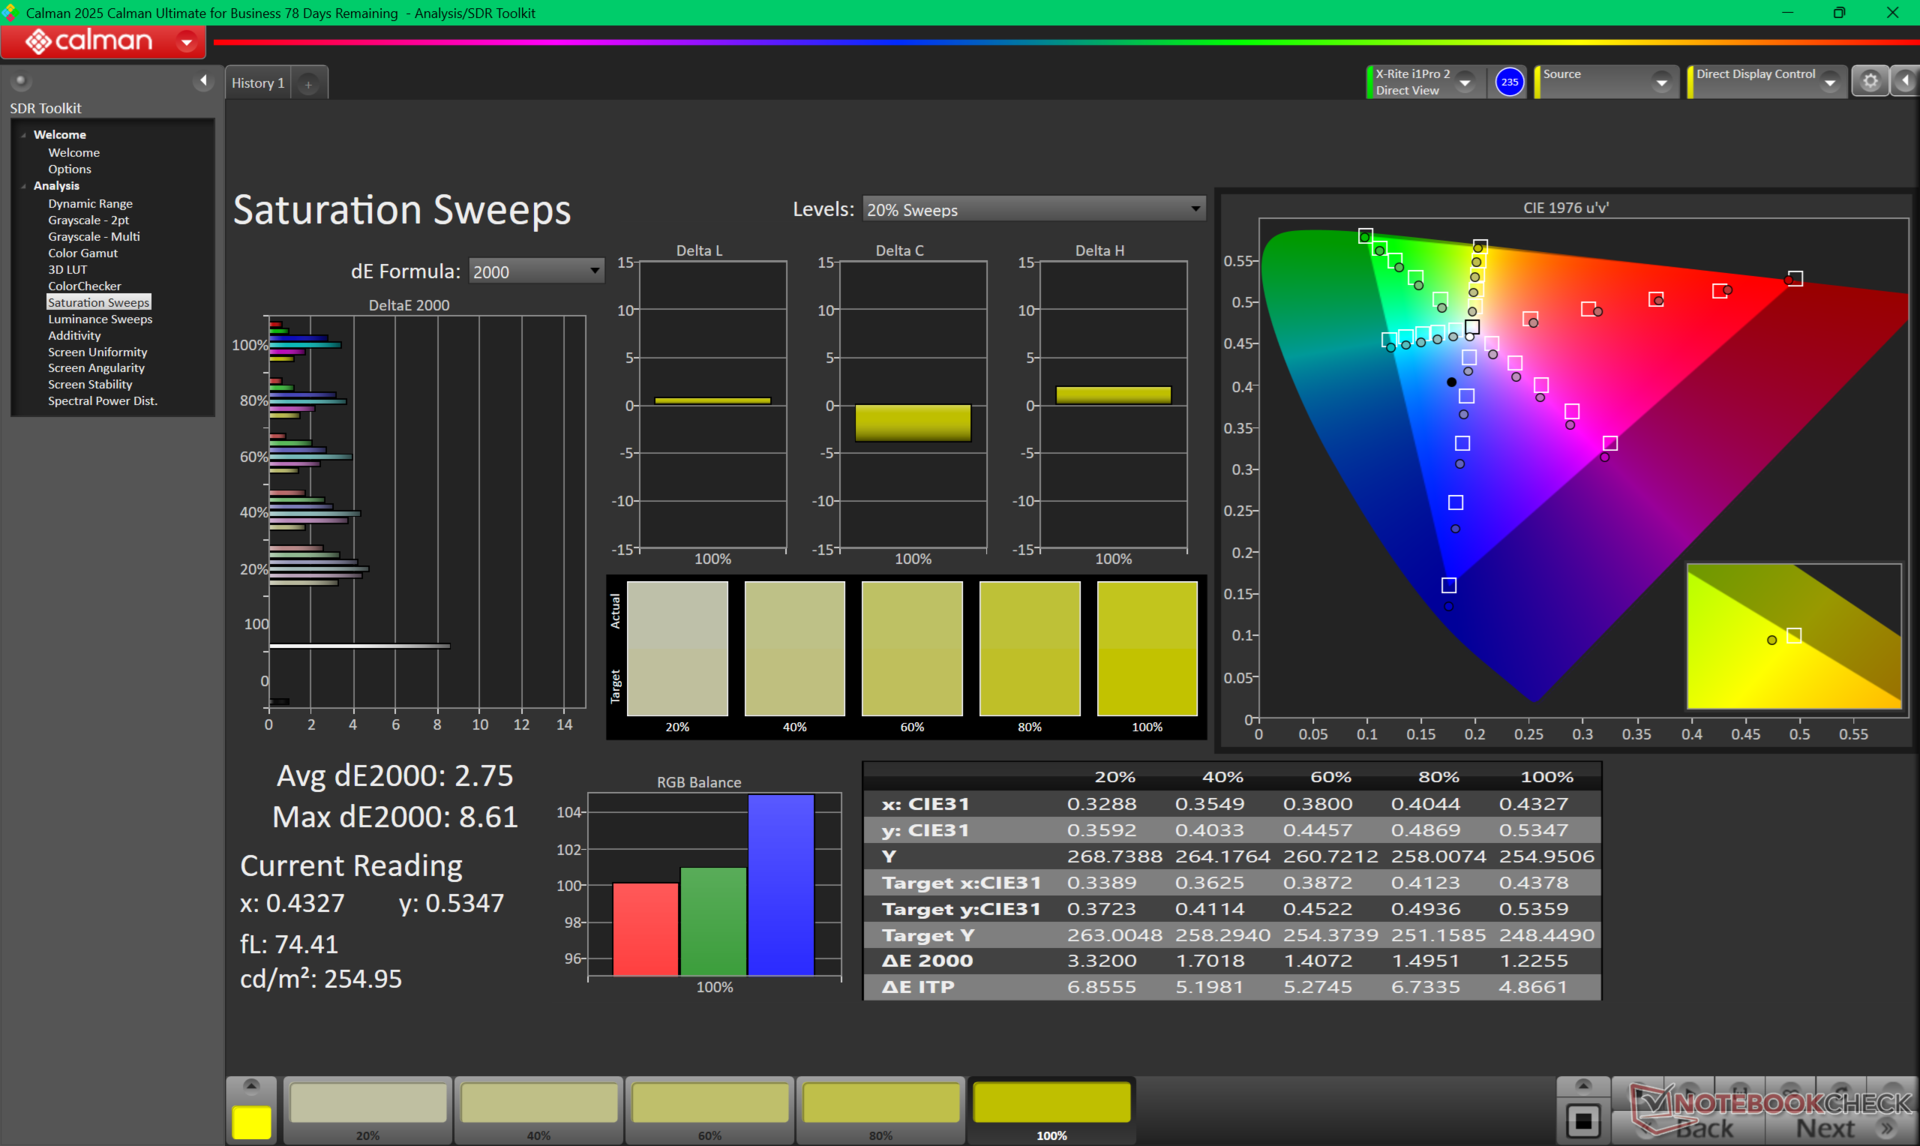
ΔE ColorChecker Calman: 3.62 | ∀{0.5-29.43 Ø4.72}
calibrated: 0.85
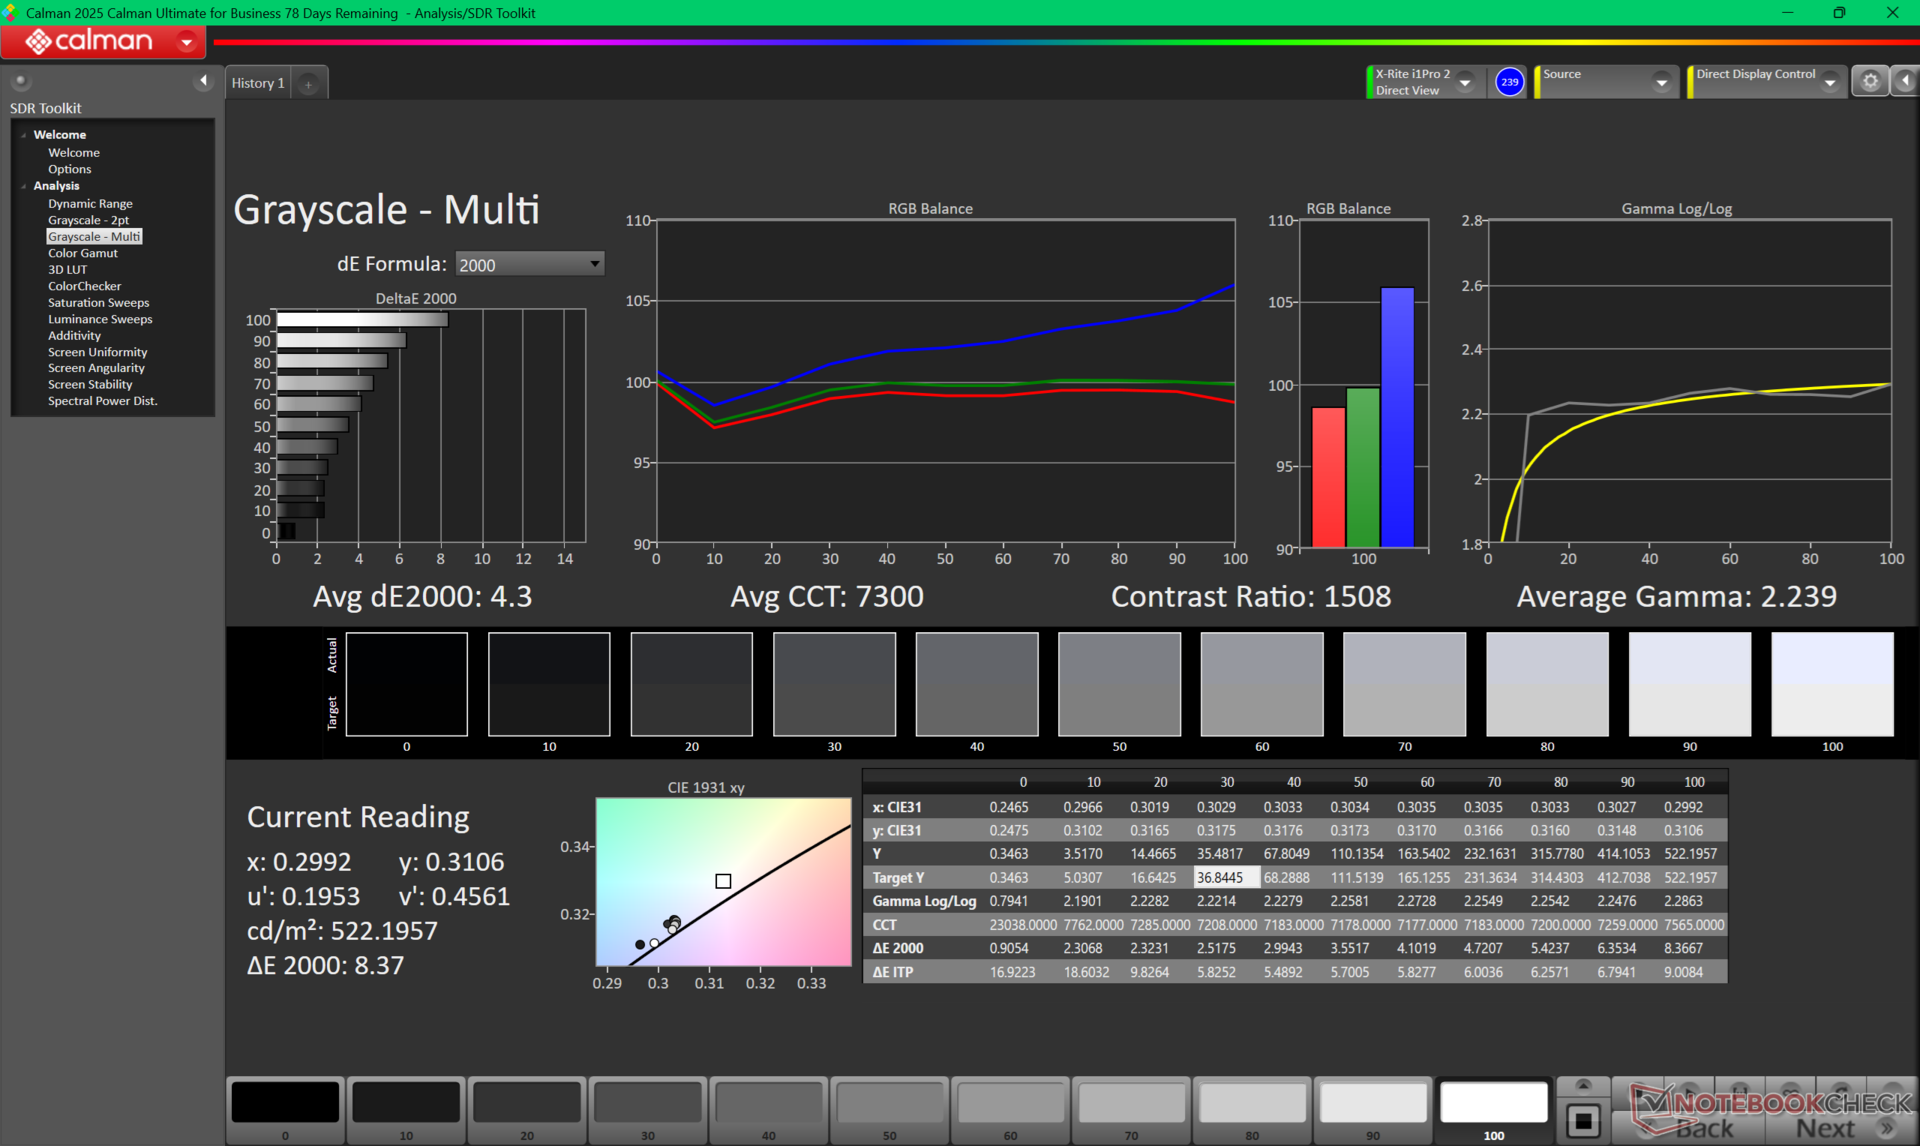
ΔE Greyscale Calman: 4.3 | ∀{0.09-98 Ø4.97}
87.7% AdobeRGB 1998 (Argyll 3D)
100% sRGB (Argyll 3D)
96.6% Display P3 (Argyll 3D)
Gamma: 2.24
CCT: 7300 K
| HP ZBook Fury G1i 18 AUO12B6, IPS, 2560x1600, 18", 165 Hz | Dell Pro Max 18 Plus MB18250 BOE NE18NZ7, IPS, 2560x1600, 18", 120 Hz | Schenker Key 18 Pro M25 RTX 5090 LQ180D1JW01, IPS, 3840x2400, 18", 200 Hz | Lenovo ThinkPad P16 Gen 2 NE160QDM-NY1, IPS, 2560x1600, 16", 165 Hz | HP ZBook X G1i 16 LG Philips LGD07B3, IPS, 2560x1600, 16", 120 Hz | HP ZBook Studio 16 G11 AUO87A8, IPS, 3840x2400, 16", 120 Hz | |
|---|---|---|---|---|---|---|
| Display | -0% | -2% | -17% | 5% | -0% | |
| Display P3 Coverage (%) | 96.6 | 97.7 1% | 90.5 -6% | 68.4 -29% | 97.2 1% | 97.7 1% |
| sRGB Coverage (%) | 100 | 99.9 0% | 100 0% | 96.9 -3% | 100 0% | 99.9 0% |
| AdobeRGB 1998 Coverage (%) | 87.7 | 85.9 -2% | 87.4 0% | 70.6 -19% | 99.9 14% | 85.7 -2% |
| Response Times | -225% | 55% | -12% | -229% | -17% | |
| Response Time Grey 50% / Grey 80% * (ms) | 12.5 ? | 39.9 ? -219% | 5.2 ? 58% | 14.1 ? -13% | 45.5 ? -264% | 14.2 ? -14% |
| Response Time Black / White * (ms) | 8.9 ? | 29.4 ? -230% | 4.3 ? 52% | 9.9 ? -11% | 26.1 ? -193% | 10.6 ? -19% |
| PWM Frequency (Hz) | 26536 ? | |||||
| PWM Amplitude * (%) | 47 | |||||
| Screen | 27% | 5% | 19% | -10% | 2% | |
| Brightness middle (cd/m²) | 517.5 | 528.8 2% | 529 2% | 531.5 3% | 461.8 -11% | 404.3 -22% |
| Brightness (cd/m²) | 497 | 515 4% | 513 3% | 499 0% | 427 -14% | 405 -19% |
| Brightness Distribution (%) | 92 | 91 -1% | 95 3% | 89 -3% | 88 -4% | 92 0% |
| Black Level * (cd/m²) | 0.32 | 0.22 31% | 0.31 3% | 0.38 -19% | 0.46 -44% | 0.28 12% |
| Contrast (:1) | 1617 | 2404 49% | 1706 6% | 1399 -13% | 1004 -38% | 1444 -11% |
| Colorchecker dE 2000 * | 3.62 | 2.76 24% | 2.7 25% | 1.82 50% | 4.08 -13% | 2.63 27% |
| Colorchecker dE 2000 max. * | 8.75 | 5.38 39% | 7.8 11% | 4.1 53% | 8.1 7% | 4.48 49% |
| Colorchecker dE 2000 calibrated * | 0.85 | 0.47 45% | 0.8 6% | 0.63 26% | 0.75 12% | 1.46 -72% |
| Greyscale dE 2000 * | 4.3 | 2.2 49% | 4.9 -14% | 1.2 72% | 3.5 19% | 2.1 51% |
| Gamma | 2.24 98% | 2.14 103% | 2.23 99% | 2.15 102% | 2.15 102% | 2.3 96% |
| CCT | 7300 89% | 2584 252% | 6997 93% | 6484 100% | 6715 97% | 6810 95% |
| Całkowita średnia (program / ustawienia) | -66% /
-15% | 19% /
11% | -3% /
7% | -78% /
-38% | -5% /
-1% |
* ... im mniej tym lepiej
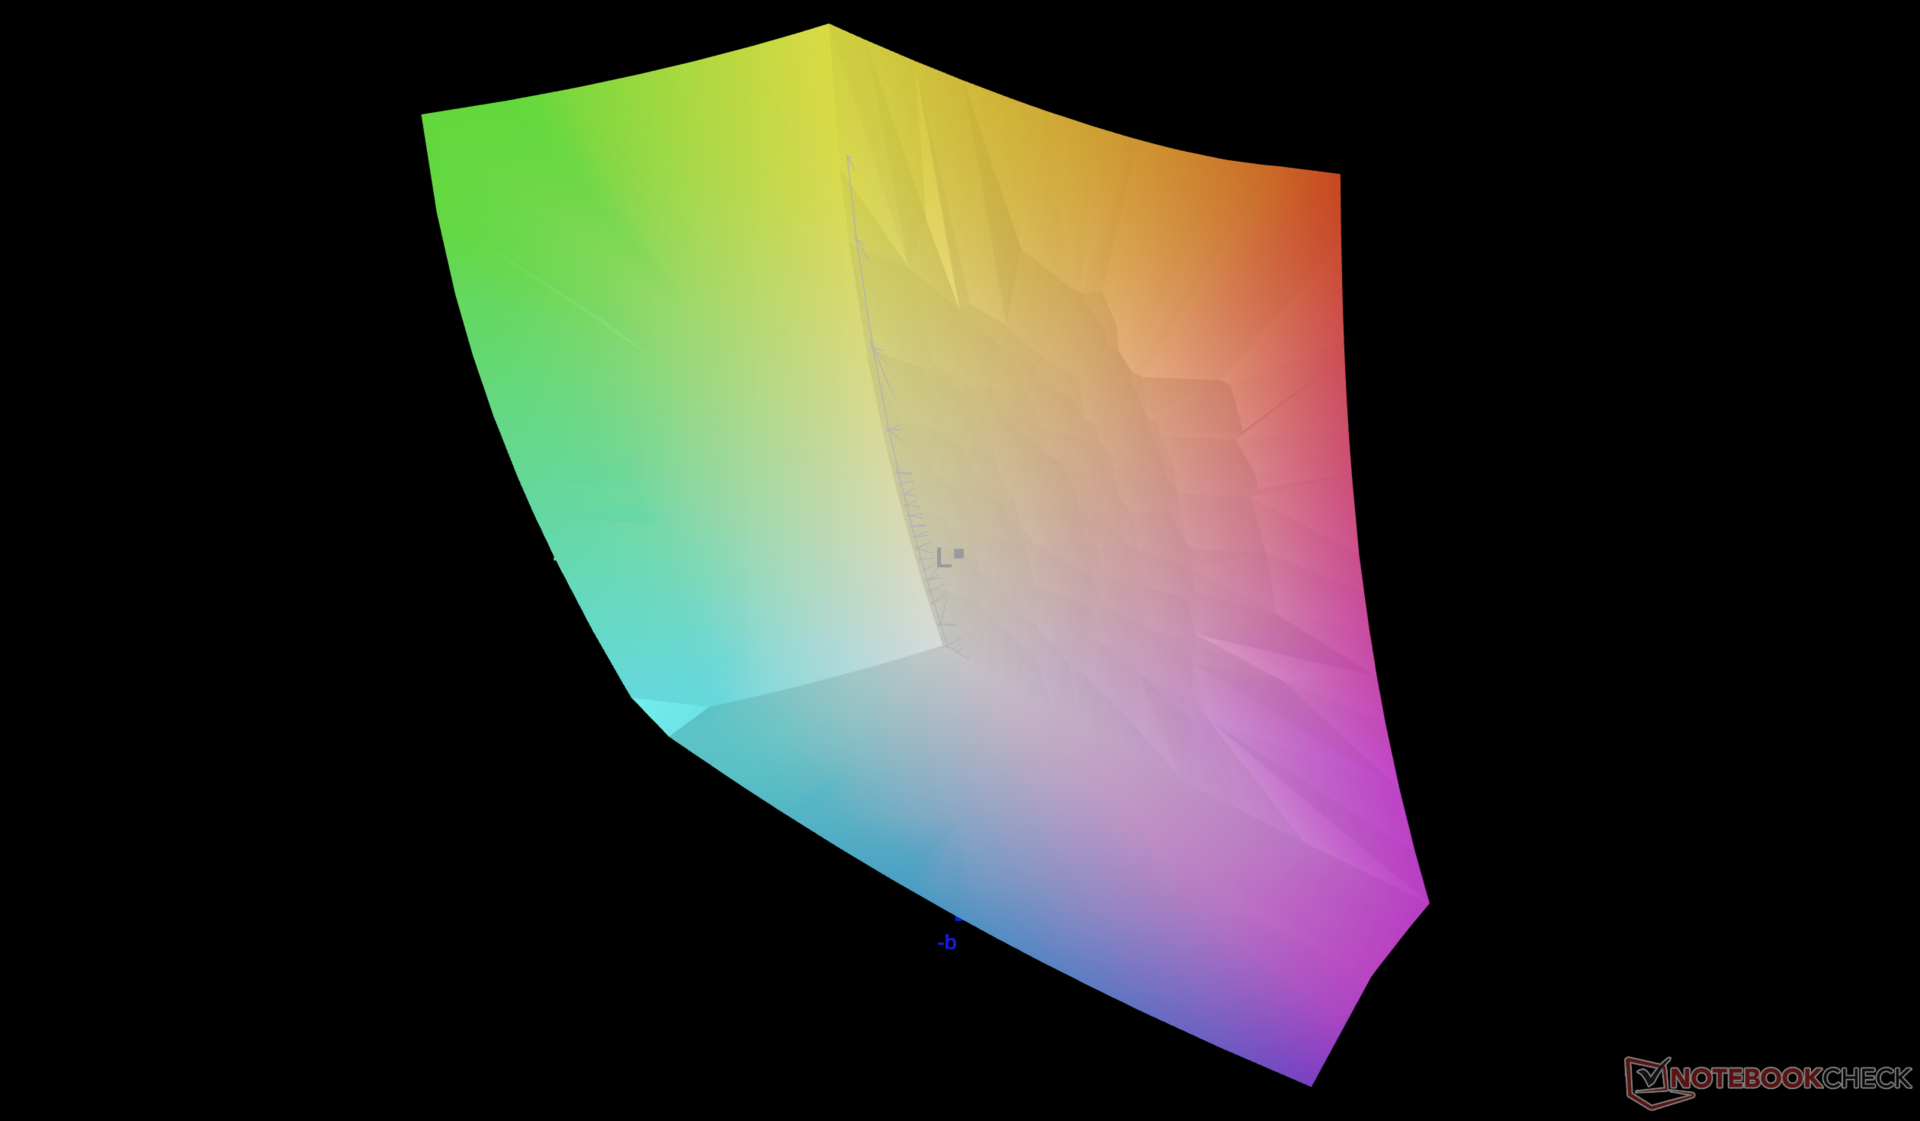
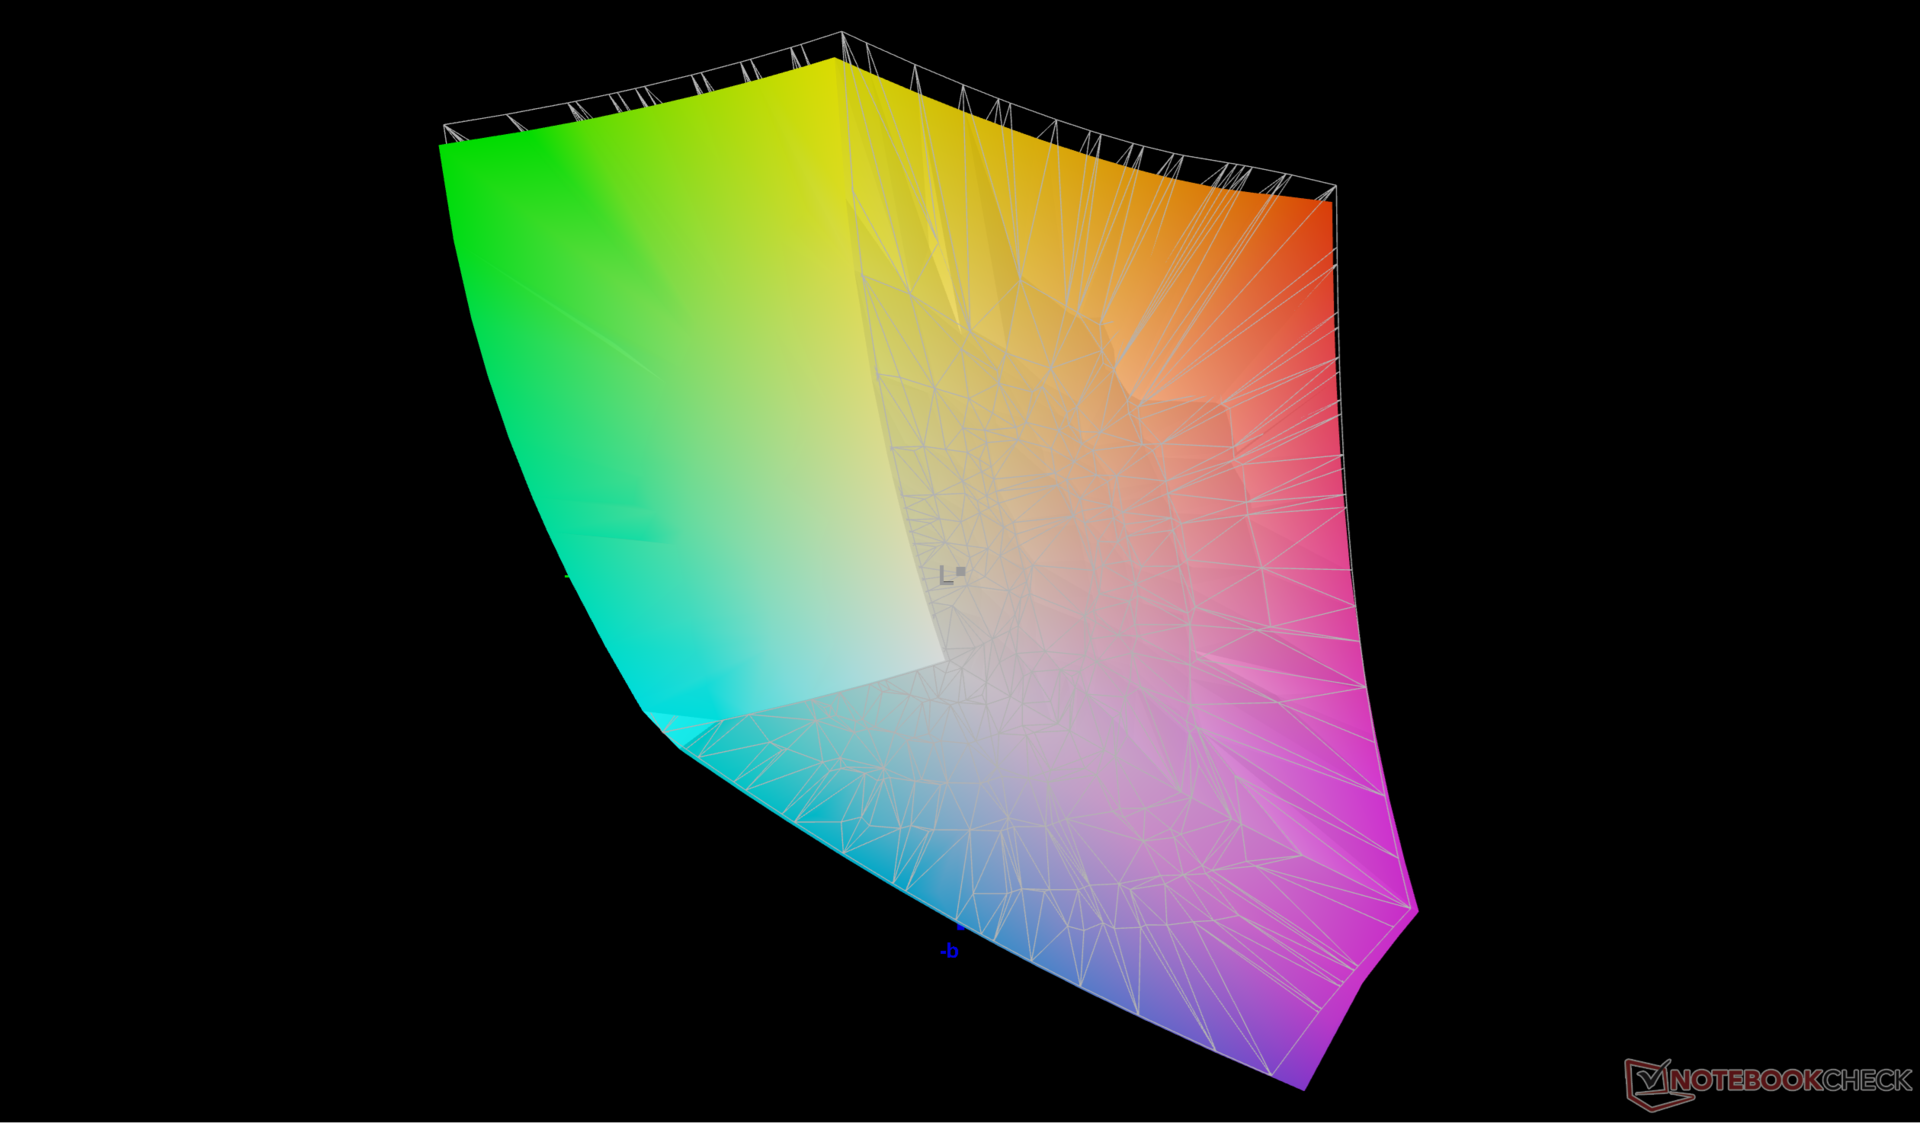
Temperatura barwowa po wyjęciu z pudełka wynosi 7300. Poza tym wyświetlacz jest przyzwoicie skalibrowany zgodnie ze standardem P3.

Wyświetl czasy reakcji
| ↔ Czas reakcji od czerni do bieli | ||
|---|---|---|
| 8.9 ms ... wzrost ↗ i spadek ↘ łącznie | ↗ 4.5 ms wzrost | 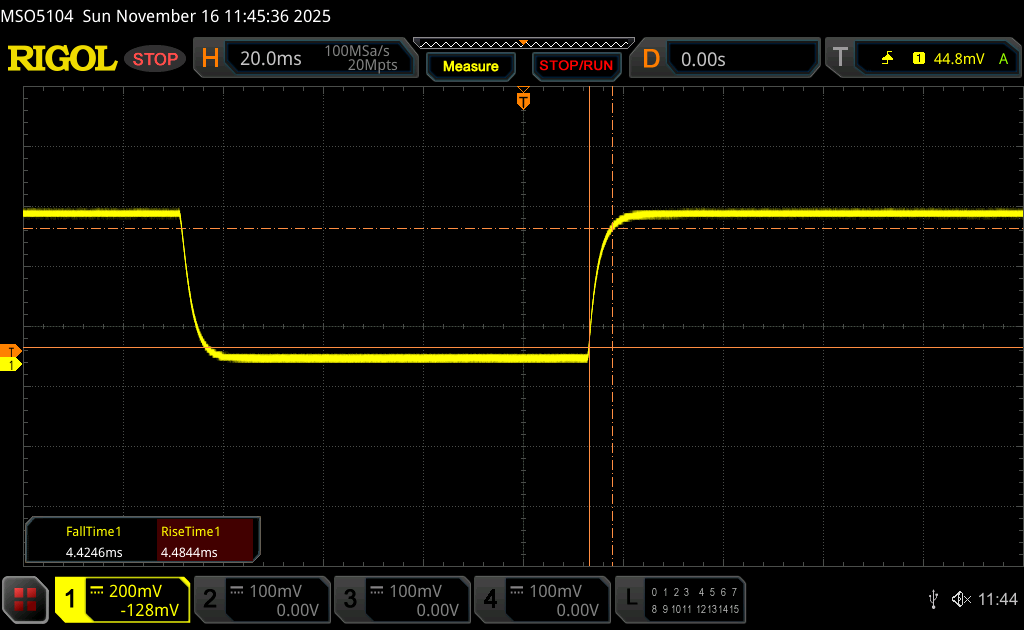 |
| ↘ 4.4 ms upadek | ||
| W naszych testach ekran wykazuje szybki czas reakcji i powinien nadawać się do gier. Dla porównania, wszystkie testowane urządzenia wahają się od 0.1 (minimum) do 240 (maksimum) ms. » 25 % wszystkich urządzeń jest lepszych. Oznacza to, że zmierzony czas reakcji jest lepszy od średniej wszystkich testowanych urządzeń (19.8 ms). | ||
| ↔ Czas reakcji 50% szarości do 80% szarości | ||
| 12.5 ms ... wzrost ↗ i spadek ↘ łącznie | ↗ 6.1 ms wzrost | 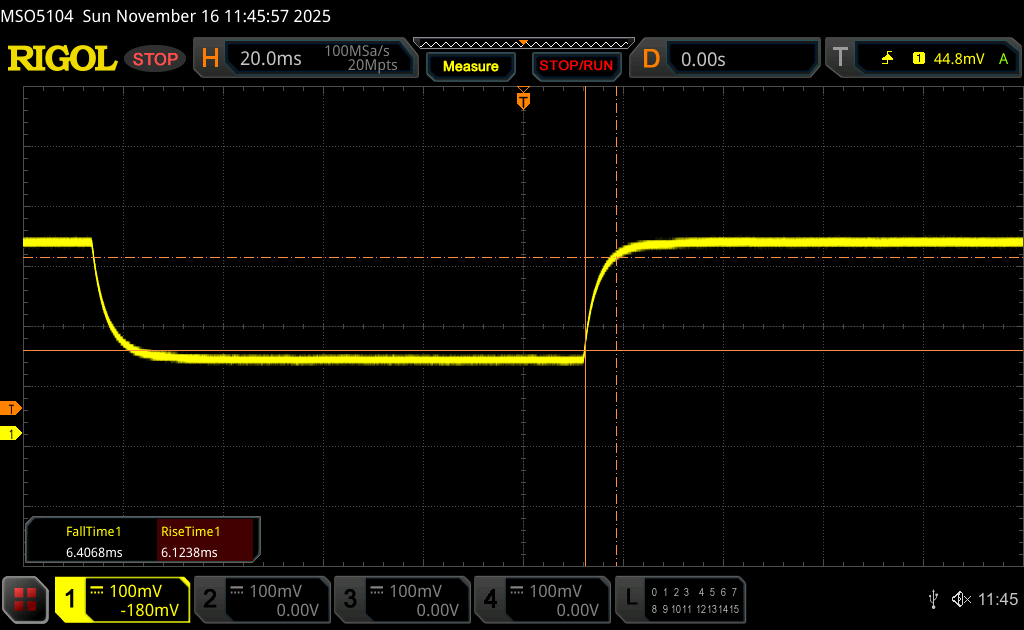 |
| ↘ 6.4 ms upadek | ||
| W naszych testach ekran wykazuje dobry współczynnik reakcji, ale może być zbyt wolny dla graczy rywalizujących ze sobą. Dla porównania, wszystkie testowane urządzenia wahają się od 0.165 (minimum) do 636 (maksimum) ms. » 26 % wszystkich urządzeń jest lepszych. Oznacza to, że zmierzony czas reakcji jest lepszy od średniej wszystkich testowanych urządzeń (31 ms). | ||
Migotanie ekranu / PWM (modulacja szerokości impulsu)
| Migotanie ekranu/nie wykryto PWM | 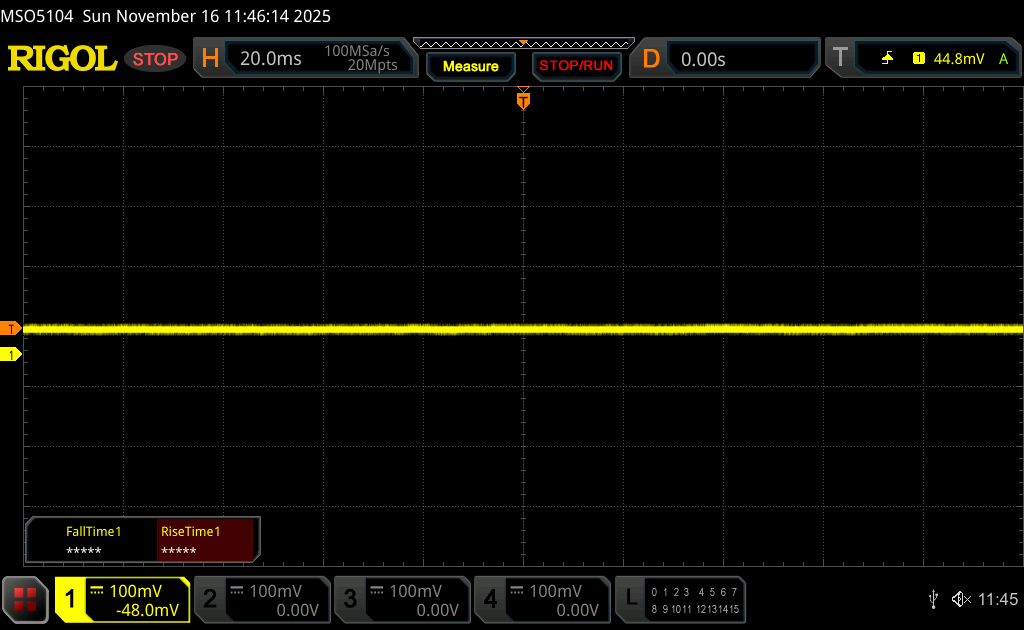 | ||
Dla porównania: 52 % wszystkich testowanych urządzeń nie używa PWM do przyciemniania wyświetlacza. Jeśli wykryto PWM, zmierzono średnio 7763 (minimum: 5 - maksimum: 343500) Hz. | |||


Wydajność - Arrow Lake-HX i Nvidia Blackwell
Warunki testowania
Przed uruchomieniem poniższych testów porównawczych ustawiliśmy system Windows na tryb wydajności z aktywnym oddzielnym procesorem graficznym. Advanced Optimus nie jest obsługiwany w przeciwieństwie do konkurencyjnego Dell Pro Max 18 Plus.
Procesor
Procesor Core Ultra 9 285HX w naszym HP działa konsekwentnie wolniej niż ten sam procesor w Dell Pro Max 18 Plus o zaledwie kilka punktów procentowych. Turbo Boost wydaje się być słabszy w HP, co pokazują poniższe wyniki pętli CineBench R15 xT, ale obie maszyny osiągają plateau przy prawie takich samych częstotliwościach taktowania, gdy korzyści z Turbo Boost ustąpią.
Konfiguracja z Core Ultra 7 255HX zamiast Core Ultra 9 285HX oczekuje się, że wpłynie na wydajność procesora o zaledwie 5 procent w oparciu o nasz czas z Lenovo Legion Pro 5 16IAX10. Użytkownicy mogą zatem rozważyć opcję procesora z niższej półki, aby zaoszczędzić na kosztach.
Cinebench R15 Multi Loop
Cinebench R23: Multi Core | Single Core
Cinebench R20: CPU (Multi Core) | CPU (Single Core)
Cinebench R15: CPU Multi 64Bit | CPU Single 64Bit
Blender: v2.79 BMW27 CPU
7-Zip 18.03: 7z b 4 | 7z b 4 -mmt1
Geekbench 6.7: Multi-Core | Single-Core
Geekbench 5.5: Multi-Core | Single-Core
HWBOT x265 Benchmark v2.2: 4k Preset
LibreOffice : 20 Documents To PDF
R Benchmark 2.5: Overall mean
| CPU Performance rating | |
| Dell Pro Max 18 Plus MB18250 | |
| Przeciętny Intel Core Ultra 9 285HX | |
| HP ZBook Fury G1i 18 | |
| Schenker Key 18 Pro M25 RTX 5090 | |
| Lenovo Legion Pro 5 16IAX10, RTX 5070 | |
| Lenovo ThinkPad P16 Gen 2 | |
| HP ZBook X G1i 16 | |
| Lenovo ThinkPad P14s Gen 6 21QT0012GE | |
| Lenovo ThinkPad P16 G1 RTX A5500 -2! | |
| Lenovo ThinkPad P16s Gen 4 21RX000YGE | |
| HP ZBook Studio 16 G11 | |
| Lenovo ThinkPad P14s G5 21G3S00A00 | |
| HP ZBook Power 15 G8 313S5EA -2! | |
| Cinebench R23 / Multi Core | |
| Dell Pro Max 18 Plus MB18250 | |
| Przeciętny Intel Core Ultra 9 285HX (34955 - 40117, n=6) | |
| Schenker Key 18 Pro M25 RTX 5090 | |
| HP ZBook Fury G1i 18 | |
| Lenovo Legion Pro 5 16IAX10, RTX 5070 | |
| Lenovo ThinkPad P16 Gen 2 | |
| HP ZBook X G1i 16 | |
| Lenovo ThinkPad P16 G1 RTX A5500 | |
| Lenovo ThinkPad P14s Gen 6 21QT0012GE | |
| Lenovo ThinkPad P16s Gen 4 21RX000YGE | |
| HP ZBook Studio 16 G11 | |
| Lenovo ThinkPad P14s G5 21G3S00A00 | |
| HP ZBook Power 15 G8 313S5EA | |
| Cinebench R23 / Single Core | |
| Schenker Key 18 Pro M25 RTX 5090 | |
| HP ZBook Fury G1i 18 | |
| Przeciętny Intel Core Ultra 9 285HX (2057 - 2303, n=6) | |
| Lenovo Legion Pro 5 16IAX10, RTX 5070 | |
| Dell Pro Max 18 Plus MB18250 | |
| Lenovo ThinkPad P14s Gen 6 21QT0012GE | |
| Lenovo ThinkPad P16 Gen 2 | |
| HP ZBook X G1i 16 | |
| Lenovo ThinkPad P16s Gen 4 21RX000YGE | |
| Lenovo ThinkPad P16 G1 RTX A5500 | |
| HP ZBook Studio 16 G11 | |
| Lenovo ThinkPad P14s G5 21G3S00A00 | |
| HP ZBook Power 15 G8 313S5EA | |
| Cinebench R20 / CPU (Multi Core) | |
| Dell Pro Max 18 Plus MB18250 | |
| Przeciętny Intel Core Ultra 9 285HX (13152 - 15751, n=6) | |
| Schenker Key 18 Pro M25 RTX 5090 | |
| HP ZBook Fury G1i 18 | |
| Lenovo Legion Pro 5 16IAX10, RTX 5070 | |
| Lenovo ThinkPad P16 Gen 2 | |
| HP ZBook X G1i 16 | |
| Lenovo ThinkPad P14s Gen 6 21QT0012GE | |
| Lenovo ThinkPad P16 G1 RTX A5500 | |
| Lenovo ThinkPad P16s Gen 4 21RX000YGE | |
| HP ZBook Studio 16 G11 | |
| Lenovo ThinkPad P14s G5 21G3S00A00 | |
| HP ZBook Power 15 G8 313S5EA | |
| Cinebench R20 / CPU (Single Core) | |
| Schenker Key 18 Pro M25 RTX 5090 | |
| Przeciętny Intel Core Ultra 9 285HX (799 - 884, n=6) | |
| HP ZBook Fury G1i 18 | |
| Lenovo Legion Pro 5 16IAX10, RTX 5070 | |
| Dell Pro Max 18 Plus MB18250 | |
| Lenovo ThinkPad P16s Gen 4 21RX000YGE | |
| Lenovo ThinkPad P14s Gen 6 21QT0012GE | |
| Lenovo ThinkPad P16 Gen 2 | |
| HP ZBook X G1i 16 | |
| Lenovo ThinkPad P16 G1 RTX A5500 | |
| Lenovo ThinkPad P14s G5 21G3S00A00 | |
| HP ZBook Studio 16 G11 | |
| HP ZBook Power 15 G8 313S5EA | |
| Cinebench R15 / CPU Multi 64Bit | |
| Dell Pro Max 18 Plus MB18250 | |
| Przeciętny Intel Core Ultra 9 285HX (5427 - 6232, n=6) | |
| Schenker Key 18 Pro M25 RTX 5090 | |
| HP ZBook Fury G1i 18 | |
| Lenovo Legion Pro 5 16IAX10, RTX 5070 | |
| Lenovo ThinkPad P16 Gen 2 | |
| HP ZBook X G1i 16 | |
| Lenovo ThinkPad P16s Gen 4 21RX000YGE | |
| Lenovo ThinkPad P16 G1 RTX A5500 | |
| Lenovo ThinkPad P14s Gen 6 21QT0012GE | |
| HP ZBook Studio 16 G11 | |
| Lenovo ThinkPad P14s G5 21G3S00A00 | |
| HP ZBook Power 15 G8 313S5EA | |
| HP ZBook Power 15 G8 313S5EA | |
| Cinebench R15 / CPU Single 64Bit | |
| Lenovo Legion Pro 5 16IAX10, RTX 5070 | |
| HP ZBook Fury G1i 18 | |
| Schenker Key 18 Pro M25 RTX 5090 | |
| Przeciętny Intel Core Ultra 9 285HX (307 - 340, n=6) | |
| Dell Pro Max 18 Plus MB18250 | |
| Lenovo ThinkPad P16s Gen 4 21RX000YGE | |
| Lenovo ThinkPad P14s Gen 6 21QT0012GE | |
| HP ZBook X G1i 16 | |
| Lenovo ThinkPad P16 Gen 2 | |
| Lenovo ThinkPad P16 G1 RTX A5500 | |
| Lenovo ThinkPad P14s G5 21G3S00A00 | |
| HP ZBook Studio 16 G11 | |
| HP ZBook Power 15 G8 313S5EA | |
| Blender / v2.79 BMW27 CPU | |
| HP ZBook Power 15 G8 313S5EA | |
| Lenovo ThinkPad P14s G5 21G3S00A00 | |
| Lenovo ThinkPad P14s Gen 6 21QT0012GE | |
| HP ZBook Studio 16 G11 | |
| Lenovo ThinkPad P16s Gen 4 21RX000YGE | |
| HP ZBook X G1i 16 | |
| Lenovo ThinkPad P16 G1 RTX A5500 | |
| Lenovo ThinkPad P16 Gen 2 | |
| Lenovo Legion Pro 5 16IAX10, RTX 5070 | |
| HP ZBook Fury G1i 18 | |
| Przeciętny Intel Core Ultra 9 285HX (83 - 103, n=6) | |
| Dell Pro Max 18 Plus MB18250 | |
| Schenker Key 18 Pro M25 RTX 5090 | |
| 7-Zip 18.03 / 7z b 4 | |
| Dell Pro Max 18 Plus MB18250 | |
| Przeciętny Intel Core Ultra 9 285HX (99260 - 128778, n=6) | |
| Schenker Key 18 Pro M25 RTX 5090 | |
| Lenovo Legion Pro 5 16IAX10, RTX 5070 | |
| HP ZBook Fury G1i 18 | |
| Lenovo ThinkPad P16 Gen 2 | |
| Lenovo ThinkPad P16 G1 RTX A5500 | |
| HP ZBook Studio 16 G11 | |
| Lenovo ThinkPad P16s Gen 4 21RX000YGE | |
| HP ZBook X G1i 16 | |
| Lenovo ThinkPad P14s G5 21G3S00A00 | |
| Lenovo ThinkPad P14s Gen 6 21QT0012GE | |
| HP ZBook Power 15 G8 313S5EA | |
| 7-Zip 18.03 / 7z b 4 -mmt1 | |
| Lenovo ThinkPad P16 Gen 2 | |
| Dell Pro Max 18 Plus MB18250 | |
| HP ZBook Fury G1i 18 | |
| Przeciętny Intel Core Ultra 9 285HX (6422 - 6822, n=6) | |
| Lenovo Legion Pro 5 16IAX10, RTX 5070 | |
| Lenovo ThinkPad P16s Gen 4 21RX000YGE | |
| Lenovo ThinkPad P16 G1 RTX A5500 | |
| HP ZBook X G1i 16 | |
| Schenker Key 18 Pro M25 RTX 5090 | |
| Lenovo ThinkPad P14s Gen 6 21QT0012GE | |
| HP ZBook Power 15 G8 313S5EA | |
| Lenovo ThinkPad P14s G5 21G3S00A00 | |
| HP ZBook Studio 16 G11 | |
| Geekbench 5.5 / Multi-Core | |
| Dell Pro Max 18 Plus MB18250 | |
| Przeciętny Intel Core Ultra 9 285HX (18992 - 27010, n=6) | |
| Lenovo Legion Pro 5 16IAX10, RTX 5070 | |
| Schenker Key 18 Pro M25 RTX 5090 | |
| HP ZBook Fury G1i 18 | |
| Lenovo ThinkPad P16 Gen 2 | |
| HP ZBook X G1i 16 | |
| Lenovo ThinkPad P16 G1 RTX A5500 | |
| Lenovo ThinkPad P16s Gen 4 21RX000YGE | |
| Lenovo ThinkPad P14s Gen 6 21QT0012GE | |
| HP ZBook Studio 16 G11 | |
| Lenovo ThinkPad P14s G5 21G3S00A00 | |
| HP ZBook Power 15 G8 313S5EA | |
| Geekbench 5.5 / Single-Core | |
| Lenovo Legion Pro 5 16IAX10, RTX 5070 | |
| Dell Pro Max 18 Plus MB18250 | |
| Przeciętny Intel Core Ultra 9 285HX (2121 - 2232, n=6) | |
| HP ZBook Fury G1i 18 | |
| Lenovo ThinkPad P16s Gen 4 21RX000YGE | |
| Schenker Key 18 Pro M25 RTX 5090 | |
| HP ZBook X G1i 16 | |
| Lenovo ThinkPad P14s Gen 6 21QT0012GE | |
| Lenovo ThinkPad P16 Gen 2 | |
| Lenovo ThinkPad P16 G1 RTX A5500 | |
| HP ZBook Studio 16 G11 | |
| Lenovo ThinkPad P14s G5 21G3S00A00 | |
| HP ZBook Power 15 G8 313S5EA | |
| HWBOT x265 Benchmark v2.2 / 4k Preset | |
| Dell Pro Max 18 Plus MB18250 | |
| Przeciętny Intel Core Ultra 9 285HX (35.3 - 44.3, n=6) | |
| Lenovo Legion Pro 5 16IAX10, RTX 5070 | |
| Schenker Key 18 Pro M25 RTX 5090 | |
| HP ZBook Fury G1i 18 | |
| HP ZBook X G1i 16 | |
| Lenovo ThinkPad P16 Gen 2 | |
| Lenovo ThinkPad P16 G1 RTX A5500 | |
| Lenovo ThinkPad P16s Gen 4 21RX000YGE | |
| Lenovo ThinkPad P14s Gen 6 21QT0012GE | |
| HP ZBook Studio 16 G11 | |
| Lenovo ThinkPad P14s G5 21G3S00A00 | |
| HP ZBook Power 15 G8 313S5EA | |
| LibreOffice / 20 Documents To PDF | |
| Lenovo ThinkPad P16s Gen 4 21RX000YGE | |
| Lenovo ThinkPad P14s G5 21G3S00A00 | |
| Lenovo ThinkPad P14s Gen 6 21QT0012GE | |
| Lenovo Legion Pro 5 16IAX10, RTX 5070 | |
| Lenovo ThinkPad P16 Gen 2 | |
| HP ZBook Studio 16 G11 | |
| Przeciętny Intel Core Ultra 9 285HX (38 - 49.1, n=6) | |
| HP ZBook Power 15 G8 313S5EA | |
| HP ZBook X G1i 16 | |
| Lenovo ThinkPad P16 G1 RTX A5500 | |
| Dell Pro Max 18 Plus MB18250 | |
| HP ZBook Fury G1i 18 | |
| Schenker Key 18 Pro M25 RTX 5090 | |
| R Benchmark 2.5 / Overall mean | |
| HP ZBook Power 15 G8 313S5EA | |
| Lenovo ThinkPad P16s Gen 4 21RX000YGE | |
| Lenovo ThinkPad P14s Gen 6 21QT0012GE | |
| Lenovo ThinkPad P14s G5 21G3S00A00 | |
| HP ZBook Studio 16 G11 | |
| Schenker Key 18 Pro M25 RTX 5090 | |
| Lenovo ThinkPad P16 G1 RTX A5500 | |
| Lenovo Legion Pro 5 16IAX10, RTX 5070 | |
| HP ZBook X G1i 16 | |
| Przeciętny Intel Core Ultra 9 285HX (0.4012 - 0.4444, n=6) | |
| HP ZBook Fury G1i 18 | |
| Dell Pro Max 18 Plus MB18250 | |
| Lenovo ThinkPad P16 Gen 2 | |
Cinebench R23: Multi Core | Single Core
Cinebench R20: CPU (Multi Core) | CPU (Single Core)
Cinebench R15: CPU Multi 64Bit | CPU Single 64Bit
Blender: v2.79 BMW27 CPU
7-Zip 18.03: 7z b 4 | 7z b 4 -mmt1
Geekbench 6.7: Multi-Core | Single-Core
Geekbench 5.5: Multi-Core | Single-Core
HWBOT x265 Benchmark v2.2: 4k Preset
LibreOffice : 20 Documents To PDF
R Benchmark 2.5: Overall mean
* ... im mniej tym lepiej
AIDA64: FP32 Ray-Trace | FPU Julia | CPU SHA3 | CPU Queen | FPU SinJulia | FPU Mandel | CPU AES | CPU ZLib | FP64 Ray-Trace | CPU PhotoWorxx
| Performance rating | |
| Dell Pro Max 18 Plus MB18250 | |
| Schenker Key 18 Pro M25 RTX 5090 | |
| Przeciętny Intel Core Ultra 9 285HX | |
| HP ZBook Fury G1i 18 | |
| Lenovo ThinkPad P16 Gen 2 | |
| HP ZBook Studio 16 G11 | |
| AIDA64 / FP32 Ray-Trace | |
| Schenker Key 18 Pro M25 RTX 5090 | |
| Dell Pro Max 18 Plus MB18250 | |
| Przeciętny Intel Core Ultra 9 285HX (29076 - 42341, n=6) | |
| HP ZBook Fury G1i 18 | |
| Lenovo ThinkPad P16 Gen 2 | |
| HP ZBook Studio 16 G11 | |
| AIDA64 / FPU Julia | |
| Schenker Key 18 Pro M25 RTX 5090 | |
| Przeciętny Intel Core Ultra 9 285HX (161276 - 210885, n=6) | |
| Dell Pro Max 18 Plus MB18250 | |
| HP ZBook Fury G1i 18 | |
| Lenovo ThinkPad P16 Gen 2 | |
| HP ZBook Studio 16 G11 | |
| AIDA64 / CPU SHA3 | |
| Schenker Key 18 Pro M25 RTX 5090 | |
| Dell Pro Max 18 Plus MB18250 | |
| Przeciętny Intel Core Ultra 9 285HX (7757 - 9815, n=6) | |
| HP ZBook Fury G1i 18 | |
| Lenovo ThinkPad P16 Gen 2 | |
| HP ZBook Studio 16 G11 | |
| AIDA64 / CPU Queen | |
| Lenovo ThinkPad P16 Gen 2 | |
| Przeciętny Intel Core Ultra 9 285HX (134345 - 141681, n=6) | |
| Dell Pro Max 18 Plus MB18250 | |
| Schenker Key 18 Pro M25 RTX 5090 | |
| HP ZBook Fury G1i 18 | |
| HP ZBook Studio 16 G11 | |
| AIDA64 / FPU SinJulia | |
| Schenker Key 18 Pro M25 RTX 5090 | |
| Dell Pro Max 18 Plus MB18250 | |
| Lenovo ThinkPad P16 Gen 2 | |
| Przeciętny Intel Core Ultra 9 285HX (12559 - 14431, n=6) | |
| HP ZBook Fury G1i 18 | |
| HP ZBook Studio 16 G11 | |
| AIDA64 / FPU Mandel | |
| Schenker Key 18 Pro M25 RTX 5090 | |
| Przeciętny Intel Core Ultra 9 285HX (84053 - 108922, n=6) | |
| Dell Pro Max 18 Plus MB18250 | |
| HP ZBook Fury G1i 18 | |
| Lenovo ThinkPad P16 Gen 2 | |
| HP ZBook Studio 16 G11 | |
| AIDA64 / CPU AES | |
| Schenker Key 18 Pro M25 RTX 5090 | |
| Dell Pro Max 18 Plus MB18250 | |
| HP ZBook Fury G1i 18 | |
| Przeciętny Intel Core Ultra 9 285HX (119553 - 134195, n=6) | |
| Lenovo ThinkPad P16 Gen 2 | |
| HP ZBook Studio 16 G11 | |
| AIDA64 / CPU ZLib | |
| Dell Pro Max 18 Plus MB18250 | |
| Schenker Key 18 Pro M25 RTX 5090 | |
| Przeciętny Intel Core Ultra 9 285HX (1886 - 2267, n=6) | |
| HP ZBook Fury G1i 18 | |
| Lenovo ThinkPad P16 Gen 2 | |
| HP ZBook Studio 16 G11 | |
| AIDA64 / FP64 Ray-Trace | |
| Schenker Key 18 Pro M25 RTX 5090 | |
| Przeciętny Intel Core Ultra 9 285HX (15059 - 22312, n=6) | |
| Dell Pro Max 18 Plus MB18250 | |
| HP ZBook Fury G1i 18 | |
| Lenovo ThinkPad P16 Gen 2 | |
| HP ZBook Studio 16 G11 | |
| AIDA64 / CPU PhotoWorxx | |
| Dell Pro Max 18 Plus MB18250 | |
| HP ZBook Studio 16 G11 | |
| Przeciętny Intel Core Ultra 9 285HX (39232 - 62611, n=6) | |
| Lenovo ThinkPad P16 Gen 2 | |
| HP ZBook Fury G1i 18 | |
| Schenker Key 18 Pro M25 RTX 5090 | |
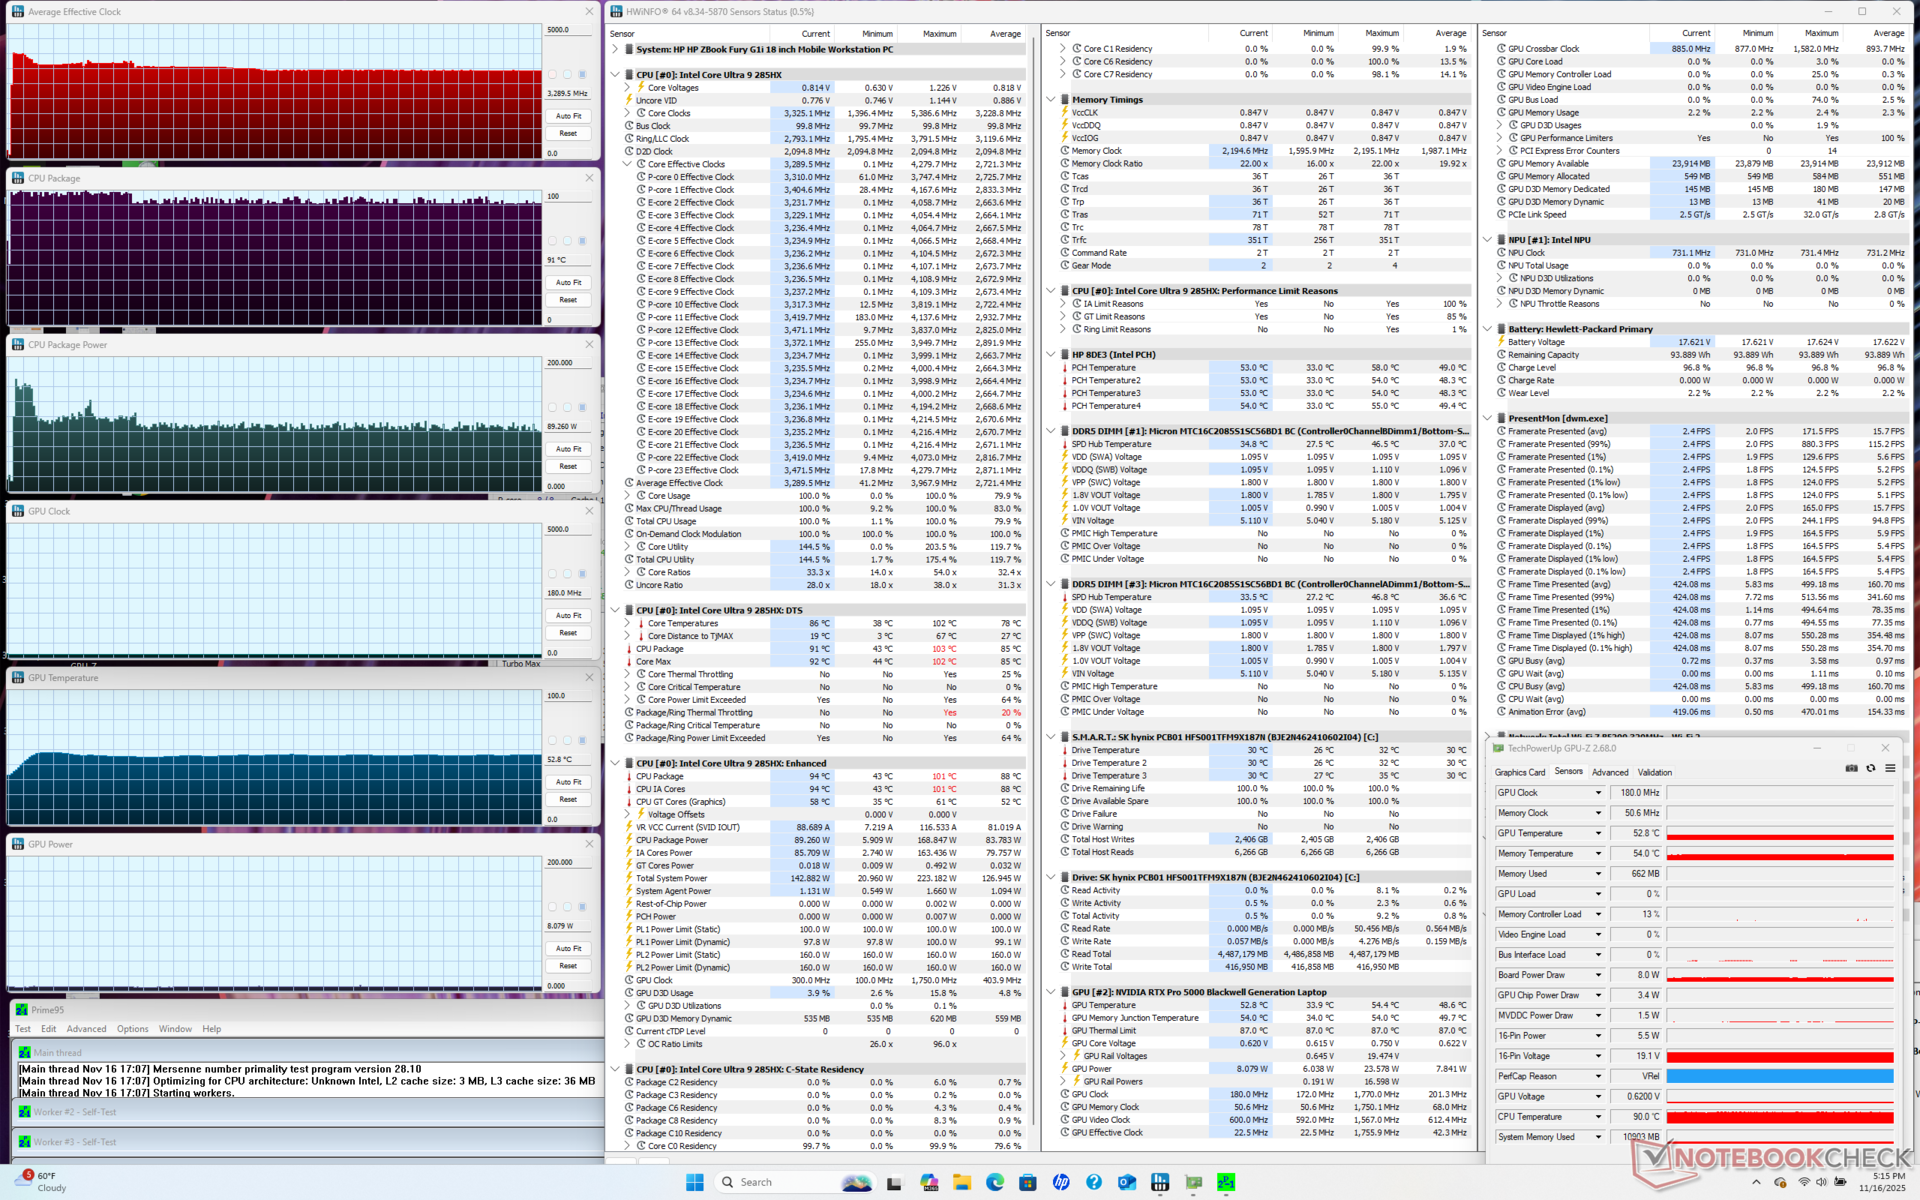
Test warunków skrajnych
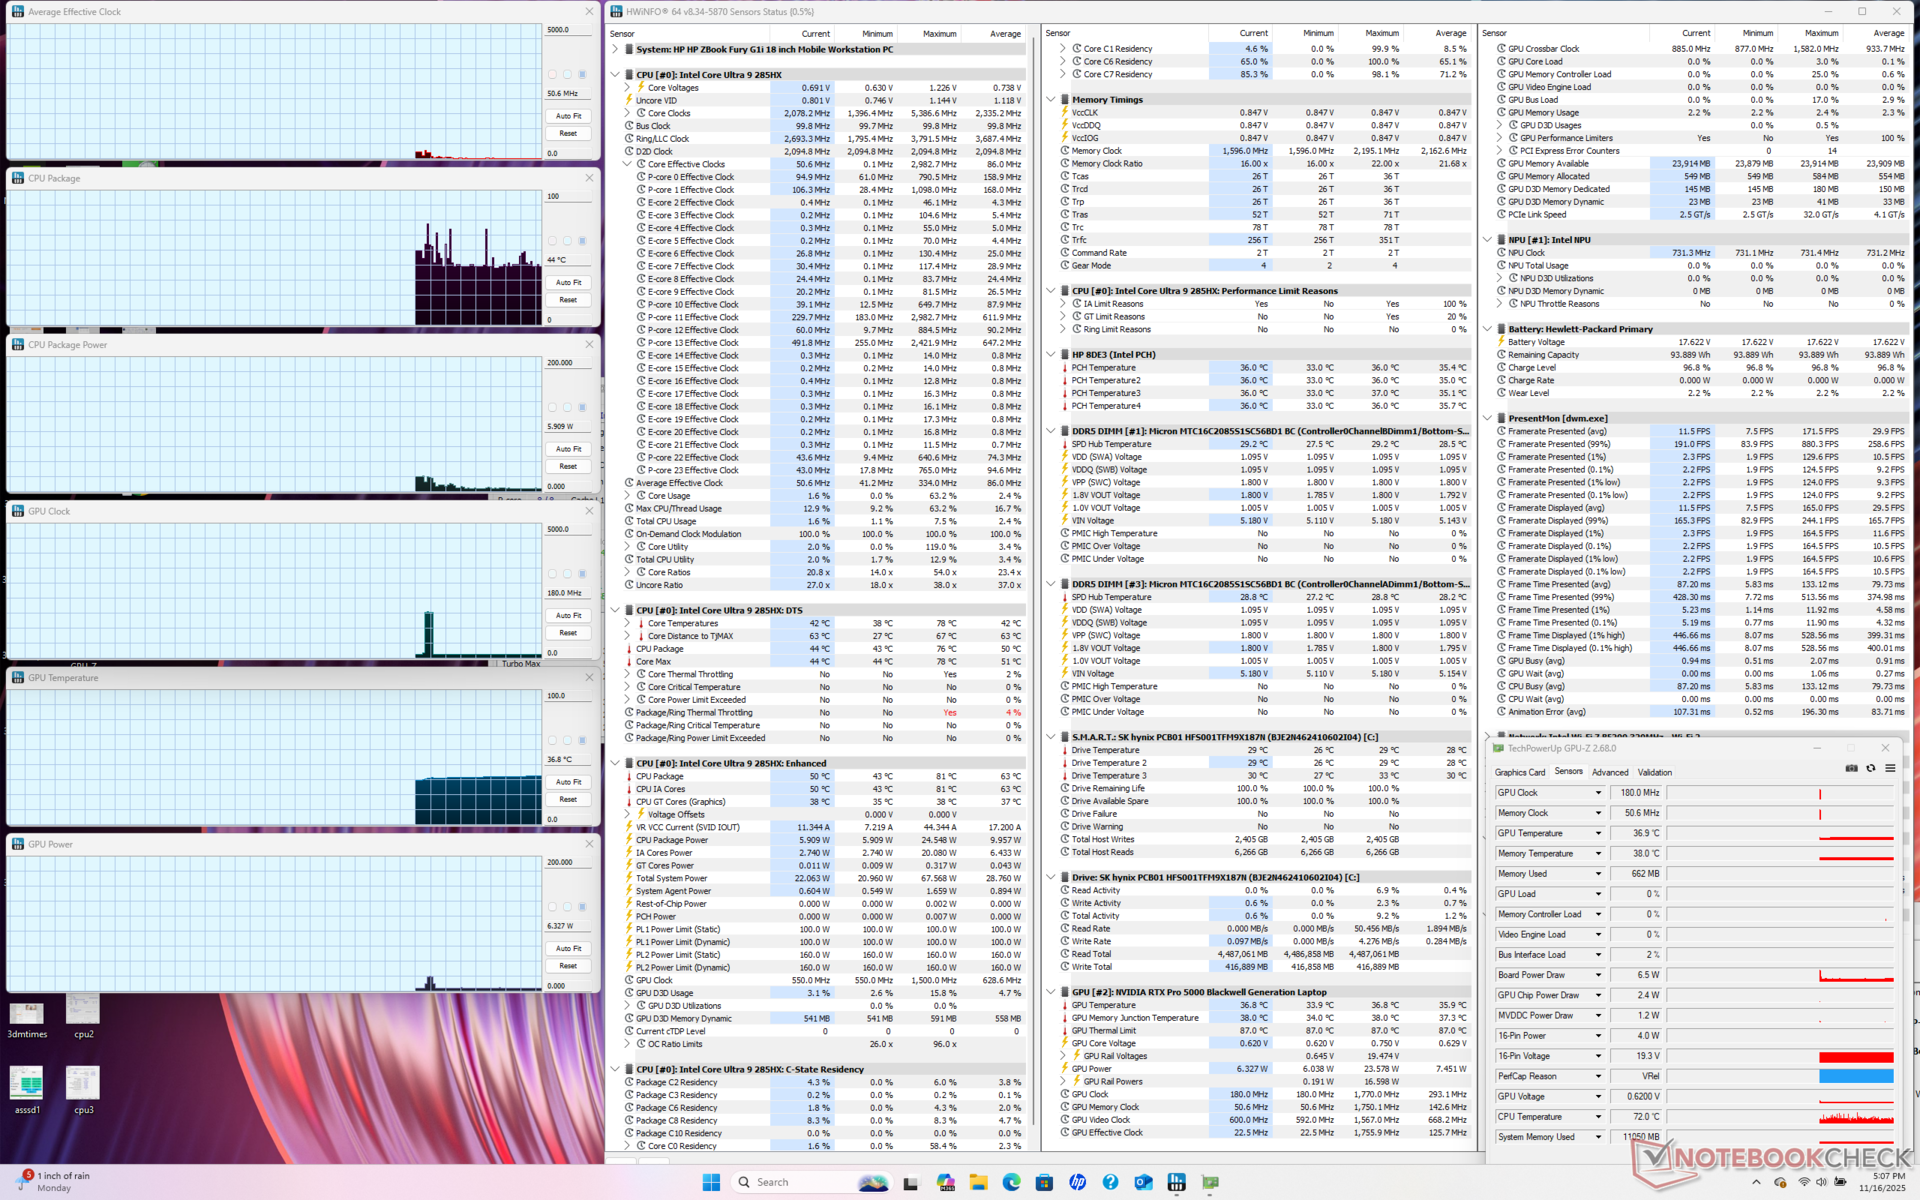
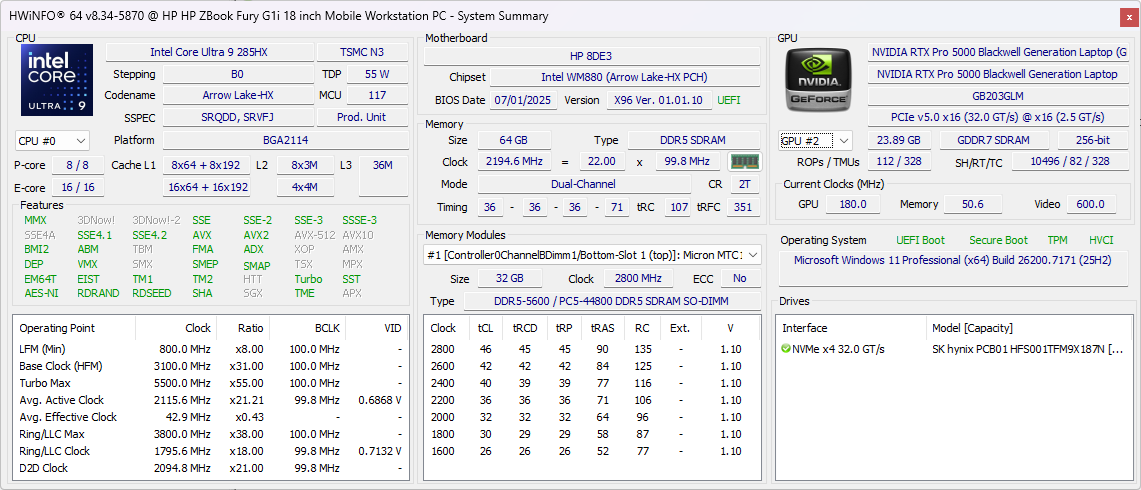
Po uruchomieniu Prime95 w celu obciążenia procesora, średnie częstotliwości taktowania wzrosłyby do 3,9 GHz, 99 C i 160 W przez zaledwie kilka sekund, zanim spadłyby i ustabilizowały się na poziomie 3,3 GHz, 91 C i 89 W. To zachowanie jest podobne do tego, co zaobserwowaliśmy na Dell Pro Max 18 Plus, choć z nieco wolniejszymi częstotliwościami taktowania średnio na HP.
Temperatury CPU i GPU podczas uruchamiania Cyberpunk 2077 ustabilizowałyby się odpowiednio na poziomie 77 C i 64 C, w porównaniu do 104 C i 75 C na Dell Pro Max 18 Plus. Wydajność jest jednak nieco niższa na HP, a pobór mocy GPU wynosi średnio zaledwie 135 W w porównaniu do 163 W na Dellu, gdy oba systemy są ustawione na tryb wydajności.

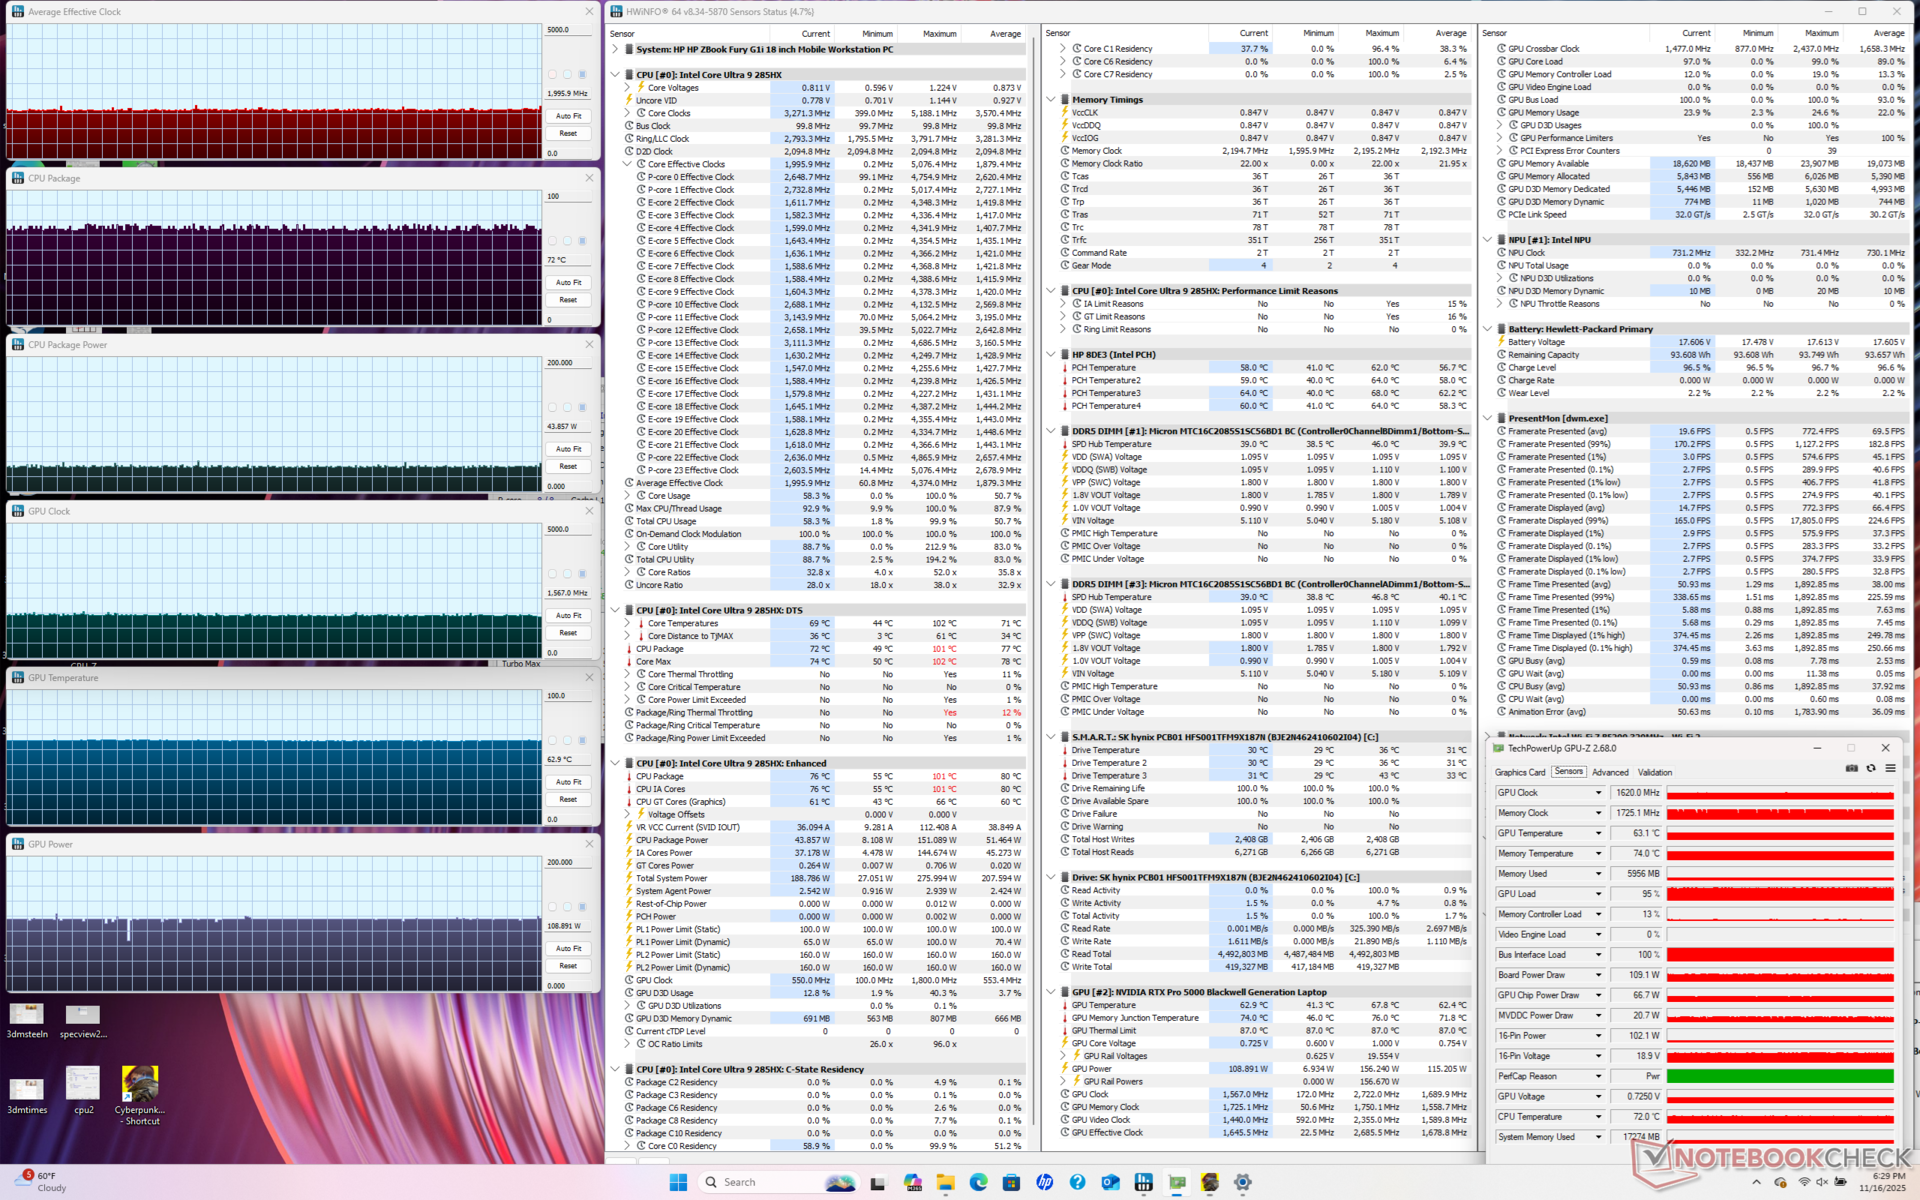
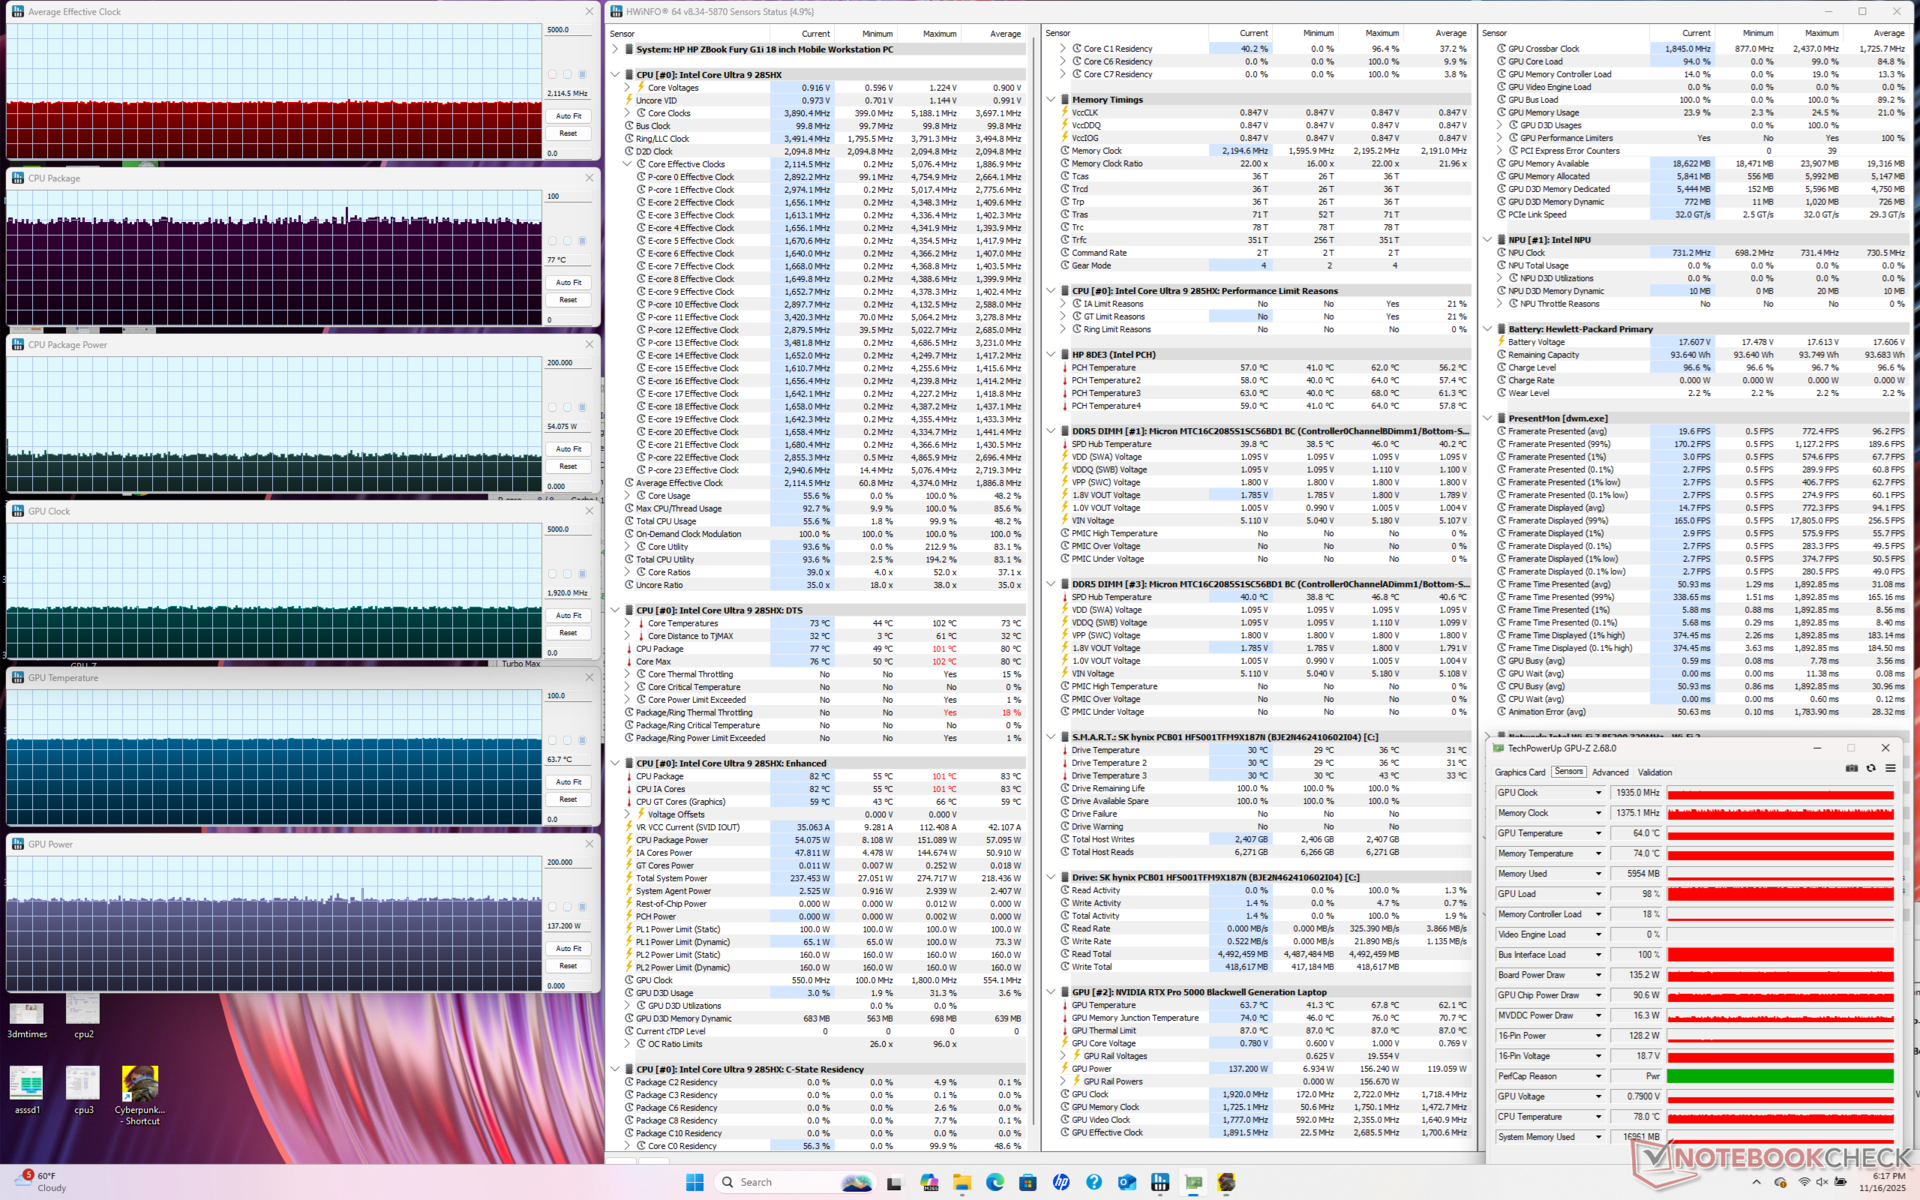
| Średnie taktowanieCPU (GHz) | Taktowanie GPU (MHz) | Średnia temperatura CPU (°C) | Średnia temperatura GPU (°C) | |
| System w stanie spoczynku | -- | -- | 44 | 37 |
| Prime95 Stress | 3.3 | -- | 91 | 53 |
| Prime95 + FurMark Stress | 3.0 | 1882 | 86 | 65 |
| Cyberpunk 2077 Stress (tryb zrównoważony) | 2.0 | 1567 | 72 | 63 |
| Cyberpunk 2077 Stress (tryb wydajności) | 2.1 | 1920 | 77 | 64 |
Wydajność systemu
PCMark 10 nie uruchomiłby się do końca bez względu na ustawienia GPU, więc jego wyniki nie zostały uwzględnione poniżej. Proszę zauważyć, że wyniki pamięci AIDA64 są znacznie wolniejsze niż w Dell Pro Max 18 Plus, ponieważ technologia pamięci RAM jest jednym z kluczowych czynników różnicujących oba modele.
CrossMark: Overall | Productivity | Creativity | Responsiveness
WebXPRT 3: Overall
WebXPRT 4: Overall
Mozilla Kraken 1.1: Total
Geekbench AI: Quantized GPU 1.7 | Half Precision GPU 1.7 | Single Precision GPU 1.7
| Performance rating | |
| Dell Pro Max 18 Plus MB18250 | |
| Przeciętny Intel Core Ultra 9 285HX, NVIDIA RTX PRO 5000 Blackwell Generation Laptop | |
| HP ZBook Fury G1i 18 | |
| Schenker Key 18 Pro M25 RTX 5090 | |
| Lenovo ThinkPad P16 Gen 2 -3! | |
| HP ZBook X G1i 16 | |
| HP ZBook Studio 16 G11 -3! | |
| CrossMark / Overall | |
| Dell Pro Max 18 Plus MB18250 | |
| Przeciętny Intel Core Ultra 9 285HX, NVIDIA RTX PRO 5000 Blackwell Generation Laptop (2142 - 2267, n=3) | |
| HP ZBook Fury G1i 18 | |
| Schenker Key 18 Pro M25 RTX 5090 | |
| Lenovo ThinkPad P16 Gen 2 | |
| HP ZBook X G1i 16 | |
| HP ZBook Studio 16 G11 | |
| CrossMark / Productivity | |
| HP ZBook Fury G1i 18 | |
| Przeciętny Intel Core Ultra 9 285HX, NVIDIA RTX PRO 5000 Blackwell Generation Laptop (2016 - 2028, n=3) | |
| Dell Pro Max 18 Plus MB18250 | |
| Schenker Key 18 Pro M25 RTX 5090 | |
| HP ZBook X G1i 16 | |
| Lenovo ThinkPad P16 Gen 2 | |
| HP ZBook Studio 16 G11 | |
| CrossMark / Creativity | |
| Dell Pro Max 18 Plus MB18250 | |
| Przeciętny Intel Core Ultra 9 285HX, NVIDIA RTX PRO 5000 Blackwell Generation Laptop (2395 - 2725, n=3) | |
| HP ZBook Fury G1i 18 | |
| Lenovo ThinkPad P16 Gen 2 | |
| HP ZBook X G1i 16 | |
| Schenker Key 18 Pro M25 RTX 5090 | |
| HP ZBook Studio 16 G11 | |
| CrossMark / Responsiveness | |
| Schenker Key 18 Pro M25 RTX 5090 | |
| Dell Pro Max 18 Plus MB18250 | |
| Przeciętny Intel Core Ultra 9 285HX, NVIDIA RTX PRO 5000 Blackwell Generation Laptop (1806 - 1858, n=3) | |
| HP ZBook Fury G1i 18 | |
| Lenovo ThinkPad P16 Gen 2 | |
| HP ZBook X G1i 16 | |
| HP ZBook Studio 16 G11 | |
| WebXPRT 3 / Overall | |
| HP ZBook Fury G1i 18 | |
| Dell Pro Max 18 Plus MB18250 | |
| Przeciętny Intel Core Ultra 9 285HX, NVIDIA RTX PRO 5000 Blackwell Generation Laptop (327 - 360, n=3) | |
| Schenker Key 18 Pro M25 RTX 5090 | |
| Lenovo ThinkPad P16 Gen 2 | |
| HP ZBook X G1i 16 | |
| HP ZBook Studio 16 G11 | |
| WebXPRT 4 / Overall | |
| HP ZBook Fury G1i 18 | |
| Schenker Key 18 Pro M25 RTX 5090 | |
| Przeciętny Intel Core Ultra 9 285HX, NVIDIA RTX PRO 5000 Blackwell Generation Laptop (306 - 323, n=3) | |
| Dell Pro Max 18 Plus MB18250 | |
| Lenovo ThinkPad P16 Gen 2 | |
| HP ZBook X G1i 16 | |
| HP ZBook Studio 16 G11 | |
| Mozilla Kraken 1.1 / Total | |
| HP ZBook Studio 16 G11 | |
| HP ZBook X G1i 16 | |
| Lenovo ThinkPad P16 Gen 2 | |
| Dell Pro Max 18 Plus MB18250 | |
| Przeciętny Intel Core Ultra 9 285HX, NVIDIA RTX PRO 5000 Blackwell Generation Laptop (411 - 439, n=3) | |
| Schenker Key 18 Pro M25 RTX 5090 | |
| HP ZBook Fury G1i 18 | |
| Geekbench AI / Quantized GPU 1.7 | |
| Dell Pro Max 18 Plus MB18250 | |
| Schenker Key 18 Pro M25 RTX 5090 | |
| Przeciętny Intel Core Ultra 9 285HX, NVIDIA RTX PRO 5000 Blackwell Generation Laptop (22519 - 24656, n=3) | |
| HP ZBook Fury G1i 18 | |
| HP ZBook X G1i 16 | |
| Geekbench AI / Half Precision GPU 1.7 | |
| Dell Pro Max 18 Plus MB18250 | |
| Przeciętny Intel Core Ultra 9 285HX, NVIDIA RTX PRO 5000 Blackwell Generation Laptop (51812 - 55275, n=3) | |
| Schenker Key 18 Pro M25 RTX 5090 | |
| HP ZBook Fury G1i 18 | |
| HP ZBook X G1i 16 | |
| Geekbench AI / Single Precision GPU 1.7 | |
| Dell Pro Max 18 Plus MB18250 | |
| Schenker Key 18 Pro M25 RTX 5090 | |
| Przeciętny Intel Core Ultra 9 285HX, NVIDIA RTX PRO 5000 Blackwell Generation Laptop (28665 - 32028, n=3) | |
| HP ZBook Fury G1i 18 | |
| HP ZBook X G1i 16 | |
* ... im mniej tym lepiej
| AIDA64 / Memory Copy | |
| Dell Pro Max 18 Plus MB18250 | |
| Przeciętny Intel Core Ultra 9 285HX (63431 - 93933, n=6) | |
| HP ZBook Studio 16 G11 | |
| HP ZBook Fury G1i 18 | |
| Lenovo ThinkPad P16 Gen 2 | |
| Schenker Key 18 Pro M25 RTX 5090 | |
| AIDA64 / Memory Read | |
| Dell Pro Max 18 Plus MB18250 | |
| Przeciętny Intel Core Ultra 9 285HX (67084 - 97565, n=6) | |
| HP ZBook Studio 16 G11 | |
| Lenovo ThinkPad P16 Gen 2 | |
| HP ZBook Fury G1i 18 | |
| Schenker Key 18 Pro M25 RTX 5090 | |
| AIDA64 / Memory Write | |
| Dell Pro Max 18 Plus MB18250 | |
| Przeciętny Intel Core Ultra 9 285HX (64112 - 89691, n=6) | |
| HP ZBook Studio 16 G11 | |
| HP ZBook Fury G1i 18 | |
| Lenovo ThinkPad P16 Gen 2 | |
| Schenker Key 18 Pro M25 RTX 5090 | |
| AIDA64 / Memory Latency | |
| Schenker Key 18 Pro M25 RTX 5090 | |
| HP ZBook Fury G1i 18 | |
| Przeciętny Intel Core Ultra 9 285HX (104.8 - 151.7, n=6) | |
| HP ZBook Studio 16 G11 | |
| Dell Pro Max 18 Plus MB18250 | |
| Lenovo ThinkPad P16 Gen 2 | |
* ... im mniej tym lepiej
Opóźnienie DPC
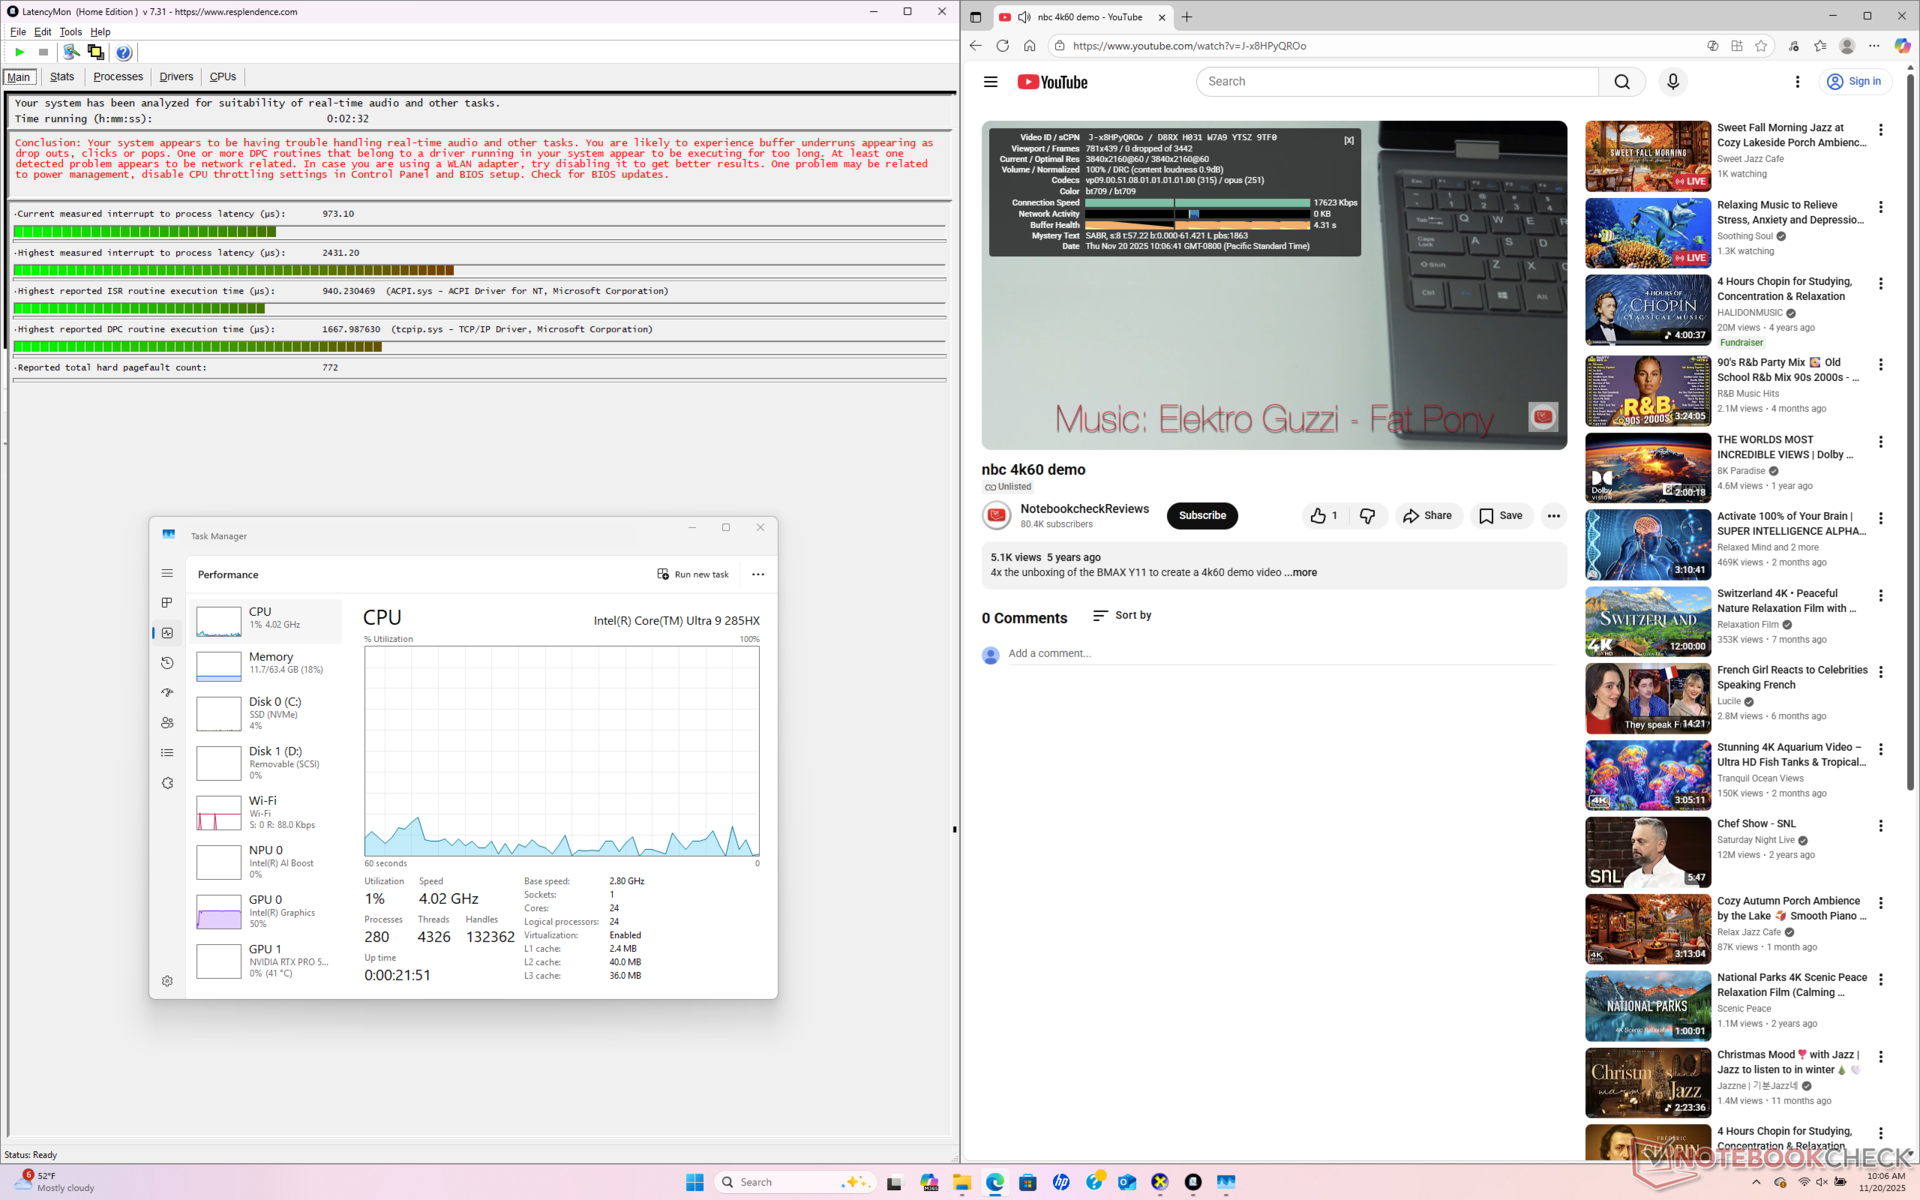
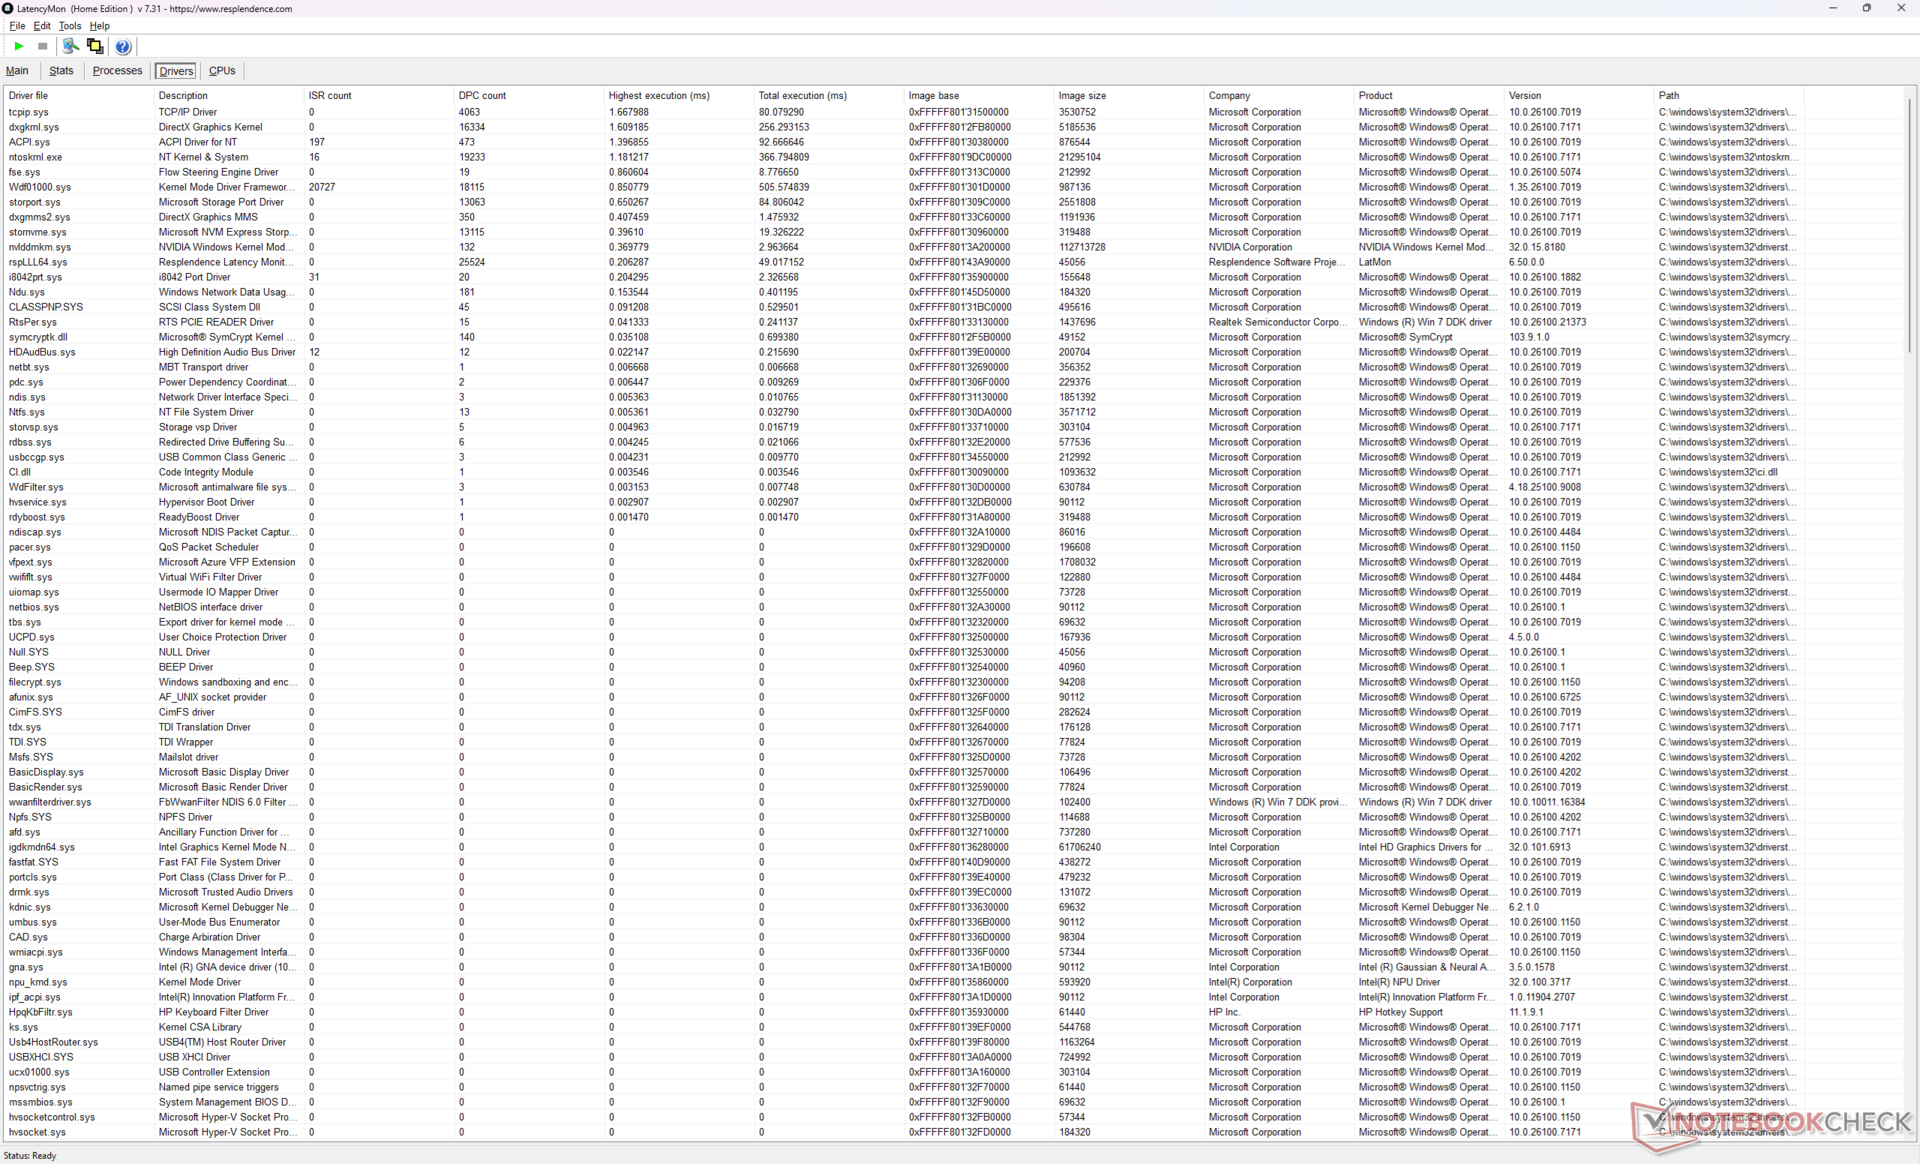
| DPC Latencies / LatencyMon - interrupt to process latency (max), Web, Youtube, Prime95 | |
| Schenker Key 18 Pro M25 RTX 5090 | |
| HP ZBook Fury G1i 18 | |
| HP ZBook Studio 16 G11 | |
| Dell Pro Max 18 Plus MB18250 | |
| Lenovo ThinkPad P16 Gen 2 | |
| HP ZBook X G1i 16 | |
* ... im mniej tym lepiej
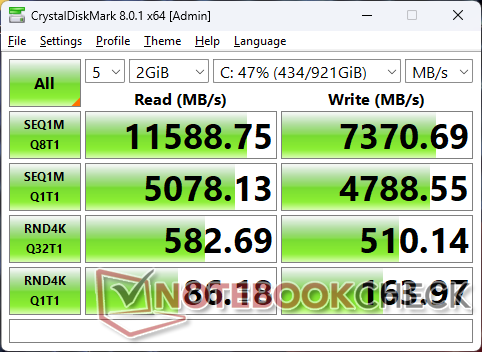
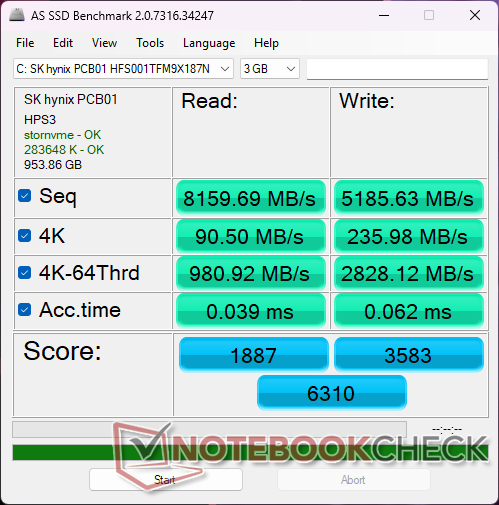
Urządzenia pamięci masowej
Nasze urządzenie jest dostarczane z SK Hynix PCB01 PCIe5 x4 NVMe SSD zapewniający stały transfer na poziomie około 12000 MB/s. HP obsługuje do czterech pojedynczych dysków SSD M.2 2280, podczas gdy Dell Pro Max 18 Plus może obsługiwać tylko do dwóch.

| Drive Performance rating - Percent | |
| Schenker Key 18 Pro M25 RTX 5090 | |
| HP ZBook Fury G1i 18 | |
| HP ZBook X G1i 16 | |
| Dell Pro Max 18 Plus MB18250 | |
| Lenovo ThinkPad P16 Gen 2 | |
| HP ZBook Studio 16 G11 | |
* ... im mniej tym lepiej
Dławienie dysku: Pętla odczytu DiskSpd, głębokość kolejki 8
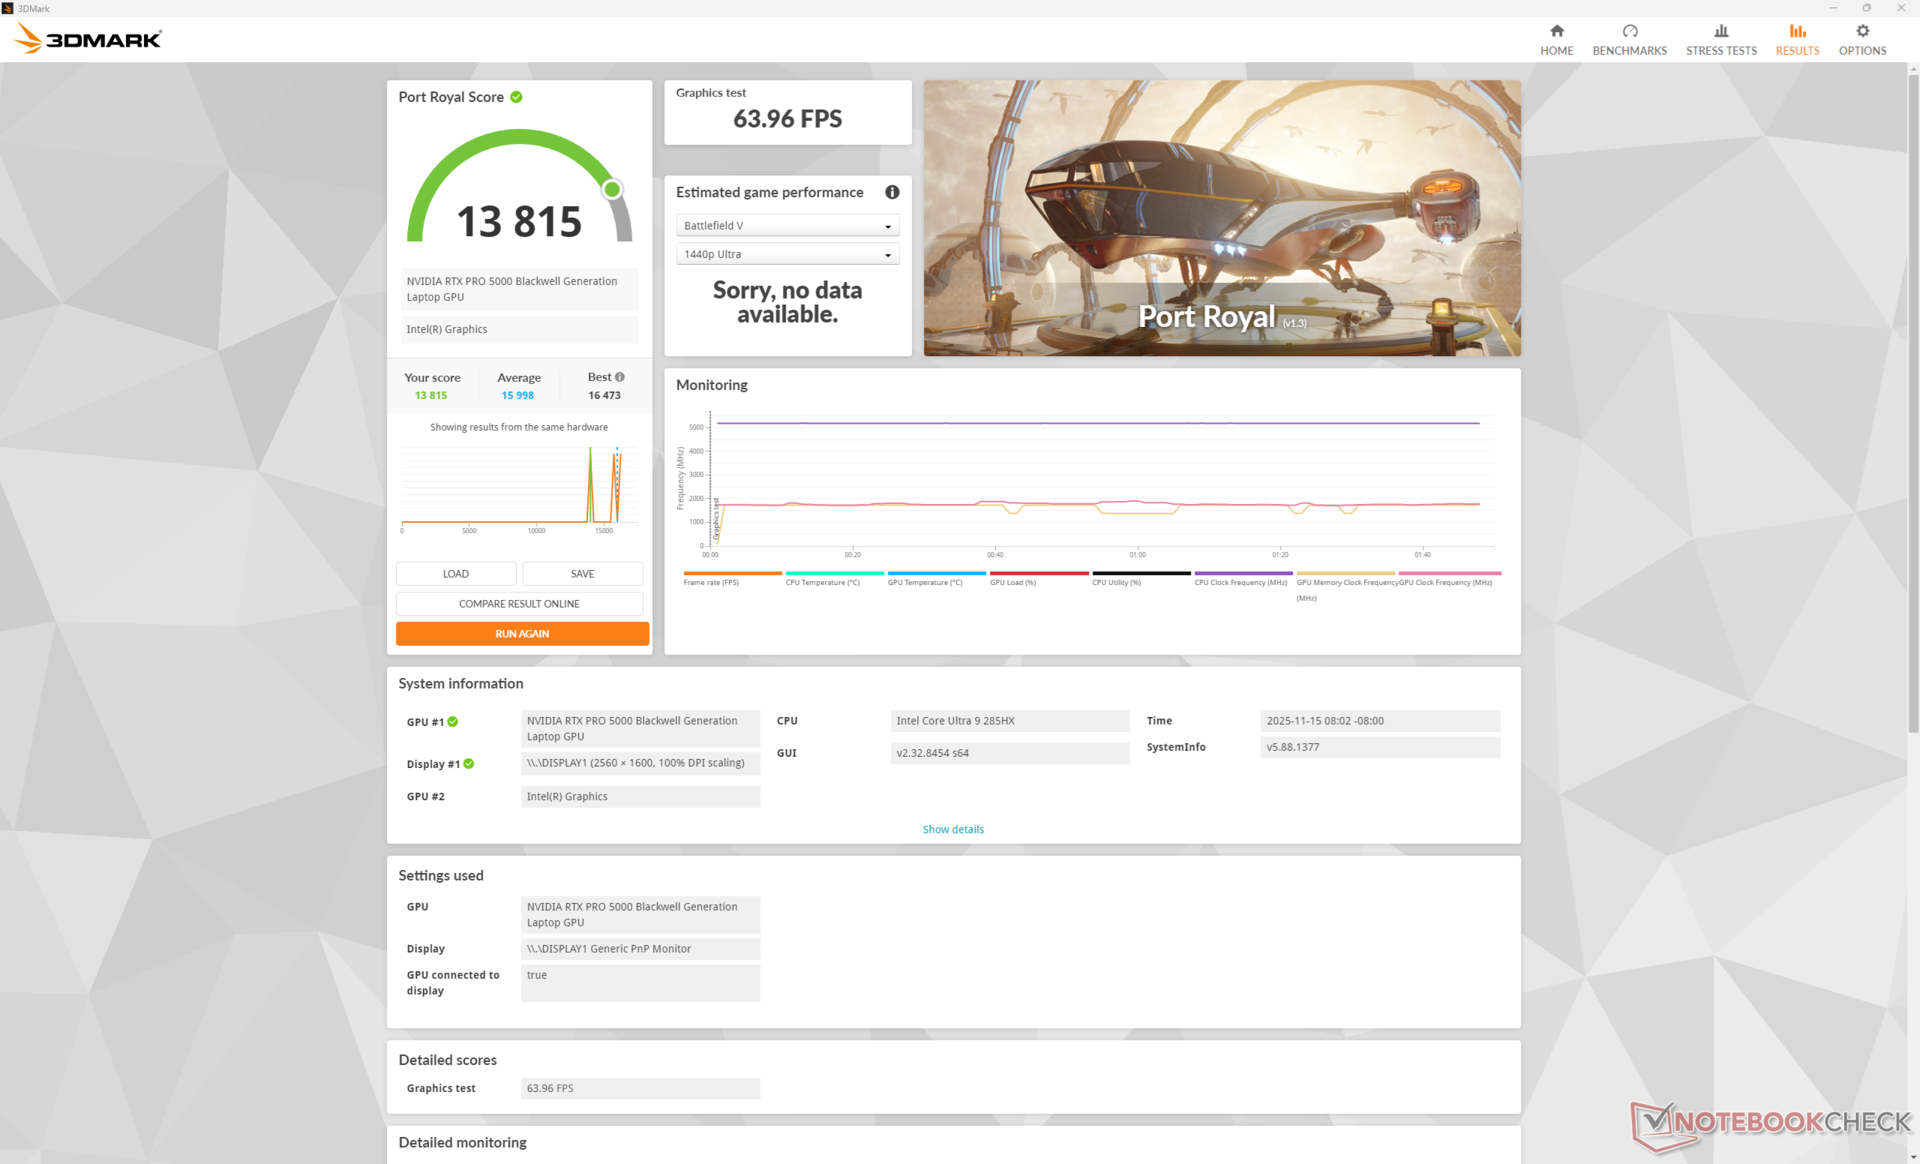
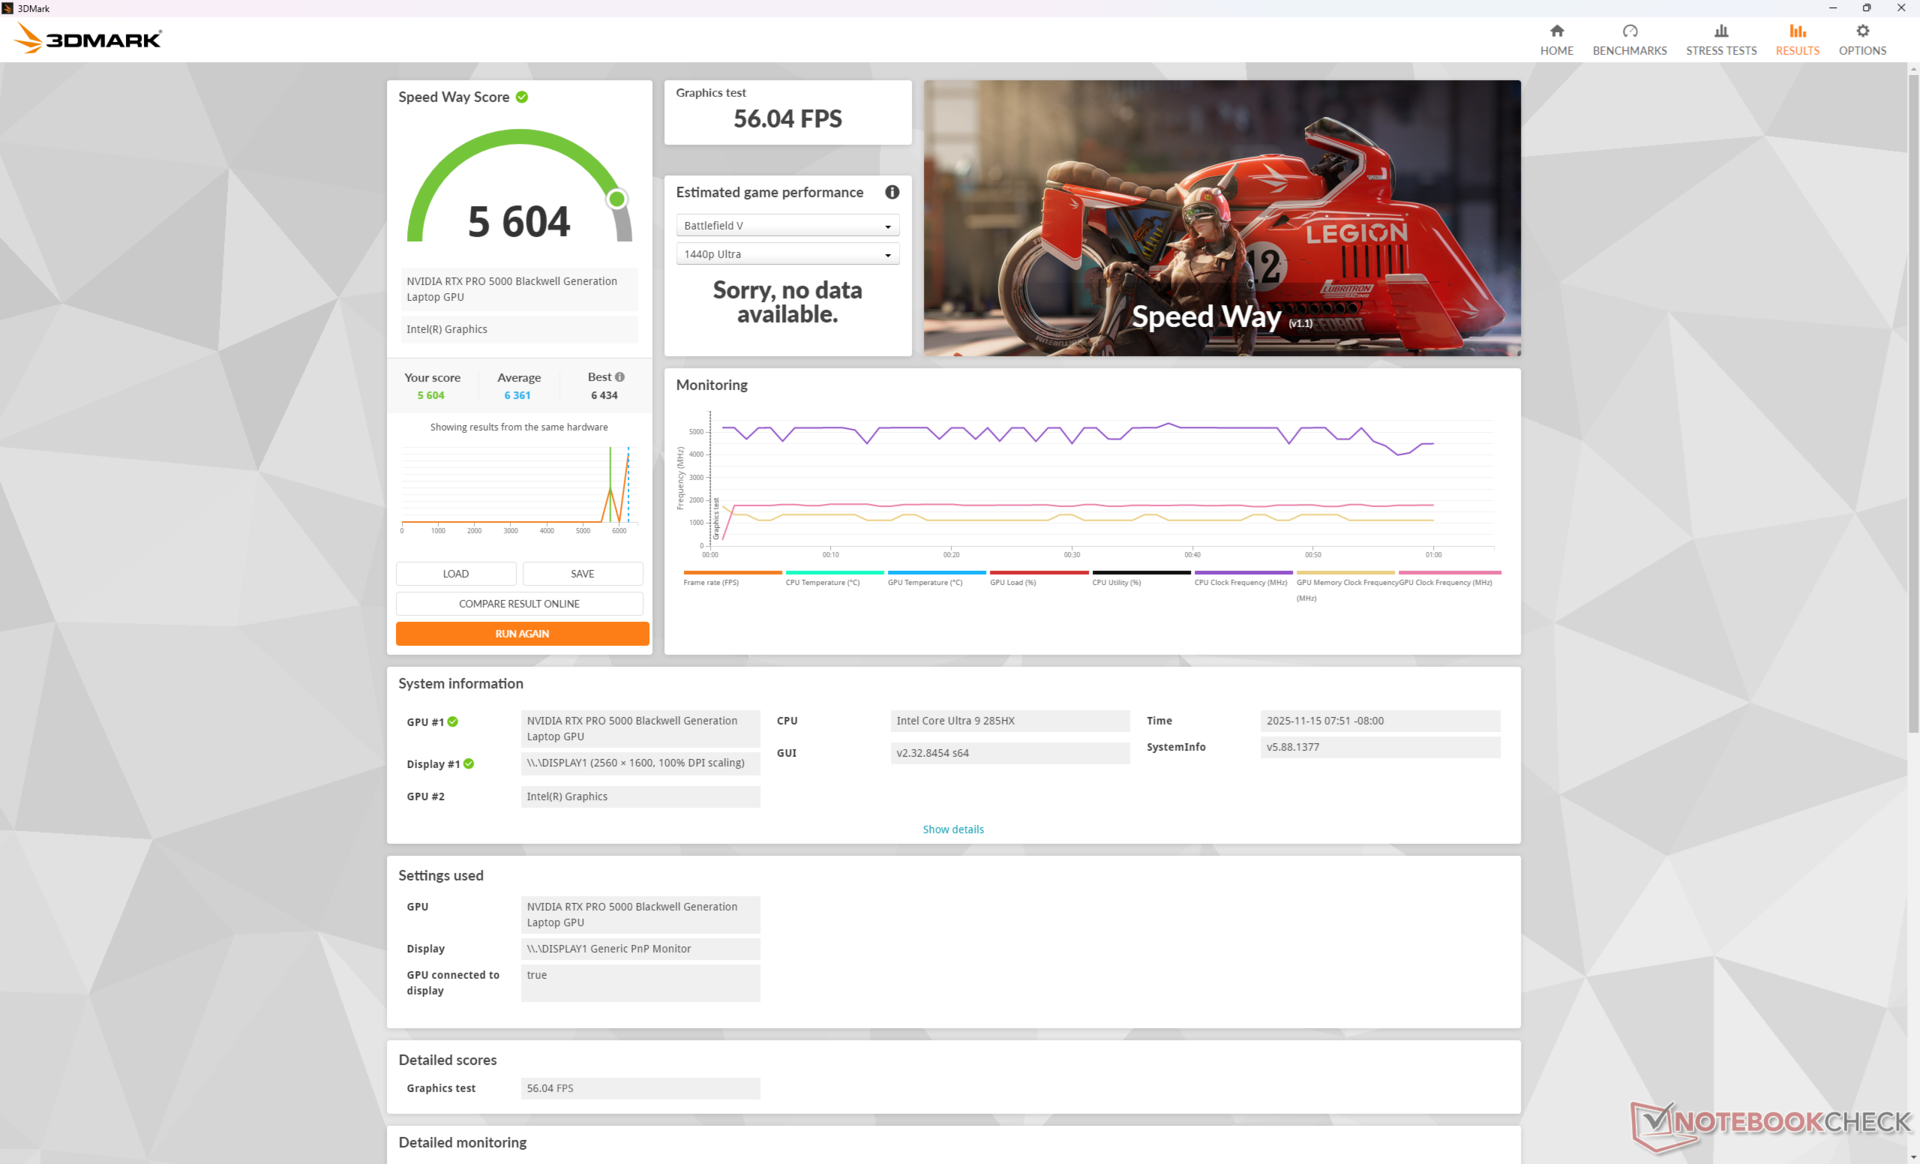
Wydajność GPU
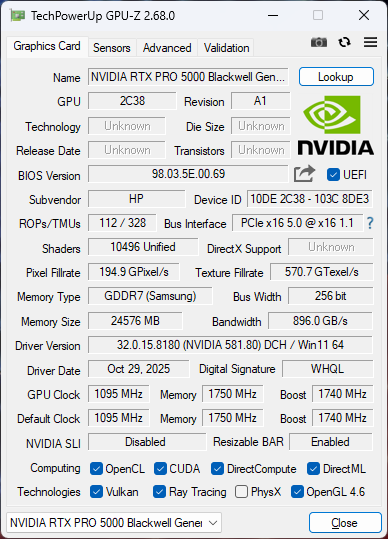
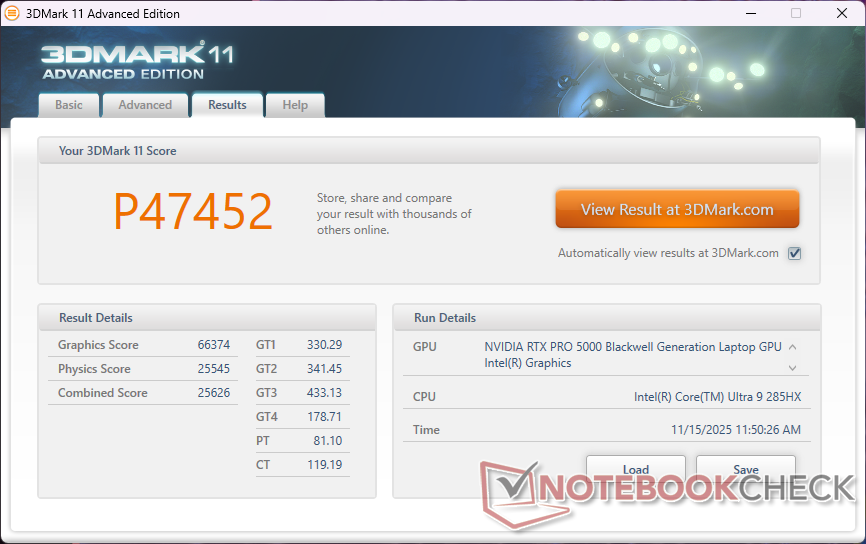
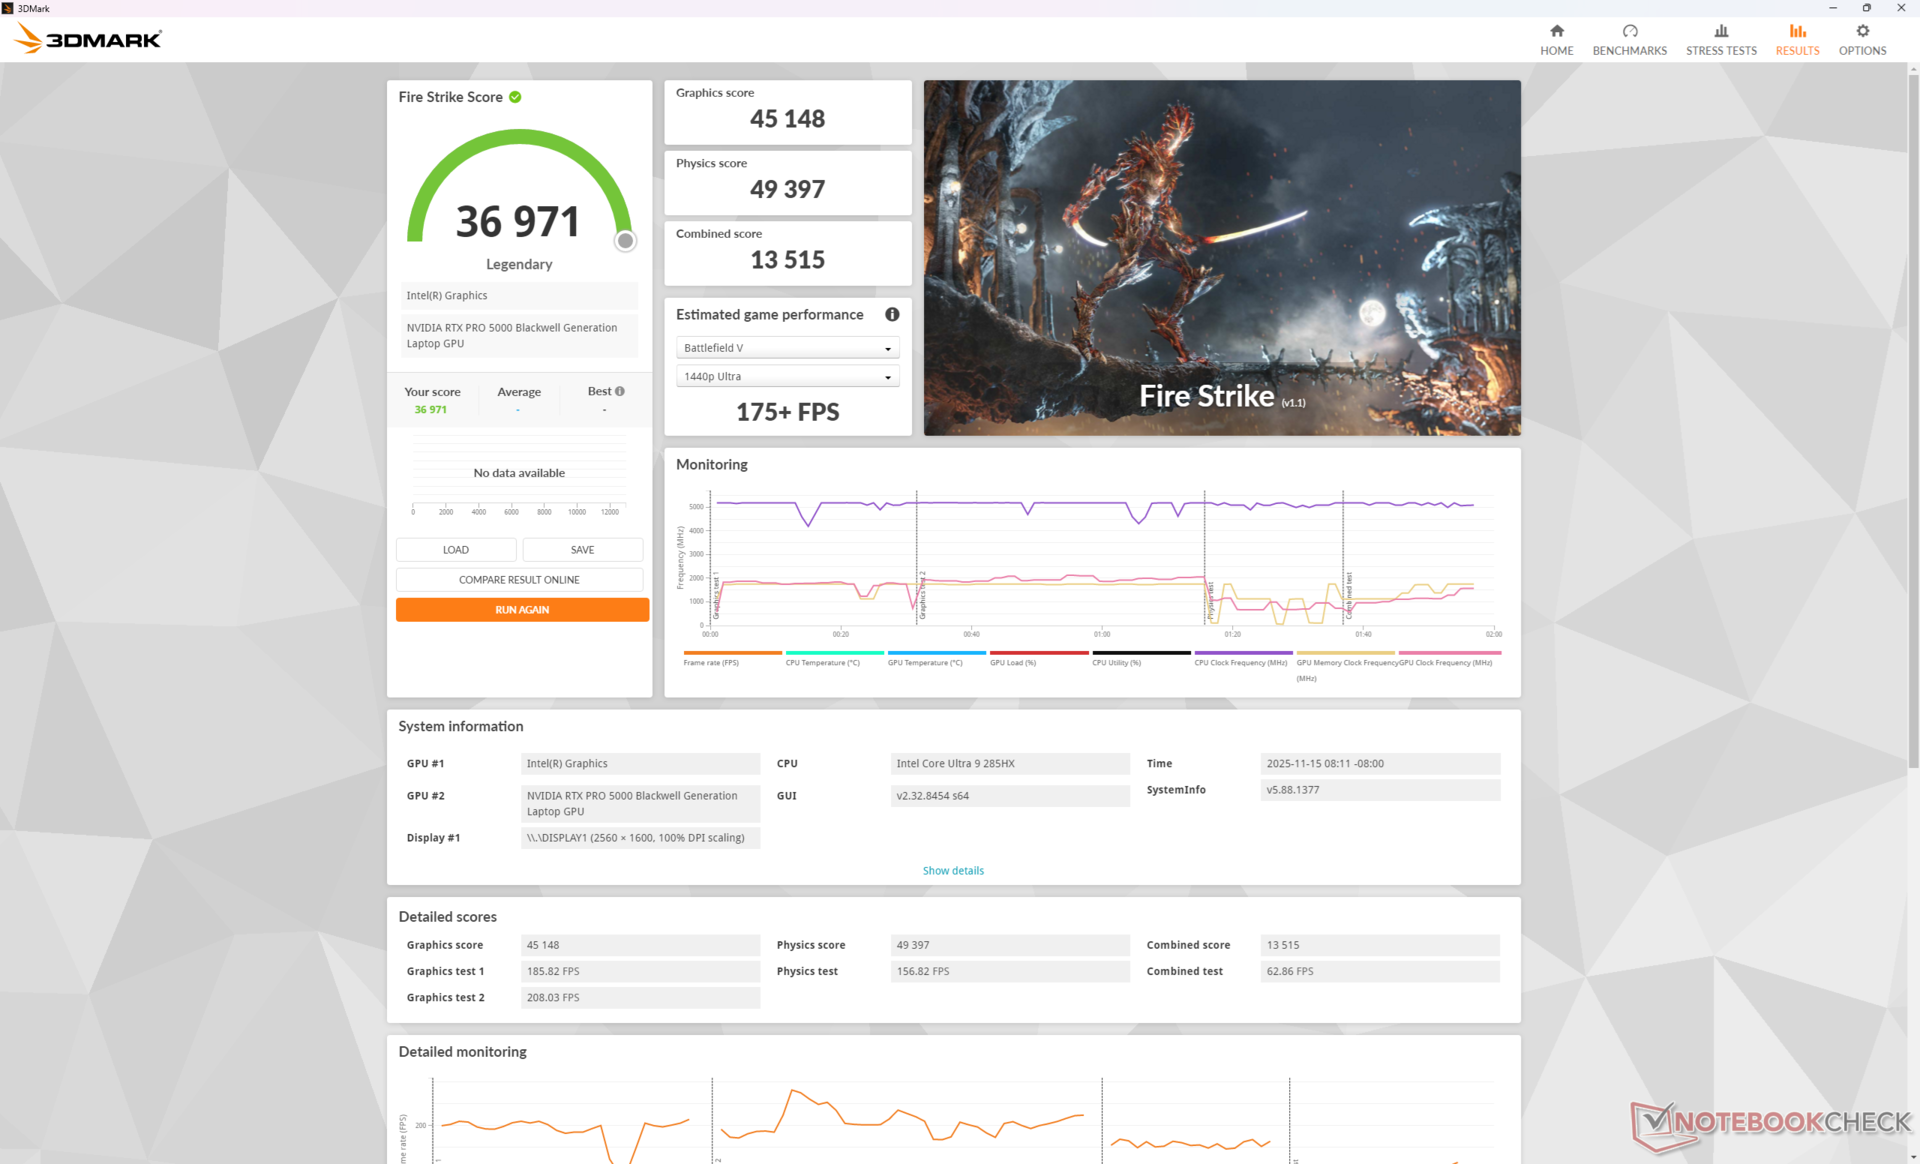
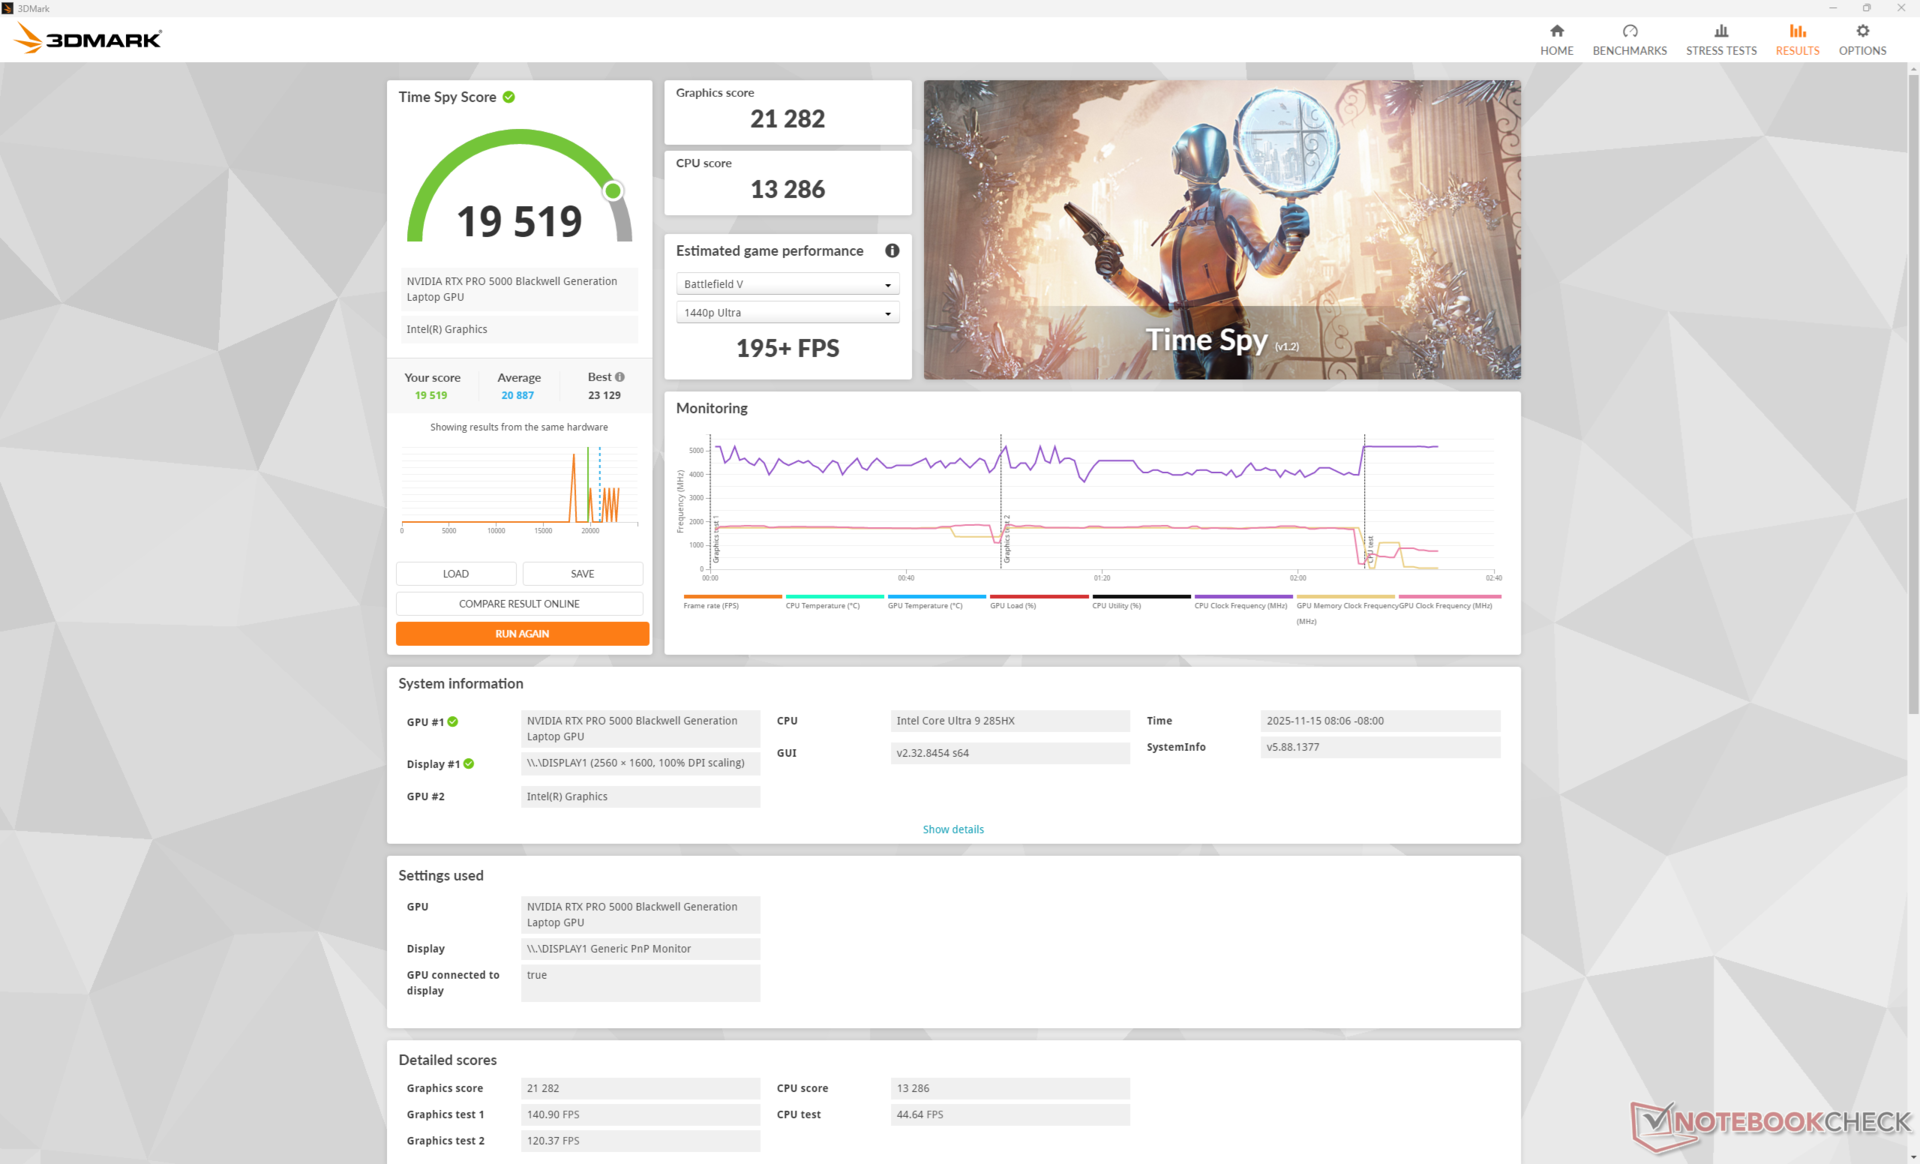
The Nvidia RTX Pro 5000 Blackwell w naszym HP działa konsekwentnie wolniej niż ten sam procesor graficzny w Dell Pro Max 18 Plus. Wynika to głównie z faktu, że GPU w HP ma moc 150 W, podczas gdy GPU w Dell ma moc 175 W, co zapewnia nieco wyższą wydajność. Korzyści w zakresie wydajności w porównaniu z opcjami Ada ostatniej generacji są jednak bardziej znaczące.
| Profil zasilania | Wynik grafiki | Wynik fizyki | Łączny wynik |
| Tryb wydajności | 45148 | 49397 | 13515 |
| Tryb zrównoważony | 43709 (-3%) | 48299 (-2%) | 11177 (-17%) |
| Zasilanie bateryjne | 28042 (-38%) | 21361 (-57%) | 7409 (-45%) |
| 3DMark Performance rating - Percent | |
| Dell Pro Max 18 Plus MB18250 | |
| Przeciętny NVIDIA RTX PRO 5000 Blackwell Generation Laptop | |
| HP ZBook Fury G1i 18 | |
| Schenker Key 18 Pro M25 RTX 5090 -1! | |
| Lenovo ThinkPad P16 Gen 2 | |
| Lenovo ThinkPad P16 G1 RTX A5500 -1! | |
| HP ZBook Studio 16 G11 | |
| HP ZBook X G1i 16 | |
| Lenovo ThinkPad P14s Gen 6 21QT0012GE -2! | |
| Lenovo ThinkPad P14s G5 21G3S00A00 -1! | |
| Lenovo ThinkPad P16s Gen 4 21RX000YGE -2! | |
| HP ZBook Power 15 G8 313S5EA -2! | |
| 3DMark 11 Performance | 47452 pkt. | |
| 3DMark Cloud Gate Standard Score | 51342 pkt. | |
| 3DMark Fire Strike Score | 36971 pkt. | |
| 3DMark Time Spy Score | 19519 pkt. | |
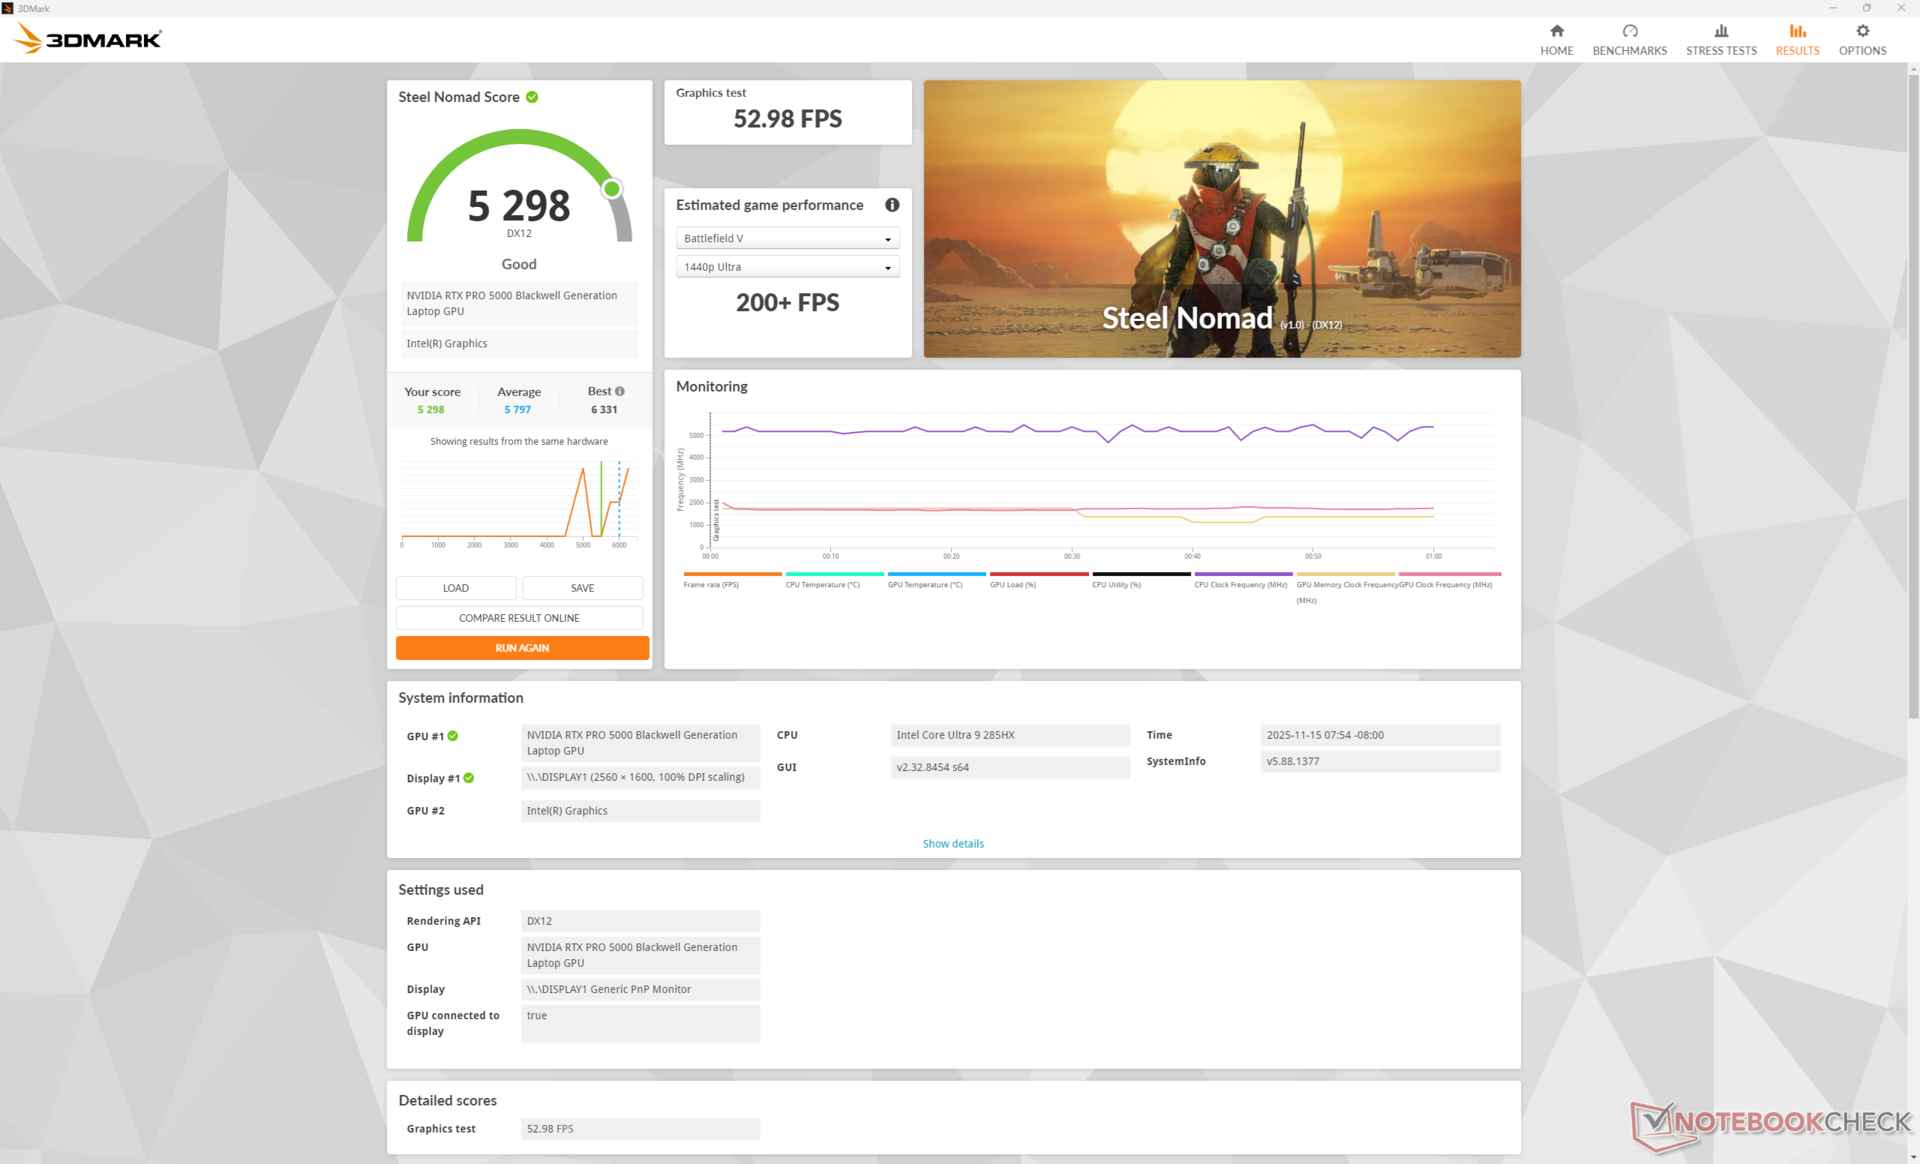
| 3DMark Steel Nomad Score | 5298 pkt. | |
Pomoc | ||
* ... im mniej tym lepiej
| Performance rating - Percent | |
| Dell Pro Max 18 Plus MB18250 | |
| Schenker Key 18 Pro M25 RTX 5090 | |
| HP ZBook Fury G1i 18 | |
| Lenovo ThinkPad P16 Gen 2 | |
| HP ZBook X G1i 16 | |
| HP ZBook Studio 16 G11 | |
| Cyberpunk 2077 - 1920x1080 Ultra Preset (FSR off) | |
| Dell Pro Max 18 Plus MB18250 | |
| Schenker Key 18 Pro M25 RTX 5090 | |
| HP ZBook Fury G1i 18 | |
| Lenovo ThinkPad P16 Gen 2 | |
| HP ZBook X G1i 16 | |
| HP ZBook Studio 16 G11 | |
| Baldur's Gate 3 - 1920x1080 Ultra Preset AA:T | |
| Dell Pro Max 18 Plus MB18250 | |
| Schenker Key 18 Pro M25 RTX 5090 | |
| HP ZBook Fury G1i 18 | |
| Lenovo ThinkPad P16 Gen 2 | |
| HP ZBook Studio 16 G11 | |
| HP ZBook X G1i 16 | |
| GTA V - 1920x1080 Highest AA:4xMSAA + FX AF:16x | |
| Dell Pro Max 18 Plus MB18250 | |
| Schenker Key 18 Pro M25 RTX 5090 | |
| HP ZBook Fury G1i 18 | |
| Lenovo ThinkPad P16 Gen 2 | |
| HP ZBook X G1i 16 | |
| HP ZBook Studio 16 G11 | |
| Final Fantasy XV Benchmark - 1920x1080 High Quality | |
| Dell Pro Max 18 Plus MB18250 | |
| HP ZBook Fury G1i 18 | |
| Schenker Key 18 Pro M25 RTX 5090 | |
| Lenovo ThinkPad P16 Gen 2 | |
| HP ZBook X G1i 16 | |
| HP ZBook Studio 16 G11 | |
| Strange Brigade - 1920x1080 ultra AA:ultra AF:16 | |
| Dell Pro Max 18 Plus MB18250 | |
| HP ZBook Fury G1i 18 | |
| Schenker Key 18 Pro M25 RTX 5090 | |
| Lenovo ThinkPad P16 Gen 2 | |
| HP ZBook Studio 16 G11 | |
| HP ZBook X G1i 16 | |
| Dota 2 Reborn - 1920x1080 ultra (3/3) best looking | |
| Lenovo ThinkPad P16 Gen 2 | |
| Dell Pro Max 18 Plus MB18250 | |
| HP ZBook Fury G1i 18 | |
| Schenker Key 18 Pro M25 RTX 5090 | |
| HP ZBook Studio 16 G11 | |
| HP ZBook X G1i 16 | |
| X-Plane 11.11 - 1920x1080 high (fps_test=3) | |
| Lenovo ThinkPad P16 Gen 2 | |
| Dell Pro Max 18 Plus MB18250 | |
| Schenker Key 18 Pro M25 RTX 5090 | |
| HP ZBook Fury G1i 18 | |
| HP ZBook Studio 16 G11 | |
| HP ZBook X G1i 16 | |
| F1 24 | |
| 3840x2160 Ultra High Preset AA:T AF:16x | |
| Dell Pro Max 18 Plus MB18250 | |
| Przeciętny NVIDIA RTX PRO 5000 Blackwell Generation Laptop (43.2 - 50.2, n=3) | |
| HP ZBook Fury G1i 18 | |
| Schenker Key 18 Pro M25 RTX 5090 | |
| 3840x2160 Ultra High Preset + Quality DLSS AF:16x | |
| Dell Pro Max 18 Plus MB18250 | |
| Przeciętny NVIDIA RTX PRO 5000 Blackwell Generation Laptop (71.8 - 85.7, n=3) | |
| HP ZBook Fury G1i 18 | |
| Schenker Key 18 Pro M25 RTX 5090 | |
| 2560x1440 Ultra High Preset + Quality DLSS AF:16x | |
| Dell Pro Max 18 Plus MB18250 | |
| Przeciętny NVIDIA RTX PRO 5000 Blackwell Generation Laptop (126.8 - 148.6, n=3) | |
| HP ZBook Fury G1i 18 | |
| Schenker Key 18 Pro M25 RTX 5090 | |
| HP ZBook X G1i 16 | |
| GTA V | |
| 3840x2160 High/On (Advanced Graphics Off) AA:FX AF:8x | |
| Przeciętny NVIDIA RTX PRO 5000 Blackwell Generation Laptop (165.3 - 170.3, n=2) | |
| HP ZBook Fury G1i 18 | |
| Lenovo Legion Pro 5 16IAX10, RTX 5070 | |
| 3840x2160 Highest AA:4xMSAA + FX AF:16x | |
| Schenker Key 18 Pro M25 RTX 5090 | |
| Przeciętny NVIDIA RTX PRO 5000 Blackwell Generation Laptop (101.6 - 105.5, n=2) | |
| HP ZBook Fury G1i 18 | |
| Lenovo Legion Pro 5 16IAX10, RTX 5070 | |
| Lenovo Legion Pro 5 16IAX10, RTX 5070 | |
| Final Fantasy XV Benchmark - 3840x2160 High Quality | |
| Schenker Key 18 Pro M25 RTX 5090 | |
| Dell Pro Max 18 Plus MB18250 | |
| Przeciętny NVIDIA RTX PRO 5000 Blackwell Generation Laptop (88.4 - 102.2, n=3) | |
| HP ZBook Fury G1i 18 | |
| Lenovo Legion Pro 5 16IAX10, RTX 5070 | |
| Lenovo ThinkPad P16 G1 RTX A5500 | |
Cyberpunk 2077 ultra FPS Chart
| low | med. | high | ultra | QHD DLSS | QHD | 4K DLSS | 4K | |
|---|---|---|---|---|---|---|---|---|
| GTA V (2015) | 186.5 | 181.3 | 175.3 | 133.6 | 130.5 | 165.3 | ||
| Dota 2 Reborn (2015) | 215 | 187.2 | 175 | 162 | 143.9 | |||
| Final Fantasy XV Benchmark (2018) | 232 | 222 | 183.8 | 145.7 | 88.4 | |||
| X-Plane 11.11 (2018) | 137.3 | 114.9 | 92 | 74.2 | ||||
| Strange Brigade (2018) | 619 | 493 | 440 | 396 | 303 | 165.7 | ||
| Baldur's Gate 3 (2023) | 245 | 208 | 182 | 177 | 179.4 | 129.5 | 114.3 | 74.1 |
| Cyberpunk 2077 (2023) | 171.8 | 173.3 | 157.7 | 143.7 | 109 | 98 | 46.1 | |
| F1 24 (2024) | 281 | 297 | 272 | 125.7 | 126.8 | 84.4 | 71.8 | 43.2 |
Emisje
Hałas systemowy
Wewnętrzne wentylatory są niesłyszalne podczas pracy na biegu jałowym lub wykonywania niewymagających zadań, takich jak przeglądarki lub Excel. Zwiększają się jednak dość szybko, gdy wprowadzane są wyższe obciążenia. W rzeczywistości system nie działa ciszej niż Dell, mimo że oba modele są dostarczane z tym samym procesorem i kartą graficzną.
Hałas
| luz |
| 25.7 / 25.7 / 25.7 dB |
| obciążenie |
| 48.3 / 56.5 dB |
 | ||
30 dB cichy 40 dB(A) słyszalny 50 dB(A) irytujący |
||
min: | ||
| HP ZBook Fury G1i 18 Ultra 9 285HX, RTX PRO 5000 Blackwell Generation Laptop | Dell Pro Max 18 Plus MB18250 Ultra 9 285HX, RTX PRO 5000 Blackwell Generation Laptop | Schenker Key 18 Pro M25 RTX 5090 Ultra 9 275HX, GeForce RTX 5090 Laptop | Lenovo ThinkPad P16 Gen 2 i7-14700HX, RTX 4000 Ada Generation Laptop | HP ZBook X G1i 16 Ultra 7 265H, RTX PRO 2000 Blackwell Generation Laptop | HP ZBook Studio 16 G11 Ultra 9 185H, RTX 3000 Ada Generation Laptop | |
|---|---|---|---|---|---|---|
| Noise | 4% | 2% | -1% | 13% | 9% | |
| wyłączone / środowisko * (dB) | 24.9 | 23.1 7% | 23.9 4% | 23.9 4% | 23.7 5% | 23.8 4% |
| Idle Minimum * (dB) | 25.7 | 27.1 -5% | 25.2 2% | 29.1 -13% | 23.7 8% | 23.8 7% |
| Idle Average * (dB) | 25.7 | 27.1 -5% | 25.2 2% | 29.1 -13% | 23.7 8% | 26.4 -3% |
| Idle Maximum * (dB) | 25.7 | 27.1 -5% | 25.2 2% | 29.1 -13% | 23.7 8% | 26.4 -3% |
| Load Average * (dB) | 48.3 | 38 21% | 47.8 1% | 41 15% | 32.7 32% | 33.7 30% |
| Cyberpunk 2077 ultra * (dB) | 58.2 | 53.8 8% | 54.4 7% | 52.8 9% | 50.9 13% | 46.1 21% |
| Load Maximum * (dB) | 56.5 | 53.8 5% | 58.6 -4% | 52.9 6% | 48 15% | 53.2 6% |
* ... im mniej tym lepiej
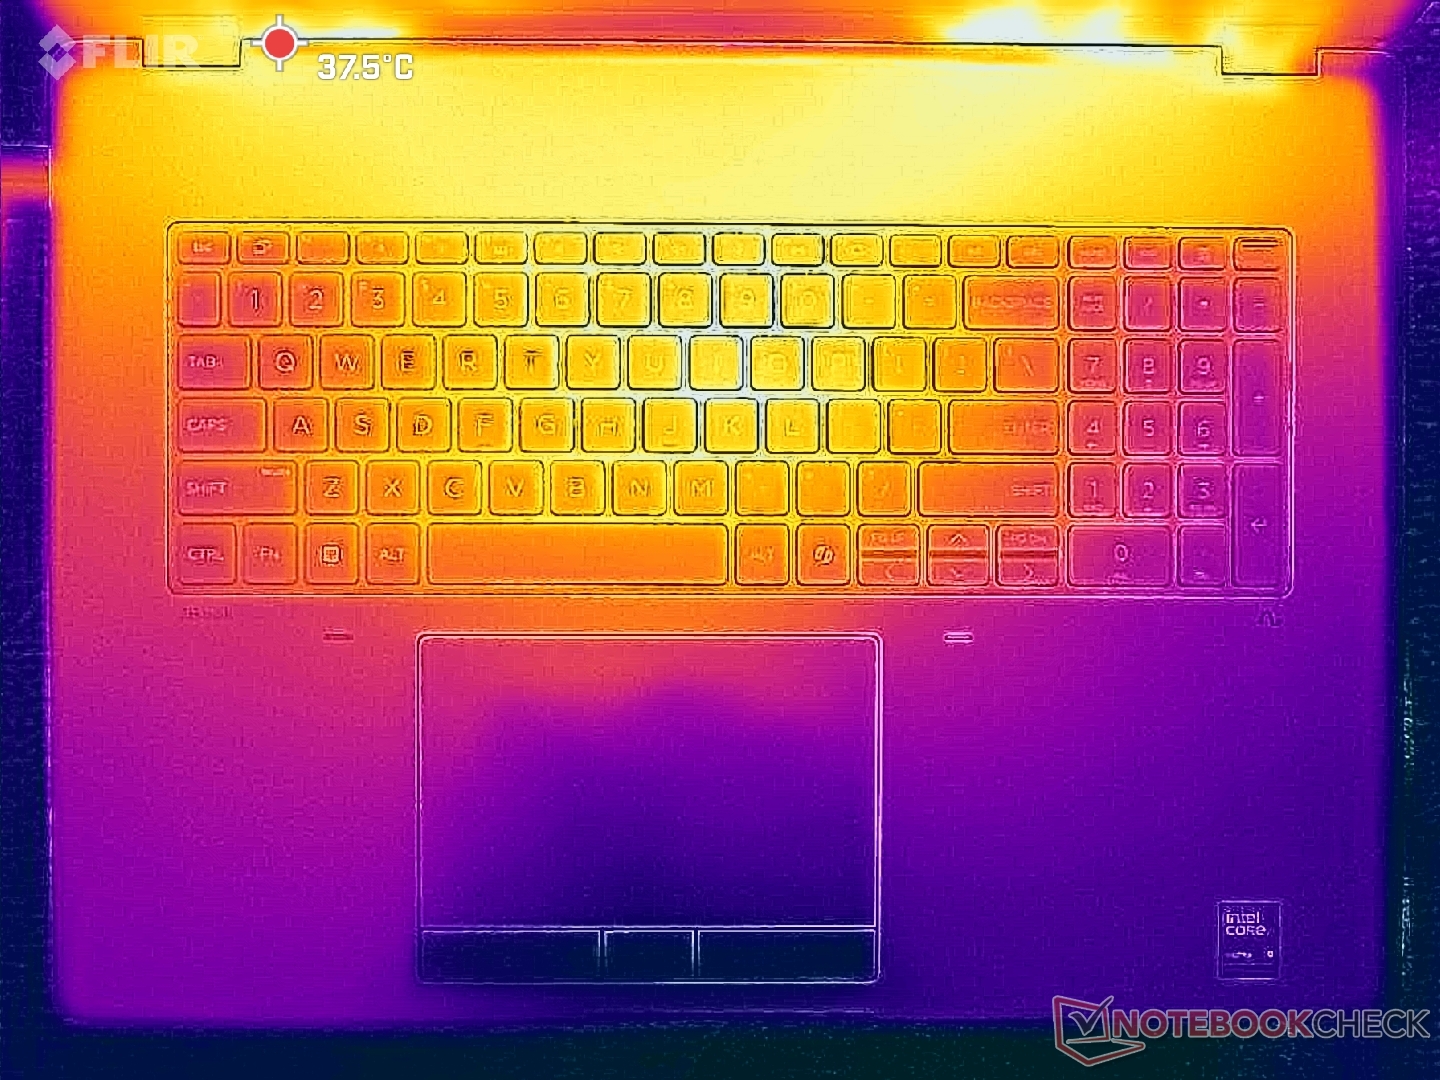
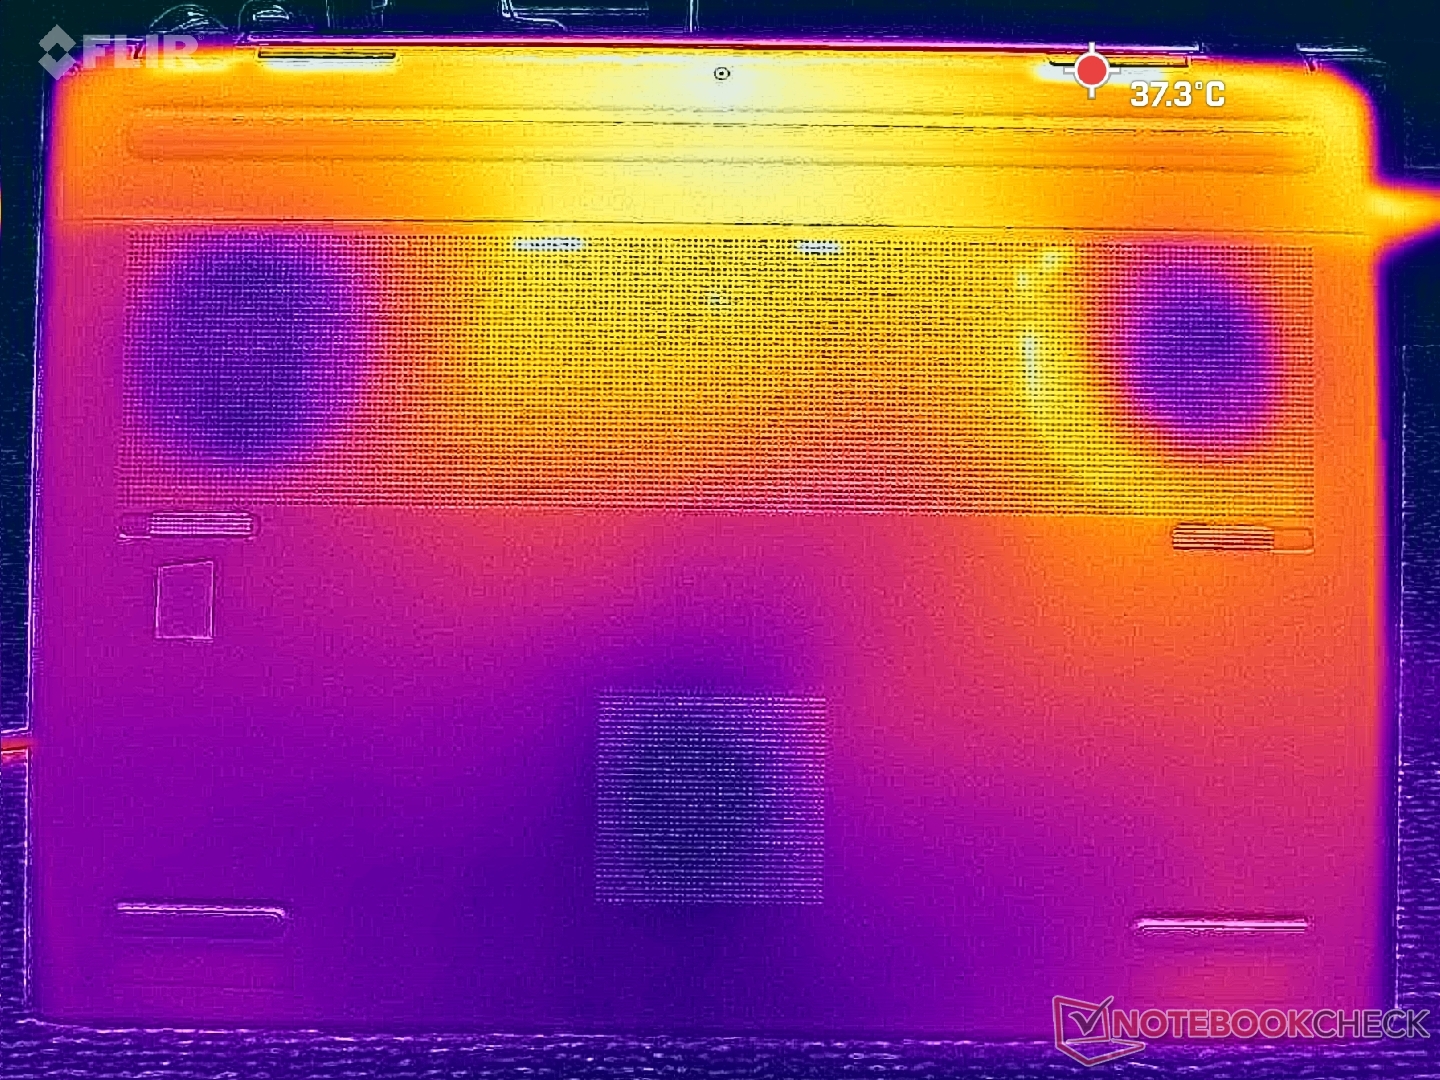
Temperatura
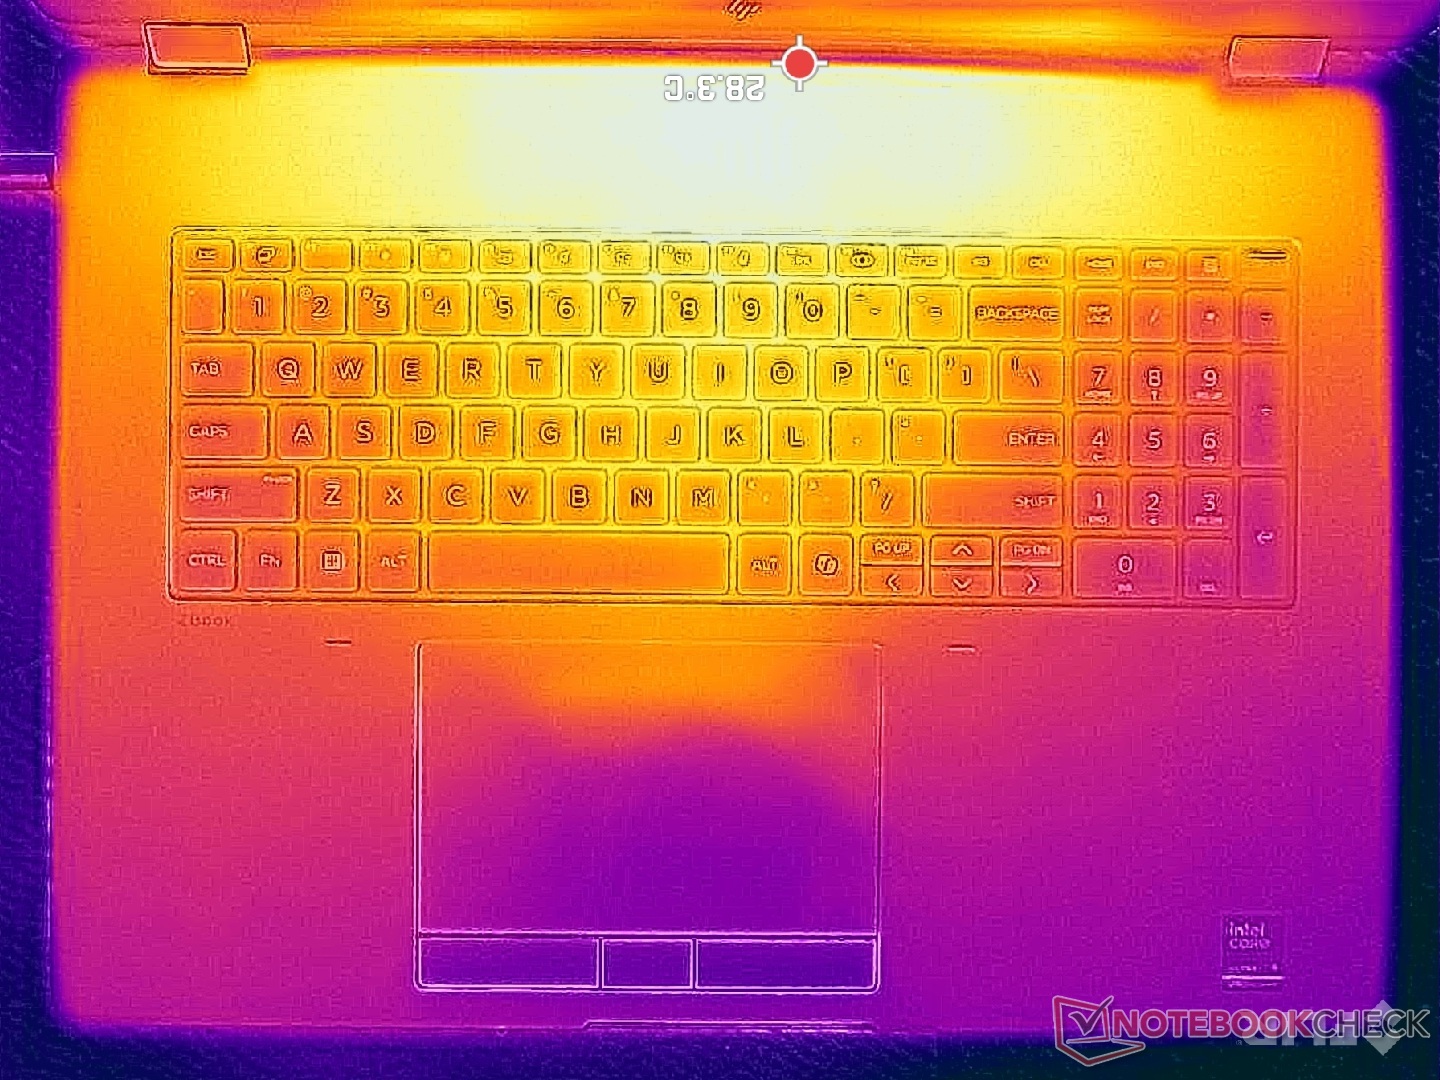
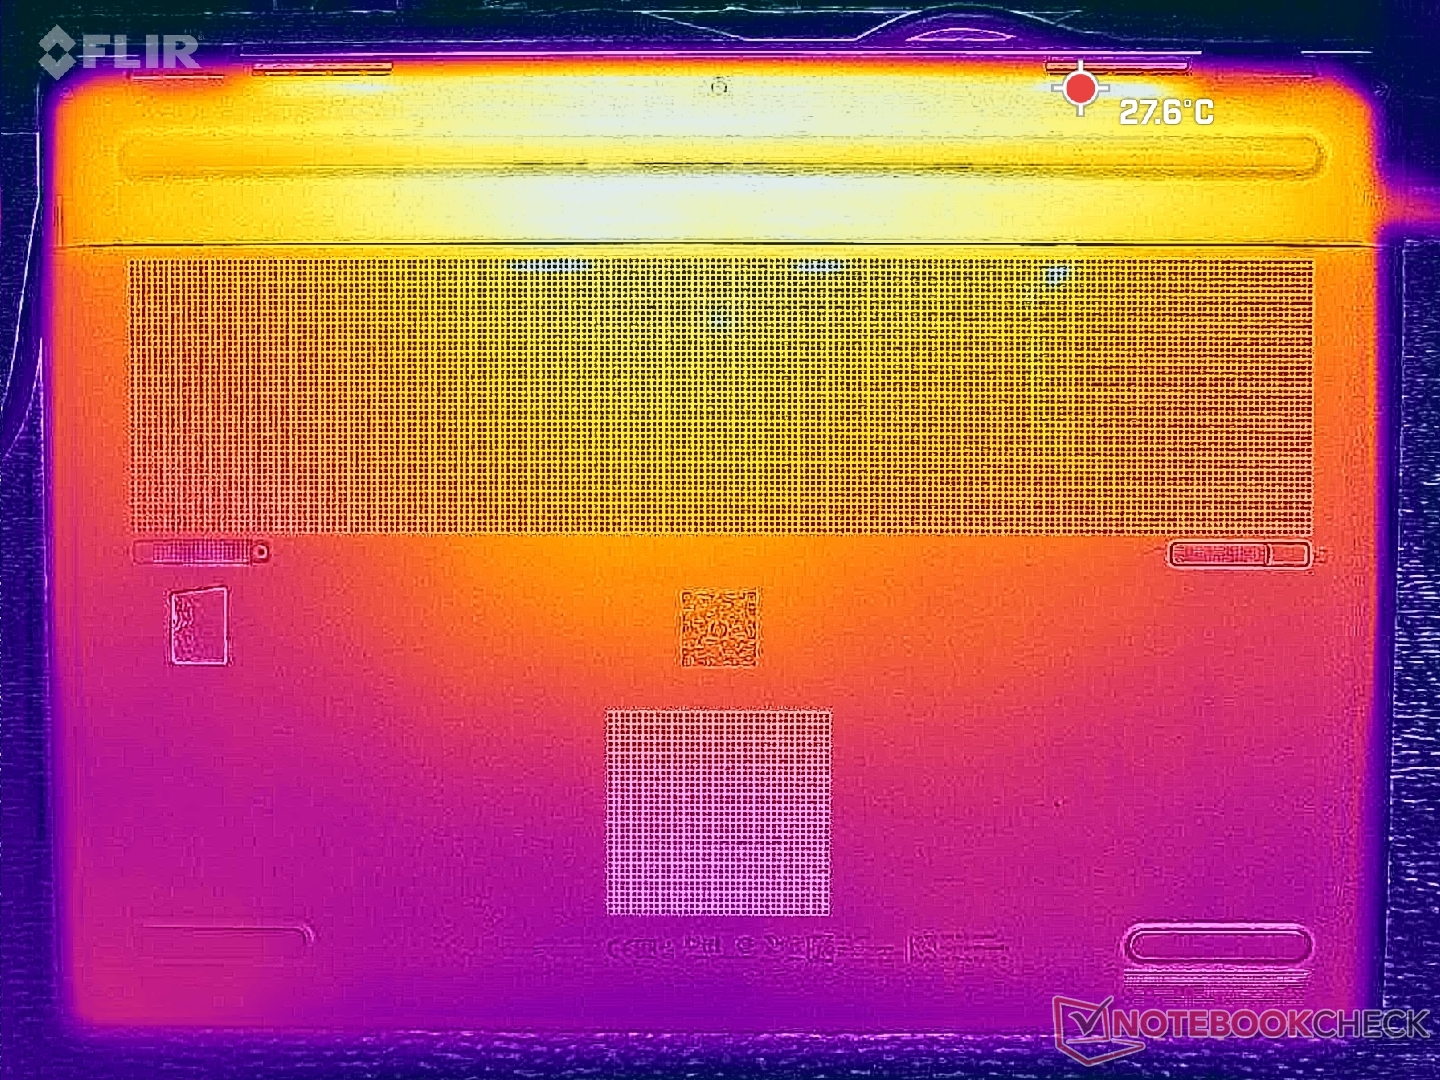
Temperatury powierzchni pozostają rozsądnie niskie nawet podczas pracy z wymagającymi obciążeniami. Gorące punkty na pokładzie klawiatury i dolnej pokrywie osiągały odpowiednio do 40 C i 36 C, w porównaniu do prawie 50 C w Schenker Key 18 Pro Schenker Key 18 Pro.
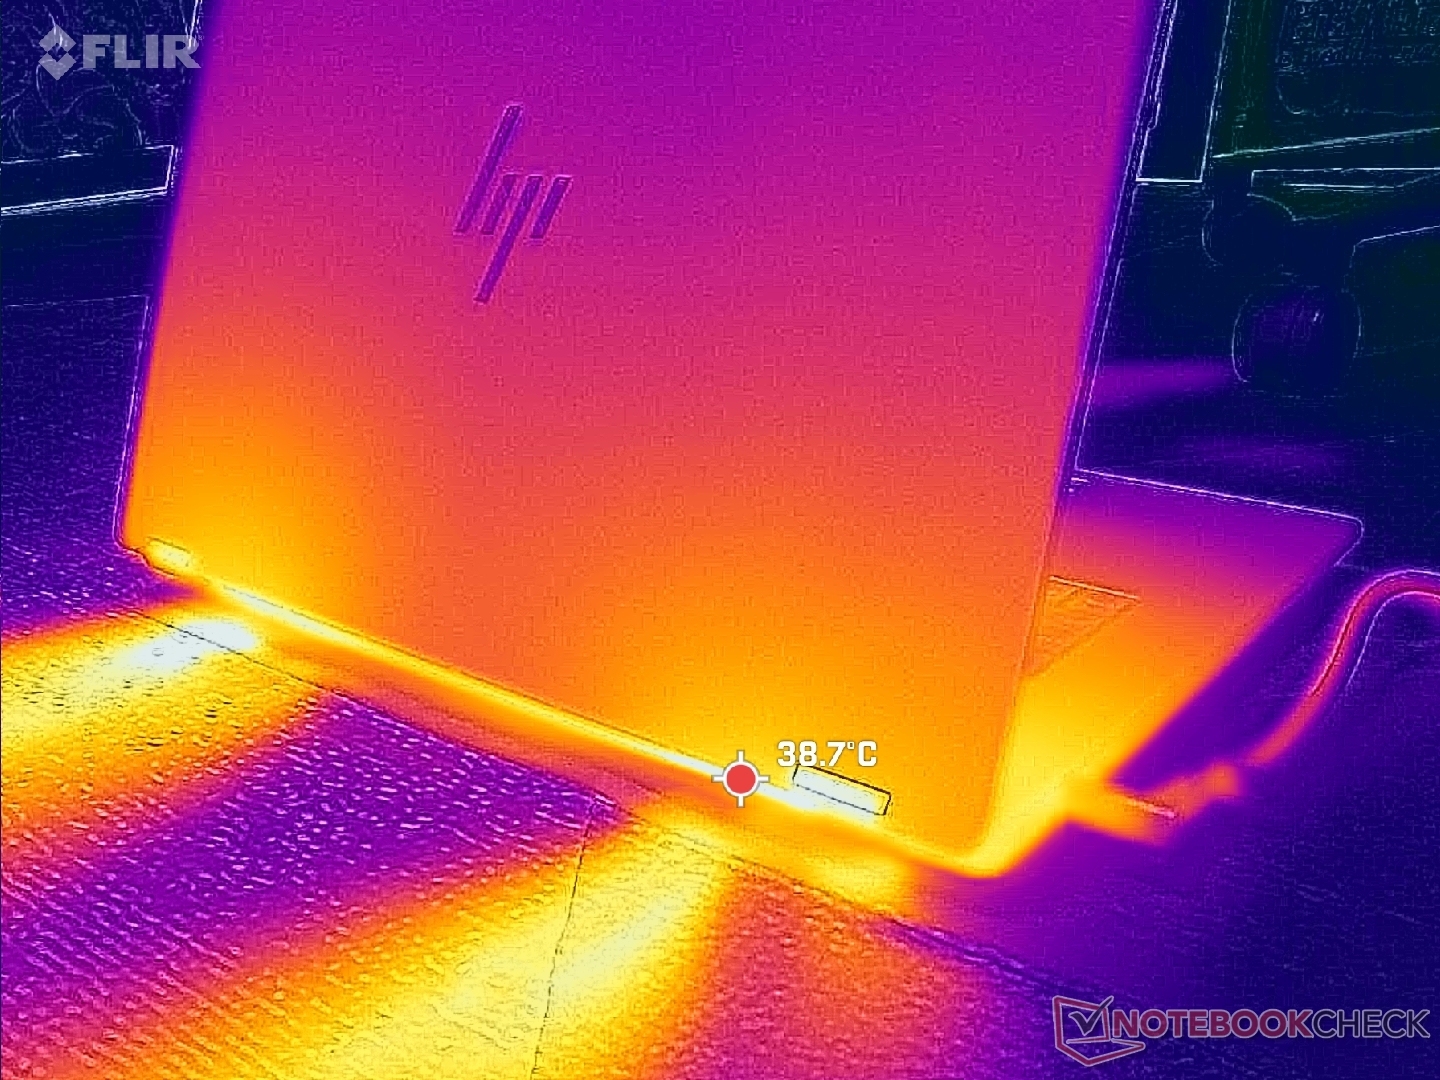
(+) Maksymalna temperatura w górnej części wynosi 39.6 °C / 103 F, w porównaniu do średniej 38.2 °C / 101 F , począwszy od 22.2 do 69.8 °C dla klasy Workstation.
(+) Dno nagrzewa się maksymalnie do 35.4 °C / 96 F, w porównaniu do średniej 41.1 °C / 106 F
(+) W stanie bezczynności średnia temperatura górnej części wynosi 28.4 °C / 83 F, w porównaniu ze średnią temperaturą urządzenia wynoszącą 32 °C / ### class_avg_f### F.
(+) Podpórki pod nadgarstki i touchpad są chłodniejsze niż temperatura skóry i maksymalnie 26 °C / 78.8 F i dlatego są chłodne w dotyku.
(±) Średnia temperatura obszaru podparcia dłoni w podobnych urządzeniach wynosiła 27.8 °C / 82 F (+1.8 °C / 3.2 F).
| HP ZBook Fury G1i 18 Ultra 9 285HX, RTX PRO 5000 Blackwell Generation Laptop | Dell Pro Max 18 Plus MB18250 Ultra 9 285HX, RTX PRO 5000 Blackwell Generation Laptop | Schenker Key 18 Pro M25 RTX 5090 Ultra 9 275HX, GeForce RTX 5090 Laptop | Lenovo ThinkPad P16 Gen 2 i7-14700HX, RTX 4000 Ada Generation Laptop | HP ZBook X G1i 16 Ultra 7 265H, RTX PRO 2000 Blackwell Generation Laptop | HP ZBook Studio 16 G11 Ultra 9 185H, RTX 3000 Ada Generation Laptop | |
|---|---|---|---|---|---|---|
| Heat | -12% | -14% | -6% | 0% | -10% | |
| Maximum Upper Side * (°C) | 39.6 | 44.8 -13% | 47.5 -20% | 46.6 -18% | 36 9% | 36.6 8% |
| Maximum Bottom * (°C) | 35.4 | 47 -33% | 52.8 -49% | 51 -44% | 39.4 -11% | 47.8 -35% |
| Idle Upper Side * (°C) | 31.6 | 31.8 -1% | 28.5 10% | 24.8 22% | 30.4 4% | 31.4 1% |
| Idle Bottom * (°C) | 31.2 | 31.4 -1% | 30.1 4% | 25.6 18% | 31.8 -2% | 35.6 -14% |
* ... im mniej tym lepiej
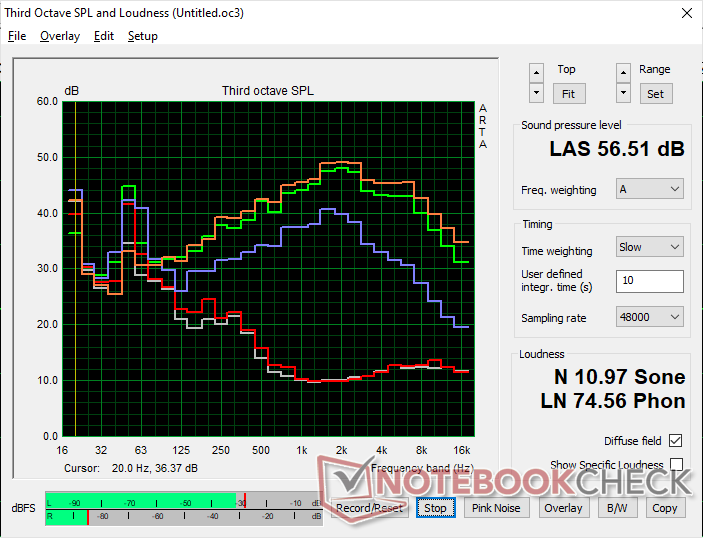
Głośniki
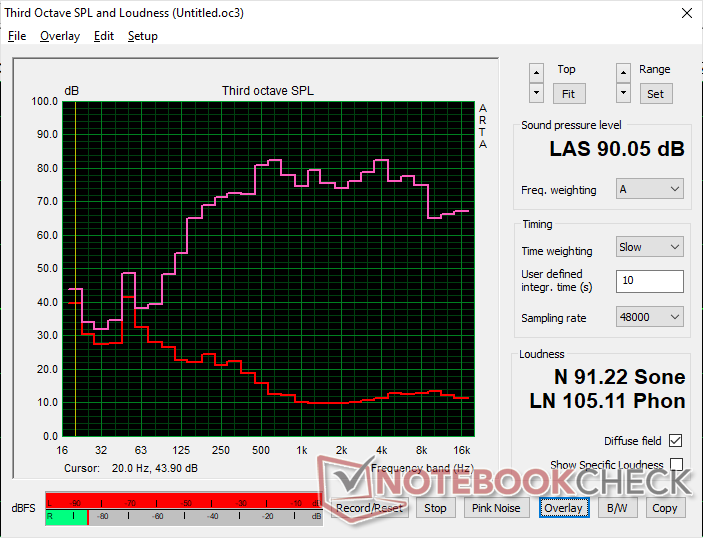
HP ZBook Fury G1i 18 analiza dźwięku
(+) | głośniki mogą odtwarzać stosunkowo głośno (90.1 dB)
Bas 100 - 315 Hz
(±) | zredukowany bas - średnio 11.4% niższy od mediany
(±) | liniowość basu jest średnia (8.9% delta do poprzedniej częstotliwości)
Średnie 400 - 2000 Hz
(+) | zbalansowane środki średnie - tylko 3.2% od mediany
(+) | średnie są liniowe (5.6% delta do poprzedniej częstotliwości)
Wysokie 2–16 kHz
(+) | zrównoważone maksima - tylko 3.7% od mediany
(+) | wzloty są liniowe (6.5% delta do poprzedniej częstotliwości)
Ogólnie 100 - 16.000 Hz
(+) | ogólny dźwięk jest liniowy (10.8% różnicy w stosunku do mediany)
W porównaniu do tej samej klasy
» 10% wszystkich testowanych urządzeń w tej klasie było lepszych, 4% podobnych, 86% gorszych
» Najlepszy miał deltę 7%, średnia wynosiła ###średnia###%, najgorsza wynosiła 35%
W porównaniu do wszystkich testowanych urządzeń
» 6% wszystkich testowanych urządzeń było lepszych, 2% podobnych, 92% gorszych
» Najlepszy miał deltę 4%, średnia wynosiła ###średnia###%, najgorsza wynosiła 134%
Apple MacBook Pro 16 2021 M1 Pro analiza dźwięku
(+) | głośniki mogą odtwarzać stosunkowo głośno (84.7 dB)
Bas 100 - 315 Hz
(+) | dobry bas - tylko 3.8% od mediany
(+) | bas jest liniowy (5.2% delta do poprzedniej częstotliwości)
Średnie 400 - 2000 Hz
(+) | zbalansowane środki średnie - tylko 1.3% od mediany
(+) | średnie są liniowe (2.1% delta do poprzedniej częstotliwości)
Wysokie 2–16 kHz
(+) | zrównoważone maksima - tylko 1.9% od mediany
(+) | wzloty są liniowe (2.7% delta do poprzedniej częstotliwości)
Ogólnie 100 - 16.000 Hz
(+) | ogólny dźwięk jest liniowy (4.6% różnicy w stosunku do mediany)
W porównaniu do tej samej klasy
» 0% wszystkich testowanych urządzeń w tej klasie było lepszych, 0% podobnych, 100% gorszych
» Najlepszy miał deltę 5%, średnia wynosiła ###średnia###%, najgorsza wynosiła 45%
W porównaniu do wszystkich testowanych urządzeń
» 0% wszystkich testowanych urządzeń było lepszych, 0% podobnych, 100% gorszych
» Najlepszy miał deltę 4%, średnia wynosiła ###średnia###%, najgorsza wynosiła 134%
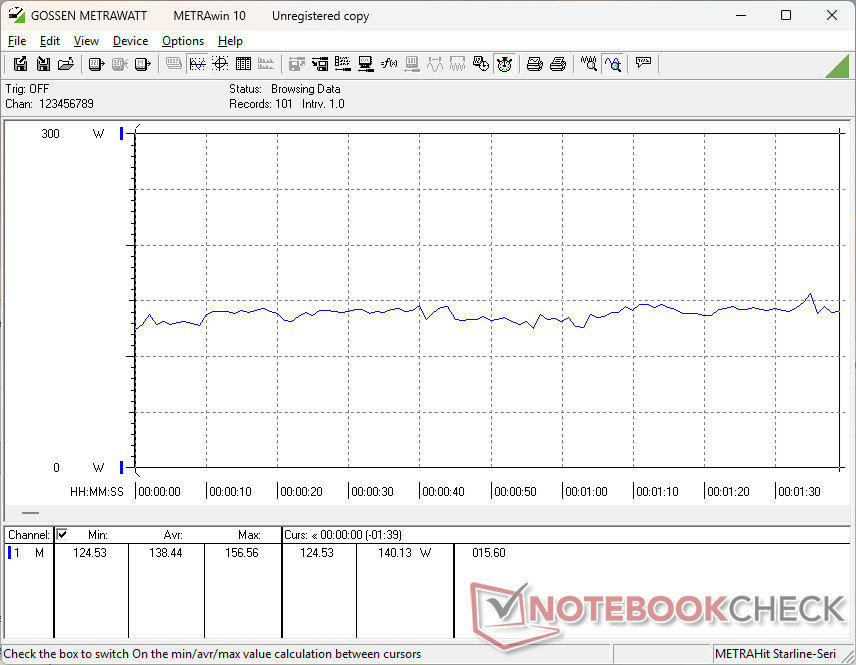
Zarządzanie energią
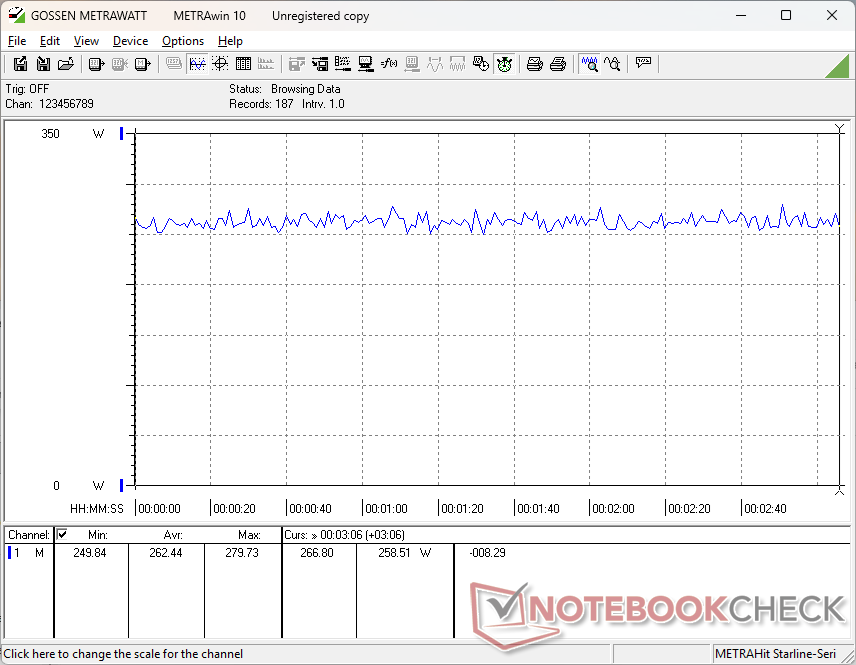
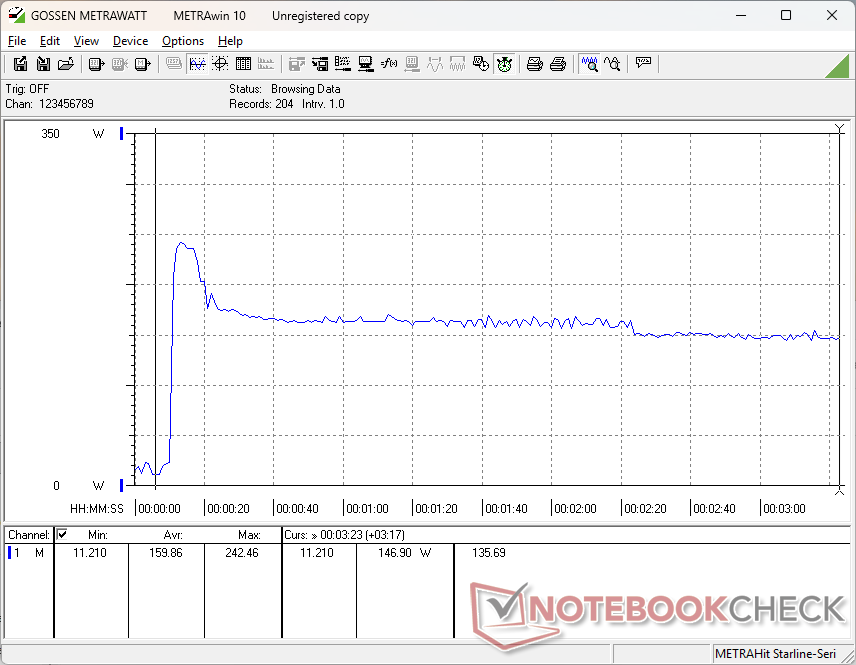
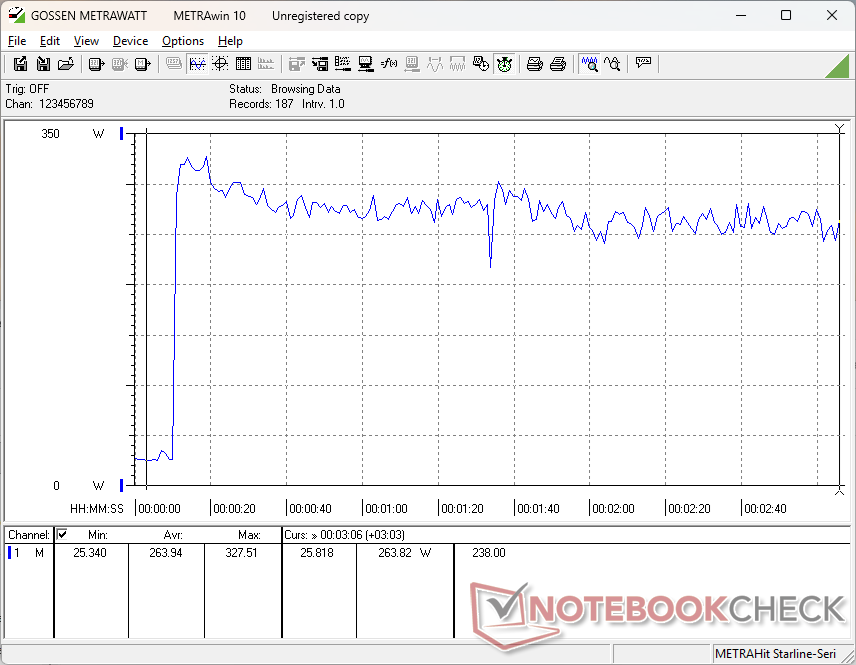
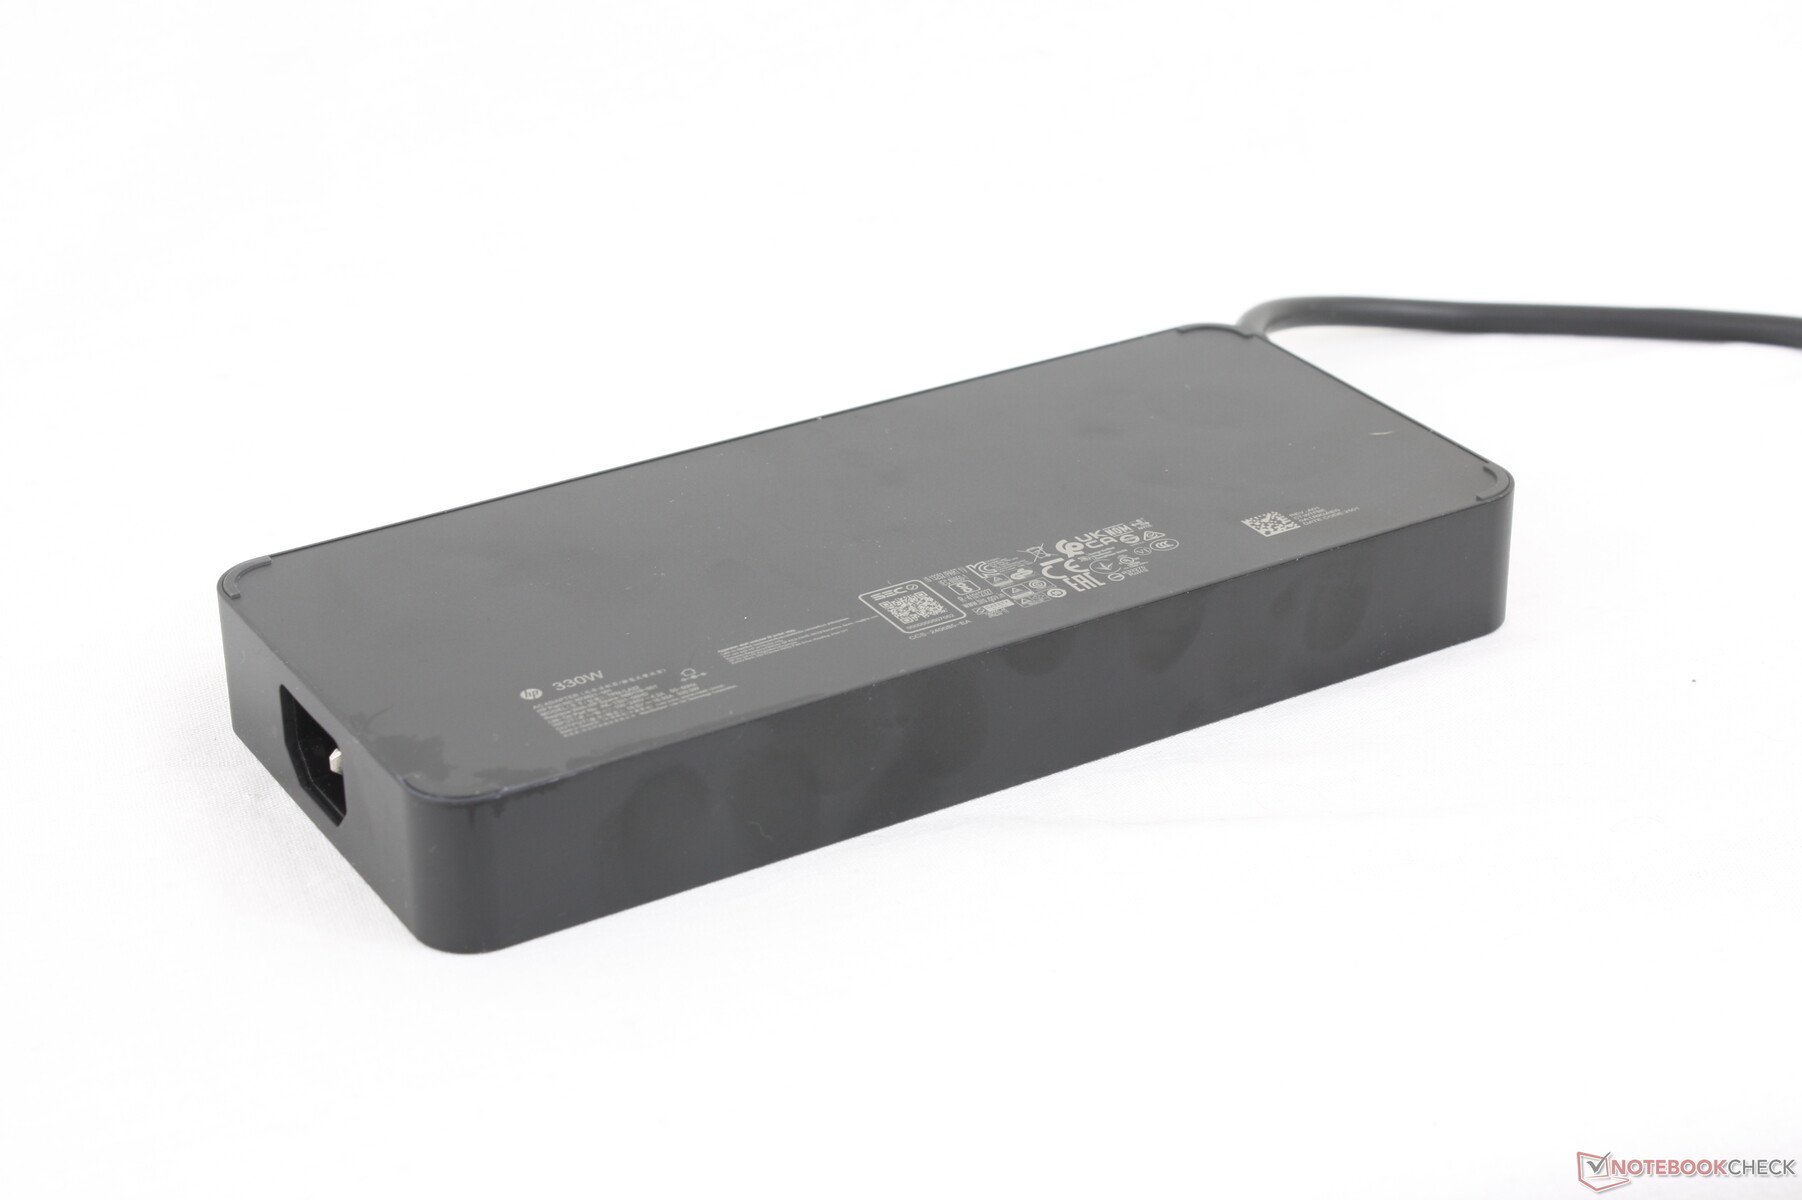
Zużycie energii
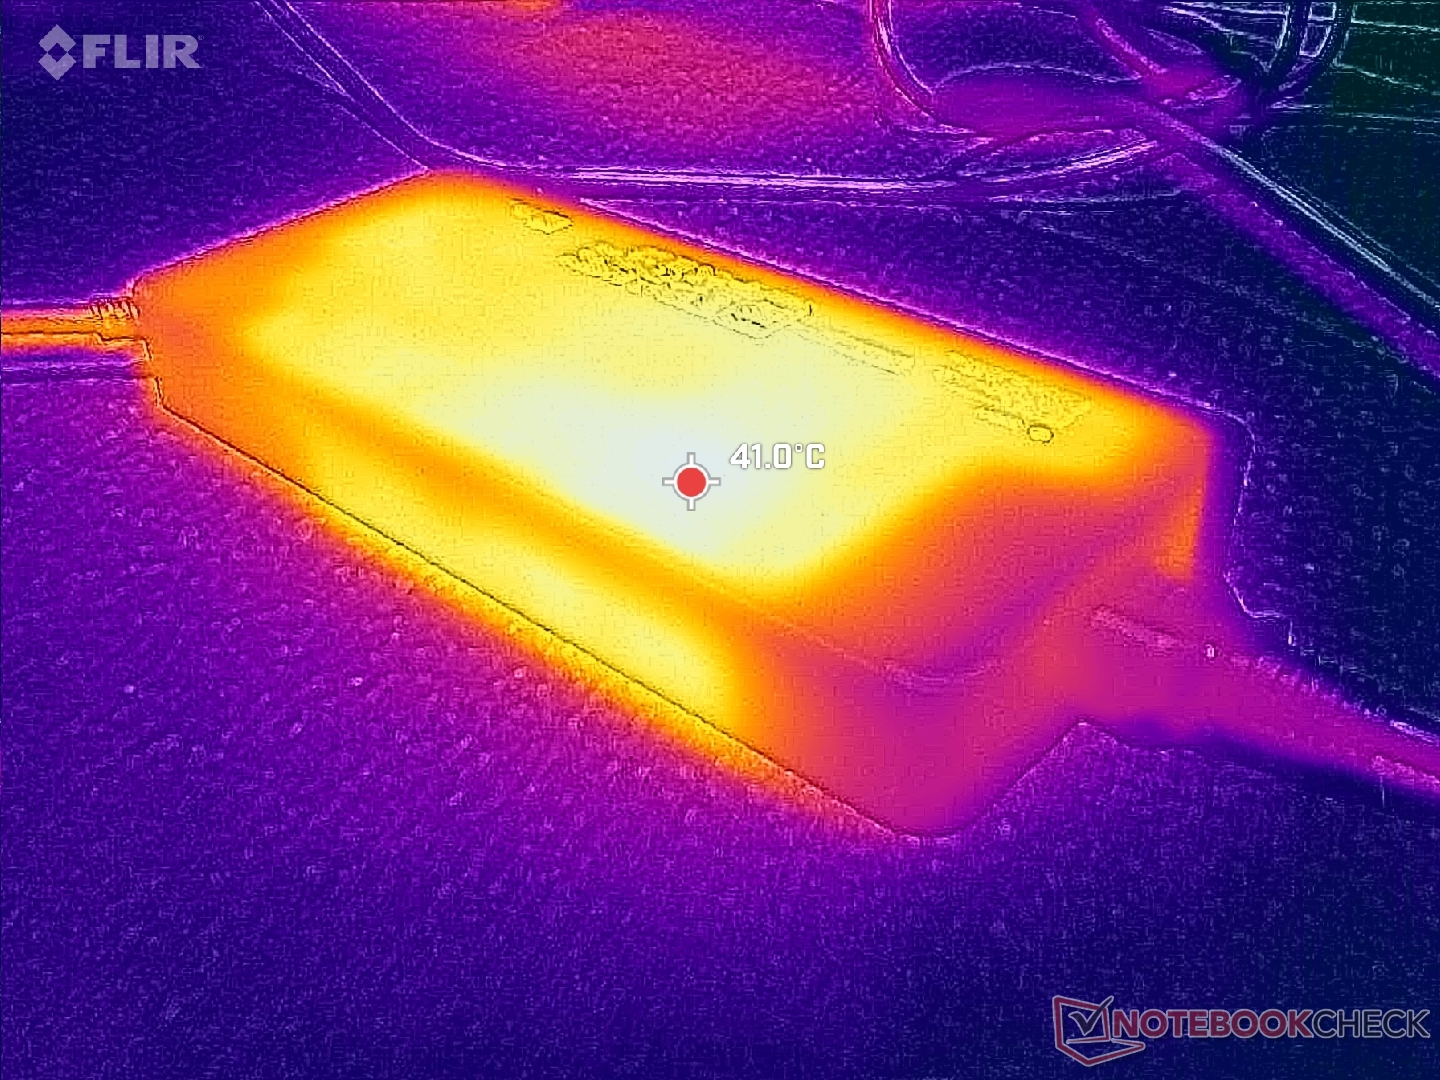
HP jest dostarczany z zasilaczem sieciowym o mocy 330 W, podczas gdy Dell jest dostarczany z zasilaczem sieciowym USB-C o mocy 280 W. Maksymalne zużycie energii jest zatem wyższe w HP, gdzie w naszych testach może osiągnąć nawet 328 W w porównaniu do 281 W w Dellu, ale tak wysoki pobór jest krótkotrwały ze względu na ograniczenia termiczne lub narzucone pułapy. Na przykład podczas jednoczesnego uruchamiania Prime95 i FurMark, pobór osiągnął szczytowy poziom 328 W, po czym szybko ustabilizował się na poziomie około 265 W, podobnie jak w przypadku Della. Tak więc, dla celów wydajności, większy zasilacz sieciowy o mocy 330 W ma niewielkie znaczenie.
| wyłączony / stan wstrzymania | |
| luz | |
| obciążenie |
|
Legenda:
min: | |
| HP ZBook Fury G1i 18 Ultra 9 285HX, RTX PRO 5000 Blackwell Generation Laptop, , IPS, 2560x1600, 18" | Dell Pro Max 18 Plus MB18250 Ultra 9 285HX, RTX PRO 5000 Blackwell Generation Laptop, , IPS, 2560x1600, 18" | Schenker Key 18 Pro M25 RTX 5090 Ultra 9 275HX, GeForce RTX 5090 Laptop, Samsung 9100 Pro 4 TB, IPS, 3840x2400, 18" | Lenovo ThinkPad P16 Gen 2 i7-14700HX, RTX 4000 Ada Generation Laptop, SK hynix PC801 HFS001TEJ9X162N, IPS, 2560x1600, 16" | HP ZBook X G1i 16 Ultra 7 265H, RTX PRO 2000 Blackwell Generation Laptop, Samsung PM9A1 MZVL22T0HBLB, IPS, 2560x1600, 16" | HP ZBook Studio 16 G11 Ultra 9 185H, RTX 3000 Ada Generation Laptop, Kioxia XG8 KXG80ZNV1T02, IPS, 3840x2400, 16" | |
|---|---|---|---|---|---|---|
| Power Consumption | 11% | -11% | 21% | 58% | 28% | |
| Idle Minimum * (Watt) | 16.1 | 6.1 62% | 14 13% | 7.9 51% | 4.1 75% | 14 13% |
| Idle Average * (Watt) | 20.3 | 15.2 25% | 21.9 -8% | 13.1 35% | 9 56% | 22.4 -10% |
| Idle Maximum * (Watt) | 25 | 32.4 -30% | 22.3 11% | 24.2 3% | 9.4 62% | 25.7 -3% |
| Load Average * (Watt) | 138.5 | 130.1 6% | 149.5 -8% | 127.4 8% | 86.7 37% | 90.2 35% |
| Cyberpunk 2077 ultra external monitor * (Watt) | 255 | 252 1% | 336 -32% | 219 14% | 102 60% | 120.3 53% |
| Cyberpunk 2077 ultra * (Watt) | 262 | 256 2% | 333 -27% | 225 14% | 106.1 60% | 125.4 52% |
| Load Maximum * (Watt) | 327.5 | 280.9 14% | 415.4 -27% | 248.5 24% | 152.9 53% | 142 57% |
* ... im mniej tym lepiej
Pobór mocy Cyberpunk / Test warunków skrajnych
Zużycie energii przez monitor zewnętrzny
Żywotność baterii
Czas pracy WLAN jest nadal bardzo dobry jak na ten rozmiar, choć nieco krótszy niż w Dell Pro Max 18 Plus. Wyświetlacz obsługuje PSR2 lub Panel Self Refresh 2 w celu oszczędzania energii zamiast Advanced Optimus.
| HP ZBook Fury G1i 18 Ultra 9 285HX, RTX PRO 5000 Blackwell Generation Laptop, 99 Wh | Dell Pro Max 18 Plus MB18250 Ultra 9 285HX, RTX PRO 5000 Blackwell Generation Laptop, 96 Wh | Schenker Key 18 Pro M25 RTX 5090 Ultra 9 275HX, GeForce RTX 5090 Laptop, 98 Wh | Lenovo ThinkPad P16 Gen 2 i7-14700HX, RTX 4000 Ada Generation Laptop, 94 Wh | HP ZBook X G1i 16 Ultra 7 265H, RTX PRO 2000 Blackwell Generation Laptop, 83 Wh | HP ZBook Studio 16 G11 Ultra 9 185H, RTX 3000 Ada Generation Laptop, 86 Wh | |
|---|---|---|---|---|---|---|
| Czasy pracy | ||||||
| WiFi v1.3 (h) | 8 | 9.3 16% | 5.8 -27% | 2.5 -69% | 12.5 56% | 4.8 -40% |
Ocena Notebookcheck
HP ZBook Fury G1i 18 brzmi świetnie na papierze, ale konserwatywna wydajność CPU i GPU oraz ogólny brak innowacji sprawiają, że Dell Pro Max 18 Plus jest prawdopodobnie bardziej atrakcyjną opcją.
HP ZBook Fury G1i 18
- 22/11/2025 v8
Allen Ngo
 Total Sustainability Score:
 Potencjalni konkurenci w porównaniu
Obraz | Model / recenzja | Cena | Waga | Wysokość | Ekran |
|---|---|---|---|---|---|
1. 89.5%  | HP ZBook Fury G1i 18 Intel Core Ultra 9 285HX ⎘ NVIDIA RTX PRO 5000 Blackwell Generation Laptop ⎘ 64 GB Pamięć | Amazon: Cena katalogowa: 11000 USD | 3.4 kg | 27 mm | 18.00" 2560x1600 168 PPI IPS |
2. 88.9% 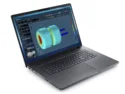 | Dell Pro Max 18 Plus MB18250 Intel Core Ultra 9 285HX ⎘ NVIDIA RTX PRO 5000 Blackwell Generation Laptop ⎘ 128 GB Pamięć | Amazon: Cena katalogowa: 6000 USD | 3.6 kg | 30.2 mm | 18.00" 2560x1600 168 PPI IPS |
3. 84.6% 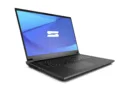 | Schenker Key 18 Pro M25 RTX 5090 Intel Core Ultra 9 275HX ⎘ NVIDIA GeForce RTX 5090 Laptop ⎘ 256 GB Pamięć, 4096 GB SSD | Amazon: Cena katalogowa: 6400€ | 4.1 kg | 29.5 mm | 18.00" 3840x2400 252 PPI IPS |
4. 85.9%  | Lenovo ThinkPad P16 Gen 2 Intel Core i7-14700HX ⎘ NVIDIA RTX 4000 Ada Generation Laptop ⎘ 32 GB Pamięć, 1024 GB SSD | Amazon: Cena katalogowa: 3500 USD | 3.1 kg | 30.23 mm | 16.00" 2560x1600 189 PPI IPS |
5. 87.4%  | HP ZBook X G1i 16 Intel Core Ultra 7 265H ⎘ NVIDIA RTX PRO 2000 Blackwell Generation Laptop ⎘ 64 GB Pamięć, 2048 GB SSD | Amazon: Cena katalogowa: 2700 USD | 2.2 kg | 23 mm | 16.00" 2560x1600 189 PPI IPS |
6. 84.2%  | HP ZBook Studio 16 G11 Intel Core Ultra 9 185H ⎘ NVIDIA RTX 3000 Ada Generation Laptop ⎘ 64 GB Pamięć, 1024 GB SSD | Amazon: Cena katalogowa: 4300 USD | 1.8 kg | 19 mm | 16.00" 3840x2400 283 PPI IPS |
Przezroczystość
Wyboru urządzeń do recenzji dokonuje nasza redakcja. Próbka testowa została udostępniona autorowi jako pożyczka od producenta lub sprzedawcy detalicznego na potrzeby tej recenzji. Pożyczkodawca nie miał wpływu na tę recenzję, producent nie otrzymał też kopii tej recenzji przed publikacją. Nie było obowiązku publikowania tej recenzji. Jako niezależna firma medialna, Notebookcheck nie podlega władzy producentów, sprzedawców detalicznych ani wydawców.
Tak testuje Notebookcheck
Każdego roku Notebookcheck niezależnie sprawdza setki laptopów i smartfonów, stosując standardowe procedury, aby zapewnić porównywalność wszystkich wyników. Od około 20 lat stale rozwijamy nasze metody badawcze, ustanawiając przy tym standardy branżowe. W naszych laboratoriach testowych doświadczeni technicy i redaktorzy korzystają z wysokiej jakości sprzętu pomiarowego. Testy te obejmują wieloetapowy proces walidacji. Nasz kompleksowy system ocen opiera się na setkach uzasadnionych pomiarów i benchmarków, co pozwala zachować obiektywizm.
