Recenzja stacji roboczej HP ZBook Studio 16 G11: Lekkość i wydajność w dobrym wydaniu
Ulepszony procesor i grafika RTX Ada.
Jedna z najlżejszych 16-calowych stacji roboczych HP otrzymała nowe opcje procesora zapewniające zauważalnie wyższą wydajność niż wcześniej. Poza tym jest to wizualnie ten sam projekt, co ZBook Studio 16 G9 lub G10, co zapewnia zasadniczo identyczne wrażenia użytkownika.Allen Ngo, 👁 Allen Ngo (tłumaczenie DeepL / Ninh Duy) Opublikowany 🇺🇸 🇫🇷 ...
Werdykt - Lżejsza niż oczekiwano jak na 16-calową stację roboczą
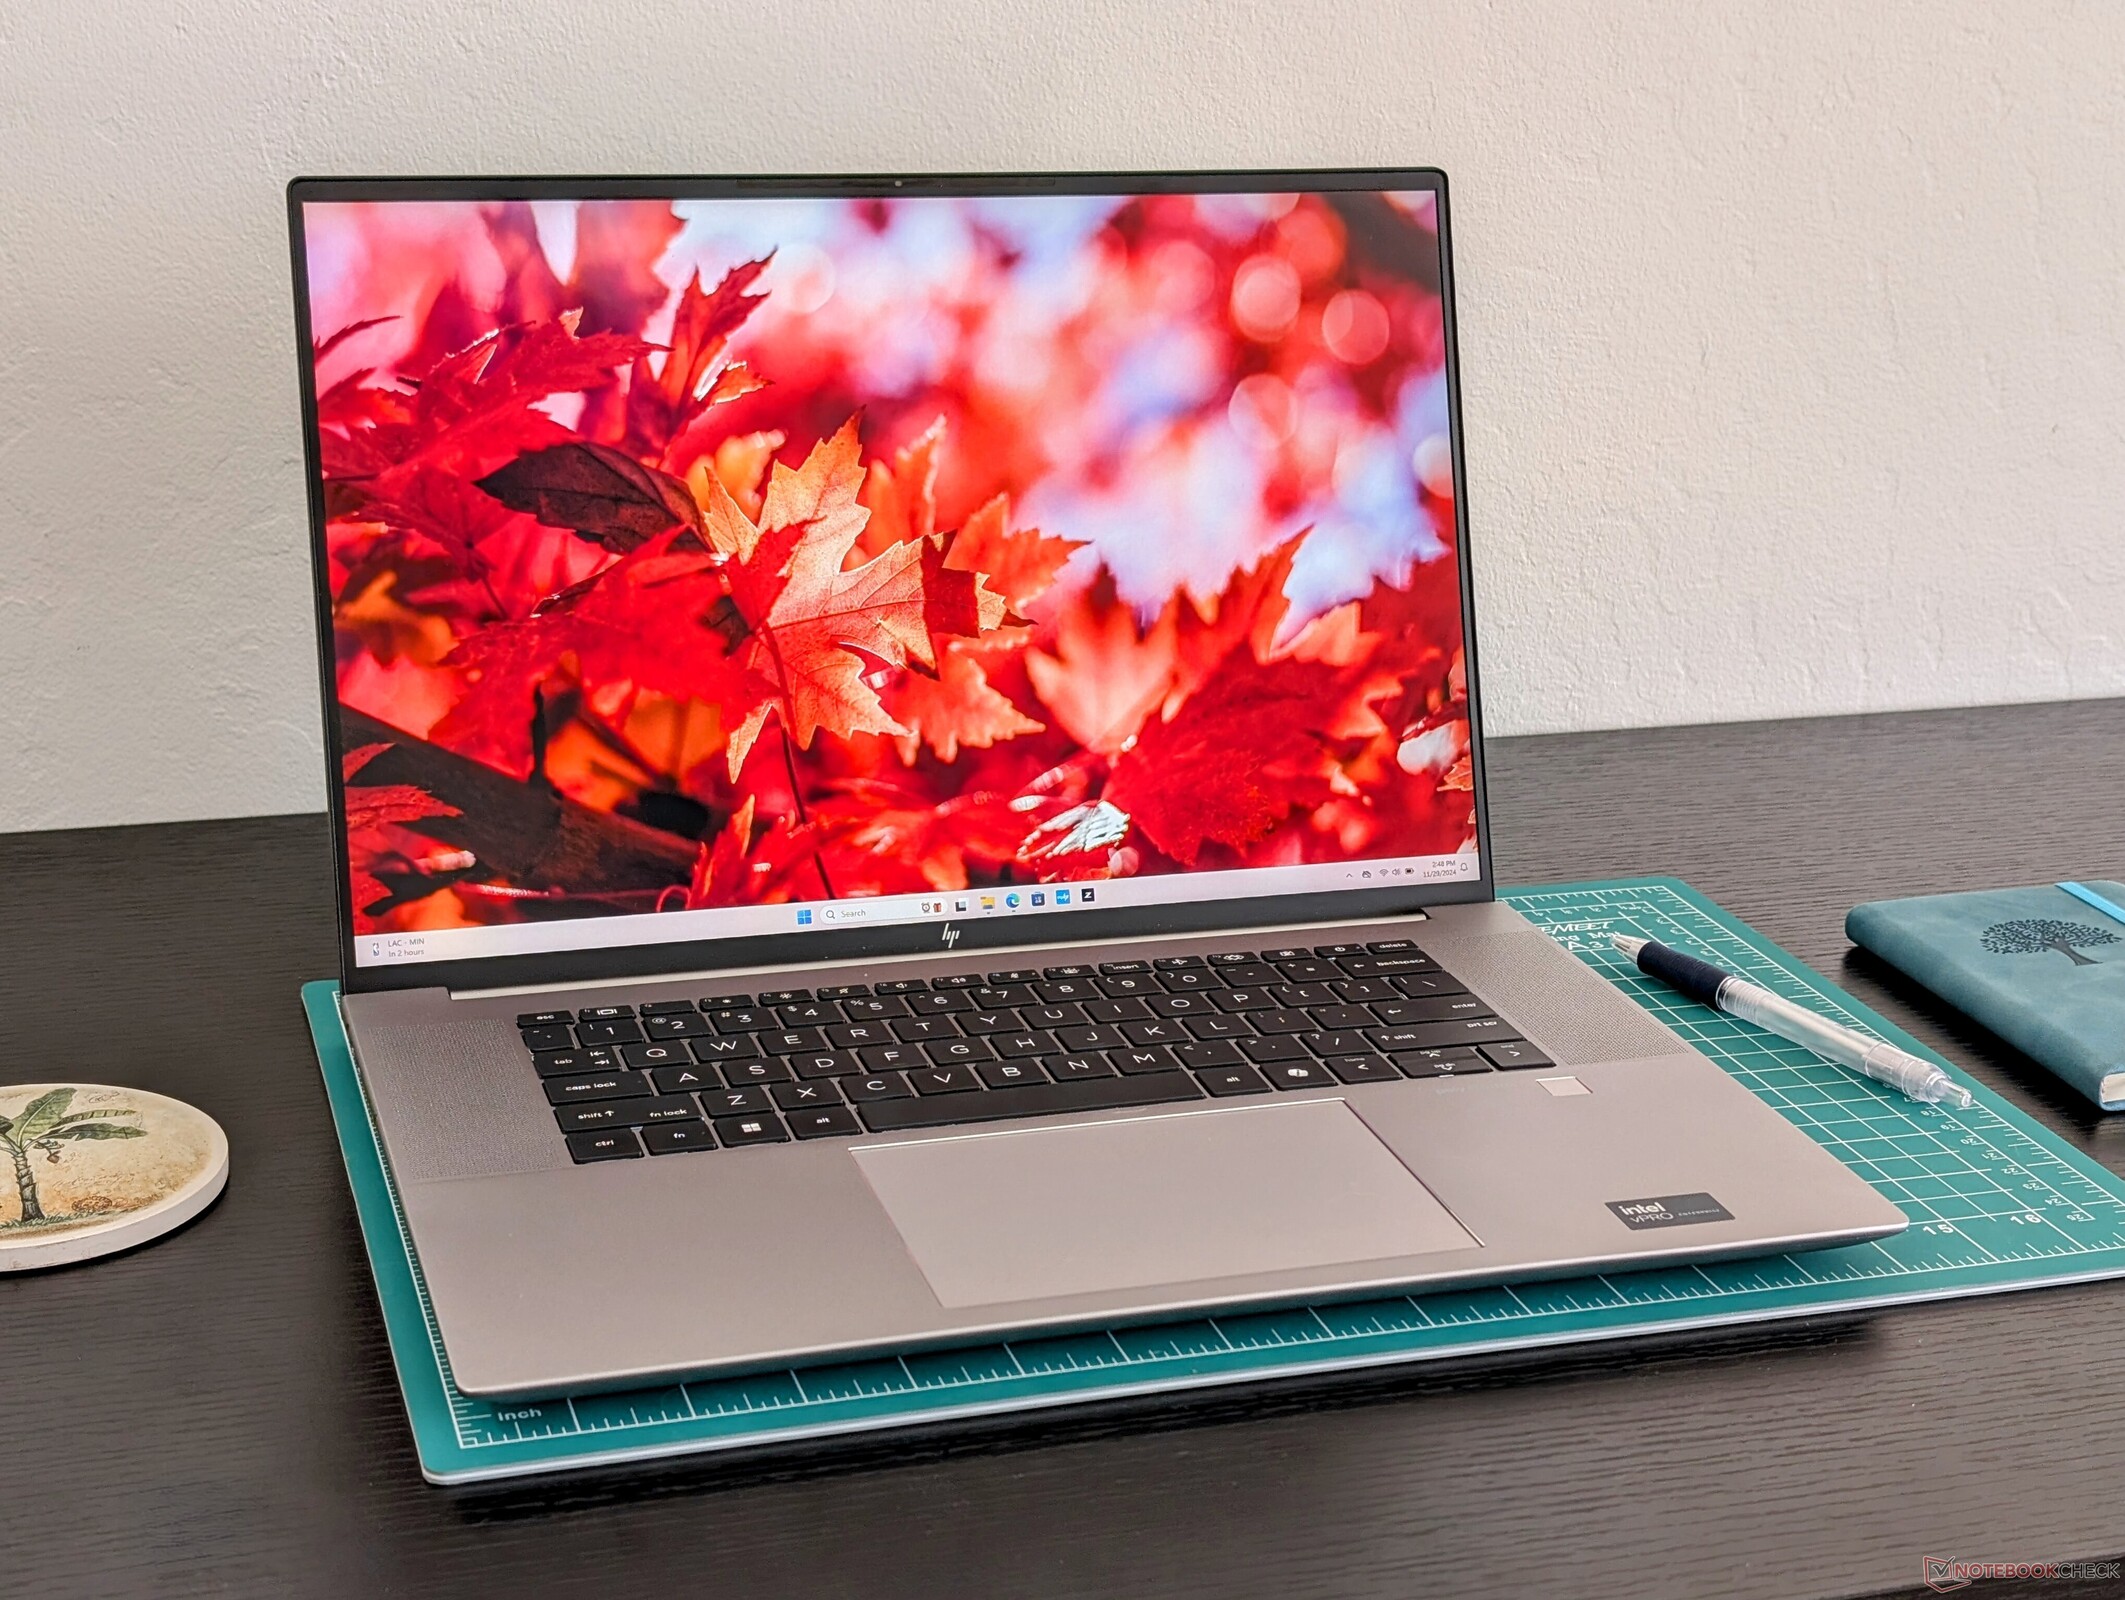
ZBook Studio 16 G11 wyróżnia się poręcznością i jakością wykonania pomimo niewielkiej grubości i dużego, 16-calowego ekranu. Profesjonaliści, którzy chcą czegoś wystarczająco lekkiego do przenoszenia bez poświęcania rozmiaru wyświetlacza lub zbyt dużej wydajności, znajdą wiele do polubienia w Studio 16 G11, zwłaszcza teraz, gdy nowe opcje GPU są zauważalnie szybsze i bardziej wydajne niż te dostępne w modelu G9.
Niestety, system nadal cierpi na wiele tych samych wad, co poprzednie modele G10 lub G9, ponieważ wszystkie mają tę samą obudowę lub szkielet. Na przykład niewyraźna kamera internetowa 1 MP i brak migawki prywatności wskazują na starzejącą się konstrukcję. Inne czynniki, takie jak temperatura pracy rdzenia i żywotność baterii, są odpowiednio cieplejsze i krótsze niż byśmy chcieli, podczas gdy aktualizacja procesora z Alder Lake-H do Meteor Lake-H nie jest tak duża, jak aktualizacja GPU. Użytkownicy wymagający dodatkowej mocy graficznej szybszej niż RTX 3000 Ada będą musieli spojrzeć na grubsze alternatywy, takie jak Seria ZBook Fury 16 które można skonfigurować z opcjami RTX 5000 Ada.
Powinniśmy również zauważyć, że doświadczyliśmy kilku problemów z zawieszaniem się na naszej jednostce testowej. Być może warto dokładnie sprawdzić swoją jednostkę przy zakupie pod kątem wadliwego działania.
Za
Przeciw
Cena i dostępność
Mniejszy SKU z Core Ultra 7 i RTX 2000 Ada jest dostępny na Amazon za 3200 USD. Dodatkowe jednostki SKU są dostępne bezpośrednio od HP.
Porównanie możliwych alternatyw
Obraz | Model / recenzja | Cena | Waga | Wysokość | Ekran |
|---|---|---|---|---|---|
1. 84.2%  | HP ZBook Studio 16 G11 Intel Core Ultra 9 185H ⎘ NVIDIA RTX 3000 Ada Generation Laptop ⎘ 64 GB Pamięć, 1024 GB SSD | Amazon: Cena katalogowa: 4300 USD | 1.8 kg | 19 mm | 16.00" 3840x2400 283 PPI IPS |
2. 90.1% v7 (old)  | HP ZBook Studio 16 G9 62U04EA Intel Core i7-12800H ⎘ NVIDIA RTX A2000 Laptop GPU ⎘ 32 GB Pamięć, 1024 GB SSD | Amazon: Cena katalogowa: 3300€ | 1.8 kg | 19 mm | 16.00" 3840x2400 283 PPI IPS |
3. 85.4%  | HP ZBook Power 16 G11 A AMD Ryzen 7 8845HS ⎘ NVIDIA RTX 2000 Ada Generation Laptop ⎘ 64 GB Pamięć, 2048 GB SSD | Amazon: Cena katalogowa: 2100 USD | 2.2 kg | 22.9 mm | 16.00" 2560x1600 189 PPI IPS |
4. 85.9%  | Lenovo ThinkPad P16 Gen 2 Intel Core i7-14700HX ⎘ NVIDIA RTX 4000 Ada Generation Laptop ⎘ 32 GB Pamięć, 1024 GB SSD | Amazon: Cena katalogowa: 3500 USD | 3.1 kg | 30.23 mm | 16.00" 2560x1600 189 PPI IPS |
5. 88.3% v7 (old)  | Dell Precision 5690 Intel Core Ultra 9 185H ⎘ NVIDIA RTX 5000 Ada Generation Laptop ⎘ 32 GB Pamięć, 2048 GB SSD | Amazon: Cena katalogowa: 5900 USD | 2.3 kg | 22.17 mm | 16.00" 3840x2400 283 PPI OLED |
6. 84.3% v7 (old)  | MSI CreatorPro Z16P B12UKST Intel Core i7-12700H ⎘ NVIDIA RTX A3000 Laptop GPU ⎘ 32 GB Pamięć, 1024 GB SSD | Amazon: Cena katalogowa: 3500€ | 2.4 kg | 19 mm | 16.00" 2560x1600 189 PPI IPS |
7. 83.5%  | Lenovo ThinkPad P1 Gen 7 21KV001SGE Intel Core Ultra 7 155H ⎘ NVIDIA GeForce RTX 4060 Laptop GPU ⎘ 32 GB Pamięć, 1024 GB SSD | Amazon: Cena katalogowa: 3239 Euro | 2 kg | 20.5 mm | 16.00" 2560x1600 189 PPI IPS LED |
Ostatnim razem, gdy recenzowaliśmy serię ZBook Studio 16, był model Model G9 w 2022 roku. W 2024 roku najnowszym modelem jest teraz G11 wyposażony zarówno w szybsze procesory Intel Meteor Lake, jak i opcje GPU Nvidia Ada Lovelace, które zastąpiły opcje Alder Lake i Ampere w starszych wersjach Studio 16.
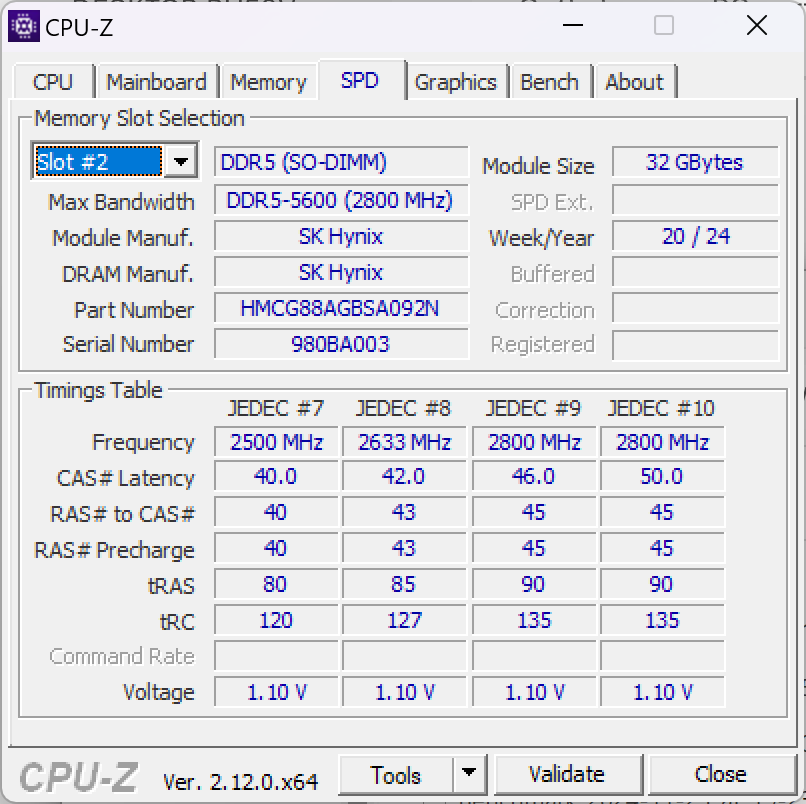
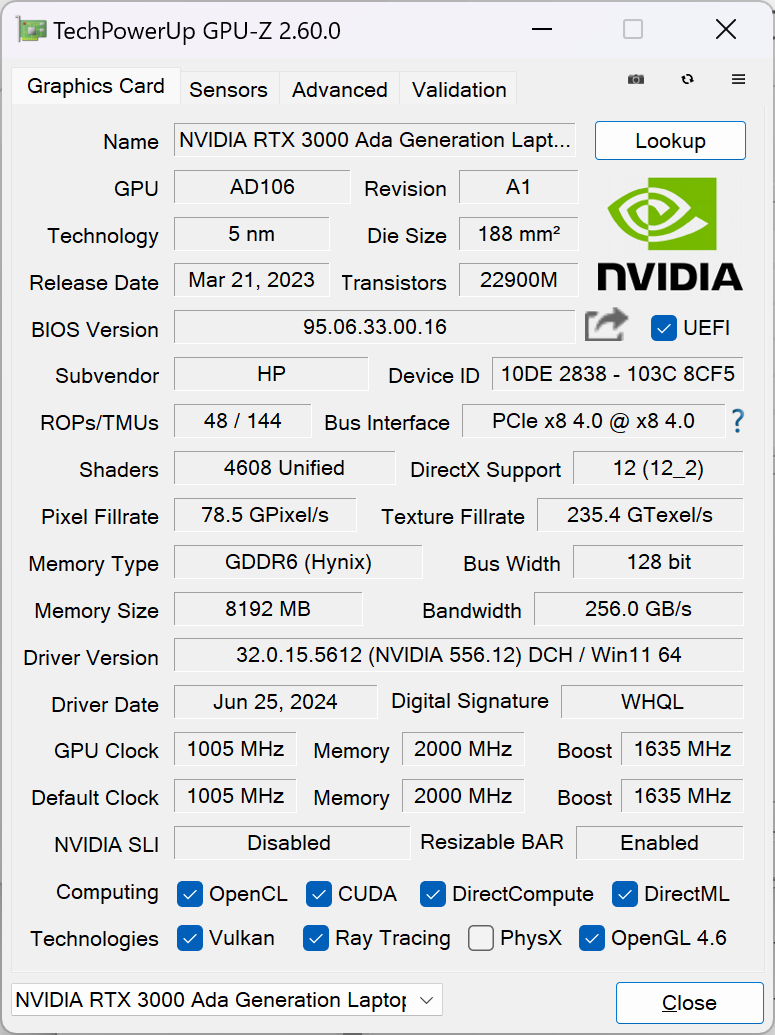
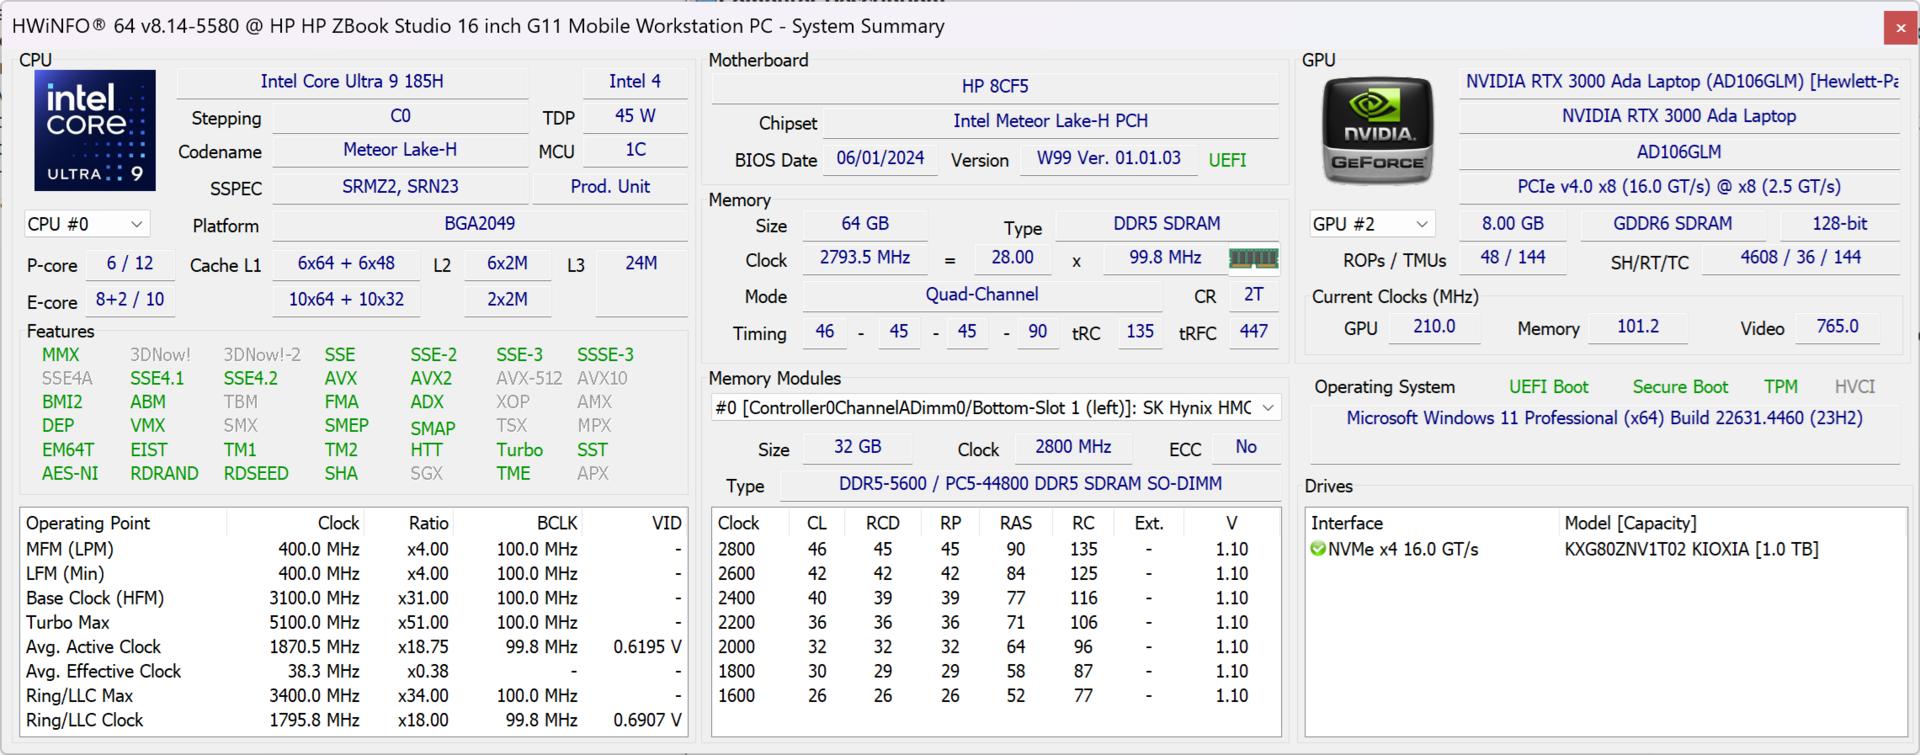
Nasza jednostka testowa to najwyższa konfiguracja z procesorem Core Ultra 9 185H vPro, GPU RTX 3000 Ada i wyświetlaczem IPS 2400p 120 Hz za około 2800 USD. Inne SKU zaczynają się od Core Ultra 7 155H, zintegrowanej grafiki Arc, GeForce RTX 4070 lub wyświetlacza 1200p zamiast tego, jak opisano na oficjalnej stronie produktu HP https://www.hp.com/us-en/shop/pdp/hp-zbook-studio-g11-mobile-workstation-pc-customizable-9q574av-mb.
Alternatywy dla ZBook Studio 16 G11 obejmują inne 16-calowe mobilne stacje robocze, takie jak Lenovo ThinkPad P16 Gen 2, Dell Precision 5690lub MSI CreatorPro Z16P.
Więcej recenzji HP:
Specyfikacje
Sprawa
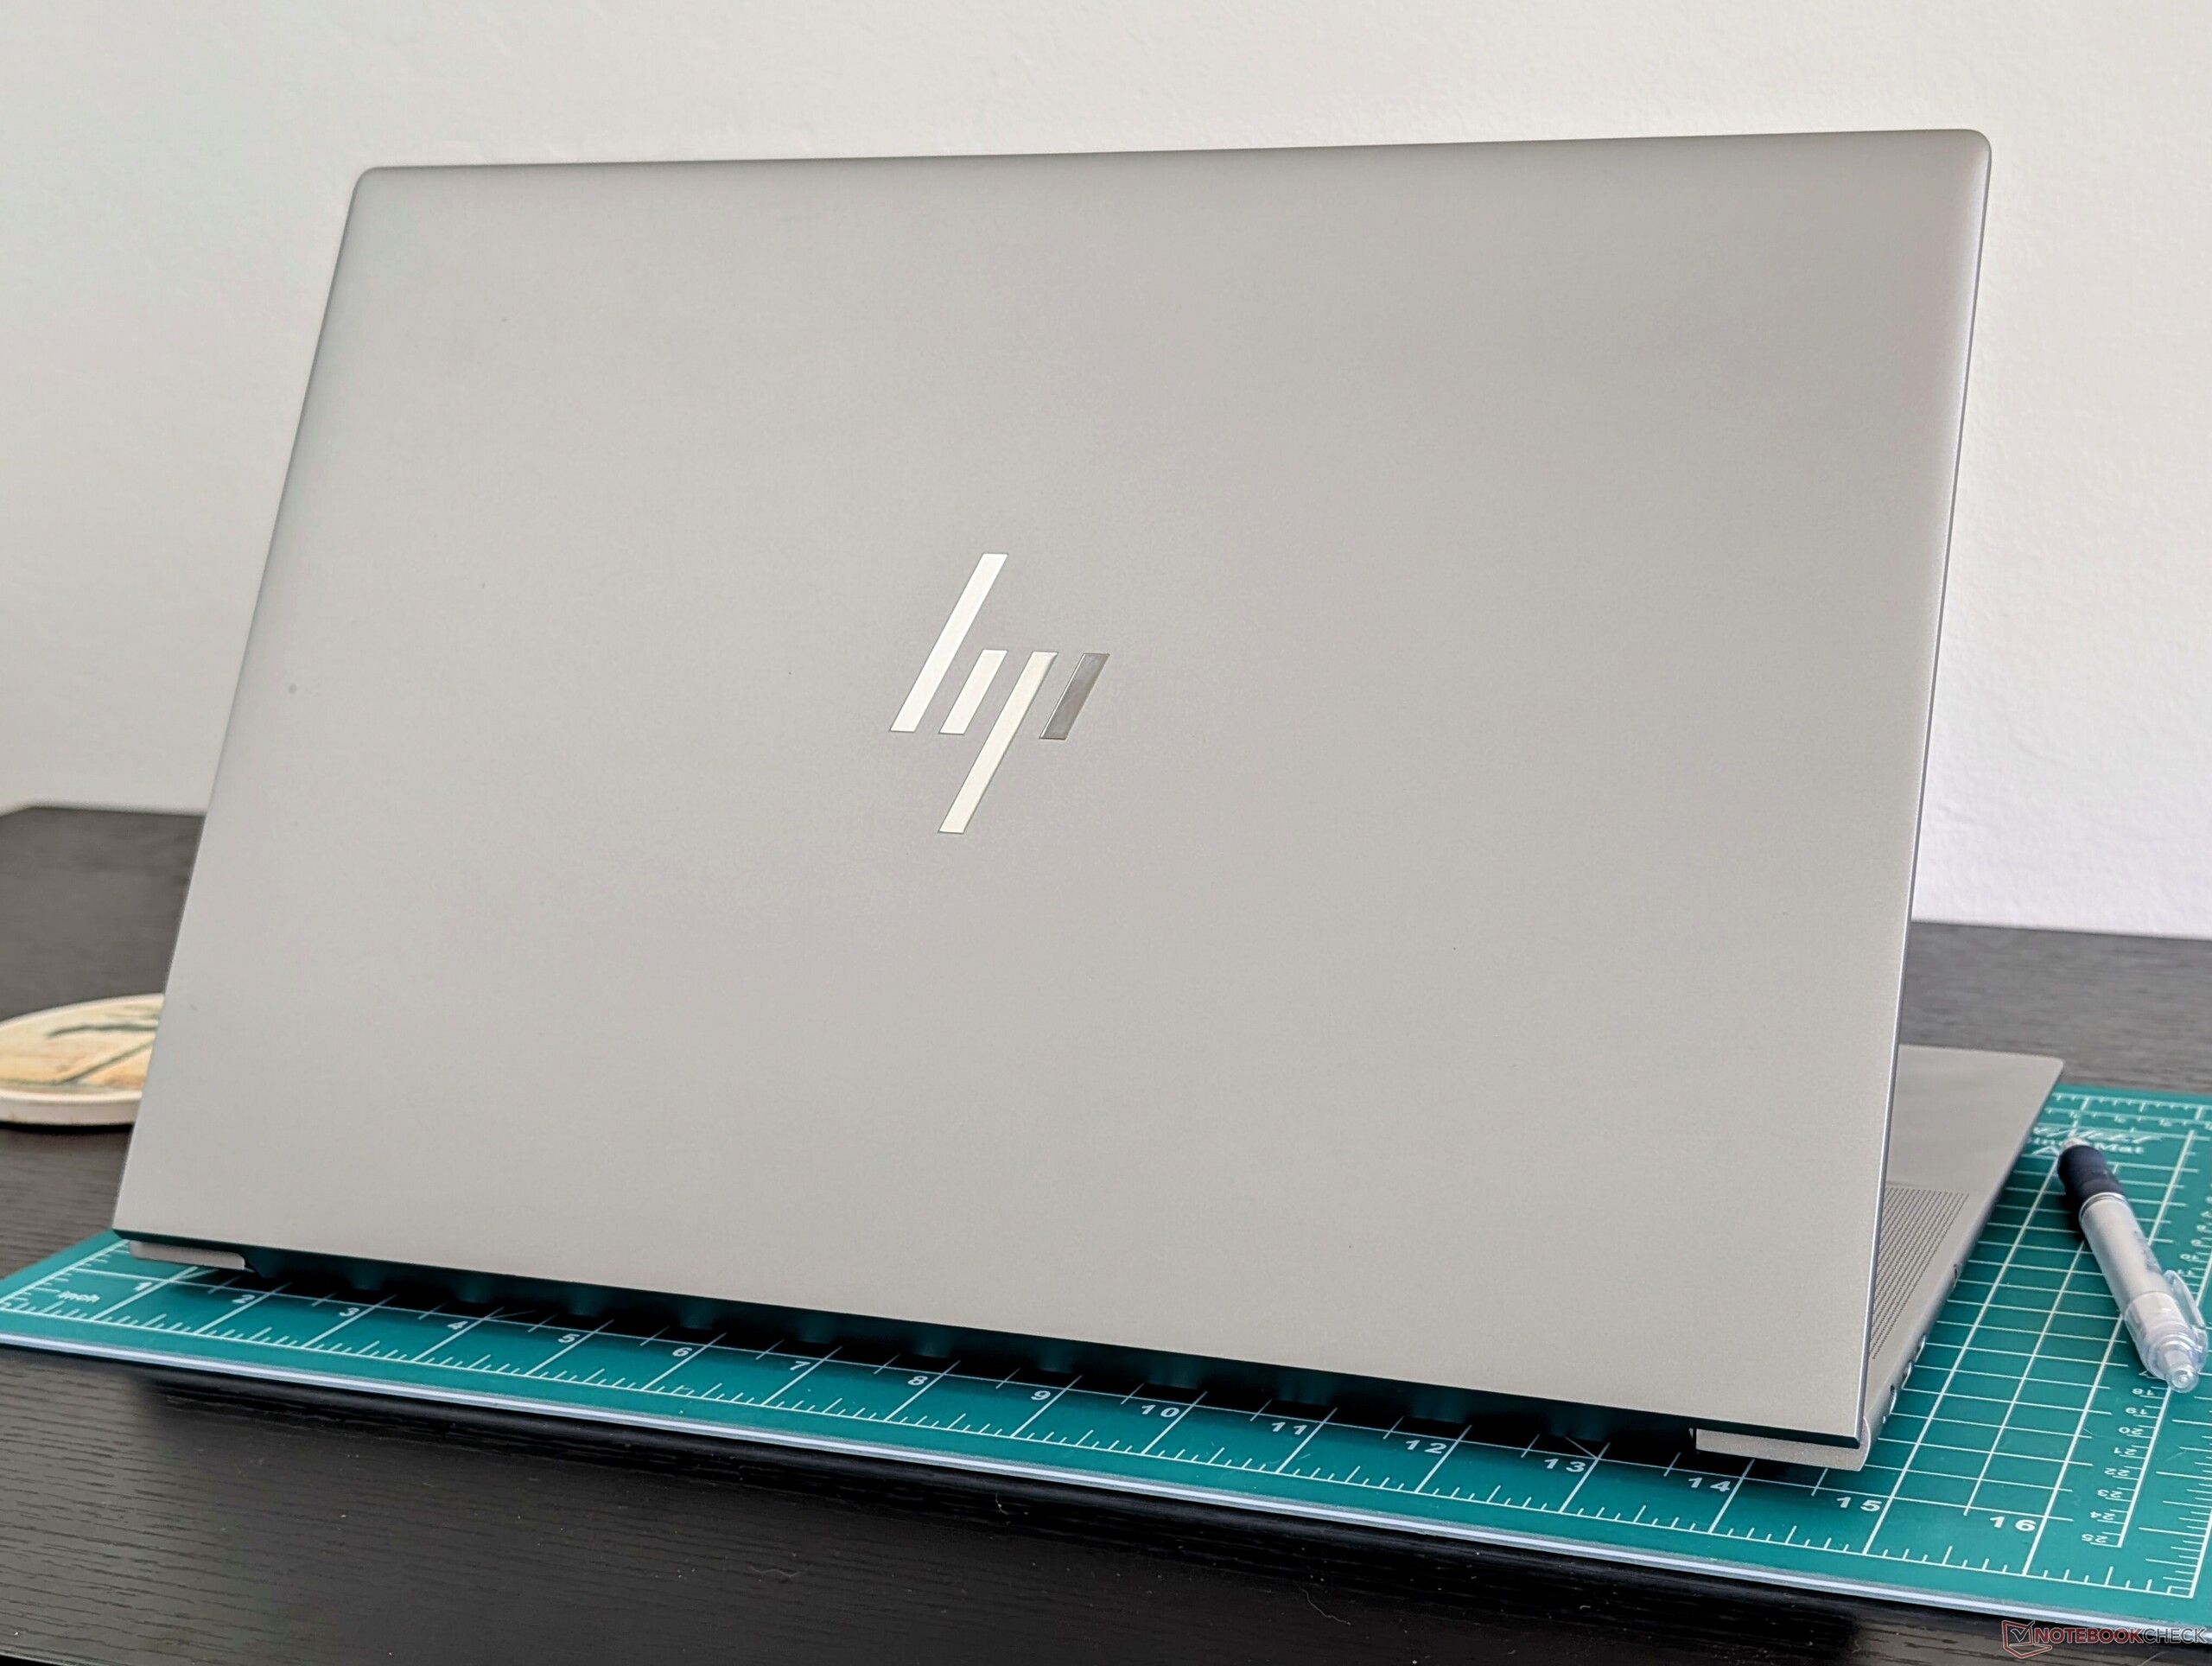
ZBook Studio 16 G11 wykorzystuje tę samą obudowę, co dwuletni ZBook Studio 16 G9. Pomimo swojego wieku, jest to nadal solidna konstrukcja, która wyróżnia się przede wszystkim smukłością i poręcznością. Komputer MSI CreatorPro Z16P lub Dell Precision 5690, na przykład, są większe i zauważalnie cięższe o co najmniej 400 do 500 gramów.
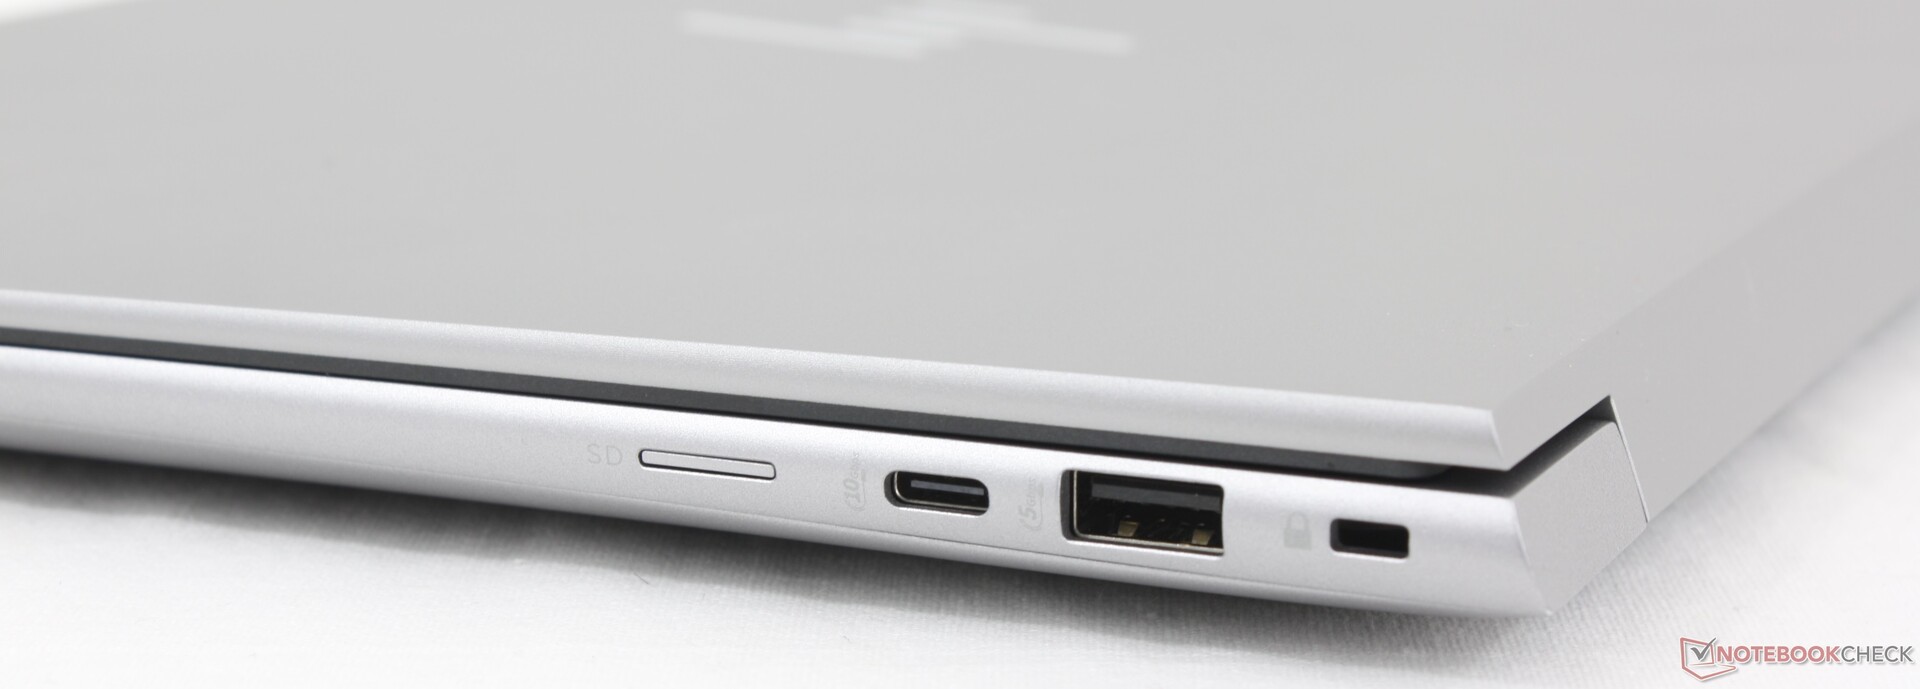
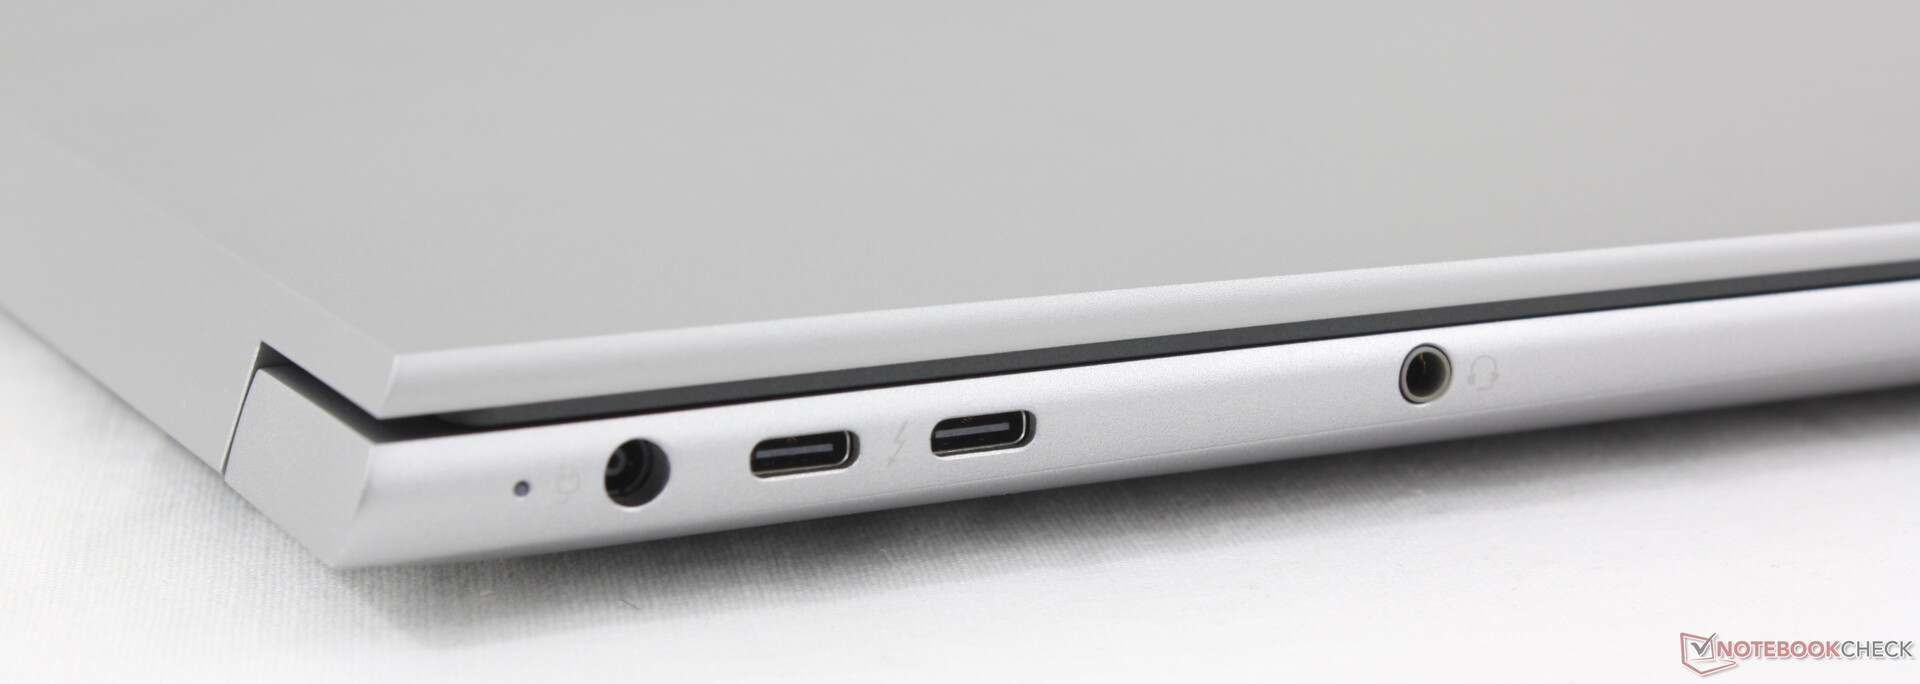
Łączność
Chociaż opcje portów nie uległy zmianie, zintegrowany czytnik MicroSD w naszym egzemplarzu był uszkodzony, więc nie byliśmy w stanie przetestować jego szybkości transferu.
Komunikacja
Łączność bezprzewodowa została ulepszona z MediaTek Wi-Fi 6E MT7922 do Intel BE200, aby obsługiwać zarówno Wi-Fi 7, jak i Bluetooth 5.4.
Kamera internetowa
Niestety, kamera internetowa pozostaje 720p lub tylko 1 MP, podczas gdy zdecydowana większość innych laptopów już odeszła od opcji 1 MP.


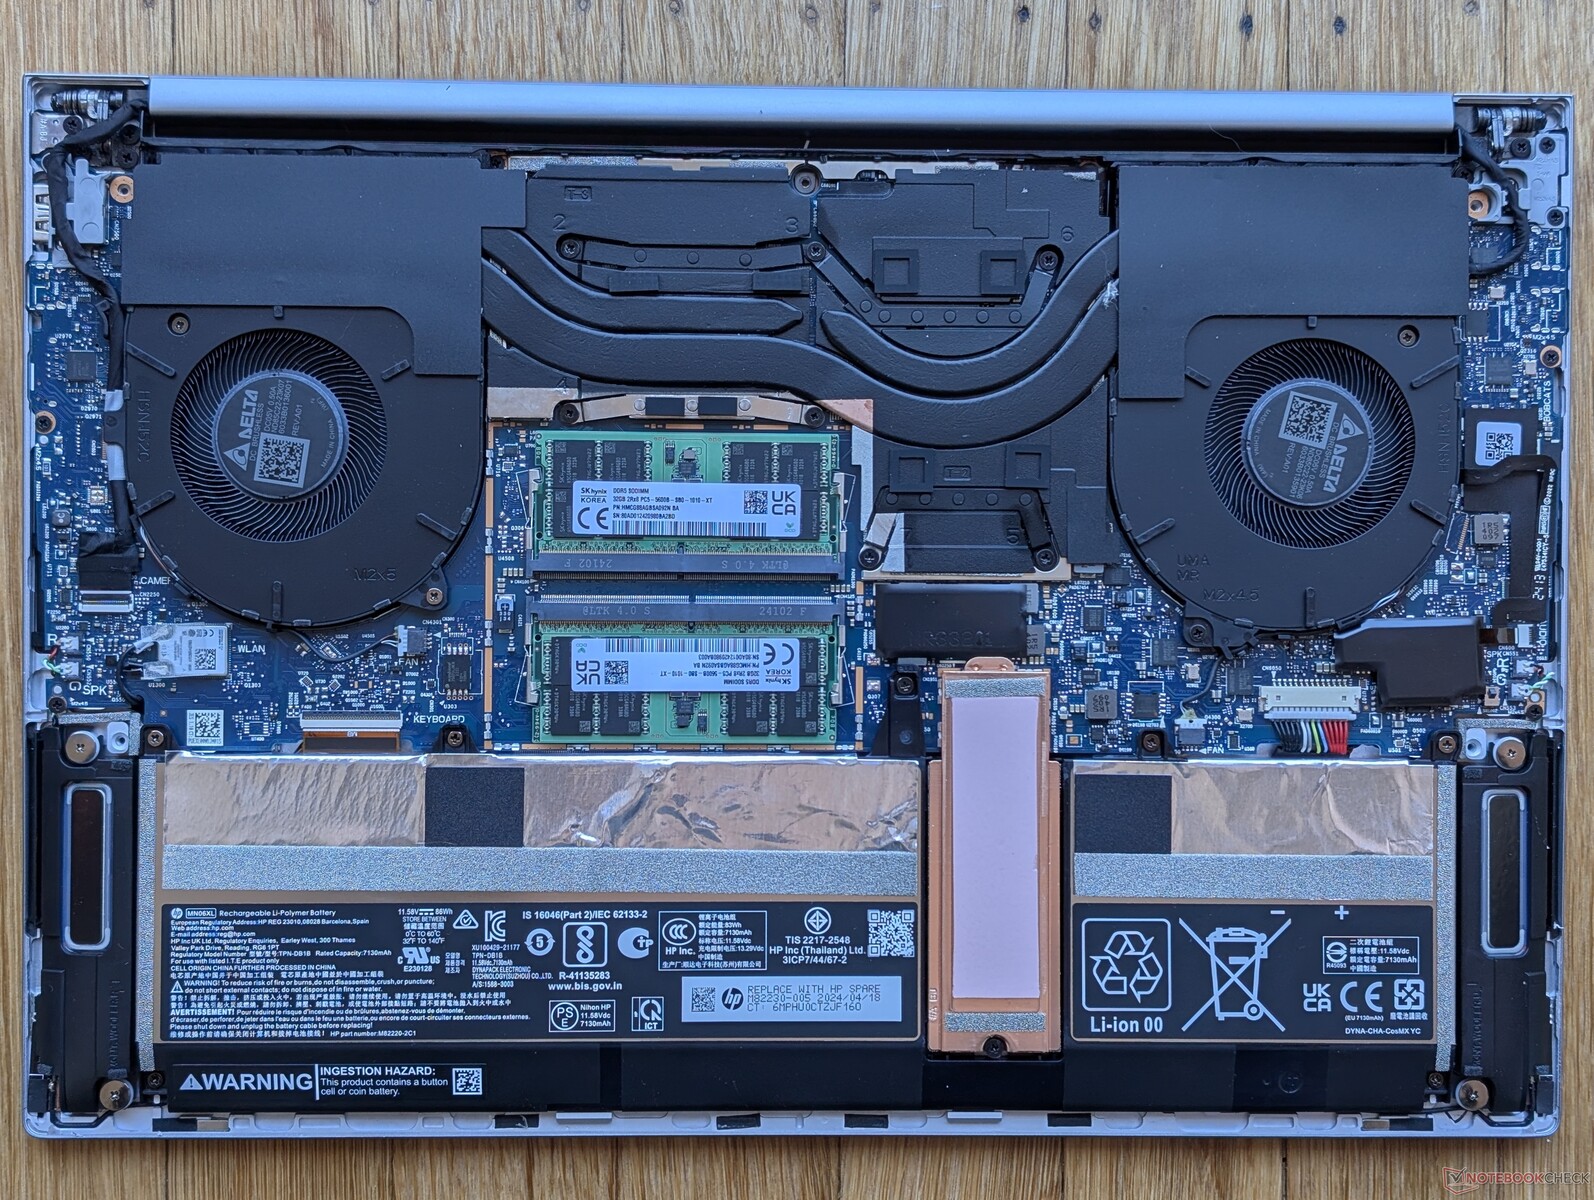
Konserwacja
Dolny panel można łatwo zdjąć za pomocą śrubokręta Torx. HP zapewnia oficjalne wideo serwisowe dla wielu swoich modeli, w przeciwieństwie do innych głównych producentów.
Zrównoważony rozwój
HP wykorzystuje tworzywa sztuczne i metale pochodzące z recyklingu we wszystkich swoich laptopach produkowanych od 2022 roku. Proporcje materiałów pochodzących z recyklingu do materiałów niepochodzących z recyklingu różnią się jednak w zależności od modelu.
Opakowanie składa się głównie z tektury i papieru, z pewną ilością plastikowego opakowania na laptopa i zasilacz sieciowy.
Gwarancja
W przypadku zakupu w Stanach Zjednoczonych obowiązuje trzyletnia ograniczona gwarancja producenta.
Wyświetlacz
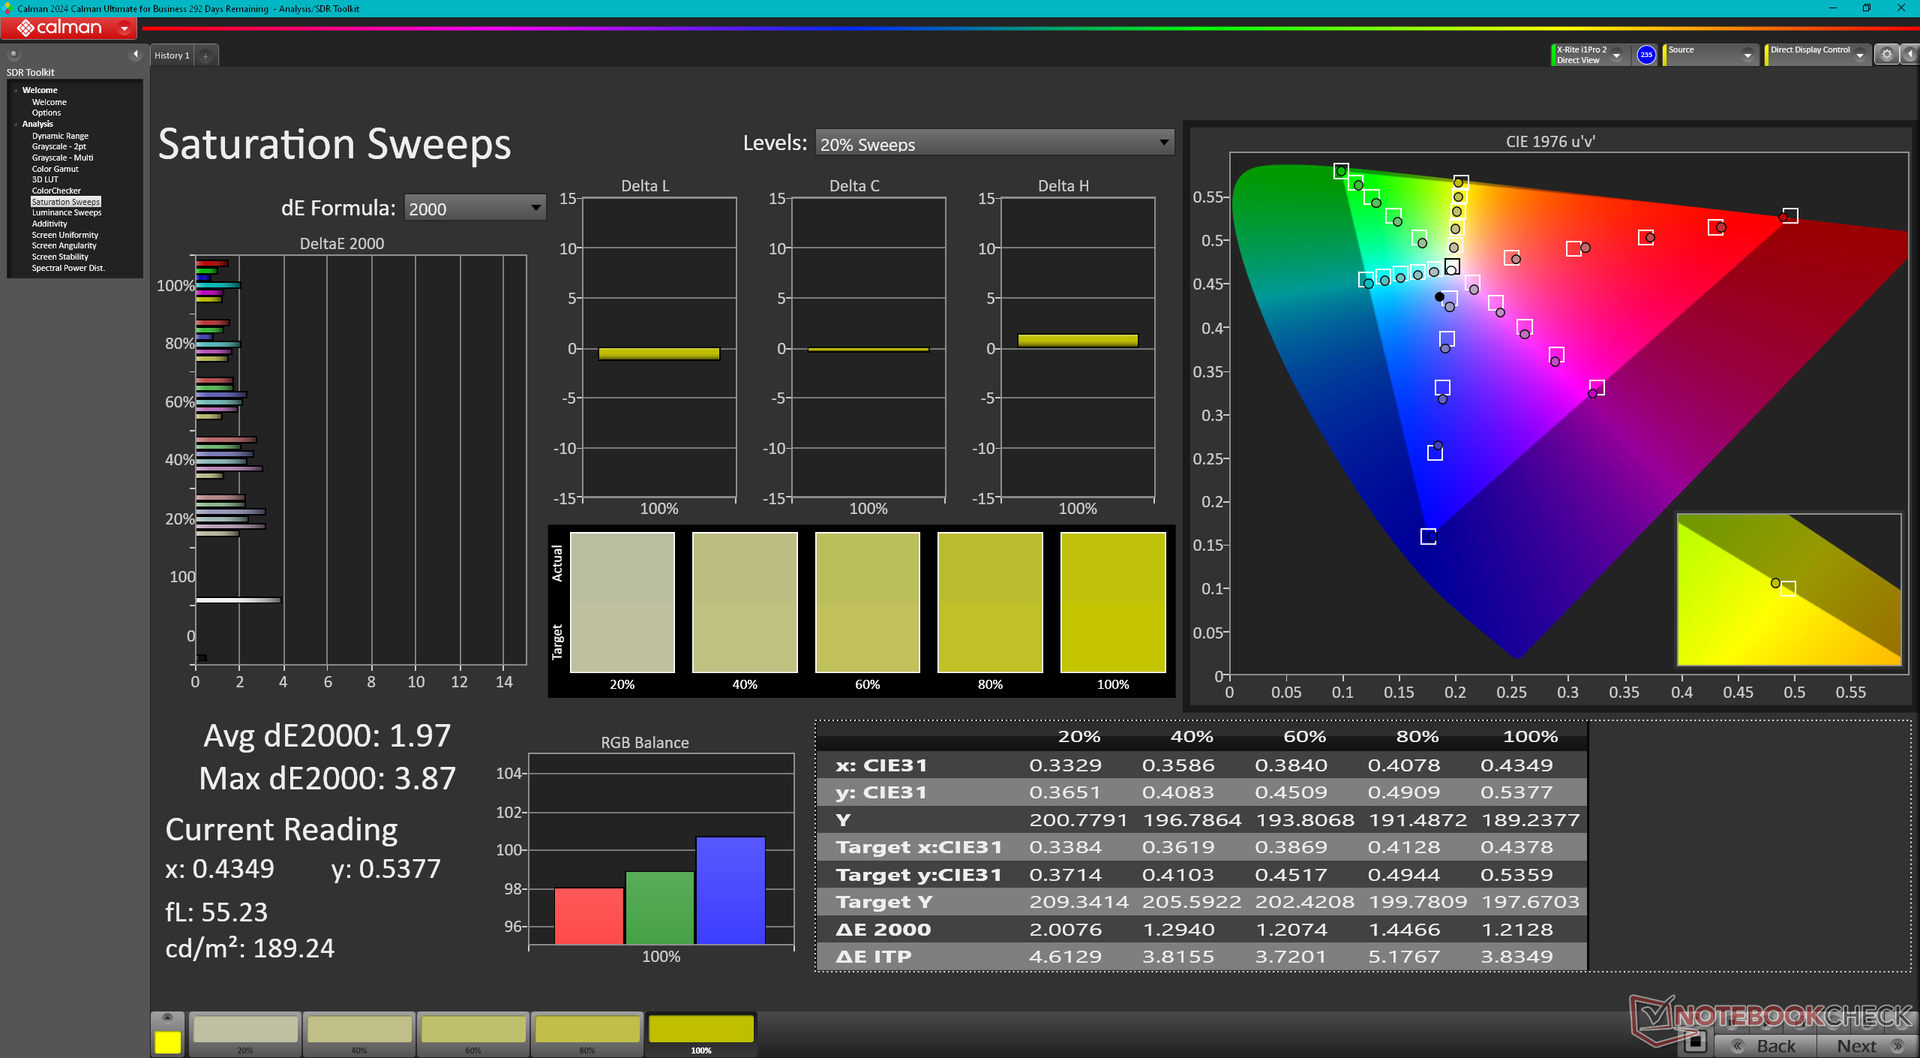
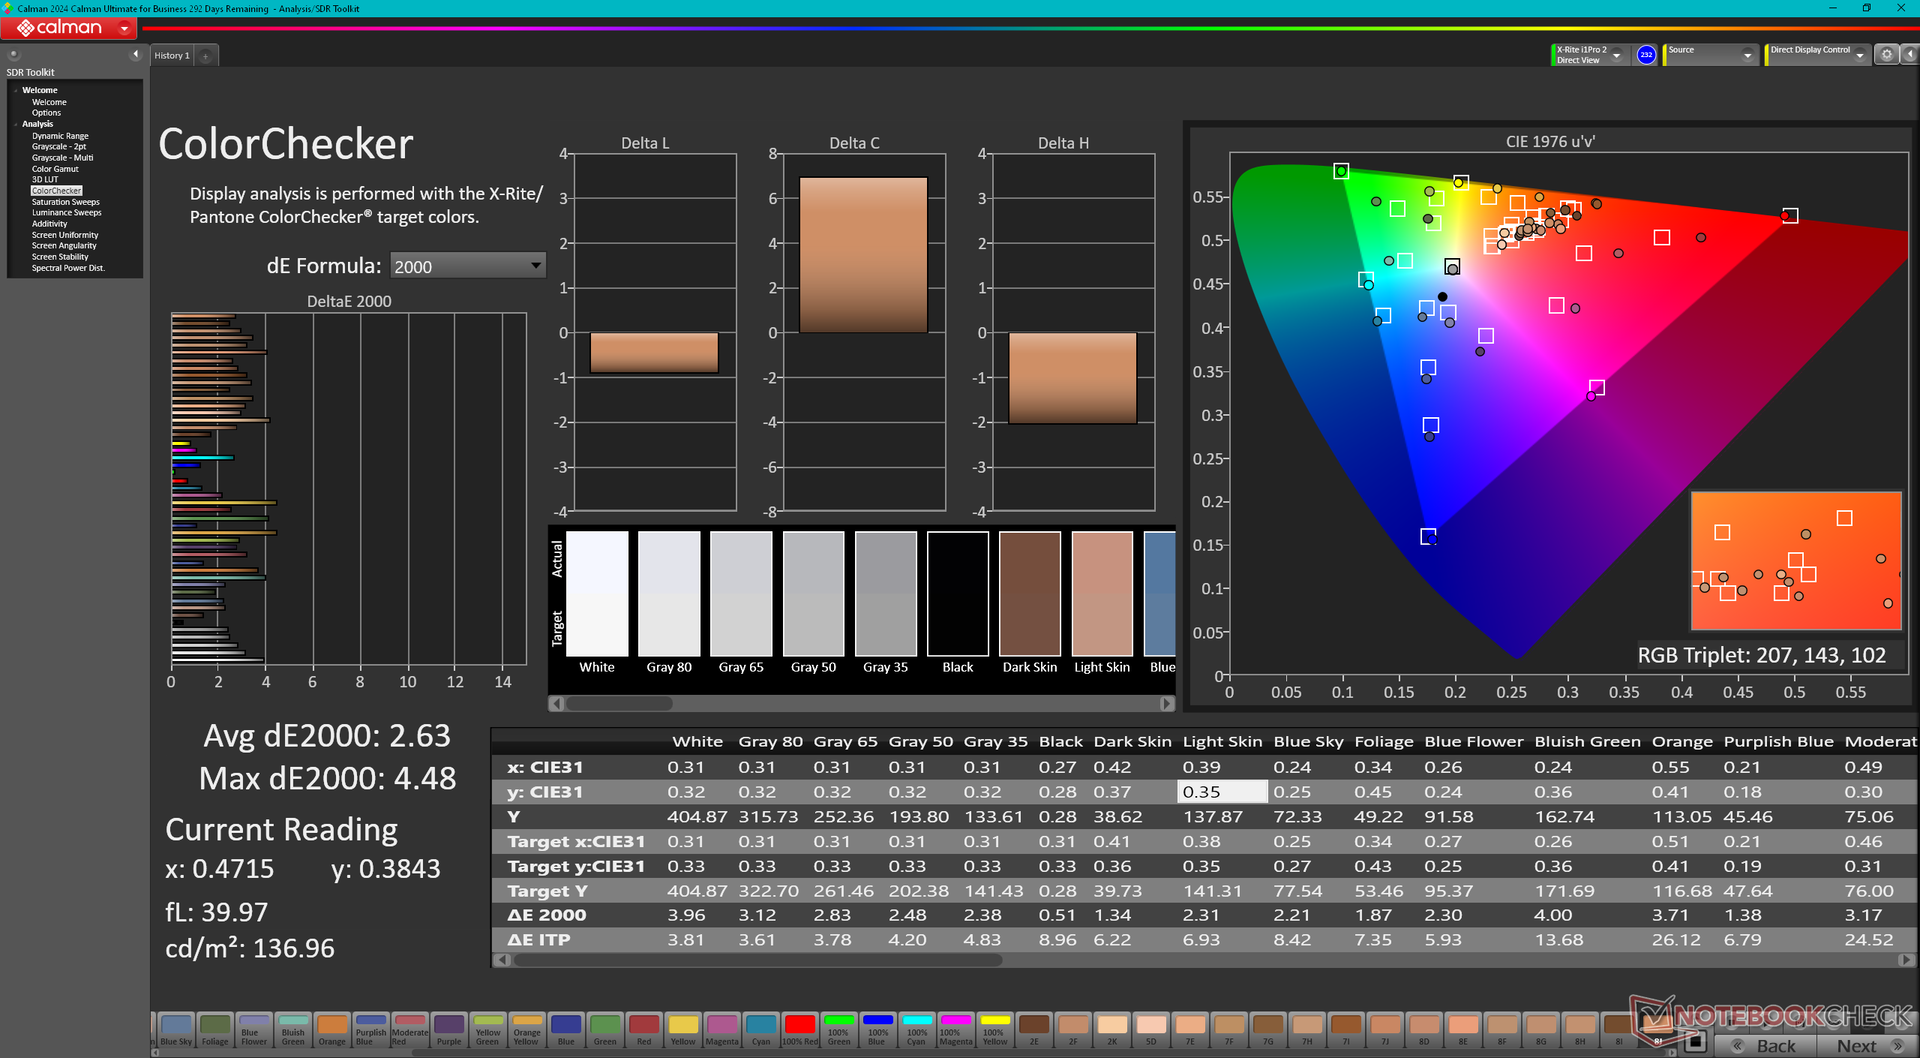
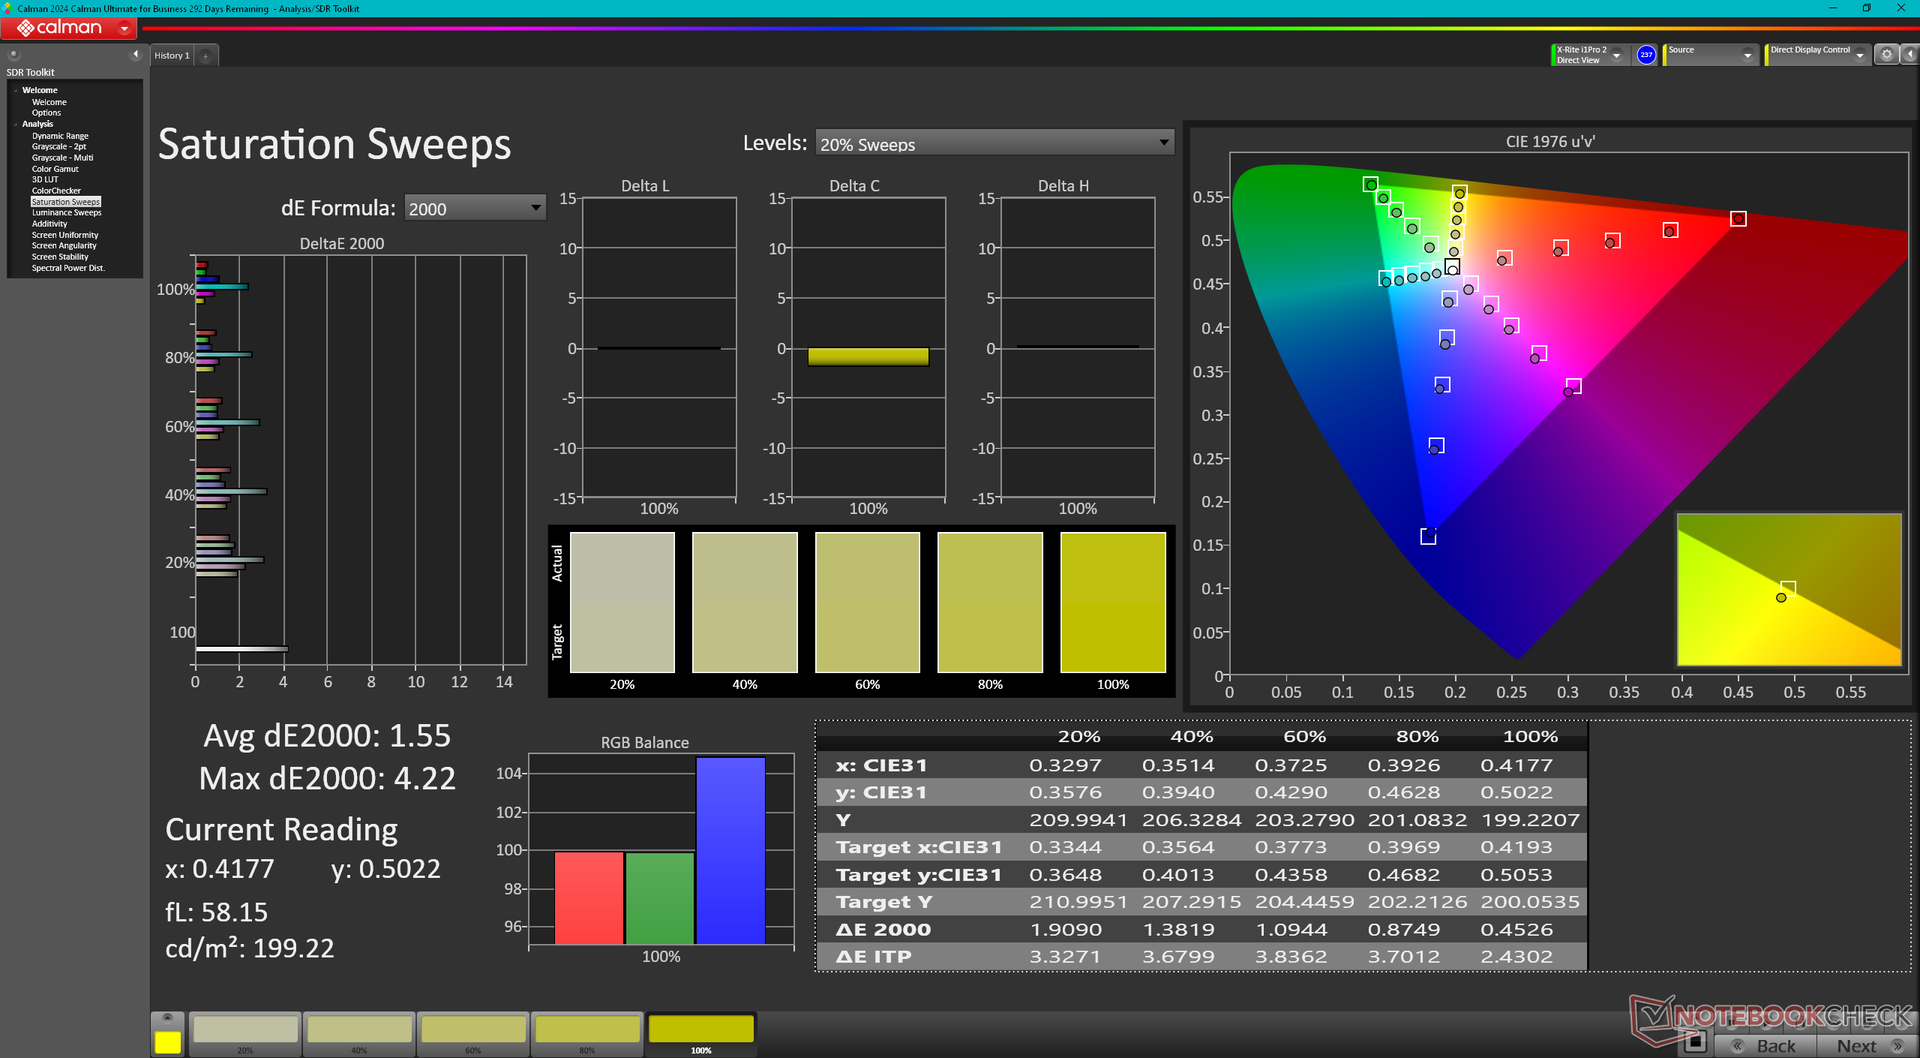
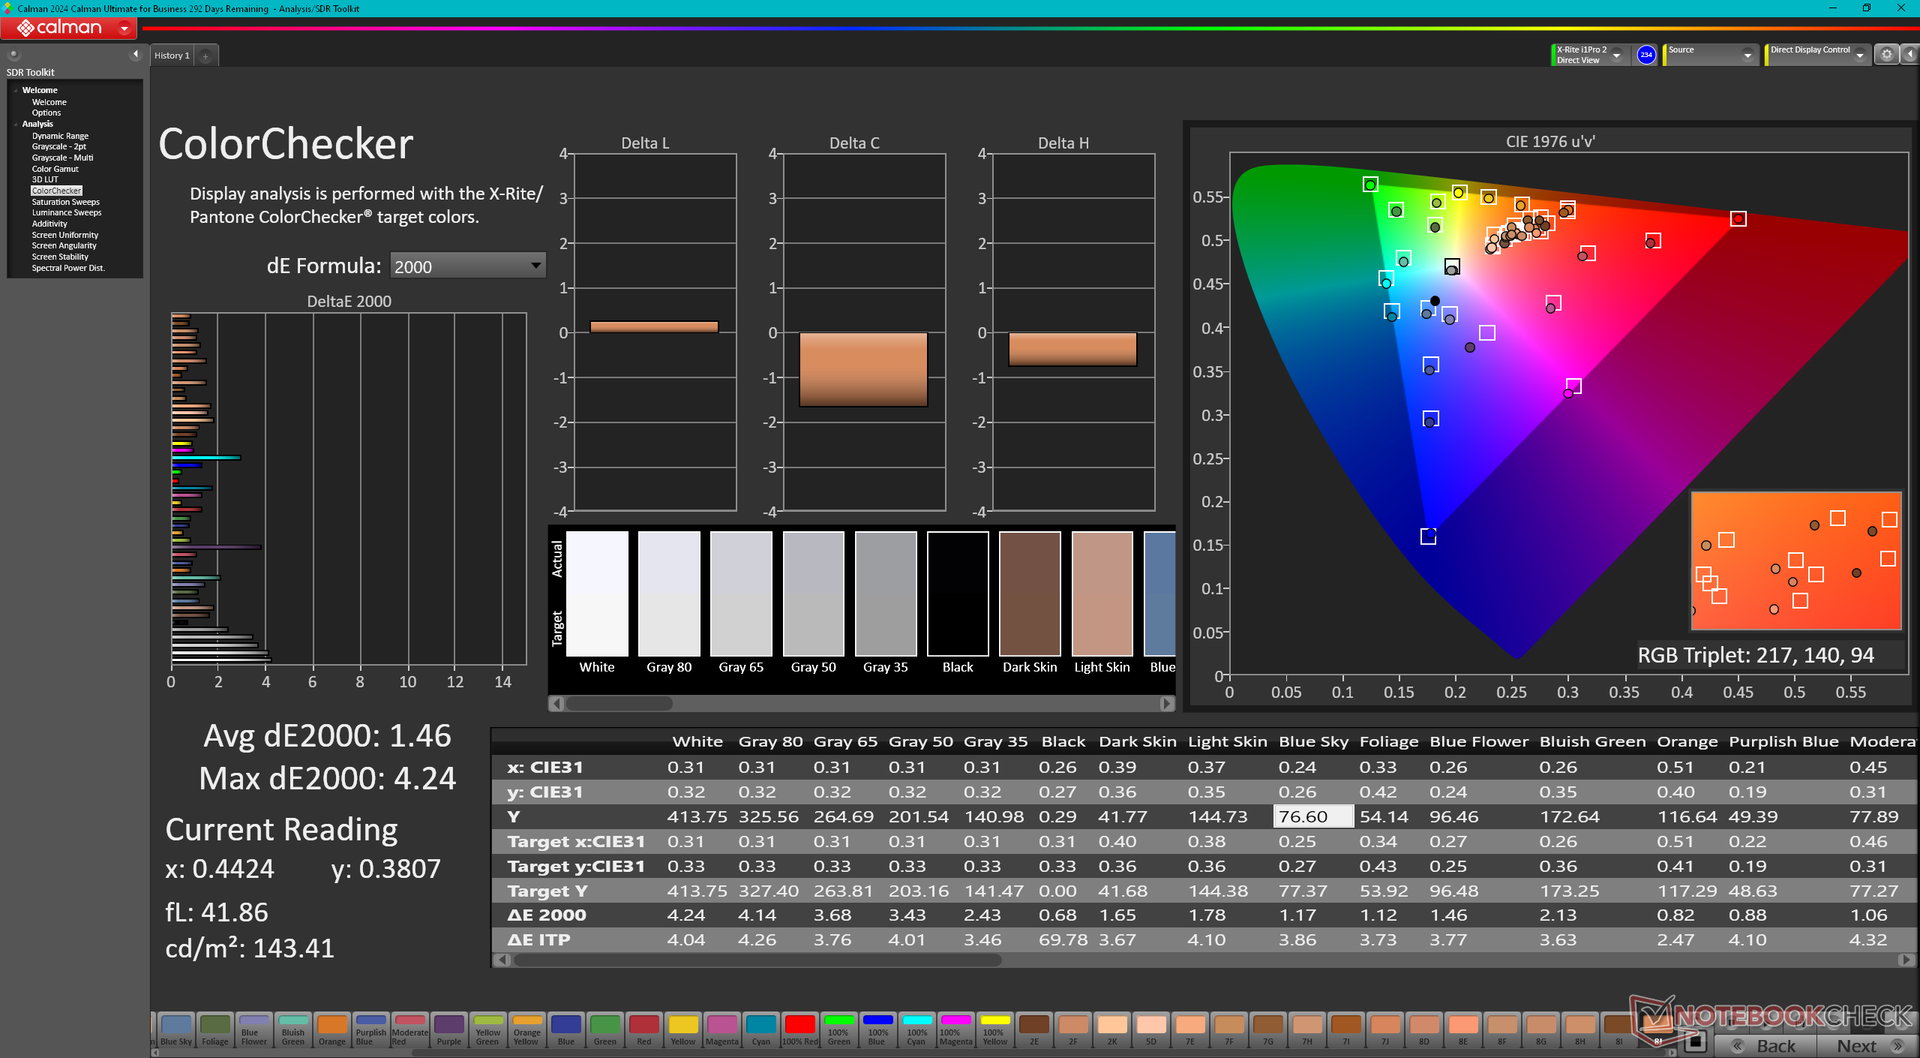
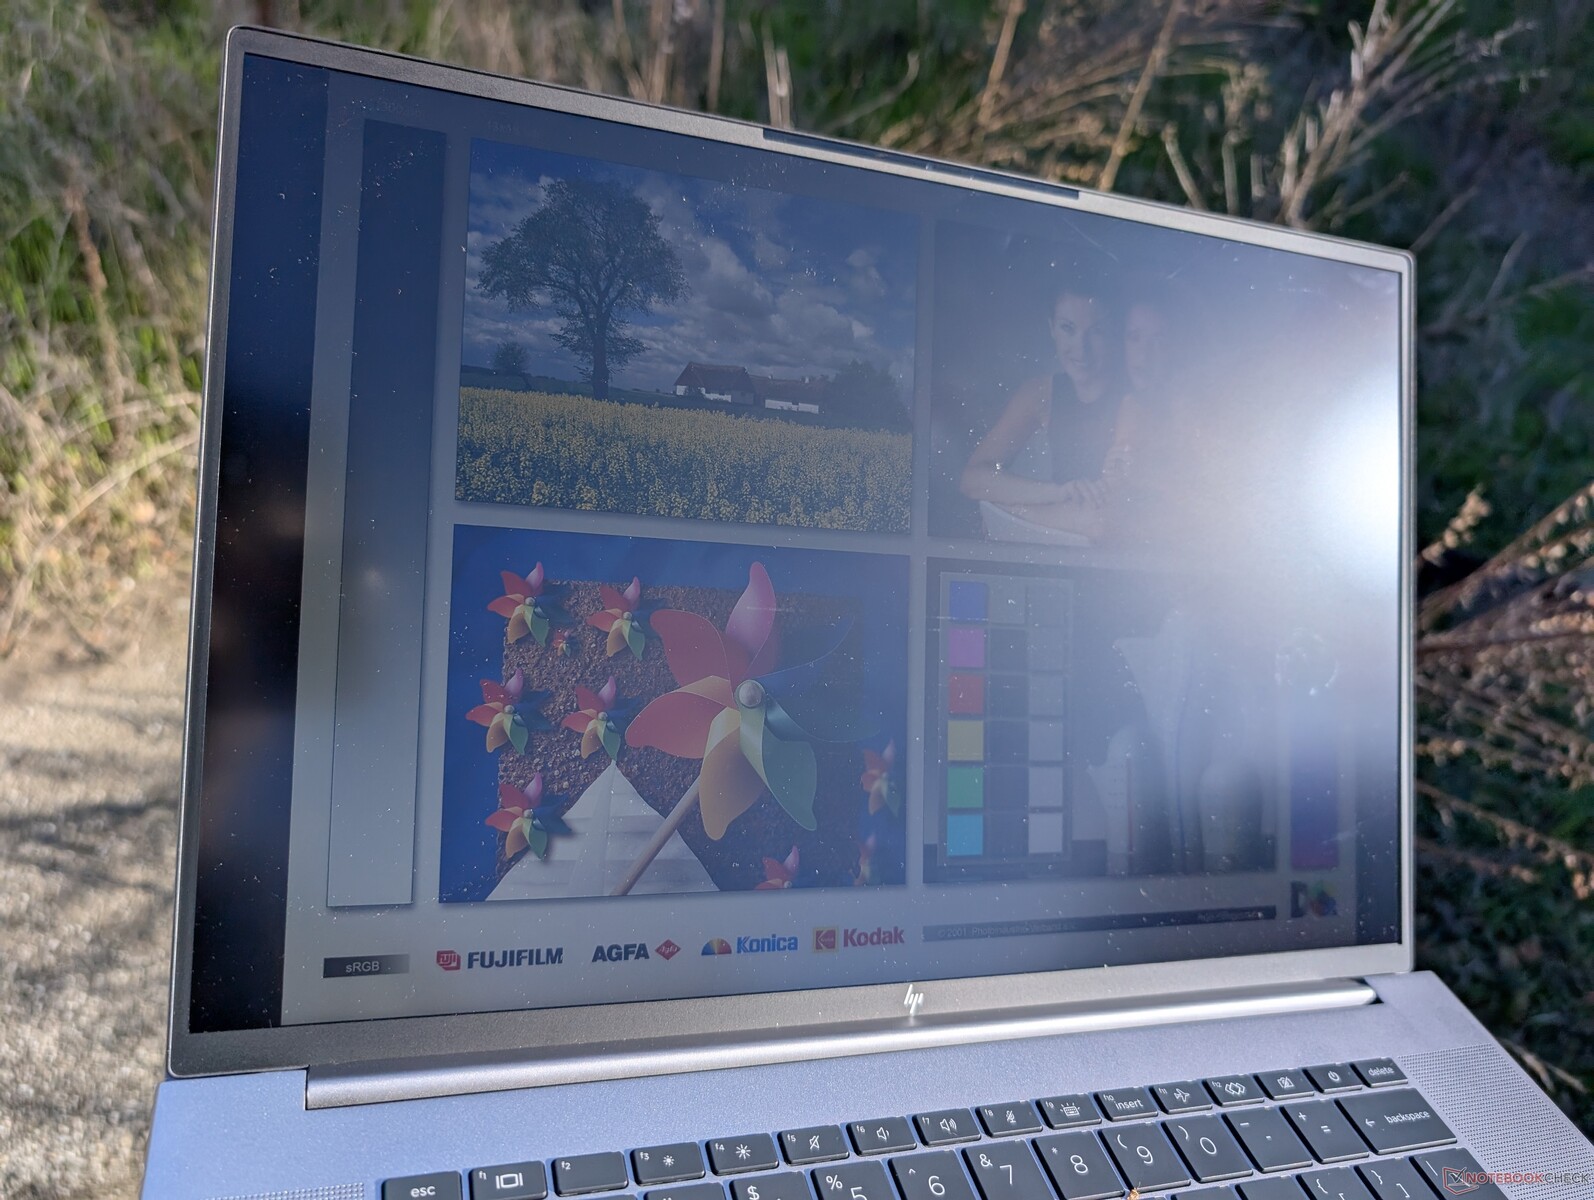
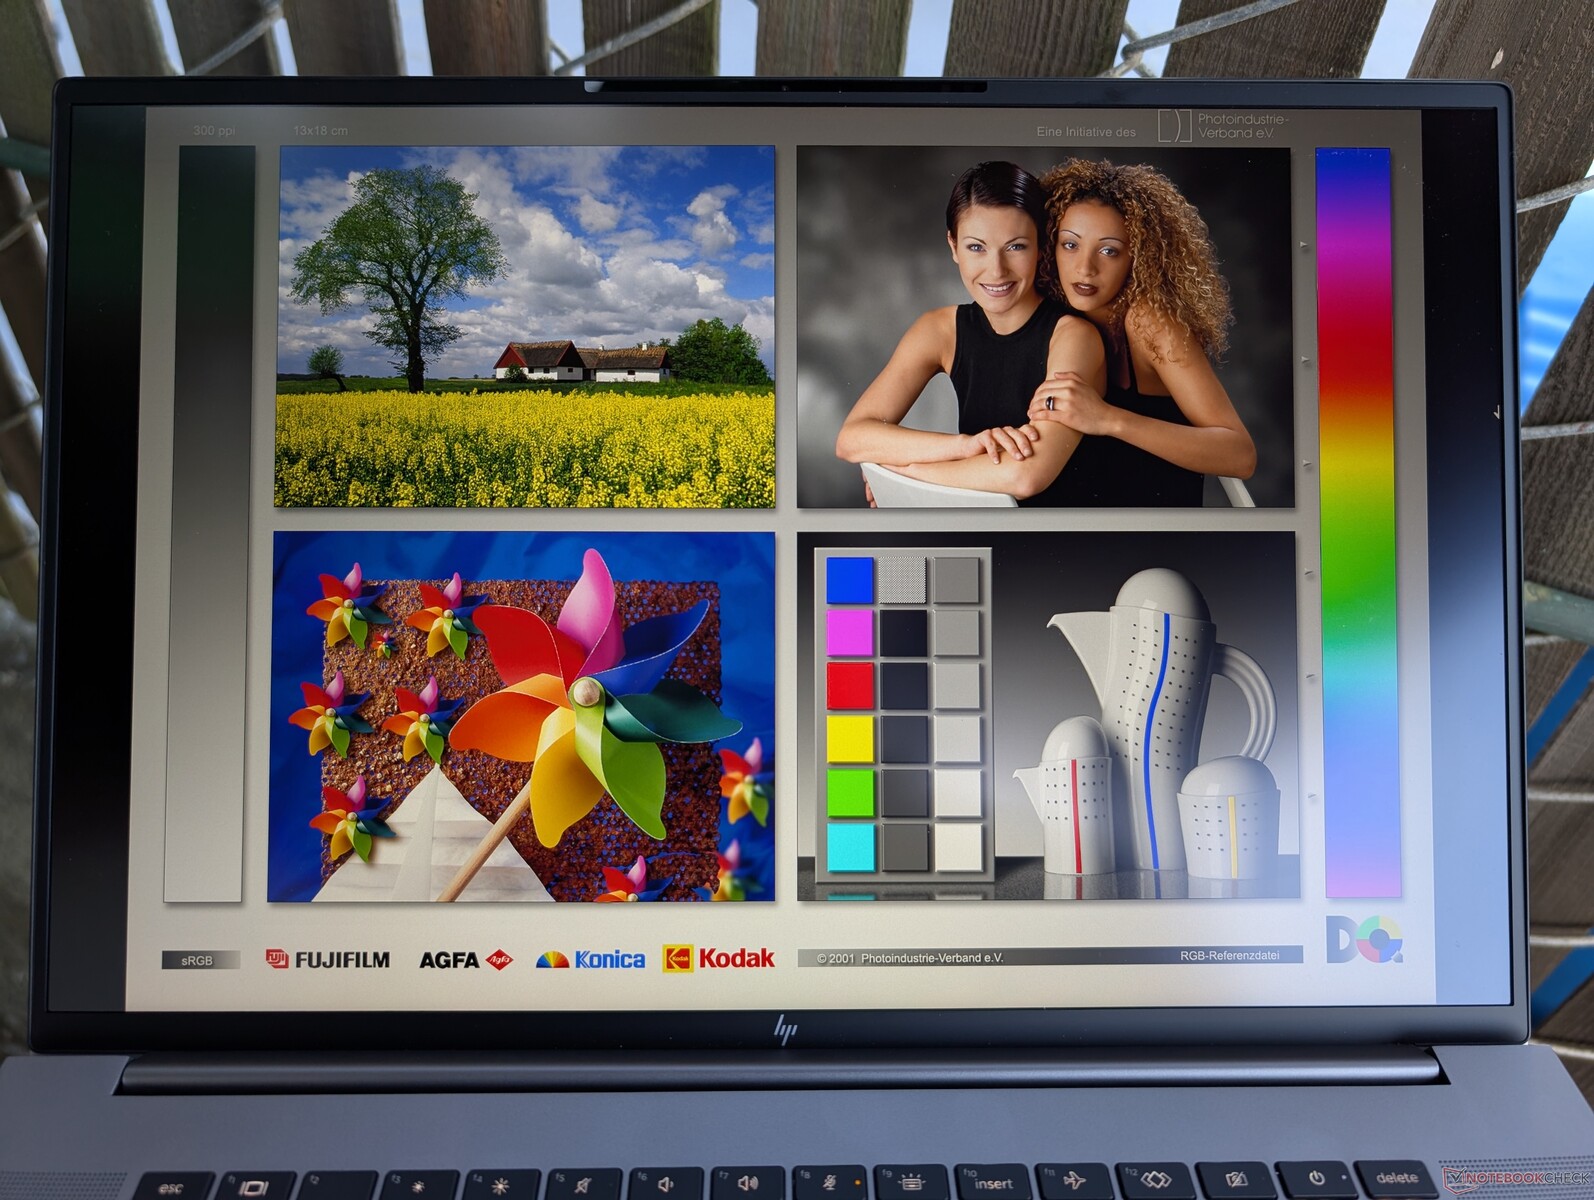
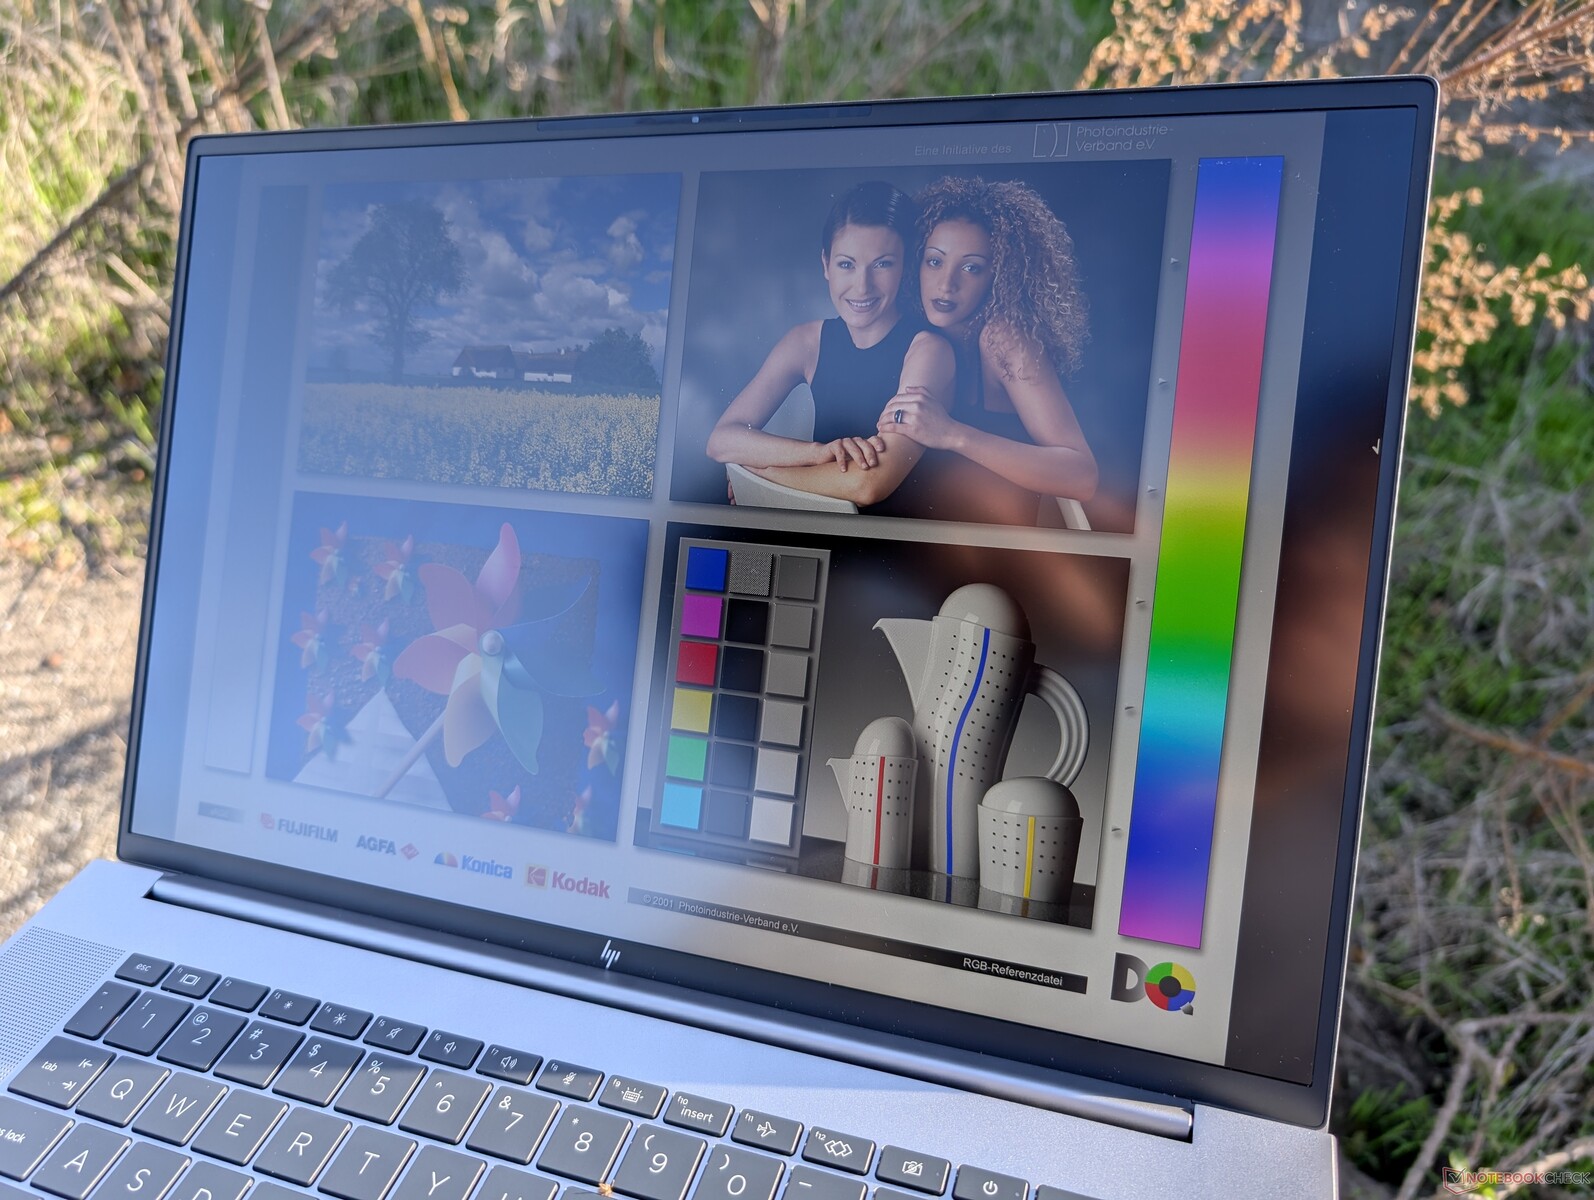
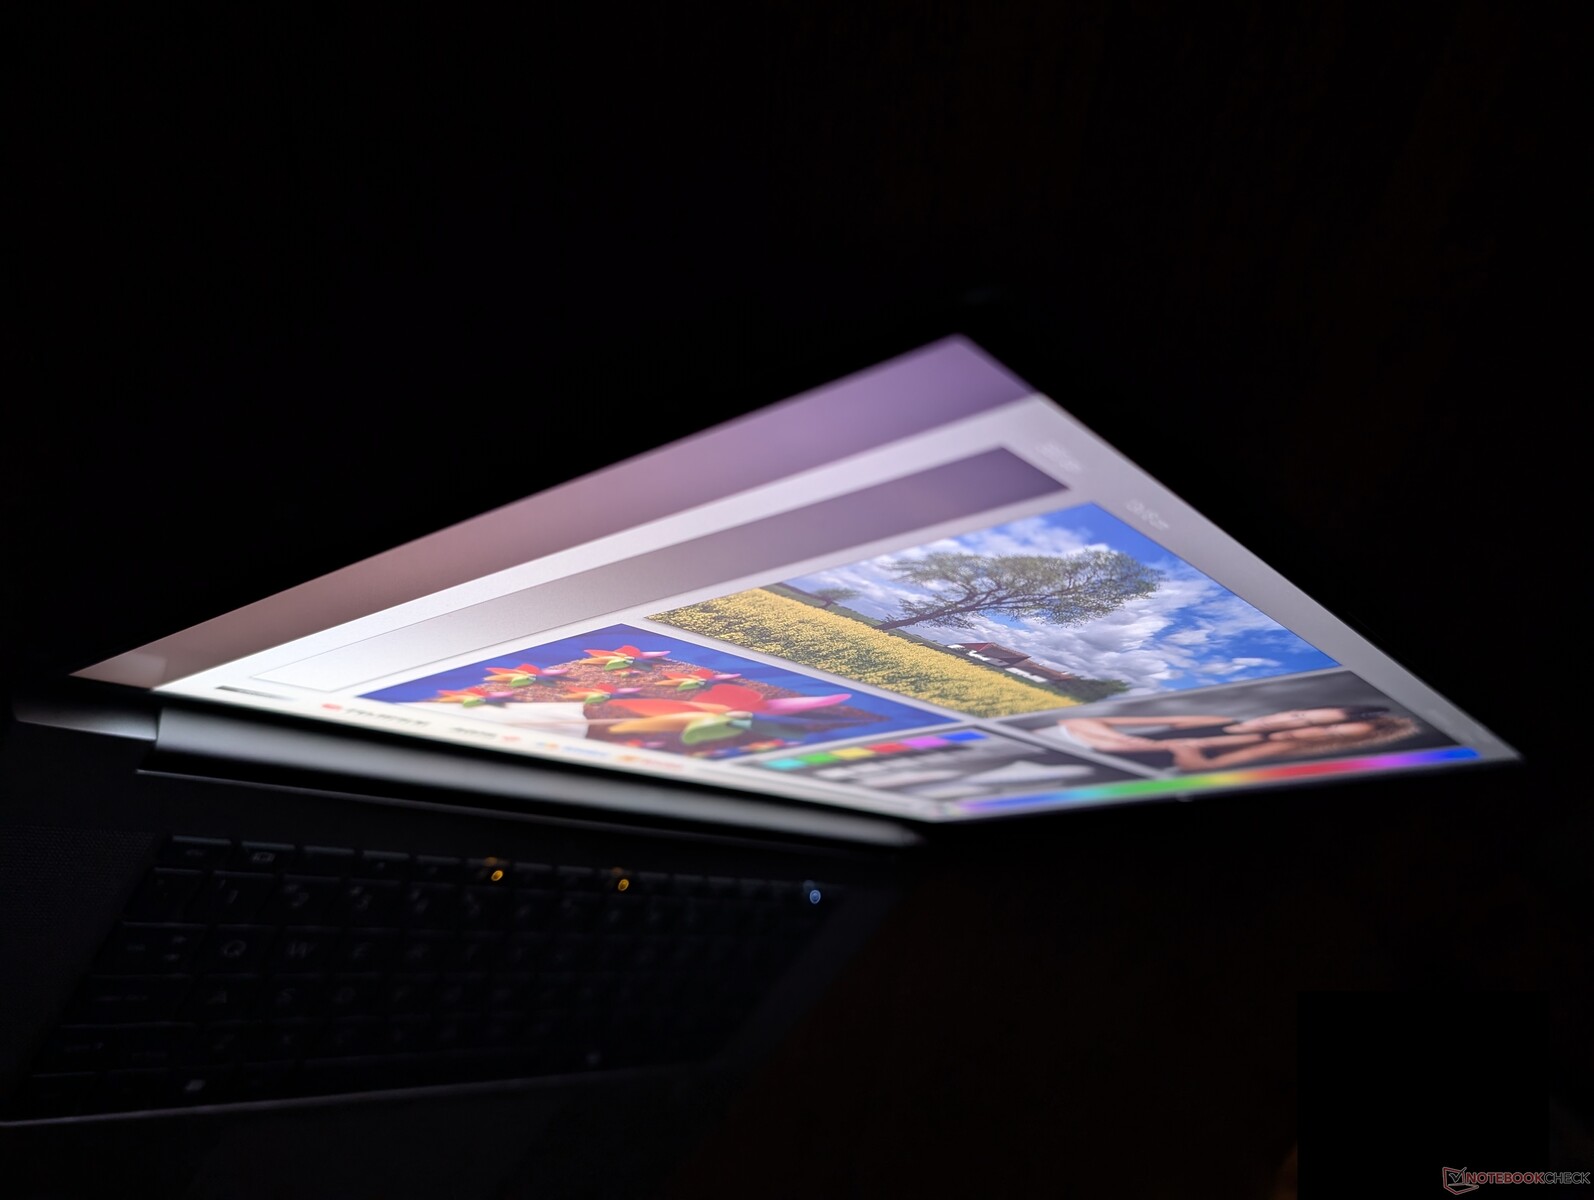
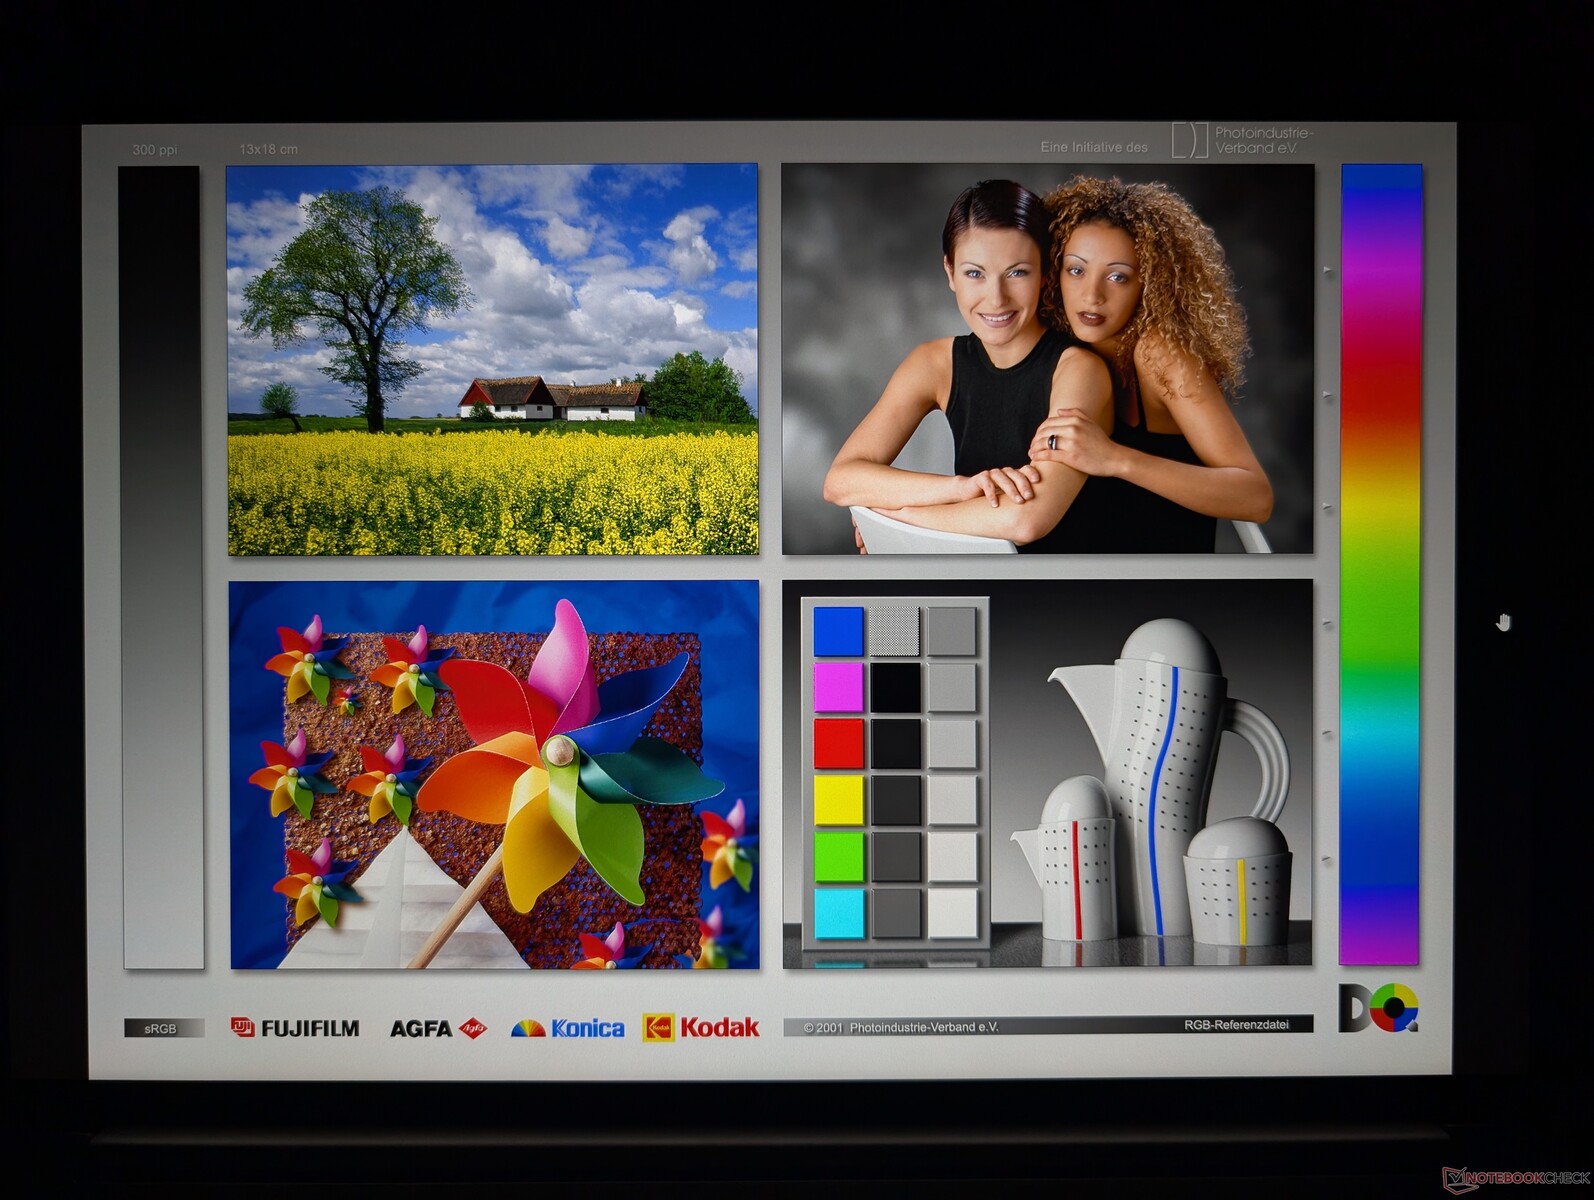
HP zmieniło dostawcę paneli 4K z BOE w Studio 16 G9 na AU Optronics dla naszego Studio 16 G11. Ich podstawowe atrybuty są zasadniczo identyczne pod względem częstotliwości odświeżania (120 Hz) i pokrycia kolorów (100% DCI-P3). Jasność jest jednak tym razem niższa o prawie 30 procent, a HDR nadal nie jest obsługiwany. Aby temu zaradzić, dostępna jest nieco jaśniejsza opcja 500 nitów.
W chwili pisania tego tekstu model ten nie zawiera żadnych opcji OLED.
| |||||||||||||||||||||||||
rozświetlenie: 92 %
na akumulatorze: 404.3 cd/m²
kontrast: 1444:1 (czerń: 0.28 cd/m²)
ΔE ColorChecker Calman: 2.63 | ∀{0.5-29.43 Ø4.72}
calibrated: 1.46
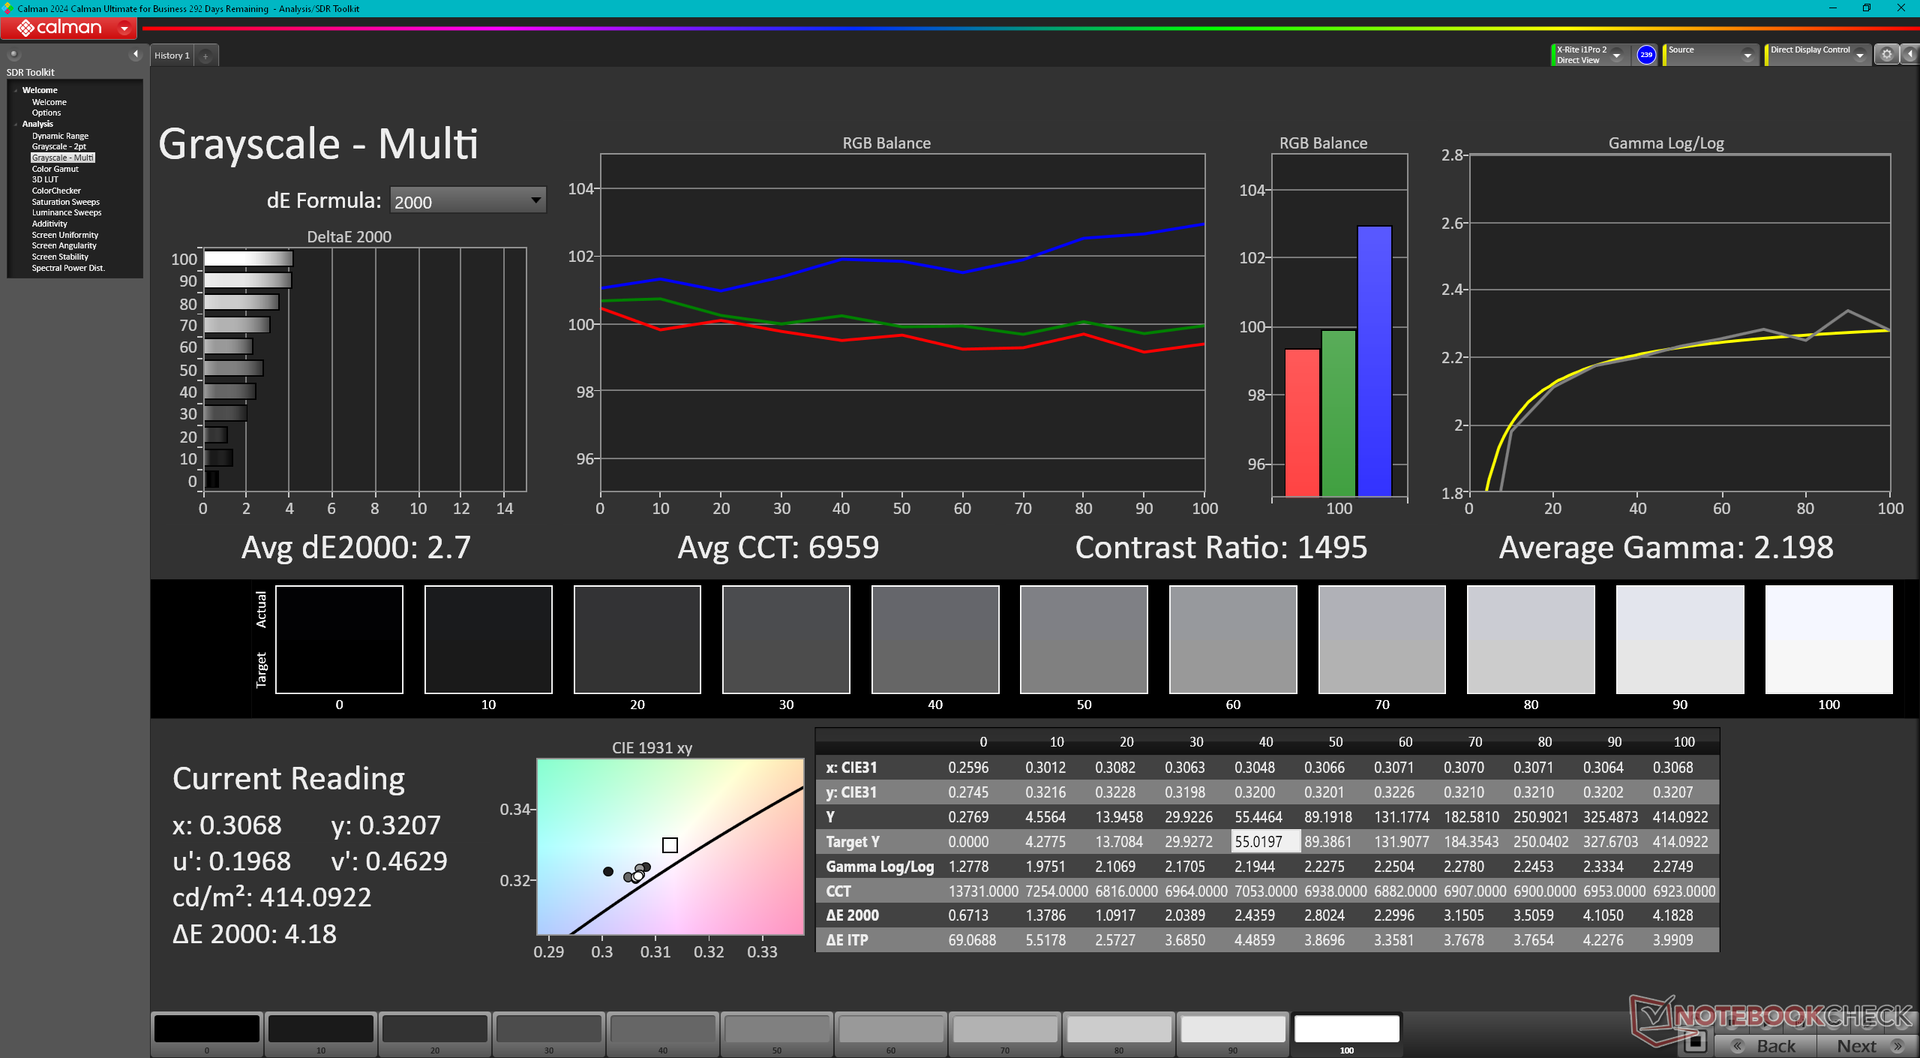
ΔE Greyscale Calman: 2.1 | ∀{0.09-98 Ø4.97}
85.7% AdobeRGB 1998 (Argyll 3D)
99.9% sRGB (Argyll 3D)
97.7% Display P3 (Argyll 3D)
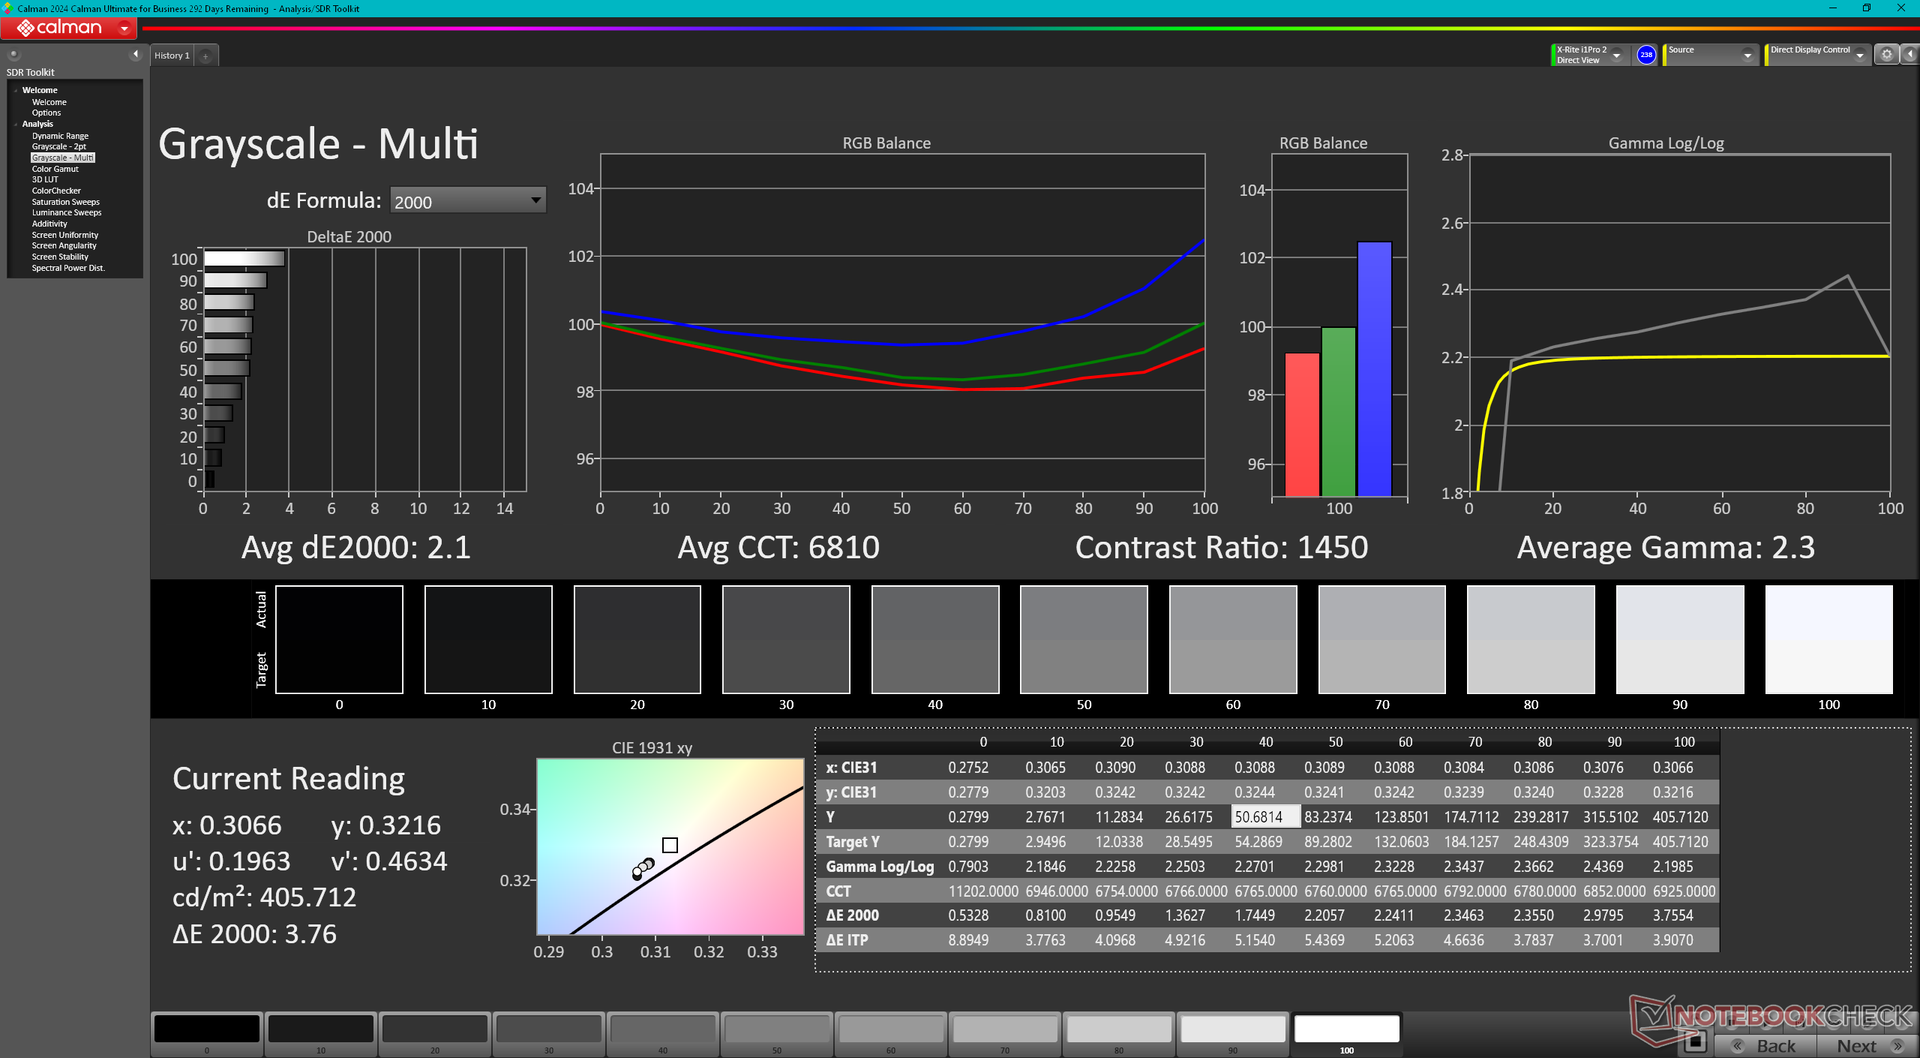
Gamma: 2.3
CCT: 6810 K
| HP ZBook Studio 16 G11 AUO87A8, IPS, 3840x2400, 16", 120 Hz | HP ZBook Studio 16 G9 62U04EA BOE0A52, IPS, 3840x2400, 16", 120 Hz | HP ZBook Power 16 G11 A AUOA0A9, IPS, 2560x1600, 16", 120 Hz | Lenovo ThinkPad P16 Gen 2 NE160QDM-NY1, IPS, 2560x1600, 16", 165 Hz | Dell Precision 5690 Samsung 160YV03, OLED, 3840x2400, 16", 60 Hz | MSI CreatorPro Z16P B12UKST B160QAN02.N, IPS, 2560x1600, 16", 165 Hz | Lenovo ThinkPad P1 Gen 7 21KV001SGE MNG007DA1-9 , IPS LED, 2560x1600, 16", 165 Hz | |
|---|---|---|---|---|---|---|---|
| Display | 0% | -16% | -17% | 5% | 1% | -16% | |
| Display P3 Coverage (%) | 97.7 | 97.5 0% | 69.1 -29% | 68.4 -30% | 99.8 2% | 97.6 0% | 69.4 -29% |
| sRGB Coverage (%) | 99.9 | 99.9 0% | 97.7 -2% | 96.9 -3% | 100 0% | 99.9 0% | 97.6 -2% |
| AdobeRGB 1998 Coverage (%) | 85.7 | 86.3 1% | 71 -17% | 70.6 -18% | 96.6 13% | 87.4 2% | 71.8 -16% |
| Response Times | 17% | 13% | 4% | 86% | 20% | 11% | |
| Response Time Grey 50% / Grey 80% * (ms) | 14.2 ? | 15.3 ? -8% | 13.6 ? 4% | 14.1 ? 1% | 1.7 ? 88% | 12.8 ? 10% | 11.2 ? 21% |
| Response Time Black / White * (ms) | 10.6 ? | 6.1 ? 42% | 8.4 ? 21% | 9.9 ? 7% | 1.7 ? 84% | 7.4 ? 30% | 10.6 ? -0% |
| PWM Frequency (Hz) | 60 ? | ||||||
| Screen | 18% | -20% | 17% | -11% | 10% | -32% | |
| Brightness middle (cd/m²) | 404.3 | 554 37% | 470.7 16% | 531.5 31% | 348.1 -14% | 407 1% | 516 28% |
| Brightness (cd/m²) | 405 | 516 27% | 431 6% | 499 23% | 351 -13% | 388 -4% | 505 25% |
| Brightness Distribution (%) | 92 | 84 -9% | 88 -4% | 89 -3% | 97 5% | 88 -4% | 89 -3% |
| Black Level * (cd/m²) | 0.28 | 0.47 -68% | 0.57 -104% | 0.38 -36% | 0.36 -29% | 0.41 -46% | |
| Contrast (:1) | 1444 | 1179 -18% | 826 -43% | 1399 -3% | 1131 -22% | 1259 -13% | |
| Colorchecker dE 2000 * | 2.63 | 1 62% | 2.16 18% | 1.82 31% | 4.18 -59% | 1.3 51% | 3.5 -33% |
| Colorchecker dE 2000 max. * | 4.48 | 2.4 46% | 4.39 2% | 4.1 8% | 6.68 -49% | 2.5 44% | 8.8 -96% |
| Colorchecker dE 2000 calibrated * | 1.46 | 0.6 59% | 1.37 6% | 0.63 57% | 0.97 34% | 0.7 52% | 1.2 18% |
| Greyscale dE 2000 * | 2.1 | 1.6 24% | 3.7 -76% | 1.2 43% | 1.7 19% | 2.1 -0% | 5.6 -167% |
| Gamma | 2.3 96% | 2.29 96% | 2.38 92% | 2.15 102% | 2.2 100% | 2.26 97% | 2.27 97% |
| CCT | 6810 95% | 6458 101% | 6765 96% | 6484 100% | 6198 105% | 6437 101% | 6071 107% |
| Całkowita średnia (program / ustawienia) | 12% /
14% | -8% /
-14% | 1% /
8% | 27% /
9% | 10% /
9% | -12% /
-22% |
* ... im mniej tym lepiej
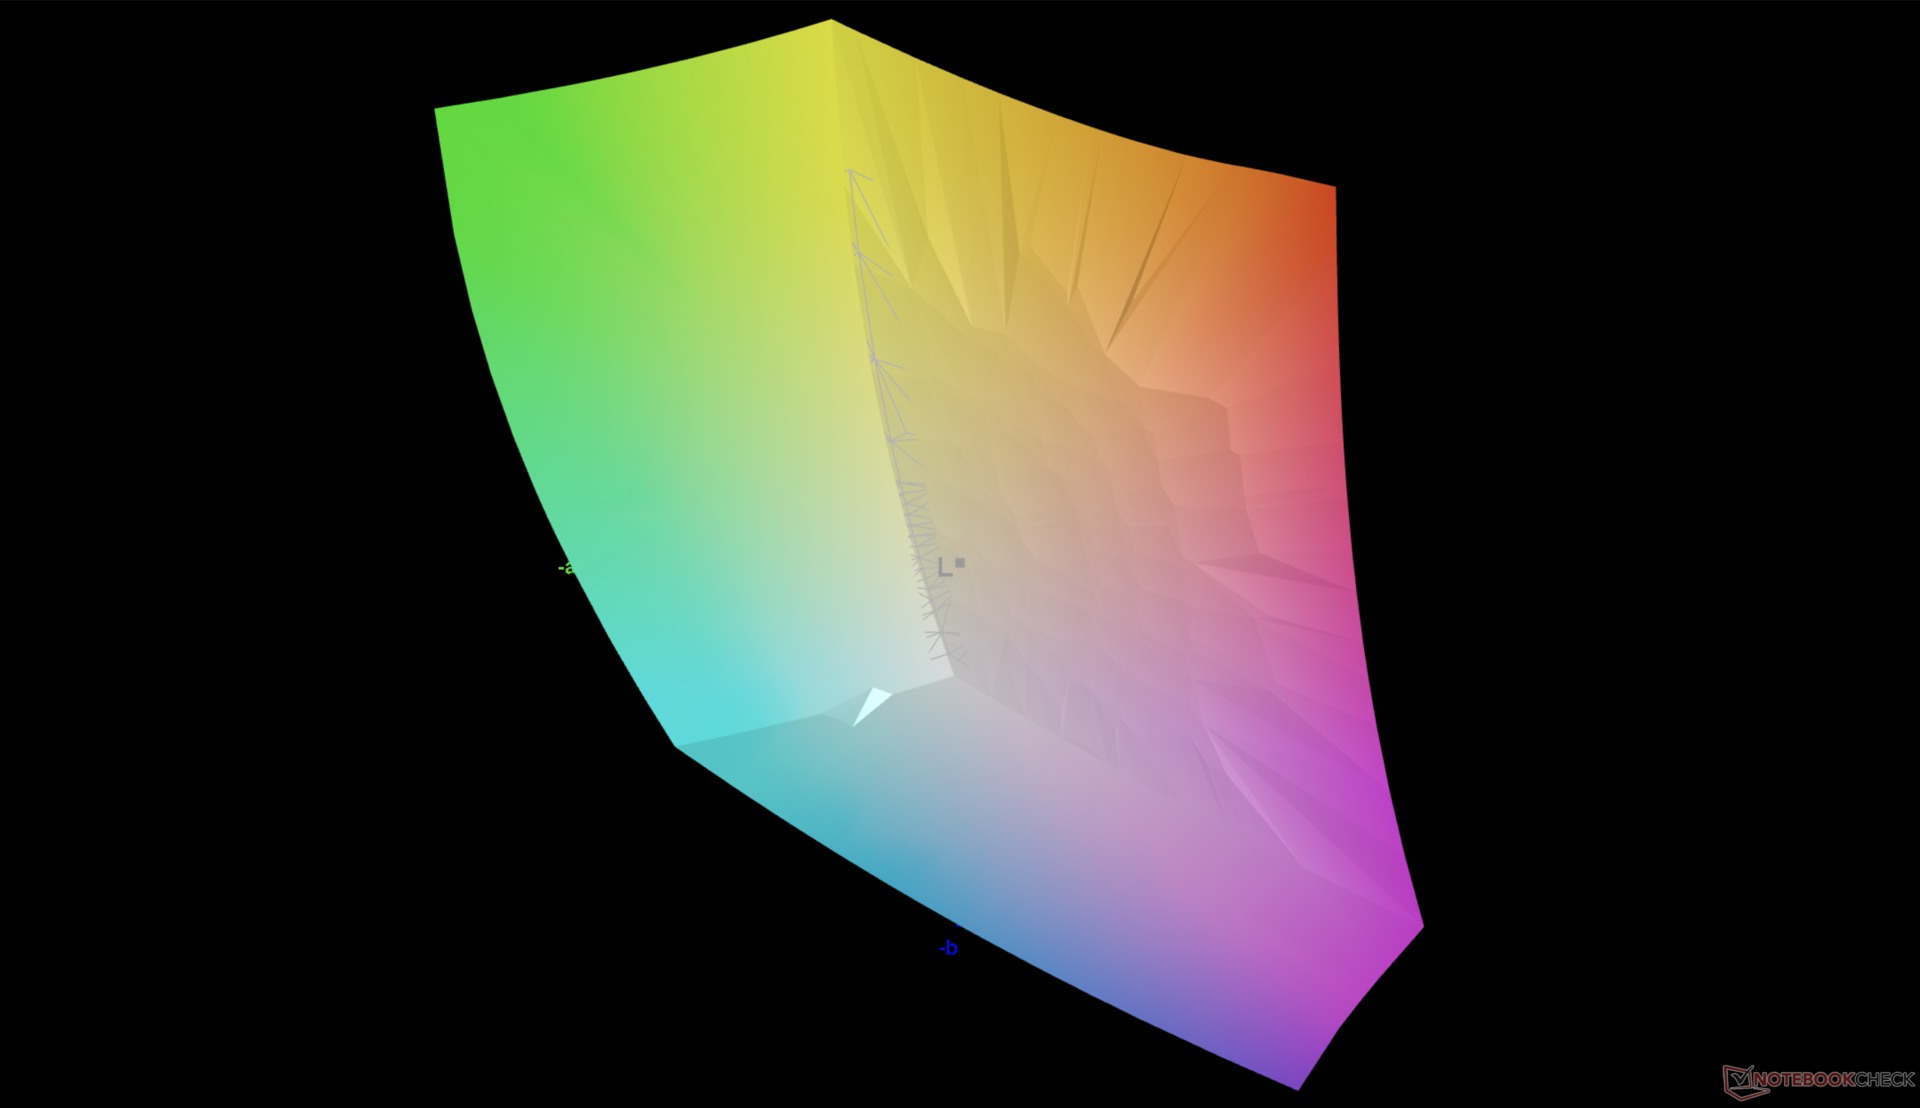
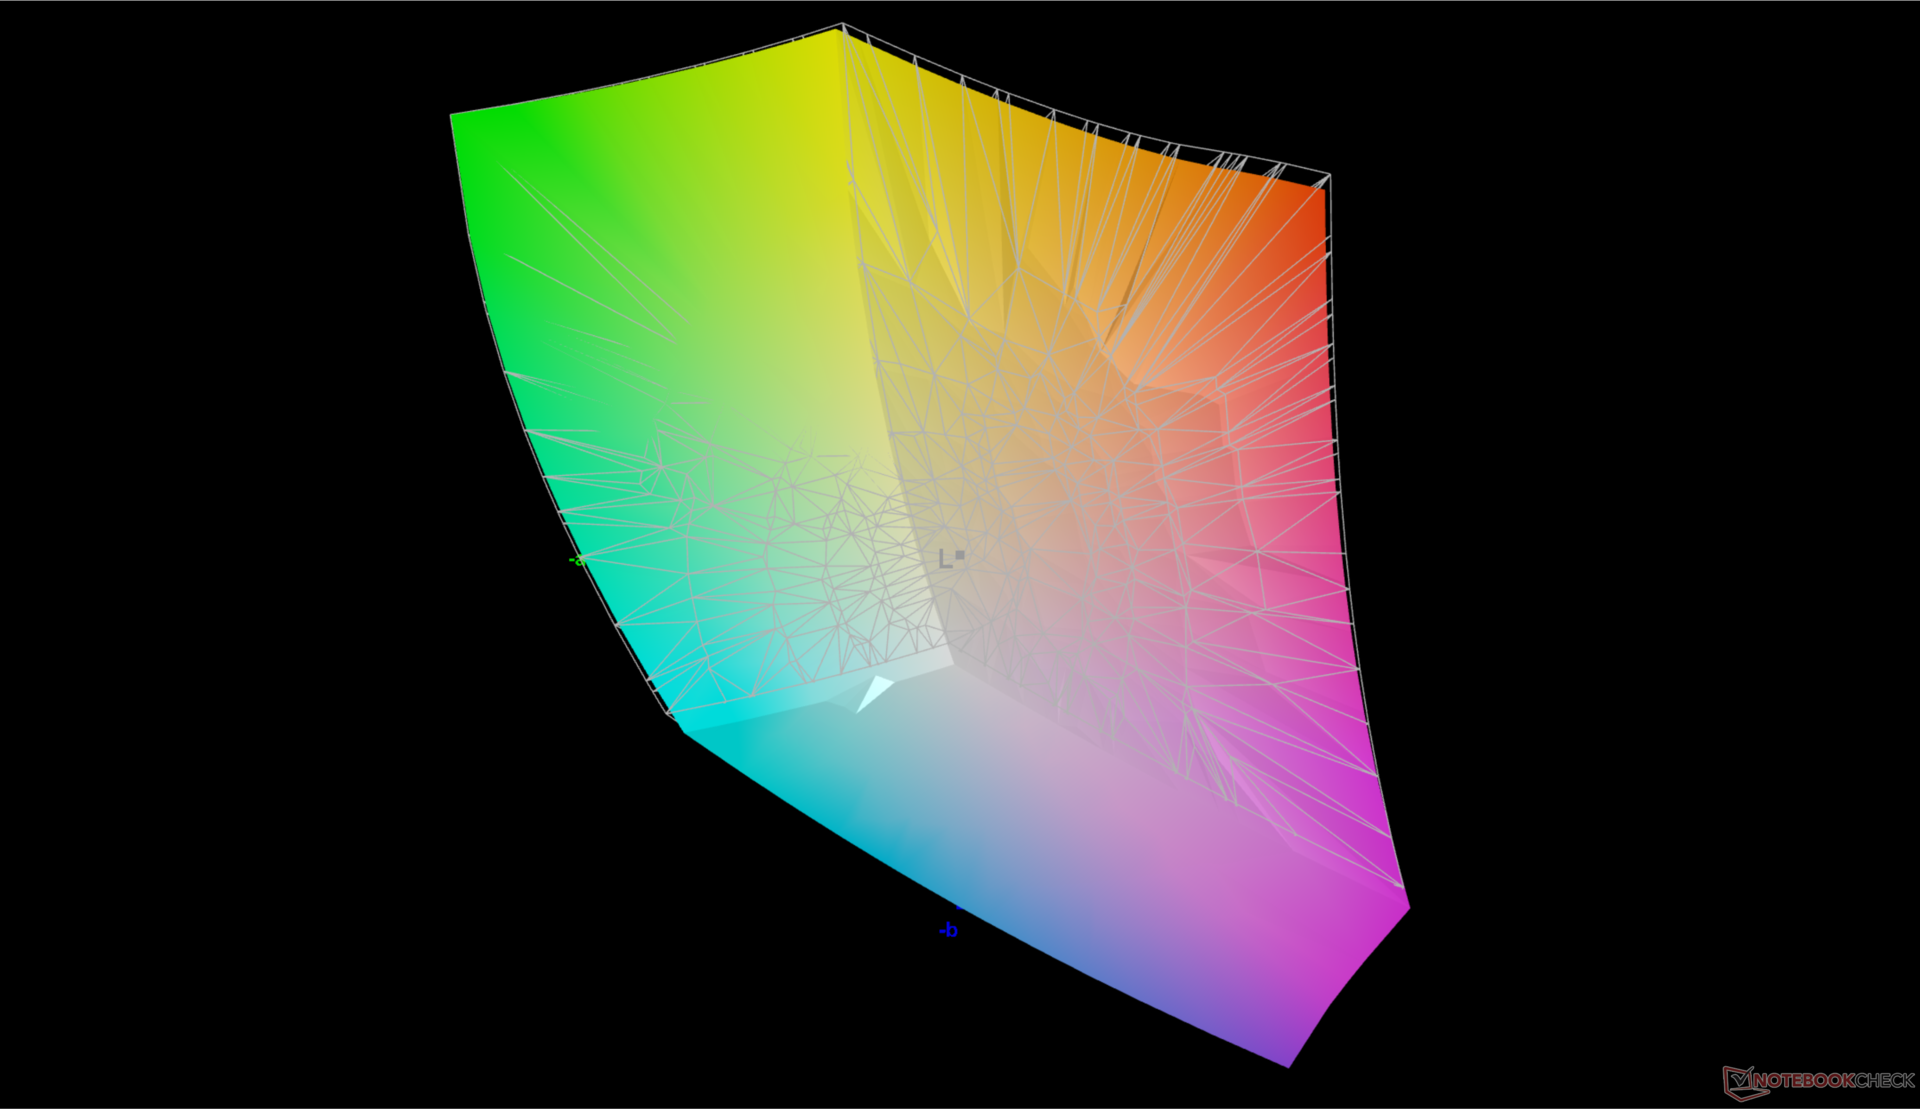
Wyświetlacz jest wstępnie skalibrowany pod kątem standardu P3 z niskimi średnimi wartościami deltaE w skali szarości i koloru, wynoszącymi odpowiednio zaledwie 2,1 i 2,63.
Wyświetl czasy reakcji
| ↔ Czas reakcji od czerni do bieli | ||
|---|---|---|
| 10.6 ms ... wzrost ↗ i spadek ↘ łącznie | ↗ 6.1 ms wzrost | 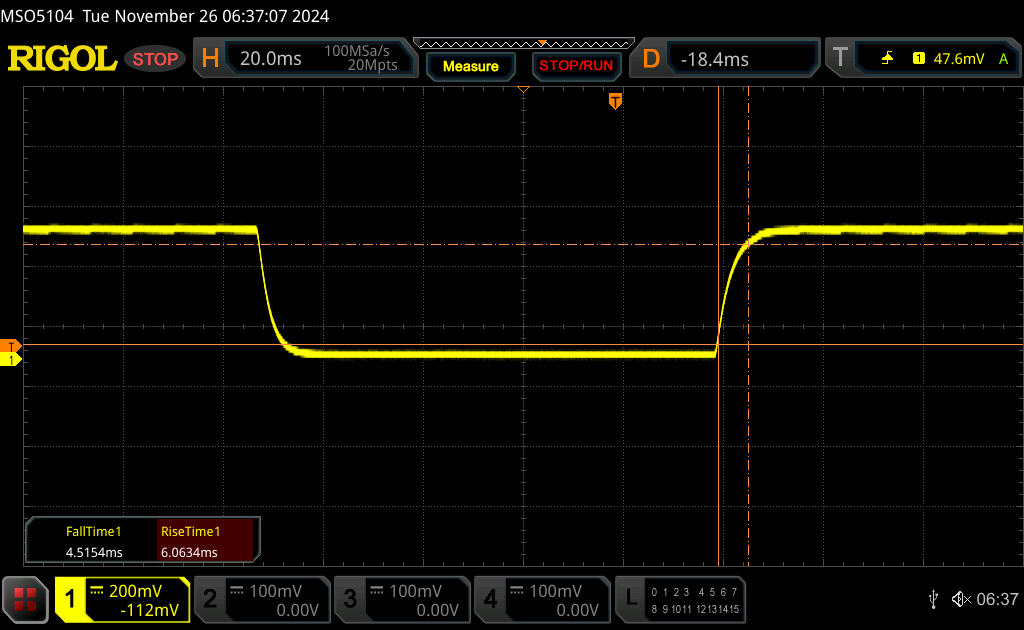 |
| ↘ 4.5 ms upadek | ||
| W naszych testach ekran wykazuje dobry współczynnik reakcji, ale może być zbyt wolny dla graczy rywalizujących ze sobą. Dla porównania, wszystkie testowane urządzenia wahają się od 0.1 (minimum) do 240 (maksimum) ms. » 29 % wszystkich urządzeń jest lepszych. Oznacza to, że zmierzony czas reakcji jest lepszy od średniej wszystkich testowanych urządzeń (19.8 ms). | ||
| ↔ Czas reakcji 50% szarości do 80% szarości | ||
| 14.2 ms ... wzrost ↗ i spadek ↘ łącznie | ↗ 6.9 ms wzrost | 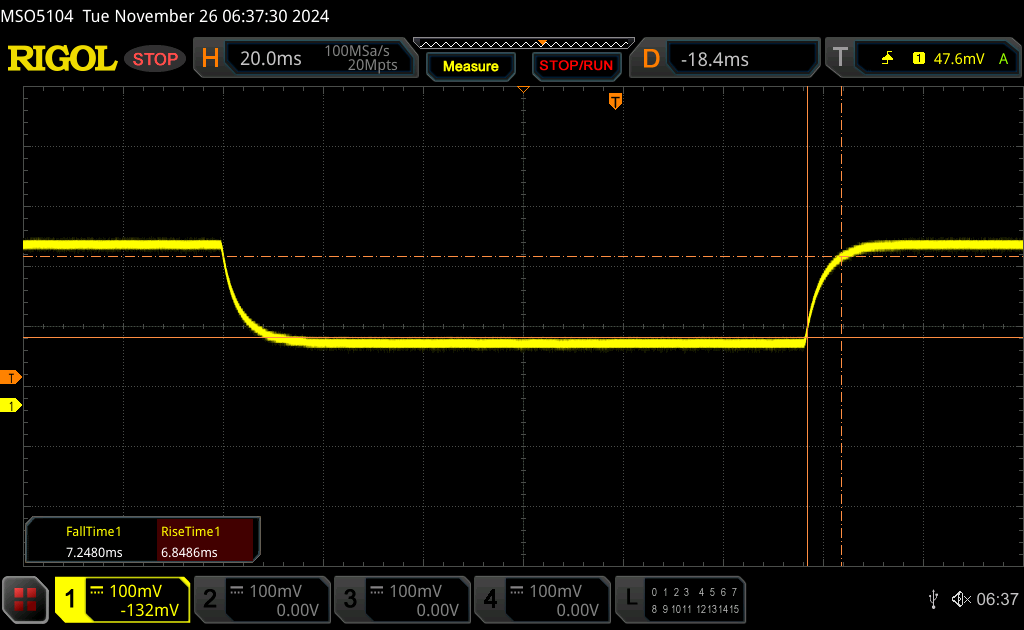 |
| ↘ 7.3 ms upadek | ||
| W naszych testach ekran wykazuje dobry współczynnik reakcji, ale może być zbyt wolny dla graczy rywalizujących ze sobą. Dla porównania, wszystkie testowane urządzenia wahają się od 0.165 (minimum) do 636 (maksimum) ms. » 28 % wszystkich urządzeń jest lepszych. Oznacza to, że zmierzony czas reakcji jest lepszy od średniej wszystkich testowanych urządzeń (31 ms). | ||
Migotanie ekranu / PWM (modulacja szerokości impulsu)
| Migotanie ekranu/nie wykryto PWM | 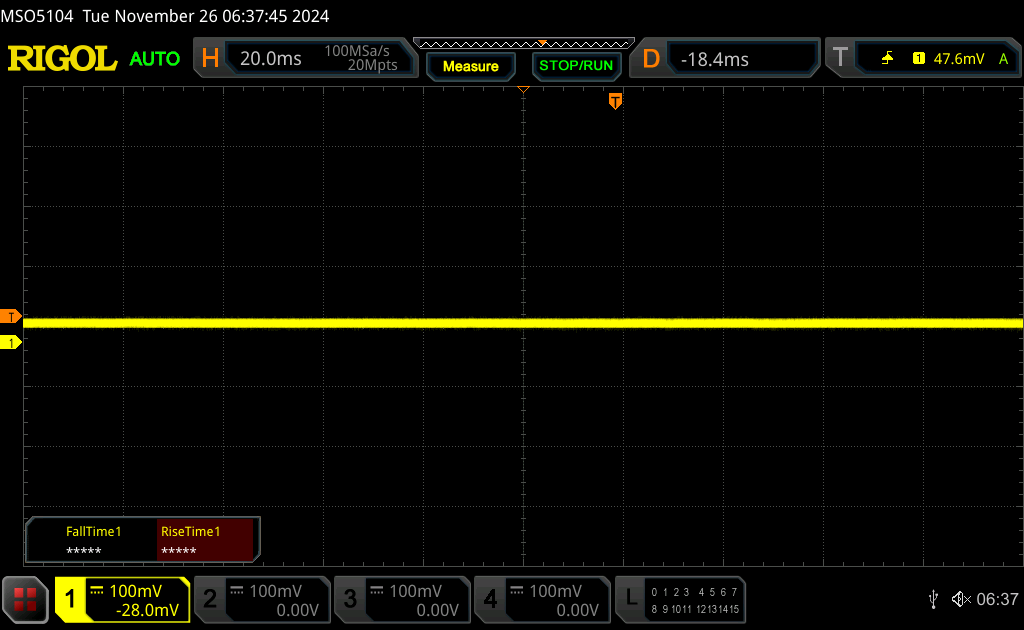 | ||
Dla porównania: 52 % wszystkich testowanych urządzeń nie używa PWM do przyciemniania wyświetlacza. Jeśli wykryto PWM, zmierzono średnio 7772 (minimum: 5 - maksimum: 343500) Hz. | |||

Wydajność
Warunki testowania
Przed wykonaniem poniższych testów ustawiliśmy system Windows i MyHP w tryb wydajności.
Procesor
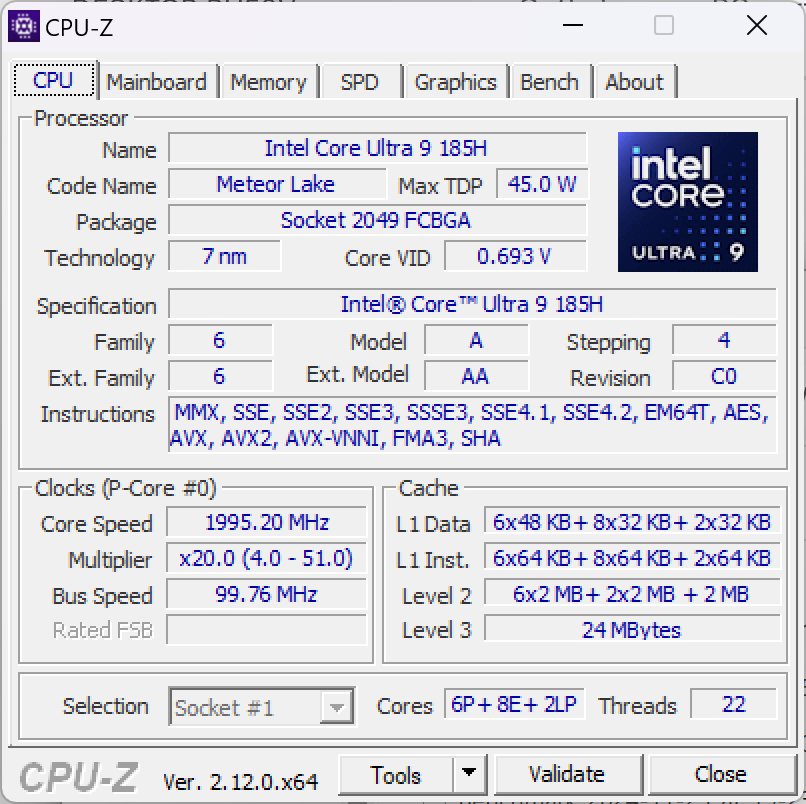
Chociaż nie są tak szybkie jak sąsiednia seria Raptor Lake-HX, oparte na Meteor Lake Core Ultra 9 185H jest wciąż niewielkim ulepszeniem w stosunku do Core i7-12800H w ZBook Studio 16 G9 o około 10 procent, jeśli chodzi o zadania wielowątkowe. Niestety, nie jest on w stanie utrzymać częstotliwości taktowania Turbo Boost przez bardzo długi czas, pomimo stosunkowo dużej 16-calowej obudowy.
Cinebench R15 Multi Loop
Cinebench R23: Multi Core | Single Core
Cinebench R20: CPU (Multi Core) | CPU (Single Core)
Cinebench R15: CPU Multi 64Bit | CPU Single 64Bit
Blender: v2.79 BMW27 CPU
7-Zip 18.03: 7z b 4 | 7z b 4 -mmt1
Geekbench 6.7: Multi-Core | Single-Core
Geekbench 5.5: Multi-Core | Single-Core
HWBOT x265 Benchmark v2.2: 4k Preset
LibreOffice : 20 Documents To PDF
R Benchmark 2.5: Overall mean
| Geekbench 6.7 / Multi-Core | |
| Lenovo ThinkPad P16 Gen 2 | |
| Średnia w klasie Workstation (12721 - 20887, n=24, ostatnie 2 lata) | |
| HP ZBook Fury 16 G10 | |
| HP ZBook Fury 16 G11 | |
| Dell Precision 5000 5680 | |
| Dell Precision 5690 | |
| HP ZBook Studio 16 G11 | |
| Przeciętny Intel Core Ultra 9 185H (9140 - 14540, n=20) | |
| Lenovo ThinkPad P1 Gen 7 21KV001SGE | |
| Lenovo ThinkPad P1 G6 21FV001KUS | |
| HP ZBook Power 16 G11 A | |
| Lenovo ThinkPad P1 G6-21FV000DGE | |
| Lenovo ThinkPad P16s G2 21K9000CGE | |
| Lenovo ThinkPad P16v G1 AMD | |
| Geekbench 6.7 / Single-Core | |
| HP ZBook Fury 16 G10 | |
| HP ZBook Fury 16 G11 | |
| Lenovo ThinkPad P16 Gen 2 | |
| Średnia w klasie Workstation (2389 - 3065, n=24, ostatnie 2 lata) | |
| Lenovo ThinkPad P1 G6 21FV001KUS | |
| Lenovo ThinkPad P1 G6-21FV000DGE | |
| HP ZBook Power 16 G11 A | |
| Dell Precision 5000 5680 | |
| Lenovo ThinkPad P16v G1 AMD | |
| Dell Precision 5690 | |
| HP ZBook Studio 16 G11 | |
| Lenovo ThinkPad P16s G2 21K9000CGE | |
| Przeciętny Intel Core Ultra 9 185H (1490 - 2573, n=20) | |
| Lenovo ThinkPad P1 Gen 7 21KV001SGE | |
Cinebench R23: Multi Core | Single Core
Cinebench R20: CPU (Multi Core) | CPU (Single Core)
Cinebench R15: CPU Multi 64Bit | CPU Single 64Bit
Blender: v2.79 BMW27 CPU
7-Zip 18.03: 7z b 4 | 7z b 4 -mmt1
Geekbench 6.7: Multi-Core | Single-Core
Geekbench 5.5: Multi-Core | Single-Core
HWBOT x265 Benchmark v2.2: 4k Preset
LibreOffice : 20 Documents To PDF
R Benchmark 2.5: Overall mean
* ... im mniej tym lepiej
AIDA64: FP32 Ray-Trace | FPU Julia | CPU SHA3 | CPU Queen | FPU SinJulia | FPU Mandel | CPU AES | CPU ZLib | FP64 Ray-Trace | CPU PhotoWorxx
| Performance rating | |
| Lenovo ThinkPad P16 Gen 2 | |
| HP ZBook Power 16 G11 A | |
| Dell Precision 5690 | |
| HP ZBook Studio 16 G11 | |
| Lenovo ThinkPad P1 Gen 7 21KV001SGE | |
| Przeciętny Intel Core Ultra 9 185H | |
| MSI CreatorPro Z16P B12UKST | |
| HP ZBook Studio 16 G9 62U04EA | |
| AIDA64 / FP32 Ray-Trace | |
| HP ZBook Power 16 G11 A | |
| Lenovo ThinkPad P16 Gen 2 | |
| Dell Precision 5690 | |
| Lenovo ThinkPad P1 Gen 7 21KV001SGE | |
| HP ZBook Studio 16 G11 | |
| Przeciętny Intel Core Ultra 9 185H (9220 - 18676, n=20) | |
| HP ZBook Studio 16 G9 62U04EA | |
| MSI CreatorPro Z16P B12UKST | |
| AIDA64 / FPU Julia | |
| HP ZBook Power 16 G11 A | |
| Lenovo ThinkPad P16 Gen 2 | |
| Dell Precision 5690 | |
| HP ZBook Studio 16 G11 | |
| Lenovo ThinkPad P1 Gen 7 21KV001SGE | |
| Przeciętny Intel Core Ultra 9 185H (48865 - 96463, n=20) | |
| HP ZBook Studio 16 G9 62U04EA | |
| MSI CreatorPro Z16P B12UKST | |
| AIDA64 / CPU SHA3 | |
| Lenovo ThinkPad P16 Gen 2 | |
| HP ZBook Power 16 G11 A | |
| Dell Precision 5690 | |
| HP ZBook Studio 16 G11 | |
| Lenovo ThinkPad P1 Gen 7 21KV001SGE | |
| Przeciętny Intel Core Ultra 9 185H (2394 - 4534, n=20) | |
| HP ZBook Studio 16 G9 62U04EA | |
| MSI CreatorPro Z16P B12UKST | |
| AIDA64 / CPU Queen | |
| Lenovo ThinkPad P16 Gen 2 | |
| HP ZBook Power 16 G11 A | |
| HP ZBook Studio 16 G9 62U04EA | |
| MSI CreatorPro Z16P B12UKST | |
| Dell Precision 5690 | |
| HP ZBook Studio 16 G11 | |
| Lenovo ThinkPad P1 Gen 7 21KV001SGE | |
| Przeciętny Intel Core Ultra 9 185H (66785 - 95241, n=20) | |
| AIDA64 / FPU SinJulia | |
| HP ZBook Power 16 G11 A | |
| Lenovo ThinkPad P16 Gen 2 | |
| Dell Precision 5690 | |
| HP ZBook Studio 16 G11 | |
| Lenovo ThinkPad P1 Gen 7 21KV001SGE | |
| Przeciętny Intel Core Ultra 9 185H (7255 - 11392, n=20) | |
| HP ZBook Studio 16 G9 62U04EA | |
| MSI CreatorPro Z16P B12UKST | |
| AIDA64 / FPU Mandel | |
| HP ZBook Power 16 G11 A | |
| Lenovo ThinkPad P16 Gen 2 | |
| Dell Precision 5690 | |
| Lenovo ThinkPad P1 Gen 7 21KV001SGE | |
| HP ZBook Studio 16 G11 | |
| Przeciętny Intel Core Ultra 9 185H (24004 - 48020, n=20) | |
| HP ZBook Studio 16 G9 62U04EA | |
| MSI CreatorPro Z16P B12UKST | |
| AIDA64 / CPU AES | |
| MSI CreatorPro Z16P B12UKST | |
| Lenovo ThinkPad P16 Gen 2 | |
| Przeciętny Intel Core Ultra 9 185H (53116 - 154066, n=20) | |
| Dell Precision 5690 | |
| HP ZBook Studio 16 G11 | |
| Lenovo ThinkPad P1 Gen 7 21KV001SGE | |
| HP ZBook Power 16 G11 A | |
| HP ZBook Studio 16 G9 62U04EA | |
| AIDA64 / CPU ZLib | |
| Lenovo ThinkPad P16 Gen 2 | |
| Dell Precision 5690 | |
| HP ZBook Studio 16 G11 | |
| Lenovo ThinkPad P1 Gen 7 21KV001SGE | |
| Przeciętny Intel Core Ultra 9 185H (678 - 1341, n=20) | |
| HP ZBook Power 16 G11 A | |
| HP ZBook Studio 16 G9 62U04EA | |
| MSI CreatorPro Z16P B12UKST | |
| AIDA64 / FP64 Ray-Trace | |
| HP ZBook Power 16 G11 A | |
| Lenovo ThinkPad P16 Gen 2 | |
| Dell Precision 5690 | |
| Lenovo ThinkPad P1 Gen 7 21KV001SGE | |
| HP ZBook Studio 16 G9 62U04EA | |
| HP ZBook Studio 16 G11 | |
| Przeciętny Intel Core Ultra 9 185H (4428 - 10078, n=20) | |
| MSI CreatorPro Z16P B12UKST | |
| AIDA64 / CPU PhotoWorxx | |
| HP ZBook Studio 16 G11 | |
| Dell Precision 5690 | |
| Przeciętny Intel Core Ultra 9 185H (44547 - 53918, n=20) | |
| MSI CreatorPro Z16P B12UKST | |
| Lenovo ThinkPad P1 Gen 7 21KV001SGE | |
| HP ZBook Power 16 G11 A | |
| Lenovo ThinkPad P16 Gen 2 | |
| HP ZBook Studio 16 G9 62U04EA | |
Test warunków skrajnych
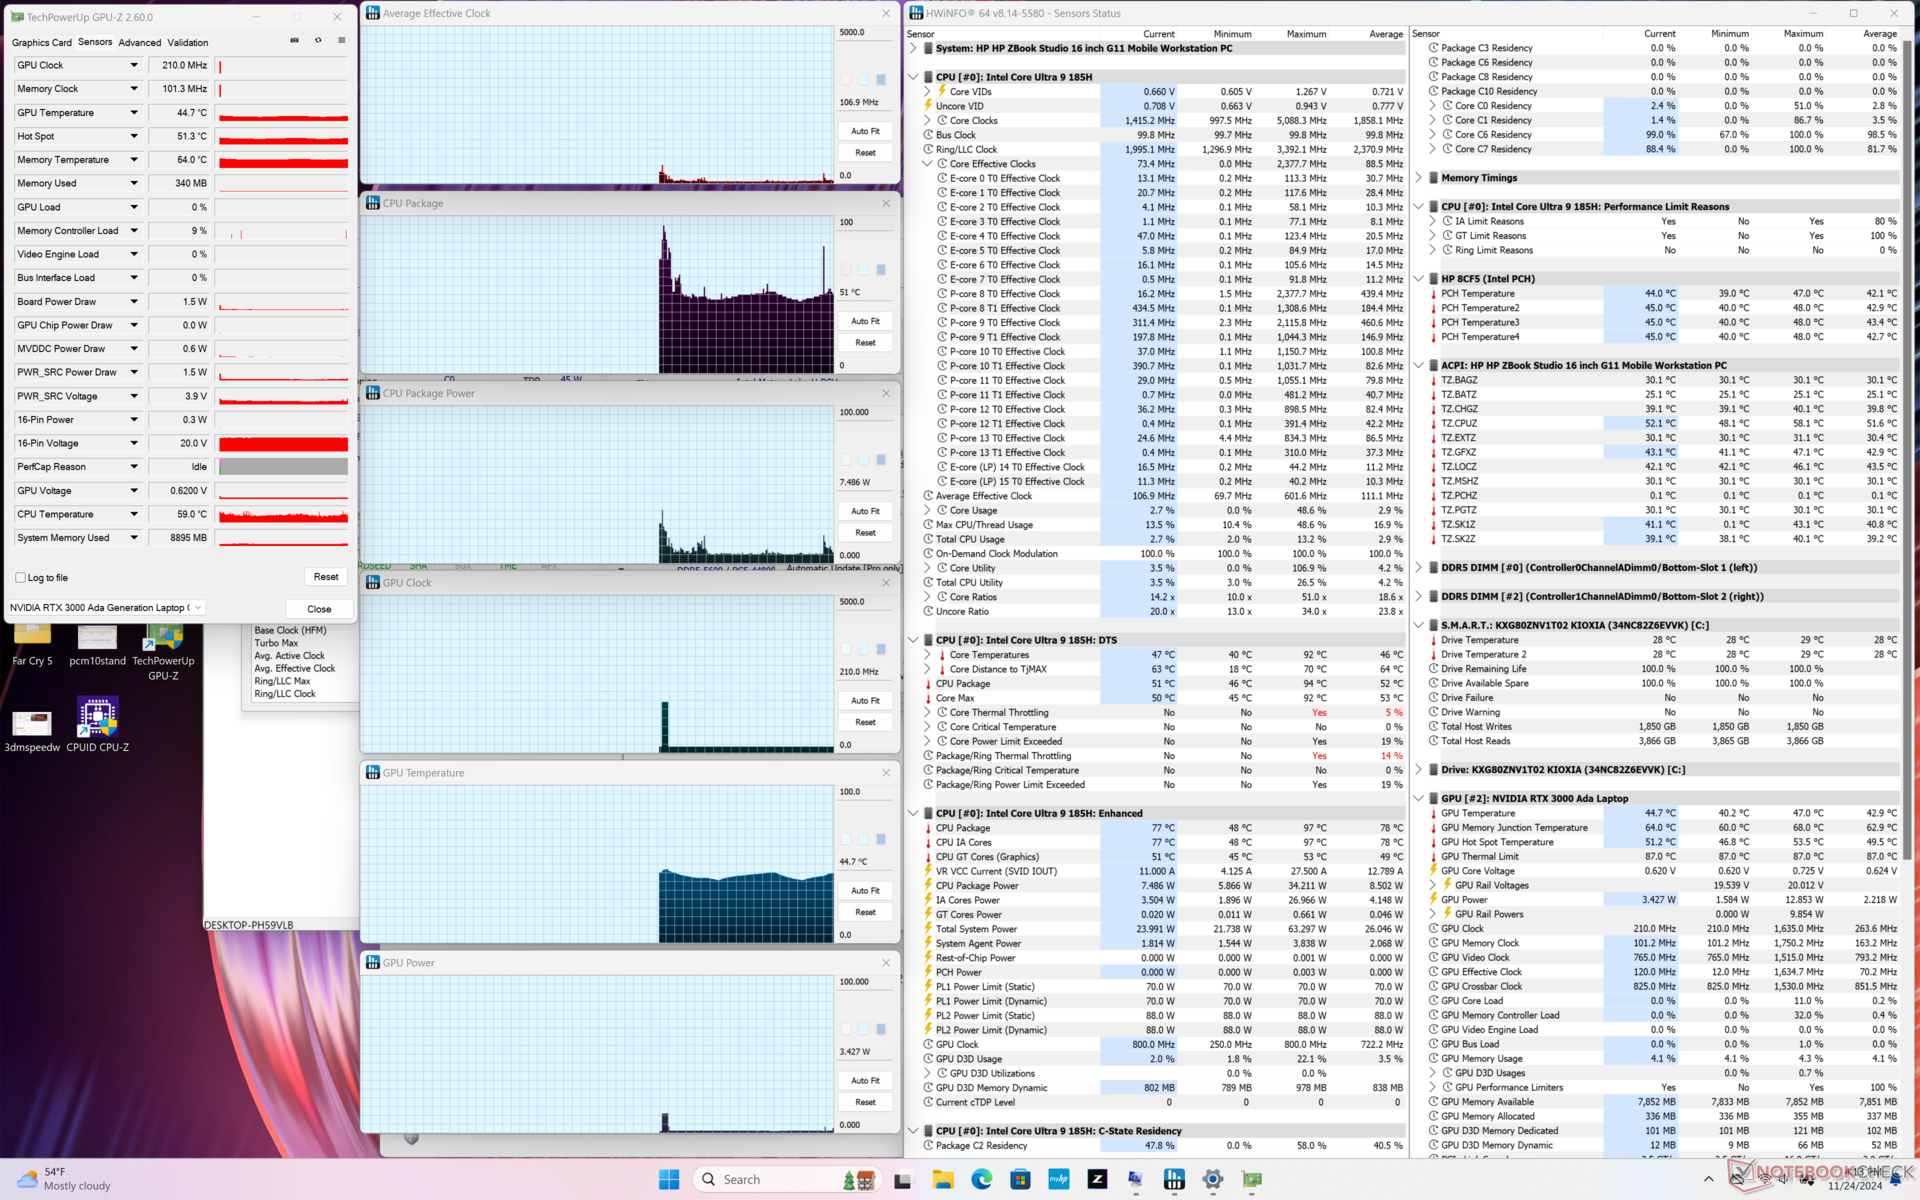
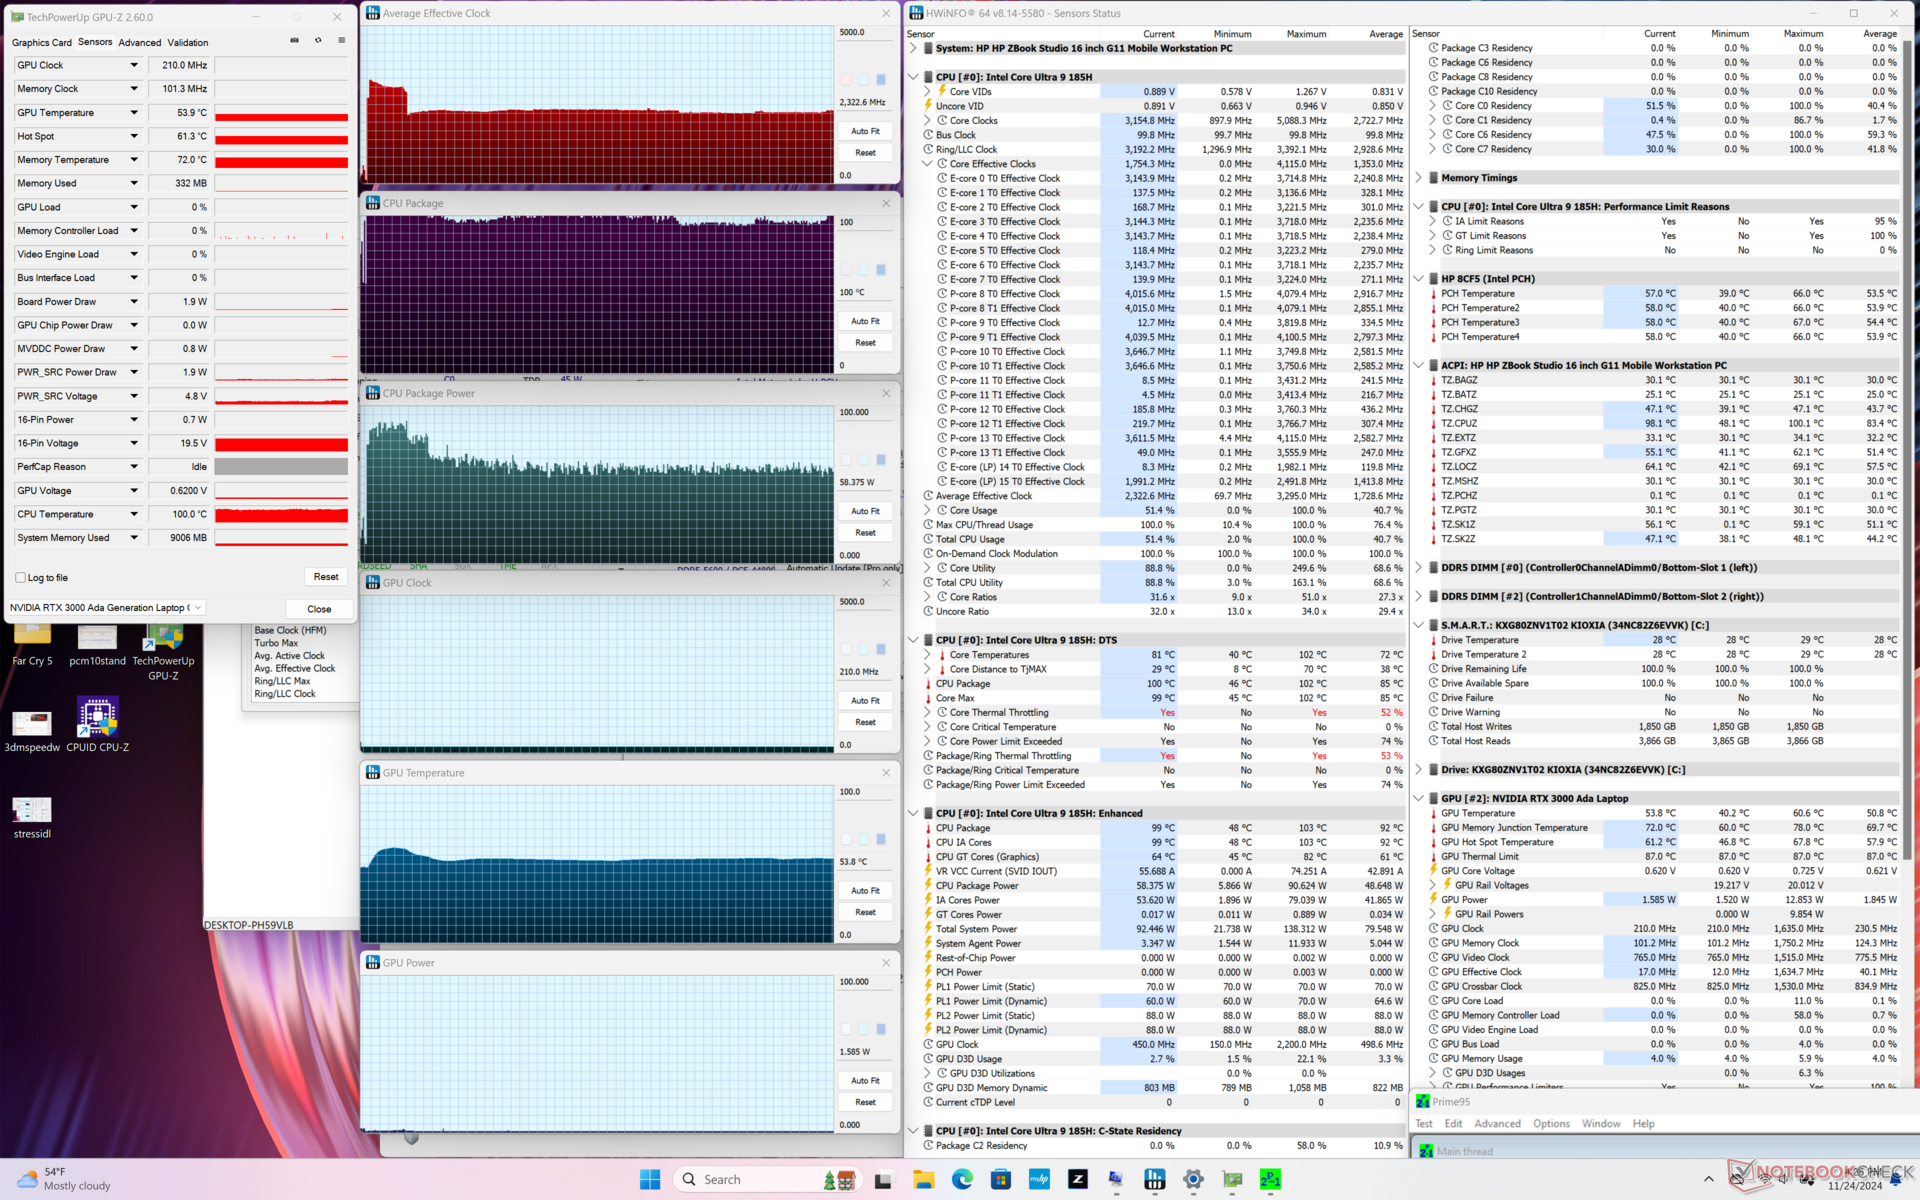
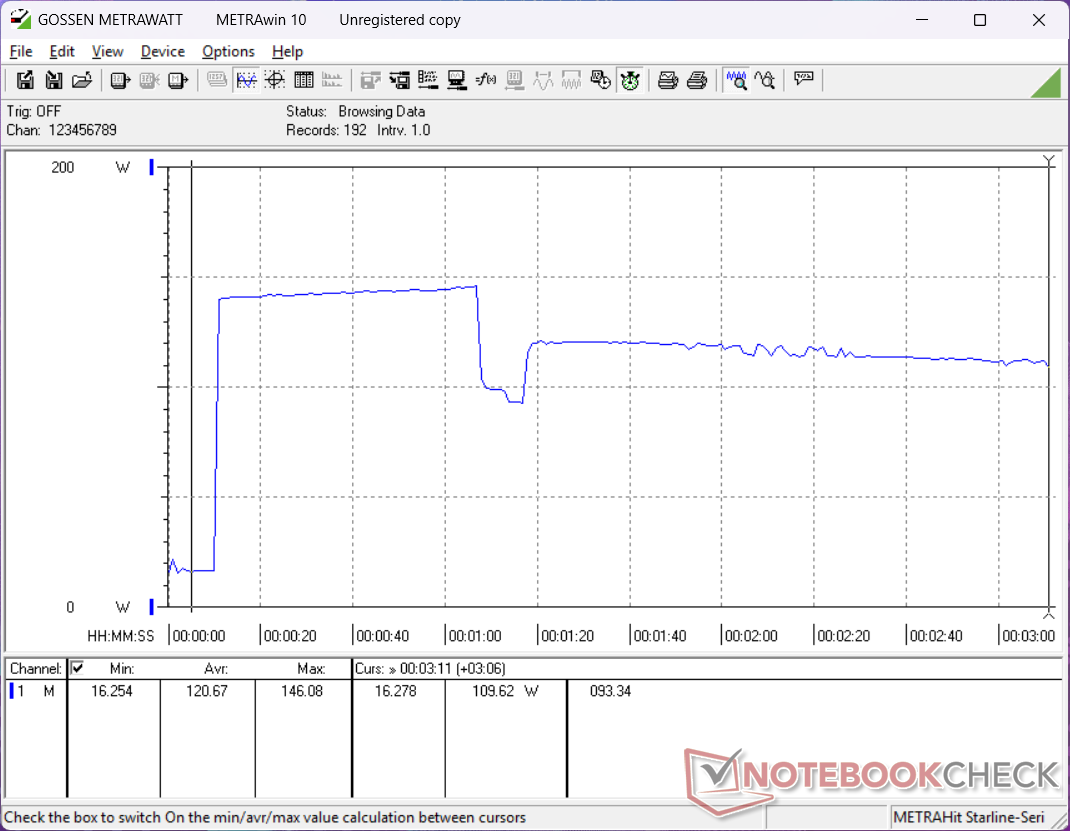
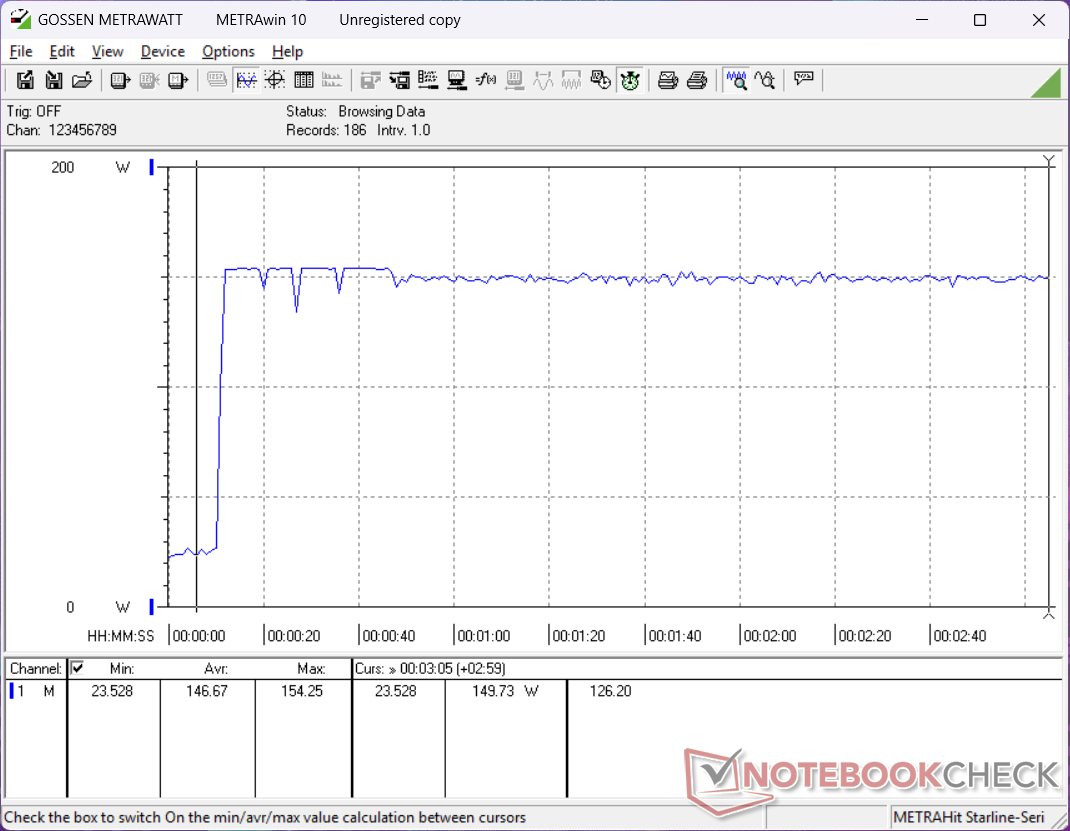
Ograniczony potencjał Turbo Boost systemu staje się widoczny, gdy przyjrzymy się bliżej jego parametrom w czasie rzeczywistym. Przykładowo, podczas testu obciążeniowego Prime95, procesor niemal natychmiast osiągał 89°C w ciągu pierwszych kilku sekund testu. Następnie szybko spadłby z 3,3 GHz i 89 W do zaledwie 2,3 GHz i 70 W, aby utrzymać temperaturę rdzenia poniżej 100 C.
Temperatura CPU i GPU podczas uruchamiania Cyberpunk 2077 ustabilizowałaby się odpowiednio na poziomie 68 C i 70 C, w porównaniu do 75 C i 62 C na mocniejszym Dell Precision 5690.
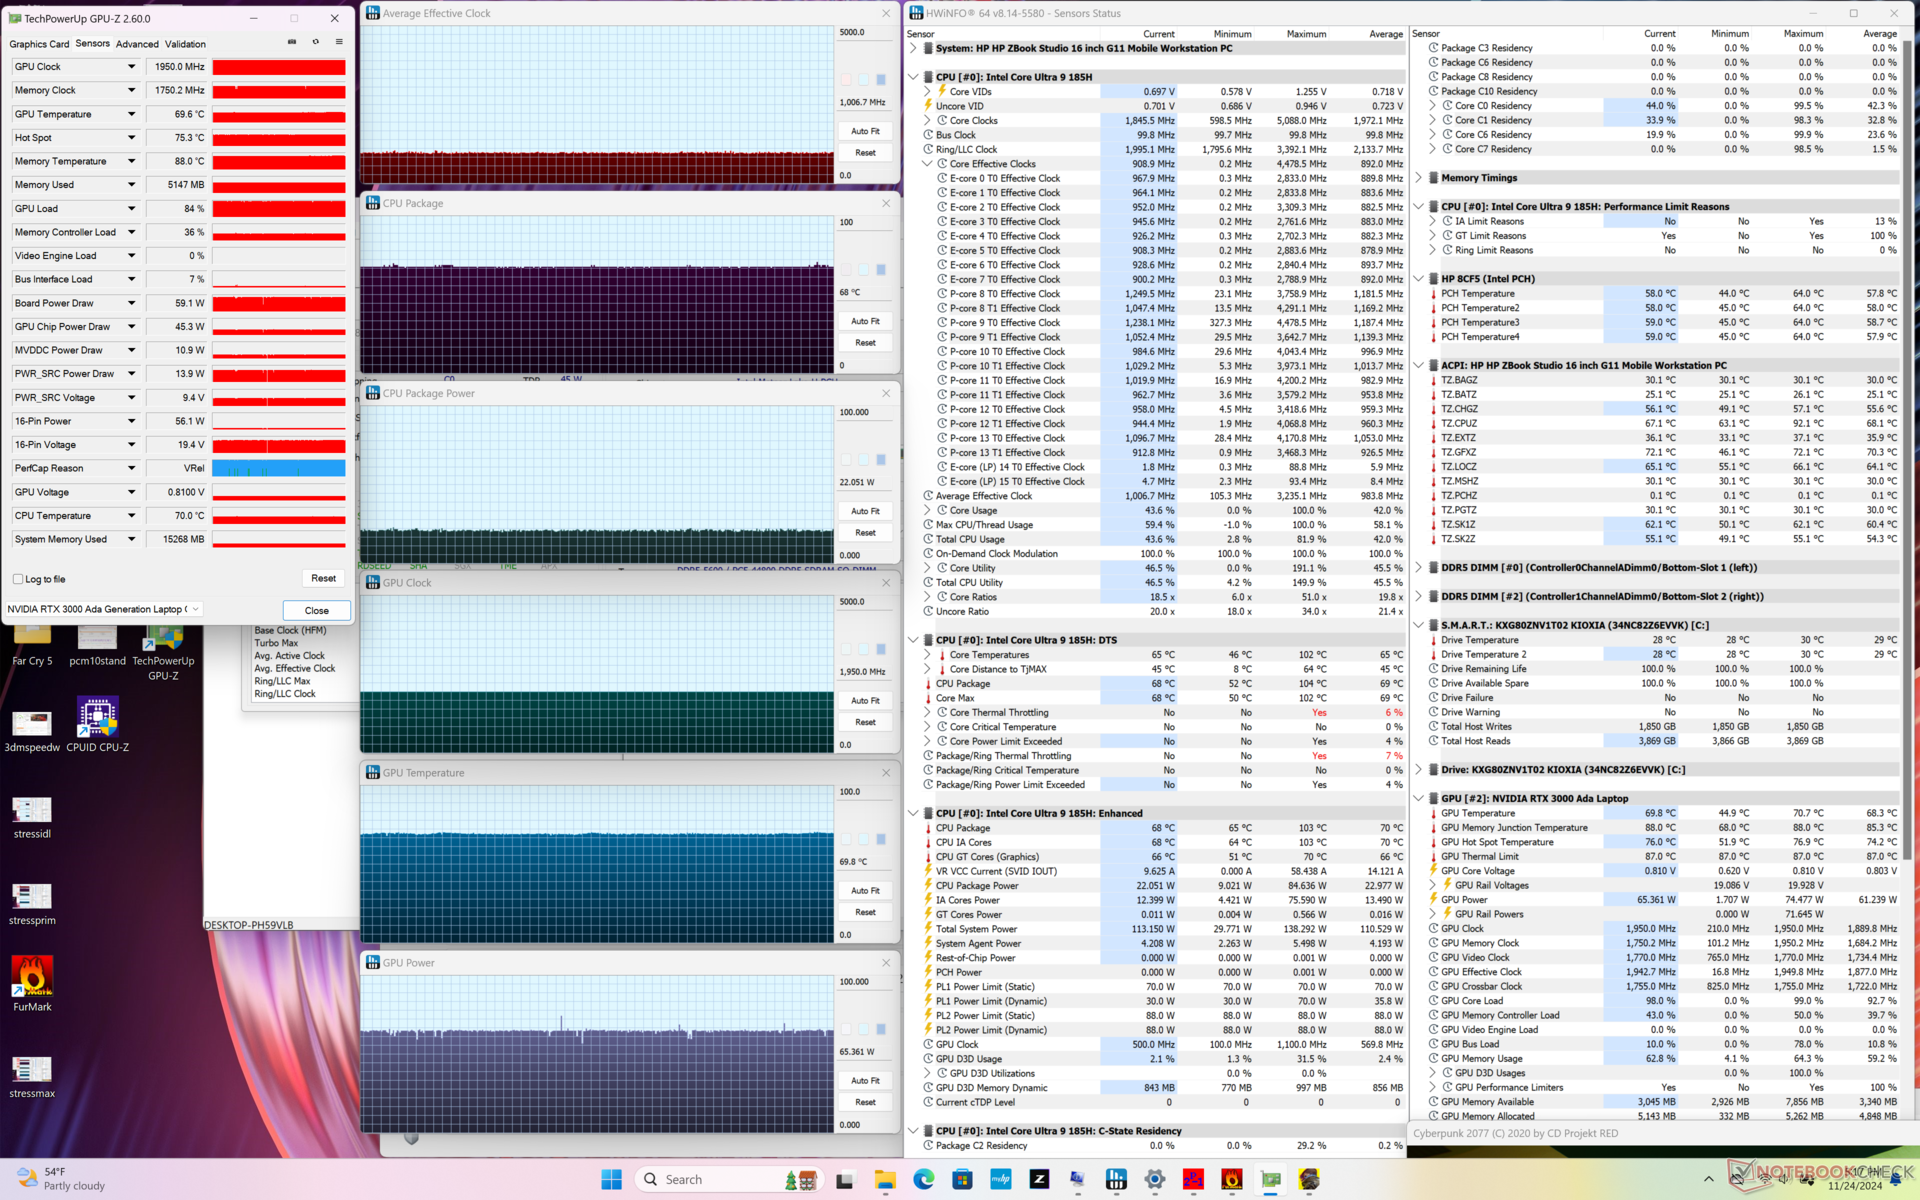
| Średnie taktowanieCPU (GHz) | Taktowanie GPU (MHz) | Średnia temperatura CPU (°C) | Średnia temperatura GPU (°C) | |
| System w stanie spoczynku | -- | -- | 51 | 45 |
| Prime95 Stress | 2.3 | -- | 99 | 54 |
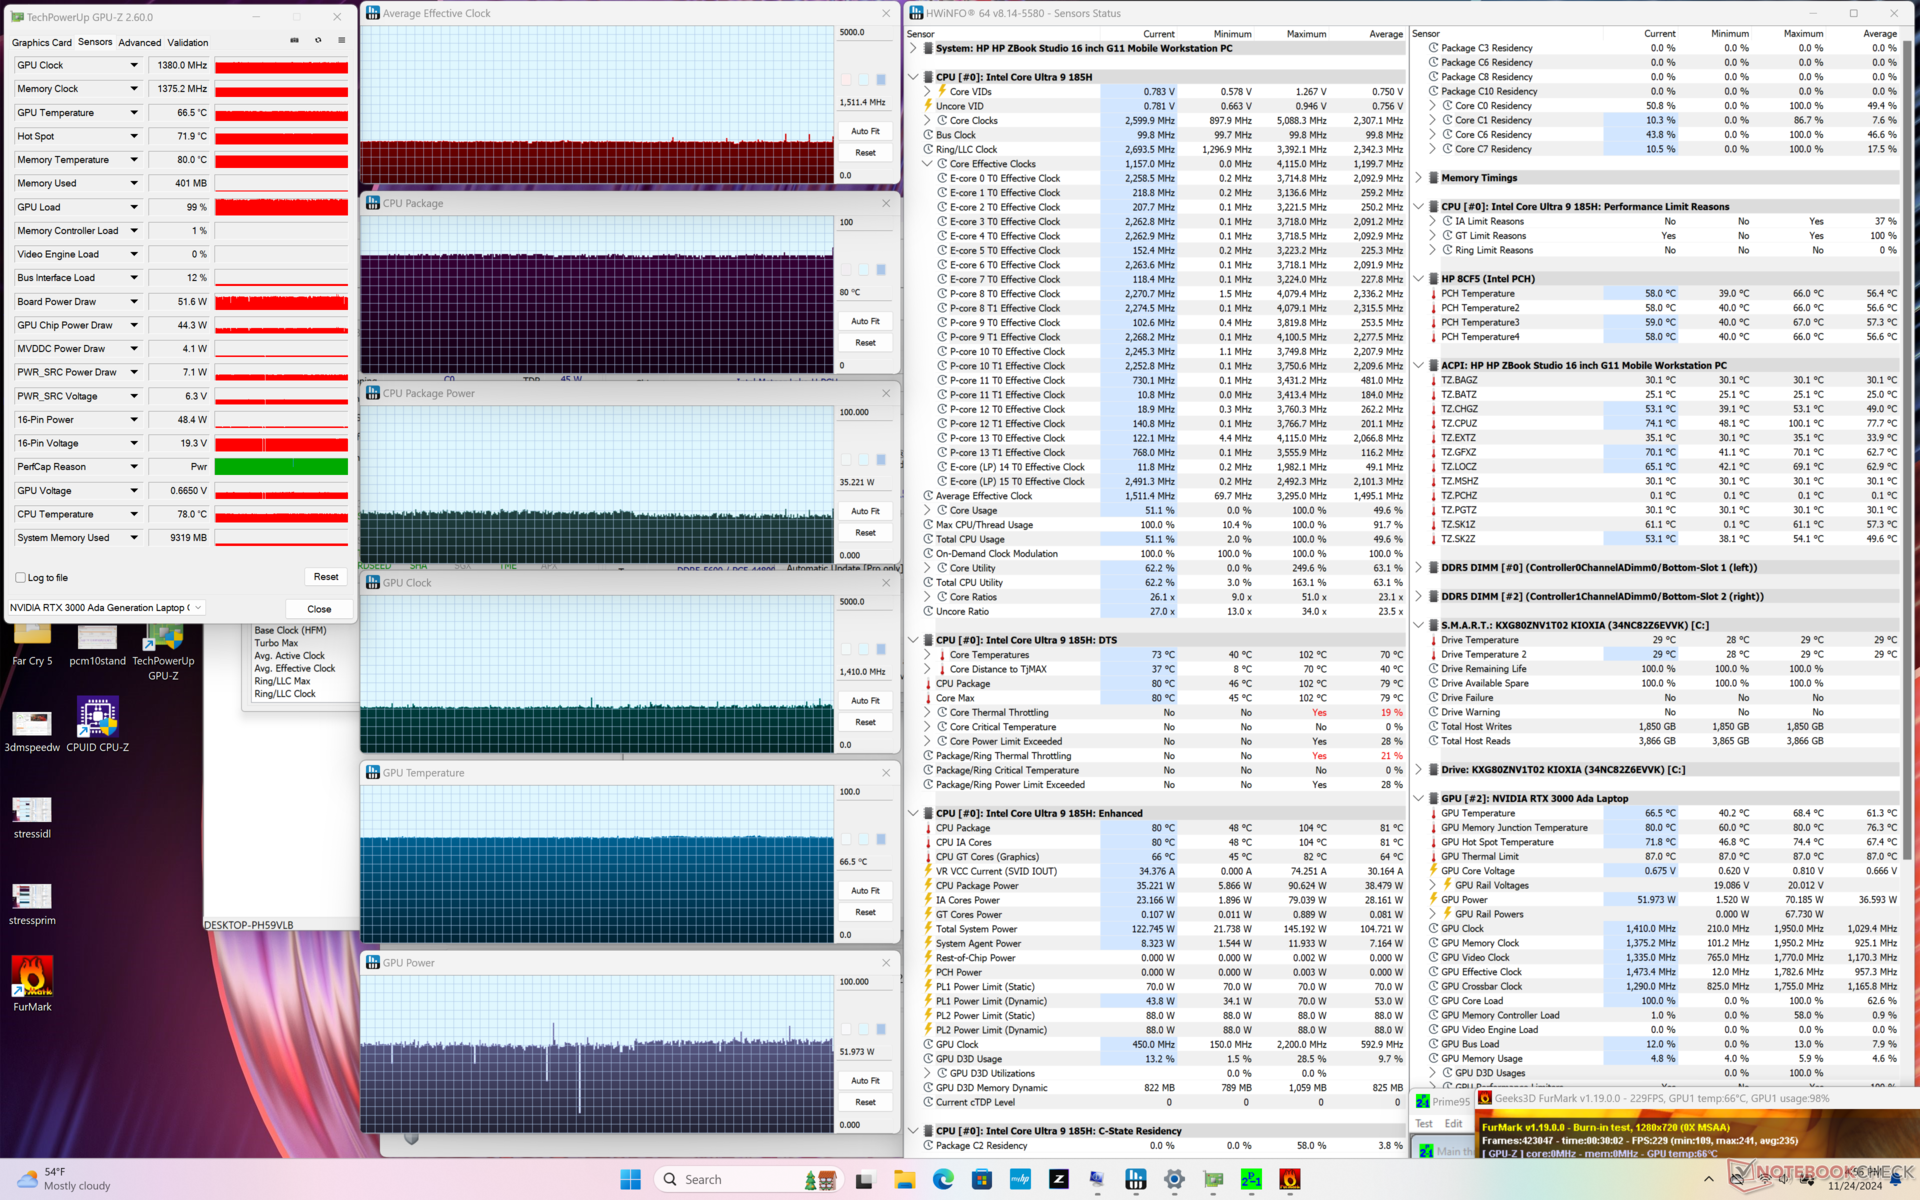
| Prime95 + FurMark Stress | 1.5 | 1410 | 80 | 67 |
| Cyberpunk 2077 Stress | 1.0 | 1950 | 68 | 70 |
Wydajność systemu
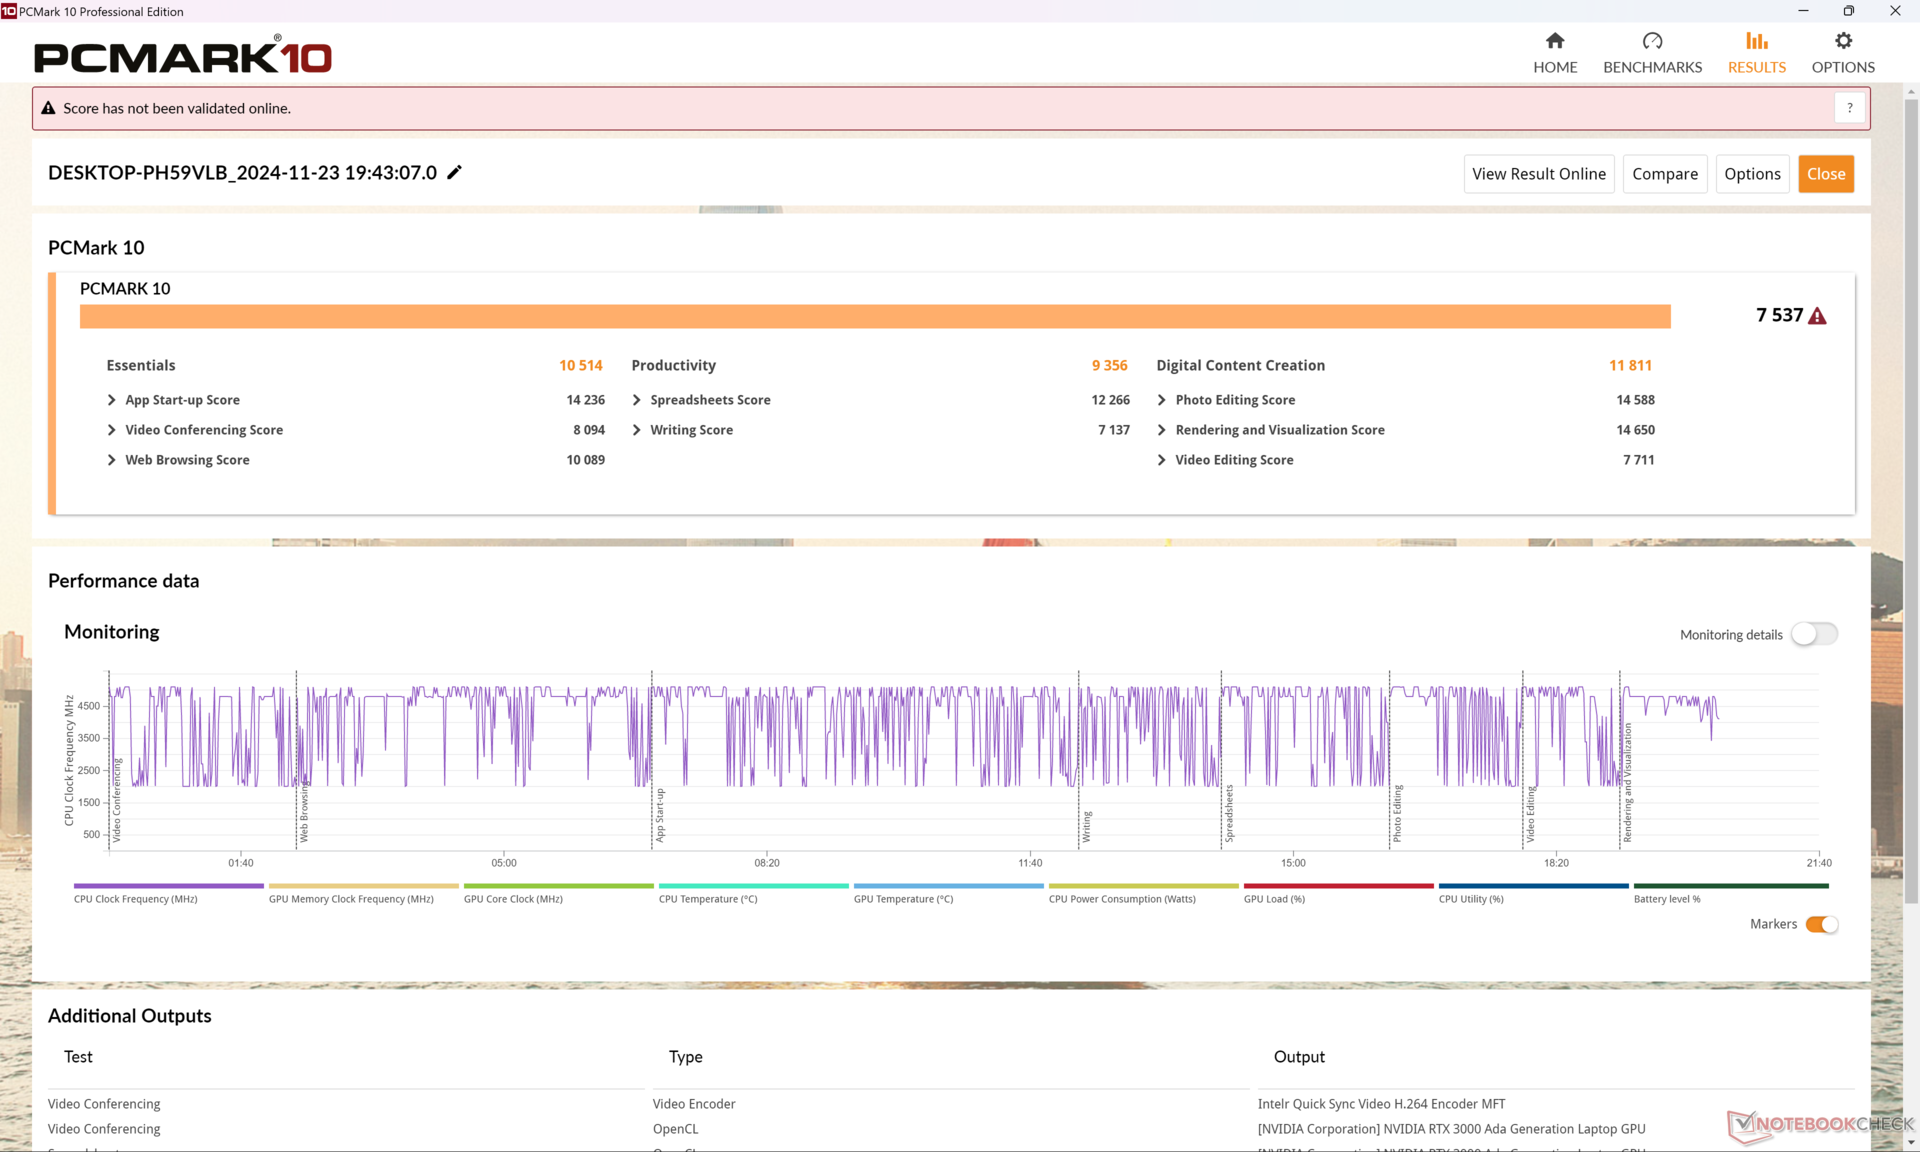
Wyniki PCMark są konsekwentnie wyższe niż w przypadku ustępującego ZBook Studio 16 G9 ze względu na ulepszenia procesora i karty graficznej. Warto jednak zauważyć, że podczas testów doświadczyliśmy kilku zawieszeń i czarnych ekranów, które za każdym razem wymagały twardego restartu.
CrossMark: Overall | Productivity | Creativity | Responsiveness
WebXPRT 3: Overall
WebXPRT 4: Overall
Mozilla Kraken 1.1: Total
| PCMark 10 / Score | |
| Lenovo ThinkPad P16 Gen 2 | |
| Dell Precision 5690 | |
| HP ZBook Studio 16 G11 | |
| Przeciętny Intel Core Ultra 9 185H, NVIDIA RTX 3000 Ada Generation Laptop (7383 - 7537, n=2) | |
| HP ZBook Power 16 G11 A | |
| Lenovo ThinkPad P1 Gen 7 21KV001SGE | |
| MSI CreatorPro Z16P B12UKST | |
| HP ZBook Studio 16 G9 62U04EA | |
| PCMark 10 / Essentials | |
| Lenovo ThinkPad P16 Gen 2 | |
| Dell Precision 5690 | |
| Przeciętny Intel Core Ultra 9 185H, NVIDIA RTX 3000 Ada Generation Laptop (10514 - 11137, n=2) | |
| MSI CreatorPro Z16P B12UKST | |
| HP ZBook Studio 16 G11 | |
| HP ZBook Power 16 G11 A | |
| Lenovo ThinkPad P1 Gen 7 21KV001SGE | |
| HP ZBook Studio 16 G9 62U04EA | |
| PCMark 10 / Productivity | |
| Dell Precision 5690 | |
| Lenovo ThinkPad P16 Gen 2 | |
| HP ZBook Power 16 G11 A | |
| HP ZBook Studio 16 G11 | |
| MSI CreatorPro Z16P B12UKST | |
| Przeciętny Intel Core Ultra 9 185H, NVIDIA RTX 3000 Ada Generation Laptop (9153 - 9356, n=2) | |
| Lenovo ThinkPad P1 Gen 7 21KV001SGE | |
| HP ZBook Studio 16 G9 62U04EA | |
| PCMark 10 / Digital Content Creation | |
| Lenovo ThinkPad P16 Gen 2 | |
| Dell Precision 5690 | |
| HP ZBook Studio 16 G11 | |
| Lenovo ThinkPad P1 Gen 7 21KV001SGE | |
| Przeciętny Intel Core Ultra 9 185H, NVIDIA RTX 3000 Ada Generation Laptop (10716 - 11811, n=2) | |
| HP ZBook Power 16 G11 A | |
| MSI CreatorPro Z16P B12UKST | |
| HP ZBook Studio 16 G9 62U04EA | |
| CrossMark / Overall | |
| Lenovo ThinkPad P16 Gen 2 | |
| MSI CreatorPro Z16P B12UKST | |
| HP ZBook Studio 16 G9 62U04EA | |
| Dell Precision 5690 | |
| HP ZBook Power 16 G11 A | |
| HP ZBook Studio 16 G11 | |
| Przeciętny Intel Core Ultra 9 185H, NVIDIA RTX 3000 Ada Generation Laptop (1754 - 1770, n=2) | |
| Lenovo ThinkPad P1 Gen 7 21KV001SGE | |
| CrossMark / Productivity | |
| Lenovo ThinkPad P16 Gen 2 | |
| MSI CreatorPro Z16P B12UKST | |
| Dell Precision 5690 | |
| HP ZBook Studio 16 G9 62U04EA | |
| HP ZBook Power 16 G11 A | |
| HP ZBook Studio 16 G11 | |
| Przeciętny Intel Core Ultra 9 185H, NVIDIA RTX 3000 Ada Generation Laptop (1643 - 1686, n=2) | |
| Lenovo ThinkPad P1 Gen 7 21KV001SGE | |
| CrossMark / Creativity | |
| Lenovo ThinkPad P16 Gen 2 | |
| HP ZBook Studio 16 G9 62U04EA | |
| MSI CreatorPro Z16P B12UKST | |
| HP ZBook Power 16 G11 A | |
| Dell Precision 5690 | |
| Przeciętny Intel Core Ultra 9 185H, NVIDIA RTX 3000 Ada Generation Laptop (1981 - 2001, n=2) | |
| HP ZBook Studio 16 G11 | |
| Lenovo ThinkPad P1 Gen 7 21KV001SGE | |
| CrossMark / Responsiveness | |
| MSI CreatorPro Z16P B12UKST | |
| Lenovo ThinkPad P16 Gen 2 | |
| HP ZBook Studio 16 G9 62U04EA | |
| Dell Precision 5690 | |
| HP ZBook Studio 16 G11 | |
| Przeciętny Intel Core Ultra 9 185H, NVIDIA RTX 3000 Ada Generation Laptop (1438 - 1458, n=2) | |
| HP ZBook Power 16 G11 A | |
| Lenovo ThinkPad P1 Gen 7 21KV001SGE | |
| WebXPRT 3 / Overall | |
| Lenovo ThinkPad P16 Gen 2 | |
| MSI CreatorPro Z16P B12UKST | |
| HP ZBook Power 16 G11 A | |
| HP ZBook Studio 16 G9 62U04EA | |
| HP ZBook Studio 16 G11 | |
| Dell Precision 5690 | |
| Przeciętny Intel Core Ultra 9 185H, NVIDIA RTX 3000 Ada Generation Laptop (286 - 295, n=2) | |
| Lenovo ThinkPad P1 Gen 7 21KV001SGE | |
| WebXPRT 4 / Overall | |
| Lenovo ThinkPad P16 Gen 2 | |
| Dell Precision 5690 | |
| MSI CreatorPro Z16P B12UKST | |
| HP ZBook Studio 16 G9 62U04EA | |
| Przeciętny Intel Core Ultra 9 185H, NVIDIA RTX 3000 Ada Generation Laptop (261 - 268, n=2) | |
| HP ZBook Studio 16 G11 | |
| Lenovo ThinkPad P1 Gen 7 21KV001SGE | |
| HP ZBook Power 16 G11 A | |
| Mozilla Kraken 1.1 / Total | |
| HP ZBook Power 16 G11 A | |
| Lenovo ThinkPad P1 Gen 7 21KV001SGE | |
| MSI CreatorPro Z16P B12UKST | |
| Przeciętny Intel Core Ultra 9 185H, NVIDIA RTX 3000 Ada Generation Laptop (515 - 522, n=2) | |
| HP ZBook Studio 16 G11 | |
| HP ZBook Studio 16 G9 62U04EA | |
| Dell Precision 5690 | |
| Lenovo ThinkPad P16 Gen 2 | |
* ... im mniej tym lepiej
| PCMark 10 Score | 7537 pkt. | |
Pomoc | ||
| AIDA64 / Memory Copy | |
| Dell Precision 5690 | |
| Przeciętny Intel Core Ultra 9 185H (69929 - 95718, n=20) | |
| HP ZBook Studio 16 G11 | |
| Lenovo ThinkPad P1 Gen 7 21KV001SGE | |
| Lenovo ThinkPad P16 Gen 2 | |
| MSI CreatorPro Z16P B12UKST | |
| HP ZBook Studio 16 G9 62U04EA | |
| HP ZBook Power 16 G11 A | |
| AIDA64 / Memory Read | |
| Dell Precision 5690 | |
| HP ZBook Studio 16 G11 | |
| Przeciętny Intel Core Ultra 9 185H (64619 - 87768, n=20) | |
| Lenovo ThinkPad P16 Gen 2 | |
| MSI CreatorPro Z16P B12UKST | |
| HP ZBook Studio 16 G9 62U04EA | |
| Lenovo ThinkPad P1 Gen 7 21KV001SGE | |
| HP ZBook Power 16 G11 A | |
| AIDA64 / Memory Write | |
| HP ZBook Power 16 G11 A | |
| HP ZBook Studio 16 G11 | |
| Dell Precision 5690 | |
| Przeciętny Intel Core Ultra 9 185H (51114 - 93871, n=20) | |
| MSI CreatorPro Z16P B12UKST | |
| HP ZBook Studio 16 G9 62U04EA | |
| Lenovo ThinkPad P16 Gen 2 | |
| Lenovo ThinkPad P1 Gen 7 21KV001SGE | |
| AIDA64 / Memory Latency | |
| Przeciętny Intel Core Ultra 9 185H (121.4 - 259, n=20) | |
| Dell Precision 5690 | |
| Lenovo ThinkPad P1 Gen 7 21KV001SGE | |
| HP ZBook Studio 16 G11 | |
| HP ZBook Power 16 G11 A | |
| MSI CreatorPro Z16P B12UKST | |
| Lenovo ThinkPad P16 Gen 2 | |
| HP ZBook Studio 16 G9 62U04EA | |
* ... im mniej tym lepiej
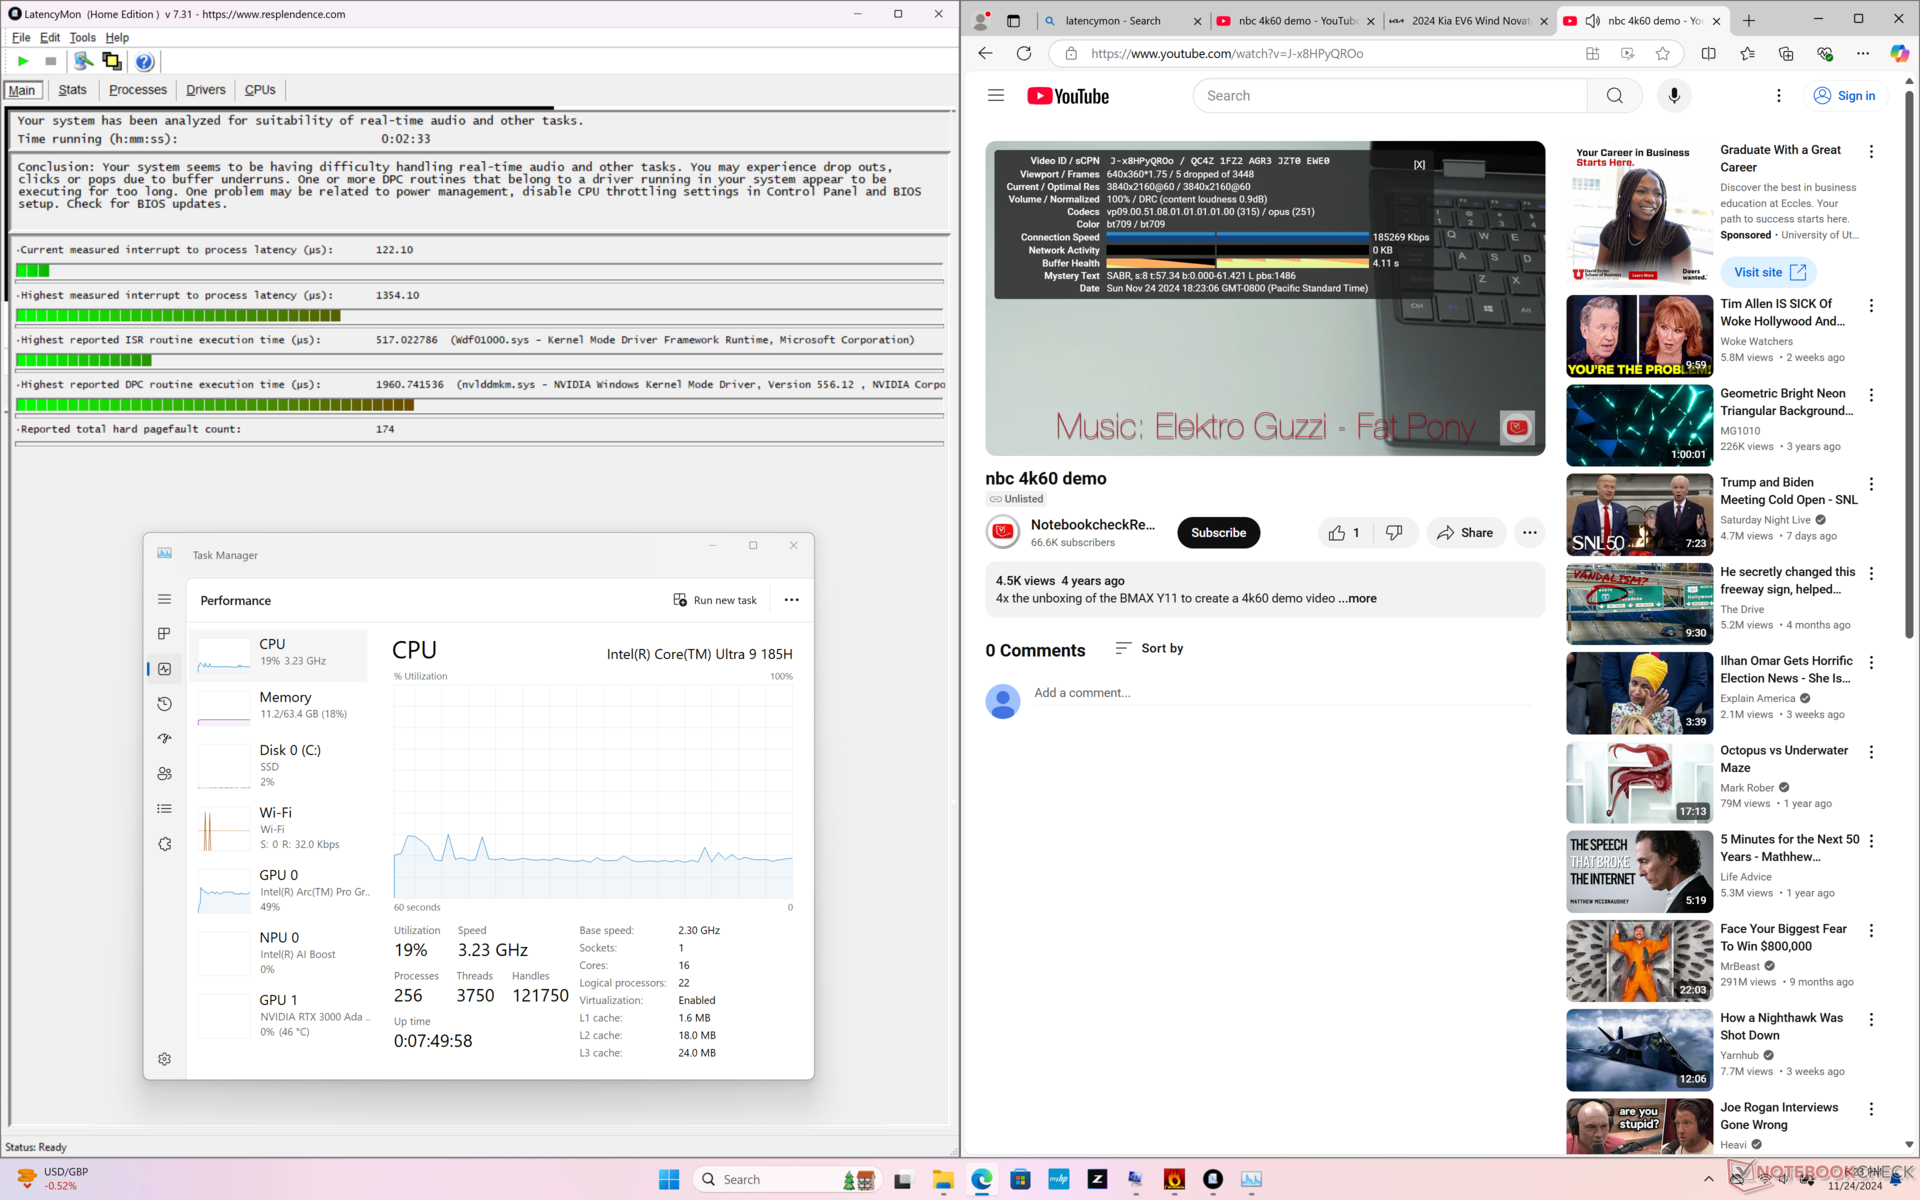
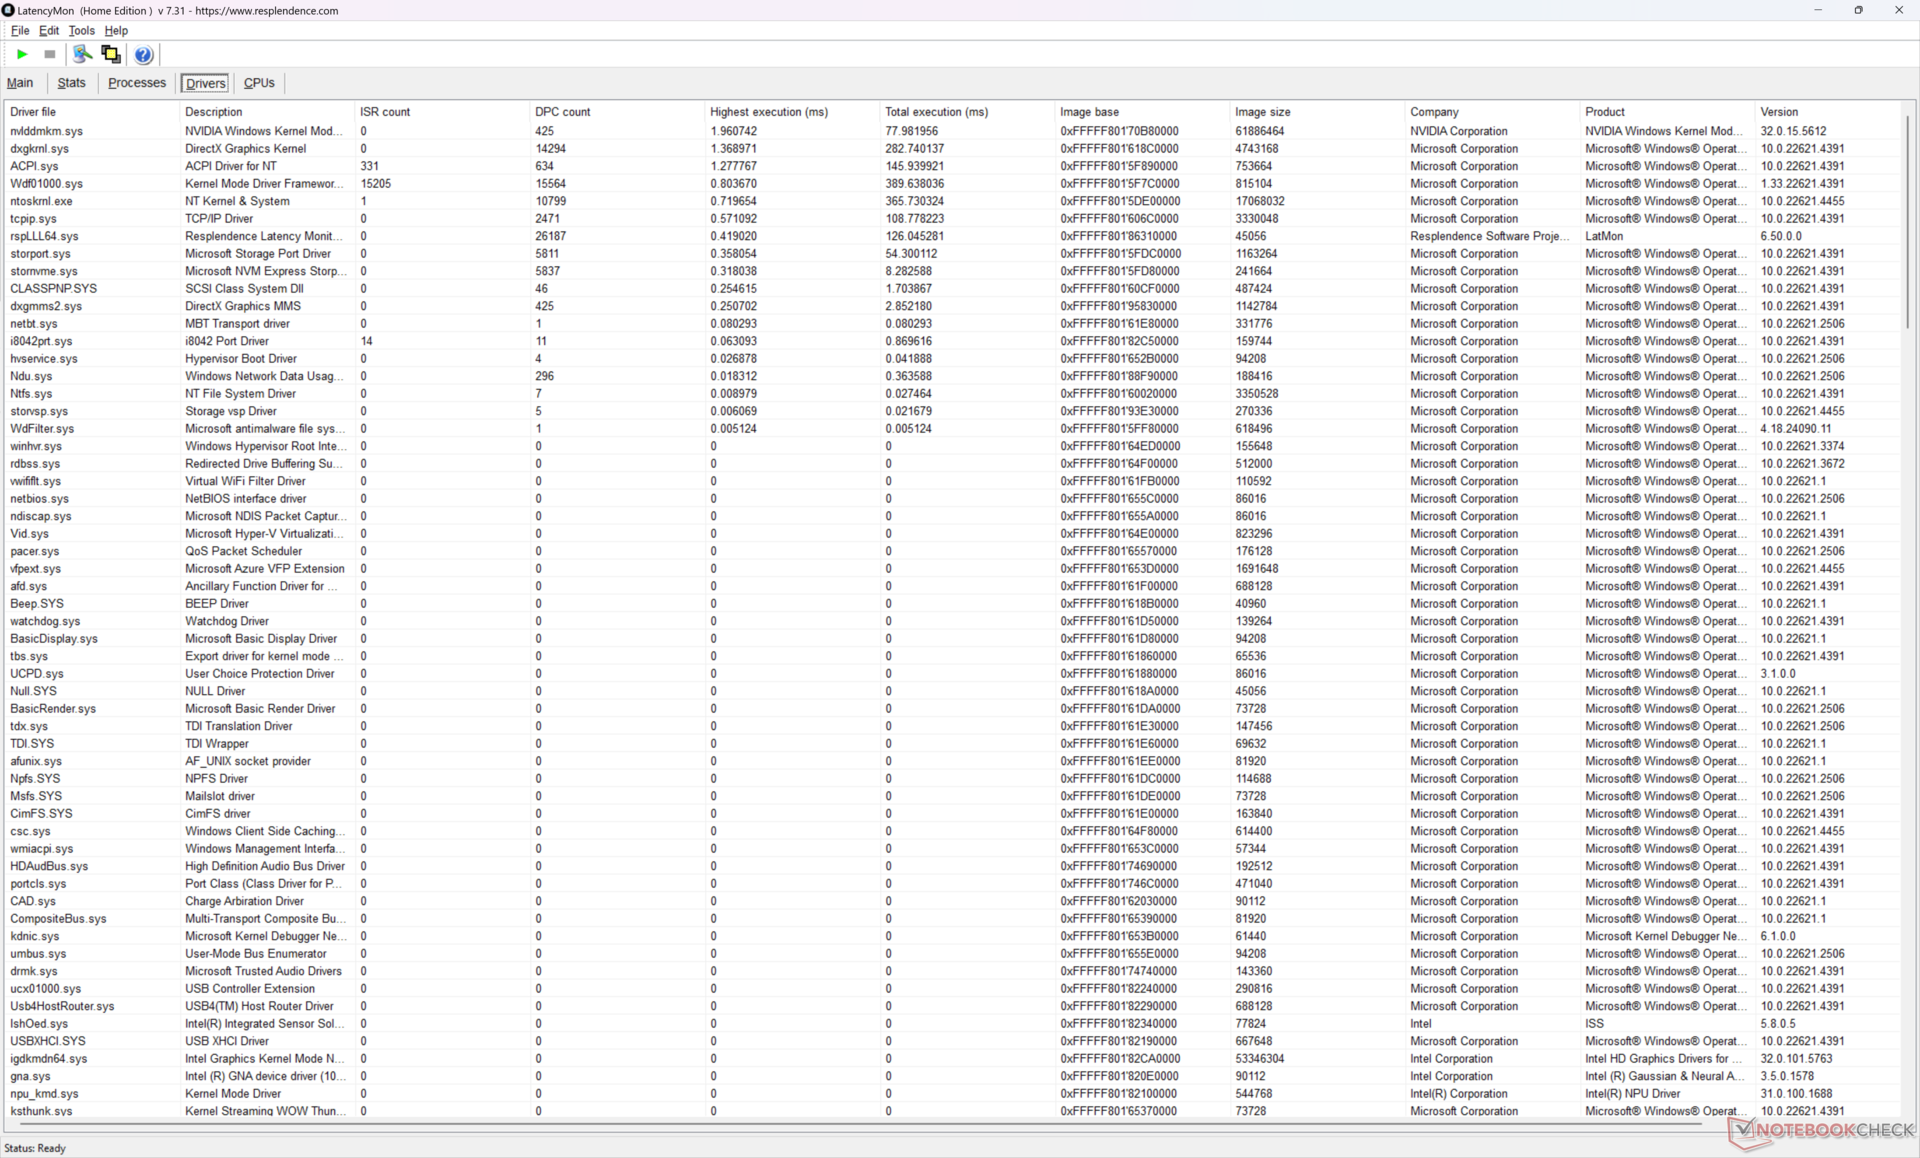
Opóźnienie DPC
LatencyMon ujawnia drobne problemy z DPC podczas otwierania wielu kart przeglądarki na naszej stronie głównej. odtwarzanie wideo 4K przy 60 FPS również wykazywało niewielkie problemy z 5 utraconymi klatkami zarejestrowanymi w 60-sekundowym oknie.
| DPC Latencies / LatencyMon - interrupt to process latency (max), Web, Youtube, Prime95 | |
| HP ZBook Power 16 G11 A | |
| Lenovo ThinkPad P1 Gen 7 21KV001SGE | |
| HP ZBook Studio 16 G11 | |
| HP ZBook Studio 16 G9 62U04EA | |
| Lenovo ThinkPad P16 Gen 2 | |
| MSI CreatorPro Z16P B12UKST | |
| Dell Precision 5690 | |
* ... im mniej tym lepiej
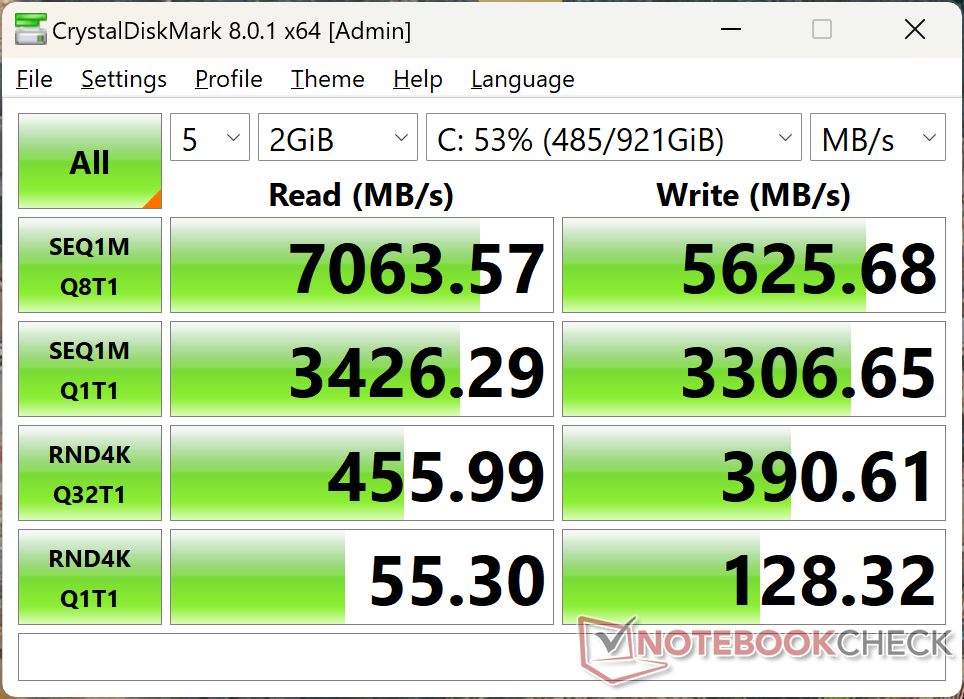
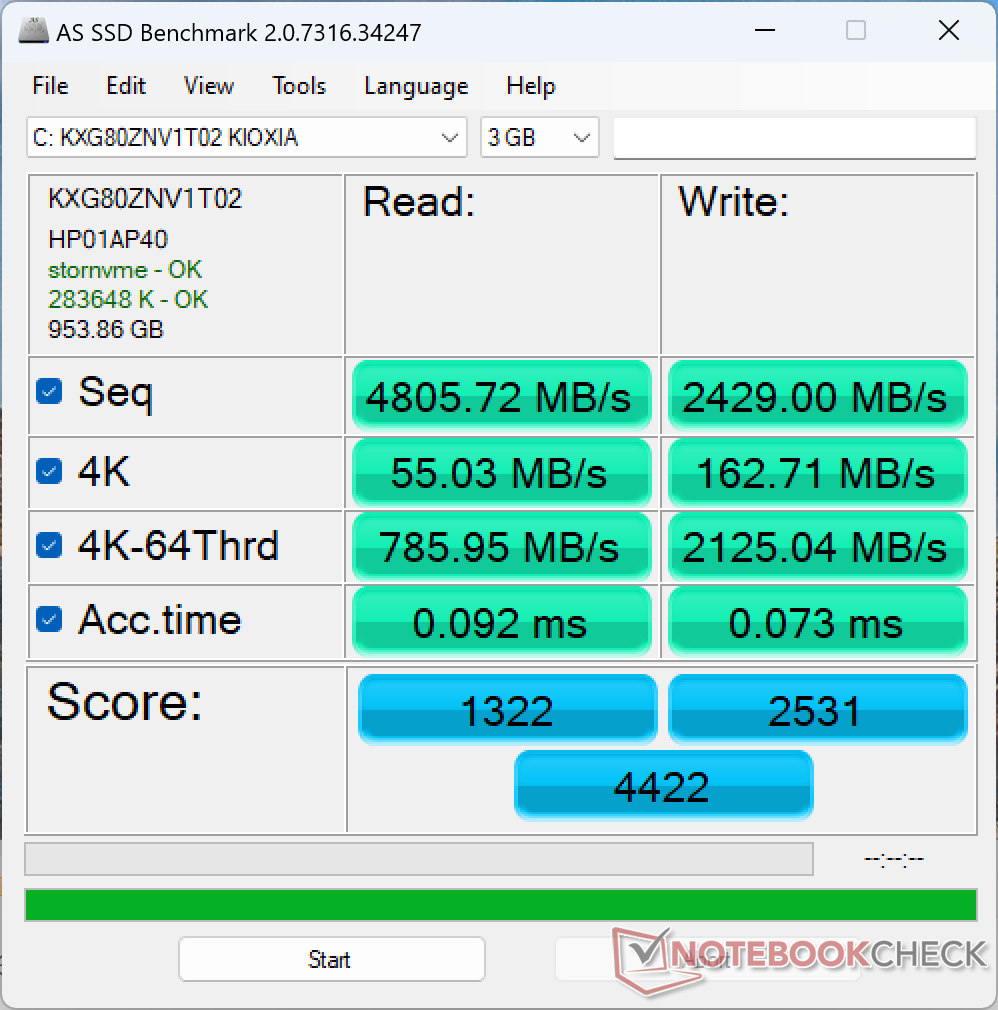
Urządzenia pamięci masowej
Nasz system jest dostarczany z Kioxia XG8 PCIe4 NVMe zamiast dysku Micron 3400, który można znaleźć w starszym ZBook Studio 16 G9. Wydajność jest poza tym doskonała i nie wykryto żadnych problemów z dławieniem.

* ... im mniej tym lepiej
Disk Throttling: DiskSpd Read Loop, Queue Depth 8
Wydajność GPU
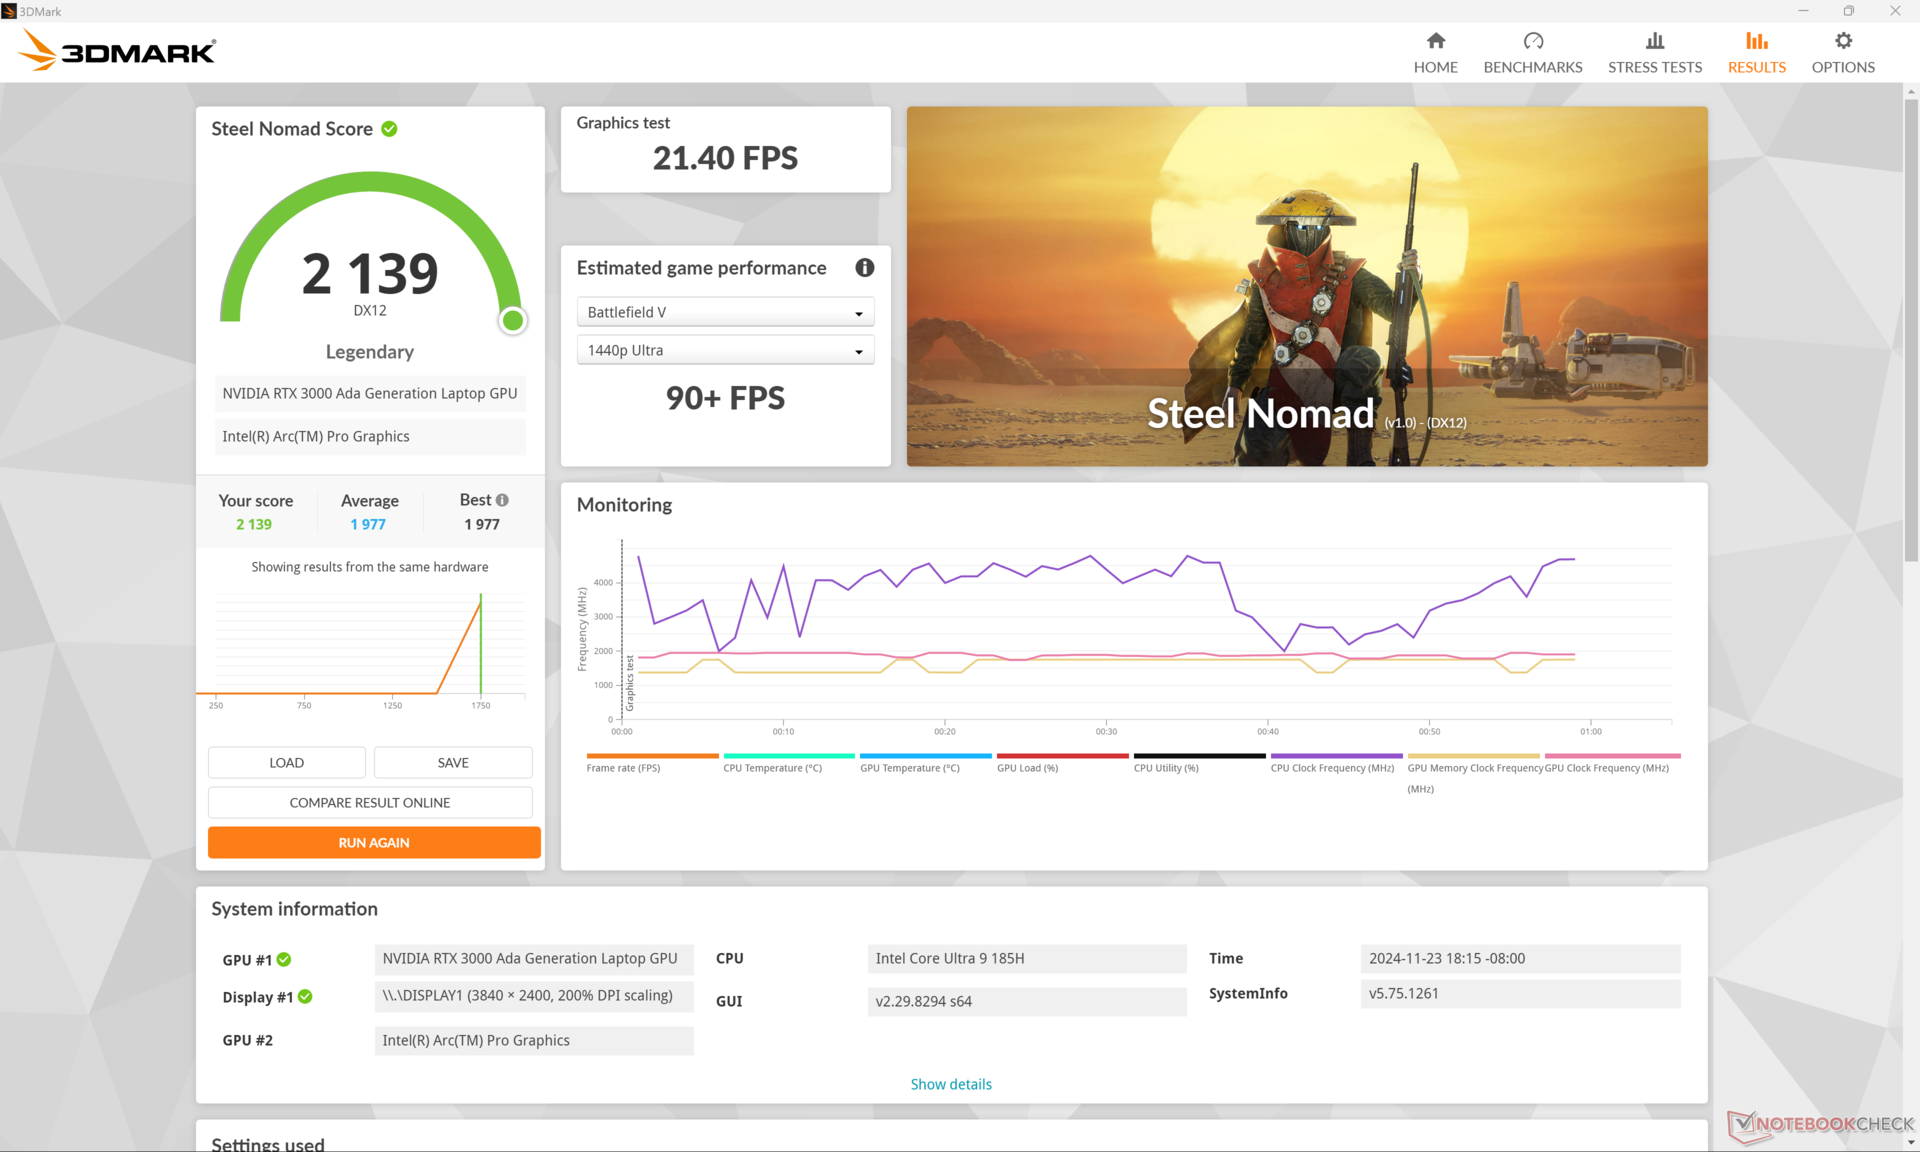
Nowszy procesor graficzny to jeden z największych powodów, dla których warto przesiąść się z ZBook Studio 16 G9 na ZBook Studio 16 G11. Nasz RTX 3000 Ada działa prawie 2x szybciej niż RTX A2000 przed uwzględnieniem jakichkolwiek funkcji akceleracji ray-tracingu.
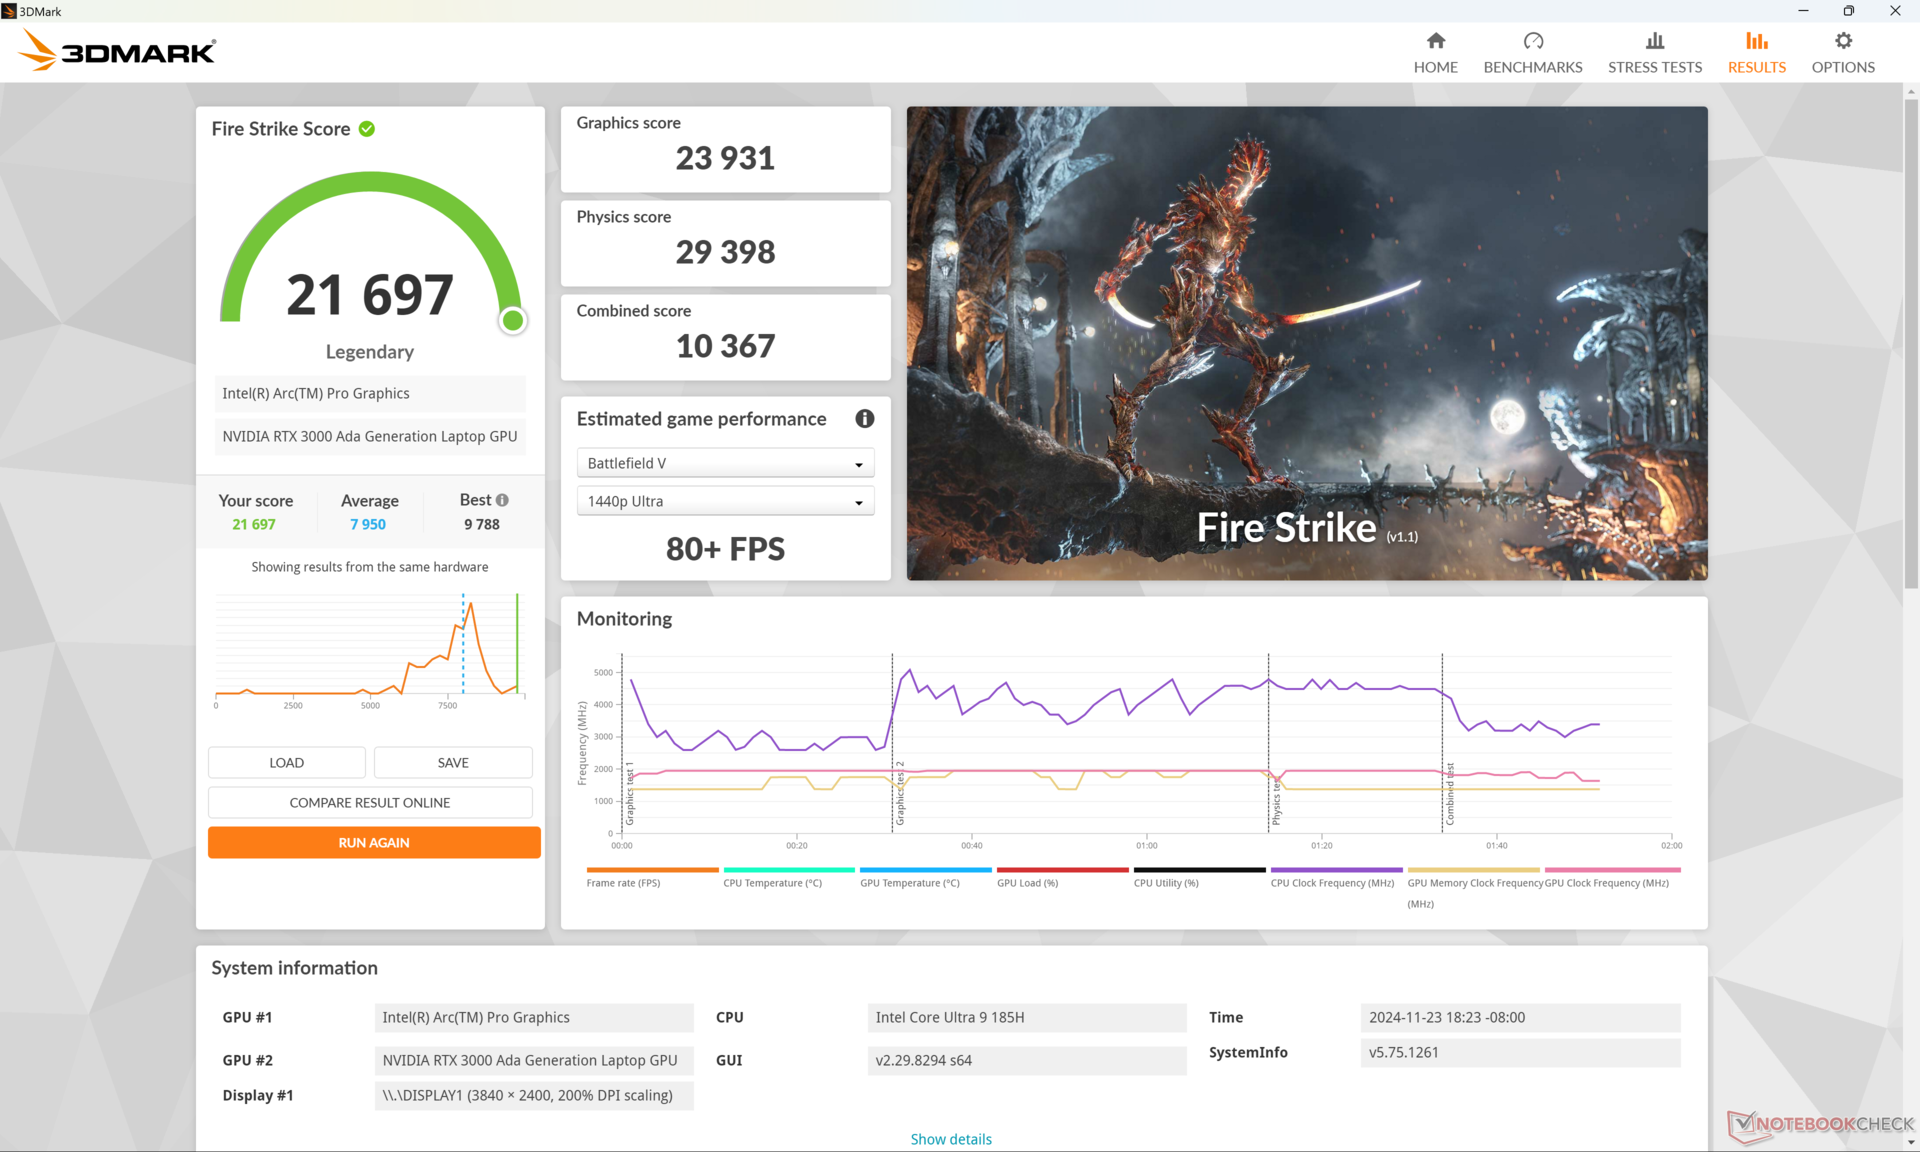
| Profil zasilania | Wynik grafiki | Wynik fizyki | Łączny wynik |
| Tryb wydajności | 23931 | 29398 | 10367 |
| Tryb zrównoważony | 21021 (-12%) | 27903 (-5%) | 8545 (-18%) |
| Zasilanie bateryjne | 14313 (-40%) | 12099 (-59%) | 5174 (-50%) |
Praca w trybie zrównoważonym nieznacznie wpływa na wydajność, jak pokazują powyższe wyniki Fire Strike. Różnica staje się znacznie wyraźniejsza, jeśli zamiast tego korzystamy z zasilania bateryjnego.
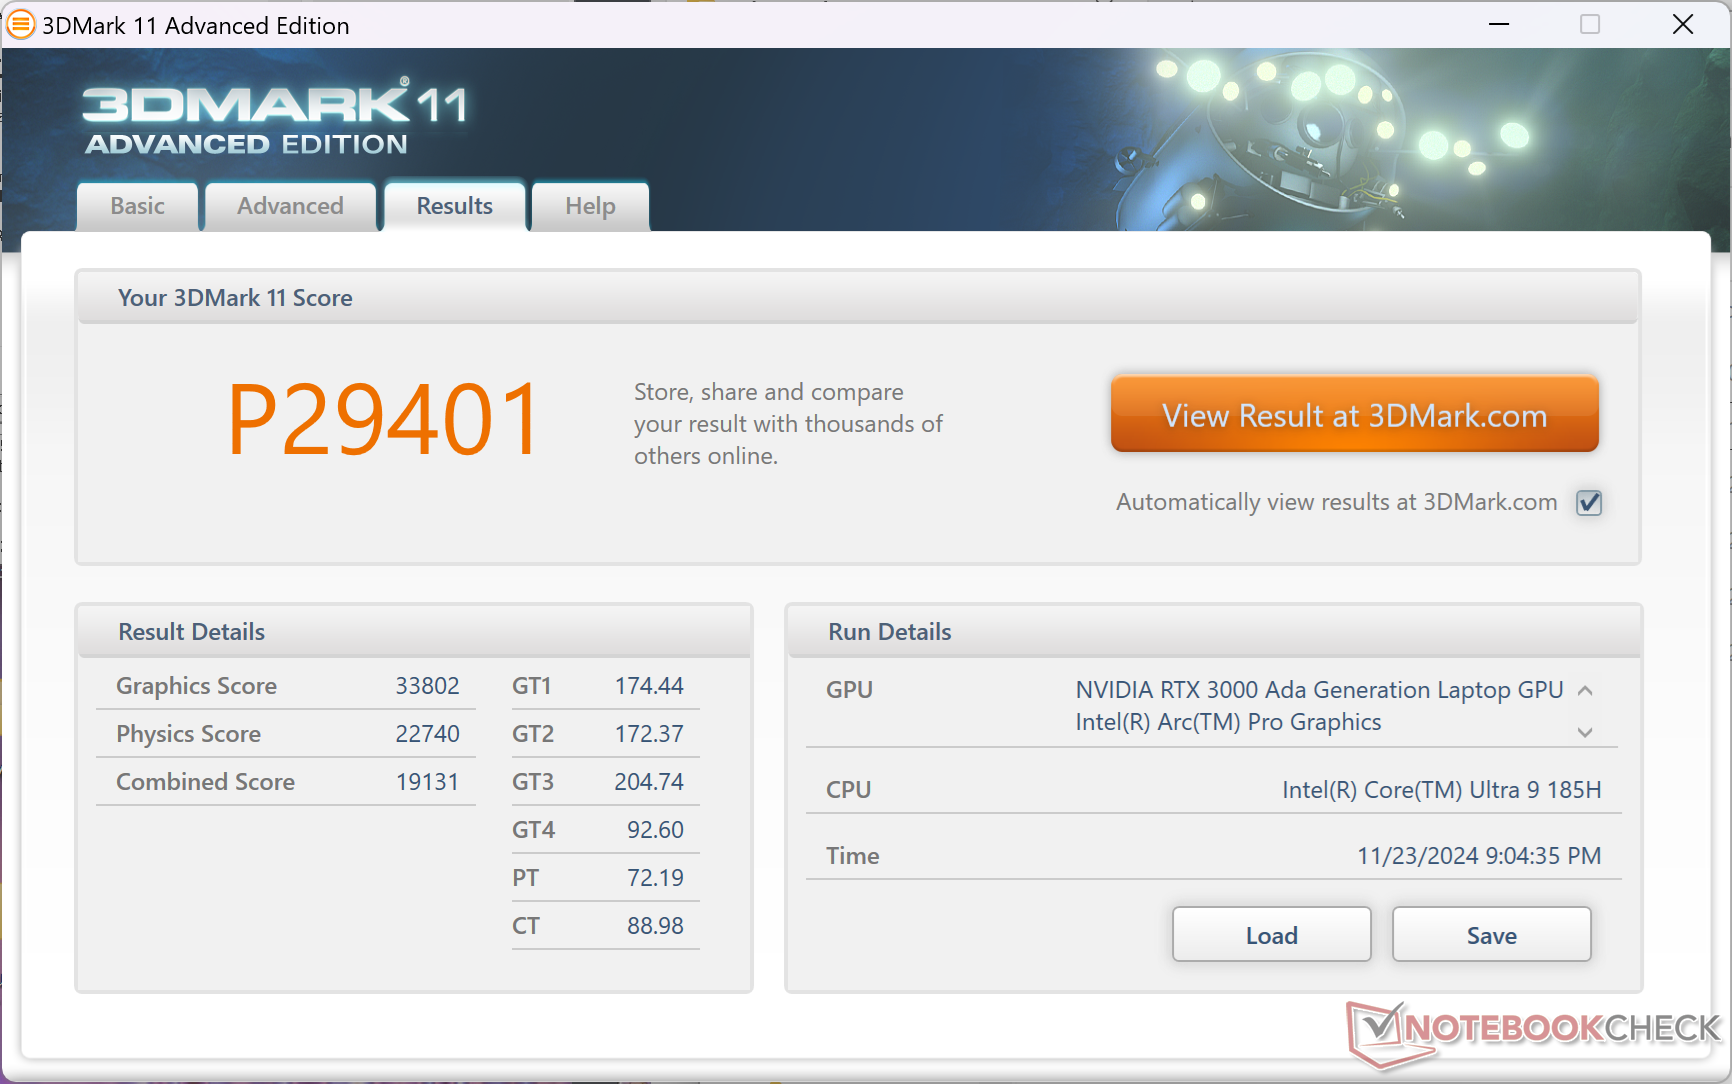
| 3DMark 11 Performance | 29401 pkt. | |
| 3DMark Cloud Gate Standard Score | 34703 pkt. | |
| 3DMark Fire Strike Score | 21697 pkt. | |
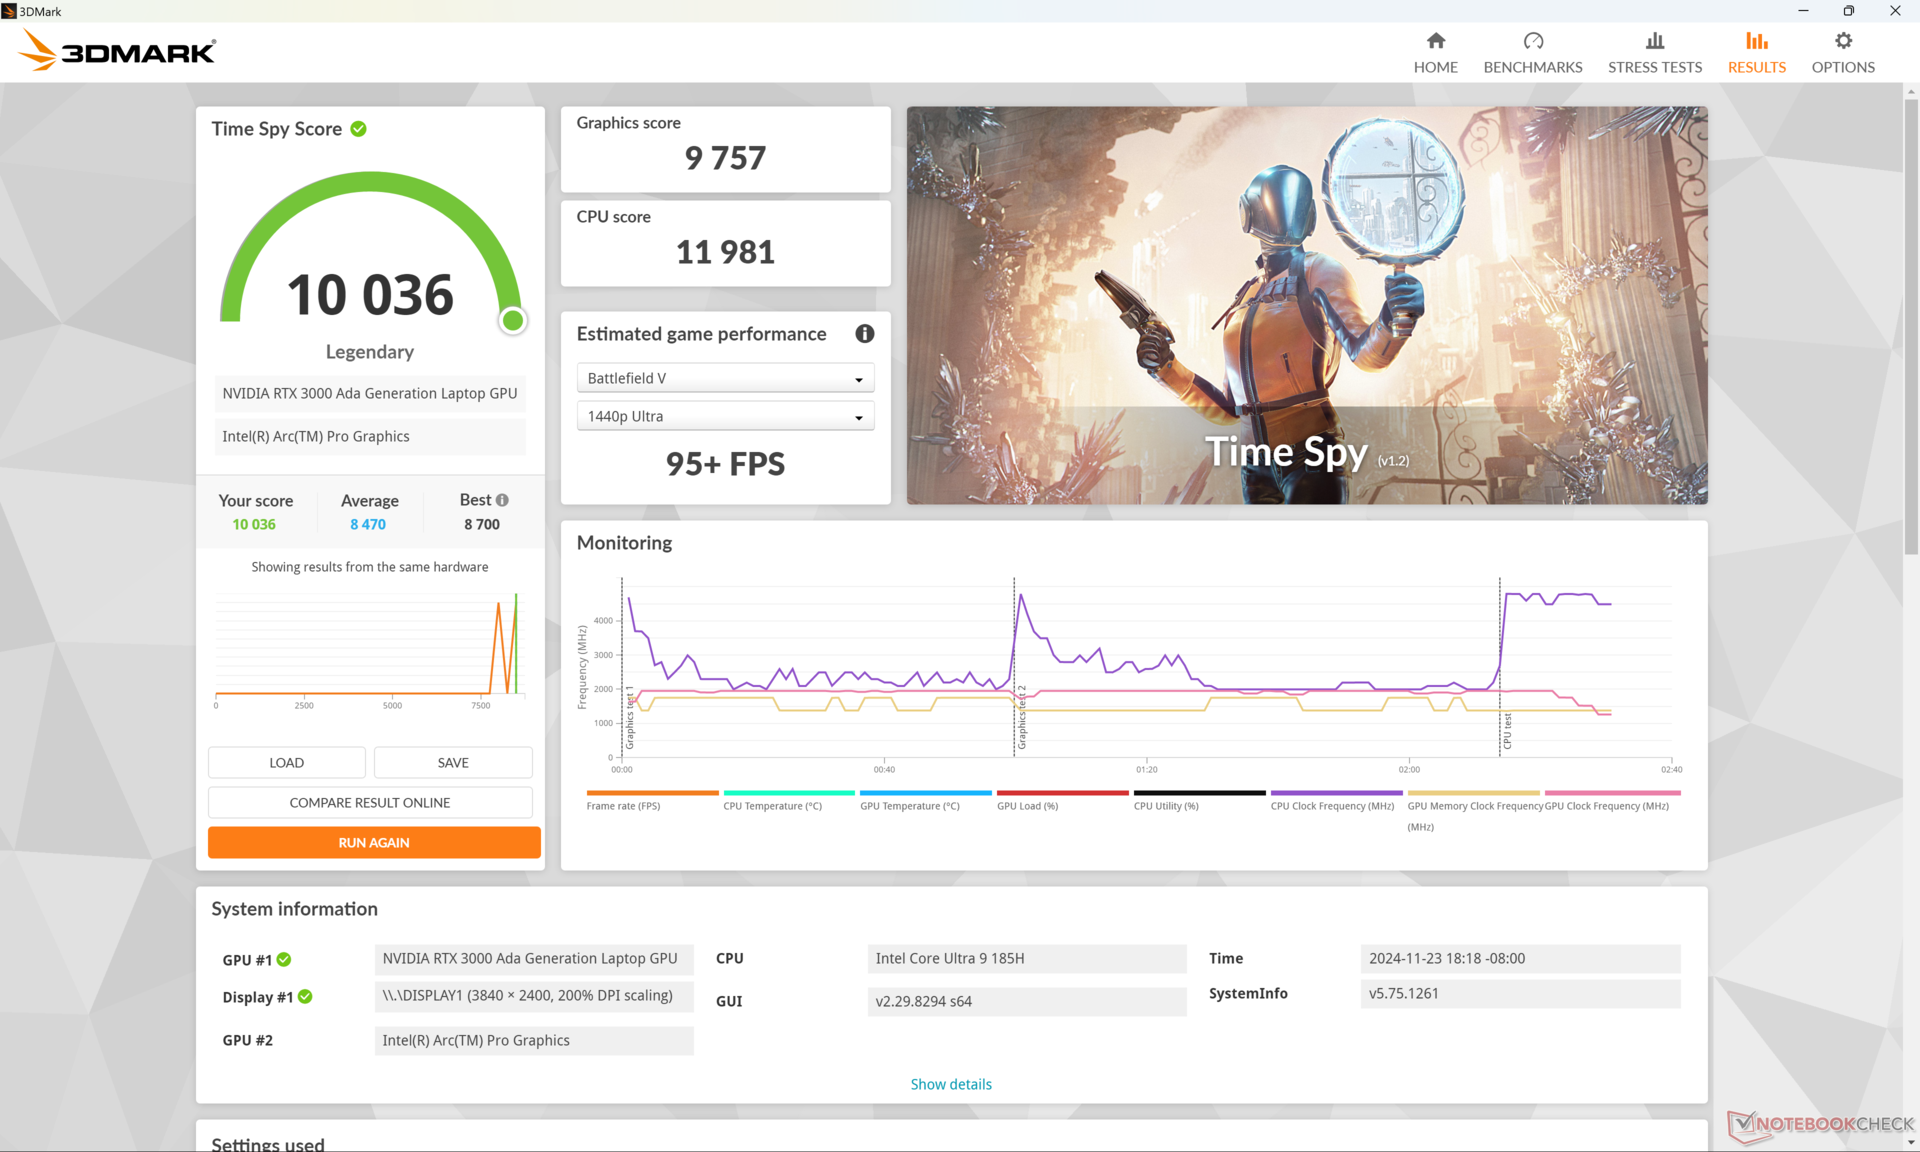
| 3DMark Time Spy Score | 10036 pkt. | |
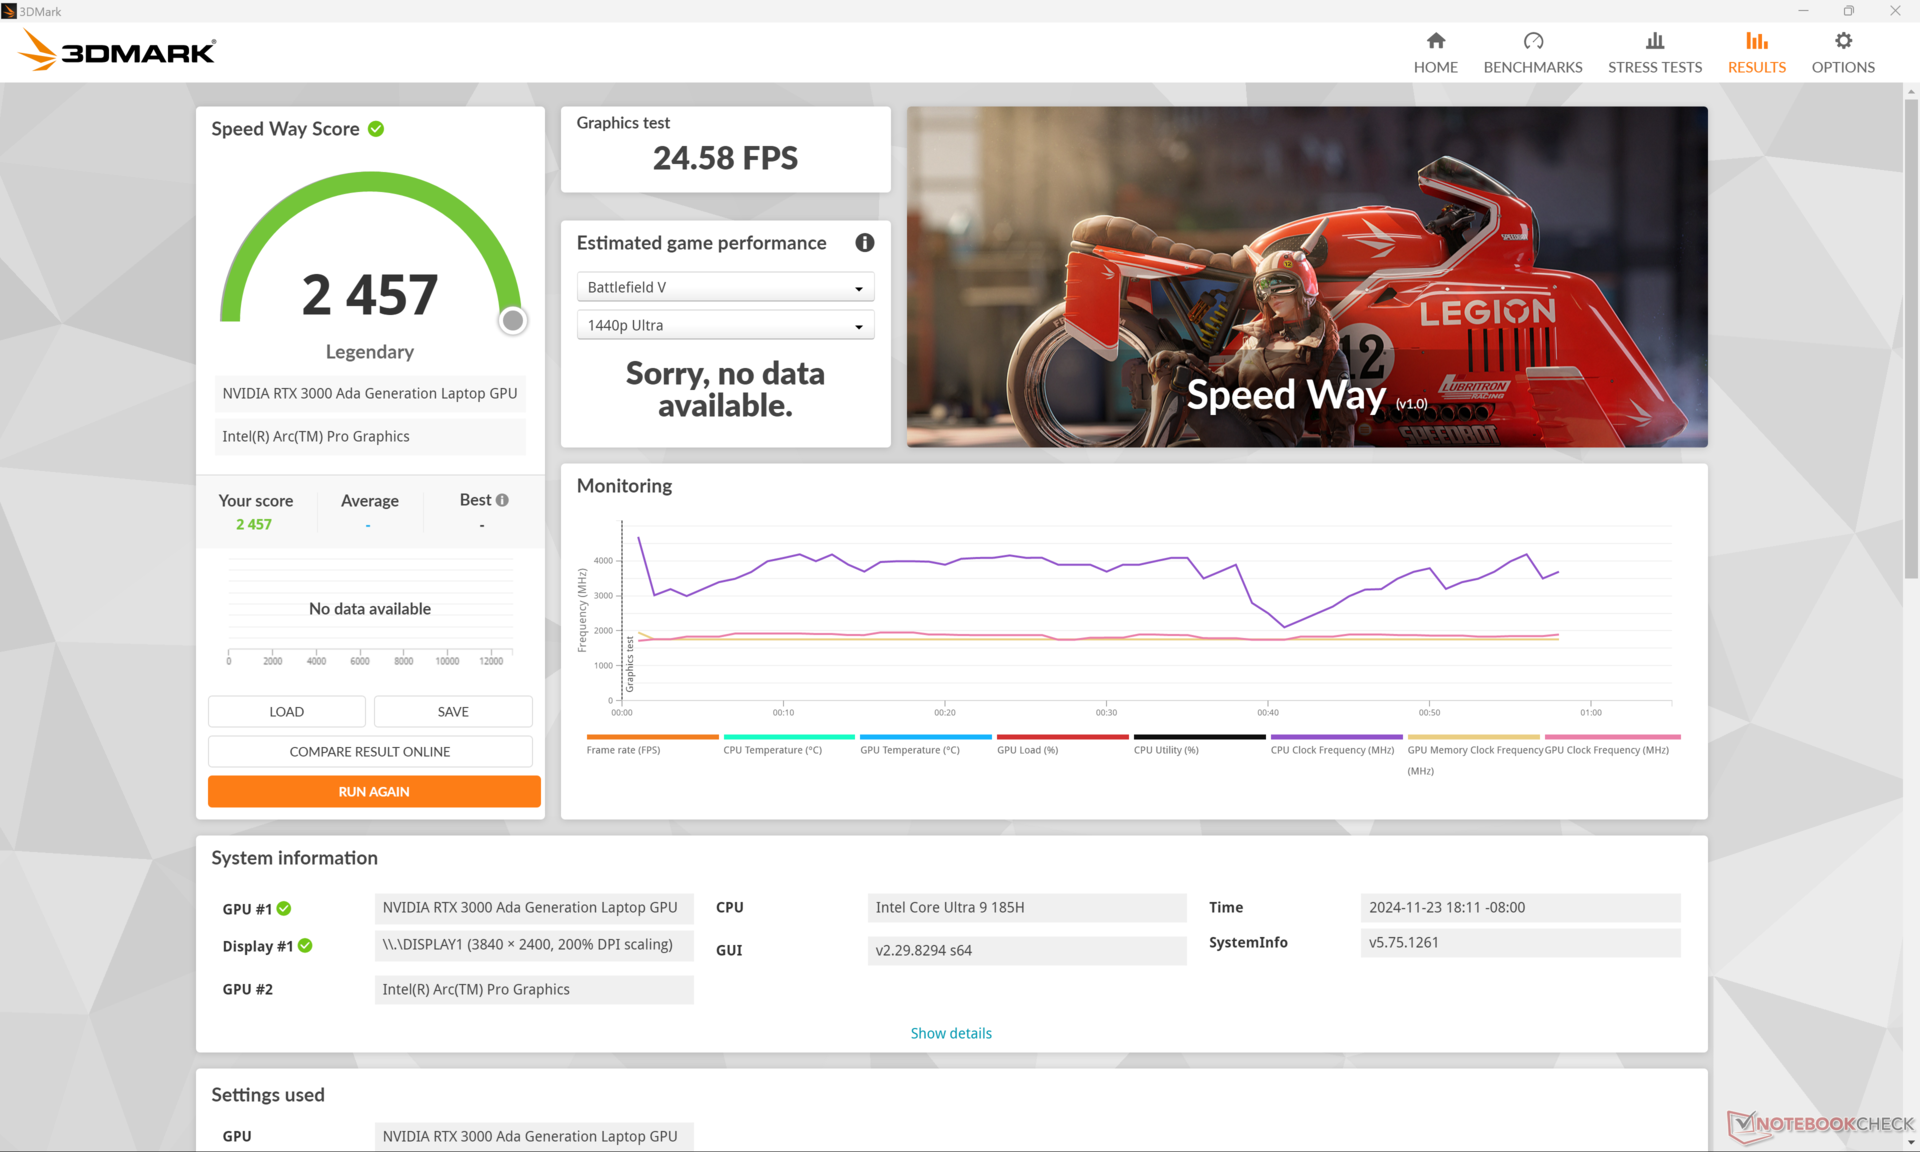
| 3DMark Steel Nomad Score | 2139 pkt. | |
Pomoc | ||
* ... im mniej tym lepiej
| Performance rating - Percent | |
| Lenovo ThinkPad P16 Gen 2 | |
| Dell Precision 5690 -1! | |
| HP ZBook Studio 16 G11 | |
| MSI CreatorPro Z16P B12UKST -2! | |
| HP ZBook Studio 16 G9 62U04EA -2! | |
| HP ZBook Power 16 G11 A | |
| Cyberpunk 2077 - 1920x1080 Ultra Preset (FSR off) | |
| Dell Precision 5690 | |
| Lenovo ThinkPad P16 Gen 2 | |
| HP ZBook Studio 16 G11 | |
| HP ZBook Power 16 G11 A | |
| Baldur's Gate 3 - 1920x1080 Ultra Preset AA:T | |
| Lenovo ThinkPad P16 Gen 2 | |
| Dell Precision 5690 | |
| HP ZBook Studio 16 G11 | |
| HP ZBook Power 16 G11 A | |
| GTA V - 1920x1080 Highest AA:4xMSAA + FX AF:16x | |
| Lenovo ThinkPad P16 Gen 2 | |
| HP ZBook Studio 16 G11 | |
| MSI CreatorPro Z16P B12UKST | |
| HP ZBook Power 16 G11 A | |
| HP ZBook Studio 16 G9 62U04EA | |
| Final Fantasy XV Benchmark - 1920x1080 High Quality | |
| Lenovo ThinkPad P16 Gen 2 | |
| Dell Precision 5690 | |
| HP ZBook Studio 16 G11 | |
| HP ZBook Power 16 G11 A | |
| MSI CreatorPro Z16P B12UKST | |
| HP ZBook Studio 16 G9 62U04EA | |
| Strange Brigade - 1920x1080 ultra AA:ultra AF:16 | |
| Lenovo ThinkPad P16 Gen 2 | |
| Dell Precision 5690 | |
| HP ZBook Studio 16 G11 | |
| HP ZBook Power 16 G11 A | |
| MSI CreatorPro Z16P B12UKST | |
| HP ZBook Studio 16 G9 62U04EA | |
| Dota 2 Reborn - 1920x1080 ultra (3/3) best looking | |
| Lenovo ThinkPad P16 Gen 2 | |
| HP ZBook Studio 16 G9 62U04EA | |
| MSI CreatorPro Z16P B12UKST | |
| HP ZBook Studio 16 G11 | |
| Dell Precision 5690 | |
| HP ZBook Power 16 G11 A | |
| X-Plane 11.11 - 1920x1080 high (fps_test=3) | |
| Lenovo ThinkPad P16 Gen 2 | |
| MSI CreatorPro Z16P B12UKST | |
| HP ZBook Studio 16 G9 62U04EA | |
| Dell Precision 5690 | |
| HP ZBook Studio 16 G11 | |
| HP ZBook Power 16 G11 A | |
Liczba klatek na sekundę jest nieco niestabilna na biegu jałowym w Cyberpunk 2077, nawet po wielokrotnych testach.
Cyberpunk 2077 ultra FPS Chart
| low | med. | high | ultra | QHD | |
|---|---|---|---|---|---|
| GTA V (2015) | 182.2 | 176 | 163.2 | 96.6 | 76.1 |
| Dota 2 Reborn (2015) | 176.2 | 159.9 | 148.2 | 143.3 | |
| Final Fantasy XV Benchmark (2018) | 189.4 | 128.7 | 97 | 71.3 | |
| X-Plane 11.11 (2018) | 131.3 | 109.7 | 87.1 | ||
| Far Cry 5 (2018) | 154 | 133 | 130 | 118 | 93 |
| Strange Brigade (2018) | 415 | 246 | 192.8 | 172.6 | 118.6 |
| Tiny Tina's Wonderlands (2022) | 194 | 157.7 | 110 | 87.9 | 60.5 |
| F1 22 (2022) | 226 | 212 | 161.1 | 62.8 | 40.7 |
| Baldur's Gate 3 (2023) | 130.6 | 111.8 | 98.4 | 96.7 | 68.7 |
| Cyberpunk 2077 (2023) | 104.6 | 87.9 | 74.2 | 64.3 | 39.6 |
Emisje
Hałas systemowy
Hałas i zachowanie wentylatorów nie zmieniły się znacząco w porównaniu do starszego modelu ZBook Studio 16 G9. Podczas pracy przy dużym obciążeniu, na przykład w grach, hałas wentylatora ustabilizował się na poziomie około 46 do 48 dB(A). W nowszym modelu G11 jesteśmy jednak w stanie zarejestrować głośniejsze maksimum na poziomie 53 dB(A), jeśli CPU i GPU są w równym stopniu obciążone.
Hałas
| luz |
| 23.8 / 26.4 / 26.4 dB |
| obciążenie |
| 33.7 / 53.2 dB |
 | ||
30 dB cichy 40 dB(A) słyszalny 50 dB(A) irytujący |
||
min: | ||
| HP ZBook Studio 16 G11 RTX 3000 Ada Generation Laptop, Ultra 9 185H, Kioxia XG8 KXG80ZNV1T02 | HP ZBook Studio 16 G9 62U04EA RTX A2000 Laptop GPU, i7-12800H, Micron 3400 1TB MTFDKBA1T0TFH | HP ZBook Power 16 G11 A RTX 2000 Ada Generation Laptop, R7 8845HS, Samsung PM9A1 MZVL22T0HBLB | Lenovo ThinkPad P16 Gen 2 RTX 4000 Ada Generation Laptop, i7-14700HX, SK hynix PC801 HFS001TEJ9X162N | Dell Precision 5690 RTX 5000 Ada Generation Laptop, Ultra 9 185H, 2x Samsung PM9A1 1TB (RAID 0) | MSI CreatorPro Z16P B12UKST RTX A3000 Laptop GPU, i7-12700H, Samsung PM9A1 MZVL21T0HCLR | Lenovo ThinkPad P1 Gen 7 21KV001SGE GeForce RTX 4060 Laptop GPU, Ultra 7 155H, Kioxia XG8 KXG8AZNV1T02 | |
|---|---|---|---|---|---|---|---|
| Noise | -3% | 9% | -11% | -4% | -6% | -6% | |
| wyłączone / środowisko * (dB) | 23.8 | 24 -1% | 23.5 1% | 23.9 -0% | 23.4 2% | 24.1 -1% | 24.7 -4% |
| Idle Minimum * (dB) | 23.8 | 24 -1% | 23.8 -0% | 29.1 -22% | 23.6 1% | 27.1 -14% | 24.7 -4% |
| Idle Average * (dB) | 26.4 | 27.7 -5% | 24.2 8% | 29.1 -10% | 24.9 6% | 27.1 -3% | 24.7 6% |
| Idle Maximum * (dB) | 26.4 | 27.7 -5% | 24.2 8% | 29.1 -10% | 30.9 -17% | 27.1 -3% | 24.7 6% |
| Load Average * (dB) | 33.7 | 39.8 -18% | 25.4 25% | 41 -22% | 40.4 -20% | 42.9 -27% | 43.7 -30% |
| Cyberpunk 2077 ultra * (dB) | 46.1 | 43 7% | 52.8 -15% | 53.2 -15% | |||
| Load Maximum * (dB) | 53.2 | 47.7 10% | 45 15% | 52.9 1% | 51.9 2% | 47 12% | 53.3 -0% |
| Witcher 3 ultra * (dB) | 44.3 | 48.3 | 44 |
* ... im mniej tym lepiej
Temperatura
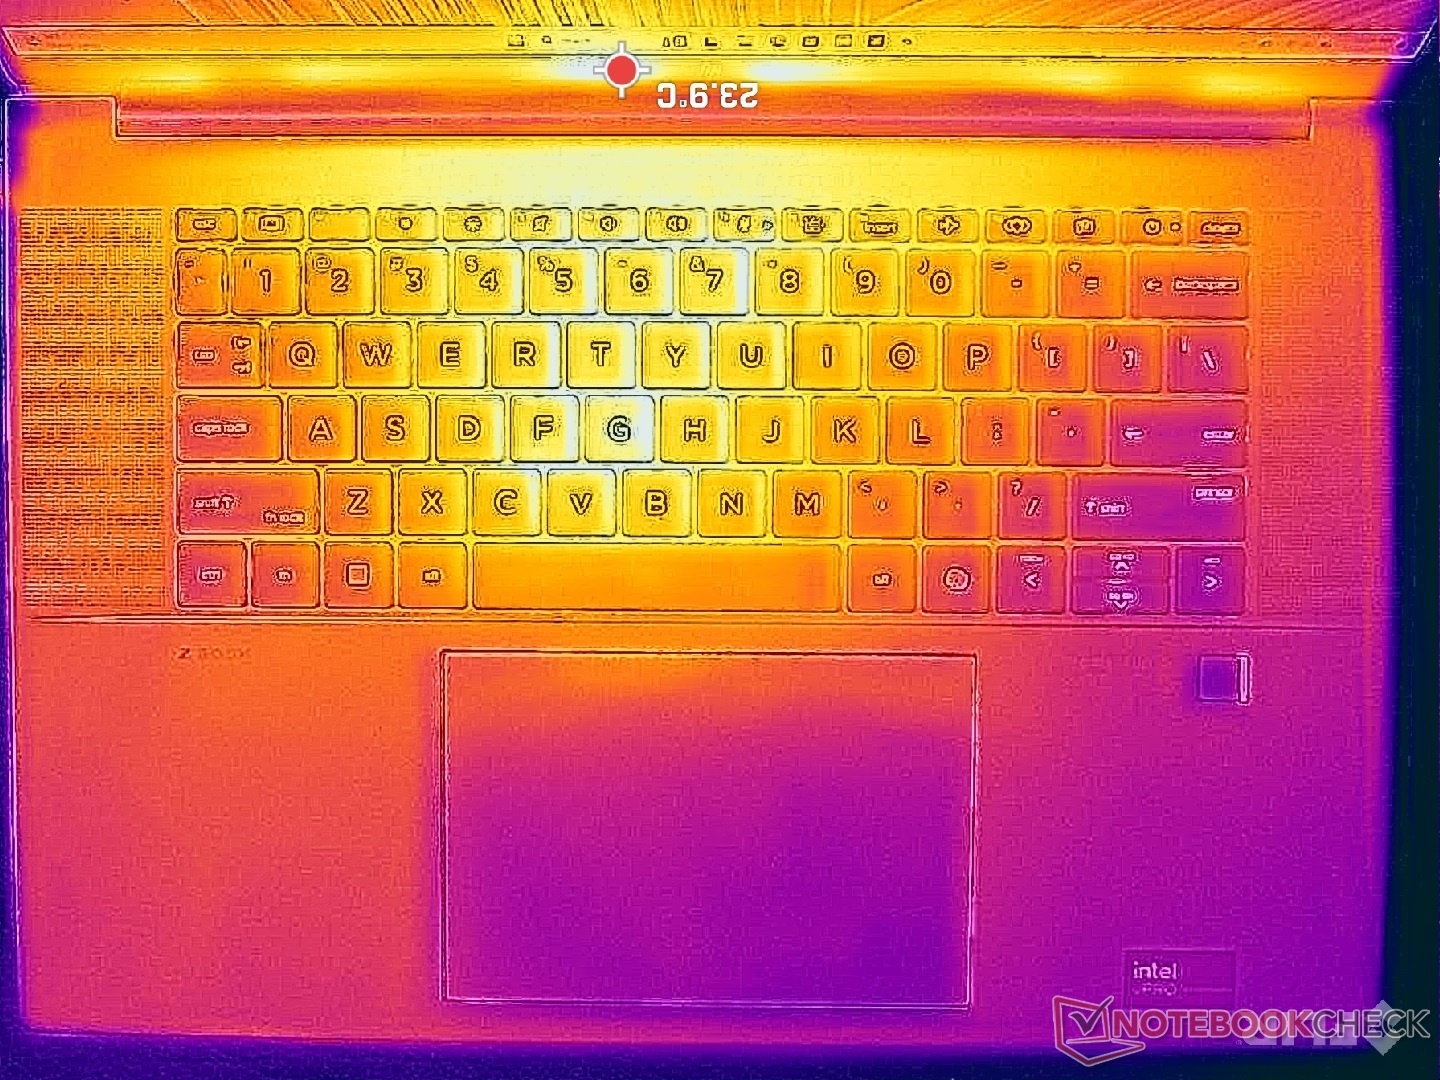
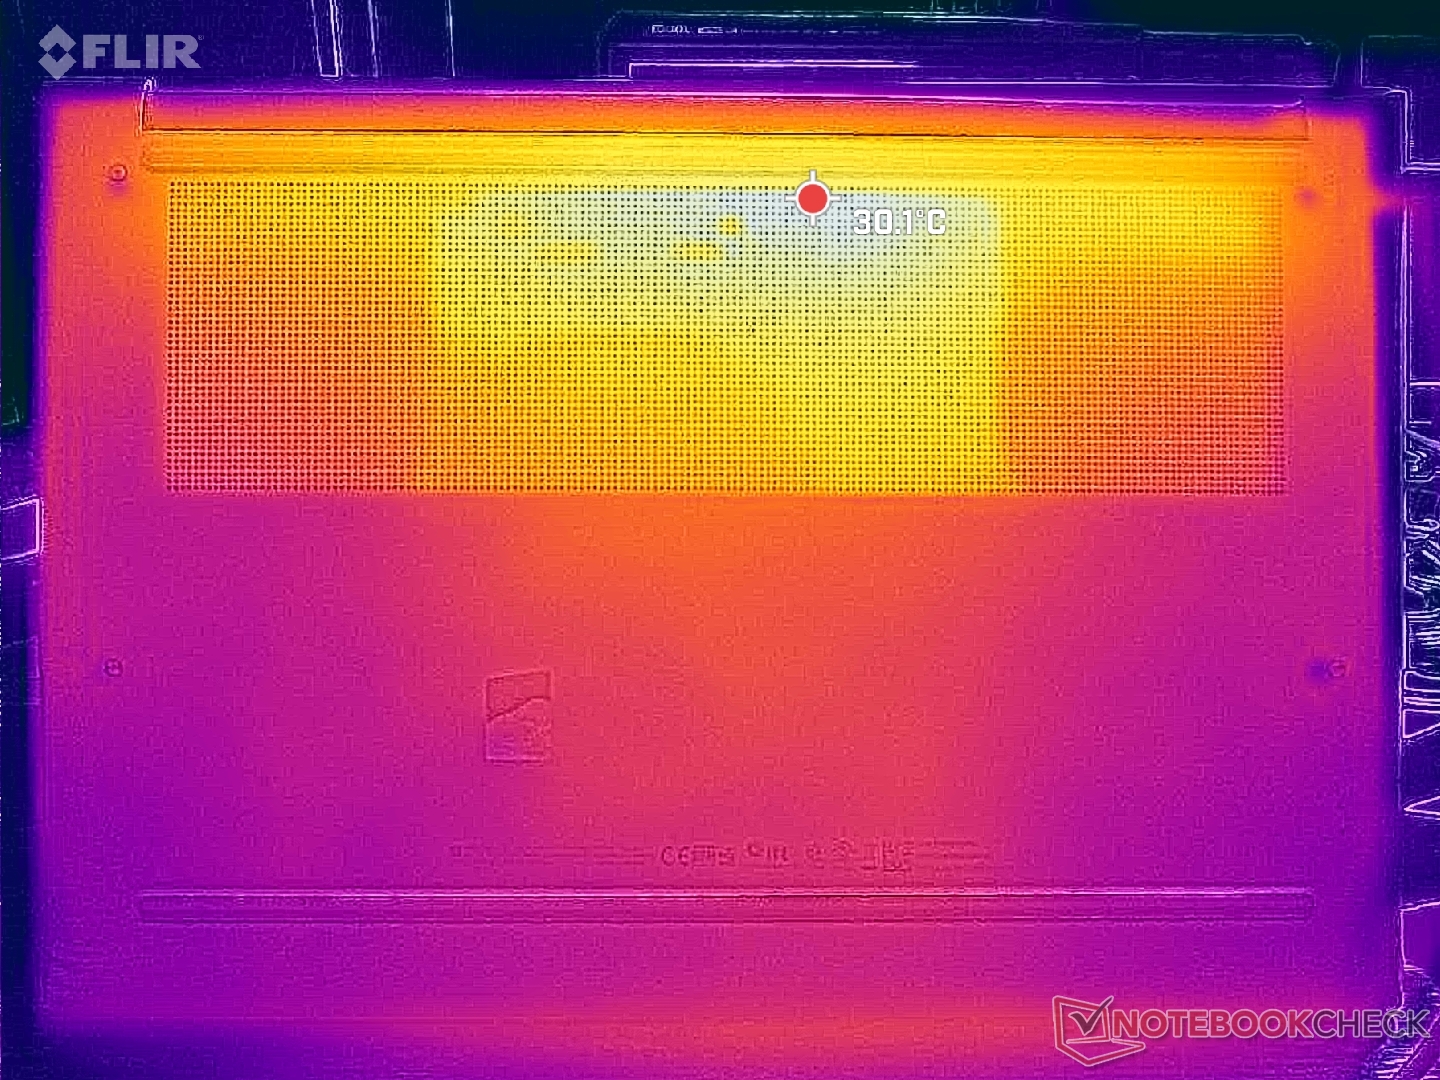
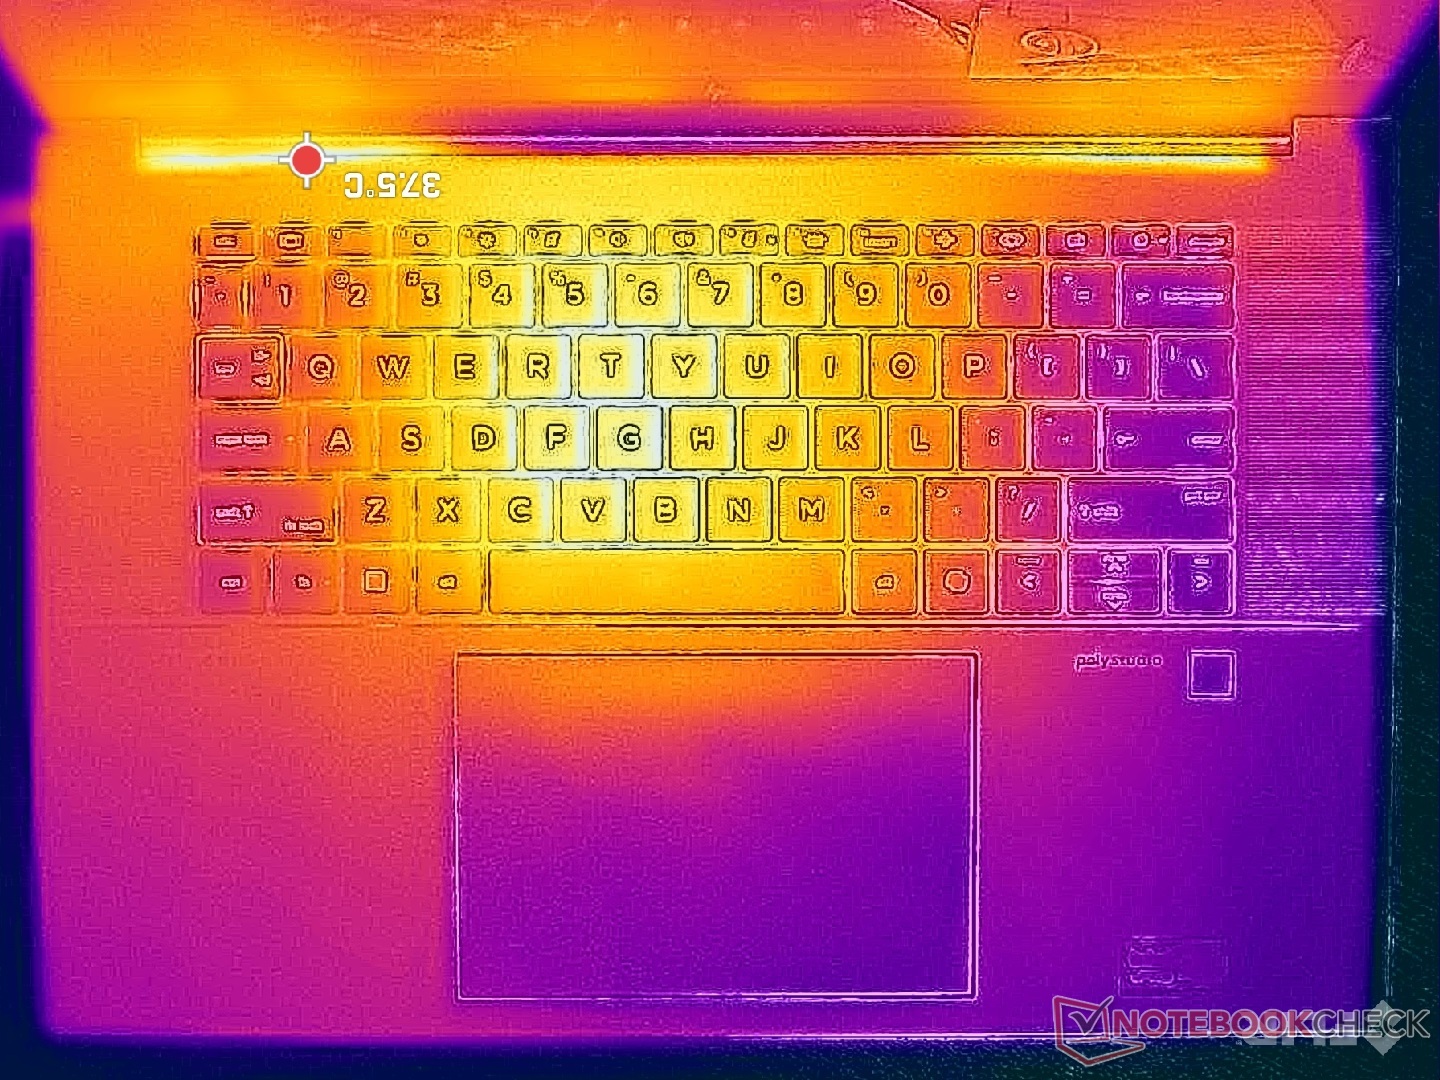
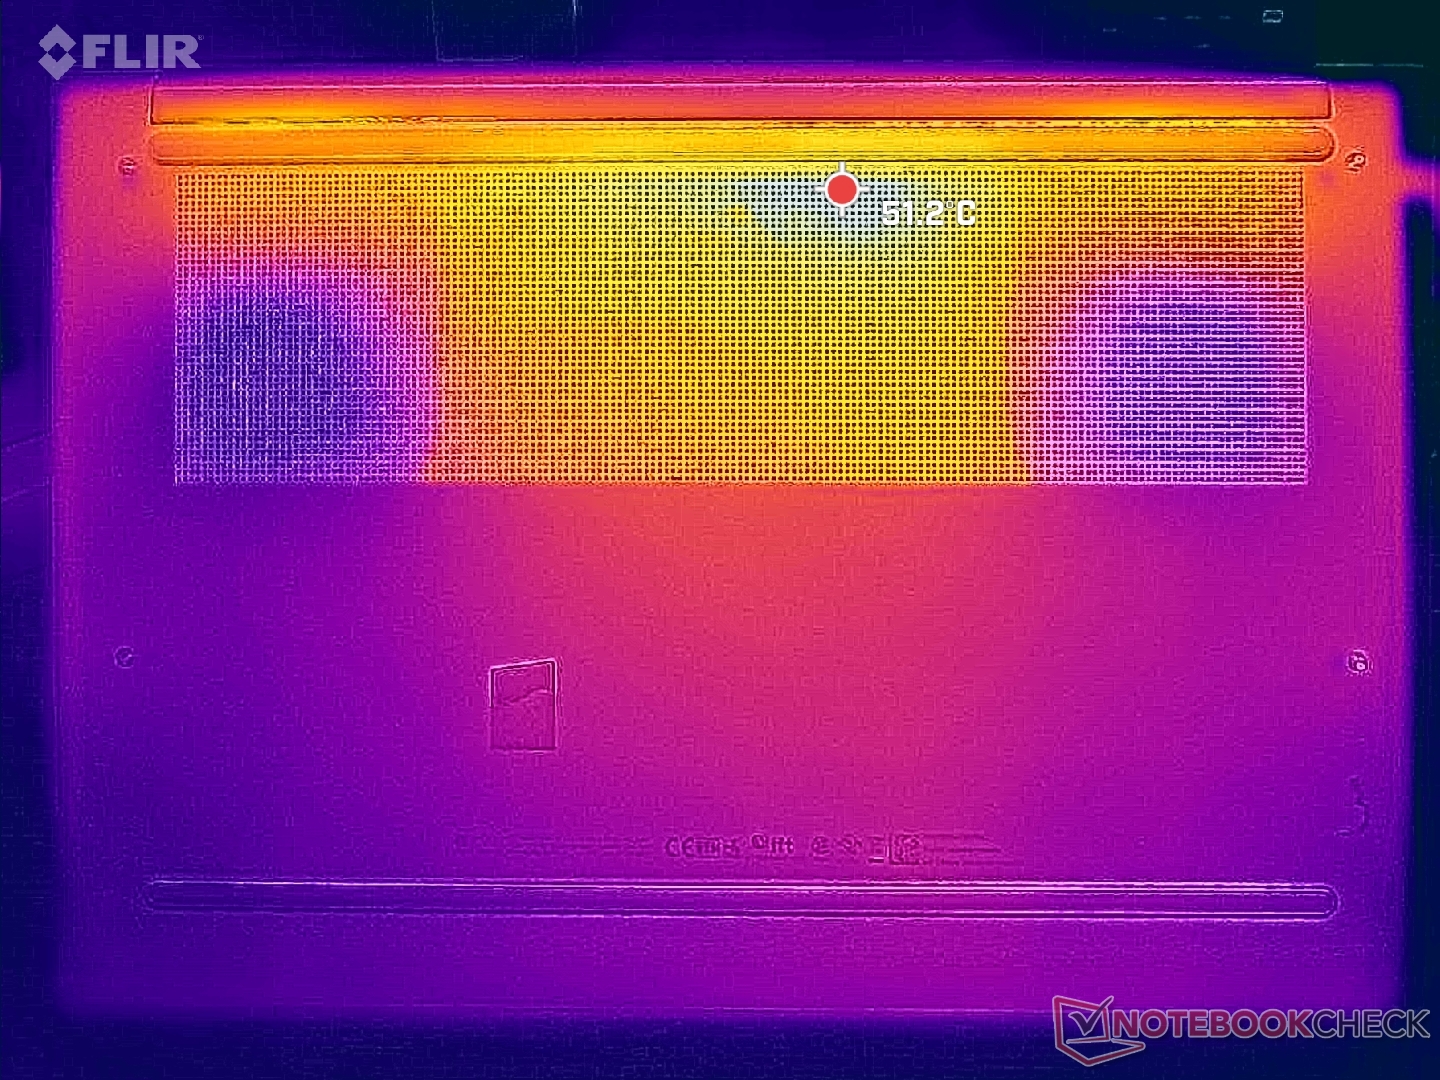
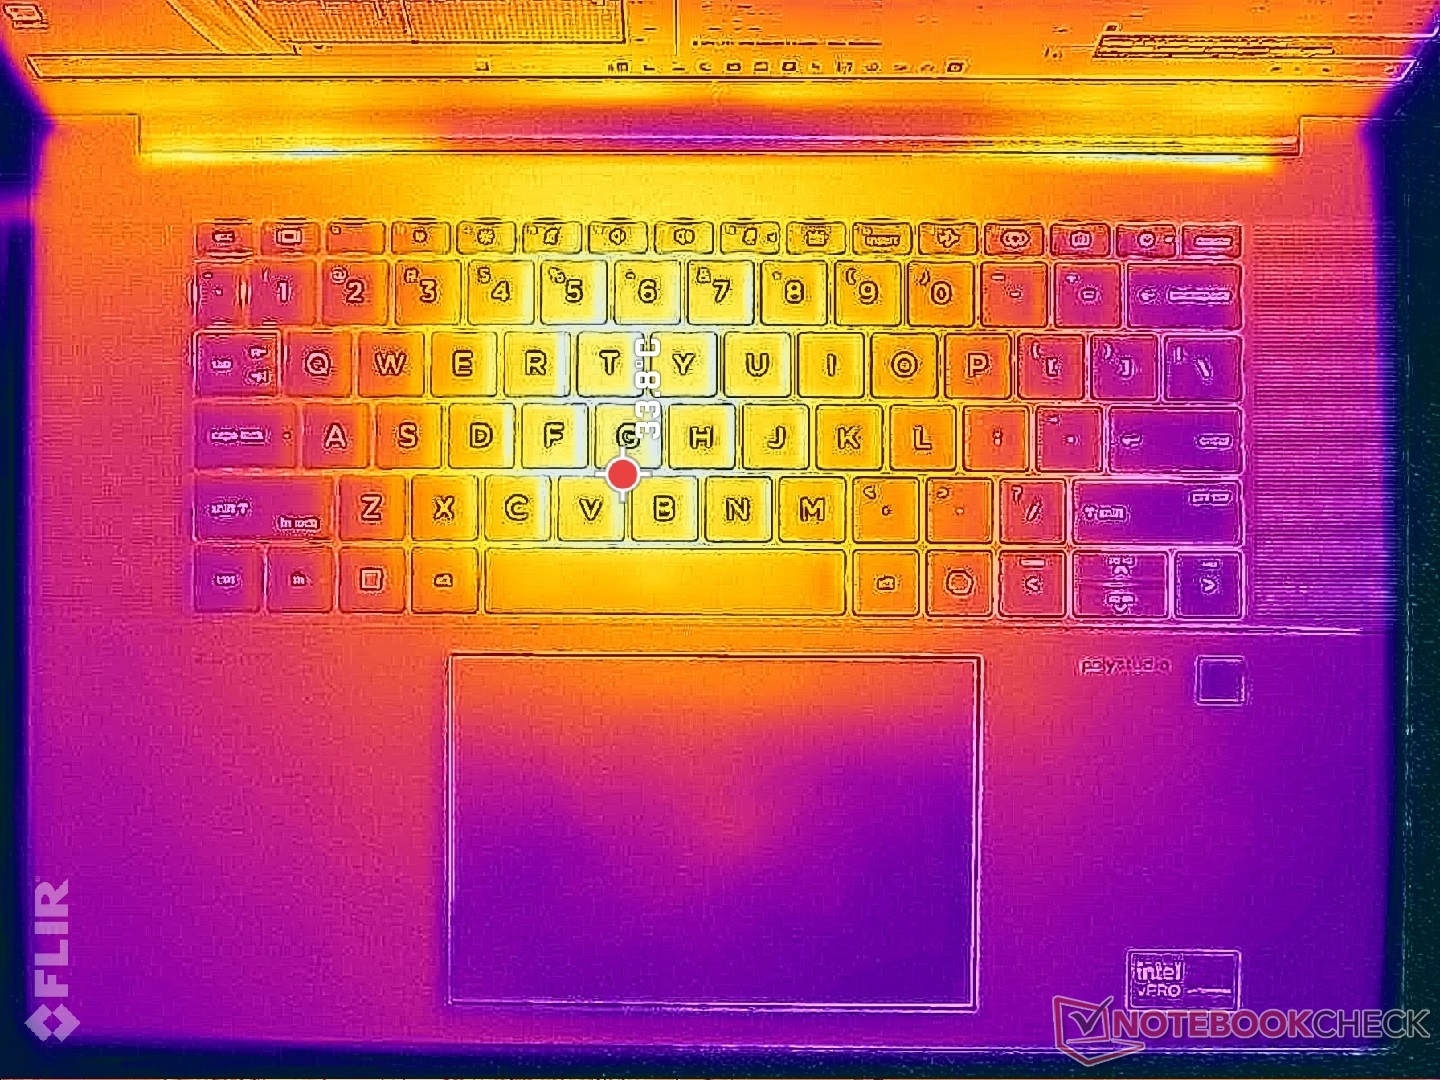
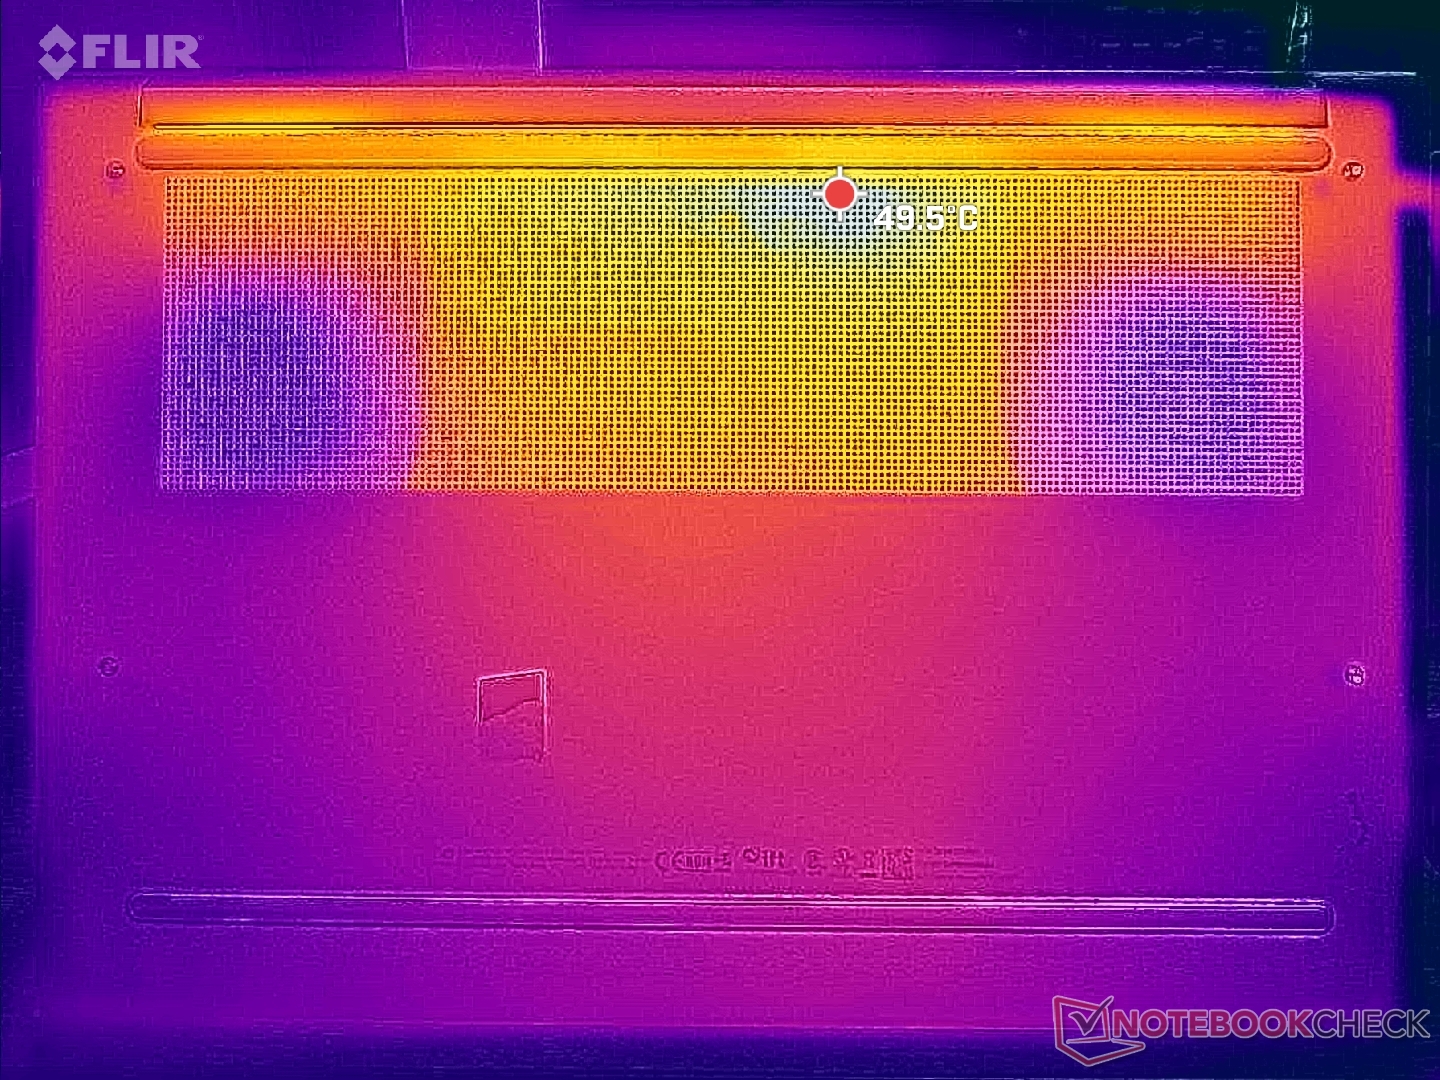
Temperatury powierzchni są najcieplejsze w pobliżu dolnej tylnej części urządzenia, gdzie gorące punkty mogą osiągnąć ponad 48 C. Na szczęście klawiatura i podpórki pod nadgarstki pozostają znacznie chłodniejsze i bardziej znośne w temperaturze do 38 C na samym środku.
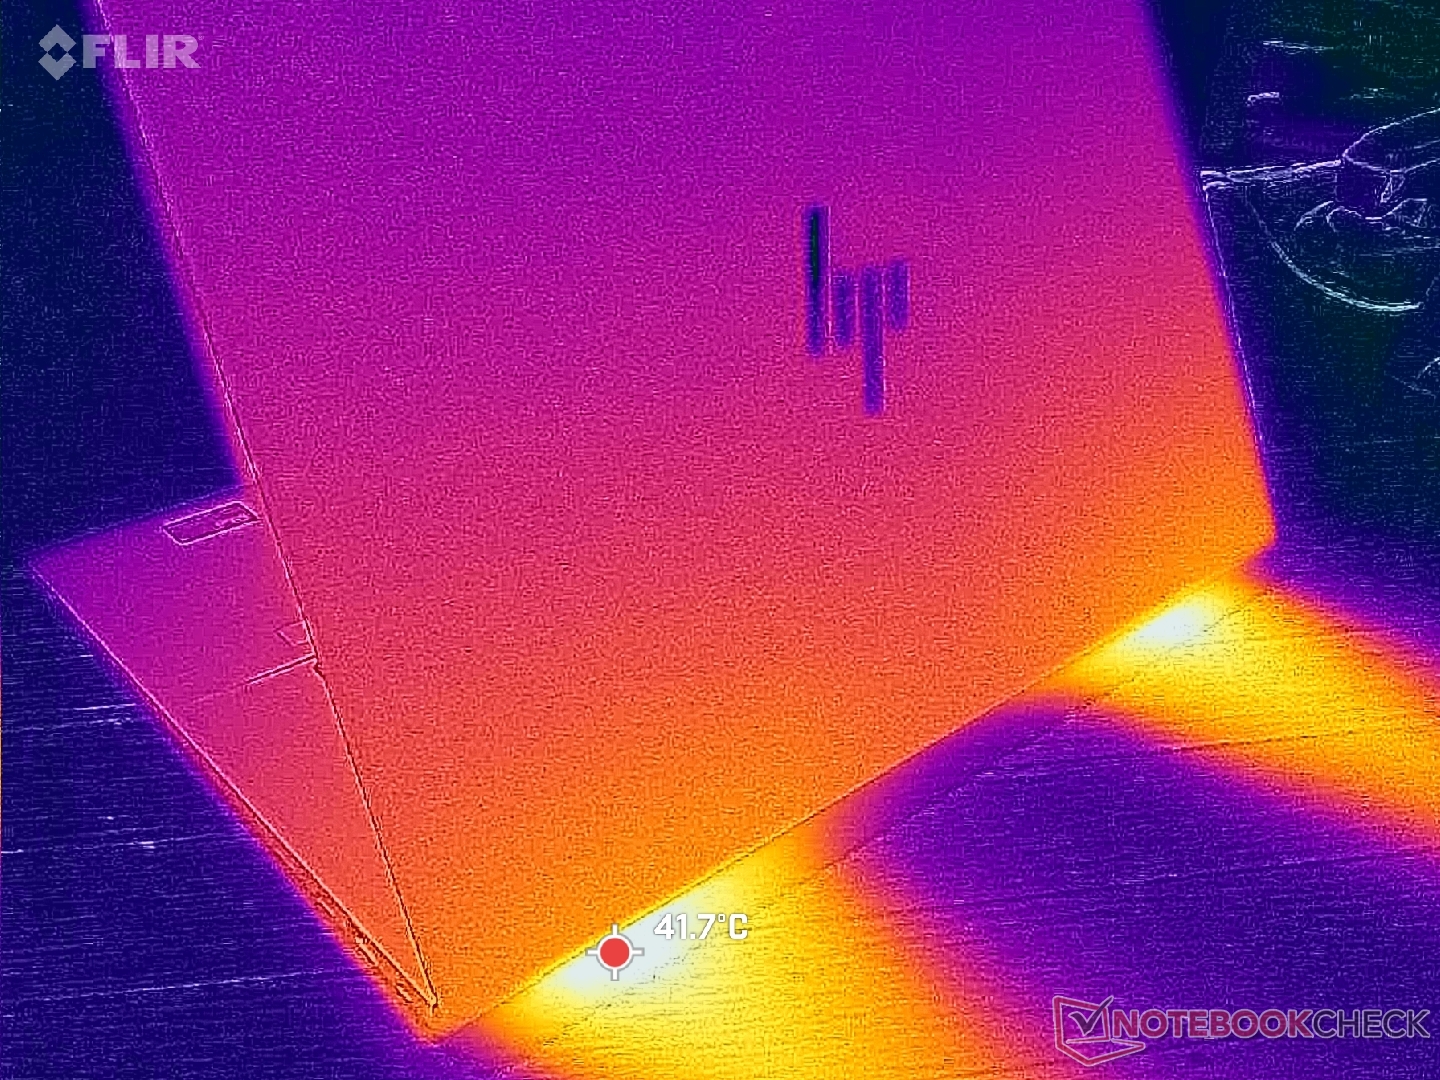
(+) Maksymalna temperatura w górnej części wynosi 36.6 °C / 98 F, w porównaniu do średniej 38.2 °C / 101 F , począwszy od 22.2 do 69.8 °C dla klasy Workstation.
(-) Dno nagrzewa się maksymalnie do 47.8 °C / 118 F, w porównaniu do średniej 41.1 °C / 106 F
(+) W stanie bezczynności średnia temperatura górnej części wynosi 27.2 °C / 81 F, w porównaniu ze średnią temperaturą urządzenia wynoszącą 32 °C / ### class_avg_f### F.
(+) 3: The average temperature for the upper side is 30.3 °C / 87 F, compared to the average of 32 °C / 90 F for the class Workstation.
(+) Podpórki pod nadgarstki i touchpad są chłodniejsze niż temperatura skóry i maksymalnie 27.4 °C / 81.3 F i dlatego są chłodne w dotyku.
(±) Średnia temperatura obszaru podparcia dłoni w podobnych urządzeniach wynosiła 27.8 °C / 82 F (+0.4 °C / 0.7 F).
| HP ZBook Studio 16 G11 Intel Core Ultra 9 185H, NVIDIA RTX 3000 Ada Generation Laptop | HP ZBook Studio 16 G9 62U04EA Intel Core i7-12800H, NVIDIA RTX A2000 Laptop GPU | HP ZBook Power 16 G11 A AMD Ryzen 7 8845HS, NVIDIA RTX 2000 Ada Generation Laptop | Lenovo ThinkPad P16 Gen 2 Intel Core i7-14700HX, NVIDIA RTX 4000 Ada Generation Laptop | Dell Precision 5690 Intel Core Ultra 9 185H, NVIDIA RTX 5000 Ada Generation Laptop | MSI CreatorPro Z16P B12UKST Intel Core i7-12700H, NVIDIA RTX A3000 Laptop GPU | Lenovo ThinkPad P1 Gen 7 21KV001SGE Intel Core Ultra 7 155H, NVIDIA GeForce RTX 4060 Laptop GPU | |
|---|---|---|---|---|---|---|---|
| Heat | 2% | 12% | 4% | 5% | -13% | 4% | |
| Maximum Upper Side * (°C) | 36.6 | 38.7 -6% | 40.6 -11% | 46.6 -27% | 46.6 -27% | 56.3 -54% | 50.3 -37% |
| Maximum Bottom * (°C) | 47.8 | 53.4 -12% | 40.6 15% | 51 -7% | 33 31% | 68.3 -43% | 38 21% |
| Idle Upper Side * (°C) | 31.4 | 27.3 13% | 26 17% | 24.8 21% | 32.4 -3% | 25.2 20% | 28.3 10% |
| Idle Bottom * (°C) | 35.6 | 31.6 11% | 26.6 25% | 25.6 28% | 29.4 17% | 25.9 27% | 27.3 23% |
* ... im mniej tym lepiej
Głośniki
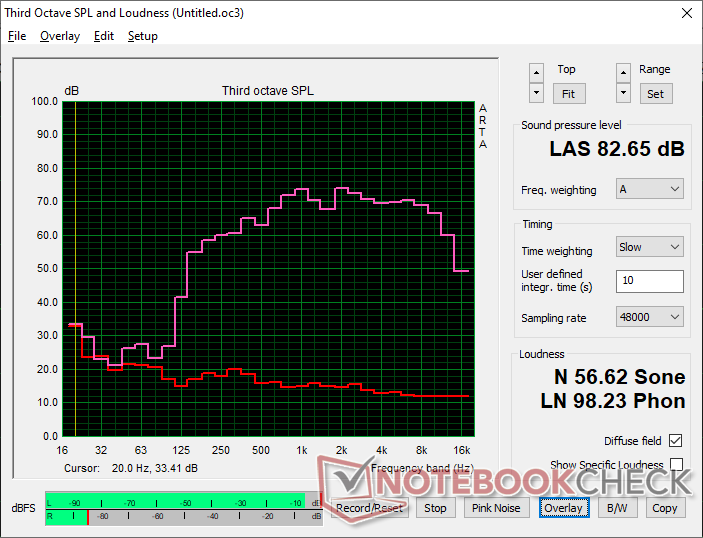
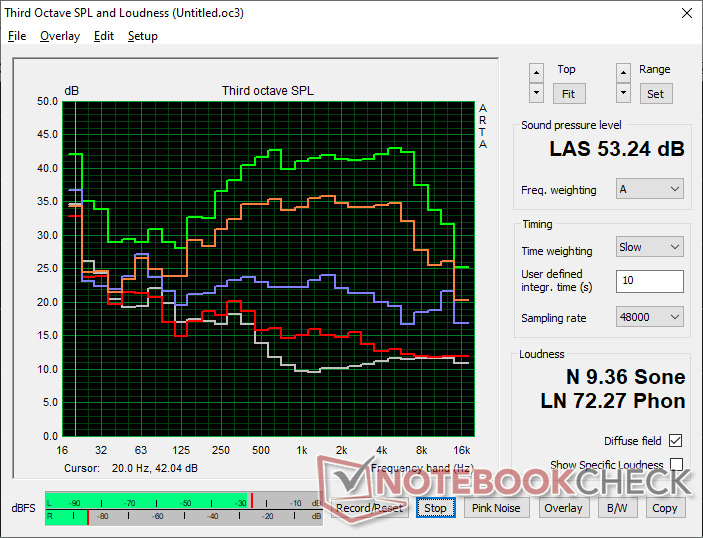
HP ZBook Studio 16 G11 analiza dźwięku
(+) | głośniki mogą odtwarzać stosunkowo głośno (82.7 dB)
Bas 100 - 315 Hz
(-) | prawie brak basu - średnio 17.4% niższa od mediany
(±) | liniowość basu jest średnia (11.8% delta do poprzedniej częstotliwości)
Średnie 400 - 2000 Hz
(+) | zbalansowane środki średnie - tylko 3.4% od mediany
(±) | liniowość środka jest średnia (7% delta do poprzedniej częstotliwości)
Wysokie 2–16 kHz
(+) | zrównoważone maksima - tylko 2.4% od mediany
(+) | wzloty są liniowe (2.6% delta do poprzedniej częstotliwości)
Ogólnie 100 - 16.000 Hz
(±) | liniowość ogólnego dźwięku jest średnia (15.2% różnicy w stosunku do mediany)
W porównaniu do tej samej klasy
» 33% wszystkich testowanych urządzeń w tej klasie było lepszych, 10% podobnych, 57% gorszych
» Najlepszy miał deltę 7%, średnia wynosiła ###średnia###%, najgorsza wynosiła 35%
W porównaniu do wszystkich testowanych urządzeń
» 21% wszystkich testowanych urządzeń było lepszych, 4% podobnych, 74% gorszych
» Najlepszy miał deltę 4%, średnia wynosiła ###średnia###%, najgorsza wynosiła 134%
Apple MacBook Pro 16 2021 M1 Pro analiza dźwięku
(+) | głośniki mogą odtwarzać stosunkowo głośno (84.7 dB)
Bas 100 - 315 Hz
(+) | dobry bas - tylko 3.8% od mediany
(+) | bas jest liniowy (5.2% delta do poprzedniej częstotliwości)
Średnie 400 - 2000 Hz
(+) | zbalansowane środki średnie - tylko 1.3% od mediany
(+) | średnie są liniowe (2.1% delta do poprzedniej częstotliwości)
Wysokie 2–16 kHz
(+) | zrównoważone maksima - tylko 1.9% od mediany
(+) | wzloty są liniowe (2.7% delta do poprzedniej częstotliwości)
Ogólnie 100 - 16.000 Hz
(+) | ogólny dźwięk jest liniowy (4.6% różnicy w stosunku do mediany)
W porównaniu do tej samej klasy
» 0% wszystkich testowanych urządzeń w tej klasie było lepszych, 0% podobnych, 100% gorszych
» Najlepszy miał deltę 5%, średnia wynosiła ###średnia###%, najgorsza wynosiła 45%
W porównaniu do wszystkich testowanych urządzeń
» 0% wszystkich testowanych urządzeń było lepszych, 0% podobnych, 100% gorszych
» Najlepszy miał deltę 4%, średnia wynosiła ###średnia###%, najgorsza wynosiła 134%
Zarządzanie energią
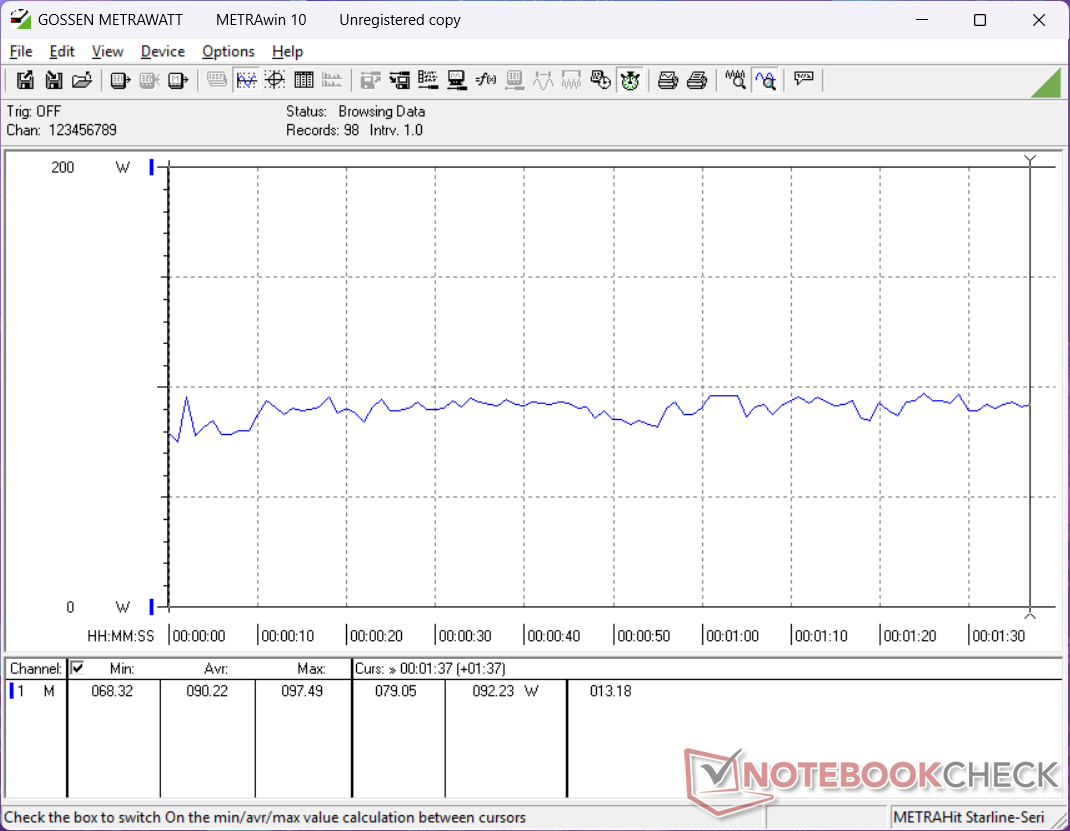
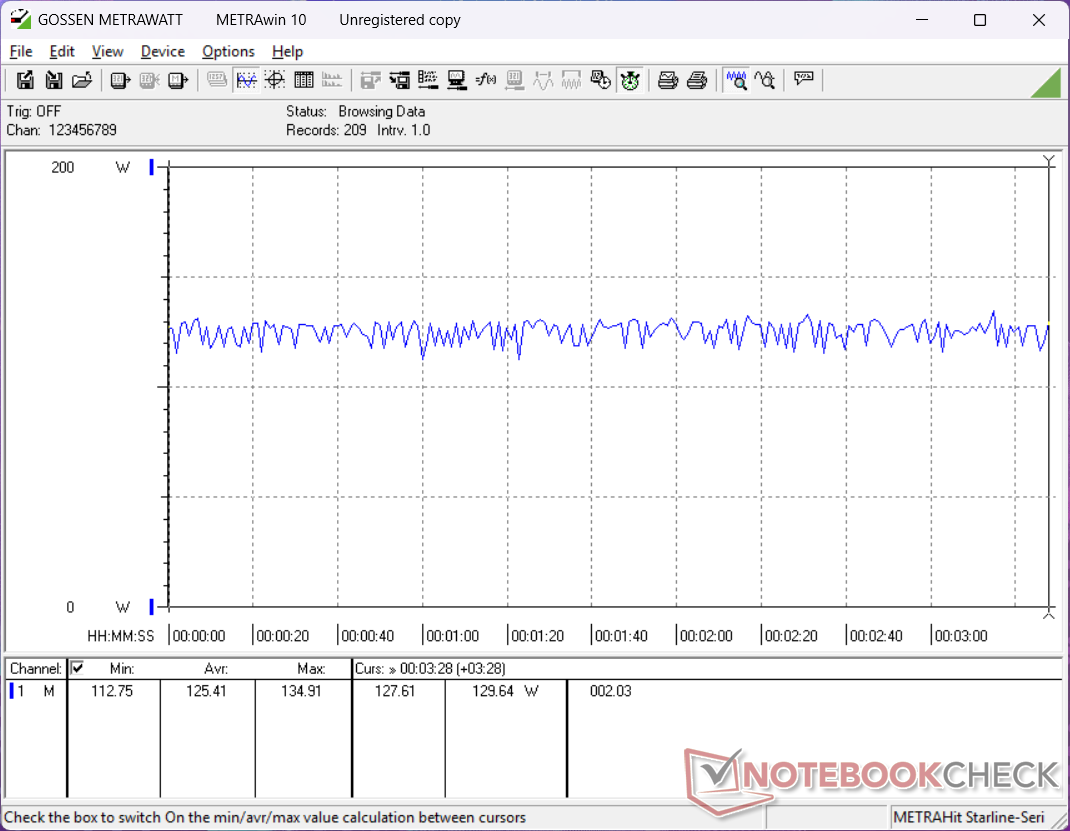
Zużycie energii
Model ten jest nieco bardziej wymagający niż starszy i wolniejszy ZBook Studio 16 G9. Jednak wydajność w przeliczeniu na wat jest nadal znacznie wyższa, co sprawia, że wyższe zużycie jest warte zachodu dla łowców wydajności.
| wyłączony / stan wstrzymania | |
| luz | |
| obciążenie |
|
Legenda:
min: | |
| HP ZBook Studio 16 G11 Ultra 9 185H, RTX 3000 Ada Generation Laptop, Kioxia XG8 KXG80ZNV1T02, IPS, 3840x2400, 16" | HP ZBook Studio 16 G9 62U04EA i7-12800H, RTX A2000 Laptop GPU, Micron 3400 1TB MTFDKBA1T0TFH, IPS, 3840x2400, 16" | HP ZBook Power 16 G11 A R7 8845HS, RTX 2000 Ada Generation Laptop, Samsung PM9A1 MZVL22T0HBLB, IPS, 2560x1600, 16" | Lenovo ThinkPad P16 Gen 2 i7-14700HX, RTX 4000 Ada Generation Laptop, SK hynix PC801 HFS001TEJ9X162N, IPS, 2560x1600, 16" | Dell Precision 5690 Ultra 9 185H, RTX 5000 Ada Generation Laptop, 2x Samsung PM9A1 1TB (RAID 0), OLED, 3840x2400, 16" | MSI CreatorPro Z16P B12UKST i7-12700H, RTX A3000 Laptop GPU, Samsung PM9A1 MZVL21T0HCLR, IPS, 2560x1600, 16" | Lenovo ThinkPad P1 Gen 7 21KV001SGE Ultra 7 155H, GeForce RTX 4060 Laptop GPU, Kioxia XG8 KXG8AZNV1T02, IPS LED, 2560x1600, 16" | |
|---|---|---|---|---|---|---|---|
| Power Consumption | 8% | 36% | -26% | 9% | 7% | 17% | |
| Idle Minimum * (Watt) | 14 | 7.2 49% | 4.6 67% | 7.9 44% | 7.9 44% | 10.8 23% | 7.3 48% |
| Idle Average * (Watt) | 22.4 | 18.1 19% | 10 55% | 13.1 42% | 12 46% | 16.3 27% | 12.3 45% |
| Idle Maximum * (Watt) | 25.7 | 18.5 28% | 10.6 59% | 24.2 6% | 28.6 -11% | 16.9 34% | 17.9 30% |
| Load Average * (Watt) | 90.2 | 112.8 -25% | 60.9 32% | 127.4 -41% | 98.8 -10% | 111.7 -24% | 78.2 13% |
| Cyberpunk 2077 ultra external monitor * (Watt) | 120.3 | 92.8 23% | 219 -82% | 117.7 2% | |||
| Cyberpunk 2077 ultra * (Watt) | 125.4 | 96.8 23% | 225 -79% | 123.5 2% | |||
| Load Maximum * (Watt) | 142 | 186 -31% | 154.8 -9% | 248.5 -75% | 174.8 -23% | 177.4 -25% | 167.5 -18% |
| Witcher 3 ultra * (Watt) | 106.7 | 144.5 | 152.1 |
* ... im mniej tym lepiej
Power Consumption Cyberpunk / Stress Test
Power Consumption external Monitor
Żywotność baterii
Czasy działania nie uległy poprawie, a nawet mogą być krótsze niż wcześniej.
| HP ZBook Studio 16 G11 Ultra 9 185H, RTX 3000 Ada Generation Laptop, 86 Wh | HP ZBook Studio 16 G9 62U04EA i7-12800H, RTX A2000 Laptop GPU, 86 Wh | HP ZBook Power 16 G11 A R7 8845HS, RTX 2000 Ada Generation Laptop, 83 Wh | Lenovo ThinkPad P16 Gen 2 i7-14700HX, RTX 4000 Ada Generation Laptop, 94 Wh | Dell Precision 5690 Ultra 9 185H, RTX 5000 Ada Generation Laptop, 98 Wh | MSI CreatorPro Z16P B12UKST i7-12700H, RTX A3000 Laptop GPU, 90 Wh | Lenovo ThinkPad P1 Gen 7 21KV001SGE Ultra 7 155H, GeForce RTX 4060 Laptop GPU, 90 Wh | |
|---|---|---|---|---|---|---|---|
| Czasy pracy | 31% | 102% | -48% | 92% | 21% | 106% | |
| WiFi v1.3 (h) | 4.8 | 6.3 31% | 9.7 102% | 2.5 -48% | 9.2 92% | 5.8 21% | 9.9 106% |
| H.264 (h) | 8.5 | ||||||
| Load (h) | 1.1 | 1.7 | 1.9 | ||||
| Reader / Idle (h) | 26.1 |
Ocena Notebookcheck
HP ZBook Studio 16 G11
- 30/11/2024 v8
Allen Ngo
 Total Sustainability Score:
 Przezroczystość
Wyboru urządzeń do recenzji dokonuje nasza redakcja. Próbka testowa została udostępniona autorowi jako pożyczka od producenta lub sprzedawcy detalicznego na potrzeby tej recenzji. Pożyczkodawca nie miał wpływu na tę recenzję, producent nie otrzymał też kopii tej recenzji przed publikacją. Nie było obowiązku publikowania tej recenzji. Jako niezależna firma medialna, Notebookcheck nie podlega władzy producentów, sprzedawców detalicznych ani wydawców.
Tak testuje Notebookcheck
Każdego roku Notebookcheck niezależnie sprawdza setki laptopów i smartfonów, stosując standardowe procedury, aby zapewnić porównywalność wszystkich wyników. Od około 20 lat stale rozwijamy nasze metody badawcze, ustanawiając przy tym standardy branżowe. W naszych laboratoriach testowych doświadczeni technicy i redaktorzy korzystają z wysokiej jakości sprzętu pomiarowego. Testy te obejmują wieloetapowy proces walidacji. Nasz kompleksowy system ocen opiera się na setkach uzasadnionych pomiarów i benchmarków, co pozwala zachować obiektywizm.
