Recenzja Medion Erazer Beast X40: Gamingowy notebook z RTX 4090
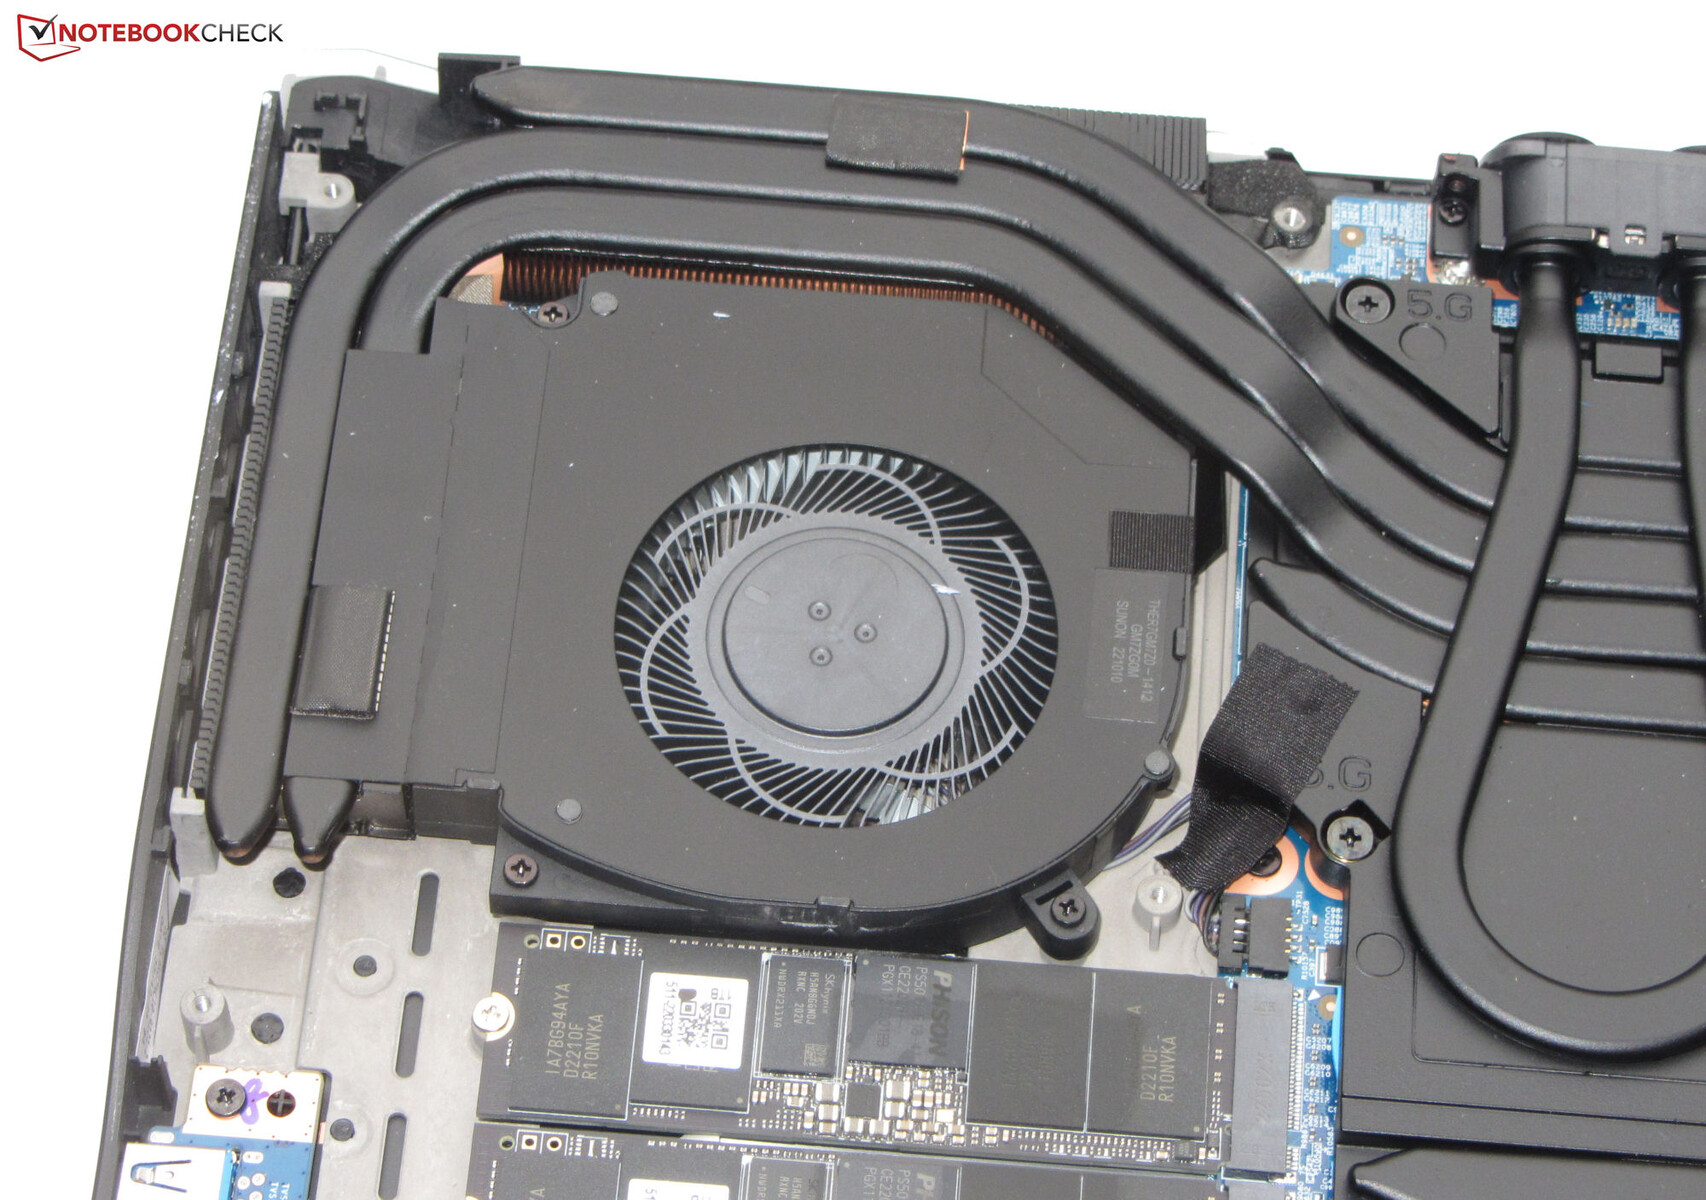
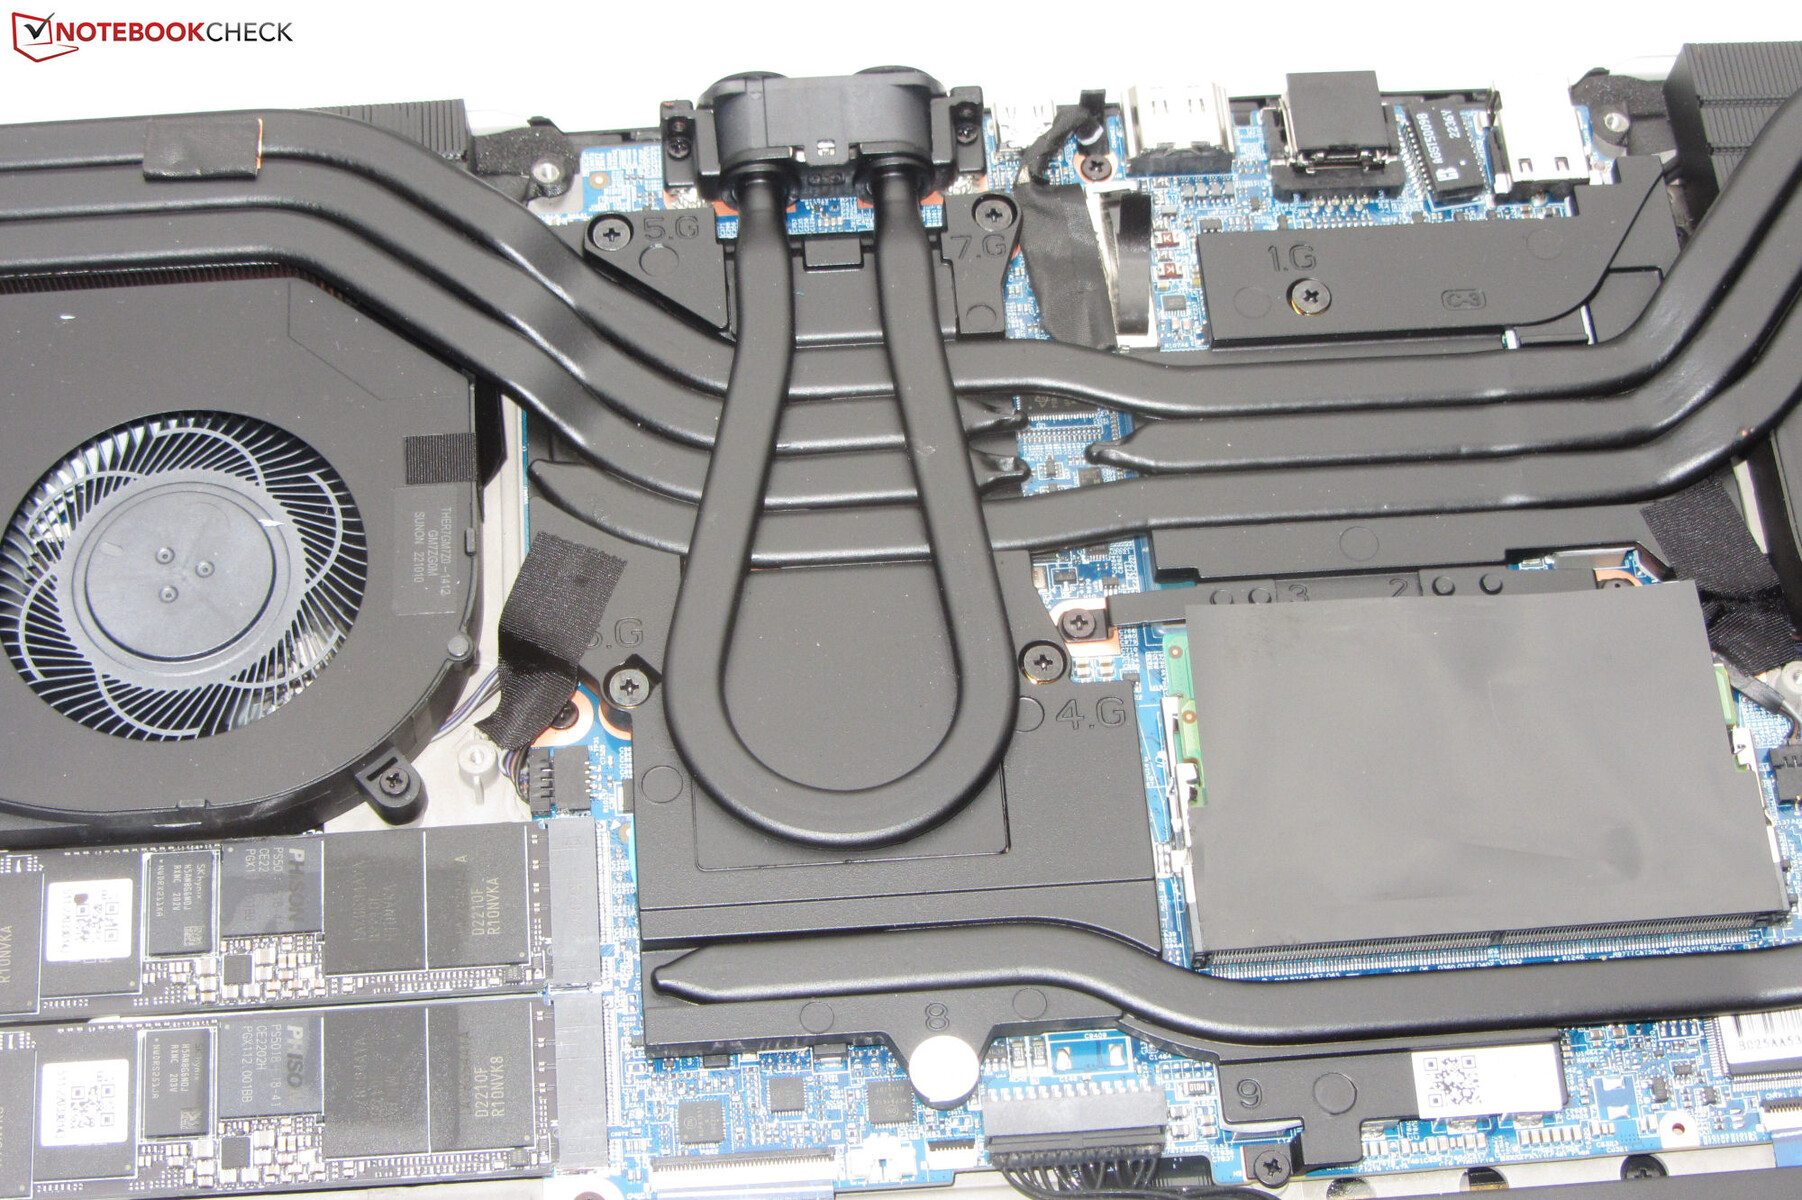
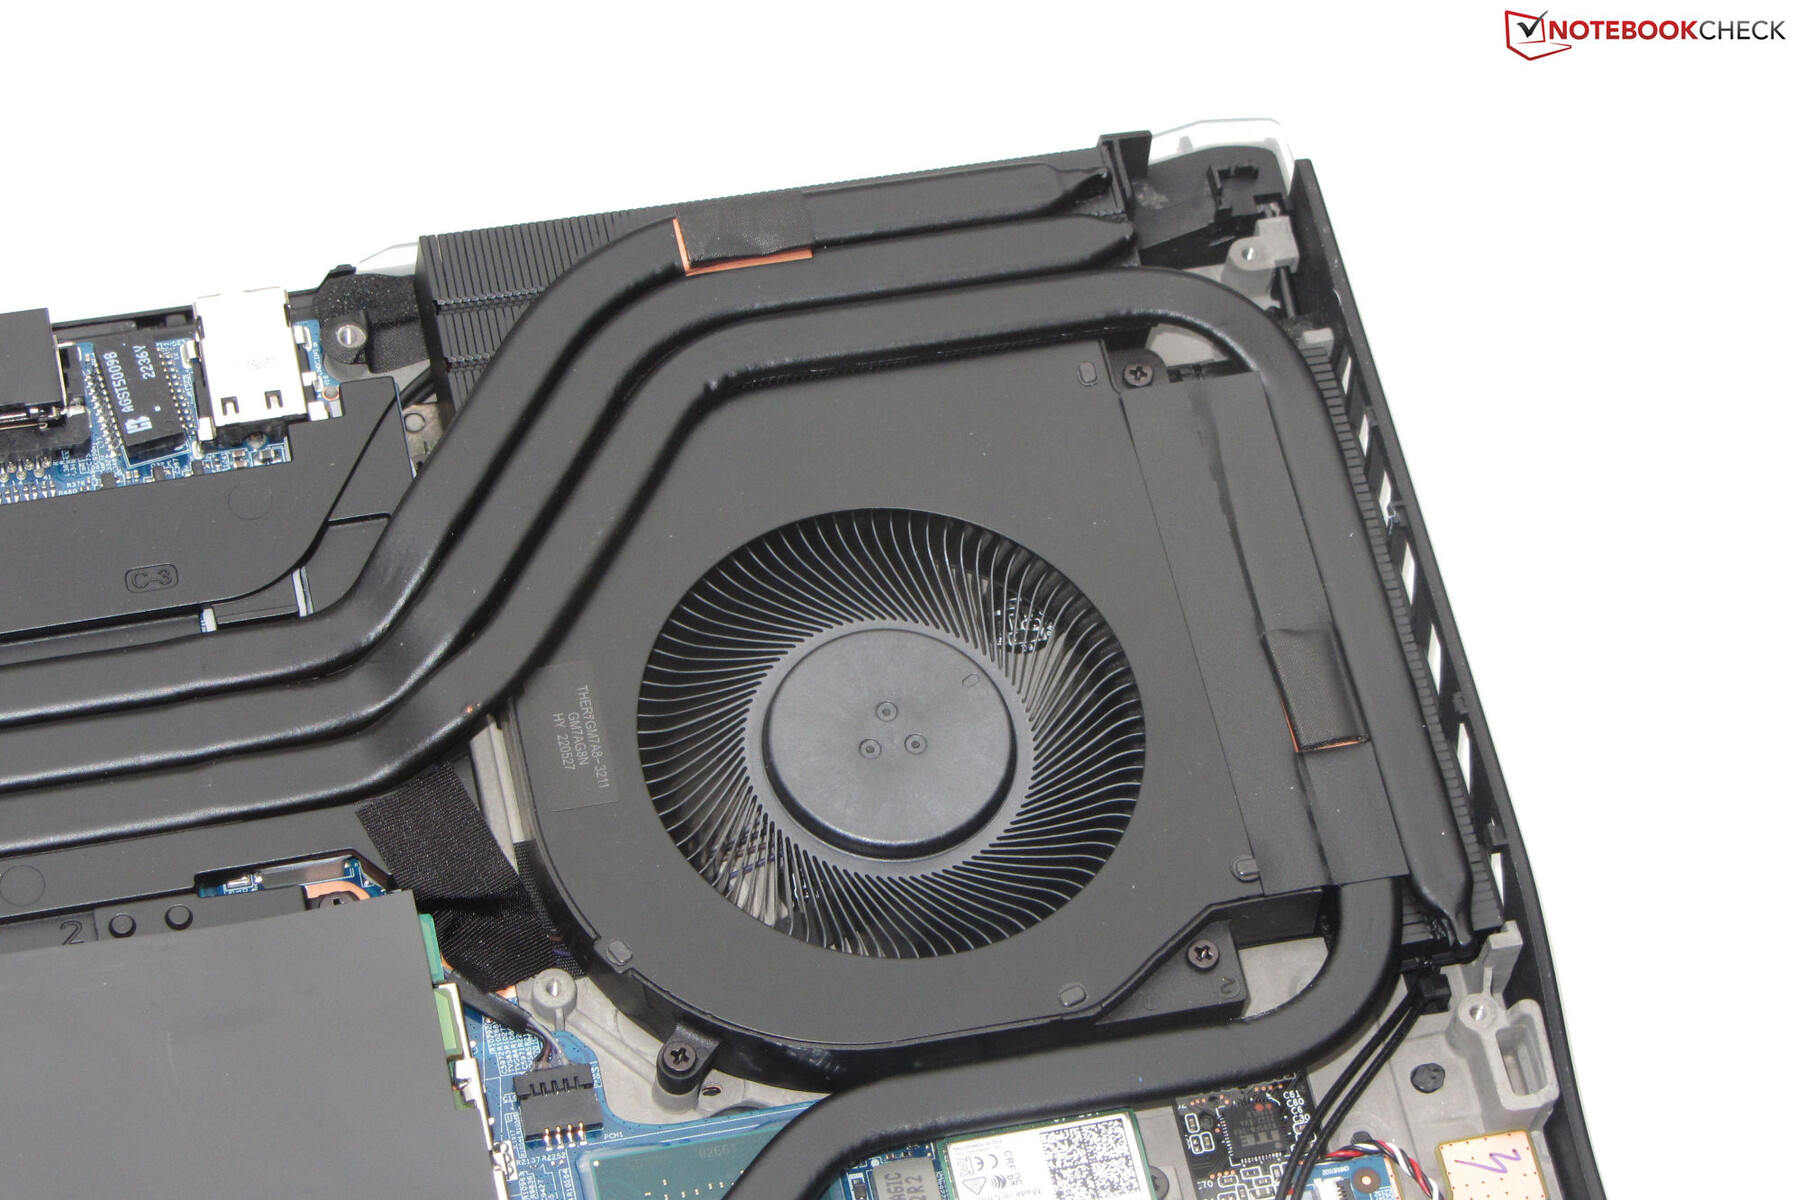
Erazer Beast X40, mimo że należy do kategorii laptopów gamingowych, został pomyślany również z myślą o innych, bardzo wymagających scenariuszach użytkowania. Niezbędną wydajność obliczeniową zapewniają procesor Raptor Lake i układ graficzny Ada Lovelace. W porównaniu z poprzednikami Medion Erazer Beast X30 review: Slim, powerful QHD gaming notebook , laptop otrzymał gruntowny remont: Medion nadał mu nowe proporcje ekranu (16:10 zamiast 16:9), system chłodzenia z opcjonalnym chłodzeniem wodnym oraz mechaniczną klawiaturę.
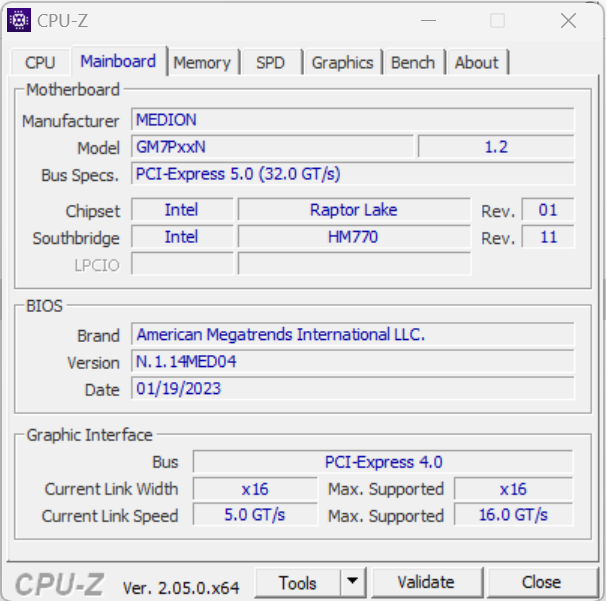
X40 bazuje na barebone'ie firmy Tongfang (GM7PX9N), który jest w większości identyczny z tym zastosowanym w modelu XMG Neo 17. Konkurencją dla niego są m.in MSI Titan GT77 HX 13VI, Alienware x17 R2 P48E, Razer Blade 16 (początek 2023)oraz Asus ROG Strix Scar 18 2023 G834JY.
Potencjalni konkurenci w porównaniu
Ocena | Data | Model | Waga | Wysokość | Rozmiar | Rezolucja | Cena |
|---|---|---|---|---|---|---|---|
| 88.4 % v7 (old) | 03/2023 | Medion Erazer Beast X40 i9-13900HX, GeForce RTX 4090 Laptop GPU | 2.9 kg | 33 mm | 17.00" | 2560x1600 | |
| 89 % v7 (old) | 02/2023 | MSI Titan GT77 HX 13VI i9-13950HX, GeForce RTX 4090 Laptop GPU | 3.5 kg | 23 mm | 17.30" | 3840x2160 | |
| 91.2 % v7 (old) | 02/2023 | Razer Blade 16 Early 2023 i9-13950HX, GeForce RTX 4080 Laptop GPU | 2.4 kg | 21.99 mm | 16.00" | 2560x1600 | |
| 87.6 % v7 (old) | 09/2022 | Schenker XMG Neo 17 M22 R9 6900HX, GeForce RTX 3080 Ti Laptop GPU | 2.8 kg | 27 mm | 17.00" | 2560x1600 | |
| 89.2 % v7 (old) | Alienware x17 R2 P48E i9-12900HK, GeForce RTX 3080 Ti Laptop GPU | 3.1 kg | 20.9 mm | 17.30" | 1920x1080 | ||
| 86.6 % v7 (old) | 02/2023 | Asus ROG Strix Scar 18 2023 G834JY-N6005W i9-13980HX, GeForce RTX 4090 Laptop GPU | 3.1 kg | 30.8 mm | 18.00" | 2560x1600 |
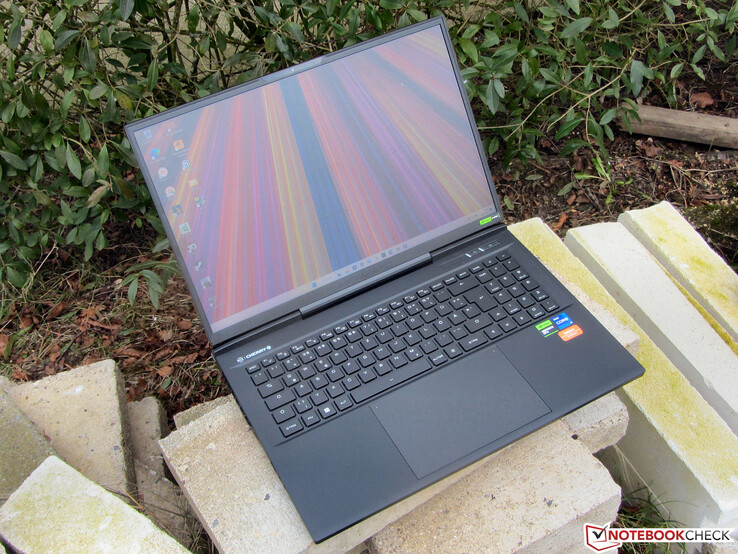
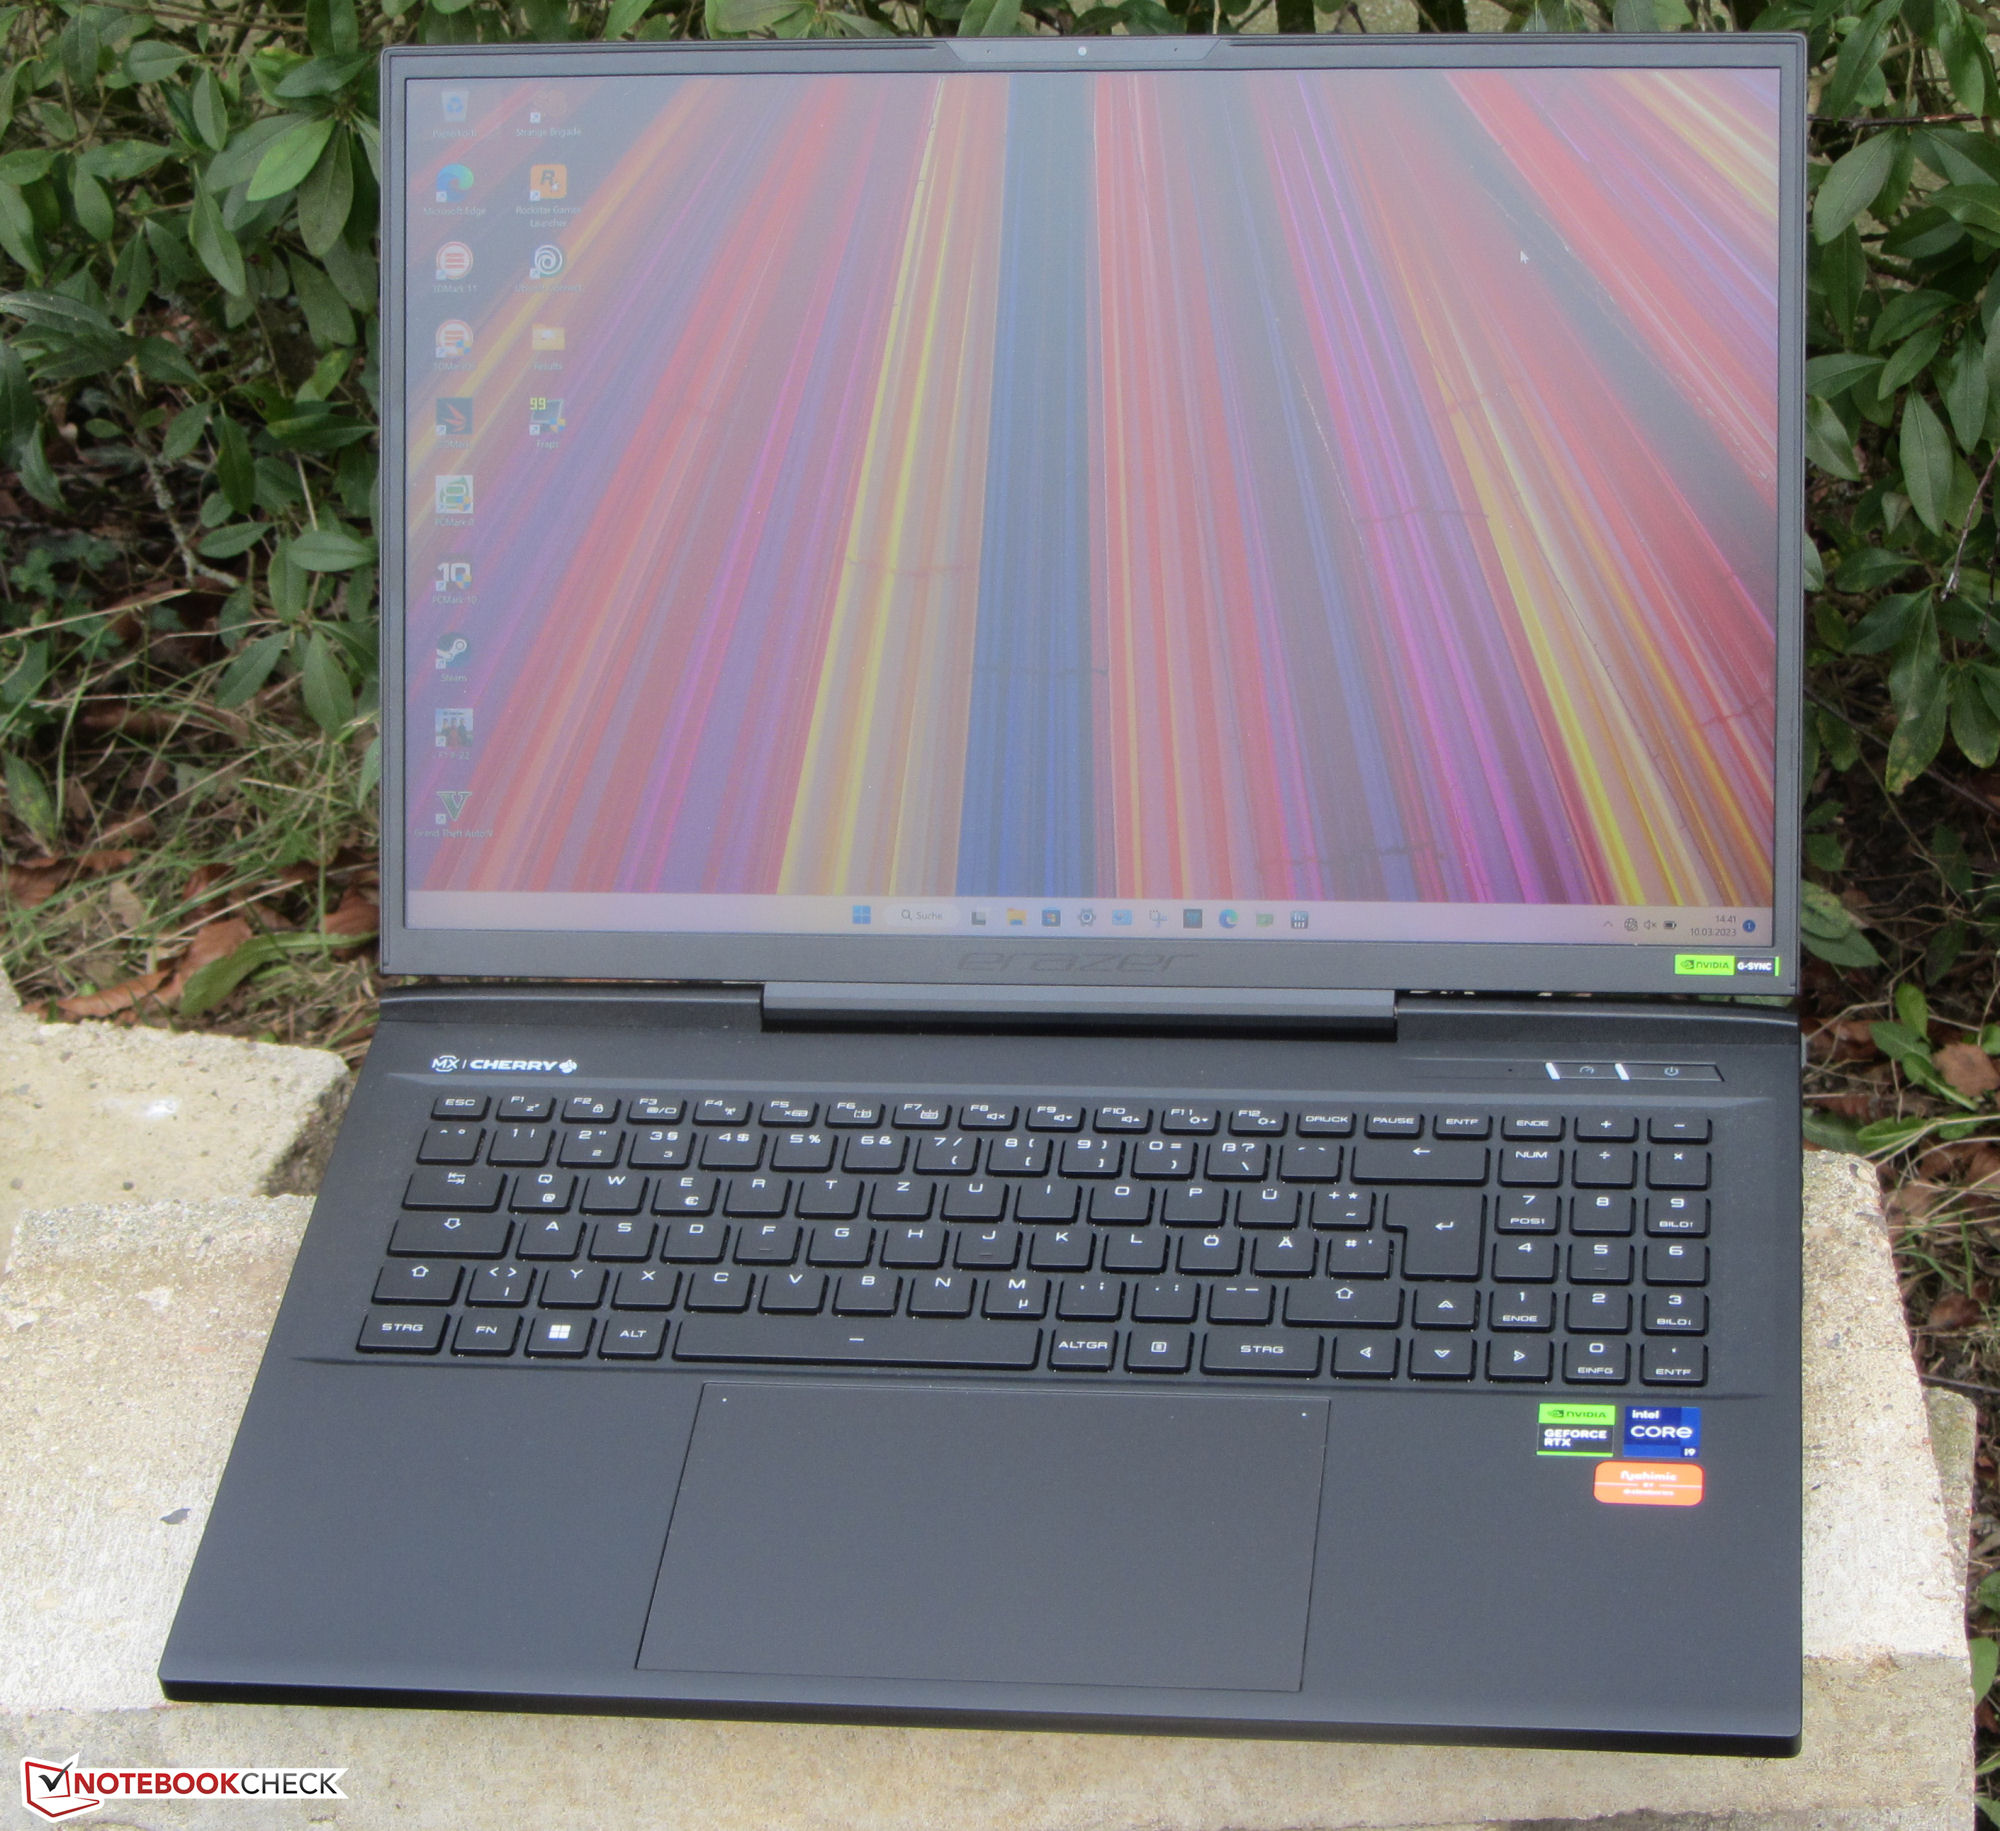
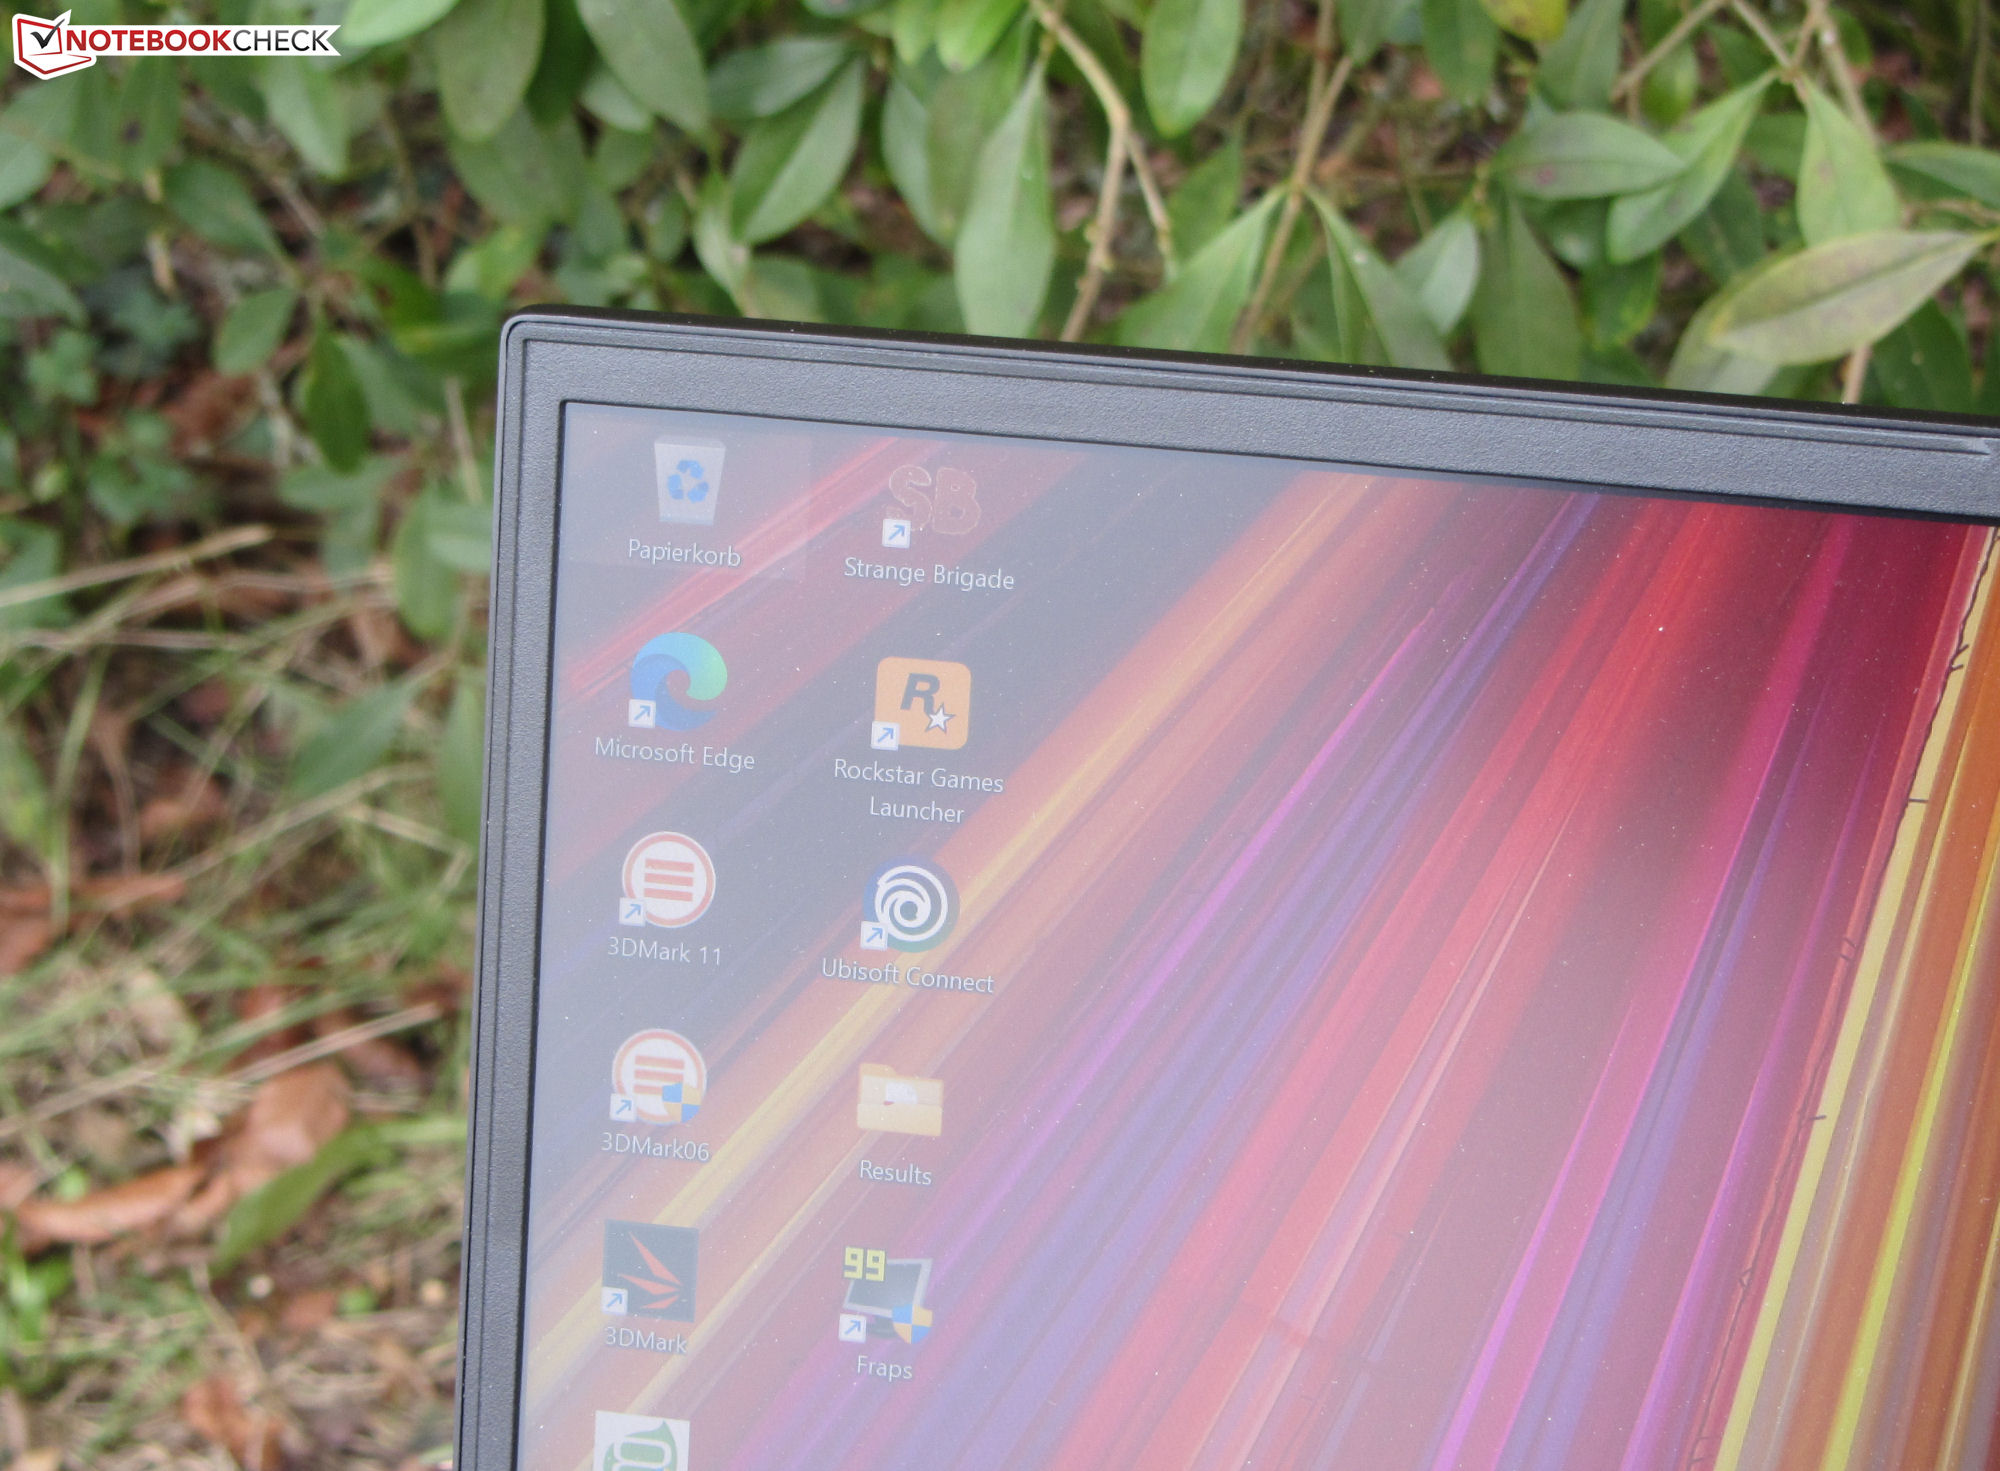
Obudowa - Erazer posiada metalową obudowę
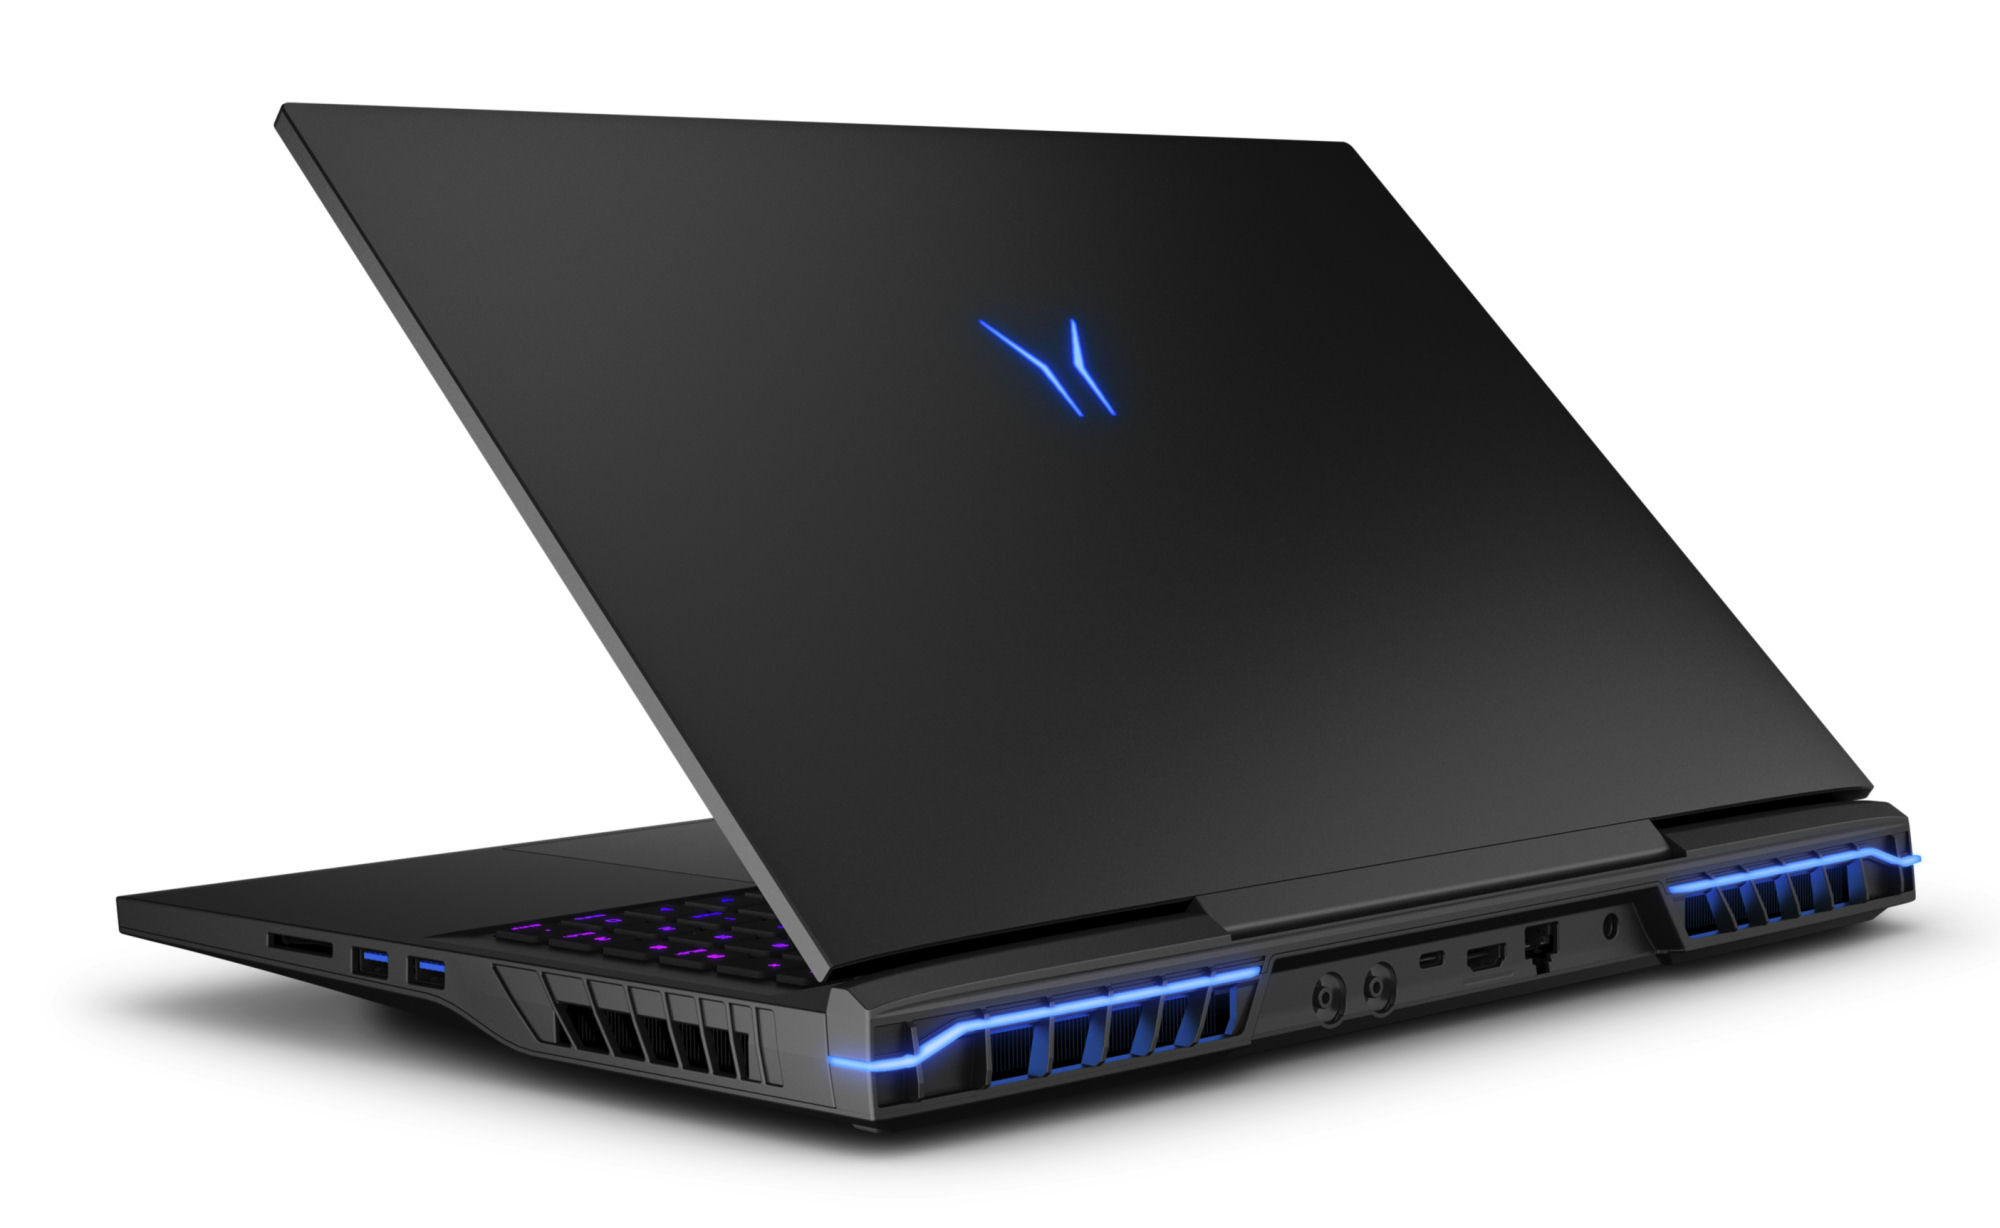
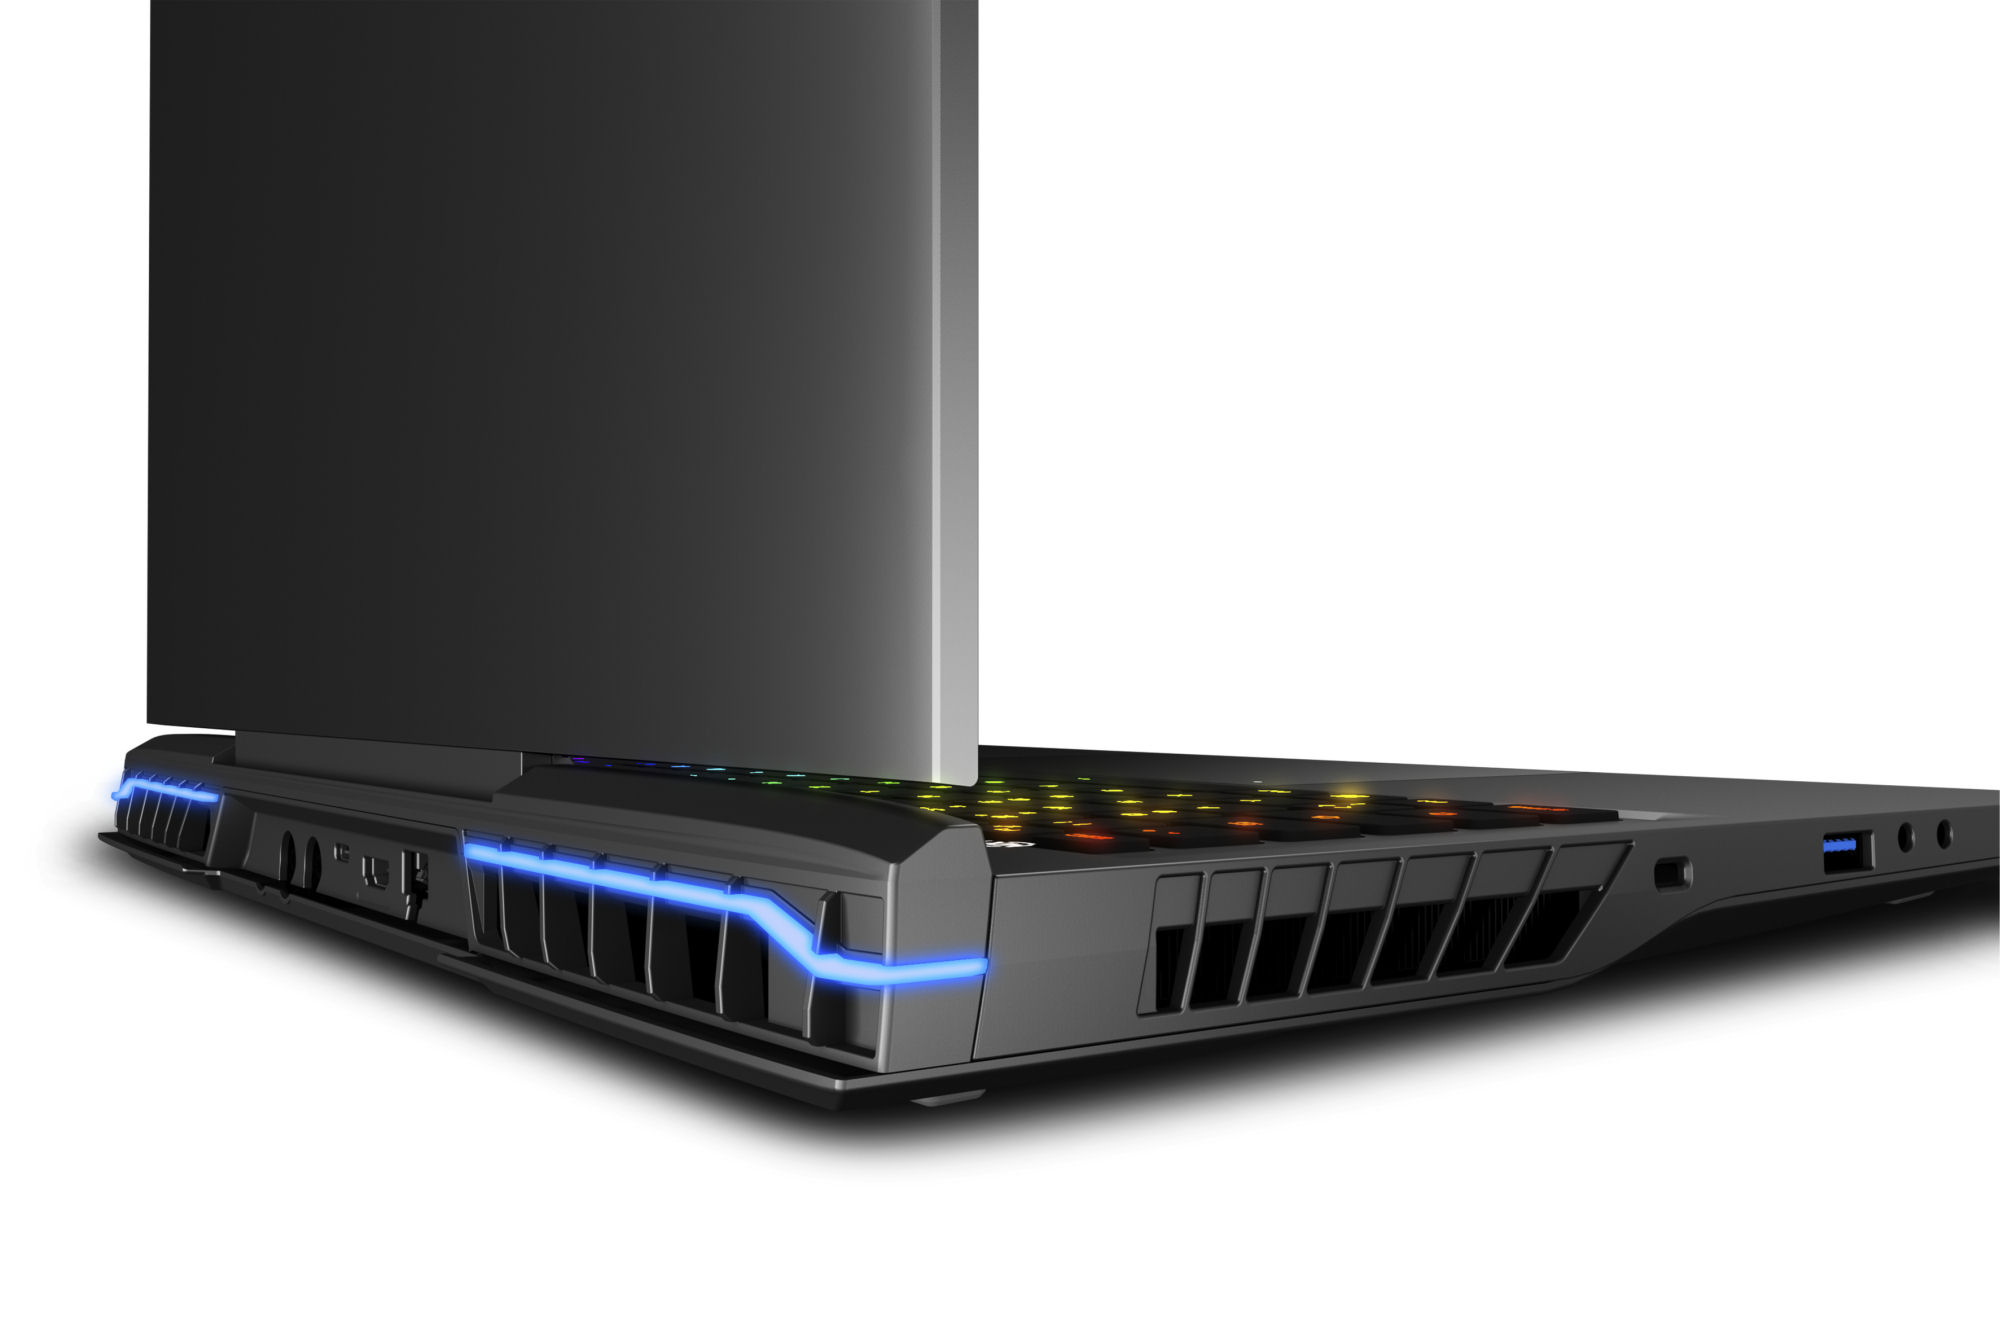
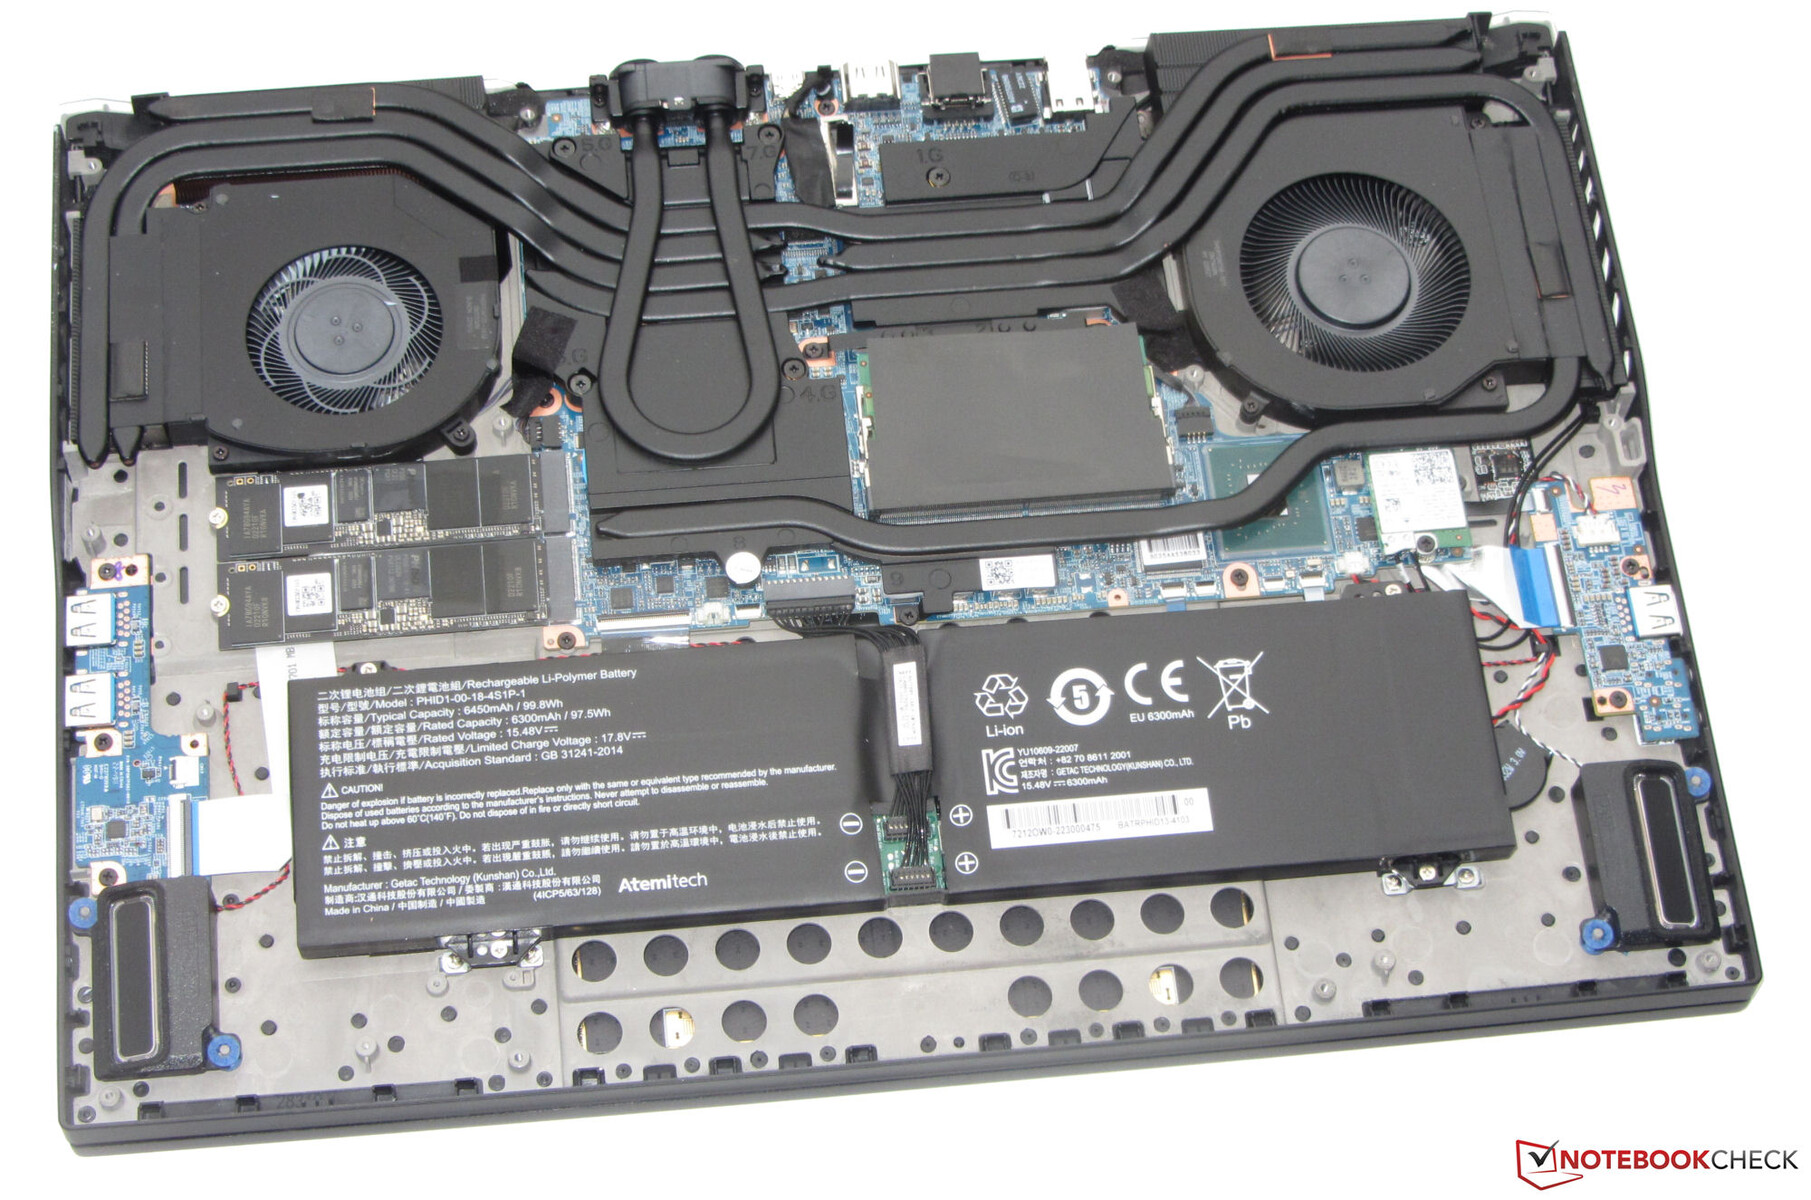
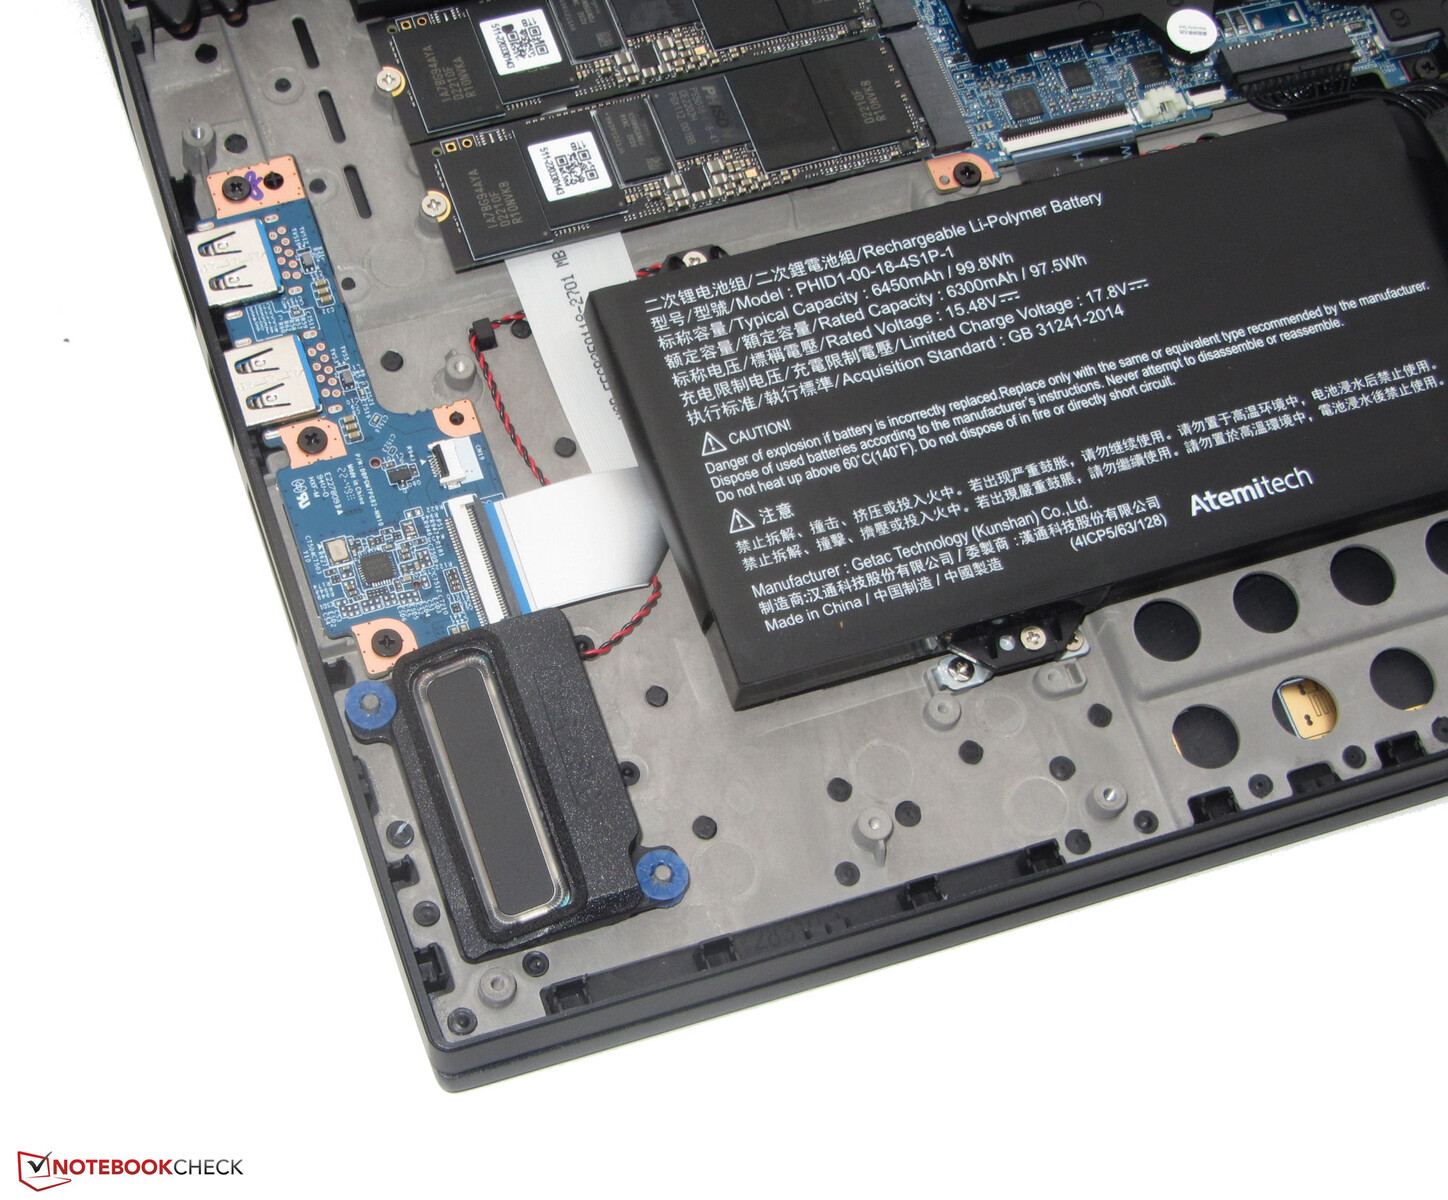
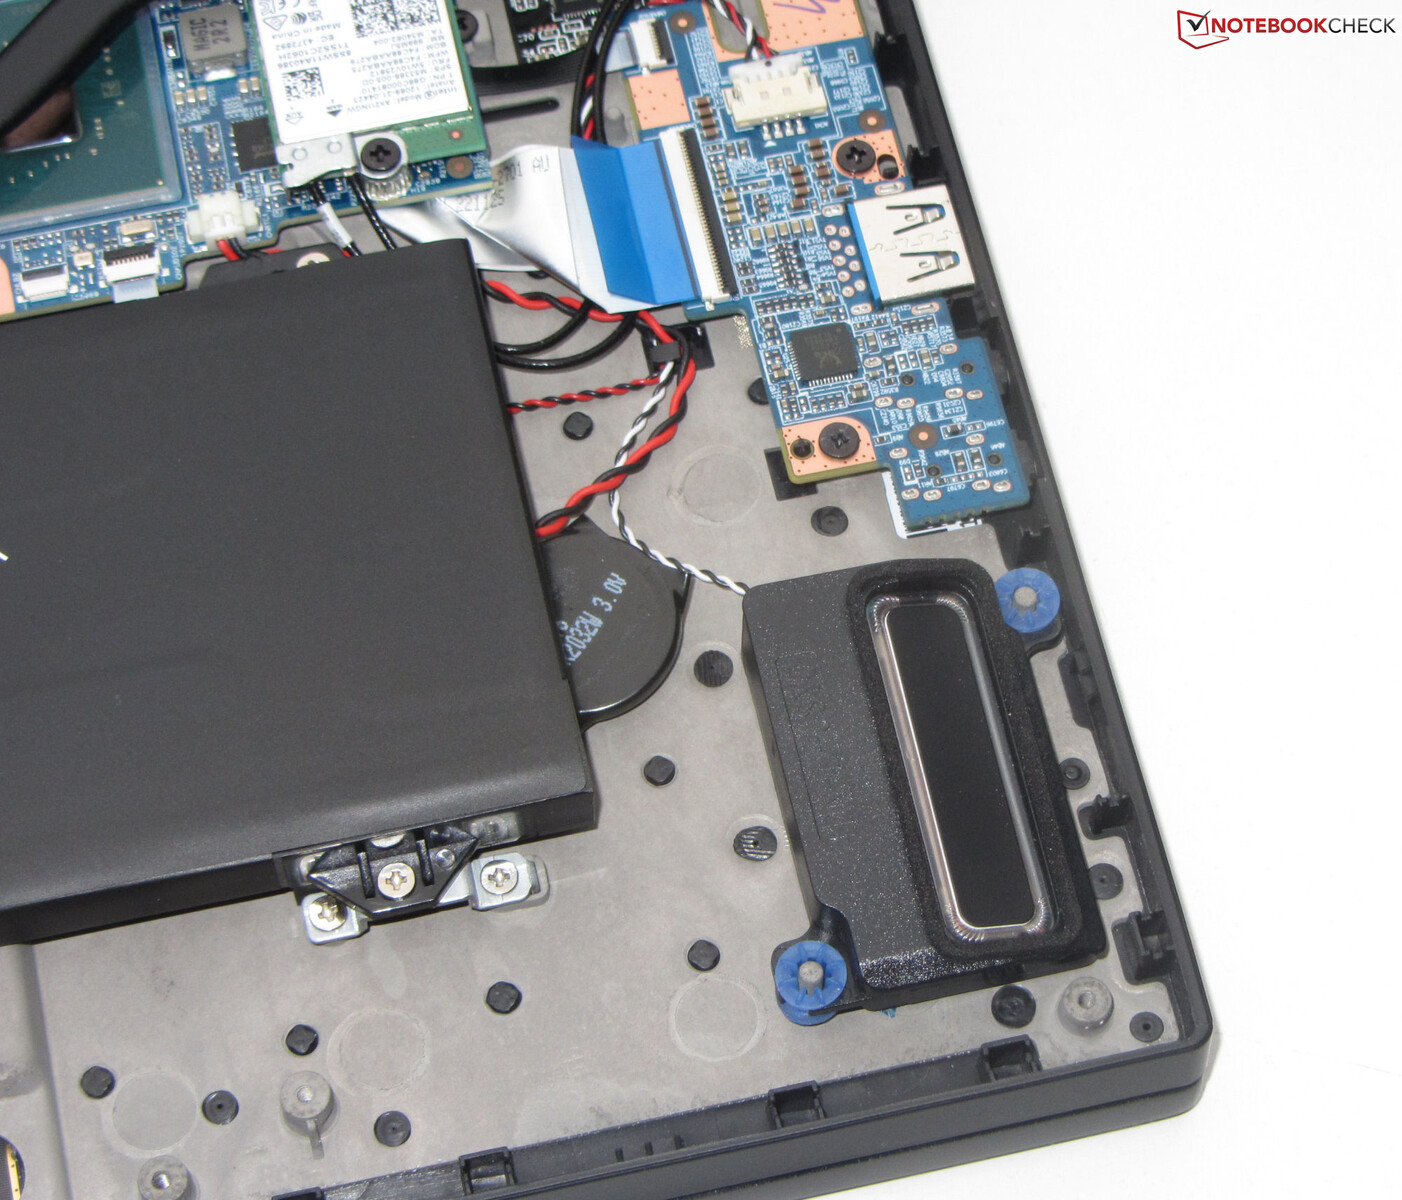
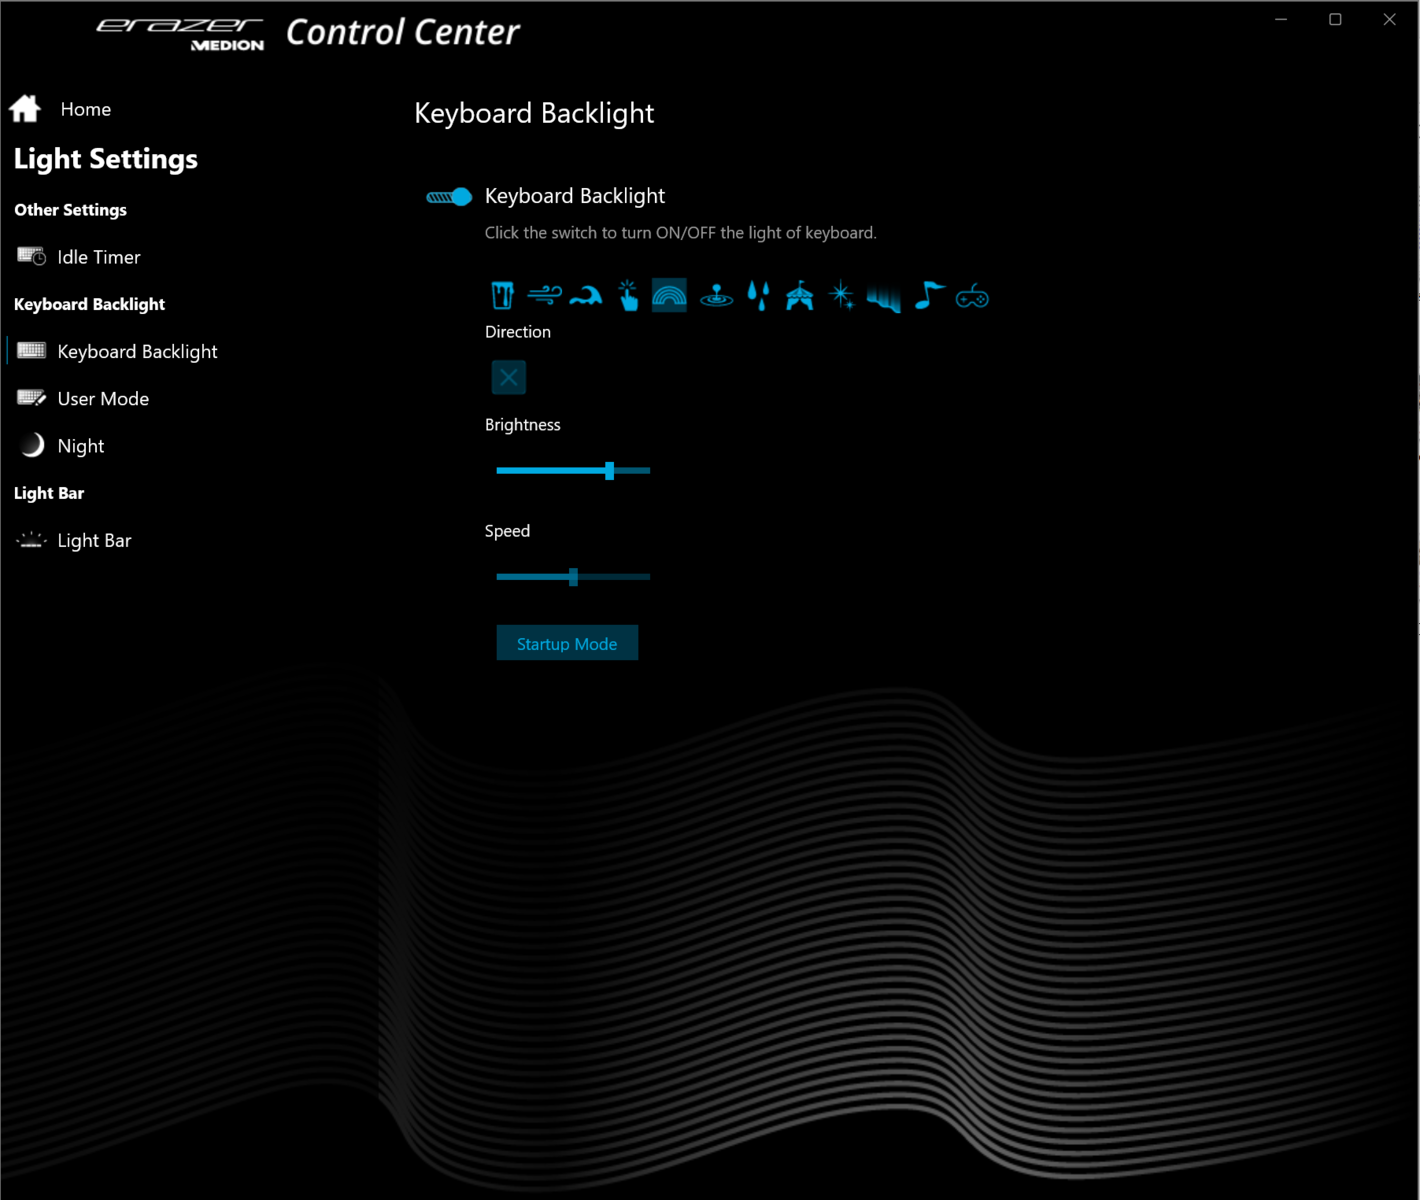
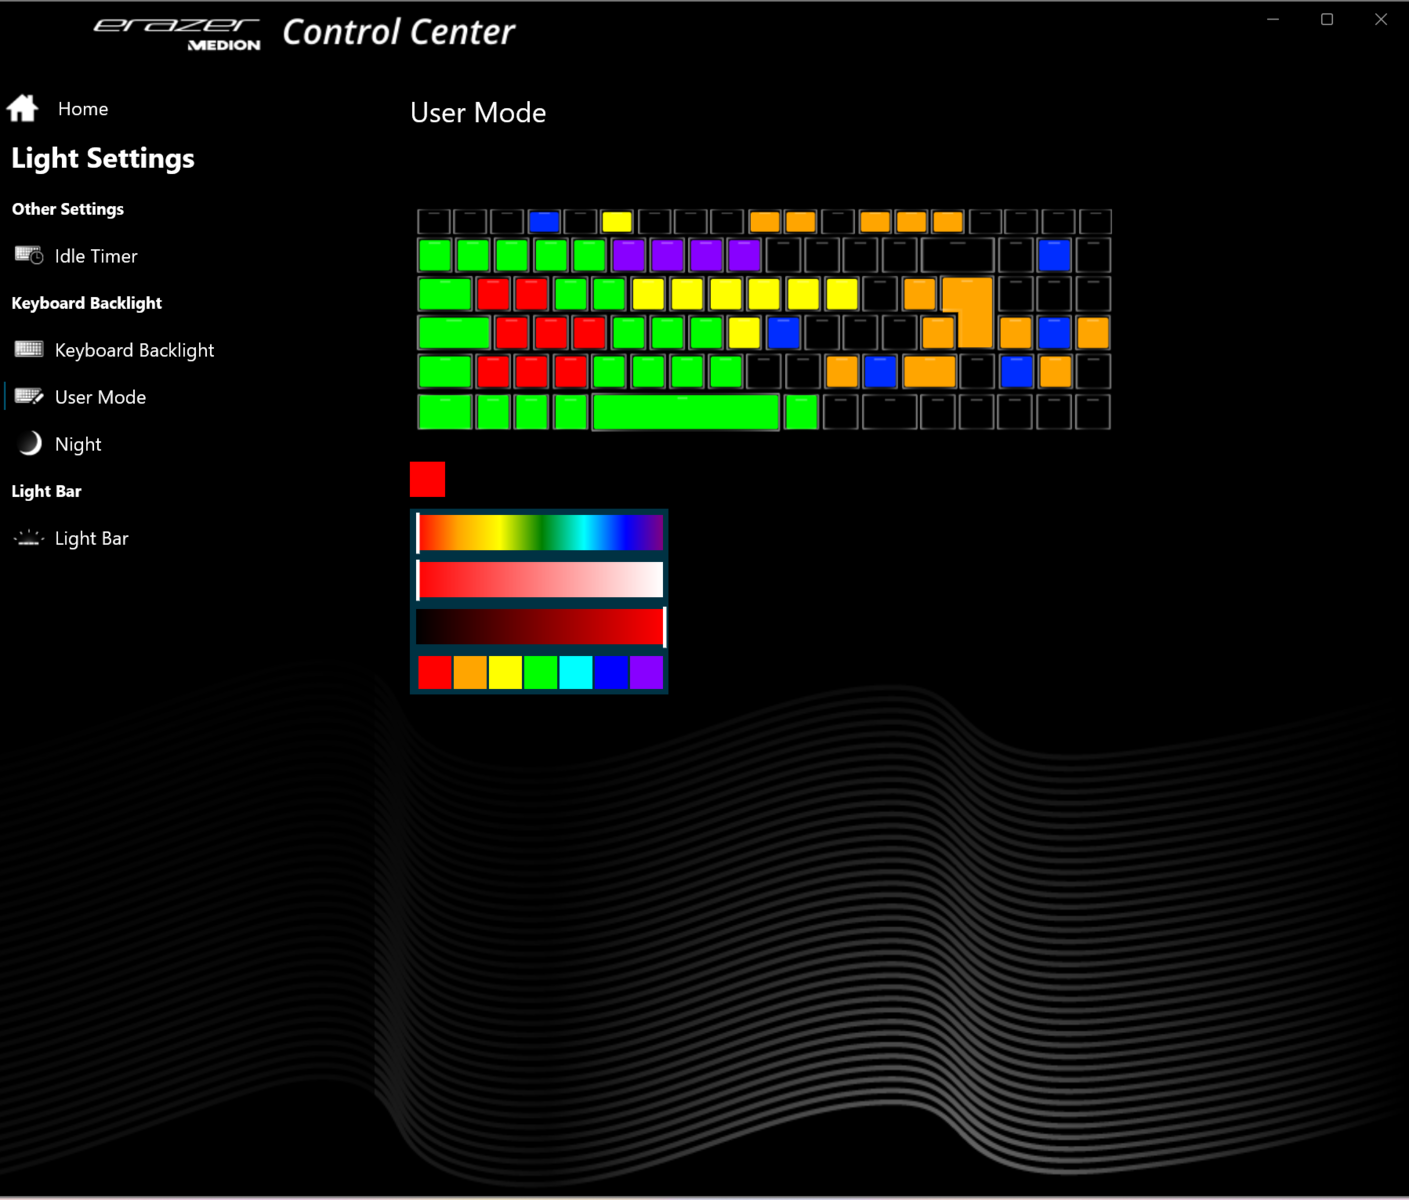
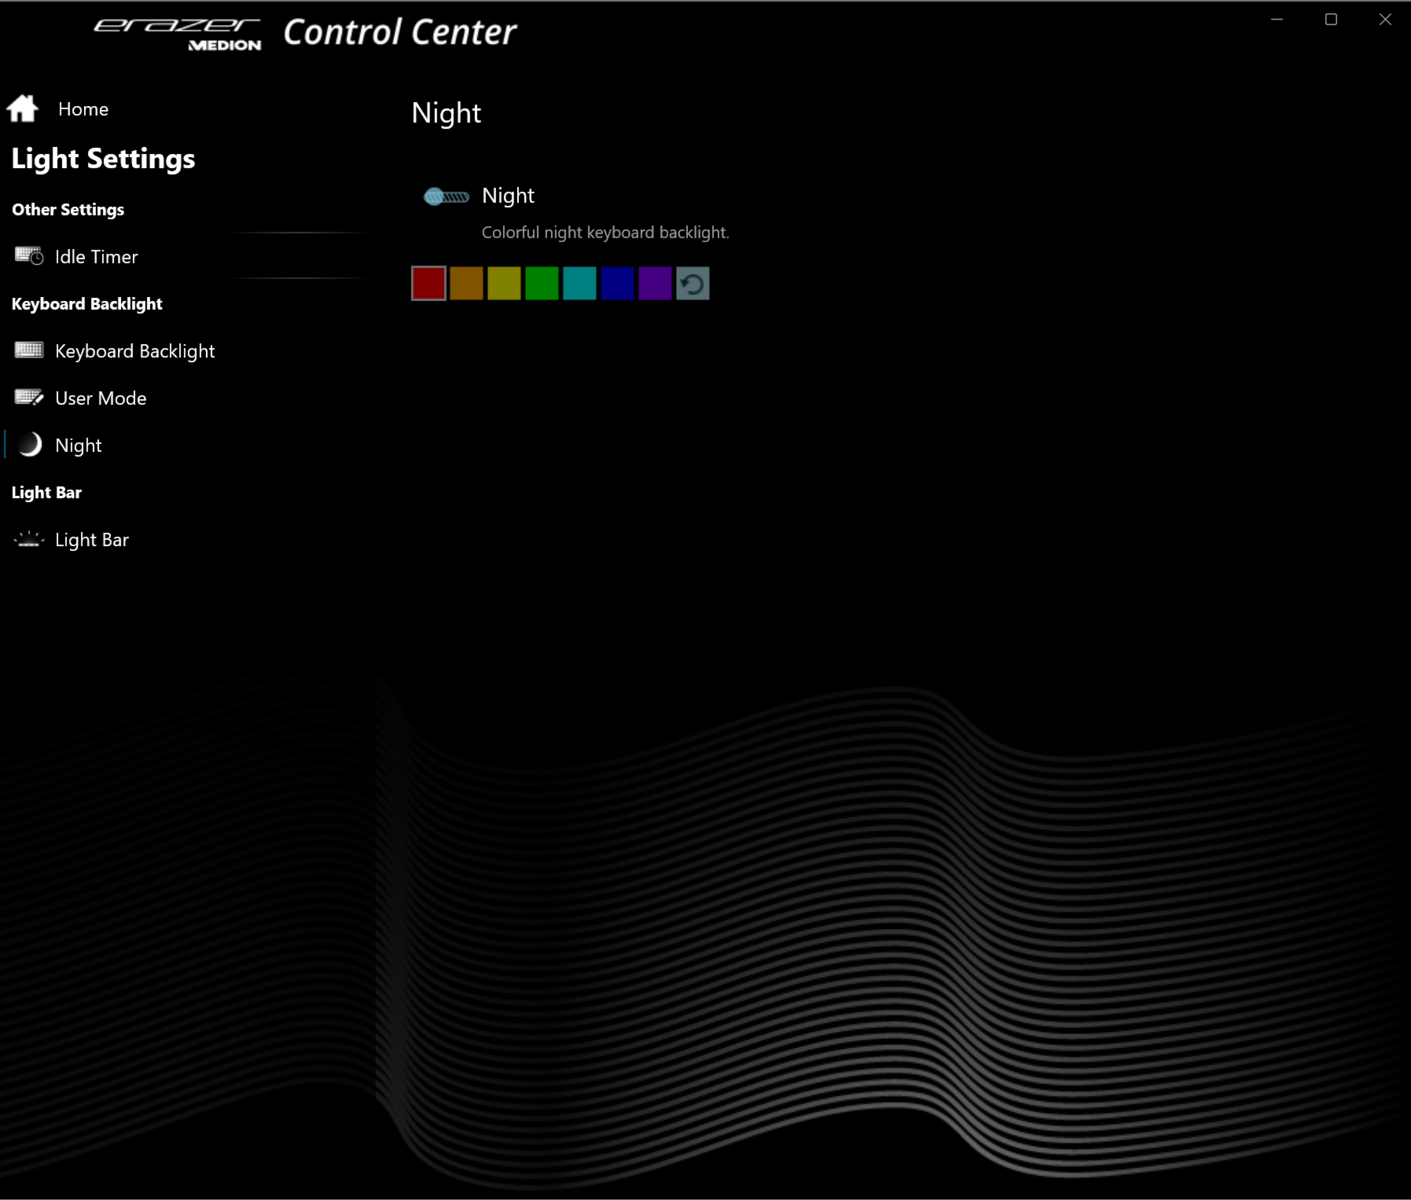
Erazer Beast X40 rezygnuje z głośnego i krzykliwego wyglądu na rzecz stonowanej konstrukcji, która nie będzie się wyróżniać w profesjonalnym otoczeniu. Podobnie jak w przypadku poprzedników, X40 wykorzystuje czarną metalową obudowę z matowymi wykończeniami. Część bazowa jest pokryta gumową, chwytliwą powłoką. Podświetlenie klawiatury (RGB), a także dwie w pełni konfigurowalne listwy LED (RGB) nad tylnymi otworami wydechowymi zapewniają laptopowi szczyptę koloru. Akumulator, który jest przykręcony a nie przyklejony, oraz reszta elementów wewnętrznych są dostępne po zdjęciu dolnej pokrywy.
W naszym egzemplarzu testowym nie zauważyliśmy żadnych problemów z jakością wykonania. Szczeliny w obudowie są ładne i ciasne, a z procesu produkcji nie pozostał żaden nadmiar materiału. Skręcenie sekcji bazowej jest praktycznie niemożliwe. Wieko może się nieco uginać, ale jego ugięcie jest w pełni akceptowalne. Zawiasy trzymają wyświetlacz mocno na miejscu i pozwalają na odchylenie go do tyłu o mniej więcej 140 stopni. Pokrywy laptopa nie da się otworzyć jedną ręką.
Medion Erazer Beast X40 jest jednym z najbardziej kompaktowych urządzeń w naszym porównaniu i plasuje się gdzieś pośrodku, jeśli chodzi o wagę.
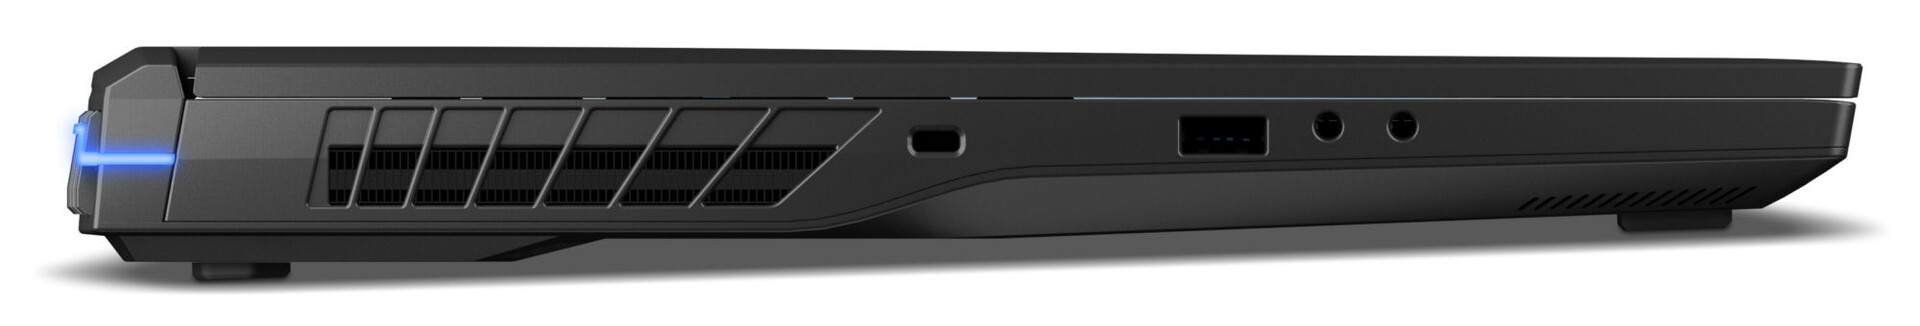
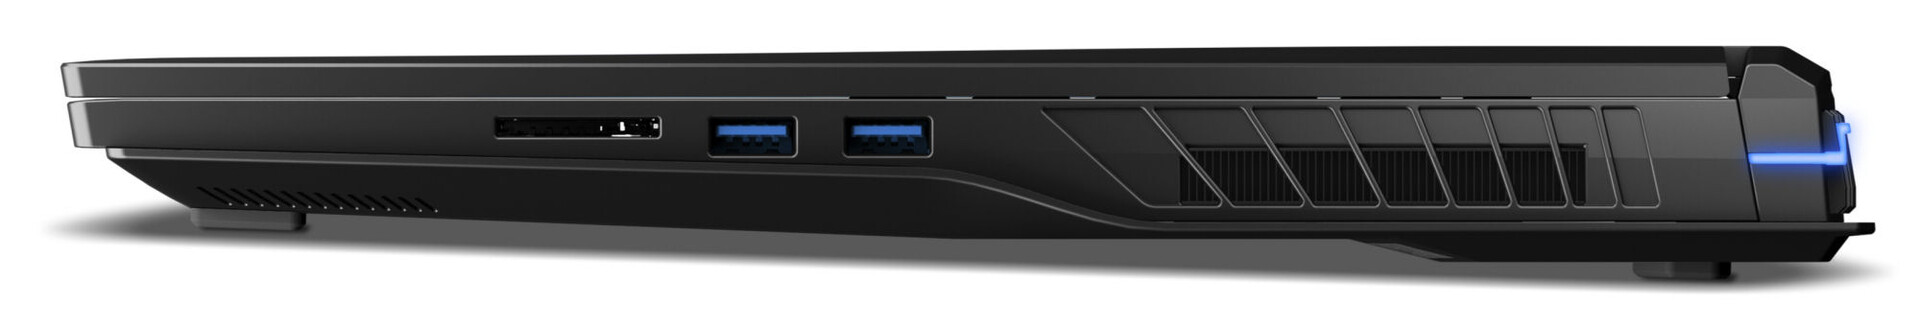
Specyfikacja - Thunderbolt 4 dla Bestii
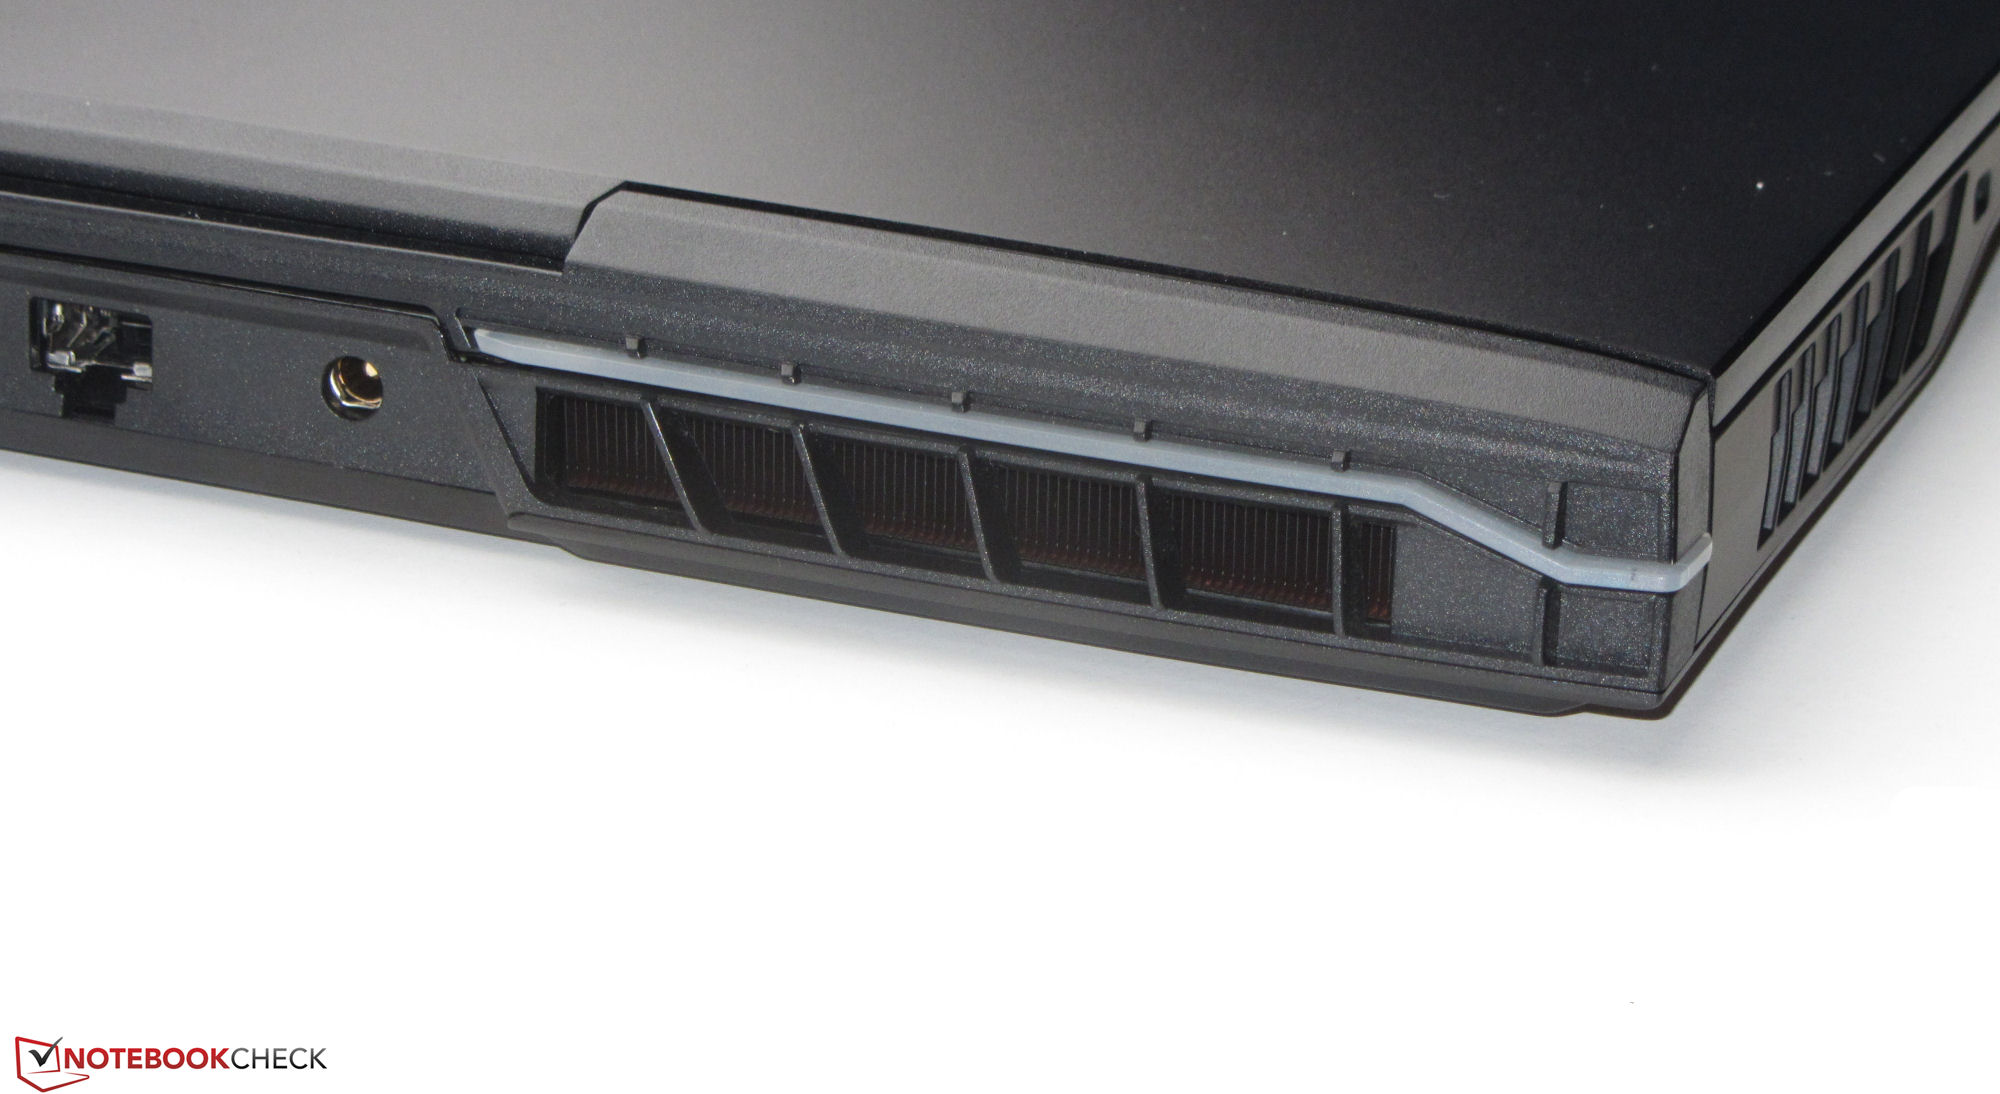
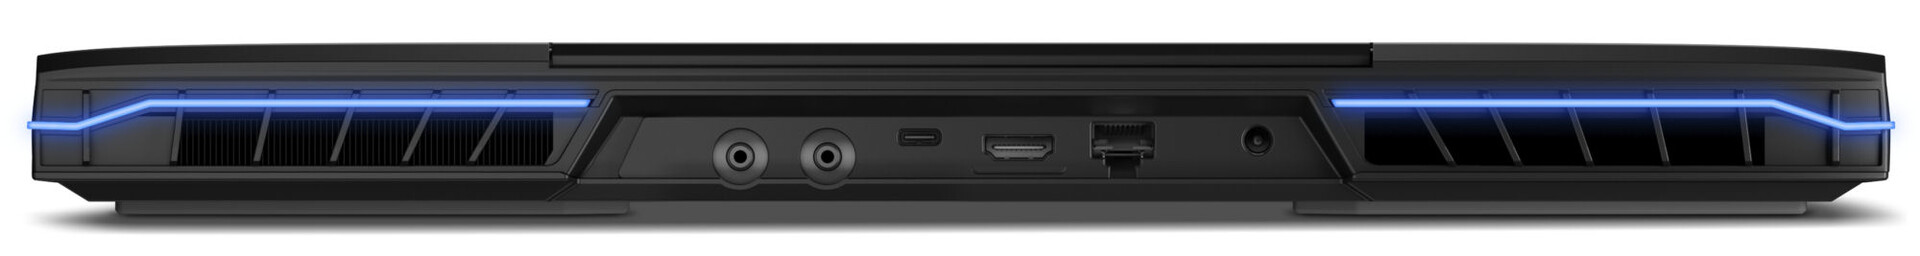
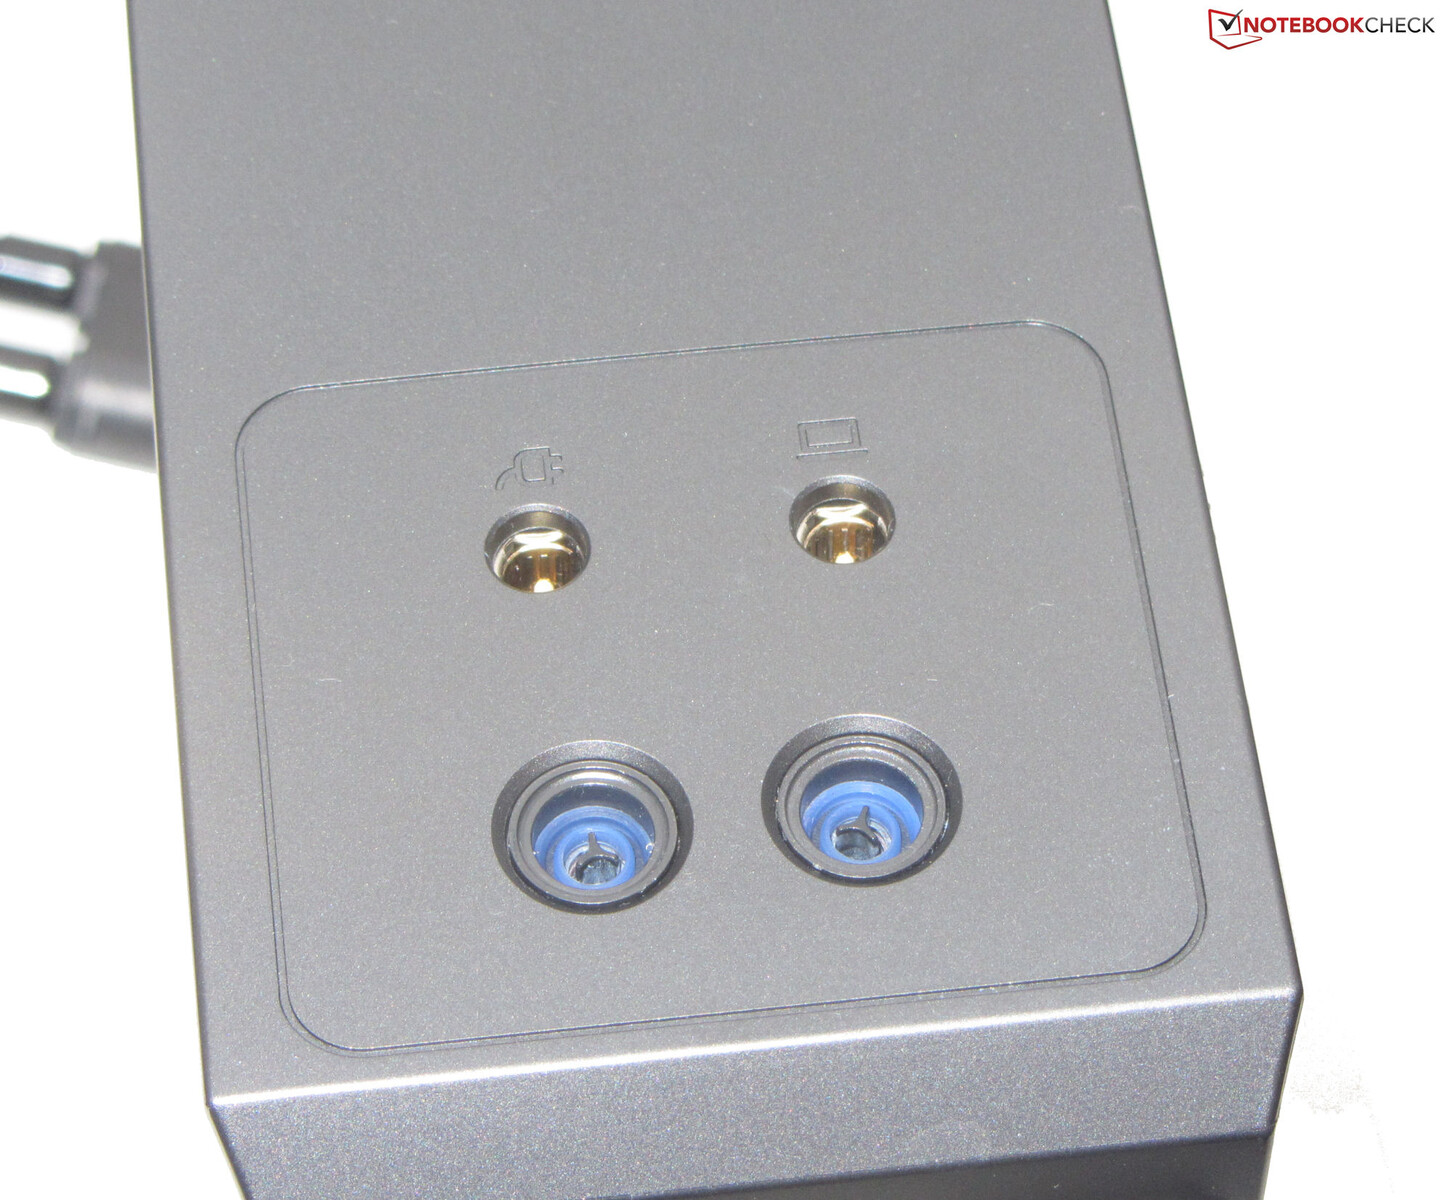
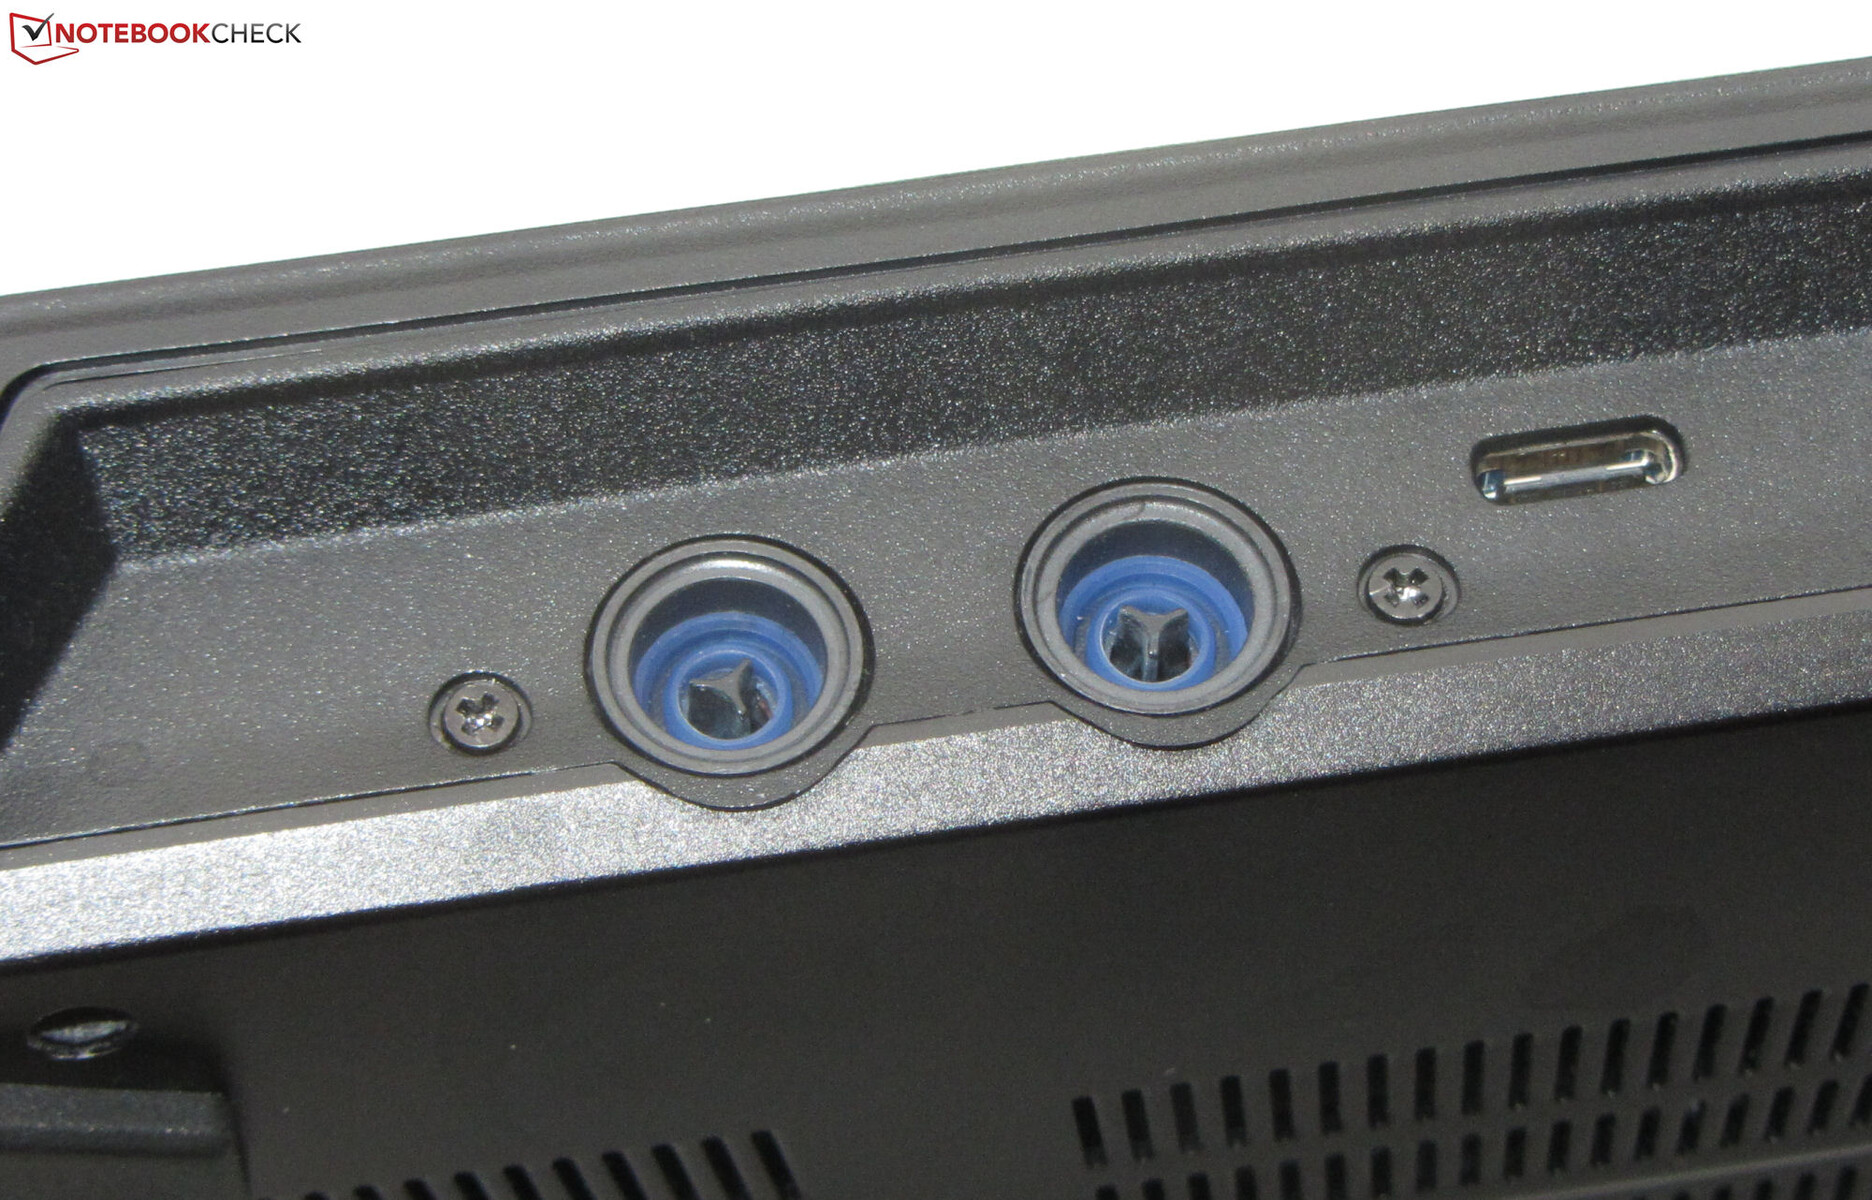
Erazer ma na pokładzie trzy porty USB-A (2x USB 3.2 Gen 1, 1x USB 3.2 Gen 2) i port USB-C (Thunderbolt 4). Ten ostatni nie obsługuje Power Delivery, ale jest w stanie wyprowadzić sygnał DisplayPort. Laptop posiada łącznie dwa wyjścia wideo (HDMI 2.1, DP), dwa gniazda audio (słuchawkowe i mic-in), jeden port Gigabit Ethernet oraz gniazdo Kensington. Z tyłu znajdziemy też złącza dla opcjonalnego rozwiązania chłodzenia wodnego.
Czytnik kart SD
Czytnik kart SD to model o średniej prędkości, który w połączeniu z naszą kartą referencyjną AV Pro microSD 128 GB V60 zdołał osiągnąć prędkość do 77 MB/s przy transferze 250 obrazów JPEG o wielkości około 5 MB każdy oraz 86 MB/s przy kopiowaniu dużych porcji danych.
| SD Card Reader | |
| average JPG Copy Test (av. of 3 runs) | |
| Alienware x17 R2 P48E (AV Pro V60) | |
| Średnia w klasie Gaming (20.9 - 210, n=54, ostatnie 2 lata) | |
| Razer Blade 16 Early 2023 (AV PRO microSD 128 GB V60) | |
| MSI Titan GT77 HX 13VI (Angelibird AV Pro V60) | |
| Medion Erazer Beast X40 (AV PRO microSD 128 GB V60) | |
| Schenker XMG Neo 17 M22 (AV PRO microSD 128 GB V60) | |
| maximum AS SSD Seq Read Test (1GB) | |
| Alienware x17 R2 P48E (AV Pro V60) | |
| Razer Blade 16 Early 2023 (AV PRO microSD 128 GB V60) | |
| Średnia w klasie Gaming (25.5 - 261, n=51, ostatnie 2 lata) | |
| MSI Titan GT77 HX 13VI (Angelibird AV Pro V60) | |
| Medion Erazer Beast X40 (AV PRO microSD 128 GB V60) | |
Łączność
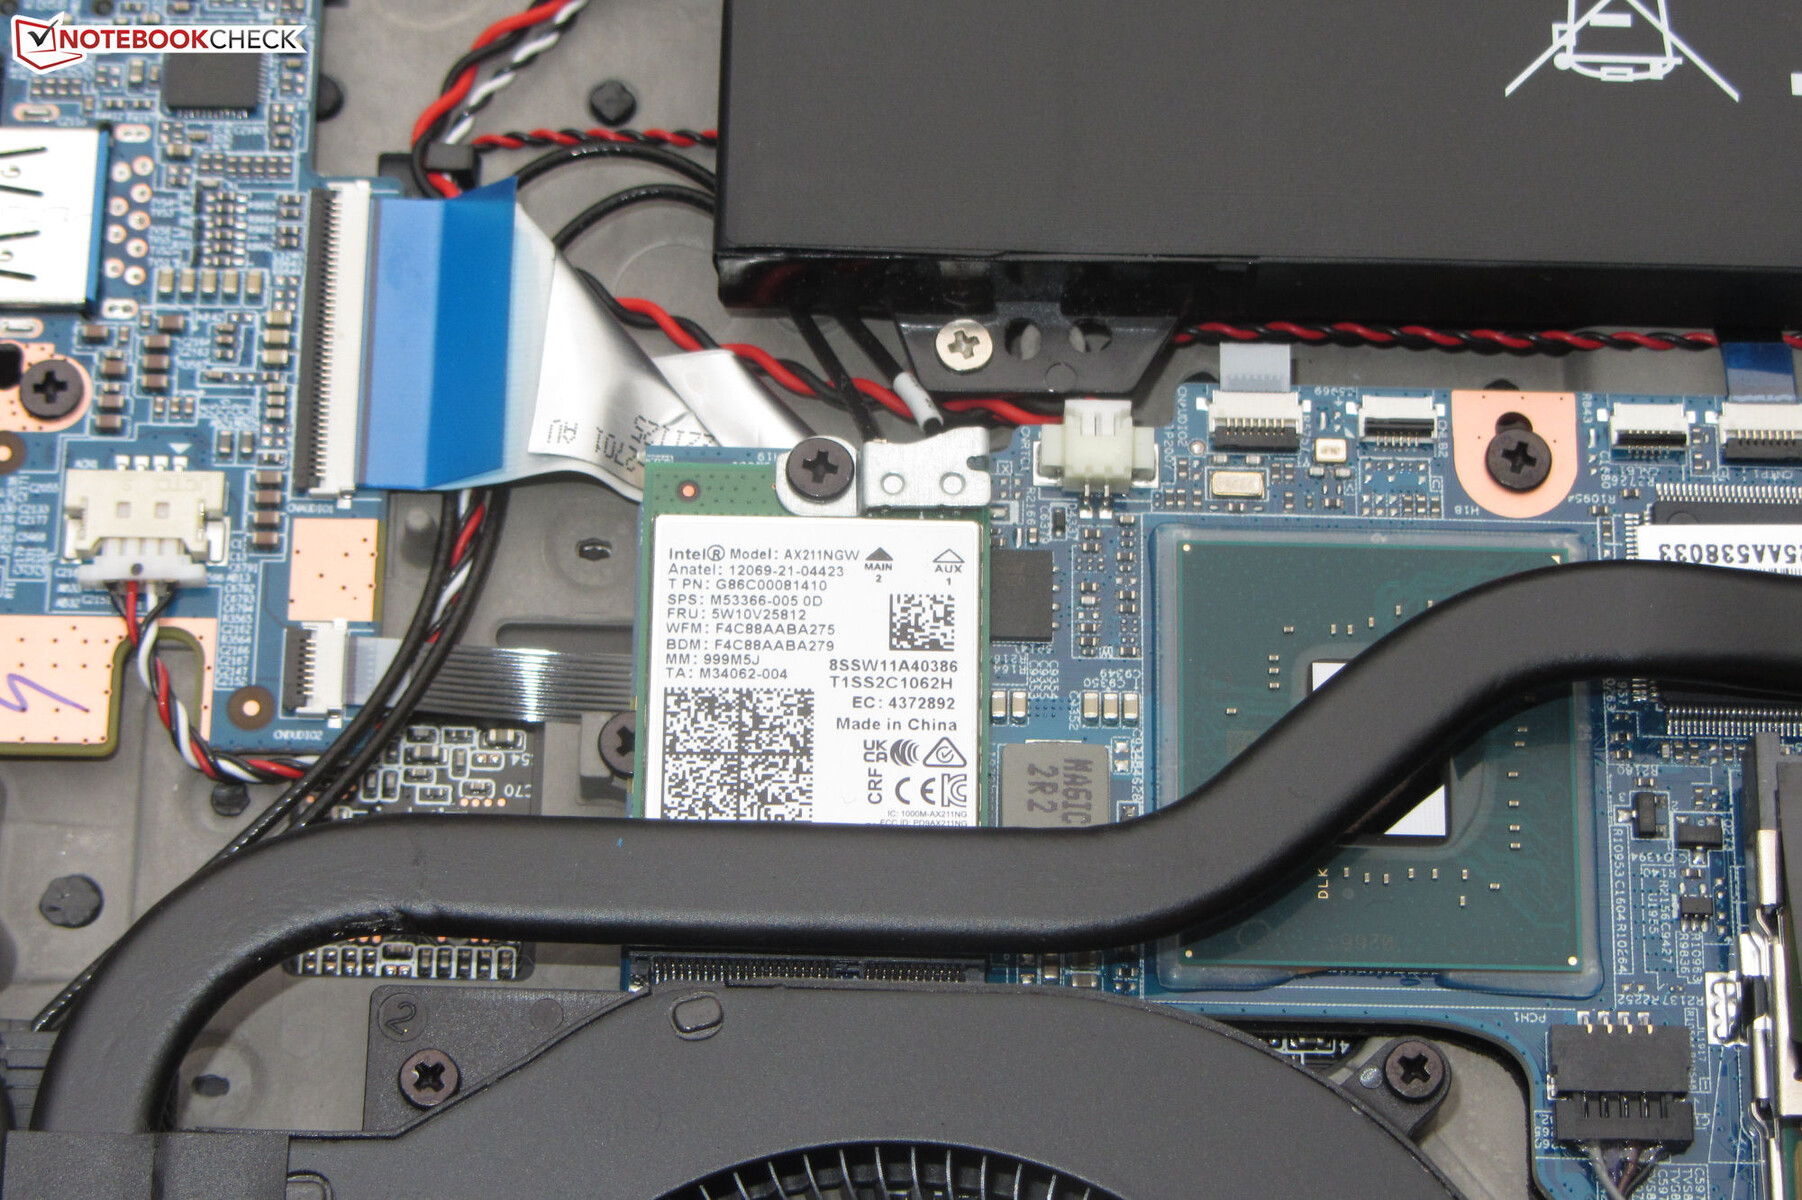
W optymalnych warunkach (brak innych urządzeń Wi-Fi w bezpośrednim otoczeniu, niewielka odległość między laptopem a komputerem serwerowym) Erazer zapewniał doskonałe prędkości transferu przez Wi-Fi, ponieważ Medion zdecydował się na moduł Intel AX211 Wi-Fi 6E. Za przewodowe połączenia sieciowe odpowiada układ Realtek RTL8125 Gigabit Ethernet, który jest w stanie osiągnąć prędkość do 2,5 Gbit/s.
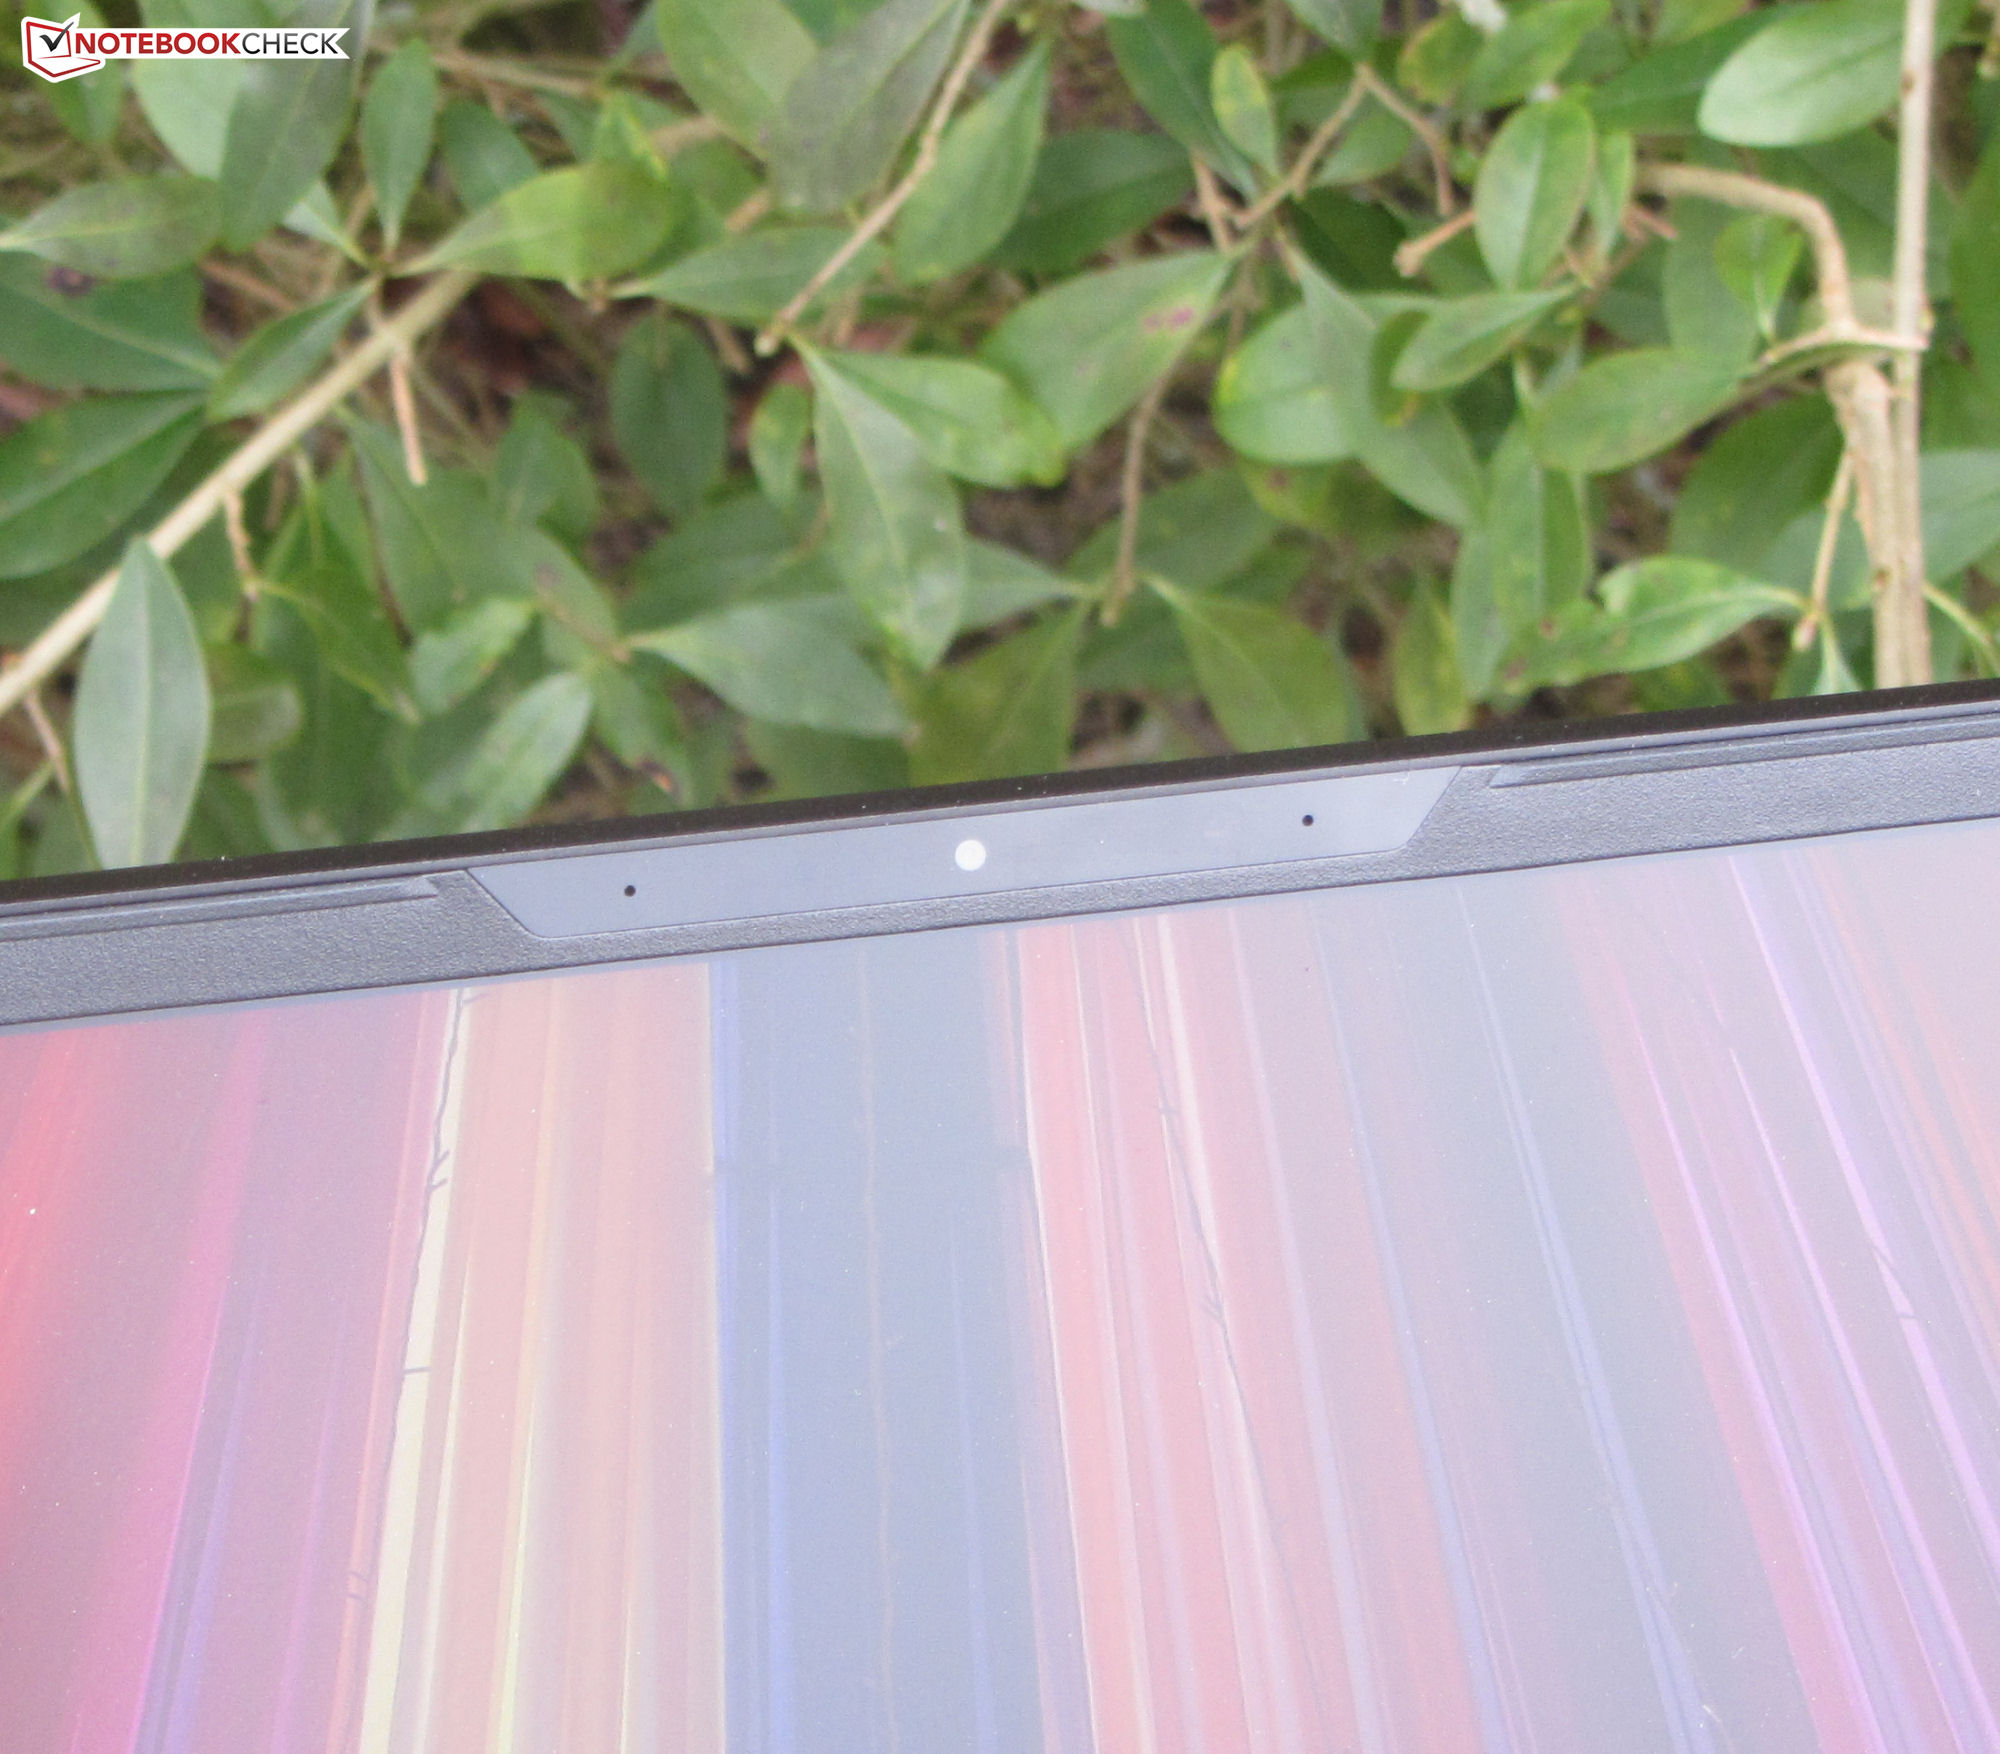
Kamera internetowa
Kamera internetowa 2,1MP rejestruje obrazy w maksymalnej rozdzielczości 1 920 x 1 080. Brakuje jej dokładności odwzorowania kolorów: kolory wytwarzane przez kamerę znacznie odbiegają od kolorów referencyjnych. W kamerze internetowej nie ma mechanicznej migawki prywatności.


Akcesoria
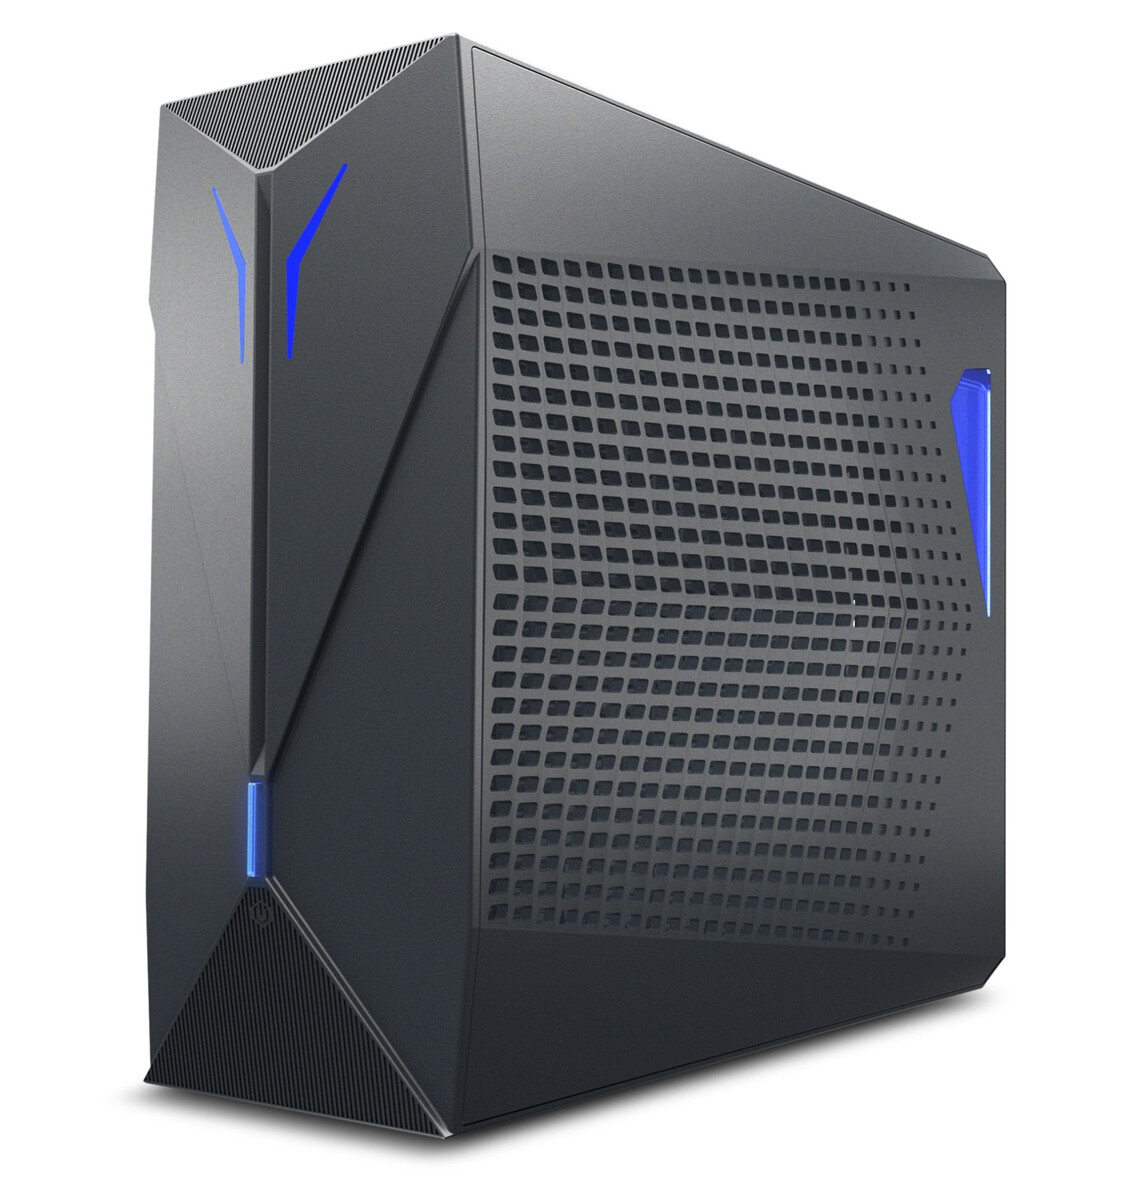
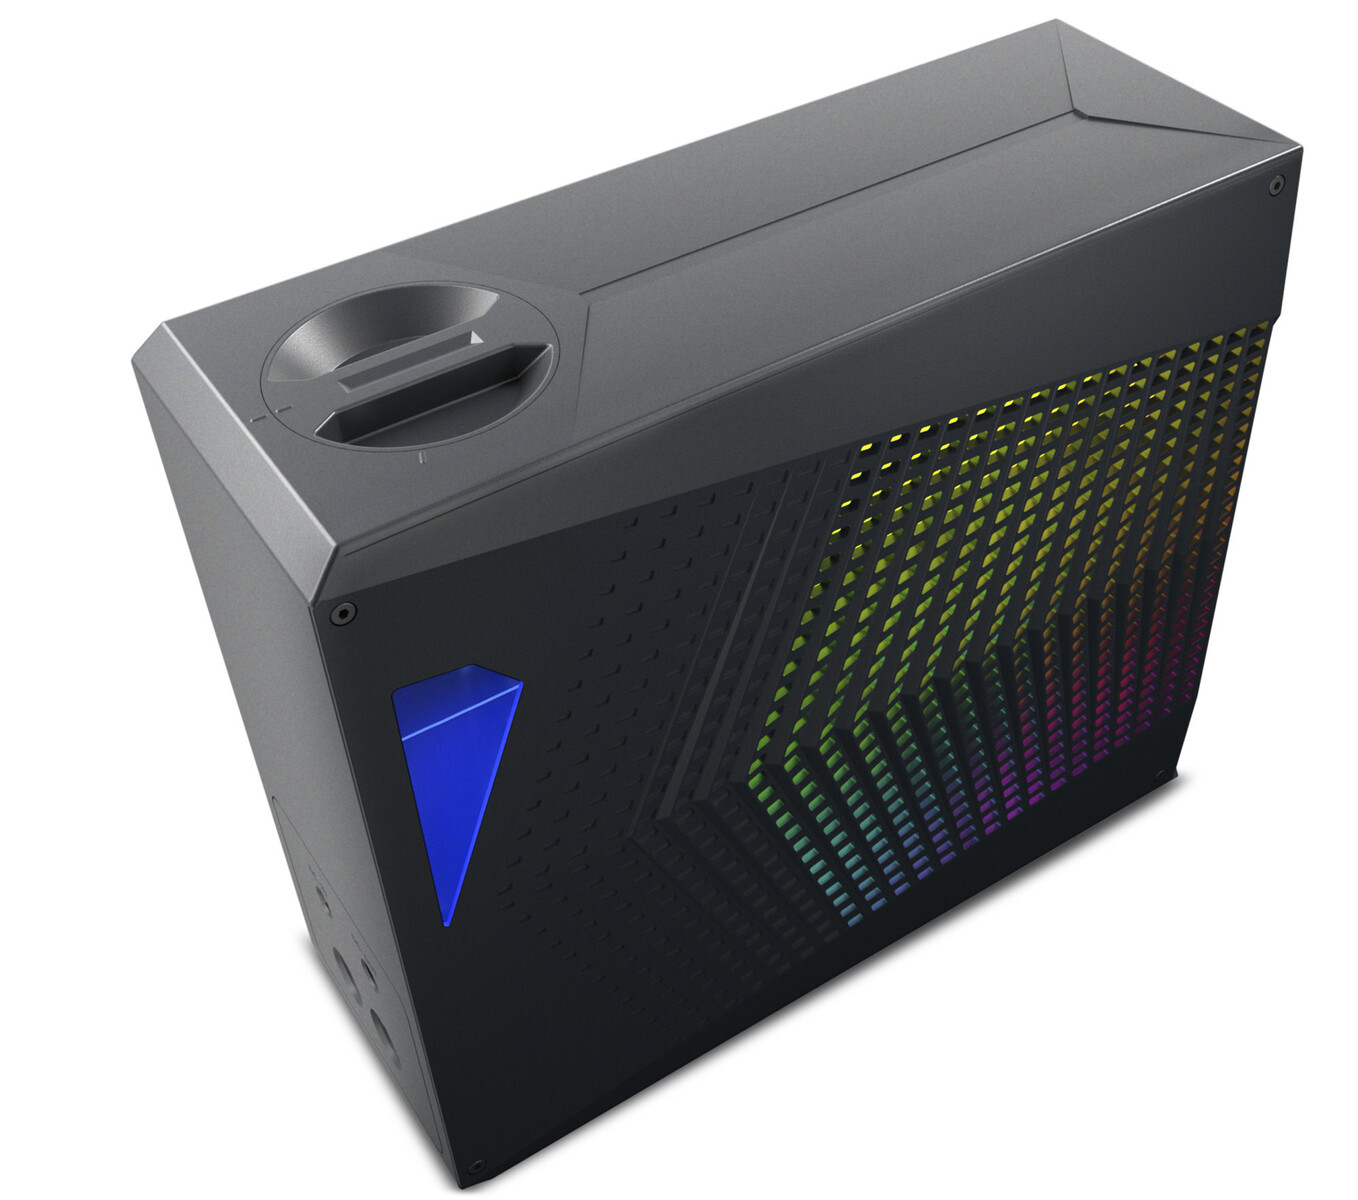
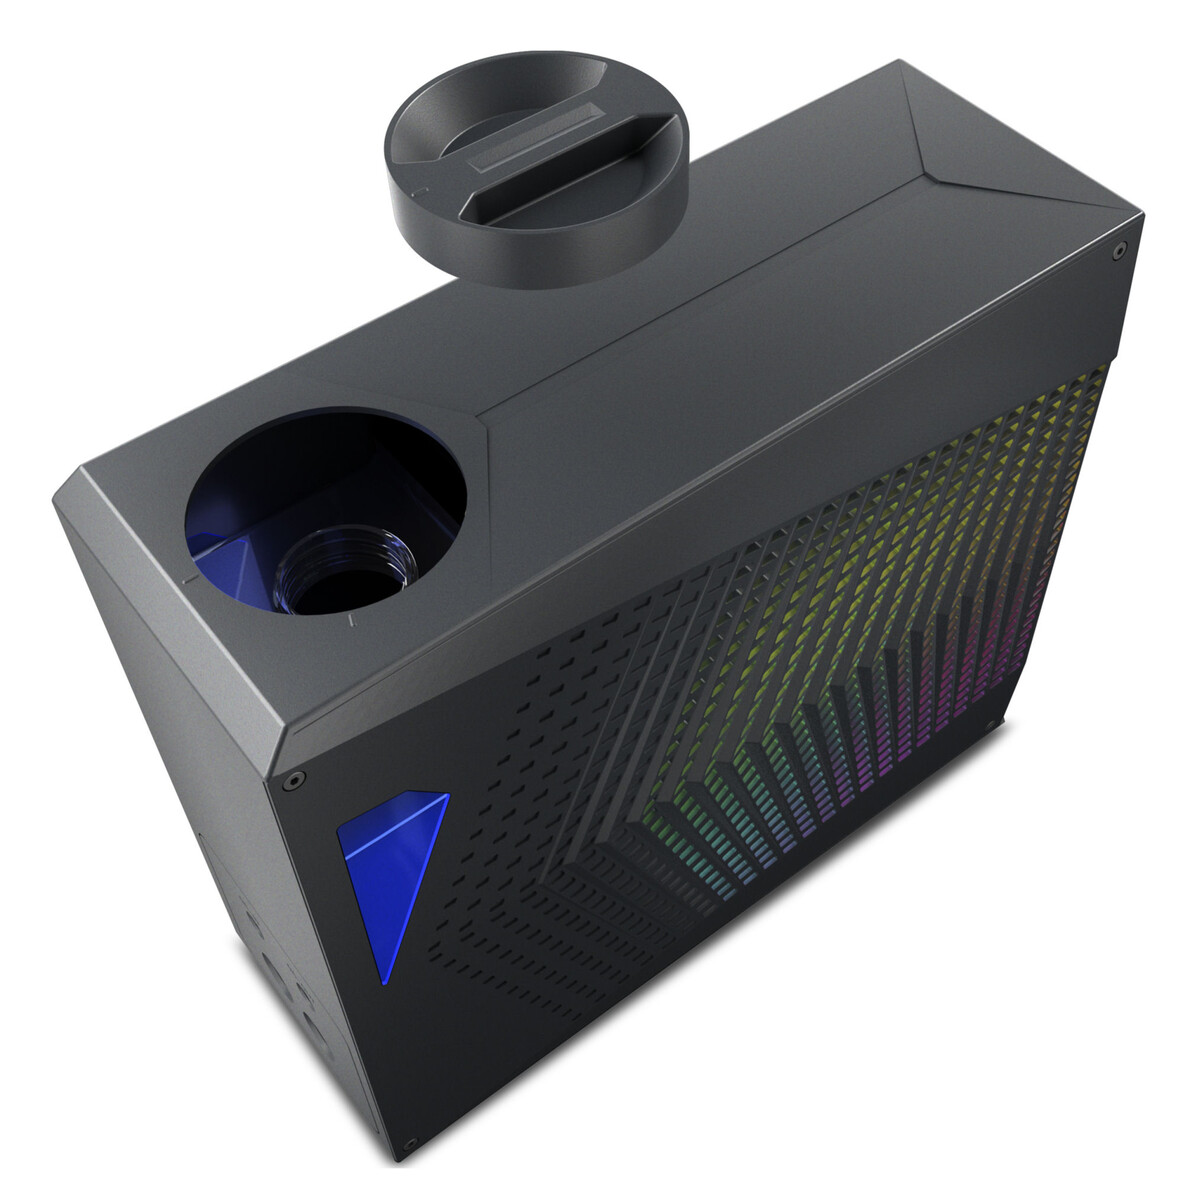
Do laptopa nie dołączono żadnych innych akcesoriów poza zwykłą dokumentacją i zasilaczem. Medion oferuje opcjonalne zewnętrzne chłodzenie wodne w cenie około 250 euro (270 dolarów), które również dostarczyła nam do testów.
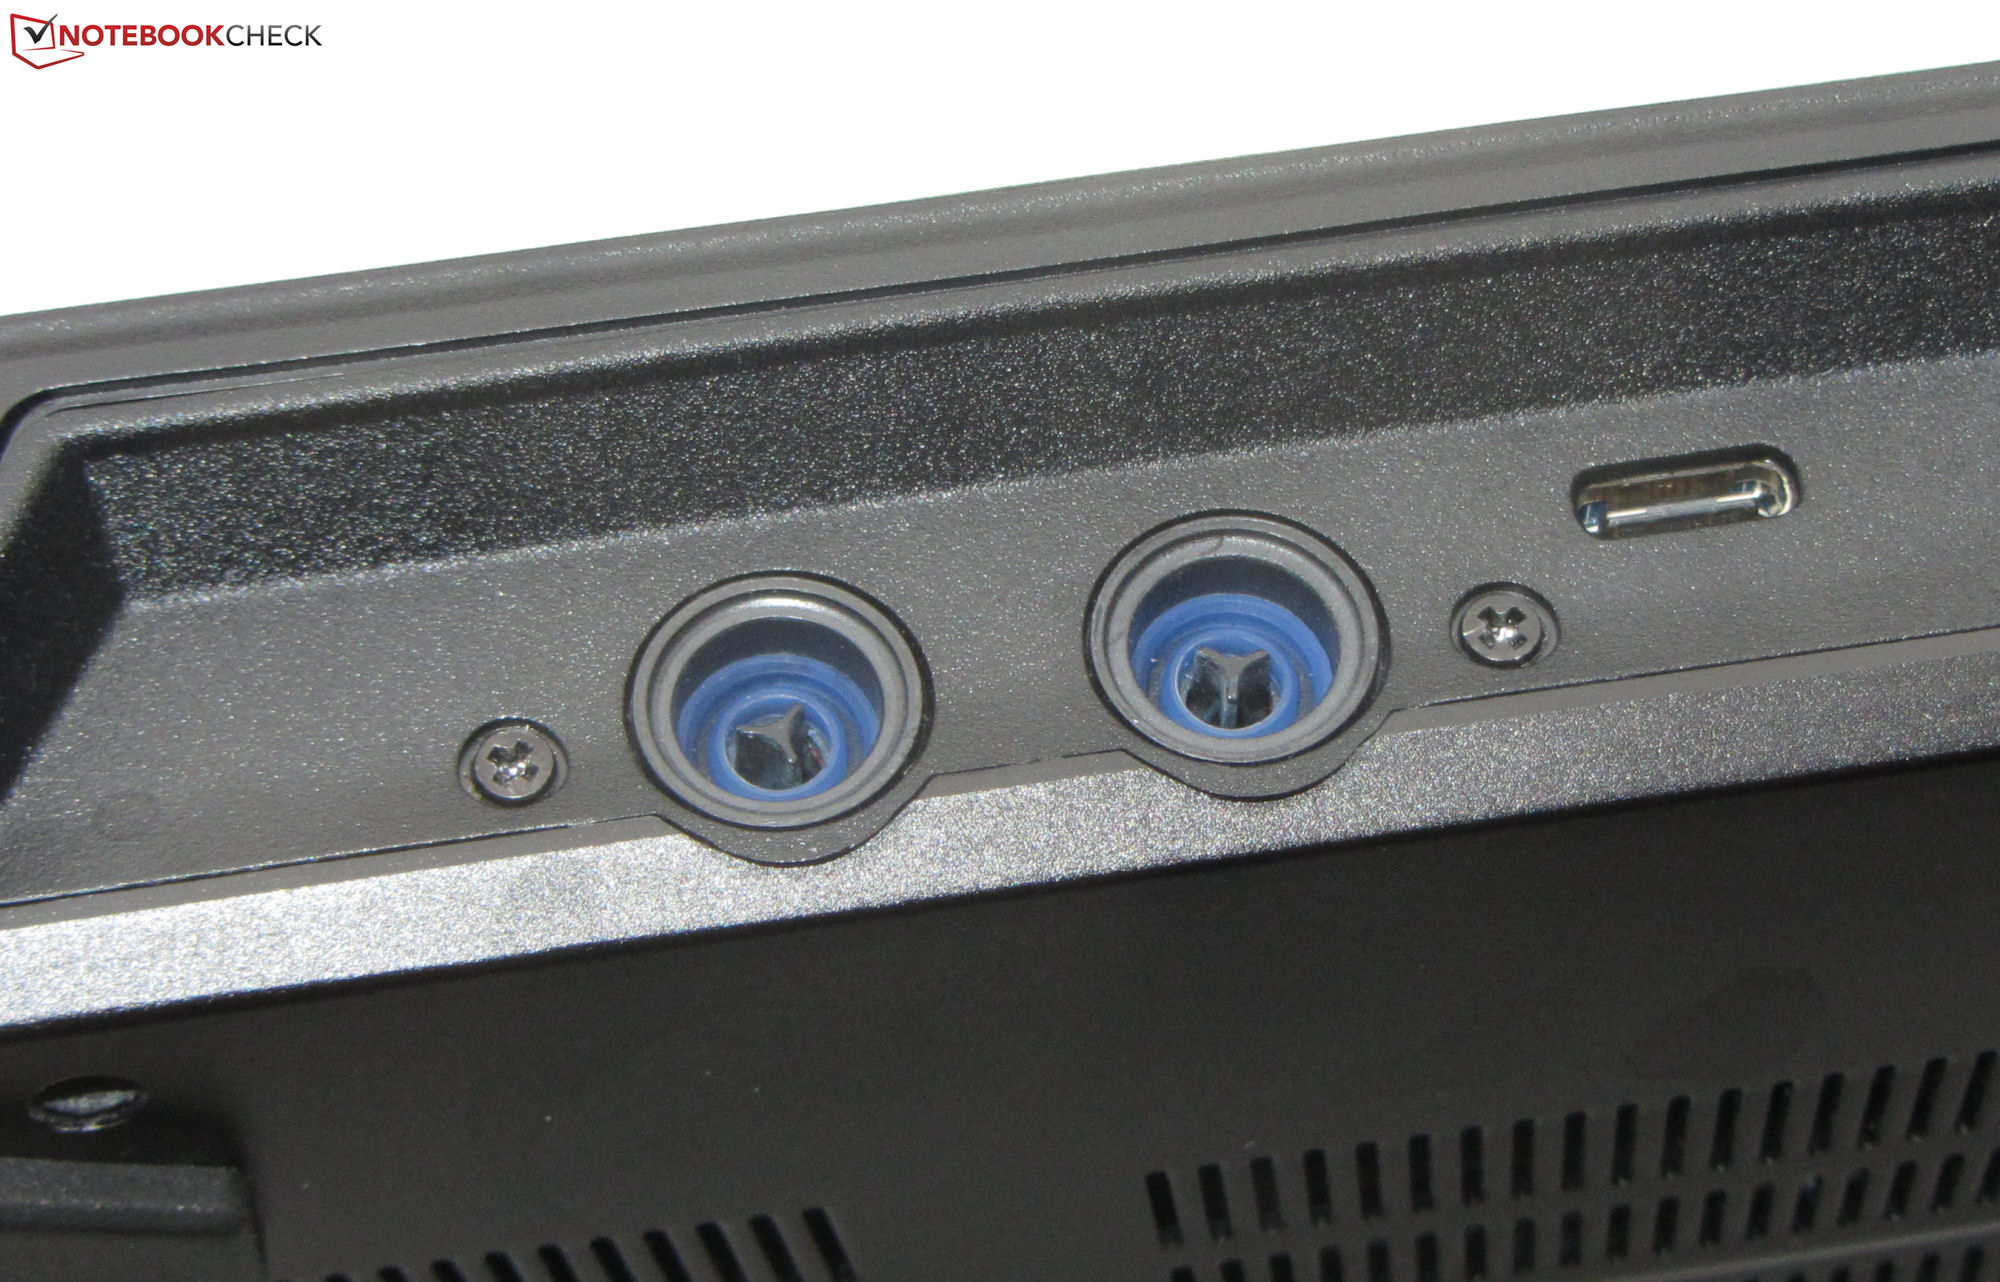
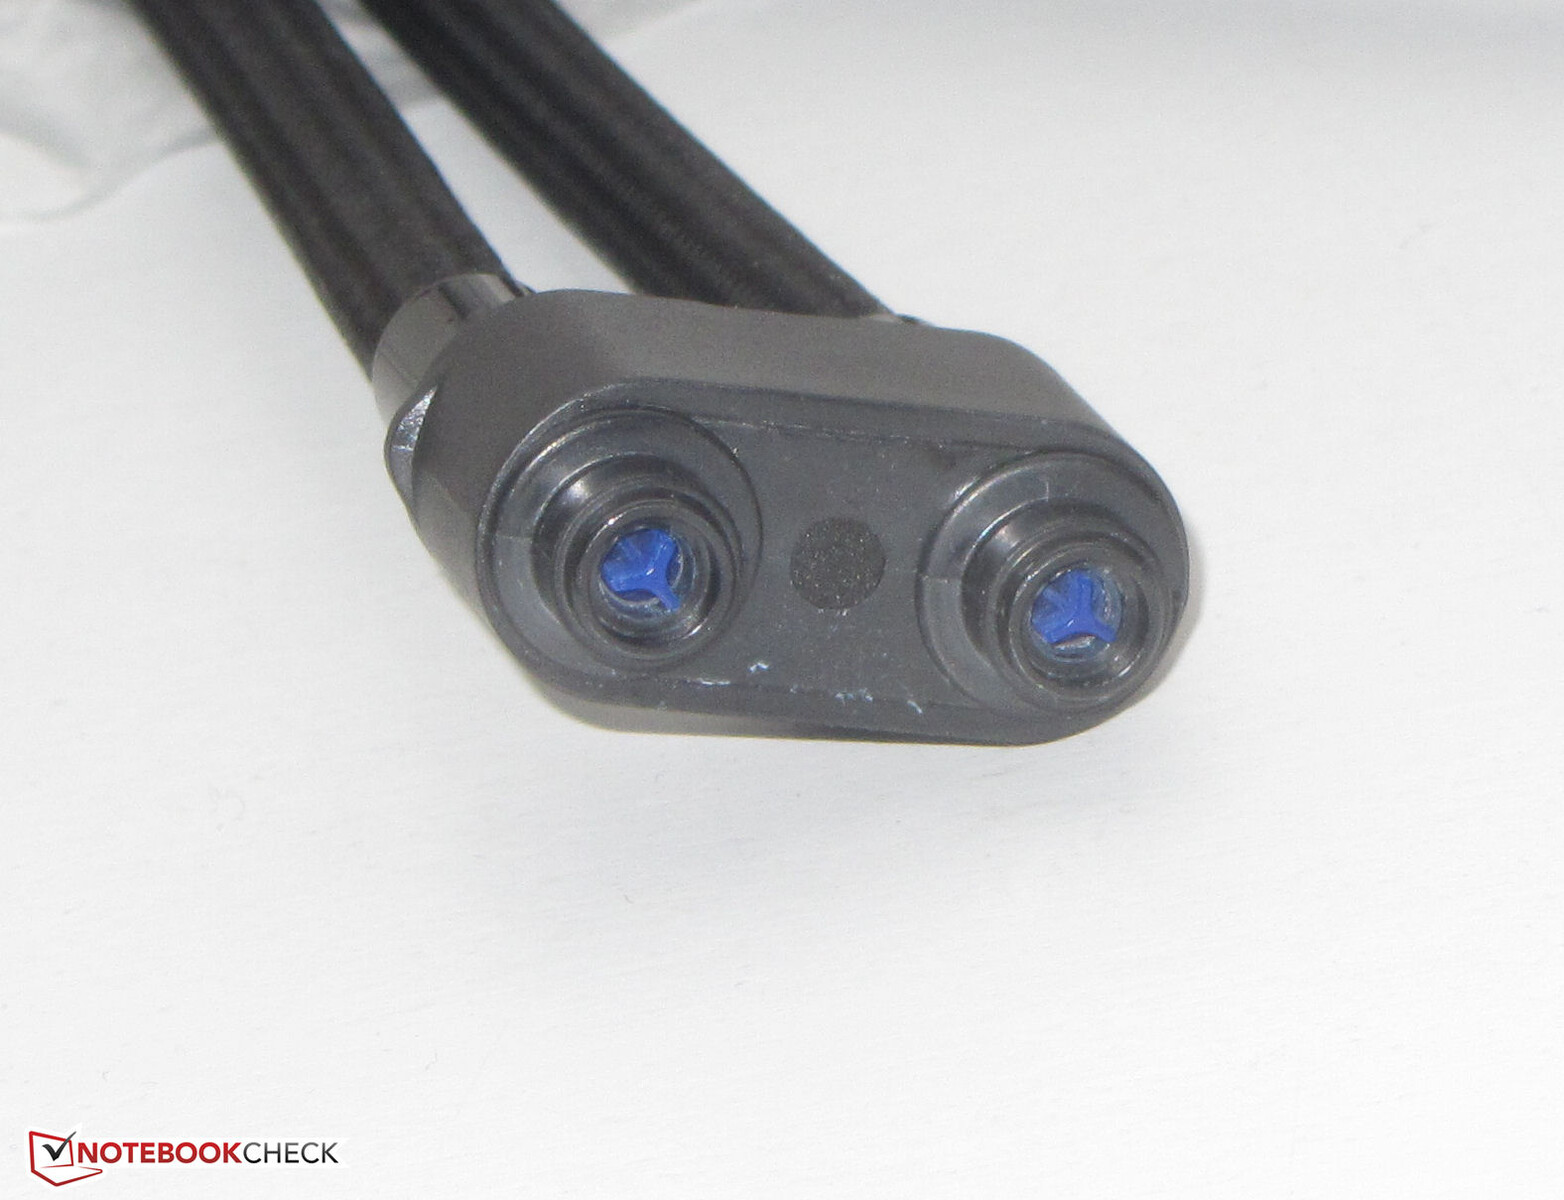
Niewielkie urządzenie chłodzące jest dość proste w obsłudze: wystarczy napełnić je wodą destylowaną, podłączyć kable i rurki, a następnie włączyć. Laptop i zewnętrzna jednostka chłodząca komunikują się ze sobą przez Bluetooth, a połączenie jest nawiązywane automatycznie. Ładowarka laptopa zasila zarówno X40, jak i jednostkę chłodzącą. Rurki z wodą utrzymywane są na miejscu magnetycznie - nie trzeba dokręcać śrubek. Podczas odłączania rurek może jednak wyciec kilka kropel wody.
Konserwacja
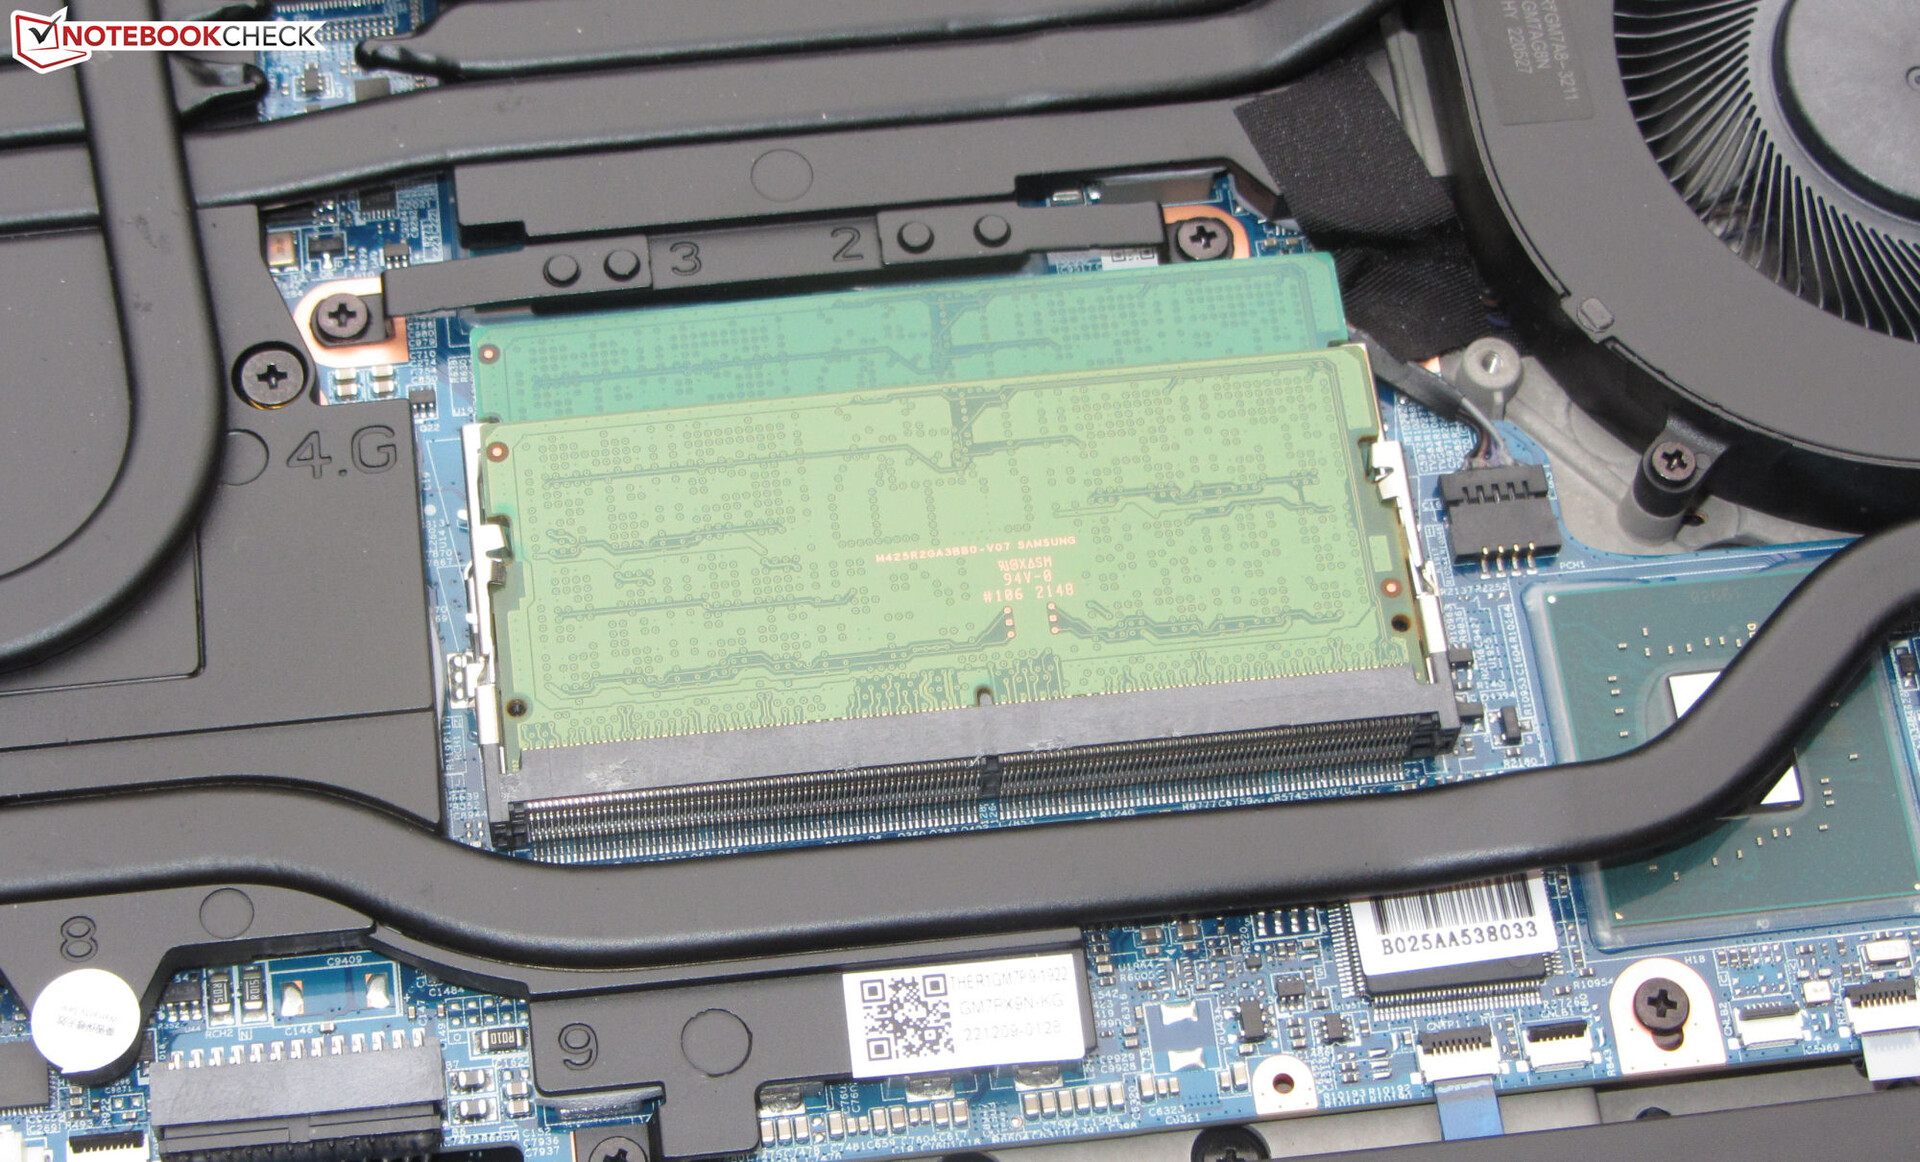
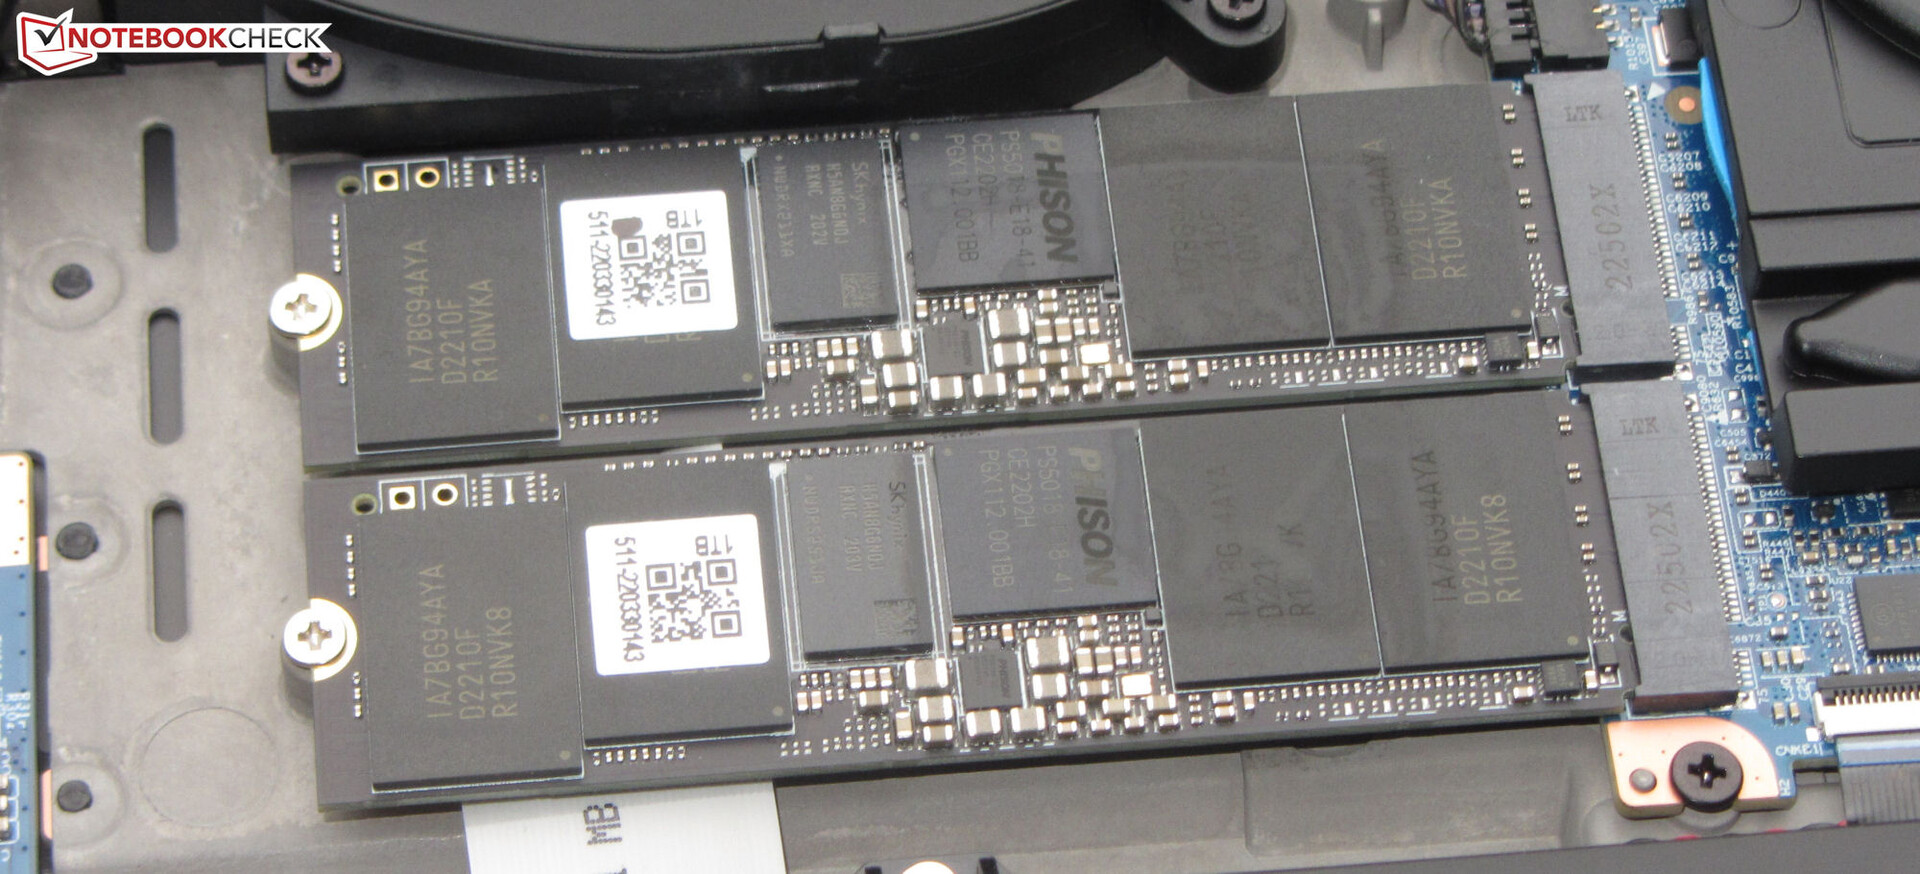
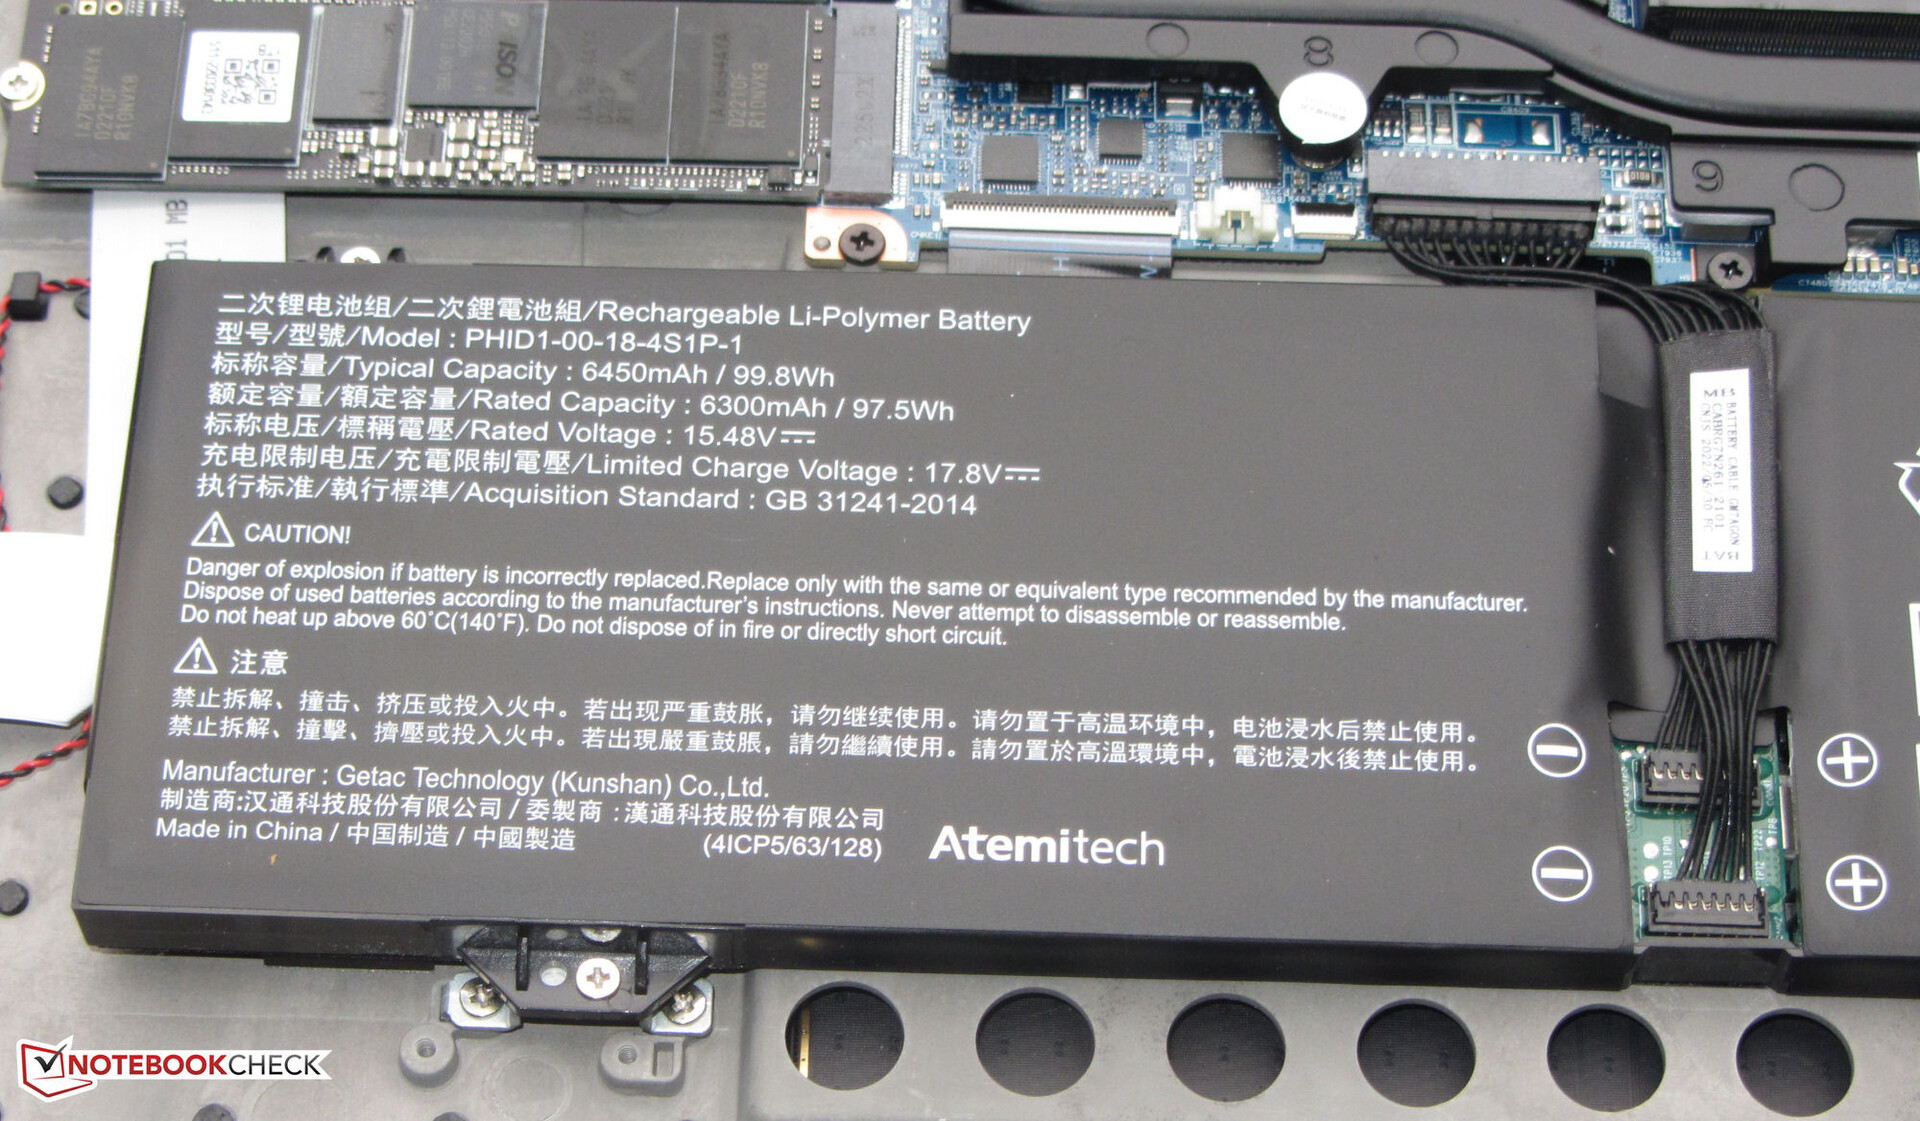
Aby zdjąć dolną pokrywę, należy odkręcić wszystkie śrubki na spodzie, a także dwie kolejne śrubki z tyłu obok złączek chłodzenia wodnego. Następnie ostrym ruchem można ściągnąć dolną pokrywę za otwory wydechowe. Zdjęcie pokrywy umożliwia dostęp do gniazd pamięci (oba są używane), dwóch dysków SSD PCIe 4.0, modułu Wi-Fi, wentylatorów, baterii BIOS-u i akumulatora.
Gwarancja
Medion udziela na Erazera dwuletniej gwarancji. Dostępne są opcje upgrade'u, ale trzeba je kupić razem z laptopem w sklepie internetowym Medionu. Po zakupie laptopa nie można uaktualnić ani rozszerzyć gwarancji. Przedłużenie gwarancji o rok kosztuje prawie 200 euro (216 USD).
Urządzenia wejściowe - Klawiatura mechaniczna z przełącznikami Cherry MX
Klawiatura
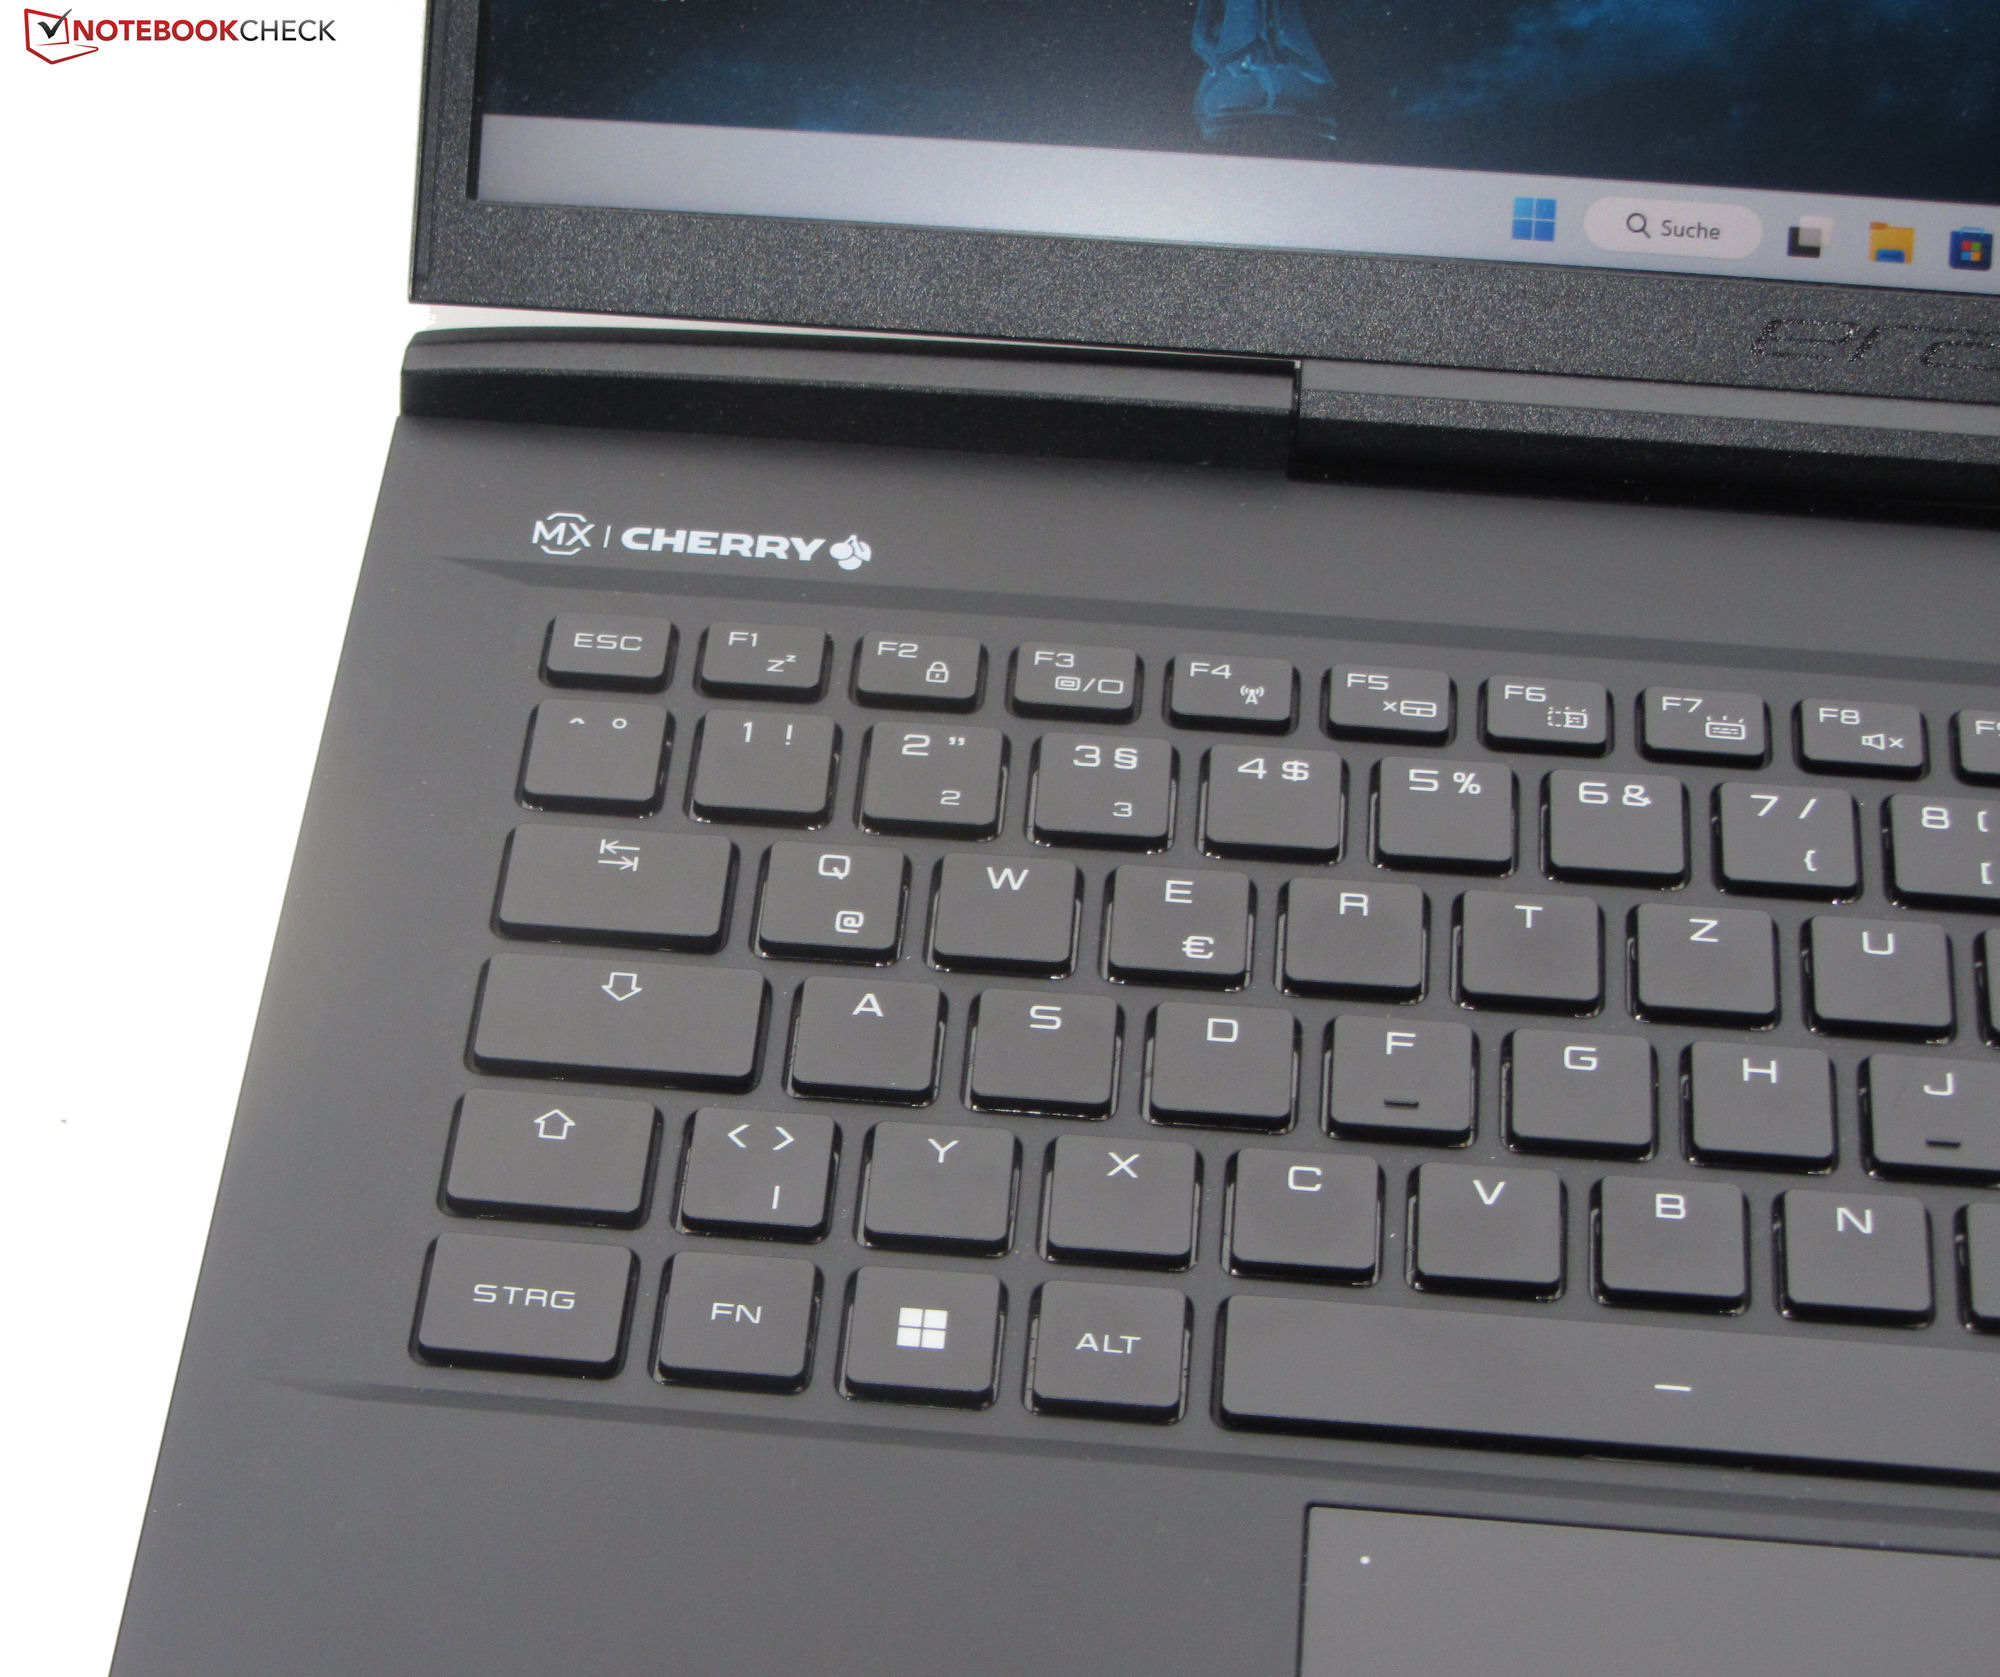
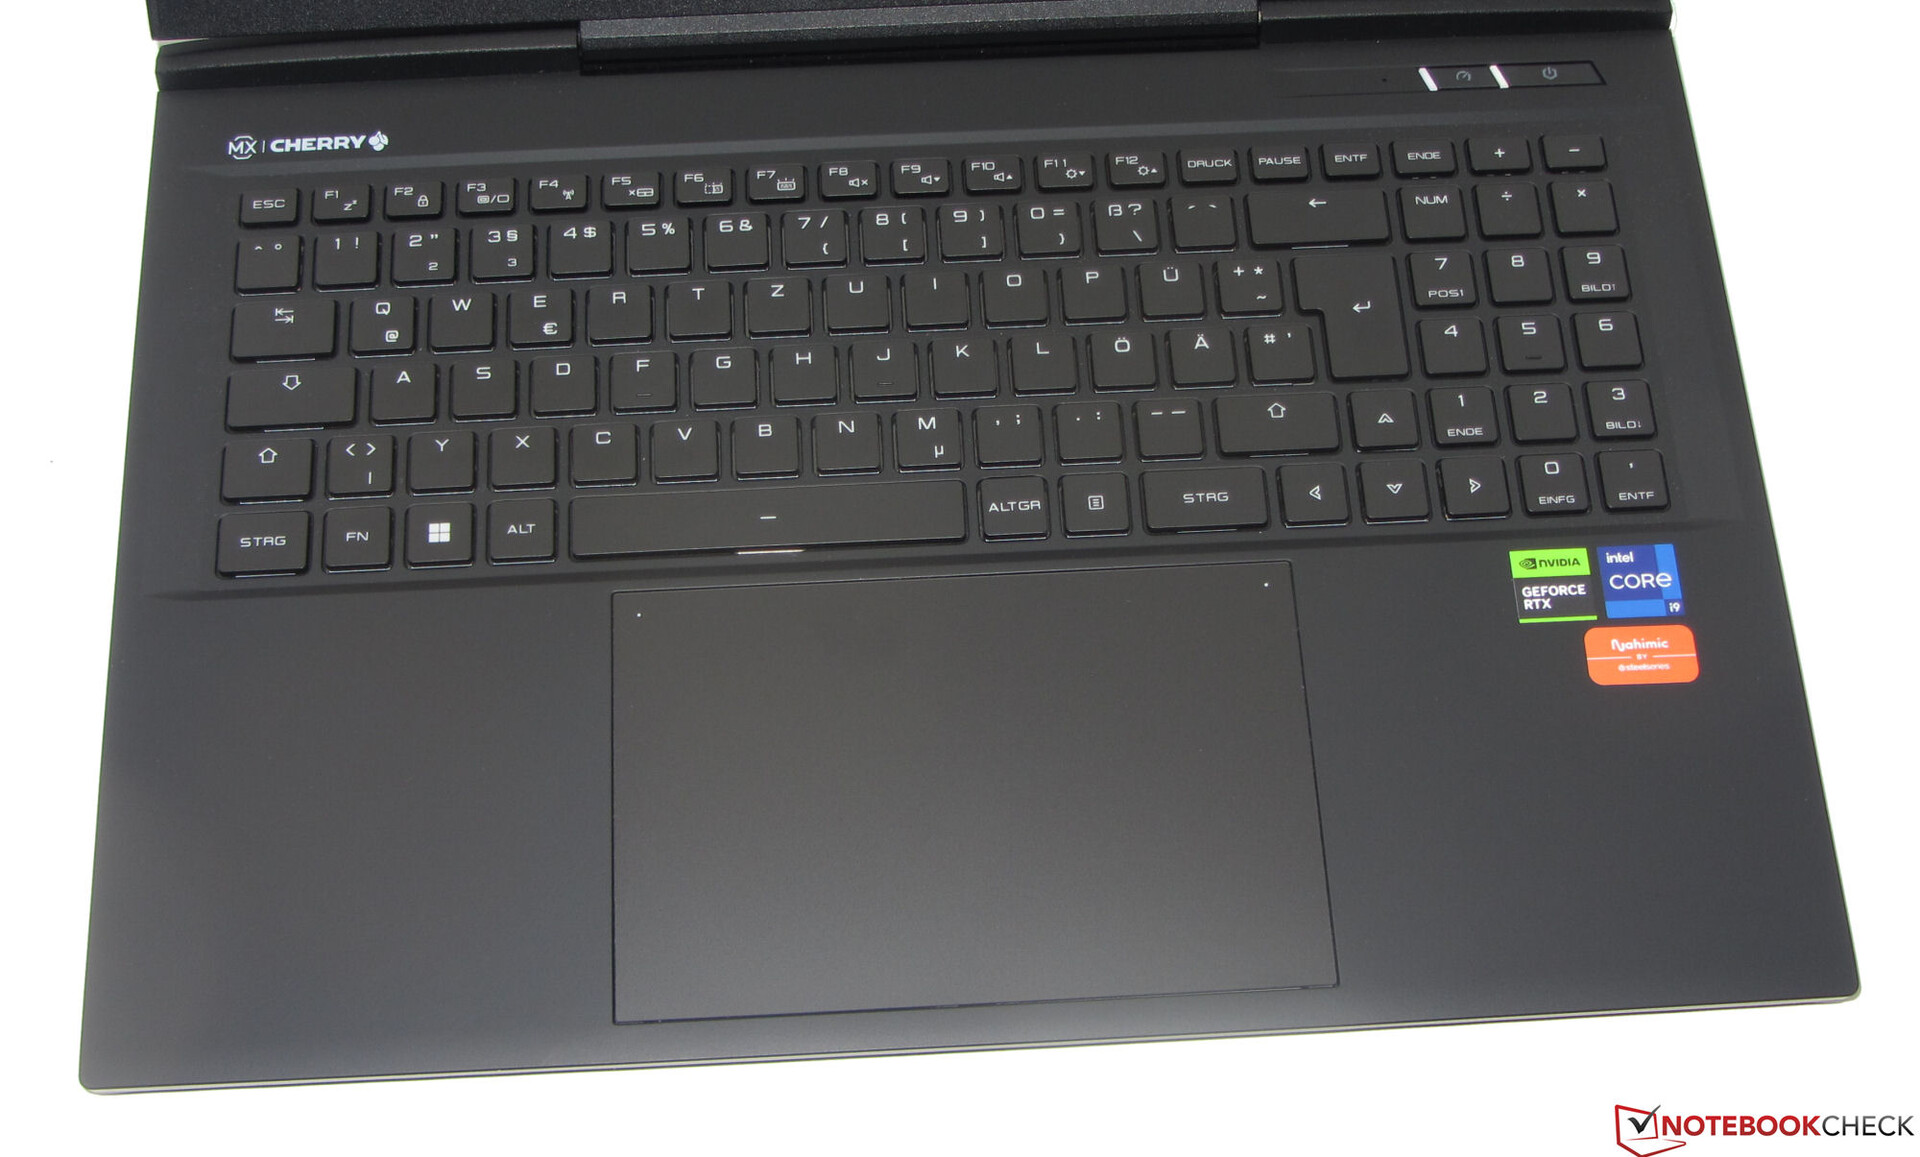
Klawiatury mechaniczne są ogólnie znane z precyzyjnego wprowadzania danych i sprzężenia zwrotnego, jak również z doskonałego czucia pisania - nie inaczej jest w przypadku klawiatury X40. Jej przełączniki Cherry MX oferują umiarkowany skok oraz słyszalny i wyczuwalny punkt aktywacji. Klawiatura nie ugina się podczas pisania. Dwa klawisze funkcyjne umożliwiają dostosowanie podświetlenia RGB dla poszczególnych klawiszy do jednego z czterech poziomów jasności. Ogólnie rzecz biorąc, Erazer Beast X40 jest fantastyczną klawiaturą.
Touchpad
Mierzący około 15,5 x 10 cm (6,1 x 3,9") multidotykowy clickpad ma gładką powierzchnię, po której łatwo przesuwać palce. Oferuje krótki skok i wyraźny punkt kliknięcia. W górnych rogach płytki znajdują się diody LED stanu. Stuknięcie lewej diody włącza lub wyłącza cały touchpad, natomiast prawa dioda służy do włączania lub wyłączania tylko prawej połowy podkładki.
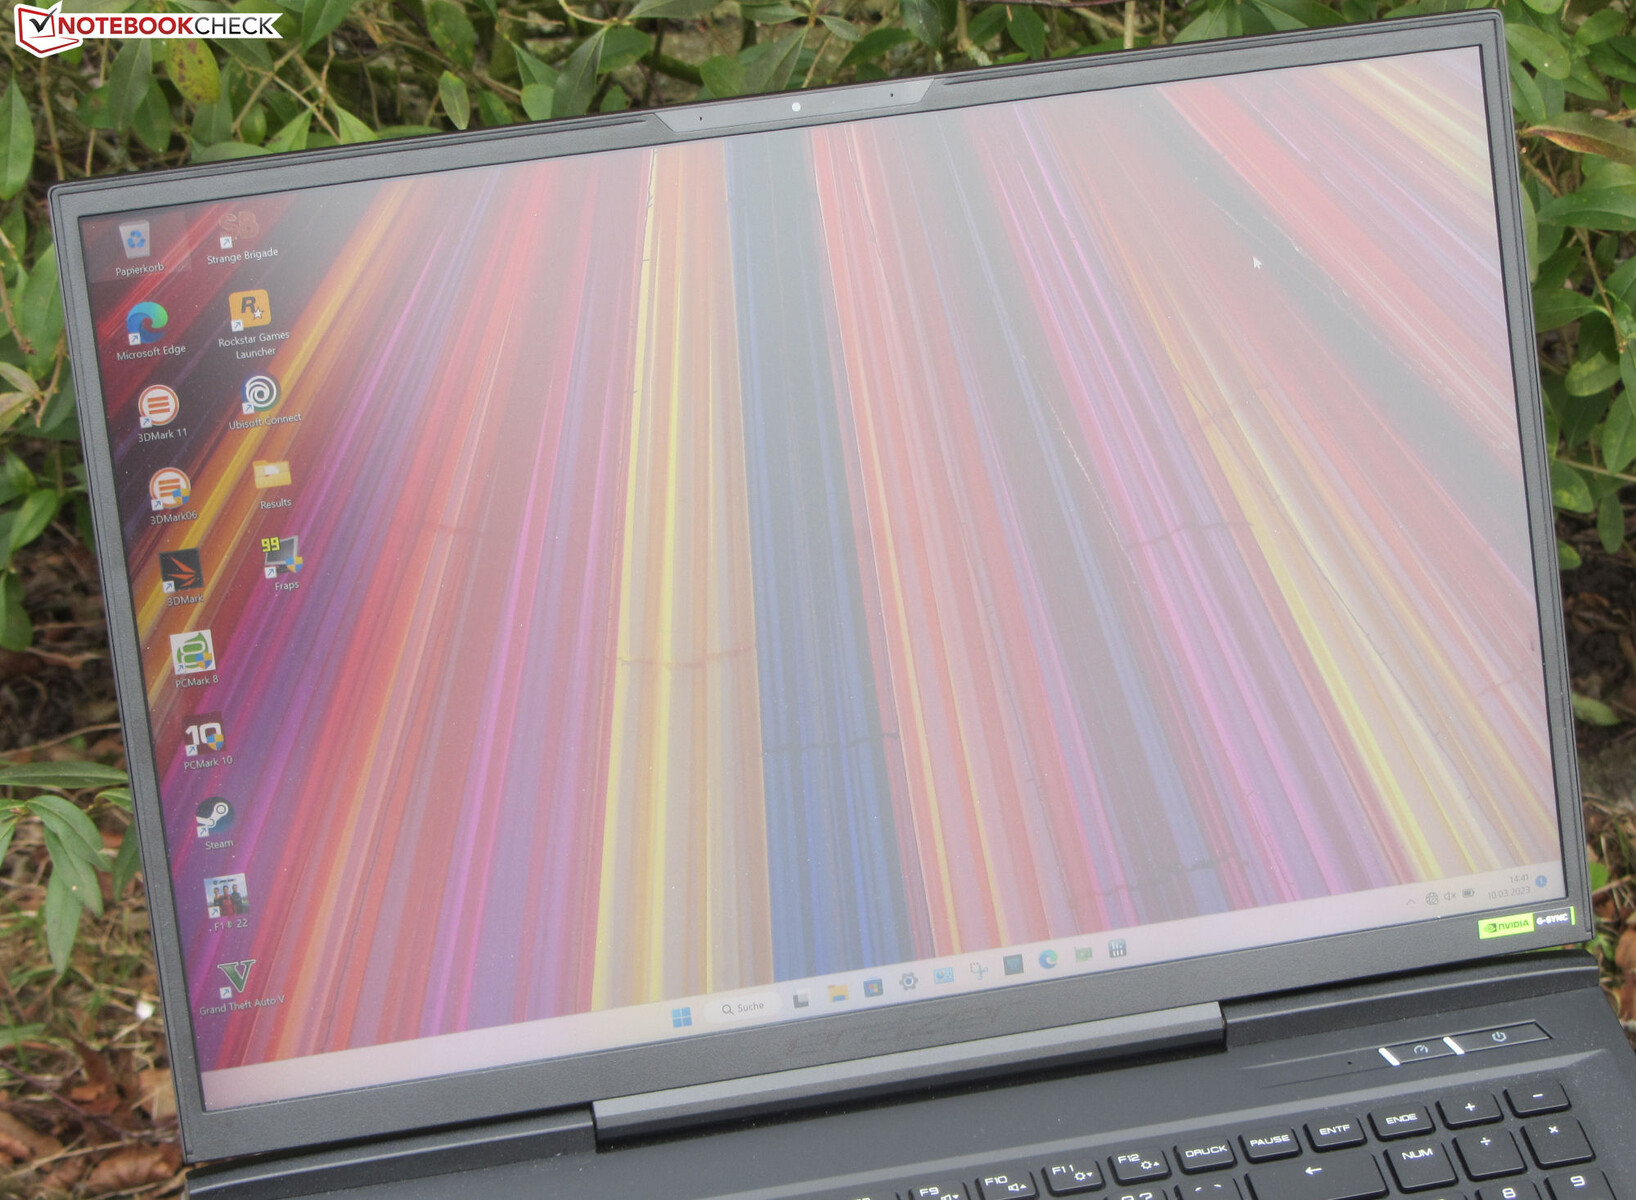
Wyświetlacz - QHD+ o proporcjach 16:10
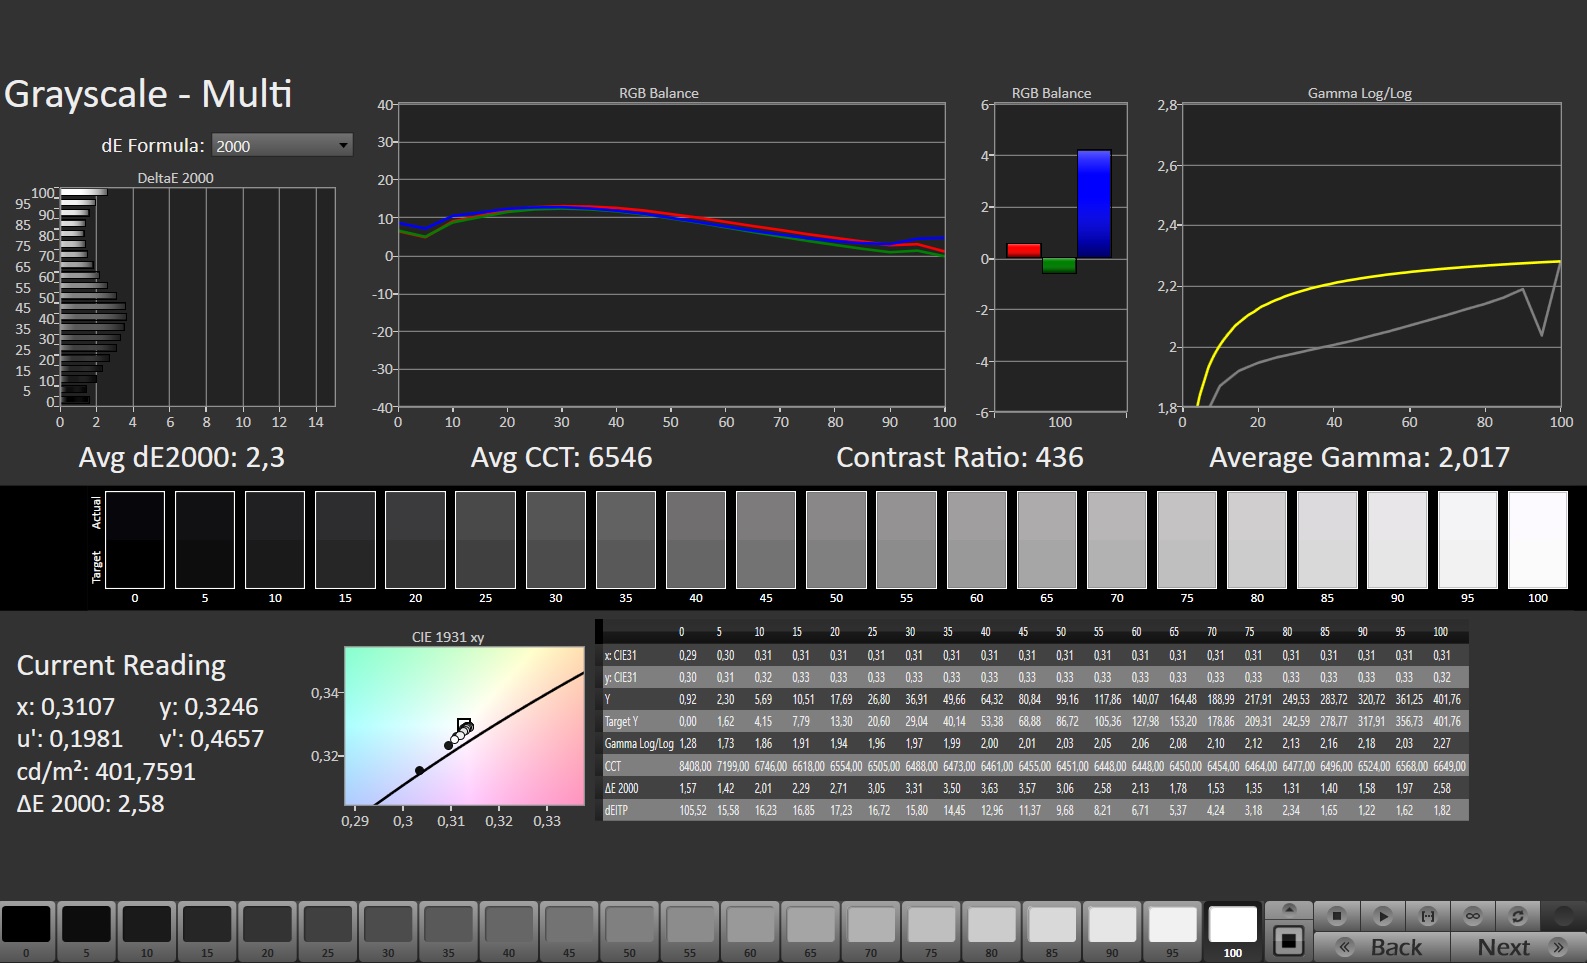
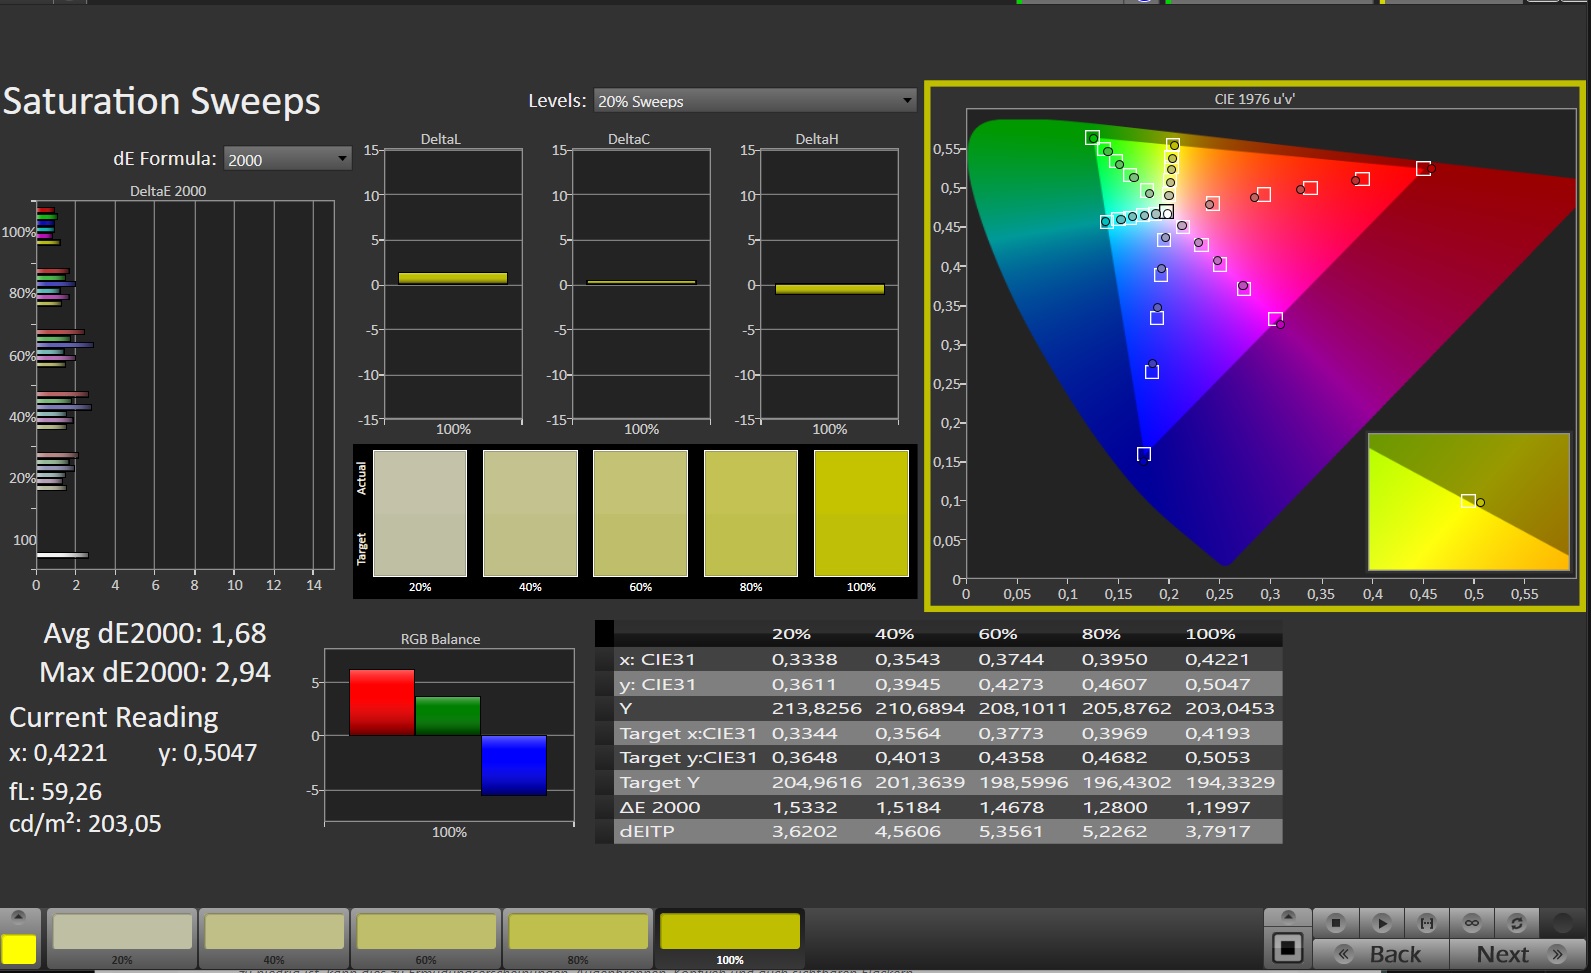
17-calowy matowy wyświetlacz IPS (2 560 x 1 440) ma proporcje 16:10 i wyróżnia się odpowiednią jasnością, szybkimi czasami reakcji, wysoką częstotliwością odświeżania (240 Hz) i brakiem migotania PWM. Jego współczynnik kontrastu wypada jednak gorzej od tego, który uznawany jest za dobry (>1 000:1).
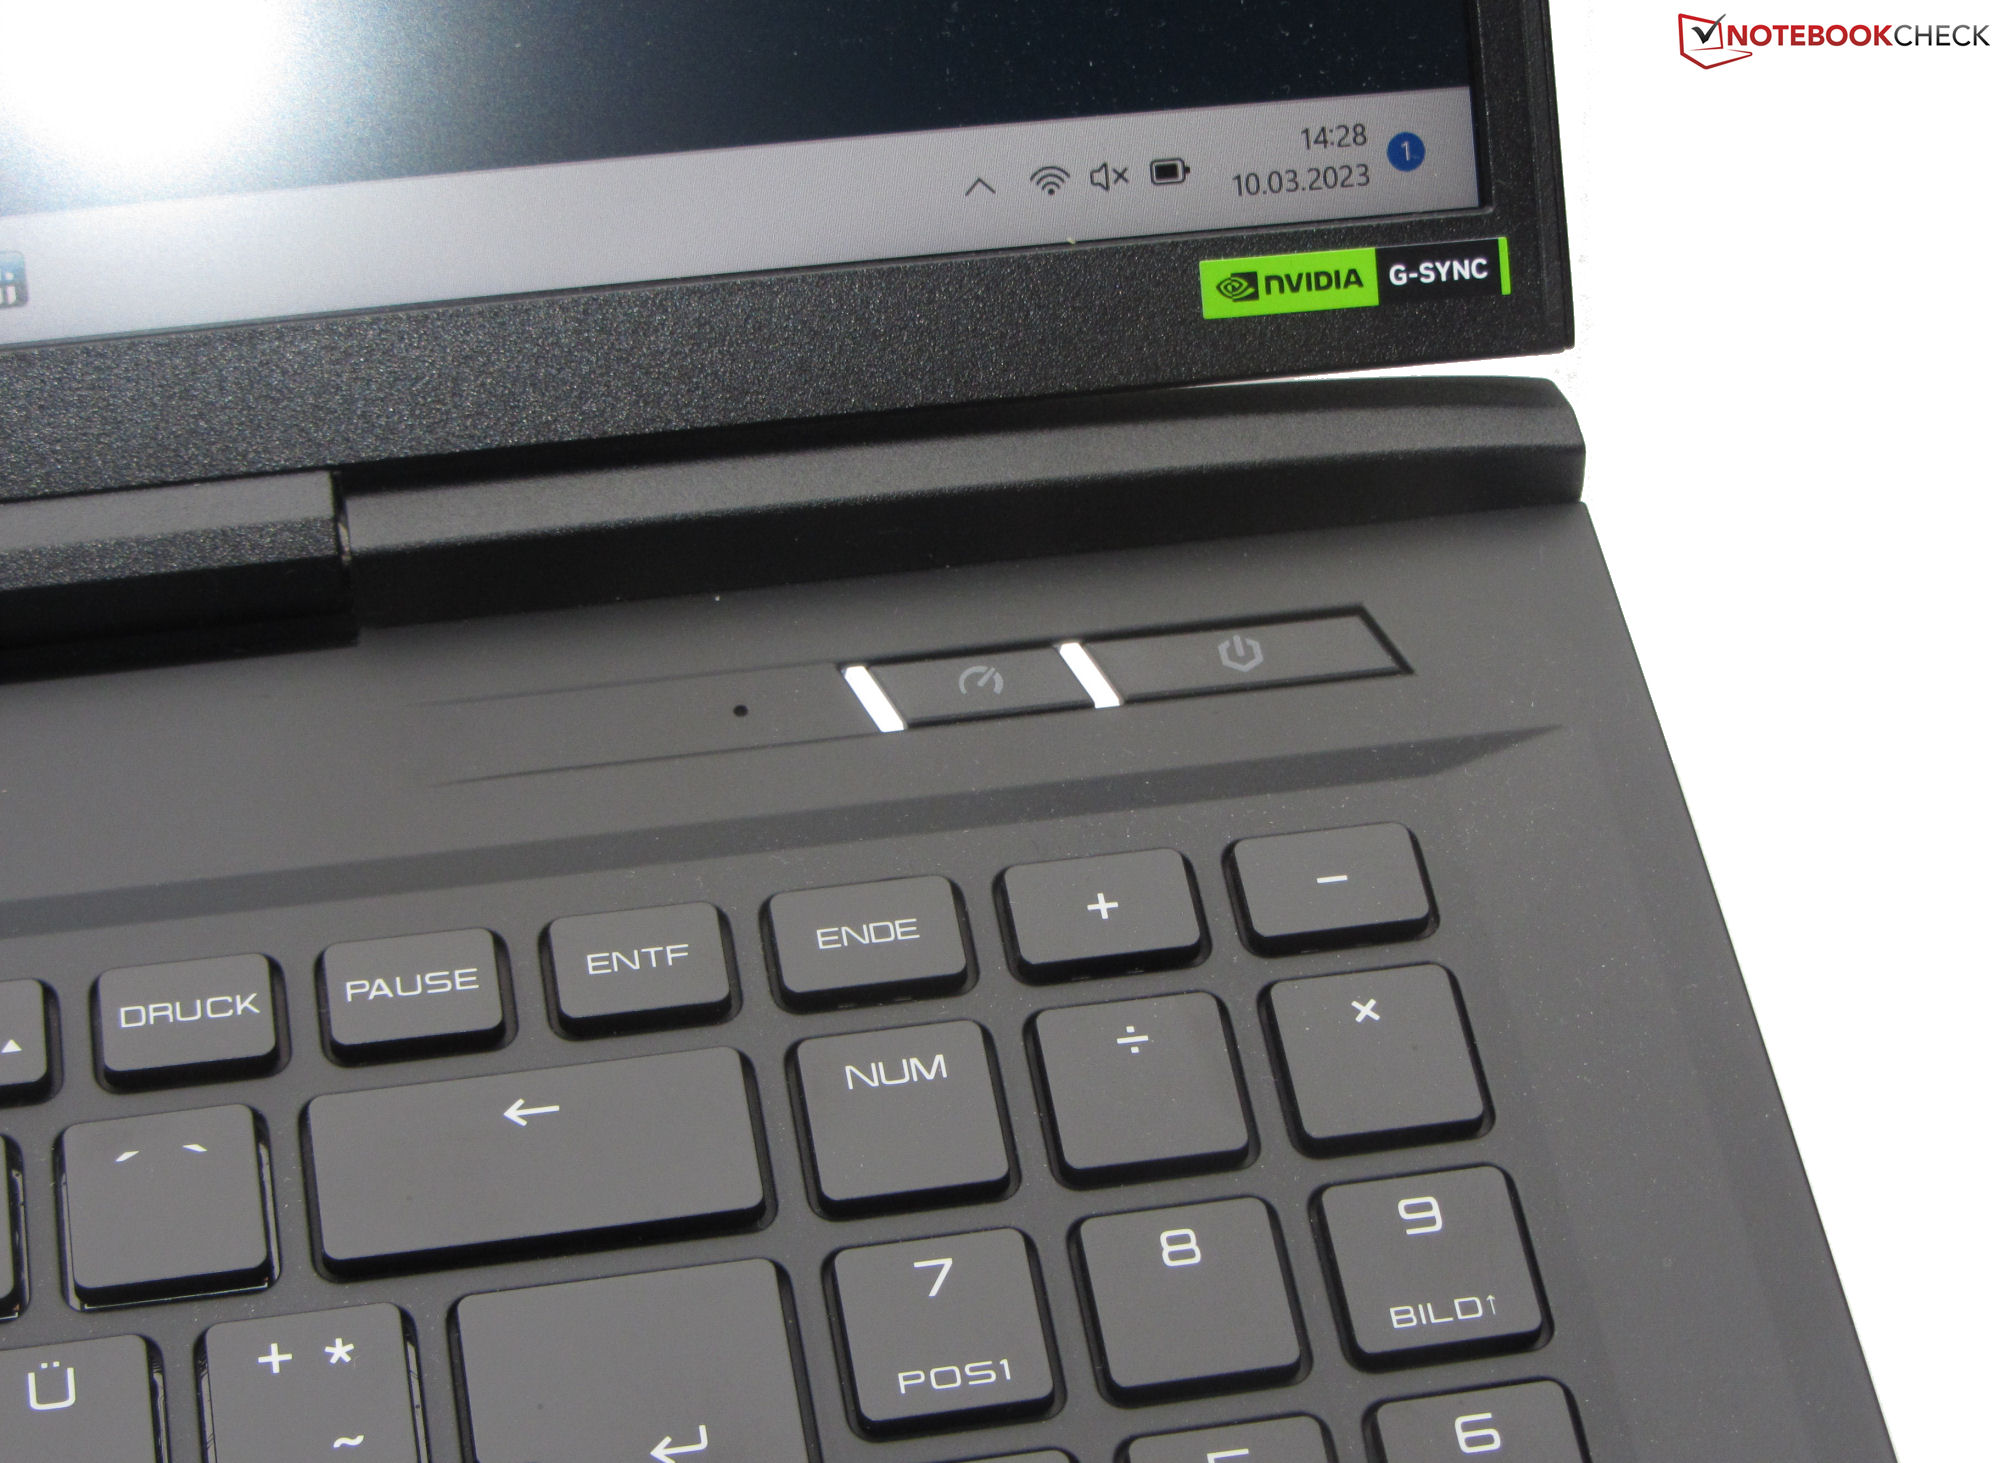
Panel obsługuje G-Sync, czyli technologię, dzięki której częstotliwość odświeżania ekranu dynamicznie dostosowuje się do częstotliwości odświeżania generowanej przez GPU. Ma to zapewnić płynniejsze wrażenia z oglądania, zwłaszcza w grach.
| |||||||||||||||||||||||||
rozświetlenie: 90 %
na akumulatorze: 384 cd/m²
kontrast: 853:1 (czerń: 0.45 cd/m²)
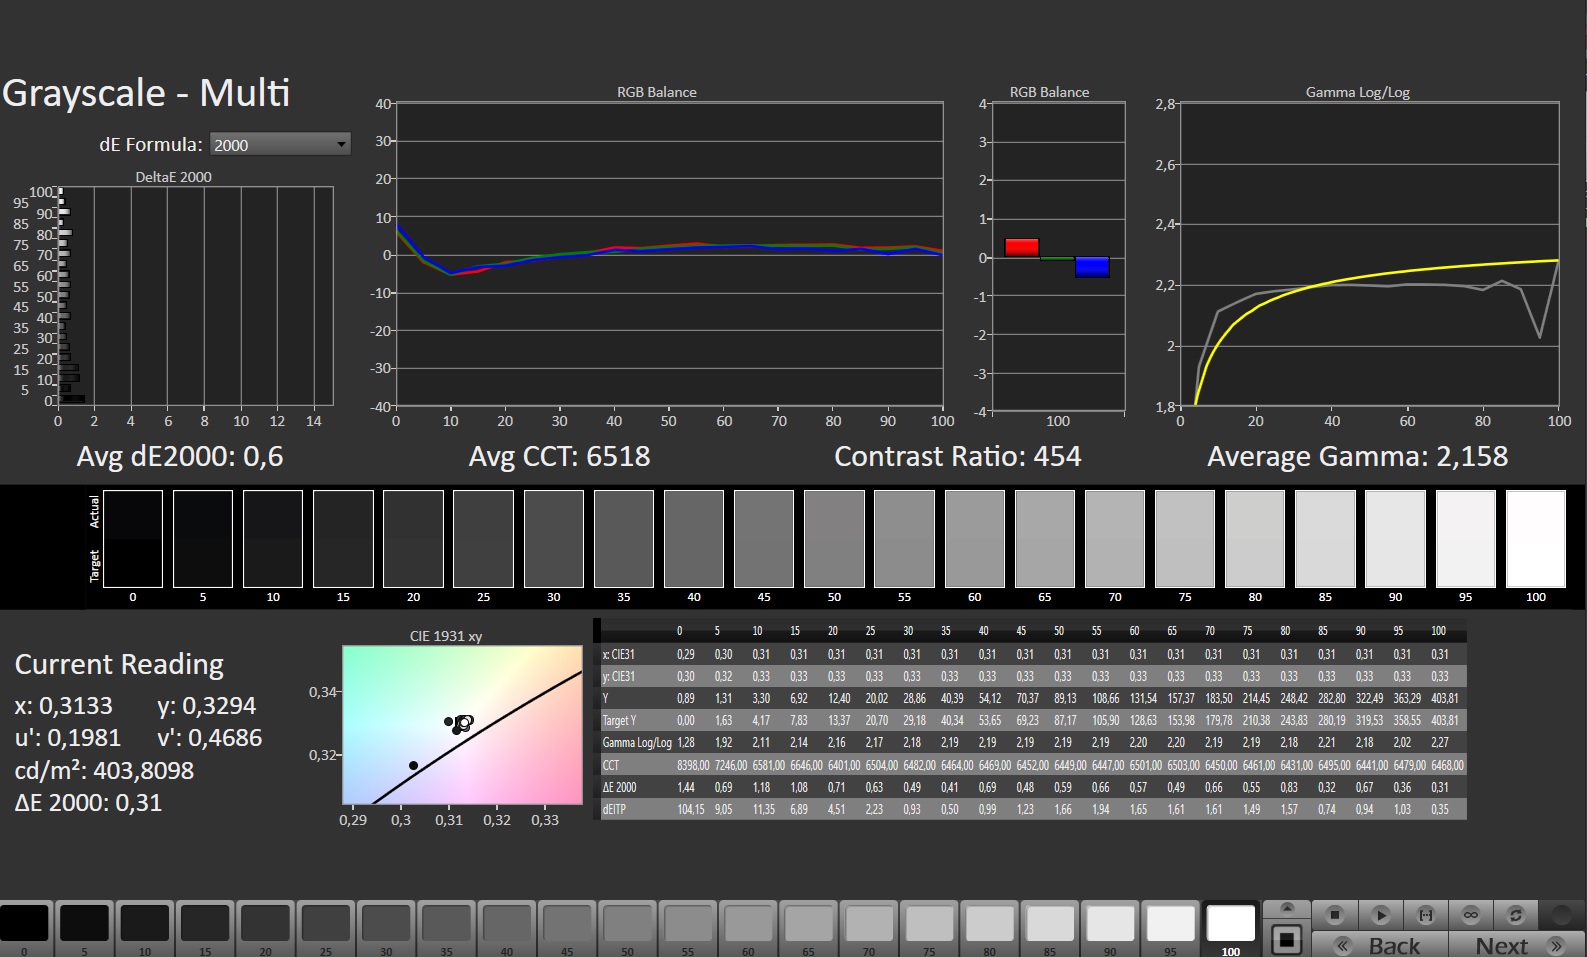
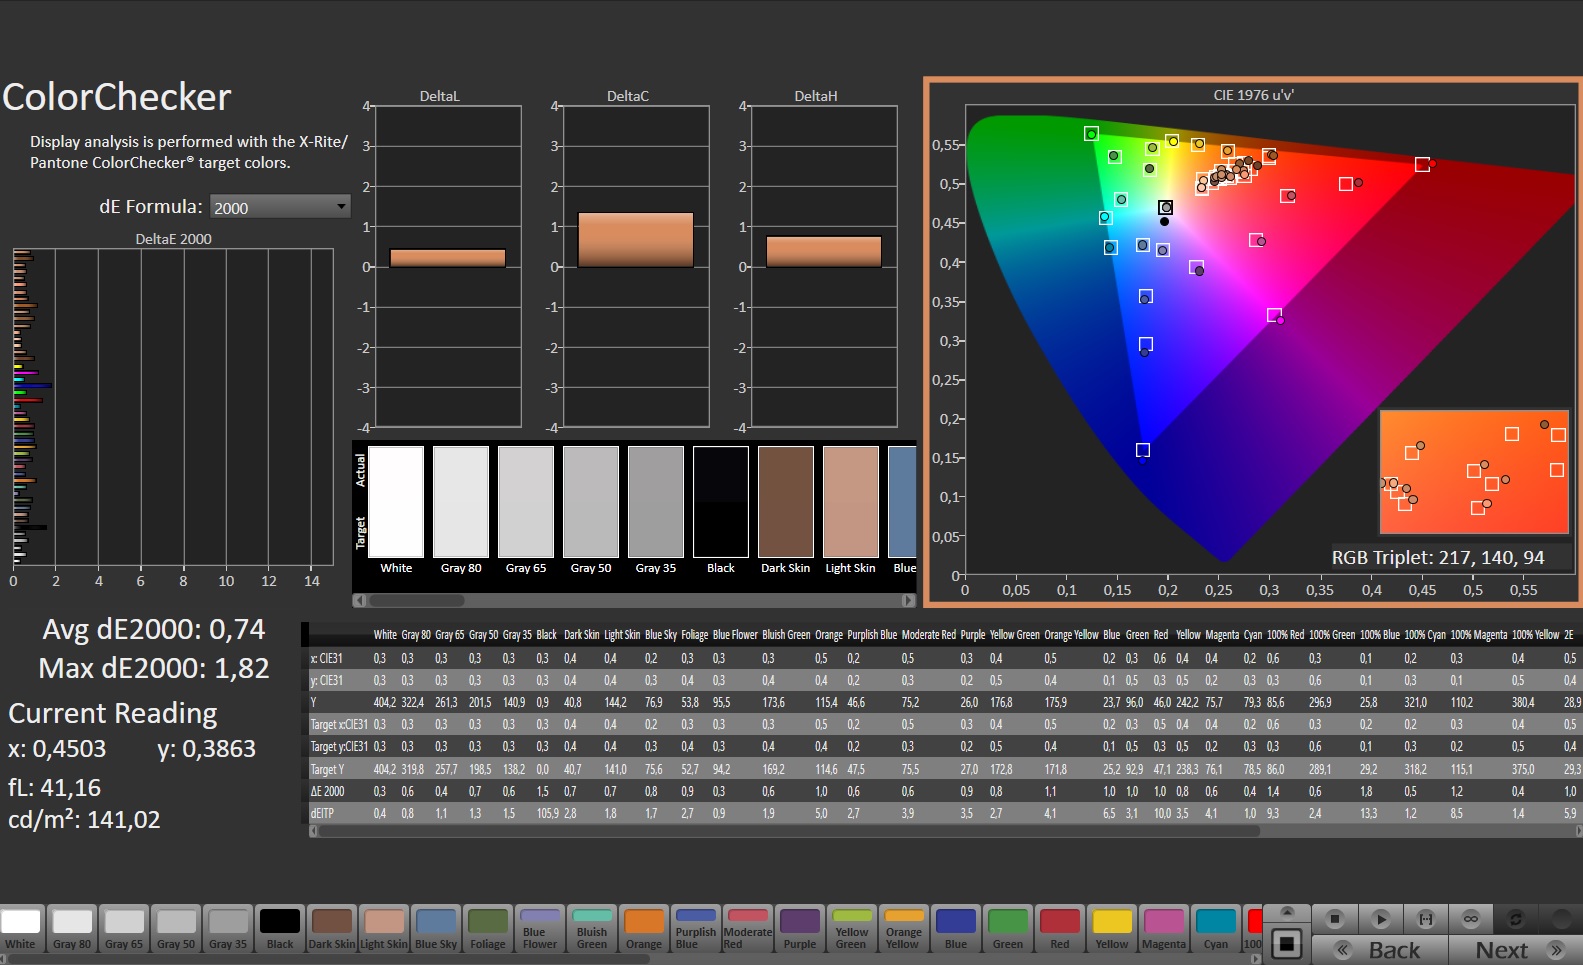
ΔE ColorChecker Calman: 2.05 | ∀{0.5-29.43 Ø4.73}
calibrated: 0.74
ΔE Greyscale Calman: 2.3 | ∀{0.09-98 Ø4.97}
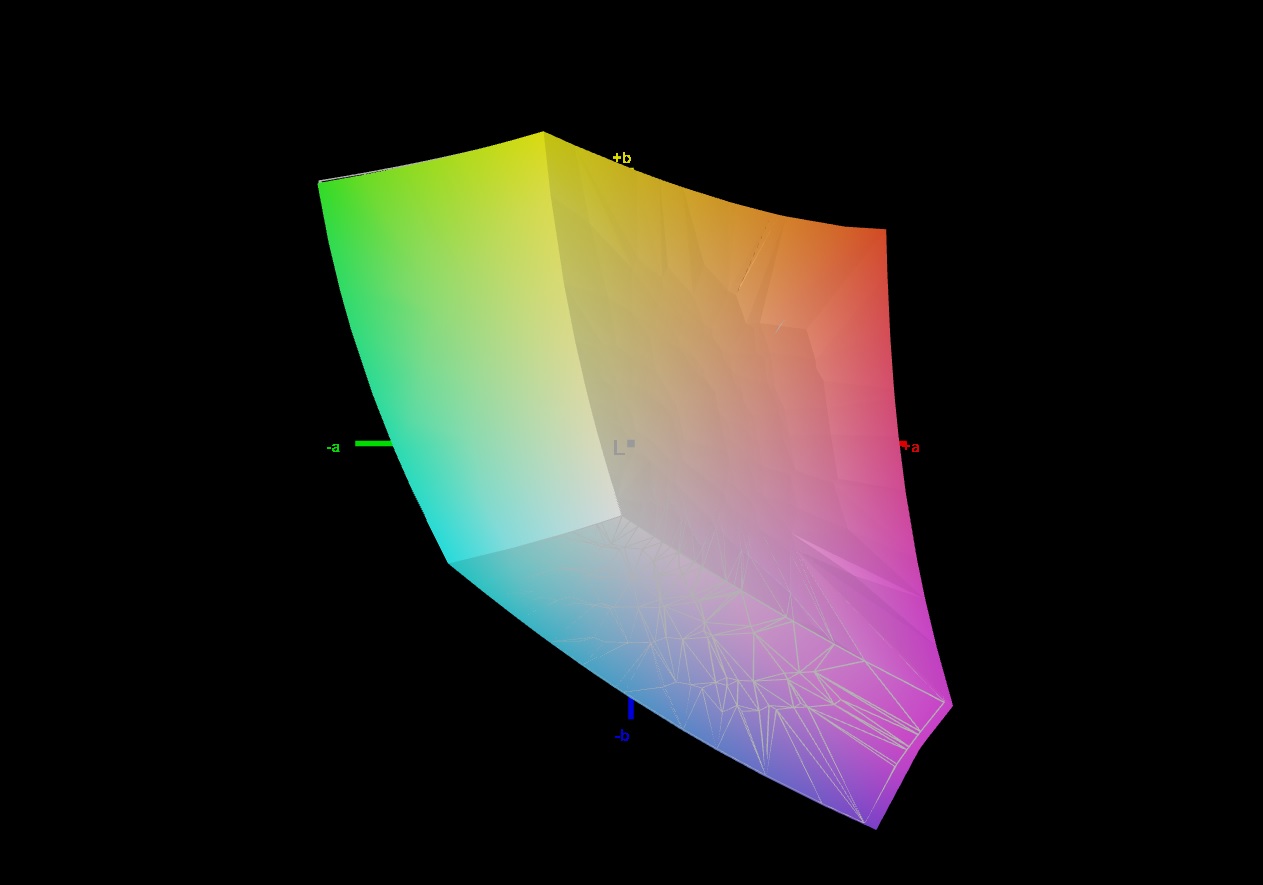
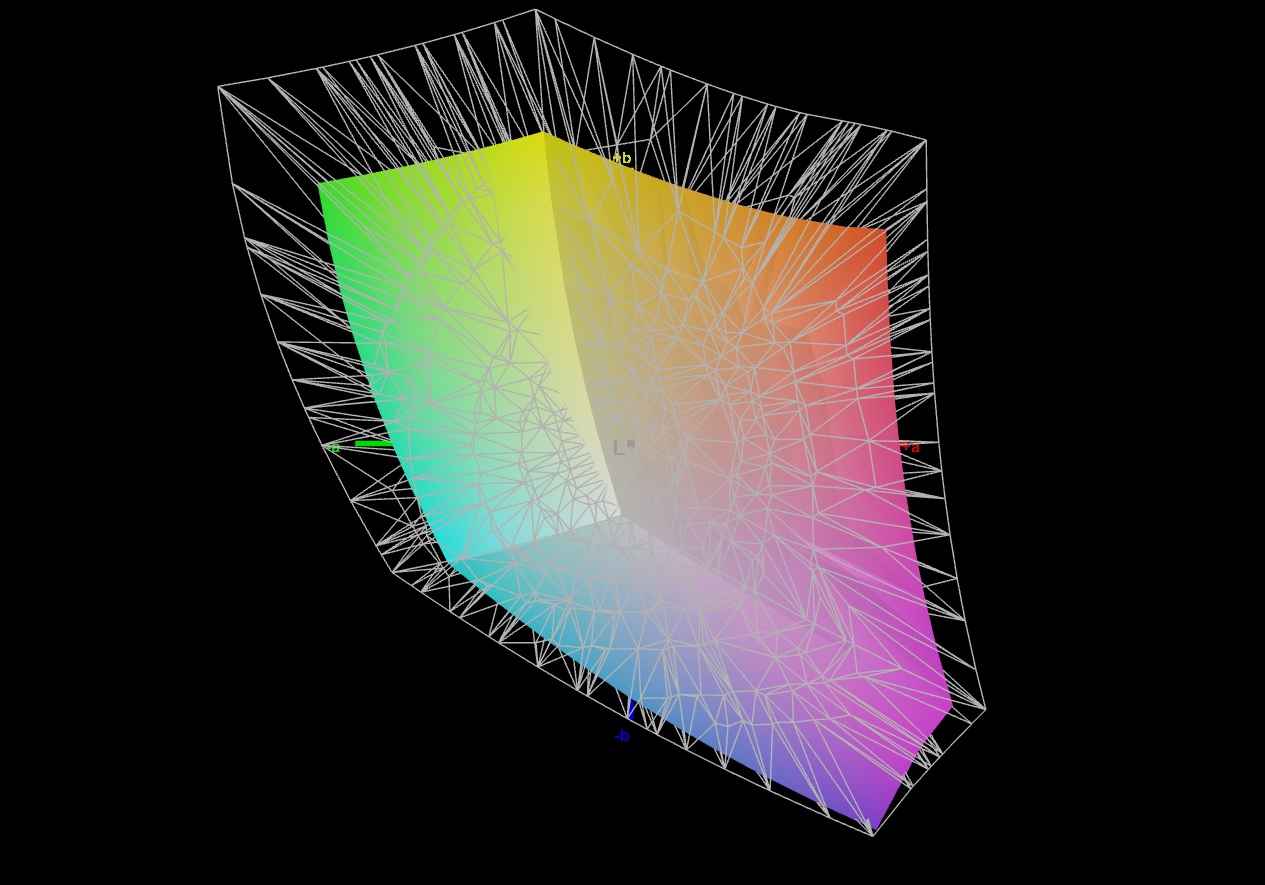
69.4% AdobeRGB 1998 (Argyll 3D)
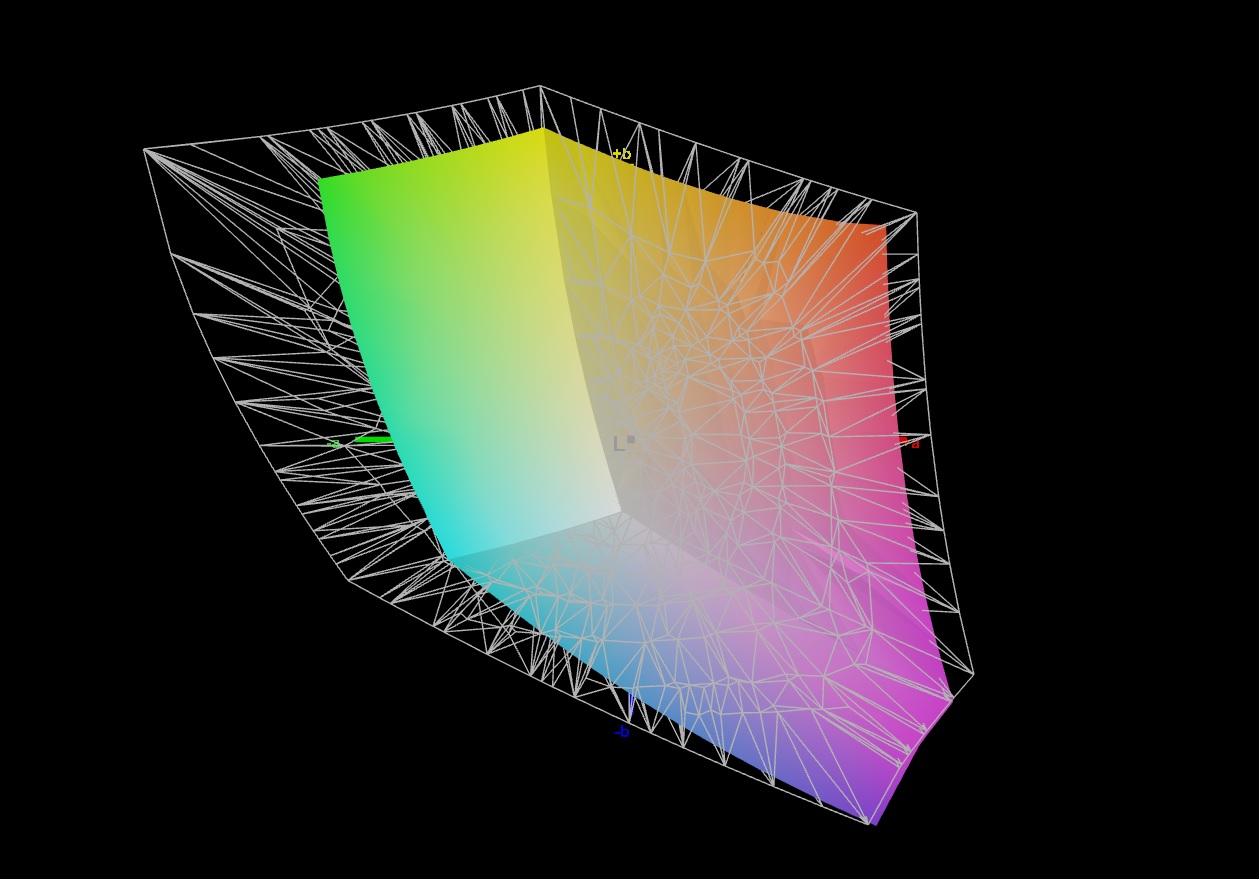
99.8% sRGB (Argyll 3D)
68.6% Display P3 (Argyll 3D)
Gamma: 2.017
CCT: 6546 K
| Medion Erazer Beast X40 BOE NE170QDM-NZ1, IPS, 2560x1600, 17" | MSI Titan GT77 HX 13VI B173ZAN06.C, Mini-LED, 3840x2160, 17.3" | Razer Blade 16 Early 2023 CSOT T3 MNG007DA4-1, IPS, 2560x1600, 16" | Schenker XMG Neo 17 M22 BOE0A99, IPS, 2560x1600, 17" | Alienware x17 R2 P48E AU Optronics B173HAN, IPS, 1920x1080, 17.3" | Asus ROG Strix Scar 18 2023 G834JY-N6005W NE180QDM-NZ2, IPS, 2560x1600, 18" | |
|---|---|---|---|---|---|---|
| Display | 24% | 24% | 0% | 10% | 21% | |
| Display P3 Coverage (%) | 68.6 | 94.9 38% | 98.5 44% | 69 1% | 79.2 15% | 97.2 42% |
| sRGB Coverage (%) | 99.8 | 99.9 0% | 100 0% | 99.8 0% | 99.8 0% | 99.9 0% |
| AdobeRGB 1998 Coverage (%) | 69.4 | 92.4 33% | 89.7 29% | 69.6 0% | 79.6 15% | 84.9 22% |
| Response Times | -248% | -9% | 12% | -17% | 19% | |
| Response Time Grey 50% / Grey 80% * (ms) | 11.3 ? | 38.4 ? -240% | 6.6 ? 42% | 10.8 ? 4% | 12.4 ? -10% | 5.41 ? 52% |
| Response Time Black / White * (ms) | 7.5 ? | 26.6 ? -255% | 12 ? -60% | 6.1 ? 19% | 9.2 ? -23% | 8.62 ? -15% |
| PWM Frequency (Hz) | 2380 ? | |||||
| Screen | 78886% | -6% | 11% | -22% | -92% | |
| Brightness middle (cd/m²) | 384 | 606 58% | 456.8 19% | 415 8% | 365.4 -5% | 490 28% |
| Brightness (cd/m²) | 377 | 602 60% | 437 16% | 399 6% | 344 -9% | 468 24% |
| Brightness Distribution (%) | 90 | 93 3% | 83 -8% | 90 0% | 85 -6% | 86 -4% |
| Black Level * (cd/m²) | 0.45 | 0.0001 100% | 0.35 22% | 0.43 4% | 0.29 36% | 0.54 -20% |
| Contrast (:1) | 853 | 6060000 710334% | 1305 53% | 965 13% | 1260 48% | 907 6% |
| Colorchecker dE 2000 * | 2.05 | 4.8 -134% | 3.7 -80% | 1.44 30% | 3.17 -55% | 4.97 -142% |
| Colorchecker dE 2000 max. * | 3.64 | 8.2 -125% | 6.42 -76% | 2.33 36% | 7.69 -111% | 11.02 -203% |
| Colorchecker dE 2000 calibrated * | 0.74 | 1.8 -143% | 0.66 11% | 0.89 -20% | 0.51 31% | 2.97 -301% |
| Greyscale dE 2000 * | 2.3 | 6.5 -183% | 2.6 -13% | 1.8 22% | 5.3 -130% | 7.2 -213% |
| Gamma | 2.017 109% | 2.63 84% | 2.3 96% | 2.132 103% | 2.18 101% | 2.161 102% |
| CCT | 6546 99% | 6596 99% | 6108 106% | 6327 103% | 5879 111% | 6515 100% |
| Całkowita średnia (program / ustawienia) | 26221% /
50682% | 3% /
-0% | 8% /
9% | -10% /
-15% | -17% /
-52% |
* ... im mniej tym lepiej
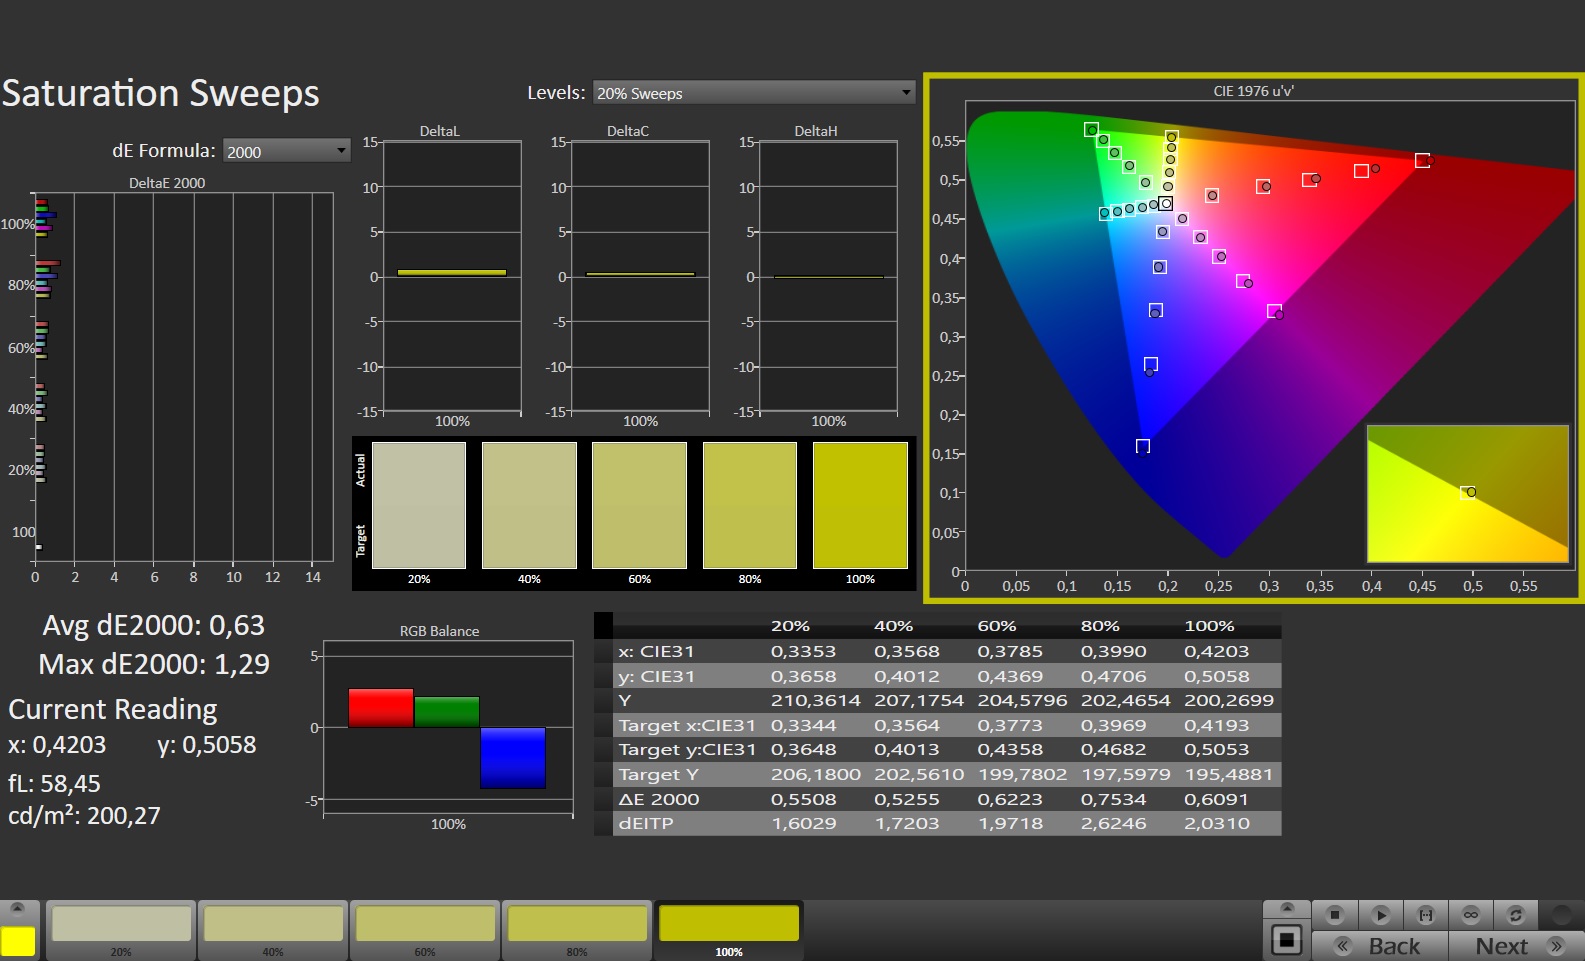
Wyświetlacz już zaraz po wyjęciu z pudełka ma świetne odwzorowanie kolorów. Jego średnia różnica kolorów wynosząca około 2 jest znacznie niższa od progu uznawanego za dobry (Delta E < 3). Kalibracja wyświetlacza zmniejszyła średnią różnicę kolorów do 0,74 i sprawiła, że skala szarości jest bardziej zrównoważona. Panel jest w stanie pokryć całą przestrzeń barwną sRGB, ale nie AdobeRGB i DCI-P3. Wyświetlacze w niektórych konkurencyjnych laptopach wypadają lepiej pod względem pokrycia kolorów.

Wyświetl czasy reakcji
| ↔ Czas reakcji od czerni do bieli | ||
|---|---|---|
| 7.5 ms ... wzrost ↗ i spadek ↘ łącznie | ↗ 3.3 ms wzrost | 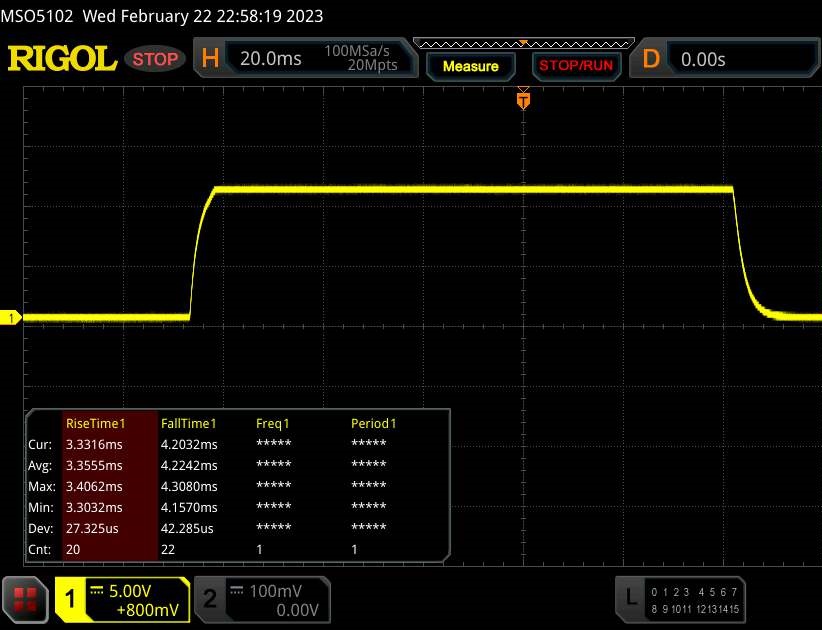 |
| ↘ 4.2 ms upadek | ||
| W naszych testach ekran wykazuje bardzo szybką reakcję i powinien bardzo dobrze nadawać się do szybkich gier. Dla porównania, wszystkie testowane urządzenia wahają się od 0.1 (minimum) do 240 (maksimum) ms. » 22 % wszystkich urządzeń jest lepszych. Oznacza to, że zmierzony czas reakcji jest lepszy od średniej wszystkich testowanych urządzeń (19.9 ms). | ||
| ↔ Czas reakcji 50% szarości do 80% szarości | ||
| 11.3 ms ... wzrost ↗ i spadek ↘ łącznie | ↗ 5.4 ms wzrost | 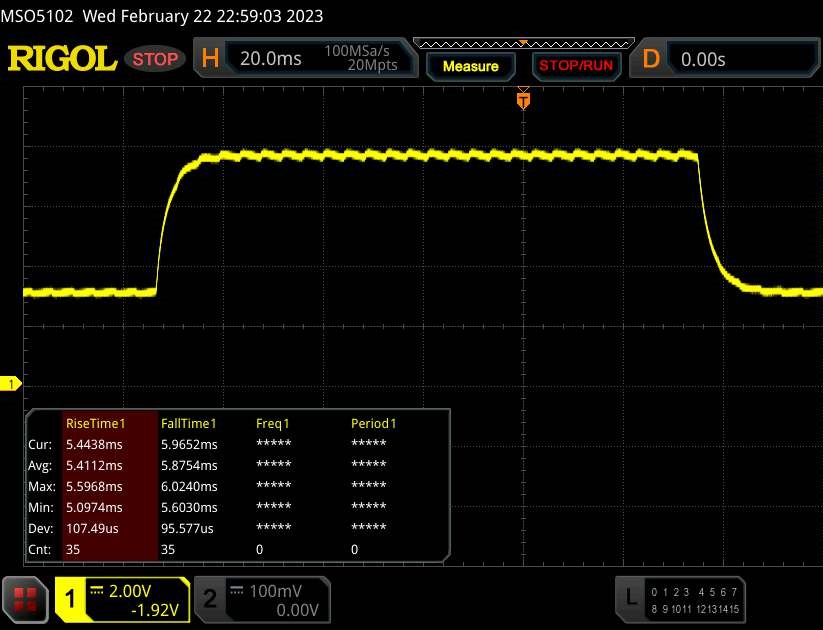 |
| ↘ 5.9 ms upadek | ||
| W naszych testach ekran wykazuje dobry współczynnik reakcji, ale może być zbyt wolny dla graczy rywalizujących ze sobą. Dla porównania, wszystkie testowane urządzenia wahają się od 0.165 (minimum) do 636 (maksimum) ms. » 25 % wszystkich urządzeń jest lepszych. Oznacza to, że zmierzony czas reakcji jest lepszy od średniej wszystkich testowanych urządzeń (31.1 ms). | ||
Migotanie ekranu / PWM (modulacja szerokości impulsu)
| Migotanie ekranu/nie wykryto PWM | 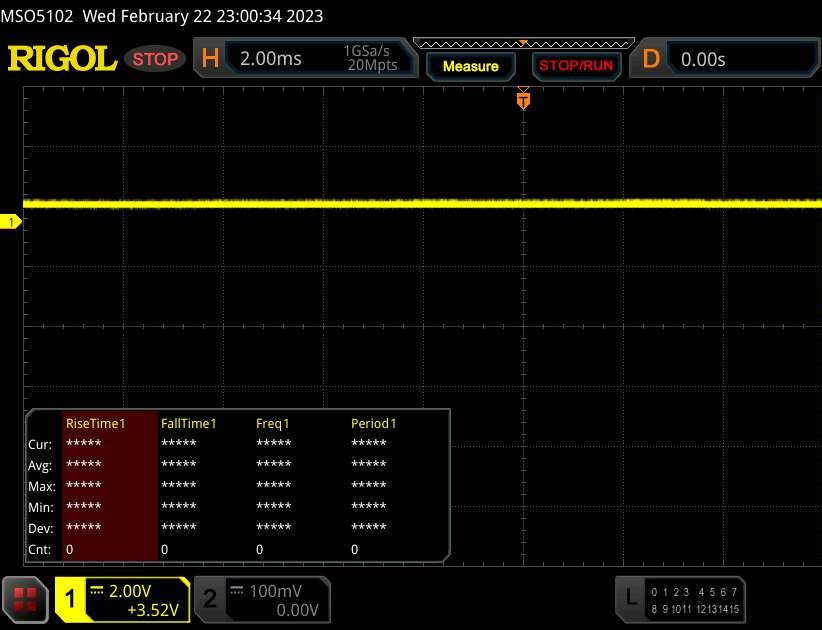 | ||
Dla porównania: 52 % wszystkich testowanych urządzeń nie używa PWM do przyciemniania wyświetlacza. Jeśli wykryto PWM, zmierzono średnio 7784 (minimum: 5 - maksimum: 343500) Hz. | |||
Panel IPS ma szerokie kąty widzenia i jest czytelny z każdej pozycji. Wyświetlacz zdecydowanie nadaje się do użytku na zewnątrz, pod warunkiem, że słońce nie jest zbyt silne.

Performance - Raptor Lake spotyka Adę Lovelace
Choć Erazer Beast X40 został zaprojektowany przede wszystkim z myślą o grach w rozdzielczości QHD+, dobrze radzi sobie również w takich zastosowaniach jak edycja i renderowanie wideo. Wymagany mięsień obliczeniowy zapewniają Raptor Lake i Ada Lovelace. Model X40 w niniejszej recenzji można mieć za około 4 500 euro (4 856 dolarów). Ale Medion oferuje też nieco niżej wycenioną konfigurację (RTX 4080 i 1 TB SSD; poza tym identyczne) za 3 500 euro (3 777 USD).
Warunki badania
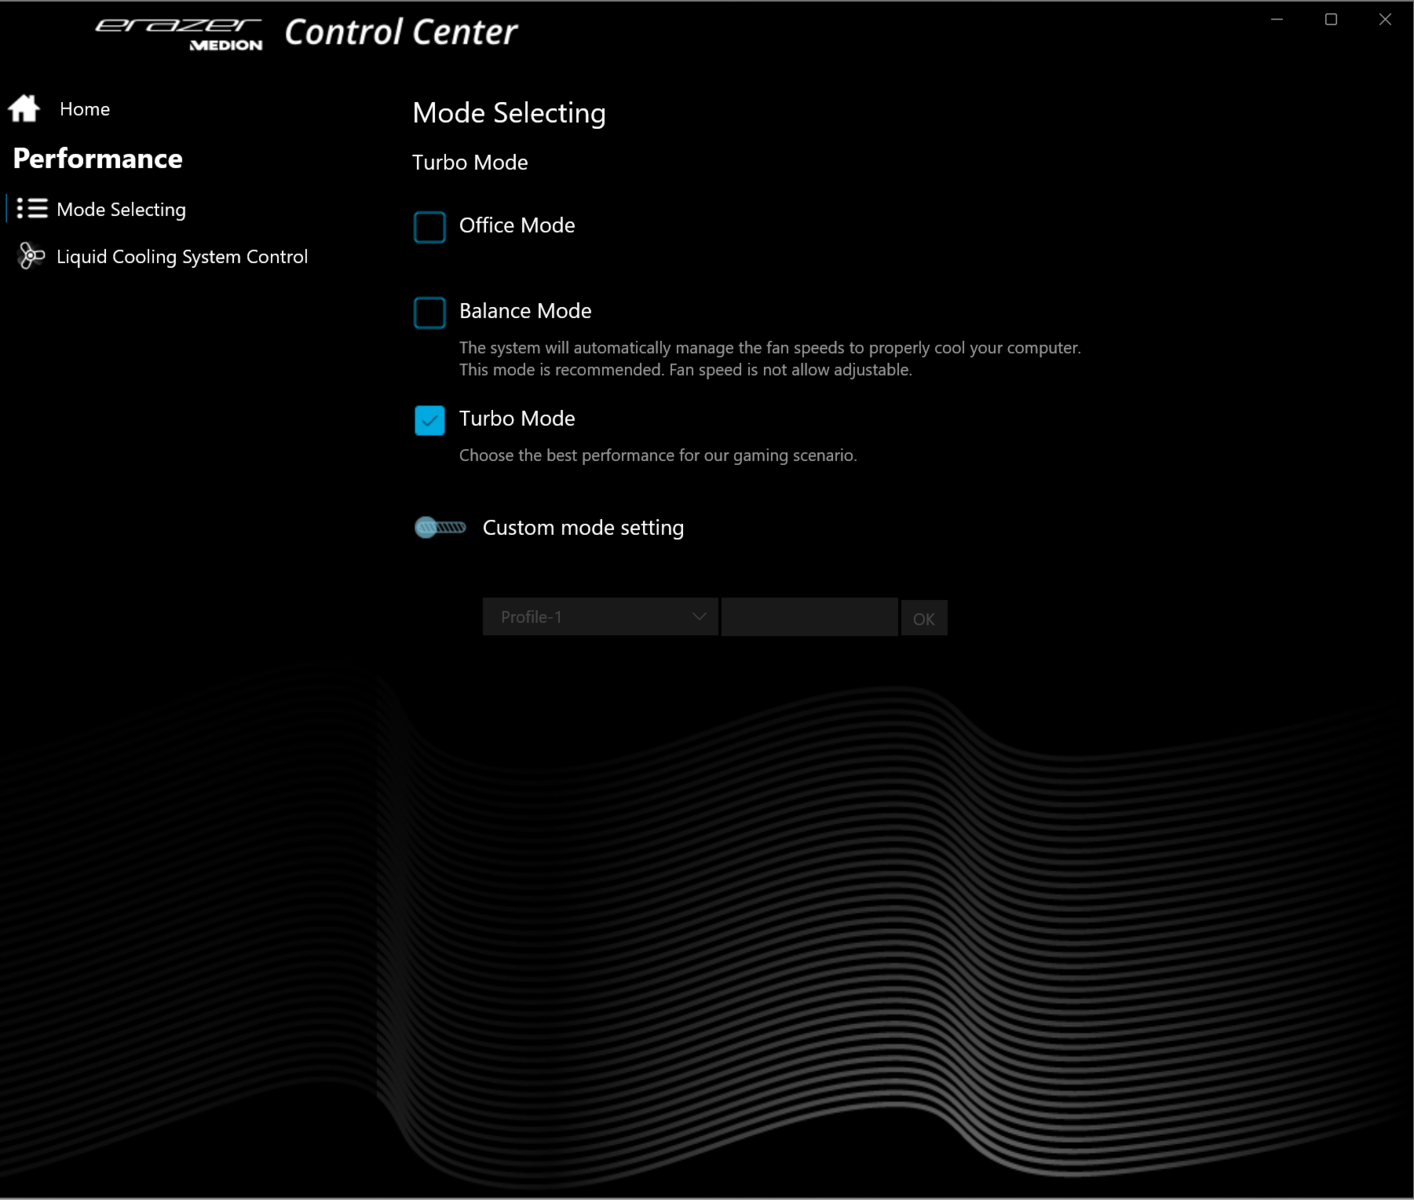
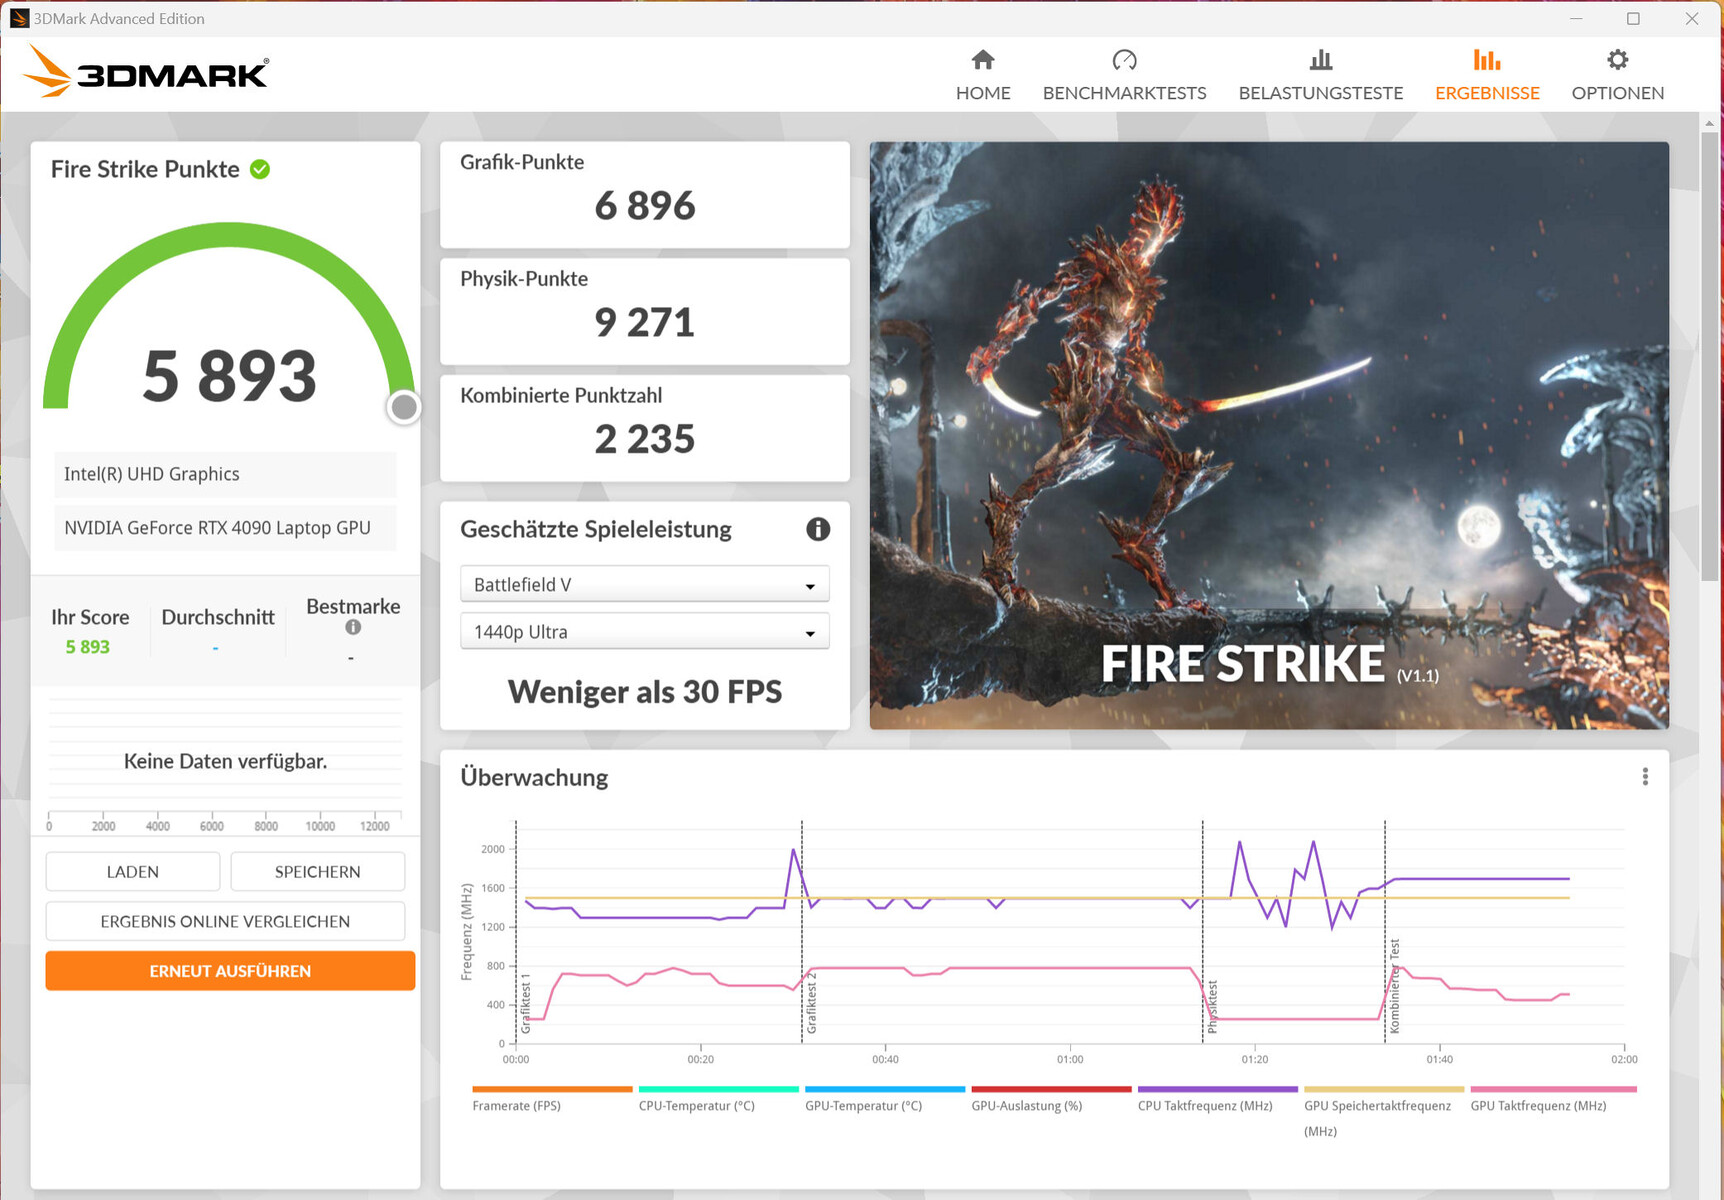
Do dyspozycji mamy trzy tryby wydajności określone przez producenta: Office, Balance i Turbo. Użyliśmy trybu Turbo do benchmarków, a trybu Office do naszych testów czasu pracy na baterii i w obu przypadkach włączyliśmy tryb Nvidia Optimus. Po zakończeniu tych testów przeprowadziliśmy kolejne benchmarki z włączonym trybem dGPU i podłączonym zewnętrznym chłodzeniem wodnym. Wyniki tych dodatkowych testów można znaleźć w tabeli porównawczej, ale nie są one brane pod uwagę przy wystawianiu oceny.
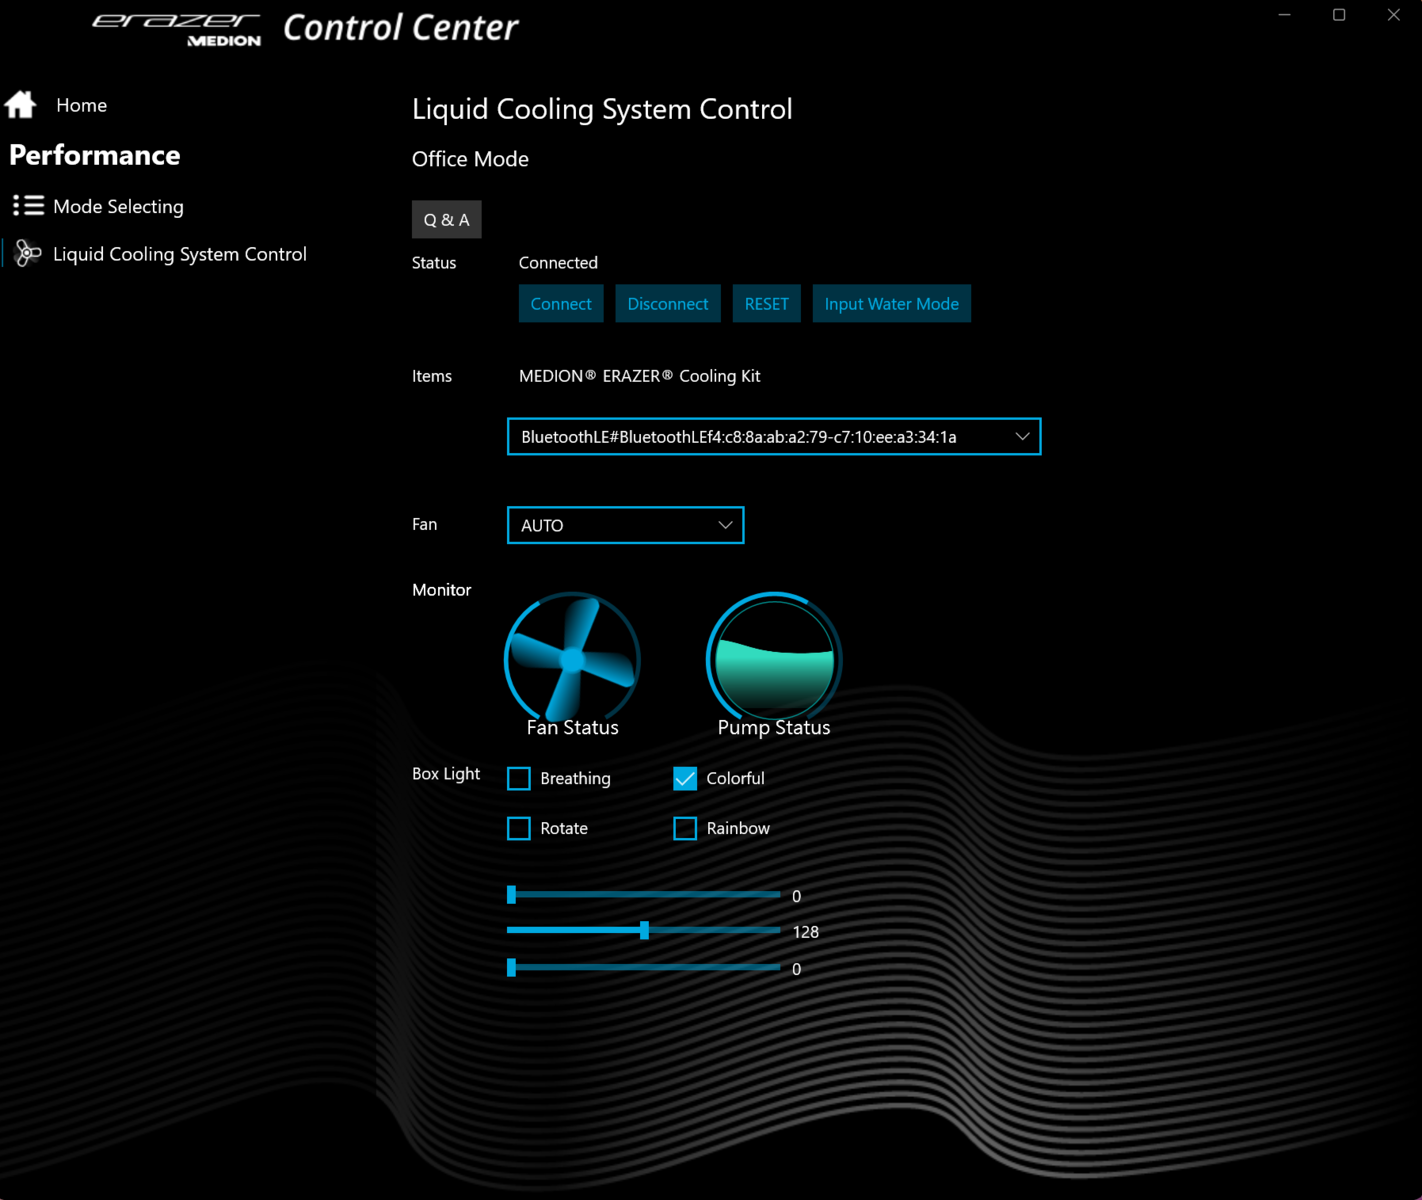
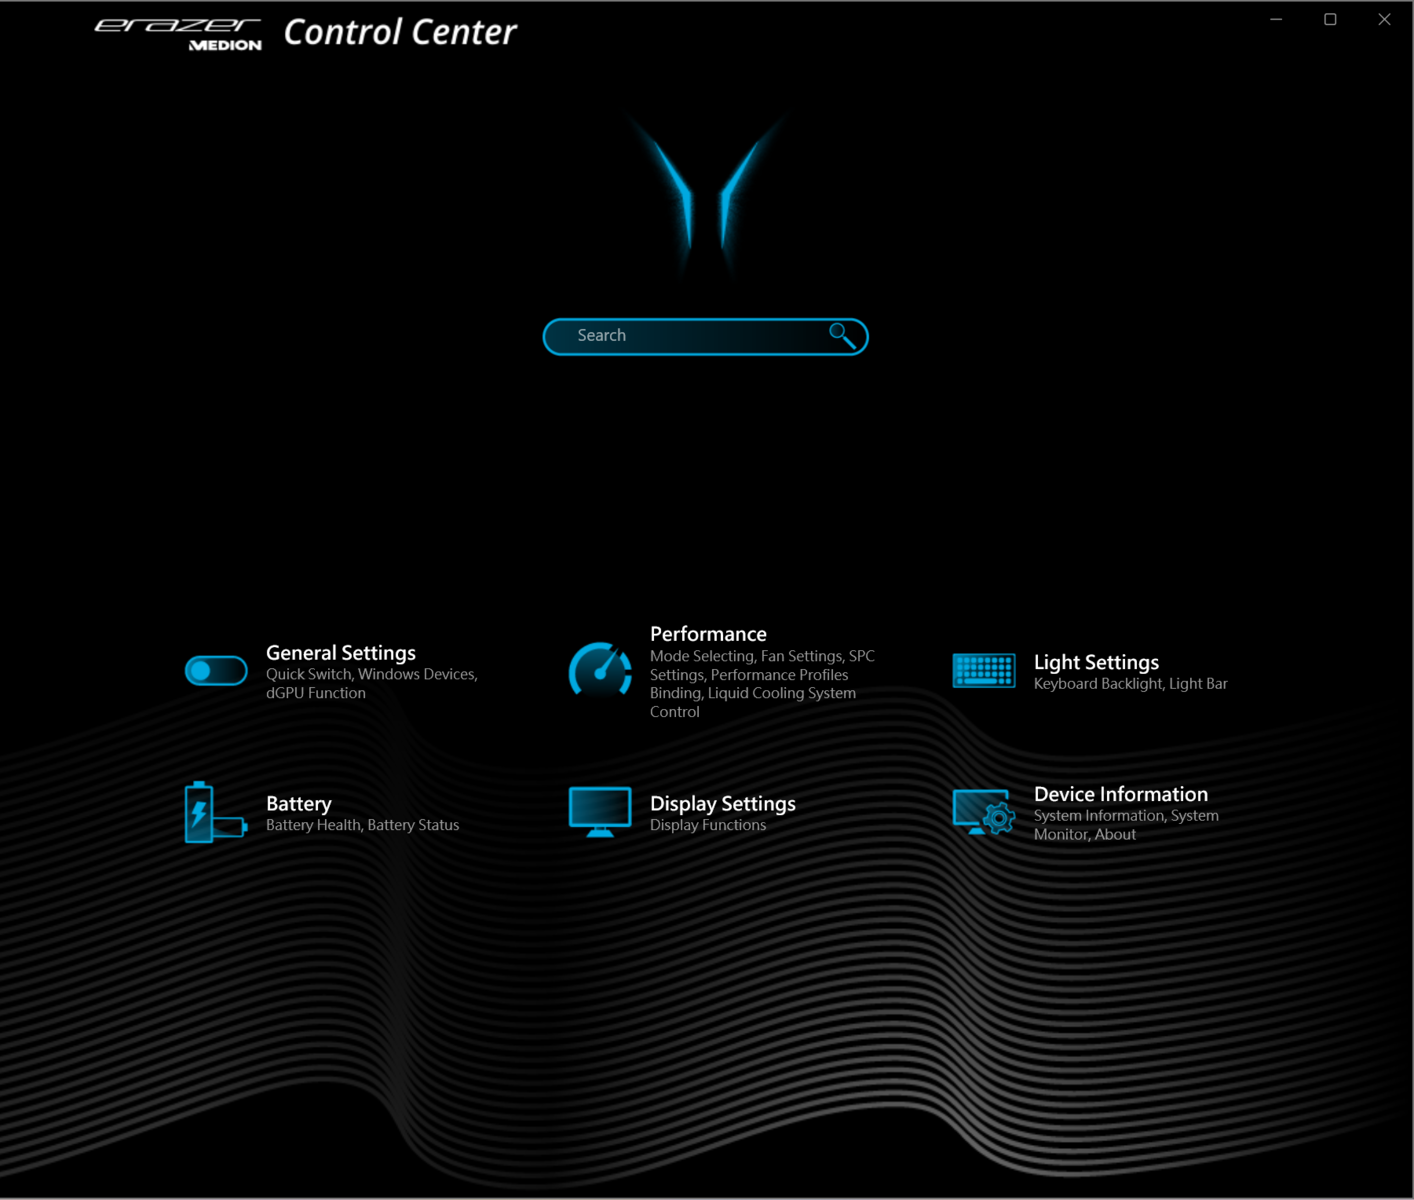
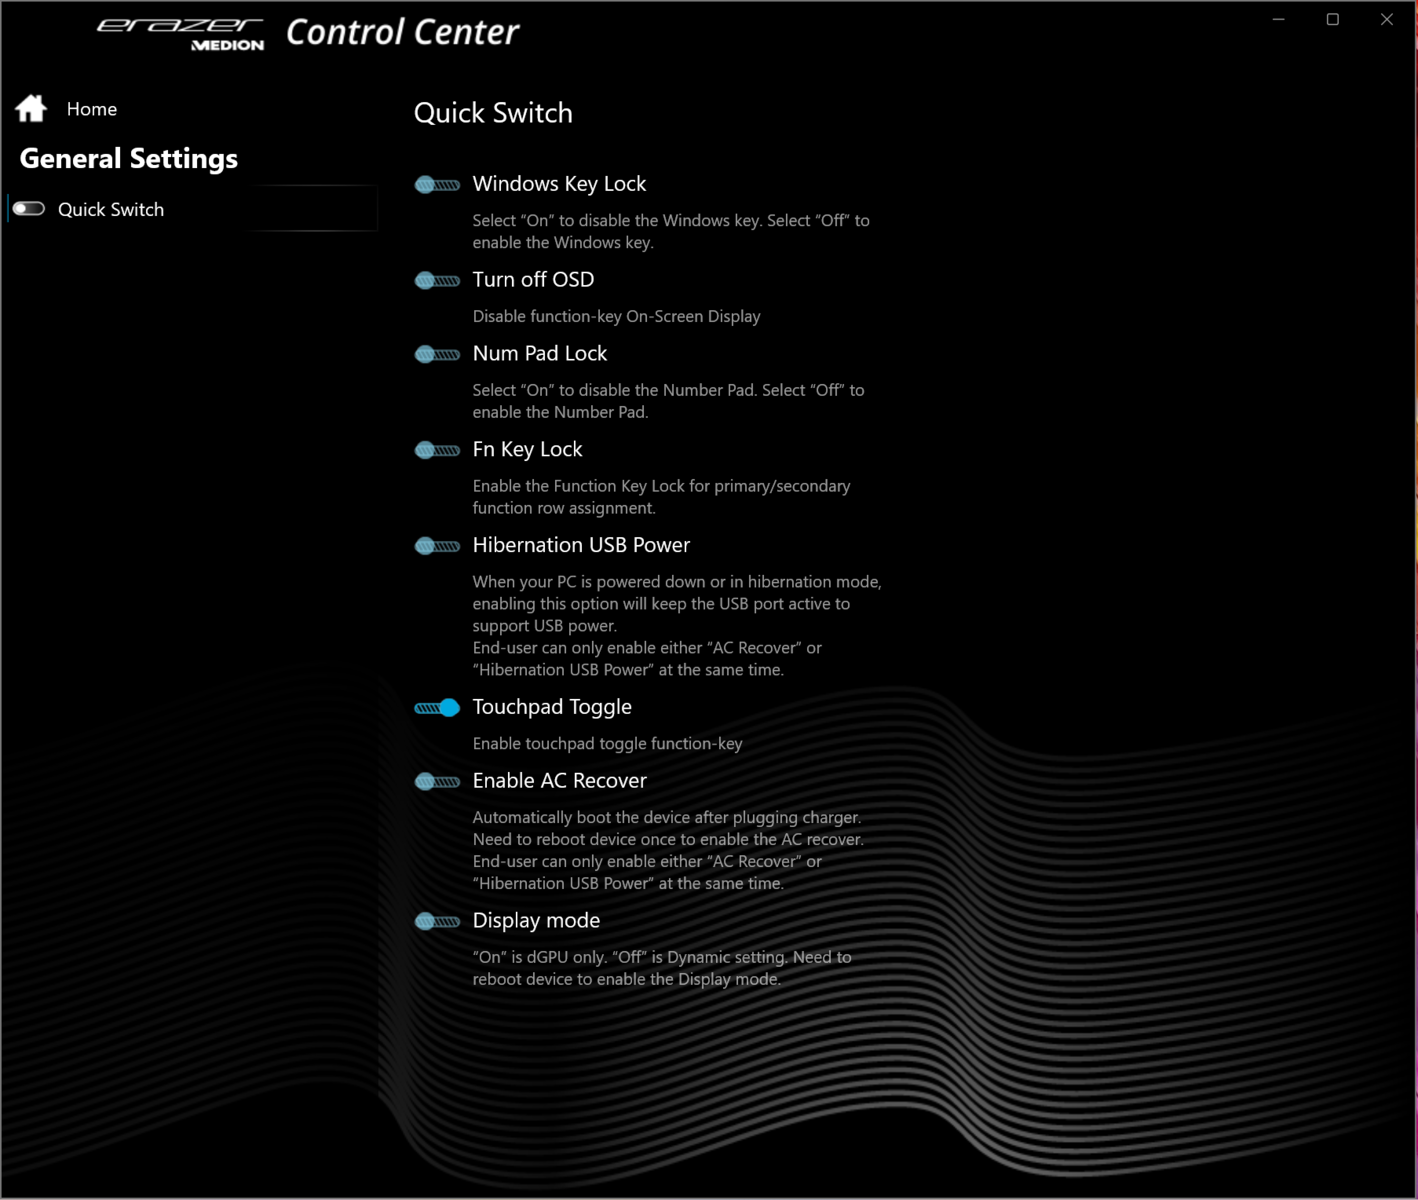
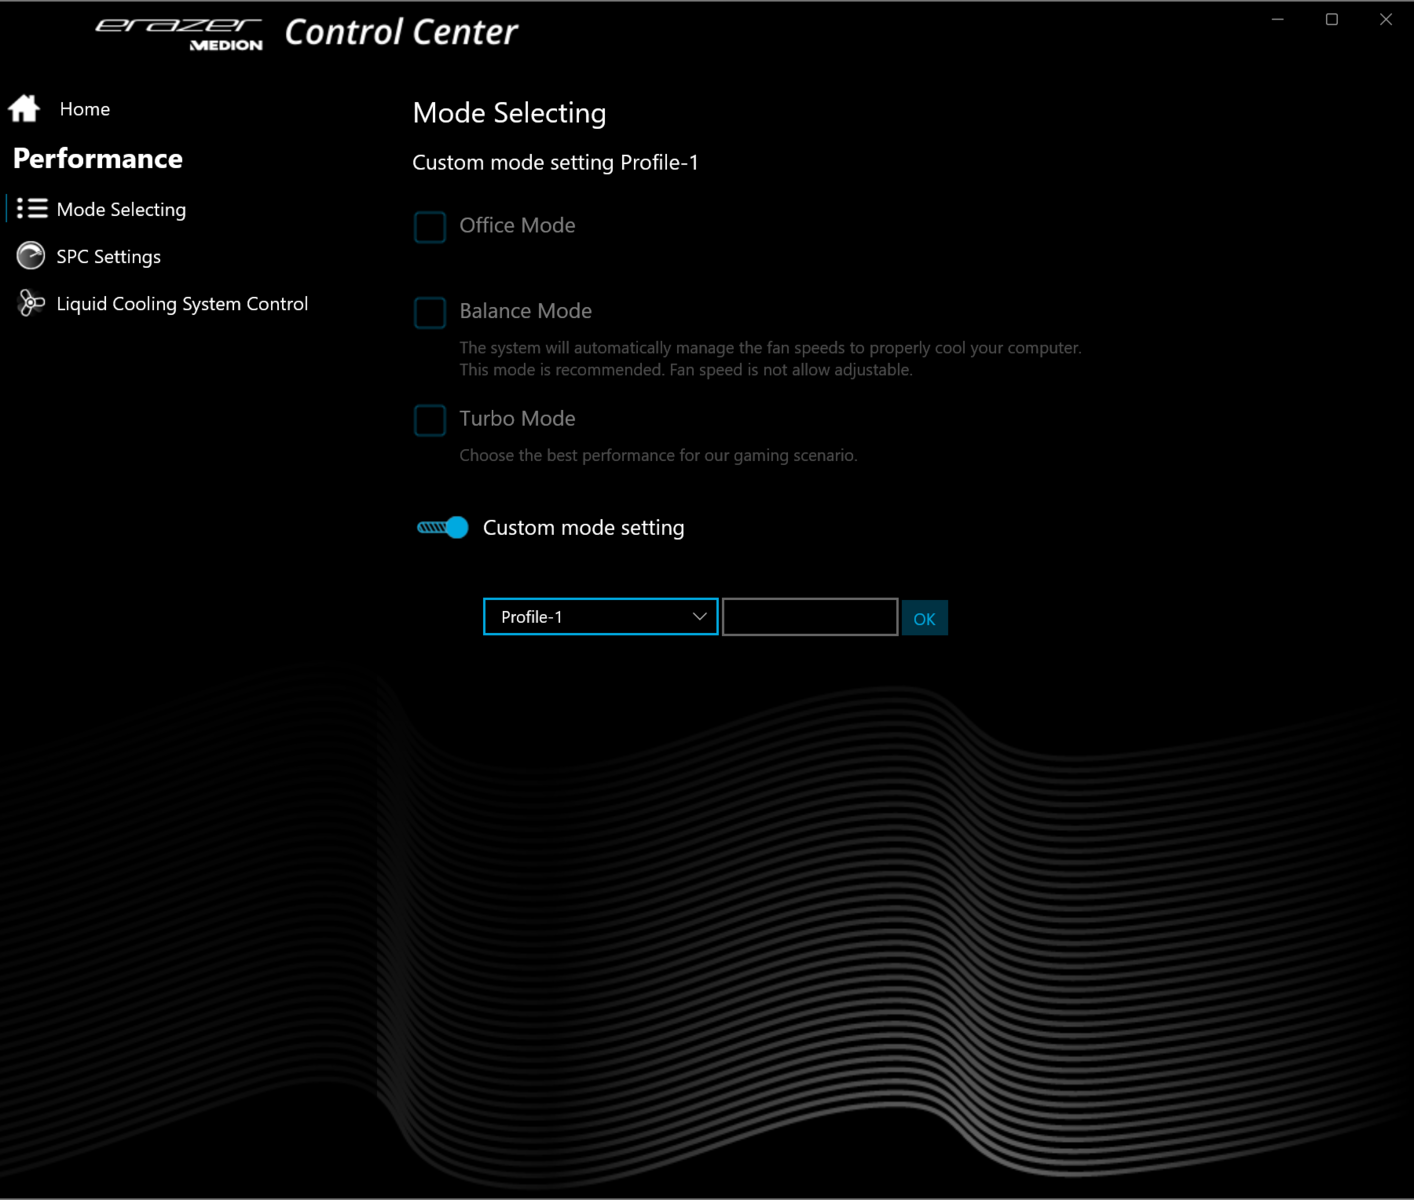
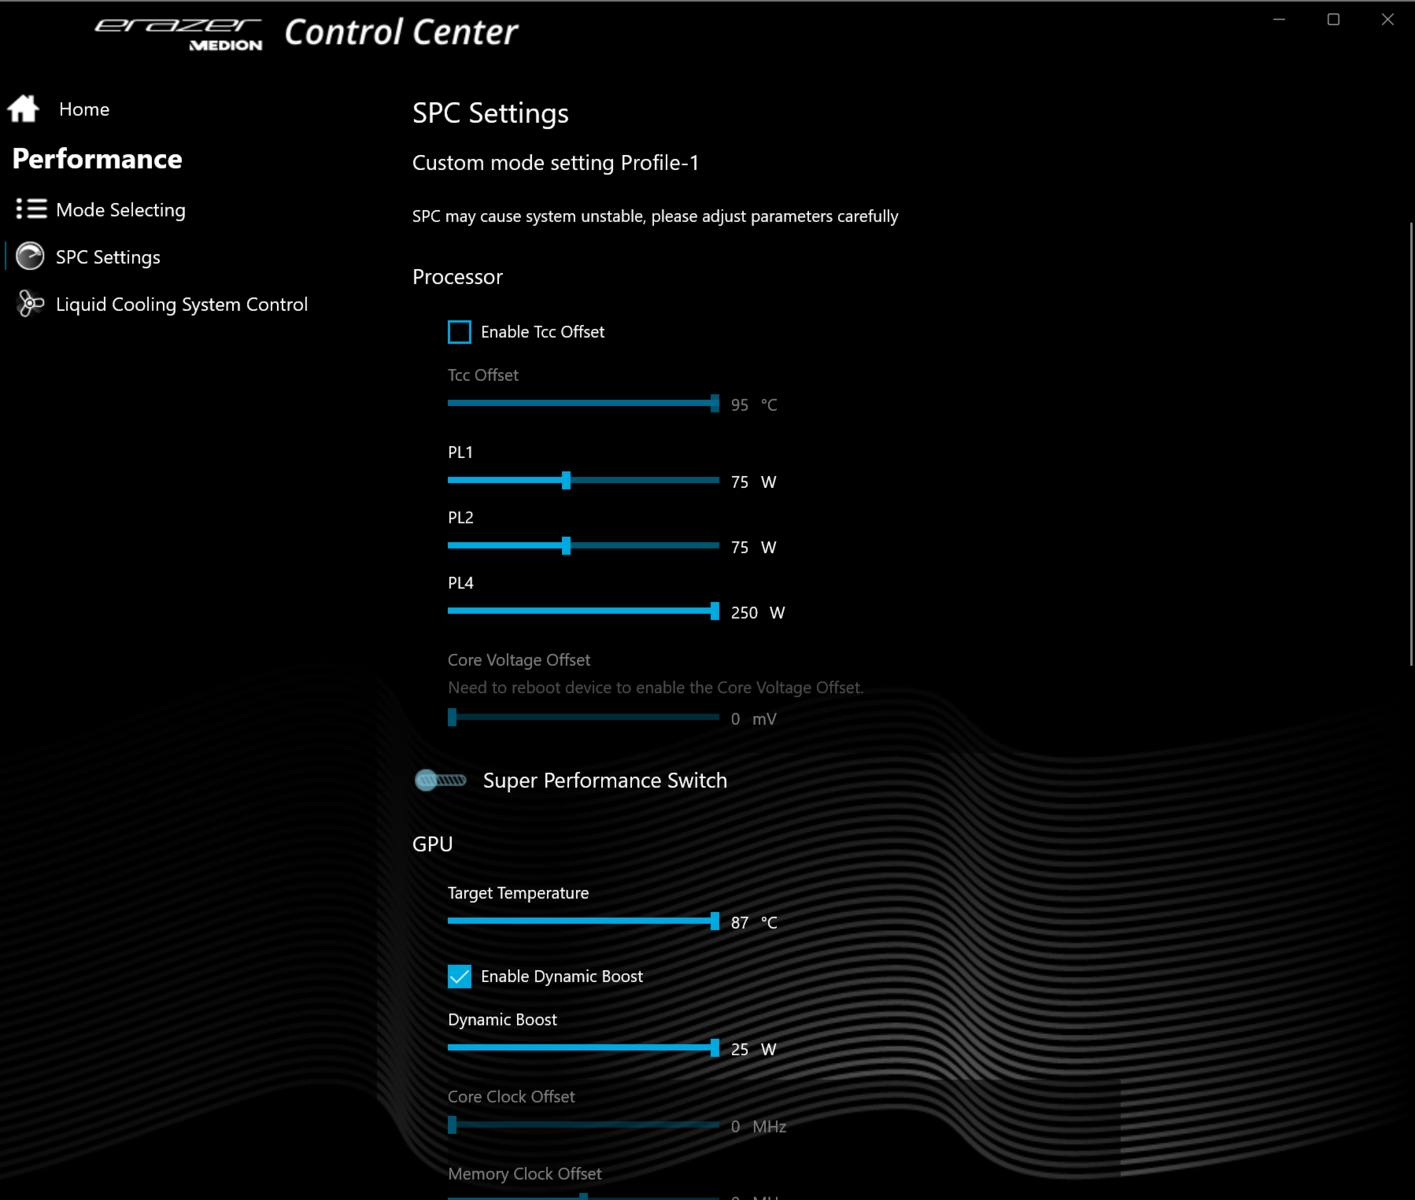
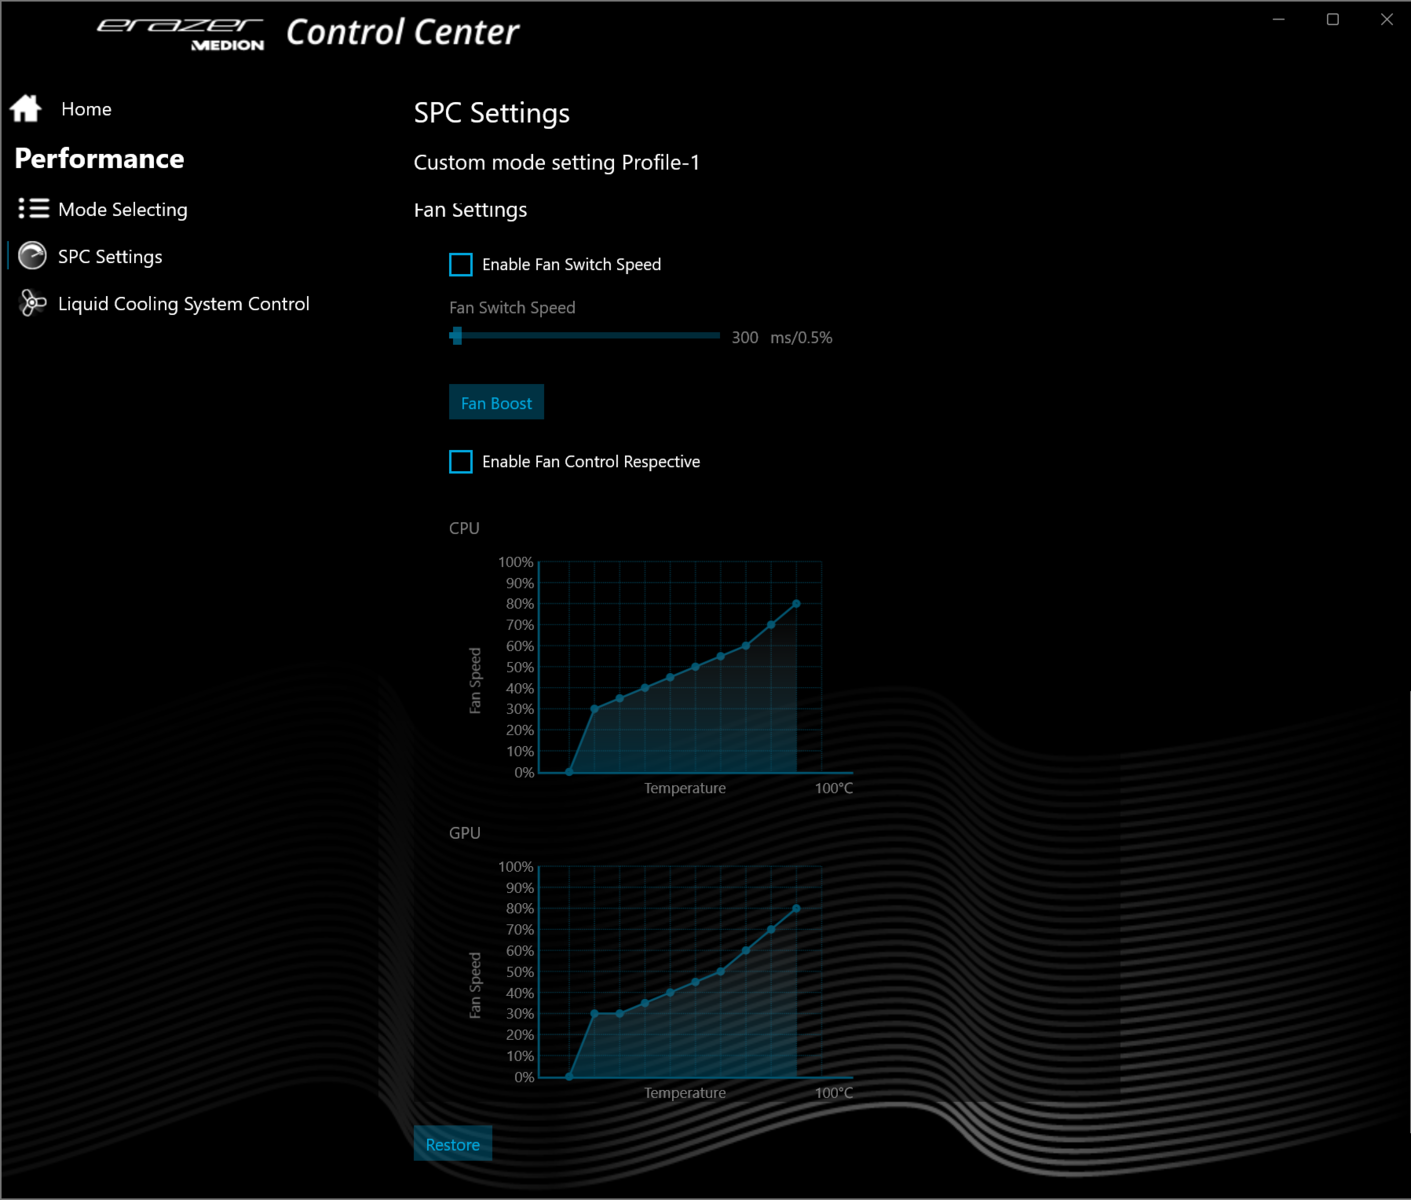
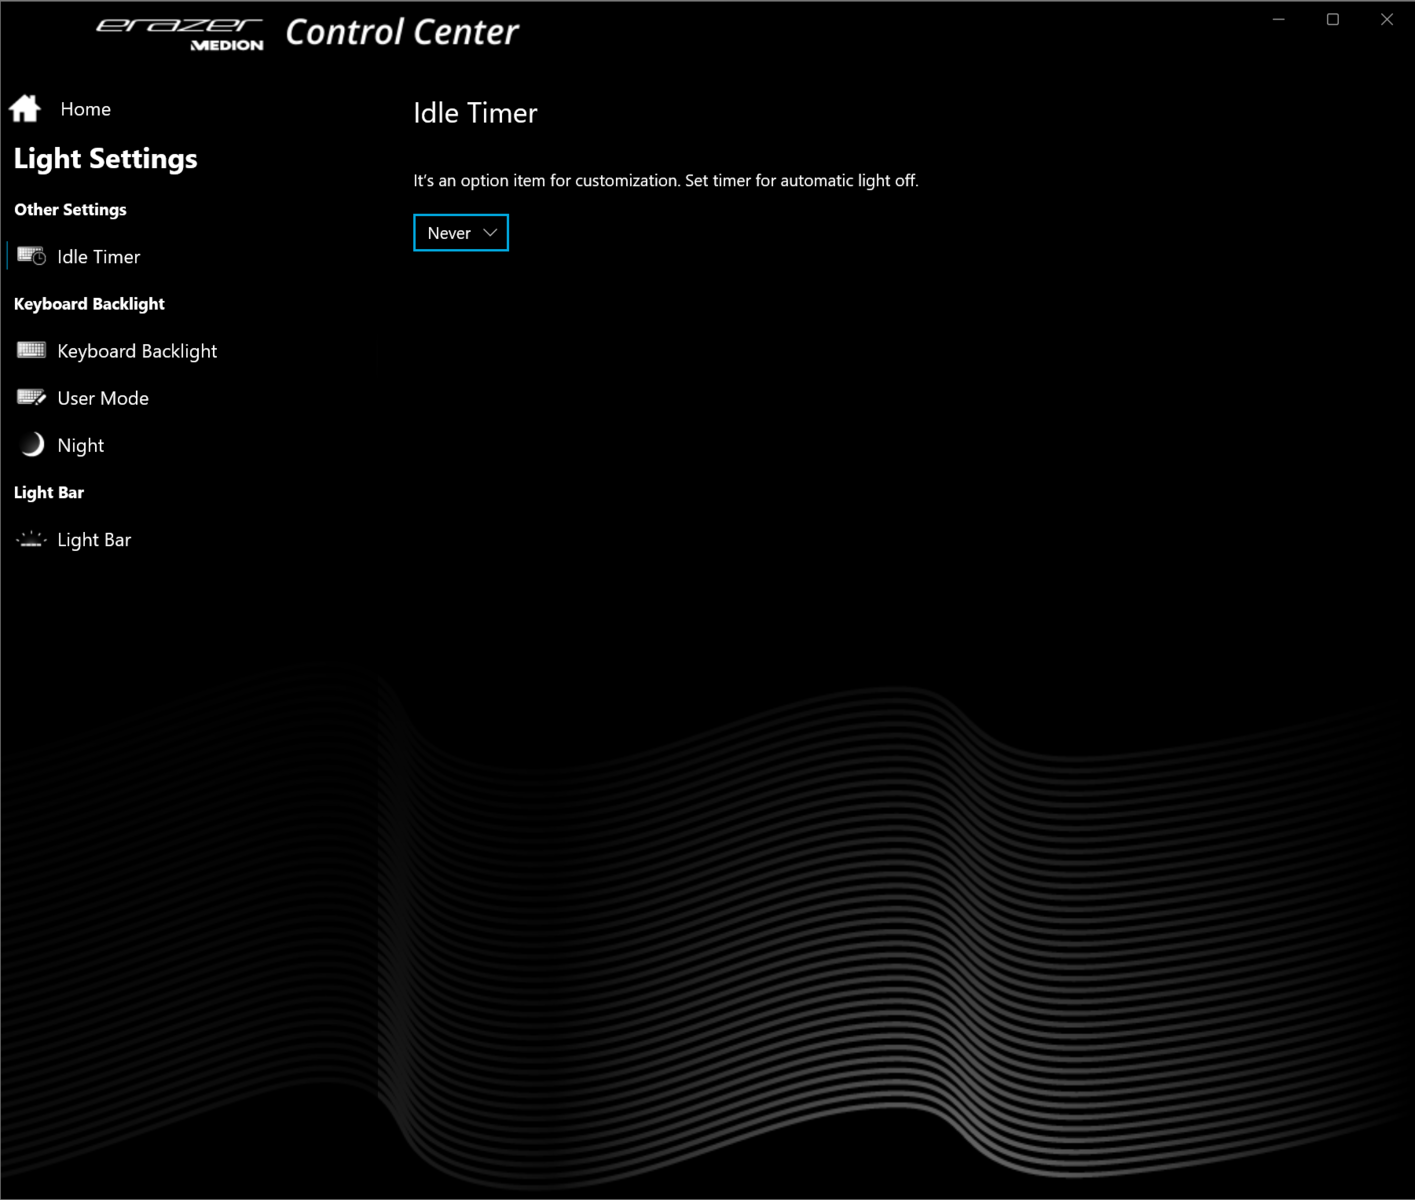
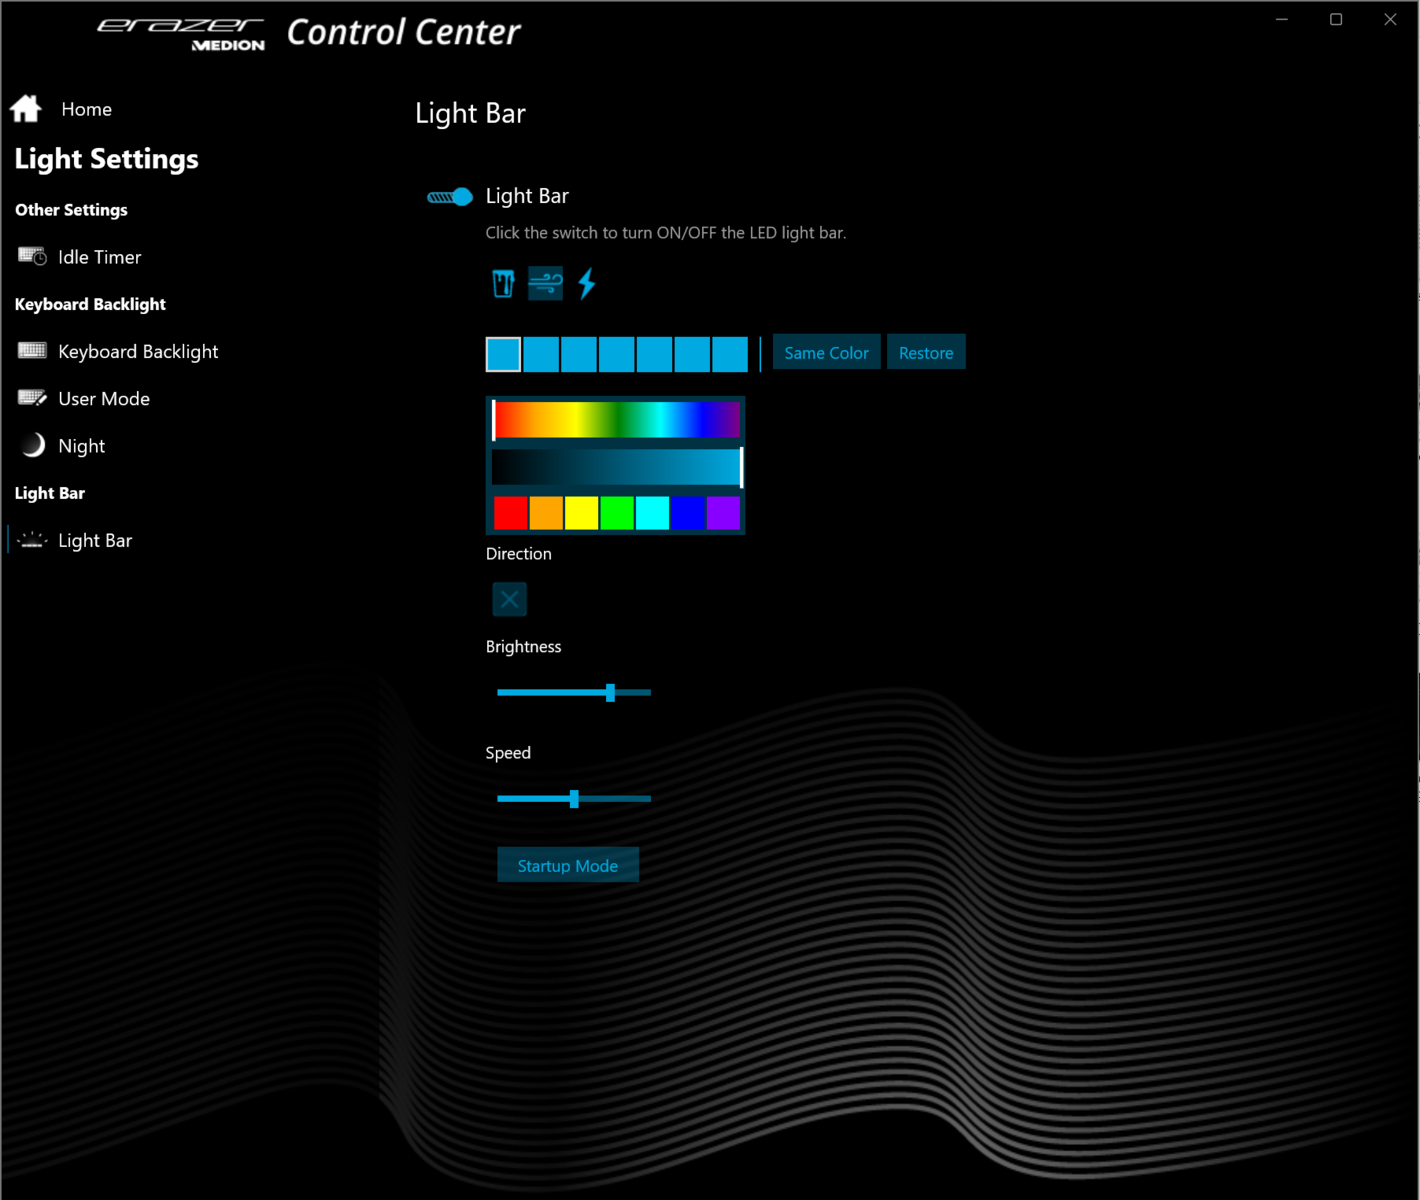
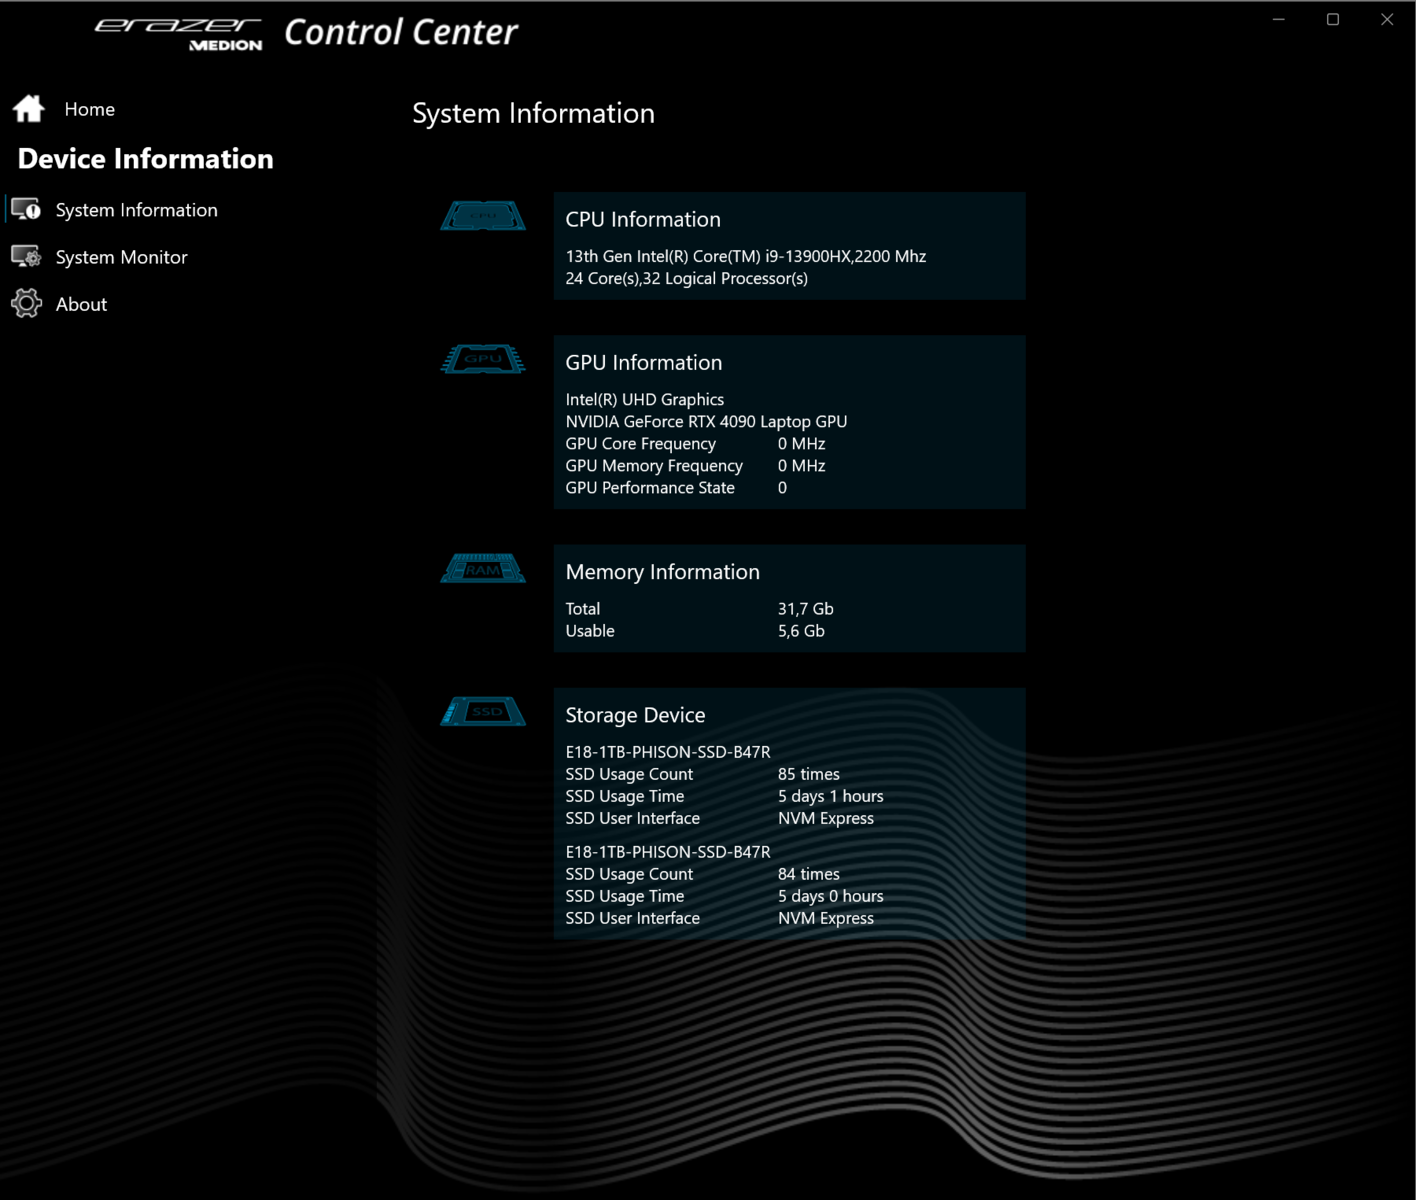
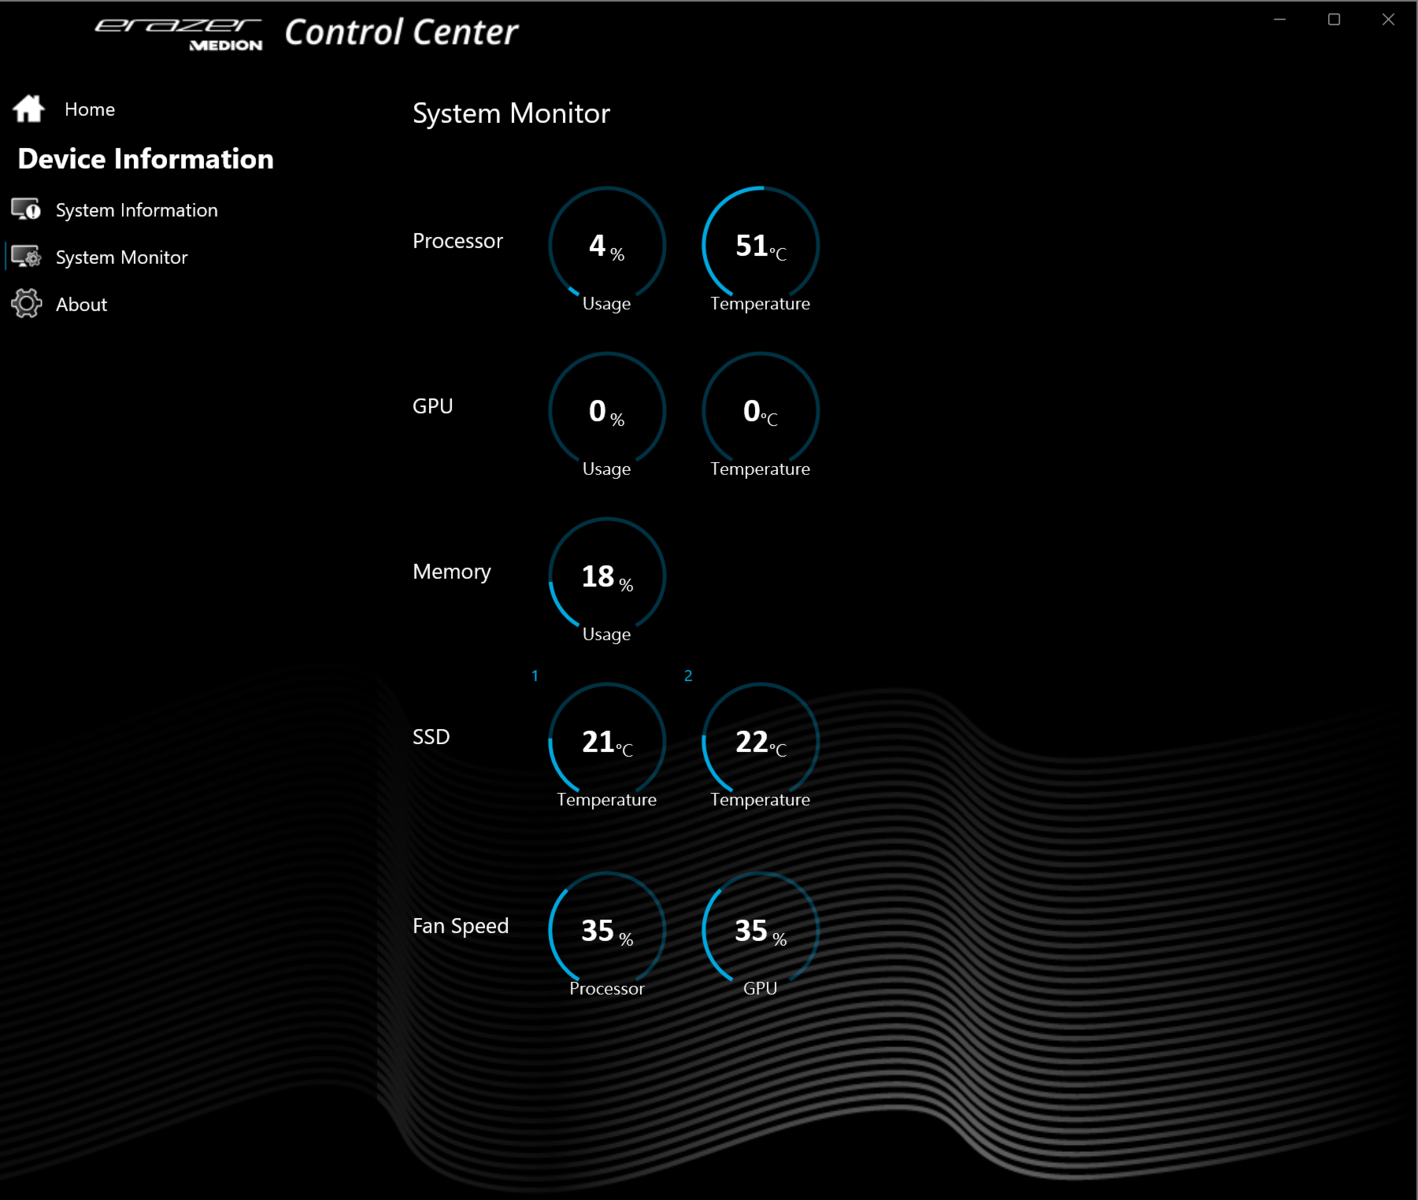
Użytkownicy mogą przełączać się pomiędzy trzema trybami za pomocą dedykowanego przycisku tuż obok przycisku zasilania. Dioda LED sygnalizuje, który tryb jest aktualnie włączony. Za pomocą preinstalowanego oprogramowania Control Center można również tworzyć własne profile. Można na przykład określić limity mocy CPU, TGP GPU, limity temperatury i tak dalej.
Uwaga: Użyliśmy angielskiego interfejsu użytkownika w oprogramowaniu Control Center, ponieważ są pewne problemy z niemieckim tłumaczeniem. Oprogramowanie pozwala na przełączanie się między dwoma językami.
| Tryb Turbo | Tryb Balance | Tryb Office | |
|---|---|---|---|
| Limit mocy 1 | 160 Watt | 160 Watt | 160 Watt |
| Limit mocy 2 | 160 Watt | 160 Watt | 160 Watt |
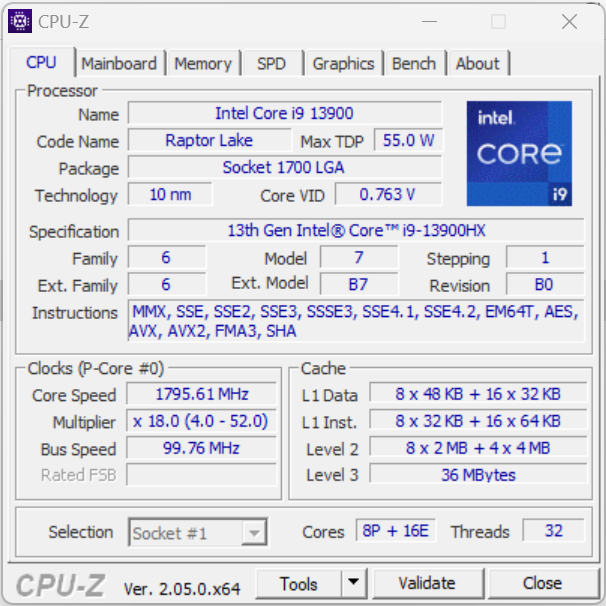
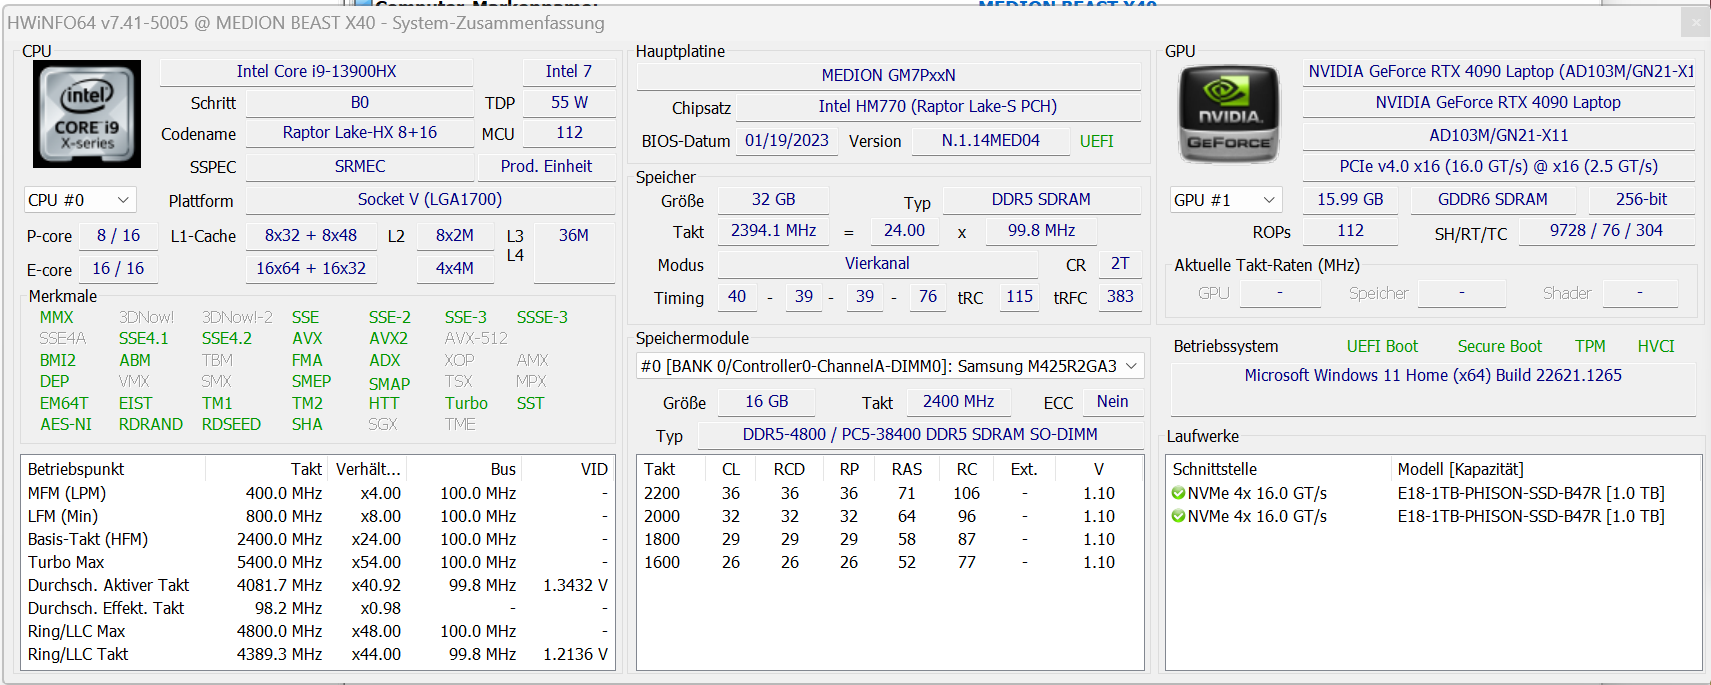
Procesor
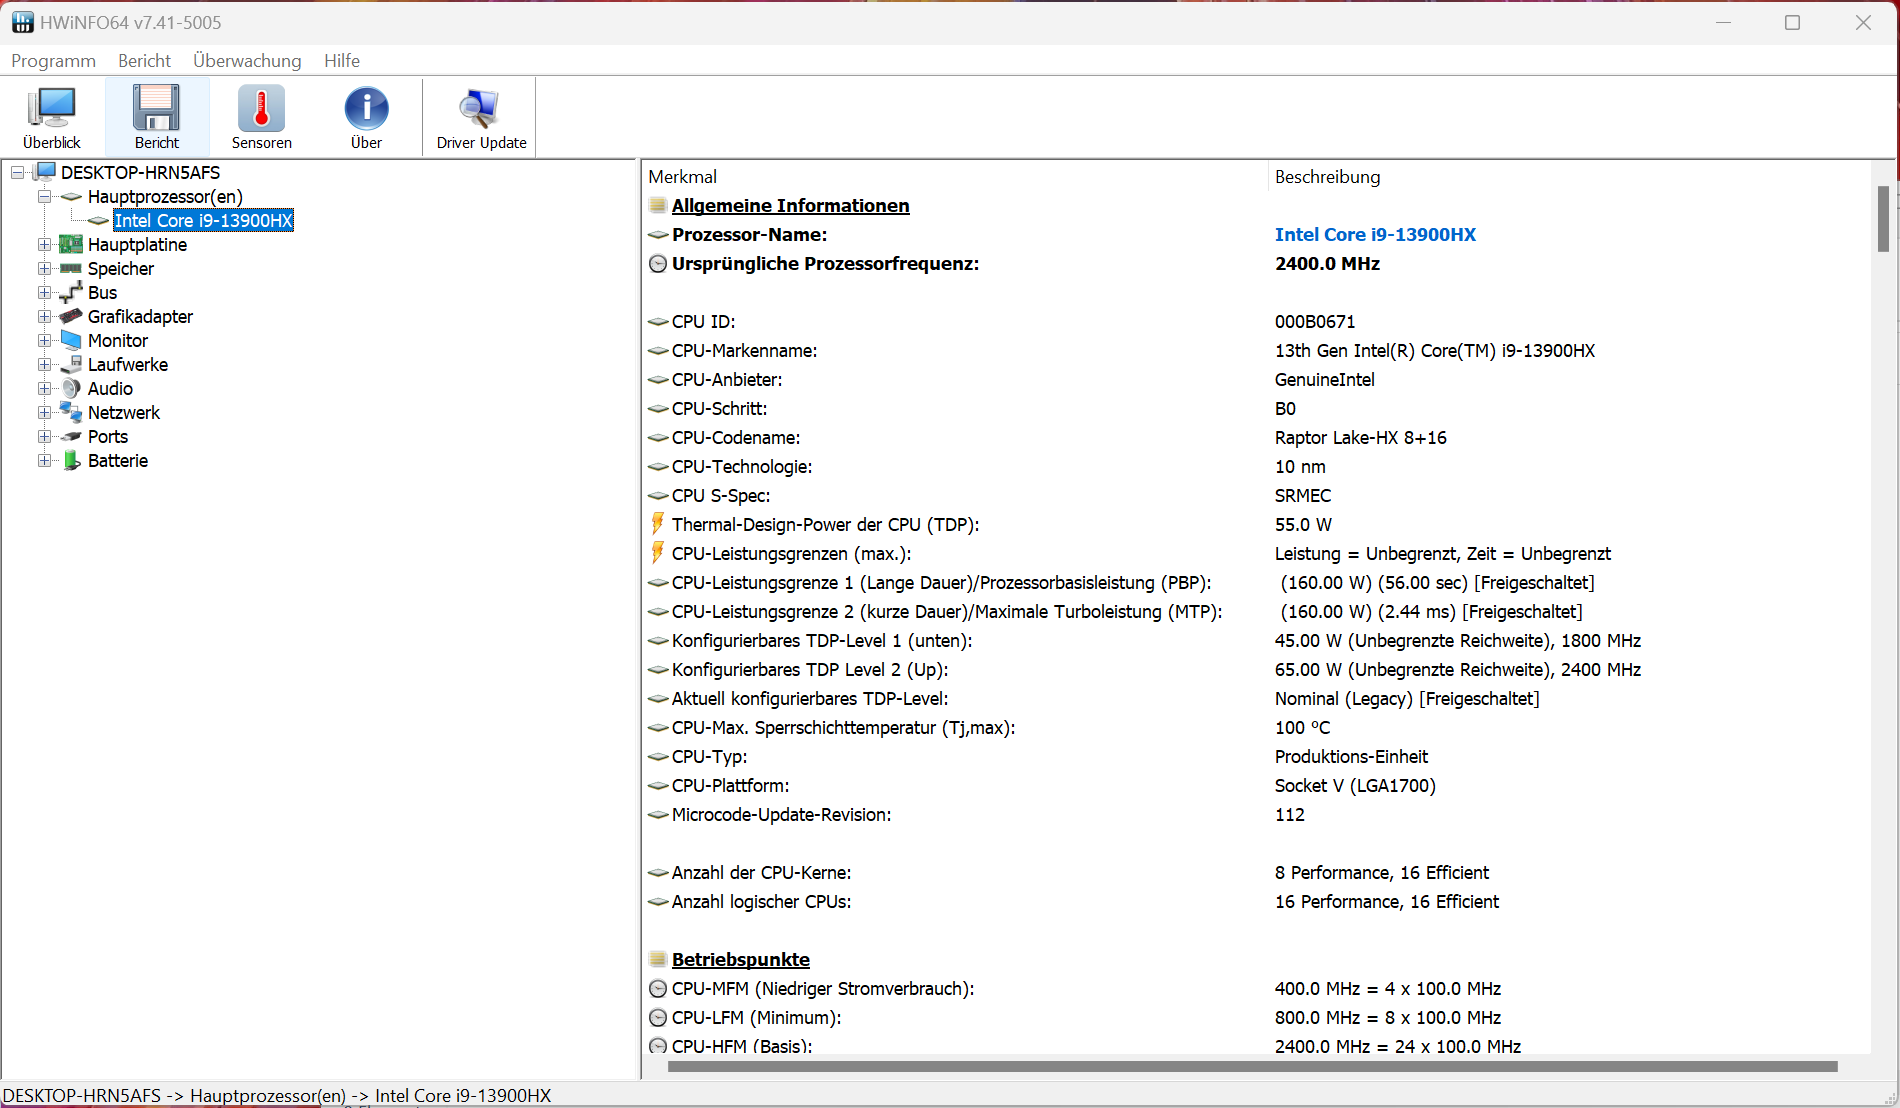
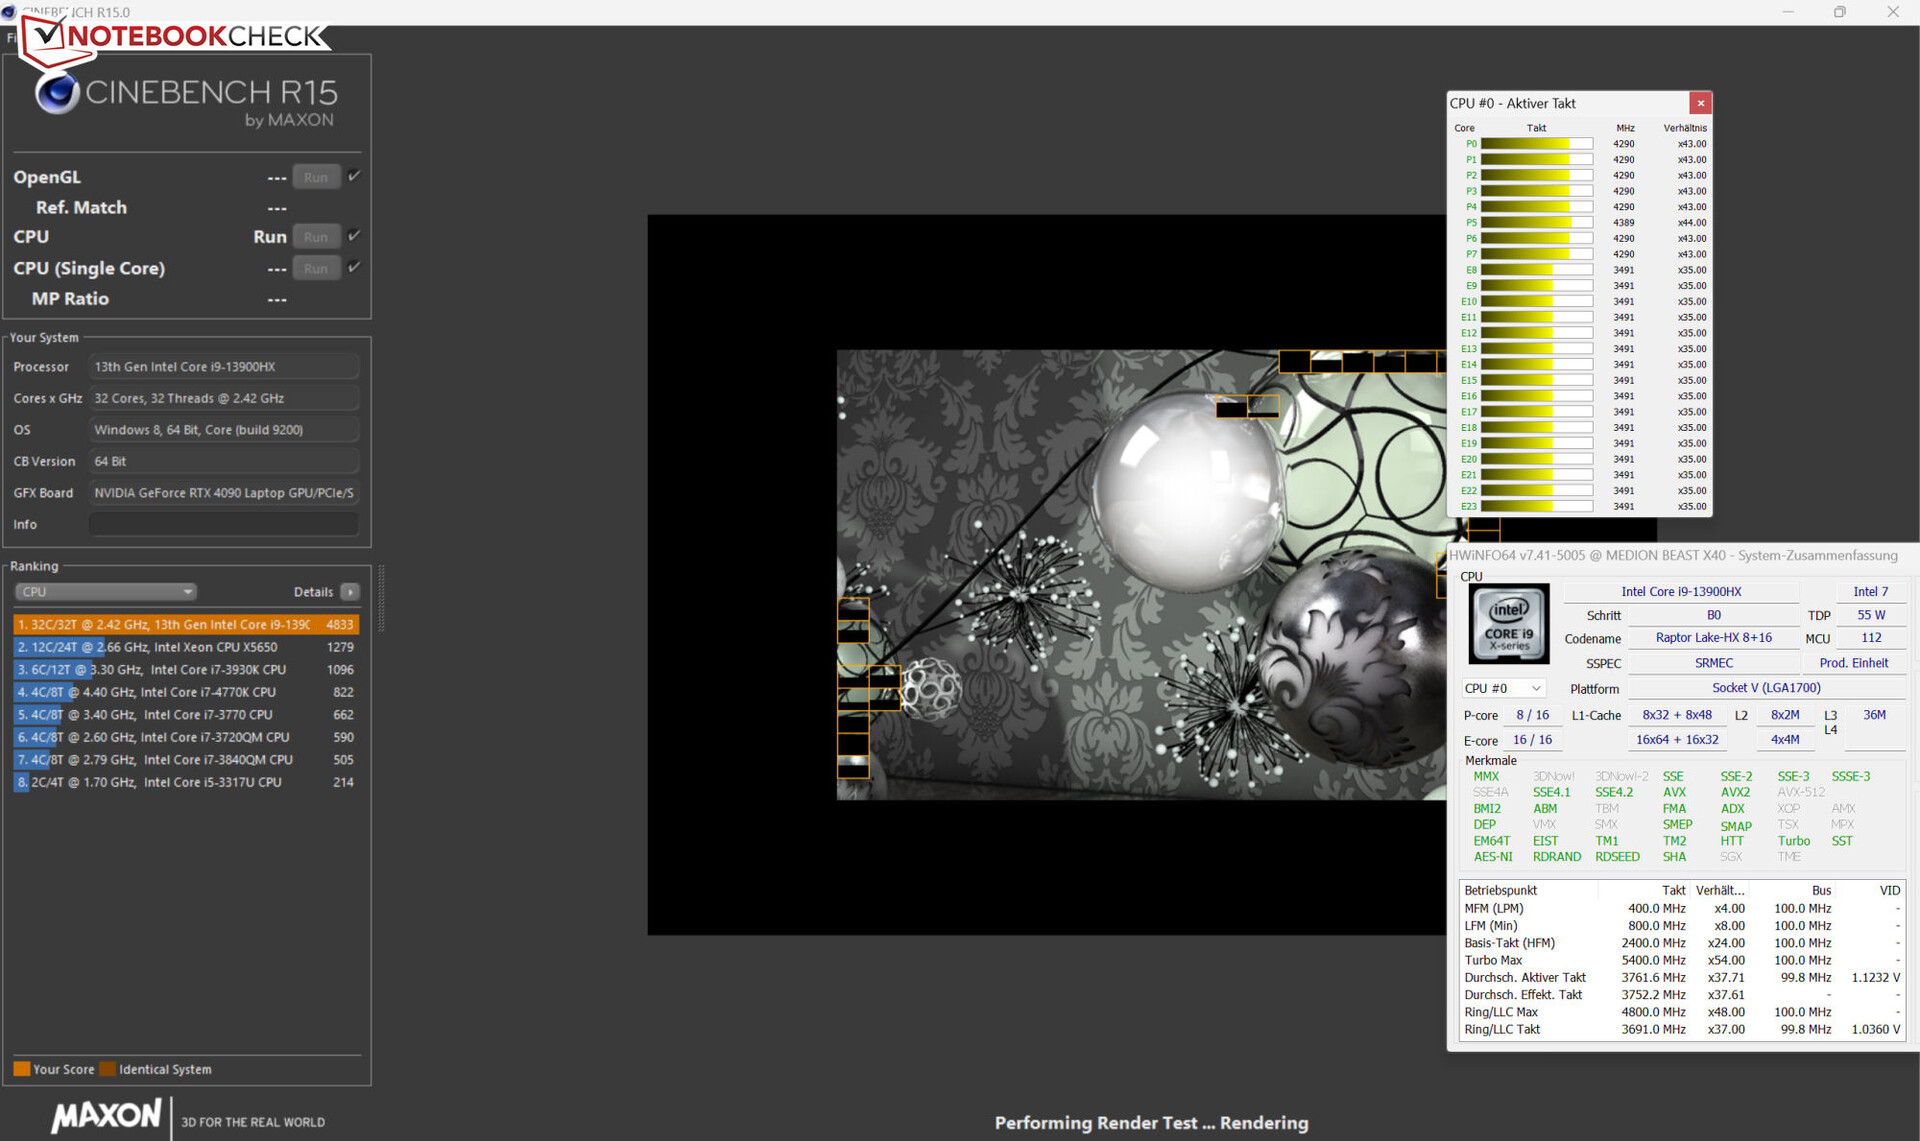
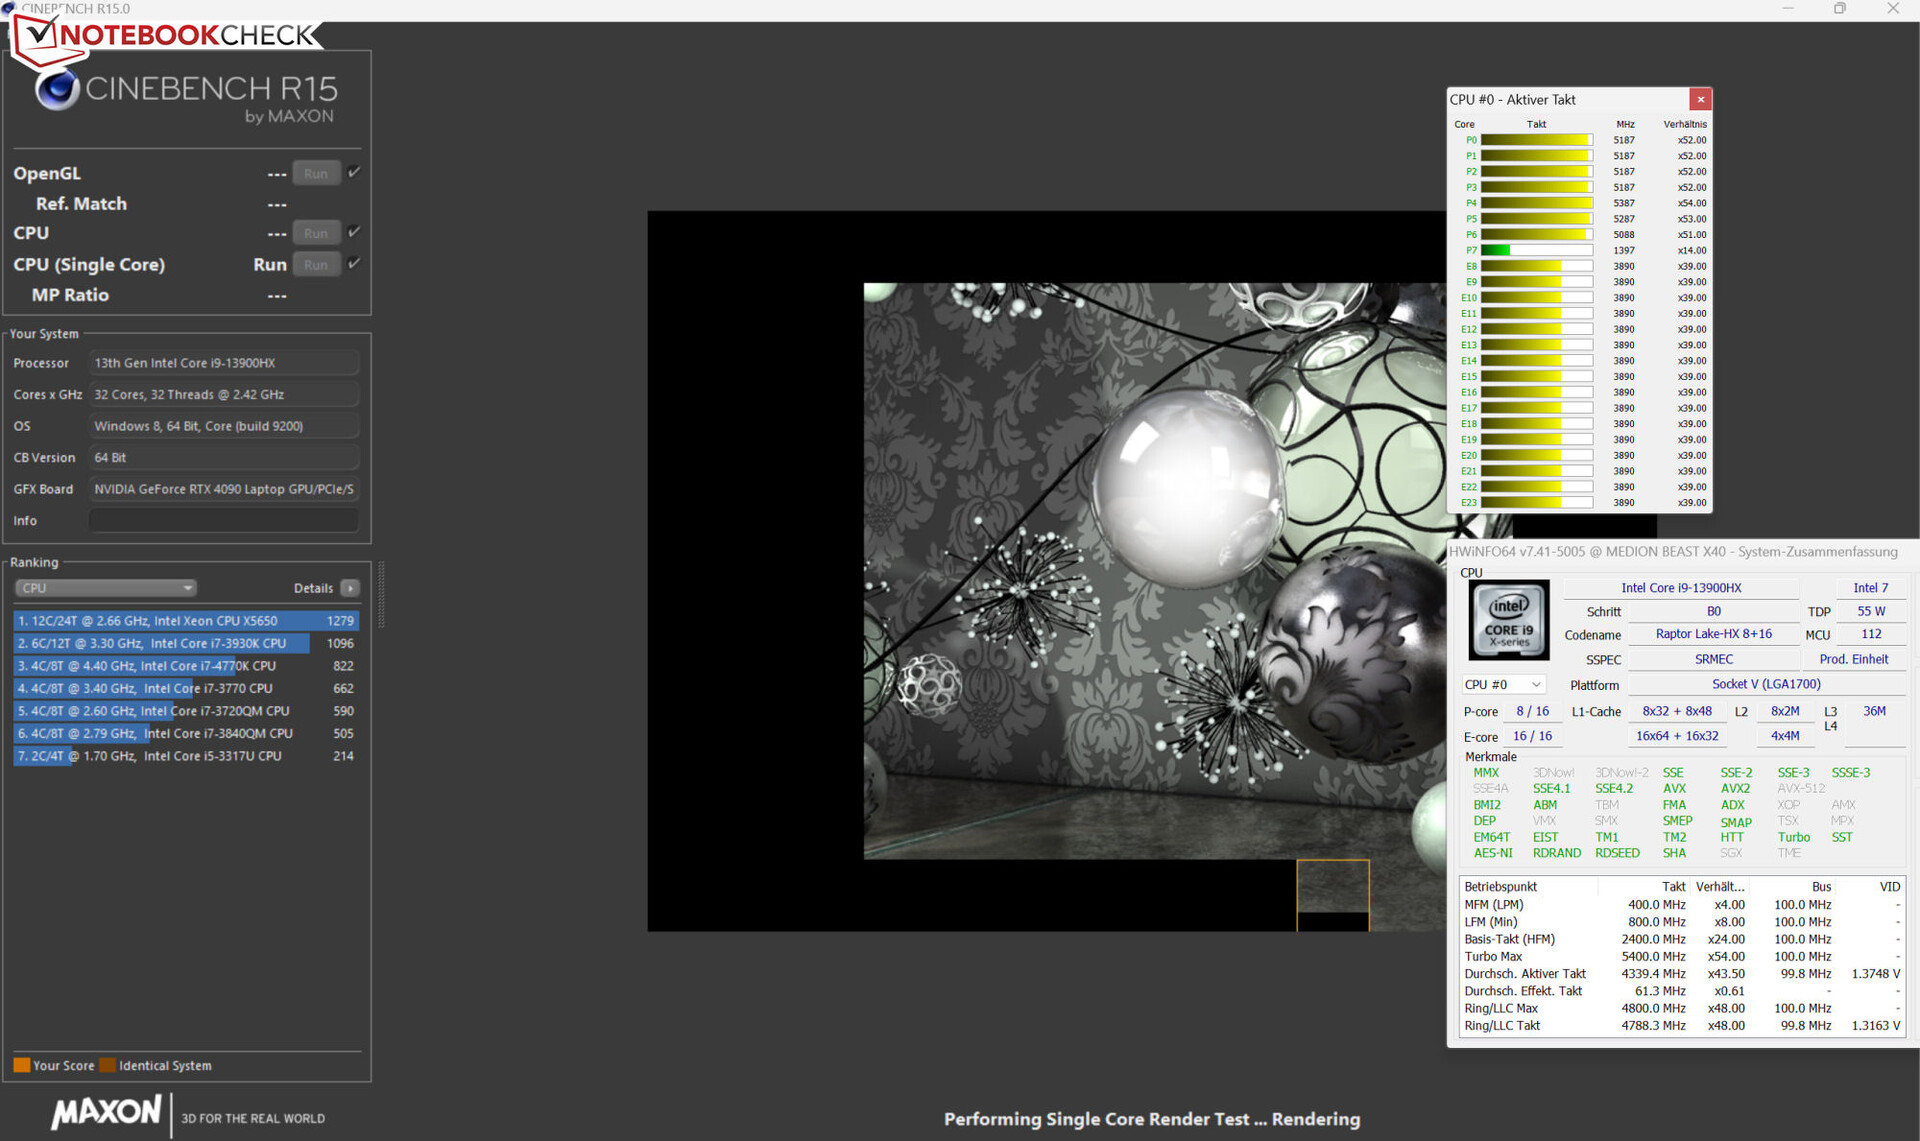
Core i9-13900HX (Raptor Lake) składa się z ośmiu rdzeni wydajnościowych (Hyper-Threading, 2,2 do 5,4 GHz) i szesnastu wydajnościowych (bez Hyper-Threadingu, 1,6 do 3,9 GHz), co daje łącznie 40 rdzeni logicznych. Uzyskane wyniki benchmarków są nieco powyżej tego, co procesor jest w stanie przeciętnie wyprodukować.
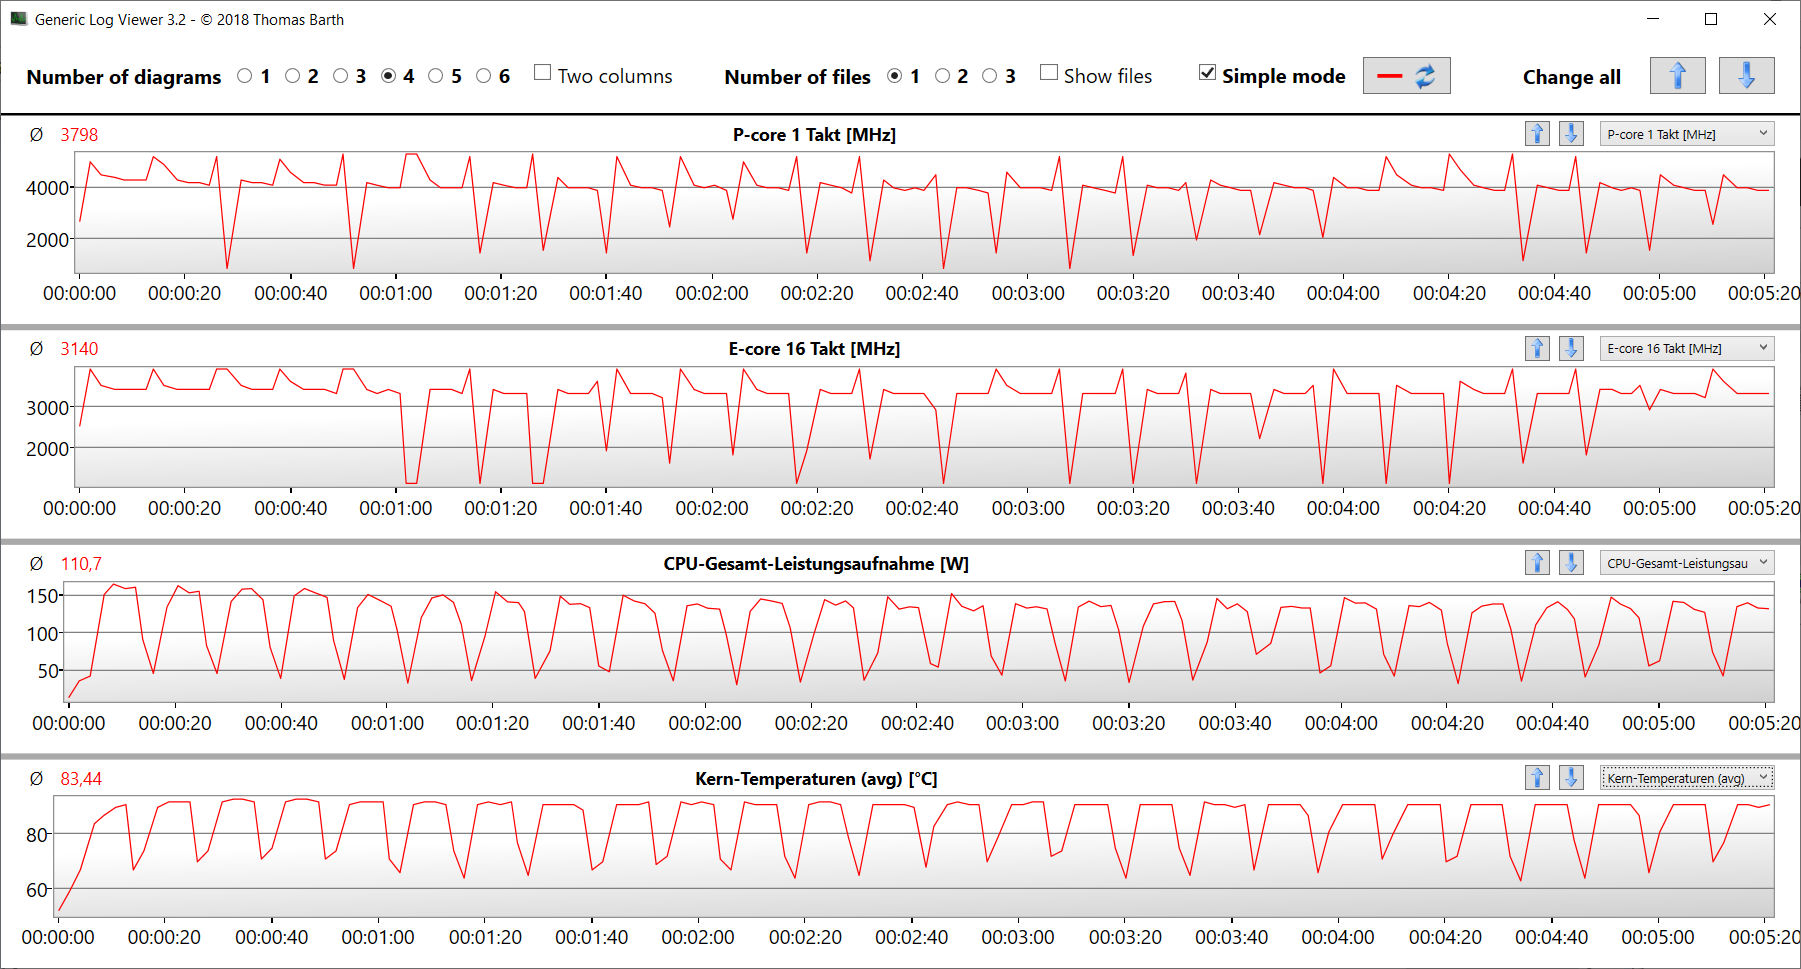
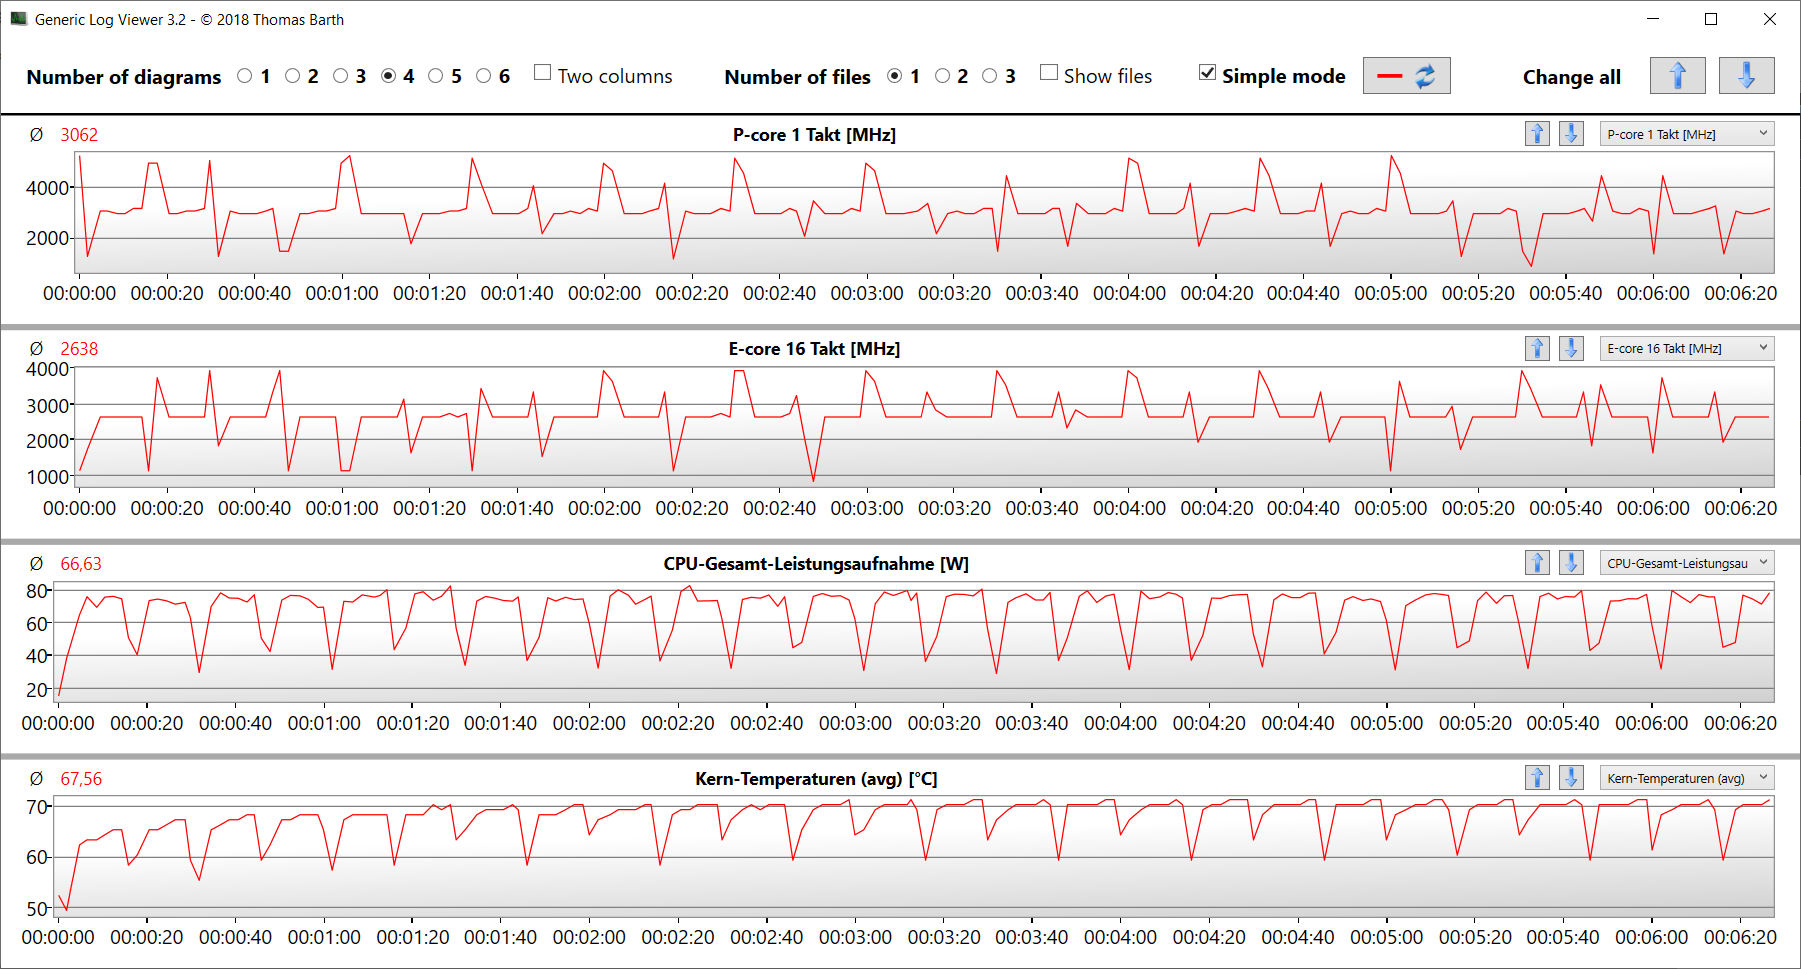
Przy podłączonym do prądu Erazerze Beast X40 jego procesor uruchomił Cinebench R15 przy wysokich do maksymalnych taktowaniach. Na zasilaniu akumulatorowym wydajność jednowątkowa była tylko minimalnie niższa (wynik: 228 pkt.), natomiast wydajność wielowątkowa znacznie ucierpiała (wynik: 1 154 pkt.). Uruchomienie Cinebench 15 w pętli pokazało, że procesor jest w stanie pracować stale z wysoką prędkością na zasilaniu sieciowym.
Zastosowanie chłodzenia wodnego nie przyniosło drastycznego wzrostu wydajności. Niemniej jednak wydajność procesora była bardziej stabilna pod długotrwałym obciążeniem wielowątkowym (pętla CB15), a średnia temperatura CPU spadła o około 5°C (9°F).
Cinebench R15 Multi Sustained Load
| CPU Performance rating - Percent | |
| Asus ROG Strix Scar 18 2023 G834JY-N6005W | |
| MSI Titan GT77 HX 13VI | |
| Medion Erazer Beast X40 | |
| Medion Erazer Beast X40 | |
| Przeciętny Intel Core i9-13900HX | |
| Razer Blade 16 Early 2023 | |
| Średnia w klasie Gaming | |
| Alienware x17 R2 P48E | |
| Schenker XMG Neo 17 M22 | |
| Cinebench R23 | |
| Multi Core | |
| MSI Titan GT77 HX 13VI | |
| Asus ROG Strix Scar 18 2023 G834JY-N6005W | |
| Medion Erazer Beast X40 | |
| Medion Erazer Beast X40 (dGPU, Cooling) | |
| Przeciętny Intel Core i9-13900HX (24270 - 32623, n=23) | |
| Razer Blade 16 Early 2023 | |
| Średnia w klasie Gaming (10488 - 40970, n=110, ostatnie 2 lata) | |
| Alienware x17 R2 P48E | |
| Schenker XMG Neo 17 M22 | |
| Single Core | |
| Asus ROG Strix Scar 18 2023 G834JY-N6005W | |
| MSI Titan GT77 HX 13VI | |
| Medion Erazer Beast X40 (dGPU, Cooling) | |
| Przeciętny Intel Core i9-13900HX (1867 - 2105, n=20) | |
| Medion Erazer Beast X40 | |
| Razer Blade 16 Early 2023 | |
| Średnia w klasie Gaming (1166 - 2356, n=110, ostatnie 2 lata) | |
| Alienware x17 R2 P48E | |
| Schenker XMG Neo 17 M22 | |
| Cinebench R20 | |
| CPU (Multi Core) | |
| MSI Titan GT77 HX 13VI | |
| Asus ROG Strix Scar 18 2023 G834JY-N6005W | |
| Medion Erazer Beast X40 (dGPU, Cooling) | |
| Medion Erazer Beast X40 | |
| Przeciętny Intel Core i9-13900HX (9152 - 12541, n=21) | |
| Średnia w klasie Gaming (4029 - 16108, n=109, ostatnie 2 lata) | |
| Razer Blade 16 Early 2023 | |
| Alienware x17 R2 P48E | |
| Schenker XMG Neo 17 M22 | |
| CPU (Single Core) | |
| Asus ROG Strix Scar 18 2023 G834JY-N6005W | |
| MSI Titan GT77 HX 13VI | |
| Medion Erazer Beast X40 (dGPU, Cooling) | |
| Przeciętny Intel Core i9-13900HX (722 - 810, n=21) | |
| Medion Erazer Beast X40 | |
| Średnia w klasie Gaming (442 - 895, n=109, ostatnie 2 lata) | |
| Razer Blade 16 Early 2023 | |
| Alienware x17 R2 P48E | |
| Schenker XMG Neo 17 M22 | |
| Cinebench R15 | |
| CPU Multi 64Bit | |
| MSI Titan GT77 HX 13VI | |
| Medion Erazer Beast X40 | |
| Medion Erazer Beast X40 (dGPU, Cooling) | |
| Medion Erazer Beast X40 (dGPU, Cooling) | |
| Asus ROG Strix Scar 18 2023 G834JY-N6005W | |
| Razer Blade 16 Early 2023 | |
| Przeciętny Intel Core i9-13900HX (3913 - 4970, n=22) | |
| Średnia w klasie Gaming (1578 - 6271, n=109, ostatnie 2 lata) | |
| Alienware x17 R2 P48E | |
| Schenker XMG Neo 17 M22 | |
| CPU Single 64Bit | |
| Asus ROG Strix Scar 18 2023 G834JY-N6005W | |
| MSI Titan GT77 HX 13VI | |
| Medion Erazer Beast X40 | |
| Średnia w klasie Gaming (188.8 - 343, n=109, ostatnie 2 lata) | |
| Medion Erazer Beast X40 (dGPU, Cooling) | |
| Medion Erazer Beast X40 (dGPU, Cooling) | |
| Przeciętny Intel Core i9-13900HX (247 - 304, n=22) | |
| Razer Blade 16 Early 2023 | |
| Alienware x17 R2 P48E | |
| Schenker XMG Neo 17 M22 | |
| Blender - v2.79 BMW27 CPU | |
| Schenker XMG Neo 17 M22 | |
| Alienware x17 R2 P48E | |
| Średnia w klasie Gaming (80 - 330, n=107, ostatnie 2 lata) | |
| Przeciętny Intel Core i9-13900HX (101 - 153, n=22) | |
| Razer Blade 16 Early 2023 | |
| Medion Erazer Beast X40 | |
| Asus ROG Strix Scar 18 2023 G834JY-N6005W | |
| Medion Erazer Beast X40 (dGPU, Cooling) | |
| MSI Titan GT77 HX 13VI | |
| 7-Zip 18.03 | |
| 7z b 4 | |
| MSI Titan GT77 HX 13VI | |
| Asus ROG Strix Scar 18 2023 G834JY-N6005W | |
| Medion Erazer Beast X40 | |
| Medion Erazer Beast X40 (dGPU, Cooling) | |
| Przeciętny Intel Core i9-13900HX (90675 - 127283, n=21) | |
| Razer Blade 16 Early 2023 | |
| Średnia w klasie Gaming (33491 - 148086, n=108, ostatnie 2 lata) | |
| Alienware x17 R2 P48E | |
| Schenker XMG Neo 17 M22 | |
| 7z b 4 -mmt1 | |
| Asus ROG Strix Scar 18 2023 G834JY-N6005W | |
| Medion Erazer Beast X40 (dGPU, Cooling) | |
| MSI Titan GT77 HX 13VI | |
| Medion Erazer Beast X40 | |
| Przeciętny Intel Core i9-13900HX (6340 - 7177, n=21) | |
| Razer Blade 16 Early 2023 | |
| Średnia w klasie Gaming (4199 - 7436, n=108, ostatnie 2 lata) | |
| Schenker XMG Neo 17 M22 | |
| Alienware x17 R2 P48E | |
| Geekbench 5.5 | |
| Multi-Core | |
| Asus ROG Strix Scar 18 2023 G834JY-N6005W | |
| MSI Titan GT77 HX 13VI | |
| Medion Erazer Beast X40 (dGPU, Cooling) | |
| Medion Erazer Beast X40 | |
| Przeciętny Intel Core i9-13900HX (17614 - 21075, n=22) | |
| Razer Blade 16 Early 2023 | |
| Średnia w klasie Gaming (6460 - 27010, n=108, ostatnie 2 lata) | |
| Alienware x17 R2 P48E | |
| Schenker XMG Neo 17 M22 | |
| Single-Core | |
| Asus ROG Strix Scar 18 2023 G834JY-N6005W | |
| Średnia w klasie Gaming (986 - 2474, n=108, ostatnie 2 lata) | |
| Medion Erazer Beast X40 (dGPU, Cooling) | |
| MSI Titan GT77 HX 13VI | |
| Medion Erazer Beast X40 | |
| Przeciętny Intel Core i9-13900HX (1345 - 2093, n=22) | |
| Alienware x17 R2 P48E | |
| Razer Blade 16 Early 2023 | |
| Schenker XMG Neo 17 M22 | |
| HWBOT x265 Benchmark v2.2 - 4k Preset | |
| Asus ROG Strix Scar 18 2023 G834JY-N6005W | |
| MSI Titan GT77 HX 13VI | |
| Medion Erazer Beast X40 (dGPU, Cooling) | |
| Medion Erazer Beast X40 | |
| Przeciętny Intel Core i9-13900HX (23.5 - 34.4, n=22) | |
| Razer Blade 16 Early 2023 | |
| Średnia w klasie Gaming (11.5 - 44.3, n=108, ostatnie 2 lata) | |
| Alienware x17 R2 P48E | |
| Schenker XMG Neo 17 M22 | |
| LibreOffice - 20 Documents To PDF | |
| Schenker XMG Neo 17 M22 | |
| Średnia w klasie Gaming (19 - 88.8, n=108, ostatnie 2 lata) | |
| Razer Blade 16 Early 2023 | |
| MSI Titan GT77 HX 13VI | |
| Medion Erazer Beast X40 | |
| Przeciętny Intel Core i9-13900HX (32.8 - 51.1, n=21) | |
| Alienware x17 R2 P48E | |
| Medion Erazer Beast X40 (dGPU, Cooling) | |
| Asus ROG Strix Scar 18 2023 G834JY-N6005W | |
| R Benchmark 2.5 - Overall mean | |
| Schenker XMG Neo 17 M22 | |
| Alienware x17 R2 P48E | |
| Średnia w klasie Gaming (0.3439 - 0.759, n=109, ostatnie 2 lata) | |
| Razer Blade 16 Early 2023 | |
| MSI Titan GT77 HX 13VI | |
| Przeciętny Intel Core i9-13900HX (0.375 - 0.4564, n=22) | |
| Medion Erazer Beast X40 | |
| Medion Erazer Beast X40 (dGPU, Cooling) | |
| Asus ROG Strix Scar 18 2023 G834JY-N6005W | |
* ... im mniej tym lepiej
AIDA64: FP32 Ray-Trace | FPU Julia | CPU SHA3 | CPU Queen | FPU SinJulia | FPU Mandel | CPU AES | CPU ZLib | FP64 Ray-Trace | CPU PhotoWorxx
| Performance rating | |
| MSI Titan GT77 HX 13VI | |
| Asus ROG Strix Scar 18 2023 G834JY-N6005W | |
| Medion Erazer Beast X40 | |
| Medion Erazer Beast X40 | |
| Średnia w klasie Gaming | |
| Przeciętny Intel Core i9-13900HX | |
| Razer Blade 16 Early 2023 | |
| Schenker XMG Neo 17 M22 | |
| Alienware x17 R2 P48E | |
| AIDA64 / FP32 Ray-Trace | |
| Średnia w klasie Gaming (10227 - 85542, n=107, ostatnie 2 lata) | |
| MSI Titan GT77 HX 13VI (v6.85.6300) | |
| Asus ROG Strix Scar 18 2023 G834JY-N6005W (v6.85.6300) | |
| Medion Erazer Beast X40 (v6.75.6100, dGPU, Cooling) | |
| Medion Erazer Beast X40 (v6.75.6100) | |
| Razer Blade 16 Early 2023 (v6.85.6300) | |
| Razer Blade 16 Early 2023 (v8.20.8100) | |
| Razer Blade 16 Early 2023 (v6.92.6600) | |
| Przeciętny Intel Core i9-13900HX (17589 - 27615, n=22) | |
| Schenker XMG Neo 17 M22 (v6.70.6000) | |
| Alienware x17 R2 P48E (v6.50.5800) | |
| AIDA64 / FPU Julia | |
| MSI Titan GT77 HX 13VI (v6.85.6300) | |
| Asus ROG Strix Scar 18 2023 G834JY-N6005W (v6.85.6300) | |
| Medion Erazer Beast X40 (v6.75.6100, dGPU, Cooling) | |
| Średnia w klasie Gaming (51376 - 238426, n=107, ostatnie 2 lata) | |
| Medion Erazer Beast X40 (v6.75.6100) | |
| Razer Blade 16 Early 2023 (v6.85.6300) | |
| Razer Blade 16 Early 2023 (v8.20.8100) | |
| Razer Blade 16 Early 2023 (v6.92.6600) | |
| Przeciętny Intel Core i9-13900HX (88686 - 137015, n=22) | |
| Schenker XMG Neo 17 M22 (v6.70.6000) | |
| Alienware x17 R2 P48E (v6.50.5800) | |
| AIDA64 / CPU SHA3 | |
| MSI Titan GT77 HX 13VI (v6.85.6300) | |
| Asus ROG Strix Scar 18 2023 G834JY-N6005W (v6.85.6300) | |
| Medion Erazer Beast X40 (v6.75.6100, dGPU, Cooling) | |
| Medion Erazer Beast X40 (v6.75.6100) | |
| Razer Blade 16 Early 2023 (v6.85.6300) | |
| Razer Blade 16 Early 2023 (v6.92.6600) | |
| Razer Blade 16 Early 2023 (v8.20.8100) | |
| Średnia w klasie Gaming (2180 - 9817, n=107, ostatnie 2 lata) | |
| Przeciętny Intel Core i9-13900HX (4362 - 7029, n=22) | |
| Alienware x17 R2 P48E (v6.50.5800) | |
| Schenker XMG Neo 17 M22 (v6.70.6000) | |
| AIDA64 / CPU Queen | |
| Asus ROG Strix Scar 18 2023 G834JY-N6005W (v6.85.6300) | |
| MSI Titan GT77 HX 13VI (v6.85.6300) | |
| Razer Blade 16 Early 2023 (v6.92.6600) | |
| Razer Blade 16 Early 2023 (v6.85.6300) | |
| Medion Erazer Beast X40 (v6.75.6100, dGPU, Cooling) | |
| Przeciętny Intel Core i9-13900HX (125644 - 141385, n=22) | |
| Medion Erazer Beast X40 (v6.75.6100) | |
| Średnia w klasie Gaming (49785 - 173351, n=98, ostatnie 2 lata) | |
| Alienware x17 R2 P48E (v6.50.5800) | |
| Schenker XMG Neo 17 M22 (v6.70.6000) | |
| AIDA64 / FPU SinJulia | |
| Asus ROG Strix Scar 18 2023 G834JY-N6005W (v6.85.6300) | |
| MSI Titan GT77 HX 13VI (v6.85.6300) | |
| Medion Erazer Beast X40 (v6.75.6100, dGPU, Cooling) | |
| Medion Erazer Beast X40 (v6.75.6100) | |
| Razer Blade 16 Early 2023 (v6.85.6300) | |
| Razer Blade 16 Early 2023 (v8.20.8100) | |
| Razer Blade 16 Early 2023 (v6.92.6600) | |
| Przeciętny Intel Core i9-13900HX (12334 - 17179, n=22) | |
| Średnia w klasie Gaming (4424 - 33636, n=107, ostatnie 2 lata) | |
| Schenker XMG Neo 17 M22 (v6.70.6000) | |
| Alienware x17 R2 P48E (v6.50.5800) | |
| AIDA64 / FPU Mandel | |
| Średnia w klasie Gaming (25115 - 128721, n=107, ostatnie 2 lata) | |
| MSI Titan GT77 HX 13VI (v6.85.6300) | |
| Asus ROG Strix Scar 18 2023 G834JY-N6005W (v6.85.6300) | |
| Medion Erazer Beast X40 (v6.75.6100, dGPU, Cooling) | |
| Medion Erazer Beast X40 (v6.75.6100) | |
| Razer Blade 16 Early 2023 (v6.85.6300) | |
| Razer Blade 16 Early 2023 (v8.20.8100) | |
| Razer Blade 16 Early 2023 (v6.92.6600) | |
| Przeciętny Intel Core i9-13900HX (43850 - 69202, n=22) | |
| Schenker XMG Neo 17 M22 (v6.70.6000) | |
| Alienware x17 R2 P48E (v6.50.5800) | |
| AIDA64 / CPU AES | |
| Razer Blade 16 Early 2023 (v6.92.6600) | |
| Razer Blade 16 Early 2023 (v8.20.8100) | |
| Razer Blade 16 Early 2023 (v6.85.6300) | |
| Przeciętny Intel Core i9-13900HX (89413 - 237881, n=22) | |
| MSI Titan GT77 HX 13VI (v6.85.6300) | |
| Schenker XMG Neo 17 M22 (v6.70.6000) | |
| Asus ROG Strix Scar 18 2023 G834JY-N6005W (v6.85.6300) | |
| Medion Erazer Beast X40 (v6.75.6100, dGPU, Cooling) | |
| Medion Erazer Beast X40 (v6.75.6100) | |
| Alienware x17 R2 P48E (v6.50.5800) | |
| Średnia w klasie Gaming (39258 - 247074, n=107, ostatnie 2 lata) | |
| AIDA64 / CPU ZLib | |
| MSI Titan GT77 HX 13VI (v6.85.6300) | |
| Asus ROG Strix Scar 18 2023 G834JY-N6005W (v6.85.6300) | |
| Medion Erazer Beast X40 (v6.75.6100, dGPU, Cooling) | |
| Medion Erazer Beast X40 (v6.75.6100) | |
| Razer Blade 16 Early 2023 (v6.85.6300) | |
| Razer Blade 16 Early 2023 (v6.92.6600) | |
| Razer Blade 16 Early 2023 (v8.20.8100) | |
| Przeciętny Intel Core i9-13900HX (1284 - 1958, n=22) | |
| Średnia w klasie Gaming (574 - 2531, n=107, ostatnie 2 lata) | |
| Alienware x17 R2 P48E (v6.50.5800) | |
| Schenker XMG Neo 17 M22 (v6.70.6000) | |
| AIDA64 / FP64 Ray-Trace | |
| Średnia w klasie Gaming (5509 - 45446, n=107, ostatnie 2 lata) | |
| MSI Titan GT77 HX 13VI (v6.85.6300) | |
| Asus ROG Strix Scar 18 2023 G834JY-N6005W (v6.85.6300) | |
| Medion Erazer Beast X40 (v6.75.6100, dGPU, Cooling) | |
| Medion Erazer Beast X40 (v6.75.6100) | |
| Razer Blade 16 Early 2023 (v6.85.6300) | |
| Razer Blade 16 Early 2023 (v6.92.6600) | |
| Razer Blade 16 Early 2023 (v8.20.8100) | |
| Przeciętny Intel Core i9-13900HX (9481 - 15279, n=22) | |
| Schenker XMG Neo 17 M22 (v6.70.6000) | |
| Alienware x17 R2 P48E (v6.50.5800) | |
| AIDA64 / CPU PhotoWorxx | |
| Razer Blade 16 Early 2023 (v6.85.6300) | |
| Razer Blade 16 Early 2023 (v6.92.6600) | |
| Razer Blade 16 Early 2023 (v8.20.8100) | |
| Przeciętny Intel Core i9-13900HX (42994 - 51994, n=22) | |
| Medion Erazer Beast X40 (v6.75.6100, dGPU, Cooling) | |
| Średnia w klasie Gaming (12271 - 89891, n=107, ostatnie 2 lata) | |
| Asus ROG Strix Scar 18 2023 G834JY-N6005W (v6.85.6300) | |
| Medion Erazer Beast X40 (v6.75.6100) | |
| MSI Titan GT77 HX 13VI (v6.85.6300) | |
| Alienware x17 R2 P48E (v6.50.5800) | |
| Schenker XMG Neo 17 M22 (v6.70.6000) | |
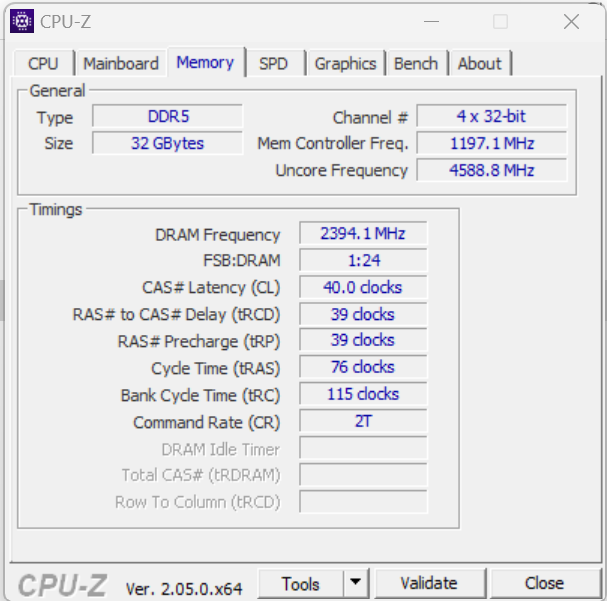
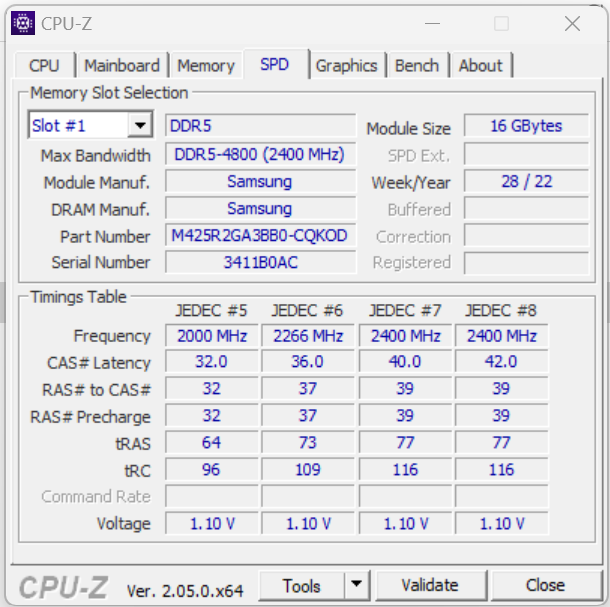
Wydajność systemu
Sprzęt w tym szybkim systemie oferuje więcej niż wystarczającą wydajność do zadań takich jak gry i renderowanie. Laptop jest wyposażony w 32 GB pamięci działającej w trybie dwukanałowym. Szybkość transferu pamięci jest typowa dla pamięci RAM DDR5-4800. Co więcej, w naszych testach system ten uzyskał również znakomite wyniki w programie PCMark.
CrossMark: Overall | Productivity | Creativity | Responsiveness
| PCMark 10 / Score | |
| Medion Erazer Beast X40 (dGPU, Cooling) | |
| MSI Titan GT77 HX 13VI | |
| Asus ROG Strix Scar 18 2023 G834JY-N6005W | |
| Przeciętny Intel Core i9-13900HX, NVIDIA GeForce RTX 4090 Laptop GPU (7690 - 9331, n=8) | |
| Średnia w klasie Gaming (5828 - 11574, n=94, ostatnie 2 lata) | |
| Alienware x17 R2 P48E | |
| Medion Erazer Beast X40 | |
| Razer Blade 16 Early 2023 | |
| Schenker XMG Neo 17 M22 | |
| PCMark 10 / Essentials | |
| MSI Titan GT77 HX 13VI | |
| Medion Erazer Beast X40 (dGPU, Cooling) | |
| Przeciętny Intel Core i9-13900HX, NVIDIA GeForce RTX 4090 Laptop GPU (10972 - 11983, n=8) | |
| Medion Erazer Beast X40 | |
| Alienware x17 R2 P48E | |
| Razer Blade 16 Early 2023 | |
| Średnia w klasie Gaming (8810 - 12600, n=98, ostatnie 2 lata) | |
| Schenker XMG Neo 17 M22 | |
| PCMark 10 / Productivity | |
| Medion Erazer Beast X40 (dGPU, Cooling) | |
| Medion Erazer Beast X40 | |
| Średnia w klasie Gaming (6845 - 18766, n=96, ostatnie 2 lata) | |
| Przeciętny Intel Core i9-13900HX, NVIDIA GeForce RTX 4090 Laptop GPU (9038 - 11680, n=8) | |
| Alienware x17 R2 P48E | |
| MSI Titan GT77 HX 13VI | |
| Schenker XMG Neo 17 M22 | |
| Razer Blade 16 Early 2023 | |
| PCMark 10 / Digital Content Creation | |
| MSI Titan GT77 HX 13VI | |
| Medion Erazer Beast X40 (dGPU, Cooling) | |
| Razer Blade 16 Early 2023 | |
| Przeciętny Intel Core i9-13900HX, NVIDIA GeForce RTX 4090 Laptop GPU (10605 - 16395, n=8) | |
| Średnia w klasie Gaming (7602 - 19657, n=96, ostatnie 2 lata) | |
| Alienware x17 R2 P48E | |
| Medion Erazer Beast X40 | |
| Schenker XMG Neo 17 M22 | |
| CrossMark / Overall | |
| Medion Erazer Beast X40 (dGPU, Cooling) | |
| MSI Titan GT77 HX 13VI | |
| Medion Erazer Beast X40 | |
| Przeciętny Intel Core i9-13900HX, NVIDIA GeForce RTX 4090 Laptop GPU (1825 - 2295, n=8) | |
| Asus ROG Strix Scar 18 2023 G834JY-N6005W | |
| Średnia w klasie Gaming (1366 - 2409, n=96, ostatnie 2 lata) | |
| Alienware x17 R2 P48E | |
| Schenker XMG Neo 17 M22 | |
| Razer Blade 16 Early 2023 | |
| CrossMark / Productivity | |
| Medion Erazer Beast X40 (dGPU, Cooling) | |
| Medion Erazer Beast X40 | |
| MSI Titan GT77 HX 13VI | |
| Przeciętny Intel Core i9-13900HX, NVIDIA GeForce RTX 4090 Laptop GPU (1666 - 2166, n=8) | |
| Asus ROG Strix Scar 18 2023 G834JY-N6005W | |
| Średnia w klasie Gaming (1386 - 2254, n=96, ostatnie 2 lata) | |
| Alienware x17 R2 P48E | |
| Schenker XMG Neo 17 M22 | |
| Razer Blade 16 Early 2023 | |
| CrossMark / Creativity | |
| Asus ROG Strix Scar 18 2023 G834JY-N6005W | |
| MSI Titan GT77 HX 13VI | |
| Medion Erazer Beast X40 (dGPU, Cooling) | |
| Medion Erazer Beast X40 | |
| Przeciętny Intel Core i9-13900HX, NVIDIA GeForce RTX 4090 Laptop GPU (2162 - 2514, n=8) | |
| Średnia w klasie Gaming (1343 - 2729, n=96, ostatnie 2 lata) | |
| Alienware x17 R2 P48E | |
| Schenker XMG Neo 17 M22 | |
| Razer Blade 16 Early 2023 | |
| CrossMark / Responsiveness | |
| Medion Erazer Beast X40 (dGPU, Cooling) | |
| MSI Titan GT77 HX 13VI | |
| Medion Erazer Beast X40 | |
| Przeciętny Intel Core i9-13900HX, NVIDIA GeForce RTX 4090 Laptop GPU (1441 - 2275, n=8) | |
| Średnia w klasie Gaming (1226 - 2334, n=96, ostatnie 2 lata) | |
| Alienware x17 R2 P48E | |
| Asus ROG Strix Scar 18 2023 G834JY-N6005W | |
| Schenker XMG Neo 17 M22 | |
| Razer Blade 16 Early 2023 | |
| PCMark 8 Home Score Accelerated v2 | 4936 pkt. | |
| PCMark 8 Work Score Accelerated v2 | 6075 pkt. | |
| PCMark 10 Score | 7932 pkt. | |
Pomoc | ||
| AIDA64 / Memory Copy | |
| Razer Blade 16 Early 2023 | |
| Razer Blade 16 Early 2023 | |
| Razer Blade 16 Early 2023 | |
| Przeciętny Intel Core i9-13900HX (67716 - 79193, n=22) | |
| Średnia w klasie Gaming (21750 - 129946, n=107, ostatnie 2 lata) | |
| Medion Erazer Beast X40 | |
| Asus ROG Strix Scar 18 2023 G834JY-N6005W | |
| MSI Titan GT77 HX 13VI | |
| Alienware x17 R2 P48E | |
| Schenker XMG Neo 17 M22 | |
| AIDA64 / Memory Read | |
| Razer Blade 16 Early 2023 | |
| Razer Blade 16 Early 2023 | |
| Razer Blade 16 Early 2023 | |
| Przeciętny Intel Core i9-13900HX (73998 - 88462, n=22) | |
| Asus ROG Strix Scar 18 2023 G834JY-N6005W | |
| Medion Erazer Beast X40 | |
| Średnia w klasie Gaming (22956 - 118858, n=107, ostatnie 2 lata) | |
| MSI Titan GT77 HX 13VI | |
| Alienware x17 R2 P48E | |
| Schenker XMG Neo 17 M22 | |
| AIDA64 / Memory Write | |
| Razer Blade 16 Early 2023 | |
| Razer Blade 16 Early 2023 | |
| Razer Blade 16 Early 2023 | |
| Średnia w klasie Gaming (22297 - 135096, n=107, ostatnie 2 lata) | |
| Przeciętny Intel Core i9-13900HX (65472 - 77045, n=22) | |
| Asus ROG Strix Scar 18 2023 G834JY-N6005W | |
| Medion Erazer Beast X40 | |
| MSI Titan GT77 HX 13VI | |
| Schenker XMG Neo 17 M22 | |
| Alienware x17 R2 P48E | |
| AIDA64 / Memory Latency | |
| Średnia w klasie Gaming (75.3 - 259, n=107, ostatnie 2 lata) | |
| Razer Blade 16 Early 2023 | |
| Razer Blade 16 Early 2023 | |
| Razer Blade 16 Early 2023 | |
| Alienware x17 R2 P48E | |
| MSI Titan GT77 HX 13VI | |
| Schenker XMG Neo 17 M22 | |
| Asus ROG Strix Scar 18 2023 G834JY-N6005W | |
| Medion Erazer Beast X40 | |
| Przeciętny Intel Core i9-13900HX (75.3 - 91.1, n=22) | |
* ... im mniej tym lepiej
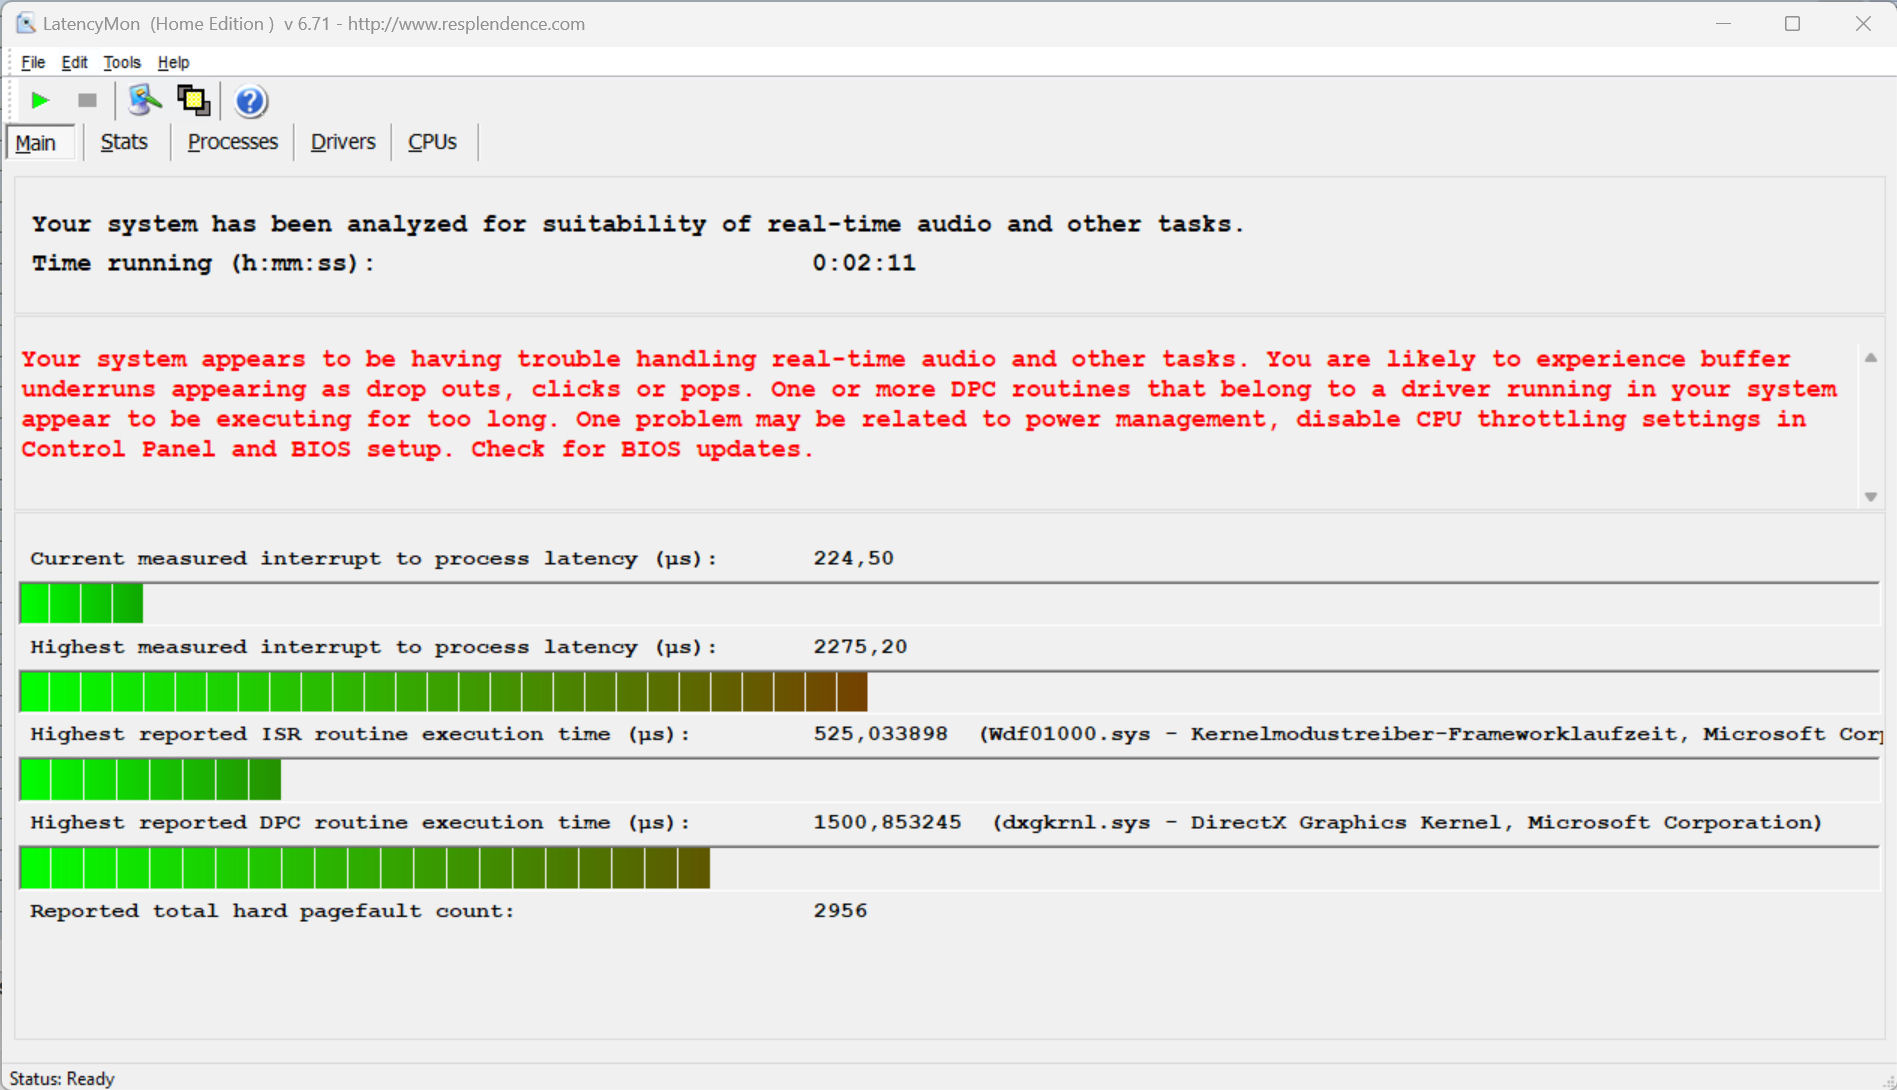
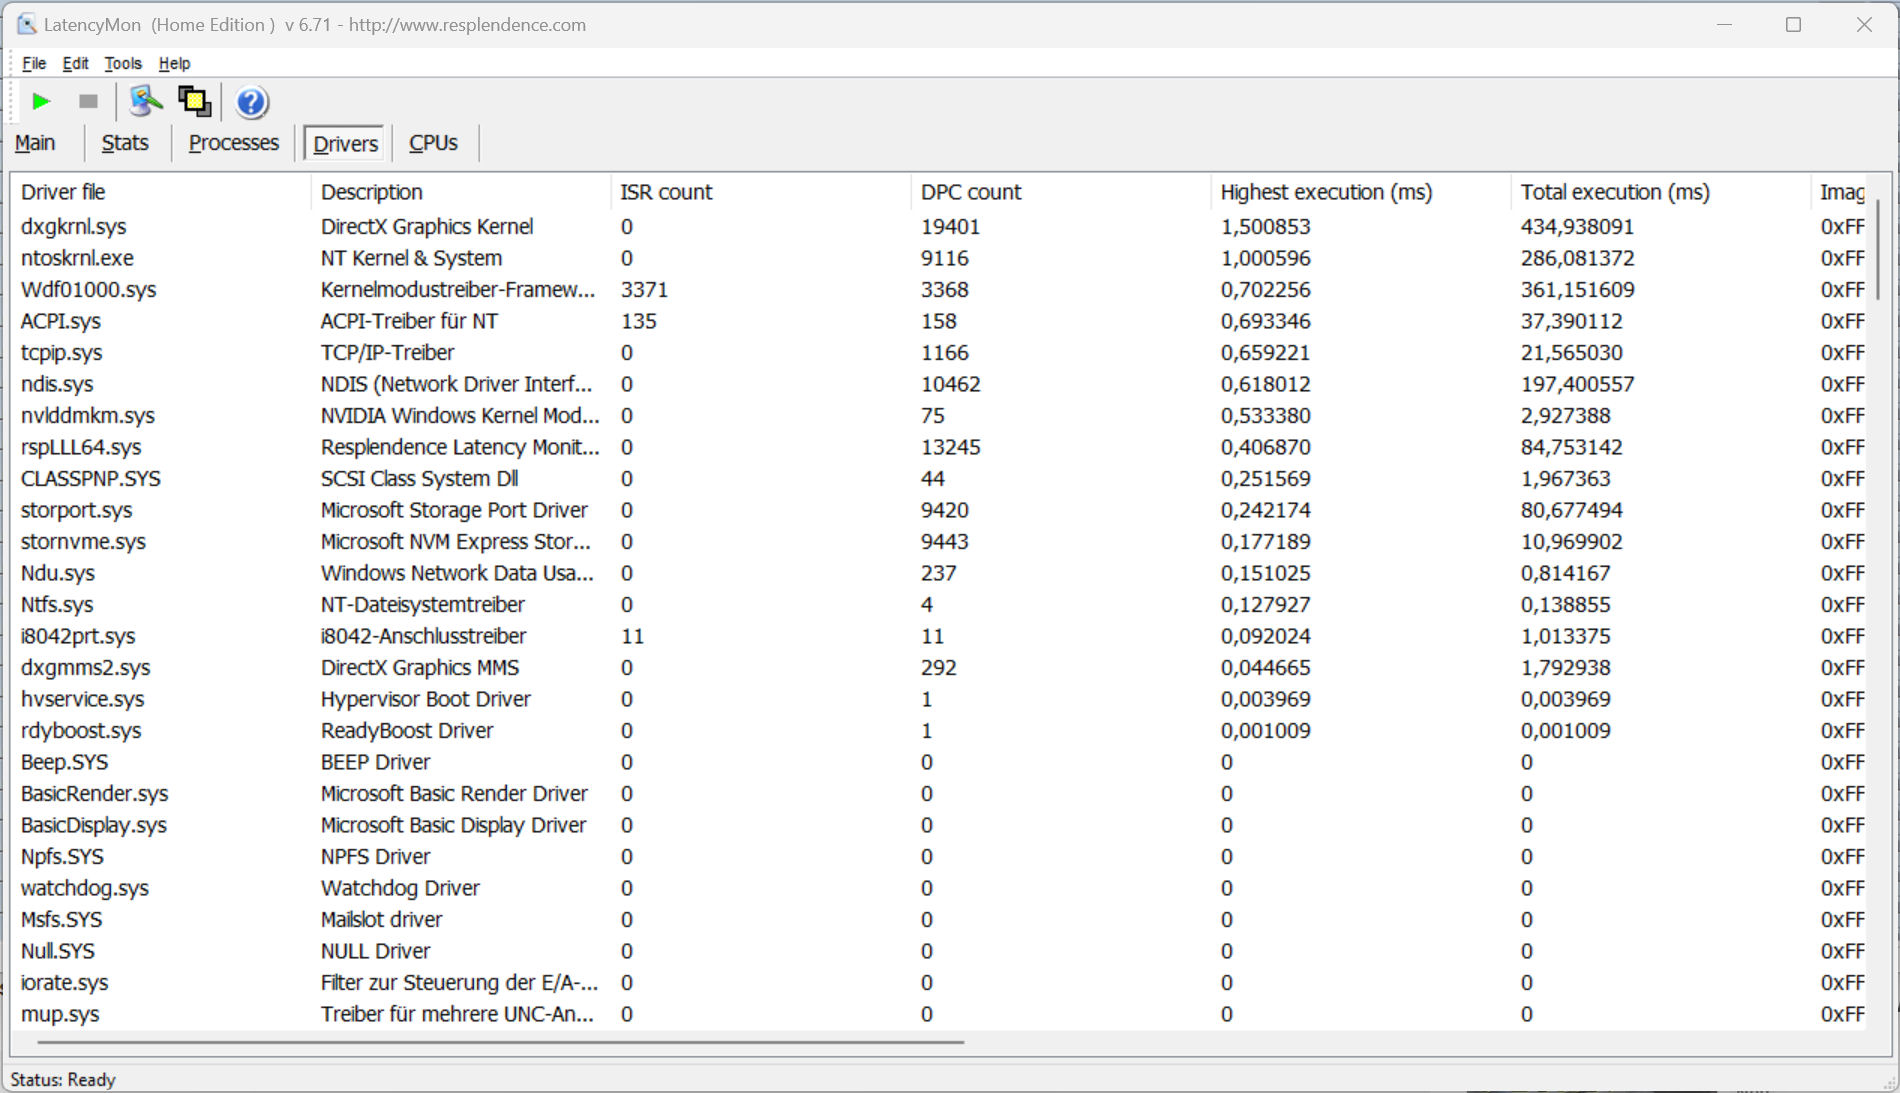
Opóźnienie DPC
Nasz standardowy test monitora latencji, obejmujący przeglądanie stron internetowych, odtwarzanie wideo 4K i wysokie obciążenie Prime95, ujawnił pewne problemy. Wydaje się, że system nie nadaje się do przetwarzania wideo i audio w czasie rzeczywistym. Mamy nadzieję, że przyszłe aktualizacje oprogramowania pomogą naprawić te problemy.
| DPC Latencies / LatencyMon - interrupt to process latency (max), Web, Youtube, Prime95 | |
| MSI Titan GT77 HX 13VI | |
| Schenker XMG Neo 17 M22 | |
| Razer Blade 16 Early 2023 | |
| Medion Erazer Beast X40 | |
| Alienware x17 R2 P48E | |
| Asus ROG Strix Scar 18 2023 G834JY-N6005W | |
* ... im mniej tym lepiej
Pamięć masowa
Medion wyposażył nasz egzemplarz recenzencki X40 w dwa dyski SSD o pojemności 1 TB (PCIe 4.0, M.2-2280) produkcji firmy Phison. Jeden z nich służy jako dysk systemowy, a drugi jest wykorzystywany do przechowywania danych. Dyski SSD nie tylko nie tworzą konfiguracji RAID, ale też sam laptop nie obsługuje RAID. Dołączone dyski nie należą do najlepszych SSD na rynku. Mimo to, nadal zapewniają świetną wydajność. Kolejną pozytywną rzeczą, o której należy wspomnieć, jest to, że nie zauważyliśmy żadnych spadków wydajności spowodowanych przez throttling termiczny.

| Drive Performance rating - Percent | |
| Schenker XMG Neo 17 M22 | |
| Przeciętny Phison E18-1TB-PHISON-SSD-B47R | |
| MSI Titan GT77 HX 13VI | |
| Medion Erazer Beast X40 | |
| Średnia w klasie Gaming | |
| Alienware x17 R2 P48E | |
| Razer Blade 16 Early 2023 | |
| Asus ROG Strix Scar 18 2023 G834JY-N6005W | |
* ... im mniej tym lepiej
Sustained Load Read: DiskSpd Read Loop, Queue Depth 8
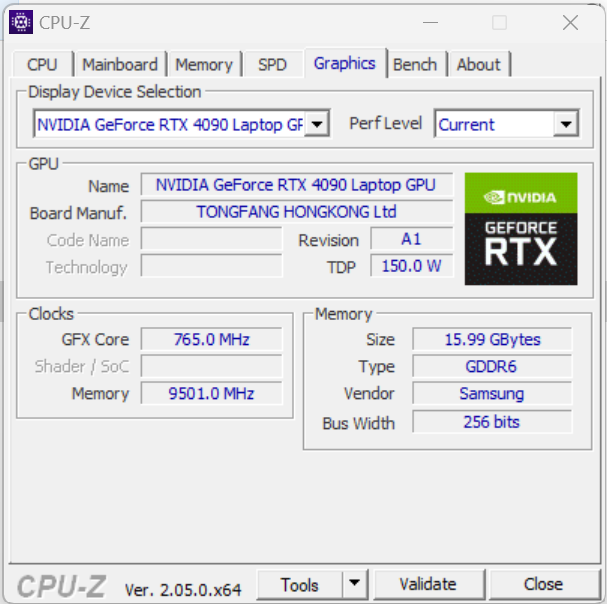
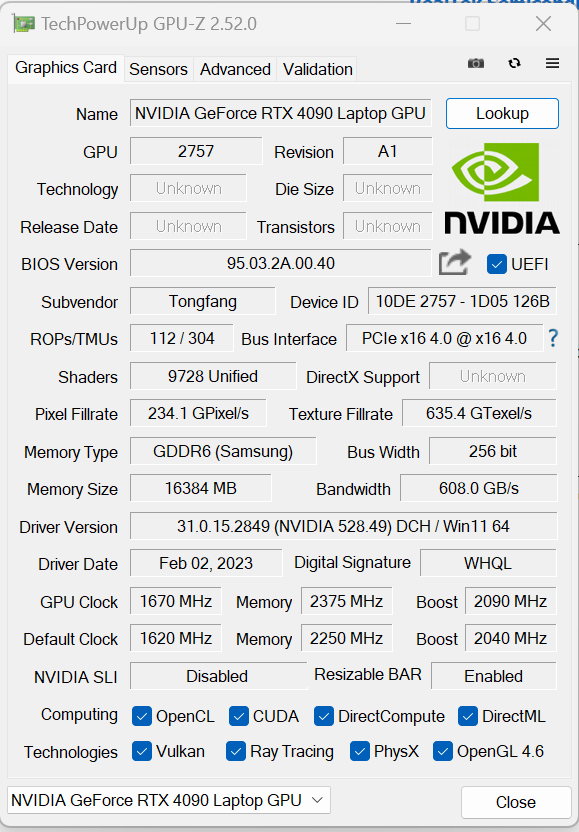
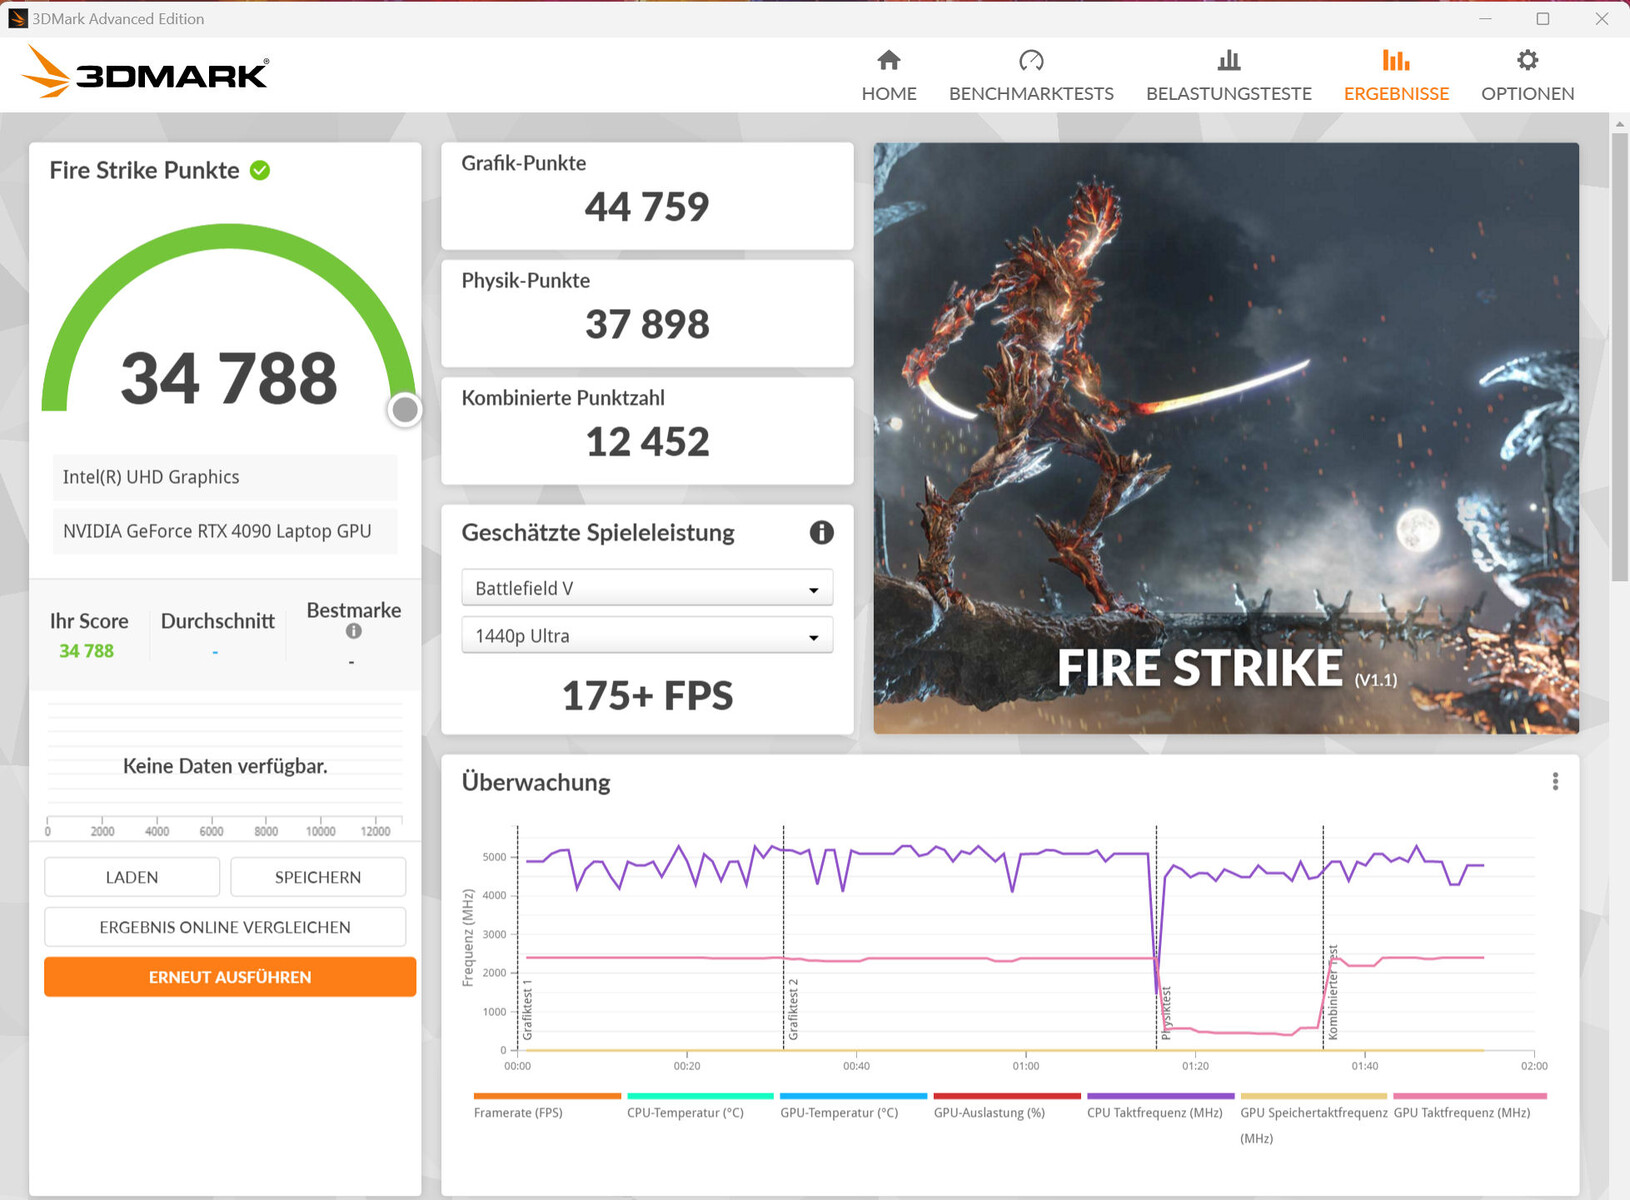
Karta graficzna
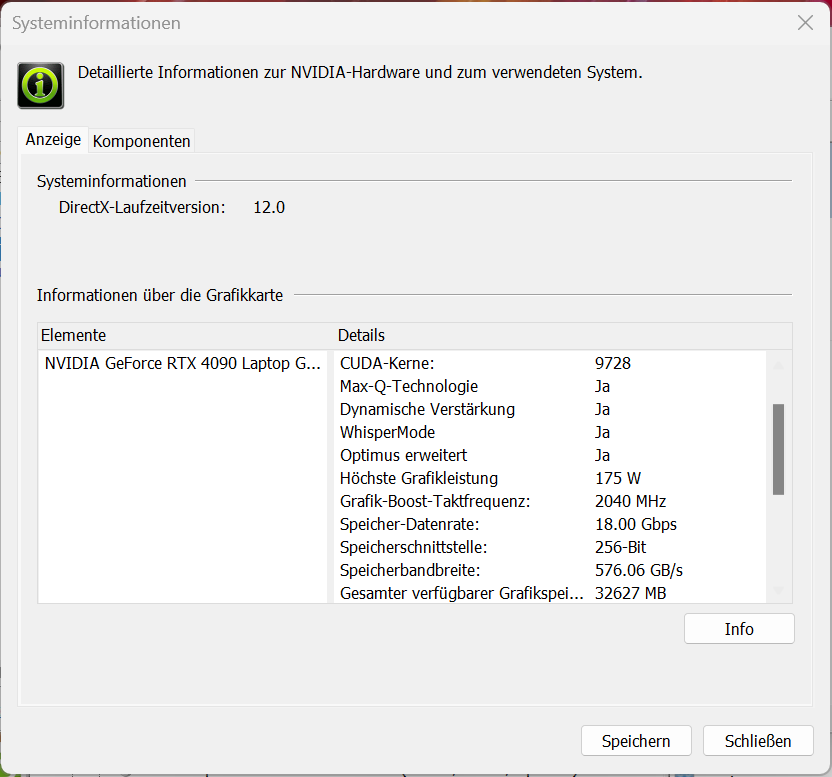
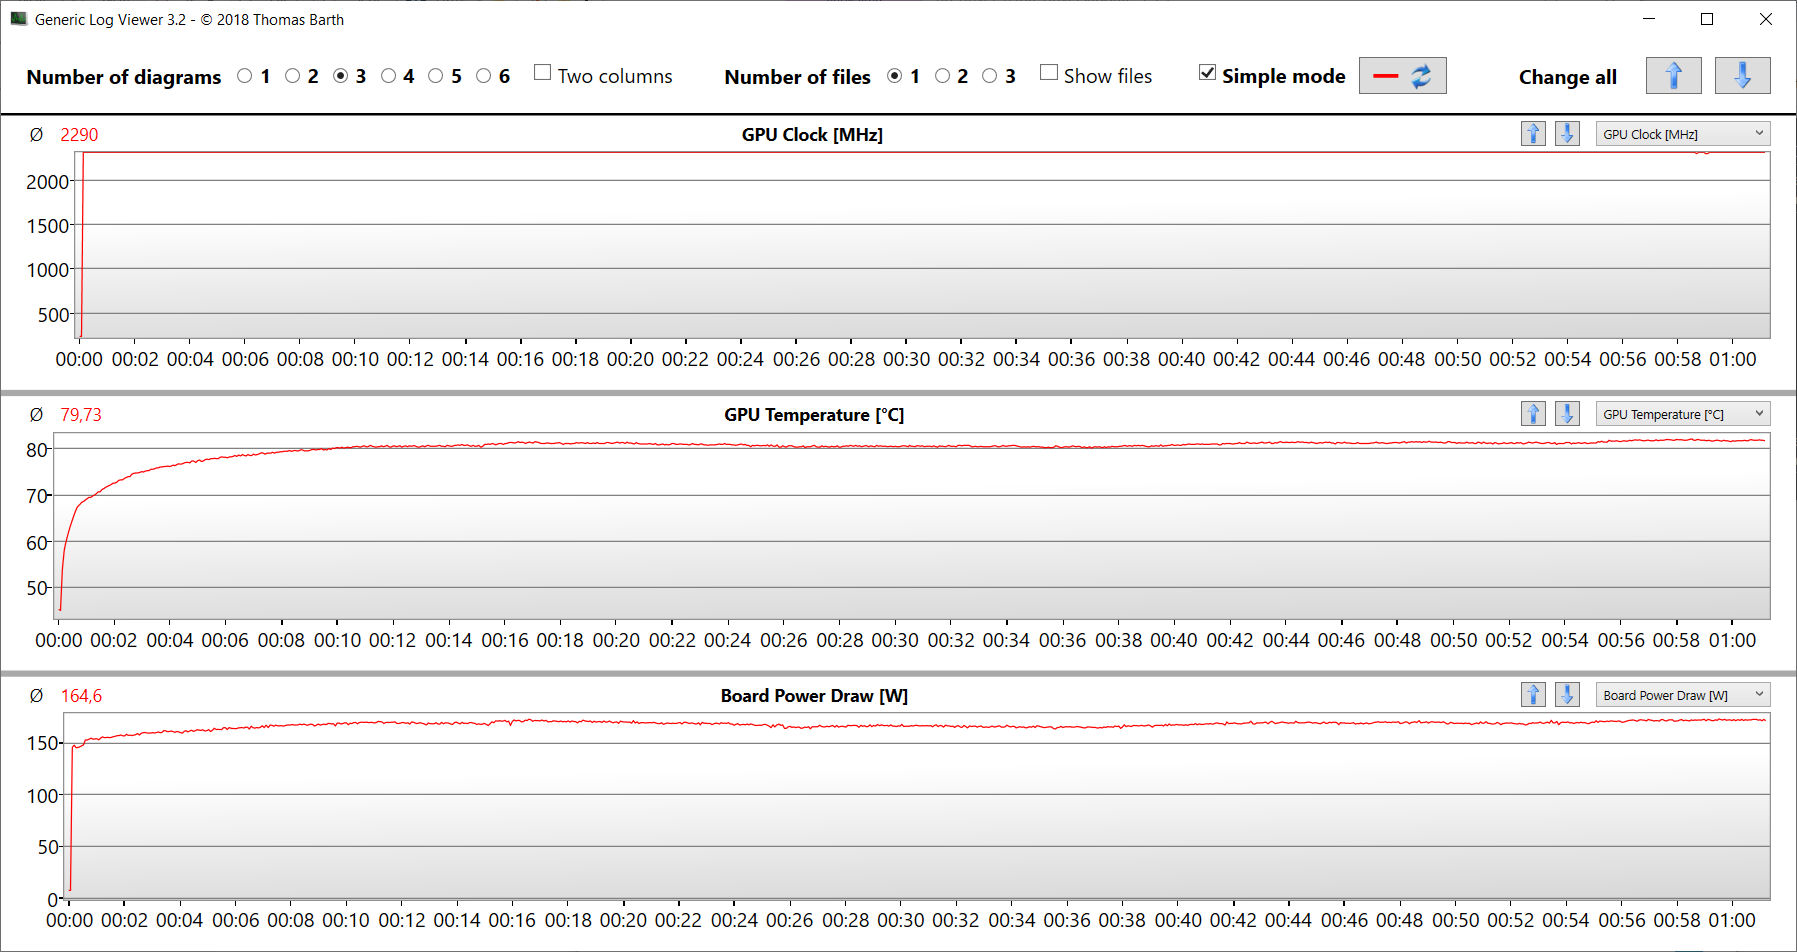
GeForce RTX 4090 Laptop to obecny flagowy mobilny procesor graficzny firmy Nvidia. Posiada 9 728 jednostek cieniujących, 256-bitową szynę pamięci i 16 384 MB szybkiej pamięci GDDR6. RTX 4090 ma do dyspozycji aż 175 watów TGP (150 watów + 25 watów Dynamic Boost) - jest to jak najbardziej możliwe. Ale TGP nie było w pełni wykorzystane podczas naszego testu Witcher 3
.
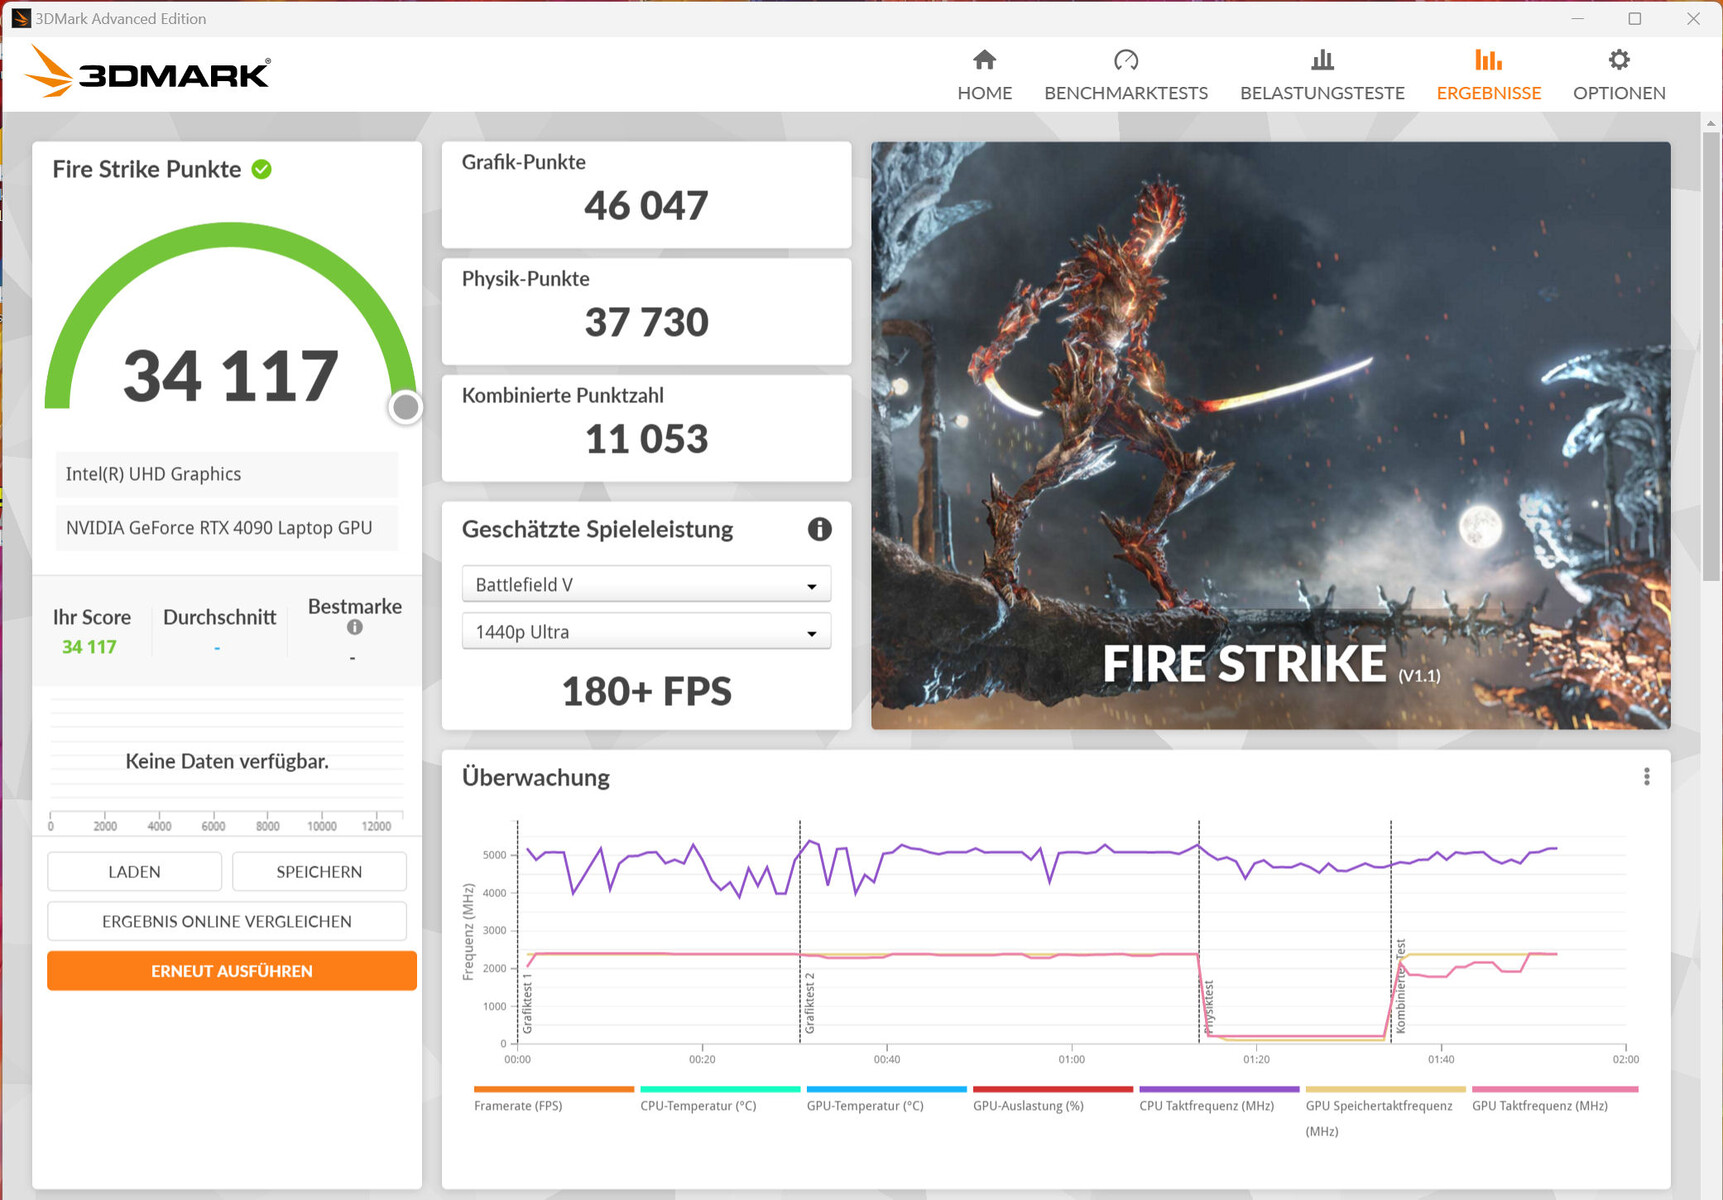
Wyniki benchmarku są na równi (tryb Optimus) lub nieco lepsze od (tryb dGPU) tego, co do tej pory widzieliśmy średnio z laptopa RTX 4090. Omawiany laptop obsługuje również Advanced Optimus. Przełączanie między trybem dGPU a Optimus nie wymaga ponownego uruchomienia komputera.
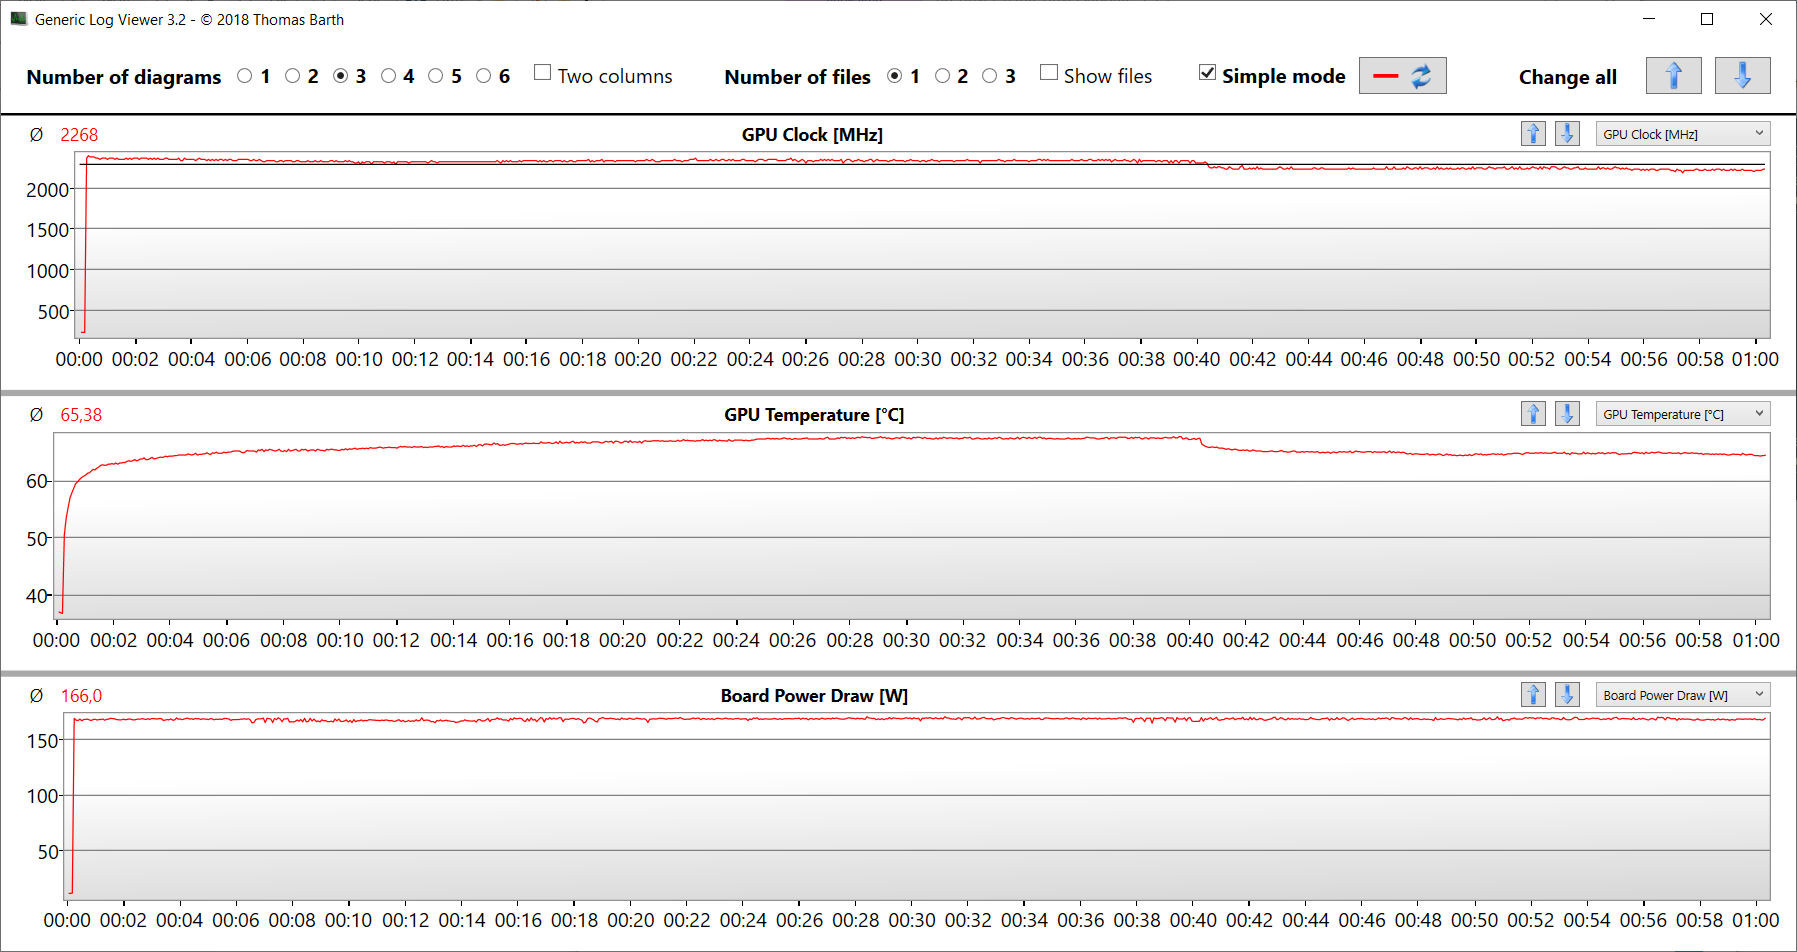
Opcjonalne chłodzenie wodne może dać niewielki wzrost wydajności w niektórych benchmarkach i grach. Witcher 3 na przykład podczas naszych testów gra działała przy wyższej liczbie klatek na sekundę. Średnia temperatura procesora graficznego była również niższa niż w przypadku zastosowania wyłącznie chłodzenia powietrzem.
| 3DMark Performance rating - Percent | |
| MSI Titan GT77 HX 13VI -1! | |
| Medion Erazer Beast X40 | |
| Medion Erazer Beast X40 | |
| Asus ROG Strix Scar 18 2023 G834JY-N6005W | |
| Medion Erazer Beast X40 | |
| Przeciętny NVIDIA GeForce RTX 4090 Laptop GPU | |
| Razer Blade 16 Early 2023 -1! | |
| Średnia w klasie Gaming | |
| Alienware x17 R2 P48E | |
| Schenker XMG Neo 17 M22 -1! | |
| 3DMark 11 - 1280x720 Performance GPU | |
| Medion Erazer Beast X40 (dGPU, Cooling) | |
| MSI Titan GT77 HX 13VI | |
| Medion Erazer Beast X40 | |
| Medion Erazer Beast X40 (dGPU) | |
| Przeciętny NVIDIA GeForce RTX 4090 Laptop GPU (54073 - 73027, n=42) | |
| Asus ROG Strix Scar 18 2023 G834JY-N6005W | |
| Razer Blade 16 Early 2023 | |
| Średnia w klasie Gaming (21841 - 80022, n=106, ostatnie 2 lata) | |
| Alienware x17 R2 P48E | |
| Schenker XMG Neo 17 M22 | |
| 3DMark 06 Standard Score | 60717 pkt. | |
| 3DMark 11 Performance | 47487 pkt. | |
| 3DMark Cloud Gate Standard Score | 66757 pkt. | |
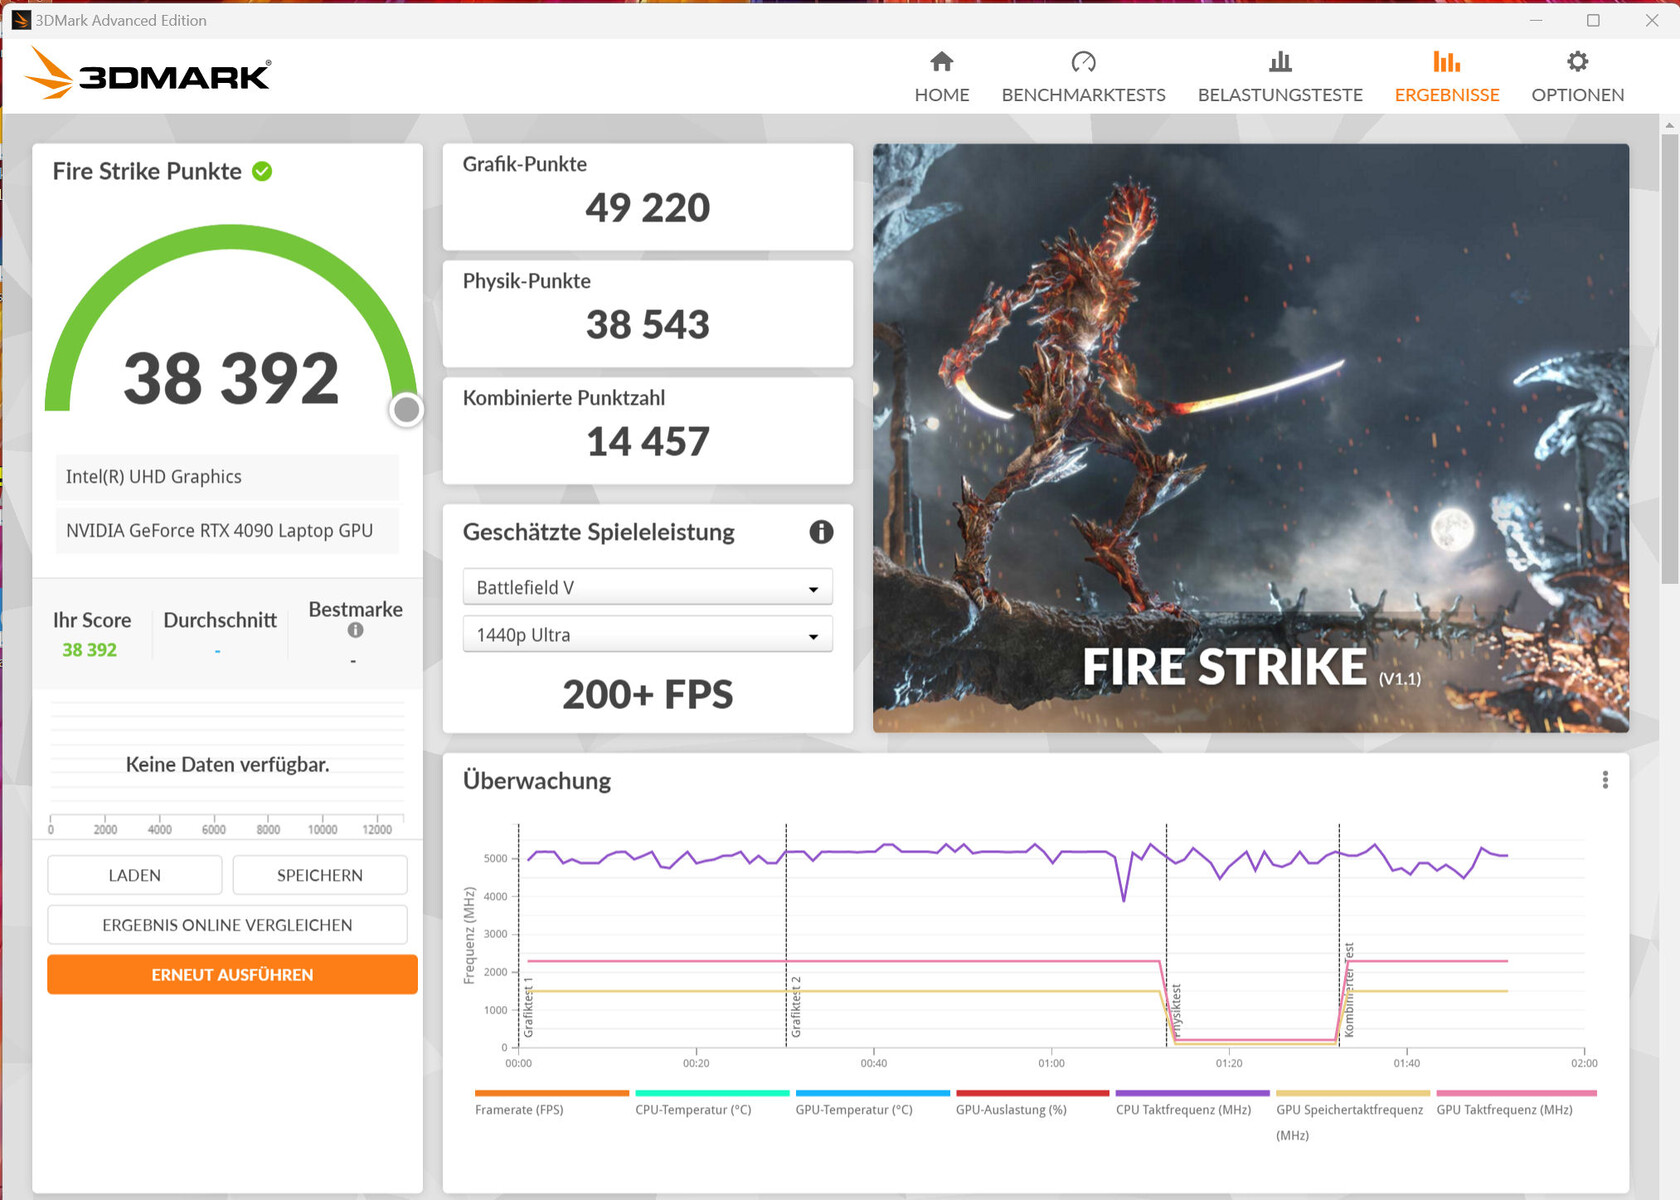
| 3DMark Fire Strike Score | 34788 pkt. | |
| 3DMark Time Spy Score | 19708 pkt. | |
Pomoc | ||
| Blender | |
| v3.3 Classroom OPTIX/RTX | |
| Średnia w klasie Gaming (9 - 32, n=109, ostatnie 2 lata) | |
| Razer Blade 16 Early 2023 (3.3.3) | |
| Medion Erazer Beast X40 (3.3.3) | |
| Przeciętny NVIDIA GeForce RTX 4090 Laptop GPU (9 - 19, n=39) | |
| Medion Erazer Beast X40 (3.3.3, dGPU, Cooling) | |
| MSI Titan GT77 HX 13VI (3.3.3) | |
| Asus ROG Strix Scar 18 2023 G834JY-N6005W (3.3.3) | |
| Medion Erazer Beast X40 (3.3.3, dGPU) | |
| v3.3 Classroom CUDA | |
| Średnia w klasie Gaming (15 - 228, n=109, ostatnie 2 lata) | |
| Razer Blade 16 Early 2023 (3.3.3) | |
| Medion Erazer Beast X40 (3.3.3) | |
| Medion Erazer Beast X40 (3.3.3, dGPU, Cooling) | |
| Przeciętny NVIDIA GeForce RTX 4090 Laptop GPU (16 - 24, n=39) | |
| Asus ROG Strix Scar 18 2023 G834JY-N6005W (3.3.3) | |
| Asus ROG Strix Scar 18 2023 G834JY-N6005W (3.3.3) | |
| Medion Erazer Beast X40 (3.3.3, dGPU) | |
| MSI Titan GT77 HX 13VI (3.3.3) | |
| Geekbench 5.5 | |
| OpenCL Score | |
| Medion Erazer Beast X40 (dGPU) | |
| MSI Titan GT77 HX 13VI | |
| Asus ROG Strix Scar 18 2023 G834JY-N6005W | |
| Przeciętny NVIDIA GeForce RTX 4090 Laptop GPU (6841 - 237138, n=39) | |
| Medion Erazer Beast X40 | |
| Medion Erazer Beast X40 (dGPU, Cooling) | |
| Razer Blade 16 Early 2023 | |
| Średnia w klasie Gaming (80702 - 277970, n=105, ostatnie 2 lata) | |
| Alienware x17 R2 P48E | |
| Schenker XMG Neo 17 M22 | |
| Vulkan Score 5.5 | |
| Medion Erazer Beast X40 (dGPU, Cooling) | |
| Średnia w klasie Gaming (9296 - 246759, n=81, ostatnie 2 lata) | |
| Przeciętny NVIDIA GeForce RTX 4090 Laptop GPU (49663 - 163089, n=28) | |
| MSI Titan GT77 HX 13VI | |
| Alienware x17 R2 P48E | |
| Medion Erazer Beast X40 (dGPU) | |
| Razer Blade 16 Early 2023 | |
| Asus ROG Strix Scar 18 2023 G834JY-N6005W | |
| V-Ray Benchmark Next 4.10 | |
| GPU | |
| Asus ROG Strix Scar 18 2023 G834JY-N6005W (v4.10.07 ) | |
| MSI Titan GT77 HX 13VI (v4.10.07 ) | |
| Medion Erazer Beast X40 (v4.10.07 ) | |
| Medion Erazer Beast X40 (v4.10.07, dGPU) | |
| Przeciętny NVIDIA GeForce RTX 4090 Laptop GPU (873 - 1334, n=30) | |
| Medion Erazer Beast X40 (v4.10.07, dGPU, Cooling ) | |
| Średnia w klasie Gaming (427 - 1333, n=103, ostatnie 2 lata) | |
| Schenker XMG Neo 17 M22 (v4.10.07 ) | |
| CPU | |
| MSI Titan GT77 HX 13VI (v4.10.07 ) | |
| Medion Erazer Beast X40 (v4.10.07, dGPU, Cooling) | |
| Asus ROG Strix Scar 18 2023 G834JY-N6005W (v4.10.07 ) | |
| Medion Erazer Beast X40 (v4.10.07 ) | |
| Medion Erazer Beast X40 (v4.10.07, dGPU) | |
| Przeciętny NVIDIA GeForce RTX 4090 Laptop GPU (18206 - 37629, n=30) | |
| Średnia w klasie Gaming (10048 - 45327, n=102, ostatnie 2 lata) | |
| Schenker XMG Neo 17 M22 (v4.10.07 ) | |
* ... im mniej tym lepiej
Wydajność w grach
X40 pozwala użytkownikom grać w gry w rozdzielczości QHD+ i na ustawieniach maksymalnych. Możliwe jest zastosowanie wyższej rozdzielczości, jeśli podłączy się laptop do odpowiedniego monitora. Gry, które testowaliśmy, generalnie działały z prędkością klatek na sekundę podobną do tego, co do tej pory widzieliśmy z RTX 4090. W zależności od gry, możesz być w stanie uzyskać wyższą liczbę klatek na sekundę, napędzając wyświetlacz bezpośrednio z GPU GeForce.
| Performance rating - Percent | |
| Medion Erazer Beast X40 | |
| Medion Erazer Beast X40 | |
| Asus ROG Strix Scar 18 2023 G834JY-N6005W -1! | |
| MSI Titan GT77 HX 13VI | |
| Medion Erazer Beast X40 | |
| Przeciętny NVIDIA GeForce RTX 4090 Laptop GPU | |
| Razer Blade 16 Early 2023 | |
| Średnia w klasie Gaming | |
| Alienware x17 R2 P48E | |
| Schenker XMG Neo 17 M22 | |
| The Witcher 3 - 1920x1080 Ultra Graphics & Postprocessing (HBAO+) | |
| Medion Erazer Beast X40 (dGPU) | |
| Medion Erazer Beast X40 (dGPU, Cooling) | |
| MSI Titan GT77 HX 13VI | |
| Przeciętny NVIDIA GeForce RTX 4090 Laptop GPU (139.2 - 216, n=35) | |
| Medion Erazer Beast X40 | |
| Razer Blade 16 Early 2023 | |
| Średnia w klasie Gaming (95 - 240, n=8, ostatnie 2 lata) | |
| Alienware x17 R2 P48E | |
| Schenker XMG Neo 17 M22 | |
| GTA V - 1920x1080 Highest AA:4xMSAA + FX AF:16x | |
| Medion Erazer Beast X40 (dGPU) | |
| Medion Erazer Beast X40 | |
| Medion Erazer Beast X40 (dGPU, Cooling) | |
| Asus ROG Strix Scar 18 2023 G834JY-N6005W | |
| MSI Titan GT77 HX 13VI | |
| Razer Blade 16 Early 2023 | |
| Przeciętny NVIDIA GeForce RTX 4090 Laptop GPU (91.1 - 167.7, n=40) | |
| Średnia w klasie Gaming (48.3 - 186.9, n=100, ostatnie 2 lata) | |
| Alienware x17 R2 P48E | |
| Schenker XMG Neo 17 M22 | |
| Final Fantasy XV Benchmark - 1920x1080 High Quality | |
| MSI Titan GT77 HX 13VI (1.3) | |
| Medion Erazer Beast X40 (1.3, dGPU) | |
| Medion Erazer Beast X40 (1.3, dGPU, Cooling) | |
| Asus ROG Strix Scar 18 2023 G834JY-N6005W (1.3) | |
| Medion Erazer Beast X40 (1.3) | |
| Przeciętny NVIDIA GeForce RTX 4090 Laptop GPU (122.2 - 201, n=40) | |
| Razer Blade 16 Early 2023 (1.3) | |
| Średnia w klasie Gaming (41 - 215, n=101, ostatnie 2 lata) | |
| Alienware x17 R2 P48E (1.3) | |
| Schenker XMG Neo 17 M22 (1.3) | |
| Strange Brigade - 1920x1080 ultra AA:ultra AF:16 | |
| Medion Erazer Beast X40 (1.47.22.14 D3D12, dGPU, Cooling) | |
| Medion Erazer Beast X40 (1.47.22.14 D3D12, dGPU) | |
| MSI Titan GT77 HX 13VI (1.47.22.14 D3D12) | |
| Asus ROG Strix Scar 18 2023 G834JY-N6005W (1.47.22.14 D3D12) | |
| Medion Erazer Beast X40 (1.47.22.14 D3D12) | |
| Przeciętny NVIDIA GeForce RTX 4090 Laptop GPU (233 - 421, n=39) | |
| Razer Blade 16 Early 2023 (1.47.22.14 D3D12) | |
| Średnia w klasie Gaming (76.3 - 456, n=91, ostatnie 2 lata) | |
| Alienware x17 R2 P48E (1.47.22.14 D3D12) | |
| Schenker XMG Neo 17 M22 (1.47.22.14 D3D12) | |
| Dota 2 Reborn - 1920x1080 ultra (3/3) best looking | |
| Razer Blade 16 Early 2023 | |
| Asus ROG Strix Scar 18 2023 G834JY-N6005W | |
| MSI Titan GT77 HX 13VI | |
| Medion Erazer Beast X40 (dGPU, Cooling) | |
| Medion Erazer Beast X40 (dGPU) | |
| Przeciętny NVIDIA GeForce RTX 4090 Laptop GPU (115.7 - 220, n=42) | |
| Medion Erazer Beast X40 | |
| Alienware x17 R2 P48E | |
| Średnia w klasie Gaming (84.8 - 248, n=110, ostatnie 2 lata) | |
| Schenker XMG Neo 17 M22 | |
| X-Plane 11.11 - 1920x1080 high (fps_test=3) | |
| Asus ROG Strix Scar 18 2023 G834JY-N6005W | |
| Razer Blade 16 Early 2023 | |
| Medion Erazer Beast X40 (dGPU) | |
| Medion Erazer Beast X40 (dGPU, Cooling) | |
| MSI Titan GT77 HX 13VI | |
| MSI Titan GT77 HX 13VI | |
| Przeciętny NVIDIA GeForce RTX 4090 Laptop GPU (77.8 - 166.2, n=46) | |
| Medion Erazer Beast X40 | |
| Alienware x17 R2 P48E | |
| Średnia w klasie Gaming (52.1 - 143.5, n=113, ostatnie 2 lata) | |
| Schenker XMG Neo 17 M22 | |
| Returnal | |
| 1920x1080 Epic Preset | |
| Przeciętny NVIDIA GeForce RTX 4090 Laptop GPU (141 - 155, n=3) | |
| Medion Erazer Beast X40 | |
| 2560x1440 Epic Preset | |
| Przeciętny NVIDIA GeForce RTX 4090 Laptop GPU (113 - 119, n=3) | |
| Medion Erazer Beast X40 | |
| 1920x1080 Epic Preset + Epic Ray-Tracing | |
| Przeciętny NVIDIA GeForce RTX 4090 Laptop GPU (126 - 128, n=2) | |
| Medion Erazer Beast X40 | |
| Atomic Heart | |
| 1920x1080 Atomic Preset | |
| Przeciętny NVIDIA GeForce RTX 4090 Laptop GPU (128.6 - 166, n=3) | |
| Medion Erazer Beast X40 | |
| 2560x1440 Atomic Preset | |
| Przeciętny NVIDIA GeForce RTX 4090 Laptop GPU (93.8 - 135, n=3) | |
| Medion Erazer Beast X40 | |
| Hogwarts Legacy | |
| 1920x1080 Ultra Preset AA:High T | |
| Medion Erazer Beast X40 | |
| Przeciętny NVIDIA GeForce RTX 4090 Laptop GPU (41.2 - 166.1, n=4) | |
| Średnia w klasie Gaming (76 - 108.3, n=2, ostatnie 2 lata) | |
| 2560x1440 Ultra Preset AA:High T | |
| Medion Erazer Beast X40 | |
| Przeciętny NVIDIA GeForce RTX 4090 Laptop GPU (40.6 - 125.9, n=4) | |
| Średnia w klasie Gaming (52 - 96.8, n=2, ostatnie 2 lata) | |
| 1920x1080 Ultra Preset + Full Ray Tracing AA:High T | |
| Medion Erazer Beast X40 | |
| Przeciętny NVIDIA GeForce RTX 4090 Laptop GPU (52.2 - 67, n=3) | |
| Company of Heroes 3 | |
| 1920x1080 Maximum Settings | |
| Przeciętny NVIDIA GeForce RTX 4090 Laptop GPU (215 - 235, n=2) | |
| Medion Erazer Beast X40 | |
| 2560x1440 Maximum Settings | |
| Przeciętny NVIDIA GeForce RTX 4090 Laptop GPU (176.4 - 194.8, n=2) | |
| Medion Erazer Beast X40 | |
| Sons of the Forest | |
| 1920x1080 Ultra Preset AA:T | |
| Przeciętny NVIDIA GeForce RTX 4090 Laptop GPU (85.7 - 93.9, n=2) | |
| Medion Erazer Beast X40 | |
| 2560x1440 Ultra Preset AA:T | |
| Przeciętny NVIDIA GeForce RTX 4090 Laptop GPU (85.2 - 89.6, n=2) | |
| Medion Erazer Beast X40 | |
By sprawdzić, czy laptop może przez dłuższy czas uruchamiać gry z przeważnie stabilną liczbą klatek na sekundę, uruchomiliśmy The Witcher 3 przez mniej więcej 60 minut w rozdzielczości Full HD i maksymalnych ustawieniach jakościowych, nie ruszając postaci gracza. Nie zaobserwowaliśmy żadnego spadku liczby klatek na sekundę.
Witcher 3 FPS graph
| low | med. | high | ultra | QHD | |
|---|---|---|---|---|---|
| GTA V (2015) | 187.5 | 187.1 | 186 | 151.3 | 145.3 |
| The Witcher 3 (2015) | 586.4 | 511.4 | 363.8 | 195.1 | |
| Dota 2 Reborn (2015) | 215 | 193.5 | 182.6 | 171.5 | |
| Final Fantasy XV Benchmark (2018) | 232 | 207 | 176.2 | 146.7 | |
| X-Plane 11.11 (2018) | 187.1 | 162.9 | 128.3 | ||
| Far Cry 5 (2018) | 199 | 172 | 167 | 158 | 151 |
| Strange Brigade (2018) | 515 | 387 | 369 | 365 | 292 |
| Hunt Showdown (2020) | 367 | 285 | 262 | 168 | |
| Death Stranding (2020) | 179 | 171.4 | 166.6 | 163 | 162.1 |
| Yakuza Like a Dragon (2020) | 179.7 | 167.7 | 166.6 | 152.3 | 138.1 |
| Back 4 Blood (2021) | 403 | 309 | 309 | 327 | |
| Guardians of the Galaxy (2021) | 163 | 160 | 158 | 152 | 141 |
| Riders Republic (2021) | 209 | 200 | 185 | 179 | 146 |
| Elex 2 (2022) | 118.2 | 117.1 | 116.2 | 116.2 | 116.7 |
| F1 22 (2022) | 301 | 290 | 268 | 118.2 | 79.9 |
| The Quarry (2022) | 278 | 211 | 177.3 | 146.1 | 100.2 |
| Hogwarts Legacy (2023) | 242 | 204 | 186.5 | 166.1 | 125.9 |
| Returnal (2023) | 178 | 171 | 164 | 146 | 113 |
| Atomic Heart (2023) | 205 | 161.8 | 144.2 | 128.6 | 93.8 |
| Company of Heroes 3 (2023) | 285.3 | 262.9 | 235.2 | 215.2 | 176.4 |
| Sons of the Forest (2023) | 96.1 | 90 | 87.9 | 85.7 | 85.2 |
Emisje - laptop Erazer może być dość głośny
Emisja hałasu
W codziennym użytkowaniu (np. aplikacje biurowe, przeglądanie stron internetowych) laptop jest stosunkowo cichy. Wentylatory mogą nawet raz na jakiś czas przestać się kręcić. Co nie dziwi, X40 potrafi zrobić się dość głośny pod dużym obciążeniem, wytwarzając podczas stress testu i testu Witcher 3 aż 53 dB(A) hałasu. Mimo dość dużego natężenia hałasu dźwięk wytwarzany przez oba wentylatory jest w sumie znośny: szumowi towarzyszy dźwięczny warkot, który wraz ze wzrostem prędkości obrotowej wentylatorów stopniowo przechodzi w lekki gwizd.
Wentylatory laptopa ustępują po podłączeniu zewnętrznego chłodzenia wodnego. Jednak sam agregat również przyczynia się do ogólnego hałasu: chociaż pompa jest stosunkowo cicha w użyciu, wentylator wewnątrz chłodzenia robi więcej hałasu. W sumie wydaje nam się, że ogólny hałas jest przyjemniejszy, gdy używa się chłodzenia wodnego.
Hałas
| luz |
| 25 / 29 / 35 dB |
| obciążenie |
| 51 / 53 dB |
 | ||
30 dB cichy 40 dB(A) słyszalny 50 dB(A) irytujący |
||
min: | ||
| Medion Erazer Beast X40 GeForce RTX 4090 Laptop GPU, i9-13900HX | MSI Titan GT77 HX 13VI GeForce RTX 4090 Laptop GPU, i9-13950HX | Razer Blade 16 Early 2023 GeForce RTX 4080 Laptop GPU, i9-13950HX | Schenker XMG Neo 17 M22 GeForce RTX 3080 Ti Laptop GPU, R9 6900HX | Alienware x17 R2 P48E GeForce RTX 3080 Ti Laptop GPU, i9-12900HK | Asus ROG Strix Scar 18 2023 G834JY-N6005W GeForce RTX 4090 Laptop GPU, i9-13980HX | |
|---|---|---|---|---|---|---|
| Noise | -3% | 13% | -3% | 15% | 4% | |
| wyłączone / środowisko * (dB) | 24 | 24.6 -3% | 23 4% | 26 -8% | 22.7 5% | 23.9 -0% |
| Idle Minimum * (dB) | 25 | 29.2 -17% | 23 8% | 26 -4% | 23.1 8% | 23.9 4% |
| Idle Average * (dB) | 29 | 29.2 -1% | 23 21% | 29 -0% | 23.1 20% | 32.6 -12% |
| Idle Maximum * (dB) | 35 | 29.2 17% | 23.6 33% | 40 -14% | 23.1 34% | 32.6 7% |
| Load Average * (dB) | 51 | 50.7 1% | 39 24% | 47 8% | 31.9 37% | 35.9 30% |
| Witcher 3 ultra * (dB) | 51 | 53.3 -5% | 51.6 -1% | 52 -2% | 52.5 -3% | |
| Load Maximum * (dB) | 53 | 61 -15% | 51.3 3% | 54 -2% | 52.5 1% | 55.8 -5% |
* ... im mniej tym lepiej
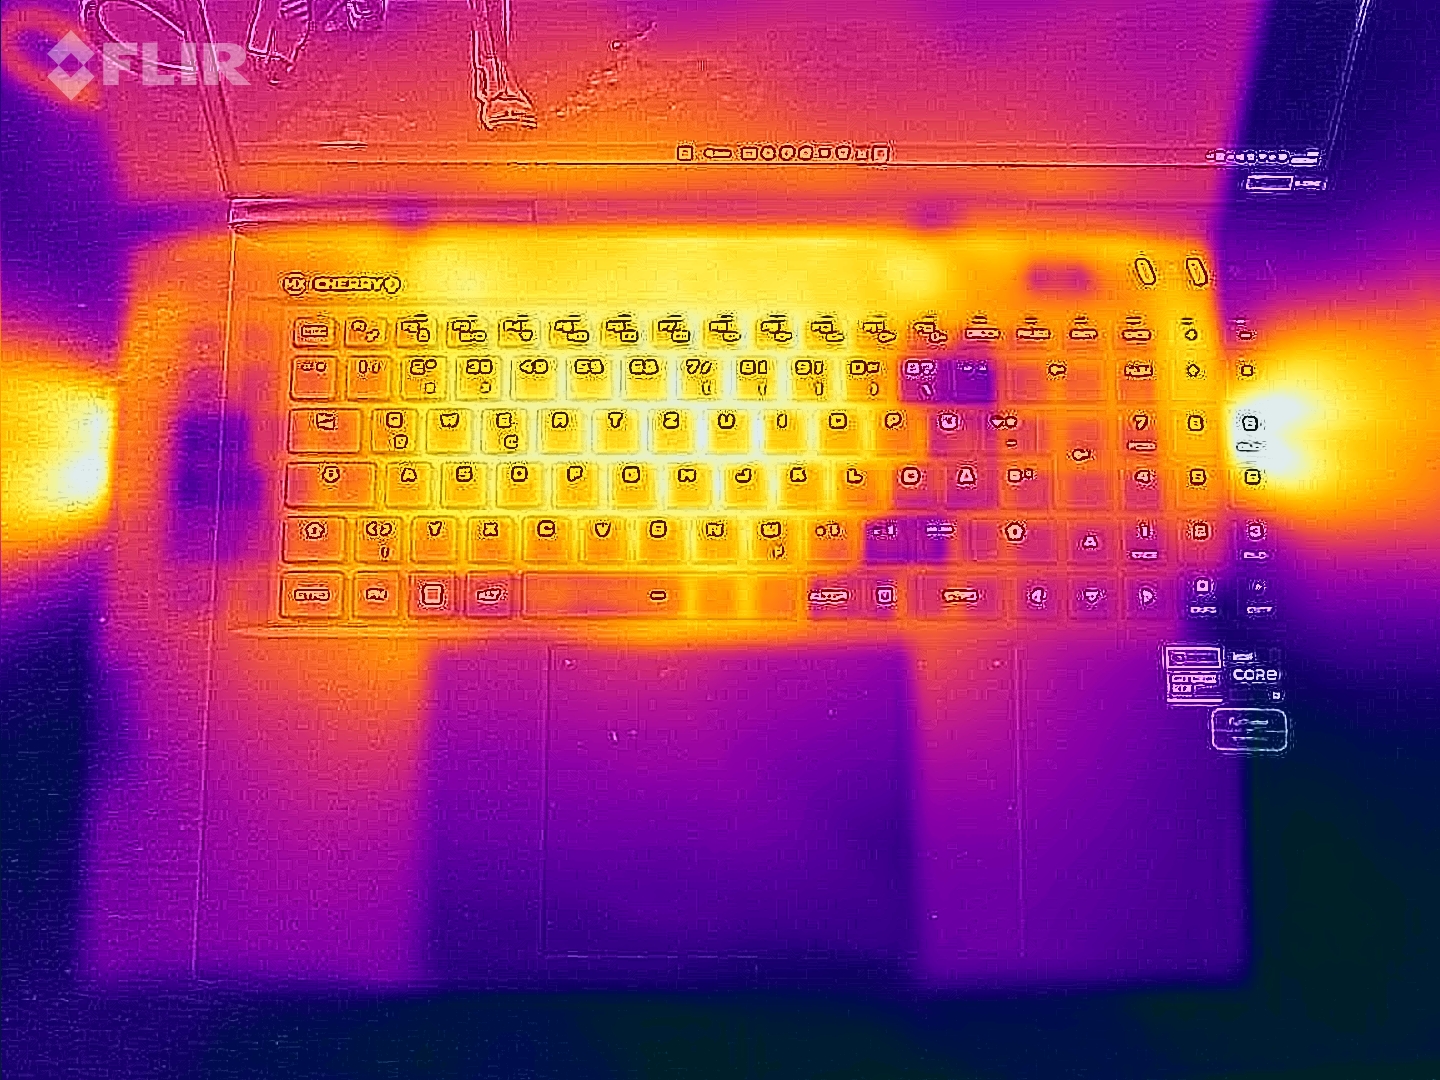
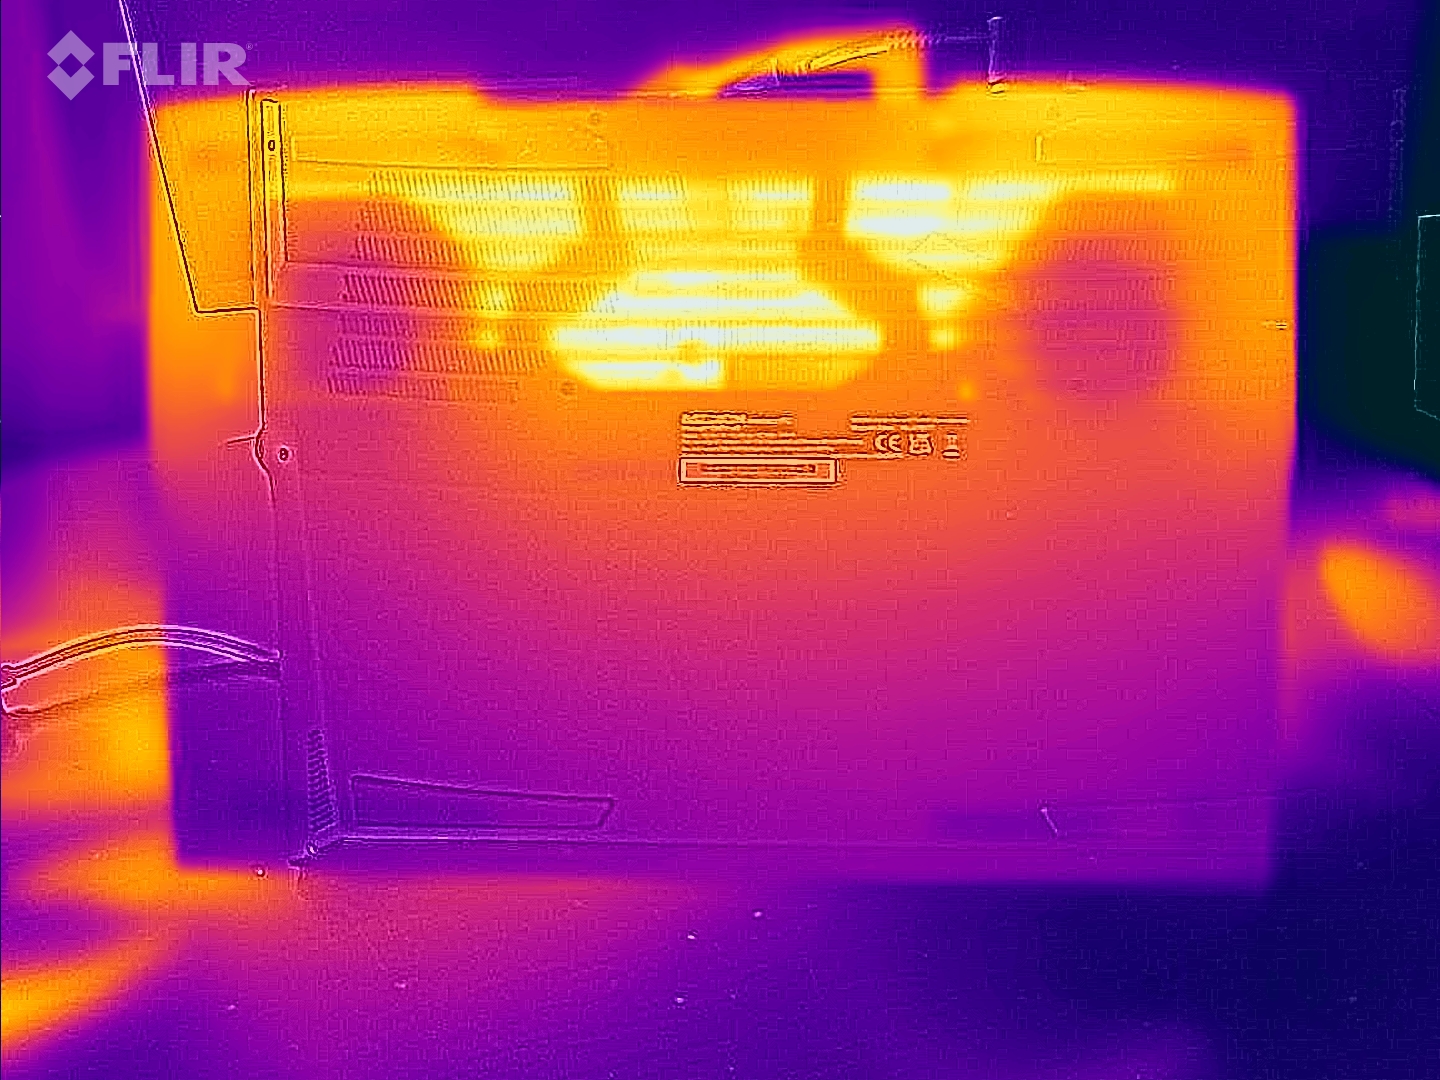
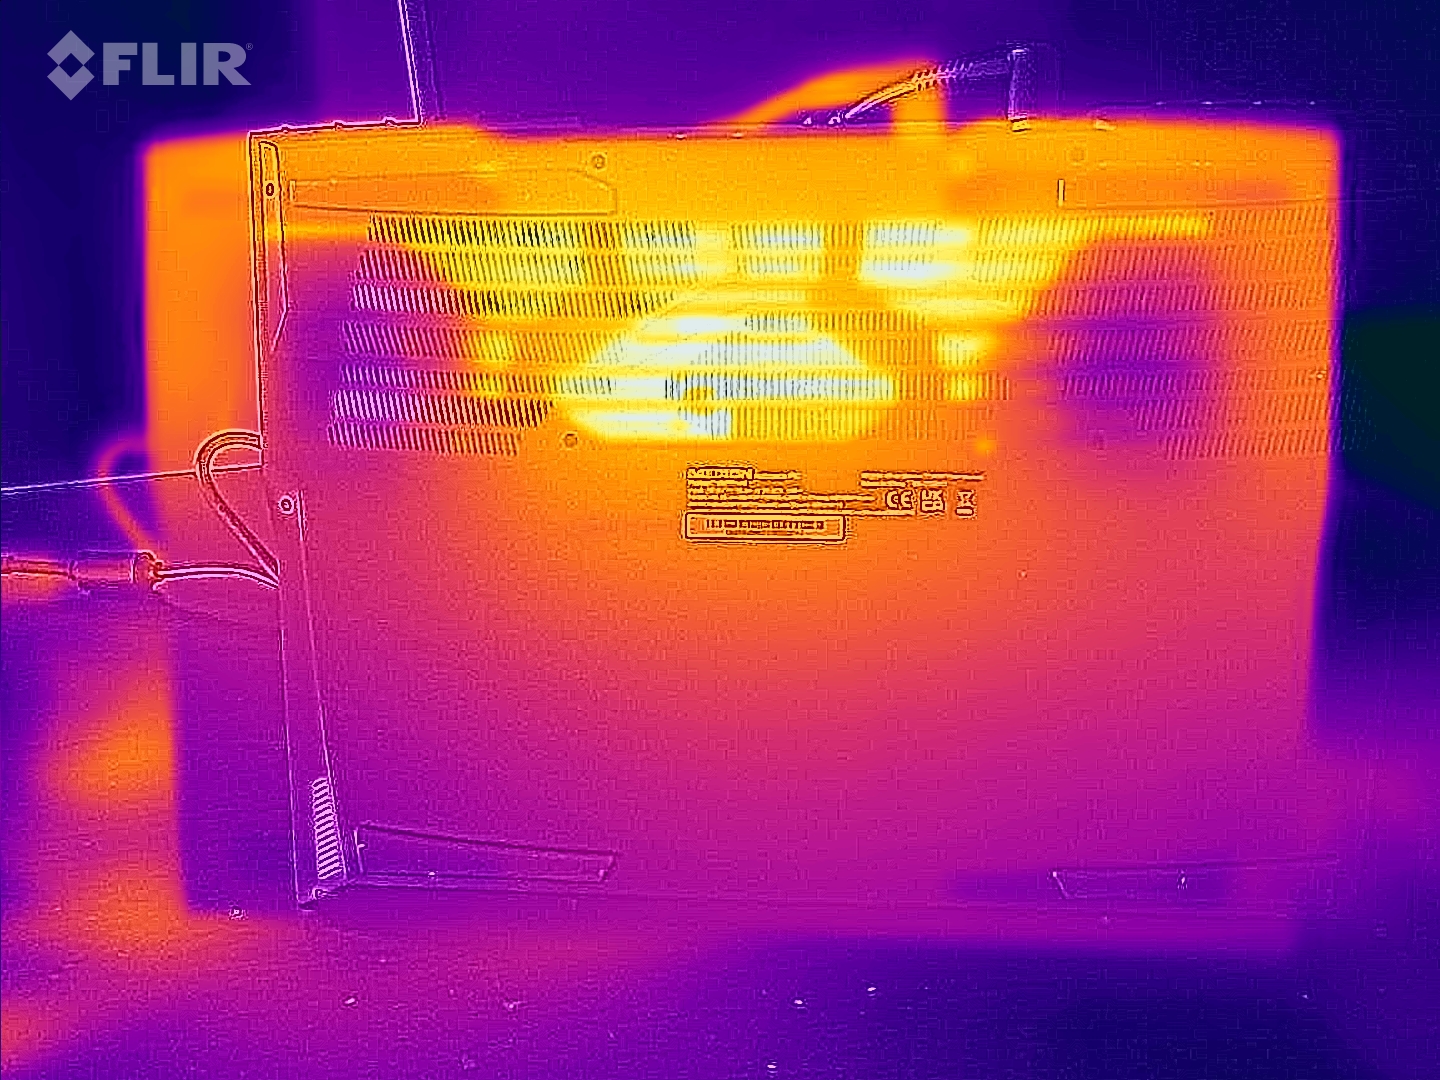
Temperatura
Temperatury obudowy pozostają w akceptowalnym zakresie w codziennych zastosowaniach, takich jak uruchamianie oprogramowania biurowego i przeglądarek internetowych. Laptop staje się zauważalnie ciepły, ale nie nadmiernie gorący pod obciążeniem, co zauważyliśmy podczas testu obciążeniowego i testu Witcher 3. Temperatury procesora również nie dały nam powodów do obaw.
(-) Maksymalna temperatura w górnej części wynosi 48 °C / 118 F, w porównaniu do średniej 40.4 °C / 105 F , począwszy od 21.2 do 68.8 °C dla klasy Gaming.
(-) Dno nagrzewa się maksymalnie do 52 °C / 126 F, w porównaniu do średniej 43.2 °C / 110 F
(+) W stanie bezczynności średnia temperatura górnej części wynosi 28.2 °C / 83 F, w porównaniu ze średnią temperaturą urządzenia wynoszącą 33.9 °C / ### class_avg_f### F.
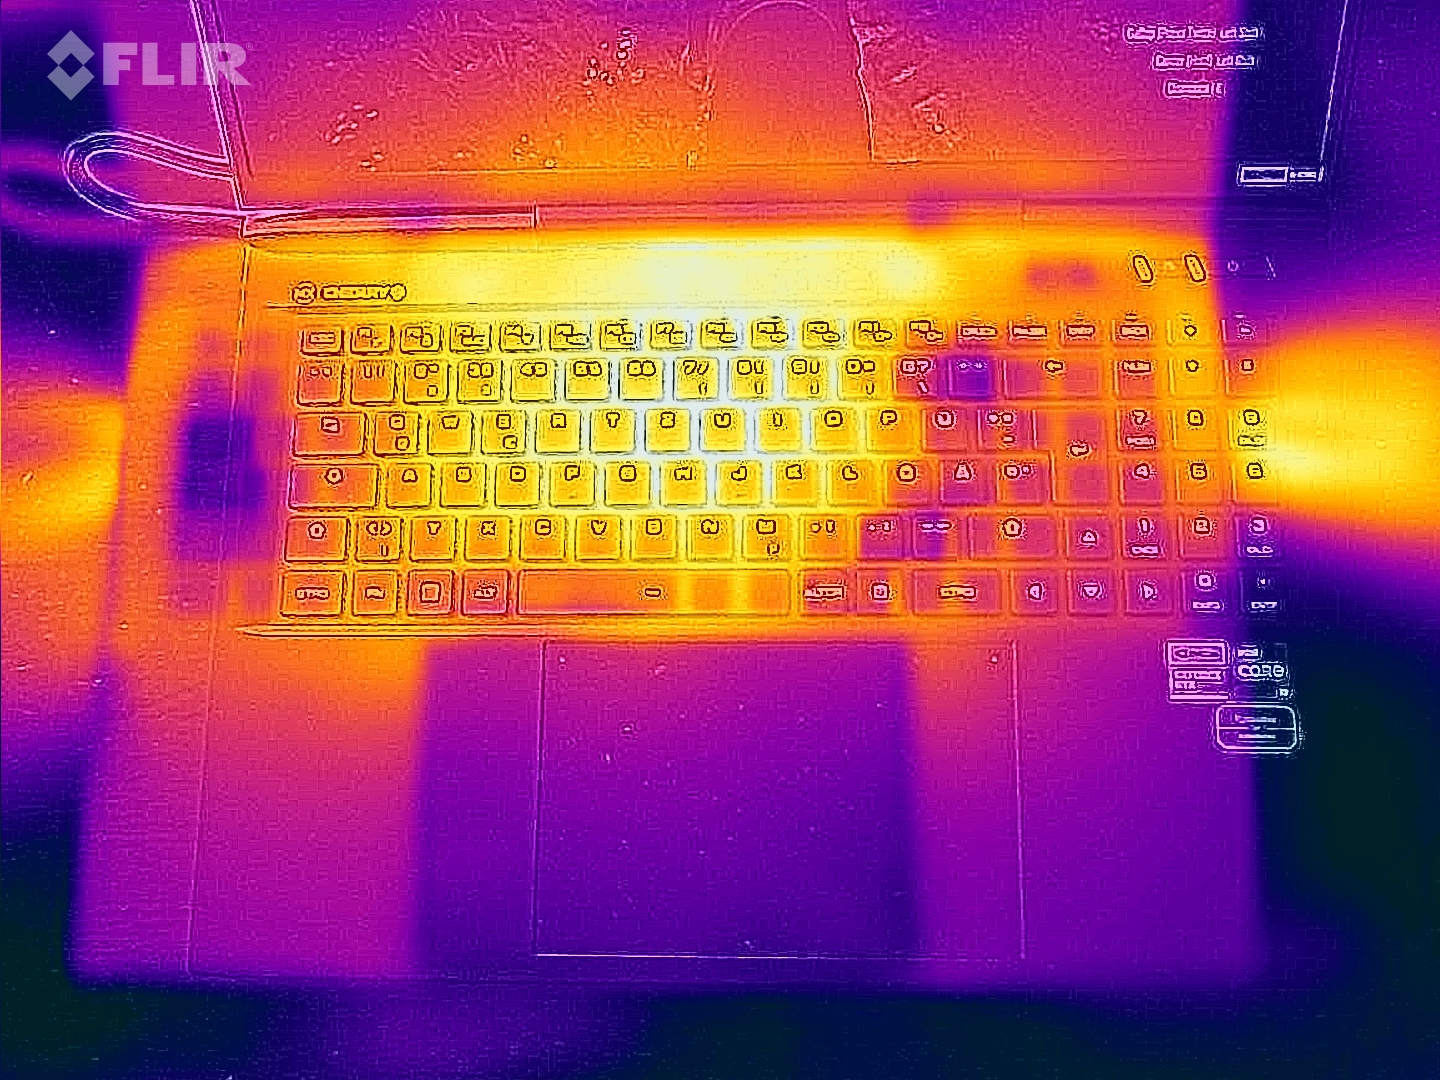
(-) Podczas gry w Wiedźmina 3 średnia temperatura górnej części wynosi 40.7 °C / 105 F, w porównaniu do średniej temperatury urządzenia wynoszącej 33.9 °C / ## #class_avg_f### F.
(+) Podparcia dłoni i touchpad osiągają maksymalną temperaturę skóry (34 °C / 93.2 F) i dlatego nie są gorące.
(-) Średnia temperatura obszaru podparcia dłoni w podobnych urządzeniach wynosiła 28.8 °C / 83.8 F (-5.2 °C / -9.4 F).
| Medion Erazer Beast X40 Intel Core i9-13900HX, NVIDIA GeForce RTX 4090 Laptop GPU | MSI Titan GT77 HX 13VI Intel Core i9-13950HX, NVIDIA GeForce RTX 4090 Laptop GPU | Razer Blade 16 Early 2023 Intel Core i9-13950HX, NVIDIA GeForce RTX 4080 Laptop GPU | Schenker XMG Neo 17 M22 AMD Ryzen 9 6900HX, NVIDIA GeForce RTX 3080 Ti Laptop GPU | Alienware x17 R2 P48E Intel Core i9-12900HK, NVIDIA GeForce RTX 3080 Ti Laptop GPU | Asus ROG Strix Scar 18 2023 G834JY-N6005W Intel Core i9-13980HX, NVIDIA GeForce RTX 4090 Laptop GPU | |
|---|---|---|---|---|---|---|
| Heat | 13% | 9% | -2% | 4% | -0% | |
| Maximum Upper Side * (°C) | 48 | 40.6 15% | 40 17% | 49 -2% | 49.6 -3% | 54 -13% |
| Maximum Bottom * (°C) | 52 | 41.1 21% | 37.6 28% | 52 -0% | 42.4 18% | 46 12% |
| Idle Upper Side * (°C) | 30 | 26.2 13% | 32.4 -8% | 30 -0% | 29.2 3% | 30 -0% |
| Idle Bottom * (°C) | 31 | 30.3 2% | 31.4 -1% | 33 -6% | 32 -3% | 31 -0% |
* ... im mniej tym lepiej
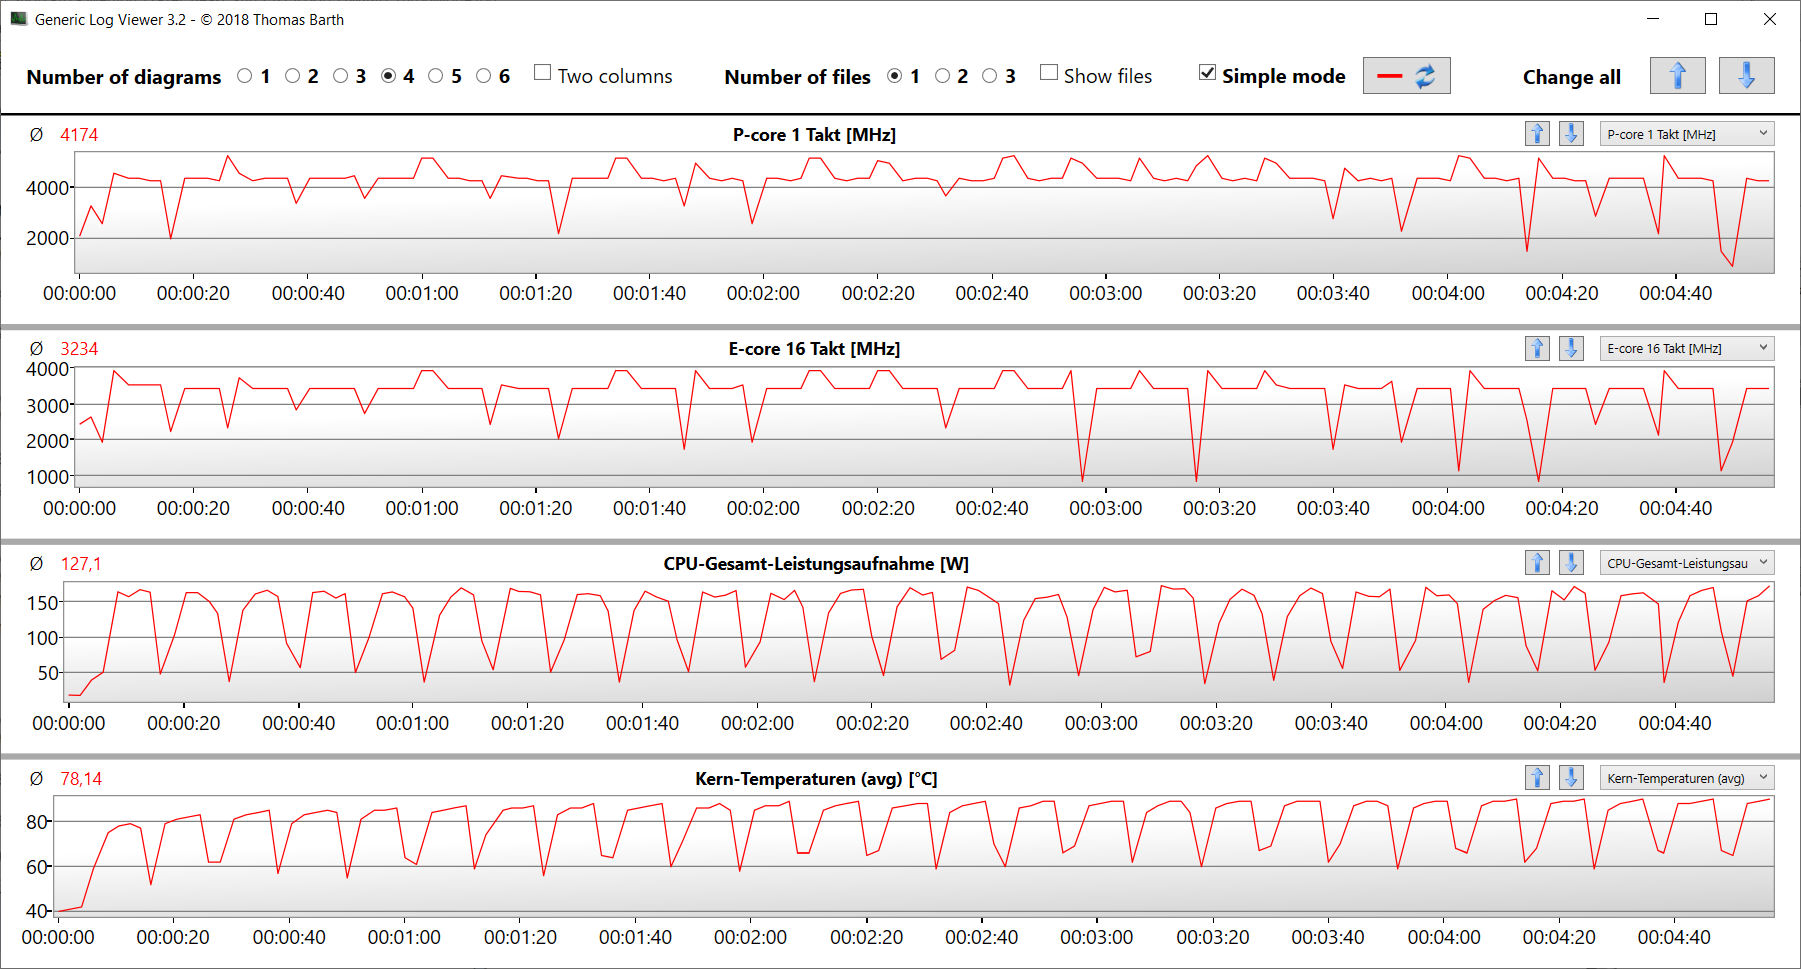
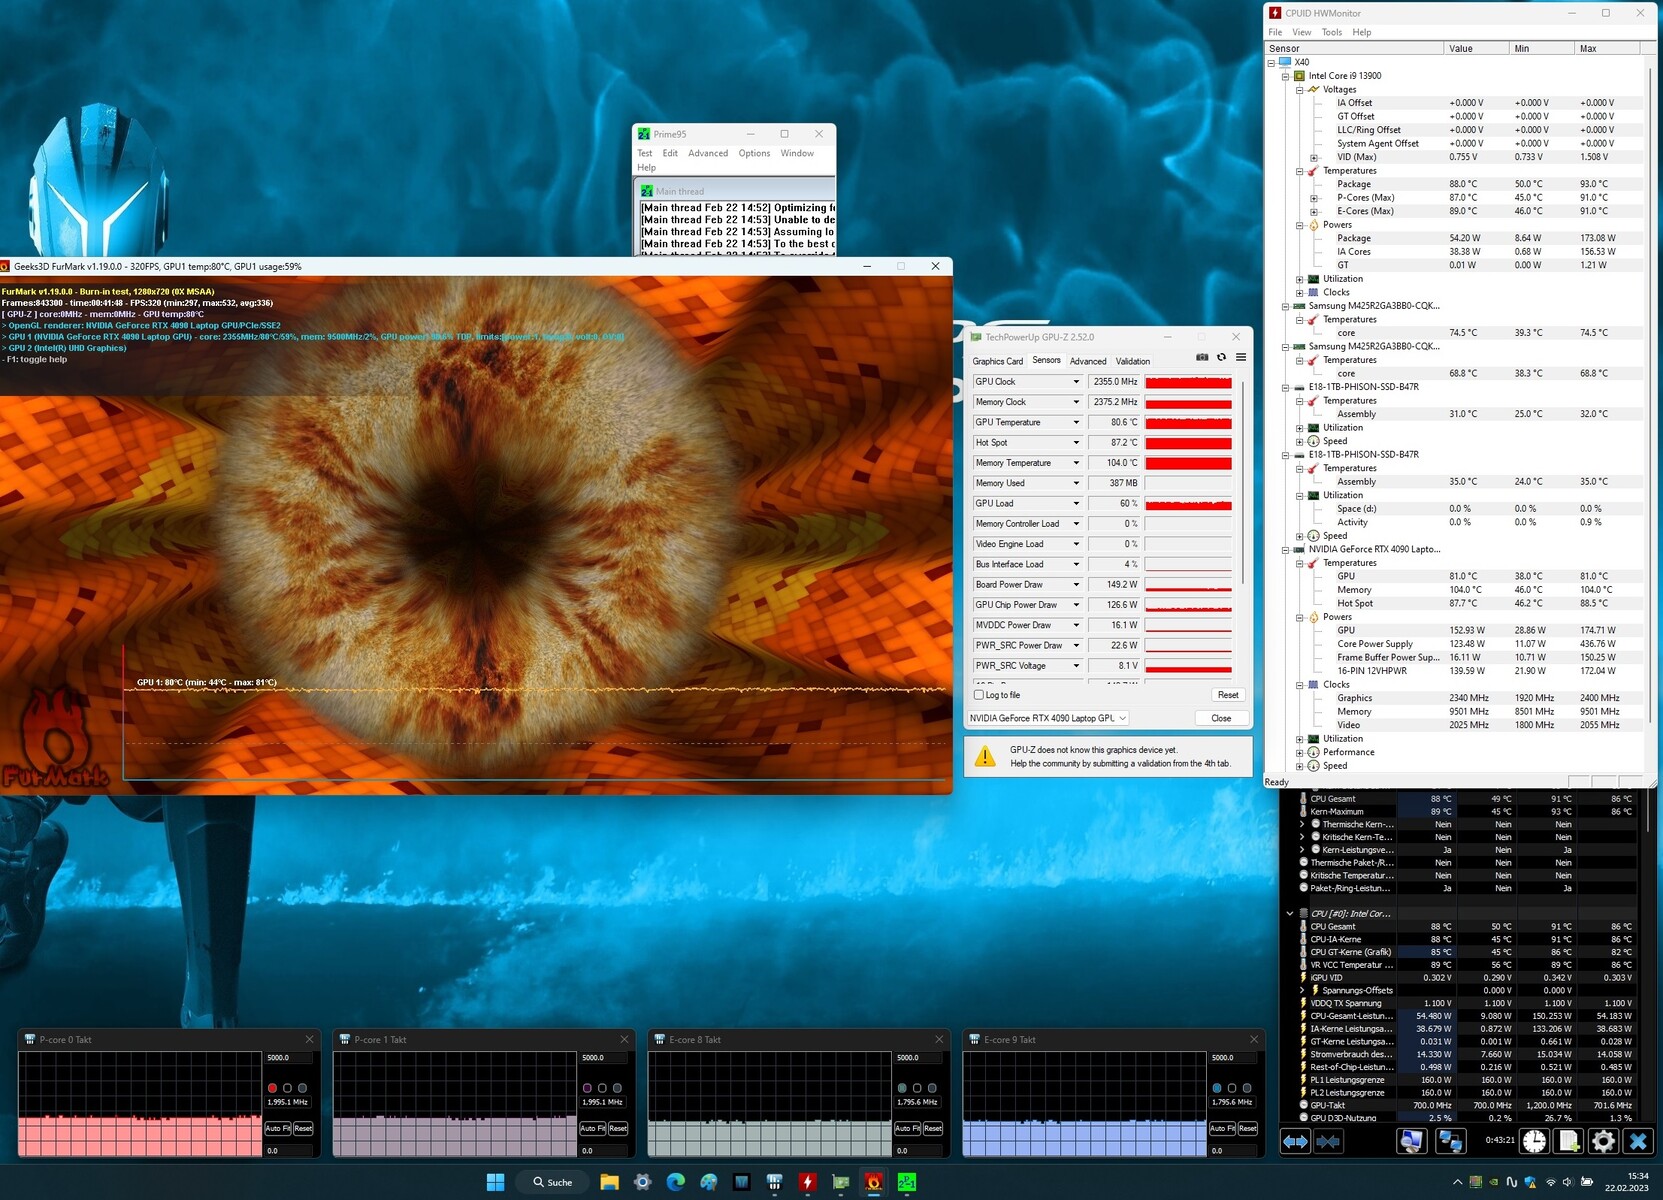
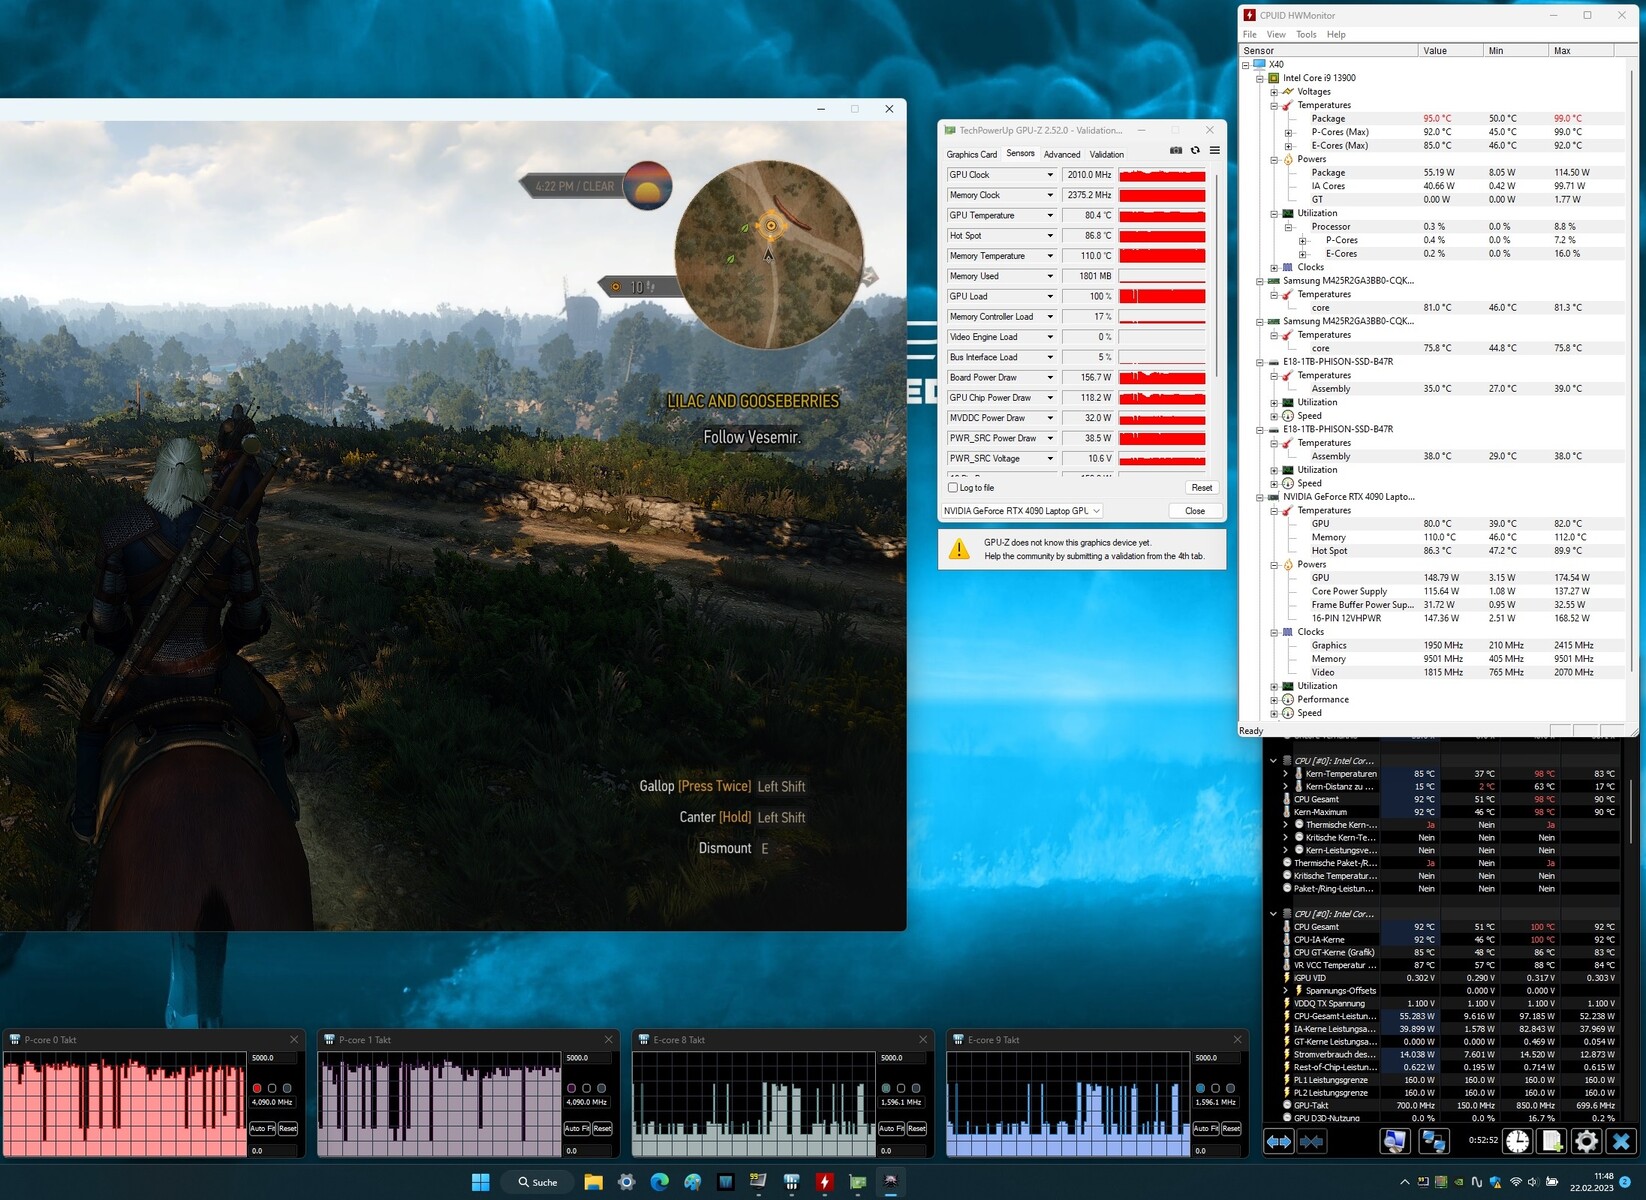
Test na stres
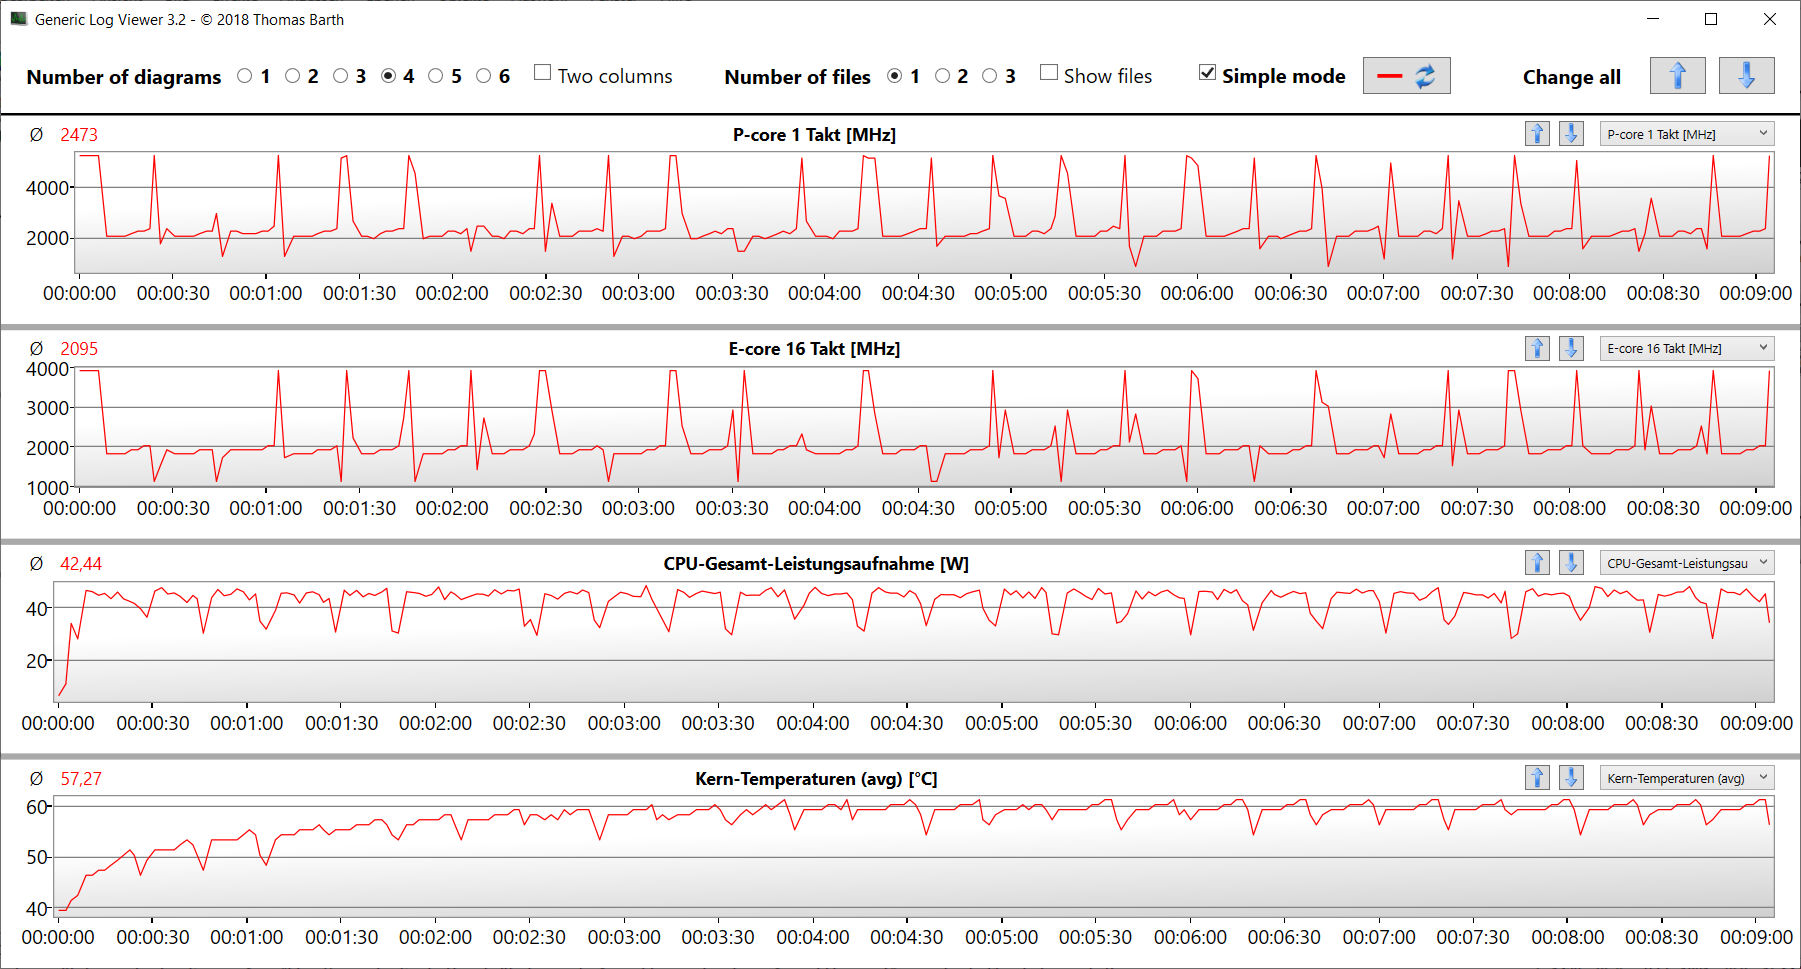
W teście warunków skrajnych pozwoliliśmy Prime95 i FurMark działać przez dłuższy czas. Jest to ekstremalny scenariusz mający na celu ocenę stabilności systemu pod pełnym obciążeniem. CPU rozpoczął pracę z wysokim taktowaniem (rdzenie P: 4 GHz, rdzenie E: 3,3 GHz), podczas gdy GPU wahało się między 1 a 1,5 GHz. Po około pięciu minutach rdzenie P i E CPU stopniowo spadły do odpowiednio 2 GHz i 1,8 GHz, natomiast taktowanie GPU wzrosło do około 2,3-2,4 GHz
Mówcy
Głośniki stereo brzmią przyzwoicie, ale nie wytwarzają prawie żadnych basów. Zalecamy użycie pary słuchawek lub głośników zewnętrznych, aby uzyskać lepsze wrażenia dźwiękowe.
Medion Erazer Beast X40 analiza dźwięku
(+) | głośniki mogą odtwarzać stosunkowo głośno (88 dB)
Bas 100 - 315 Hz
(-) | prawie brak basu - średnio 20.2% niższa od mediany
(±) | liniowość basu jest średnia (8.4% delta do poprzedniej częstotliwości)
Średnie 400 - 2000 Hz
(±) | wyższe średnie - średnio 5.5% wyższe niż mediana
(+) | średnie są liniowe (6.5% delta do poprzedniej częstotliwości)
Wysokie 2–16 kHz
(+) | zrównoważone maksima - tylko 3.1% od mediany
(+) | wzloty są liniowe (5.8% delta do poprzedniej częstotliwości)
Ogólnie 100 - 16.000 Hz
(±) | liniowość ogólnego dźwięku jest średnia (16.1% różnicy w stosunku do mediany)
W porównaniu do tej samej klasy
» 39% wszystkich testowanych urządzeń w tej klasie było lepszych, 6% podobnych, 54% gorszych
» Najlepszy miał deltę 6%, średnia wynosiła ###średnia###%, najgorsza wynosiła 132%
W porównaniu do wszystkich testowanych urządzeń
» 26% wszystkich testowanych urządzeń było lepszych, 5% podobnych, 69% gorszych
» Najlepszy miał deltę 4%, średnia wynosiła ###średnia###%, najgorsza wynosiła 134%
MSI Titan GT77 HX 13VI analiza dźwięku
(+) | głośniki mogą odtwarzać stosunkowo głośno (90.1 dB)
Bas 100 - 315 Hz
(±) | zredukowany bas - średnio 14.3% niższy od mediany
(±) | liniowość basu jest średnia (7.5% delta do poprzedniej częstotliwości)
Średnie 400 - 2000 Hz
(+) | zbalansowane środki średnie - tylko 3.5% od mediany
(+) | średnie są liniowe (3.2% delta do poprzedniej częstotliwości)
Wysokie 2–16 kHz
(+) | zrównoważone maksima - tylko 1.9% od mediany
(+) | wzloty są liniowe (3.8% delta do poprzedniej częstotliwości)
Ogólnie 100 - 16.000 Hz
(+) | ogólny dźwięk jest liniowy (11.1% różnicy w stosunku do mediany)
W porównaniu do tej samej klasy
» 8% wszystkich testowanych urządzeń w tej klasie było lepszych, 3% podobnych, 89% gorszych
» Najlepszy miał deltę 6%, średnia wynosiła ###średnia###%, najgorsza wynosiła 132%
W porównaniu do wszystkich testowanych urządzeń
» 7% wszystkich testowanych urządzeń było lepszych, 2% podobnych, 92% gorszych
» Najlepszy miał deltę 4%, średnia wynosiła ###średnia###%, najgorsza wynosiła 134%
Zarządzanie energią - X40 oferuje dość dobrą wytrzymałość
Pobór mocy
Pobór mocy X40 wyniósł średnio 280 W w teście Witcher 3, a w teście obciążeniowym osiągnął na krótko 363 W. Podczas gdy zużycie energii spadło nieznacznie w trakcie testu Witcher 3, wahało się w trakcie testu obciążeniowego. W stanie bezczynności laptop pobiera dość normalną ilość energii jak na sprzęt znajdujący się w środku. Dołączona ładowarka ma moc 330 W, a więc może dostarczyć laptopowi wystarczającą ilość energii.
| wyłączony / stan wstrzymania | |
| luz | |
| obciążenie |
|
Legenda:
min: | |
| Medion Erazer Beast X40 i9-13900HX, GeForce RTX 4090 Laptop GPU | MSI Titan GT77 HX 13VI i9-13950HX, GeForce RTX 4090 Laptop GPU | Razer Blade 16 Early 2023 i9-13950HX, GeForce RTX 4080 Laptop GPU | Schenker XMG Neo 17 M22 R9 6900HX, GeForce RTX 3080 Ti Laptop GPU | Alienware x17 R2 P48E i9-12900HK, GeForce RTX 3080 Ti Laptop GPU | Asus ROG Strix Scar 18 2023 G834JY-N6005W i9-13980HX, GeForce RTX 4090 Laptop GPU | Przeciętny NVIDIA GeForce RTX 4090 Laptop GPU | Średnia w klasie Gaming | |
|---|---|---|---|---|---|---|---|---|
| Power Consumption | -5% | -14% | 31% | -42% | -30% | -15% | 9% | |
| Idle Minimum * (Watt) | 11 | 14 -27% | 15.2 -38% | 7 36% | 24.1 -119% | 17.3 -57% | 16.2 ? -47% | 13.2 ? -20% |
| Idle Average * (Watt) | 18 | 21.6 -20% | 22.8 -27% | 11 39% | 28.5 -58% | 27 -50% | 23.1 ? -28% | 18.9 ? -5% |
| Idle Maximum * (Watt) | 30 | 24.8 17% | 49.8 -66% | 17 43% | 60 -100% | 46 -53% | 34.2 ? -14% | 24.3 ? 19% |
| Load Average * (Watt) | 136 | 122.5 10% | 121.2 11% | 92 32% | 128.7 5% | 133 2% | 130.5 ? 4% | 108.3 ? 20% |
| Witcher 3 ultra * (Watt) | 280 | 265 5% | 242 14% | 221 21% | 254 9% | |||
| Load Maximum * (Watt) | 363 | 418 -15% | 273.7 25% | 306 16% | 323 11% | 329 9% | 324 ? 11% | 254 ? 30% |
* ... im mniej tym lepiej
Power consumption Witcher 3 / Stress test
Power consumption with external monitor
Żywotność baterii
17-calowy laptop wytrzymał odpowiednio 6h 22m i 6h 56m w teście Wi-Fi (uzyskiwanie dostępu do stron internetowych automatycznie przy użyciu skryptu) i teście wideo (zapętlenie krótkiego filmu Big Buck Bunny, zakodowanego w H.264, w rozdzielczości Full HD). W obu testach wszystkie funkcje oszczędzania energii były w laptopie wyłączone, a jasność ekranu była ustawiona na około 150 cd/m². Karta bezprzewodowa była również wyłączona, kiedy przeprowadzaliśmy test wideo.
Ogólnie rzecz biorąc, Erazer zapewnia świetne czasy pracy na akumulatorze jak na tak wydajny laptop. Jest w stanie przewyższyć większość konkurentów, nawet tych o identycznej pojemności akumulatora.
| Medion Erazer Beast X40 i9-13900HX, GeForce RTX 4090 Laptop GPU, 99.8 Wh | MSI Titan GT77 HX 13VI i9-13950HX, GeForce RTX 4090 Laptop GPU, 99.9 Wh | Razer Blade 16 Early 2023 i9-13950HX, GeForce RTX 4080 Laptop GPU, 95.2 Wh | Schenker XMG Neo 17 M22 R9 6900HX, GeForce RTX 3080 Ti Laptop GPU, 99 Wh | Alienware x17 R2 P48E i9-12900HK, GeForce RTX 3080 Ti Laptop GPU, 87 Wh | Asus ROG Strix Scar 18 2023 G834JY-N6005W i9-13980HX, GeForce RTX 4090 Laptop GPU, 90 Wh | Średnia w klasie Gaming | |
|---|---|---|---|---|---|---|---|
| Czasy pracy | -19% | -12% | 15% | -62% | -14% | 0% | |
| Reader / Idle (h) | 9.4 | 8.9 -5% | 12 28% | 3.9 -59% | 8.71 ? -7% | ||
| H.264 (h) | 6.9 | 6 -13% | 6.6 -4% | 7 1% | 8.26 ? 20% | ||
| WiFi v1.3 (h) | 6.4 | 5.3 -17% | 6.1 -5% | 9 41% | 2 -69% | 7.1 11% | 7.04 ? 10% |
| Load (h) | 1.9 | 1.4 -26% | 1.4 -26% | 1.8 -5% | 0.8 -58% | 0.9 -53% | 1.47 ? -23% |
| Witcher 3 ultra (h) | 0.9 |
Za
Przeciw
Werdykt - Wyjątkowy, wysokiej klasy notebook do gier

Medion Erazer Beast X40 to laptop przeznaczony do bardzo wymagających zastosowań, takich jak edycja wideo, renderowanie i gry. Moc obliczeniową wymaganą do tych zastosowań zapewnia jedna z najpotężniejszych obecnie kombinacji CPU-GPU: procesor Core i9-13900HX sparowany z GeForce RTX 4090.
Procesor i karta graficzna są w stanie pracować konsekwentnie z wysoką częstotliwością taktowania, a X40 wytwarza dość normalną ilość ciepła i hałasu jak na tę klasę urządzeń.
Podsumowując, Erazer Beast X40 to przekonujący laptop do gier i innych wymagających zastosowań.
Matowy 17-calowy wyświetlacz o proporcjach 16:10 (QHD, IPS, 240 Hz, G-Sync, sRGB) w większości przypadków wygląda świetnie. Jedynym minusem jest to, że jego kontrast jest nieco za niski. Znakomita klawiatura mechaniczna (z podświetleniem RGB) sprawia, że laptop wygląda jeszcze bardziej atrakcyjnie. Osoby, które nigdy wcześniej nie korzystały z klawiatury mechanicznej, czeka nowe doświadczenie w pisaniu na klawiaturze. Port Thunderbolt 4 w laptopie otwiera opcje rozbudowy (np. zewnętrzne GPU, rozwiązanie dokujące), ale nie obsługuje Power Delivery.
Jedną z możliwych alternatyw dla Erazera Beast X40 jest np Asus ROG Strix Scar 18 2023 G834JY. Asus ROG wyróżnia się 18-calowym panelem 16:10 QHD+, większą ilością pamięci RAM (64 GB) i obsługą RAID. W cenie około 4 800 euro (5 177 dolarów) znajduje się w tym samym przedziale cenowym, co Bestia. Jeśli pieniądze nie są przeszkodą, możesz spojrzeć naMSI Titan GT77 HX 13V jako kolejną alternatywę. Oferuje on nieco większą wydajność procesora, trzy gniazda na dyski SSD, obsługę RAID i cztery gniazda na pamięć RAM. Uwagę zwraca wyjątkowo jasny wyświetlacz mini-LED o doskonałym kontraście. Jednak za cały pakiet trzeba zapłacić około 6 600 euro (7 120 dolarów).
Werdykt w sprawie chłodzenia wodnego
Opcjonalny moduł chłodzenia wodnego zasadniczo robi to, co powinien: poprawia wydajność (Medion obiecuje wzrost do 10%) oraz redukuje ciepło i hałas. W rzeczywistym użytkowaniu przyrost wydajności jest jednak raczej skromny, a laptop jest ograniczony do miejsca stacjonarnego. Jedynymi zaletami, jakie pozostały, są niższe temperatury i poziom hałasu. Do każdego posiadacza X40 należy decyzja, czy te korzyści są warte dodatkowych 250 euro (270 USD).
Cena i dostępność
W Niemczech recenzowana konfiguracja Medion Erazer Beast X40 jest dostępna na stronie Saturn.de a jej cena wynosi 4 499 € (4 856 USD).
Medion Erazer Beast X40
- 20/03/2023 v7 (old)
Sascha Mölck
Przezroczystość
Wyboru urządzeń do recenzji dokonuje nasza redakcja. Próbka testowa została udostępniona autorowi jako pożyczka od producenta lub sprzedawcy detalicznego na potrzeby tej recenzji. Pożyczkodawca nie miał wpływu na tę recenzję, producent nie otrzymał też kopii tej recenzji przed publikacją. Nie było obowiązku publikowania tej recenzji. Jako niezależna firma medialna, Notebookcheck nie podlega władzy producentów, sprzedawców detalicznych ani wydawców.
Tak testuje Notebookcheck
Każdego roku Notebookcheck niezależnie sprawdza setki laptopów i smartfonów, stosując standardowe procedury, aby zapewnić porównywalność wszystkich wyników. Od około 20 lat stale rozwijamy nasze metody badawcze, ustanawiając przy tym standardy branżowe. W naszych laboratoriach testowych doświadczeni technicy i redaktorzy korzystają z wysokiej jakości sprzętu pomiarowego. Testy te obejmują wieloetapowy proces walidacji. Nasz kompleksowy system ocen opiera się na setkach uzasadnionych pomiarów i benchmarków, co pozwala zachować obiektywizm.Price comparison

