Recenzja mobilnej stacji roboczej HP ZBook Fury 16 G10: 100 W Nvidia RTX 5000 Ada

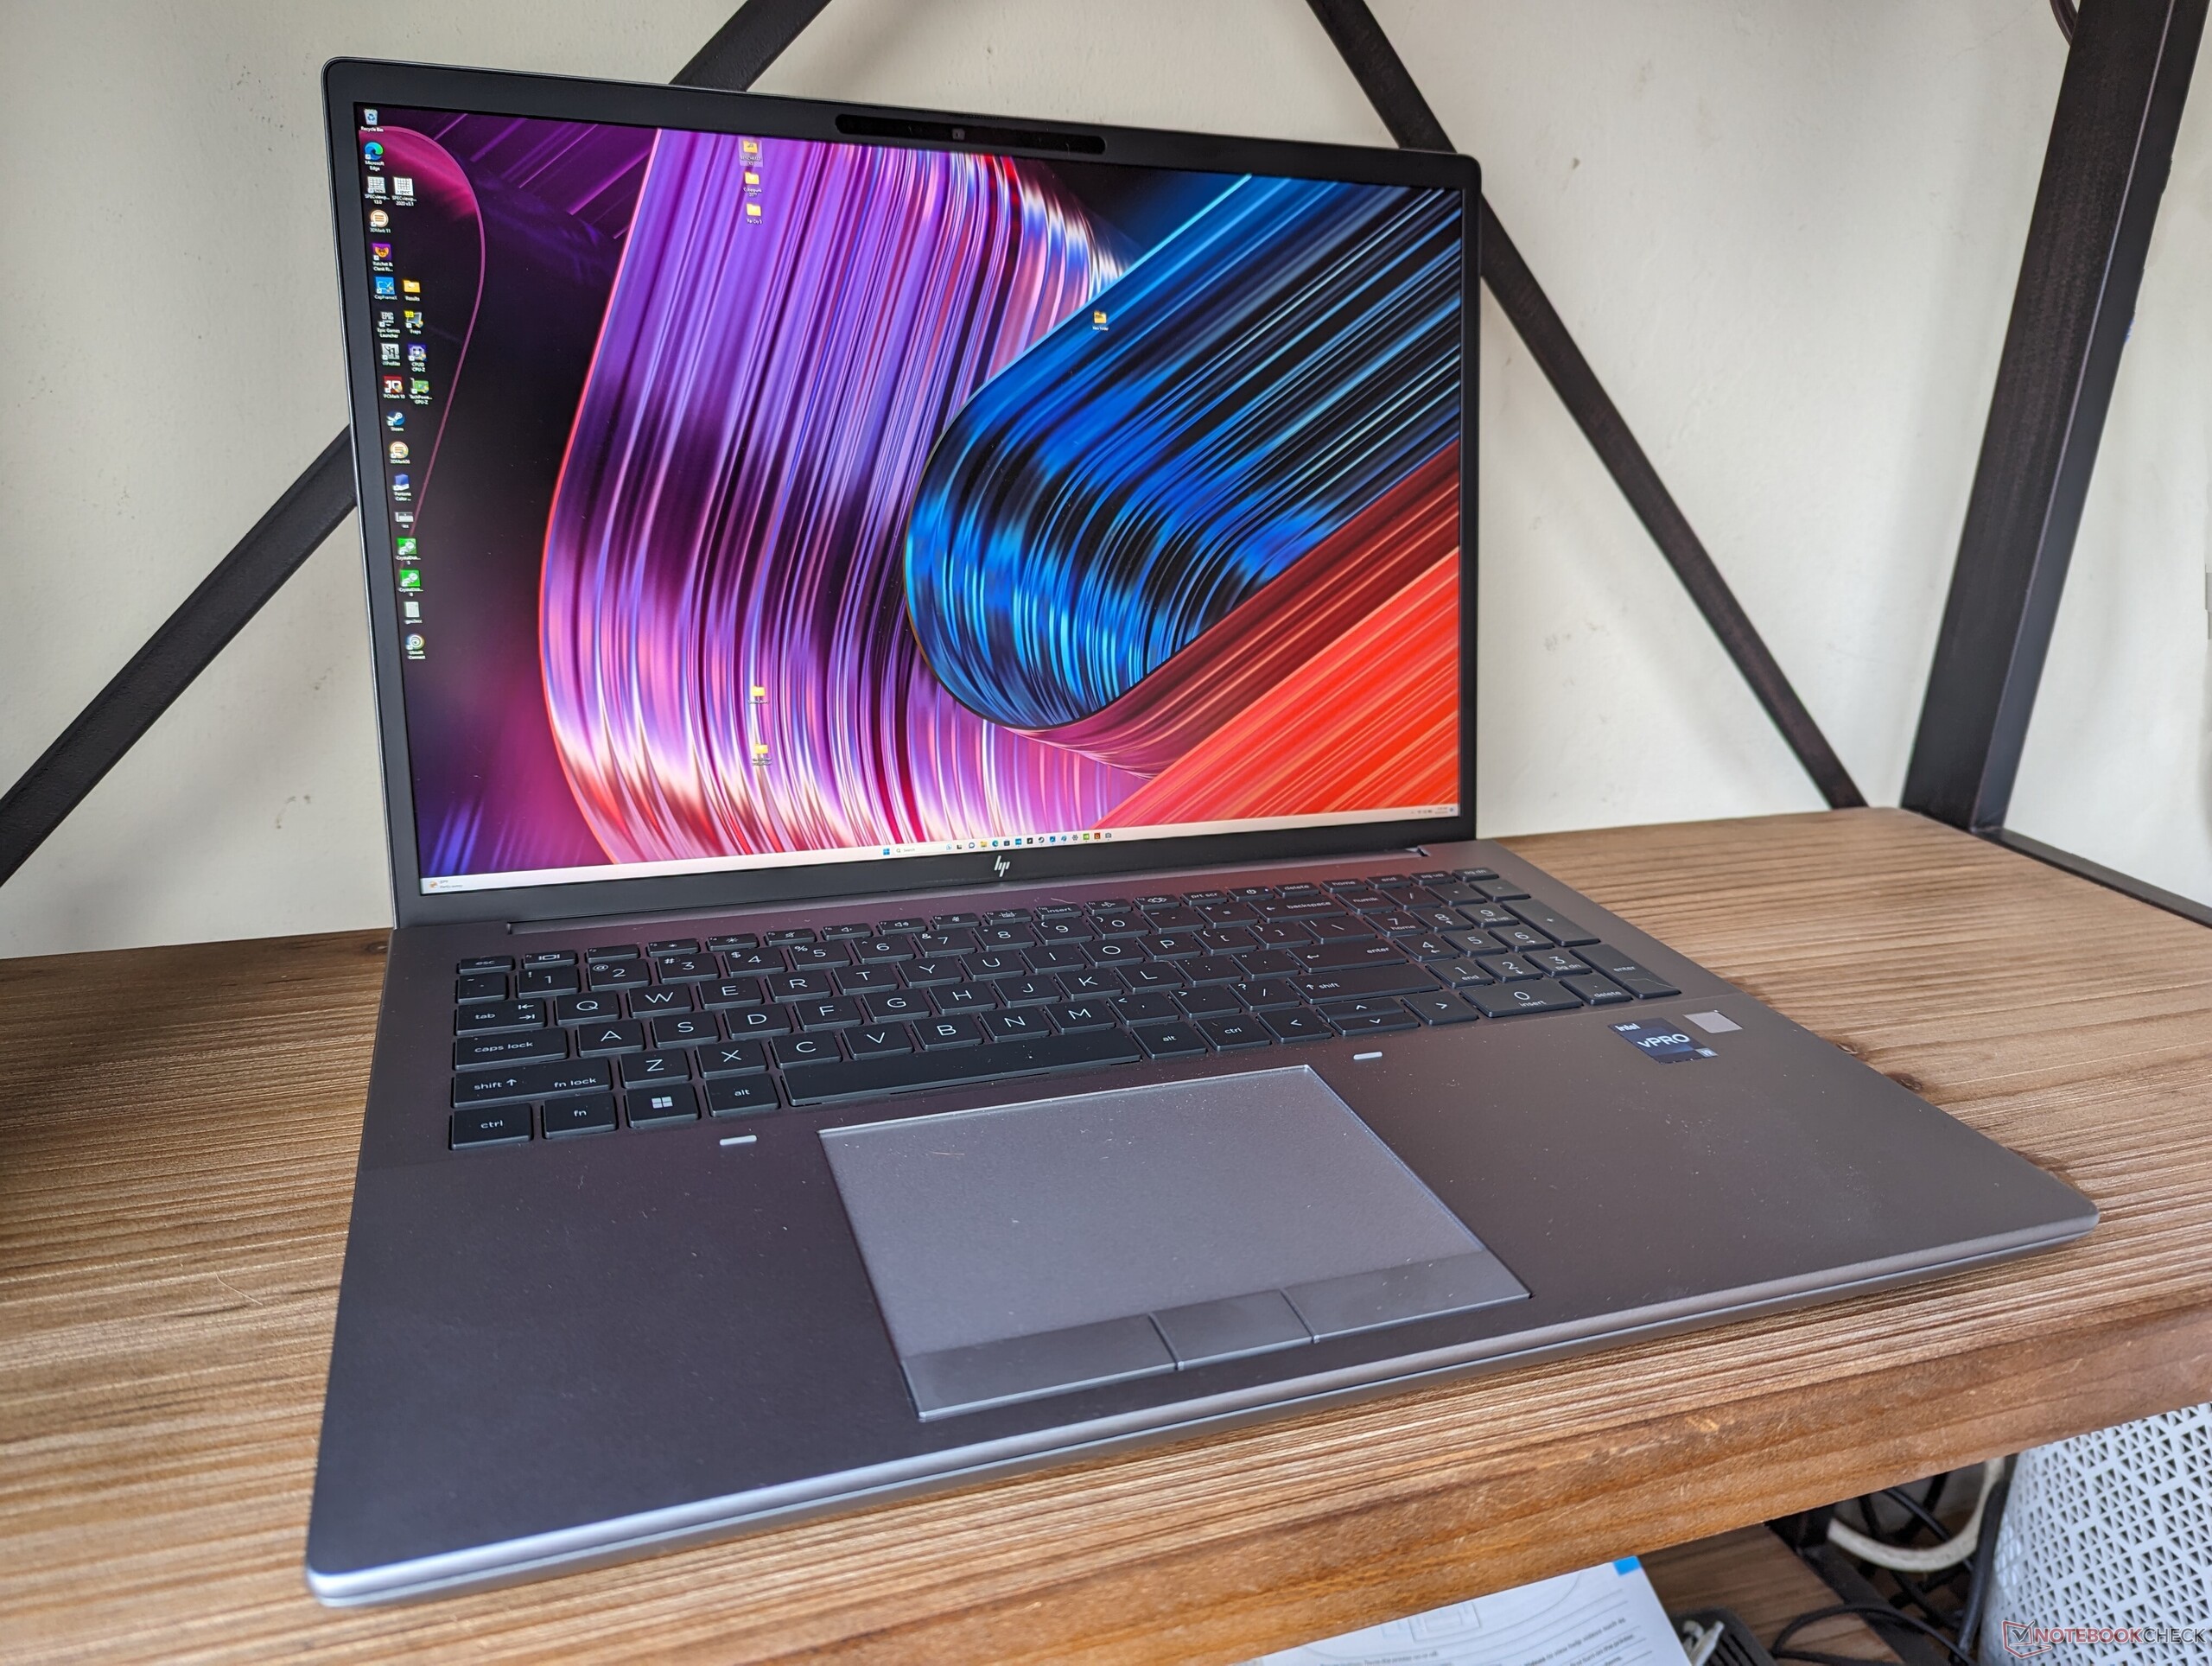
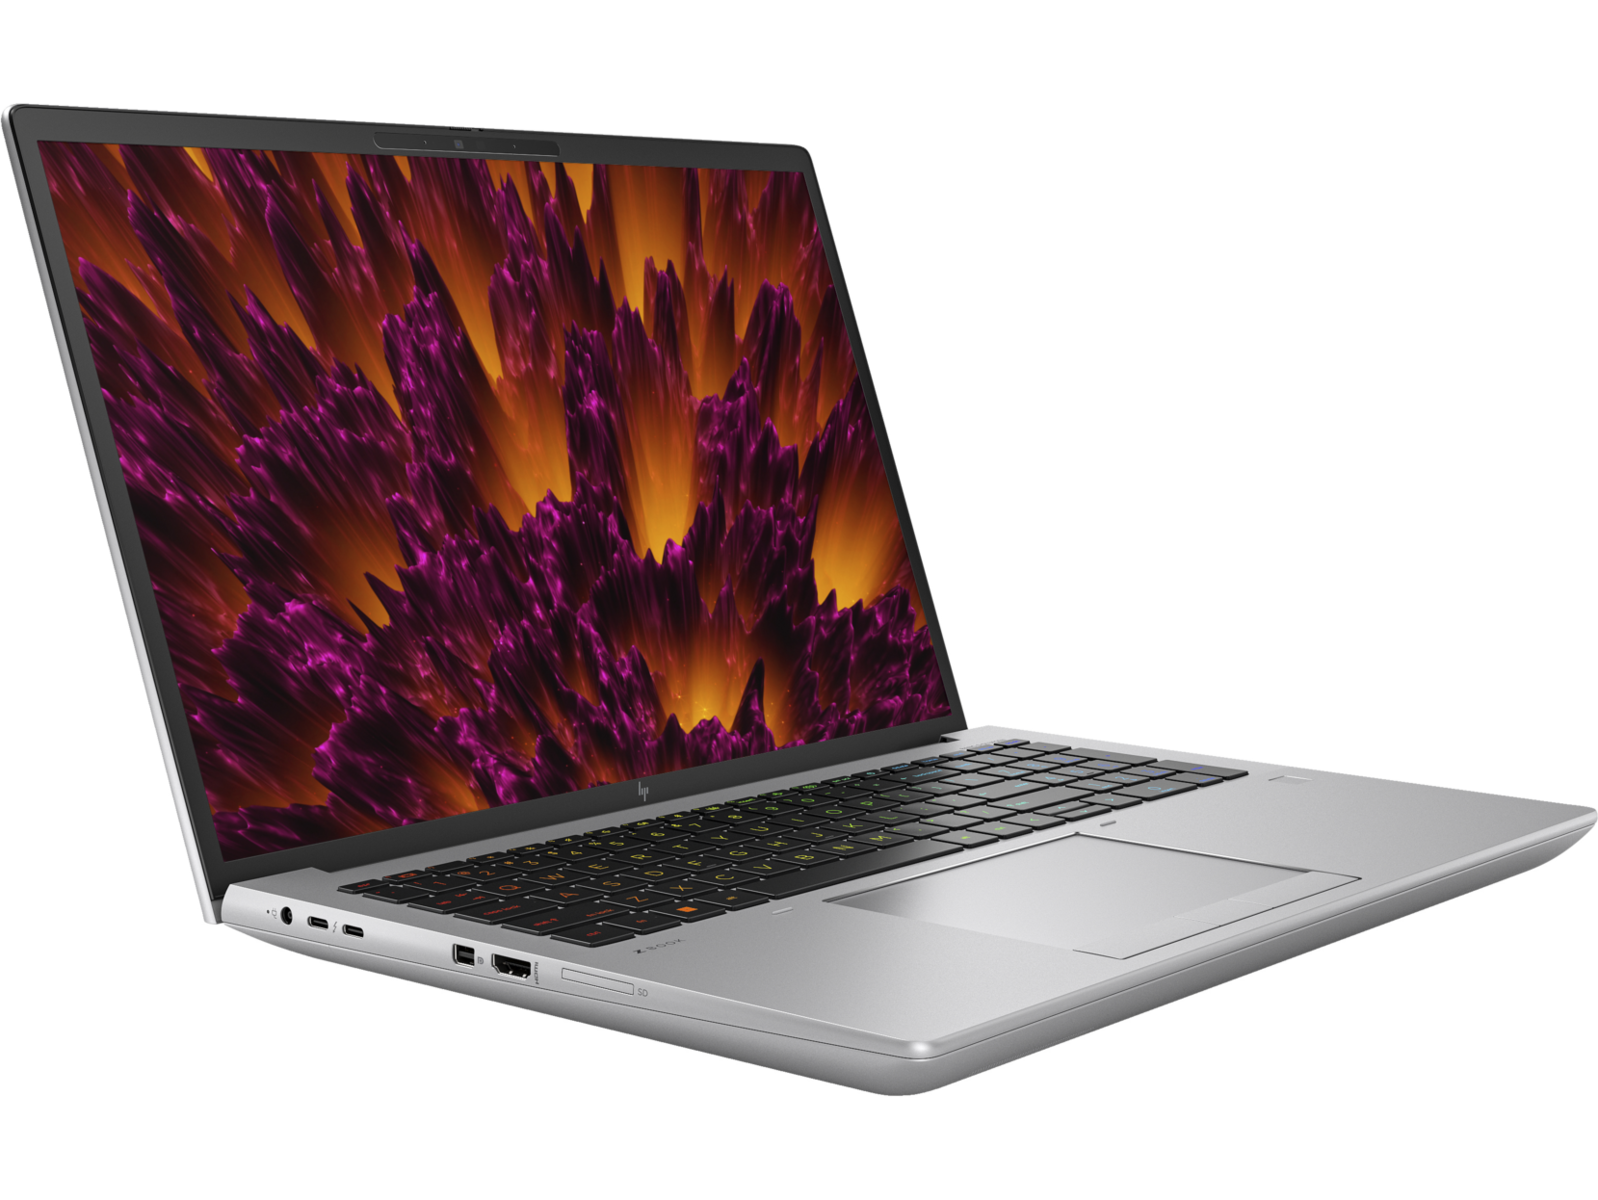
ZBook Fury 16 G10 jest bezpośrednim następcą zeszłorocznego ZBook Fury 16 G9 z nowymi opcjami procesora Raptor Lake-HX 13. generacji i karty graficznej Nvidia RTX Ada, które zastępują odpowiednio starsze procesory Alder Lake 12. generacji i RTX Ampere. Nowy model jest wizualnie identyczny z Fury 16 G9, więc zalecamy zapoznanie się z naszą recenzją zeszłorocznego modelu naszą recenzję zeszłorocznego modelu aby dowiedzieć się więcej o fizycznych cechach Fury 16 G10.
Nasza konkretna jednostka testowa to konfiguracja z wyższej półki z procesorem Core i9-13950HX, kartą graficzną Nvidia RTX 5000 Ada i wyświetlaczem IPS 2400p w cenie detalicznej około 5300 USD. Mniejsze konfiguracje są dostępne w niższych cenach początkowych, zgodnie z oficjalną listą specyfikacji HP https://www8.hp.com/h20195/v2/GetDocument.aspx?docname=c08558392.
Alternatywy dla Fury 16 G10 obejmują inne 16-calowe mobilne stacje robocze, takie jak Dell Precision 5680, Lenovo ThinkPad P16 G1,MSI CreatorPro Z16PlubAsus ProArt StudioBook 16.
Więcej recenzji HP:
Potencjalni konkurenci w porównaniu
Ocena | Data | Model | Waga | Wysokość | Rozmiar | Rezolucja | Cena |
|---|---|---|---|---|---|---|---|
| 92.3 % v7 (old) | 09/2023 | HP ZBook Fury 16 G10 i9-13950HX, RTX 5000 Ada Generation Laptop | 2.6 kg | 28.5 mm | 16.00" | 3840x2400 | |
| 91 % v7 (old) | 06/2023 | HP ZBook Fury 16 G9 i9-12950HX, RTX A5500 Laptop GPU | 2.6 kg | 28.5 mm | 16.00" | 3840x2400 | |
| 89 % v7 (old) | 08/2023 | Dell Precision 5000 5680 i9-13900H, RTX 5000 Ada Generation Laptop | 2.3 kg | 22.17 mm | 16.00" | 3840x2400 | |
| 91 % v7 (old) | 02/2023 | Lenovo ThinkPad P16 G1 RTX A5500 i9-12950HX, RTX A5500 Laptop GPU | 3 kg | 30.23 mm | 16.00" | 3840x2400 | |
| 84.3 % v7 (old) | 11/2022 | MSI CreatorPro Z16P B12UKST i7-12700H, RTX A3000 Laptop GPU | 2.4 kg | 19 mm | 16.00" | 2560x1600 | |
v (old) | Asus ProArt StudioBook 16 W7600H5A-2BL2 W-11955M, RTX A5000 Laptop GPU | 2.4 kg | 21.4 mm | 16.00" | 3840x2400 |
Obudowa - znana konstrukcja ZBook Fury 16 G9
Czytnik kart SD
| SD Card Reader | |
| average JPG Copy Test (av. of 3 runs) | |
| Dell Precision 5000 5680 (Toshiba Exceria Pro SDXC 64 GB UHS-II) | |
| MSI CreatorPro Z16P B12UKST (AV Pro V60) | |
| HP ZBook Fury 16 G10 (Toshiba Exceria Pro SDXC 64 GB UHS-II) | |
| HP ZBook Fury 16 G9 (PNY EliteX-PRO60) | |
| Lenovo ThinkPad P16 G1 RTX A5500 (Toshiba Exceria Pro SDXC 64 GB UHS-II) | |
| Asus ProArt StudioBook 16 W7600H5A-2BL2 (AV Pro SD microSD 128 GB V60) | |
| maximum AS SSD Seq Read Test (1GB) | |
| Dell Precision 5000 5680 (Toshiba Exceria Pro SDXC 64 GB UHS-II) | |
| HP ZBook Fury 16 G10 (Toshiba Exceria Pro SDXC 64 GB UHS-II) | |
| Asus ProArt StudioBook 16 W7600H5A-2BL2 (AV Pro SD microSD 128 GB V60) | |
| HP ZBook Fury 16 G9 (PNY EliteX-PRO60) | |
| MSI CreatorPro Z16P B12UKST (AV Pro V60) | |
| Lenovo ThinkPad P16 G1 RTX A5500 (Toshiba Exceria Pro SDXC 64 GB UHS-II) | |
Komunikacja
| Networking | |
| iperf3 transmit AX12 | |
| Asus ProArt StudioBook 16 W7600H5A-2BL2 | |
| iperf3 receive AX12 | |
| Asus ProArt StudioBook 16 W7600H5A-2BL2 | |
| iperf3 transmit AXE11000 | |
| HP ZBook Fury 16 G10 | |
| Lenovo ThinkPad P16 G1 RTX A5500 | |
| Dell Precision 5000 5680 | |
| HP ZBook Fury 16 G9 | |
| iperf3 receive AXE11000 | |
| HP ZBook Fury 16 G9 | |
| HP ZBook Fury 16 G10 | |
| Lenovo ThinkPad P16 G1 RTX A5500 | |
| Dell Precision 5000 5680 | |
| iperf3 transmit AXE11000 6GHz | |
| MSI CreatorPro Z16P B12UKST | |
| Lenovo ThinkPad P16 G1 RTX A5500 | |
| HP ZBook Fury 16 G10 | |
| Dell Precision 5000 5680 | |
| iperf3 receive AXE11000 6GHz | |
| MSI CreatorPro Z16P B12UKST | |
| HP ZBook Fury 16 G10 | |
| Lenovo ThinkPad P16 G1 RTX A5500 | |
| Dell Precision 5000 5680 | |
Kamera internetowa
Laptopy HP nadal mają jedne z kamer internetowych o najwyższej rozdzielczości na rynku. Czujnik 5 MP w Fury 16 G10 oferuje znacznie czystszy obraz niż kamera internetowa 2 MP w Precision 5680.


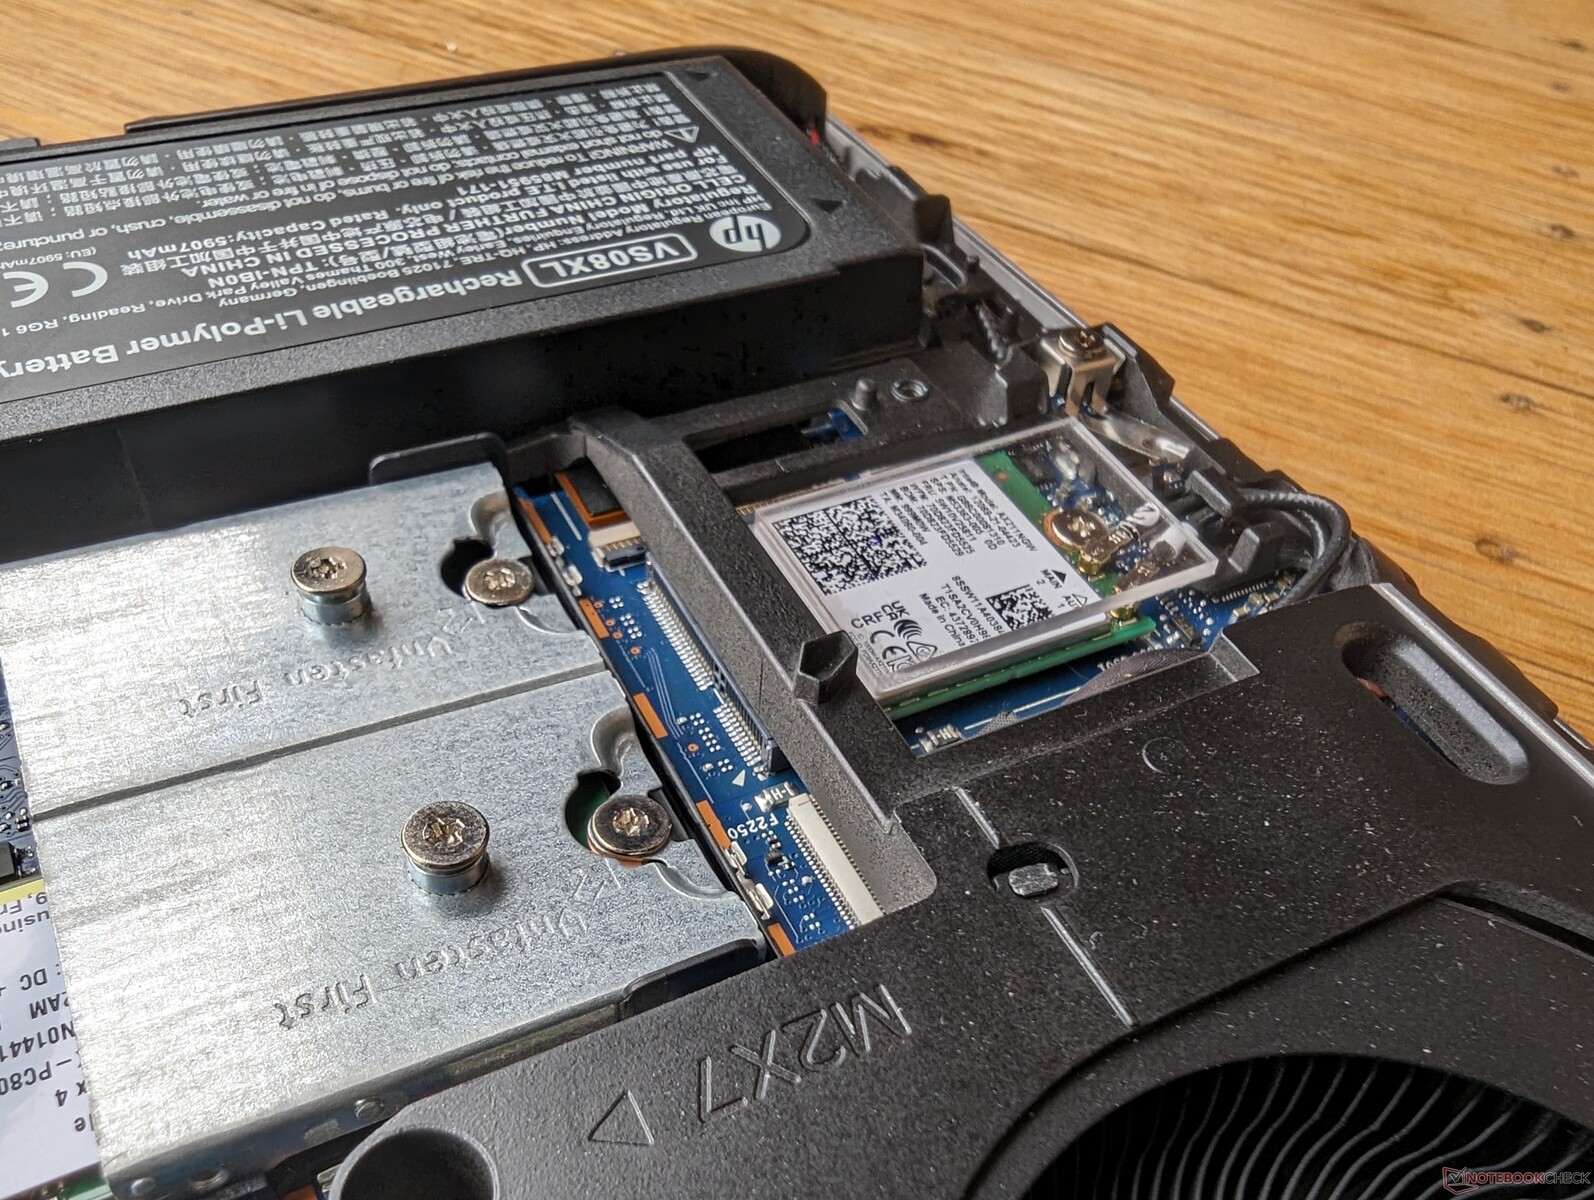
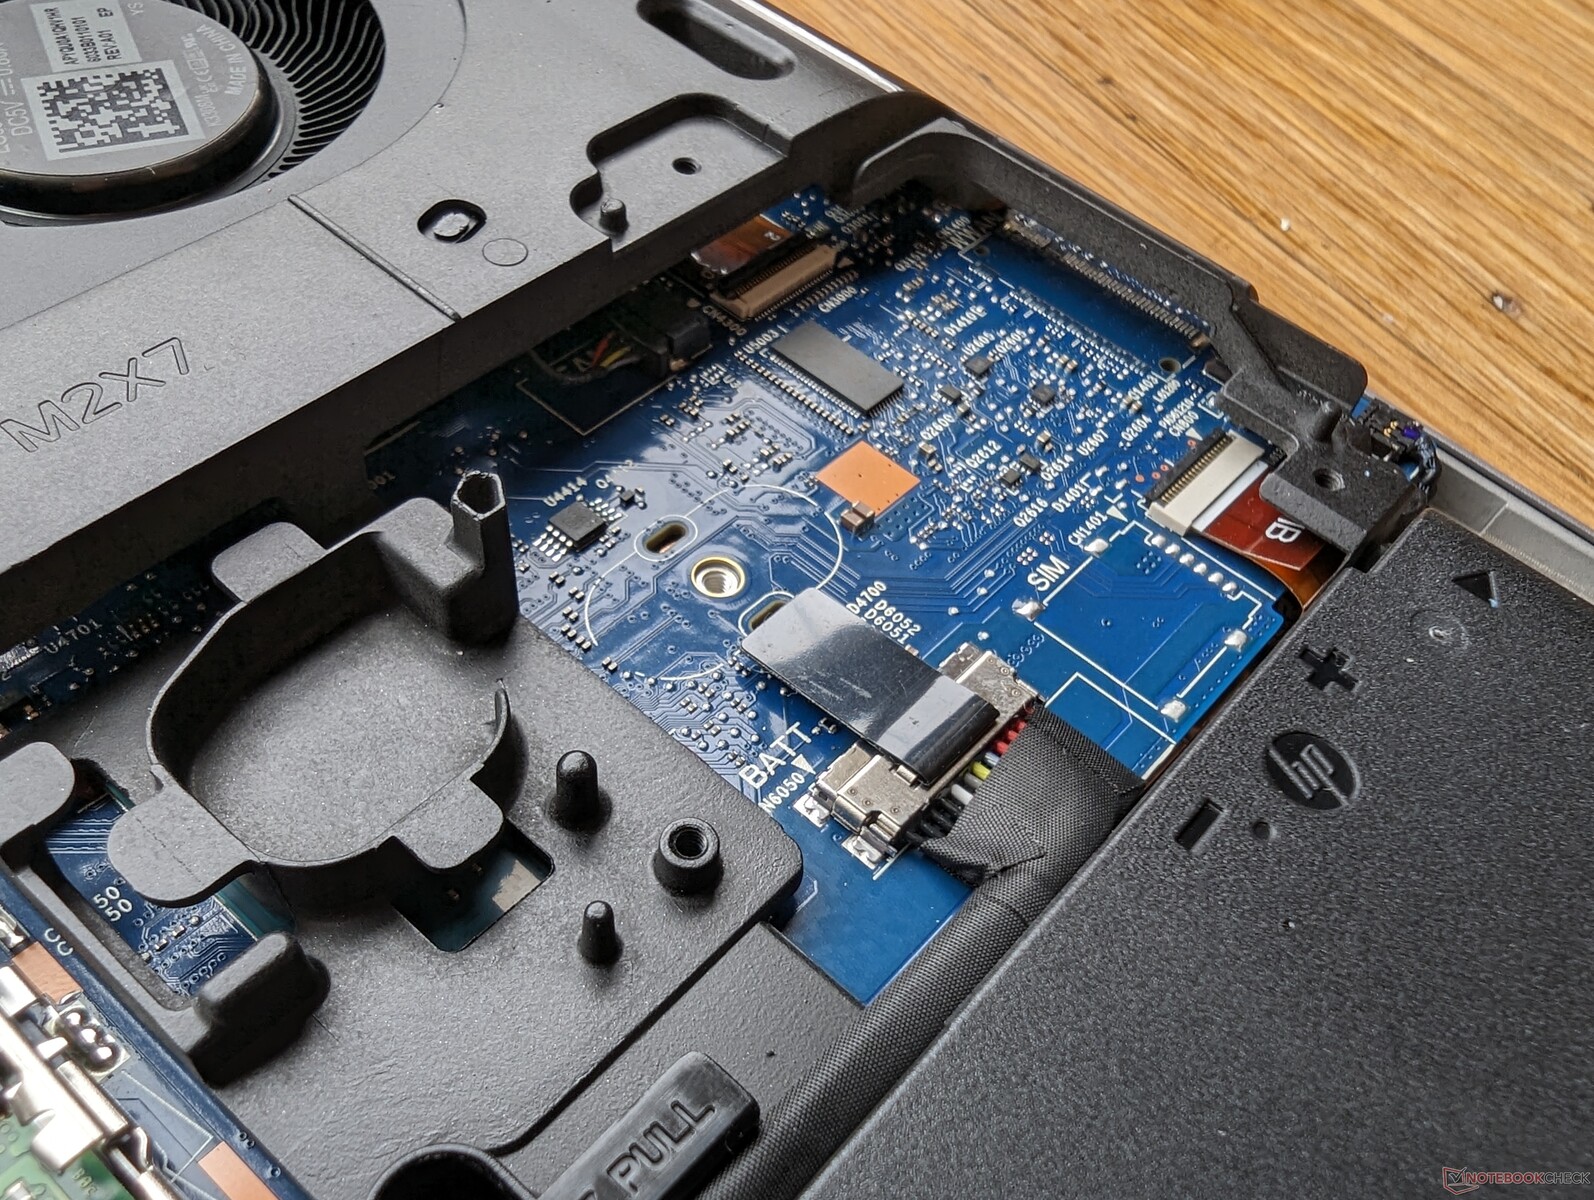
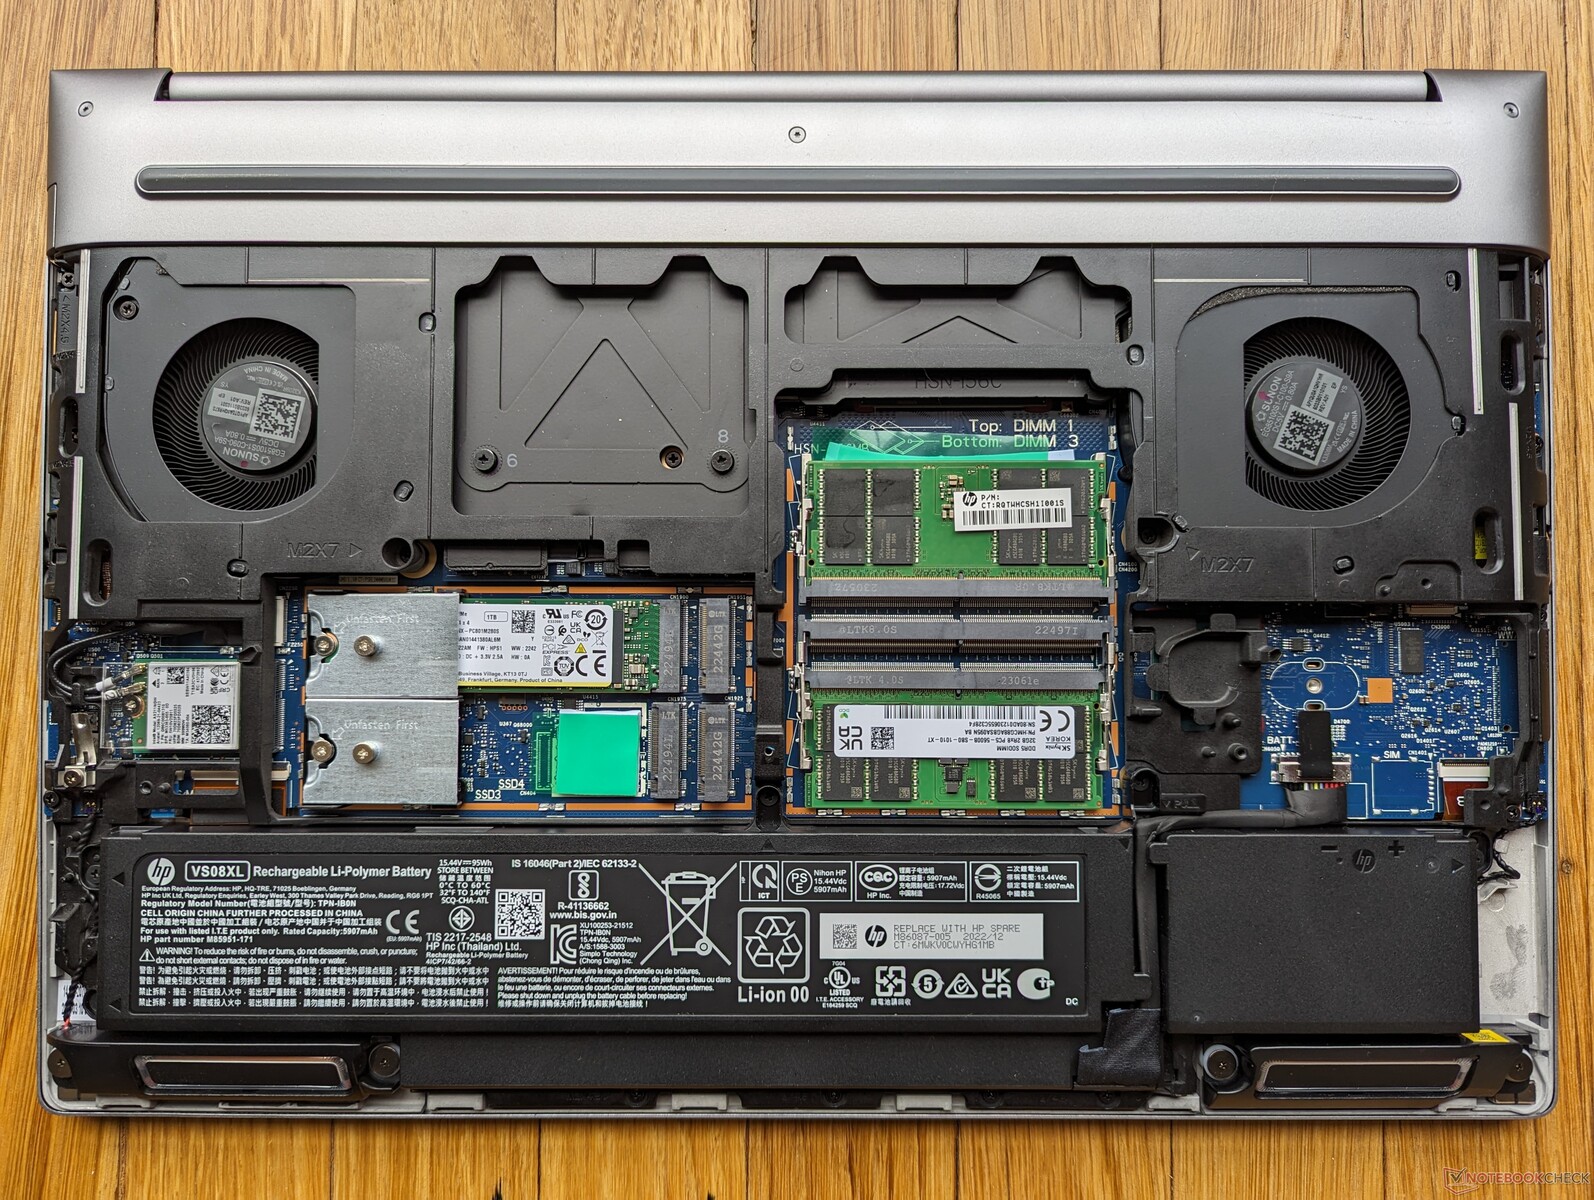
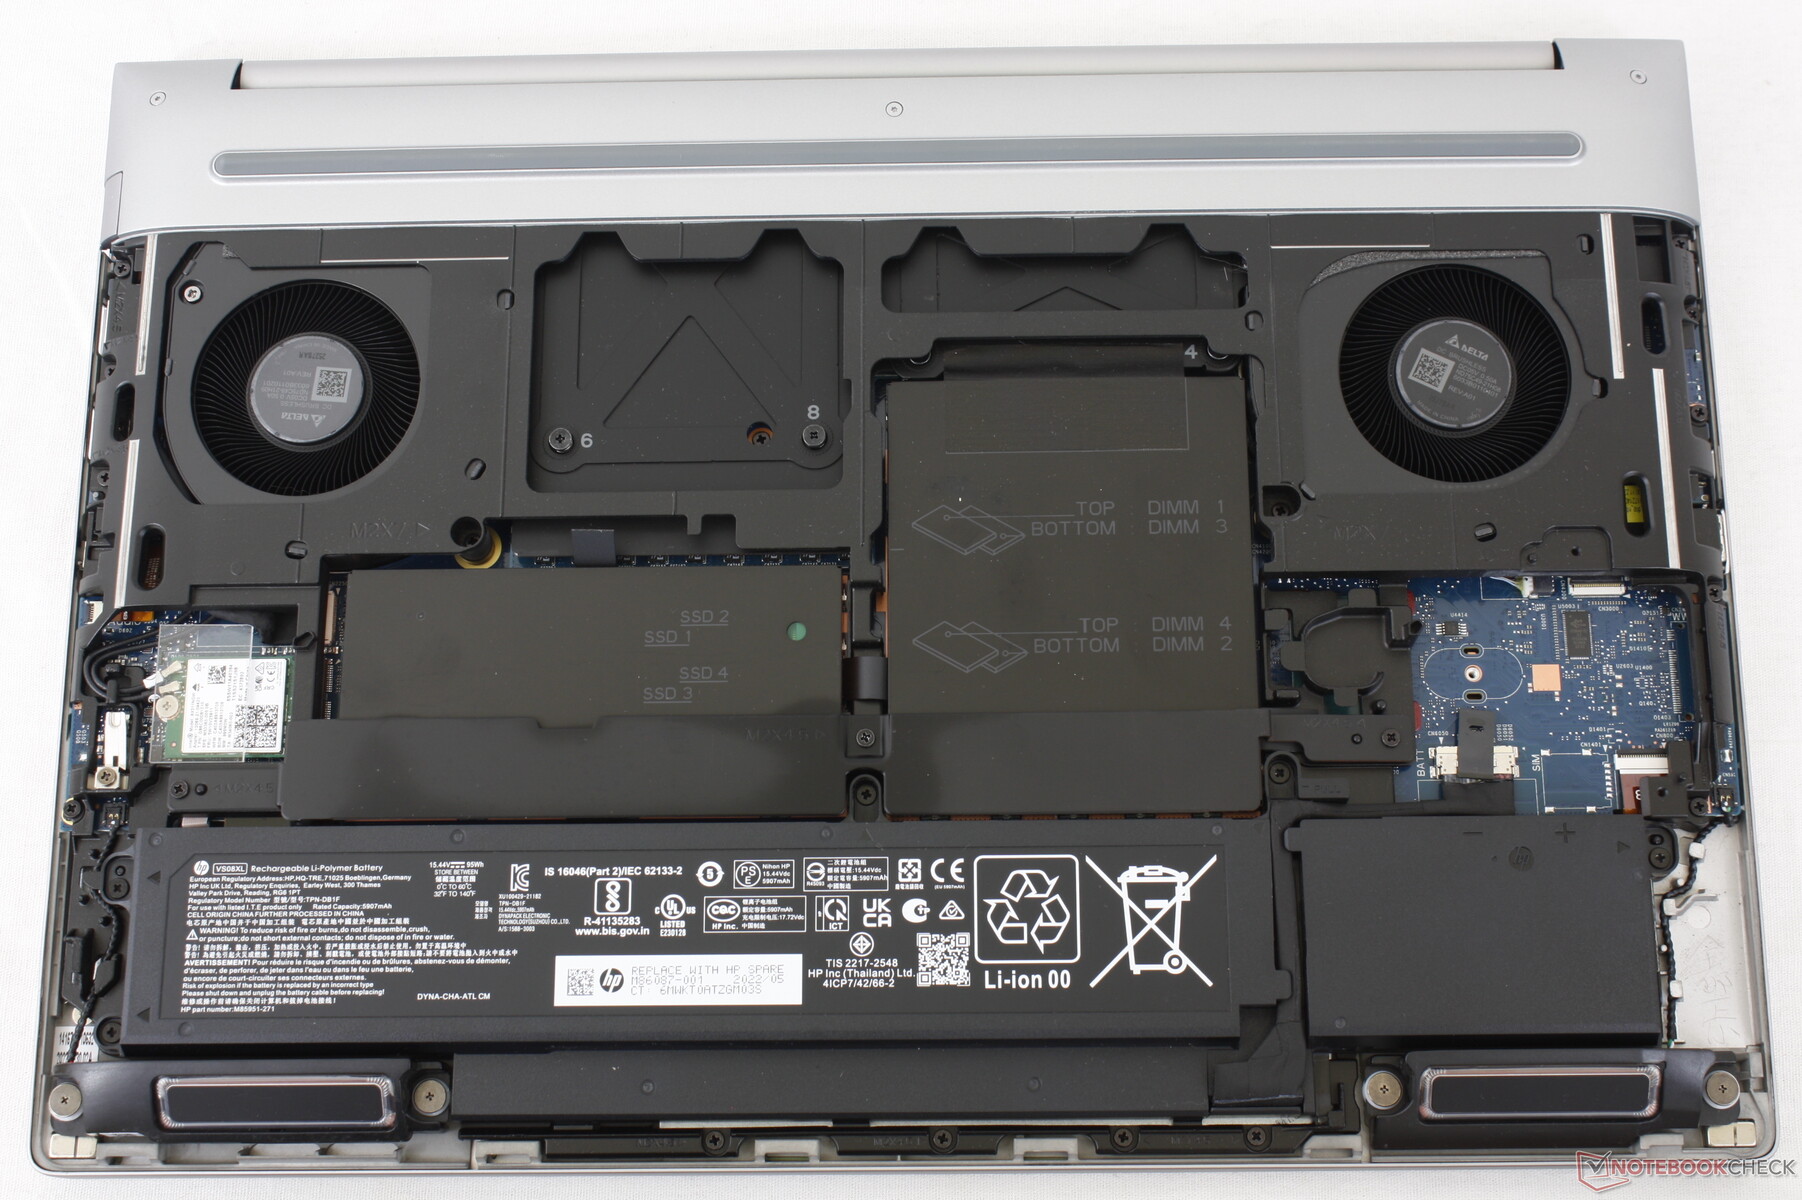
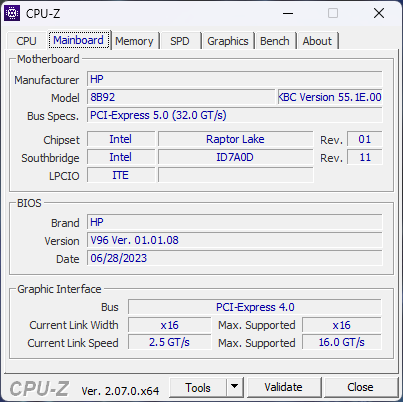
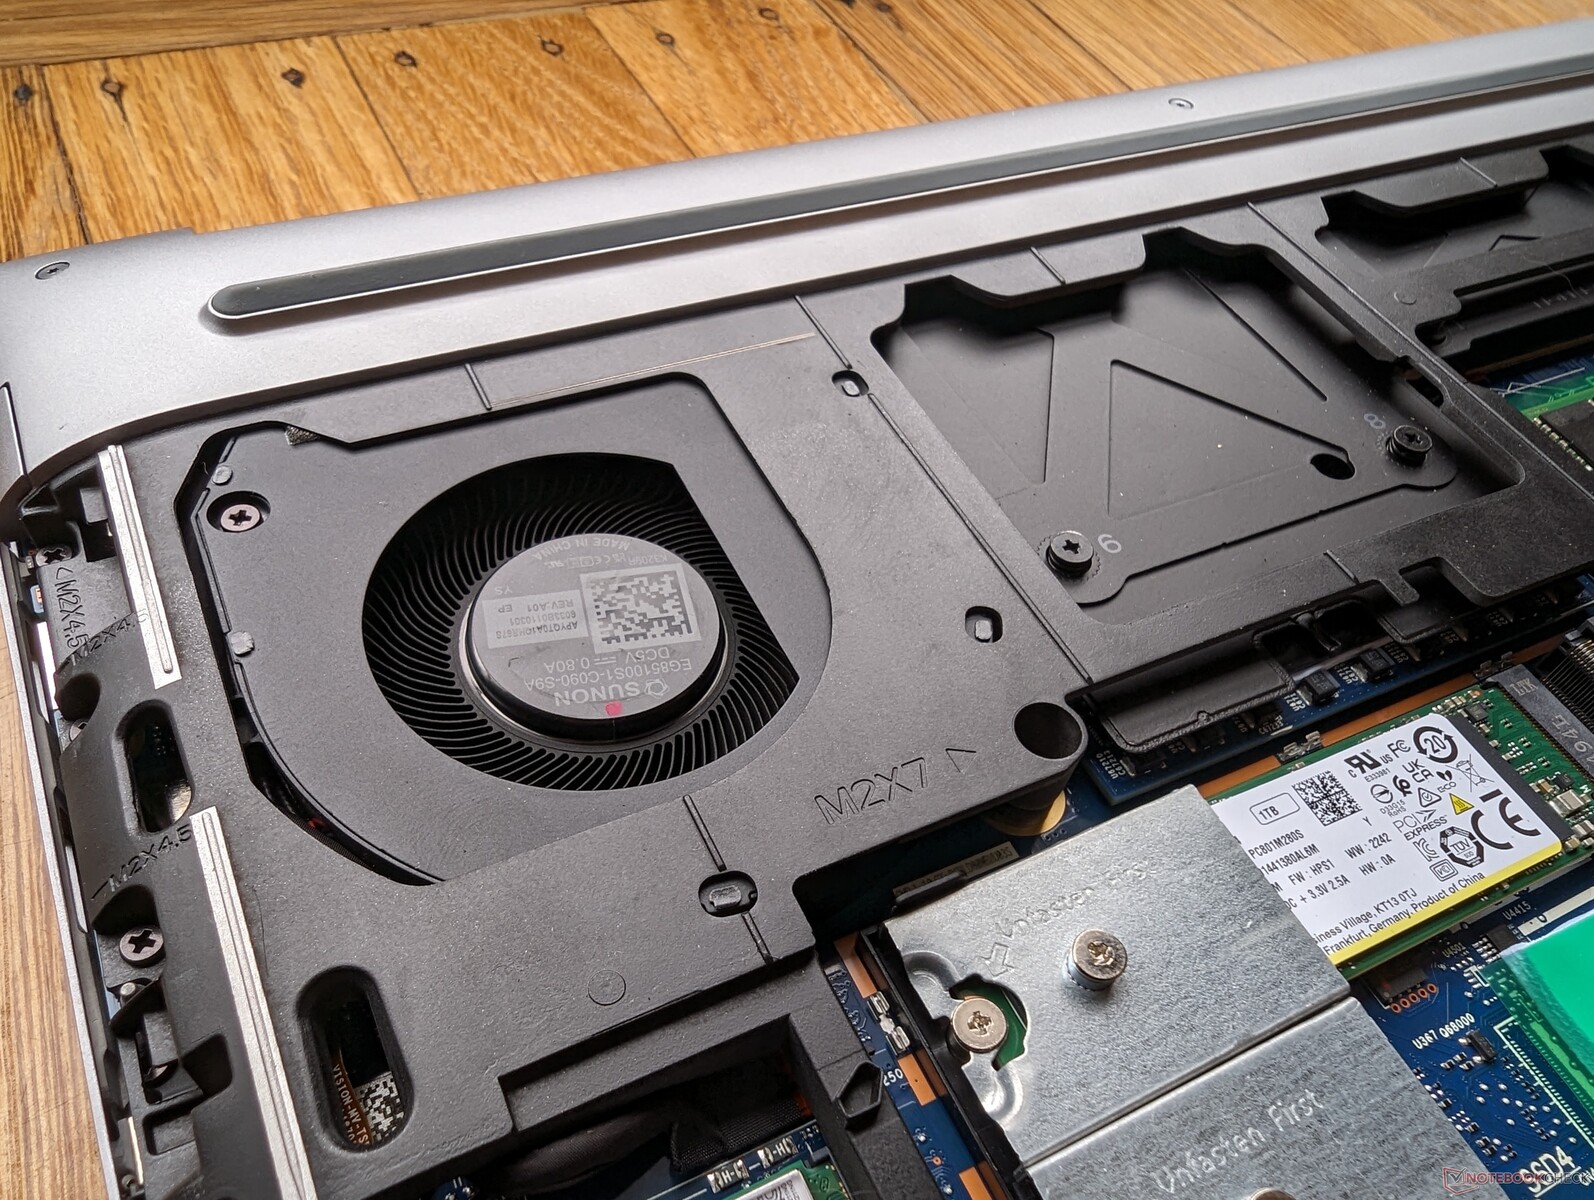
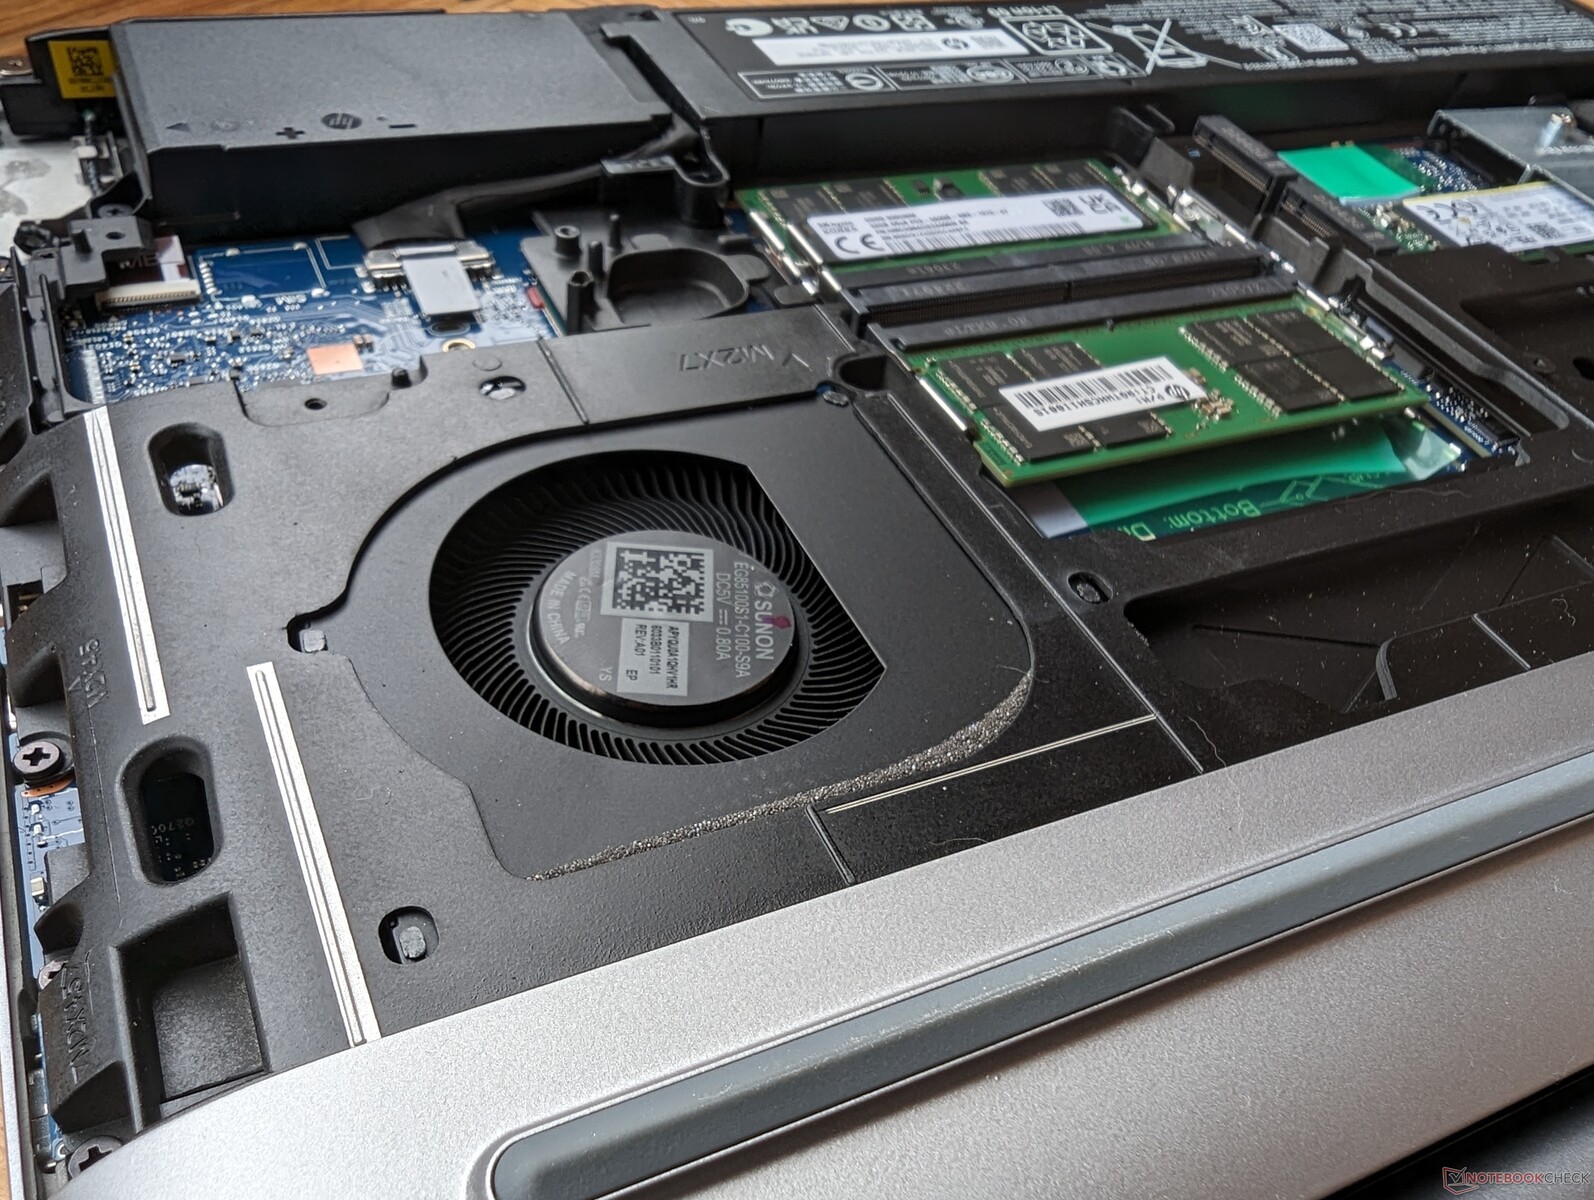
Konserwacja
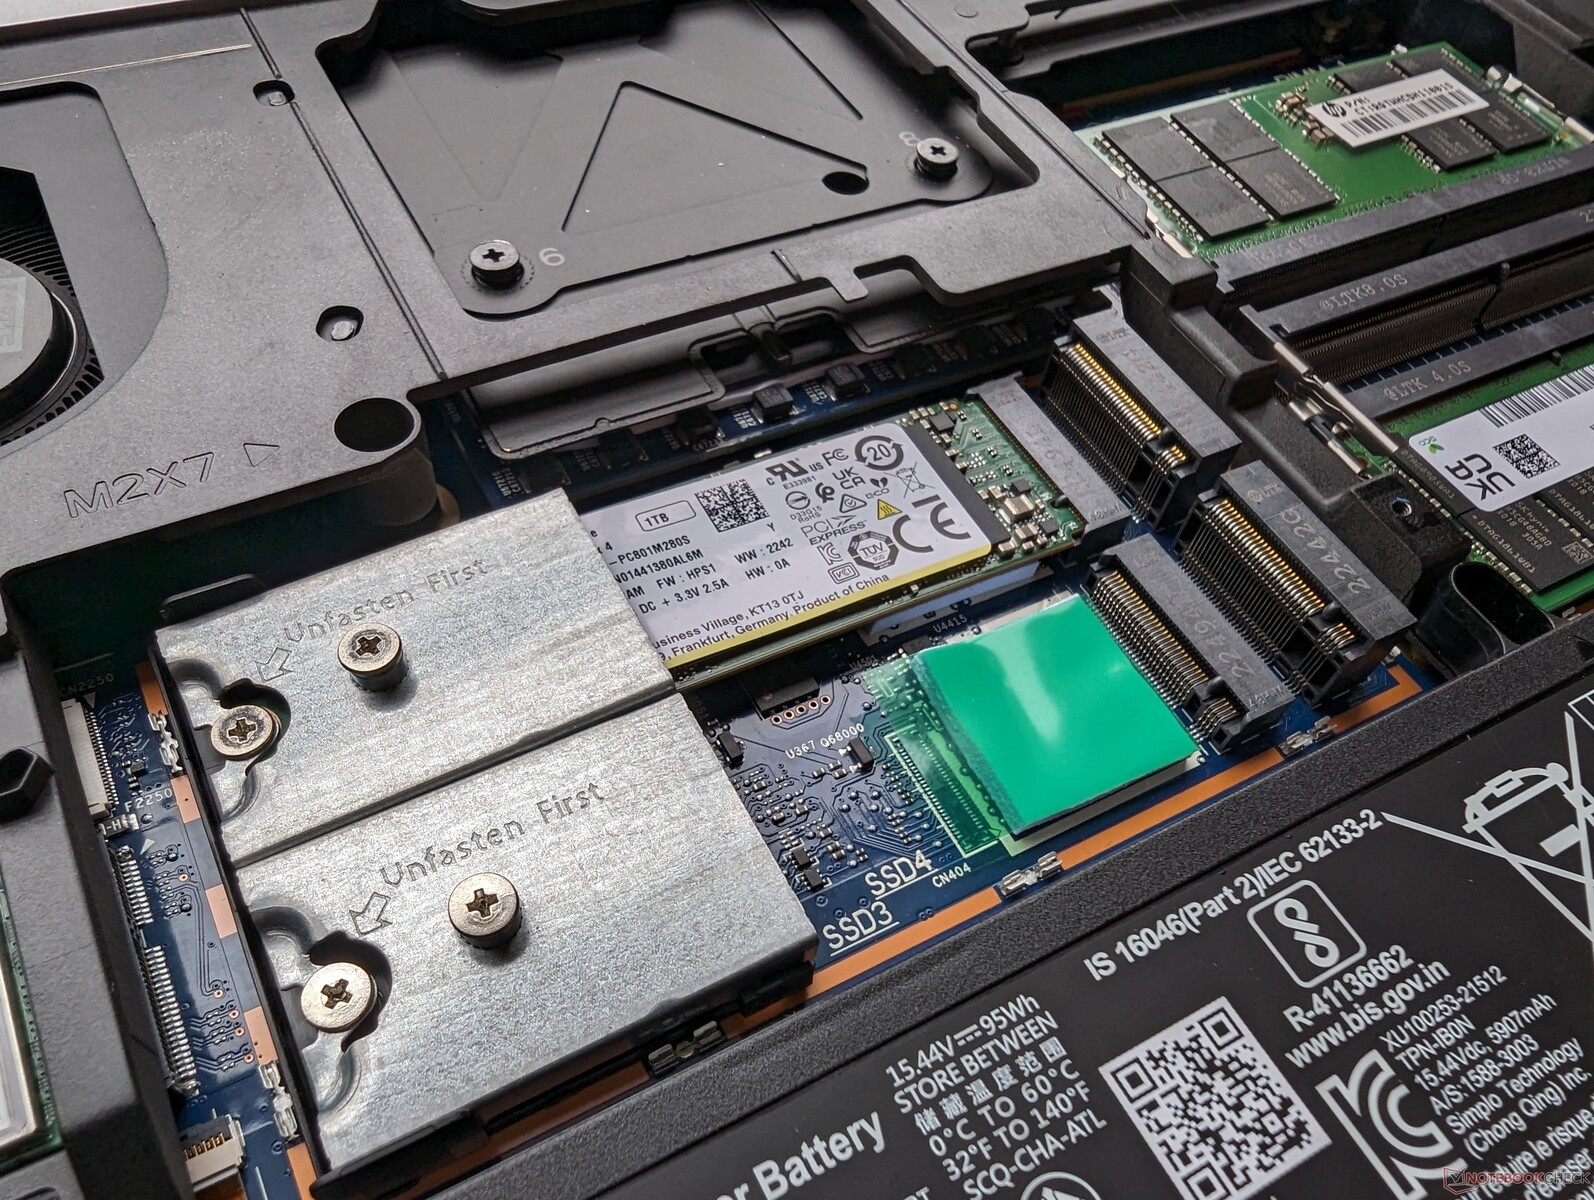
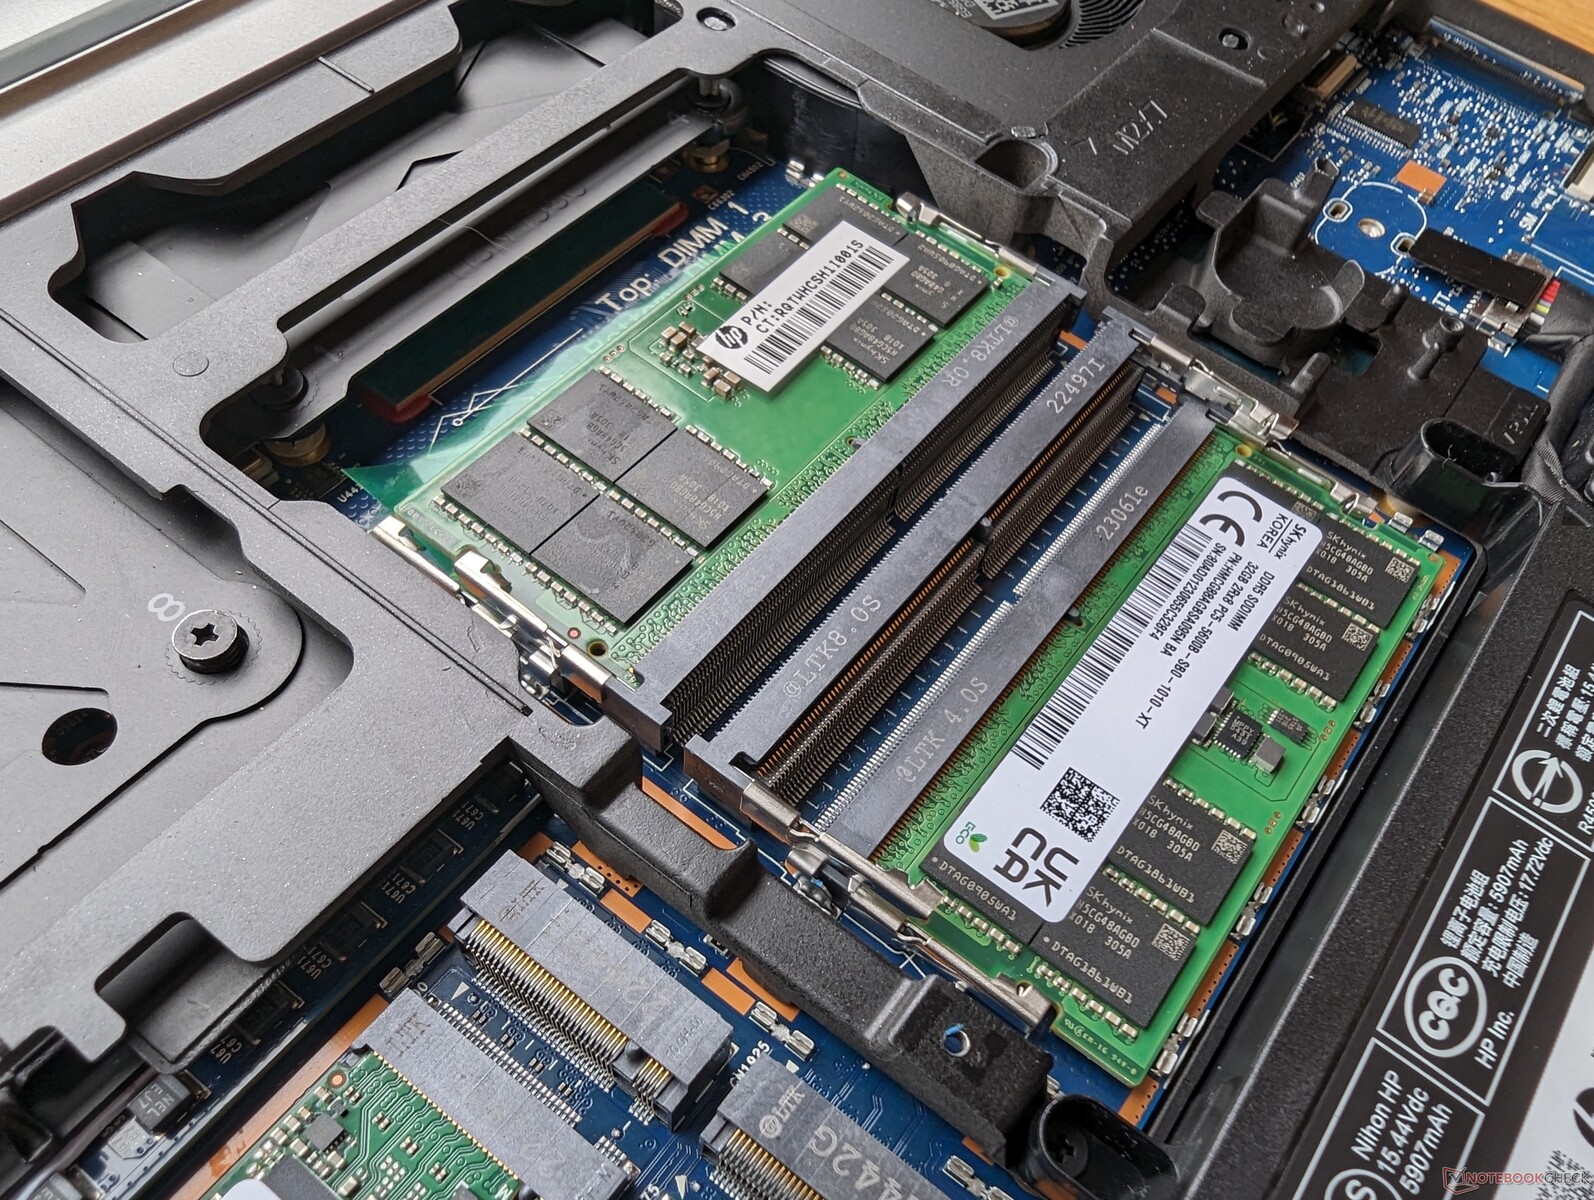
Serwisowanie jest "beznarzędziowe" w tym sensie, że dolny panel można zdjąć bez użycia narzędzi. Jednak po wejściu do środka, śrubokręt będzie wymagany do usunięcia metalowej płytki chroniącej cztery dyski SSD i cztery moduły pamięci RAM. W związku z tym nadal będziesz potrzebował śrubokręta do jakichkolwiek znaczących aktualizacji.
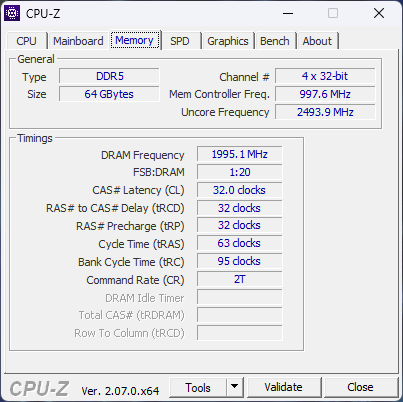
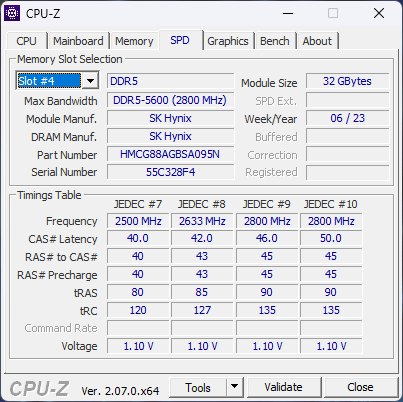
Obsługiwane jest do 128 GB pamięci RAM, aczkolwiek tylko do 4000 MT/s.
Akcesoria i gwarancja
W pudełku nie ma żadnych dodatków poza zasilaczem sieciowym i dokumentacją. HP oferuje trzyletnią ograniczoną gwarancję w standardzie.
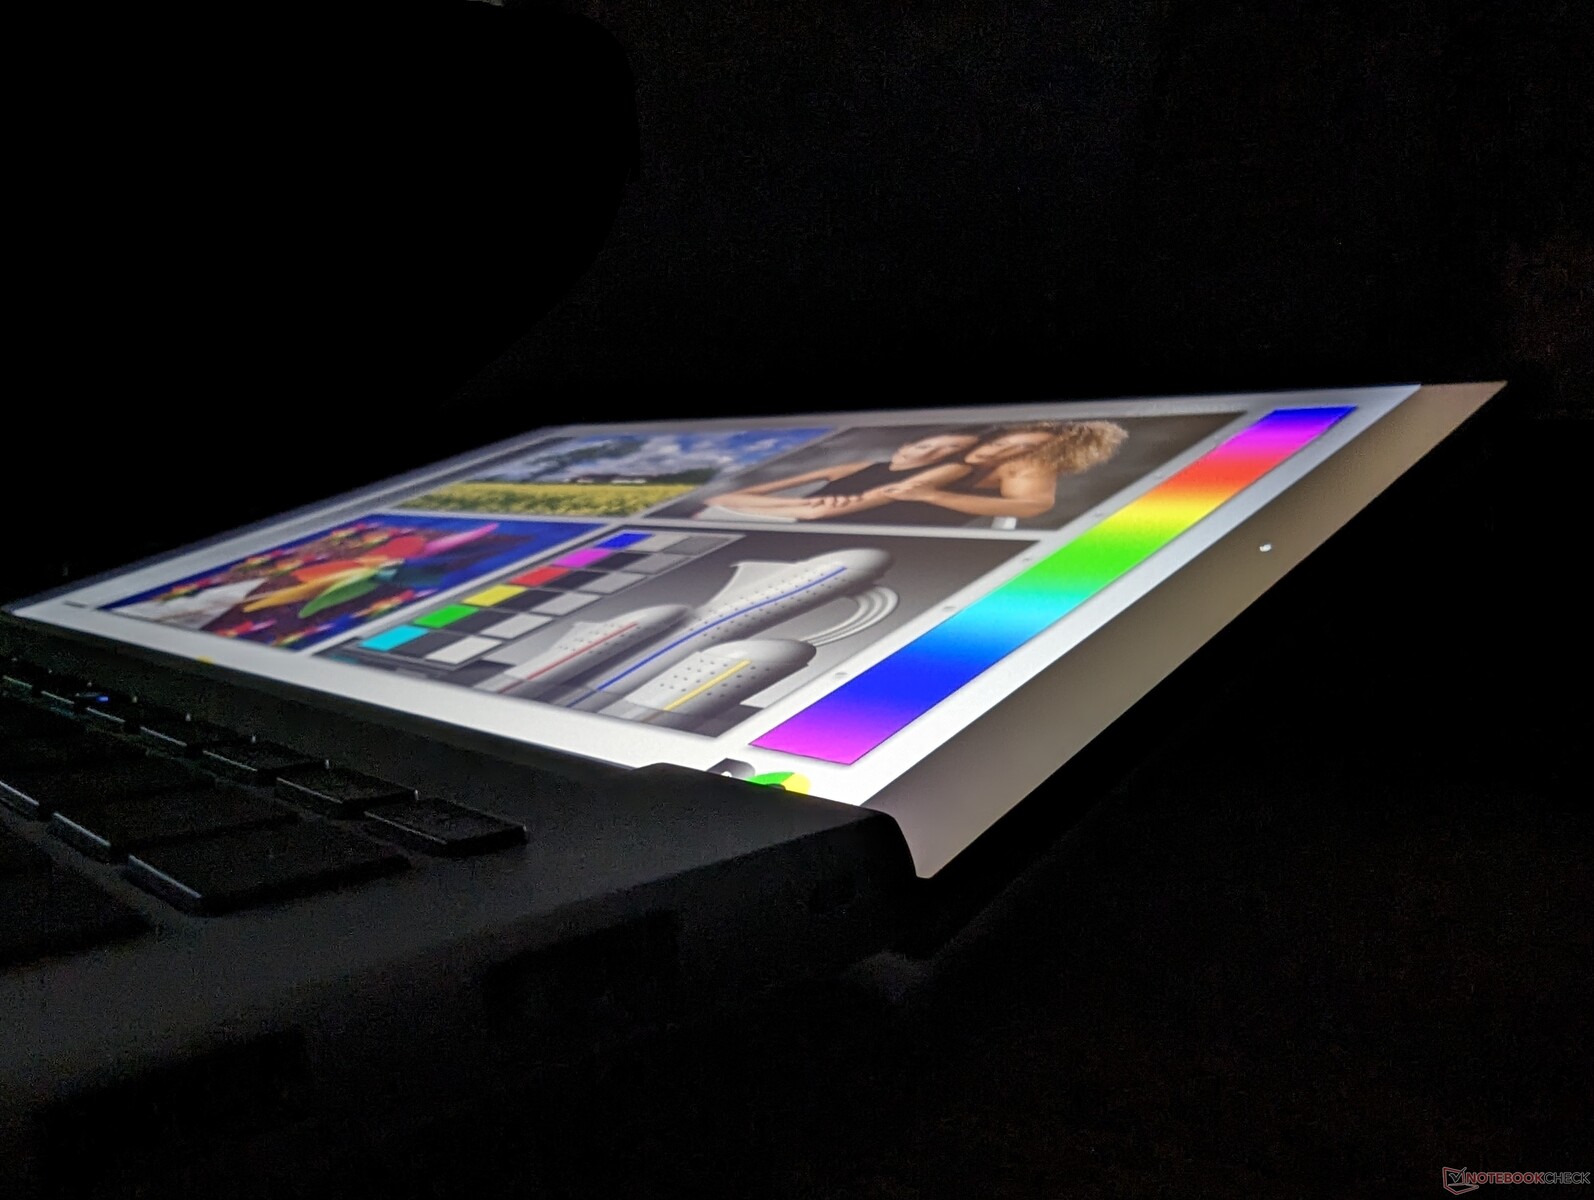
Wyświetlacz
Poniższe trzy opcje wyświetlania eDP+PSR (Panel Self Refresh) są dostępne dla 16-calowego Fury 16 G10. Nasza konkretna recenzja została skonfigurowana z pogrubioną opcją:
- 3840 x 2400, 60 Hz, OLED, ekran dotykowy, 400 nitów, 100% DCI-P3, błyszczący
- 3840 x 2400, 120 Hz, IPS, bezdotykowy, 500 nitów, 100% DCI-P3, matowy
- 1920 x 1200, 60 Hz, IPS, bezdotykowy, 1000 nitów, 100% sRGB, matowy
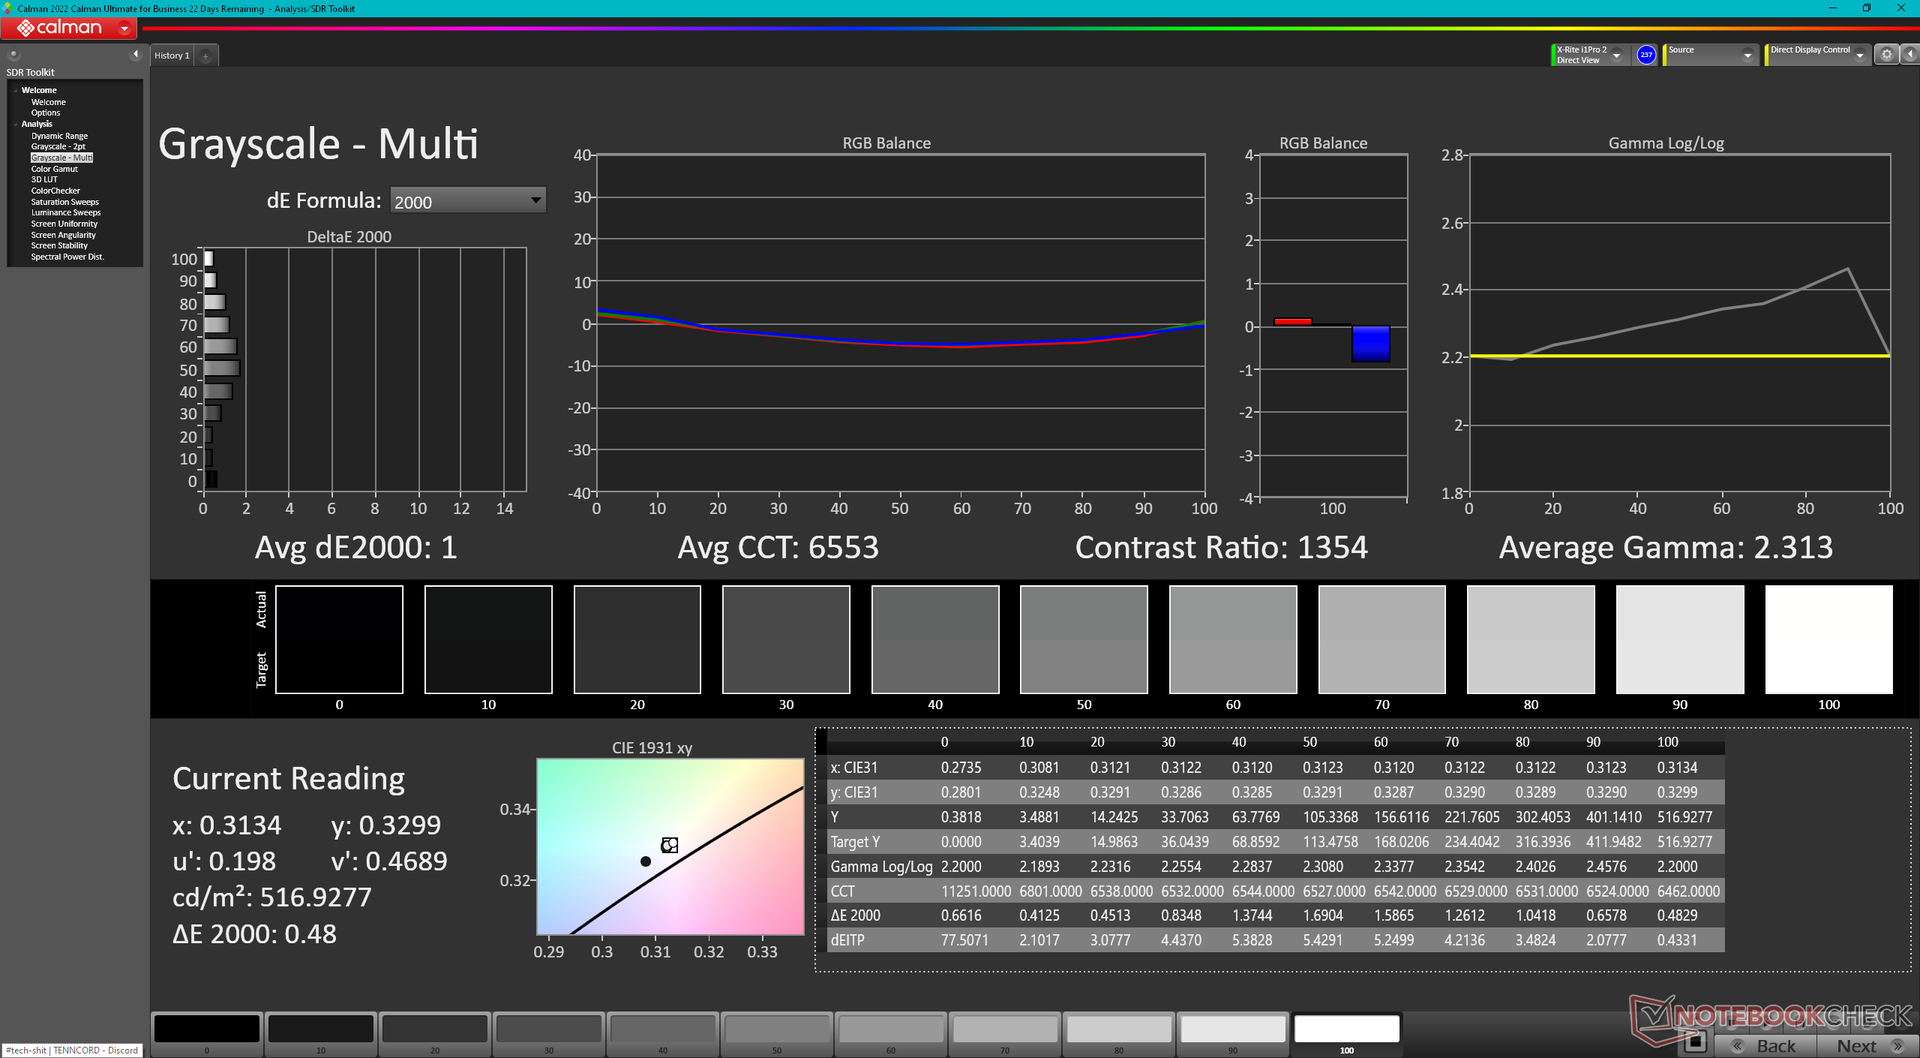
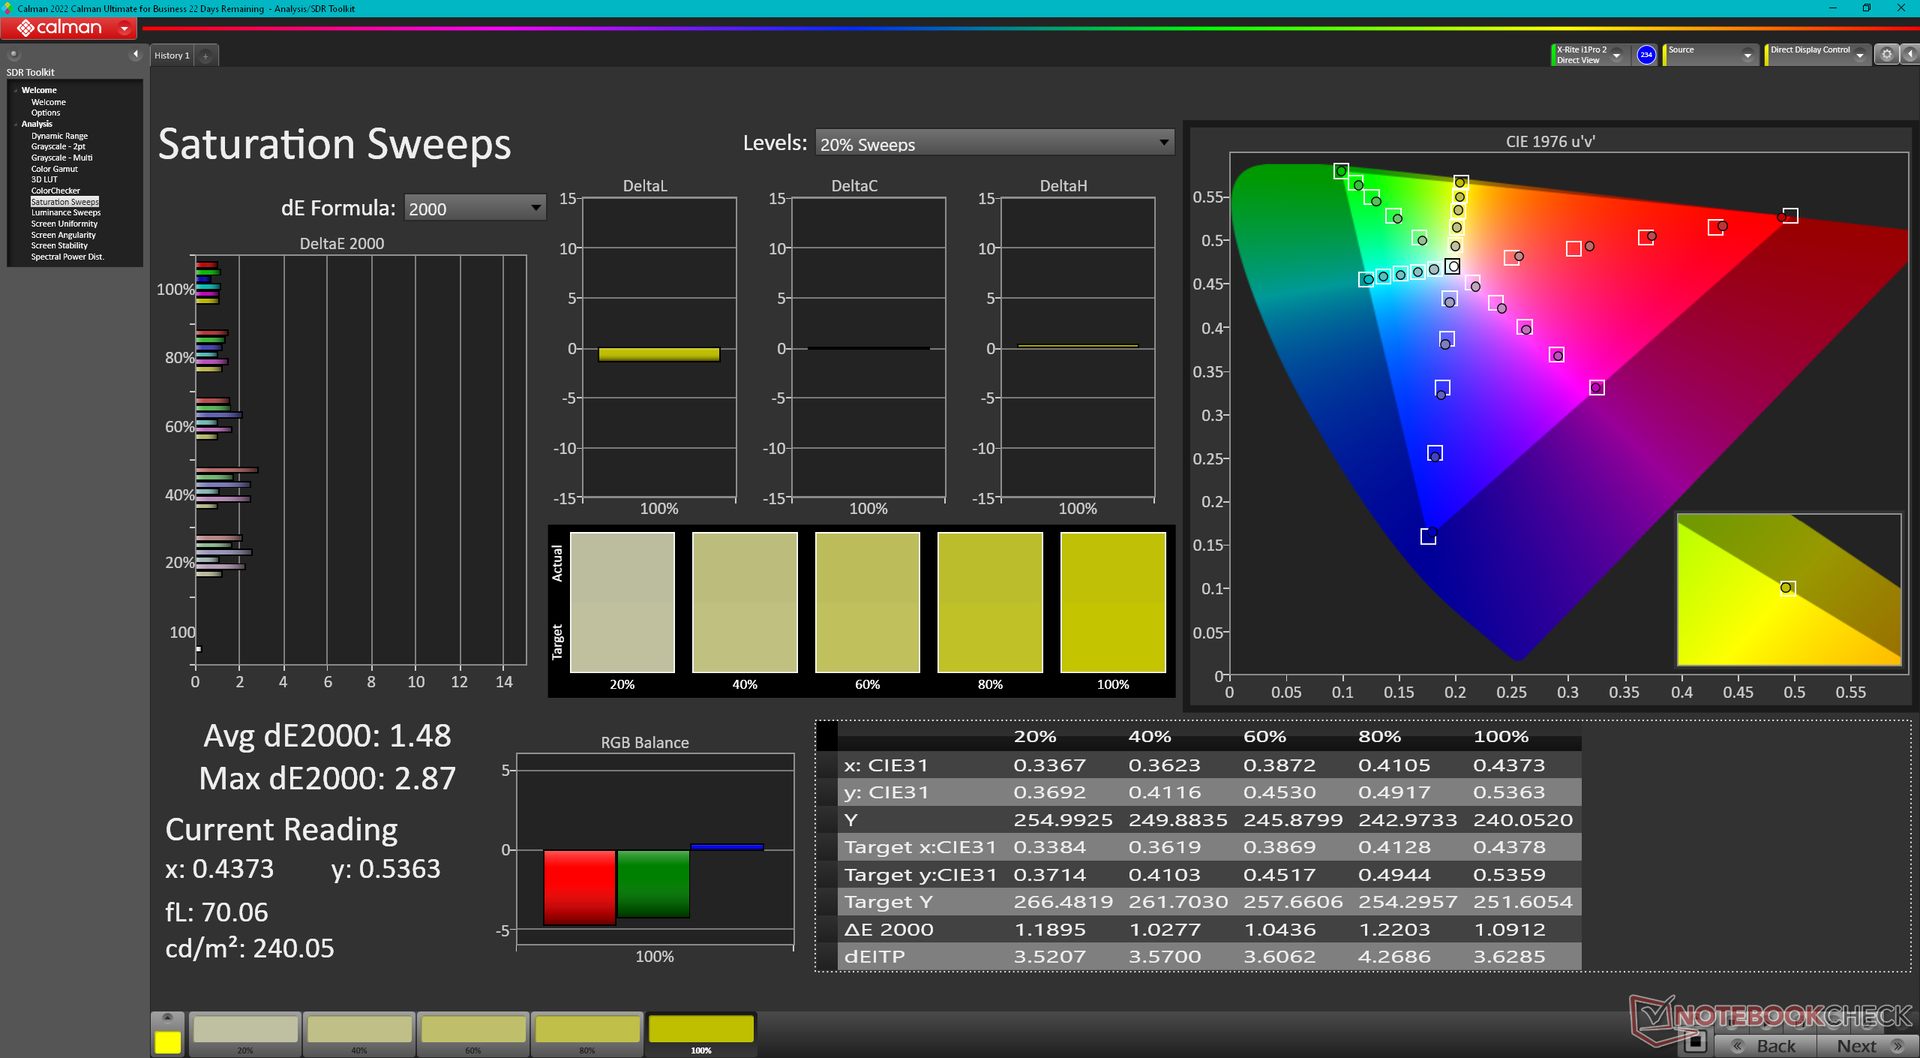
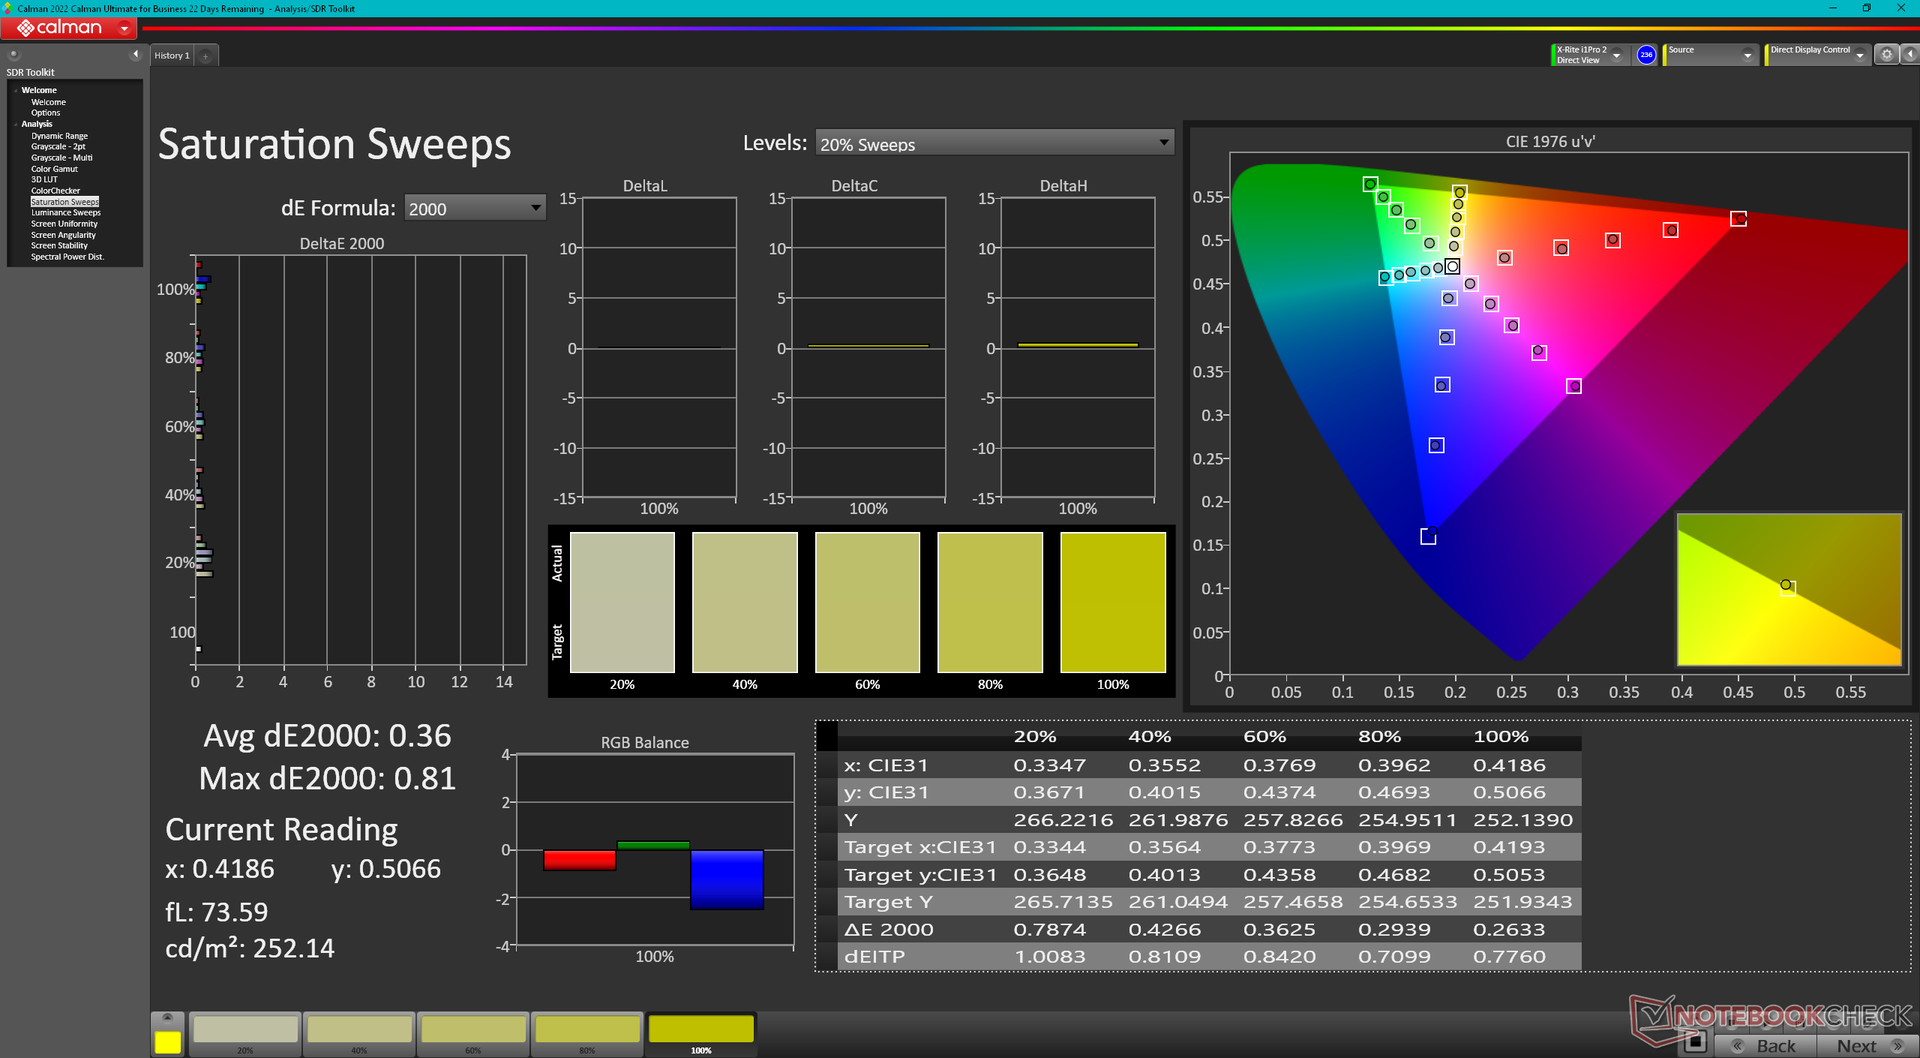
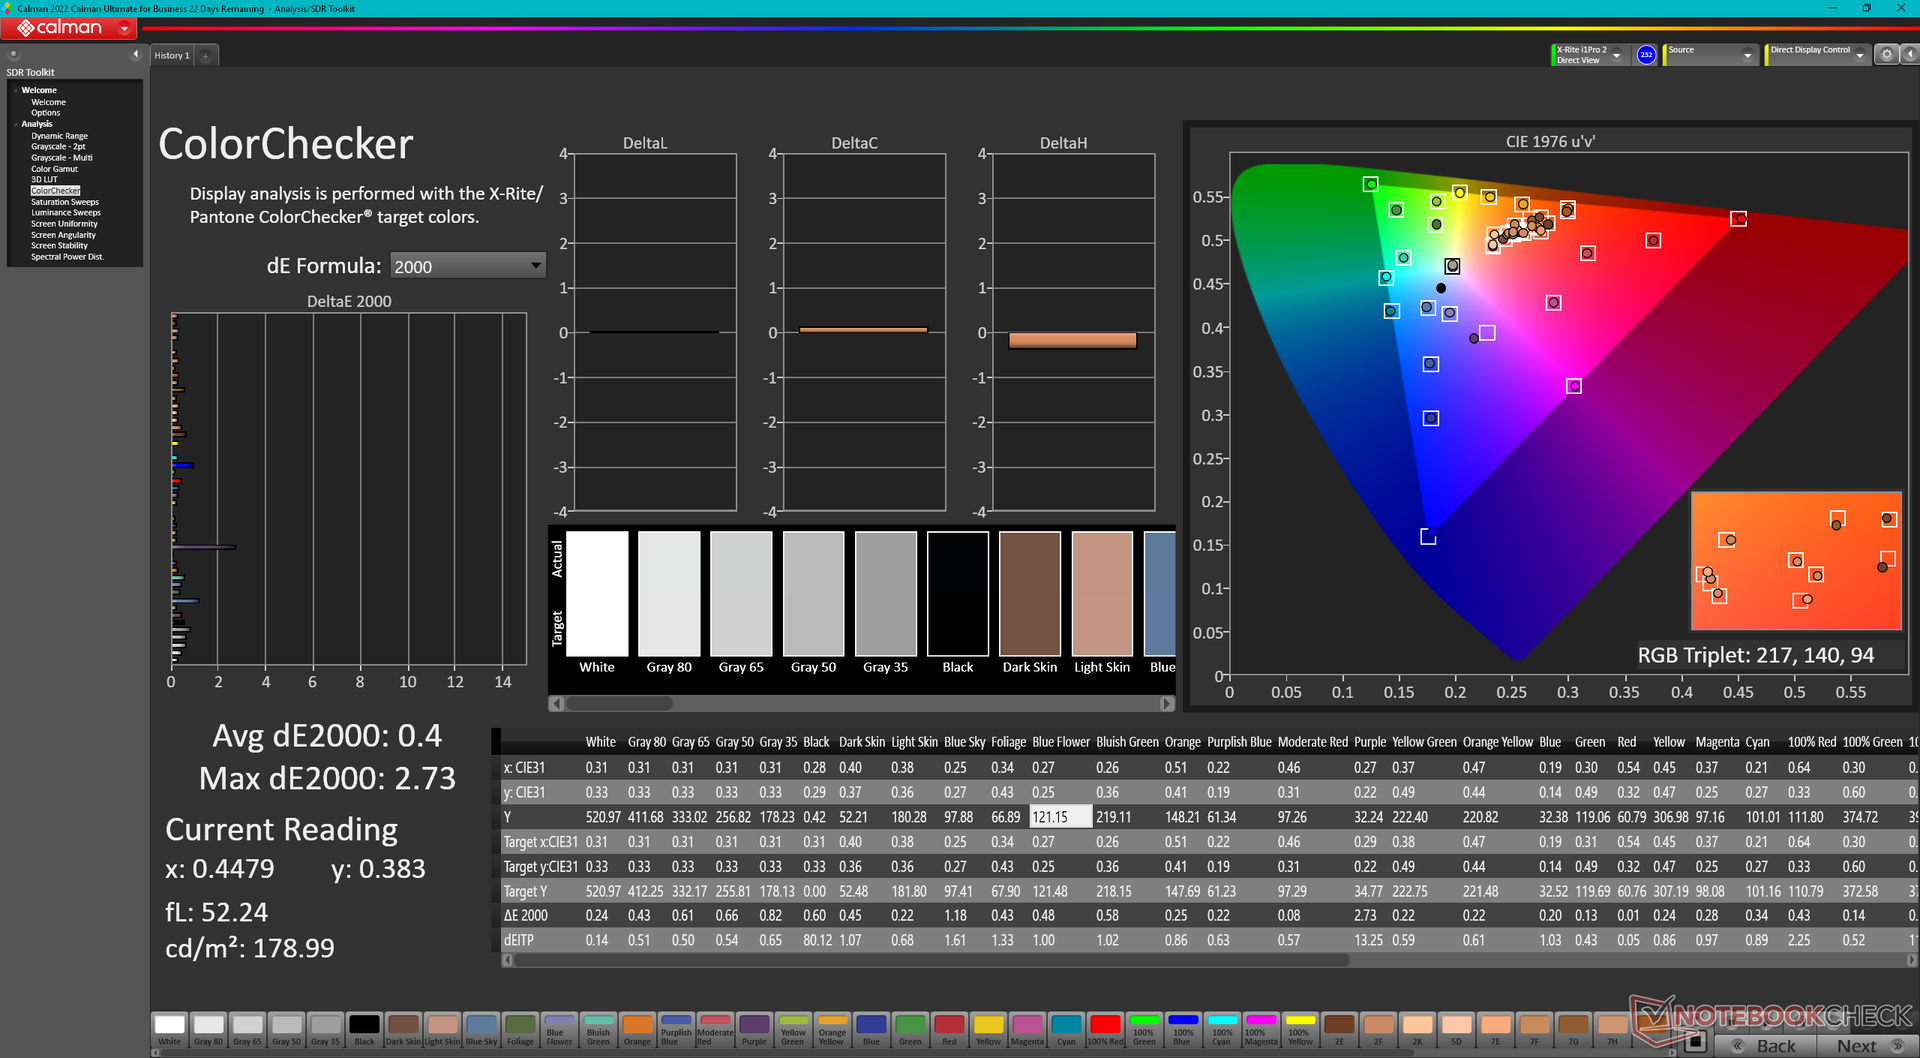
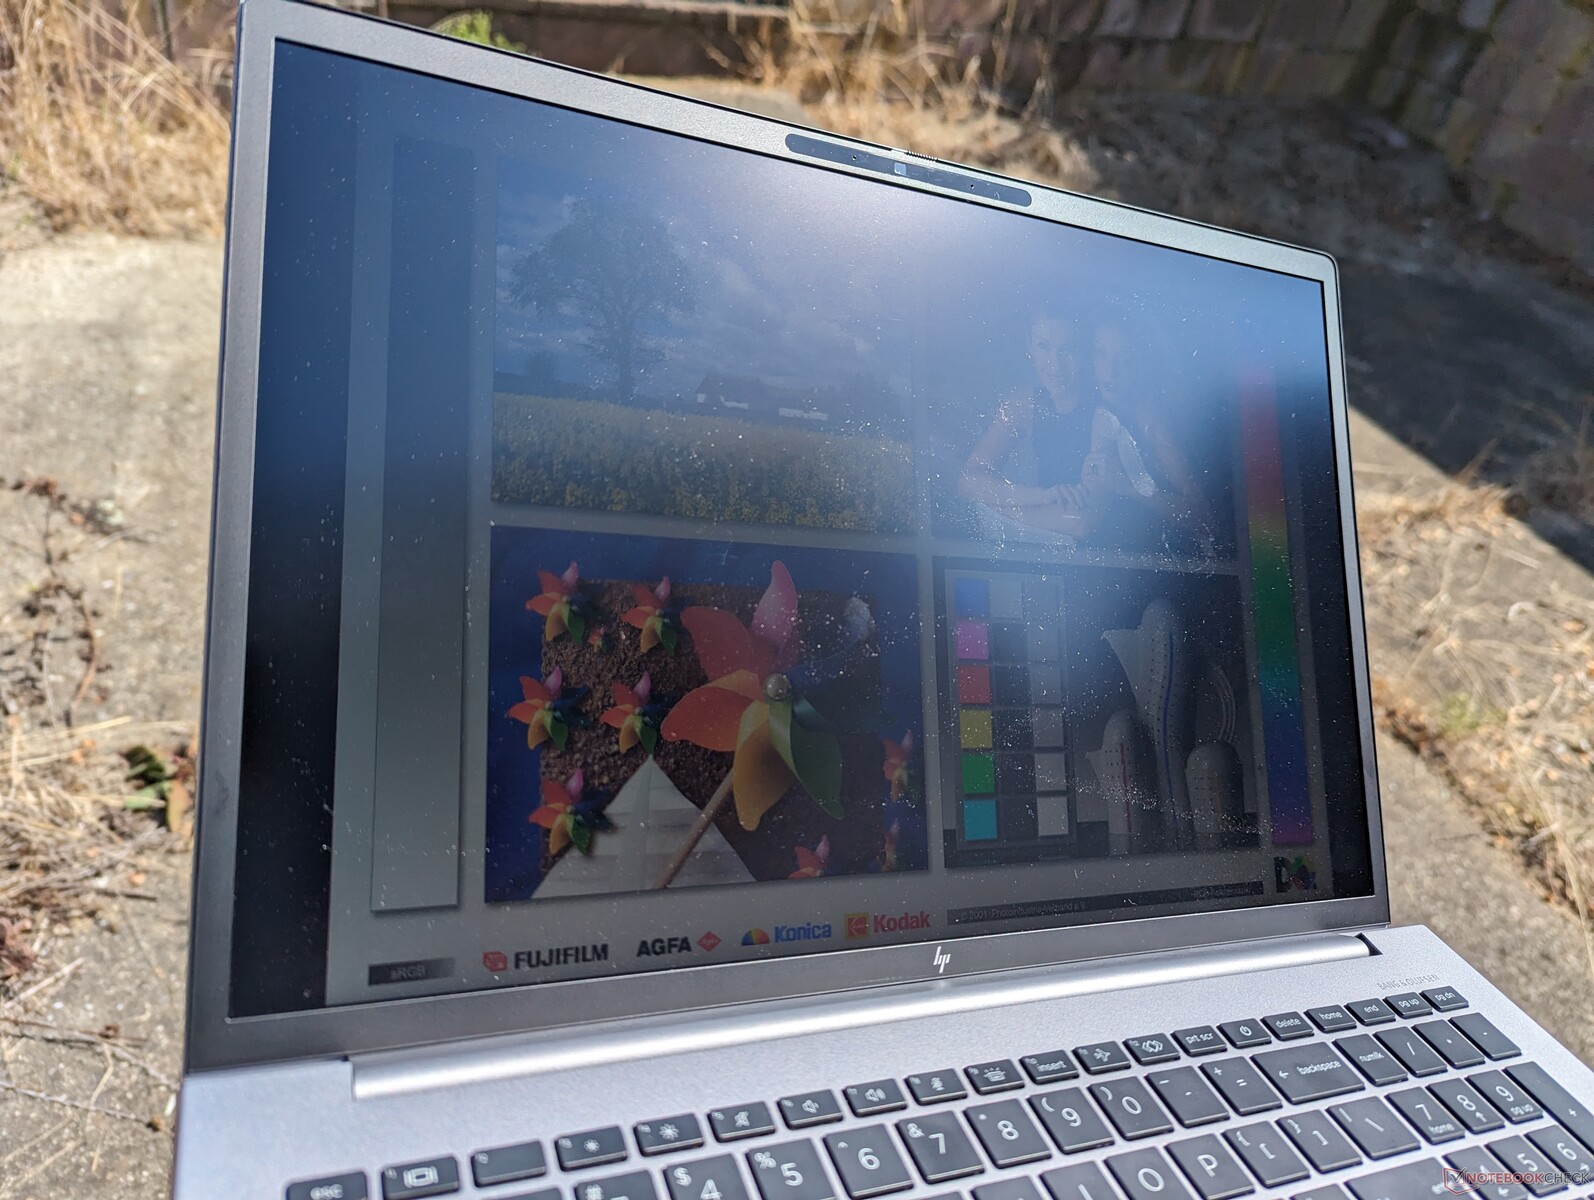
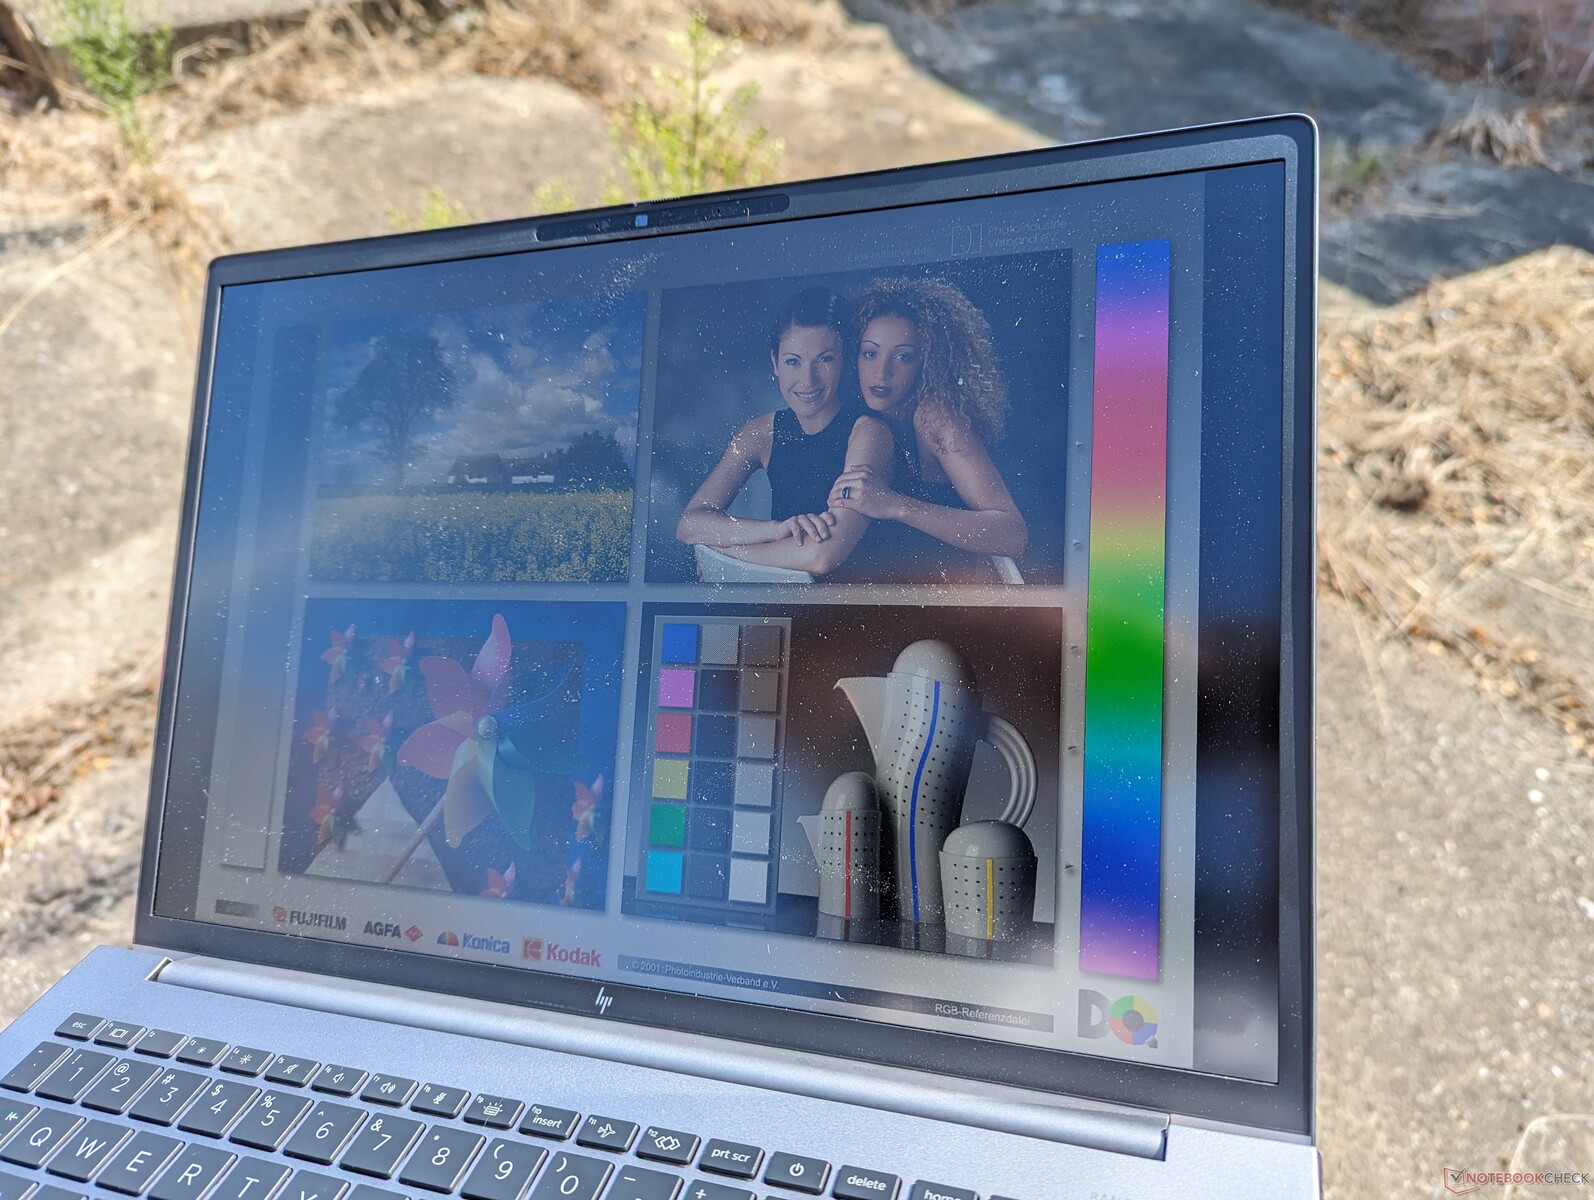
Nasze niezależne pomiary kolorymetrem X-Rite potwierdzają zarówno pełne pokrycie P3, jak i maksymalną jasność 500 nitów, zgodnie z reklamą. Częstotliwość odświeżania 120 Hz jest również zauważalnym wzrostem w porównaniu z panelem 60 Hz w zeszłorocznym Fury 16 G9. Jest to obecnie jedna z niewielu stacji roboczych na rynku, która oferuje panel 4K IPS z kolorami P3 i szybką częstotliwością odświeżania 120 Hz.

| |||||||||||||||||||||||||
rozświetlenie: 90 %
na akumulatorze: 514.6 cd/m²
kontrast: 1119:1 (czerń: 0.46 cd/m²)
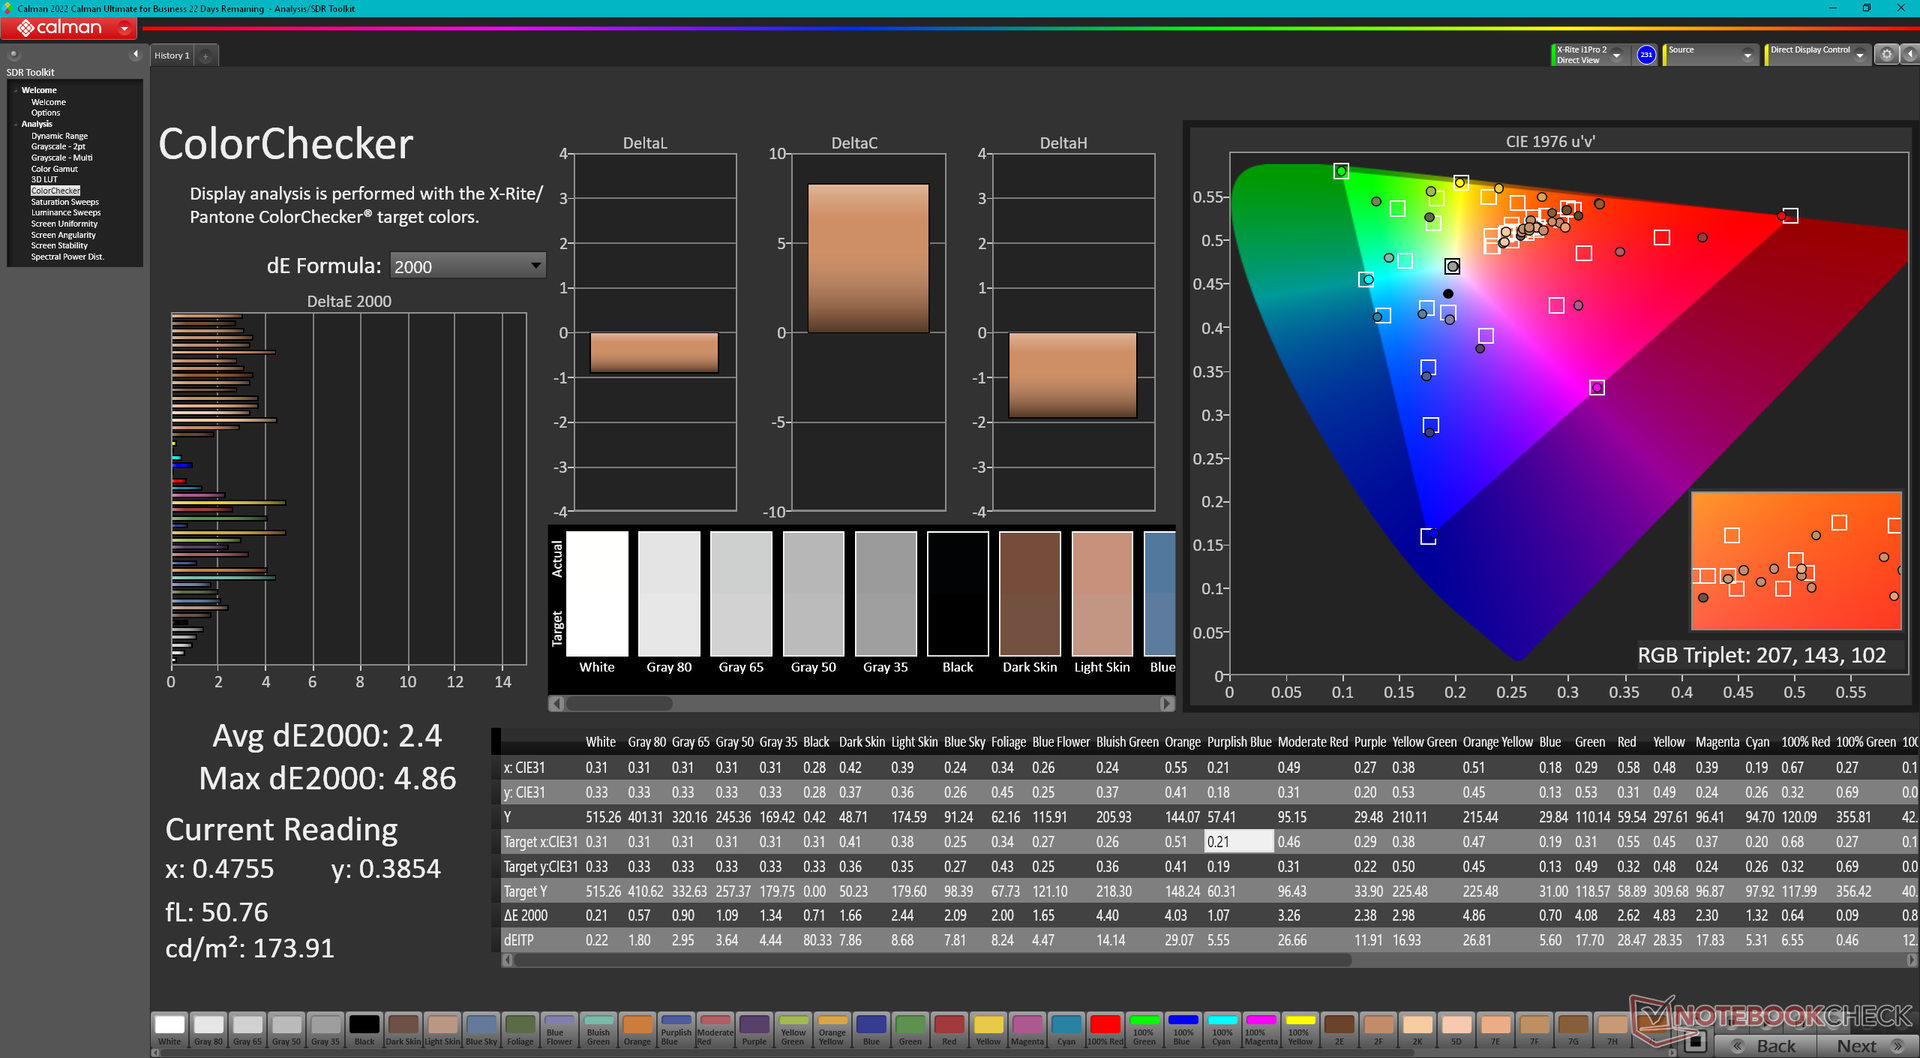
ΔE ColorChecker Calman: 2.4 | ∀{0.5-29.43 Ø4.72}
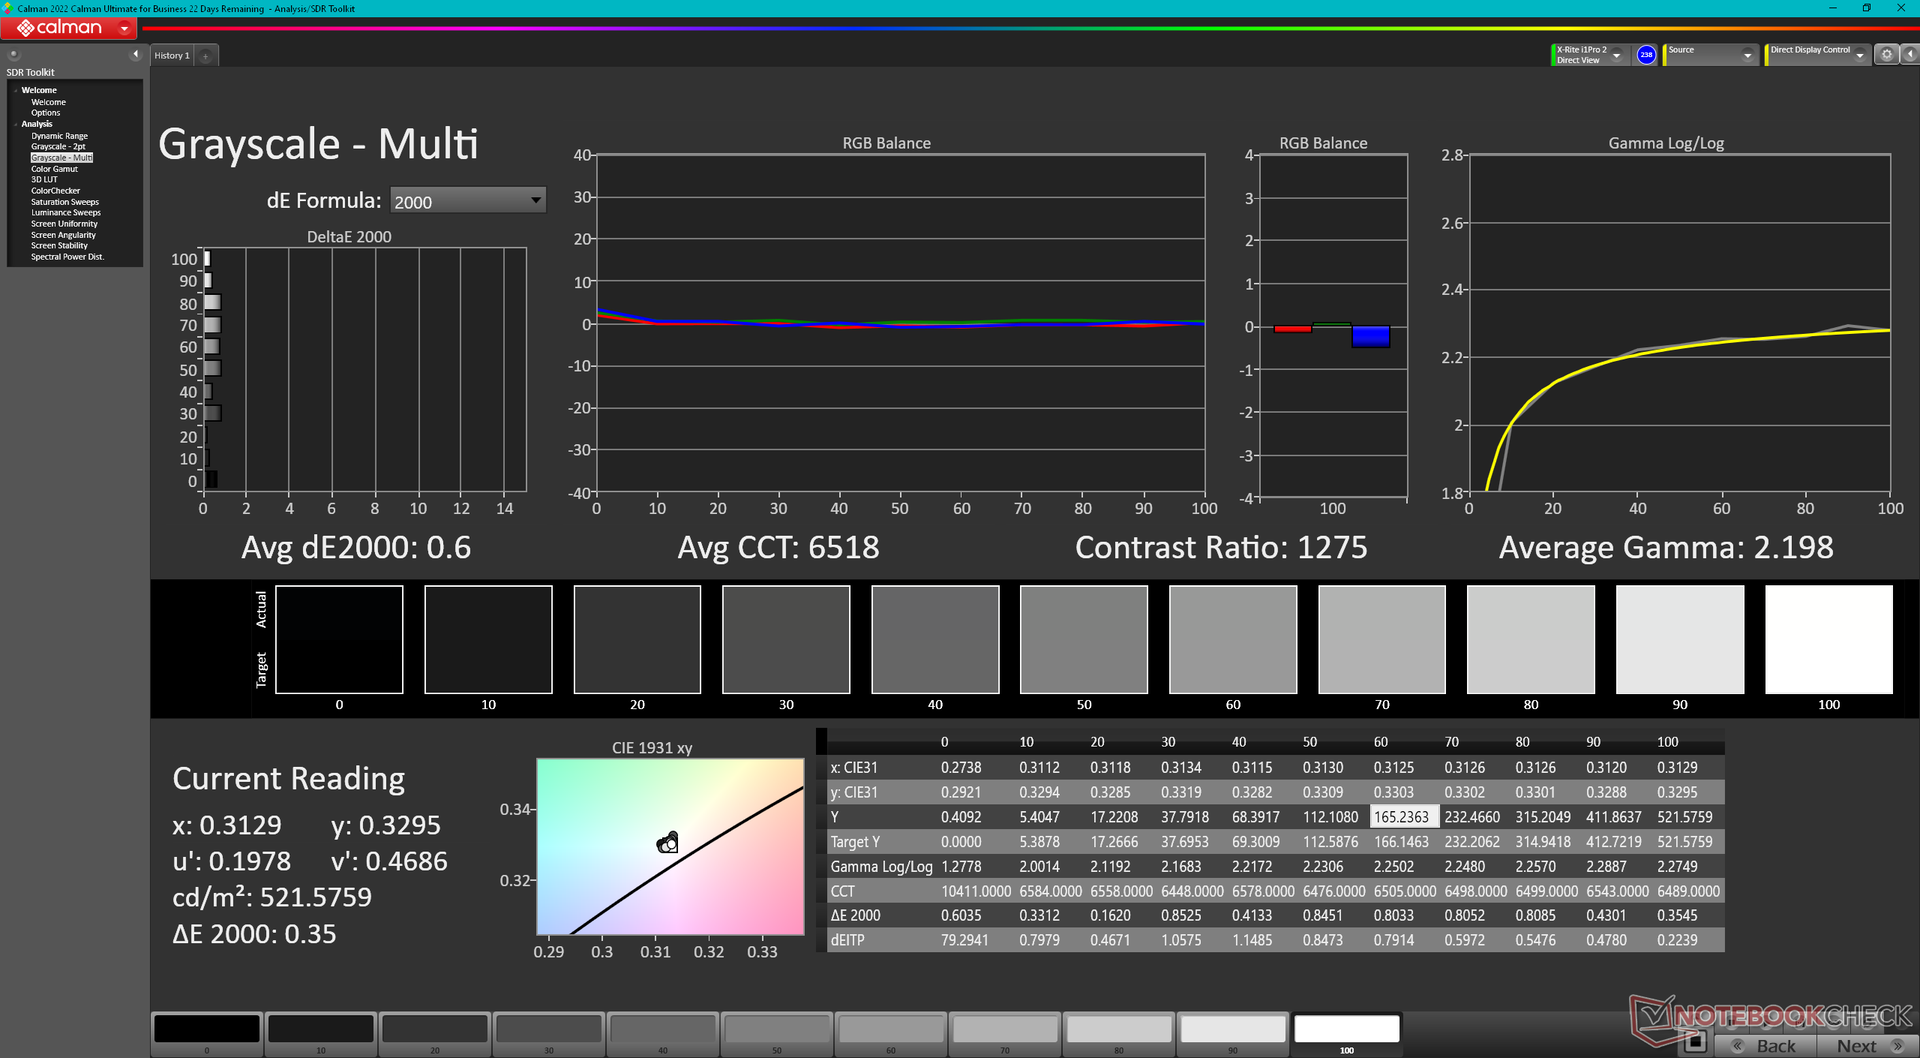
calibrated: 0.4
ΔE Greyscale Calman: 1 | ∀{0.09-98 Ø4.97}
86.2% AdobeRGB 1998 (Argyll 3D)
99.9% sRGB (Argyll 3D)
98% Display P3 (Argyll 3D)
Gamma: 2.3
CCT: 6553 K
| HP ZBook Fury 16 G10 AUO87A8, IPS, 3840x2400, 16" | HP ZBook Fury 16 G9 BOE0A52, IPS, 3840x2400, 16" | Dell Precision 5000 5680 Samsung 160YV03, OLED, 3840x2400, 16" | Lenovo ThinkPad P16 G1 RTX A5500 LP160UQ1-SPB1, IPS, 3840x2400, 16" | MSI CreatorPro Z16P B12UKST B160QAN02.N, IPS, 2560x1600, 16" | Asus ProArt StudioBook 16 W7600H5A-2BL2 ATNA60YV02-0, OLED, 3840x2400, 16" | |
|---|---|---|---|---|---|---|
| Display | -0% | 5% | -2% | 0% | 5% | |
| Display P3 Coverage (%) | 98 | 97.4 -1% | 99.9 2% | 82.9 -15% | 97.6 0% | 99.9 2% |
| sRGB Coverage (%) | 99.9 | 99.9 0% | 100 0% | 98.9 -1% | 99.9 0% | 100 0% |
| AdobeRGB 1998 Coverage (%) | 86.2 | 86.3 0% | 97.5 13% | 95.9 11% | 87.4 1% | 98.6 14% |
| Response Times | -3% | 84% | -283% | 8% | 81% | |
| Response Time Grey 50% / Grey 80% * (ms) | 11.9 ? | 13.7 ? -15% | 1.68 ? 86% | 45.6 ? -283% | 12.8 ? -8% | 2 ? 83% |
| Response Time Black / White * (ms) | 9.6 ? | 8.6 ? 10% | 1.77 ? 82% | 36.8 ? -283% | 7.4 ? 23% | 2 ? 79% |
| PWM Frequency (Hz) | 60 ? | 240 ? | ||||
| Screen | -141% | -72% | -16% | -12% | -102% | |
| Brightness middle (cd/m²) | 514.6 | 530.5 3% | 345.7 -33% | 601.9 17% | 407 -21% | 353 -31% |
| Brightness (cd/m²) | 495 | 476 -4% | 349 -29% | 569 15% | 388 -22% | 360 -27% |
| Brightness Distribution (%) | 90 | 83 -8% | 98 9% | 77 -14% | 88 -2% | 96 7% |
| Black Level * (cd/m²) | 0.46 | 0.57 -24% | 0.47 -2% | 0.36 22% | ||
| Contrast (:1) | 1119 | 931 -17% | 1281 14% | 1131 1% | ||
| Colorchecker dE 2000 * | 2.4 | 2.26 6% | 3.59 -50% | 2.45 -2% | 1.3 46% | 2.45 -2% |
| Colorchecker dE 2000 max. * | 4.86 | 7.02 -44% | 4.46 8% | 2.5 49% | 3.75 23% | |
| Colorchecker dE 2000 calibrated * | 0.4 | 4.73 -1083% | 0.99 -147% | 0.7 -75% | 2.77 -593% | |
| Greyscale dE 2000 * | 1 | 1 -0% | 3.1 -210% | 2.6 -160% | 2.1 -110% | 1.88 -88% |
| Gamma | 2.3 96% | 2.28 96% | 2.13 103% | 2.3 96% | 2.26 97% | 2.31 95% |
| CCT | 6553 99% | 6543 99% | 6448 101% | 6805 96% | 6437 101% | 6441 101% |
| Całkowita średnia (program / ustawienia) | -48% /
-87% | 6% /
-27% | -100% /
-53% | -1% /
-7% | -5% /
-44% |
* ... im mniej tym lepiej
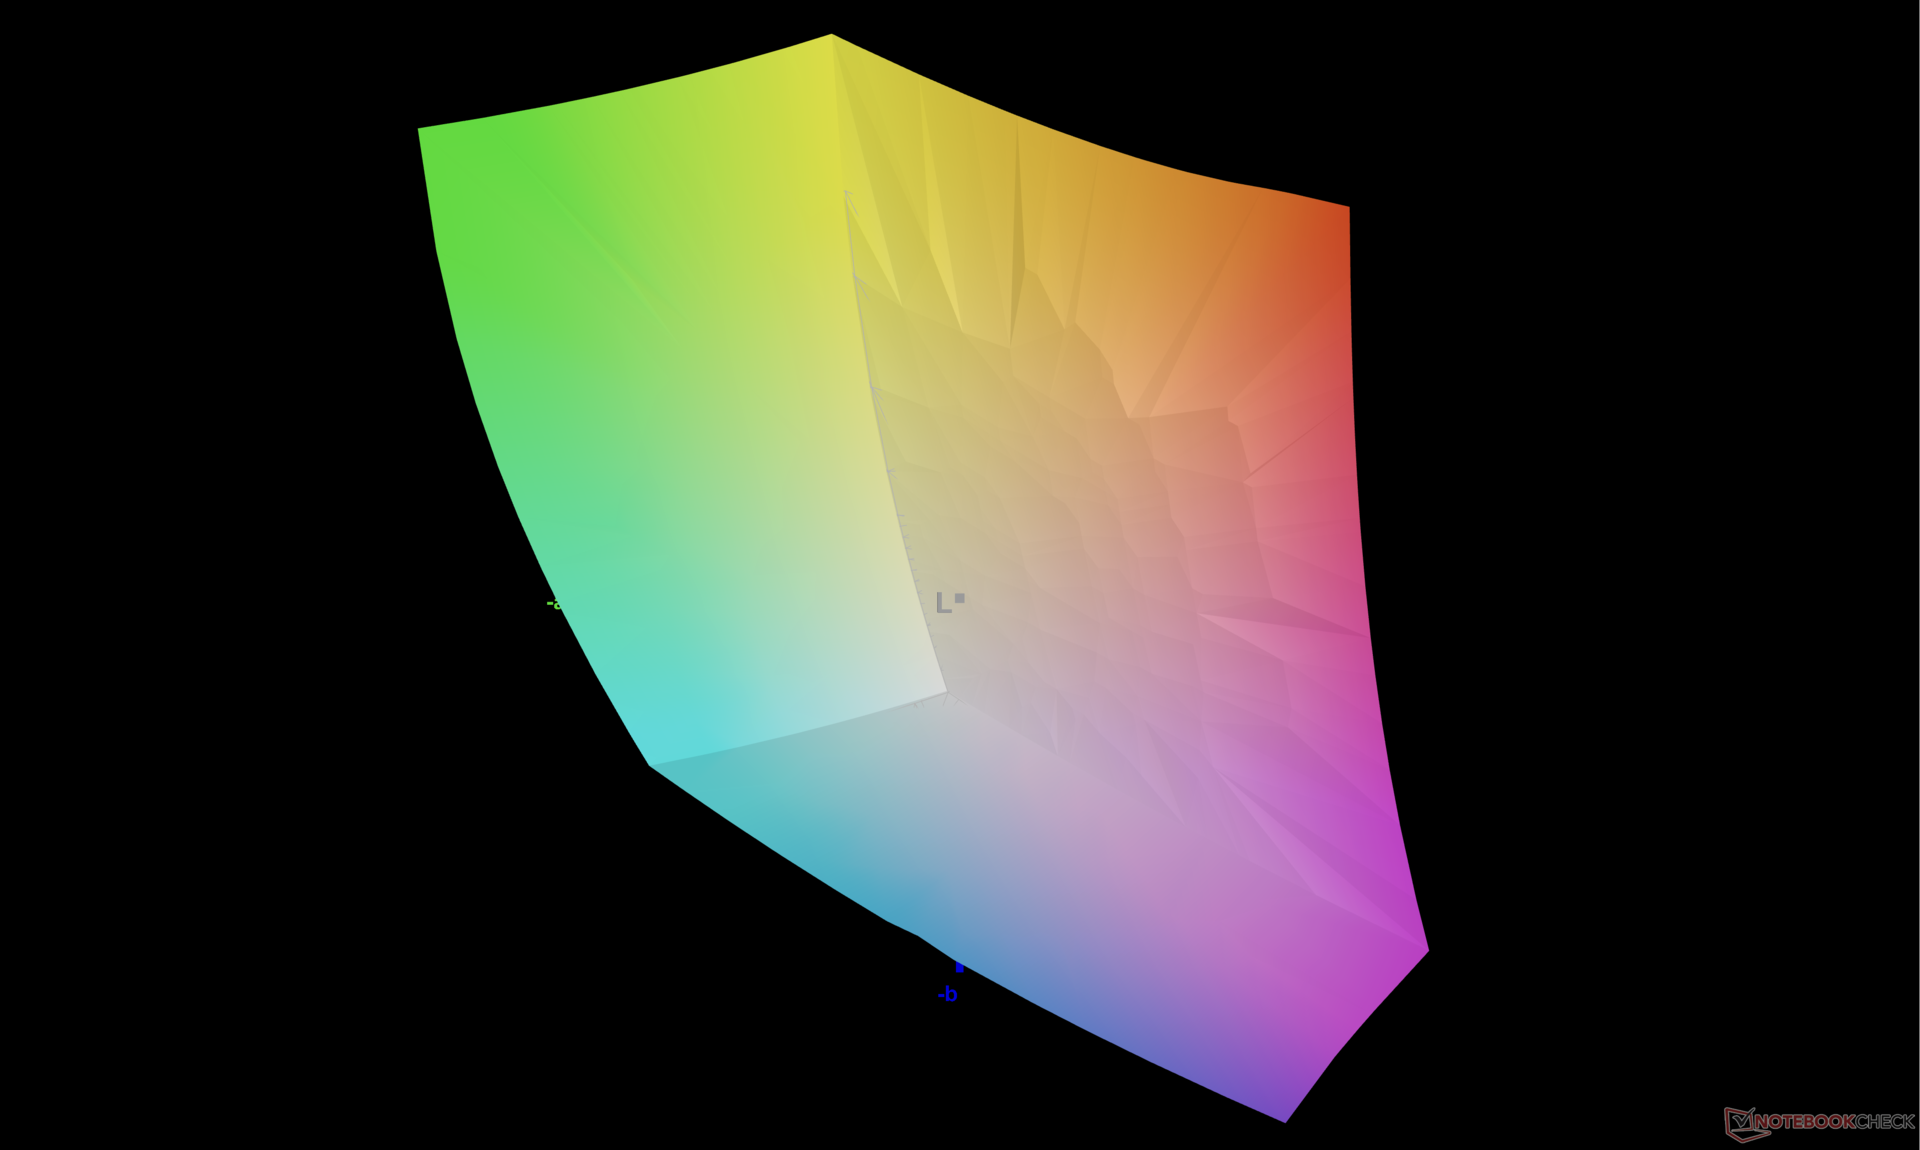
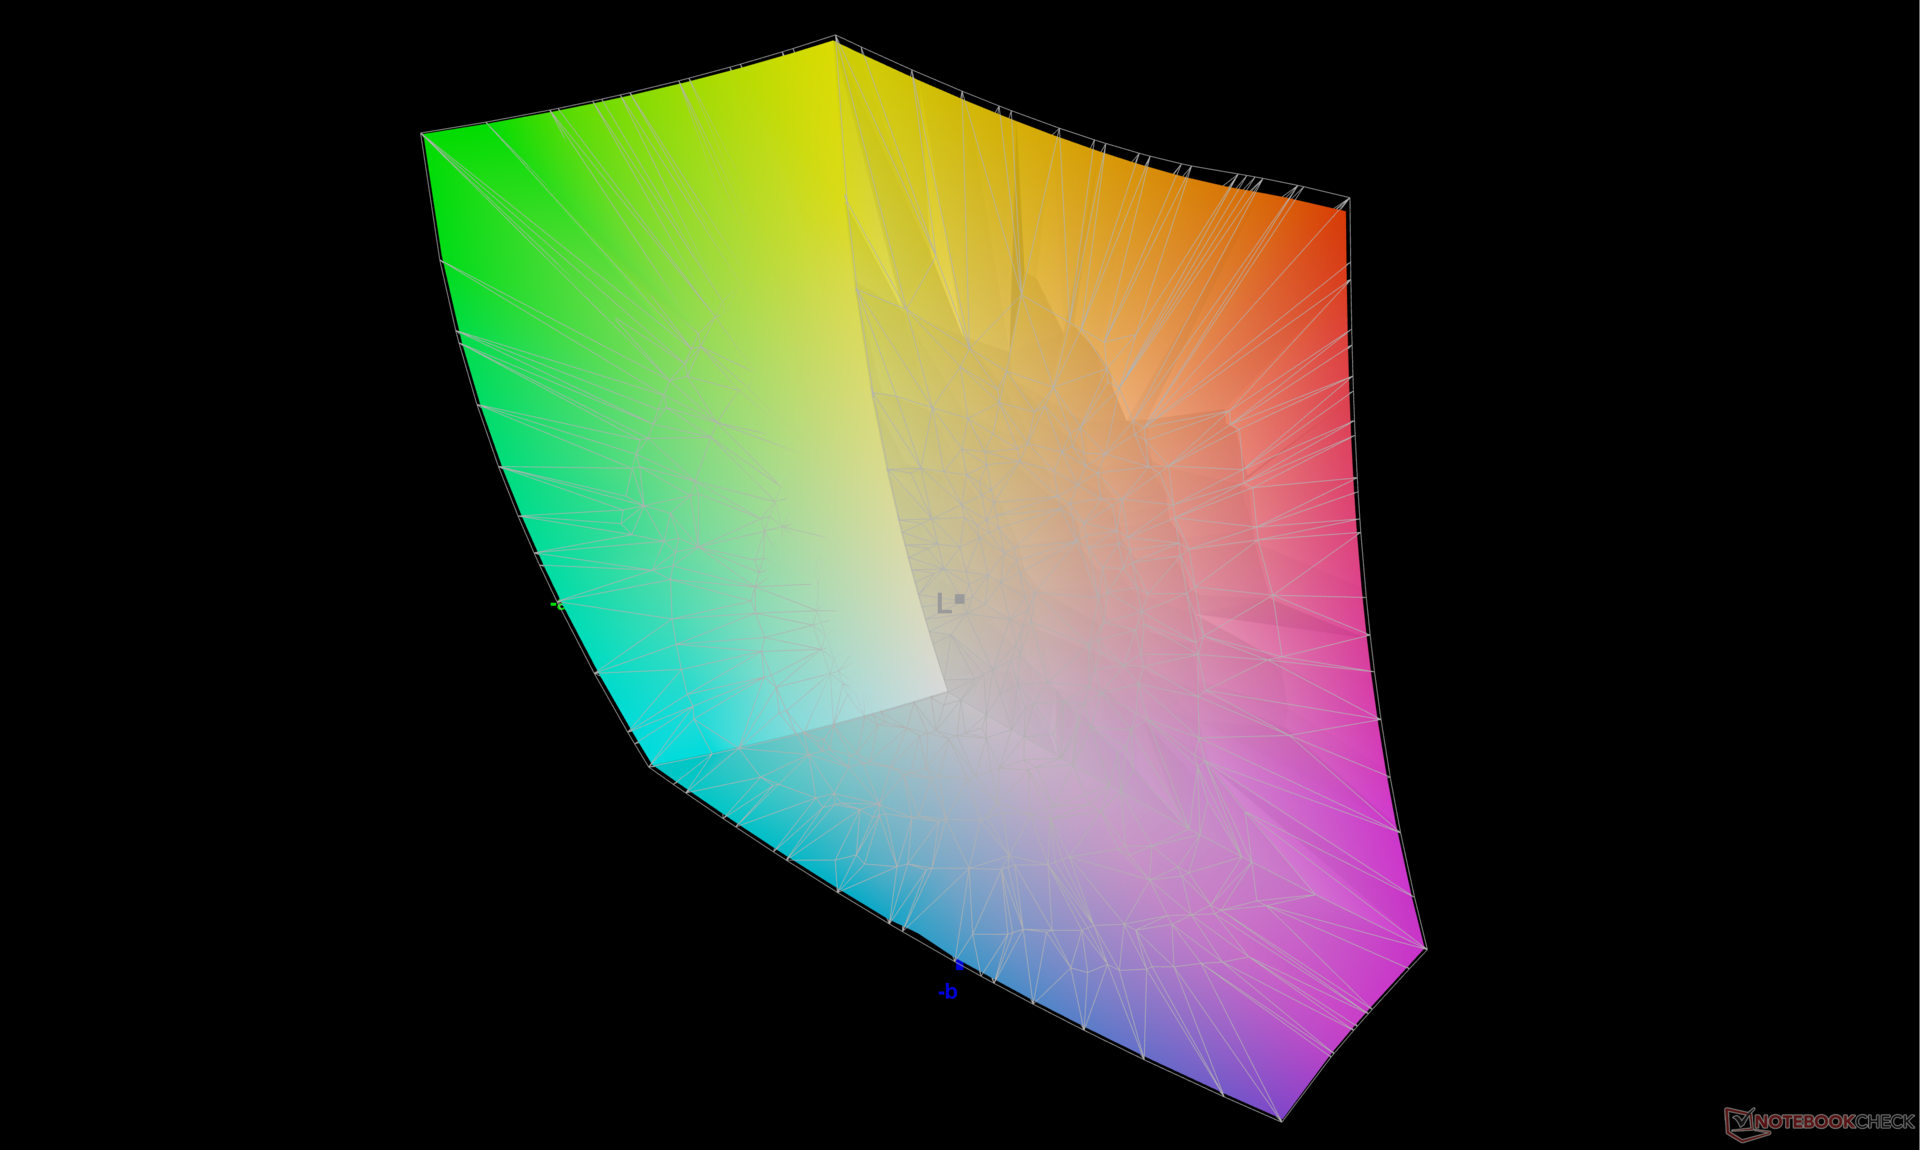
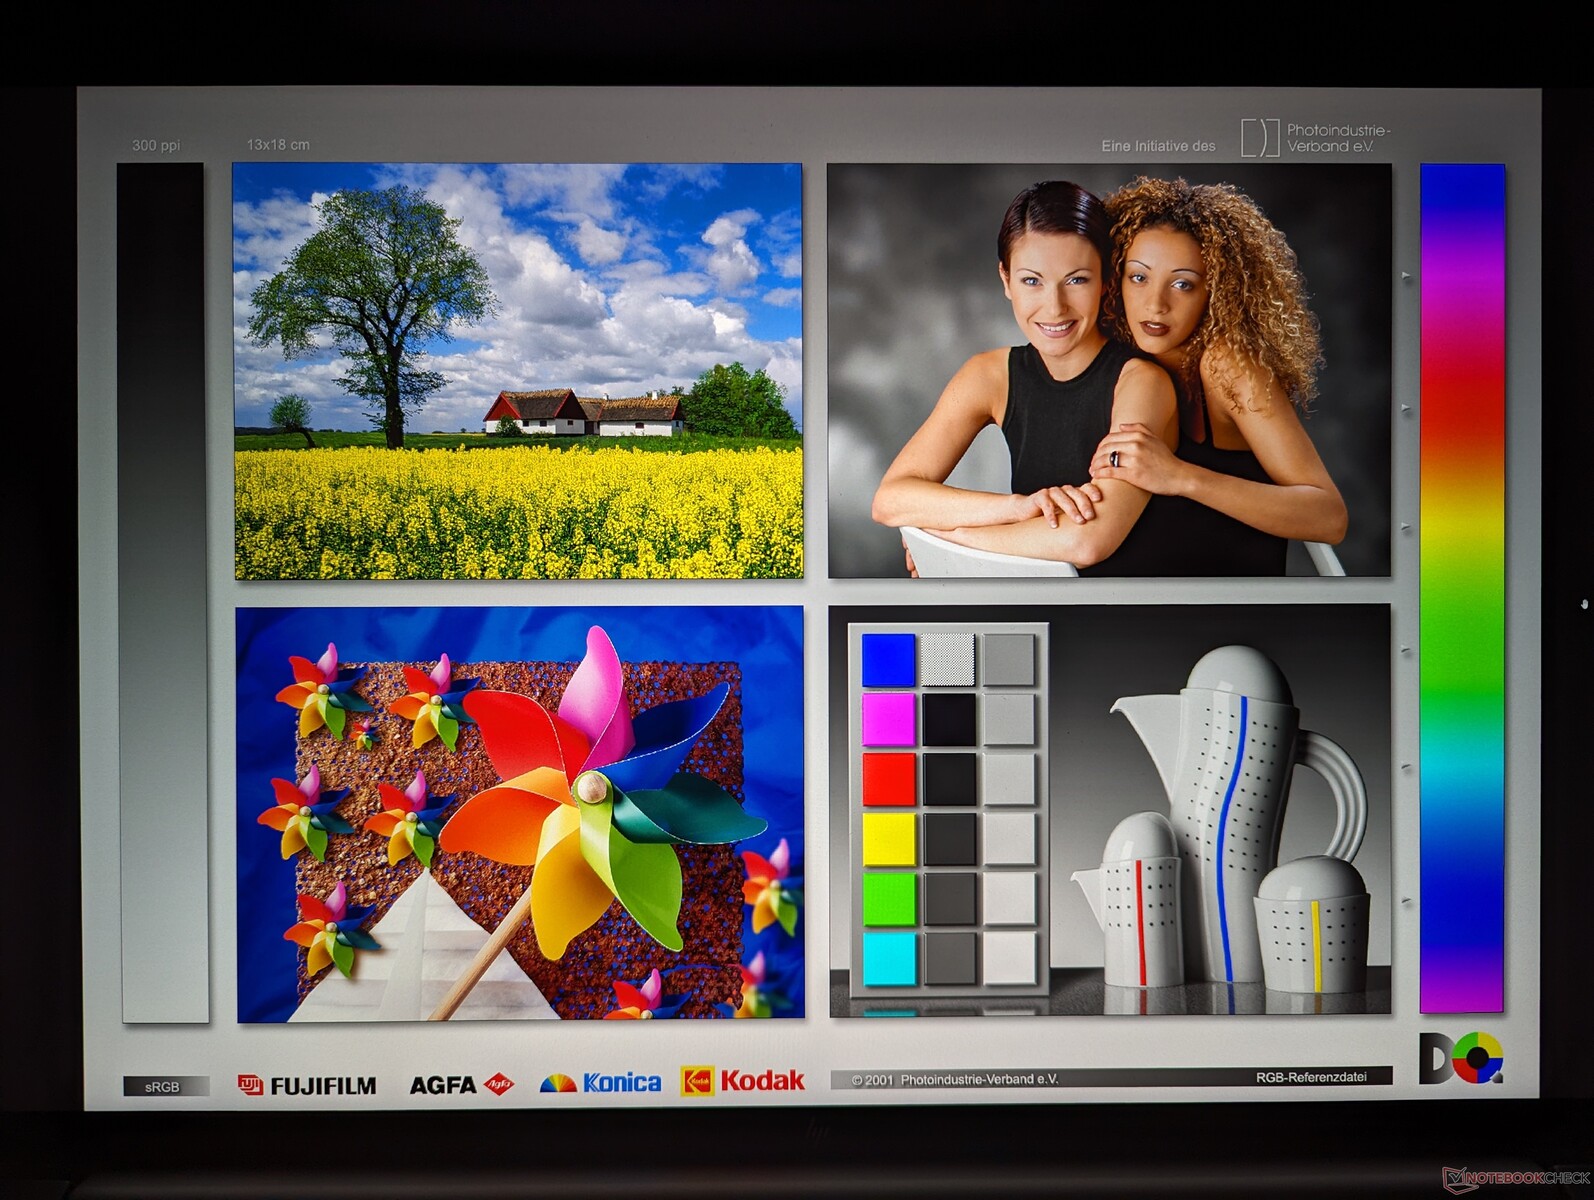
Wyświetlacz jest dobrze skalibrowany po wyjęciu z pudełka zgodnie ze standardem P3, więc kalibracja przez użytkownika końcowego nie jest tak konieczna.
Wyświetl czasy reakcji
| ↔ Czas reakcji od czerni do bieli | ||
|---|---|---|
| 9.6 ms ... wzrost ↗ i spadek ↘ łącznie | ↗ 5.1 ms wzrost | 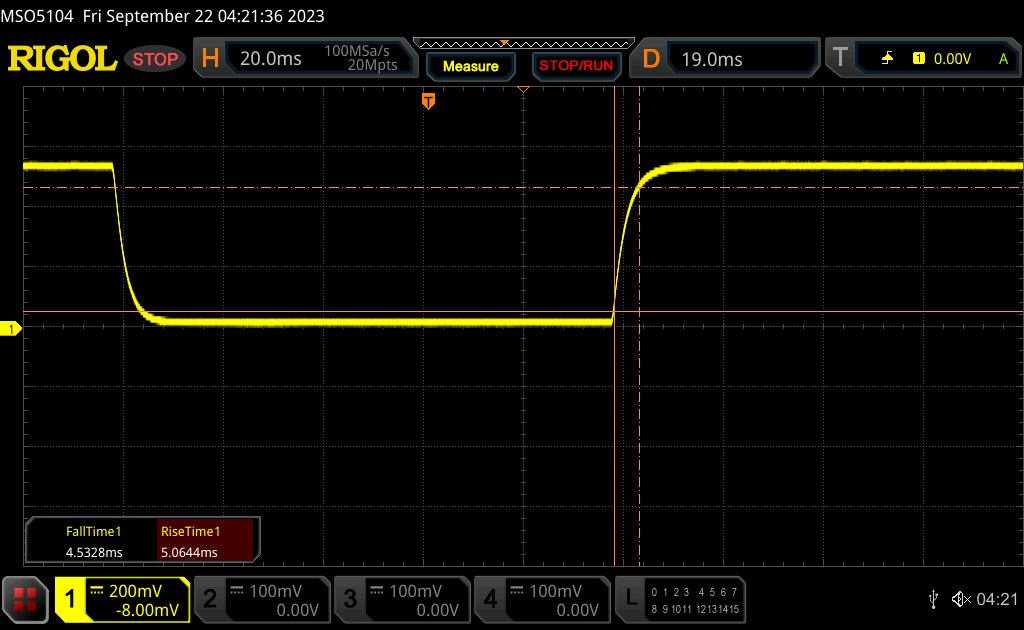 |
| ↘ 4.5 ms upadek | ||
| W naszych testach ekran wykazuje szybki czas reakcji i powinien nadawać się do gier. Dla porównania, wszystkie testowane urządzenia wahają się od 0.1 (minimum) do 240 (maksimum) ms. » 26 % wszystkich urządzeń jest lepszych. Oznacza to, że zmierzony czas reakcji jest lepszy od średniej wszystkich testowanych urządzeń (19.8 ms). | ||
| ↔ Czas reakcji 50% szarości do 80% szarości | ||
| 11.9 ms ... wzrost ↗ i spadek ↘ łącznie | ↗ 5.9 ms wzrost | 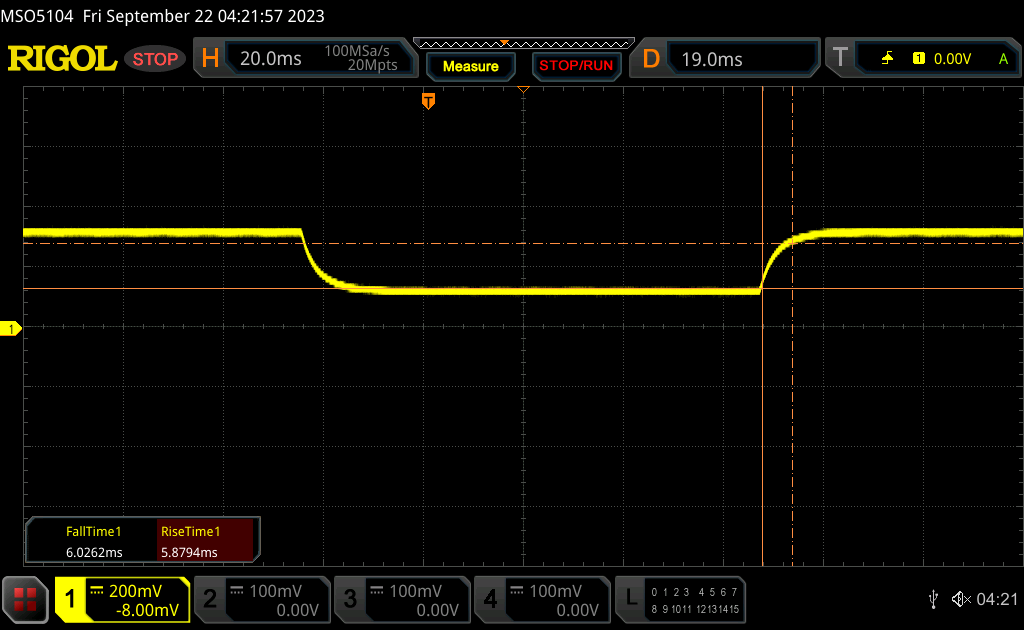 |
| ↘ 6 ms upadek | ||
| W naszych testach ekran wykazuje dobry współczynnik reakcji, ale może być zbyt wolny dla graczy rywalizujących ze sobą. Dla porównania, wszystkie testowane urządzenia wahają się od 0.165 (minimum) do 636 (maksimum) ms. » 25 % wszystkich urządzeń jest lepszych. Oznacza to, że zmierzony czas reakcji jest lepszy od średniej wszystkich testowanych urządzeń (31 ms). | ||
Migotanie ekranu / PWM (modulacja szerokości impulsu)
| Migotanie ekranu/nie wykryto PWM | 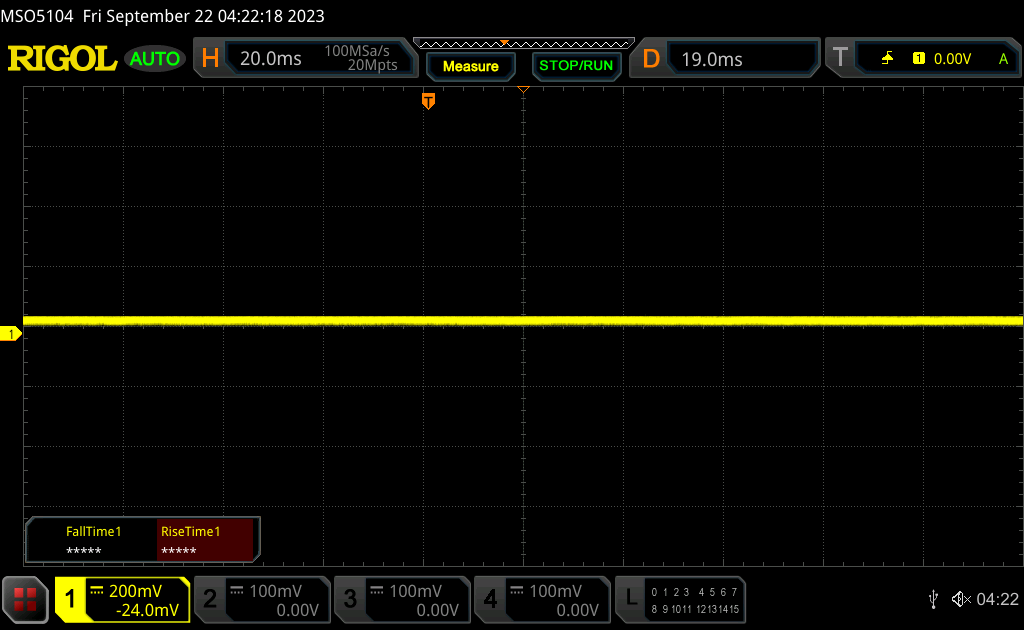 | ||
Dla porównania: 52 % wszystkich testowanych urządzeń nie używa PWM do przyciemniania wyświetlacza. Jeśli wykryto PWM, zmierzono średnio 7769 (minimum: 5 - maksimum: 343500) Hz. | |||


Wydajność
Warunki testowania
Przed uruchomieniem poniższych testów porównawczych ustawiliśmy system Windows w tryb wydajności.
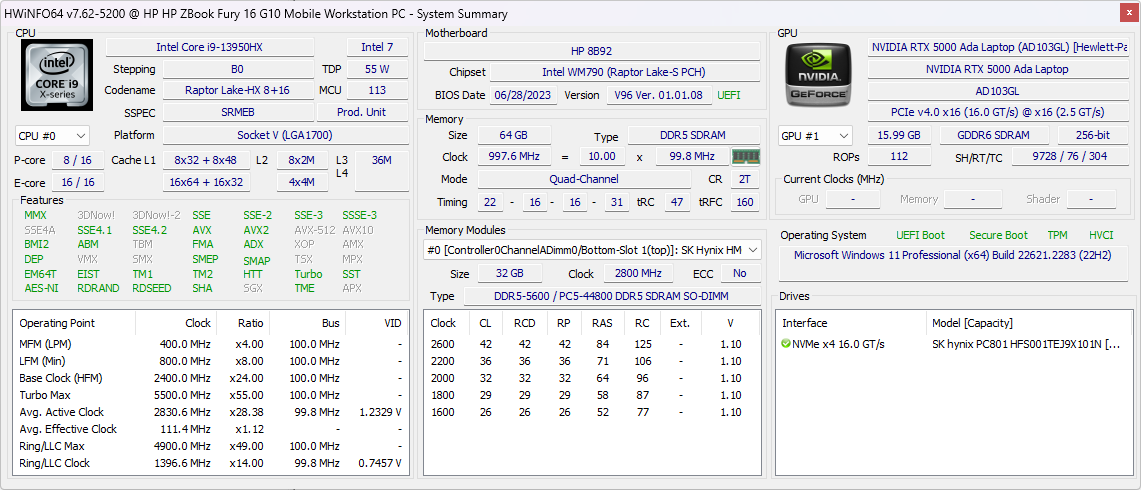
Procesory Advanced Optimus, MUX i Intel Xeon nie są obsługiwane. Warto jednak zauważyć, że model ten oficjalnie obsługuje pamięć RAM DDR5 ECC pomimo braku jakichkolwiek opcji Xeon, co jest funkcją niespotykaną w większości innych mobilnych stacji roboczych.
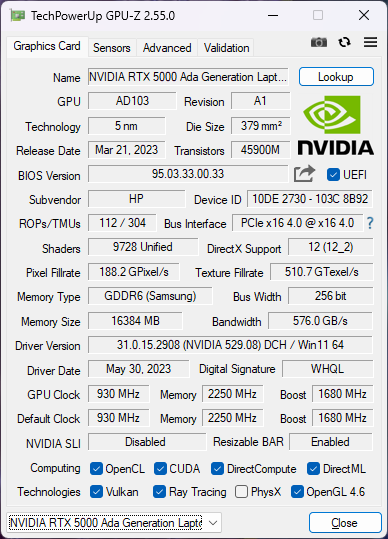
Tryb ECC VRAM można włączać i wyłączać, podobnie jak w innych procesorach graficznych Ada Lovelace zaprojektowanych dla stacji roboczych. Włączenie tego trybu zmniejsza maksymalną użyteczną pamięć VRAM z 16 GB do 15 GB.
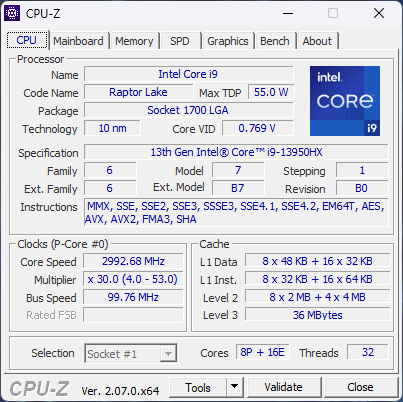
Procesor
Wydajność procesora jest mieszana. Z jednej strony, wydajność wielowątkowa jest o około 25 do 30 procent szybsza niż w przypadku Core i9-12950HX w zeszłorocznym Fury 16 G9. Z drugiej strony, wydajność jest średnio o około 15 procent wolniejsza niż w innych laptopach z tym samym procesorem.Core i9-13950HX jak nasz HP. Dokładnie ten sam procesor w większymRazer Blade 18 i MSI GE78HXna przykład, działają konsekwentnie szybciej niż nasz HP. Nie oznacza to, że Fury 16 G10 jest wolny, ale pokazuje, że procesor jest nieco wolniejszy niż oczekiwano.
Cinebench R15 Multi Loop
Cinebench R23: Multi Core | Single Core
Cinebench R20: CPU (Multi Core) | CPU (Single Core)
Cinebench R15: CPU Multi 64Bit | CPU Single 64Bit
Blender: v2.79 BMW27 CPU
7-Zip 18.03: 7z b 4 | 7z b 4 -mmt1
Geekbench 5.5: Multi-Core | Single-Core
HWBOT x265 Benchmark v2.2: 4k Preset
LibreOffice : 20 Documents To PDF
R Benchmark 2.5: Overall mean
| CPU Performance rating | |
| Przeciętny Intel Core i9-13950HX | |
| HP ZBook Fury 16 G10 | |
| Lenovo ThinkPad P16 G1 RTX A5500 | |
| Dell Precision 5000 5680 | |
| HP ZBook Fury 16 G9 | |
| Lenovo ThinkPad P16 G1 21D6001DMB | |
| HP ZBook Studio 16 G9 62U04EA | |
| MSI CreatorPro Z16P B12UKST | |
| Asus ProArt StudioBook 16 W7600H5A-2BL2 | |
| Lenovo ThinkPad P1 G4-20Y4Z9DVUS | |
| Cinebench R23 / Multi Core | |
| Przeciętny Intel Core i9-13950HX (24560 - 33277, n=7) | |
| HP ZBook Fury 16 G10 | |
| Lenovo ThinkPad P16 G1 RTX A5500 | |
| HP ZBook Fury 16 G9 | |
| Dell Precision 5000 5680 | |
| Lenovo ThinkPad P16 G1 21D6001DMB | |
| MSI CreatorPro Z16P B12UKST | |
| HP ZBook Studio 16 G9 62U04EA | |
| Lenovo ThinkPad P1 G4-20Y4Z9DVUS | |
| Asus ProArt StudioBook 16 W7600H5A-2BL2 | |
| Cinebench R23 / Single Core | |
| HP ZBook Fury 16 G10 | |
| Przeciętny Intel Core i9-13950HX (1952 - 2113, n=7) | |
| Dell Precision 5000 5680 | |
| HP ZBook Fury 16 G9 | |
| Lenovo ThinkPad P16 G1 RTX A5500 | |
| HP ZBook Studio 16 G9 62U04EA | |
| Lenovo ThinkPad P16 G1 21D6001DMB | |
| MSI CreatorPro Z16P B12UKST | |
| Lenovo ThinkPad P1 G4-20Y4Z9DVUS | |
| Asus ProArt StudioBook 16 W7600H5A-2BL2 | |
| Cinebench R20 / CPU (Multi Core) | |
| Przeciętny Intel Core i9-13950HX (8697 - 12648, n=7) | |
| HP ZBook Fury 16 G10 | |
| Lenovo ThinkPad P16 G1 RTX A5500 | |
| HP ZBook Fury 16 G9 | |
| Dell Precision 5000 5680 | |
| Lenovo ThinkPad P16 G1 21D6001DMB | |
| MSI CreatorPro Z16P B12UKST | |
| HP ZBook Studio 16 G9 62U04EA | |
| Lenovo ThinkPad P1 G4-20Y4Z9DVUS | |
| Asus ProArt StudioBook 16 W7600H5A-2BL2 | |
| Cinebench R20 / CPU (Single Core) | |
| HP ZBook Fury 16 G10 | |
| Przeciętny Intel Core i9-13950HX (742 - 816, n=7) | |
| Dell Precision 5000 5680 | |
| HP ZBook Fury 16 G9 | |
| Lenovo ThinkPad P16 G1 RTX A5500 | |
| HP ZBook Studio 16 G9 62U04EA | |
| Lenovo ThinkPad P16 G1 21D6001DMB | |
| MSI CreatorPro Z16P B12UKST | |
| Lenovo ThinkPad P1 G4-20Y4Z9DVUS | |
| Asus ProArt StudioBook 16 W7600H5A-2BL2 | |
| Cinebench R15 / CPU Multi 64Bit | |
| Przeciętny Intel Core i9-13950HX (3625 - 5227, n=7) | |
| HP ZBook Fury 16 G10 | |
| Lenovo ThinkPad P16 G1 RTX A5500 | |
| Lenovo ThinkPad P16 G1 21D6001DMB | |
| HP ZBook Studio 16 G9 62U04EA | |
| HP ZBook Fury 16 G9 | |
| Dell Precision 5000 5680 | |
| MSI CreatorPro Z16P B12UKST | |
| Lenovo ThinkPad P1 G4-20Y4Z9DVUS | |
| Asus ProArt StudioBook 16 W7600H5A-2BL2 | |
| Cinebench R15 / CPU Single 64Bit | |
| HP ZBook Fury 16 G10 | |
| Przeciętny Intel Core i9-13950HX (274 - 303, n=7) | |
| Dell Precision 5000 5680 | |
| Lenovo ThinkPad P16 G1 RTX A5500 | |
| HP ZBook Studio 16 G9 62U04EA | |
| Lenovo ThinkPad P16 G1 21D6001DMB | |
| MSI CreatorPro Z16P B12UKST | |
| Lenovo ThinkPad P1 G4-20Y4Z9DVUS | |
| Asus ProArt StudioBook 16 W7600H5A-2BL2 | |
| HP ZBook Fury 16 G9 | |
| Blender / v2.79 BMW27 CPU | |
| Asus ProArt StudioBook 16 W7600H5A-2BL2 | |
| Lenovo ThinkPad P1 G4-20Y4Z9DVUS | |
| MSI CreatorPro Z16P B12UKST | |
| Dell Precision 5000 5680 | |
| HP ZBook Studio 16 G9 62U04EA | |
| Lenovo ThinkPad P16 G1 21D6001DMB | |
| HP ZBook Fury 16 G9 | |
| Lenovo ThinkPad P16 G1 RTX A5500 | |
| HP ZBook Fury 16 G10 | |
| Przeciętny Intel Core i9-13950HX (100 - 137, n=7) | |
| 7-Zip 18.03 / 7z b 4 | |
| Przeciętny Intel Core i9-13950HX (99351 - 127295, n=7) | |
| HP ZBook Fury 16 G10 | |
| Lenovo ThinkPad P16 G1 RTX A5500 | |
| HP ZBook Fury 16 G9 | |
| Dell Precision 5000 5680 | |
| Lenovo ThinkPad P16 G1 21D6001DMB | |
| HP ZBook Studio 16 G9 62U04EA | |
| MSI CreatorPro Z16P B12UKST | |
| Lenovo ThinkPad P1 G4-20Y4Z9DVUS | |
| Asus ProArt StudioBook 16 W7600H5A-2BL2 | |
| 7-Zip 18.03 / 7z b 4 -mmt1 | |
| Przeciętny Intel Core i9-13950HX (6445 - 7064, n=7) | |
| HP ZBook Fury 16 G10 | |
| Dell Precision 5000 5680 | |
| Lenovo ThinkPad P16 G1 RTX A5500 | |
| HP ZBook Fury 16 G9 | |
| HP ZBook Studio 16 G9 62U04EA | |
| Lenovo ThinkPad P16 G1 21D6001DMB | |
| MSI CreatorPro Z16P B12UKST | |
| Lenovo ThinkPad P1 G4-20Y4Z9DVUS | |
| Asus ProArt StudioBook 16 W7600H5A-2BL2 | |
| Geekbench 5.5 / Multi-Core | |
| Przeciętny Intel Core i9-13950HX (16776 - 21853, n=7) | |
| HP ZBook Fury 16 G10 | |
| Lenovo ThinkPad P16 G1 RTX A5500 | |
| Dell Precision 5000 5680 | |
| HP ZBook Fury 16 G9 | |
| Lenovo ThinkPad P16 G1 21D6001DMB | |
| HP ZBook Studio 16 G9 62U04EA | |
| MSI CreatorPro Z16P B12UKST | |
| Asus ProArt StudioBook 16 W7600H5A-2BL2 | |
| Lenovo ThinkPad P1 G4-20Y4Z9DVUS | |
| Geekbench 5.5 / Single-Core | |
| HP ZBook Fury 16 G10 | |
| Dell Precision 5000 5680 | |
| Przeciętny Intel Core i9-13950HX (1805 - 2097, n=7) | |
| HP ZBook Fury 16 G9 | |
| Lenovo ThinkPad P16 G1 RTX A5500 | |
| HP ZBook Studio 16 G9 62U04EA | |
| MSI CreatorPro Z16P B12UKST | |
| Lenovo ThinkPad P16 G1 21D6001DMB | |
| Lenovo ThinkPad P1 G4-20Y4Z9DVUS | |
| Asus ProArt StudioBook 16 W7600H5A-2BL2 | |
| HWBOT x265 Benchmark v2.2 / 4k Preset | |
| Przeciętny Intel Core i9-13950HX (26 - 34.5, n=7) | |
| HP ZBook Fury 16 G10 | |
| Lenovo ThinkPad P16 G1 RTX A5500 | |
| Dell Precision 5000 5680 | |
| HP ZBook Fury 16 G9 | |
| HP ZBook Studio 16 G9 62U04EA | |
| MSI CreatorPro Z16P B12UKST | |
| Lenovo ThinkPad P16 G1 21D6001DMB | |
| Lenovo ThinkPad P1 G4-20Y4Z9DVUS | |
| Asus ProArt StudioBook 16 W7600H5A-2BL2 | |
| LibreOffice / 20 Documents To PDF | |
| Lenovo ThinkPad P1 G4-20Y4Z9DVUS | |
| Lenovo ThinkPad P16 G1 21D6001DMB | |
| Przeciętny Intel Core i9-13950HX (32.8 - 52.1, n=7) | |
| HP ZBook Fury 16 G10 | |
| HP ZBook Studio 16 G9 62U04EA | |
| Dell Precision 5000 5680 | |
| Lenovo ThinkPad P16 G1 RTX A5500 | |
| MSI CreatorPro Z16P B12UKST | |
| HP ZBook Fury 16 G9 | |
| Asus ProArt StudioBook 16 W7600H5A-2BL2 | |
| R Benchmark 2.5 / Overall mean | |
| Asus ProArt StudioBook 16 W7600H5A-2BL2 | |
| Lenovo ThinkPad P1 G4-20Y4Z9DVUS | |
| MSI CreatorPro Z16P B12UKST | |
| Lenovo ThinkPad P16 G1 21D6001DMB | |
| HP ZBook Studio 16 G9 62U04EA | |
| Lenovo ThinkPad P16 G1 RTX A5500 | |
| HP ZBook Fury 16 G9 | |
| Dell Precision 5000 5680 | |
| Przeciętny Intel Core i9-13950HX (0.3823 - 0.4121, n=7) | |
| HP ZBook Fury 16 G10 | |
* ... im mniej tym lepiej
AIDA64: FP32 Ray-Trace | FPU Julia | CPU SHA3 | CPU Queen | FPU SinJulia | FPU Mandel | CPU AES | CPU ZLib | FP64 Ray-Trace | CPU PhotoWorxx
| Performance rating | |
| Przeciętny Intel Core i9-13950HX | |
| HP ZBook Fury 16 G10 | |
| Lenovo ThinkPad P16 G1 RTX A5500 | |
| HP ZBook Fury 16 G9 | |
| Dell Precision 5000 5680 | |
| MSI CreatorPro Z16P B12UKST | |
| AIDA64 / FP32 Ray-Trace | |
| Przeciętny Intel Core i9-13950HX (17993 - 28957, n=9) | |
| HP ZBook Fury 16 G10 | |
| Lenovo ThinkPad P16 G1 RTX A5500 | |
| HP ZBook Fury 16 G9 | |
| Dell Precision 5000 5680 | |
| MSI CreatorPro Z16P B12UKST | |
| AIDA64 / FPU Julia | |
| Przeciętny Intel Core i9-13950HX (89362 - 144303, n=9) | |
| HP ZBook Fury 16 G10 | |
| HP ZBook Fury 16 G9 | |
| Lenovo ThinkPad P16 G1 RTX A5500 | |
| Dell Precision 5000 5680 | |
| MSI CreatorPro Z16P B12UKST | |
| AIDA64 / CPU SHA3 | |
| Przeciętny Intel Core i9-13950HX (4518 - 7093, n=9) | |
| HP ZBook Fury 16 G10 | |
| Lenovo ThinkPad P16 G1 RTX A5500 | |
| HP ZBook Fury 16 G9 | |
| MSI CreatorPro Z16P B12UKST | |
| Dell Precision 5000 5680 | |
| AIDA64 / CPU Queen | |
| Przeciętny Intel Core i9-13950HX (131931 - 140103, n=8) | |
| HP ZBook Fury 16 G10 | |
| Dell Precision 5000 5680 | |
| Lenovo ThinkPad P16 G1 RTX A5500 | |
| HP ZBook Fury 16 G9 | |
| MSI CreatorPro Z16P B12UKST | |
| AIDA64 / FPU SinJulia | |
| Przeciętny Intel Core i9-13950HX (12318 - 17057, n=9) | |
| HP ZBook Fury 16 G10 | |
| Lenovo ThinkPad P16 G1 RTX A5500 | |
| HP ZBook Fury 16 G9 | |
| Dell Precision 5000 5680 | |
| MSI CreatorPro Z16P B12UKST | |
| AIDA64 / FPU Mandel | |
| Przeciętny Intel Core i9-13950HX (44372 - 71038, n=9) | |
| HP ZBook Fury 16 G10 | |
| HP ZBook Fury 16 G9 | |
| Lenovo ThinkPad P16 G1 RTX A5500 | |
| Dell Precision 5000 5680 | |
| MSI CreatorPro Z16P B12UKST | |
| AIDA64 / CPU AES | |
| Przeciętny Intel Core i9-13950HX (99981 - 204491, n=9) | |
| MSI CreatorPro Z16P B12UKST | |
| HP ZBook Fury 16 G10 | |
| HP ZBook Fury 16 G9 | |
| Lenovo ThinkPad P16 G1 RTX A5500 | |
| Dell Precision 5000 5680 | |
| AIDA64 / CPU ZLib | |
| Przeciętny Intel Core i9-13950HX (1263 - 2069, n=9) | |
| HP ZBook Fury 16 G10 | |
| Lenovo ThinkPad P16 G1 RTX A5500 | |
| HP ZBook Fury 16 G9 | |
| MSI CreatorPro Z16P B12UKST | |
| Dell Precision 5000 5680 | |
| AIDA64 / FP64 Ray-Trace | |
| Przeciętny Intel Core i9-13950HX (9649 - 15573, n=9) | |
| HP ZBook Fury 16 G10 | |
| Lenovo ThinkPad P16 G1 RTX A5500 | |
| HP ZBook Fury 16 G9 | |
| Dell Precision 5000 5680 | |
| MSI CreatorPro Z16P B12UKST | |
| AIDA64 / CPU PhotoWorxx | |
| Dell Precision 5000 5680 | |
| Przeciętny Intel Core i9-13950HX (40233 - 50864, n=9) | |
| MSI CreatorPro Z16P B12UKST | |
| Lenovo ThinkPad P16 G1 RTX A5500 | |
| HP ZBook Fury 16 G10 | |
| HP ZBook Fury 16 G9 | |
Wydajność systemu
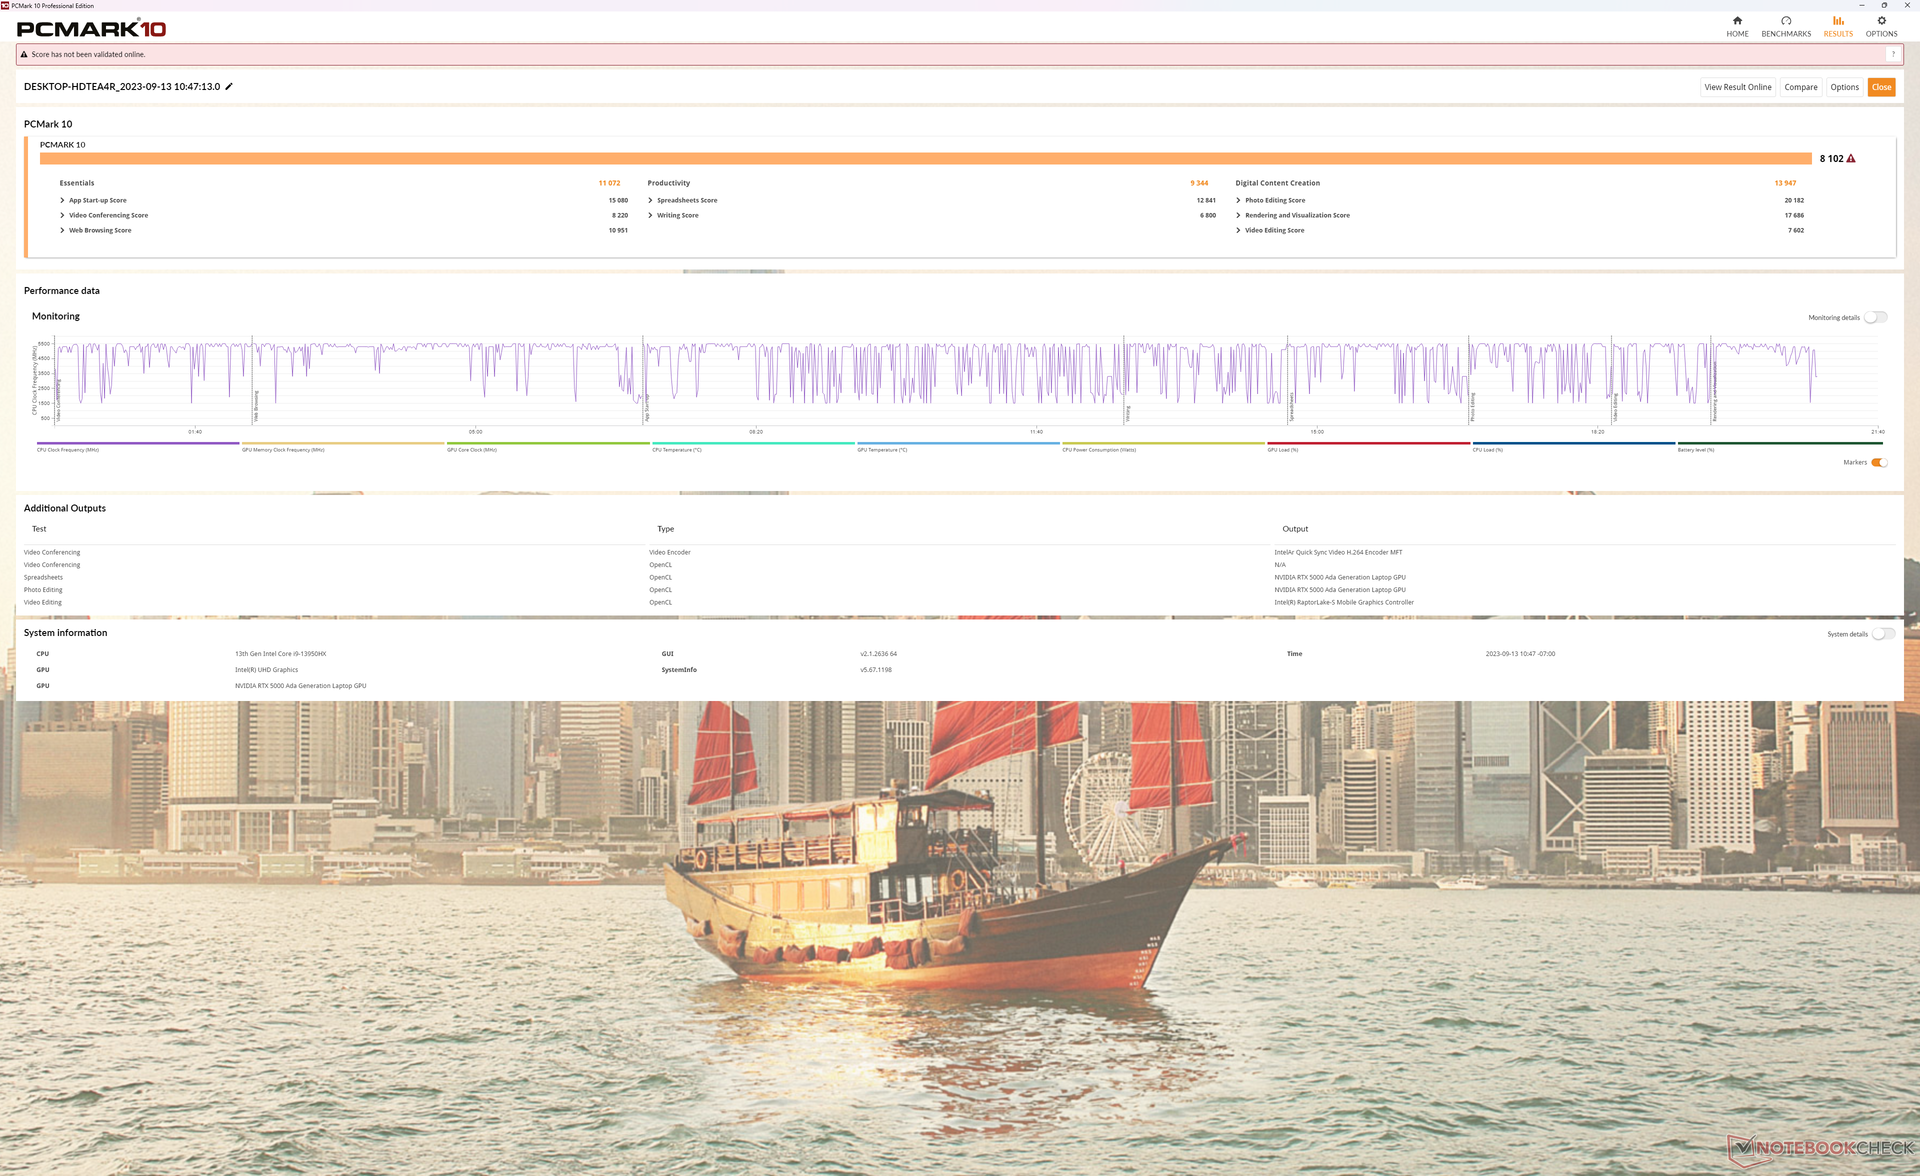
Wyniki PCMark wyprzedzają zeszłoroczny model Fury 16 G9, zwłaszcza w podteście Digital Content Creation, ze względu na znaczny wzrost wydajności GPU. Tymczasem Precision 5680 uzyskuje wyższe wyniki w kategorii Produktywność ze względu na dyski SSD RAID 0. Oczywiście nasz HP może być również skonfigurowany z RAID, jeśli zajdzie taka potrzeba.
CrossMark: Overall | Productivity | Creativity | Responsiveness
| PCMark 10 / Score | |
| Dell Precision 5000 5680 | |
| HP ZBook Fury 16 G10 | |
| Przeciętny Intel Core i9-13950HX, NVIDIA RTX 5000 Ada Generation Laptop (n=1) | |
| Lenovo ThinkPad P16 G1 RTX A5500 | |
| MSI CreatorPro Z16P B12UKST | |
| Asus ProArt StudioBook 16 W7600H5A-2BL2 | |
| HP ZBook Fury 16 G9 | |
| PCMark 10 / Essentials | |
| Dell Precision 5000 5680 | |
| HP ZBook Fury 16 G10 | |
| Przeciętny Intel Core i9-13950HX, NVIDIA RTX 5000 Ada Generation Laptop (n=1) | |
| HP ZBook Fury 16 G9 | |
| Lenovo ThinkPad P16 G1 RTX A5500 | |
| MSI CreatorPro Z16P B12UKST | |
| Asus ProArt StudioBook 16 W7600H5A-2BL2 | |
| PCMark 10 / Productivity | |
| Dell Precision 5000 5680 | |
| Lenovo ThinkPad P16 G1 RTX A5500 | |
| MSI CreatorPro Z16P B12UKST | |
| HP ZBook Fury 16 G10 | |
| Przeciętny Intel Core i9-13950HX, NVIDIA RTX 5000 Ada Generation Laptop (n=1) | |
| Asus ProArt StudioBook 16 W7600H5A-2BL2 | |
| HP ZBook Fury 16 G9 | |
| PCMark 10 / Digital Content Creation | |
| HP ZBook Fury 16 G10 | |
| Przeciętny Intel Core i9-13950HX, NVIDIA RTX 5000 Ada Generation Laptop (n=1) | |
| Dell Precision 5000 5680 | |
| Asus ProArt StudioBook 16 W7600H5A-2BL2 | |
| Lenovo ThinkPad P16 G1 RTX A5500 | |
| MSI CreatorPro Z16P B12UKST | |
| HP ZBook Fury 16 G9 | |
| CrossMark / Overall | |
| MSI CreatorPro Z16P B12UKST | |
| Dell Precision 5000 5680 | |
| HP ZBook Fury 16 G10 | |
| Przeciętny Intel Core i9-13950HX, NVIDIA RTX 5000 Ada Generation Laptop (n=1) | |
| HP ZBook Fury 16 G9 | |
| Lenovo ThinkPad P16 G1 RTX A5500 | |
| CrossMark / Productivity | |
| HP ZBook Fury 16 G10 | |
| Przeciętny Intel Core i9-13950HX, NVIDIA RTX 5000 Ada Generation Laptop (n=1) | |
| MSI CreatorPro Z16P B12UKST | |
| Dell Precision 5000 5680 | |
| HP ZBook Fury 16 G9 | |
| Lenovo ThinkPad P16 G1 RTX A5500 | |
| CrossMark / Creativity | |
| Lenovo ThinkPad P16 G1 RTX A5500 | |
| Dell Precision 5000 5680 | |
| HP ZBook Fury 16 G9 | |
| HP ZBook Fury 16 G10 | |
| Przeciętny Intel Core i9-13950HX, NVIDIA RTX 5000 Ada Generation Laptop (n=1) | |
| MSI CreatorPro Z16P B12UKST | |
| CrossMark / Responsiveness | |
| MSI CreatorPro Z16P B12UKST | |
| HP ZBook Fury 16 G10 | |
| Przeciętny Intel Core i9-13950HX, NVIDIA RTX 5000 Ada Generation Laptop (n=1) | |
| HP ZBook Fury 16 G9 | |
| Dell Precision 5000 5680 | |
| Lenovo ThinkPad P16 G1 RTX A5500 | |
| PCMark 10 Score | 8102 pkt. | |
Pomoc | ||
| AIDA64 / Memory Copy | |
| Dell Precision 5000 5680 | |
| Lenovo ThinkPad P16 G1 RTX A5500 | |
| MSI CreatorPro Z16P B12UKST | |
| HP ZBook Fury 16 G10 | |
| HP ZBook Fury 16 G9 | |
| AIDA64 / Memory Read | |
| Dell Precision 5000 5680 | |
| MSI CreatorPro Z16P B12UKST | |
| Lenovo ThinkPad P16 G1 RTX A5500 | |
| HP ZBook Fury 16 G10 | |
| HP ZBook Fury 16 G9 | |
| AIDA64 / Memory Write | |
| Dell Precision 5000 5680 | |
| MSI CreatorPro Z16P B12UKST | |
| Lenovo ThinkPad P16 G1 RTX A5500 | |
| HP ZBook Fury 16 G10 | |
| HP ZBook Fury 16 G9 | |
| AIDA64 / Memory Latency | |
| HP ZBook Fury 16 G10 | |
| MSI CreatorPro Z16P B12UKST | |
| Dell Precision 5000 5680 | |
| HP ZBook Fury 16 G9 | |
| Lenovo ThinkPad P16 G1 RTX A5500 | |
| Asus ProArt StudioBook 16 W7600H5A-2BL2 | |
| Asus ProArt StudioBook 16 W7600H5A-2BL2 | |
* ... im mniej tym lepiej
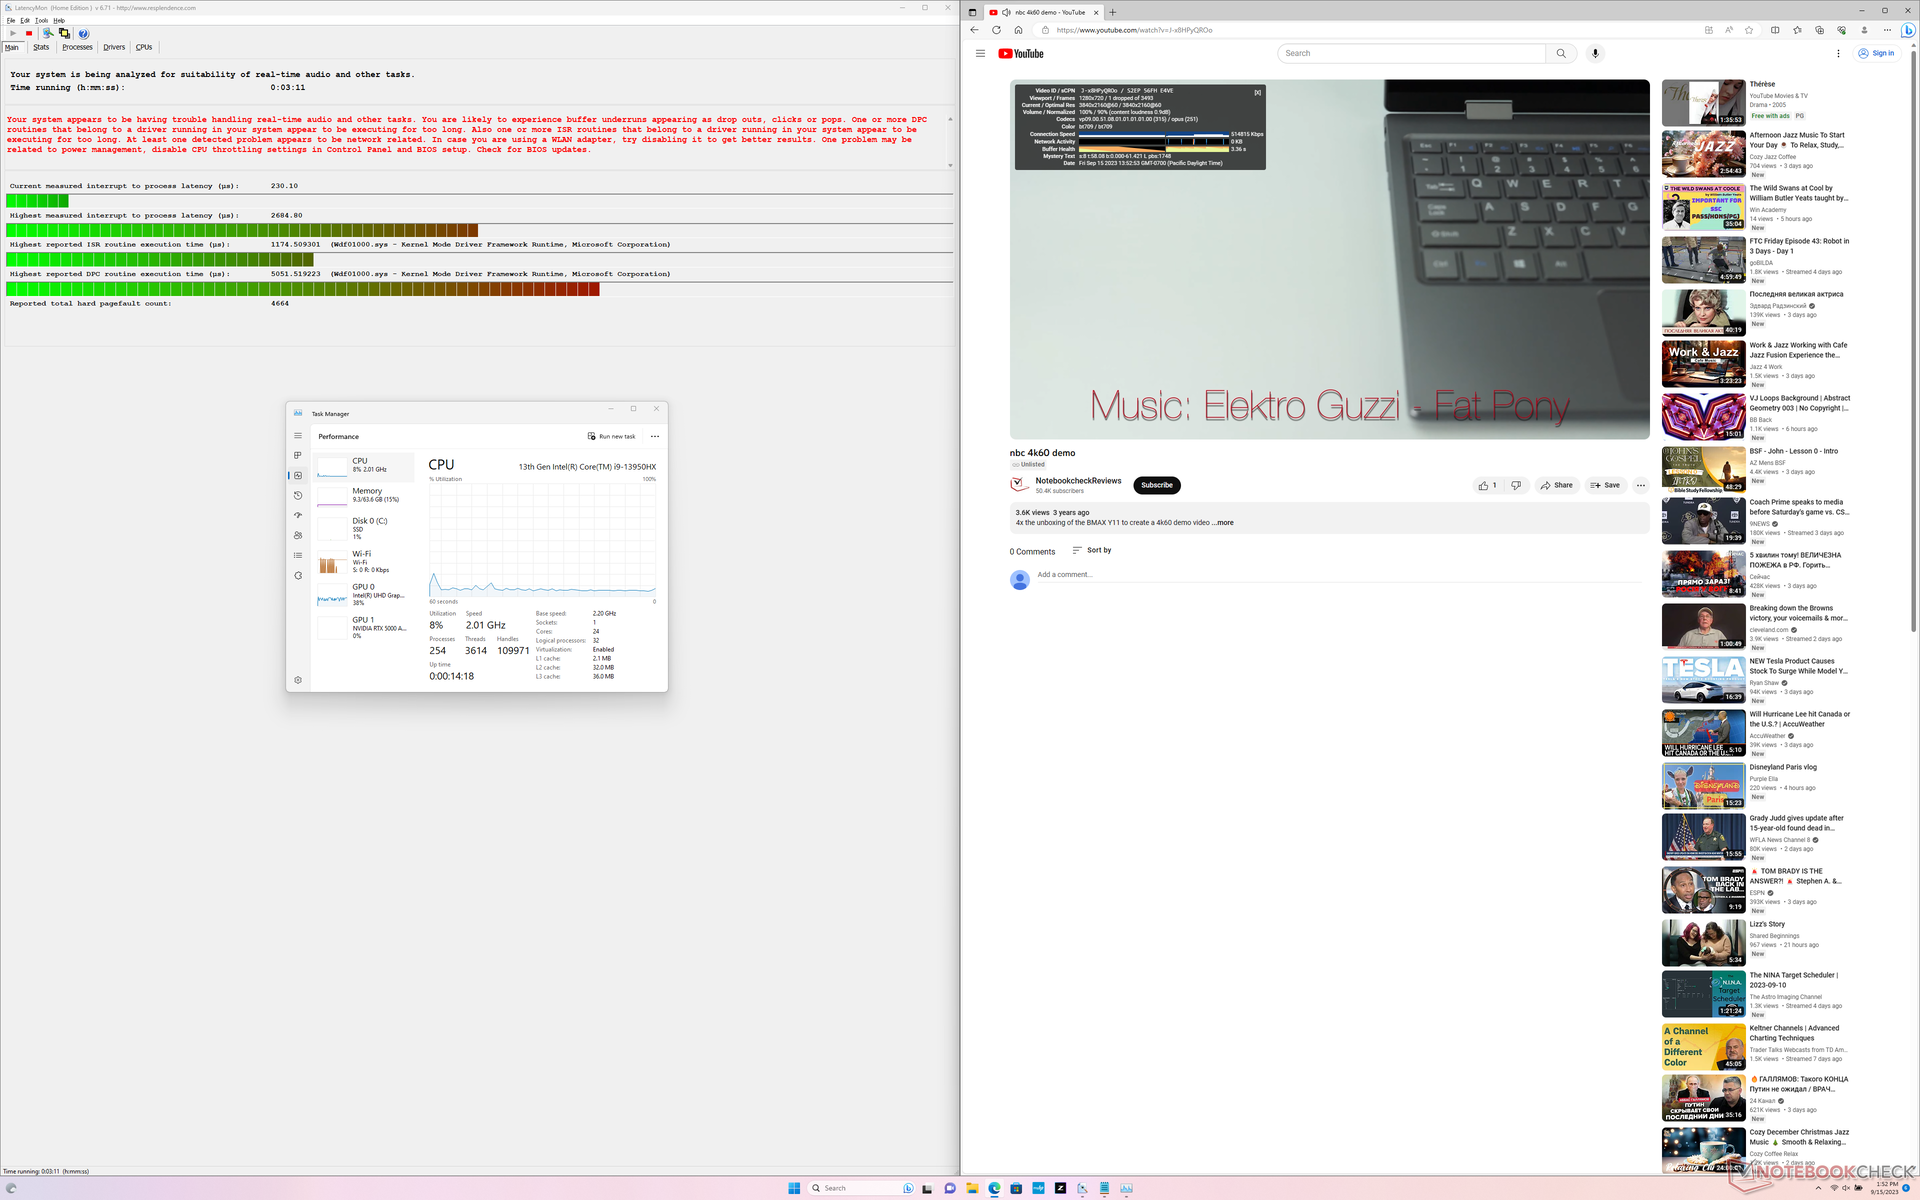
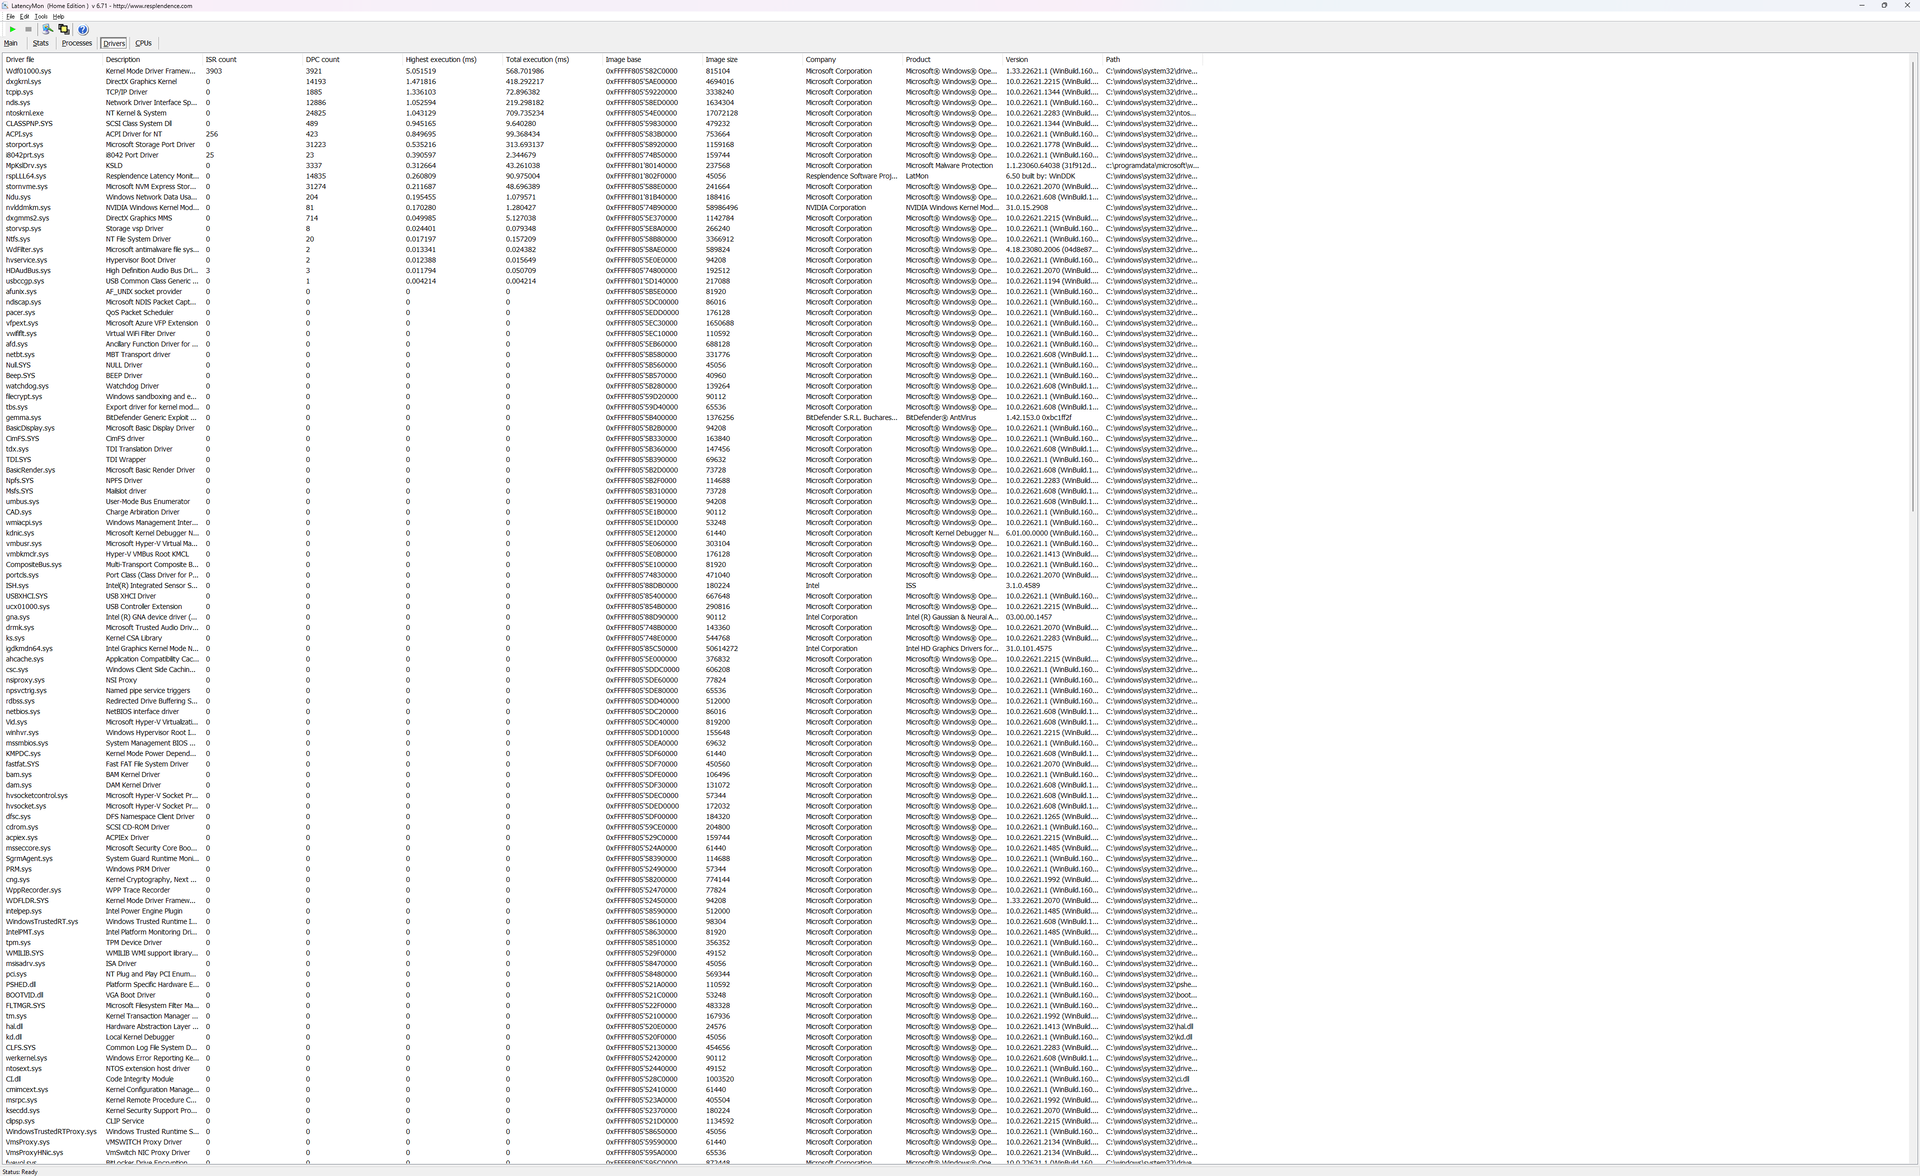
Opóźnienie DPC
LatencyMon ujawnia problemy z DPC podczas otwierania wielu kart na naszej stronie głównej. odtwarzanie wideo 4K przy 60 FPS jest prawie idealne, z tylko jedną utraconą klatką zarejestrowaną podczas 60-sekundowego interwału.
| DPC Latencies / LatencyMon - interrupt to process latency (max), Web, Youtube, Prime95 | |
| HP ZBook Fury 16 G10 | |
| HP ZBook Fury 16 G9 | |
| Dell Precision 5000 5680 | |
| Lenovo ThinkPad P16 G1 RTX A5500 | |
| Asus ProArt StudioBook 16 W7600H5A-2BL2 | |
| MSI CreatorPro Z16P B12UKST | |
* ... im mniej tym lepiej
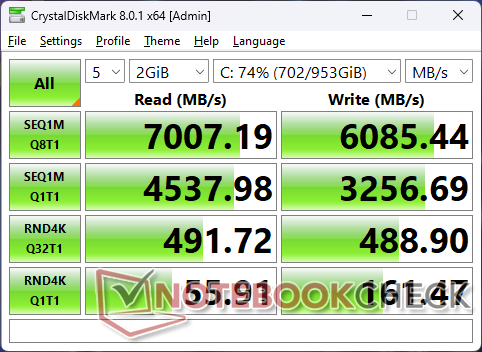
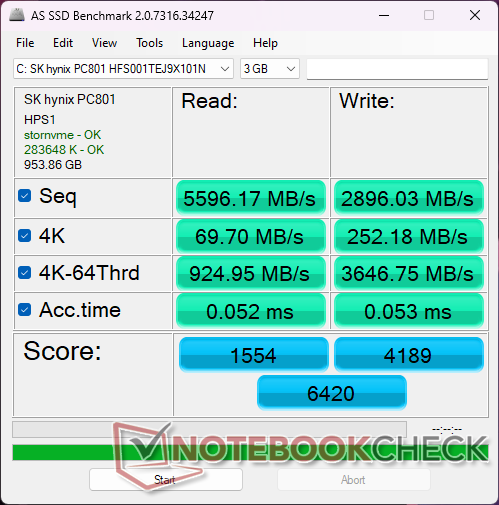
Urządzenia pamięci masowej
Nasza jednostka testowa jest dostarczana z SK hynix PC801 PCIe4 x4 NVMe SSD, podczas gdy nasza starsza jednostka Fury G16 G9 była dostarczana z dyskiem Micron 3400. Niestety, wydajność nadal spadała do 3400 MB/s po około minucie naszego testu obciążeniowego, co pokazuje poniższy wykres. Oczywiste jest, że cztery gniazda M.2 SSD naprawdę przydałyby się do lepszego chłodzenia, aby poprawić spójność wydajności.

| Drive Performance rating - Percent | |
| MSI CreatorPro Z16P B12UKST -8! | |
| HP ZBook Fury 16 G9 | |
| HP ZBook Fury 16 G10 | |
| Dell Precision 5000 5680 | |
| Lenovo ThinkPad P16 G1 RTX A5500 | |
| Asus ProArt StudioBook 16 W7600H5A-2BL2 | |
* ... im mniej tym lepiej
Disk Throttling: DiskSpd Read Loop, Queue Depth 8
Wydajność GPU - Mobile Monster
The RTX 5000 Ada w naszym systemie HP jest od 10 do 20 procent szybszy niż ten sam procesor graficzny w Dell Precision 5680. Jego niewielką, ale stałą przewagę wydajnościową można przypisać wyższemu pułapowi TGP, podczas gdy GPU we wspomnianym Dellu działałby przy niższej obwiedni mocy. Nasza sekcja testów obciążeniowych poniżej szczegółowo opisuje nasze obserwacje.
Ogólna wydajność znacznie wyprzedzaRTX A5500 w zeszłorocznej karcie Fury 16 G9 nawet o 40% lub 80% w zależności od zastosowania.
| 3DMark Performance rating - Percent | |
| HP ZBook Fury 16 G10 | |
| Przeciętny NVIDIA RTX 5000 Ada Generation Laptop | |
| Dell Precision 5000 5680 | |
| Lenovo ThinkPad P16 G1 RTX A5500 | |
| Asus ProArt StudioBook 16 W7600H5A-2BL2 -20! | |
| HP ZBook Fury 16 G9 | |
| Dell Precision 5480 -2! | |
| MSI CreatorPro Z16P B12UKST -17! | |
| HP ZBook Studio 16 G9 62U04EA -10! | |
| Lenovo ThinkPad P16 G1 21D6001DMB -18! | |
| Lenovo ThinkPad P1 G4-20Y4Z9DVUS -18! | |
| 3DMark 11 - 1280x720 Performance GPU | |
| HP ZBook Fury 16 G10 | |
| Przeciętny NVIDIA RTX 5000 Ada Generation Laptop (49833 - 54334, n=3) | |
| Dell Precision 5000 5680 | |
| Lenovo ThinkPad P16 G1 RTX A5500 | |
| HP ZBook Fury 16 G9 | |
| Dell Precision 5480 | |
| MSI CreatorPro Z16P B12UKST | |
| HP ZBook Studio 16 G9 62U04EA | |
| Lenovo ThinkPad P16 G1 21D6001DMB | |
| Lenovo ThinkPad P1 G4-20Y4Z9DVUS | |
| 3DMark 11 Performance | 39530 pkt. | |
| 3DMark Fire Strike Score | 28837 pkt. | |
| 3DMark Time Spy Score | 15989 pkt. | |
Pomoc | ||
* ... im mniej tym lepiej
Witcher 3 FPS Chart
| low | med. | high | ultra | QHD | 4K | |
|---|---|---|---|---|---|---|
| The Witcher 3 (2015) | 510.5 | 430.3 | 298.1 | 156.5 | 105.2 | |
| Dota 2 Reborn (2015) | 211 | 191.7 | 188.2 | 166.7 | 157.3 | |
| Final Fantasy XV Benchmark (2018) | 196.9 | 179.9 | 149.1 | 120 | 68.7 | |
| X-Plane 11.11 (2018) | 175.5 | 153.9 | 122.4 | 102.6 | ||
| Far Cry 5 (2018) | 158 | 144 | 138 | 131 | 129 | |
| Strange Brigade (2018) | 411 | 337 | 306 | 283 | 216 | 105.1 |
| Cyberpunk 2077 1.6 (2022) | 110.5 | 106.8 | 104.9 | 103.8 | 74.7 | 37 |
| Tiny Tina's Wonderlands (2022) | 267.5 | 227.7 | 171.7 | 139.4 | 99.4 | 53.9 |
| F1 22 (2022) | 249 | 246 | 211 | 86.2 | 64.4 | 33.4 |
| Ratchet & Clank Rift Apart (2023) | 118 | 93.9 | 69.4 | 54.5 | 43.4 | 33.3 |
Emisje
Hałas systemowy
Charakterystyka wentylatora podczas typowego użytkowania, hałas w różnych scenariuszach obciążenia zgodnie z pomiarami, irytujące brzęczenie (np. tranzystorów) i inne nieprawidłowości (szybko obracający się dysk twardy, ODD, niestabilny wentylator itp.)
Analiza charakterystyki hałasu - czy występują jakieś nieprawidłowości? Krótka recenzja:Krótka analiza emisji hałasu, porównanie konkurencji.Max. 500 znaków
Hałas
| luz |
| 22.9 / 22.9 / 28.5 dB |
| obciążenie |
| 40.6 / 45.8 dB |
 | ||
30 dB cichy 40 dB(A) słyszalny 50 dB(A) irytujący |
||
min: | ||
| HP ZBook Fury 16 G10 RTX 5000 Ada Generation Laptop, i9-13950HX, SK hynix PC801 HFS001TEJ9X101N | HP ZBook Fury 16 G9 RTX A5500 Laptop GPU, i9-12950HX, Micron 3400 1TB MTFDKBA1T0TFH | Dell Precision 5000 5680 RTX 5000 Ada Generation Laptop, i9-13900H, 2x SK hynix PC801 HFS512GEJ9X101N RAID 0 | Lenovo ThinkPad P16 G1 RTX A5500 RTX A5500 Laptop GPU, i9-12950HX, WDC PC SN810 2TB | MSI CreatorPro Z16P B12UKST RTX A3000 Laptop GPU, i7-12700H, Samsung PM9A1 MZVL21T0HCLR | Asus ProArt StudioBook 16 W7600H5A-2BL2 RTX A5000 Laptop GPU, W-11955M, 2x Micron 2300 2TB MTFDHBA2T0TDV (RAID 0) | |
|---|---|---|---|---|---|---|
| Noise | -1% | 0% | 2% | -6% | -5% | |
| wyłączone / środowisko * (dB) | 22.9 | 22.6 1% | 22.8 -0% | 23.1 -1% | 24.1 -5% | 26 -14% |
| Idle Minimum * (dB) | 22.9 | 22.7 1% | 23 -0% | 23.1 -1% | 27.1 -18% | 26 -14% |
| Idle Average * (dB) | 22.9 | 22.7 1% | 23 -0% | 23.1 -1% | 27.1 -18% | 26 -14% |
| Idle Maximum * (dB) | 28.5 | 28.8 -1% | 23 19% | 23.1 19% | 27.1 5% | 26.5 7% |
| Load Average * (dB) | 40.6 | 36.2 11% | 37.2 8% | 28.9 29% | 42.9 -6% | 42 -3% |
| Witcher 3 ultra * (dB) | 44.1 | 49.5 -12% | 51 -16% | 51.6 -17% | 44 -0% | |
| Load Maximum * (dB) | 45.8 | 49.3 -8% | 51 -11% | 51.4 -12% | 47 -3% | 43 6% |
* ... im mniej tym lepiej
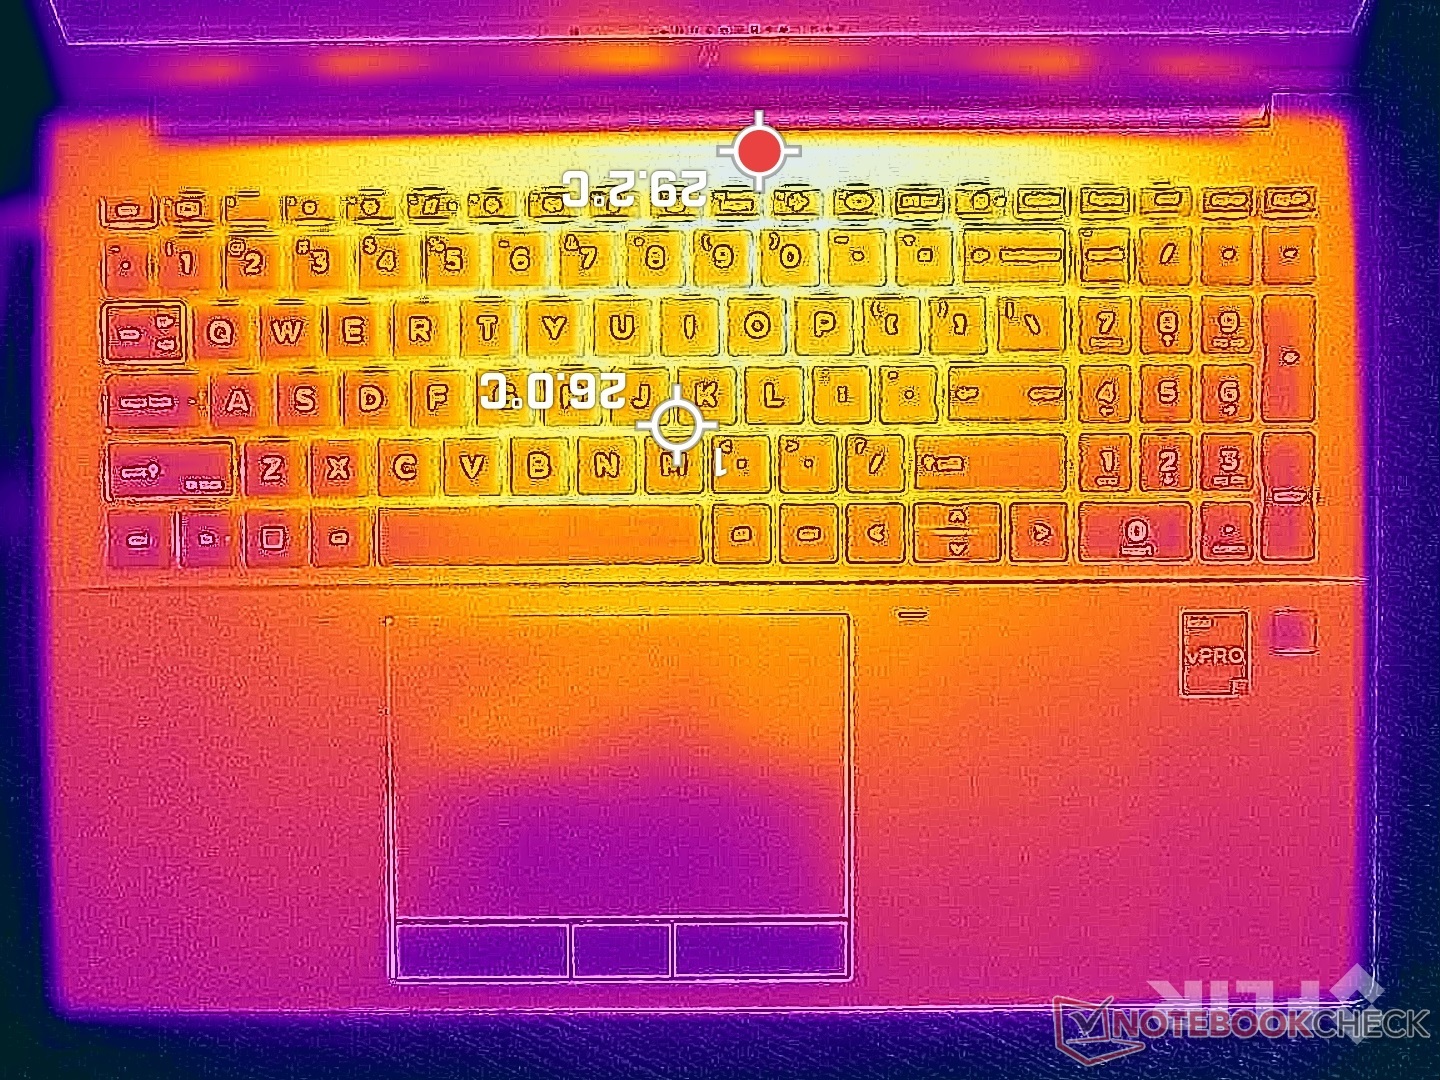
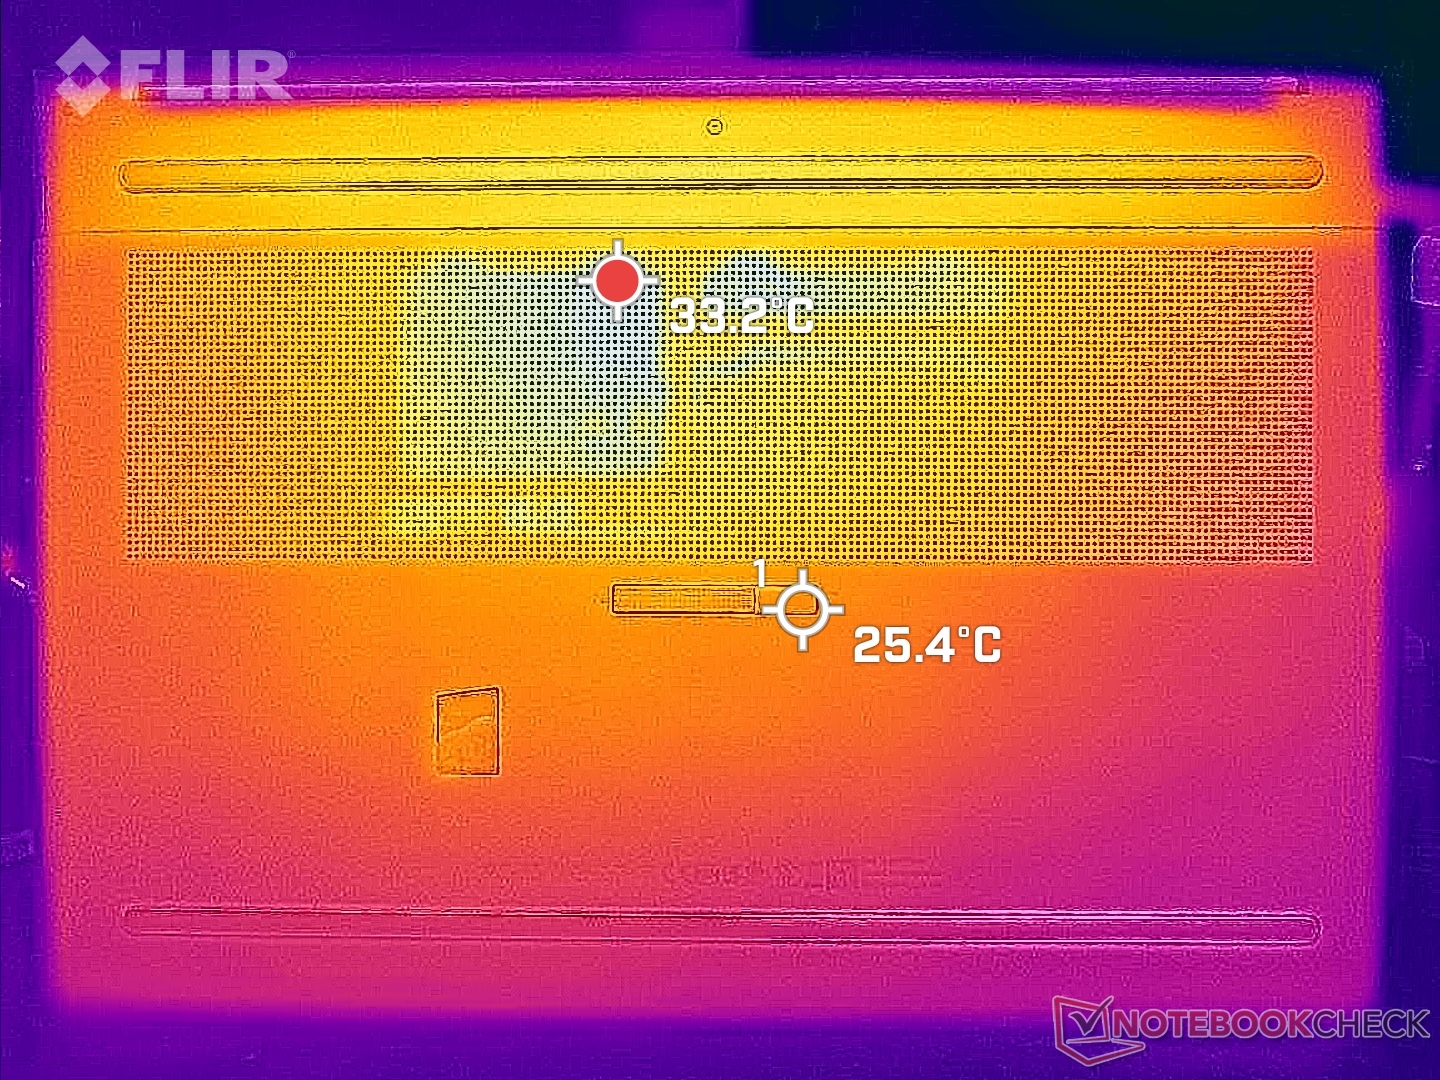
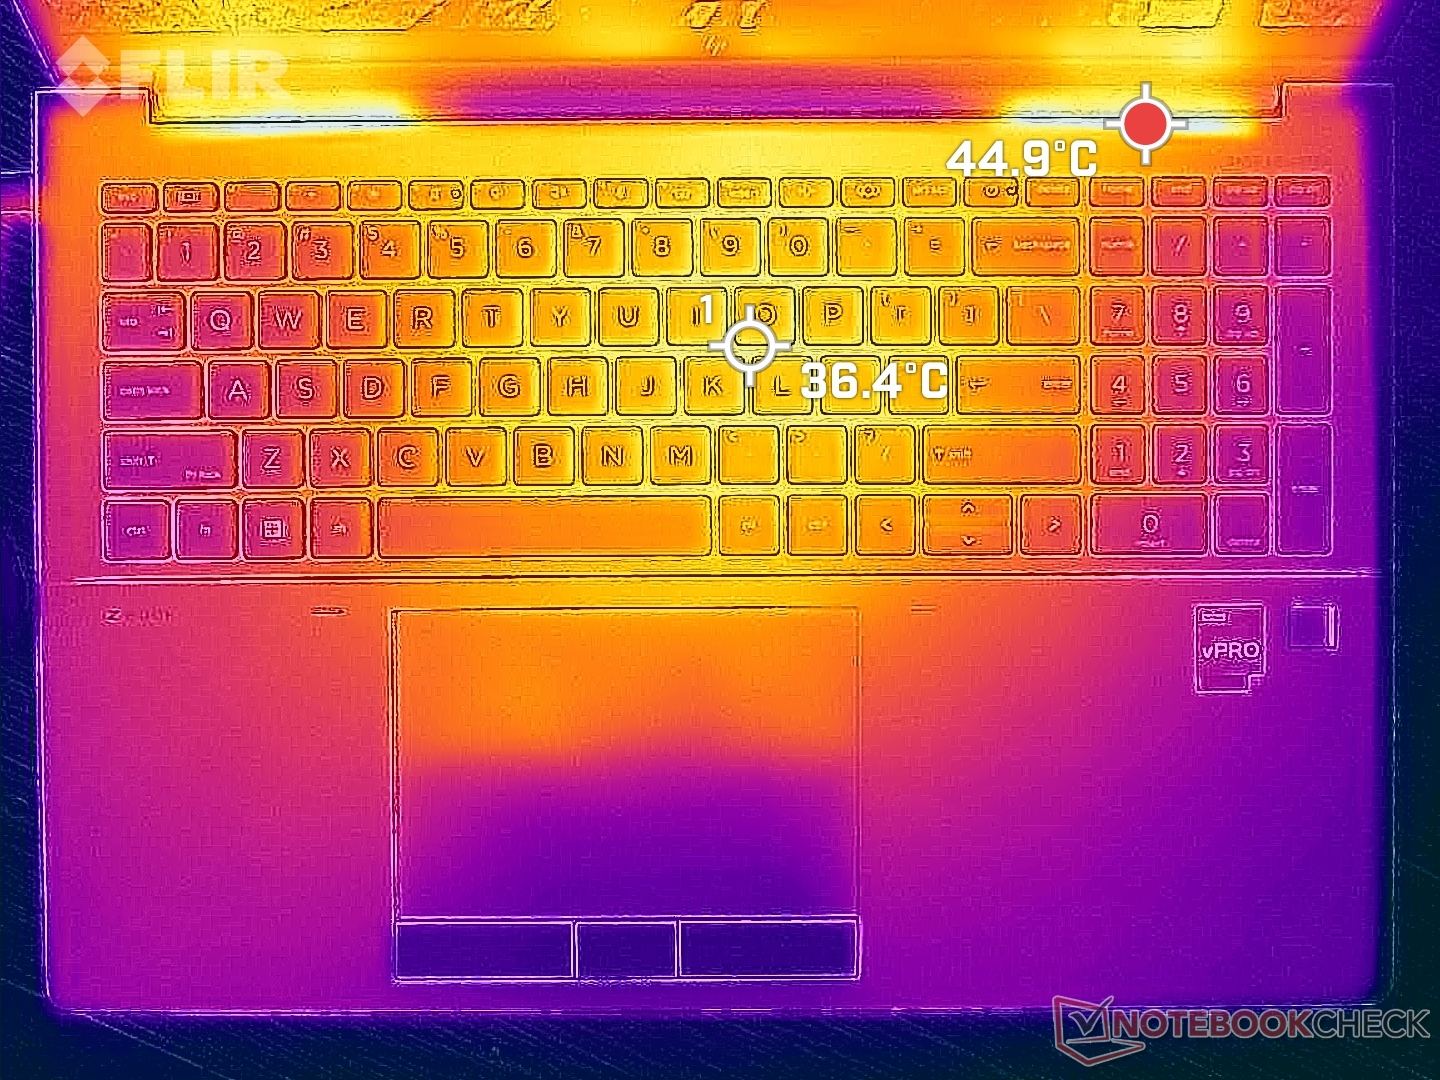
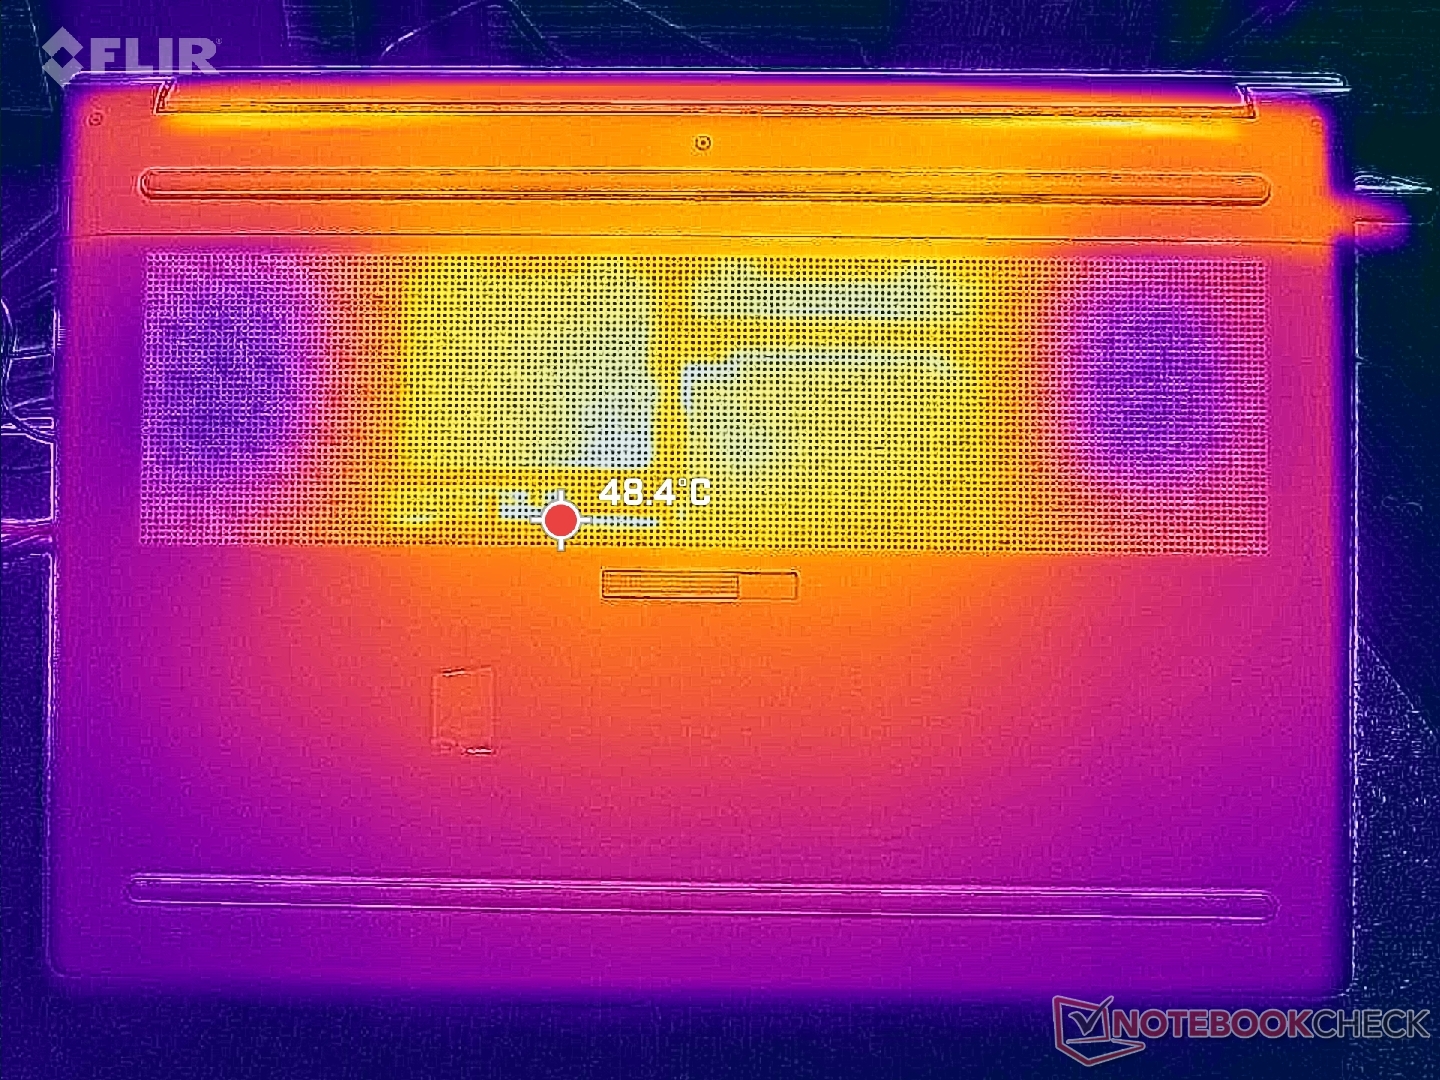
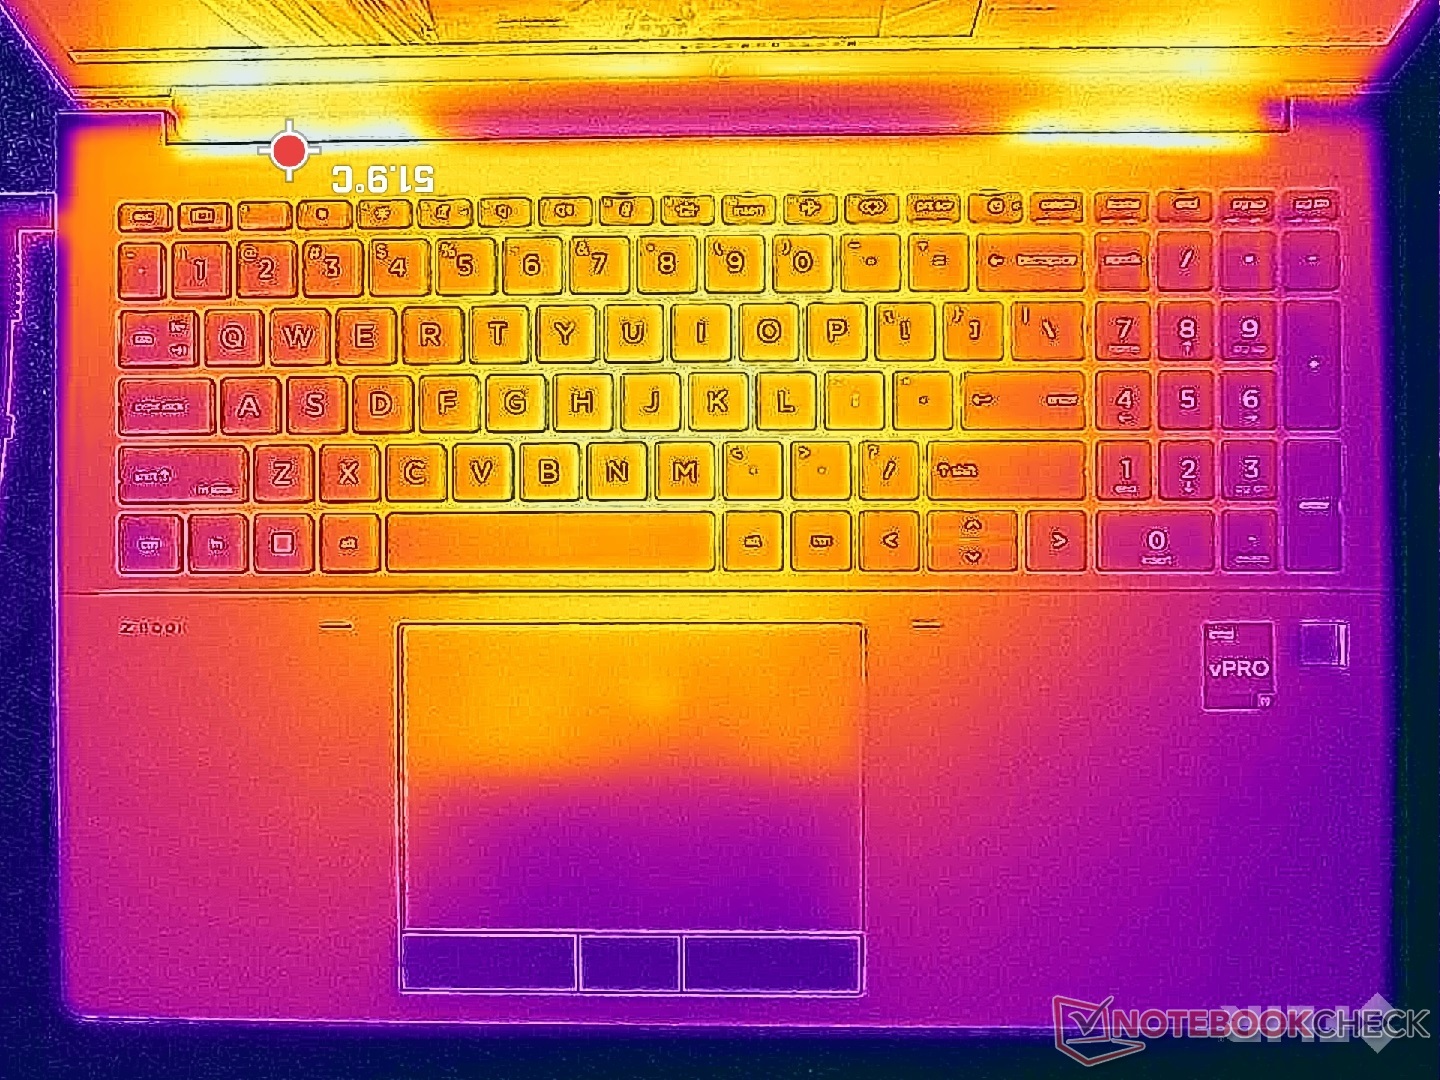
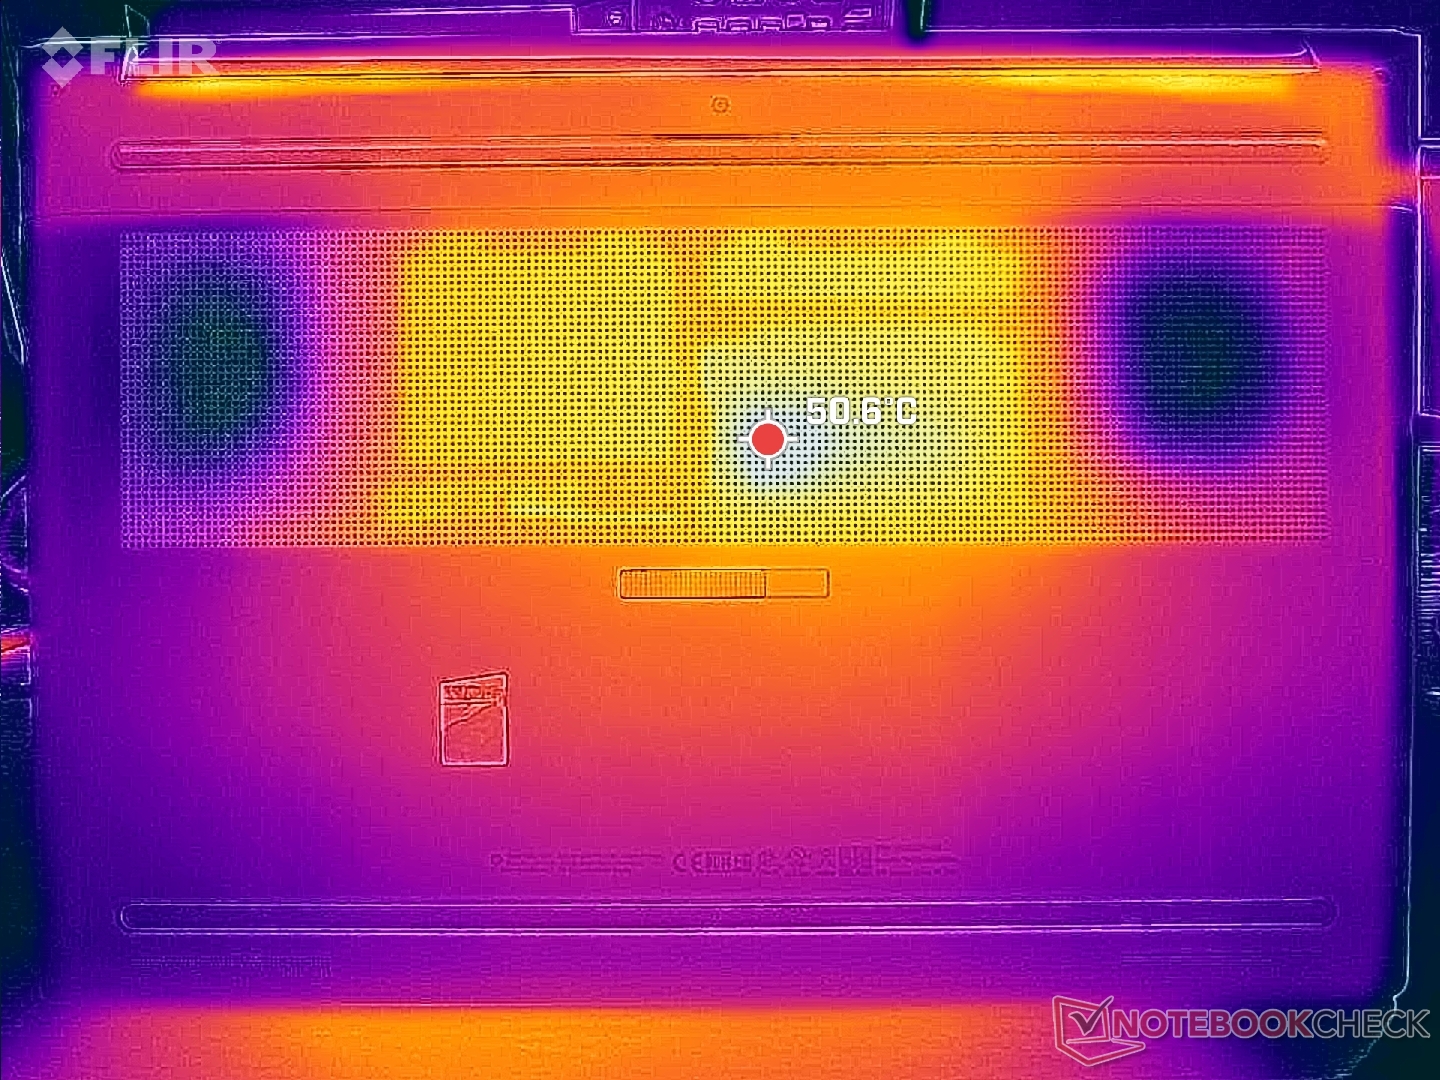
Temperatura
Temperatury powierzchni mogą osiągnąć ponad 36 C na środku klawiatury lub 45 C wzdłuż tylnej części podczas pracy z dużym obciążeniem. Co ciekawe, system jest chłodniejszy niż Precision 5680 na klawiaturze, ale odwrotnie jest w przypadku ich dolnych powierzchni.
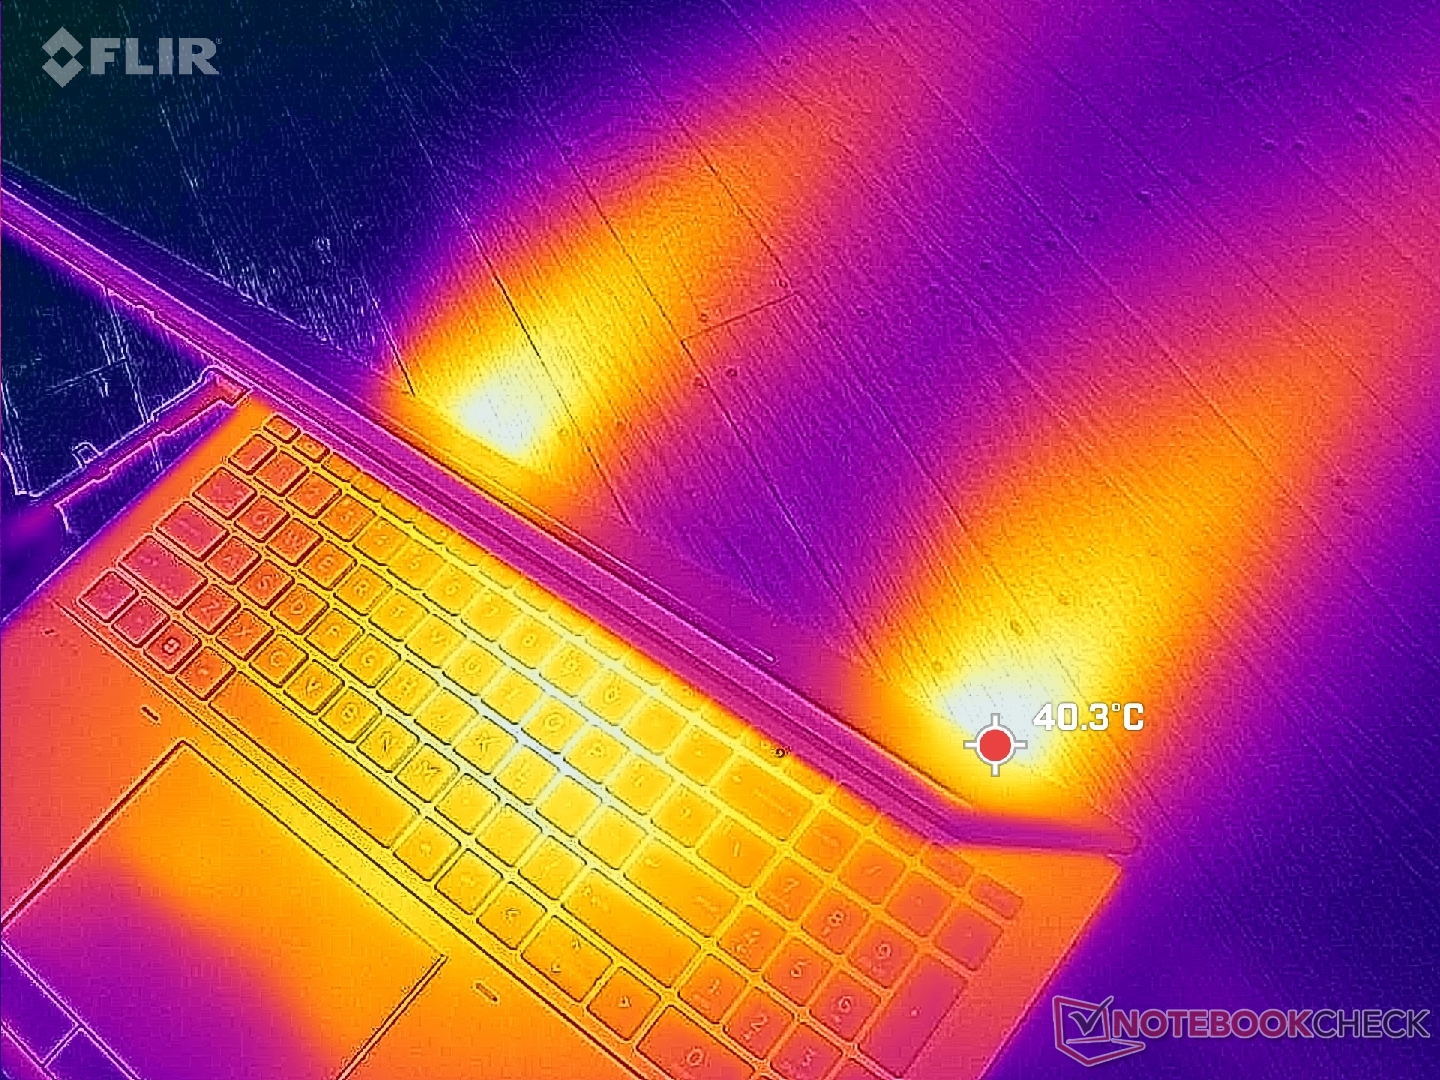
(±) Maksymalna temperatura w górnej części wynosi 44.8 °C / 113 F, w porównaniu do średniej 38.2 °C / 101 F , począwszy od 22.2 do 69.8 °C dla klasy Workstation.
(-) Dno nagrzewa się maksymalnie do 50 °C / 122 F, w porównaniu do średniej 41.1 °C / 106 F
(+) W stanie bezczynności średnia temperatura górnej części wynosi 30.6 °C / 87 F, w porównaniu ze średnią temperaturą urządzenia wynoszącą 32 °C / ### class_avg_f### F.
(±) Podczas gry w Wiedźmina 3 średnia temperatura górnej części wynosi 34.7 °C / 94 F, w porównaniu do średniej temperatury urządzenia wynoszącej 32 °C / ## #class_avg_f### F.
(±) Podpórki pod nadgarstki i touchpad mogą się bardzo nagrzać w dotyku, maksymalnie do 39.2 °C / 102.6 F.
(-) Średnia temperatura obszaru podparcia dłoni w podobnych urządzeniach wynosiła 27.8 °C / 82 F (-11.4 °C / -20.6 F).
| HP ZBook Fury 16 G10 Intel Core i9-13950HX, NVIDIA RTX 5000 Ada Generation Laptop | HP ZBook Fury 16 G9 Intel Core i9-12950HX, NVIDIA RTX A5500 Laptop GPU | Dell Precision 5000 5680 Intel Core i9-13900H, NVIDIA RTX 5000 Ada Generation Laptop | Lenovo ThinkPad P16 G1 RTX A5500 Intel Core i9-12950HX, NVIDIA RTX A5500 Laptop GPU | MSI CreatorPro Z16P B12UKST Intel Core i7-12700H, NVIDIA RTX A3000 Laptop GPU | Asus ProArt StudioBook 16 W7600H5A-2BL2 Intel Xeon W-11955M, NVIDIA RTX A5000 Laptop GPU | |
|---|---|---|---|---|---|---|
| Heat | 8% | 4% | -3% | -4% | -3% | |
| Maximum Upper Side * (°C) | 44.8 | 43.2 4% | 50.2 -12% | 44.8 -0% | 56.3 -26% | 45.7 -2% |
| Maximum Bottom * (°C) | 50 | 50.4 -1% | 32 36% | 49.8 -0% | 68.3 -37% | 48.3 3% |
| Idle Upper Side * (°C) | 34.4 | 28.6 17% | 37.4 -9% | 30.6 11% | 25.2 27% | 35.3 -3% |
| Idle Bottom * (°C) | 31.8 | 28.2 11% | 31.2 2% | 38.6 -21% | 25.9 19% | 34.4 -8% |
* ... im mniej tym lepiej
Test warunków skrajnych
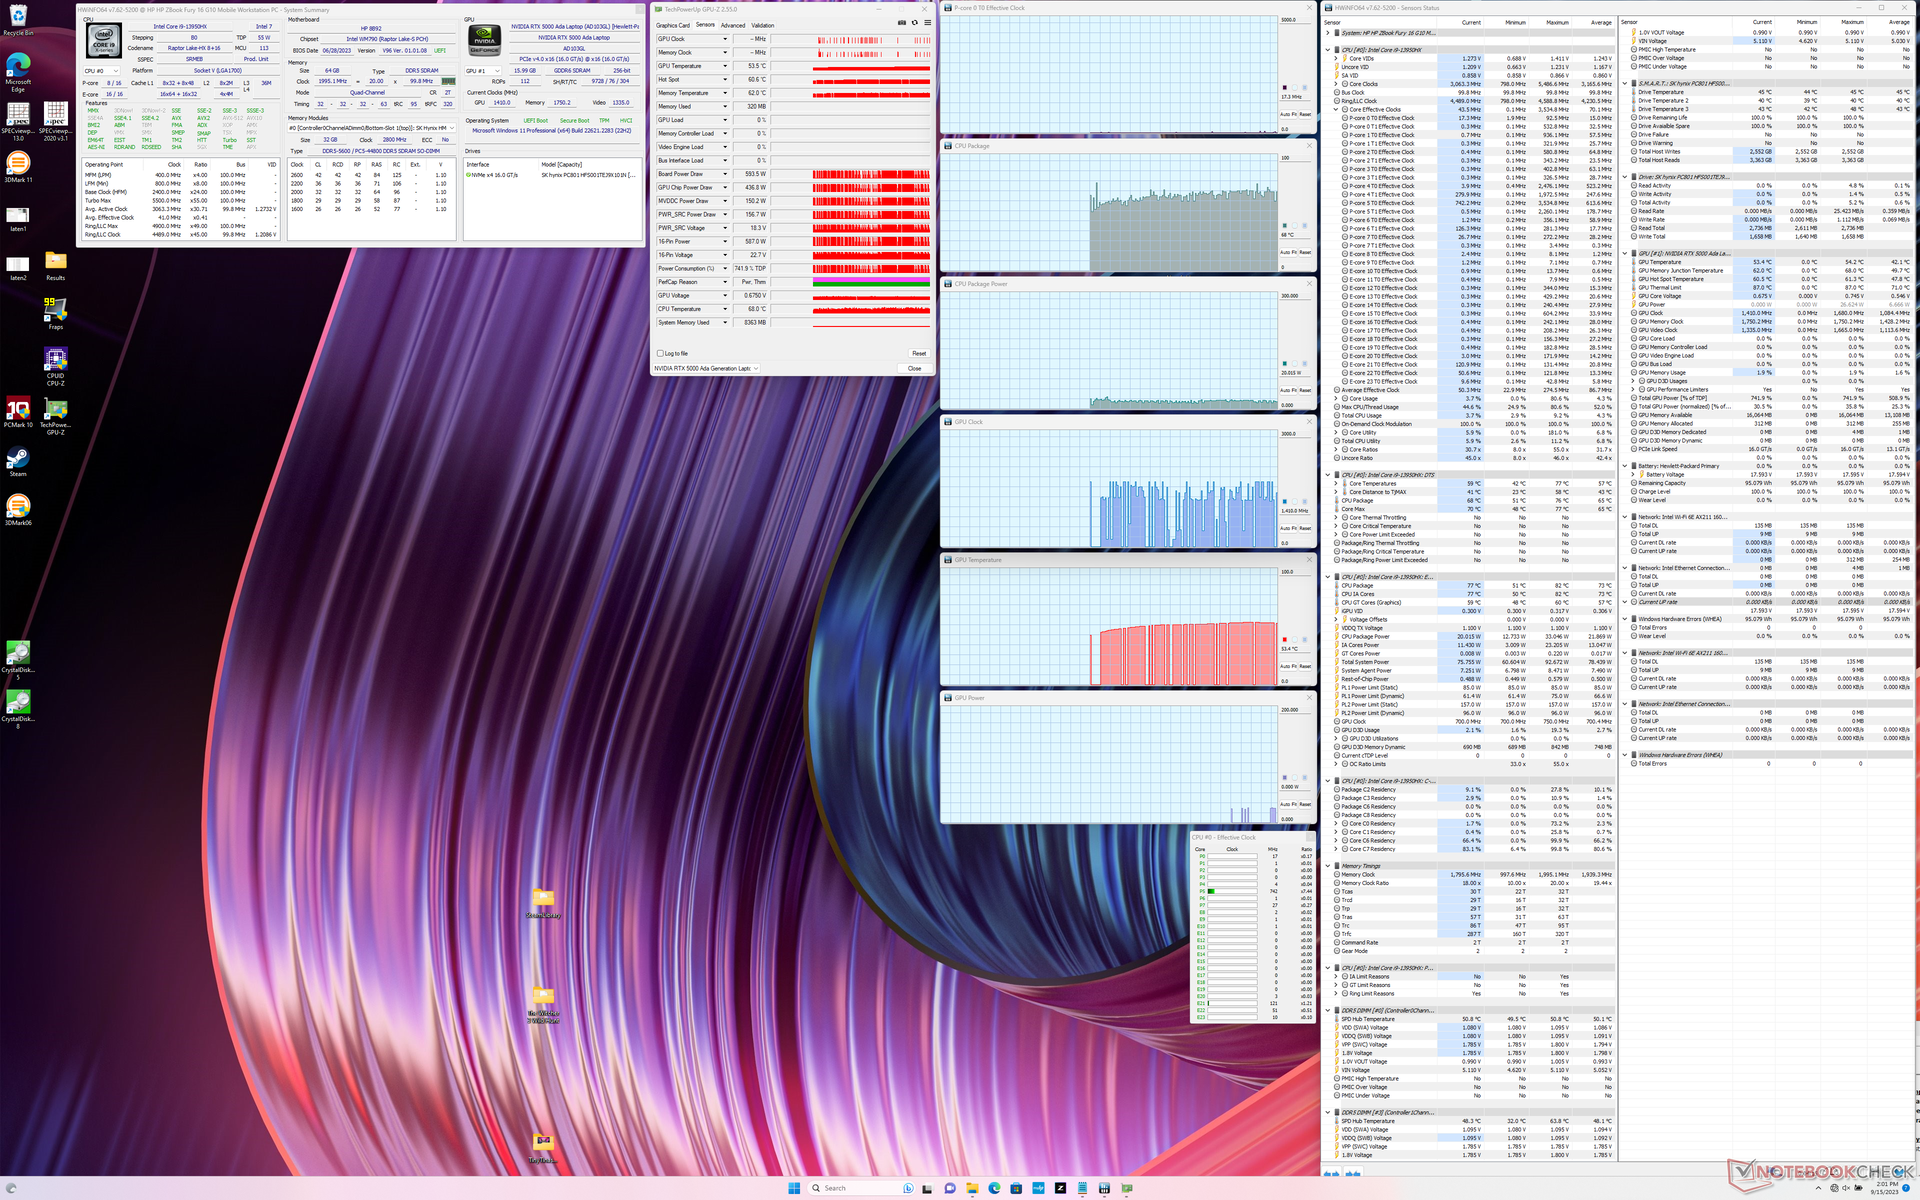
Średnie częstotliwości taktowania procesora i pobór mocy na płycie podczas uruchamiania Prime95 ustabilizowałyby się odpowiednio na poziomie 1,5 GHz i 48 W, w porównaniu do 2,9 GHz i 115 W w Razer Blade 18 wyposażonym w ten sam procesor Core i9-13950HX. Temperatura rdzenia byłaby niższa o około 8 ° C w HP, co sugeruje, że Fury 16 G10 priorytetowo traktuje kontrolę temperatury nad szybszą wydajnością.
Praca w trybie zrównoważonym zmniejsza wydajność graficzną. Przykładowo, częstotliwość taktowania GPU i pobór mocy w trybie Witcher 3 ustabilizowałyby się odpowiednio na poziomie 1845 MHz i 102 W, w porównaniu do 1770 MHz i 94 W w trybie zrównoważonym. Tak czy inaczej, system HP osiąga wyższe rzeczywiste wartości TGP niż ten sam procesor graficzny w modelu Precision 5680 gdzie jest to tylko 72 W.
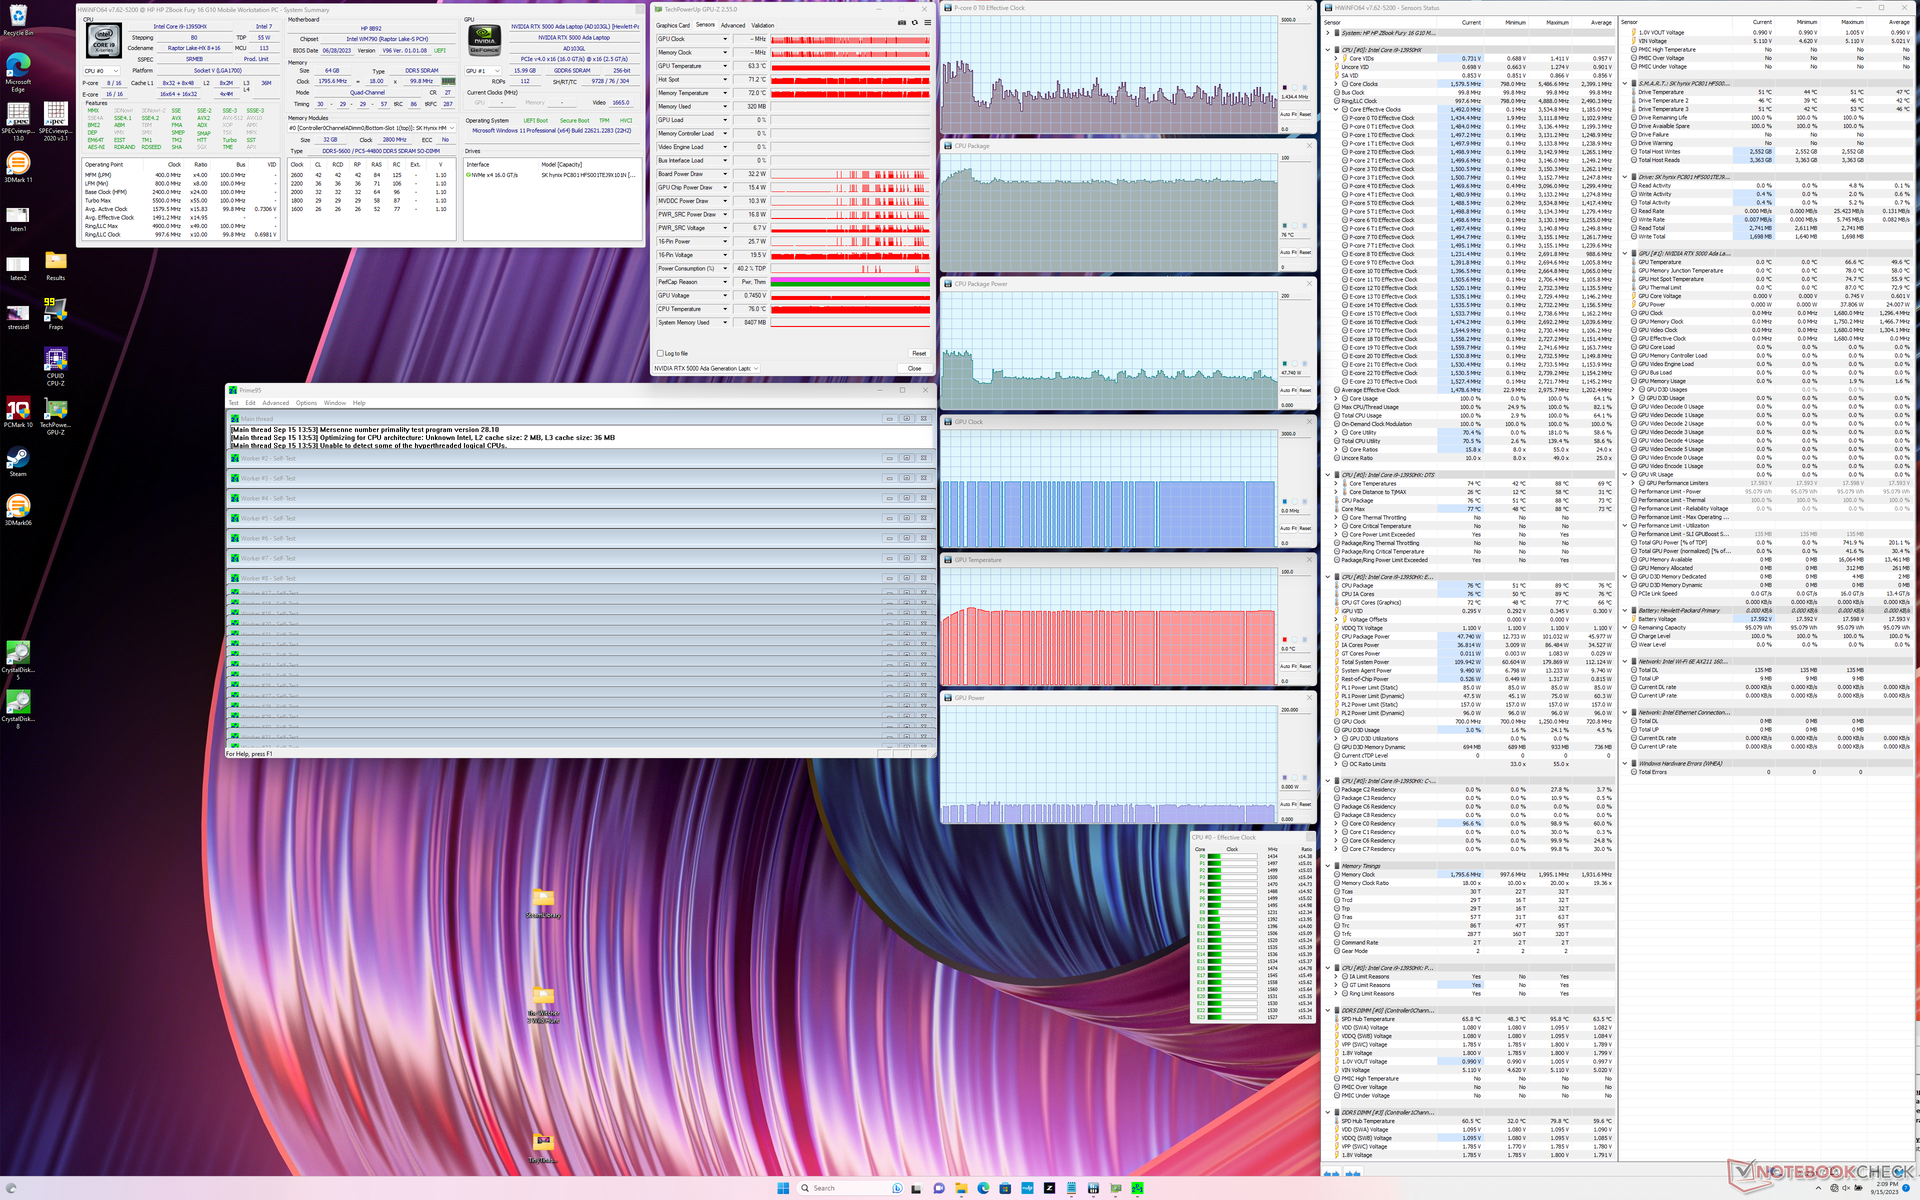
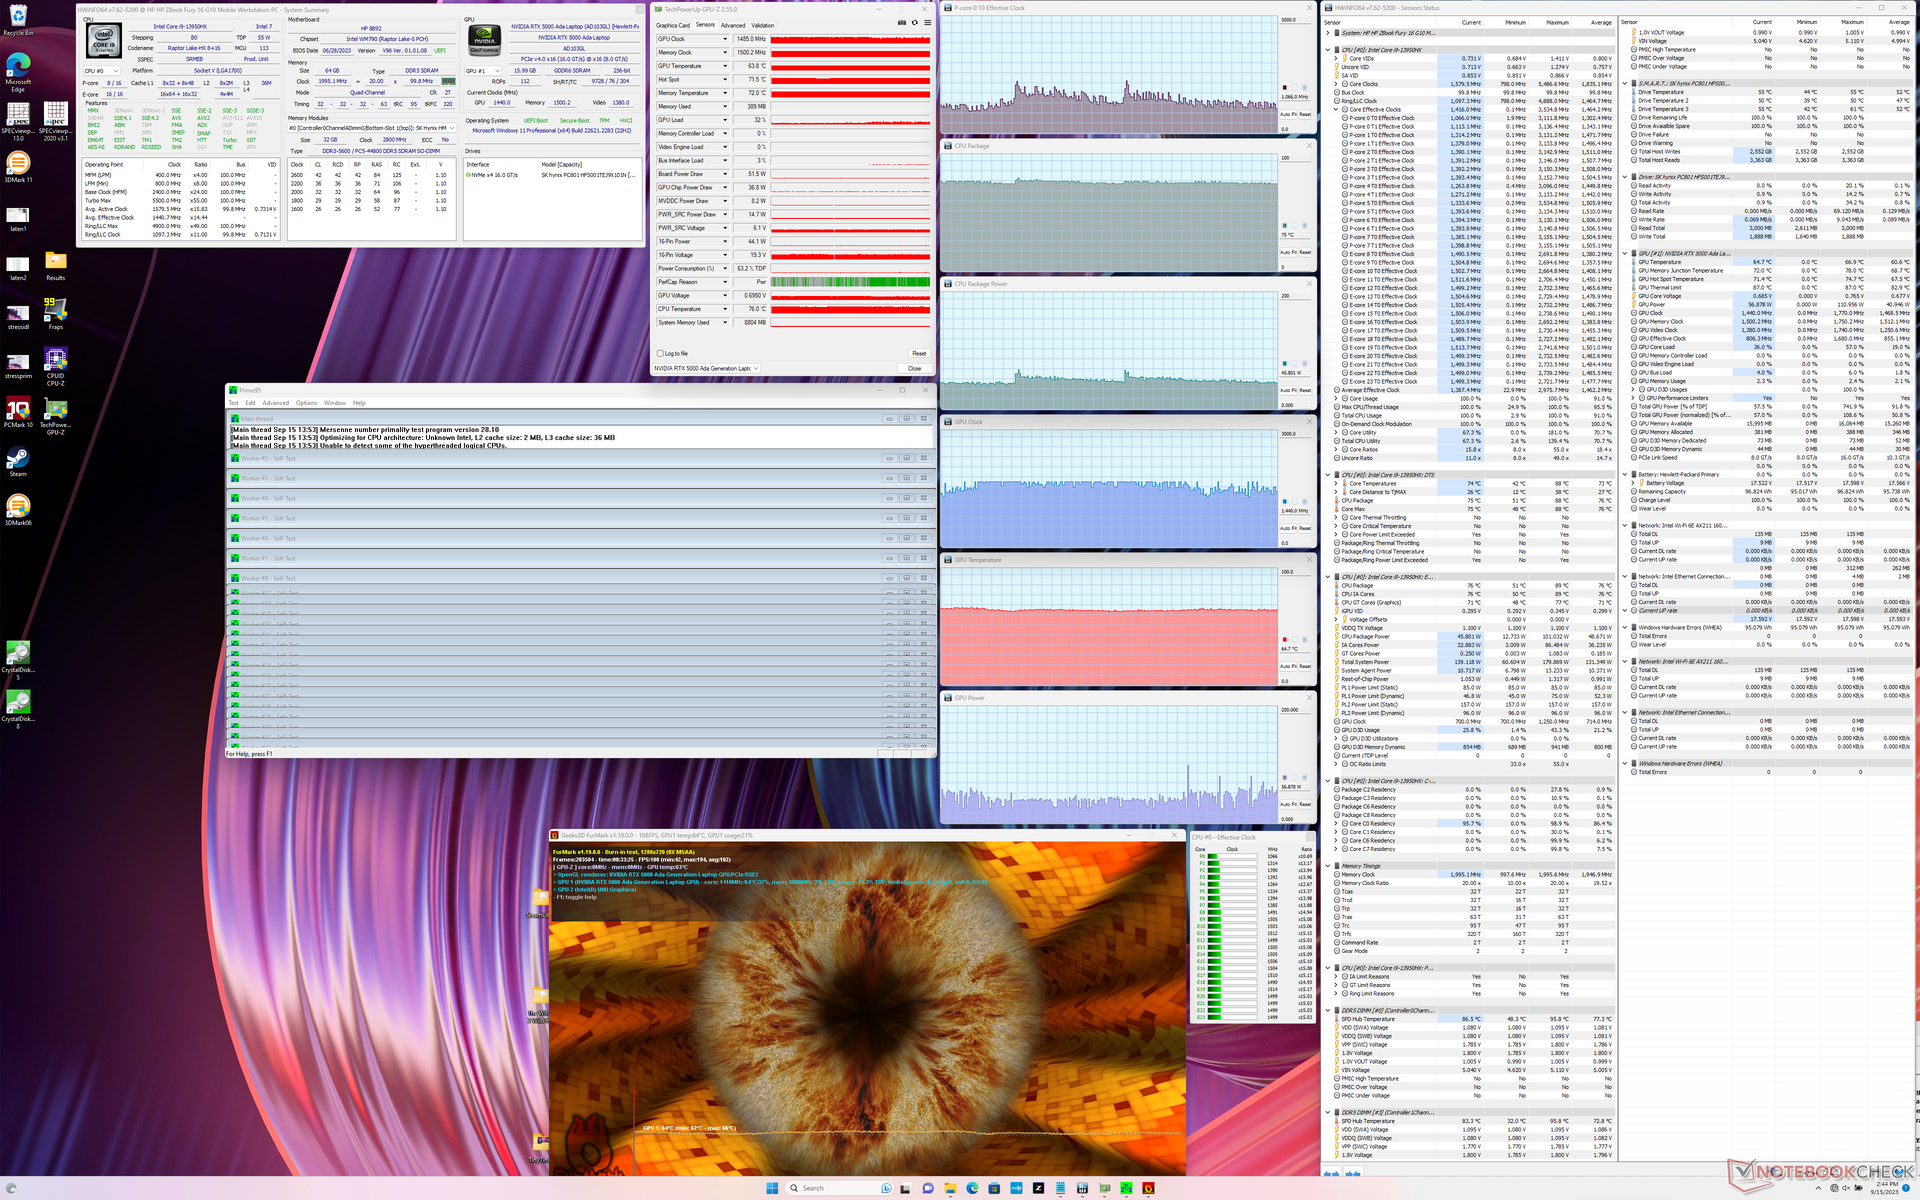
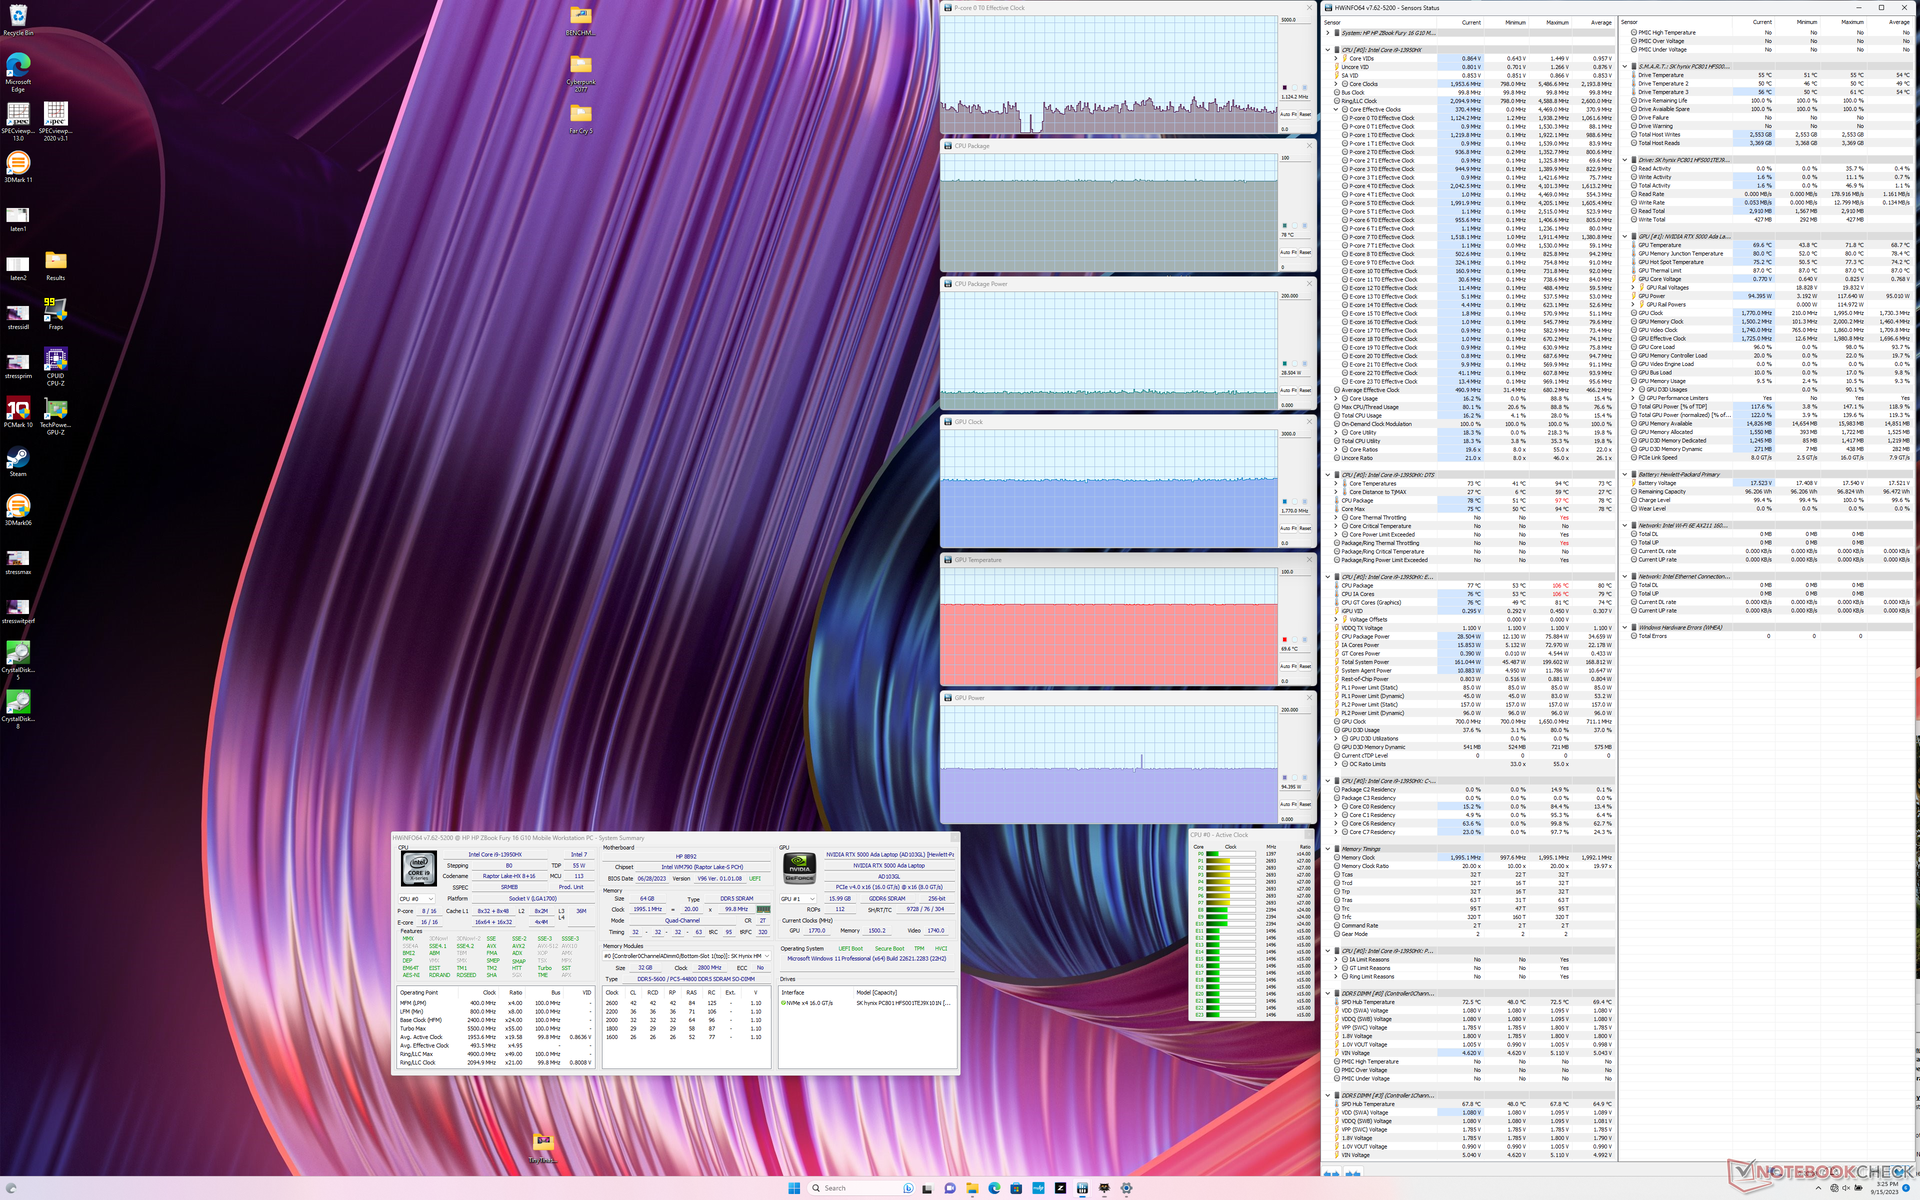

| Taktowanie CPU (GHz) | Taktowanie GPU (MHz) | Średnia temperatura CPU (°C) | Średnia temperatura GPU (°C) | |
| System w stanie spoczynku | -- | -- | 68 | 54 |
| Prime95Stress | ~1.7 | -- | 76 | 63 |
| Prime95+ FurMark Stress | ~1.1 | 1440 | 75 | 65 |
| Witcher 3 Obciążenie(tryb zrównoważony) | ~1.1 | 1770 | 78 | 70 |
| Witcher 3 Stres (trybwydajności) | ~1.1 | 1845 | 79 | 70 |
Głośniki
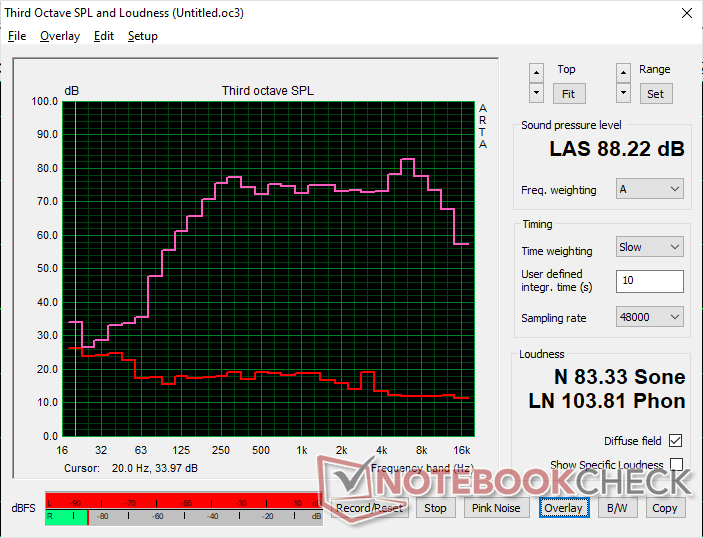
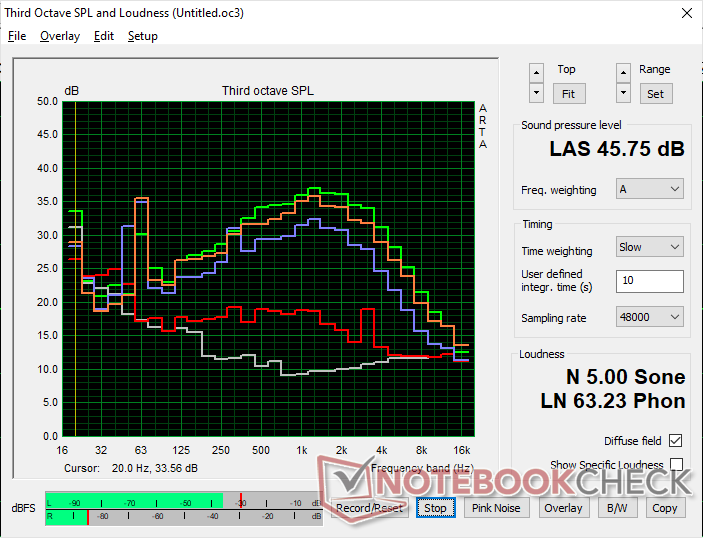
HP ZBook Fury 16 G10 analiza dźwięku
(+) | głośniki mogą odtwarzać stosunkowo głośno (88.2 dB)
Bas 100 - 315 Hz
(±) | zredukowany bas - średnio 7.7% niższy od mediany
(±) | liniowość basu jest średnia (8.7% delta do poprzedniej częstotliwości)
Średnie 400 - 2000 Hz
(+) | zbalansowane środki średnie - tylko 1.2% od mediany
(+) | średnie są liniowe (3.3% delta do poprzedniej częstotliwości)
Wysokie 2–16 kHz
(+) | zrównoważone maksima - tylko 2.8% od mediany
(+) | wzloty są liniowe (5.2% delta do poprzedniej częstotliwości)
Ogólnie 100 - 16.000 Hz
(+) | ogólny dźwięk jest liniowy (8.6% różnicy w stosunku do mediany)
W porównaniu do tej samej klasy
» 2% wszystkich testowanych urządzeń w tej klasie było lepszych, 1% podobnych, 96% gorszych
» Najlepszy miał deltę 7%, średnia wynosiła ###średnia###%, najgorsza wynosiła 35%
W porównaniu do wszystkich testowanych urządzeń
» 2% wszystkich testowanych urządzeń było lepszych, 1% podobnych, 97% gorszych
» Najlepszy miał deltę 4%, średnia wynosiła ###średnia###%, najgorsza wynosiła 134%
Apple MacBook Pro 16 2021 M1 Pro analiza dźwięku
(+) | głośniki mogą odtwarzać stosunkowo głośno (84.7 dB)
Bas 100 - 315 Hz
(+) | dobry bas - tylko 3.8% od mediany
(+) | bas jest liniowy (5.2% delta do poprzedniej częstotliwości)
Średnie 400 - 2000 Hz
(+) | zbalansowane środki średnie - tylko 1.3% od mediany
(+) | średnie są liniowe (2.1% delta do poprzedniej częstotliwości)
Wysokie 2–16 kHz
(+) | zrównoważone maksima - tylko 1.9% od mediany
(+) | wzloty są liniowe (2.7% delta do poprzedniej częstotliwości)
Ogólnie 100 - 16.000 Hz
(+) | ogólny dźwięk jest liniowy (4.6% różnicy w stosunku do mediany)
W porównaniu do tej samej klasy
» 0% wszystkich testowanych urządzeń w tej klasie było lepszych, 0% podobnych, 100% gorszych
» Najlepszy miał deltę 5%, średnia wynosiła ###średnia###%, najgorsza wynosiła 45%
W porównaniu do wszystkich testowanych urządzeń
» 0% wszystkich testowanych urządzeń było lepszych, 0% podobnych, 100% gorszych
» Najlepszy miał deltę 4%, średnia wynosiła ###średnia###%, najgorsza wynosiła 134%
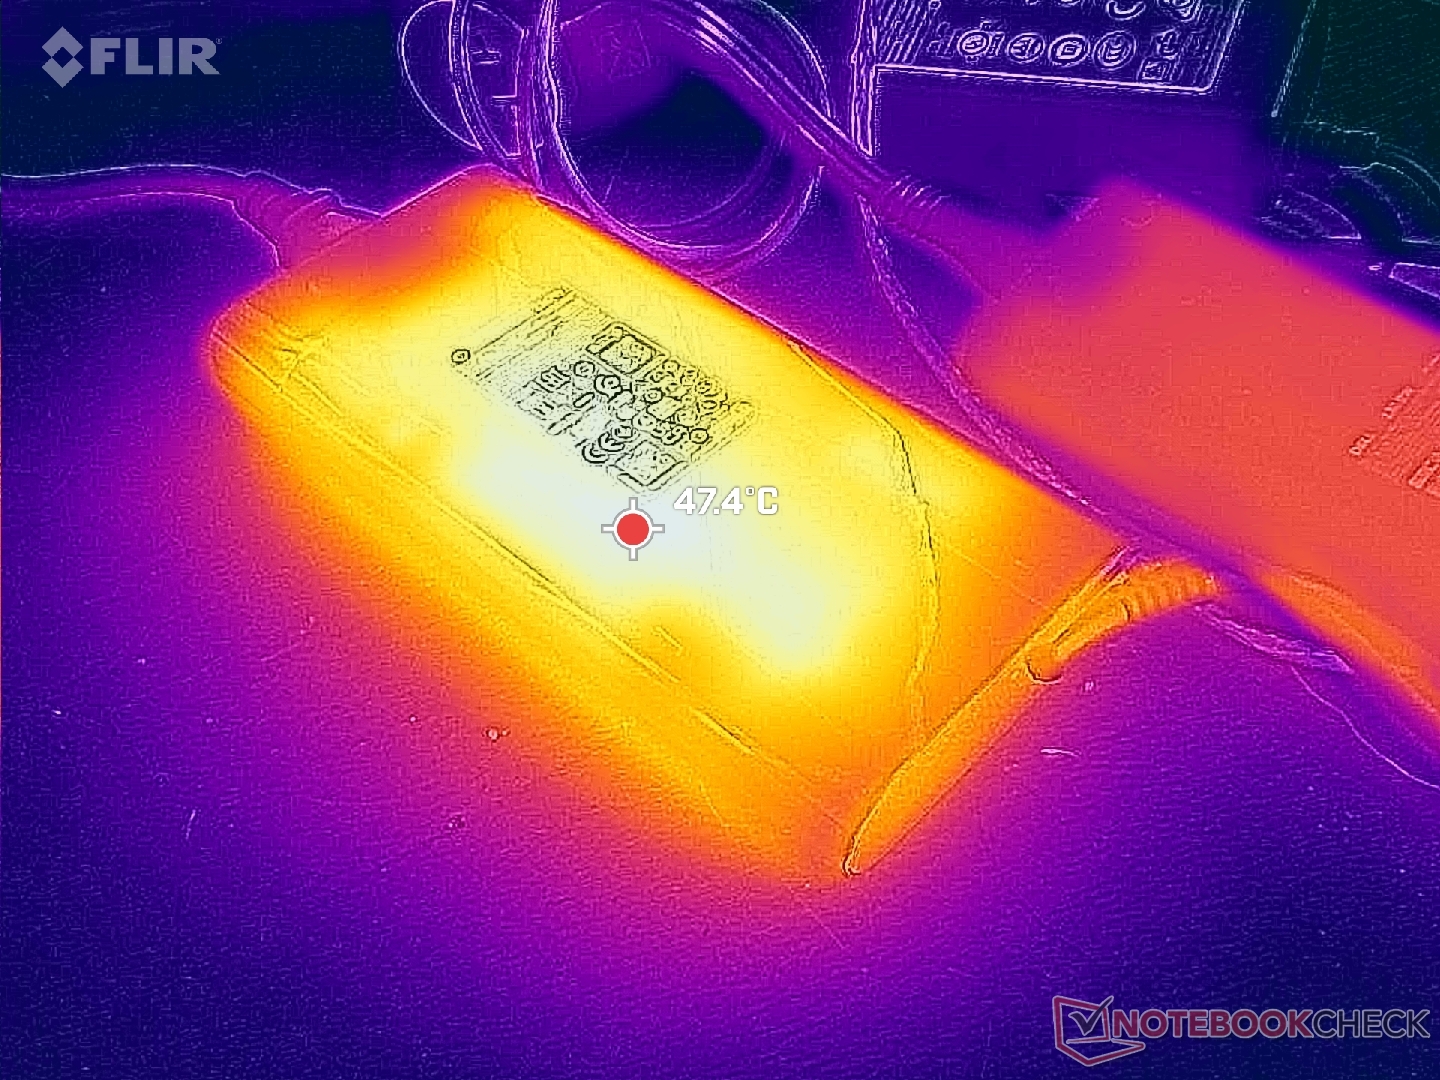
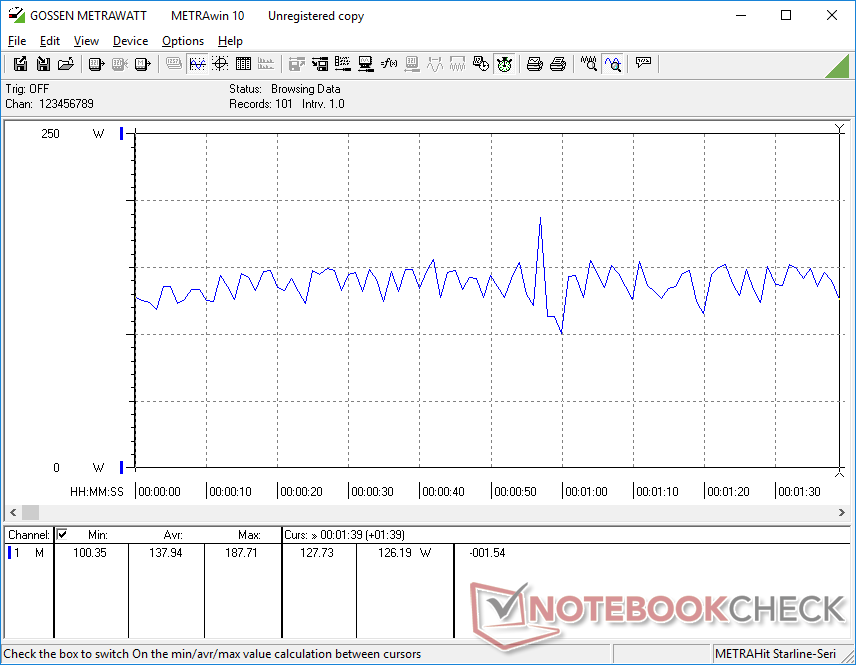
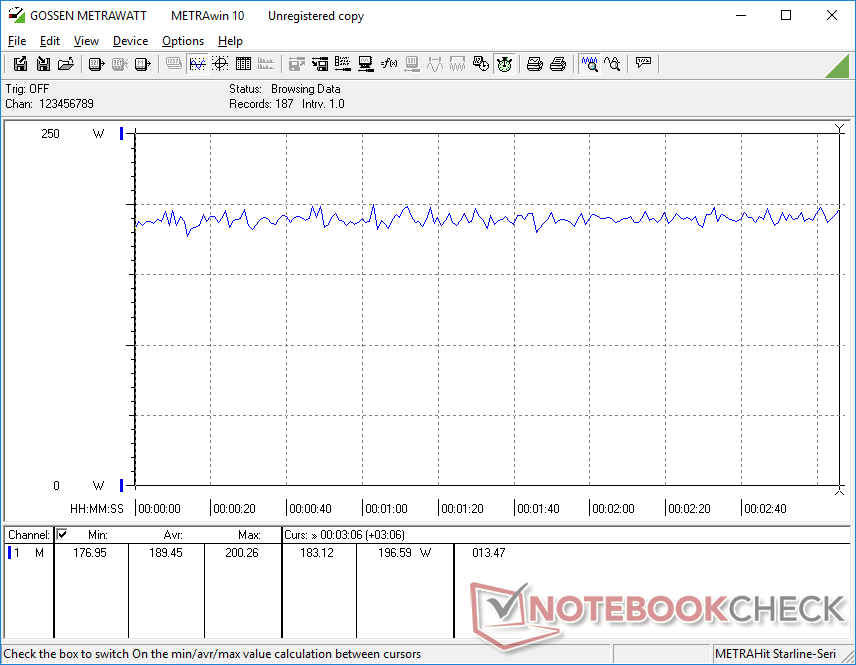
Zarządzanie energią
Zużycie energii
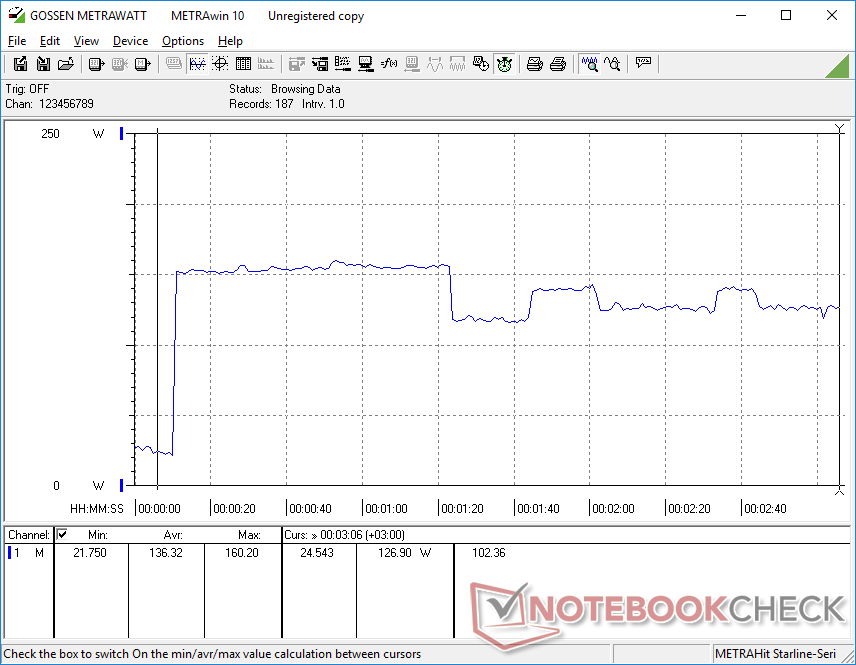
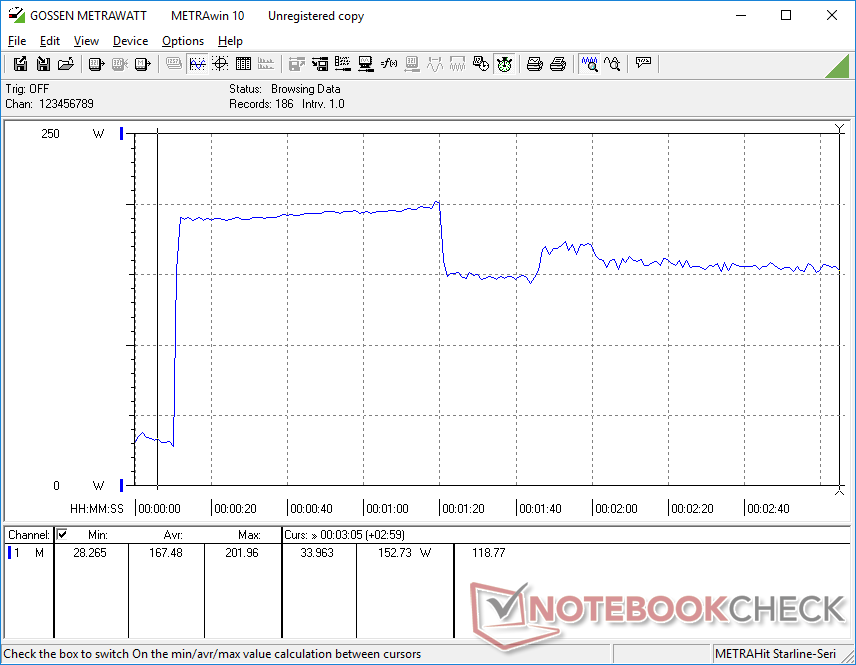
Pobór mocy pod obciążeniem pozostaje mniej więcej taki sam jak w zeszłorocznym modelu, pomimo ulepszeń CPU i GPU zapewniających znacznie wyższą wydajność na wat. Jest on również ogólnie wyższy niż w przypadku Precision 5680 ze względu na wyższe cele TGP w modelu HP.
Należy zauważyć, że nasz Fury 16 G10 pobierałby zauważalnie więcej energii niż podobnie skonfigurowany Precision 5680 podczas uruchamiania dużych obciążeń, takich jak gry, głównie ze względu na wyższe docelowe pułapy mocy dla HP. HP jest dostarczany z zasilaczem sieciowym o mocy 230 W, podczas gdy Dell jest dostarczany z mniejszym zasilaczem USB-C o mocy 165 W.
| wyłączony / stan wstrzymania | |
| luz | |
| obciążenie |
|
Legenda:
min: | |
| HP ZBook Fury 16 G10 i9-13950HX, RTX 5000 Ada Generation Laptop, SK hynix PC801 HFS001TEJ9X101N, IPS, 3840x2400, 16" | HP ZBook Fury 16 G9 i9-12950HX, RTX A5500 Laptop GPU, Micron 3400 1TB MTFDKBA1T0TFH, IPS, 3840x2400, 16" | Dell Precision 5000 5680 i9-13900H, RTX 5000 Ada Generation Laptop, 2x SK hynix PC801 HFS512GEJ9X101N RAID 0, OLED, 3840x2400, 16" | Lenovo ThinkPad P16 G1 RTX A5500 i9-12950HX, RTX A5500 Laptop GPU, WDC PC SN810 2TB, IPS, 3840x2400, 16" | MSI CreatorPro Z16P B12UKST i7-12700H, RTX A3000 Laptop GPU, Samsung PM9A1 MZVL21T0HCLR, IPS, 2560x1600, 16" | Asus ProArt StudioBook 16 W7600H5A-2BL2 W-11955M, RTX A5000 Laptop GPU, 2x Micron 2300 2TB MTFDHBA2T0TDV (RAID 0), OLED, 3840x2400, 16" | |
|---|---|---|---|---|---|---|
| Power Consumption | -24% | 28% | -9% | 22% | 18% | |
| Idle Minimum * (Watt) | 15.3 | 19.5 -27% | 8 48% | 7.5 51% | 10.8 29% | 12.4 19% |
| Idle Average * (Watt) | 18.2 | 29 -59% | 10.4 43% | 20.1 -10% | 16.3 10% | 16.5 9% |
| Idle Maximum * (Watt) | 28 | 40.7 -45% | 30.5 -9% | 40 -43% | 16.9 40% | 25 11% |
| Load Average * (Watt) | 137.9 | 142.1 -3% | 75.4 45% | 137 1% | 111.7 19% | 132 4% |
| Witcher 3 ultra * (Watt) | 189.4 | 188.6 -0% | 134 29% | 208 -10% | 152.1 20% | 132 30% |
| Load Maximum * (Watt) | 202 | 224.4 -11% | 175 13% | 285.9 -42% | 177.4 12% | 134 34% |
* ... im mniej tym lepiej
Power Consumption Witcher 3 / Stresstest
Power Consumption external Monitor
Żywotność baterii
Ogólne czasy pracy nie są krótsze niż w zeszłorocznym modelu, pomimo wzrostu wydajności procesora, wydajności karty graficznej i częstotliwości odświeżania wyświetlacza. Jesteśmy w stanie zarejestrować nieco ponad 7 godzin przeglądania sieci WLAN w trybie zrównoważonym, czyli prawie godzinę dłużej niż w przypadku zeszłorocznego Fury 16 G9.
Ładowanie od zera do pełna za pomocą dołączonego zasilacza sieciowego trwa nieco poniżej 90 minut. System można również ładować za pomocą adapterów USB-C innych firm, choć wolniej.
| HP ZBook Fury 16 G10 i9-13950HX, RTX 5000 Ada Generation Laptop, 95 Wh | HP ZBook Fury 16 G9 i9-12950HX, RTX A5500 Laptop GPU, 95 Wh | Dell Precision 5000 5680 i9-13900H, RTX 5000 Ada Generation Laptop, 98 Wh | Lenovo ThinkPad P16 G1 RTX A5500 i9-12950HX, RTX A5500 Laptop GPU, 94 Wh | MSI CreatorPro Z16P B12UKST i7-12700H, RTX A3000 Laptop GPU, 90 Wh | Asus ProArt StudioBook 16 W7600H5A-2BL2 W-11955M, RTX A5000 Laptop GPU, 90 Wh | |
|---|---|---|---|---|---|---|
| Czasy pracy | -18% | 36% | -21% | -21% | -32% | |
| WiFi v1.3 (h) | 7.3 | 6 -18% | 9.9 36% | 5.8 -21% | 5.8 -21% | 5 -32% |
| Reader / Idle (h) | 5.3 | 17.9 | ||||
| Load (h) | 1.2 | 1.7 | ||||
| H.264 (h) | 1.8 | |||||
| Witcher 3 ultra (h) | 1.6 |
Za
Przeciw
Werdykt - najlepsza stacja robocza HP dla łowców grafiki
Czasami aktualizacje procesorów z roku na rok mogą być stosunkowo niewielkie. Innym razem jednak mogą być dość znaczące. ZBook Fury 16 G10 należy do tej drugiej kategorii, ponieważ jego procesor 13. generacji i opcje GPU Nvidia RTX Ada mogą zaoferować znaczny wzrost wydajności w porównaniu do ZBook Fury 16 G9, zwłaszcza jeśli chodzi o grafikę. Jeśli cenisz sobie pamięć RAM ECC i maksymalizację mocy GPU z wyższymi limitami TGP, to Fury 16 G10 jest absolutnie wart rozważenia w porównaniu z każdą inną 16-calową stacją roboczą w tej chwili, w tym Precision 5680 która oferuje te same opcje GPU, ale przy niższych docelowych wartościach TGP.
ZBook Fury 16 G10 maksymalizuje moc GPU, aby być jedną z najszybszych mobilnych stacji roboczych, jeśli chodzi o grafikę. Wydaje się jednak, że odbywa się to kosztem wydajności dysków SSD i procesora.
Kilka kwestii powstrzymuje HP przed byciem "idealnym". Dławienie dysku SSD nadal występuje, a procesor jest wolniejszy niż oczekiwano, nawet po ustawieniu trybu wydajności. Byłoby to łatwiejsze do wybaczenia w przypadku smuklejszych lub mniejszych stacji roboczych, ale Fury 16 G10 nie jest cienki i lekki.
Cena i dostępność
HP wysyła obecnie swojego ZBooka Fury 16 G10 w cenie od 2700 USD za konfigurację podstawową do ponad 4200 USD w przypadku pełnej konfiguracji z Core i9 i RTX 5000 Ada.
HP ZBook Fury 16 G10
- 23/09/2023 v7 (old)
Allen Ngo
Przezroczystość
Wyboru urządzeń do recenzji dokonuje nasza redakcja. Próbka testowa została udostępniona autorowi jako pożyczka od producenta lub sprzedawcy detalicznego na potrzeby tej recenzji. Pożyczkodawca nie miał wpływu na tę recenzję, producent nie otrzymał też kopii tej recenzji przed publikacją. Nie było obowiązku publikowania tej recenzji. Jako niezależna firma medialna, Notebookcheck nie podlega władzy producentów, sprzedawców detalicznych ani wydawców.
Tak testuje Notebookcheck
Każdego roku Notebookcheck niezależnie sprawdza setki laptopów i smartfonów, stosując standardowe procedury, aby zapewnić porównywalność wszystkich wyników. Od około 20 lat stale rozwijamy nasze metody badawcze, ustanawiając przy tym standardy branżowe. W naszych laboratoriach testowych doświadczeni technicy i redaktorzy korzystają z wysokiej jakości sprzętu pomiarowego. Testy te obejmują wieloetapowy proces walidacji. Nasz kompleksowy system ocen opiera się na setkach uzasadnionych pomiarów i benchmarków, co pozwala zachować obiektywizm.Price comparison

