Recenzja laptopa HP Envy 17: GeForce GPU gra na eleganckim wyświetlaczu 4K multimedialnego laptopa
Seria modeli Envy firmy HP oznacza wydajne laptopy dla mobilnych kreatywnych profesjonalistów. W tej serii producent oferuje modele począwszy od kompaktowych 13,3 aż do dużych 17,3-calowych rozmiarów. HP Envy 17-cr0079ng jest pozycjonowany na najwyższym poziomie, przynosząc w tej wersji modelowej duży 17,3-calowy wyświetlacz UHD.
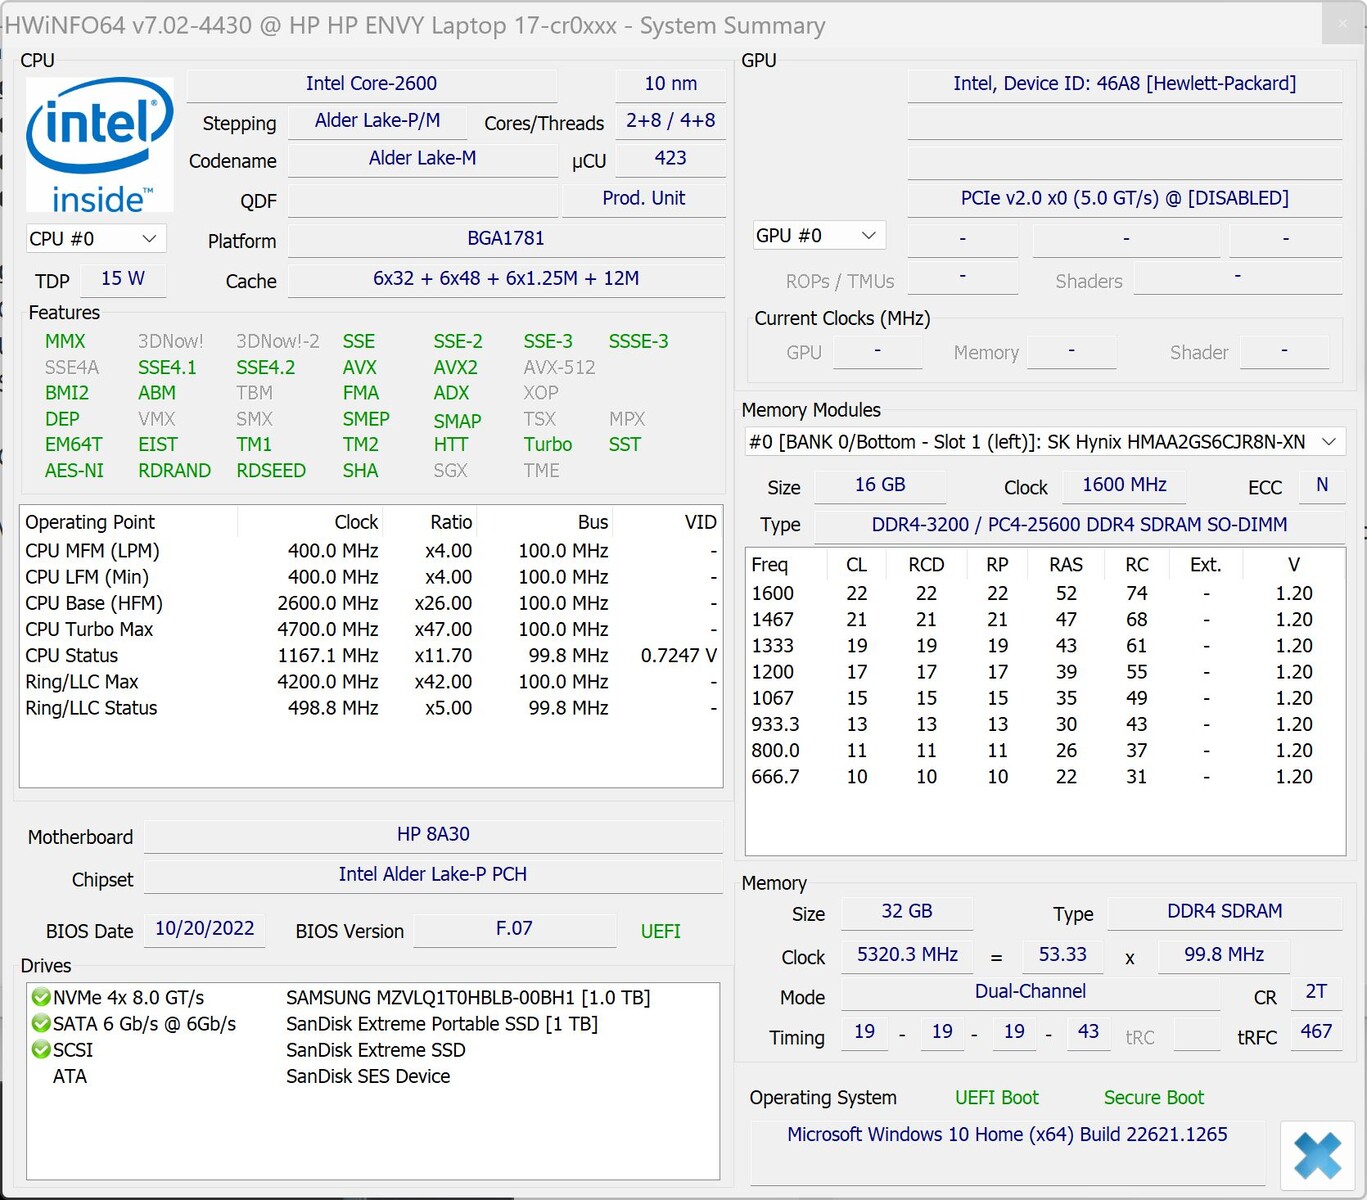
Pod maską, HP Envy 17-cr0079ng jest w stanie zaoferować również niezłe wyposażenie: HP wykorzystuje m.in Intel Core i7-1255Uprocesor 12. generacji (Alder Lake), łącząc go z dedykowanym Nvidia GeForce RTX 2050 Laptop gPU z niższej średniej półki z 4 GB GDDR6, 32 GB pamięci roboczej DDR4 oraz dużym, 1-TB dyskiem SSD. Razem z akumulatorem o pojemności 55 Wh daje to w efekcie ~2,5 kg (~5,5 lb) 17-calowy laptop, który teraz musi się sprawdzić w naszym teście.
W naszej recenzji Envy 17 musi konkurować z innymi laptopami z Core i7-1255U, np. z bardziej kompaktowym HP ProBook 450 G9 6A180EA, a także tym samym rozwiązaniem graficznym, jak np Acer Aspire 5 A515-57G-53N8oraz 17-calowy LG Gram 17mistrz wytrzymałości.
Potencjalni konkurenci w porównaniu
Ocena | Data | Model | Waga | Wysokość | Rozmiar | Rezolucja | Cena |
|---|---|---|---|---|---|---|---|
| 86.3 % v7 (old) | 04/2023 | HP Envy 17-cr0079ng i7-1255U, GeForce RTX 2050 Mobile | 2.6 kg | 19.6 mm | 17.30" | 3840x2160 | |
| 85 % v7 (old) | HP ProBook 450 G9 6A180EA i7-1255U, Iris Xe G7 96EUs | 1.7 kg | 19.9 mm | 15.60" | 1920x1080 | ||
| 86.4 % v7 (old) | 03/2023 | LG Gram 17Z90Q-E.AD78G i7-1260P, GeForce RTX 2050 Mobile | 1.4 kg | 17.8 mm | 17.00" | 2560x1600 | |
| 80.7 % v7 (old) | 09/2022 | Acer Aspire 5 A515-57G-53N8 i5-1240P, GeForce RTX 2050 Mobile | 1.8 kg | 18 mm | 15.60" | 1920x1080 | |
| 89.3 % v7 (old) | 02/2023 | Dell XPS 17 9720 i7-12700H, GeForce RTX 3050 4GB Laptop GPU | 2.5 kg | 19.5 mm | 17.00" | 3840x2400 | |
| 79.4 % v7 (old) | 03/2023 | Lenovo IdeaPad 3 17ABA7 R5 5625U, Vega 7 | 2 kg | 19.9 mm | 17.30" | 1920x1080 |
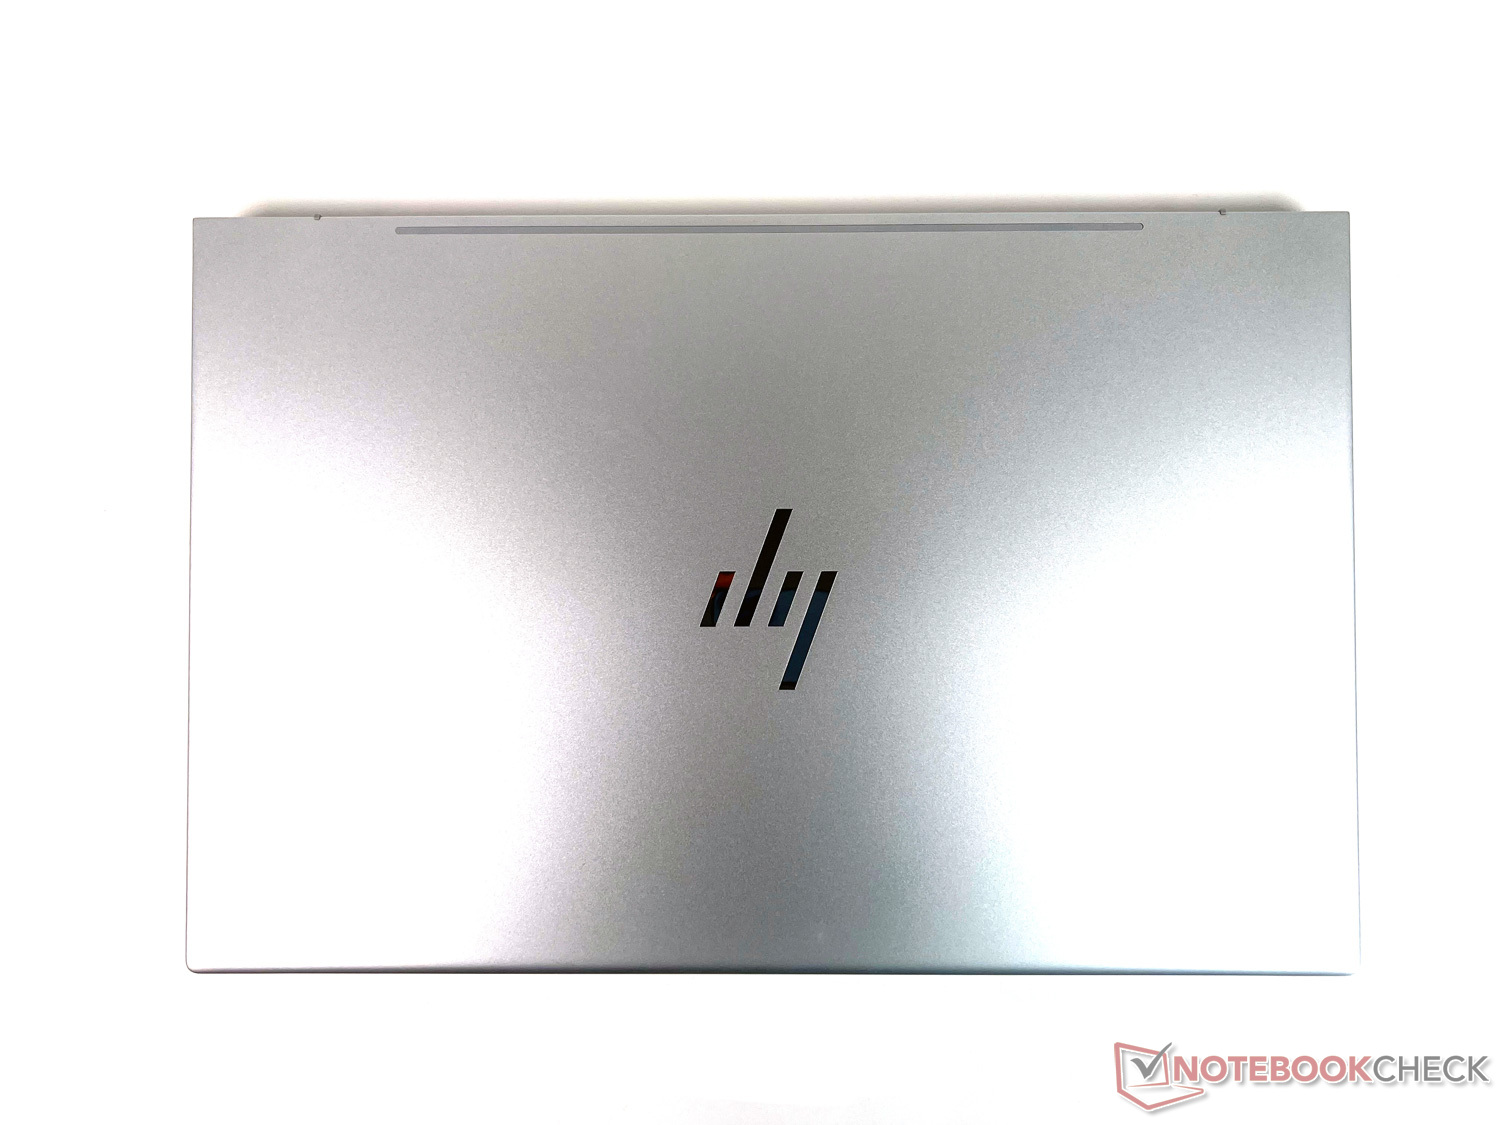
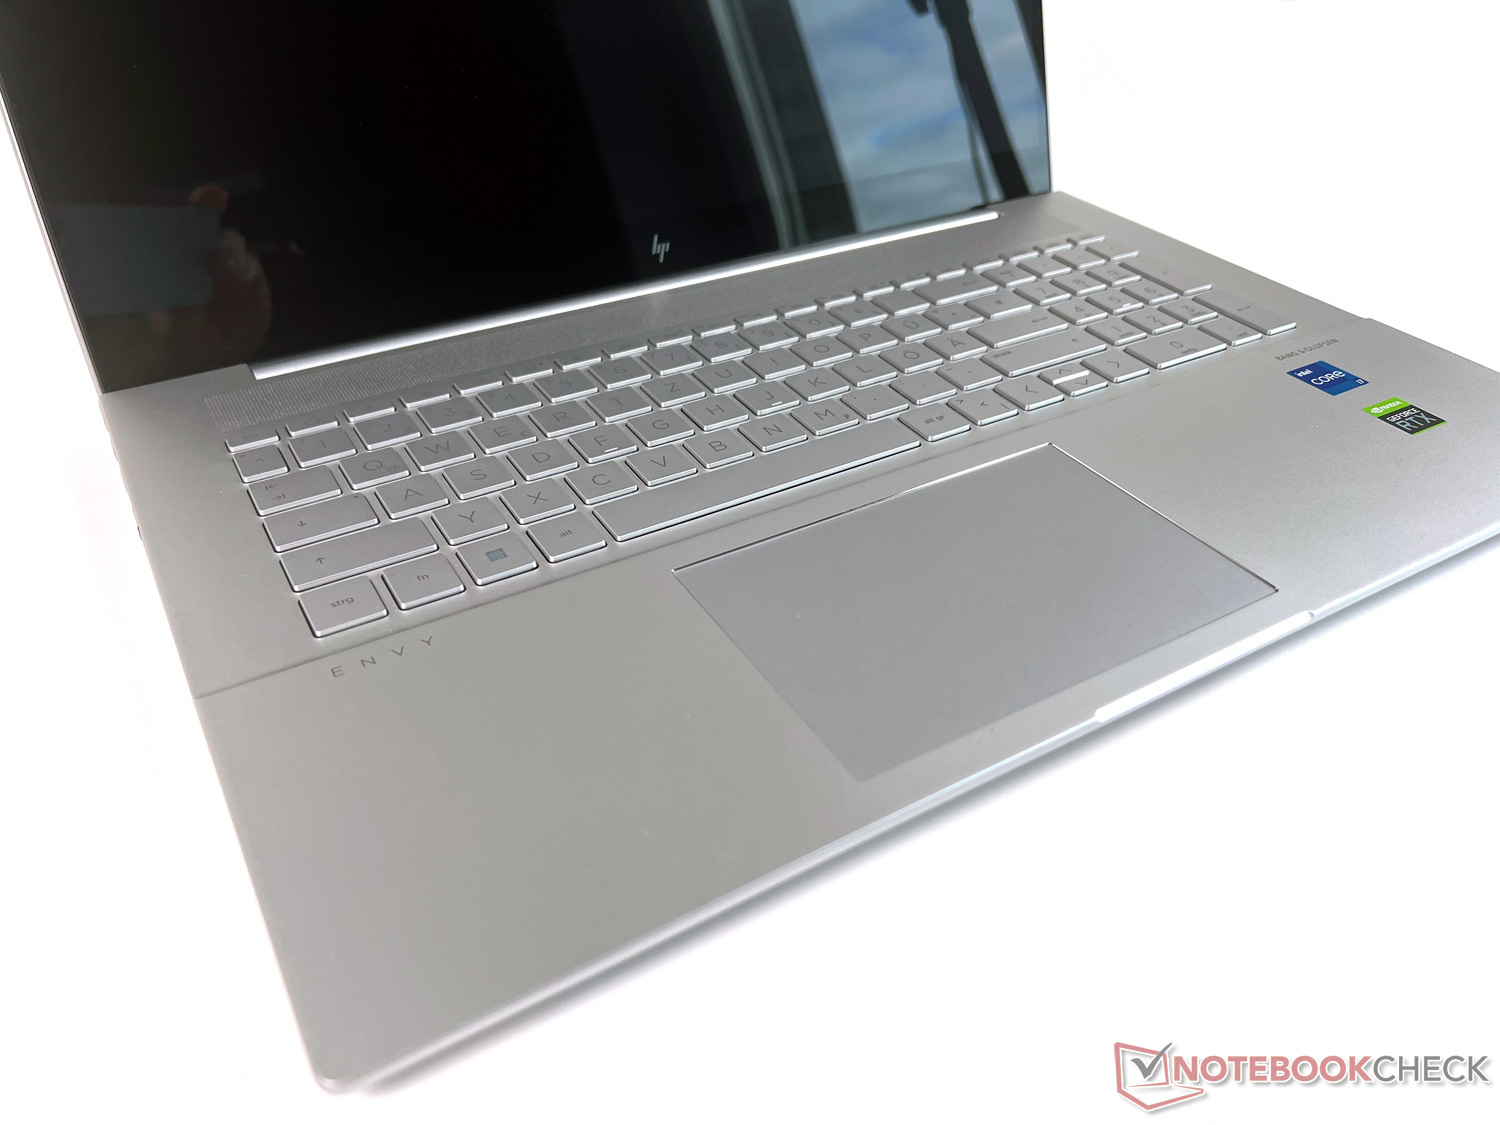
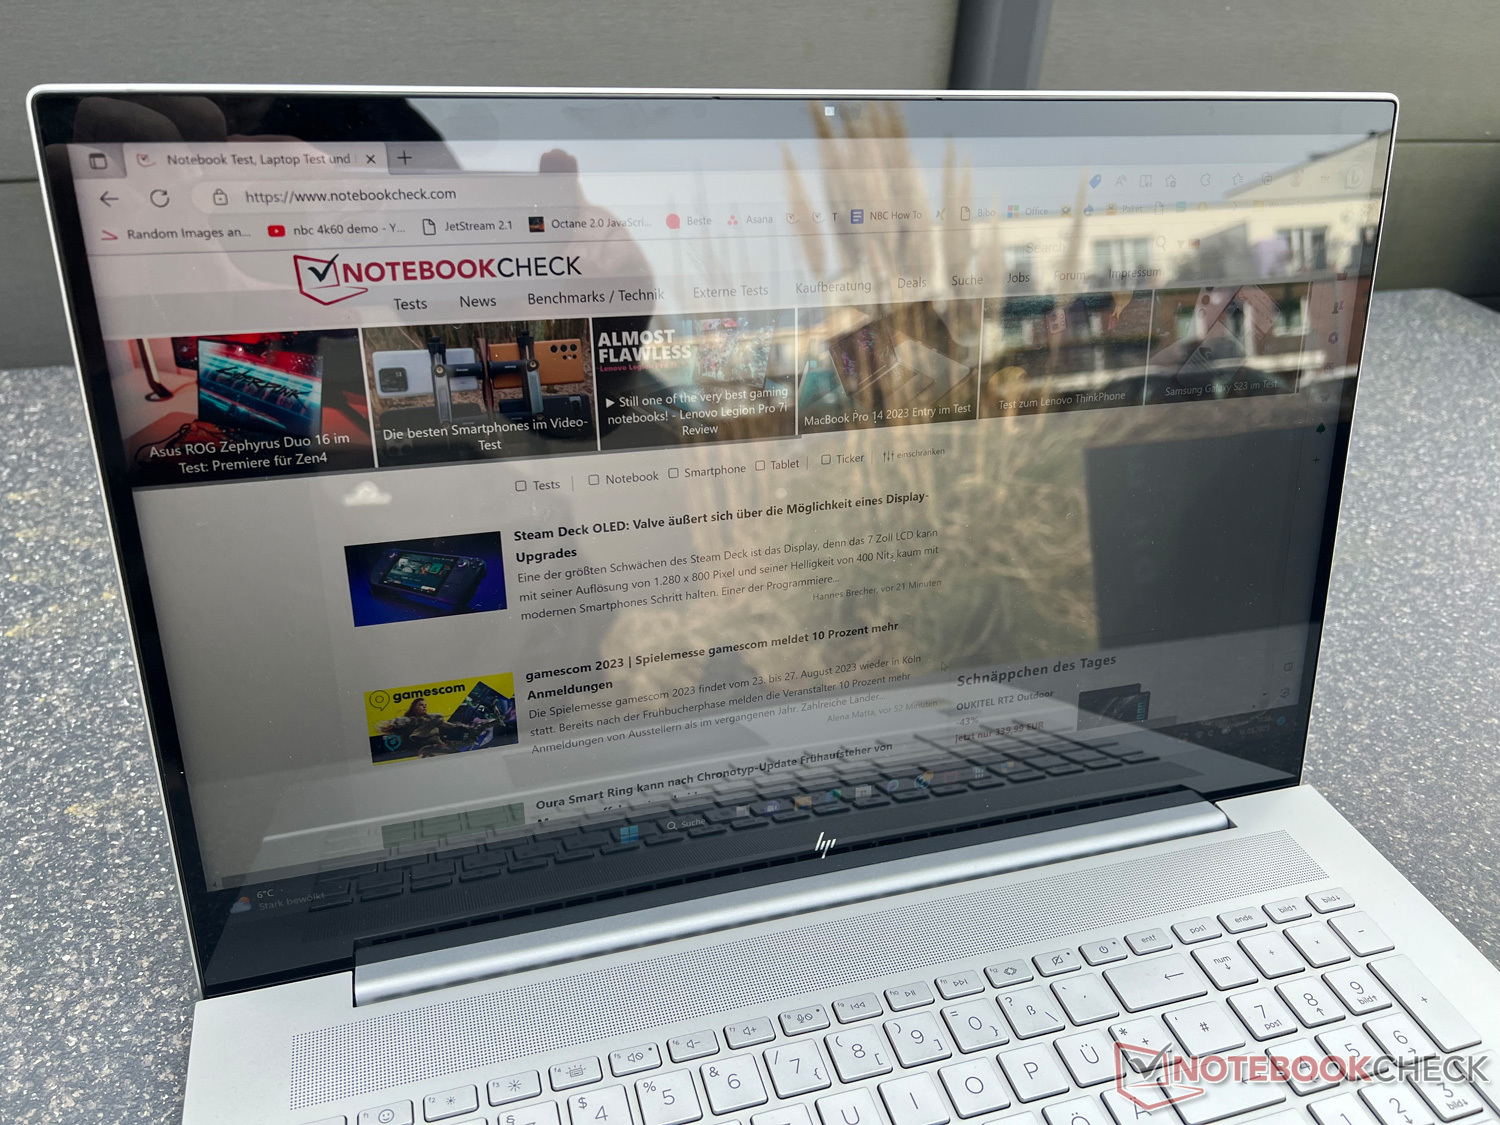
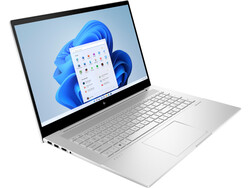
Obudowa: Elegancka i prosta w kolorze srebrnym
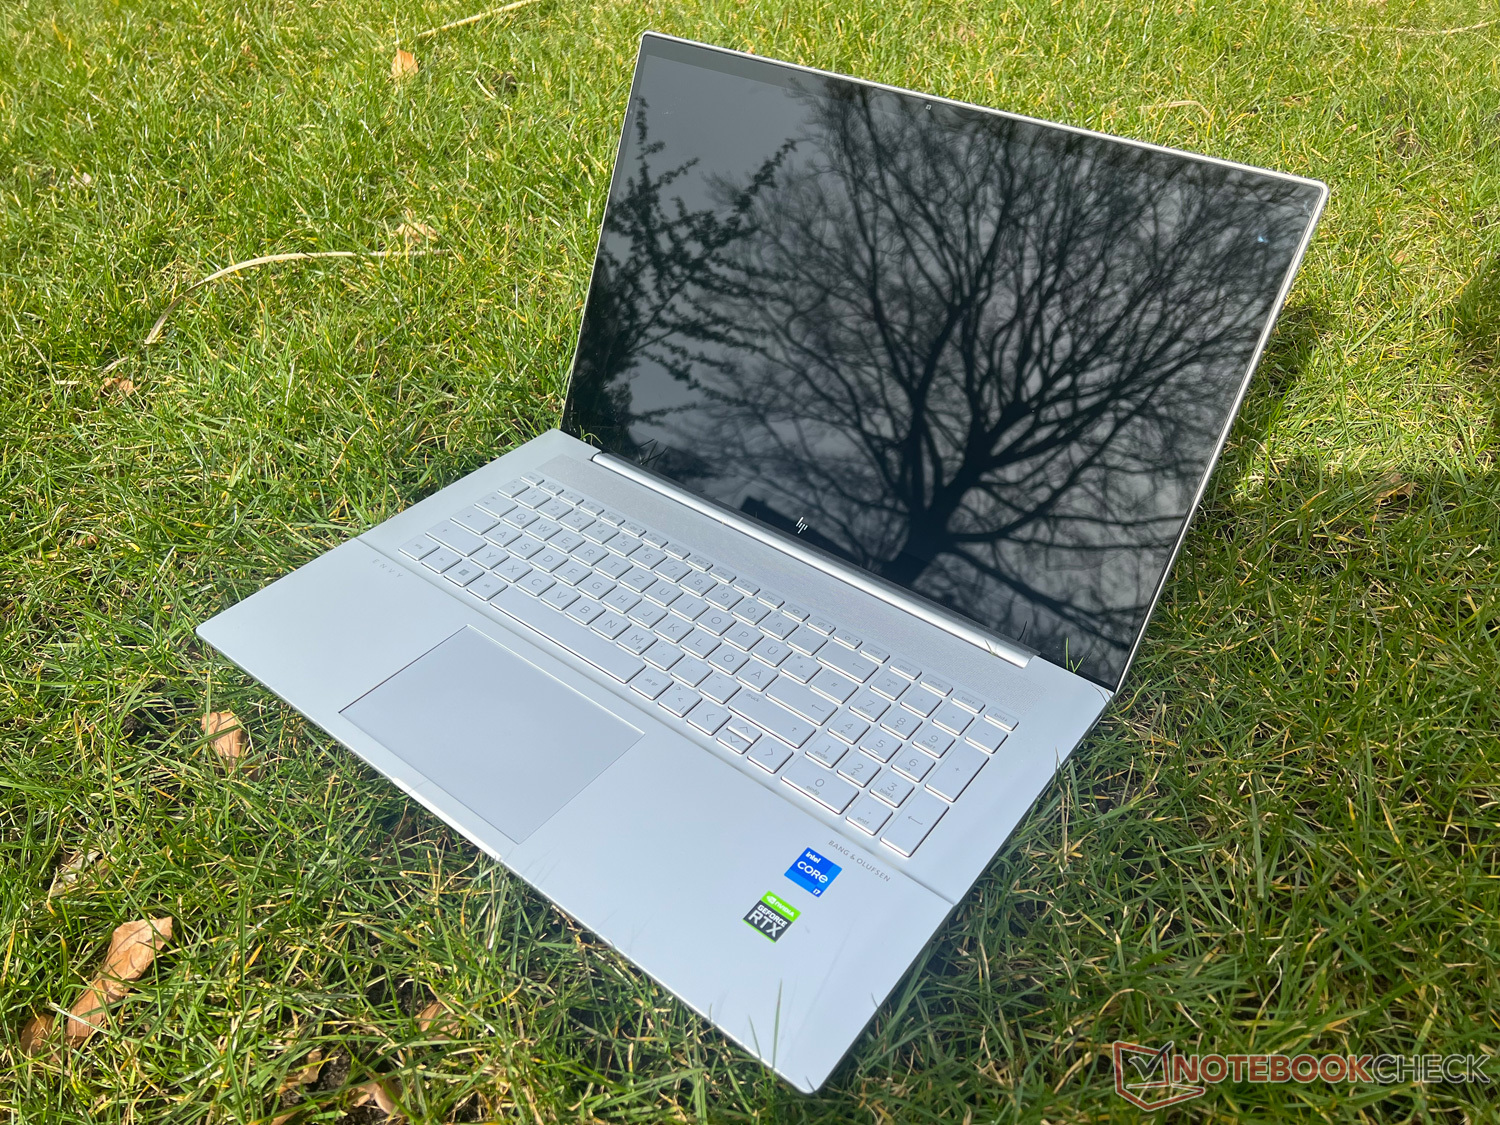
HP Envy 17 prezentuje się w prostej konstrukcji w srebrnym kolorze. Mimo że większość obudowy jest wykonana z plastiku, oferuje ona wrażenie wysokiej jakości dzięki dobremu wykonaniu. Szeroki zawias dość mocno utrzymuje duży wyświetlacz, przez co do otwarcia laptopa trzeba użyć obu rąk.
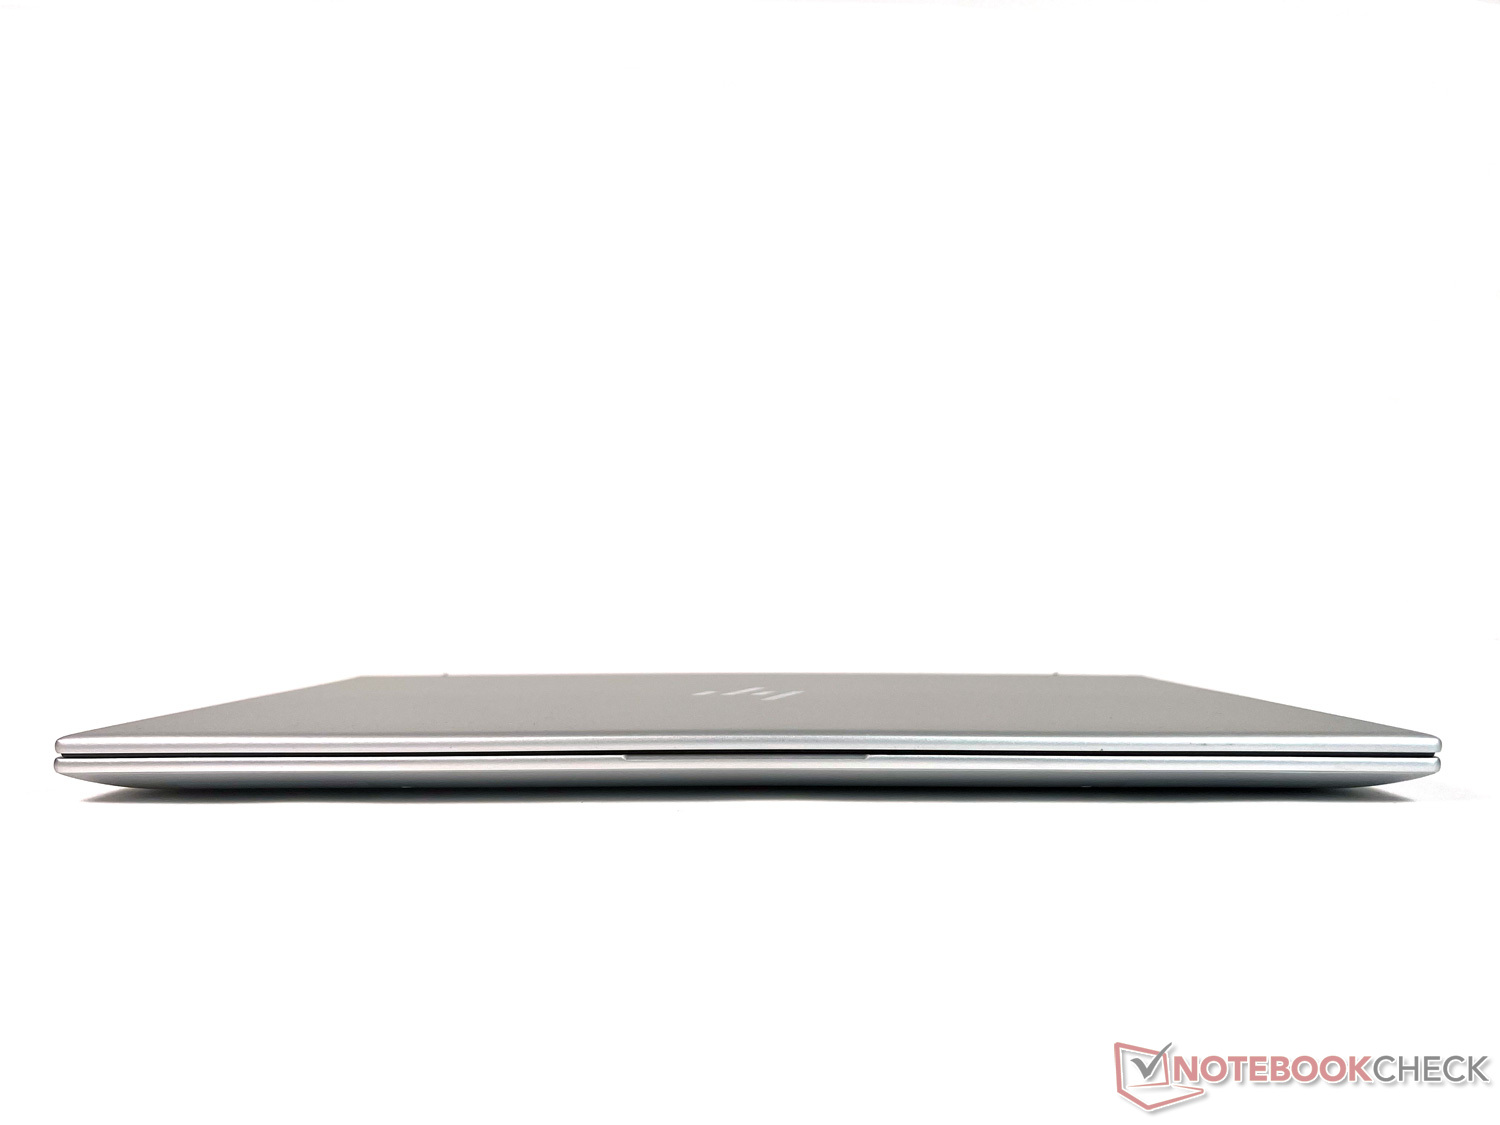
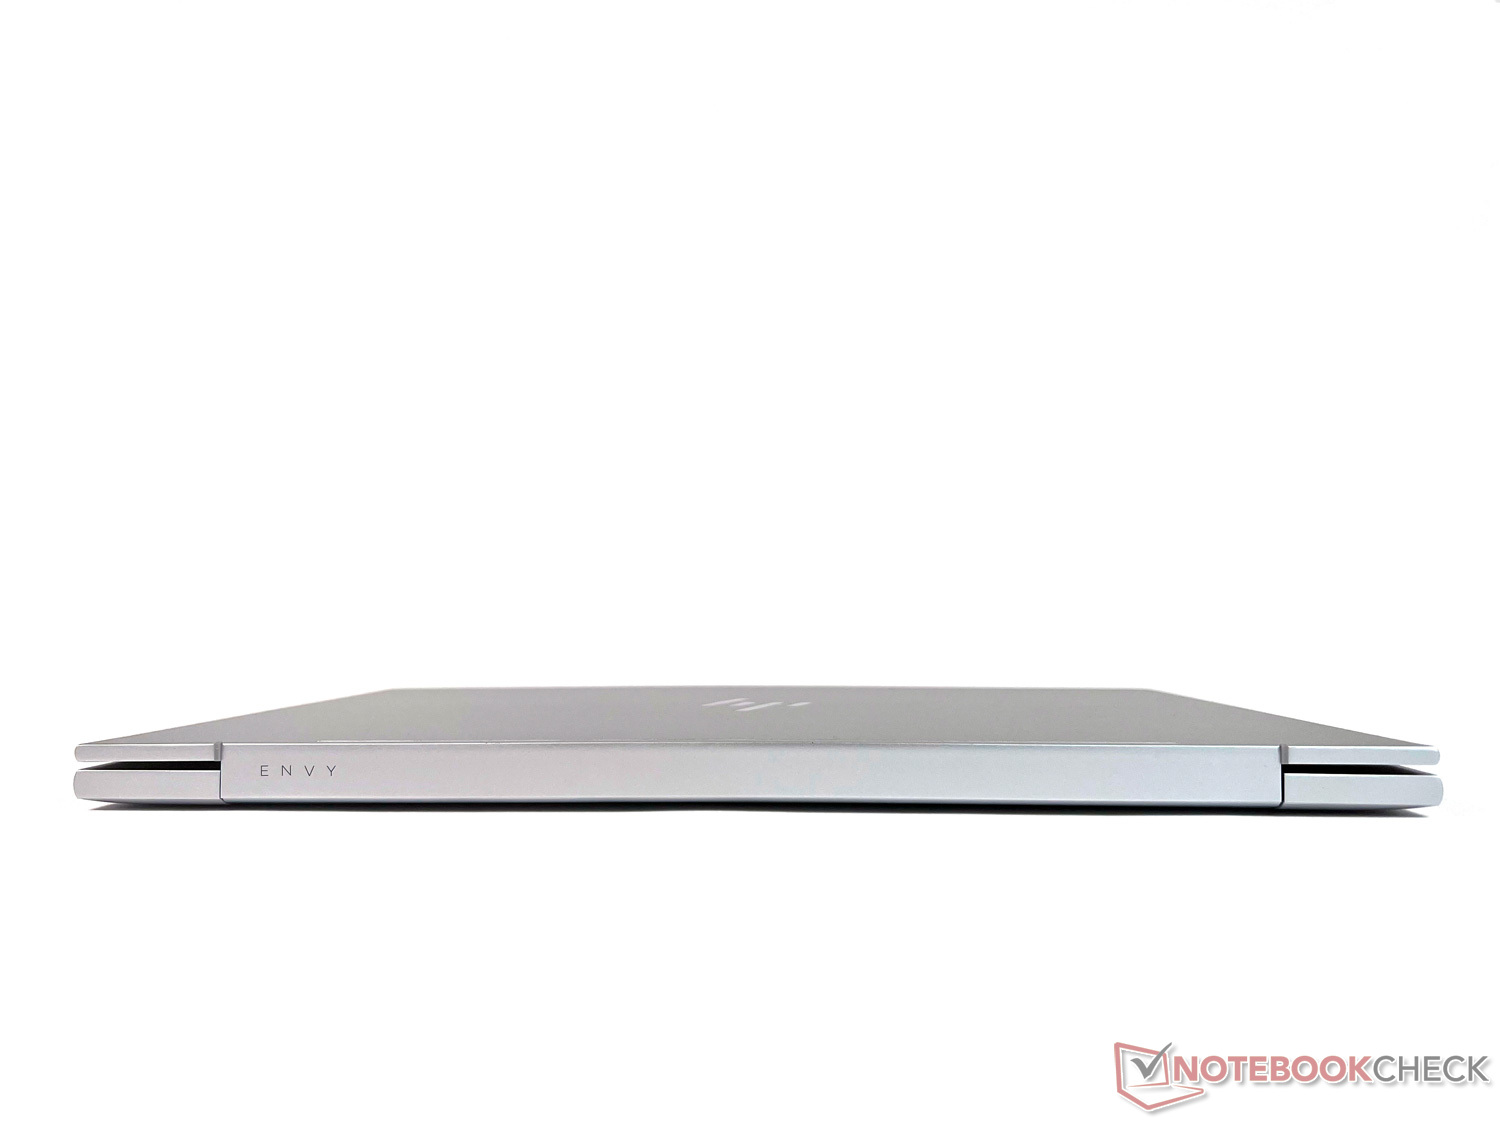
Jako 17-calowy laptop HP Envy 17 nie jest oczywiście zbyt kompaktowy. Ale dzięki smukłym ramkom wyświetlacza szczególnie po lewej i prawej stronie ogólny rozmiar pozostaje w granicach. W porównaniu z innymi dużymi urządzeniami 17-calowymi plasuje się on w środku pola testowego.
Waga ~2,5 kg plus 500 g ładowarki mają wpływ na mobilne użytkowanie. Duża przekątna wyświetlacza domaga się należnego jej miejsca. Jednak nawet przy tej wielkości laptopy mogą być lżejsze, co pokazują konkurenci. Nasz testowy egzemplarz jest jednym z najcięższych modeli tutaj, co jest negatywnym punktem dla mobilnego użytkowania.
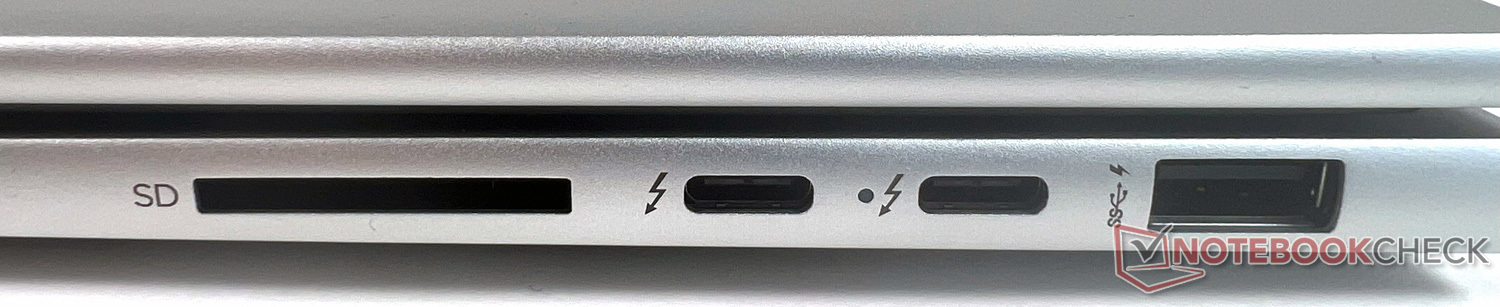
Wyposażenie: Laptop multimedialny z 2x Thunderbolt 4
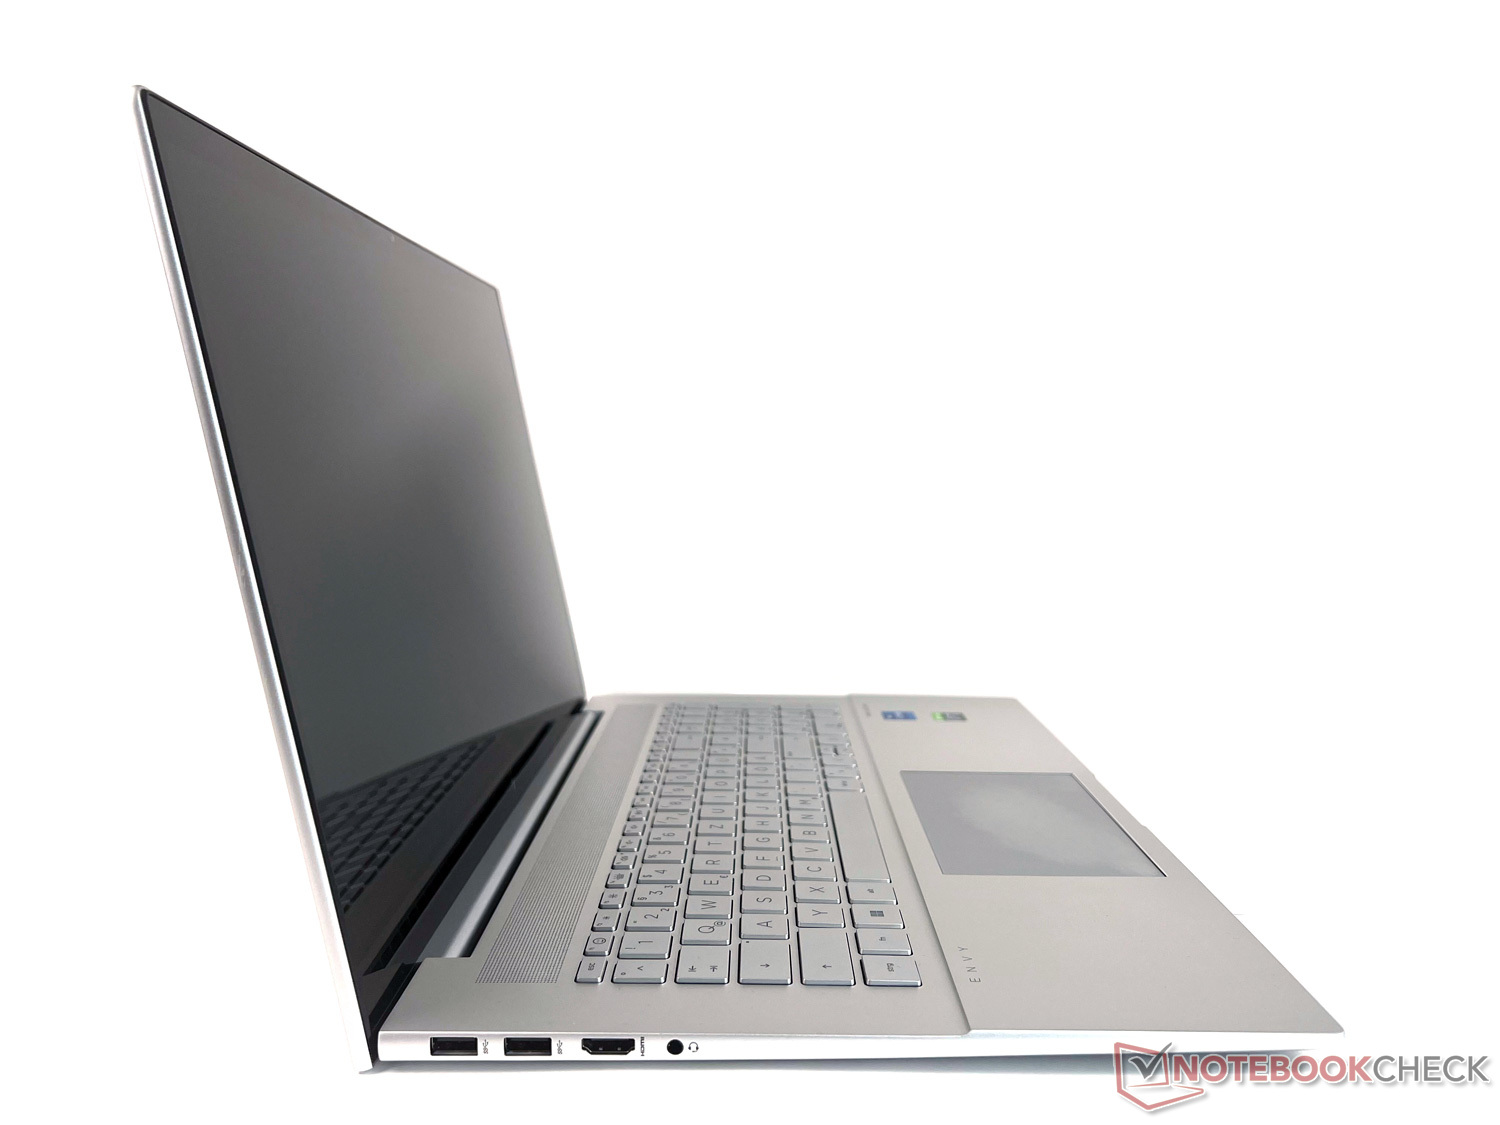
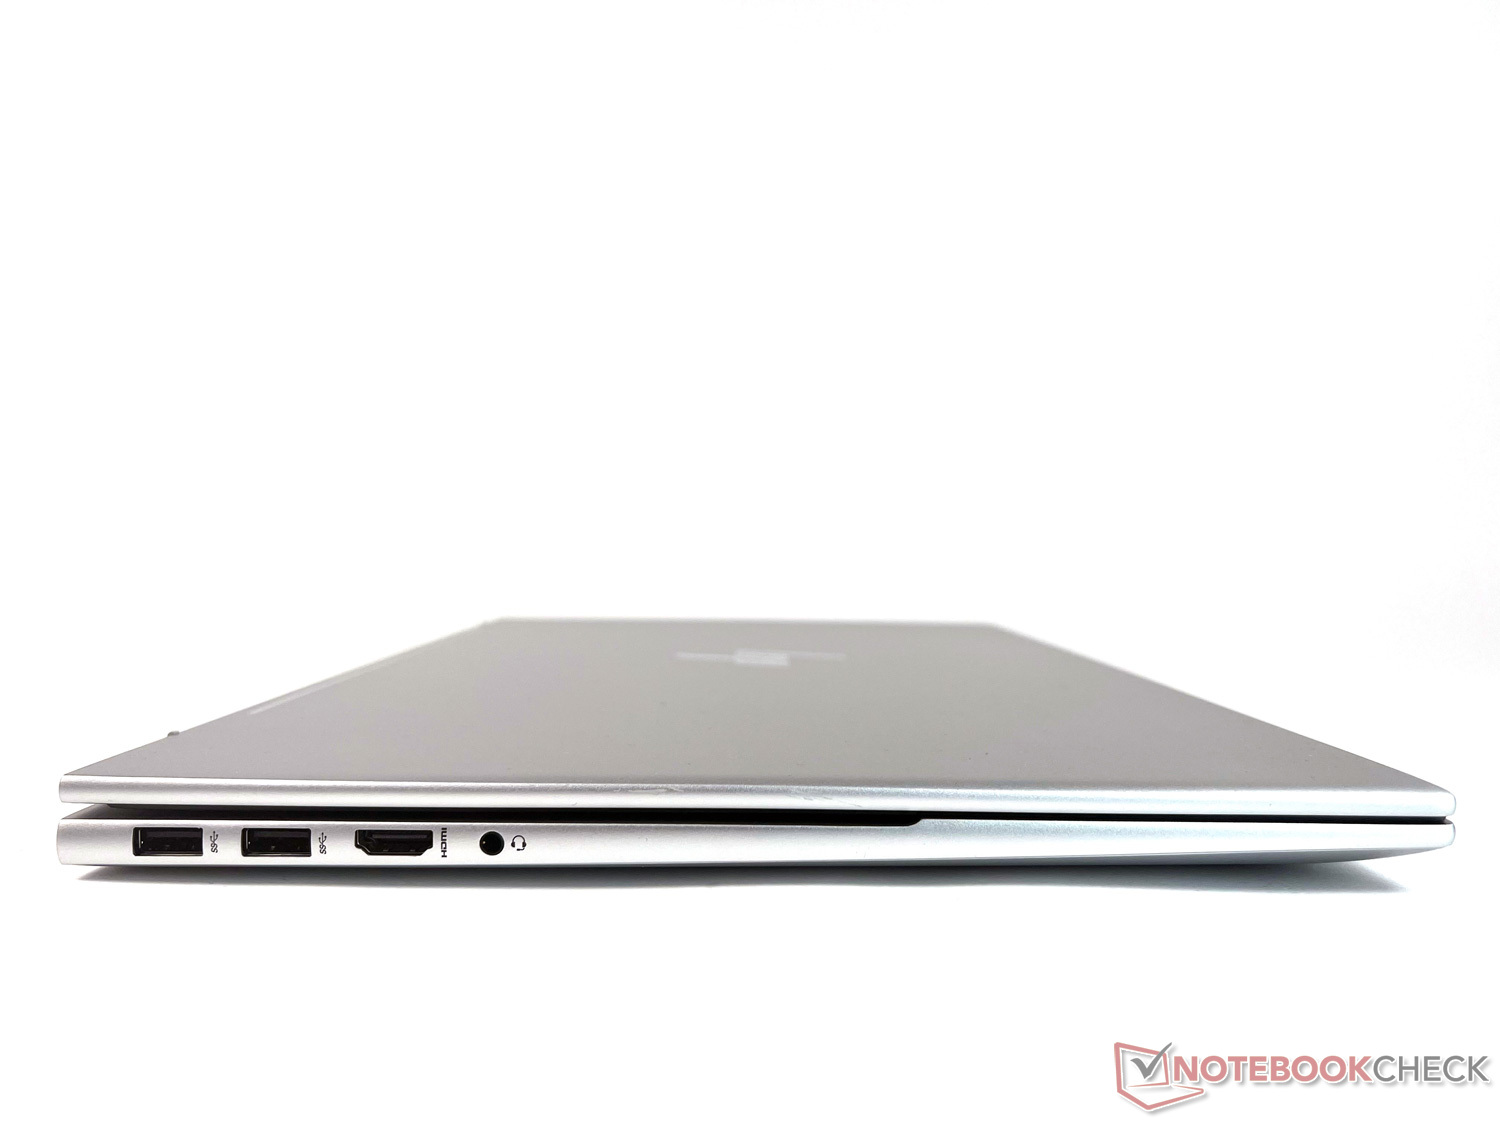
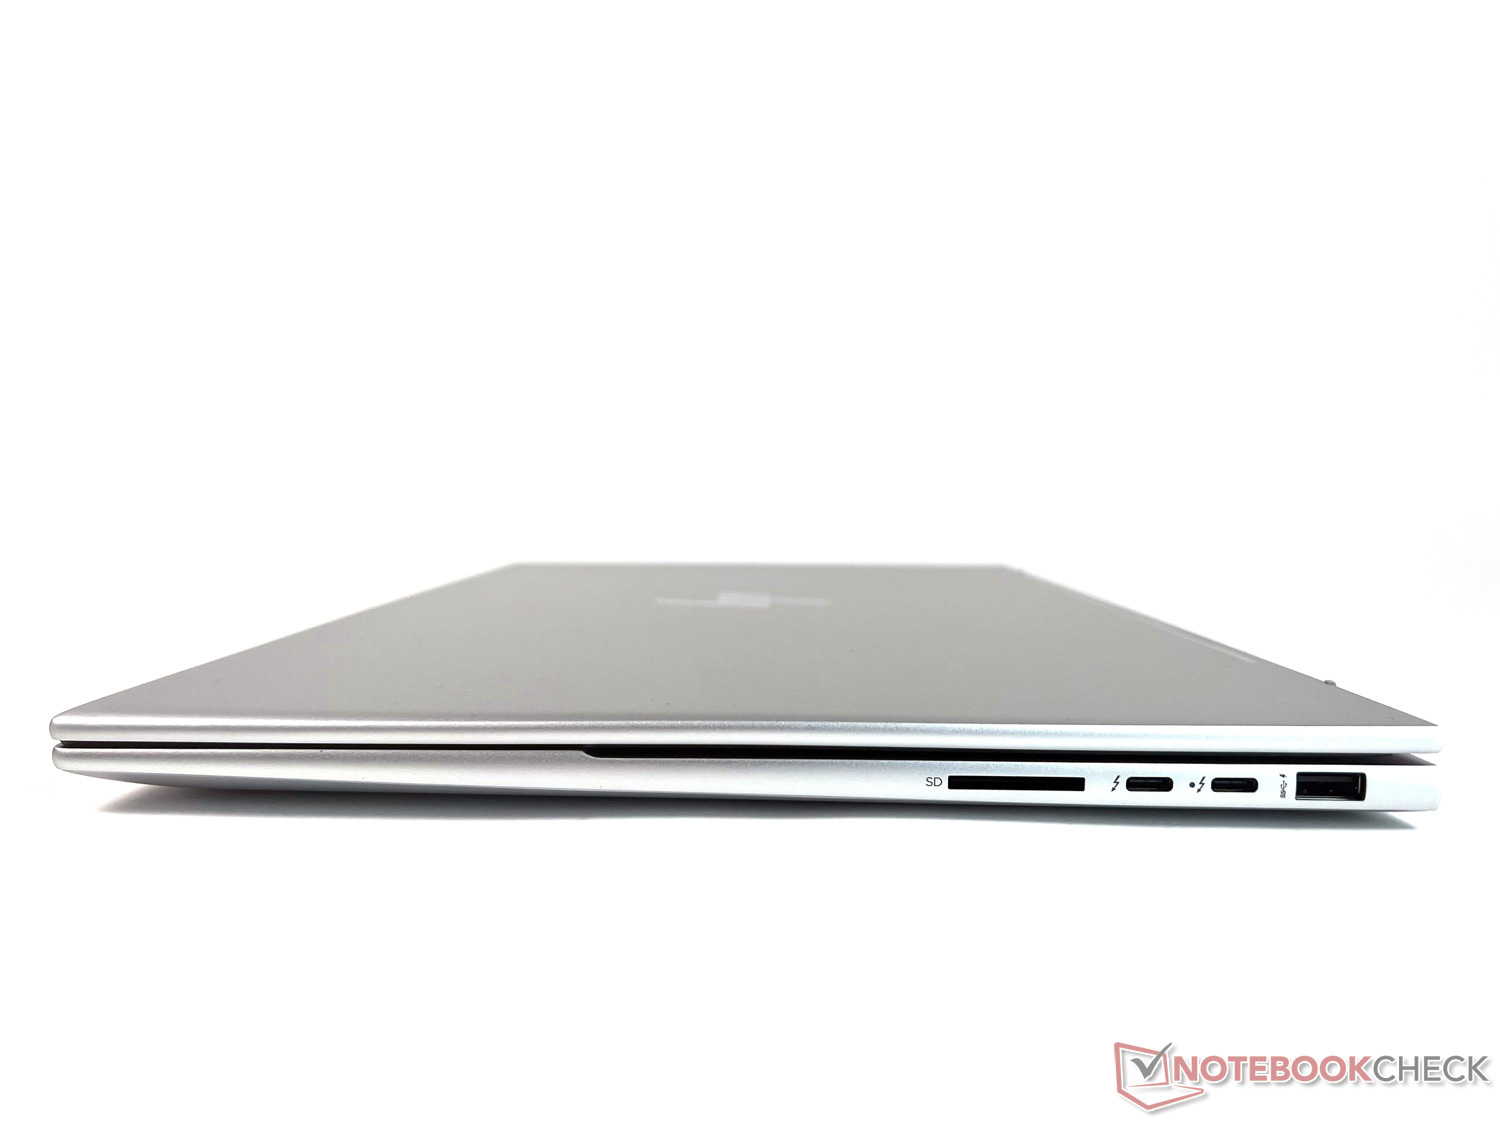
Envy 17 oferuje bogate wyposażenie w porty, z wyjątkiem portu LAN. W zestawie są dwa porty Thunderbolt 4 z USB 4 Type-C do transferu danych do 40 Gbit/s, ładowania oraz DisplayPort 1.4, przy czym oba porty umieszczono na prawym boku. W niektórych sytuacjach rozłożenie ich po obu stronach byłoby bardziej pożądane. Jeden z portów Thunderbolt jest wykorzystywany przez dołączoną do zestawu ładowarkę do zapewnienia zasilania.
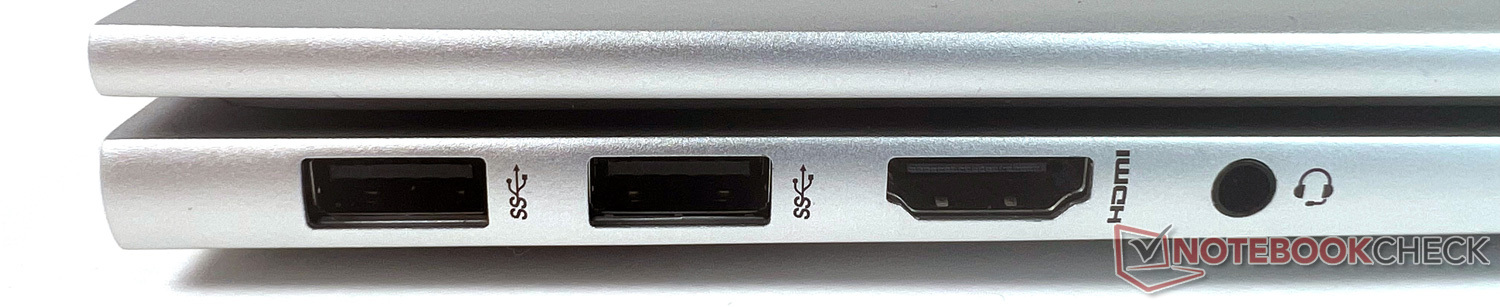
Po lewej stronie port HDMI-2.1 pozwala na podłączenie zewnętrznego monitora, alternatywnie do złącza DisplayPort. Trzy dodatkowe porty USB-A rozmieszczone po obu stronach są wystarczające, jest też czytnik kart SD. Wszystkie złącza są łatwo dostępne.
Czytnik kart SD
Wbudowany czytnik kart SD nie należy do szybkich przedstawicieli tego typu. W naszych pomiarach z wykorzystaniem referencyjnej karty pamięci AV PRO microSD 128 GB V60 zawsze zajmuje ostatnie miejsce, ale dystans za większością konkurentów nie jest zbyt duży. Jednak osoby, które często muszą kopiować duże ilości danych z karty pamięci, nadal będą lepiej obsługiwane przez inne urządzenia.
| SD Card Reader | |
| average JPG Copy Test (av. of 3 runs) | |
| Dell XPS 17 9720 (Toshiba Exceria Pro SDXC 64 GB UHS-II) | |
| Średnia w klasie Multimedia (23 - 531, n=36, ostatnie 2 lata) | |
| Lenovo IdeaPad 3 17ABA7 (AV Pro SD microSD 128 GB V60) | |
| LG Gram 17Z90Q-E.AD78G (AV Pro SD microSD 128 GB V60) | |
| HP Envy 17-cr0079ng (AV Pro SD microSD 128 GB V60) | |
| maximum AS SSD Seq Read Test (1GB) | |
| Dell XPS 17 9720 (Toshiba Exceria Pro SDXC 64 GB UHS-II) | |
| Średnia w klasie Multimedia (37.3 - 1455, n=35, ostatnie 2 lata) | |
| LG Gram 17Z90Q-E.AD78G (AV Pro SD microSD 128 GB V60) | |
| Lenovo IdeaPad 3 17ABA7 (AV Pro SD microSD 128 GB V60) | |
| HP Envy 17-cr0079ng (AV Pro SD microSD 128 GB V60) | |
Komunikacja
Zastosowany tu moduł Wi-Fi 6E AX211 firmy Intel zapewnia szybkie połączenie WLAN, które niemal nie zmienia się w czasie. Nasze pomiary są na poziomie średniej dla tego modułu WLAN. Połączenie sieci przewodowej w postaci portu LAN czy połączenia komórkowego nie jest dostępne.
| Networking | |
| iperf3 receive AXE11000 6GHz | |
| Średnia w klasie Multimedia (1212 - 2361, n=23, ostatnie 2 lata) | |
| LG Gram 17Z90Q-E.AD78G | |
| HP ProBook 450 G9 6A180EA | |
| Przeciętny Intel Wi-Fi 6E AX211 (700 - 1857, n=226) | |
| HP Envy 17-cr0079ng | |
| iperf3 receive AXE11000 | |
| LG Gram 17Z90Q-E.AD78G | |
| Dell XPS 17 9720 | |
| HP Envy 17-cr0079ng | |
| Przeciętny Intel Wi-Fi 6E AX211 (582 - 1890, n=276) | |
| Średnia w klasie Multimedia (682 - 1818, n=53, ostatnie 2 lata) | |
| Acer Aspire 5 A515-57G-53N8 | |
| Lenovo IdeaPad 3 17ABA7 | |
Kamera internetowa
Kamera na podczerwień HP True Vision jest umieszczona w centralnej części górnej ramki wyświetlacza. Oferuje ona czasowe tłumienie szumów oraz zintegrowany dwuszeregowy mikrofon cyfrowy. Rozdzielczość 5 MP jest dość wysoka i może być również wykorzystywana do Windows Hello. Choć jakość obrazu jest dobra, ma on lekki czerwony odcień. W porównaniu z konkurencją w naszym teście, ma drugie najniższe odchylenie kolorów z solidnym ∆E wynoszącym 8. Jest to absolutnie wystarczające do profesjonalnych lub prywatnych rozmów wideo.
Miły gimmick: migawka prywatności nie jest otwierana i zamykana ręcznie za pomocą suwaka, ale poprzez naciśnięcie klawisza na klawiaturze. Dodatkowo, mała lampka obok kamery wskazuje, kiedy jest ona aktywna.


Bezpieczeństwo
Oprócz ochrony prywatności dla kamery, HP Envy 17 obsługuje również Trusted Platform Module (firmware TPM). Nie ma Kensington Lock ani czujnika linii papilarnych, ale Windows Hello jest obsługiwany do odblokowywania za pomocą rozpoznawania twarzy.
Akcesoria
HP dołącza do laptopa wydajną, 90-watową ładowarkę USB-C. Opcjonalnie HP oferuje również szereg akcesoriów, ale nie są one przeznaczone specjalnie dla tego laptopa.
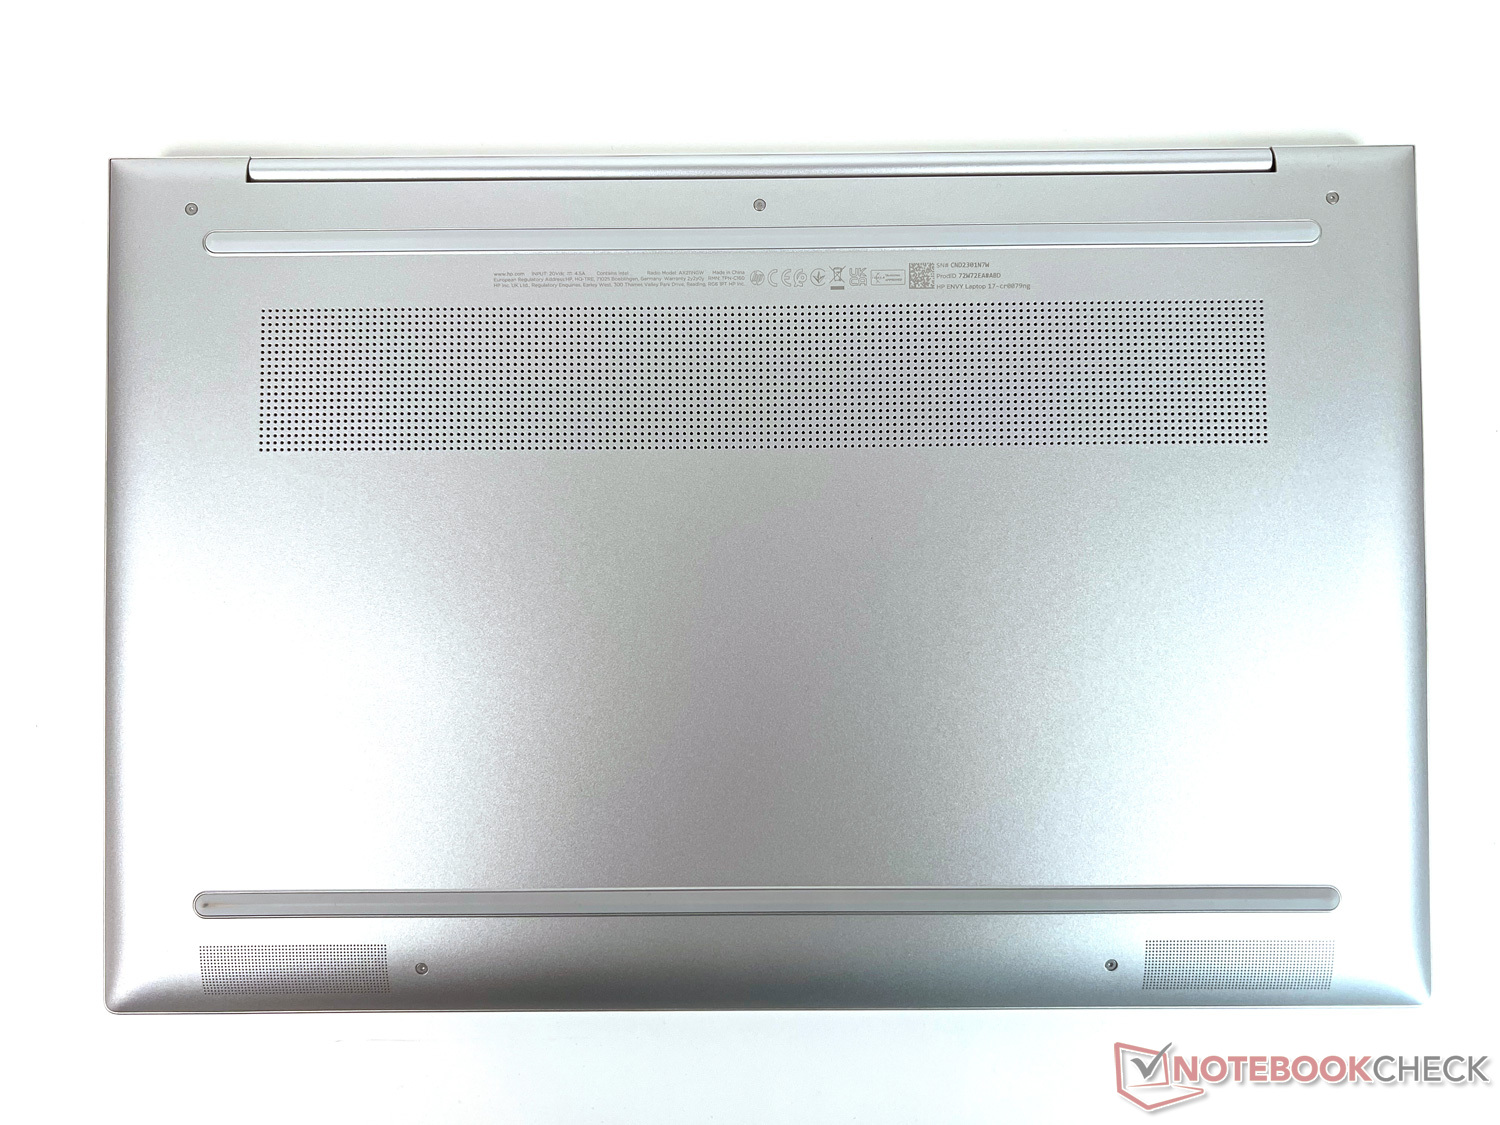
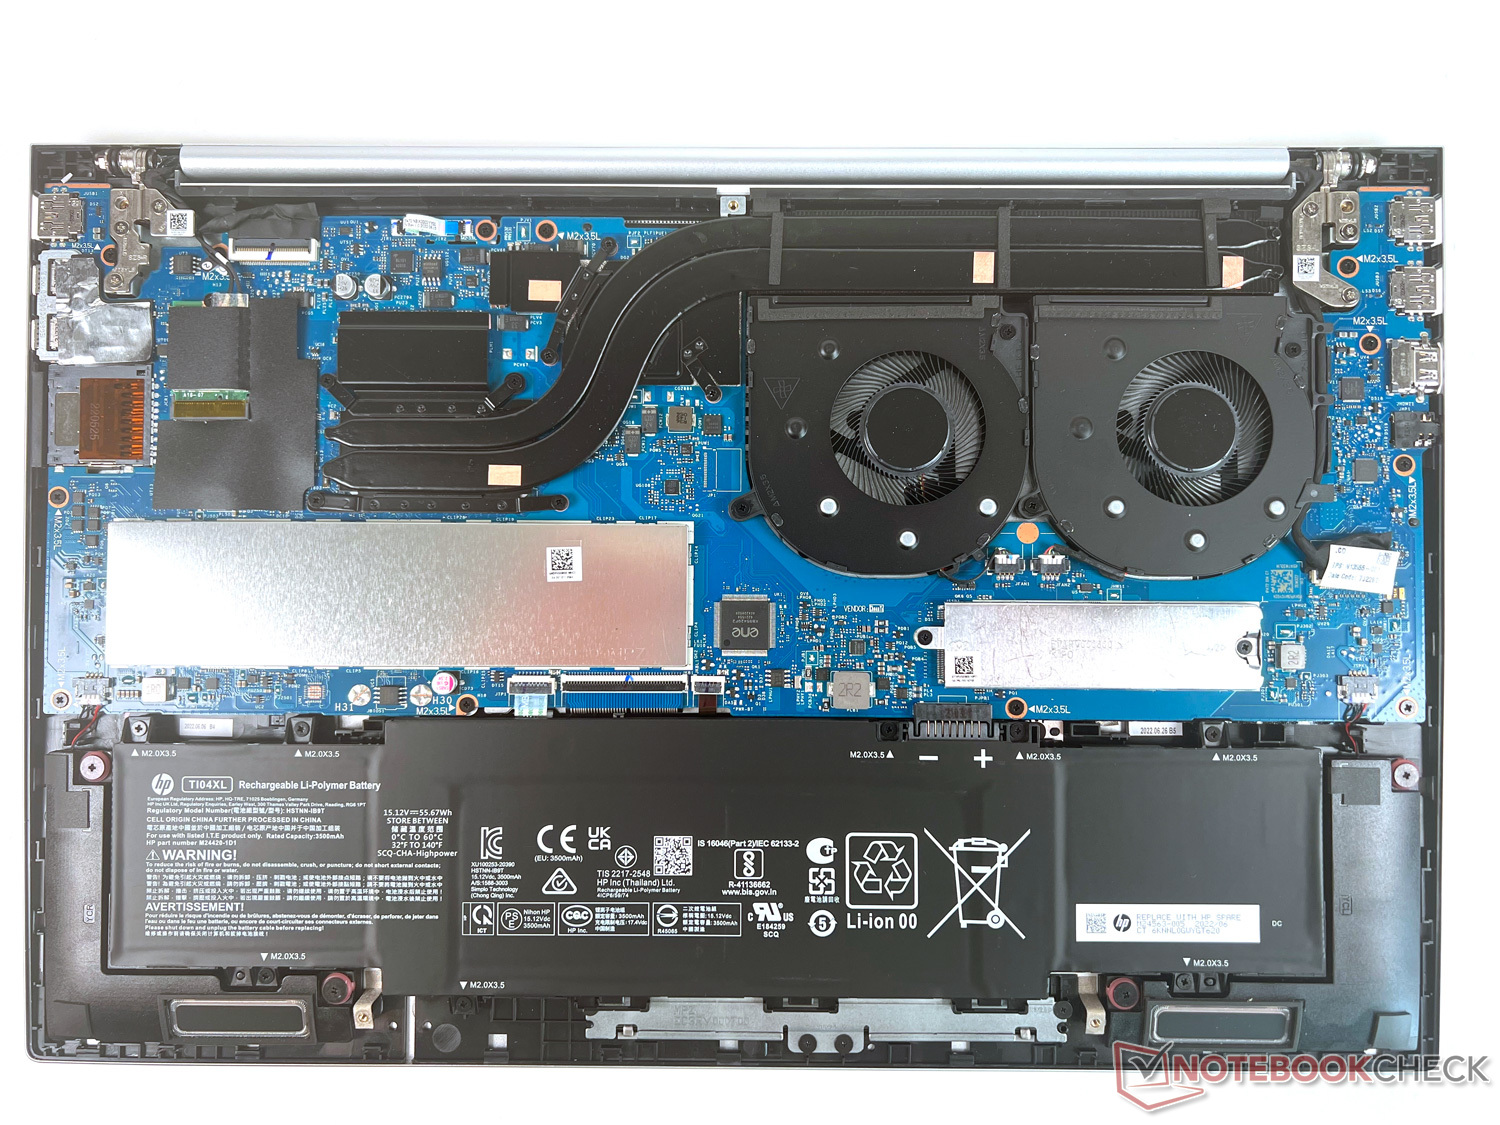
Konserwacja
Dostęp do wnętrza blokuje pięć malutkich śrubek Torx. Po uzyskaniu dostępu nie oferuje się praktycznie żadnych możliwości konserwacji. Nie ma wolnych slotów na rozszerzenie pamięci masowej, ale biorąc pod uwagę, że oferuje już 32 GB RAM, nie powinno to być zbyt trudne do zaakceptowania. Można natomiast wymienić akumulator, dysk SSD M.2 oraz moduł Wi-Fi.
Gwarancja
W Niemczech HP oferuje 2-letnią gwarancję producenta na części i robociznę.
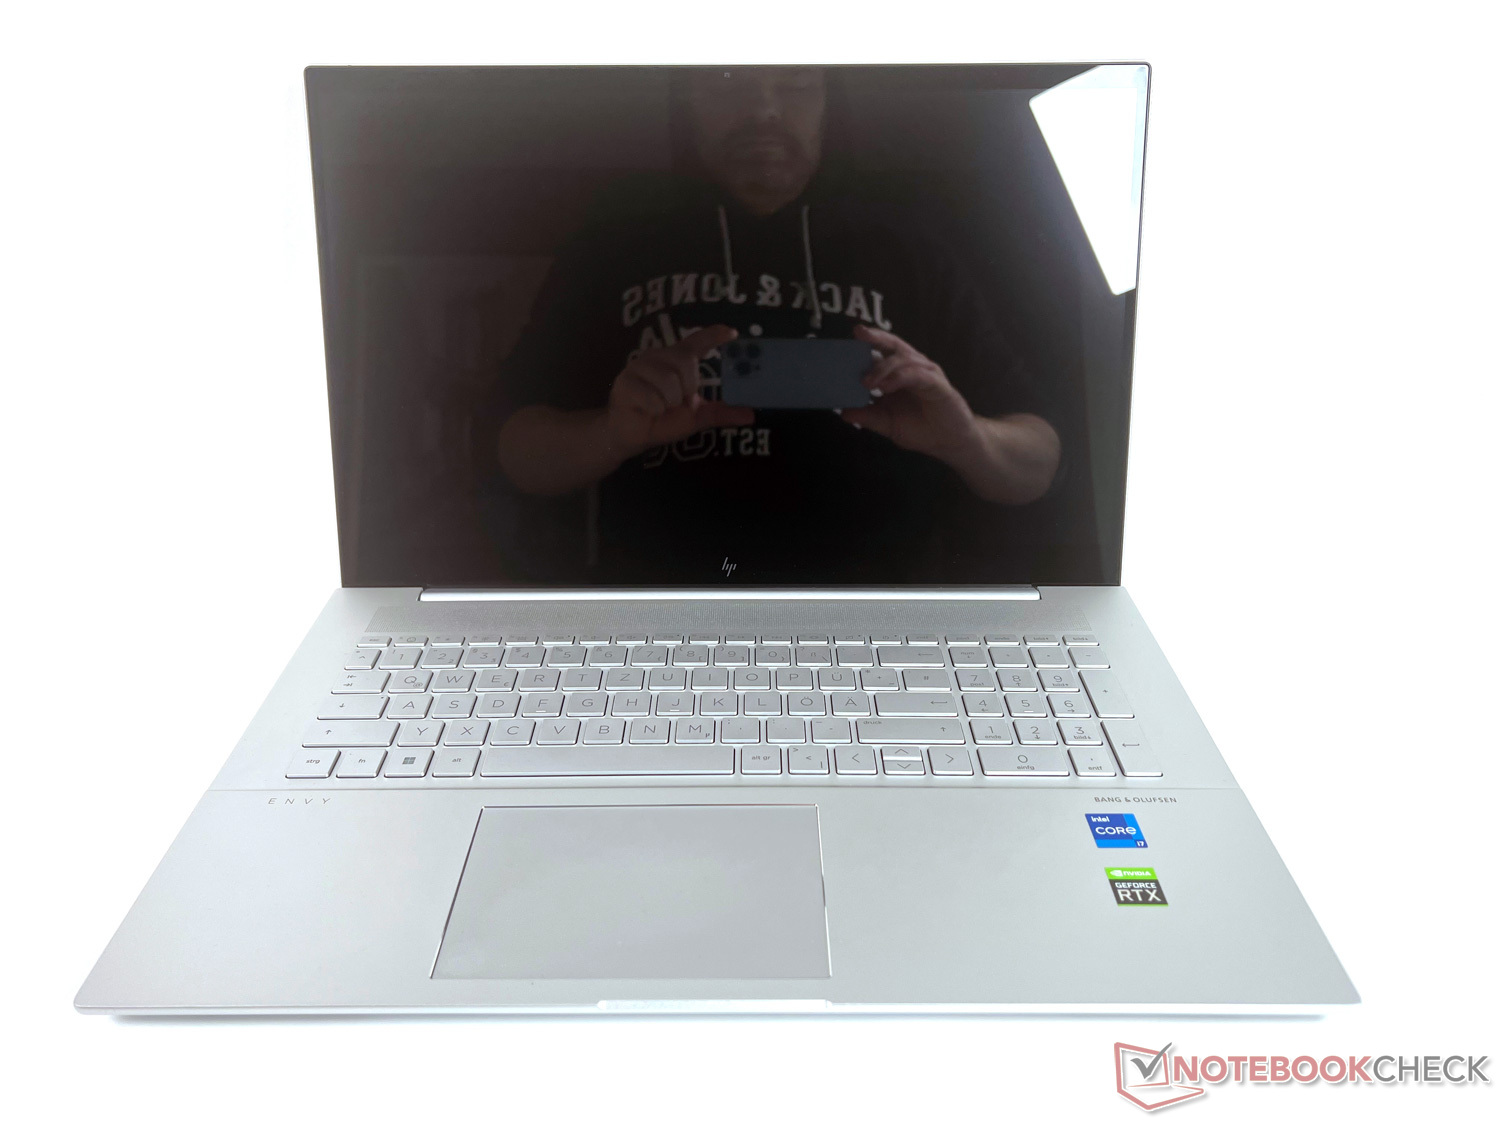
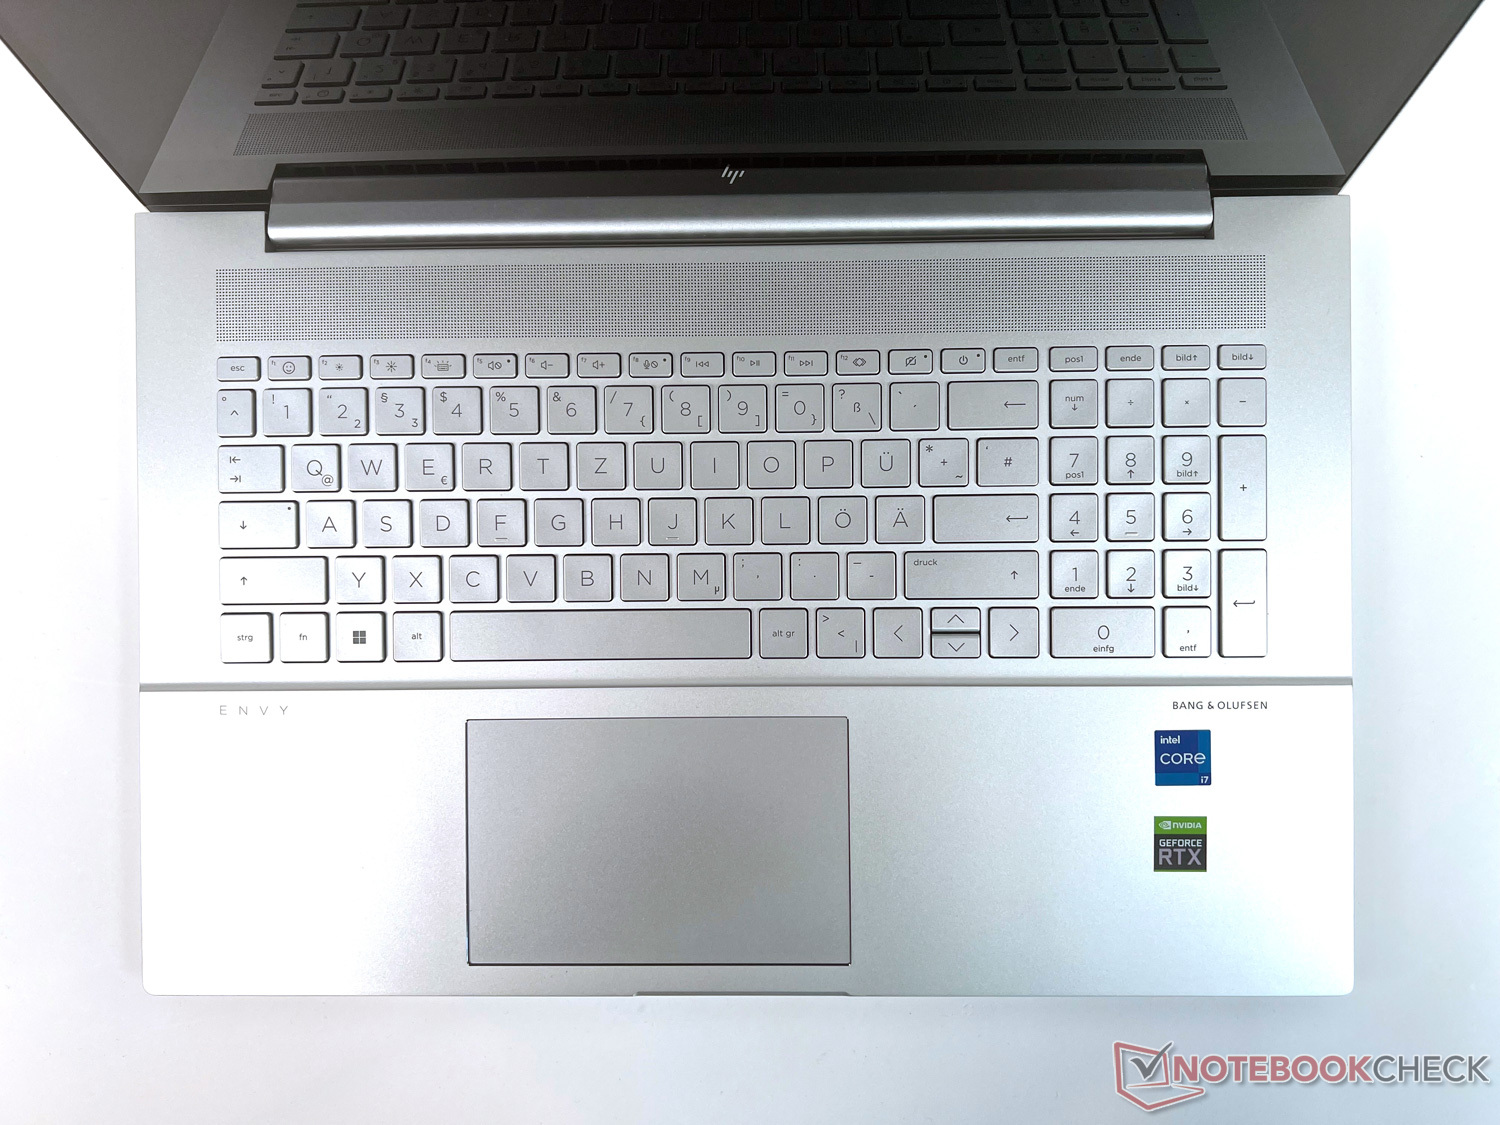
Input Devices: Duża klawiatura nie daje powodów do narzekań
17,3-calowa przekątna wyświetlacza oznacza również, że jest sporo miejsca na klawiaturę. Pomijając około 3 cm (~1,2 cala) na krawędziach, HP wykorzystuje tę przestrzeń na wystarczająco dużą klawiaturę wraz z numpadem na boku.
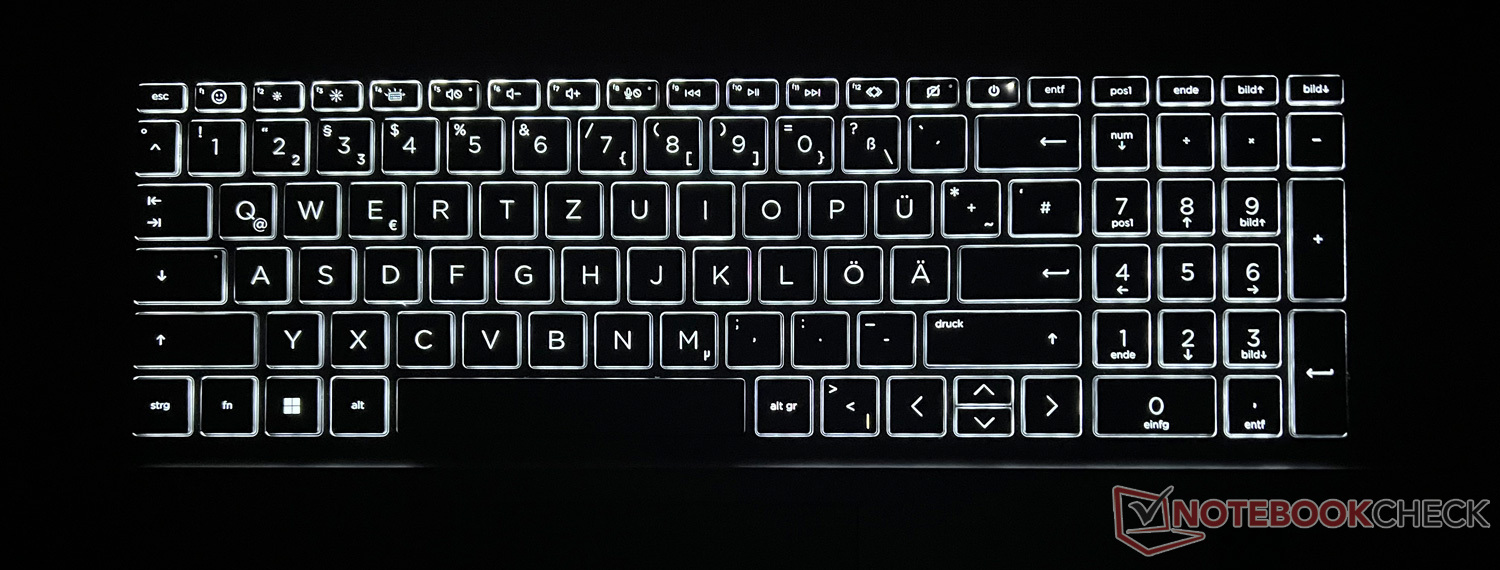
Klawiatura
Przy wymiarach około 1,7 x 1,7 cm (~0,67 cala) klawisze są wystarczająco duże, a przy stoke klawiszy wynoszącym około 2 mm (~0,08 cala) klawiatura oferuje komfortowe pisanie. Klawisze od F1 do F12 producent zajmuje typowymi funkcjami dodatkowymi, na przykład do sterowania trzystopniowym podświetleniem klawiatury, głośnością, jasnością wyświetlacza czy wspomnianą już przez nas migawką aparatu. Po prawej stronie znajduje się klawisz zasilania, służący do włączania urządzenia.
Numpad jest wygodny zwłaszcza do wprowadzania cyfr. Podświetlenie klawiatury zapewnia równomierne podświetlenie klawiszy i dobrą czytelność etykiet.
Touchpad
Touchpad umieszczony jest pod klawiaturą nieco na lewo od środka. Przy wymiarach około 12,5 x 8 cm (~4,9 x 3,15 cala) nie mamy powodów do narzekań ani na wielkość, ani na haptykę, dzięki gładkiej powierzchni. Kliknięcia w lewo są możliwe na prawie całej powierzchni touchpada, a poza prawym dolnym rogiem, również w prawo. Nie ma haptycznego rozdzielenia tych obszarów, ale w codziennej pracy nie zauważysz, że tego brakuje.
Reakcja na wejścia jest szybka i bezproblemowa. Obsługiwane są gesty wielodotykowe, takie jak przewijanie dwoma palcami czy powiększanie i zmniejszanie obrazu.
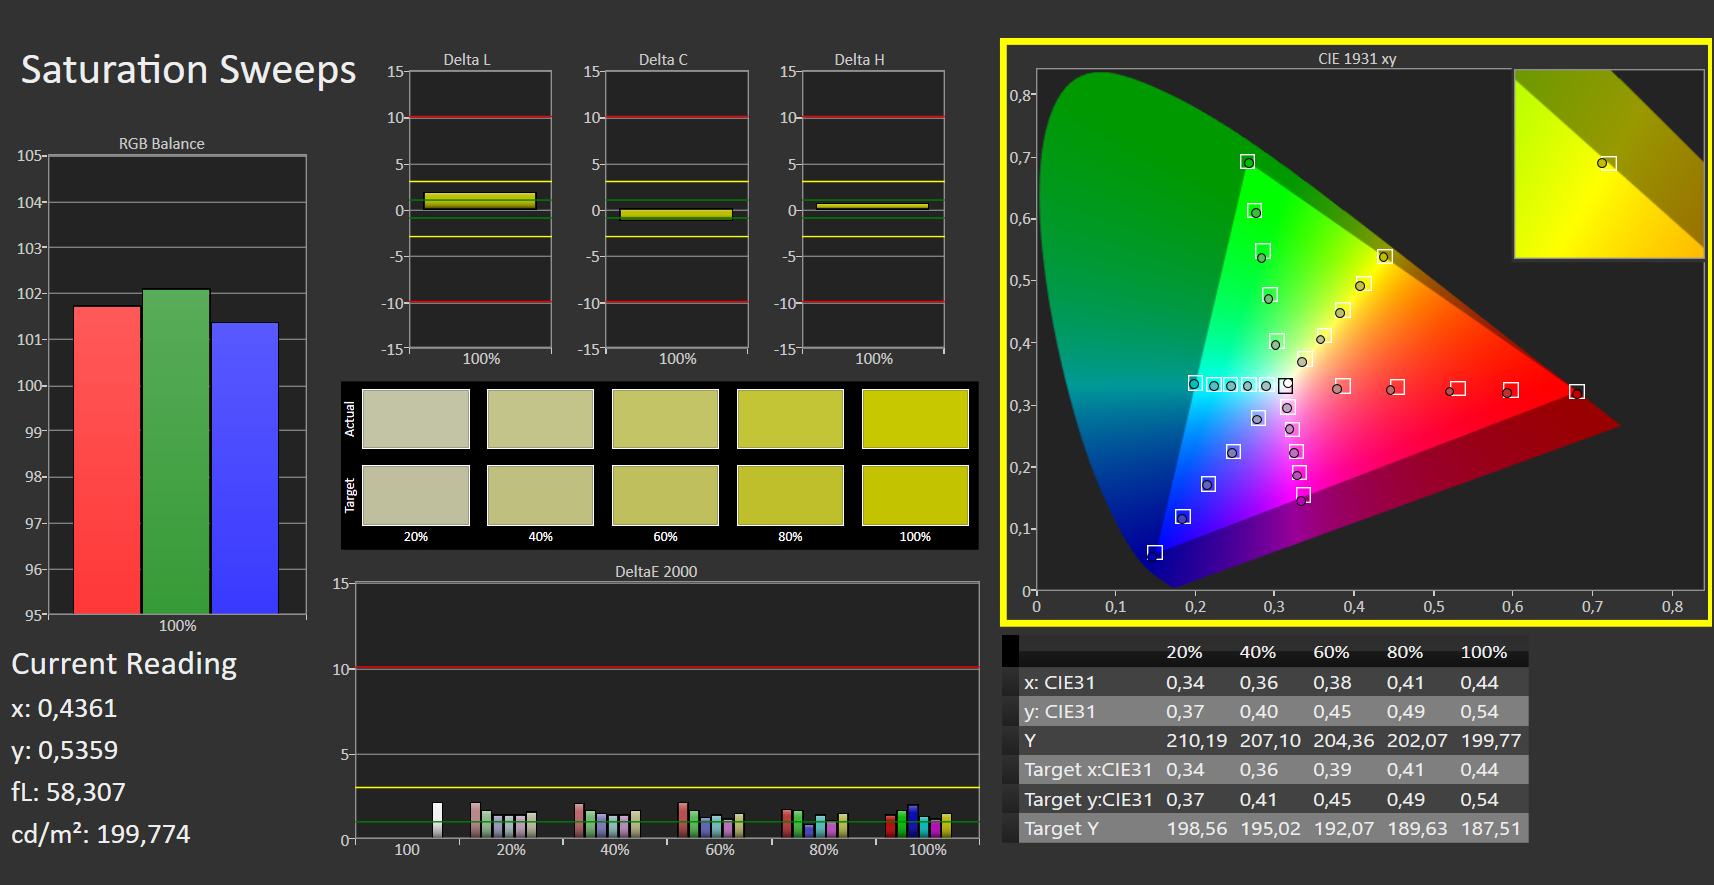
Wyświetlacz: Wysoka rozdzielczość i dobry, ale bardzo refleksyjny
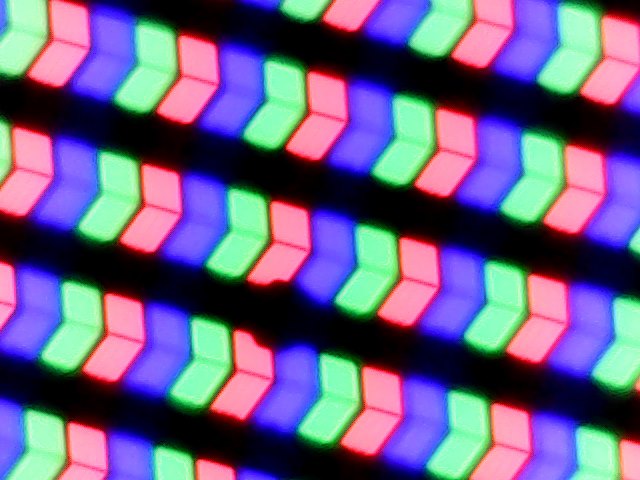

HP wyposażył model Envy 17-cr0079ng w duży 17,3-calowy panel IPS o wysokiej rozdzielczości 4K od BOE o rozdzielczości 3 840 x 2 160 pikseli, częstotliwości 60 Hz i krótkim czasie reakcji. Alternatywnie w tej serii modeli można wybrać także wersje z wyświetlaczem FHD.
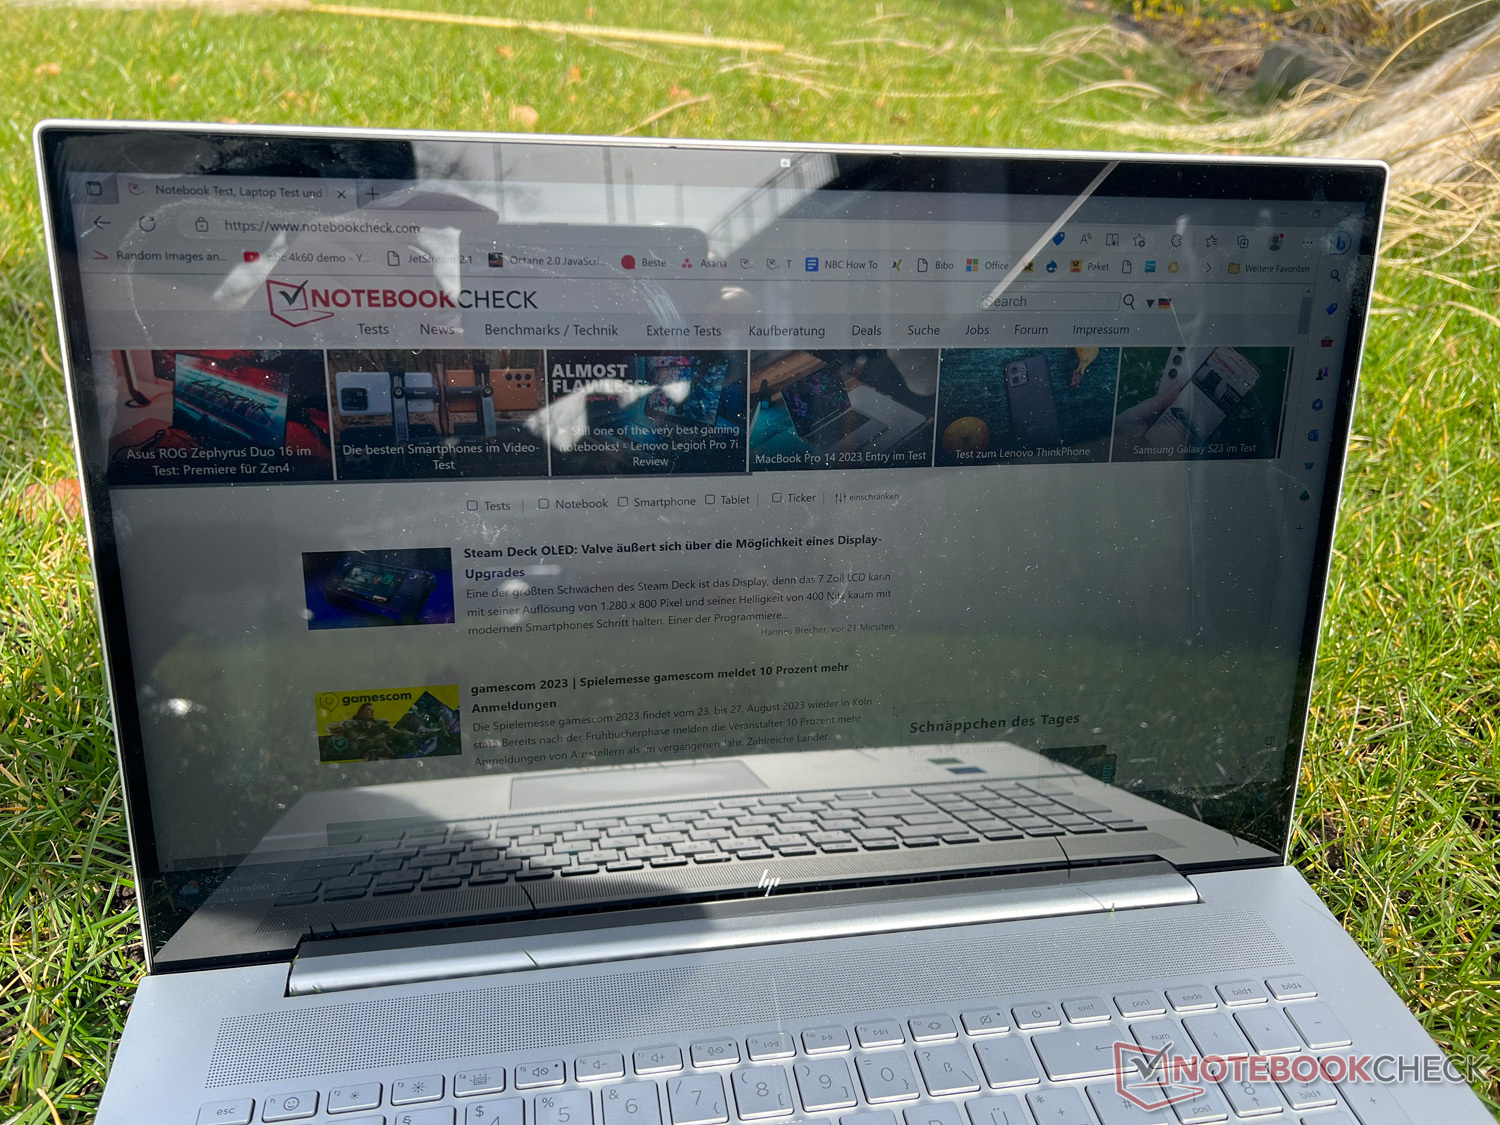
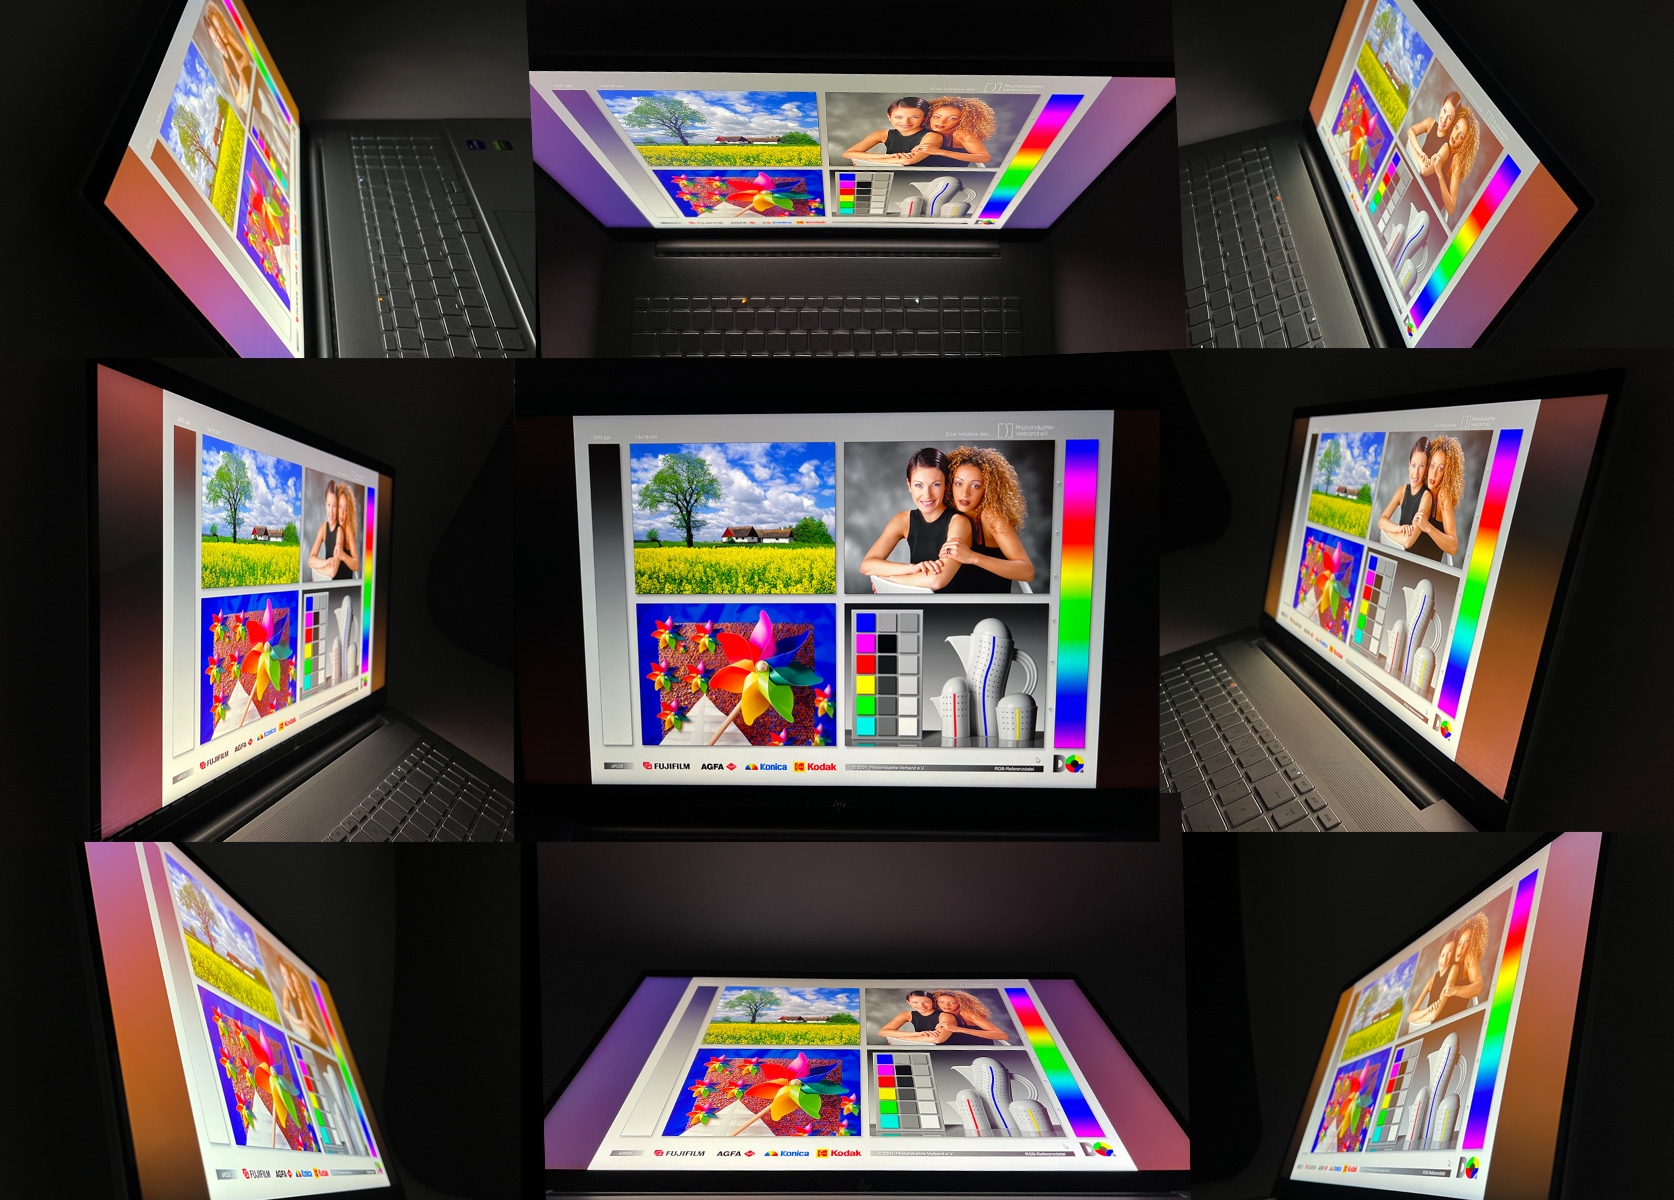
Producent obiecuje jasność wyświetlacza na poziomie 400 Nitów, co jesteśmy w stanie potwierdzić w naszych pomiarach testowych w niektórych miejscach, a także niemal średnio na całej powierzchni. Na naszym polu porównawczym testowany egzemplarz oferuje jeden z najjaśniejszych wyświetlaczy, ale niestety nie pomaga to w przypadku korzystania z niego na zewnątrz, ponieważ producent zdecydował się na zastosowanie wersji odblaskowej. Choć wygląda to świetnie, to jednocześnie tworzy silne refleksy, przez co zawartość jest mało rozpoznawalna na zewnątrz (patrz zdjęcia poniżej). W pomieszczeniach zamkniętych działa to lepiej, ale nadal pojawiają się denerwujące odbicia od źródeł światła, takich jak lampy czy okna.
Pod względem wartości czerni i kontrastu HP Envy 17 przewyższa większość konkurentów. Na naszym polu porównawczym wyświetlacz ten daje jeden z najlepszych wyników ogólnych, ale cierpi też na lekkie cloudingi i znaczny backlight bleeding, co oznacza, że przy wyświetlaniu ciemnych treści można dostrzec na krawędziach pewne jaśniejsze miejsca w podświetleniu tła.
| |||||||||||||||||||||||||
rozświetlenie: 86 %
na akumulatorze: 390 cd/m²
kontrast: 987:1 (czerń: 0.395 cd/m²)
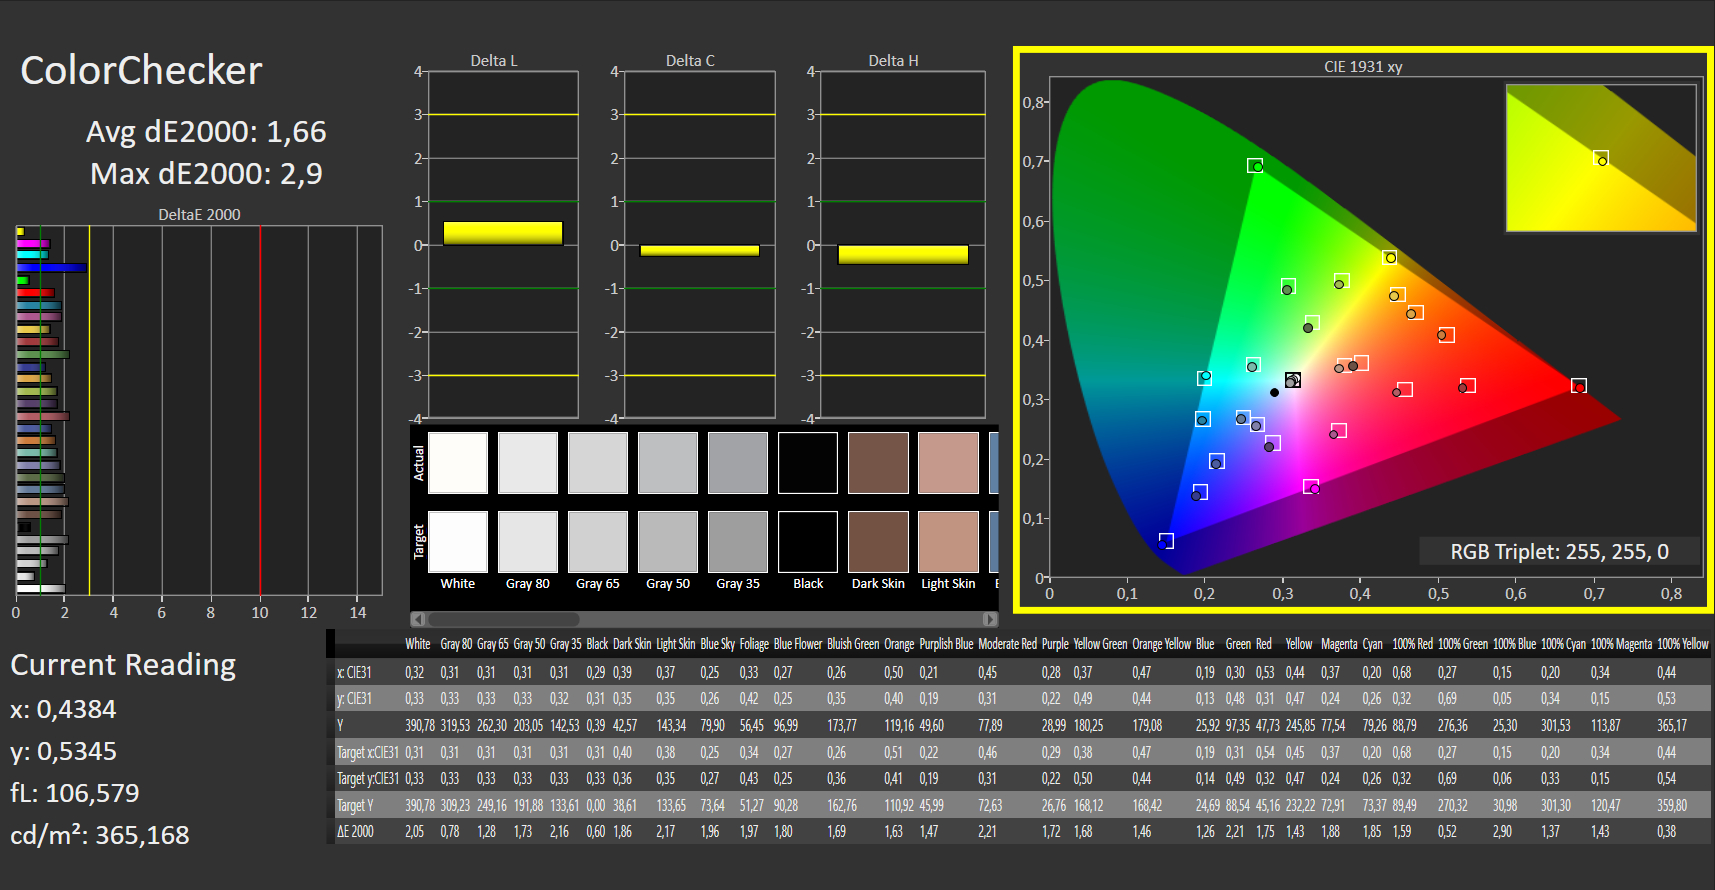
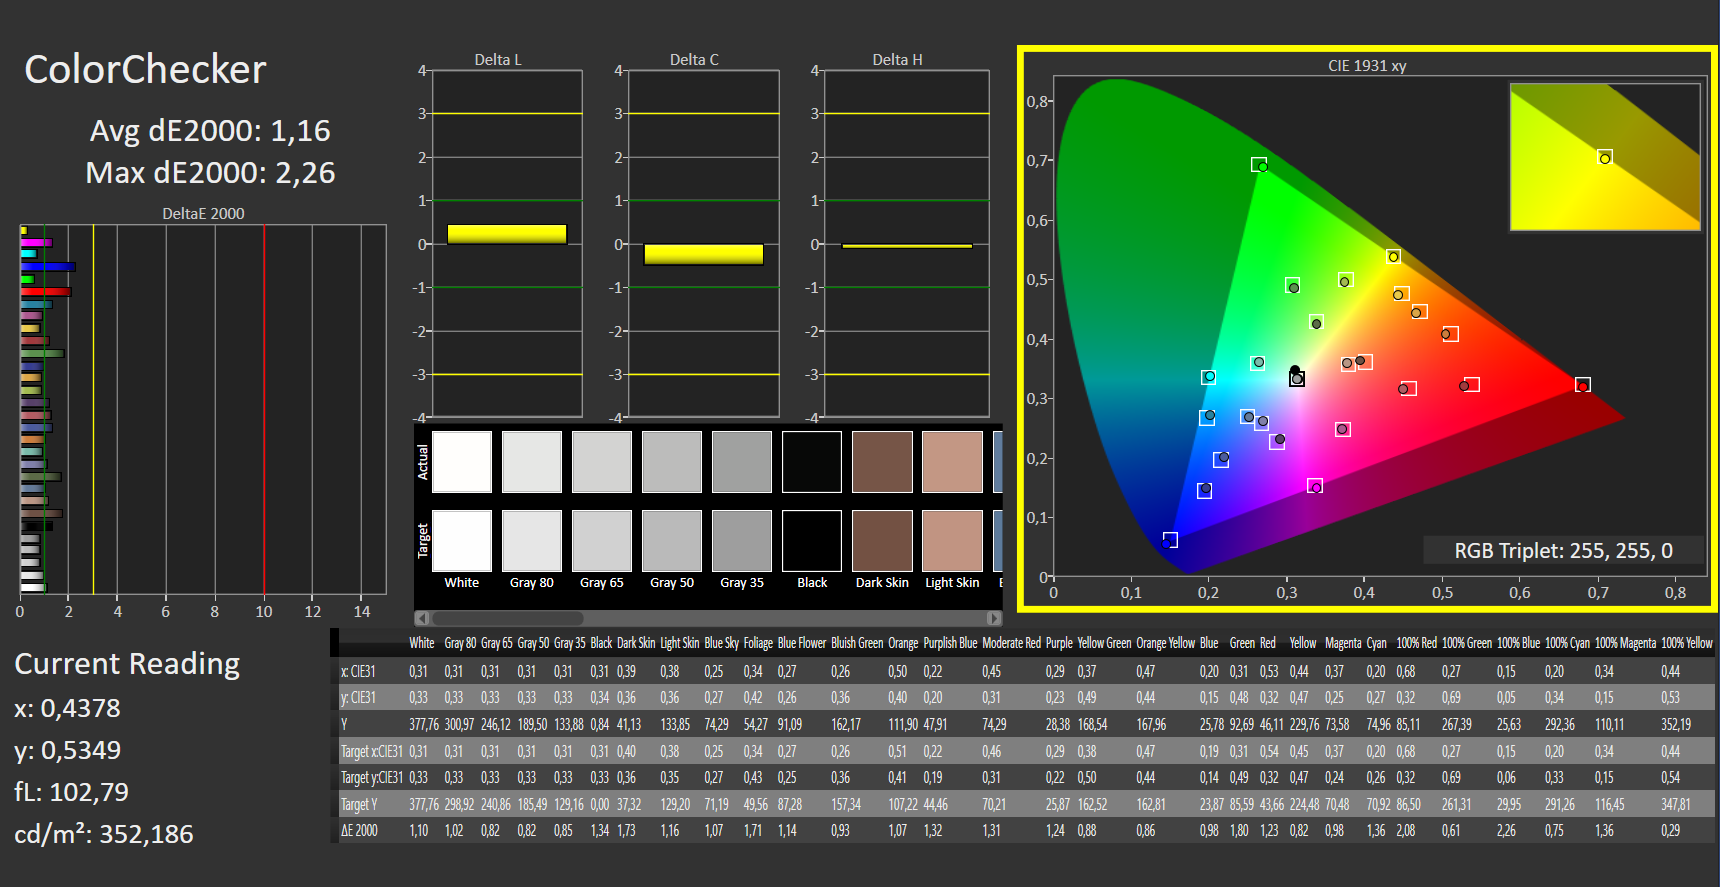
ΔE ColorChecker Calman: 1.66 | ∀{0.5-29.43 Ø4.71}
calibrated: 1.16
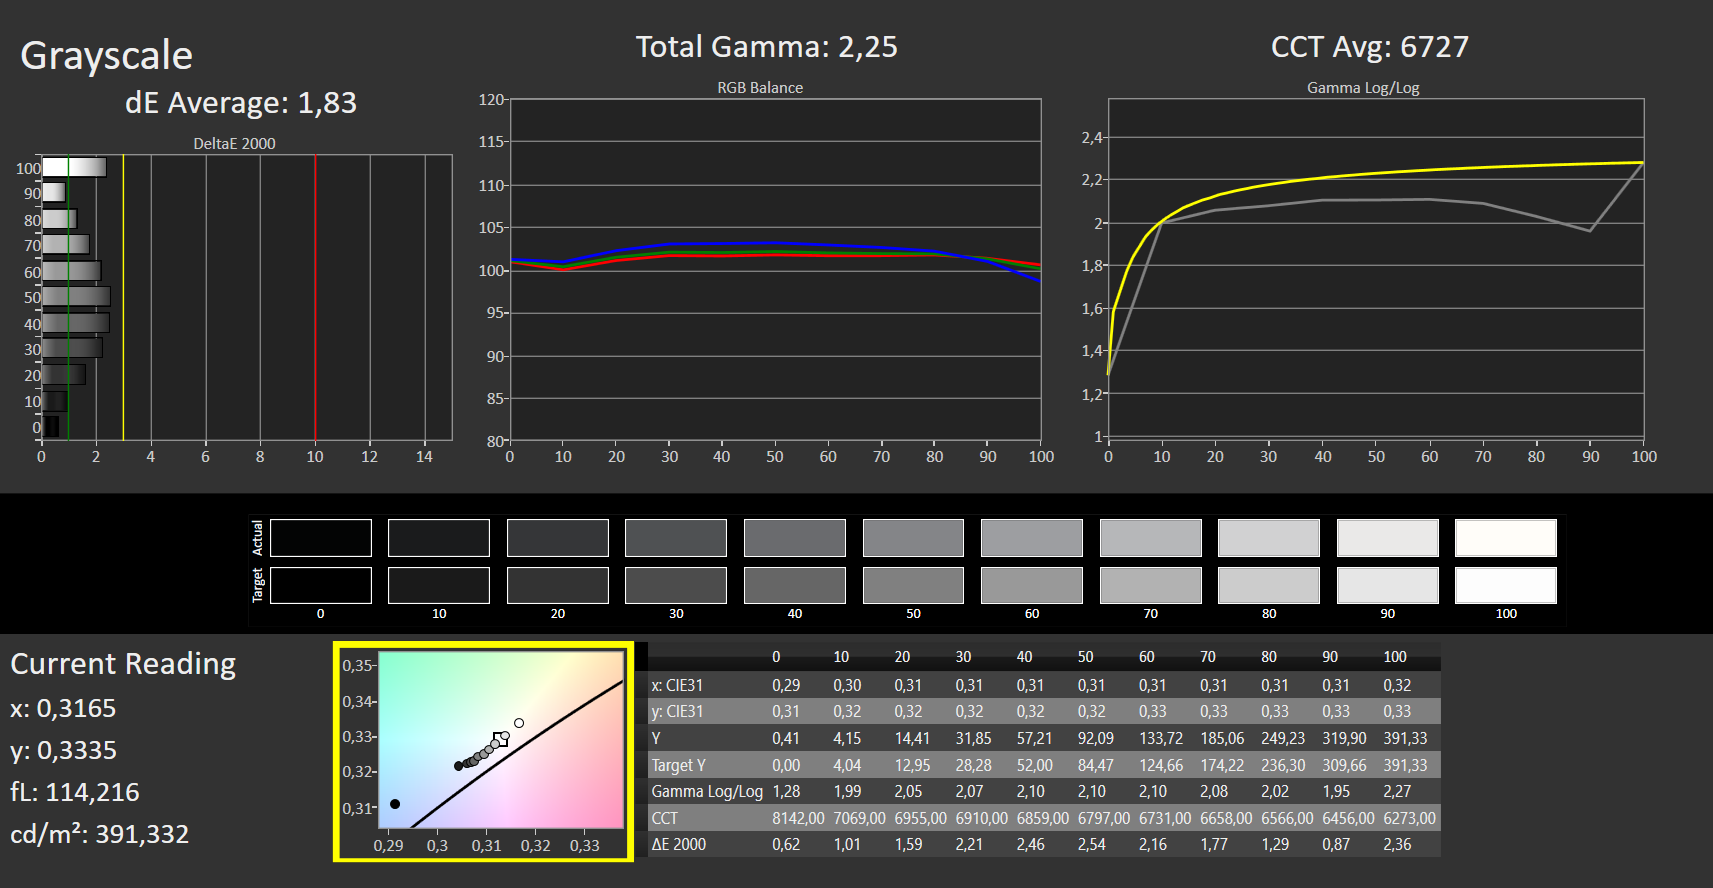
ΔE Greyscale Calman: 1.83 | ∀{0.09-98 Ø4.96}
87.03% AdobeRGB 1998 (Argyll 3D)
100% sRGB (Argyll 3D)
98.31% Display P3 (Argyll 3D)
Gamma: 2.25
CCT: 6727 K
| HP Envy 17-cr0079ng BOE0A66, IPS, 3840x2160, 17.3" | HP ProBook 450 G9 6A180EA Chi Mei CMN1512, , 1920x1080, 15.6" | LG Gram 17Z90Q-E.AD78G LG Display LP170WQ1-SPF2, IPS, 2560x1600, 17" | Acer Aspire 5 A515-57G-53N8 CMN N156HCA-EAB, IPS, 1920x1080, 15.6" | Dell XPS 17 9720 Sharp LQ170R1, IPS, 3840x2400, 17" | Lenovo IdeaPad 3 17ABA7 Lenovo LEN173FHD, IPS, 1920x1080, 17.3" | |
|---|---|---|---|---|---|---|
| Display | -47% | -4% | -47% | 4% | -22% | |
| Display P3 Coverage (%) | 98.31 | 42.76 -57% | 92.2 -6% | 43.3 -56% | 94.8 -4% | 67.8 -31% |
| sRGB Coverage (%) | 100 | 63.9 -36% | 98.66 -1% | 65 -35% | 100 0% | 88.9 -11% |
| AdobeRGB 1998 Coverage (%) | 87.03 | 44.2 -49% | 82.98 -5% | 44.8 -49% | 100 15% | 65 -25% |
| Response Times | -1443% | -1086% | -1855% | -2763% | -443% | |
| Response Time Grey 50% / Grey 80% * (ms) | 1 | 28 ? -2700% | 22 ? -2100% | 35.6 ? -3460% | 53.2 ? -5220% | 10 ? -900% |
| Response Time Black / White * (ms) | 7 ? | 20 ? -186% | 12 ? -71% | 24.5 ? -250% | 28.4 ? -306% | 6 ? 14% |
| PWM Frequency (Hz) | 17990 ? | |||||
| Screen | -124% | -36% | -97% | -17% | -109% | |
| Brightness middle (cd/m²) | 390 | 234 -40% | 391 0% | 250 -36% | 438 12% | 353 -9% |
| Brightness (cd/m²) | 385 | 218 -43% | 358 -7% | 234 -39% | 411 7% | 307 -20% |
| Brightness Distribution (%) | 86 | 85 -1% | 84 -2% | 79 -8% | 86 0% | 78 -9% |
| Black Level * (cd/m²) | 0.395 | 0.17 57% | 0.29 27% | 0.19 52% | 0.27 32% | 0.775 -96% |
| Contrast (:1) | 987 | 1376 39% | 1348 37% | 1316 33% | 1622 64% | 455 -54% |
| Colorchecker dE 2000 * | 1.66 | 5.04 -204% | 3.52 -112% | 3.94 -137% | 2.5 -51% | 5.48 -230% |
| Colorchecker dE 2000 max. * | 2.9 | 18.04 -522% | 6.06 -109% | 16.73 -477% | 6.3 -117% | 10.13 -249% |
| Colorchecker dE 2000 calibrated * | 1.16 | 4.13 -256% | 1.43 -23% | 3.09 -166% | 0.8 31% | 2.44 -110% |
| Greyscale dE 2000 * | 1.83 | 4.43 -142% | 4.27 -133% | 3.6 -97% | 4.2 -130% | 5.56 -204% |
| Gamma | 2.25 98% | 2.41 91% | 2.3 96% | 2.081 106% | 2.22 99% | 2.43 91% |
| CCT | 6727 97% | 6350 102% | 7203 90% | 6476 100% | 7034 92% | 7582 86% |
| Całkowita średnia (program / ustawienia) | -538% /
-296% | -375% /
-179% | -666% /
-338% | -925% /
-405% | -191% /
-138% |
* ... im mniej tym lepiej
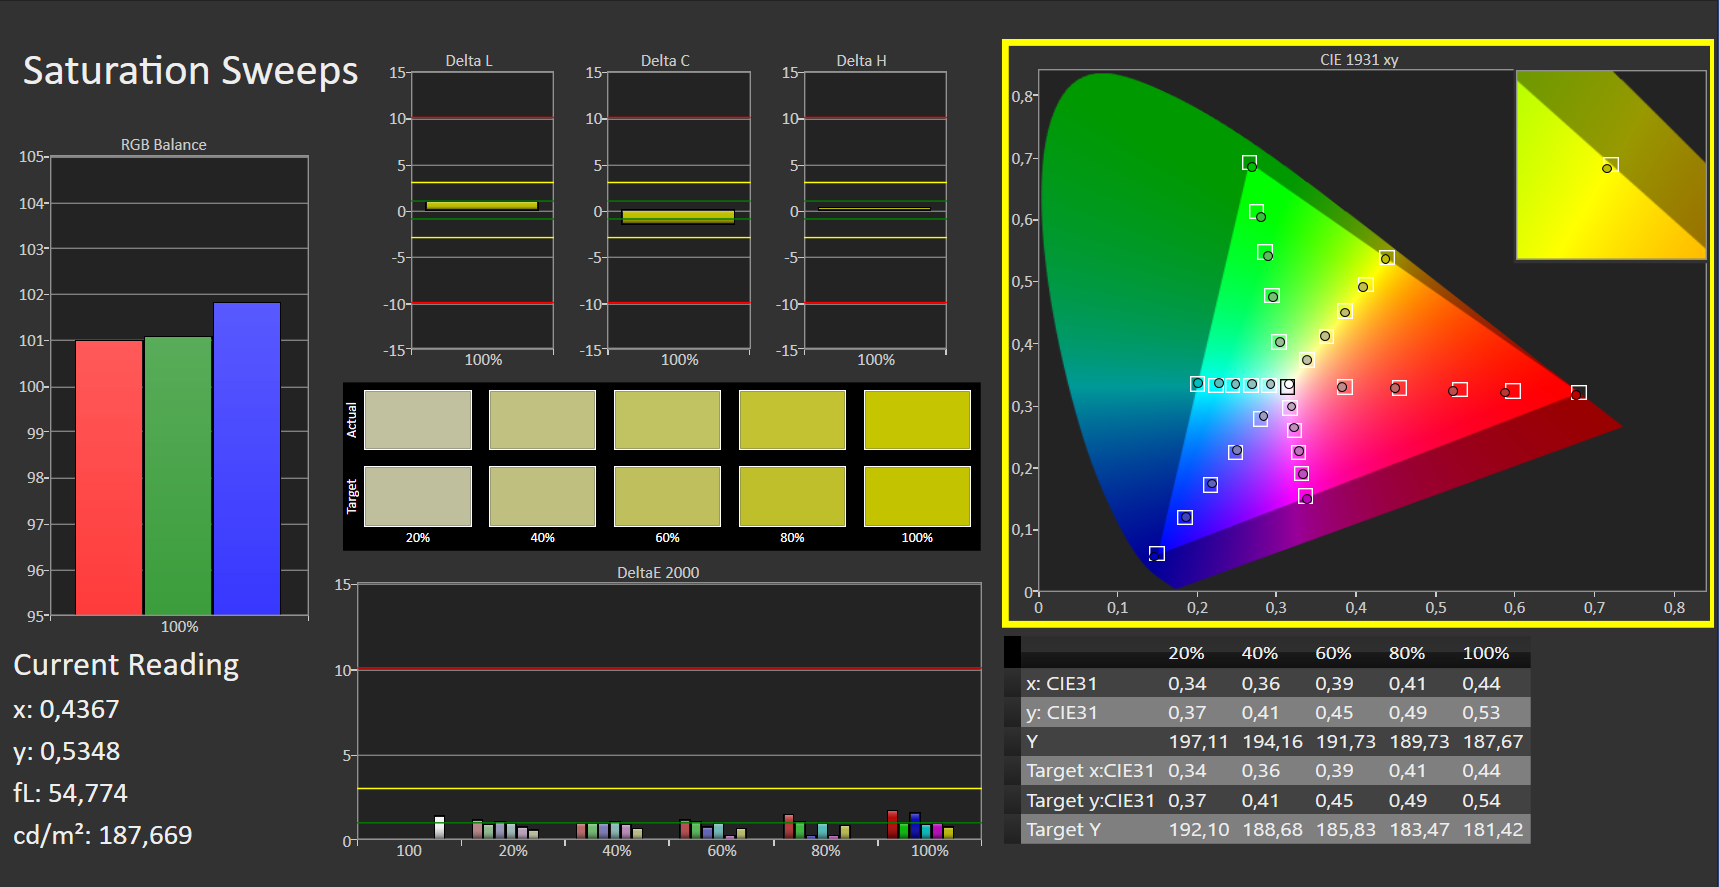
W porównaniu z innymi kandydatami do testu pokrycie przestrzeni barw jest dobre. Panel pokrywa 100% mniejszej przestrzeni kolorów sRGB. Przy dobrym 98% pokryciu przestrzeni barw P3 i 87% przestrzeni AdobeRGB osiąga dobre wartości, ale nadal nie byłby to idealny wybór dla grafików.
Urządzenie oferuje też dobre odwzorowanie kolorów w porównaniu z konkurencją, o czym świadczą niskie pomiary Delta E. Wartości, które w stanie dostawy są już dość wyrównane, można jeszcze poprawić poprzez kalibrację.

Wyświetl czasy reakcji
| ↔ Czas reakcji od czerni do bieli | ||
|---|---|---|
| 7 ms ... wzrost ↗ i spadek ↘ łącznie | ↗ 1 ms wzrost |  |
| ↘ 6 ms upadek | ||
| W naszych testach ekran wykazuje bardzo szybką reakcję i powinien bardzo dobrze nadawać się do szybkich gier. Dla porównania, wszystkie testowane urządzenia wahają się od 0.1 (minimum) do 240 (maksimum) ms. » 21 % wszystkich urządzeń jest lepszych. Oznacza to, że zmierzony czas reakcji jest lepszy od średniej wszystkich testowanych urządzeń (19.8 ms). | ||
| ↔ Czas reakcji 50% szarości do 80% szarości | ||
| 1 ms ... wzrost ↗ i spadek ↘ łącznie | ↗ 0 ms wzrost |  |
| ↘ 0 ms upadek | ||
| W naszych testach ekran wykazuje bardzo szybką reakcję i powinien bardzo dobrze nadawać się do szybkich gier. Dla porównania, wszystkie testowane urządzenia wahają się od 0.165 (minimum) do 636 (maksimum) ms. » 4 % wszystkich urządzeń jest lepszych. Oznacza to, że zmierzony czas reakcji jest lepszy od średniej wszystkich testowanych urządzeń (30.9 ms). | ||
Migotanie ekranu / PWM (modulacja szerokości impulsu)
| Migotanie ekranu/nie wykryto PWM |  | ||
Dla porównania: 52 % wszystkich testowanych urządzeń nie używa PWM do przyciemniania wyświetlacza. Jeśli wykryto PWM, zmierzono średnio 7741 (minimum: 5 - maksimum: 343500) Hz. | |||
Odblaskowy wyświetlacz stwarza pewne problemy podczas używania go na zewnątrz. Wyświetlacz IPS oferuje dobrą stabilność kątów widzenia, która jest typowa dla tego rodzaju panelu.
Wydajność: Dzięki GeForce RTX 2050 nadaje się również do gier
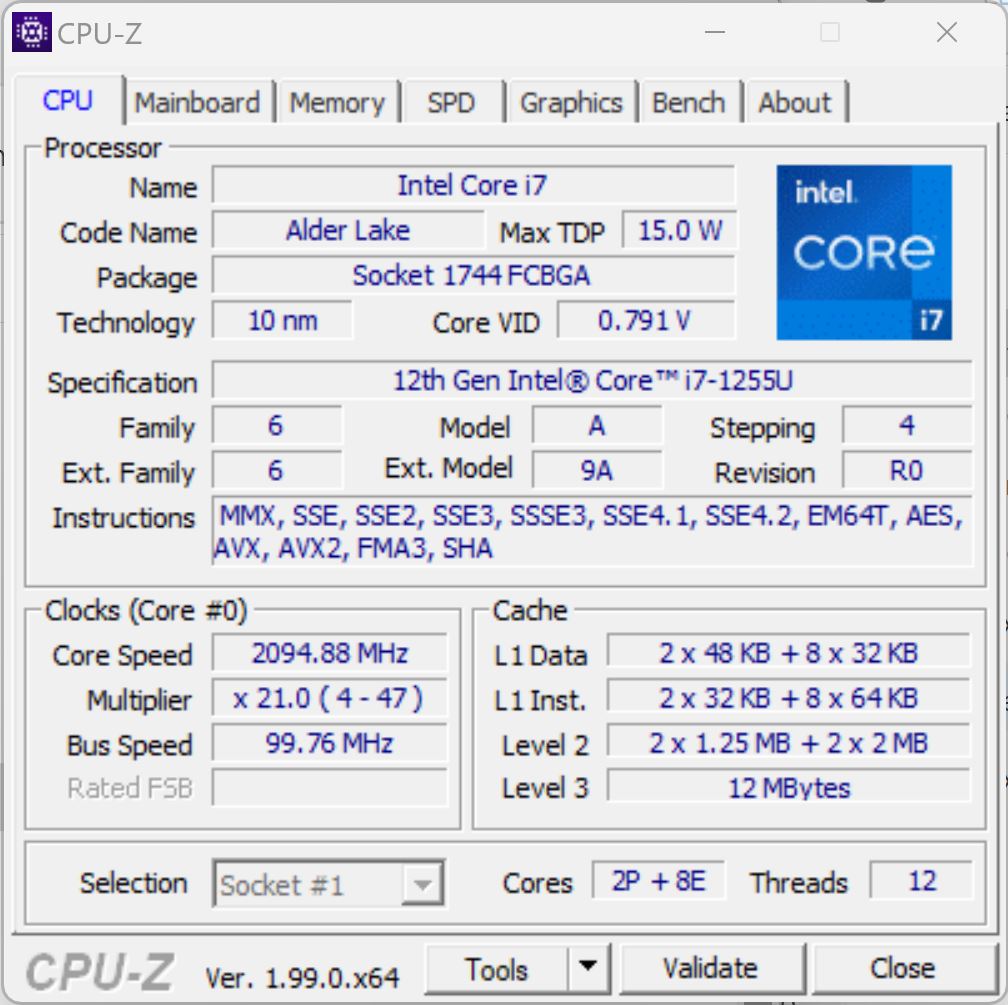
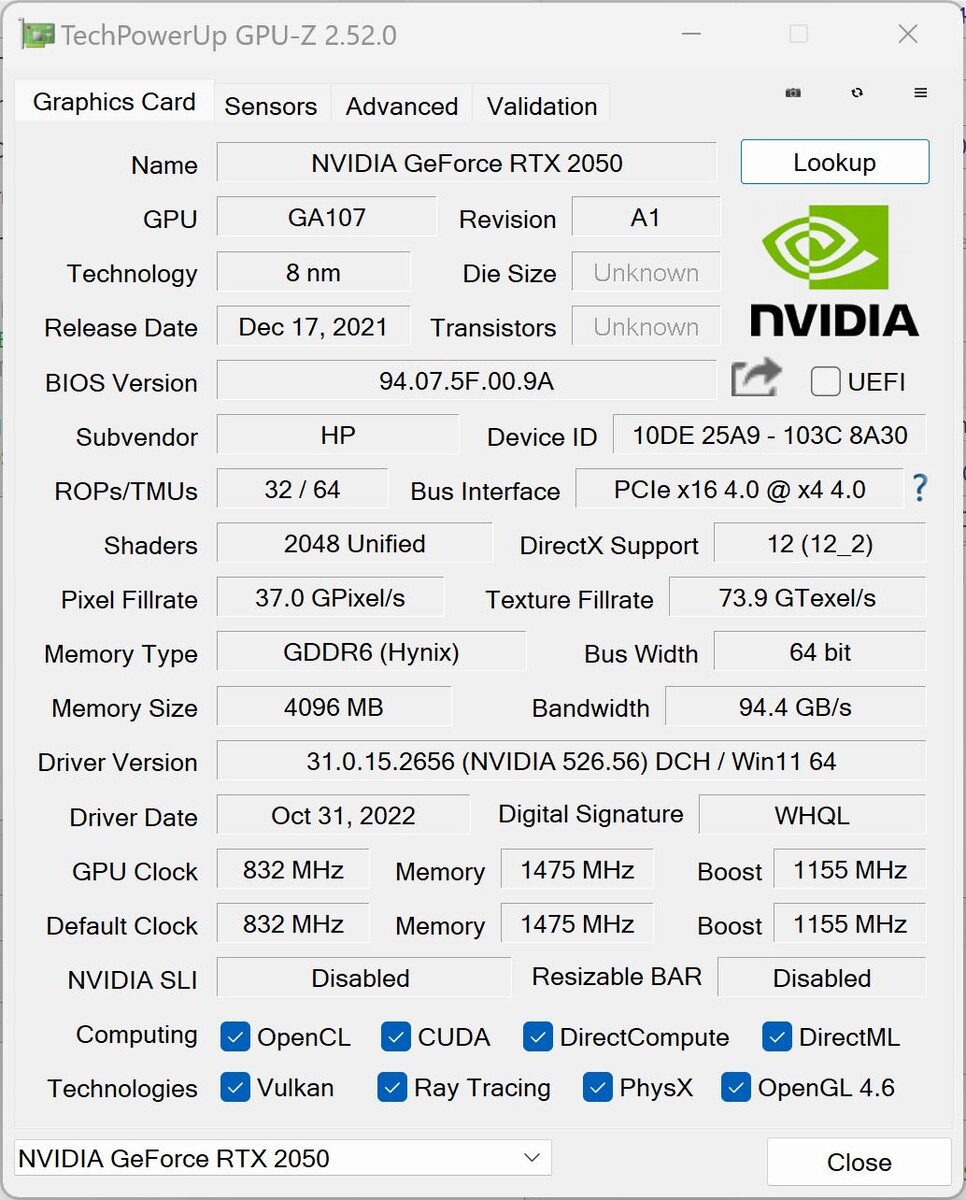
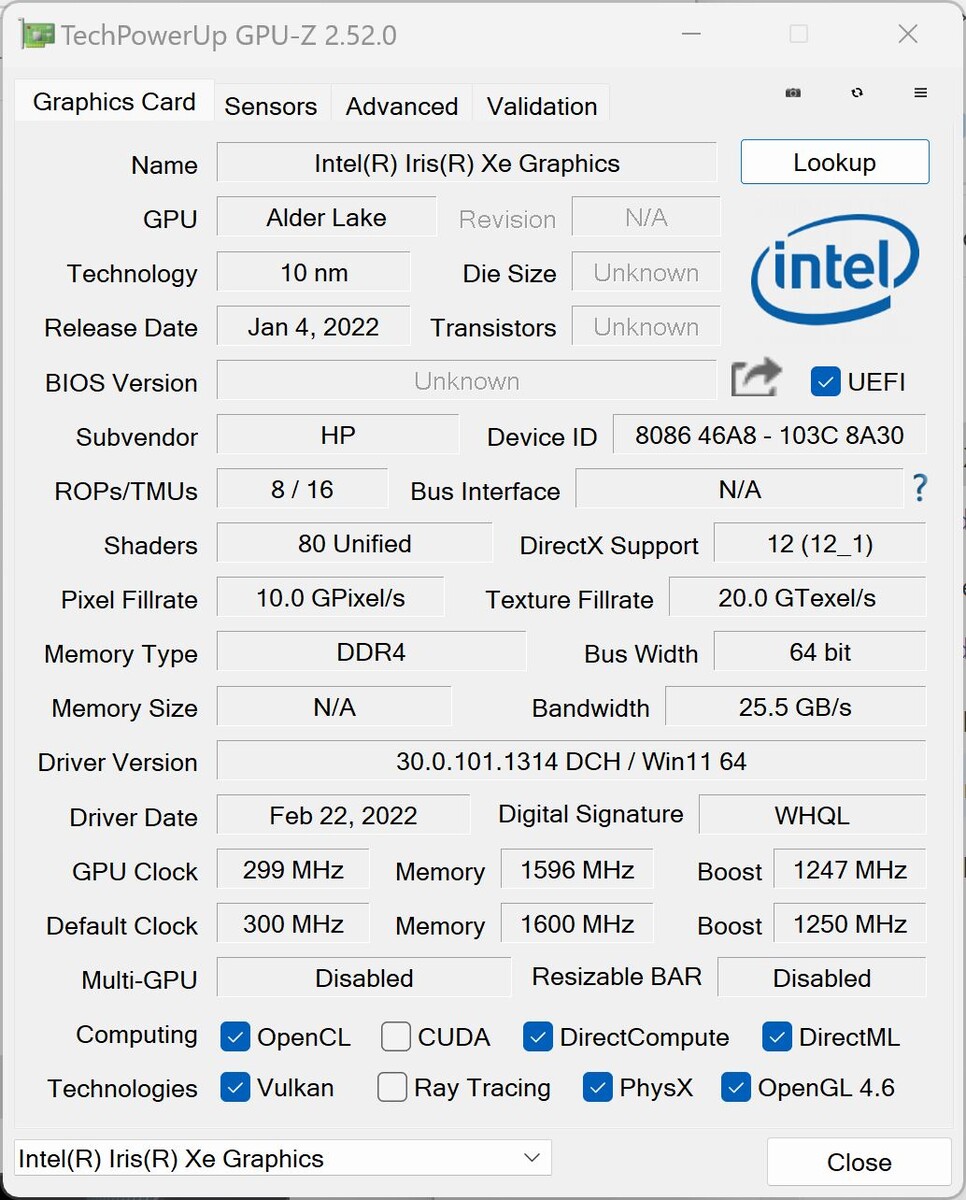
W naszej konfiguracji testowej cr0079ng (72W72EA), HP Envy 17 wyposażony jest w Core i7-1255Uz 12. generacji procesorów Intela (Alder Lake U). Producent łączy go z dodatkowymi 32 GB pamięci RAM DDR4 3200 MHz (2x 16 GB) oraz dużym dyskiem SSD PCIe NVMe M.2 o pojemności 1 TB. W zależności od zapotrzebowania, dedykowany m.in Nvidia GeForce RTX 2050 Laptop GPU z 4 GB GDDR6 lub wewnętrzny układ graficzny Intel Iris Xe Graphics obsługują wyjścia graficzne.
Alternatywnie, HP oferuje również Envy 17 w wielu innych konfiguracjach, na przykład z mniejszą ilością pamięci RAM i pamięci masowej lub z różnymi procesorami, jak np Intel Core i5-1235U lub Core i7-1260P.
Warunki badania
W Command Center, HP oferuje własne narzędzie, pozwalające na wybór spośród trybów wydajności "Balanced", "Performance" i "Cool", jak również tryb "Power Saving" w trybie pracy na baterii, lub można również wybrać automatyczny tryb "Intelligent Adjustment". W naszych benchmarkach wybieraliśmy zwykle tryb "Performance" HP wraz z ustawieniem "Best Performance" Windows.
| tryb "Performance" | Tryb "Intelligent Adjustment" | Tryb "Cool" | |
|---|---|---|---|
| Limit mocy 1 | 18 Watt | 15 Watt | 10 Watt |
| Limit mocy 2 | 51 Watt | 46 Watt | 15 Watt |
Procesor
Na stronie Core i7-1255Uzastosowany tutaj pochodzi z 12. generacji procesorów Intela (Alder Lake) i jest przeznaczony do laptopów z wyższej półki. Dziesięciordzeniowy procesor składa się z dwóch rdzeni Performance i ośmiu Efficiency, co daje dwanaście wątków dzięki hiperwątkowości rdzeni P. Częstotliwość taktowania waha się od 1,7 do 4,7 GHz.
W benchmarkach CPU podczas naszych testów HP Envy 17 osiąga w większości bardzo dobre wyniki, pozycjonując się zazwyczaj powyżej średniej dla tego procesora i konkurentów z tym samym procesorem. W naszym teście stałego obciążenia wydajność jest również stale dostępna. Podczas pracy na akumulatorze wydajność spada o około 70%.
Cinebench R15 Multi Constant Load Test
Cinebench R23: Multi Core | Single Core
Cinebench R20: CPU (Multi Core) | CPU (Single Core)
Cinebench R15: CPU Multi 64Bit | CPU Single 64Bit
Blender: v2.79 BMW27 CPU
7-Zip 18.03: 7z b 4 | 7z b 4 -mmt1
Geekbench 5.5: Multi-Core | Single-Core
HWBOT x265 Benchmark v2.2: 4k Preset
LibreOffice : 20 Documents To PDF
R Benchmark 2.5: Overall mean
| CPU Performance rating | |
| Średnia w klasie Multimedia | |
| Dell XPS 17 9720 | |
| Acer Aspire 5 A515-57G-53N8 | |
| HP Envy 17-cr0079ng | |
| LG Gram 17Z90Q-E.AD78G | |
| Przeciętny Intel Core i7-1255U | |
| Lenovo IdeaPad 3 17ABA7 | |
| HP ProBook 450 G9 6A180EA | |
| HP Envy 17-cg | |
| Cinebench R23 / Multi Core | |
| Dell XPS 17 9720 | |
| Średnia w klasie Multimedia (4861 - 33362, n=65, ostatnie 2 lata) | |
| Acer Aspire 5 A515-57G-53N8 | |
| HP Envy 17-cr0079ng | |
| LG Gram 17Z90Q-E.AD78G | |
| LG Gram 17Z90Q-E.AD78G | |
| Lenovo IdeaPad 3 17ABA7 | |
| Przeciętny Intel Core i7-1255U (5269 - 9628, n=11) | |
| HP ProBook 450 G9 6A180EA | |
| HP Envy 17-cg | |
| Cinebench R23 / Single Core | |
| Średnia w klasie Multimedia (1128 - 2459, n=64, ostatnie 2 lata) | |
| Dell XPS 17 9720 | |
| Acer Aspire 5 A515-57G-53N8 | |
| Przeciętny Intel Core i7-1255U (1408 - 1775, n=11) | |
| LG Gram 17Z90Q-E.AD78G | |
| HP Envy 17-cr0079ng | |
| HP ProBook 450 G9 6A180EA | |
| Lenovo IdeaPad 3 17ABA7 | |
| HP Envy 17-cg | |
| Cinebench R20 / CPU (Multi Core) | |
| Średnia w klasie Multimedia (1887 - 12912, n=56, ostatnie 2 lata) | |
| Dell XPS 17 9720 | |
| Acer Aspire 5 A515-57G-53N8 | |
| HP Envy 17-cr0079ng | |
| Lenovo IdeaPad 3 17ABA7 | |
| LG Gram 17Z90Q-E.AD78G | |
| Przeciętny Intel Core i7-1255U (2095 - 3702, n=11) | |
| HP ProBook 450 G9 6A180EA | |
| HP Envy 17-cg | |
| Cinebench R20 / CPU (Single Core) | |
| Średnia w klasie Multimedia (425 - 853, n=56, ostatnie 2 lata) | |
| Dell XPS 17 9720 | |
| Acer Aspire 5 A515-57G-53N8 | |
| Przeciętny Intel Core i7-1255U (550 - 682, n=11) | |
| HP Envy 17-cr0079ng | |
| LG Gram 17Z90Q-E.AD78G | |
| HP ProBook 450 G9 6A180EA | |
| Lenovo IdeaPad 3 17ABA7 | |
| HP Envy 17-cg | |
| Cinebench R15 / CPU Multi 64Bit | |
| Dell XPS 17 9720 | |
| Dell XPS 17 9720 | |
| Średnia w klasie Multimedia (856 - 5224, n=60, ostatnie 2 lata) | |
| Acer Aspire 5 A515-57G-53N8 | |
| LG Gram 17Z90Q-E.AD78G | |
| Lenovo IdeaPad 3 17ABA7 | |
| HP Envy 17-cr0079ng | |
| Przeciętny Intel Core i7-1255U (919 - 1577, n=11) | |
| HP ProBook 450 G9 6A180EA | |
| HP Envy 17-cg | |
| Cinebench R15 / CPU Single 64Bit | |
| Średnia w klasie Multimedia (184.8 - 326, n=58, ostatnie 2 lata) | |
| Dell XPS 17 9720 | |
| HP Envy 17-cr0079ng | |
| Acer Aspire 5 A515-57G-53N8 | |
| Przeciętny Intel Core i7-1255U (161 - 251, n=12) | |
| Lenovo IdeaPad 3 17ABA7 | |
| LG Gram 17Z90Q-E.AD78G | |
| HP ProBook 450 G9 6A180EA | |
| HP Envy 17-cg | |
| Blender / v2.79 BMW27 CPU | |
| HP ProBook 450 G9 6A180EA | |
| HP Envy 17-cg | |
| HP Envy 17-cr0079ng | |
| Przeciętny Intel Core i7-1255U (372 - 601, n=11) | |
| LG Gram 17Z90Q-E.AD78G | |
| Acer Aspire 5 A515-57G-53N8 | |
| Lenovo IdeaPad 3 17ABA7 | |
| Średnia w klasie Multimedia (100 - 557, n=57, ostatnie 2 lata) | |
| Dell XPS 17 9720 | |
| 7-Zip 18.03 / 7z b 4 | |
| Dell XPS 17 9720 | |
| Średnia w klasie Multimedia (26062 - 130368, n=54, ostatnie 2 lata) | |
| Acer Aspire 5 A515-57G-53N8 | |
| LG Gram 17Z90Q-E.AD78G | |
| HP Envy 17-cr0079ng | |
| Lenovo IdeaPad 3 17ABA7 | |
| Przeciętny Intel Core i7-1255U (24126 - 37365, n=11) | |
| HP ProBook 450 G9 6A180EA | |
| HP Envy 17-cg | |
| 7-Zip 18.03 / 7z b 4 -mmt1 | |
| Średnia w klasie Multimedia (3666 - 7545, n=55, ostatnie 2 lata) | |
| Dell XPS 17 9720 | |
| HP Envy 17-cr0079ng | |
| Przeciętny Intel Core i7-1255U (5059 - 5529, n=11) | |
| Lenovo IdeaPad 3 17ABA7 | |
| HP ProBook 450 G9 6A180EA | |
| Acer Aspire 5 A515-57G-53N8 | |
| LG Gram 17Z90Q-E.AD78G | |
| HP Envy 17-cg | |
| Geekbench 5.5 / Multi-Core | |
| Dell XPS 17 9720 | |
| Średnia w klasie Multimedia (4652 - 20422, n=55, ostatnie 2 lata) | |
| Acer Aspire 5 A515-57G-53N8 | |
| LG Gram 17Z90Q-E.AD78G | |
| HP Envy 17-cr0079ng | |
| Przeciętny Intel Core i7-1255U (4463 - 8821, n=12) | |
| HP ProBook 450 G9 6A180EA | |
| Lenovo IdeaPad 3 17ABA7 | |
| HP Envy 17-cg | |
| Geekbench 5.5 / Single-Core | |
| Średnia w klasie Multimedia (805 - 2974, n=55, ostatnie 2 lata) | |
| Dell XPS 17 9720 | |
| HP Envy 17-cr0079ng | |
| HP ProBook 450 G9 6A180EA | |
| Przeciętny Intel Core i7-1255U (1560 - 1712, n=12) | |
| Acer Aspire 5 A515-57G-53N8 | |
| LG Gram 17Z90Q-E.AD78G | |
| HP Envy 17-cg | |
| Lenovo IdeaPad 3 17ABA7 | |
| HWBOT x265 Benchmark v2.2 / 4k Preset | |
| Średnia w klasie Multimedia (5.26 - 36.1, n=55, ostatnie 2 lata) | |
| Dell XPS 17 9720 | |
| Acer Aspire 5 A515-57G-53N8 | |
| HP Envy 17-cr0079ng | |
| LG Gram 17Z90Q-E.AD78G | |
| Lenovo IdeaPad 3 17ABA7 | |
| Przeciętny Intel Core i7-1255U (6.31 - 10.1, n=11) | |
| HP ProBook 450 G9 6A180EA | |
| HP Envy 17-cg | |
| LibreOffice / 20 Documents To PDF | |
| LG Gram 17Z90Q-E.AD78G | |
| Acer Aspire 5 A515-57G-53N8 | |
| HP Envy 17-cg | |
| Lenovo IdeaPad 3 17ABA7 | |
| HP ProBook 450 G9 6A180EA | |
| Średnia w klasie Multimedia (23.9 - 146.7, n=56, ostatnie 2 lata) | |
| Przeciętny Intel Core i7-1255U (35.6 - 52.5, n=11) | |
| HP Envy 17-cr0079ng | |
| Dell XPS 17 9720 | |
| R Benchmark 2.5 / Overall mean | |
| HP Envy 17-cg | |
| Lenovo IdeaPad 3 17ABA7 | |
| HP ProBook 450 G9 6A180EA | |
| LG Gram 17Z90Q-E.AD78G | |
| Przeciętny Intel Core i7-1255U (0.4688 - 0.558, n=11) | |
| Acer Aspire 5 A515-57G-53N8 | |
| HP Envy 17-cr0079ng | |
| Średnia w klasie Multimedia (0.3604 - 0.947, n=55, ostatnie 2 lata) | |
| Dell XPS 17 9720 | |
* ... im mniej tym lepiej
AIDA64: FP32 Ray-Trace | FPU Julia | CPU SHA3 | CPU Queen | FPU SinJulia | FPU Mandel | CPU AES | CPU ZLib | FP64 Ray-Trace | CPU PhotoWorxx
| Performance rating | |
| Średnia w klasie Multimedia | |
| Lenovo IdeaPad 3 17ABA7 | |
| Dell XPS 17 9720 | |
| HP Envy 17-cr0079ng | |
| Acer Aspire 5 A515-57G-53N8 | |
| Przeciętny Intel Core i7-1255U | |
| LG Gram 17Z90Q-E.AD78G | |
| HP ProBook 450 G9 6A180EA | |
| HP Envy 17-cg -9! | |
| AIDA64 / FP32 Ray-Trace | |
| Średnia w klasie Multimedia (2214 - 50388, n=53, ostatnie 2 lata) | |
| Lenovo IdeaPad 3 17ABA7 | |
| HP Envy 17-cr0079ng | |
| Dell XPS 17 9720 | |
| Przeciętny Intel Core i7-1255U (4313 - 8127, n=11) | |
| Acer Aspire 5 A515-57G-53N8 | |
| HP ProBook 450 G9 6A180EA | |
| LG Gram 17Z90Q-E.AD78G | |
| AIDA64 / FPU Julia | |
| Średnia w klasie Multimedia (12867 - 201874, n=53, ostatnie 2 lata) | |
| Lenovo IdeaPad 3 17ABA7 | |
| HP Envy 17-cr0079ng | |
| Przeciętny Intel Core i7-1255U (19813 - 41353, n=11) | |
| Dell XPS 17 9720 | |
| Acer Aspire 5 A515-57G-53N8 | |
| HP ProBook 450 G9 6A180EA | |
| LG Gram 17Z90Q-E.AD78G | |
| AIDA64 / CPU SHA3 | |
| Średnia w klasie Multimedia (626 - 8623, n=53, ostatnie 2 lata) | |
| Dell XPS 17 9720 | |
| Lenovo IdeaPad 3 17ABA7 | |
| HP Envy 17-cr0079ng | |
| Przeciętny Intel Core i7-1255U (1325 - 2135, n=11) | |
| Acer Aspire 5 A515-57G-53N8 | |
| LG Gram 17Z90Q-E.AD78G | |
| HP ProBook 450 G9 6A180EA | |
| AIDA64 / CPU Queen | |
| Dell XPS 17 9720 | |
| Acer Aspire 5 A515-57G-53N8 | |
| Lenovo IdeaPad 3 17ABA7 | |
| Średnia w klasie Multimedia (13483 - 181505, n=40, ostatnie 2 lata) | |
| LG Gram 17Z90Q-E.AD78G | |
| HP Envy 17-cr0079ng | |
| Przeciętny Intel Core i7-1255U (61375 - 65892, n=11) | |
| HP ProBook 450 G9 6A180EA | |
| AIDA64 / FPU SinJulia | |
| Lenovo IdeaPad 3 17ABA7 | |
| Średnia w klasie Multimedia (886 - 28794, n=53, ostatnie 2 lata) | |
| Dell XPS 17 9720 | |
| Acer Aspire 5 A515-57G-53N8 | |
| LG Gram 17Z90Q-E.AD78G | |
| HP Envy 17-cr0079ng | |
| Przeciętny Intel Core i7-1255U (3577 - 5095, n=11) | |
| HP ProBook 450 G9 6A180EA | |
| AIDA64 / FPU Mandel | |
| Średnia w klasie Multimedia (6395 - 105740, n=53, ostatnie 2 lata) | |
| Lenovo IdeaPad 3 17ABA7 | |
| HP Envy 17-cr0079ng | |
| Dell XPS 17 9720 | |
| Przeciętny Intel Core i7-1255U (11759 - 20187, n=11) | |
| Acer Aspire 5 A515-57G-53N8 | |
| LG Gram 17Z90Q-E.AD78G | |
| HP ProBook 450 G9 6A180EA | |
| AIDA64 / CPU AES | |
| Lenovo IdeaPad 3 17ABA7 | |
| Dell XPS 17 9720 | |
| Średnia w klasie Multimedia (8171 - 126790, n=53, ostatnie 2 lata) | |
| HP Envy 17-cr0079ng | |
| Przeciętny Intel Core i7-1255U (27900 - 67458, n=11) | |
| Acer Aspire 5 A515-57G-53N8 | |
| LG Gram 17Z90Q-E.AD78G | |
| HP ProBook 450 G9 6A180EA | |
| AIDA64 / CPU ZLib | |
| Średnia w klasie Multimedia (143.8 - 2022, n=53, ostatnie 2 lata) | |
| Dell XPS 17 9720 | |
| Acer Aspire 5 A515-57G-53N8 | |
| HP Envy 17-cr0079ng | |
| LG Gram 17Z90Q-E.AD78G | |
| Lenovo IdeaPad 3 17ABA7 | |
| Przeciętny Intel Core i7-1255U (393 - 640, n=11) | |
| HP ProBook 450 G9 6A180EA | |
| HP Envy 17-cg | |
| AIDA64 / FP64 Ray-Trace | |
| Średnia w klasie Multimedia (1014 - 26875, n=53, ostatnie 2 lata) | |
| Lenovo IdeaPad 3 17ABA7 | |
| HP Envy 17-cr0079ng | |
| Dell XPS 17 9720 | |
| Przeciętny Intel Core i7-1255U (2474 - 4400, n=11) | |
| Acer Aspire 5 A515-57G-53N8 | |
| LG Gram 17Z90Q-E.AD78G | |
| HP ProBook 450 G9 6A180EA | |
| AIDA64 / CPU PhotoWorxx | |
| Średnia w klasie Multimedia (8187 - 88154, n=53, ostatnie 2 lata) | |
| Dell XPS 17 9720 | |
| LG Gram 17Z90Q-E.AD78G | |
| Przeciętny Intel Core i7-1255U (13899 - 44054, n=11) | |
| HP Envy 17-cr0079ng | |
| Acer Aspire 5 A515-57G-53N8 | |
| HP ProBook 450 G9 6A180EA | |
| Lenovo IdeaPad 3 17ABA7 | |
Wydajność systemu
W praktycznym działaniu zastosowany tu sprzęt zapewnia więcej niż solidną wydajność. W benchmarkach takich jak PCMark 10 laptop jest w stanie dobrze trzymać się czołówki i przeważnie ustępuje tylko dwóm laptopom wyposażonym w mocniejszy sprzęt. Dla tych, którzy chcą jeszcze większej wydajności, lepszym rozwiązaniem jest m.in Intel Core i7-12700H wDell XPS 17 9720, na przykład.
Z jakichś dziwnych powodów test Creative Benchmark w PCMarku 8 był zawsze przerywany w połowie przy konfiguracji sprzętu i sterowników w naszym egzemplarzu testowym. W związku z tym pominęliśmy ten benchmark.
CrossMark: Overall | Productivity | Creativity | Responsiveness
| PCMark 10 / Score | |
| Średnia w klasie Multimedia (4325 - 10386, n=51, ostatnie 2 lata) | |
| Dell XPS 17 9720 | |
| LG Gram 17Z90Q-E.AD78G | |
| HP Envy 17-cr0079ng | |
| Przeciętny Intel Core i7-1255U, NVIDIA GeForce RTX 2050 Mobile (n=1) | |
| Acer Aspire 5 A515-57G-53N8 | |
| Lenovo IdeaPad 3 17ABA7 | |
| HP Envy 17-cg | |
| HP ProBook 450 G9 6A180EA | |
| PCMark 10 / Essentials | |
| Średnia w klasie Multimedia (8025 - 11664, n=50, ostatnie 2 lata) | |
| Lenovo IdeaPad 3 17ABA7 | |
| Dell XPS 17 9720 | |
| HP Envy 17-cr0079ng | |
| Przeciętny Intel Core i7-1255U, NVIDIA GeForce RTX 2050 Mobile (n=1) | |
| LG Gram 17Z90Q-E.AD78G | |
| HP ProBook 450 G9 6A180EA | |
| Acer Aspire 5 A515-57G-53N8 | |
| HP Envy 17-cg | |
| PCMark 10 / Productivity | |
| Średnia w klasie Multimedia (7323 - 18233, n=50, ostatnie 2 lata) | |
| LG Gram 17Z90Q-E.AD78G | |
| Dell XPS 17 9720 | |
| Lenovo IdeaPad 3 17ABA7 | |
| HP Envy 17-cr0079ng | |
| Przeciętny Intel Core i7-1255U, NVIDIA GeForce RTX 2050 Mobile (n=1) | |
| HP Envy 17-cg | |
| Acer Aspire 5 A515-57G-53N8 | |
| HP ProBook 450 G9 6A180EA | |
| PCMark 10 / Digital Content Creation | |
| Średnia w klasie Multimedia (3651 - 16240, n=50, ostatnie 2 lata) | |
| Dell XPS 17 9720 | |
| LG Gram 17Z90Q-E.AD78G | |
| HP Envy 17-cr0079ng | |
| Przeciętny Intel Core i7-1255U, NVIDIA GeForce RTX 2050 Mobile (n=1) | |
| Acer Aspire 5 A515-57G-53N8 | |
| HP Envy 17-cg | |
| Lenovo IdeaPad 3 17ABA7 | |
| HP ProBook 450 G9 6A180EA | |
| CrossMark / Overall | |
| Średnia w klasie Multimedia (866 - 2728, n=59, ostatnie 2 lata) | |
| Dell XPS 17 9720 | |
| LG Gram 17Z90Q-E.AD78G | |
| HP Envy 17-cr0079ng | |
| Przeciętny Intel Core i7-1255U, NVIDIA GeForce RTX 2050 Mobile (n=1) | |
| HP ProBook 450 G9 6A180EA | |
| Lenovo IdeaPad 3 17ABA7 | |
| CrossMark / Productivity | |
| Średnia w klasie Multimedia (931 - 2489, n=59, ostatnie 2 lata) | |
| Dell XPS 17 9720 | |
| LG Gram 17Z90Q-E.AD78G | |
| HP Envy 17-cr0079ng | |
| Przeciętny Intel Core i7-1255U, NVIDIA GeForce RTX 2050 Mobile (n=1) | |
| HP ProBook 450 G9 6A180EA | |
| Lenovo IdeaPad 3 17ABA7 | |
| CrossMark / Creativity | |
| Średnia w klasie Multimedia (907 - 3465, n=59, ostatnie 2 lata) | |
| Dell XPS 17 9720 | |
| LG Gram 17Z90Q-E.AD78G | |
| HP Envy 17-cr0079ng | |
| Przeciętny Intel Core i7-1255U, NVIDIA GeForce RTX 2050 Mobile (n=1) | |
| HP ProBook 450 G9 6A180EA | |
| Lenovo IdeaPad 3 17ABA7 | |
| CrossMark / Responsiveness | |
| Dell XPS 17 9720 | |
| Średnia w klasie Multimedia (605 - 2024, n=59, ostatnie 2 lata) | |
| LG Gram 17Z90Q-E.AD78G | |
| HP Envy 17-cr0079ng | |
| Przeciętny Intel Core i7-1255U, NVIDIA GeForce RTX 2050 Mobile (n=1) | |
| Lenovo IdeaPad 3 17ABA7 | |
| HP ProBook 450 G9 6A180EA | |
| PCMark 8 Home Score Accelerated v2 | 5469 pkt. | |
| PCMark 8 Work Score Accelerated v2 | 5812 pkt. | |
| PCMark 10 Score | 6351 pkt. | |
Pomoc | ||
| AIDA64 / Memory Copy | |
| Średnia w klasie Multimedia (11299 - 132135, n=53, ostatnie 2 lata) | |
| LG Gram 17Z90Q-E.AD78G | |
| Dell XPS 17 9720 | |
| Przeciętny Intel Core i7-1255U (22846 - 67017, n=11) | |
| HP Envy 17-cr0079ng | |
| Acer Aspire 5 A515-57G-53N8 | |
| HP ProBook 450 G9 6A180EA | |
| Lenovo IdeaPad 3 17ABA7 | |
| AIDA64 / Memory Read | |
| Średnia w klasie Multimedia (11624 - 174586, n=53, ostatnie 2 lata) | |
| LG Gram 17Z90Q-E.AD78G | |
| Dell XPS 17 9720 | |
| Przeciętny Intel Core i7-1255U (22877 - 67398, n=11) | |
| HP Envy 17-cr0079ng | |
| Acer Aspire 5 A515-57G-53N8 | |
| HP ProBook 450 G9 6A180EA | |
| Lenovo IdeaPad 3 17ABA7 | |
| AIDA64 / Memory Write | |
| Średnia w klasie Multimedia (11755 - 134998, n=53, ostatnie 2 lata) | |
| Dell XPS 17 9720 | |
| LG Gram 17Z90Q-E.AD78G | |
| Przeciętny Intel Core i7-1255U (22883 - 65839, n=11) | |
| HP Envy 17-cr0079ng | |
| Acer Aspire 5 A515-57G-53N8 | |
| HP ProBook 450 G9 6A180EA | |
| Lenovo IdeaPad 3 17ABA7 | |
| AIDA64 / Memory Latency | |
| Średnia w klasie Multimedia (7 - 535, n=52, ostatnie 2 lata) | |
| LG Gram 17Z90Q-E.AD78G | |
| Dell XPS 17 9720 | |
| Lenovo IdeaPad 3 17ABA7 | |
| Przeciętny Intel Core i7-1255U (76 - 163.2, n=11) | |
| HP ProBook 450 G9 6A180EA | |
| HP Envy 17-cr0079ng | |
| HP Envy 17-cg | |
* ... im mniej tym lepiej
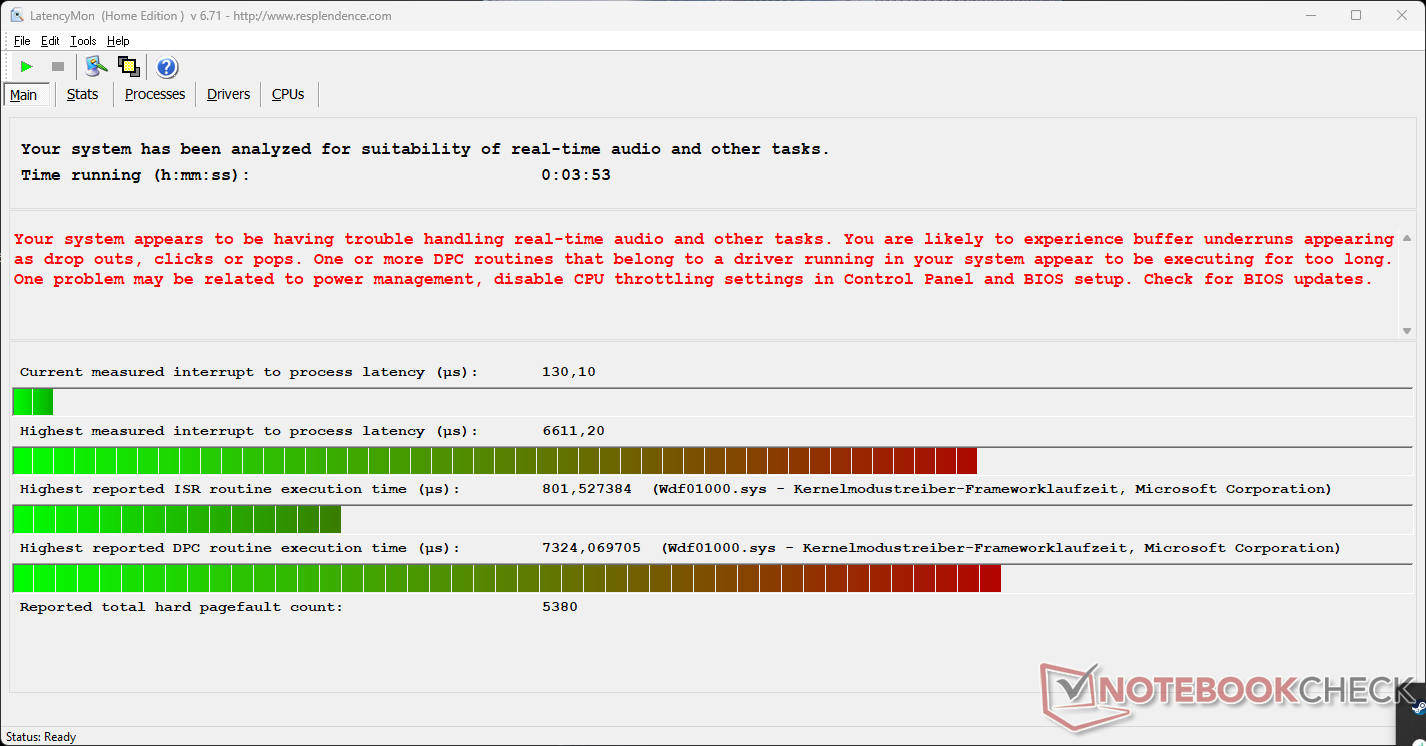
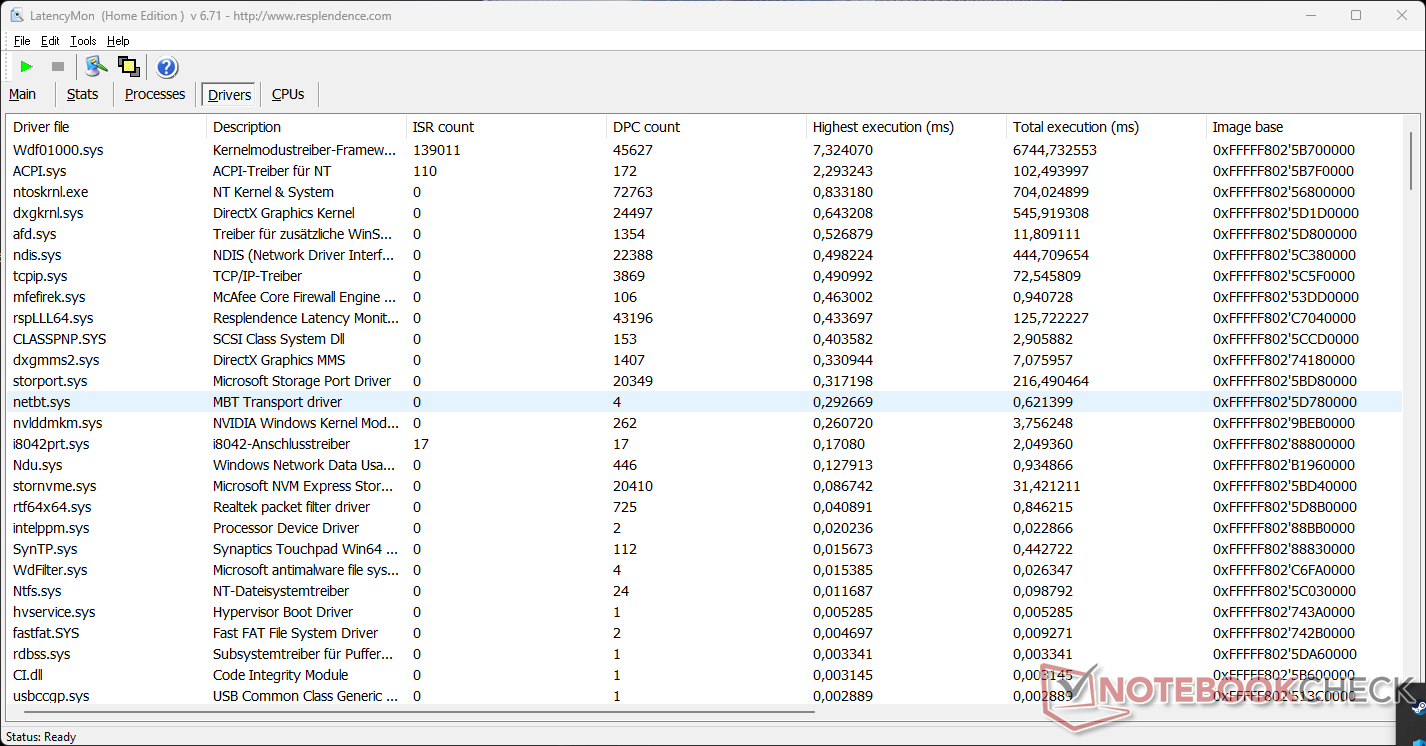
Opóźnienia DPC
Nasz testowy egzemplarz wykazuje stosunkowo wysokie opóźnienia DPC. Chociaż może to wskazywać na pewne problemy z przetwarzaniem dźwięku i obrazu w czasie rzeczywistym, jak zawsze jest to tylko chwilowa migawka aktualnej konfiguracji sterownika.
| DPC Latencies / LatencyMon - interrupt to process latency (max), Web, Youtube, Prime95 | |
| HP ProBook 450 G9 6A180EA | |
| HP Envy 17-cr0079ng | |
| LG Gram 17Z90Q-E.AD78G | |
| HP Envy 17-cg | |
| Acer Aspire 5 A515-57G-53N8 | |
| Lenovo IdeaPad 3 17ABA7 | |
| Dell XPS 17 9720 | |
* ... im mniej tym lepiej
Rozwiązanie w zakresie przechowywania
Dysk SSD o pojemności 1 TB od Samsunga nie wypada szczególnie dobrze w naszych pomiarach testowych. Nie tylko plasuje się za większością pozostałych konkurentów, ale także poniżej średniego poziomu dla dysku SSD. HP nie wyświadczyło sobie łaski tym wyborem, ale i tak nie dałoby się zauważyć żadnych ograniczeń podczas codziennej pracy. Przynajmniej wartości pozostają niemal identyczne w stałej wydajności, nie zaczynając być dławionym.

| Drive Performance rating - Percent | |
| Dell XPS 17 9720 | |
| Średnia w klasie Multimedia | |
| LG Gram 17Z90Q-E.AD78G | |
| Acer Aspire 5 A515-57G-53N8 | |
| HP ProBook 450 G9 6A180EA | |
| Przeciętny Samsung PM991a MZVLQ1T0HBLB | |
| HP Envy 17-cr0079ng | |
| Lenovo IdeaPad 3 17ABA7 | |
* ... im mniej tym lepiej
Disk Throttling: DiskSpd Read Loop, Queue Depth 8
Karta graficzna
Podczas gdy procesor graficzny Intel Iris Xe Graphics iGPU radzi sobie z mniej wymagającymi zadaniami graficznymi, to przy wyższych wymaganiach Nvidia GeForce RTX 2050 Laptop GPU jest aktywowany. Dzięki temu na pokładzie znajduje się dedykowane rozwiązanie graficzne z niższej półki cenowej, jednak GPU również pochodzi z 2021 roku, więc nie jest to już wiosenny kurczak. Karta graficzna wyposażona jest w 4 GB pamięci graficznej GDDR6 i pracuje z częstotliwością taktowania do 1477 MHz. Nie jest ona w stanie dotrzymać kroku m.in GeForce RTX 4050który został niedawno wprowadzony przez Nvidię, co pozostawia go daleko w tyle.
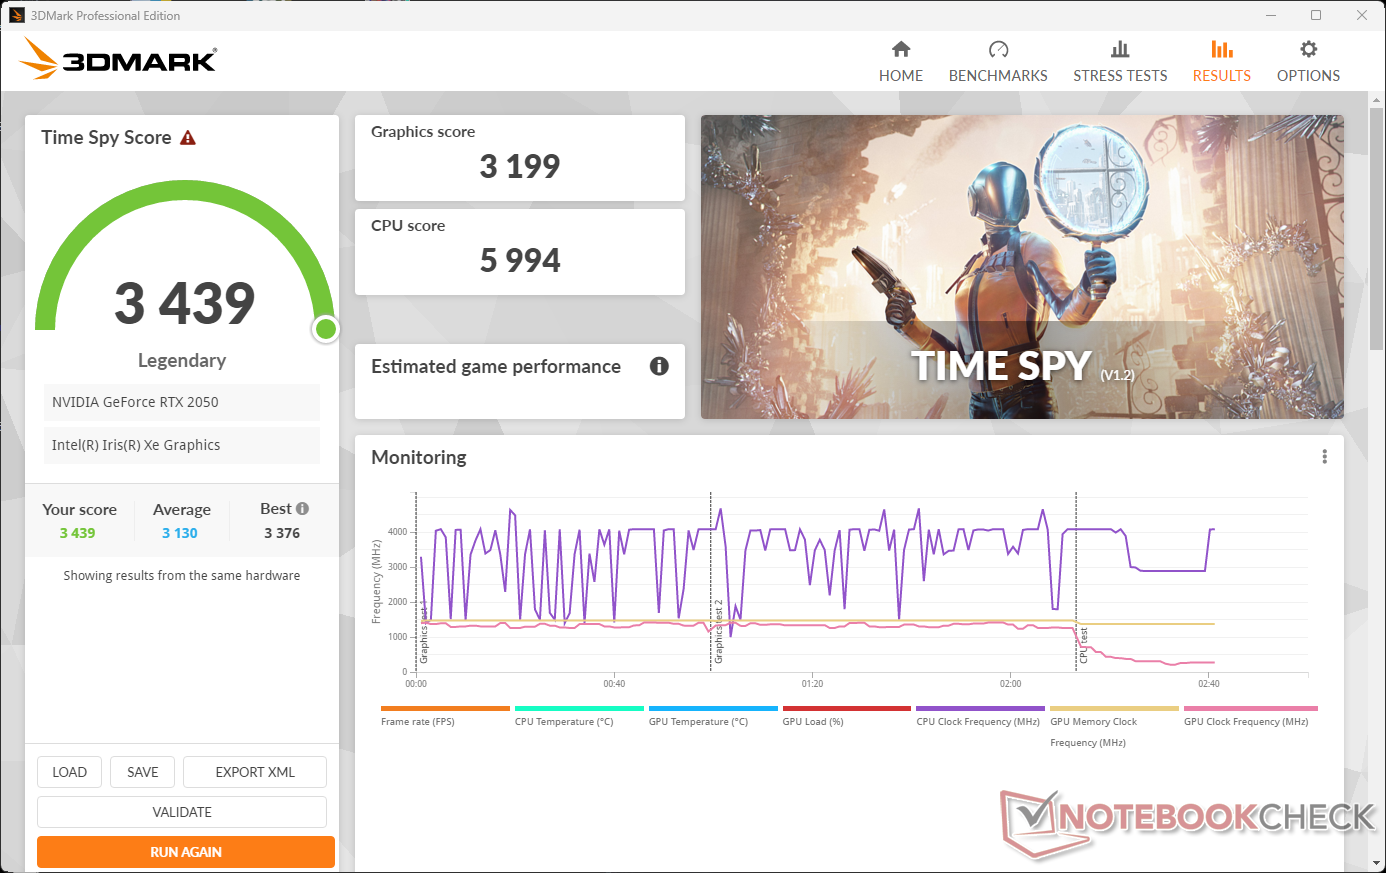
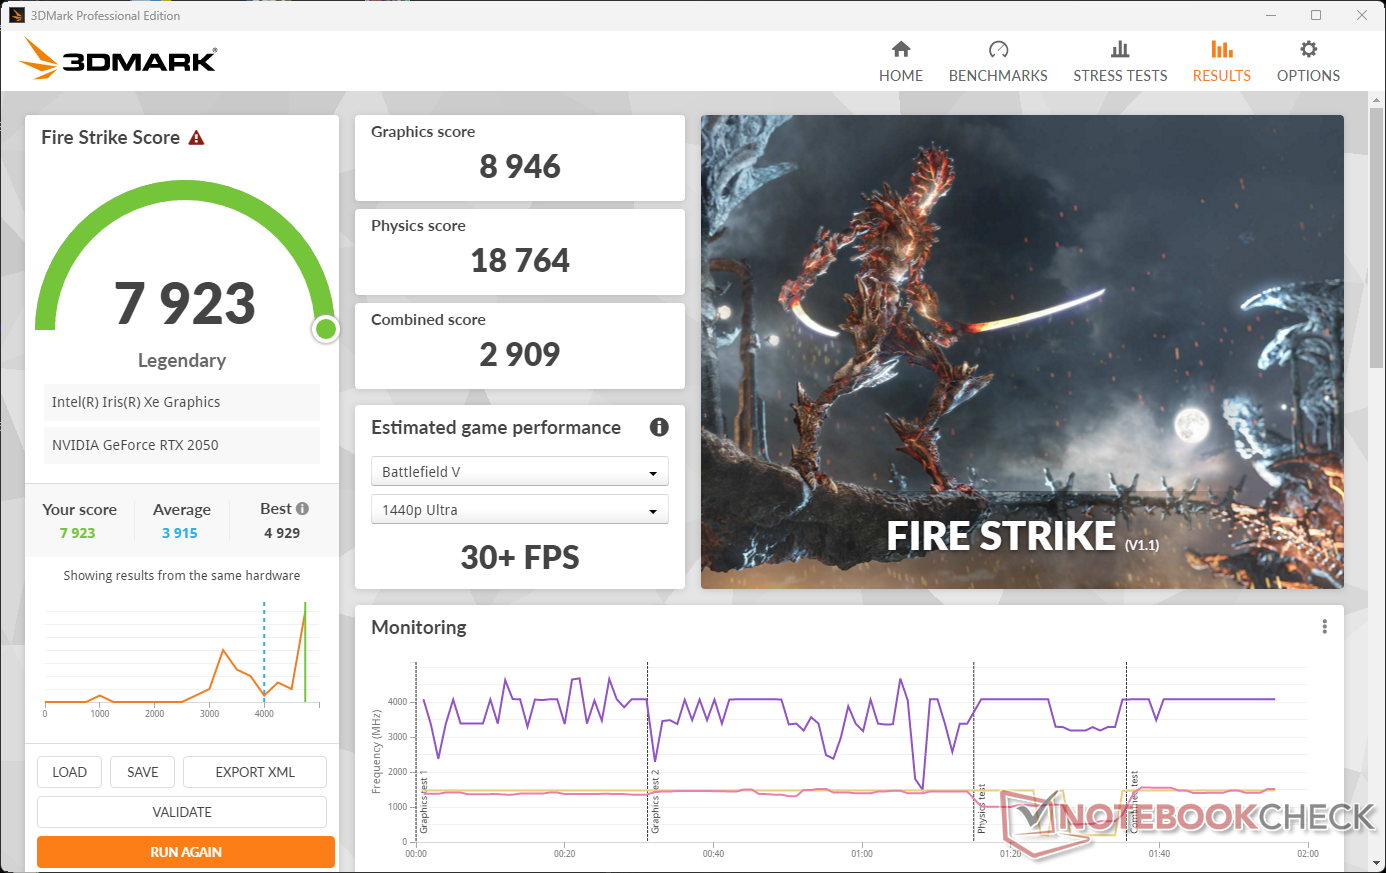
W benchmarkach graficznych HP Envy 17-cr0079ng osiąga w naszym teście solidne wartości. Choć pozostają one w części poniżej średniej dla tego rozwiązania graficznego, są zawsze powyżej wyników lekkich LG Gram 17Z90Qmistrza wytrzymałości i na poziomie m.in Acer Aspire 5 A515, które to modele są wyposażone w ten sam układ dGPU.
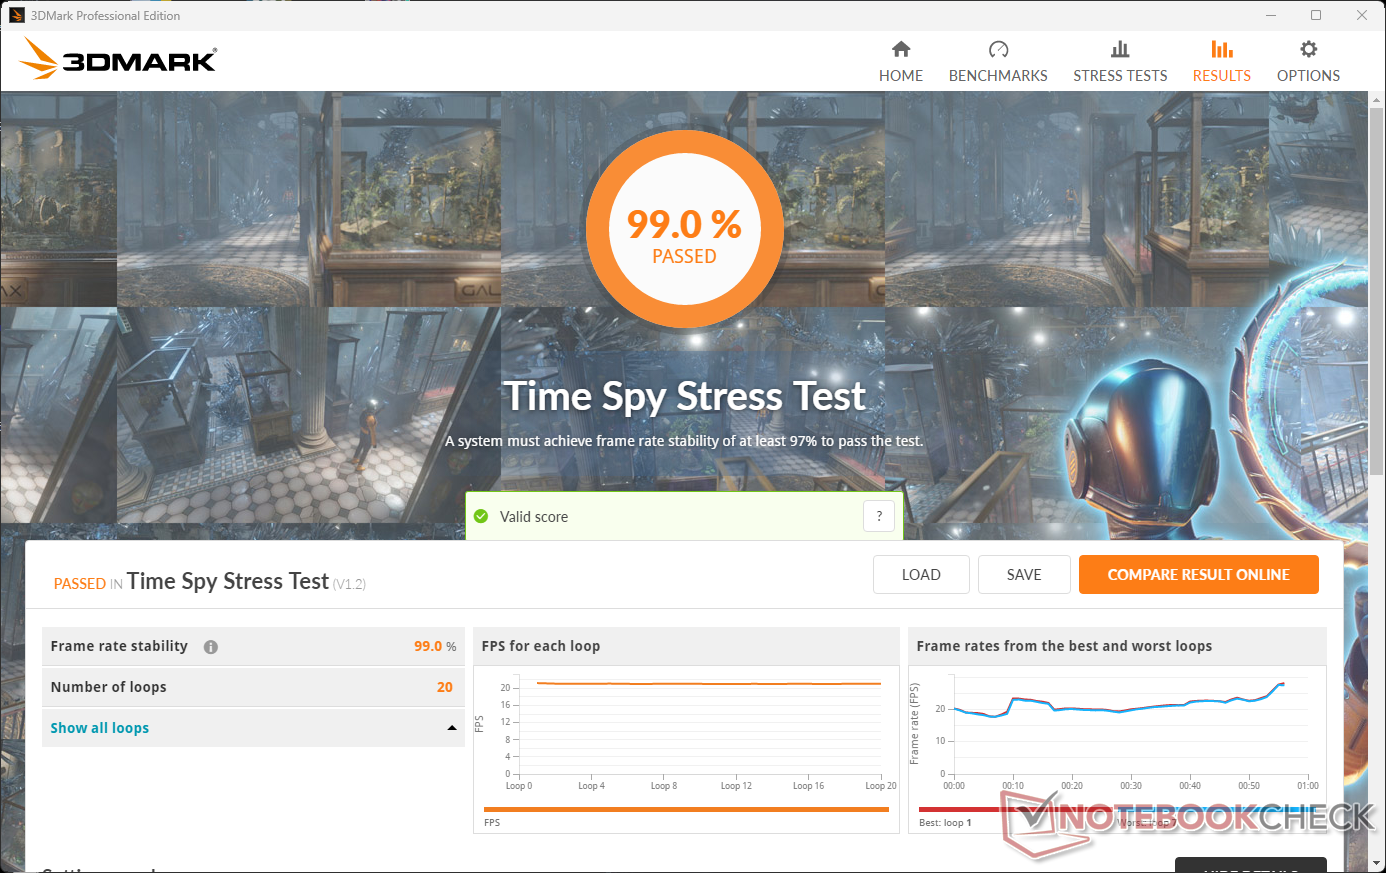
W trybie pracy z zasilaniem sieciowym wydajność grafiki pozostaje stała w czasie, co pokazuje stress test 3DMark (wynik: 99%). Podczas pracy na akumulatorze laptop nadal osiąga od 80 do 90% w zależności od benchmarku (3DMark 11: 11 017 punktów graficznych).
| 3DMark Performance rating - Percent | |
| MSI Katana 15 B12VEK | |
| Średnia w klasie Multimedia | |
| Dell XPS 17 9720 | |
| Przeciętny NVIDIA GeForce RTX 2050 Mobile | |
| HP Envy 17-cr0079ng | |
| Acer Aspire 5 A515-57G-53N8 | |
| LG Gram 17Z90Q-E.AD78G | |
| HP ProBook 450 G9 6A180EA | |
| Lenovo IdeaPad 3 17ABA7 | |
| 3DMark 11 - 1280x720 Performance GPU | |
| MSI Katana 15 B12VEK | |
| Średnia w klasie Multimedia (3749 - 60002, n=54, ostatnie 2 lata) | |
| Dell XPS 17 9720 | |
| Przeciętny NVIDIA GeForce RTX 2050 Mobile (10598 - 15411, n=10) | |
| HP Envy 17-cr0079ng | |
| Acer Aspire 5 A515-57G-53N8 | |
| LG Gram 17Z90Q-E.AD78G | |
| HP ProBook 450 G9 6A180EA | |
| Lenovo IdeaPad 3 17ABA7 | |
| 3DMark | |
| 1280x720 Cloud Gate Standard Graphics | |
| MSI Katana 15 B12VEK | |
| Dell XPS 17 9720 | |
| HP Envy 17-cr0079ng | |
| Przeciętny NVIDIA GeForce RTX 2050 Mobile (47225 - 66365, n=9) | |
| Średnia w klasie Multimedia (16765 - 143501, n=32, ostatnie 2 lata) | |
| Acer Aspire 5 A515-57G-53N8 | |
| LG Gram 17Z90Q-E.AD78G | |
| HP ProBook 450 G9 6A180EA | |
| Lenovo IdeaPad 3 17ABA7 | |
| 1920x1080 Fire Strike Graphics | |
| MSI Katana 15 B12VEK | |
| Średnia w klasie Multimedia (2328 - 48907, n=57, ostatnie 2 lata) | |
| Dell XPS 17 9720 | |
| Przeciętny NVIDIA GeForce RTX 2050 Mobile (8249 - 10621, n=10) | |
| HP Envy 17-cr0079ng | |
| Acer Aspire 5 A515-57G-53N8 | |
| LG Gram 17Z90Q-E.AD78G | |
| HP ProBook 450 G9 6A180EA | |
| Lenovo IdeaPad 3 17ABA7 | |
| 2560x1440 Time Spy Graphics | |
| MSI Katana 15 B12VEK | |
| Średnia w klasie Multimedia (696 - 19403, n=57, ostatnie 2 lata) | |
| Dell XPS 17 9720 | |
| HP Envy 17-cr0079ng | |
| Acer Aspire 5 A515-57G-53N8 | |
| Przeciętny NVIDIA GeForce RTX 2050 Mobile (1072 - 3938, n=10) | |
| HP ProBook 450 G9 6A180EA | |
| LG Gram 17Z90Q-E.AD78G | |
| Lenovo IdeaPad 3 17ABA7 | |
| 3DMark 11 Performance | 12472 pkt. | |
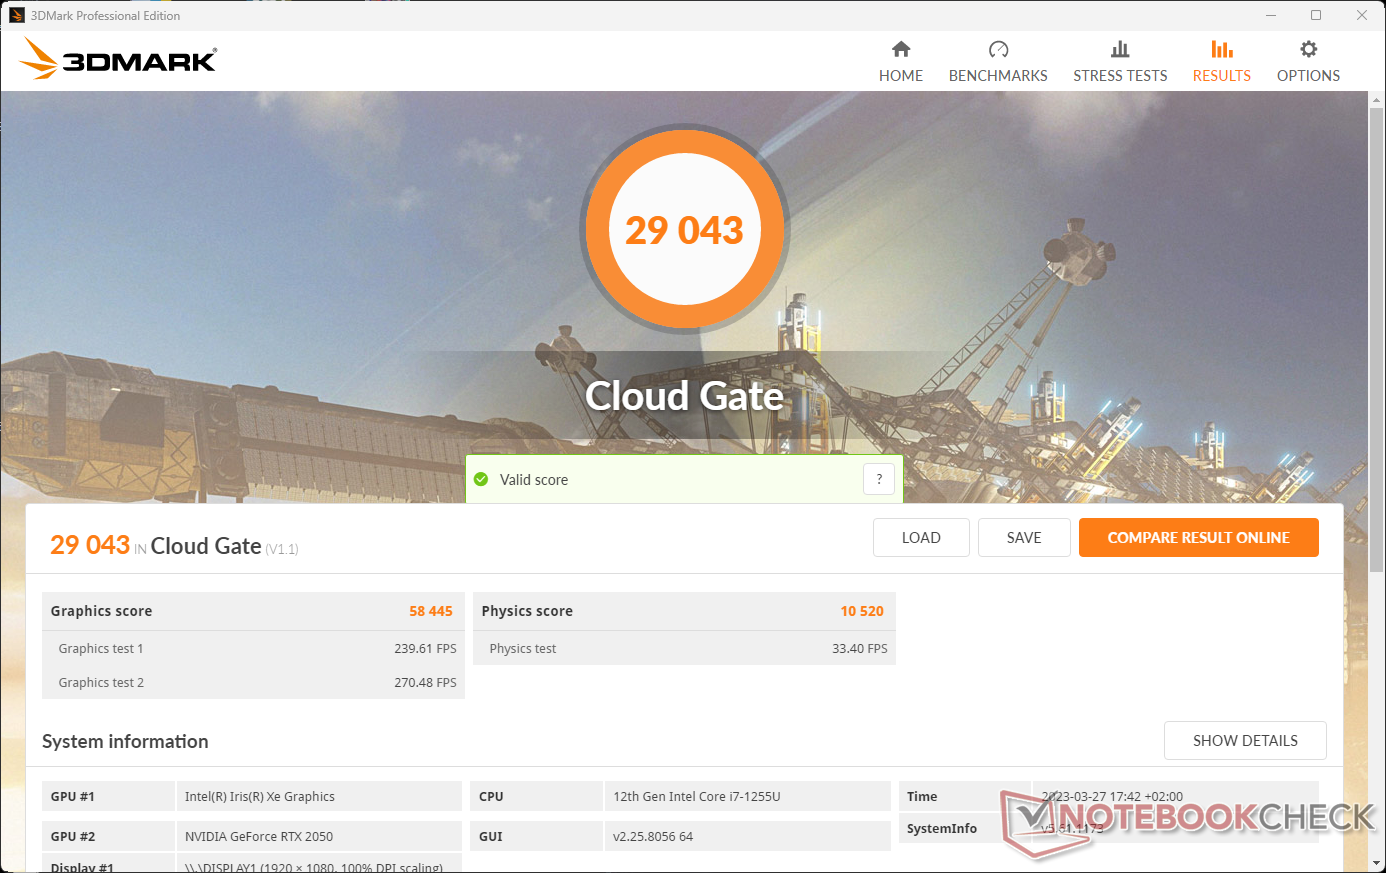
| 3DMark Cloud Gate Standard Score | 29043 pkt. | |
| 3DMark Fire Strike Score | 7923 pkt. | |
| 3DMark Time Spy Score | 3439 pkt. | |
Pomoc | ||
| Blender | |
| v3.3 Classroom HIP/AMD | |
| Lenovo IdeaPad 3 17ABA7 | |
| v3.3 Classroom OPTIX/RTX | |
| Przeciętny NVIDIA GeForce RTX 2050 Mobile (76 - 110, n=9) | |
| LG Gram 17Z90Q-E.AD78G | |
| HP Envy 17-cr0079ng | |
| Średnia w klasie Multimedia (12 - 105, n=21, ostatnie 2 lata) | |
| v3.3 Classroom CUDA | |
| Przeciętny NVIDIA GeForce RTX 2050 Mobile (126 - 175, n=9) | |
| LG Gram 17Z90Q-E.AD78G | |
| HP Envy 17-cr0079ng | |
| Średnia w klasie Multimedia (20 - 186, n=21, ostatnie 2 lata) | |
| v3.3 Classroom CPU | |
| HP ProBook 450 G9 6A180EA | |
| HP Envy 17-cr0079ng | |
| LG Gram 17Z90Q-E.AD78G | |
| Przeciętny NVIDIA GeForce RTX 2050 Mobile (413 - 773, n=9) | |
| Lenovo IdeaPad 3 17ABA7 | |
| Średnia w klasie Multimedia (134.5 - 1042, n=61, ostatnie 2 lata) | |
* ... im mniej tym lepiej
Wydajność w grach
Do kultowej rundy gier z multimedialnym laptopem HP Envy 17 dedykowane rozwiązanie graficzne spokojnie wystarczy. Większość gier, które wybraliśmy do naszego testu, działa płynnie na wysokich, a często nawet maksymalnych ustawieniach graficznych w rozdzielczości FHD. GPU raczej nie pozwoli jednak cieszyć się pełną rozdzielczością 4K wyświetlacza.
Irytacja: Korzystając z trybu "Performance" w HP Command Center, wiele gier minimalizowało się przy zmianie rozdzielczości wyświetlacza i nie mogliśmy ich potem kontynuować, albo nawet całkowicie się zawieszały. Podczas naszych testów HP Envy 17 nie udało nam się opanować tego problemu. Dlatego niektóre pomiary gier przeprowadziliśmy tylko w trybie "Inteligentna regulacja", w którym problem ten nie występował.
| Performance rating - Percent | |
| MSI Katana 15 B12VEK | |
| Dell XPS 17 9720 | |
| Średnia w klasie Multimedia | |
| HP Envy 17-cr0079ng | |
| Acer Aspire 5 A515-57G-53N8 -1! | |
| LG Gram 17Z90Q-E.AD78G | |
| HP ProBook 450 G9 6A180EA -1! | |
| Lenovo IdeaPad 3 17ABA7 | |
| The Witcher 3 - 1920x1080 Ultra Graphics & Postprocessing (HBAO+) | |
| MSI Katana 15 B12VEK | |
| Dell XPS 17 9720 | |
| Średnia w klasie Multimedia (11 - 107, n=5, ostatnie 2 lata) | |
| LG Gram 17Z90Q-E.AD78G | |
| HP Envy 17-cr0079ng | |
| Acer Aspire 5 A515-57G-53N8 | |
| HP ProBook 450 G9 6A180EA | |
| Lenovo IdeaPad 3 17ABA7 | |
| GTA V - 1920x1080 Highest AA:4xMSAA + FX AF:16x | |
| MSI Katana 15 B12VEK | |
| Dell XPS 17 9720 | |
| Średnia w klasie Multimedia (7.92 - 141.6, n=53, ostatnie 2 lata) | |
| HP Envy 17-cr0079ng | |
| Acer Aspire 5 A515-57G-53N8 | |
| LG Gram 17Z90Q-E.AD78G | |
| Lenovo IdeaPad 3 17ABA7 | |
| Final Fantasy XV Benchmark - 1920x1080 High Quality | |
| MSI Katana 15 B12VEK | |
| Średnia w klasie Multimedia (7.61 - 144.4, n=56, ostatnie 2 lata) | |
| Dell XPS 17 9720 | |
| HP Envy 17-cr0079ng | |
| Acer Aspire 5 A515-57G-53N8 | |
| LG Gram 17Z90Q-E.AD78G | |
| HP ProBook 450 G9 6A180EA | |
| Lenovo IdeaPad 3 17ABA7 | |
| Strange Brigade - 1920x1080 ultra AA:ultra AF:16 | |
| MSI Katana 15 B12VEK | |
| Średnia w klasie Multimedia (13.3 - 303, n=55, ostatnie 2 lata) | |
| Dell XPS 17 9720 | |
| HP Envy 17-cr0079ng | |
| LG Gram 17Z90Q-E.AD78G | |
| HP ProBook 450 G9 6A180EA | |
| Lenovo IdeaPad 3 17ABA7 | |
| Dota 2 Reborn - 1920x1080 ultra (3/3) best looking | |
| Dell XPS 17 9720 | |
| MSI Katana 15 B12VEK | |
| HP Envy 17-cr0079ng | |
| Średnia w klasie Multimedia (29 - 179.9, n=57, ostatnie 2 lata) | |
| Acer Aspire 5 A515-57G-53N8 | |
| LG Gram 17Z90Q-E.AD78G | |
| HP ProBook 450 G9 6A180EA | |
| Lenovo IdeaPad 3 17ABA7 | |
| X-Plane 11.11 - 1920x1080 high (fps_test=3) | |
| MSI Katana 15 B12VEK | |
| Dell XPS 17 9720 | |
| HP Envy 17-cr0079ng | |
| LG Gram 17Z90Q-E.AD78G | |
| LG Gram 17Z90Q-E.AD78G | |
| Acer Aspire 5 A515-57G-53N8 | |
| Średnia w klasie Multimedia (16.9 - 141.1, n=53, ostatnie 2 lata) | |
| HP ProBook 450 G9 6A180EA | |
| Lenovo IdeaPad 3 17ABA7 | |
W naszym "The Witcher 3" teście stałego obciążenia, liczba klatek na sekundę pozostaje na stałym poziomie i nie mierzymy żadnych spadków.
The Witcher 3 FPS Chart
| low | med. | high | ultra | QHD | 4K | |
|---|---|---|---|---|---|---|
| GTA V (2015) | 150.7 | 139.3 | 90.2 | 44.8 | ||
| The Witcher 3 (2015) | 175.7 | 106.4 | 58.2 | 33.4 | ||
| Dota 2 Reborn (2015) | 140.9 | 125.8 | 119.5 | 112.6 | 54.8 | |
| Final Fantasy XV Benchmark (2018) | 90.5 | 49 | 35 | 25 | 13.4 | |
| X-Plane 11.11 (2018) | 97.8 | 83.9 | 68.1 | 51.7 | ||
| Far Cry 5 (2018) | 107 | 59 | 53 | 49 | 35 | 18 |
| Strange Brigade (2018) | 170.8 | 74.2 | 60.9 | 53.3 | ||
| Monster Hunter Stories 2 (2021) | 94.4 | 91.2 | 89.7 | 72.5 | ||
| F1 2021 (2021) | 190.7 | 105.6 | 66.2 | 36.1 | 27 | 11 |
| GRID Legends (2022) | 100.6 | 80.8 | 67.9 | 49.5 | 39.4 | 23.3 |
| F1 22 (2022) | 167.7 | 106.6 | 92.7 | 59 | 12 | |
| Dead Space Remake (2023) | 30.8 | 25.8 | 20.4 | 17.8 | 7.4 |
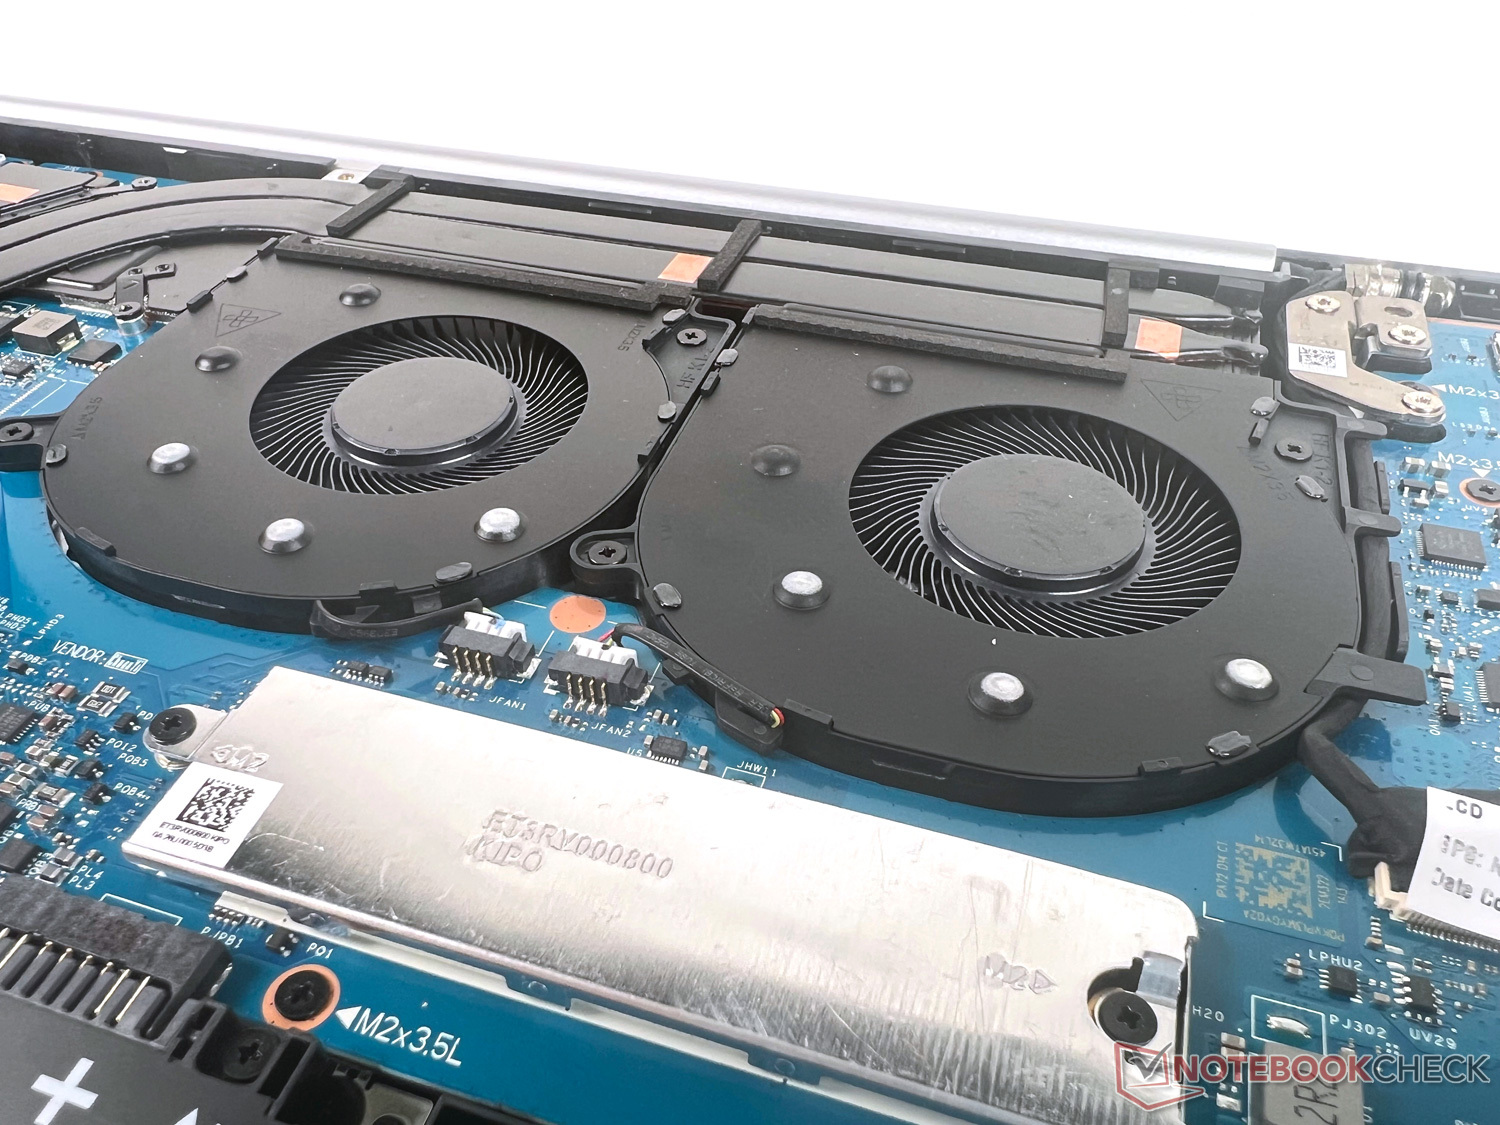
Emisja: Bas, bas, gdzie jest bas...
Poziomy hałasu
Podczas pracy na biegu jałowym i pod niewielkim obciążeniem HP Envy 17 nie jest słyszalny. Pod pewnymi lekkimi wymaganiami dwa wentylatory dla CPU i GPU mruczą stale, nie będąc szczególnie irytującymi. Z drugiej strony, jeśli rzucimy wyzwanie wbudowanemu sprzętowi (na przykład podczas gry), urządzenie osiąga hałas o natężeniu do 48 dB. Tryb "Inteligentnej regulacji" prawie nie przynosi korzyści w postaci hałasu, gdy obciążenie jest nieco obniżone.
Nasz testowy egzemplarz nie wydaje żadnych innych denerwujących odgłosów.
Hałas
| luz |
| 28.5 / 28.5 / 29.7 dB |
| obciążenie |
| 39.5 / 48 dB |
 | ||
30 dB cichy 40 dB(A) słyszalny 50 dB(A) irytujący |
||
min: | ||
| HP Envy 17-cr0079ng GeForce RTX 2050 Mobile, i7-1255U, Samsung PM991a MZVLQ1T0HBLB | HP ProBook 450 G9 6A180EA Iris Xe G7 96EUs, i7-1255U, SK Hynix HFM512GD3JX013N | LG Gram 17Z90Q-E.AD78G GeForce RTX 2050 Mobile, i7-1260P, Samsung PM9A1 MZVL21T0HCLR | Acer Aspire 5 A515-57G-53N8 GeForce RTX 2050 Mobile, i5-1240P, Micron 2450 512GB MTFDKBA512TFK | Dell XPS 17 9720 GeForce RTX 3050 4GB Laptop GPU, i7-12700H, Micron 3400 MTFDKBA512TFH 512GB | Lenovo IdeaPad 3 17ABA7 Vega 7, R5 5625U, Intel SSDPEKNW512GZL | |
|---|---|---|---|---|---|---|
| Noise | 19% | -3% | -0% | 8% | -5% | |
| wyłączone / środowisko * (dB) | 26.5 | 25.5 4% | 26 2% | 25 6% | 24 9% | 26 2% |
| Idle Minimum * (dB) | 28.5 | 25.5 11% | 28 2% | 25 12% | 24 16% | 26 9% |
| Idle Average * (dB) | 28.5 | 25.5 11% | 28 2% | 29 -2% | 24 16% | 30.8 -8% |
| Idle Maximum * (dB) | 29.7 | 25.5 14% | 28.8 3% | 31 -4% | 24 19% | 33.4 -12% |
| Load Average * (dB) | 39.5 | 28 29% | 49.3 -25% | 46 -16% | 43.9 -11% | 47.6 -21% |
| Load Maximum * (dB) | 48 | 27.7 42% | 49.1 -2% | 47 2% | 48.4 -1% | 47.5 1% |
| Witcher 3 ultra * (dB) | 42 | 48.4 |
* ... im mniej tym lepiej
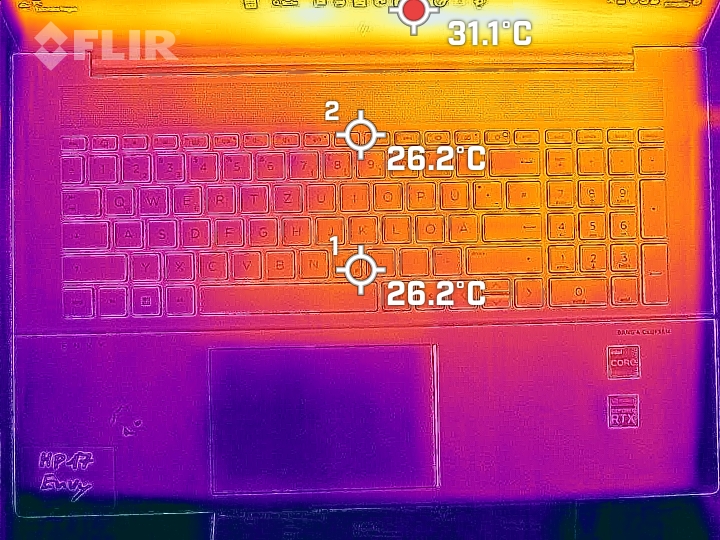
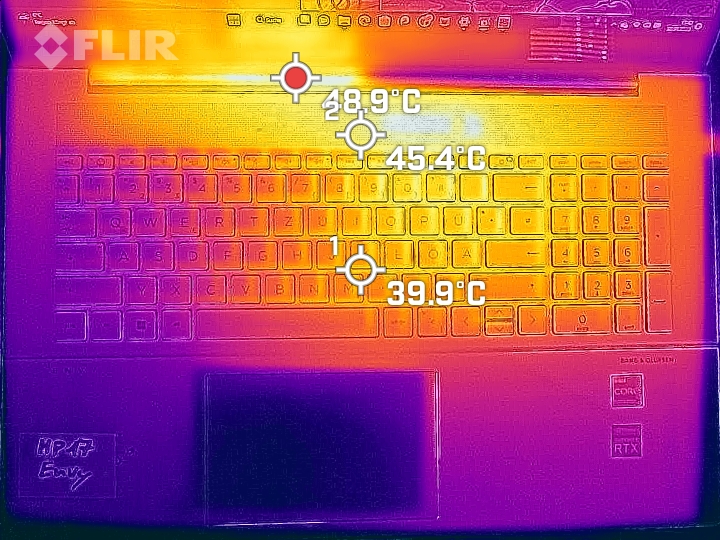
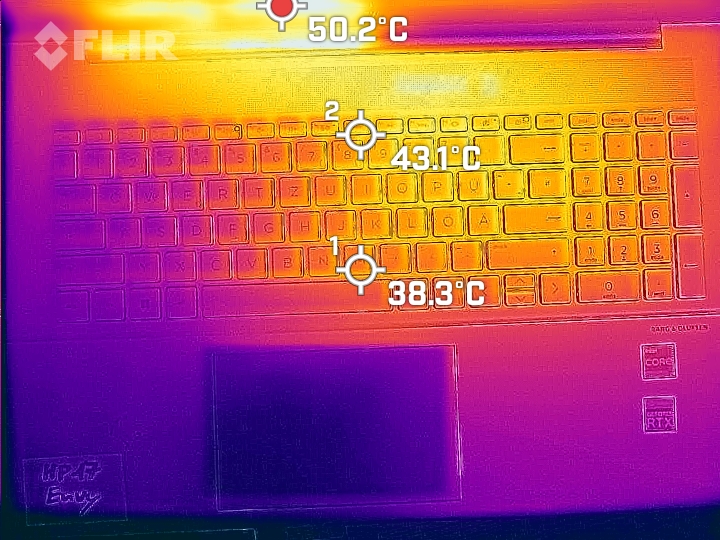
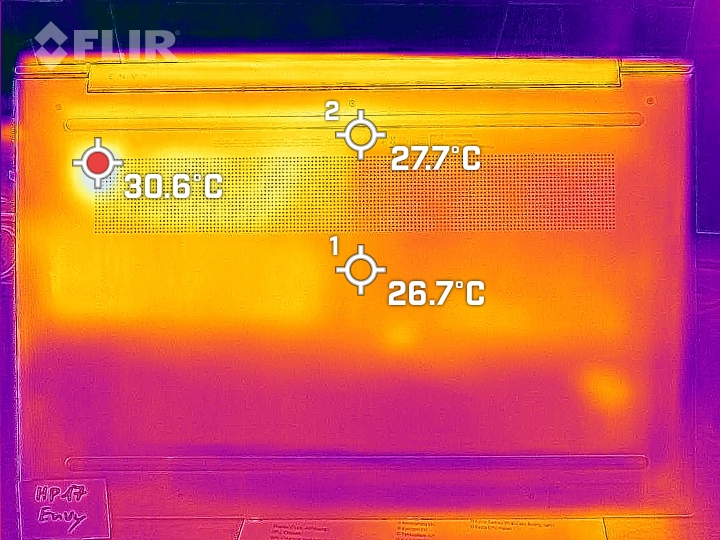
Temperatura
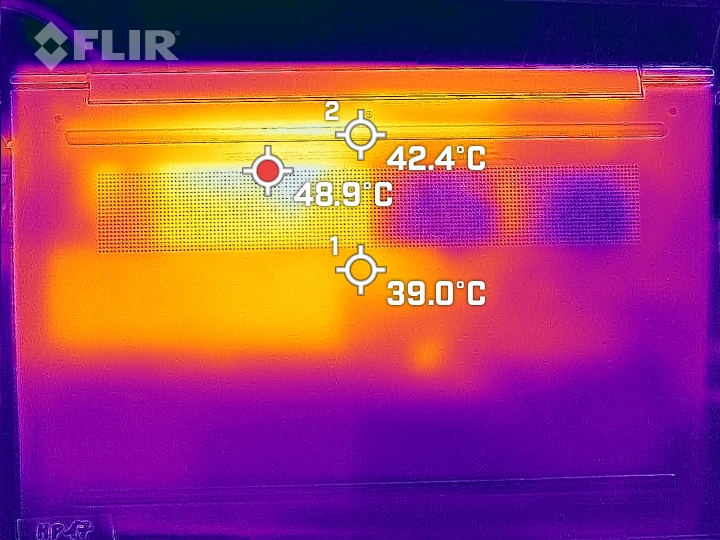
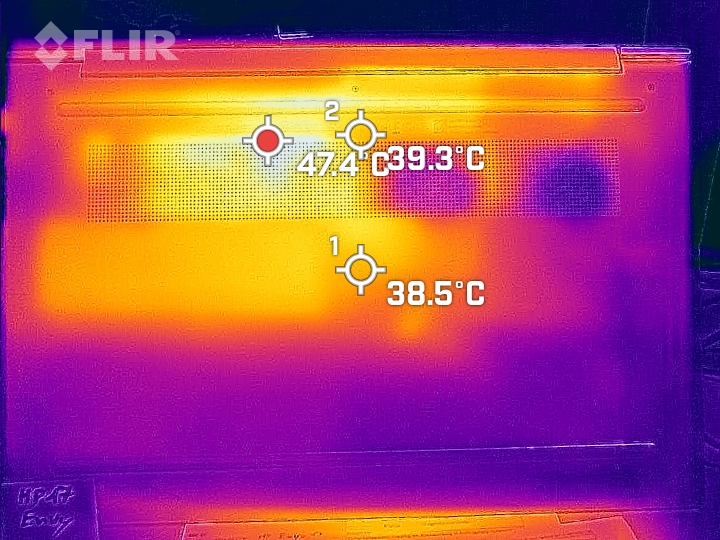
W stanie spoczynku laptop jest niewiele cieplejszy od temperatury pokojowej. Pod obciążeniem w centrum przed ekranem powstaje punkt ciepła, który rozszerza się w kierunku klawiatury, osiągając temperaturę bliską 50°C (122°F). Choć to nagrzewanie jest odczuwalne podczas pisania, nie staje się zbyt niekomfortowe.
(-) Maksymalna temperatura w górnej części wynosi 47.1 °C / 117 F, w porównaniu do średniej 36.8 °C / 98 F , począwszy od 21 do 71 °C dla klasy Multimedia.
(±) Dno nagrzewa się maksymalnie do 43.8 °C / 111 F, w porównaniu do średniej 39.1 °C / 102 F
(+) W stanie bezczynności średnia temperatura górnej części wynosi 23.9 °C / 75 F, w porównaniu ze średnią temperaturą urządzenia wynoszącą 31.3 °C / ### class_avg_f### F.
(±) Podczas gry w Wiedźmina 3 średnia temperatura górnej części wynosi 34.5 °C / 94 F, w porównaniu do średniej temperatury urządzenia wynoszącej 31.3 °C / ## #class_avg_f### F.
(+) Podpórki pod nadgarstki i touchpad są chłodniejsze niż temperatura skóry i maksymalnie 31.7 °C / 89.1 F i dlatego są chłodne w dotyku.
(-) Średnia temperatura obszaru podparcia dłoni w podobnych urządzeniach wynosiła 28.7 °C / 83.7 F (-3 °C / -5.4 F).
| HP Envy 17-cr0079ng Intel Core i7-1255U, NVIDIA GeForce RTX 2050 Mobile | HP ProBook 450 G9 6A180EA Intel Core i7-1255U, Intel Iris Xe Graphics G7 96EUs | LG Gram 17Z90Q-E.AD78G Intel Core i7-1260P, NVIDIA GeForce RTX 2050 Mobile | Acer Aspire 5 A515-57G-53N8 Intel Core i5-1240P, NVIDIA GeForce RTX 2050 Mobile | Dell XPS 17 9720 Intel Core i7-12700H, NVIDIA GeForce RTX 3050 4GB Laptop GPU | Lenovo IdeaPad 3 17ABA7 AMD Ryzen 5 5625U, AMD Radeon RX Vega 7 | Średnia w klasie Multimedia | |
|---|---|---|---|---|---|---|---|
| Heat | -14% | -9% | -2% | -3% | 1% | 0% | |
| Maximum Upper Side * (°C) | 47.1 | 40.5 14% | 50.3 -7% | 43 9% | 49.5 -5% | 43.1 8% | 41 ? 13% |
| Maximum Bottom * (°C) | 43.8 | 47.6 -9% | 52.5 -20% | 48 -10% | 38.4 12% | 43.6 -0% | 43.4 ? 1% |
| Idle Upper Side * (°C) | 25.2 | 32.6 -29% | 26.9 -7% | 26 -3% | 28 -11% | 25.1 -0% | 26.9 ? -7% |
| Idle Bottom * (°C) | 25.9 | 34.2 -32% | 26.5 -2% | 27 -4% | 27.8 -7% | 27 -4% | 27.8 ? -7% |
* ... im mniej tym lepiej
Stress Test
W naszym teście obciążeniowym z Prime95 i Furmarkiem, który wymagał od sprzętu co najmniej jednej godziny, CPU i GPU utrzymują stały wynik bez większych spadków w trakcie testu. Procesor osiąga średnio 71°C (160°F) i około 1,65 GHz, czyli nieco poniżej podstawowego taktowania 1,7 GHz. Nie ma to jednak żadnego wpływu na codzienną pracę. GPU zużywa 35 W, pracując z częstotliwością około 1,1 GHz przy temperaturze około 75 °C (167 °F).
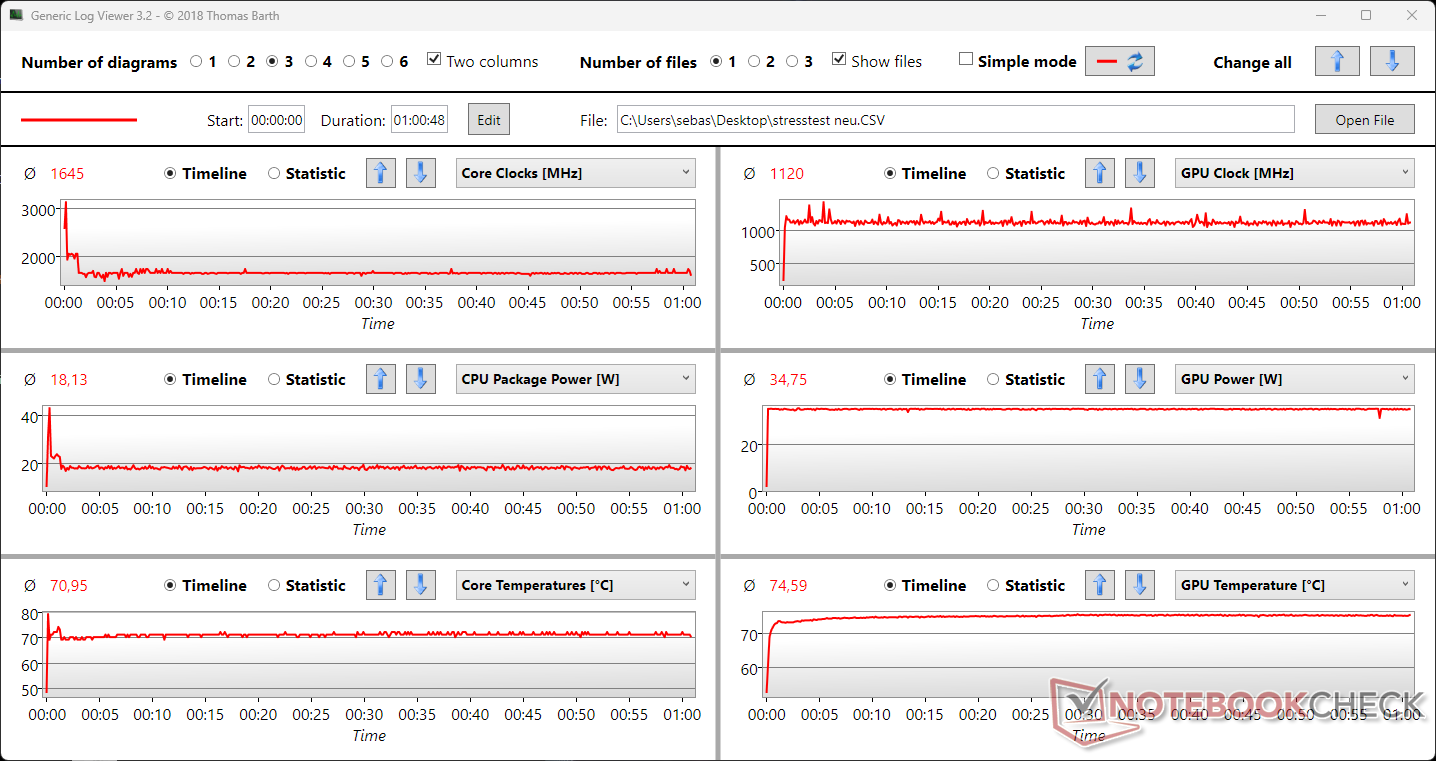
| ZegarCPU (GHz) | Zegar GPU (MHz) | Średnia temperatura CPU (°C) | Średnia temperatura GPU (°C) | |
| System Idle | 2.0 | 0 | 49 | 55 |
| Prime95, stres | 2.5 | 0 | 68 | 55 |
| Prime95 + FurMark, Stress | 1.65 | 1.1 | 71 | 75 |
| The Witcher 3, Stress | 3.3 | 1.3 | 65 | 71 |
Mówcy
Stereofoniczne kolumny Bang & Olufsen potrafią zagrać stosunkowo głośno i oferują dość wyrównane średnie i wysokie tony. Brakuje jednak niemal zupełnie basów. Ogólnie rzecz biorąc, nasz testowy egzemplarz plasuje się w dolnej połowie dziedziny multimedialnej pod względem reprodukcji dźwięku. Szczególnie do słuchania muzyki lub grania polecamy podłączenie słuchawek lub zestawu słuchawkowego przez 3,5-mm port audio.
HP Envy 17-cr0079ng analiza dźwięku
(+) | głośniki mogą odtwarzać stosunkowo głośno (86.2 dB)
Bas 100 - 315 Hz
(-) | prawie brak basu - średnio 17.6% niższa od mediany
(±) | liniowość basu jest średnia (12.4% delta do poprzedniej częstotliwości)
Średnie 400 - 2000 Hz
(+) | zbalansowane środki średnie - tylko 2.5% od mediany
(+) | średnie są liniowe (3.6% delta do poprzedniej częstotliwości)
Wysokie 2–16 kHz
(±) | wyższe maksima - średnio 10.1% wyższe od mediany
(+) | wzloty są liniowe (4.2% delta do poprzedniej częstotliwości)
Ogólnie 100 - 16.000 Hz
(±) | liniowość ogólnego dźwięku jest średnia (18.3% różnicy w stosunku do mediany)
W porównaniu do tej samej klasy
» 56% wszystkich testowanych urządzeń w tej klasie było lepszych, 7% podobnych, 38% gorszych
» Najlepszy miał deltę 5%, średnia wynosiła ###średnia###%, najgorsza wynosiła 45%
W porównaniu do wszystkich testowanych urządzeń
» 40% wszystkich testowanych urządzeń było lepszych, 8% podobnych, 52% gorszych
» Najlepszy miał deltę 4%, średnia wynosiła ###średnia###%, najgorsza wynosiła 134%
Apple MacBook Pro 16 2021 M1 Pro analiza dźwięku
(+) | głośniki mogą odtwarzać stosunkowo głośno (84.7 dB)
Bas 100 - 315 Hz
(+) | dobry bas - tylko 3.8% od mediany
(+) | bas jest liniowy (5.2% delta do poprzedniej częstotliwości)
Średnie 400 - 2000 Hz
(+) | zbalansowane środki średnie - tylko 1.3% od mediany
(+) | średnie są liniowe (2.1% delta do poprzedniej częstotliwości)
Wysokie 2–16 kHz
(+) | zrównoważone maksima - tylko 1.9% od mediany
(+) | wzloty są liniowe (2.7% delta do poprzedniej częstotliwości)
Ogólnie 100 - 16.000 Hz
(+) | ogólny dźwięk jest liniowy (4.6% różnicy w stosunku do mediany)
W porównaniu do tej samej klasy
» 0% wszystkich testowanych urządzeń w tej klasie było lepszych, 0% podobnych, 100% gorszych
» Najlepszy miał deltę 5%, średnia wynosiła ###średnia###%, najgorsza wynosiła 45%
W porównaniu do wszystkich testowanych urządzeń
» 0% wszystkich testowanych urządzeń było lepszych, 0% podobnych, 100% gorszych
» Najlepszy miał deltę 4%, średnia wynosiła ###średnia###%, najgorsza wynosiła 134%
Zarządzanie energią: HP Envy 17 nie jest mistrzem wytrzymałości
Pobór mocy
HP Envy 17-cr0079ng nie jest zbyt wydajny. W porównaniu z LG Gram 17o tej samej przekątnej wyświetlacza i dGPU, a także większości innych modeli porównawczych, pobiera więcej energii z ładowarki, która przy mocy 90 W jest wystarczająco duża, by zapewnić pobór mocy na poziomie około 70 W. Tylko pod absolutnym szczytowym obciążeniem pobór osiąga niewiele wyższy poziom 93 W.
| wyłączony / stan wstrzymania | |
| luz | |
| obciążenie |
|
Legenda:
min: | |
| HP Envy 17-cr0079ng i7-1255U, GeForce RTX 2050 Mobile, Samsung PM991a MZVLQ1T0HBLB, IPS, 3840x2160, 17.3" | HP ProBook 450 G9 6A180EA i7-1255U, Iris Xe G7 96EUs, SK Hynix HFM512GD3JX013N, , 1920x1080, 15.6" | LG Gram 17Z90Q-E.AD78G i7-1260P, GeForce RTX 2050 Mobile, Samsung PM9A1 MZVL21T0HCLR, IPS, 2560x1600, 17" | Acer Aspire 5 A515-57G-53N8 i5-1240P, GeForce RTX 2050 Mobile, Micron 2450 512GB MTFDKBA512TFK, IPS, 1920x1080, 15.6" | Dell XPS 17 9720 i7-12700H, GeForce RTX 3050 4GB Laptop GPU, Micron 3400 MTFDKBA512TFH 512GB, IPS, 3840x2400, 17" | Lenovo IdeaPad 3 17ABA7 R5 5625U, Vega 7, Intel SSDPEKNW512GZL, IPS, 1920x1080, 17.3" | Przeciętny NVIDIA GeForce RTX 2050 Mobile | Średnia w klasie Multimedia | |
|---|---|---|---|---|---|---|---|---|
| Power Consumption | 47% | 31% | 26% | -35% | 42% | 18% | 10% | |
| Idle Minimum * (Watt) | 5.8 | 4.5 22% | 4.1 29% | 4 31% | 7.8 -34% | 5.1 12% | 5.11 ? 12% | 5.62 ? 3% |
| Idle Average * (Watt) | 14.3 | 7.3 49% | 9.8 31% | 8 44% | 15.1 -6% | 8.3 42% | 9.15 ? 36% | 10.2 ? 29% |
| Idle Maximum * (Watt) | 18.4 | 8.1 56% | 12 35% | 13 29% | 17 8% | 9.6 48% | 11.2 ? 39% | 12.5 ? 32% |
| Load Average * (Watt) | 70 | 32.8 53% | 49.3 30% | 62 11% | 114 -63% | 33.6 52% | 70.6 ? -1% | 65 ? 7% |
| Witcher 3 ultra * (Watt) | 69.4 | 32 54% | 49.3 29% | 60 14% | 115.2 -66% | 33.3 52% | ||
| Load Maximum * (Watt) | 93 | 47 49% | 66 29% | 70 25% | 135.6 -46% | 51.9 44% | 87.4 ? 6% | 111.9 ? -20% |
* ... im mniej tym lepiej
Power Consumption The Witcher 3 / Stress Test
Power Consumption with External Monitor
Czas pracy na baterii
HP wyposażyło nasz testowy egzemplarz Envy 17 w akumulator o pojemności 55 Wh. Dzięki temu jest on nieco większy niż w większości pozostałych urządzeń porównawczych. Jedynie mistrz wytrzymałości LG Gram 17 i power laptop Dell XPS 17 mają znacznie większe akumulatory.
Wielkość akumulatora przekłada się jednak w ograniczonym stopniu na czasy pracy na baterii naszego testowanego egzemplarza. Na polu porównawczym nasze urządzenie zajmuje ostatnie miejsce, co zapewne wynika głównie z dość jasnego wyświetlacza 4K o wysokiej rozdzielczości. Pod obciążeniem bateria wyczerpuje się już po około 90 minutach, a podczas surfowania czy oglądania filmów wartości również nie zachęcają do jakiegoś entuzjazmu, wynosząc odpowiednio około 4,5 i 5,5 godziny.
| HP Envy 17-cr0079ng i7-1255U, GeForce RTX 2050 Mobile, 55 Wh | HP ProBook 450 G9 6A180EA i7-1255U, Iris Xe G7 96EUs, 51 Wh | LG Gram 17Z90Q-E.AD78G i7-1260P, GeForce RTX 2050 Mobile, 90 Wh | Acer Aspire 5 A515-57G-53N8 i5-1240P, GeForce RTX 2050 Mobile, 50 Wh | Dell XPS 17 9720 i7-12700H, GeForce RTX 3050 4GB Laptop GPU, 97 Wh | Lenovo IdeaPad 3 17ABA7 R5 5625U, Vega 7, 38 Wh | Średnia w klasie Multimedia | |
|---|---|---|---|---|---|---|---|
| Czasy pracy | 111% | 124% | 19% | 58% | 45% | 123% | |
| H.264 (h) | 5.5 | 11.2 104% | 16.8 ? 205% | ||||
| WiFi v1.3 (h) | 4.7 | 10.1 115% | 14.5 209% | 7.1 51% | 9.2 96% | 6.8 45% | 12.3 ? 162% |
| Load (h) | 1.6 | 3.3 106% | 2.2 38% | 1.4 -13% | 1.2 -25% | 1.645 ? 3% | |
| Witcher 3 ultra (h) | 2.7 | 1.7 | |||||
| Reader / Idle (h) | 15.8 | 24.9 ? |
Za
Przeciw
Werdykt: HP Envy 17 jest dobrym, wszechstronnym urządzeniem z kilkoma wyróżnikami
W naszym teście HP Envy 17-cr0079ng prezentuje się jako zrównoważony laptop multimedialny. Dzięki solidnej wydajności procesora i dedykowanej płycie podstawowej GeForce, można go również wykorzystać do grania w gry wideo, o ile wymagania nie są zbyt wysokie. Osoby szukające czegoś więcej mogą to znaleźć w Dell XPS 17 na przykład.
Jedną z atrakcji powinien być rzeczywiście duży i jasny wyświetlacz o rozdzielczości UHD. Dzięki wykonaniu na wysoki połysk wygląda też naprawdę dobrze, ale okazuje się to problemem przy lekkich refleksach lub na zewnątrz.
Laptop wykazuje również pewne słabości w zakresie czasu pracy na baterii, więc nie jest to idealny kompan do pracy na świeżym powietrzu lub w podróży. Osoby, którym zależy na jak najdłuższej pracy z dala od gniazdka, powinny zdecydowanie wybrać inny laptop, np. niezwykle trwałyLG Gram 17.
Ogólnie rzecz biorąc, HP Envy 17 zdobywa w naszym teście więcej mocnych niż słabych stron, ale nie jest w stanie naprawdę wyróżnić się w żadnej dziedzinie. Oferuje dobrą mieszankę dla multimediów, gier i Office, ale również kosztuje wysoką cenę na MSRP prawie 2.000 euro (~ 2.210 dolarów). Inne urządzenia oferują tutaj więcej za te pieniądze, jak np Acer Aspire 5 A515-57Gz tym samym dGPU, ale bez wyświetlacza 4K, kosztujący tylko połowę mniej, lub jeszcze droższy, ale też mocniejszy i ogólnie bardziej "doskonały" Dell XPS 17.
Cena i dostępność
HP Envy 17 jest dostępny w wielu konfiguracjach od HP w cenie od 699,99 USD. Model o niemal podobnej konfiguracji jak nasz egzemplarz testowy (Intel Core i7-1260P zamiast i7-1255U, 32 GB RAM, 1-TB SSD, wyświetlacz QHD), ale pozbawiony dedykowanej karty graficznej jest dostępny za 1309,99 USD, a inna konfiguracja z kartą graficzną, ale mniejszą ilością pamięci RAM i mniejszym ekranem FHD kosztuje 1049,99 USD.
HP Envy 17-cr0079ng
- 28/03/2023 v7 (old)
Marcus Schwarten
Przezroczystość
Wyboru urządzeń do recenzji dokonuje nasza redakcja. Próbka testowa została udostępniona autorowi jako pożyczka od producenta lub sprzedawcy detalicznego na potrzeby tej recenzji. Pożyczkodawca nie miał wpływu na tę recenzję, producent nie otrzymał też kopii tej recenzji przed publikacją. Nie było obowiązku publikowania tej recenzji. Jako niezależna firma medialna, Notebookcheck nie podlega władzy producentów, sprzedawców detalicznych ani wydawców.
Tak testuje Notebookcheck
Każdego roku Notebookcheck niezależnie sprawdza setki laptopów i smartfonów, stosując standardowe procedury, aby zapewnić porównywalność wszystkich wyników. Od około 20 lat stale rozwijamy nasze metody badawcze, ustanawiając przy tym standardy branżowe. W naszych laboratoriach testowych doświadczeni technicy i redaktorzy korzystają z wysokiej jakości sprzętu pomiarowego. Testy te obejmują wieloetapowy proces walidacji. Nasz kompleksowy system ocen opiera się na setkach uzasadnionych pomiarów i benchmarków, co pozwala zachować obiektywizm.Price comparison

