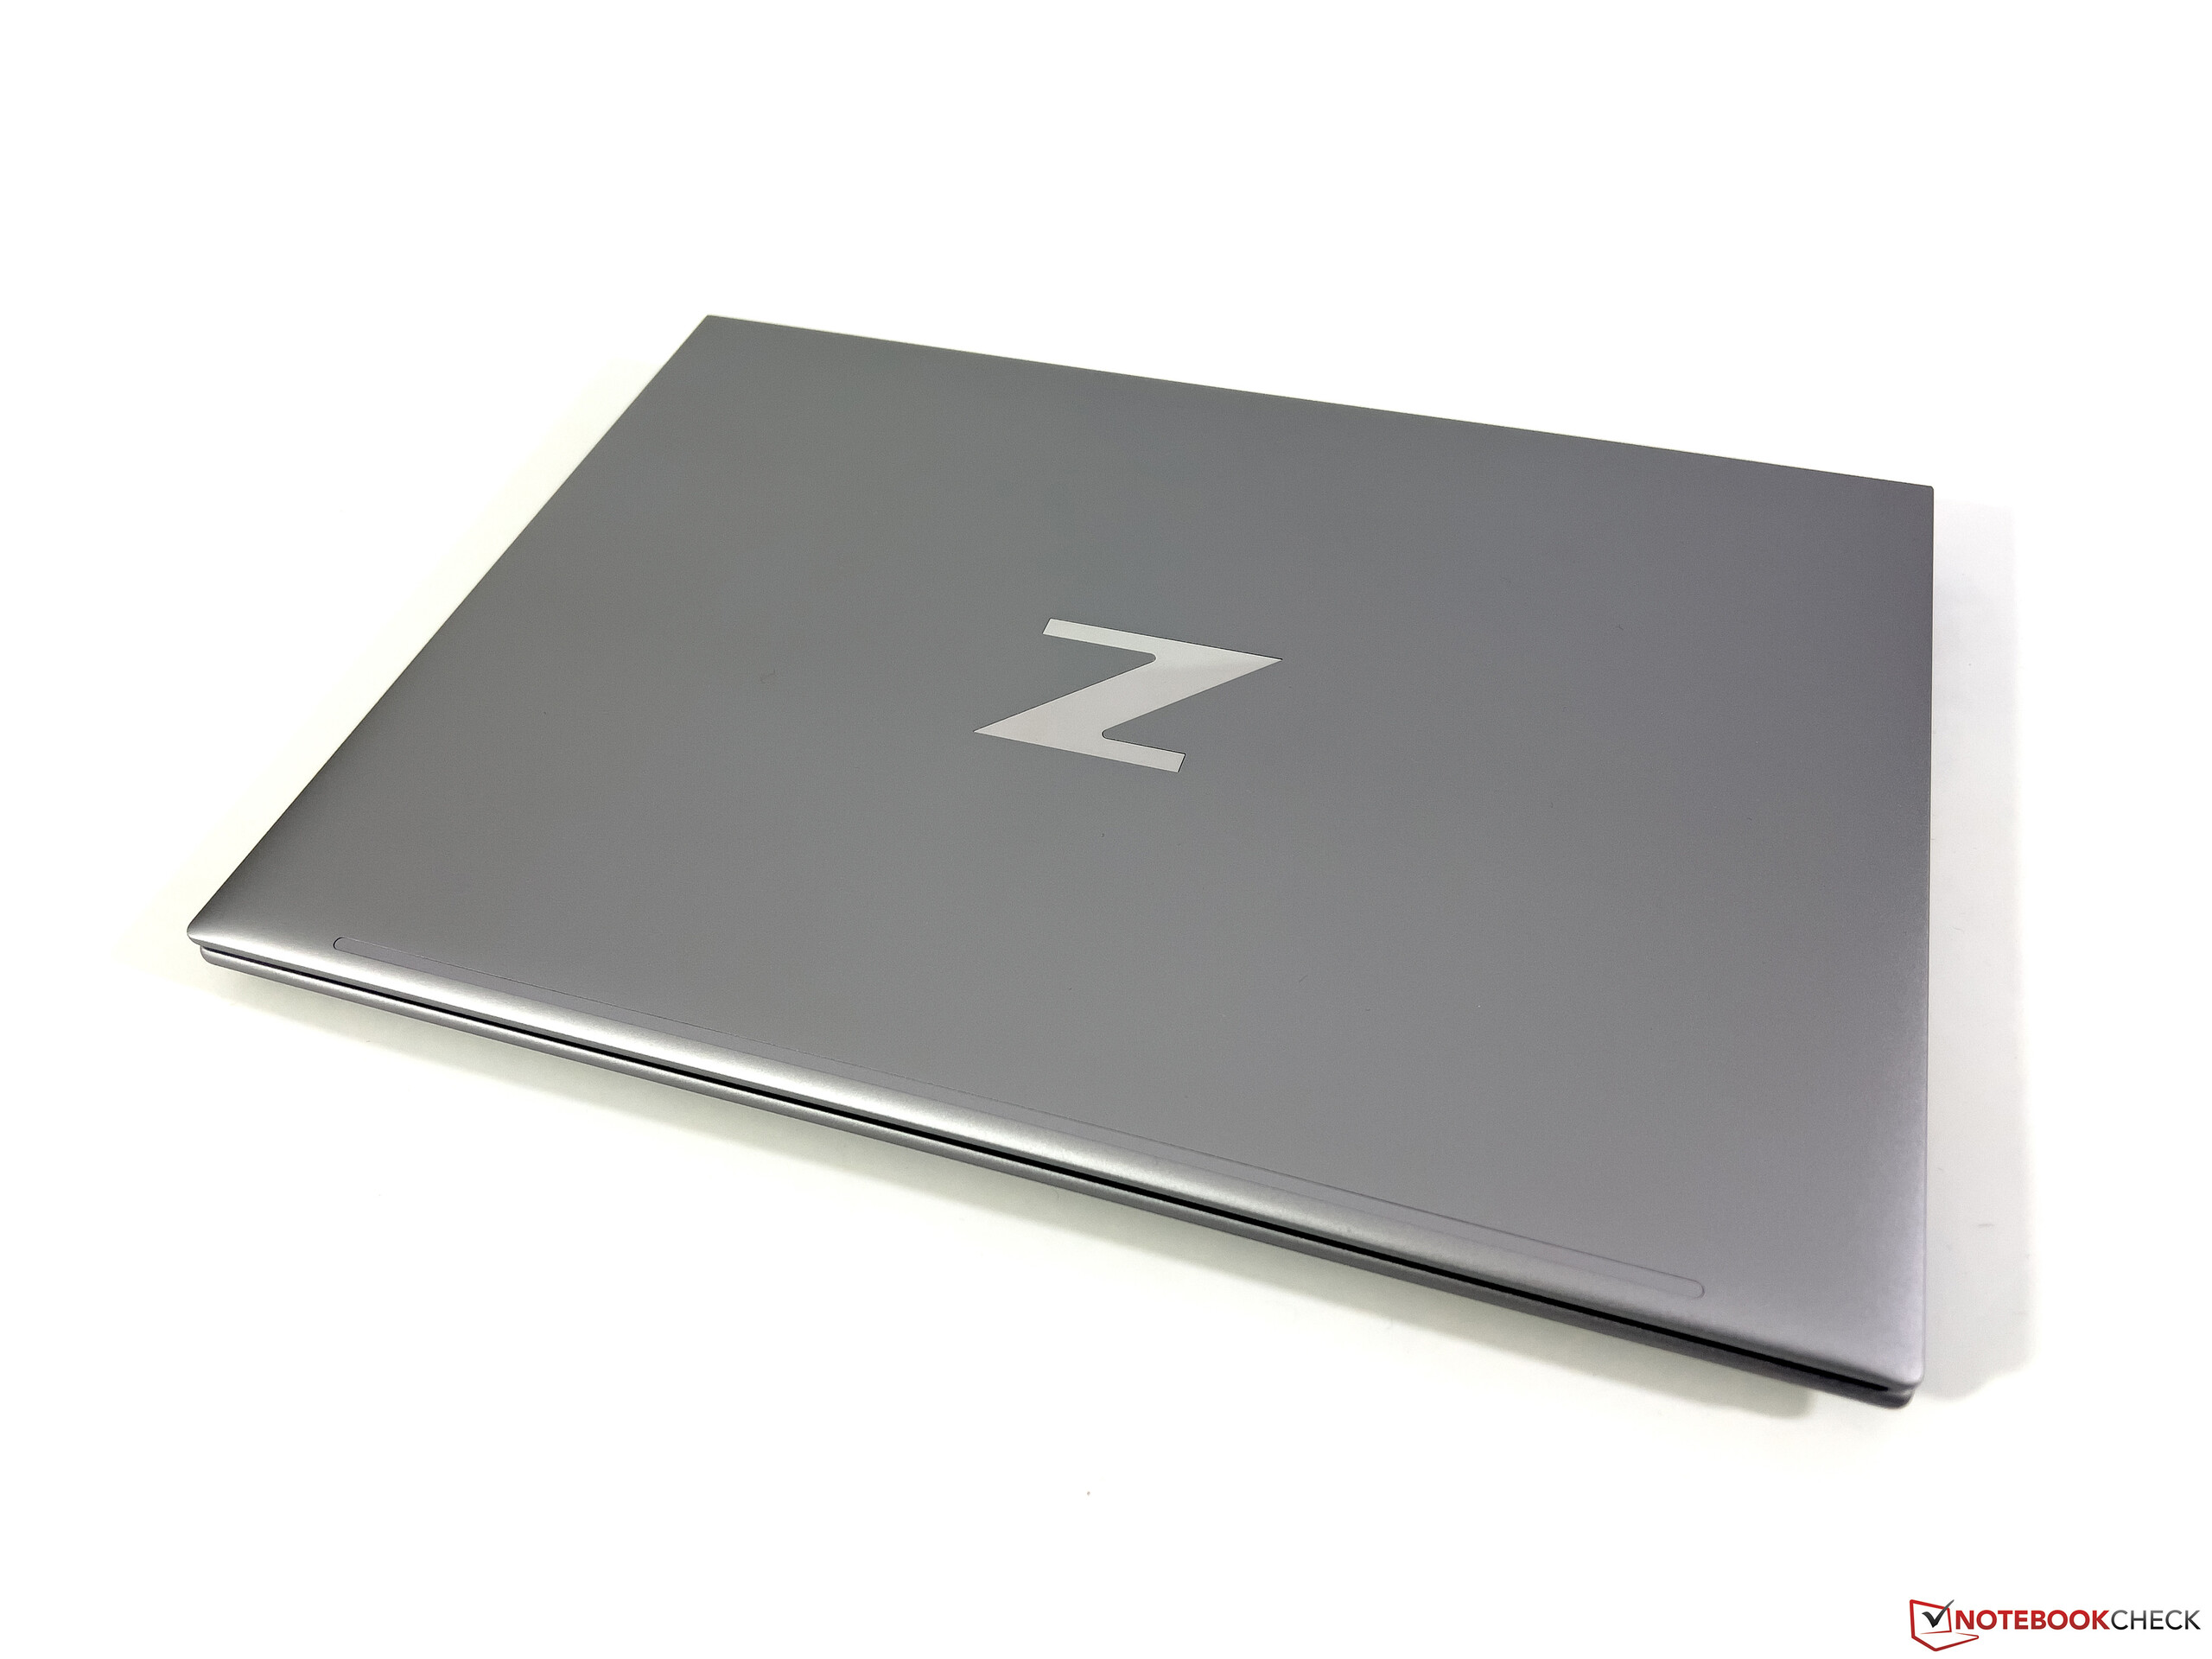
Laptop HP ZBook Firefly 14 G9 w recenzji: Intel Alder Lake-U spowalnia tę mobilną stację roboczą
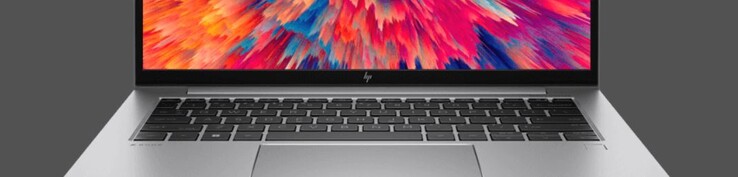
Niedawno recenzowaliśmy większy ZBook Firefly 16 G9 a teraz przyglądamy się mobilnej stacji roboczej HP z 14-calowym wyświetlaczem. Podobnie jak większy kuzyn, ZBook Firefly 14 G9 również wyposażony jest w aktualny procesor Intel Alder Lake wraz z dedykowaną Nvidia T550 profesjonalnym GPU, a więc skierowany jest do sektora profesjonalnego klasy podstawowej.
Nasza konfiguracja o oznaczeniu 6B8A2EA wykorzystuje m.in.Core i7-1265U, Nvidię T550, 32 GB pamięci RAM, dysk SSD o pojemności 1 TB oraz matowy panel Full HD w formacie 16:10. Taka konfiguracja kosztuje obecnie około 2 100 euro (~2 075 dolarów amerykańskich).
Potencjalni konkurenci w porównaniu
Ocena | Data | Model | Waga | Wysokość | Rozmiar | Rezolucja | Cena |
|---|---|---|---|---|---|---|---|
| 83.6 % v7 (old) | 10/2022 | HP ZBook Firefly 14 G9-6B8A2EA i7-1265U, T550 Laptop GPU | 1.5 kg | 19.9 mm | 14.00" | 1920x1200 | |
| 87.6 % v7 (old) | 10/2022 | Dell Precision 5000 5470 i9-12900H, RTX A1000 Laptop GPU | 1.6 kg | 18.95 mm | 14.00" | 2560x1600 | |
| 85.1 % v7 (old) | Lenovo ThinkPad P14s Gen2-20VX000GGE i7-1185G7, T500 Laptop GPU | 1.5 kg | 18 mm | 14.00" | 1920x1080 | ||
| 89 % v7 (old) | 10/2024 | Microsoft Surface Laptop Studio i7 RTX 3050 Ti i7-11370H, GeForce RTX 3050 Ti Laptop GPU | 1.8 kg | 19 mm | 14.40" | 2400x1600 | |
| 92.7 % v7 (old) | 11/2024 | Apple MacBook Pro 14 2021 M1 Pro Entry M1 Pro 8-Core, M1 Pro 14-Core GPU | 1.6 kg | 15.5 mm | 14.20" | 3024x1964 |
Skrzynia i wyposażenie
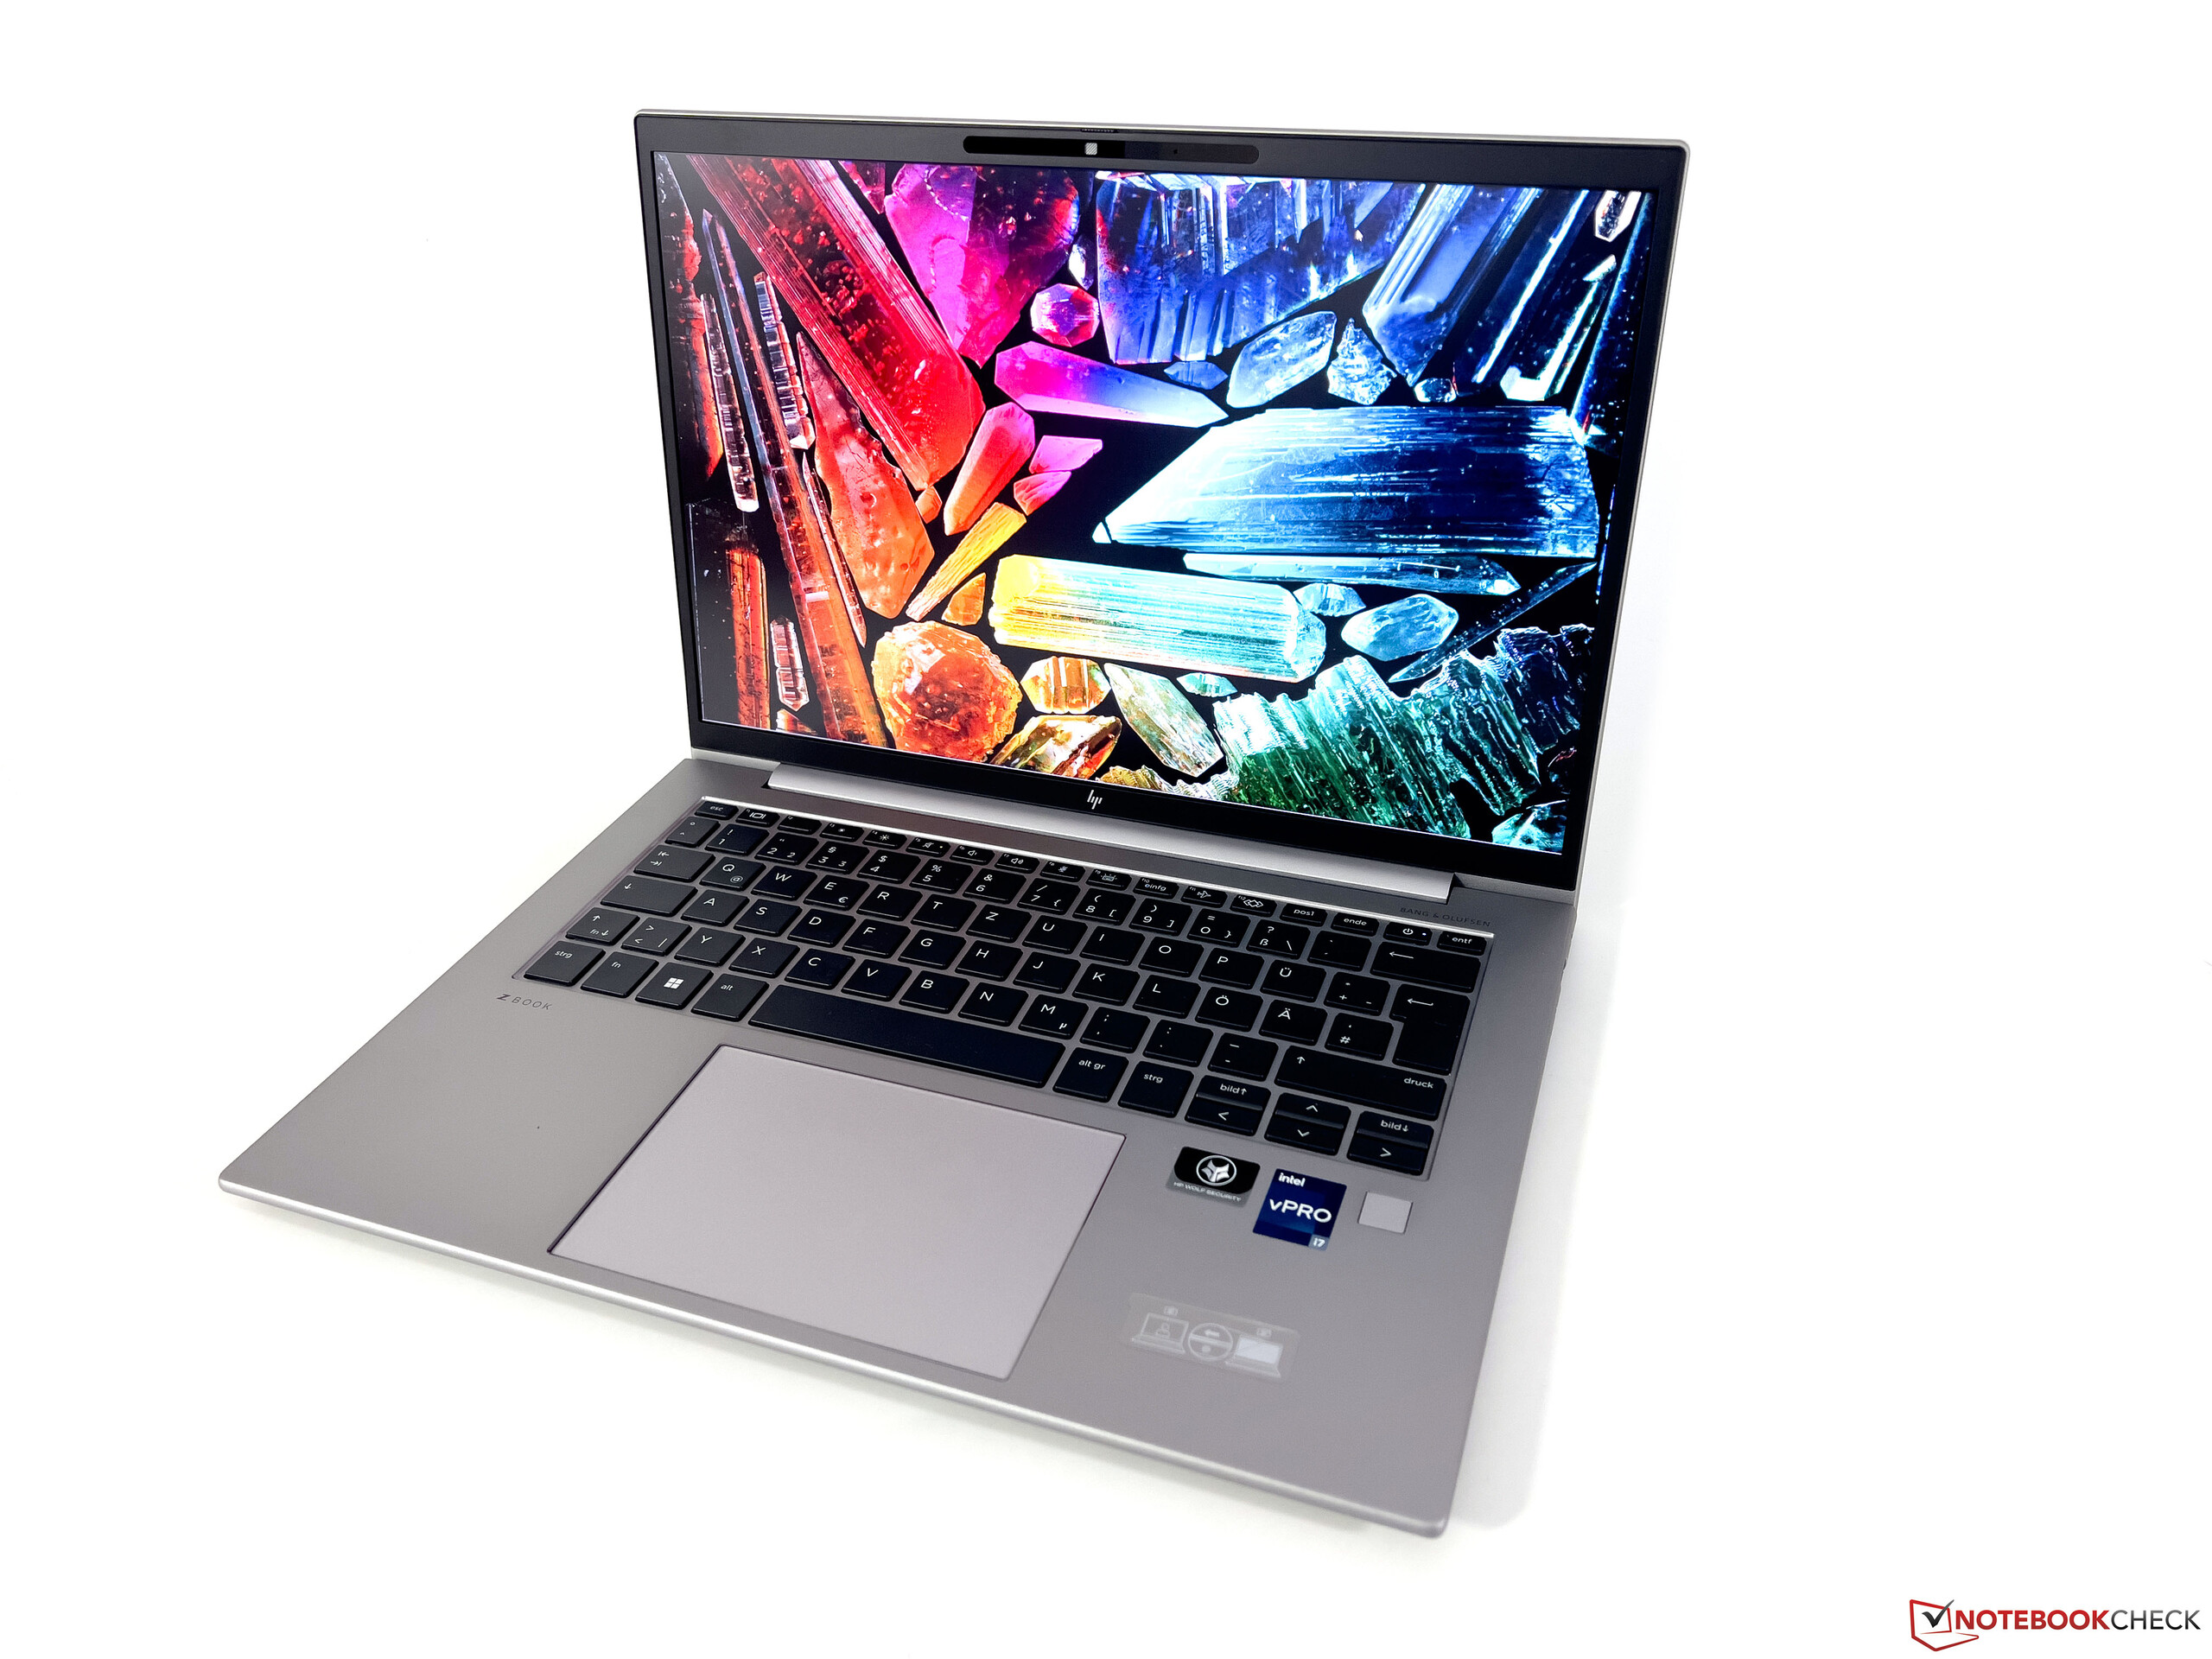
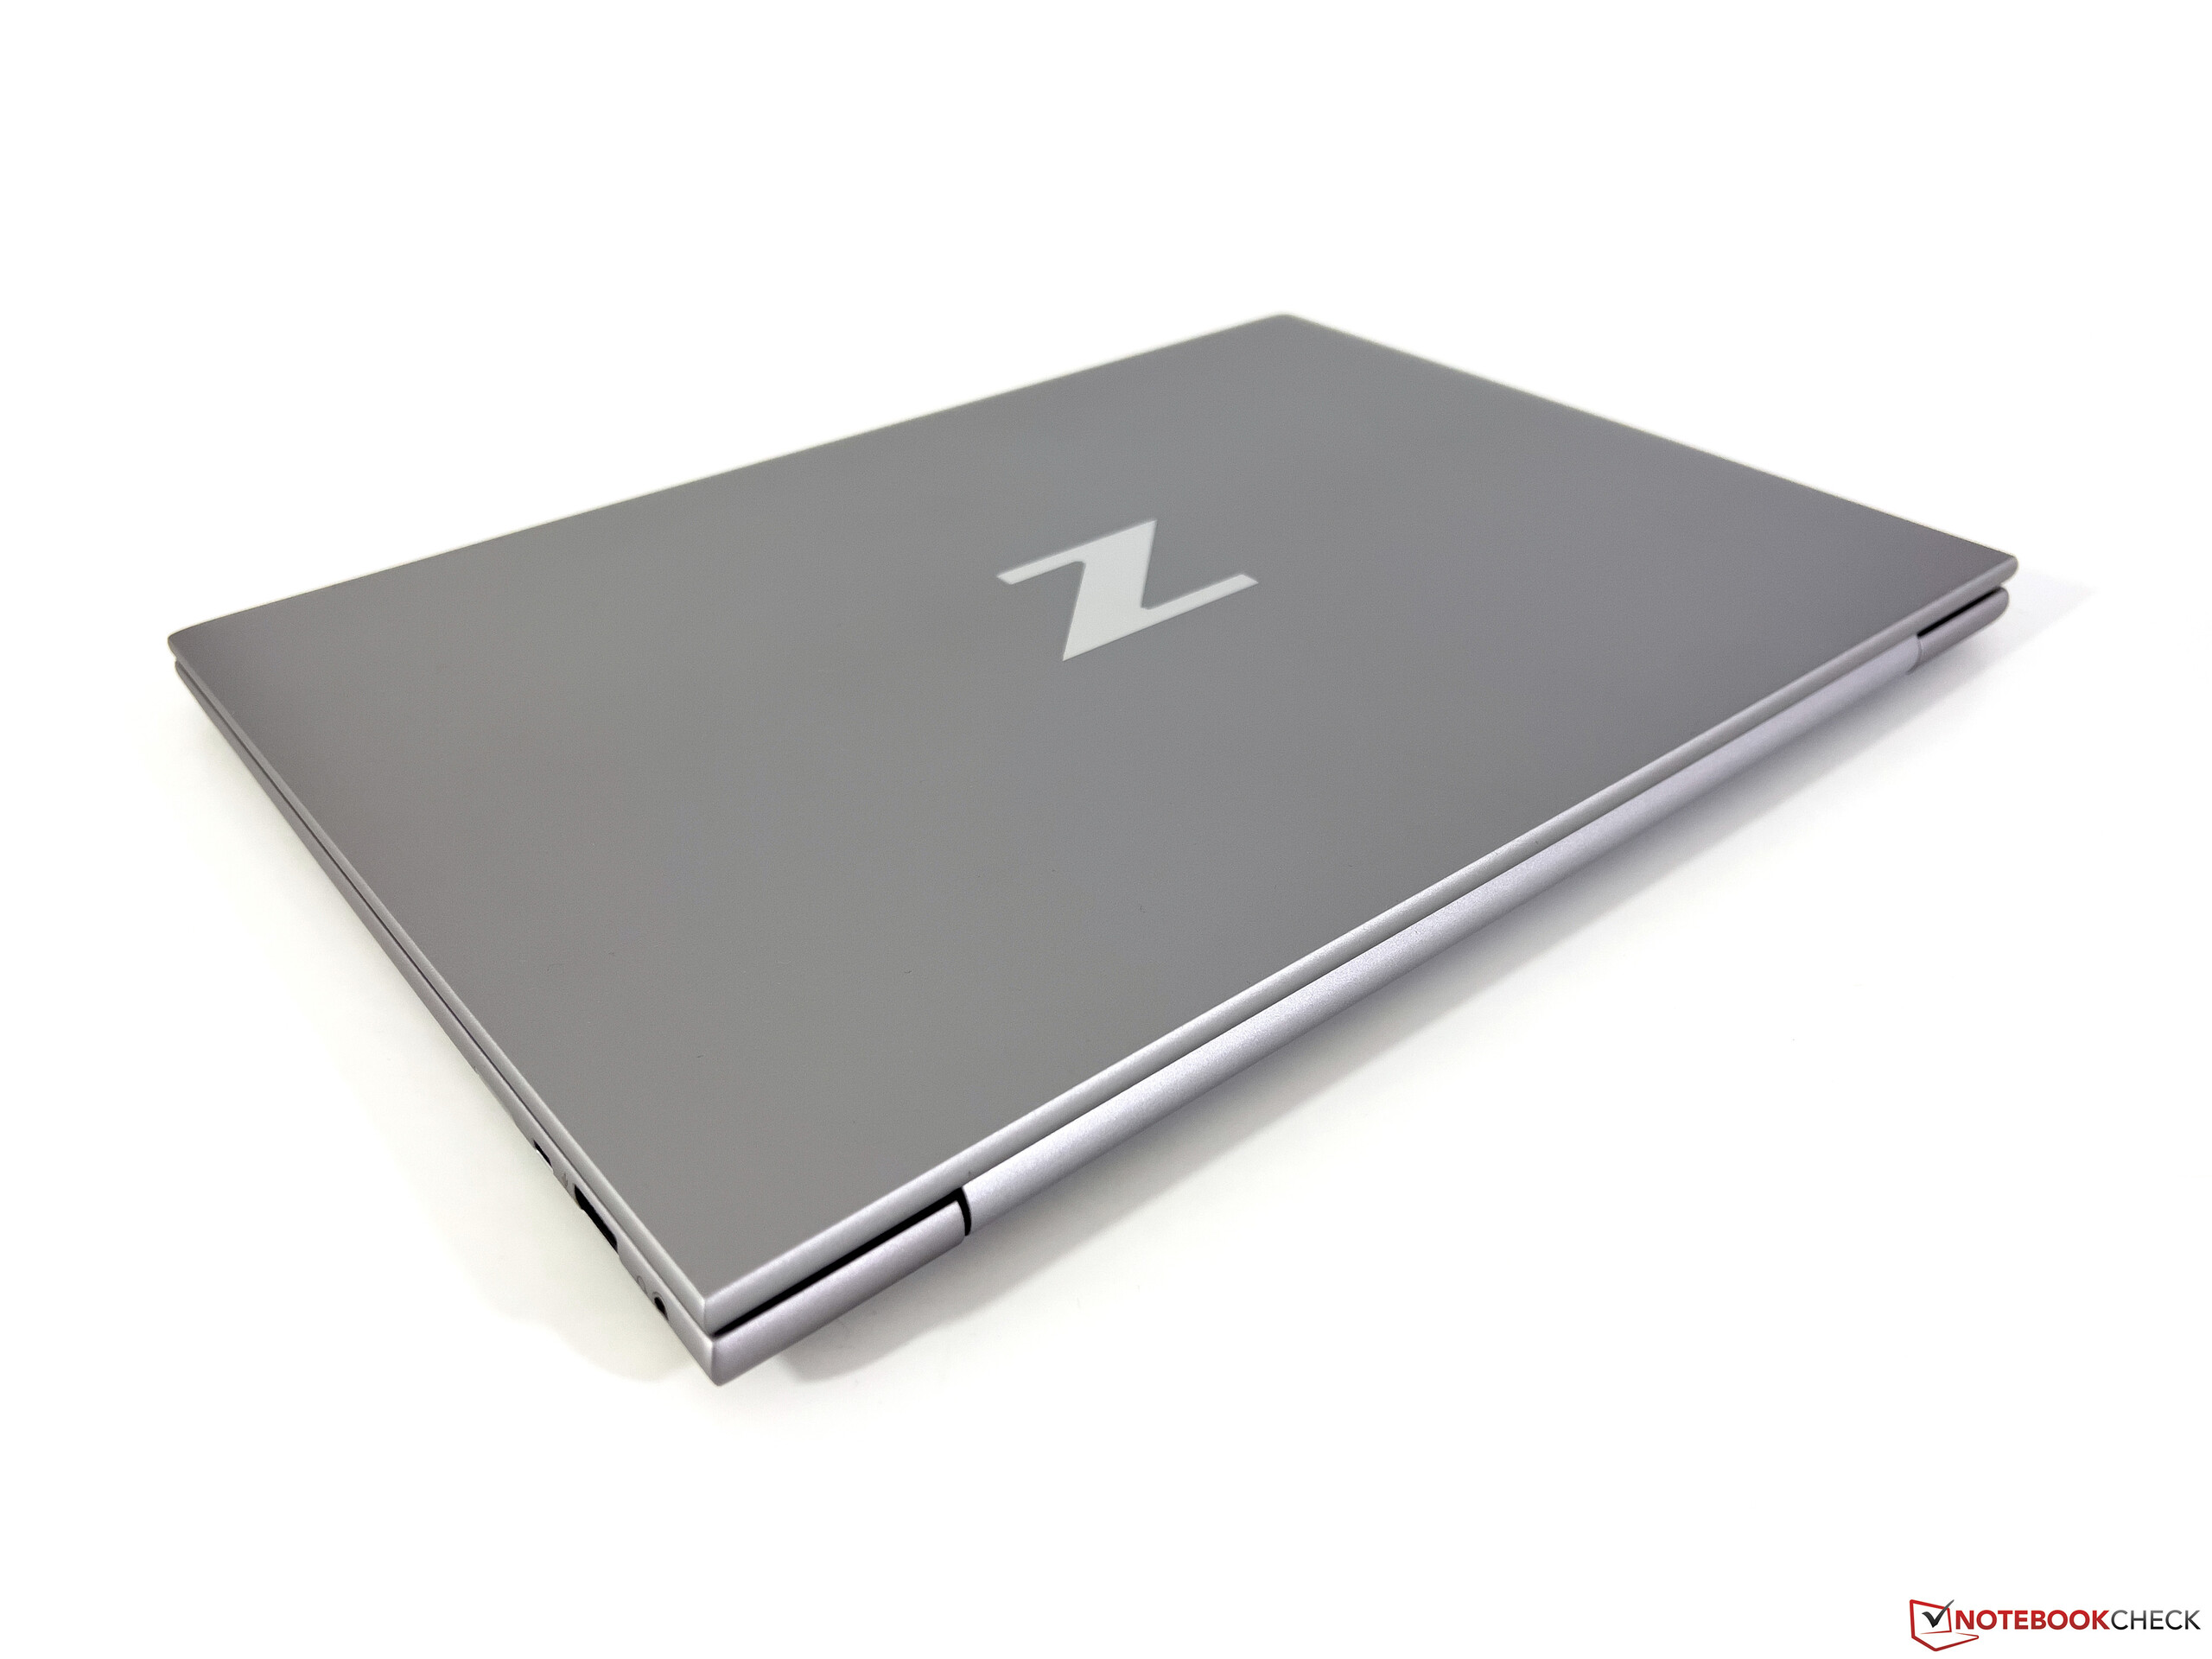
HP ZBook Firefly G9 wykorzystuje tę samą obudowę, którą można zobaczyć w regularnych modelach biznesowych firmy, takich jak EliteBook 840 G9 czy 845 G9, ale srebrny kolor wydaje się w tej mobilnej stacji roboczej nieco ciemniejszy. Aluminiowa obudowa pozostawia wrażenie wysokiej jakości, jest też bardzo stabilna. Nie napotkaliśmy żadnych problemów w rodzaju poluzowania się ramki ekranu (zob recenzja EliteBooka 845 G9). Dzięki wyświetlaczowi 16:10 i wąskim krawędziom ekranu ten kompaktowy 14-calowiec wygląda dość nowocześnie, ale nie wyróżnia się szczególnie w środowisku profesjonalnym swoim dość powściągliwym wzornictwem. Maksymalny kąt otwarcia wynosi około 170 stopni, a zawiasy są dobrze wyregulowane. Bez problemu można otworzyć wieko jedną ręką, jednocześnie niemal całkowicie zapobiegając teeteringowi.
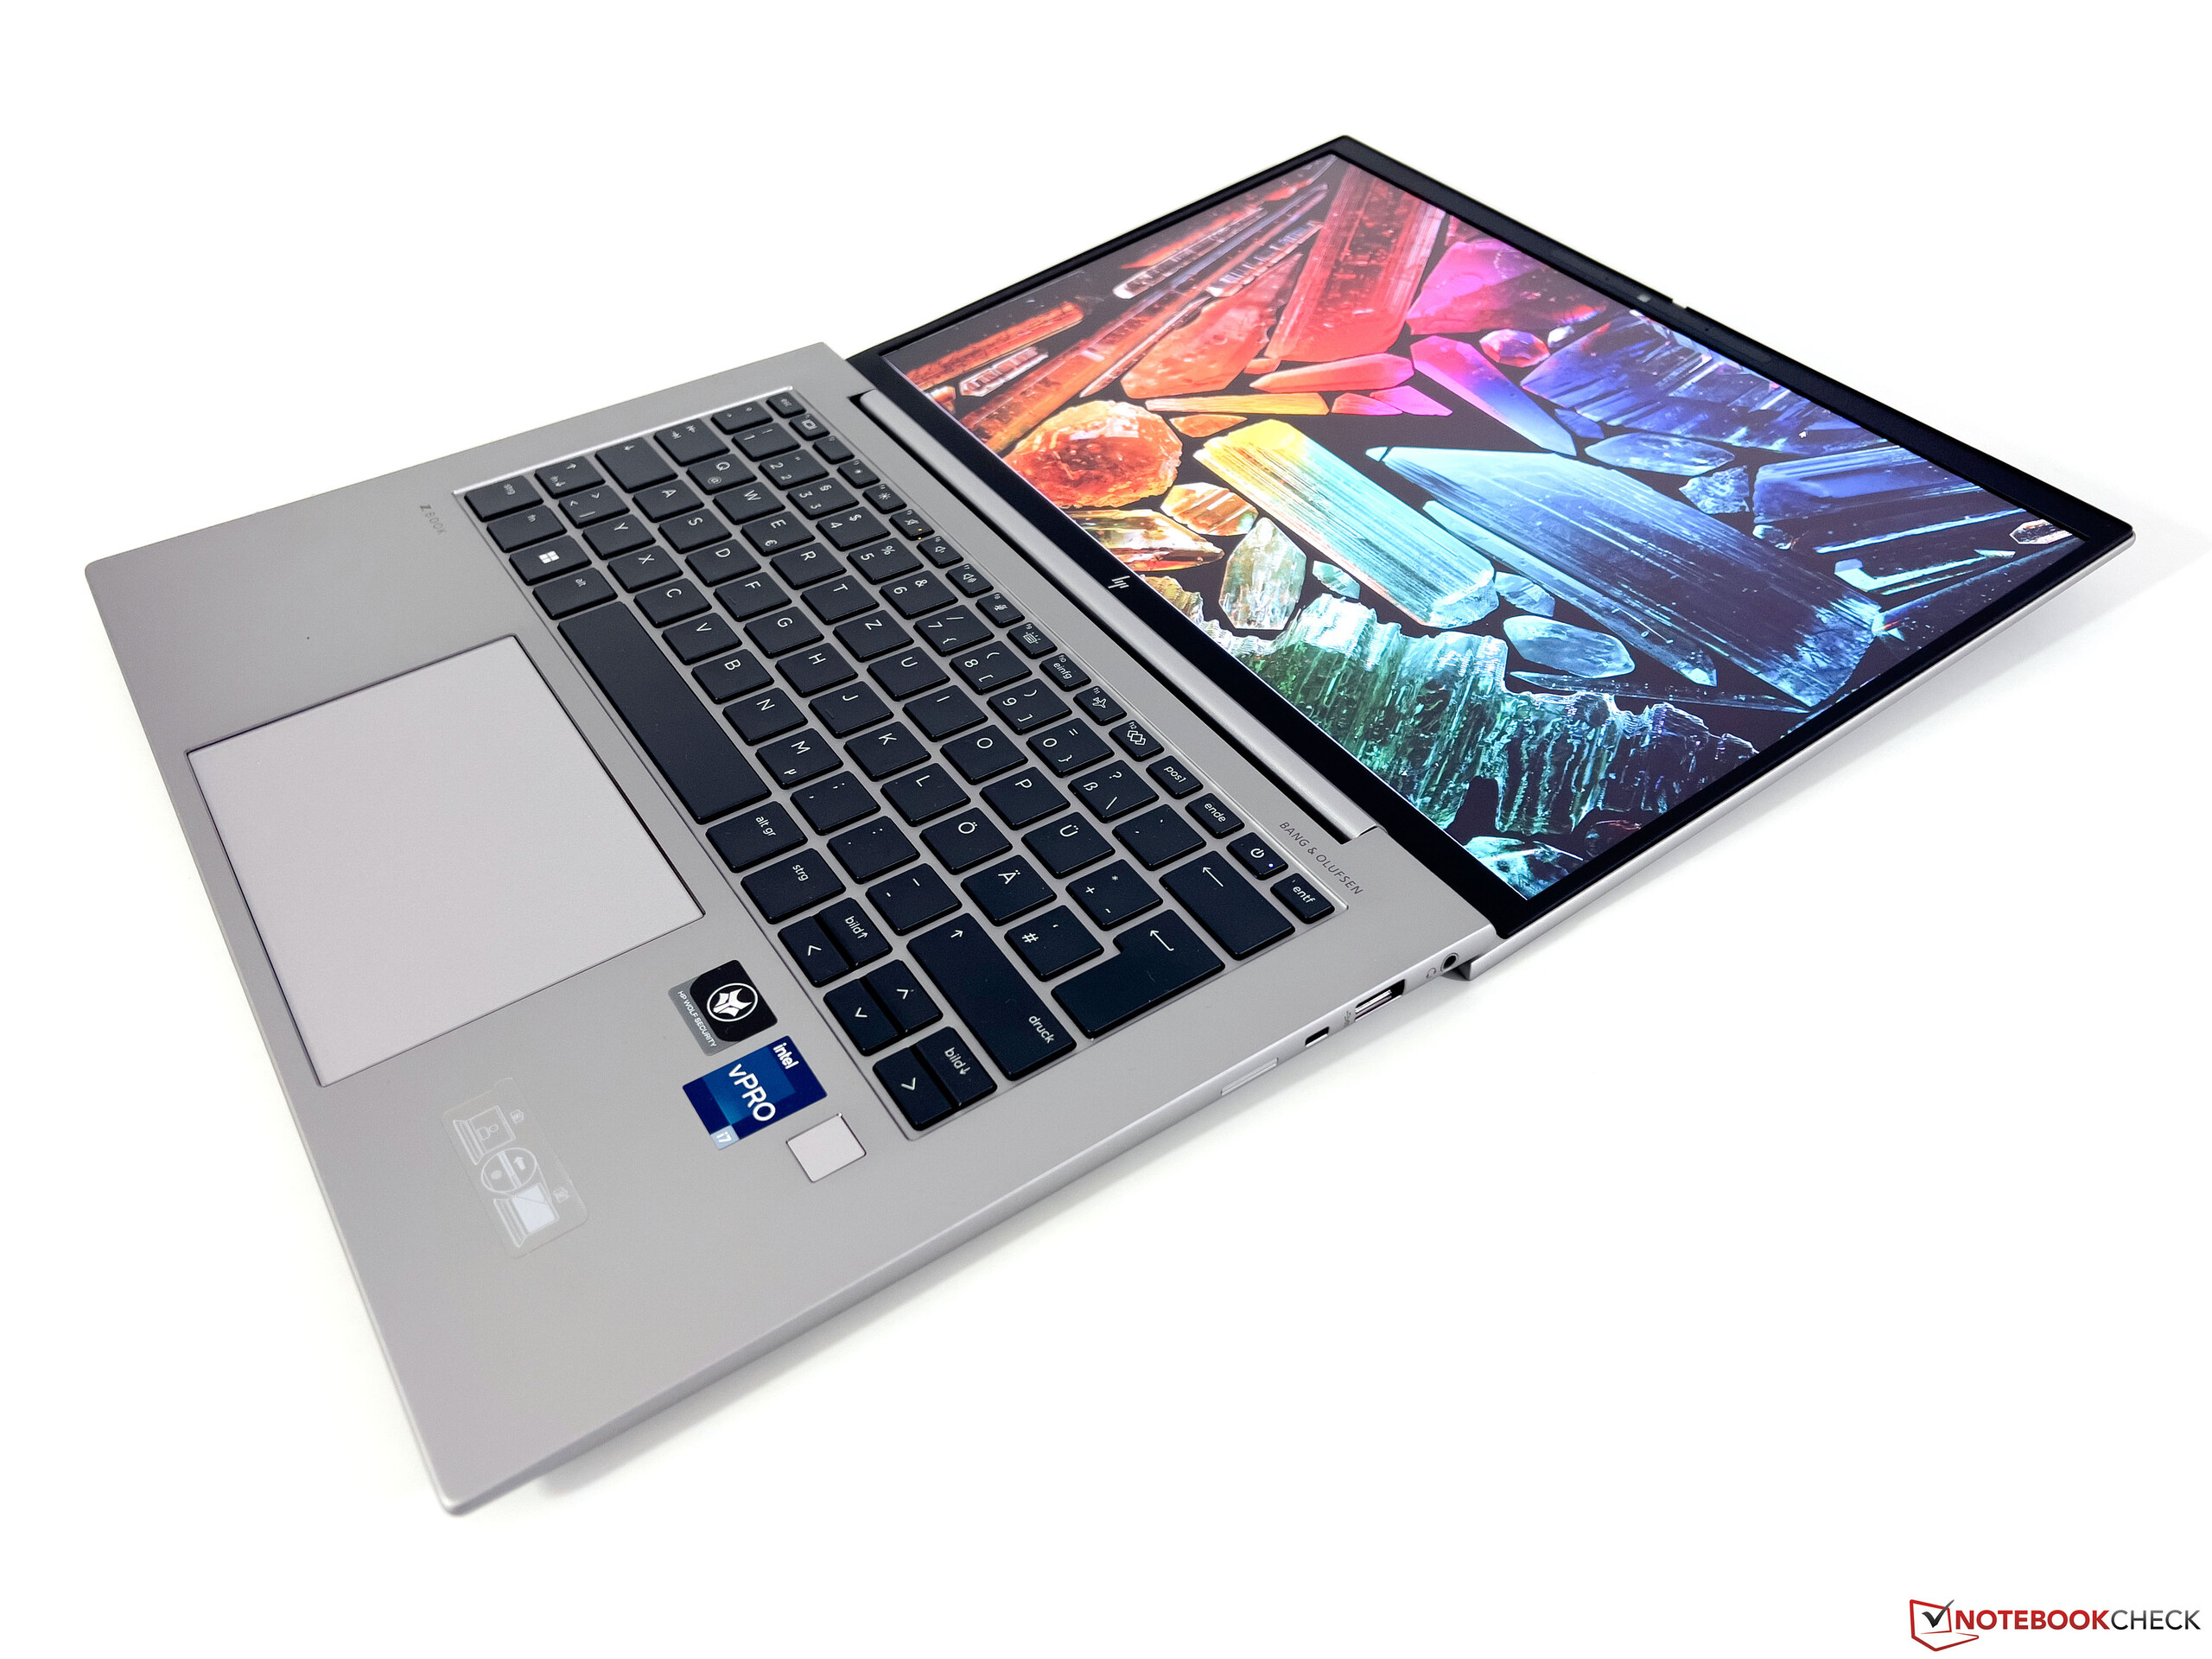
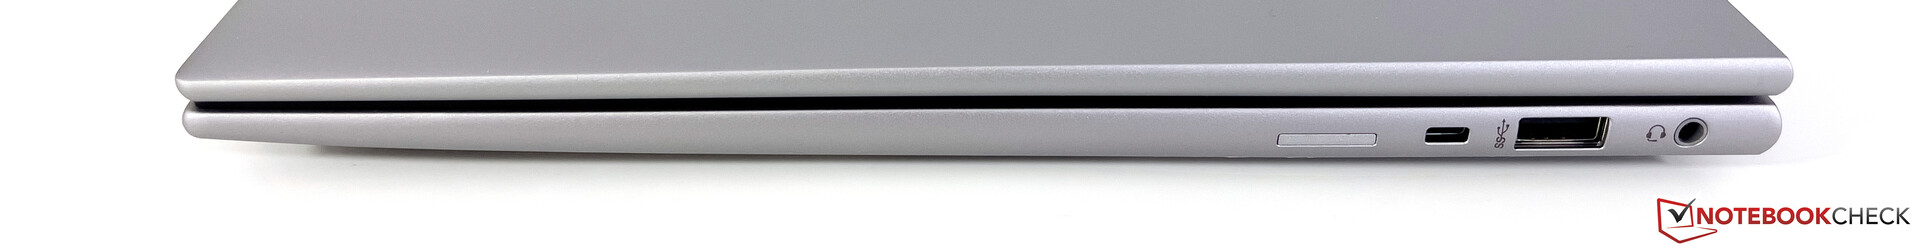
ZBook oferuje wszystkie ważne porty, w tym dwa porty USB-C z obsługą Thunderbolt 4, które umożliwiają także zasilanie lub podłączenie do stacji dokującej. Oprócz pełnoprawnego wyjścia HDMI jest też czytnik SmartCard i gniazdo na kartę nano-SIM w modelach WWAN (opcjonalnie z 5G). Modułu WWAN nie można jednak uaktualnić. HP stosuje nowoczesny moduł WLAN AX211 od Intela, który obsługuje standard Wi-Fi 6E. W teście bez problemu udało nam się połączyć z siecią 6 GHz naszego referencyjnego routera od Asusa, a prędkości transferu są bardzo dobre. W zestawie nie ma portu Ethernet i czytnika kart.
Oprócz kamerki na podczerwień HP zainstalowało 5 MP kamerkę internetową z mechaniczną przysłoną, która rejestruje tylko zdjęcia o maksymalnej rozdzielczości 2 560 x 1 440 pikseli (3,7 MP). Filmy można nagrywać w maksymalnej rozdzielczości 1440p przy 30 klatkach na sekundę. Kamera pozostawia dobre wrażenie i może wyróżniać się na tle zwykłych modułów 720p czy 1080p pod względem ostrości obrazu, a także wierności kolorów.

| Networking | |
| iperf3 transmit AX12 | |
| Microsoft Surface Laptop Studio i7 RTX 3050 Ti | |
| HP ZBook Firefly 14 G8 2C9Q2EA | |
| Przeciętny Intel Wi-Fi 6E AX211 (1003 - 1501, n=4) | |
| Lenovo ThinkPad P14s Gen2-20VX000GGE | |
| Apple MacBook Pro 14 2021 M1 Pro Entry | |
| iperf3 receive AX12 | |
| Przeciętny Intel Wi-Fi 6E AX211 (1178 - 1623, n=4) | |
| HP ZBook Firefly 14 G8 2C9Q2EA | |
| Microsoft Surface Laptop Studio i7 RTX 3050 Ti | |
| Lenovo ThinkPad P14s Gen2-20VX000GGE | |
| Apple MacBook Pro 14 2021 M1 Pro Entry | |
| iperf3 transmit AXE11000 6GHz | |
| HP ZBook Firefly 14 G9-6B8A2EA | |
| Przeciętny Intel Wi-Fi 6E AX211 (385 - 1851, n=226) | |
| Średnia w klasie Workstation (604 - 1642, n=20, ostatnie 2 lata) | |
| Dell Precision 5000 5470 | |
| iperf3 receive AXE11000 6GHz | |
| HP ZBook Firefly 14 G9-6B8A2EA | |
| Średnia w klasie Workstation (1196 - 1762, n=20, ostatnie 2 lata) | |
| Przeciętny Intel Wi-Fi 6E AX211 (700 - 1857, n=226) | |
| Dell Precision 5000 5470 | |


Konserwacja
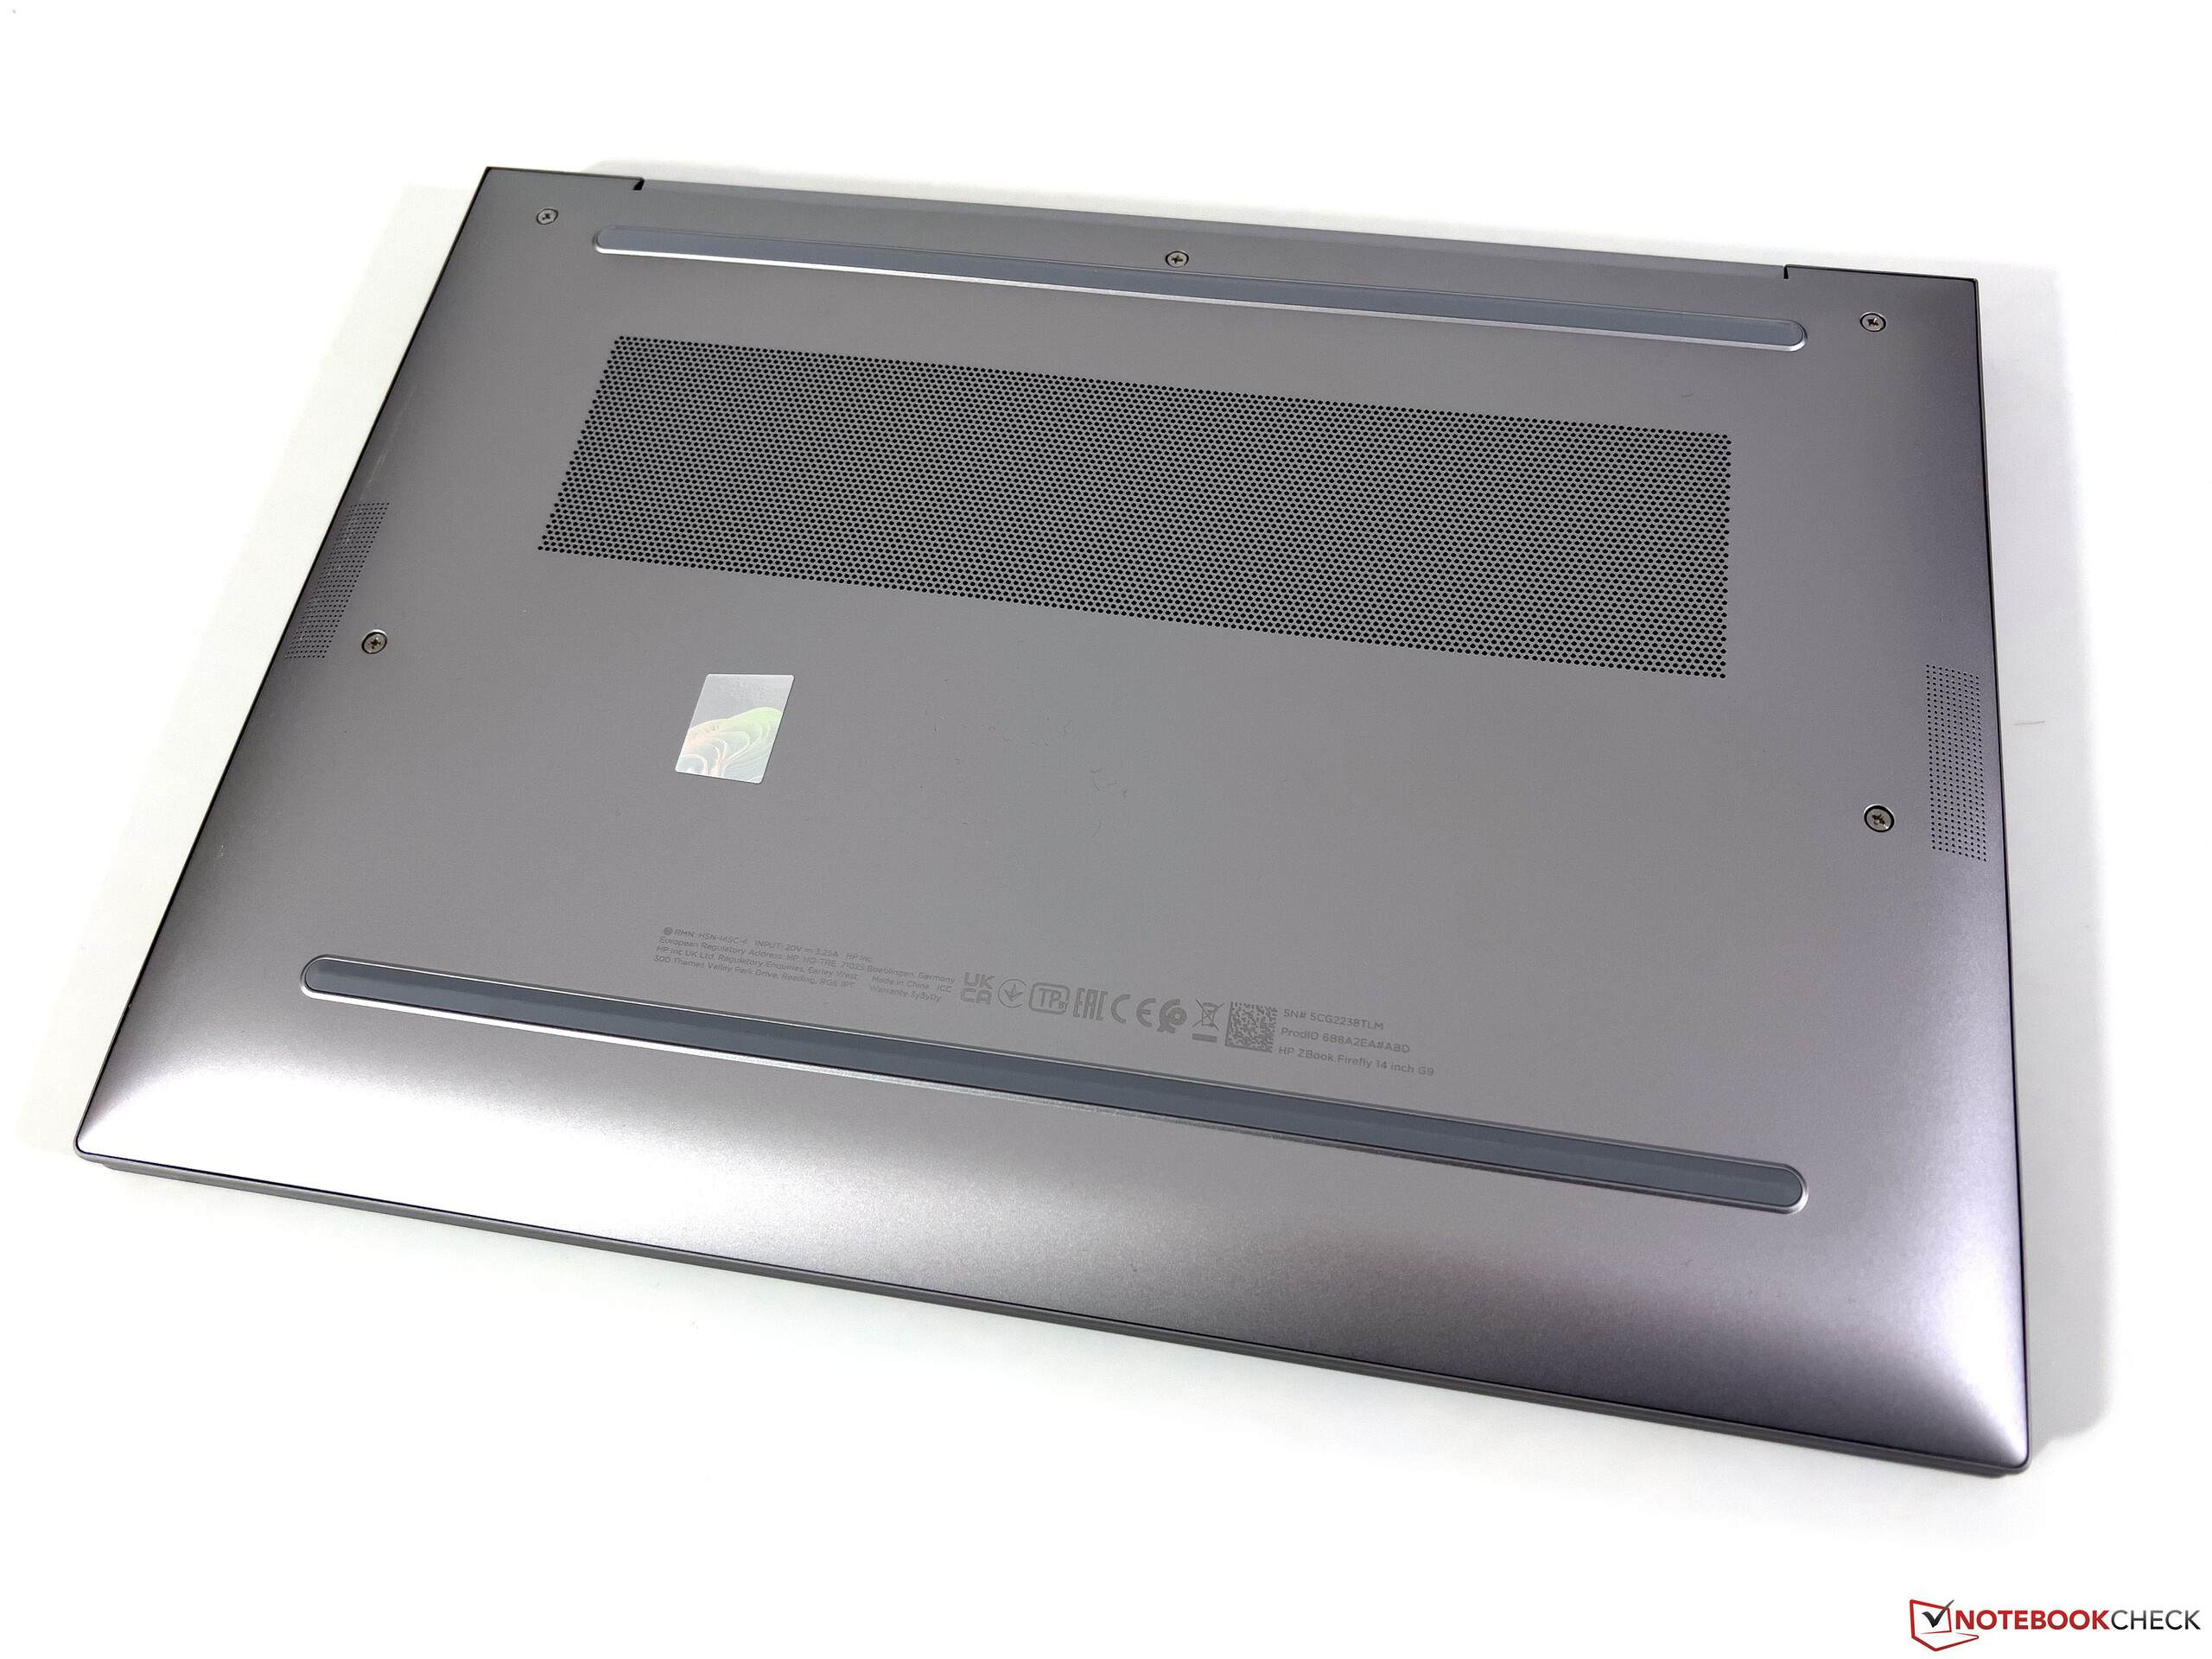
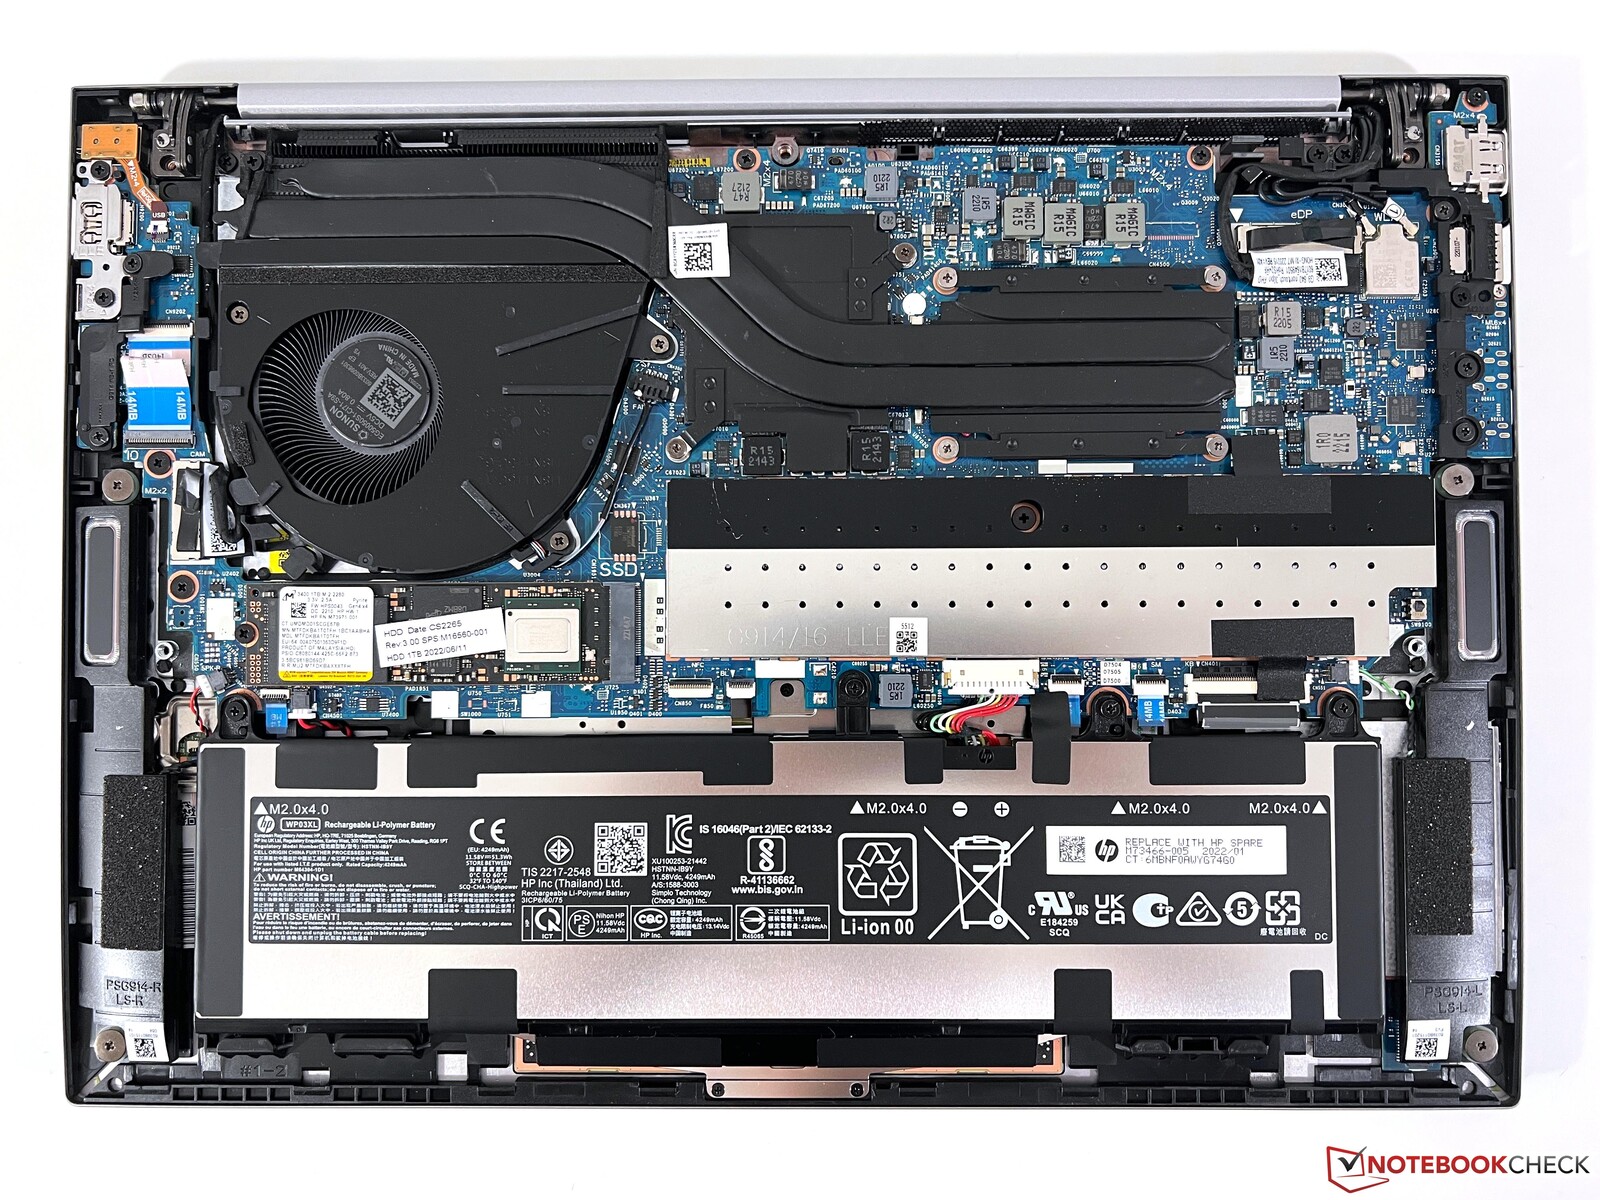
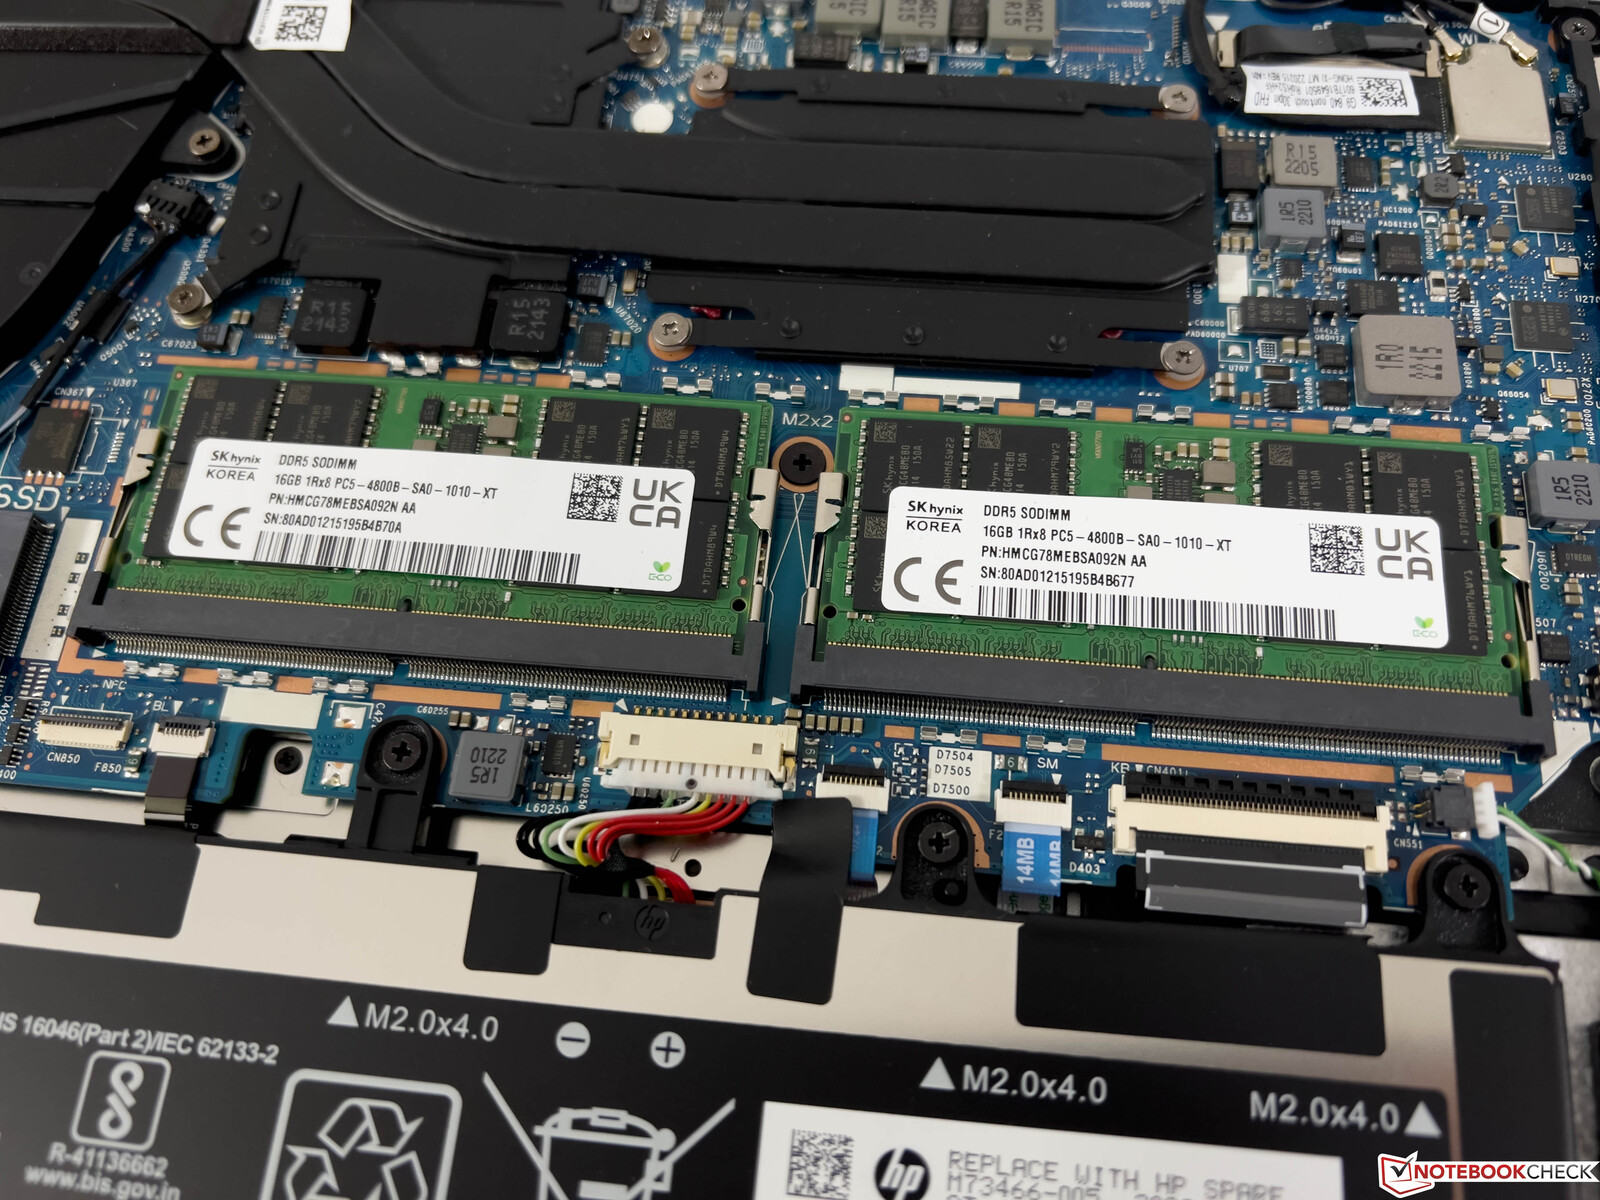
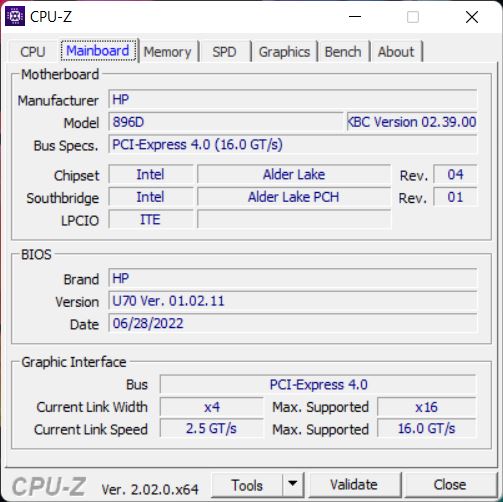
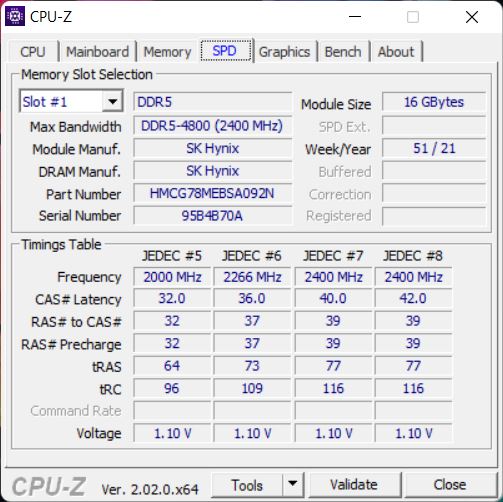
Dolna pokrywa obudowy jest zabezpieczona konwencjonalnymi śrubkami Philipsa (tylko się odkręcają, a nie odkręcają całkowicie) i można ją łatwo zdjąć. Wewnątrz uzyskujemy dostęp do wentylatora, podkręconej baterii, gniazda M.2-2280, a także dwóch slotów SO-DIMM, które znajdują się pod dodatkową pokrywą. Moduł WLAN jest natomiast przylutowany do płyty głównej.
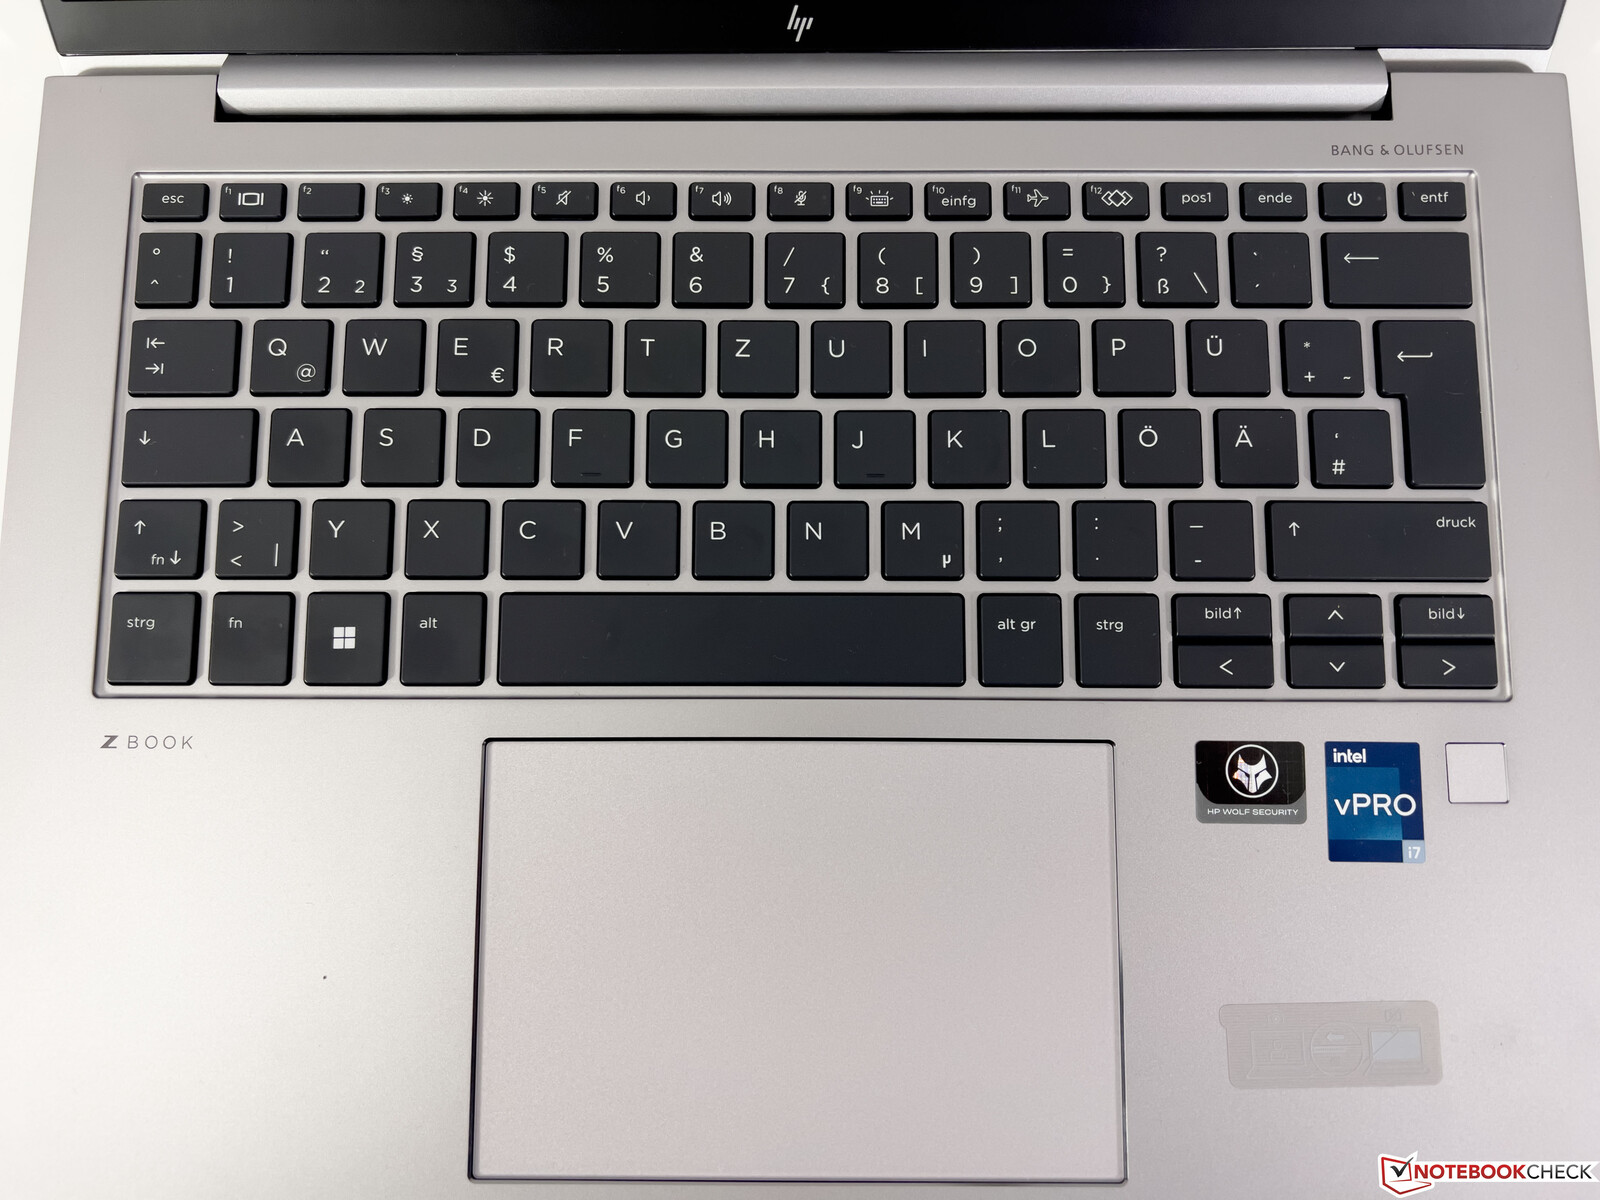
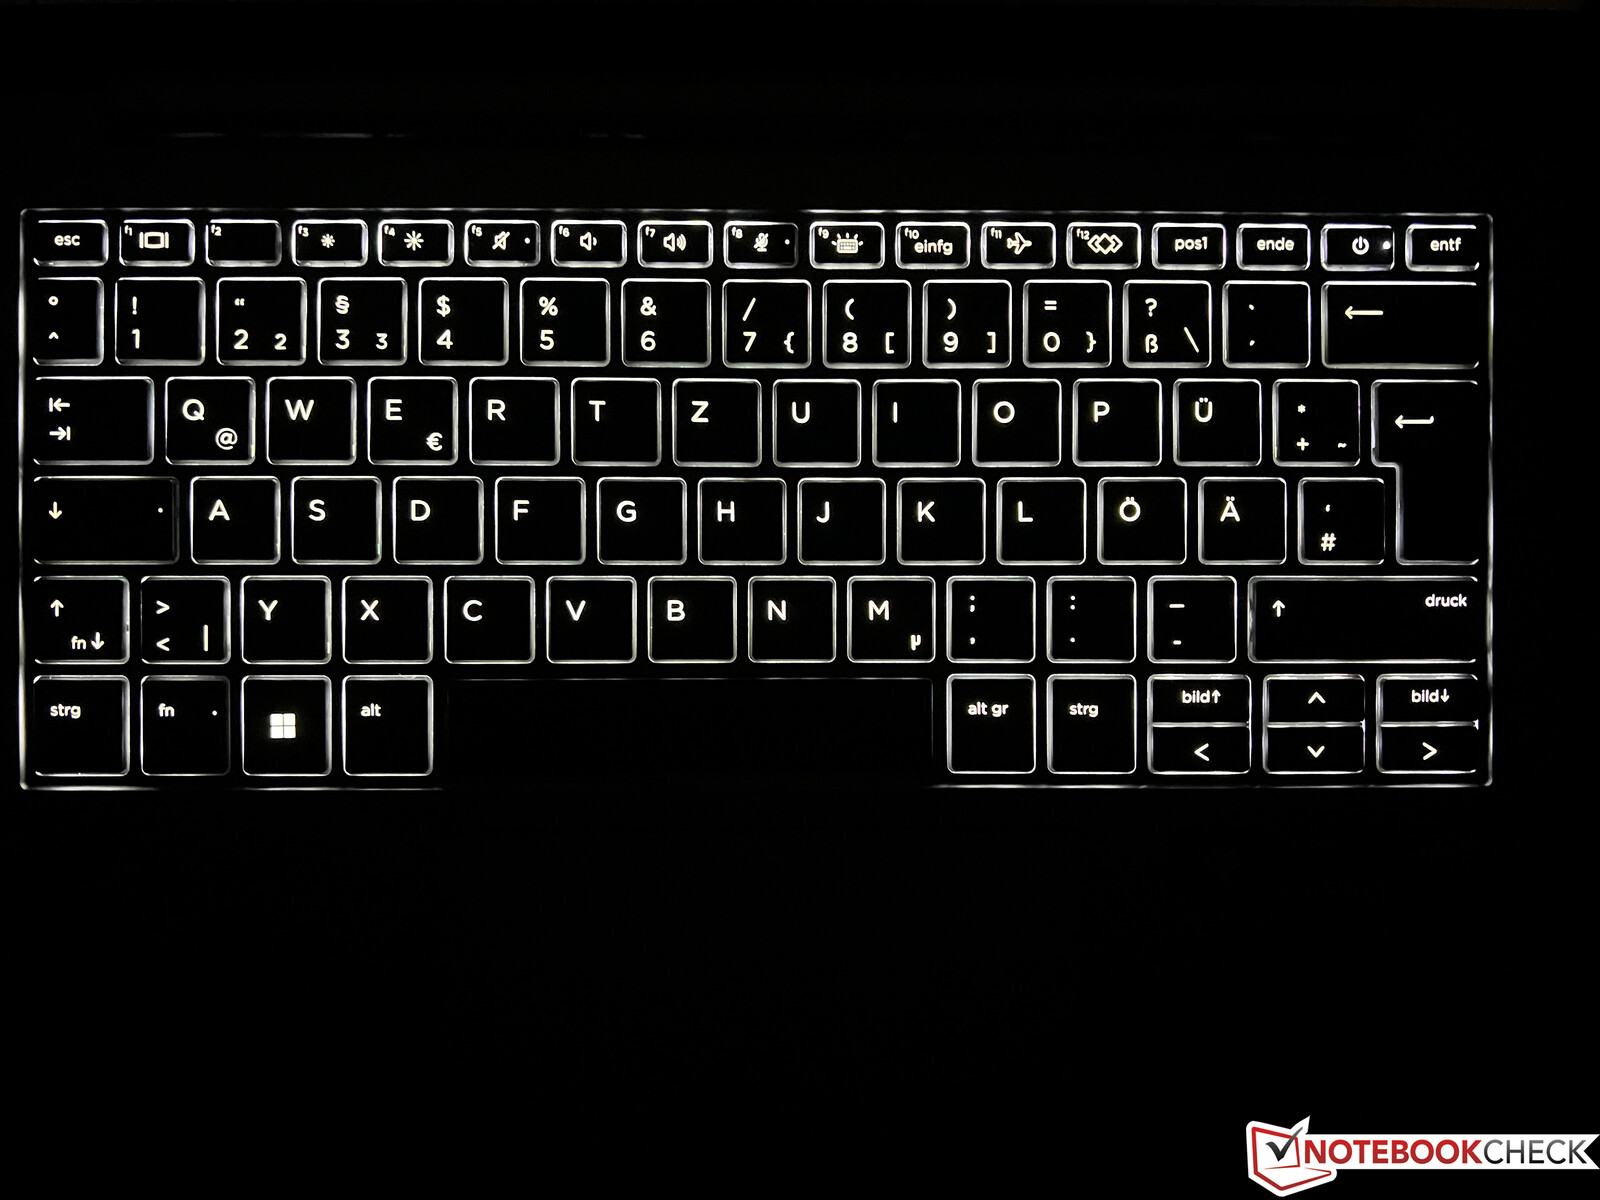
Urządzenia wejściowe: Zbook z bardzo dobrą klawiaturą
Podświetlana klawiatura oferuje pewny punkt nacisku i ogólnie bardzo wygodne pisanie, dzięki czemu ZBook nadaje się do pisania bardzo długich tekstów. Przycisk zasilania jest zintegrowany z prawym górnym rogiem klawiatury i istnieje ryzyko przypadkowego uderzenia w ten klawisz. Ponadto klawisze strzałek są bardzo małe. Skaner linii papilarnych znajduje się pod klawiaturą po prawej stronie.
Duży clickpad (12 x 8 cm) oferuje dobre właściwości ślizgowe i bardzo dobrze sprawdza się w codziennym użytkowaniu. Dolną część podkładki można nacisnąć, co jest potwierdzane przyjemnie bogatym i cichym odgłosem kliknięcia - tak jak powinno być.
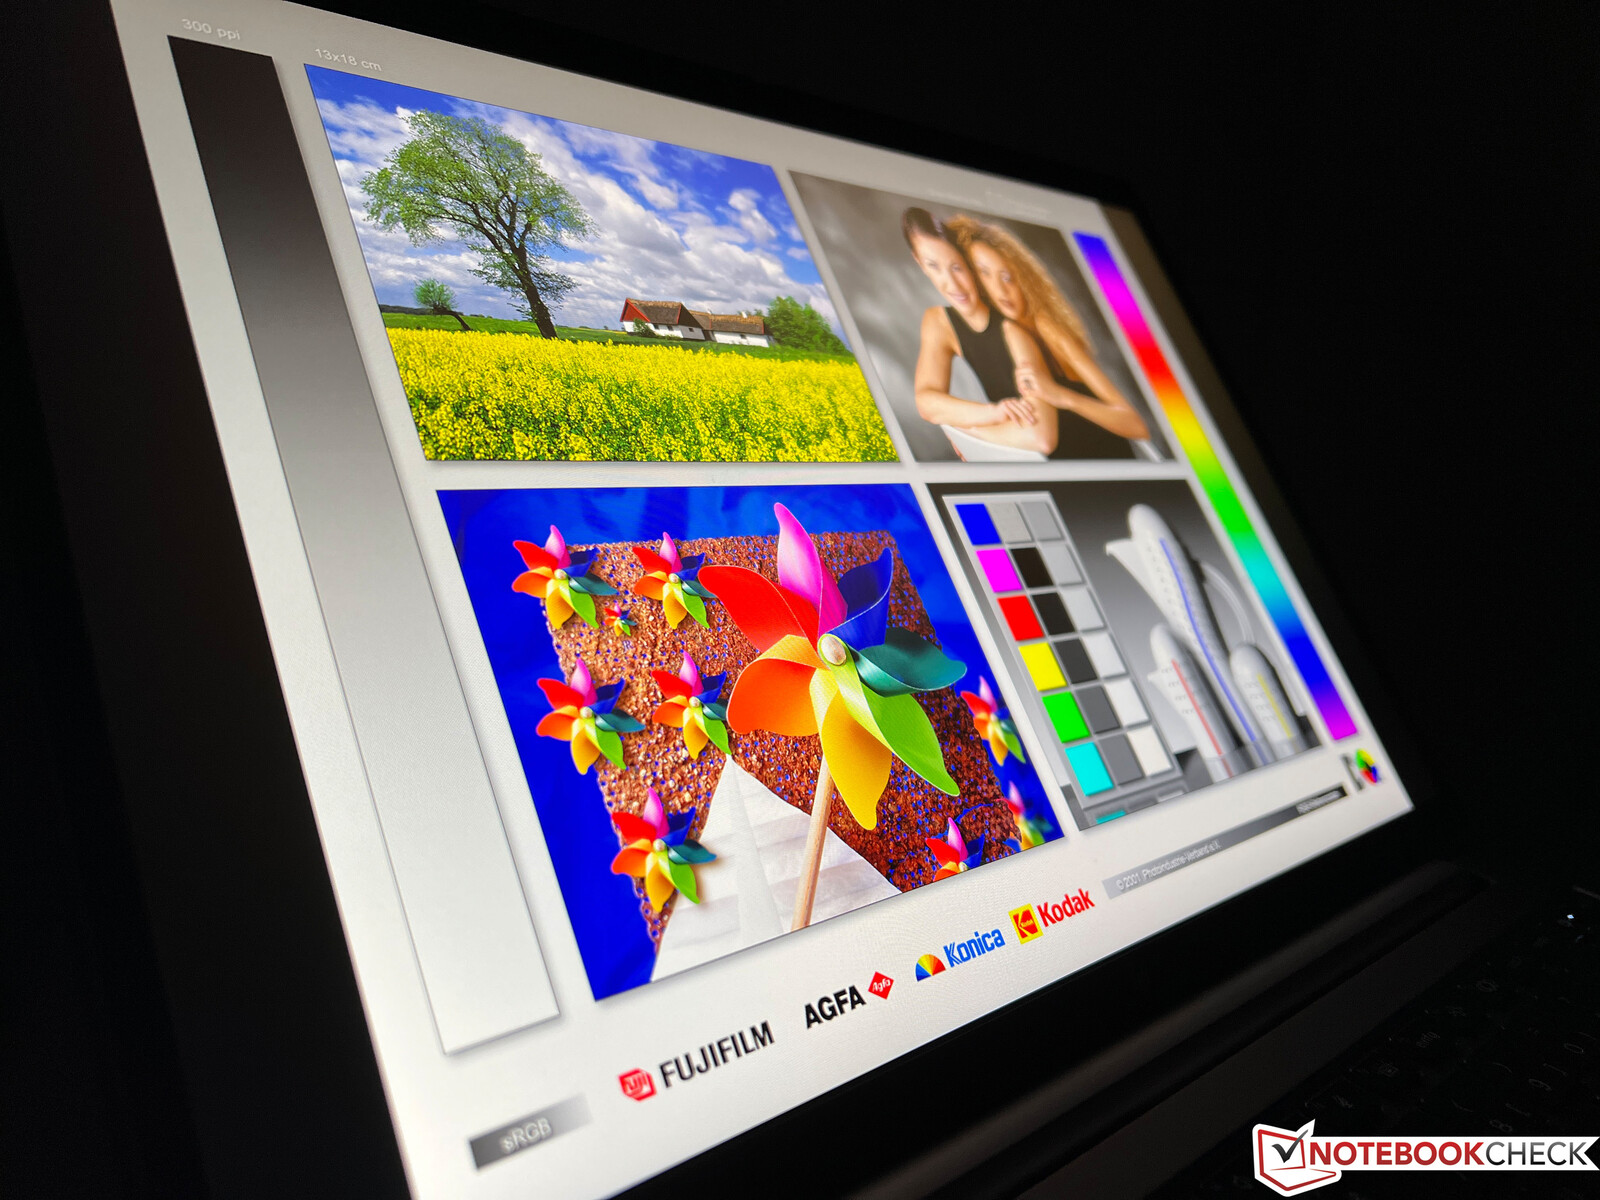
Wyświetlacz: ZBook z matowym panelem IPS
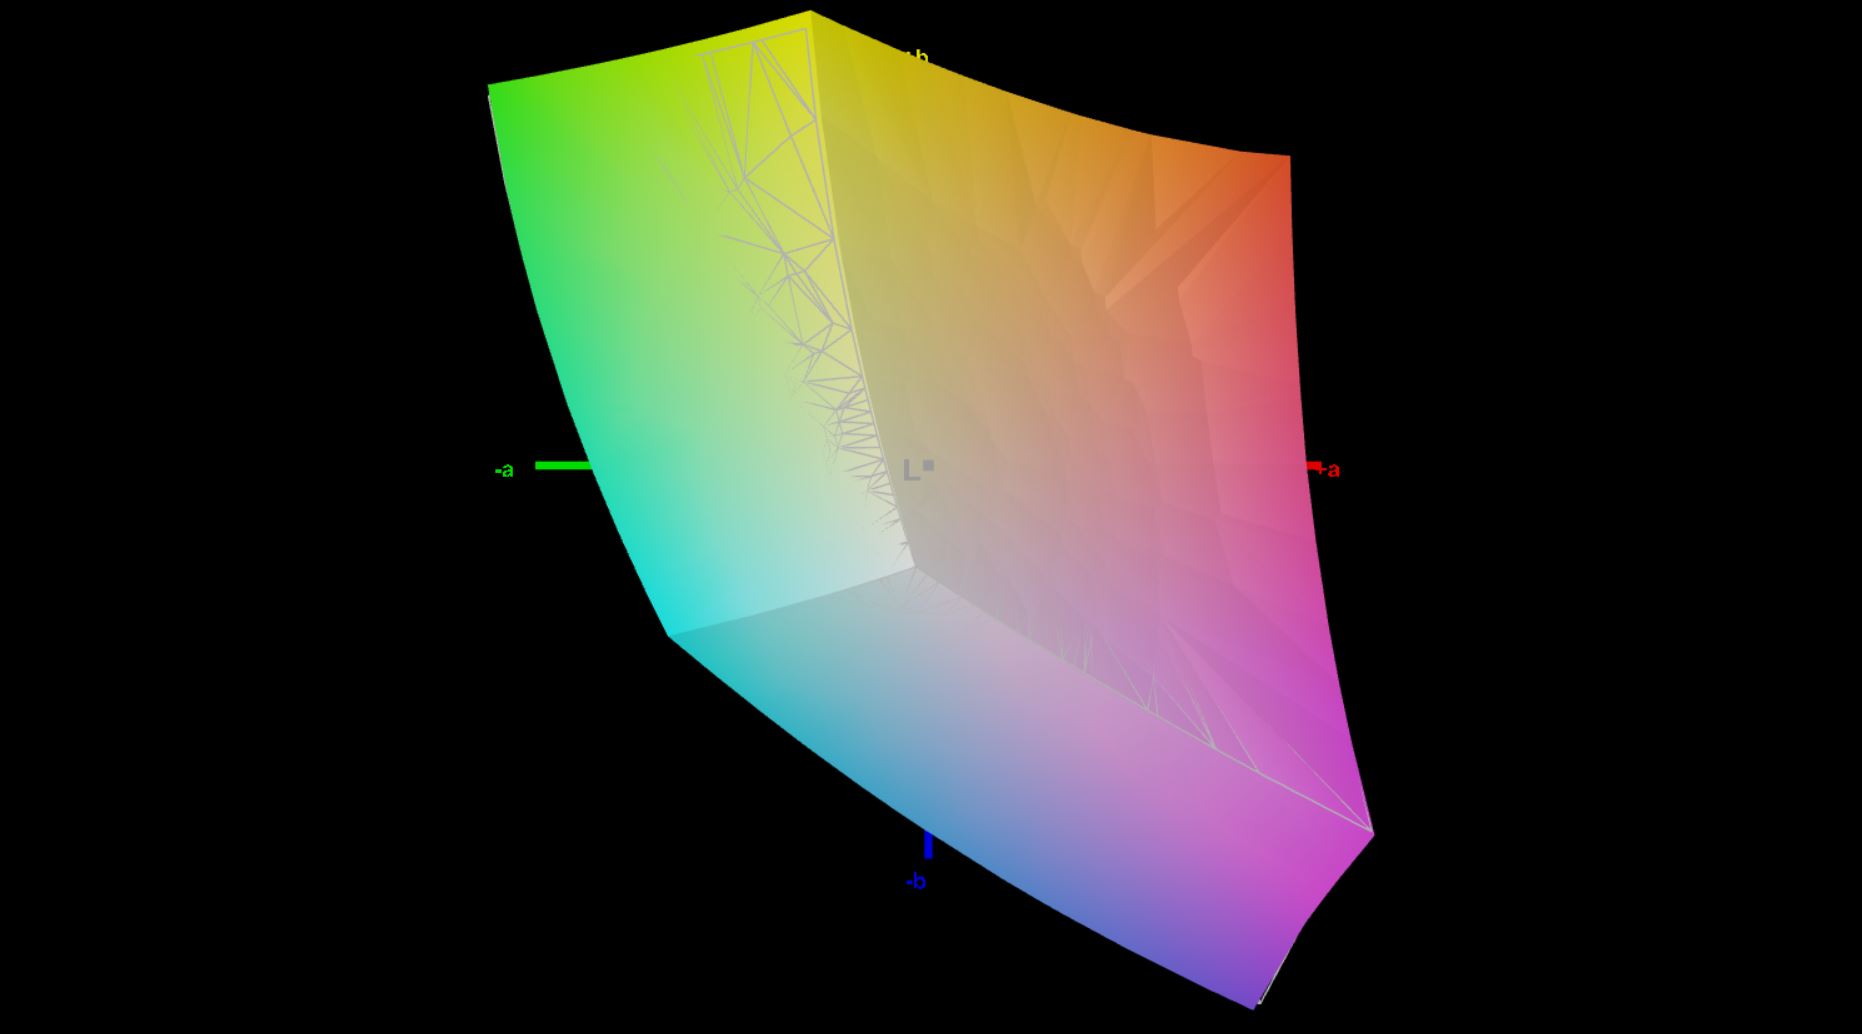
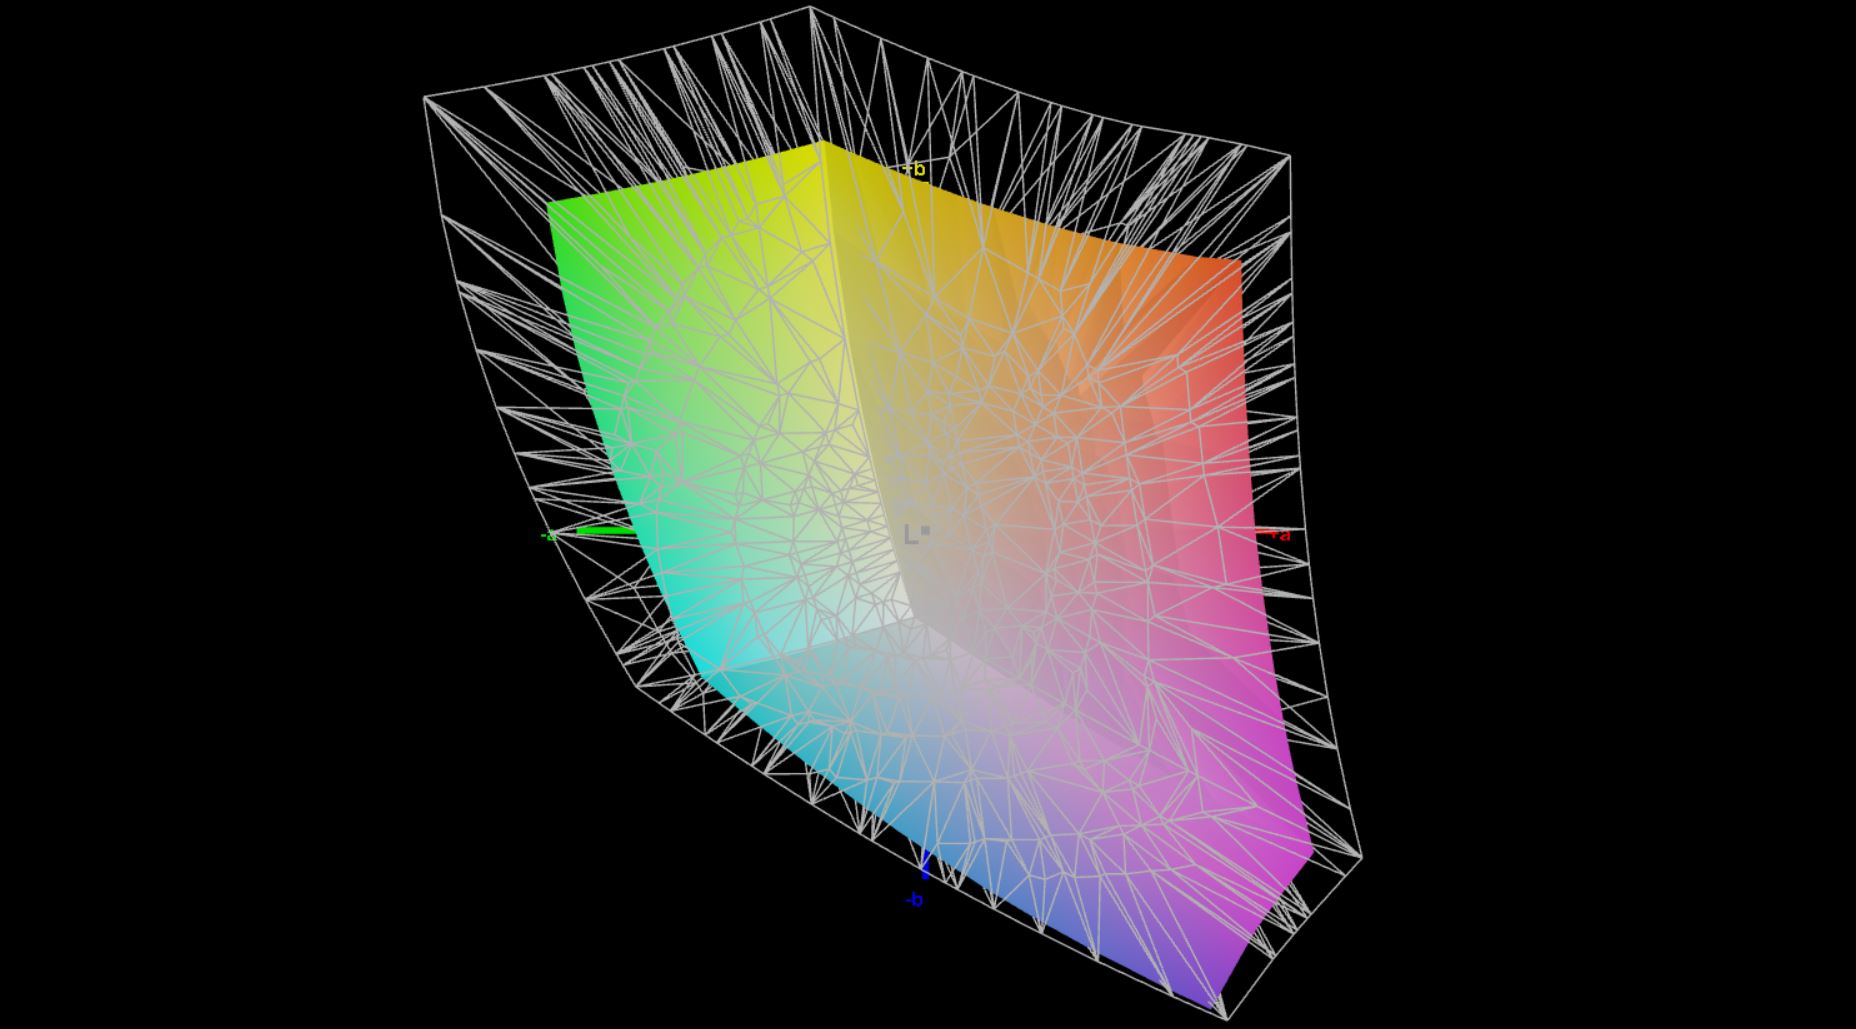
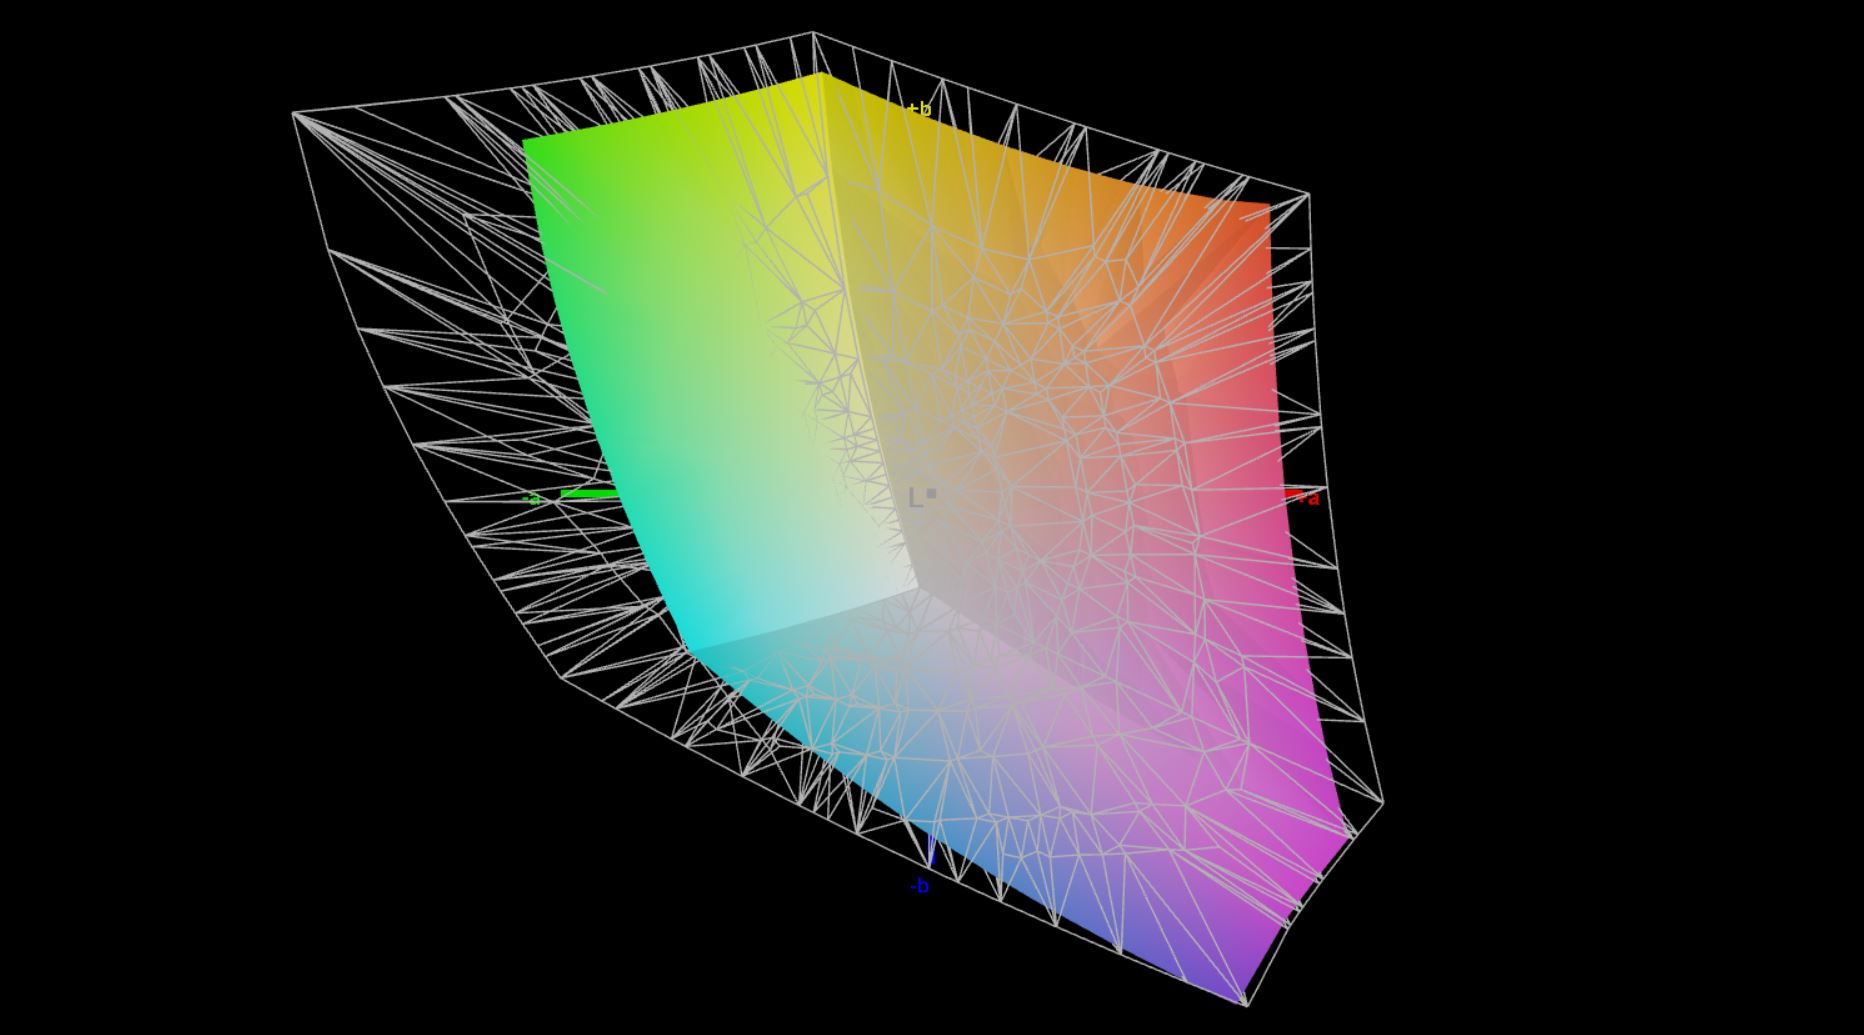
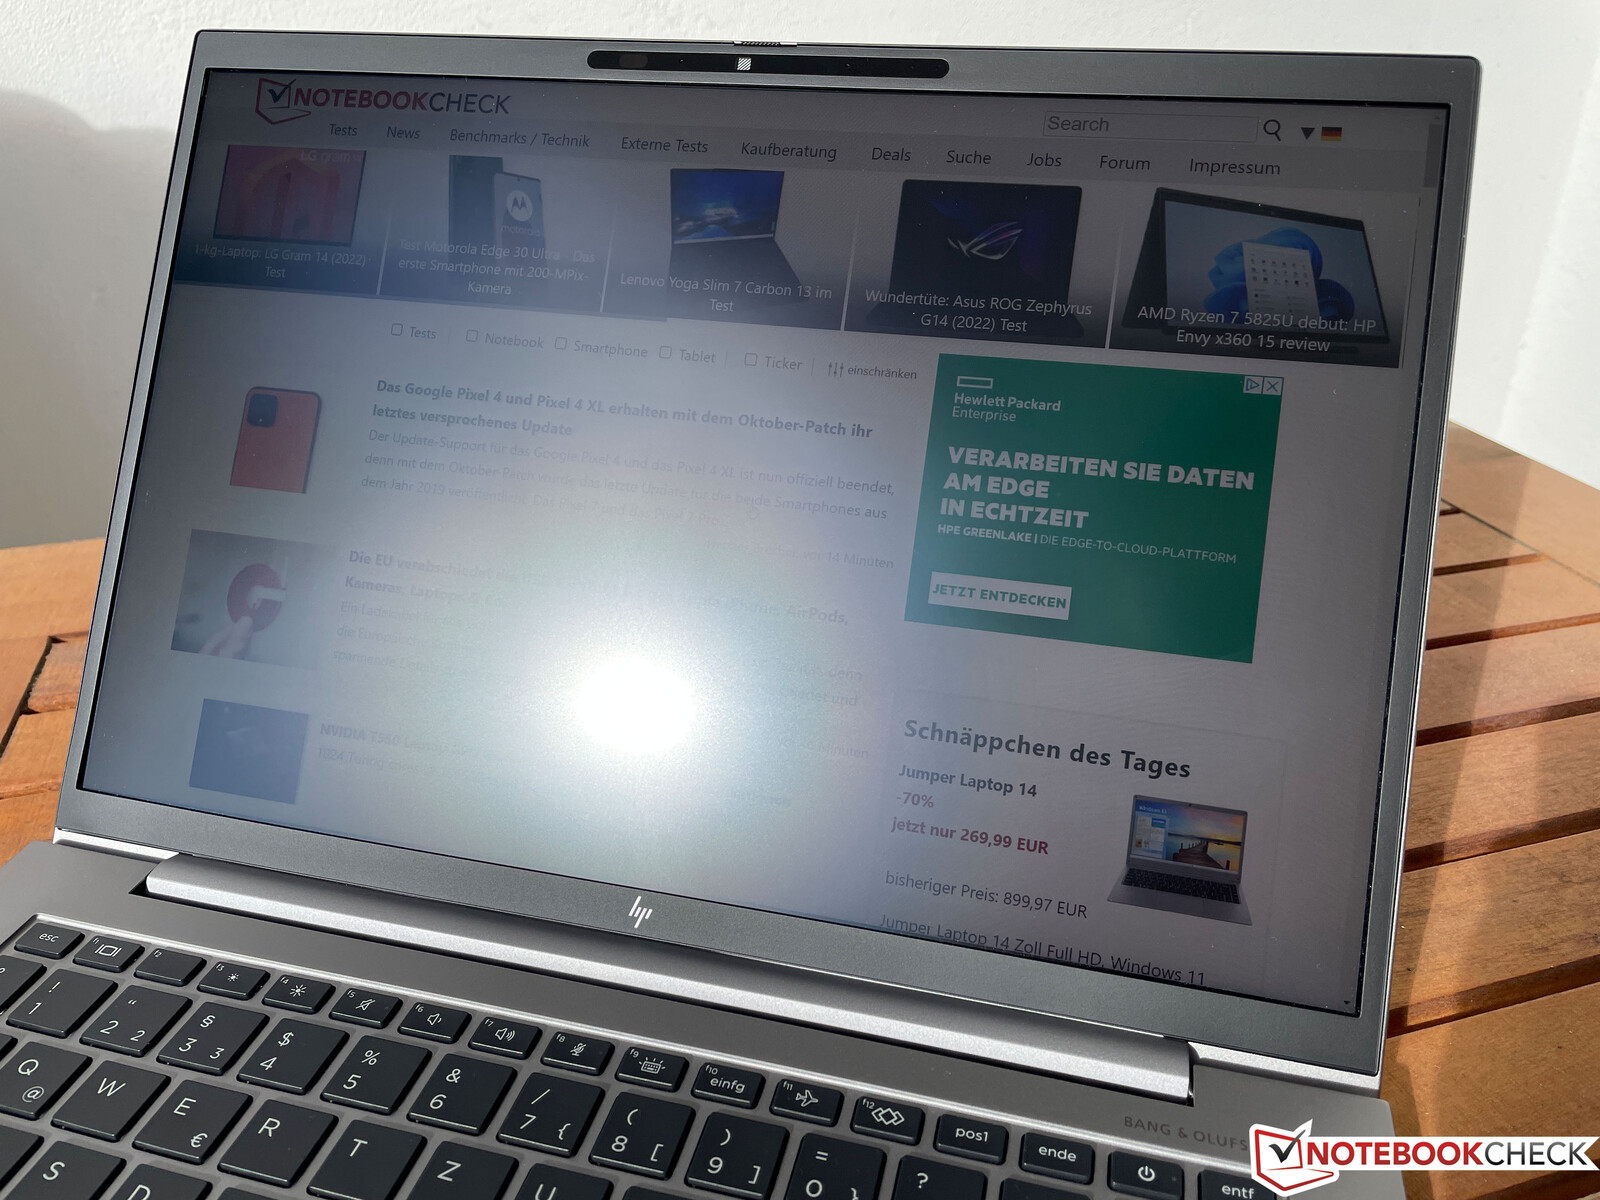
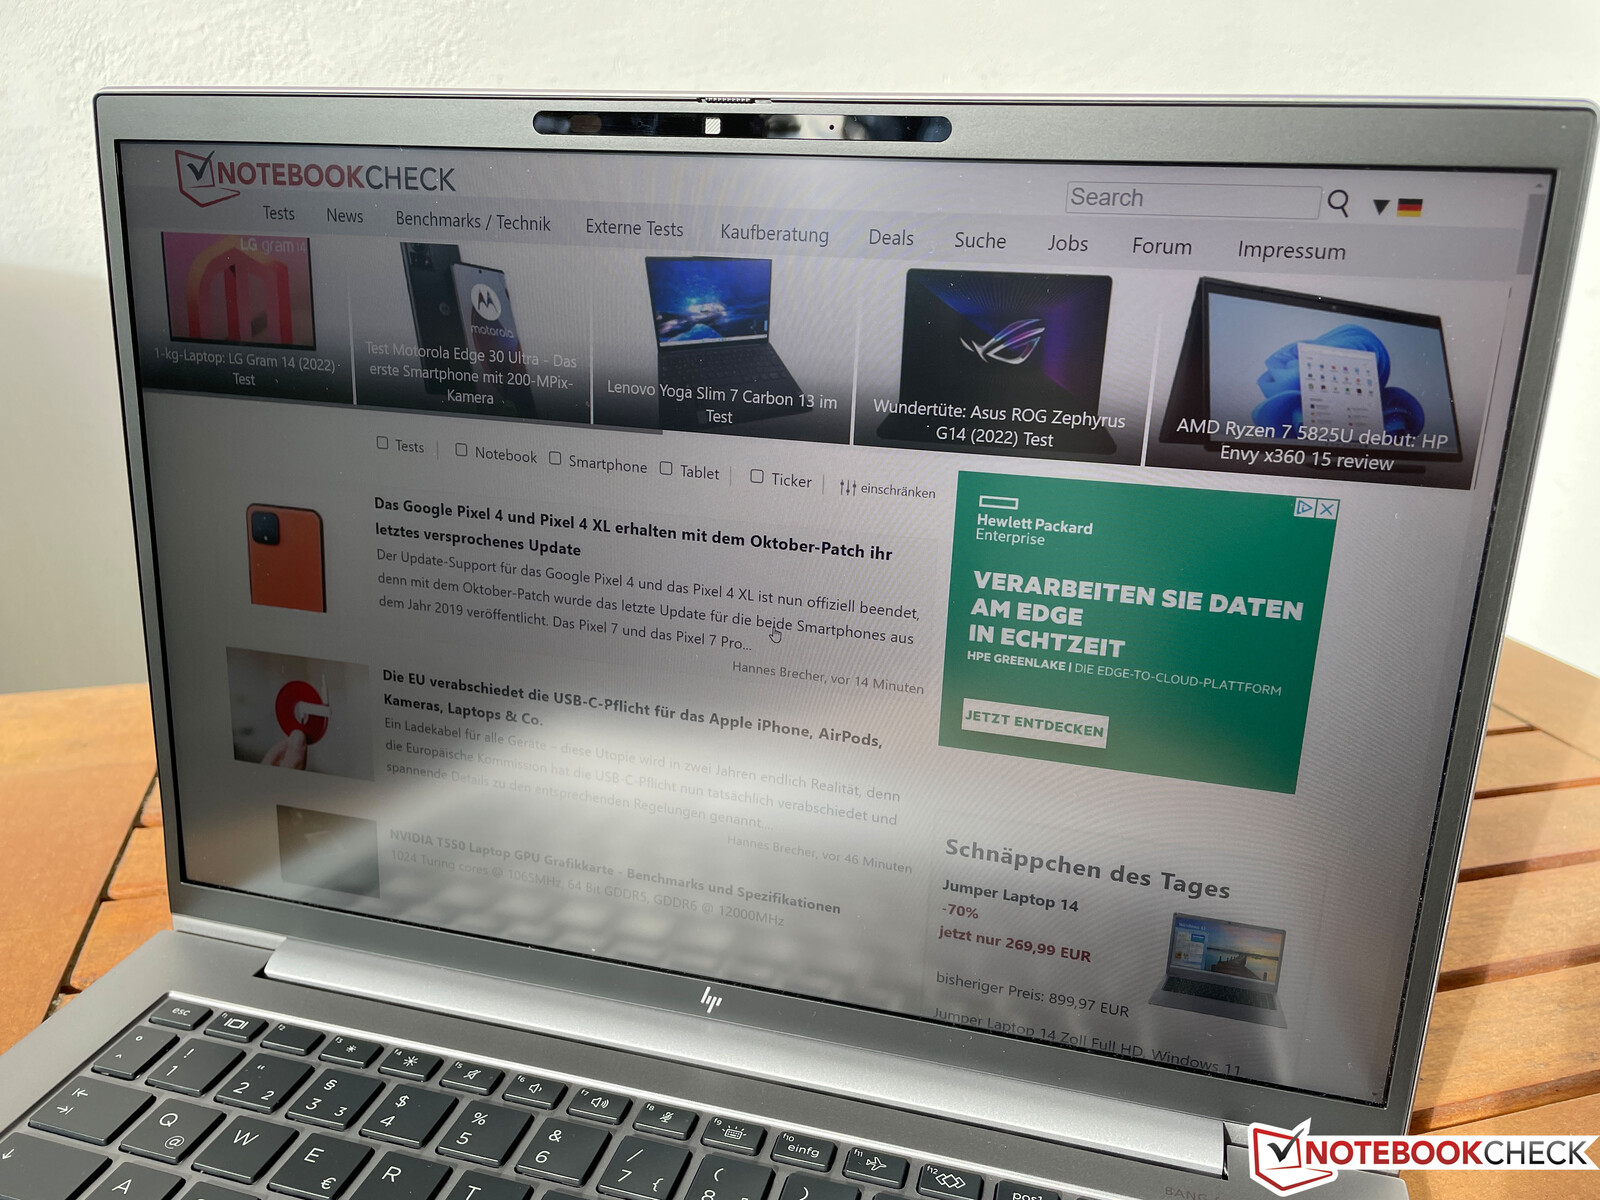
HP oferuje w sumie cztery różne panele 16:10 do wyboru w ZBooku Firefly 14 G9; wszystkie są oparte na technologii IPS i mają matową powierzchnię. W miarę możliwości należy jednak unikać standardowego modelu z jasnością 250 cd/m² i ekranem dotykowym. Panel SureView z wbudowanym filtrem prywatności ma też pewne wady, o czym przekonaliśmy się w recenzji m.in EliteBook 845 G9. W naszym urządzeniu testowym zainstalowano panel o jasności 400 nitów i rozdzielczości 1920 x 1200 pikseli (100% sRGB), ale opcjonalnie dostępny jest panel DreamColor z pokryciem przestrzeni barw P3 i rozdzielczością 2660 x 1600 pikseli oraz częstotliwością odświeżania 120 Hz.
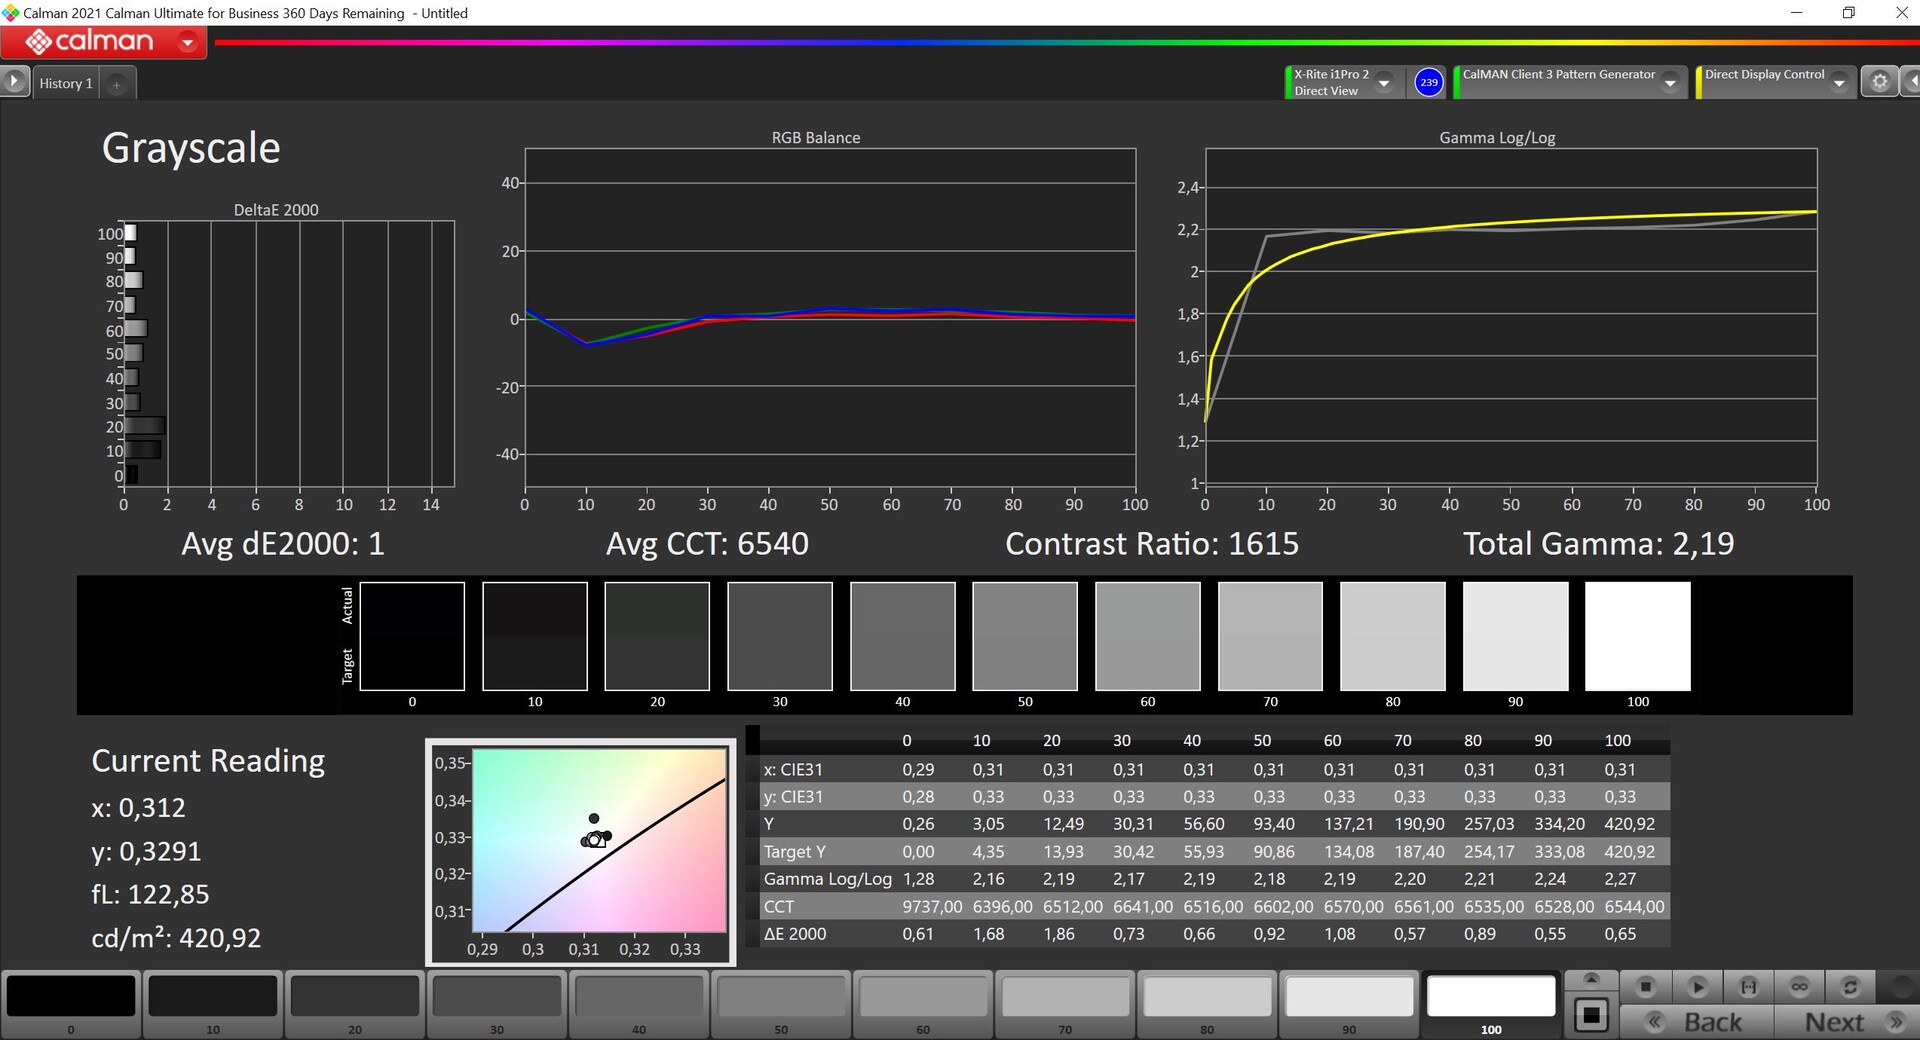
Subiektywnie panel oferuje doskonałą jakość obrazu, gdyż nawet jasne powierzchnie nie wyglądają na ziarniste pomimo matowej powłoki. Średnia jasność wynosi ponad 400 cd/m², a współczynnik kontrastu jest wysoki. Nie zauważyliśmy żadnego migotania PWM, a stabilność kątów widzenia jest bardzo dobra. Tylko przy maksymalnej jasności zauważamy lekkie halo na dolnych krawędziach na ciemnych tłach.
| |||||||||||||||||||||||||
rozświetlenie: 91 %
na akumulatorze: 431 cd/m²
kontrast: 1543:1 (czerń: 0.28 cd/m²)
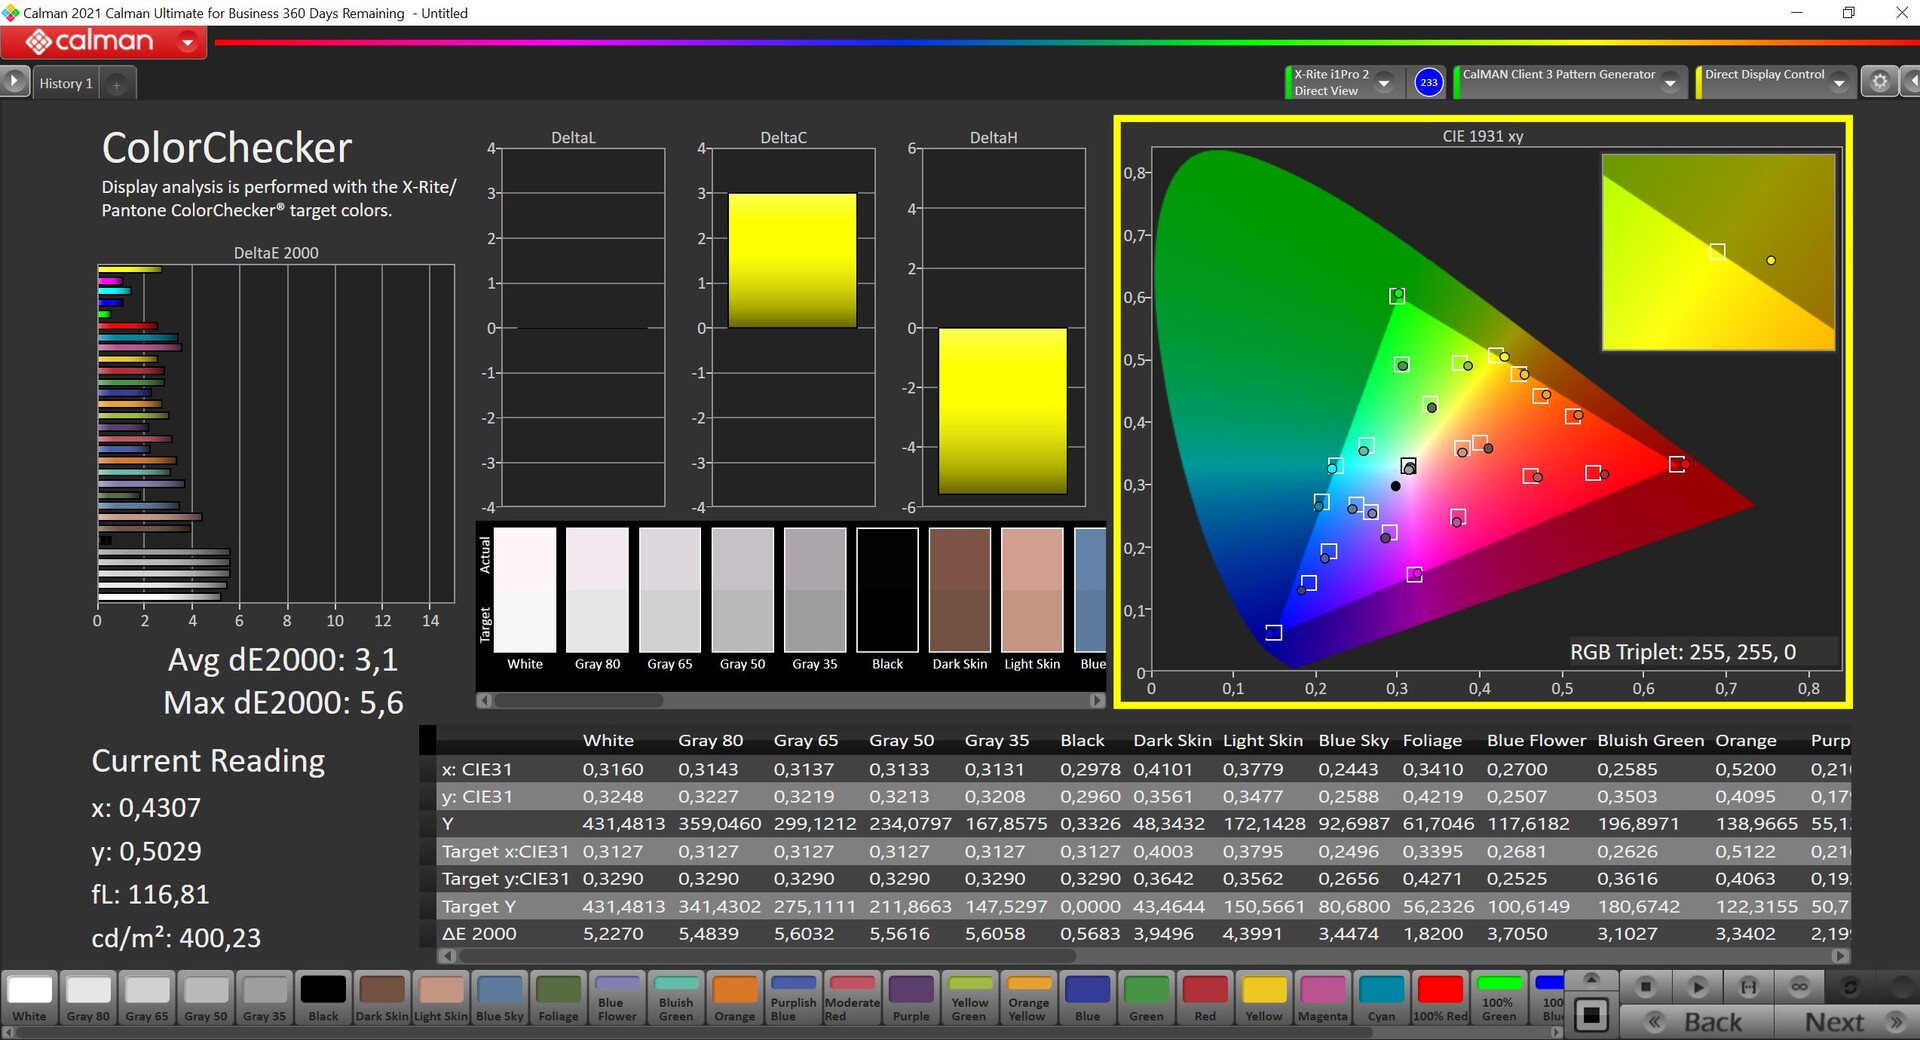
ΔE ColorChecker Calman: 3.1 | ∀{0.5-29.43 Ø4.72}
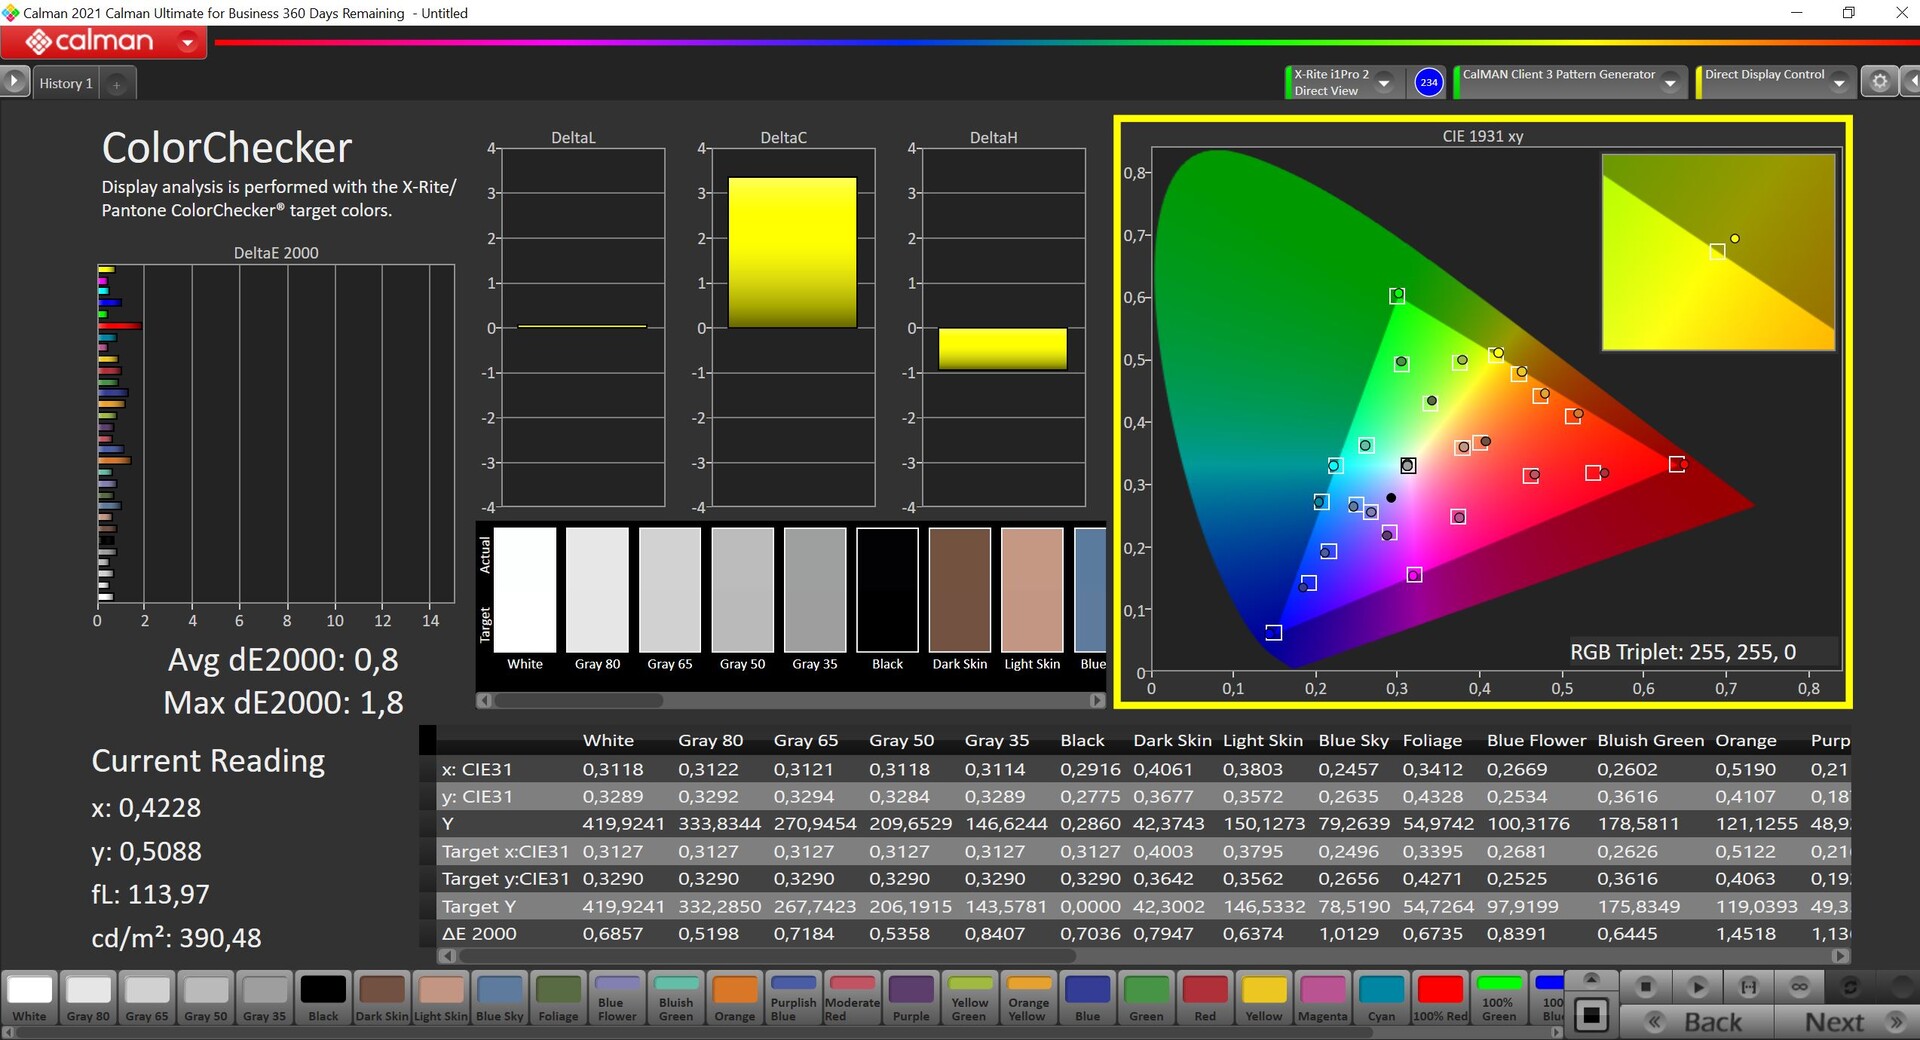
calibrated: 0.8
ΔE Greyscale Calman: 4.5 | ∀{0.09-98 Ø4.97}
71.1% AdobeRGB 1998 (Argyll 3D)
99.9% sRGB (Argyll 3D)
69.6% Display P3 (Argyll 3D)
Gamma: 2
CCT: 6528 K
| HP ZBook Firefly 14 G9-6B8A2EA CMN1435, IPS, 1920x1200, 14" | Dell Precision 5000 5470 AU Optronics B140QAN, IPS, 2560x1600, 14" | Lenovo ThinkPad P14s Gen2-20VX000GGE B140HAN05.7, IPS, 1920x1080, 14" | Microsoft Surface Laptop Studio i7 RTX 3050 Ti LQ144P1JX01, IPS, 2400x1600, 14.4" | Apple MacBook Pro 14 2021 M1 Pro Entry Mini-LED, 3024x1964, 14.2" | HP ZBook Firefly 14 G8 2C9Q2EA AU Optronics AUO068B, IPS, 1920x1080, 14" | |
|---|---|---|---|---|---|---|
| Display | 8% | -5% | 9% | 43% | 0% | |
| Display P3 Coverage (%) | 69.6 | 79.3 14% | 65.4 -6% | 80.6 16% | 99.3 43% | 70 1% |
| sRGB Coverage (%) | 99.9 | 100 0% | 96.6 -3% | 99.9 0% | 99.5 0% | |
| AdobeRGB 1998 Coverage (%) | 71.1 | 78.7 11% | 66.5 -6% | 78.5 10% | 71.4 0% | |
| Response Times | -9% | -15% | 2% | -29% | -13% | |
| Response Time Grey 50% / Grey 80% * (ms) | 56.3 ? | 52.4 ? 7% | 58.8 ? -4% | 58.4 ? -4% | 58.4 ? -4% | 64.4 ? -14% |
| Response Time Black / White * (ms) | 26.2 ? | 32.4 ? -24% | 32.8 ? -25% | 24 ? 8% | 40.4 ? -54% | 29.2 ? -11% |
| PWM Frequency (Hz) | 5000 ? | 14880 | ||||
| Screen | 10% | -9% | 24% | 428% | 3% | |
| Brightness middle (cd/m²) | 432 | 537 24% | 350 -19% | 497 15% | 489 13% | 461 7% |
| Brightness (cd/m²) | 407 | 518 27% | 348 -14% | 491 21% | 479 18% | 439 8% |
| Brightness Distribution (%) | 91 | 94 3% | 94 3% | 92 1% | 94 3% | 89 -2% |
| Black Level * (cd/m²) | 0.28 | 0.33 -18% | 0.14 50% | 0.29 -4% | 0.01 96% | 0.24 14% |
| Contrast (:1) | 1543 | 1627 5% | 2500 62% | 1714 11% | 48900 3069% | 1921 24% |
| Colorchecker dE 2000 * | 3.1 | 2.97 4% | 4.3 -39% | 1.2 61% | 0.8 74% | 2.6 16% |
| Colorchecker dE 2000 max. * | 5.6 | 5.33 5% | 6.7 -20% | 2.8 50% | 1.3 77% | 5.8 -4% |
| Colorchecker dE 2000 calibrated * | 0.8 | 0.88 -10% | 1.5 -88% | 0.8 -0% | 1.1 -38% | |
| Greyscale dE 2000 * | 4.5 | 2.4 47% | 5.3 -18% | 1.9 58% | 1.1 76% | 4.4 2% |
| Gamma | 2 110% | 2.06 107% | 2.42 91% | 2.14 103% | 2.24 98% | 2.29 96% |
| CCT | 6528 100% | 6668 97% | 7631 85% | 6821 95% | 6478 100% | |
| Color Space (Percent of AdobeRGB 1998) (%) | 61.1 | 65.2 | ||||
| Color Space (Percent of sRGB) (%) | 96.4 | 99.4 | ||||
| Całkowita średnia (program / ustawienia) | 3% /
7% | -10% /
-9% | 12% /
17% | 147% /
310% | -3% /
0% |
* ... im mniej tym lepiej
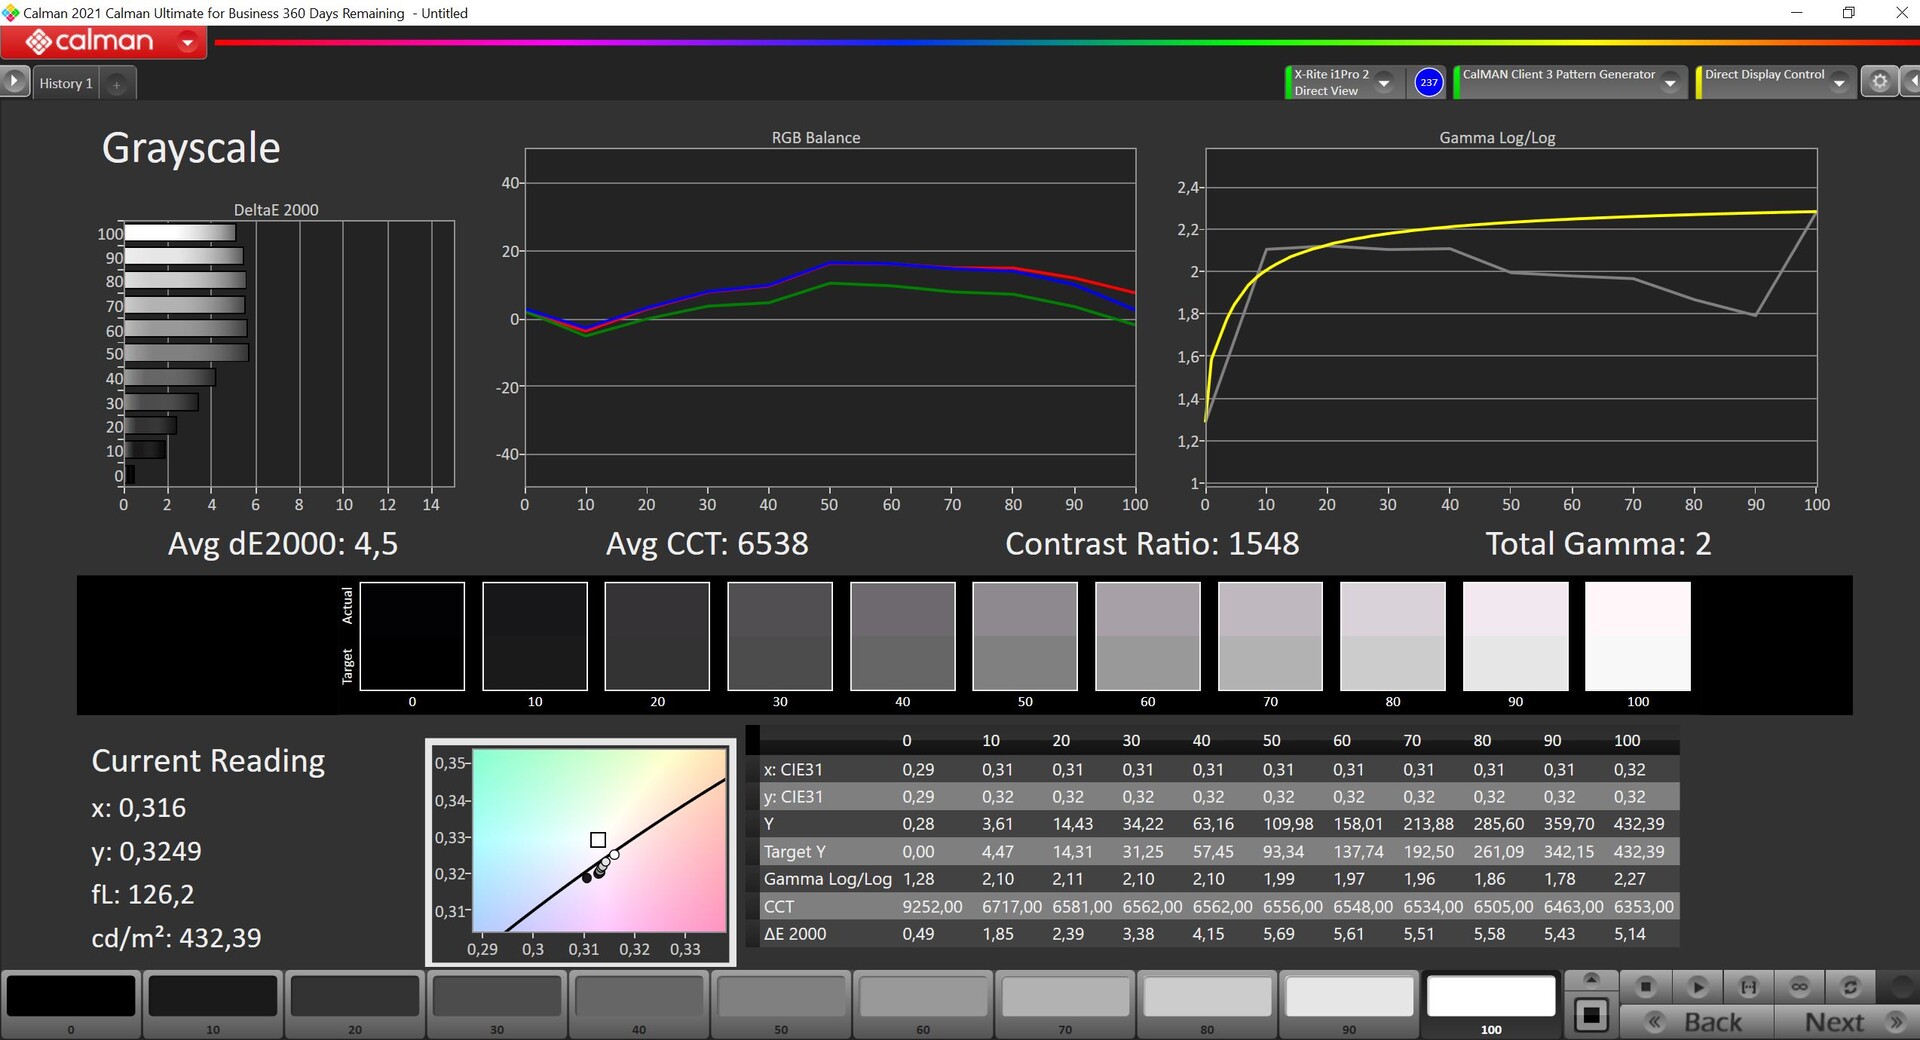
Nasza analiza za pomocą profesjonalnego oprogramowania CalMAN wykazała w stanie dostawy lekką obsadę kolorów w kierunku niebieskiego/czerwonego, a wiele kolorów jest również nieco powyżej odchylenia DeltaE 2000 wynoszącego 3 w porównaniu z referencyjną przestrzenią kolorów sRGB. Dopóki nie edytujesz zdjęć, jest to całkowicie wystarczające do codziennego użytku
Nasza własna kalibracja pokazuje jednak, jak duży potencjał ma ten panel. Udało nam się całkowicie wyeliminować color cast, a średnie odchylenie kolorów spada do zaledwie 0,8 (maksymalnie 1,8), co jest doskonałym osiągnięciem.

Wyświetl czasy reakcji
| ↔ Czas reakcji od czerni do bieli | ||
|---|---|---|
| 26.2 ms ... wzrost ↗ i spadek ↘ łącznie | ↗ 9.7 ms wzrost | 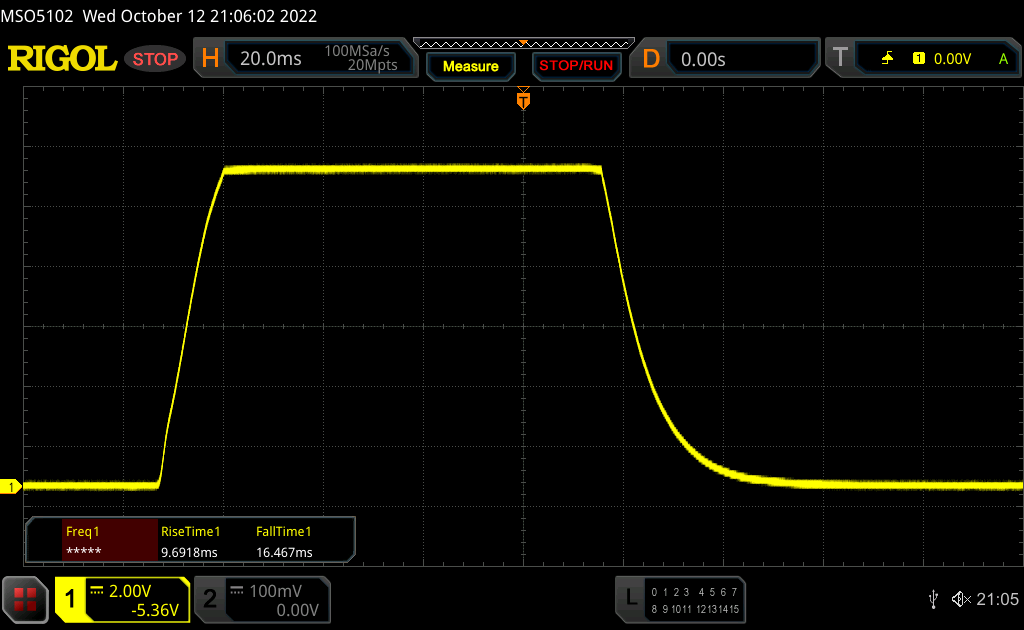 |
| ↘ 16.5 ms upadek | ||
| W naszych testach ekran wykazuje stosunkowo powolne tempo reakcji i może być zbyt wolny dla graczy. Dla porównania, wszystkie testowane urządzenia wahają się od 0.1 (minimum) do 240 (maksimum) ms. » 65 % wszystkich urządzeń jest lepszych. Oznacza to, że zmierzony czas reakcji jest gorszy od średniej wszystkich testowanych urządzeń (19.8 ms). | ||
| ↔ Czas reakcji 50% szarości do 80% szarości | ||
| 56.3 ms ... wzrost ↗ i spadek ↘ łącznie | ↗ 25 ms wzrost | 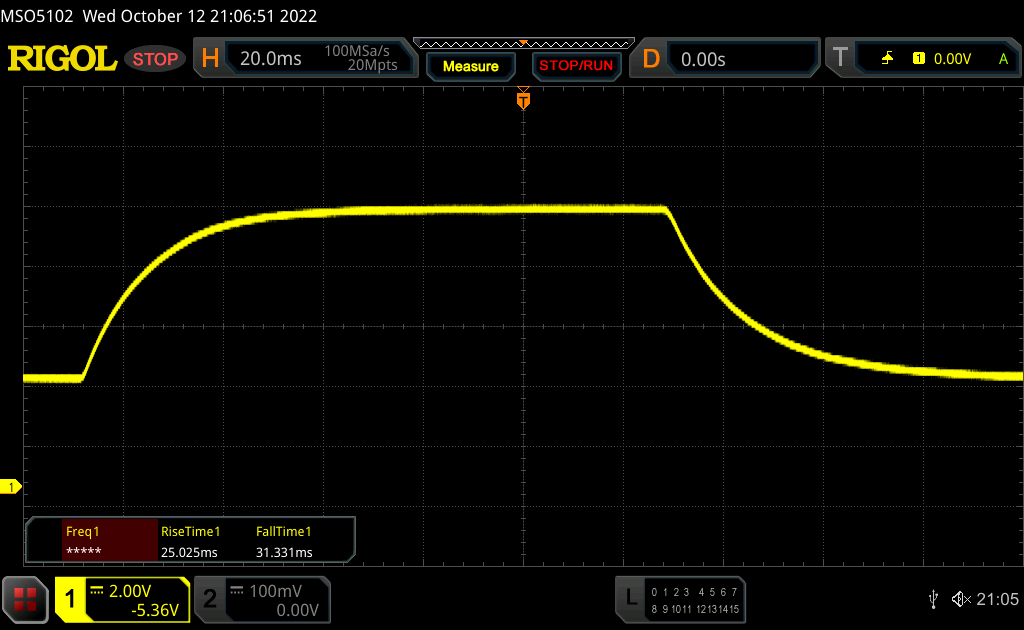 |
| ↘ 31.3 ms upadek | ||
| W naszych testach ekran wykazuje powolne tempo reakcji, co będzie niezadowalające dla graczy. Dla porównania, wszystkie testowane urządzenia wahają się od 0.165 (minimum) do 636 (maksimum) ms. » 93 % wszystkich urządzeń jest lepszych. Oznacza to, że zmierzony czas reakcji jest gorszy od średniej wszystkich testowanych urządzeń (31 ms). | ||
Migotanie ekranu / PWM (modulacja szerokości impulsu)
| Migotanie ekranu/nie wykryto PWM |  | ||
Dla porównania: 52 % wszystkich testowanych urządzeń nie używa PWM do przyciemniania wyświetlacza. Jeśli wykryto PWM, zmierzono średnio 7772 (minimum: 5 - maksimum: 343500) Hz. | |||
Matowy wyświetlacz bardzo dobrze sprawdza się na zewnątrz. Panel mógłby być jedynie nieco jaśniejszy w bezpośrednim świetle słonecznym.
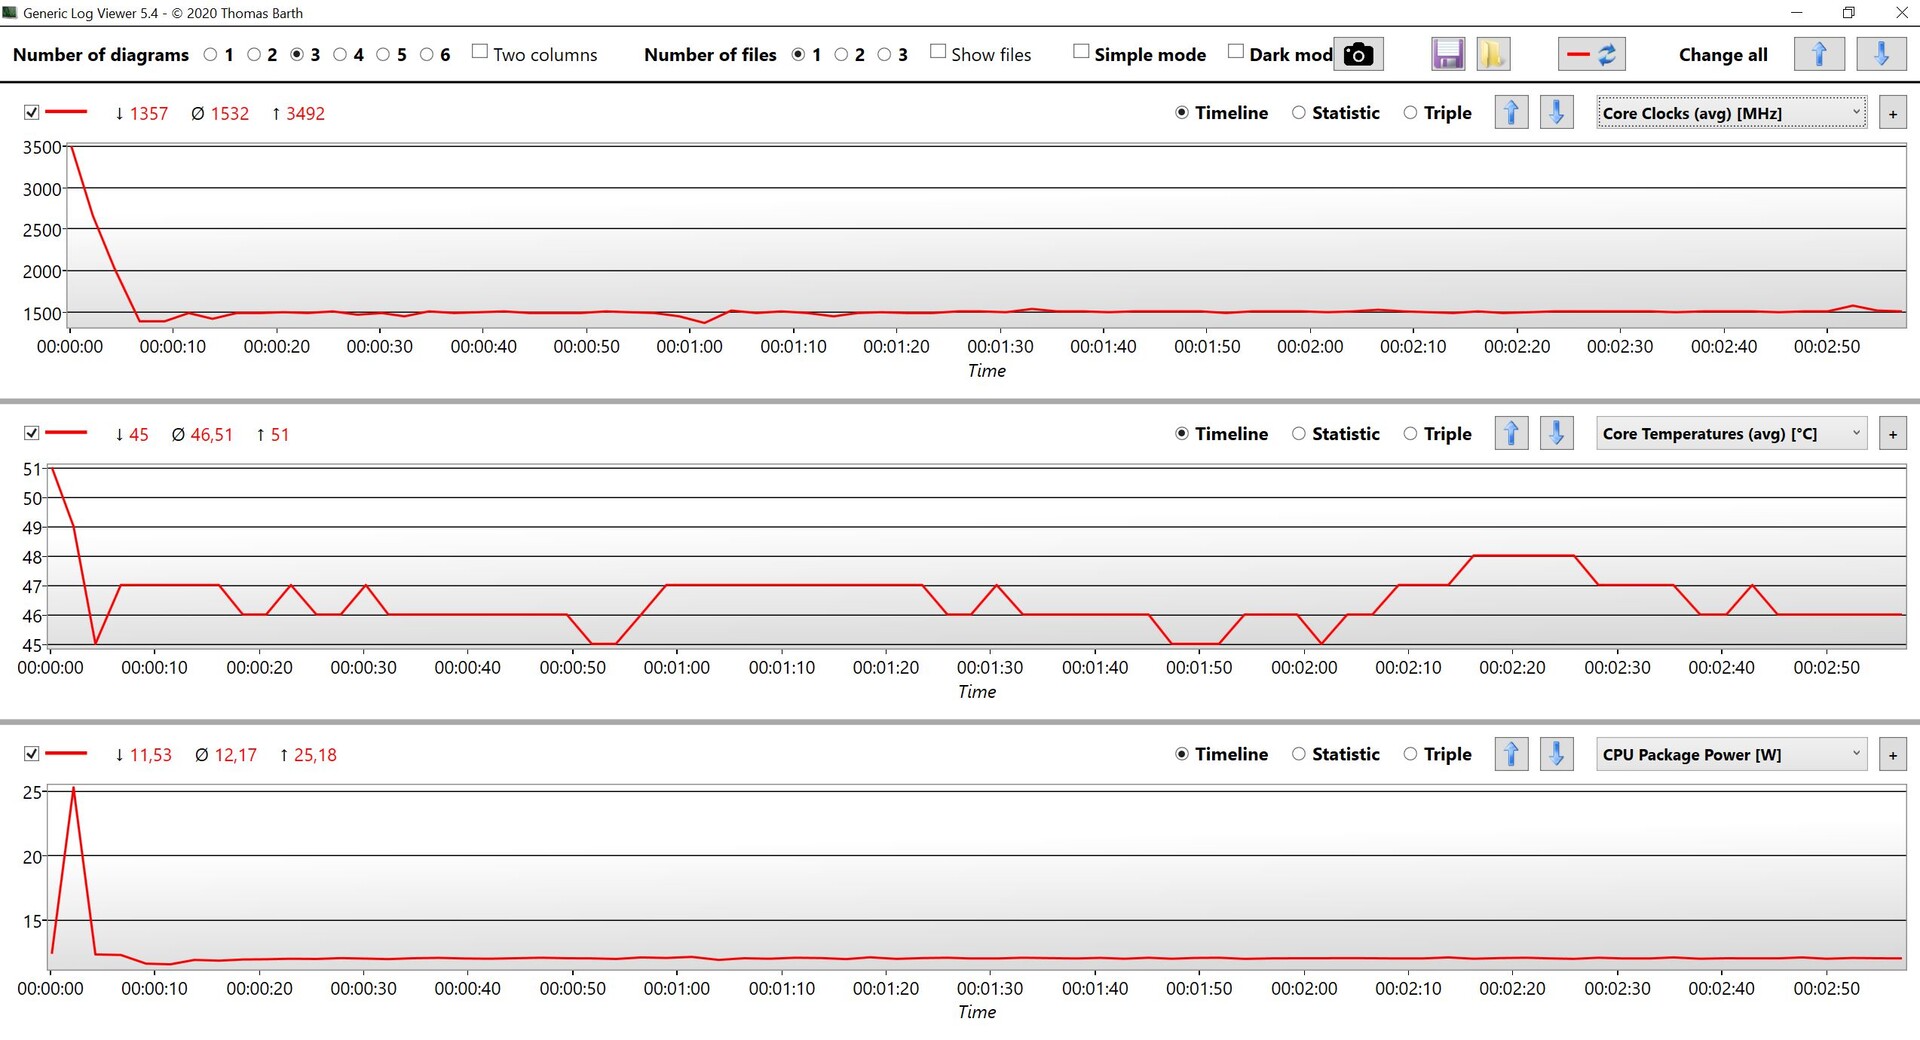
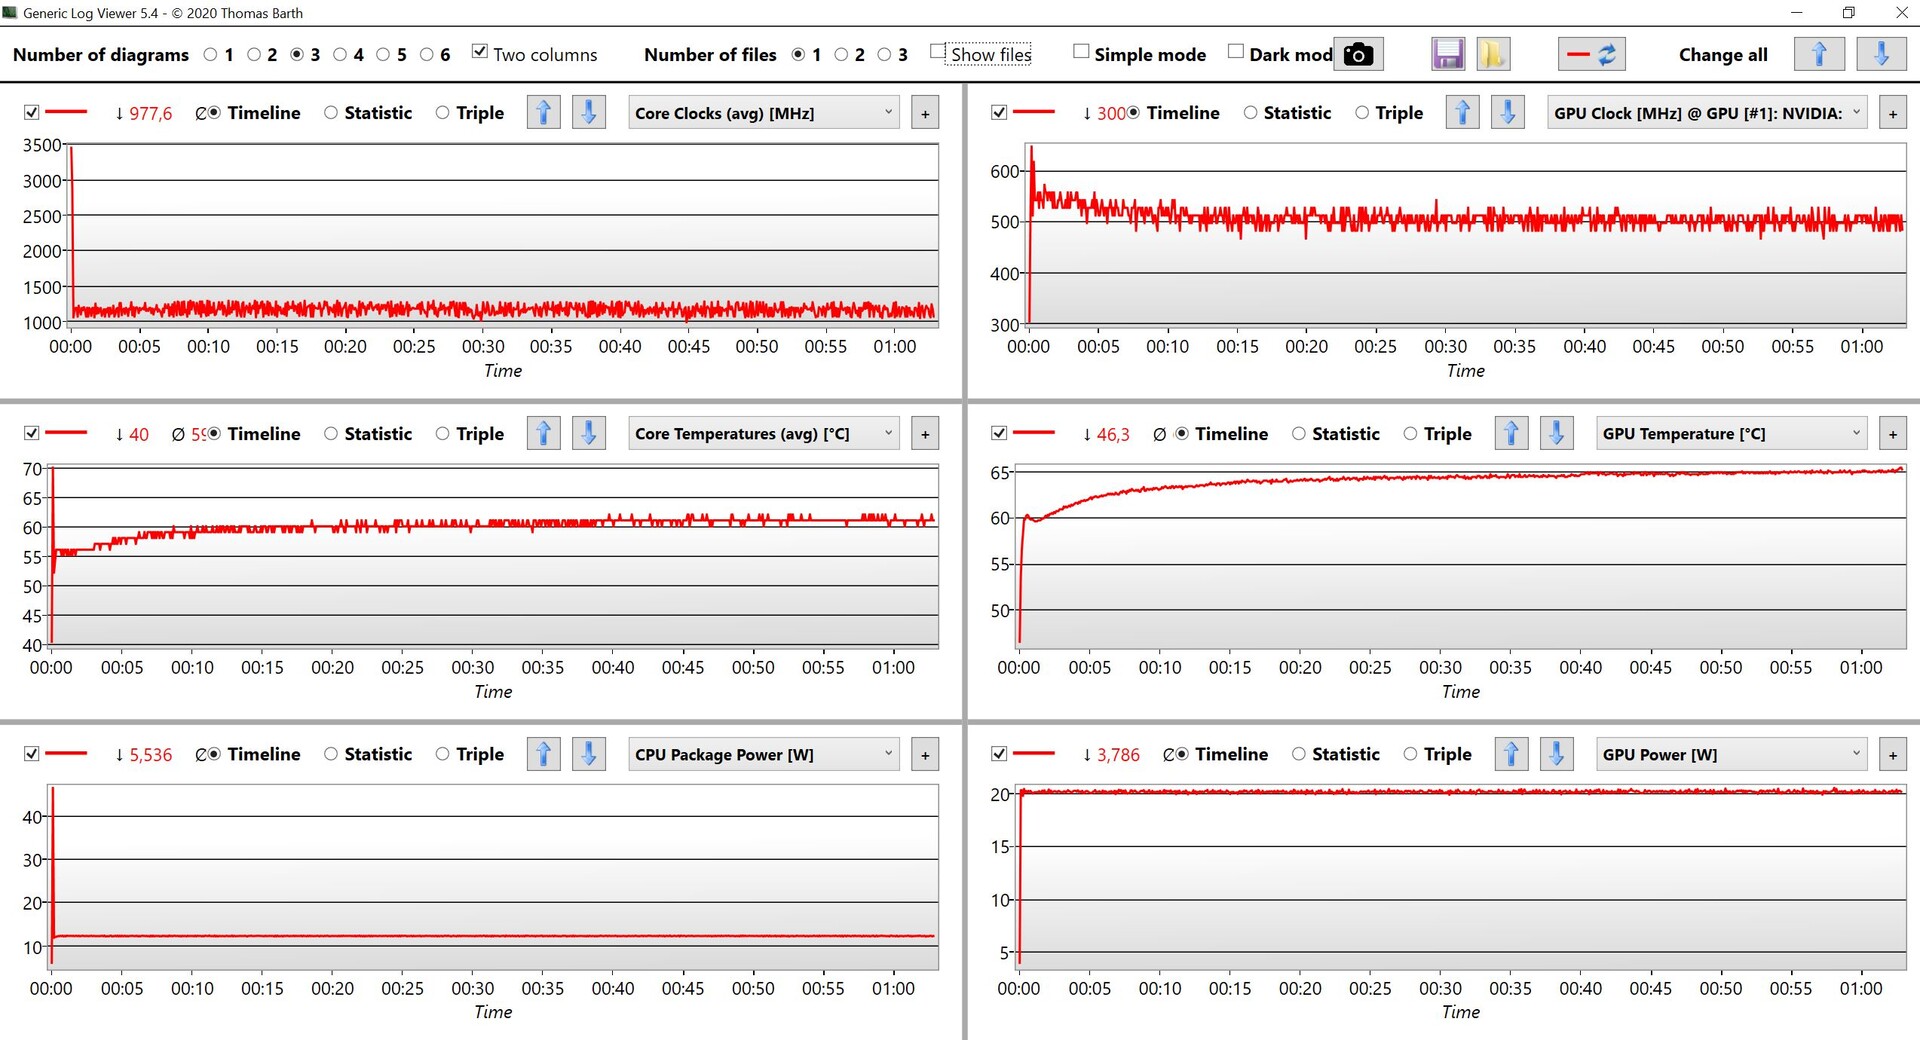
Wydajność: 12 W Alder Lake-U
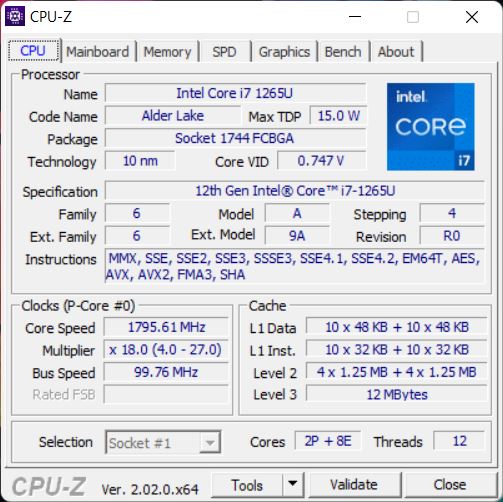
Procesor: Intel Core i7-1265U
Core i7-1265U to aktualny układ Alder Lake (12. generacji) z dwoma szybkimi rdzeniami wydajnościowymi i ośmioma wydajnymi. Potencjał wydajnościowy jest teoretycznie również bardzo duży, ale układ w ZBooku Firefly 14 G9 jest spowalniany przez bardzo niski limit mocy 12 W, który wbija się po kilku sekundach. Jest to wystarczające do prostych zadań, ale ogólna wydajność jest nieco niższa od nawet Tiger Lake Core i7-1165G7 w modelu poprzednika HP ZBook Firefly 14 G8 laptop in review: Small workstation with faster ports jeśli weźmiemy pod uwagę wszystkie benchmarki CPU.
Podobny problem wystąpił również w większym Firefly 16 G9 i w związku z tym jesteśmy w kontakcie z producentem. Wydajność jest zdecydowanie rozczarowująca jak na mobilną stację roboczą. Dla porównania, normalny wariant biznesowy EliteBook 845 G9 z AMD Ryzen 9 Pro 6950HS oferuje około trzykrotnie wyższą wydajność wielordzeniową.
Więcej benchmarków procesorów znajdziecie w naszym dziale technologicznym.
Cinebench R15 multi-core loop
Cinebench R23: Multi Core | Single Core
Cinebench R20: CPU (Multi Core) | CPU (Single Core)
Cinebench R15: CPU Multi 64Bit | CPU Single 64Bit
Blender: v2.79 BMW27 CPU
7-Zip 18.03: 7z b 4 | 7z b 4 -mmt1
Geekbench 5.5: Multi-Core | Single-Core
HWBOT x265 Benchmark v2.2: 4k Preset
LibreOffice : 20 Documents To PDF
R Benchmark 2.5: Overall mean
| CPU Performance rating | |
| Średnia w klasie Workstation | |
| Dell Precision 5000 5470 | |
| Apple MacBook Pro 14 2021 M1 Pro Entry -8! | |
| HP EliteBook 845 G9 6F6H6EA | |
| Przeciętny Intel Core i7-1265U | |
| Microsoft Surface Laptop Studio i7 RTX 3050 Ti | |
| Lenovo ThinkPad P14s Gen2-20VX000GGE | |
| HP ZBook Firefly 14 G8 2C9Q2EA -2! | |
| HP ZBook Firefly 14 G9-6B8A2EA | |
| HP ZBook Firefly 16 G9-6B897EA | |
| Cinebench R23 / Multi Core | |
| Średnia w klasie Workstation (14621 - 38520, n=24, ostatnie 2 lata) | |
| Dell Precision 5000 5470 | |
| HP EliteBook 845 G9 6F6H6EA | |
| Apple MacBook Pro 14 2021 M1 Pro Entry | |
| Przeciętny Intel Core i7-1265U (4332 - 9219, n=10) | |
| Microsoft Surface Laptop Studio i7 RTX 3050 Ti | |
| Lenovo ThinkPad P14s Gen2-20VX000GGE | |
| HP ZBook Firefly 16 G9-6B897EA | |
| HP ZBook Firefly 14 G9-6B8A2EA | |
| Cinebench R23 / Single Core | |
| Średnia w klasie Workstation (1712 - 2228, n=24, ostatnie 2 lata) | |
| Dell Precision 5000 5470 | |
| Przeciętny Intel Core i7-1265U (1144 - 1820, n=10) | |
| Apple MacBook Pro 14 2021 M1 Pro Entry | |
| HP EliteBook 845 G9 6F6H6EA | |
| Microsoft Surface Laptop Studio i7 RTX 3050 Ti | |
| Lenovo ThinkPad P14s Gen2-20VX000GGE | |
| HP ZBook Firefly 14 G9-6B8A2EA | |
| HP ZBook Firefly 16 G9-6B897EA | |
| Cinebench R20 / CPU (Multi Core) | |
| Średnia w klasie Workstation (5760 - 15043, n=24, ostatnie 2 lata) | |
| Dell Precision 5000 5470 | |
| HP EliteBook 845 G9 6F6H6EA | |
| Przeciętny Intel Core i7-1265U (1669 - 3584, n=10) | |
| Microsoft Surface Laptop Studio i7 RTX 3050 Ti | |
| Lenovo ThinkPad P14s Gen2-20VX000GGE | |
| HP ZBook Firefly 14 G8 2C9Q2EA | |
| HP ZBook Firefly 14 G9-6B8A2EA | |
| HP ZBook Firefly 16 G9-6B897EA | |
| Cinebench R20 / CPU (Single Core) | |
| Średnia w klasie Workstation (671 - 857, n=24, ostatnie 2 lata) | |
| Dell Precision 5000 5470 | |
| Przeciętny Intel Core i7-1265U (528 - 701, n=10) | |
| HP EliteBook 845 G9 6F6H6EA | |
| HP ZBook Firefly 14 G8 2C9Q2EA | |
| Microsoft Surface Laptop Studio i7 RTX 3050 Ti | |
| HP ZBook Firefly 16 G9-6B897EA | |
| Lenovo ThinkPad P14s Gen2-20VX000GGE | |
| HP ZBook Firefly 14 G9-6B8A2EA | |
| Cinebench R15 / CPU Multi 64Bit | |
| Średnia w klasie Workstation (2489 - 5810, n=24, ostatnie 2 lata) | |
| Dell Precision 5000 5470 | |
| HP EliteBook 845 G9 6F6H6EA | |
| Apple MacBook Pro 14 2021 M1 Pro Entry | |
| Przeciętny Intel Core i7-1265U (706 - 1572, n=10) | |
| Microsoft Surface Laptop Studio i7 RTX 3050 Ti | |
| Lenovo ThinkPad P14s Gen2-20VX000GGE | |
| HP ZBook Firefly 14 G8 2C9Q2EA | |
| HP ZBook Firefly 16 G9-6B897EA | |
| HP ZBook Firefly 14 G9-6B8A2EA | |
| Cinebench R15 / CPU Single 64Bit | |
| Średnia w klasie Workstation (191.4 - 328, n=24, ostatnie 2 lata) | |
| Dell Precision 5000 5470 | |
| HP EliteBook 845 G9 6F6H6EA | |
| Przeciętny Intel Core i7-1265U (165.3 - 260, n=10) | |
| HP ZBook Firefly 14 G8 2C9Q2EA | |
| Microsoft Surface Laptop Studio i7 RTX 3050 Ti | |
| HP ZBook Firefly 14 G9-6B8A2EA | |
| Lenovo ThinkPad P14s Gen2-20VX000GGE | |
| Apple MacBook Pro 14 2021 M1 Pro Entry | |
| HP ZBook Firefly 16 G9-6B897EA | |
| Blender / v2.79 BMW27 CPU | |
| HP ZBook Firefly 16 G9-6B897EA | |
| HP ZBook Firefly 14 G9-6B8A2EA | |
| Lenovo ThinkPad P14s Gen2-20VX000GGE | |
| HP ZBook Firefly 14 G8 2C9Q2EA | |
| Microsoft Surface Laptop Studio i7 RTX 3050 Ti | |
| Przeciętny Intel Core i7-1265U (364 - 684, n=10) | |
| HP EliteBook 845 G9 6F6H6EA | |
| Dell Precision 5000 5470 | |
| Średnia w klasie Workstation (91 - 222, n=24, ostatnie 2 lata) | |
| 7-Zip 18.03 / 7z b 4 | |
| Średnia w klasie Workstation (60489 - 116969, n=24, ostatnie 2 lata) | |
| Dell Precision 5000 5470 | |
| HP EliteBook 845 G9 6F6H6EA | |
| Przeciętny Intel Core i7-1265U (20087 - 38715, n=10) | |
| Microsoft Surface Laptop Studio i7 RTX 3050 Ti | |
| HP ZBook Firefly 14 G8 2C9Q2EA | |
| HP ZBook Firefly 14 G9-6B8A2EA | |
| Lenovo ThinkPad P14s Gen2-20VX000GGE | |
| HP ZBook Firefly 16 G9-6B897EA | |
| 7-Zip 18.03 / 7z b 4 -mmt1 | |
| Średnia w klasie Workstation (5126 - 6960, n=24, ostatnie 2 lata) | |
| HP EliteBook 845 G9 6F6H6EA | |
| Lenovo ThinkPad P14s Gen2-20VX000GGE | |
| Dell Precision 5000 5470 | |
| HP ZBook Firefly 14 G8 2C9Q2EA | |
| Przeciętny Intel Core i7-1265U (4614 - 5617, n=10) | |
| Microsoft Surface Laptop Studio i7 RTX 3050 Ti | |
| HP ZBook Firefly 16 G9-6B897EA | |
| HP ZBook Firefly 14 G9-6B8A2EA | |
| Geekbench 5.5 / Multi-Core | |
| Średnia w klasie Workstation (11542 - 25554, n=24, ostatnie 2 lata) | |
| Dell Precision 5000 5470 | |
| Apple MacBook Pro 14 2021 M1 Pro Entry | |
| Przeciętny Intel Core i7-1265U (5022 - 8981, n=10) | |
| HP EliteBook 845 G9 6F6H6EA | |
| HP ZBook Firefly 14 G9-6B8A2EA | |
| Microsoft Surface Laptop Studio i7 RTX 3050 Ti | |
| Lenovo ThinkPad P14s Gen2-20VX000GGE | |
| HP ZBook Firefly 16 G9-6B897EA | |
| HP ZBook Firefly 14 G8 2C9Q2EA | |
| Geekbench 5.5 / Single-Core | |
| Średnia w klasie Workstation (1783 - 2183, n=24, ostatnie 2 lata) | |
| HP ZBook Firefly 14 G9-6B8A2EA | |
| Dell Precision 5000 5470 | |
| HP ZBook Firefly 16 G9-6B897EA | |
| Apple MacBook Pro 14 2021 M1 Pro Entry | |
| Przeciętny Intel Core i7-1265U (1429 - 1806, n=10) | |
| Lenovo ThinkPad P14s Gen2-20VX000GGE | |
| HP ZBook Firefly 14 G8 2C9Q2EA | |
| Microsoft Surface Laptop Studio i7 RTX 3050 Ti | |
| HP EliteBook 845 G9 6F6H6EA | |
| HWBOT x265 Benchmark v2.2 / 4k Preset | |
| Średnia w klasie Workstation (17.8 - 40.5, n=24, ostatnie 2 lata) | |
| Dell Precision 5000 5470 | |
| HP EliteBook 845 G9 6F6H6EA | |
| Przeciętny Intel Core i7-1265U (5.09 - 10.6, n=10) | |
| Microsoft Surface Laptop Studio i7 RTX 3050 Ti | |
| Lenovo ThinkPad P14s Gen2-20VX000GGE | |
| HP ZBook Firefly 14 G8 2C9Q2EA | |
| HP ZBook Firefly 14 G9-6B8A2EA | |
| HP ZBook Firefly 16 G9-6B897EA | |
| LibreOffice / 20 Documents To PDF | |
| HP EliteBook 845 G9 6F6H6EA | |
| Microsoft Surface Laptop Studio i7 RTX 3050 Ti | |
| HP ZBook Firefly 14 G8 2C9Q2EA | |
| HP ZBook Firefly 16 G9-6B897EA | |
| Przeciętny Intel Core i7-1265U (44 - 61.6, n=10) | |
| Średnia w klasie Workstation (37.1 - 74.7, n=24, ostatnie 2 lata) | |
| HP ZBook Firefly 14 G9-6B8A2EA | |
| Dell Precision 5000 5470 | |
| Lenovo ThinkPad P14s Gen2-20VX000GGE | |
| R Benchmark 2.5 / Overall mean | |
| Microsoft Surface Laptop Studio i7 RTX 3050 Ti | |
| HP ZBook Firefly 14 G8 2C9Q2EA | |
| Lenovo ThinkPad P14s Gen2-20VX000GGE | |
| HP ZBook Firefly 16 G9-6B897EA | |
| HP ZBook Firefly 14 G9-6B8A2EA | |
| HP EliteBook 845 G9 6F6H6EA | |
| Przeciętny Intel Core i7-1265U (0.4666 - 0.578, n=10) | |
| Dell Precision 5000 5470 | |
| Średnia w klasie Workstation (0.3825 - 0.603, n=24, ostatnie 2 lata) | |
* ... im mniej tym lepiej
AIDA64: FP32 Ray-Trace | FPU Julia | CPU SHA3 | CPU Queen | FPU SinJulia | FPU Mandel | CPU AES | CPU ZLib | FP64 Ray-Trace | CPU PhotoWorxx
| Performance rating | |
| Średnia w klasie Workstation | |
| HP EliteBook 845 G9 6F6H6EA | |
| Dell Precision 5000 5470 | |
| Microsoft Surface Laptop Studio i7 RTX 3050 Ti | |
| Przeciętny Intel Core i7-1265U | |
| HP ZBook Firefly 14 G8 2C9Q2EA | |
| HP ZBook Firefly 14 G9-6B8A2EA | |
| HP ZBook Firefly 16 G9-6B897EA | |
| AIDA64 / FP32 Ray-Trace | |
| Średnia w klasie Workstation (15143 - 61611, n=24, ostatnie 2 lata) | |
| HP EliteBook 845 G9 6F6H6EA | |
| Dell Precision 5000 5470 | |
| Microsoft Surface Laptop Studio i7 RTX 3050 Ti | |
| HP ZBook Firefly 14 G8 2C9Q2EA | |
| Przeciętny Intel Core i7-1265U (2619 - 8178, n=10) | |
| HP ZBook Firefly 14 G9-6B8A2EA | |
| HP ZBook Firefly 16 G9-6B897EA | |
| AIDA64 / FPU Julia | |
| Średnia w klasie Workstation (81575 - 186971, n=24, ostatnie 2 lata) | |
| HP EliteBook 845 G9 6F6H6EA | |
| Dell Precision 5000 5470 | |
| Przeciętny Intel Core i7-1265U (12909 - 41649, n=10) | |
| Microsoft Surface Laptop Studio i7 RTX 3050 Ti | |
| HP ZBook Firefly 14 G8 2C9Q2EA | |
| HP ZBook Firefly 14 G9-6B8A2EA | |
| HP ZBook Firefly 16 G9-6B897EA | |
| AIDA64 / CPU SHA3 | |
| Średnia w klasie Workstation (3833 - 8975, n=24, ostatnie 2 lata) | |
| HP EliteBook 845 G9 6F6H6EA | |
| Dell Precision 5000 5470 | |
| Microsoft Surface Laptop Studio i7 RTX 3050 Ti | |
| HP ZBook Firefly 14 G8 2C9Q2EA | |
| Przeciętny Intel Core i7-1265U (824 - 2183, n=10) | |
| HP ZBook Firefly 14 G9-6B8A2EA | |
| HP ZBook Firefly 16 G9-6B897EA | |
| AIDA64 / CPU Queen | |
| Dell Precision 5000 5470 | |
| Średnia w klasie Workstation (60778 - 144411, n=24, ostatnie 2 lata) | |
| HP EliteBook 845 G9 6F6H6EA | |
| HP ZBook Firefly 14 G9-6B8A2EA | |
| Przeciętny Intel Core i7-1265U (63615 - 67065, n=10) | |
| HP ZBook Firefly 16 G9-6B897EA | |
| HP ZBook Firefly 14 G8 2C9Q2EA | |
| Microsoft Surface Laptop Studio i7 RTX 3050 Ti | |
| AIDA64 / FPU SinJulia | |
| Średnia w klasie Workstation (8165 - 29343, n=24, ostatnie 2 lata) | |
| HP EliteBook 845 G9 6F6H6EA | |
| Dell Precision 5000 5470 | |
| HP ZBook Firefly 14 G8 2C9Q2EA | |
| Microsoft Surface Laptop Studio i7 RTX 3050 Ti | |
| Przeciętny Intel Core i7-1265U (3105 - 5135, n=10) | |
| HP ZBook Firefly 14 G9-6B8A2EA | |
| HP ZBook Firefly 16 G9-6B897EA | |
| AIDA64 / FPU Mandel | |
| Średnia w klasie Workstation (40055 - 98153, n=24, ostatnie 2 lata) | |
| HP EliteBook 845 G9 6F6H6EA | |
| Dell Precision 5000 5470 | |
| Microsoft Surface Laptop Studio i7 RTX 3050 Ti | |
| HP ZBook Firefly 14 G8 2C9Q2EA | |
| Przeciętny Intel Core i7-1265U (6967 - 20804, n=10) | |
| HP ZBook Firefly 14 G9-6B8A2EA | |
| HP ZBook Firefly 16 G9-6B897EA | |
| AIDA64 / CPU AES | |
| Średnia w klasie Workstation (73133 - 187841, n=24, ostatnie 2 lata) | |
| HP ZBook Firefly 14 G8 2C9Q2EA | |
| HP EliteBook 845 G9 6F6H6EA | |
| Microsoft Surface Laptop Studio i7 RTX 3050 Ti | |
| Dell Precision 5000 5470 | |
| Przeciętny Intel Core i7-1265U (19489 - 42966, n=10) | |
| HP ZBook Firefly 14 G9-6B8A2EA | |
| HP ZBook Firefly 16 G9-6B897EA | |
| AIDA64 / CPU ZLib | |
| Średnia w klasie Workstation (929 - 2148, n=24, ostatnie 2 lata) | |
| HP EliteBook 845 G9 6F6H6EA | |
| Przeciętny Intel Core i7-1265U (314 - 632, n=10) | |
| Dell Precision 5000 5470 | |
| HP ZBook Firefly 14 G8 2C9Q2EA | |
| HP ZBook Firefly 14 G9-6B8A2EA | |
| Microsoft Surface Laptop Studio i7 RTX 3050 Ti | |
| HP ZBook Firefly 16 G9-6B897EA | |
| AIDA64 / FP64 Ray-Trace | |
| Średnia w klasie Workstation (7813 - 32891, n=24, ostatnie 2 lata) | |
| Dell Precision 5000 5470 | |
| HP EliteBook 845 G9 6F6H6EA | |
| Microsoft Surface Laptop Studio i7 RTX 3050 Ti | |
| HP ZBook Firefly 14 G8 2C9Q2EA | |
| Przeciętny Intel Core i7-1265U (1473 - 4376, n=10) | |
| HP ZBook Firefly 14 G9-6B8A2EA | |
| HP ZBook Firefly 16 G9-6B897EA | |
| AIDA64 / CPU PhotoWorxx | |
| Średnia w klasie Workstation (37151 - 93684, n=24, ostatnie 2 lata) | |
| Dell Precision 5000 5470 | |
| Microsoft Surface Laptop Studio i7 RTX 3050 Ti | |
| Przeciętny Intel Core i7-1265U (20213 - 47031, n=10) | |
| HP ZBook Firefly 14 G9-6B8A2EA | |
| HP ZBook Firefly 14 G8 2C9Q2EA | |
| HP ZBook Firefly 16 G9-6B897EA | |
| HP EliteBook 845 G9 6F6H6EA | |
Wydajność systemu
Subiektywna wydajność systemu jest bardzo dobra mimo stosunkowo niskiej wydajności procesora, co można przypisać również szybkiemu dyskowi SSD PCIe 4.0. Podczas testu nie wykryliśmy też żadnych problemów.
CrossMark: Overall | Productivity | Creativity | Responsiveness
| PCMark 10 / Score | |
| Średnia w klasie Workstation (6563 - 10409, n=20, ostatnie 2 lata) | |
| Dell Precision 5000 5470 | |
| HP EliteBook 845 G9 6F6H6EA | |
| Przeciętny Intel Core i7-1265U, NVIDIA T550 Laptop GPU (5488 - 6181, n=3) | |
| Lenovo ThinkPad P14s Gen2-20VX000GGE | |
| HP ZBook Firefly 16 G9-6B897EA | |
| Microsoft Surface Laptop Studio i7 RTX 3050 Ti | |
| HP ZBook Firefly 14 G9-6B8A2EA | |
| HP ZBook Firefly 14 G8 2C9Q2EA | |
| PCMark 10 / Essentials | |
| Dell Precision 5000 5470 | |
| Średnia w klasie Workstation (9622 - 11157, n=20, ostatnie 2 lata) | |
| HP ZBook Firefly 16 G9-6B897EA | |
| Przeciętny Intel Core i7-1265U, NVIDIA T550 Laptop GPU (9960 - 10250, n=3) | |
| HP ZBook Firefly 14 G9-6B8A2EA | |
| Lenovo ThinkPad P14s Gen2-20VX000GGE | |
| HP EliteBook 845 G9 6F6H6EA | |
| HP ZBook Firefly 14 G8 2C9Q2EA | |
| Microsoft Surface Laptop Studio i7 RTX 3050 Ti | |
| PCMark 10 / Productivity | |
| Średnia w klasie Workstation (8789 - 20616, n=20, ostatnie 2 lata) | |
| Lenovo ThinkPad P14s Gen2-20VX000GGE | |
| Przeciętny Intel Core i7-1265U, NVIDIA T550 Laptop GPU (8315 - 9474, n=3) | |
| HP ZBook Firefly 16 G9-6B897EA | |
| Dell Precision 5000 5470 | |
| Microsoft Surface Laptop Studio i7 RTX 3050 Ti | |
| HP ZBook Firefly 14 G8 2C9Q2EA | |
| HP ZBook Firefly 14 G9-6B8A2EA | |
| HP EliteBook 845 G9 6F6H6EA | |
| PCMark 10 / Digital Content Creation | |
| Średnia w klasie Workstation (8108 - 15631, n=20, ostatnie 2 lata) | |
| Dell Precision 5000 5470 | |
| HP EliteBook 845 G9 6F6H6EA | |
| Microsoft Surface Laptop Studio i7 RTX 3050 Ti | |
| Przeciętny Intel Core i7-1265U, NVIDIA T550 Laptop GPU (5399 - 6793, n=3) | |
| Lenovo ThinkPad P14s Gen2-20VX000GGE | |
| HP ZBook Firefly 16 G9-6B897EA | |
| HP ZBook Firefly 14 G8 2C9Q2EA | |
| HP ZBook Firefly 14 G9-6B8A2EA | |
| CrossMark / Overall | |
| Średnia w klasie Workstation (1307 - 2267, n=23, ostatnie 2 lata) | |
| Dell Precision 5000 5470 | |
| HP ZBook Firefly 16 G9-6B897EA | |
| HP ZBook Firefly 14 G9-6B8A2EA | |
| Przeciętny Intel Core i7-1265U, NVIDIA T550 Laptop GPU (1591 - 1623, n=3) | |
| Apple MacBook Pro 14 2021 M1 Pro Entry | |
| Microsoft Surface Laptop Studio i7 RTX 3050 Ti | |
| HP EliteBook 845 G9 6F6H6EA | |
| CrossMark / Productivity | |
| Średnia w klasie Workstation (1130 - 2122, n=23, ostatnie 2 lata) | |
| Dell Precision 5000 5470 | |
| HP ZBook Firefly 16 G9-6B897EA | |
| HP ZBook Firefly 14 G9-6B8A2EA | |
| Przeciętny Intel Core i7-1265U, NVIDIA T550 Laptop GPU (1553 - 1592, n=3) | |
| Microsoft Surface Laptop Studio i7 RTX 3050 Ti | |
| HP EliteBook 845 G9 6F6H6EA | |
| Apple MacBook Pro 14 2021 M1 Pro Entry | |
| CrossMark / Creativity | |
| Średnia w klasie Workstation (1657 - 2725, n=23, ostatnie 2 lata) | |
| Dell Precision 5000 5470 | |
| Apple MacBook Pro 14 2021 M1 Pro Entry | |
| HP ZBook Firefly 16 G9-6B897EA | |
| HP ZBook Firefly 14 G9-6B8A2EA | |
| Przeciętny Intel Core i7-1265U, NVIDIA T550 Laptop GPU (1723 - 1751, n=3) | |
| Microsoft Surface Laptop Studio i7 RTX 3050 Ti | |
| HP EliteBook 845 G9 6F6H6EA | |
| CrossMark / Responsiveness | |
| Średnia w klasie Workstation (993 - 2096, n=23, ostatnie 2 lata) | |
| Dell Precision 5000 5470 | |
| HP ZBook Firefly 14 G9-6B8A2EA | |
| HP ZBook Firefly 16 G9-6B897EA | |
| Przeciętny Intel Core i7-1265U, NVIDIA T550 Laptop GPU (1344 - 1376, n=3) | |
| Microsoft Surface Laptop Studio i7 RTX 3050 Ti | |
| HP EliteBook 845 G9 6F6H6EA | |
| Apple MacBook Pro 14 2021 M1 Pro Entry | |
| PCMark 10 Score | 5488 pkt. | |
Pomoc | ||
| AIDA64 / Memory Copy | |
| Średnia w klasie Workstation (56003 - 164795, n=24, ostatnie 2 lata) | |
| Dell Precision 5000 5470 | |
| Przeciętny Intel Core i7-1265U (40212 - 72204, n=10) | |
| Microsoft Surface Laptop Studio i7 RTX 3050 Ti | |
| HP ZBook Firefly 14 G9-6B8A2EA | |
| HP ZBook Firefly 14 G8 2C9Q2EA | |
| AIDA64 / Memory Read | |
| Średnia w klasie Workstation (55795 - 121563, n=24, ostatnie 2 lata) | |
| Dell Precision 5000 5470 | |
| HP ZBook Firefly 14 G9-6B8A2EA | |
| Przeciętny Intel Core i7-1265U (41808 - 69493, n=10) | |
| Microsoft Surface Laptop Studio i7 RTX 3050 Ti | |
| HP ZBook Firefly 14 G8 2C9Q2EA | |
| AIDA64 / Memory Write | |
| Średnia w klasie Workstation (55663 - 214520, n=24, ostatnie 2 lata) | |
| Dell Precision 5000 5470 | |
| HP ZBook Firefly 14 G9-6B8A2EA | |
| Microsoft Surface Laptop Studio i7 RTX 3050 Ti | |
| Przeciętny Intel Core i7-1265U (41382 - 76027, n=10) | |
| HP ZBook Firefly 14 G8 2C9Q2EA | |
| AIDA64 / Memory Latency | |
| Średnia w klasie Workstation (84.5 - 165.2, n=24, ostatnie 2 lata) | |
| Dell Precision 5000 5470 | |
| Microsoft Surface Laptop Studio i7 RTX 3050 Ti | |
| Przeciętny Intel Core i7-1265U (74.6 - 112.4, n=10) | |
| HP ZBook Firefly 14 G9-6B8A2EA | |
| HP ZBook Firefly 14 G8 2C9Q2EA | |
* ... im mniej tym lepiej
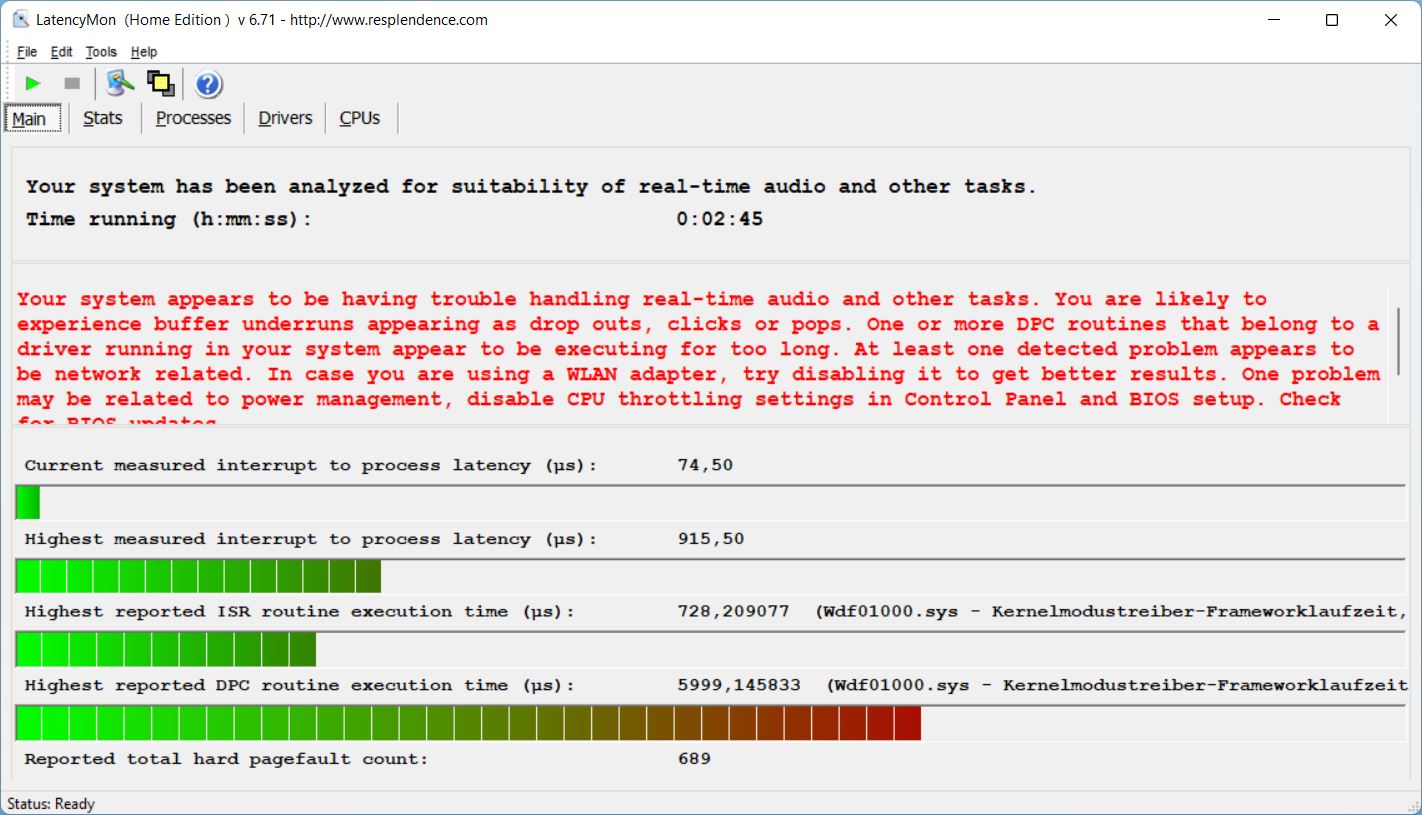
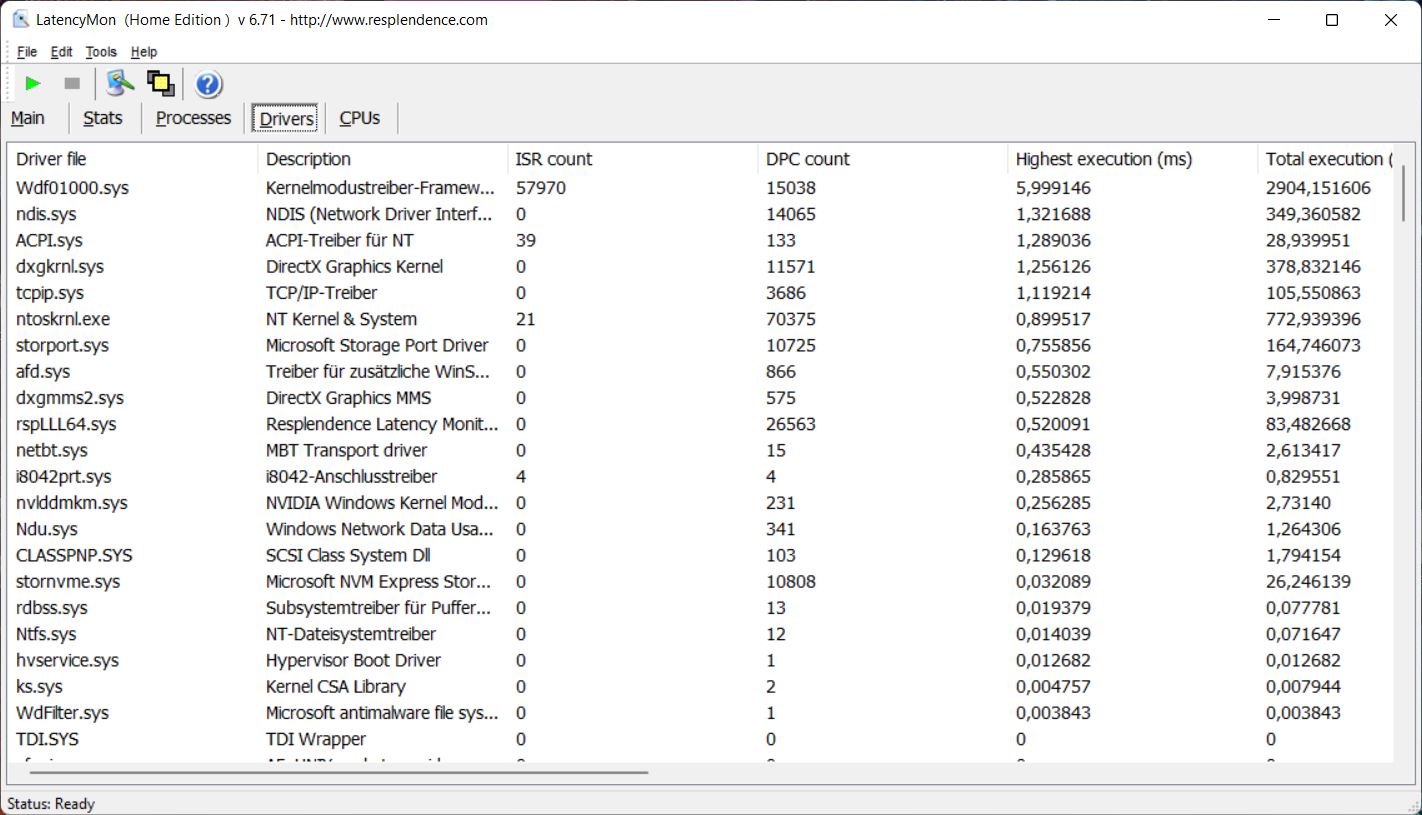
Opóźnienie DPC
Z wersją BIOS-u pod ręką, ZBook wykazuje ograniczenia w naszym teście latencji i dlatego nie nadaje się idealnie do zastosowań audio w czasie rzeczywistym.
| DPC Latencies / LatencyMon - interrupt to process latency (max), Web, Youtube, Prime95 | |
| HP ZBook Firefly 14 G8 2C9Q2EA | |
| Dell Precision 5000 5470 | |
| HP EliteBook 845 G9 6F6H6EA | |
| Lenovo ThinkPad P14s Gen2-20VX000GGE | |
| HP ZBook Firefly 16 G9-6B897EA | |
| HP ZBook Firefly 14 G9-6B8A2EA | |
| Microsoft Surface Laptop Studio i7 RTX 3050 Ti | |
* ... im mniej tym lepiej
Pamięć masowa
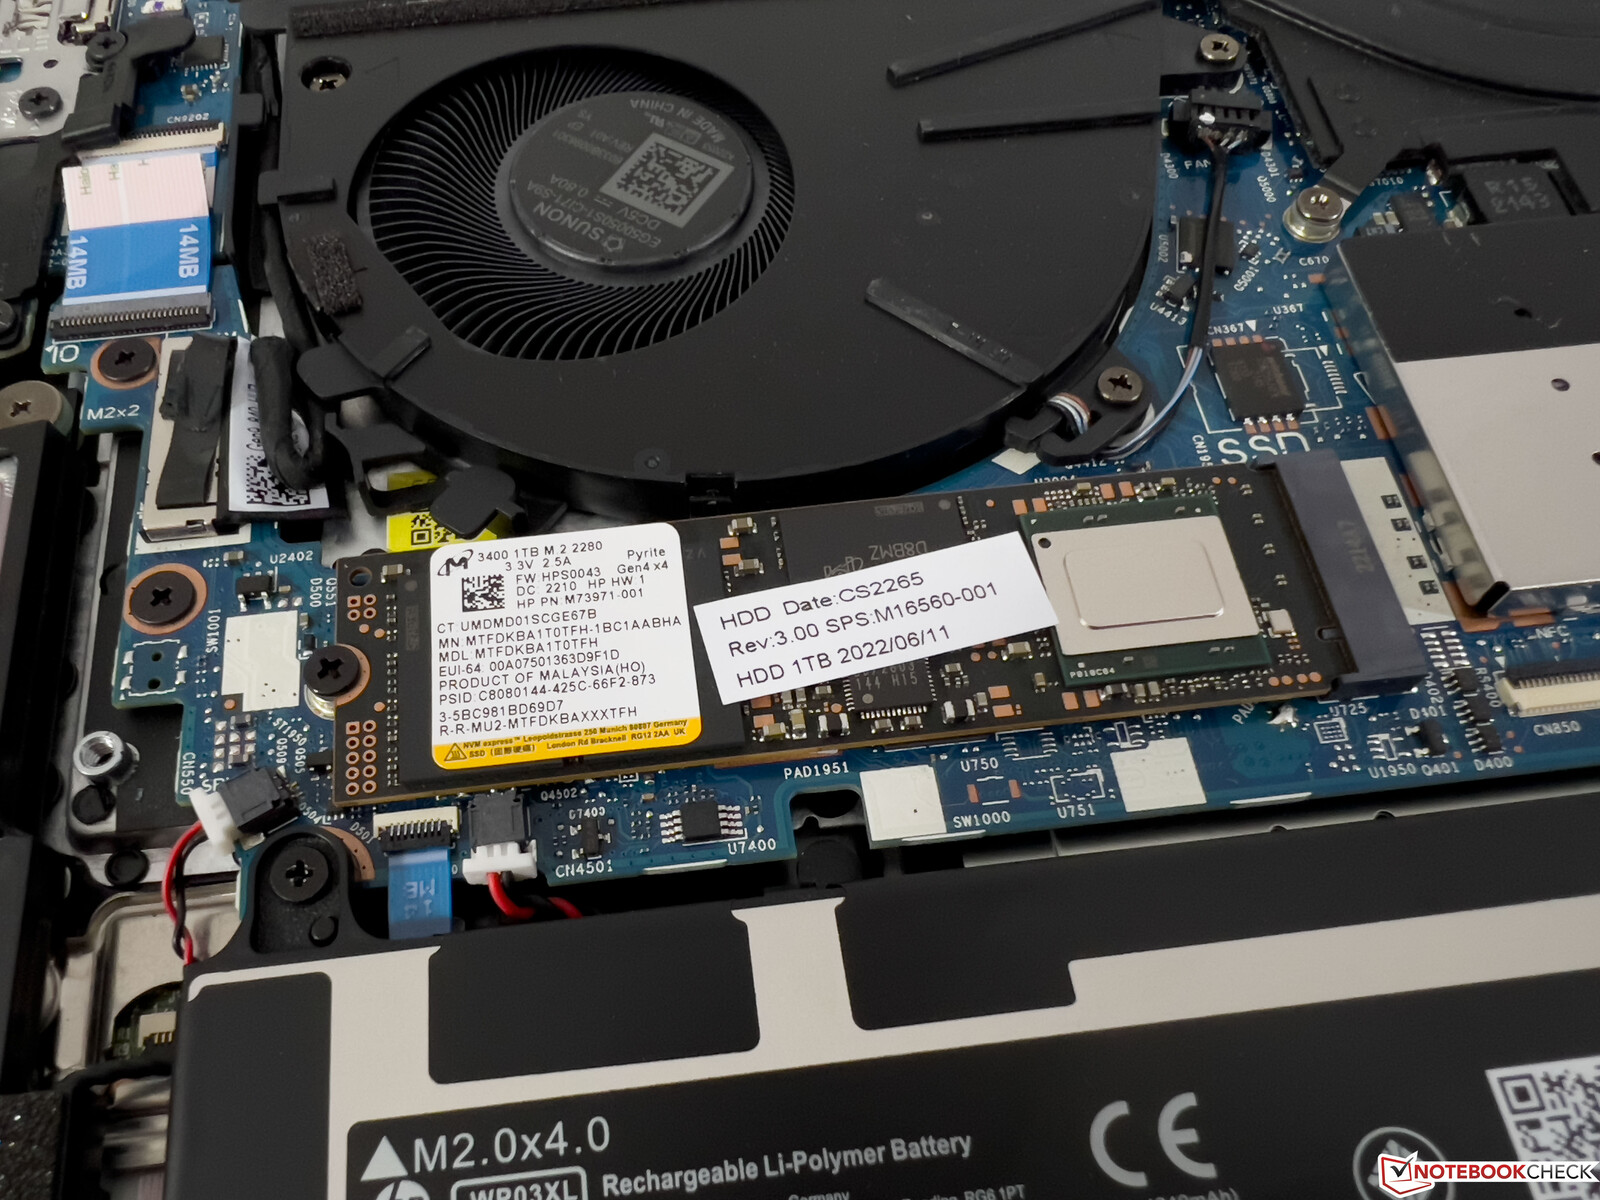
HP instaluje szybki dysk SSD PCIe 4.0 Micron 3400 o pojemności 1 TB, z czego po pierwszym uruchomieniu pozostaje do dyspozycji 885 GB. Transfery na poziomie ponad 6 GB/s to dobra rzecz, ale wahania wydajności występują po kilku minutach podczas stałego obciążenia ze względu na wysokie temperatury.
Kolejne benchmarki dysków SSD są dostępne m.in.tutaj.

| Drive Performance rating - Percent | |
| Średnia w klasie Workstation | |
| Przeciętny Micron 3400 1TB MTFDKBA1T0TFH | |
| Dell Precision 5000 5470 | |
| HP ZBook Firefly 16 G9-6B897EA | |
| Lenovo ThinkPad P14s Gen2-20VX000GGE | |
| HP ZBook Firefly 14 G9-6B8A2EA | |
| HP EliteBook 845 G9 6F6H6EA | |
| Microsoft Surface Laptop Studio i7 RTX 3050 Ti | |
| HP ZBook Firefly 14 G8 2C9Q2EA | |
* ... im mniej tym lepiej
Dauerleistung Lesen: DiskSpd Read Loop, Queue Depth 8
Karta graficzna
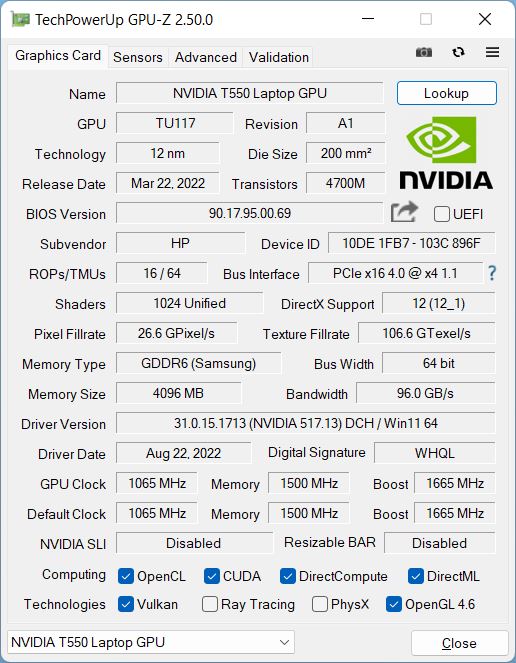
Podobnie jak w przypadku większego Firefly 16 G9, dedykowany Nvidia T550pracuje przy TGP wynoszącym zaledwie 20 W, co jest minimalną wartością, jaką podaje Nvidia (20-60 W). Ponieważ jest to profesjonalne GPU, otrzymujemy zoptymalizowane sterowniki wraz z certyfikatami dla profesjonalnych aplikacji. Dlatego GPU mimo klasyfikacji entry-level nadal ma sens.
Pod względem czystej wydajności nowy T550 nieco rozczarowuje i tylko nieznacznie wyprzedza m.in GPU T500 w starym ZBook Firefly 14 G8. Wydajność pozostaje stabilna pod stałym obciążeniem i w trybie bateryjnym
Więcej benchmarków GPU można znaleźć w naszej sekcji technologicznej.
Wydajność w grach jest również w przedziale podstawowym, ale przynajmniej w nowoczesne tytuły casualowe można często grać rozsądnie z obniżonymi detalami, o ile wymagania nie są zbyt wysokie.
3DMark: 1280x720 Cloud Gate Standard Graphics | 1920x1080 Fire Strike Graphics | 2560x1440 Time Spy Graphics | Wild Life Extreme Unlimited | Wild Life Extreme
| 3DMark Performance rating | |
| Średnia w klasie Workstation | |
| Apple MacBook Pro 14 2021 M1 Pro Entry -3! | |
| Microsoft Surface Laptop Studio i7 RTX 3050 Ti | |
| Dell Precision 5000 5470 -2! | |
| HP ZBook Firefly 16 G9-6B897EA | |
| Przeciętny NVIDIA T550 Laptop GPU | |
| HP ZBook Firefly 14 G9-6B8A2EA | |
| HP ZBook Firefly 14 G8 2C9Q2EA -2! | |
| HP EliteBook 845 G9 6F6H6EA -2! | |
| Lenovo ThinkPad P14s Gen2-20VX000GGE -2! | |
| 3DMark / Cloud Gate Standard Graphics | |
| Średnia w klasie Workstation (58392 - 152418, n=14, ostatnie 2 lata) | |
| Dell Precision 5000 5470 | |
| Microsoft Surface Laptop Studio i7 RTX 3050 Ti | |
| HP ZBook Firefly 16 G9-6B897EA | |
| Przeciętny NVIDIA T550 Laptop GPU (32743 - 33694, n=2) | |
| HP ZBook Firefly 14 G9-6B8A2EA | |
| HP EliteBook 845 G9 6F6H6EA | |
| HP ZBook Firefly 14 G8 2C9Q2EA | |
| Lenovo ThinkPad P14s Gen2-20VX000GGE | |
| 3DMark / Fire Strike Graphics | |
| Średnia w klasie Workstation (8293 - 52560, n=24, ostatnie 2 lata) | |
| Microsoft Surface Laptop Studio i7 RTX 3050 Ti | |
| Dell Precision 5000 5470 | |
| Przeciętny NVIDIA T550 Laptop GPU (4816 - 5593, n=3) | |
| HP ZBook Firefly 16 G9-6B897EA | |
| HP ZBook Firefly 14 G9-6B8A2EA | |
| HP ZBook Firefly 14 G8 2C9Q2EA | |
| Lenovo ThinkPad P14s Gen2-20VX000GGE | |
| HP EliteBook 845 G9 6F6H6EA | |
| 3DMark / Time Spy Graphics | |
| Średnia w klasie Workstation (2725 - 24806, n=24, ostatnie 2 lata) | |
| Microsoft Surface Laptop Studio i7 RTX 3050 Ti | |
| Dell Precision 5000 5470 | |
| Przeciętny NVIDIA T550 Laptop GPU (1882 - 2252, n=3) | |
| HP ZBook Firefly 14 G8 2C9Q2EA | |
| HP ZBook Firefly 16 G9-6B897EA | |
| HP ZBook Firefly 14 G9-6B8A2EA | |
| Lenovo ThinkPad P14s Gen2-20VX000GGE | |
| HP EliteBook 845 G9 6F6H6EA | |
| 3DMark / Wild Life Extreme Unlimited | |
| Średnia w klasie Workstation (n=1ostatnie 2 lata) | |
| Microsoft Surface Laptop Studio i7 RTX 3050 Ti | |
| Apple MacBook Pro 14 2021 M1 Pro Entry | |
| HP ZBook Firefly 16 G9-6B897EA | |
| Przeciętny NVIDIA T550 Laptop GPU (3530 - 3649, n=2) | |
| HP ZBook Firefly 14 G9-6B8A2EA | |
| 3DMark / Wild Life Extreme | |
| Średnia w klasie Workstation (5189 - 30182, n=10, ostatnie 2 lata) | |
| Microsoft Surface Laptop Studio i7 RTX 3050 Ti | |
| Apple MacBook Pro 14 2021 M1 Pro Entry | |
| HP ZBook Firefly 16 G9-6B897EA | |
| Przeciętny NVIDIA T550 Laptop GPU (3617 - 3739, n=2) | |
| HP ZBook Firefly 14 G9-6B8A2EA | |
| 3DMark Cloud Gate Standard Score | 17829 pkt. | |
| 3DMark Fire Strike Score | 4559 pkt. | |
| 3DMark Time Spy Score | 2031 pkt. | |
Pomoc | ||
* ... im mniej tym lepiej
The Witcher 3 FPS chart
| low | med. | high | ultra | |
|---|---|---|---|---|
| GTA V (2015) | 116 | 117.2 | 61.6 | 29 |
| The Witcher 3 (2015) | 121 | 73 | 39 | 19.6 |
| Dota 2 Reborn (2015) | 113.3 | 103.8 | 92.3 | 84 |
| Final Fantasy XV Benchmark (2018) | 60.2 | 30.5 | 22 | |
| X-Plane 11.11 (2018) | 68.1 | 64.1 | 58.8 | |
| Strange Brigade (2018) | 126.1 | 47.7 | 38.7 | 33.2 |
| F1 2021 (2021) | 152.7 | 70.7 | 56.5 | 36.1 |
| F1 22 (2022) | 66.4 | 59.9 | 41.4 | 29.5 |
Emisje i energia
Emisja hałasu
W codziennym użytkowaniu niska wydajność procesora jest zauważalna w zachowaniu wentylatora, gdyż ZBook Firefly 14 G9 pozostaje niezwykle cichy, o ile nie korzysta się z dedykowanego GPU. Nawet przy pełnym obciążeniu procesora wentylator warczy z prędkością poniżej 30 dB(A), a więc jest ledwie słyszalny w normalnym otoczeniu
Kiedy T550 jest również aktywny, wentylator szybko osiąga ~40 dB(A). Nie udało nam się wykryć żadnych innych elektronicznych hałasów.
Hałas
| luz |
| 24.3 / 24.3 / 24.3 dB |
| obciążenie |
| 35.6 / 41 dB |
 | ||
30 dB cichy 40 dB(A) słyszalny 50 dB(A) irytujący |
||
min: | ||
| HP ZBook Firefly 14 G9-6B8A2EA T550 Laptop GPU, i7-1265U, Micron 3400 1TB MTFDKBA1T0TFH | Dell Precision 5000 5470 RTX A1000 Laptop GPU, i9-12900H, Samsung PM9A1 MZVL21T0HCLR | Lenovo ThinkPad P14s Gen2-20VX000GGE T500 Laptop GPU, i7-1185G7, Toshiba XG6 KXG6AZNV1T02 | Microsoft Surface Laptop Studio i7 RTX 3050 Ti GeForce RTX 3050 Ti Laptop GPU, i7-11370H, SK Hynix PC711 1TB HFS001TDE9X084N | Apple MacBook Pro 14 2021 M1 Pro Entry M1 Pro 14-Core GPU, M1 Pro 8-Core, Apple SSD AP0512 | HP ZBook Firefly 14 G8 2C9Q2EA T500 Laptop GPU, i7-1165G7, Toshiba XG6 KXG60ZNV1T02 | HP EliteBook 845 G9 6F6H6EA Radeon 680M, R9 PRO 6950HS, WDC PC SN810 1TB | HP ZBook Firefly 16 G9-6B897EA T550 Laptop GPU, i7-1265U, Samsung PM9A1 MZVL21T0HCLR | |
|---|---|---|---|---|---|---|---|---|
| Noise | -10% | -1% | -4% | 3% | -10% | -6% | -1% | |
| wyłączone / środowisko * (dB) | 24.3 | 23 5% | 24.6 -1% | 24.7 -2% | 24.8 -2% | 28.7 -18% | 25.5 -5% | 23.8 2% |
| Idle Minimum * (dB) | 24.3 | 23.3 4% | 24.6 -1% | 24.7 -2% | 24.8 -2% | 28.7 -18% | 25.5 -5% | 23.8 2% |
| Idle Average * (dB) | 24.3 | 23.3 4% | 24.6 -1% | 24.7 -2% | 24.8 -2% | 28.7 -18% | 25.5 -5% | 23.8 2% |
| Idle Maximum * (dB) | 24.3 | 23.3 4% | 24.6 -1% | 24.7 -2% | 24.8 -2% | 28.7 -18% | 25.5 -5% | 23.8 2% |
| Load Average * (dB) | 35.6 | 48.5 -36% | 38.9 -9% | 33.2 7% | 27.8 22% | 34 4% | 38.1 -7% | 39.4 -11% |
| Witcher 3 ultra * (dB) | 38.2 | 48.6 -27% | 44.5 -16% | 27.8 27% | 40.1 -5% | 40.5 -6% | ||
| Load Maximum * (dB) | 41 | 50.4 -23% | 38.9 5% | 46.7 -14% | 49.5 -21% | 40.1 2% | 44 -7% | 41.4 -1% |
* ... im mniej tym lepiej
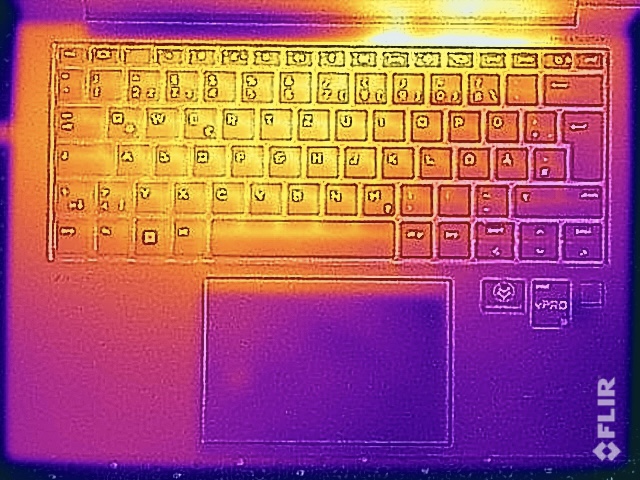
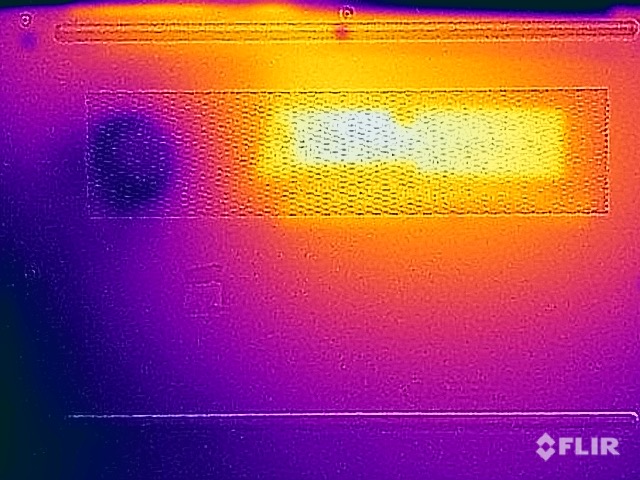
Temperatura
W normalnym użytkowaniu ZBook Firefly 14 G9 nie ma problemów z temperaturami, a powierzchnie pozostają przyjemnie chłodne. Pod pełnym obciążeniem (zwłaszcza z aktywnym GPU) temperatury nie stają się krytyczne, ale niektóre miejsca na spodzie przekraczają 47°C mimo stosunkowo niskiej wydajności.
W teście stresu następuje wtedy typowe zachowanie: CPU natychmiast osiada na poziomie 12 W, a GPU pozostaje stabilne przy 20 W.
(±) Maksymalna temperatura w górnej części wynosi 41.2 °C / 106 F, w porównaniu do średniej 38.2 °C / 101 F , począwszy od 22.2 do 69.8 °C dla klasy Workstation.
(-) Dno nagrzewa się maksymalnie do 47.9 °C / 118 F, w porównaniu do średniej 41.1 °C / 106 F
(+) W stanie bezczynności średnia temperatura górnej części wynosi 25.8 °C / 78 F, w porównaniu ze średnią temperaturą urządzenia wynoszącą 32 °C / ### class_avg_f### F.
(±) Podczas gry w Wiedźmina 3 średnia temperatura górnej części wynosi 32.7 °C / 91 F, w porównaniu do średniej temperatury urządzenia wynoszącej 32 °C / ## #class_avg_f### F.
(+) Podparcia dłoni i touchpad osiągają maksymalną temperaturę skóry (32.1 °C / 89.8 F) i dlatego nie są gorące.
(-) Średnia temperatura obszaru podparcia dłoni w podobnych urządzeniach wynosiła 27.8 °C / 82 F (-4.3 °C / -7.8 F).
| HP ZBook Firefly 14 G9-6B8A2EA Intel Core i7-1265U, NVIDIA T550 Laptop GPU | Dell Precision 5000 5470 Intel Core i9-12900H, NVIDIA RTX A1000 Laptop GPU | Lenovo ThinkPad P14s Gen2-20VX000GGE Intel Core i7-1185G7, NVIDIA T500 Laptop GPU | Microsoft Surface Laptop Studio i7 RTX 3050 Ti Intel Core i7-11370H, NVIDIA GeForce RTX 3050 Ti Laptop GPU | Apple MacBook Pro 14 2021 M1 Pro Entry Apple M1 Pro 8-Core, Apple M1 Pro 14-Core GPU | HP ZBook Firefly 14 G8 2C9Q2EA Intel Core i7-1165G7, NVIDIA T500 Laptop GPU | HP EliteBook 845 G9 6F6H6EA AMD Ryzen 9 PRO 6950HS, AMD Radeon 680M | |
|---|---|---|---|---|---|---|---|
| Heat | -8% | -12% | 11% | 5% | 3% | -13% | |
| Maximum Upper Side * (°C) | 41.2 | 41.8 -1% | 52.4 -27% | 42.3 -3% | 46.8 -14% | 42.6 -3% | 49.4 -20% |
| Maximum Bottom * (°C) | 47.9 | 36 25% | 63.7 -33% | 38.2 20% | 40.9 15% | 49.4 -3% | 48 -0% |
| Idle Upper Side * (°C) | 26.5 | 34.6 -31% | 24.6 7% | 23.4 12% | 24.2 9% | 24.2 9% | 30.8 -16% |
| Idle Bottom * (°C) | 27 | 33.6 -24% | 26 4% | 23.5 13% | 24.2 10% | 24.6 9% | 31.4 -16% |
* ... im mniej tym lepiej
Głośniki
Dwa głośniki stereo oferują przyzwoite brzmienie - jedynie basy są bardzo słabe i dźwięk przez to nie wydaje się zbyt mocny. Głośniki nadają się jednak bardzo dobrze do prowadzenia konferencji i odtwarzania głosu.
HP ZBook Firefly 14 G9-6B8A2EA analiza dźwięku
(+) | głośniki mogą odtwarzać stosunkowo głośno (84.5 dB)
Bas 100 - 315 Hz
(-) | prawie brak basu - średnio 19.6% niższa od mediany
(±) | liniowość basu jest średnia (13% delta do poprzedniej częstotliwości)
Średnie 400 - 2000 Hz
(+) | zbalansowane środki średnie - tylko 2.5% od mediany
(+) | średnie są liniowe (3.5% delta do poprzedniej częstotliwości)
Wysokie 2–16 kHz
(+) | zrównoważone maksima - tylko 1.9% od mediany
(+) | wzloty są liniowe (3.2% delta do poprzedniej częstotliwości)
Ogólnie 100 - 16.000 Hz
(+) | ogólny dźwięk jest liniowy (12.7% różnicy w stosunku do mediany)
W porównaniu do tej samej klasy
» 21% wszystkich testowanych urządzeń w tej klasie było lepszych, 4% podobnych, 74% gorszych
» Najlepszy miał deltę 7%, średnia wynosiła ###średnia###%, najgorsza wynosiła 35%
W porównaniu do wszystkich testowanych urządzeń
» 12% wszystkich testowanych urządzeń było lepszych, 3% podobnych, 86% gorszych
» Najlepszy miał deltę 4%, średnia wynosiła ###średnia###%, najgorsza wynosiła 134%
Apple MacBook Pro 14 2021 M1 Pro Entry analiza dźwięku
(+) | głośniki mogą odtwarzać stosunkowo głośno (84.9 dB)
Bas 100 - 315 Hz
(+) | dobry bas - tylko 4.3% od mediany
(+) | bas jest liniowy (5.9% delta do poprzedniej częstotliwości)
Średnie 400 - 2000 Hz
(+) | zbalansowane środki średnie - tylko 1.1% od mediany
(+) | średnie są liniowe (1.9% delta do poprzedniej częstotliwości)
Wysokie 2–16 kHz
(+) | zrównoważone maksima - tylko 2.9% od mediany
(+) | wzloty są liniowe (3% delta do poprzedniej częstotliwości)
Ogólnie 100 - 16.000 Hz
(+) | ogólny dźwięk jest liniowy (5.6% różnicy w stosunku do mediany)
W porównaniu do tej samej klasy
» 2% wszystkich testowanych urządzeń w tej klasie było lepszych, 1% podobnych, 97% gorszych
» Najlepszy miał deltę 5%, średnia wynosiła ###średnia###%, najgorsza wynosiła 45%
W porównaniu do wszystkich testowanych urządzeń
» 0% wszystkich testowanych urządzeń było lepszych, 0% podobnych, 100% gorszych
» Najlepszy miał deltę 4%, średnia wynosiła ###średnia###%, najgorsza wynosiła 134%
Zużycie energii
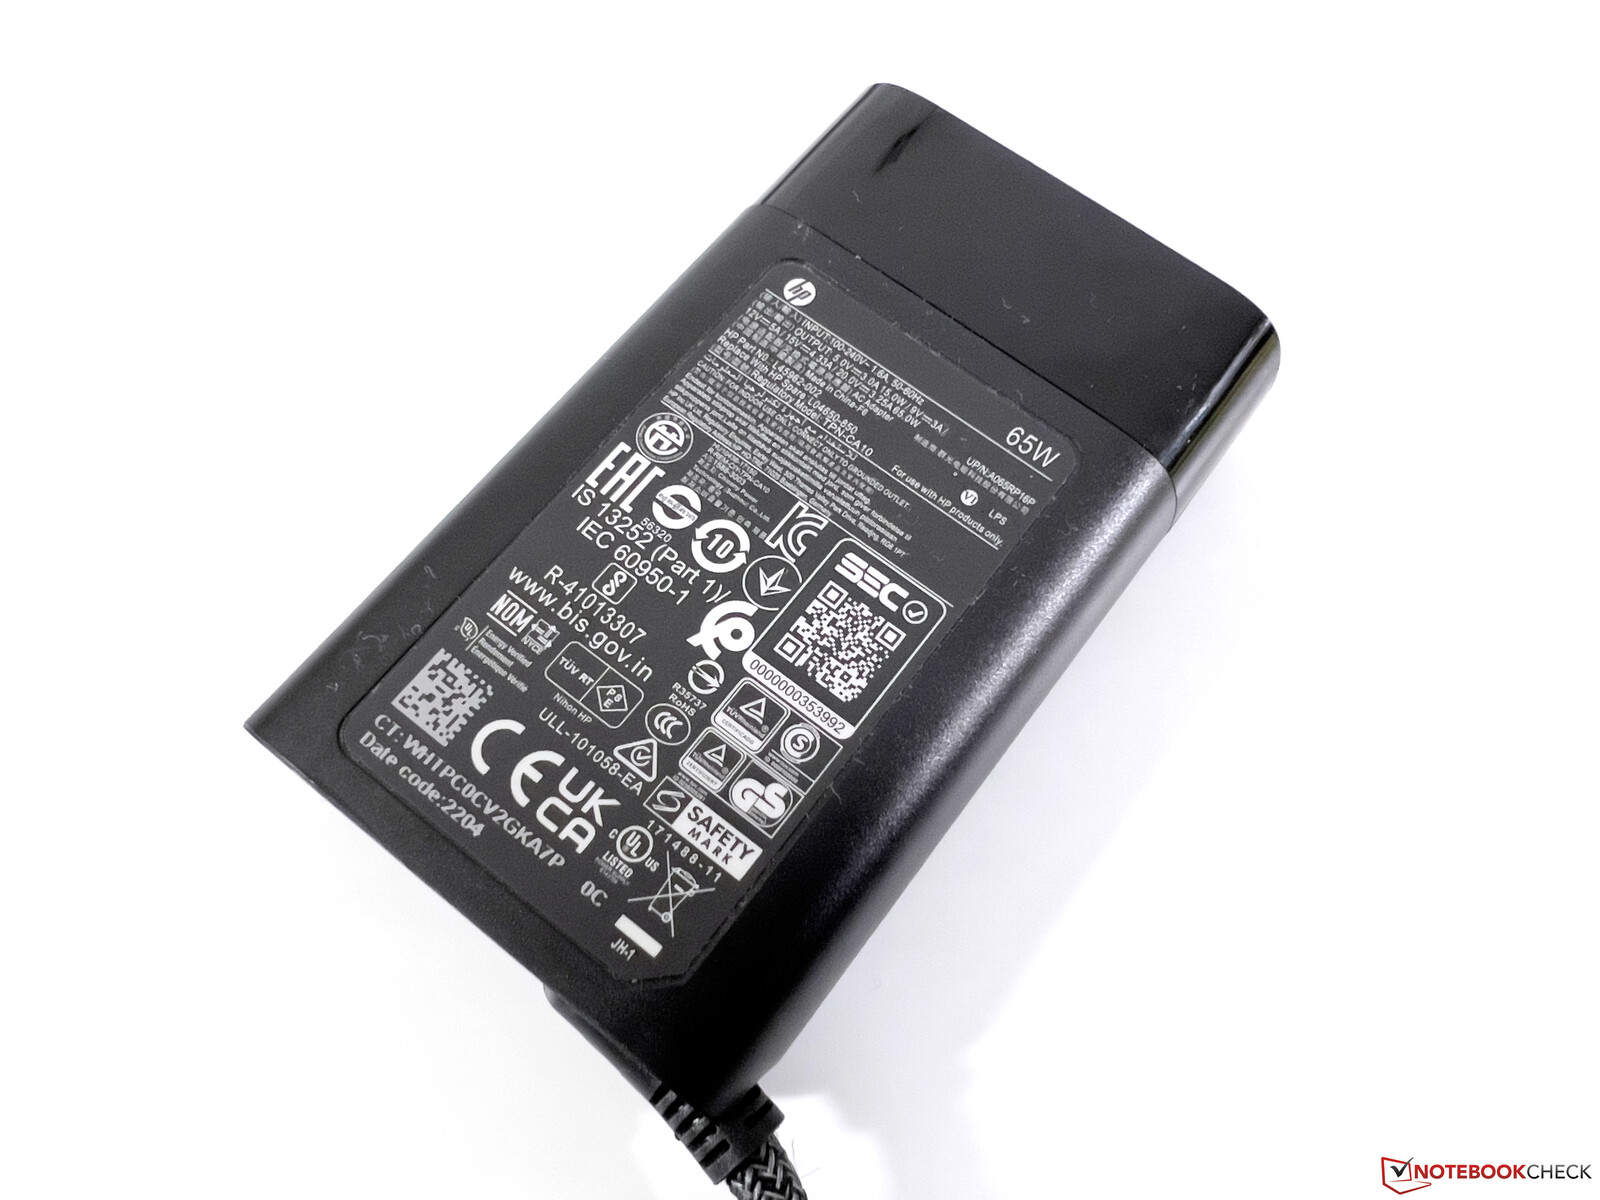
Ogólnie rzecz biorąc, ZBook Firefly 14 G9 to bardzo wydajny laptop, choć efekty niskiej wydajności są zauważalne pod obciążeniem. W teście obciążeniowym osiąga on na bardzo krótko 68 W, ale zużycie natychmiast osiada na poziomie ~45 W i utrzymuje się na tym poziomie. Dołączony do zestawu zasilacz o mocy 65 W jest więc wystarczający.
| wyłączony / stan wstrzymania | |
| luz | |
| obciążenie |
|
Legenda:
min: | |
Power consumption - The Witcher 3 / Stress test
Power consumption - External monitor
Żywotność baterii
Dzięki akumulatorowi o pojemności 51 Whr ZBook Firefly 14 G9 oferuje przyzwoity czas pracy - prawie 9 godzin w naszym teście WLAN przy 150 cd/m² (co odpowiada 63% maksymalnej jasności); i ~7,5 godziny przy pełnej jasności ekranu. Rywale oferują jednak większą wytrzymałość z wyjątkiem Surface Studio - nawet stary ZBook Firefly 14 G8 wytrzymywał znacznie dłużej.
Pełne naładowanie trwa 140 minut, gdy urządzenie jest włączone, a 80% ładunku jest dostępne po 72 minutach. Nie ma funkcji szybkiego ładowania.
| HP ZBook Firefly 14 G9-6B8A2EA i7-1265U, T550 Laptop GPU, 51 Wh | Dell Precision 5000 5470 i9-12900H, RTX A1000 Laptop GPU, 72 Wh | Lenovo ThinkPad P14s Gen2-20VX000GGE i7-1185G7, T500 Laptop GPU, 50 Wh | Microsoft Surface Laptop Studio i7 RTX 3050 Ti i7-11370H, GeForce RTX 3050 Ti Laptop GPU, 58 Wh | Apple MacBook Pro 14 2021 M1 Pro Entry M1 Pro 8-Core, M1 Pro 14-Core GPU, 69.9 Wh | HP ZBook Firefly 14 G8 2C9Q2EA i7-1165G7, T500 Laptop GPU, 53 Wh | HP EliteBook 845 G9 6F6H6EA R9 PRO 6950HS, Radeon 680M, 51 Wh | Średnia w klasie Workstation | |
|---|---|---|---|---|---|---|---|---|
| Czasy pracy | ||||||||
| WiFi v1.3 (h) | 8.8 | 9.6 9% | 9.2 5% | 8 -9% | 13.6 55% | 12.8 45% | 9.3 6% | 8.52 ? -3% |
Za
Przeciw
Werdykt: ZBook Firefly 14 jest zbyt wolny
Nasze wnioski dotyczące ZBooka Firefly 14 G9 w zasadzie pokrywają się z wnioskami dotyczącymi większego Firefly 16 G9ponieważ jest to dobry notebook w wielu dziedzinach. Aspekty takie jak obudowa, wyświetlacz, wyposażenie i urządzenia wejściowe są dość przekonujące, ale w mobilnej stacji roboczej liczy się przede wszystkim wydajność
Zwłaszcza procesor nie spełnia tego wymogu, a nowy Firefly 14 G9 jest też wolniejszy od swojego poprzednika z procesorem Tiger Lake. Dedykowany Nvidia T550karta graficzna ma sens w zastosowaniach profesjonalnych, ale jest to też najwolniejsza wersja z TGP wynoszącym zaledwie 20 W
HP ZBook Firefly 14 G9 może przekonać w wielu obszarach, ale wydajność jest po prostu zbyt niska jak na mobilną stację roboczą
Jeśli ktoś potrzebuje większej mocy procesora, powinien zwrócić uwagę na normalny wariant biznesowy HP EliteBook 845 G9 który jest wyposażony w 35 W procesor od AMD, a jednocześnie unika panelu SureView.
Uwaga: Obecnie jesteśmy w kontakcie z HP w sprawie niskiej wydajności procesora i zaktualizujemy odpowiednio artykuł, gdy tylko otrzymamy nowe informacje.
Cena i dostępność
ZBook Firefly 14 G9 można skonfigurować bezpośrednio w HP bezpośrednio. Alternatywnie, nasza konfiguracja testowa jest również dostępna w sklepach internetowych, takich jak Cyberport za około 2 100 € (~2 075 USD).
HP ZBook Firefly 14 G9-6B8A2EA
- 19/10/2022 v7 (old)
Andreas Osthoff
Price comparison
