Laptop HP ZBook Firefly 14 G9 w recenzji - mobilna stacja robocza z większą wydajnością po aktualizacjach
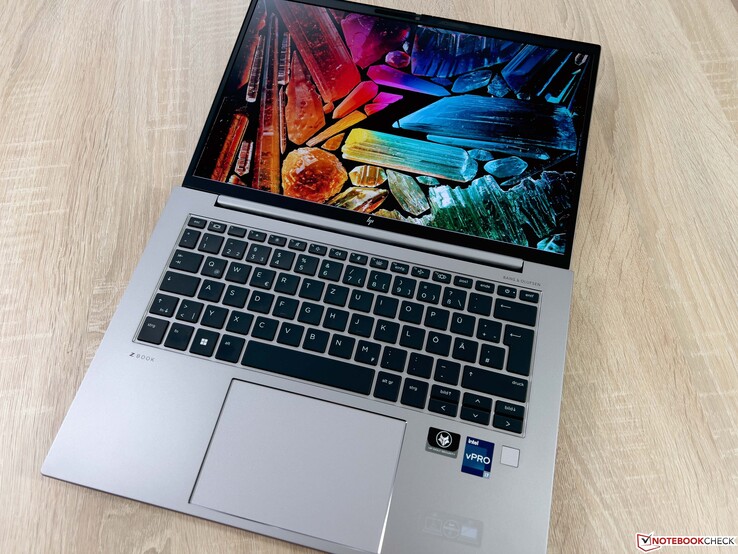
Po naszej pierwotnej recenzji obecnego HP ZBook Firefly 14 G9 z rozczarowującymi wskaźnikami wydajności, producent poprawił wydajność za pomocą aktualizacji. Jednak kolejne aktualizacje, w tym BIOS w wersji 01.04.10, ponownie pogorszyły nieco wydajność procesora. Oznacza to dla nas sporo dodatkowej pracy podczas testów, a sytuacja ta jest również problematyczna dla klientów, ponieważ nigdy nie wiadomo, jak potoczą się losy wydajności po kolejnej aktualizacji.
W poniższym artykule skupimy się na wpływie aktualizacji na wydajność CPU i GPU oraz jak wzrost wydajności wpływa na temperatury powierzchni pod obciążeniem i zachowanie wentylatorów. Wszystkie pozostałe informacje można znaleźć w naszej oryginalnej recenzji ZBook Firefly 14 G9.
Wydajność - CPU i GPU są teraz szybsze
W naszej oryginalnej recenzji ZBook Firefly 14 G9 (a także większego ZBook Firefly 16 G9 z identycznym chłodzeniem) byliśmy zaskoczeni niskimi limitami mocy podzespołów, gdyż Core i7-1265U miał prawo pobierać tylko 12 W po krótkim szczycie 25 W, a Nvidia T550 zaledwie 20 W. Oczywiście miało to ogromny wpływ na wydajność, a HP również było zaskoczone wynikami, co doprowadziło do pewnych aktualizacji ze strony producenta.
Karta graficzna może teraz pobierać 30 zamiast 20 watów, a limity mocy dla procesora zostały podniesione do 33/51 watów. Te wartości również udało się osiągnąć, ale HP przy kolejnych aktualizacjach znów minimalnie obniżyło wydajność. Teoretycznie wartości 33/51 W są nadal aktualne, ale wartość ta nie jest już stabilna.
Procesor - Core i7-1265U
Ze względu na zwiększone limity mocy Core i7-1265U w ZBooku jest teraz dużo bardziej konkurencyjny niż w przypadku starych ustawień, zwłaszcza pod krótkotrwałym obciążeniem, a do tego dochodzi jeszcze wyraźna przewaga nad starym modelem. Dzięki zwiększonym limitom mocy Firefly 14 ma teraz także dostęp do pełnej mocy pojedynczych rdzeni wydajnościowych, co w przypadku Core i7-1265U wymaga około 21 W przy taktowaniu 4,6-4,7 GHz. Sytuacja nie wygląda jednak do końca dobrze, ponieważ zegary wahają się podczas obciążenia wielordzeniowego i wolelibyśmy tutaj stały poziom. Trzeba po prostu powiedzieć, że wysokie limity mocy szybko prowadzą do bardzo wysokich temperatur układu, z którymi najpierw musi sobie poradzić chłodzenie. To, że Intel pozwala na maksymalny pobór 51 W w procesorach z serii U, nie zawsze ma sens ustawianie limitów wyżej.
Cinebench R15 Multi loop
Jednocześnie trzeba jasno powiedzieć, że obecne procesory AMD jak np Ryzen 7 Pro 6850U w HP EliteBook 865 G9 oferują znacznie bardziej spójne, a także lepsze wyniki w obciążeniach wielordzeniowych przy 25 W. Intel ma przewagę dzięki rdzeniom wydajnościowym w trybie jednordzeniowym, ale potrzebuje też więcej mocy.
W trybie bateryjnym procesor może pobierać 30 W przez pierwsze 10 sekund w testach wielordzeniowych, a potem spada do 15 W. W trybie jednordzeniowym jest to 17 W, a później już tylko 15 W, więc pełna wydajność również nie jest tu dostępna. Dalsze benchmarki CPU są dostępne w naszym dziale technologicznym.
Cinebench R23: Multi Core | Single Core
Cinebench R20: CPU (Multi Core) | CPU (Single Core)
Cinebench R15: CPU Multi 64Bit | CPU Single 64Bit
Blender: v2.79 BMW27 CPU
7-Zip 18.03: 7z b 4 | 7z b 4 -mmt1
Geekbench 5.5: Multi-Core | Single-Core
HWBOT x265 Benchmark v2.2: 4k Preset
LibreOffice : 20 Documents To PDF
R Benchmark 2.5: Overall mean
| CPU Performance rating | |
| Średnia w klasie Workstation | |
| Dell Precision 5000 5470 | |
| Apple MacBook Pro 14 2021 M1 Pro Entry -8! | |
| HP ZBook Firefly 14 G9-6B8A2EA | |
| HP EliteBook 865 G9 | |
| Przeciętny Intel Core i7-1265U | |
| Lenovo ThinkPad P14s Gen2-20VX000GGE | |
| HP ZBook Firefly 14 G9-6B8A2EA | |
| HP ZBook Firefly 14 G8 2C9Q2EA -2! | |
| Cinebench R23 / Multi Core | |
| Średnia w klasie Workstation (14055 - 38520, n=25, ostatnie 2 lata) | |
| Dell Precision 5000 5470 | |
| HP EliteBook 865 G9 | |
| Apple MacBook Pro 14 2021 M1 Pro Entry | |
| HP ZBook Firefly 14 G9-6B8A2EA | |
| Przeciętny Intel Core i7-1265U (4332 - 9219, n=10) | |
| Lenovo ThinkPad P14s Gen2-20VX000GGE | |
| HP ZBook Firefly 14 G9-6B8A2EA | |
| Cinebench R23 / Single Core | |
| Średnia w klasie Workstation (1712 - 2228, n=25, ostatnie 2 lata) | |
| Dell Precision 5000 5470 | |
| HP ZBook Firefly 14 G9-6B8A2EA | |
| Przeciętny Intel Core i7-1265U (1144 - 1820, n=10) | |
| Apple MacBook Pro 14 2021 M1 Pro Entry | |
| Lenovo ThinkPad P14s Gen2-20VX000GGE | |
| HP ZBook Firefly 14 G9-6B8A2EA | |
| HP EliteBook 865 G9 | |
| Cinebench R20 / CPU (Multi Core) | |
| Średnia w klasie Workstation (5471 - 15043, n=25, ostatnie 2 lata) | |
| Dell Precision 5000 5470 | |
| HP EliteBook 865 G9 | |
| HP ZBook Firefly 14 G9-6B8A2EA | |
| Przeciętny Intel Core i7-1265U (1669 - 3584, n=10) | |
| Lenovo ThinkPad P14s Gen2-20VX000GGE | |
| HP ZBook Firefly 14 G8 2C9Q2EA | |
| HP ZBook Firefly 14 G9-6B8A2EA | |
| Cinebench R20 / CPU (Single Core) | |
| Średnia w klasie Workstation (671 - 857, n=25, ostatnie 2 lata) | |
| Dell Precision 5000 5470 | |
| HP ZBook Firefly 14 G9-6B8A2EA | |
| Przeciętny Intel Core i7-1265U (528 - 701, n=10) | |
| HP EliteBook 865 G9 | |
| HP ZBook Firefly 14 G8 2C9Q2EA | |
| Lenovo ThinkPad P14s Gen2-20VX000GGE | |
| HP ZBook Firefly 14 G9-6B8A2EA | |
| Cinebench R15 / CPU Multi 64Bit | |
| Średnia w klasie Workstation (2489 - 5810, n=25, ostatnie 2 lata) | |
| Dell Precision 5000 5470 | |
| HP EliteBook 865 G9 | |
| HP ZBook Firefly 14 G9-6B8A2EA | |
| Apple MacBook Pro 14 2021 M1 Pro Entry | |
| Przeciętny Intel Core i7-1265U (706 - 1572, n=10) | |
| Lenovo ThinkPad P14s Gen2-20VX000GGE | |
| HP ZBook Firefly 14 G8 2C9Q2EA | |
| HP ZBook Firefly 14 G9-6B8A2EA | |
| Cinebench R15 / CPU Single 64Bit | |
| Średnia w klasie Workstation (191.4 - 328, n=25, ostatnie 2 lata) | |
| HP ZBook Firefly 14 G9-6B8A2EA | |
| Dell Precision 5000 5470 | |
| HP EliteBook 865 G9 | |
| Przeciętny Intel Core i7-1265U (165.3 - 260, n=10) | |
| HP ZBook Firefly 14 G8 2C9Q2EA | |
| HP ZBook Firefly 14 G9-6B8A2EA | |
| Lenovo ThinkPad P14s Gen2-20VX000GGE | |
| Apple MacBook Pro 14 2021 M1 Pro Entry | |
| Blender / v2.79 BMW27 CPU | |
| HP ZBook Firefly 14 G9-6B8A2EA | |
| Lenovo ThinkPad P14s Gen2-20VX000GGE | |
| HP ZBook Firefly 14 G8 2C9Q2EA | |
| Przeciętny Intel Core i7-1265U (364 - 684, n=10) | |
| HP ZBook Firefly 14 G9-6B8A2EA | |
| HP EliteBook 865 G9 | |
| Dell Precision 5000 5470 | |
| Średnia w klasie Workstation (91 - 261, n=25, ostatnie 2 lata) | |
| 7-Zip 18.03 / 7z b 4 | |
| Średnia w klasie Workstation (54741 - 116969, n=25, ostatnie 2 lata) | |
| Dell Precision 5000 5470 | |
| HP EliteBook 865 G9 | |
| HP ZBook Firefly 14 G9-6B8A2EA | |
| Przeciętny Intel Core i7-1265U (20087 - 38715, n=10) | |
| HP ZBook Firefly 14 G8 2C9Q2EA | |
| HP ZBook Firefly 14 G9-6B8A2EA | |
| Lenovo ThinkPad P14s Gen2-20VX000GGE | |
| 7-Zip 18.03 / 7z b 4 -mmt1 | |
| Średnia w klasie Workstation (5126 - 6960, n=25, ostatnie 2 lata) | |
| HP ZBook Firefly 14 G9-6B8A2EA | |
| HP EliteBook 865 G9 | |
| Lenovo ThinkPad P14s Gen2-20VX000GGE | |
| Dell Precision 5000 5470 | |
| HP ZBook Firefly 14 G8 2C9Q2EA | |
| Przeciętny Intel Core i7-1265U (4614 - 5617, n=10) | |
| HP ZBook Firefly 14 G9-6B8A2EA | |
| Geekbench 5.5 / Multi-Core | |
| Średnia w klasie Workstation (11542 - 25554, n=25, ostatnie 2 lata) | |
| Dell Precision 5000 5470 | |
| Apple MacBook Pro 14 2021 M1 Pro Entry | |
| HP ZBook Firefly 14 G9-6B8A2EA | |
| Przeciętny Intel Core i7-1265U (5022 - 8981, n=10) | |
| HP EliteBook 865 G9 | |
| HP ZBook Firefly 14 G9-6B8A2EA | |
| Lenovo ThinkPad P14s Gen2-20VX000GGE | |
| HP ZBook Firefly 14 G8 2C9Q2EA | |
| Geekbench 5.5 / Single-Core | |
| Średnia w klasie Workstation (1781 - 2183, n=25, ostatnie 2 lata) | |
| HP ZBook Firefly 14 G9-6B8A2EA | |
| Dell Precision 5000 5470 | |
| Apple MacBook Pro 14 2021 M1 Pro Entry | |
| HP ZBook Firefly 14 G9-6B8A2EA | |
| Przeciętny Intel Core i7-1265U (1429 - 1806, n=10) | |
| Lenovo ThinkPad P14s Gen2-20VX000GGE | |
| HP ZBook Firefly 14 G8 2C9Q2EA | |
| HP EliteBook 865 G9 | |
| HWBOT x265 Benchmark v2.2 / 4k Preset | |
| Średnia w klasie Workstation (14.4 - 40.5, n=25, ostatnie 2 lata) | |
| Dell Precision 5000 5470 | |
| HP EliteBook 865 G9 | |
| HP ZBook Firefly 14 G9-6B8A2EA | |
| Przeciętny Intel Core i7-1265U (5.09 - 10.6, n=10) | |
| Lenovo ThinkPad P14s Gen2-20VX000GGE | |
| HP ZBook Firefly 14 G8 2C9Q2EA | |
| HP ZBook Firefly 14 G9-6B8A2EA | |
| LibreOffice / 20 Documents To PDF | |
| HP EliteBook 865 G9 | |
| HP ZBook Firefly 14 G8 2C9Q2EA | |
| Przeciętny Intel Core i7-1265U (44 - 61.6, n=10) | |
| Średnia w klasie Workstation (37.1 - 74.7, n=25, ostatnie 2 lata) | |
| HP ZBook Firefly 14 G9-6B8A2EA | |
| Dell Precision 5000 5470 | |
| HP ZBook Firefly 14 G9-6B8A2EA | |
| Lenovo ThinkPad P14s Gen2-20VX000GGE | |
| R Benchmark 2.5 / Overall mean | |
| HP ZBook Firefly 14 G8 2C9Q2EA | |
| Lenovo ThinkPad P14s Gen2-20VX000GGE | |
| HP ZBook Firefly 14 G9-6B8A2EA | |
| HP EliteBook 865 G9 | |
| Przeciętny Intel Core i7-1265U (0.4666 - 0.578, n=10) | |
| HP ZBook Firefly 14 G9-6B8A2EA | |
| Dell Precision 5000 5470 | |
| Średnia w klasie Workstation (0.3825 - 0.603, n=25, ostatnie 2 lata) | |
* ... im mniej tym lepiej
AIDA64: FP32 Ray-Trace | FPU Julia | CPU SHA3 | CPU Queen | FPU SinJulia | FPU Mandel | CPU AES | CPU ZLib | FP64 Ray-Trace | CPU PhotoWorxx
| Performance rating | |
| Średnia w klasie Workstation | |
| Dell Precision 5000 5470 | |
| HP EliteBook 865 G9 | |
| HP ZBook Firefly 14 G9-6B8A2EA | |
| Przeciętny Intel Core i7-1265U | |
| HP ZBook Firefly 14 G8 2C9Q2EA | |
| HP ZBook Firefly 14 G9-6B8A2EA | |
| AIDA64 / FP32 Ray-Trace | |
| Średnia w klasie Workstation (10658 - 61611, n=25, ostatnie 2 lata) | |
| Dell Precision 5000 5470 | |
| HP EliteBook 865 G9 | |
| HP ZBook Firefly 14 G9-6B8A2EA | |
| HP ZBook Firefly 14 G8 2C9Q2EA | |
| Przeciętny Intel Core i7-1265U (2619 - 8178, n=10) | |
| HP ZBook Firefly 14 G9-6B8A2EA | |
| AIDA64 / FPU Julia | |
| Średnia w klasie Workstation (56664 - 186971, n=25, ostatnie 2 lata) | |
| HP EliteBook 865 G9 | |
| Dell Precision 5000 5470 | |
| HP ZBook Firefly 14 G9-6B8A2EA | |
| Przeciętny Intel Core i7-1265U (12909 - 41649, n=10) | |
| HP ZBook Firefly 14 G8 2C9Q2EA | |
| HP ZBook Firefly 14 G9-6B8A2EA | |
| AIDA64 / CPU SHA3 | |
| Średnia w klasie Workstation (2608 - 8975, n=25, ostatnie 2 lata) | |
| Dell Precision 5000 5470 | |
| HP EliteBook 865 G9 | |
| HP ZBook Firefly 14 G9-6B8A2EA | |
| HP ZBook Firefly 14 G8 2C9Q2EA | |
| Przeciętny Intel Core i7-1265U (824 - 2183, n=10) | |
| HP ZBook Firefly 14 G9-6B8A2EA | |
| AIDA64 / CPU Queen | |
| Dell Precision 5000 5470 | |
| Średnia w klasie Workstation (60778 - 144411, n=25, ostatnie 2 lata) | |
| HP EliteBook 865 G9 | |
| HP ZBook Firefly 14 G9-6B8A2EA | |
| HP ZBook Firefly 14 G9-6B8A2EA | |
| Przeciętny Intel Core i7-1265U (63615 - 67065, n=10) | |
| HP ZBook Firefly 14 G8 2C9Q2EA | |
| AIDA64 / FPU SinJulia | |
| Średnia w klasie Workstation (8165 - 29343, n=25, ostatnie 2 lata) | |
| HP EliteBook 865 G9 | |
| Dell Precision 5000 5470 | |
| HP ZBook Firefly 14 G9-6B8A2EA | |
| HP ZBook Firefly 14 G8 2C9Q2EA | |
| Przeciętny Intel Core i7-1265U (3105 - 5135, n=10) | |
| HP ZBook Firefly 14 G9-6B8A2EA | |
| AIDA64 / FPU Mandel | |
| Średnia w klasie Workstation (27301 - 98153, n=25, ostatnie 2 lata) | |
| HP EliteBook 865 G9 | |
| Dell Precision 5000 5470 | |
| HP ZBook Firefly 14 G9-6B8A2EA | |
| HP ZBook Firefly 14 G8 2C9Q2EA | |
| Przeciętny Intel Core i7-1265U (6967 - 20804, n=10) | |
| HP ZBook Firefly 14 G9-6B8A2EA | |
| AIDA64 / CPU AES | |
| Średnia w klasie Workstation (56077 - 187841, n=25, ostatnie 2 lata) | |
| HP ZBook Firefly 14 G8 2C9Q2EA | |
| HP EliteBook 865 G9 | |
| HP ZBook Firefly 14 G9-6B8A2EA | |
| Dell Precision 5000 5470 | |
| Przeciętny Intel Core i7-1265U (19489 - 42966, n=10) | |
| HP ZBook Firefly 14 G9-6B8A2EA | |
| AIDA64 / CPU ZLib | |
| Średnia w klasie Workstation (742 - 2148, n=25, ostatnie 2 lata) | |
| HP EliteBook 865 G9 | |
| HP ZBook Firefly 14 G9-6B8A2EA | |
| Przeciętny Intel Core i7-1265U (314 - 632, n=10) | |
| Dell Precision 5000 5470 | |
| HP ZBook Firefly 14 G8 2C9Q2EA | |
| HP ZBook Firefly 14 G9-6B8A2EA | |
| AIDA64 / FP64 Ray-Trace | |
| Średnia w klasie Workstation (5580 - 32891, n=25, ostatnie 2 lata) | |
| Dell Precision 5000 5470 | |
| HP EliteBook 865 G9 | |
| HP ZBook Firefly 14 G9-6B8A2EA | |
| HP ZBook Firefly 14 G8 2C9Q2EA | |
| Przeciętny Intel Core i7-1265U (1473 - 4376, n=10) | |
| HP ZBook Firefly 14 G9-6B8A2EA | |
| AIDA64 / CPU PhotoWorxx | |
| Średnia w klasie Workstation (37151 - 93684, n=25, ostatnie 2 lata) | |
| Dell Precision 5000 5470 | |
| HP ZBook Firefly 14 G9-6B8A2EA | |
| Przeciętny Intel Core i7-1265U (20213 - 47031, n=10) | |
| HP ZBook Firefly 14 G9-6B8A2EA | |
| HP ZBook Firefly 14 G8 2C9Q2EA | |
| HP EliteBook 865 G9 | |
Wydajność systemu
Subiektywnie nie widać wyższej wydajności w codziennych scenariuszach, ale w syntetycznym benchmarku PCMark 10 wydajność jest już o 13% lepsza.
CrossMark: Overall | Productivity | Creativity | Responsiveness
| PCMark 10 / Score | |
| Średnia w klasie Workstation (6436 - 10409, n=21, ostatnie 2 lata) | |
| Dell Precision 5000 5470 | |
| HP ZBook Firefly 14 G9-6B8A2EA | |
| HP EliteBook 865 G9 | |
| Przeciętny Intel Core i7-1265U, NVIDIA T550 Laptop GPU (5488 - 6181, n=3) | |
| Lenovo ThinkPad P14s Gen2-20VX000GGE | |
| HP ZBook Firefly 14 G9-6B8A2EA | |
| HP ZBook Firefly 14 G8 2C9Q2EA | |
| PCMark 10 / Essentials | |
| Dell Precision 5000 5470 | |
| Średnia w klasie Workstation (9622 - 11157, n=21, ostatnie 2 lata) | |
| Przeciętny Intel Core i7-1265U, NVIDIA T550 Laptop GPU (9960 - 10250, n=3) | |
| HP ZBook Firefly 14 G9-6B8A2EA | |
| HP ZBook Firefly 14 G9-6B8A2EA | |
| Lenovo ThinkPad P14s Gen2-20VX000GGE | |
| HP EliteBook 865 G9 | |
| HP ZBook Firefly 14 G8 2C9Q2EA | |
| PCMark 10 / Productivity | |
| Średnia w klasie Workstation (8789 - 20616, n=21, ostatnie 2 lata) | |
| HP ZBook Firefly 14 G9-6B8A2EA | |
| Lenovo ThinkPad P14s Gen2-20VX000GGE | |
| Przeciętny Intel Core i7-1265U, NVIDIA T550 Laptop GPU (8315 - 9474, n=3) | |
| HP EliteBook 865 G9 | |
| Dell Precision 5000 5470 | |
| HP ZBook Firefly 14 G8 2C9Q2EA | |
| HP ZBook Firefly 14 G9-6B8A2EA | |
| PCMark 10 / Digital Content Creation | |
| Średnia w klasie Workstation (7744 - 15631, n=21, ostatnie 2 lata) | |
| Dell Precision 5000 5470 | |
| HP EliteBook 865 G9 | |
| HP ZBook Firefly 14 G9-6B8A2EA | |
| Przeciętny Intel Core i7-1265U, NVIDIA T550 Laptop GPU (5399 - 6793, n=3) | |
| Lenovo ThinkPad P14s Gen2-20VX000GGE | |
| HP ZBook Firefly 14 G8 2C9Q2EA | |
| HP ZBook Firefly 14 G9-6B8A2EA | |
| CrossMark / Overall | |
| Średnia w klasie Workstation (1307 - 2267, n=24, ostatnie 2 lata) | |
| Dell Precision 5000 5470 | |
| HP ZBook Firefly 14 G9-6B8A2EA | |
| Przeciętny Intel Core i7-1265U, NVIDIA T550 Laptop GPU (1591 - 1623, n=3) | |
| HP ZBook Firefly 14 G9-6B8A2EA | |
| Apple MacBook Pro 14 2021 M1 Pro Entry | |
| HP EliteBook 865 G9 | |
| CrossMark / Productivity | |
| Średnia w klasie Workstation (1130 - 2122, n=24, ostatnie 2 lata) | |
| Dell Precision 5000 5470 | |
| HP ZBook Firefly 14 G9-6B8A2EA | |
| Przeciętny Intel Core i7-1265U, NVIDIA T550 Laptop GPU (1553 - 1592, n=3) | |
| HP ZBook Firefly 14 G9-6B8A2EA | |
| HP EliteBook 865 G9 | |
| Apple MacBook Pro 14 2021 M1 Pro Entry | |
| CrossMark / Creativity | |
| Średnia w klasie Workstation (1657 - 2725, n=24, ostatnie 2 lata) | |
| Dell Precision 5000 5470 | |
| Apple MacBook Pro 14 2021 M1 Pro Entry | |
| HP ZBook Firefly 14 G9-6B8A2EA | |
| Przeciętny Intel Core i7-1265U, NVIDIA T550 Laptop GPU (1723 - 1751, n=3) | |
| HP ZBook Firefly 14 G9-6B8A2EA | |
| HP EliteBook 865 G9 | |
| CrossMark / Responsiveness | |
| Średnia w klasie Workstation (993 - 2096, n=24, ostatnie 2 lata) | |
| Dell Precision 5000 5470 | |
| HP ZBook Firefly 14 G9-6B8A2EA | |
| Przeciętny Intel Core i7-1265U, NVIDIA T550 Laptop GPU (1344 - 1376, n=3) | |
| HP ZBook Firefly 14 G9-6B8A2EA | |
| HP EliteBook 865 G9 | |
| Apple MacBook Pro 14 2021 M1 Pro Entry | |
| PCMark 10 Score | 6181 pkt. | |
Pomoc | ||
Karta graficzna
Po aktualizacjach dedykowane GPU T550 od Nvidii ma teraz prawo pobierać 30 zamiast 20 W, a w benchmarkach z GPU przewaga wynosi 10-20%. Tym samym teraz jest też wyraźna przewaga nad starym Nvidia T500. Prawdą jest jednak również to, że po ostatnich aktualizacjach wydajność nie jest do końca stabilna, a wyniki są o kilka punktów procentowych niższe, na przykład w teście obciążeniowym 3DMark Time Spy również po prostu nie przeszedł.
Wyższa wydajność zauważalna jest także w benchmarkach gamingowych, ponieważ i tu widzimy przewagę 10-20% nad naszym autorskim testem, w zależności od tytułu i ustawień.
GPU jest ograniczone do 20 W w trybie bateryjnym, więc ZBook spada tutaj do starego poziomu. Więcej benchmarków GPU znajduje siętutaj.
| 3DMark | |
| 1920x1080 Fire Strike Graphics | |
| Średnia w klasie Workstation (7578 - 52560, n=25, ostatnie 2 lata) | |
| Dell Precision 5000 5470 | |
| HP ZBook Firefly 14 G9-6B8A2EA | |
| Przeciętny NVIDIA T550 Laptop GPU (4816 - 5593, n=3) | |
| HP ZBook Firefly 14 G9-6B8A2EA | |
| HP ZBook Firefly 14 G8 2C9Q2EA | |
| HP EliteBook 865 G9 | |
| Lenovo ThinkPad P14s Gen2-20VX000GGE | |
| 2560x1440 Time Spy Graphics | |
| Średnia w klasie Workstation (2725 - 24806, n=25, ostatnie 2 lata) | |
| Dell Precision 5000 5470 | |
| HP ZBook Firefly 14 G9-6B8A2EA | |
| Przeciętny NVIDIA T550 Laptop GPU (1882 - 2252, n=3) | |
| HP ZBook Firefly 14 G8 2C9Q2EA | |
| HP ZBook Firefly 14 G9-6B8A2EA | |
| Lenovo ThinkPad P14s Gen2-20VX000GGE | |
| HP EliteBook 865 G9 | |
| Geekbench 5.5 - OpenCL Score | |
| Średnia w klasie Workstation (33651 - 272866, n=25, ostatnie 2 lata) | |
| Dell Precision 5000 5470 | |
| HP ZBook Firefly 14 G9-6B8A2EA | |
| Apple MacBook Pro 14 2021 M1 Pro Entry | |
| Przeciętny NVIDIA T550 Laptop GPU (32530 - 36536, n=3) | |
| HP ZBook Firefly 14 G9-6B8A2EA | |
| HP ZBook Firefly 14 G8 2C9Q2EA | |
| Lenovo ThinkPad P14s Gen2-20VX000GGE | |
| HP EliteBook 865 G9 | |
| Blender / v3.3 Classroom HIP/AMD | |
| HP EliteBook 865 G9 | |
| Blender / v3.3 Classroom OPTIX/RTX | |
| HP ZBook Firefly 14 G9-6B8A2EA | |
| Przeciętny NVIDIA T550 Laptop GPU (256 - 269, n=3) | |
| HP ZBook Firefly 14 G9-6B8A2EA | |
| Dell Precision 5000 5470 | |
| Średnia w klasie Workstation (10 - 95, n=19, ostatnie 2 lata) | |
| Blender / v3.3 Classroom CUDA | |
| HP ZBook Firefly 14 G9-6B8A2EA | |
| Przeciętny NVIDIA T550 Laptop GPU (278 - 285, n=3) | |
| HP ZBook Firefly 14 G9-6B8A2EA | |
| Dell Precision 5000 5470 | |
| Średnia w klasie Workstation (16 - 142, n=19, ostatnie 2 lata) | |
| Blender / v3.3 Classroom CPU | |
| HP ZBook Firefly 14 G9-6B8A2EA | |
| Przeciętny NVIDIA T550 Laptop GPU (728 - 1326, n=3) | |
| HP ZBook Firefly 14 G9-6B8A2EA | |
| HP EliteBook 865 G9 | |
| Dell Precision 5000 5470 | |
| Średnia w klasie Workstation (148 - 464, n=25, ostatnie 2 lata) | |
* ... im mniej tym lepiej
| Performance rating - Percent | |
| Średnia w klasie Workstation | |
| Dell Precision 5000 5470 | |
| HP ZBook Firefly 14 G8 2C9Q2EA -2! | |
| HP ZBook Firefly 14 G9-6B8A2EA | |
| HP ZBook Firefly 14 G9-6B8A2EA | |
| Lenovo ThinkPad P14s Gen2-20VX000GGE | |
| HP EliteBook 865 G9 | |
| The Witcher 3 - 1920x1080 Ultra Graphics & Postprocessing (HBAO+) | |
| Średnia w klasie Workstation (26.3 - 91.7, n=3, ostatnie 2 lata) | |
| Dell Precision 5000 5470 | |
| HP ZBook Firefly 14 G9-6B8A2EA | |
| HP ZBook Firefly 14 G8 2C9Q2EA | |
| HP ZBook Firefly 14 G9-6B8A2EA | |
| Lenovo ThinkPad P14s Gen2-20VX000GGE | |
| HP EliteBook 865 G9 | |
| GTA V - 1920x1080 Highest AA:4xMSAA + FX AF:16x | |
| Średnia w klasie Workstation (18.1 - 156.1, n=24, ostatnie 2 lata) | |
| Dell Precision 5000 5470 | |
| HP ZBook Firefly 14 G9-6B8A2EA | |
| HP ZBook Firefly 14 G9-6B8A2EA | |
| Lenovo ThinkPad P14s Gen2-20VX000GGE | |
| HP EliteBook 865 G9 | |
| Final Fantasy XV Benchmark - 1920x1080 High Quality | |
| Średnia w klasie Workstation (26.4 - 197.6, n=25, ostatnie 2 lata) | |
| Dell Precision 5000 5470 | |
| HP ZBook Firefly 14 G9-6B8A2EA | |
| HP ZBook Firefly 14 G9-6B8A2EA | |
| HP ZBook Firefly 14 G8 2C9Q2EA | |
| Lenovo ThinkPad P14s Gen2-20VX000GGE | |
| HP EliteBook 865 G9 | |
| Strange Brigade - 1920x1080 ultra AA:ultra AF:16 | |
| Średnia w klasie Workstation (54.5 - 418, n=19, ostatnie 2 lata) | |
| Dell Precision 5000 5470 | |
| HP ZBook Firefly 14 G9-6B8A2EA | |
| HP ZBook Firefly 14 G9-6B8A2EA | |
| Lenovo ThinkPad P14s Gen2-20VX000GGE | |
| HP EliteBook 865 G9 | |
| Dota 2 Reborn - 1920x1080 ultra (3/3) best looking | |
| Dell Precision 5000 5470 | |
| Średnia w klasie Workstation (50.7 - 178.4, n=25, ostatnie 2 lata) | |
| HP ZBook Firefly 14 G9-6B8A2EA | |
| HP ZBook Firefly 14 G9-6B8A2EA | |
| HP ZBook Firefly 14 G8 2C9Q2EA | |
| Lenovo ThinkPad P14s Gen2-20VX000GGE | |
| HP EliteBook 865 G9 | |
| X-Plane 11.11 - 1920x1080 high (fps_test=3) | |
| Średnia w klasie Workstation (30.5 - 139.7, n=25, ostatnie 2 lata) | |
| Dell Precision 5000 5470 | |
| HP ZBook Firefly 14 G9-6B8A2EA | |
| HP ZBook Firefly 14 G9-6B8A2EA | |
| HP ZBook Firefly 14 G8 2C9Q2EA | |
| Lenovo ThinkPad P14s Gen2-20VX000GGE | |
| HP EliteBook 865 G9 | |
Witcher 3 FPS chart
| low | med. | high | ultra | |
|---|---|---|---|---|
| GTA V (2015) | 127.2 | 120.6 | 63.9 | 29.6 |
| The Witcher 3 (2015) | 139 | 78 | 43 | 23.2 |
| Dota 2 Reborn (2015) | 126 | 110.1 | 101.2 | 93.4 |
| Final Fantasy XV Benchmark (2018) | 65.7 | 30.5 | 22.2 | |
| X-Plane 11.11 (2018) | 77.4 | 65.4 | 57 | |
| Strange Brigade (2018) | 139 | 56 | 44 | 38 |
| F1 2021 (2021) | 156.6 | 75.4 | 59.9 | 36.8 |
| F1 22 (2022) | 69.9 | 63 | 44.6 | 33.4 |
Emisje - ZBook teraz z bardziej aktywnym wentylatorem
Wentylator po aktualizacji stał się nieco głośniejszy i bardziej aktywny. Odpowiedzialne są za to wysokie limity mocy, ponieważ podczas krótkich szczytów obciążenia osiągane są już wysokie temperatury chipów. Dlatego w codziennym użytkowaniu częściej może się zdarzyć, że wentylator zacznie pracować. Zmierzyliśmy 33 dB(A) pod czystym obciążeniem procesora (zarówno jedno-, jak i wielordzeniowego), a ponad 40 dB(A), gdy tylko obciążona zostanie również karta graficzna.
Hałas
| luz |
| 23.6 / 23.6 / 23.6 dB |
| obciążenie |
| 42.5 / 42.5 dB |
 | ||
30 dB cichy 40 dB(A) słyszalny 50 dB(A) irytujący |
||
min: | ||
| HP ZBook Firefly 14 G9-6B8A2EA T550 Laptop GPU, i7-1265U, Micron 3400 1TB MTFDKBA1T0TFH | HP ZBook Firefly 14 G9-6B8A2EA T550 Laptop GPU, i7-1265U, Micron 3400 1TB MTFDKBA1T0TFH | HP ZBook Firefly 14 G8 2C9Q2EA T500 Laptop GPU, i7-1165G7, Toshiba XG6 KXG60ZNV1T02 | HP EliteBook 865 G9 Radeon 680M, R7 PRO 6850U, Samsung PM991 MZVLQ512HBLU | Apple MacBook Pro 14 2021 M1 Pro Entry M1 Pro 14-Core GPU, M1 Pro 8-Core, Apple SSD AP0512 | Dell Precision 5000 5470 RTX A1000 Laptop GPU, i9-12900H, Samsung PM9A1 MZVL21T0HCLR | Lenovo ThinkPad P14s Gen2-20VX000GGE T500 Laptop GPU, i7-1185G7, Toshiba XG6 KXG6AZNV1T02 | |
|---|---|---|---|---|---|---|---|
| Noise | 3% | -8% | 14% | 5% | -6% | 0% | |
| wyłączone / środowisko * (dB) | 23.6 | 24.3 -3% | 28.7 -22% | 23 3% | 24.8 -5% | 23 3% | 24.6 -4% |
| Idle Minimum * (dB) | 23.6 | 24.3 -3% | 28.7 -22% | 23 3% | 24.8 -5% | 23.3 1% | 24.6 -4% |
| Idle Average * (dB) | 23.6 | 24.3 -3% | 28.7 -22% | 23 3% | 24.8 -5% | 23.3 1% | 24.6 -4% |
| Idle Maximum * (dB) | 23.6 | 24.3 -3% | 28.7 -22% | 23 3% | 24.8 -5% | 23.3 1% | 24.6 -4% |
| Load Average * (dB) | 42.5 | 35.6 16% | 34 20% | 29.1 32% | 27.8 35% | 48.5 -14% | 38.9 8% |
| Witcher 3 ultra * (dB) | 42.5 | 38.2 10% | 40.1 6% | 29.1 32% | 27.8 35% | 48.6 -14% | |
| Load Maximum * (dB) | 42.5 | 41 4% | 40.1 6% | 32.9 23% | 49.5 -16% | 50.4 -19% | 38.9 8% |
* ... im mniej tym lepiej
Temperatura
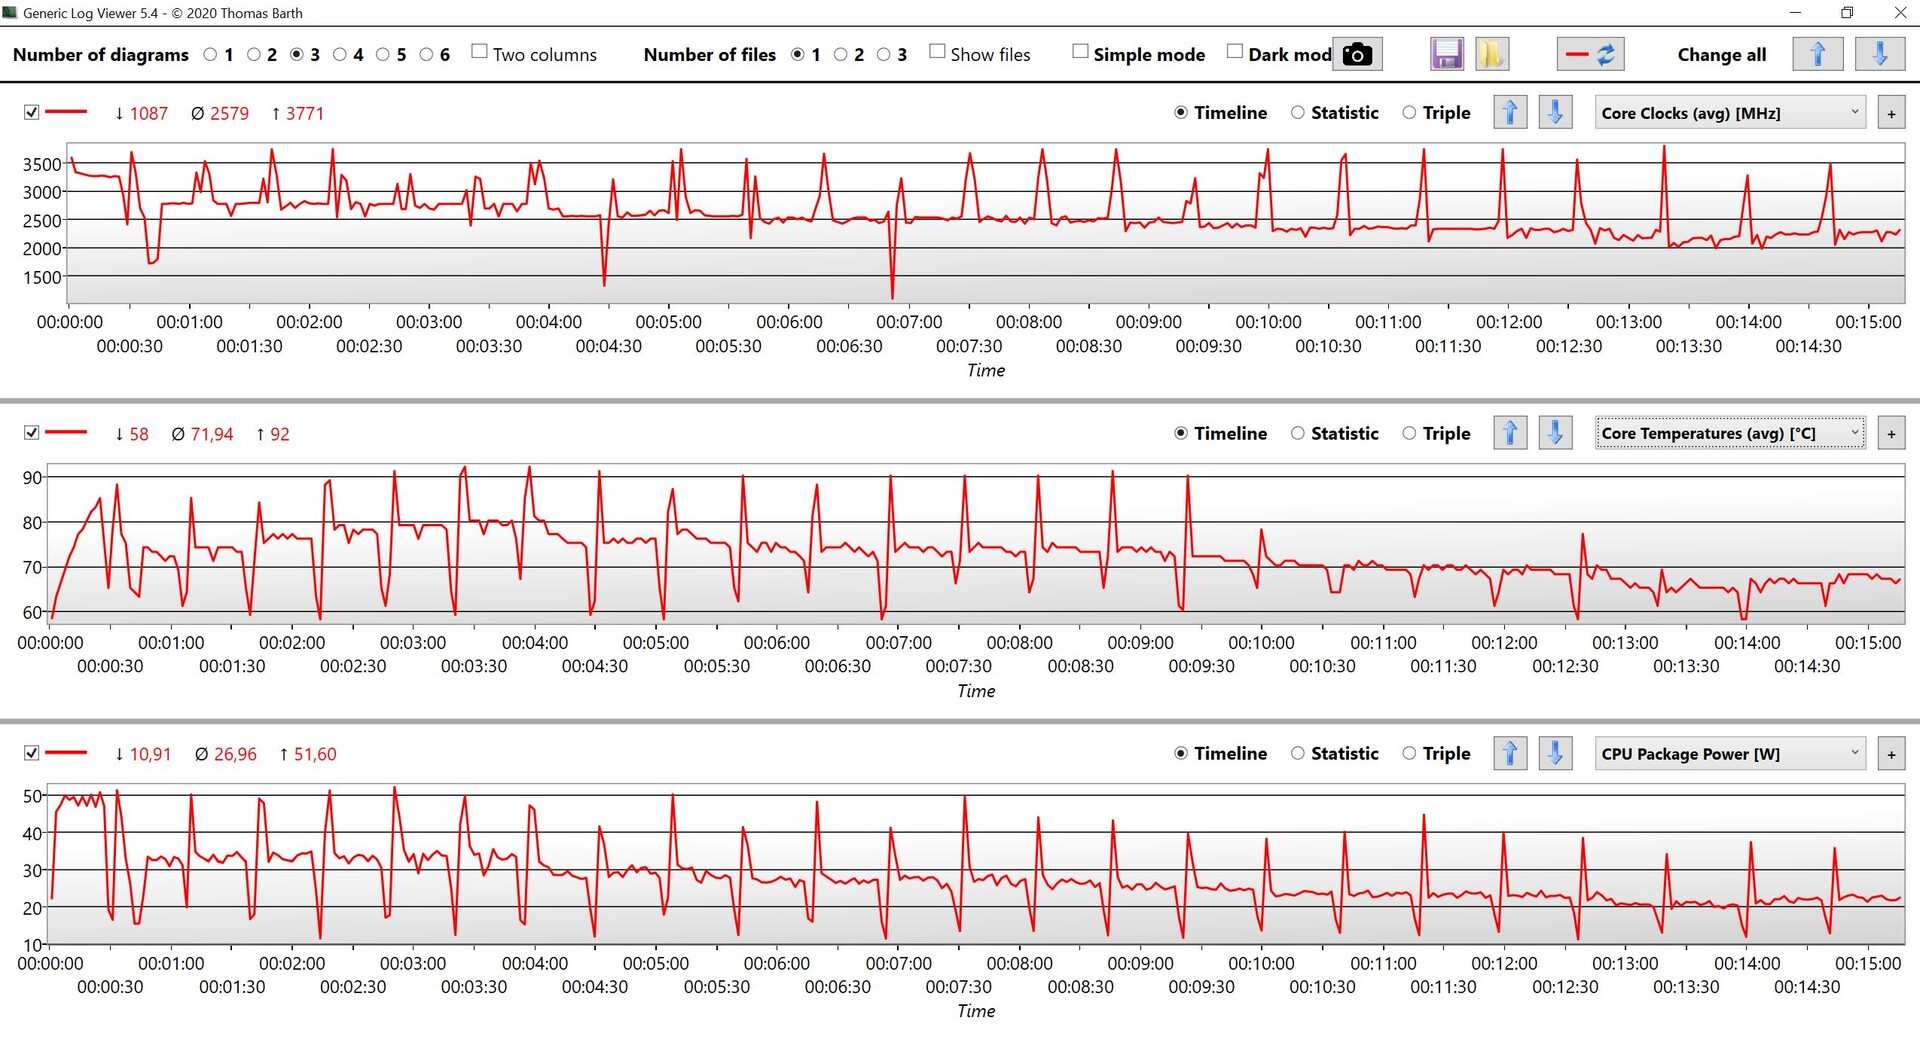
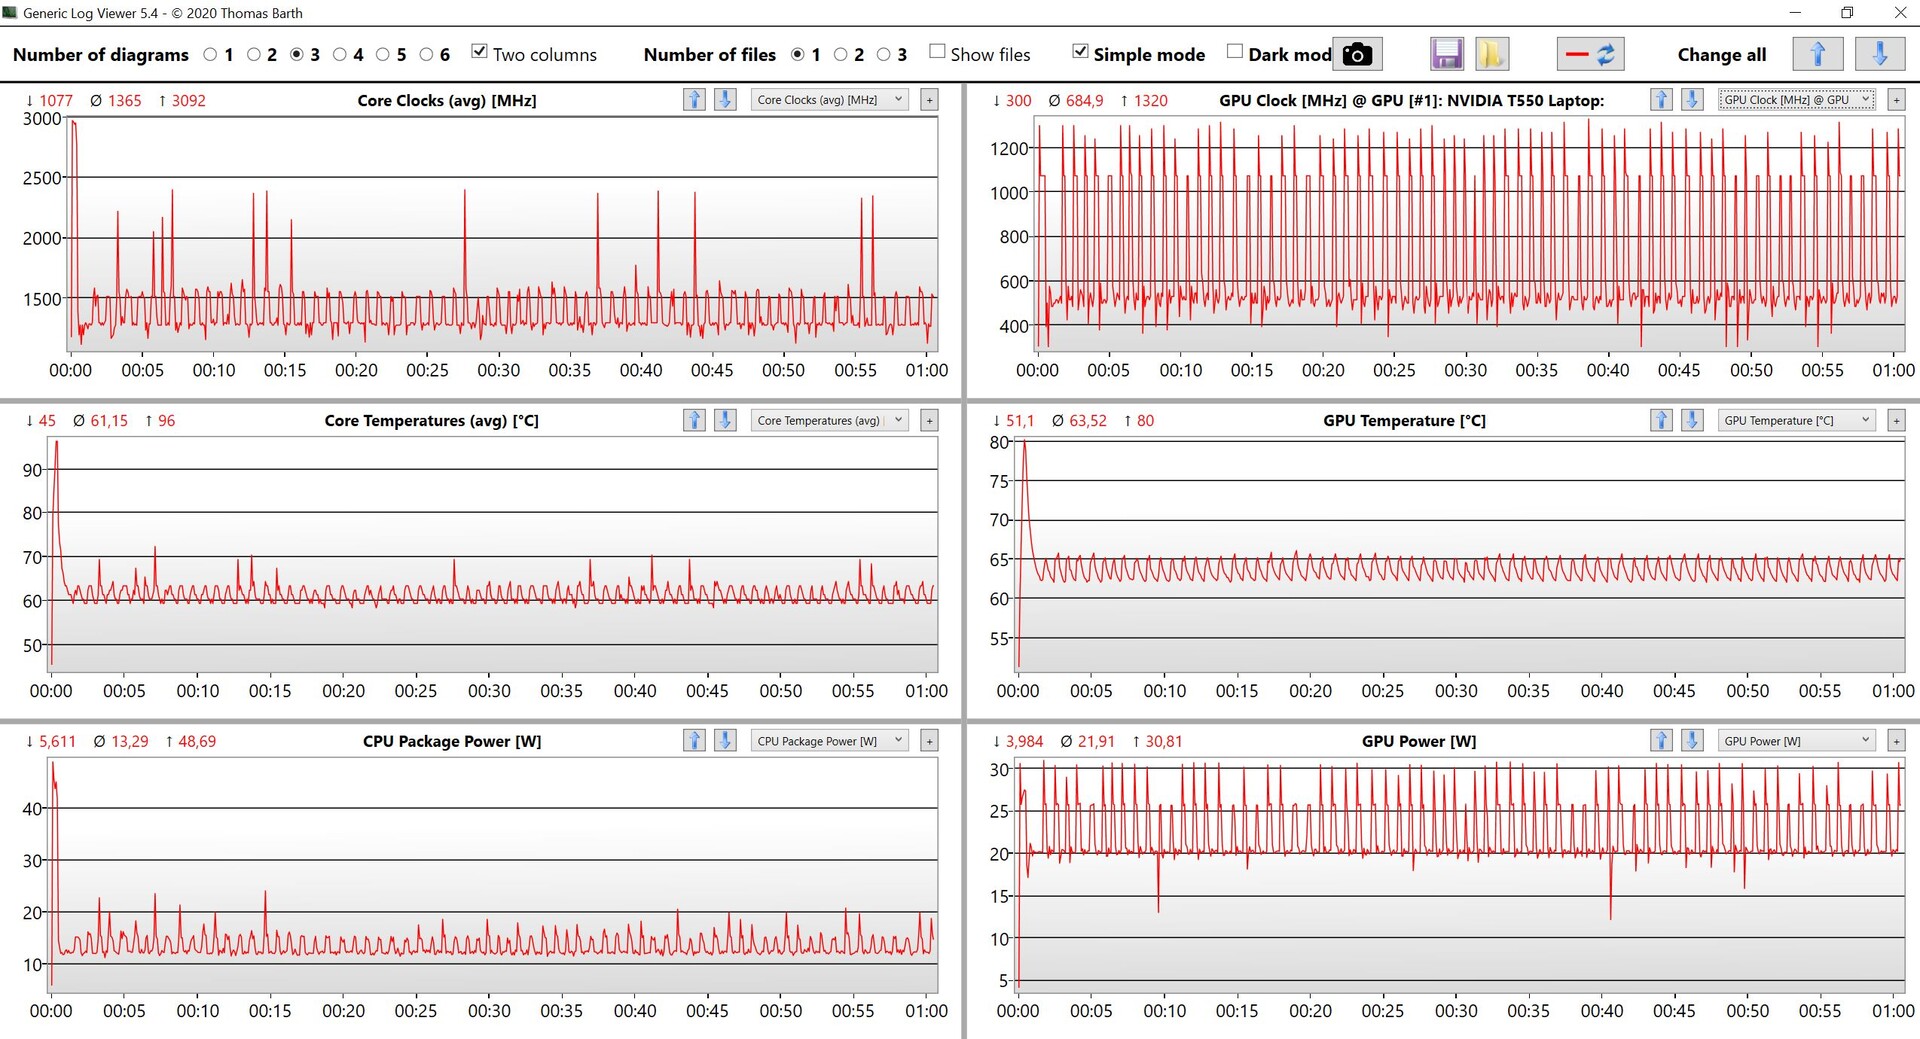
Temperatury powierzchni pod obciążeniem pozostały praktycznie takie same, więc nieco zwiększona wydajność jest rekompensowana przez większą prędkość obrotową wentylatora. Analiza danych wydajnościowych w naszym stress teście pokazuje jednak wyraźnie, że wydajność obu komponentów nie jest bynajmniej stała, ale ulega wahaniom. Tym samym jest tu jeszcze miejsce na optymalizację. Na zasilaniu akumulatorowym wydajność jest nieco niższa przy 15 W dla procesora i 20 W dla GPU, ale przynajmniej stała.
Za
Przeciw
Werdykt - aktualizacje BIOS-u pomagają, ale wciąż jest więcej miejsca na poprawę
Przede wszystkim pozytywne jest to, że HP wzięło sobie do serca naszą krytykę w pierwotnej recenzji i następnie wydało aktualizacje poprawiające wydajność. Później jednak pojawiły się kolejne aktualizacje, które obniżyły nieco wydajność CPU i GPU. Ogólnie rzecz biorąc, kompaktowa mobilna stacja robocza pozostawia teraz dużo lepsze ogólne wrażenie. Zakładamy, że większy ZBook Firefly 16 G9 z identycznym chłodzeniem również skorzysta z aktualizacji.
Dzięki aktualizacjom ZBook Firefly 14 G9 pozostawia teraz lepsze ogólne wrażenie i zarówno CPU jak i GPU mogą teraz zdystansować poprzednika.
Poza pozytywnymi aspektami trzeba jednak powiedzieć, że wydajność obu podzespołów nadal może się nieco wahać, zwłaszcza gdy CPU i GPU są obciążone jednocześnie. Tym samym nadal istnieje tutaj potrzeba optymalizacji. W pozostałych plusach i minusach nie ma zmian i ogólnie rzecz biorąc, ZBook Firefly 14 G9 jest obecnie dobrą kompaktową stacją roboczą.
Cena i dostępność
Na przykład nasza testowa konfiguracja ZBook Firefly 14 G9 jest dostępna w internetowym sklepie Cyberport za około 2 030 euro.
HP ZBook Firefly 14 G9-6B8A2EA
- 08/01/2023 v7 (old)
Andreas Osthoff
Price comparison
