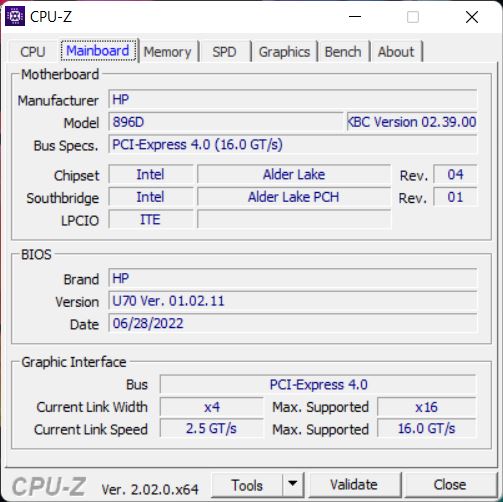
Laptop HP ZBook Firefly 16 G9 w recenzji - mobilna stacja robocza o niezbyt zadowalającej wydajności
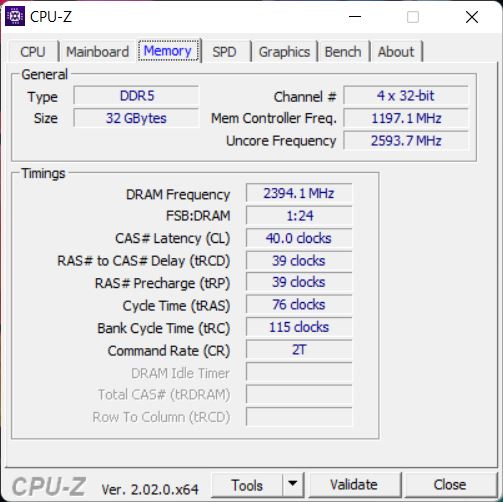
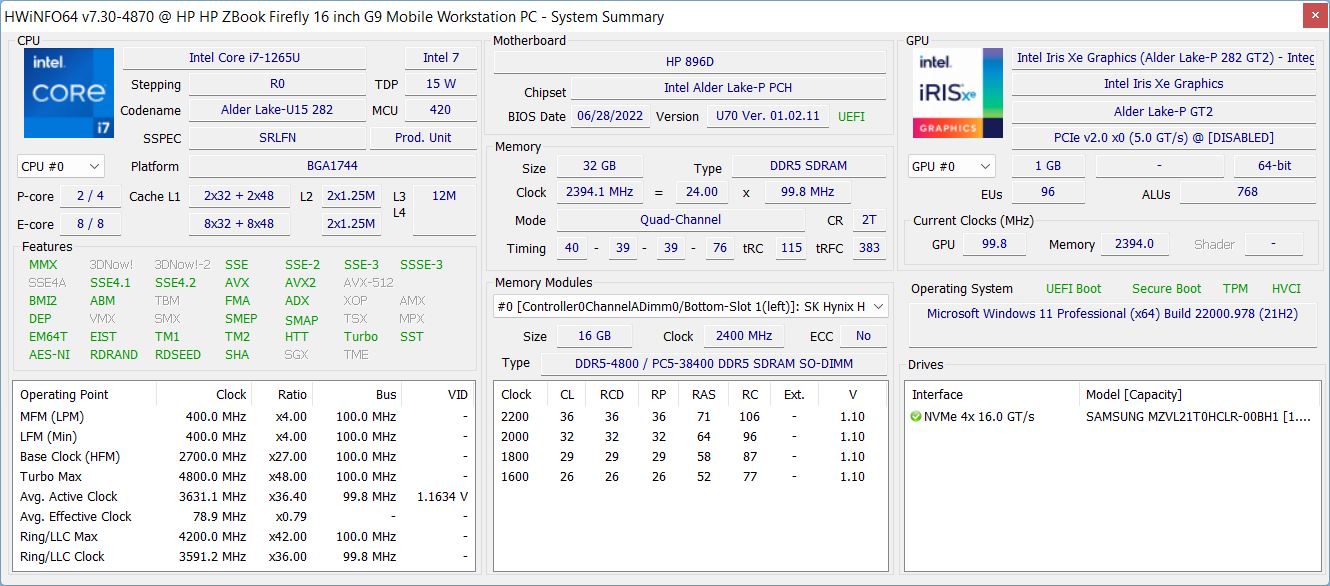
Seria ZBook Firefly firmy HP od lat składa się ze smukłych stacji roboczych z profesjonalnymi procesorami graficznymi klasy podstawowej, choć tylko w 14- i 15-calowej obudowie. Tegoroczny Firefly 16 G9 jest wyposażony w większy, 16-calowy wyświetlacz i podobnie jak mniejsze modele został przez HP oznaczony jako 9. generacja. W aluminiowej obudowie znajduje się nowy procesor Alder Lake-U od Intela oraz profesjonalnej klasy GPU T550 od Nvidii. Dodatkowo laptop jest wyposażony w 32 GB pamięci RAM, dysk SSD o pojemności 1 TB oraz matowy wyświetlacz IPS o proporcjach 16:10 (1920 x 1200 pikseli) w cenie około 3000 USD obecnie.
Potencjalni konkurenci w porównaniu
Ocena | Data | Model | Waga | Wysokość | Rozmiar | Rezolucja | Cena |
|---|---|---|---|---|---|---|---|
| 82.9 % v7 (old) | 10/2022 | HP ZBook Firefly 16 G9-6B897EA i7-1265U, T550 Laptop GPU | 2 kg | 19.2 mm | 16.00" | 1920x1200 | |
| 89.3 % v7 (old) | Lenovo ThinkPad P1 G4-20Y4Z9DVUS i7-11800H, T1200 Laptop GPU | 1.8 kg | 17.7 mm | 16.00" | 2560x1600 | ||
| 88.3 % v7 (old) | Dell Precision 5000 5560 i7-11850H, RTX A2000 Laptop GPU | 2 kg | 18 mm | 15.60" | 3840x2400 | ||
| 85.3 % v7 (old) | Lenovo ThinkPad P15s Gen2-20W6000GGE i7-1165G7, T500 Laptop GPU | 1.9 kg | 19.1 mm | 15.60" | 3840x2160 | ||
| 83.8 % v7 (old) | HP ZBook Firefly 15 G8 2C9R7EA i7-1165G7, T500 Laptop GPU | 1.8 kg | 19.2 mm | 15.60" | 1920x1080 | ||
| 93.2 % v7 (old) | Apple MacBook Pro 16 2021 M1 Pro M1 Pro, M1 Pro 16-Core GPU | 2.2 kg | 16.8 mm | 16.20" | 3456x2234 |
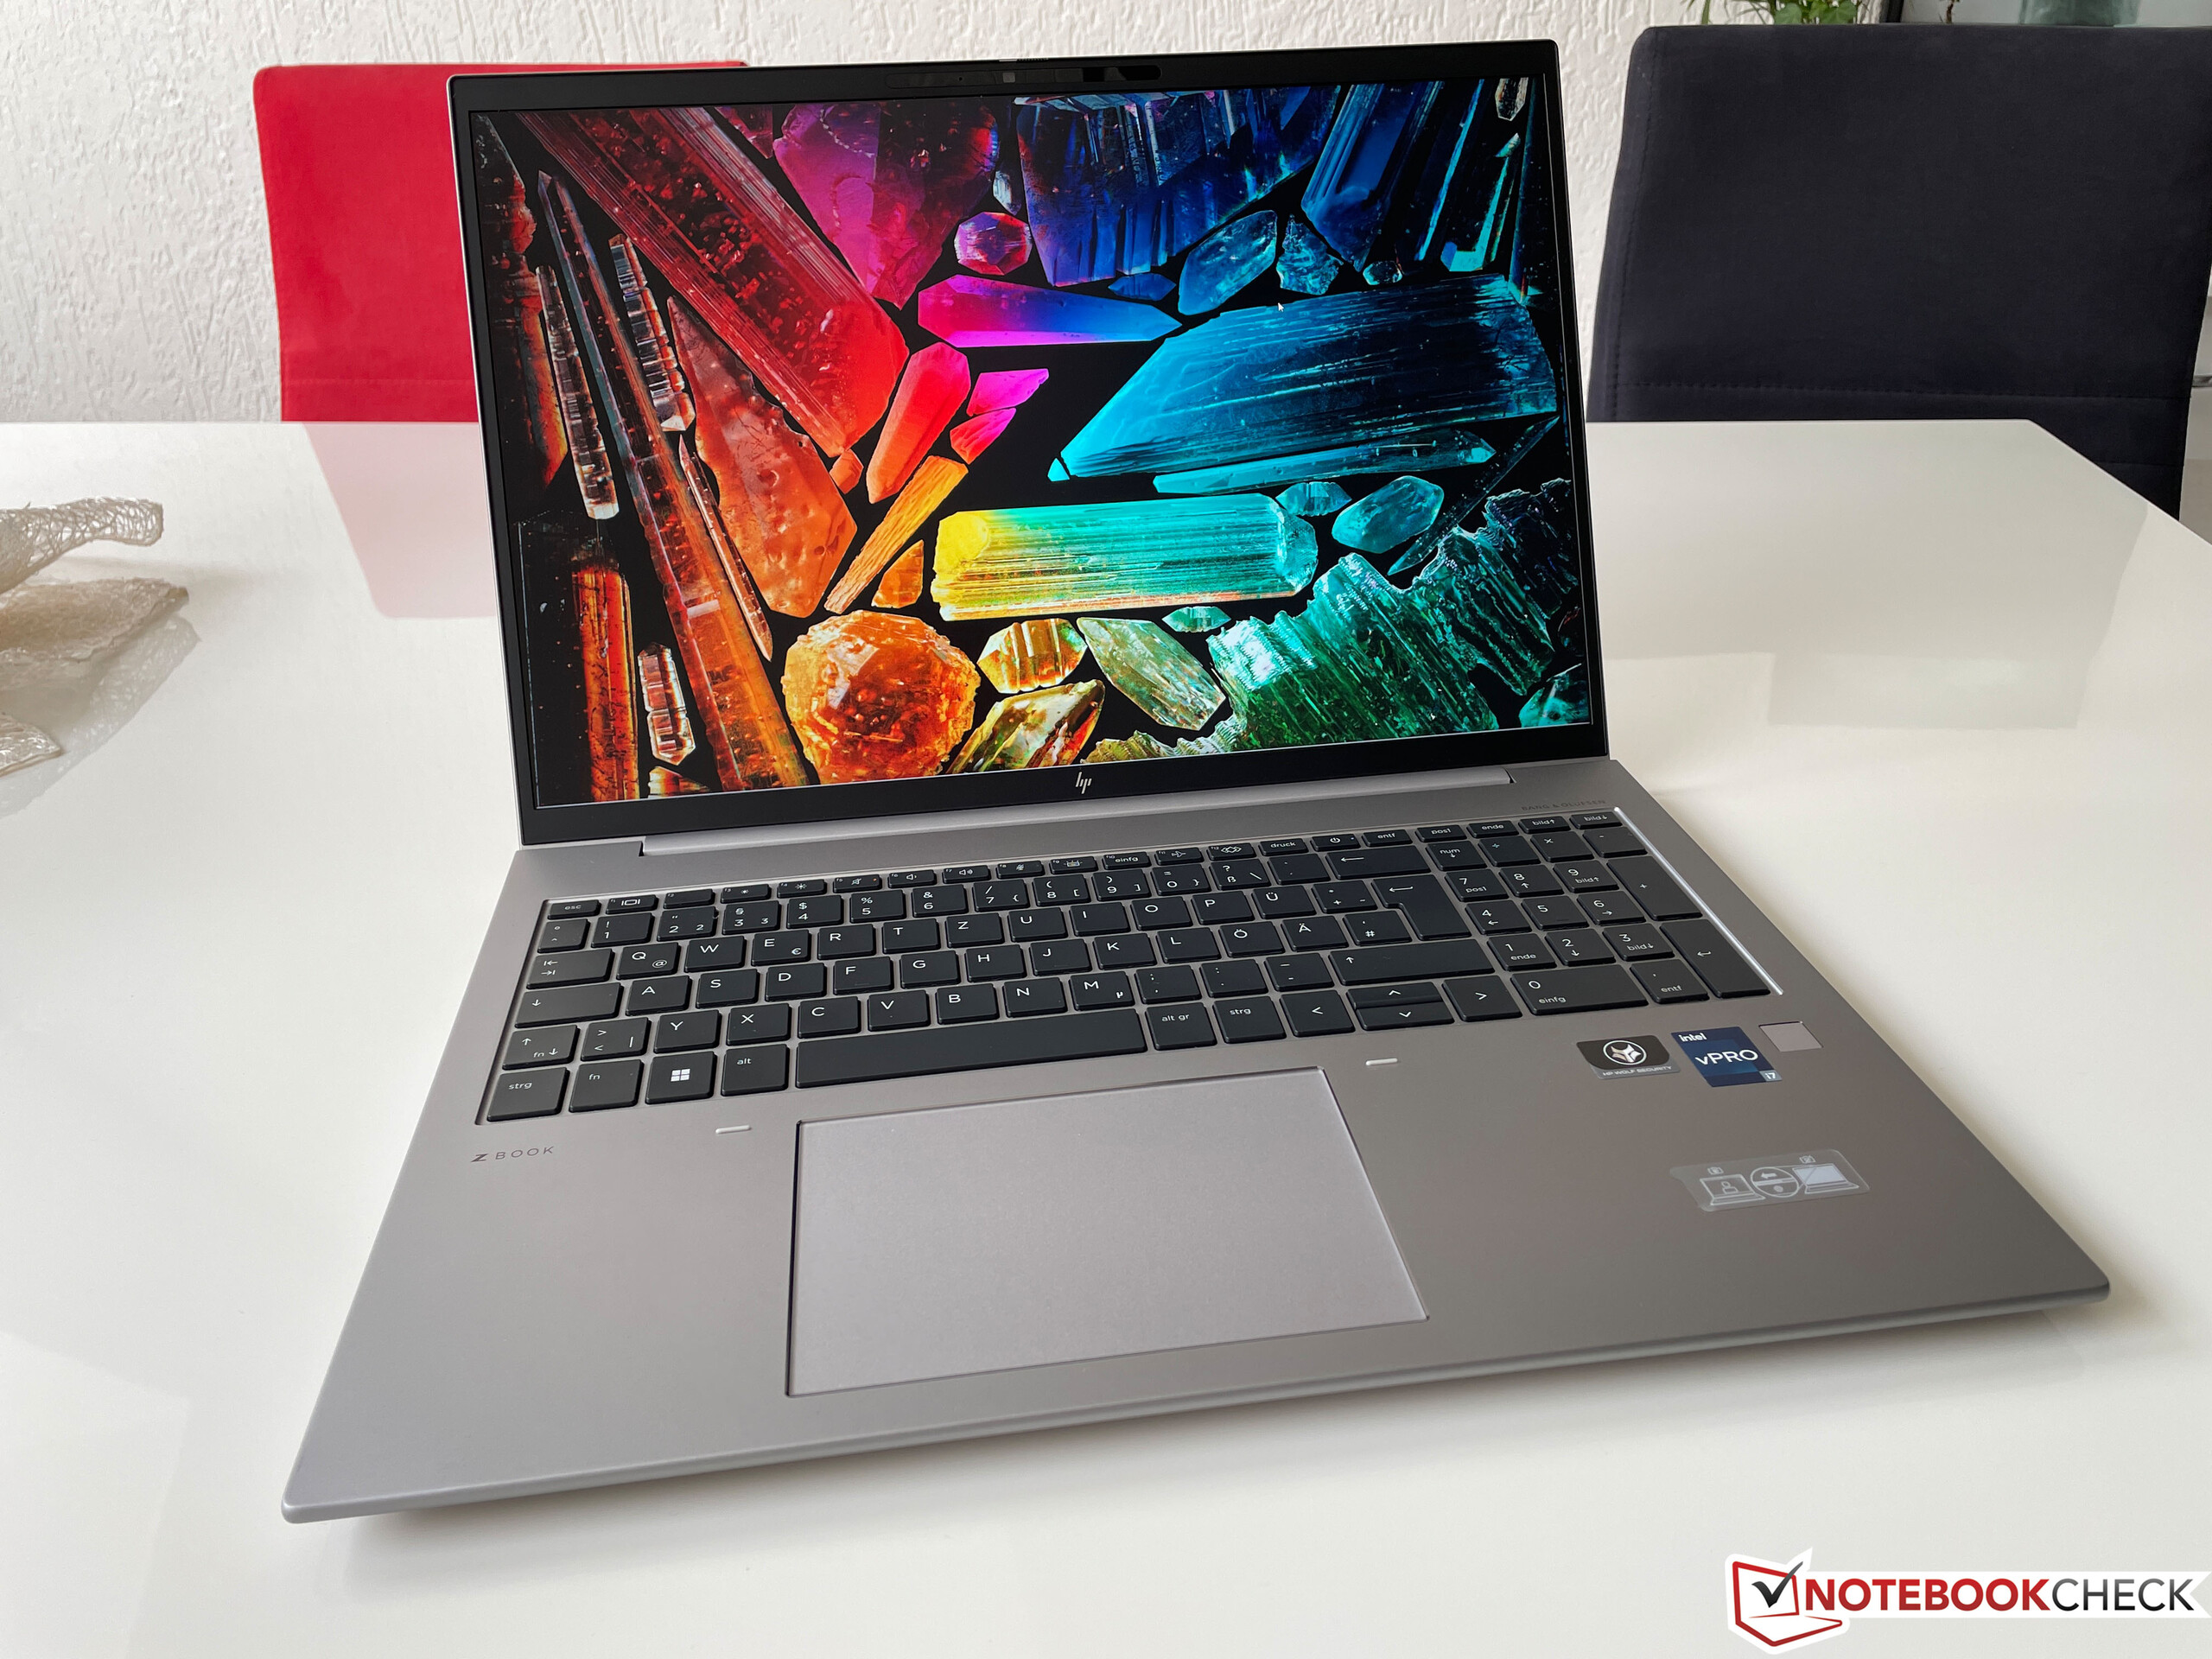
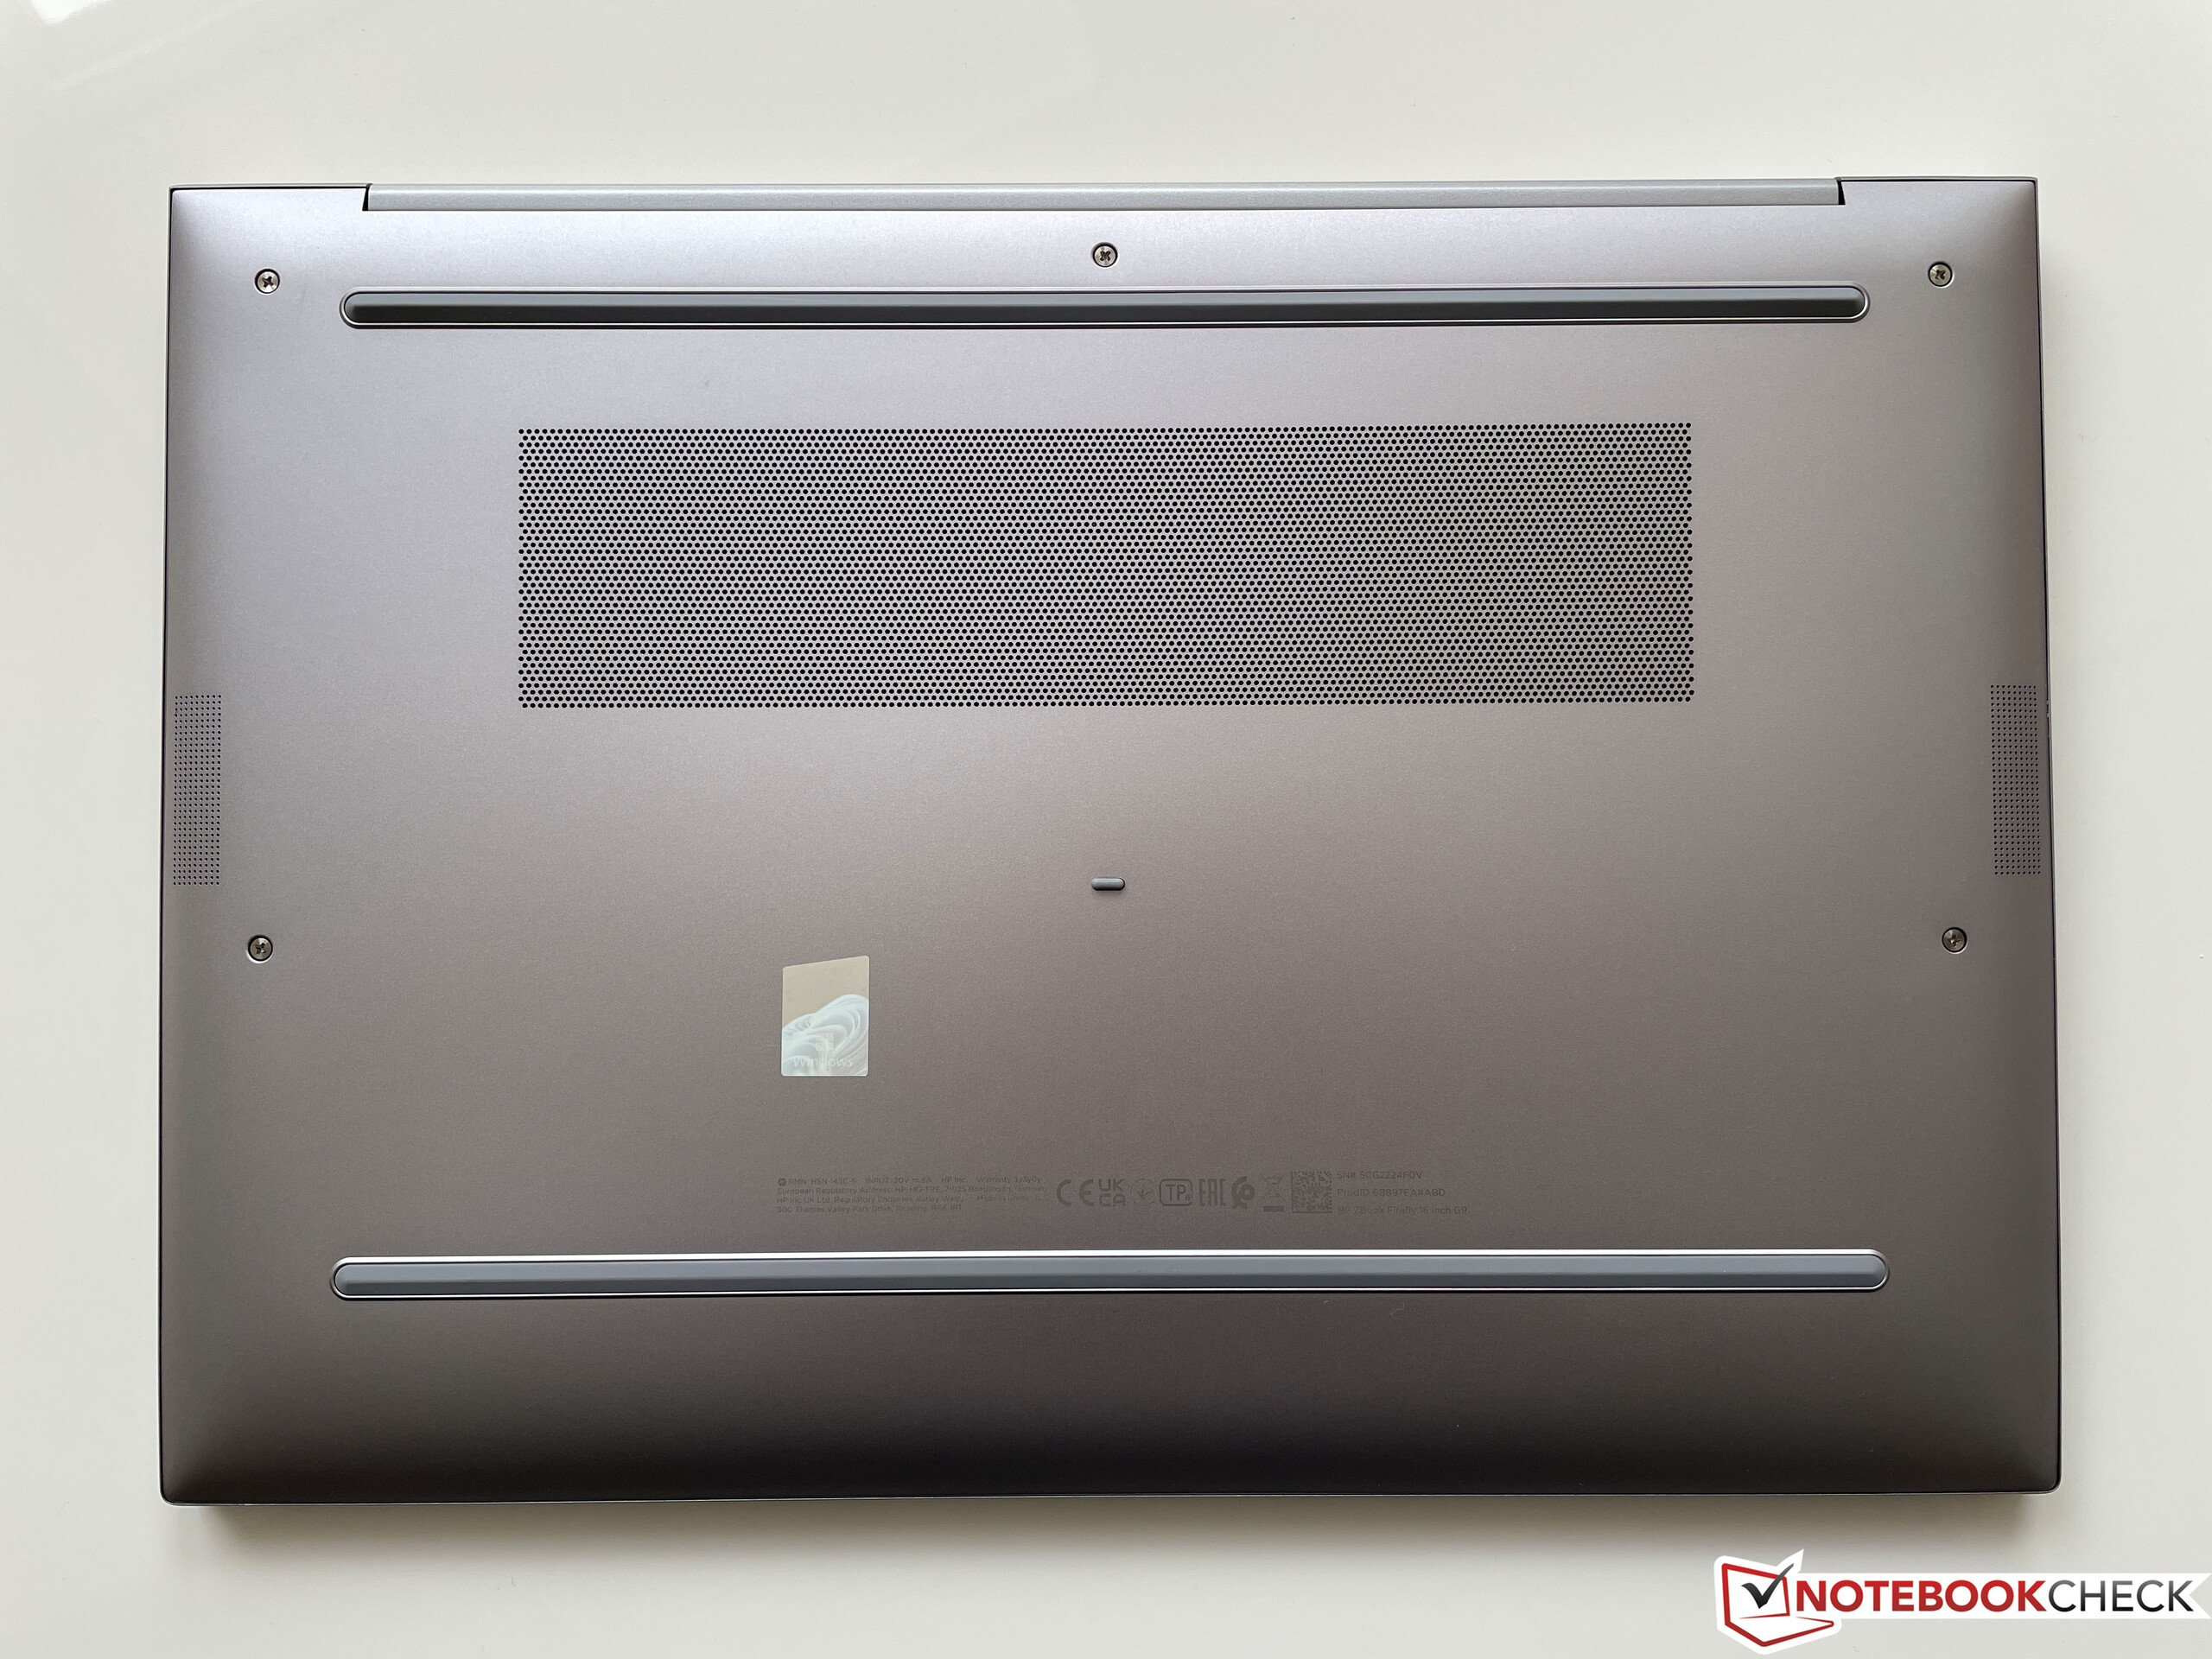
Obudowa - HP wykorzystuje wysokiej jakości aluminiową powłokę
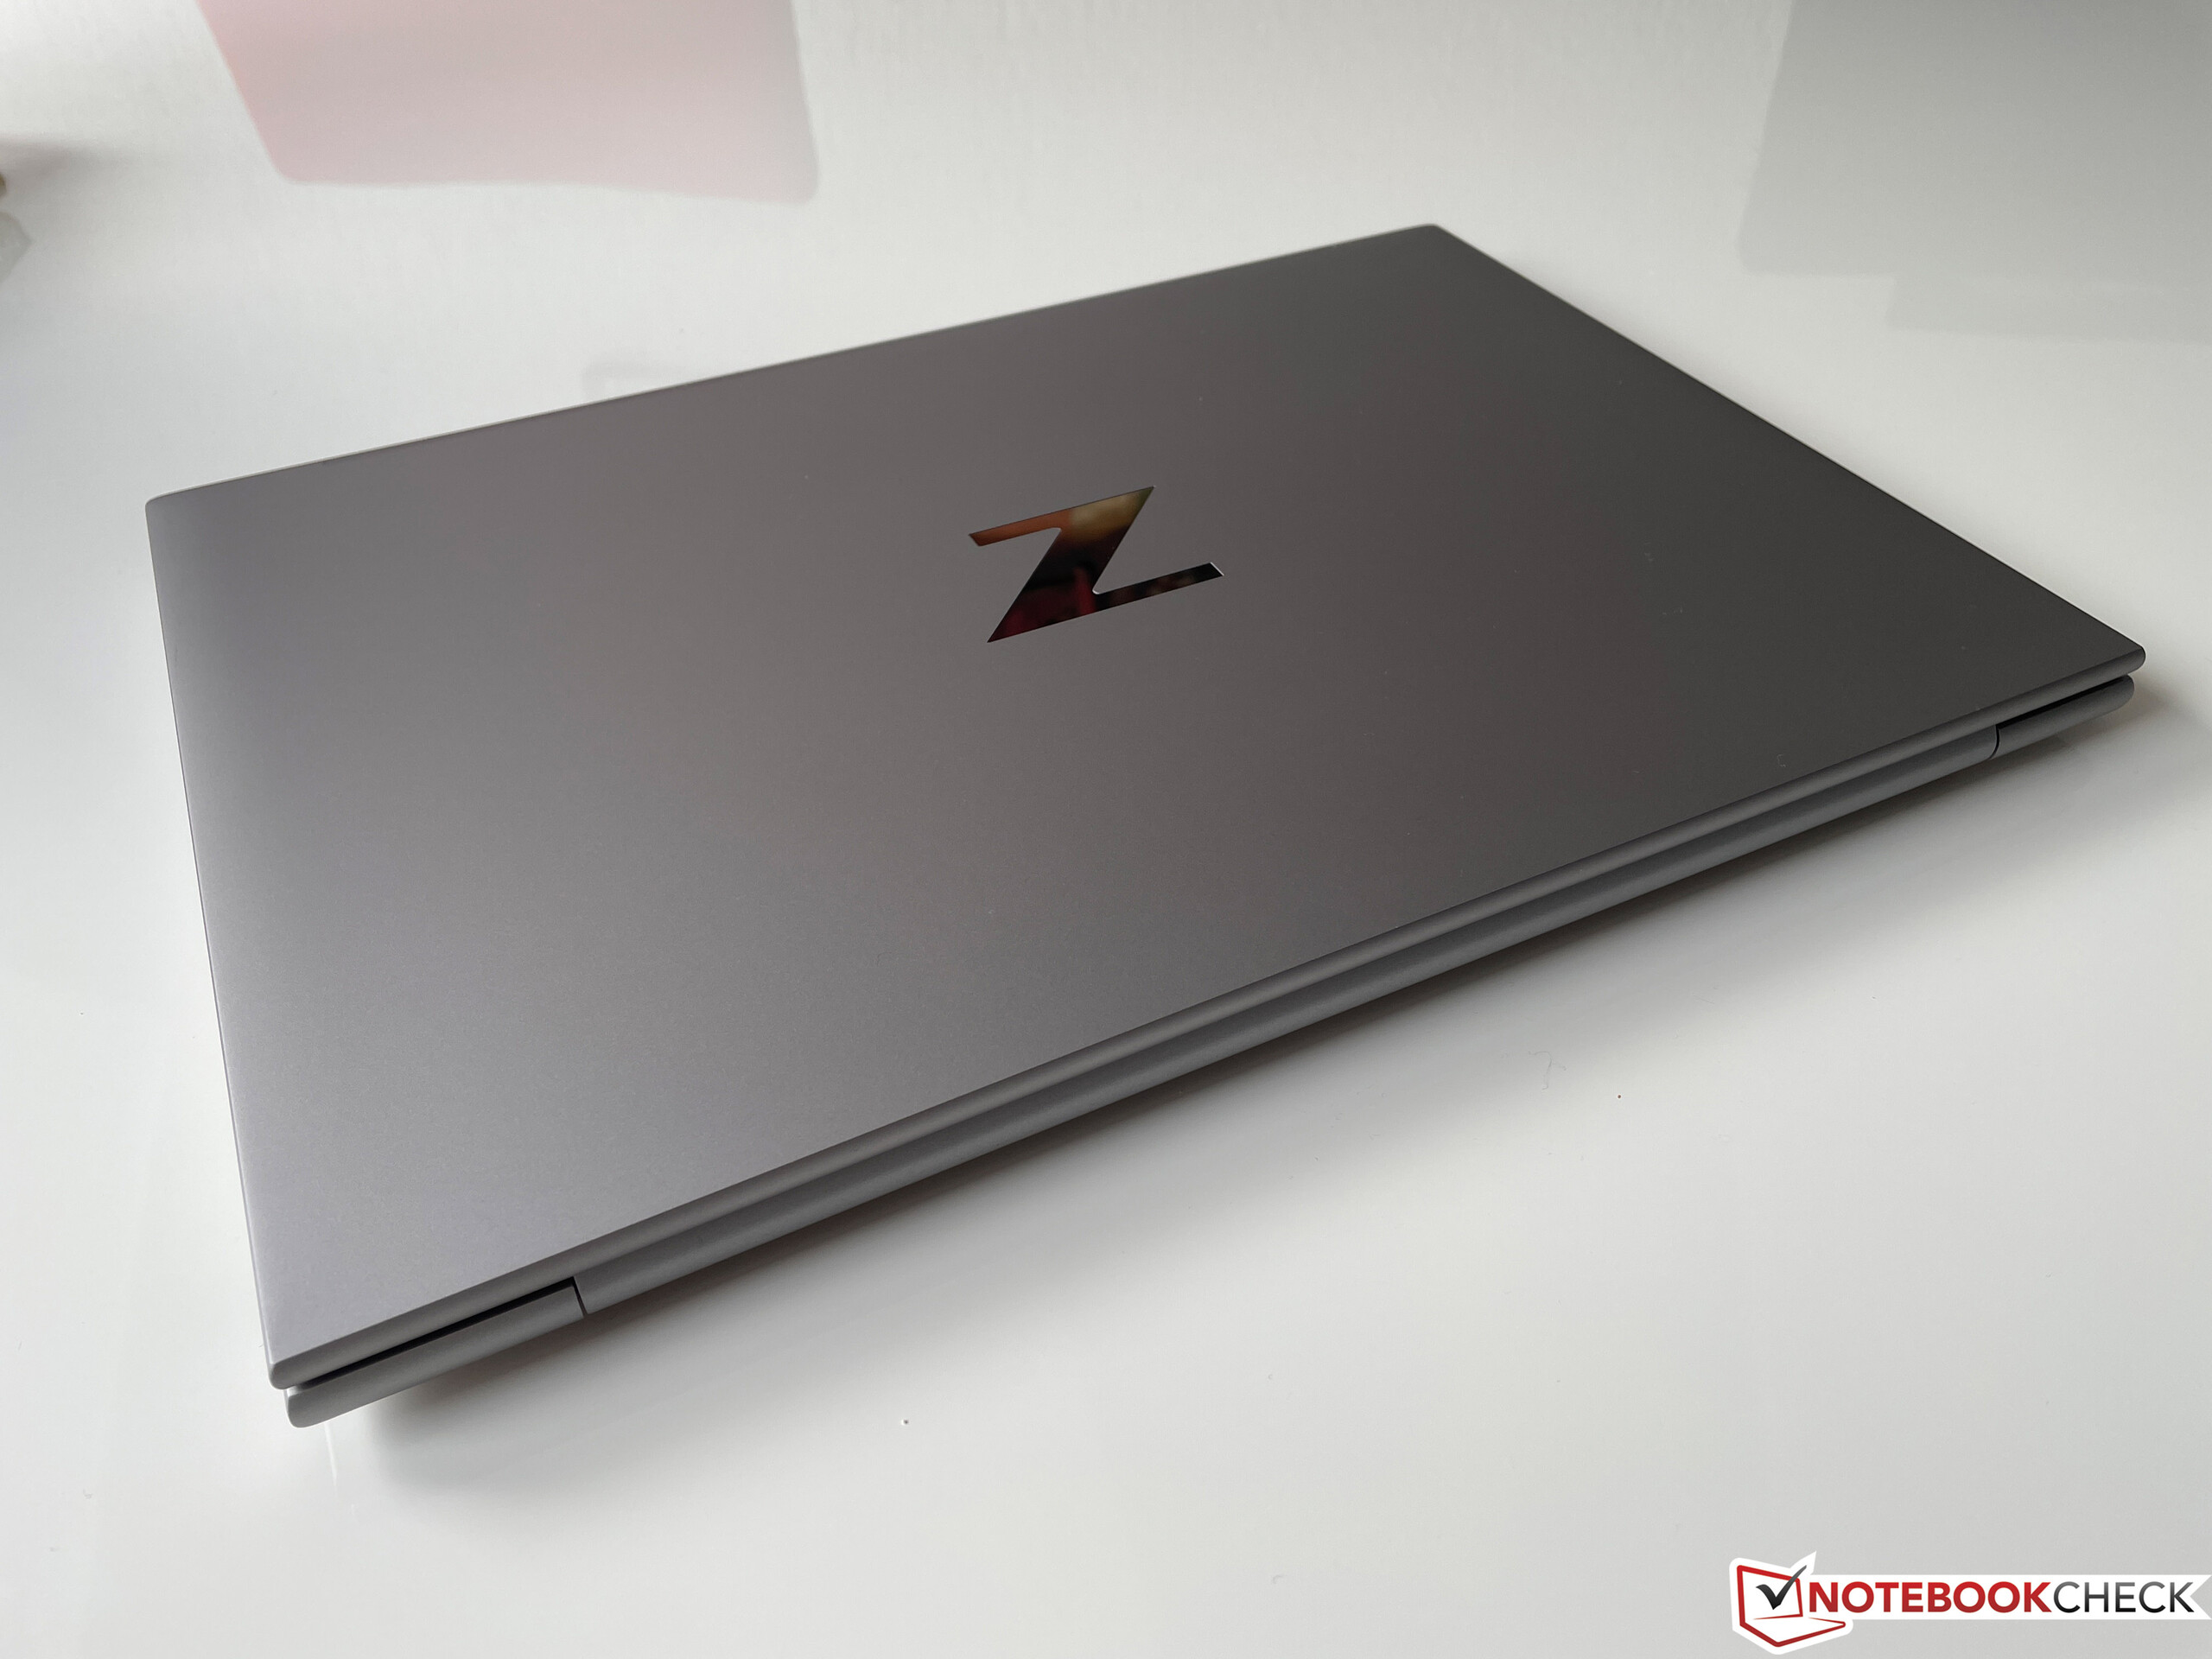
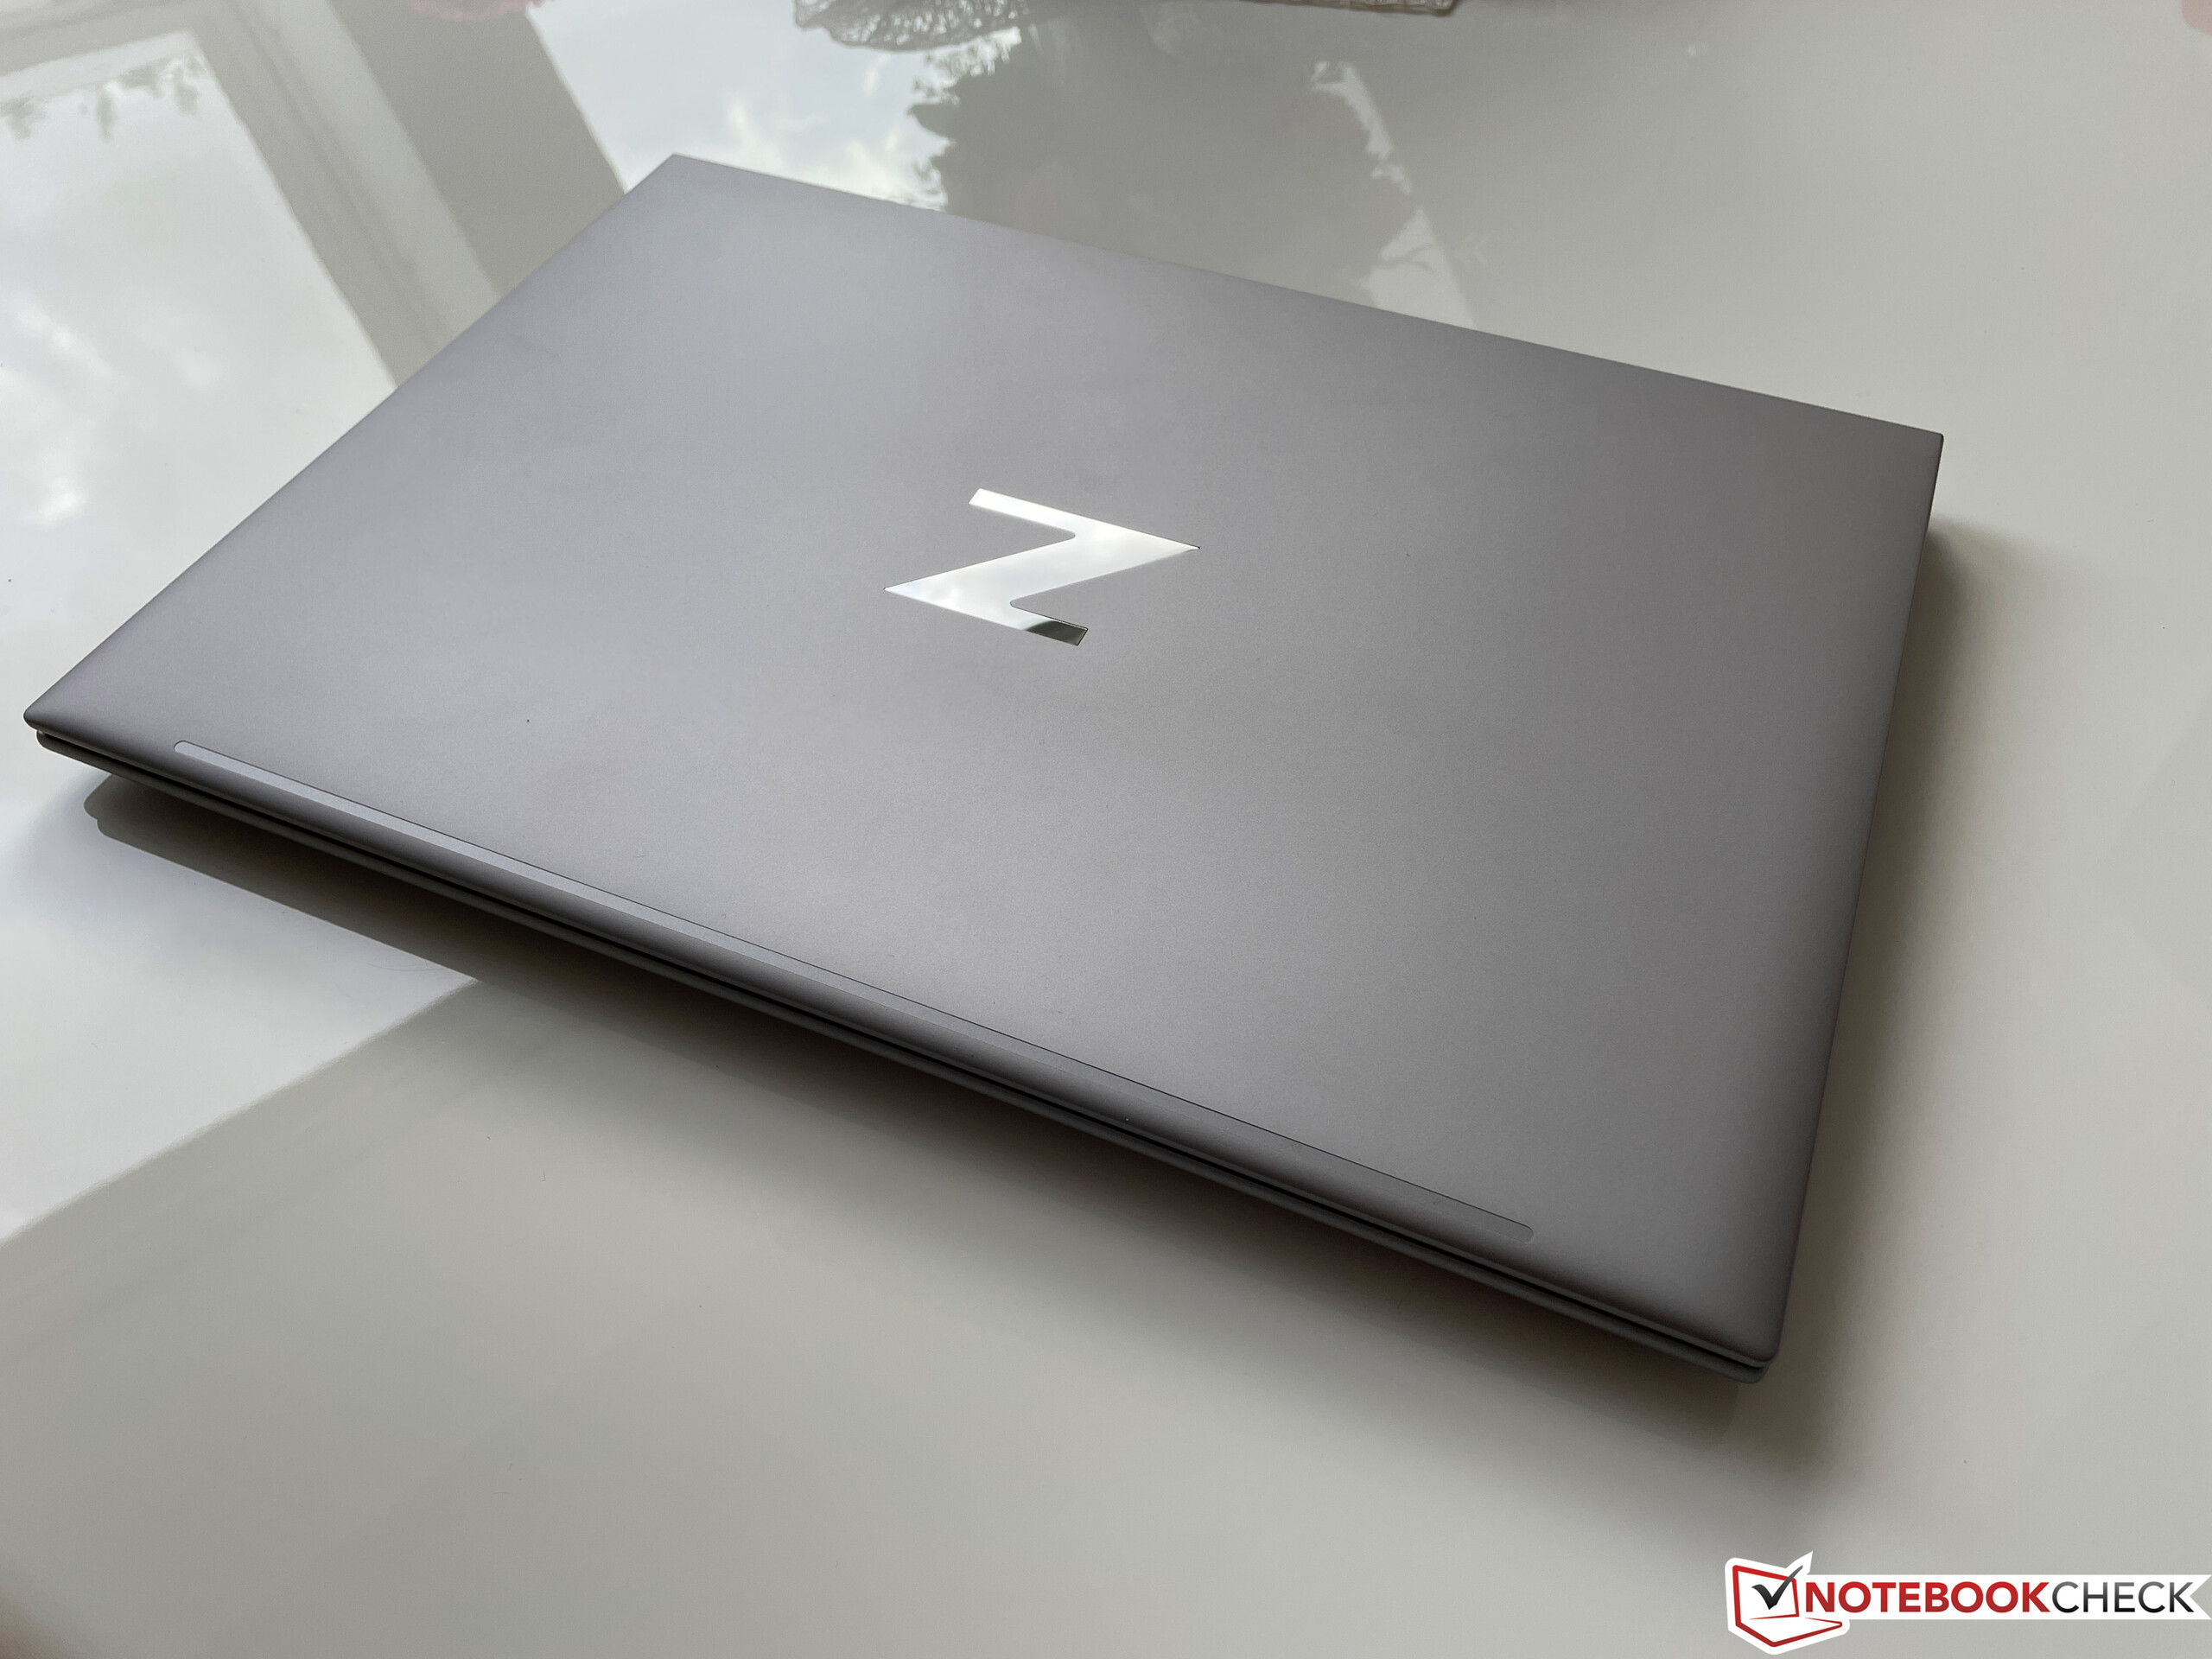
W porównaniu do zeszłorocznego Modelu G8s, HP stosuje w nowszym Firefly G9 (dotyczy to zarówno modelu 16- jak i 14-calowego) bardziej zaokrąglone elementy wzornicze o dobrej haptyce. Nie oferuje on większych niespodzianek, a srebrna obudowa, która składa się w całości z aluminium, sprawia wrażenie bardzo premium. Jednostka zasadnicza jest wyjątkowo odporna na wykręcanie z rogów i ledwo ugina się pod naciskiem. Wieko kontynuuje ten trend z minimalną podatnością na wykręcanie i brakiem zniekształceń na wyświetlaczu nawet pod skoncentrowanym naciskiem na plecy. Tymczasem zawiasy są nieco zbyt luźne. Choć wyświetlacz można bez problemu otworzyć jedną ręką, zawiasy nie zapobiegają w pełni przechylaniu się lub zamykaniu wyświetlacza pod niewielkim kątem. Wyświetlacz można otworzyć do maksymalnego kąta 180 stopni.
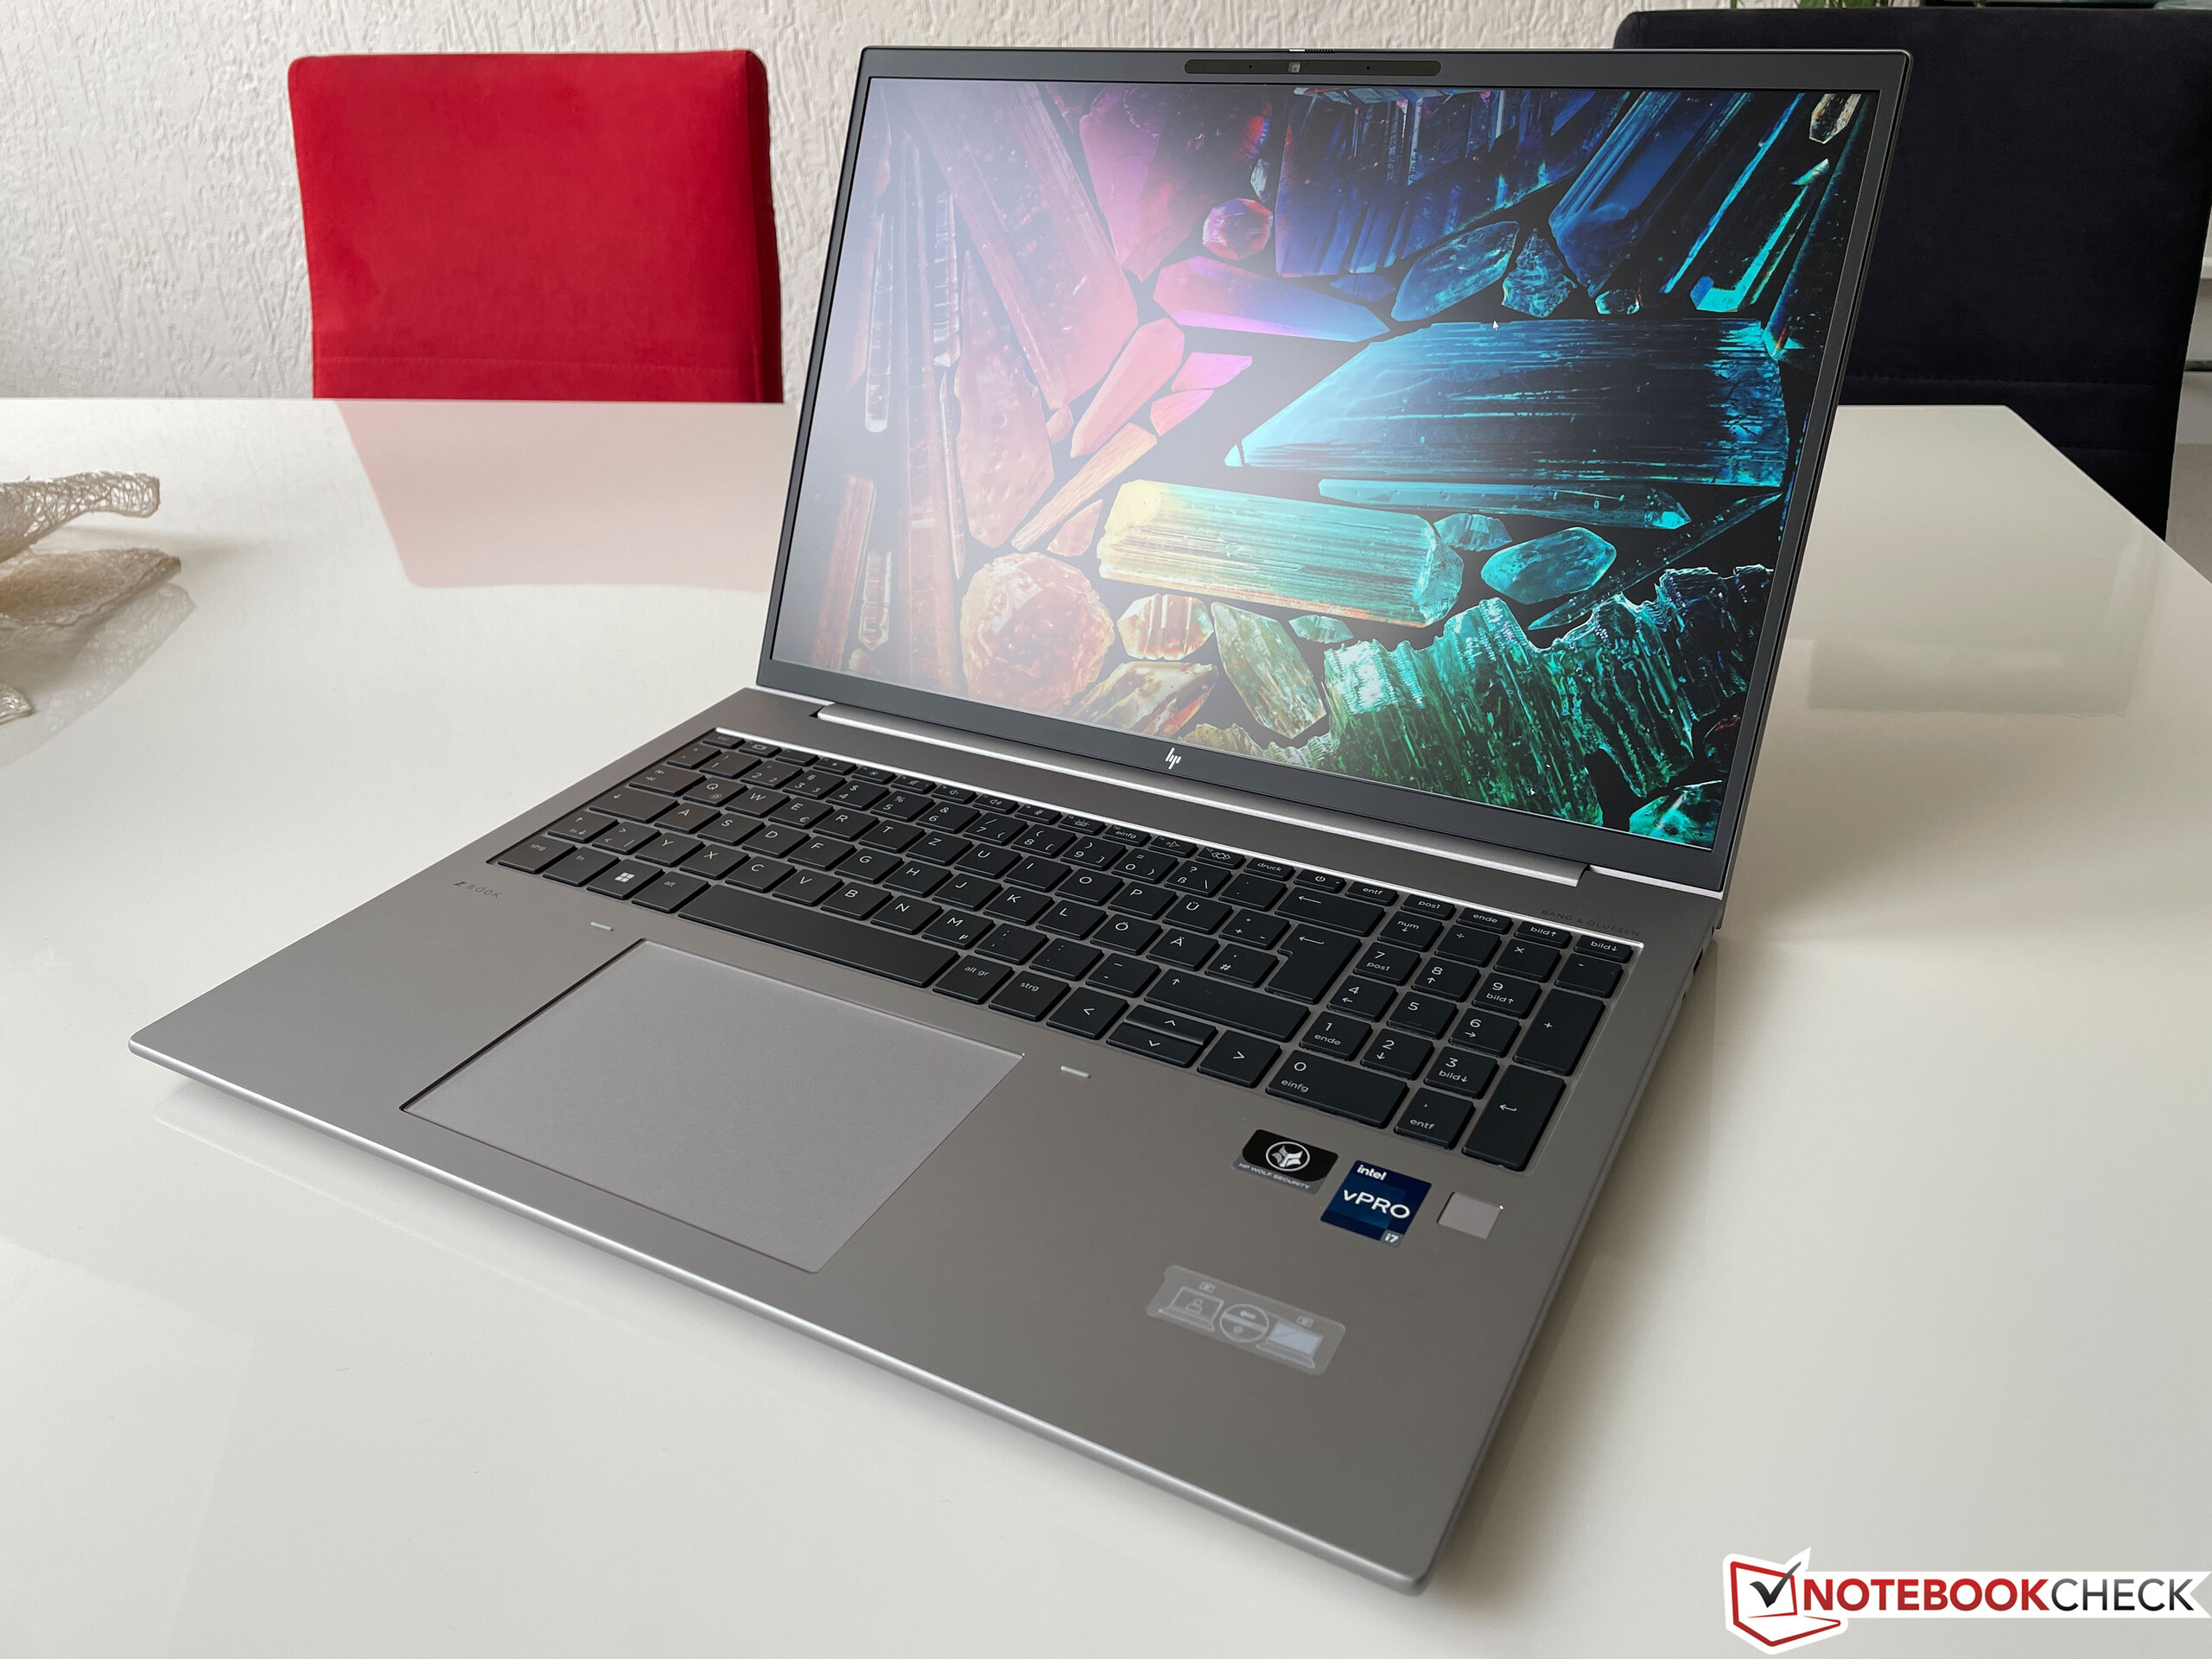
ZBook Firefly jest dość subtelny wizualnie, gdyż błyszczące logo Z na pokrywie, czarna klawiatura i czarne ramki wyświetlacza to jedyne zauważalne elementy kontrastujące. Ramki ze wszystkich stron są dość wąskie, a urządzenie wygląda ogólnie bardzo nowocześnie.
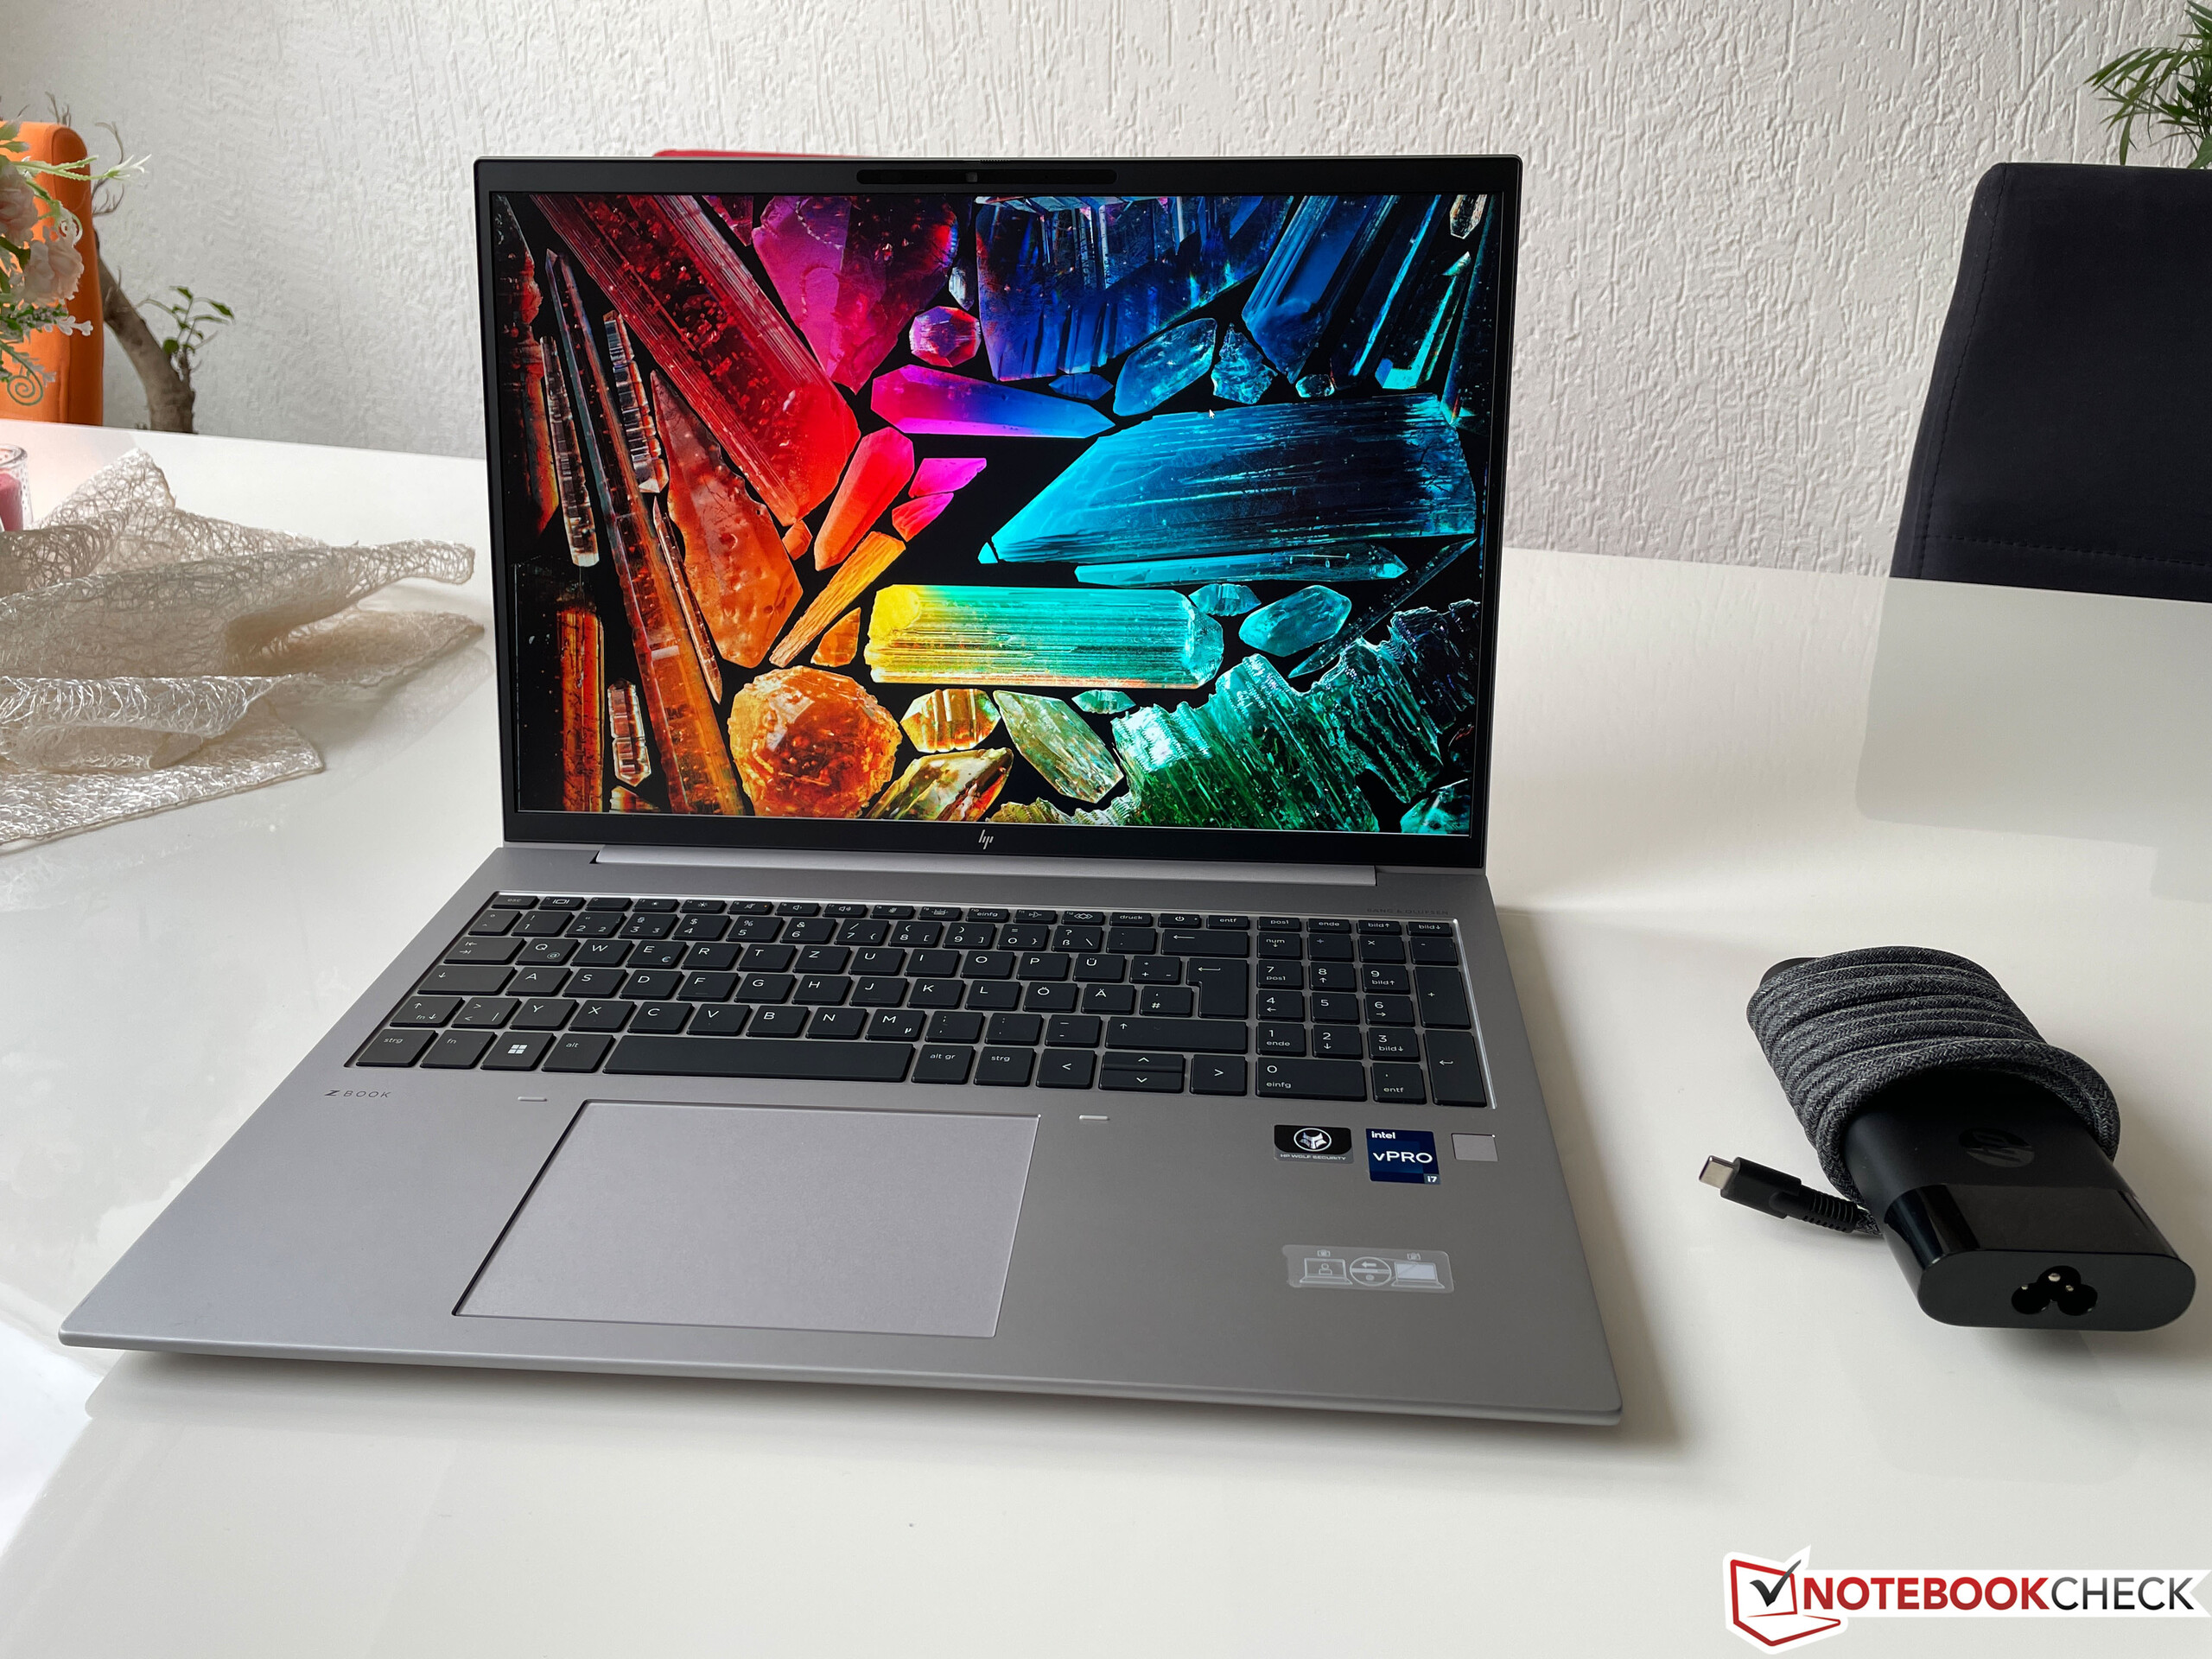
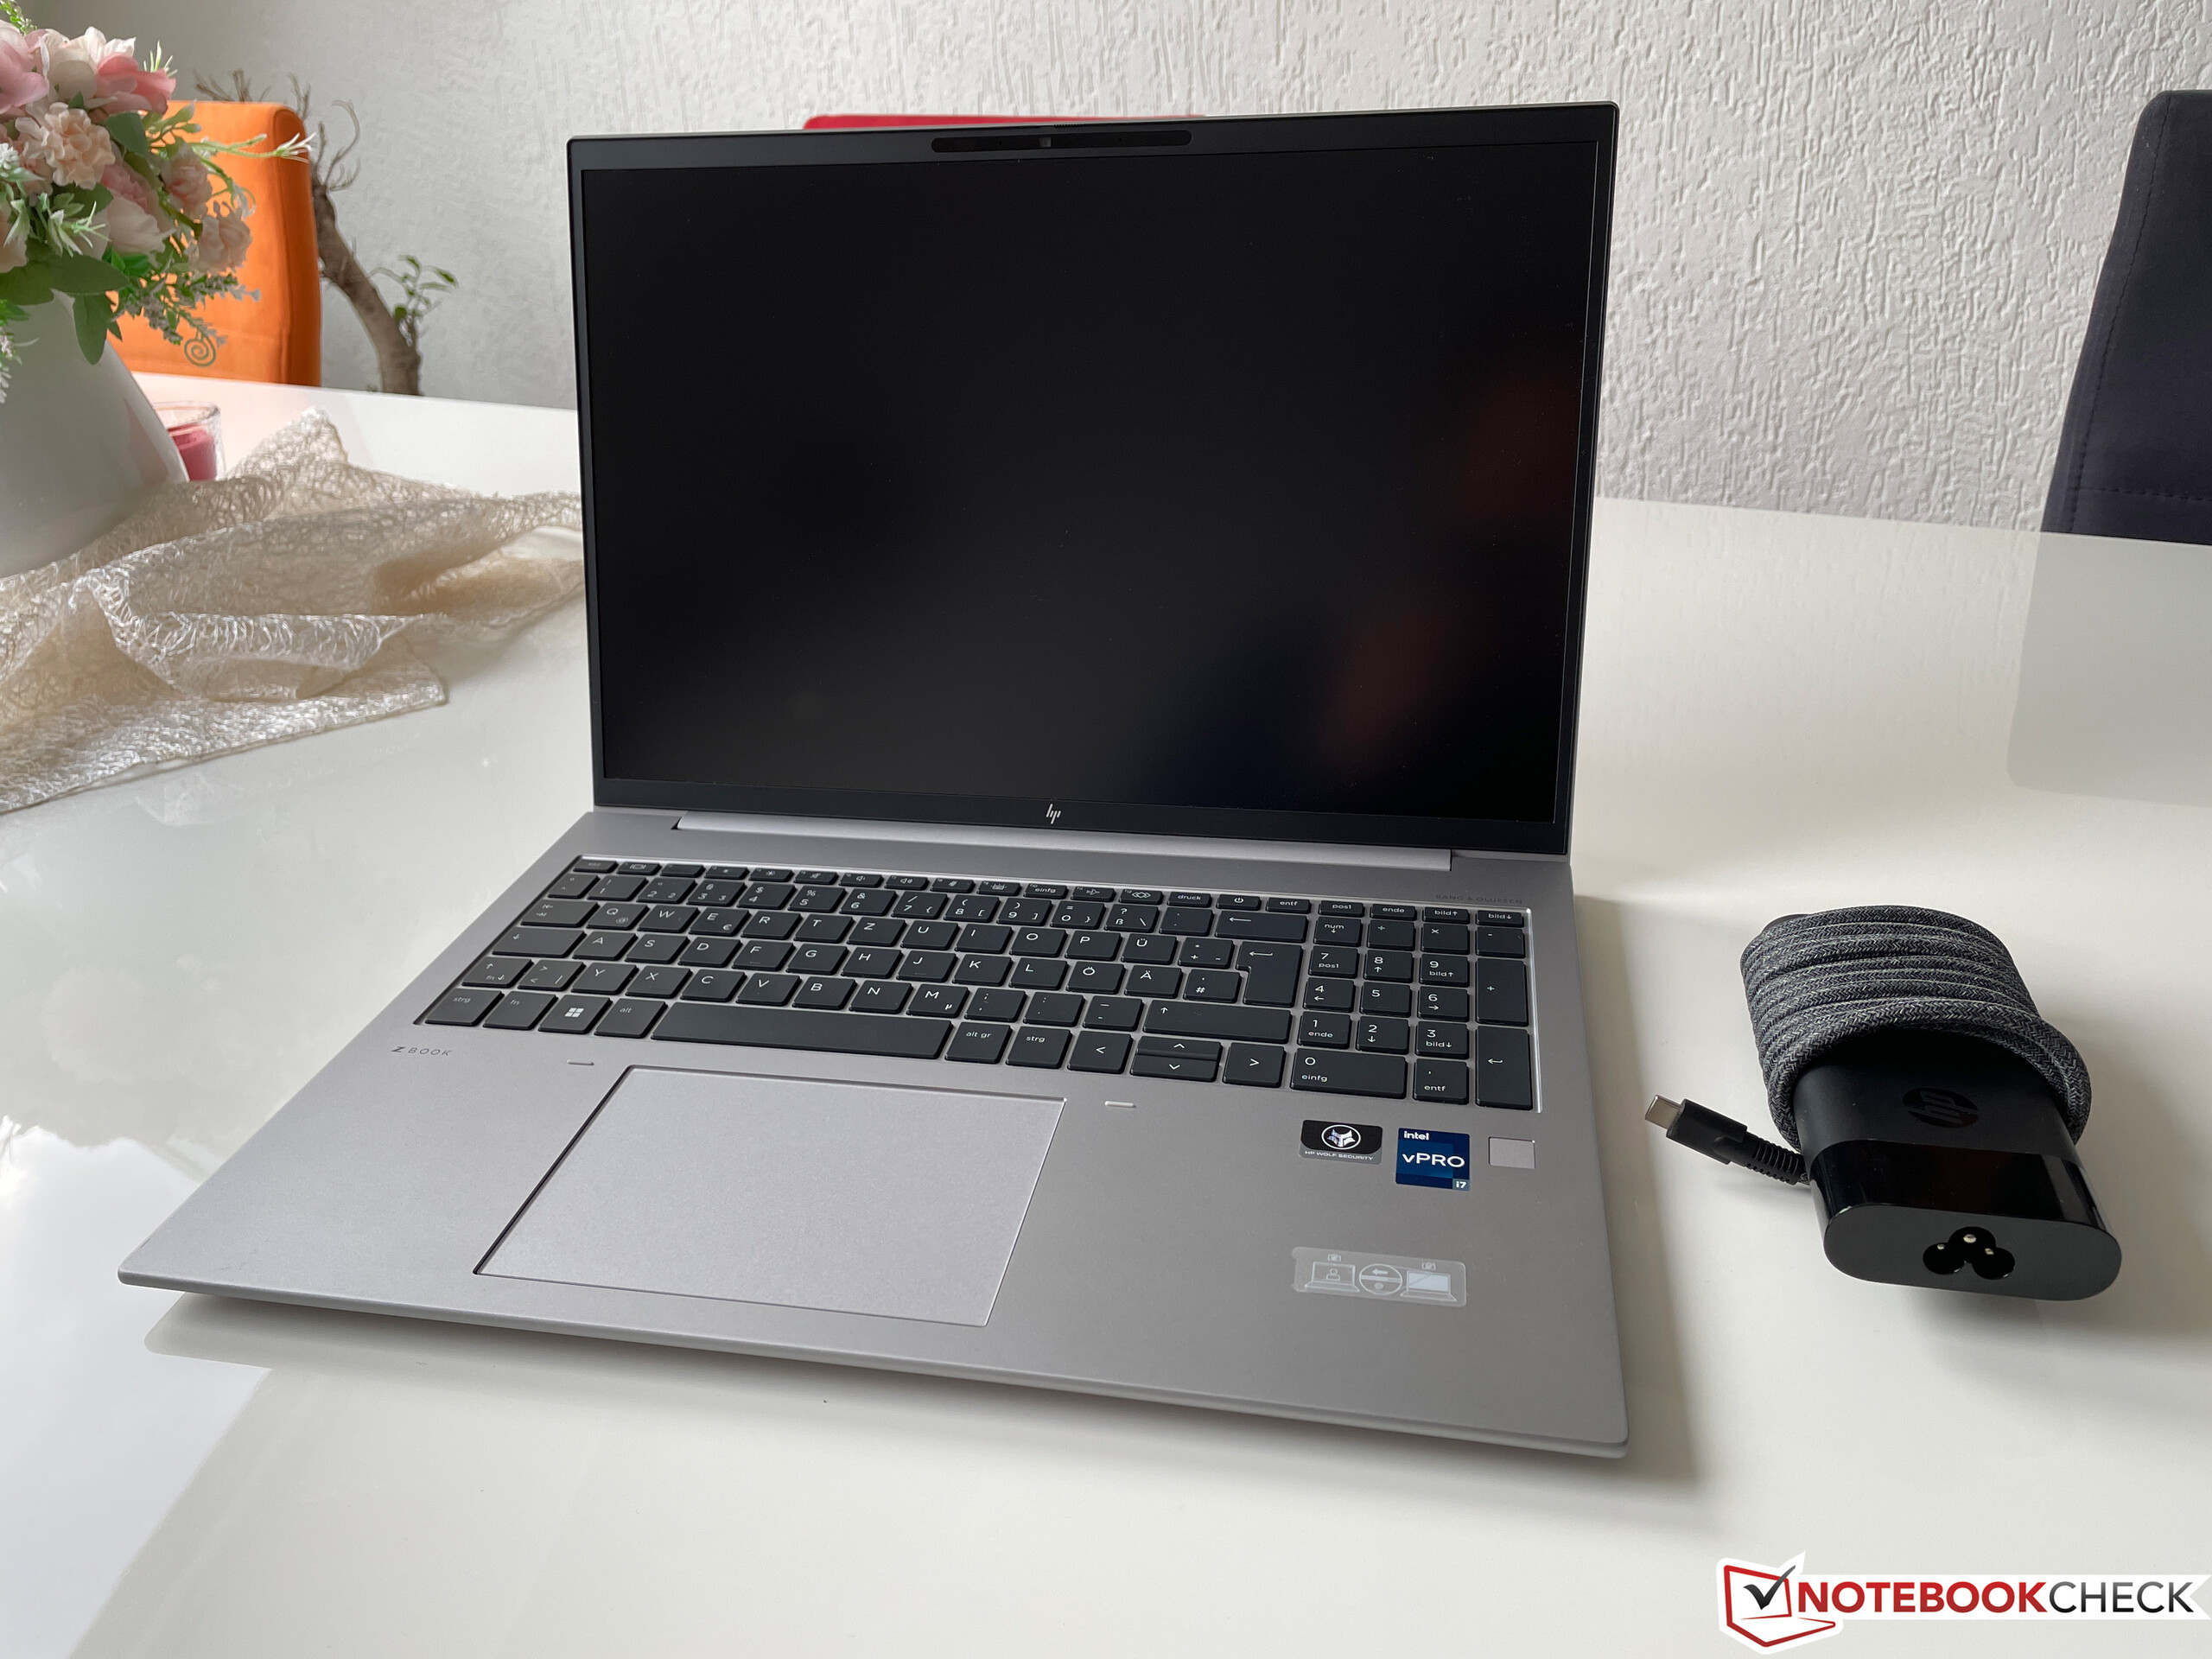
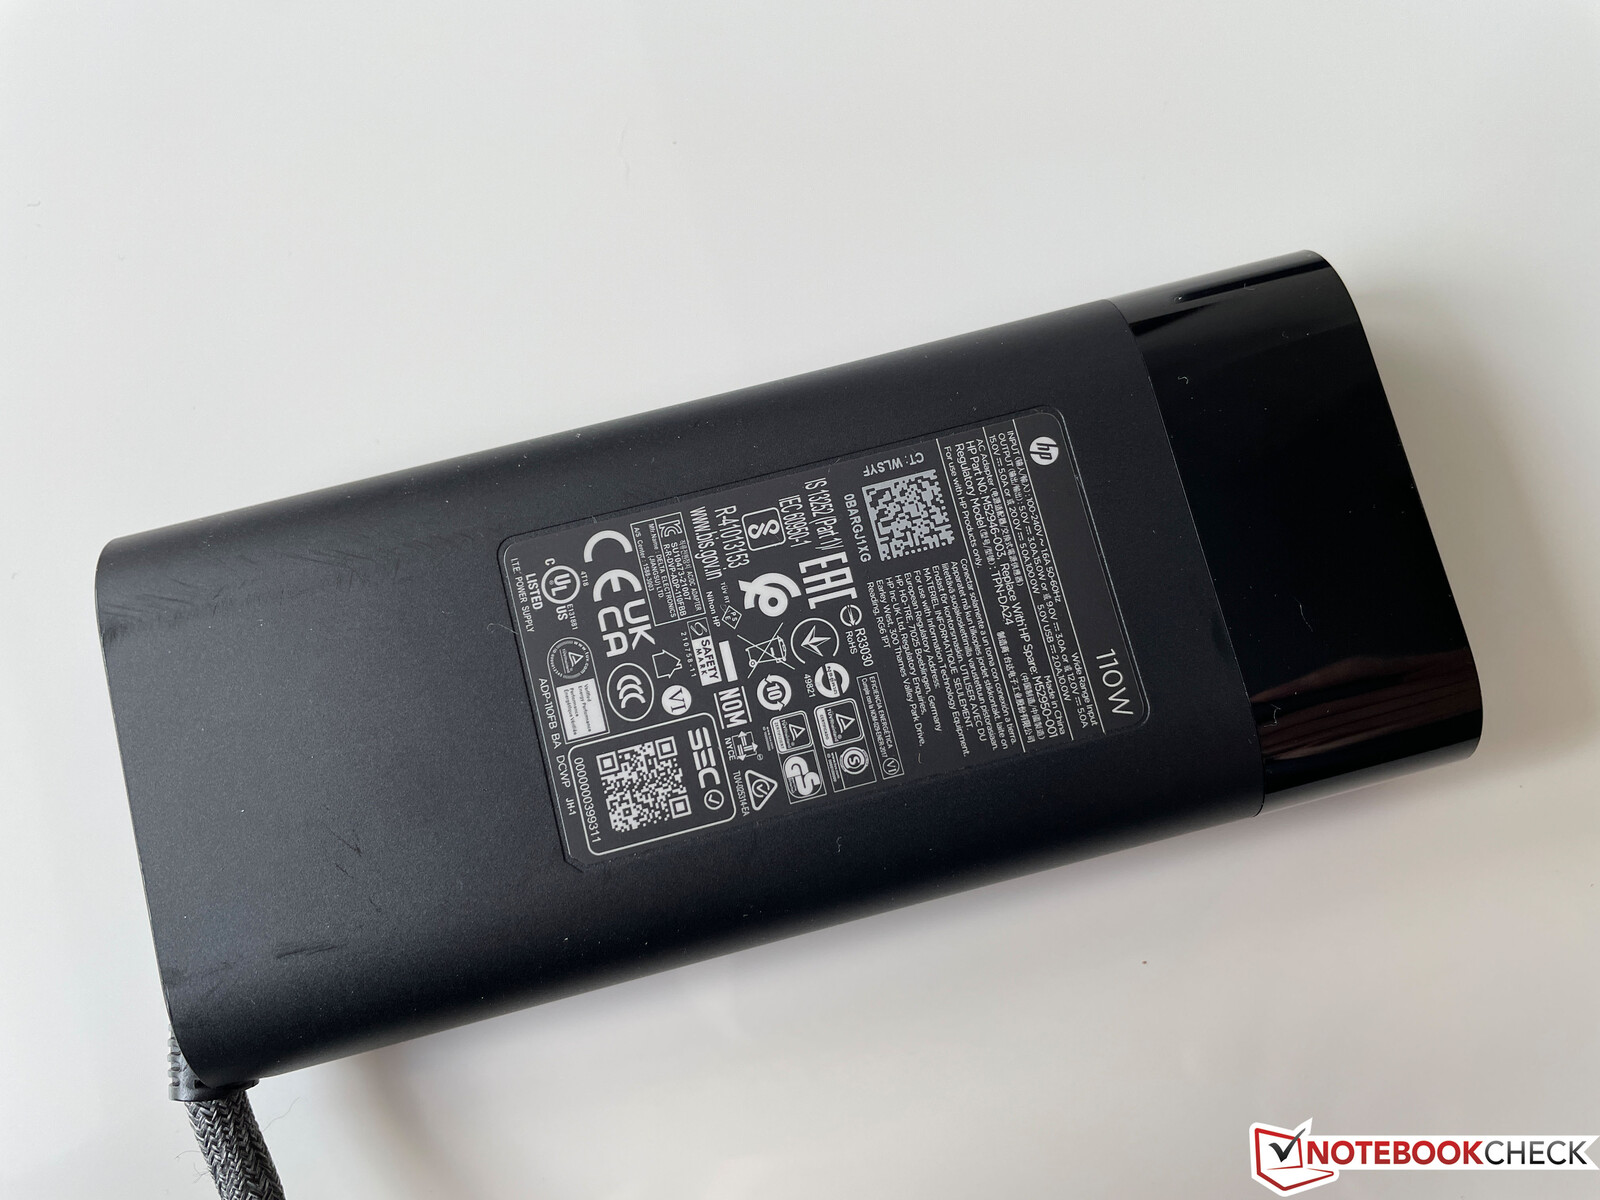
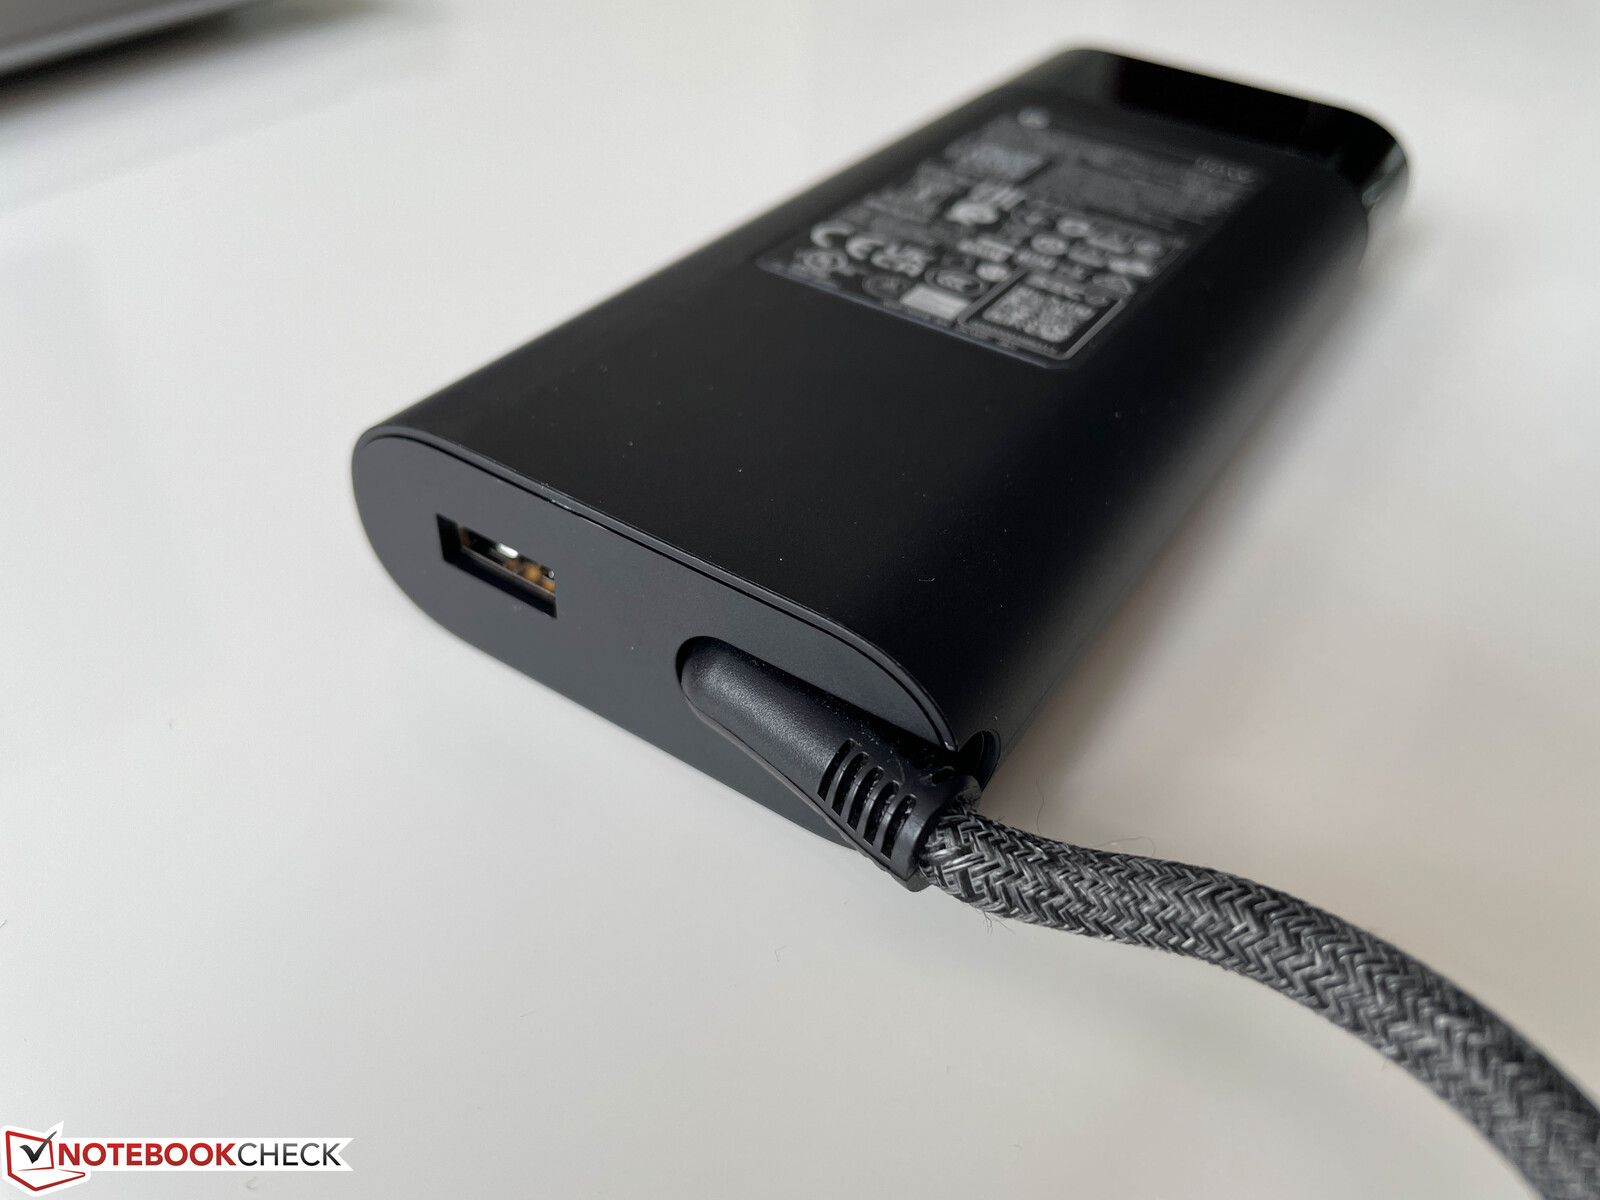
Firefly 16 G9 jest stosunkowo kompaktowy jak na 16-calowy model i tylko nieznacznie szerszy od np. starszego ZBook Firefly 15 G8. Jego waga wynosi blisko 2 kg, a 110-watowa ładowarka waży blisko kolejne 500 gramów (~1,1 funta).
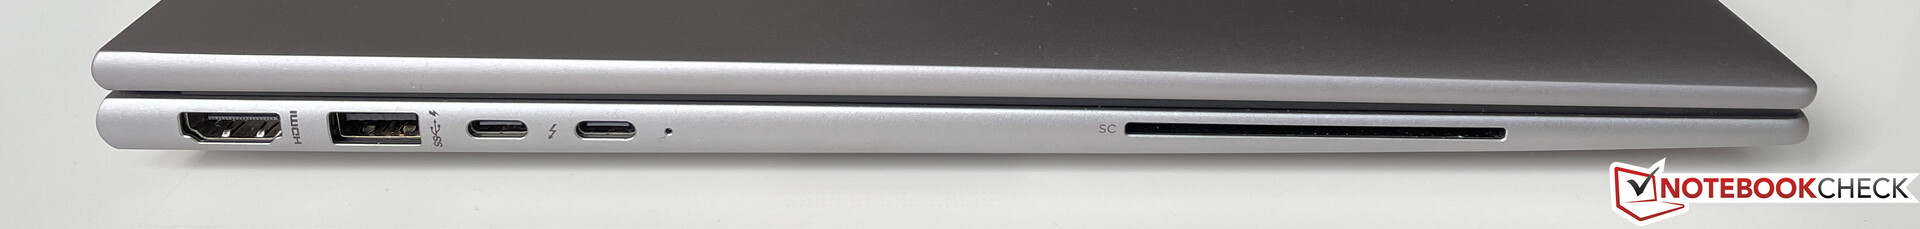
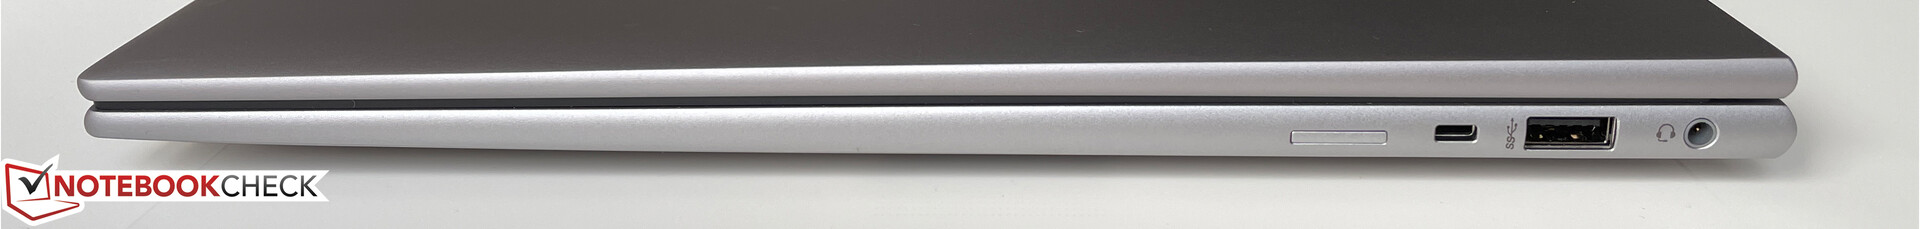
Łączność - Firefly z Thunderbolt 4 i Wi-Fi 6E
Większość portów znajduje się po lewej stronie obudowy, gdzie oprócz dwóch portów USB typu C znajduje się zwykły port USB typu A, wyjście HDMI oraz czytnik kart inteligentnych. Dzięki wbudowanemu Thunderbolt 4, ZBook jest na bieżąco z obecnymi standardami, chociaż stacja robocza jest dostarczana bez portu Ethernet (który można zamiast tego dodać poprzez adapter USB-C).
Komunikacja
ZBook Firefly może być skonfigurowany - ale nie doposażony - w opcjonalny moduł LTE lub nawet 5G. Nowoczesny moduł AX211E firmy Intel obsługuje komunikację bezprzewodową i obsługuje wszystkie najnowsze standardy Wi-Fi, a także Bluetooth 5.2. W naszych testach połączenie z siecią 6-GHz naszego referencyjnego routera Asus zostało nawiązane bez żadnych problemów, a szybkość transferu była niezmiennie doskonała.
Kamera internetowa
Specyfikacja kamery internetowej na karcie katalogowej jest nieco myląca, ponieważ HP wspomina o kamerze IR o rozdzielczości 5 MP. Podczas gdy nie jesteśmy w stanie wypowiedzieć się na temat rozdzielczości kamery IR (która jest wykorzystywana do rozpoznawania twarzy poprzez Windows Hello), główna kamera rejestruje zdjęcia w rozdzielczości do 3,7 MP (2560 x 1440 pikseli). Zalety wyższej rozdzielczości w porównaniu do starszych kamerek są bardzo widoczne, choć dokładność kolorów nie jest niczym, o czym można by napisać.


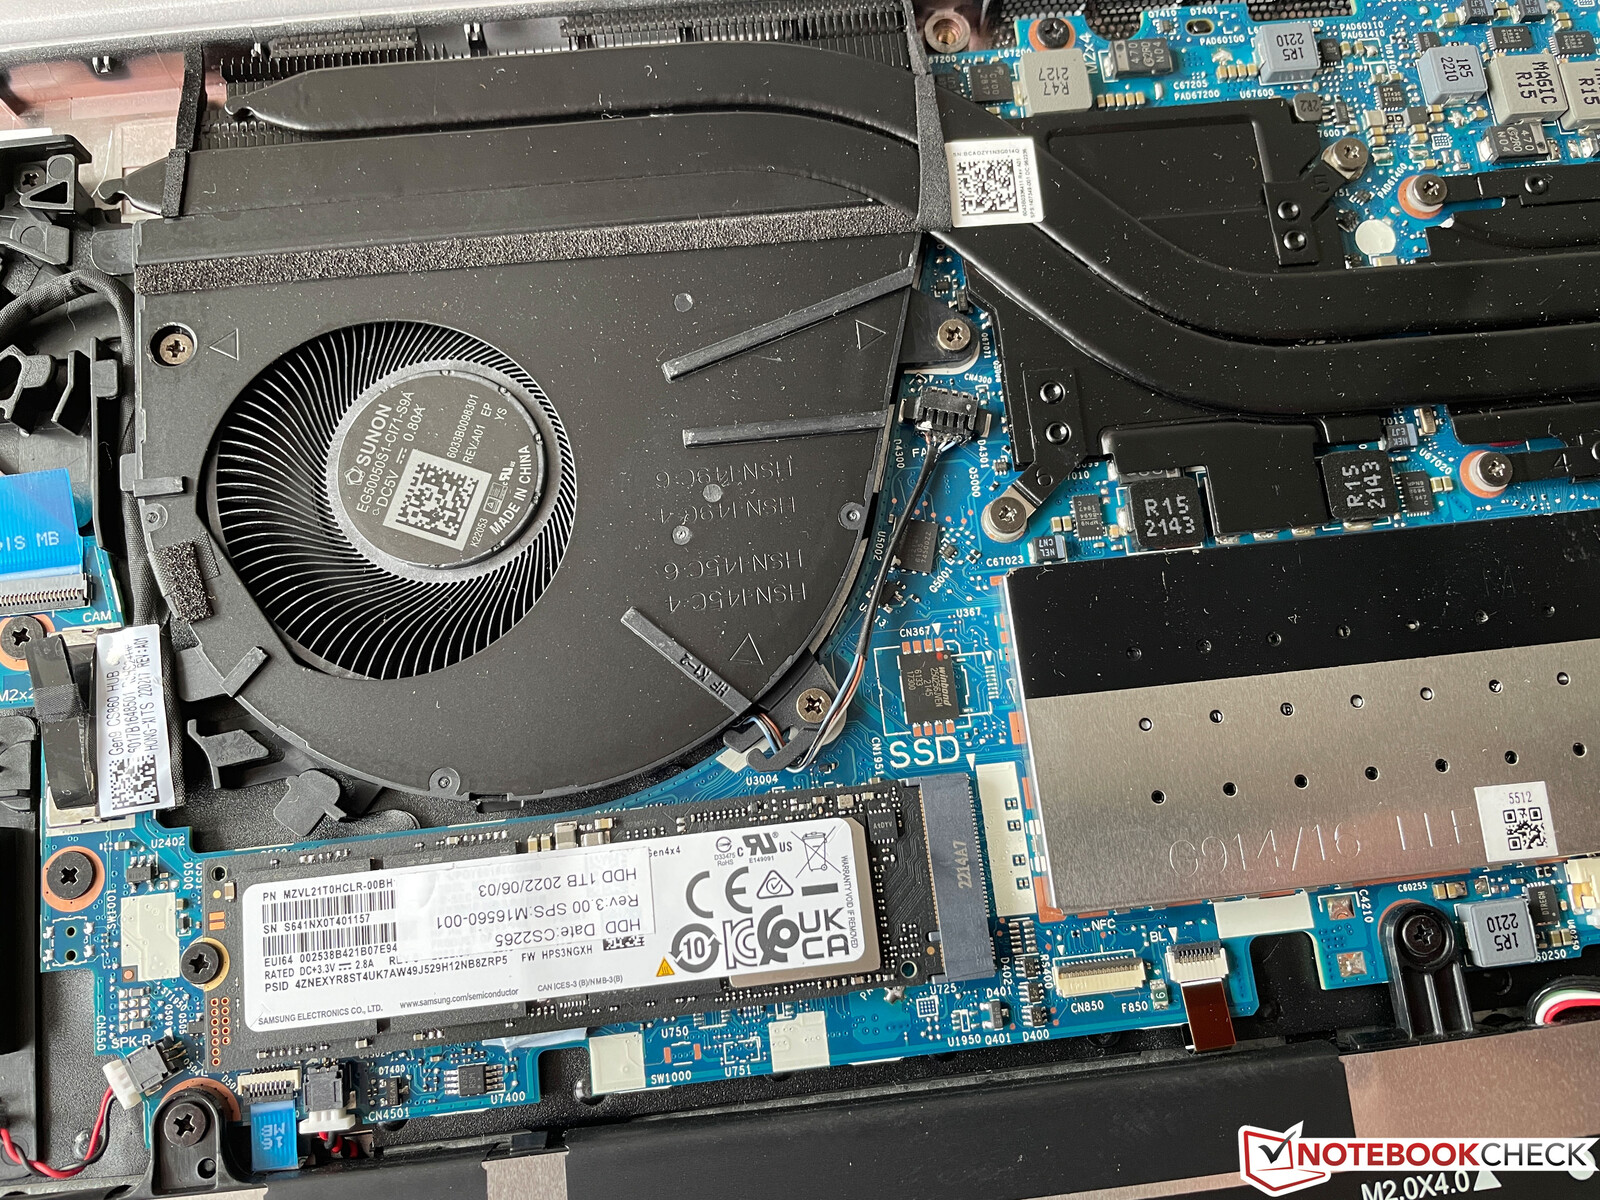
Konserwacja
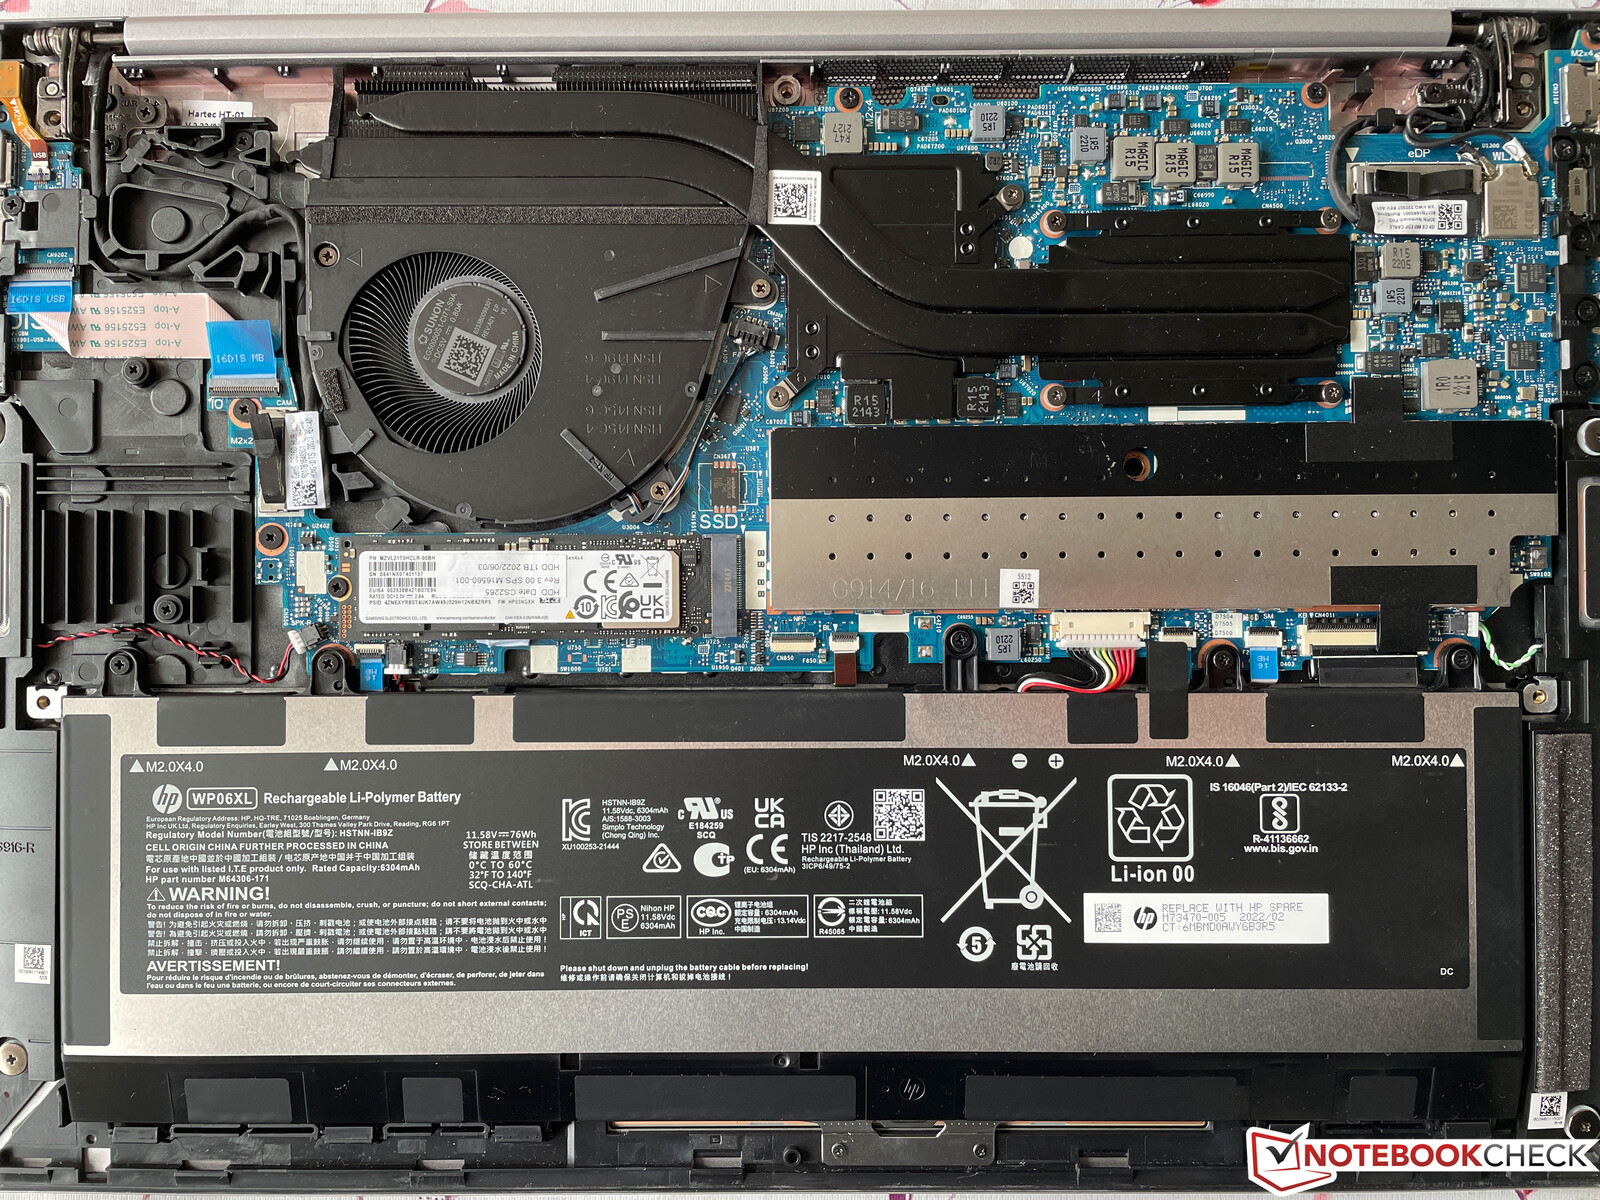
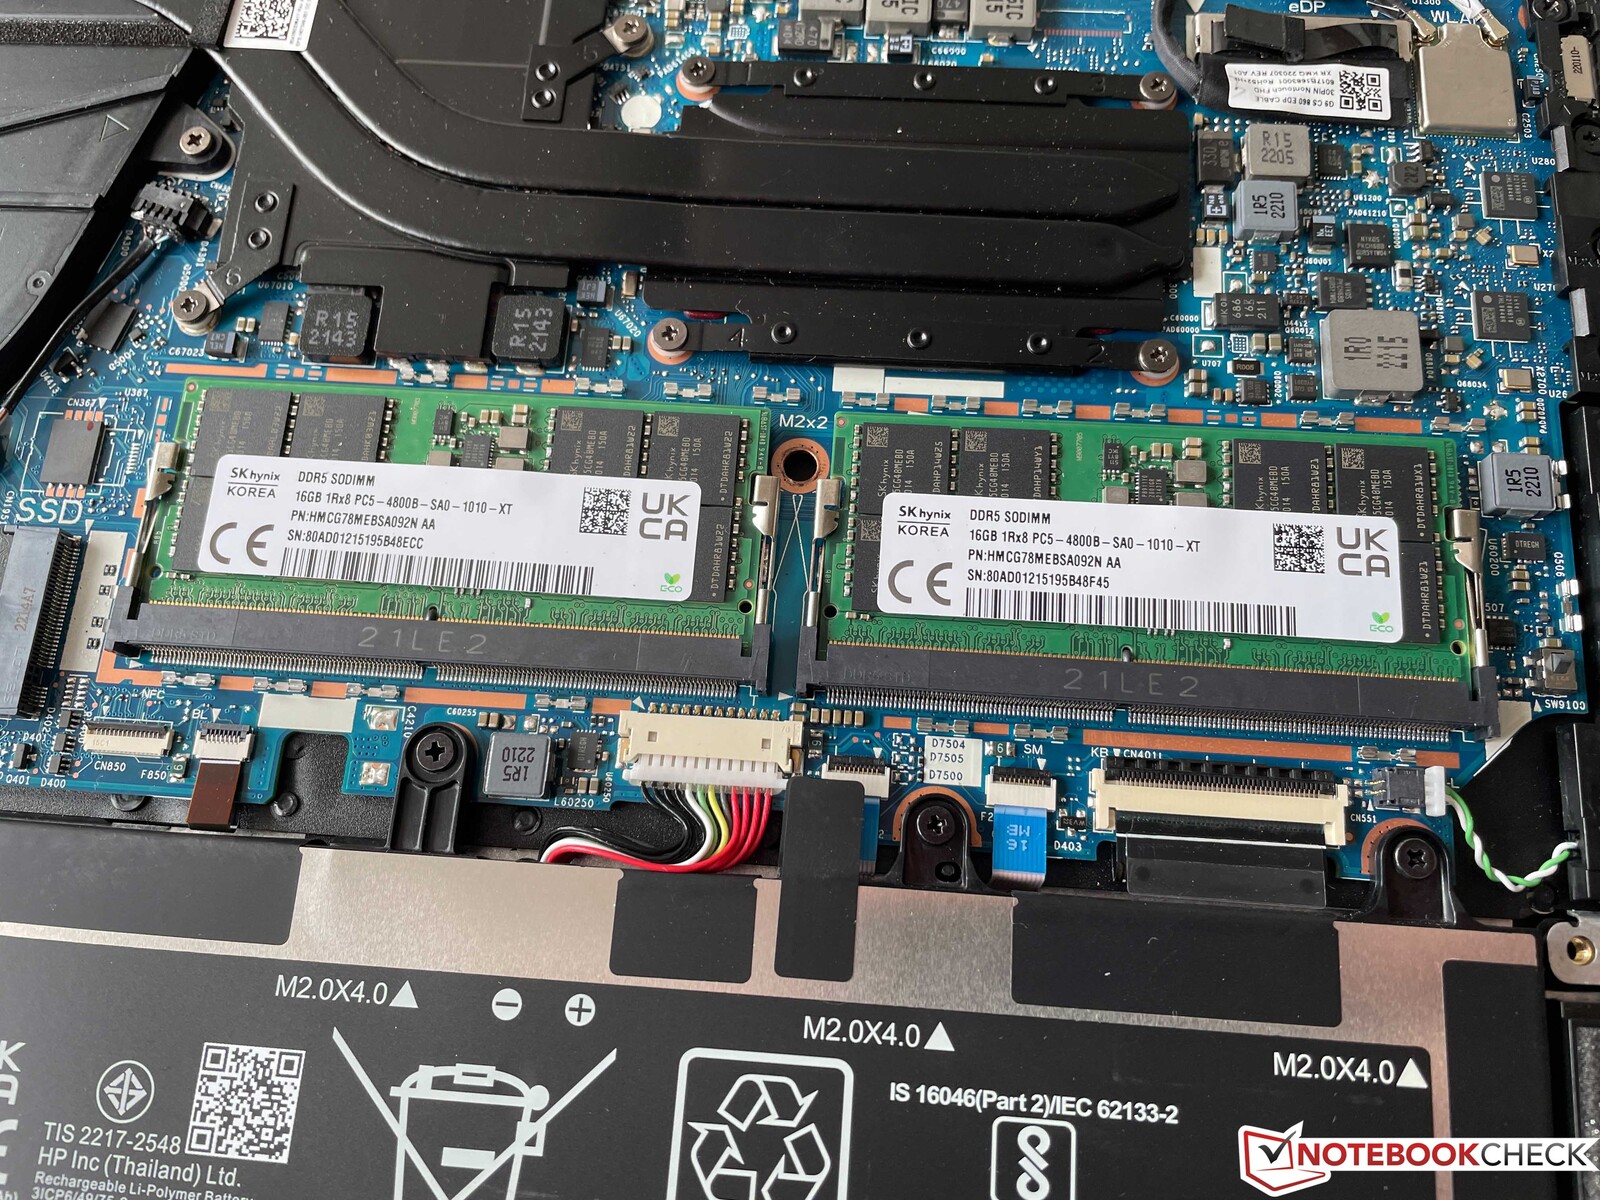
Spodnią płytę można łatwo zdjąć, gdyż zastosowano wyłącznie standardowe śrubki z łbem Philipsa (które należy tylko poluzować, a nie wykręcać na siłę). Wewnątrz użytkownicy mają dostęp do akumulatora, wentylatora, dysku SSD M.2-2280 oraz obu modułów SODIMM, które są ukryte pod dodatkową pokrywą. Moduł Wi-Fi nie może zostać zmodernizowany.
Urządzenia wejściowe - ZBook z doskonałą klawiaturą
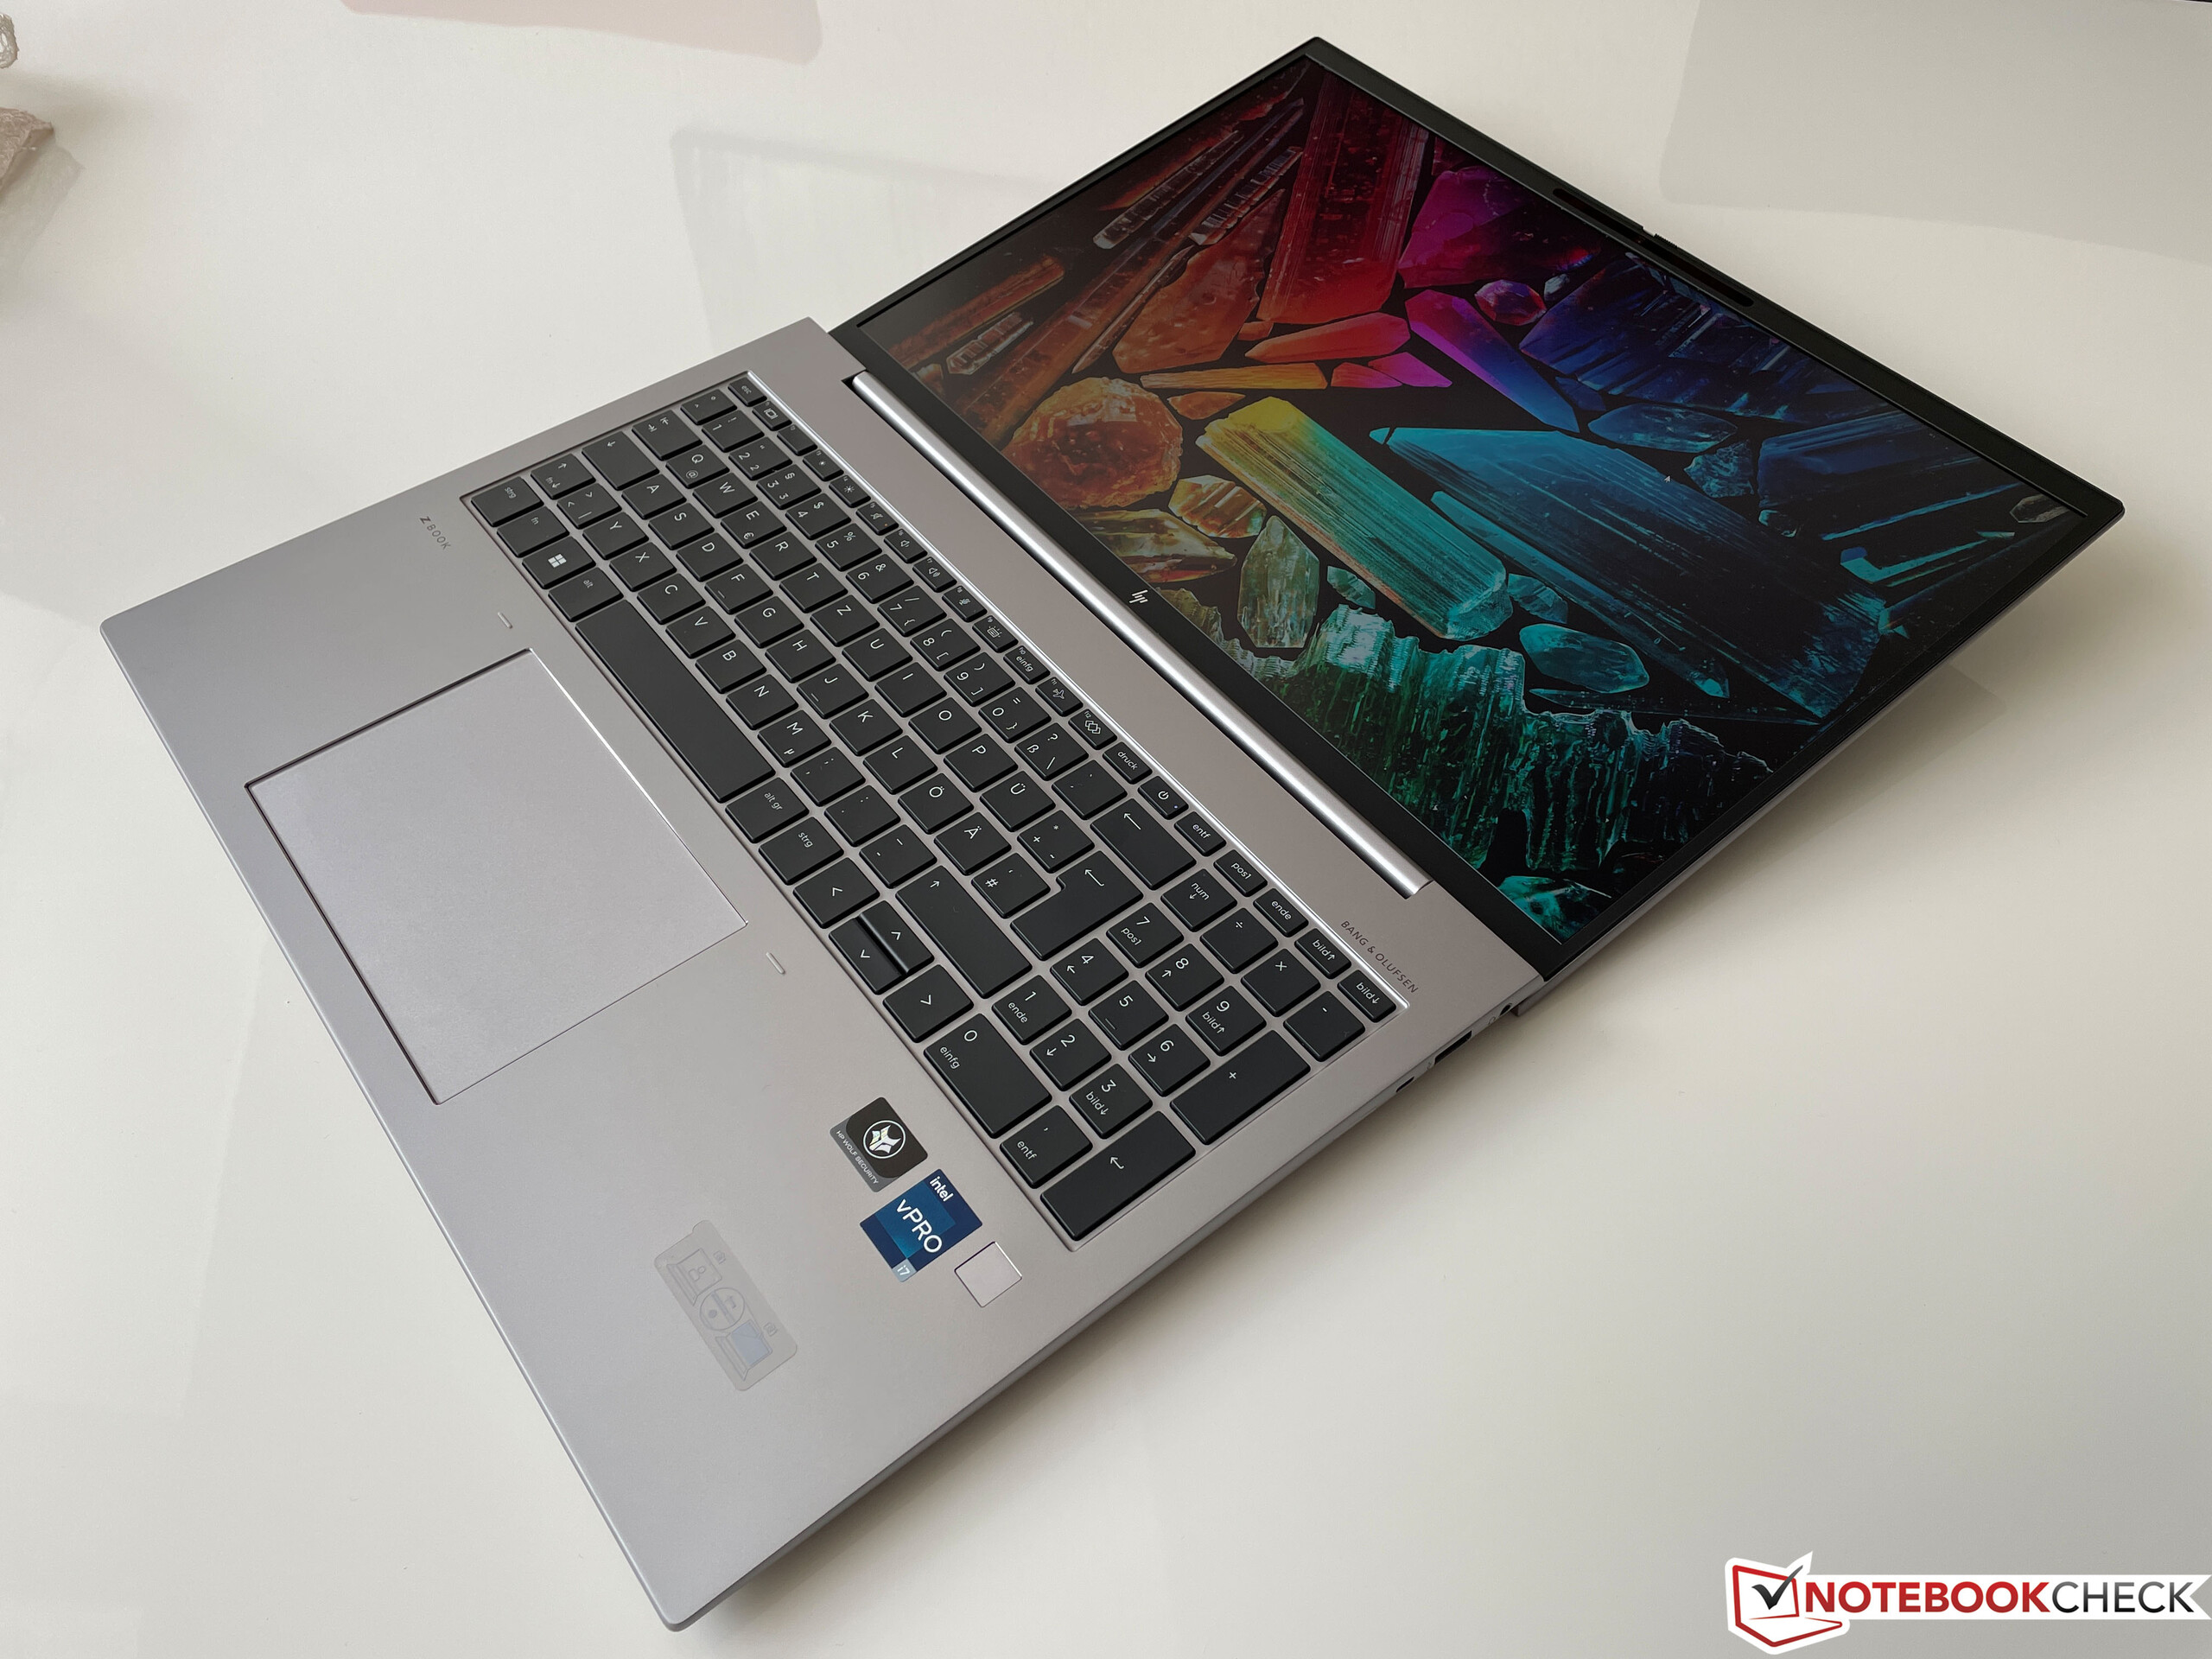
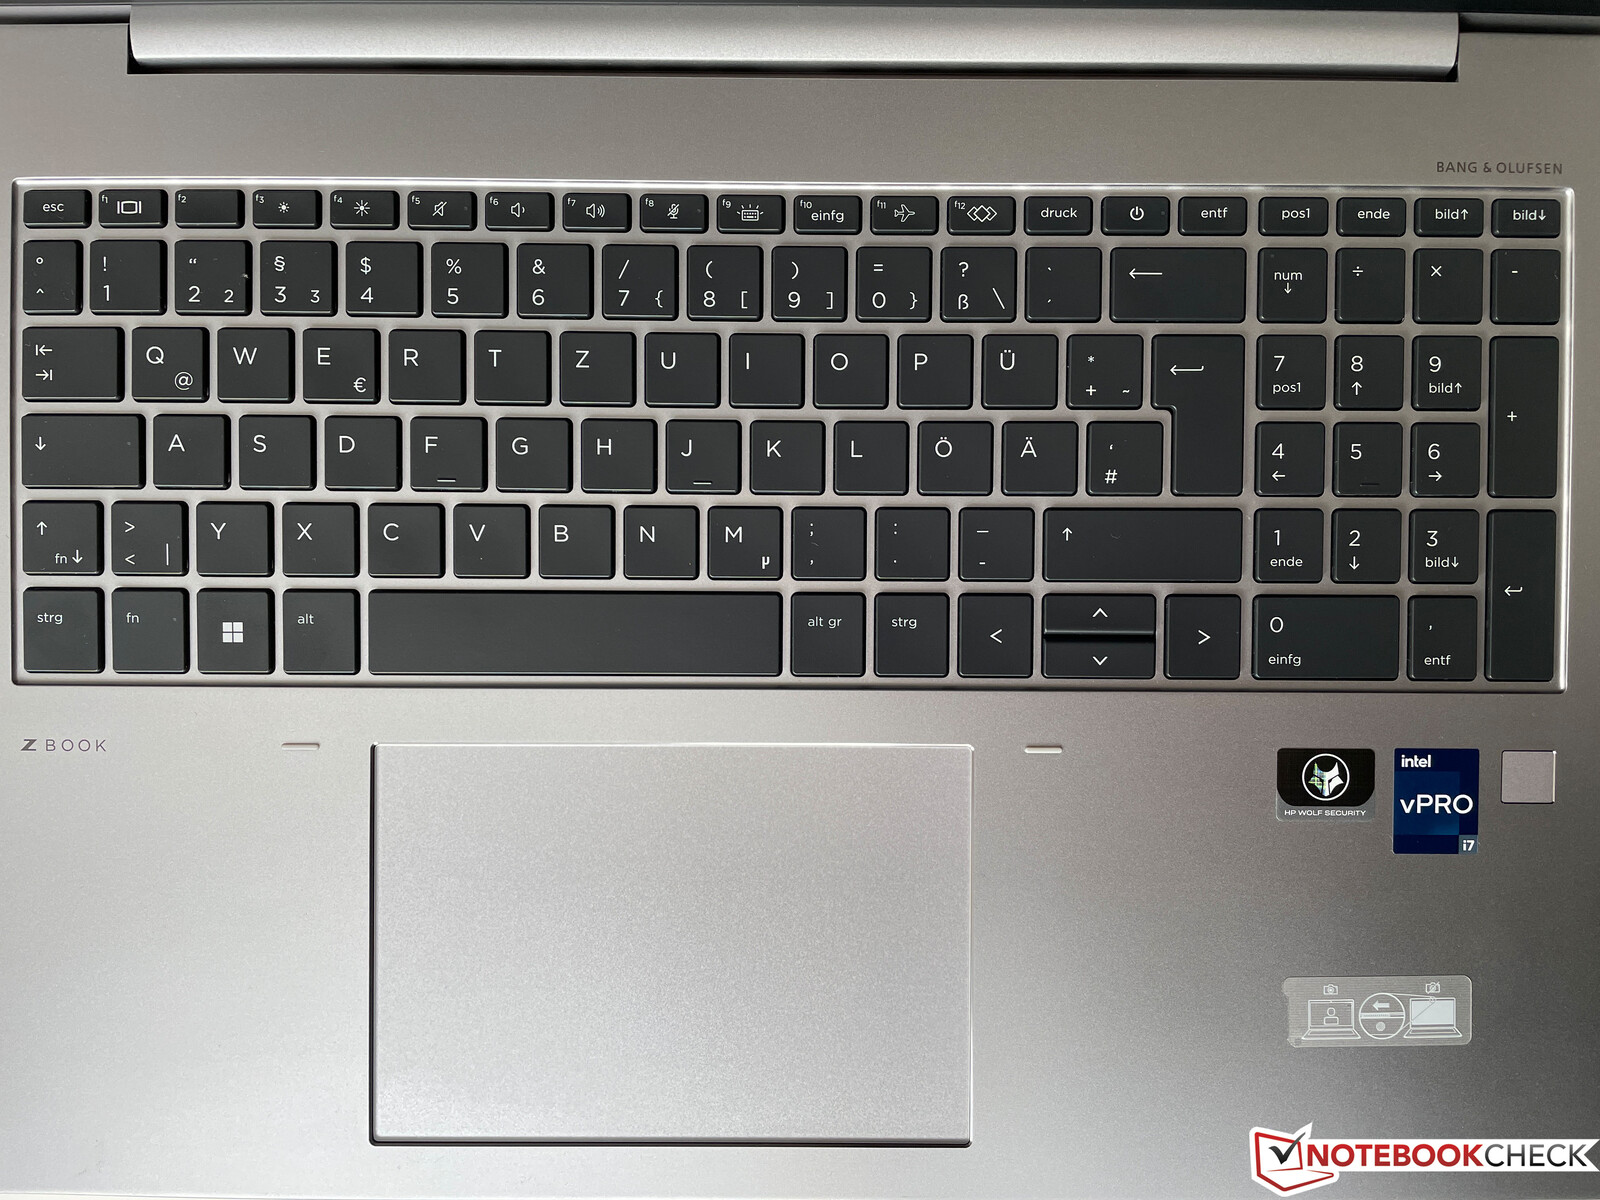
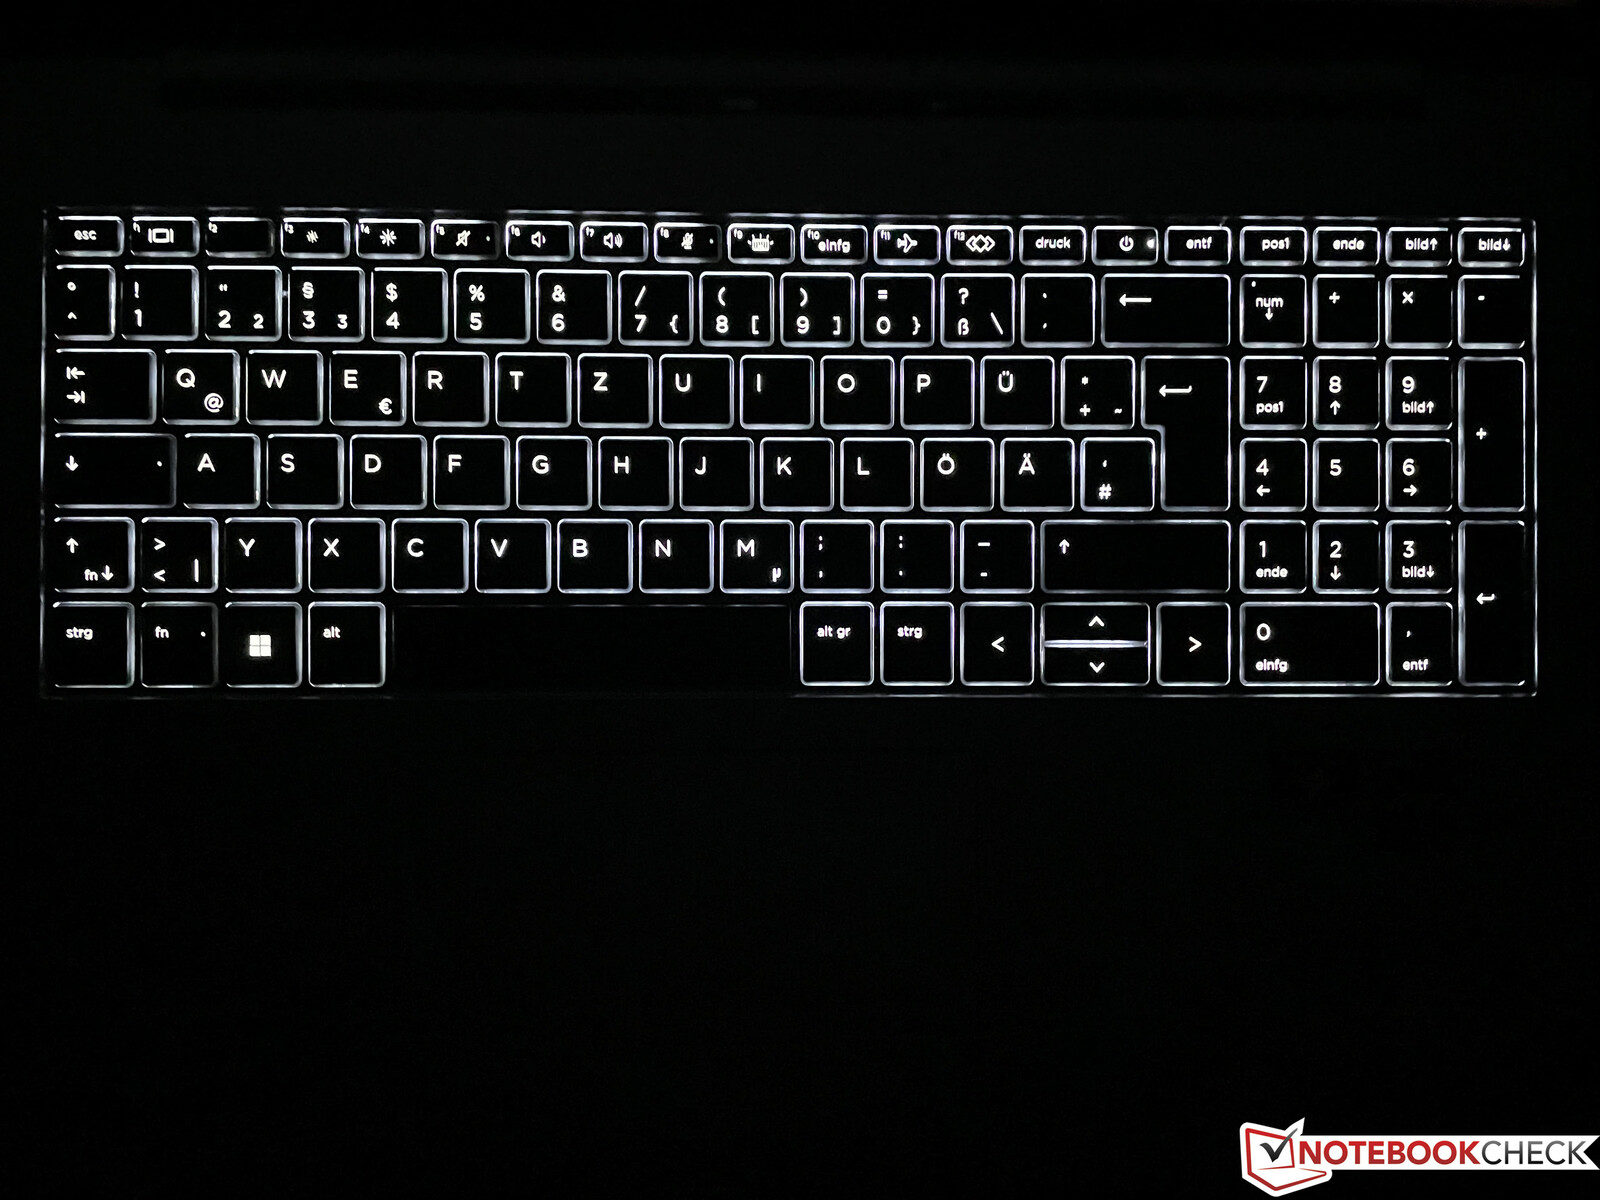
HP zastosowało klawiaturę z numpadem, białym podświetleniem z dwoma ustawieniami jasności oraz odpornością na wodę rozpryskową. Jesteśmy ogólnie bardzo zadowoleni z klawiatury, a ponieważ HP nie zmniejszyło wielokrotnie skoku klawiszy, subiektywnie czuje się ją nawet lepiej niż w obecnych modelach Lenovo ThinkPad. Ponieważ jednak sprzężenie zwrotne jest dość twarde, wrażenie z klawiatury może się zmienić w zależności od osobistych preferencji. Przycisk zasilania jest zintegrowany z klawiaturą, co jest mniej niż idealne, a pod prawą dolną częścią klawiatury znajduje się skaner linii papilarnych.
Ponieważ HP pomija trackpoint w centrum klawiatury, duży clickpad jest jedyną metodą wprowadzania danych za pomocą myszy, która jest domyślnie dostępna. Jest on przesunięty nieco w lewo i przy wymiarach 12,8 x 8,7 cm (~5,04 x 3,43 cala) wystarczająco duży nawet dla gestów wymagających użycia nawet czterech palców. Gładka powierzchnia oferuje dobre właściwości ślizgowe, a sterowanie kursorem jest bez zarzutu. Kliknięcia mogą być wyzwalane w dolnej części podkładki i brzmią przyjemnie głęboko.
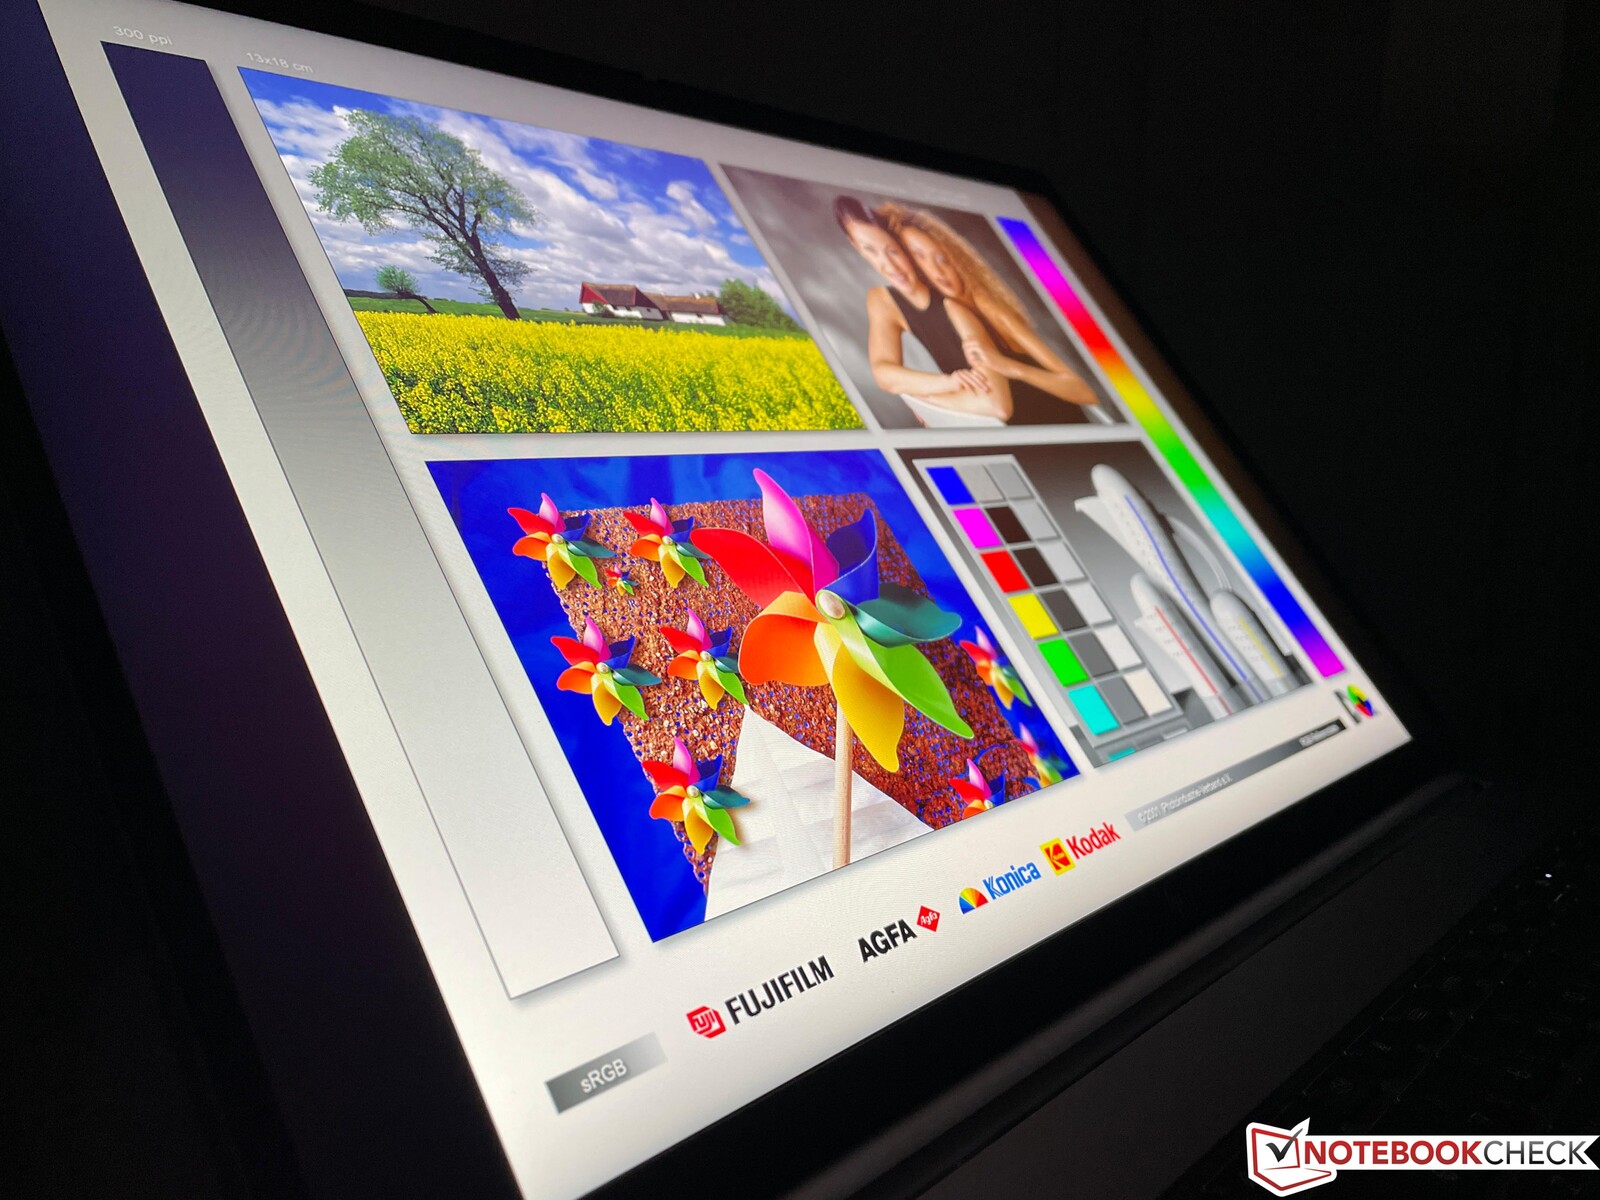
Wyświetlacz - HP zastosowało matowy panel 16:10
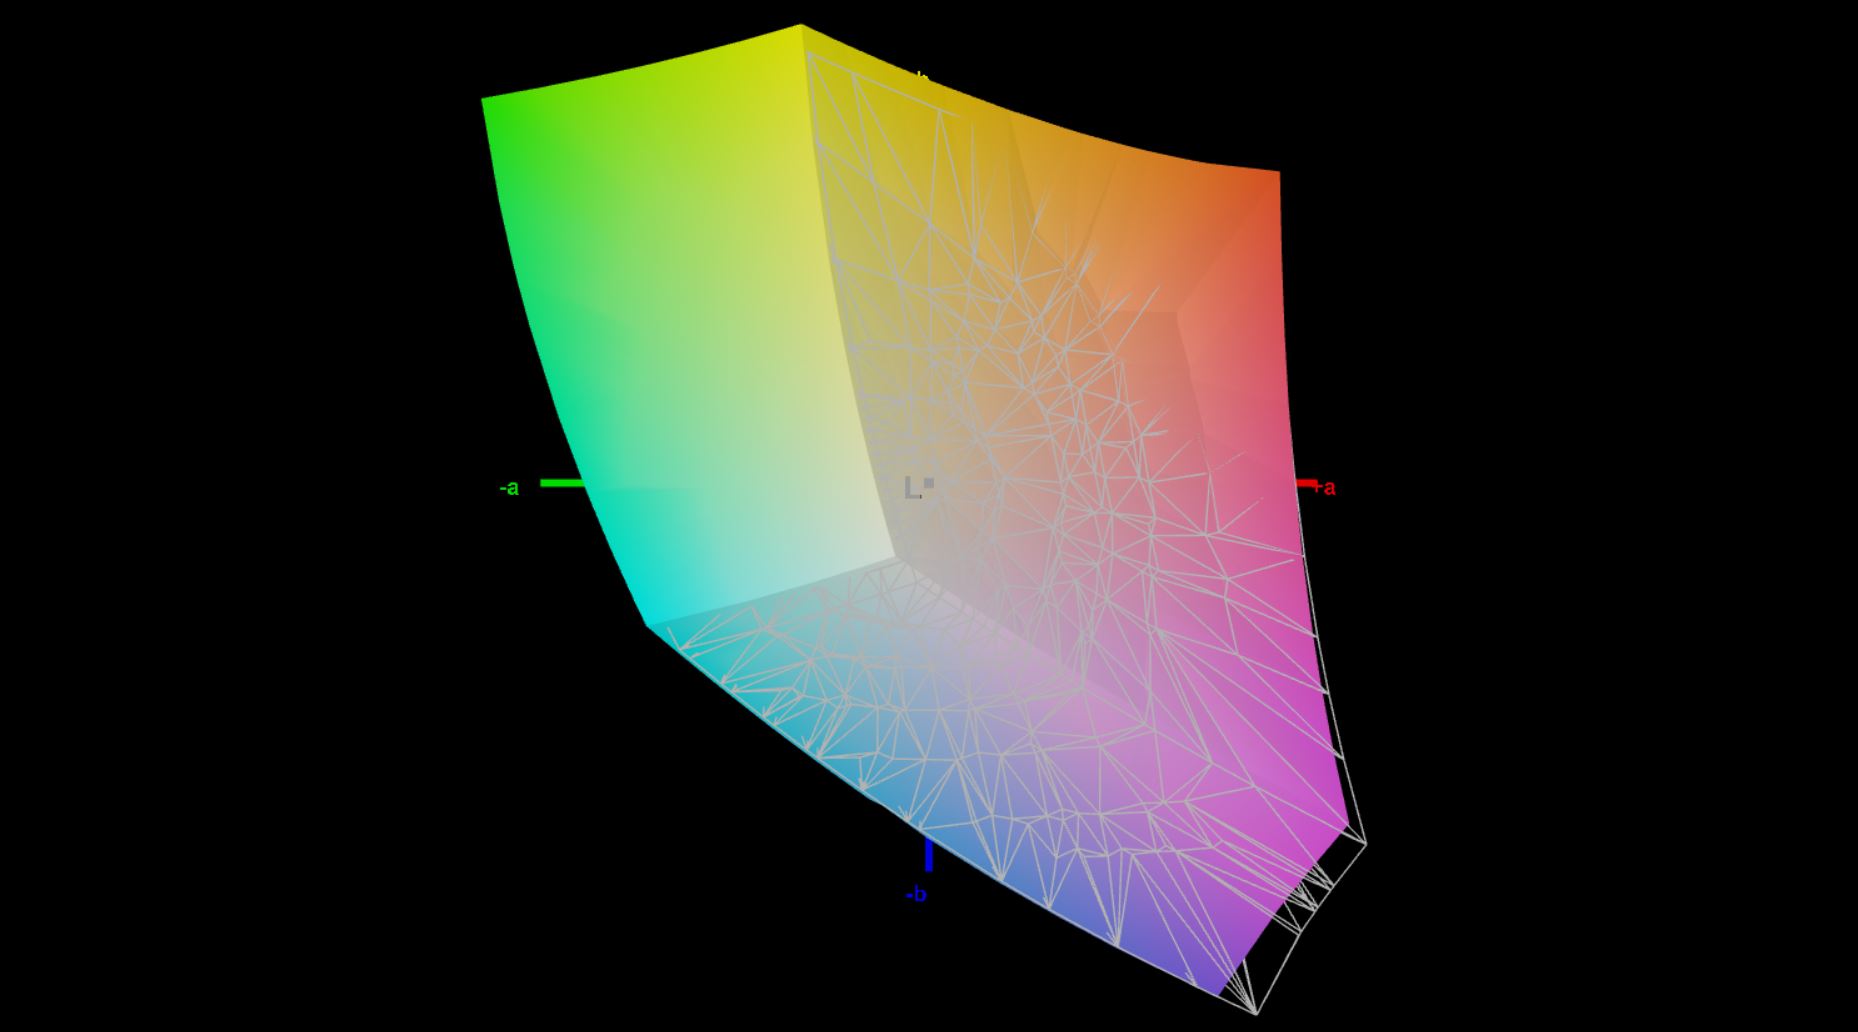
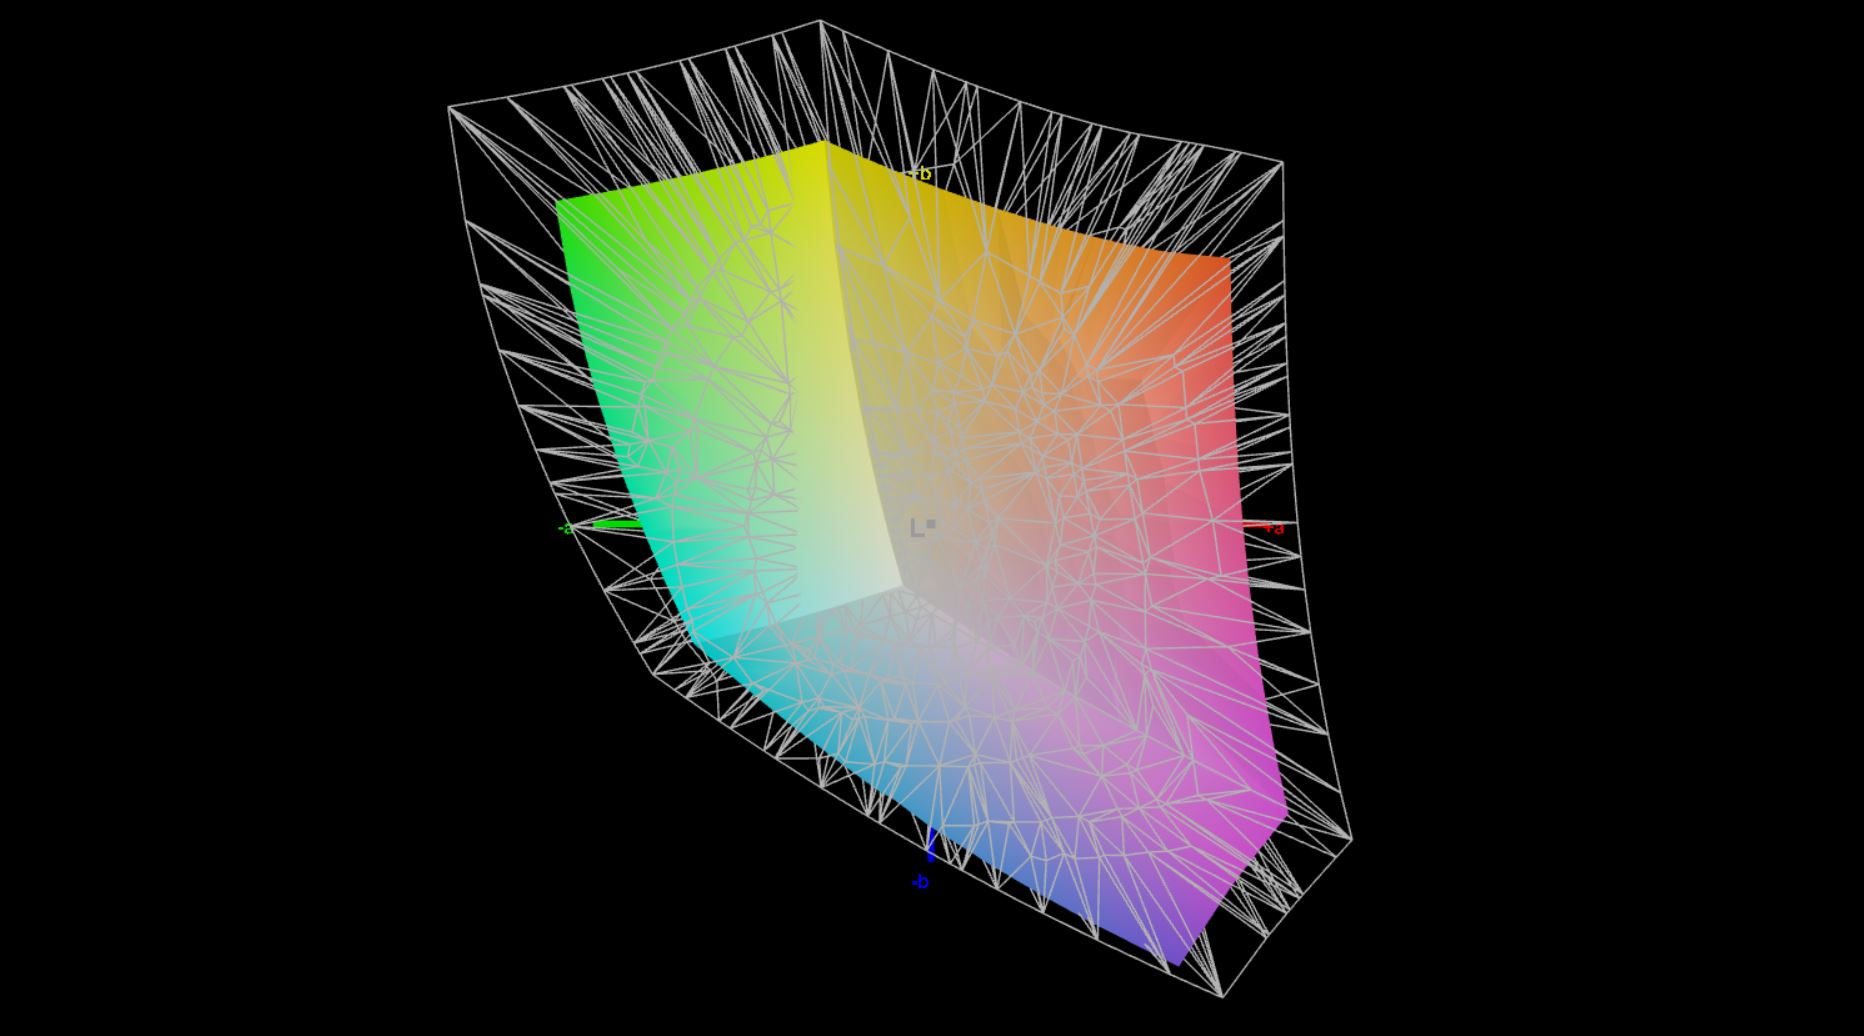
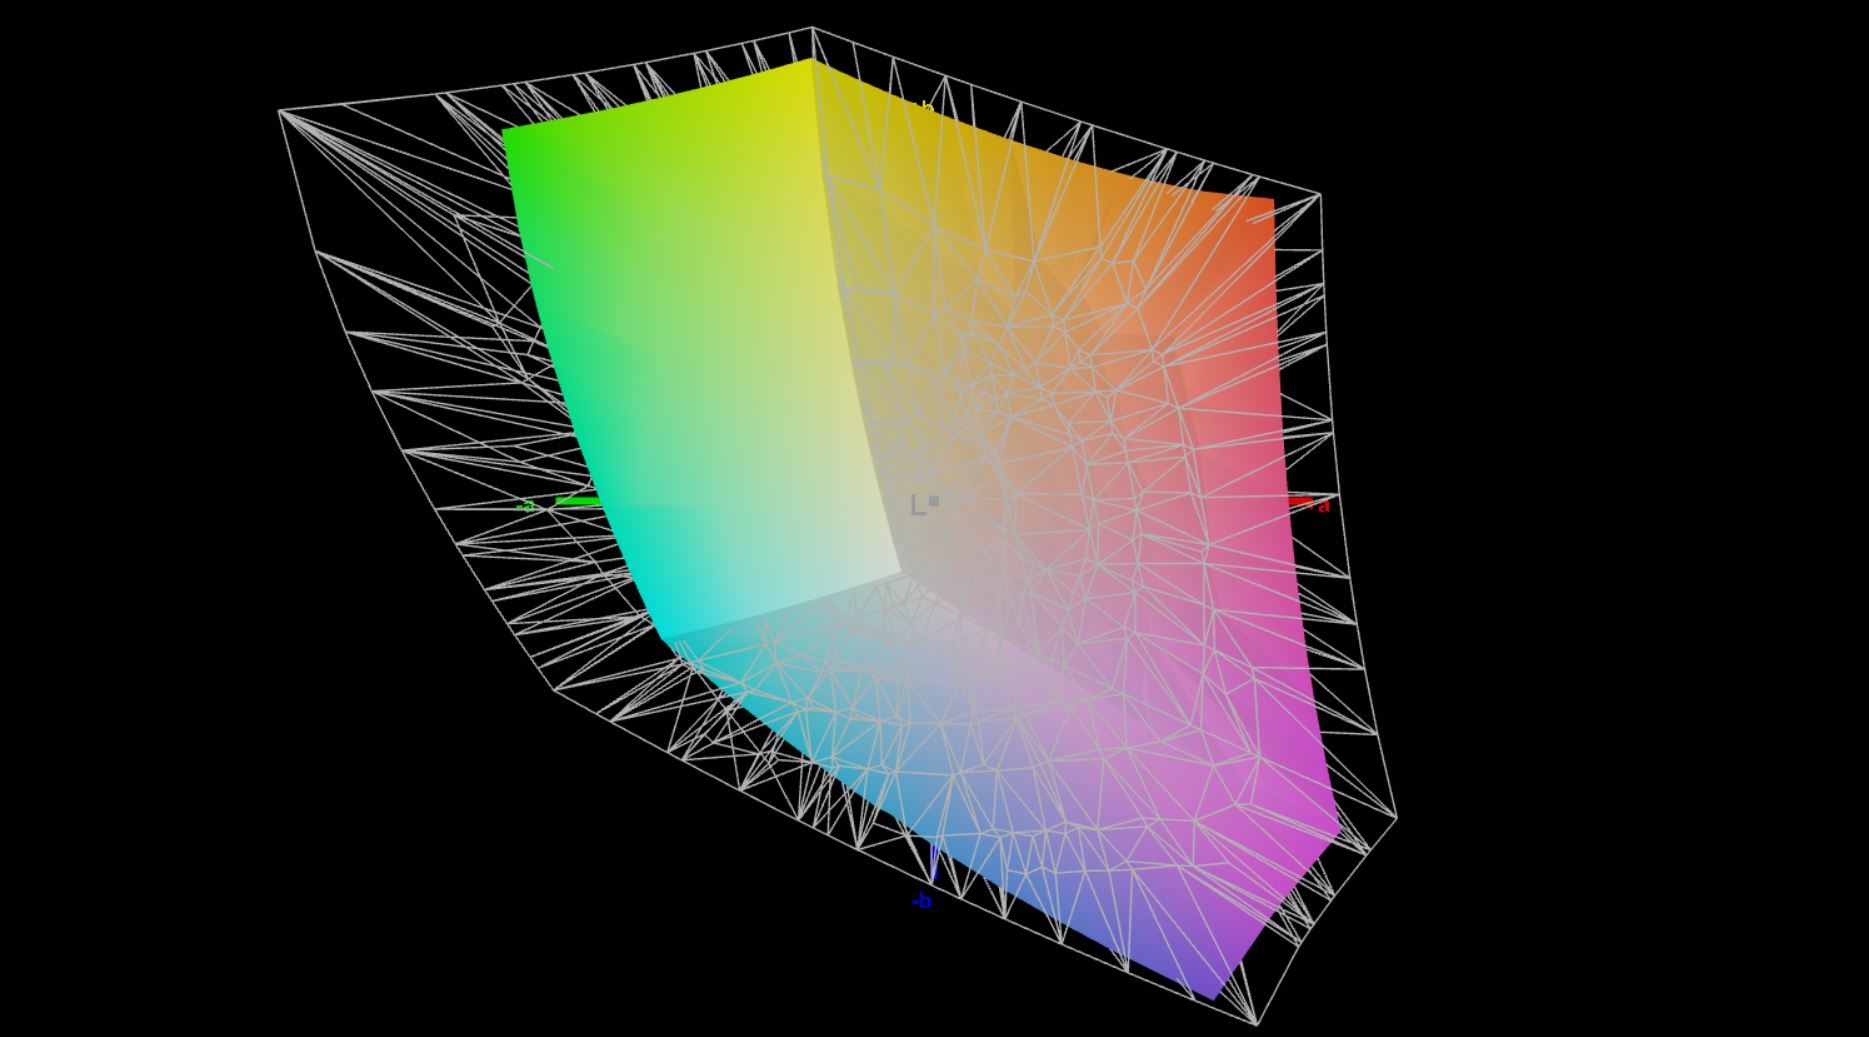
W ZBooku Firefly 16 G9 zastosowano wyłącznie matowe panele IPS o natywnej rozdzielczości 1920 x 1200 pikseli. Nie są dostępne opcje wyświetlacza o wyższej rozdzielczości lub rozszerzonym pokryciu przestrzeni kolorów. Dwie standardowe opcje (45-procentowe pokrycie przestrzeni kolorów NTSC) należy pominąć, gdyż są one określone dla niskiej jasności maksymalnej wynoszącej zaledwie 250 nitów.
- WUXGA (1920 x 1200), 250 nitów, matowy, IPS, 45% NTSC
- WUXGA (1920 x 1200), 250 nitów, matowy, IPS, 45 % NTSC, ekran dotykowy
- WUXGA (1920 x 1200), 400 nitów, matowy, IPS, 100 % sRGB
- WUXGA (1920 x 1200), 1000 nitów, SureView, matowy, IPS, 100 % sRGB
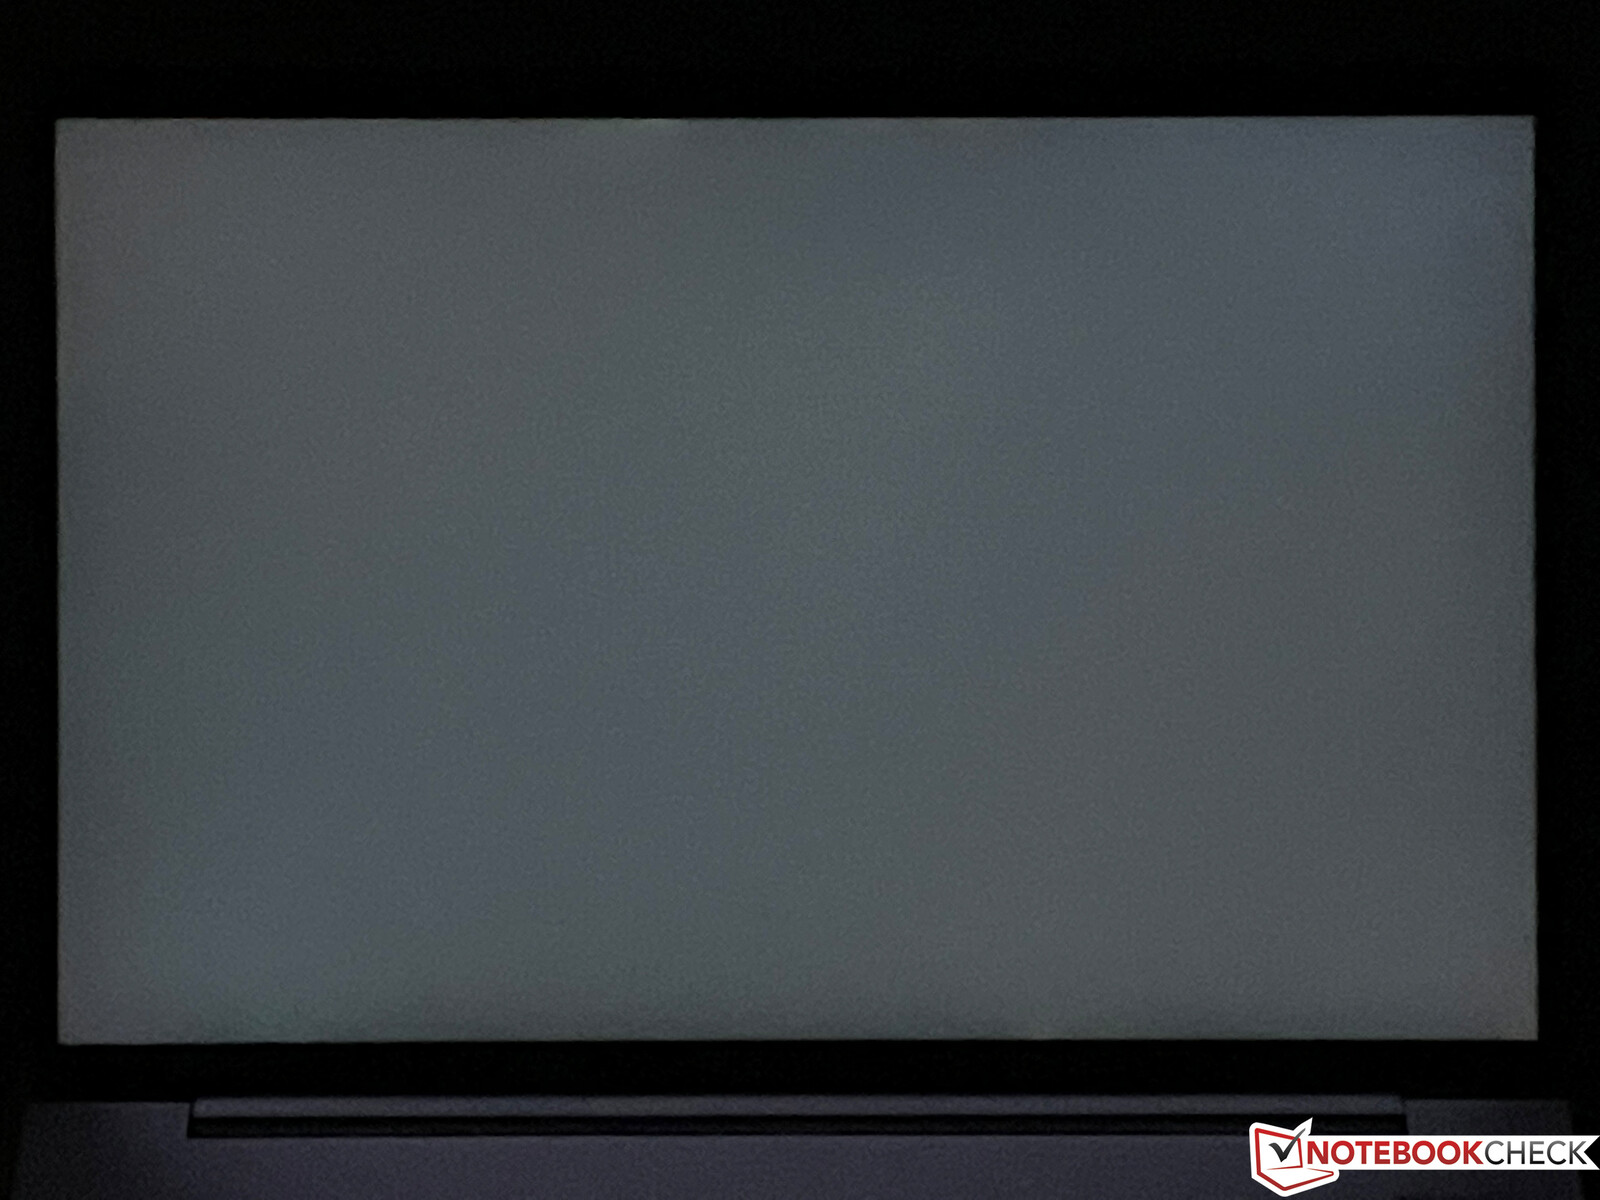
Jak już zauważyliśmy wiele razy wcześniej, opcjonalny wyświetlacz SureView nie jest pozbawiony słabych stron, co sprawia, że panel o jasności 400 nitów i pełnym pokryciu przestrzeni barw sRGB, z którego korzysta również nasza konfiguracja testowa, jest najlepszą opcją zapewniającą dobrą równowagę między jasnością a jakością obrazu. Byliśmy mile zaskoczeni naszą próbką testową BOE, która znacznie przekracza swoją specyfikację, osiągając średnio prawie 500 nitów. Jednocześnie jego wartość czerni 0,31 nits jest dobra, co skutkuje doskonałym współczynnikiem kontrastu ~1700:1.
Subiektywnie obraz wygląda świetnie i nawet jaśniejsze obszary nie wyglądają na ziarniste mimo matowej warstwy. Ekran oferuje wystarczającą do produktywności ostrość mimo rozdzielczości FHD. Czasy reakcji są jednak nieco wolne i występuje lekki, ale zauważalny ghosting na przykład podczas przesuwania kursora. Nawet przy maksymalnej jasności nie zaobserwowaliśmy większego krwawienia podświetlenia, nie ma też migotania PWM.
| |||||||||||||||||||||||||
rozświetlenie: 93 %
na akumulatorze: 524 cd/m²
kontrast: 1697:1 (czerń: 0.31 cd/m²)
ΔE ColorChecker Calman: 3.6 | ∀{0.5-29.43 Ø4.72}
calibrated: 2.6
ΔE Greyscale Calman: 5.5 | ∀{0.09-98 Ø4.97}
70% AdobeRGB 1998 (Argyll 3D)
96.1% sRGB (Argyll 3D)
68.1% Display P3 (Argyll 3D)
Gamma: 2.02
CCT: 6527 K
| HP ZBook Firefly 16 G9-6B897EA BOE0A02, IPS, 1920x1200, 16" | Lenovo ThinkPad P1 G4-20Y4Z9DVUS NE160QDM-N63, IPS, 2560x1600, 16" | Dell Precision 5000 5560 Sharp LQ156R1, IPS, 3840x2400, 15.6" | Lenovo ThinkPad P15s Gen2-20W6000GGE MNF601EA1-1, IPS LED, 3840x2160, 15.6" | HP ZBook Firefly 15 G8 2C9R7EA LGD069B, IPS, 1920x1080, 15.6" | Apple MacBook Pro 16 2021 M1 Pro Liquid Retina XDR, Mini-LED, 3456x2234, 16.2" | |
|---|---|---|---|---|---|---|
| Display | 6% | 29% | 22% | 1% | 25% | |
| Display P3 Coverage (%) | 68.1 | 72.7 7% | 94.9 39% | 84.5 24% | 68.6 1% | 99.1 46% |
| sRGB Coverage (%) | 96.1 | 99.3 3% | 100 4% | 98.7 3% | 98.5 2% | 100 4% |
| AdobeRGB 1998 Coverage (%) | 70 | 74.7 7% | 100 43% | 97.8 40% | 70 0% | 88 26% |
| Response Times | 8% | -23% | 3% | -35% | -176% | |
| Response Time Grey 50% / Grey 80% * (ms) | 52.8 ? | 40.8 23% | 47.2 ? 11% | 40 ? 24% | 56 ? -6% | 42.8 ? 19% |
| Response Time Black / White * (ms) | 19.5 ? | 20.8 -7% | 30.4 ? -56% | 23.2 ? -19% | 32 ? -64% | 91.6 ? -370% |
| PWM Frequency (Hz) | 14880 | |||||
| Screen | 9% | -5% | 35% | -3% | 211% | |
| Brightness middle (cd/m²) | 526 | 441 -16% | 501.5 -5% | 604 15% | 397 -25% | 514 -2% |
| Brightness (cd/m²) | 499 | 420 -16% | 467 -6% | 609 22% | 402 -19% | 497 0% |
| Brightness Distribution (%) | 93 | 90 -3% | 83 -11% | 91 -2% | 84 -10% | 95 2% |
| Black Level * (cd/m²) | 0.31 | 0.27 13% | 0.44 -42% | 0.34 -10% | 0.13 58% | 0.02 94% |
| Contrast (:1) | 1697 | 1633 -4% | 1140 -33% | 1776 5% | 3054 80% | 25700 1414% |
| Colorchecker dE 2000 * | 3.6 | 2.6 28% | 4.73 -31% | 0.9 75% | 5.9 -64% | 1.4 61% |
| Colorchecker dE 2000 max. * | 6.6 | 6 9% | 8.45 -28% | 2.6 61% | 9.4 -42% | 2.8 58% |
| Colorchecker dE 2000 calibrated * | 2.6 | 1.2 54% | 0.51 80% | 0.8 69% | 1.1 58% | |
| Greyscale dE 2000 * | 5.5 | 4.5 18% | 3.6 35% | 1.1 80% | 8.8 -60% | 2.3 58% |
| Gamma | 2.02 109% | 2.18 101% | 2.08 106% | 2.15 102% | 2.47 89% | 2.27 97% |
| CCT | 6527 100% | 6623 98% | 6447 101% | 6656 98% | 6416 101% | 6792 96% |
| Color Space (Percent of AdobeRGB 1998) (%) | 84.5 | 63.7 | ||||
| Color Space (Percent of sRGB) (%) | 98.6 | 98.5 | ||||
| Całkowita średnia (program / ustawienia) | 8% /
8% | 0% /
0% | 20% /
28% | -12% /
-7% | 20% /
108% |
* ... im mniej tym lepiej
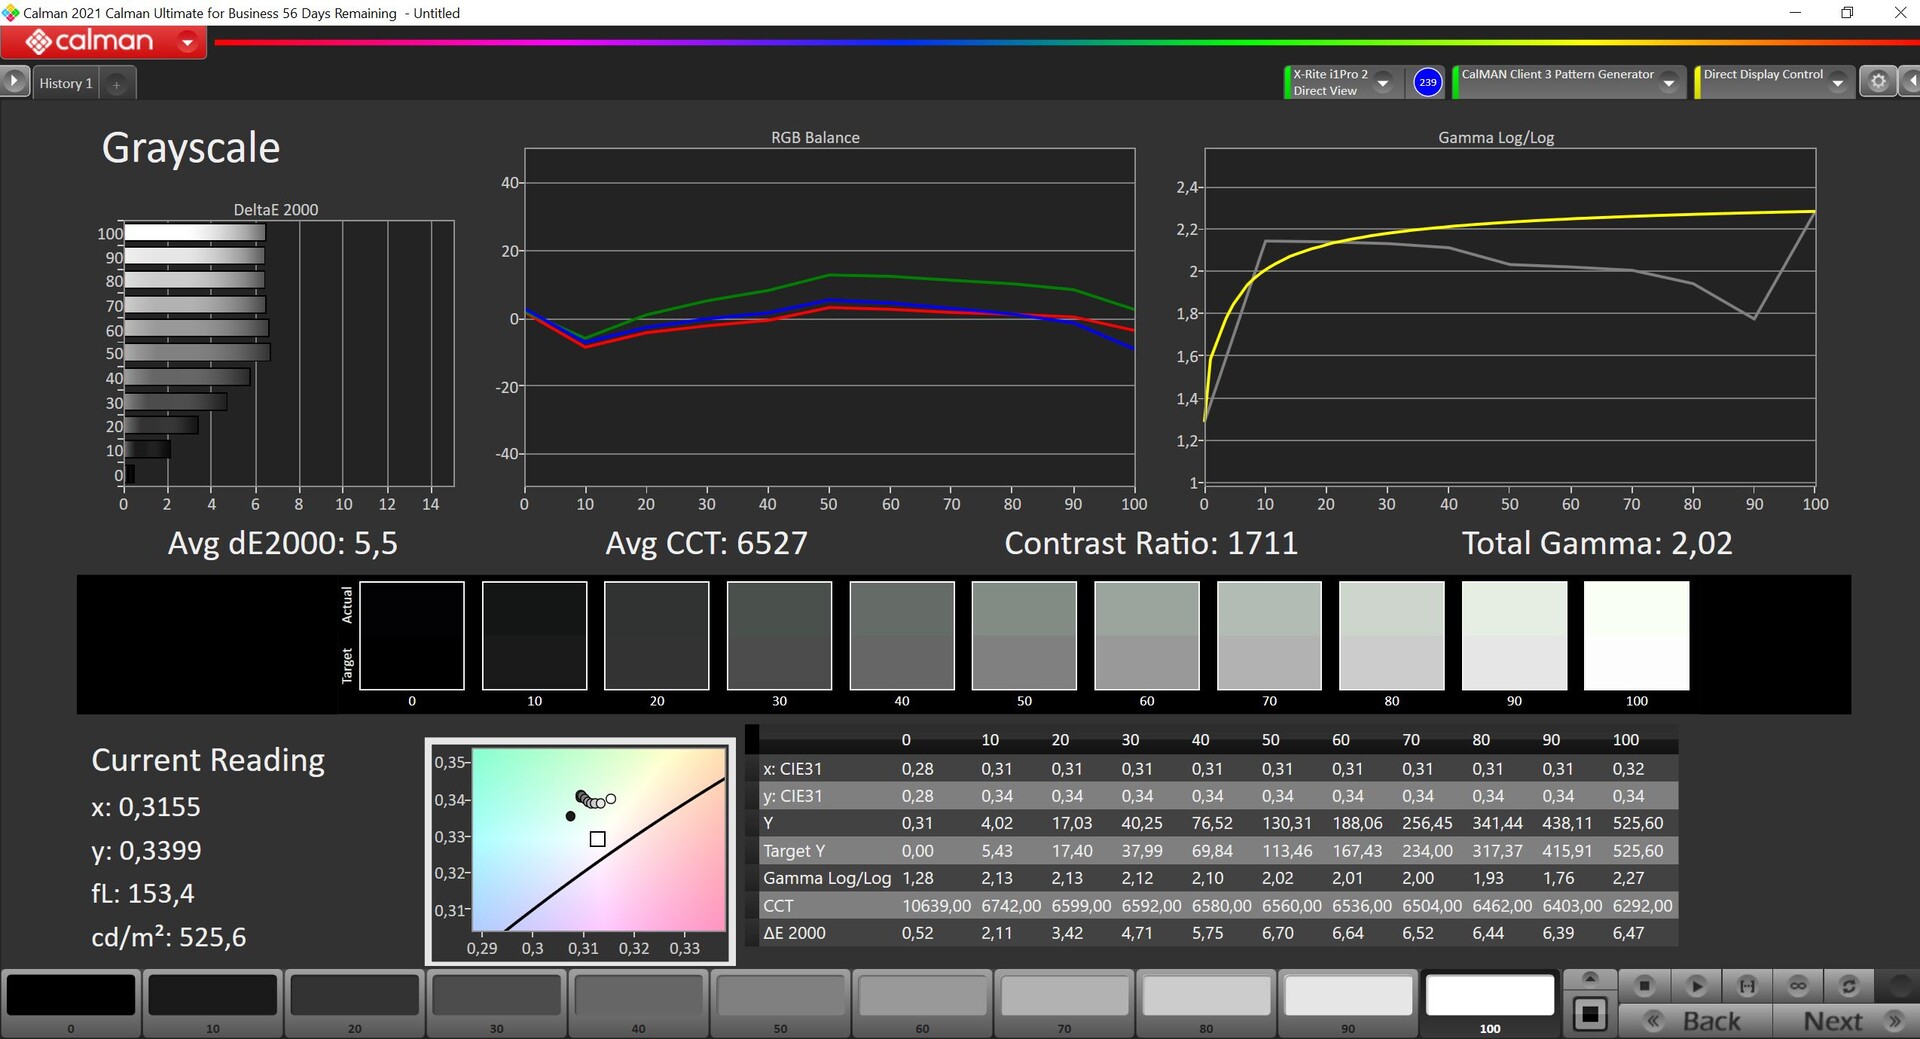
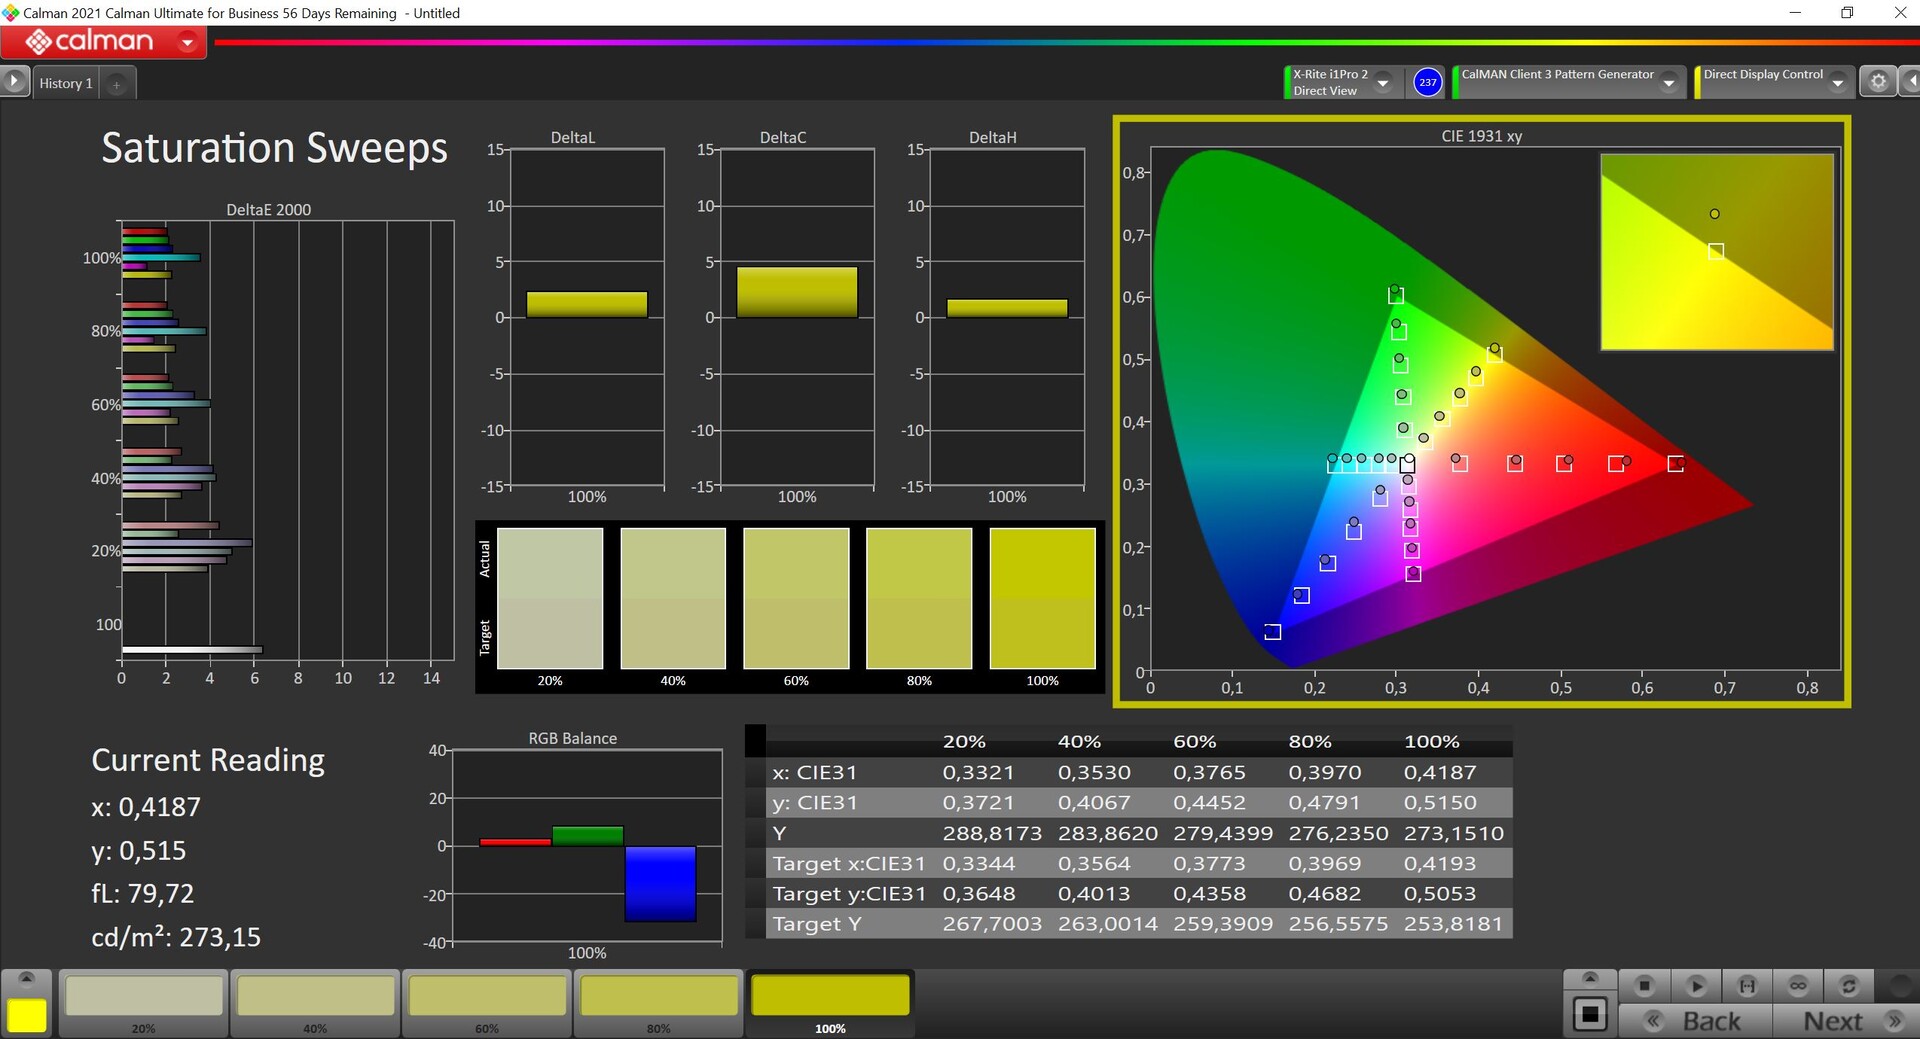
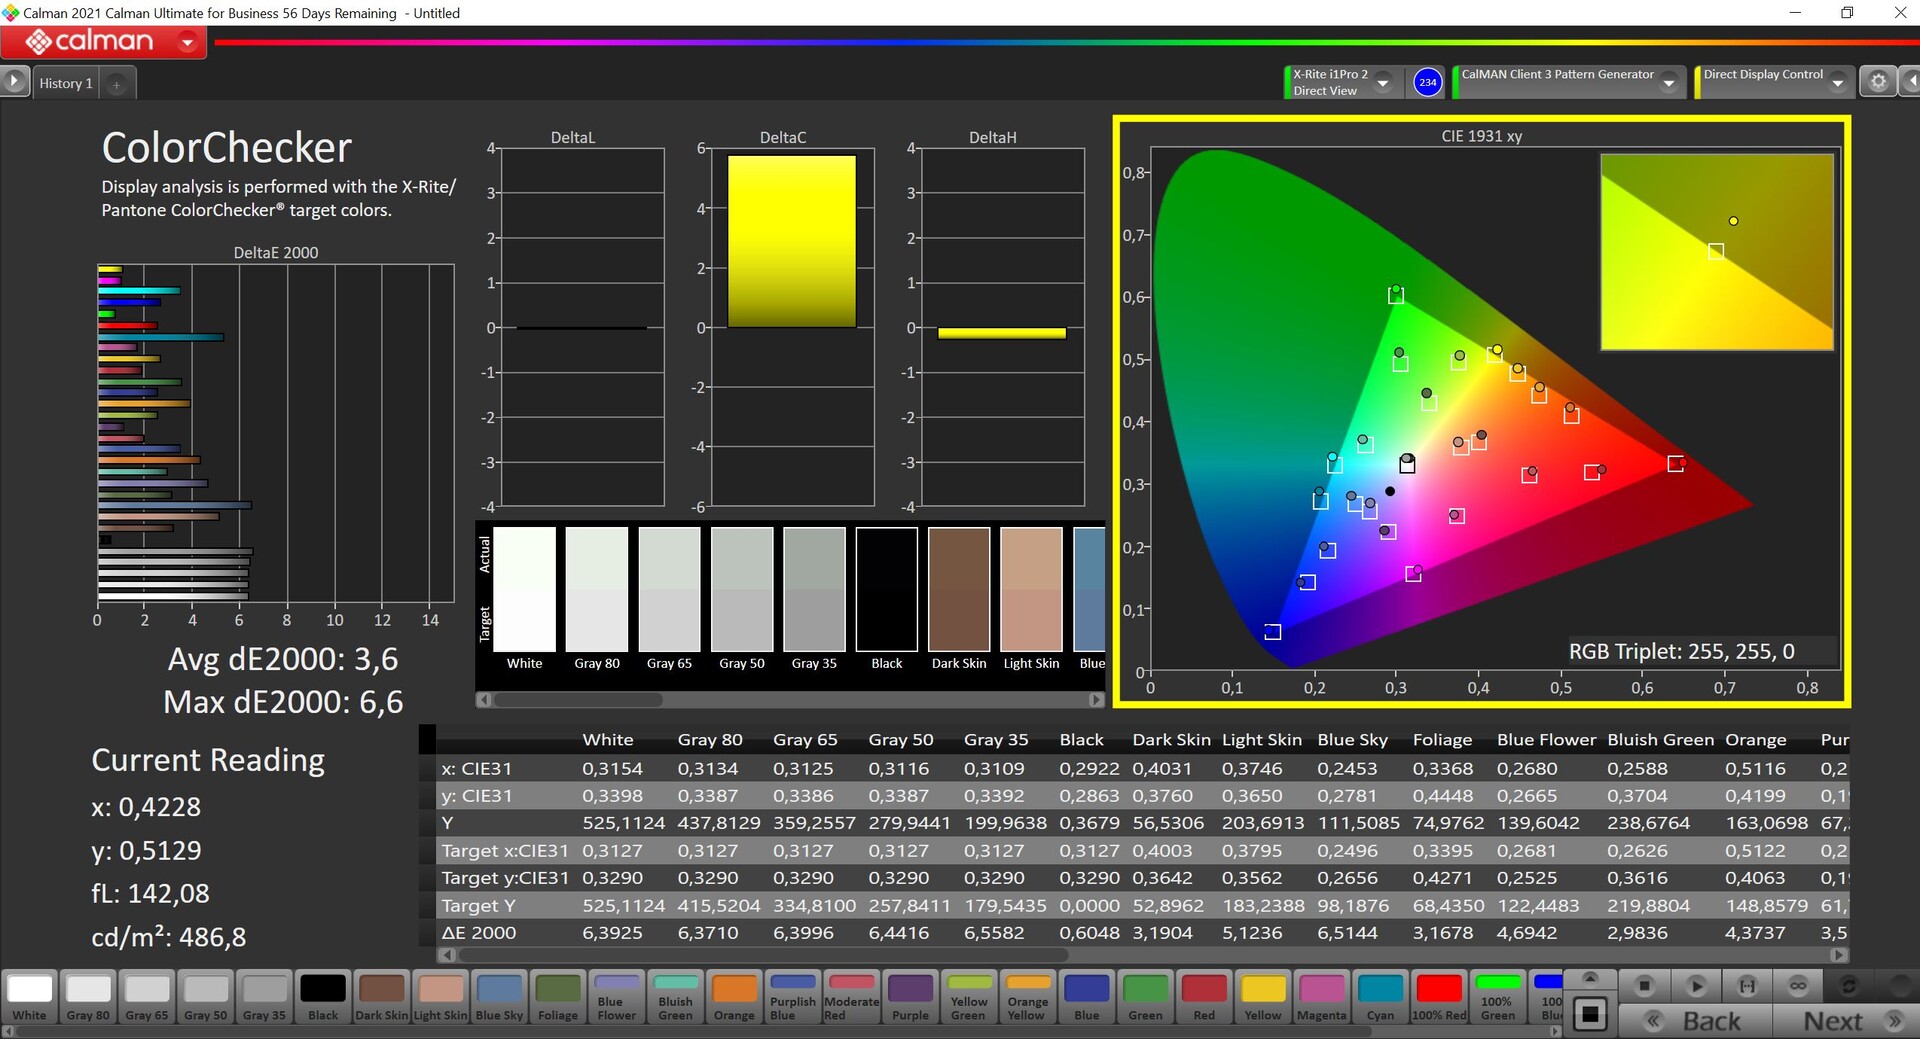
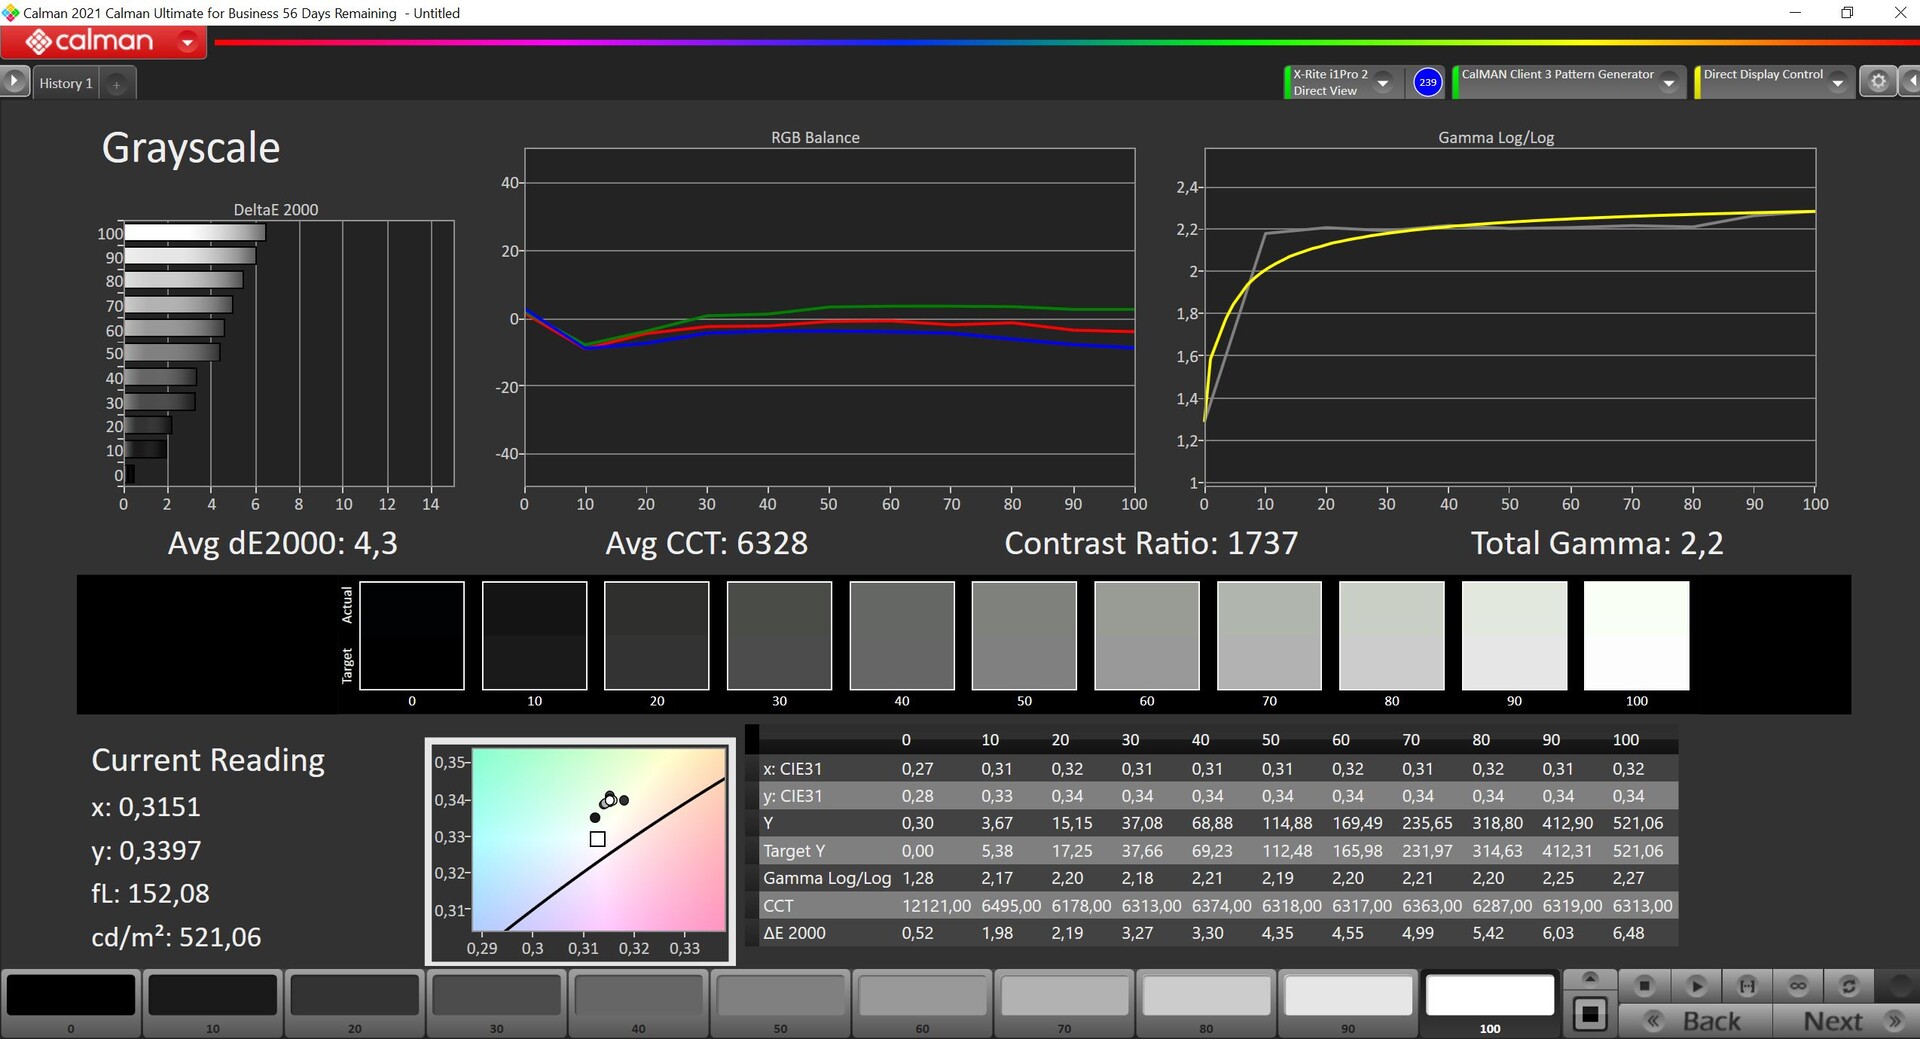
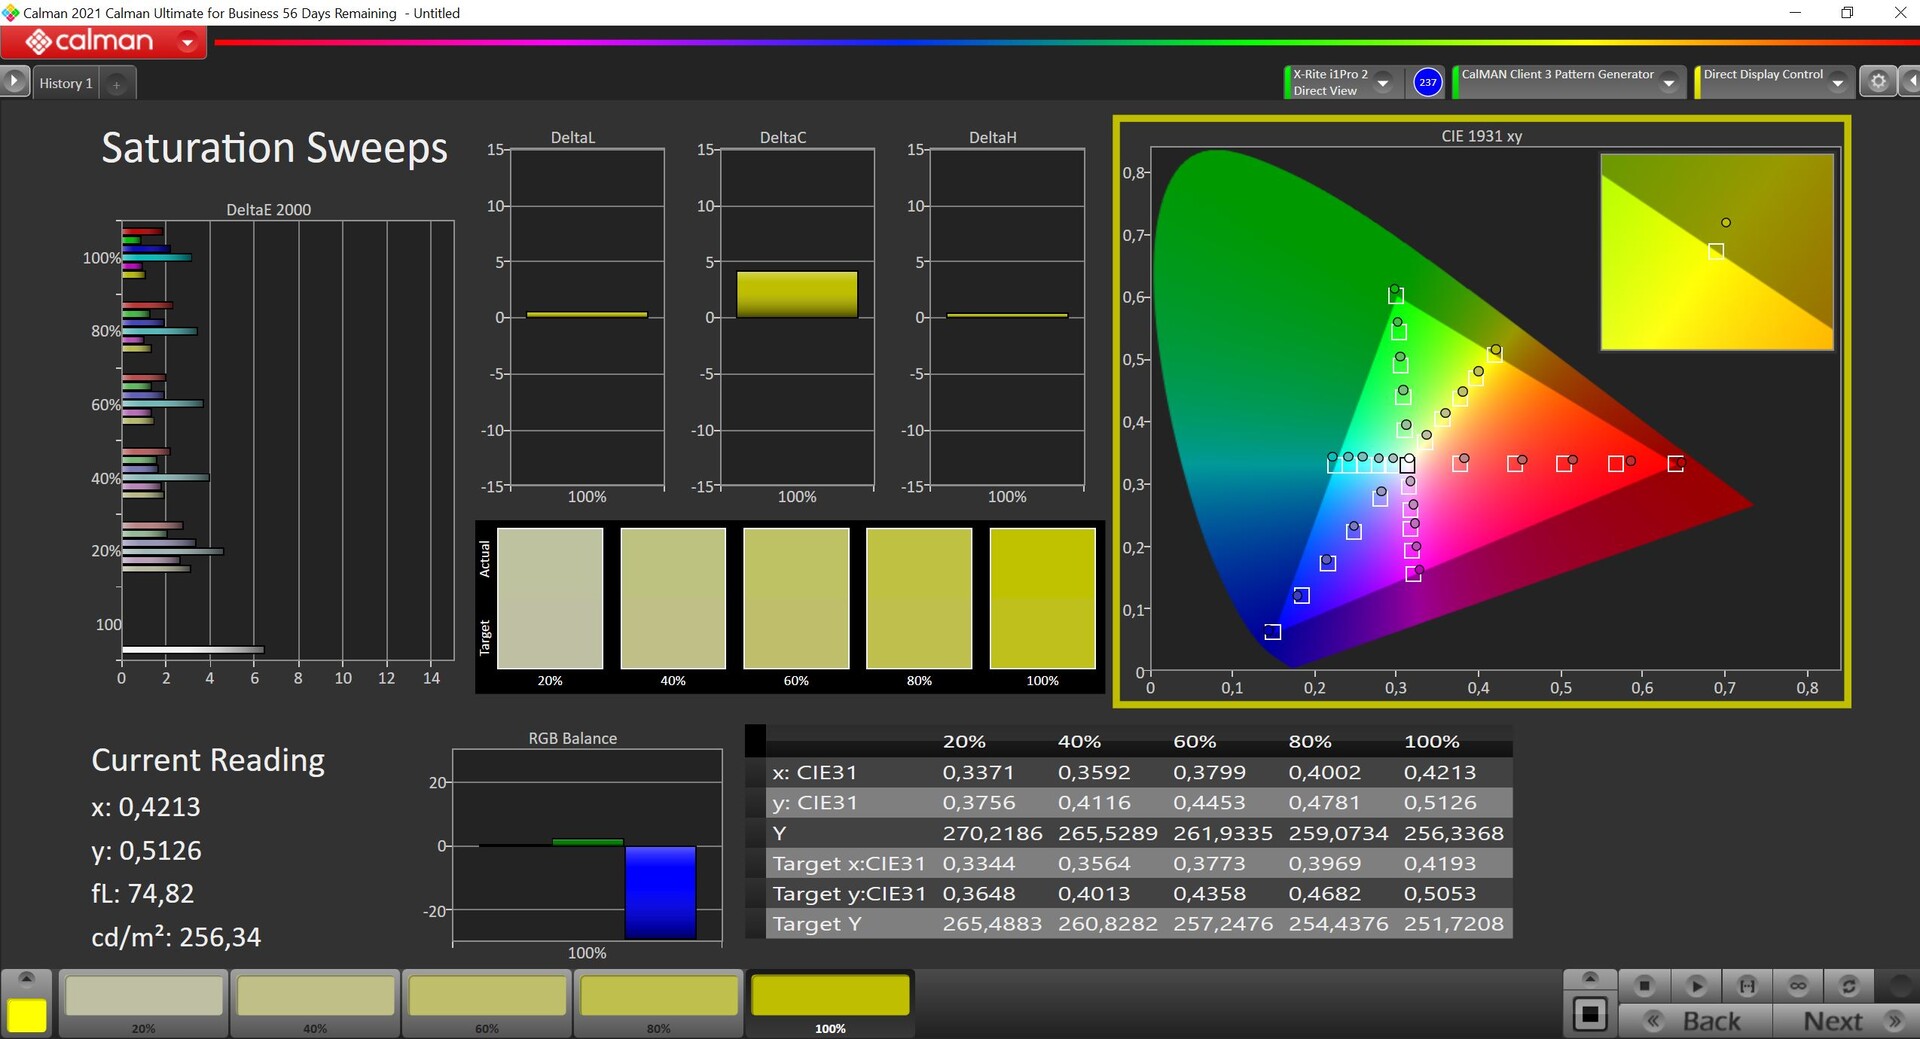
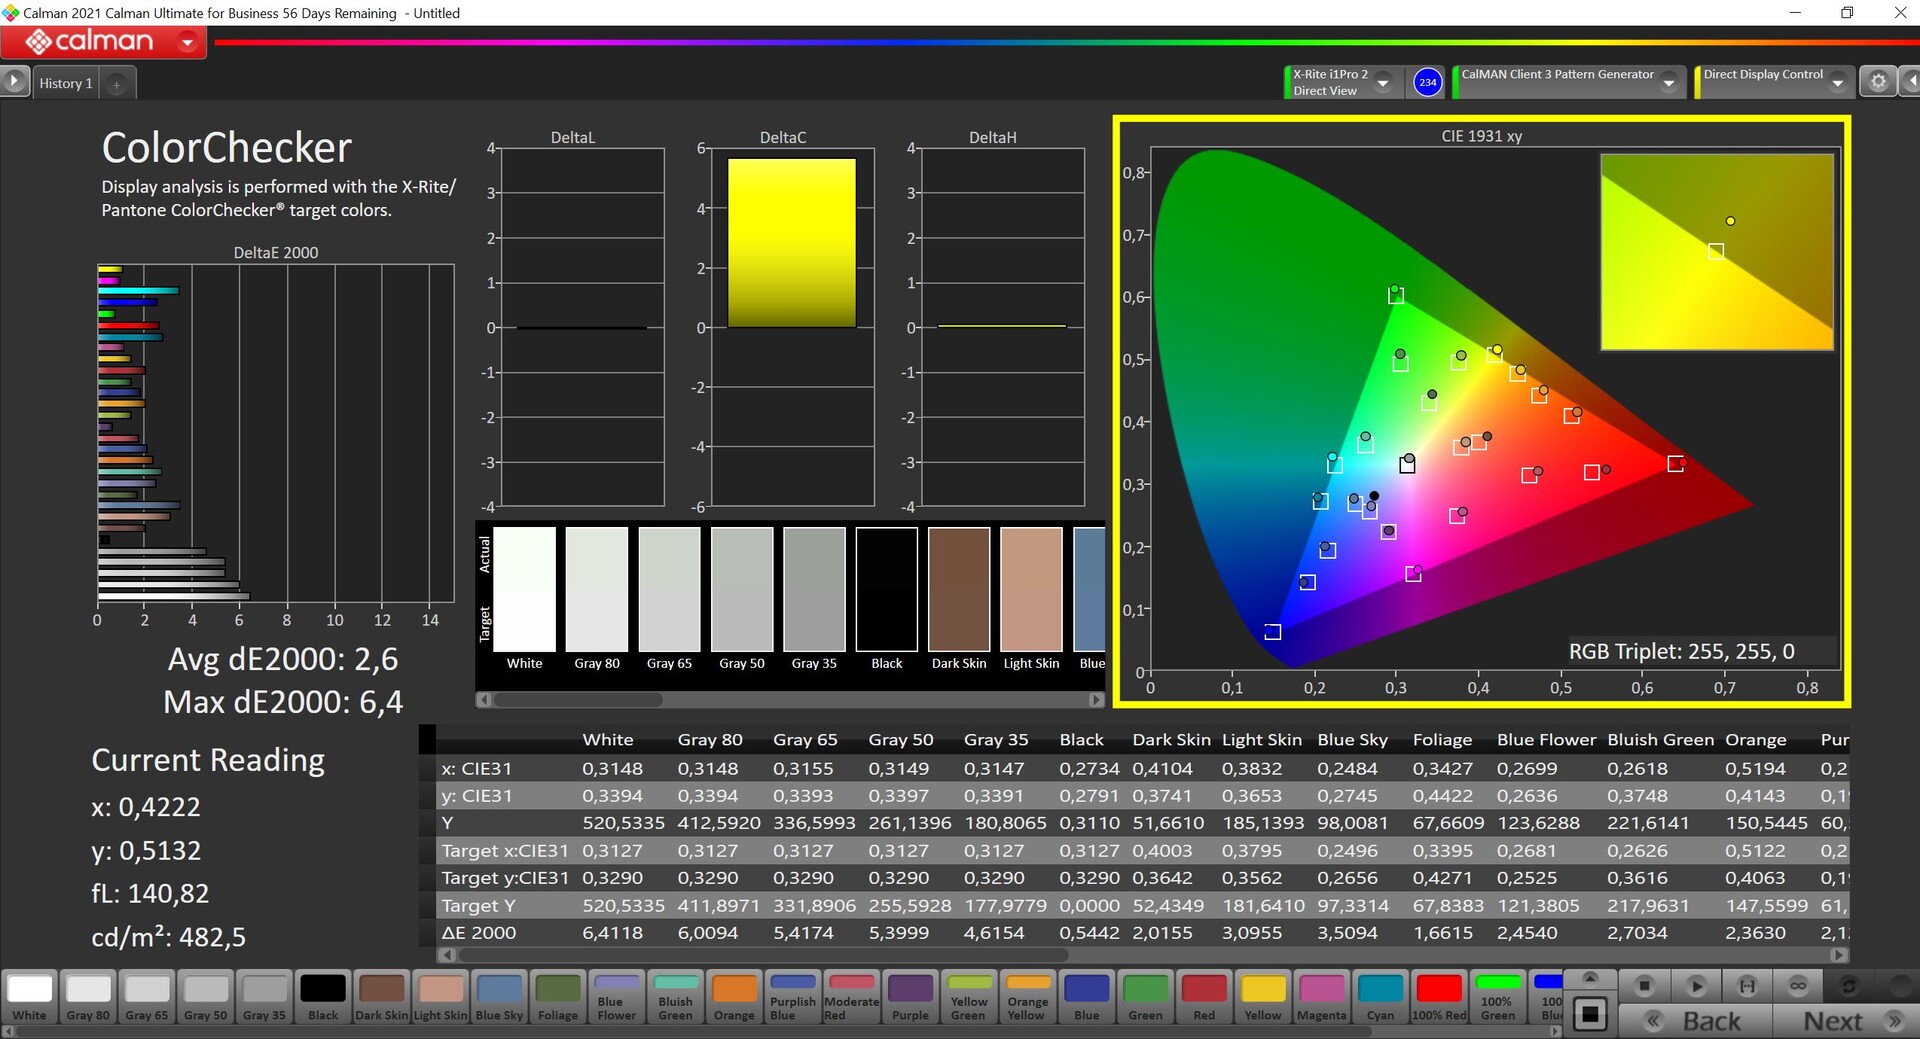
Podczas naszej profesjonalnej analizy CalMAN (X-Rite i1 Pro 2) zaobserwowaliśmy słaby zielony odcień i średnią skalę szarości oraz odchylenia kolorów przekraczające 3 względem referencyjnej przestrzeni barw sRGB. Po skalibrowaniu wyświetlacza zielony odcień nie stanowi już problemu, a dokładność odwzorowania większości kolorów mieści się w idealnym zakresie. Dzięki niemal pełnemu pokryciu przestrzeni barw sRGB, edycja zdjęć staje się realną możliwością.
Wyświetl czasy reakcji
| ↔ Czas reakcji od czerni do bieli | ||
|---|---|---|
| 19.5 ms ... wzrost ↗ i spadek ↘ łącznie | ↗ 6 ms wzrost | 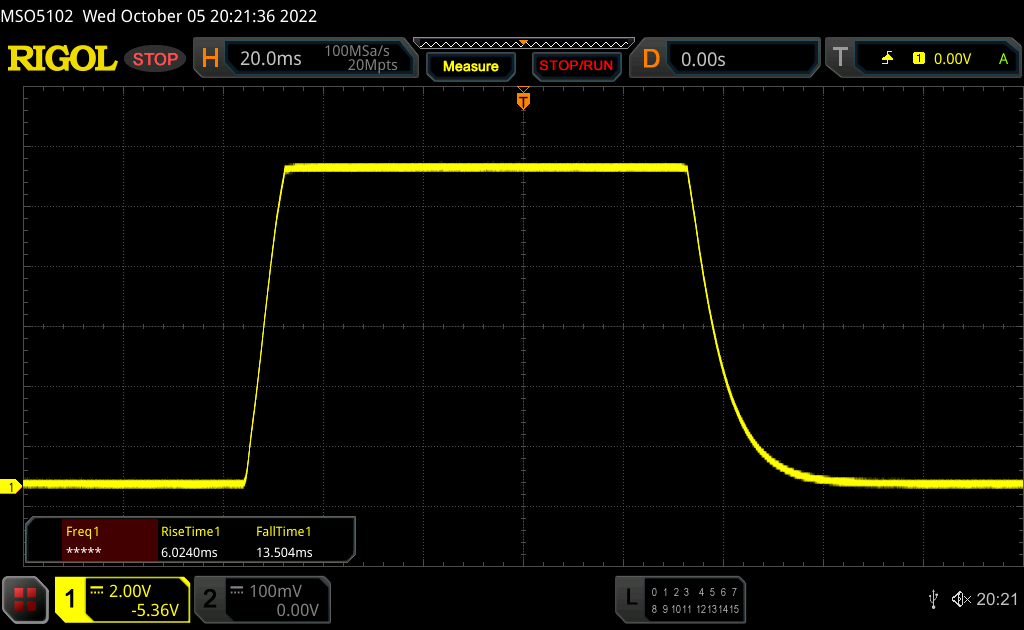 |
| ↘ 13.5 ms upadek | ||
| W naszych testach ekran wykazuje dobry współczynnik reakcji, ale może być zbyt wolny dla graczy rywalizujących ze sobą. Dla porównania, wszystkie testowane urządzenia wahają się od 0.1 (minimum) do 240 (maksimum) ms. » 43 % wszystkich urządzeń jest lepszych. Oznacza to, że zmierzony czas reakcji jest zbliżony do średniej wszystkich testowanych urządzeń (19.8 ms). | ||
| ↔ Czas reakcji 50% szarości do 80% szarości | ||
| 52.8 ms ... wzrost ↗ i spadek ↘ łącznie | ↗ 22.9 ms wzrost | 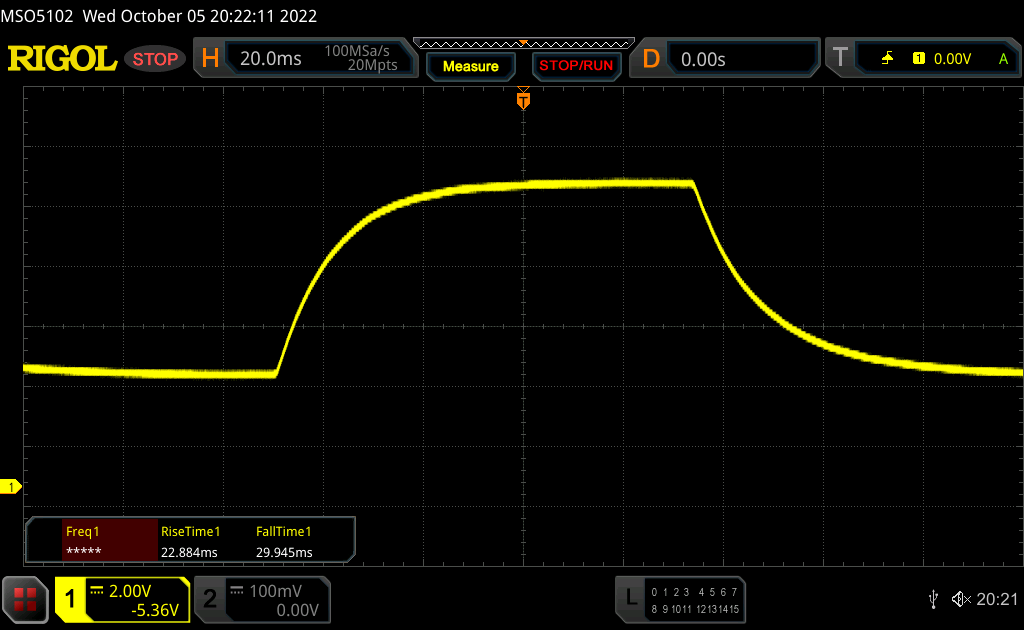 |
| ↘ 29.9 ms upadek | ||
| W naszych testach ekran wykazuje powolne tempo reakcji, co będzie niezadowalające dla graczy. Dla porównania, wszystkie testowane urządzenia wahają się od 0.165 (minimum) do 636 (maksimum) ms. » 89 % wszystkich urządzeń jest lepszych. Oznacza to, że zmierzony czas reakcji jest gorszy od średniej wszystkich testowanych urządzeń (31 ms). | ||
Migotanie ekranu / PWM (modulacja szerokości impulsu)
| Migotanie ekranu/nie wykryto PWM | 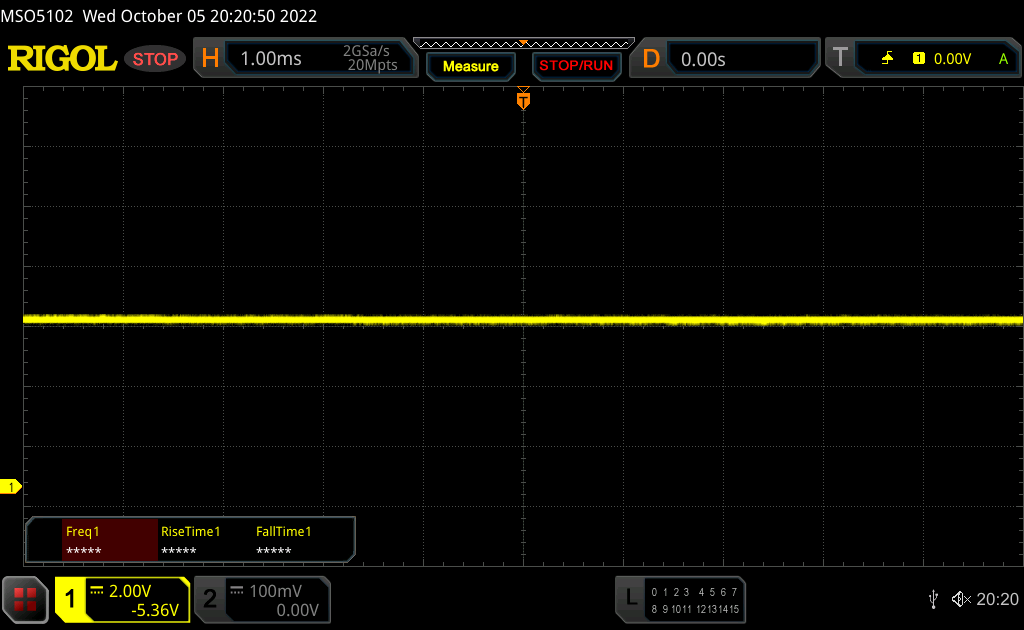 | ||
Dla porównania: 52 % wszystkich testowanych urządzeń nie używa PWM do przyciemniania wyświetlacza. Jeśli wykryto PWM, zmierzono średnio 7781 (minimum: 5 - maksimum: 343500) Hz. | |||
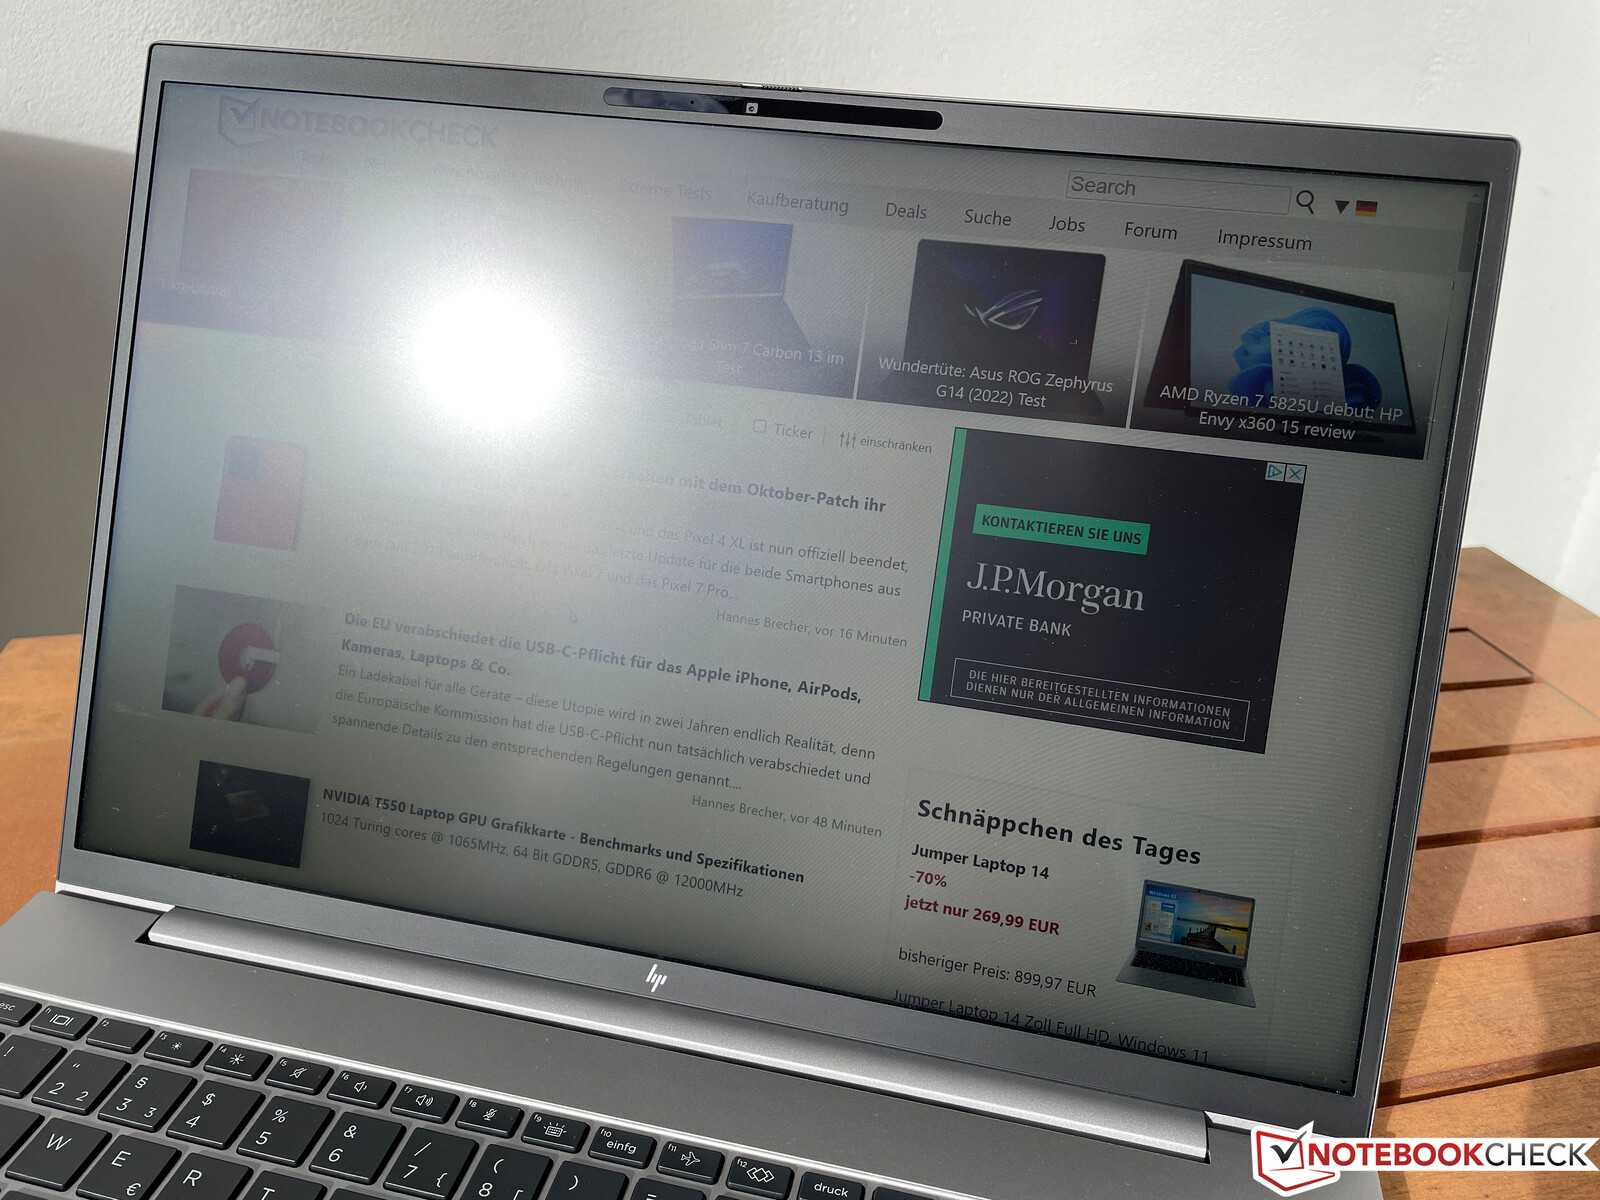
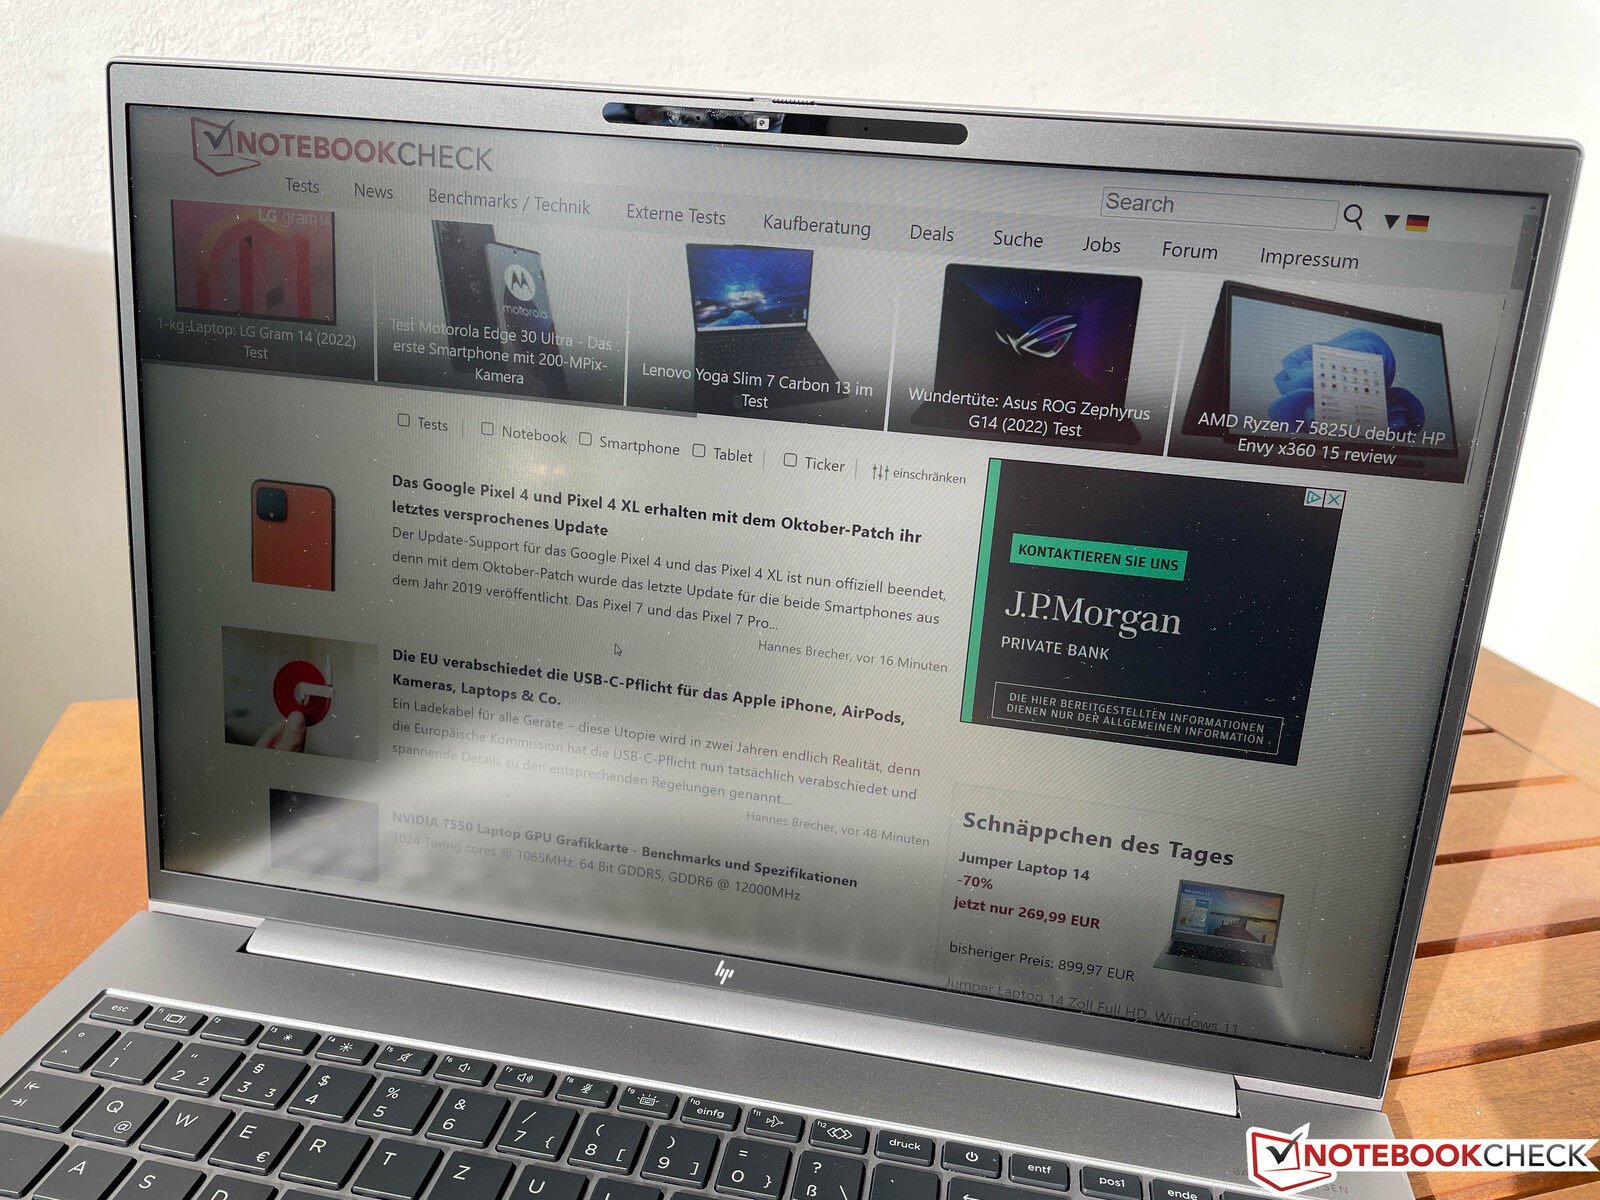
ZBook Firefly 16 G9 dobrze nadaje się do pracy na dworze, gdzie matowy panel i wysoka jasność maksymalna są bardzo przydatne. Nawet słoneczne dni nie powinny stanowić problemu, pod warunkiem, że promienie słoneczne nie będą bezpośrednio uderzać w ekran.
Wydajność - Alder Lake-U i Nvidia T550
Warunki badania
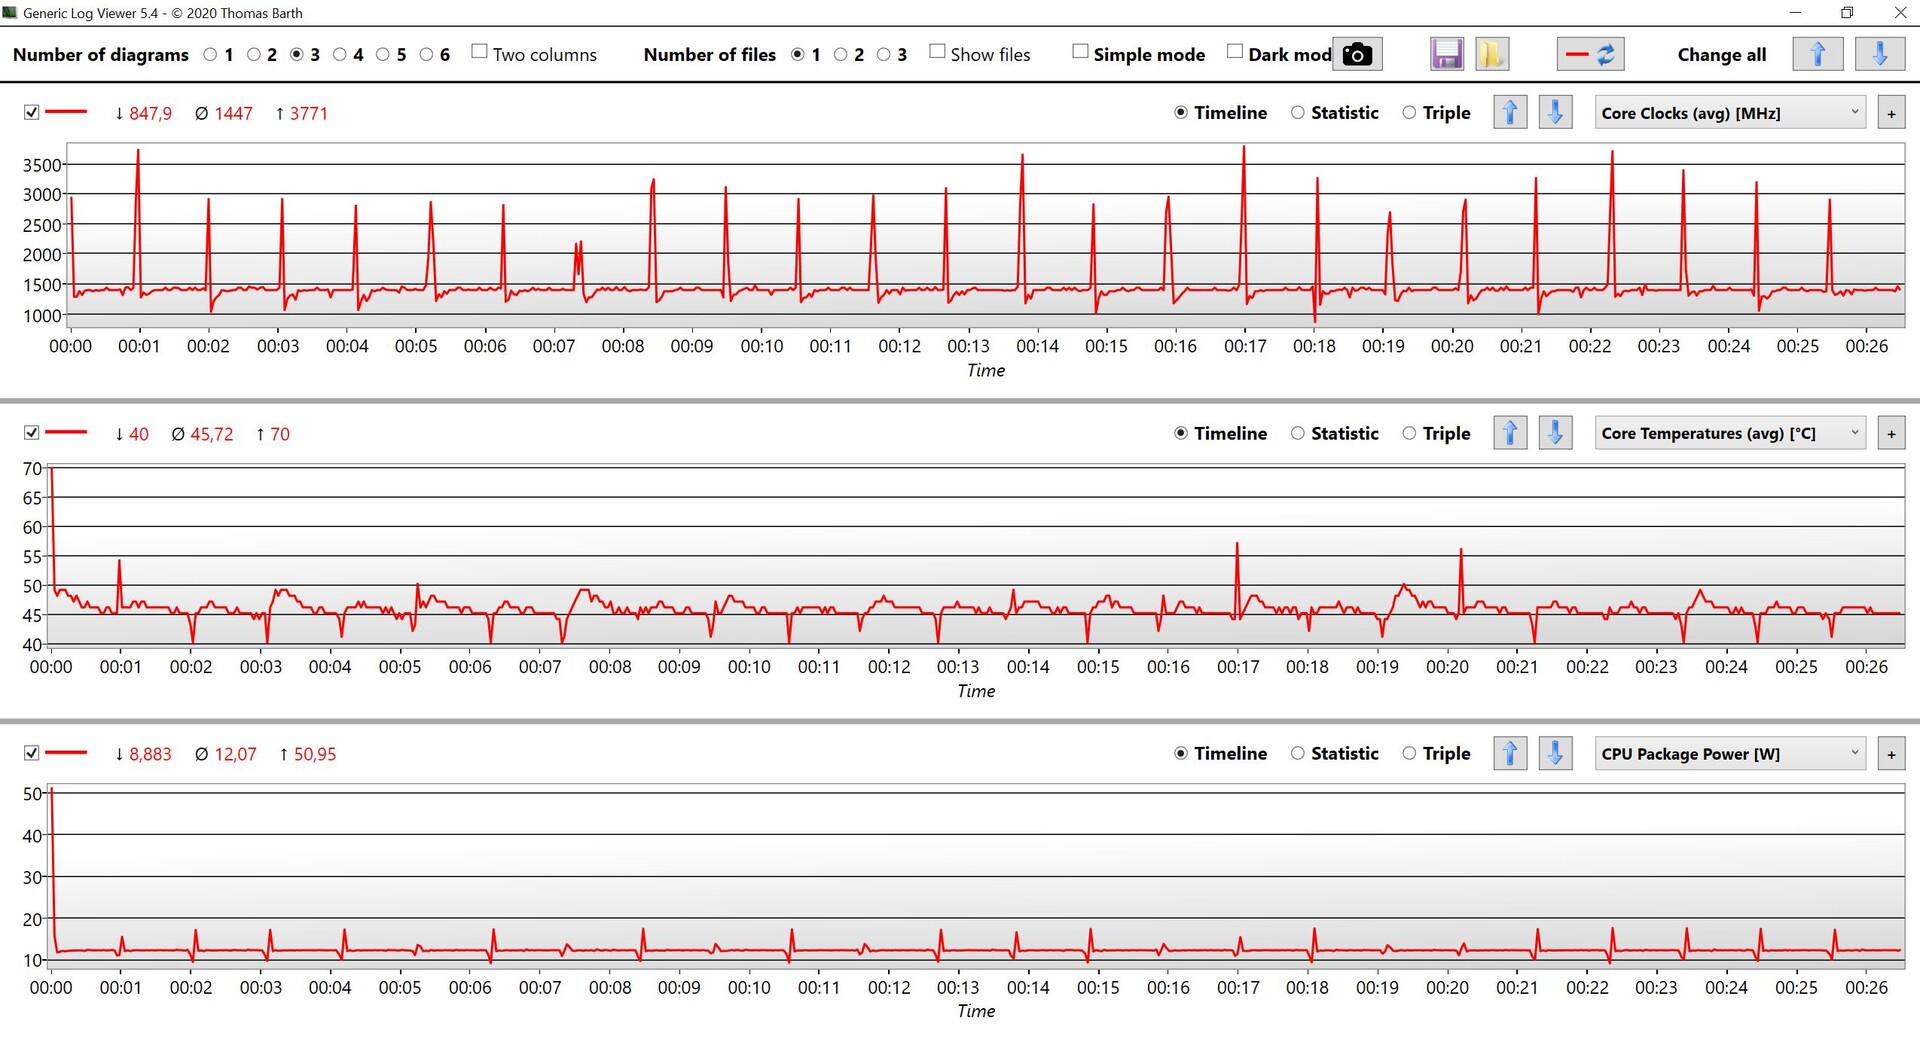
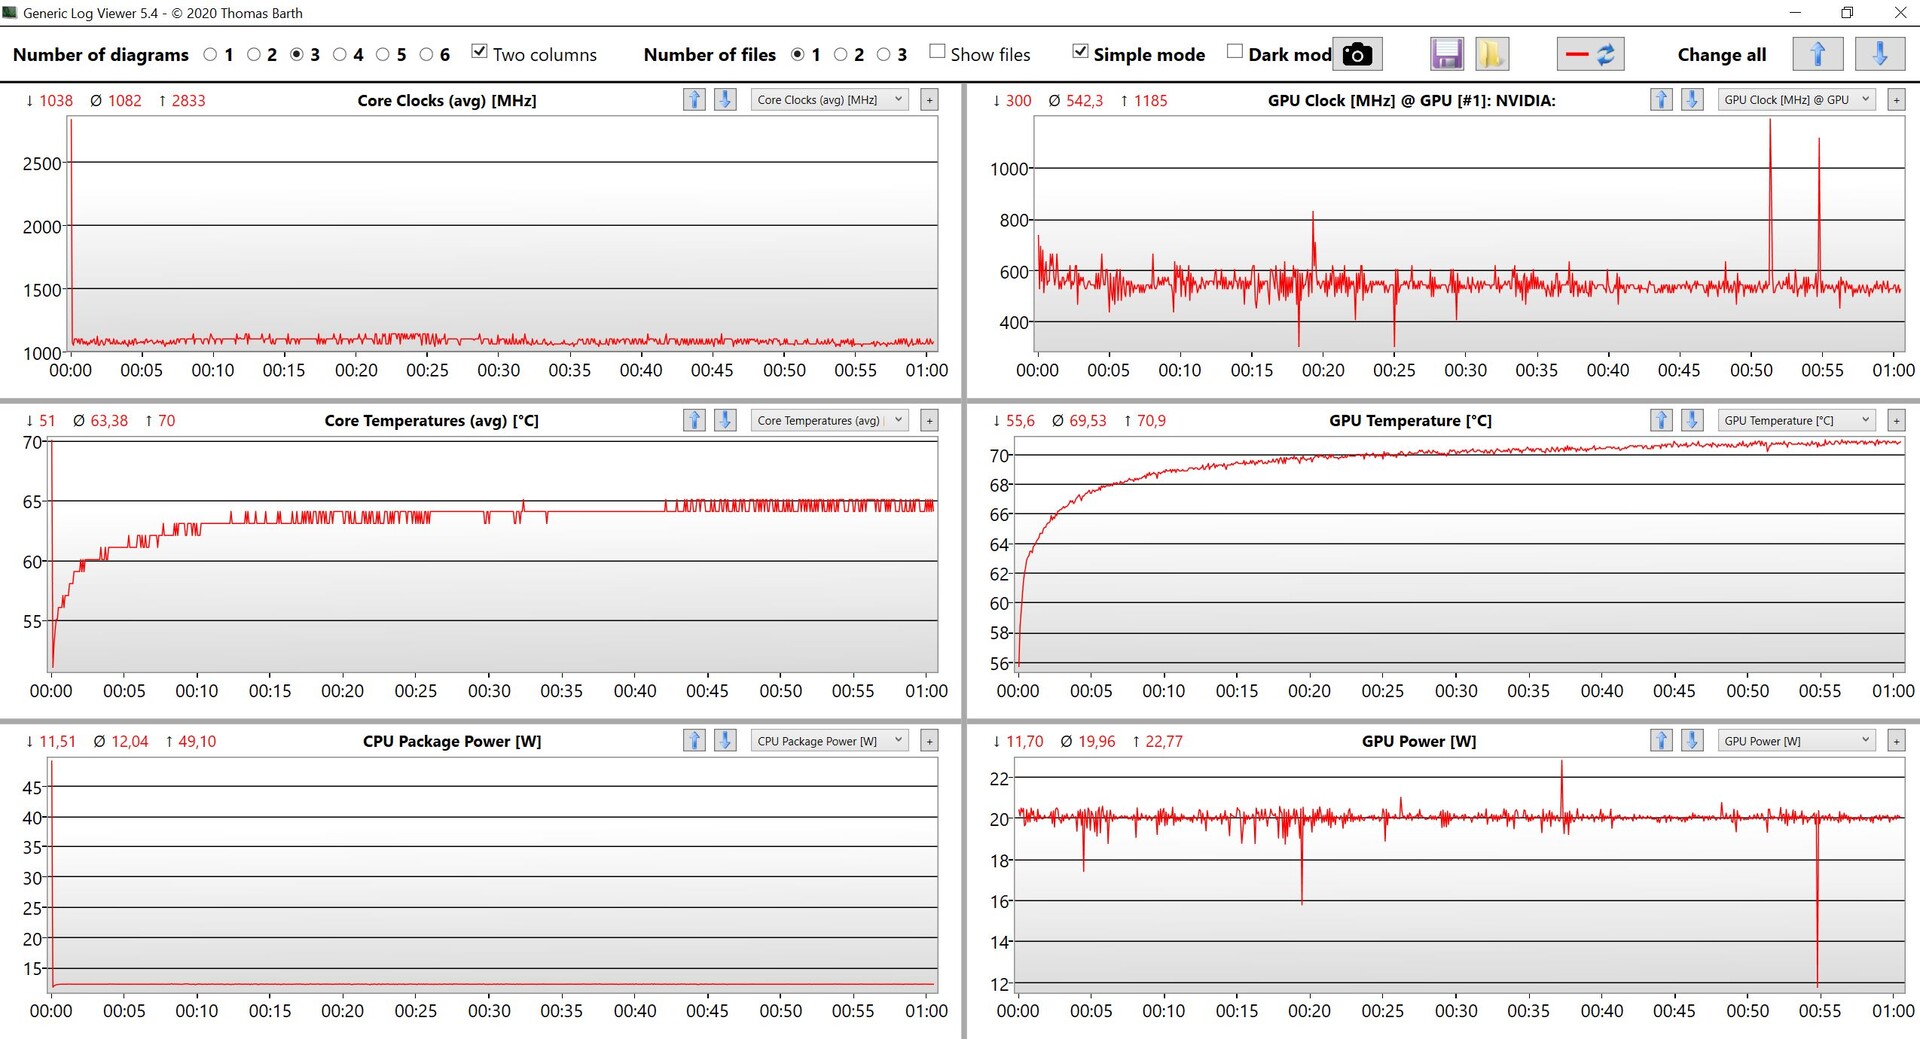
Nie ma żadnych profili zasilania poza domyślnymi ustawieniami wydajności systemu Windows. Byliśmy niezwykle zaskoczeni, widząc bardzo niskie limity mocy, wynoszące 51 watów podczas krótkich wybuchów i 12 watów przy ciągłym obciążeniu. Co najważniejsze, wysoki Turbo Boost jest dostępny tylko przez około jedną sekundę. Sprawdziliśmy wszystkie ustawienia (w tym BIOS) i zainstalowaliśmy wszystkie dostępne aktualizacje, ale limity nie chciały się zmienić. Podobnie, 20-watowy limit karty graficznej stanowi absolutnie najniższą wartość dla tego układu. Ponieważ podobne zachowanie obserwujemy na naszej wersji 14-calowej, problem z naszym urządzeniem testowym wydaje się mało prawdopodobny. Nawet jeśli rozwiązanie chłodzące osiąga swoje granice przy łącznym obciążeniu CPU/GPU, nie możemy znaleźć powodu, by procesor tak mocno dławił się pod czystym obciążeniem. Według arkusza danych układy Alder Lake-P, takie jak np Core i5-1240P lub Core i7-1260P są również dostępne, choć obecnie nie jesteśmy w stanie stwierdzić, czy ich limity mocy są bardziej rozsądne.
Procesor
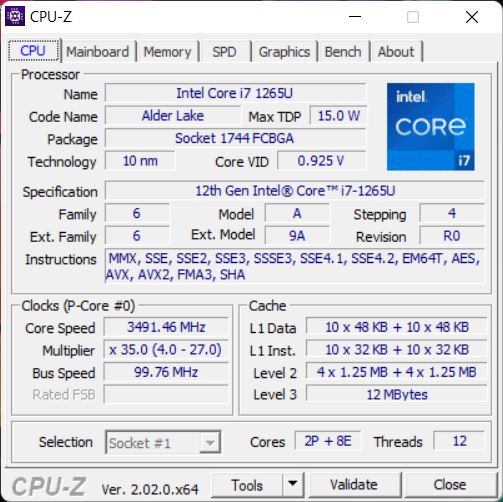
Nominalnie Intel Core i7-1265U to szybki procesor z dwoma rdzeniami o wysokiej wydajności i ośmioma wydajnymi. Ze względu na jego TDP ograniczone do zaledwie 12 W, wydajność jest jednak fatalna, a throttling występuje nawet w benchmarkach dla pojedynczych rdzeni. Chociaż rzeczywista wydajność obecnych procesorów graficznych Intela może się znacznie różnić w zależności od TDP ustalonego przez producenta, nigdy nie widzieliśmy tak niskich wyników i nawet starszy Firefly 15 G8 z Core i7-1165G7 przewyższa naszego ZBooka Firefly 16 G9. O ile w benchmarkach jednordzeniowych deficyt jest mniej dramatyczny, przez co słaba wydajność nie jest tak zauważalna podczas codziennego użytkowania, o tyle wyniki benchmarków wielordzeniowych czynią z tej mobilnej stacji roboczej mniej więcej jeden z najwolniejszych dostępnych laptopów. Ku naszemu zaskoczeniu wydajność w trybie akumulatorowym jest jeszcze gorsza, a limity mocy wynoszą zaledwie 30/10 W. Więcej benchmarków jest dostępnych tutaj.
Cinebench R15 Multi Loop
Cinebench R23: Multi Core | Single Core
Cinebench R20: CPU (Multi Core) | CPU (Single Core)
Cinebench R15: CPU Multi 64Bit | CPU Single 64Bit
Blender: v2.79 BMW27 CPU
7-Zip 18.03: 7z b 4 | 7z b 4 -mmt1
Geekbench 5.5: Multi-Core | Single-Core
HWBOT x265 Benchmark v2.2: 4k Preset
LibreOffice : 20 Documents To PDF
R Benchmark 2.5: Overall mean
| CPU Performance rating | |
| Średnia w klasie Workstation | |
| Apple MacBook Pro 16 2021 M1 Pro -5! | |
| Lenovo ThinkPad P1 G4-20Y4Z9DVUS | |
| Dell Precision 5000 5560 -2! | |
| Przeciętny Intel Core i7-1265U | |
| Lenovo ThinkPad P15s Gen2-20W6000GGE | |
| HP ZBook Firefly 15 G8 2C9R7EA -2! | |
| HP ZBook Firefly 16 G9-6B897EA | |
| Cinebench R23 / Multi Core | |
| Średnia w klasie Workstation (14055 - 38520, n=25, ostatnie 2 lata) | |
| Lenovo ThinkPad P1 G4-20Y4Z9DVUS | |
| Apple MacBook Pro 16 2021 M1 Pro | |
| Dell Precision 5000 5560 | |
| Przeciętny Intel Core i7-1265U (4332 - 9219, n=10) | |
| Lenovo ThinkPad P15s Gen2-20W6000GGE | |
| HP ZBook Firefly 16 G9-6B897EA | |
| Cinebench R23 / Single Core | |
| Średnia w klasie Workstation (1712 - 2228, n=25, ostatnie 2 lata) | |
| Przeciętny Intel Core i7-1265U (1144 - 1820, n=10) | |
| Apple MacBook Pro 16 2021 M1 Pro | |
| Dell Precision 5000 5560 | |
| Lenovo ThinkPad P1 G4-20Y4Z9DVUS | |
| Lenovo ThinkPad P15s Gen2-20W6000GGE | |
| HP ZBook Firefly 16 G9-6B897EA | |
| Cinebench R20 / CPU (Multi Core) | |
| Średnia w klasie Workstation (5471 - 15043, n=25, ostatnie 2 lata) | |
| Lenovo ThinkPad P1 G4-20Y4Z9DVUS | |
| Dell Precision 5000 5560 | |
| Przeciętny Intel Core i7-1265U (1669 - 3584, n=10) | |
| Apple MacBook Pro 16 2021 M1 Pro | |
| HP ZBook Firefly 15 G8 2C9R7EA | |
| Lenovo ThinkPad P15s Gen2-20W6000GGE | |
| HP ZBook Firefly 16 G9-6B897EA | |
| Cinebench R20 / CPU (Single Core) | |
| Średnia w klasie Workstation (671 - 857, n=25, ostatnie 2 lata) | |
| Przeciętny Intel Core i7-1265U (528 - 701, n=10) | |
| HP ZBook Firefly 15 G8 2C9R7EA | |
| Lenovo ThinkPad P1 G4-20Y4Z9DVUS | |
| Dell Precision 5000 5560 | |
| Lenovo ThinkPad P15s Gen2-20W6000GGE | |
| HP ZBook Firefly 16 G9-6B897EA | |
| Apple MacBook Pro 16 2021 M1 Pro | |
| Cinebench R15 / CPU Multi 64Bit | |
| Średnia w klasie Workstation (2489 - 5810, n=25, ostatnie 2 lata) | |
| Lenovo ThinkPad P1 G4-20Y4Z9DVUS | |
| Apple MacBook Pro 16 2021 M1 Pro | |
| Dell Precision 5000 5560 | |
| Przeciętny Intel Core i7-1265U (706 - 1572, n=10) | |
| Lenovo ThinkPad P15s Gen2-20W6000GGE | |
| HP ZBook Firefly 15 G8 2C9R7EA | |
| HP ZBook Firefly 16 G9-6B897EA | |
| Cinebench R15 / CPU Single 64Bit | |
| Średnia w klasie Workstation (191.4 - 328, n=25, ostatnie 2 lata) | |
| Dell Precision 5000 5560 | |
| Lenovo ThinkPad P1 G4-20Y4Z9DVUS | |
| Przeciętny Intel Core i7-1265U (165.3 - 260, n=10) | |
| HP ZBook Firefly 15 G8 2C9R7EA | |
| Lenovo ThinkPad P15s Gen2-20W6000GGE | |
| Apple MacBook Pro 16 2021 M1 Pro | |
| HP ZBook Firefly 16 G9-6B897EA | |
| Blender / v2.79 BMW27 CPU | |
| HP ZBook Firefly 16 G9-6B897EA | |
| HP ZBook Firefly 15 G8 2C9R7EA | |
| Lenovo ThinkPad P15s Gen2-20W6000GGE | |
| Przeciętny Intel Core i7-1265U (364 - 684, n=10) | |
| Dell Precision 5000 5560 | |
| Lenovo ThinkPad P1 G4-20Y4Z9DVUS | |
| Apple MacBook Pro 16 2021 M1 Pro | |
| Średnia w klasie Workstation (91 - 261, n=25, ostatnie 2 lata) | |
| 7-Zip 18.03 / 7z b 4 | |
| Średnia w klasie Workstation (54741 - 116969, n=25, ostatnie 2 lata) | |
| Lenovo ThinkPad P1 G4-20Y4Z9DVUS | |
| Dell Precision 5000 5560 | |
| Przeciętny Intel Core i7-1265U (20087 - 38715, n=10) | |
| HP ZBook Firefly 15 G8 2C9R7EA | |
| Lenovo ThinkPad P15s Gen2-20W6000GGE | |
| HP ZBook Firefly 16 G9-6B897EA | |
| 7-Zip 18.03 / 7z b 4 -mmt1 | |
| Średnia w klasie Workstation (5126 - 6960, n=25, ostatnie 2 lata) | |
| Dell Precision 5000 5560 | |
| Lenovo ThinkPad P1 G4-20Y4Z9DVUS | |
| HP ZBook Firefly 15 G8 2C9R7EA | |
| Lenovo ThinkPad P15s Gen2-20W6000GGE | |
| Przeciętny Intel Core i7-1265U (4614 - 5617, n=10) | |
| HP ZBook Firefly 16 G9-6B897EA | |
| Geekbench 5.5 / Multi-Core | |
| Średnia w klasie Workstation (11542 - 25554, n=25, ostatnie 2 lata) | |
| Apple MacBook Pro 16 2021 M1 Pro | |
| Lenovo ThinkPad P1 G4-20Y4Z9DVUS | |
| Przeciętny Intel Core i7-1265U (5022 - 8981, n=10) | |
| Lenovo ThinkPad P15s Gen2-20W6000GGE | |
| HP ZBook Firefly 16 G9-6B897EA | |
| HP ZBook Firefly 15 G8 2C9R7EA | |
| Geekbench 5.5 / Single-Core | |
| Średnia w klasie Workstation (1781 - 2183, n=25, ostatnie 2 lata) | |
| HP ZBook Firefly 16 G9-6B897EA | |
| Apple MacBook Pro 16 2021 M1 Pro | |
| Przeciętny Intel Core i7-1265U (1429 - 1806, n=10) | |
| Lenovo ThinkPad P1 G4-20Y4Z9DVUS | |
| HP ZBook Firefly 15 G8 2C9R7EA | |
| Lenovo ThinkPad P15s Gen2-20W6000GGE | |
| HWBOT x265 Benchmark v2.2 / 4k Preset | |
| Średnia w klasie Workstation (14.4 - 40.5, n=25, ostatnie 2 lata) | |
| Lenovo ThinkPad P1 G4-20Y4Z9DVUS | |
| Dell Precision 5000 5560 | |
| Przeciętny Intel Core i7-1265U (5.09 - 10.6, n=10) | |
| Lenovo ThinkPad P15s Gen2-20W6000GGE | |
| HP ZBook Firefly 15 G8 2C9R7EA | |
| HP ZBook Firefly 16 G9-6B897EA | |
| LibreOffice / 20 Documents To PDF | |
| HP ZBook Firefly 16 G9-6B897EA | |
| Lenovo ThinkPad P1 G4-20Y4Z9DVUS | |
| Przeciętny Intel Core i7-1265U (44 - 61.6, n=10) | |
| Dell Precision 5000 5560 | |
| Średnia w klasie Workstation (37.1 - 74.7, n=25, ostatnie 2 lata) | |
| Lenovo ThinkPad P15s Gen2-20W6000GGE | |
| HP ZBook Firefly 15 G8 2C9R7EA | |
| R Benchmark 2.5 / Overall mean | |
| HP ZBook Firefly 15 G8 2C9R7EA | |
| Lenovo ThinkPad P15s Gen2-20W6000GGE | |
| Lenovo ThinkPad P1 G4-20Y4Z9DVUS | |
| HP ZBook Firefly 16 G9-6B897EA | |
| Dell Precision 5000 5560 | |
| Przeciętny Intel Core i7-1265U (0.4666 - 0.578, n=10) | |
| Średnia w klasie Workstation (0.3825 - 0.603, n=25, ostatnie 2 lata) | |
* ... im mniej tym lepiej
AIDA64: FP32 Ray-Trace | FPU Julia | CPU SHA3 | CPU Queen | FPU SinJulia | FPU Mandel | CPU AES | CPU ZLib | FP64 Ray-Trace | CPU PhotoWorxx
| Performance rating | |
| Średnia w klasie Workstation | |
| Lenovo ThinkPad P1 G4-20Y4Z9DVUS | |
| Lenovo ThinkPad P15s Gen2-20W6000GGE | |
| Przeciętny Intel Core i7-1265U | |
| HP ZBook Firefly 15 G8 2C9R7EA | |
| HP ZBook Firefly 16 G9-6B897EA | |
| AIDA64 / FP32 Ray-Trace | |
| Średnia w klasie Workstation (10658 - 61611, n=25, ostatnie 2 lata) | |
| Lenovo ThinkPad P1 G4-20Y4Z9DVUS | |
| Lenovo ThinkPad P15s Gen2-20W6000GGE | |
| HP ZBook Firefly 15 G8 2C9R7EA | |
| Przeciętny Intel Core i7-1265U (2619 - 8178, n=10) | |
| HP ZBook Firefly 16 G9-6B897EA | |
| AIDA64 / FPU Julia | |
| Średnia w klasie Workstation (56664 - 186971, n=25, ostatnie 2 lata) | |
| Lenovo ThinkPad P1 G4-20Y4Z9DVUS | |
| Przeciętny Intel Core i7-1265U (12909 - 41649, n=10) | |
| Lenovo ThinkPad P15s Gen2-20W6000GGE | |
| HP ZBook Firefly 15 G8 2C9R7EA | |
| HP ZBook Firefly 16 G9-6B897EA | |
| AIDA64 / CPU SHA3 | |
| Średnia w klasie Workstation (2608 - 8975, n=25, ostatnie 2 lata) | |
| Lenovo ThinkPad P1 G4-20Y4Z9DVUS | |
| Lenovo ThinkPad P15s Gen2-20W6000GGE | |
| HP ZBook Firefly 15 G8 2C9R7EA | |
| Przeciętny Intel Core i7-1265U (824 - 2183, n=10) | |
| HP ZBook Firefly 16 G9-6B897EA | |
| AIDA64 / CPU Queen | |
| Średnia w klasie Workstation (60778 - 144411, n=25, ostatnie 2 lata) | |
| Lenovo ThinkPad P1 G4-20Y4Z9DVUS | |
| Przeciętny Intel Core i7-1265U (63615 - 67065, n=10) | |
| HP ZBook Firefly 16 G9-6B897EA | |
| Lenovo ThinkPad P15s Gen2-20W6000GGE | |
| HP ZBook Firefly 15 G8 2C9R7EA | |
| AIDA64 / FPU SinJulia | |
| Średnia w klasie Workstation (8165 - 29343, n=25, ostatnie 2 lata) | |
| Lenovo ThinkPad P1 G4-20Y4Z9DVUS | |
| Lenovo ThinkPad P15s Gen2-20W6000GGE | |
| HP ZBook Firefly 15 G8 2C9R7EA | |
| Przeciętny Intel Core i7-1265U (3105 - 5135, n=10) | |
| HP ZBook Firefly 16 G9-6B897EA | |
| AIDA64 / FPU Mandel | |
| Średnia w klasie Workstation (27301 - 98153, n=25, ostatnie 2 lata) | |
| Lenovo ThinkPad P1 G4-20Y4Z9DVUS | |
| Lenovo ThinkPad P15s Gen2-20W6000GGE | |
| HP ZBook Firefly 15 G8 2C9R7EA | |
| Przeciętny Intel Core i7-1265U (6967 - 20804, n=10) | |
| HP ZBook Firefly 16 G9-6B897EA | |
| AIDA64 / CPU AES | |
| Średnia w klasie Workstation (56077 - 187841, n=25, ostatnie 2 lata) | |
| Lenovo ThinkPad P1 G4-20Y4Z9DVUS | |
| Lenovo ThinkPad P15s Gen2-20W6000GGE | |
| HP ZBook Firefly 15 G8 2C9R7EA | |
| Przeciętny Intel Core i7-1265U (19489 - 42966, n=10) | |
| HP ZBook Firefly 16 G9-6B897EA | |
| AIDA64 / CPU ZLib | |
| Średnia w klasie Workstation (742 - 2148, n=25, ostatnie 2 lata) | |
| Lenovo ThinkPad P1 G4-20Y4Z9DVUS | |
| Przeciętny Intel Core i7-1265U (314 - 632, n=10) | |
| Lenovo ThinkPad P15s Gen2-20W6000GGE | |
| HP ZBook Firefly 15 G8 2C9R7EA | |
| HP ZBook Firefly 16 G9-6B897EA | |
| AIDA64 / FP64 Ray-Trace | |
| Średnia w klasie Workstation (5580 - 32891, n=25, ostatnie 2 lata) | |
| Lenovo ThinkPad P1 G4-20Y4Z9DVUS | |
| Lenovo ThinkPad P15s Gen2-20W6000GGE | |
| HP ZBook Firefly 15 G8 2C9R7EA | |
| Przeciętny Intel Core i7-1265U (1473 - 4376, n=10) | |
| HP ZBook Firefly 16 G9-6B897EA | |
| AIDA64 / CPU PhotoWorxx | |
| Średnia w klasie Workstation (37151 - 93684, n=25, ostatnie 2 lata) | |
| Przeciętny Intel Core i7-1265U (20213 - 47031, n=10) | |
| Lenovo ThinkPad P15s Gen2-20W6000GGE | |
| HP ZBook Firefly 16 G9-6B897EA | |
| HP ZBook Firefly 15 G8 2C9R7EA | |
| Lenovo ThinkPad P1 G4-20Y4Z9DVUS | |
Wydajność systemu
Subiektywnie rzecz biorąc, wydajność podczas codziennego użytkowania jest doskonała, a słaba wydajność procesora nie jest tak widoczna w syntetycznych benchmarkach, co oczywiście można częściowo przypisać szybkiemu dyskowi SSD PCIe-4.0. Mimo to użytkownicy szybko napotkają ograniczenia, gdy będą obciążać system, na przykład poprzez wykonywanie wielu zadań. Wolna wydajność procesora oznacza również, że system z pewnością nie jest przyszłościowy.
CrossMark: Overall | Productivity | Creativity | Responsiveness
| PCMark 10 / Score | |
| Średnia w klasie Workstation (6436 - 10409, n=21, ostatnie 2 lata) | |
| Dell Precision 5000 5560 | |
| Lenovo ThinkPad P1 G4-20Y4Z9DVUS | |
| Przeciętny Intel Core i7-1265U, NVIDIA T550 Laptop GPU (5488 - 6181, n=3) | |
| HP ZBook Firefly 16 G9-6B897EA | |
| HP ZBook Firefly 15 G8 2C9R7EA | |
| Lenovo ThinkPad P15s Gen2-20W6000GGE | |
| PCMark 10 / Essentials | |
| Dell Precision 5000 5560 | |
| Średnia w klasie Workstation (9622 - 11157, n=21, ostatnie 2 lata) | |
| HP ZBook Firefly 16 G9-6B897EA | |
| Przeciętny Intel Core i7-1265U, NVIDIA T550 Laptop GPU (9960 - 10250, n=3) | |
| Lenovo ThinkPad P1 G4-20Y4Z9DVUS | |
| Lenovo ThinkPad P15s Gen2-20W6000GGE | |
| HP ZBook Firefly 15 G8 2C9R7EA | |
| PCMark 10 / Productivity | |
| Średnia w klasie Workstation (8789 - 20616, n=21, ostatnie 2 lata) | |
| Lenovo ThinkPad P15s Gen2-20W6000GGE | |
| Dell Precision 5000 5560 | |
| HP ZBook Firefly 15 G8 2C9R7EA | |
| Przeciętny Intel Core i7-1265U, NVIDIA T550 Laptop GPU (8315 - 9474, n=3) | |
| HP ZBook Firefly 16 G9-6B897EA | |
| Lenovo ThinkPad P1 G4-20Y4Z9DVUS | |
| PCMark 10 / Digital Content Creation | |
| Średnia w klasie Workstation (7744 - 15631, n=21, ostatnie 2 lata) | |
| Dell Precision 5000 5560 | |
| Lenovo ThinkPad P1 G4-20Y4Z9DVUS | |
| Przeciętny Intel Core i7-1265U, NVIDIA T550 Laptop GPU (5399 - 6793, n=3) | |
| HP ZBook Firefly 15 G8 2C9R7EA | |
| HP ZBook Firefly 16 G9-6B897EA | |
| Lenovo ThinkPad P15s Gen2-20W6000GGE | |
| CrossMark / Overall | |
| Średnia w klasie Workstation (1307 - 2267, n=24, ostatnie 2 lata) | |
| HP ZBook Firefly 16 G9-6B897EA | |
| Przeciętny Intel Core i7-1265U, NVIDIA T550 Laptop GPU (1591 - 1623, n=3) | |
| Apple MacBook Pro 16 2021 M1 Pro | |
| Lenovo ThinkPad P1 G4-20Y4Z9DVUS | |
| CrossMark / Productivity | |
| Średnia w klasie Workstation (1130 - 2122, n=24, ostatnie 2 lata) | |
| HP ZBook Firefly 16 G9-6B897EA | |
| Przeciętny Intel Core i7-1265U, NVIDIA T550 Laptop GPU (1553 - 1592, n=3) | |
| Lenovo ThinkPad P1 G4-20Y4Z9DVUS | |
| Apple MacBook Pro 16 2021 M1 Pro | |
| CrossMark / Creativity | |
| Średnia w klasie Workstation (1657 - 2725, n=24, ostatnie 2 lata) | |
| Apple MacBook Pro 16 2021 M1 Pro | |
| HP ZBook Firefly 16 G9-6B897EA | |
| Przeciętny Intel Core i7-1265U, NVIDIA T550 Laptop GPU (1723 - 1751, n=3) | |
| Lenovo ThinkPad P1 G4-20Y4Z9DVUS | |
| CrossMark / Responsiveness | |
| Średnia w klasie Workstation (993 - 2096, n=24, ostatnie 2 lata) | |
| HP ZBook Firefly 16 G9-6B897EA | |
| Przeciętny Intel Core i7-1265U, NVIDIA T550 Laptop GPU (1344 - 1376, n=3) | |
| Lenovo ThinkPad P1 G4-20Y4Z9DVUS | |
| Apple MacBook Pro 16 2021 M1 Pro | |
| PCMark 10 Score | 5634 pkt. | |
Pomoc | ||
| AIDA64 / Memory Copy | |
| Średnia w klasie Workstation (56003 - 164795, n=25, ostatnie 2 lata) | |
| Przeciętny Intel Core i7-1265U (40212 - 72204, n=10) | |
| HP ZBook Firefly 16 G9-6B897EA | |
| Lenovo ThinkPad P15s Gen2-20W6000GGE | |
| Lenovo ThinkPad P1 G4-20Y4Z9DVUS | |
| HP ZBook Firefly 15 G8 2C9R7EA | |
| AIDA64 / Memory Read | |
| Średnia w klasie Workstation (55795 - 121563, n=25, ostatnie 2 lata) | |
| Przeciętny Intel Core i7-1265U (41808 - 69493, n=10) | |
| HP ZBook Firefly 16 G9-6B897EA | |
| Lenovo ThinkPad P15s Gen2-20W6000GGE | |
| Lenovo ThinkPad P1 G4-20Y4Z9DVUS | |
| HP ZBook Firefly 15 G8 2C9R7EA | |
| AIDA64 / Memory Write | |
| Średnia w klasie Workstation (55663 - 214520, n=25, ostatnie 2 lata) | |
| HP ZBook Firefly 16 G9-6B897EA | |
| Przeciętny Intel Core i7-1265U (41382 - 76027, n=10) | |
| Lenovo ThinkPad P15s Gen2-20W6000GGE | |
| Lenovo ThinkPad P1 G4-20Y4Z9DVUS | |
| HP ZBook Firefly 15 G8 2C9R7EA | |
| AIDA64 / Memory Latency | |
| Średnia w klasie Workstation (84.5 - 165.2, n=25, ostatnie 2 lata) | |
| Przeciętny Intel Core i7-1265U (74.6 - 112.4, n=10) | |
| HP ZBook Firefly 16 G9-6B897EA | |
| Lenovo ThinkPad P1 G4-20Y4Z9DVUS | |
| Lenovo ThinkPad P15s Gen2-20W6000GGE | |
| HP ZBook Firefly 15 G8 2C9R7EA | |
* ... im mniej tym lepiej
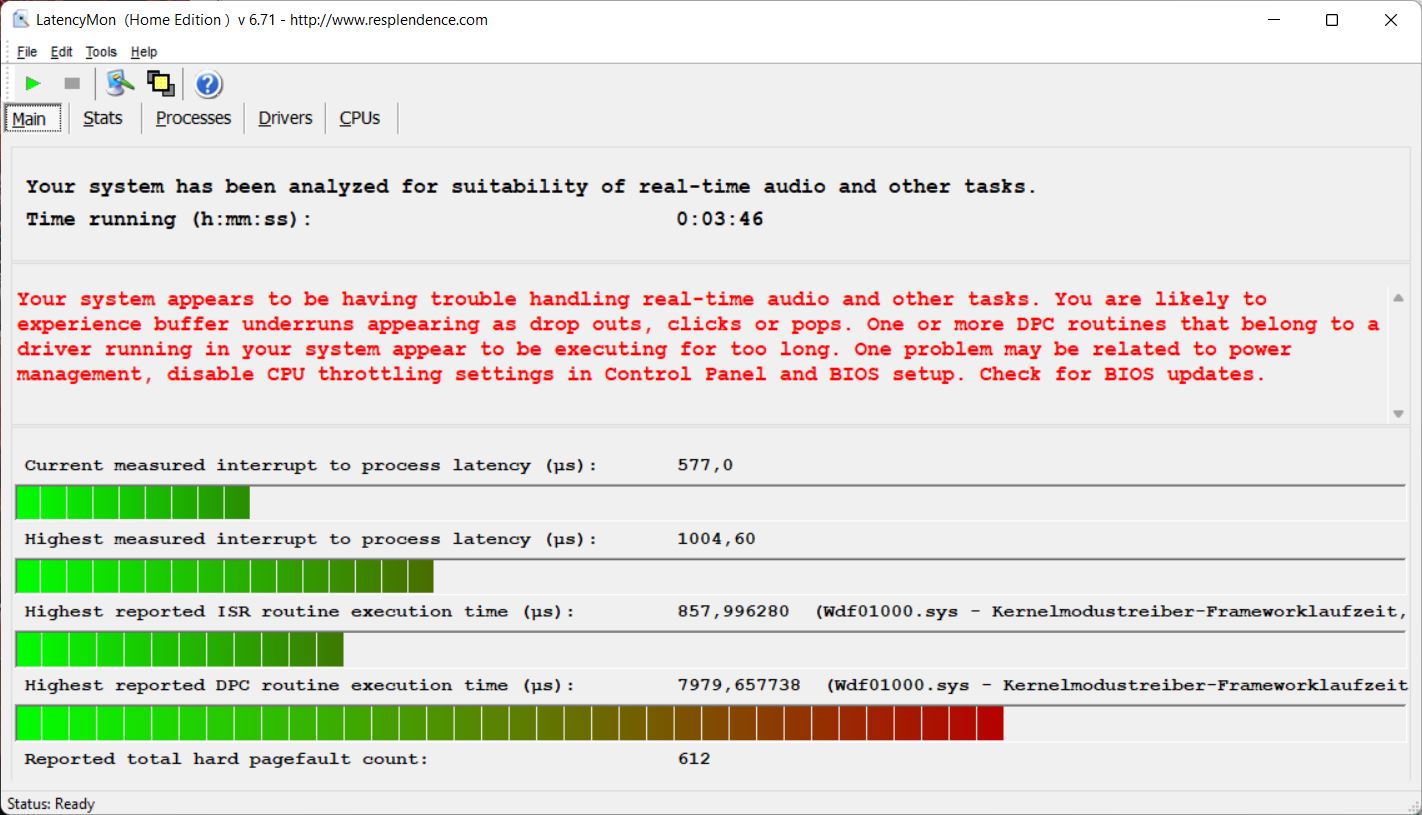
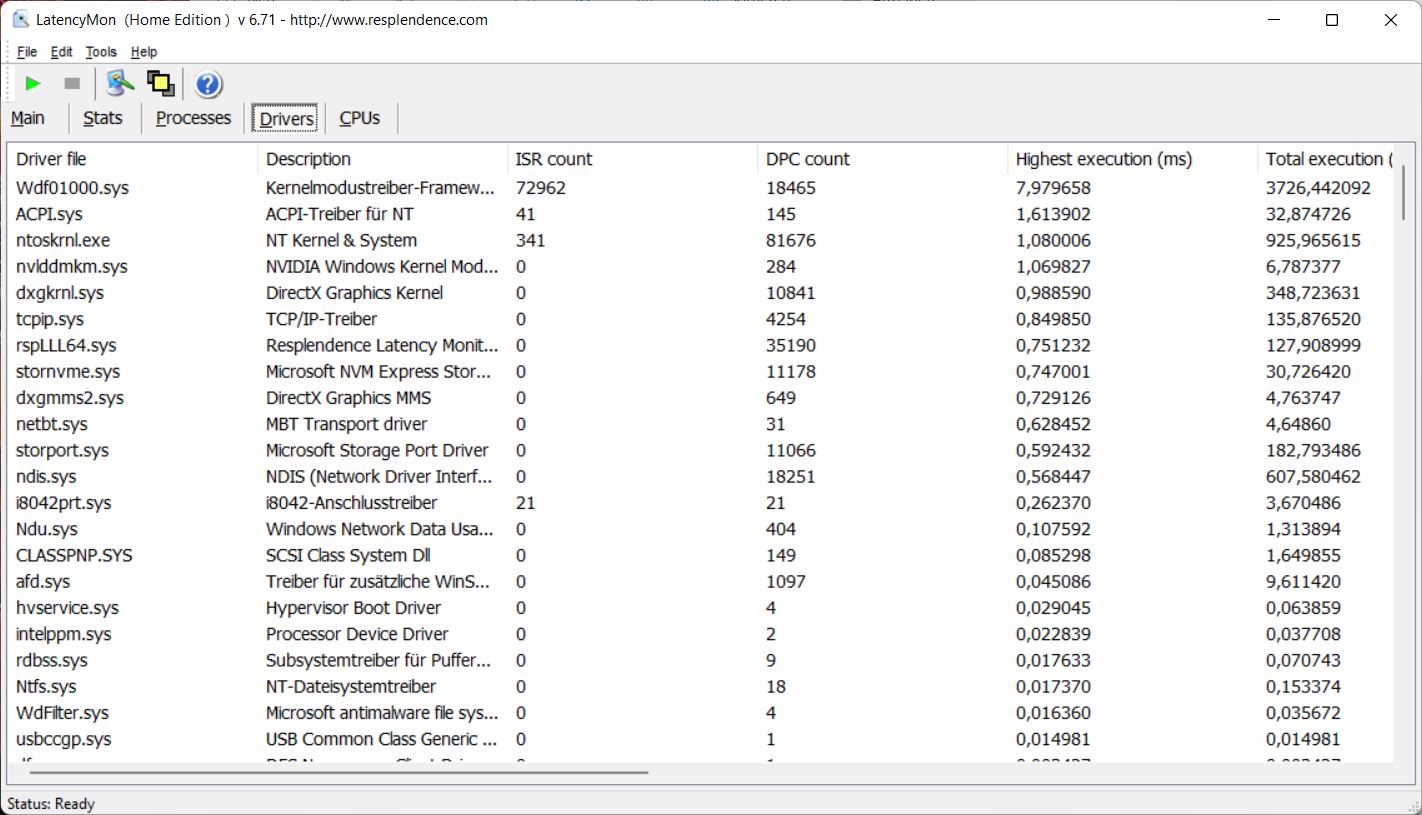
Opóźnienie DPC
Przy najbardziej aktualnej wersji BIOS-u w momencie przeprowadzania testów, nasze urządzenie testowe cierpi na nieco zwiększone opóźnienia DPC podczas naszego standardowego testu Wi-Fi (przeglądanie stron internetowych, oglądanie filmu 4K YouTube, stres procesora), co czyni ZBooka nieoptymalnym wyborem do korzystania z oprogramowania audio w czasie rzeczywistym.
| DPC Latencies / LatencyMon - interrupt to process latency (max), Web, Youtube, Prime95 | |
| Lenovo ThinkPad P15s Gen2-20W6000GGE | |
| Lenovo ThinkPad P1 G4-20Y4Z9DVUS | |
| HP ZBook Firefly 15 G8 2C9R7EA | |
| HP ZBook Firefly 16 G9-6B897EA | |
| Dell Precision 5000 5560 | |
* ... im mniej tym lepiej
Rozwiązanie w zakresie przechowywania
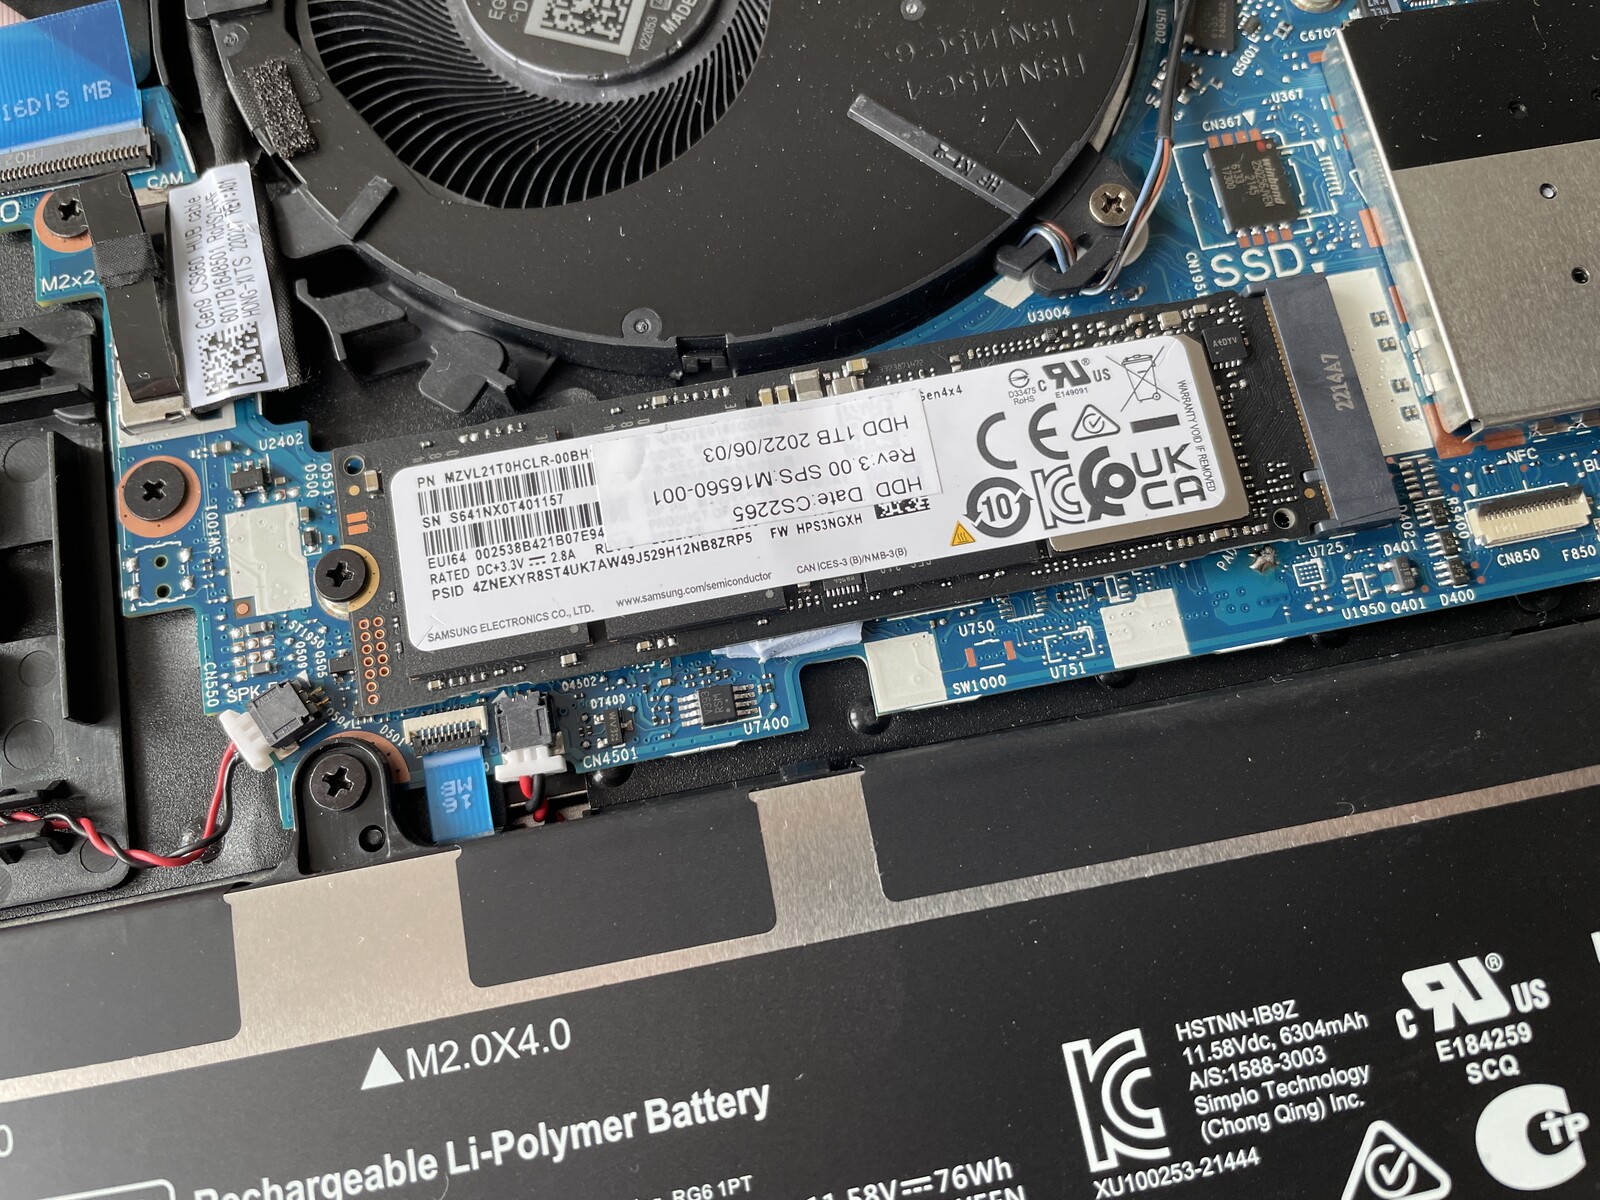
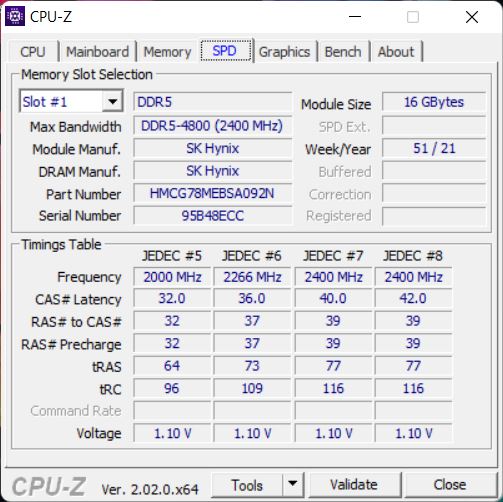
ZBook Firefly 16 G9 jest wyposażony w szybkie gniazdo PCIe-4.0, a w przypadku naszego egzemplarza testowego - w 1-TB dysk SSD Samsung M.2-2280. PM9A1 jest jednym z najszybszych dostępnych dysków SSD i zmierzyliśmy doskonałe transfery. Pomimo tego, że dysk SSD nie posiada coolera, wydajność nie spada pod ciągłym obciążeniem. Czynnikiem jest tutaj oczywiście także umiejscowienie w obudowie. Fabrycznie do dyspozycji użytkownika jest 890 GB. Więcej benchmarków SSD można tutaj.

| Drive Performance rating - Percent | |
| Przeciętny Samsung PM9A1 MZVL21T0HCLR | |
| Średnia w klasie Workstation | |
| Dell Precision 5000 5560 | |
| Lenovo ThinkPad P1 G4-20Y4Z9DVUS | |
| HP ZBook Firefly 16 G9-6B897EA | |
| Lenovo ThinkPad P15s Gen2-20W6000GGE | |
| HP ZBook Firefly 15 G8 2C9R7EA | |
* ... im mniej tym lepiej
Disk Throttling: DiskSpd Read Loop, Queue Depth 8
Wydajność GPU
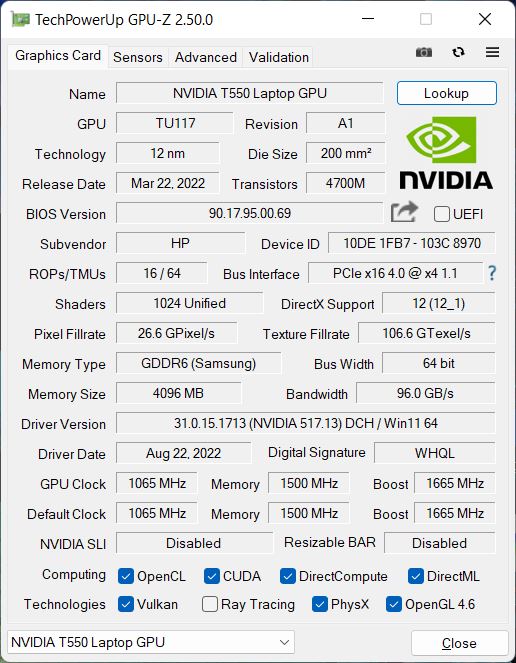
Nowy Nvidia T550 to niewielki upgrade w porównaniu do starszego T500 i nadal bazuje na układzie TU-117, z którego korzysta także m.in GeForce MX550 & MX450. Innymi słowy, jest to w dużej mierze karta klasy podstawowej, zwłaszcza że HP ustawiło swój TGP na zaledwie 20 W (możliwe byłoby nawet 60 W). W zależności od przypadku użycia, profesjonalne sterowniki nadają GPU pewne uzasadnienie.
Wyniki naszych syntetycznych benchmarków 3DMark są rozczarowujące, gdyż T500 w starszych modelach Firefly 15 G8 jest nieco szybszy, a konsumencki układ MX550, który testowaliśmy przy TGP 35 W, oferuje znacznie lepszą wydajność. Przynajmniej w profesjonalnych benchmarkach SPECViewperf, T550 zapewnia sobie niewielką przewagę nad starszym T500.
Wydajność GPU pozostaje na tym ogólnie niskim poziomie nawet pod ciągłym obciążeniem i w trybie akumulatorowym. Więcej benchmarków GPU można znaleźć w naszym lista benchmarków.
| 3DMark 11 - 1280x720 Performance GPU | |
| Średnia w klasie Workstation (10888 - 69594, n=25, ostatnie 2 lata) | |
| Dell Precision 5000 5560 | |
| Lenovo ThinkPad P1 G4-20Y4Z9DVUS | |
| Lenovo ThinkPad T14 G3-21CF004NGE | |
| Lenovo IdeaCentre AIO 3 24IAP7 | |
| HP ZBook Firefly 15 G8 2C9R7EA | |
| Przeciętny NVIDIA T550 Laptop GPU (7432 - 8701, n=2) | |
| HP ZBook Firefly 16 G9-6B897EA | |
| HP EliteBook 845 G9 6F6H6EA | |
| Lenovo ThinkPad P15s Gen2-20W6000GGE | |
| 3DMark | |
| 1920x1080 Fire Strike Graphics | |
| Średnia w klasie Workstation (7578 - 52560, n=25, ostatnie 2 lata) | |
| Dell Precision 5000 5560 | |
| Lenovo ThinkPad P1 G4-20Y4Z9DVUS | |
| Lenovo ThinkPad T14 G3-21CF004NGE | |
| Lenovo IdeaCentre AIO 3 24IAP7 | |
| HP ZBook Firefly 15 G8 2C9R7EA | |
| Przeciętny NVIDIA T550 Laptop GPU (4816 - 5593, n=3) | |
| HP ZBook Firefly 16 G9-6B897EA | |
| HP EliteBook 845 G9 6F6H6EA | |
| Lenovo ThinkPad P15s Gen2-20W6000GGE | |
| 2560x1440 Time Spy Graphics | |
| Średnia w klasie Workstation (2725 - 24806, n=25, ostatnie 2 lata) | |
| Dell Precision 5000 5560 | |
| Lenovo ThinkPad P1 G4-20Y4Z9DVUS | |
| Lenovo IdeaCentre AIO 3 24IAP7 | |
| Lenovo ThinkPad T14 G3-21CF004NGE | |
| HP ZBook Firefly 15 G8 2C9R7EA | |
| Przeciętny NVIDIA T550 Laptop GPU (1882 - 2252, n=3) | |
| HP ZBook Firefly 16 G9-6B897EA | |
| Lenovo ThinkPad P15s Gen2-20W6000GGE | |
| HP EliteBook 845 G9 6F6H6EA | |
| Wild Life Extreme Unlimited | |
| Średnia w klasie Workstation (n=1ostatnie 2 lata) | |
| Apple MacBook Pro 16 2021 M1 Pro | |
| Lenovo IdeaCentre AIO 3 24IAP7 | |
| HP ZBook Firefly 16 G9-6B897EA | |
| Przeciętny NVIDIA T550 Laptop GPU (3530 - 3649, n=2) | |
| Lenovo ThinkPad T14 G3-21CF004NGE | |
| Geekbench 5.5 - OpenCL Score | |
| Średnia w klasie Workstation (33651 - 272866, n=25, ostatnie 2 lata) | |
| Lenovo ThinkPad P1 G4-20Y4Z9DVUS | |
| Lenovo IdeaCentre AIO 3 24IAP7 | |
| Apple MacBook Pro 16 2021 M1 Pro | |
| Przeciętny NVIDIA T550 Laptop GPU (32530 - 36536, n=3) | |
| HP ZBook Firefly 16 G9-6B897EA | |
| Lenovo ThinkPad T14 G3-21CF004NGE | |
| HP ZBook Firefly 15 G8 2C9R7EA | |
| Lenovo ThinkPad P15s Gen2-20W6000GGE | |
| HP EliteBook 845 G9 6F6H6EA | |
| GFXBench | |
| 2560x1440 Aztec Ruins High Tier Offscreen | |
| Apple MacBook Pro 16 2021 M1 Pro | |
| Średnia w klasie Workstation (60.6 - 224, n=7, ostatnie 2 lata) | |
| Lenovo IdeaCentre AIO 3 24IAP7 | |
| HP ZBook Firefly 16 G9-6B897EA | |
| Przeciętny NVIDIA T550 Laptop GPU (n=1) | |
| 1920x1080 Aztec Ruins Normal Tier Offscreen | |
| Apple MacBook Pro 16 2021 M1 Pro | |
| Średnia w klasie Workstation (152.8 - 583, n=7, ostatnie 2 lata) | |
| Lenovo IdeaCentre AIO 3 24IAP7 | |
| HP ZBook Firefly 16 G9-6B897EA | |
| Przeciętny NVIDIA T550 Laptop GPU (n=1) | |
| 1920x1080 Car Chase Offscreen | |
| Apple MacBook Pro 16 2021 M1 Pro | |
| Średnia w klasie Workstation (157.3 - 526, n=6, ostatnie 2 lata) | |
| Lenovo IdeaCentre AIO 3 24IAP7 | |
| HP ZBook Firefly 16 G9-6B897EA | |
| Przeciętny NVIDIA T550 Laptop GPU (n=1) | |
| 3DMark 06 Standard Score | 31003 pkt. | |
| 3DMark Vantage P Result | 25155 pkt. | |
| 3DMark 11 Performance | 7405 pkt. | |
| 3DMark Cloud Gate Standard Score | 17399 pkt. | |
| 3DMark Fire Strike Score | 4581 pkt. | |
| 3DMark Time Spy Score | 2066 pkt. | |
Pomoc | ||
| Blender | |
| v3.3 Classroom HIP/AMD | |
| Lenovo Legion 5 Pro 16 ARH7H-82RG0047GE | |
| Lenovo ThinkPad T14 G3-21CF004NGE | |
| v3.3 Classroom OPTIX/RTX | |
| HP ZBook Firefly 16 G9-6B897EA | |
| Dell Precision 5000 5470 | |
| Asus VivoBook Pro 16X OLED N7600PC-L2026X | |
| Lenovo Legion 5 Pro 16 ARH7H-82RG0047GE | |
| Średnia w klasie Workstation (10 - 95, n=19, ostatnie 2 lata) | |
| v3.3 Classroom CUDA | |
| HP ZBook Firefly 16 G9-6B897EA | |
| Dell Precision 5000 5470 | |
| Asus VivoBook Pro 16X OLED N7600PC-L2026X | |
| Lenovo Legion 5 Pro 16 ARH7H-82RG0047GE | |
| Średnia w klasie Workstation (16 - 142, n=19, ostatnie 2 lata) | |
| v3.3 Classroom CPU | |
| HP ZBook Firefly 16 G9-6B897EA | |
| Asus VivoBook Pro 16X OLED N7600PC-L2026X | |
| Lenovo ThinkPad T14 G3-21CF004NGE | |
| Lenovo Legion 5 Pro 16 ARH7H-82RG0047GE | |
| Dell Precision 5000 5470 | |
| Średnia w klasie Workstation (148 - 464, n=25, ostatnie 2 lata) | |
* ... im mniej tym lepiej
SPECviewperf 13: Solidworks (sw-04) | Siemens NX (snx-03) | Showcase (showcase-02) | Medical (medical-02) | Maya (maya-05) | Energy (energy-02) | Creo (creo-02) | Catia (catia-05) | 3ds Max (3dsmax-06)
| SPECviewperf 2020 / Solidworks (solidworks-05) | |
| Dell Precision 5000 5560 | |
| Lenovo ThinkPad P1 G4-20Y4Z9DVUS | |
| HP ZBook Firefly 16 G9-6B897EA | |
| HP ZBook Firefly 15 G8 2C9R7EA | |
| Lenovo ThinkPad P15s Gen2-20W6000GGE | |
| SPECviewperf 2020 / Siemens NX (snx-04) | |
| Dell Precision 5000 5560 | |
| Lenovo ThinkPad P1 G4-20Y4Z9DVUS | |
| HP ZBook Firefly 16 G9-6B897EA | |
| HP ZBook Firefly 15 G8 2C9R7EA | |
| Lenovo ThinkPad P15s Gen2-20W6000GGE | |
| SPECviewperf 2020 / Medical (medical-03) | |
| Dell Precision 5000 5560 | |
| Lenovo ThinkPad P1 G4-20Y4Z9DVUS | |
| HP ZBook Firefly 16 G9-6B897EA | |
| HP ZBook Firefly 15 G8 2C9R7EA | |
| Lenovo ThinkPad P15s Gen2-20W6000GGE | |
| SPECviewperf 2020 / Maya (maya-06) | |
| Dell Precision 5000 5560 | |
| Lenovo ThinkPad P1 G4-20Y4Z9DVUS | |
| HP ZBook Firefly 16 G9-6B897EA | |
| HP ZBook Firefly 15 G8 2C9R7EA | |
| Lenovo ThinkPad P15s Gen2-20W6000GGE | |
| SPECviewperf 2020 / Energy (energy-03) | |
| Dell Precision 5000 5560 | |
| Lenovo ThinkPad P1 G4-20Y4Z9DVUS | |
| HP ZBook Firefly 16 G9-6B897EA | |
| HP ZBook Firefly 15 G8 2C9R7EA | |
| Lenovo ThinkPad P15s Gen2-20W6000GGE | |
| SPECviewperf 2020 / Creo (creo-03) | |
| Dell Precision 5000 5560 | |
| Lenovo ThinkPad P1 G4-20Y4Z9DVUS | |
| HP ZBook Firefly 16 G9-6B897EA | |
| HP ZBook Firefly 15 G8 2C9R7EA | |
| Lenovo ThinkPad P15s Gen2-20W6000GGE | |
| SPECviewperf 2020 / CATIA (catia-06) | |
| Dell Precision 5000 5560 | |
| Lenovo ThinkPad P1 G4-20Y4Z9DVUS | |
| HP ZBook Firefly 16 G9-6B897EA | |
| HP ZBook Firefly 15 G8 2C9R7EA | |
| Lenovo ThinkPad P15s Gen2-20W6000GGE | |
| SPECviewperf 2020 / 3ds Max (3dsmax-07) | |
| Dell Precision 5000 5560 | |
| Lenovo ThinkPad P1 G4-20Y4Z9DVUS | |
| HP ZBook Firefly 16 G9-6B897EA | |
| HP ZBook Firefly 15 G8 2C9R7EA | |
| Lenovo ThinkPad P15s Gen2-20W6000GGE | |
| SPECviewperf 13 / Solidworks (sw-04) | |
| Dell Precision 5000 5560 | |
| Lenovo ThinkPad P1 G4-20Y4Z9DVUS | |
| HP ZBook Firefly 16 G9-6B897EA | |
| HP ZBook Firefly 15 G8 2C9R7EA | |
| Lenovo ThinkPad P15s Gen2-20W6000GGE | |
| SPECviewperf 13 / Siemens NX (snx-03) | |
| Dell Precision 5000 5560 | |
| Lenovo ThinkPad P1 G4-20Y4Z9DVUS | |
| HP ZBook Firefly 16 G9-6B897EA | |
| HP ZBook Firefly 15 G8 2C9R7EA | |
| Lenovo ThinkPad P15s Gen2-20W6000GGE | |
| SPECviewperf 13 / Showcase (showcase-02) | |
| Dell Precision 5000 5560 | |
| Lenovo ThinkPad P1 G4-20Y4Z9DVUS | |
| HP ZBook Firefly 16 G9-6B897EA | |
| HP ZBook Firefly 15 G8 2C9R7EA | |
| Lenovo ThinkPad P15s Gen2-20W6000GGE | |
| SPECviewperf 13 / Medical (medical-02) | |
| Dell Precision 5000 5560 | |
| Lenovo ThinkPad P1 G4-20Y4Z9DVUS | |
| HP ZBook Firefly 16 G9-6B897EA | |
| HP ZBook Firefly 15 G8 2C9R7EA | |
| Lenovo ThinkPad P15s Gen2-20W6000GGE | |
| SPECviewperf 13 / Maya (maya-05) | |
| Dell Precision 5000 5560 | |
| Lenovo ThinkPad P1 G4-20Y4Z9DVUS | |
| HP ZBook Firefly 16 G9-6B897EA | |
| HP ZBook Firefly 15 G8 2C9R7EA | |
| Lenovo ThinkPad P15s Gen2-20W6000GGE | |
| SPECviewperf 13 / Energy (energy-02) | |
| Dell Precision 5000 5560 | |
| Lenovo ThinkPad P1 G4-20Y4Z9DVUS | |
| HP ZBook Firefly 15 G8 2C9R7EA | |
| HP ZBook Firefly 16 G9-6B897EA | |
| Lenovo ThinkPad P15s Gen2-20W6000GGE | |
| SPECviewperf 13 / Creo (creo-02) | |
| Dell Precision 5000 5560 | |
| Lenovo ThinkPad P1 G4-20Y4Z9DVUS | |
| HP ZBook Firefly 16 G9-6B897EA | |
| HP ZBook Firefly 15 G8 2C9R7EA | |
| Lenovo ThinkPad P15s Gen2-20W6000GGE | |
| SPECviewperf 13 / Catia (catia-05) | |
| Dell Precision 5000 5560 | |
| Lenovo ThinkPad P1 G4-20Y4Z9DVUS | |
| HP ZBook Firefly 16 G9-6B897EA | |
| HP ZBook Firefly 15 G8 2C9R7EA | |
| Lenovo ThinkPad P15s Gen2-20W6000GGE | |
| SPECviewperf 13 / 3ds Max (3dsmax-06) | |
| Dell Precision 5000 5560 | |
| Lenovo ThinkPad P1 G4-20Y4Z9DVUS | |
| HP ZBook Firefly 16 G9-6B897EA | |
| HP ZBook Firefly 15 G8 2C9R7EA | |
| Lenovo ThinkPad P15s Gen2-20W6000GGE | |
Wydajność w grach
Nawet jeśli Nvidia T550 naturalnie nadaje się w pewnym stopniu do gier, wydajność cierpi z powodu wolnego procesora, a T550 jest ledwo szybszy od zintegrowanego Radeon 680M z ThinkPad T14 G3, na przykład. Pod warunkiem, że dany tytuł jest mniej wymagający, średnie i wysokie ustawienia powinny być jeszcze możliwe przez większość czasu.
| The Witcher 3 | |
| 1920x1080 High Graphics & Postprocessing (Nvidia HairWorks Off) | |
| Średnia w klasie Workstation (53.4 - 156.4, n=3, ostatnie 2 lata) | |
| Dell Precision 5000 5560 | |
| Lenovo ThinkPad P1 G4-20Y4Z9DVUS | |
| Lenovo ThinkPad T14 G3-21CF004NGE | |
| Przeciętny NVIDIA T550 Laptop GPU (39 - 43, n=3) | |
| HP ZBook Firefly 16 G9-6B897EA | |
| Lenovo ThinkPad P15s Gen2-20W6000GGE | |
| 1920x1080 Ultra Graphics & Postprocessing (HBAO+) | |
| Średnia w klasie Workstation (26.3 - 91.7, n=3, ostatnie 2 lata) | |
| Dell Precision 5000 5560 | |
| Lenovo ThinkPad P1 G4-20Y4Z9DVUS | |
| Lenovo ThinkPad T14 G3-21CF004NGE | |
| HP ZBook Firefly 15 G8 2C9R7EA | |
| Przeciętny NVIDIA T550 Laptop GPU (19.6 - 23.2, n=3) | |
| HP ZBook Firefly 16 G9-6B897EA | |
| Lenovo ThinkPad P15s Gen2-20W6000GGE | |
| GTA V | |
| 1920x1080 High/On (Advanced Graphics Off) AA:2xMSAA + FX AF:8x | |
| Średnia w klasie Workstation (44.4 - 179.4, n=22, ostatnie 2 lata) | |
| Dell Precision 5000 5560 | |
| Lenovo ThinkPad T14 G3-21CF004NGE | |
| Przeciętny NVIDIA T550 Laptop GPU (61.5 - 63.9, n=3) | |
| HP ZBook Firefly 16 G9-6B897EA | |
| Lenovo ThinkPad P15s Gen2-20W6000GGE | |
| 1920x1080 Highest AA:4xMSAA + FX AF:16x | |
| Średnia w klasie Workstation (18.1 - 156.1, n=24, ostatnie 2 lata) | |
| Dell Precision 5000 5560 | |
| Przeciętny NVIDIA T550 Laptop GPU (29 - 29.6, n=3) | |
| HP ZBook Firefly 16 G9-6B897EA | |
| Lenovo ThinkPad P15s Gen2-20W6000GGE | |
| Lenovo ThinkPad T14 G3-21CF004NGE | |
| Final Fantasy XV Benchmark | |
| 1920x1080 Standard Quality | |
| Średnia w klasie Workstation (38.2 - 232, n=25, ostatnie 2 lata) | |
| Dell Precision 5000 5560 | |
| Lenovo ThinkPad P1 G4-20Y4Z9DVUS | |
| Lenovo ThinkPad T14 G3-21CF004NGE | |
| HP ZBook Firefly 16 G9-6B897EA | |
| Przeciętny NVIDIA T550 Laptop GPU (30.5 - 31.2, n=3) | |
| Lenovo ThinkPad P15s Gen2-20W6000GGE | |
| 1920x1080 High Quality | |
| Średnia w klasie Workstation (26.4 - 197.6, n=25, ostatnie 2 lata) | |
| Dell Precision 5000 5560 | |
| Lenovo ThinkPad P1 G4-20Y4Z9DVUS | |
| Lenovo ThinkPad T14 G3-21CF004NGE | |
| HP ZBook Firefly 16 G9-6B897EA | |
| Przeciętny NVIDIA T550 Laptop GPU (22 - 22.3, n=3) | |
| Lenovo ThinkPad P15s Gen2-20W6000GGE | |
| F1 2021 | |
| 1920x1080 High Preset AA:T AF:16x | |
| Dell Precision 5000 5560 | |
| HP ZBook Firefly 16 G9-6B897EA | |
| Przeciętny NVIDIA T550 Laptop GPU (56.5 - 59.9, n=3) | |
| Lenovo ThinkPad T14 G3-21CF004NGE | |
| 1920x1080 Ultra High Preset + Raytracing AA:T AF:16x | |
| Dell Precision 5000 5560 | |
| HP ZBook Firefly 16 G9-6B897EA | |
| Przeciętny NVIDIA T550 Laptop GPU (36.1 - 37, n=3) | |
| Lenovo ThinkPad T14 G3-21CF004NGE | |
| Far Cry 5 | |
| 1920x1080 High Preset AA:T | |
| Średnia w klasie Workstation (39 - 138, n=11, ostatnie 2 lata) | |
| Dell Precision 5000 5560 | |
| HP ZBook Firefly 16 G9-6B897EA | |
| Przeciętny NVIDIA T550 Laptop GPU (n=1) | |
| Lenovo ThinkPad T14 G3-21CF004NGE | |
| HP ZBook Firefly 15 G8 2C9R7EA | |
| 1920x1080 Ultra Preset AA:T | |
| Średnia w klasie Workstation (37 - 128, n=11, ostatnie 2 lata) | |
| Dell Precision 5000 5560 | |
| HP ZBook Firefly 16 G9-6B897EA | |
| Przeciętny NVIDIA T550 Laptop GPU (n=1) | |
| Lenovo ThinkPad T14 G3-21CF004NGE | |
| HP ZBook Firefly 15 G8 2C9R7EA | |
| Dota 2 Reborn | |
| 1920x1080 high (2/3) | |
| Średnia w klasie Workstation (52.1 - 199.8, n=25, ostatnie 2 lata) | |
| Dell Precision 5000 5560 | |
| Lenovo ThinkPad P1 G4-20Y4Z9DVUS | |
| HP ZBook Firefly 15 G8 2C9R7EA | |
| Przeciętny NVIDIA T550 Laptop GPU (92.1 - 101.2, n=3) | |
| HP ZBook Firefly 16 G9-6B897EA | |
| Lenovo ThinkPad P15s Gen2-20W6000GGE | |
| Lenovo ThinkPad T14 G3-21CF004NGE | |
| 1920x1080 ultra (3/3) best looking | |
| Średnia w klasie Workstation (50.7 - 178.4, n=25, ostatnie 2 lata) | |
| Dell Precision 5000 5560 | |
| Lenovo ThinkPad P1 G4-20Y4Z9DVUS | |
| HP ZBook Firefly 15 G8 2C9R7EA | |
| Przeciętny NVIDIA T550 Laptop GPU (84 - 93.4, n=3) | |
| HP ZBook Firefly 16 G9-6B897EA | |
| Lenovo ThinkPad P15s Gen2-20W6000GGE | |
| Lenovo ThinkPad T14 G3-21CF004NGE | |
Witcher 3 FPS Graph
| low | med. | high | ultra | |
|---|---|---|---|---|
| GTA V (2015) | 106.2 | 103.3 | 61.5 | 29.2 |
| The Witcher 3 (2015) | 123 | 75 | 40 | 19.9 |
| Dota 2 Reborn (2015) | 111.4 | 100.3 | 92.1 | 85.2 |
| Final Fantasy XV Benchmark (2018) | 60.7 | 31.2 | 22.3 | |
| X-Plane 11.11 (2018) | 65.5 | 59.4 | 55.5 | |
| Far Cry 5 (2018) | 75 | 41 | 38 | 35 |
| Strange Brigade (2018) | 128 | 51 | 42 | 36 |
| F1 2021 (2021) | 151.1 | 74.4 | 59.5 | 37 |
| F1 22 (2022) | 69.6 | 62 | 43.3 | 31 |
Emisje i energia
Szum systemu
Jedną z możliwych przyczyn słabej wydajności dwóch głównych komponentów można dostrzec po wewnętrznej stronie obudowy: Jest tam tylko jeden wentylator. Jedyną wyraźną zaletą niskiej wydajności jest cichy wentylator, który zawsze pracuje na biegu jałowym przy niskim obciążeniu, a przy pełnym obciążeniu procesora jest ledwo wyczuwalny i wynosi 29 dB(A). Kiedy do akcji wkracza dedykowane GPU, robi się głośniej - około 40-41 dB(A). To stawia ZBooka na równi ze znacznie szybszym Dell Precision 5560a jednocześnie jest zauważalnie głośniejszy od np MacBook Pro 16 czy poprzednika ZBook Firefly 15 G8, które oferowały lepszą wydajność. Nie zauważyliśmy żadnych elektronicznych szumów ani wycieku cewek.
Hałas
| luz |
| 23.8 / 23.8 / 23.8 dB |
| obciążenie |
| 39.4 / 41.4 dB |
 | ||
30 dB cichy 40 dB(A) słyszalny 50 dB(A) irytujący |
||
min: | ||
| HP ZBook Firefly 16 G9-6B897EA T550 Laptop GPU, i7-1265U, Samsung PM9A1 MZVL21T0HCLR | Lenovo ThinkPad P1 G4-20Y4Z9DVUS T1200 Laptop GPU, i7-11800H, Samsung PM9A1 MZVL2512HCJQ | Dell Precision 5000 5560 RTX A2000 Laptop GPU, i7-11850H, Samsung PM9A1 MZVL22T0HBLB | Lenovo ThinkPad P15s Gen2-20W6000GGE T500 Laptop GPU, i7-1165G7, WDC PC SN720 SDAQNTW-1T00 | HP ZBook Firefly 15 G8 2C9R7EA T500 Laptop GPU, i7-1165G7, Toshiba XG6 KXG60ZNV1T02 | Apple MacBook Pro 16 2021 M1 Pro M1 Pro 16-Core GPU, M1 Pro, Apple SSD AP1024R | |
|---|---|---|---|---|---|---|
| Noise | -9% | 6% | 0% | 3% | 5% | |
| wyłączone / środowisko * (dB) | 23.8 | 24.3 -2% | 23.4 2% | 24.3 -2% | 24.1 -1% | 24.7 -4% |
| Idle Minimum * (dB) | 23.8 | 24.3 -2% | 23.6 1% | 25.5 -7% | 24.1 -1% | 24.7 -4% |
| Idle Average * (dB) | 23.8 | 24.3 -2% | 23.6 1% | 25.5 -7% | 24.1 -1% | 24.7 -4% |
| Idle Maximum * (dB) | 23.8 | 26.6 -12% | 23.6 1% | 25.5 -7% | 27.1 -14% | 24.7 -4% |
| Load Average * (dB) | 39.4 | 46.8 -19% | 25.8 35% | 35.65 10% | 32.8 17% | 26.1 34% |
| Witcher 3 ultra * (dB) | 40.5 | 46.8 -16% | 40.1 1% | 36.1 11% | ||
| Load Maximum * (dB) | 41.4 | 46.8 -13% | 41.4 -0% | 35.65 14% | 36.1 13% | 37.4 10% |
* ... im mniej tym lepiej
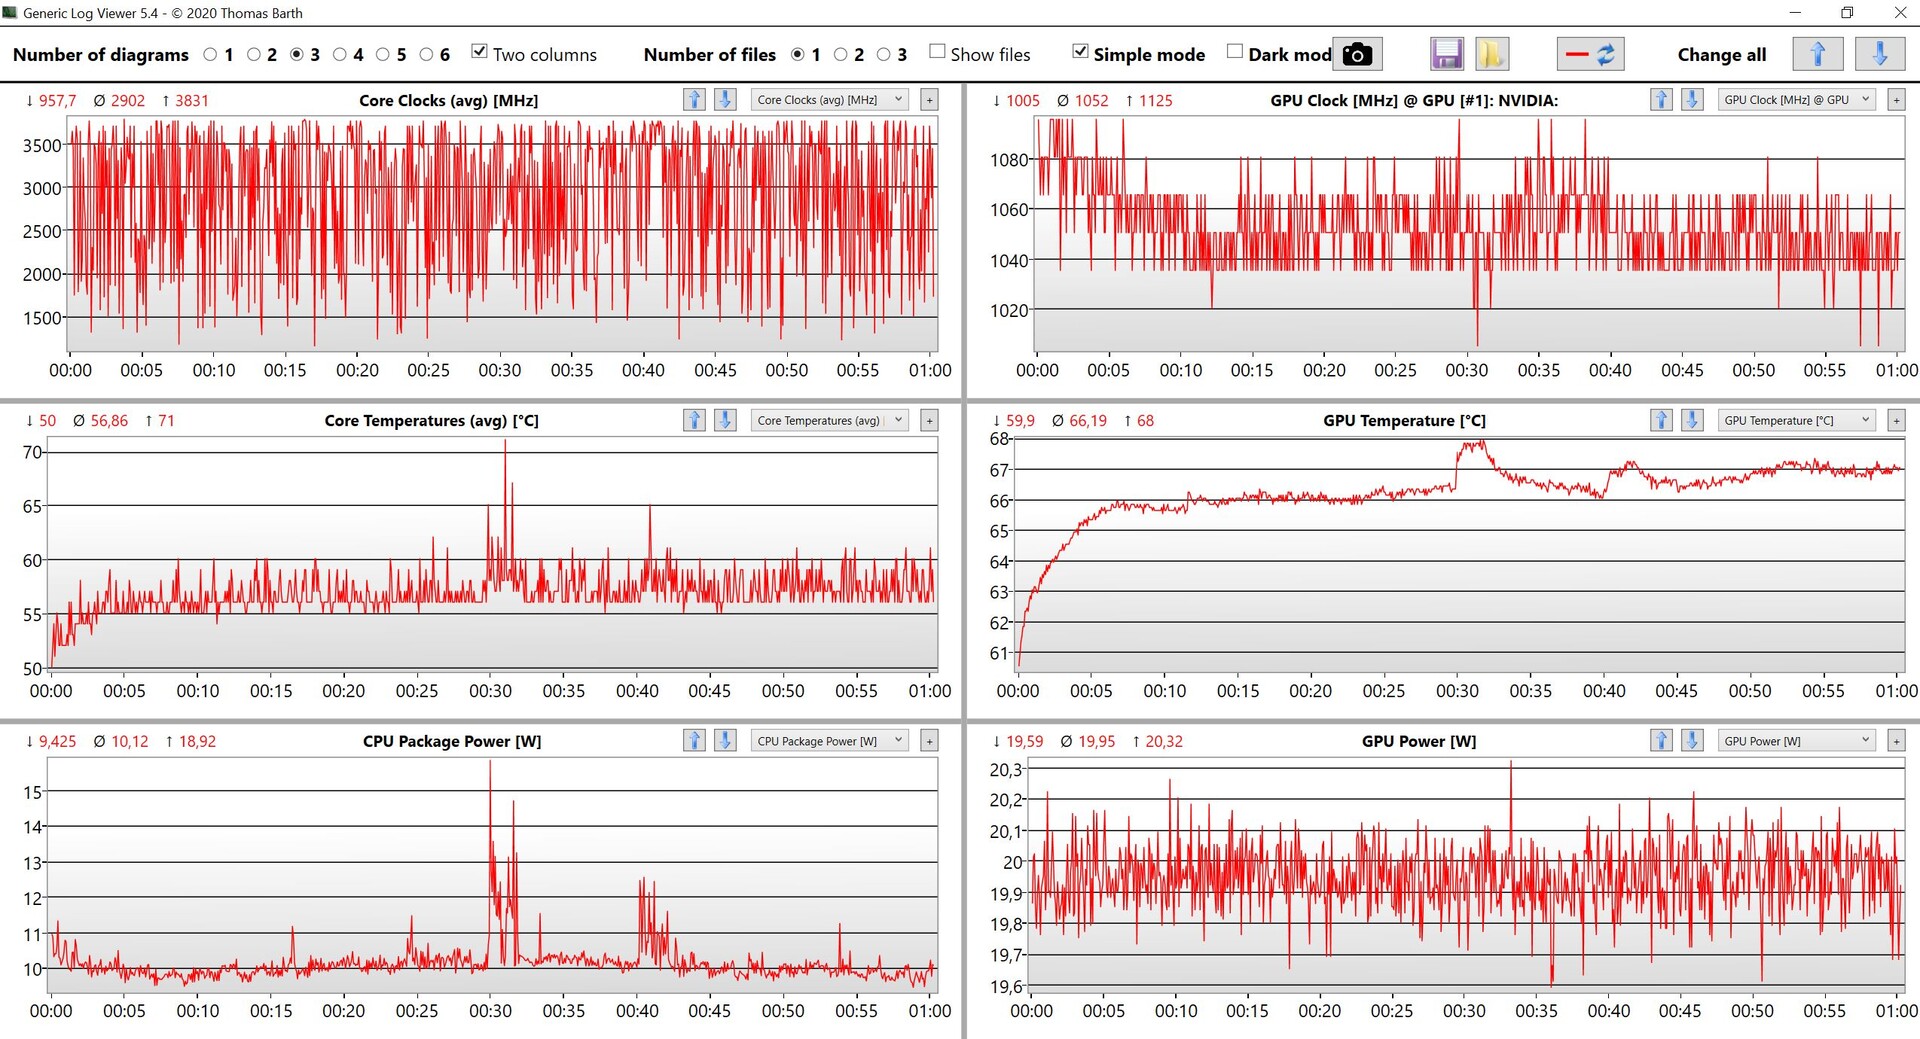
Temperatura
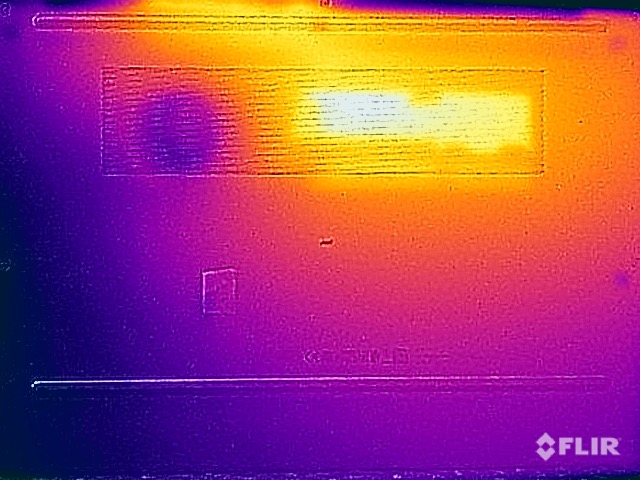
Użytkownicy korzystają z niskiego poboru energii przez CPU szczególnie podczas codziennego użytkowania, kiedy dedykowany GPU pracuje w trybie jałowym, a metalowe powierzchnie są tylko letnie, co sprawia, że można go wygodnie używać na kolanach. Jednak obciążenie GPU skutkuje znacznie wyższymi temperaturami. Choć 48°C (118,4°F) na spodzie jest dalekie od krytycznych, jest dość ciepłe, biorąc pod uwagę słabą wydajność (całkowita moc systemu to tylko 32 W). Podczas testu obciążeniowego procesor niemal natychmiast spada do 12 W, a GPU utrzymuje się na stałym poziomie 20 W.
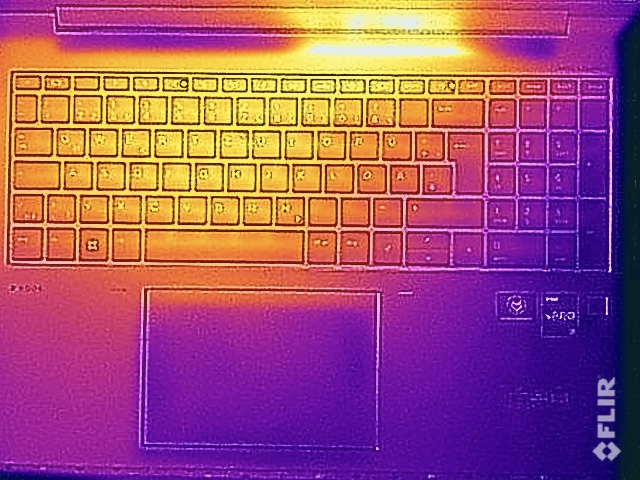
(±) Maksymalna temperatura w górnej części wynosi 42.1 °C / 108 F, w porównaniu do średniej 38.2 °C / 101 F , począwszy od 22.2 do 69.8 °C dla klasy Workstation.
(-) Dno nagrzewa się maksymalnie do 48 °C / 118 F, w porównaniu do średniej 41.1 °C / 106 F
(+) W stanie bezczynności średnia temperatura górnej części wynosi 27.4 °C / 81 F, w porównaniu ze średnią temperaturą urządzenia wynoszącą 32 °C / ### class_avg_f### F.
(±) Podczas gry w Wiedźmina 3 średnia temperatura górnej części wynosi 33.6 °C / 92 F, w porównaniu do średniej temperatury urządzenia wynoszącej 32 °C / ## #class_avg_f### F.
(+) Podpórki pod nadgarstki i touchpad są chłodniejsze niż temperatura skóry i maksymalnie 30.9 °C / 87.6 F i dlatego są chłodne w dotyku.
(-) Średnia temperatura obszaru podparcia dłoni w podobnych urządzeniach wynosiła 27.8 °C / 82 F (-3.1 °C / -5.6 F).
| HP ZBook Firefly 16 G9-6B897EA Intel Core i7-1265U, NVIDIA T550 Laptop GPU | Lenovo ThinkPad P1 G4-20Y4Z9DVUS Intel Core i7-11800H, NVIDIA T1200 Laptop GPU | Dell Precision 5000 5560 Intel Core i7-11850H, NVIDIA RTX A2000 Laptop GPU | Lenovo ThinkPad P15s Gen2-20W6000GGE Intel Core i7-1165G7, NVIDIA T500 Laptop GPU | HP ZBook Firefly 15 G8 2C9R7EA Intel Core i7-1165G7, NVIDIA T500 Laptop GPU | Apple MacBook Pro 16 2021 M1 Pro Apple M1 Pro, Apple M1 Pro 16-Core GPU | |
|---|---|---|---|---|---|---|
| Heat | -1% | -7% | -0% | 13% | 17% | |
| Maximum Upper Side * (°C) | 42.1 | 49.9 -19% | 48.2 -14% | 42.8 -2% | 41.2 2% | 41 3% |
| Maximum Bottom * (°C) | 48 | 56.7 -18% | 42.6 11% | 59.1 -23% | 47.2 2% | 39 19% |
| Idle Upper Side * (°C) | 29.9 | 25.5 15% | 34.8 -16% | 26.4 12% | 23.7 21% | 24 20% |
| Idle Bottom * (°C) | 32.9 | 26.2 20% | 35.2 -7% | 28.9 12% | 23.9 27% | 24 27% |
* ... im mniej tym lepiej
Mówcy
Dwa głośniki stereo typu downfiring znajdują się w centralnej części po lewej i prawej stronie klawiatury. Choć dźwięk nie jest tak dobry jak w np MacBook Pro 16, to i tak jest on ogólnie znakomity, o bardzo pojemnej i pełnej charakterystyce. Jest jeszcze miejsce na poprawę szczególnie w zakresie basów.
HP ZBook Firefly 16 G9-6B897EA analiza dźwięku
(+) | głośniki mogą odtwarzać stosunkowo głośno (83 dB)
Bas 100 - 315 Hz
(-) | prawie brak basu - średnio 17.5% niższa od mediany
(±) | liniowość basu jest średnia (12.1% delta do poprzedniej częstotliwości)
Średnie 400 - 2000 Hz
(+) | zbalansowane środki średnie - tylko 2.7% od mediany
(+) | średnie są liniowe (3.8% delta do poprzedniej częstotliwości)
Wysokie 2–16 kHz
(+) | zrównoważone maksima - tylko 3% od mediany
(+) | wzloty są liniowe (5.3% delta do poprzedniej częstotliwości)
Ogólnie 100 - 16.000 Hz
(+) | ogólny dźwięk jest liniowy (13.3% różnicy w stosunku do mediany)
W porównaniu do tej samej klasy
» 25% wszystkich testowanych urządzeń w tej klasie było lepszych, 4% podobnych, 71% gorszych
» Najlepszy miał deltę 7%, średnia wynosiła ###średnia###%, najgorsza wynosiła 35%
W porównaniu do wszystkich testowanych urządzeń
» 14% wszystkich testowanych urządzeń było lepszych, 3% podobnych, 83% gorszych
» Najlepszy miał deltę 4%, średnia wynosiła ###średnia###%, najgorsza wynosiła 134%
Apple MacBook Pro 16 2021 M1 Pro analiza dźwięku
(+) | głośniki mogą odtwarzać stosunkowo głośno (84.7 dB)
Bas 100 - 315 Hz
(+) | dobry bas - tylko 3.8% od mediany
(+) | bas jest liniowy (5.2% delta do poprzedniej częstotliwości)
Średnie 400 - 2000 Hz
(+) | zbalansowane środki średnie - tylko 1.3% od mediany
(+) | średnie są liniowe (2.1% delta do poprzedniej częstotliwości)
Wysokie 2–16 kHz
(+) | zrównoważone maksima - tylko 1.9% od mediany
(+) | wzloty są liniowe (2.7% delta do poprzedniej częstotliwości)
Ogólnie 100 - 16.000 Hz
(+) | ogólny dźwięk jest liniowy (4.6% różnicy w stosunku do mediany)
W porównaniu do tej samej klasy
» 0% wszystkich testowanych urządzeń w tej klasie było lepszych, 0% podobnych, 100% gorszych
» Najlepszy miał deltę 5%, średnia wynosiła ###średnia###%, najgorsza wynosiła 45%
W porównaniu do wszystkich testowanych urządzeń
» 0% wszystkich testowanych urządzeń było lepszych, 0% podobnych, 100% gorszych
» Najlepszy miał deltę 4%, średnia wynosiła ###średnia###%, najgorsza wynosiła 134%
Zużycie energii
Podczas testów w trybie jałowym ZBook Firefly 16 G9 prezentuje się jako bardzo energooszczędny laptop z jasnym, ale oszczędnym panelem FHD. Choć urządzenie jest również bardzo oszczędne pod obciążeniem, odbywa się to kosztem wydajności. Podczas testu obciążeniowego mierzymy czasem nieco powyżej 90 W, ale wartość ta potem szybko spada i stabilizuje się na poziomie 47 W. Wystarczyłaby ładowarka o mocy 65 watów. Model 110-W jest oceniany na 100 watów przez USB-C i 10 watów przez dodatkowy port USB-A.
| HP ZBook Firefly 16 G9-6B897EA T550 Laptop GPU, i7-1265U, Samsung PM9A1 MZVL21T0HCLR | Lenovo ThinkPad P1 G4-20Y4Z9DVUS T1200 Laptop GPU, i7-11800H, Samsung PM9A1 MZVL2512HCJQ | Dell Precision 5000 5560 RTX A2000 Laptop GPU, i7-11850H, Samsung PM9A1 MZVL22T0HBLB | Lenovo ThinkPad P15s Gen2-20W6000GGE T500 Laptop GPU, i7-1165G7, WDC PC SN720 SDAQNTW-1T00 | HP ZBook Firefly 15 G8 2C9R7EA T500 Laptop GPU, i7-1165G7, Toshiba XG6 KXG60ZNV1T02 | Apple MacBook Pro 16 2021 M1 Pro M1 Pro 16-Core GPU, M1 Pro, Apple SSD AP1024R | |
|---|---|---|---|---|---|---|
| Power Consumption | -93% | -86% | -19% | 6% | -37% | |
| Idle Minimum * (Watt) | 4.5 | 9.9 -120% | 6.2 -38% | 5.8 -29% | 3.3 27% | 5 -11% |
| Idle Average * (Watt) | 8 | 13.9 -74% | 13.9 -74% | 13.3 -66% | 5.6 30% | 15.1 -89% |
| Idle Maximum * (Watt) | 8.7 | 14.6 -68% | 23.8 -174% | 15.6 -79% | 8.7 -0% | 15.5 -78% |
| Load Average * (Watt) | 48.3 | 95 -97% | 95.7 -98% | 43.2 11% | 64.4 -33% | 54 -12% |
| Witcher 3 ultra * (Watt) | 45.3 | 98.9 -118% | 87 -92% | 37.1 18% | 53 -17% | |
| Load Maximum * (Watt) | 94.7 | 170.8 -80% | 132.6 -40% | 67.3 29% | 69 27% | 90 5% |
* ... im mniej tym lepiej
| wyłączony / stan wstrzymania | |
| luz | |
| obciążenie |
|
Legenda:
min: | |
Energy Consumption Witcher 3 / Stress Test
Energy Consumption external Monitor
Czas pracy na baterii
Czas pracy na baterii jest znakomity dzięki dużemu akumulatorowi (76 Wh) i niskiemu poborowi mocy. W naszym teście Wi-Fi system wytrzymuje prawie 10 godzin przy maksymalnej jasności i imponujące 13 godzin przy dostosowanej jasności 150 nitów (w przypadku naszego urządzenia testowego było to 57% jasności), natomiast test wideo trwa ponad 18 godzin. Wyniki te czynią z ZBooka mocnego konkurenta w tej kategorii nawet dla m.in MacBooka Pro 16. W maksymalnym stresie bateria wytrzymuje jeszcze dwie godziny, co po raz kolejny wynika z niskiej wydajności. Pełne ładowanie urządzenia podczas pracy trwa tylko 90 minut, przy czym 50-procentowe naładowanie jest dostępne już po 30 minutach.
| HP ZBook Firefly 16 G9-6B897EA i7-1265U, T550 Laptop GPU, 76 Wh | Lenovo ThinkPad P1 G4-20Y4Z9DVUS i7-11800H, T1200 Laptop GPU, 90 Wh | Dell Precision 5000 5560 i7-11850H, RTX A2000 Laptop GPU, 86 Wh | Lenovo ThinkPad P15s Gen2-20W6000GGE i7-1165G7, T500 Laptop GPU, 57 Wh | HP ZBook Firefly 15 G8 2C9R7EA i7-1165G7, T500 Laptop GPU, 56 Wh | Apple MacBook Pro 16 2021 M1 Pro M1 Pro, M1 Pro 16-Core GPU, 99.6 Wh | Średnia w klasie Workstation | |
|---|---|---|---|---|---|---|---|
| Czasy pracy | -32% | -31% | -31% | -7% | 13% | -37% | |
| H.264 (h) | 18.4 | 9.9 -46% | 15.3 -17% | 17.5 -5% | 9.51 ? -48% | ||
| WiFi v1.3 (h) | 13 | 8.8 -32% | 6.3 -52% | 7.7 -41% | 10.5 -19% | 16.9 30% | 8.53 ? -34% |
| Load (h) | 2 | 1.8 -10% | 1.9 -5% | 2.3 15% | 1.429 ? -29% |
Za
Przeciw
Werdykt - Mobilna stacja robocza jest wolniejsza od zeszłorocznego modelu

Dobra, stała wydajność powinna być priorytetem numer jeden w przypadku mobilnej stacji roboczej. Mimo że modele ZBook Firefly to smukłe stacje robocze z podzespołami klasy podstawowej, wyjątkowo niski limit mocy procesora wyraźnie pokazuje, że HP nie trafił w dziesiątkę. Jesteśmy oszołomieni tym, jak procesor obecnej generacji Alder Lake-U musi pracować z mocą zaledwie 12 W po jednej sekundzie, zwłaszcza w dużej 16-calowej obudowie. Tutaj dowolny 13-calowy subnotebook zapewnia (dużo) lepszą wydajność.
Wydajność m.in Nvidia T550 GPU jest podobnie rozczarowująca, gdyż działa ona tylko przy 20 W - minimalnej wartości dla tego GPU. W rezultacie wydajność graficzna jest tylko minimalnie lepsza, a w niektórych scenariuszach nawet gorsza w porównaniu ze starszym ZBook Firefly 15 G8 z układem Nvidia T500. Jest to krok w złym kierunku. Pomimo wolnej wydajności zmierzyliśmy wysokie temperatury powierzchni pod obciążeniem, co wskazuje na słabą wydajność chłodzenia.
Inne aspekty laptopa są ledwie warte wzmianki, gdyż Firefly 16 G9 nie spełnia swojego głównego zadania jako stacja robocza. Cichy wentylator i długie czasy pracy na akumulatorze niewiele mogą zmienić ten fakt. A szkoda, bo obudowa klasy premium, świetna klawiatura i matowy ekran w innym przypadku stanowiłyby solidny fundament dobrego produktu.
Choć HP ZBook Firefly 16 G9 wykazuje potencjał jako solidna mobilna stacja robocza klasy podstawowej, słaba wydajność procesora i mierna wydajność karty graficznej dyskwalifikują go z punktu widzenia jego przeznaczenia. Choć nie jest to koniecznie zły laptop, wydajność CPU wygląda na przestarzałą nawet jak na standardy klasy konsumenckiej.
Choć mamy jeszcze do czynienia z konkurencyjnymi stacjami roboczymi, odradzamy zakup HP ze względu na słabą wydajność procesora. Postaramy się dostać w swoje ręce inny model testowy z procesorem Alder Lake-P i - miejmy nadzieję - z ogólnie lepszą charakterystyką wydajności CPU.
Cena i dostępność
Nasza konfiguracja testowa jest dostępna u różnych sprzedawców internetowych lub w sklepie internetowym HP bezpośrednio za około 3000 USD.
HP ZBook Firefly 16 G9-6B897EA
- 07/10/2022 v7 (old)
Andreas Osthoff
Price comparison

