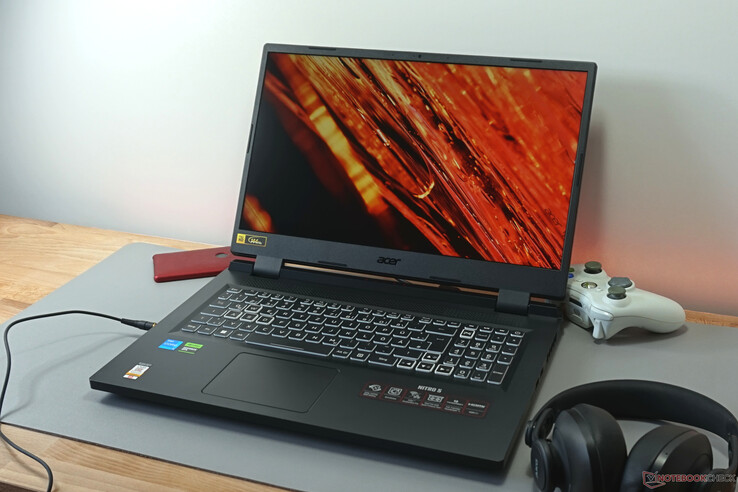
Recenzja Acer Nitro 5 AN517: Laptop do gier z cichą kartą RTX 4050
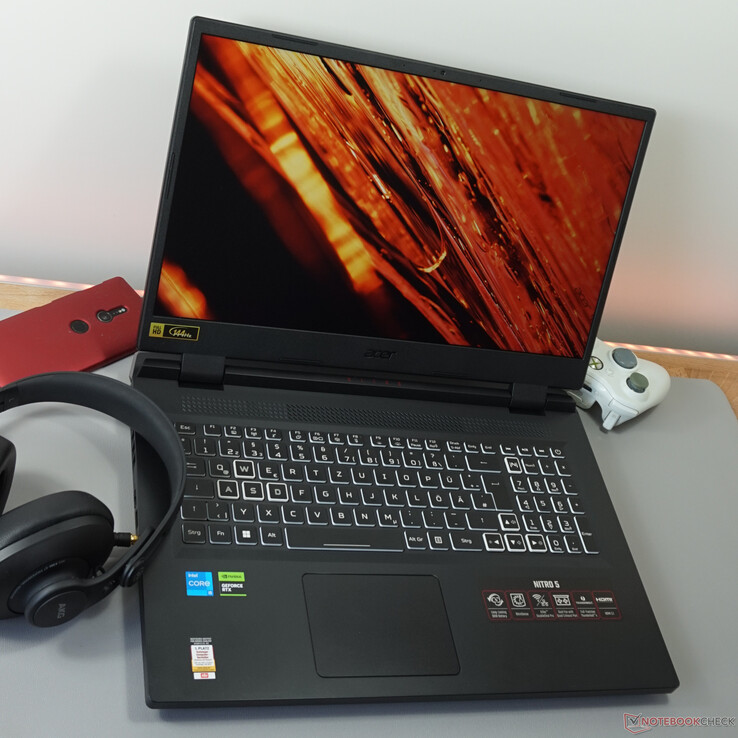
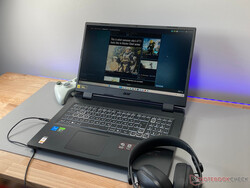
Stosunkowo duży Acer Nitro 5 AN517 jest domem dla procesora Alder Lake - który nie jest już najnowszym dzieckiem na rynku - i jest połączony z kartą graficzną Nvidia GeForce z serii RTX 4000. Rezultatem jest solidny, podstawowy laptop do gier, który jest przyzwoicie wyposażony w oświetlenie RGB, panel 144 Hz i port Thunderbolt 4.
W zeszłym roku recenzowaliśmy bardzo podobnego poprzednika, modelAcer Nitro 5 AN517-55-738Rz kartą graficznąRTX 3060który zwrócił na siebie uwagę między innymi nadmiernym poziomem hałasu. To właśnie w tym obszarze Acer wprowadził ulepszenia i jednocześnie czerpie korzyści z RTX 4050tak jak w naszym recenzowanym modelu. Nasza recenzja ujawnia, jakiego poziomu cichej rozgrywki można się spodziewać.
Konkurenci z porównywalną technologią to Medion Erazer Scout E20który jest wyposażony w nowszy, większy procesor lub Asus TUF Gaming A16który postawił na podzespoły AMD.
Potencjalni konkurenci w porównaniu
Ocena | Data | Model | Waga | Wysokość | Rozmiar | Rezolucja | Cena |
|---|---|---|---|---|---|---|---|
| 85.5 % v7 (old) | 06/2023 | Acer Nitro 5 AN517-55-5552 i5-12500H, GeForce RTX 4050 Laptop GPU | 3 kg | 28.9 mm | 17.30" | 1920x1080 | |
| 86.9 % v7 (old) | 06/2023 | Asus TUF Gaming A16 FA617XS R9 7940HS, Radeon RX 7600S | 2.2 kg | 22.1 mm | 16.00" | 1920x1200 | |
| 83.9 % v7 (old) | Acer Nitro 5 AN517-55-738R i7-12700H, GeForce RTX 3060 Laptop GPU | 3.1 kg | 28.6 mm | 17.30" | 1920x1080 | ||
| 83 % v7 (old) | 05/2023 | Medion Erazer Scout E20 i7-13700H, GeForce RTX 4050 Laptop GPU | 2.8 kg | 29 mm | 17.30" | 1920x1080 | |
| 82.9 % v7 (old) | 03/2023 | MSI Katana 15 B12VEK i7-12650H, GeForce RTX 4050 Laptop GPU | 2.3 kg | 24.9 mm | 15.60" | 1920x1080 | |
| 82.4 % v7 (old) | 04/2023 | MSI Cyborg 15 A12VF i7-12650H, GeForce RTX 4060 Laptop GPU | 2 kg | 22.9 mm | 15.60" | 1920x1080 |
Obudowa - duży Nitro 5 potrzebuje miejsca
Ponadprzeciętna głębokość Acer Nitro 5 jest znaczna, nawet jak na urządzenie o przekątnej 17,3 cala. Nic więc dziwnego, że urządzenie jest nieco cięższe od podobnie wyposażonych konkurentów. W zamian laptop jest bardzo solidnie wykonany.
Zawiasy są solidne, można je otworzyć do kąta 145 ° i zapobiegają chybotaniu się dużego wyświetlacza. Cała obudowa składa się z tworzywa sztucznego, które nie wpływa negatywnie na sztywność skrętną urządzenia. Ramka ekranu może być lekko skręcona. Natomiast podstawa przez cały czas pozostaje absolutnie solidna - i cicha.
Oczywiście zdania na temat designu mogą być podzielone. Jednak lekko przesunięte srebrne rogi i cienkie kolorowe paski wydają się nieco mniej niż odważne. Wątpliwe jest, czy różnica w stosunku do całkowicie czarnej obudowy byłaby w ogóle zauważalna.
Cechy - Laptop do gier z niezbędnymi dodatkami
Wybór portów jest ograniczony, ale, co cieszy, najważniejsze z nich są pod ręką. Po lewej i prawej stronie znajdują się porty USB-A, a po prawej dwa. Ich maksymalna prędkość transferu wynosi 10 Gbit/s (USB 3.2 Gen2). Z tyłu laptopa można znaleźć port HDMI i Thunderbolt 4, a także dwa wyjścia wideo. Ponadto TB4 ma odpowiedni interfejs, aby móc korzystać z zewnętrznego dysku SSD z maksymalną prędkością.
Brakuje gniazda na kartę, a trzecie wyjście wideo - czasami używane jako Mini DP, ale zwykle jako dodatkowy port USB-C z obsługą DP - jest nieobecne. Ponadto port LAN ma szybkość przesyłania danych tylko 1 Gbit / s.
Komunikacja
Moduł Wi-Fi Killer Wi-Fi 6 AX1650i działa zgodnie z oczekiwaniami. Przy niewielkiej odległości od routera możliwe jest osiągnięcie prędkości przekraczających 1,5 Gbit/s.
Wi-Fi 6E nie jest obsługiwane, co oznacza, że należy spodziewać się zauważalnego spadku teoretycznie możliwych prędkości transferu danych, szczególnie w obszarach z wieloma sieciami bezprzewodowymi.
| Networking | |
| iperf3 transmit AXE11000 6GHz | |
| Gigabyte Aero 14 OLED BMF | |
| Acer Nitro 5 AN517-55-5552 | |
| Przeciętny Killer Wi-Fi 6 AX1650i 160MHz Wireless Network Adapter (201NGW) (1473 - 1511, n=2) | |
| Acer Nitro 5 AN517-55-738R | |
| Średnia w klasie Gaming (648 - 2355, n=47, ostatnie 2 lata) | |
| Lenovo Legion Pro 5 16IRX8 | |
| Schenker XMG Core 15 (M22) | |
| iperf3 receive AXE11000 6GHz | |
| Acer Nitro 5 AN517-55-738R | |
| Gigabyte Aero 14 OLED BMF | |
| Przeciętny Killer Wi-Fi 6 AX1650i 160MHz Wireless Network Adapter (201NGW) (1572 - 1703, n=2) | |
| Acer Nitro 5 AN517-55-5552 | |
| Średnia w klasie Gaming (975 - 1788, n=46, ostatnie 2 lata) | |
| Lenovo Legion Pro 5 16IRX8 | |
| Schenker XMG Core 15 (M22) | |
Kamera internetowa
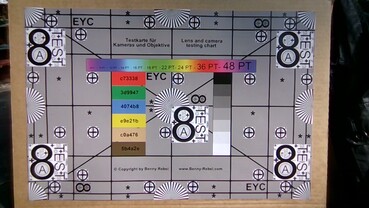
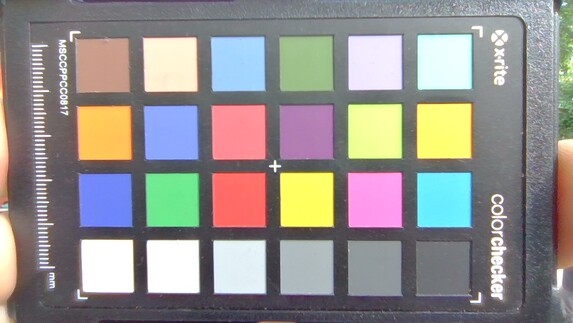
Kamera internetowa działa słabo z rozdzielczością HD, maksymalnie 30 klatek na sekundę i ledwo akceptowalną jakością obrazu. Ale przynajmniej jest przyzwoite rozjaśnienie w warunkach słabego oświetlenia, bez generowania zbyt dużych szumów obrazu.
Przy bliższym przyjrzeniu się, podwójny mikrofon wypada znacznie lepiej. Dobrze radzi sobie z nagrywaniem głosu użytkownika z wielu kierunków i odległości przy względnie stabilnej głośności i nie ma zniekształceń, szumów ani metalicznych tonów. Sprawia to, że laptop jest dobrze przygotowany do obsługi połączeń wideo lub czatów w grach.
Serwis
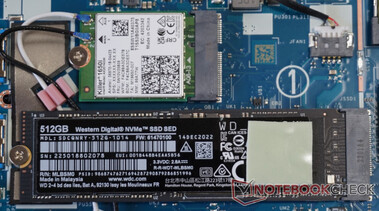
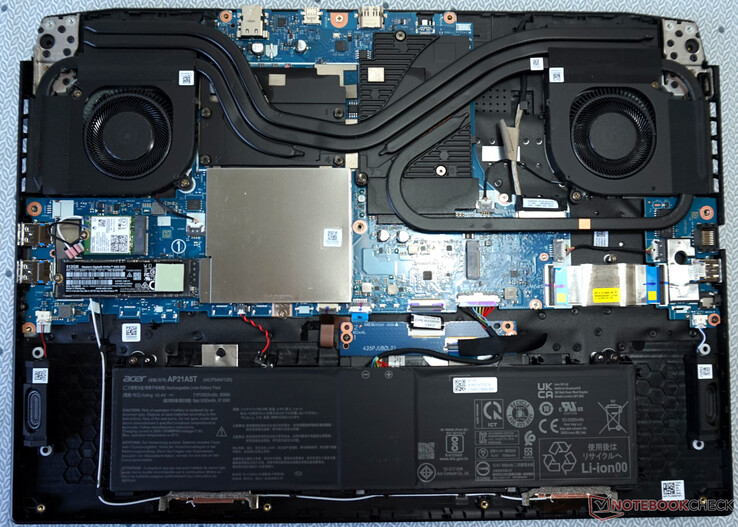
Otwarcie Acer Nitro 5 nie jest szczególnie problematyczne: Po pierwsze, konieczne jest usunięcie dwunastu identycznych śrub krzyżakowych. Po wykonaniu tej czynności można zdjąć podstawę, zdejmując ją z tylnych rogów - a wszystko to przy minimalnym wysiłku.
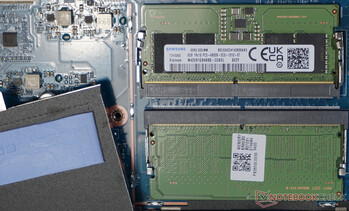
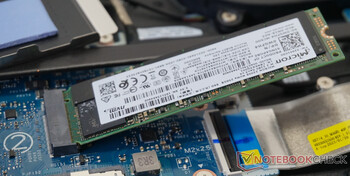
Szybki rzut oka do środka ujawnia dużą, przestronną przestrzeń. Jednak wolną przestrzeń można było wykorzystać nieco lepiej, zwłaszcza w okolicy baterii, na coś w rodzaju dysków SSD M.2. Oba gniazda są również łatwo dostępne. Drugi slot może zostać uruchomiony w późniejszym czasie i jest wyraźnie oznaczony numerem "2". Moduł Wi-Fi, układy pamięci i baterię można łatwo wymienić.
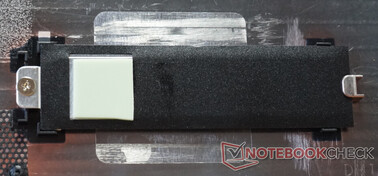
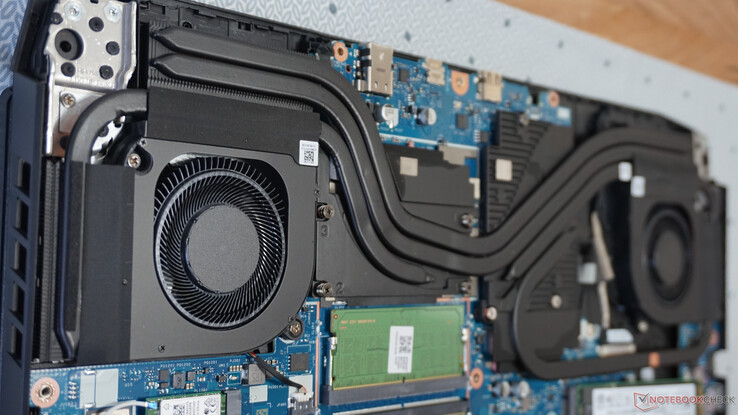
Uwagę przykuwa duża liczba elementów pasywnego chłodzenia. Pamięć RAM pod pokrywą jest wyposażona w duże podkładki termiczne. Ponadto, tego typu podkładka znajduje się również na kontrolerze dysku SSD i styka się z elementem chłodzącym w płycie bazowej, gdy pokrywa jest zamknięta. Taki element i podkładka termiczna są również wstępnie zamontowane w drugim gnieździe M.2.
Urządzenia wejściowe
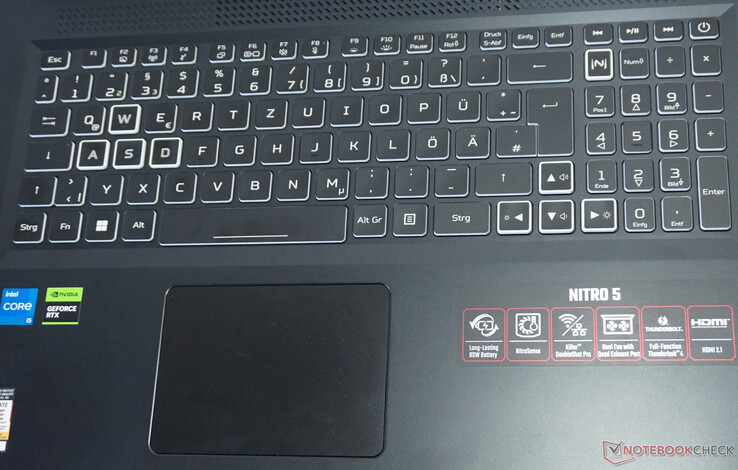
Wrażenia z pisania są przyjemne. Nie jest to oczywiście klawiatura mechaniczna, ale nadal może pochwalić się skokiem klawisza wynoszącym 1,5 mm (nasz pomiar), równomiernym i uspokajającym oporem, a także stabilną ramą klawiatury.
Co więcej, projekt wizualny jest również dobrze wykonany: Dzięki białym krawędziom klawisze wyróżniają się od siebie. Klawisze strzałek, "WASD" i specjalny klawisz dla oprogramowania Acer "NitroSense" mają dodatkowe oznaczenie, które znacznie ułatwia ich znalezienie, zwłaszcza kątem oka.
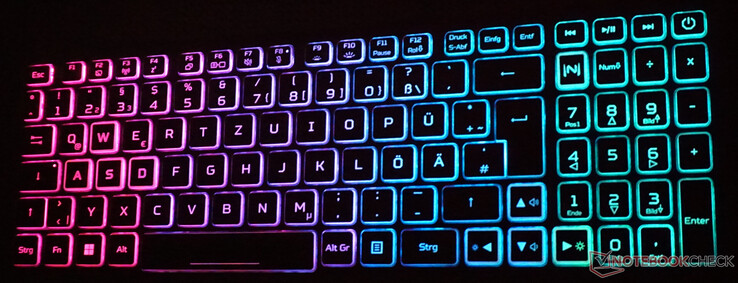
Kolorowe podświetlenie klawiszy wykorzystuje tylko cztery konfigurowalne obszary. Jednocześnie dostępne jest duże i precyzyjnie stopniowane spektrum kolorów, dzięki czemu między innymi efekt tęczy jest naprawdę skuteczny.
Touchpad jest znacznie mniej imponujący i przy wymiarach 10 x 8 cm nie jest szczególnie duży. Ukryte klawisze nie zawsze reagują natychmiast. Było to wielokrotnie zauważalne przy niedokładnym odwzorowaniu ruchów palców. Jednak, podobnie jak w przypadku większości laptopów do gier, nie powinno się to pojawiać podczas grania.
Wyświetlacz - zbyt ciemny i nijaki jak na laptop do gier
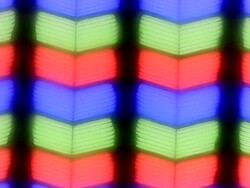
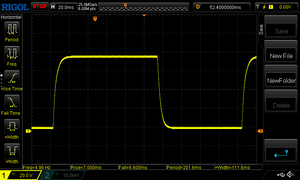
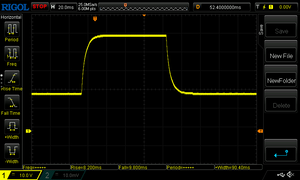
Bardzo podstawowy panel IPS Acer Nitro 5 niemal przypomina monitor biurowy, gdyby nie częstotliwość odświeżania 144 Hz. Jest to w harmonii z rozdzielczością Full HD, a także ograniczoną wydajnością graficzną. Ponadto zmierzone czasy reakcji są również przyzwoite.
Niestety, wszystkie pozostałe aspekty są poniżej średniej. Średnia jasność na poziomie prawie 250 cd/m² i stosunkowo kiepskie poziomy czerni skutkują słabym kontrastem. Podczas oglądania ciemnego obrazu w ciemnym pomieszczeniu można zaobserwować znaczne krwawienie ekranu wokół wyświetlacza.
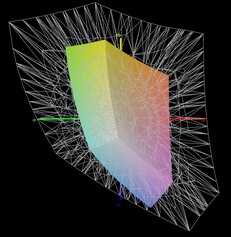
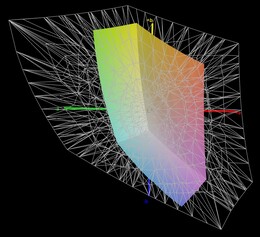
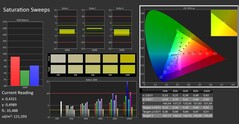
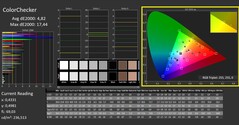
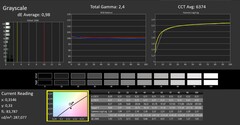
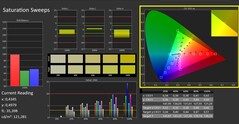
Różnorodność kolorów, dokładność odwzorowania kolorów i podświetlenie są również niezmiennie słabe. Nie ma to negatywnego wpływu na granie w gry, ale powoduje, że niektóre efekty nie przyciągają wzroku.
Ponadto ogranicza to wszechstronność laptopa. Ekran nie jest poważną opcją, nawet dla skromnie ambitnych fotografów-hobbystów.
| |||||||||||||||||||||||||
rozświetlenie: 81 %
na akumulatorze: 285 cd/m²
kontrast: 491:1 (czerń: 0.58 cd/m²)
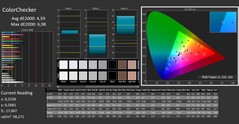
ΔE ColorChecker Calman: 4.59 | ∀{0.5-29.43 Ø4.77}
calibrated: 4.82
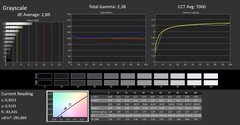
ΔE Greyscale Calman: 2.89 | ∀{0.09-98 Ø5}
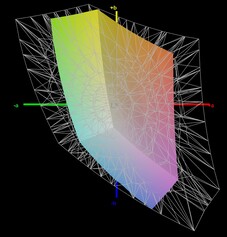
38.9% AdobeRGB 1998 (Argyll 3D)
56.4% sRGB (Argyll 3D)
37.6% Display P3 (Argyll 3D)
Gamma: 2.38
CCT: 7000 K
| Acer Nitro 5 AN517-55-5552 BOE0A6F NV173FHM-NX4, IPS, 1920x1080, 17.3" | Asus TUF Gaming A16 FA617XS BOE NE160WUM-NX2, IPS, 1920x1200, 16" | Acer Nitro 5 AN517-55-738R B173HAN04.0, IPS, 1920x1080, 17.3" | Medion Erazer Scout E20 LG Philips LGD0611, IPS, 1920x1080, 17.3" | MSI Katana 15 B12VEK AUOAF90 (B156HAN08.4), IPS, 1920x1080, 15.6" | MSI Cyborg 15 A12VF AU Optronics B156HAN15.1, IPS, 1920x1080, 15.6" | |
|---|---|---|---|---|---|---|
| Display | 80% | 55% | 72% | 1% | 12% | |
| Display P3 Coverage (%) | 37.6 | 69.3 84% | 58.9 57% | 65.1 73% | 38.1 1% | 42.3 13% |
| sRGB Coverage (%) | 56.4 | 97.3 73% | 86.4 53% | 96.7 71% | 56.8 1% | 62.6 11% |
| AdobeRGB 1998 Coverage (%) | 38.9 | 70.7 82% | 60.5 56% | 66.5 71% | 39.3 1% | 43.7 12% |
| Response Times | 21% | 55% | 22% | -104% | -11% | |
| Response Time Grey 50% / Grey 80% * (ms) | 18 ? | 15.6 ? 13% | 6 ? 67% | 14.8 ? 18% | 38.8 ? -116% | 22 ? -22% |
| Response Time Black / White * (ms) | 14 ? | 10 ? 29% | 8 ? 43% | 10.4 ? 26% | 26.8 ? -91% | 14 ? -0% |
| PWM Frequency (Hz) | ||||||
| Screen | 55% | 24% | 41% | 3% | 24% | |
| Brightness middle (cd/m²) | 285 | 301 6% | 286 0% | 312 9% | 261 -8% | 247 -13% |
| Brightness (cd/m²) | 257 | 294 14% | 278 8% | 303 18% | 258 0% | 234 -9% |
| Brightness Distribution (%) | 81 | 94 16% | 89 10% | 91 12% | 92 14% | 89 10% |
| Black Level * (cd/m²) | 0.58 | 0.21 64% | 0.32 45% | 0.25 57% | 0.19 67% | 0.25 57% |
| Contrast (:1) | 491 | 1433 192% | 894 82% | 1248 154% | 1374 180% | 988 101% |
| Colorchecker dE 2000 * | 4.59 | 1.79 61% | 3.05 34% | 2.65 42% | 5.57 -21% | 3.78 18% |
| Colorchecker dE 2000 max. * | 6.98 | 3.48 50% | 5.83 16% | 6.44 8% | 20.6 -195% | 6.42 8% |
| Colorchecker dE 2000 calibrated * | 4.82 | 1.2 75% | 3.13 35% | 0.96 80% | 4.63 4% | 3.94 18% |
| Greyscale dE 2000 * | 2.89 | 2.5 13% | 3.17 -10% | 3.2 -11% | 3.19 -10% | 2.16 25% |
| Gamma | 2.38 92% | 2.265 97% | 2.29 96% | 2.246 98% | 2.45 90% | 2.33 94% |
| CCT | 7000 93% | 6157 106% | 6916 94% | 7258 90% | 6146 106% | 6906 94% |
| Całkowita średnia (program / ustawienia) | 52% /
55% | 45% /
35% | 45% /
45% | -33% /
-12% | 8% /
16% |
* ... im mniej tym lepiej
Ekran może wyświetlać mniej więcej połowę sRGB, przestrzeni kolorów używanej zazwyczaj w grach. W rezultacie dokładna gradacja kolorów, taka jak reprezentacja nieba, może wyglądać blokowo. Należałoby oczekiwać co najmniej prawie całkowitego pokrycia przestrzeni sRGB, jak w przypadku poprzednika, modeluNitro 5 AN517-55-738R. Ale niestety tak nie jest w tym przypadku. Jest wystarczająco dobry do gier, ale nadal rozczarowujący.
Zmierzyliśmy odchylenia w reprodukcji kolorów, zwłaszcza jeśli chodzi o odcienie niebieskiego, co było widoczne nawet dla mniej doświadczonych oczu. Nie można było jednak oczekiwać lepszego wyniku, biorąc pod uwagę ogólnie słabe odwzorowanie kolorów. Średnia DeltaE wynosząca nieco poniżej 5, której nie można poprawić poprzez kalibrację, jest całkiem przyzwoita, jeśli skupiamy się zasadniczo tylko na grach.
Wyświetl czasy reakcji
| ↔ Czas reakcji od czerni do bieli | ||
|---|---|---|
| 14 ms ... wzrost ↗ i spadek ↘ łącznie | ↗ 7 ms wzrost | |
| ↘ 7 ms upadek | ||
| W naszych testach ekran wykazuje dobry współczynnik reakcji, ale może być zbyt wolny dla graczy rywalizujących ze sobą. Dla porównania, wszystkie testowane urządzenia wahają się od 0.1 (minimum) do 240 (maksimum) ms. » 33 % wszystkich urządzeń jest lepszych. Oznacza to, że zmierzony czas reakcji jest lepszy od średniej wszystkich testowanych urządzeń (20.2 ms). | ||
| ↔ Czas reakcji 50% szarości do 80% szarości | ||
| 18 ms ... wzrost ↗ i spadek ↘ łącznie | ↗ 8 ms wzrost | |
| ↘ 10 ms upadek | ||
| W naszych testach ekran wykazuje dobry współczynnik reakcji, ale może być zbyt wolny dla graczy rywalizujących ze sobą. Dla porównania, wszystkie testowane urządzenia wahają się od 0.165 (minimum) do 636 (maksimum) ms. » 31 % wszystkich urządzeń jest lepszych. Oznacza to, że zmierzony czas reakcji jest lepszy od średniej wszystkich testowanych urządzeń (31.5 ms). | ||
Migotanie ekranu / PWM (modulacja szerokości impulsu)
| Migotanie ekranu/nie wykryto PWM | |||
Dla porównania: 53 % wszystkich testowanych urządzeń nie używa PWM do przyciemniania wyświetlacza. Jeśli wykryto PWM, zmierzono średnio 8073 (minimum: 5 - maksimum: 343500) Hz. | |||
Rozczarowanie wyświetlaczem nie ustąpiło, gdy zwróciliśmy się do kątów widzenia: Pod kątem około 45 ° widoczne są znaczne zniekształcenia kolorów, przesuwające się w kierunku żółtego lub niebieskiego. Jak na panel IPS, jest to niezwykle słaba wydajność.
Wydajność - Acer Nitro 517 jest imponujący, ale tylko dzięki RTX 4050
Najmniejszy procesor graficzny w serii RTX 4000, czyli RTX 4050nitro należy do podstawowej klasy laptopów do gier. Dołącza do niego chip wprowadzony już na początku 2022 roku, czyli Intel Core i5-12500H. Nie był to topowy model, nawet gdy został wprowadzony, ale nadal oferuje wystarczającą moc obliczeniową do zamierzonego zastosowania. Dodatkowo oba komponenty mogą być zasilane dużą ilością energii, przynajmniej na papierze. CPU pobiera do 115 W, a GPU nawet 140 W z dynamicznym boostem.
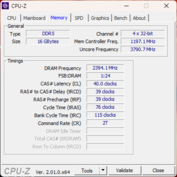
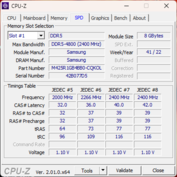
Oprócz tego mamy 16 GB pamięci RAM DDR5 4800 od Samsunga, która jest wystarczająco szybka, aby zapewnić wysoką liczbę klatek na sekundę w mniej wymagających grach. W przypadku gier Full HD podstawy wydają się być stosunkowo spójne, o ile możesz żyć bez jednego lub dwóch szczegółów tu lub tam.
Warunki testowe
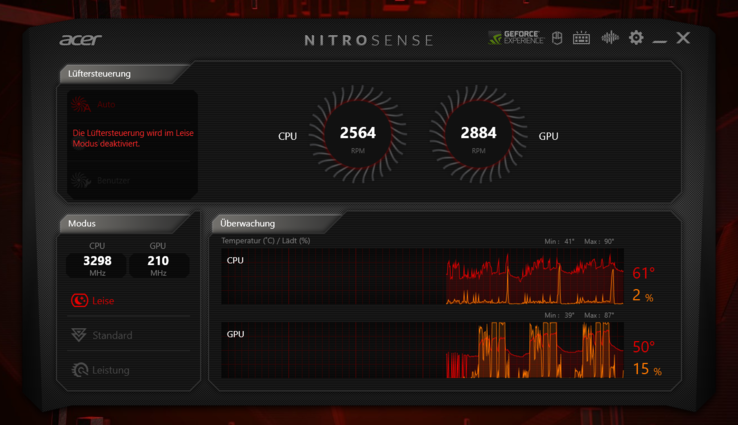
Dostarczone przez firmę Acer oprogramowanie sterujące "NitroSense" jest dostępne za pośrednictwem wyznaczonego przycisku i umożliwia dostęp do różnych ustawień trybu wydajności, a także zarządzania wentylatorem. Ponadto można dostosować podświetlenie klawiszy, wybrać profile dźwięku głośników i dokonać kilku podstawowych ustawień.
Do naszych testów w grach i benchmarkach wybraliśmy profil "Wydajność" i utrzymaliśmy automatyczny wentylator. Używając profilu "Standard" poziom hałasu został znacznie zredukowany, a w trybie "Quiet" głośność chłodzenia spada jeszcze bardziej, ale pozostaje stale słyszalna.
| Wydajność | Standardowy | Cichy | Tryb baterii | |
| PL1 | 95 W | 80 W | 80 W | 70 W |
| PL2 | 115 W | 115 W | 115 W | 115 W |
Procesor
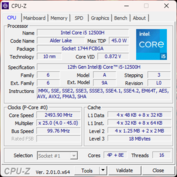
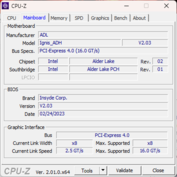
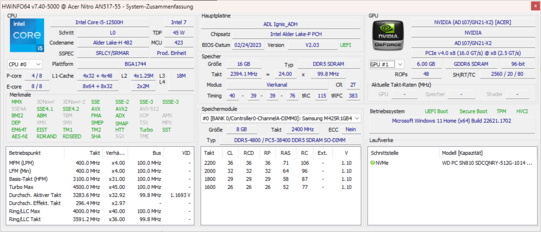
Procesor Intel Core i5-12500Hto niewielki procesor - przynajmniej jak na laptopa do gier - oferujący dwanaście rdzeni, z których cztery to rdzenie wydajnościowe, a osiem rdzeni wydajnościowych obsługuje łącznie 16 wątków. Jest to wystarczające do wielozadaniowości na wysokim poziomie. Laptop jest nadal łatwy w obsłudze, nawet przy wymagających programach. Maksymalna częstotliwość taktowania wynosi tylko 4,5 GHz, a pamięć podręczna L3 nie jest szczególnie duża i wynosi 18 MB.
Pomimo tych raczej skromnych specyfikacji, pętla Cinebench R15 działała bardzo dobrze. Na przykładMedion Erazer Defender P40radzi sobie o 30% lepiej na starcie dzięki znacznie szybszemu procesorowi i7-13700HX. Pod koniec pętli nie jest to nawet 10% przewagi. W tym miejscu na pierwszy plan wysuwa się hojne chłodzenie, co widać po niemal płaskiej serii pomiarów. Procesor może zużywać 95 watów przez dłuższy czas i 115 watów przez krótki czas bez dramatycznego wzrostu temperatur.
Również w trybie "Quiet" (zielona linia w pętli Cinebench) - podczas którego zakłócające hałasy były ledwo słyszalne - uzyskano solidne wyniki, które były średnio na równi z MSI Cyborg 15 A12V.MSI Cyborg 15 A12VF. Nitro zużywa mniej energii, mimo że MSI ma większy procesor. Fakt, że Nitro 5 nadal osiąga tutaj dobre wyniki, wynika z redukcji do 70 watów, podczas gdy krótkotrwałe maksimum 115 watów pozostaje niezmienione. W trybach "Standard" i baterii limit mocy wynosi 80 watów.
Dodatkowe testy porównawcze i informacje można znaleźć tutaj w naszymLista benchmarków CPU.
Cinebench R15 Multi continuous test
Cinebench R23: Multi Core | Single Core
Cinebench R20: CPU (Multi Core) | CPU (Single Core)
Cinebench R15: CPU Multi 64Bit | CPU Single 64Bit
Blender: v2.79 BMW27 CPU
7-Zip 18.03: 7z b 4 | 7z b 4 -mmt1
Geekbench 5.5: Multi-Core | Single-Core
HWBOT x265 Benchmark v2.2: 4k Preset
LibreOffice : 20 Documents To PDF
R Benchmark 2.5: Overall mean
| CPU Performance rating | |
| Średnia w klasie Gaming | |
| Asus TUF Gaming A16 FA617XS | |
| Medion Erazer Scout E20 | |
| MSI Cyborg 15 A12VF | |
| MSI Katana 15 B12VEK | |
| Acer Nitro 5 AN517-55-738R | |
| Acer Nitro 5 AN517-55-5552 | |
| Przeciętny Intel Core i5-12500H | |
| Cinebench R23 / Multi Core | |
| Średnia w klasie Gaming (5668 - 40970, n=145, ostatnie 2 lata) | |
| Asus TUF Gaming A16 FA617XS | |
| Medion Erazer Scout E20 | |
| MSI Katana 15 B12VEK | |
| MSI Cyborg 15 A12VF | |
| Acer Nitro 5 AN517-55-5552 | |
| Acer Nitro 5 AN517-55-738R | |
| Przeciętny Intel Core i5-12500H (11330 - 14686, n=9) | |
| Cinebench R23 / Single Core | |
| Średnia w klasie Gaming (1136 - 2267, n=145, ostatnie 2 lata) | |
| Medion Erazer Scout E20 | |
| Acer Nitro 5 AN517-55-738R | |
| Asus TUF Gaming A16 FA617XS | |
| MSI Cyborg 15 A12VF | |
| MSI Katana 15 B12VEK | |
| Przeciętny Intel Core i5-12500H (1558 - 1701, n=9) | |
| Acer Nitro 5 AN517-55-5552 | |
| Cinebench R20 / CPU (Multi Core) | |
| Średnia w klasie Gaming (2179 - 16108, n=144, ostatnie 2 lata) | |
| Asus TUF Gaming A16 FA617XS | |
| Medion Erazer Scout E20 | |
| Acer Nitro 5 AN517-55-738R | |
| MSI Katana 15 B12VEK | |
| MSI Cyborg 15 A12VF | |
| Acer Nitro 5 AN517-55-5552 | |
| Przeciętny Intel Core i5-12500H (4687 - 5640, n=9) | |
| Cinebench R20 / CPU (Single Core) | |
| Średnia w klasie Gaming (439 - 870, n=144, ostatnie 2 lata) | |
| Medion Erazer Scout E20 | |
| Asus TUF Gaming A16 FA617XS | |
| Acer Nitro 5 AN517-55-738R | |
| MSI Cyborg 15 A12VF | |
| MSI Katana 15 B12VEK | |
| Przeciętny Intel Core i5-12500H (602 - 656, n=9) | |
| Acer Nitro 5 AN517-55-5552 | |
| Cinebench R15 / CPU Multi 64Bit | |
| Średnia w klasie Gaming (1537 - 6271, n=144, ostatnie 2 lata) | |
| Medion Erazer Scout E20 | |
| Asus TUF Gaming A16 FA617XS | |
| Acer Nitro 5 AN517-55-738R | |
| MSI Katana 15 B12VEK | |
| Acer Nitro 5 AN517-55-5552 | |
| MSI Cyborg 15 A12VF | |
| Przeciętny Intel Core i5-12500H (1970 - 2283, n=10) | |
| Cinebench R15 / CPU Single 64Bit | |
| Średnia w klasie Gaming (188.8 - 343, n=143, ostatnie 2 lata) | |
| Asus TUF Gaming A16 FA617XS | |
| Medion Erazer Scout E20 | |
| Acer Nitro 5 AN517-55-738R | |
| MSI Katana 15 B12VEK | |
| MSI Cyborg 15 A12VF | |
| Przeciętny Intel Core i5-12500H (220 - 250, n=9) | |
| Acer Nitro 5 AN517-55-5552 | |
| Blender / v2.79 BMW27 CPU | |
| MSI Cyborg 15 A12VF | |
| Przeciętny Intel Core i5-12500H (223 - 288, n=9) | |
| MSI Katana 15 B12VEK | |
| Acer Nitro 5 AN517-55-5552 | |
| Acer Nitro 5 AN517-55-738R | |
| Medion Erazer Scout E20 | |
| Asus TUF Gaming A16 FA617XS | |
| Średnia w klasie Gaming (80 - 517, n=140, ostatnie 2 lata) | |
| 7-Zip 18.03 / 7z b 4 | |
| Średnia w klasie Gaming (23795 - 148086, n=142, ostatnie 2 lata) | |
| Asus TUF Gaming A16 FA617XS | |
| Medion Erazer Scout E20 | |
| MSI Katana 15 B12VEK | |
| MSI Cyborg 15 A12VF | |
| Acer Nitro 5 AN517-55-738R | |
| Acer Nitro 5 AN517-55-5552 | |
| Przeciętny Intel Core i5-12500H (44105 - 54380, n=9) | |
| 7-Zip 18.03 / 7z b 4 -mmt1 | |
| Asus TUF Gaming A16 FA617XS | |
| Średnia w klasie Gaming (4199 - 7508, n=142, ostatnie 2 lata) | |
| Medion Erazer Scout E20 | |
| MSI Cyborg 15 A12VF | |
| Acer Nitro 5 AN517-55-738R | |
| MSI Katana 15 B12VEK | |
| Przeciętny Intel Core i5-12500H (5151 - 5563, n=9) | |
| Acer Nitro 5 AN517-55-5552 | |
| Geekbench 5.5 / Multi-Core | |
| Średnia w klasie Gaming (4557 - 27010, n=141, ostatnie 2 lata) | |
| Acer Nitro 5 AN517-55-738R | |
| Medion Erazer Scout E20 | |
| Asus TUF Gaming A16 FA617XS | |
| MSI Katana 15 B12VEK | |
| MSI Cyborg 15 A12VF | |
| Acer Nitro 5 AN517-55-5552 | |
| Przeciętny Intel Core i5-12500H (7962 - 10828, n=9) | |
| Geekbench 5.5 / Single-Core | |
| Asus TUF Gaming A16 FA617XS | |
| Średnia w klasie Gaming (986 - 2474, n=141, ostatnie 2 lata) | |
| Medion Erazer Scout E20 | |
| MSI Cyborg 15 A12VF | |
| Acer Nitro 5 AN517-55-738R | |
| MSI Katana 15 B12VEK | |
| Przeciętny Intel Core i5-12500H (1471 - 1693, n=9) | |
| Acer Nitro 5 AN517-55-5552 | |
| HWBOT x265 Benchmark v2.2 / 4k Preset | |
| Średnia w klasie Gaming (7.7 - 44.3, n=142, ostatnie 2 lata) | |
| Asus TUF Gaming A16 FA617XS | |
| MSI Katana 15 B12VEK | |
| Medion Erazer Scout E20 | |
| Acer Nitro 5 AN517-55-5552 | |
| MSI Cyborg 15 A12VF | |
| MSI Cyborg 15 A12VF | |
| Przeciętny Intel Core i5-12500H (12 - 16.6, n=9) | |
| Acer Nitro 5 AN517-55-738R | |
| LibreOffice / 20 Documents To PDF | |
| Acer Nitro 5 AN517-55-5552 | |
| Acer Nitro 5 AN517-55-738R | |
| Przeciętny Intel Core i5-12500H (40.1 - 58.5, n=9) | |
| Średnia w klasie Gaming (19 - 88.8, n=141, ostatnie 2 lata) | |
| MSI Katana 15 B12VEK | |
| Medion Erazer Scout E20 | |
| Asus TUF Gaming A16 FA617XS | |
| MSI Cyborg 15 A12VF | |
| R Benchmark 2.5 / Overall mean | |
| Acer Nitro 5 AN517-55-5552 | |
| Przeciętny Intel Core i5-12500H (0.4748 - 0.535, n=9) | |
| MSI Katana 15 B12VEK | |
| MSI Cyborg 15 A12VF | |
| Acer Nitro 5 AN517-55-738R | |
| Medion Erazer Scout E20 | |
| Średnia w klasie Gaming (0.3439 - 0.759, n=142, ostatnie 2 lata) | |
| Asus TUF Gaming A16 FA617XS | |
* ... im mniej tym lepiej
AIDA64: FP32 Ray-Trace | FPU Julia | CPU SHA3 | CPU Queen | FPU SinJulia | FPU Mandel | CPU AES | CPU ZLib | FP64 Ray-Trace | CPU PhotoWorxx
| Performance rating | |
| Średnia w klasie Gaming | |
| Asus TUF Gaming A16 FA617XS | |
| Medion Erazer Scout E20 | |
| MSI Katana 15 B12VEK | |
| MSI Cyborg 15 A12VF | |
| Acer Nitro 5 AN517-55-5552 | |
| Przeciętny Intel Core i5-12500H | |
| Acer Nitro 5 AN517-55-738R | |
| AIDA64 / FP32 Ray-Trace | |
| Średnia w klasie Gaming (7192 - 85542, n=141, ostatnie 2 lata) | |
| Asus TUF Gaming A16 FA617XS (v6.75.6100) | |
| MSI Katana 15 B12VEK (v6.85.6300) | |
| Medion Erazer Scout E20 (v6.75.6100) | |
| Acer Nitro 5 AN517-55-5552 (v6.75.6100) | |
| MSI Cyborg 15 A12VF (v6.75.6100) | |
| Przeciętny Intel Core i5-12500H (6851 - 13947, n=9) | |
| Acer Nitro 5 AN517-55-738R (v6.50.5800) | |
| AIDA64 / FPU Julia | |
| Średnia w klasie Gaming (35040 - 238426, n=141, ostatnie 2 lata) | |
| Asus TUF Gaming A16 FA617XS (v6.75.6100) | |
| MSI Katana 15 B12VEK (v6.85.6300) | |
| Medion Erazer Scout E20 | |
| MSI Cyborg 15 A12VF (v6.75.6100) | |
| Acer Nitro 5 AN517-55-5552 (v6.75.6100) | |
| Przeciętny Intel Core i5-12500H (29874 - 68178, n=9) | |
| Acer Nitro 5 AN517-55-738R (v6.50.5800) | |
| AIDA64 / CPU SHA3 | |
| Średnia w klasie Gaming (1728 - 9817, n=141, ostatnie 2 lata) | |
| Asus TUF Gaming A16 FA617XS (v6.75.6100) | |
| MSI Katana 15 B12VEK (v6.85.6300) | |
| Medion Erazer Scout E20 (v6.75.6100) | |
| Acer Nitro 5 AN517-55-5552 (v6.75.6100) | |
| MSI Cyborg 15 A12VF (v6.75.6100) | |
| Przeciętny Intel Core i5-12500H (2287 - 3337, n=9) | |
| Acer Nitro 5 AN517-55-738R (v6.50.5800) | |
| AIDA64 / CPU Queen | |
| Asus TUF Gaming A16 FA617XS (v6.75.6100) | |
| Średnia w klasie Gaming (49785 - 173351, n=141, ostatnie 2 lata) | |
| Medion Erazer Scout E20 (v6.75.6100) | |
| Acer Nitro 5 AN517-55-738R (v6.50.5800) | |
| MSI Katana 15 B12VEK (v6.85.6300) | |
| MSI Cyborg 15 A12VF (v6.75.6100) | |
| Przeciętny Intel Core i5-12500H (77935 - 80703, n=9) | |
| Acer Nitro 5 AN517-55-5552 (v6.75.6100) | |
| AIDA64 / FPU SinJulia | |
| Asus TUF Gaming A16 FA617XS (v6.75.6100) | |
| Średnia w klasie Gaming (4424 - 33636, n=141, ostatnie 2 lata) | |
| Medion Erazer Scout E20 (v6.75.6100) | |
| Acer Nitro 5 AN517-55-738R (v6.50.5800) | |
| MSI Katana 15 B12VEK (v6.85.6300) | |
| MSI Cyborg 15 A12VF (v6.75.6100) | |
| Acer Nitro 5 AN517-55-5552 (v6.75.6100) | |
| Przeciętny Intel Core i5-12500H (6590 - 7431, n=9) | |
| AIDA64 / FPU Mandel | |
| Średnia w klasie Gaming (17585 - 128721, n=141, ostatnie 2 lata) | |
| Asus TUF Gaming A16 FA617XS (v6.75.6100) | |
| MSI Katana 15 B12VEK (v6.85.6300) | |
| Medion Erazer Scout E20 (v6.75.6100) | |
| Acer Nitro 5 AN517-55-5552 (v6.75.6100) | |
| MSI Cyborg 15 A12VF (v6.75.6100) | |
| Przeciętny Intel Core i5-12500H (18252 - 34041, n=9) | |
| Acer Nitro 5 AN517-55-738R (v6.50.5800) | |
| AIDA64 / CPU AES | |
| Średnia w klasie Gaming (19065 - 247074, n=141, ostatnie 2 lata) | |
| Przeciętny Intel Core i5-12500H (50298 - 111567, n=9) | |
| Asus TUF Gaming A16 FA617XS (v6.75.6100) | |
| Medion Erazer Scout E20 (v6.75.6100) | |
| MSI Katana 15 B12VEK (v6.85.6300) | |
| MSI Cyborg 15 A12VF (v6.75.6100) | |
| Acer Nitro 5 AN517-55-5552 (v6.75.6100) | |
| Acer Nitro 5 AN517-55-738R (v6.50.5800) | |
| AIDA64 / CPU ZLib | |
| Średnia w klasie Gaming (373 - 2531, n=141, ostatnie 2 lata) | |
| Asus TUF Gaming A16 FA617XS (v6.75.6100) | |
| Medion Erazer Scout E20 (v6.75.6100) | |
| Acer Nitro 5 AN517-55-738R (v6.50.5800) | |
| Acer Nitro 5 AN517-55-5552 (v6.75.6100) | |
| MSI Cyborg 15 A12VF (v6.75.6100) | |
| MSI Katana 15 B12VEK (v6.85.6300) | |
| Przeciętny Intel Core i5-12500H (746 - 924, n=9) | |
| AIDA64 / FP64 Ray-Trace | |
| Średnia w klasie Gaming (3856 - 45446, n=141, ostatnie 2 lata) | |
| Asus TUF Gaming A16 FA617XS (v6.75.6100) | |
| MSI Katana 15 B12VEK (v6.85.6300) | |
| Medion Erazer Scout E20 (v6.75.6100) | |
| Acer Nitro 5 AN517-55-5552 (v6.75.6100) | |
| MSI Cyborg 15 A12VF (v6.75.6100) | |
| Przeciętny Intel Core i5-12500H (3848 - 7405, n=9) | |
| Acer Nitro 5 AN517-55-738R (v6.50.5800) | |
| AIDA64 / CPU PhotoWorxx | |
| Średnia w klasie Gaming (10805 - 62916, n=141, ostatnie 2 lata) | |
| Medion Erazer Scout E20 (v6.75.6100) | |
| MSI Katana 15 B12VEK (v6.85.6300) | |
| MSI Cyborg 15 A12VF (v6.75.6100) | |
| Acer Nitro 5 AN517-55-5552 (v6.75.6100) | |
| Przeciętny Intel Core i5-12500H (13686 - 43813, n=9) | |
| Asus TUF Gaming A16 FA617XS (v6.75.6100) | |
| Acer Nitro 5 AN517-55-738R (v6.50.5800) | |
Wydajność systemu
Dzięki niezbyt mocnemu procesorowi wyniki CrossMark i PCMark również nie są porywające. Porównywalne laptopy gamingowe potrafią osiągnąć dodatkowe kilka punktów procentowych.
Niemniej jednak mamy do czynienia z wydajnym, 16-wątkowym procesorem, który bez problemu radzi sobie z wielozadaniowością, uruchamianiem programów oraz procesami instalacji i deinstalacji. Otwieranie przeglądarki, odtwarzanie filmów i dodatkowe codzienne zadania mogą być wykonywane bez żadnych lagów.
CrossMark: Overall | Productivity | Creativity | Responsiveness
| PCMark 10 / Score | |
| Średnia w klasie Gaming (5776 - 10060, n=119, ostatnie 2 lata) | |
| Asus TUF Gaming A16 FA617XS | |
| Medion Erazer Scout E20 | |
| MSI Cyborg 15 A12VF | |
| MSI Katana 15 B12VEK | |
| Acer Nitro 5 AN517-55-5552 | |
| Przeciętny Intel Core i5-12500H, NVIDIA GeForce RTX 4050 Laptop GPU (6220 - 6719, n=2) | |
| Gigabyte G7 KE | |
| PCMark 10 / Essentials | |
| Medion Erazer Scout E20 | |
| Asus TUF Gaming A16 FA617XS | |
| Średnia w klasie Gaming (8810 - 12600, n=123, ostatnie 2 lata) | |
| MSI Cyborg 15 A12VF | |
| Gigabyte G7 KE | |
| MSI Katana 15 B12VEK | |
| Acer Nitro 5 AN517-55-5552 | |
| Przeciętny Intel Core i5-12500H, NVIDIA GeForce RTX 4050 Laptop GPU (9418 - 9985, n=2) | |
| PCMark 10 / Productivity | |
| Asus TUF Gaming A16 FA617XS | |
| Średnia w klasie Gaming (6662 - 16716, n=121, ostatnie 2 lata) | |
| MSI Cyborg 15 A12VF | |
| Medion Erazer Scout E20 | |
| MSI Katana 15 B12VEK | |
| Gigabyte G7 KE | |
| Acer Nitro 5 AN517-55-5552 | |
| Przeciętny Intel Core i5-12500H, NVIDIA GeForce RTX 4050 Laptop GPU (8822 - 8980, n=2) | |
| PCMark 10 / Digital Content Creation | |
| Średnia w klasie Gaming (7440 - 19351, n=121, ostatnie 2 lata) | |
| Asus TUF Gaming A16 FA617XS | |
| Medion Erazer Scout E20 | |
| Acer Nitro 5 AN517-55-5552 | |
| MSI Cyborg 15 A12VF | |
| MSI Katana 15 B12VEK | |
| Przeciętny Intel Core i5-12500H, NVIDIA GeForce RTX 4050 Laptop GPU (7862 - 9180, n=2) | |
| Gigabyte G7 KE | |
| CrossMark / Overall | |
| Średnia w klasie Gaming (1247 - 2344, n=117, ostatnie 2 lata) | |
| Medion Erazer Scout E20 | |
| Gigabyte G7 KE | |
| MSI Cyborg 15 A12VF | |
| Asus TUF Gaming A16 FA617XS | |
| Acer Nitro 5 AN517-55-5552 | |
| MSI Katana 15 B12VEK | |
| Przeciętny Intel Core i5-12500H, NVIDIA GeForce RTX 4050 Laptop GPU (1702 - 1726, n=2) | |
| CrossMark / Productivity | |
| Medion Erazer Scout E20 | |
| Średnia w klasie Gaming (1299 - 2211, n=117, ostatnie 2 lata) | |
| Gigabyte G7 KE | |
| MSI Cyborg 15 A12VF | |
| Asus TUF Gaming A16 FA617XS | |
| Acer Nitro 5 AN517-55-5552 | |
| Przeciętny Intel Core i5-12500H, NVIDIA GeForce RTX 4050 Laptop GPU (1648 - 1675, n=2) | |
| MSI Katana 15 B12VEK | |
| CrossMark / Creativity | |
| Średnia w klasie Gaming (1275 - 2729, n=117, ostatnie 2 lata) | |
| Medion Erazer Scout E20 | |
| Asus TUF Gaming A16 FA617XS | |
| MSI Cyborg 15 A12VF | |
| MSI Katana 15 B12VEK | |
| Gigabyte G7 KE | |
| Acer Nitro 5 AN517-55-5552 | |
| Przeciętny Intel Core i5-12500H, NVIDIA GeForce RTX 4050 Laptop GPU (1752 - 1775, n=2) | |
| CrossMark / Responsiveness | |
| Gigabyte G7 KE | |
| Medion Erazer Scout E20 | |
| Acer Nitro 5 AN517-55-5552 | |
| Przeciętny Intel Core i5-12500H, NVIDIA GeForce RTX 4050 Laptop GPU (1718 - 1736, n=2) | |
| Średnia w klasie Gaming (1030 - 2330, n=117, ostatnie 2 lata) | |
| MSI Cyborg 15 A12VF | |
| MSI Katana 15 B12VEK | |
| Asus TUF Gaming A16 FA617XS | |
| PCMark 10 Score | 6719 pkt. | |
Pomoc | ||
| AIDA64 / Memory Copy | |
| Średnia w klasie Gaming (21750 - 108104, n=141, ostatnie 2 lata) | |
| Asus TUF Gaming A16 FA617XS | |
| Medion Erazer Scout E20 | |
| MSI Cyborg 15 A12VF | |
| MSI Katana 15 B12VEK | |
| Acer Nitro 5 AN517-55-5552 | |
| Przeciętny Intel Core i5-12500H (23850 - 66598, n=9) | |
| Acer Nitro 5 AN517-55-738R | |
| AIDA64 / Memory Read | |
| Średnia w klasie Gaming (22956 - 104349, n=141, ostatnie 2 lata) | |
| Medion Erazer Scout E20 | |
| MSI Katana 15 B12VEK | |
| MSI Cyborg 15 A12VF | |
| Asus TUF Gaming A16 FA617XS | |
| Acer Nitro 5 AN517-55-5552 | |
| Przeciętny Intel Core i5-12500H (24879 - 68013, n=9) | |
| Acer Nitro 5 AN517-55-738R | |
| AIDA64 / Memory Write | |
| Średnia w klasie Gaming (22297 - 133486, n=141, ostatnie 2 lata) | |
| Asus TUF Gaming A16 FA617XS | |
| Medion Erazer Scout E20 | |
| MSI Katana 15 B12VEK | |
| MSI Cyborg 15 A12VF | |
| Acer Nitro 5 AN517-55-5552 | |
| Acer Nitro 5 AN517-55-738R | |
| Przeciętny Intel Core i5-12500H (23543 - 58797, n=9) | |
| AIDA64 / Memory Latency | |
| Średnia w klasie Gaming (59.5 - 259, n=141, ostatnie 2 lata) | |
| Acer Nitro 5 AN517-55-5552 | |
| Przeciętny Intel Core i5-12500H (83.8 - 114.7, n=9) | |
| Medion Erazer Scout E20 | |
| MSI Katana 15 B12VEK | |
| MSI Cyborg 15 A12VF | |
| Asus TUF Gaming A16 FA617XS | |
| Acer Nitro 5 AN517-55-738R | |
* ... im mniej tym lepiej
Opóźnienia DPC
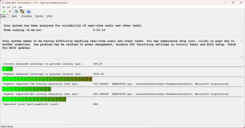
Nasz test LatencyMon wypadł bardzo dobrze. W przypadku specjalnych testów, takich jak edycja dźwięku w czasie rzeczywistym, Acer Nitro 5 oferuje tylko ograniczoną przydatność, ale nadal jest w stanie poradzić sobie z nimi z bardzo niewielką liczbą usterek.
Obecnie sterownik Nvidia przyczynia się do mierzonych spadków wydajności. Aktualizacje i ogólnie zmienione lub usunięte sterowniki mogą jeszcze bardziej poprawić lub znacznie pogorszyć wyniki.
odtwarzanie wideo 4K przebiegało równolegle bez problemów. Pominięte klatki nie były wykrywane. Układ iGPU jest przeciążony w prawie 40%, a winę za to ponosi większość procesorów Alder Lake.
| DPC Latencies / LatencyMon - interrupt to process latency (max), Web, Youtube, Prime95 | |
| MSI Katana 15 B12VEK | |
| Medion Erazer Scout E20 | |
| Acer Nitro 5 AN517-55-5552 | |
| MSI Cyborg 15 A12VF | |
| Asus TUF Gaming A16 FA617XS | |
| Acer Nitro 5 AN517-55-738R | |
* ... im mniej tym lepiej
Pamięć masowa
Dysk SSD M.2 NVMe od Western Digital osiągnął znakomity wynik, lepszy niż średnia dla pamięci masowych w recenzowanych przez nas laptopach do gier.
Pomimo pasywnie chłodzonego kontrolera nie był on w stanie utrzymać bardzo wysokiej szybkości dostępu w teście ciągłym, ale i tak osiągnął średnio ponad 6 GB/s.
| Drive Performance rating - Percent | |
| Acer Nitro 5 AN517-55-5552 | |
| Medion Erazer Scout E20 | |
| Średnia w klasie Gaming | |
| Acer Nitro 5 AN517-55-738R | |
| Przeciętny WDC PC SN810 512GB | |
| MSI Cyborg 15 A12VF | |
| MSI Katana 15 B12VEK | |
| Asus TUF Gaming A16 FA617XS | |
* ... im mniej tym lepiej
Continuous Performance Read: DiskSpd Read Loop, Queue Depth 8
Karta graficzna
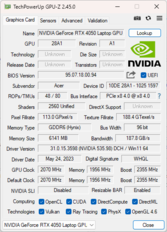
TheNvidia GeForce RTX 4050 to podstawowy model z serii RTX 4000 o wydajności porównywalnej z kartami RTX 3060. W przeciwieństwie do poprzedniej generacji, TDP GPU wynosi 140 watów, w tym 25 watów dynamicznego doładowania. W przypadku RTX 3050 było to maksymalnie 105 watów.RTX 3050(ale także 140 watów w przypadkuRTX 3060).
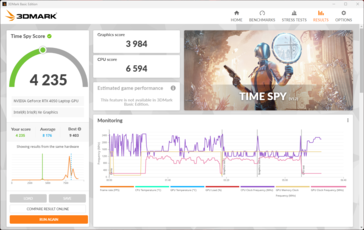
Acer Nitro 5's RTX 4050osiąga tę wartość tylko w ekstremalnych sytuacjach. W teście obciążeniowym karty graficznej krótko zmierzyliśmy maksymalne możliwe 140 watów, ale poza tym pobór mocy przy najwyższej wydajności i maksymalnej prędkości wentylatora wynosił około 100 watów, ponieważ osiągnięcie krytycznej temperatury GPU odpowiada za spadek prędkości zegara. Przez dłuższy czas, na przykład w teście ciągłym Witcher 3, stale dostępne jest tylko 80 watów, a w trybie cichym jest to tylko 50 watów.
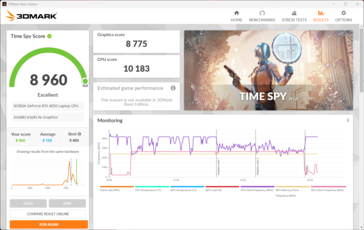
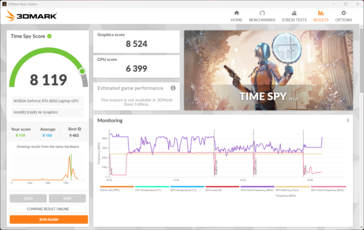
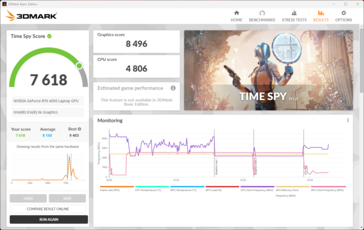
Jednocześnie nasze pomiary Witcher 3 i syntetyczne benchmarki nie wykazały żadnych spadków wydajności, jeśli wentylatory są ustawione na "Quiet". W rzeczywistych grach, średnia liczba klatek na sekundę spadła o mniej niż 10% i tylko 15% w 3DMark Time Spy. W benchmarkach Blendera wartości różniły się tylko o 1 sekundę.
Wydajność graficzna pozostała wysoka w trybie cichym, a wymagające graficznie aplikacje działały płynnie, chociaż zużycie energii zostało znacznie zmniejszone. W zamian znacznie obniża to wymagania dotyczące chłodzenia.
| 3DMark Performance rating - Percent | |
| Średnia w klasie Gaming | |
| Medion Erazer Defender P40 | |
| Asus TUF Gaming A16 FA617XS | |
| Acer Nitro 5 AN517-55-5552 | |
| MSI Katana 15 B12VEK | |
| Medion Erazer Scout E20 | |
| Acer Nitro 5 AN517-55-5552 | |
| MSI Cyborg 15 A12VF | |
| Przeciętny NVIDIA GeForce RTX 4050 Laptop GPU | |
| Acer Nitro 5 AN517-55-738R | |
| 3DMark 11 - 1280x720 Performance GPU | |
| Średnia w klasie Gaming (13523 - 80022, n=138, ostatnie 2 lata) | |
| Medion Erazer Defender P40 | |
| Asus TUF Gaming A16 FA617XS | |
| Acer Nitro 5 AN517-55-5552 | |
| Acer Nitro 5 AN517-55-5552 | |
| MSI Katana 15 B12VEK | |
| Medion Erazer Scout E20 | |
| Przeciętny NVIDIA GeForce RTX 4050 Laptop GPU (13339 - 32642, n=41) | |
| MSI Cyborg 15 A12VF | |
| Acer Nitro 5 AN517-55-738R | |
| 3DMark 11 Performance | 27855 pkt. | |
| 3DMark Cloud Gate Standard Score | 56305 pkt. | |
| 3DMark Fire Strike Score | 19904 pkt. | |
| 3DMark Time Spy Score | 8960 pkt. | |
Pomoc | ||
* ... im mniej tym lepiej
Wydajność w grach
Jeśli chodzi o wydajność w grach, Nitro 5 AN517 osiąga przyzwoitą liczbę klatek na sekundę, nawet w aktualnych grach. Jeśli możesz obejść się bez kilku szczegółów tu i tam, wymagające gry mogą działać z prędkością ponad 60 klatek na sekundę. Odpowiada to wynikom, które otrzymaliśmy z podobnie wyposażonymi laptopami do gier. Poprzednia generacja Nitro 5z kartą graficzną RTX 3060jest w większości na tym samym poziomie. Podobnie, dotyczy to również AMD Asus TUF Gaming A16. Wydajność systemu jest zgodna z rozdzielczością wyświetlacza Full HD urządzenia.
Testy porównawcze Nitro są szczególnie interesujące, jeśli chodzi o ciche chłodzenie, a niektóre wyniki pozostają niemal identyczne. Czasami są one minimalnie poniżej maksymalnych pomiarów wydajności. Tylko w GTA V zauważyliśmy spadek liczby klatek na sekundę o około 22%. Oznacza to, że w sześciu grach różnica wyniosła zaledwie 6%. Pomijając GTA V, różnica wyniosła zaledwie 3%, choć poziom hałasu wentylatorów spadł o około jedną trzecią.
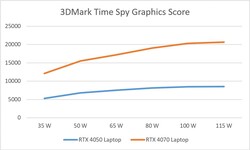
Oznacza to, że przy dodatkowym zużyciu energii od 40 do 50 W i znacznie większym hałasie, należy spodziewać się jedynie niewielkiego wzrostu wydajności. RTX 4050 wydaje się być bardzo wydajny, ale nie przynosi prawie żadnych korzyści, gdy działa przy maksymalnym możliwym zapotrzebowaniu na moc. Nasza analiza GPU przy różnych obciążeniach. Grafika do artykułu jest wyświetlana po prawej stronie.
| Performance rating - Percent | |
| Średnia w klasie Gaming | |
| Medion Erazer Defender P40 | |
| Medion Erazer Scout E20 | |
| MSI Katana 15 B12VEK | |
| MSI Cyborg 15 A12VF | |
| Acer Nitro 5 AN517-55-738R | |
| Acer Nitro 5 AN517-55-5552 | |
| Asus TUF Gaming A16 FA617XS | |
| Acer Nitro 5 AN517-55-5552 | |
| The Witcher 3 - 1920x1080 Ultra Graphics & Postprocessing (HBAO+) | |
| Średnia w klasie Gaming (18.4 - 240, n=48, ostatnie 2 lata) | |
| Medion Erazer Defender P40 | |
| Asus TUF Gaming A16 FA617XS (neu) | |
| Acer Nitro 5 AN517-55-5552 | |
| Acer Nitro 5 AN517-55-5552 (Leiser Modus) | |
| Medion Erazer Scout E20 | |
| Acer Nitro 5 AN517-55-738R | |
| MSI Katana 15 B12VEK | |
| MSI Cyborg 15 A12VF | |
| GTA V - 1920x1080 Highest AA:4xMSAA + FX AF:16x | |
| Średnia w klasie Gaming (12.1 - 186.9, n=127, ostatnie 2 lata) | |
| Medion Erazer Defender P40 | |
| Medion Erazer Scout E20 | |
| Asus TUF Gaming A16 FA617XS | |
| MSI Katana 15 B12VEK | |
| MSI Cyborg 15 A12VF | |
| Acer Nitro 5 AN517-55-5552 | |
| Acer Nitro 5 AN517-55-738R | |
| Acer Nitro 5 AN517-55-5552 (Leiser Modus) | |
| Final Fantasy XV Benchmark - 1920x1080 High Quality | |
| Średnia w klasie Gaming (19.2 - 215, n=137, ostatnie 2 lata) | |
| Medion Erazer Defender P40 (1.3) | |
| Asus TUF Gaming A16 FA617XS (1.3) | |
| Acer Nitro 5 AN517-55-5552 (1.3) | |
| MSI Katana 15 B12VEK (1.3) | |
| Medion Erazer Scout E20 (1.3) | |
| MSI Cyborg 15 A12VF (1.3) | |
| Acer Nitro 5 AN517-55-5552 (Leiser Modus) | |
| Acer Nitro 5 AN517-55-738R (1.3) | |
| Strange Brigade - 1920x1080 ultra AA:ultra AF:16 | |
| Średnia w klasie Gaming (38.9 - 456, n=126, ostatnie 2 lata) | |
| Medion Erazer Defender P40 (1.47.22.14 D3D12) | |
| Asus TUF Gaming A16 FA617XS (1.47.22.14 D3D12) | |
| Acer Nitro 5 AN517-55-5552 (1.47.22.14 D3D12) | |
| MSI Katana 15 B12VEK (1.47.22.14 D3D12) | |
| Acer Nitro 5 AN517-55-5552 (Leiser Modus) | |
| Medion Erazer Scout E20 (1.47.22.14 D3D12) | |
| Acer Nitro 5 AN517-55-738R (1.47.22.14 D3D12) | |
| MSI Cyborg 15 A12VF (1.47.22.14 D3D12) | |
| Dota 2 Reborn - 1920x1080 ultra (3/3) best looking | |
| Acer Nitro 5 AN517-55-738R | |
| Średnia w klasie Gaming (65.1 - 248, n=143, ostatnie 2 lata) | |
| Medion Erazer Defender P40 | |
| MSI Katana 15 B12VEK | |
| Medion Erazer Scout E20 | |
| MSI Cyborg 15 A12VF | |
| Acer Nitro 5 AN517-55-5552 | |
| Acer Nitro 5 AN517-55-5552 (Leiser Modus) | |
| Asus TUF Gaming A16 FA617XS | |
| X-Plane 11.11 - 1920x1080 high (fps_test=3) | |
| Medion Erazer Defender P40 | |
| Medion Erazer Scout E20 | |
| Średnia w klasie Gaming (33.4 - 150.2, n=146, ostatnie 2 lata) | |
| MSI Katana 15 B12VEK | |
| MSI Cyborg 15 A12VF | |
| Acer Nitro 5 AN517-55-738R | |
| Acer Nitro 5 AN517-55-5552 (Leiser Modus) | |
| Acer Nitro 5 AN517-55-5552 | |
| Asus TUF Gaming A16 FA617XS | |
| The Witcher 3 | |
| 1920x1080 High Graphics & Postprocessing (Nvidia HairWorks Off) | |
| Średnia w klasie Gaming (138 - 424, n=30, ostatnie 2 lata) | |
| Asus TUF Gaming A16 FA617XS | |
| Acer Nitro 5 AN517-55-5552 | |
| MSI Katana 15 B12VEK | |
| Acer Nitro 5 AN517-55-738R | |
| Medion Erazer Scout E20 | |
| Przeciętny NVIDIA GeForce RTX 4050 Laptop GPU (87 - 177, n=28) | |
| MSI Cyborg 15 A12VF | |
| 1920x1080 Ultra Graphics & Postprocessing (HBAO+) | |
| Średnia w klasie Gaming (18.4 - 240, n=48, ostatnie 2 lata) | |
| Asus TUF Gaming A16 FA617XS | |
| Acer Nitro 5 AN517-55-5552 | |
| Medion Erazer Scout E20 | |
| Acer Nitro 5 AN517-55-738R | |
| MSI Katana 15 B12VEK | |
| MSI Cyborg 15 A12VF | |
| Przeciętny NVIDIA GeForce RTX 4050 Laptop GPU (18.5 - 94.7, n=40) | |
| Far Cry 5 | |
| 1920x1080 High Preset AA:T | |
| Średnia w klasie Gaming (82 - 186, n=37, ostatnie 2 lata) | |
| MSI Katana 15 B12VEK | |
| Medion Erazer Scout E20 | |
| Acer Nitro 5 AN517-55-5552 | |
| Asus TUF Gaming A16 FA617XS | |
| MSI Cyborg 15 A12VF | |
| Przeciętny NVIDIA GeForce RTX 4050 Laptop GPU (51 - 135, n=24) | |
| Acer Nitro 5 AN517-55-738R | |
| 1920x1080 Ultra Preset AA:T | |
| Średnia w klasie Gaming (70 - 174, n=37, ostatnie 2 lata) | |
| MSI Katana 15 B12VEK | |
| Medion Erazer Scout E20 | |
| Acer Nitro 5 AN517-55-5552 | |
| Asus TUF Gaming A16 FA617XS | |
| MSI Cyborg 15 A12VF | |
| Przeciętny NVIDIA GeForce RTX 4050 Laptop GPU (50 - 127, n=24) | |
| Acer Nitro 5 AN517-55-738R | |
W teście wytrzymałościowym Witcher 3, Acer Nitro 5 AN517 nie wykazał żadnych słabości, a liczba klatek na sekundę pozostała stabilna. Niewielkie wahania odpowiadają rytmowi dnia i nocy w grze.
Natomiast w trybie "Cichym" zaobserwowaliśmy niewielki spadek. Początkowo zielona linia (cisza) pozostawała prawie zgodna z czerwoną linią (wydajność). Przy niższym taktowaniu zegara i zasilaczu, po godzinie nastąpił spadek liczby klatek na sekundę o 7%.
Ponadto występowały niewielkie spadki. Ponieważ wentylatorów nie można po prostu podkręcić w trybie "Quiet", prędkość zegara musiała zostać ponownie zmniejszona na krótki czas. Niemniej jednak wartość ta pozostała na wysokim poziomie i tylko raz spadła poniżej 60 klatek na sekundę. MedionMedion Erazer Scout E20z tą samą kartą graficzną, osiągnął porównywalne wartości fps tylko w trybie wydajności.
Witcher 3 FPS diagram
| low | med. | high | ultra | |
|---|---|---|---|---|
| GTA V (2015) | 162.4 | 88.8 | ||
| The Witcher 3 (2015) | 164 | 88 | ||
| Dota 2 Reborn (2015) | 129 | 123.1 | ||
| Final Fantasy XV Benchmark (2018) | 83.6 | |||
| X-Plane 11.11 (2018) | 79.7 | |||
| Far Cry 5 (2018) | 123 | 116 | ||
| Strange Brigade (2018) | 174.8 | 152 | ||
| Cyberpunk 2077 1.6 (2022) | 91.3 | 79.4 | ||
| F1 22 (2022) | 149 | 55 | ||
| Hogwarts Legacy (2023) | 67 | 53 | ||
| Sons of the Forest (2023) | 75 | 73 | ||
| Star Wars Jedi Survivor (2023) | 56 | 53 |
Emisje - cichy, ciepły Nitro 5
Emisja hałasu
Wentylatory włączają się nawet przy niewielkim obciążeniu systemu. Skutkuje to hałasem w tle, który nie zakłóca sesji gier ani własnych myśli.
I odwrotnie, laptop do gier staje się naprawdę głośny przy ustawieniu "Wydajność". Można stwierdzić, że ktoś gra, nawet zza zamkniętych drzwi. Zmienia się to znacznie w trybie "Cichym". Zmierzyliśmy tylko jedną trzecią oryginalnego poziomu hałasu.
Wytwarzane dźwięki znajdują się powyżej poziomów hałasu występujących na przykład w laptopie biznesowym z jego wentylatorami. Jednak nigdy nie czujesz potrzeby chwycenia pary słuchawek. Niektóre komputery stacjonarne i większość laptopów do gier będą znacznie głośniejsze.
Hałas
| luz |
| 25.7 / 31.5 / 31.2 dB |
| obciążenie |
| 62.9 / 67.5 dB |
 | ||
30 dB cichy 40 dB(A) słyszalny 50 dB(A) irytujący |
||
min: | ||
| Acer Nitro 5 AN517-55-5552 GeForce RTX 4050 Laptop GPU, i5-12500H, WDC PC SN810 512GB | Asus TUF Gaming A16 FA617XS Radeon RX 7600S, R9 7940HS, Micron 2400 MTFDKBA512QFM | Acer Nitro 5 AN517-55-738R GeForce RTX 3060 Laptop GPU, i7-12700H, Samsung PM9A1 MZVL2512HCJQ | Medion Erazer Scout E20 GeForce RTX 4050 Laptop GPU, i7-13700H, Phison PS5021-E21 1TB | MSI Katana 15 B12VEK GeForce RTX 4050 Laptop GPU, i7-12650H, Micron 2400 MTFDKBA1T0QFM | MSI Cyborg 15 A12VF GeForce RTX 4060 Laptop GPU, i7-12650H, Samsung PM9B1 1024GB MZVL41T0HBLB | |
|---|---|---|---|---|---|---|
| Noise | 14% | 8% | 6% | 20% | -4% | |
| wyłączone / środowisko * (dB) | 25.7 | 25 3% | 25.5 1% | 25 3% | 24 7% | 27 -5% |
| Idle Minimum * (dB) | 25.7 | 25 3% | 25.5 1% | 26 -1% | 24 7% | 27 -5% |
| Idle Average * (dB) | 31.5 | 26 17% | 25.5 19% | 27 14% | 24 24% | 37.5 -19% |
| Idle Maximum * (dB) | 31.2 | 28 10% | 27 13% | 32 -3% | 24 23% | 38 -22% |
| Load Average * (dB) | 62.9 | 43 32% | 52.6 16% | 57 9% | 37.71 40% | 56.3 10% |
| Load Maximum * (dB) | 67.5 | 53 21% | 68.2 -1% | 57 16% | 54.55 19% | 56.3 17% |
| Witcher 3 ultra * (dB) | 51 | 50 | 45.75 |
* ... im mniej tym lepiej
Temperatura
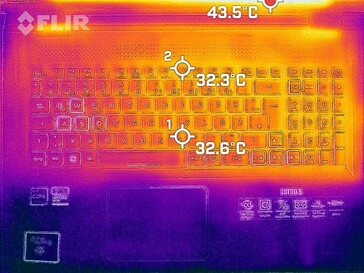
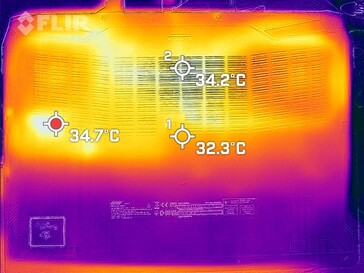
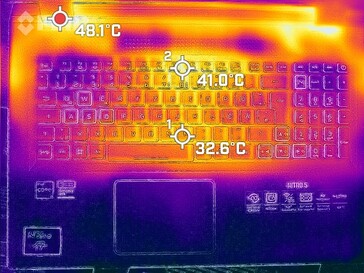
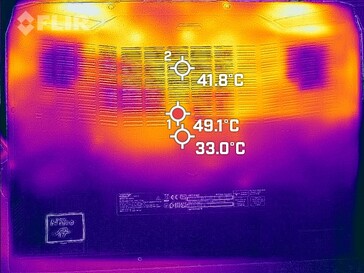
Jak można się domyślić na podstawie zdjęcia w sekcji "Konserwacja", podpórka pod nadgarstki pozostaje chłodna, nawet przy teoretycznym scenariuszu maksymalnego obciążenia. Zmierzyliśmy tylko nieco ponad 30 °C w środku. Z kolei na stronie Witcher 3 nie odnotowaliśmy znaczącego wzrostu temperatury.
Oznacza to, że przynajmniej obszar klawiatury pozostaje poniżej 40°C. Coś, co nie jest idealne, ale wciąż możliwe do opanowania. W tylnej części, gdzie znajdują się wentylatory, temperatura wzrasta, ale utrzymuje się poniżej 50 °C, czyli poniżej tego, co miał poprzednik poprzednik nie był w stanie osiągnąć.
W innych trybach wydajności rozpraszanie ciepła pozostaje porównywalne. Oznacza to, że można spodziewać się ciepłej klawiatury.
(±) Maksymalna temperatura w górnej części wynosi 42.4 °C / 108 F, w porównaniu do średniej 40.4 °C / 105 F , począwszy od 21.2 do 68.8 °C dla klasy Gaming.
(-) Dno nagrzewa się maksymalnie do 48.2 °C / 119 F, w porównaniu do średniej 43.3 °C / 110 F
(+) W stanie bezczynności średnia temperatura górnej części wynosi 29.2 °C / 85 F, w porównaniu ze średnią temperaturą urządzenia wynoszącą 33.9 °C / ### class_avg_f### F.
(±) Podczas gry w Wiedźmina 3 średnia temperatura górnej części wynosi 32.2 °C / 90 F, w porównaniu do średniej temperatury urządzenia wynoszącej 33.9 °C / ## #class_avg_f### F.
(+) Podpórki pod nadgarstki i touchpad są chłodniejsze niż temperatura skóry i maksymalnie 27.4 °C / 81.3 F i dlatego są chłodne w dotyku.
(±) Średnia temperatura obszaru podparcia dłoni w podobnych urządzeniach wynosiła 28.8 °C / 83.8 F (+1.4 °C / 2.5 F).
| Acer Nitro 5 AN517-55-5552 Intel Core i5-12500H, NVIDIA GeForce RTX 4050 Laptop GPU | Asus TUF Gaming A16 FA617XS AMD Ryzen 9 7940HS, AMD Radeon RX 7600S | Acer Nitro 5 AN517-55-738R Intel Core i7-12700H, NVIDIA GeForce RTX 3060 Laptop GPU | Medion Erazer Scout E20 Intel Core i7-13700H, NVIDIA GeForce RTX 4050 Laptop GPU | MSI Katana 15 B12VEK Intel Core i7-12650H, NVIDIA GeForce RTX 4050 Laptop GPU | MSI Cyborg 15 A12VF Intel Core i7-12650H, NVIDIA GeForce RTX 4060 Laptop GPU | |
|---|---|---|---|---|---|---|
| Heat | -3% | -10% | 9% | -9% | 9% | |
| Maximum Upper Side * (°C) | 42.4 | 53 -25% | 48.3 -14% | 41 3% | 47 -11% | 47.5 -12% |
| Maximum Bottom * (°C) | 48.2 | 48 -0% | 52 -8% | 39 19% | 48 -0% | 35.5 26% |
| Idle Upper Side * (°C) | 31.6 | 30 5% | 34.5 -9% | 31 2% | 35 -11% | 27.7 12% |
| Idle Bottom * (°C) | 33.1 | 30 9% | 35.8 -8% | 29 12% | 38 -15% | 29.5 11% |
* ... im mniej tym lepiej
Test warunków skrajnych
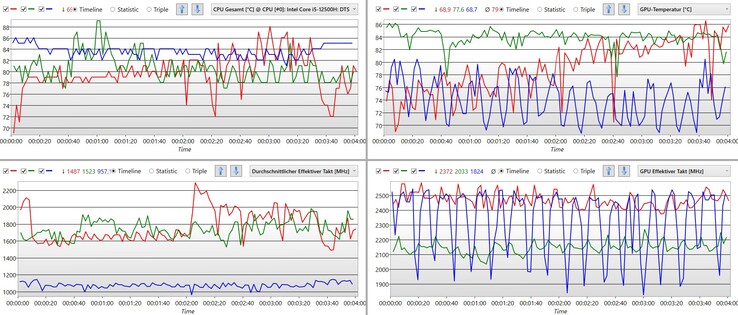
Nawet przy maksymalnym obciążeniu procesor nie osiąga maksymalnego możliwego poboru mocy 115 watów. Przez kilka chwil mierzyliśmy prawie 100 watów, podczas gdy temperatura wzrosła do 100 °C, co z kolei zmniejszyło pobór mocy.
Dla kontrastu, procesor może przez krótki czas zużywać 140 watów i udaje mu się pozostać na stałe znacznie poniżej 90 ° C przy ponad 100 watów. Dokładnie tak powinien wyglądać laptop do gier.
Porównanie trybów wydajności jest interesujące, zwłaszcza przy ustawieniu "Cichy" (niebieska linia): Wydajność procesora jest wyraźnie ograniczona, podczas gdy układowi graficznemu nadal udaje się osiągnąć poziom, który normalnie jest dozwolony tylko w trybie "Wydajność". Chociaż na naszym wykresie wygląda to nieregularnie, częstotliwość taktowania GPU waha się tylko między 1800 a ponad 2500 MHz. Jednocześnie temperatura utrzymuje się znacznie powyżej 80°C.
Tryb "Quiet" pozwala uzyskać wysoką wydajność graficzną bez nadmiernego wydzielania ciepła, ponieważ moc procesora jest bardzo ograniczona.
Głośniki
Małe głośniki stereo spełniają minimalne wymagania. W szczególności odtwarzanie głosu jest dobrze wykonane. Od słowa mówionego po wyrafinowane wokale, brzmi dobrze.
Bas jest w dużej mierze nieobecny, a średnie tony są słabo zdefiniowane. Głośniki Nitro 5 nie nadają się do słuchania muzyki, ale są wystarczające do strumieniowania wideo lub gier.
Acer Nitro 5 AN517-55-5552 analiza dźwięku
(±) | głośność głośnika jest średnia, ale dobra (80.4 dB)
Bas 100 - 315 Hz
(-) | prawie brak basu - średnio 23.4% niższa od mediany
(±) | liniowość basu jest średnia (14.9% delta do poprzedniej częstotliwości)
Średnie 400 - 2000 Hz
(+) | zbalansowane środki średnie - tylko 2.2% od mediany
(+) | średnie są liniowe (5.8% delta do poprzedniej częstotliwości)
Wysokie 2–16 kHz
(+) | zrównoważone maksima - tylko 4.6% od mediany
(+) | wzloty są liniowe (4.8% delta do poprzedniej częstotliwości)
Ogólnie 100 - 16.000 Hz
(±) | liniowość ogólnego dźwięku jest średnia (17.1% różnicy w stosunku do mediany)
W porównaniu do tej samej klasy
» 45% wszystkich testowanych urządzeń w tej klasie było lepszych, 12% podobnych, 43% gorszych
» Najlepszy miał deltę 6%, średnia wynosiła ###średnia###%, najgorsza wynosiła 132%
W porównaniu do wszystkich testowanych urządzeń
» 30% wszystkich testowanych urządzeń było lepszych, 8% podobnych, 62% gorszych
» Najlepszy miał deltę 4%, średnia wynosiła ###średnia###%, najgorsza wynosiła 134%
Apple MacBook Pro 16 2021 M1 Pro analiza dźwięku
(+) | głośniki mogą odtwarzać stosunkowo głośno (84.7 dB)
Bas 100 - 315 Hz
(+) | dobry bas - tylko 3.8% od mediany
(+) | bas jest liniowy (5.2% delta do poprzedniej częstotliwości)
Średnie 400 - 2000 Hz
(+) | zbalansowane środki średnie - tylko 1.3% od mediany
(+) | średnie są liniowe (2.1% delta do poprzedniej częstotliwości)
Wysokie 2–16 kHz
(+) | zrównoważone maksima - tylko 1.9% od mediany
(+) | wzloty są liniowe (2.7% delta do poprzedniej częstotliwości)
Ogólnie 100 - 16.000 Hz
(+) | ogólny dźwięk jest liniowy (4.6% różnicy w stosunku do mediany)
W porównaniu do tej samej klasy
» 0% wszystkich testowanych urządzeń w tej klasie było lepszych, 0% podobnych, 100% gorszych
» Najlepszy miał deltę 5%, średnia wynosiła ###średnia###%, najgorsza wynosiła 45%
W porównaniu do wszystkich testowanych urządzeń
» 0% wszystkich testowanych urządzeń było lepszych, 0% podobnych, 100% gorszych
» Najlepszy miał deltę 4%, średnia wynosiła ###średnia###%, najgorsza wynosiła 134%
Zarządzanie energią
Zużycie energii
Fakt, że procesor nie jest aktualny, jest zauważalny pod względem zużycia energii. Przy nieco ponad 7 watach, minimalny pobór mocy jest dobry, ale mógłby być nieco niższy, jak w przypadku Medion Erazer Scoutz jegoi7-13700H. Nawet przy typowym użytkowaniu, 150 watów to raczej słaba wartość. Średnia dlaRTX 4050wynosi poniżej 100 watów. Jednak w trybie cichym całkowity pobór mocy również wynosi około 100 watów.
Maksymalny pobór mocy wynoszący 244 W został zarejestrowany tylko w jednym pomiarze szczytowym. Zasilacz o mocy 230 W powinien być zatem wystarczający i mieć wystarczające rezerwy, aby naładować baterię.
| wyłączony / stan wstrzymania | |
| luz | |
| obciążenie |
|
Legenda:
min: | |
| Acer Nitro 5 AN517-55-5552 i5-12500H, GeForce RTX 4050 Laptop GPU, WDC PC SN810 512GB, IPS, 1920x1080, 17.3" | Asus TUF Gaming A16 FA617XS R9 7940HS, Radeon RX 7600S, Micron 2400 MTFDKBA512QFM, IPS, 1920x1200, 16" | Acer Nitro 5 AN517-55-738R i7-12700H, GeForce RTX 3060 Laptop GPU, Samsung PM9A1 MZVL2512HCJQ, IPS, 1920x1080, 17.3" | Medion Erazer Scout E20 i7-13700H, GeForce RTX 4050 Laptop GPU, Phison PS5021-E21 1TB, IPS, 1920x1080, 17.3" | MSI Katana 15 B12VEK i7-12650H, GeForce RTX 4050 Laptop GPU, Micron 2400 MTFDKBA1T0QFM, IPS, 1920x1080, 15.6" | MSI Cyborg 15 A12VF i7-12650H, GeForce RTX 4060 Laptop GPU, Samsung PM9B1 1024GB MZVL41T0HBLB, IPS, 1920x1080, 15.6" | Przeciętny NVIDIA GeForce RTX 4050 Laptop GPU | Średnia w klasie Gaming | |
|---|---|---|---|---|---|---|---|---|
| Power Consumption | 13% | -14% | 7% | 17% | 33% | -6% | -39% | |
| Idle Minimum * (Watt) | 7.6 | 7 8% | 9.7 -28% | 5 34% | 8.5 -12% | 6 21% | 9.95 ? -31% | 13.6 ? -79% |
| Idle Average * (Watt) | 11.3 | 10 12% | 14.6 -29% | 11 3% | 10.2 10% | 8.8 22% | 15.8 ? -40% | 19.3 ? -71% |
| Idle Maximum * (Watt) | 15.4 | 15 3% | 16.7 -8% | 22 -43% | 11.3 27% | 11.9 23% | 20.1 ? -31% | 25.7 ? -67% |
| Load Average * (Watt) | 151 | 86 43% | 166 -10% | 96 36% | 84 44% | 89 41% | 88 ? 42% | 110.1 ? 27% |
| Witcher 3 ultra * (Watt) | 137.8 | 160.6 -17% | 145.2 -5% | 128 7% | 90.3 34% | |||
| Load Maximum * (Watt) | 244 | 172 30% | 235 4% | 201 18% | 189 23% | 99 59% | 176.3 ? 28% | 258 ? -6% |
* ... im mniej tym lepiej
Power consumption Witcher 3 / stress test
Power consumption with an external monitor
Żywotność baterii
Żywotność baterii Acer Nitro 5 jest bardzo praktyczna: nawet przy maksymalnej jasności ekranu, laptopowi udało się znacznie ponad 8 godzin w naszym teście Wi-Fi podczas przełączania stron internetowych. Przy ograniczonej jasności można spodziewać się dodatkowej godziny. Jednak pojemność baterii wynosząca 90 Wh jest również bardzo wysoka.
LaptopAsus TUF Gaming 16- który może uzyskać 12 godzin i więcej z baterii o tej samej pojemności - pokazuje, że laptop do gier może działać znacznie wydajniej.
| Acer Nitro 5 AN517-55-5552 i5-12500H, GeForce RTX 4050 Laptop GPU, 90 Wh | Asus TUF Gaming A16 FA617XS R9 7940HS, Radeon RX 7600S, 90 Wh | Acer Nitro 5 AN517-55-738R i7-12700H, GeForce RTX 3060 Laptop GPU, 90.61 Wh | Medion Erazer Scout E20 i7-13700H, GeForce RTX 4050 Laptop GPU, 53.35 Wh | MSI Katana 15 B12VEK i7-12650H, GeForce RTX 4050 Laptop GPU, 53.5 Wh | MSI Cyborg 15 A12VF i7-12650H, GeForce RTX 4060 Laptop GPU, 53.5 Wh | Średnia w klasie Gaming | |
|---|---|---|---|---|---|---|---|
| Czasy pracy | 50% | -30% | -44% | -48% | -6% | -9% | |
| H.264 (h) | 7.4 | 12.4 68% | 5.3 -28% | 4.6 -38% | 4.4 -41% | 8 8% | 8.13 ? 10% |
| WiFi v1.3 (h) | 9.4 | 12.4 32% | 6.5 -31% | 4.7 -50% | 4.3 -54% | 7.5 -20% | 6.75 ? -28% |
Za
Przeciw
Werdykt - Wydajny procesor graficzny Nitro 5 jest dobrze zaimplementowany
Z prostym procesorem i5-12500H i podstawową kartą graficzną RTX 4050, Acer Nitro 5 zapewnia niezłą, ale w najlepszym razie przeciętną wydajność. Następnie włączany jest tryb "Quiet":
Przy słyszalnych, ale nigdy irytujących odgłosach wentylatora, wydajność w grach spada minimalnie, szczególnie w grach, w których stwierdziliśmy różnicę zaledwie kilku punktów procentowych. Nitro płynnie odtwarza bieżące gry w rozdzielczości Full HD, przy wysokich ustawieniach szczegółów i nigdy nie przekracza poziomów hałasu występujących u jego odpowiedników.
Ciche wentylatory i granie w rozdzielczości Full HD nie wykluczają się wzajemnie w Acer Nitro 5.
Jest to możliwe dzięki wydajnemu układowi graficznemu Nvidii, który nie korzysta z wyższego zużycia energii. Jest to jednak również możliwe dzięki bardzo dużej obudowie i równie dużemu systemowi chłodzenia, który posiada sprytne ustawienia. Do tego dochodzi klawiatura RGB, Thunderbolt 4 i dwa porty USB 10 Gbit/s.
To, co naprawdę rozczarowuje, to wyświetlacz: Podczas gdy rozdzielczość i rozmiar idealnie pasują do wielkości laptopa Acer, odwzorowanie kolorów, kontrast i szczytowa jasność są wyraźnie poniżej średniej, nawet jak na podstawowe standardy, które są w cenie.
Jeśli chodzi tylko o wydajność w grach, istnieją szybsze laptopy. Na przykładMedion Erazer Scout E20 jest również wyposażony w kartęRTX 4050 a także ma znacznie lepszy wyświetlacz. Nie jest jednak tak cichy jak Nitro i jest minimalnie droższy.
Cena i dostępność
Acer Nitro 5 (RTX 4050, 16 GB pamięci RAM DDR5) jest dostępny na Amazon za około 1225 USD.
Acer Nitro 5 AN517-55-5552
- 13/06/2023 v7 (old)
Mario Petzold
Przezroczystość
Wyboru urządzeń do recenzji dokonuje nasza redakcja. Próbka testowa została udostępniona autorowi jako pożyczka od producenta lub sprzedawcy detalicznego na potrzeby tej recenzji. Pożyczkodawca nie miał wpływu na tę recenzję, producent nie otrzymał też kopii tej recenzji przed publikacją. Nie było obowiązku publikowania tej recenzji. Jako niezależna firma medialna, Notebookcheck nie podlega władzy producentów, sprzedawców detalicznych ani wydawców.
Tak testuje Notebookcheck
Każdego roku Notebookcheck niezależnie sprawdza setki laptopów i smartfonów, stosując standardowe procedury, aby zapewnić porównywalność wszystkich wyników. Od około 20 lat stale rozwijamy nasze metody badawcze, ustanawiając przy tym standardy branżowe. W naszych laboratoriach testowych doświadczeni technicy i redaktorzy korzystają z wysokiej jakości sprzętu pomiarowego. Testy te obejmują wieloetapowy proces walidacji. Nasz kompleksowy system ocen opiera się na setkach uzasadnionych pomiarów i benchmarków, co pozwala zachować obiektywizm.

