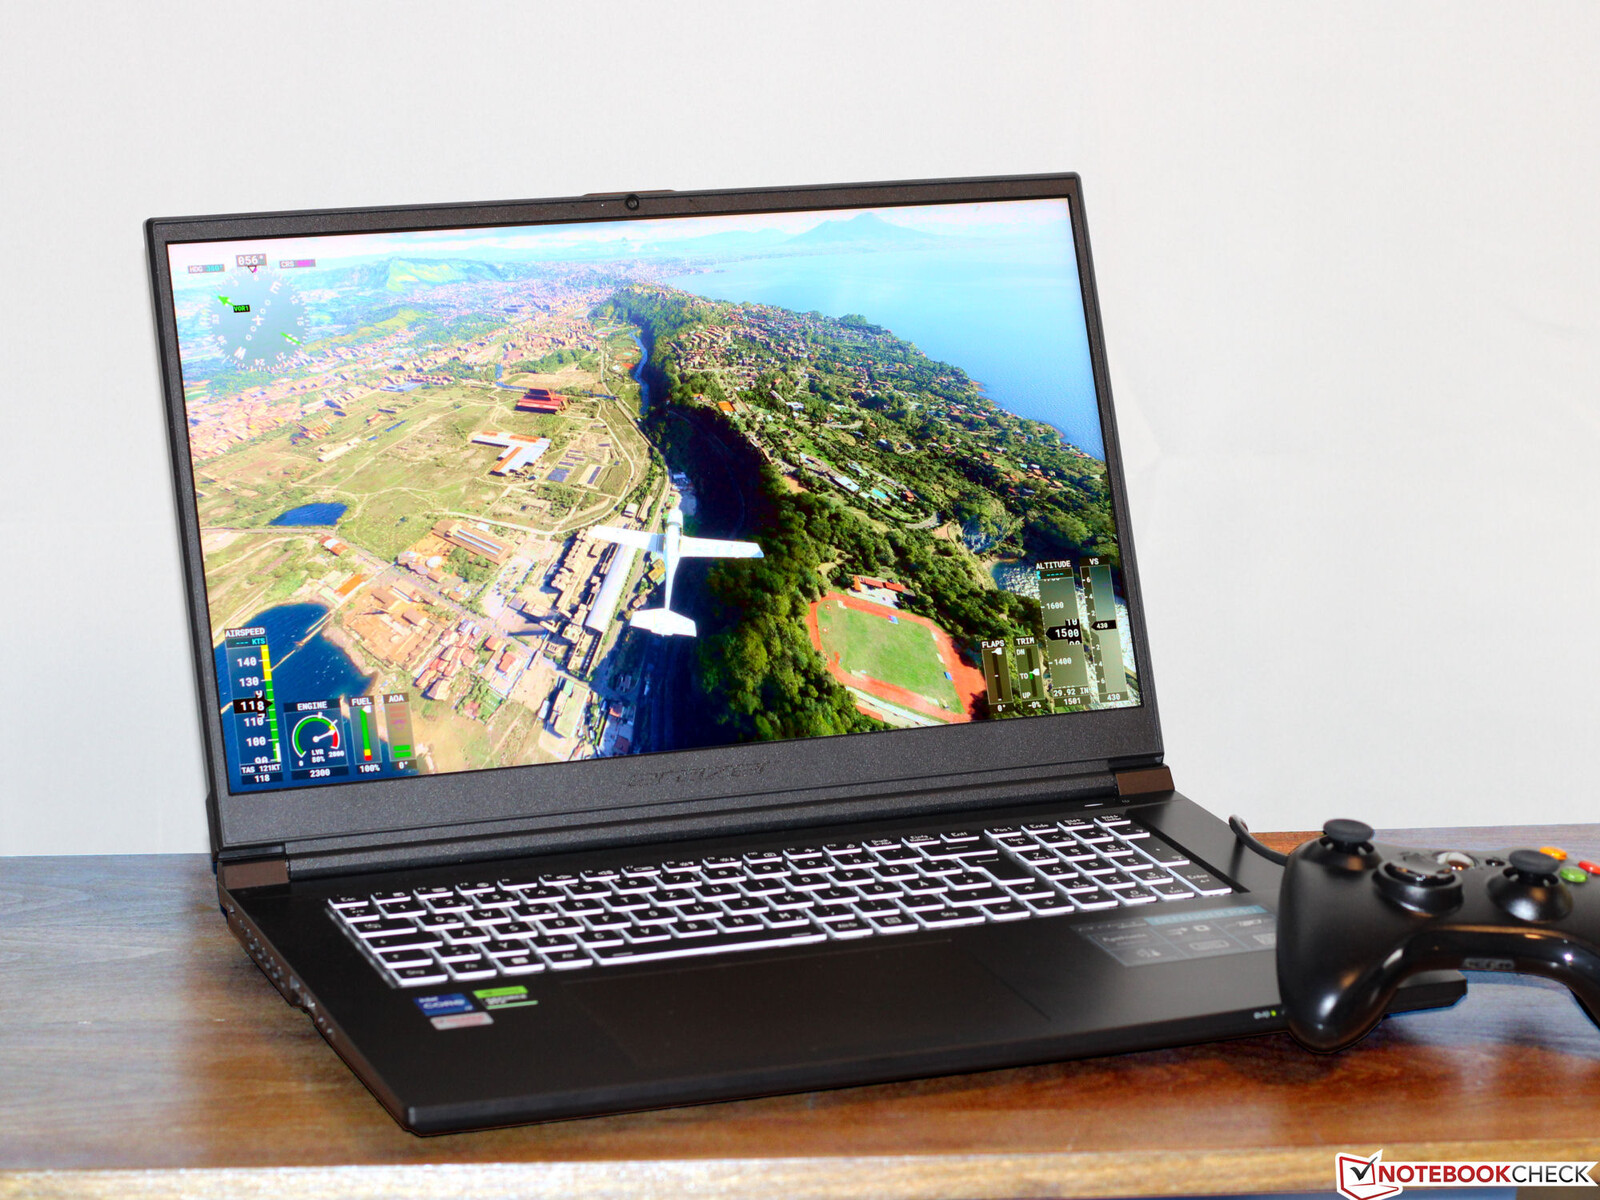
Recenzja Medion Erazer Defender P40: Niedrogi laptop do gier QHD z RTX 4060
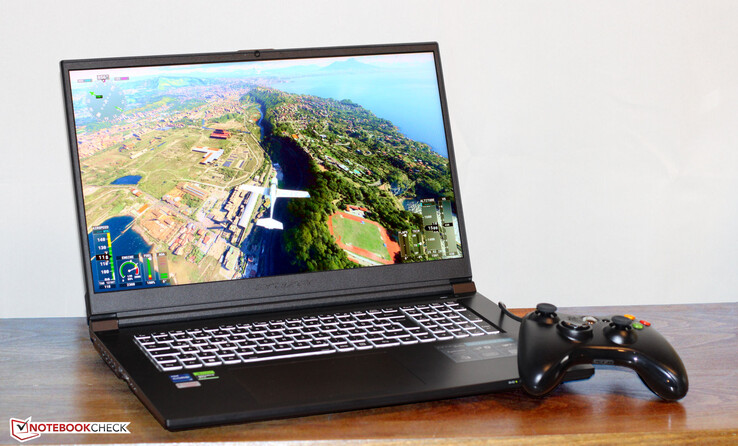
Medion zaprezentował Erazer Defender P40, średniej klasy laptop do gier QHD napędzany przez Core-i7-13700HXprocesor i kartę graficznąGeForce-RTX-4060gPU. Bazuje on na płycie głównej (NP70SND) wyprodukowanej przez firmę Clevo i jest dostępny w cenie około 1900 USD. Wśród konkurentów znajdują się takie urządzenia jakMSI Katana 17,Acer Predator Helios 300, Lenovo Legion Pro 5 16IRX8, Asus TUF Gaming A16 FA617oraz Gigabyte G7 KE.
Potencjalni konkurenci w porównaniu
Ocena | Data | Model | Waga | Wysokość | Rozmiar | Rezolucja | Cena |
|---|---|---|---|---|---|---|---|
| 84.6 % v7 (old) | 05/2023 | Medion Erazer Defender P40 i7-13700HX, GeForce RTX 4060 Laptop GPU | 2.9 kg | 33 mm | 17.30" | 2560x1440 | |
| 82.1 % v7 (old) | 02/2023 | MSI Katana 17 B13VFK i7-13620H, GeForce RTX 4060 Laptop GPU | 2.8 kg | 25.2 mm | 17.30" | 1920x1080 | |
| 86.5 % v7 (old) | 11/2022 | Acer Predator Helios 300 (i7-12700H, RTX 3070 Ti) i7-12700H, GeForce RTX 3070 Ti Laptop GPU | 3 kg | 27.65 mm | 17.30" | 2560x1440 | |
| 87.9 % v7 (old) | 05/2023 | Lenovo Legion Pro 5 16IRX8 i7-13700HX, GeForce RTX 4060 Laptop GPU | 2.5 kg | 26.8 mm | 16.00" | 2560x1600 | |
| 86.2 % v7 (old) | 02/2023 | Asus TUF Gaming A16 FA617 R7 7735HS, Radeon RX 7600S | 2.2 kg | 27 mm | 16.00" | 1920x1200 | |
| 83.3 % v7 (old) | 01/2023 | Gigabyte G7 KE i5-12500H, GeForce RTX 3060 Laptop GPU | 2.6 kg | 25 mm | 17.30" | 1920x1080 |
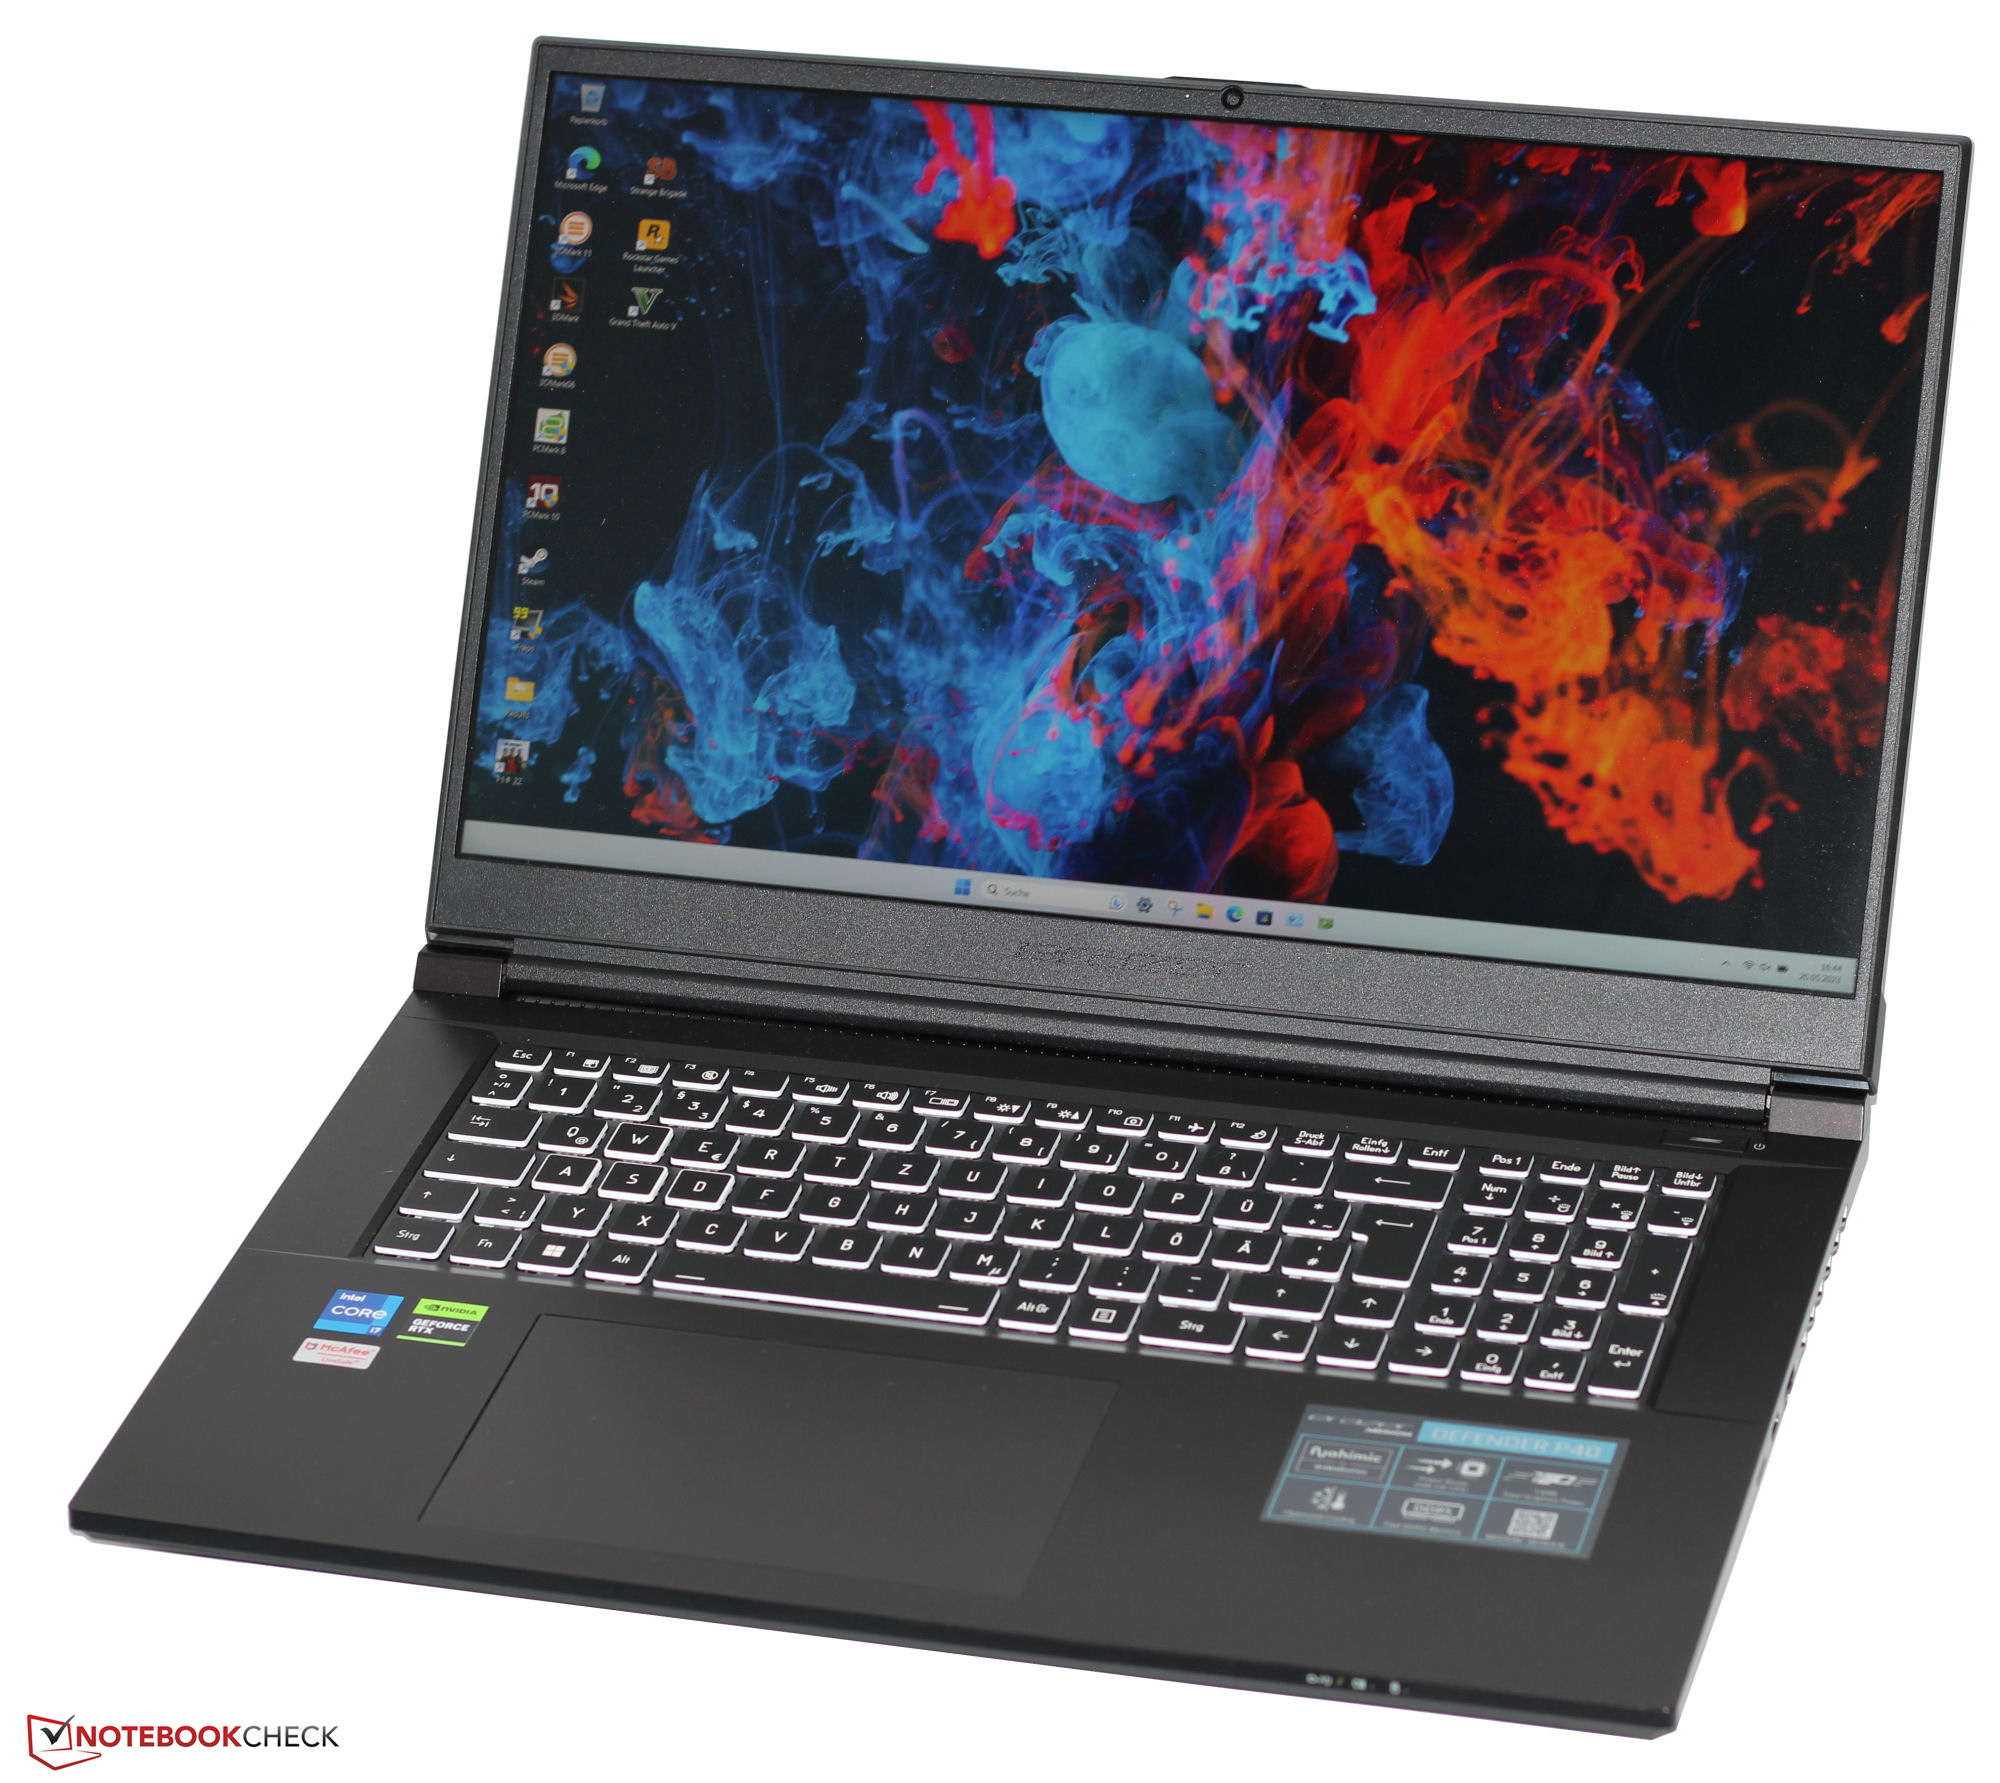
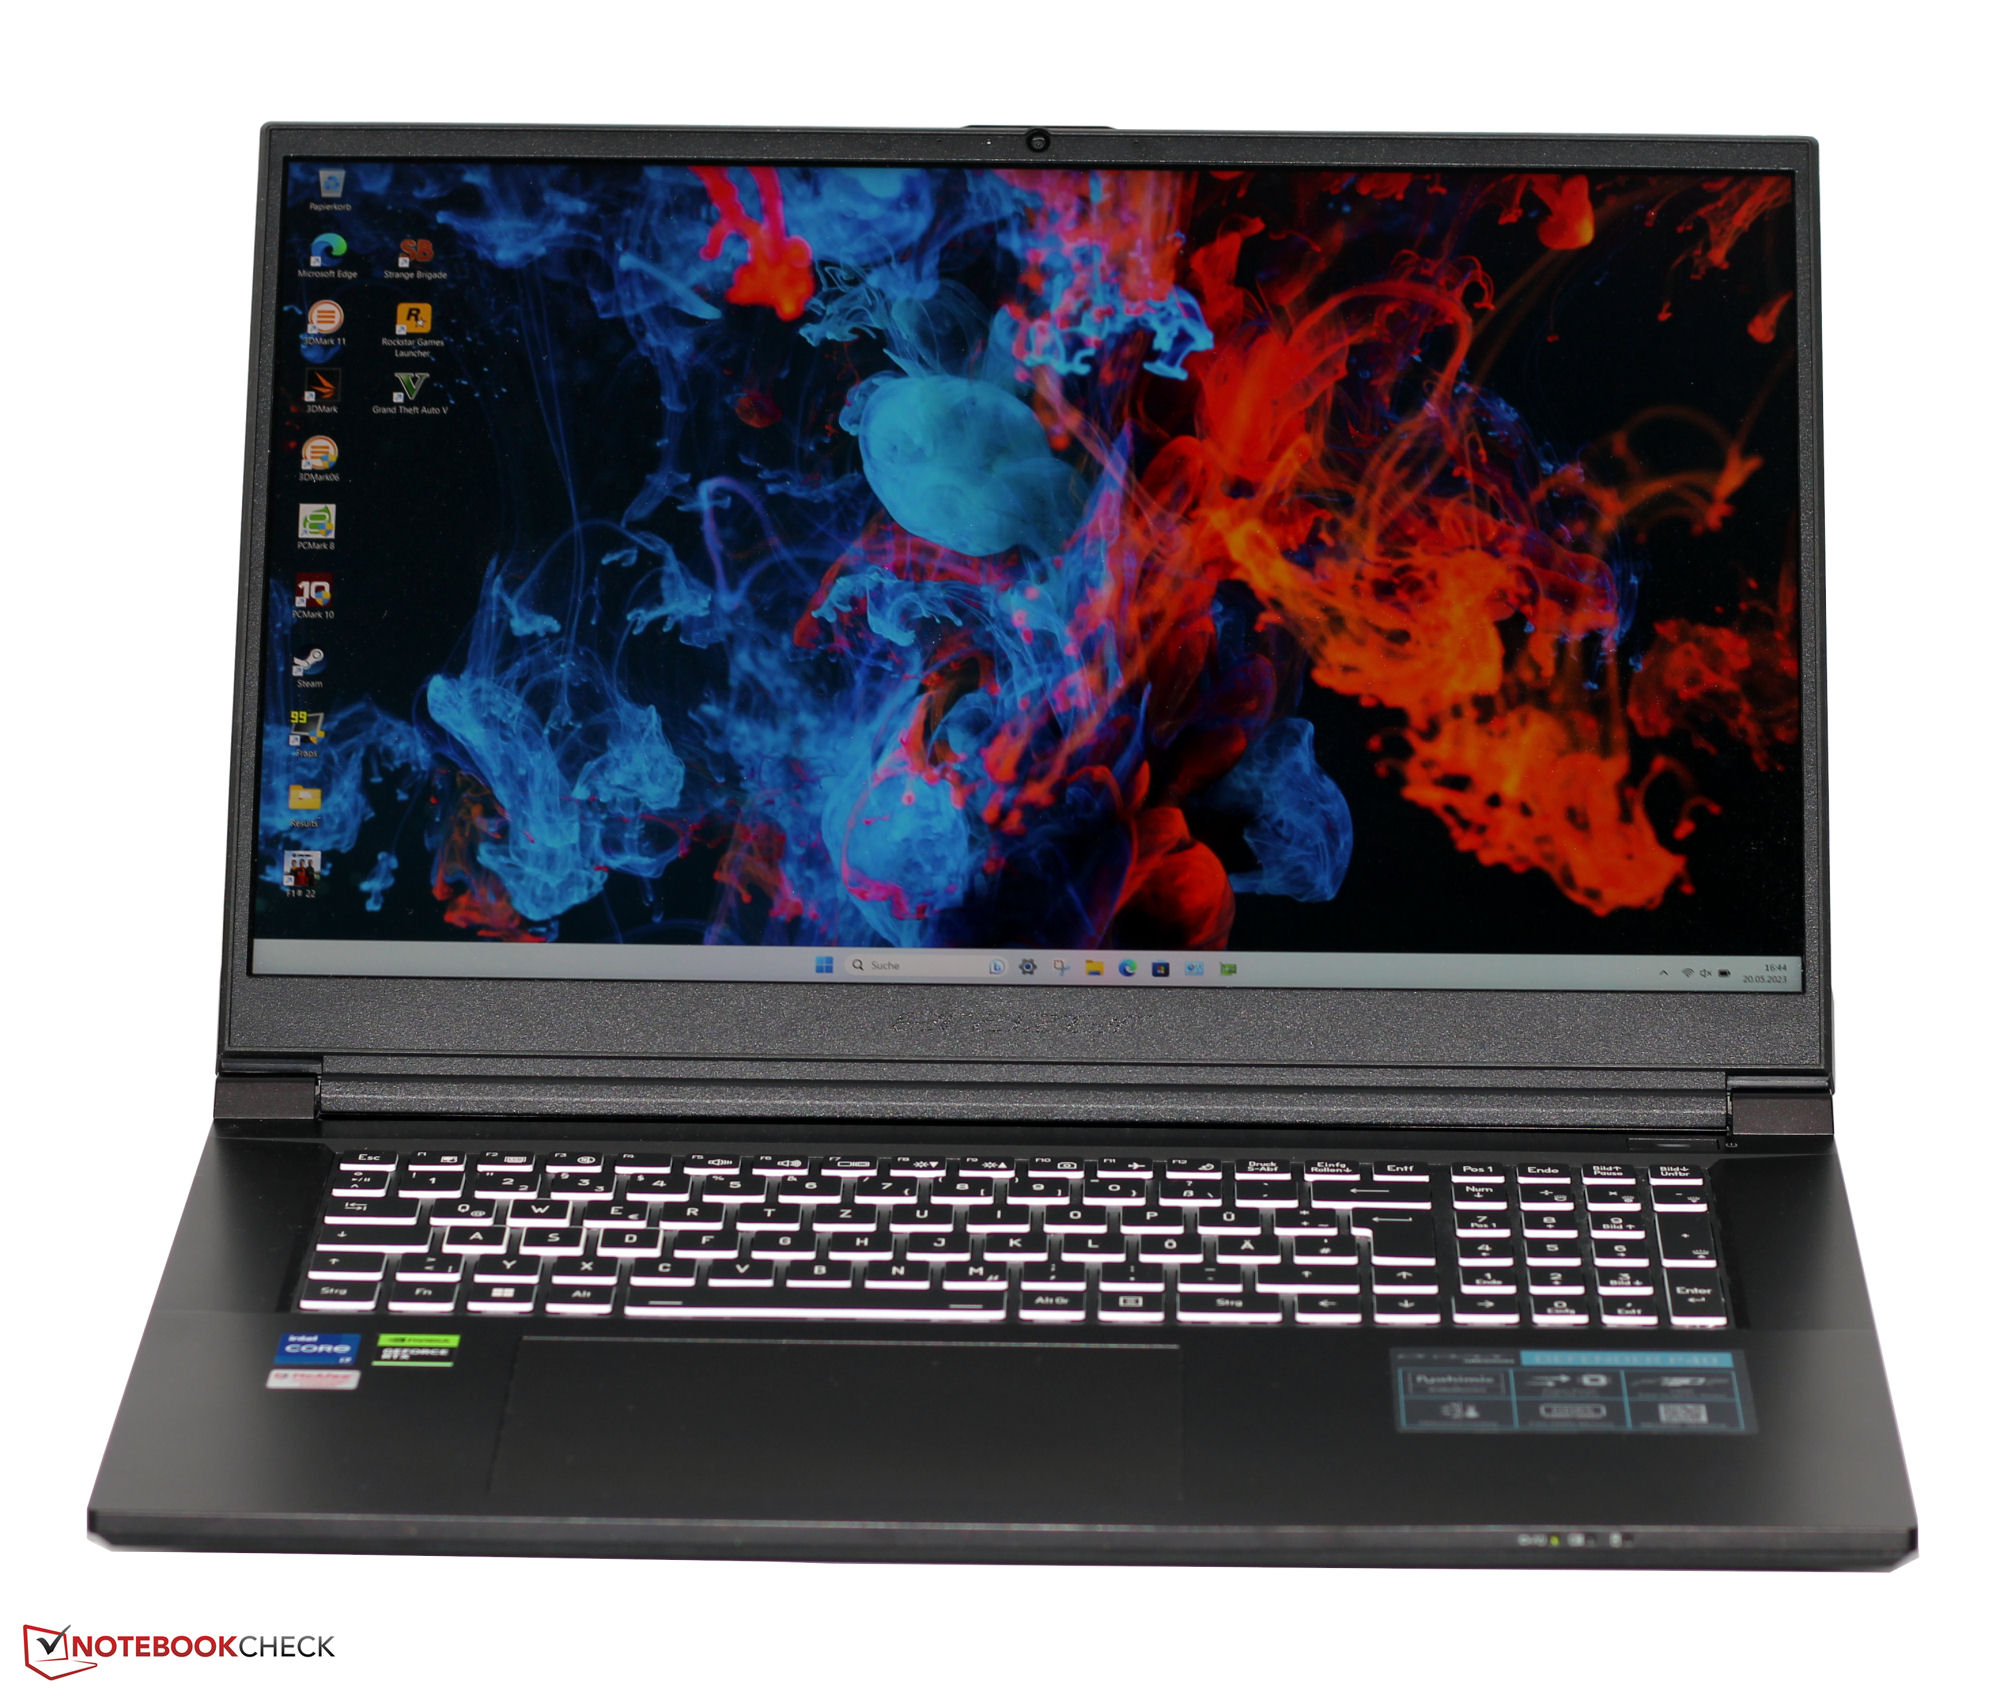
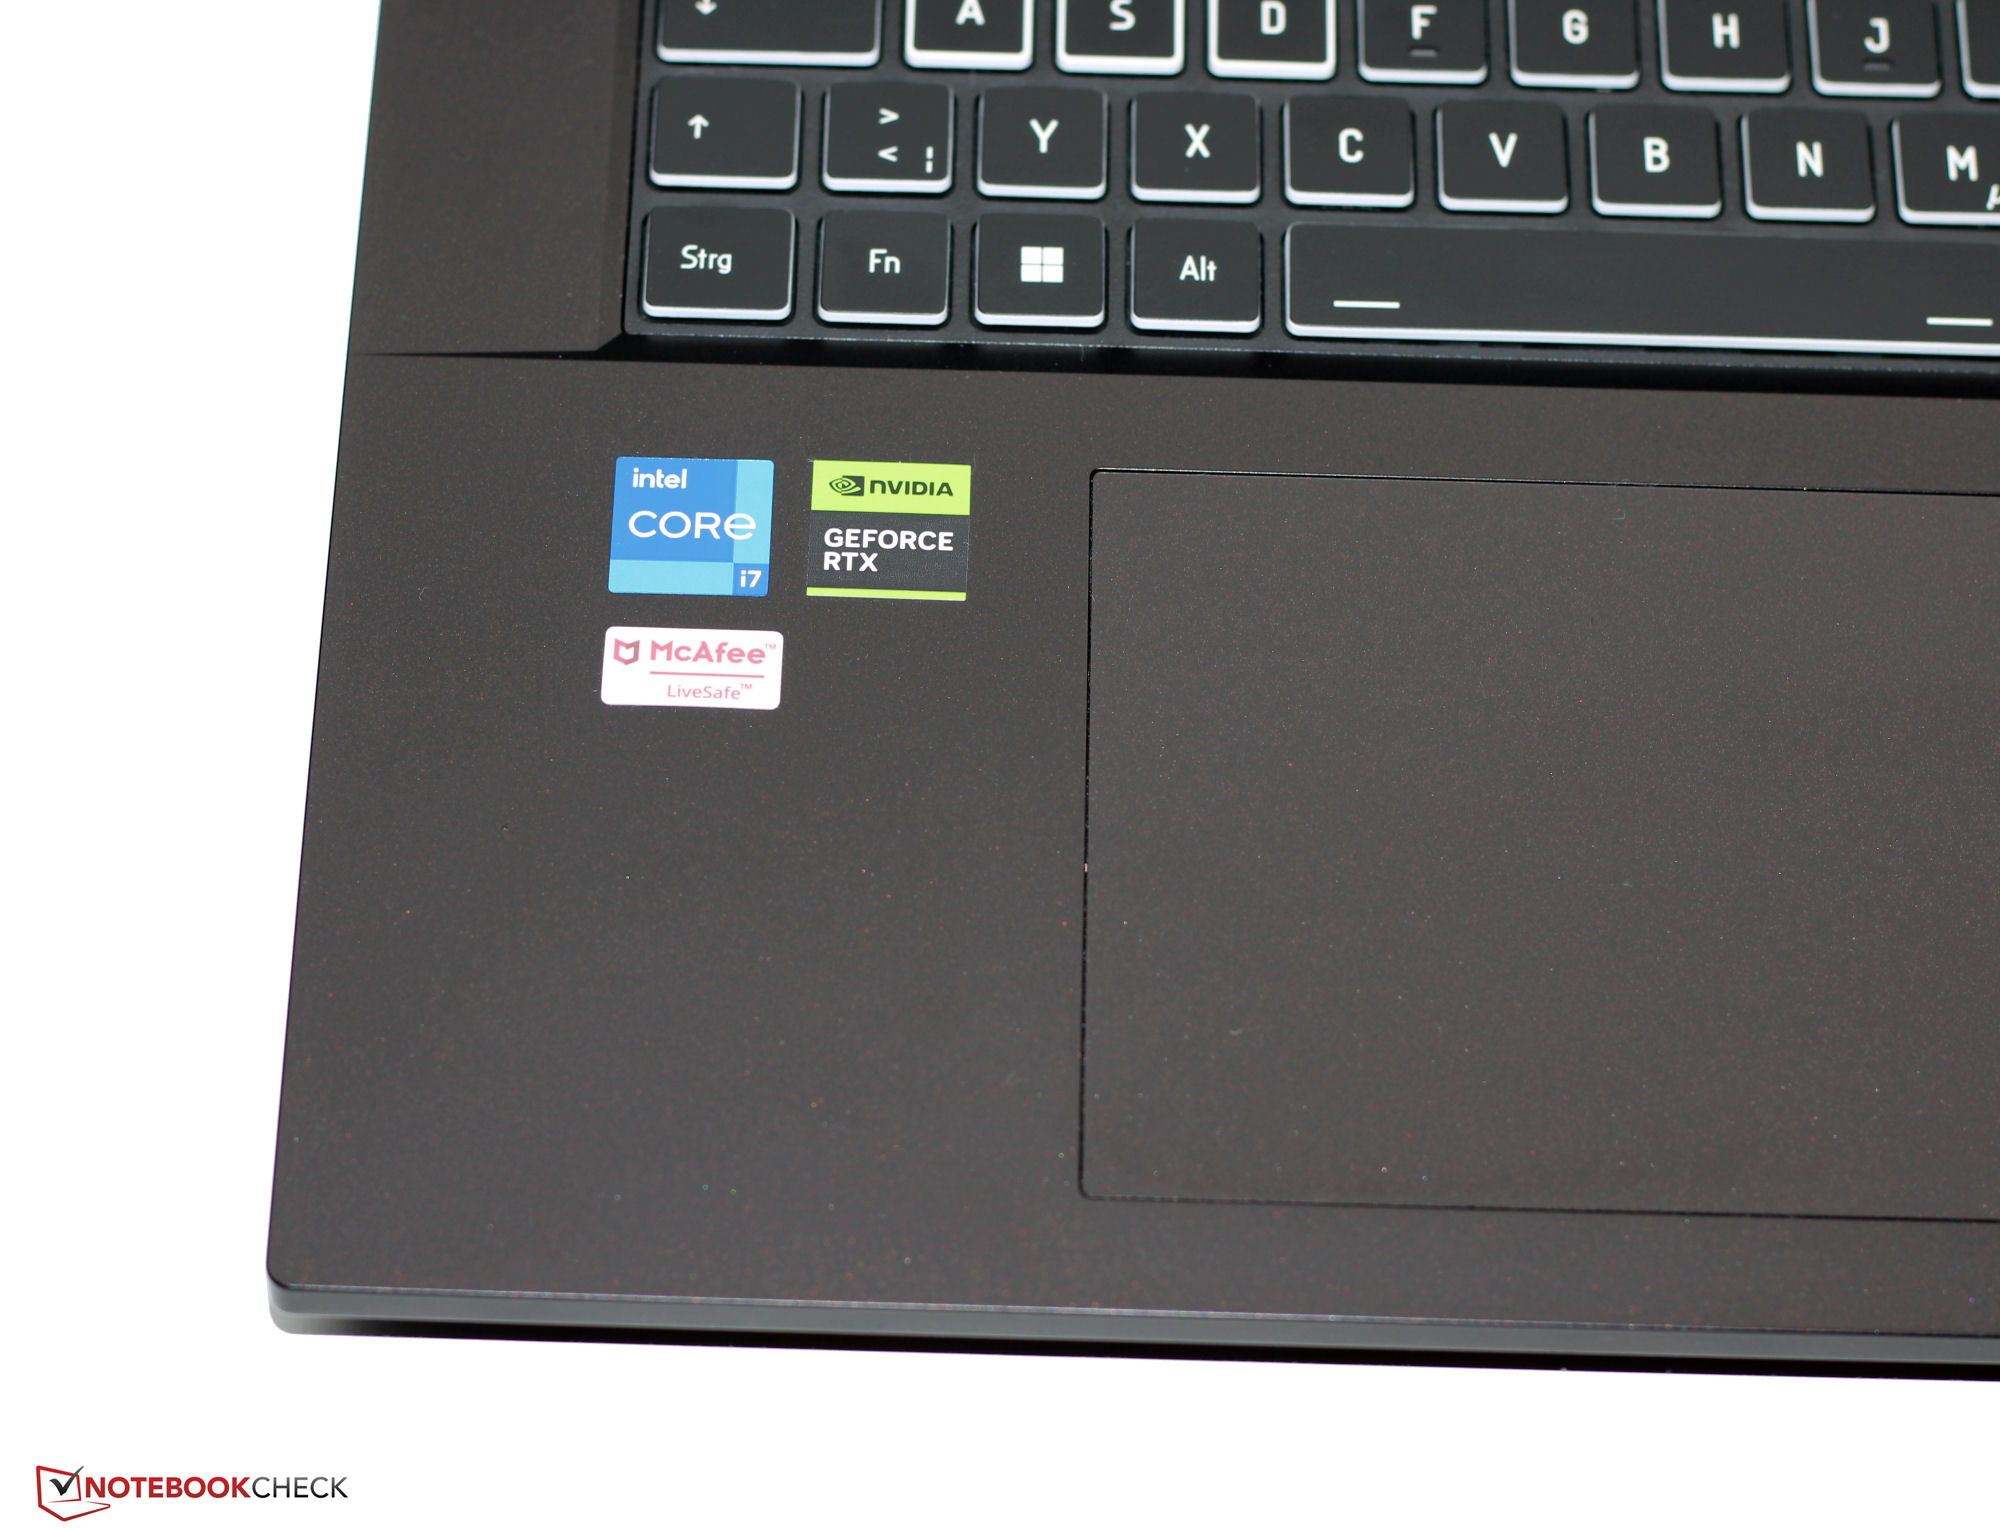
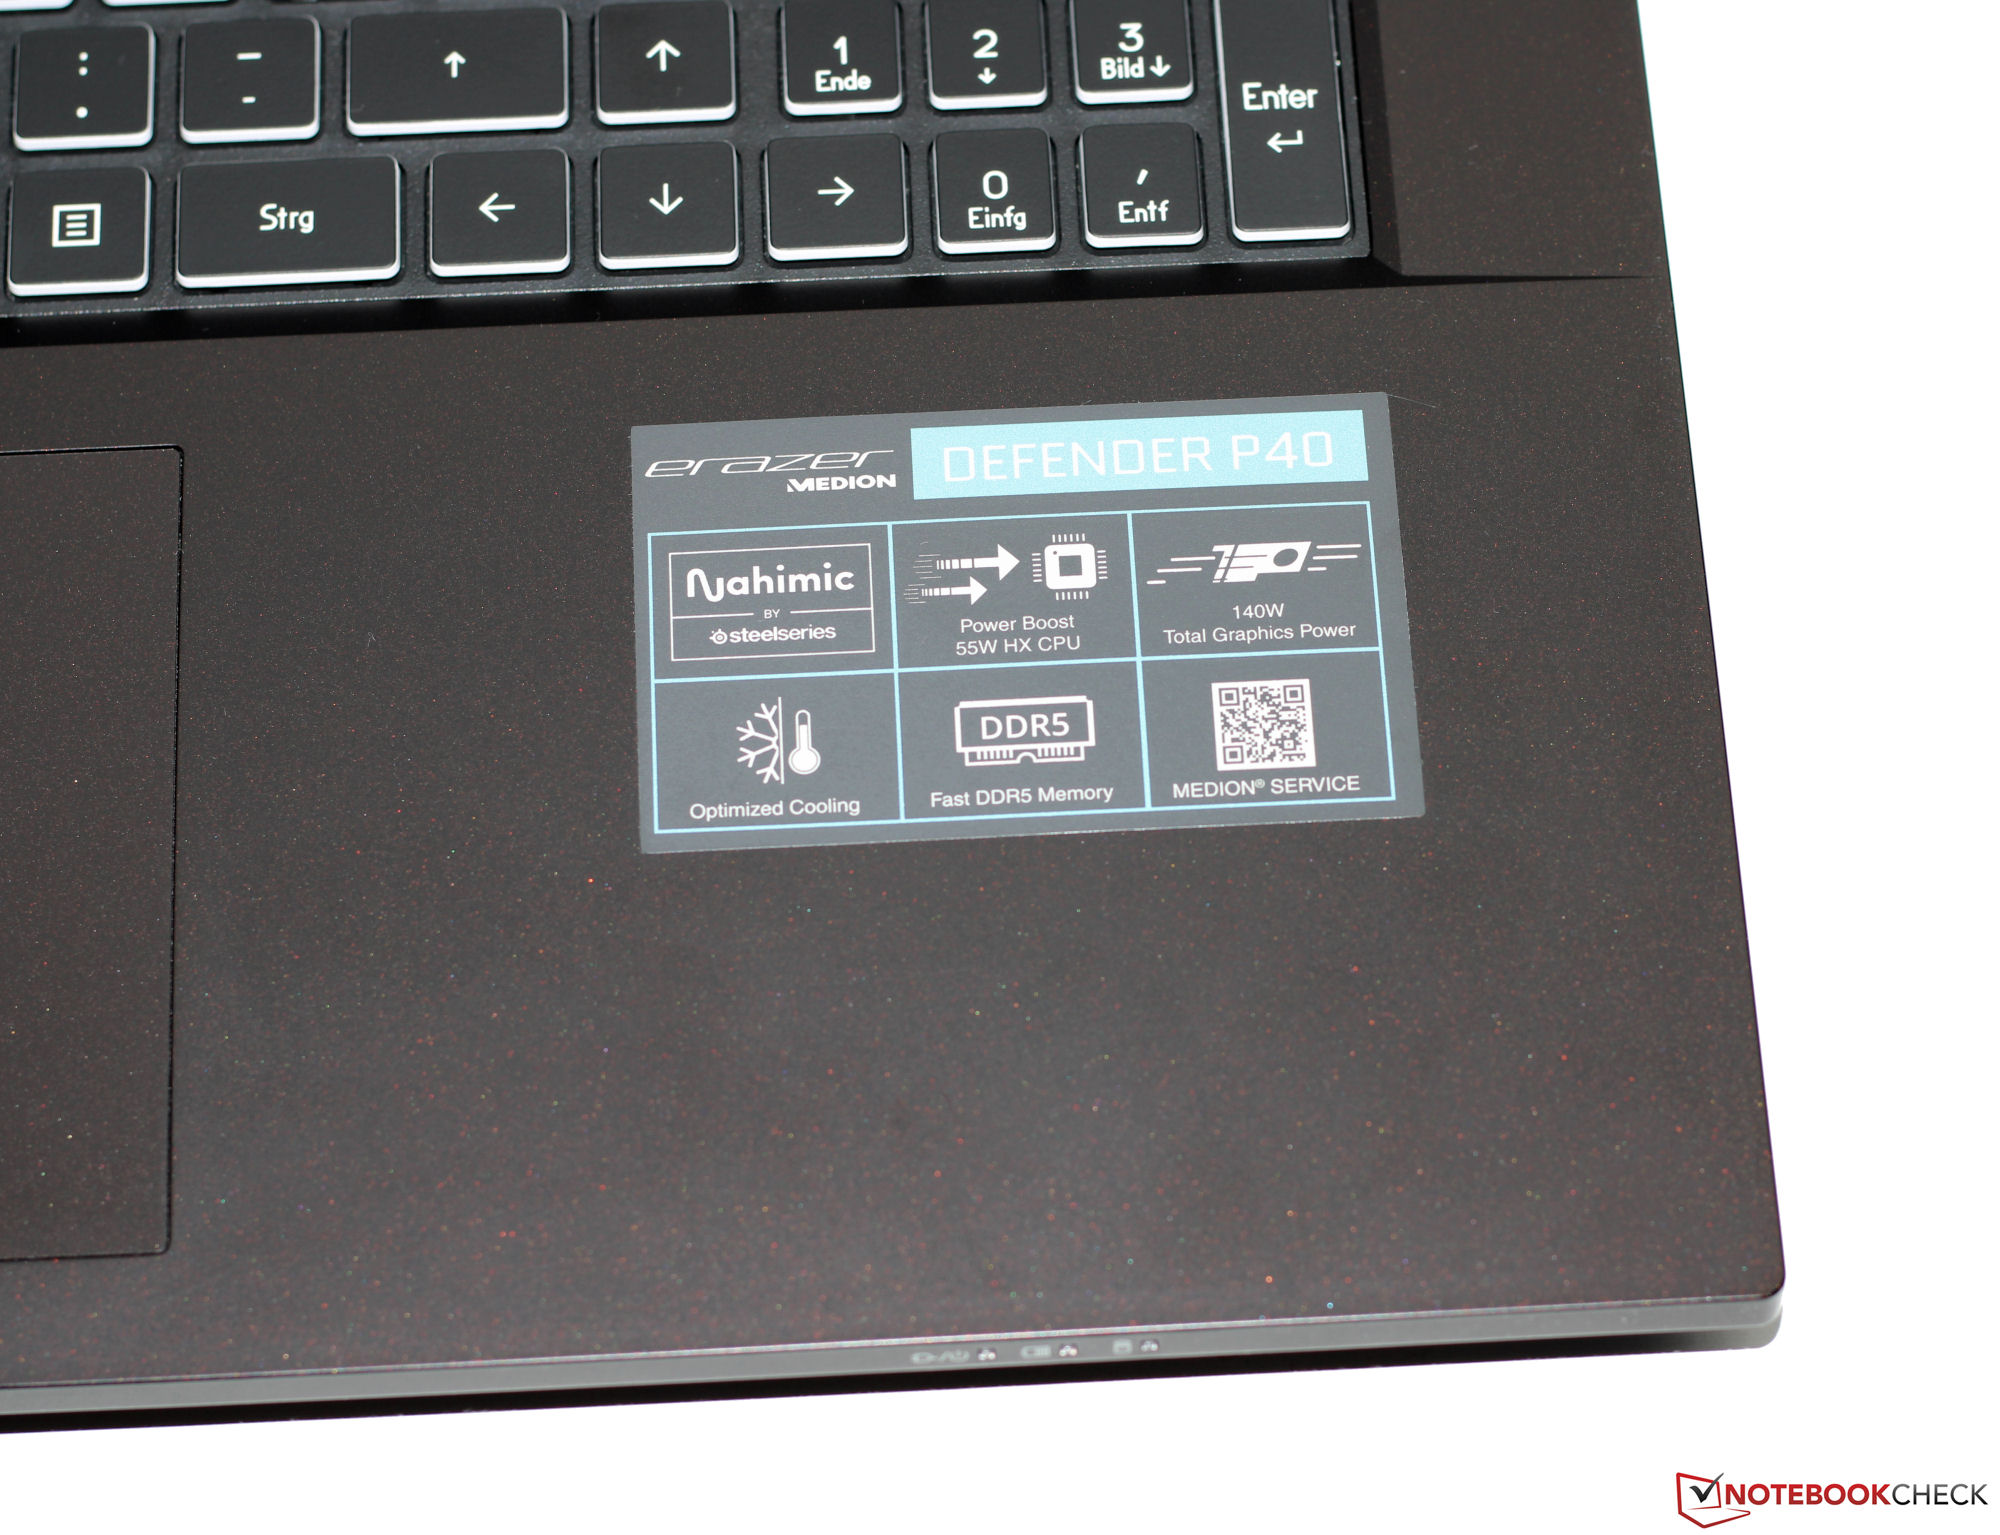
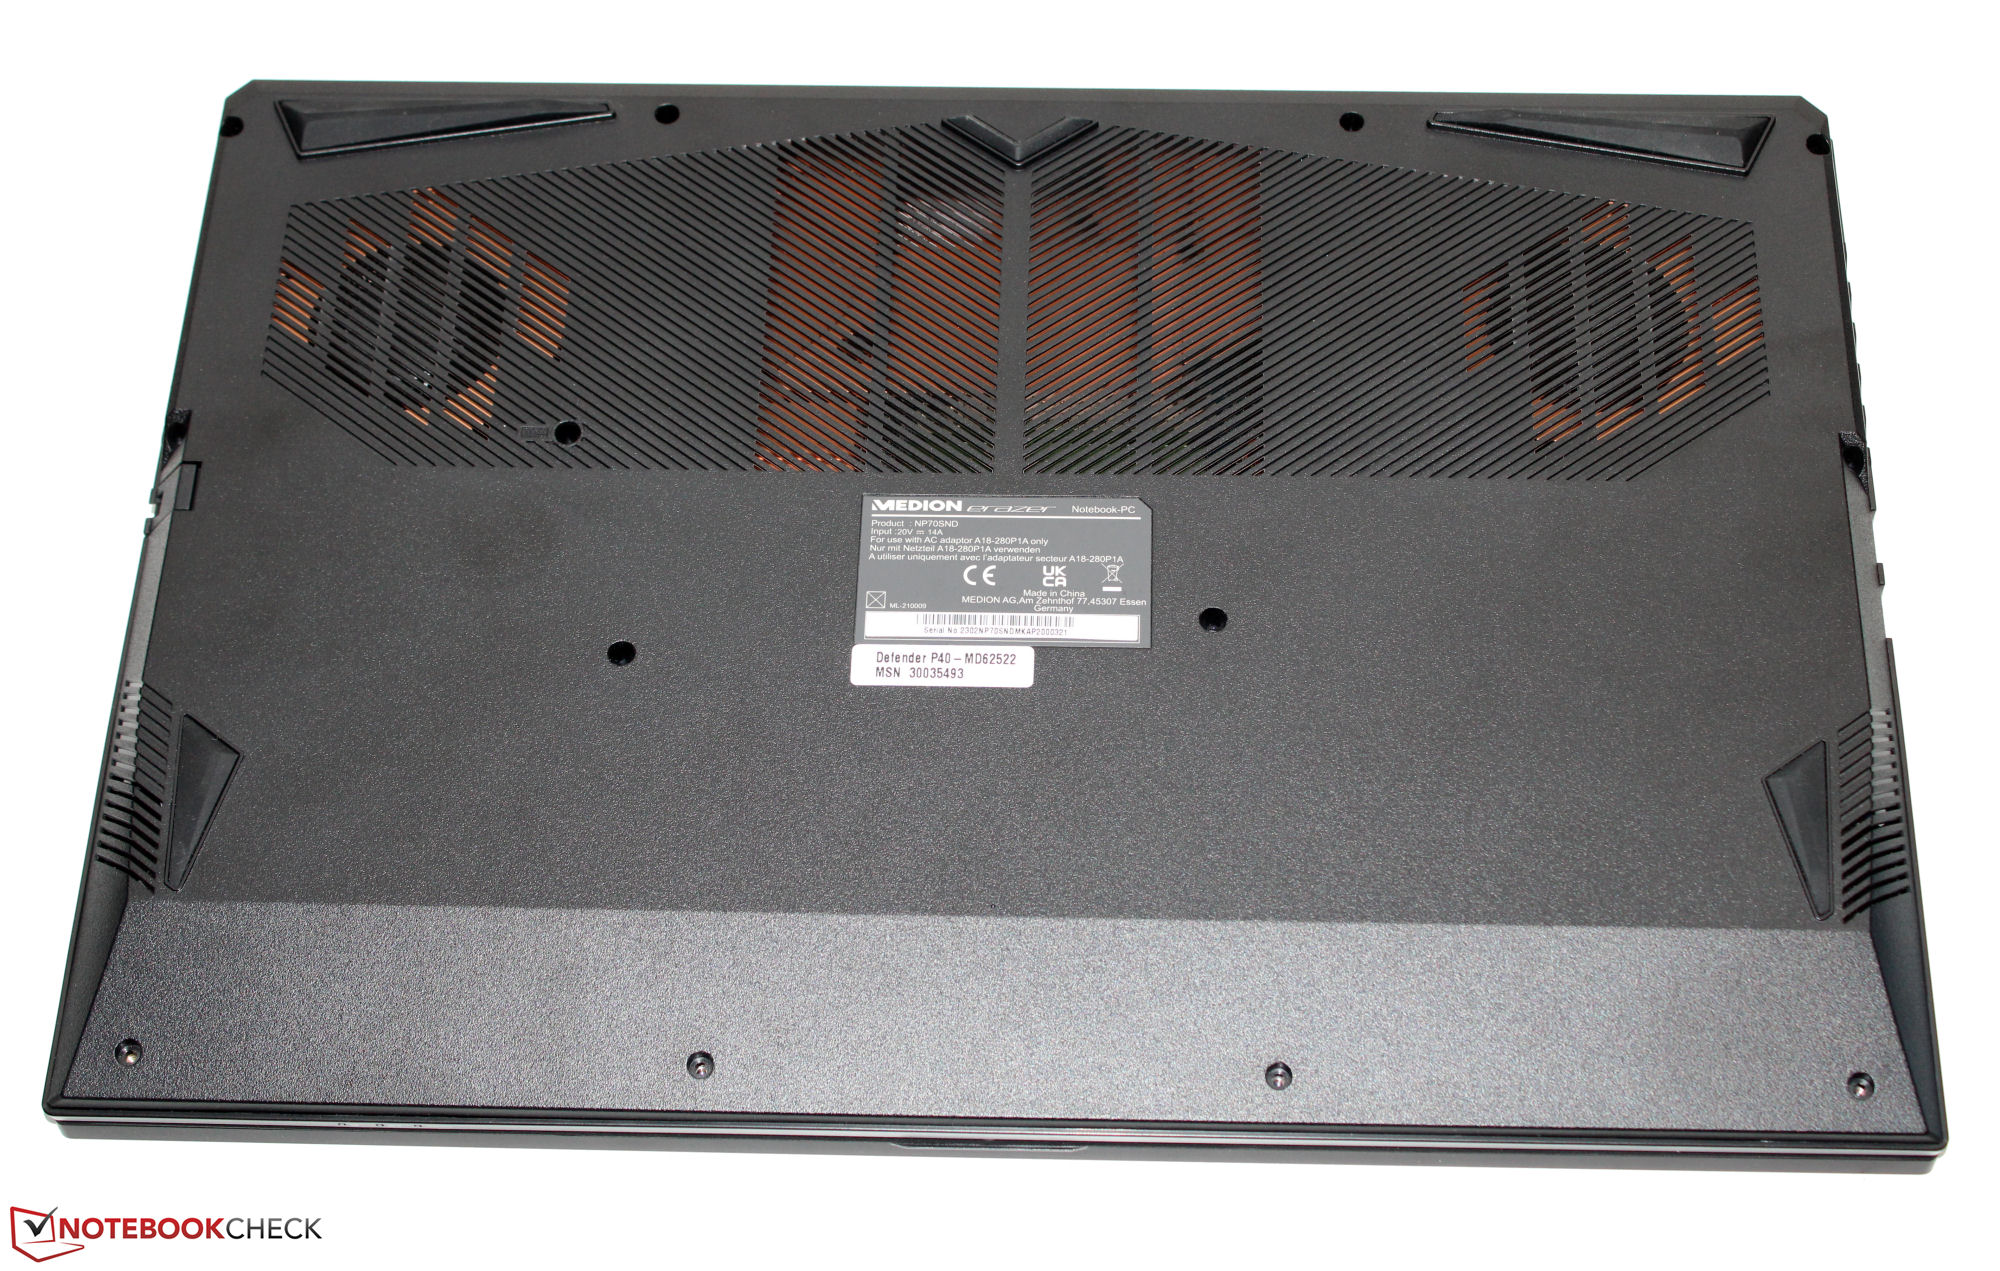
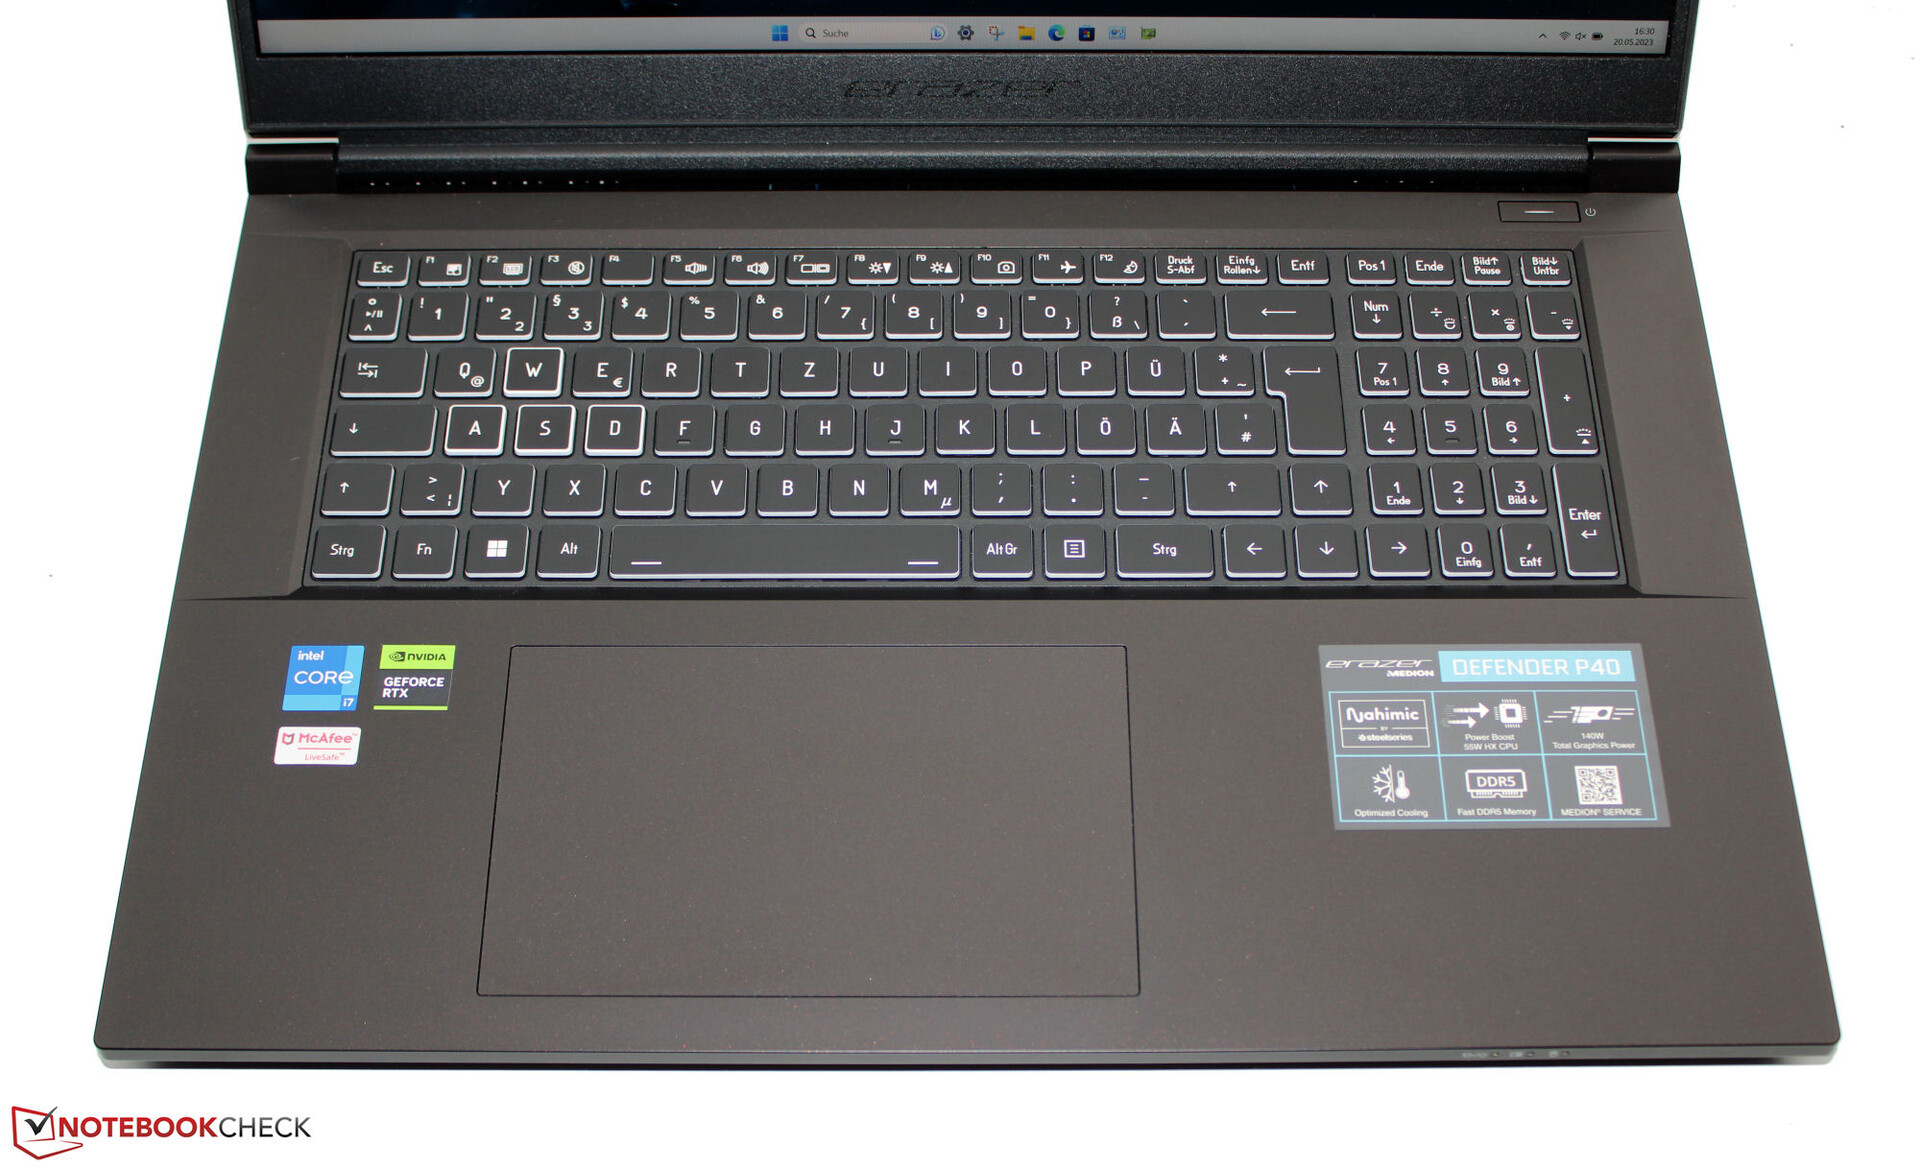
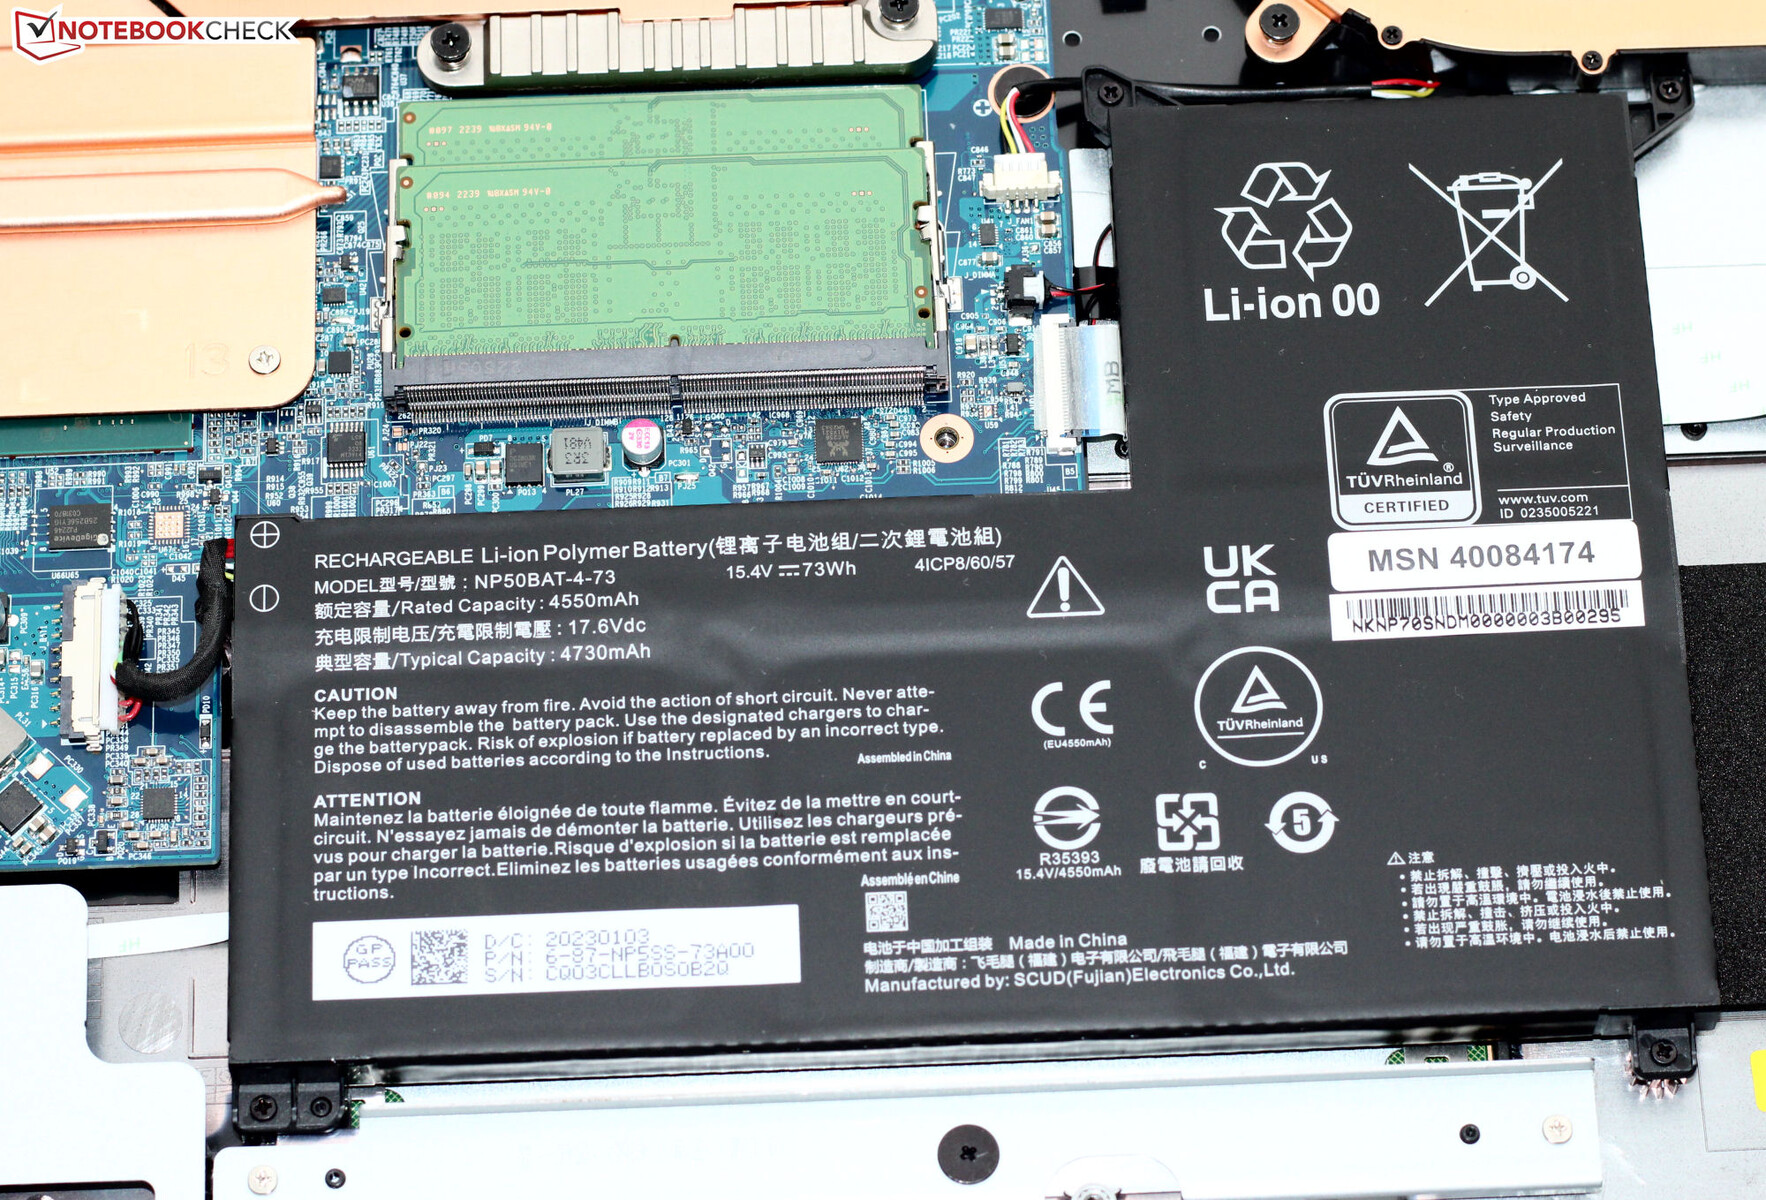
Obudowa - P40 ma plastikową obudowę
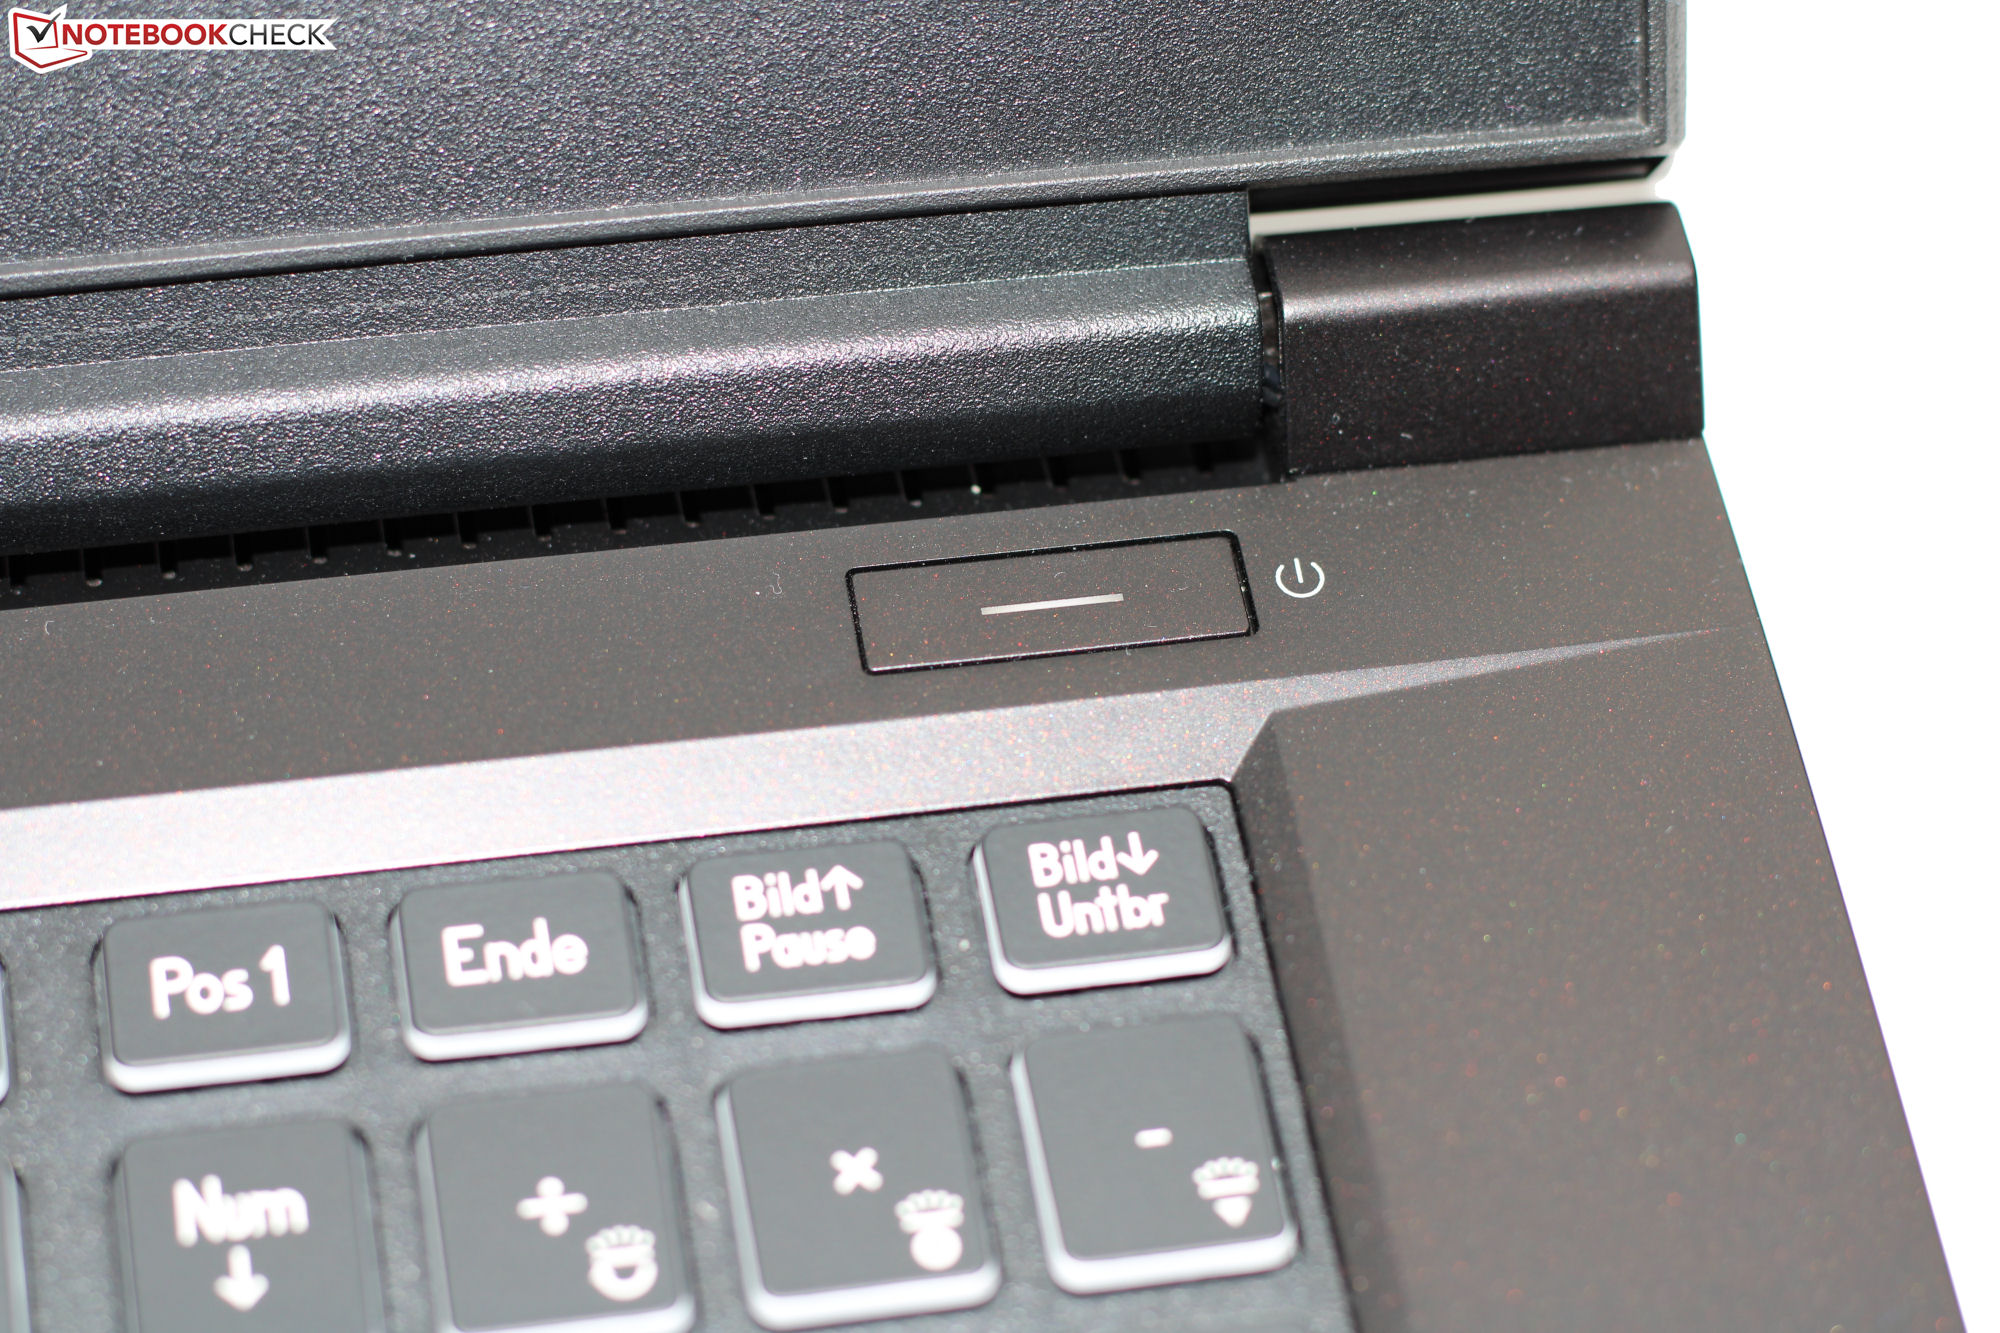
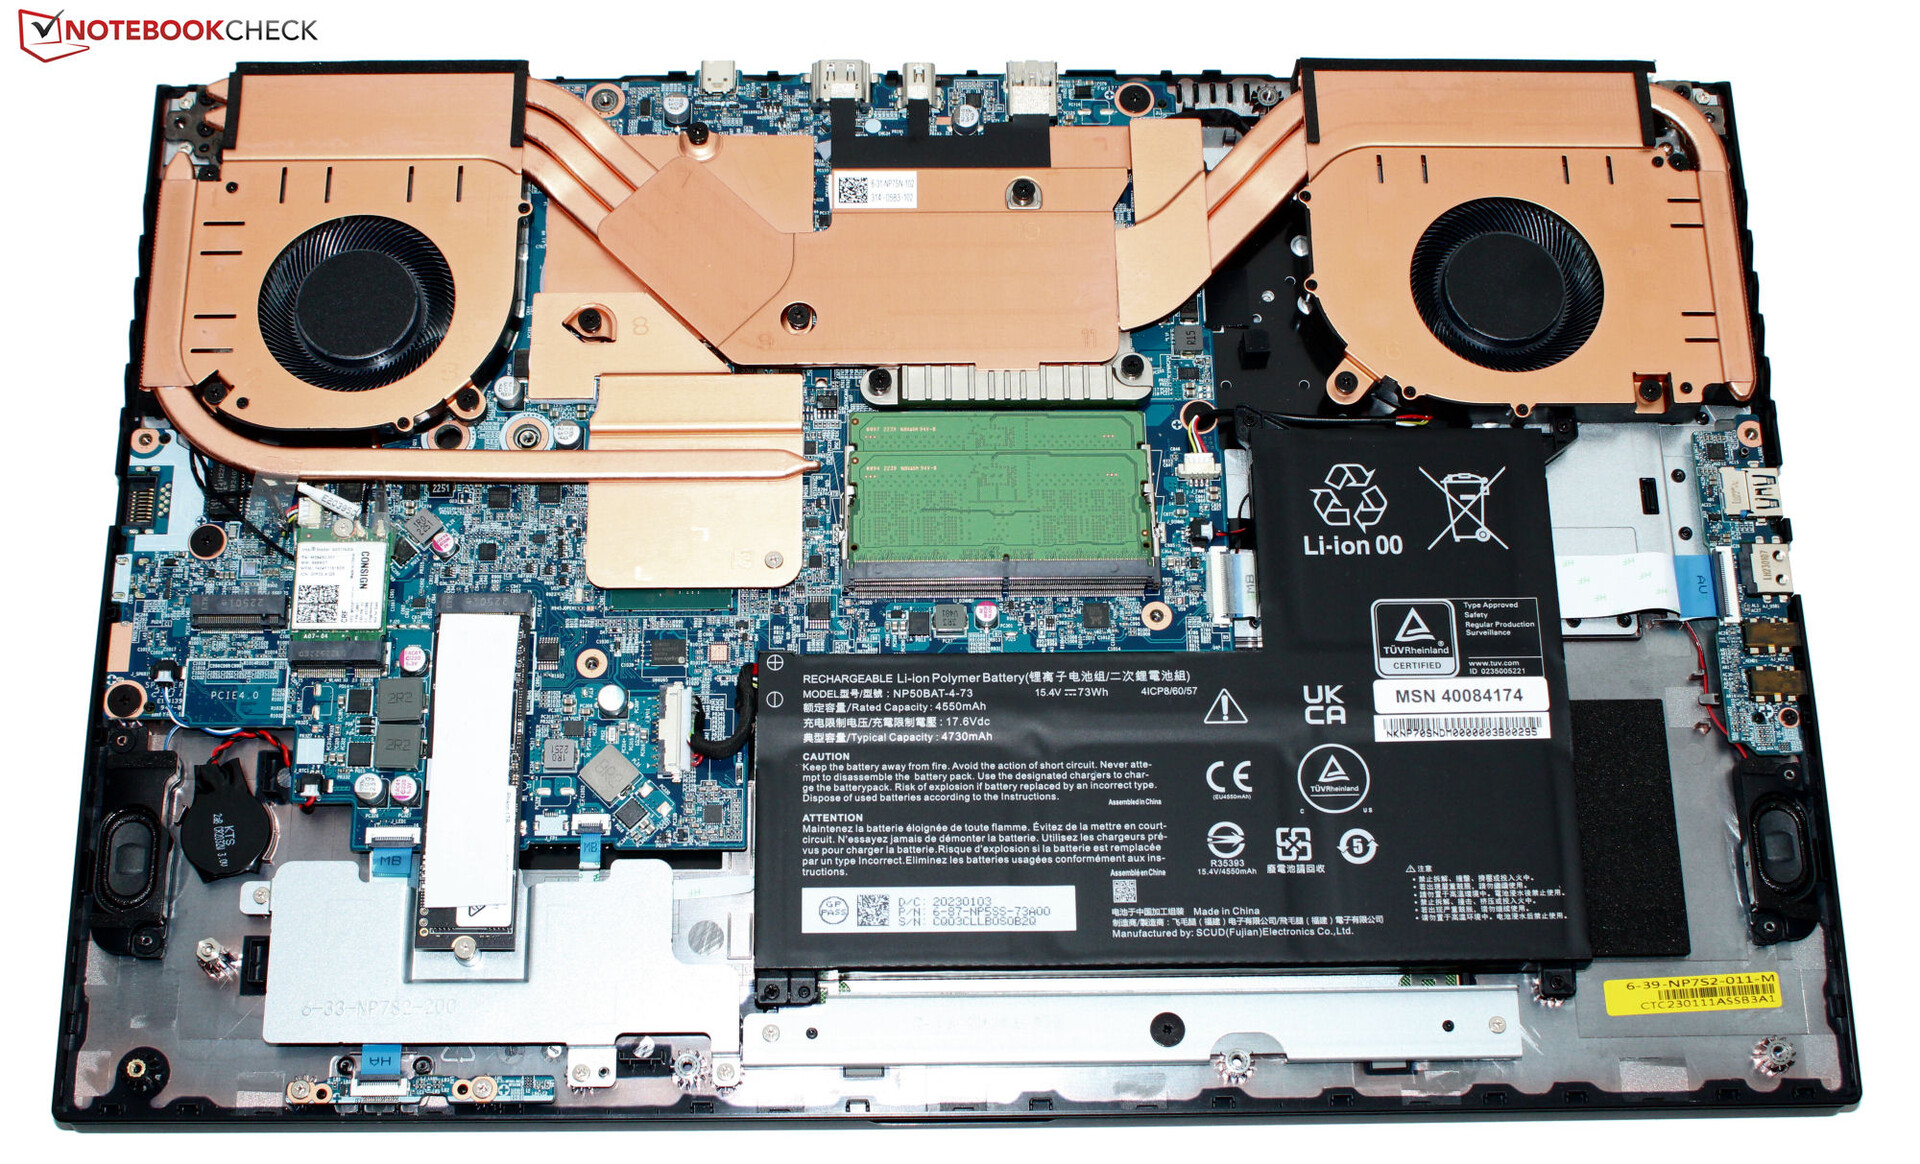
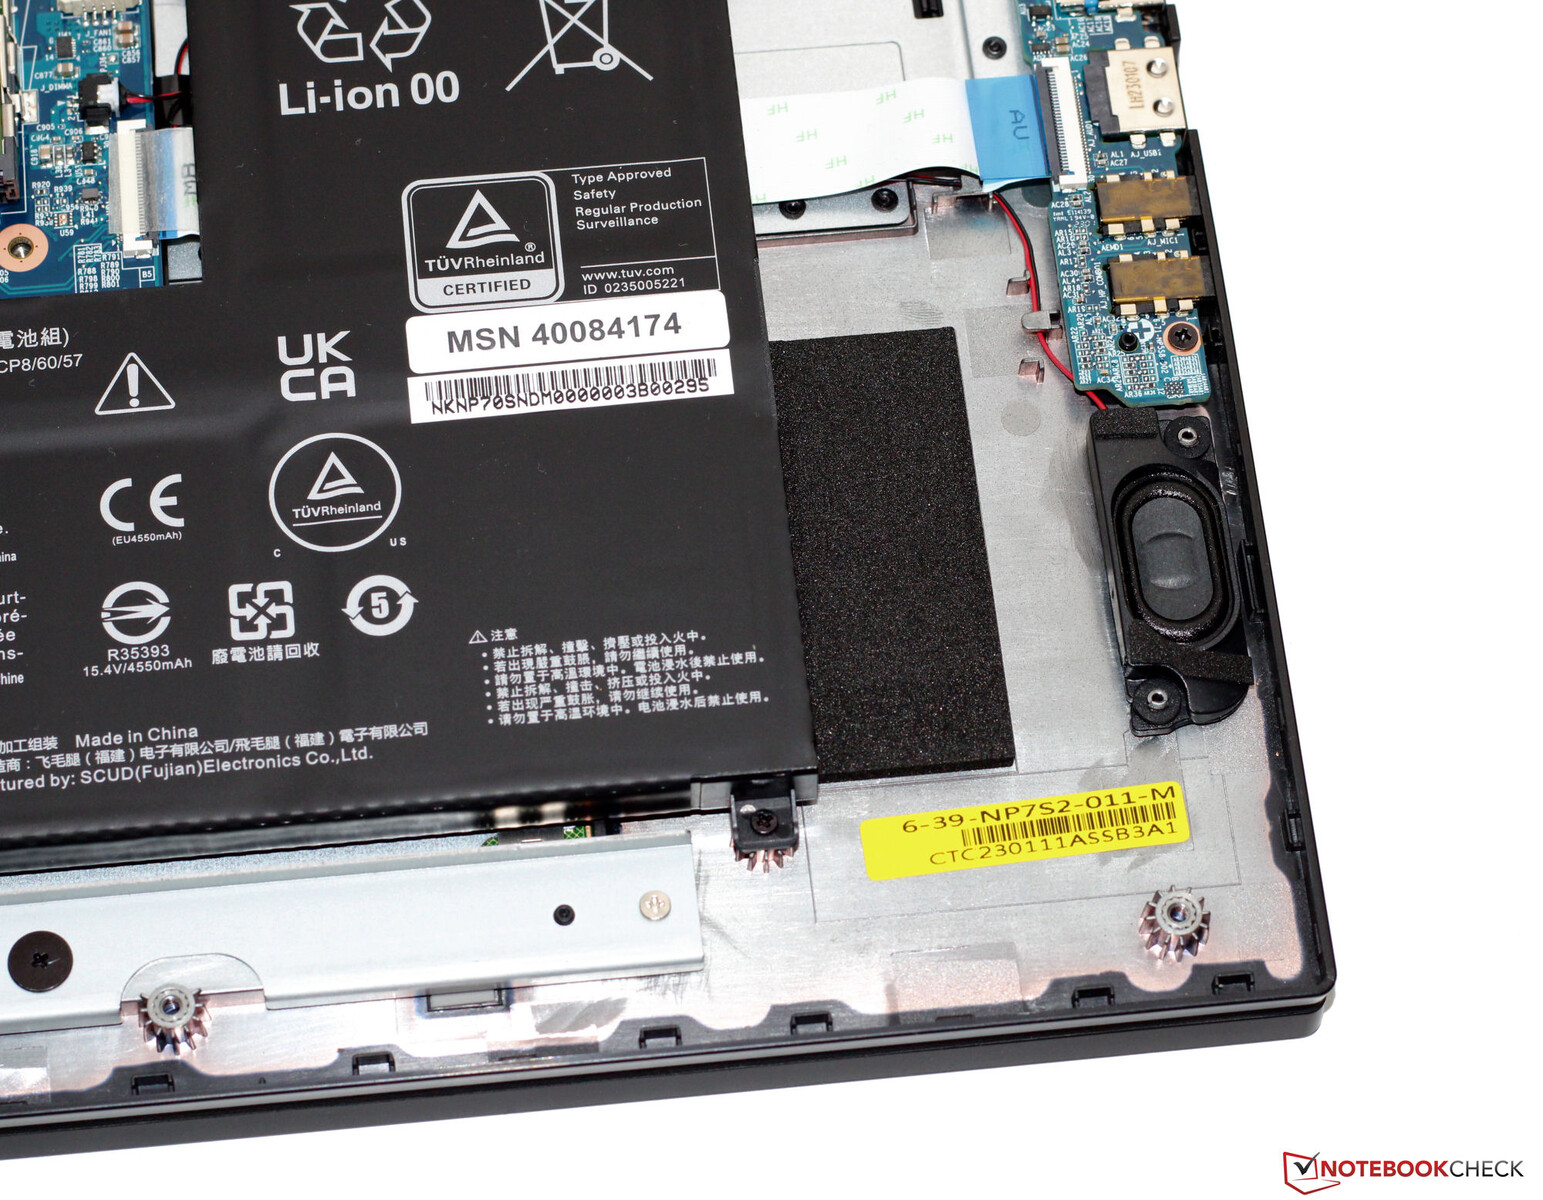
Medion wybrał czarną obudowę dla P40 z gładkimi, matowymi powierzchniami odbijającymi światło. Elegancko wyglądający laptop nie ma ekstrawaganckich cech konstrukcyjnych. Poza podświetlaną klawiaturą, laptop nie posiada żadnych elementów LED. Dostęp do baterii (przykręcanej, a nie przyklejanej), jak i reszty wnętrza laptopa jest łatwy po zdjęciu dolnej części obudowy.
Wykonanie nie budzi zastrzeżeń - wszystkie szczeliny są spasowane i nie ma ostrych krawędzi. Podstawę i pokrywę można lekko przekręcić, ale nie jest to nic nadzwyczajnego. Zawiasy mocno trzymają pokrywę laptopa w miejscu, a maksymalny kąt jej otwarcia wynosi około 135 stopni. Laptopa można otworzyć jedną ręką.
P40 jest nieco bardziej kompaktowy niżKatana 17ale waży około 100 gramów więcej. Oba urządzenia są pokonane przezGigabyte G7 KEw tych kategoriach.
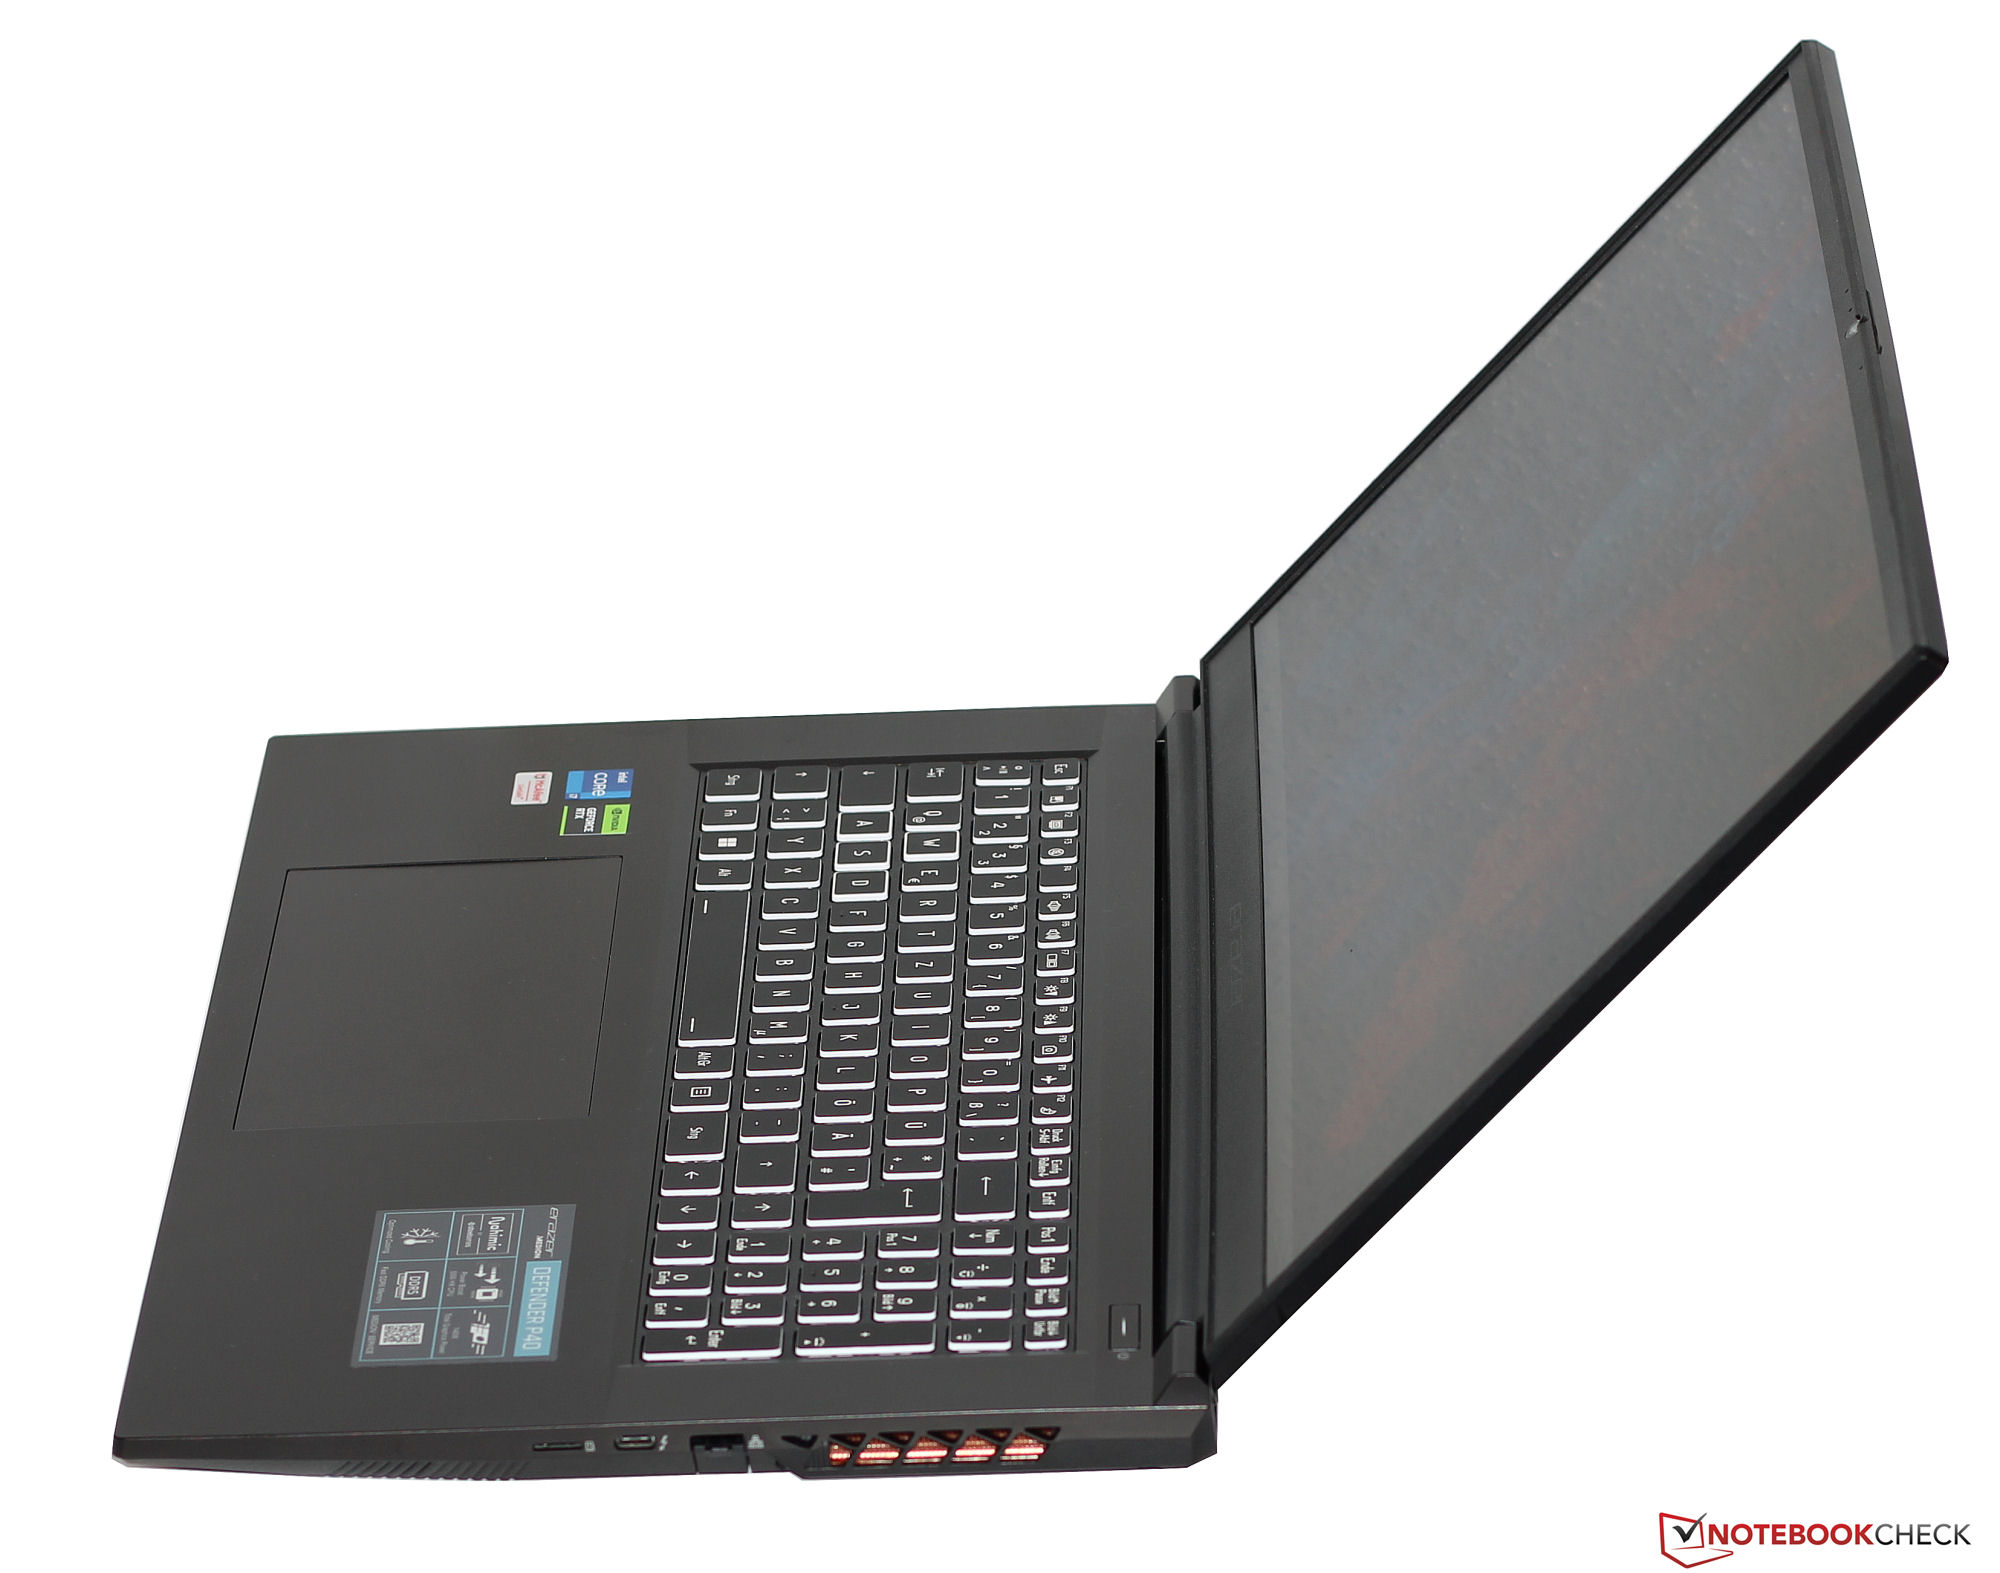
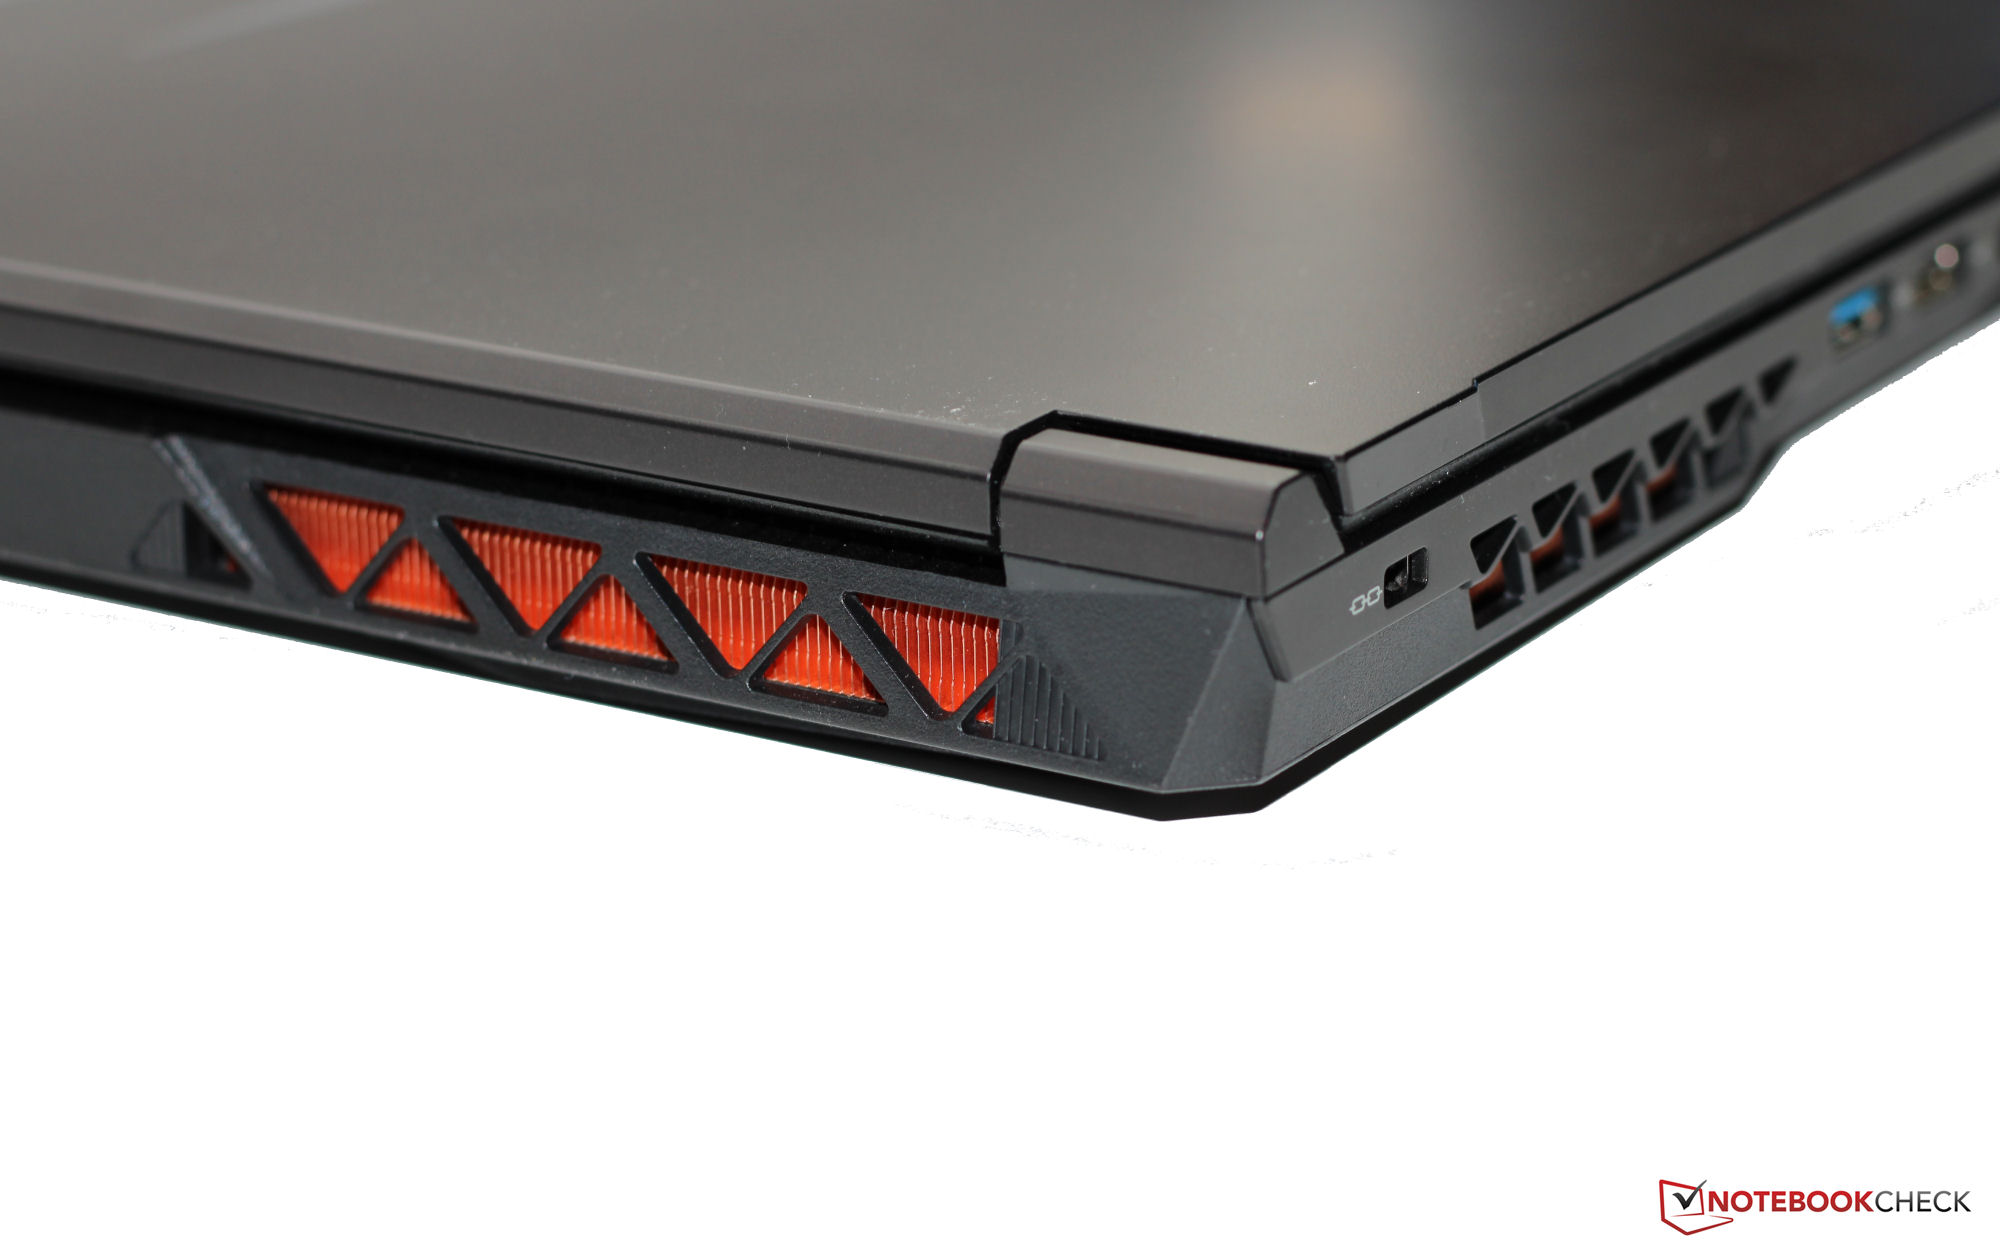
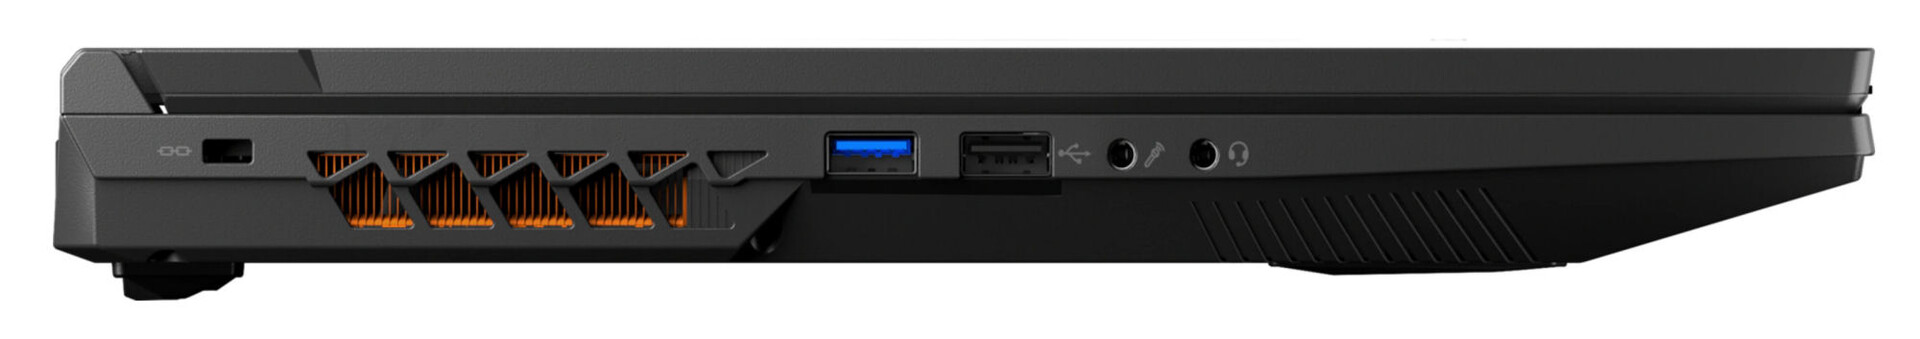
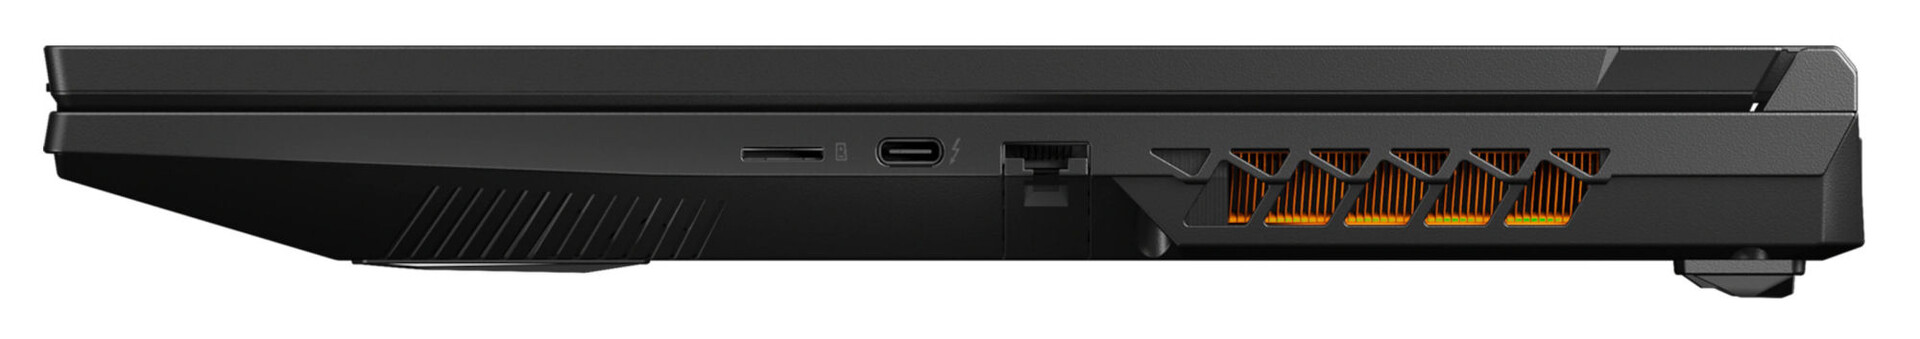
Łączność - Medion Defender ma Thunderbolt, ale nie ma Power Delivery
Pomimo rozmiaru 17,3 cala, laptop ma tylko dwa złącza USB-A (1x USB 3.2 Gen 1, 1x USB 2.0) - trzeci port po prawej stronie laptopa byłby naprawdę przydatny. Żaden z portów USB-C (1x Thunderbolt 4, 1x USB 3.2 Gen 2) nie obsługuje Power Delivery, ale port TB4 może wyprowadzać sygnał DisplayPort. W sumie urządzenie ma trzy wyjścia wideo (2x DP, 1x HDMI), dwa porty audio i port Gigabit Ethernet.
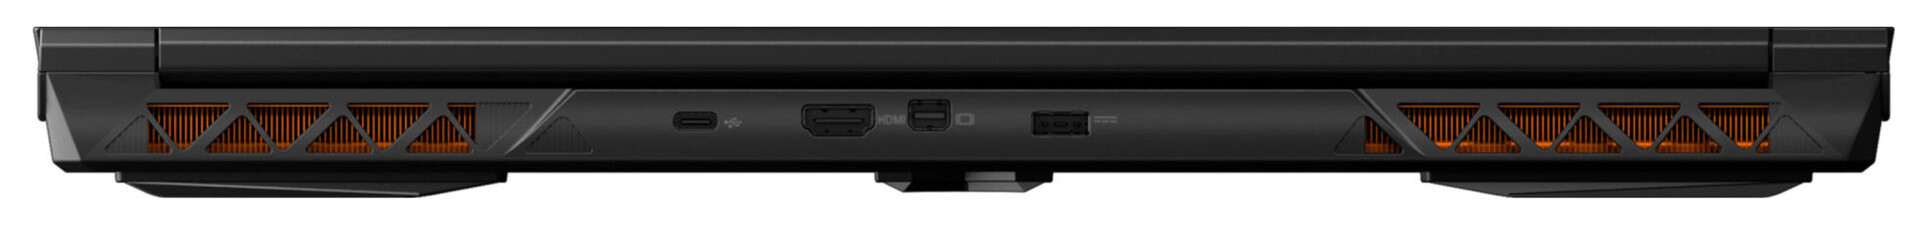
Dwa wyjścia wideo i złącze zasilania znajdują się z tyłu laptopa. Odpowiednie kable biegną z tyłu urządzenia - co oznacza, że nie będą przeszkadzać. Niestety, tego samego nie można powiedzieć o kablu Ethernet, jeśli jest on używany.
Czytnik kart SD
Czytnik kart SD (karta referencyjna: AV PRO microSD 128 GB V60) charakteryzuje się maksymalnymi transferami na poziomie 86 MB/s (przesyłanie 250 zdjęć jpg - około 5 MB każde) oraz 91 MB/s (kopiowanie dużych bloków danych) - co czyni ten model przeciętnie szybkim.
| SD Card Reader | |
| average JPG Copy Test (av. of 3 runs) | |
| Średnia w klasie Gaming (20.9 - 210, n=54, ostatnie 2 lata) | |
| HP Omen 17-ck1075ng (AV Pro SD microSD 128 GB V60) | |
| Medion Erazer Defender P40 (AV PRO microSD 128 GB V60) | |
| MSI GE78HX 13VH-070US (Angelibird AV Pro V60) | |
| maximum AS SSD Seq Read Test (1GB) | |
| Średnia w klasie Gaming (25.5 - 261, n=51, ostatnie 2 lata) | |
| HP Omen 17-ck1075ng (AV Pro SD microSD 128 GB V60) | |
| Medion Erazer Defender P40 (AV PRO microSD 128 GB V60) | |
| Gigabyte G7 KE (AV PRO microSD 128 GB V60) | |
| MSI GE78HX 13VH-070US (Angelibird AV Pro V60) | |
Komunikacja
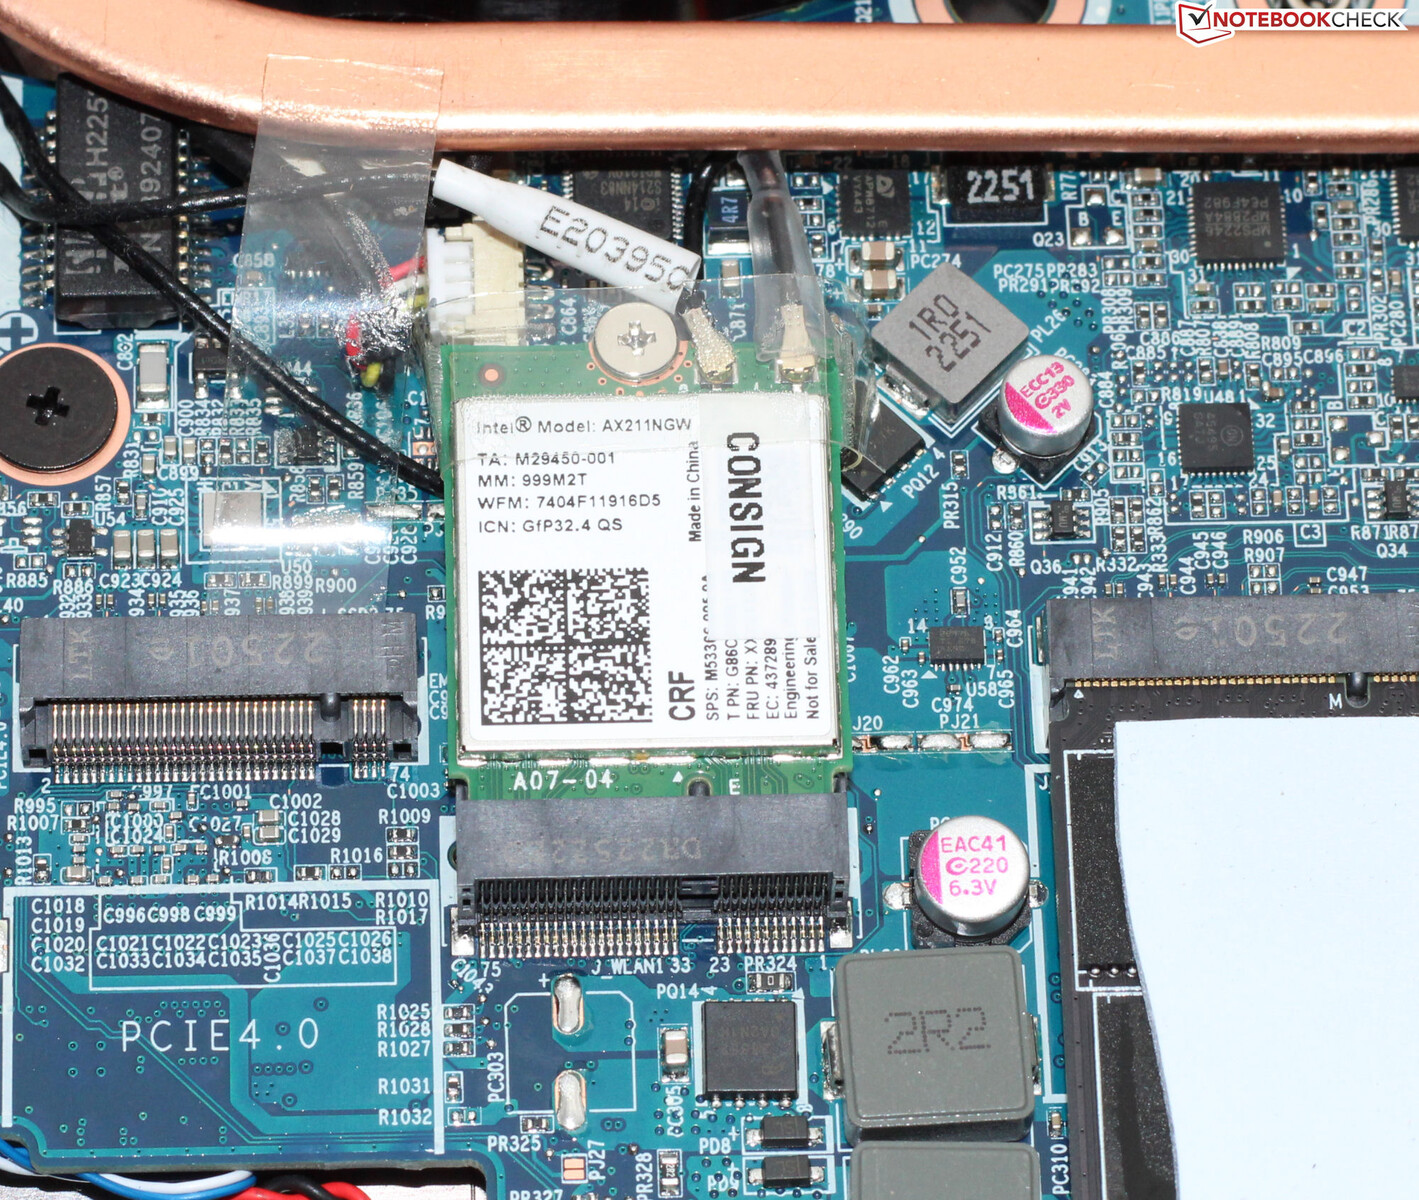
W optymalnych warunkach (brak urządzeń WLAN w bliskim sąsiedztwie, niewielka odległość między laptopem a serwerem PC), laptop był w stanie osiągnąć imponujące prędkości transmisji danych WiFi. Laptop Medion wykorzystuje układ WiFi 6E (Intel AX211). Za połączenia przewodowe również odpowiada układ Intela (I219-V; 1 GBit/s).
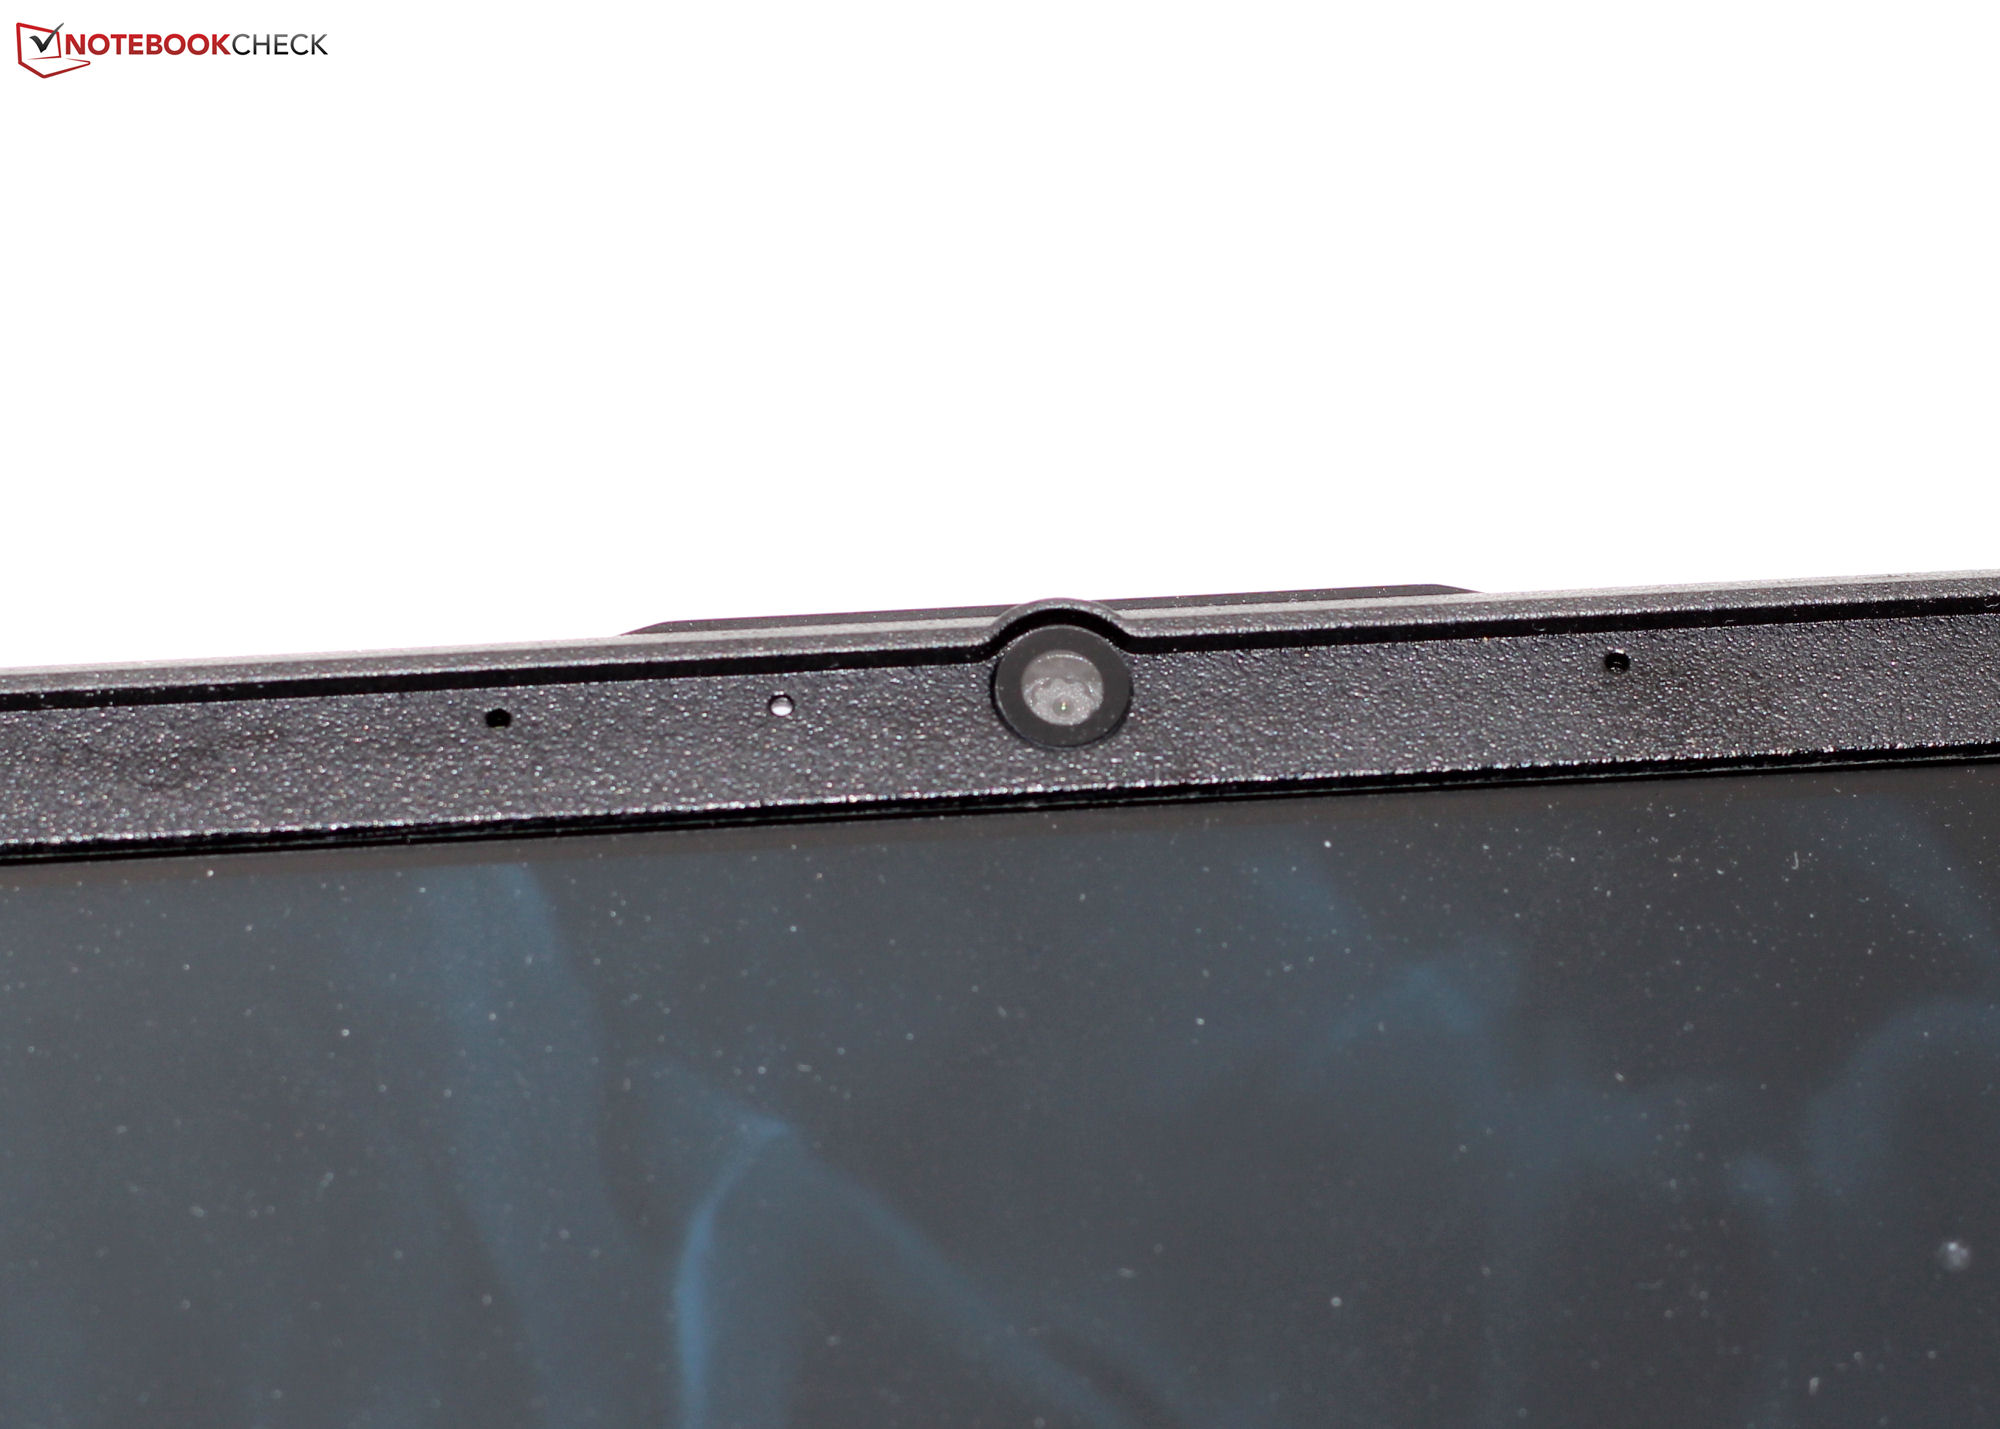
Kamera internetowa
Kamerka internetowa (0,9 MP, maks. 1280 x 720 pikseli) nie ma mechanicznej osłony. Jej jakość niestety nie jest najlepsza - jednak w porównaniu, jej odchylenia kolorystyczne są wręcz minimalne.


Akcesoria
Poza zwykłymi dokumentami (skrócona instrukcja obsługi i informacje o gwarancji), laptop nie jest dostarczany z żadnymi dodatkowymi akcesoriami.
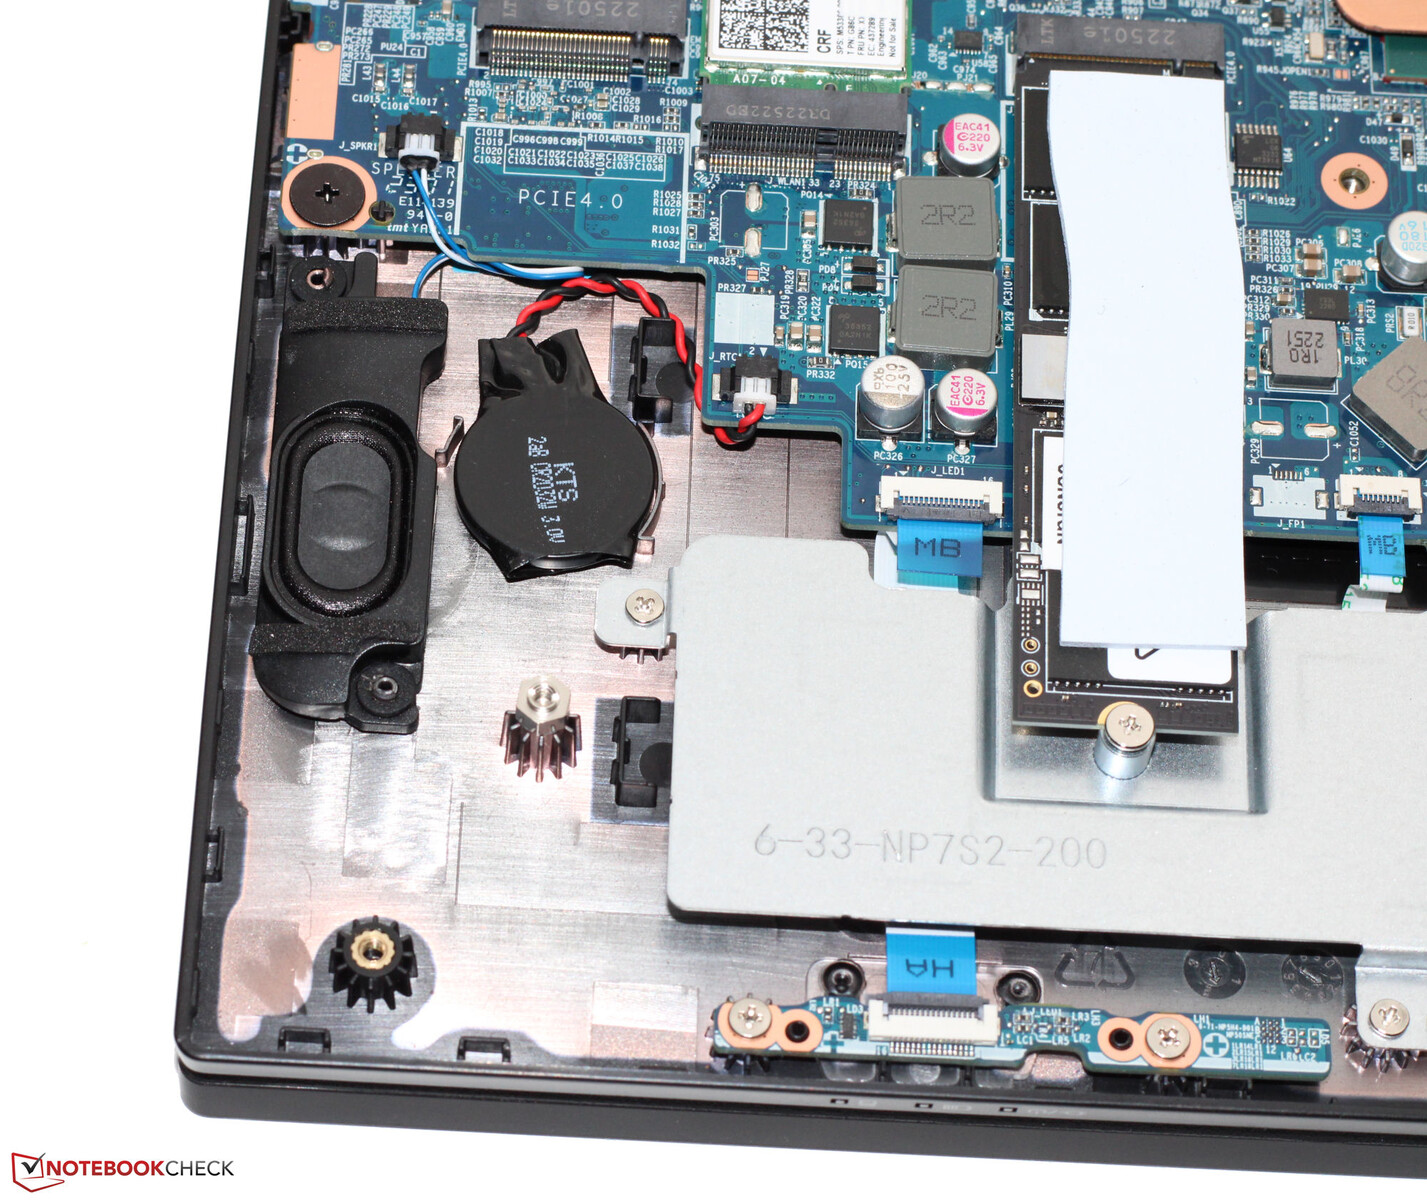
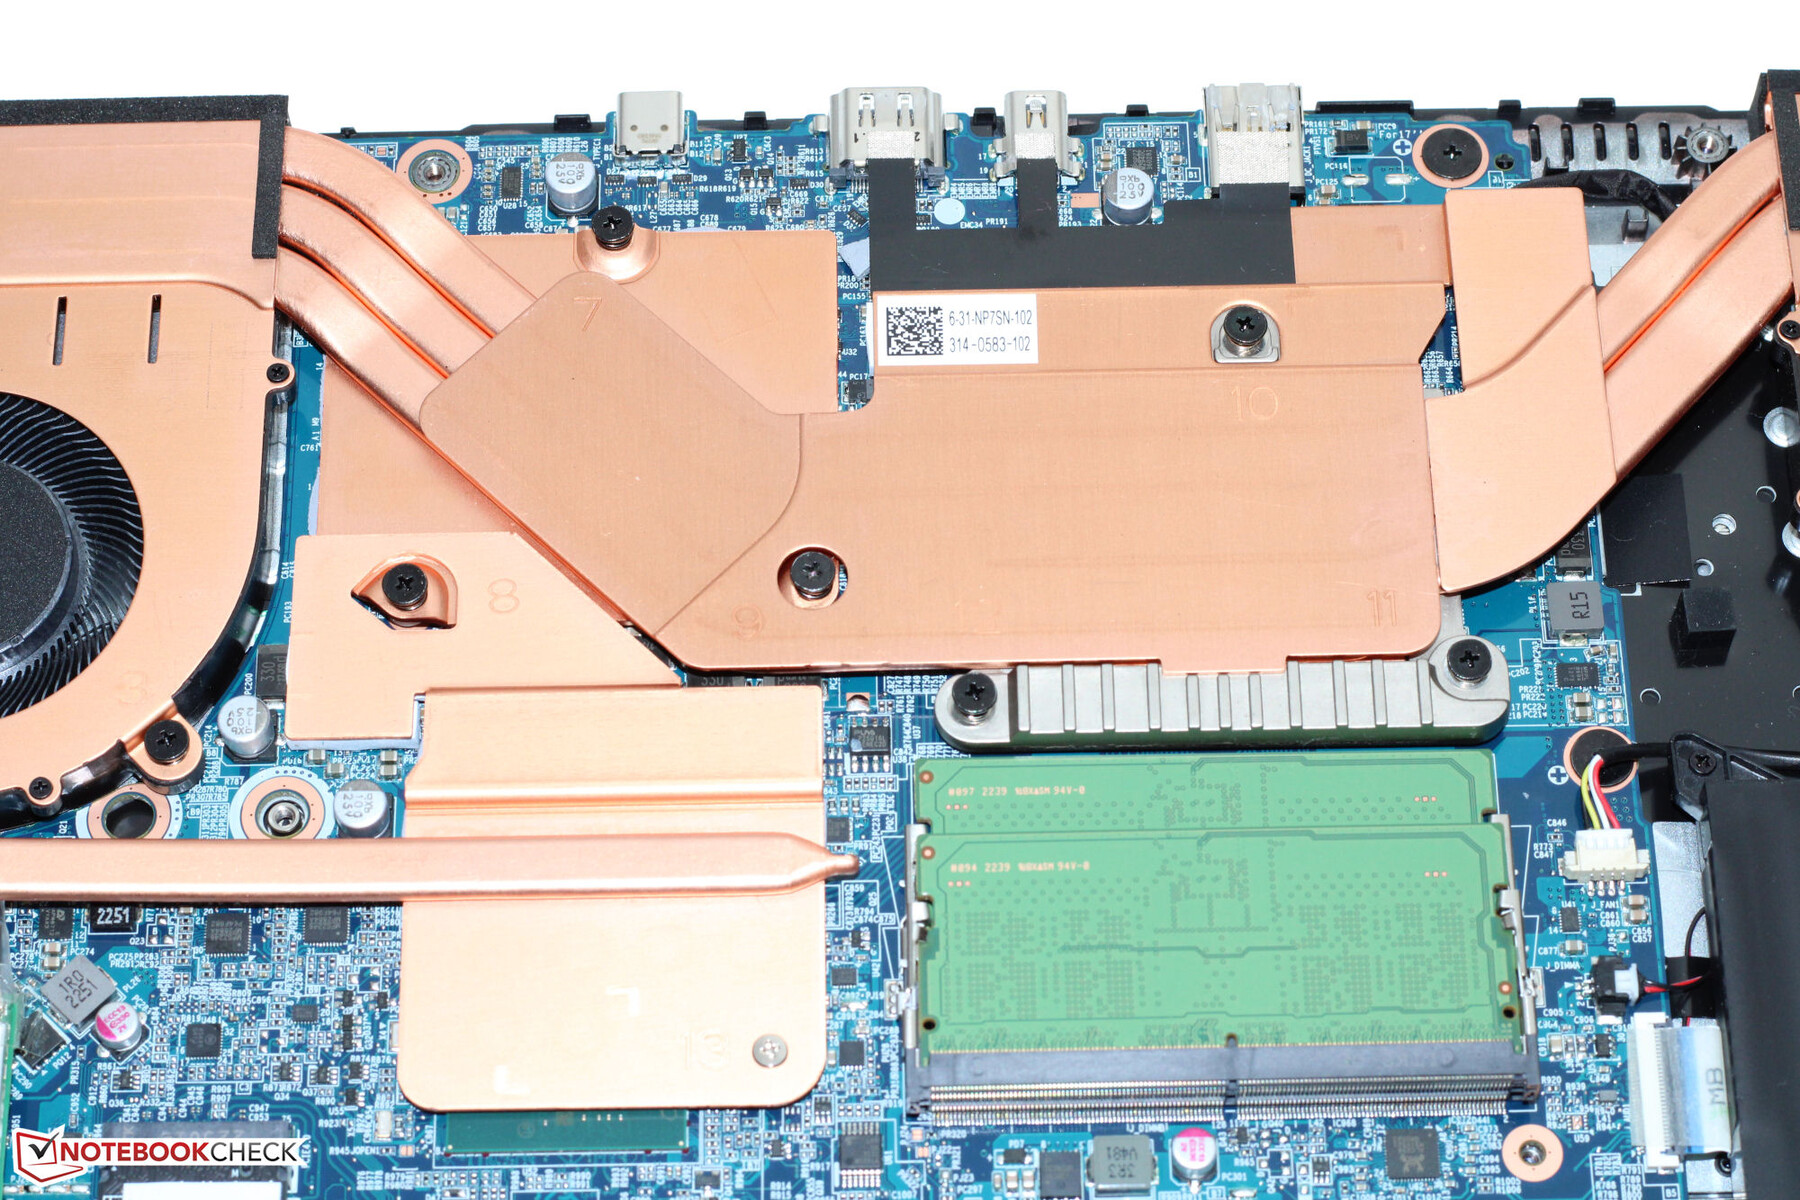
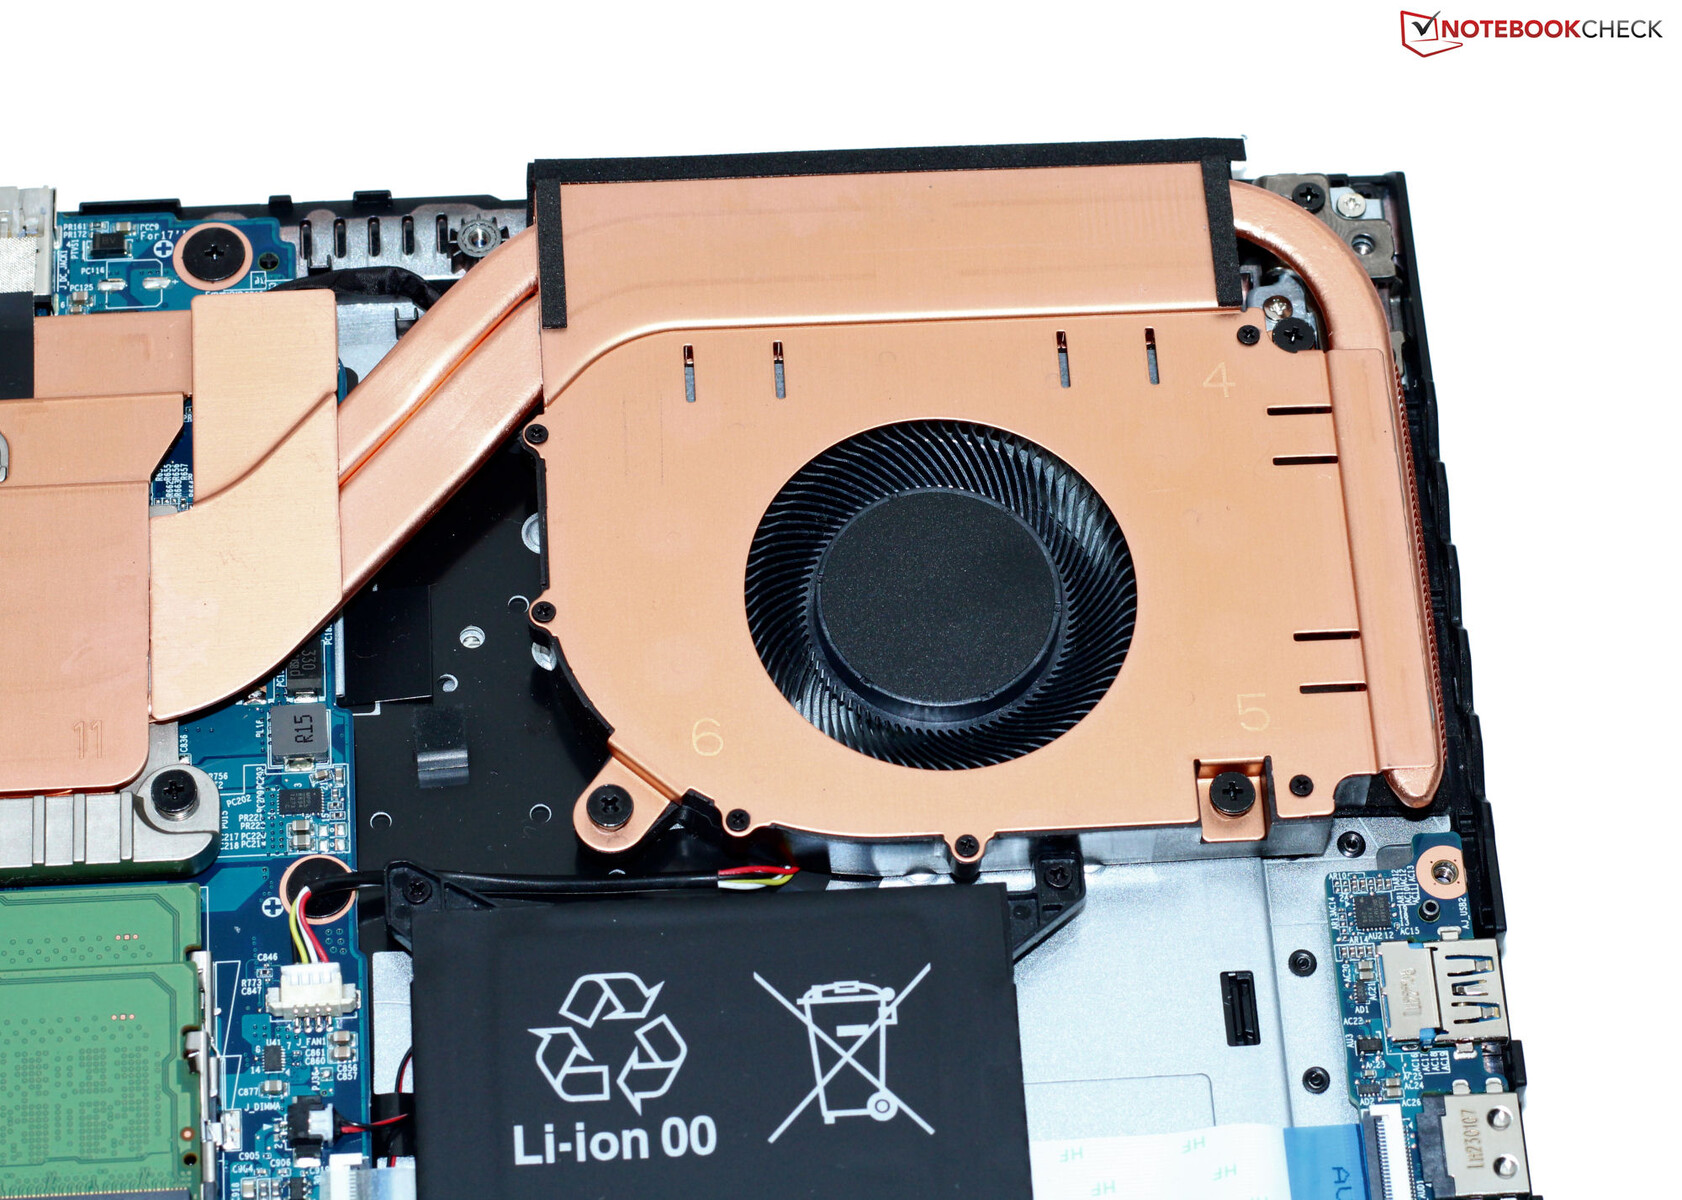
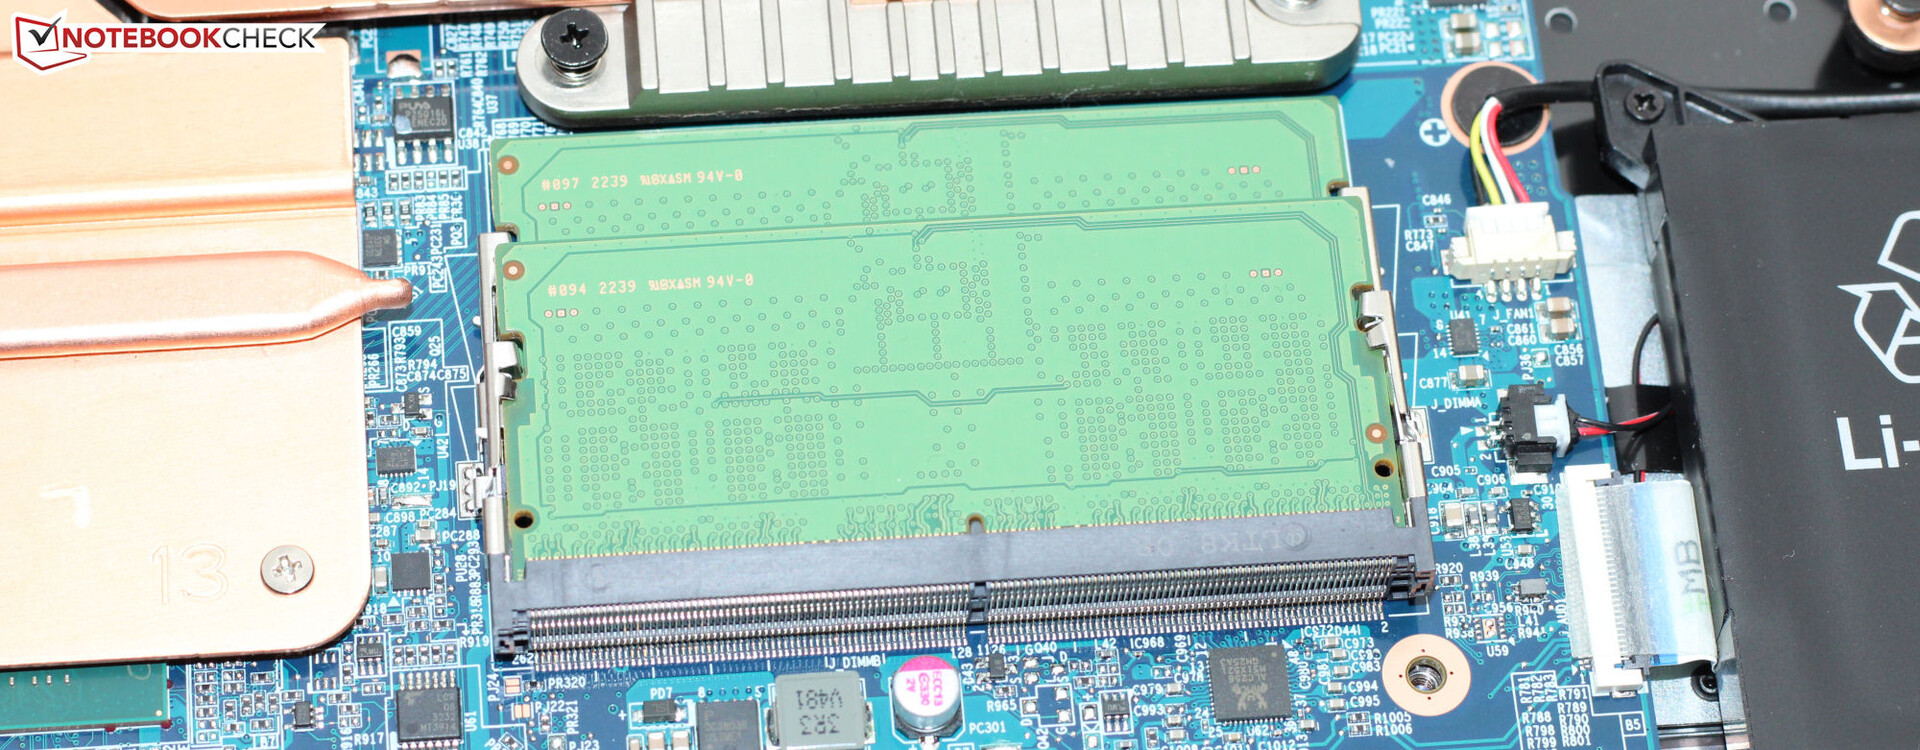
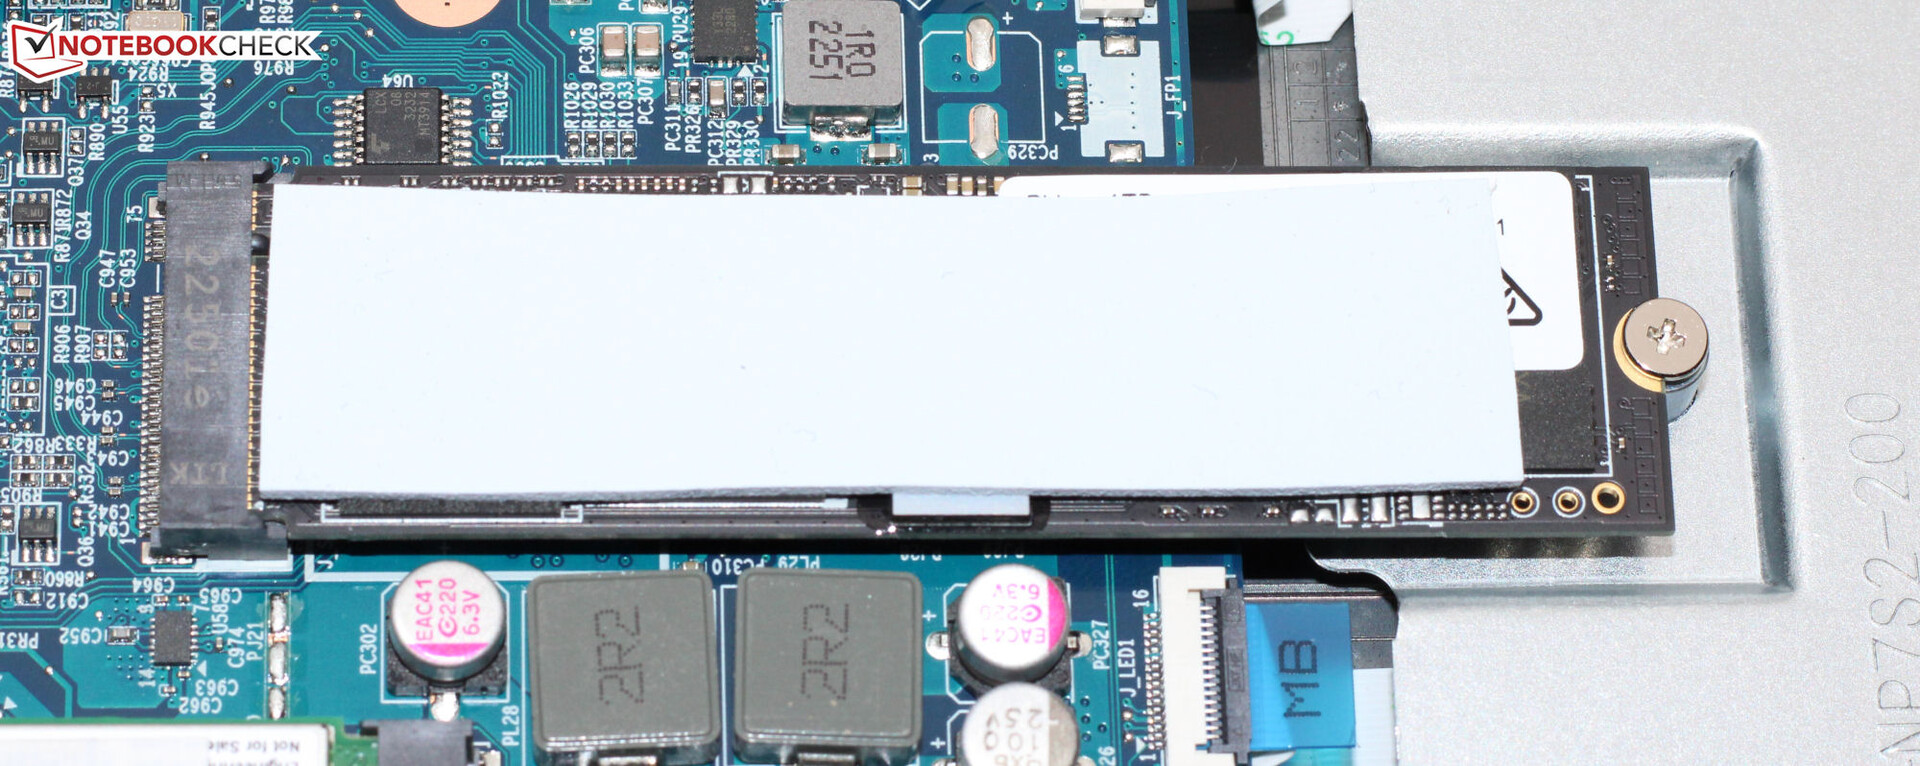
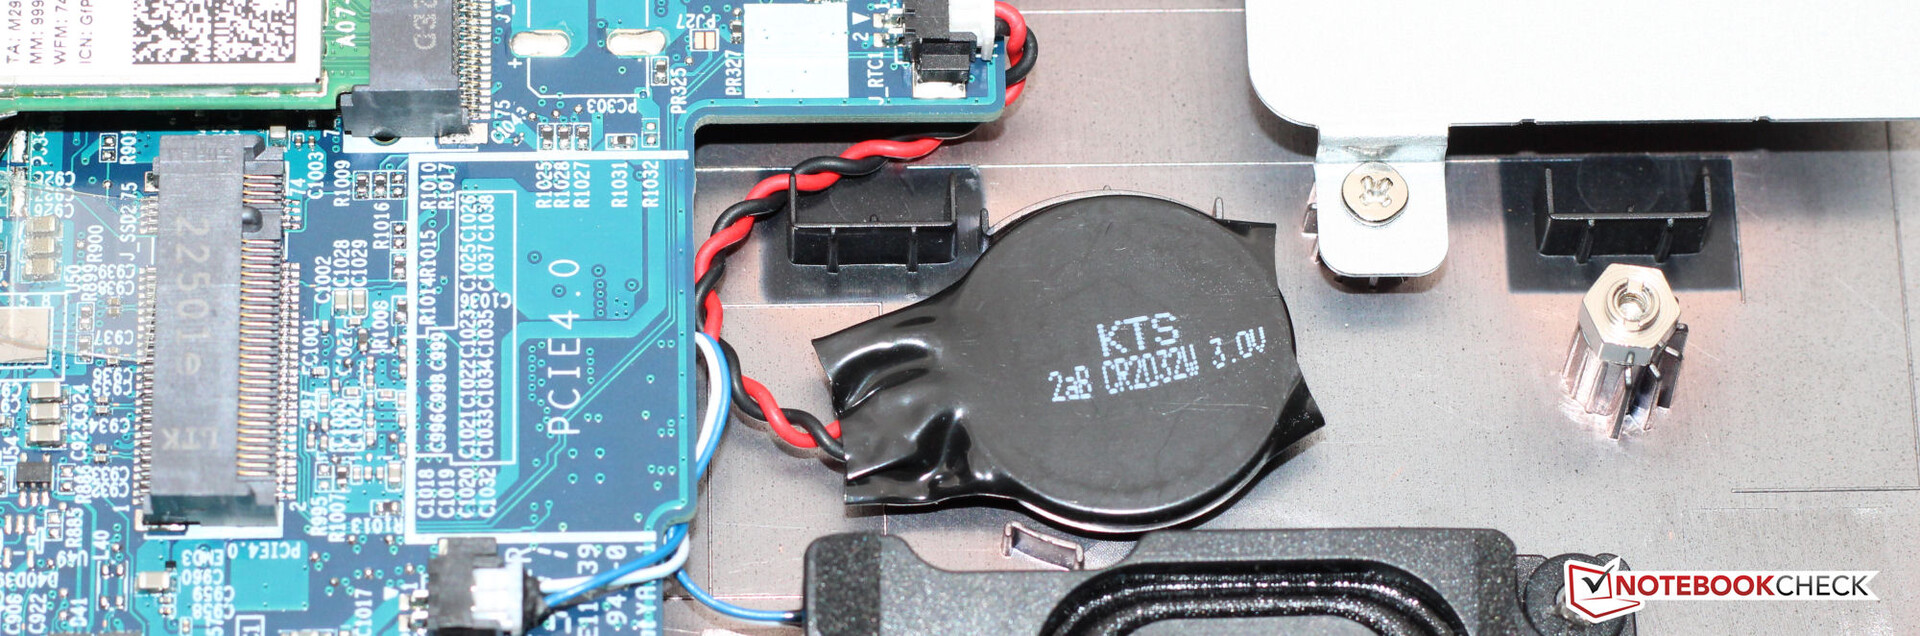
Konserwacja
Po odkręceniu wszystkich śrub na spodzie urządzenia, dolną płytę można zdjąć za pomocą płaskiej szpatułki lub plectrum. W ten sposób można uzyskać dostęp do obu banków pamięci (w użyciu), drugiego gniazda SSD (PCIe 4, M.2-2280), modułu WLAN, baterii BIOS, wentylatorów i akumulatora.
Gwarancja
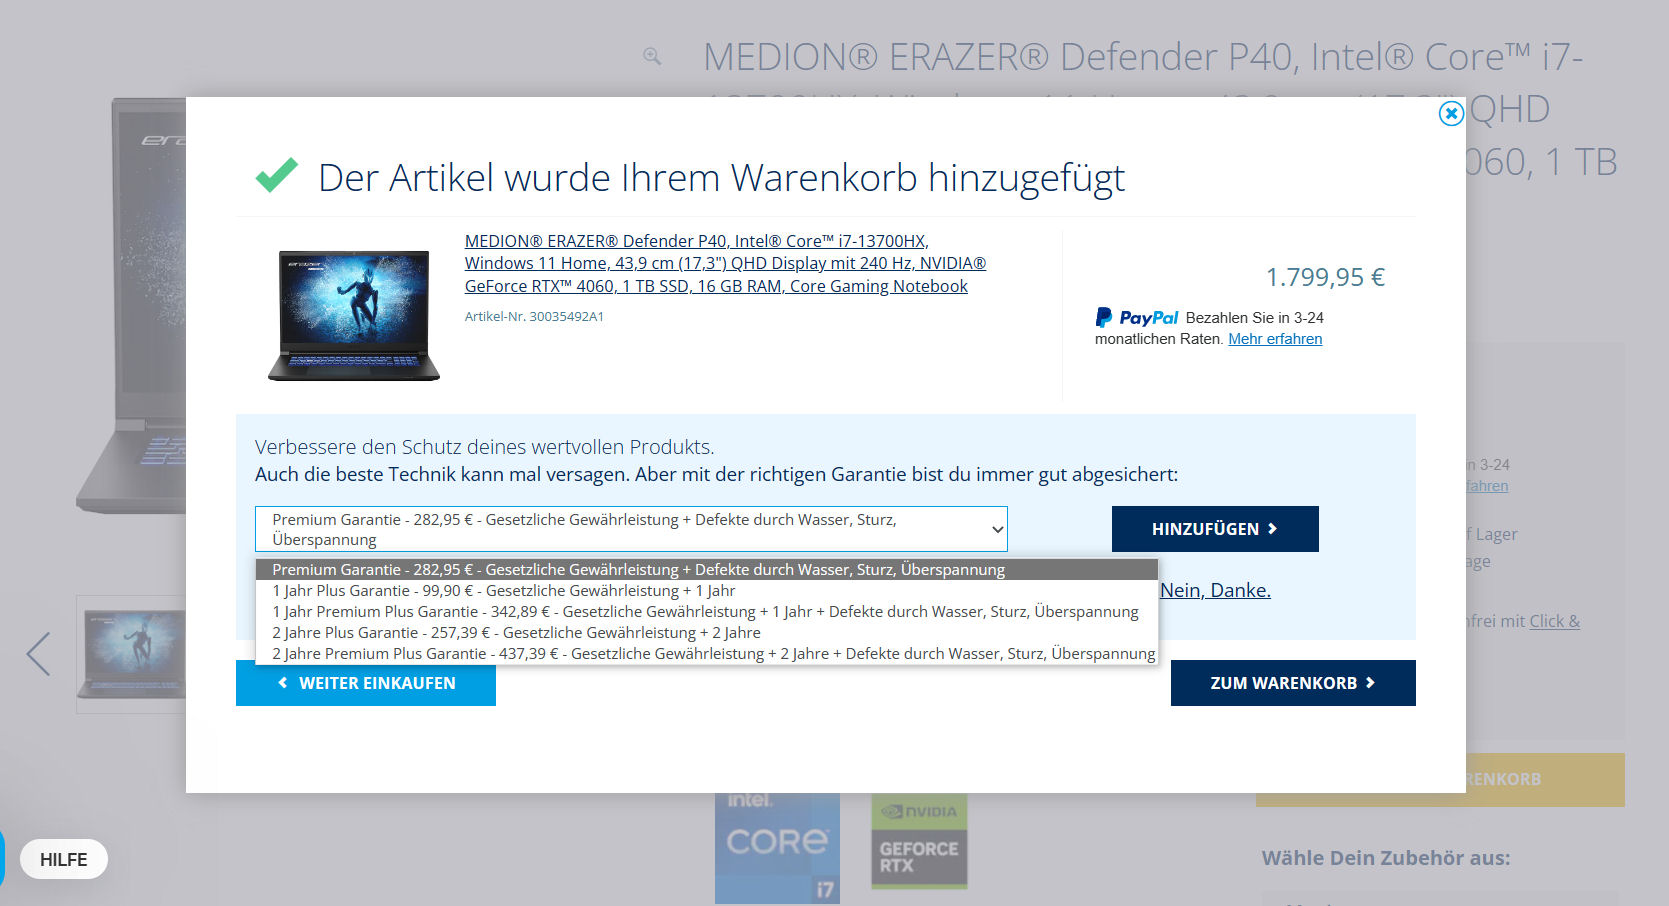
Erazer firmy Medion objęty jest dwuletnią gwarancją. Dostępne są przedłużenia gwarancji, jednak należy je zakupić wraz z laptopem w sklepie internetowym Medion - nie ma możliwości zakupu przedłużenia z mocą wsteczną.
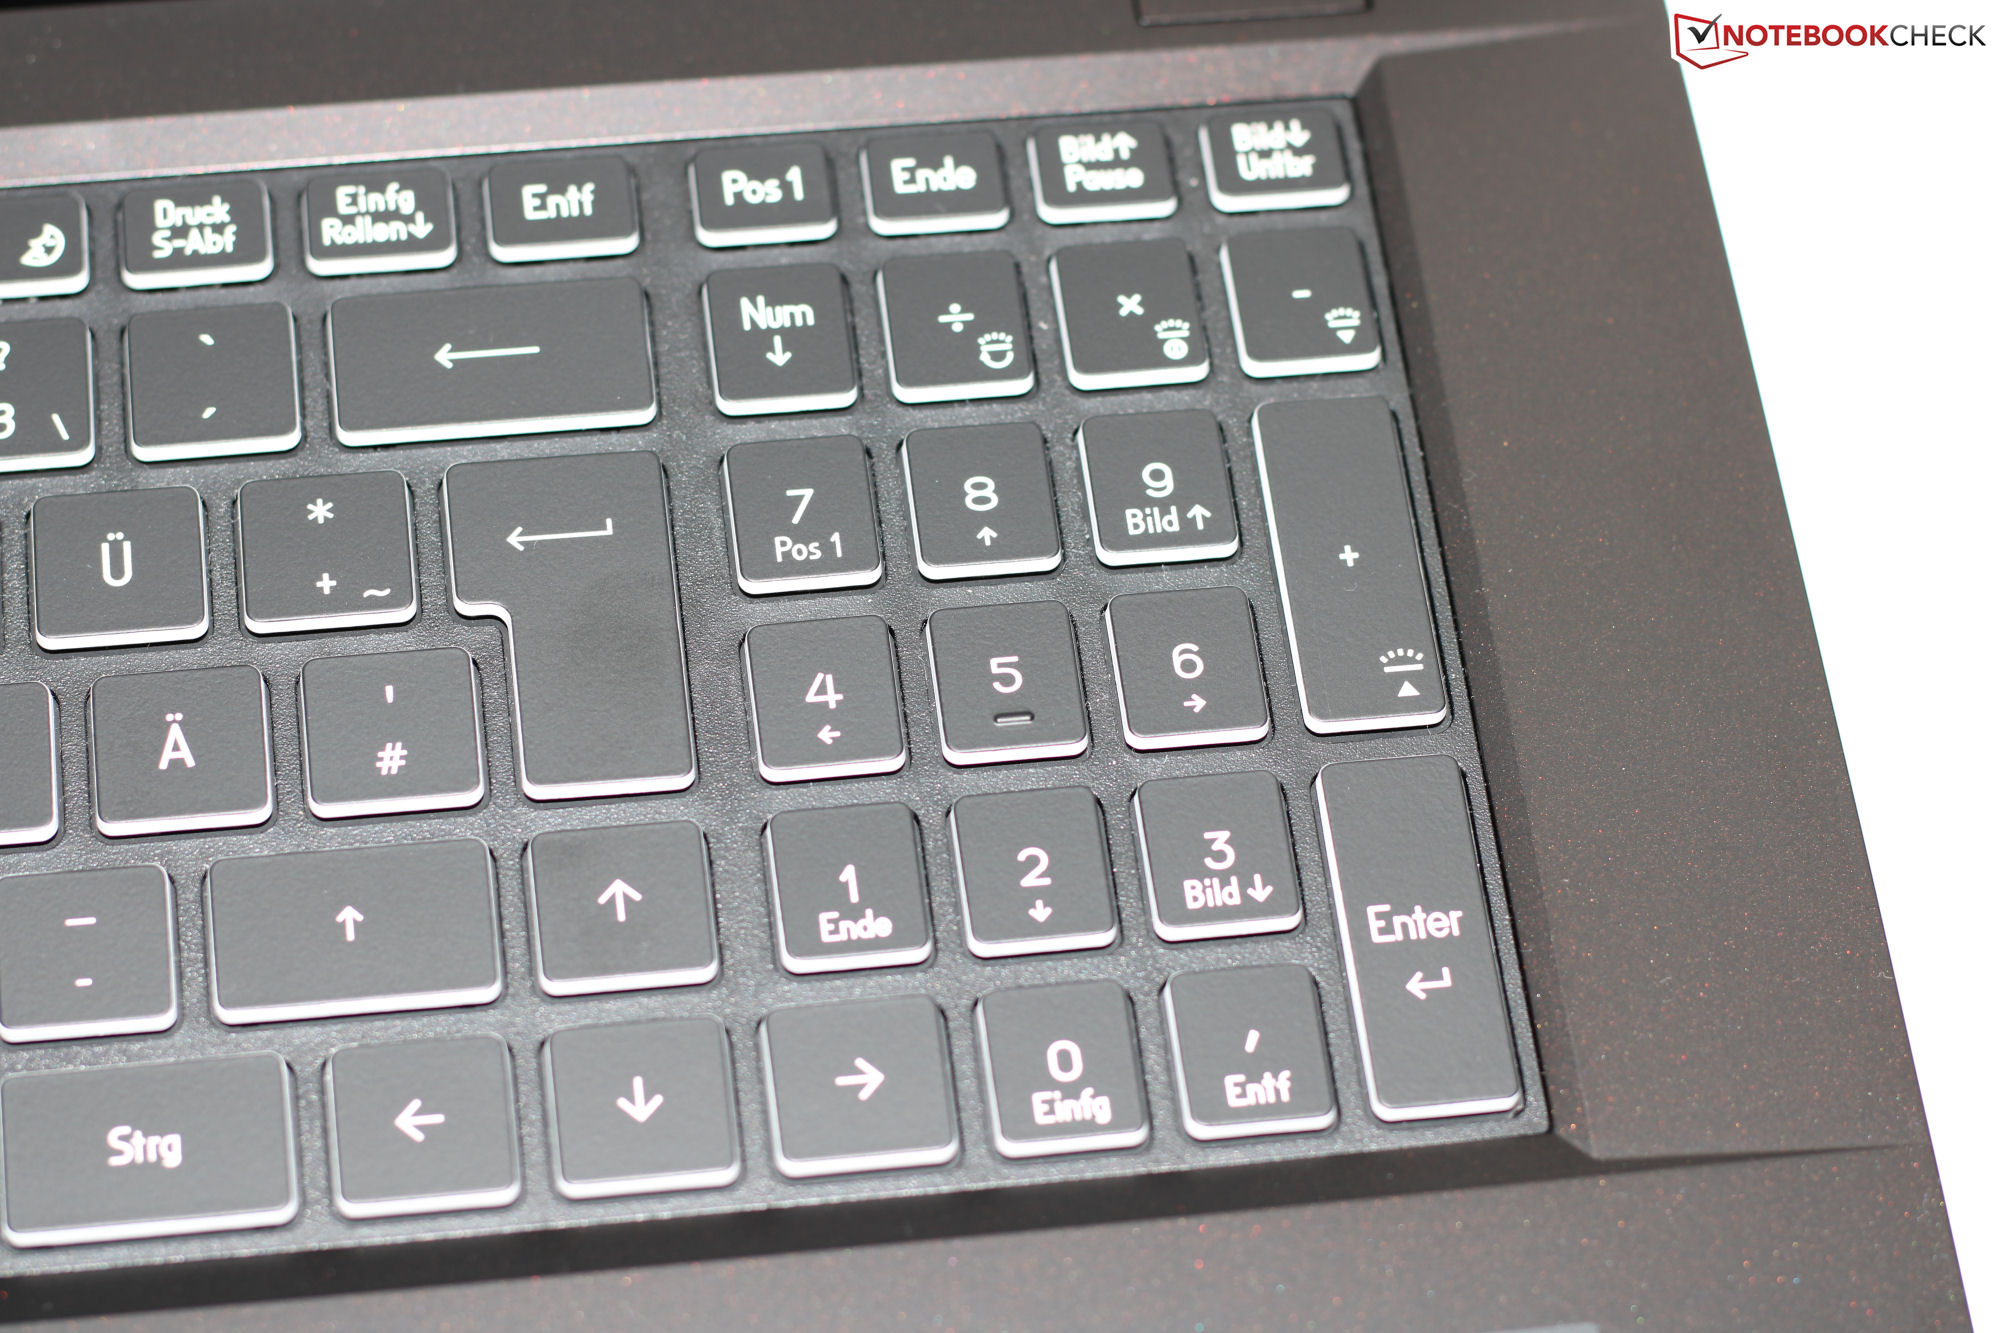
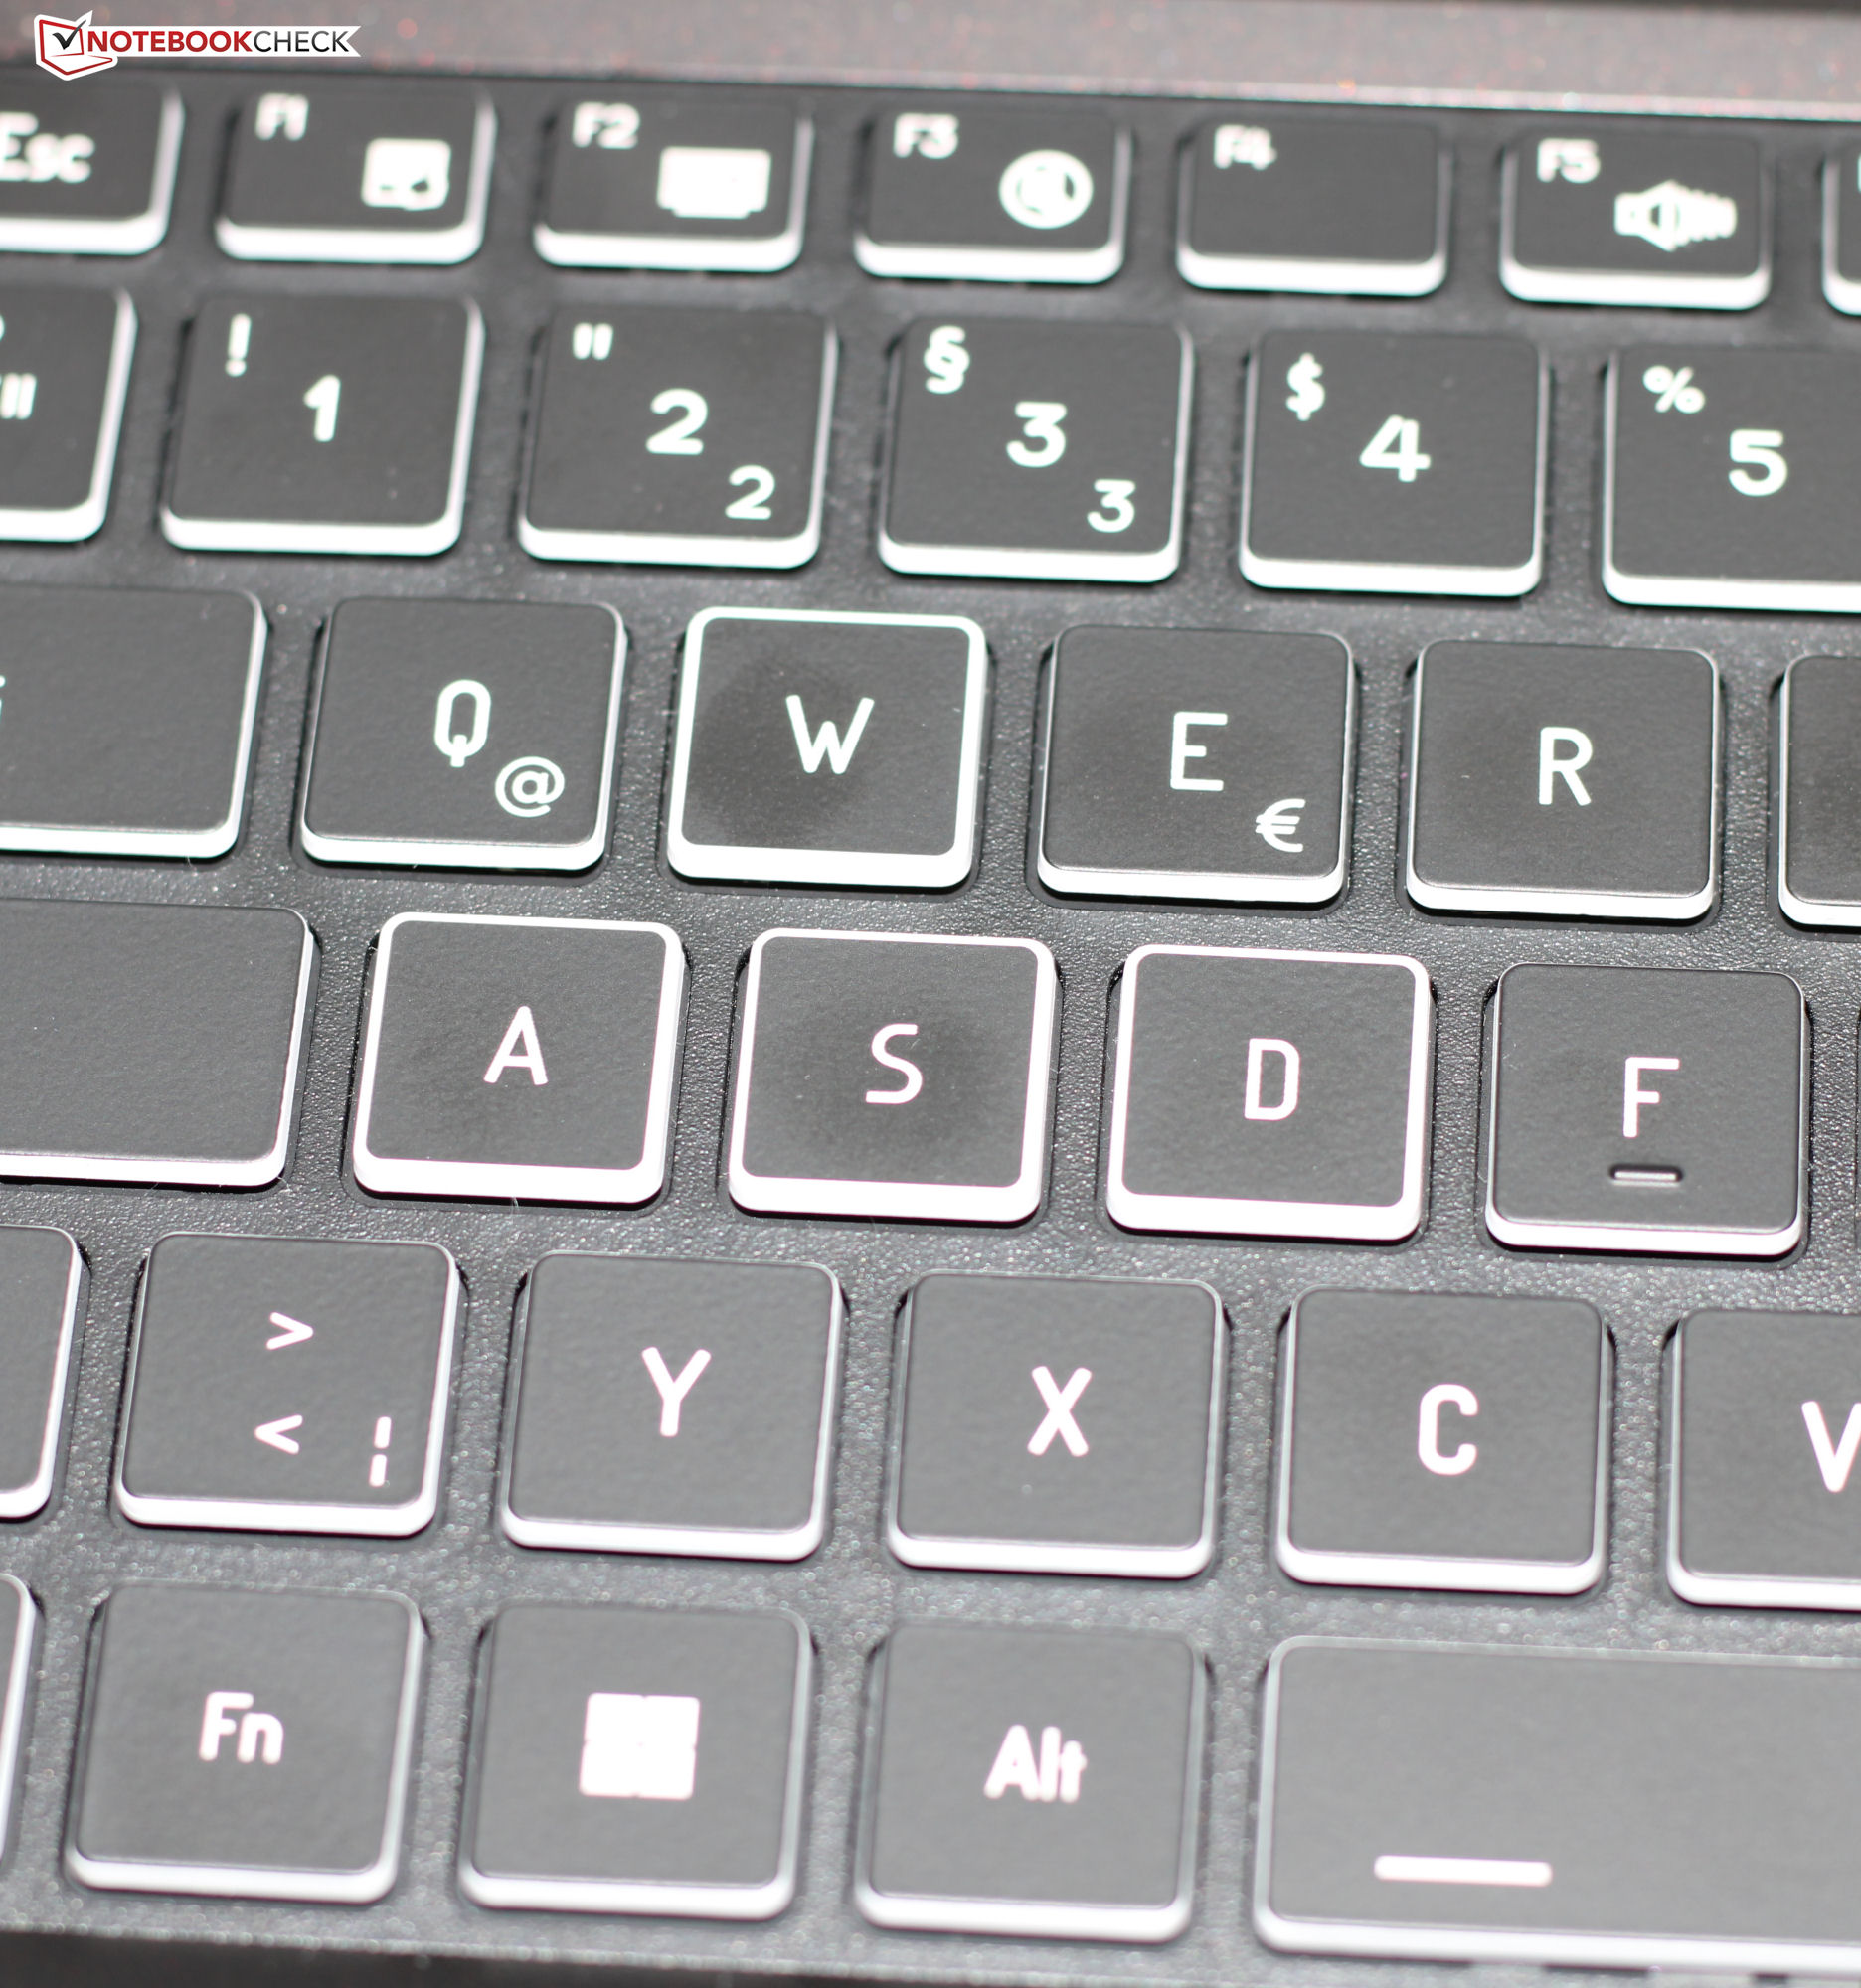
Urządzenia wejściowe - klawiatura P40 ma podświetlenie RGB
Klawiatura
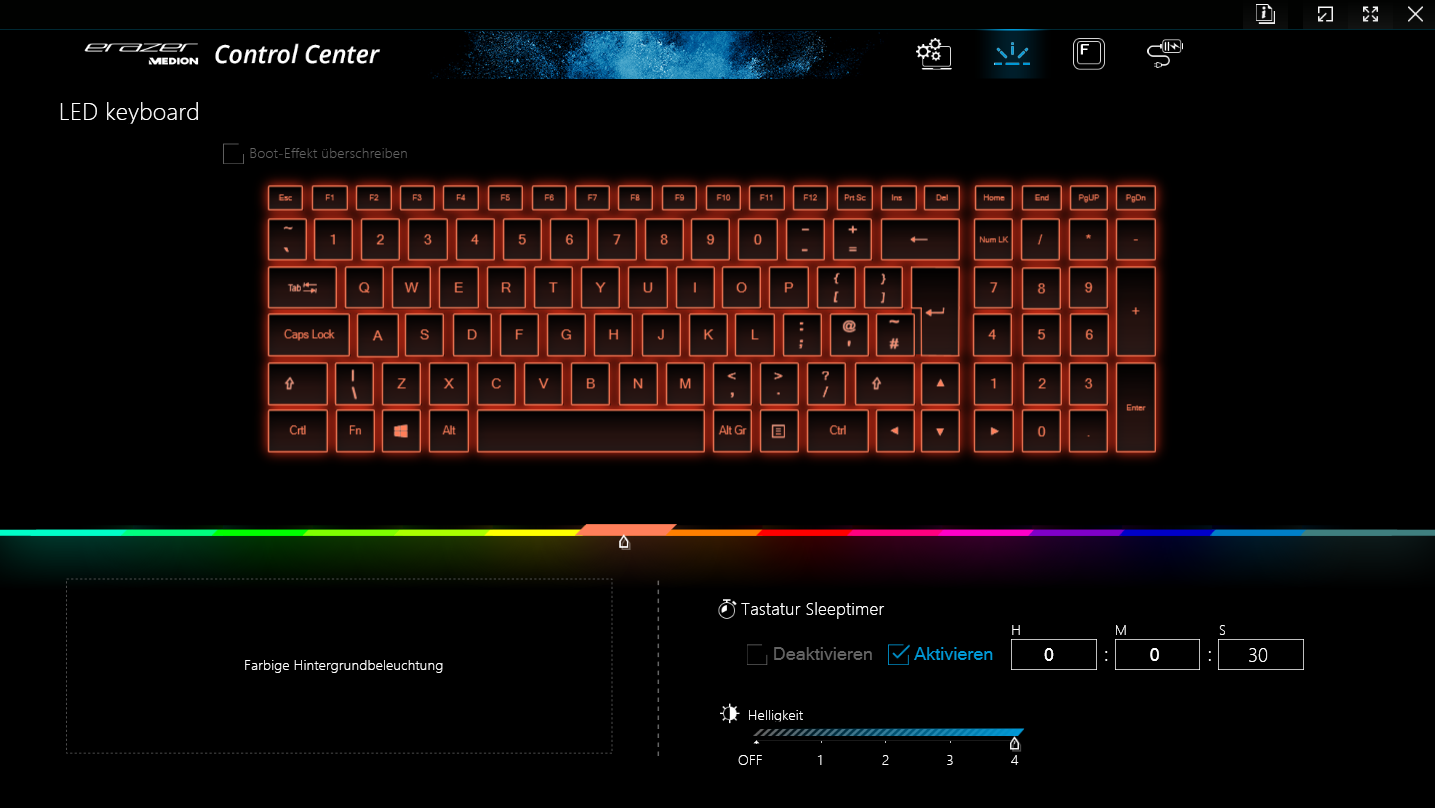
Podświetlana (4 poziomy) klawiatura chiclet laptopa (w tym klawiatura numeryczna) składa się z gładkich i równych klawiszy. Mają one krótki skok, wyraźny punkt nacisku i przyjemny poziom oporu. Podczas pisania klawisze lekko się uginają, ale nie powinno to być zbyt uciążliwe. Podsumowując, Medion dostarczył klawiaturę nadającą się do codziennego użytku.
Touchpad
Podkładka pod mysz (około 15,1 x 9,2 cm) zastępuje mysz - ma gładką powierzchnię, po której palce mogą się łatwo przesuwać. Ma krótki skok i wyraźny punkt nacisku.
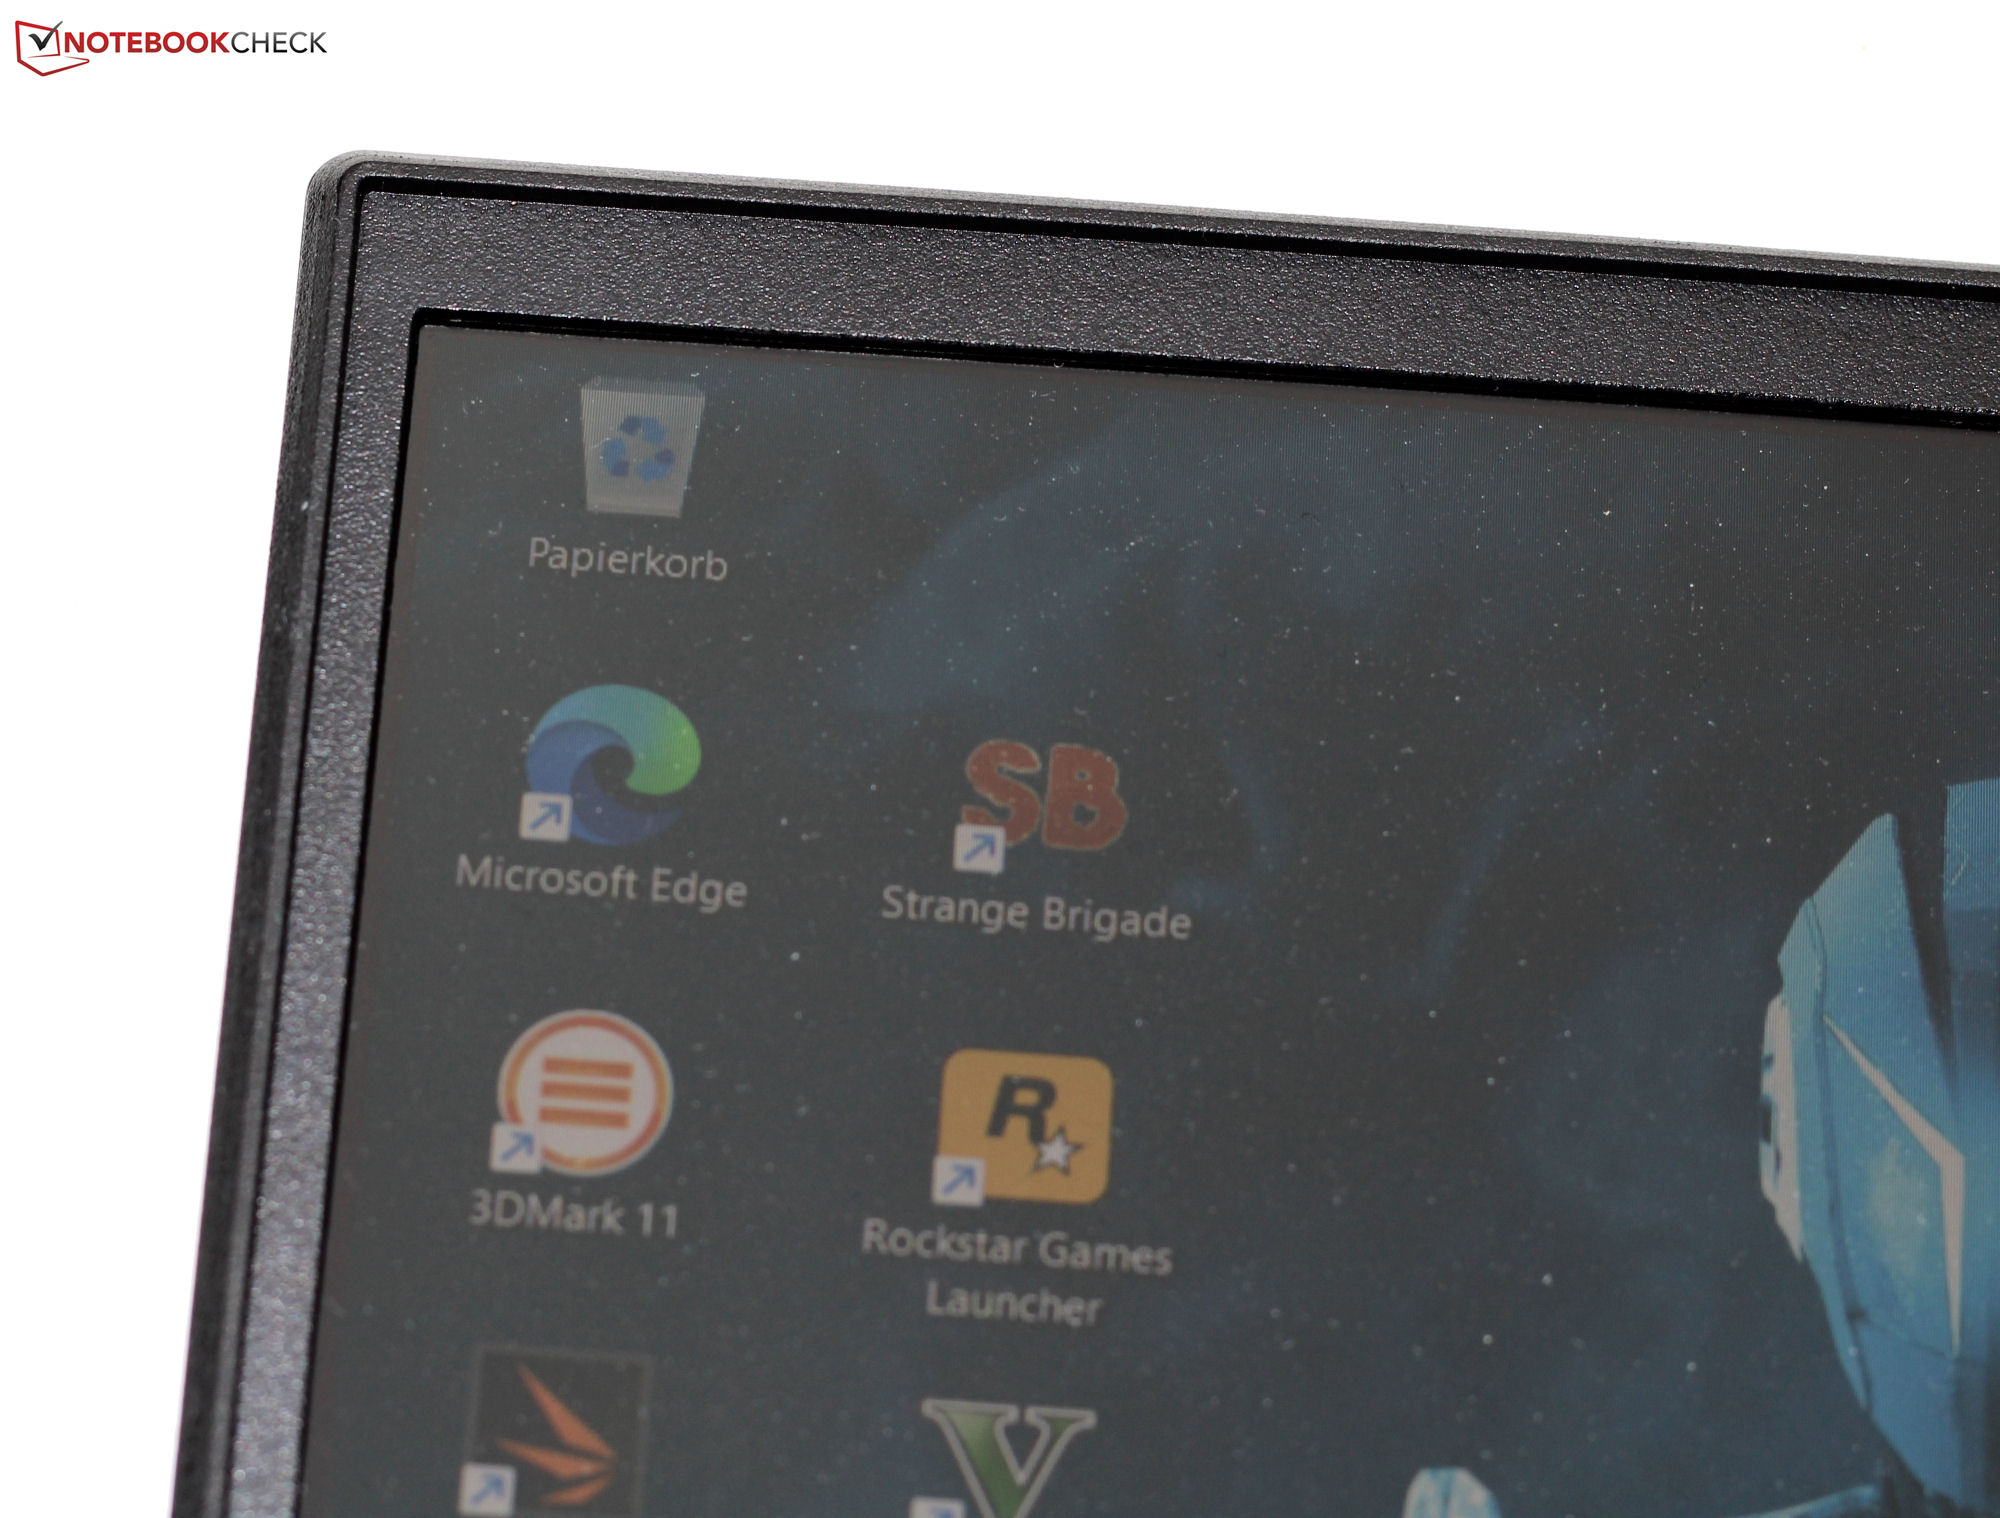
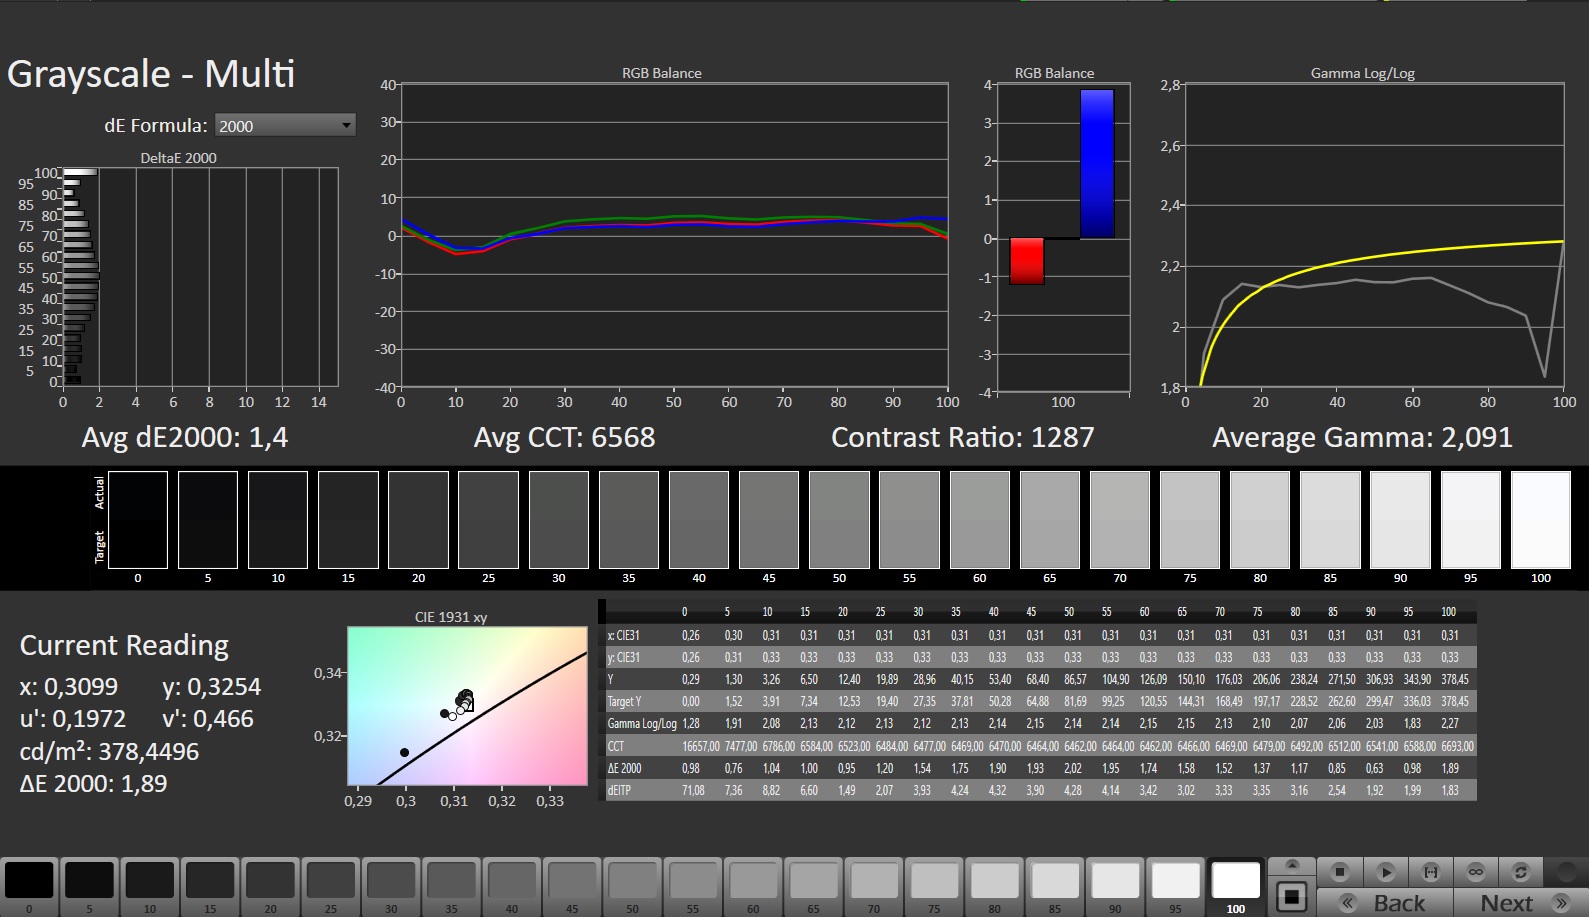
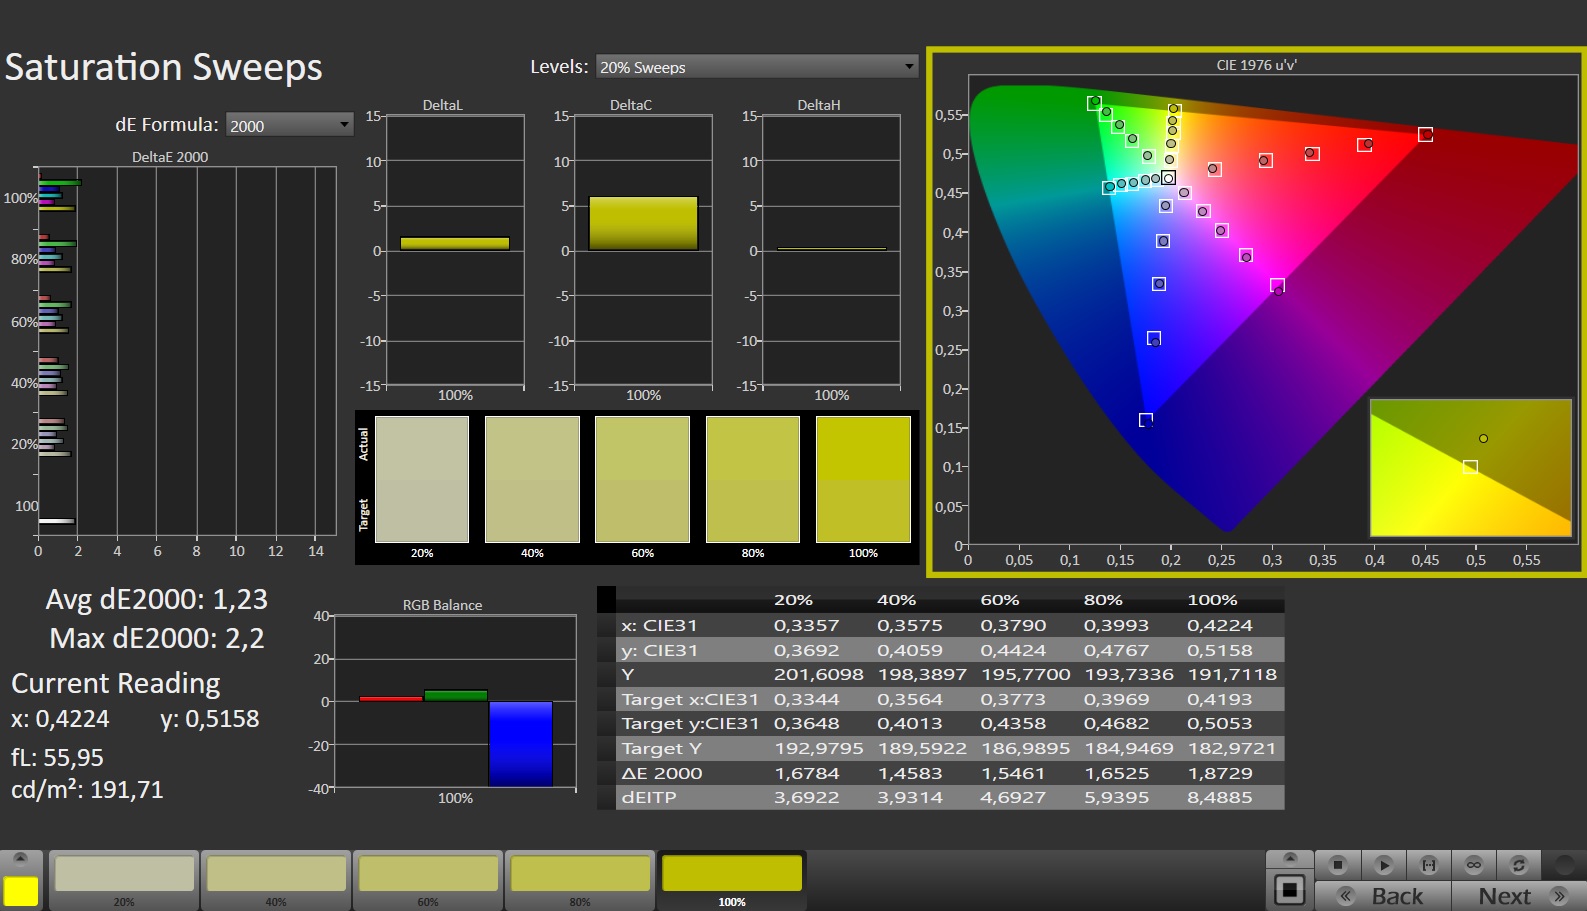
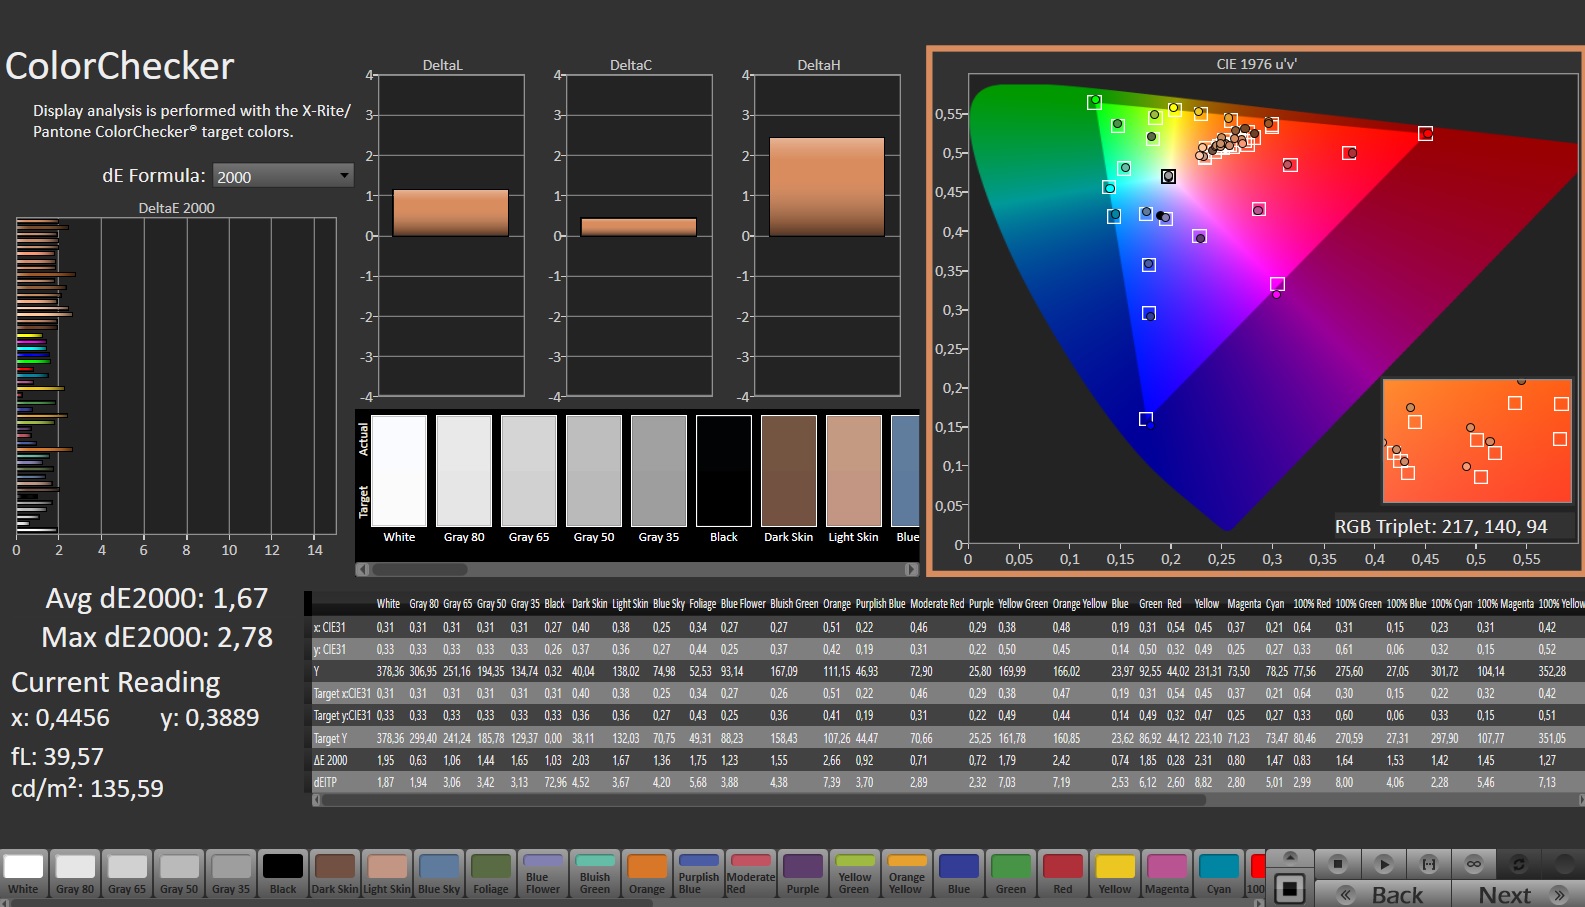
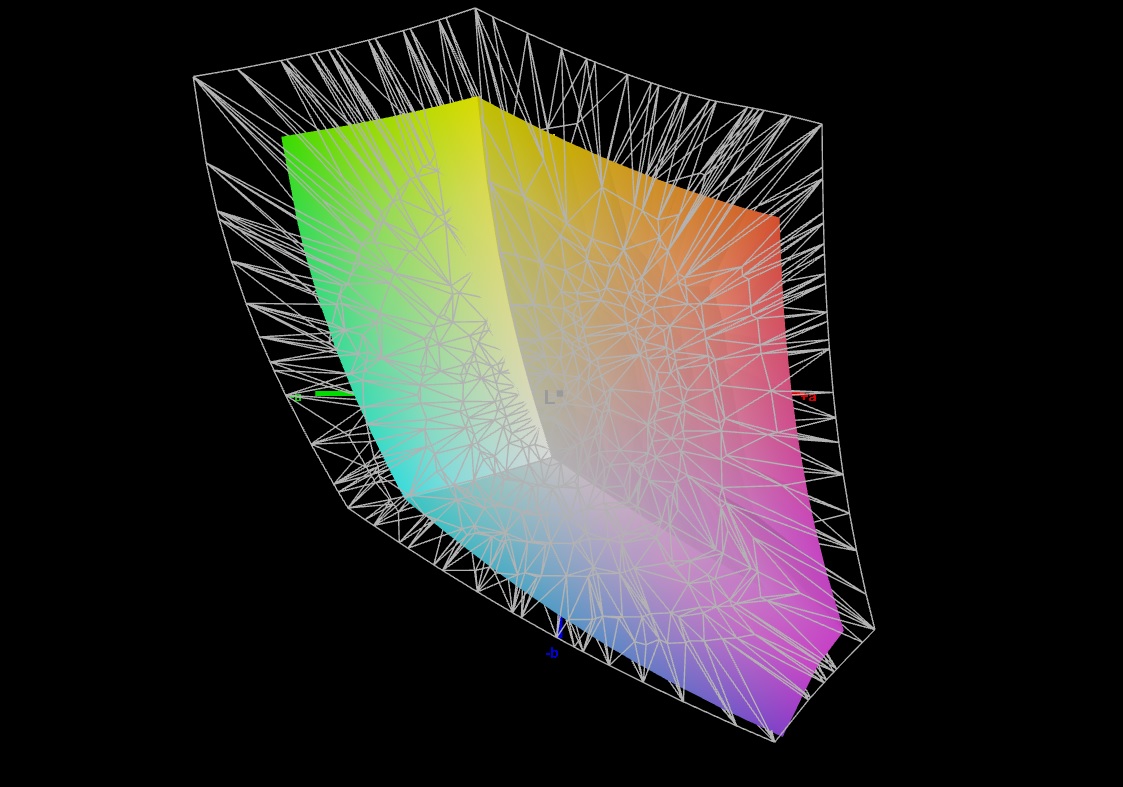
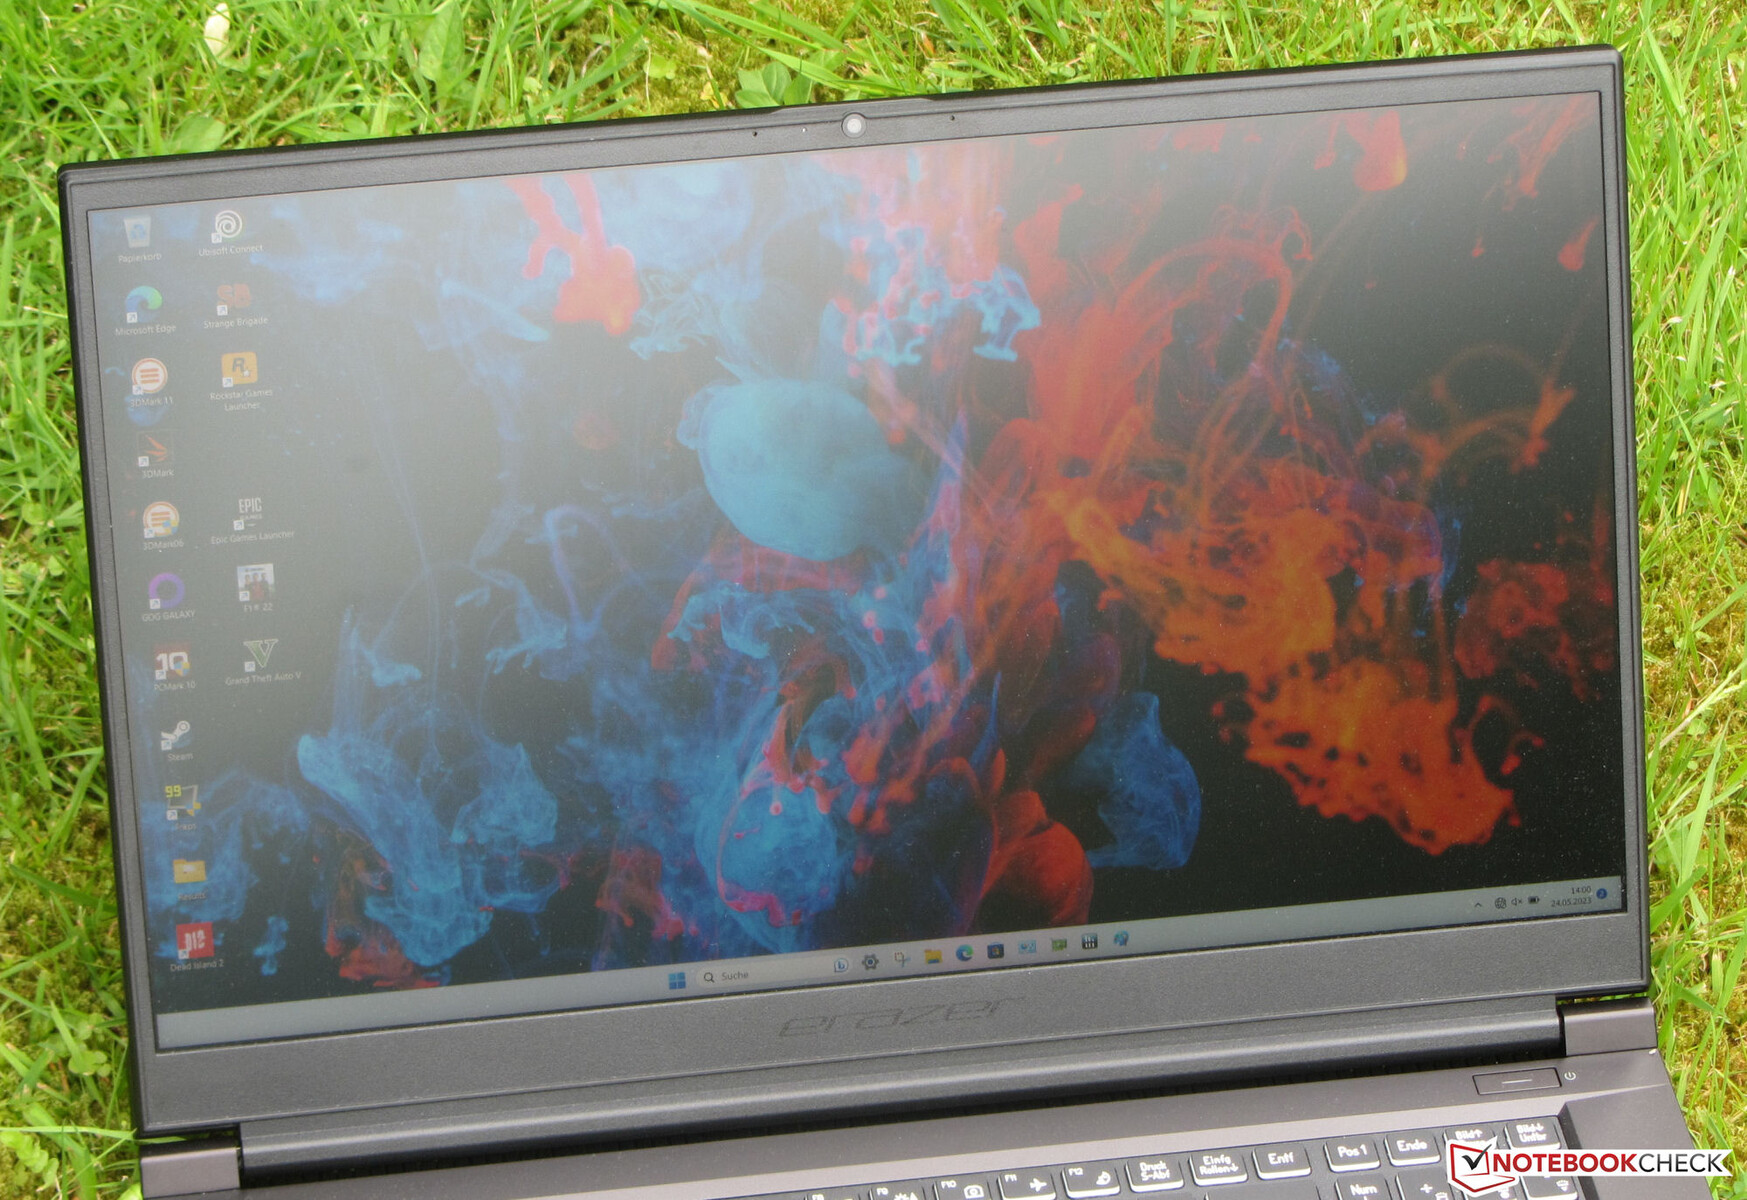
Wyświetlacz - ekran QHD z pokryciem sRGB
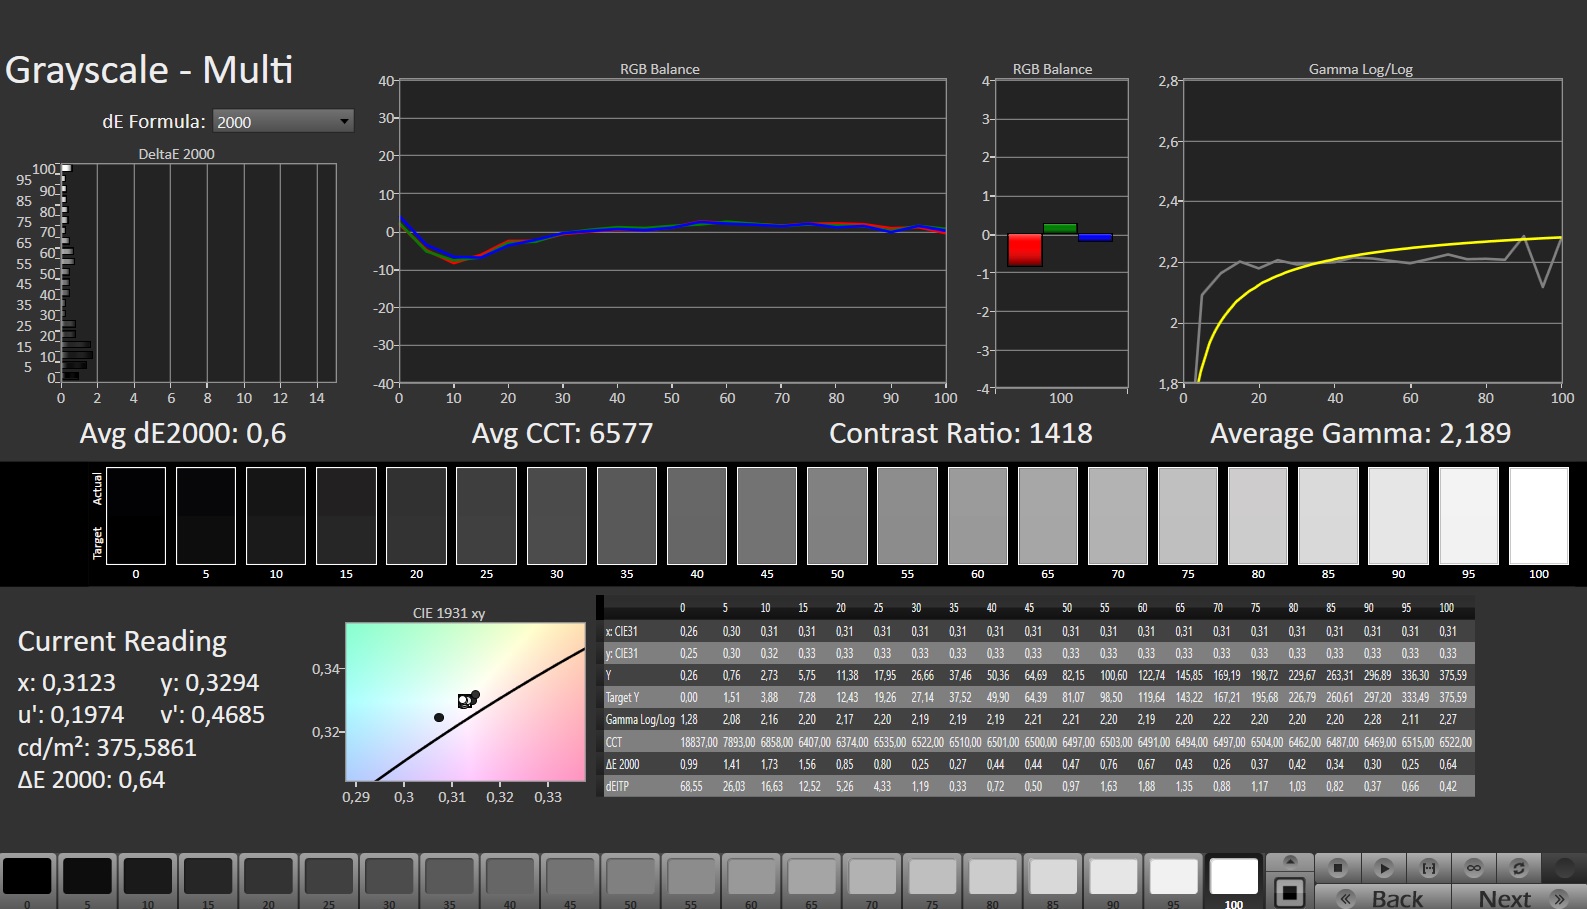
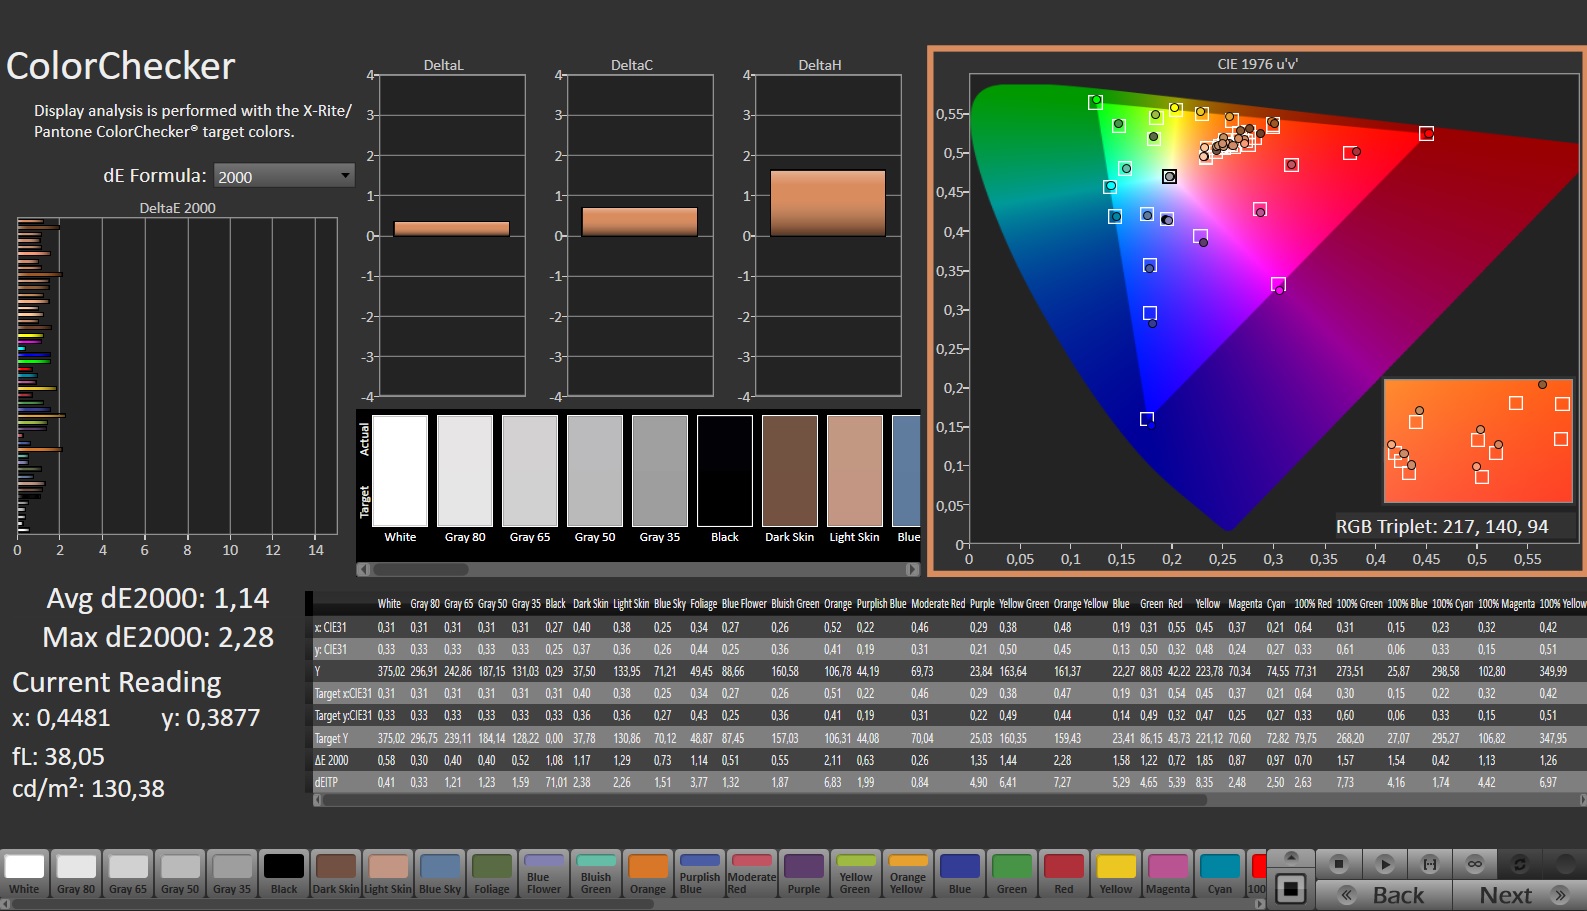
Panel Swift 240 Hz w formacie 16:9 nie wykazuje migotania PWM na żadnym poziomie jasności. Jasność i kontrast 17,3-calowego wyświetlacza (2560 x 1440 pikseli) są dokładnie takie, jak powinny (> 300 cd/m² lub 1000:1). Medion nie oferuje żadnych innych opcji wyświetlania.
| |||||||||||||||||||||||||
rozświetlenie: 86 %
na akumulatorze: 364 cd/m²
kontrast: 1300:1 (czerń: 0.28 cd/m²)
ΔE ColorChecker Calman: 1.67 | ∀{0.5-29.43 Ø4.72}
calibrated: 1.14
ΔE Greyscale Calman: 1.4 | ∀{0.09-98 Ø4.97}
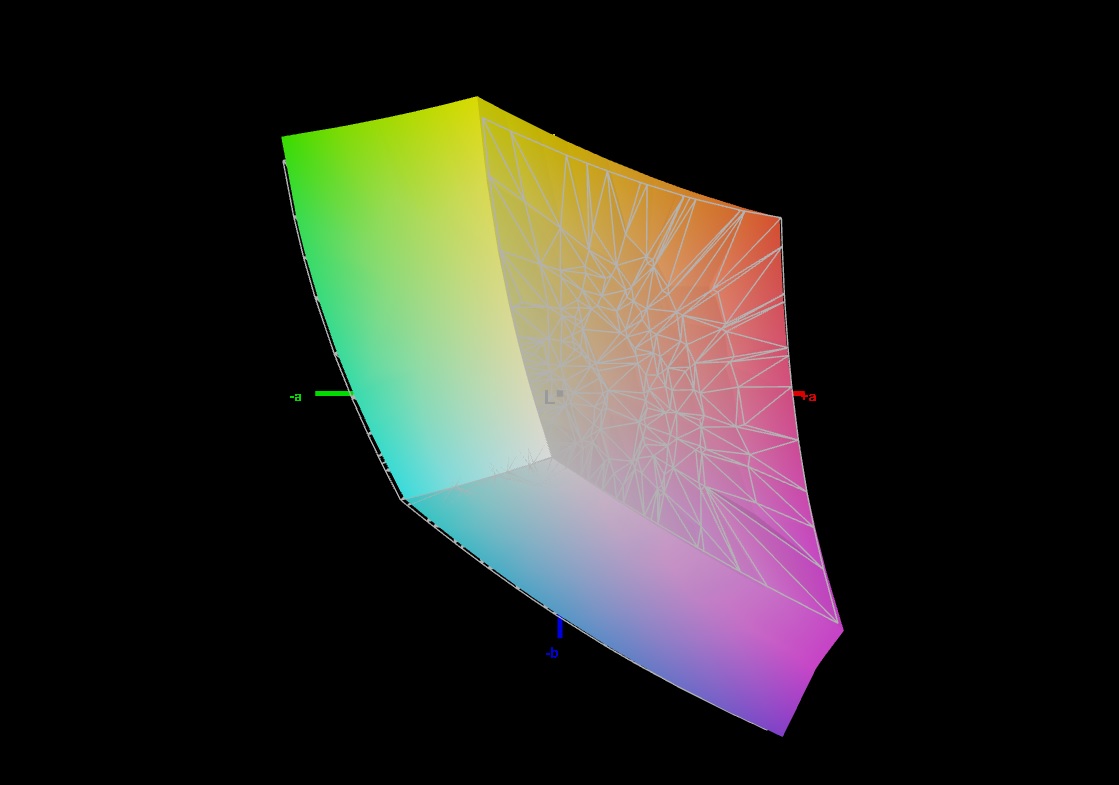
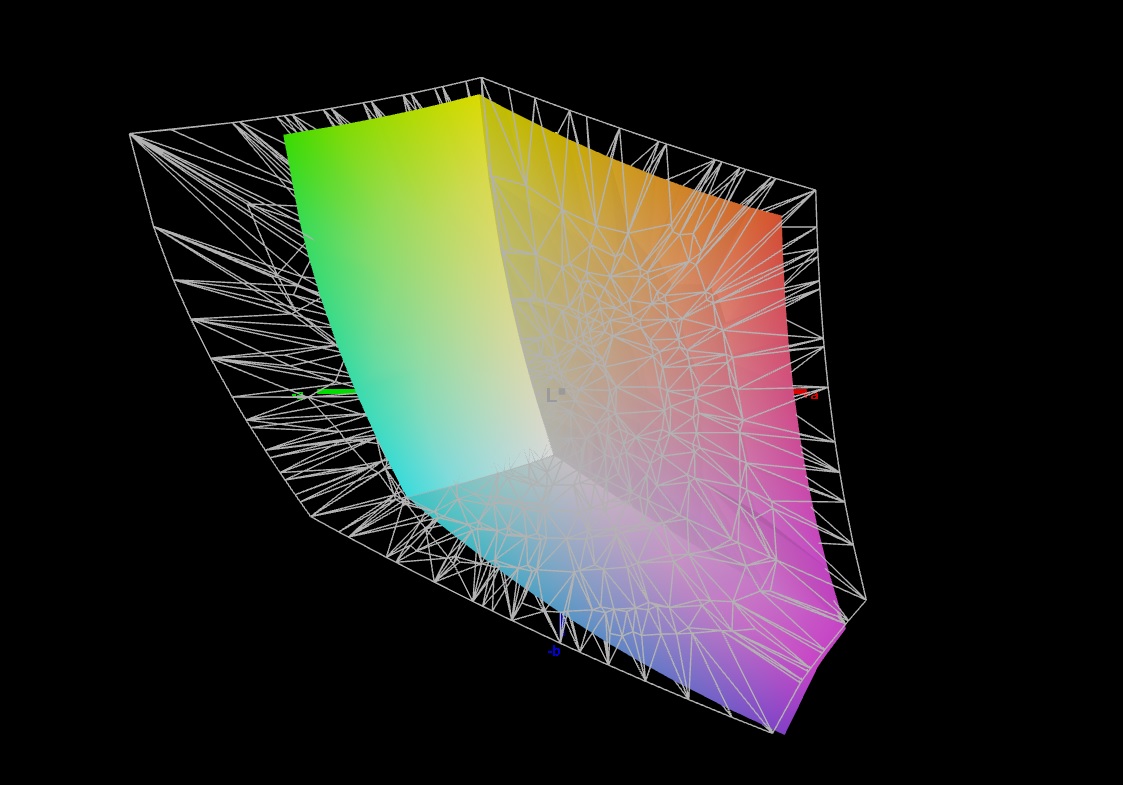
69.8% AdobeRGB 1998 (Argyll 3D)
98.1% sRGB (Argyll 3D)
68.3% Display P3 (Argyll 3D)
Gamma: 2.091
CCT: 6568 K
| Medion Erazer Defender P40 BOE CQ NE173QHM-NZ3, IPS, 2560x1440, 17.3" | MSI Katana 17 B13VFK B173HAN04.9, IPS LED, 1920x1080, 17.3" | Acer Predator Helios 300 (i7-12700H, RTX 3070 Ti) BOE0A1A, IPS, 2560x1440, 17.3" | Lenovo Legion Pro 5 16IRX8 AU Optronics B160QAN03.1, IPS, 2560x1600, 16" | Asus TUF Gaming A16 FA617 NE160WUM-NX2 (BOE0B33), IPS-Level, 1920x1200, 16" | Gigabyte G7 KE AU Optronics B173HAN05.1, IPS, 1920x1080, 17.3" | |
|---|---|---|---|---|---|---|
| Display | -39% | 22% | 3% | 1% | 3% | |
| Display P3 Coverage (%) | 68.3 | 40.8 -40% | 96.8 42% | 71.2 4% | 69.4 2% | 70.4 3% |
| sRGB Coverage (%) | 98.1 | 61 -38% | 99.9 2% | 98.8 1% | 97.8 0% | 99.8 2% |
| AdobeRGB 1998 Coverage (%) | 69.8 | 42.2 -40% | 84.8 21% | 73.3 5% | 70.9 2% | 71.7 3% |
| Response Times | -163% | -21% | -10% | -16% | 36% | |
| Response Time Grey 50% / Grey 80% * (ms) | 14.6 ? | 33 ? -126% | 16.4 ? -12% | 14.5 ? 1% | 17 ? -16% | 5 ? 66% |
| Response Time Black / White * (ms) | 8.7 ? | 26 ? -199% | 11.2 ? -29% | 10.4 ? -20% | 10.1 ? -16% | 8.3 ? 5% |
| PWM Frequency (Hz) | ||||||
| Screen | -126% | -59% | -2% | -5% | -6% | |
| Brightness middle (cd/m²) | 364 | 267 -27% | 366 1% | 405.7 11% | 308 -15% | 307 -16% |
| Brightness (cd/m²) | 343 | 256 -25% | 340 -1% | 368 7% | 293 -15% | 301 -12% |
| Brightness Distribution (%) | 86 | 93 8% | 85 -1% | 87 1% | 90 5% | 93 8% |
| Black Level * (cd/m²) | 0.28 | 0.21 25% | 0.31 -11% | 0.38 -36% | 0.23 18% | 0.2 29% |
| Contrast (:1) | 1300 | 1271 -2% | 1181 -9% | 1068 -18% | 1339 3% | 1535 18% |
| Colorchecker dE 2000 * | 1.67 | 4.7 -181% | 3.56 -113% | 1.65 1% | 1.47 12% | 1.32 21% |
| Colorchecker dE 2000 max. * | 2.78 | 20.4 -634% | 5.66 -104% | 4.2 -51% | 2.98 -7% | 4.6 -65% |
| Colorchecker dE 2000 calibrated * | 1.14 | 4.5 -295% | 3.31 -190% | 0.53 54% | 1.02 11% | 1.03 10% |
| Greyscale dE 2000 * | 1.4 | 1.5 -7% | 2.84 -103% | 1.2 14% | 2.2 -57% | 2.1 -50% |
| Gamma | 2.091 105% | 2.12 104% | 2.29 96% | 2.3 96% | 2.228 99% | 2.247 98% |
| CCT | 6568 99% | 6552 99% | 6835 95% | 6453 101% | 6228 104% | 6815 95% |
| Całkowita średnia (program / ustawienia) | -109% /
-113% | -19% /
-36% | -3% /
-2% | -7% /
-5% | 11% /
2% |
* ... im mniej tym lepiej
Ex działa, ekran ma już świetne odwzorowanie kolorów: Odchylenie około 1,7 jest akceptowalne (DeltaE < 3). Kalibracja prowadzi do mniejszego odchylenia 1,13 i bardziej zrównoważonych odcieni szarości.
Panel pokrywa całą przestrzeń barw sRGB - ale nie AdobeRGB czy DCI P3. Nie różni się to zbytnio od konkurentów urządzenia. Tylko ekran Acer Predator Recenzja Acer Predator Helios 300: Podkręcony laptop do gier z dobrym wyświetlaczem może przedstawiać przestrzeń P3
.

Wyświetl czasy reakcji
| ↔ Czas reakcji od czerni do bieli | ||
|---|---|---|
| 8.7 ms ... wzrost ↗ i spadek ↘ łącznie | ↗ 3.6 ms wzrost | 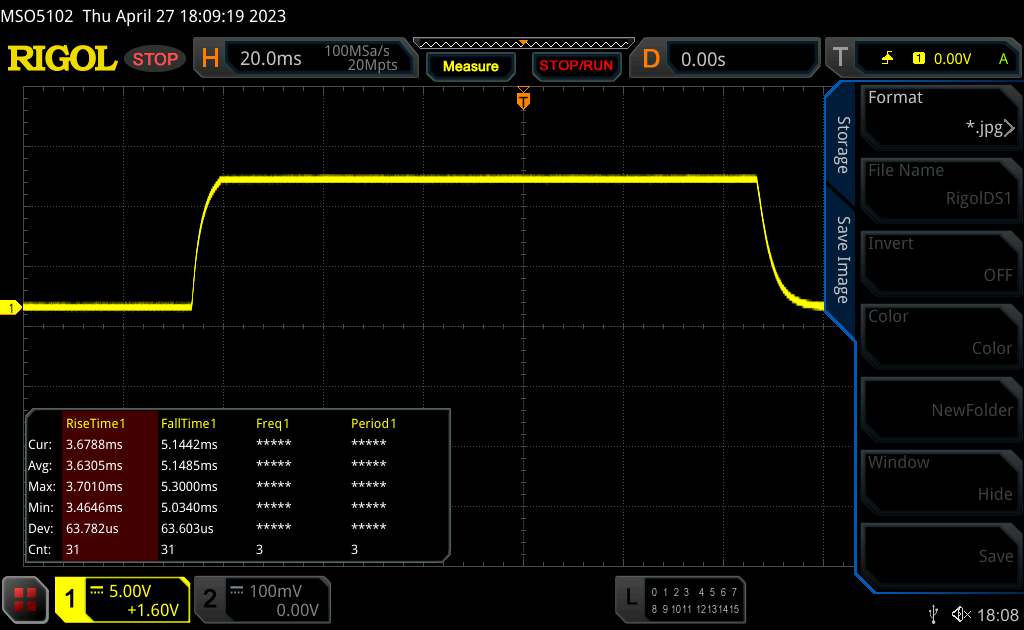 |
| ↘ 5.1 ms upadek | ||
| W naszych testach ekran wykazuje szybki czas reakcji i powinien nadawać się do gier. Dla porównania, wszystkie testowane urządzenia wahają się od 0.1 (minimum) do 240 (maksimum) ms. » 24 % wszystkich urządzeń jest lepszych. Oznacza to, że zmierzony czas reakcji jest lepszy od średniej wszystkich testowanych urządzeń (19.8 ms). | ||
| ↔ Czas reakcji 50% szarości do 80% szarości | ||
| 14.6 ms ... wzrost ↗ i spadek ↘ łącznie | ↗ 7.1 ms wzrost | 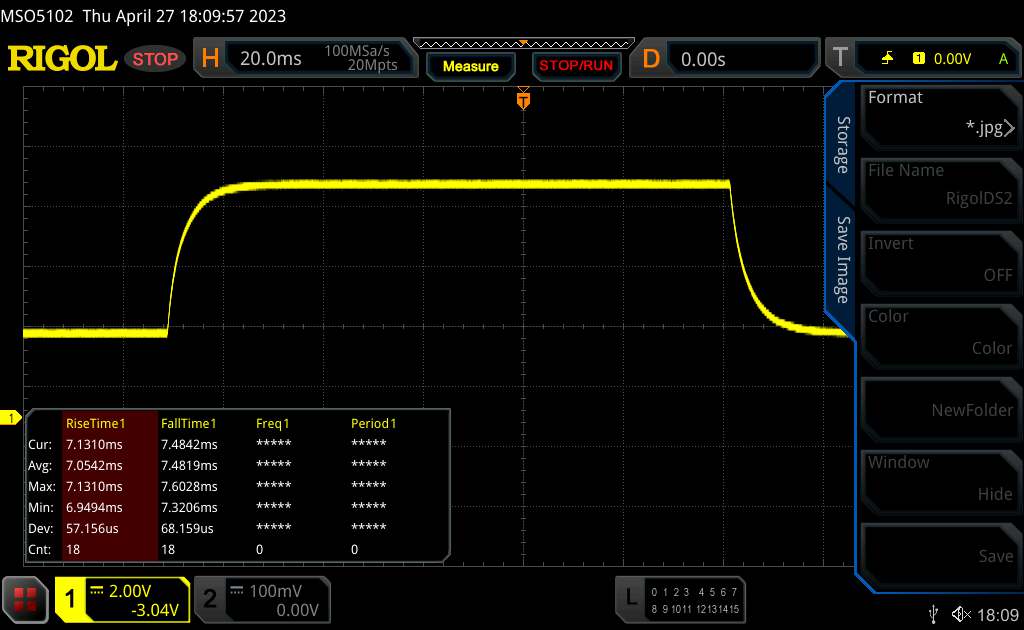 |
| ↘ 7.5 ms upadek | ||
| W naszych testach ekran wykazuje dobry współczynnik reakcji, ale może być zbyt wolny dla graczy rywalizujących ze sobą. Dla porównania, wszystkie testowane urządzenia wahają się od 0.165 (minimum) do 636 (maksimum) ms. » 29 % wszystkich urządzeń jest lepszych. Oznacza to, że zmierzony czas reakcji jest lepszy od średniej wszystkich testowanych urządzeń (31 ms). | ||
Migotanie ekranu / PWM (modulacja szerokości impulsu)
| Migotanie ekranu/nie wykryto PWM | 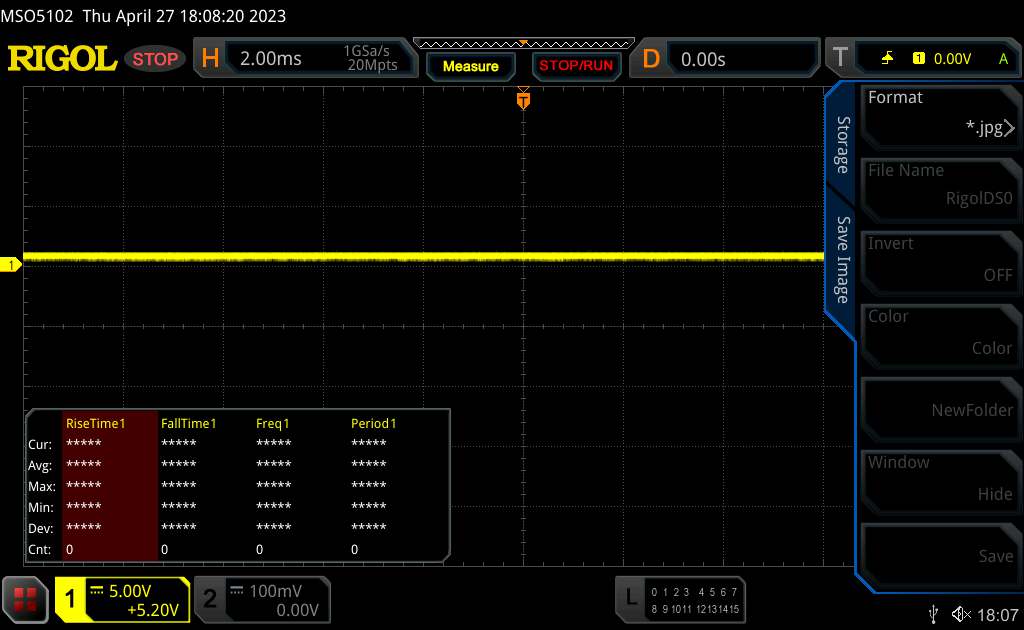 | ||
Dla porównania: 52 % wszystkich testowanych urządzeń nie używa PWM do przyciemniania wyświetlacza. Jeśli wykryto PWM, zmierzono średnio 7769 (minimum: 5 - maksimum: 343500) Hz. | |||
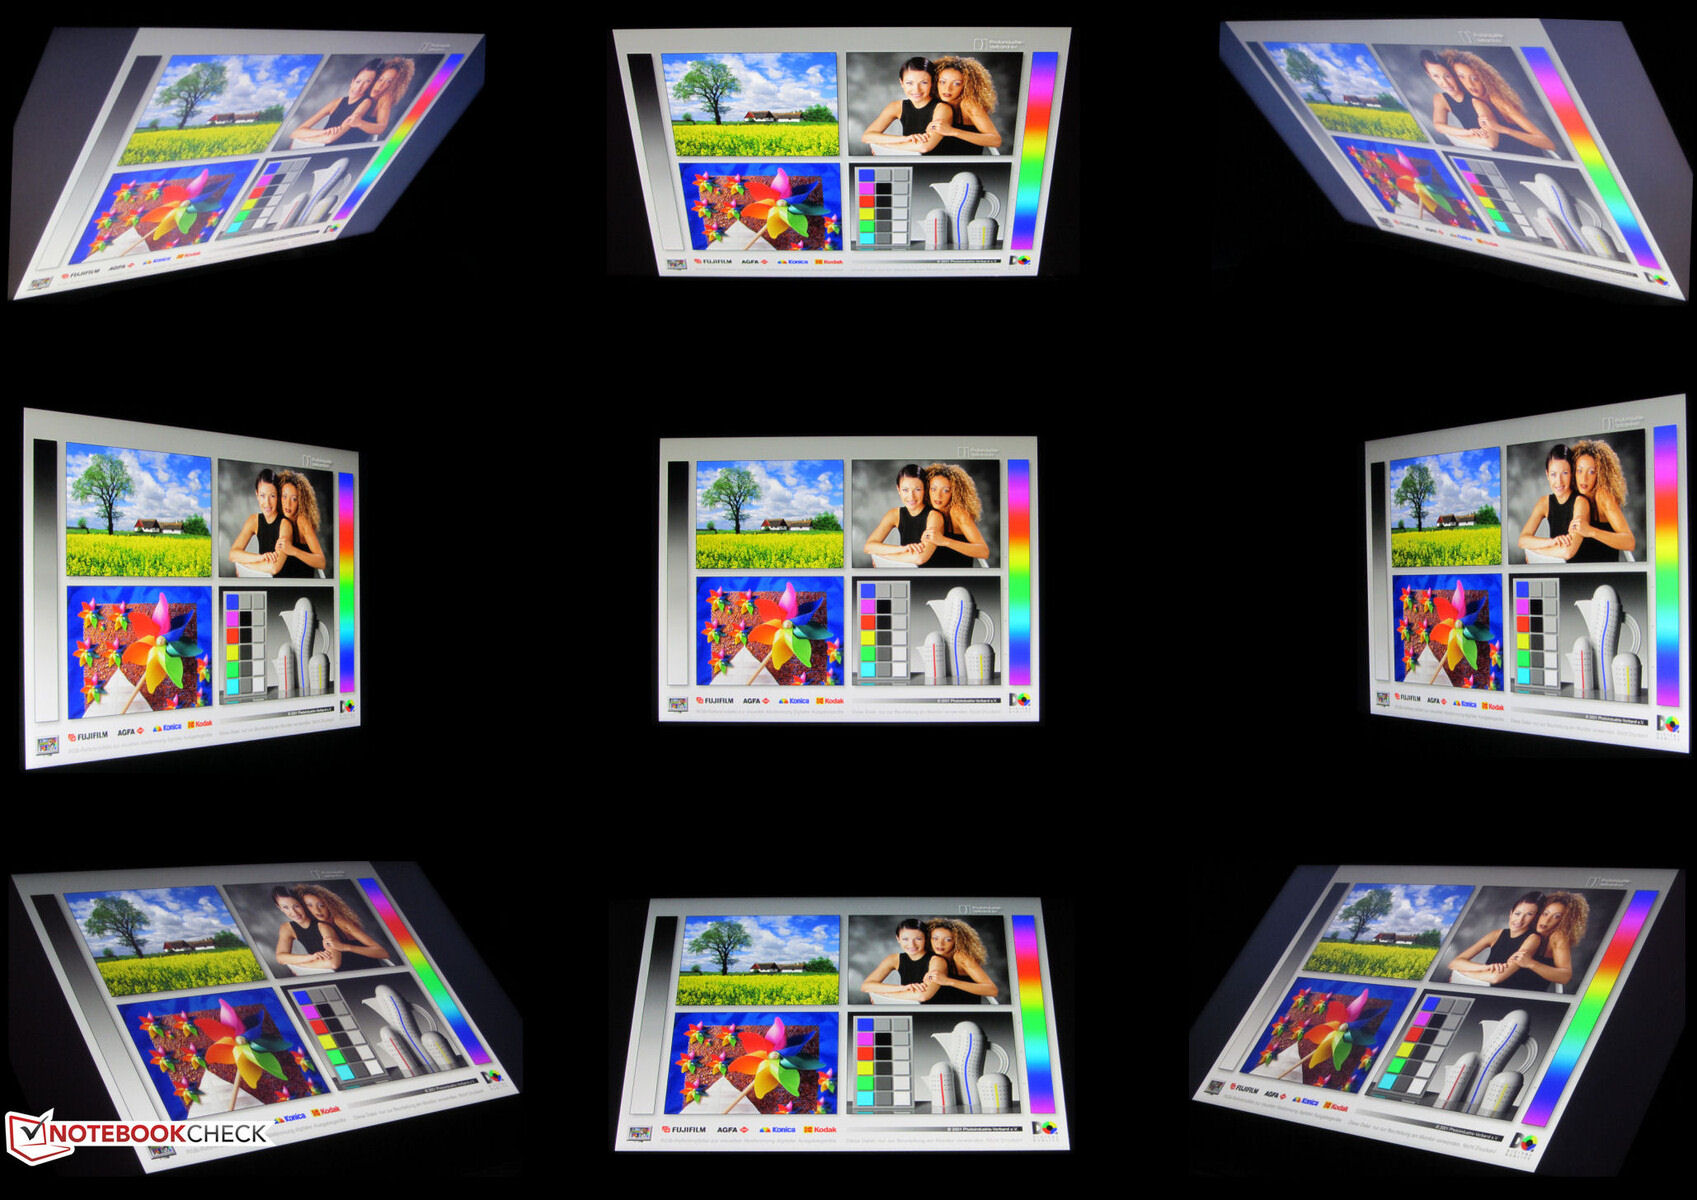
Stabilny kąt widzenia panelu IBS pozostaje czytelny z każdej pozycji. Na zewnątrz ekran pozostaje czytelny, o ile słońce nie świeci zbyt mocno.
Wydajność - komputer Erazer wyposażony jest w sprzęt średniej klasy
Erazer Defender P40 firmy Medion to średniej klasy laptop do gier z ekranem QHD. Procesory Raptor Lake i Ada Lovelace zapewniają odpowiednią wydajność obliczeniową. Obecny model można kupić za około 1900 USD - inne modele o różnych funkcjach nie są dostępne.
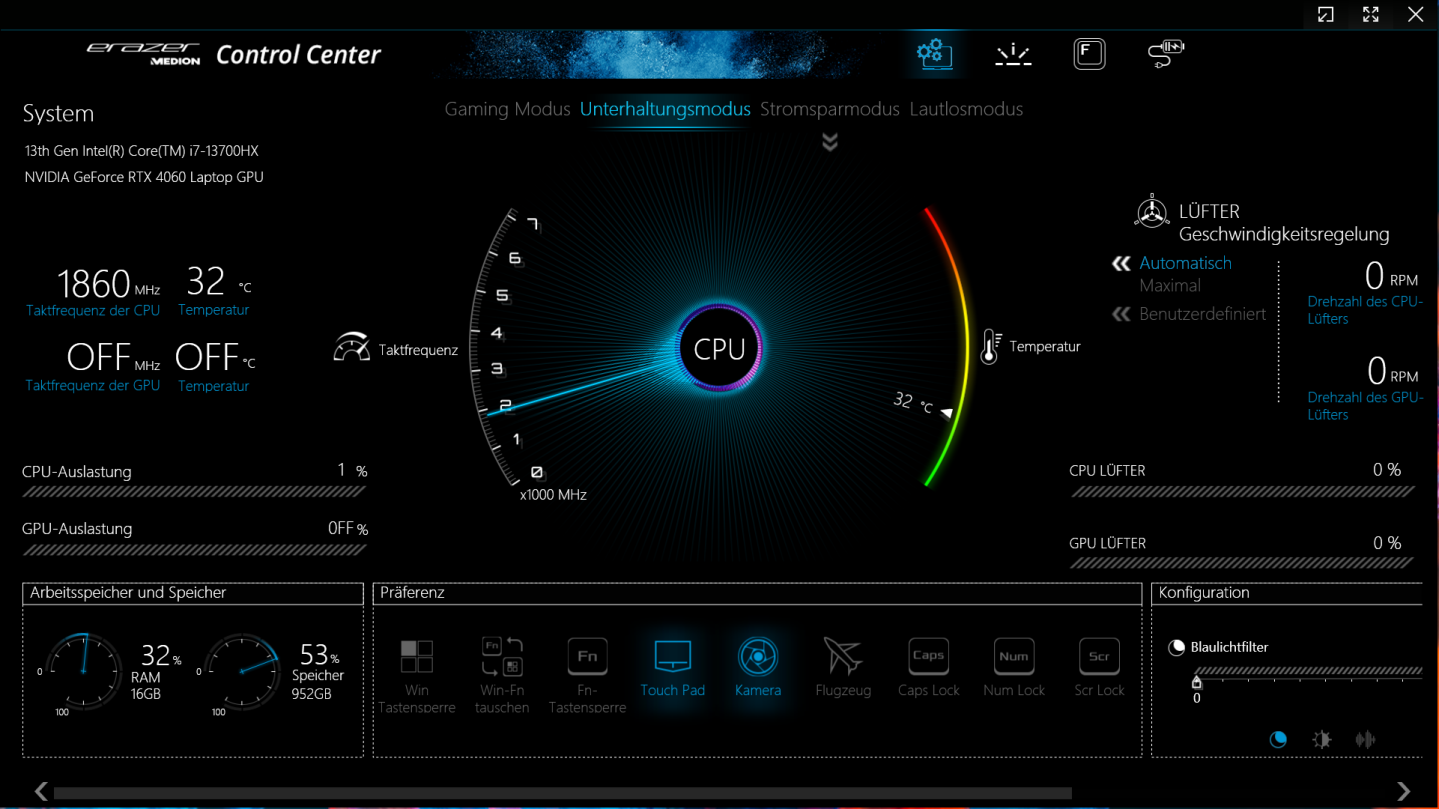
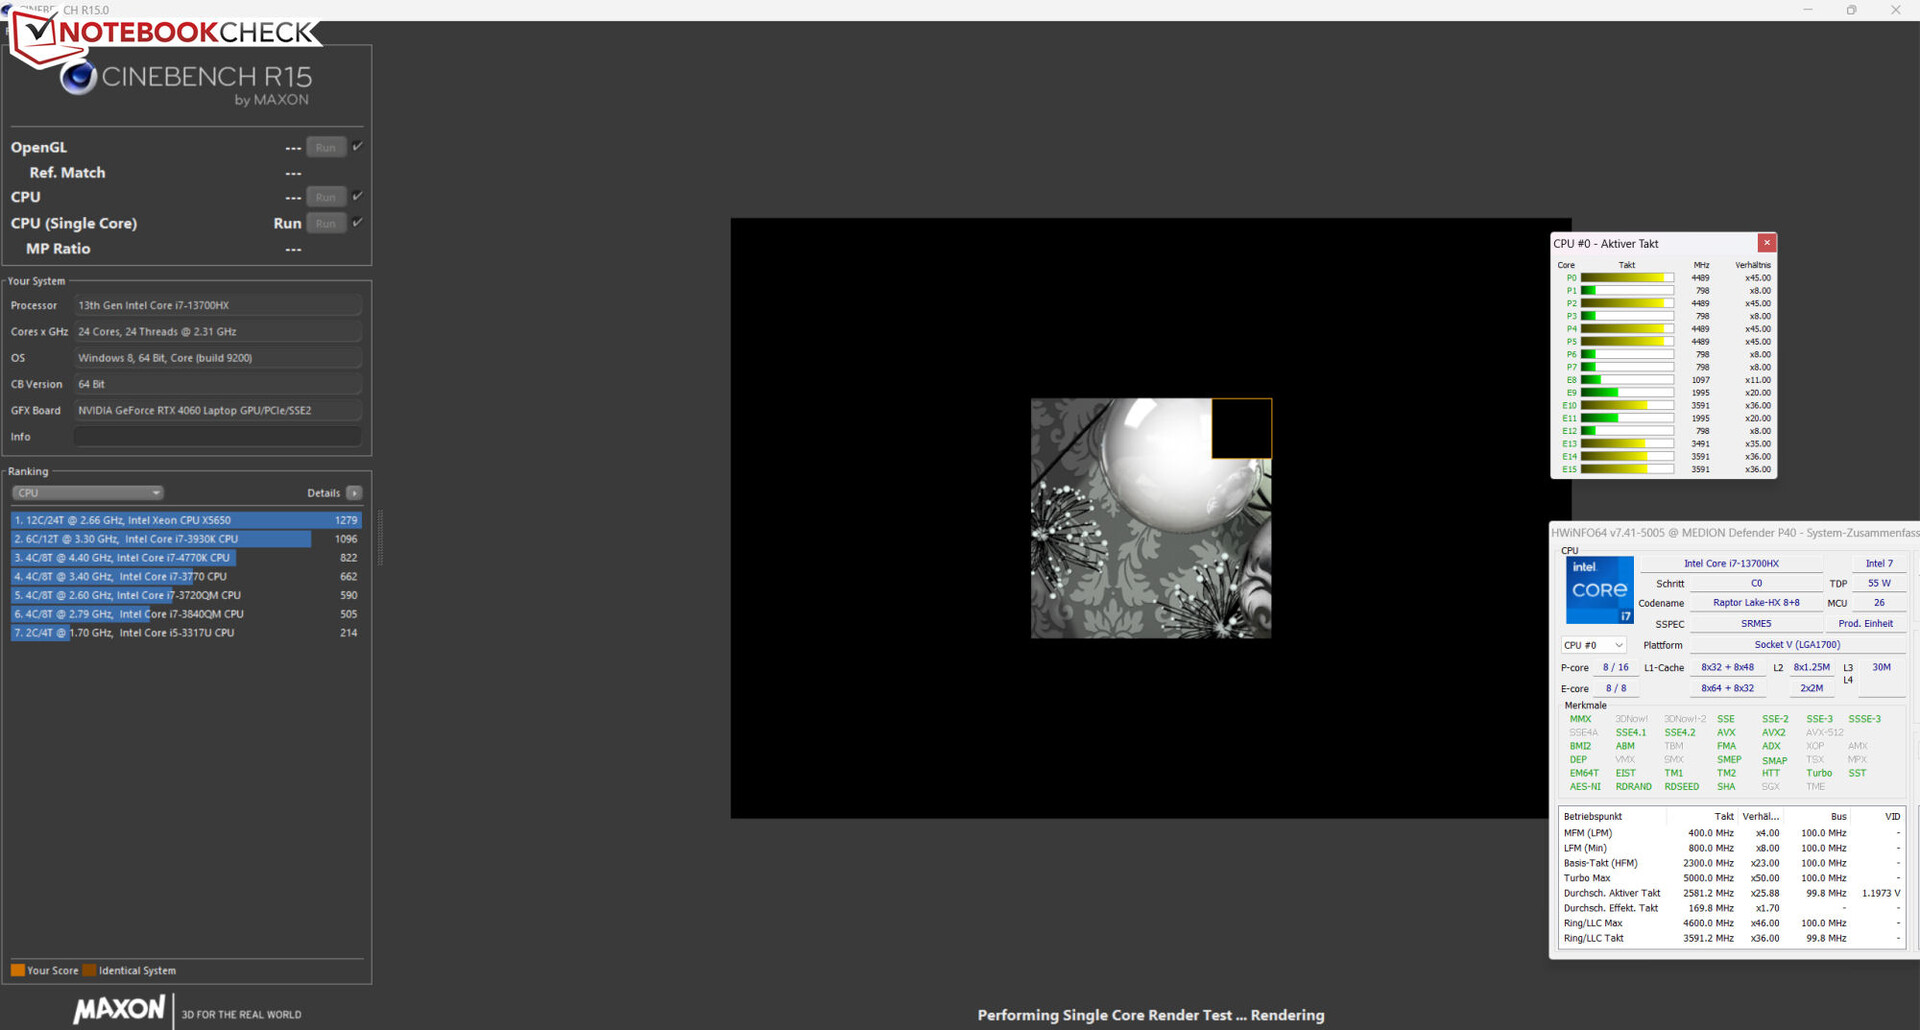
Warunki testowania
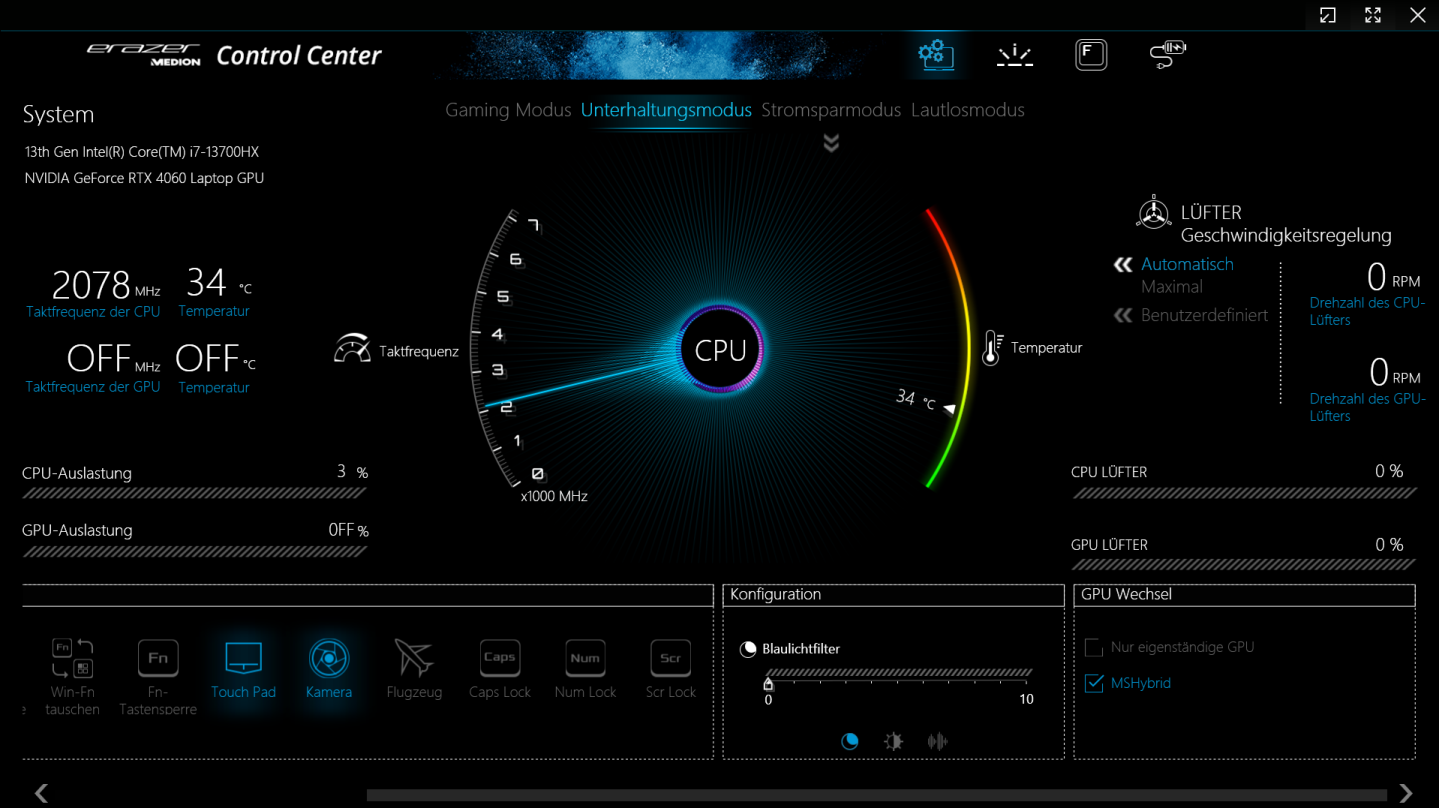
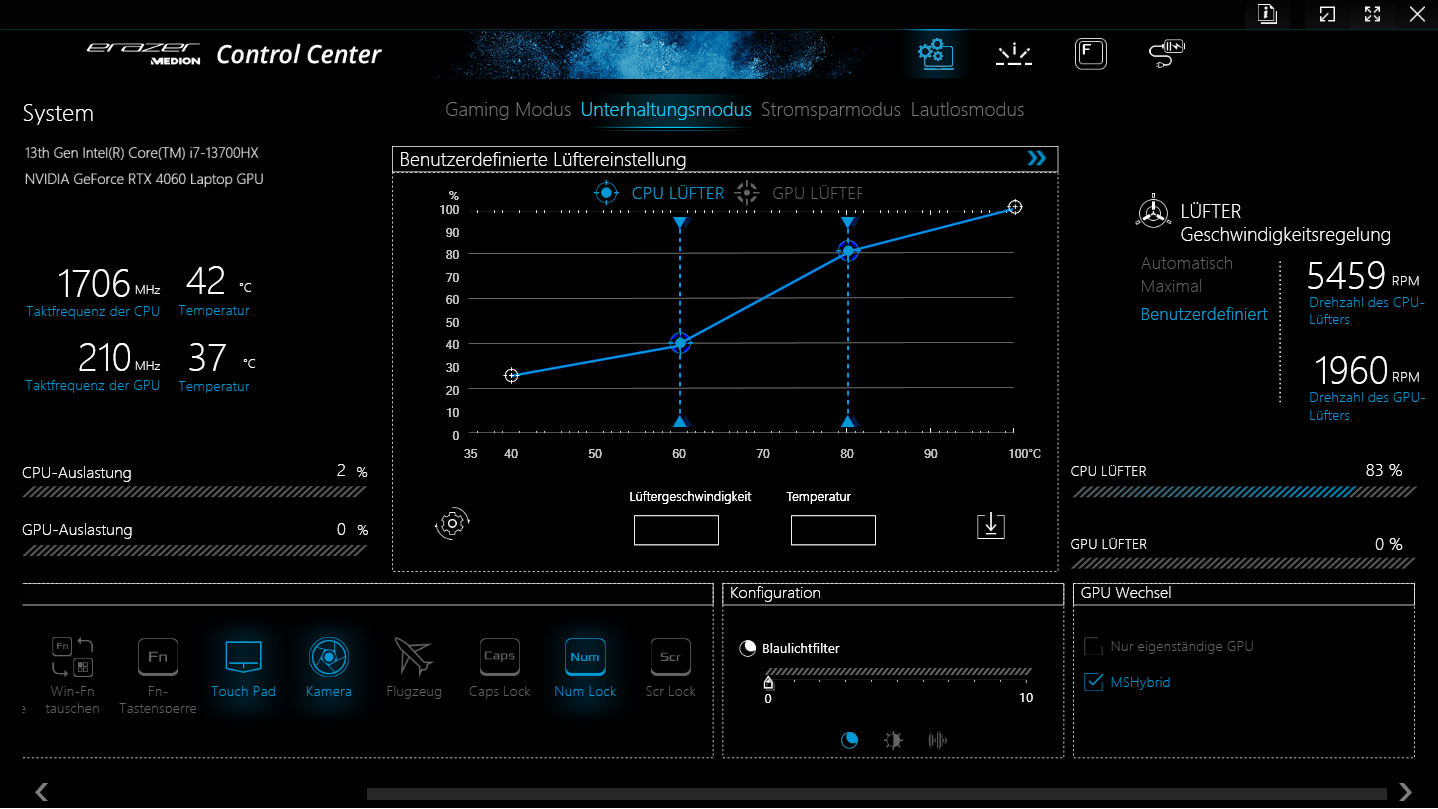
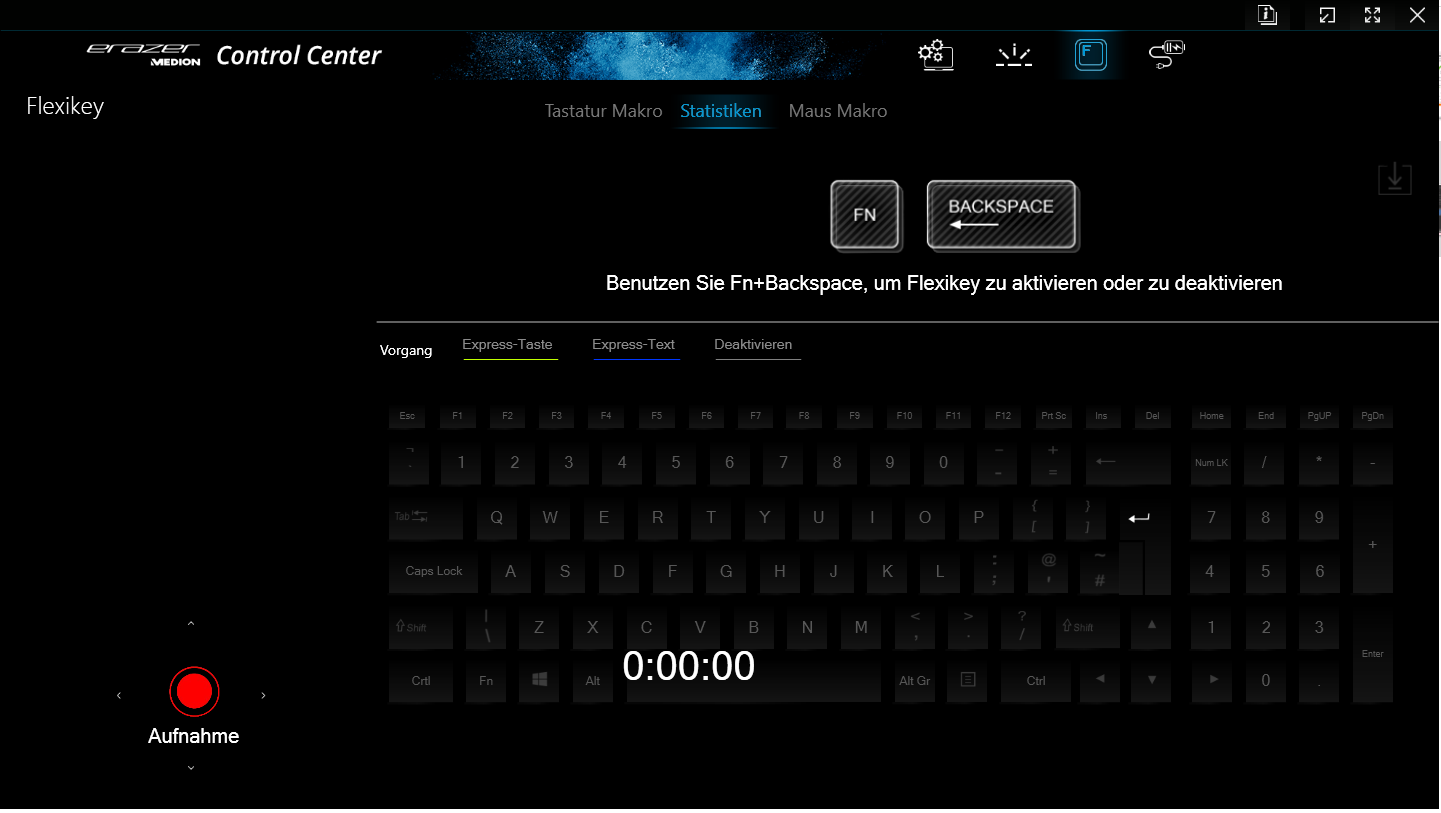
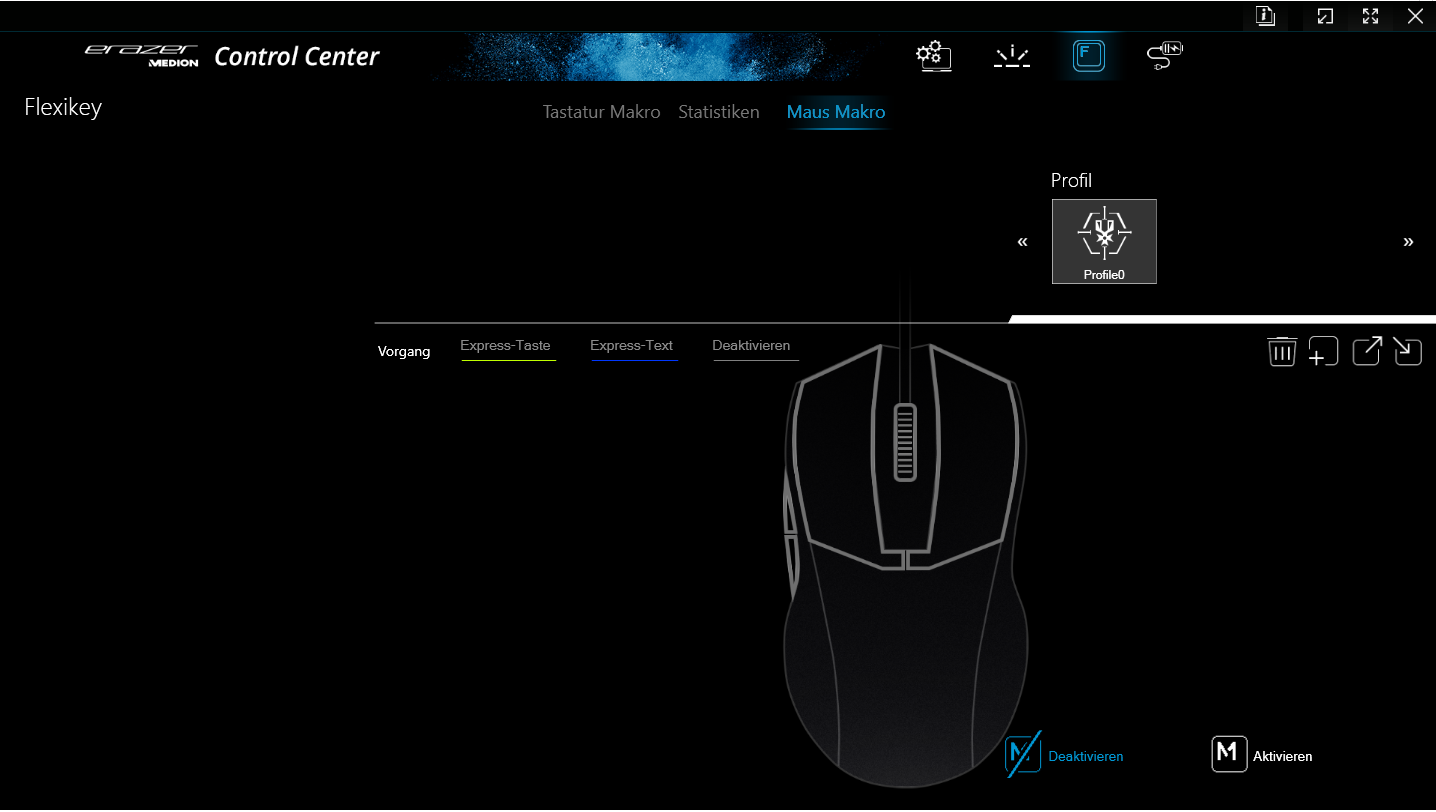
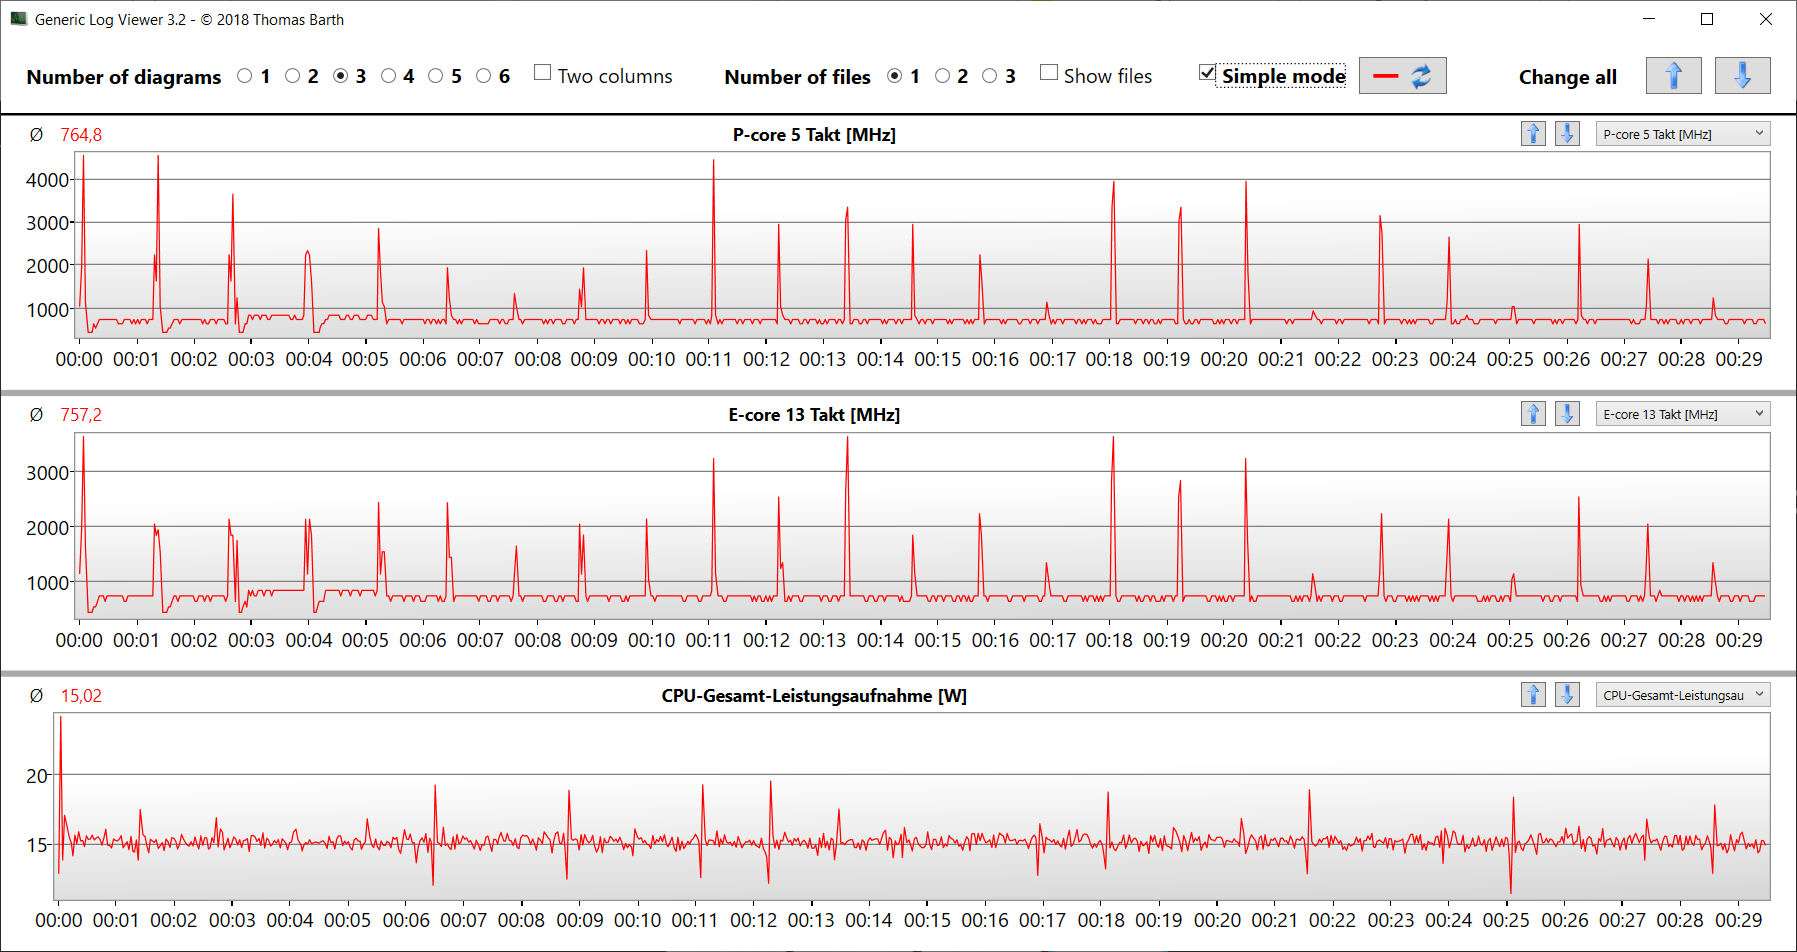
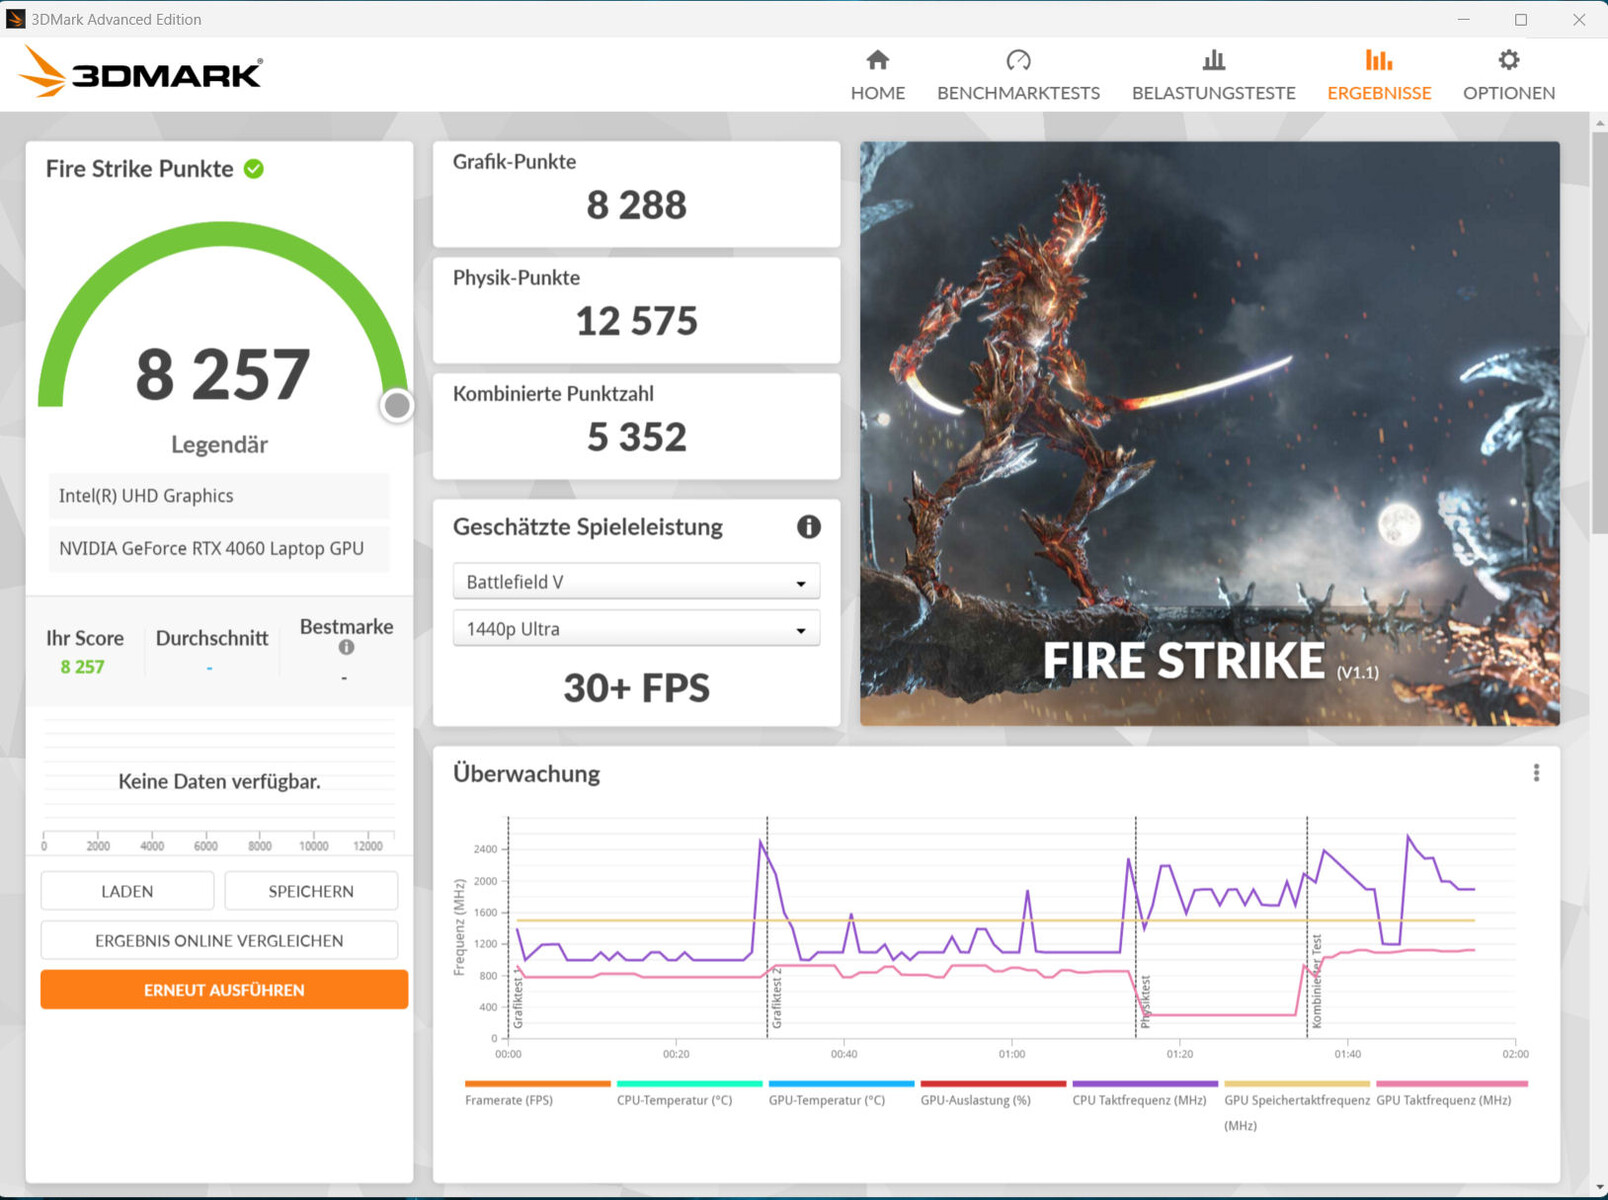
P40 ma cztery tryby wydajności specyficzne dla producenta (patrz tabela), między którymi można przełączać się za pomocą oprogramowania centrum sterowania laptopa. Użyliśmy "trybu rozrywki" (benchmarki) i "trybu oszczędzania energii" (testy baterii; dezaktywuje RTX 4060). Optimus był aktywowany. Przetestowaliśmy również oba pozostałe tryby: "tryb gamingowy" prowadzi do poprawy wydajności procesora, a "tryb cichy" pozwala na rozgrywkę z niższą emisją hałasu.
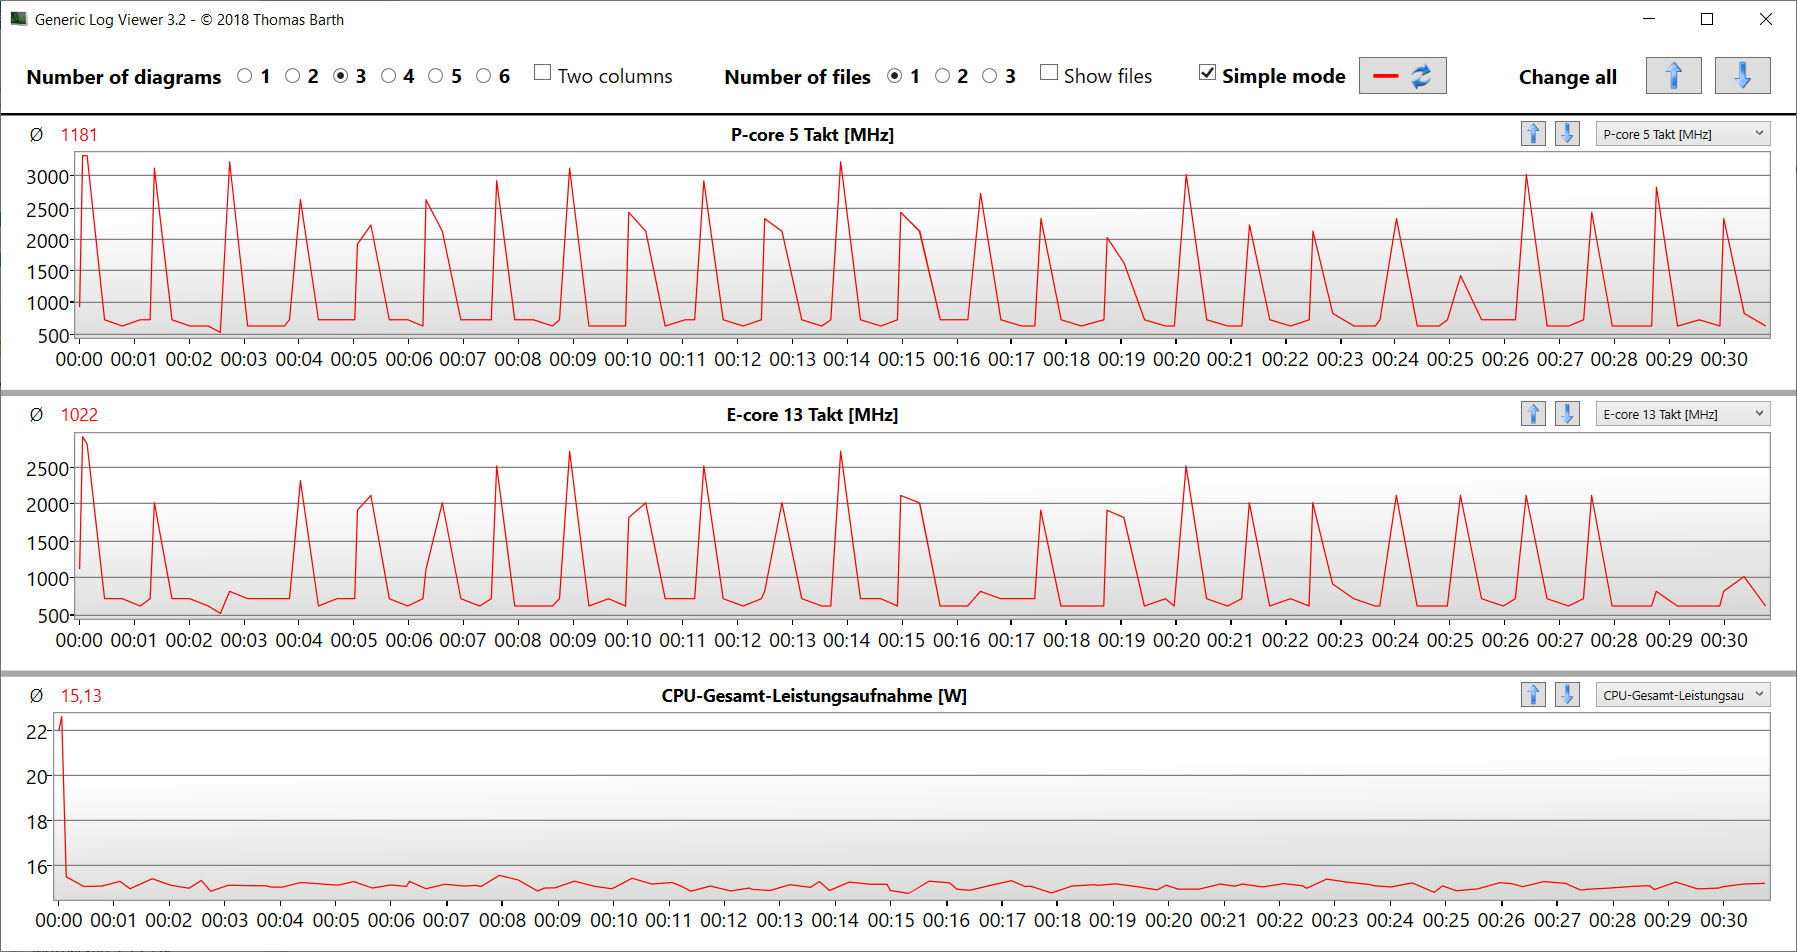
Według HWInfo "tryb oszczędzania energii" ustawia PL 1 procesora (45 watów) na wyższy poziom niż PL 2 (30 watów). Jest to najprawdopodobniej błąd. Podczas wykonywania pętli CB15 zużycie energii przez procesor wynosi 15 watów.
| Tryb gry | Tryb rozrywki | Tryb oszczędzania energii | Tryb cichy | |
|---|---|---|---|---|
| CPU PL1 (HWInfo) | 135 watów | 65 watów | 45 watów | 15 watów |
| CPU PL2 (HWInfo) | 162 waty | 130 watów | 30 watów | 30 watów |
| Hałas (Witcher 3) | 62 dB(A) | 56 dB(A) | - | 36 dB(A) |
| Wydajność (Witcher 3) | ~102 fps | ~100 fps | - | 30 - 50 fps |
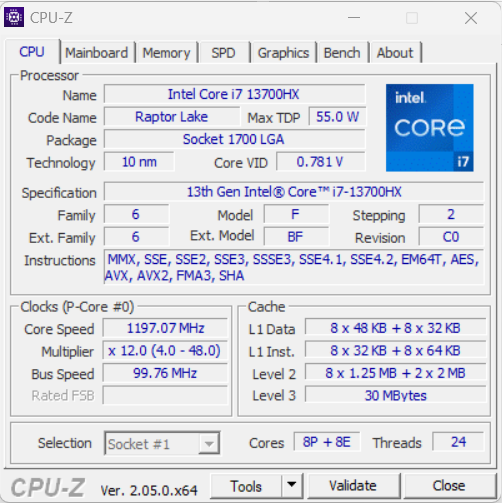
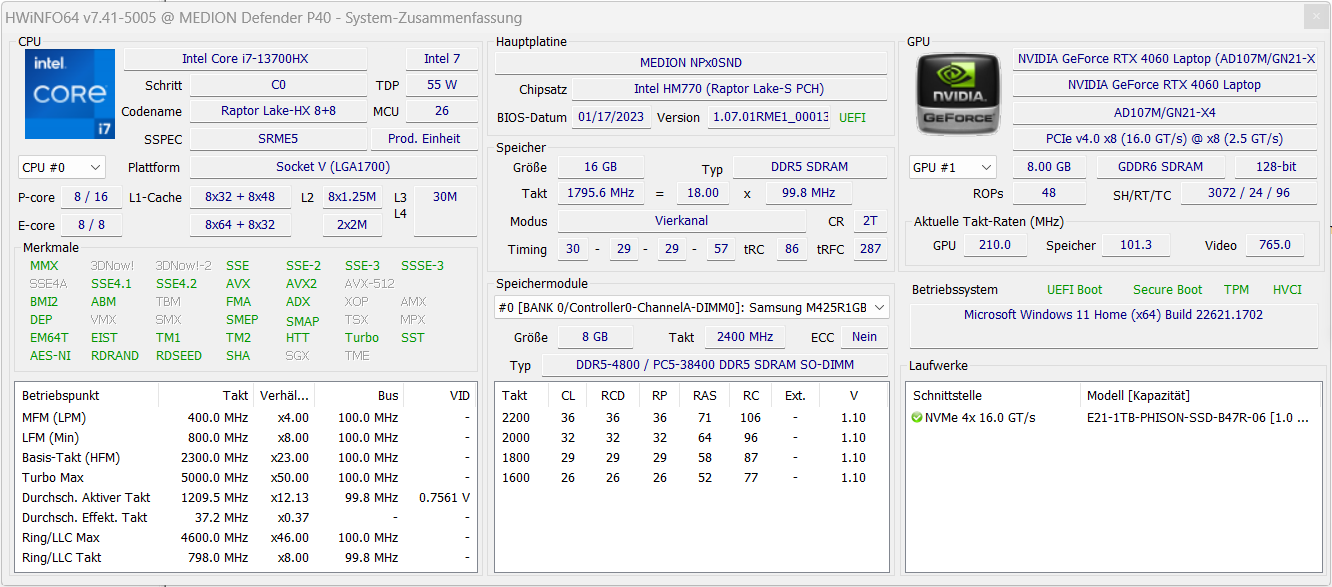
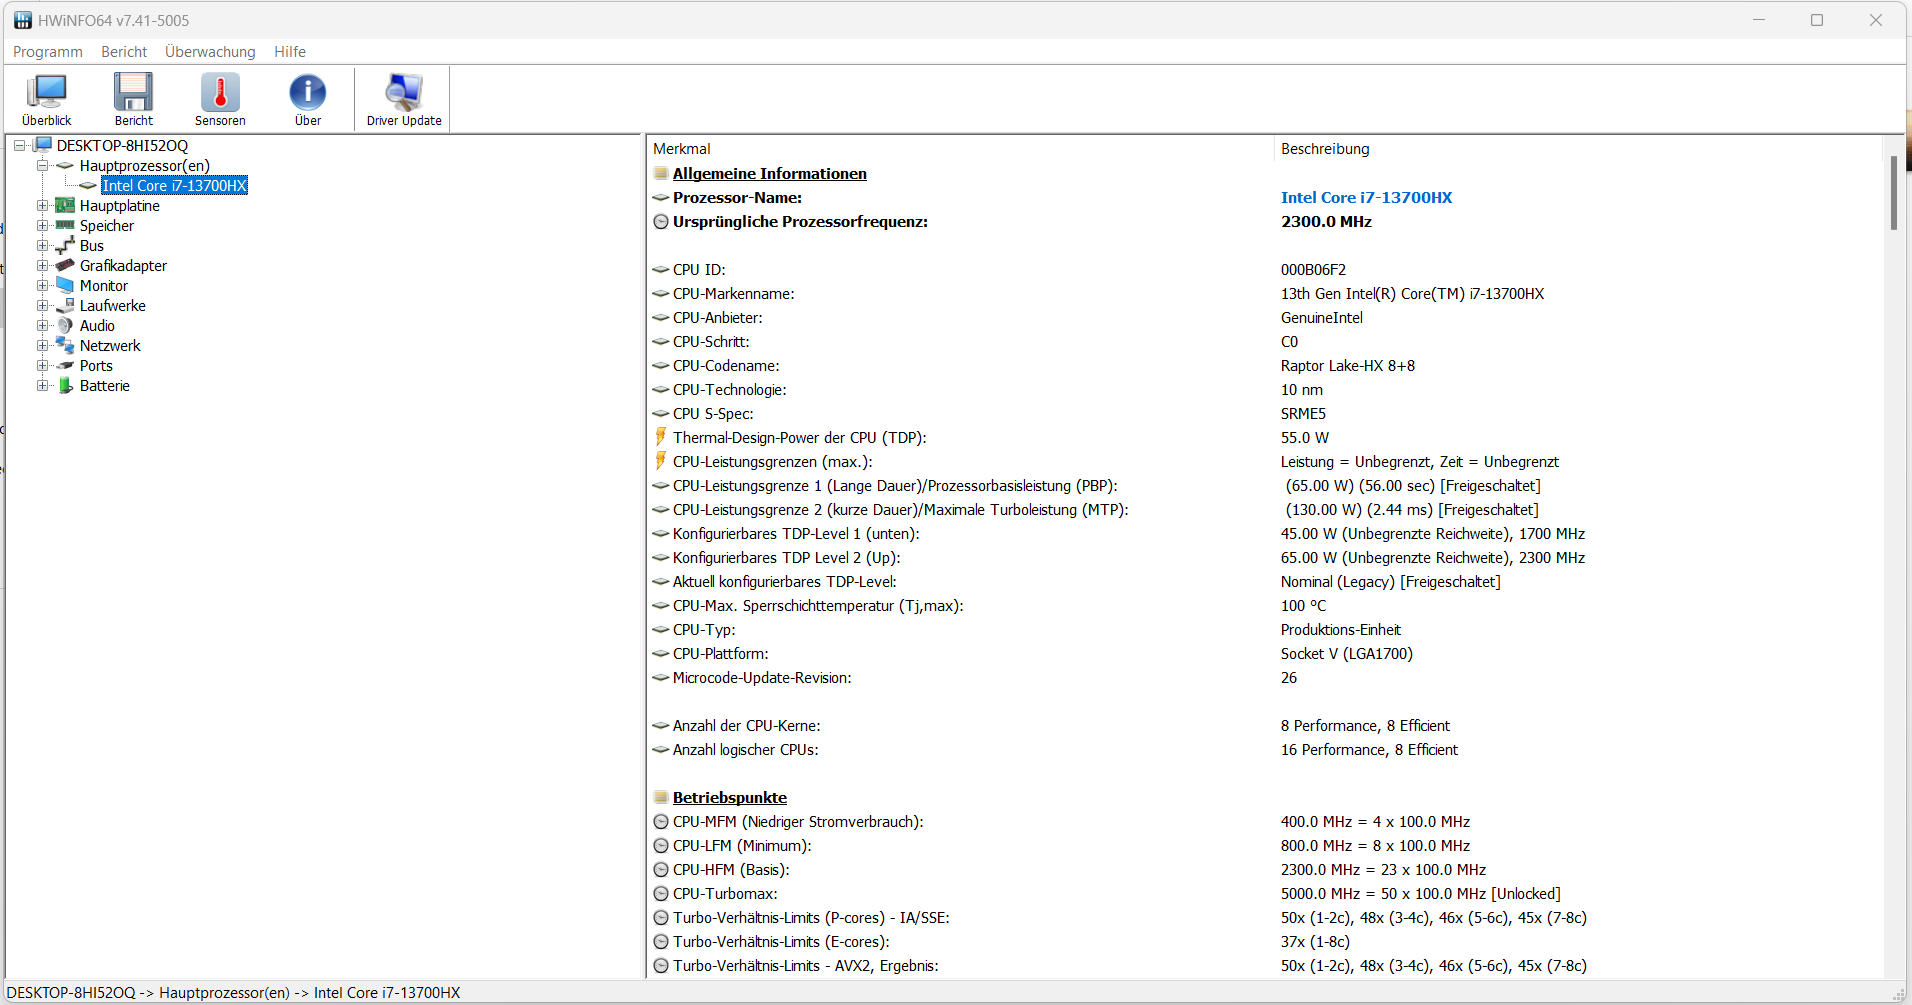
Procesor
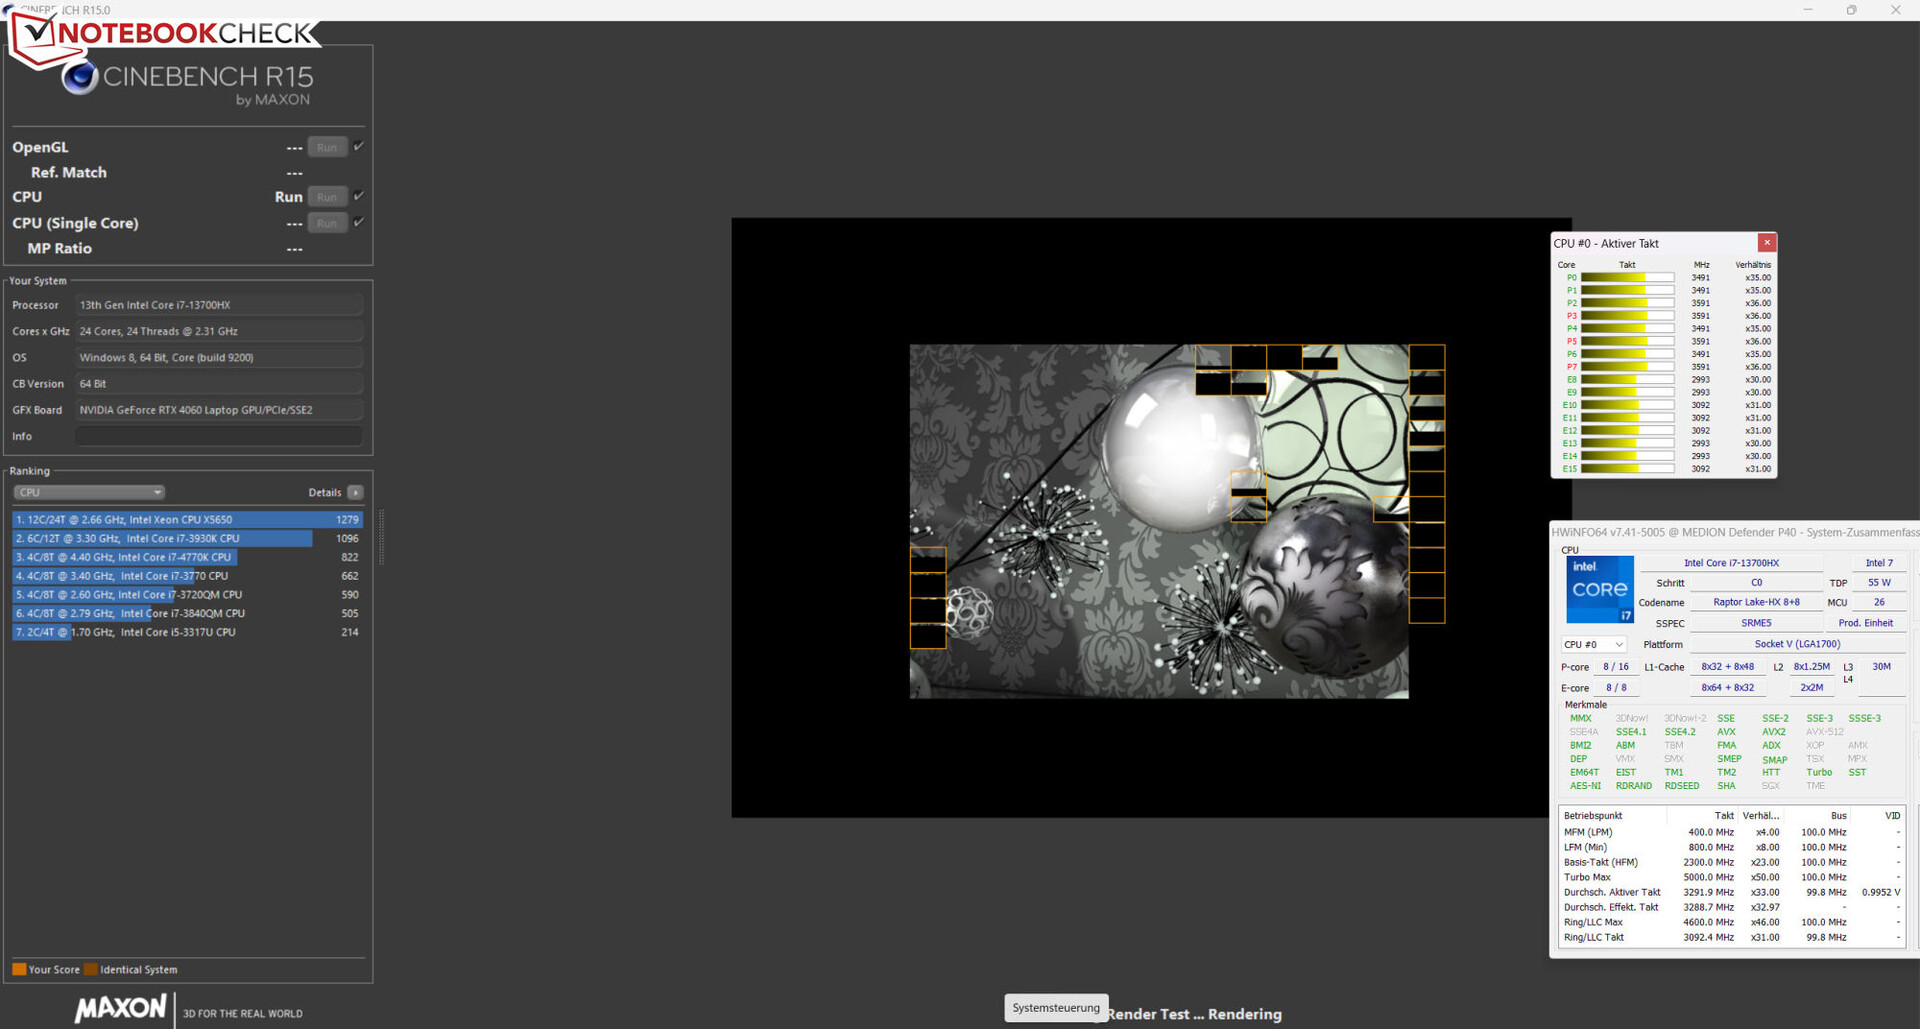
ProcesorCore-i7-13700HX(Raptor Lake) składa się z ośmiu rdzeni wydajnościowych (bez hiperwątkowości, 1,5 - 3,7 GHz) i ośmiu rdzeni wydajnościowych (hiperwątkowość, 2,1 - 5 GHz). Łącznie daje to 24 logiczne rdzenie CPU.
Testy porównawcze przyniosły wyniki nieco poniżej poprzedniej średniej CPU ("tryb rozrywkowy"). "Tryb gamingowy" zazwyczaj prowadził jedynie do minimalnego wzrostu wydajności - z wyjątkiem benchmarków AIDA64. Mógł on pokazać swoje lepsze właściwości tylko przy ciągłym obciążeniu. Bardziej istotna wydajność jednowątkowa laptopa (205 punktów) była mniej obniżona w trybie bateryjnym niż jego wydajność wielordzeniowa (1619 punktów).
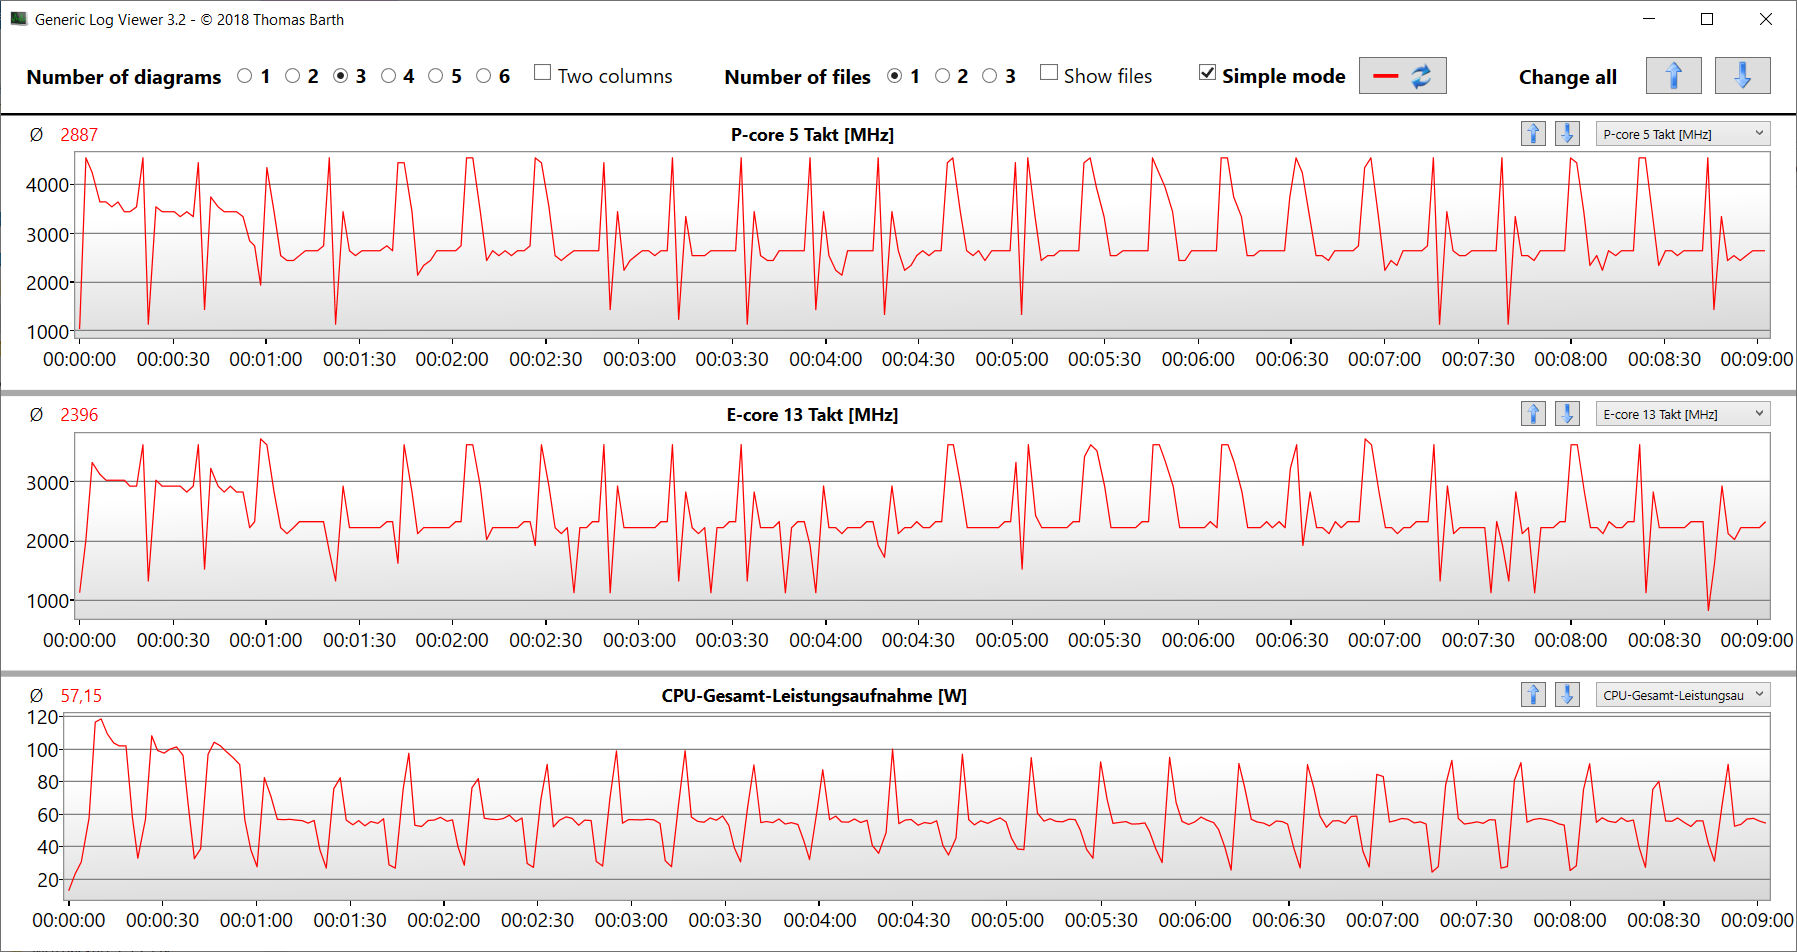
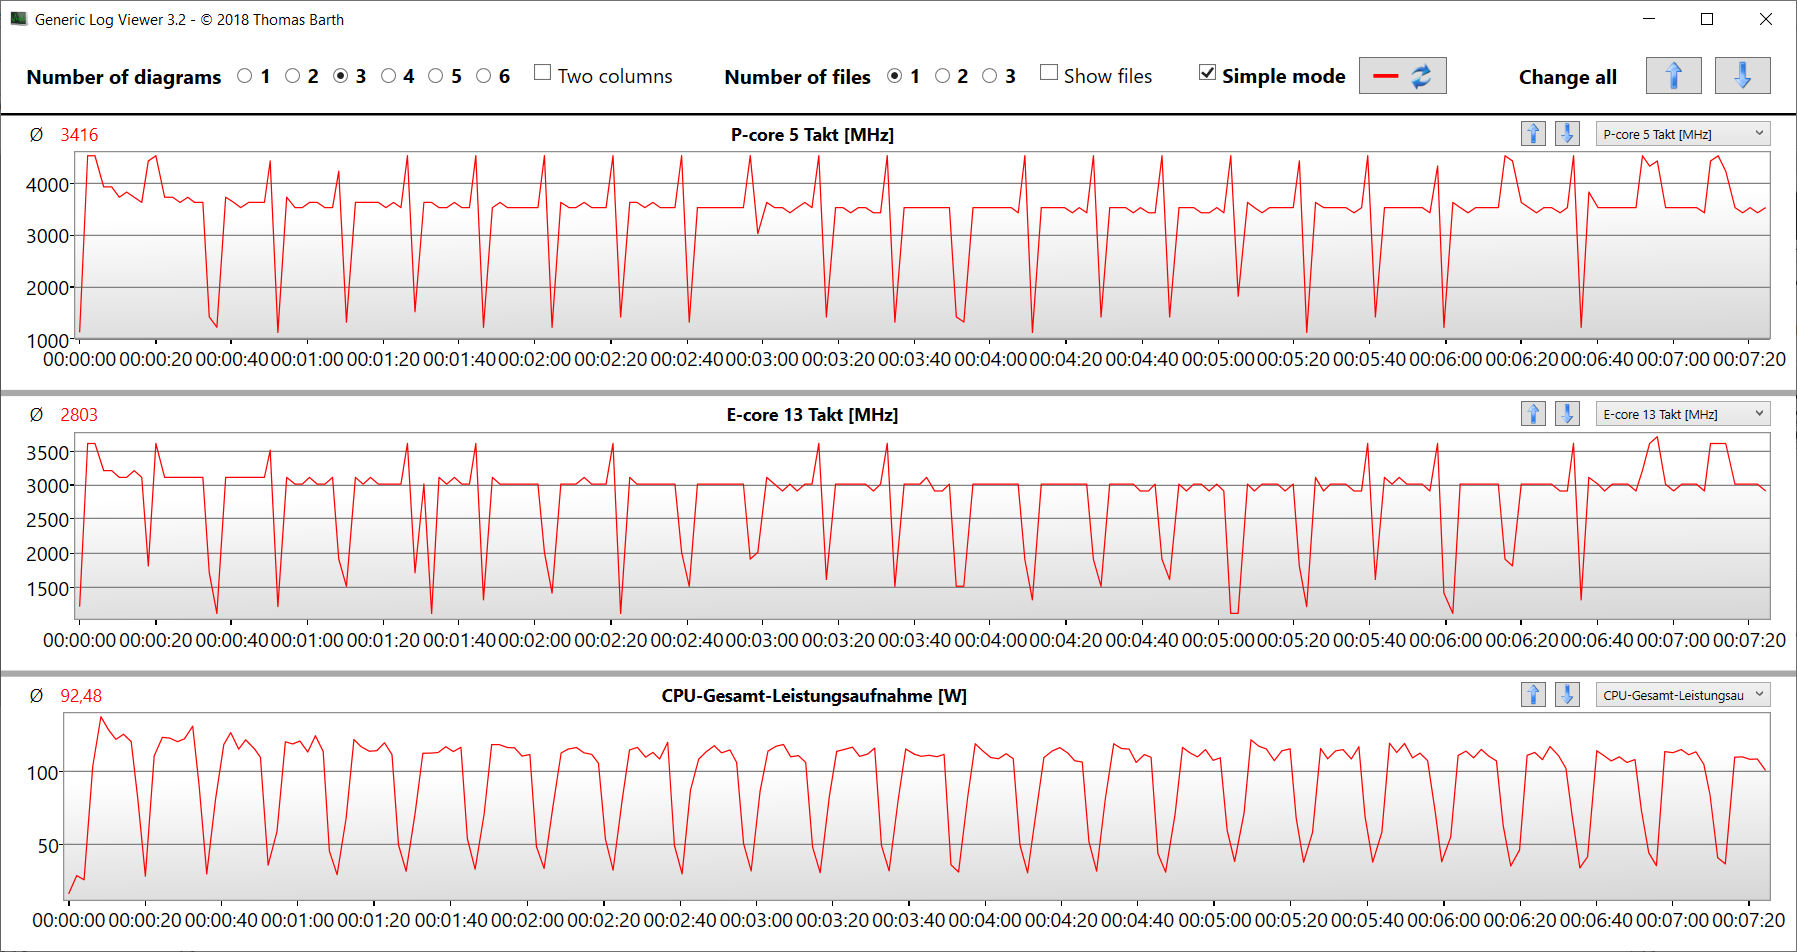
Test pętli CB15 wykazał: Stałe obciążenie wielowątkowe doprowadziło do spadku częstotliwości taktowania turbo od pierwszego do czwartego przebiegu. Następnie utrzymywało się na stałym poziomie. "Tryb gamingowy" prowadził do stale wyższych częstotliwości taktowania.
Cinebench R15 Multi continuous test
* ... im mniej tym lepiej
AIDA64: FP32 Ray-Trace | FPU Julia | CPU SHA3 | CPU Queen | FPU SinJulia | FPU Mandel | CPU AES | CPU ZLib | FP64 Ray-Trace | CPU PhotoWorxx
| Performance rating | |
| Średnia w klasie Gaming | |
| Lenovo Legion Pro 5 16IRX8 | |
| Przeciętny Intel Core i7-13700HX | |
| Acer Predator Helios 300 (i7-12700H, RTX 3070 Ti) | |
| Asus TUF Gaming A16 FA617 | |
| Medion Erazer Defender P40 | |
| Gigabyte G7 KE | |
| MSI Katana 17 B13VFK | |
| AIDA64 / FP32 Ray-Trace | |
| Średnia w klasie Gaming (10227 - 85542, n=107, ostatnie 2 lata) | |
| Lenovo Legion Pro 5 16IRX8 (v6.85.6300) | |
| Przeciętny Intel Core i7-13700HX (14261 - 21999, n=11) | |
| Acer Predator Helios 300 (i7-12700H, RTX 3070 Ti) (v6.75.6100) | |
| Asus TUF Gaming A16 FA617 (v6.85.6300) | |
| Medion Erazer Defender P40 (v6.75.6100) | |
| MSI Katana 17 B13VFK (v6.85.6300) | |
| Gigabyte G7 KE (v6.75.6100) | |
| AIDA64 / FPU Julia | |
| Średnia w klasie Gaming (51376 - 238426, n=107, ostatnie 2 lata) | |
| Lenovo Legion Pro 5 16IRX8 (v6.85.6300) | |
| Asus TUF Gaming A16 FA617 (v6.85.6300) | |
| Przeciętny Intel Core i7-13700HX (74636 - 109364, n=11) | |
| Acer Predator Helios 300 (i7-12700H, RTX 3070 Ti) (v6.75.6100) | |
| Medion Erazer Defender P40 (v6.75.6100) | |
| MSI Katana 17 B13VFK (v6.85.6300) | |
| Gigabyte G7 KE (v6.75.6100) | |
| AIDA64 / CPU SHA3 | |
| Średnia w klasie Gaming (2180 - 9817, n=107, ostatnie 2 lata) | |
| Lenovo Legion Pro 5 16IRX8 (v6.85.6300) | |
| Przeciętny Intel Core i7-13700HX (3359 - 5053, n=11) | |
| Acer Predator Helios 300 (i7-12700H, RTX 3070 Ti) (v6.75.6100) | |
| Asus TUF Gaming A16 FA617 (v6.85.6300) | |
| Medion Erazer Defender P40 (v6.75.6100) | |
| Gigabyte G7 KE (v6.75.6100) | |
| MSI Katana 17 B13VFK (v6.85.6300) | |
| AIDA64 / CPU Queen | |
| Średnia w klasie Gaming (49785 - 173351, n=95, ostatnie 2 lata) | |
| Lenovo Legion Pro 5 16IRX8 (v6.85.6300) | |
| Medion Erazer Defender P40 (v6.75.6100) | |
| Przeciętny Intel Core i7-13700HX (86532 - 114717, n=11) | |
| Asus TUF Gaming A16 FA617 (v6.85.6300) | |
| Acer Predator Helios 300 (i7-12700H, RTX 3070 Ti) (v6.75.6100) | |
| Gigabyte G7 KE (v6.75.6100) | |
| MSI Katana 17 B13VFK | |
| AIDA64 / FPU SinJulia | |
| Średnia w klasie Gaming (4424 - 33636, n=107, ostatnie 2 lata) | |
| Lenovo Legion Pro 5 16IRX8 (v6.85.6300) | |
| Asus TUF Gaming A16 FA617 (v6.85.6300) | |
| Przeciętny Intel Core i7-13700HX (9290 - 13519, n=11) | |
| Medion Erazer Defender P40 (v6.75.6100) | |
| Acer Predator Helios 300 (i7-12700H, RTX 3070 Ti) (v6.75.6100) | |
| MSI Katana 17 B13VFK | |
| Gigabyte G7 KE (v6.75.6100) | |
| AIDA64 / FPU Mandel | |
| Średnia w klasie Gaming (25115 - 128721, n=107, ostatnie 2 lata) | |
| Asus TUF Gaming A16 FA617 (v6.85.6300) | |
| Lenovo Legion Pro 5 16IRX8 (v6.85.6300) | |
| Przeciętny Intel Core i7-13700HX (35751 - 53484, n=11) | |
| Acer Predator Helios 300 (i7-12700H, RTX 3070 Ti) (v6.75.6100) | |
| Medion Erazer Defender P40 (v6.75.6100) | |
| MSI Katana 17 B13VFK (v6.85.6300) | |
| Gigabyte G7 KE (v6.75.6100) | |
| AIDA64 / CPU AES | |
| Przeciętny Intel Core i7-13700HX (67846 - 182575, n=11) | |
| Gigabyte G7 KE (v6.75.6100) | |
| Średnia w klasie Gaming (39258 - 247074, n=107, ostatnie 2 lata) | |
| Lenovo Legion Pro 5 16IRX8 (v6.85.6300) | |
| Acer Predator Helios 300 (i7-12700H, RTX 3070 Ti) (v6.75.6100) | |
| Medion Erazer Defender P40 (v6.75.6100) | |
| Asus TUF Gaming A16 FA617 (v6.85.6300) | |
| MSI Katana 17 B13VFK (v6.85.6300) | |
| AIDA64 / CPU ZLib | |
| Średnia w klasie Gaming (574 - 2531, n=107, ostatnie 2 lata) | |
| Lenovo Legion Pro 5 16IRX8 (v6.85.6300) | |
| Przeciętny Intel Core i7-13700HX (981 - 1451, n=11) | |
| Acer Predator Helios 300 (i7-12700H, RTX 3070 Ti) (v6.75.6100) | |
| Medion Erazer Defender P40 (v6.75.6100) | |
| Gigabyte G7 KE (v6.75.6100) | |
| Asus TUF Gaming A16 FA617 (v6.85.6300) | |
| MSI Katana 17 B13VFK (v6.85.6300) | |
| AIDA64 / FP64 Ray-Trace | |
| Średnia w klasie Gaming (5509 - 45446, n=107, ostatnie 2 lata) | |
| Lenovo Legion Pro 5 16IRX8 (v6.85.6300) | |
| Przeciętny Intel Core i7-13700HX (7728 - 11837, n=11) | |
| Acer Predator Helios 300 (i7-12700H, RTX 3070 Ti) (v6.75.6100) | |
| Asus TUF Gaming A16 FA617 (v6.85.6300) | |
| Medion Erazer Defender P40 (v6.75.6100) | |
| MSI Katana 17 B13VFK (v6.85.6300) | |
| Gigabyte G7 KE (v6.75.6100) | |
| AIDA64 / CPU PhotoWorxx | |
| Średnia w klasie Gaming (12271 - 89891, n=107, ostatnie 2 lata) | |
| Acer Predator Helios 300 (i7-12700H, RTX 3070 Ti) (v6.75.6100) | |
| Lenovo Legion Pro 5 16IRX8 (v6.85.6300) | |
| Medion Erazer Defender P40 (v6.75.6100) | |
| Przeciętny Intel Core i7-13700HX (19678 - 42415, n=11) | |
| MSI Katana 17 B13VFK (v6.85.6300) | |
| Gigabyte G7 KE (v6.75.6100) | |
| Asus TUF Gaming A16 FA617 (v6.85.6300) | |
Wydajność systemu
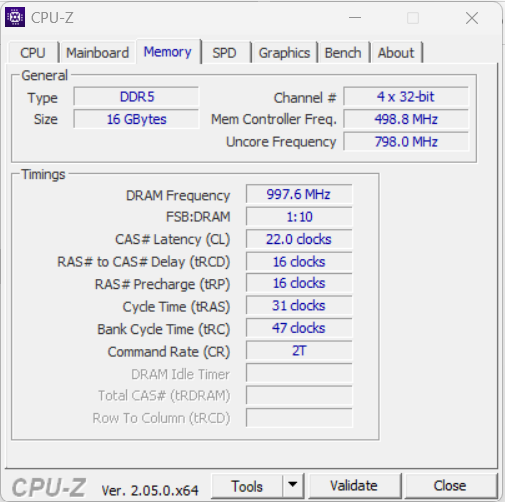
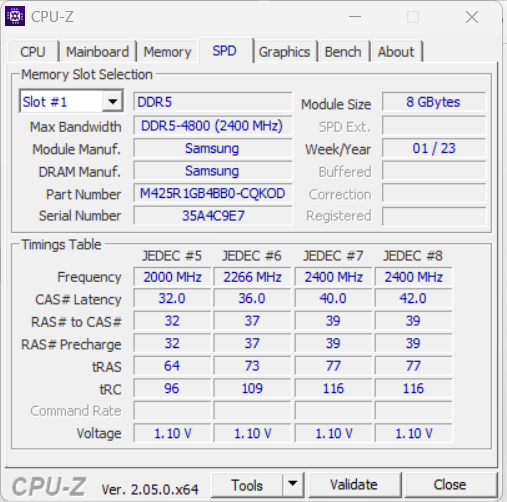
Jego płynnie działający system jest przygotowany do wymagających wydajności aplikacji, takich jak rendering i gry - potwierdzają to dobre wyniki laptopa w PCMark. Transfery pamięci RAM są na normalnym poziomie dla pamięci DDR5 4800.
CrossMark: Overall | Productivity | Creativity | Responsiveness
| PCMark 10 / Score | |
| Średnia w klasie Gaming (5828 - 11574, n=95, ostatnie 2 lata) | |
| Acer Predator Helios 300 (i7-12700H, RTX 3070 Ti) | |
| Lenovo Legion Pro 5 16IRX8 | |
| Przeciętny Intel Core i7-13700HX, NVIDIA GeForce RTX 4060 Laptop GPU (6909 - 7743, n=5) | |
| Asus TUF Gaming A16 FA617 | |
| MSI Katana 17 B13VFK | |
| Medion Erazer Defender P40 | |
| Gigabyte G7 KE | |
| PCMark 10 / Essentials | |
| Lenovo Legion Pro 5 16IRX8 | |
| MSI Katana 17 B13VFK | |
| Acer Predator Helios 300 (i7-12700H, RTX 3070 Ti) | |
| Przeciętny Intel Core i7-13700HX, NVIDIA GeForce RTX 4060 Laptop GPU (9760 - 11313, n=5) | |
| Średnia w klasie Gaming (8810 - 12600, n=99, ostatnie 2 lata) | |
| Asus TUF Gaming A16 FA617 | |
| Gigabyte G7 KE | |
| Medion Erazer Defender P40 | |
| PCMark 10 / Productivity | |
| Średnia w klasie Gaming (6845 - 21327, n=97, ostatnie 2 lata) | |
| Acer Predator Helios 300 (i7-12700H, RTX 3070 Ti) | |
| Medion Erazer Defender P40 | |
| Przeciętny Intel Core i7-13700HX, NVIDIA GeForce RTX 4060 Laptop GPU (9131 - 11018, n=5) | |
| Asus TUF Gaming A16 FA617 | |
| MSI Katana 17 B13VFK | |
| Lenovo Legion Pro 5 16IRX8 | |
| Gigabyte G7 KE | |
| PCMark 10 / Digital Content Creation | |
| Średnia w klasie Gaming (7602 - 19657, n=97, ostatnie 2 lata) | |
| Acer Predator Helios 300 (i7-12700H, RTX 3070 Ti) | |
| Lenovo Legion Pro 5 16IRX8 | |
| Przeciętny Intel Core i7-13700HX, NVIDIA GeForce RTX 4060 Laptop GPU (9393 - 12434, n=5) | |
| Asus TUF Gaming A16 FA617 | |
| MSI Katana 17 B13VFK | |
| Medion Erazer Defender P40 | |
| Gigabyte G7 KE | |
| CrossMark / Overall | |
| Średnia w klasie Gaming (1366 - 2409, n=95, ostatnie 2 lata) | |
| Acer Predator Helios 300 (i7-12700H, RTX 3070 Ti) | |
| Przeciętny Intel Core i7-13700HX, NVIDIA GeForce RTX 4060 Laptop GPU (1663 - 2105, n=5) | |
| MSI Katana 17 B13VFK | |
| Gigabyte G7 KE | |
| Medion Erazer Defender P40 | |
| Lenovo Legion Pro 5 16IRX8 | |
| CrossMark / Productivity | |
| Średnia w klasie Gaming (1386 - 2254, n=95, ostatnie 2 lata) | |
| Gigabyte G7 KE | |
| Acer Predator Helios 300 (i7-12700H, RTX 3070 Ti) | |
| Przeciętny Intel Core i7-13700HX, NVIDIA GeForce RTX 4060 Laptop GPU (1618 - 1989, n=5) | |
| MSI Katana 17 B13VFK | |
| Medion Erazer Defender P40 | |
| Lenovo Legion Pro 5 16IRX8 | |
| CrossMark / Creativity | |
| Średnia w klasie Gaming (1343 - 2729, n=95, ostatnie 2 lata) | |
| Acer Predator Helios 300 (i7-12700H, RTX 3070 Ti) | |
| Przeciętny Intel Core i7-13700HX, NVIDIA GeForce RTX 4060 Laptop GPU (1710 - 2274, n=5) | |
| MSI Katana 17 B13VFK | |
| Medion Erazer Defender P40 | |
| Gigabyte G7 KE | |
| Lenovo Legion Pro 5 16IRX8 | |
| CrossMark / Responsiveness | |
| Gigabyte G7 KE | |
| MSI Katana 17 B13VFK | |
| Acer Predator Helios 300 (i7-12700H, RTX 3070 Ti) | |
| Średnia w klasie Gaming (1226 - 2334, n=95, ostatnie 2 lata) | |
| Przeciętny Intel Core i7-13700HX, NVIDIA GeForce RTX 4060 Laptop GPU (1269 - 1983, n=5) | |
| Lenovo Legion Pro 5 16IRX8 | |
| Medion Erazer Defender P40 | |
| PCMark 8 Home Score Accelerated v2 | 4659 pkt. | |
| PCMark 8 Work Score Accelerated v2 | 5797 pkt. | |
| PCMark 10 Score | 6909 pkt. | |
Pomoc | ||
| AIDA64 / Memory Copy | |
| Średnia w klasie Gaming (21750 - 129946, n=107, ostatnie 2 lata) | |
| Lenovo Legion Pro 5 16IRX8 | |
| Medion Erazer Defender P40 | |
| Acer Predator Helios 300 (i7-12700H, RTX 3070 Ti) | |
| Przeciętny Intel Core i7-13700HX (36125 - 63990, n=11) | |
| MSI Katana 17 B13VFK | |
| Asus TUF Gaming A16 FA617 | |
| Gigabyte G7 KE | |
| AIDA64 / Memory Read | |
| Średnia w klasie Gaming (22956 - 118858, n=107, ostatnie 2 lata) | |
| Lenovo Legion Pro 5 16IRX8 | |
| Medion Erazer Defender P40 | |
| MSI Katana 17 B13VFK | |
| Przeciętny Intel Core i7-13700HX (36510 - 69729, n=11) | |
| Acer Predator Helios 300 (i7-12700H, RTX 3070 Ti) | |
| Asus TUF Gaming A16 FA617 | |
| Gigabyte G7 KE | |
| AIDA64 / Memory Write | |
| Średnia w klasie Gaming (22297 - 135096, n=107, ostatnie 2 lata) | |
| Lenovo Legion Pro 5 16IRX8 | |
| Przeciętny Intel Core i7-13700HX (33598 - 85675, n=11) | |
| Medion Erazer Defender P40 | |
| Acer Predator Helios 300 (i7-12700H, RTX 3070 Ti) | |
| Asus TUF Gaming A16 FA617 | |
| MSI Katana 17 B13VFK | |
| Gigabyte G7 KE | |
| AIDA64 / Memory Latency | |
| Średnia w klasie Gaming (75.3 - 259, n=107, ostatnie 2 lata) | |
| MSI Katana 17 B13VFK | |
| Medion Erazer Defender P40 | |
| Acer Predator Helios 300 (i7-12700H, RTX 3070 Ti) | |
| Gigabyte G7 KE | |
| Przeciętny Intel Core i7-13700HX (81.5 - 97.9, n=11) | |
| Asus TUF Gaming A16 FA617 | |
| Lenovo Legion Pro 5 16IRX8 | |
* ... im mniej tym lepiej
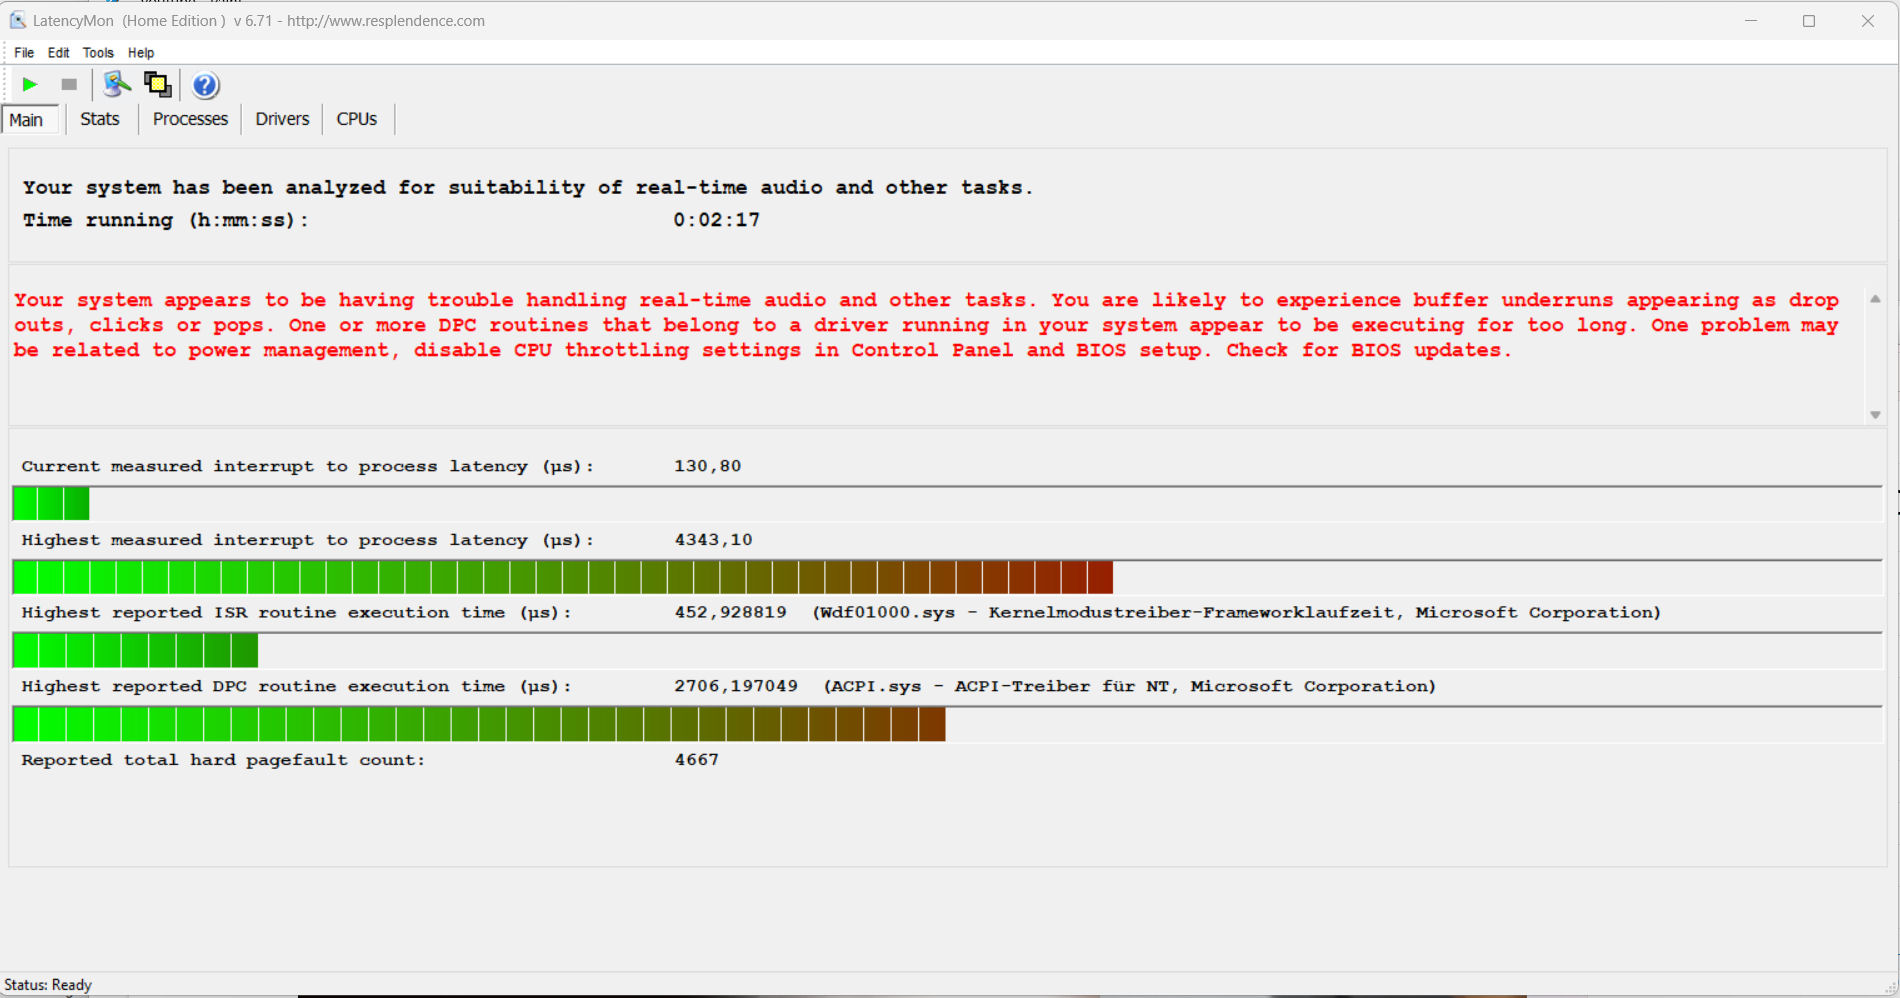
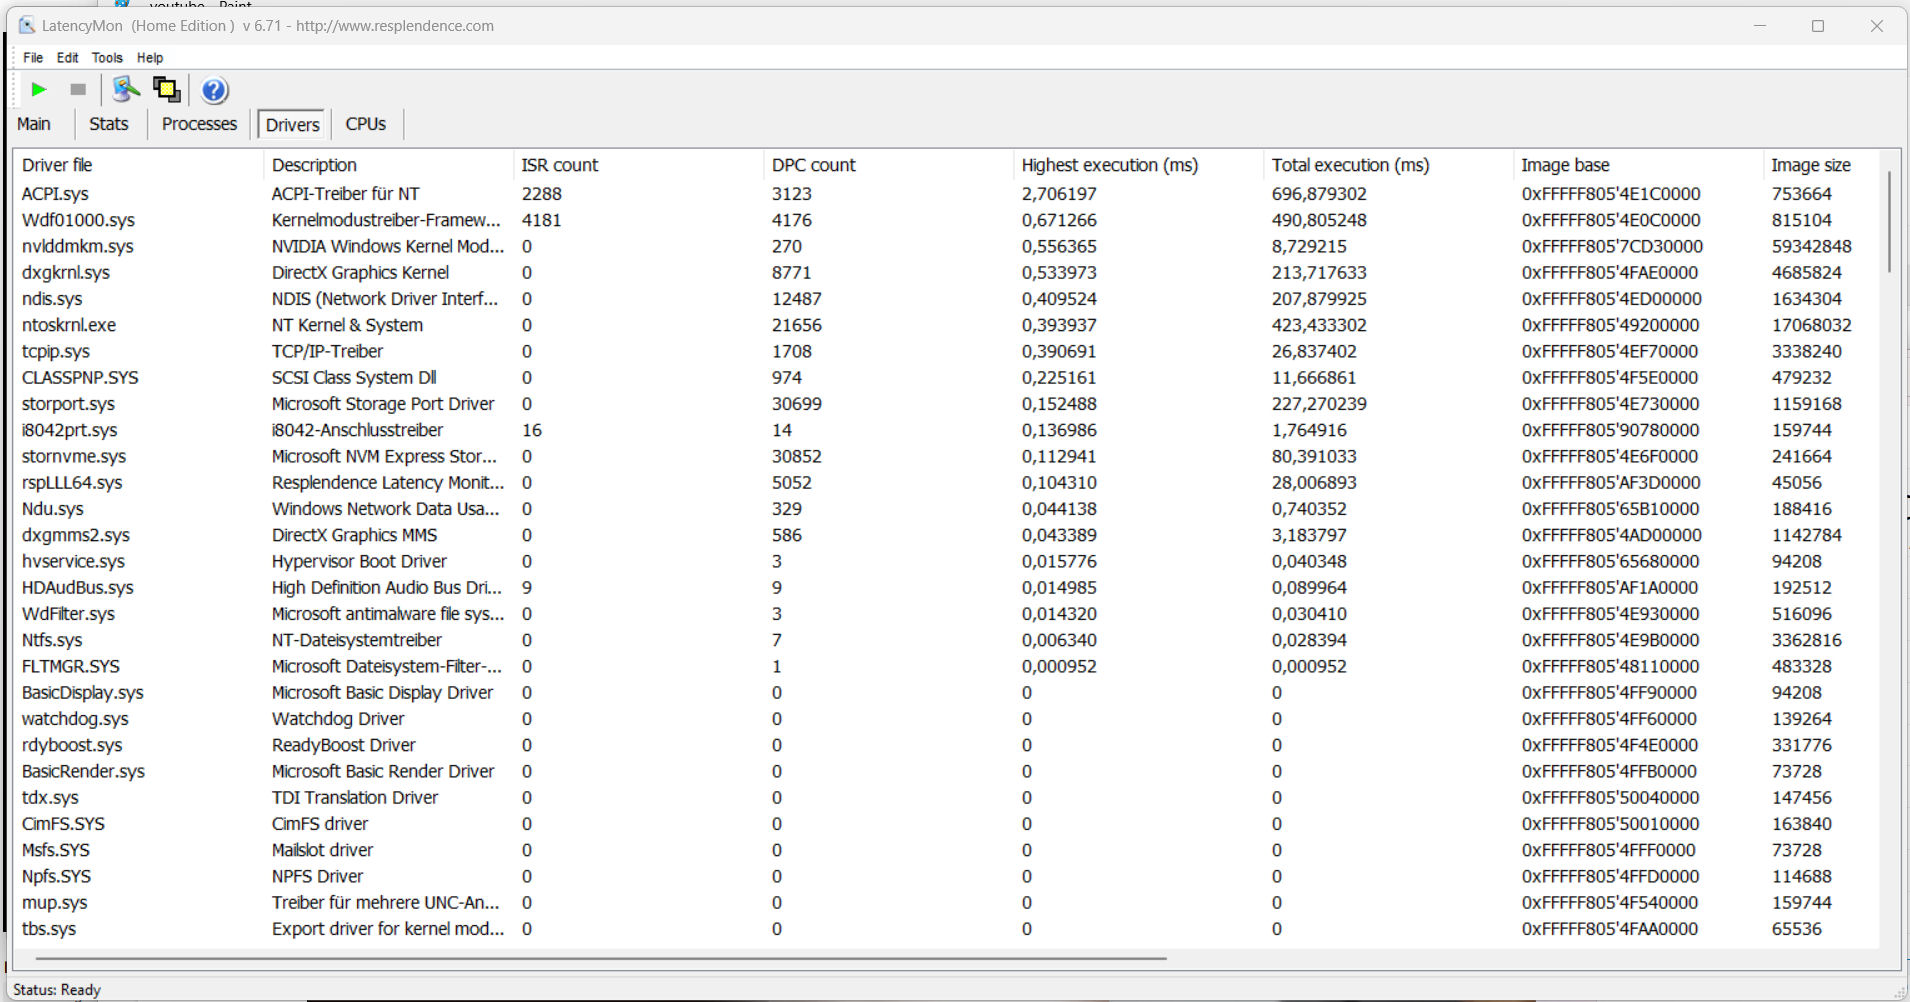
Opóźnienie DPC
Standardowy test monitora opóźnień (surfowanie po sieci, odtwarzanie wideo 4k, wysokie obciążenie Prime95) ujawnił pewne anomalie. System nie wydaje się być odpowiedni do edycji wideo i audio w czasie rzeczywistym. Przyszłe aktualizacje oprogramowania mogą doprowadzić do poprawy lub nawet pogorszenia wydajności.
| DPC Latencies / LatencyMon - interrupt to process latency (max), Web, Youtube, Prime95 | |
| Medion Erazer Defender P40 | |
| MSI Katana 17 B13VFK | |
| Gigabyte G7 KE | |
| Acer Predator Helios 300 (i7-12700H, RTX 3070 Ti) | |
| Lenovo Legion Pro 5 16IRX8 | |
| Asus TUF Gaming A16 FA617 | |
* ... im mniej tym lepiej
Urządzenia pamięci masowej
P40 posiada dysk SSD PCIe-4 (1 TB) w formacie M.2-2280 firmy Phison. Zapewnia on bardzo dobre prędkości transferu, ale nie jest jednym z najlepszych dysków SSD. Spadki wydajności spowodowane dławieniem termicznym nie występują. Laptop posiada miejsce na drugi dysk SSD PCIe-4.

* ... im mniej tym lepiej
Reading continuous performance: DiskSpd Read Loop, Queue Depth 8
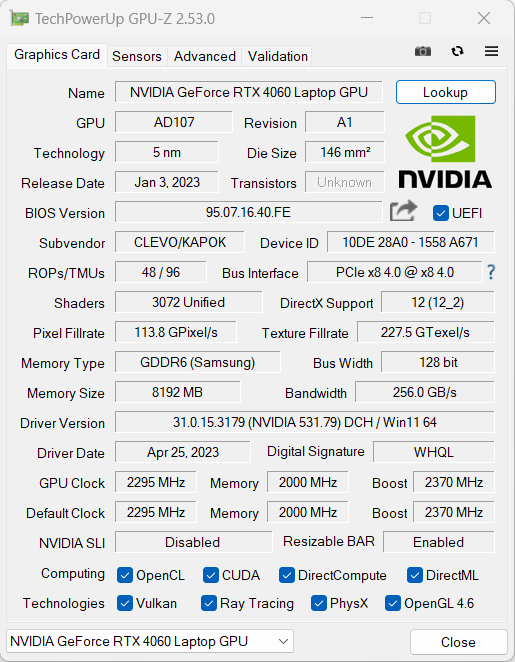
Karta graficzna
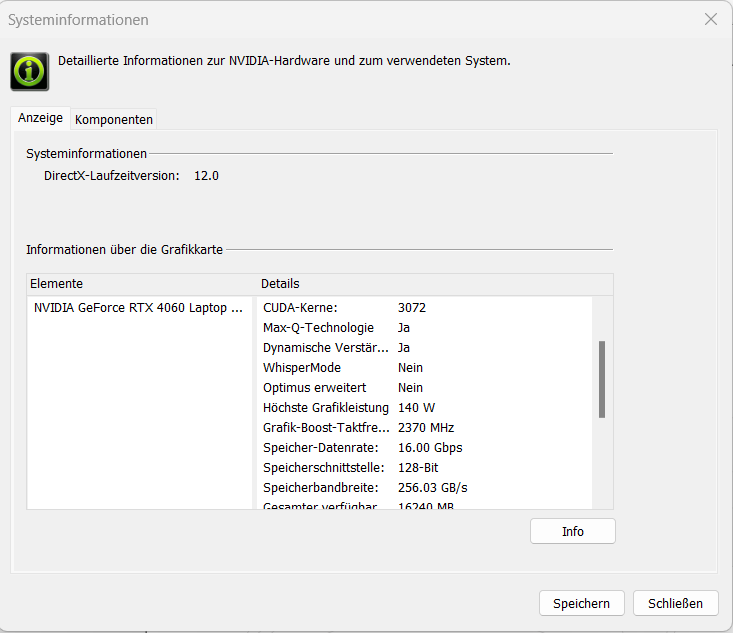
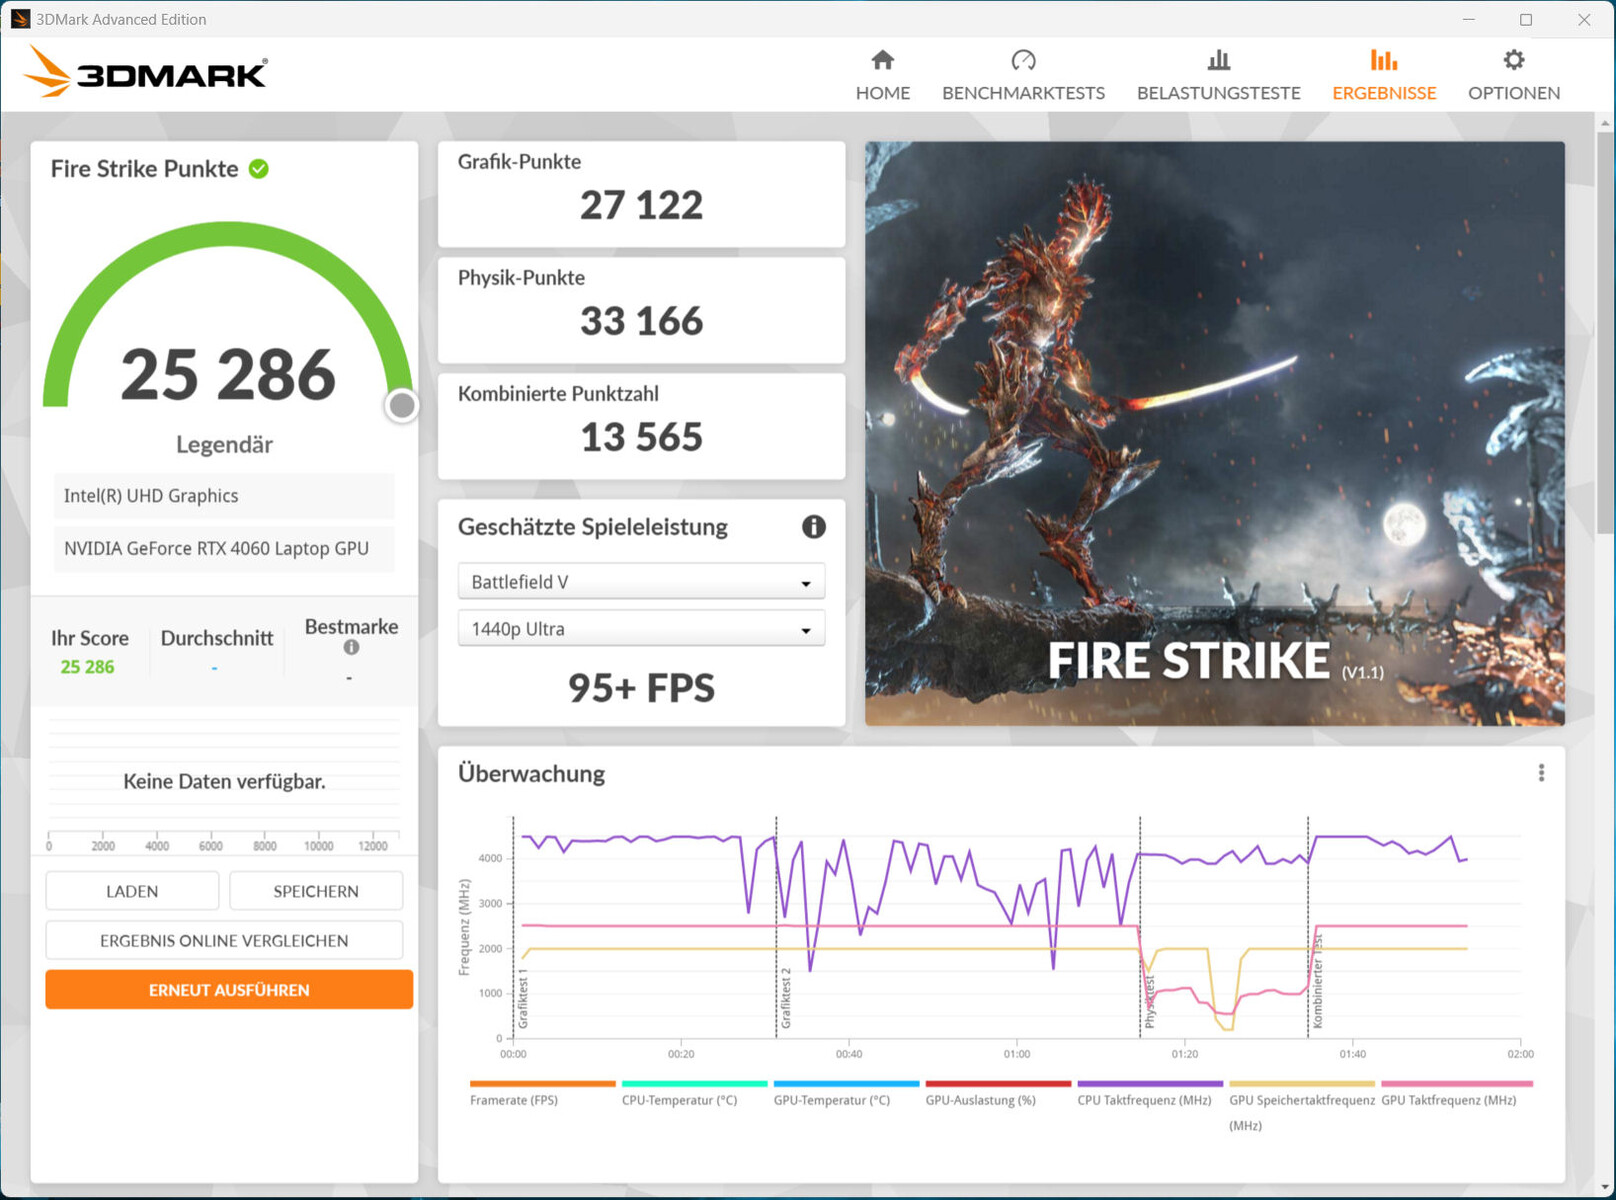
W ramach obecnej gamy procesorów graficznych Nvidia RTX 4000 do laptopów, modeleGeForce-RTX-4060 zajmuje czwartą pozycję, a zatem można go sklasyfikować jako model ze średniej półki. Oferuje on 3 072 jednostek cieniujących, magistralę o szerokości 128 bitów i szybką pamięć GDDR6 (8 192 MB). Jego maksymalne TGP wynosi 140 W (115 W + 25 W Dynamic Boost) - więcej nie jest możliwe. Według testów TGP nie jest w pełni wykorzystywane Witcher 3 testu.
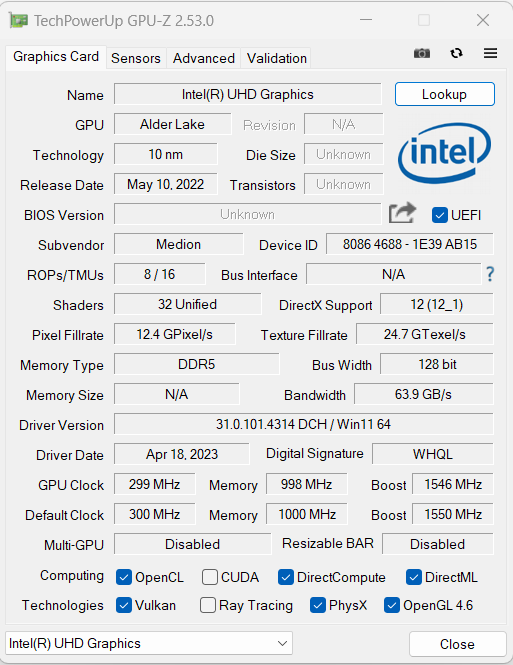
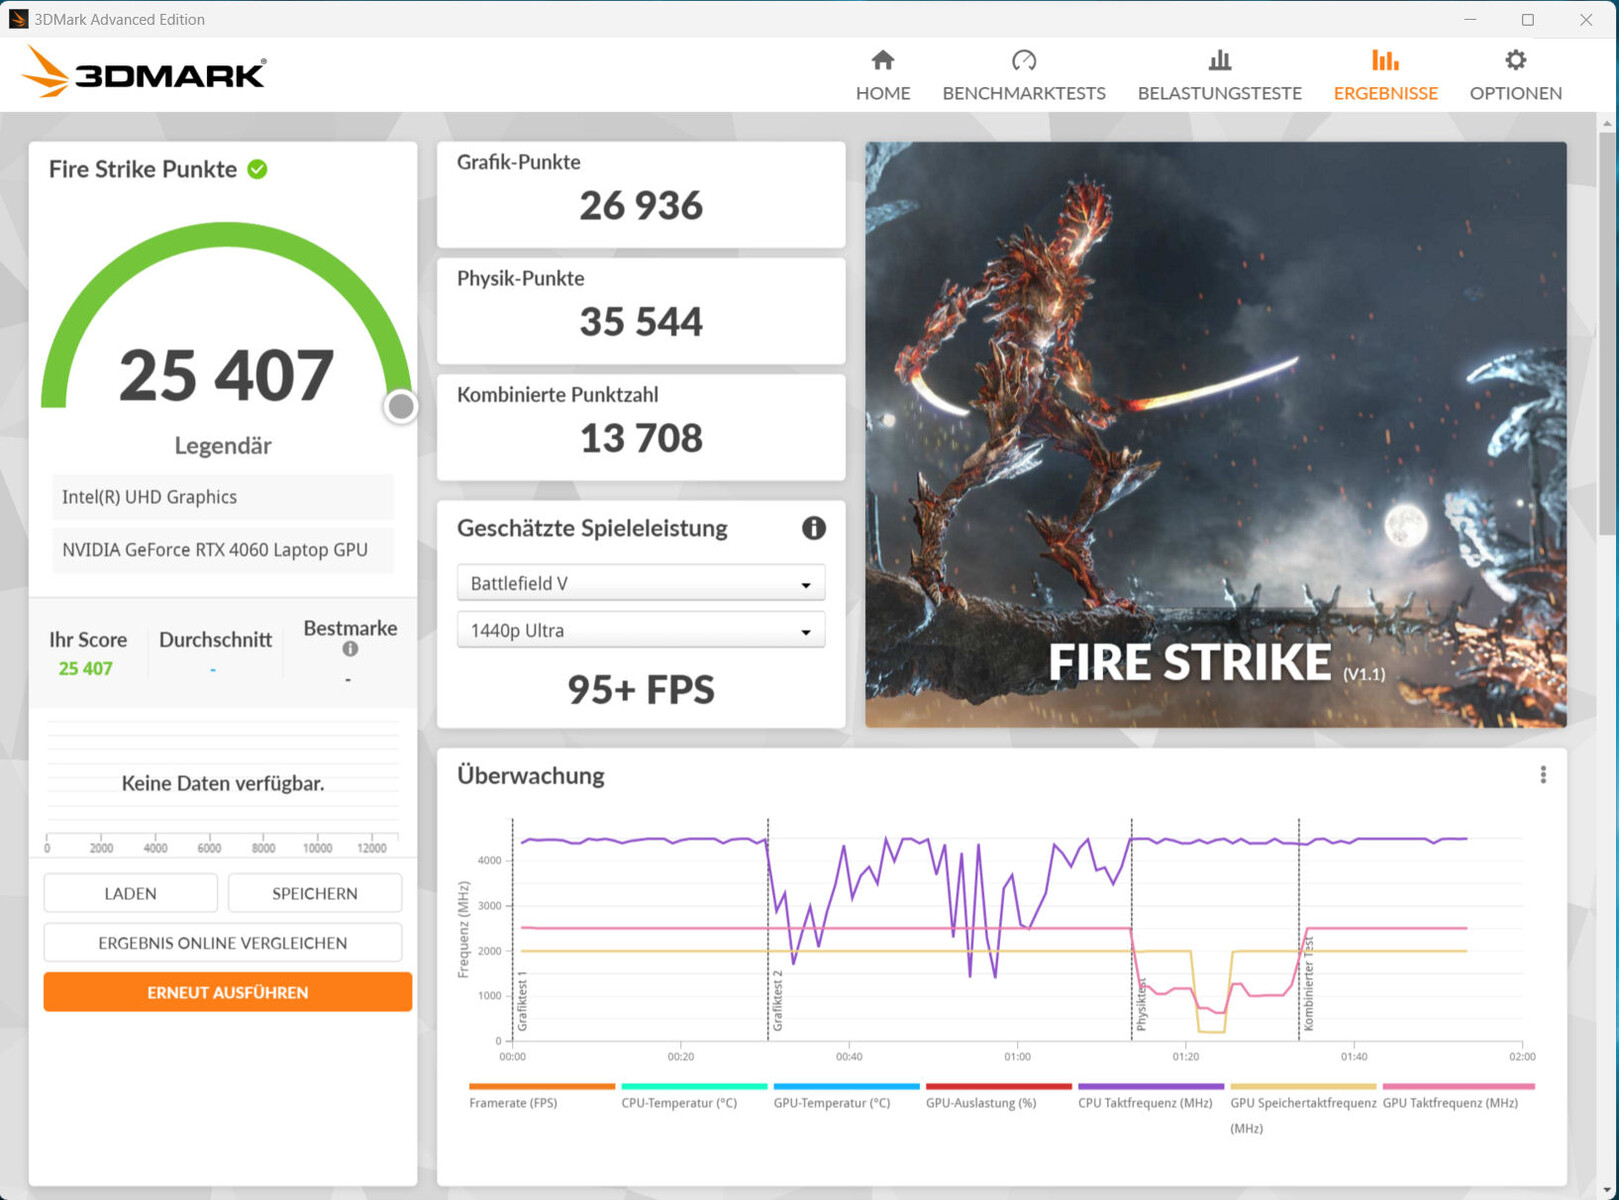
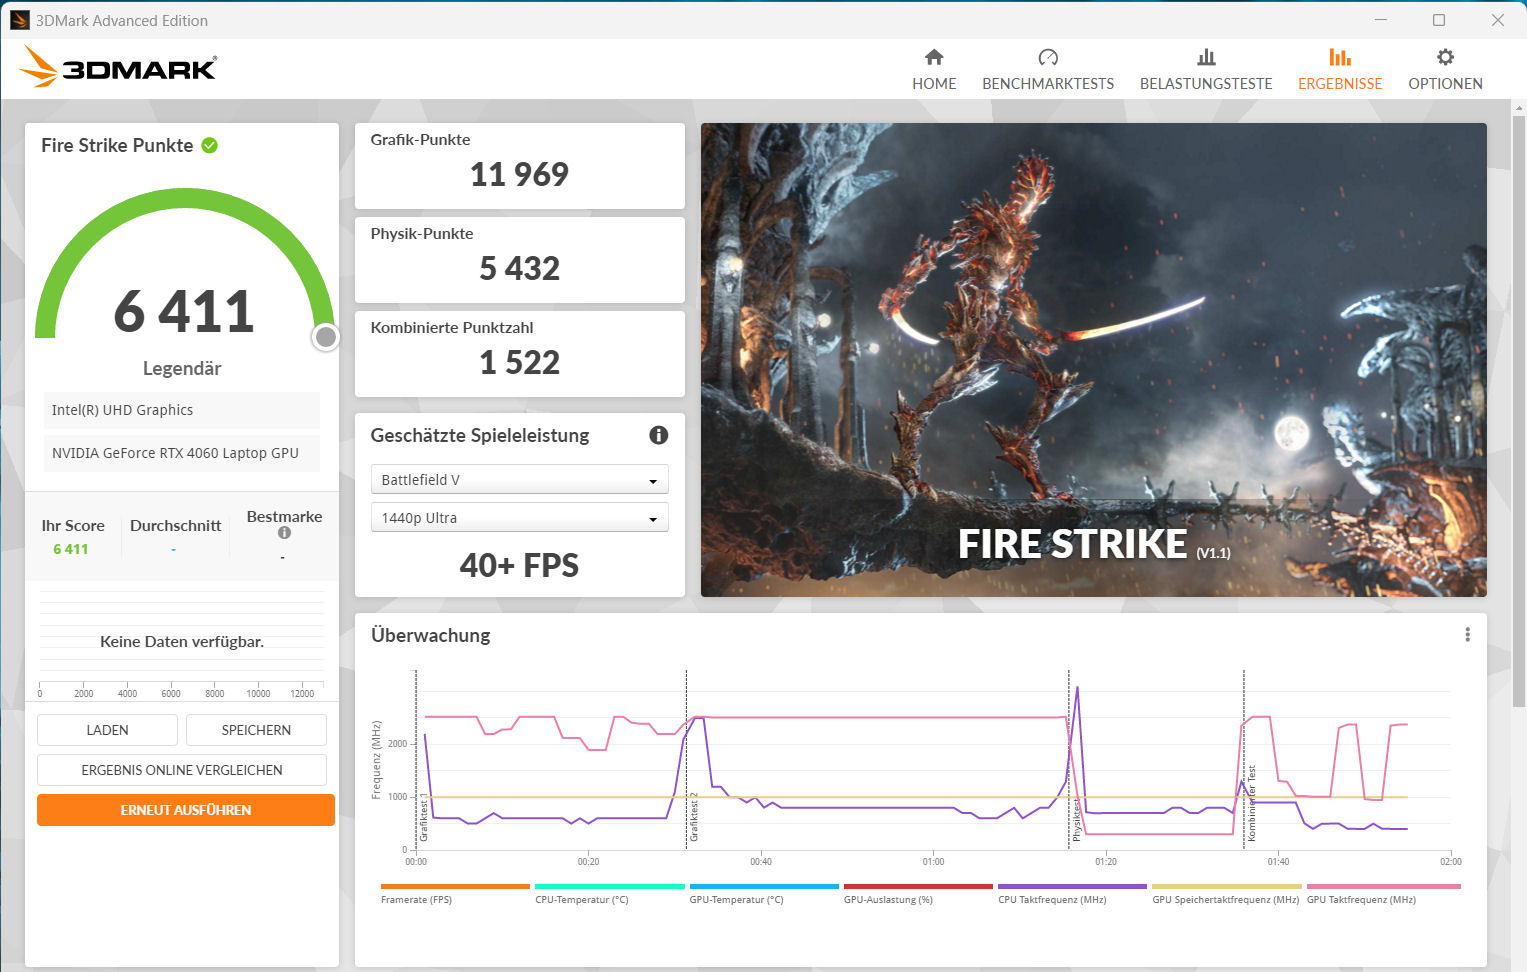
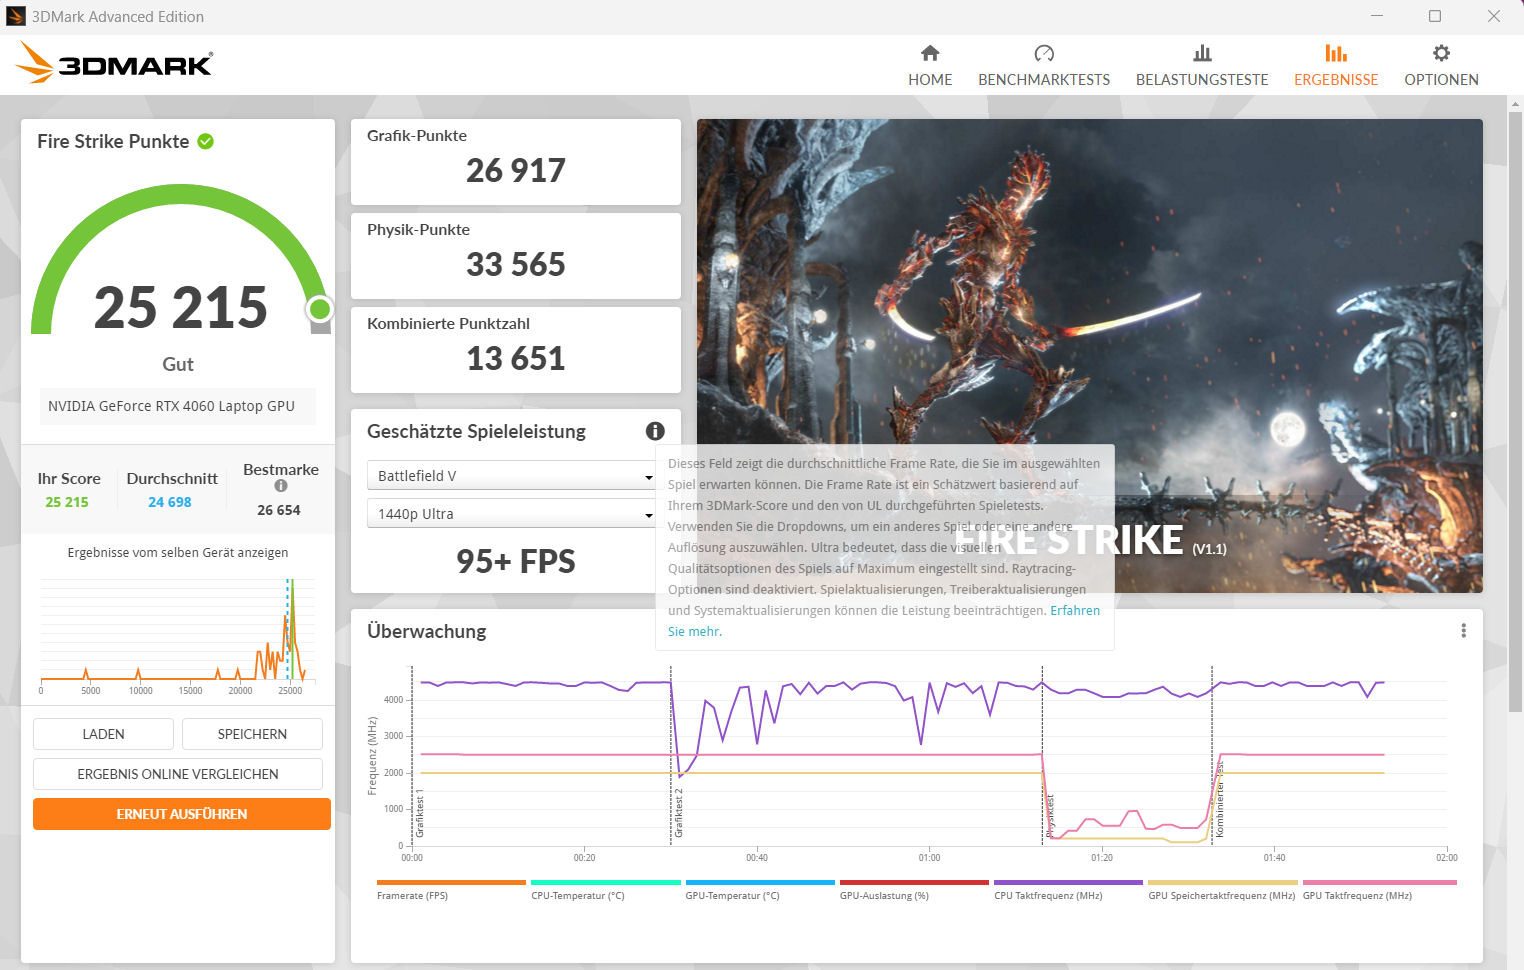
Wyniki benchmarków są powyżej wcześniej ustalonej średniej RTX 4060 ("tryb rozrywkowy") - na równi z szybkościamiMSI Katana 17 (RTX 4060, 140 W). Ani "tryb gamingowy", ani bezpośrednie wyjście obrazu przez GPU GeForce (tryb dGPU) nie doprowadziły do wzrostu wydajności. Przełączanie między trybem Optimus i dGPU może odbywać się za pośrednictwem BIOS-u lub Control Center. Zaawansowany Optimus nie jest obsługiwany.
| 3DMark 06 Standard Score | 50480 pkt. | |
| 3DMark 11 Performance | 31939 pkt. | |
| 3DMark Cloud Gate Standard Score | 57165 pkt. | |
| 3DMark Fire Strike Score | 25286 pkt. | |
| 3DMark Time Spy Score | 10764 pkt. | |
Pomoc | ||
| V-Ray Benchmark Next 4.10 | |
| GPU | |
| Średnia w klasie Gaming (427 - 1627, n=103, ostatnie 2 lata) | |
| MSI Katana 17 B13VFK (v4.10.07 ) | |
| Przeciętny NVIDIA GeForce RTX 4060 Laptop GPU (483 - 715, n=46) | |
| Medion Erazer Defender P40 (v4.10.07 ) | |
| Acer Predator Helios 300 (i7-12700H, RTX 3070 Ti) (v4.10.07 ) | |
| Gigabyte G7 KE (v4.10.07 ) | |
| Asus TUF Gaming A16 FA617 (v4.10.07 ) | |
| CPU | |
| Średnia w klasie Gaming (10048 - 45327, n=101, ostatnie 2 lata) | |
| Przeciętny NVIDIA GeForce RTX 4060 Laptop GPU (12680 - 32360, n=46) | |
| Medion Erazer Defender P40 (v4.10.07 ) | |
| Acer Predator Helios 300 (i7-12700H, RTX 3070 Ti) (v4.10.07 ) | |
| MSI Katana 17 B13VFK (v4.10.07 ) | |
| Asus TUF Gaming A16 FA617 (v4.10.07 ) | |
| Gigabyte G7 KE (v4.10.07 ) | |
* ... im mniej tym lepiej
Wydajność w grach
Medion Defender został zaprojektowany do gier w rozdzielczości QHD przy wysokich i maksymalnych ustawieniach. Wyższe rozdzielczości można osiągnąć za pomocą zewnętrznego monitora - przy częściowo zredukowanych ustawieniach. Osiągana jest liczba klatek na sekundę powyżej średniej RTX 4060. Tryb dGPU może - w zależności od gry - prowadzić do minimalnego wzrostu liczby klatek na sekundę.
"Tryb cichy" umożliwia granie przy niskim poziomie hałasu. Jednak grywalna liczba klatek na sekundę jest zwykle osiągana tylko przy obniżonych ustawieniach, ponieważ moc obliczeniowa sprzętu jest znacznie zmniejszona.
| The Witcher 3 - 1920x1080 Ultra Graphics & Postprocessing (HBAO+) | |
| Średnia w klasie Gaming (95 - 240, n=8, ostatnie 2 lata) | |
| Acer Predator Helios 300 (i7-12700H, RTX 3070 Ti) | |
| Lenovo Legion Pro 5 16IRX8 | |
| MSI Katana 17 B13VFK | |
| Medion Erazer Defender P40 | |
| Przeciętny NVIDIA GeForce RTX 4060 Laptop GPU (77 - 159.7, n=42) | |
| Asus TUF Gaming A16 FA617 | |
| Gigabyte G7 KE | |
| Final Fantasy XV Benchmark - 1920x1080 High Quality | |
| Średnia w klasie Gaming (41 - 215, n=99, ostatnie 2 lata) | |
| Acer Predator Helios 300 (i7-12700H, RTX 3070 Ti) (1.3) | |
| Lenovo Legion Pro 5 16IRX8 (1.3) | |
| Medion Erazer Defender P40 (1.3) | |
| Przeciętny NVIDIA GeForce RTX 4060 Laptop GPU (75.1 - 109.8, n=51) | |
| MSI Katana 17 B13VFK (1.3) | |
| Gigabyte G7 KE (1.3) | |
| Asus TUF Gaming A16 FA617 (1.3) | |
| Strange Brigade - 1920x1080 ultra AA:ultra AF:16 | |
| Średnia w klasie Gaming (76.3 - 456, n=89, ostatnie 2 lata) | |
| Acer Predator Helios 300 (i7-12700H, RTX 3070 Ti) (1.47.22.14 D3D12) | |
| Medion Erazer Defender P40 (1.47.22.14 D3D12) | |
| MSI Katana 17 B13VFK (1.47.22.14 D3D12) | |
| Przeciętny NVIDIA GeForce RTX 4060 Laptop GPU (135.3 - 210, n=50) | |
| Asus TUF Gaming A16 FA617 (1.47.22.14 D3D12) | |
| Gigabyte G7 KE (1.47.22.14 D3D12) | |
| Dead Space Remake | |
| 1920x1080 Ultra Preset AA:T | |
| Medion Erazer Defender P40 | |
| MSI Katana 17 B13VFK | |
| Przeciętny NVIDIA GeForce RTX 4060 Laptop GPU (53.3 - 70.4, n=3) | |
| Gigabyte G7 KE | |
| Asus TUF Gaming A16 FA617 | |
| Średnia w klasie Gaming (n=1ostatnie 2 lata) | |
| 2560x1440 Ultra Preset AA:T | |
| Medion Erazer Defender P40 | |
| Przeciętny NVIDIA GeForce RTX 4060 Laptop GPU (43.4 - 44.5, n=2) | |
| MSI Katana 17 B13VFK | |
| Asus TUF Gaming A16 FA617 | |
| The Witcher 3 v4 | |
| 1920x1080 Ultra Preset / On AA:FX | |
| Asus TUF Gaming A16 FA617 | |
| Gigabyte G7 KE | |
| Medion Erazer Defender P40 | |
| MSI Katana 17 B13VFK | |
| Przeciętny NVIDIA GeForce RTX 4060 Laptop GPU (50.3 - 72.8, n=3) | |
| 2560x1440 Ultra Preset / On AA:FX | |
| Asus TUF Gaming A16 FA617 | |
| Medion Erazer Defender P40 | |
| Przeciętny NVIDIA GeForce RTX 4060 Laptop GPU (40.5 - 44.8, n=2) | |
| MSI Katana 17 B13VFK | |
| Resident Evil 4 Remake | |
| 1920x1080 Max Preset | |
| Medion Erazer Defender P40 | |
| Przeciętny NVIDIA GeForce RTX 4060 Laptop GPU (50.9 - 72.7, n=3) | |
| 2560x1440 Max Preset | |
| Przeciętny NVIDIA GeForce RTX 4060 Laptop GPU (52.1 - 55.1, n=2) | |
| Medion Erazer Defender P40 | |
| Dead Island 2 | |
| 1920x1080 Ultra Preset AA:High T | |
| XMG Pro 15 E23 | |
| Przeciętny NVIDIA GeForce RTX 4060 Laptop GPU (148.5 - 158.8, n=2) | |
| Medion Erazer Defender P40 | |
| 2560x1440 Ultra Preset AA:High T | |
| XMG Pro 15 E23 | |
| Przeciętny NVIDIA GeForce RTX 4060 Laptop GPU (98 - 101.9, n=2) | |
| Medion Erazer Defender P40 | |
| Star Wars Jedi Survivor | |
| 1920x1080 Epic Preset | |
| XMG Pro 15 E23 | |
| Medion Erazer Defender P40 | |
| Przeciętny NVIDIA GeForce RTX 4060 Laptop GPU (45.5 - 66.7, n=10) | |
| 2560x1440 Epic Preset | |
| XMG Pro 15 E23 | |
| Medion Erazer Defender P40 | |
| Przeciętny NVIDIA GeForce RTX 4060 Laptop GPU (30.3 - 41.7, n=10) | |
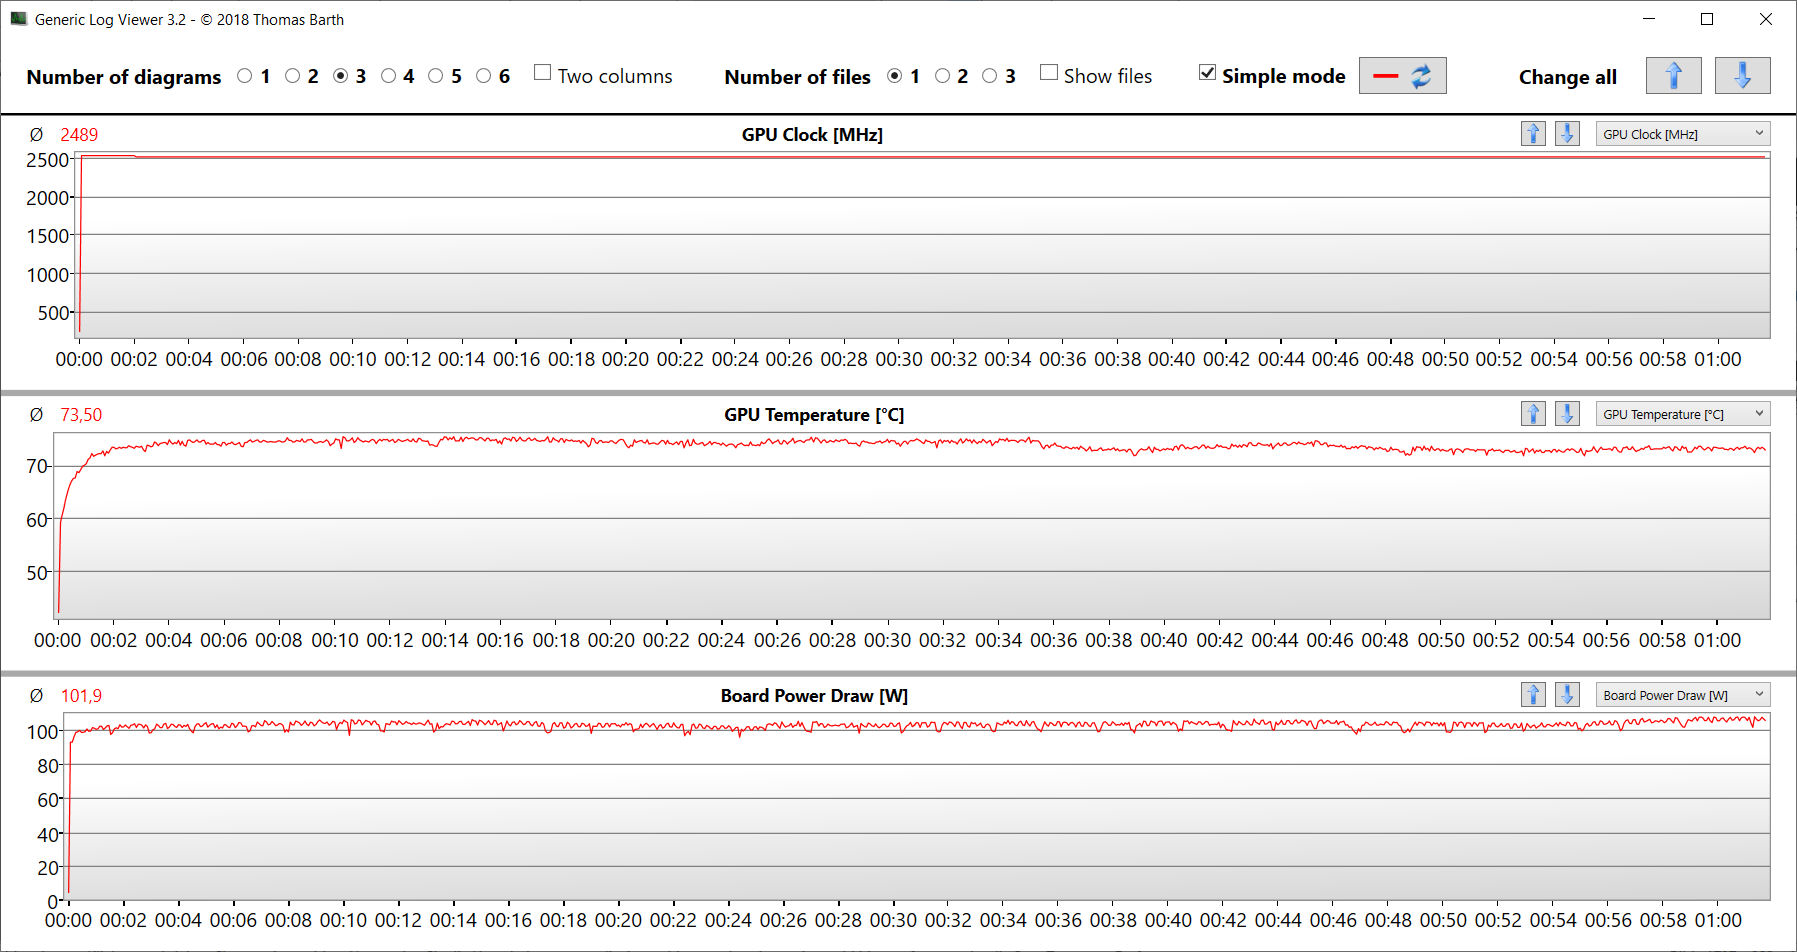
Aby sprawdzić, czy liczba klatek na sekundę pozostaje w dużej mierze stała przez dłuższy czas, uruchomiliśmy grę The Witcher 3 na około 60 minut w rozdzielczości Full HD i maksymalnych ustawieniach jakości. Postać w grze nie była poruszana. Spadek liczby klatek na sekundę wystąpił tylko wtedy, gdy aktywny był "tryb cichy".
Witcher 3 FPS diagram
| low | med. | high | ultra | QHD | |
|---|---|---|---|---|---|
| GTA V (2015) | 186.3 | 183.1 | 176 | 113.9 | 83.1 |
| The Witcher 3 (2015) | 459.5 | 318.2 | 195.9 | 103 | |
| Dota 2 Reborn (2015) | 178.7 | 163.1 | 151.3 | 144.3 | |
| Final Fantasy XV Benchmark (2018) | 188.5 | 141.9 | 100.8 | 74 | |
| X-Plane 11.11 (2018) | 159.8 | 139.1 | 109.3 | ||
| Far Cry 5 (2018) | 167 | 142 | 136 | 128 | 102 |
| Strange Brigade (2018) | 473 | 279 | 221 | 188.3 | 126.4 |
| F1 22 (2022) | 243 | 232 | 178 | 65.7 | 42 |
| The Witcher 3 v4 (2023) | 210 | 171.6 | 85.4 | 72.8 | 44.8 |
| Dead Space Remake (2023) | 88.5 | 83.2 | 71.1 | 70.4 | 44.5 |
| Resident Evil 4 Remake (2023) | 141.5 | 107.2 | 97.3 | 72.7 | 52.1 |
| Dead Island 2 (2023) | 189.9 | 181.7 | 153.5 | 148.5 | 98 |
| Star Wars Jedi Survivor (2023) | 77.2 | 69.1 | 64.8 | 61.7 | 38.5 |
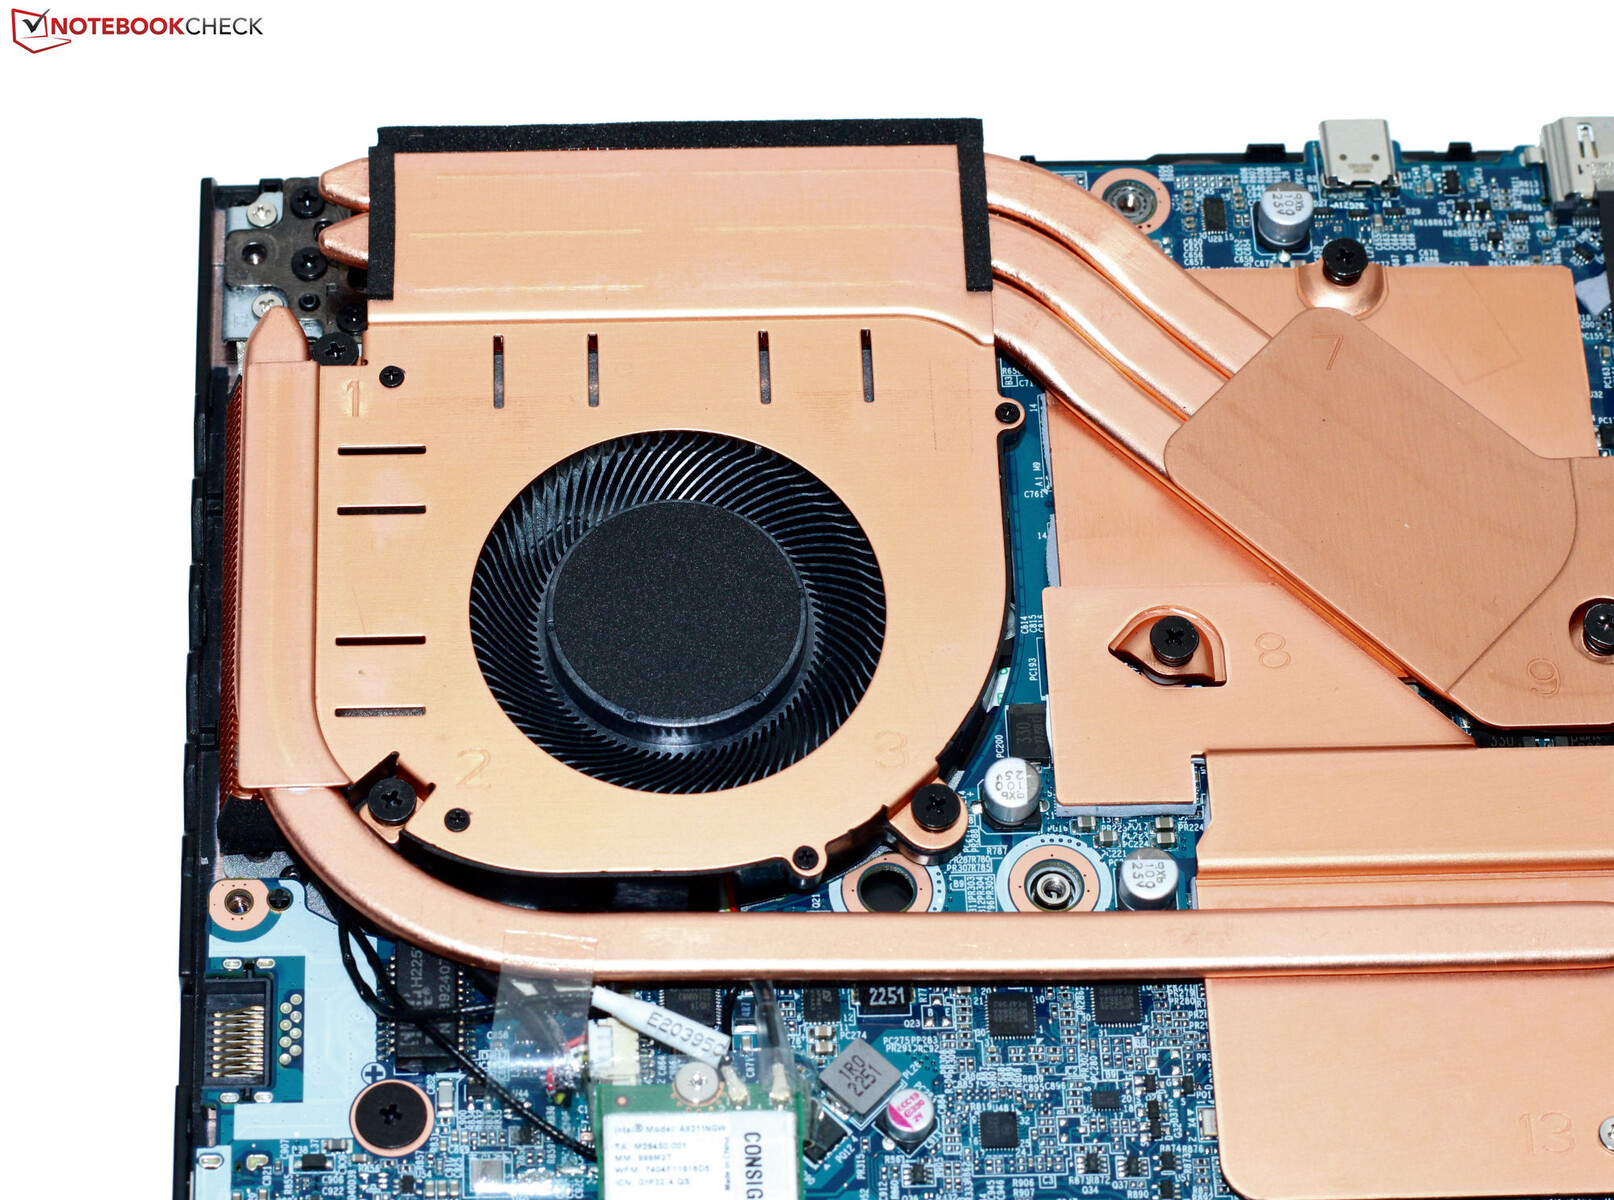
Emisje - laptop Medion z umiarkowanym wzrostem temperatury
Emisja hałasu
Pod obciążeniem Erazer Defender potrafi wytworzyć sporo hałasu. "Tryb gamingowy" spowodował, że poziom ciśnienia akustycznego wzrósł do 62 dB(A), a maksimum 56 dB(A) osiągnięto przy aktywowanym "trybie rozrywkowym" - wciąż bardzo głośno.
Dwa pozostałe tryby znacznie ograniczyły hałas kosztem mocy obliczeniowej - prawdopodobnie jest to pierwszy wybór do codziennego użytku. Jednak "tryb cichy" nie spełnia swojej nazwy. Niemniej jednak: Umożliwia granie przy niskiej głośności pracy (Witcher 3: 36 dB(A)).
| HD Low | FHD Low | FHD Medium | FHD High | FHD Ultra | |
|---|---|---|---|---|---|
| Dota 2 Reborn | 85.8 fps | - | - | 51.7 fps | 45.1 fps |
| X-Plane 11.11 | 52.1 fps | - | 41.2 fps | 35.9 fps | - |
| Strange Brigade | - | - | - | - | 60 fps |
Notebook często pracuje cicho, czasem bezgłośnie, zarówno w trybie bezczynności, jak i w codziennym użytkowaniu (biuro, Internet). Zdarza się jednak, że wentylatory niepotrzebnie przyspieszają (zjawisko typowe dla barebone'ów Clevo).
Hałas
| luz |
| 26 / 27 / 32 dB |
| obciążenie |
| 53 / 64 dB |
 | ||
30 dB cichy 40 dB(A) słyszalny 50 dB(A) irytujący |
||
min: | ||
| Medion Erazer Defender P40 GeForce RTX 4060 Laptop GPU, i7-13700HX, Phison PS5021-E21 1TB | MSI Katana 17 B13VFK GeForce RTX 4060 Laptop GPU, i7-13620H, Micron 2400 MTFDKBA1T0QFM | Acer Predator Helios 300 (i7-12700H, RTX 3070 Ti) GeForce RTX 3070 Ti Laptop GPU, i7-12700H, Samsung PM9A1 MZVL21T0HCLR | Lenovo Legion Pro 5 16IRX8 GeForce RTX 4060 Laptop GPU, i7-13700HX, SK hynix PC801 HFS512GEJ9X115N | Asus TUF Gaming A16 FA617 Radeon RX 7600S, R7 7735HS, Micron 2400 MTFDKBA1T0QFM | Gigabyte G7 KE GeForce RTX 3060 Laptop GPU, i5-12500H, Gigabyte AG470S1TB-SI B10 | |
|---|---|---|---|---|---|---|
| Noise | 1% | 1% | 16% | 12% | -7% | |
| wyłączone / środowisko * (dB) | 25 | 24.5 2% | 23 8% | 23 8% | 24 4% | 27 -8% |
| Idle Minimum * (dB) | 26 | 24.5 6% | 23 12% | 23.1 11% | 24 8% | 27 -4% |
| Idle Average * (dB) | 27 | 24.5 9% | 25.92 4% | 23.1 14% | 25 7% | 35 -30% |
| Idle Maximum * (dB) | 32 | 40 -25% | 40.67 -27% | 26.6 17% | 28 12% | 38 -19% |
| Load Average * (dB) | 53 | 48.3 9% | 42.7 19% | 34.7 35% | 42 21% | 52 2% |
| Witcher 3 ultra * (dB) | 56 | 56 -0% | 62.48 -12% | 47.6 15% | 50 11% | 56 -0% |
| Load Maximum * (dB) | 64 | 59.1 8% | 62.67 2% | 54.8 14% | 50 22% | 59 8% |
* ... im mniej tym lepiej
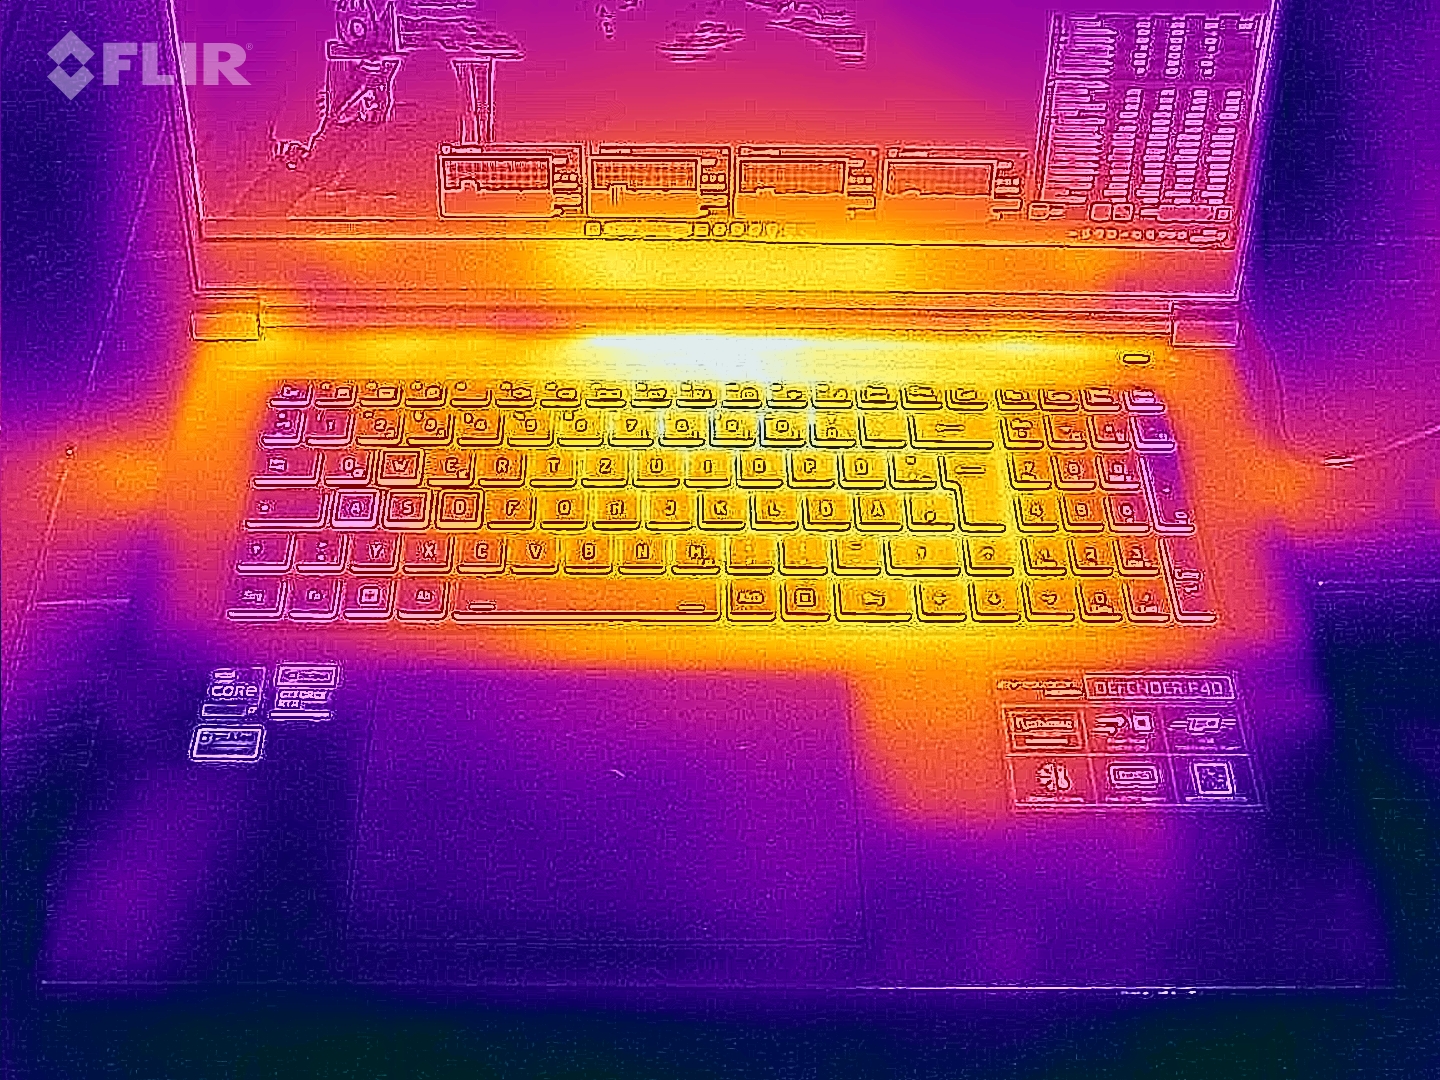
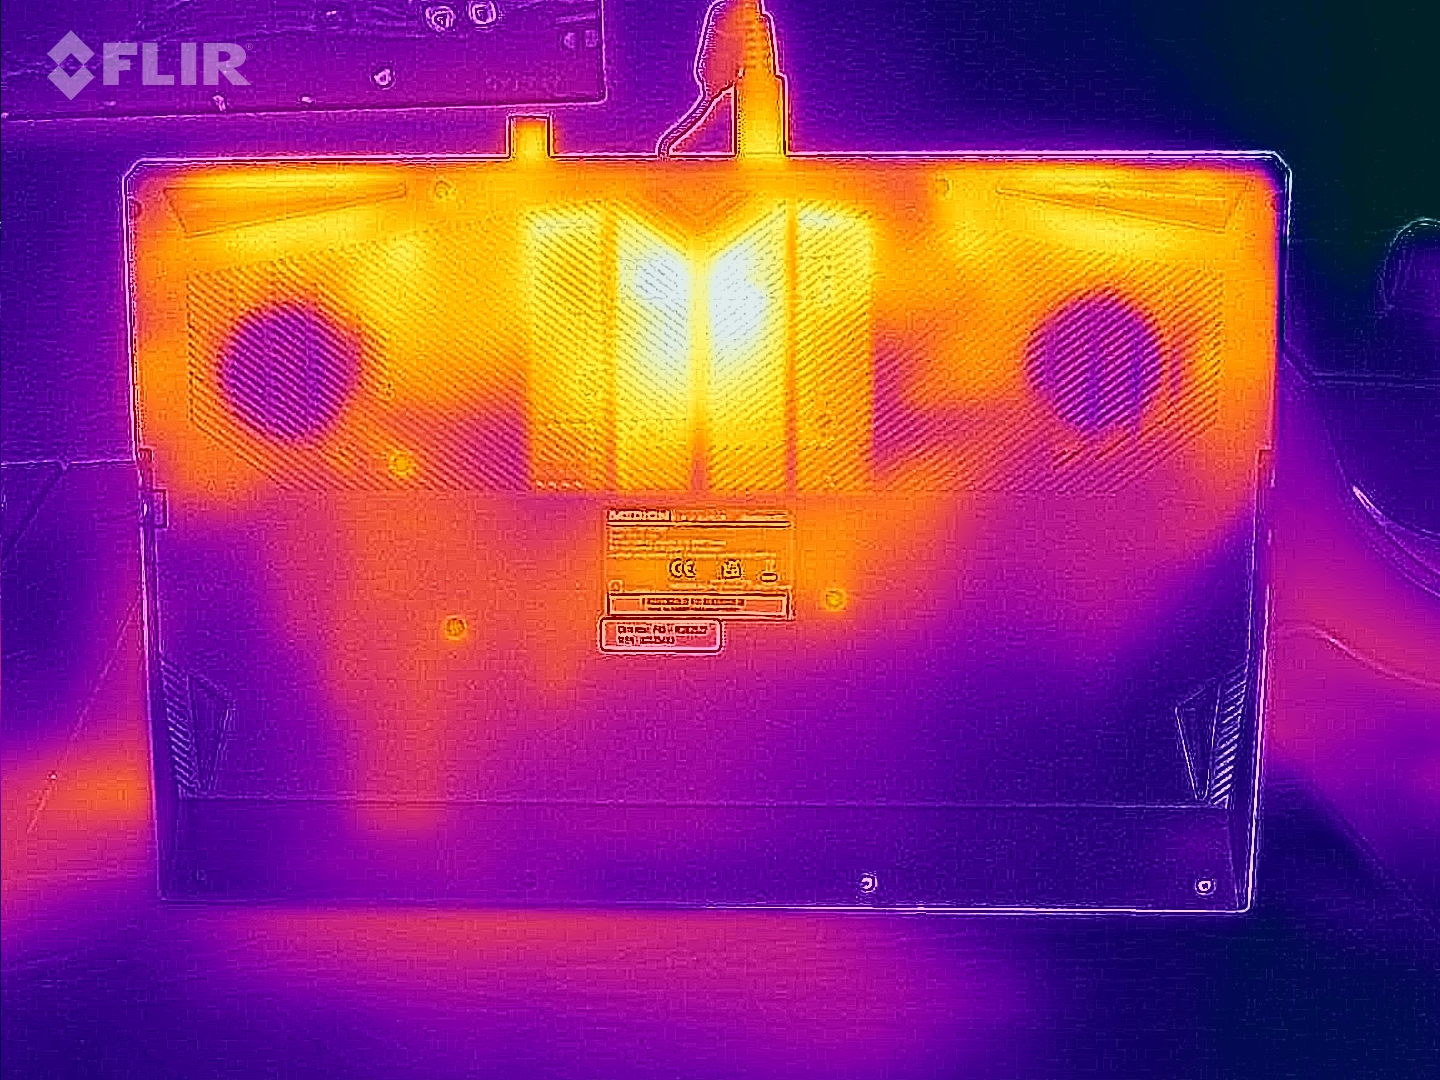
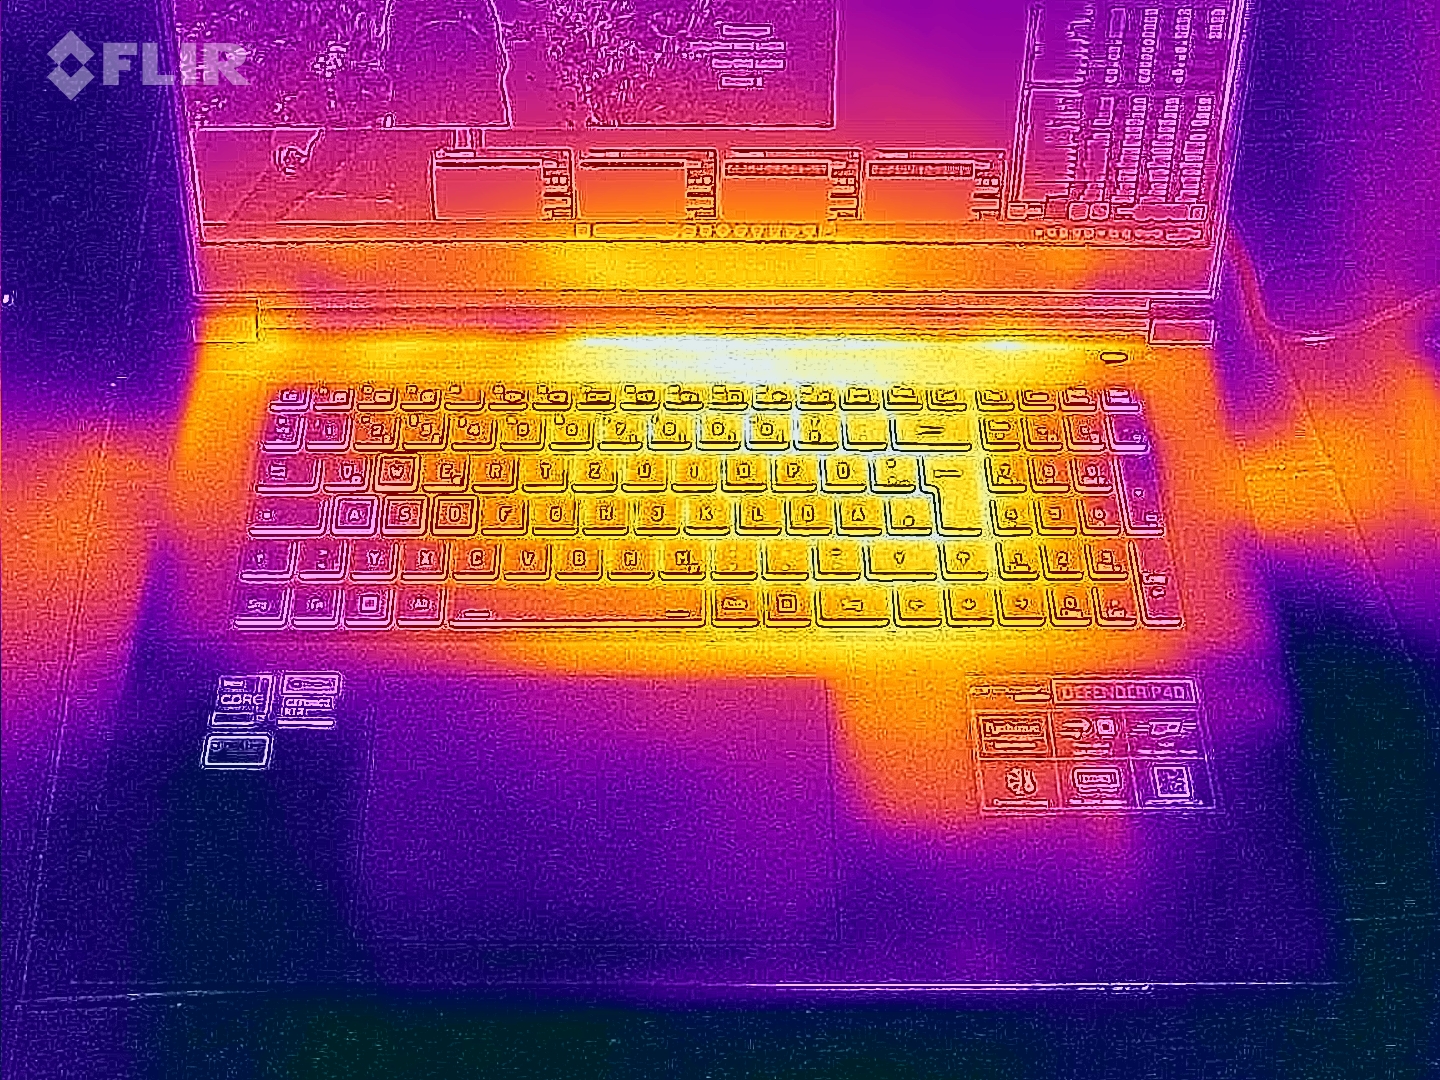
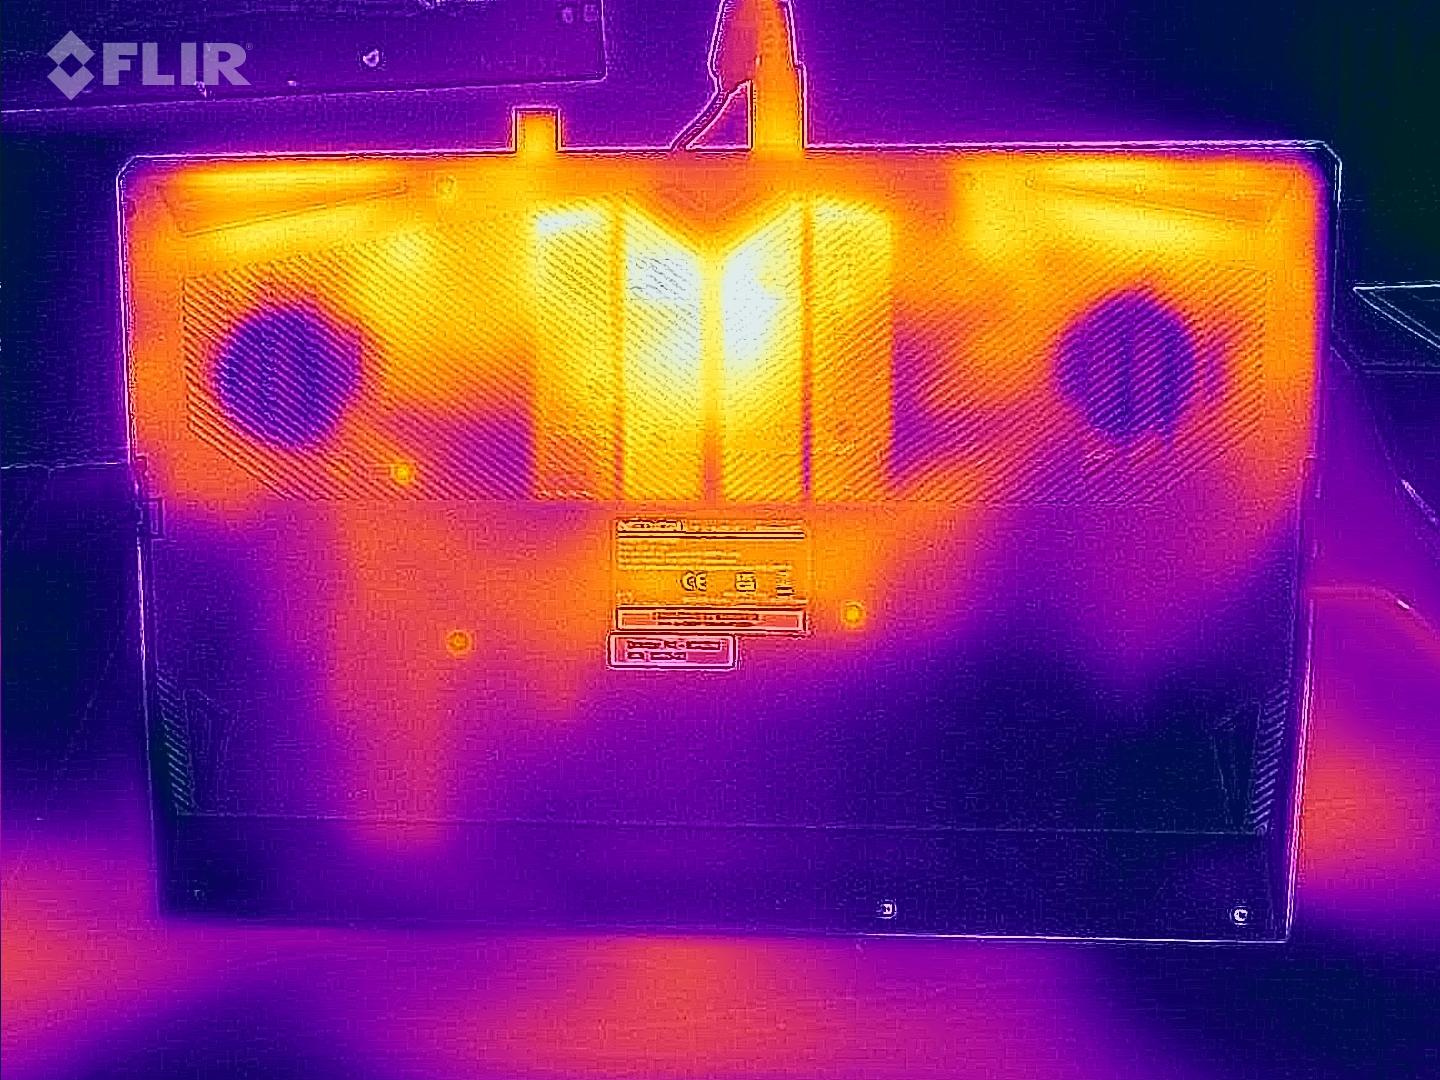
Temperatura
Notebook nie nagrzewa się zbytnio. We wszystkich punktach pomiarowych rejestrowane są temperatury znacznie poniżej 50°C. W codziennym użytkowaniu wskaźniki mieszczą się w zielonej strefie.
(±) Maksymalna temperatura w górnej części wynosi 42 °C / 108 F, w porównaniu do średniej 40.4 °C / 105 F , począwszy od 21.2 do 68.8 °C dla klasy Gaming.
(±) Dno nagrzewa się maksymalnie do 45 °C / 113 F, w porównaniu do średniej 43.2 °C / 110 F
(+) W stanie bezczynności średnia temperatura górnej części wynosi 26.6 °C / 80 F, w porównaniu ze średnią temperaturą urządzenia wynoszącą 33.9 °C / ### class_avg_f### F.
(±) Podczas gry w Wiedźmina 3 średnia temperatura górnej części wynosi 37.1 °C / 99 F, w porównaniu do średniej temperatury urządzenia wynoszącej 33.9 °C / ## #class_avg_f### F.
(+) Podpórki pod nadgarstki i touchpad są chłodniejsze niż temperatura skóry i maksymalnie 31 °C / 87.8 F i dlatego są chłodne w dotyku.
(-) Średnia temperatura obszaru podparcia dłoni w podobnych urządzeniach wynosiła 28.8 °C / 83.8 F (-2.2 °C / -4 F).
| Medion Erazer Defender P40 Intel Core i7-13700HX, NVIDIA GeForce RTX 4060 Laptop GPU | MSI Katana 17 B13VFK Intel Core i7-13620H, NVIDIA GeForce RTX 4060 Laptop GPU | Acer Predator Helios 300 (i7-12700H, RTX 3070 Ti) Intel Core i7-12700H, NVIDIA GeForce RTX 3070 Ti Laptop GPU | Lenovo Legion Pro 5 16IRX8 Intel Core i7-13700HX, NVIDIA GeForce RTX 4060 Laptop GPU | Asus TUF Gaming A16 FA617 AMD Ryzen 7 7735HS, AMD Radeon RX 7600S | Gigabyte G7 KE Intel Core i5-12500H, NVIDIA GeForce RTX 3060 Laptop GPU | |
|---|---|---|---|---|---|---|
| Heat | -7% | -5% | -8% | -27% | -13% | |
| Maximum Upper Side * (°C) | 42 | 41.6 1% | 35 17% | 42.8 -2% | 54 -29% | 52 -24% |
| Maximum Bottom * (°C) | 45 | 43.1 4% | 53 -18% | 50 -11% | 47 -4% | 54 -20% |
| Idle Upper Side * (°C) | 28 | 32 -14% | 29 -4% | 29.6 -6% | 40 -43% | 28 -0% |
| Idle Bottom * (°C) | 30 | 35.8 -19% | 34 -13% | 34 -13% | 40 -33% | 32 -7% |
* ... im mniej tym lepiej
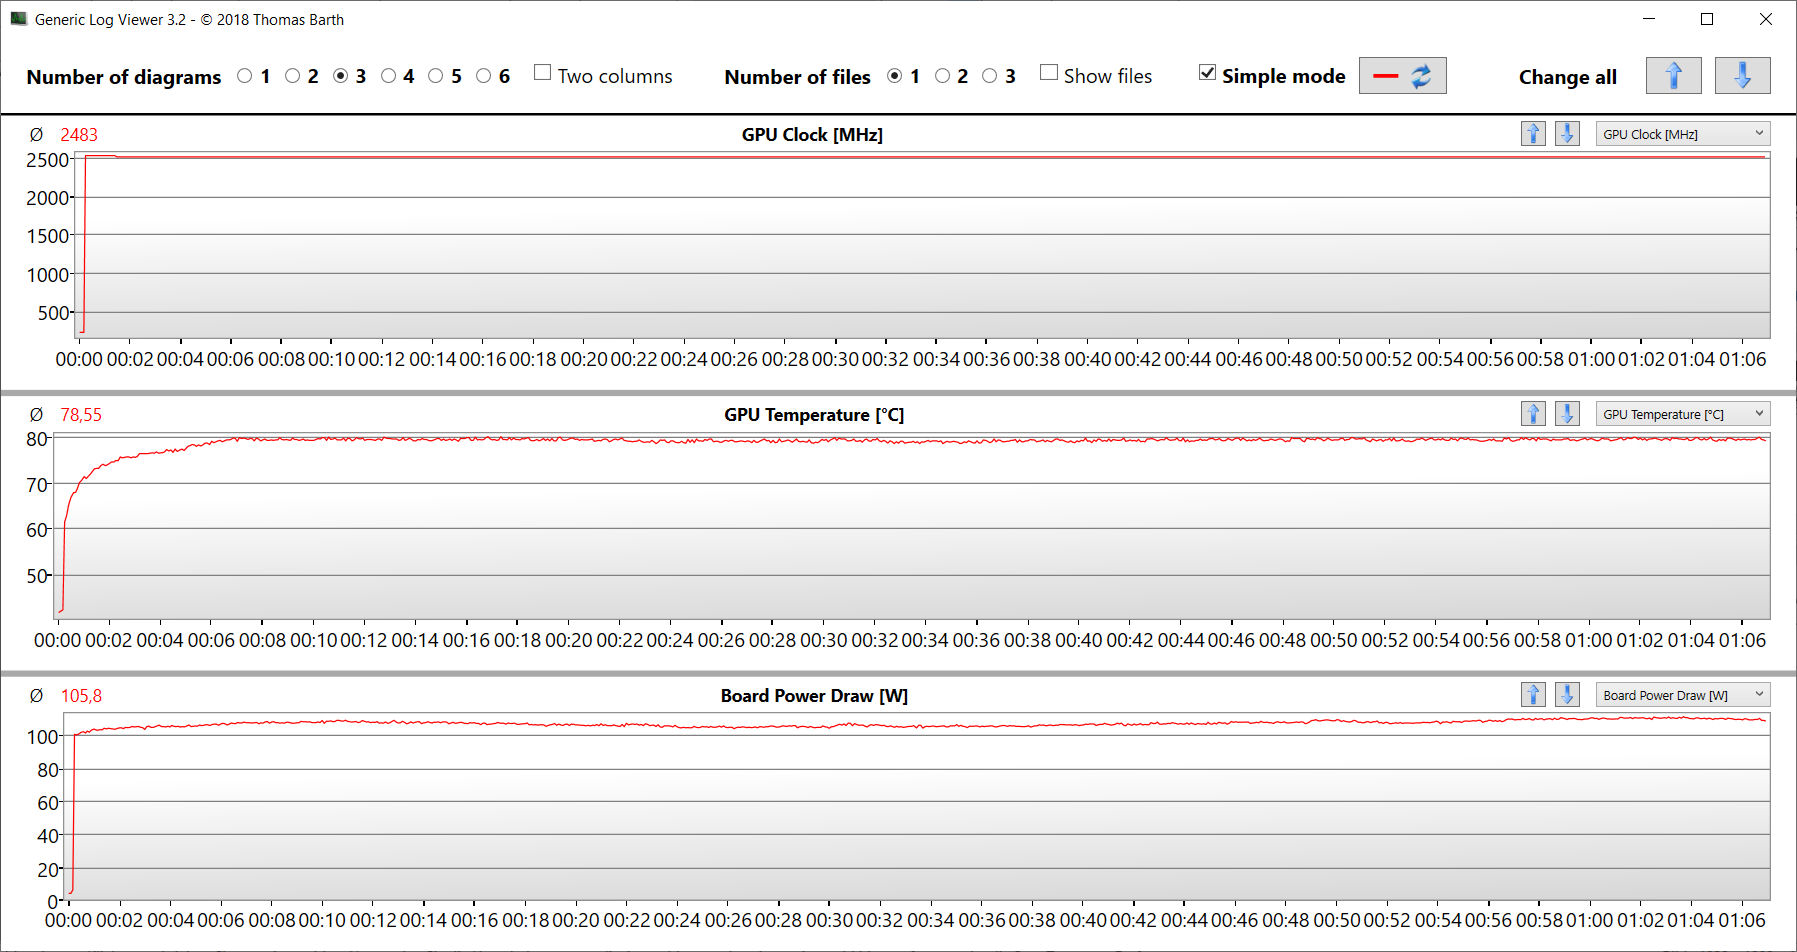
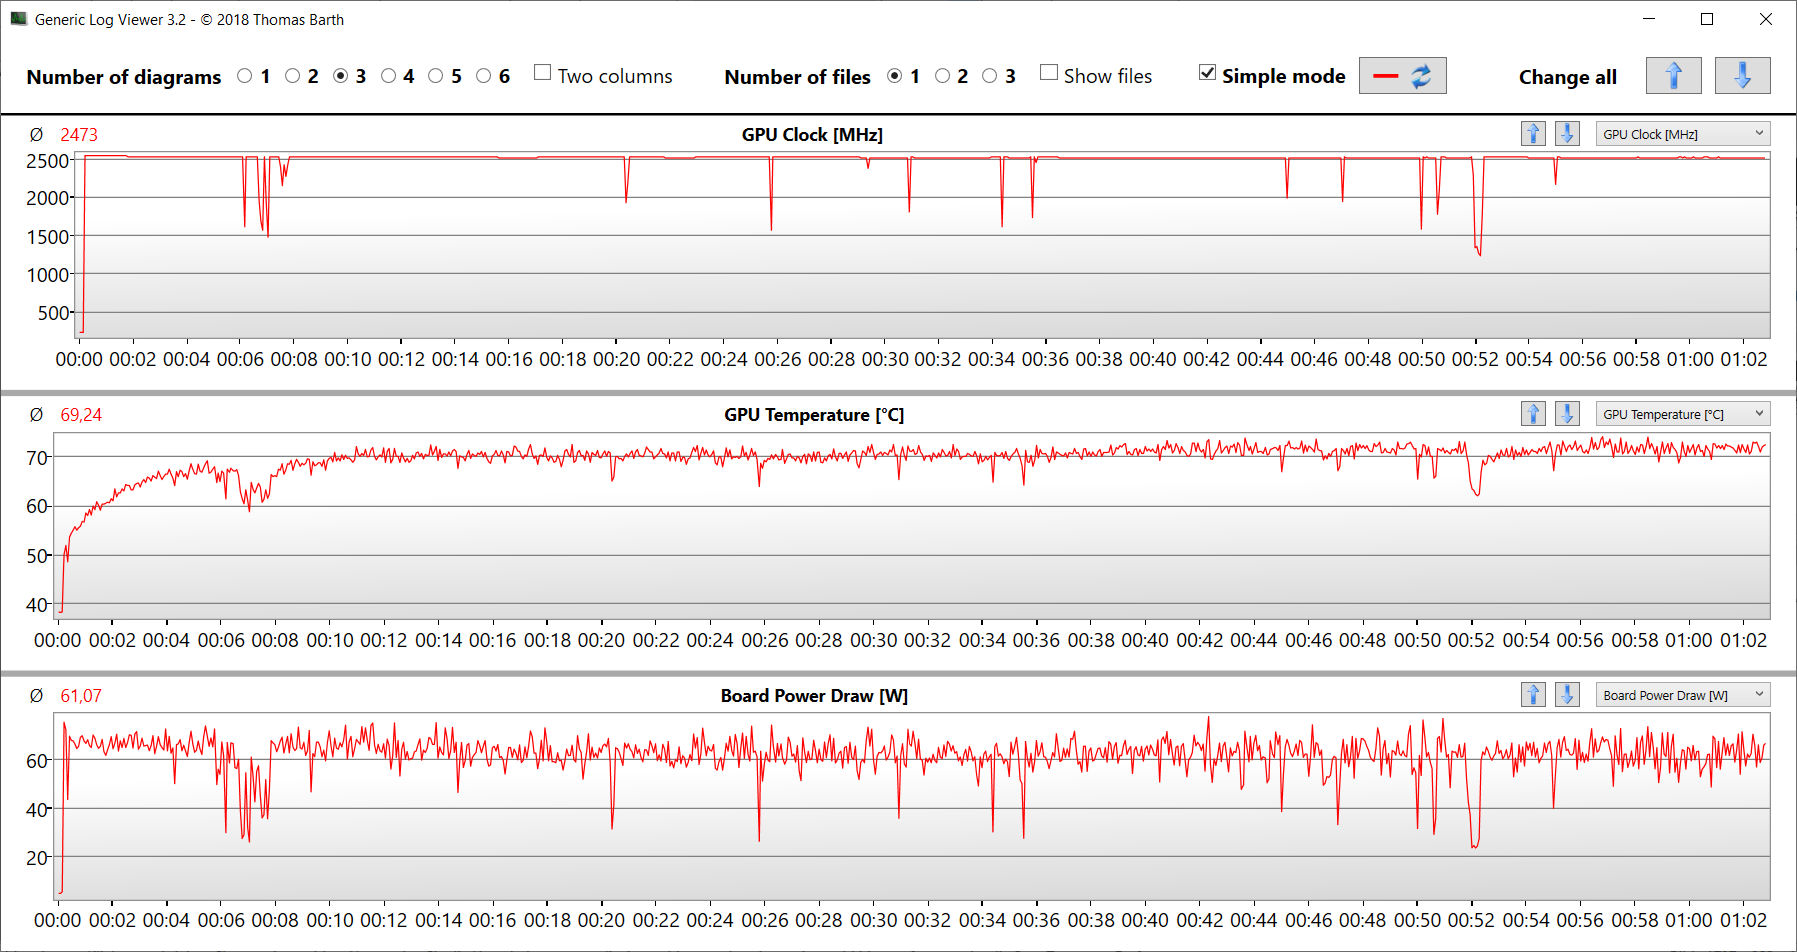
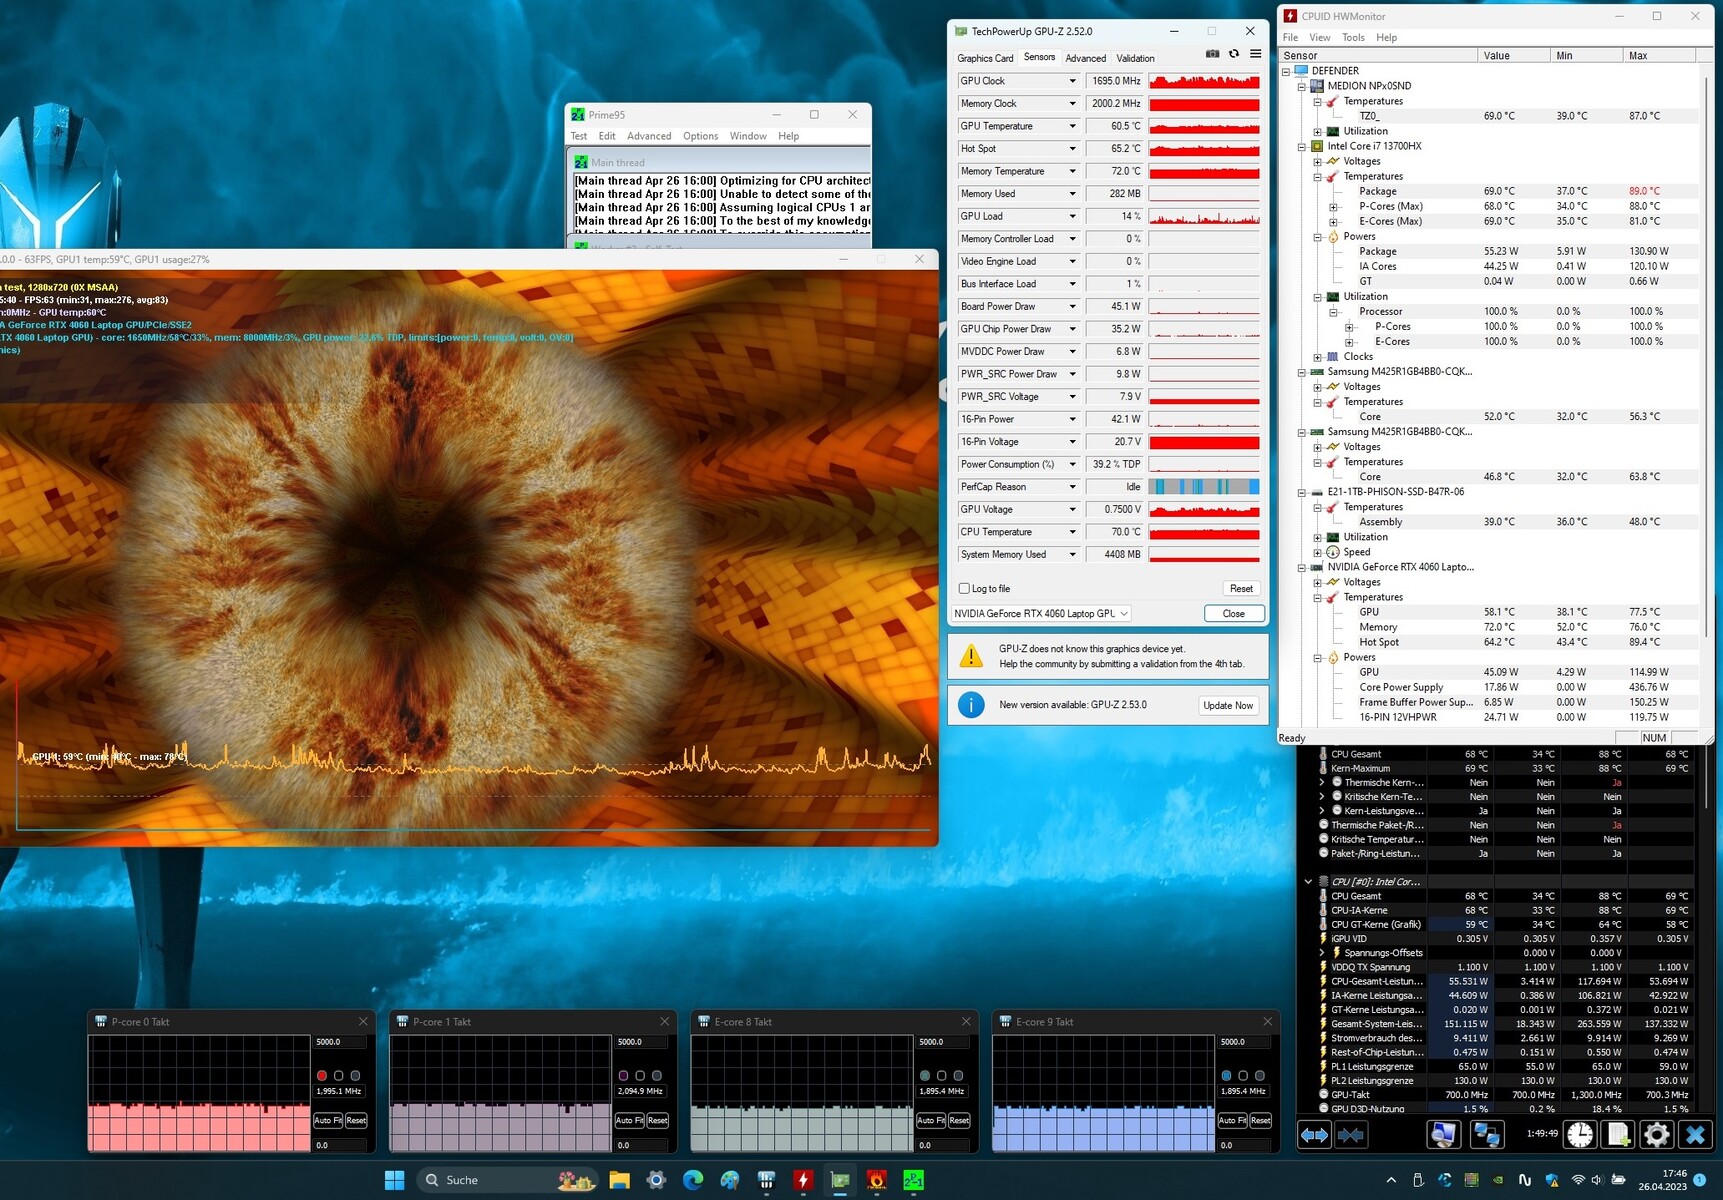
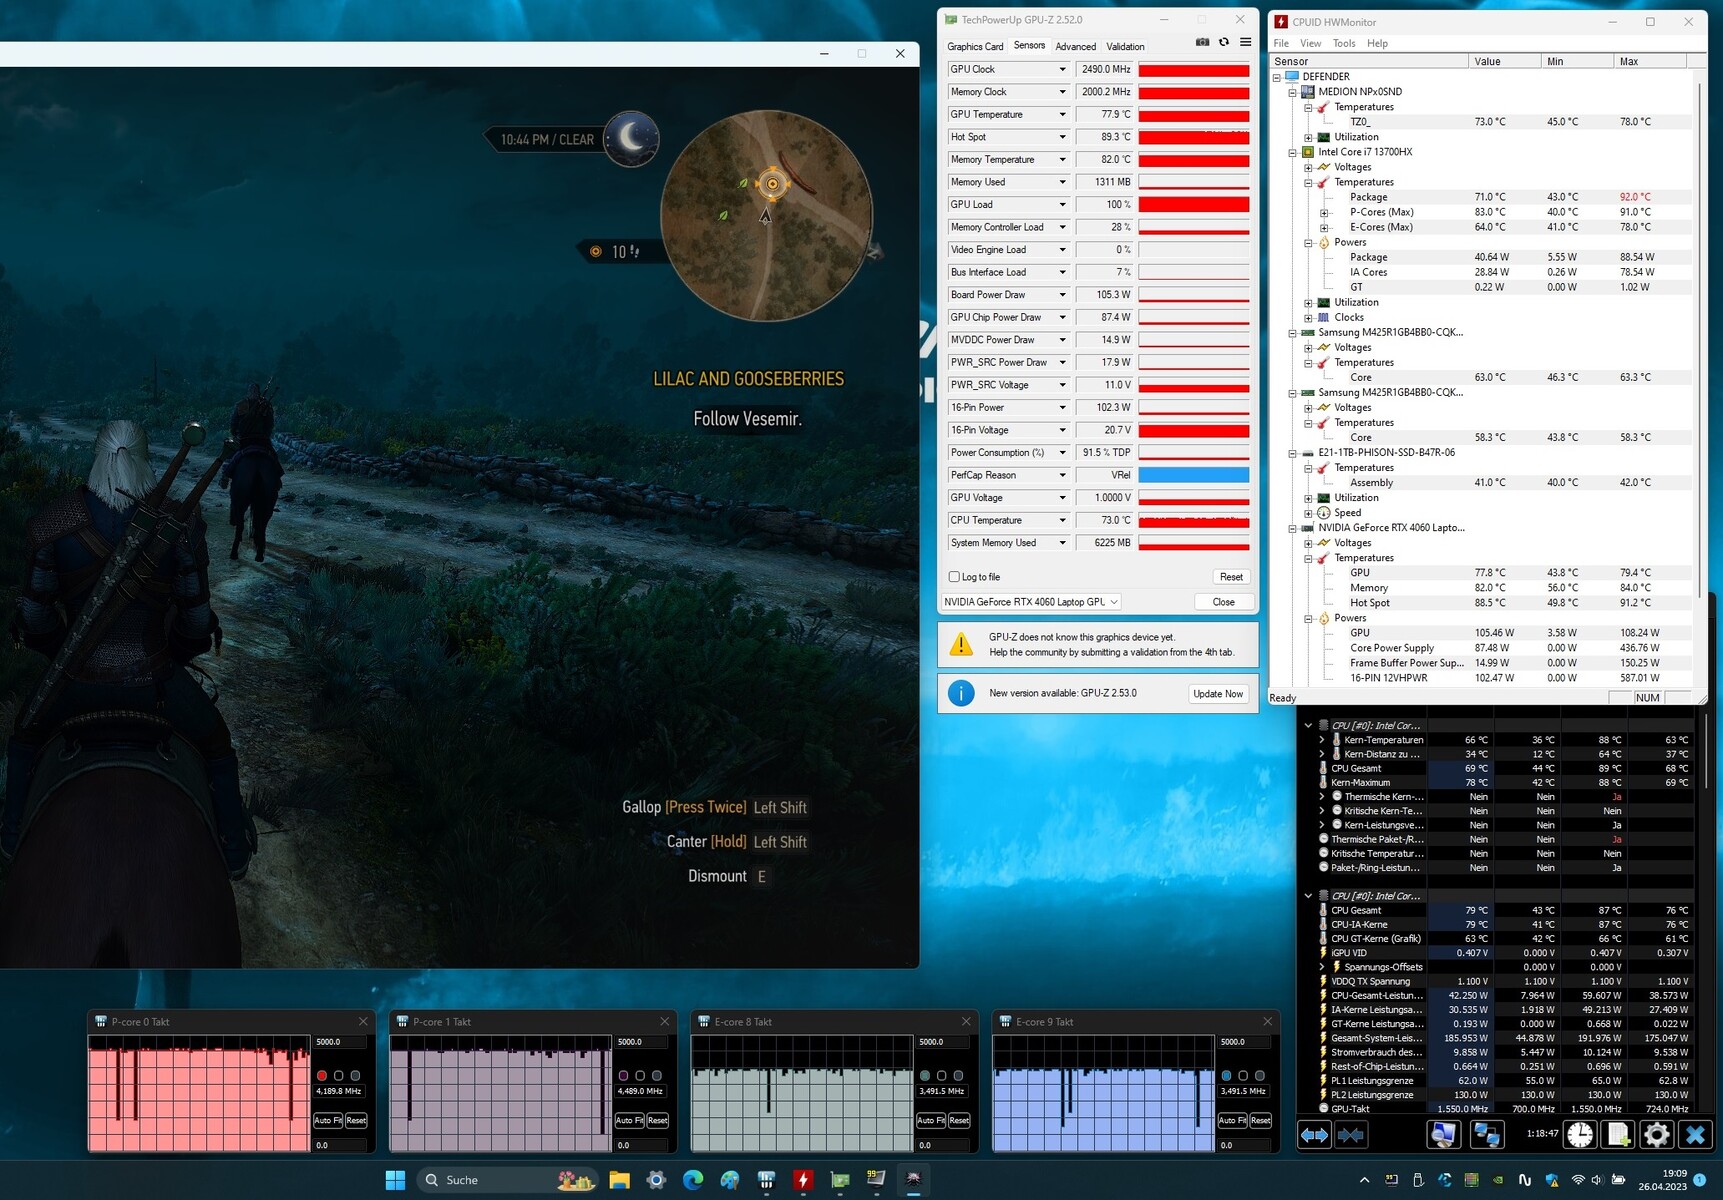
Test warunków skrajnych
Test warunków skrajnych (Prime95 i Furmark w trybie ciągłym) symuluje ekstremalny scenariusz w celu przetestowania stabilności systemu przy pełnym obciążeniu. Procesor rozpoczął test z wysokimi częstotliwościami taktowania (P: 3,5 do 3,8 GHz, E: 3,1 do 3,2 GHz), a karta graficzna działała z częstotliwością 2,4 do 2,5 GHz. Podczas gdy taktowanie CPU zostało obniżone po niecałej minucie, GPU działało z pełną mocą przez cały czas.
Głośniki
Głośniki stereo generują przyzwoity dźwięk, który niestety nie ma prawie żadnych basów do zaoferowania. Lepsze wrażenia dźwiękowe można uzyskać przy użyciu słuchawek lub głośników zewnętrznych.
Medion Erazer Defender P40 analiza dźwięku
(±) | głośność głośnika jest średnia, ale dobra (81 dB)
Bas 100 - 315 Hz
(-) | prawie brak basu - średnio 29.9% niższa od mediany
(±) | liniowość basu jest średnia (12.4% delta do poprzedniej częstotliwości)
Średnie 400 - 2000 Hz
(±) | wyższe średnie - średnio 6.4% wyższe niż mediana
(±) | liniowość środka jest średnia (8.1% delta do poprzedniej częstotliwości)
Wysokie 2–16 kHz
(+) | zrównoważone maksima - tylko 2.4% od mediany
(+) | wzloty są liniowe (3.6% delta do poprzedniej częstotliwości)
Ogólnie 100 - 16.000 Hz
(±) | liniowość ogólnego dźwięku jest średnia (22.4% różnicy w stosunku do mediany)
W porównaniu do tej samej klasy
» 80% wszystkich testowanych urządzeń w tej klasie było lepszych, 6% podobnych, 14% gorszych
» Najlepszy miał deltę 6%, średnia wynosiła ###średnia###%, najgorsza wynosiła 132%
W porównaniu do wszystkich testowanych urządzeń
» 65% wszystkich testowanych urządzeń było lepszych, 6% podobnych, 29% gorszych
» Najlepszy miał deltę 4%, średnia wynosiła ###średnia###%, najgorsza wynosiła 134%
MSI Katana 17 B13VFK analiza dźwięku
(±) | głośność głośnika jest średnia, ale dobra (78.5 dB)
Bas 100 - 315 Hz
(-) | prawie brak basu - średnio 17.7% niższa od mediany
(±) | liniowość basu jest średnia (11.7% delta do poprzedniej częstotliwości)
Średnie 400 - 2000 Hz
(±) | wyższe średnie - średnio 6.8% wyższe niż mediana
(+) | średnie są liniowe (6.7% delta do poprzedniej częstotliwości)
Wysokie 2–16 kHz
(+) | zrównoważone maksima - tylko 3.2% od mediany
(±) | liniowość wysokich wartości jest średnia (7.2% delta do poprzedniej częstotliwości)
Ogólnie 100 - 16.000 Hz
(±) | liniowość ogólnego dźwięku jest średnia (19.4% różnicy w stosunku do mediany)
W porównaniu do tej samej klasy
» 67% wszystkich testowanych urządzeń w tej klasie było lepszych, 7% podobnych, 26% gorszych
» Najlepszy miał deltę 6%, średnia wynosiła ###średnia###%, najgorsza wynosiła 132%
W porównaniu do wszystkich testowanych urządzeń
» 48% wszystkich testowanych urządzeń było lepszych, 7% podobnych, 45% gorszych
» Najlepszy miał deltę 4%, średnia wynosiła ###średnia###%, najgorsza wynosiła 134%
Zarządzanie energią - laptop do gier z przyzwoitym czasem pracy
Zużycie energii
Pobór mocy laptopa Medion jest na normalnym poziomie dla zainstalowanego sprzętu. Test Witcher 3 test i test warunków skrajnych zostały przeprowadzone przy stałym lub względnie stałym zużyciu energii. Zasilacz (280 W) jest wystarczającej wielkości.
| wyłączony / stan wstrzymania | |
| luz | |
| obciążenie |
|
Legenda:
min: | |
| Medion Erazer Defender P40 i7-13700HX, GeForce RTX 4060 Laptop GPU, Phison PS5021-E21 1TB, IPS, 2560x1440, 17.3" | MSI Katana 17 B13VFK i7-13620H, GeForce RTX 4060 Laptop GPU, Micron 2400 MTFDKBA1T0QFM, IPS LED, 1920x1080, 17.3" | Acer Predator Helios 300 (i7-12700H, RTX 3070 Ti) i7-12700H, GeForce RTX 3070 Ti Laptop GPU, Samsung PM9A1 MZVL21T0HCLR, IPS, 2560x1440, 17.3" | Lenovo Legion Pro 5 16IRX8 i7-13700HX, GeForce RTX 4060 Laptop GPU, SK hynix PC801 HFS512GEJ9X115N, IPS, 2560x1600, 16" | Asus TUF Gaming A16 FA617 R7 7735HS, Radeon RX 7600S, Micron 2400 MTFDKBA1T0QFM, IPS-Level, 1920x1200, 16" | Gigabyte G7 KE i5-12500H, GeForce RTX 3060 Laptop GPU, Gigabyte AG470S1TB-SI B10, IPS, 1920x1080, 17.3" | Przeciętny NVIDIA GeForce RTX 4060 Laptop GPU | Średnia w klasie Gaming | |
|---|---|---|---|---|---|---|---|---|
| Power Consumption | -1% | -40% | -71% | 13% | -24% | -11% | -31% | |
| Idle Minimum * (Watt) | 8 | 12.2 -53% | 15 -88% | 24.5 -206% | 8 -0% | 15 -88% | 11.5 ? -44% | 13.2 ? -65% |
| Idle Average * (Watt) | 12 | 14.9 -24% | 20 -67% | 29.2 -143% | 11 8% | 17 -42% | 16 ? -33% | 18.9 ? -58% |
| Idle Maximum * (Watt) | 18 | 15.8 12% | 22.3 -24% | 34.3 -91% | 16 11% | 24 -33% | 20.3 ? -13% | 24.5 ? -36% |
| Load Average * (Watt) | 101 | 85.22 16% | 133 -32% | 98.7 2% | 97 4% | 111 -10% | 92.9 ? 8% | 108.8 ? -8% |
| Witcher 3 ultra * (Watt) | 180.8 | 151.1 16% | 231 -28% | 178.6 1% | 161.5 11% | 174.1 4% | ||
| Load Maximum * (Watt) | 284 | 212.8 25% | 290 -2% | 249.6 12% | 168 41% | 208 27% | 210 ? 26% | 254 ? 11% |
* ... im mniej tym lepiej
Power consumption Witcher 3 / stress test
Power consumption with external monitor
Żywotność baterii
17,3-calowy laptop osiągnął czasy pracy wynoszące odpowiednio 6:13 h i 5:39 h w teście WLAN (wywoływanie stron internetowych za pomocą skryptu) i teście wideo (krótki film Big Buck Bunny (kodowanie H.264, FHD) w pętli). Podczas obu testów funkcje oszczędzania energii urządzenia były wyłączone, a jasność wyświetlacza ustawiona na około 150 cd/m². Moduły bezprzewodowe były również wyłączone na czas testu wideo.
Podsumowując, P40 osiągnął bardzo przyzwoite wskaźniki wytrzymałości. Uplasował się w połowie stawki porównywanych urządzeń. Żaden z komputerów nie był w stanie dorównać doskonałym czasom pracy Asus TUF Gaming A16. Ten ostatni korzysta z połączenia oszczędnego APU i dużej pojemności baterii.
| Medion Erazer Defender P40 i7-13700HX, GeForce RTX 4060 Laptop GPU, 73 Wh | MSI Katana 17 B13VFK i7-13620H, GeForce RTX 4060 Laptop GPU, 53.5 Wh | Acer Predator Helios 300 (i7-12700H, RTX 3070 Ti) i7-12700H, GeForce RTX 3070 Ti Laptop GPU, 90 Wh | Lenovo Legion Pro 5 16IRX8 i7-13700HX, GeForce RTX 4060 Laptop GPU, 80 Wh | Asus TUF Gaming A16 FA617 R7 7735HS, Radeon RX 7600S, 90 Wh | Gigabyte G7 KE i5-12500H, GeForce RTX 3060 Laptop GPU, 54 Wh | Średnia w klasie Gaming | |
|---|---|---|---|---|---|---|---|
| Czasy pracy | -38% | 13% | -38% | 80% | -24% | 17% | |
| Reader / Idle (h) | 8.8 | 6.7 -24% | 20.2 130% | 7.1 -19% | 8.71 ? -1% | ||
| H.264 (h) | 5.7 | 5.9 4% | 2.2 -61% | 8.28 ? 45% | |||
| WiFi v1.3 (h) | 6.2 | 2.9 -53% | 6 -3% | 3.4 -45% | 12.1 95% | 5.3 -15% | 6.96 ? 12% |
| Load (h) | 1.3 | 1 -23% | 1.8 38% | 0.7 -46% | 1.5 15% | 1.3 0% | 1.47 ? 13% |
Za
Przeciw
Werdykt - Dobrze zaokrąglona sprawa
P40 nadaje się do grania w rozdzielczości QHD przy wysokich lub maksymalnych ustawieniach - ale laptop powinien być świetny do użytku w wielu innych obszarach (edycja wideo, renderowanie) dzięki swojemuCore i7-13700HXiGeForce RTX 4060. CPU i GPU pracują z niezmiennie wysokimi częstotliwościami taktowania, a szybki dysk SSD PCIe 4 (1 TB) oznacza krótkie czasy ładowania.
Erazer Defender P40 firmy Medion to dobrze wyposażony laptop do gier QHD średniej klasy.
Laptop nie nagrzewa się szczególnie pod obciążeniem - ale może być głośny. Aby to zrekompensować, urządzenie ma "tryb cichy" - kosztem wydajności przetwarzania. Pozwala to na cichsze granie (ale nie całkiem bezgłośne).
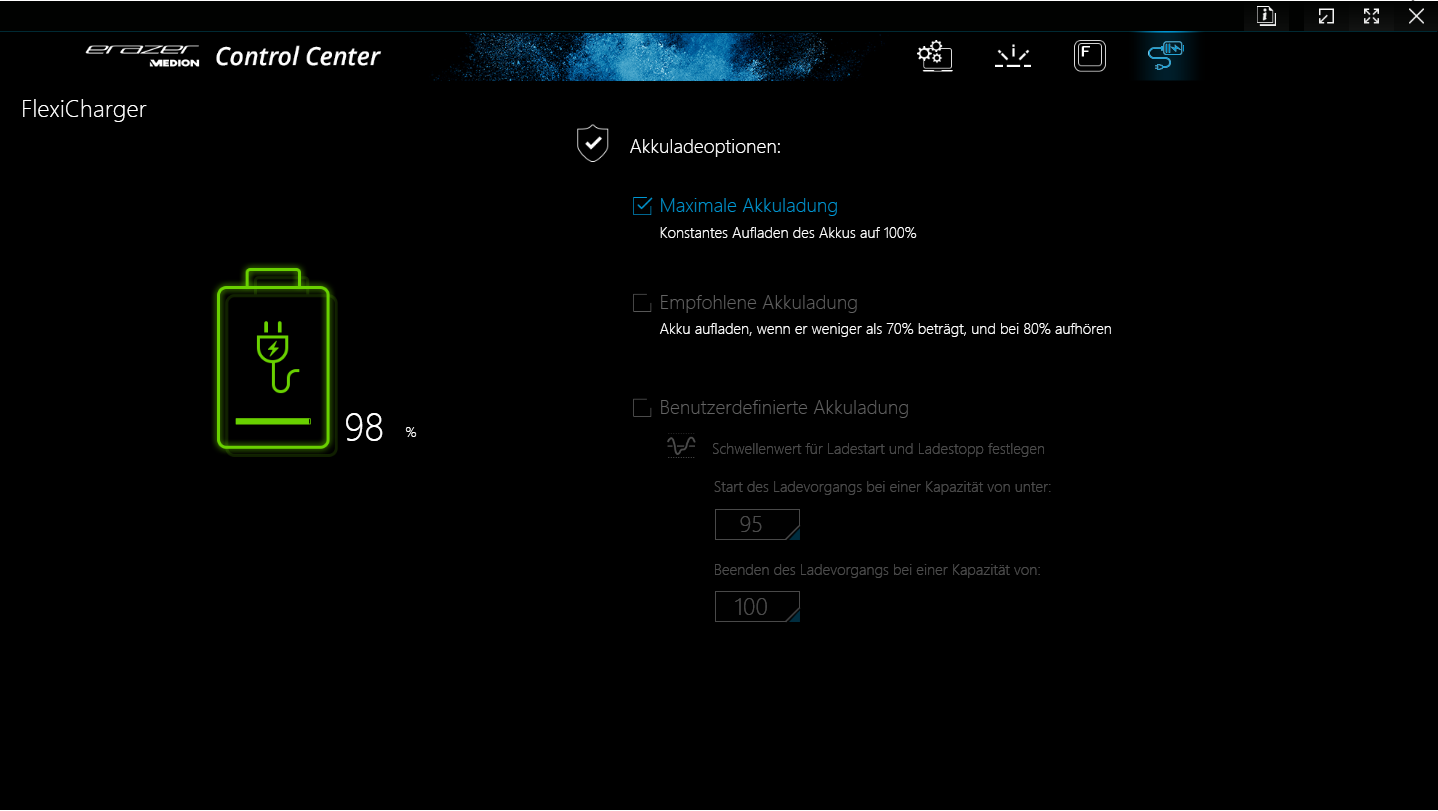
Jedno ładowanie baterii (73 Wh) oznacza, że można realistycznie uzyskać czas pracy na poziomie 5,5 - 6,5 godziny - całkiem przyzwoicie. Baterii nie można ładować za pomocą ładowarki USB-C - zamiast tego trzeba użyć nieporęcznego zasilacza dołączonego do laptopa. Ogólnie rzecz biorąc, jego matowy, 17,3-calowy wyświetlacz (QHD, IPS, 240 Hz, sRGB) zrobił na nas dobre wrażenie.
LaptopMSI Katana 17przychodzi na myśl jako możliwa alternatywa dla P40. Oferuje podobną wydajność, ale gorsze czasy pracy. Karta graficznaGigabyte G7 KEto nieco tańsza alternatywa: za około 1000 USD (bez systemu Windows) pozwala na granie w rozdzielczości FHD przy ustawieniach od wysokich do maksymalnych.
Cena i dostępność
Cena detaliczna Medion Erazer Defender P40 wynosi około 1900 USD. W momencie zakupu nie byliśmy w stanie znaleźć laptopa w sprzedaży u głównych sprzedawców internetowych w USA, jednak możesz sprawdzić podobne urządzenia, takie jak MSI Katana 17 lub Acer Predator Helios 300 na Amazon.
Medion Erazer Defender P40
- 24/05/2023 v7 (old)
Sascha Mölck
Przezroczystość
Wyboru urządzeń do recenzji dokonuje nasza redakcja. Próbka testowa została udostępniona autorowi jako pożyczka od producenta lub sprzedawcy detalicznego na potrzeby tej recenzji. Pożyczkodawca nie miał wpływu na tę recenzję, producent nie otrzymał też kopii tej recenzji przed publikacją. Nie było obowiązku publikowania tej recenzji. Jako niezależna firma medialna, Notebookcheck nie podlega władzy producentów, sprzedawców detalicznych ani wydawców.
Tak testuje Notebookcheck
Każdego roku Notebookcheck niezależnie sprawdza setki laptopów i smartfonów, stosując standardowe procedury, aby zapewnić porównywalność wszystkich wyników. Od około 20 lat stale rozwijamy nasze metody badawcze, ustanawiając przy tym standardy branżowe. W naszych laboratoriach testowych doświadczeni technicy i redaktorzy korzystają z wysokiej jakości sprzętu pomiarowego. Testy te obejmują wieloetapowy proces walidacji. Nasz kompleksowy system ocen opiera się na setkach uzasadnionych pomiarów i benchmarków, co pozwala zachować obiektywizm.Price comparison

