 Deutsch
 English
 Español
 Français
 Italiano
 Nederlands
 Polski
 Português
 Русский
 Türkçe
 Svenska
 Chinese
 Magyar
Recenzja laptopa Eurocom Raptor X17 Core i9-14900HX: 175 W GPU dla maksymalnej wydajności

Raptor X17 to jeden z najszybszych laptopów dostępnych w ofercie Eurocom. Tegoroczny model został odświeżony o nowsze opcje Raptor Lake-HX, ale poza tym z tym samym GPU i obudową co poprzednio. W związku z tym zalecamy zapoznanie się z naszymi recenzjami na temat 2023 Raptor X17 i Schenker Key 17 Pro aby uzyskać więcej informacji na temat fizycznych cech laptopa, ponieważ nasze dotychczasowe komentarze nadal mają zastosowanie.
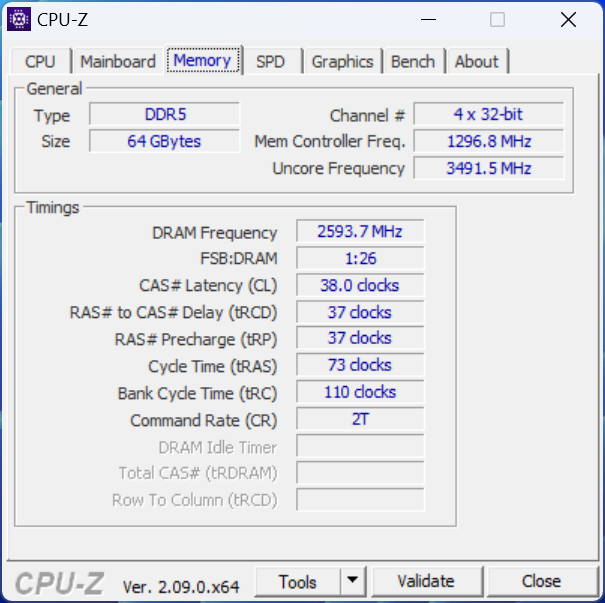
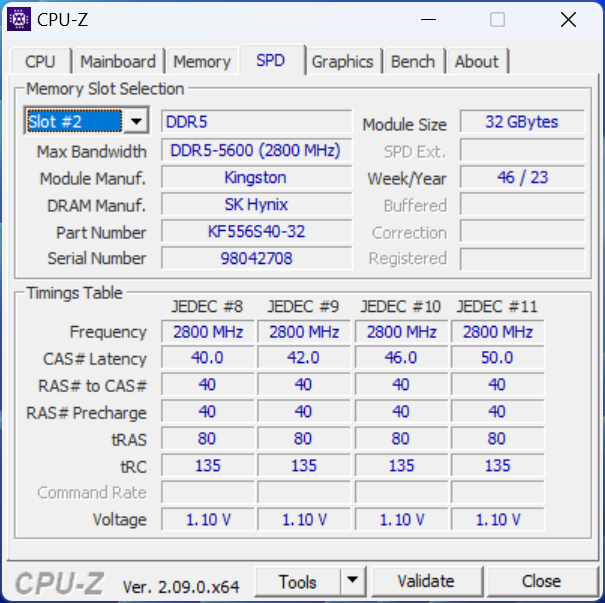
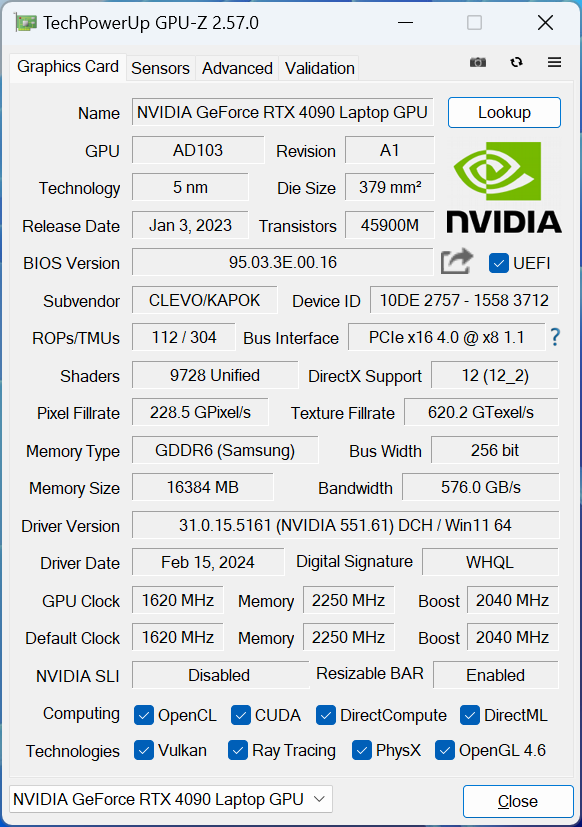
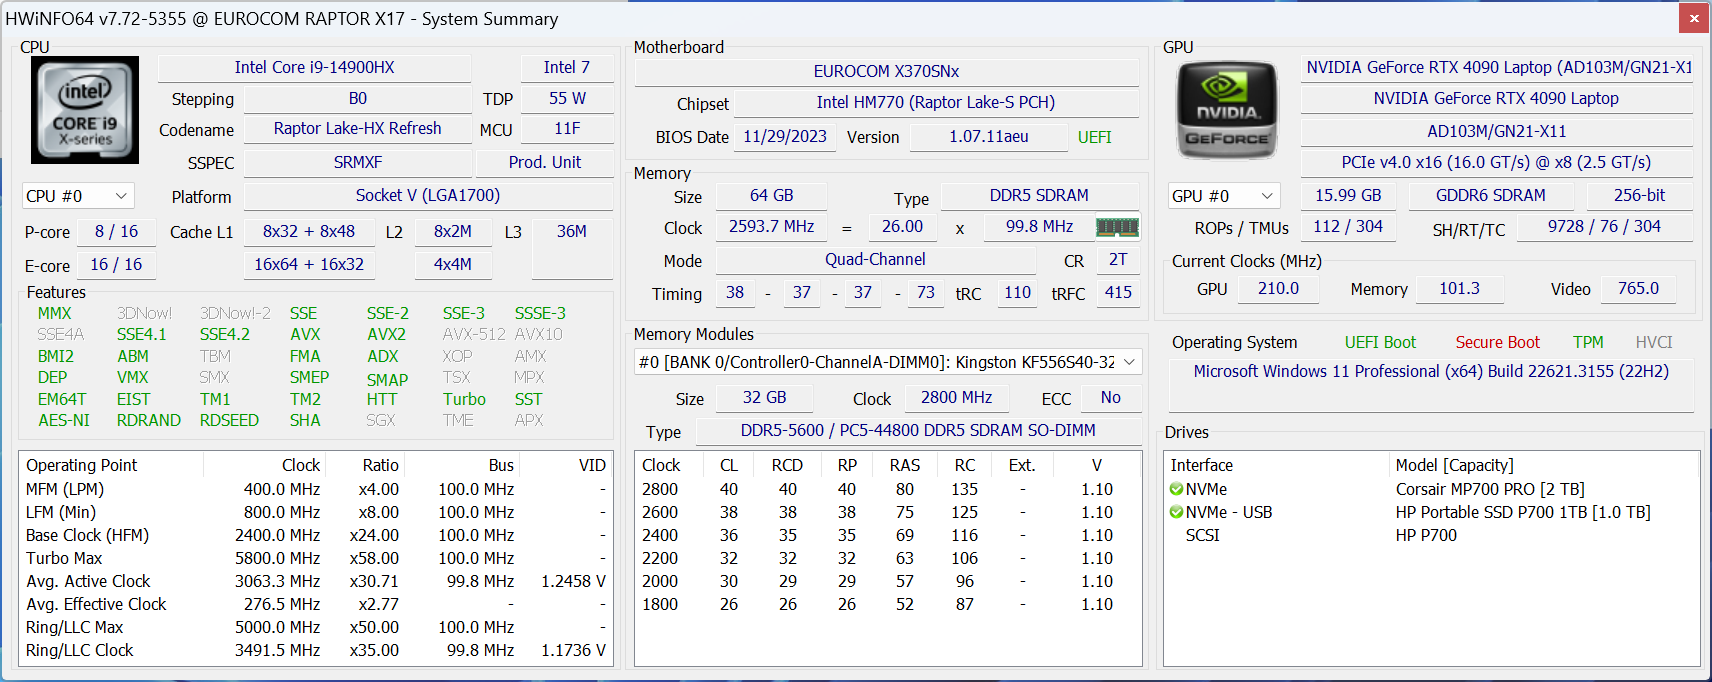
Nasza jednostka testowa 2024 Raptor X17 jest dostarczana z procesorem Core i9-14900HX, dyskiem SSD PCIe5 i wyświetlaczem 4K 144 Hz, w przeciwieństwie do Core i9-13900HX, dysku SSD PCIe4 i wyświetlacza 2K 240 Hz w naszym modelu 2023. Moc 175 W GeForce RTX 4090 pozostaje bez zmian.
Alternatywy dla Raptor X17 obejmują inne wysokowydajne laptopy do gier, takie jak Asus ROG Strix Scar 17, MSI Titan 18 HXlub Alienware m18 R2. Warto zauważyć, że Raptor X17 jest jednym z niewielu laptopów gamingowych RTX 4090 na rynku z 17,3-calowym wyświetlaczem 16:9.
Więcej recenzji Eurocom:
Potencjalni konkurenci w porównaniu
Rating | Date | Model | Weight | Height | Size | Resolution | Best Price |
|---|---|---|---|---|---|---|---|
| 85.2 % | 03/2024 | Eurocom Raptor X17 Core i9-14900HX i9-14900HX, NVIDIA GeForce RTX 4090 Laptop GPU | 3.4 kg | 24.9 mm | 17.30" | 3840x2160 | |
| 82.8 % | 05/2023 | Eurocom Raptor X17 i9-13900HX, NVIDIA GeForce RTX 4090 Laptop GPU | 3.5 kg | 24.9 mm | 17.30" | 2560x1440 | |
| 85.6 % | 01/2024 | Asus TUF Gaming A17 FA707XI-NS94 R9 7940HS, NVIDIA GeForce RTX 4070 Laptop GPU | 2.5 kg | 25.4 mm | 17.30" | 1920x1080 | |
| 88.3 % | 04/2023 | Asus ROG Strix Scar 17 G733PY-XS96 R9 7945HX, NVIDIA GeForce RTX 4090 Laptop GPU | 2.9 kg | 28.3 mm | 17.30" | 2560x1440 | |
| MSI Raider GE78 HX 13VI i9-13980HX, NVIDIA GeForce RTX 4090 Laptop GPU | 17.30" | 2560x1600 | |||||
| 88.8 % | 01/2024 | MSI Titan 18 HX A14VIG i9-14900HX, NVIDIA GeForce RTX 4090 Laptop GPU | 3.6 kg | 32.1 mm | 18.00" | 3840x2400 |
Komunikacja
Kamera internetowa


Wyświetlacz
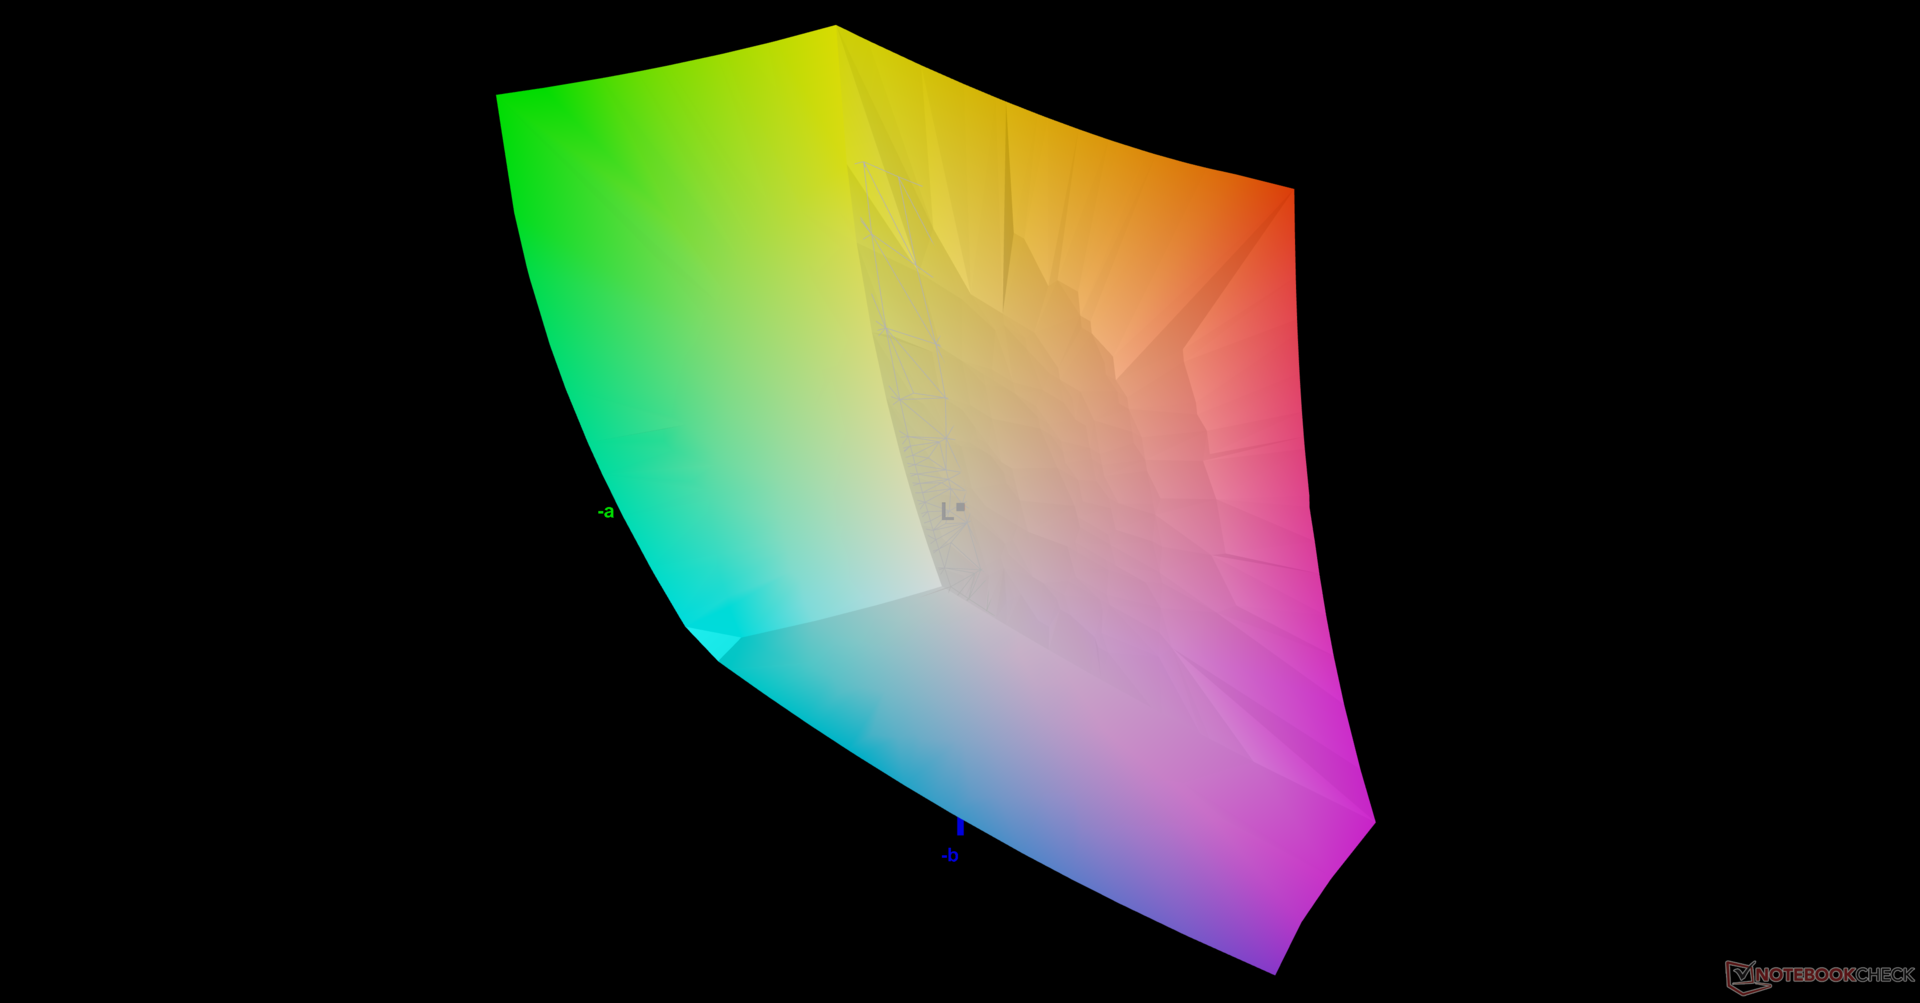
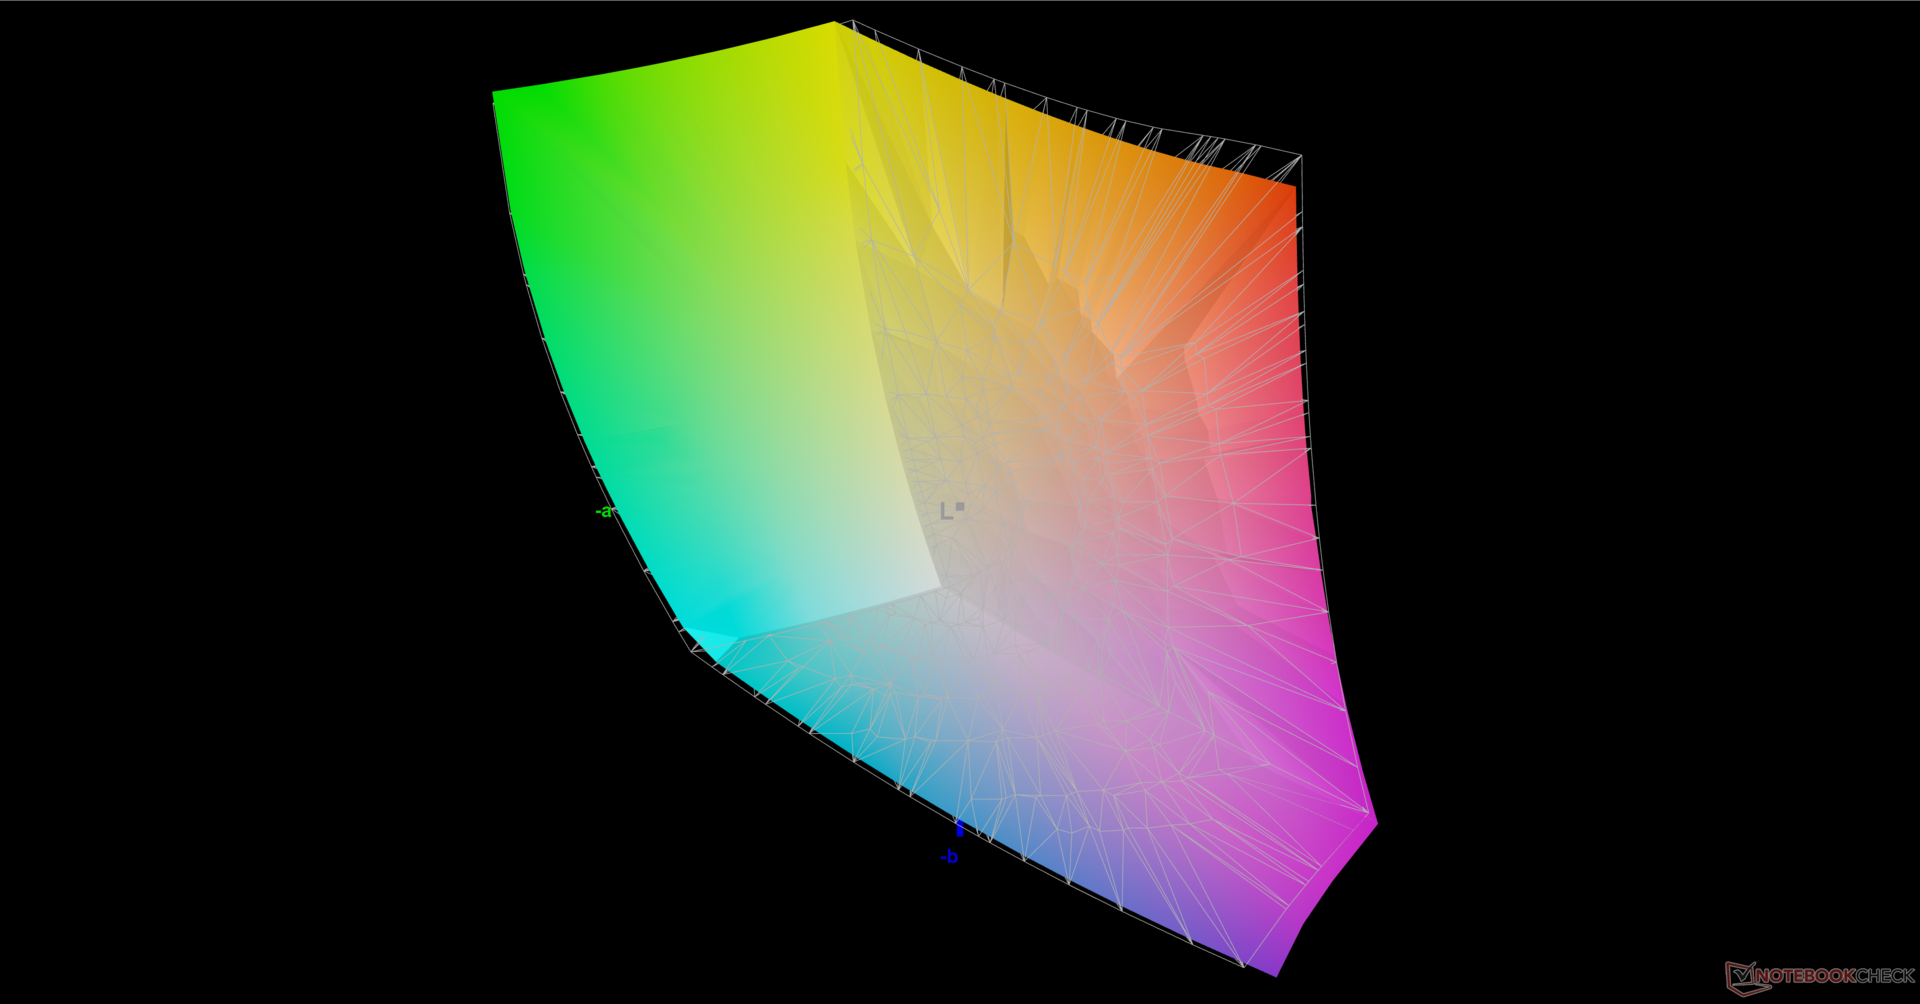
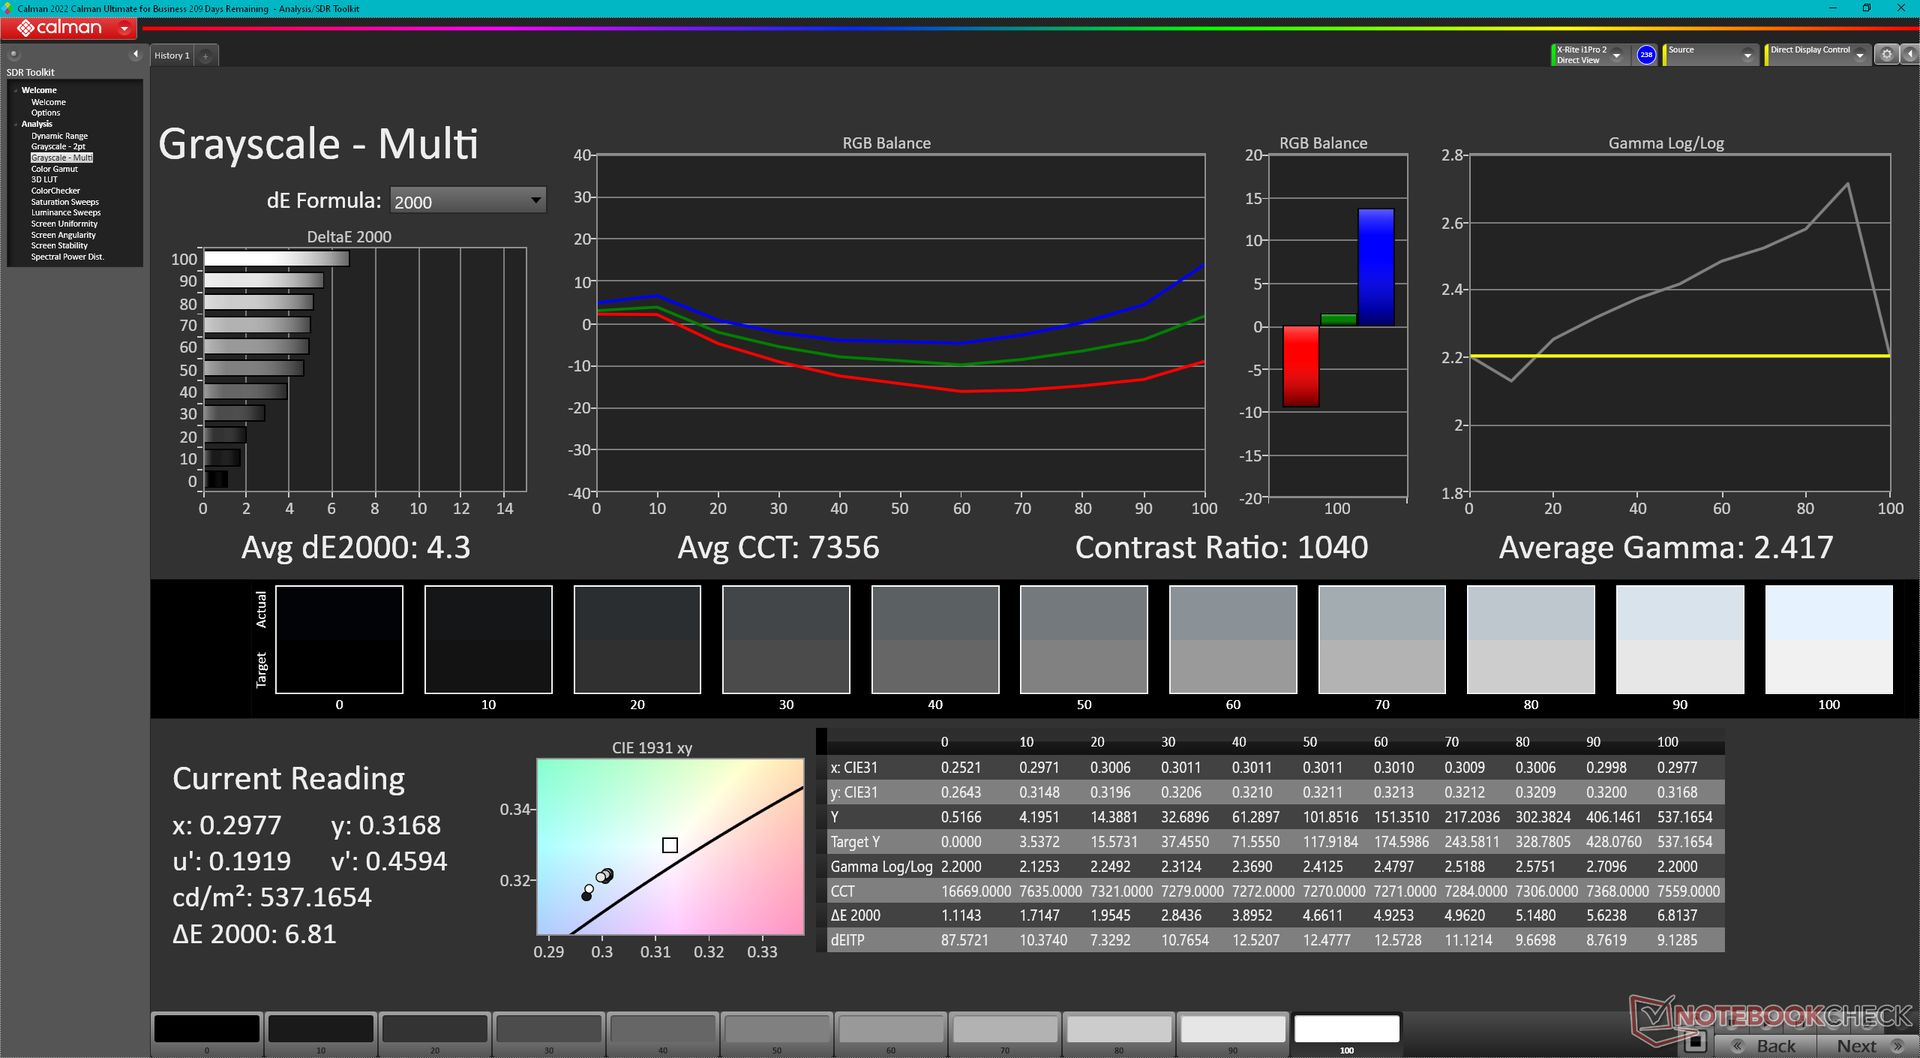
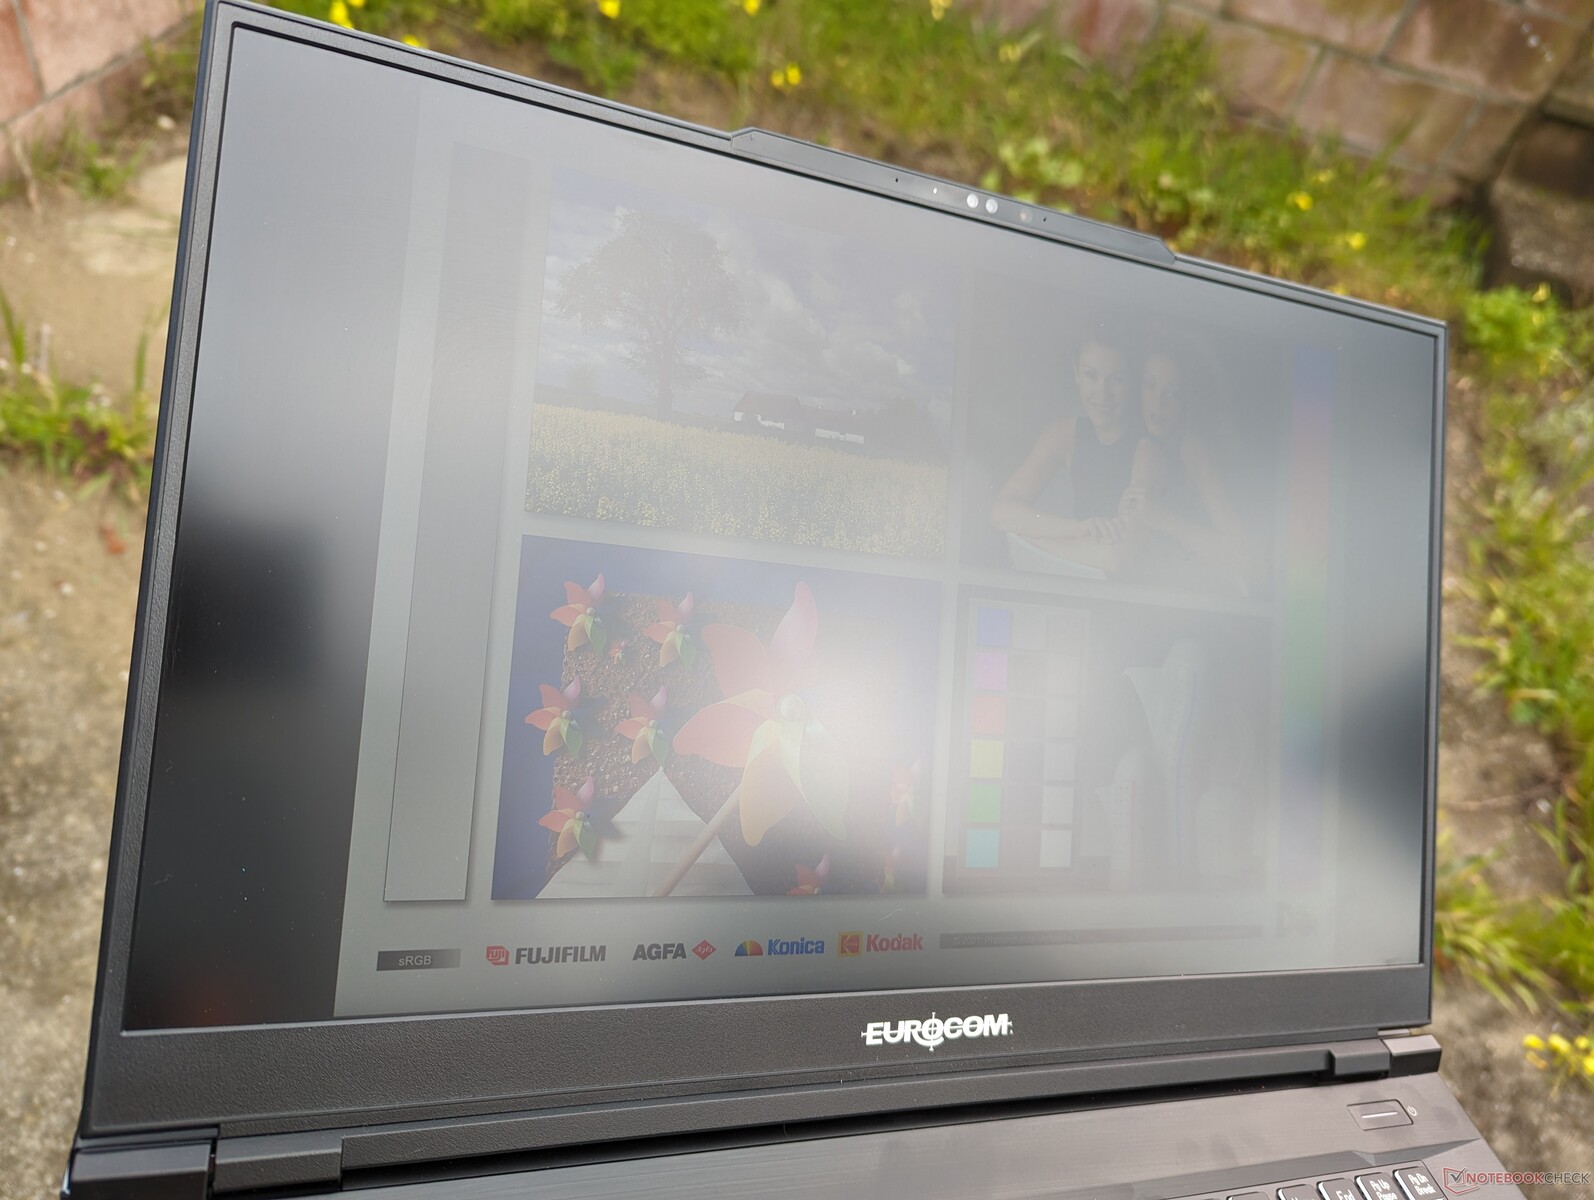
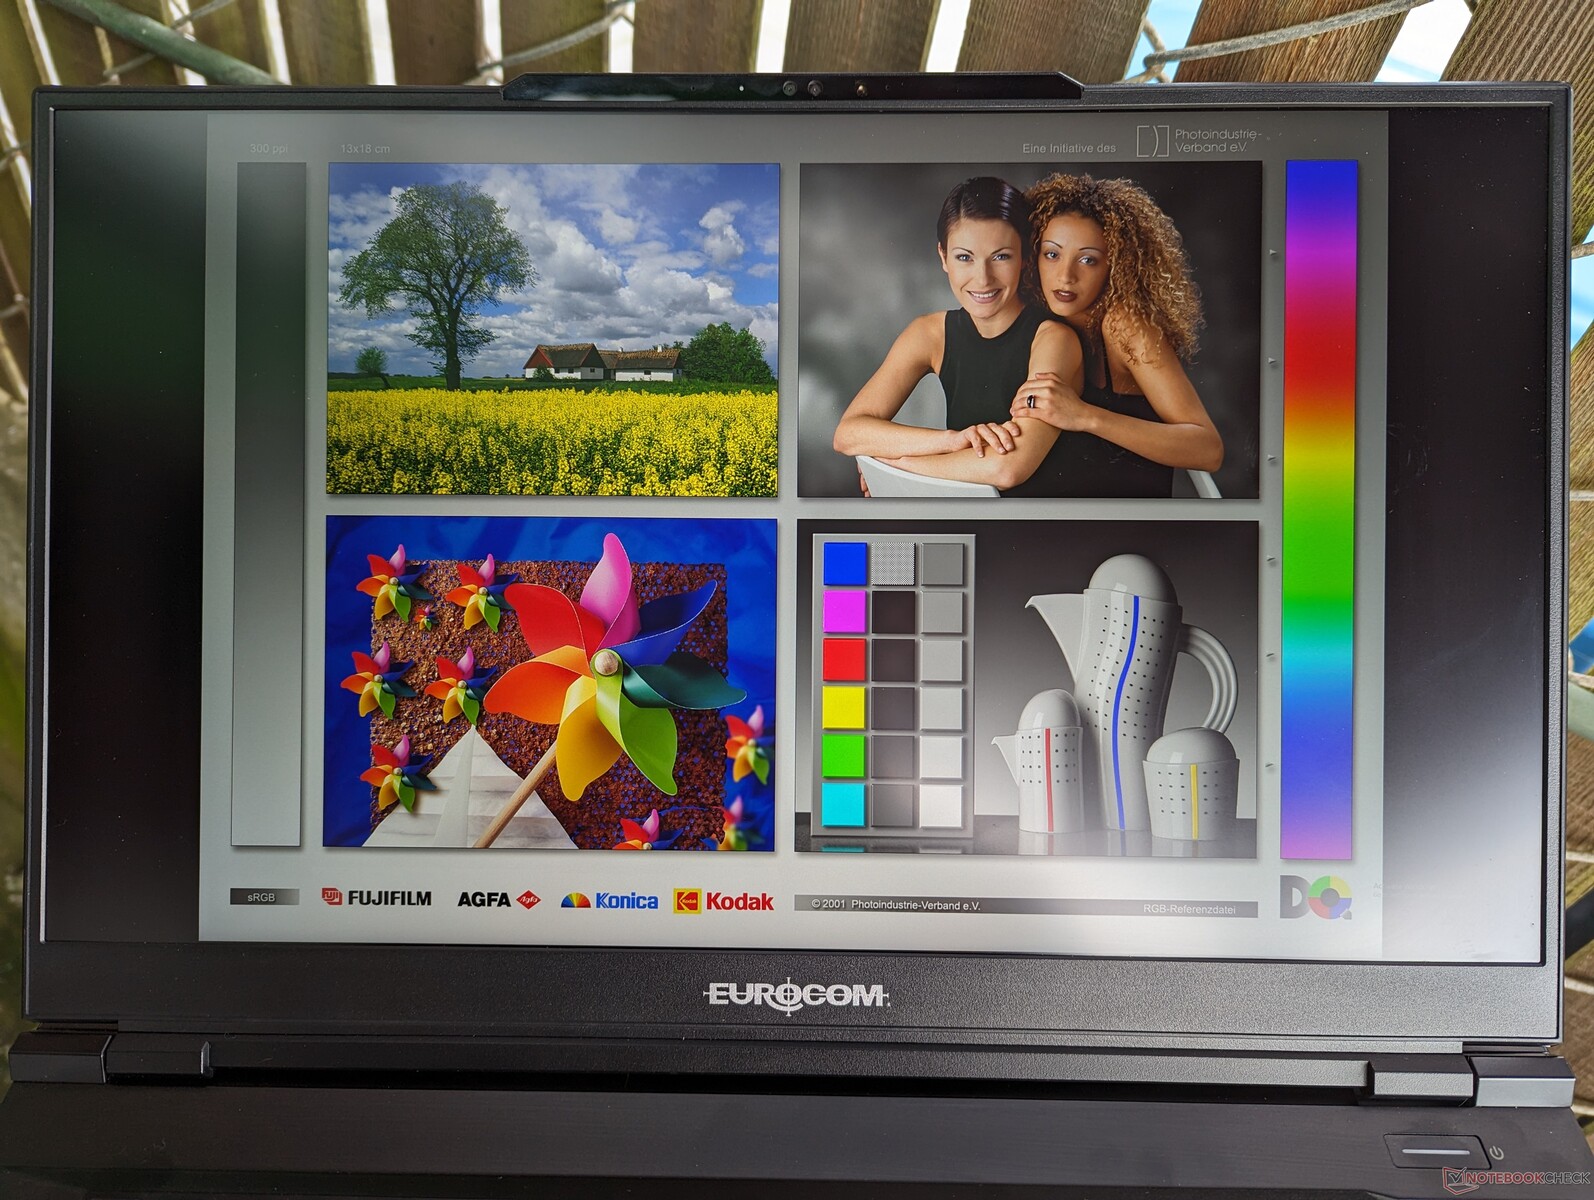
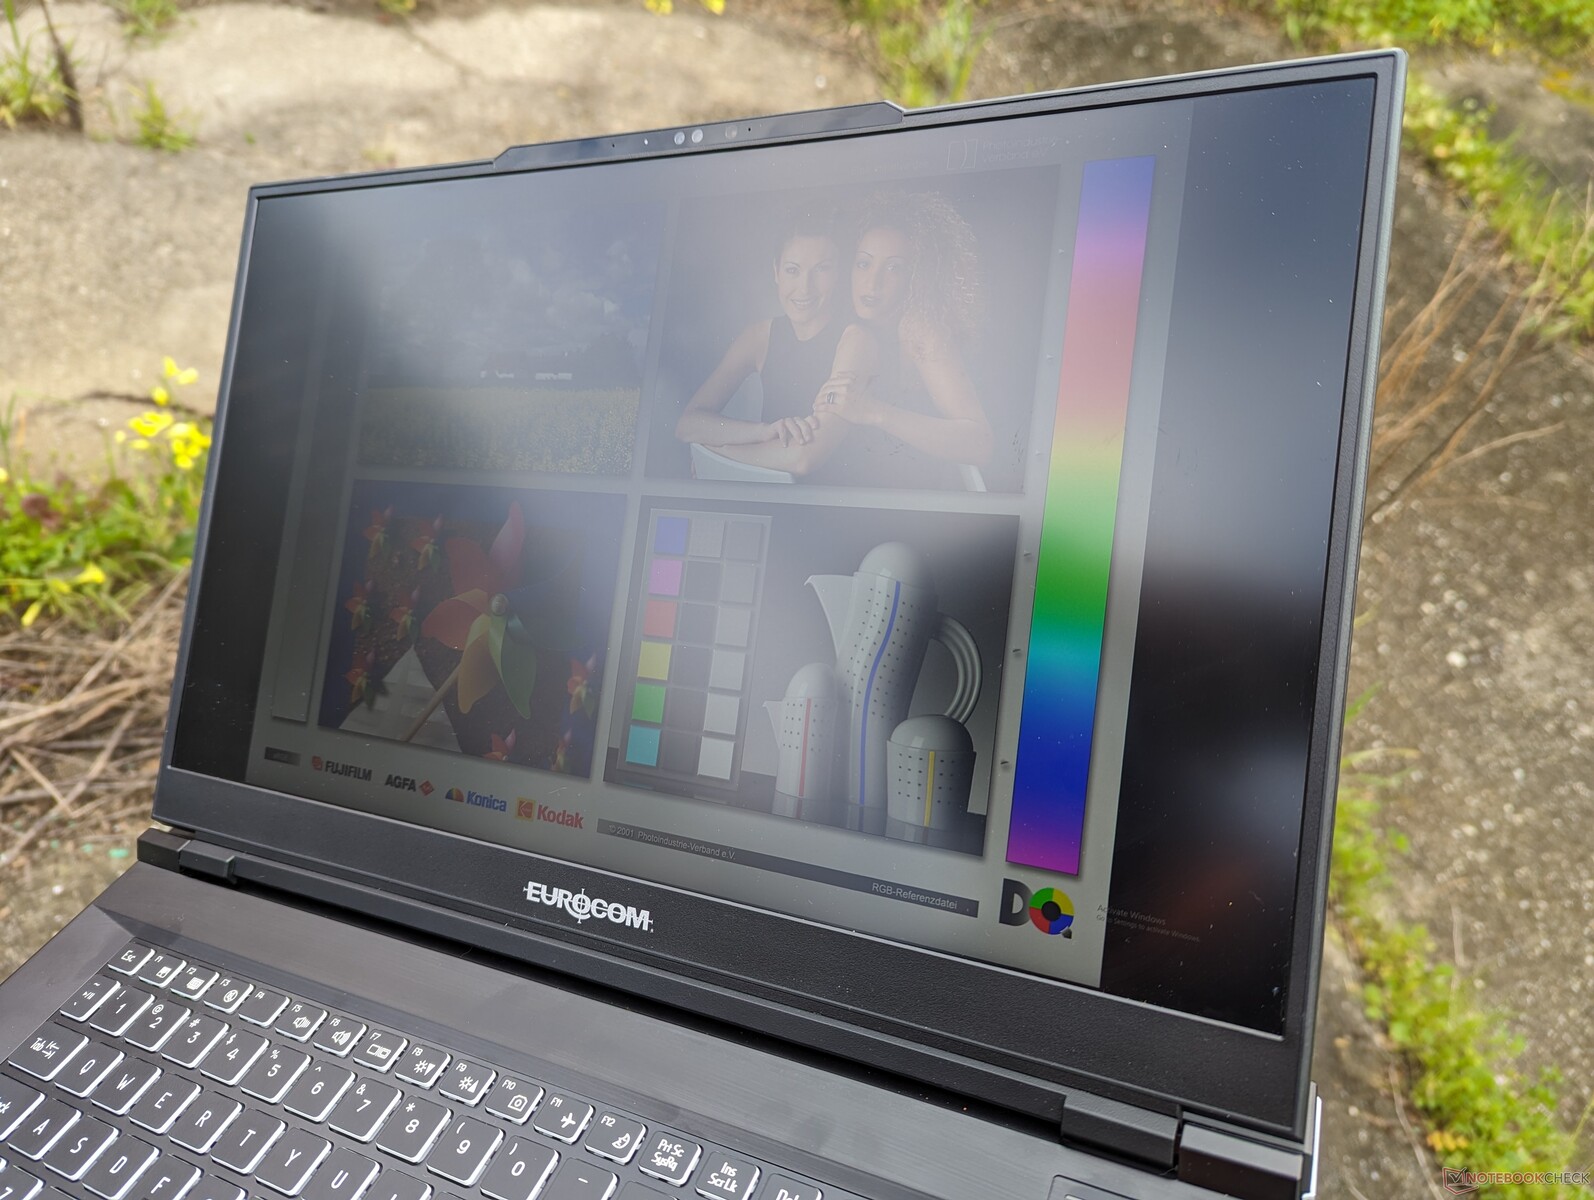
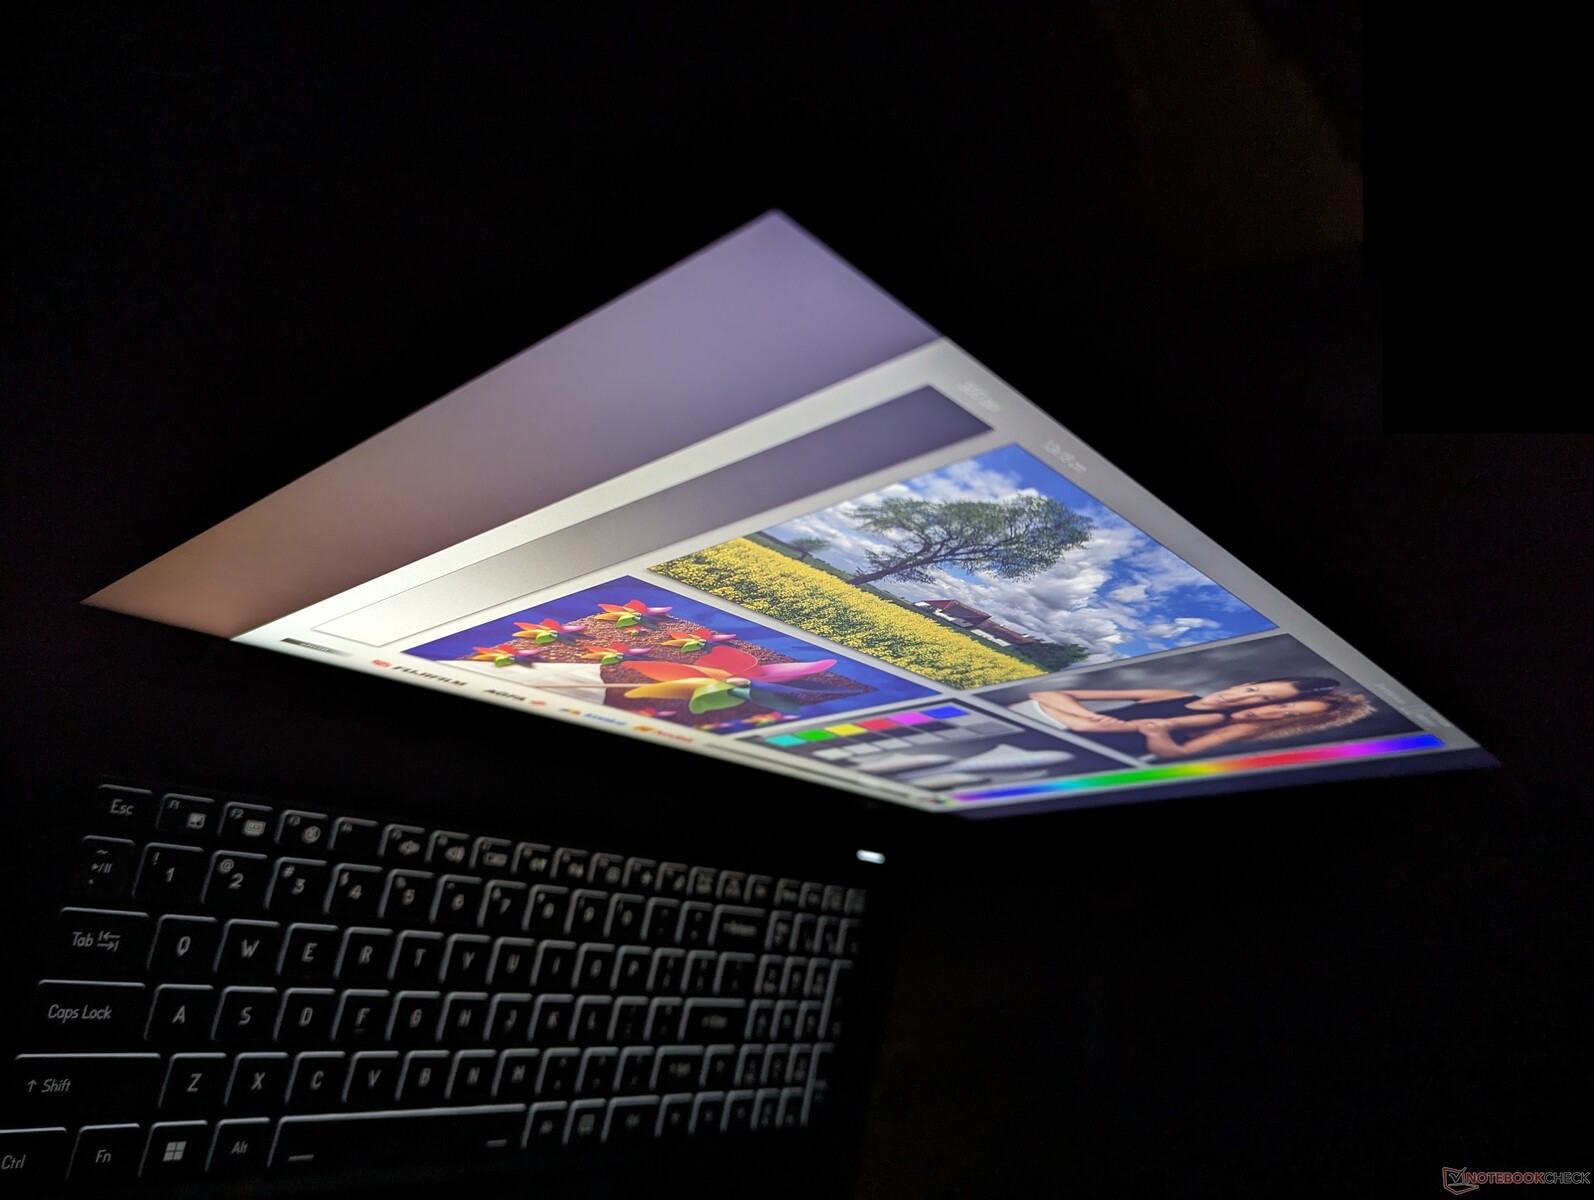
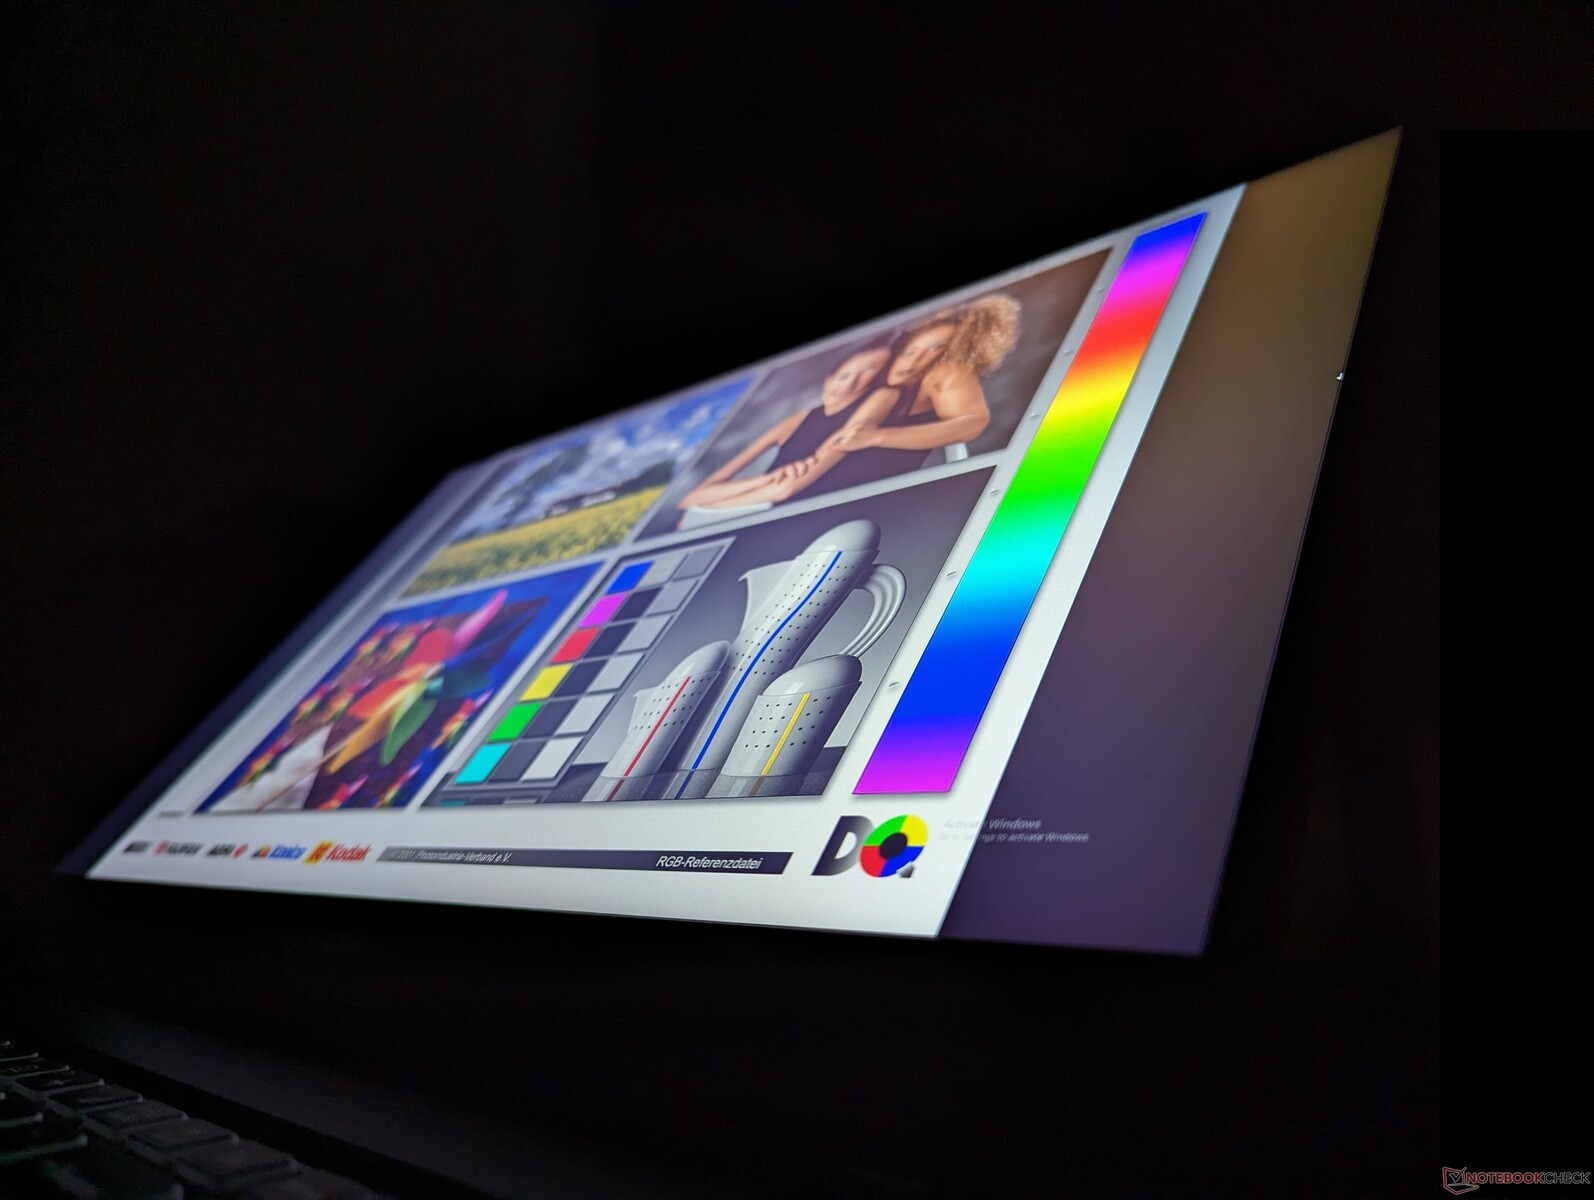
W porównaniu do wyświetlacza 2K 240 Hz w naszej konfiguracji 2023, nasza konfiguracja 2024 wykorzystuje panel 4K 144 Hz, ale z podobnym pokryciem kolorów, współczynnikiem kontrastu i czasem reakcji. Nasz panel o wyższej rozdzielczości jest również zauważalnie jaśniejszy, średnio o około 500 nitów.
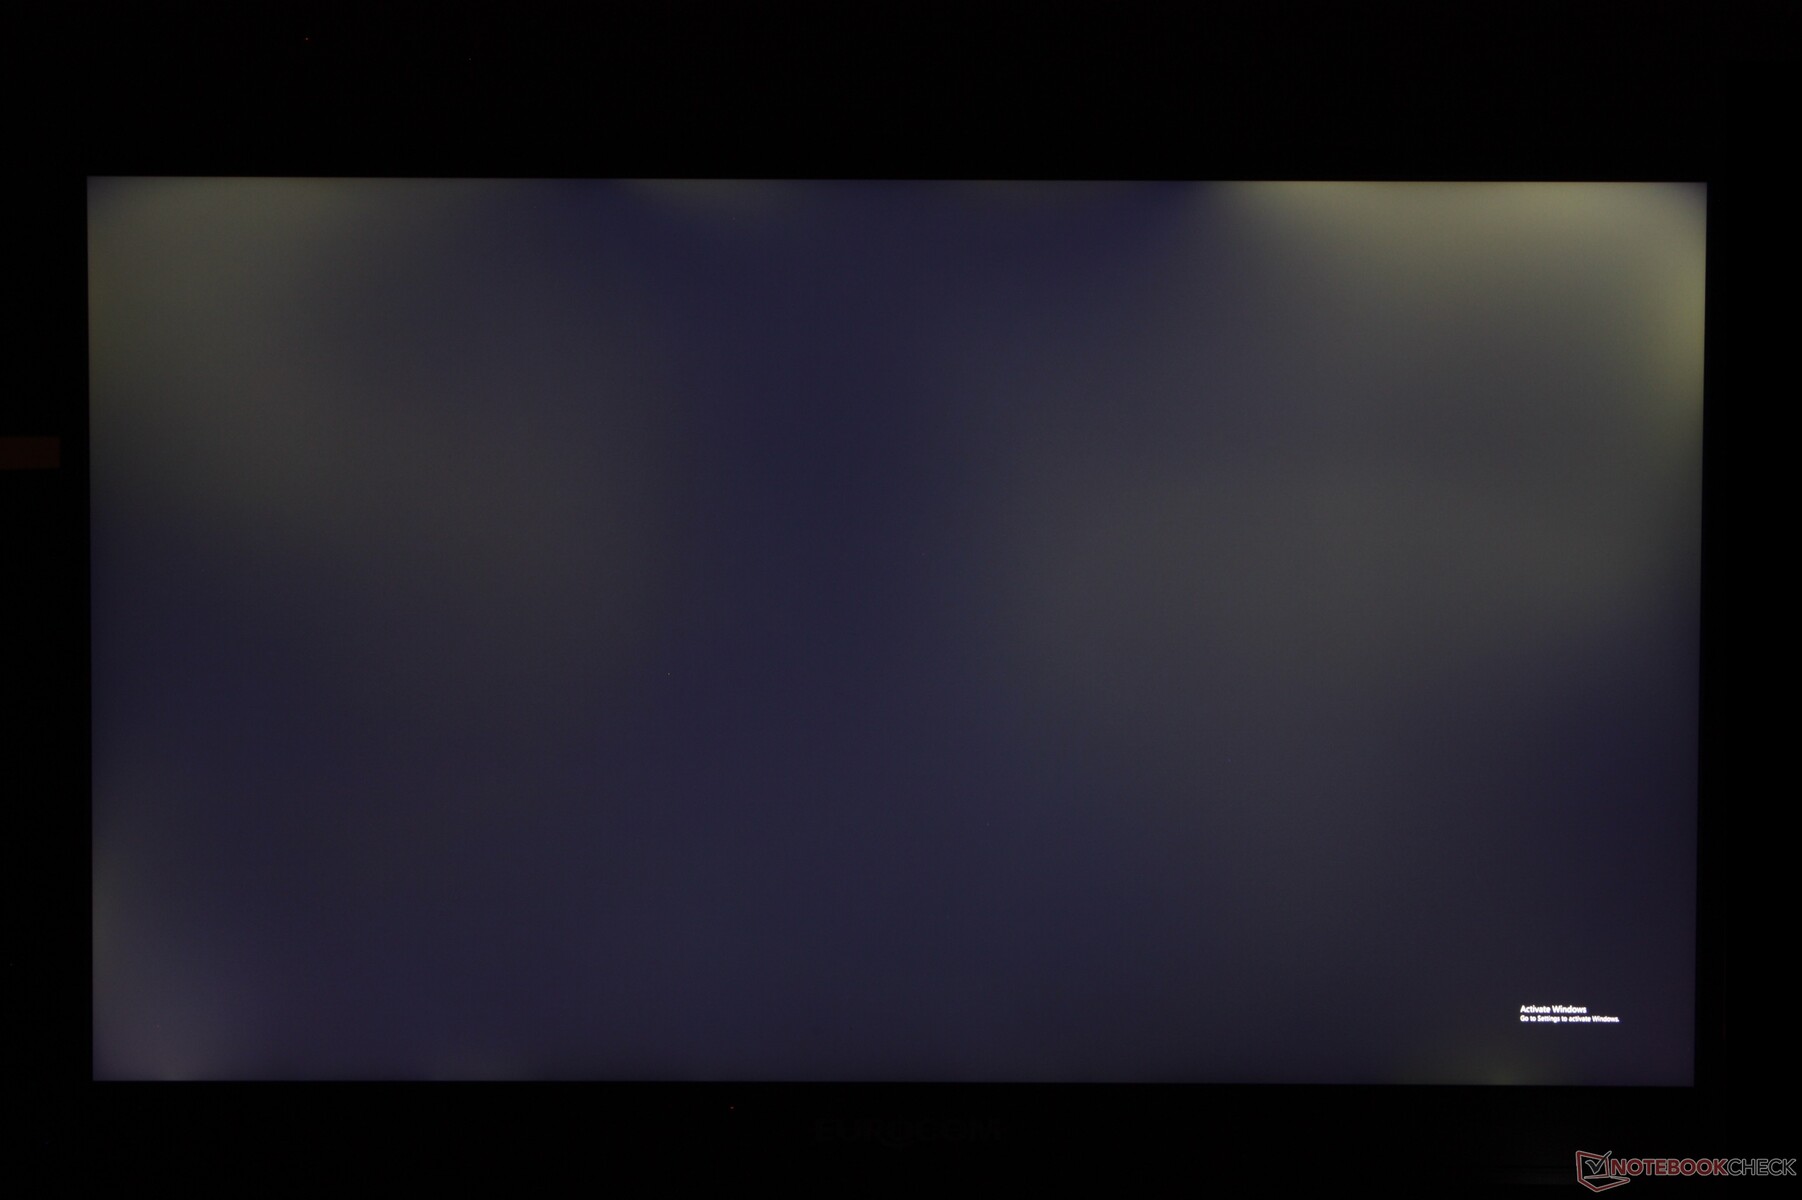
Kluczową wadą wyświetlacza jest nieco ziarnisty matowy panel, zauważalne krwawienie podświetlenia w ciemnych scenach i brak obsługi HDR. Alternatywy OLED wyglądają znacznie wyraźniej i bardziej żywo niż to, co Raptor X17 ma do zaoferowania pod tym względem.
Panel BOE NE173QUM-NY1 można również znaleźć w innych modelach, takich jak Schenker Key 17 Pro.

| |||||||||||||||||||||||||
rozświetlenie: 77 %
na akumulatorze: 544.6 cd/m²
kontrast: 1135:1 (czerń: 0.48 cd/m²)
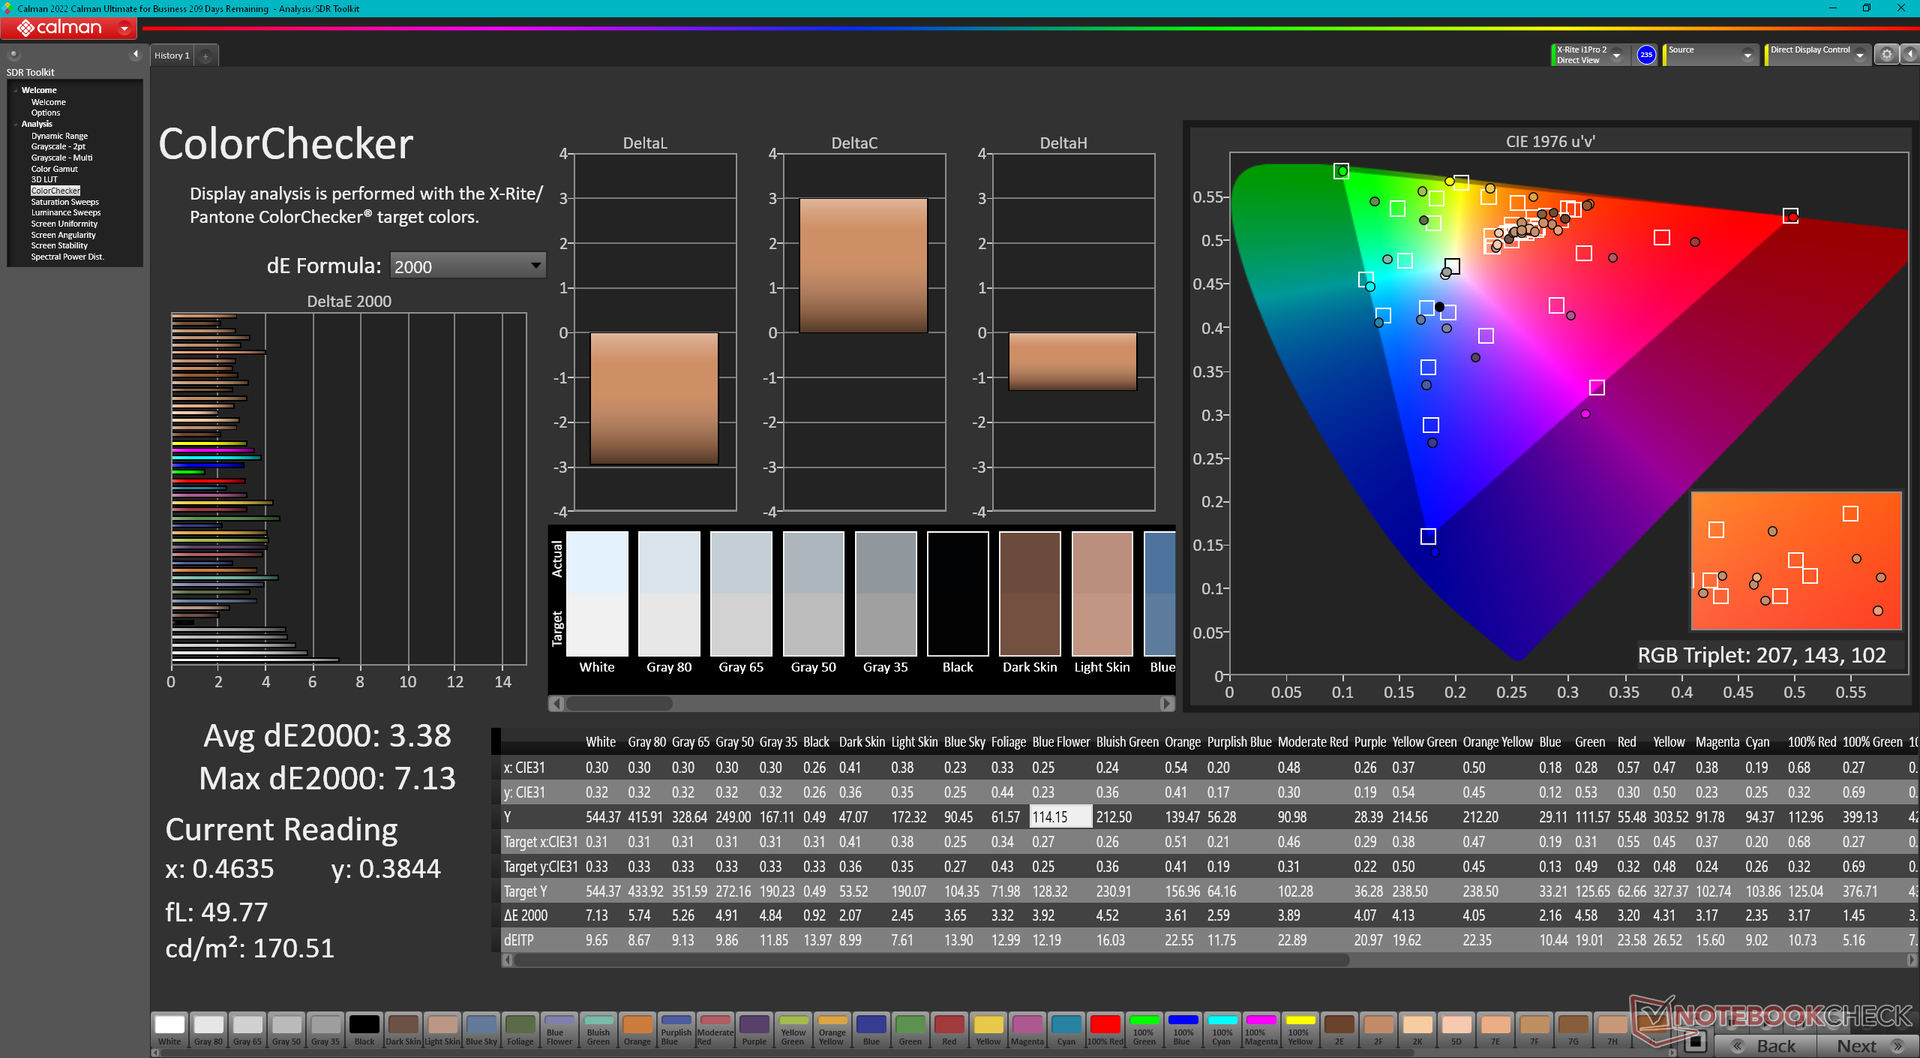
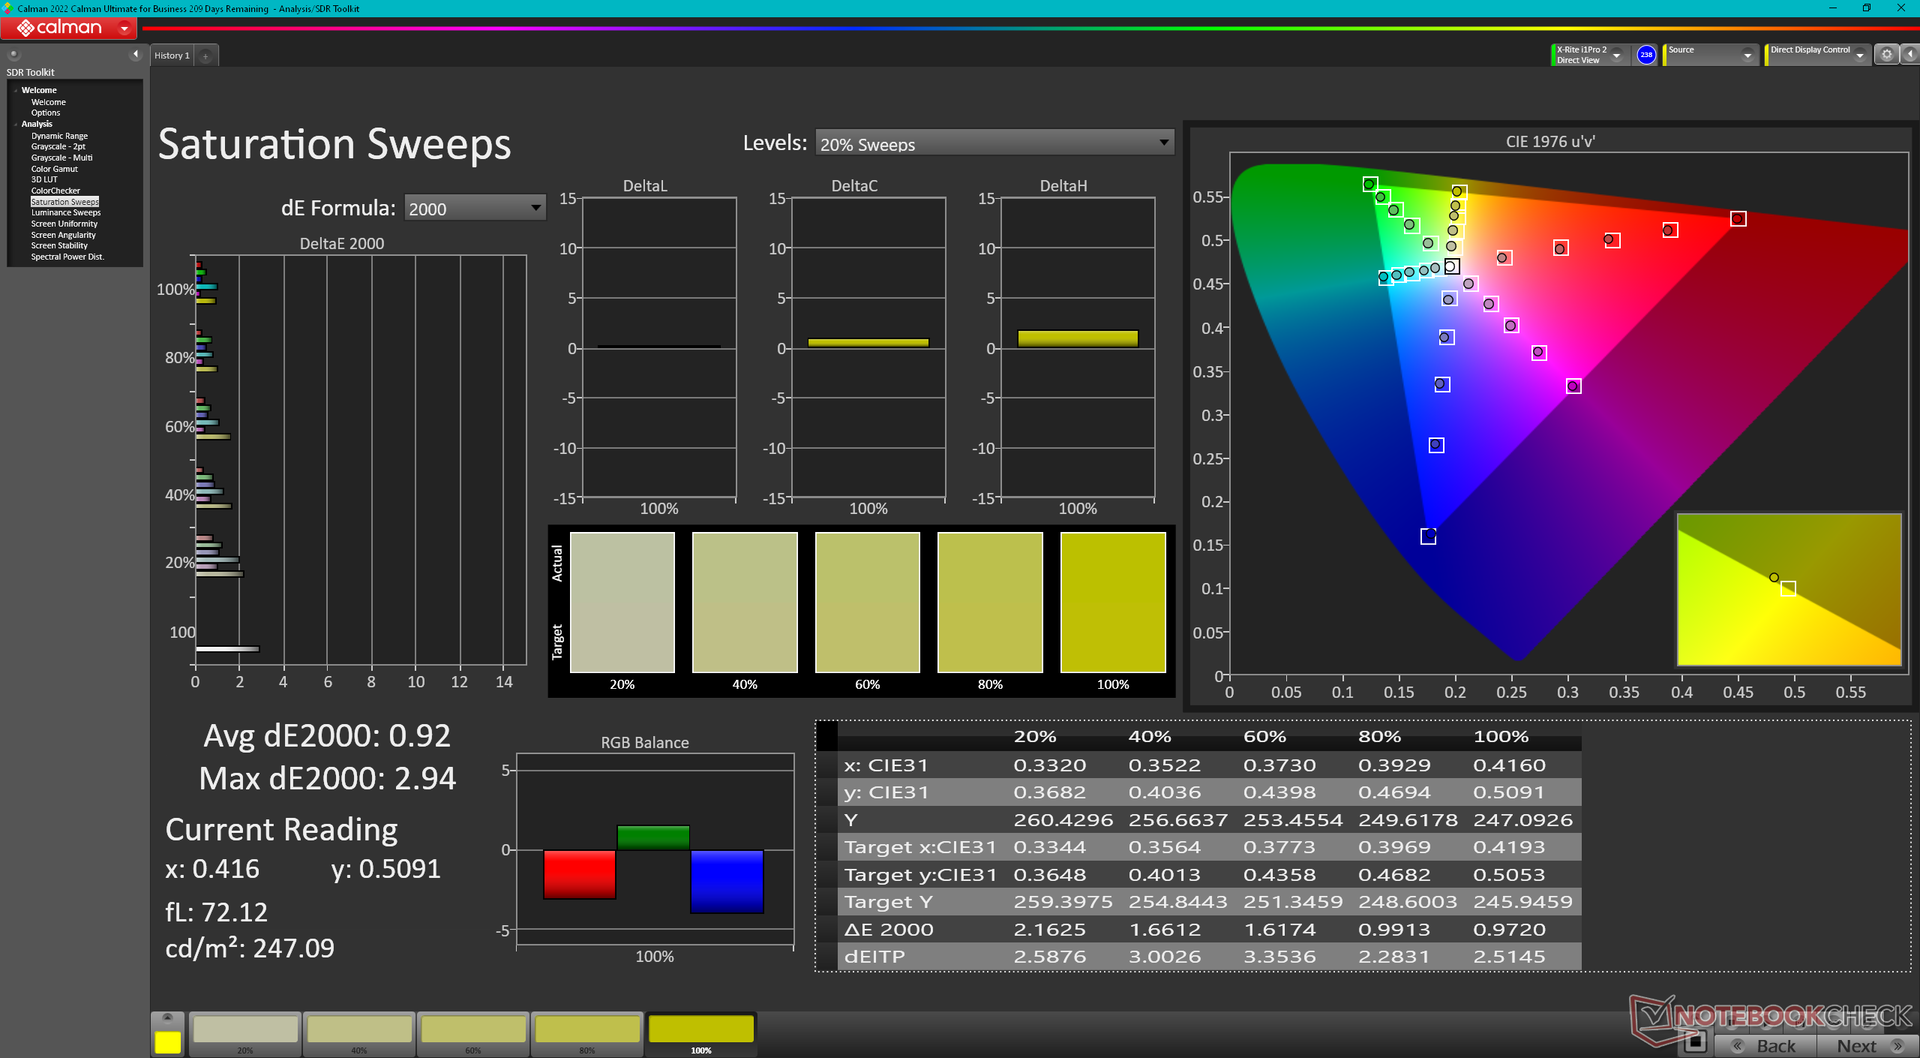
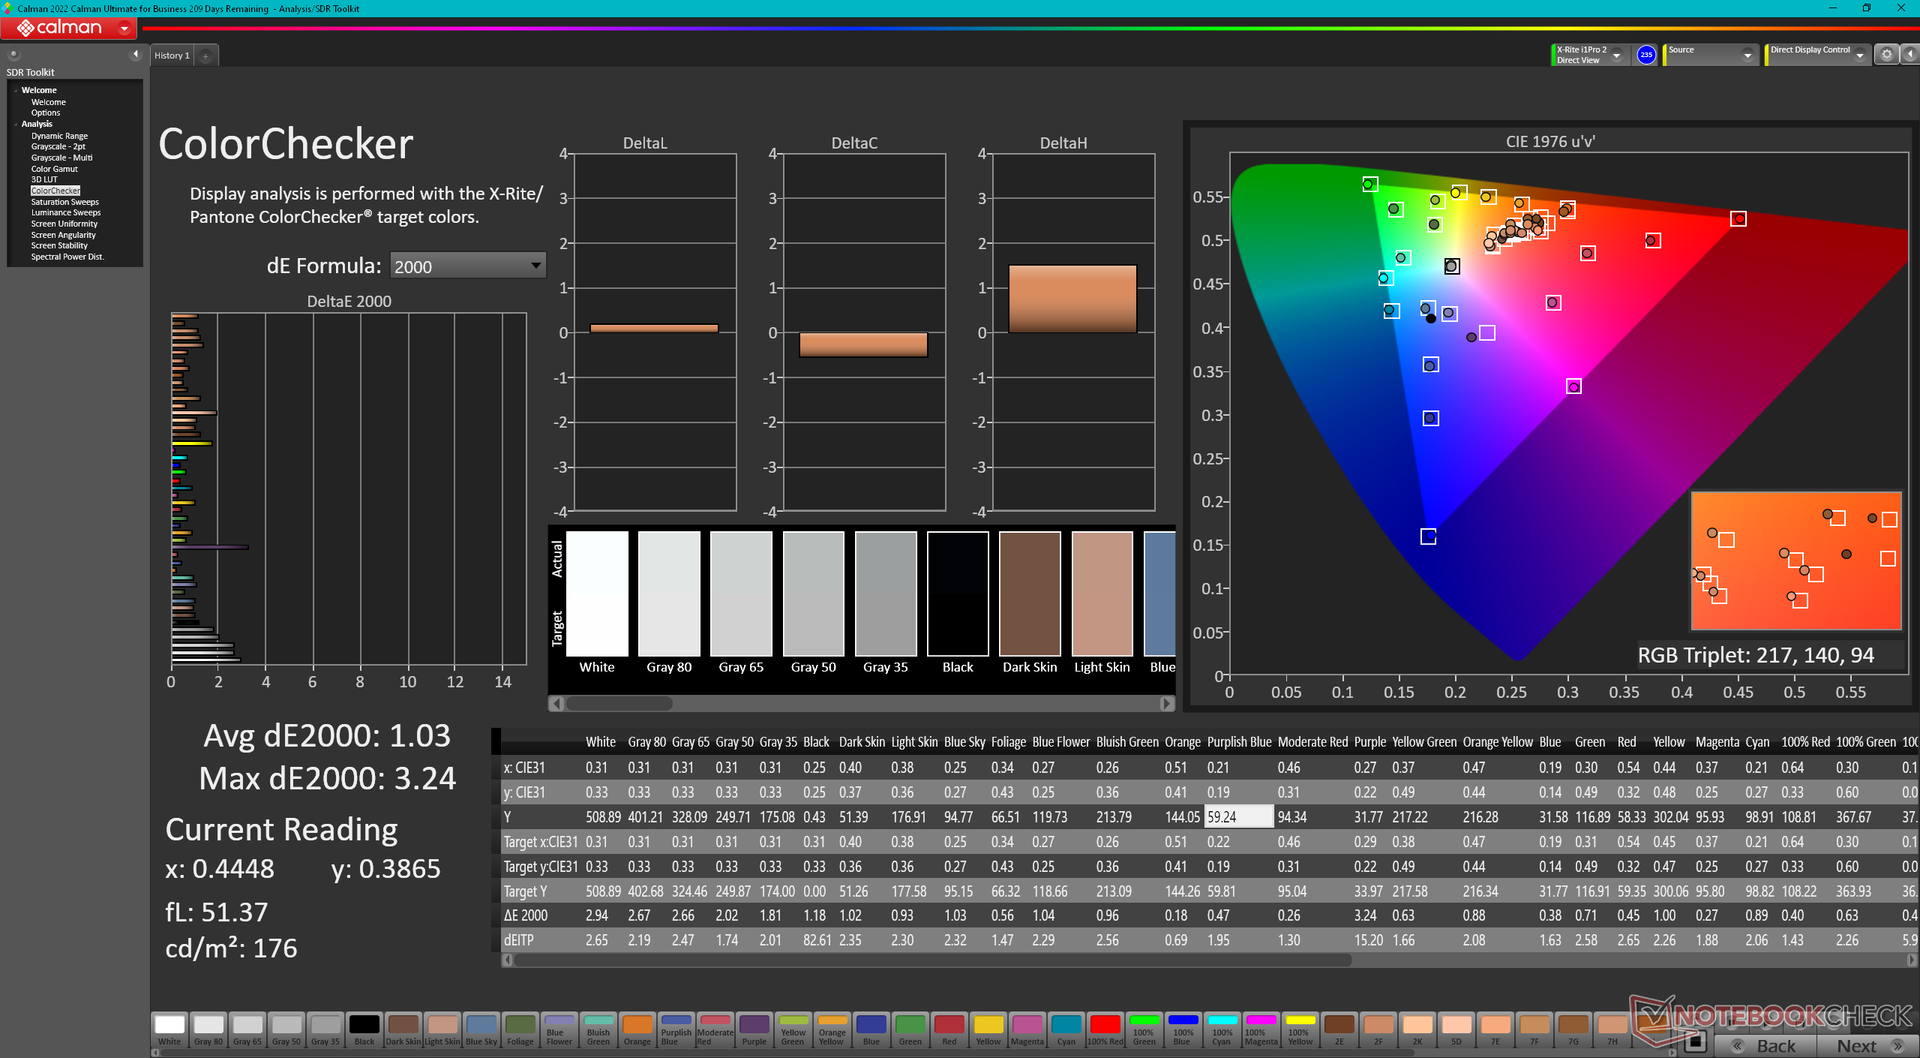
ΔE Color 3.38 | 0.5-29.43 Ø5, calibrated: 1.03
ΔE Greyscale 4.3 | 0.57-98 Ø5.3
84.2% AdobeRGB 1998 (Argyll 2.2.0 3D)
99.8% sRGB (Argyll 2.2.0 3D)
95.9% Display P3 (Argyll 2.2.0 3D)
Gamma: 2.42
| Eurocom Raptor X17 Core i9-14900HX BOE CQ NE173QUM-NY1, IPS, 3840x2160, 17.30 | Eurocom Raptor X17 BOE NE173QHM-NZ1, IPS, 2560x1440, 17.30 | Asus TUF Gaming A17 FA707XI-NS94 AU Optronics B173HAN04.9, IPS, 1920x1080, 17.30 | Asus ROG Strix Scar 17 G733PY-XS96 NE173QHM-NZ2, IPS, 2560x1440, 17.30 | MSI GE78HX 13VH-070US AU Optronics B170QAN01.2, IPS, 2560x1600, 17.00 | MSI Titan 18 HX A14VIG AU Optronics B180ZAN01.0, Mini-LED, 3840x2400, 18.00 | |
|---|---|---|---|---|---|---|
| Display | 1% | -50% | 1% | 2% | 1% | |
| Display P3 Coverage | 95.9 | 97.8 2% | 39.7 -59% | 98 2% | 97.6 2% | 98.1 2% |
| sRGB Coverage | 99.8 | 99.9 0% | 59.1 -41% | 100 0% | 99.9 0% | 99.8 0% |
| AdobeRGB 1998 Coverage | 84.2 | 85.4 1% | 41 -51% | 85.6 2% | 86.5 3% | 86.2 2% |
| Response Times | 11% | -150% | 29% | 58% | -288% | |
| Response Time Grey 50% / Grey 80% * | 14.8 ? | 13.3 ? 10% | 39 ? -164% | 6.2 ? 58% | 4.2 ? 72% | 8.6 ? 42% |
| Response Time Black / White * | 11.4 ? | 10 ? 12% | 26.9 ? -136% | 11.4 ? -0% | 6.4 ? 44% | 81.8 ? -618% |
| PWM Frequency | 2592 ? | |||||
| Screen | -4% | -33% | 22% | -16% | -23% | |
| Brightness middle | 544.6 | 312.6 -43% | 255.9 -53% | 322.5 -41% | 398.6 -27% | 467.5 -14% |
| Brightness | 507 | 292 -42% | 248 -51% | 317 -37% | 384 -24% | 459 -9% |
| Brightness Distribution | 77 | 75 -3% | 91 18% | 86 12% | 89 16% | 90 17% |
| Black Level * | 0.48 | 0.26 46% | 0.21 56% | 0.29 40% | 0.46 4% | |
| Contrast | 1135 | 1202 6% | 1219 7% | 1112 -2% | 867 -24% | |
| Colorchecker dE 2000 * | 3.38 | 3.43 -1% | 4.51 -33% | 1.15 66% | 4.05 -20% | 3.77 -12% |
| Colorchecker dE 2000 max. * | 7.13 | 8.31 -17% | 20.77 -191% | 3.03 58% | 8.68 -22% | 6.12 14% |
| Colorchecker dE 2000 calibrated * | 1.03 | 0.74 28% | 1.82 -77% | 0.56 46% | 1.02 1% | 2.94 -185% |
| Greyscale dE 2000 * | 4.3 | 4.8 -12% | 3.2 26% | 1.7 60% | 6.5 -51% | 3.2 26% |
| Gamma | 2.42 91% | 2.12 104% | 2.08 106% | 2.27 97% | 2.11 104% | 2.43 91% |
| CCT | 7356 88% | 7082 92% | 6054 107% | 6299 103% | 7518 86% | 6478 100% |
| Total Average (Program / Settings) | 3% /
-1% | -78% /
-54% | 17% /
19% | 15% /
-2% | -103% /
-61% |
* ... im mniej tym lepiej
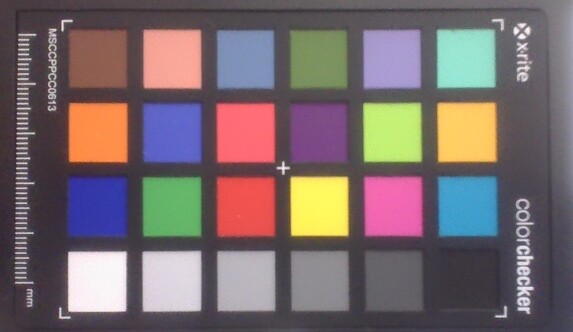
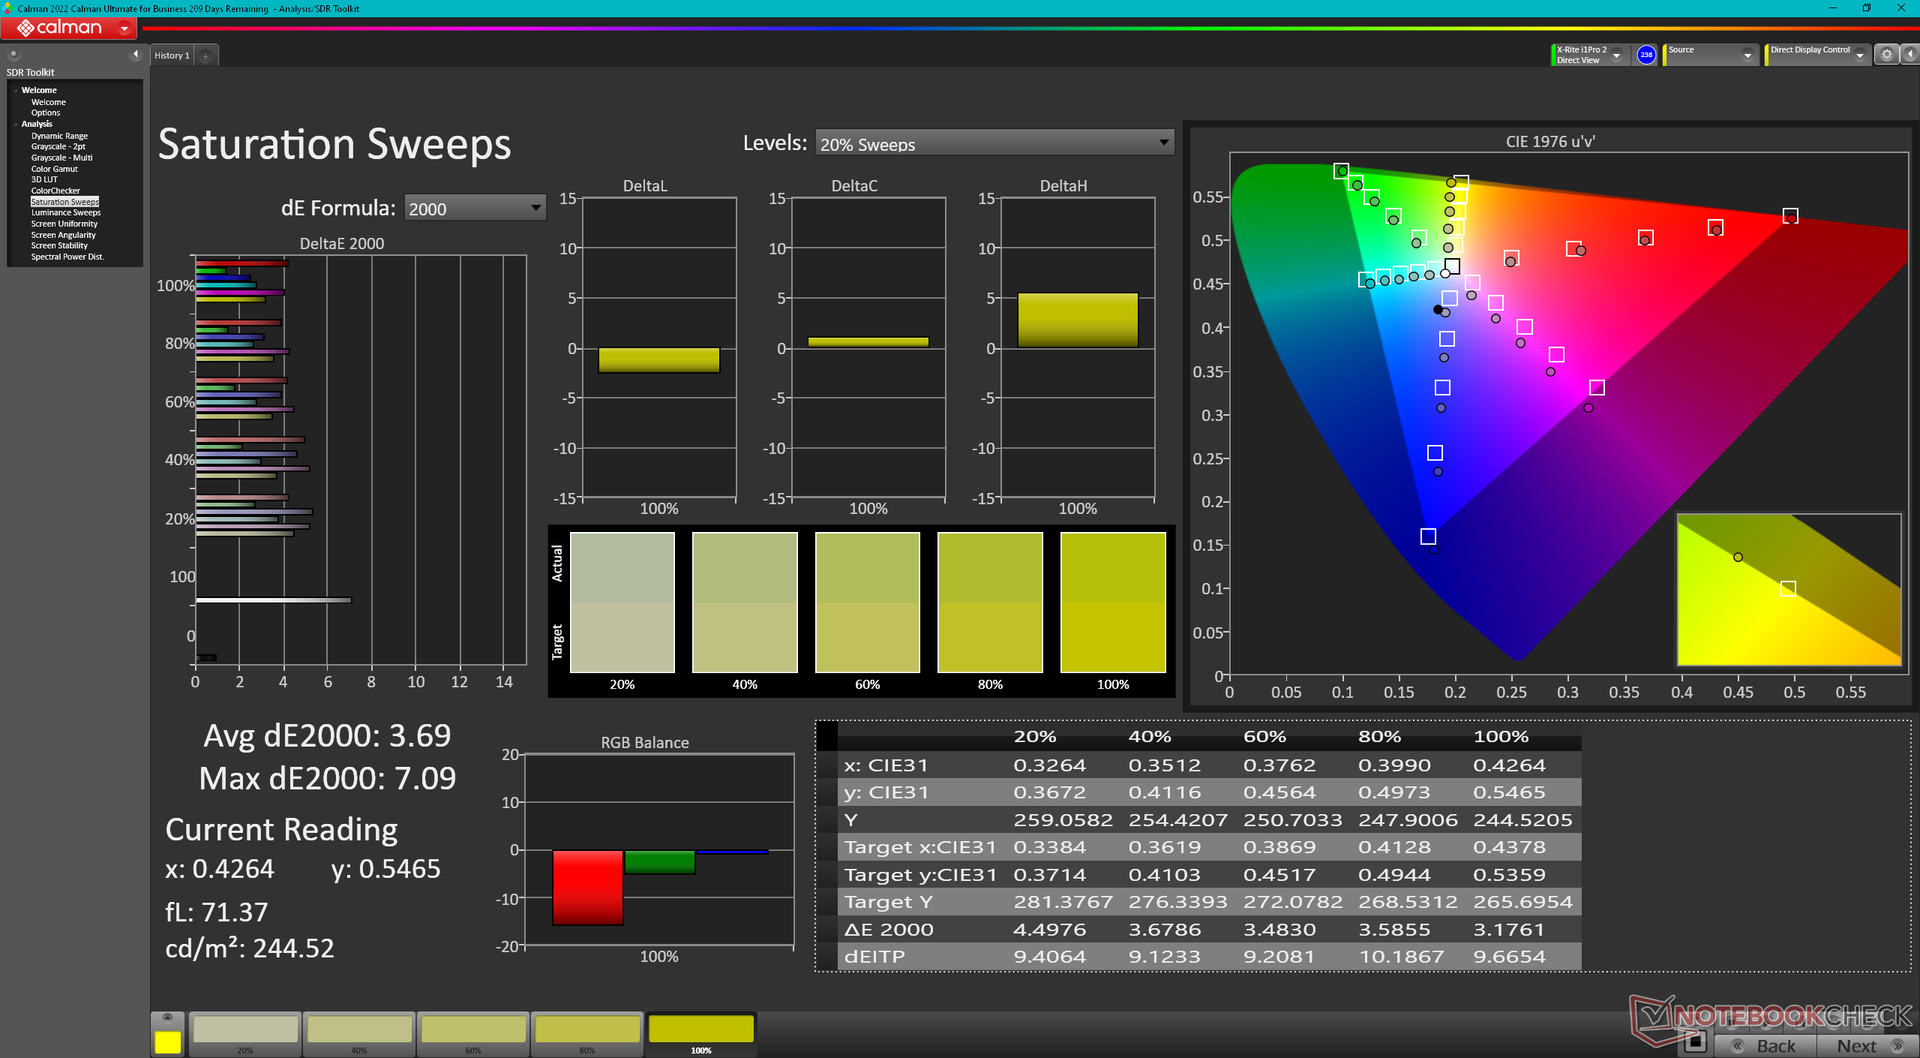
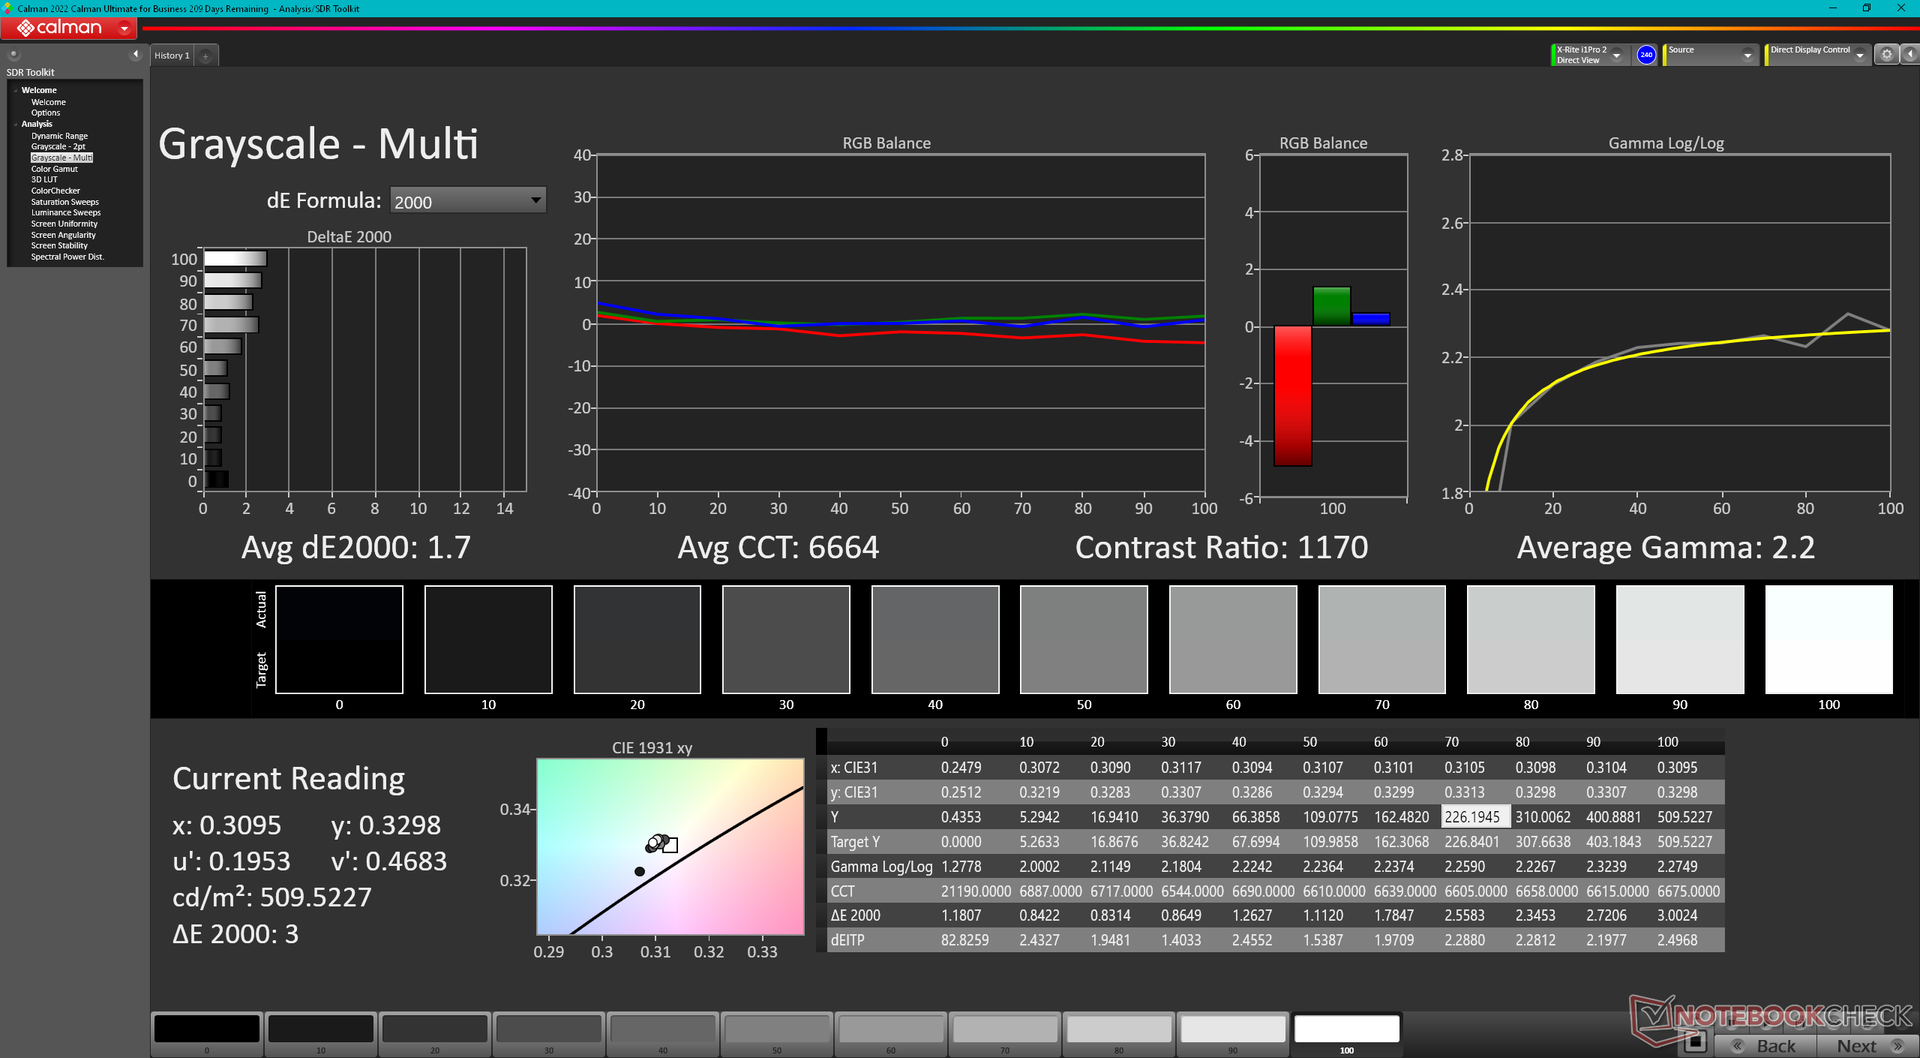
Chociaż standard P3 jest obsługiwany, dokładność kolorów mogłaby być lepsza. Temperatura barwowa jest zbyt niska, co wpływa na wartości deltaE skali szarości i kolorów. Kalibracja za pomocą naszego kolorymetru X-Rite rozwiązuje ten problem. Nasz profil ICM można pobrać bezpłatnie powyżej.
Display Response Times
| ↔ Response Time Black to White | ||
|---|---|---|
| 11.4 ms ... rise ↗ and fall ↘ combined | ↗ 6.1 ms rise | 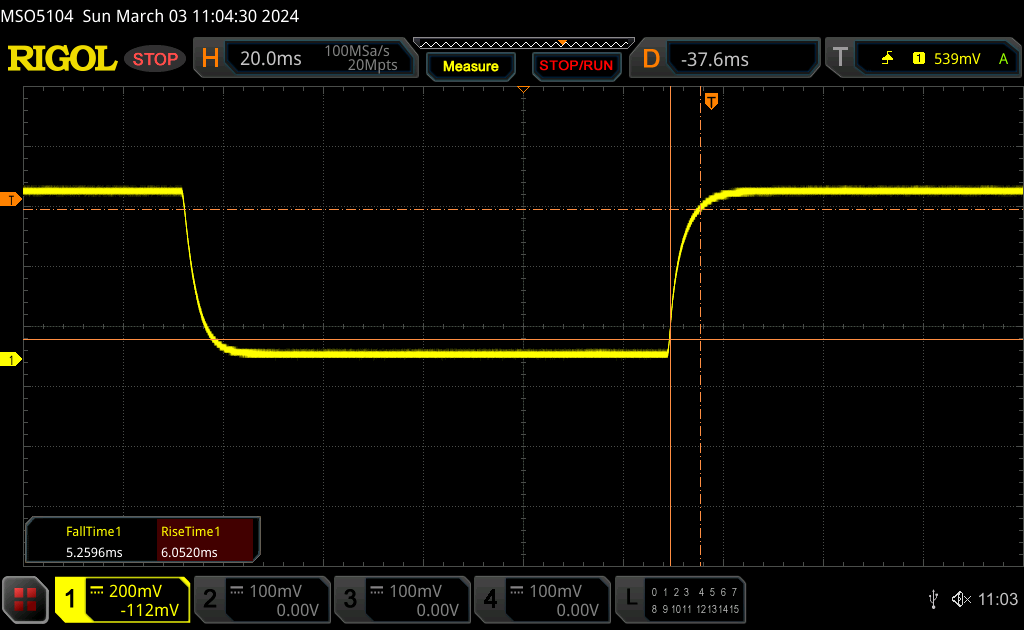 |
| ↘ 5.3 ms fall | ||
| The screen shows good response rates in our tests, but may be too slow for competitive gamers. In comparison, all tested devices range from 0.1 (minimum) to 240 (maximum) ms. » 26 % of all devices are better. This means that the measured response time is better than the average of all tested devices (21.5 ms). | ||
| ↔ Response Time 50% Grey to 80% Grey | ||
| 14.8 ms ... rise ↗ and fall ↘ combined | ↗ 7.2 ms rise | 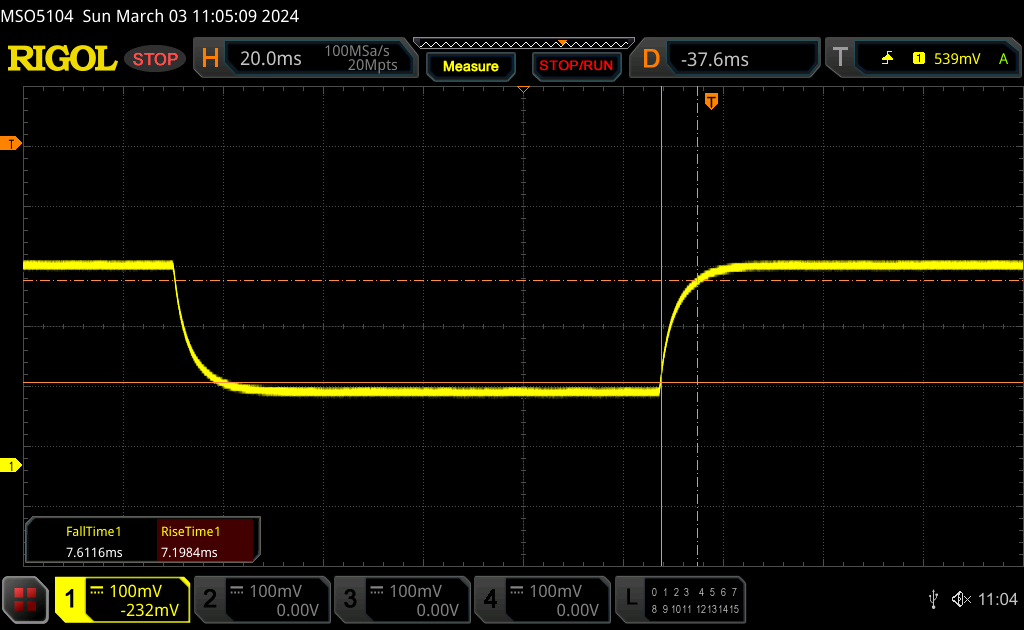 |
| ↘ 7.6 ms fall | ||
| The screen shows good response rates in our tests, but may be too slow for competitive gamers. In comparison, all tested devices range from 0.2 (minimum) to 636 (maximum) ms. » 23 % of all devices are better. This means that the measured response time is better than the average of all tested devices (33.7 ms). | ||
Screen Flickering / PWM (Pulse-Width Modulation)
| Screen flickering / PWM not detected |  | ||
In comparison: 53 % of all tested devices do not use PWM to dim the display. If PWM was detected, an average of 17903 (minimum: 5 - maximum: 3846000) Hz was measured. | |||

Wydajność - Raptor Lake-HX Refresh
Warunki testowania
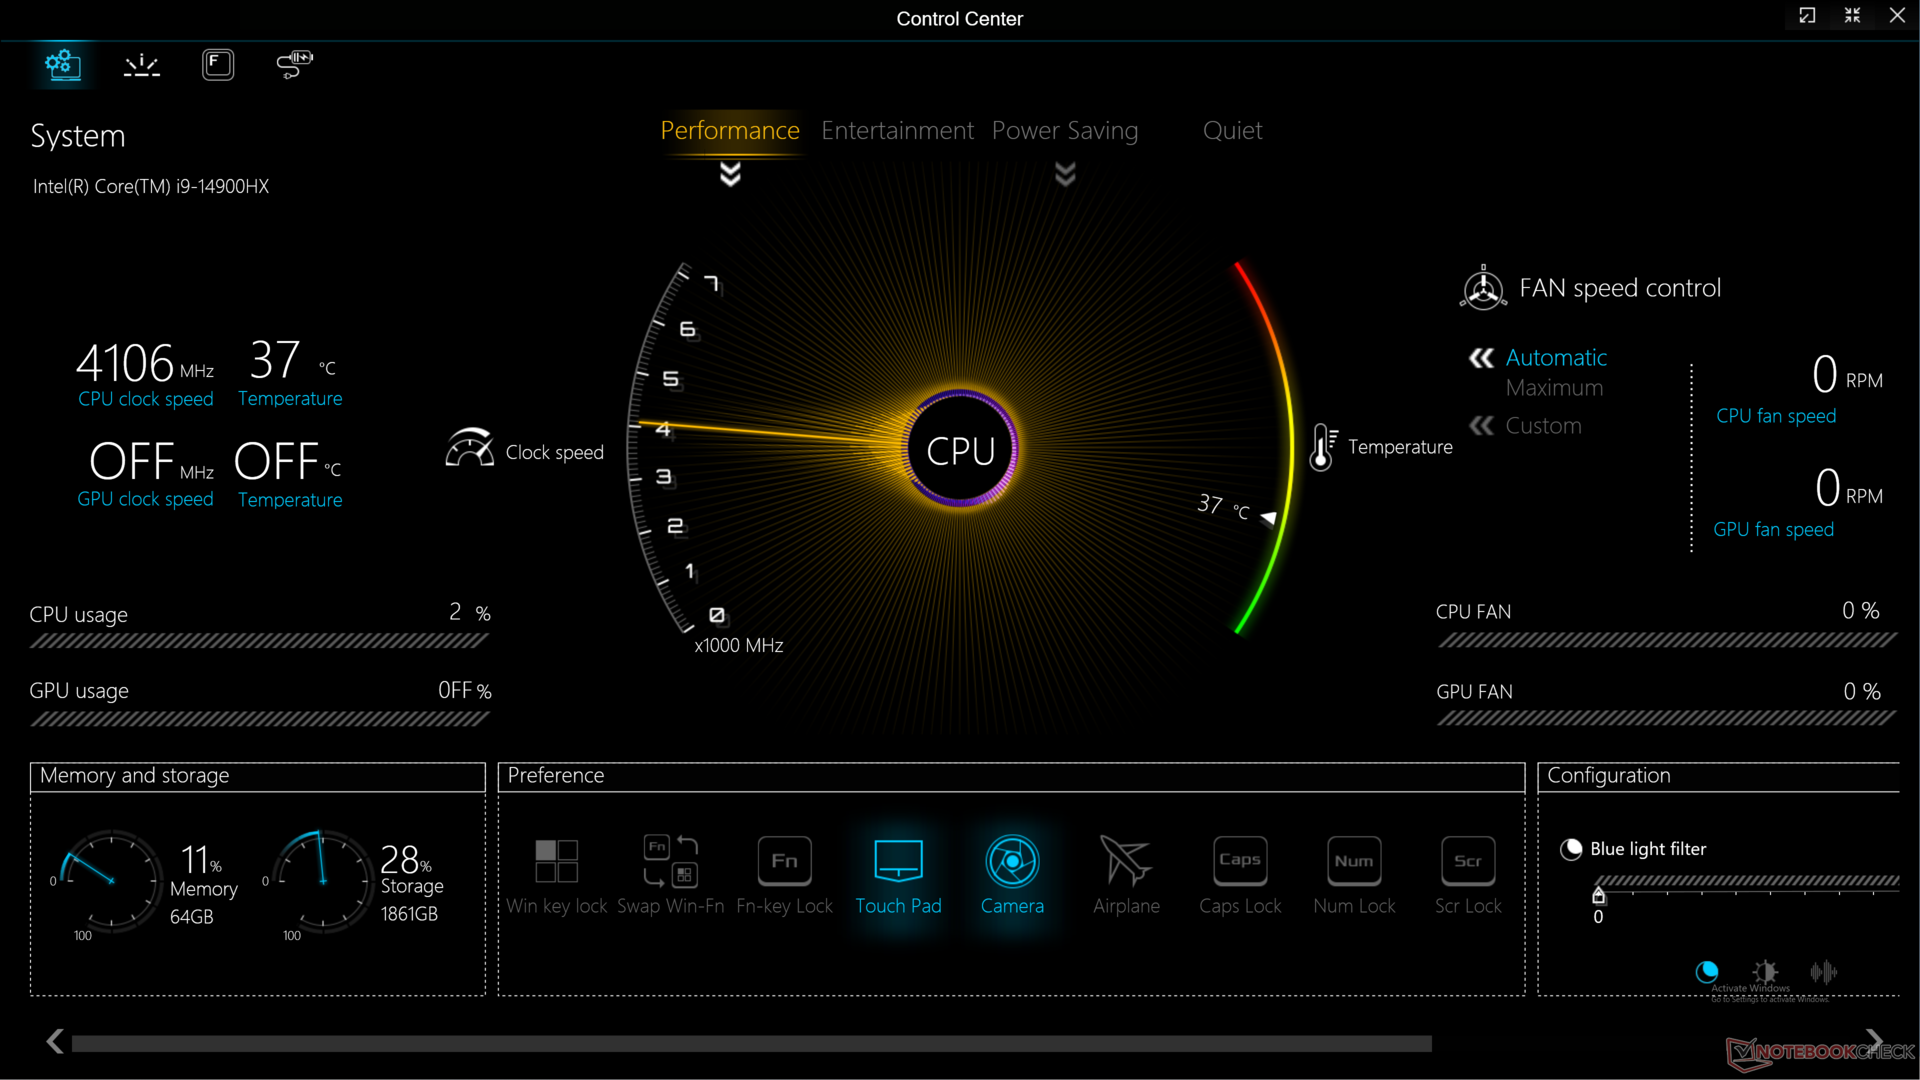
Przed uruchomieniem poniższych testów porównawczych ustawiliśmy system Windows i Centrum sterowania na tryb wydajności z aktywnym maksymalnym wentylatorem. Ręczny przełącznik GPU można również znaleźć w Centrum sterowania, ale jest on niewygodnie ukryty za paskiem przewijania. G-Sync jest obsługiwany, podczas gdy Advanced Optimus nie, co oznacza, że podczas przełączania między iGPU i dGPU wymagane jest ponowne uruchomienie komputera.
Tryby "Rozrywka" i "Wydajność" w Centrum sterowania mogą być nieco mylące. Być może zmiana nazwy trybu "Rozrywka" na coś w rodzaju "Zrównoważony" byłaby bardziej odpowiednia.
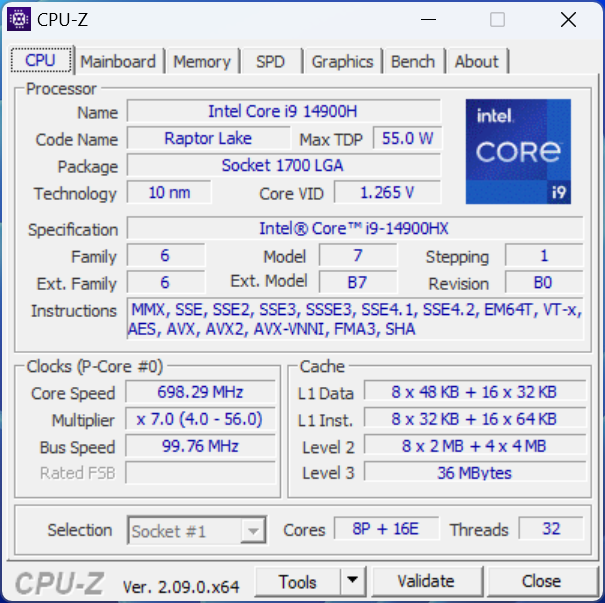
Procesor
Seria Raptor Lake-HX została odświeżona na rok 2024, ale korzyści w zakresie wydajności są w najlepszym razie marginalne w porównaniu do serii 2023. Przeskakując z modelu Core i9-13900HX w zeszłorocznym Raptorze X17 do modelu Core i9-14900HX w tej nowszej konfiguracji poprawia wydajność o zaledwie 5 do 10 procent. Chipset nie posiada zintegrowanej jednostki NPU, w przeciwieństwie do platformy Meteor Lake.
Cinebench R15 Multi Loop
Cinebench R23: Multi Core | Single Core
Cinebench R20: CPU (Multi Core) | CPU (Single Core)
Cinebench R15: CPU Multi 64Bit | CPU Single 64Bit
Blender: v2.79 BMW27 CPU
7-Zip 18.03: 7z b 4 | 7z b 4 -mmt1
Geekbench 6.2: Multi-Core | Single-Core
Geekbench 5.5: Multi-Core | Single-Core
HWBOT x265 Benchmark v2.2: 4k Preset
LibreOffice : 20 Documents To PDF
R Benchmark 2.5: Overall mean
| CPU Performance Rating | |
| KFA2 GeForce RTX 4080 Super SG -6! | |
| Asus ROG Strix Scar 17 G733PYV-LL053X | |
| Asus ROG Strix Scar 17 G733PY-XS96 -2! | |
| MSI GE78HX 13VH-070US -2! | |
| MSI Titan 18 HX A14VIG | |
| Average Intel Core i9-14900HX | |
| MSI Raider GE78 HX 13VI | |
| Eurocom Raptor X17 Core i9-14900HX | |
| Eurocom Raptor X17 -2! | |
| Alienware x16 R1 -3! | |
| Asus TUF Gaming A17 FA707XI-NS94 | |
| Dell XPS 17 9730 RTX 4070 -2! | |
| Medion Erazer Defender P40 -2! | |
| Eurocom Nightsky TXi317 -4! | |
| Acer Nitro 17 AN17-41-R9LN | |
| Alienware m17 R5 (R9 6900HX, RX 6850M XT) -2! | |
| Cinebench R15 / CPU Single 64Bit | |
| Asus ROG Strix Scar 17 G733PYV-LL053X | |
| Asus ROG Strix Scar 17 G733PY-XS96 | |
| Average Intel Core i9-14900HX (287 - 320, n=24) | |
| MSI GE78HX 13VH-070US | |
| MSI Raider GE78 HX 13VI | |
| MSI Titan 18 HX A14VIG | |
| Eurocom Raptor X17 Core i9-14900HX | |
| Eurocom Raptor X17 | |
| Asus TUF Gaming A17 FA707XI-NS94 | |
| Alienware x16 R1 | |
| Dell XPS 17 9730 RTX 4070 | |
| Acer Nitro 17 AN17-41-R9LN | |
| Alienware m17 R5 (R9 6900HX, RX 6850M XT) | |
| Medion Erazer Defender P40 | |
| Geekbench 6.2 / Multi-Core | |
| KFA2 GeForce RTX 4080 Super SG | |
| Eurocom Raptor X17 Core i9-14900HX | |
| MSI Raider GE78 HX 13VI | |
| Average Intel Core i9-14900HX (15849 - 18643, n=23) | |
| Asus ROG Strix Scar 17 G733PYV-LL053X | |
| MSI Titan 18 HX A14VIG | |
| Asus TUF Gaming A17 FA707XI-NS94 | |
| Acer Nitro 17 AN17-41-R9LN | |
| Geekbench 6.2 / Single-Core | |
| KFA2 GeForce RTX 4080 Super SG | |
| Average Intel Core i9-14900HX (2800 - 3095, n=23) | |
| Asus ROG Strix Scar 17 G733PYV-LL053X | |
| Eurocom Raptor X17 Core i9-14900HX | |
| MSI Titan 18 HX A14VIG | |
| MSI Raider GE78 HX 13VI | |
| Asus TUF Gaming A17 FA707XI-NS94 | |
| Acer Nitro 17 AN17-41-R9LN | |
Cinebench R23: Multi Core | Single Core
Cinebench R20: CPU (Multi Core) | CPU (Single Core)
Cinebench R15: CPU Multi 64Bit | CPU Single 64Bit
Blender: v2.79 BMW27 CPU
7-Zip 18.03: 7z b 4 | 7z b 4 -mmt1
Geekbench 6.2: Multi-Core | Single-Core
Geekbench 5.5: Multi-Core | Single-Core
HWBOT x265 Benchmark v2.2: 4k Preset
LibreOffice : 20 Documents To PDF
R Benchmark 2.5: Overall mean
* ... im mniej tym lepiej
AIDA64: FP32 Ray-Trace | FPU Julia | CPU SHA3 | CPU Queen | FPU SinJulia | FPU Mandel | CPU AES | CPU ZLib | FP64 Ray-Trace | CPU PhotoWorxx
| Performance Rating | |
| Asus ROG Strix Scar 17 G733PY-XS96 | |
| Eurocom Raptor X17 Core i9-14900HX | |
| MSI GE78HX 13VH-070US | |
| MSI Titan 18 HX A14VIG | |
| Average Intel Core i9-14900HX | |
| Eurocom Raptor X17 | |
| Asus TUF Gaming A17 FA707XI-NS94 | |
| AIDA64 / FP32 Ray-Trace | |
| Asus ROG Strix Scar 17 G733PY-XS96 | |
| MSI Titan 18 HX A14VIG | |
| Asus TUF Gaming A17 FA707XI-NS94 | |
| MSI GE78HX 13VH-070US | |
| Eurocom Raptor X17 Core i9-14900HX | |
| Average Intel Core i9-14900HX (17244 - 29351, n=22) | |
| Eurocom Raptor X17 | |
| AIDA64 / FPU Julia | |
| Asus ROG Strix Scar 17 G733PY-XS96 | |
| MSI Titan 18 HX A14VIG | |
| MSI GE78HX 13VH-070US | |
| Eurocom Raptor X17 Core i9-14900HX | |
| Average Intel Core i9-14900HX (88537 - 148888, n=22) | |
| Asus TUF Gaming A17 FA707XI-NS94 | |
| Eurocom Raptor X17 | |
| AIDA64 / CPU SHA3 | |
| Asus ROG Strix Scar 17 G733PY-XS96 | |
| MSI Titan 18 HX A14VIG | |
| Eurocom Raptor X17 Core i9-14900HX | |
| MSI GE78HX 13VH-070US | |
| Average Intel Core i9-14900HX (4267 - 7229, n=22) | |
| Eurocom Raptor X17 | |
| Asus TUF Gaming A17 FA707XI-NS94 | |
| AIDA64 / CPU Queen | |
| Asus ROG Strix Scar 17 G733PY-XS96 | |
| MSI Titan 18 HX A14VIG | |
| Eurocom Raptor X17 Core i9-14900HX | |
| MSI GE78HX 13VH-070US | |
| Average Intel Core i9-14900HX (118405 - 148773, n=22) | |
| Eurocom Raptor X17 | |
| Asus TUF Gaming A17 FA707XI-NS94 | |
| AIDA64 / FPU SinJulia | |
| Asus ROG Strix Scar 17 G733PY-XS96 | |
| MSI Titan 18 HX A14VIG | |
| MSI GE78HX 13VH-070US | |
| Eurocom Raptor X17 Core i9-14900HX | |
| Asus TUF Gaming A17 FA707XI-NS94 | |
| Average Intel Core i9-14900HX (12217 - 18256, n=22) | |
| Eurocom Raptor X17 | |
| AIDA64 / FPU Mandel | |
| Asus ROG Strix Scar 17 G733PY-XS96 | |
| MSI Titan 18 HX A14VIG | |
| MSI GE78HX 13VH-070US | |
| Eurocom Raptor X17 Core i9-14900HX | |
| Asus TUF Gaming A17 FA707XI-NS94 | |
| Average Intel Core i9-14900HX (43302 - 72594, n=22) | |
| Eurocom Raptor X17 | |
| AIDA64 / CPU AES | |
| Eurocom Raptor X17 Core i9-14900HX | |
| Asus ROG Strix Scar 17 G733PY-XS96 | |
| MSI Titan 18 HX A14VIG | |
| Average Intel Core i9-14900HX (86964 - 241777, n=22) | |
| MSI GE78HX 13VH-070US | |
| Eurocom Raptor X17 | |
| Asus TUF Gaming A17 FA707XI-NS94 | |
| AIDA64 / CPU ZLib | |
| Asus ROG Strix Scar 17 G733PY-XS96 | |
| MSI Titan 18 HX A14VIG | |
| MSI GE78HX 13VH-070US | |
| Eurocom Raptor X17 Core i9-14900HX | |
| Average Intel Core i9-14900HX (1265 - 2149, n=22) | |
| Eurocom Raptor X17 | |
| Asus TUF Gaming A17 FA707XI-NS94 | |
| AIDA64 / FP64 Ray-Trace | |
| Asus ROG Strix Scar 17 G733PY-XS96 | |
| MSI Titan 18 HX A14VIG | |
| Asus TUF Gaming A17 FA707XI-NS94 | |
| MSI GE78HX 13VH-070US | |
| Eurocom Raptor X17 Core i9-14900HX | |
| Average Intel Core i9-14900HX (9170 - 16128, n=22) | |
| Eurocom Raptor X17 | |
| AIDA64 / CPU PhotoWorxx | |
| Eurocom Raptor X17 | |
| Eurocom Raptor X17 Core i9-14900HX | |
| MSI GE78HX 13VH-070US | |
| Average Intel Core i9-14900HX (33960 - 51118, n=22) | |
| Asus ROG Strix Scar 17 G733PY-XS96 | |
| MSI Titan 18 HX A14VIG | |
| Asus TUF Gaming A17 FA707XI-NS94 | |
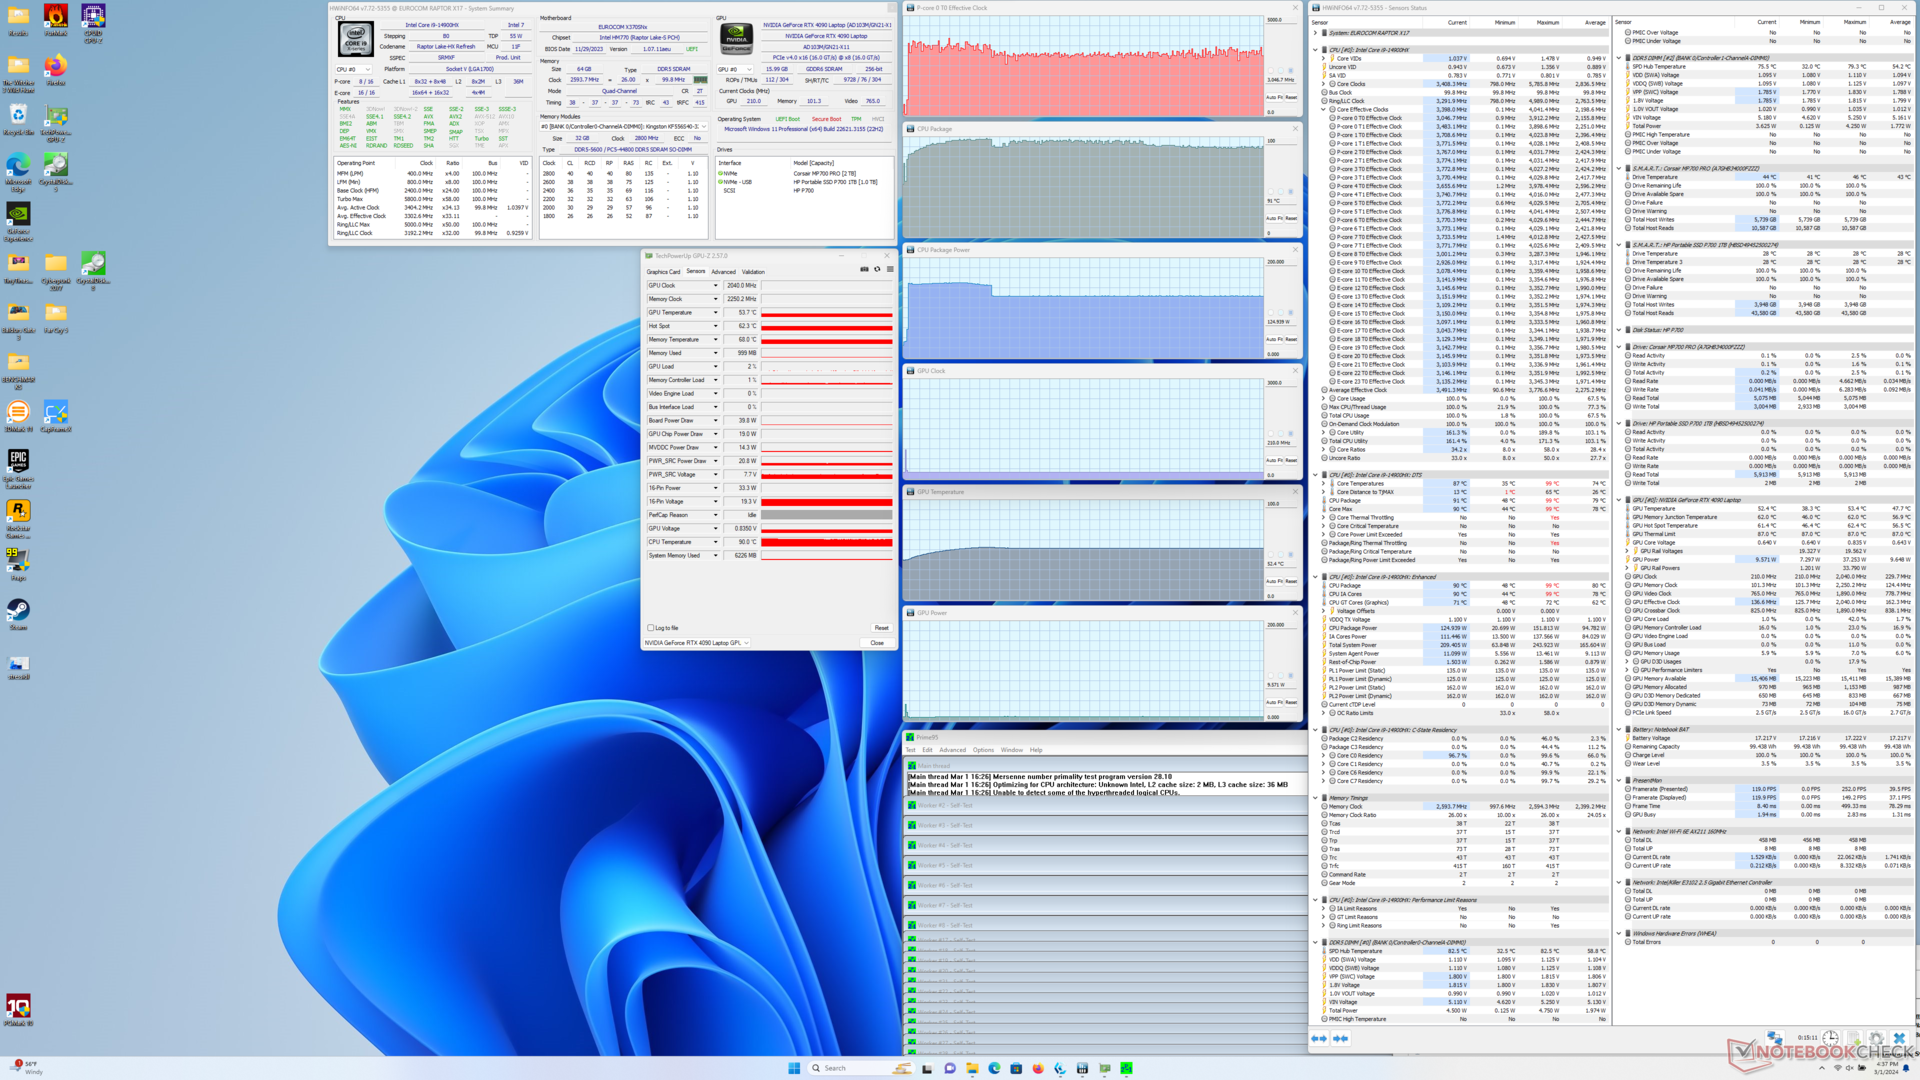
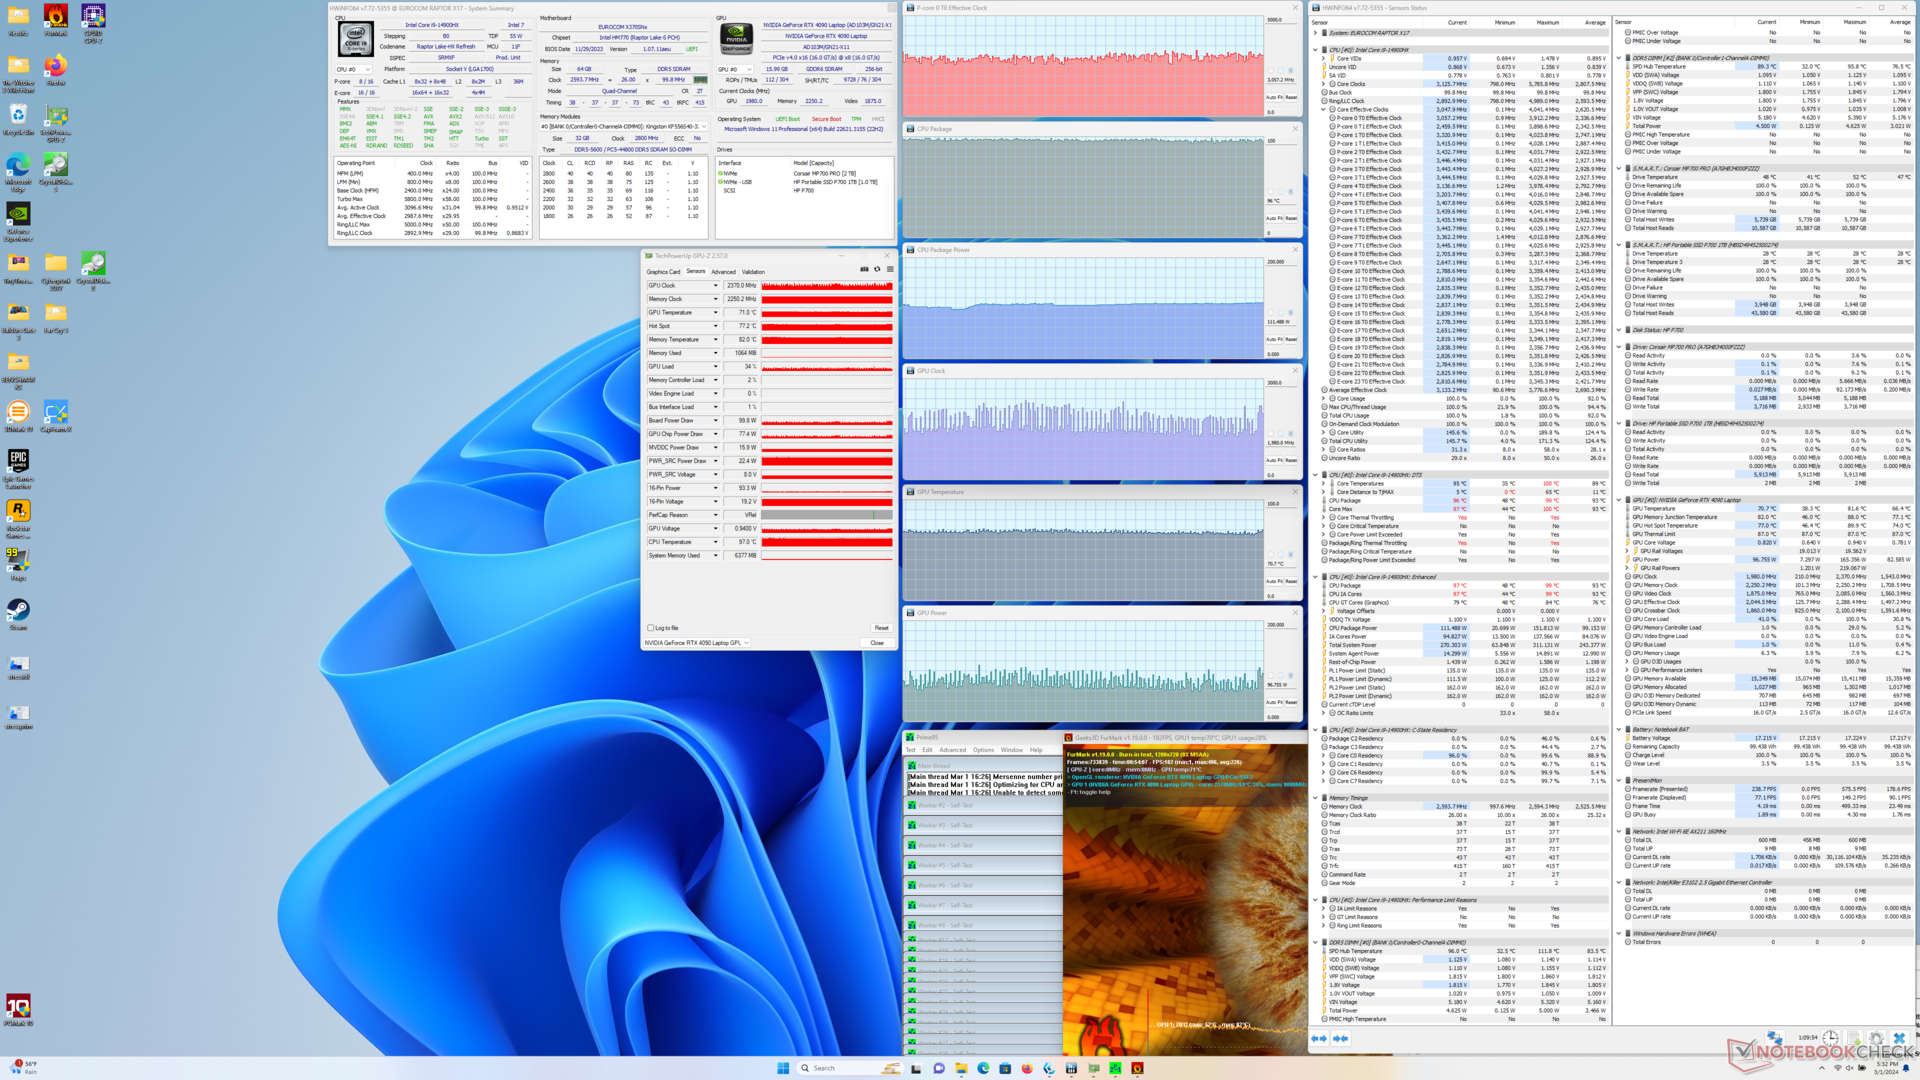
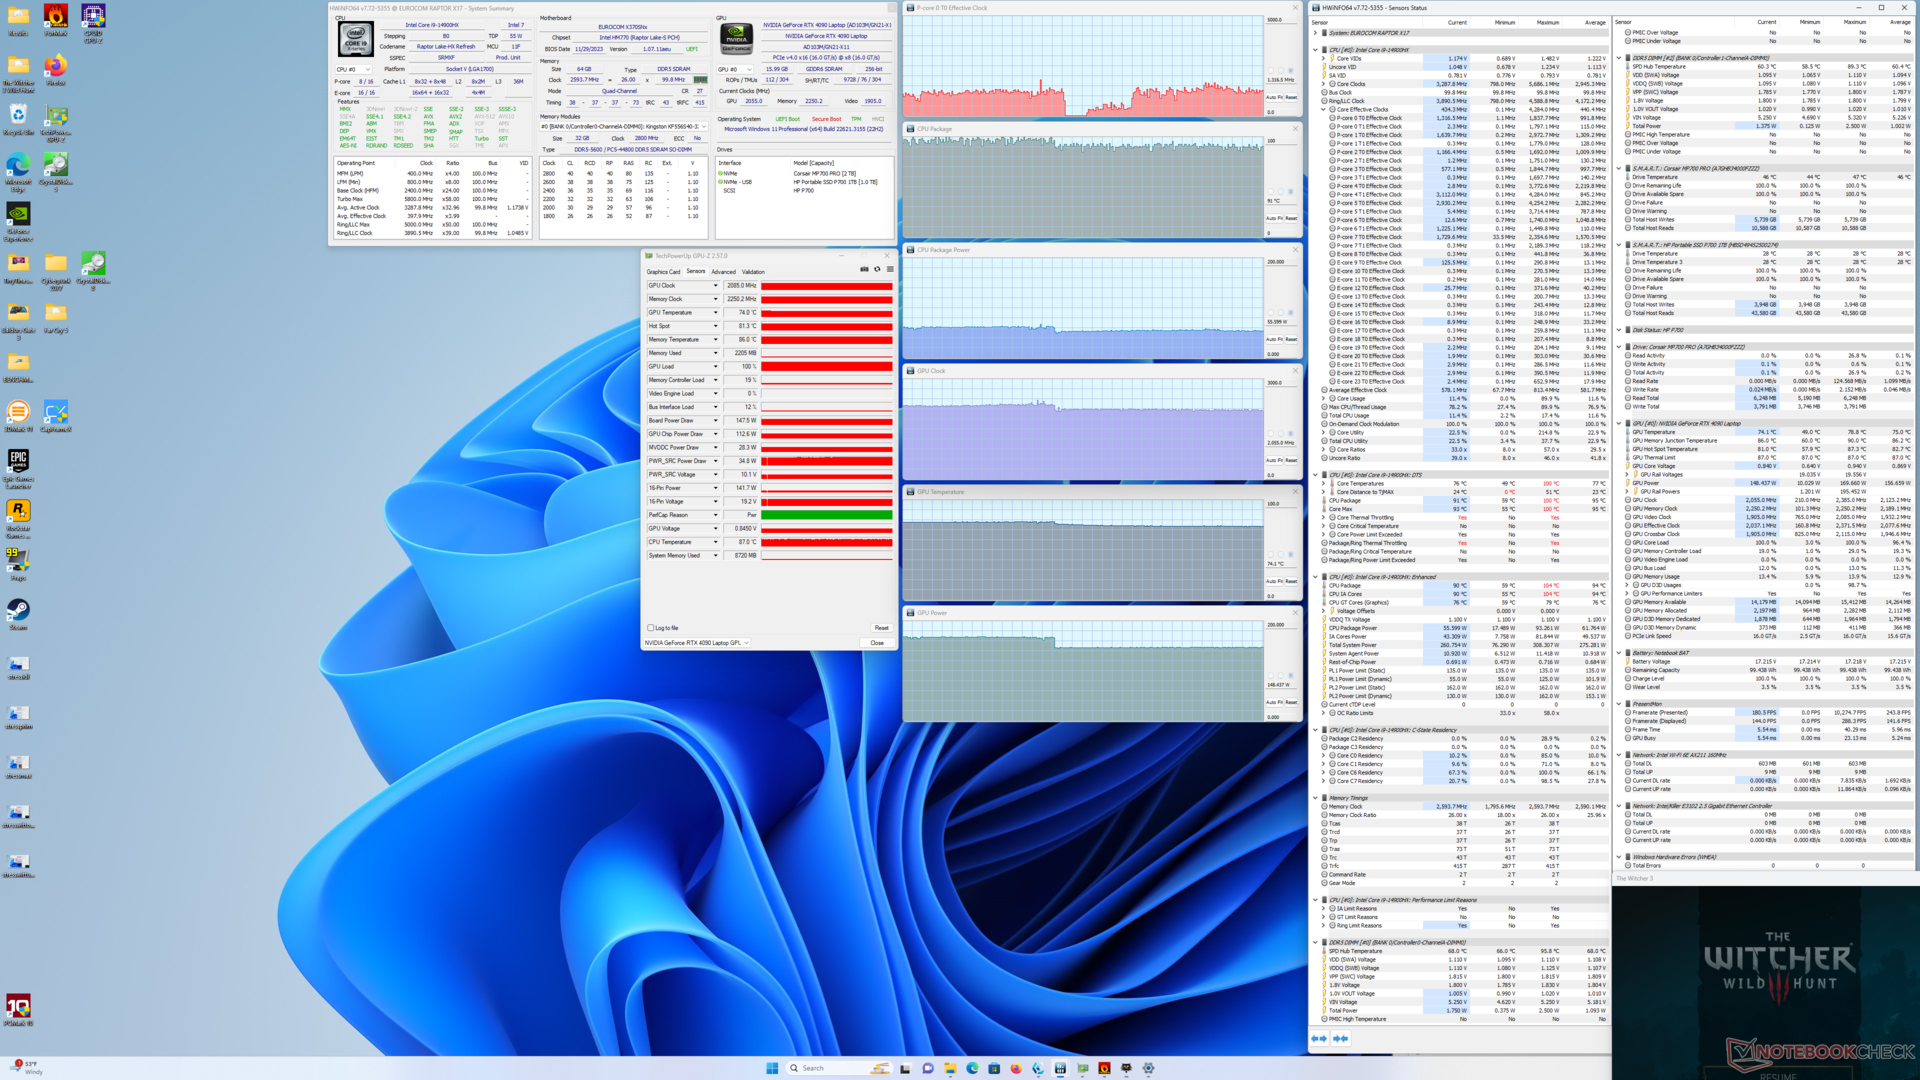
Test warunków skrajnych
Temperatura rdzenia w stresie Prime95 jest tym razem nieco niższa i wynosi 91 C w porównaniu do 97 C w zeszłorocznym modelu, co sugeruje niewielki wzrost wydajności.
Uruchamianie Witcher 3 w celu odwzorowania typowych obciążeń w grach z włączonym i wyłączonym trybem maksymalnego wentylatora nie wykazuje większych różnic w wydajności między nimi. Wyniki te uzupełniają nasze wyniki Fire Strike w sekcji Wydajność GPU poniżej. Włączenie trybu maksymalnych obrotów wentylatorów jedynie uruchamia wentylatory z maksymalną prędkością obrotową, niezależnie od obciążenia na ekranie; w rzeczywistości nie podnosi maksymalnego pułapu wentylatorów. W związku z tym hałas wentylatorów podczas grania będzie taki sam w obu trybach.
Pobór mocy karty graficznej podczas grania jest stabilny na poziomie 169 W, co prawie osiąga docelowe maksimum 175 W. Przejście w tryb rozrywki obniża pobór mocy karty graficznej do 148 W, co przekłada się na nieco wolniejszą wydajność graficzną.
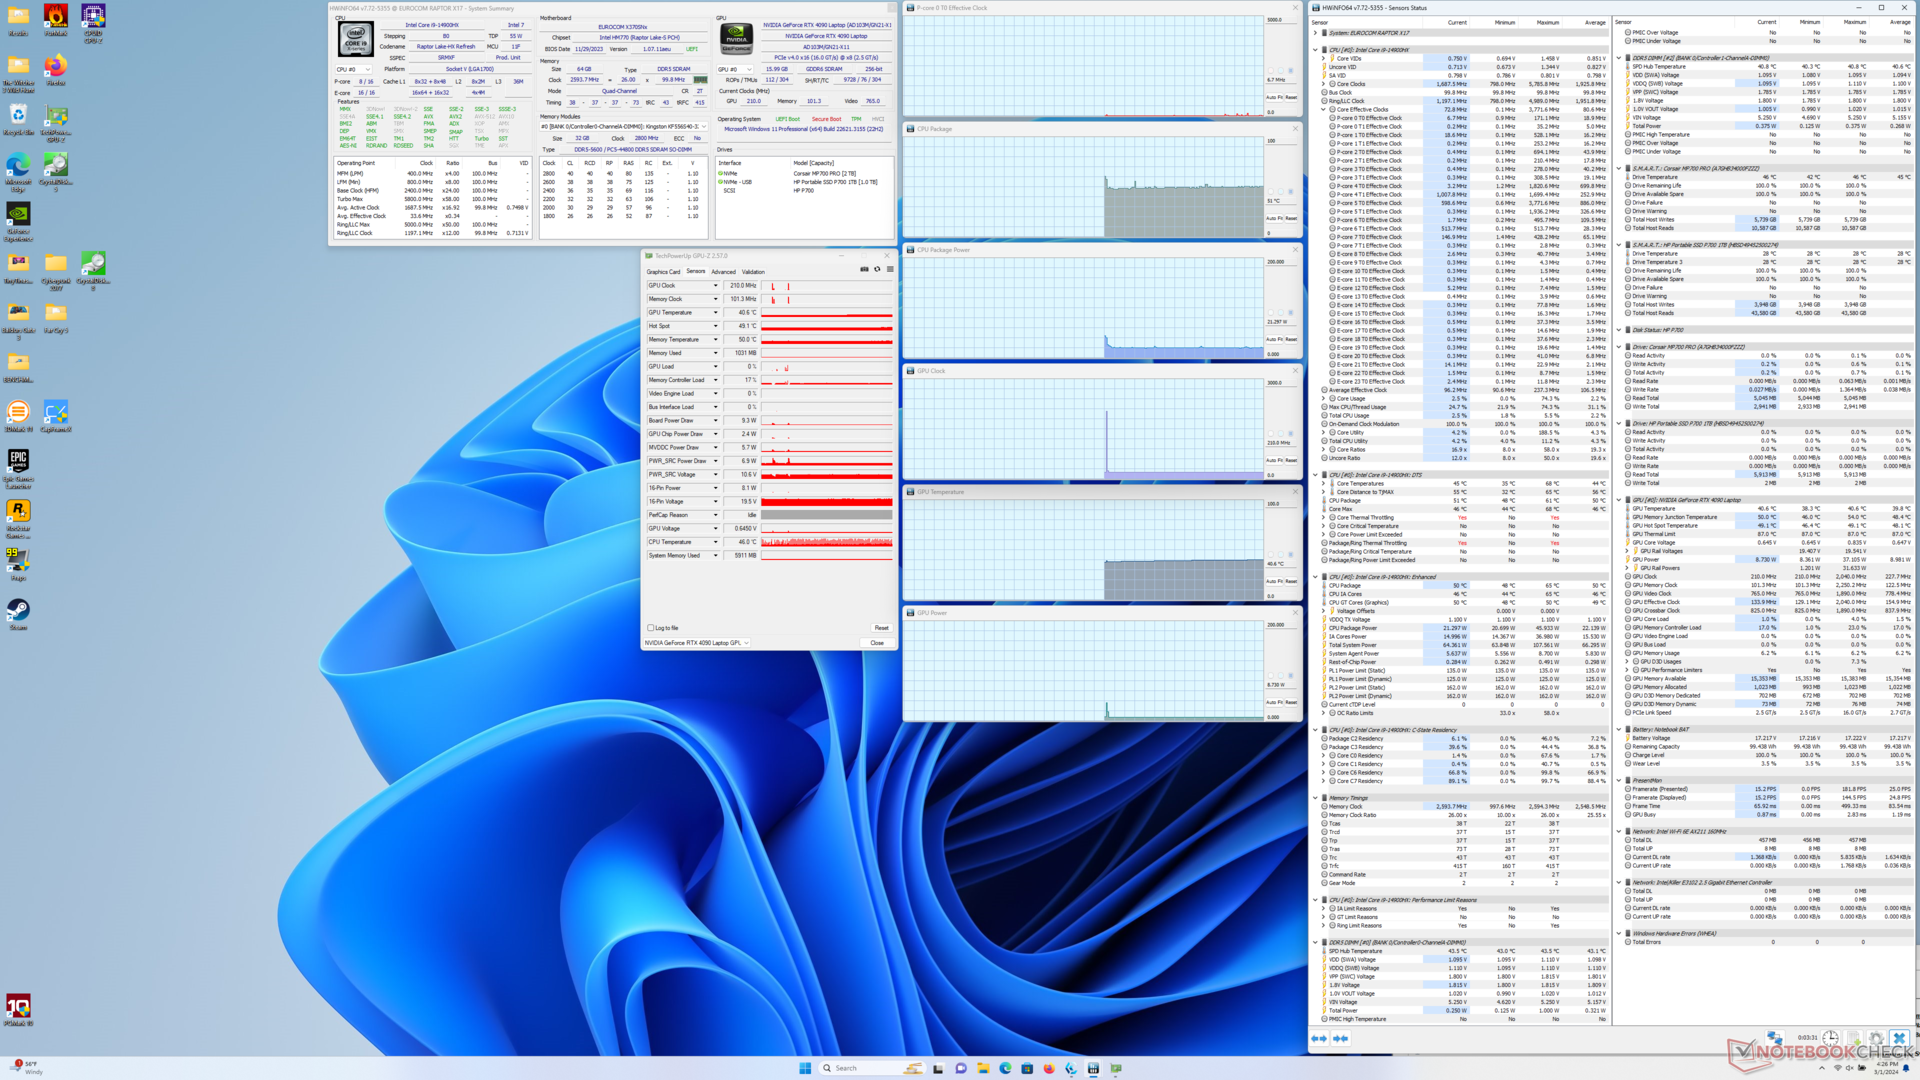
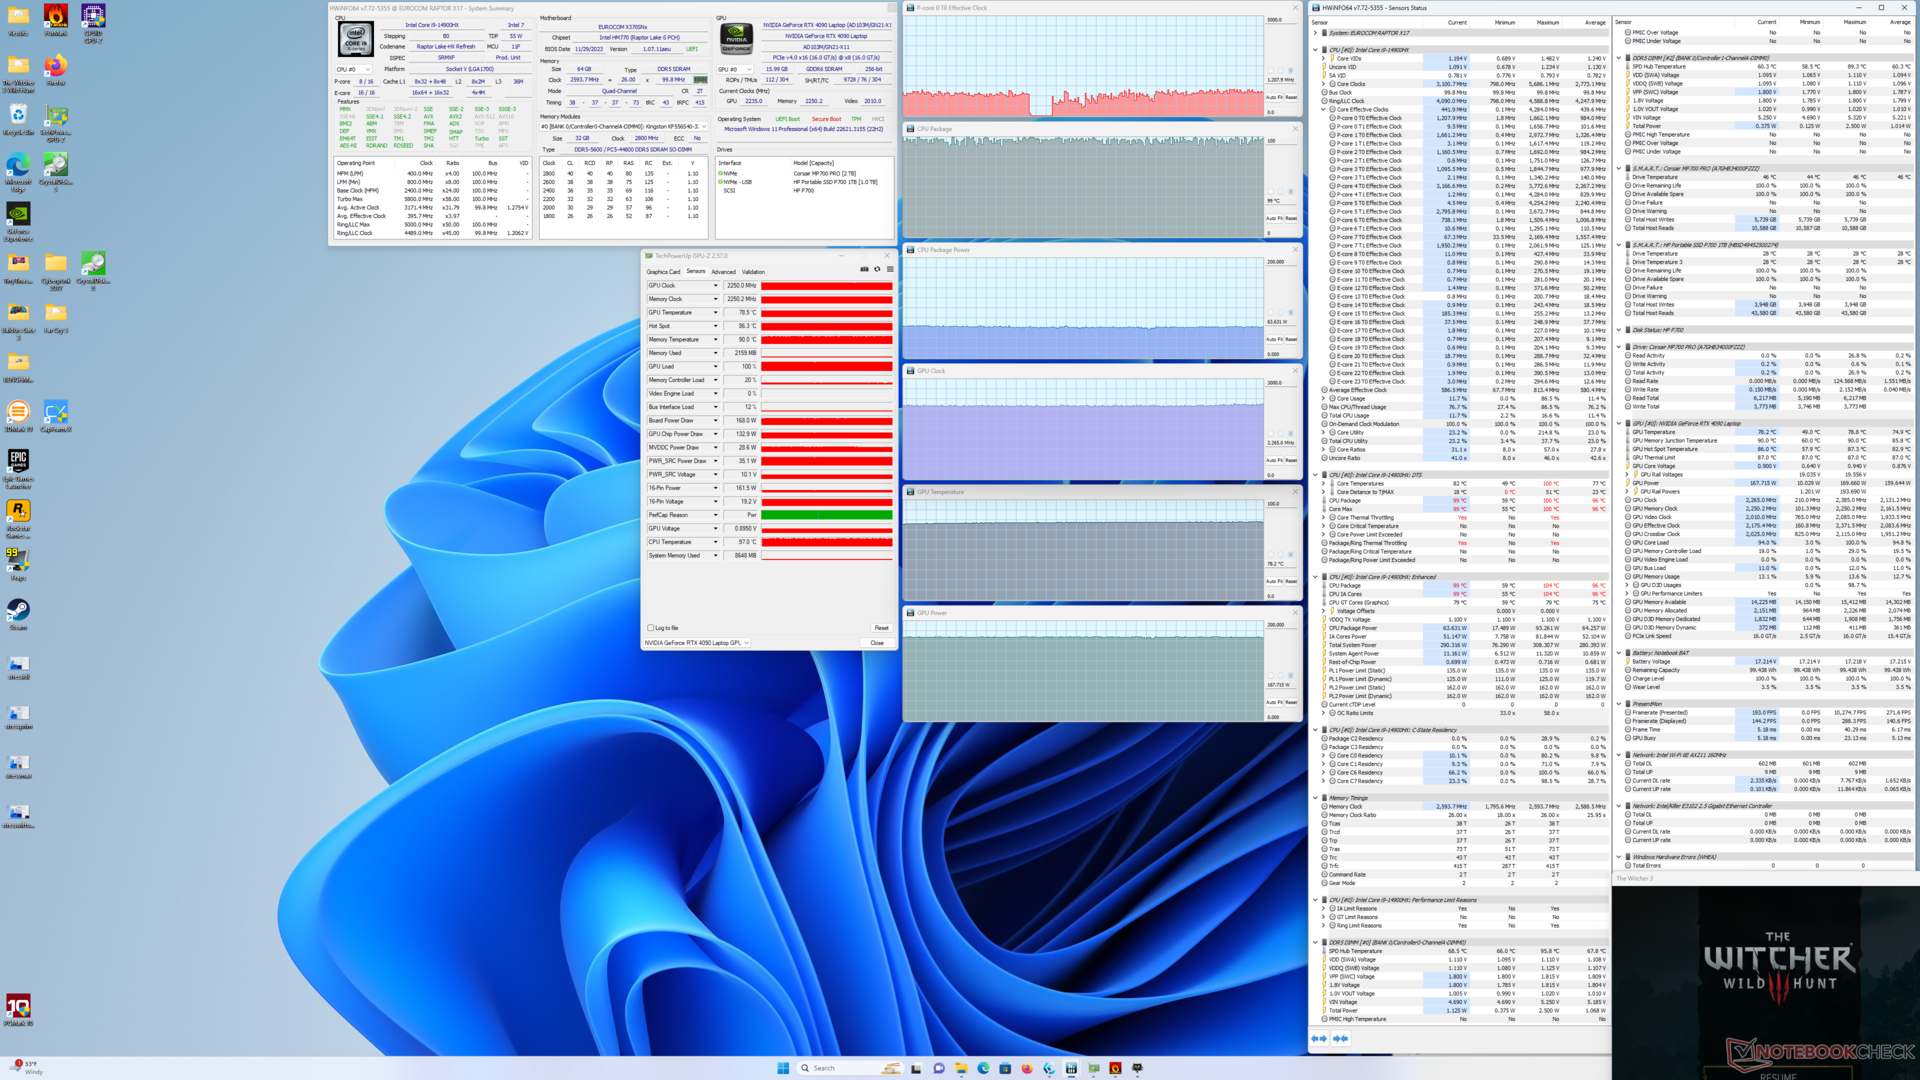

| Taktowanie CPU (GHz) | Taktowanie GPU (MHz) | Średnia temperatura CPU (°C) | Średnia temperatura GPU (°C) | |
| System bezczynności | -- | -- | 51 | 41 |
| Prime95Stress | 3.1 | -- | 91 | 52 |
| Prime95+ FurMark Stress | 3.1 | 1000 - 2300 | 96 | 71 |
| Witcher 3 Obciążenie(tryb rozrywki) | ~1.3 | 2085 | 91 | 74 |
| Witcher 3 Obciążenie (tryb wydajnościz wyłączonym wentylatorem maksymalnym) | 1.2 | 2250 | 99 | 78 |
| Witcher 3 Stres (tryb wydajności z maksymalnie włączonym wentylatorem) | 1.2 | 2205 | 97 | 78 |
| AIDA64 / Memory Copy | |
| Average Intel Core i9-14900HX (56992 - 83392, n=22) | |
| MSI GE78HX 13VH-070US | |
| Eurocom Raptor X17 | |
| Eurocom Raptor X17 Core i9-14900HX | |
| Asus TUF Gaming A17 FA707XI-NS94 | |
| MSI Titan 18 HX A14VIG | |
| Asus ROG Strix Scar 17 G733PY-XS96 | |
| AIDA64 / Memory Read | |
| MSI GE78HX 13VH-070US | |
| Average Intel Core i9-14900HX (54443 - 87507, n=22) | |
| Eurocom Raptor X17 | |
| Eurocom Raptor X17 Core i9-14900HX | |
| Asus TUF Gaming A17 FA707XI-NS94 | |
| Asus ROG Strix Scar 17 G733PY-XS96 | |
| MSI Titan 18 HX A14VIG | |
| AIDA64 / Memory Write | |
| MSI GE78HX 13VH-070US | |
| Eurocom Raptor X17 Core i9-14900HX | |
| Eurocom Raptor X17 | |
| Average Intel Core i9-14900HX (51387 - 78199, n=22) | |
| Asus TUF Gaming A17 FA707XI-NS94 | |
| Asus ROG Strix Scar 17 G733PY-XS96 | |
| MSI Titan 18 HX A14VIG | |
| AIDA64 / Memory Latency | |
| MSI Titan 18 HX A14VIG | |
| Asus TUF Gaming A17 FA707XI-NS94 | |
| Eurocom Raptor X17 Core i9-14900HX | |
| MSI GE78HX 13VH-070US | |
| Average Intel Core i9-14900HX (79.7 - 105, n=22) | |
| Eurocom Raptor X17 | |
| Asus ROG Strix Scar 17 G733PY-XS96 | |
* ... im mniej tym lepiej
Opóźnienie DPC
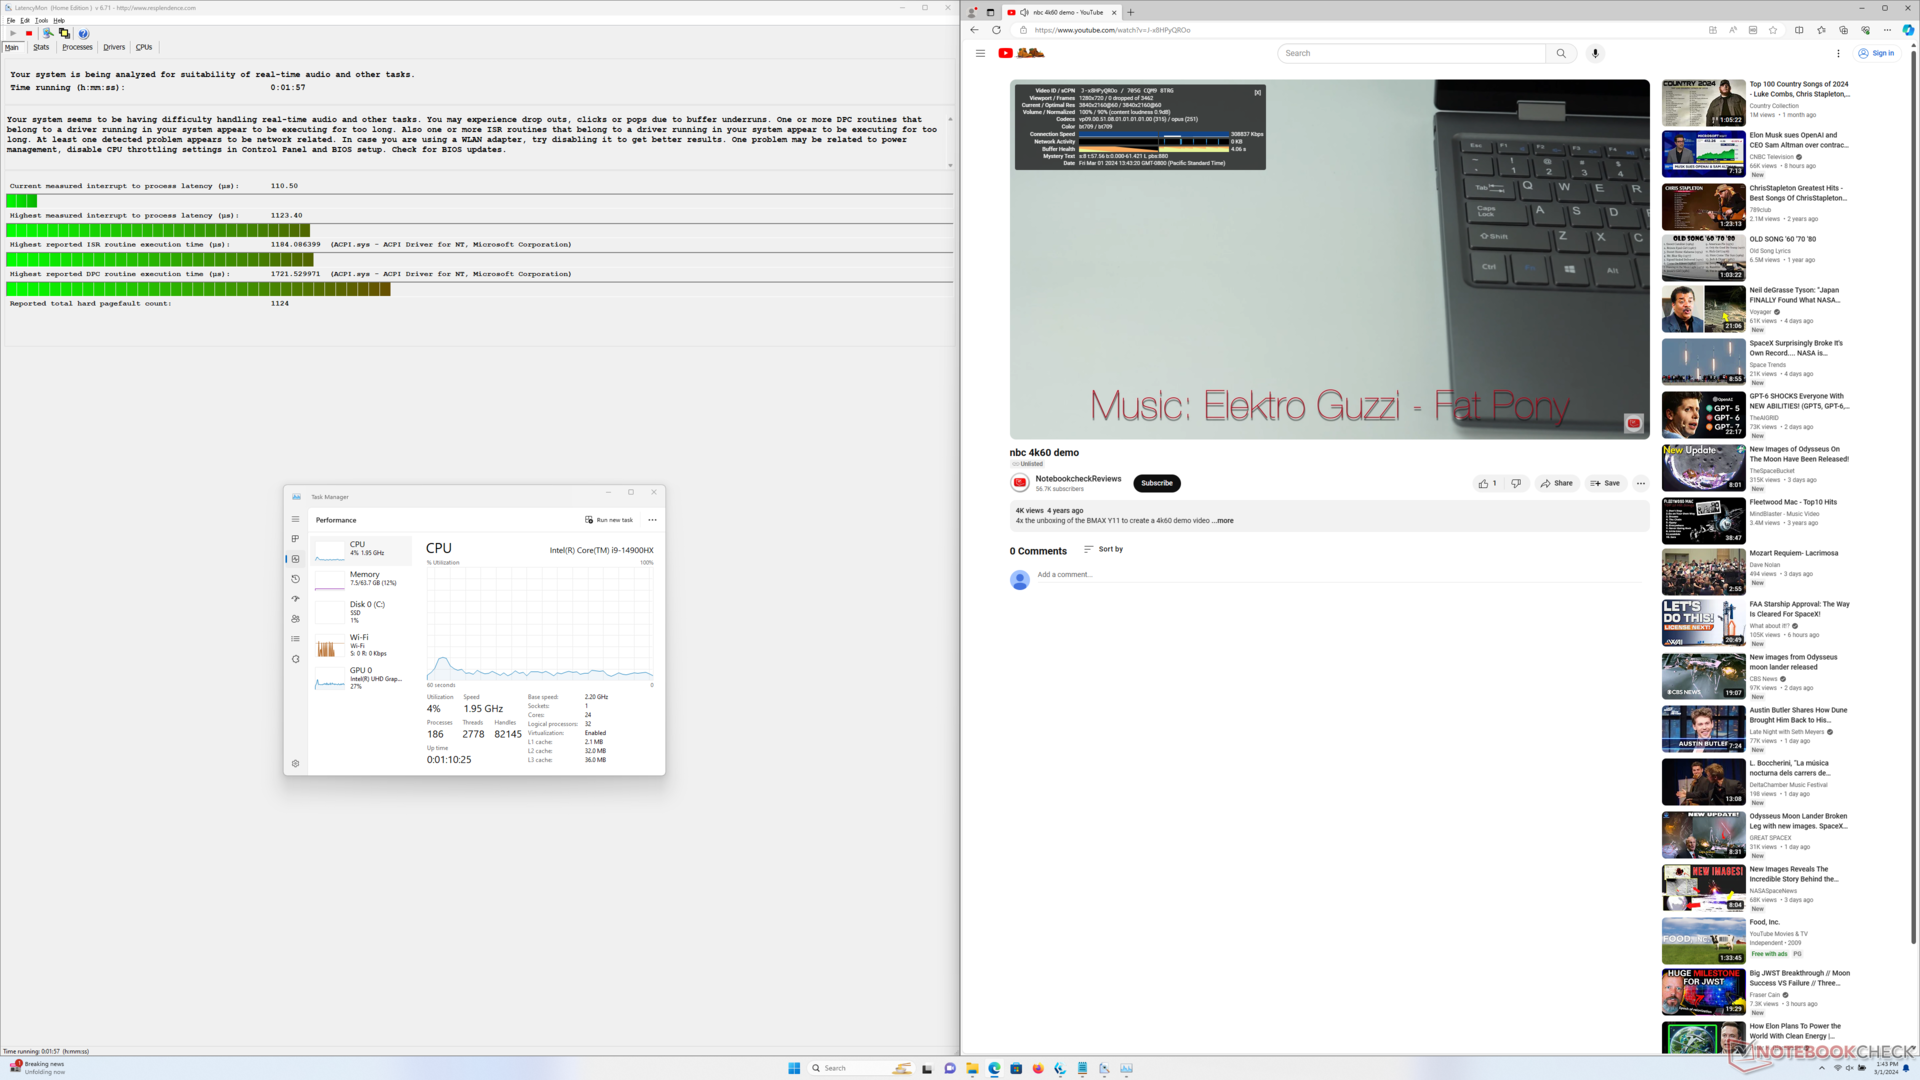
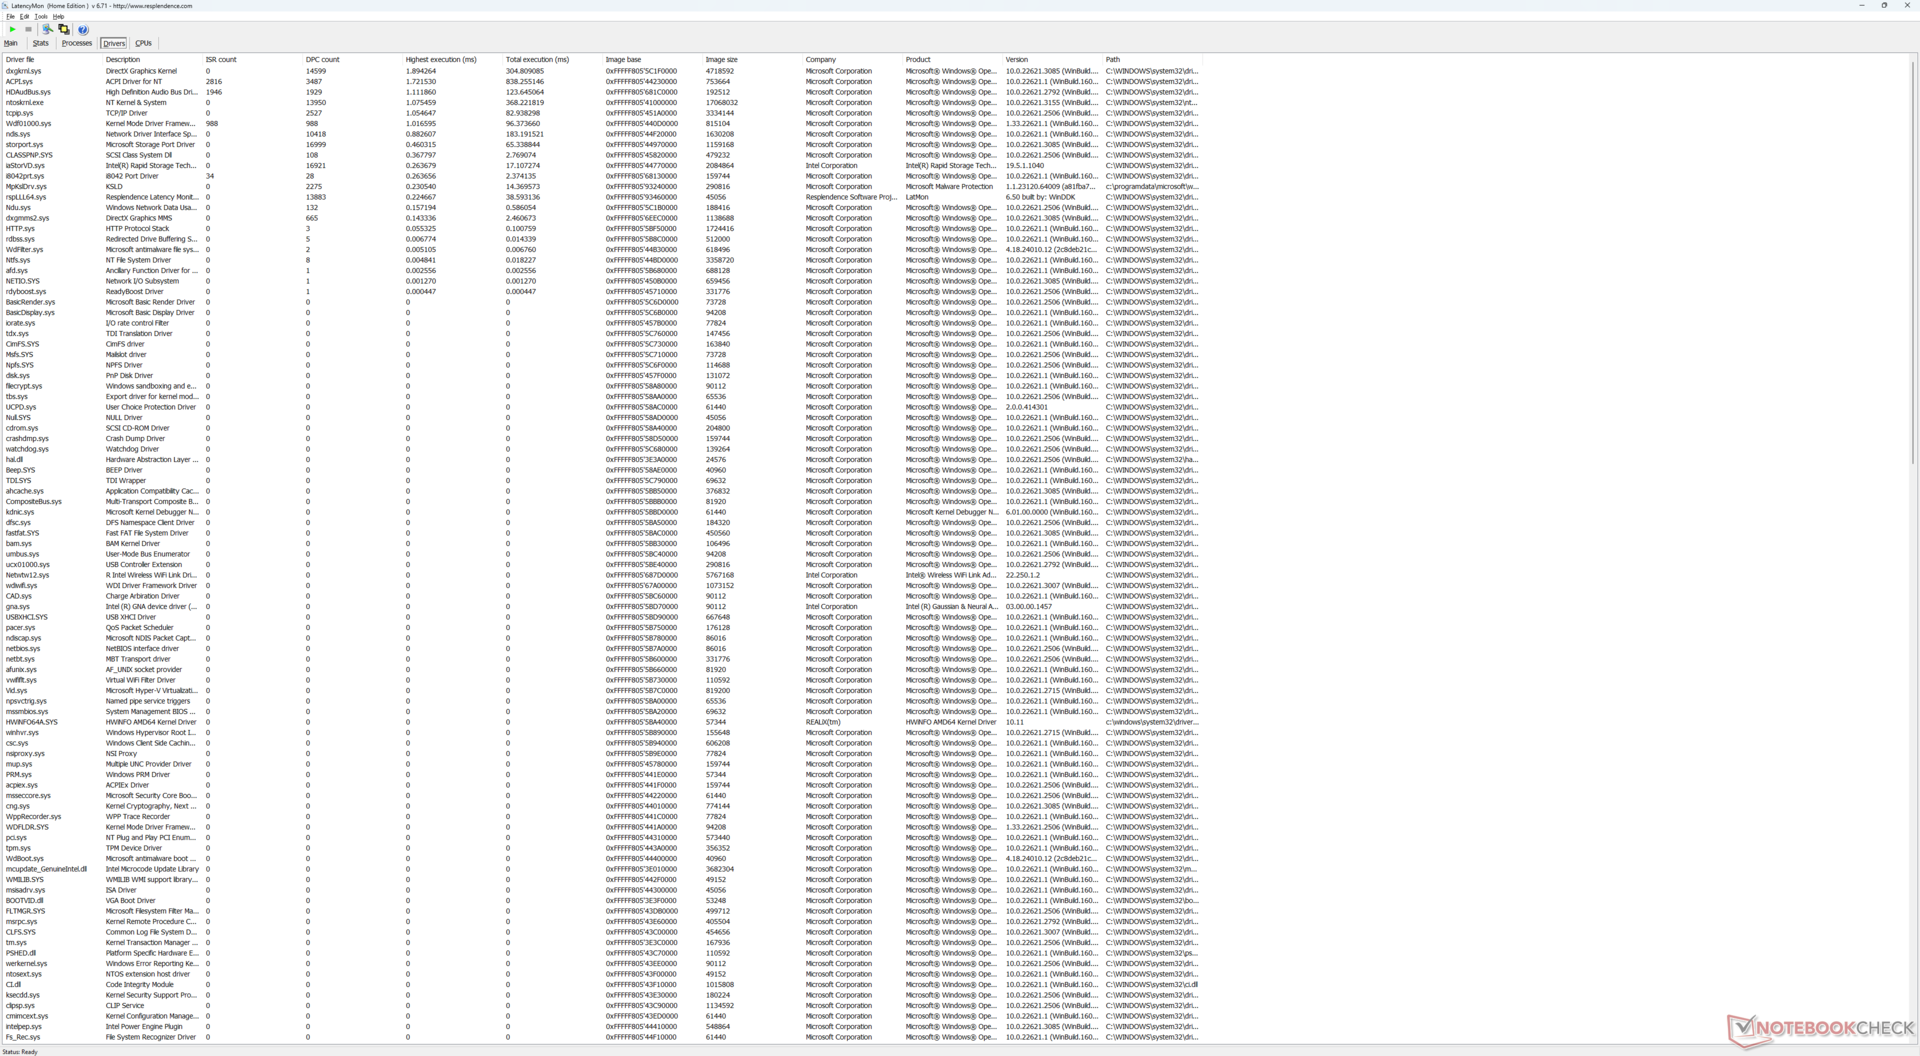
| DPC Latencies / LatencyMon - interrupt to process latency (max), Web, Youtube, Prime95 | |
| MSI GE78HX 13VH-070US | |
| Eurocom Raptor X17 | |
| MSI Titan 18 HX A14VIG | |
| Asus ROG Strix Scar 17 G733PY-XS96 | |
| Asus TUF Gaming A17 FA707XI-NS94 | |
| Eurocom Raptor X17 Core i9-14900HX | |
* ... im mniej tym lepiej
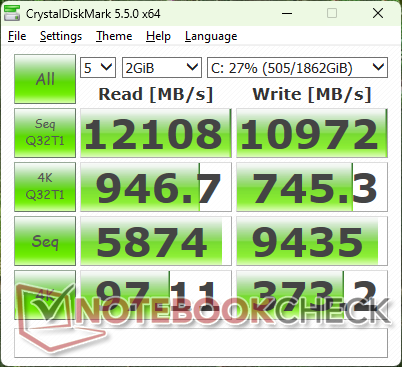
Urządzenia pamięci masowej
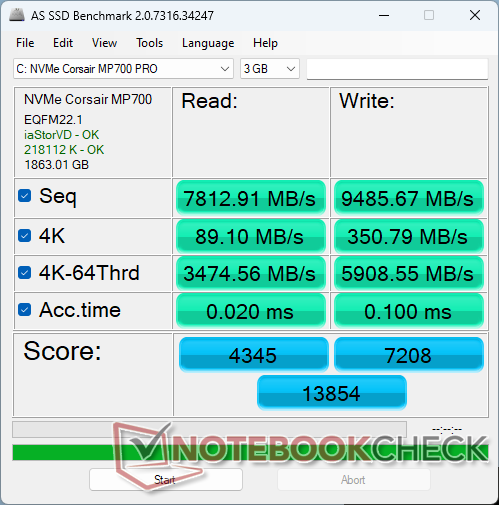
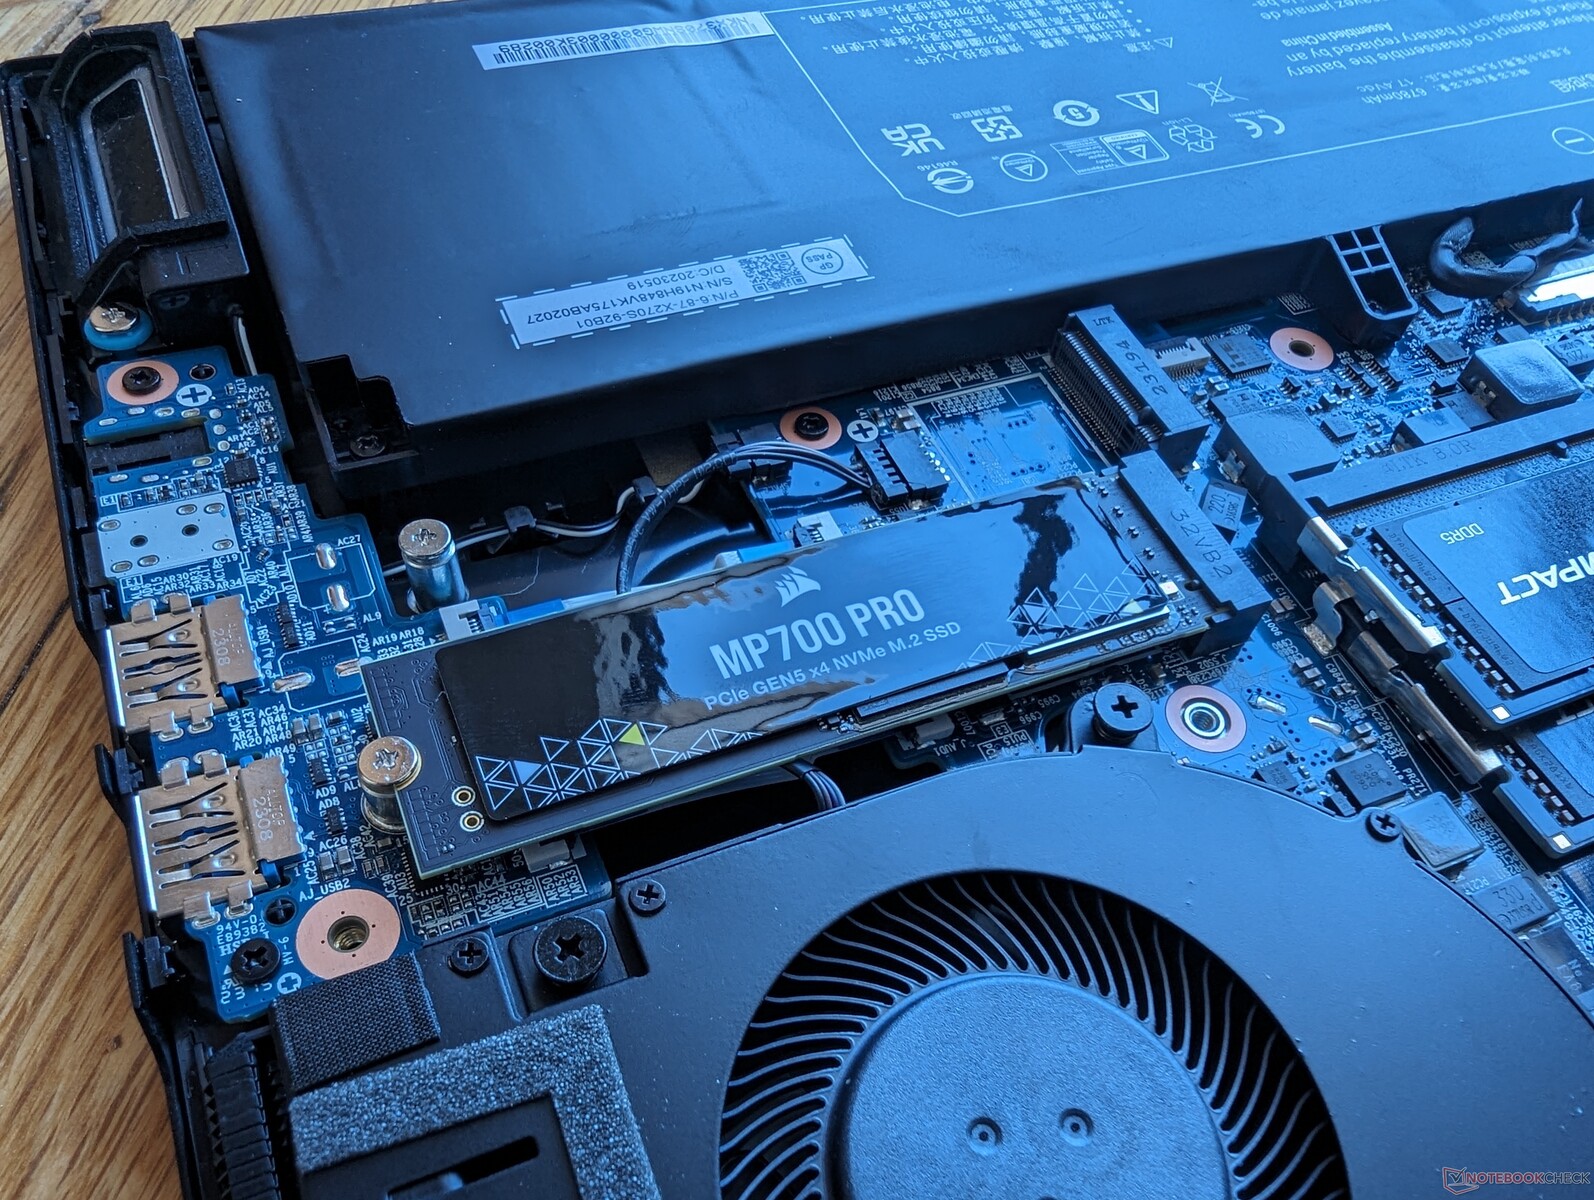
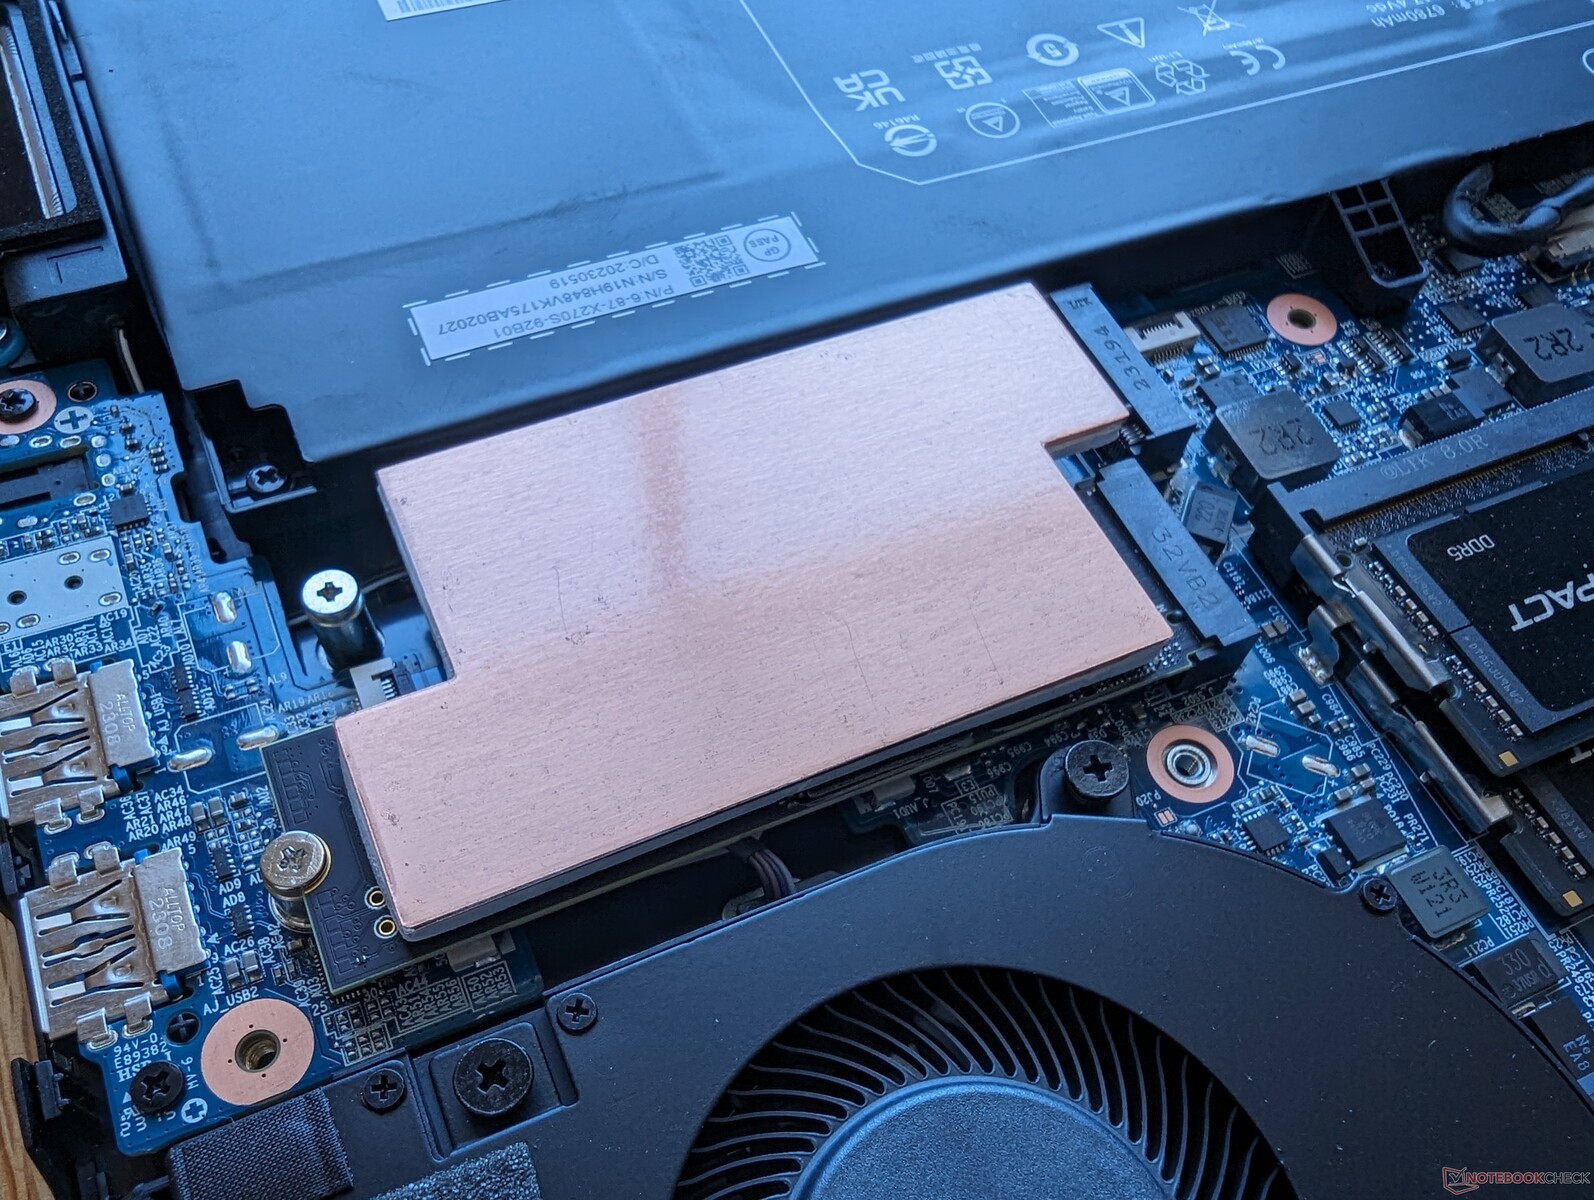
Eurocom jest jednym z niewielu sprzedawców, którzy skonfigurowali z Corsair MP700 Pro PCI5 x4 NVMe SSD dla sekwencyjnych prędkości odczytu do 13000 MB/s, które są prawie 2x szybsze niż najszybsze dyski PCIe4. Aby utrzymać tak wysokie prędkości transferu, wymagany jest jednak rozpraszacz ciepła. Poniższe wyniki naszej pętli DiskSpd pokazują różnice w wydajności z i bez rozpraszacza ciepła. Jeśli nie zostanie on zainstalowany, maksymalne prędkości transferu będą osiągalne tylko przez około pierwszą minutę, a następnie spadną do zakresu od 3500 MB/s do 6500 MB/s. Zainstalowanie rozpraszacza ciepła pozwala dyskowi działać znacznie szybciej i dłużej.

| Drive Performance Rating - Percent | |
| Eurocom Raptor X17 Core i9-14900HX | |
| Eurocom Raptor X17 | |
| MSI GE78HX 13VH-070US | |
| MSI Titan 18 HX A14VIG | |
| Asus ROG Strix Scar 17 G733PY-XS96 | |
| Asus TUF Gaming A17 FA707XI-NS94 | |
* ... im mniej tym lepiej
Disk Throttling: DiskSpd Read Loop, Queue Depth 8
Wydajność GPU
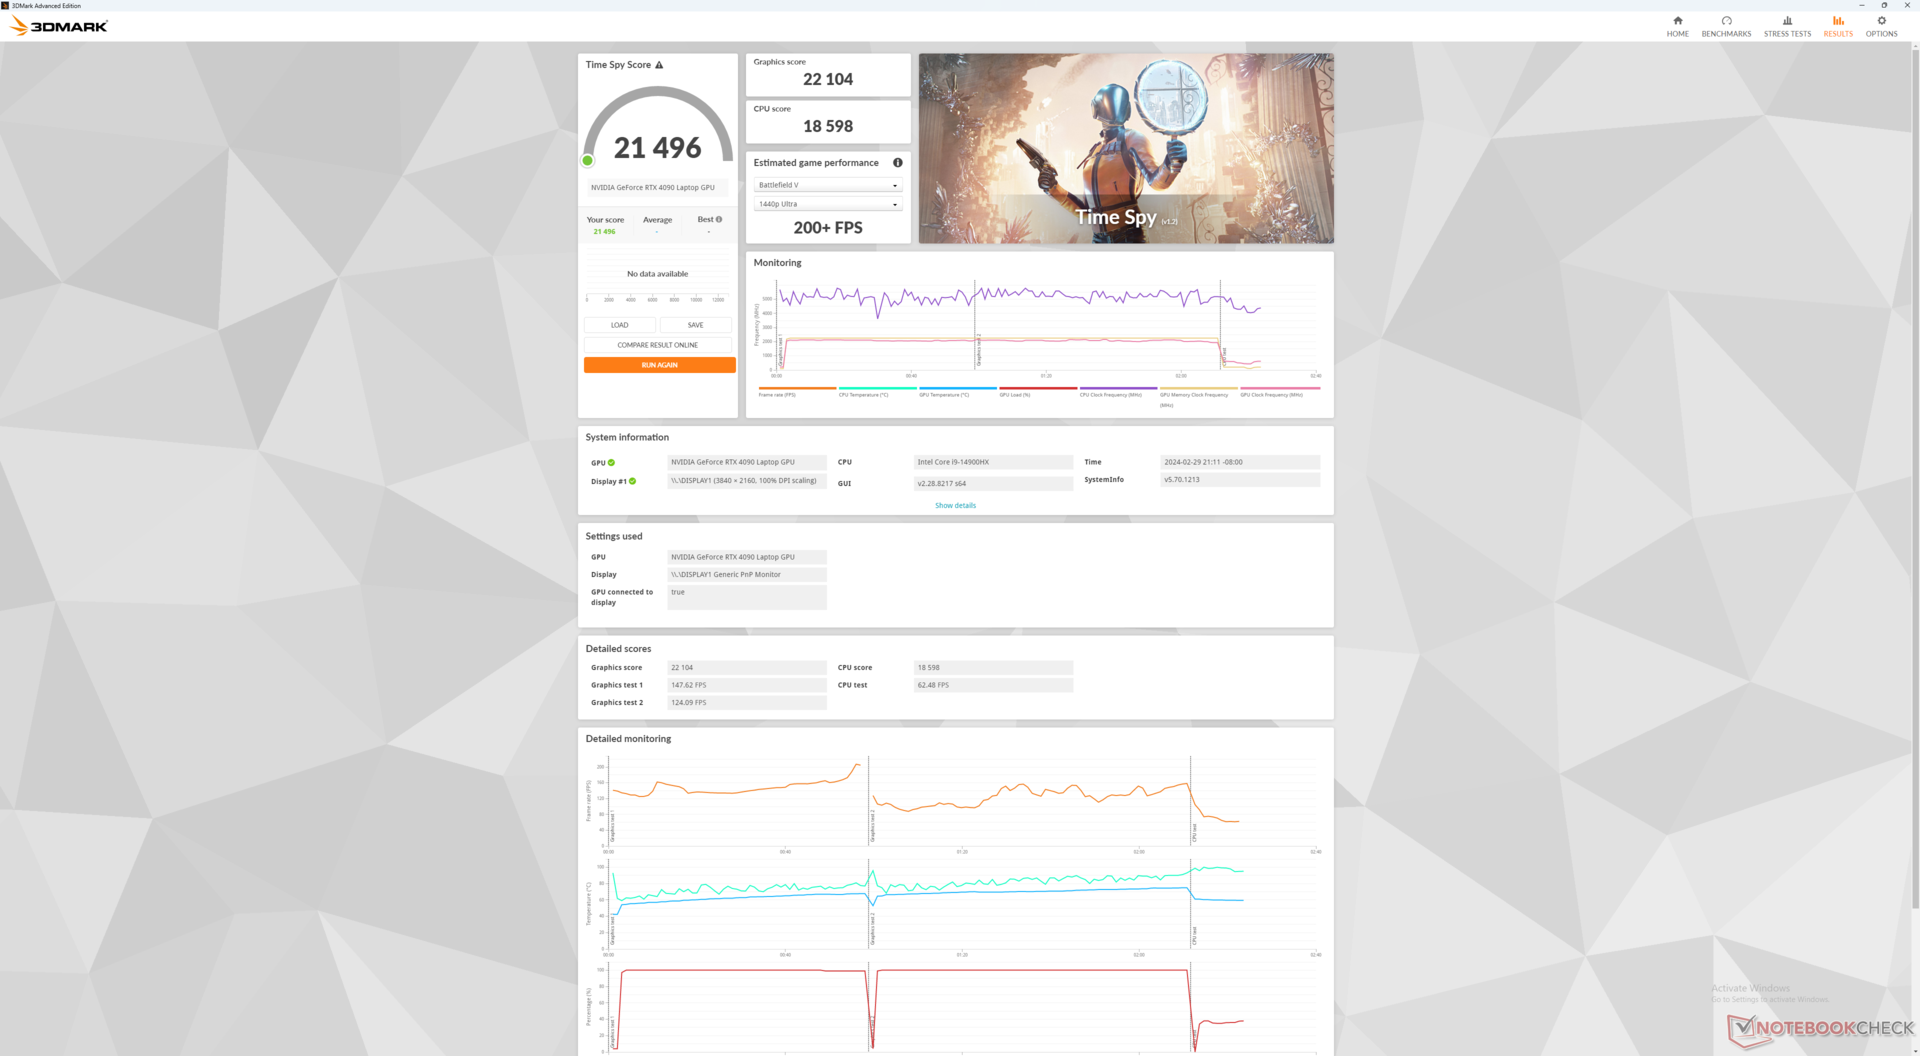
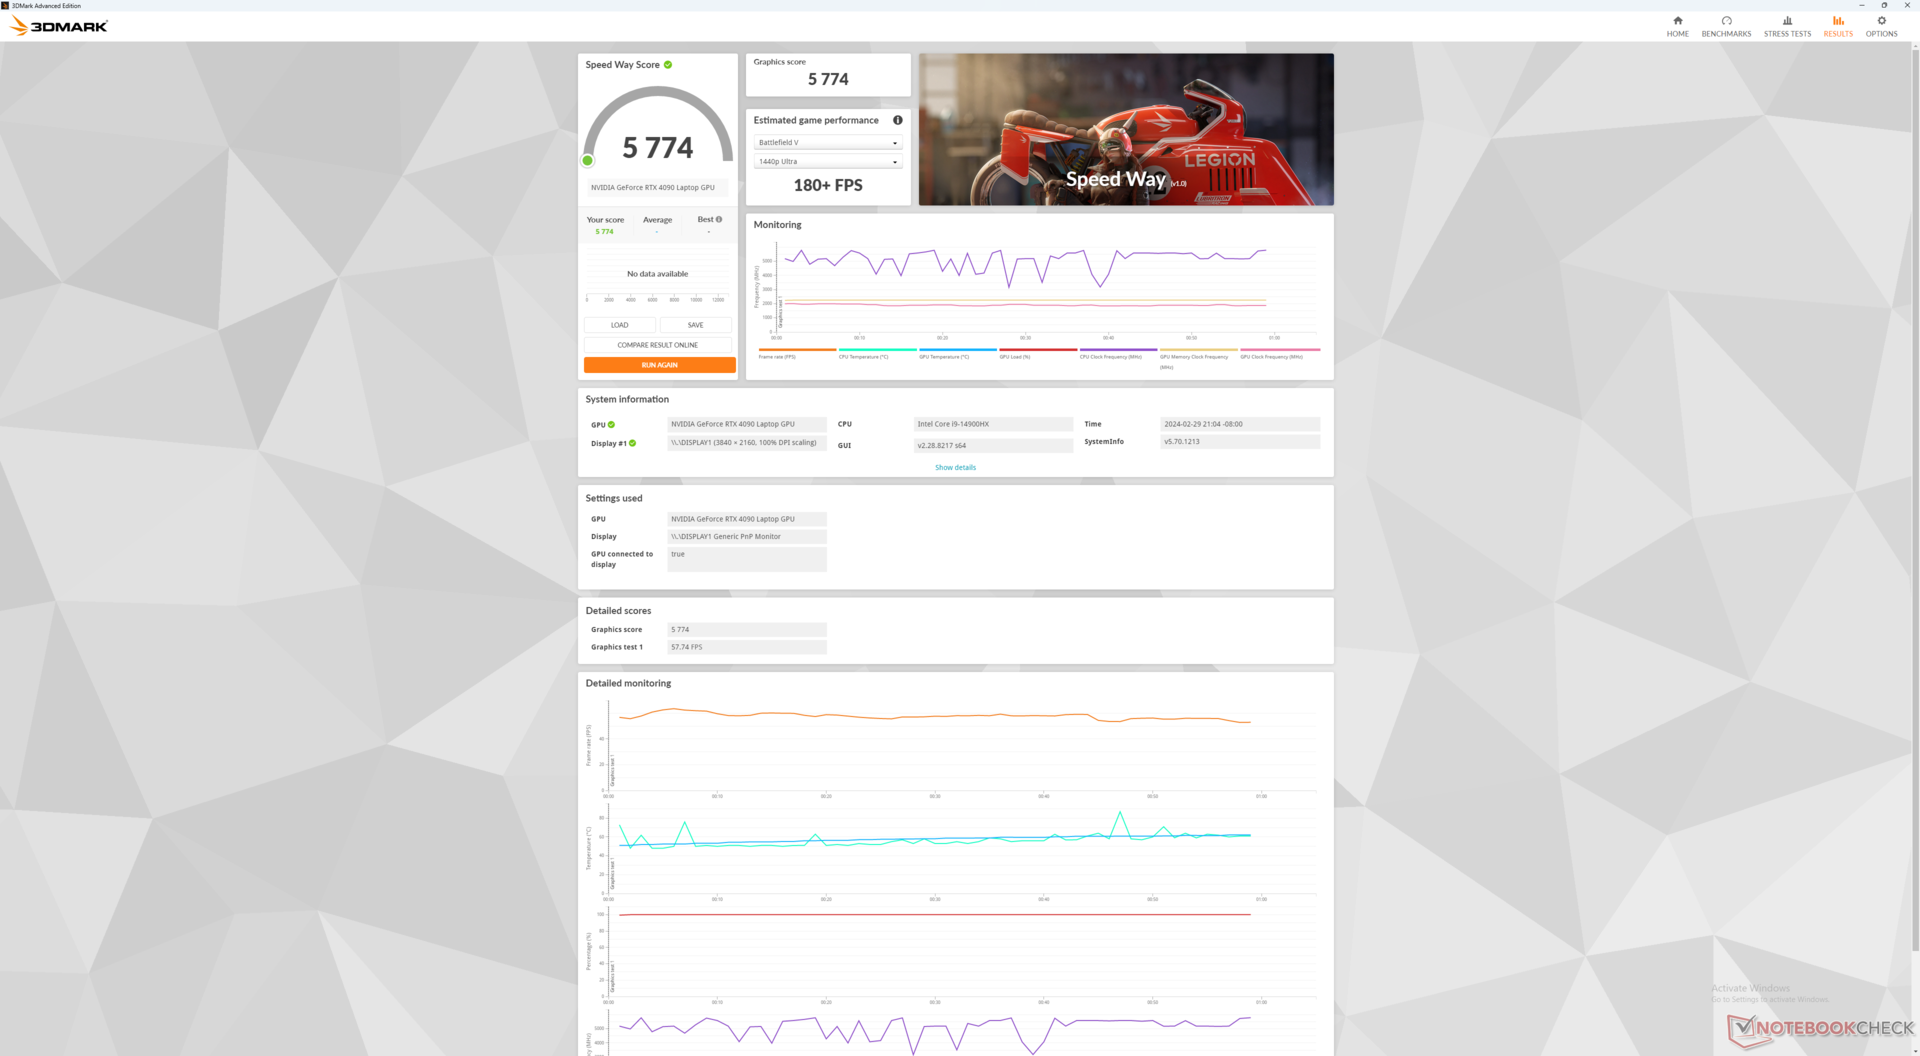
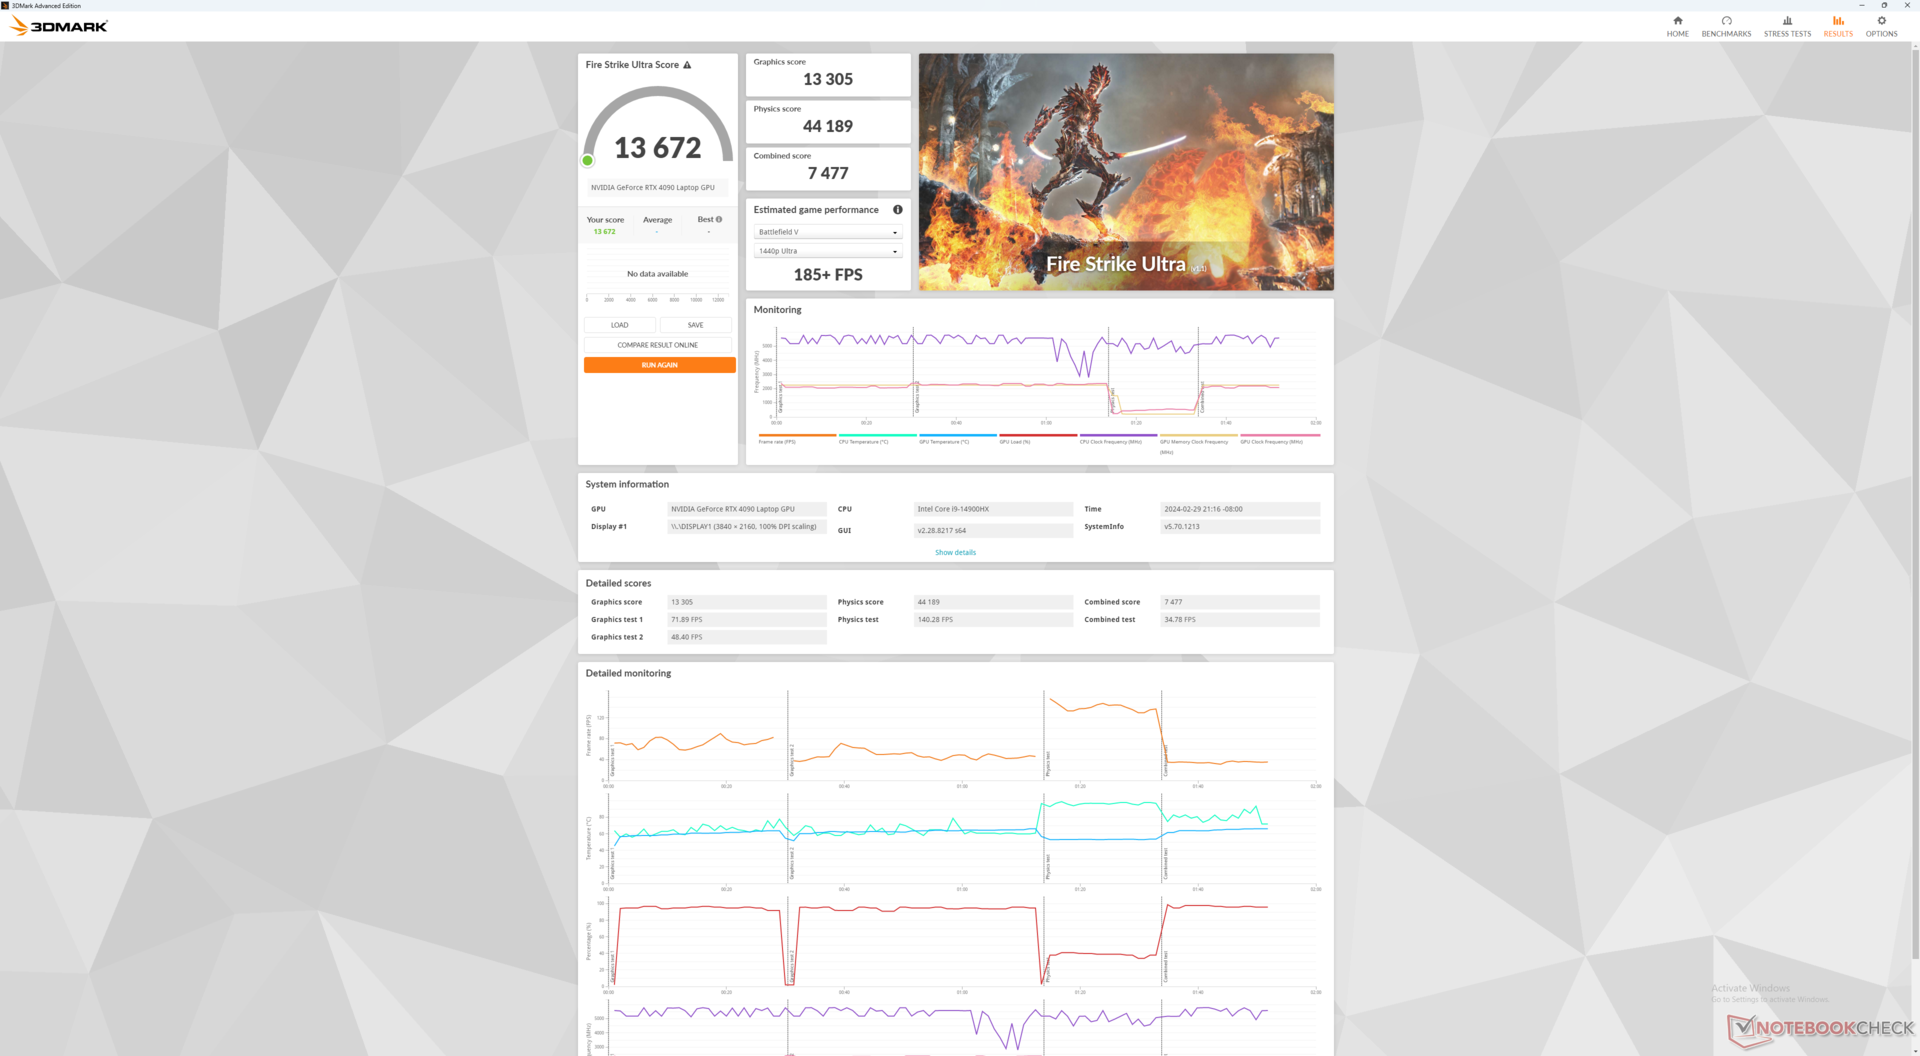
Nasz 175 W GeForce RTX 4090 GPU jest o około 5 procent szybszy niż ten, który zarejestrowaliśmy na zeszłorocznym Raptor X17. Mniej więcej rywalizuje z MSI Titan 18 HX który jest większy i droższy niż nasza jednostka Eurocom.
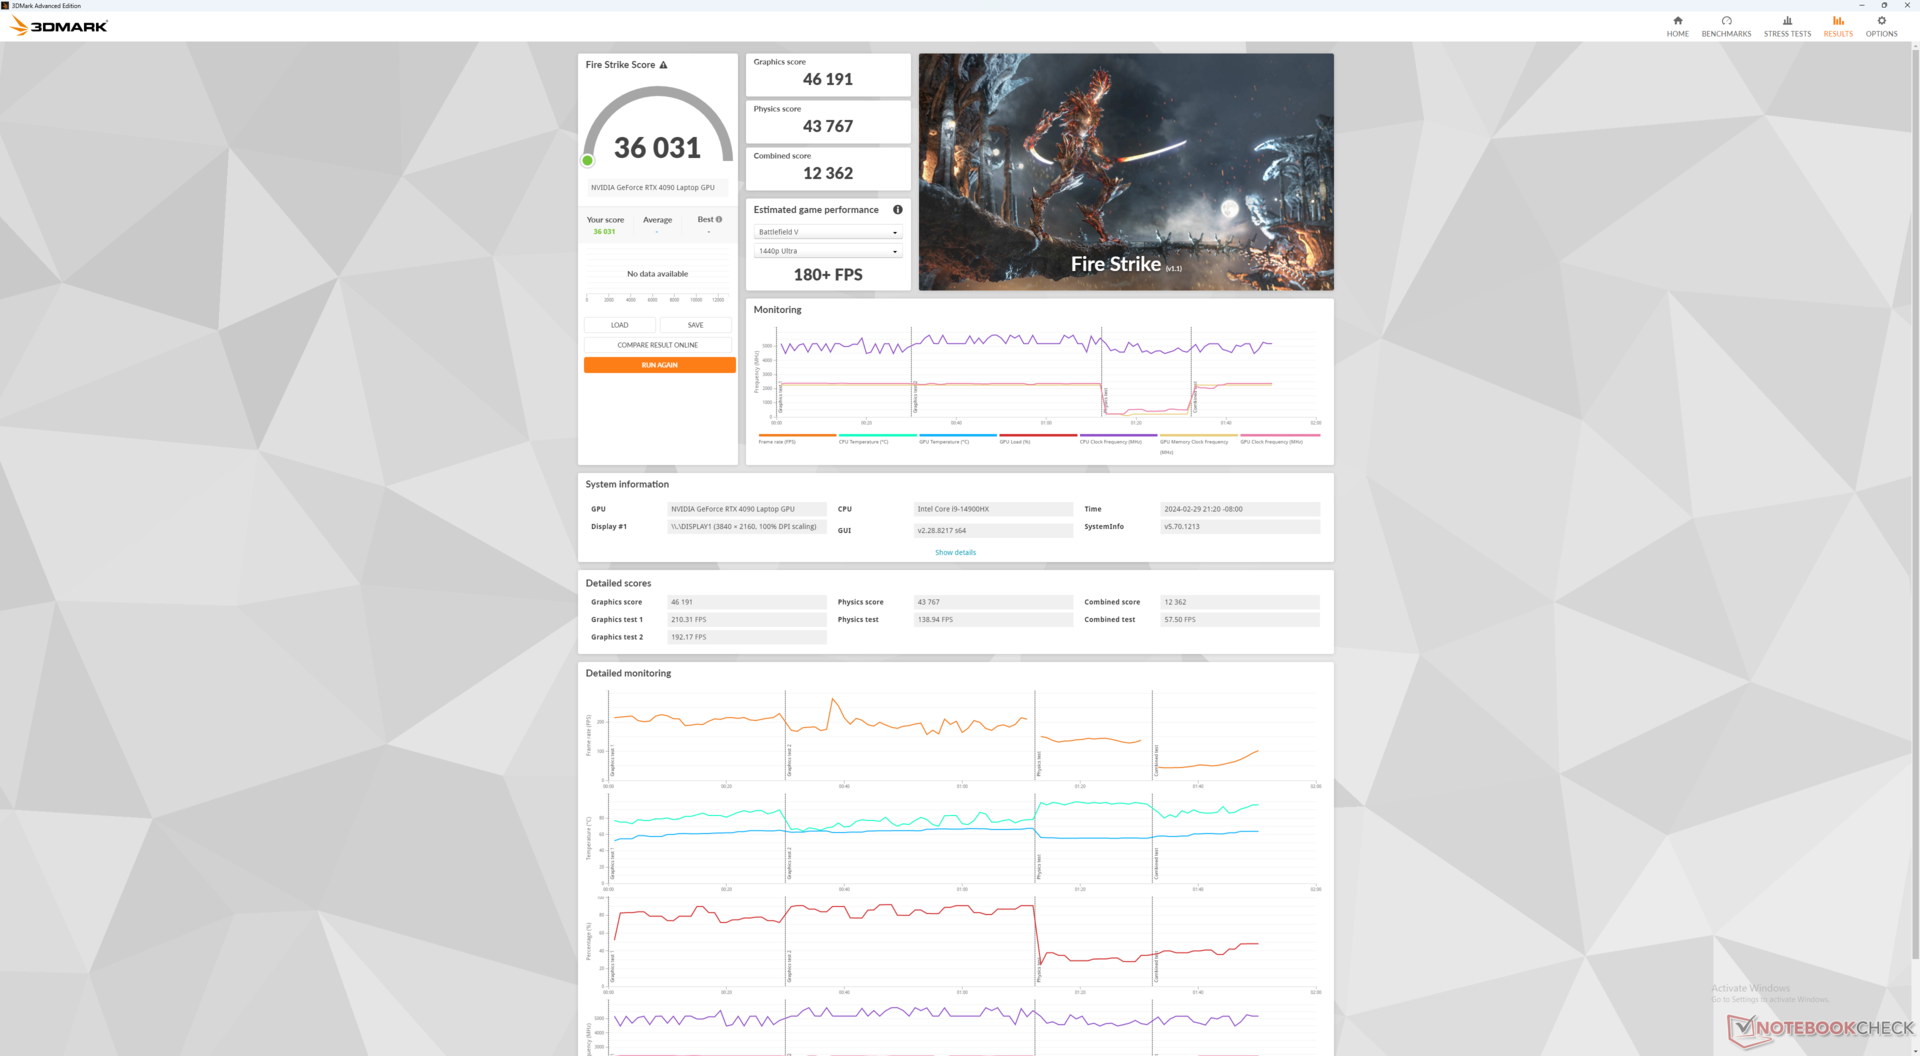
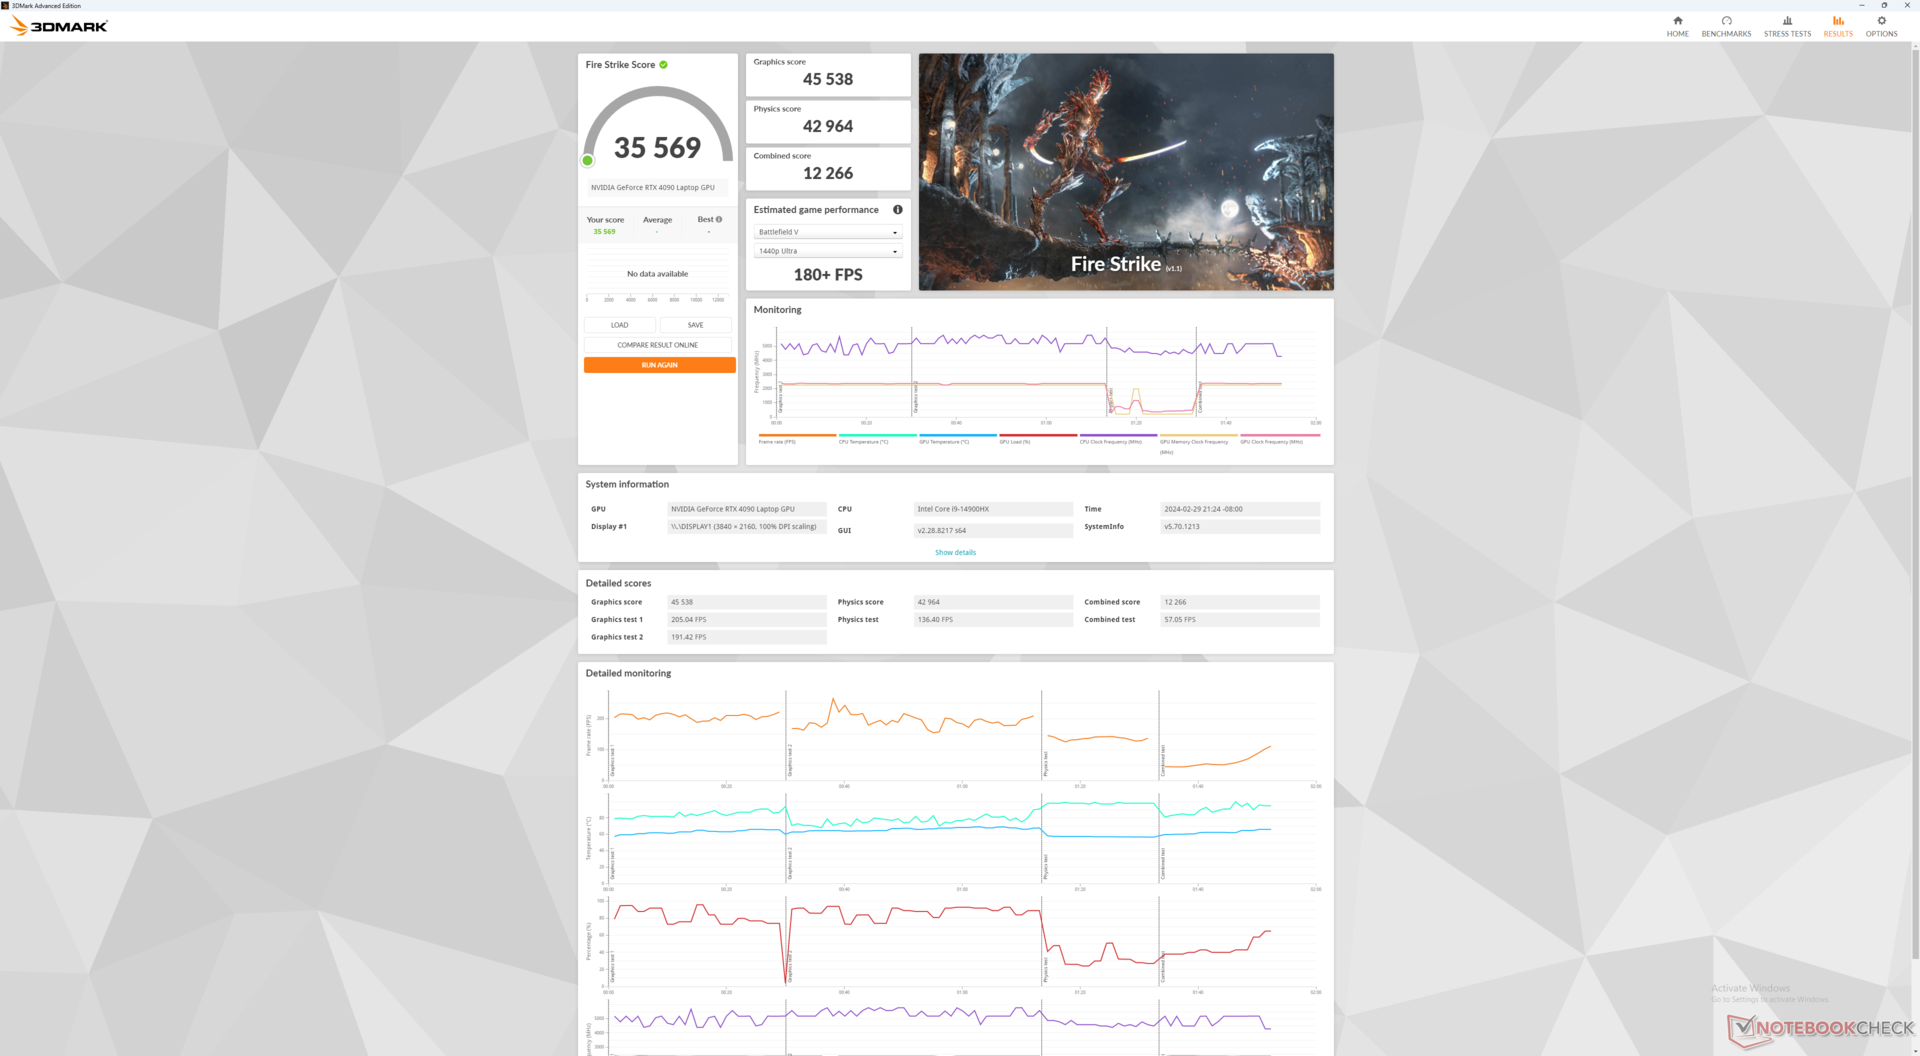
Proszę pamiętać, że włączenie trybu maksymalnego wentylatora nie zwiększa wydajności w zauważalnym stopniu, jak pokazuje nasza tabela wyników Fire Strike poniżej. Tryb ten nie jest zatem niezbędny do maksymalizacji wydajności przy ustawieniach fabrycznych. Zejście do trybu Rozrywka ma jednak większy wpływ na wydajność.
| Profil zasilania | Wynik grafiki | Wynik fizyki | Łączny wynik |
| Tryb wydajności z maksymalnie włączonym wentylatorem | 46191 | 43767 | 12362 |
| Tryb wydajności z maksymalnie wyłączonym wentylatorem | 45538 (-1%) | 42964 (-2%) | 12266 (-1%) |
| Tryb zrównoważony systemu Windows | 45892 (-1%) | 42567 (-3%) | 13382 (-0%) |
| Tryb rozrywki | 44593 (-4%) | 36839 (-16%) | 9640 (-22%) |
| Zasilanie bateryjne | 7324 (-84%) | 14932 (-66%) | 1901 (-85%) |
Niemniej jednak doświadczyliśmy kilku problemów, o których warto wspomnieć. Ubisoft Connect nie uruchamiał się za każdym razem, Final Fantasy XV zawieszało się na wysokich ustawieniach, a PCMark 10 również się zawieszał, nawet po aktualizacji do najnowszej wersji.
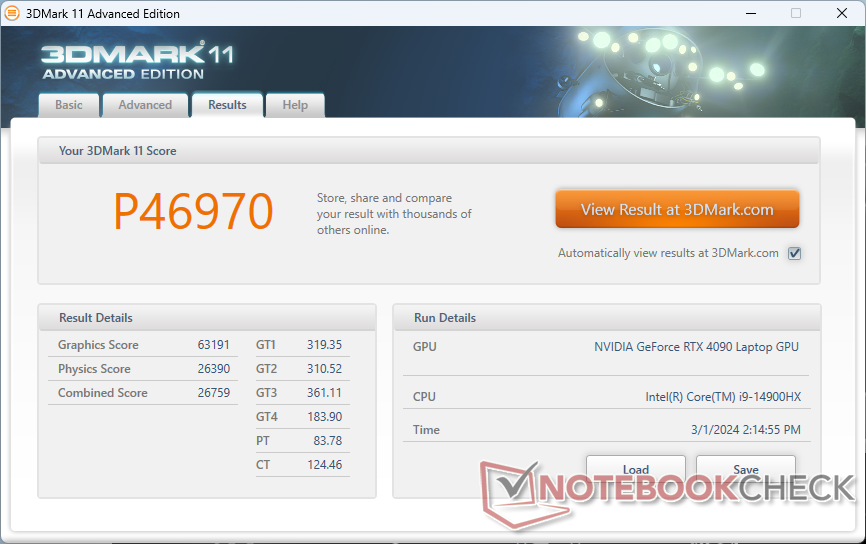
| 3DMark 11 Performance | 46970 pkt. | |
| 3DMark Fire Strike Score | 36031 pkt. | |
| 3DMark Time Spy Score | 21496 pkt. | |
Pomoc | ||
* ... im mniej tym lepiej
| Performance Rating - Percent | |
| Eurocom Raptor X17 Core i9-14900HX -1! | |
| MSI Titan 18 HX A14VIG | |
| Eurocom Raptor X17 | |
| Asus ROG Strix Scar 17 G733PY-XS96 -1! | |
| MSI GE78HX 13VH-070US | |
| Asus TUF Gaming A17 FA707XI-NS94 -1! | |
| The Witcher 3 - 1920x1080 Ultra Graphics & Postprocessing (HBAO+) | |
| MSI Titan 18 HX A14VIG | |
| Eurocom Raptor X17 | |
| Asus ROG Strix Scar 17 G733PY-XS96 | |
| Eurocom Raptor X17 Core i9-14900HX | |
| MSI GE78HX 13VH-070US | |
| Asus TUF Gaming A17 FA707XI-NS94 | |
| GTA V - 1920x1080 Highest Settings possible AA:4xMSAA + FX AF:16x | |
| Eurocom Raptor X17 Core i9-14900HX | |
| Eurocom Raptor X17 | |
| MSI Titan 18 HX A14VIG | |
| Asus ROG Strix Scar 17 G733PY-XS96 | |
| MSI GE78HX 13VH-070US | |
| Final Fantasy XV Benchmark - 1920x1080 High Quality | |
| MSI Titan 18 HX A14VIG | |
| Eurocom Raptor X17 | |
| Asus ROG Strix Scar 17 G733PY-XS96 | |
| MSI GE78HX 13VH-070US | |
| Asus TUF Gaming A17 FA707XI-NS94 | |
| Strange Brigade - 1920x1080 ultra AA:ultra AF:16 | |
| Eurocom Raptor X17 Core i9-14900HX | |
| MSI Titan 18 HX A14VIG | |
| Eurocom Raptor X17 | |
| MSI GE78HX 13VH-070US | |
| Asus TUF Gaming A17 FA707XI-NS94 | |
| Dota 2 Reborn - 1920x1080 ultra (3/3) best looking | |
| Eurocom Raptor X17 Core i9-14900HX | |
| Eurocom Raptor X17 | |
| MSI Titan 18 HX A14VIG | |
| MSI GE78HX 13VH-070US | |
| Asus ROG Strix Scar 17 G733PY-XS96 | |
| Asus TUF Gaming A17 FA707XI-NS94 | |
| X-Plane 11.11 - 1920x1080 high (fps_test=3) | |
| Eurocom Raptor X17 Core i9-14900HX | |
| Eurocom Raptor X17 | |
| MSI GE78HX 13VH-070US | |
| MSI Titan 18 HX A14VIG | |
| Asus ROG Strix Scar 17 G733PY-XS96 | |
| Asus TUF Gaming A17 FA707XI-NS94 | |
Witcher 3 FPS Chart
| low | med. | high | ultra | QHD | 4K | |
| GTA V (2015) | 187.6 | 186.9 | 185.8 | 152.2 | 145.7 | 178.8 |
| The Witcher 3 (2015) | 688.1 | 591.6 | 423.9 | 200 | 149.7 | |
| Dota 2 Reborn (2015) | 254 | 224 | 212 | 195.2 | 195 | |
| X-Plane 11.11 (2018) | 221 | 193.1 | 150.2 | 126.7 | ||
| Far Cry 5 (2018) | 222 | 195 | 186 | 174 | 171 | 113 |
| Strange Brigade (2018) | 567 | 459 | 433 | 402 | 309 | 156.8 |
| F1 22 (2022) | 360 | 331 | 116.3 | 87.8 | 44.2 | |
| Baldur's Gate 3 (2023) | 244.1 | 217.9 | 203.8 | 200.4 | 148.9 | 75.6 |
| Cyberpunk 2077 2.0 Phantom Liberty (2023) | 195.2 | 185.2 | 164.5 | 144.7 | 93.8 | 41.4 |
Emisje
Hałas systemowy - głośniejszy niż w wielu innych laptopach do gier
Wentylatory nie pulsują tak często, jak w zeszłorocznym modelu. Na przykład podczas uruchamiania 3DMark 06 wentylatory pozostawały cichsze przez dłuższy czas, a następnie powoli rosły, podczas gdy model 2023 osiągał prawie 60 dB(A). W przeciwnym razie hałas wentylatorów ustabilizowałby się na mniej więcej takich samych wartościach między dwoma modelami podczas uruchamiania wymagających obciążeń, takich jak gry.
Granie w trybie rozrywki jest nieco cichsze niż granie w trybie wydajności (58,3 dB(A) vs 61,4 dB(A)). Proszę tylko pamiętać, że tryb Rozrywka wiąże się z kosztem wydajności, jak wspomniano powyżej.
Hałas
| luz |
| 31.7 / 31.7 / 32.9 dB |
| obciążenie |
| 34 / 61.6 dB |
 | ||
30 dB cichy 40 dB(A) słyszalny 50 dB(A) irytujący |
||
min: | ||
| Eurocom Raptor X17 Core i9-14900HX NVIDIA GeForce RTX 4090 Laptop GPU, i9-14900HX, Corsair MP700 Pro 2TB | Eurocom Raptor X17 NVIDIA GeForce RTX 4090 Laptop GPU, i9-13900HX, 3x Samsung SSD 980 Pro 1TB (RAID 0) | Asus TUF Gaming A17 FA707XI-NS94 NVIDIA GeForce RTX 4070 Laptop GPU, R9 7940HS, WD PC SN560 SDDPNQE-1T00 | Asus ROG Strix Scar 17 G733PY-XS96 NVIDIA GeForce RTX 4090 Laptop GPU, R9 7945HX, SK hynix PC801 HFS001TEJ9X101N | MSI GE78HX 13VH-070US NVIDIA GeForce RTX 4080 Laptop GPU, i9-13950HX, Samsung PM9A1 MZVL22T0HBLB | MSI Titan 18 HX A14VIG NVIDIA GeForce RTX 4090 Laptop GPU, i9-14900HX, 2x Samsung PM9A1a MZVL22T0HDLB (RAID 0) | |
|---|---|---|---|---|---|---|
| Noise | -15% | 3% | 14% | 5% | 9% | |
| off / environment * | 23.7 | 23.3 2% | 27.9 -18% | 22.7 4% | 23.4 1% | 22.8 4% |
| Idle Minimum * | 31.7 | 33.1 -4% | 28.5 10% | 23.5 26% | 24.2 24% | 23.8 25% |
| Idle Average * | 31.7 | 33.1 -4% | 29.8 6% | 27.7 13% | 25.6 19% | 23.8 25% |
| Idle Maximum * | 32.9 | 40.7 -24% | 29.8 9% | 27.7 16% | 31 6% | 28 15% |
| Load Average * | 34 | 59.9 -76% | 34.8 -2% | 30.5 10% | 43.3 -27% | 38 -12% |
| Witcher 3 ultra * | 61.6 | 60.8 1% | 57.1 7% | 51.4 17% | 56.3 9% | 57.3 7% |
| Load Maximum * | 61.6 | 61 1% | 57.3 7% | 54.1 12% | 59.1 4% | 62.8 -2% |
* ... im mniej tym lepiej
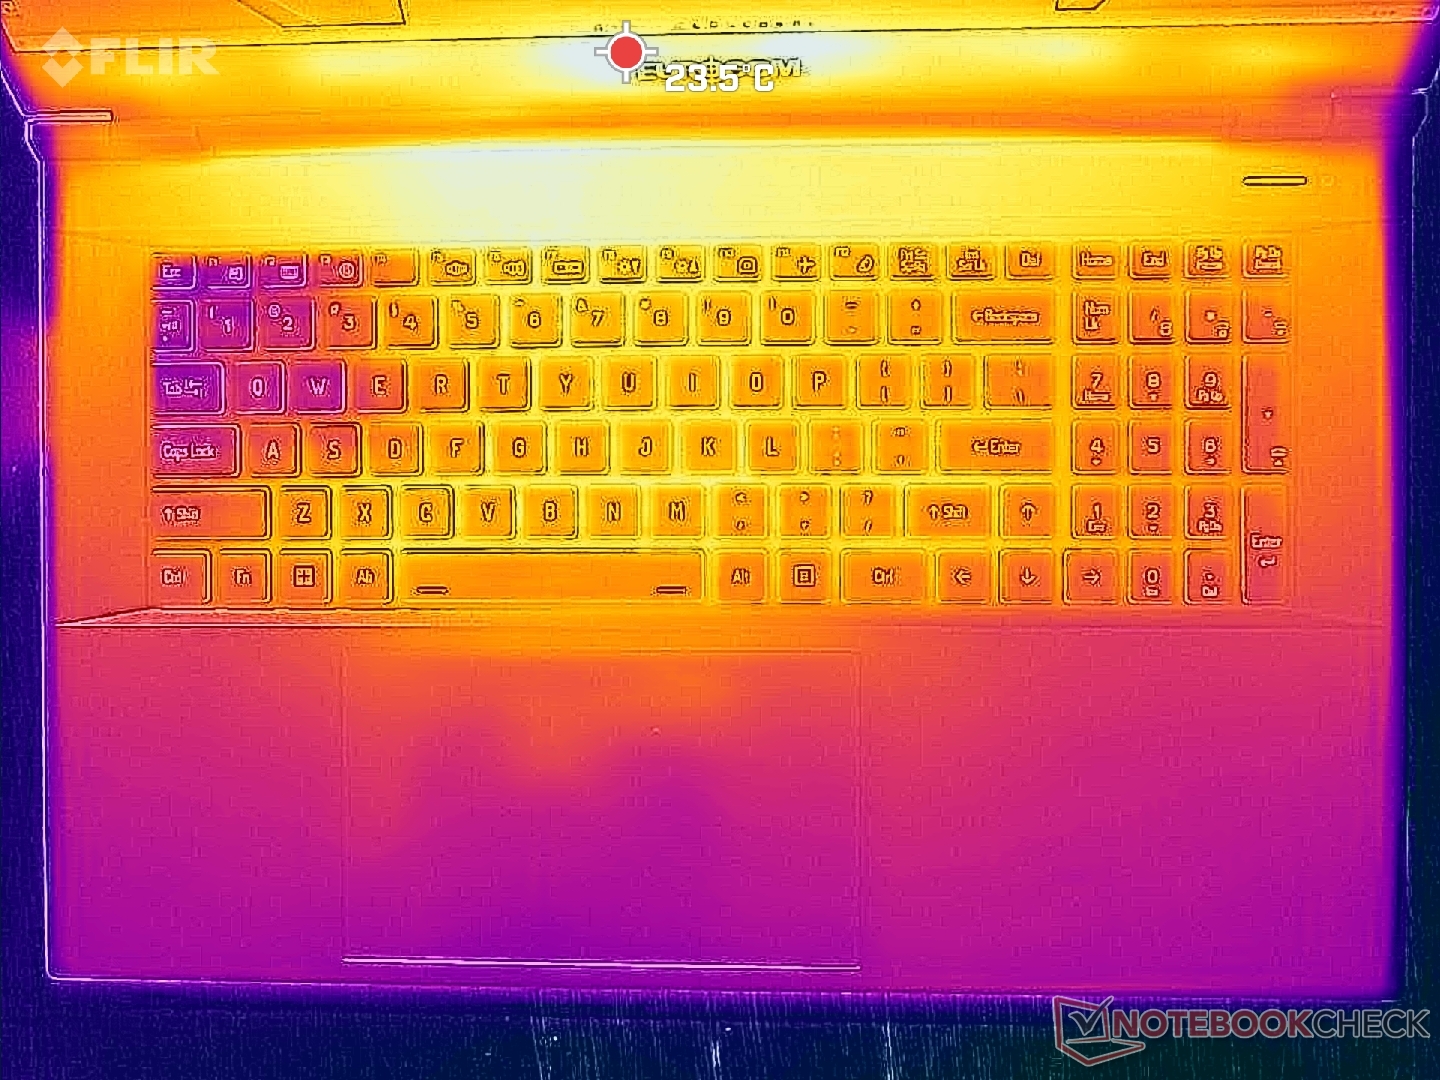
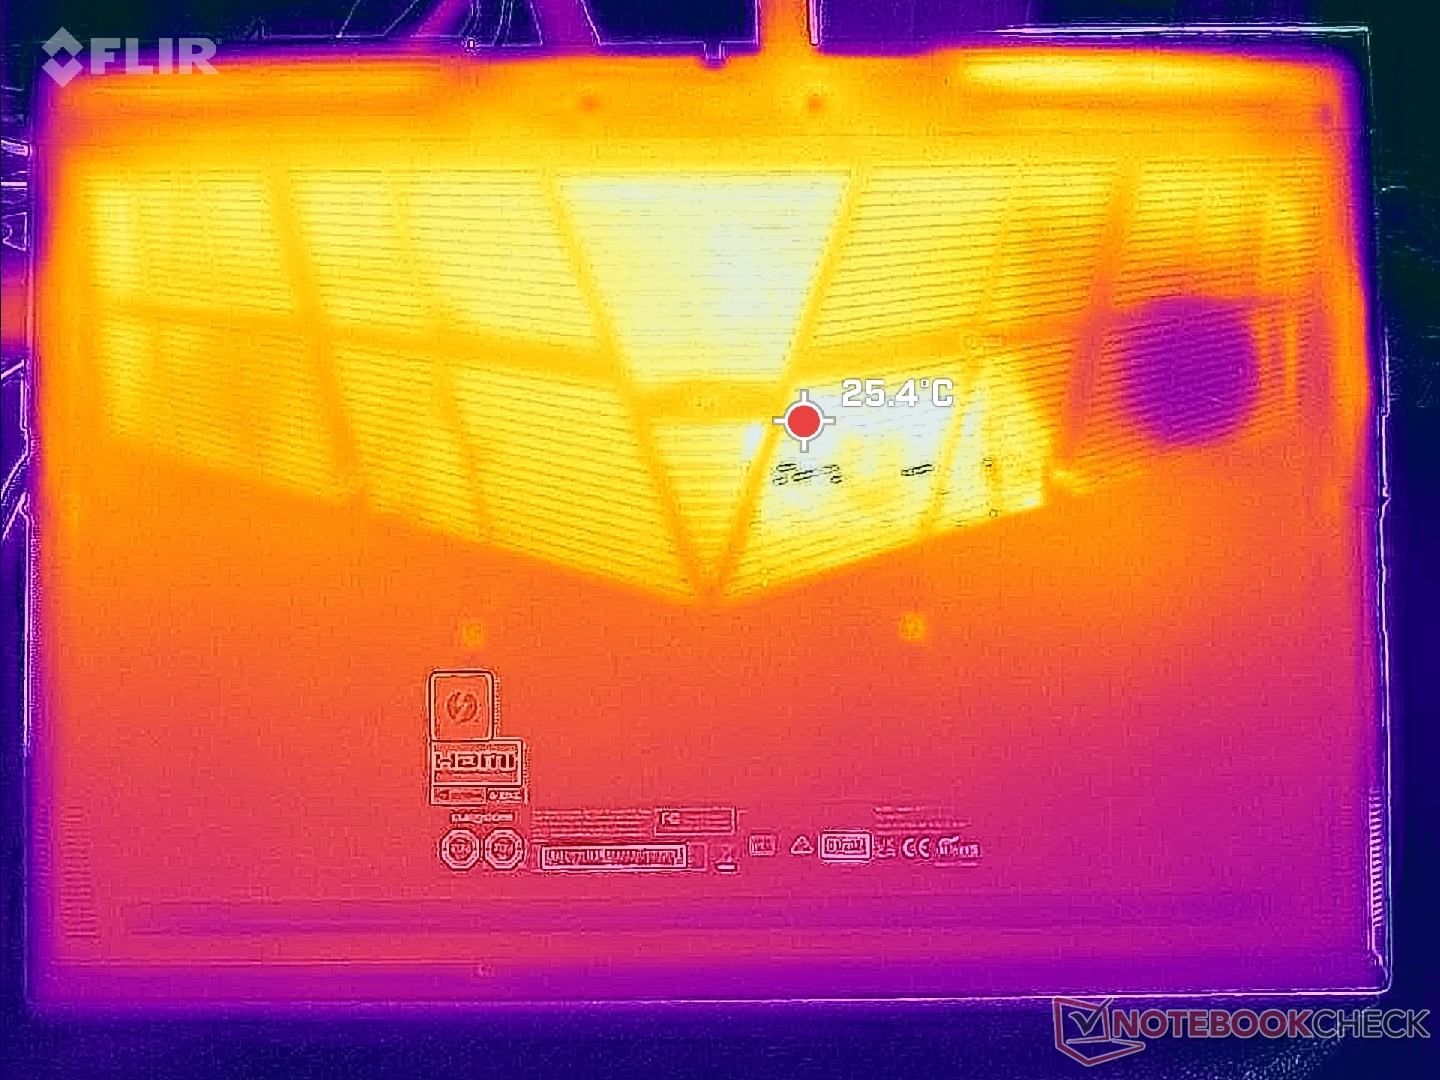
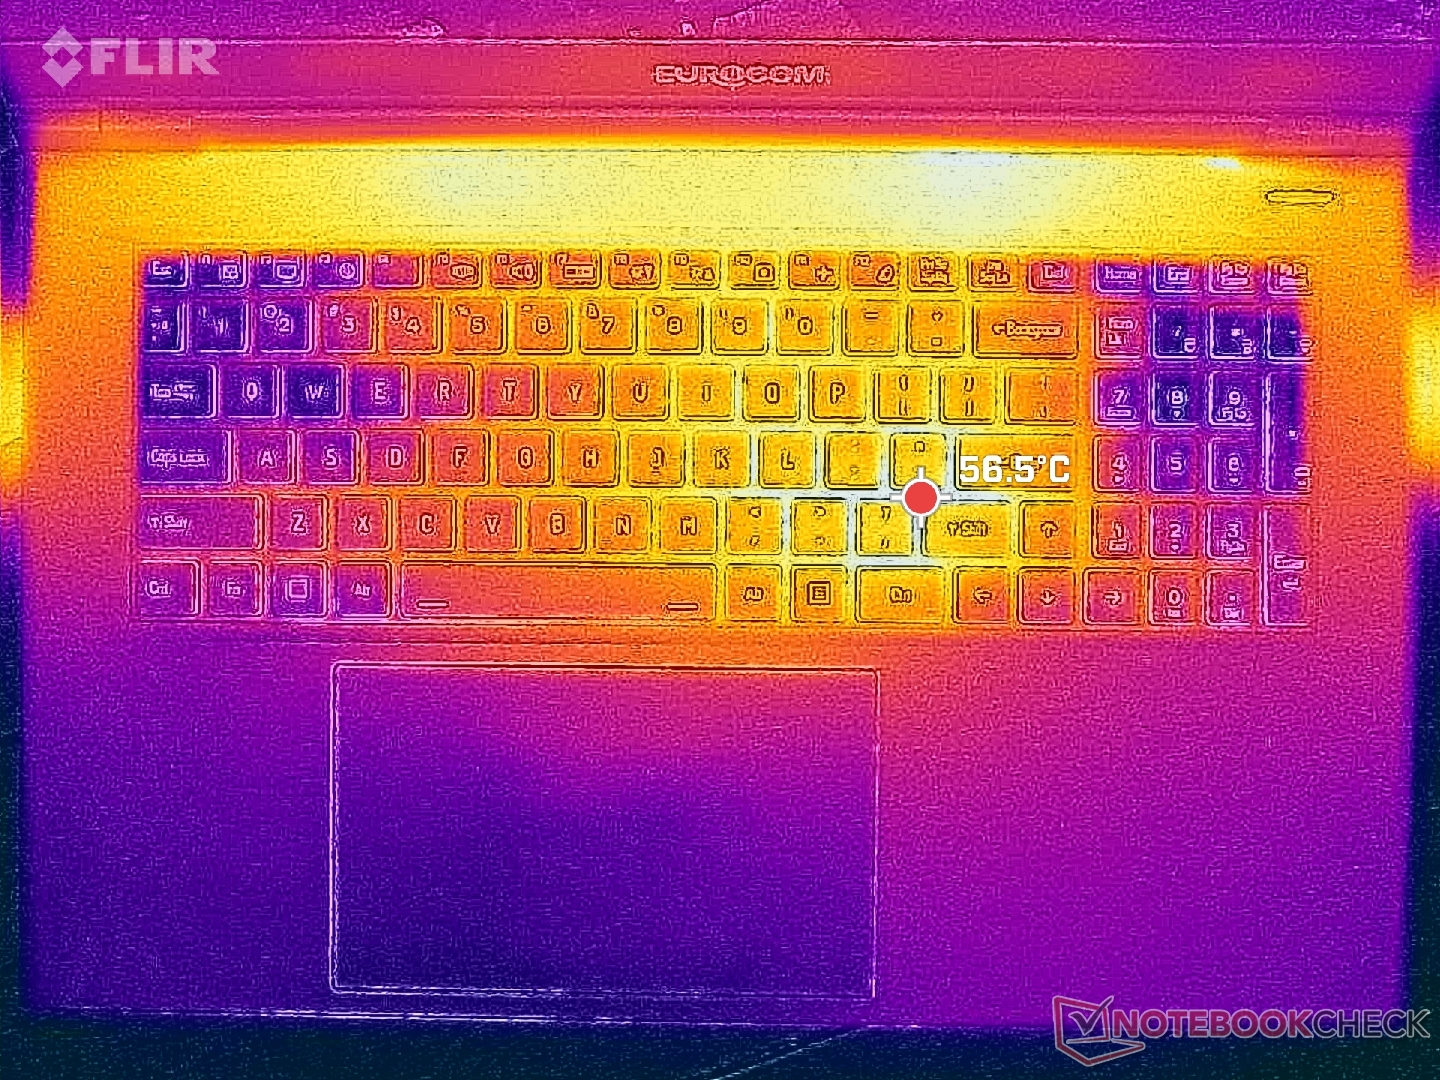
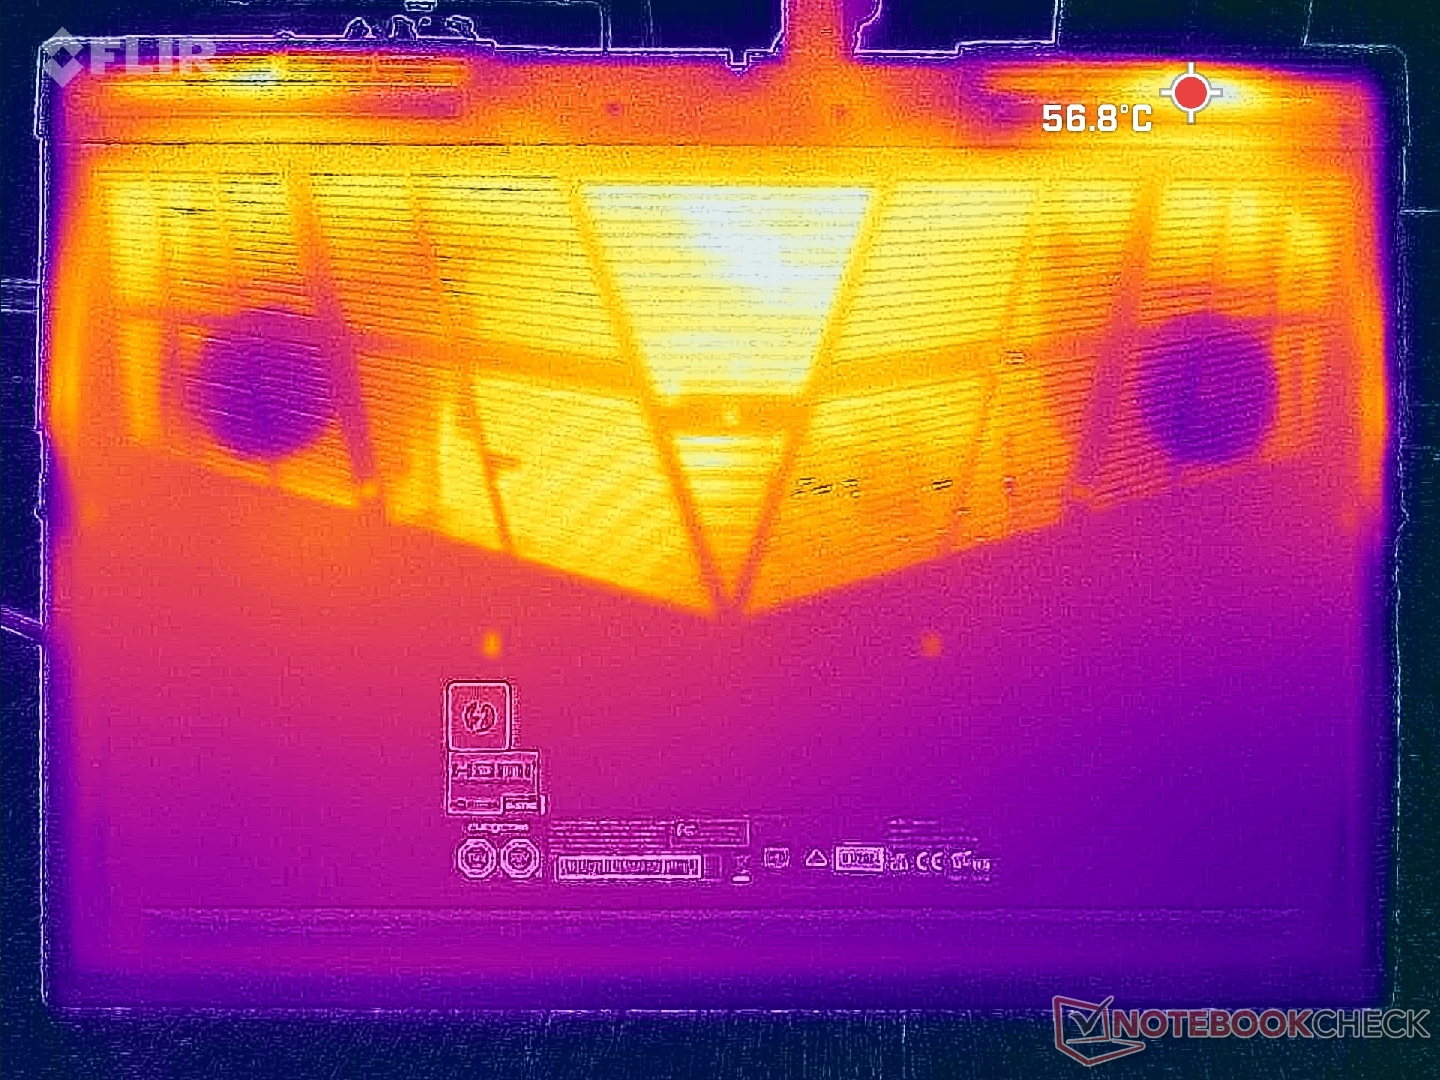
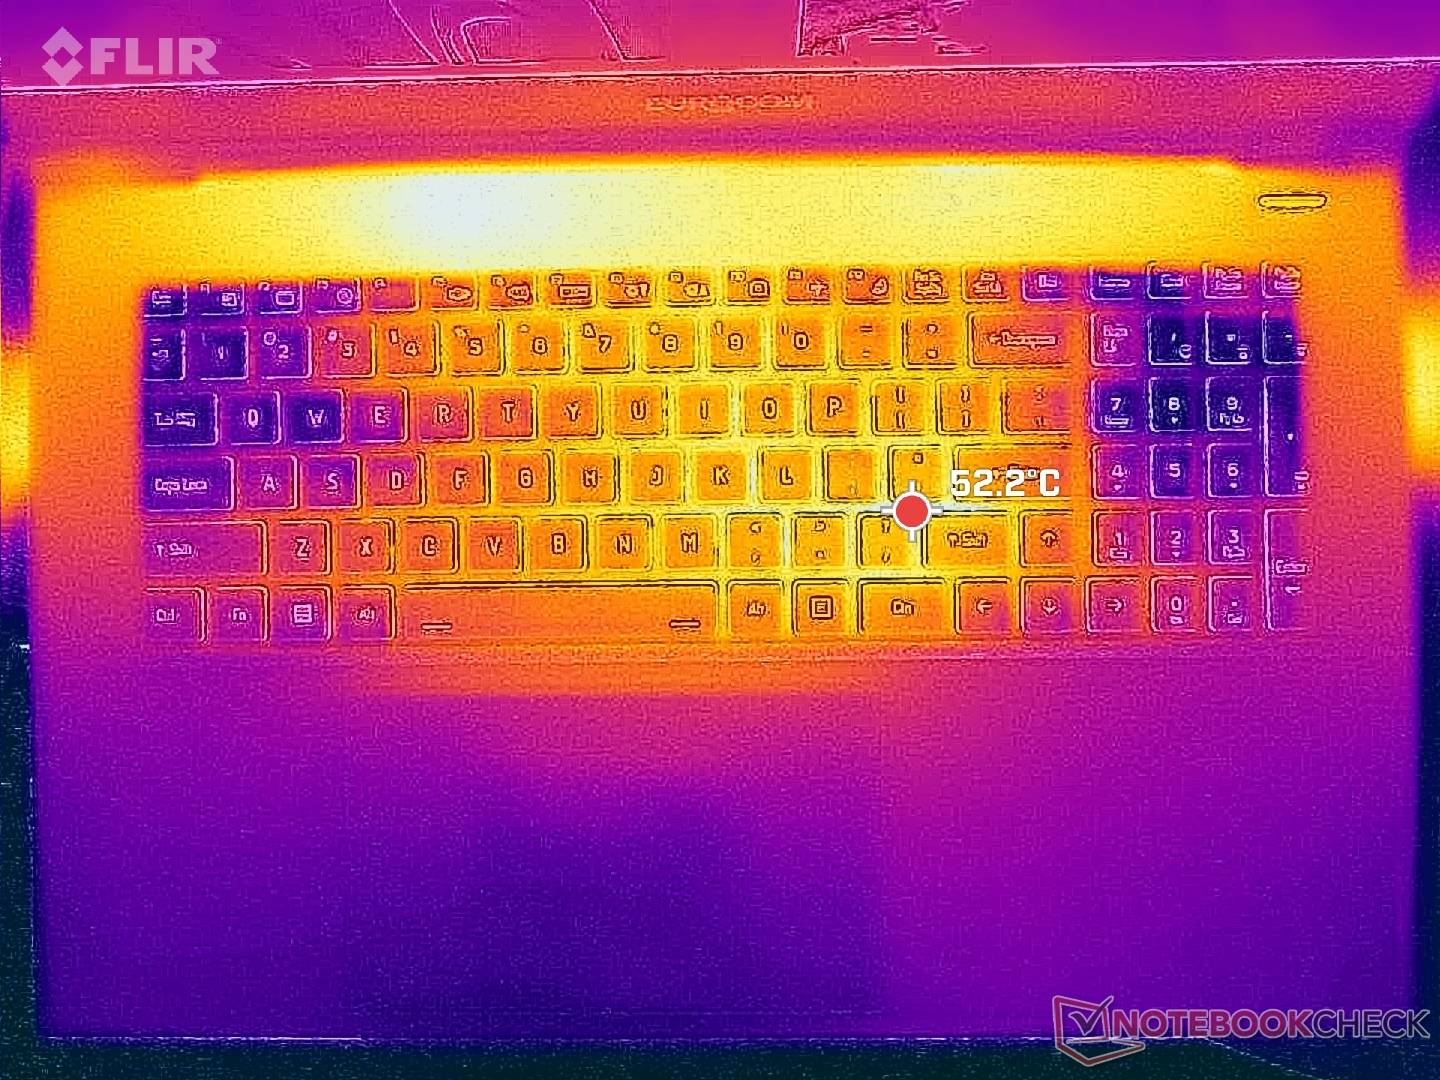
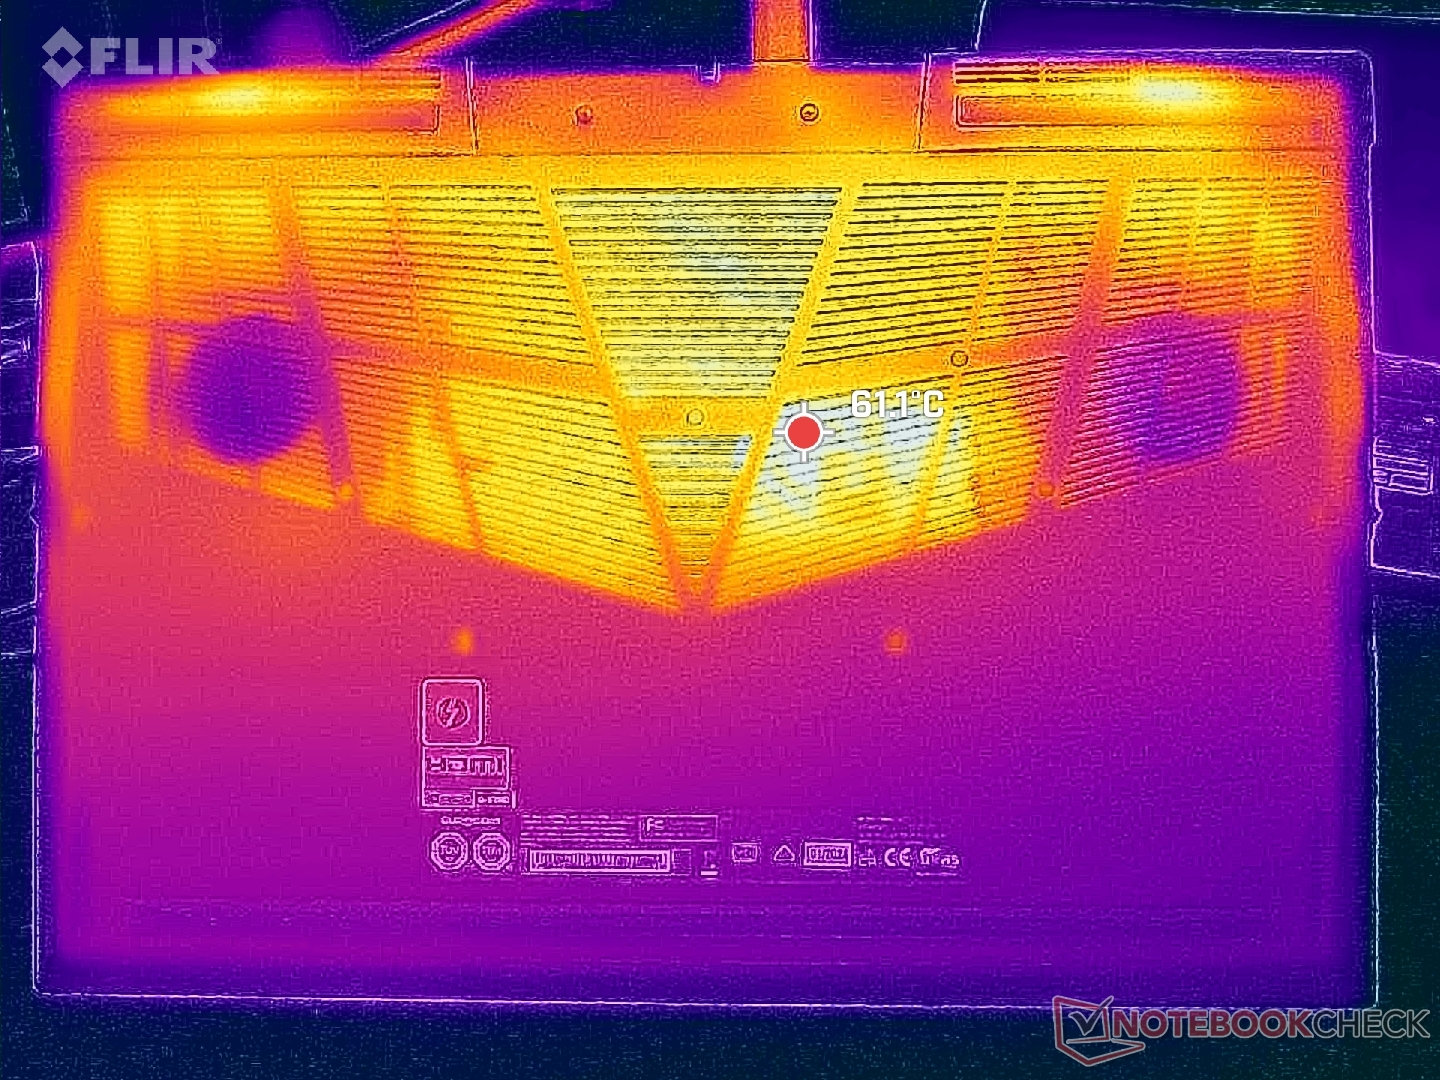
Temperatura
Miejsca o wysokiej temperaturze powierzchni są zauważalnie cieplejsze niż w innych laptopach do gier. W szczególności niektóre obszary klawiatury mogą być ciepłe nawet do 53 C podczas grania w porównaniu do zaledwie 37 C lub 40 C w MSI GE78HX lub Asus TUF Gaming A17.
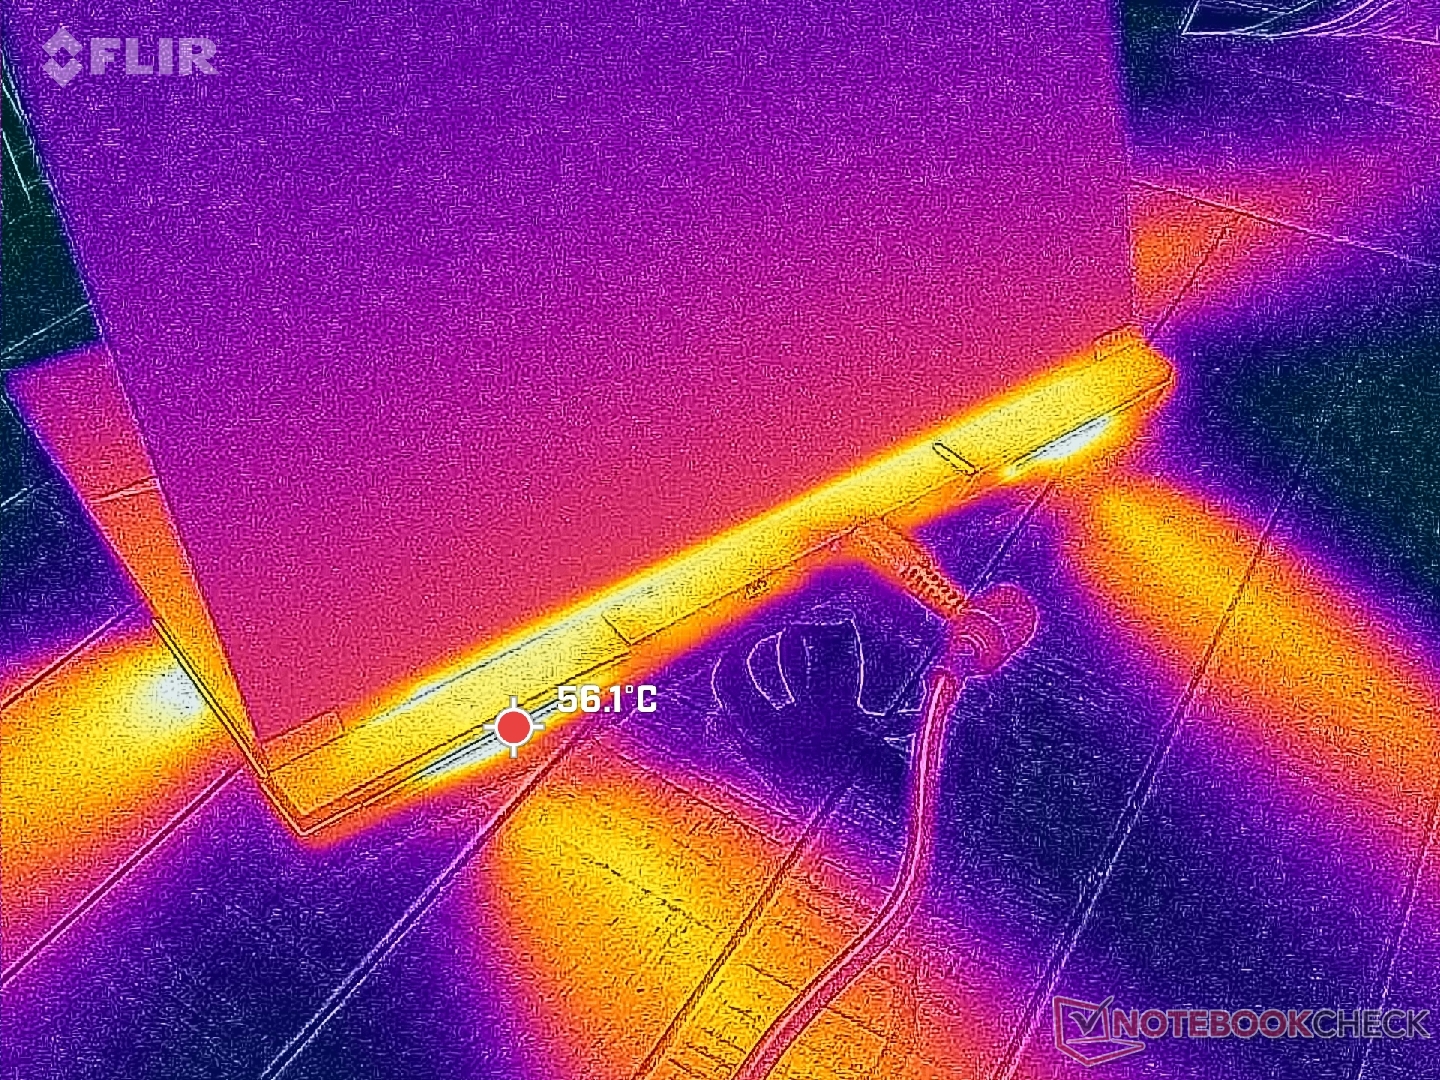
(-) The maximum temperature on the upper side is 52.2 °C / 126 F, compared to the average of 40.4 °C / 105 F, ranging from 21.2 to 68.8 °C for the class Gaming.
(-) The bottom heats up to a maximum of 53.2 °C / 128 F, compared to the average of 43.2 °C / 110 F
(+) In idle usage, the average temperature for the upper side is 25.8 °C / 78 F, compared to the device average of 33.8 °C / 93 F.
(±) Playing The Witcher 3, the average temperature for the upper side is 36.7 °C / 98 F, compared to the device average of 33.8 °C / 93 F.
(+) The palmrests and touchpad are cooler than skin temperature with a maximum of 28.8 °C / 83.8 F and are therefore cool to the touch.
(±) The average temperature of the palmrest area of similar devices was 28.9 °C / 84 F (+0.1 °C / 0.2 F).
| Eurocom Raptor X17 Core i9-14900HX Intel Core i9-14900HX, NVIDIA GeForce RTX 4090 Laptop GPU | Eurocom Raptor X17 Intel Core i9-13900HX, NVIDIA GeForce RTX 4090 Laptop GPU | Asus TUF Gaming A17 FA707XI-NS94 AMD Ryzen 9 7940HS, NVIDIA GeForce RTX 4070 Laptop GPU | Asus ROG Strix Scar 17 G733PY-XS96 AMD Ryzen 9 7945HX, NVIDIA GeForce RTX 4090 Laptop GPU | MSI GE78HX 13VH-070US Intel Core i9-13950HX, NVIDIA GeForce RTX 4080 Laptop GPU | MSI Titan 18 HX A14VIG Intel Core i9-14900HX, NVIDIA GeForce RTX 4090 Laptop GPU | |
|---|---|---|---|---|---|---|
| Heat | -7% | 21% | 18% | 8% | 4% | |
| Maximum Upper Side * | 52.2 | 49.4 5% | 40 23% | 34.6 34% | 37.4 28% | 37.8 28% |
| Maximum Bottom * | 53.2 | 55.2 -4% | 33.6 37% | 35.6 33% | 45 15% | 37.6 29% |
| Idle Upper Side * | 28.6 | 33.4 -17% | 26.6 7% | 27.2 5% | 29.8 -4% | 34.8 -22% |
| Idle Bottom * | 29.8 | 33.4 -12% | 24.4 18% | 30 -1% | 32.4 -9% | 36 -21% |
* ... im mniej tym lepiej
Głośniki
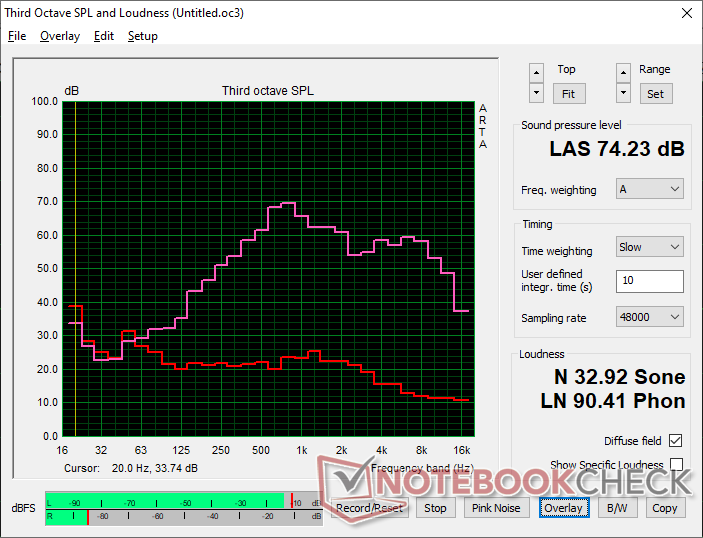
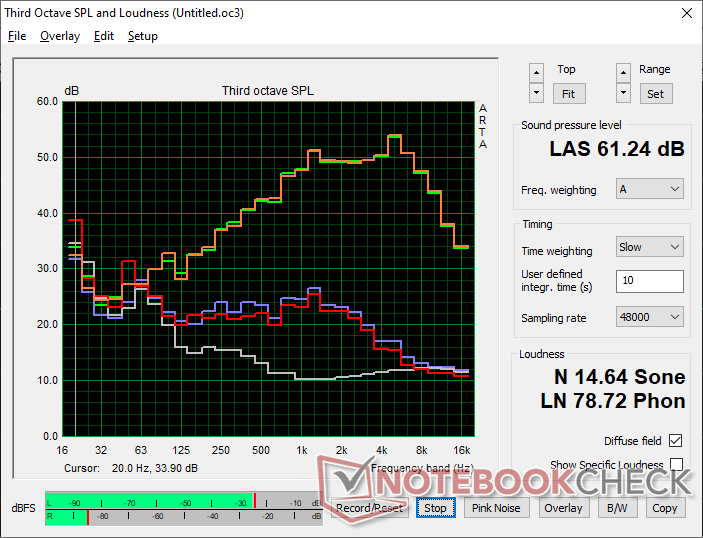
Eurocom Raptor X17 Core i9-14900HX audio analysis
(±) | speaker loudness is average but good (74.2 dB)
Bass 100 - 315 Hz
(±) | reduced bass - on average 13.4% lower than median
(±) | linearity of bass is average (10.1% delta to prev. frequency)
Mids 400 - 2000 Hz
(±) | higher mids - on average 6.6% higher than median
(±) | linearity of mids is average (8.6% delta to prev. frequency)
Highs 2 - 16 kHz
(+) | balanced highs - only 2% away from median
(±) | linearity of highs is average (8.5% delta to prev. frequency)
Overall 100 - 16.000 Hz
(±) | linearity of overall sound is average (24% difference to median)
Compared to same class
» 84% of all tested devices in this class were better, 5% similar, 11% worse
» The best had a delta of 6%, average was 18%, worst was 132%
Compared to all devices tested
» 68% of all tested devices were better, 7% similar, 25% worse
» The best had a delta of 4%, average was 25%, worst was 134%
Apple MacBook Pro 16 2021 M1 Pro audio analysis
(+) | speakers can play relatively loud (84.7 dB)
Bass 100 - 315 Hz
(+) | good bass - only 3.8% away from median
(+) | bass is linear (5.2% delta to prev. frequency)
Mids 400 - 2000 Hz
(+) | balanced mids - only 1.3% away from median
(+) | mids are linear (2.1% delta to prev. frequency)
Highs 2 - 16 kHz
(+) | balanced highs - only 1.9% away from median
(+) | highs are linear (2.7% delta to prev. frequency)
Overall 100 - 16.000 Hz
(+) | overall sound is linear (4.6% difference to median)
Compared to same class
» 0% of all tested devices in this class were better, 0% similar, 100% worse
» The best had a delta of 5%, average was 18%, worst was 45%
Compared to all devices tested
» 0% of all tested devices were better, 0% similar, 100% worse
» The best had a delta of 4%, average was 25%, worst was 134%
Zarządzanie energią
Zużycie energii
Bieganie Witcher 3 wymaga nieco więcej mocy niż poprzednio, około 325 W, aby być prawie tak samo jak Titan 18 HX. Wyższe zużycie energii w porównaniu do naszego modelu 2023 można prawdopodobnie przypisać jaśniejszemu panelowi 4K o wyższej rozdzielczości w naszej nowszej konfiguracji.
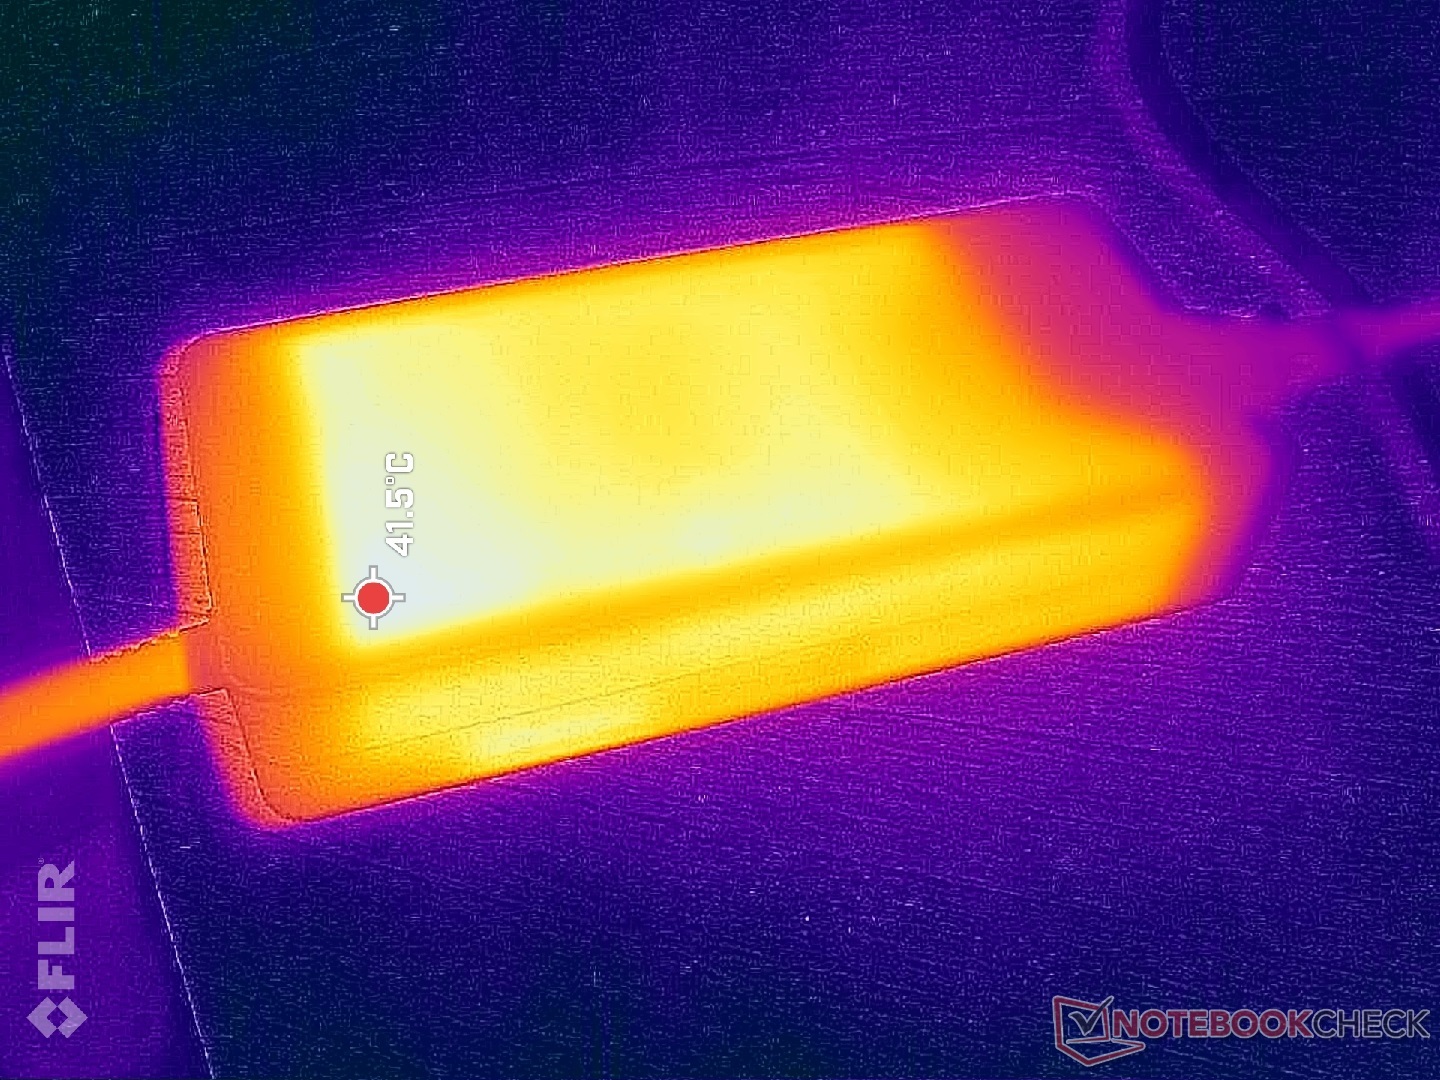
Duży zasilacz sieciowy o mocy 330 W pozostaje taki sam jak wcześniej. Ponieważ gry wymagają już prawie całej mocy wyjściowej zasilacza, próba naładowania baterii podczas grania potrwa znacznie, znacznie dłużej.
(Uwaga redaktora: Ta sekcja zostanie zaktualizowana po zakończeniu naprawy naszego multimetru Metrahit Energy. Przepraszamy za niedogodności)
| Eurocom Raptor X17 Core i9-14900HX i9-14900HX, NVIDIA GeForce RTX 4090 Laptop GPU, Corsair MP700 Pro 2TB, IPS, 3840x2160, 17.30 | Eurocom Raptor X17 i9-13900HX, NVIDIA GeForce RTX 4090 Laptop GPU, 3x Samsung SSD 980 Pro 1TB (RAID 0), IPS, 2560x1440, 17.30 | Asus TUF Gaming A17 FA707XI-NS94 R9 7940HS, NVIDIA GeForce RTX 4070 Laptop GPU, WD PC SN560 SDDPNQE-1T00, IPS, 1920x1080, 17.30 | Asus ROG Strix Scar 17 G733PY-XS96 R9 7945HX, NVIDIA GeForce RTX 4090 Laptop GPU, SK hynix PC801 HFS001TEJ9X101N, IPS, 2560x1440, 17.30 | MSI GE78HX 13VH-070US i9-13950HX, NVIDIA GeForce RTX 4080 Laptop GPU, Samsung PM9A1 MZVL22T0HBLB, IPS, 2560x1600, 17.00 | MSI Titan 18 HX A14VIG i9-14900HX, NVIDIA GeForce RTX 4090 Laptop GPU, 2x Samsung PM9A1a MZVL22T0HDLB (RAID 0), Mini-LED, 3840x2400, 18.00 | |
|---|---|---|---|---|---|---|
| Power Consumption | ||||||
| Idle Minimum * | 13.4 | 6.2 | 14.5 | 16.1 | 13.2 | |
| Idle Average * | 22.2 | 21.8 | 21.1 | 24 | 25.4 | |
| Idle Maximum * | 42.4 | 22 | 42.8 | 34 | 53.5 | |
| Load Average * | 132.8 | 59.2 | 116.7 | 123.6 | 151.4 | |
| Witcher 3 ultra * | 304 | 189.7 | 278 | 286 | 336 | |
| Load Maximum * | 319.8 | 247.8 | 279.6 | 285.7 | 395.2 |
* ... im mniej tym lepiej
Power Consumption Witcher 3 / Stresstest
Power Consumption external Monitor
Żywotność baterii
Czas pracy jest tylko nieznacznie krótszy niż w zeszłorocznej konfiguracji, prawdopodobnie ze względu na bardziej wymagającą rozdzielczość 4K.
| Eurocom Raptor X17 Core i9-14900HX i9-14900HX, NVIDIA GeForce RTX 4090 Laptop GPU, 99 Wh | Eurocom Raptor X17 i9-13900HX, NVIDIA GeForce RTX 4090 Laptop GPU, 99 Wh | Asus TUF Gaming A17 FA707XI-NS94 R9 7940HS, NVIDIA GeForce RTX 4070 Laptop GPU, 90 Wh | Asus ROG Strix Scar 17 G733PY-XS96 R9 7945HX, NVIDIA GeForce RTX 4090 Laptop GPU, 90 Wh | MSI GE78HX 13VH-070US i9-13950HX, NVIDIA GeForce RTX 4080 Laptop GPU, 99 Wh | MSI Titan 18 HX A14VIG i9-14900HX, NVIDIA GeForce RTX 4090 Laptop GPU, 99.9 Wh | |
|---|---|---|---|---|---|---|
| Czasy pracy | 5% | 93% | -13% | 28% | -11% | |
| WiFi v1.3 | 284 | 299 5% | 548 93% | 248 -13% | 363 28% | 252 -11% |
| Reader / Idle | 612 | 1180 | 439 | 353 | ||
| Load | 91 | 103 | 89 | 72 |
Za
Przeciw
Werdykt - nowy procesor, ten sam wygląd

Od Core i9-14900HX jest w dużej mierze rebrandingiem poprzedniego Core i9-13900HX, Eurocom Raptor X17 z 2024 roku nie oferuje zbyt wiele w porównaniu z wersją z 2023 roku. Wydajność procesora może być nieco wyższa, ale większość innych elementów pozostaje niezmieniona. Ogólna wydajność jest jednak nadal porównywalna z niektórymi najszybszymi dostępnymi laptopami, w tym MSI Titan HX lub Asus ROG Strix Scar 18. Eurocom nie oferuje mini-LED ani OLED dla tego modelu, ale takie opcje są przeznaczone dla użytkowników multimedialnych, podczas gdy Raptor X17 jest przeznaczony bardziej do profesjonalnych przestrzeni o wysokiej wydajności.
Hałas wentylatora może być nieco bardziej stabilny, ale proszę nie oczekiwać znaczącego wzrostu wydajności w porównaniu do już superszybkich opcji poprzedniej generacji.
Zaawansowani użytkownicy, którzy zdecydują się na konfigurację z dyskiem SSD PCIe5, powinni bezwzględnie rozważyć zamówienie również rozpraszacza ciepła. W przeciwnym razie dysk PCIe5 będzie zachowywał się bardziej jak dysk PCIe4 po zaledwie kilku minutach intensywnego użytkowania.
Cena i dostępność
Eurocom jest obecnie w sprzedaży 2024 Raptor X17 w cenie zaczynającej się od 3500 USD za RTX 4080 i wyświetlacz 2K. Konfiguracja z RTX 4090 i wyświetlaczem 4K, tak jak w naszej jednostce testowej, podniesie cenę do ponad 4200 USD.
Eurocom Raptor X17 Core i9-14900HX
-
15/03/2024 v7
Allen Ngo
Transparency
The present review sample was made available to the author as a loan by the manufacturer or a shop for the purposes of review. The lender had no influence on this review, nor did the manufacturer receive a copy of this review before publication. There was no obligation to publish this review.
Pricecompare

