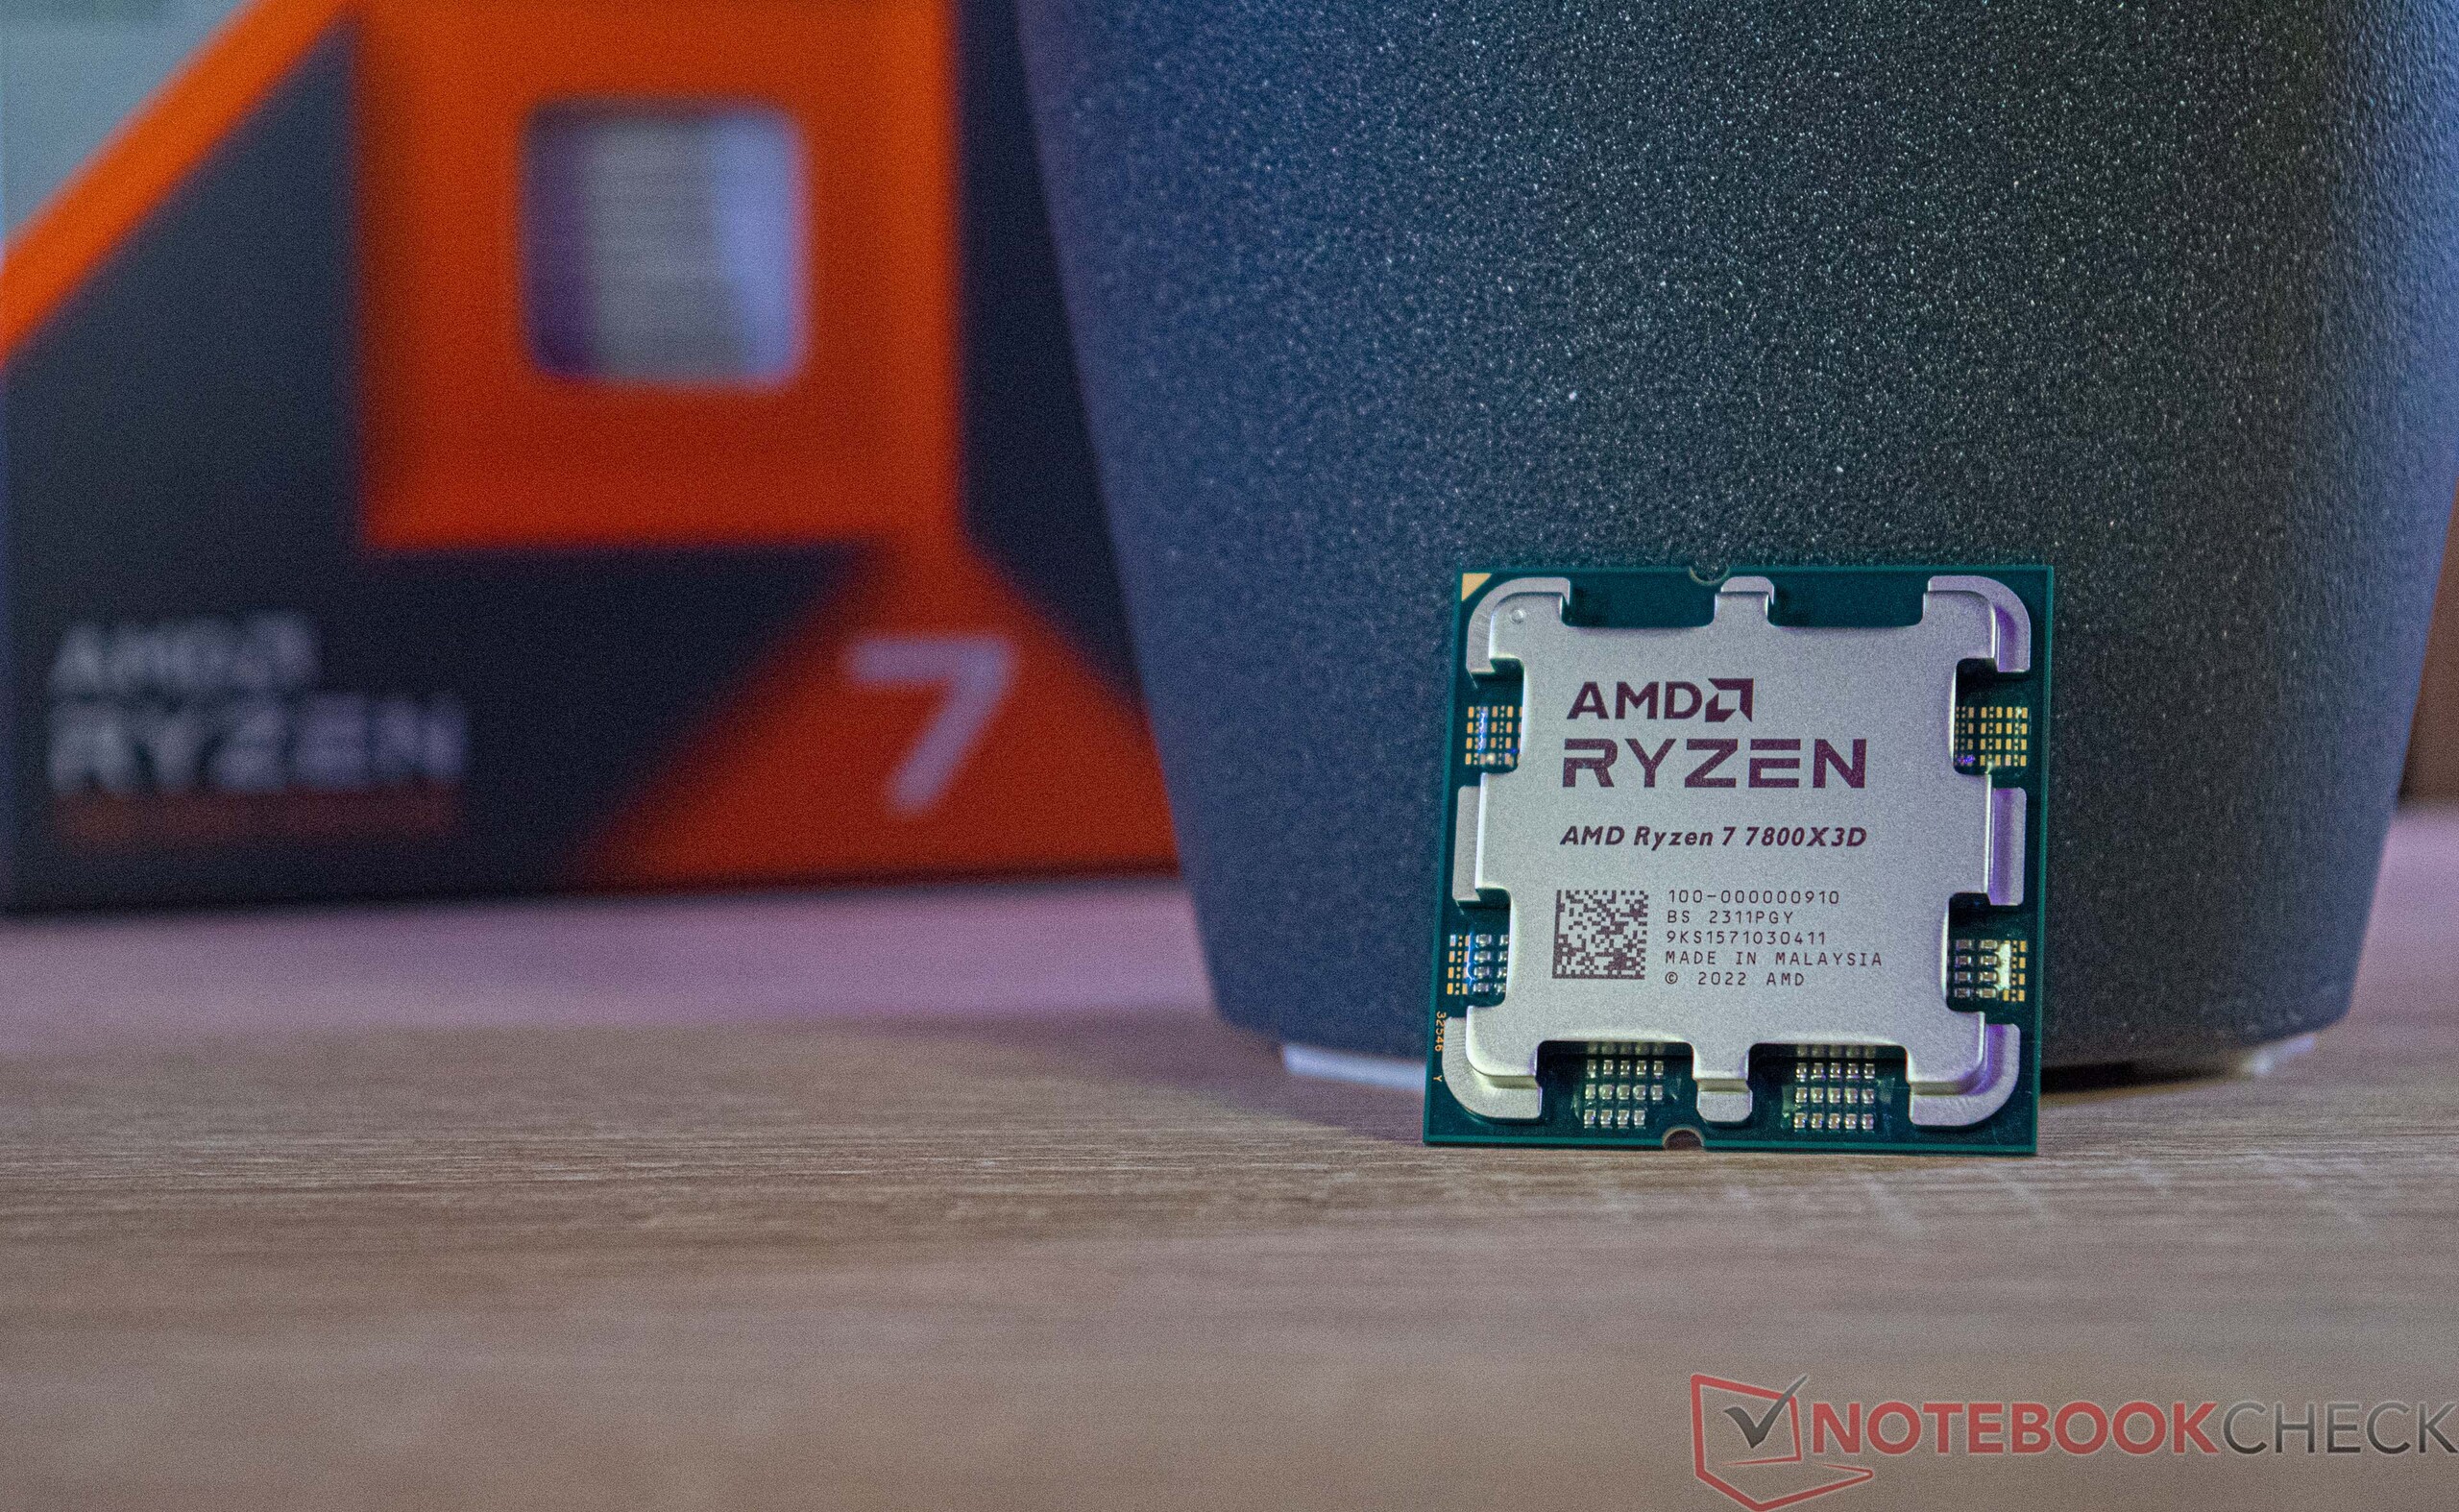
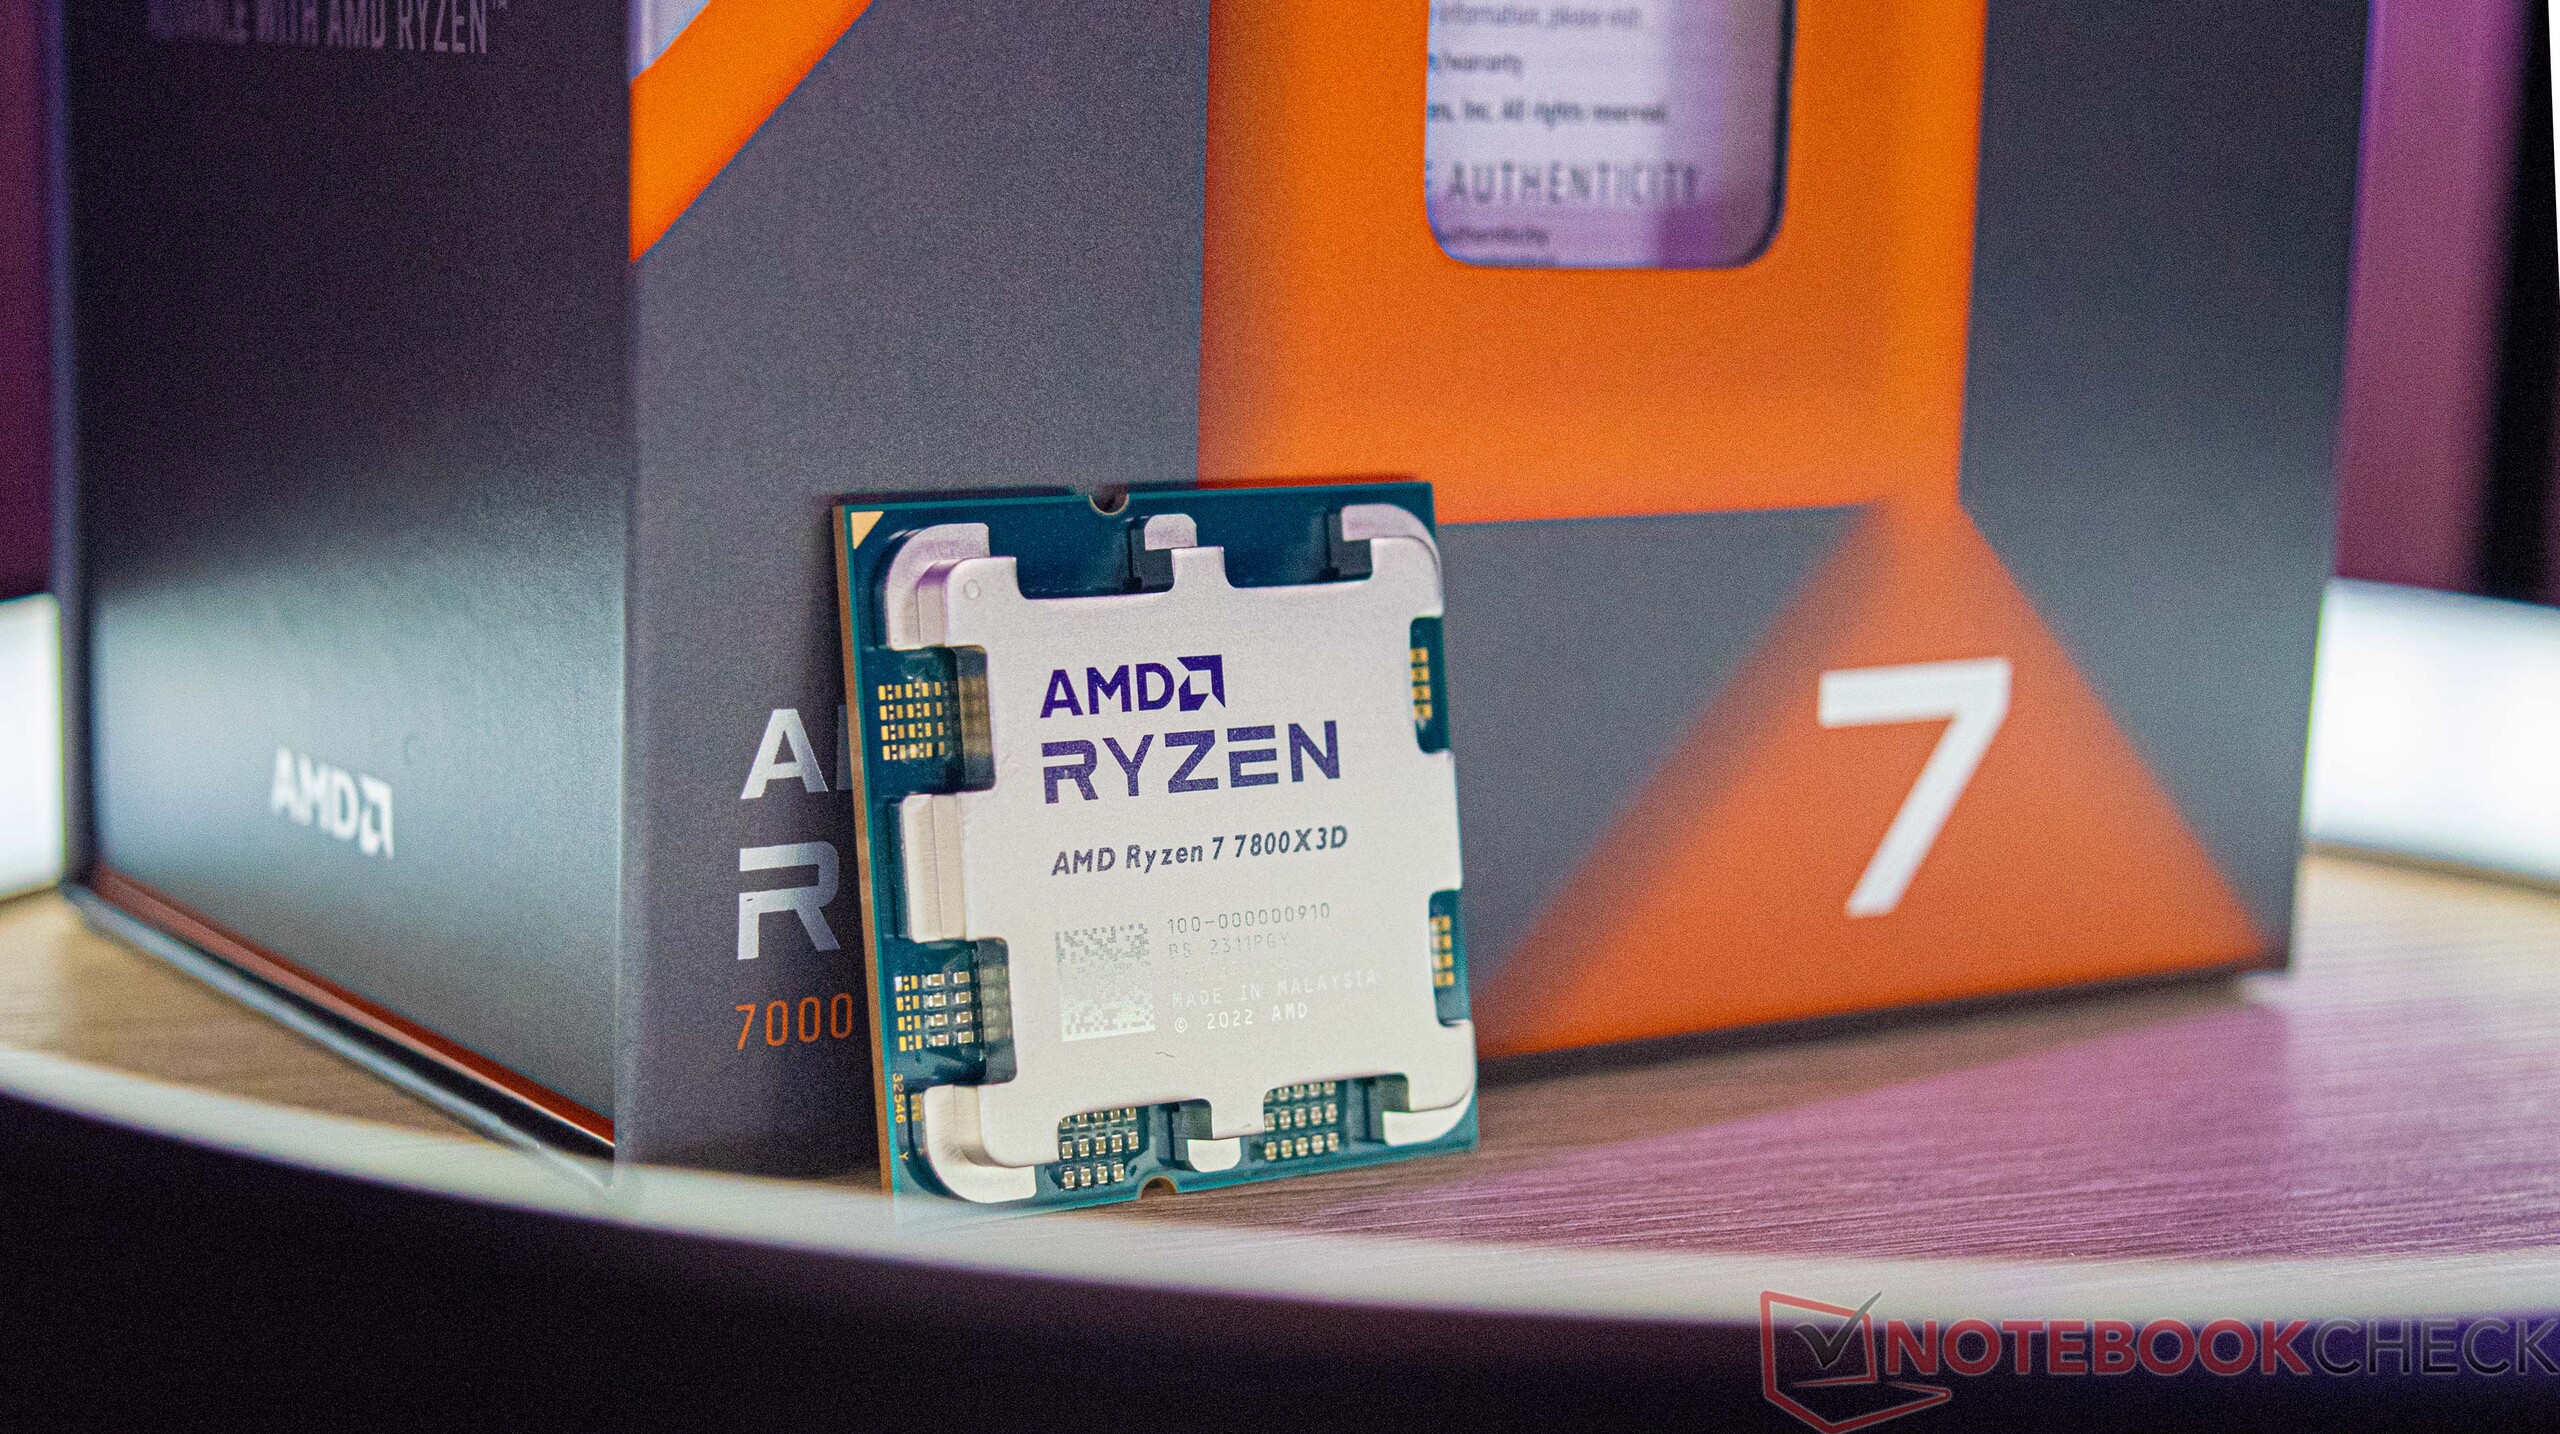
Recenzja procesora AMD Ryzen 7 7800X3D do komputerów stacjonarnych: Szybszy niż Core i9-13900K dzięki 3D V-Cache i tylko 8 rdzeniom
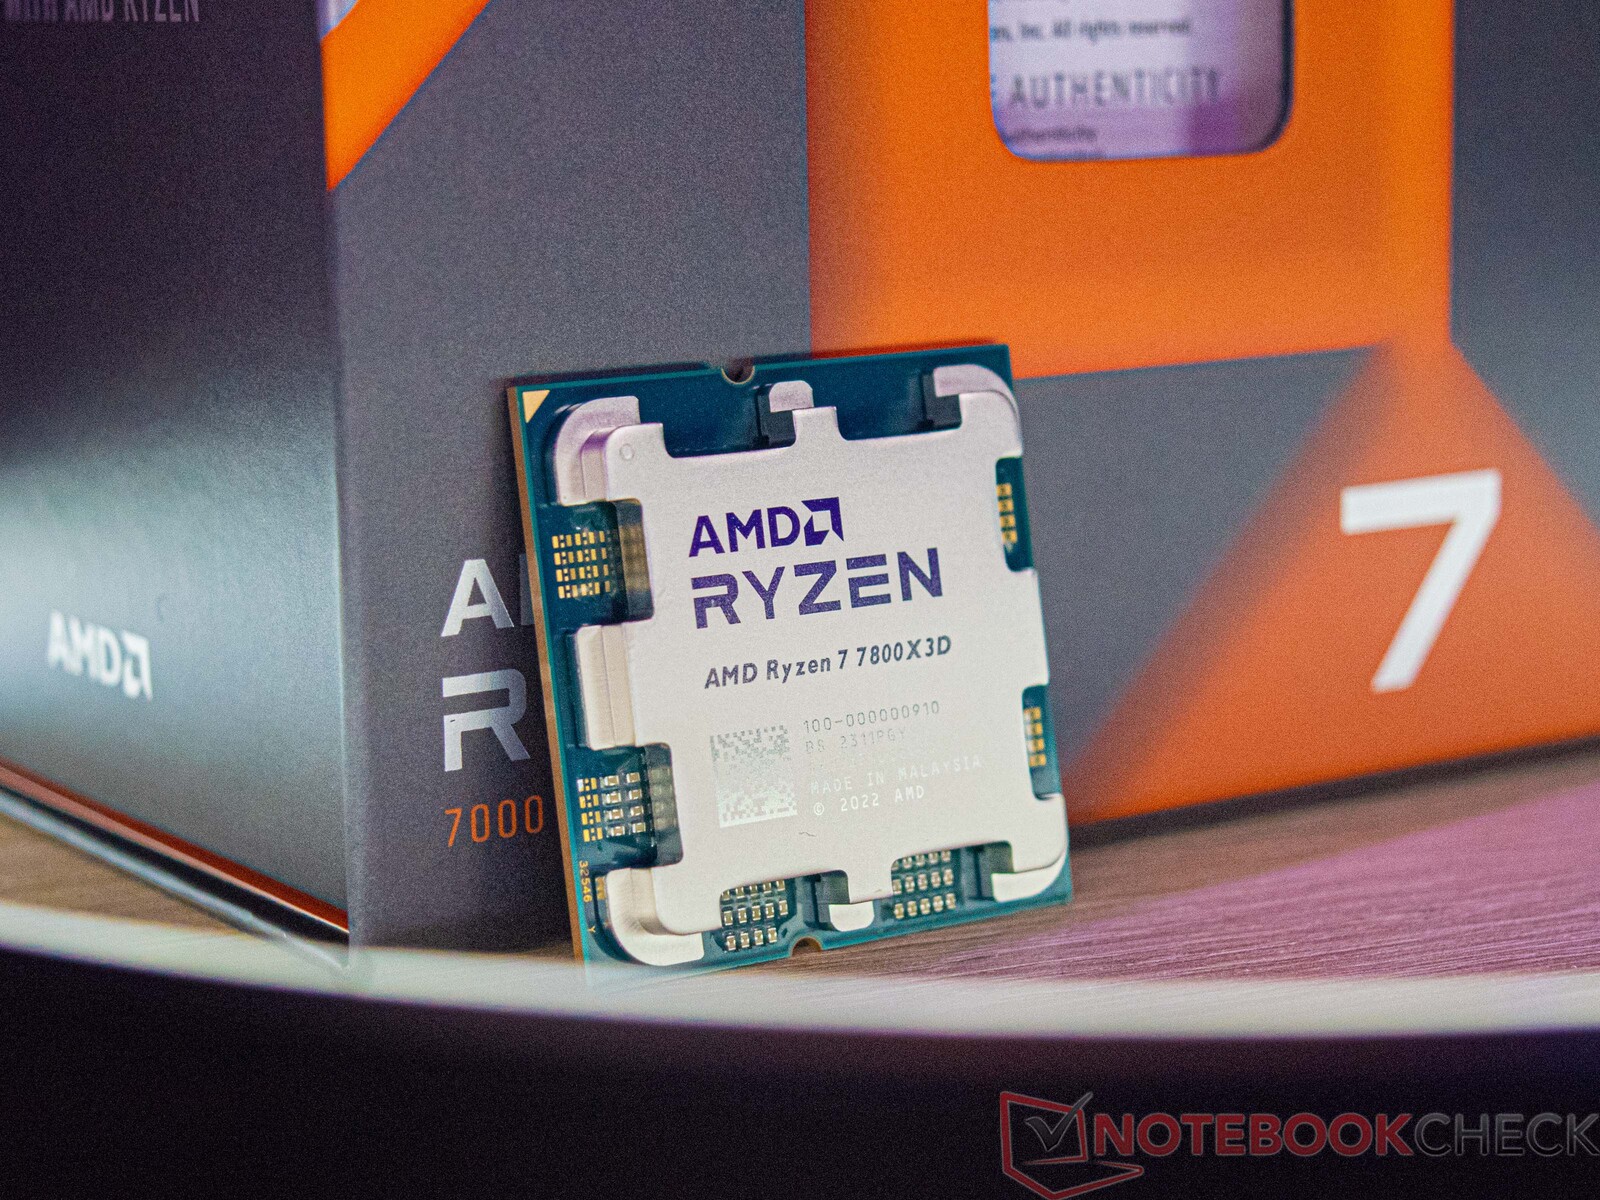
AMD Ryzen 7 7800X3D jest już trzecim procesorem AMD opartym na AM 5 z 3D V-Sync - po obu modelach Ryzen 9 (AMD Ryzen 9 7950X3Di AMD Ryzen 9 7900X3D). Wraz z dwoma większymi modelami, natywny 8-rdzeniowy procesor został zaprezentowany w styczniu tego roku na targach CES w Las Vegas. Trzeba było jednak sporo poczekać, aż komponent zostanie ostatecznie wprowadzony na rynek 6 kwietnia 2023 roku.
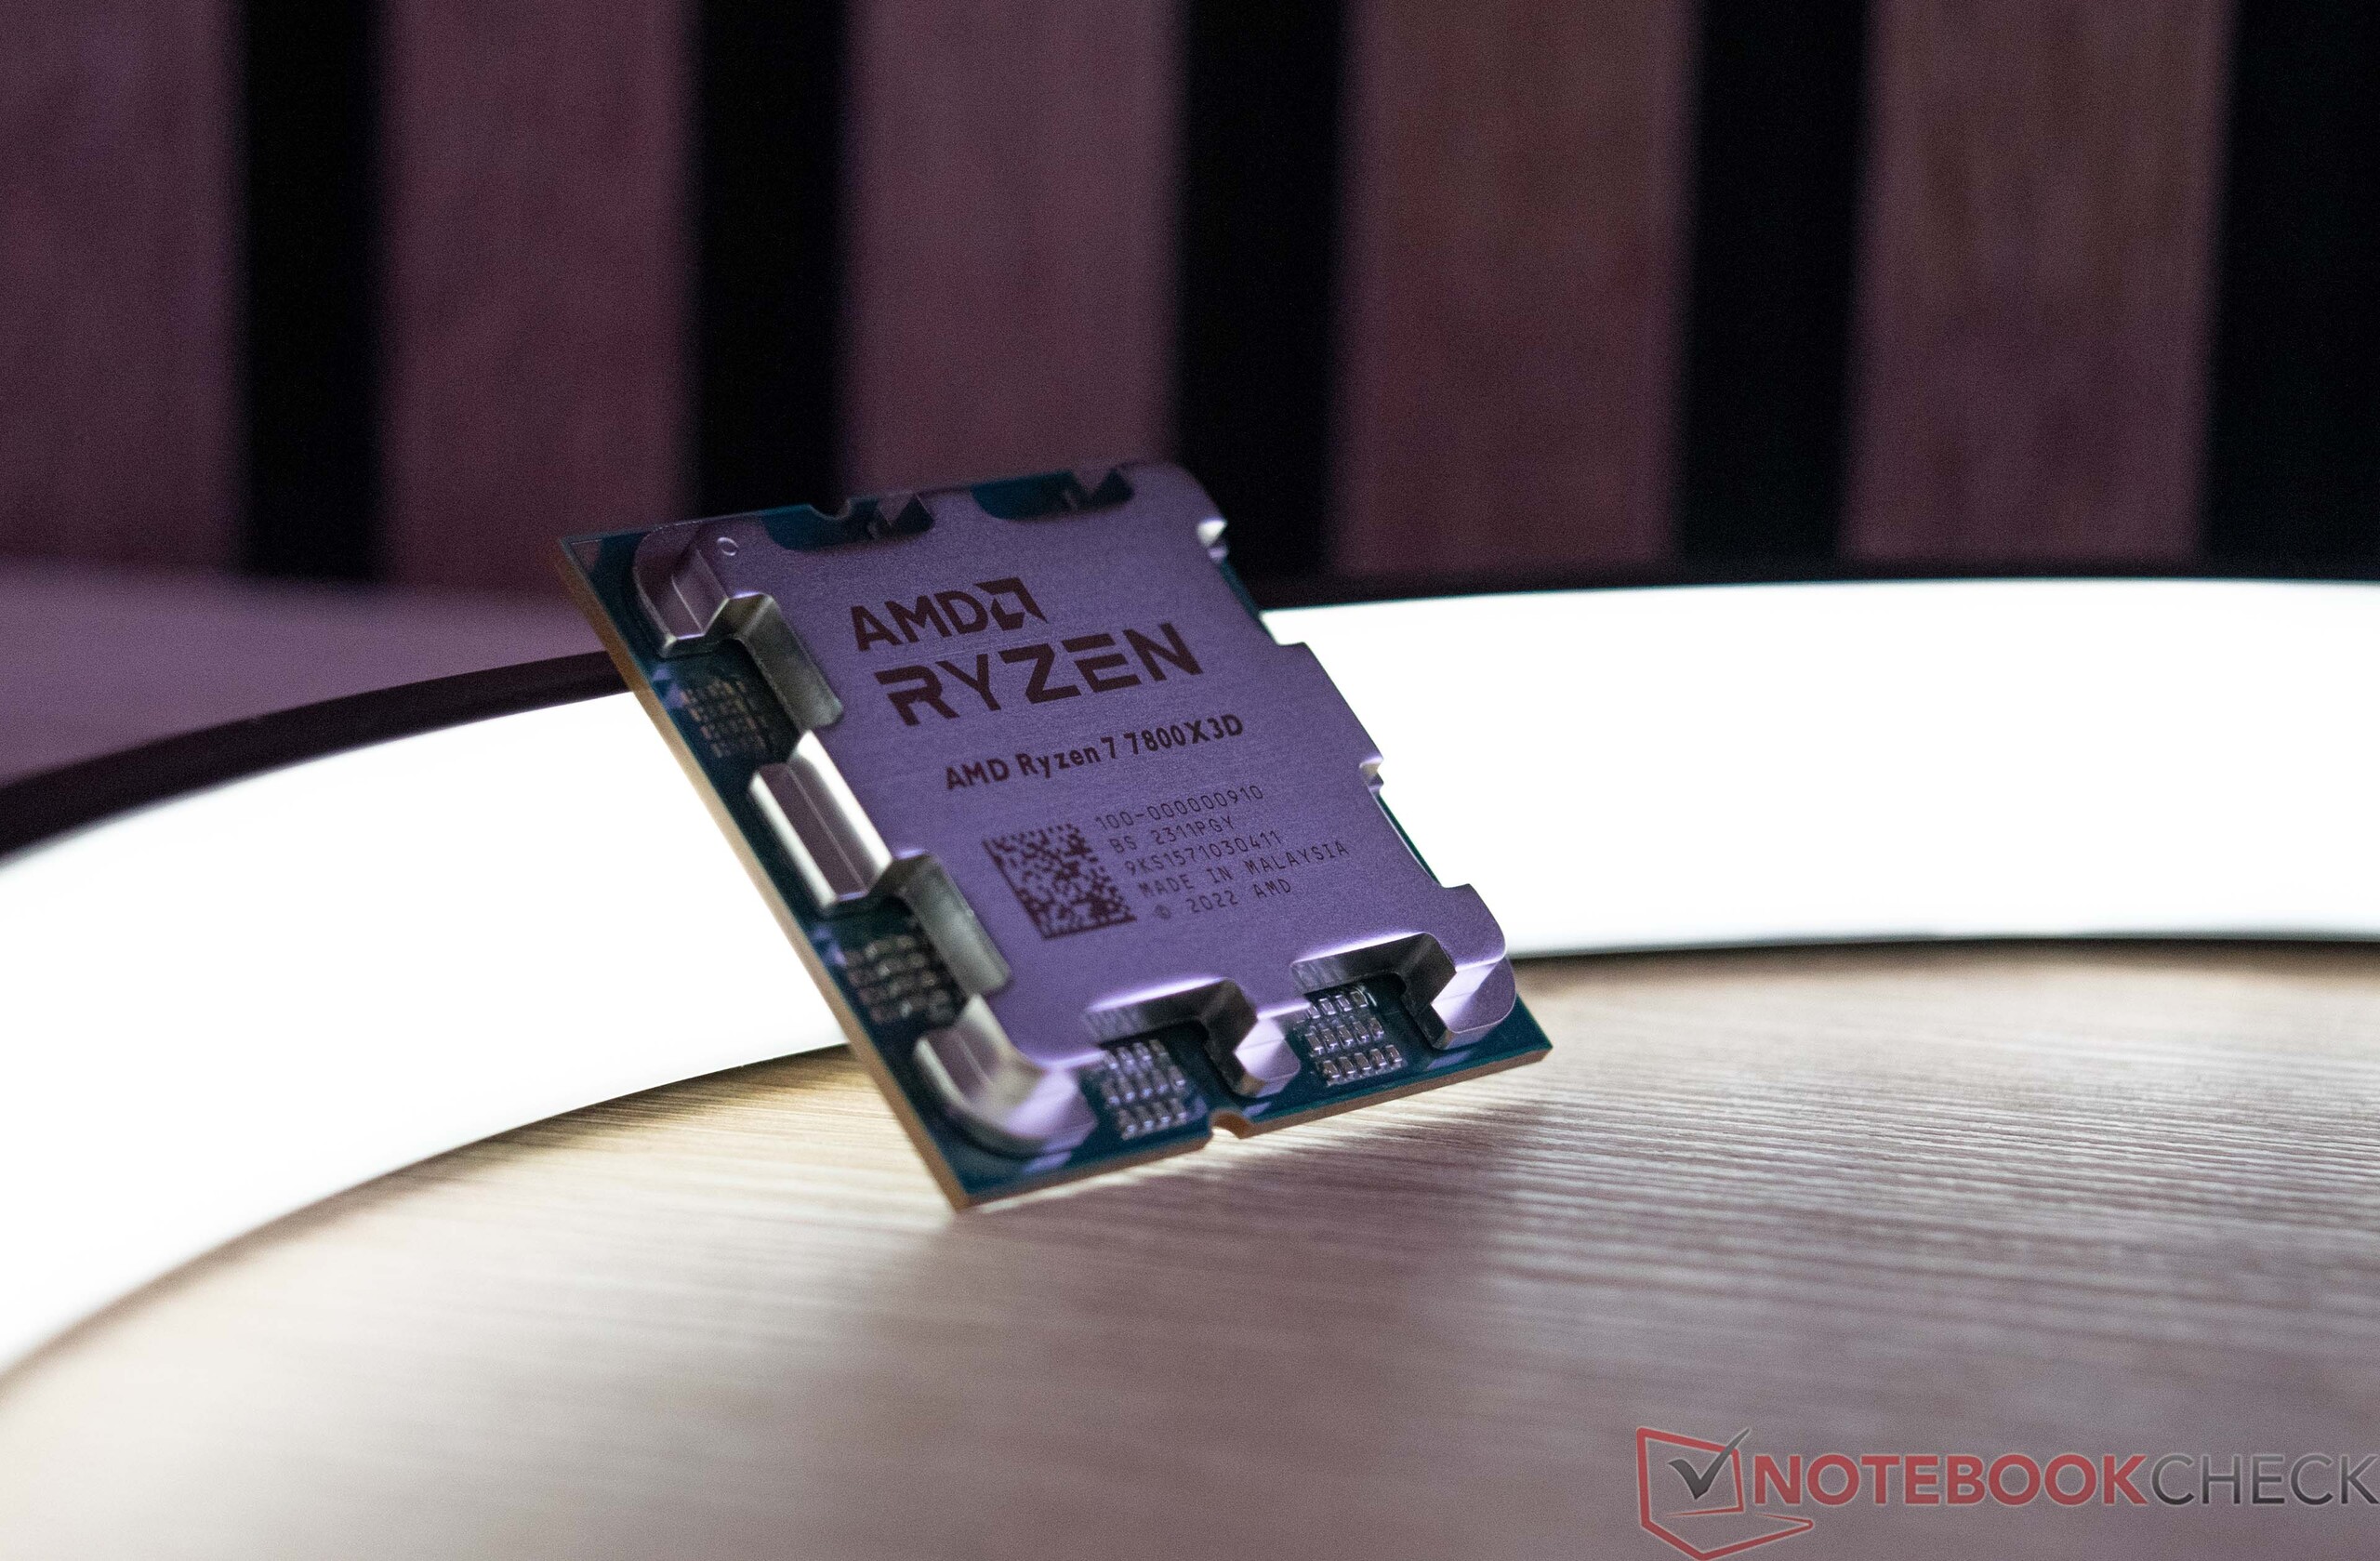
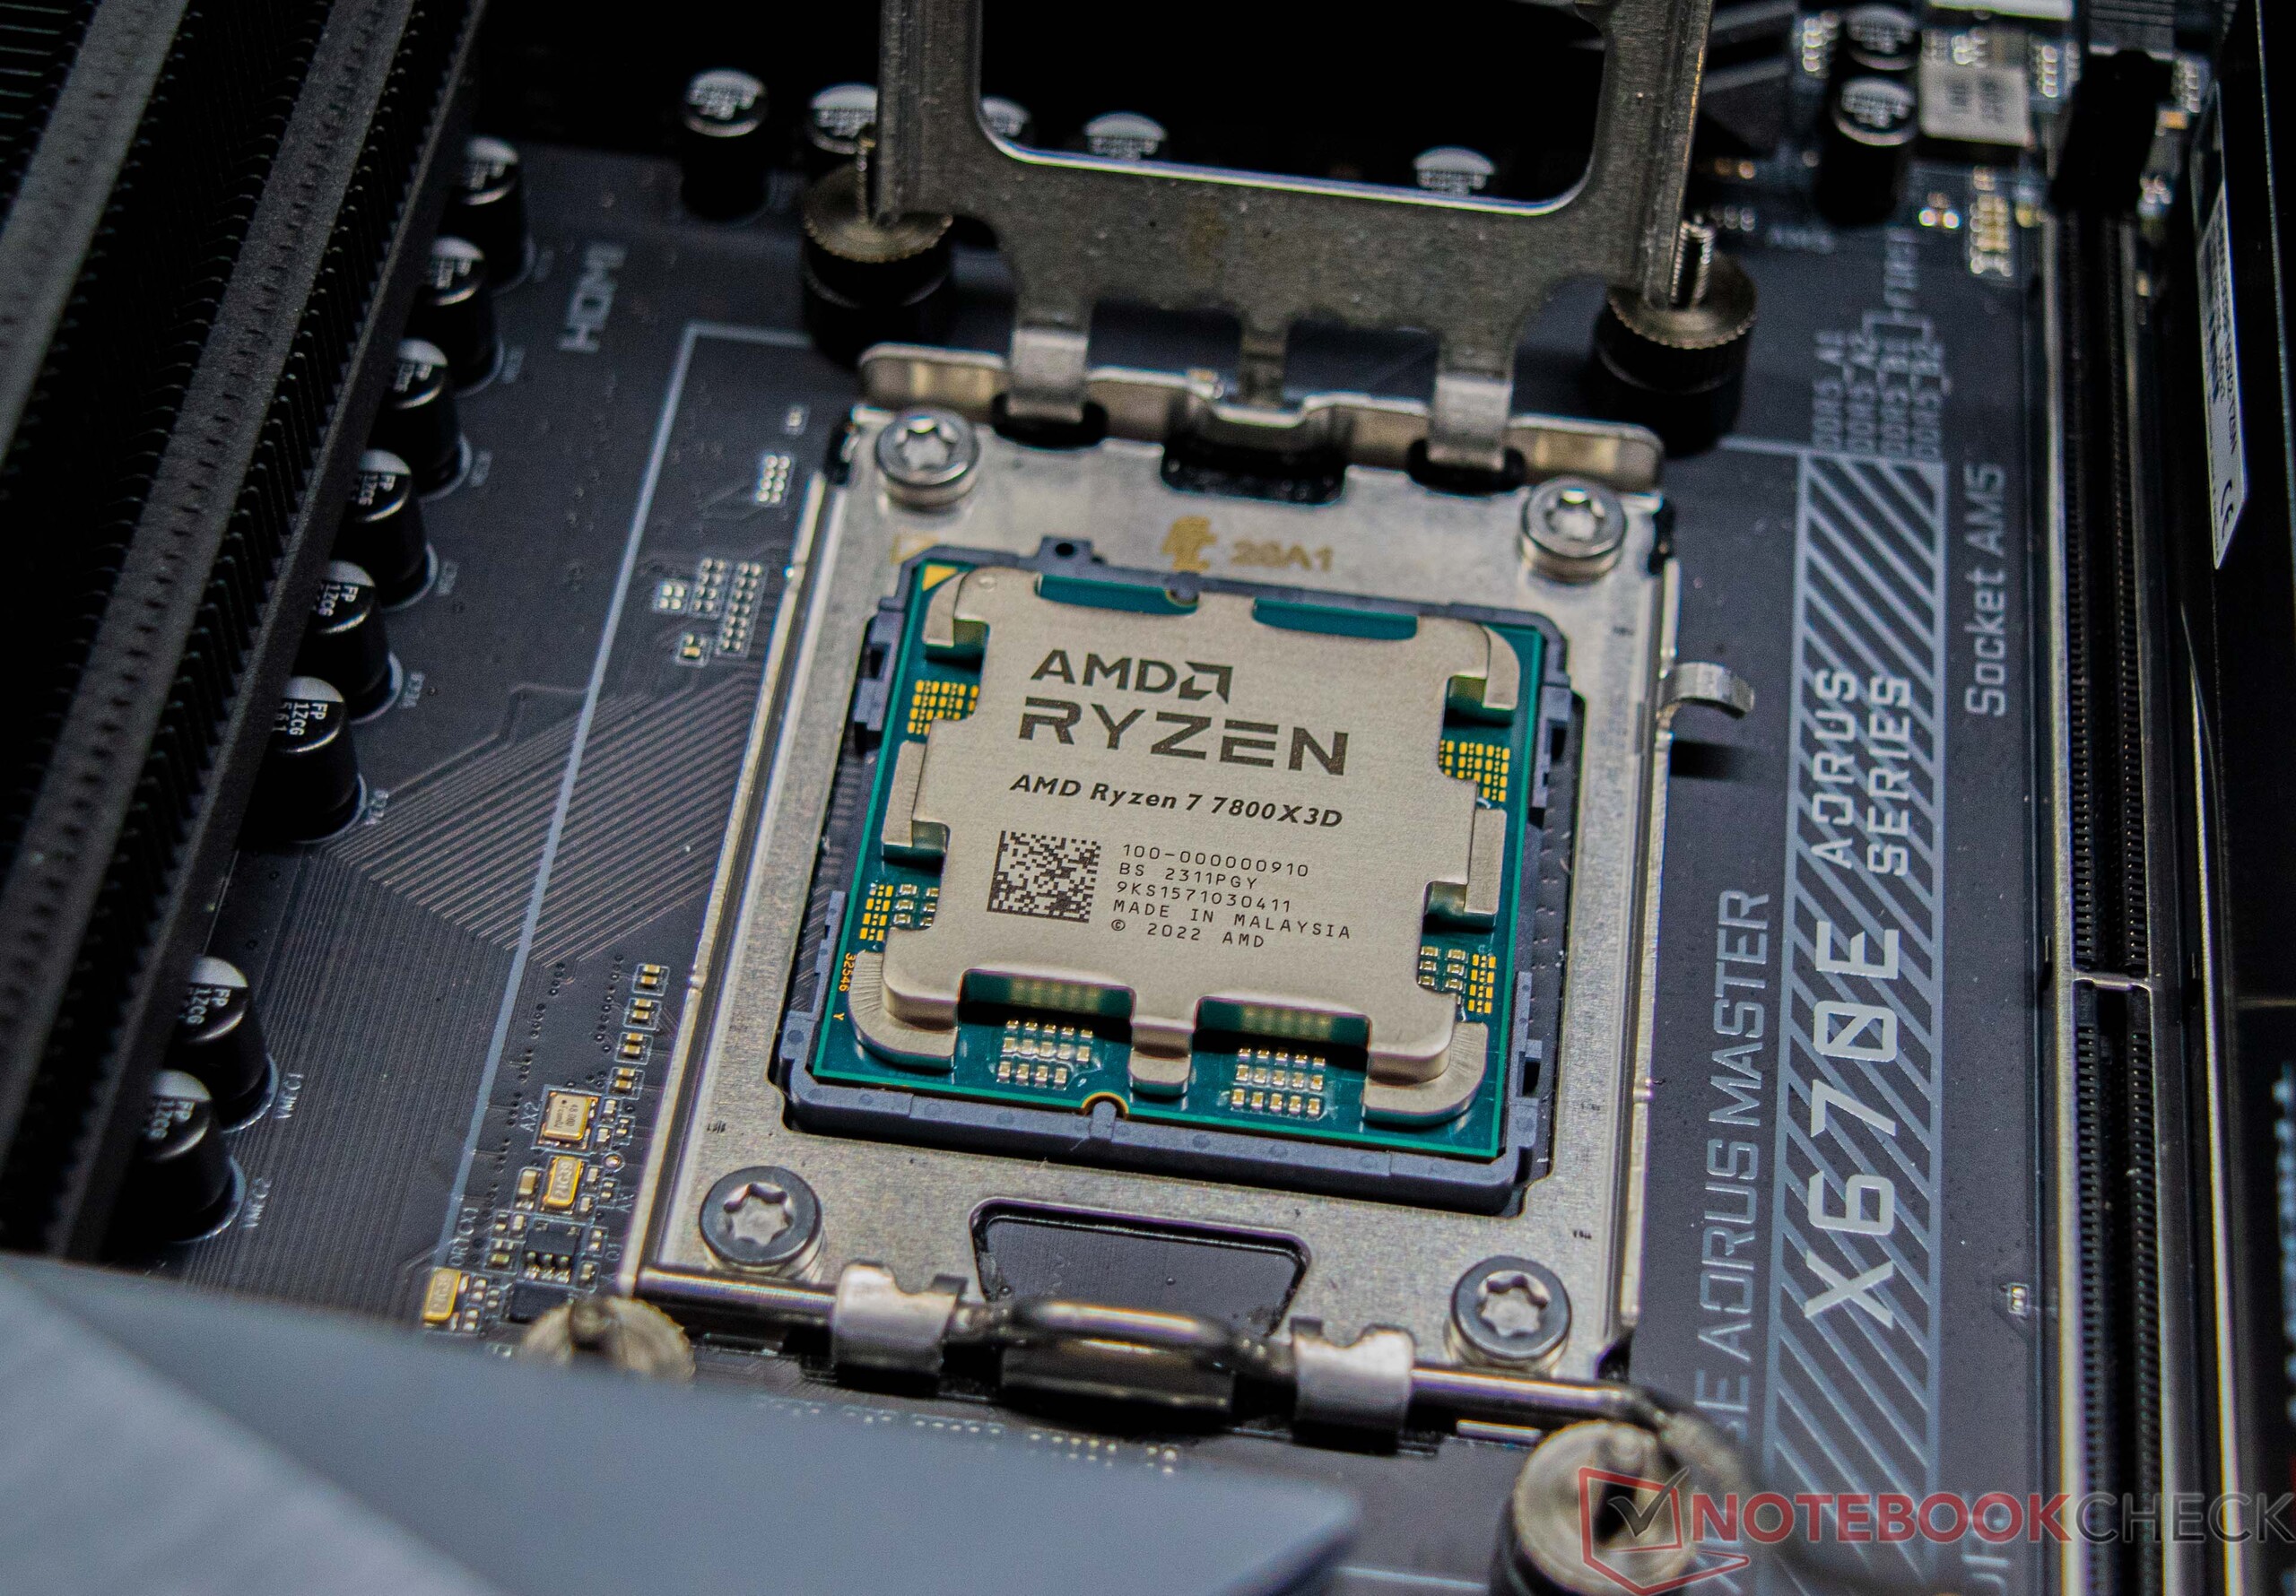
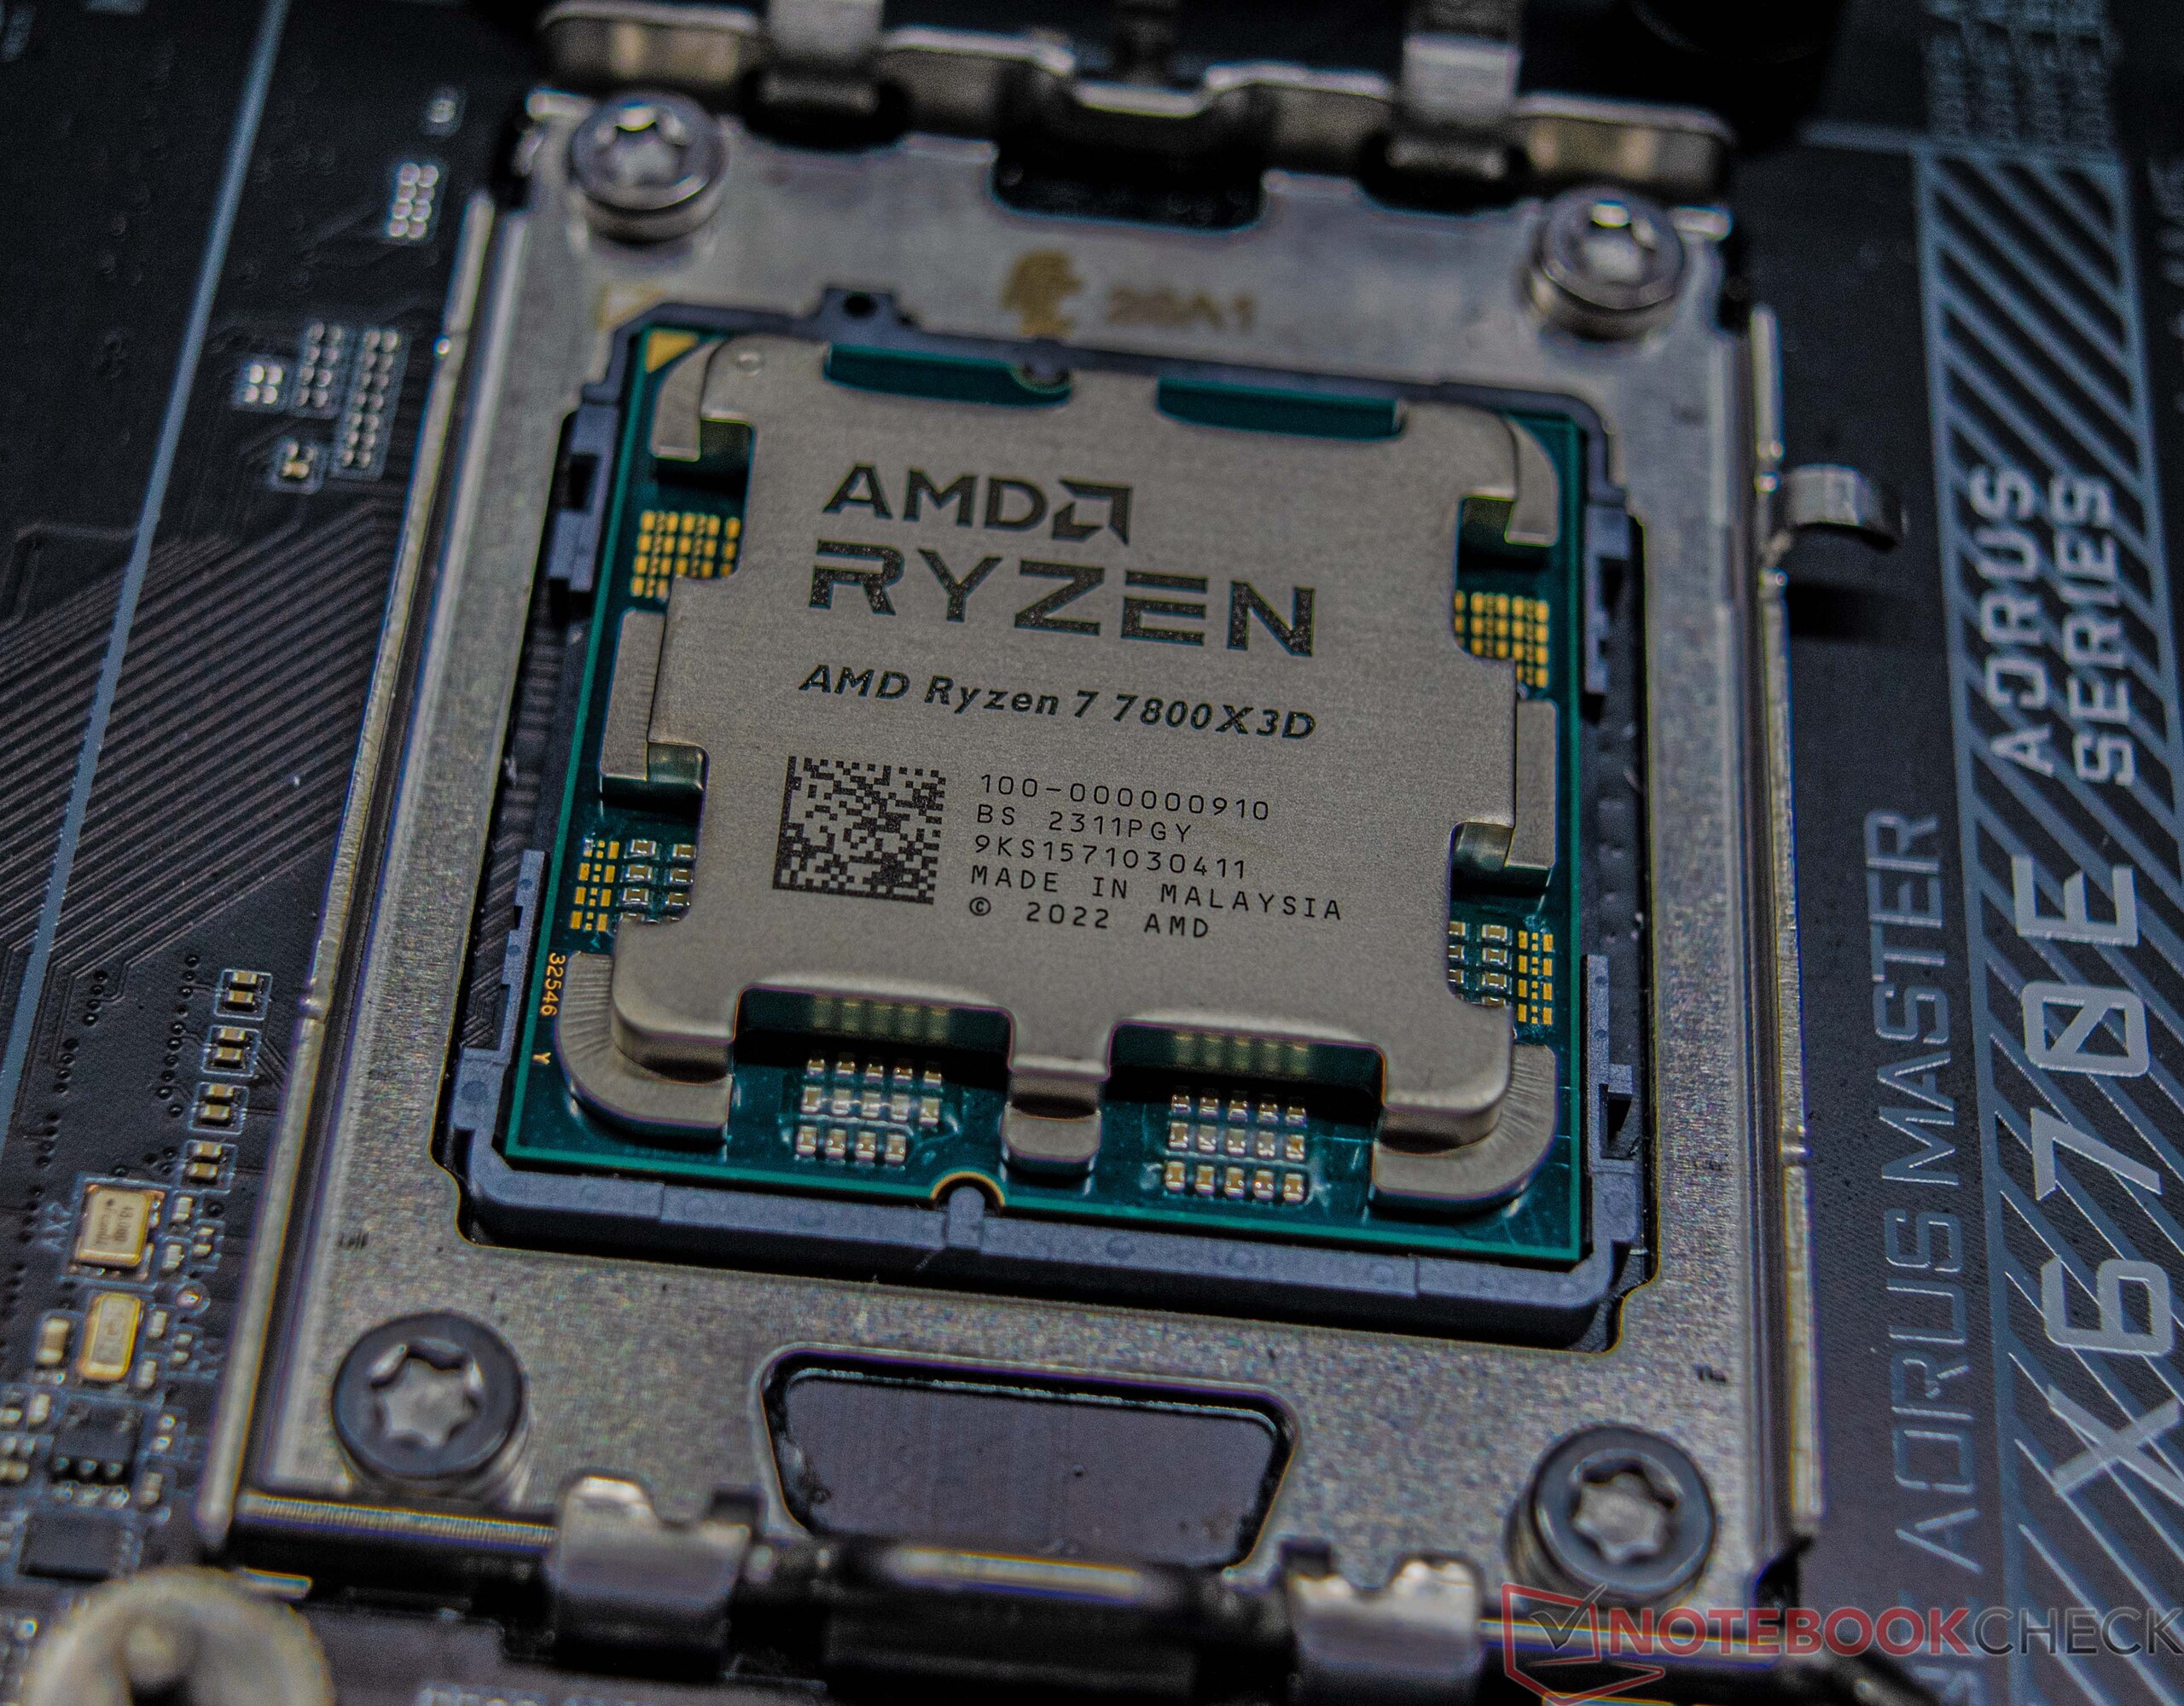
My już testowaliśmy aMD Ryzen 9 7950X3D i byliśmy pod wrażeniem jego świetnej wydajności i niskiego zużycia energii. Zobaczymy, jak dobrze w porównaniu wypadnie AMD Ryzen 7 7800X3D. Ogólnie rzecz biorąc, jego pamięć podręczna 3D V-Cache powinna skutkować wzrostem wydajności, co oznacza, żeAMD Ryzen 7 5800X3Doparty na AM4 powinien nadal być dość popularny. Jednak jego wewnętrzna konstrukcja różni się w porównaniu do obu modeli Ryzen 9, które mają ten 3D V-Cache. AMD Ryzen 7 7800X3D ma tylko jeden CCD z 8 rdzeniami, w tym szybką pamięć podręczną, a z kolei modele Ryzen 9 mają dwa CCD z odpowiednio 6 i 8 rdzeniami CPU. Jednak tylko jeden z CCD jest wyposażony w 3D V-Cache, podczas gdy drugi CCD jest dobrze znany z modeluAMD Ryzen 9 7950X. CCD to rzeczywista matryca procesora pod rozpraszaczem ciepła, która łączy maksymalnie osiem rdzeni.
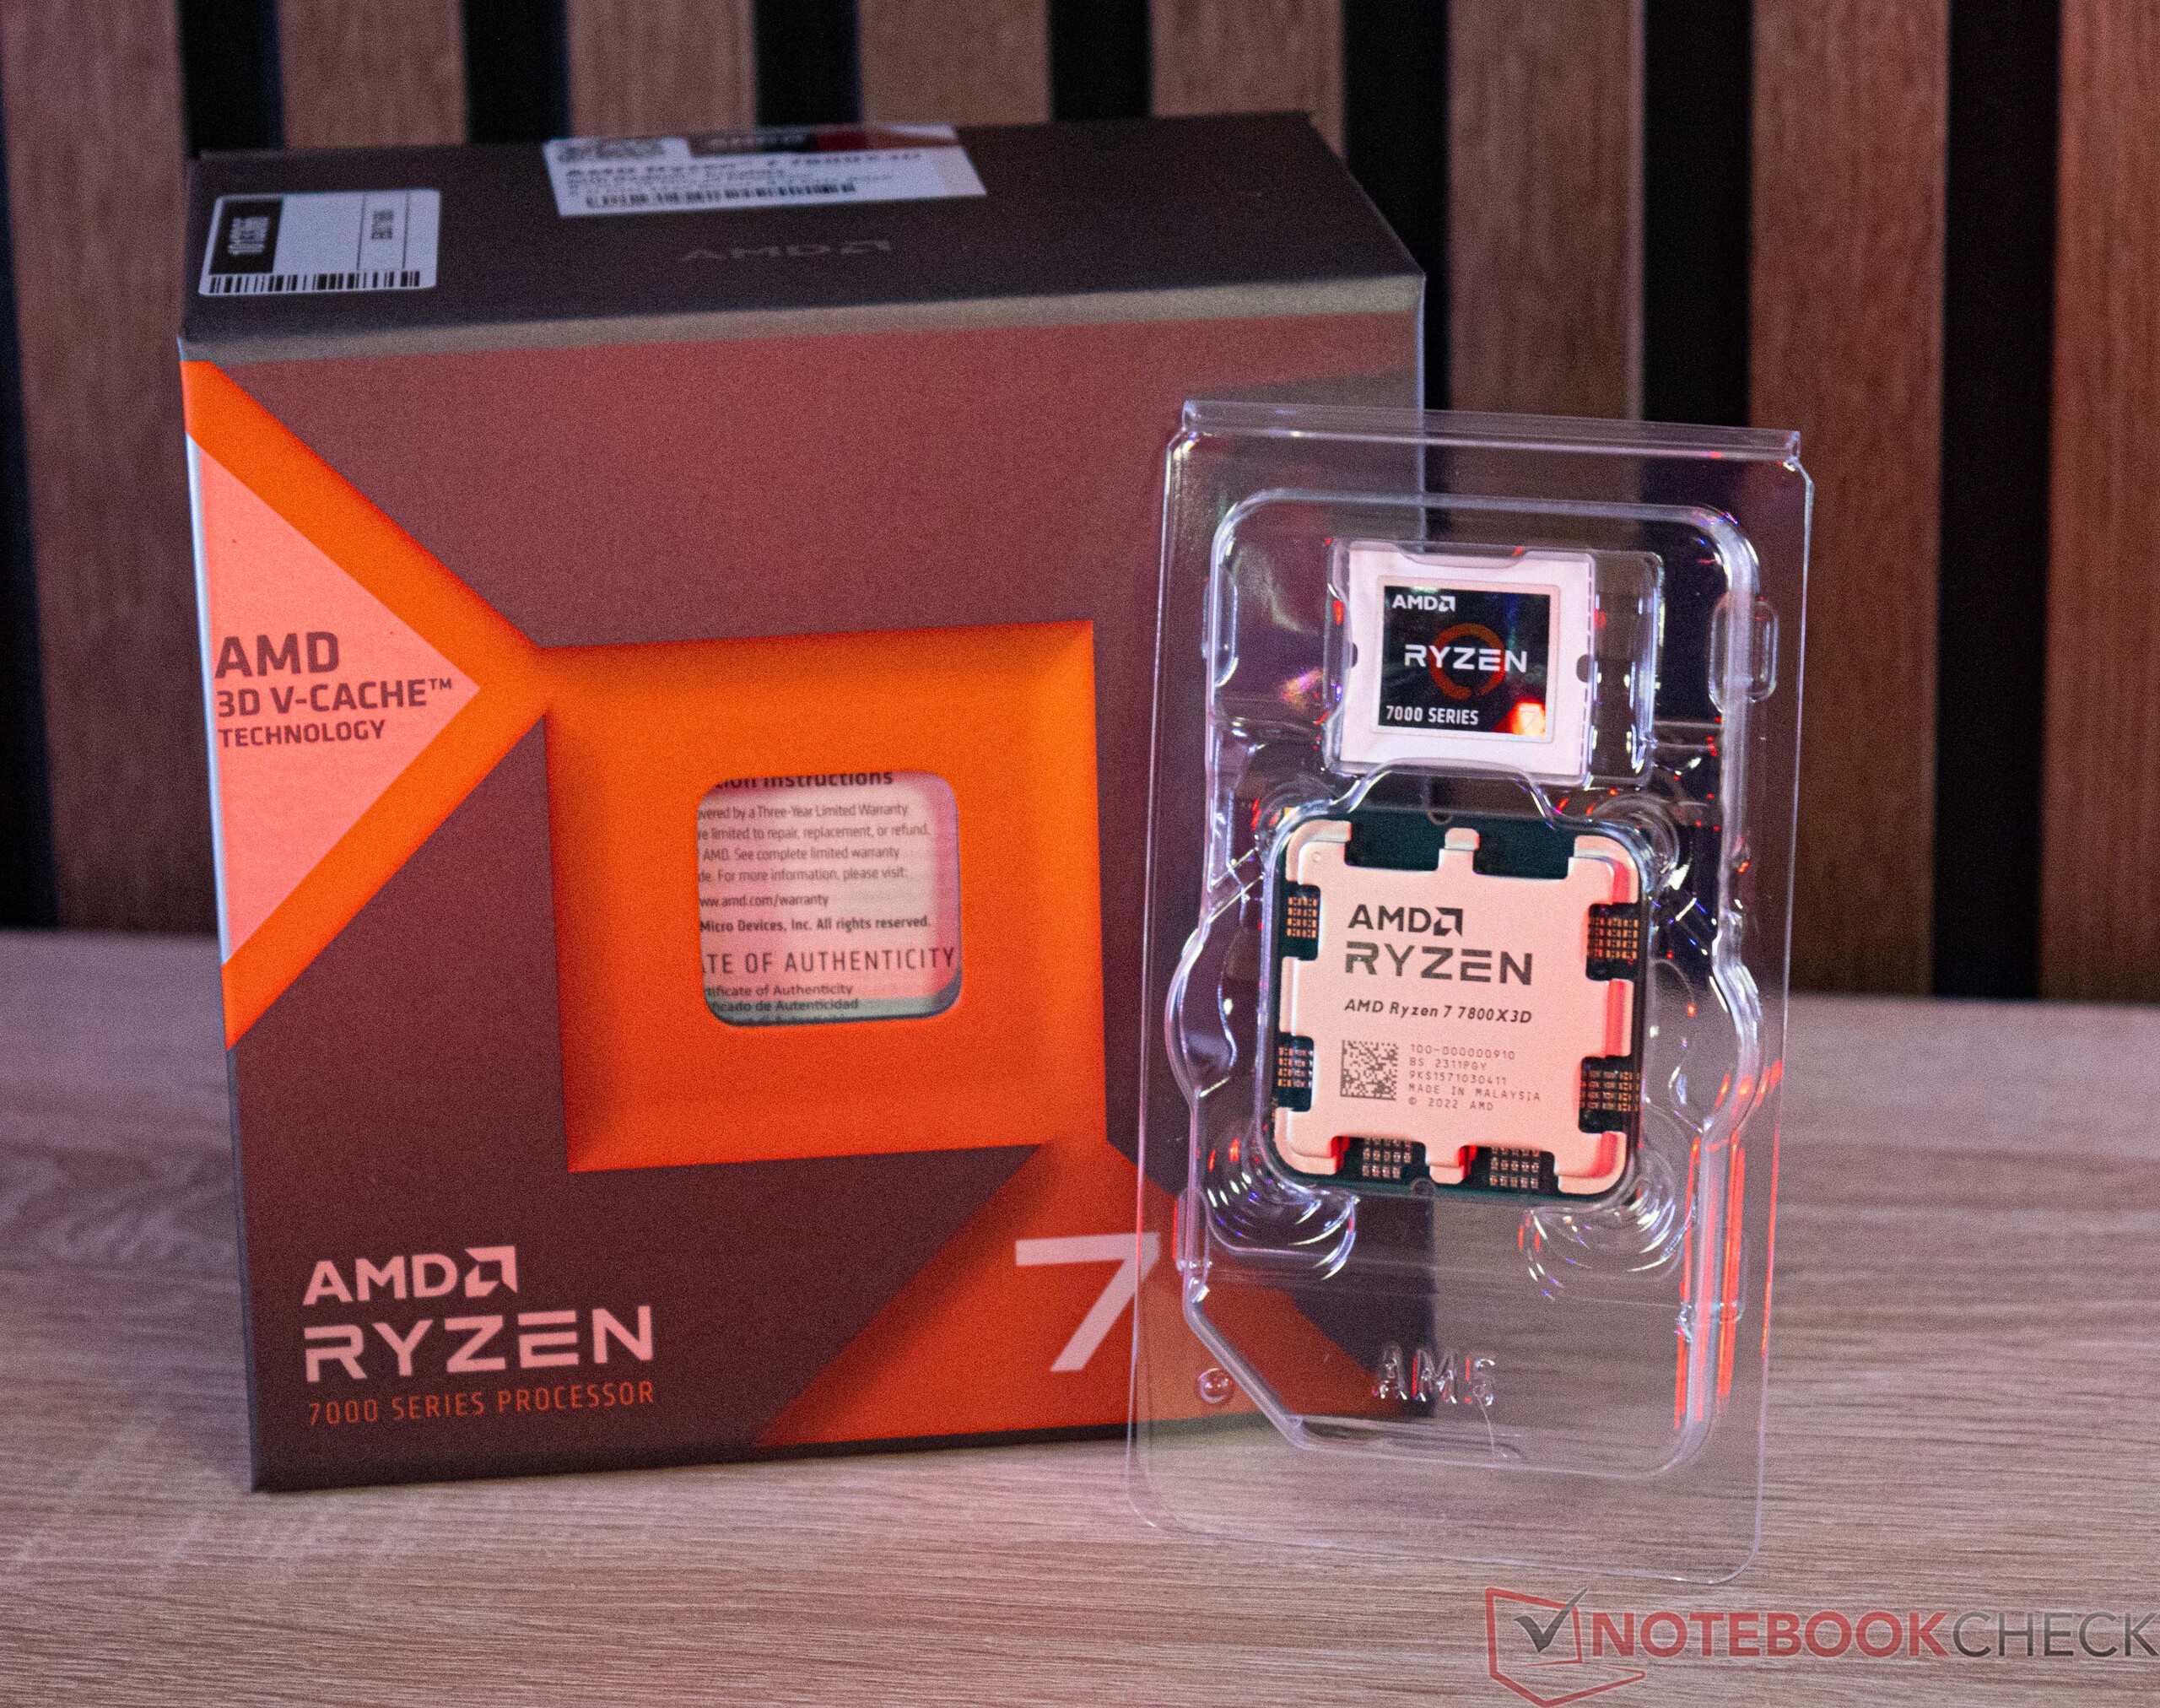
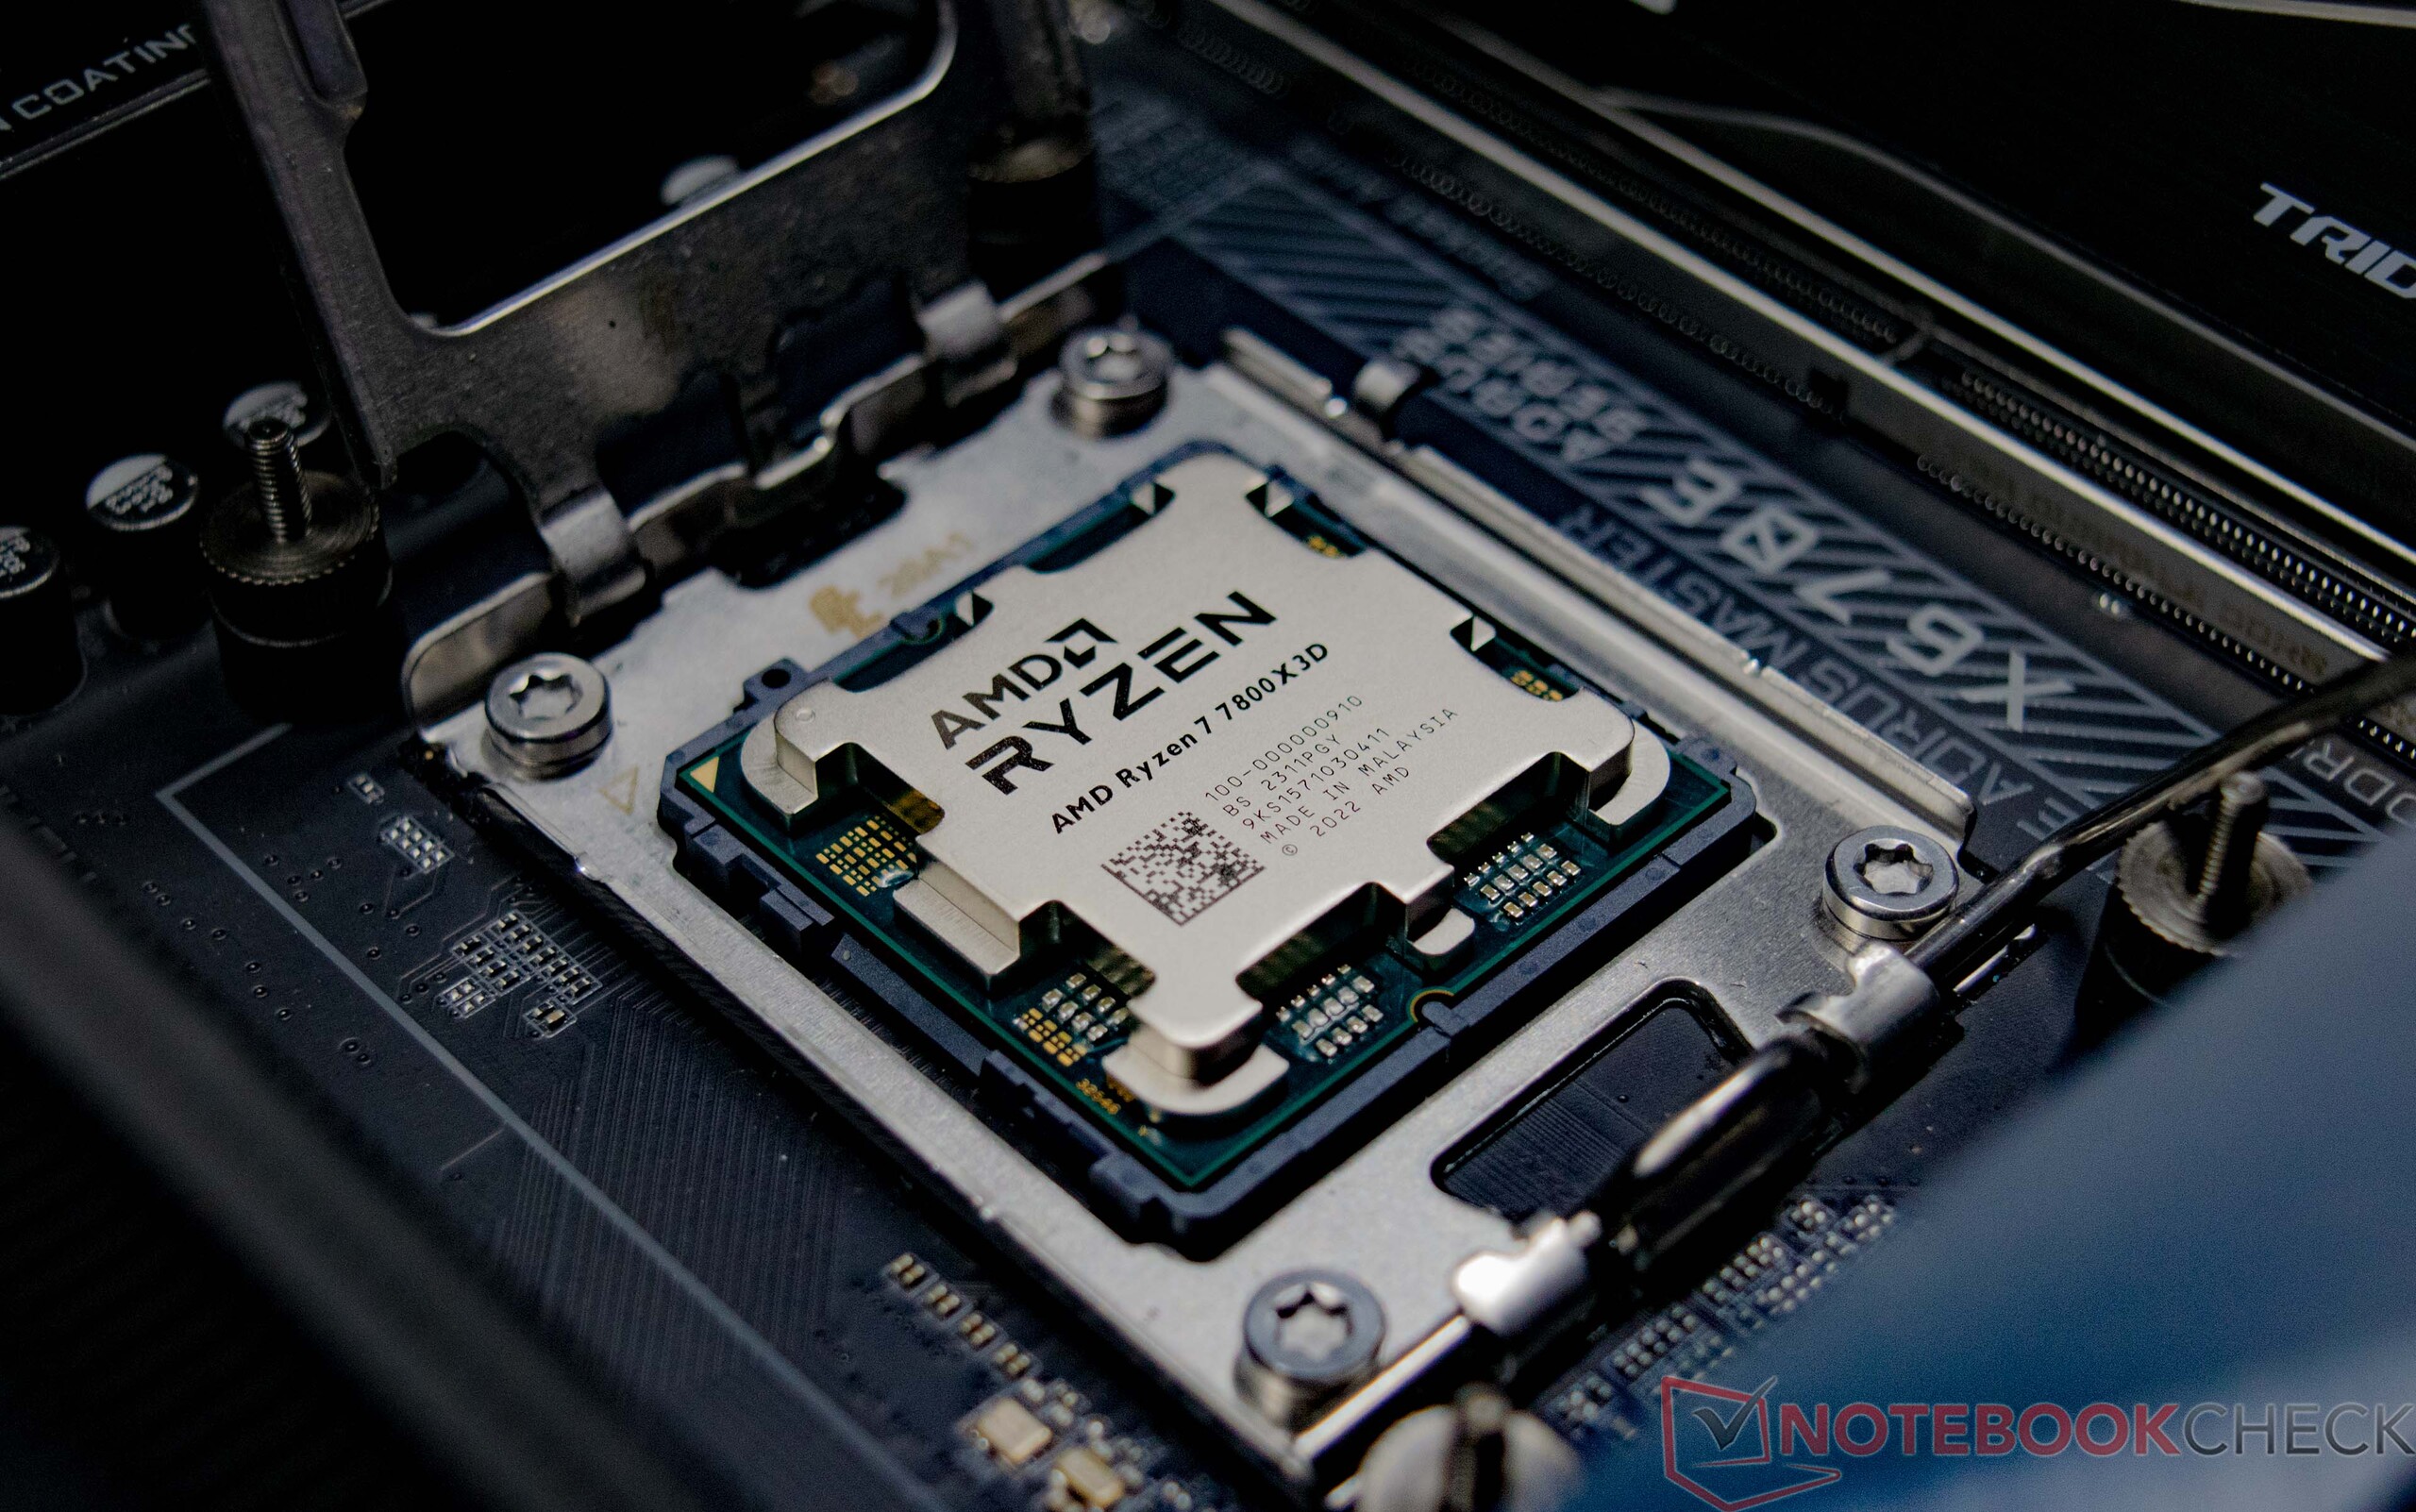
AMD Ryzen 7 7800X3D, podobnie jak wszystkie procesory z serii Ryzen 7000, wymaga gniazda AM5 (1718 styków). Aktualizacja z Ryzena serii 5000 lub starszego oznacza zakup nowej płyty głównej i konieczność zainwestowania w nową pamięć RAM. Jeśli chodzi o pobór mocy, producent podaje TDP na poziomie 120 watów. Maksymalny pobór mocy jest jednak ograniczony do 162 watów przez PPT (Package Power Tracking).
Die AMD-Ryzen-7000-Familie im Überblick
| Model | Rdzenie/Wątki | Taktowanie bazowe | Taktowanie Turbo | L2-Cache | L3-Cache | TDP | PPT | Cena premierowa |
|---|---|---|---|---|---|---|---|---|
| Ryzen 9 7950X3D | 16/32 | 4,2 GHz | 5,7 GHz | 16x 1 MB | 128 MB | 120 W | 162 W | 699 USD |
| Ryzen 9 7950X | 16/32 | 4,5 GHz | 5,7 GHz | 16x 1 MB | 64 MB | 170 W | 230 W | 699 USD |
| Ryzen 9 7900X3D | 12/24 | 4,4 GHz | 5,6 GHz | 12x 1 MB | 128 MB | 120 W | 162 W | 599 USD |
| Ryzen 9 7900X | 12/24 | 4,7 GHz | 5,6 GHz | 12x 1 MB | 64 MB | 170 W | 230 W | 549 USD |
| Ryzen 7 7800X3D | 8/16 | 4,2 GHz | 5,0 GHz | 8x 1 MB | 96 MB | 120 W | 162 W | 549 USD |
| Ryzen 7 7700X | 8/16 | 4,5 GHz | 5,4 GHz | 8x 1 MB | 32 MB | 105 W | 142 W | 399 USD |
| Ryzen 5 7600X | 6/12 | 4,7 GHz | 5,3 GHz | 6x 1 MB | 32 MB | 105 W | 142 W | 299 USD |
Nasz system testowy w szczegółach
Wykorzystaliśmy ten system do następujących testów porównawczych i testów:
- Lian Li O11 Dynamic
- AMD Ryzen 7 7800X3D
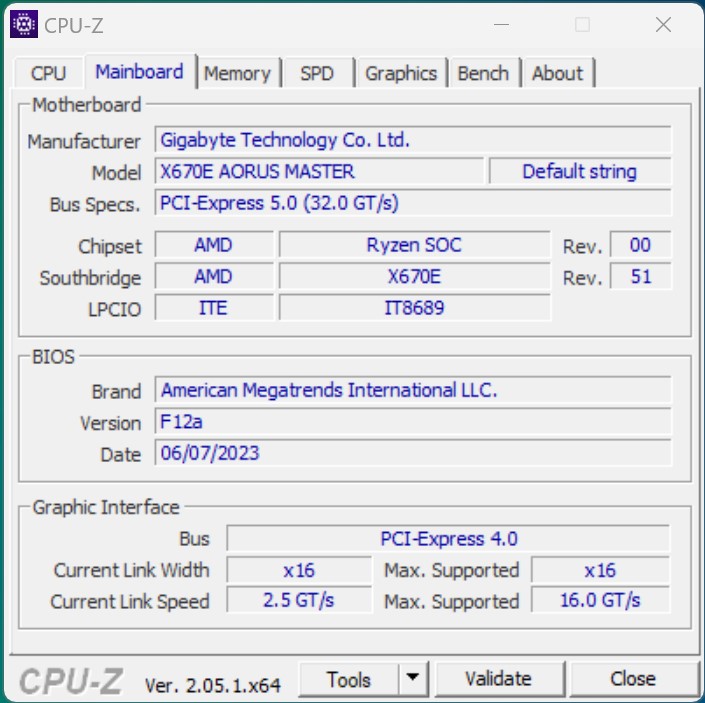
- Gigabyte X670E Aorus Master, BIOS: F12a
- Palit GeForce RTX 4090 GameRock OC
- DeepCool LT360
- Corsair HX1200i
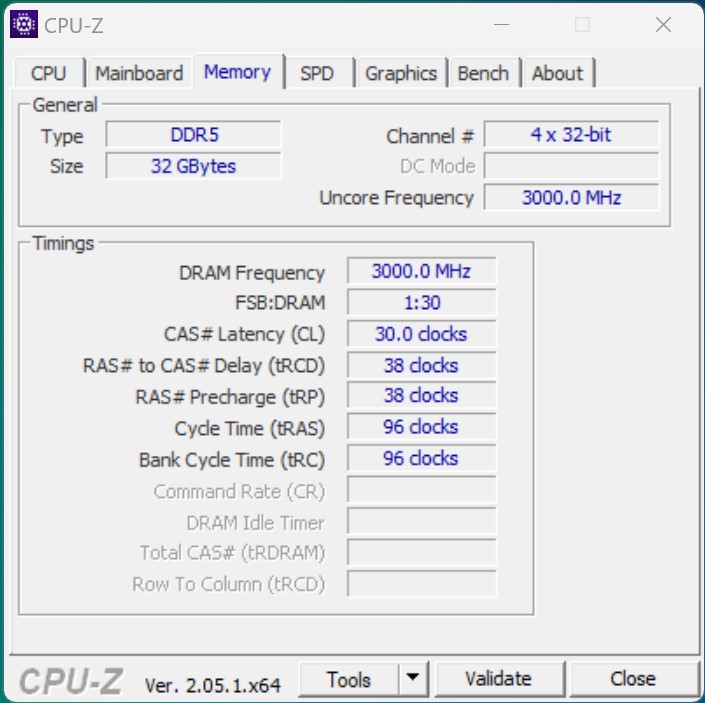
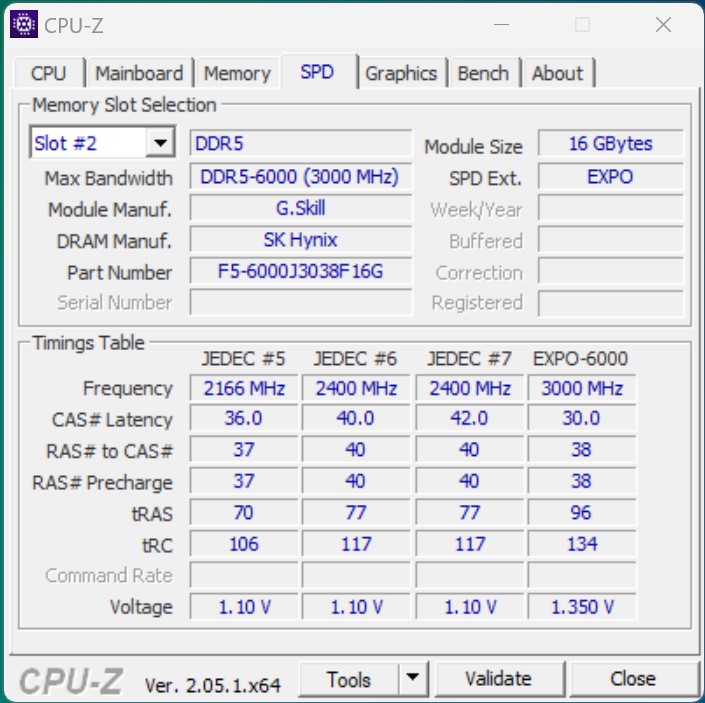
- G.Skill Trident Z5 Neo DDR5-6000 2x 16 GB, EXPO (DDR5-6000 CL30-38-38-96)
- Corsair MP600
- Microsoft Windows 11 Professional 64 Bit (wersja 22H2)

Warunki testowania
Wszystkie testy wydajności przeprowadziliśmy przy użyciu profilu energetycznego "Najwyższa wydajność". Odstąpiliśmy od niego jedynie podczas pomiarów zużycia energii. Jako jednostkę chłodzącą w tym teście wykorzystano rozwiązanie DeepCool LT360 AiO. Według producenta jest on wymieniony wśród kompatybilnych jednostek chłodzących dla procesorów AMD Ryzen 7000. W związku z tym będziesz po bezpiecznej stronie, używając tego rozwiązania, aby nie naruszyć specyfikacji producenta.
Testy porównawcze procesora - przeciętny Ryzen 7 7800X3D
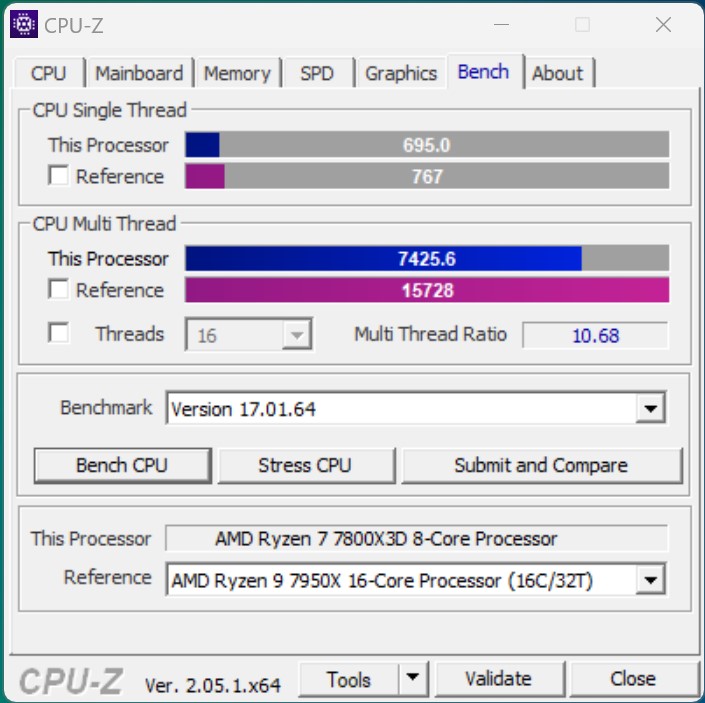
Zanim przyjrzymy się testom porównawczym w grach, najpierw rzucimy okiem na czystą wydajność procesora. Za pomocą różnych testów porównawczych zauważyliśmy, że AMD Ryzen 7 7800X3D osiągnął mniej więcej tak dobrą ocenę wydajności, jakAMD Ryzen 9 5950X. W porównaniu do Intela, to wystarczyło, aby pokonaćAMD Ryzen 9 5950X. W tym miejscu chcielibyśmy powtórzyć, że AMD Ryzen 7 7800X3D jest procesorem 8-rdzeniowym. Oznacza to, że w wielowątkowych testach porównawczych wypada znacznie gorzej niż wielu jego konkurentów.
W porównaniu do AMD Ryzen 9 7950X3D, mniejszy Ryzen 7 7800X3D był około 24 procent w tyle. Na tym etapie, Intel Core i9-13900K wypadł najlepiej, uzyskując wynik o jeden punkt procentowy lepszy od wcześniej topowego modelu AMD.
Więcej testów porównawczych procesorów można znaleźć tutaj.
| Performance rating - Percent | |
| Intel Core i9-13900K | |
| AMD Ryzen 9 7950X | |
| AMD Ryzen 9 7950X3D | |
| Intel Core i7-13700K | |
| AMD Ryzen 9 7900X | |
| AMD Ryzen 9 5950X | |
| Intel Core i5-13600K | |
| AMD Ryzen 7 7800X3D | |
| Intel Core i7-12700 | |
| Intel Core i5-12600K | |
| Intel Core i5-13400 | |
| Cinebench R15 | |
| CPU Single 64Bit | |
| Intel Core i9-13900K | |
| AMD Ryzen 9 7950X3D | |
| AMD Ryzen 9 7900X | |
| AMD Ryzen 9 7950X | |
| Intel Core i7-13700K | |
| AMD Ryzen 7 7800X3D | |
| Intel Core i5-13600K | |
| Intel Core i5-12600K | |
| AMD Ryzen 9 5950X | |
| Intel Core i7-12700 | |
| Intel Core i5-13400 | |
| CPU Multi 64Bit | |
| AMD Ryzen 9 7950X | |
| Intel Core i9-13900K | |
| AMD Ryzen 9 7950X3D | |
| AMD Ryzen 9 7900X | |
| Intel Core i7-13700K | |
| AMD Ryzen 9 5950X | |
| Intel Core i5-13600K | |
| Intel Core i7-12700 | |
| AMD Ryzen 7 7800X3D | |
| Intel Core i5-12600K | |
| Intel Core i5-13400 | |
| Cinebench R20 | |
| CPU (Single Core) | |
| Intel Core i9-13900K | |
| Intel Core i7-13700K | |
| AMD Ryzen 9 7950X3D | |
| AMD Ryzen 9 7900X | |
| AMD Ryzen 9 7950X | |
| Intel Core i5-13600K | |
| Intel Core i5-12600K | |
| Intel Core i7-12700 | |
| AMD Ryzen 7 7800X3D | |
| Intel Core i5-13400 | |
| AMD Ryzen 9 5950X | |
| CPU (Multi Core) | |
| Intel Core i9-13900K | |
| AMD Ryzen 9 7950X | |
| AMD Ryzen 9 7950X3D | |
| Intel Core i7-13700K | |
| AMD Ryzen 9 7900X | |
| AMD Ryzen 9 5950X | |
| Intel Core i5-13600K | |
| Intel Core i7-12700 | |
| AMD Ryzen 7 7800X3D | |
| Intel Core i5-12600K | |
| Intel Core i5-13400 | |
| Cinebench R23 | |
| Single Core | |
| Intel Core i9-13900K | |
| Intel Core i7-13700K | |
| AMD Ryzen 9 7950X3D | |
| AMD Ryzen 9 7900X | |
| AMD Ryzen 9 7950X | |
| Intel Core i5-13600K | |
| Intel Core i5-12600K | |
| Intel Core i7-12700 | |
| AMD Ryzen 7 7800X3D | |
| Intel Core i5-13400 | |
| AMD Ryzen 9 5950X | |
| Multi Core | |
| Intel Core i9-13900K | |
| AMD Ryzen 9 7950X | |
| AMD Ryzen 9 7950X3D | |
| Intel Core i7-13700K | |
| AMD Ryzen 9 7900X | |
| AMD Ryzen 9 5950X | |
| Intel Core i5-13600K | |
| Intel Core i7-12700 | |
| AMD Ryzen 7 7800X3D | |
| Intel Core i5-12600K | |
| Intel Core i5-13400 | |
| Cinebench R11.5 | |
| CPU Single 64Bit | |
| Intel Core i9-13900K | |
| AMD Ryzen 9 7950X3D | |
| AMD Ryzen 9 7900X | |
| AMD Ryzen 9 7950X | |
| Intel Core i7-13700K | |
| Intel Core i5-13600K | |
| AMD Ryzen 7 7800X3D | |
| Intel Core i5-12600K | |
| Intel Core i7-12700 | |
| AMD Ryzen 9 5950X | |
| Intel Core i5-13400 | |
| CPU Multi 64Bit | |
| Intel Core i9-13900K | |
| AMD Ryzen 9 7950X | |
| AMD Ryzen 9 7950X3D | |
| AMD Ryzen 9 7900X | |
| Intel Core i7-13700K | |
| AMD Ryzen 9 5950X | |
| Intel Core i5-13600K | |
| Intel Core i7-12700 | |
| AMD Ryzen 7 7800X3D | |
| Intel Core i5-12600K | |
| Intel Core i5-13400 | |
| Blender - v2.79 BMW27 CPU | |
| Intel Core i5-13400 | |
| Intel Core i5-12600K | |
| AMD Ryzen 7 7800X3D | |
| Intel Core i7-12700 | |
| Intel Core i5-13600K | |
| AMD Ryzen 9 5950X | |
| AMD Ryzen 9 7900X | |
| Intel Core i7-13700K | |
| AMD Ryzen 9 7950X3D | |
| AMD Ryzen 9 7950X | |
| Intel Core i9-13900K | |
| wPrime 2.10 | |
| 32m | |
| Intel Core i5-12600K | |
| Intel Core i5-13400 | |
| Intel Core i7-12700 | |
| AMD Ryzen 9 5950X | |
| Intel Core i5-13600K | |
| AMD Ryzen 7 7800X3D | |
| Intel Core i7-13700K | |
| AMD Ryzen 9 7950X3D | |
| Intel Core i9-13900K | |
| AMD Ryzen 9 7900X | |
| AMD Ryzen 9 7950X | |
| 1024m | |
| Intel Core i5-13400 | |
| Intel Core i7-12700 | |
| Intel Core i5-12600K | |
| Intel Core i5-13600K | |
| Intel Core i7-13700K | |
| Intel Core i9-13900K | |
| AMD Ryzen 9 5950X | |
| AMD Ryzen 7 7800X3D | |
| AMD Ryzen 9 7900X | |
| AMD Ryzen 9 7950X3D | |
| AMD Ryzen 9 7950X | |
| X264 HD Benchmark 4.0 | |
| Pass 1 | |
| Intel Core i9-13900K | |
| Intel Core i7-13700K | |
| AMD Ryzen 9 7950X3D | |
| Intel Core i5-13600K | |
| AMD Ryzen 9 7950X | |
| AMD Ryzen 9 7900X | |
| Intel Core i7-12700 | |
| AMD Ryzen 7 7800X3D | |
| AMD Ryzen 9 5950X | |
| Intel Core i5-12600K | |
| Intel Core i5-13400 | |
| Pass 2 | |
| AMD Ryzen 9 7950X | |
| Intel Core i9-13900K | |
| AMD Ryzen 9 7950X3D | |
| AMD Ryzen 9 7900X | |
| Intel Core i7-13700K | |
| AMD Ryzen 9 5950X | |
| Intel Core i5-13600K | |
| Intel Core i7-12700 | |
| AMD Ryzen 7 7800X3D | |
| Intel Core i5-12600K | |
| Intel Core i5-13400 | |
| WinRAR - Result | |
| AMD Ryzen 9 7900X | |
| AMD Ryzen 7 7800X3D | |
| AMD Ryzen 9 7950X3D | |
| AMD Ryzen 9 7950X | |
| Intel Core i9-13900K | |
| Intel Core i7-13700K | |
| AMD Ryzen 9 5950X | |
| Intel Core i5-13600K | |
| Intel Core i7-12700 | |
| Intel Core i5-13400 | |
| Intel Core i5-12600K | |
| TrueCrypt | |
| AES Mean 100MB | |
| AMD Ryzen 9 7950X | |
| Intel Core i9-13900K | |
| AMD Ryzen 9 5950X | |
| AMD Ryzen 9 7950X3D | |
| Intel Core i5-13600K | |
| Intel Core i7-13700K | |
| AMD Ryzen 7 7800X3D | |
| AMD Ryzen 9 7900X | |
| Intel Core i7-12700 | |
| Intel Core i5-12600K | |
| Intel Core i5-13400 | |
| Twofish Mean 100MB | |
| Intel Core i9-13900K | |
| AMD Ryzen 9 7950X | |
| AMD Ryzen 9 7950X3D | |
| Intel Core i7-13700K | |
| AMD Ryzen 9 5950X | |
| Intel Core i5-13600K | |
| AMD Ryzen 9 7900X | |
| Intel Core i7-12700 | |
| Intel Core i5-12600K | |
| AMD Ryzen 7 7800X3D | |
| Intel Core i5-13400 | |
| Serpent Mean 100MB | |
| Intel Core i9-13900K | |
| AMD Ryzen 9 7950X | |
| AMD Ryzen 9 7950X3D | |
| AMD Ryzen 9 5950X | |
| Intel Core i7-13700K | |
| Intel Core i5-13600K | |
| AMD Ryzen 9 7900X | |
| Intel Core i7-12700 | |
| Intel Core i5-12600K | |
| AMD Ryzen 7 7800X3D | |
| Intel Core i5-13400 | |
| Geekbench 5.5 | |
| Multi-Core | |
| AMD Ryzen 9 7950X3D | |
| Intel Core i9-13900K | |
| AMD Ryzen 9 7950X | |
| AMD Ryzen 9 7900X | |
| Intel Core i7-13700K | |
| AMD Ryzen 9 5950X | |
| Intel Core i5-13600K | |
| Intel Core i7-12700 | |
| AMD Ryzen 7 7800X3D | |
| Intel Core i5-12600K | |
| Intel Core i5-13400 | |
| Single-Core | |
| AMD Ryzen 9 7950X3D | |
| Intel Core i9-13900K | |
| AMD Ryzen 9 7900X | |
| AMD Ryzen 9 7950X | |
| Intel Core i7-13700K | |
| AMD Ryzen 7 7800X3D | |
| Intel Core i5-13600K | |
| Intel Core i7-12700 | |
| Intel Core i5-12600K | |
| Intel Core i5-13400 | |
| AMD Ryzen 9 5950X | |
| Geekbench 5.0 | |
| 5.0 Multi-Core | |
| Intel Core i9-13900K | |
| AMD Ryzen 9 7950X3D | |
| AMD Ryzen 9 7950X | |
| AMD Ryzen 9 7900X | |
| Intel Core i7-13700K | |
| Intel Core i5-13600K | |
| AMD Ryzen 9 5950X | |
| Intel Core i7-12700 | |
| AMD Ryzen 7 7800X3D | |
| Intel Core i5-12600K | |
| Intel Core i5-13400 | |
| 5.0 Single-Core | |
| Intel Core i9-13900K | |
| AMD Ryzen 9 7900X | |
| AMD Ryzen 9 7950X3D | |
| AMD Ryzen 9 7950X | |
| Intel Core i7-13700K | |
| AMD Ryzen 7 7800X3D | |
| Intel Core i5-13600K | |
| Intel Core i7-12700 | |
| Intel Core i5-12600K | |
| Intel Core i5-13400 | |
| AMD Ryzen 9 5950X | |
| Geekbench 4.4 | |
| 64 Bit Single-Core Score | |
| Intel Core i9-13900K | |
| AMD Ryzen 9 7950X3D | |
| AMD Ryzen 9 7900X | |
| AMD Ryzen 7 7800X3D | |
| AMD Ryzen 9 7950X | |
| Intel Core i7-13700K | |
| Intel Core i5-13600K | |
| Intel Core i5-12600K | |
| Intel Core i7-12700 | |
| Intel Core i5-13400 | |
| AMD Ryzen 9 5950X | |
| 64 Bit Multi-Core Score | |
| AMD Ryzen 9 7950X3D | |
| Intel Core i9-13900K | |
| AMD Ryzen 9 7950X | |
| AMD Ryzen 9 7900X | |
| Intel Core i7-13700K | |
| AMD Ryzen 9 5950X | |
| Intel Core i5-13600K | |
| AMD Ryzen 7 7800X3D | |
| Intel Core i7-12700 | |
| Intel Core i5-12600K | |
| Intel Core i5-13400 | |
| 3DMark 11 - 1280x720 Performance Physics | |
| AMD Ryzen 9 7950X3D | |
| AMD Ryzen 7 7800X3D | |
| AMD Ryzen 9 7950X | |
| Intel Core i9-13900K | |
| Intel Core i7-13700K | |
| Intel Core i5-13600K | |
| AMD Ryzen 9 7900X | |
| Intel Core i7-12700 | |
| AMD Ryzen 9 5950X | |
| Intel Core i5-12600K | |
| Intel Core i5-13400 | |
| 7-Zip 18.03 | |
| 7z b 4 | |
| AMD Ryzen 9 7950X3D | |
| AMD Ryzen 9 7950X | |
| Intel Core i9-13900K | |
| AMD Ryzen 9 5950X | |
| AMD Ryzen 9 7900X | |
| Intel Core i7-13700K | |
| Intel Core i5-13600K | |
| AMD Ryzen 7 7800X3D | |
| Intel Core i7-12700 | |
| Intel Core i5-12600K | |
| Intel Core i5-13400 | |
| 7z b 4 -mmt1 | |
| AMD Ryzen 9 7950X3D | |
| AMD Ryzen 9 7900X | |
| AMD Ryzen 7 7800X3D | |
| AMD Ryzen 9 7950X | |
| Intel Core i9-13900K | |
| Intel Core i7-13700K | |
| AMD Ryzen 9 5950X | |
| Intel Core i5-13600K | |
| Intel Core i7-12700 | |
| Intel Core i5-12600K | |
| Intel Core i5-13400 | |
| HWBOT x265 Benchmark v2.2 - 4k Preset | |
| AMD Ryzen 9 7950X | |
| Intel Core i9-13900K | |
| AMD Ryzen 9 7950X3D | |
| AMD Ryzen 9 7900X | |
| Intel Core i7-13700K | |
| AMD Ryzen 9 5950X | |
| Intel Core i5-12600K | |
| Intel Core i5-13600K | |
| Intel Core i7-12700 | |
| AMD Ryzen 7 7800X3D | |
| Intel Core i5-13400 | |
| R Benchmark 2.5 - Overall mean | |
| Intel Core i5-13400 | |
| AMD Ryzen 9 5950X | |
| Intel Core i5-12600K | |
| Intel Core i7-12700 | |
| AMD Ryzen 7 7800X3D | |
| Intel Core i5-13600K | |
| Intel Core i7-13700K | |
| AMD Ryzen 9 7950X | |
| AMD Ryzen 9 7900X | |
| AMD Ryzen 9 7950X3D | |
| Intel Core i9-13900K | |
| LibreOffice - 20 Documents To PDF | |
| Intel Core i5-12600K | |
| AMD Ryzen 9 5950X | |
| AMD Ryzen 7 7800X3D | |
| Intel Core i5-13400 | |
| AMD Ryzen 9 7950X3D | |
| Intel Core i7-12700 | |
| Intel Core i9-13900K | |
| AMD Ryzen 9 7950X | |
| Intel Core i5-13600K | |
| AMD Ryzen 9 7900X | |
| Intel Core i7-13700K | |
| WebXPRT 3 - Overall | |
| AMD Ryzen 9 7950X3D | |
| AMD Ryzen 9 7900X | |
| Intel Core i9-13900K | |
| AMD Ryzen 9 7950X | |
| AMD Ryzen 7 7800X3D | |
| Intel Core i7-13700K | |
| Intel Core i5-13600K | |
| Intel Core i7-12700 | |
| Intel Core i5-13400 | |
| Intel Core i5-12600K | |
| AMD Ryzen 9 5950X | |
| Mozilla Kraken 1.1 - Total | |
| AMD Ryzen 9 5950X | |
| Intel Core i5-13400 | |
| Intel Core i5-12600K | |
| Intel Core i7-12700 | |
| AMD Ryzen 7 7800X3D | |
| Intel Core i5-13600K | |
| Intel Core i7-13700K | |
| AMD Ryzen 9 7950X | |
| AMD Ryzen 9 7950X3D | |
| Intel Core i9-13900K | |
| AMD Ryzen 9 7900X | |
| 3DMark | |
| 1920x1080 Fire Strike Physics | |
| Intel Core i9-13900K | |
| AMD Ryzen 9 7950X | |
| Intel Core i7-13700K | |
| AMD Ryzen 9 7950X3D | |
| AMD Ryzen 9 7900X | |
| AMD Ryzen 9 5950X | |
| Intel Core i5-13600K | |
| Intel Core i7-12700 | |
| AMD Ryzen 7 7800X3D | |
| Intel Core i5-12600K | |
| Intel Core i5-13400 | |
| 2560x1440 Time Spy CPU | |
| Intel Core i9-13900K | |
| Intel Core i7-13700K | |
| AMD Ryzen 9 7950X3D | |
| Intel Core i5-13600K | |
| AMD Ryzen 9 7900X | |
| Intel Core i7-12700 | |
| AMD Ryzen 9 7950X | |
| AMD Ryzen 7 7800X3D | |
| Intel Core i5-12600K | |
| AMD Ryzen 9 5950X | |
| Intel Core i5-13400 | |
* ... im mniej tym lepiej
AMD Ryzen 7 7800X3D vs. Cinebench R15 Multi Loop
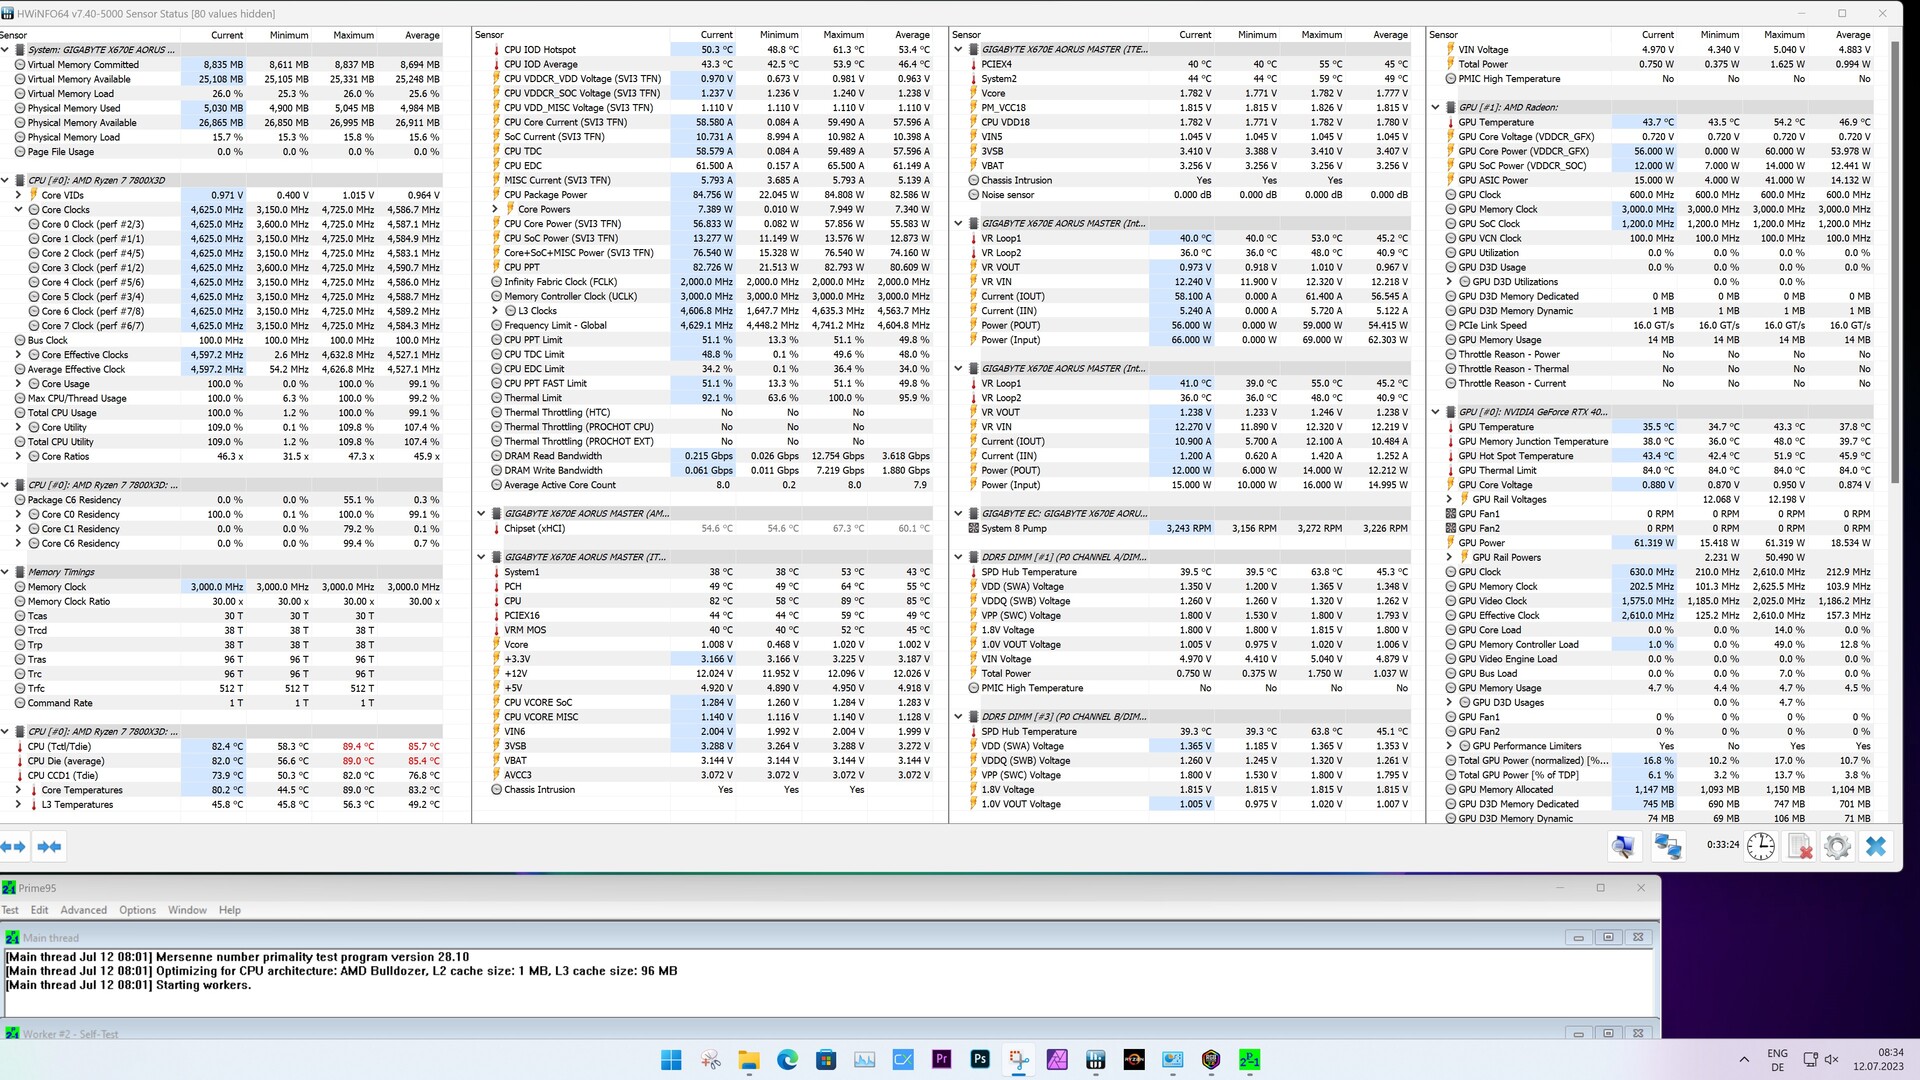
Z pomocą Cinebench R15 Multi Loop możemy w tym momencie zobaczyć, że system chłodzenia DeepCool jest wystarczający do niezawodnego chłodzenia AMD Ryzen 7 7800X3D. Dla pełnego ujawnienia, powinniśmy zauważyć, że wszystkie testy zostały przeprowadzone przy zamkniętej obudowie. Cyrkulacja powietrza w Lian Li O11 Dynamic nie była najlepsza w naszym systemie testowym, ponieważ nie było zainstalowanych wentylatorów, które miałyby dostęp do świeżego powietrza.
Syntetyczne testy porównawcze i wydajność aplikacji
Syntetyczne benchmarki aplikacji AMD Ryzen 7 7800X3D wyglądają już nieco lepiej niż benchmarki procesora. Nie był daleko w tyle zaIntel Core i5-13600KiAMD Ryzen 9 5950Xbył wyraźnie lepszy.
Podczas testów pamięci RAM spodziewalibyśmy się podobnych wyników jak w przypadku AMD Ryzen 9 7950X3D, ponieważ platforma testowa jest taka sama, a częstotliwość taktowania pamięci RAM wynosząca 6000 MT/s również pozostaje taka sama. Należy jednak pamiętać, że AMD Ryzen 7 7800X3D działa poza specyfikacjami producenta, gdy włączony jest profil EXPO. Zwykła częstotliwość taktowania AMD Ryzen 7 7800X3D wynosi 5 200 MT/s.
| Performance rating - Percent | |
| Intel Core i9-13900K | |
| AMD Ryzen 9 7950X | |
| AMD Ryzen 9 7950X3D | |
| Intel Core i7-13700K | |
| AMD Ryzen 9 7900X | |
| Intel Core i5-13600K | |
| AMD Ryzen 7 7800X3D | |
| Intel Core i7-12700 | |
| AMD Ryzen 9 5950X | |
| Intel Core i5-13400 | |
| PCMark 10 | |
| Productivity | |
| AMD Ryzen 9 7950X3D | |
| AMD Ryzen 9 7950X | |
| Intel Core i7-13700K | |
| AMD Ryzen 7 7800X3D | |
| AMD Ryzen 9 7900X | |
| Intel Core i5-13600K | |
| Intel Core i9-13900K | |
| Intel Core i7-12700 | |
| AMD Ryzen 9 5950X | |
| Intel Core i5-13400 | |
| Essentials | |
| Intel Core i9-13900K | |
| AMD Ryzen 9 7900X | |
| AMD Ryzen 9 7950X | |
| Intel Core i5-13600K | |
| AMD Ryzen 9 7950X3D | |
| Intel Core i7-13700K | |
| AMD Ryzen 7 7800X3D | |
| AMD Ryzen 9 5950X | |
| Intel Core i7-12700 | |
| Intel Core i5-13400 | |
| 3DMark | |
| 1920x1080 Fire Strike Physics | |
| Intel Core i9-13900K | |
| AMD Ryzen 9 7950X | |
| Intel Core i7-13700K | |
| AMD Ryzen 9 7950X3D | |
| AMD Ryzen 9 7900X | |
| AMD Ryzen 9 5950X | |
| Intel Core i5-13600K | |
| Intel Core i7-12700 | |
| AMD Ryzen 7 7800X3D | |
| Intel Core i5-13400 | |
| 2560x1440 Time Spy CPU | |
| Intel Core i9-13900K | |
| Intel Core i7-13700K | |
| AMD Ryzen 9 7950X3D | |
| Intel Core i5-13600K | |
| AMD Ryzen 9 7900X | |
| Intel Core i7-12700 | |
| AMD Ryzen 9 7950X | |
| AMD Ryzen 7 7800X3D | |
| AMD Ryzen 9 5950X | |
| Intel Core i5-13400 | |
| 3DMark 11 - 1280x720 Performance Physics | |
| AMD Ryzen 9 7950X3D | |
| AMD Ryzen 7 7800X3D | |
| AMD Ryzen 9 7950X | |
| Intel Core i9-13900K | |
| Intel Core i7-13700K | |
| Intel Core i5-13600K | |
| AMD Ryzen 9 7900X | |
| Intel Core i7-12700 | |
| AMD Ryzen 9 5950X | |
| Intel Core i5-13400 | |
| CrossMark - Overall | |
| Intel Core i9-13900K | |
| AMD Ryzen 9 7950X | |
| AMD Ryzen 9 7900X | |
| Intel Core i7-13700K | |
| Intel Core i5-13600K | |
| AMD Ryzen 7 7800X3D | |
| AMD Ryzen 9 7950X3D | |
| Intel Core i7-12700 | |
| Intel Core i5-13400 | |
| AMD Ryzen 9 5950X | |
| AIDA64 / Memory Copy | |
| Intel Core i9-13900K | |
| AMD Ryzen 9 7950X3D | |
| Intel Core i7-13700K | |
| Intel Core i7-12700 | |
| Intel Core i5-13400 | |
| Intel Core i5-13600K | |
| Intel Core i5-12600K | |
| AMD Ryzen 9 7900X | |
| AMD Ryzen 9 7950X | |
| AMD Ryzen 7 7800X3D | |
| AMD Ryzen 9 5950X | |
| Średnia w klasie (4514 - 234662, n=2219) | |
| AIDA64 / Memory Read | |
| Intel Core i9-13900K | |
| Intel Core i7-13700K | |
| Intel Core i7-12700 | |
| AMD Ryzen 9 7950X3D | |
| Intel Core i5-13400 | |
| Intel Core i5-12600K | |
| Intel Core i5-13600K | |
| AMD Ryzen 9 7950X | |
| AMD Ryzen 9 7900X | |
| AMD Ryzen 9 5950X | |
| AMD Ryzen 7 7800X3D | |
| Średnia w klasie (4031 - 271066, n=2181) | |
| AIDA64 / Memory Write | |
| AMD Ryzen 7 7800X3D | |
| Intel Core i7-12700 | |
| AMD Ryzen 9 7950X3D | |
| AMD Ryzen 9 7900X | |
| AMD Ryzen 9 7950X | |
| Intel Core i9-13900K | |
| Intel Core i5-13400 | |
| Intel Core i5-12600K | |
| Intel Core i5-13600K | |
| Intel Core i7-13700K | |
| Średnia w klasie (3506 - 242868, n=2186) | |
| AMD Ryzen 9 5950X | |
| AIDA64 / Memory Latency | |
| Średnia w klasie (6.1 - 536, n=2247) | |
| Intel Core i5-13600K | |
| Intel Core i5-13400 | |
| Intel Core i9-13900K | |
| Intel Core i7-12700 | |
| Intel Core i7-13700K | |
| AMD Ryzen 7 7800X3D | |
| AMD Ryzen 9 5950X | |
| AMD Ryzen 9 7950X3D | |
| AMD Ryzen 9 7950X | |
| AMD Ryzen 9 7900X | |
* ... im mniej tym lepiej
Testy porównawcze w grach - naprawdę szybki jak na 8 rdzeni
Podczas naszych testów w grach zauważyliśmy, że AMD Ryzen 7 7800X3D doskonale poradził sobie ze swoim głównym zadaniem. 8-rdzeniowy procesor był nawet w stanie strącić z pierwszego miejsca flagowy model firmy, przesuwając go na drugie miejsce. Oczywiście jego przewaga jest minimalna i niezauważalna w codziennym użytkowaniu - ale jeśli chodzi o koronowanie króla wydajności, musimy trzymać się czystych liczb. Nasza próbka testowa wygrała porównanie zIntel Core i9-13900Kdość łatwo i uzyskał przewagę 13 punktów procentowych.
AMD Ryzen 9 7950X3D czasami zmagał się z problemami z rozkładem obciążenia między dwoma CCD w niektórych testowanych przez nas grach, ponieważ, jak wiemy, tylko jeden CCD z 16-rdzeniowego komponentu posiada pamięć podręczną 3D-V. AMD Ryzen 7 7800X3D nie ma tego problemu i prawdopodobnie dlatego osiągnął nieco lepszą wydajność w grach. Ze względu na benchmarki CPU, na tym etapie możemy porównać naszą próbkę testową z procesorem Intel Core i7-12700. Wcześniej był na równi z AMD Ryzen 7 7800X3D, ale teraz możemy udokumentować różnicę wynoszącą dobre 30 procent.
W połączeniu z Palit GeForce RTX 4090 GameRock OC, platforma AM5 oparta na AMD Ryzen 7 7800X3D oferuje obecnie najlepszą kombinację, jeśli chodzi o czysty gaming. Przegląd wszystkich gier, które przetestowaliśmy na tej platformie, pokazuje, że wszystkie z nich są obecnie płynnie odtwarzane w 2160p przy maksymalnych detalach. Zasadniczo jest to również możliwe w przypadku Intel Core i9-13900K lub AMD Ryzen 9 7590X3D. Za te dwa modele trzeba jednak zapłacić więcej.
| Performance rating - Percent | |
| AMD Ryzen 7 7800X3D | |
| AMD Ryzen 9 7950X3D | |
| Intel Core i9-13900K | |
| Intel Core i7-13700K | |
| Intel Core i7-13700 | |
| Intel Core i7-12700 | |
| Intel Core i5-13400 | |
| Intel Core i5-12400F | |
| F1 22 | |
| 1920x1080 Low Preset AA:T AF:16x | |
| AMD Ryzen 7 7800X3D | |
| AMD Ryzen 9 7950X3D | |
| Intel Core i9-13900K | |
| Intel Core i7-13700K | |
| Intel Core i7-13700 | |
| Intel Core i7-12700 | |
| Intel Core i5-12400F | |
| Intel Core i5-13400 | |
| 3840x2160 Ultra High Preset AA:T AF:16x | |
| AMD Ryzen 7 7800X3D | |
| Intel Core i7-13700K | |
| AMD Ryzen 9 7950X3D | |
| Intel Core i5-12400F | |
| Intel Core i7-13700 | |
| Intel Core i7-12700 | |
| Intel Core i5-13400 | |
| Intel Core i9-13900K | |
| Far Cry 5 | |
| 1280x720 Low Preset AA:T | |
| AMD Ryzen 7 7800X3D | |
| AMD Ryzen 9 7950X3D | |
| Intel Core i7-13700K | |
| Intel Core i9-13900K | |
| Intel Core i7-13700 | |
| Intel Core i7-12700 | |
| Intel Core i5-13400 | |
| Intel Core i5-12400F | |
| 3840x2160 Ultra Preset AA:T | |
| AMD Ryzen 7 7800X3D | |
| AMD Ryzen 9 7950X3D | |
| Intel Core i9-13900K | |
| Intel Core i7-13700K | |
| Intel Core i7-13700 | |
| Intel Core i7-12700 | |
| Intel Core i5-13400 | |
| Intel Core i5-12400F | |
| X-Plane 11.11 | |
| 1280x720 low (fps_test=1) | |
| Intel Core i9-13900K | |
| AMD Ryzen 9 7950X3D | |
| Intel Core i7-13700K | |
| AMD Ryzen 7 7800X3D | |
| Intel Core i7-13700 | |
| Intel Core i7-12700 | |
| Intel Core i5-13400 | |
| Intel Core i5-12400F | |
| 3840x2160 high (fps_test=3) | |
| AMD Ryzen 7 7800X3D | |
| AMD Ryzen 9 7950X3D | |
| Intel Core i9-13900K | |
| Intel Core i7-13700K | |
| Intel Core i7-13700 | |
| Intel Core i7-12700 | |
| Intel Core i5-13400 | |
| Intel Core i5-12400F | |
| Final Fantasy XV Benchmark | |
| 1280x720 Lite Quality | |
| Intel Core i7-13700 | |
| Intel Core i7-13700K | |
| AMD Ryzen 7 7800X3D | |
| Intel Core i9-13900K | |
| AMD Ryzen 9 7950X3D | |
| Intel Core i7-12700 | |
| Intel Core i5-12400F | |
| Intel Core i5-13400 | |
| 3840x2160 High Quality | |
| AMD Ryzen 7 7800X3D | |
| Intel Core i7-13700 | |
| AMD Ryzen 9 7950X3D | |
| Intel Core i7-13700K | |
| Intel Core i9-13900K | |
| Intel Core i7-12700 | |
| Intel Core i5-12400F | |
| Intel Core i5-13400 | |
| Dota 2 Reborn | |
| 1280x720 min (0/3) fastest | |
| AMD Ryzen 7 7800X3D | |
| AMD Ryzen 9 7950X3D | |
| Intel Core i9-13900K | |
| Intel Core i7-13700K | |
| Intel Core i7-13700 | |
| Intel Core i7-12700 | |
| Intel Core i5-12400F | |
| Intel Core i5-13400 | |
| 3840x2160 ultra (3/3) best looking | |
| AMD Ryzen 7 7800X3D | |
| AMD Ryzen 9 7950X3D | |
| Intel Core i9-13900K | |
| Intel Core i7-13700K | |
| Intel Core i7-13700 | |
| Intel Core i7-12700 | |
| Intel Core i5-12400F | |
| Intel Core i5-13400 | |
| The Witcher 3 | |
| 1024x768 Low Graphics & Postprocessing | |
| AMD Ryzen 9 7950X3D | |
| AMD Ryzen 7 7800X3D | |
| Intel Core i9-13900K | |
| Intel Core i7-13700K | |
| Intel Core i7-13700 | |
| Intel Core i7-12700 | |
| Intel Core i5-13400 | |
| Intel Core i5-12400F | |
| 3840x2160 High Graphics & Postprocessing (Nvidia HairWorks Off) | |
| Intel Core i5-13400 | |
| Intel Core i7-13700 | |
| Intel Core i7-12700 | |
| Intel Core i9-13900K | |
| AMD Ryzen 7 7800X3D | |
| Intel Core i7-13700K | |
| AMD Ryzen 9 7950X3D | |
| Intel Core i5-12400F | |
| F1 2021 | |
| 3840x2160 Ultra High Preset + Raytracing AA:T AF:16x | |
| AMD Ryzen 7 7800X3D | |
| AMD Ryzen 9 7950X3D | |
| Intel Core i7-13700K | |
| Intel Core i7-13700 | |
| Intel Core i9-13900K | |
| Intel Core i7-12700 | |
| Intel Core i5-12400F | |
| Intel Core i5-13400 | |
| 1280x720 Ultra Low Preset | |
| AMD Ryzen 7 7800X3D | |
| AMD Ryzen 9 7950X3D | |
| Intel Core i9-13900K | |
| Intel Core i7-13700K | |
| Intel Core i7-13700 | |
| Intel Core i7-12700 | |
| Intel Core i5-12400F | |
| Intel Core i5-13400 | |
| Shadow of the Tomb Raider | |
| 1280x720 Lowest Preset | |
| AMD Ryzen 7 7800X3D | |
| AMD Ryzen 9 7950X3D | |
| Intel Core i9-13900K | |
| Intel Core i7-13700 | |
| Intel Core i7-13700K | |
| Intel Core i7-12700 | |
| Intel Core i5-13400 | |
| Intel Core i5-12400F | |
| 3840x2160 Highest Preset AA:T | |
| Intel Core i7-13700K | |
| AMD Ryzen 7 7800X3D | |
| Intel Core i7-13700 | |
| AMD Ryzen 9 7950X3D | |
| Intel Core i9-13900K | |
| Intel Core i7-12700 | |
| Intel Core i5-13400 | |
| Intel Core i5-12400F | |
| Borderlands 3 | |
| 1280x720 Very Low Overall Quality (DX11) | |
| AMD Ryzen 7 7800X3D | |
| AMD Ryzen 9 7950X3D | |
| Intel Core i9-13900K | |
| Intel Core i7-13700 | |
| Intel Core i7-13700K | |
| Intel Core i7-12700 | |
| Intel Core i5-13400 | |
| Intel Core i5-12400F | |
| 3840x2160 Badass Overall Quality (DX11) | |
| Intel Core i7-13700K | |
| AMD Ryzen 7 7800X3D | |
| AMD Ryzen 9 7950X3D | |
| Intel Core i9-13900K | |
| Intel Core i7-13700 | |
| Intel Core i7-12700 | |
| Intel Core i5-13400 | |
| Intel Core i5-12400F | |
| Tiny Tina's Wonderlands | |
| 1280x720 Lowest Preset (DX12) | |
| AMD Ryzen 7 7800X3D | |
| AMD Ryzen 9 7950X3D | |
| Intel Core i9-13900K | |
| Intel Core i7-13700 | |
| Intel Core i7-13700K | |
| Intel Core i7-12700 | |
| Intel Core i5-13400 | |
| Intel Core i5-12400F | |
| 3840x2160 Badass Preset (DX12) | |
| AMD Ryzen 9 7950X3D | |
| Intel Core i7-13700 | |
| AMD Ryzen 7 7800X3D | |
| Intel Core i7-12700 | |
| Intel Core i5-13400 | |
| Intel Core i7-13700K | |
| Intel Core i9-13900K | |
| Intel Core i5-12400F | |
| God of War | |
| 1280x720 Low Preset | |
| AMD Ryzen 9 7950X3D | |
| AMD Ryzen 7 7800X3D | |
| Intel Core i9-13900K | |
| Intel Core i7-13700K | |
| Intel Core i7-13700 | |
| Intel Core i7-12700 | |
| Intel Core i5-13400 | |
| Intel Core i5-12400F | |
| 3840x2160 Ultra Preset | |
| AMD Ryzen 7 7800X3D | |
| AMD Ryzen 9 7950X3D | |
| Intel Core i7-13700 | |
| Intel Core i5-13400 | |
| Intel Core i7-13700K | |
| Intel Core i9-13900K | |
| Intel Core i7-12700 | |
| Intel Core i5-12400F | |
| Far Cry New Dawn | |
| 1280x720 Low Preset | |
| AMD Ryzen 7 7800X3D | |
| AMD Ryzen 9 7950X3D | |
| Intel Core i9-13900K | |
| Intel Core i7-13700 | |
| Intel Core i7-13700K | |
| Intel Core i7-12700 | |
| Intel Core i5-13400 | |
| Intel Core i5-12400F | |
| 3840x2160 Ultra Preset | |
| AMD Ryzen 7 7800X3D | |
| AMD Ryzen 9 7950X3D | |
| Intel Core i9-13900K | |
| Intel Core i7-13700 | |
| Intel Core i7-13700K | |
| Intel Core i7-12700 | |
| Intel Core i5-13400 | |
| Intel Core i5-12400F | |
| Far Cry 6 | |
| 1280x720 Low Graphics Quality | |
| AMD Ryzen 7 7800X3D | |
| AMD Ryzen 9 7950X3D | |
| Intel Core i9-13900K | |
| Intel Core i7-13700 | |
| Intel Core i7-13700K | |
| Intel Core i7-12700 | |
| Intel Core i5-13400 | |
| Intel Core i5-12400F | |
| 3840x2160 Ultra Graphics Quality + HD Textures AA:T | |
| AMD Ryzen 7 7800X3D | |
| AMD Ryzen 9 7950X3D | |
| Intel Core i7-13700K | |
| Intel Core i7-13700 | |
| Intel Core i9-13900K | |
| Intel Core i7-12700 | |
| Intel Core i5-13400 | |
| Intel Core i5-12400F | |
AMD Ryzen 7 78003D with an Nvidia GeForce RTX 4090
| low | med. | high | ultra | QHD | 4K DLSS | 4K | |
|---|---|---|---|---|---|---|---|
| GTA V (2015) | 188.5 | 188.5 | 188.1 | 182 | 181.1 | 188 | |
| The Witcher 3 (2015) | 858.4 | 820.4 | 658.8 | 314.3 | 281 | ||
| Dota 2 Reborn (2015) | 322.9 | 299.6 | 288.9 | 267.5 | 258.2 | ||
| Final Fantasy XV Benchmark (2018) | 236 | 234 | 233 | 231 | 158.2 | ||
| X-Plane 11.11 (2018) | 219 | 214 | 188.1 | 160.5 | |||
| Far Cry 5 (2018) | 344 | 303 | 303 | 278 | 268 | 187 | |
| Strange Brigade (2018) | 760 | 618 | 601 | 589 | 534 | 289 | |
| Shadow of the Tomb Raider (2018) | 407 | 383 | 387 | 375 | 322 | 187.7 | |
| Far Cry New Dawn (2019) | 291 | 258 | 253 | 226 | 223 | 180 | |
| Metro Exodus (2019) | 374 | 326 | 268 | 219 | 199.8 | 141.6 | |
| Control (2019) | 240 | 240 | 240 | 220 | 137.5 | 114 | |
| Borderlands 3 (2019) | 310 | 271 | 252 | 241 | 224 | 137.4 | |
| F1 2020 (2020) | 681 | 571 | 563 | 503 | 446 | 288 | |
| F1 2021 (2021) | 830 | 763 | 667 | 369 | 324 | 207 | |
| Far Cry 6 (2021) | 285 | 256 | 230 | 223 | 211 | 141.4 | |
| Guardians of the Galaxy (2021) | 268 | 266 | 267 | 267 | 263 | 194 | |
| God of War (2022) | 315 | 313 | 287 | 212 | 181.5 | 132 | |
| Cyberpunk 2077 1.6 (2022) | 272 | 268 | 251 | 241 | 166.6 | 82.3 | |
| Tiny Tina's Wonderlands (2022) | 506 | 434 | 371 | 309 | 233 | 129.8 | |
| F1 22 (2022) | 533 | 483 | 477 | 221 | 162.9 | 84.5 | |
| The Quarry (2022) | 462 | 355 | 309 | 267 | 198.1 | 82.6 | |
| A Plague Tale Requiem (2022) | 231 | 209 | 189.9 | 168.8 | 132.5 | 148.3 | 76.3 |
| Uncharted Legacy of Thieves Collection (2022) | 159.8 | 164.5 | 163 | 156.9 | 155.8 | 103.5 | |
| Spider-Man Miles Morales (2022) | 233 | 233 | 196.7 | 191.6 | 245 | 134.9 | |
| The Callisto Protocol (2022) | 279.1 | 279.7 | 280.8 | 281.1 | 274.5 | 237.1 | |
| High On Life (2023) | 446 | 404 | 345 | 312 | 225 | 107.8 | |
| The Witcher 3 v4 (2023) | 367 | 300 | 279 | 261 | 260 | 169.9 | |
| Dead Space Remake (2023) | 291 | 282 | 262 | 259 | 201 | 106.7 | |
| Hogwarts Legacy (2023) | 218 | 200 | 164.4 | 163.3 | 146.7 | 82.4 | |
| Returnal (2023) | 262 | 256 | 237 | 211 | 172 | 112 | |
| Atomic Heart (2023) | 360 | 306 | 274 | 228 | 184.1 | 112.4 | |
| Company of Heroes 3 (2023) | 465.1 | 429.6 | 376.5 | 373.3 | 314.6 | 215.4 | |
| Sons of the Forest (2023) | 184.7 | 176.4 | 171.4 | 165.4 | 159.1 | 132.1 | |
| Resident Evil 4 Remake (2023) | 383 | 344 | 336 | 237 | 199.9 | 124.2 | |
| The Last of Us (2023) | 241 | 215 | 202 | 191.1 | 146 | 122.9 | 82.6 |
| Dead Island 2 (2023) | 379 | 369 | 336 | 315 | 284 | 161.6 | |
| Star Wars Jedi Survivor (2023) | 197.7 | 197.3 | 196.1 | 193.8 | 157.6 | 82.3 | |
| Diablo 4 (2023) | 399 | 399 | 398 | 397 | 390 | 238 | 216 |
| F1 23 (2023) | 576 | 594 | 542 | 226 | 152 | 80 |
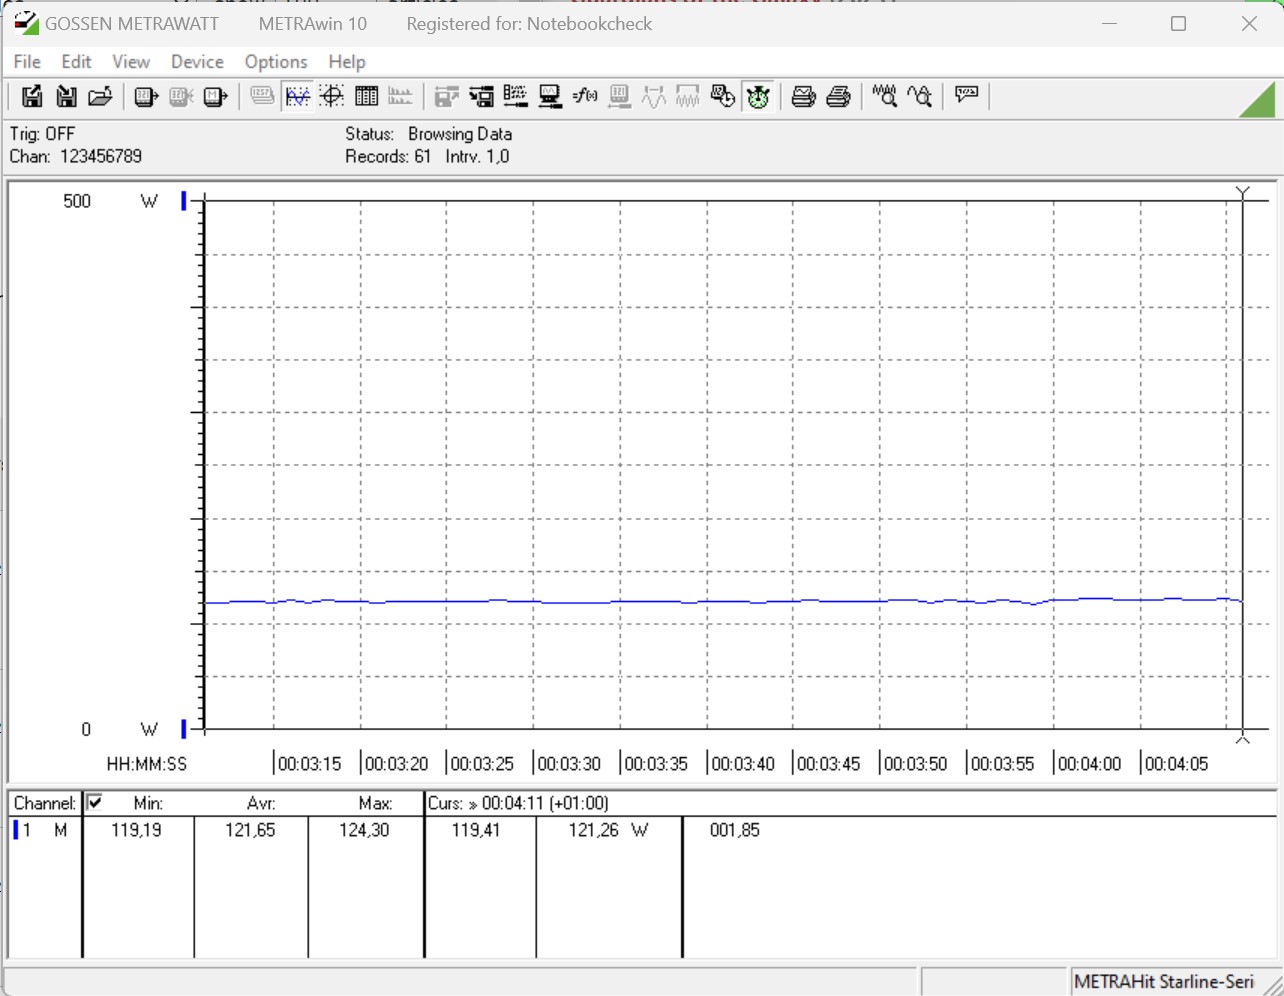
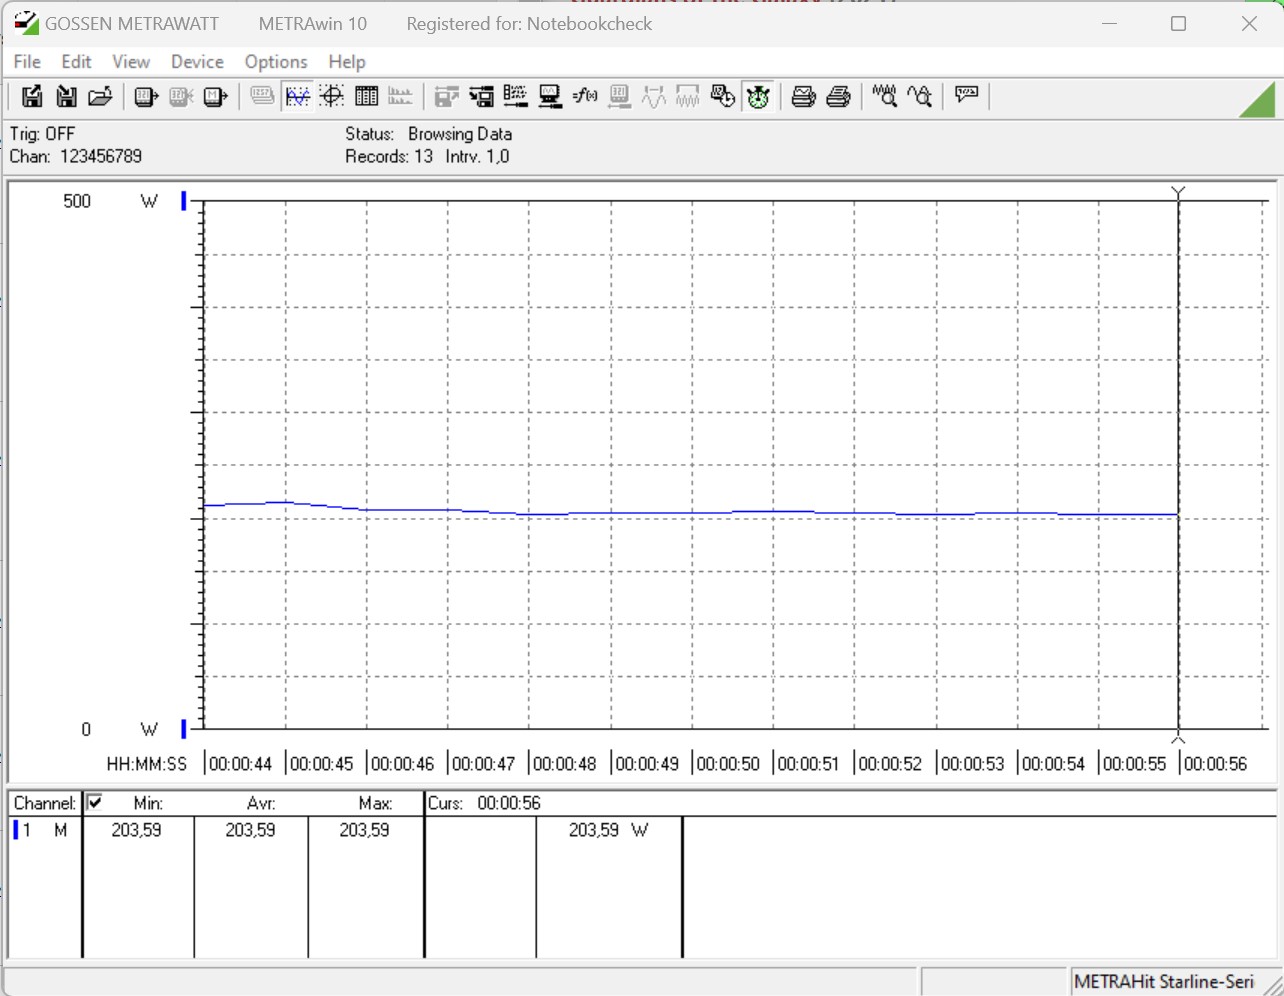
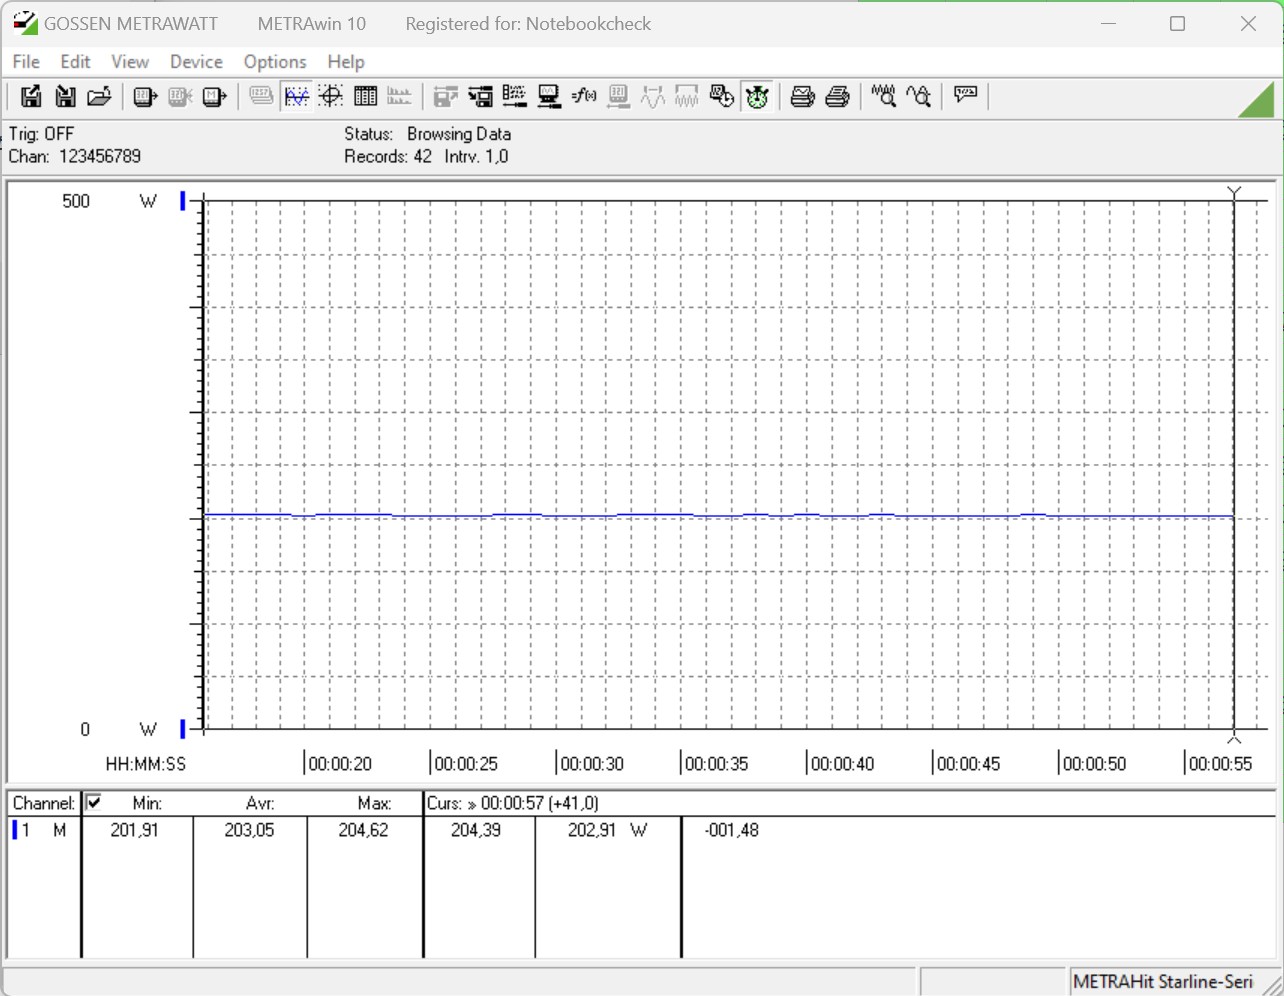
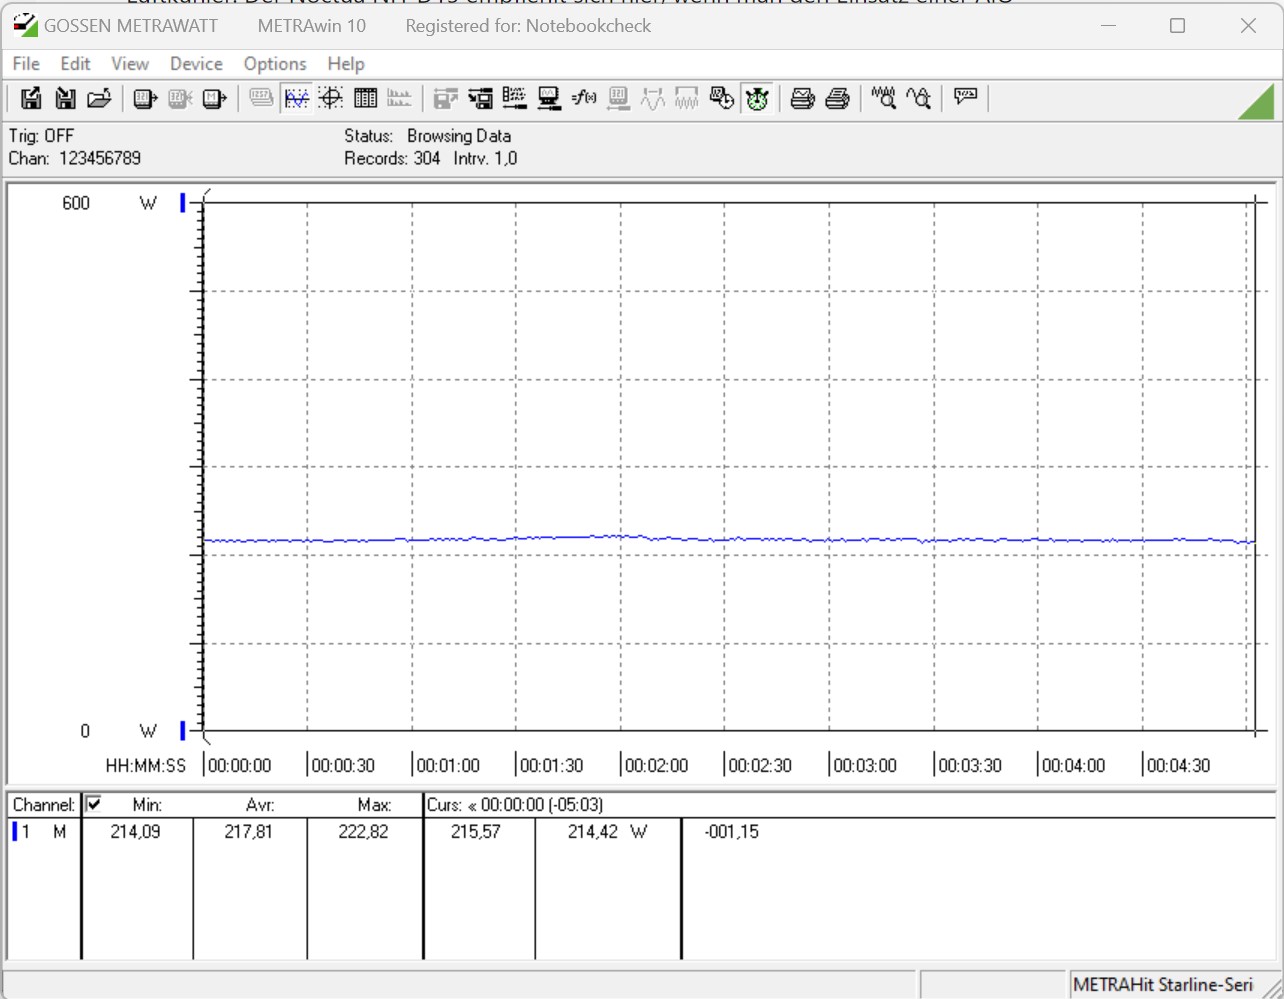
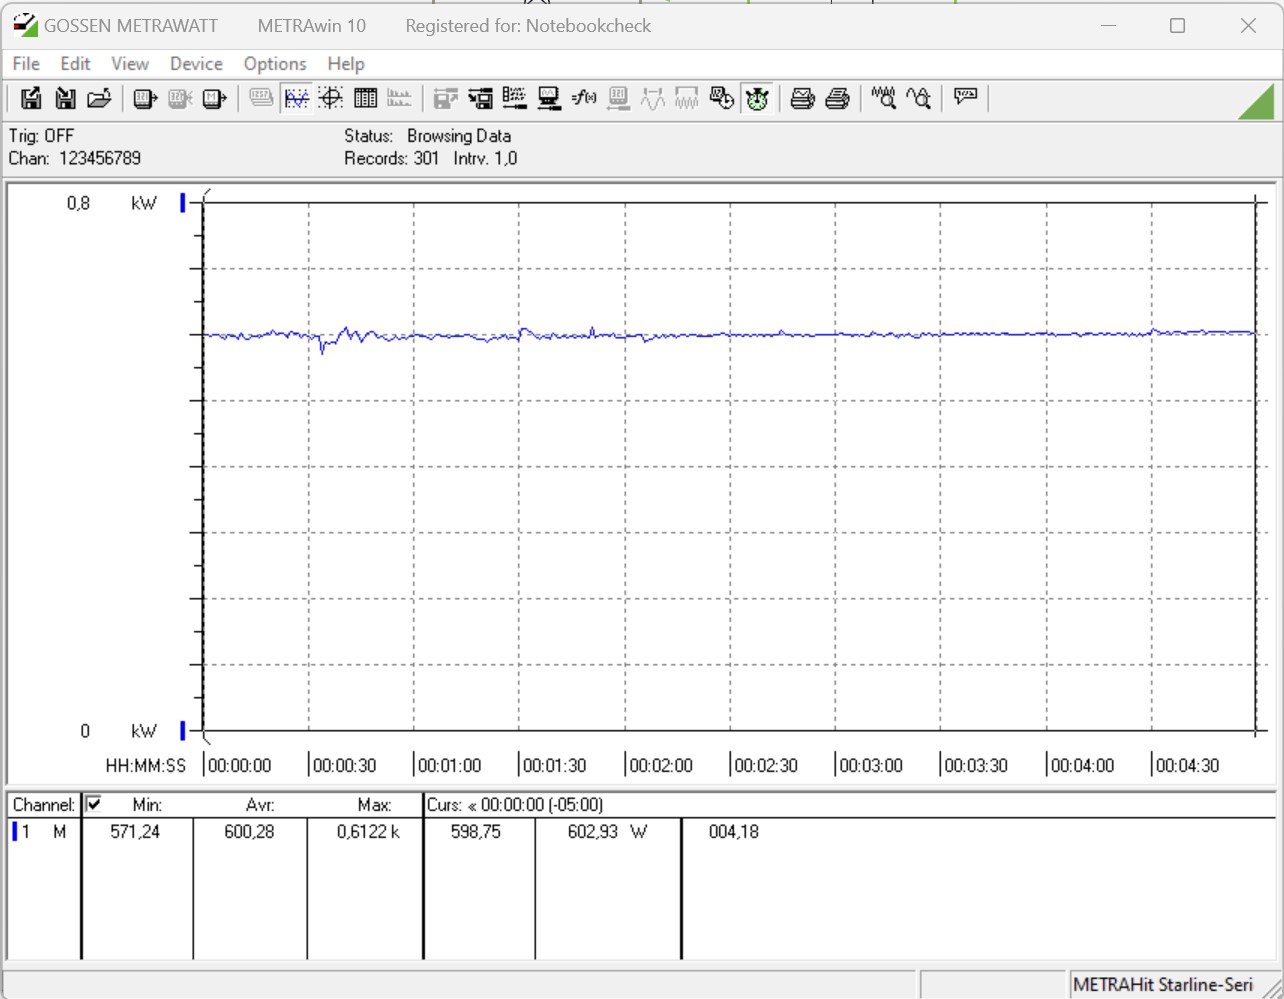
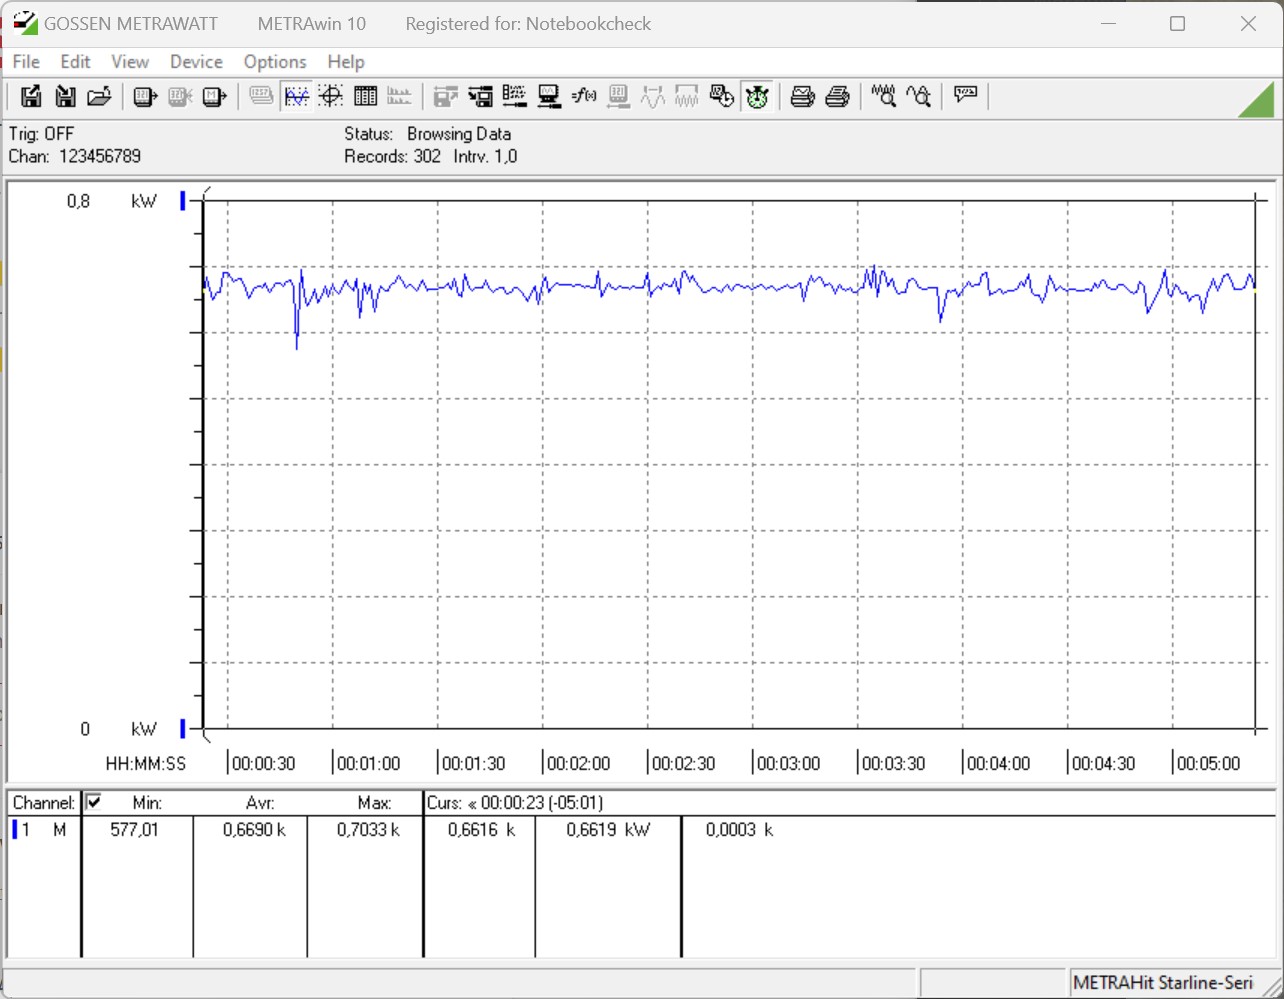
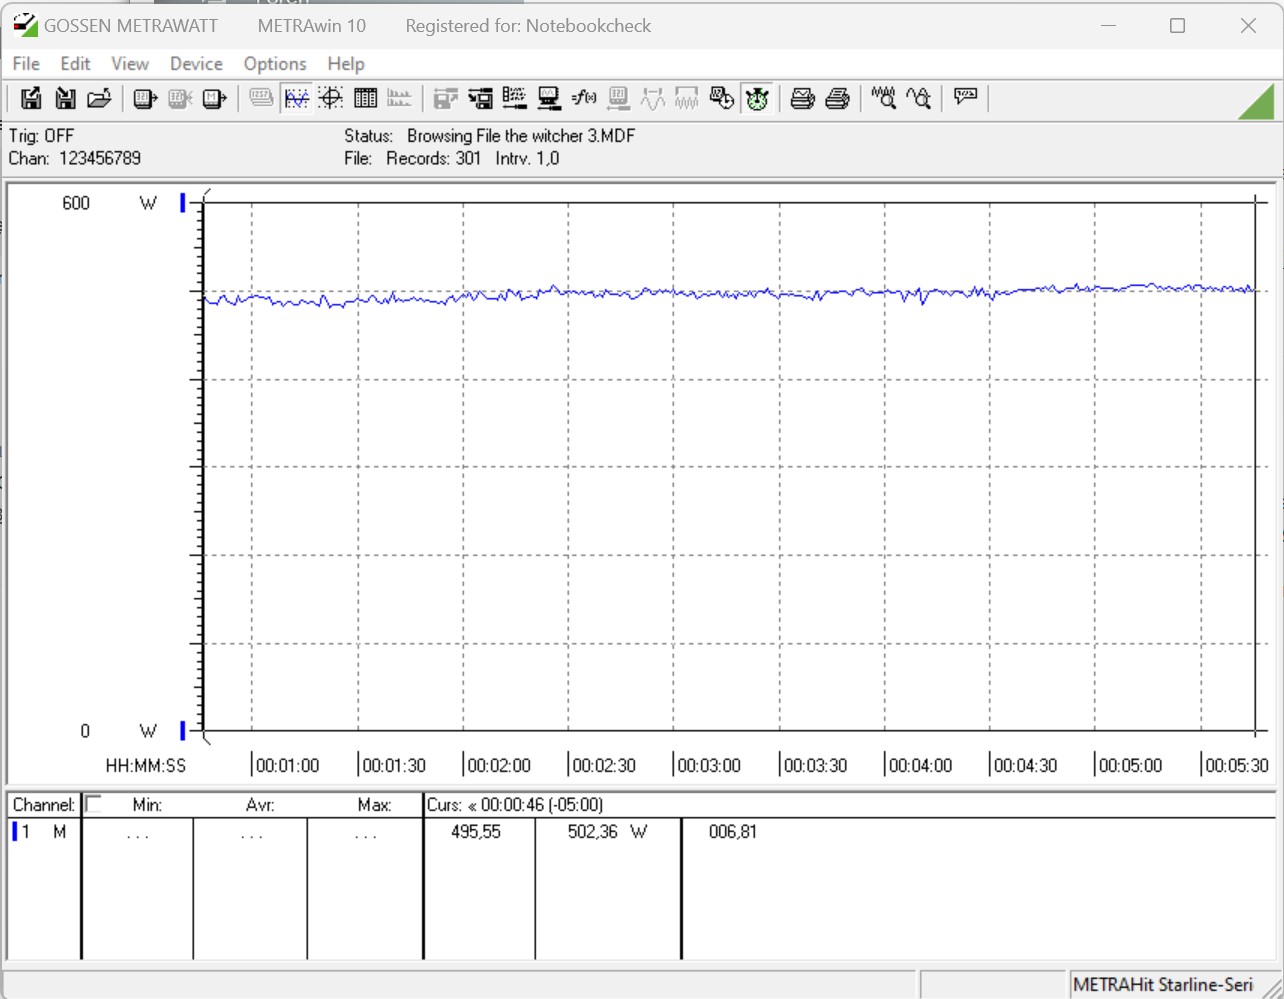
Zużycie energii - oszczędne, ale dobry przepływ powietrza jest niezbędny
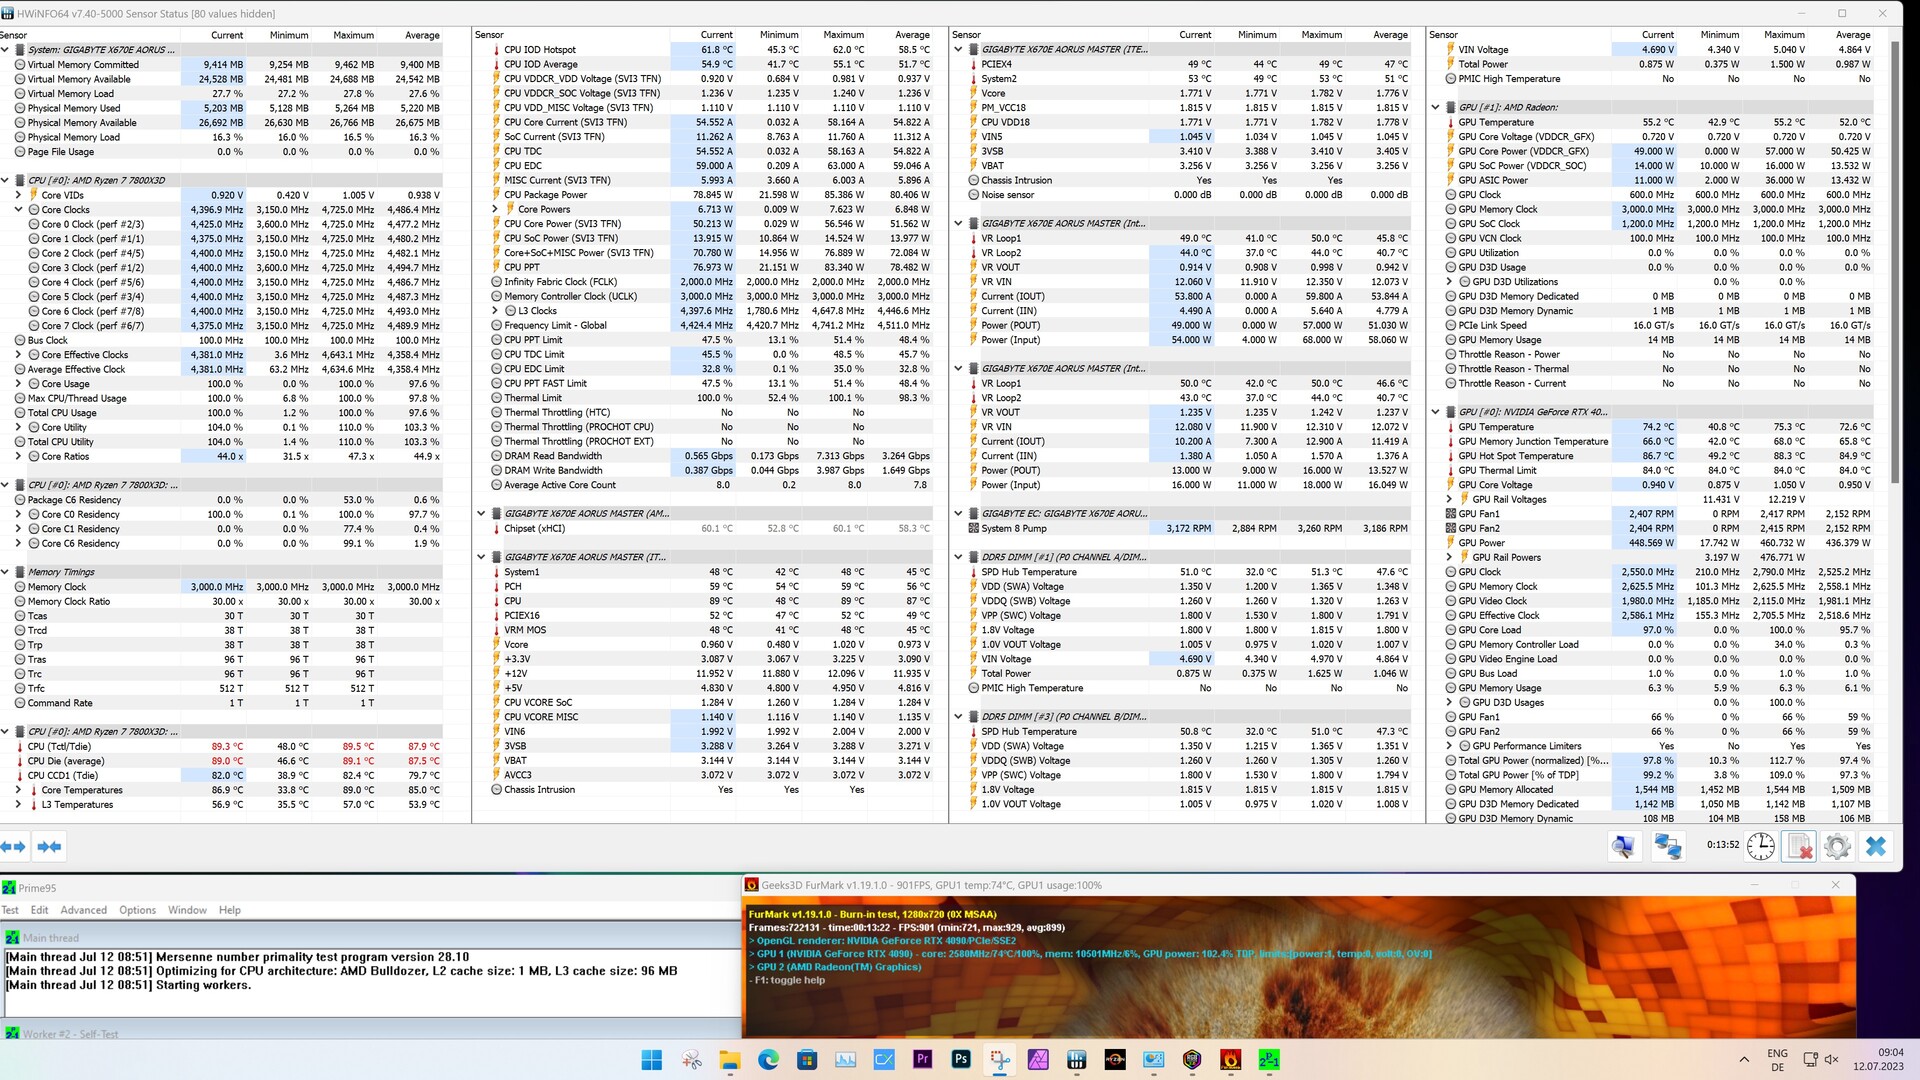
Wszystkie procesory X3D z serii 7000 są ograniczone do maksymalnego poboru mocy 162 watów (PPT). W rezultacie to samo można powiedzieć o naszym AMD Ryzen 7 7800X3D. W trybie bezczynności nie odnotowaliśmy rekordowych wartości na poziomie 120 watów, ale w porównaniu doAMD Ryzen 9 7950X3Dnasze zmierzone wartości były niemal identyczne. Podczas grania udokumentowaliśmy średnio 497 watów podczas naszej Witcher 3 sceny gry. Oznacza to, że nasz system testowy jest mniej więcej na tym samym poziomie, co system oparty na procesorzeIntel Core i5-13400. Podczas naszego testu obciążeniowego Prime95 system oparty na AMD Ryzen 7 7800X3D był w rzeczywistości najbardziej oszczędny. Jego mediana wyniosła zaledwie 218 watów.
W przypadku naszych pomiarów pod obciążeniem należy wziąć pod uwagę zużycie energii przez kartę graficzną. ThePalit GeForce RTX 4090 GameRock OCzużywa już 450 watów.
Odnotowaliśmy dość wysokie temperatury, które wynikają ze złego chłodzenia obudowy. W tym najgorszym scenariuszu AMD Ryzen 7 7800X3D osiągnął swój limit termiczny i musiał zostać zdławiony. Aby nie zafałszować naszych pomiarów, nie przeprowadziliśmy tego testu z otwartą obudową. Usunęliśmy boczną część, co doprowadziło do dość szybkiego spadku temperatury procesora do niekrytycznych wartości. Obudowa z dobrą cyrkulacją powietrza dobrze chłodzi 8-rdzeniowy procesor. Nie zalecalibyśmy jednak rezygnacji z AiO. Na tym etapie radzimy zapoznać się z listą rekomendowanych coolerów producenta https://www.amd.com/de/technologies/cpu-cooler-solution#AMD-FL%C3%9CSSIGK%C3%9CHLER-ANIMATIONEN dla procesorów AMD Ryzen 7000.
| Power Consumption / Cinebench R15 Multi (external Monitor) | |
| Schenker XMG SECTOR, i9 13900K, RTX 4090 | |
| Intel Core i7-13700 | |
| Intel Core i7-13700K | |
| Intel Core i7-12700 | |
| AMD Ryzen 9 7950X3D | |
| AMD Ryzen 7 7800X3D | |
| Intel Core i5-13400 | |
| Intel Core i5-12400F | |
| Power Consumption / Cinebench R15 Multi Efficiency (external Monitor) | |
| AMD Ryzen 9 7950X3D | |
| AMD Ryzen 7 7800X3D | |
| Power Consumption / Prime95 V2810 Stress (external Monitor) | |
| Intel Core i7-13700 | |
| Schenker XMG SECTOR, i9 13900K, RTX 4090 | |
| Intel Core i7-13700K | |
| Intel Core i7-12700 | |
| AMD Ryzen 9 7950X3D | |
| Intel Core i5-12400F | |
| Intel Core i5-13400 | |
| AMD Ryzen 7 7800X3D | |
| Power Consumption / The Witcher 3 ultra (external Monitor) | |
| Intel Core i7-13700 | |
| Intel Core i7-13700K | |
| AMD Ryzen 9 7950X3D | |
| Schenker XMG SECTOR, i9 13900K, RTX 4090 | |
| Intel Core i7-12700 | |
| Intel Core i5-13400 | |
| AMD Ryzen 7 7800X3D | |
| Intel Core i5-12400F | |
* ... im mniej tym lepiej
| Power Consumption - Cinebench R15 Multi Efficiency (external Monitor) | |
| AMD Ryzen 9 7950X3D | |
| AMD Ryzen 9 5950X | |
| AMD Ryzen 9 7950X | |
| AMD Ryzen 9 7900X | |
| AMD Ryzen 7 7800X3D | |
| Intel Core i9-13900K | |
Power consumption with external monitor
Za
Przeciw
Werdykt - Świetny procesor dla wymagających graczy
W tej recenzji przyjrzeliśmy się bliżej AMD Ryzen 7 7800X3D - pierwszemu procesorowi X3D z nowej platformy AM5. Rozumiemy przez to, że jest to nowy procesor, który nie jest zbudowany w oparciu o konstrukcję hybrydową - zamiast tego ma tylko jedną kość CCD w postaci pamięci podręcznej 3D V-Cache. Jest to zaleta dla wielu gier, w wyniku czego 8-rdzeniowy procesor jest w stanie nieznacznie wyprzedzić AMD Ryzen 9 7950X3D.
Nie oznacza to, że AMD Ryzen 7 7800X3D może uchodzić za wszechstronny. 8-rdzeniowy procesor nie poradził sobie wystarczająco dobrze w testach wydajności CPU, a ze względu na ograniczoną wydajność wielordzeniową, komponent nie mógł nadążyć za modelami z wyższej półki. Ale nie musi. Jako czysty procesor do gier, 7800X3D może robić dokładnie to, do czego został stworzony. Pozytywnym aspektem jest niski pobór mocy.
AMD Ryzen 7 7800X3D zapewnia świetną wydajność w grach. Biorąc pod uwagę cenę, 8-rdzeniowy procesor obecnie nadal będzie miał trochę trudności z przekonaniem kupujących do wyboru tego modelu.
Podsumowując, możemy powiedzieć, że AMD Ryzen 7 7800X3D jest obecnie jednym z najszybszych procesorów do gier na rynku. Nie możemy nazwać go najszybszym procesorem - na przykładAMD Ryzen 9 7950X3Dzapewnia tylko nieco lepszą wydajność w kilku grach, o ile jego prawidłowa alokacja wątków może wykorzystać pełną wydajność procesora. Ze względu na hybrydową strukturę modeli Ryzen 9 z 3D V-Cache, niestety nie zawsze można zagwarantować, że CCD z 3D V-Cache będzie traktowany priorytetowo. Tutaj AMD Ryzen 7 7800X3D zyskuje dzięki prostszej budowie wewnętrznej. Chociaż jest to narzekanie na najwyższym poziomie - wszystkie testowane przez nas gry można było uruchomić, niezależnie od używanego procesora.
Największym problemem tego komponentu jest w naszych oczach jego cena. Obecnie jest on sprzedawany za minimum 441,99 USD. AIntel Core i7-13700Kkosztuje mniej więcej tyle samo i oferuje podobny poziom wydajności - ale zapewnia lepszą całkowitą wydajność procesora. Jeśli weźmiemy pod uwagę, jak przyszłościowe są te procesory, to nikt nie może pokonać AMD. Wierzcie lub nie, ale plotki sugerują, że platforma AM5 będzie nadal wspierana do 2025 roku. Gniazdo 1700, które jest obecnie stosowane w systemach Intela, prawdopodobnie zostanie zastąpione przez jego następcę w przyszłym roku i żadne inne procesory nie zostaną wydane dla gniazda 1700.
Cena i dostępność
Obecnie AMD Ryzen 7 7800X3D można kupić w sklepie Amazon za 441,99 USD.
Przezroczystość
Wyboru urządzeń do recenzji dokonuje nasza redakcja. Próbkę do badań autor zakupił bezpłatnie na własny koszt. Pożyczkodawca nie miał wpływu na tę recenzję, producent nie otrzymał też kopii tej recenzji przed publikacją. Nie było obowiązku publikowania tej recenzji. Jako niezależna firma medialna, Notebookcheck nie podlega władzy producentów, sprzedawców detalicznych ani wydawców.
Tak testuje Notebookcheck
Każdego roku Notebookcheck niezależnie sprawdza setki laptopów i smartfonów, stosując standardowe procedury, aby zapewnić porównywalność wszystkich wyników. Od około 20 lat stale rozwijamy nasze metody badawcze, ustanawiając przy tym standardy branżowe. W naszych laboratoriach testowych doświadczeni technicy i redaktorzy korzystają z wysokiej jakości sprzętu pomiarowego. Testy te obejmują wieloetapowy proces walidacji. Nasz kompleksowy system ocen opiera się na setkach uzasadnionych pomiarów i benchmarków, co pozwala zachować obiektywizm.
