Recenzja laptopa Eluktronics Mech-17 GP2: MSI GT77 Titan wydajność bez rozmiarów
Eluktronics Mech-17 GP2 zastępuje zeszłoroczny Mech-17 GP, zamieniając opcje Intel 12th gen i Nvidia Ampere na odpowiednio Intel 13th gen i Nvidia Ada Lovelace. Warto zwrócić uwagę na oferowanie procesorów z serii Core HX i grafiki 175 W GeForce RTX 4090 pomimo niewielkich rozmiarów w stosunku do innych 17-calowych laptopów dla graczy.
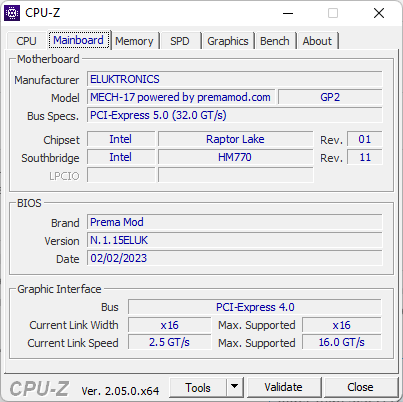
Mech-17 GP2 jest oparty na zaktualizowanej wersji zeszłorocznego Schenkera Neo 17 M22 zaprojektowanego przez Uniwill. Jest to w zasadzie Neo 17 E23 choć pod marką Eluktronics. W tym roku wprowadzono kilka istotnych zmian w płytach głównych, które wyszczególnimy w naszych analizach poniżej. Poza tym, ich wygląd zewnętrzny pozostaje identyczny, więc polecamy sprawdzić naszą istniejącą recenzję Schenker Neo 17 M22, aby dowiedzieć się więcej o fizycznych cechach Mech-17 GP2.
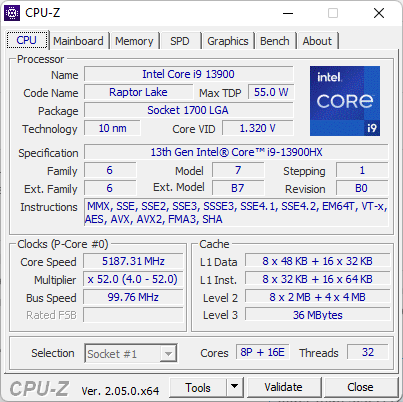
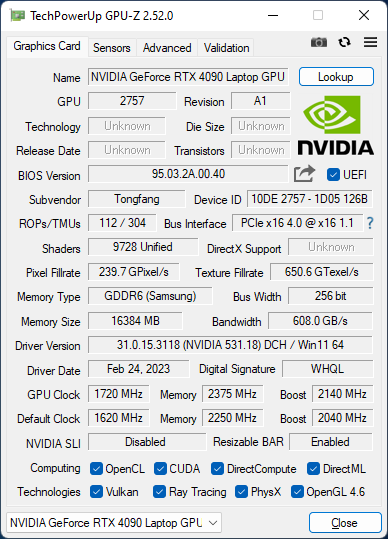
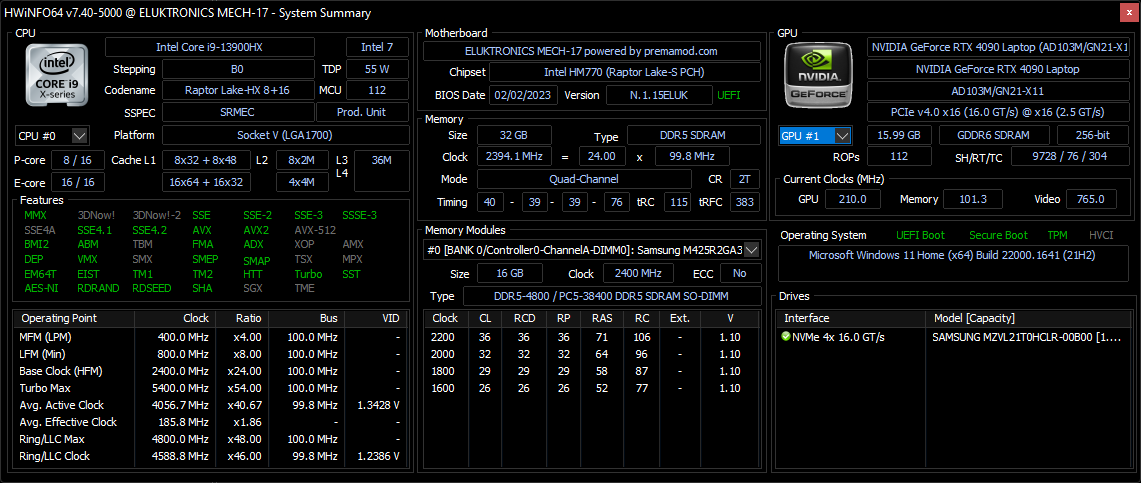
Nasza konfiguracja w recenzji została w pełni skonfigurowana z Core i9-13900HX i RTX 4090 za około 3400 USD. Mniejsze jednostki SKU są dostępne w dół do RTX 4070, ale wszystkie opcje inaczej pochodzą z tego samego procesora i 240 Hz 2560 x 1600 IPS wyświetlacz.
Alternatywy dla Mech-17 GP2 obejmują inne wysokiej klasy 17-calowe laptopy do gier, takie jak Razer Blade 17, Alienware m17 R5, Asus Zephyrus S17, lub MSI Titan GT77.
Więcej recenzji Eluktronika:
Potencjalni konkurenci w porównaniu
Ocena | Data | Model | Waga | Wysokość | Rozmiar | Rezolucja | Cena |
|---|---|---|---|---|---|---|---|
| 89.9 % v7 (old) | 03/2023 | Eluktronics Mech-17 GP2 i9-13900HX, GeForce RTX 4090 Laptop GPU | 2.9 kg | 27 mm | 17.00" | 2560x1600 | |
| 87.6 % v7 (old) | 09/2022 | Schenker XMG Neo 17 M22 R9 6900HX, GeForce RTX 3080 Ti Laptop GPU | 2.8 kg | 27 mm | 17.00" | 2560x1600 | |
| 82.1 % v7 (old) | 02/2023 | MSI Katana 17 B13VFK i7-13620H, GeForce RTX 4060 Laptop GPU | 2.8 kg | 25.2 mm | 17.30" | 1920x1080 | |
| 89 % v7 (old) | 02/2023 | MSI Titan GT77 HX 13VI i9-13950HX, GeForce RTX 4090 Laptop GPU | 3.5 kg | 23 mm | 17.30" | 3840x2160 | |
| 86.1 % v7 (old) | 01/2023 | Alienware m17 R5 (R9 6900HX, RX 6850M XT) R9 6900HX, Radeon RX 6850M XT | 3.4 kg | 26.7 mm | 17.00" | 3840x2160 | |
| 91.4 % v7 (old) | 02/2023 | Razer Blade 18 RTX 4070 i9-13950HX, GeForce RTX 4070 Laptop GPU | 3 kg | 21.9 mm | 18.00" | 2560x1600 |
Sprawa
Czytnik kart SD
Czytnik kart SD jest wolny w stosunku do wysokiej ceny tego modelu. Razer Blade 18 i Dell XPS mają 2x do 3x szybsze czytniki kart.
| SD Card Reader | |
| average JPG Copy Test (av. of 3 runs) | |
| Razer Blade 18 RTX 4070 (Angelibird AV Pro V60) | |
| MSI Titan GT77 HX 13VI (Angelibird AV Pro V60) | |
| Eluktronics Mech-17 GP2 (Angelibird AV Pro V60) | |
| Schenker XMG Neo 17 M22 (AV PRO microSD 128 GB V60) | |
| maximum AS SSD Seq Read Test (1GB) | |
| Razer Blade 18 RTX 4070 (Angelibird AV Pro V60) | |
| Eluktronics Mech-17 GP2 (Angelibird AV Pro V60) | |
| MSI Titan GT77 HX 13VI (Angelibird AV Pro V60) | |
Komunikacja
Standardem jest Intel AX201, który zapewnia łączność Wi-Fi 6 i Bluetooth 5.2. Niemniej jednak, biorąc pod uwagę cenę systemu, spodziewaliśmy się AX210/211 dla szybszych prędkości Wi-Fi 6E.
| Networking | |
| iperf3 transmit AXE11000 | |
| MSI Titan GT77 HX 13VI | |
| MSI Katana 17 B13VFK | |
| Eluktronics Mech-17 GP2 | |
| Razer Blade 18 RTX 4070 | |
| Alienware m17 R5 (R9 6900HX, RX 6850M XT) | |
| Schenker XMG Neo 17 M22 | |
| iperf3 receive AXE11000 | |
| MSI Katana 17 B13VFK | |
| MSI Titan GT77 HX 13VI | |
| Razer Blade 18 RTX 4070 | |
| Eluktronics Mech-17 GP2 | |
| Alienware m17 R5 (R9 6900HX, RX 6850M XT) | |
| Schenker XMG Neo 17 M22 | |
| iperf3 transmit AXE11000 6GHz | |
| Razer Blade 18 RTX 4070 | |
| iperf3 receive AXE11000 6GHz | |
| Razer Blade 18 RTX 4070 | |
Kamera internetowa
Kamera internetowa 2 MP FHD i podczerwień są w standardzie dla obsługi Hello. Nie ma jednak przełącznika prywatności ani opcji migawki.


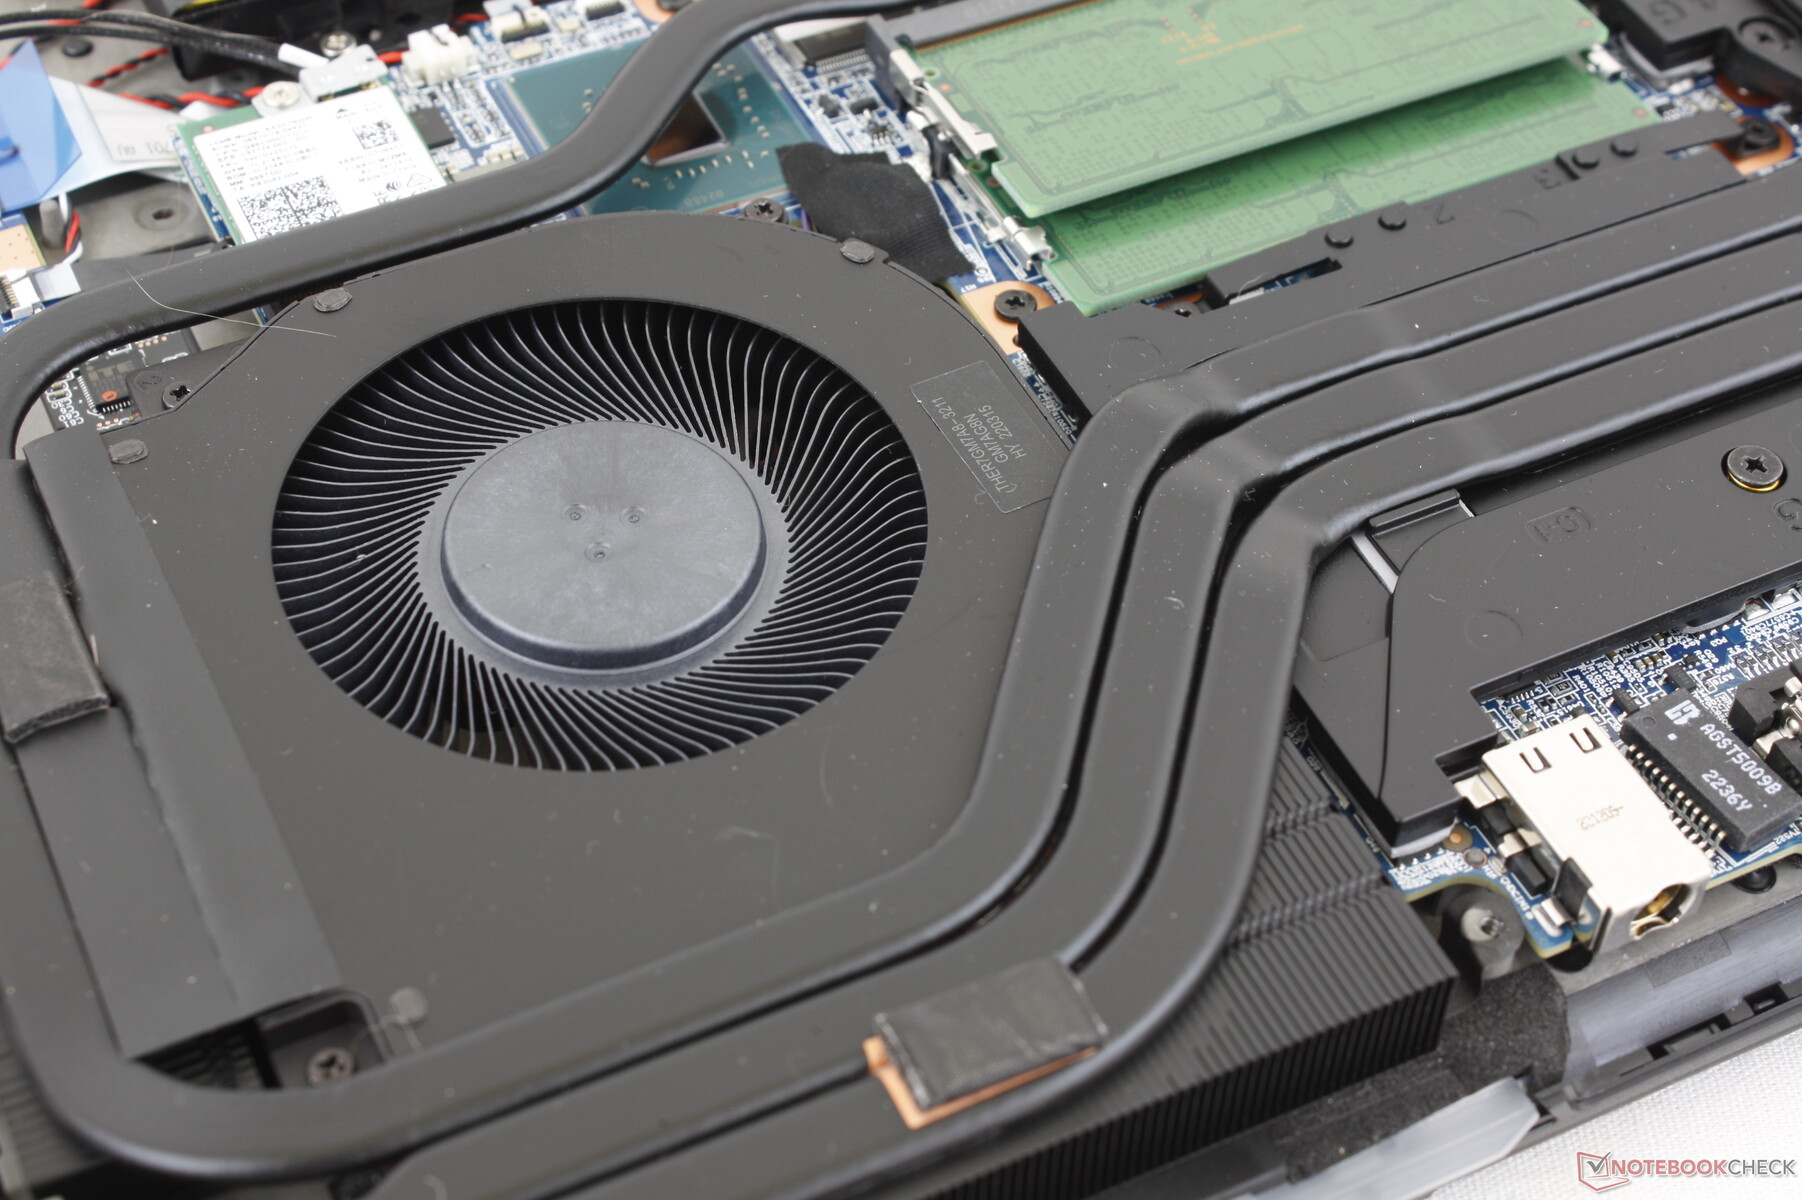
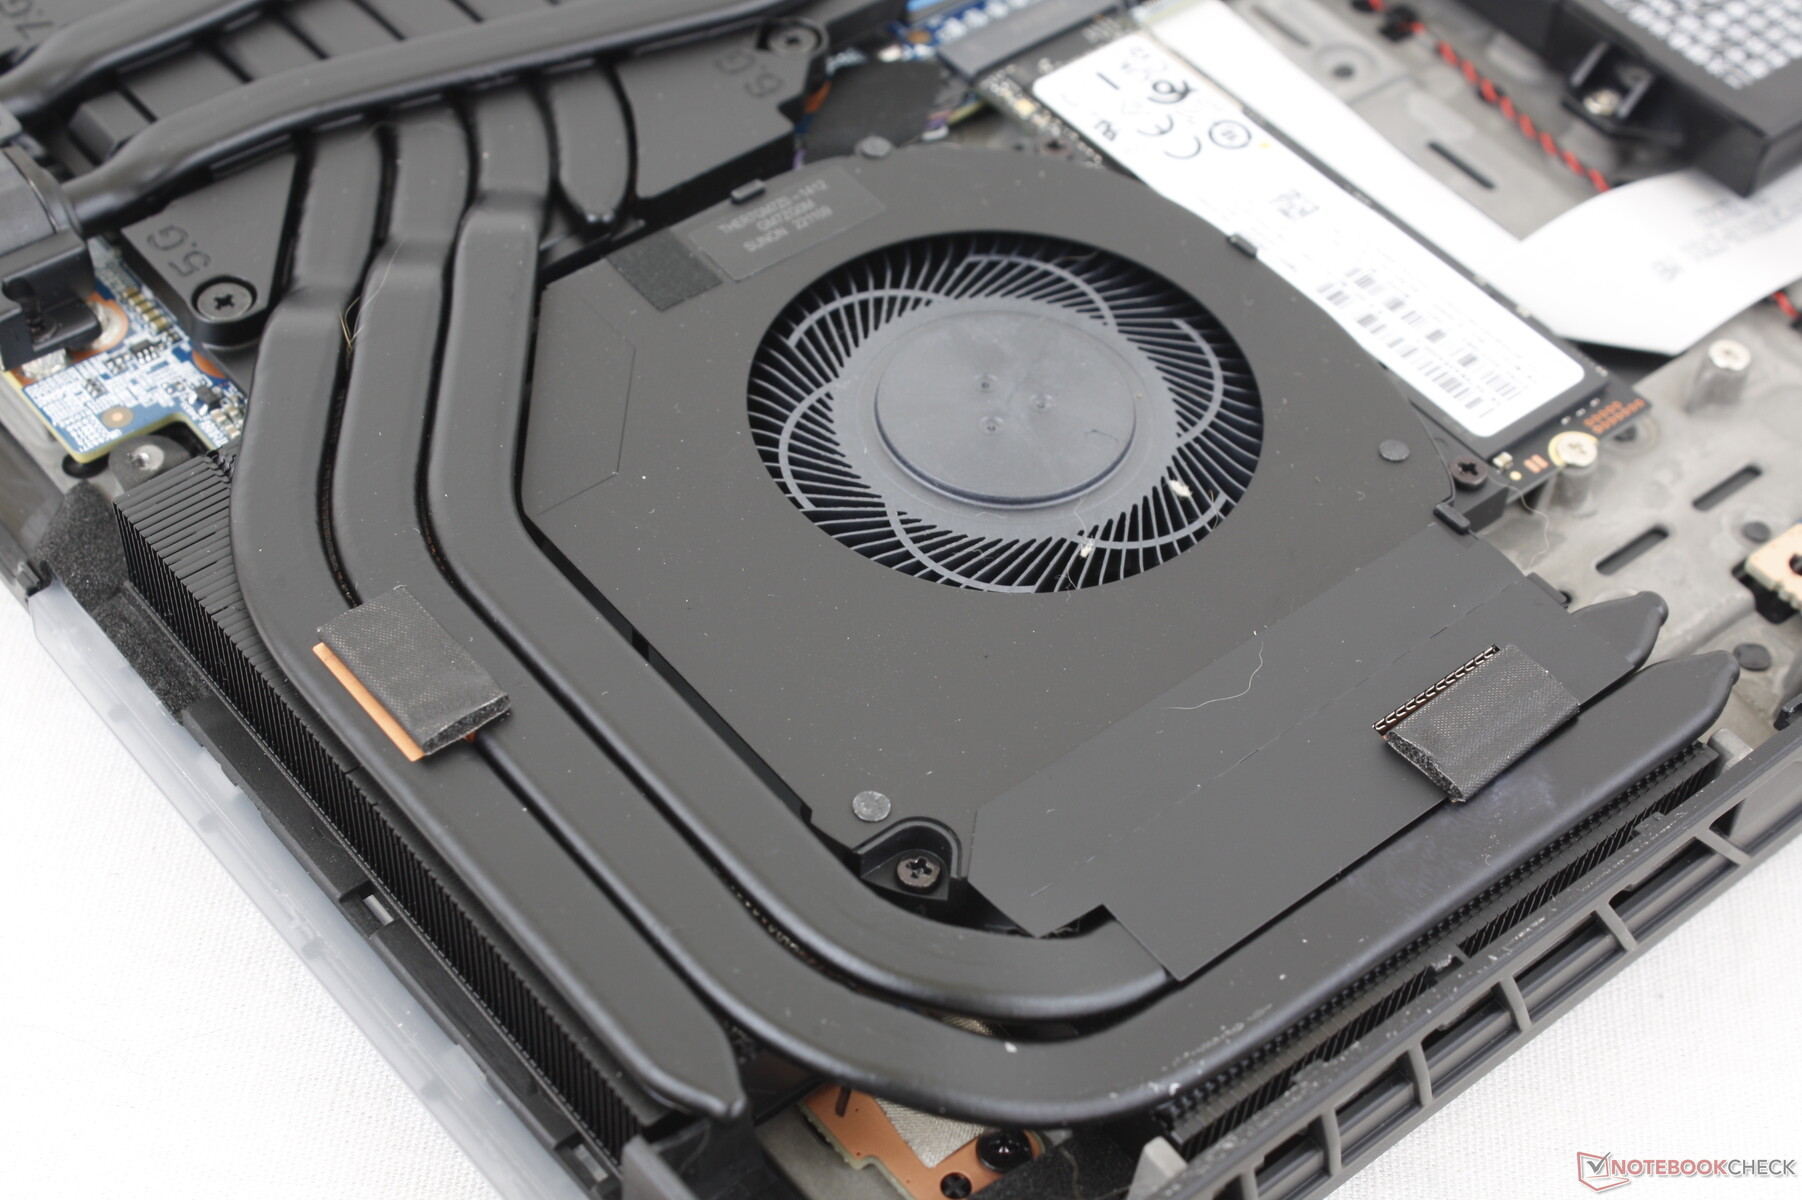
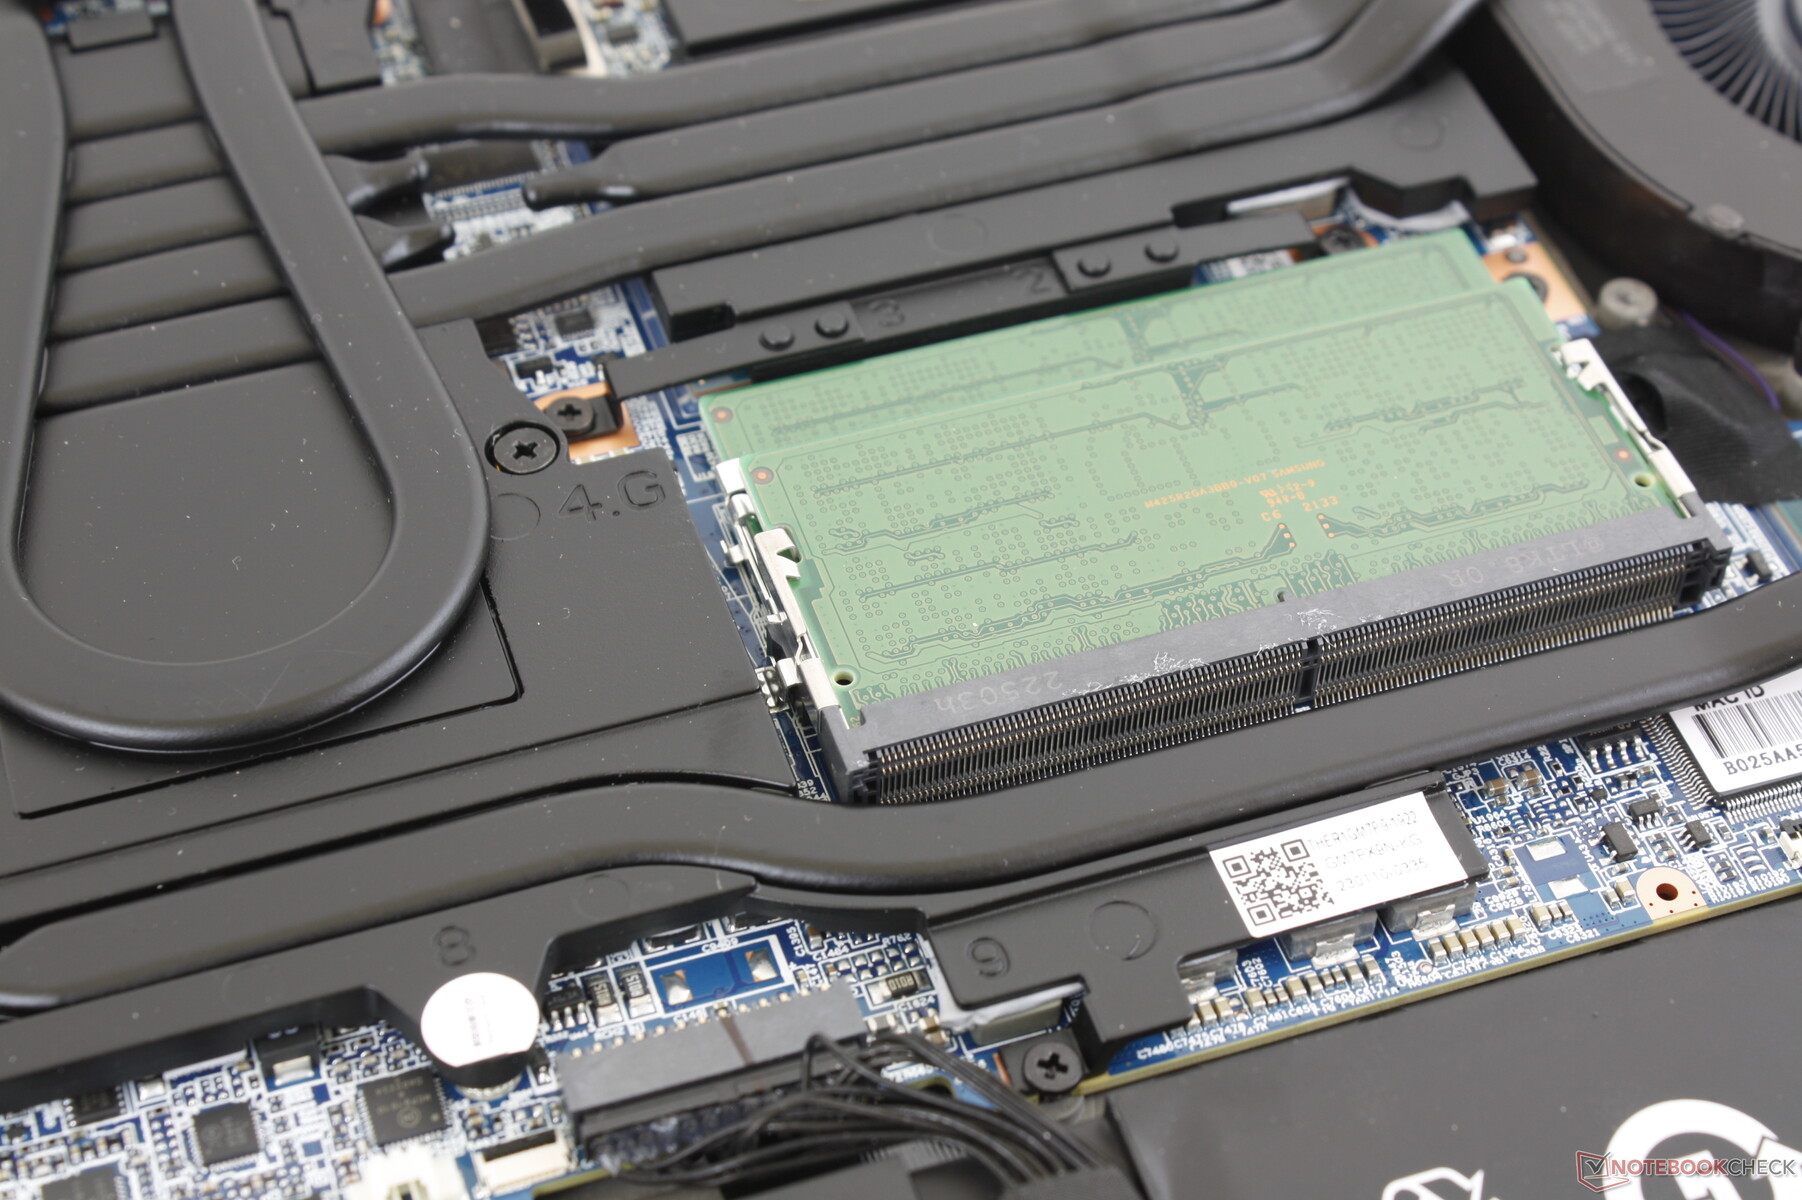
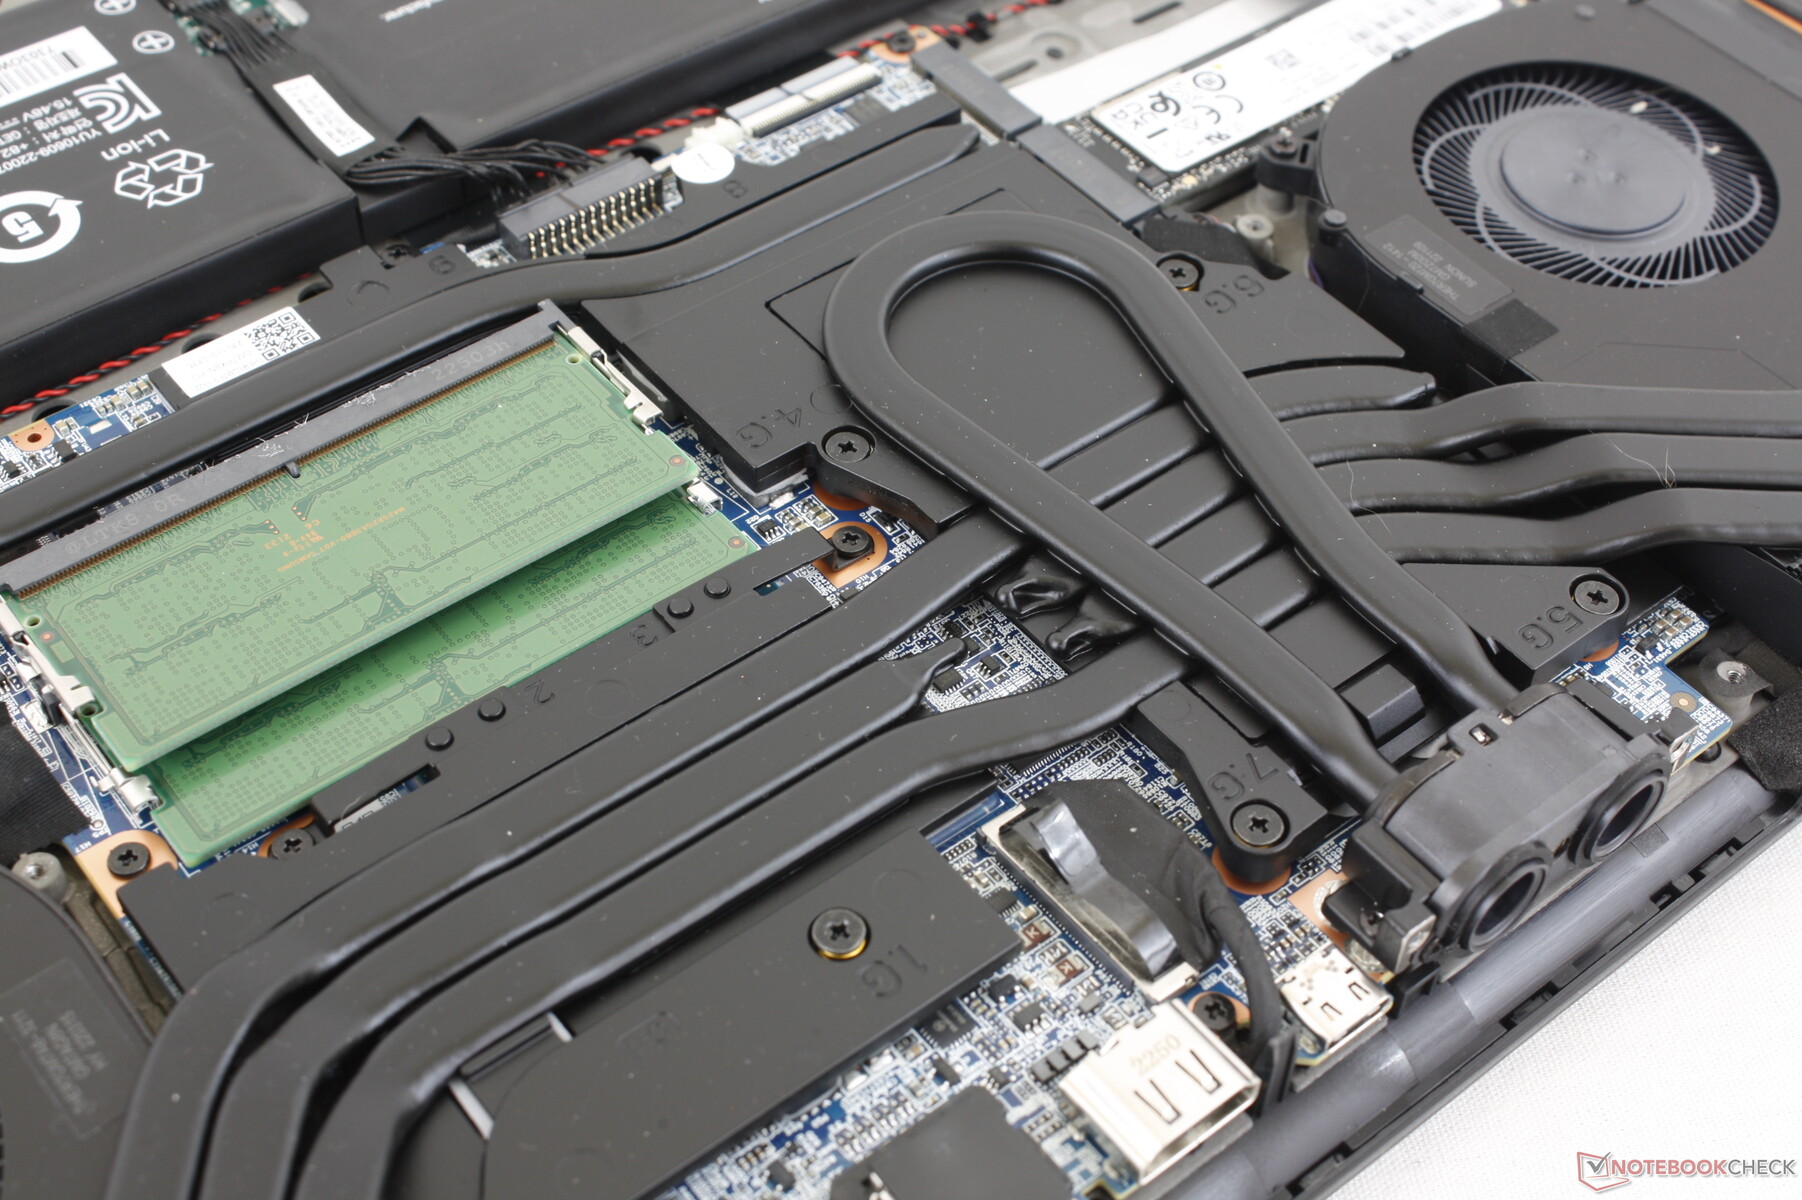
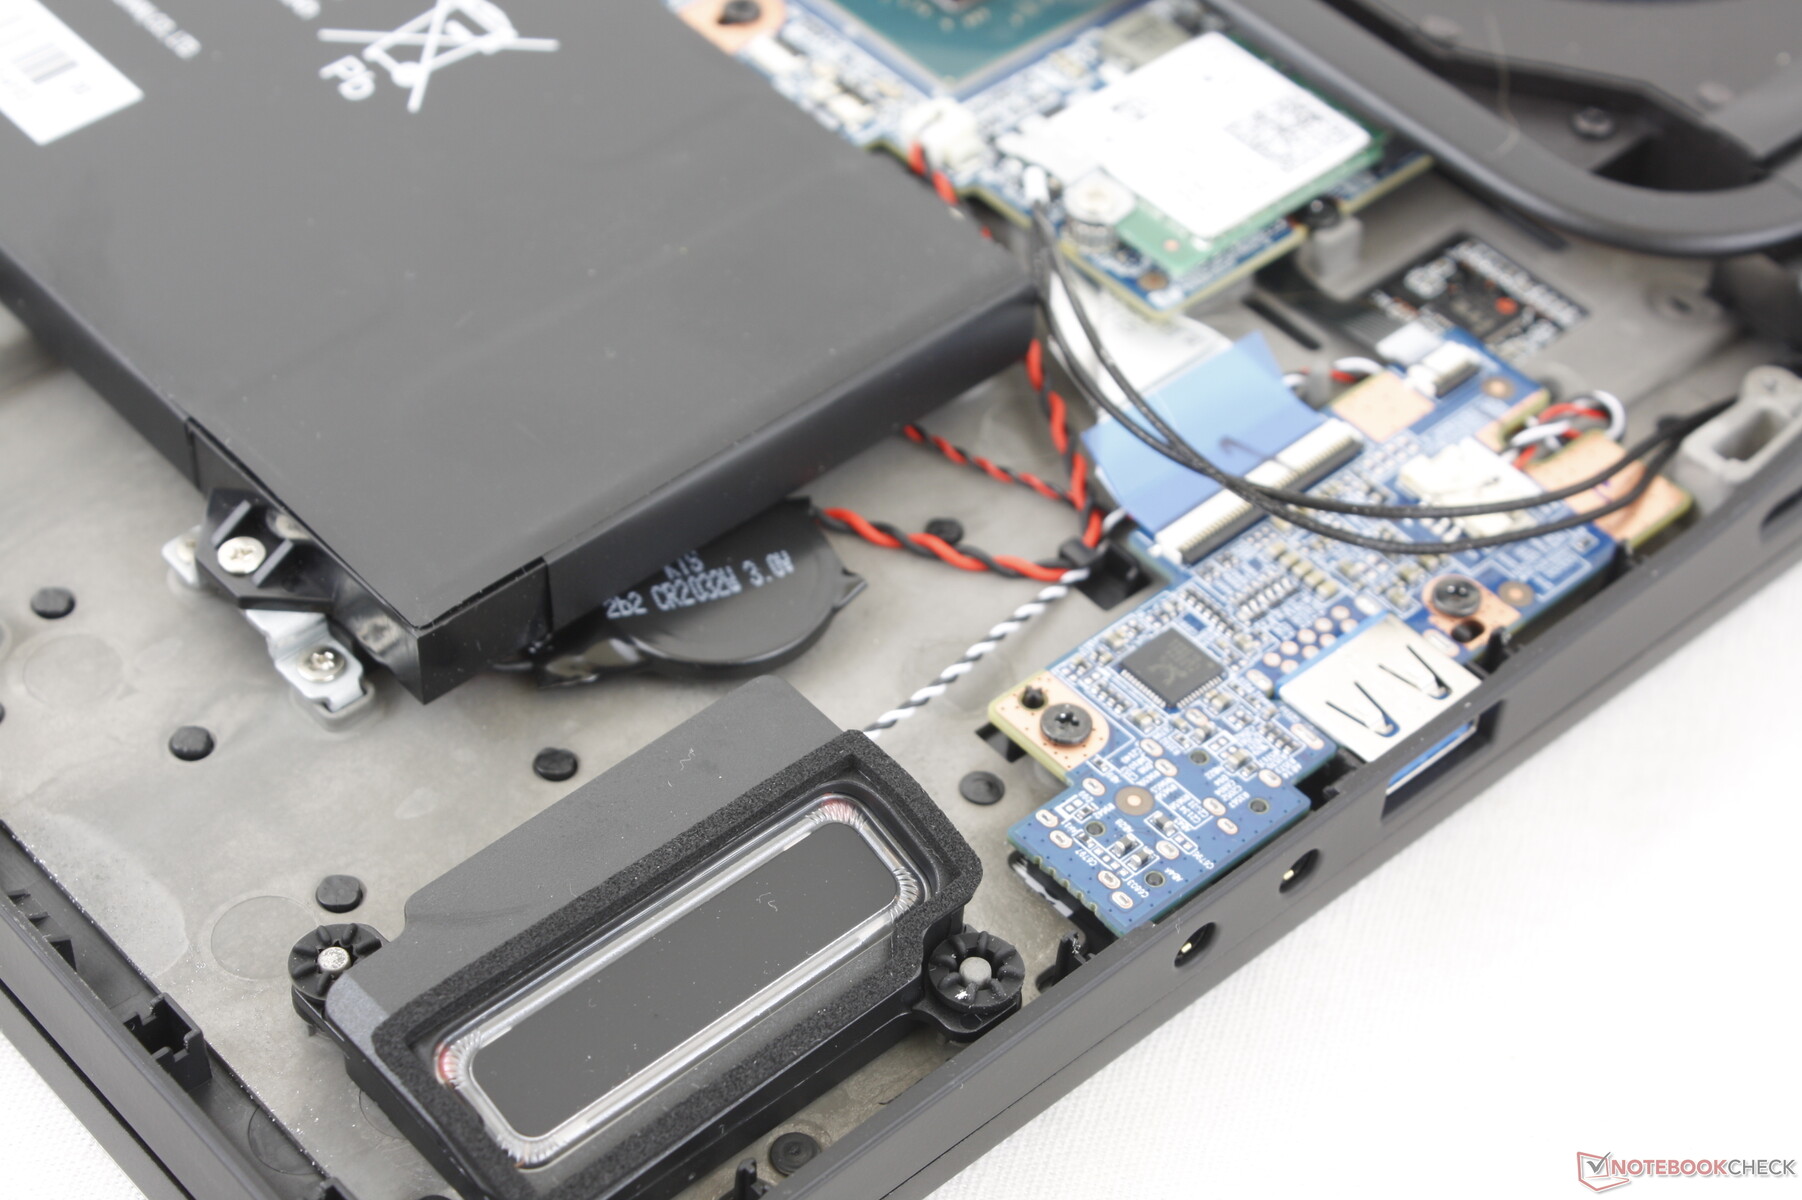
Konserwacja
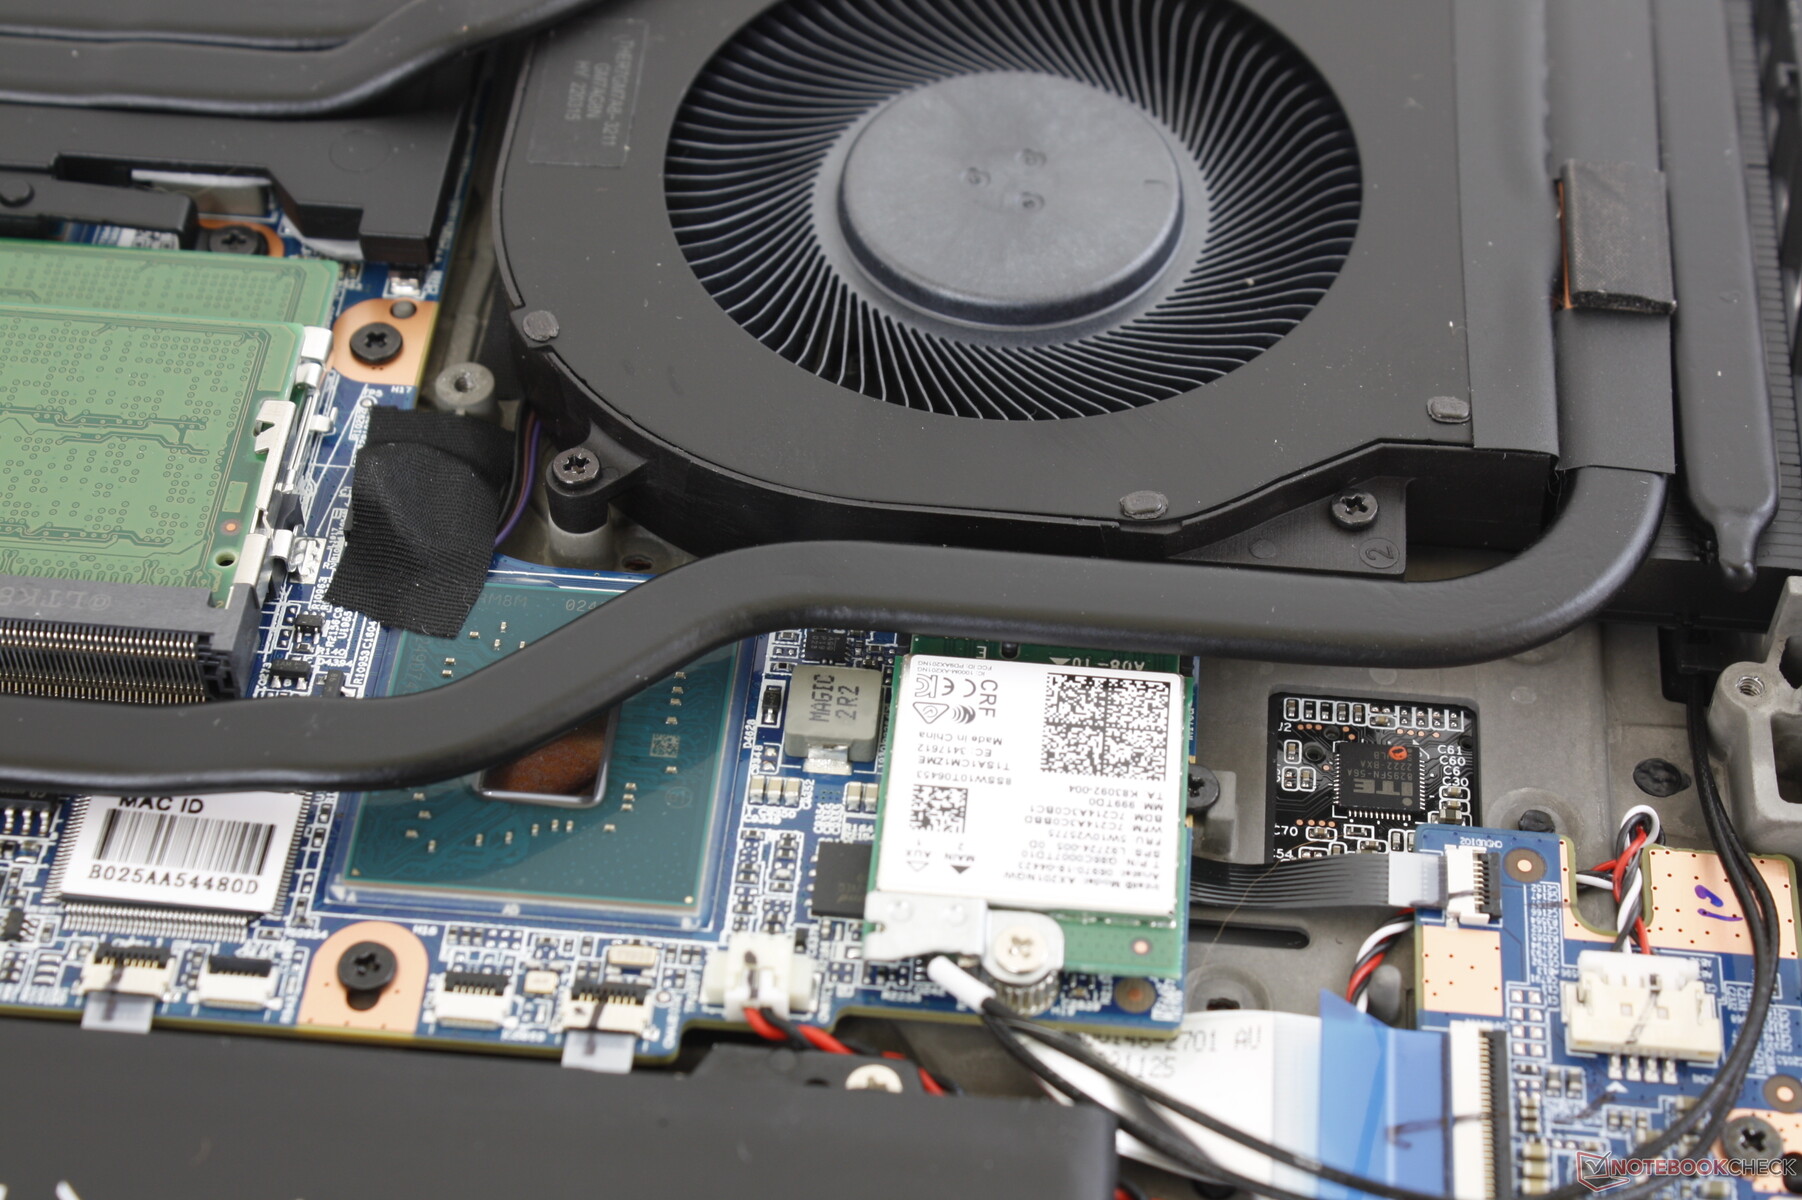
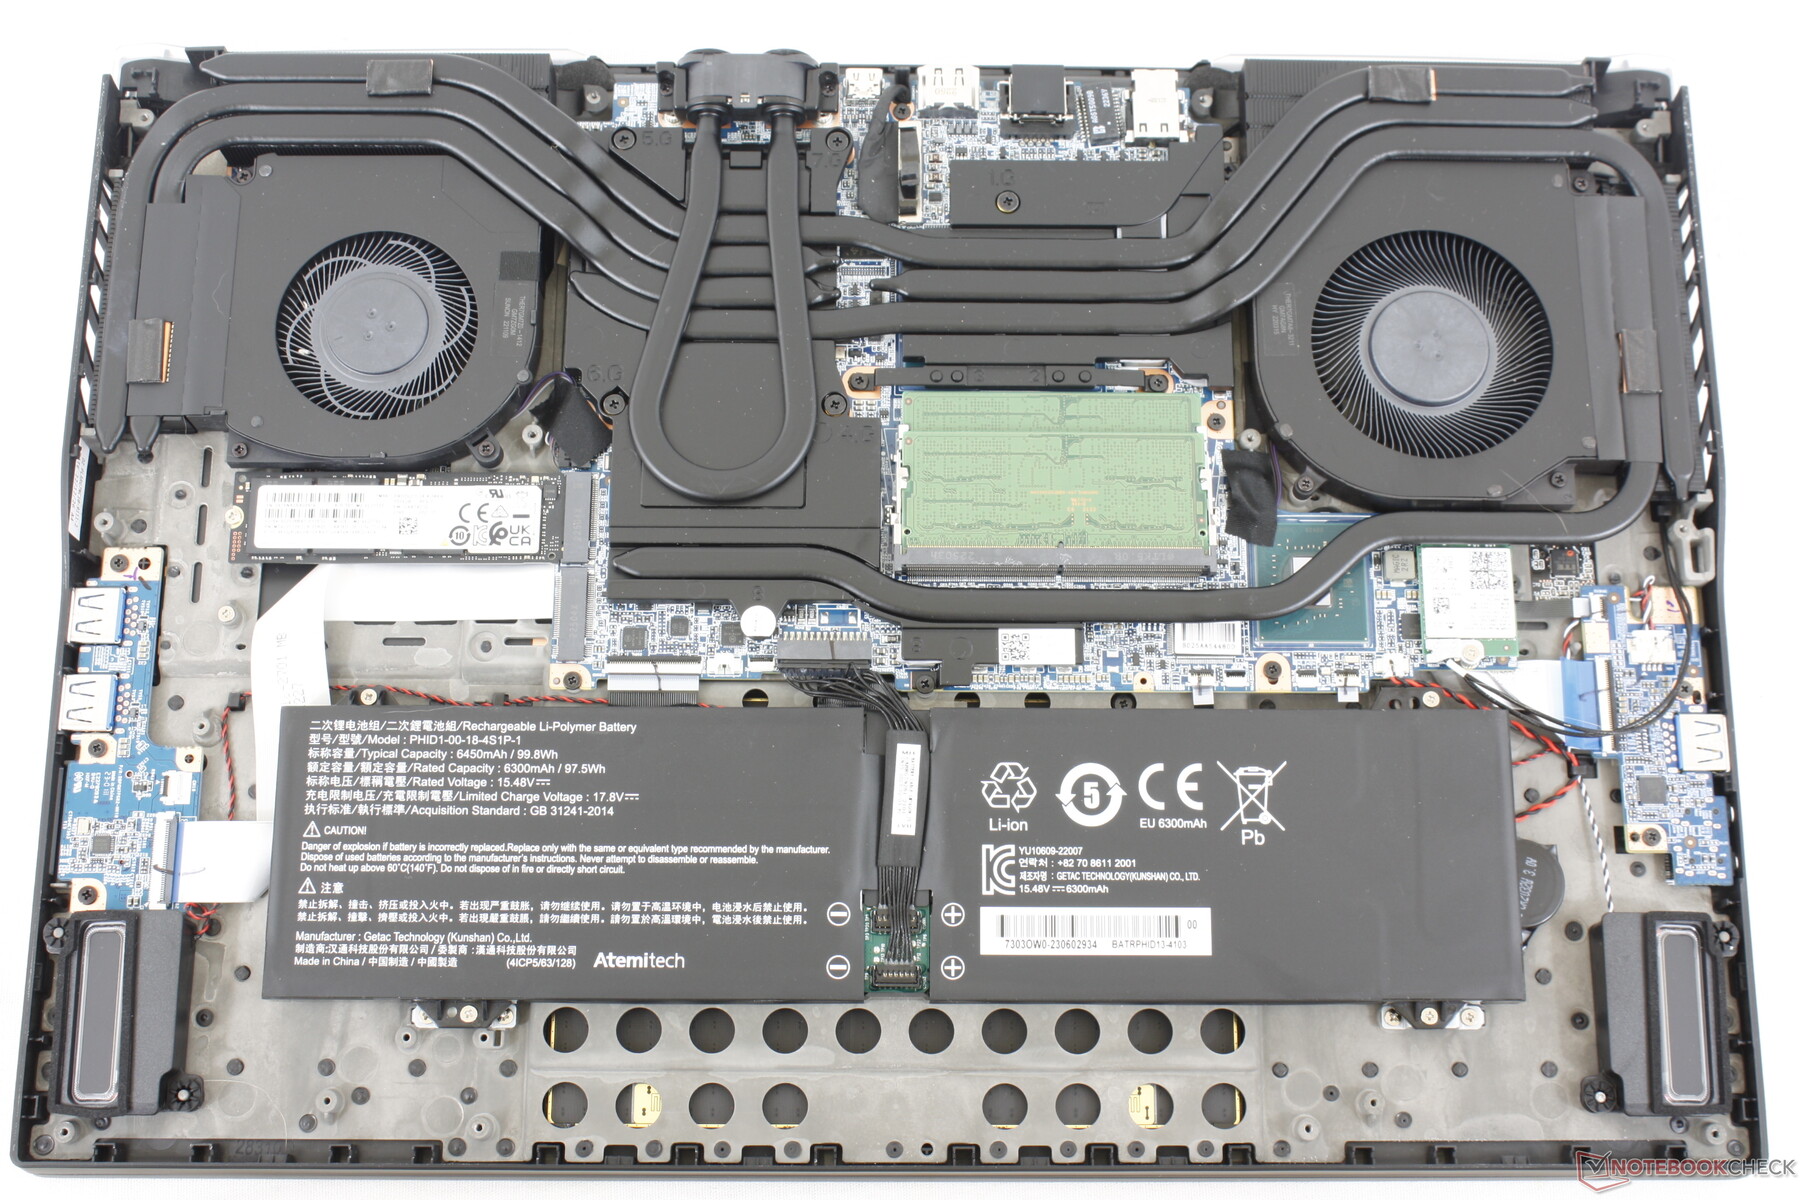
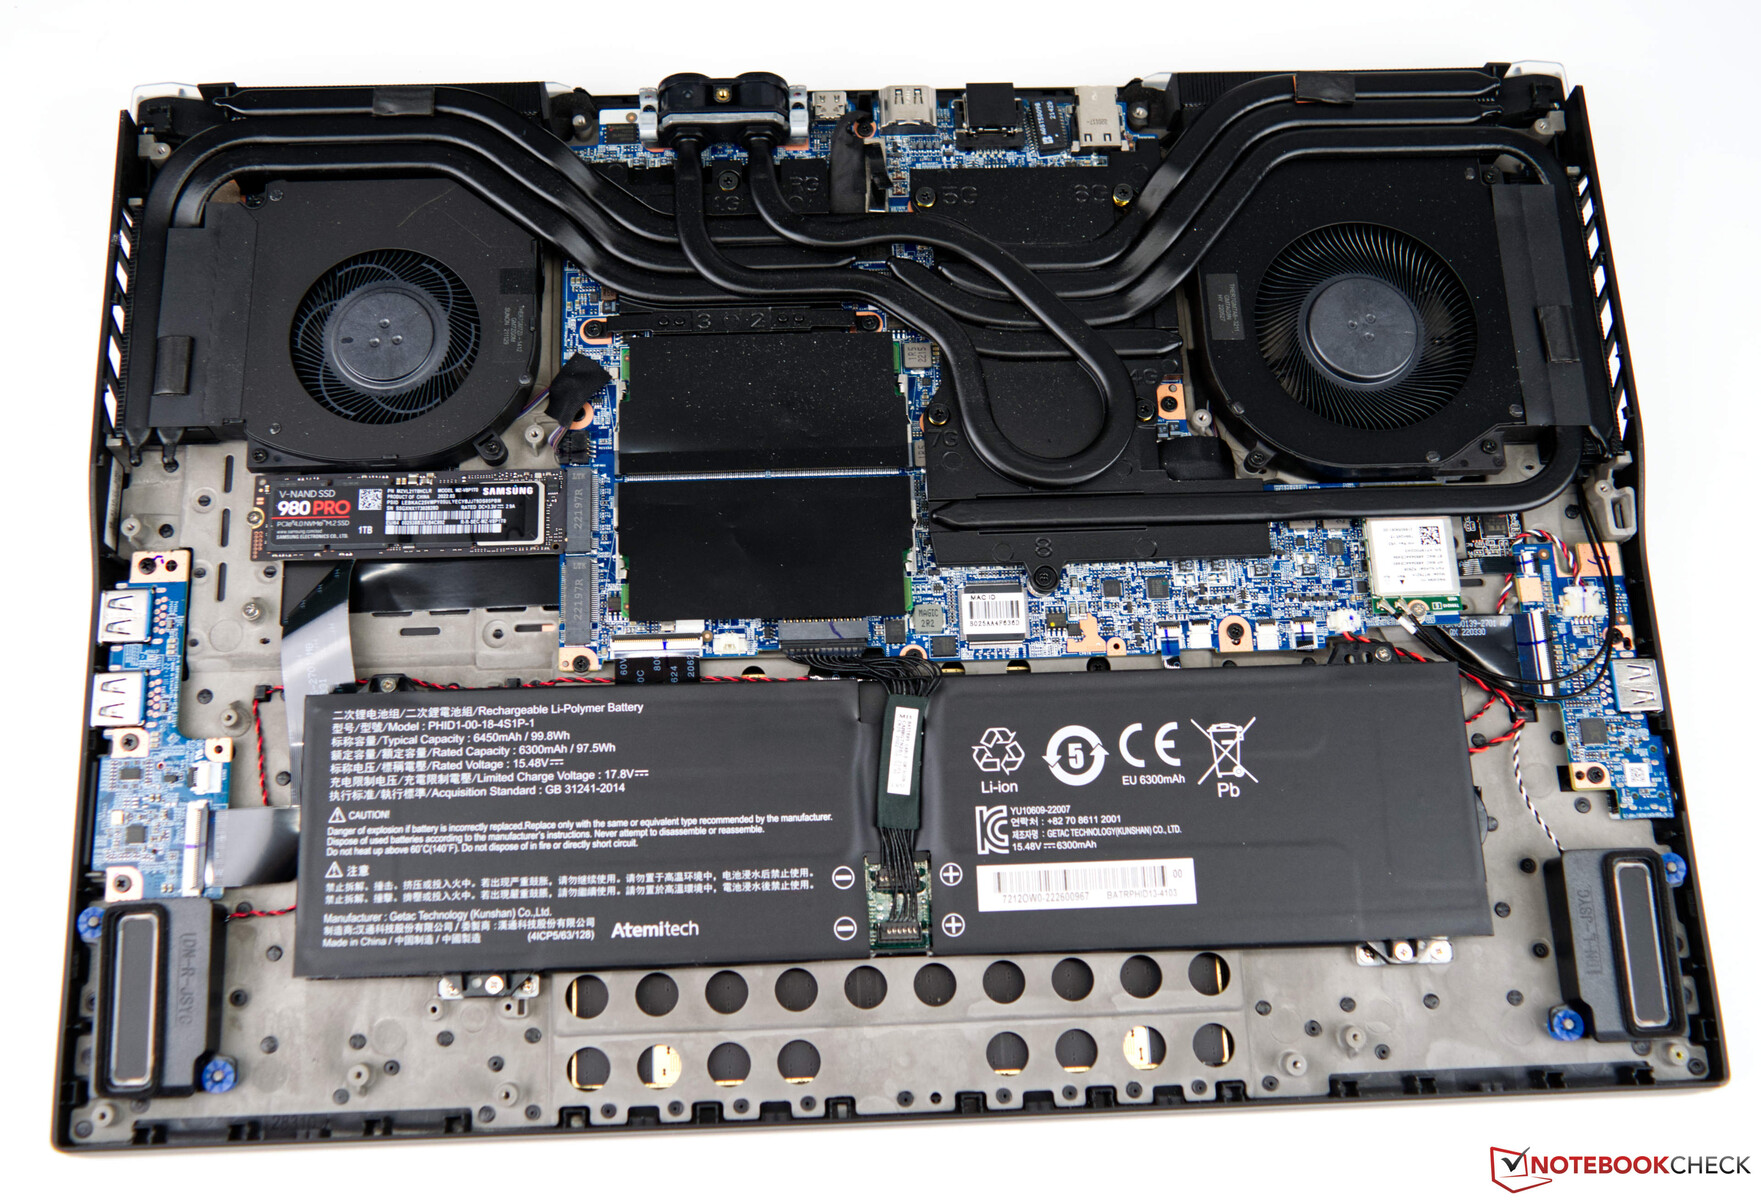
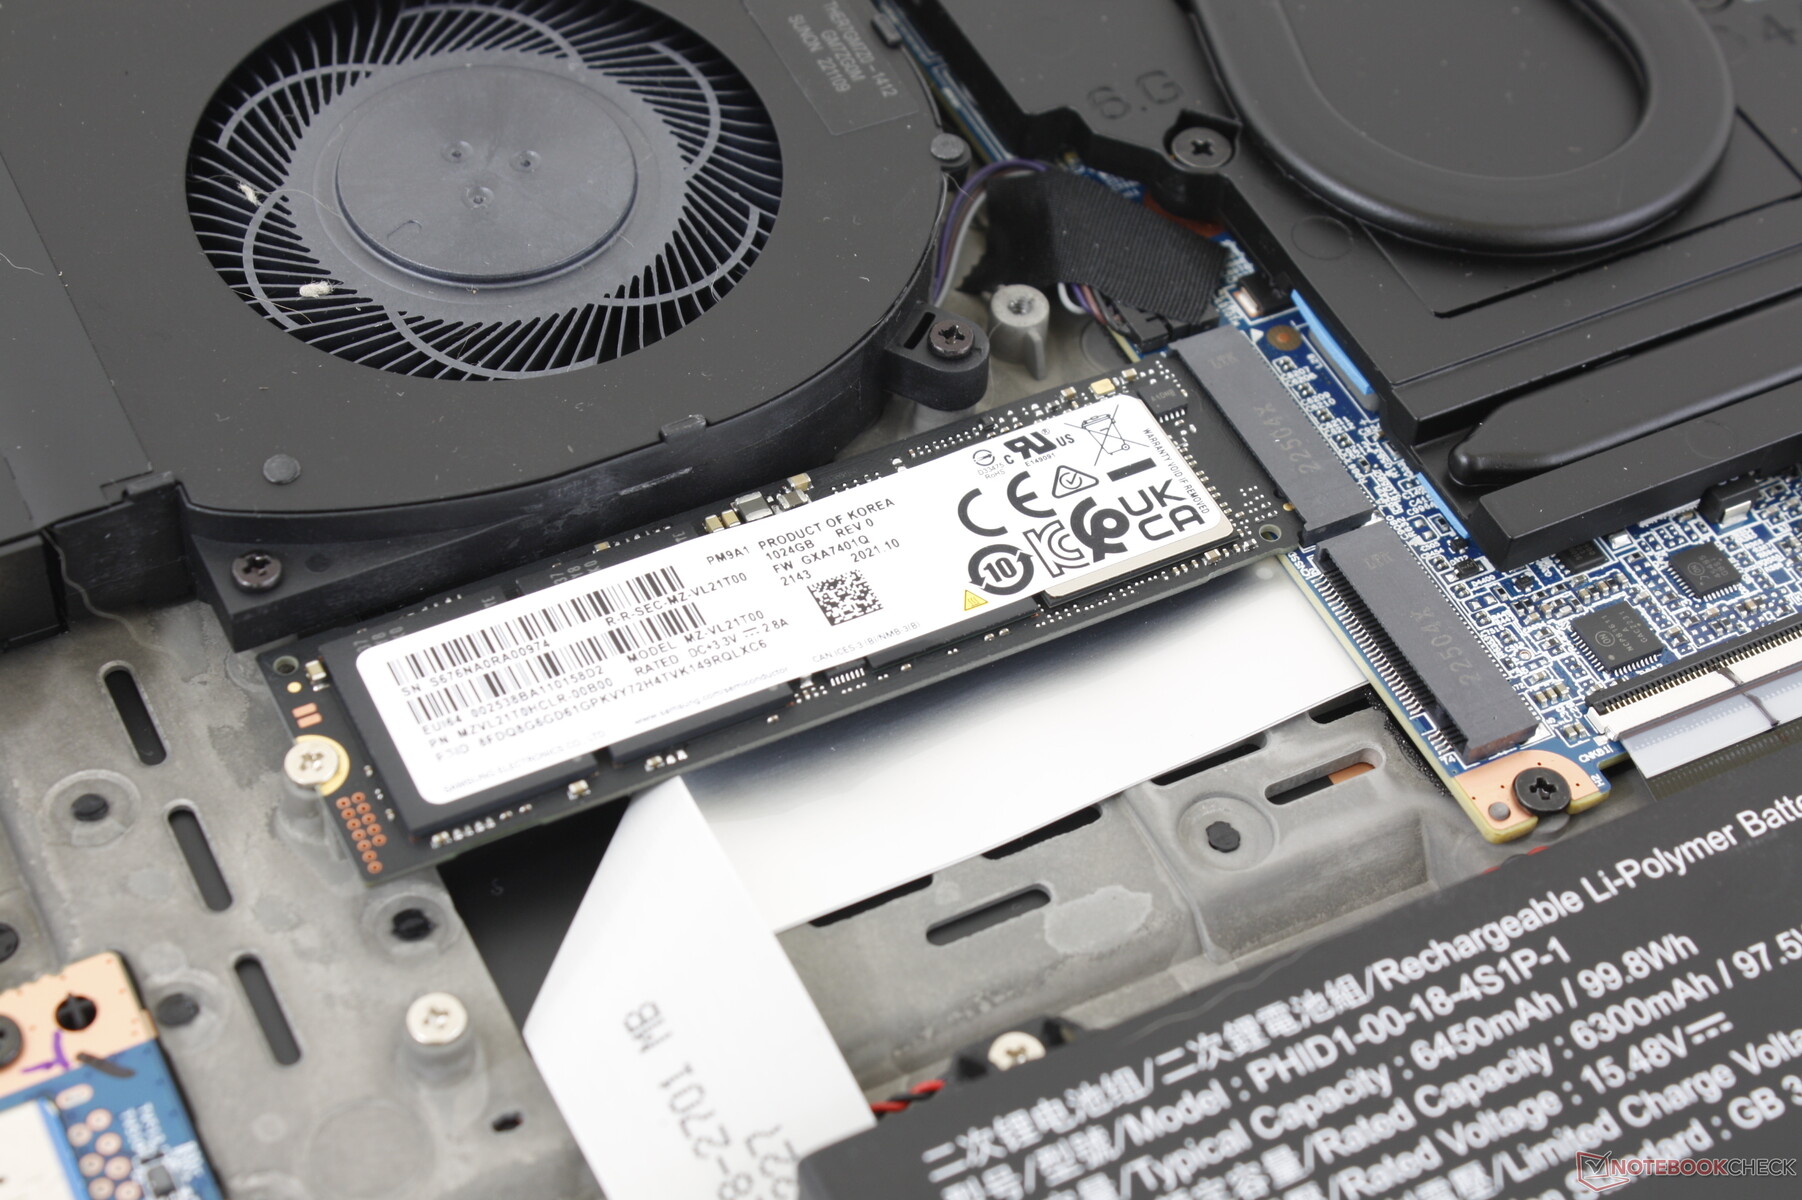
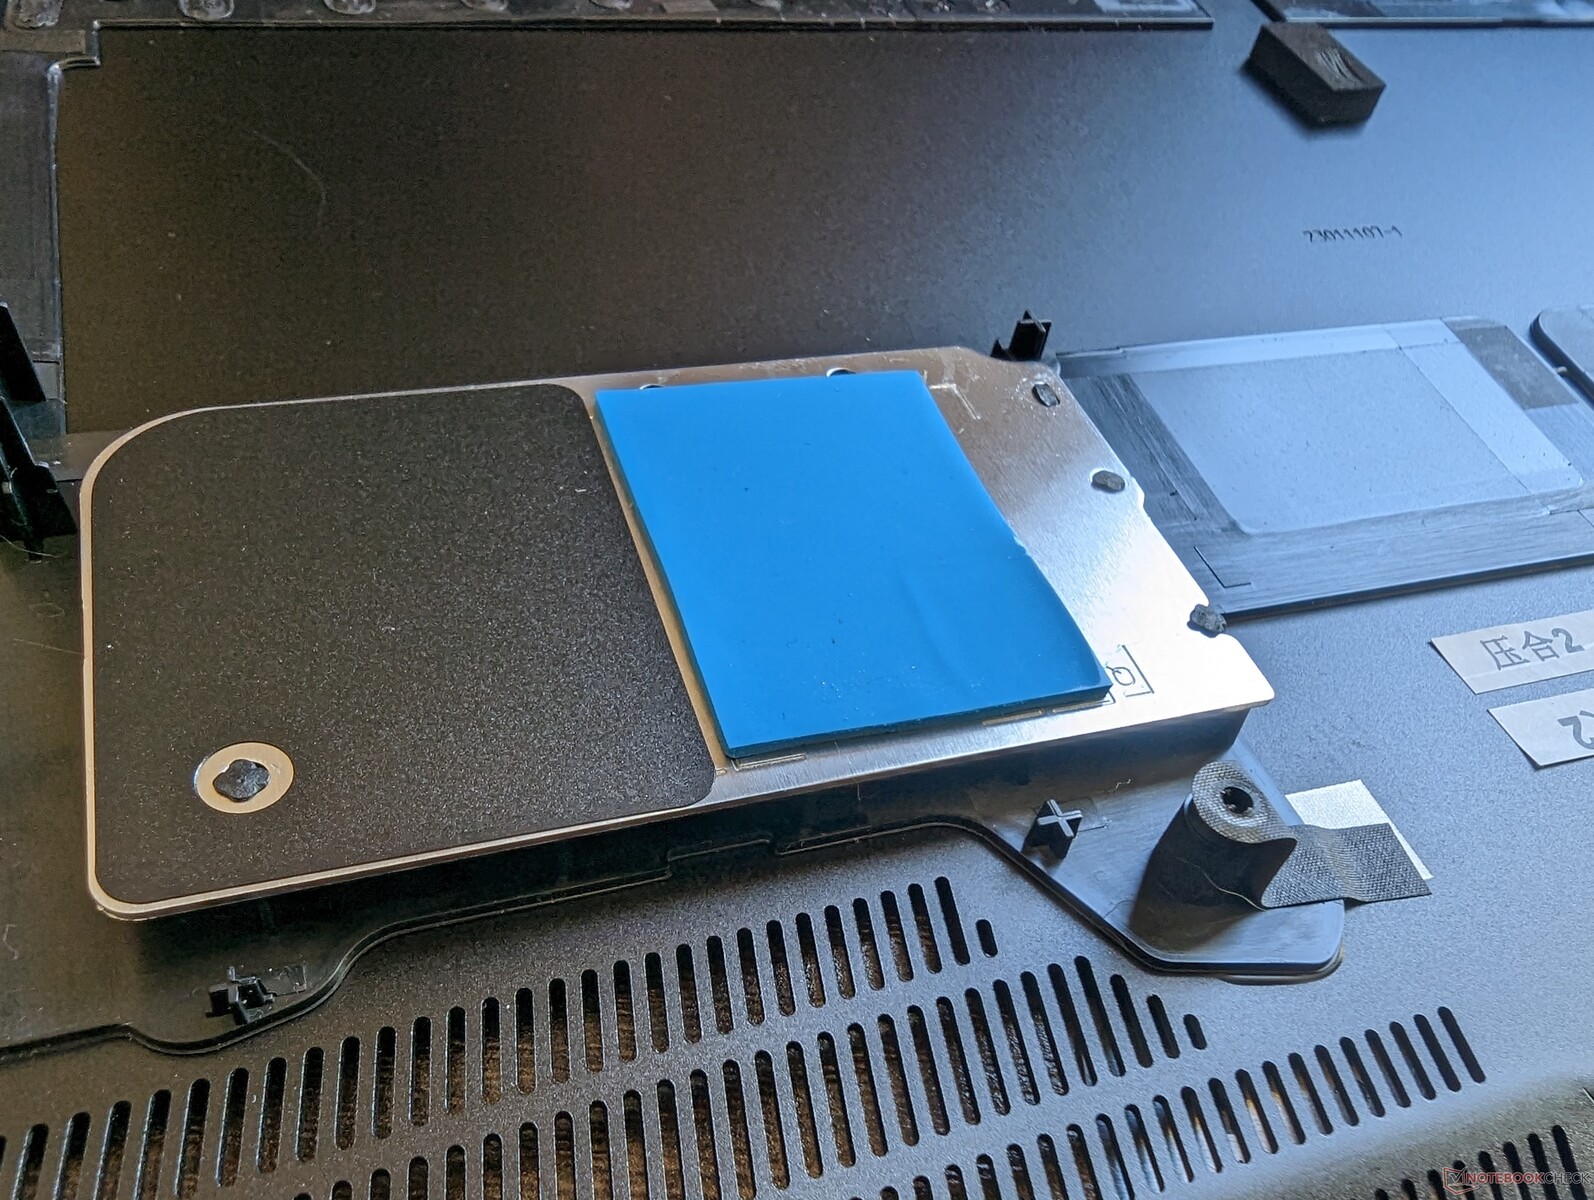
Dolny panel jest zabezpieczony 14 śrubami Philipsa, co pozwala na stosunkowo łatwe serwisowanie. W porównaniu do zeszłorocznego modelu producent zmienił układy wewnętrzne, co widać poniżej, mimo że ich wygląd zewnętrzny pozostał identyczny. Dwa moduły pamięci RAM są teraz ułożone jeden na drugim, aby zaoszczędzić miejsce na płycie głównej, natomiast CPU i GPU zamieniły się pozycjami.
Akcesoria i gwarancja
W pudełku detalicznym nie ma żadnych dodatków poza zasilaczem sieciowym i papierami. Model jest zgodny z opcjonalną zewnętrzną chłodnicą Liquid Propulsion Package drugiej generacji (LPP G2).
Obowiązuje standardowa roczna ograniczona gwarancja producenta. Aktualizacja do trzech lat jest dostępna za dodatkowe 250 dolarów.
Wyświetl
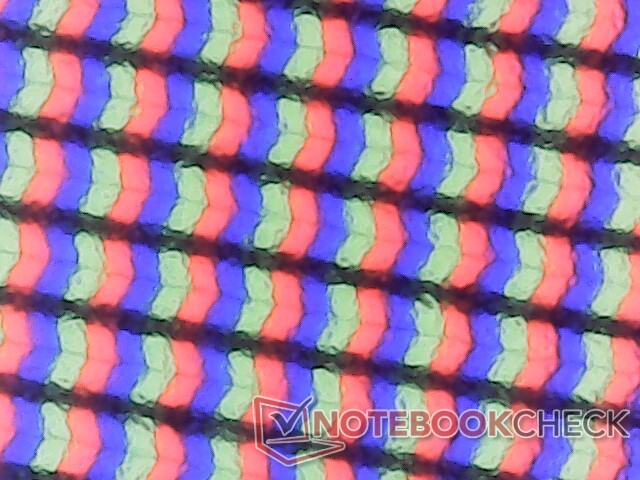
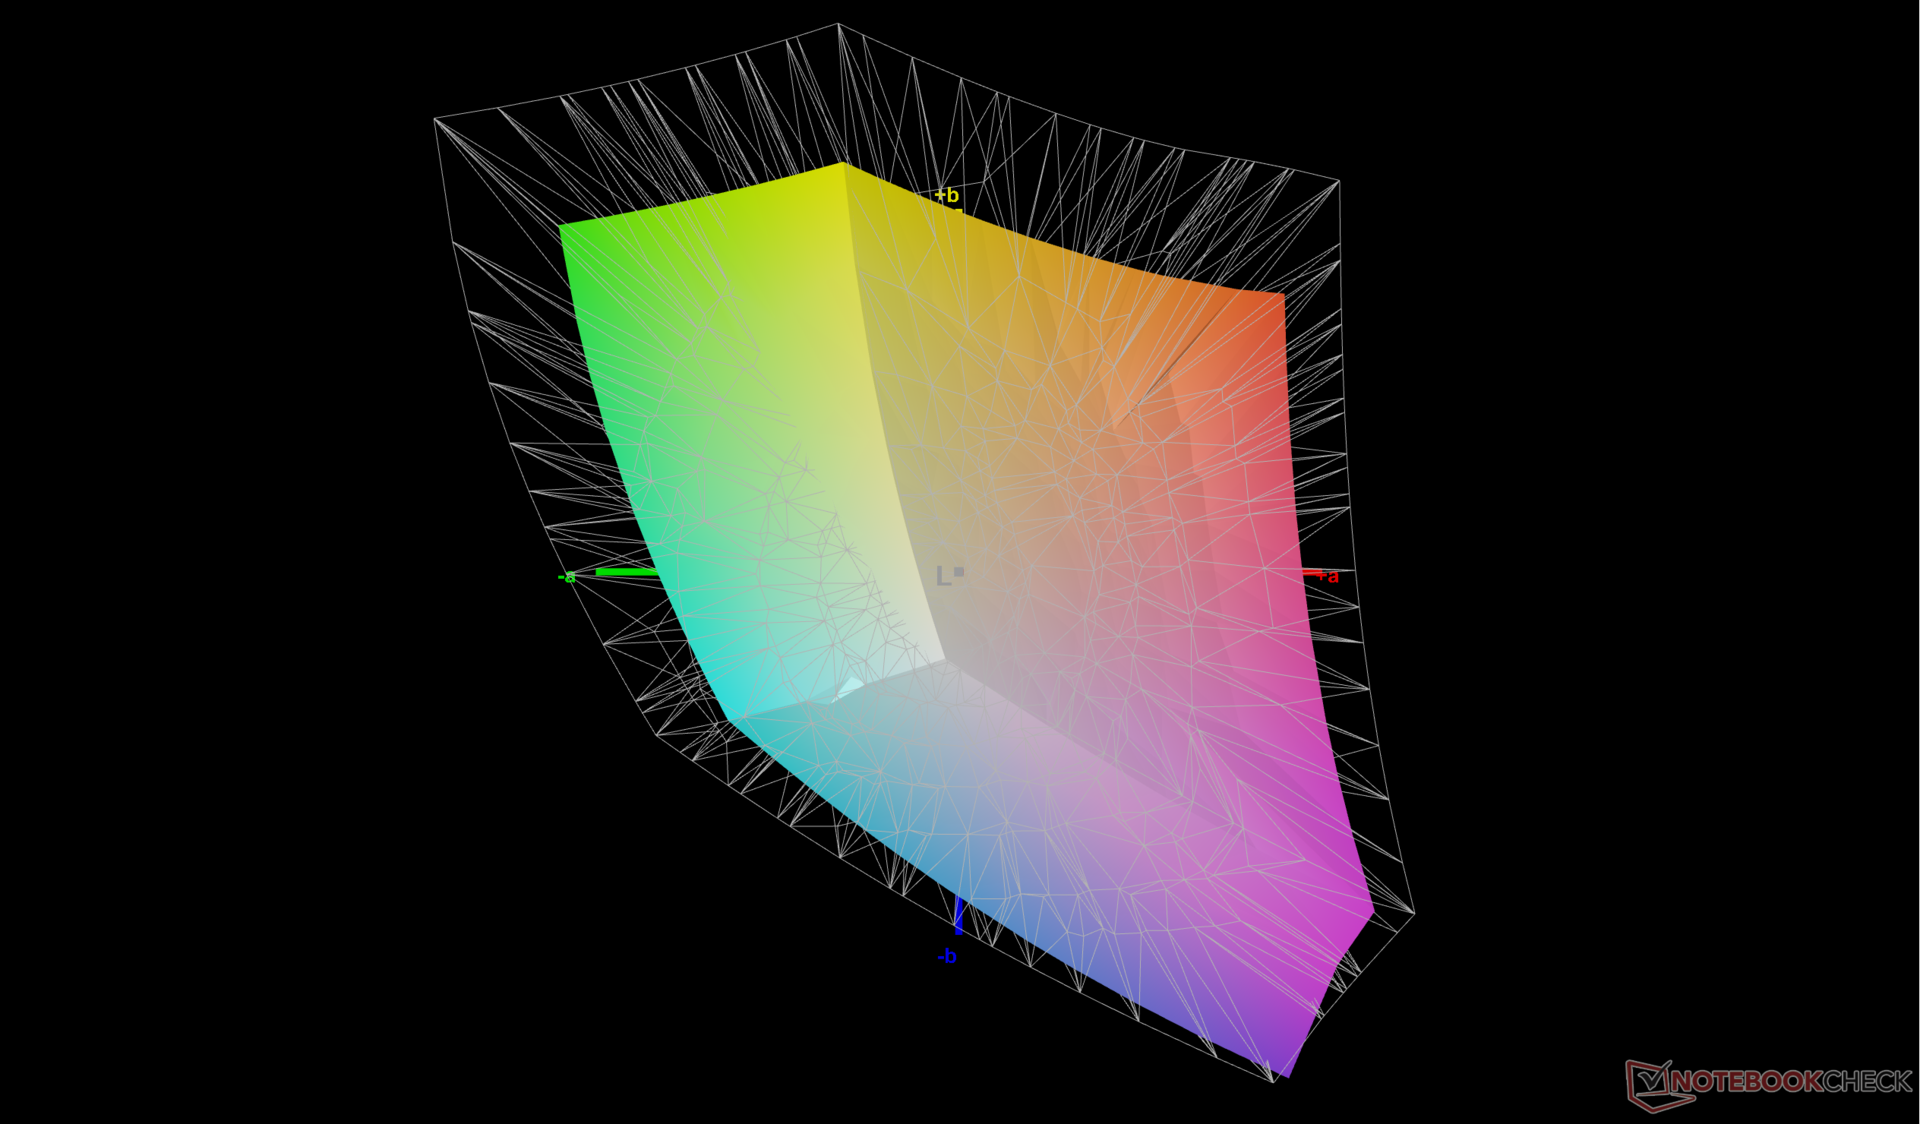
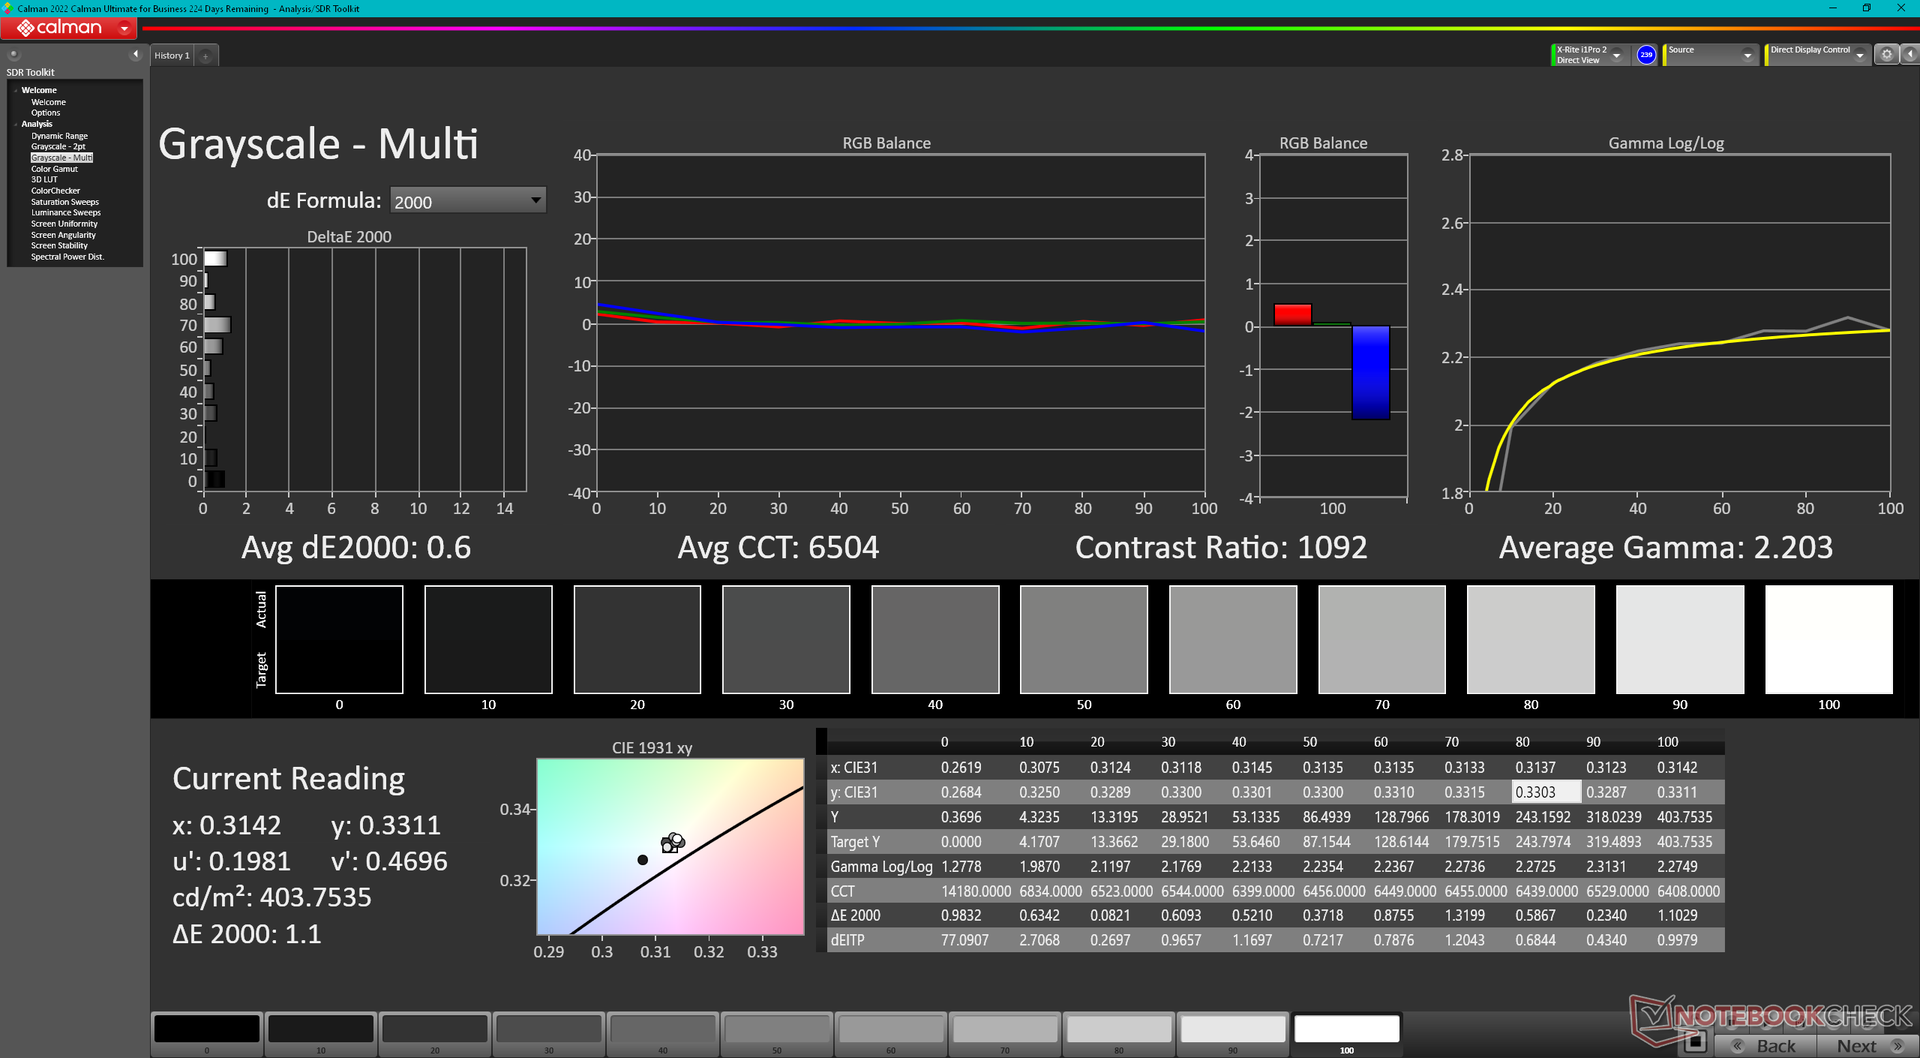
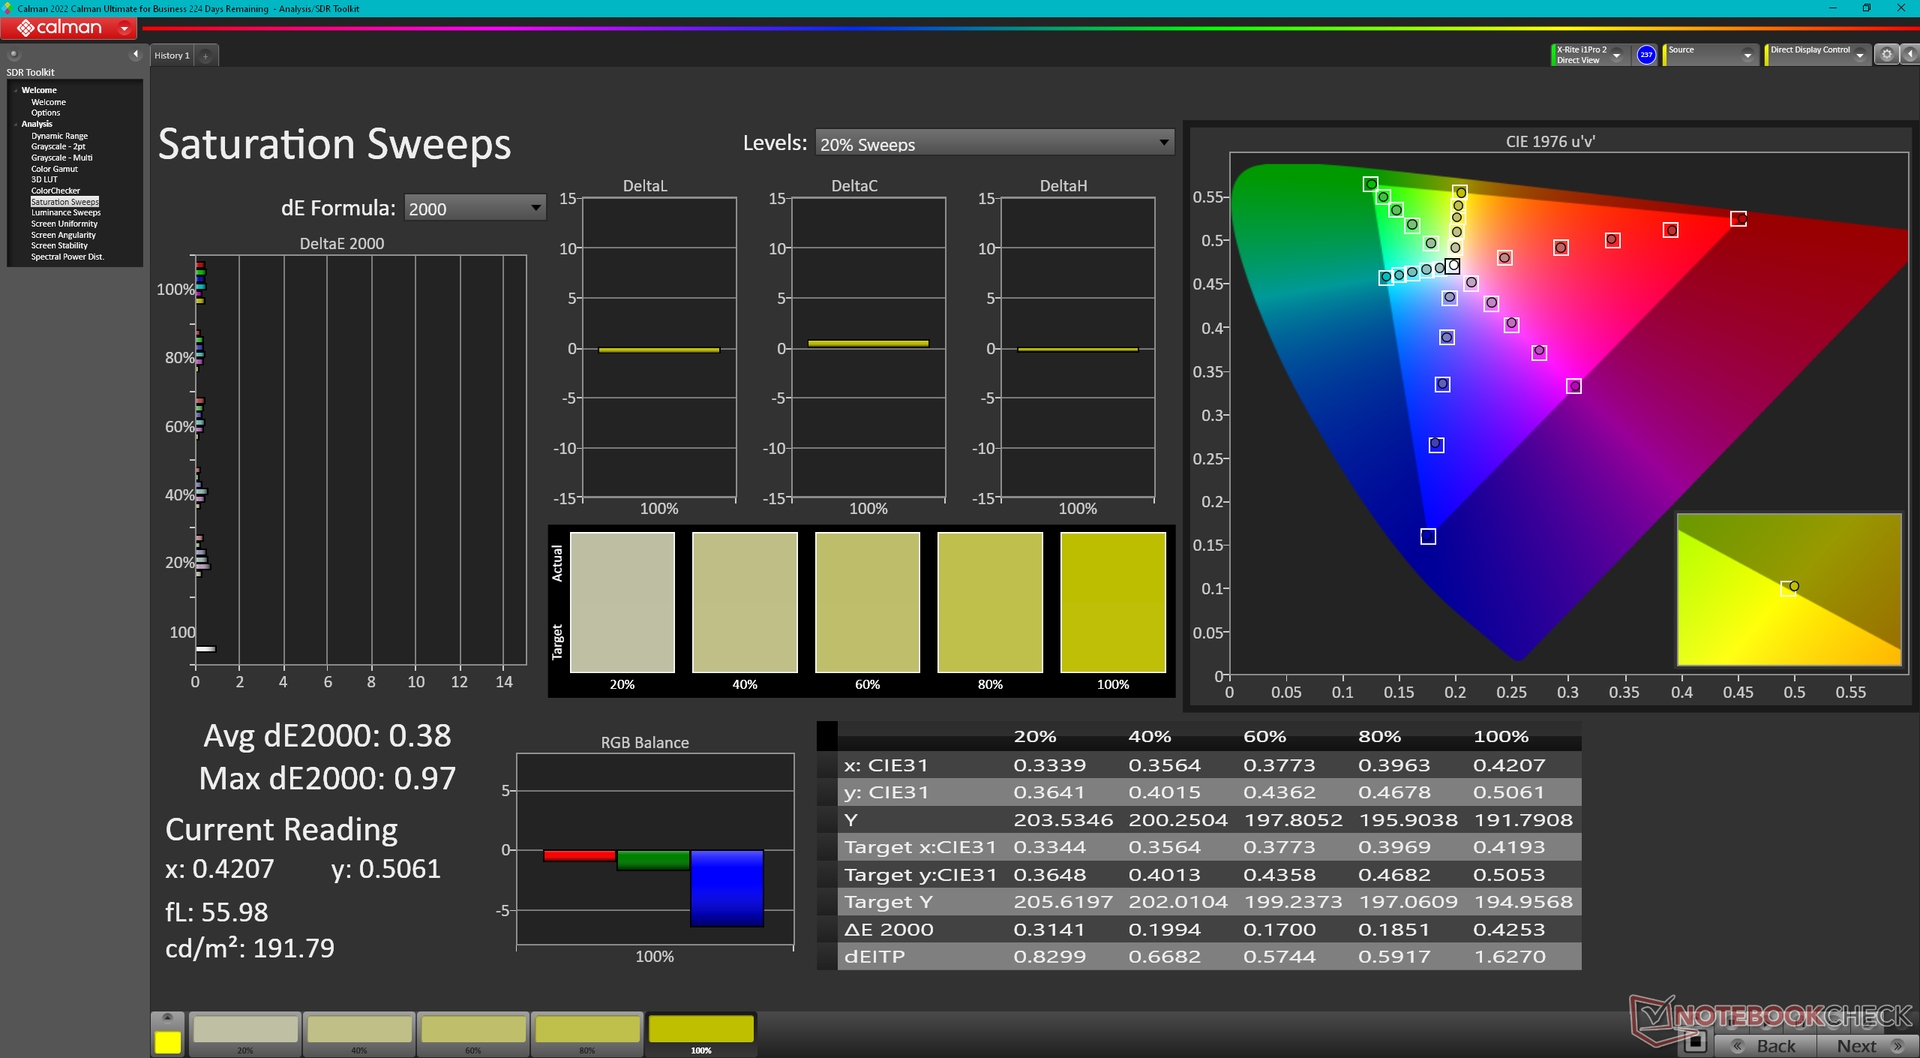
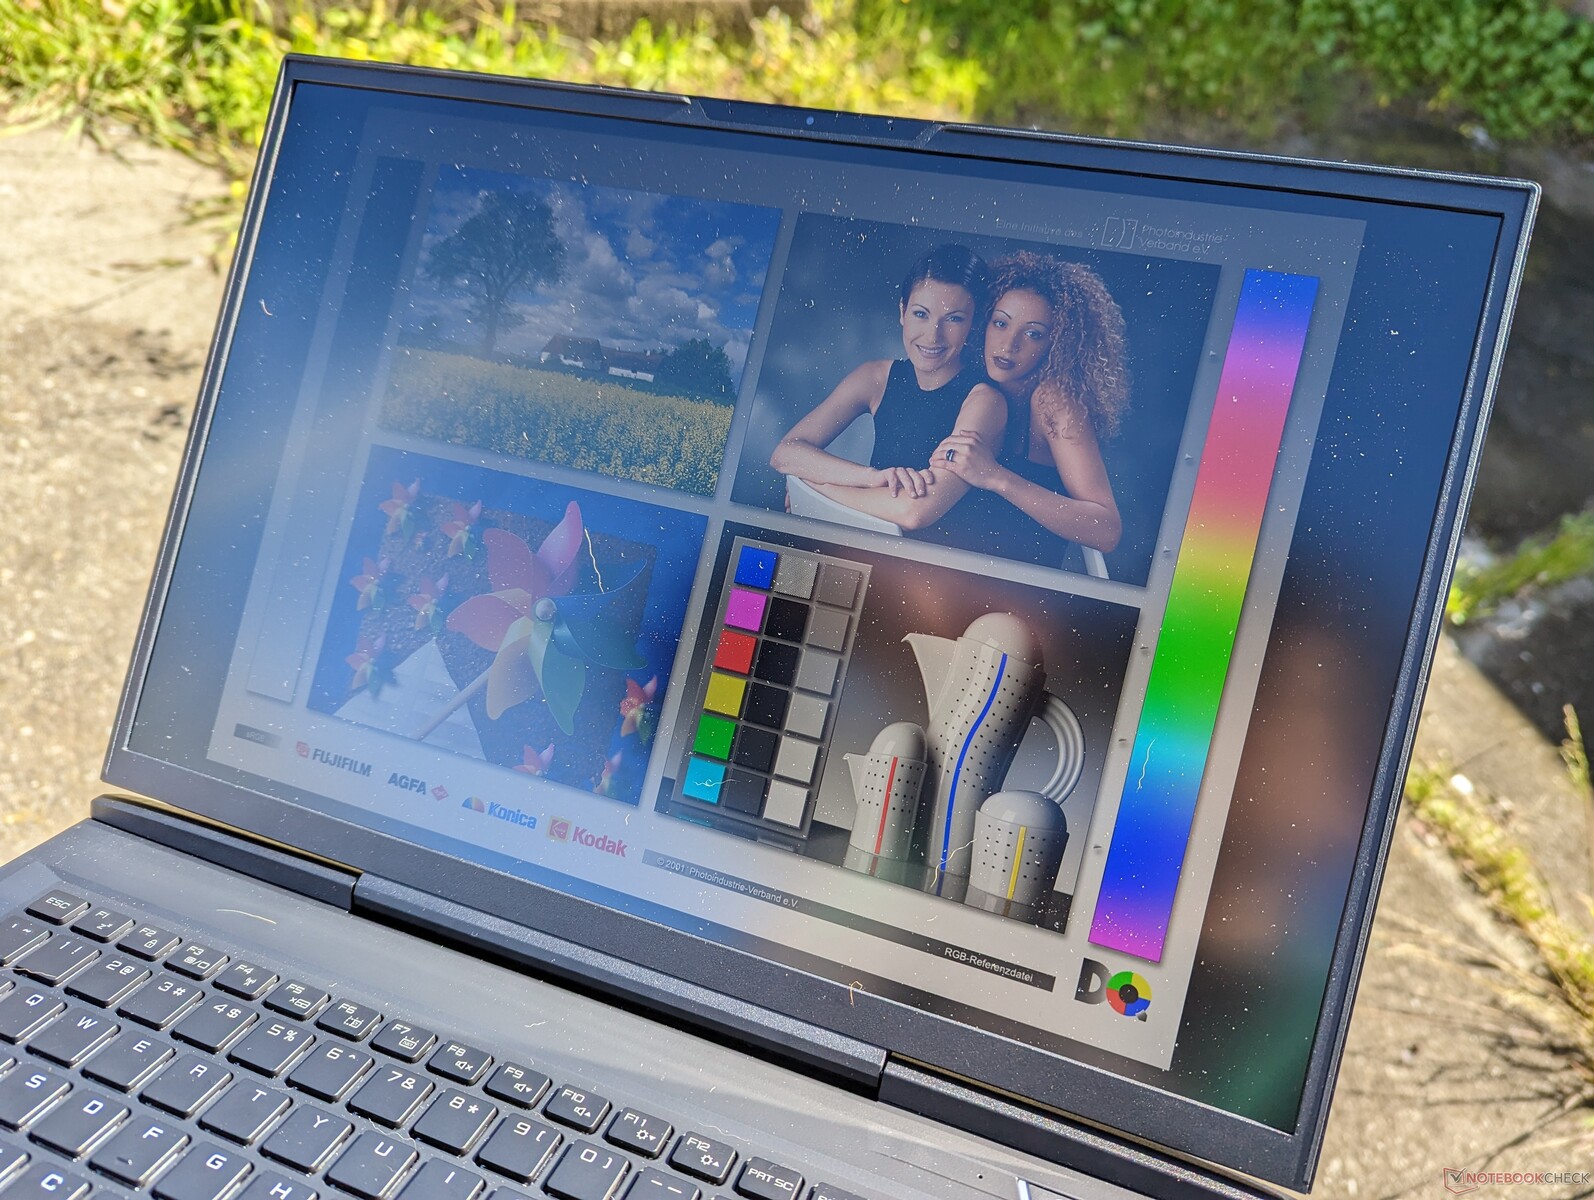
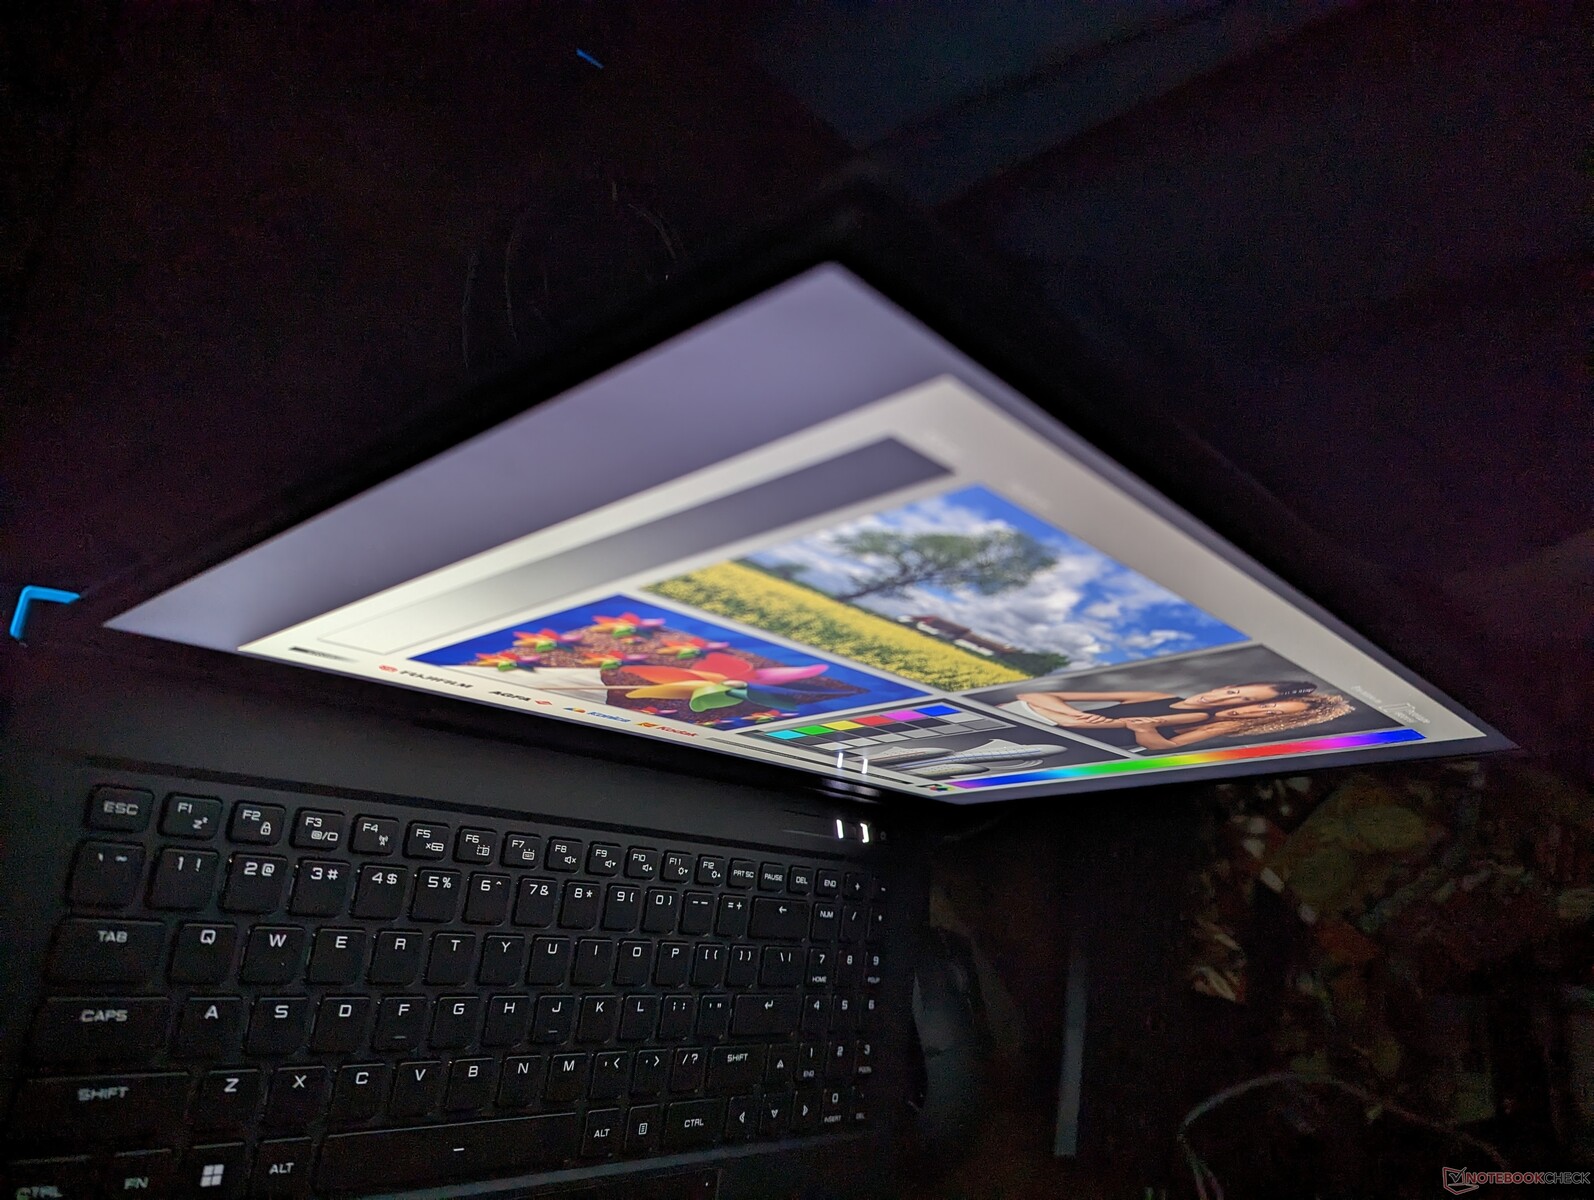
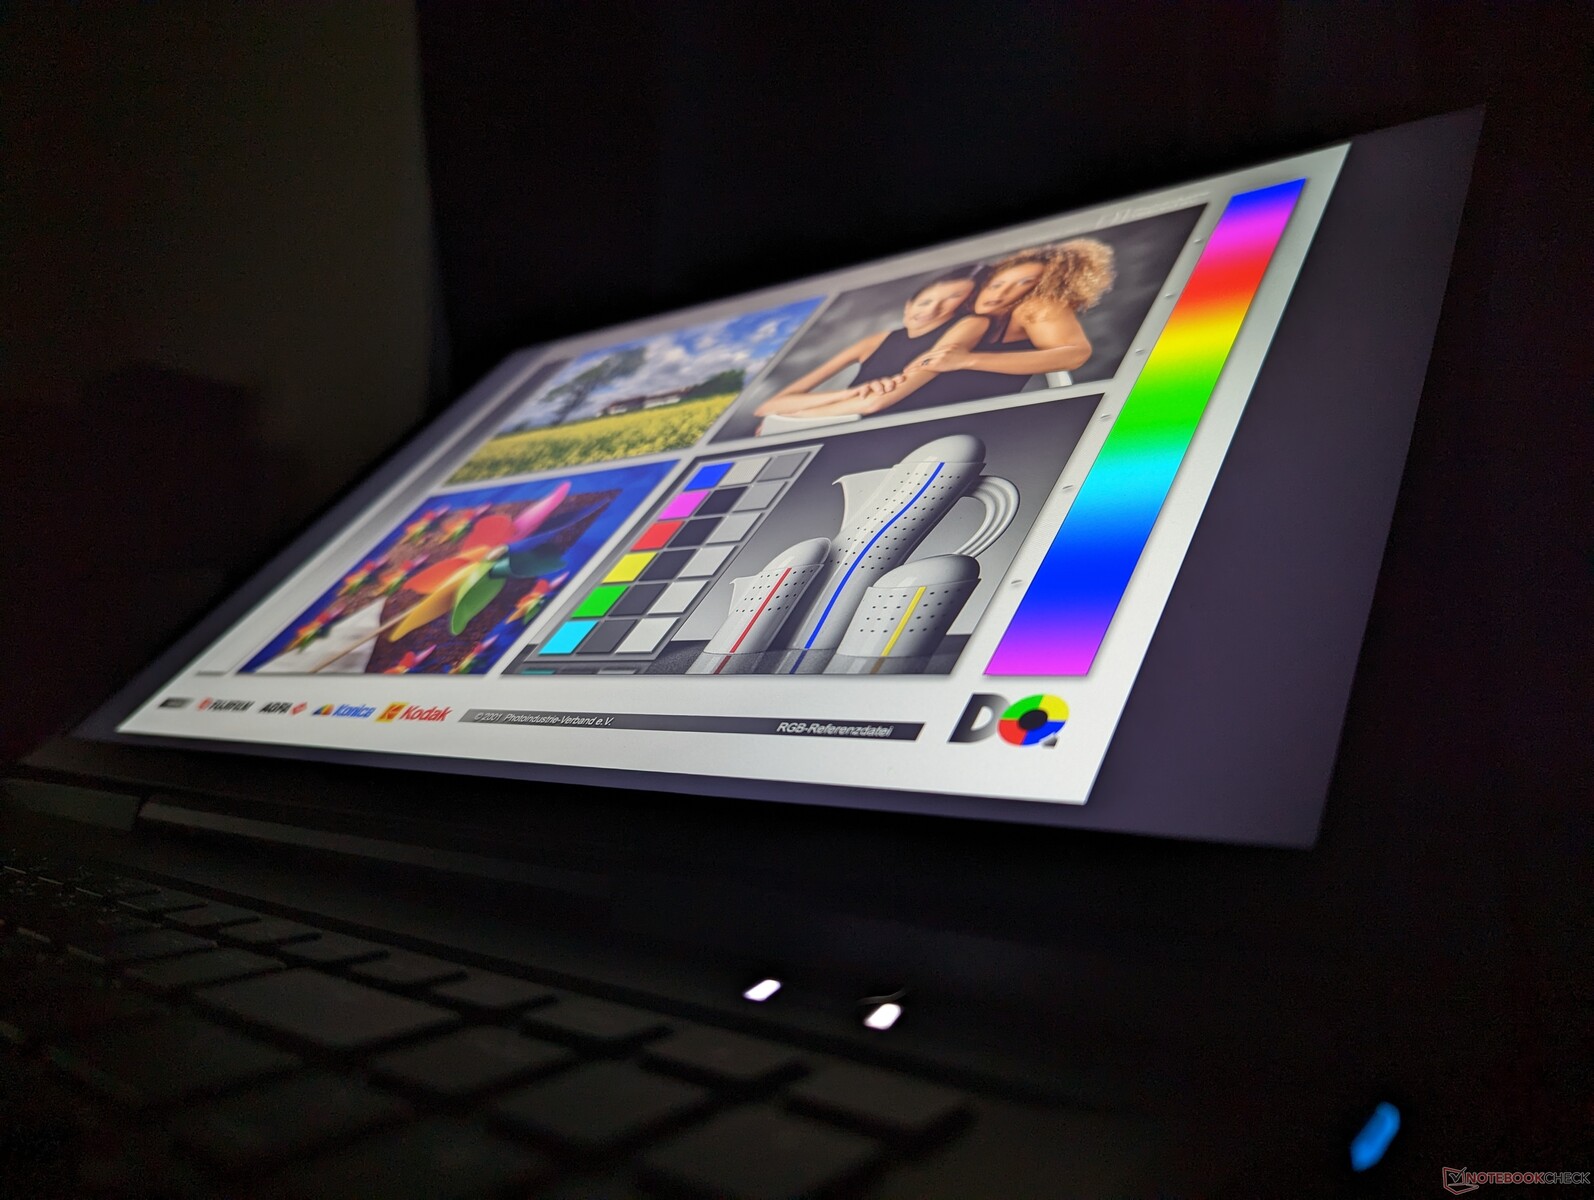
Nasz wczesny model 2023 wykorzystuje ten sam panel BOE NE170QDM-NZ1 i kontroler BOE0A99, co w modelu 2022, co oznacza, że wrażenia wizualne nie różnią się rok do roku. Nasze poniższe pomiary są więc niemal identyczne pomiędzy modelami 2022 i 2023. Nie jest to jednak powód do narzekań, gdyż panel oferuje niemal wszystko, czego oczekujemy od laptopa do gier z wyższej półki, w tym szybkie odświeżanie, krótki czas reakcji, pełne pokrycie palety sRGB oraz obsługę G-Sync. Dla wyższych rozdzielczości i jeszcze głębszych kolorów P3, jednak, będziesz musiał szukać gdzie indziej zamiast jak MSI GT77 lub Razer Blade 18.
| |||||||||||||||||||||||||
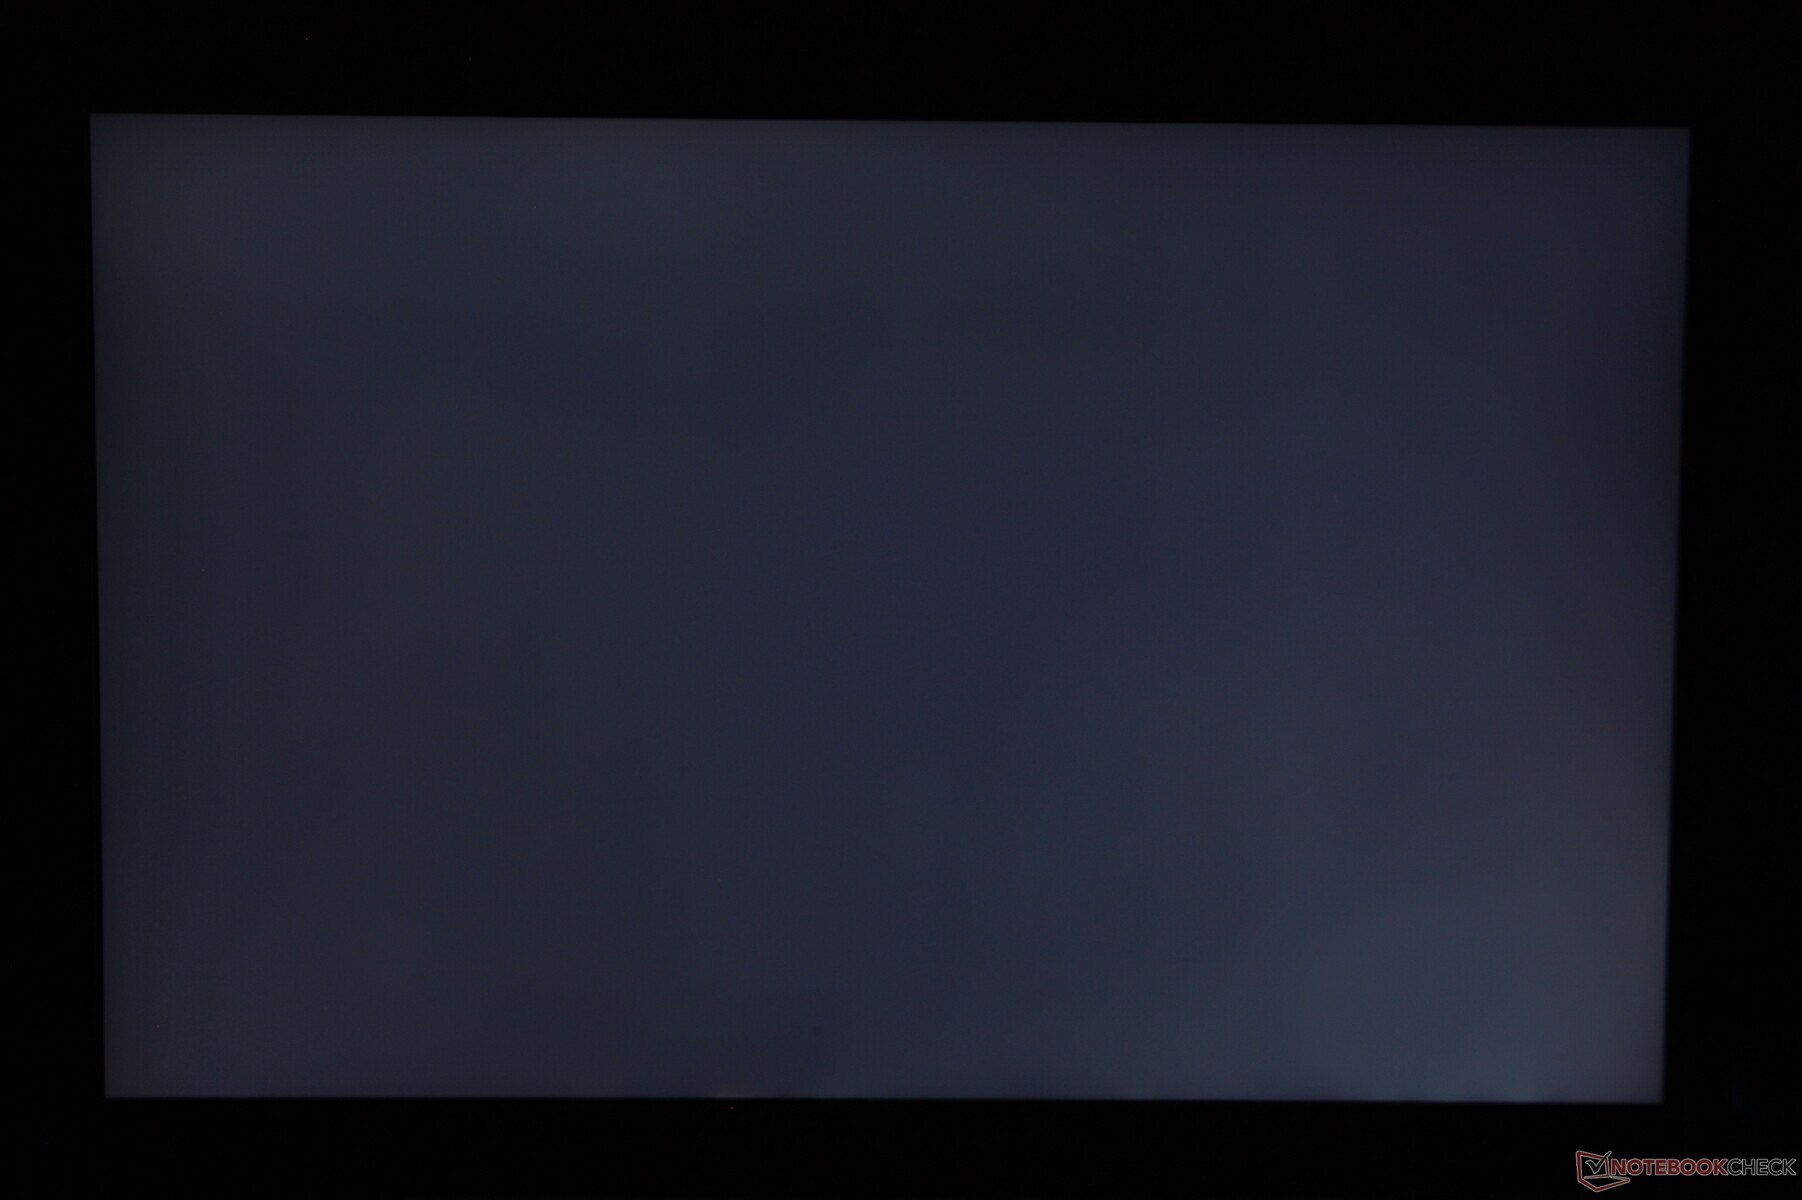
rozświetlenie: 87 %
na akumulatorze: 417.3 cd/m²
kontrast: 994:1 (czerń: 0.42 cd/m²)
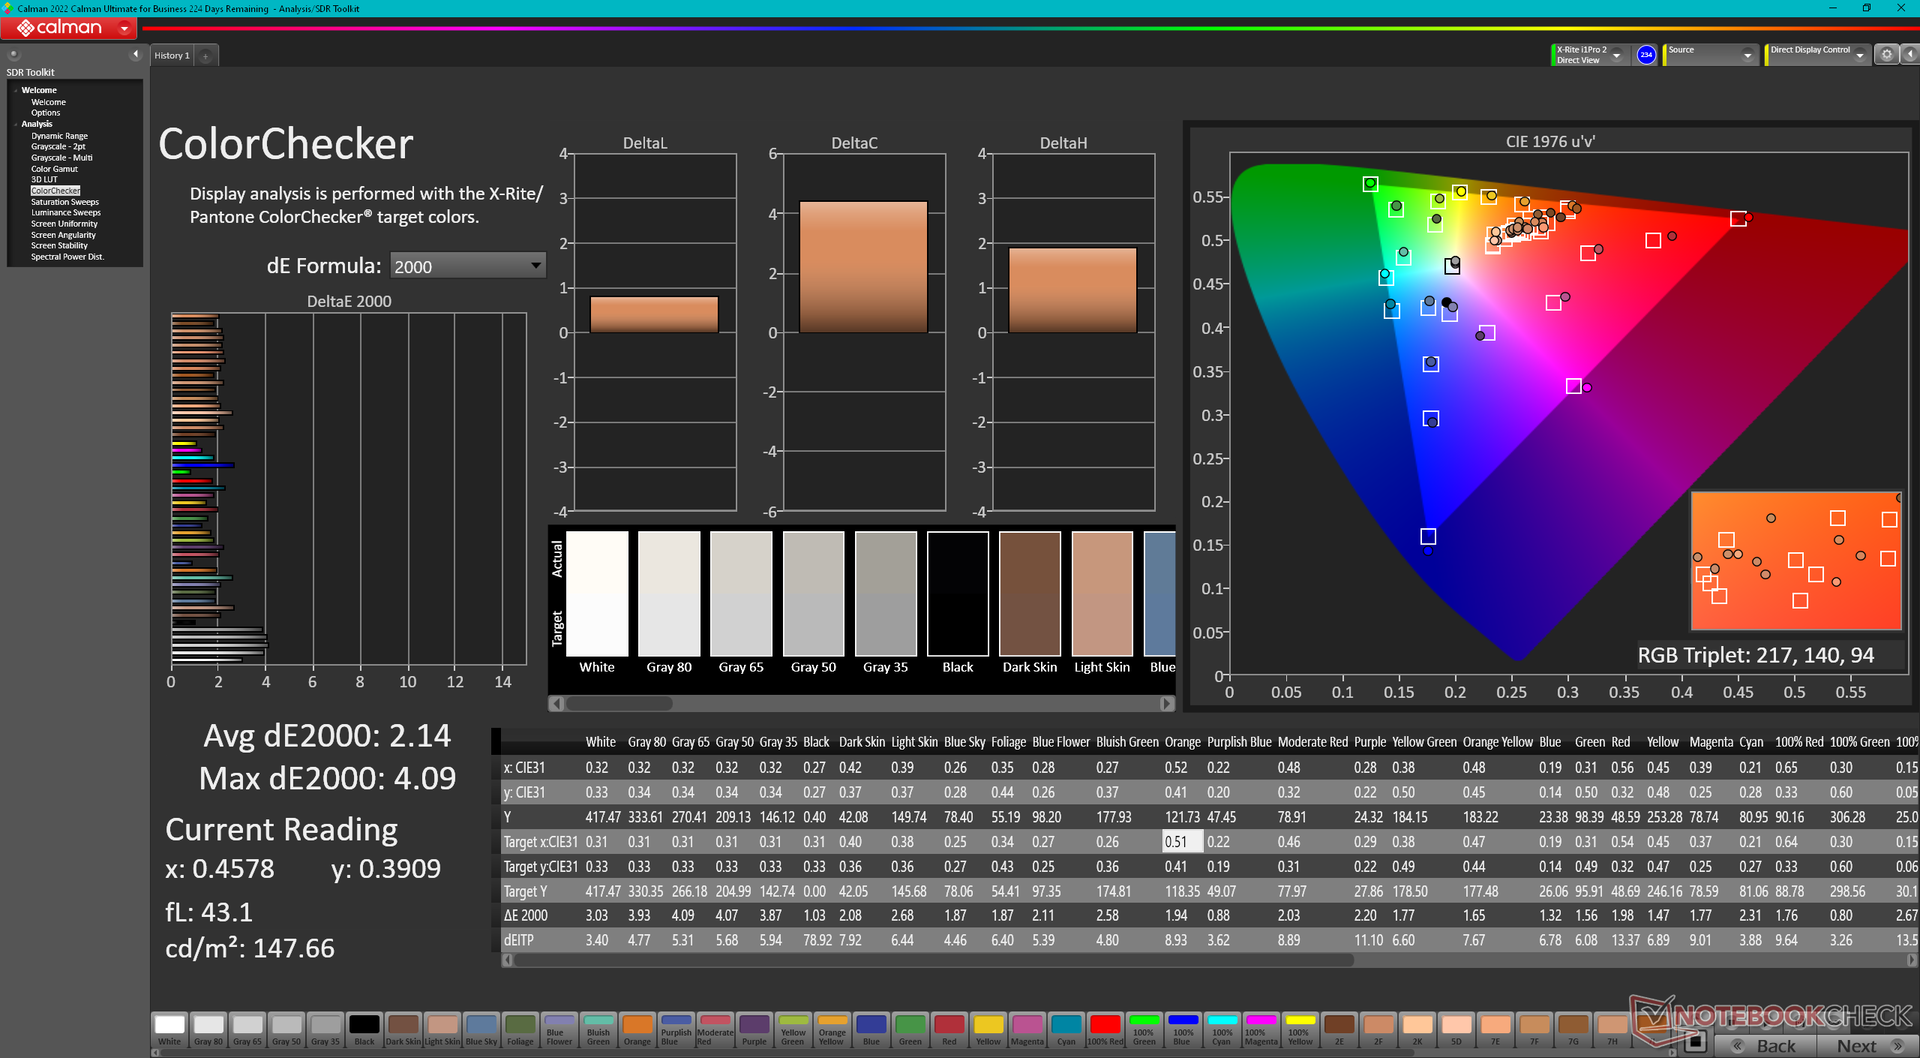
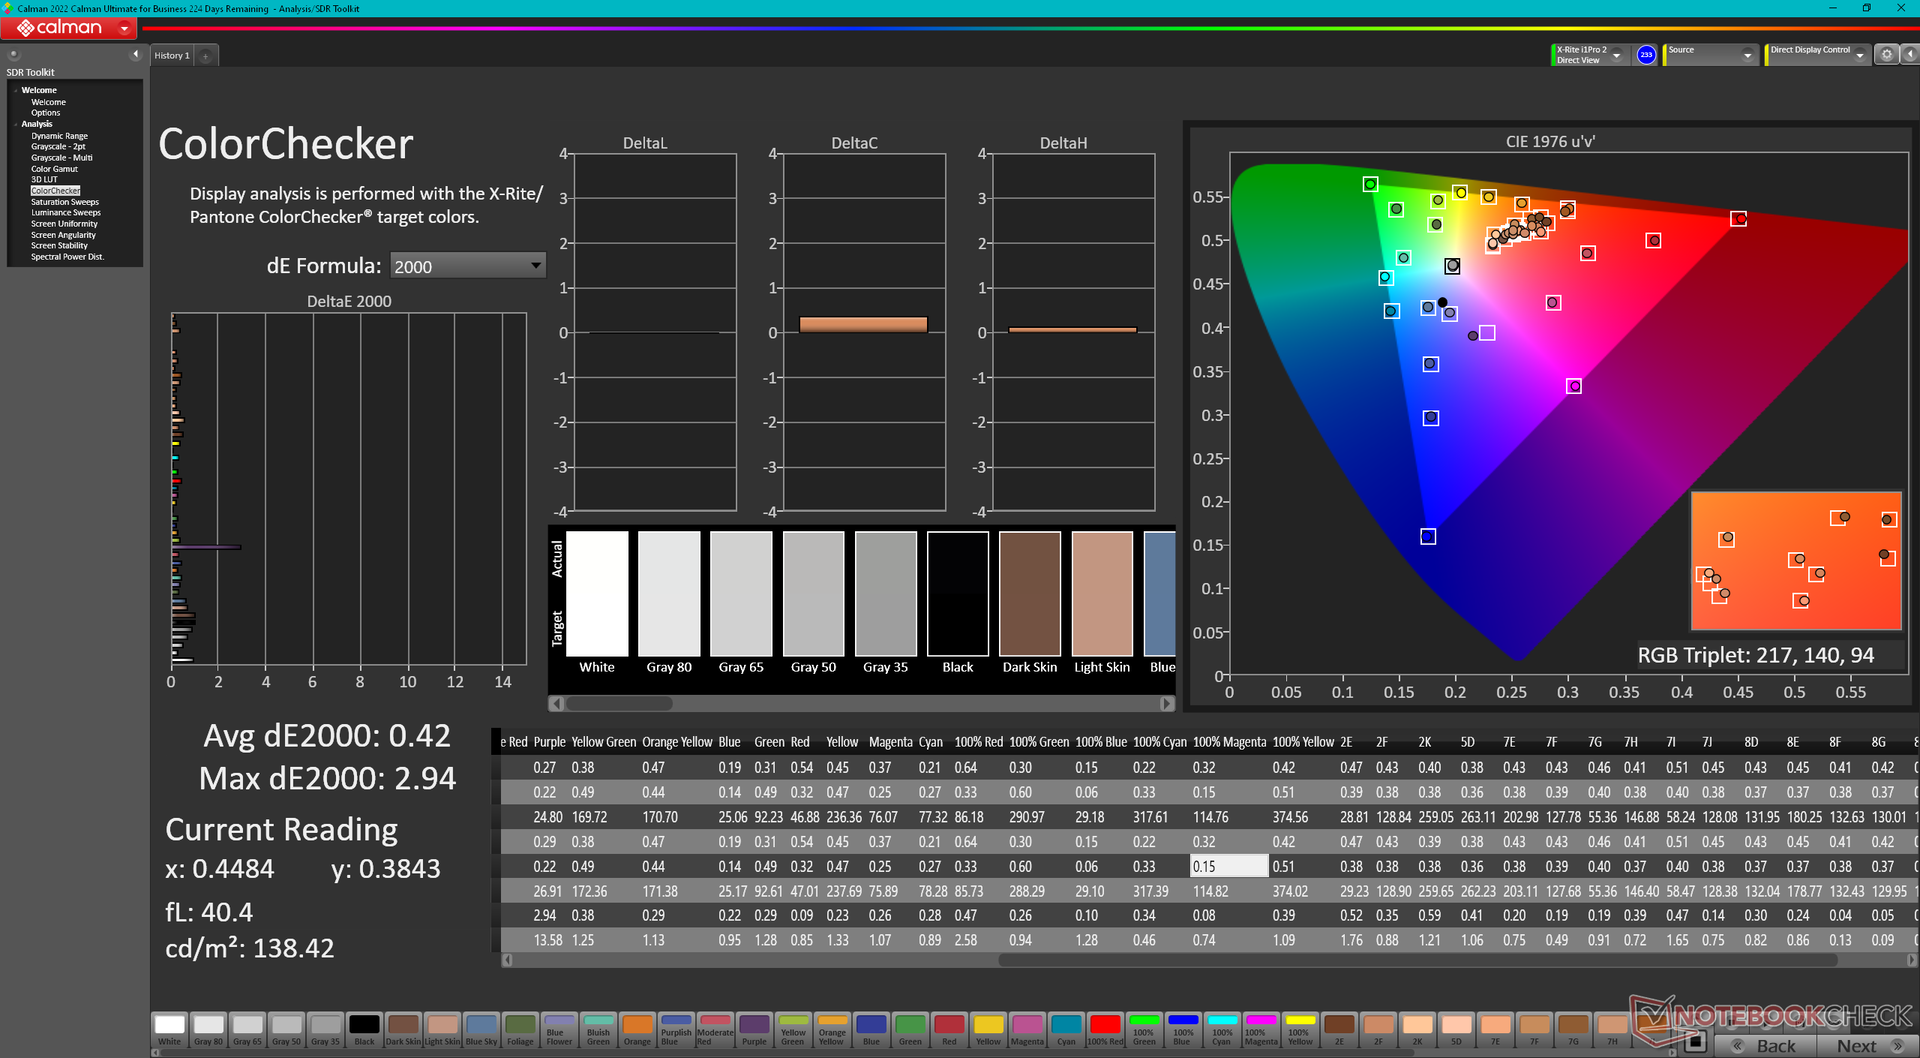
ΔE ColorChecker Calman: 2.14 | ∀{0.5-29.43 Ø4.71}
calibrated: 0.42
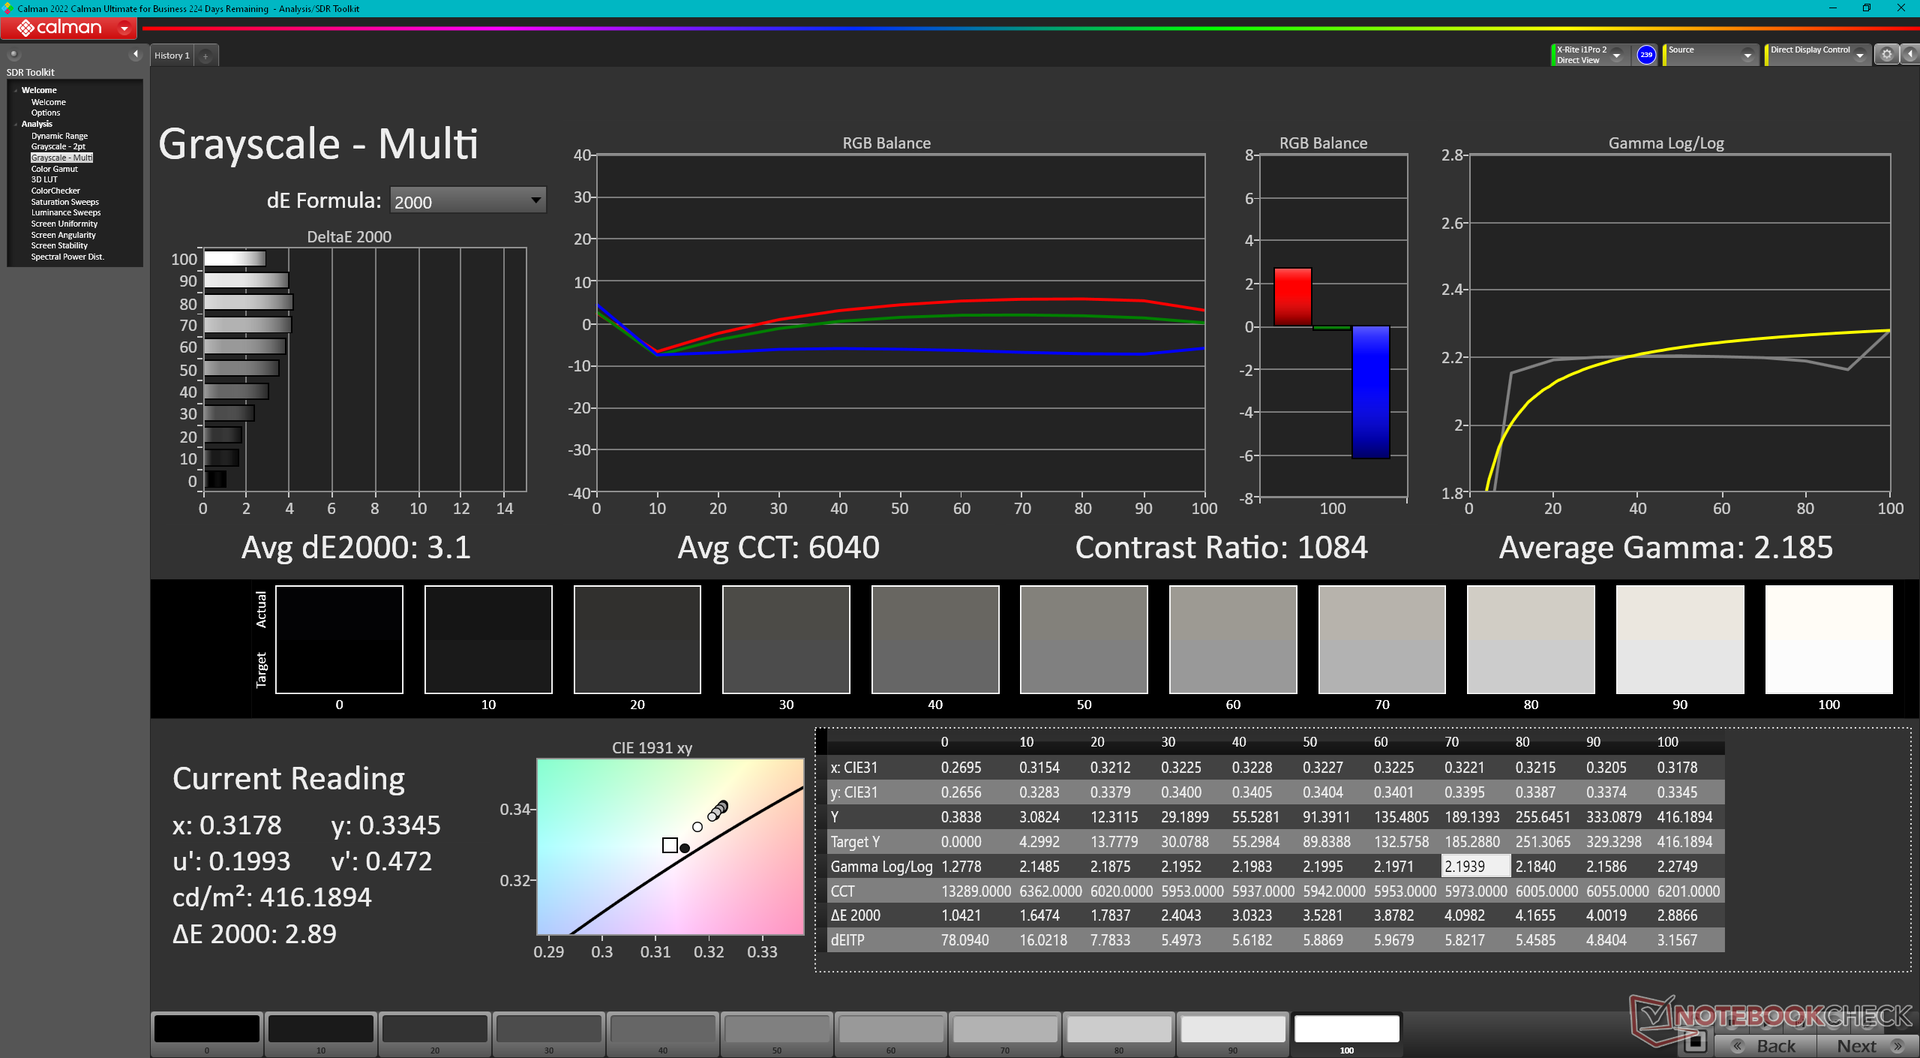
ΔE Greyscale Calman: 3.1 | ∀{0.09-98 Ø4.96}
69.8% AdobeRGB 1998 (Argyll 3D)
99.7% sRGB (Argyll 3D)
69.1% Display P3 (Argyll 3D)
Gamma: 2.19
CCT: 6040 K
| Eluktronics Mech-17 GP2 BOE NE170QDM-NZ1, IPS, 2560x1600, 17" | Schenker XMG Neo 17 M22 BOE0A99, IPS, 2560x1600, 17" | MSI Katana 17 B13VFK B173HAN04.9, IPS LED, 1920x1080, 17.3" | MSI Titan GT77 HX 13VI B173ZAN06.C, Mini-LED, 3840x2160, 17.3" | Alienware m17 R5 (R9 6900HX, RX 6850M XT) AU Optronics AUODBA3, IPS, 3840x2160, 17" | Razer Blade 18 RTX 4070 AU Optronics B180QAN01.0, IPS, 2560x1600, 18" | |
|---|---|---|---|---|---|---|
| Display | 0% | -40% | 23% | 23% | 21% | |
| Display P3 Coverage (%) | 69.1 | 69 0% | 40.8 -41% | 94.9 37% | 97.2 41% | 96.9 40% |
| sRGB Coverage (%) | 99.7 | 99.8 0% | 61 -39% | 99.9 0% | 99.6 0% | 99.8 0% |
| AdobeRGB 1998 Coverage (%) | 69.8 | 69.6 0% | 42.2 -40% | 92.4 32% | 88.4 27% | 85.3 22% |
| Response Times | 23% | -176% | -202% | -30% | 40% | |
| Response Time Grey 50% / Grey 80% * (ms) | 12 ? | 10.8 ? 10% | 33 ? -175% | 38.4 ? -220% | 16.4 ? -37% | 4.2 ? 65% |
| Response Time Black / White * (ms) | 9.4 ? | 6.1 ? 35% | 26 ? -177% | 26.6 ? -183% | 11.6 ? -23% | 8 ? 15% |
| PWM Frequency (Hz) | 2380 ? | |||||
| Screen | 1% | -158% | 67678% | -147% | -64% | |
| Brightness middle (cd/m²) | 417.3 | 415 -1% | 267 -36% | 606 45% | 484 16% | 549.6 32% |
| Brightness (cd/m²) | 387 | 399 3% | 256 -34% | 602 56% | 449 16% | 524 35% |
| Brightness Distribution (%) | 87 | 90 3% | 93 7% | 93 7% | 87 0% | 89 2% |
| Black Level * (cd/m²) | 0.42 | 0.43 -2% | 0.21 50% | 0.0001 100% | 0.55 -31% | 0.53 -26% |
| Contrast (:1) | 994 | 965 -3% | 1271 28% | 6060000 609558% | 880 -11% | 1037 4% |
| Colorchecker dE 2000 * | 2.14 | 1.44 33% | 4.7 -120% | 4.8 -124% | 4.8 -124% | 3.32 -55% |
| Colorchecker dE 2000 max. * | 4.09 | 2.33 43% | 20.4 -399% | 8.2 -100% | 7.48 -83% | 6.63 -62% |
| Colorchecker dE 2000 calibrated * | 0.42 | 0.89 -112% | 4.5 -971% | 1.8 -329% | 4.74 -1029% | 2.7 -543% |
| Greyscale dE 2000 * | 3.1 | 1.8 42% | 1.5 52% | 6.5 -110% | 5.5 -77% | 2 35% |
| Gamma | 2.19 100% | 2.132 103% | 2.12 104% | 2.63 84% | 2.42 91% | 2.29 96% |
| CCT | 6040 108% | 6327 103% | 6552 99% | 6596 99% | 6148 106% | 6319 103% |
| Całkowita średnia (program / ustawienia) | 8% /
4% | -125% /
-135% | 22500% /
43484% | -51% /
-94% | -1% /
-31% |
* ... im mniej tym lepiej
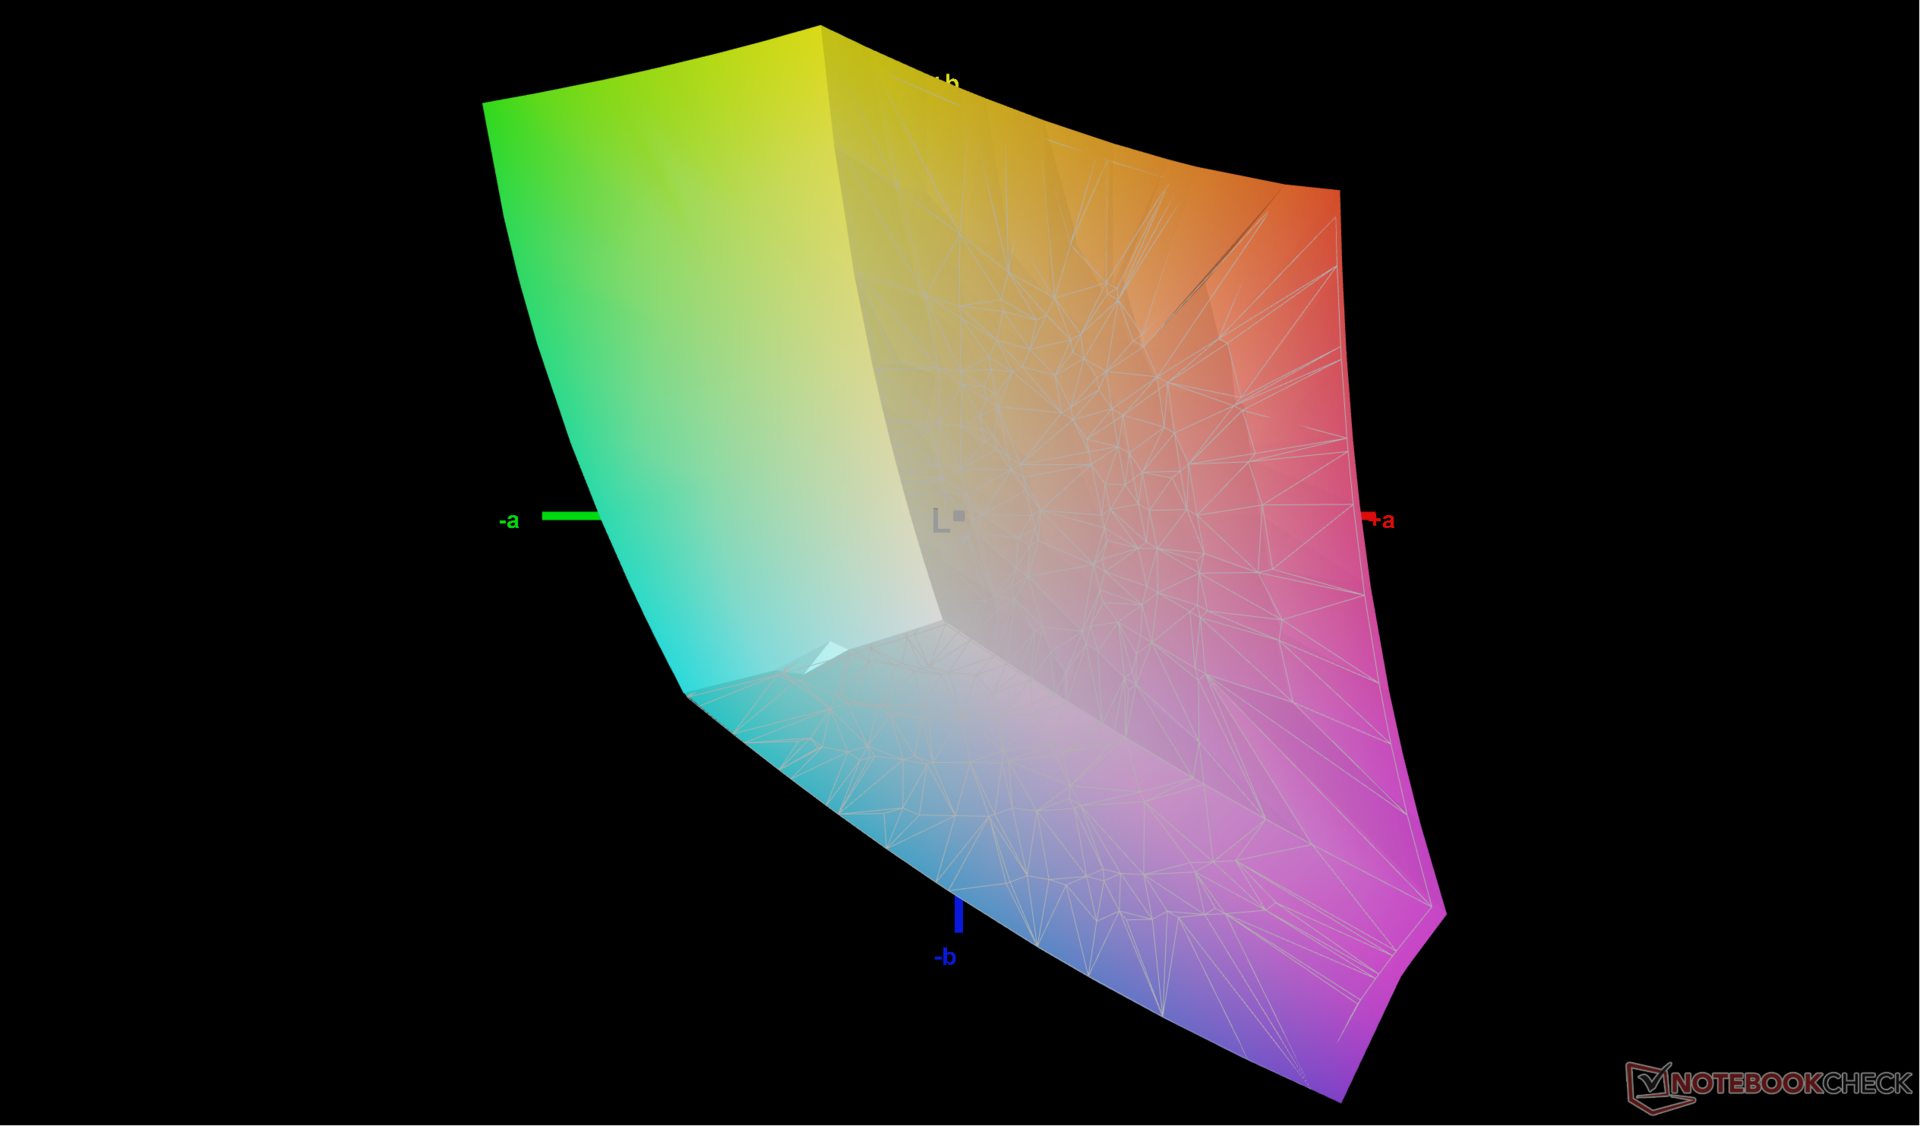
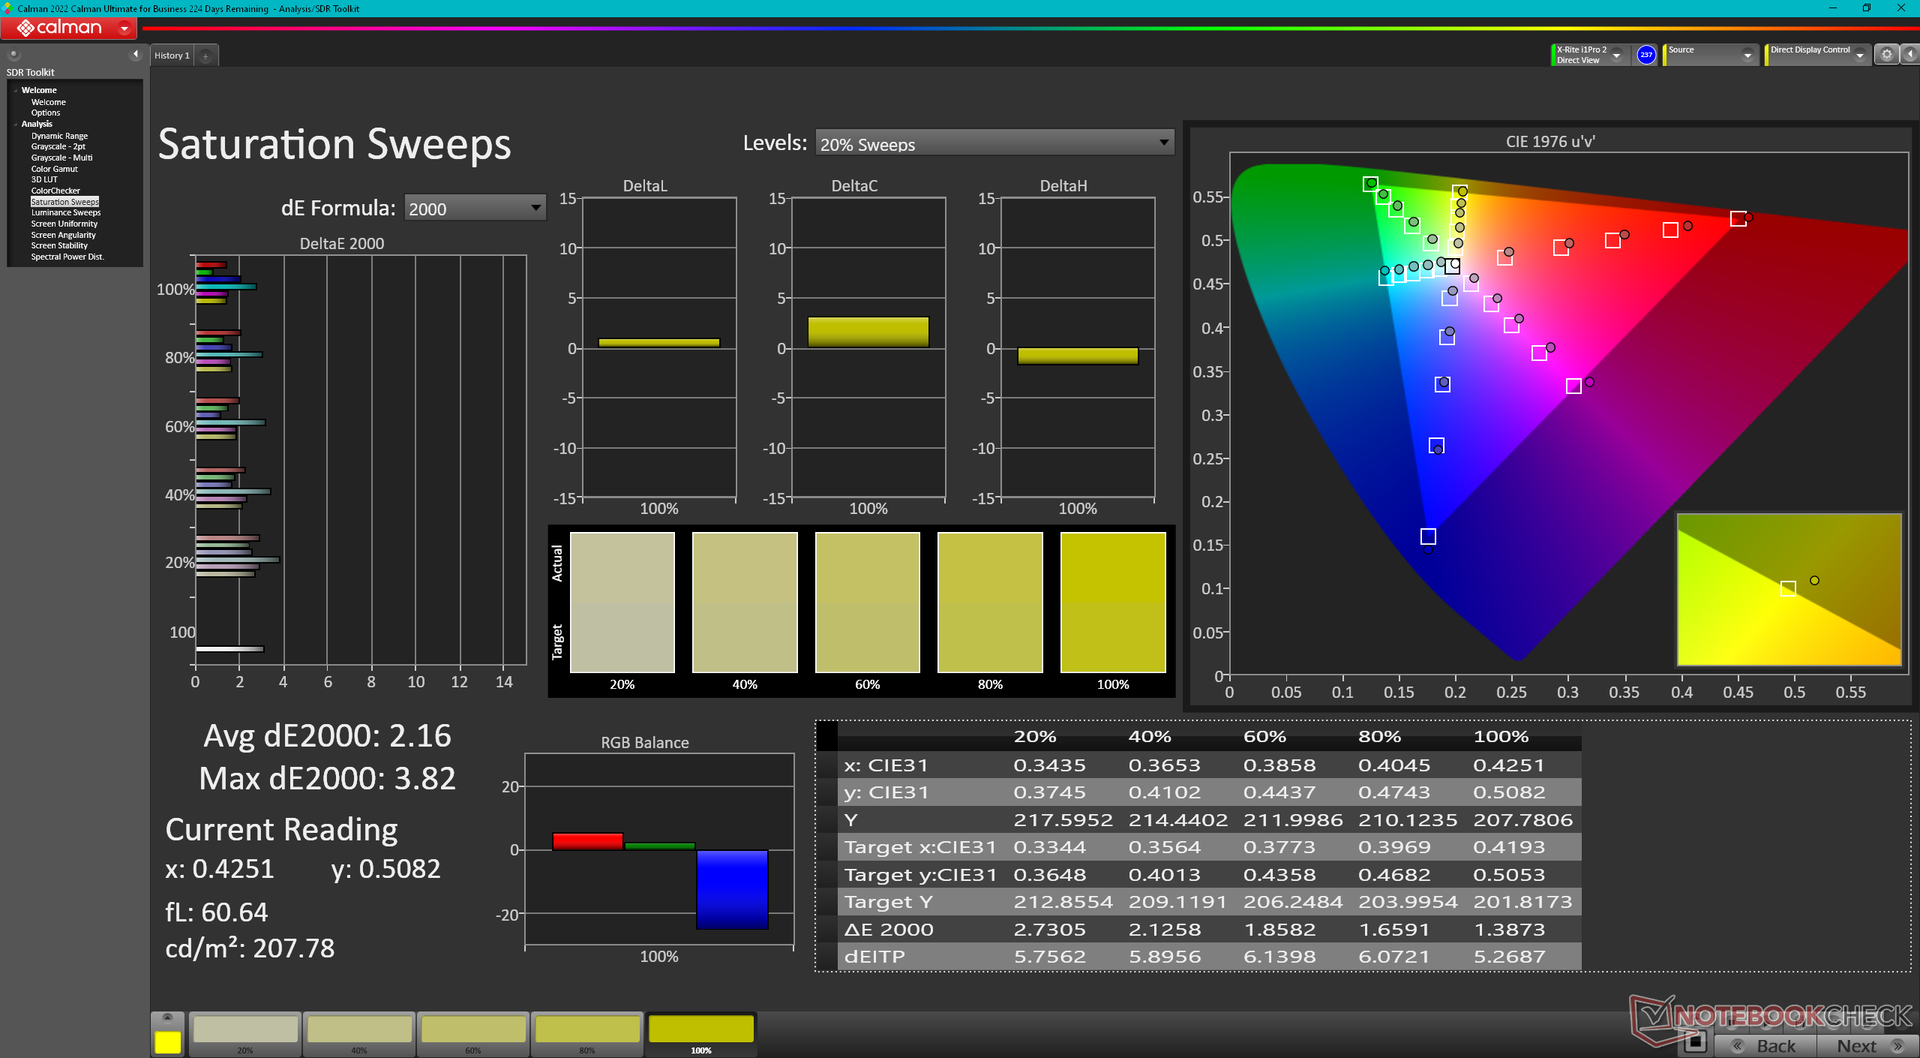
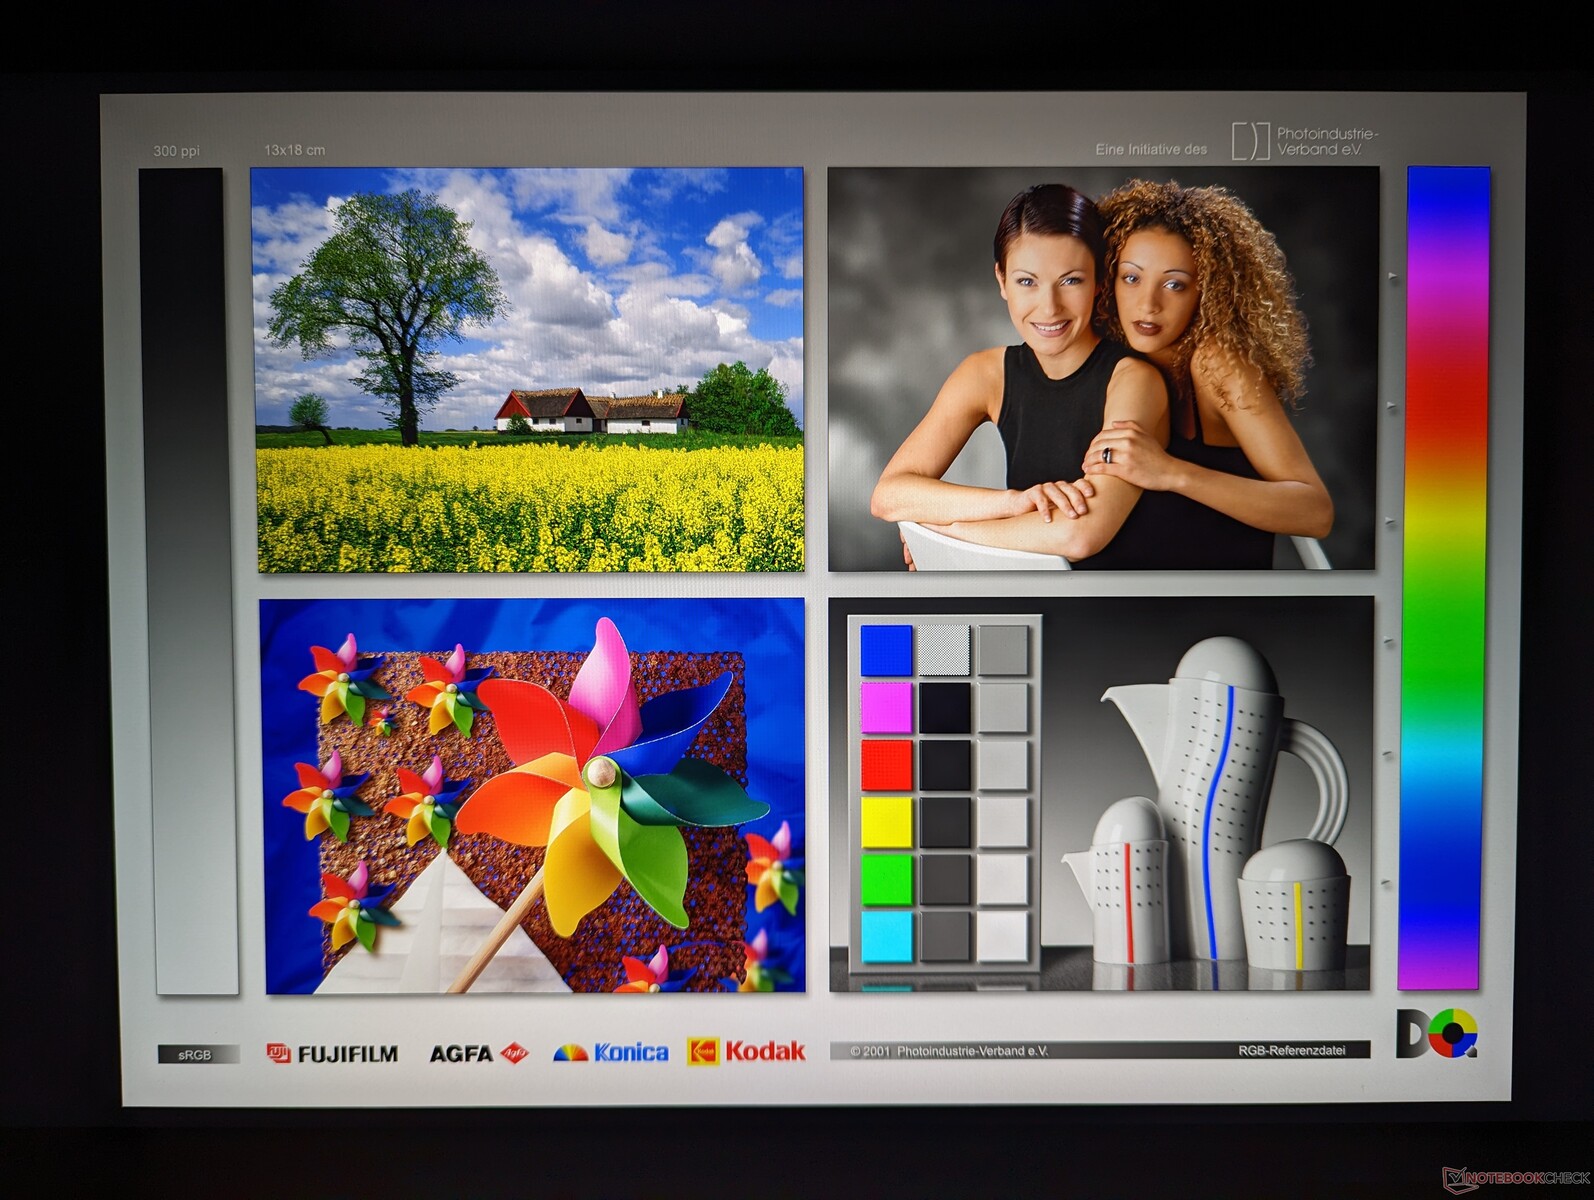
Wyświetlacz jest dobrze skalibrowany po wyjęciu z pudełka, a średnie wartości deltaE dla skali szarości i kolorów wynoszą odpowiednio 3,1 i 2,14. Samodzielna kalibracja pozwoliłaby na jeszcze większą poprawę średnich wartości deltaE do zaledwie 0,6 i 0,42 względem standardu sRGB. Nasz skalibrowany profil ICM jest dostępny do pobrania za darmo.
Wyświetl czasy reakcji
| ↔ Czas reakcji od czerni do bieli | ||
|---|---|---|
| 9.4 ms ... wzrost ↗ i spadek ↘ łącznie | ↗ 4.9 ms wzrost | 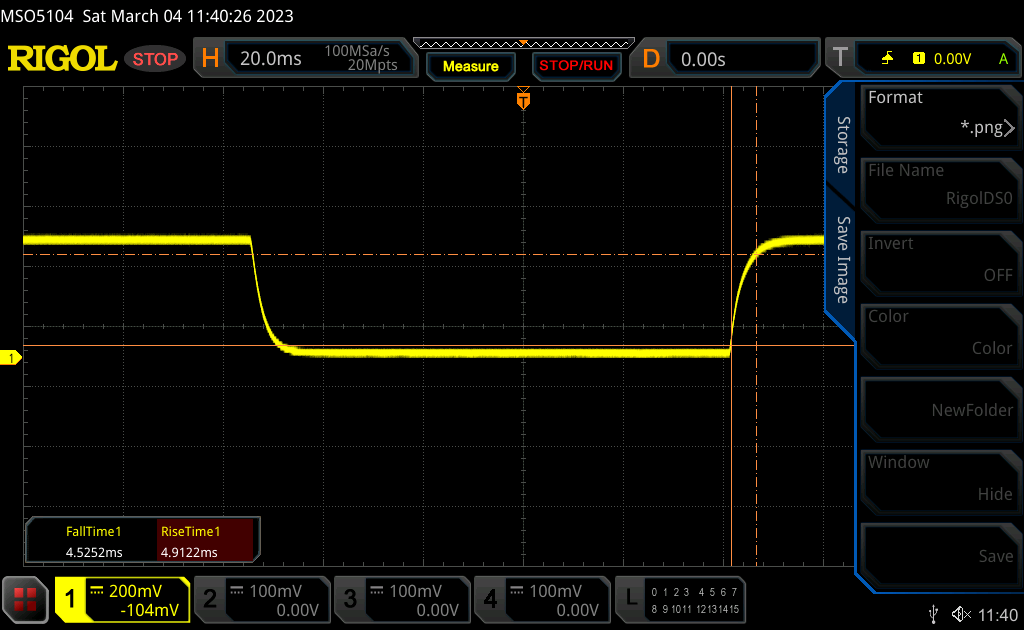 |
| ↘ 4.5 ms upadek | ||
| W naszych testach ekran wykazuje szybki czas reakcji i powinien nadawać się do gier. Dla porównania, wszystkie testowane urządzenia wahają się od 0.1 (minimum) do 240 (maksimum) ms. » 26 % wszystkich urządzeń jest lepszych. Oznacza to, że zmierzony czas reakcji jest lepszy od średniej wszystkich testowanych urządzeń (19.8 ms). | ||
| ↔ Czas reakcji 50% szarości do 80% szarości | ||
| 12 ms ... wzrost ↗ i spadek ↘ łącznie | ↗ 5.4 ms wzrost | 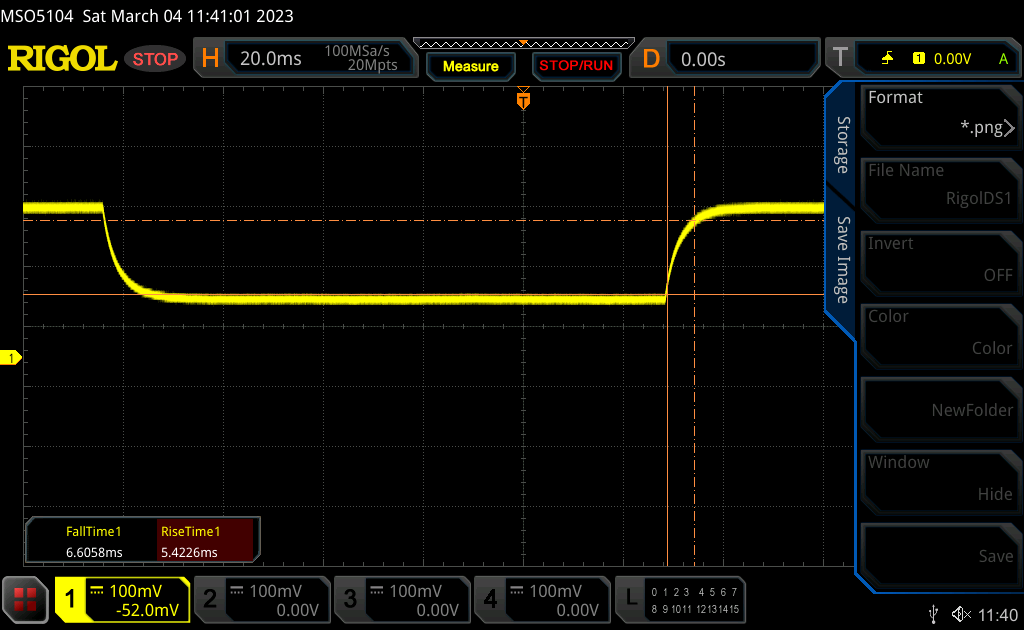 |
| ↘ 6.6 ms upadek | ||
| W naszych testach ekran wykazuje dobry współczynnik reakcji, ale może być zbyt wolny dla graczy rywalizujących ze sobą. Dla porównania, wszystkie testowane urządzenia wahają się od 0.165 (minimum) do 636 (maksimum) ms. » 25 % wszystkich urządzeń jest lepszych. Oznacza to, że zmierzony czas reakcji jest lepszy od średniej wszystkich testowanych urządzeń (31 ms). | ||
Migotanie ekranu / PWM (modulacja szerokości impulsu)
| Migotanie ekranu/nie wykryto PWM | 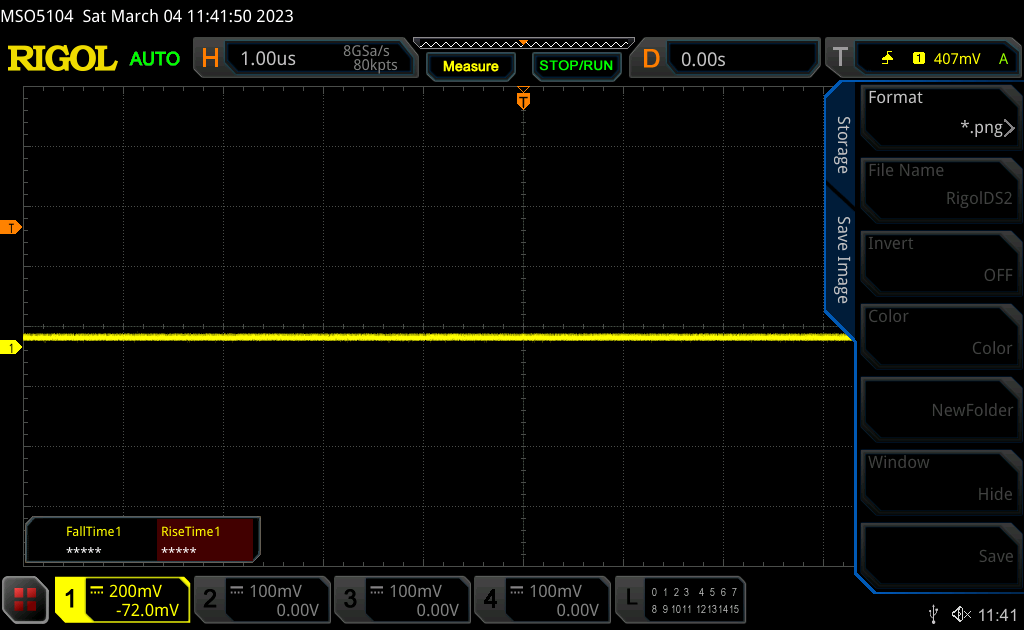 | ||
Dla porównania: 52 % wszystkich testowanych urządzeń nie używa PWM do przyciemniania wyświetlacza. Jeśli wykryto PWM, zmierzono średnio 7754 (minimum: 5 - maksimum: 343500) Hz. | |||
Wydajność
Warunki badania
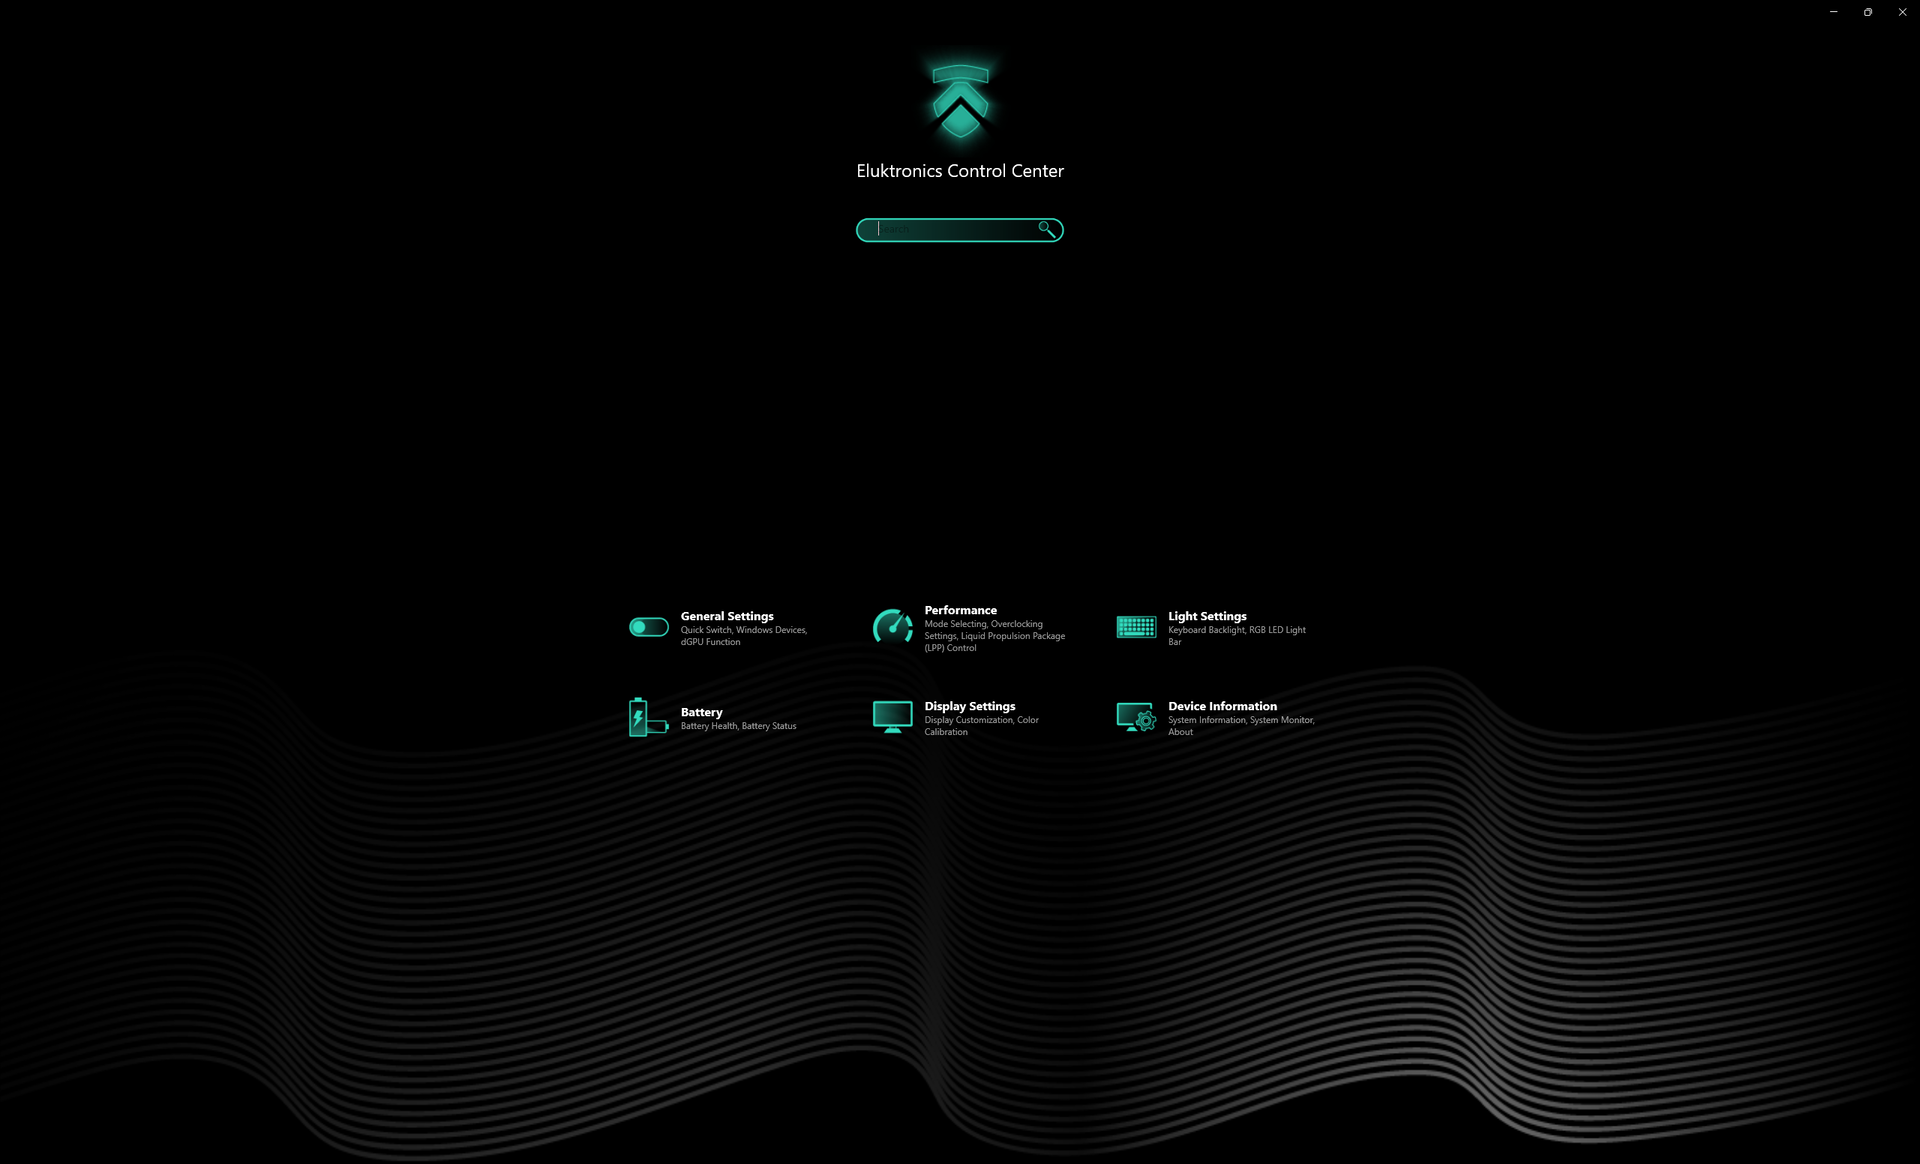
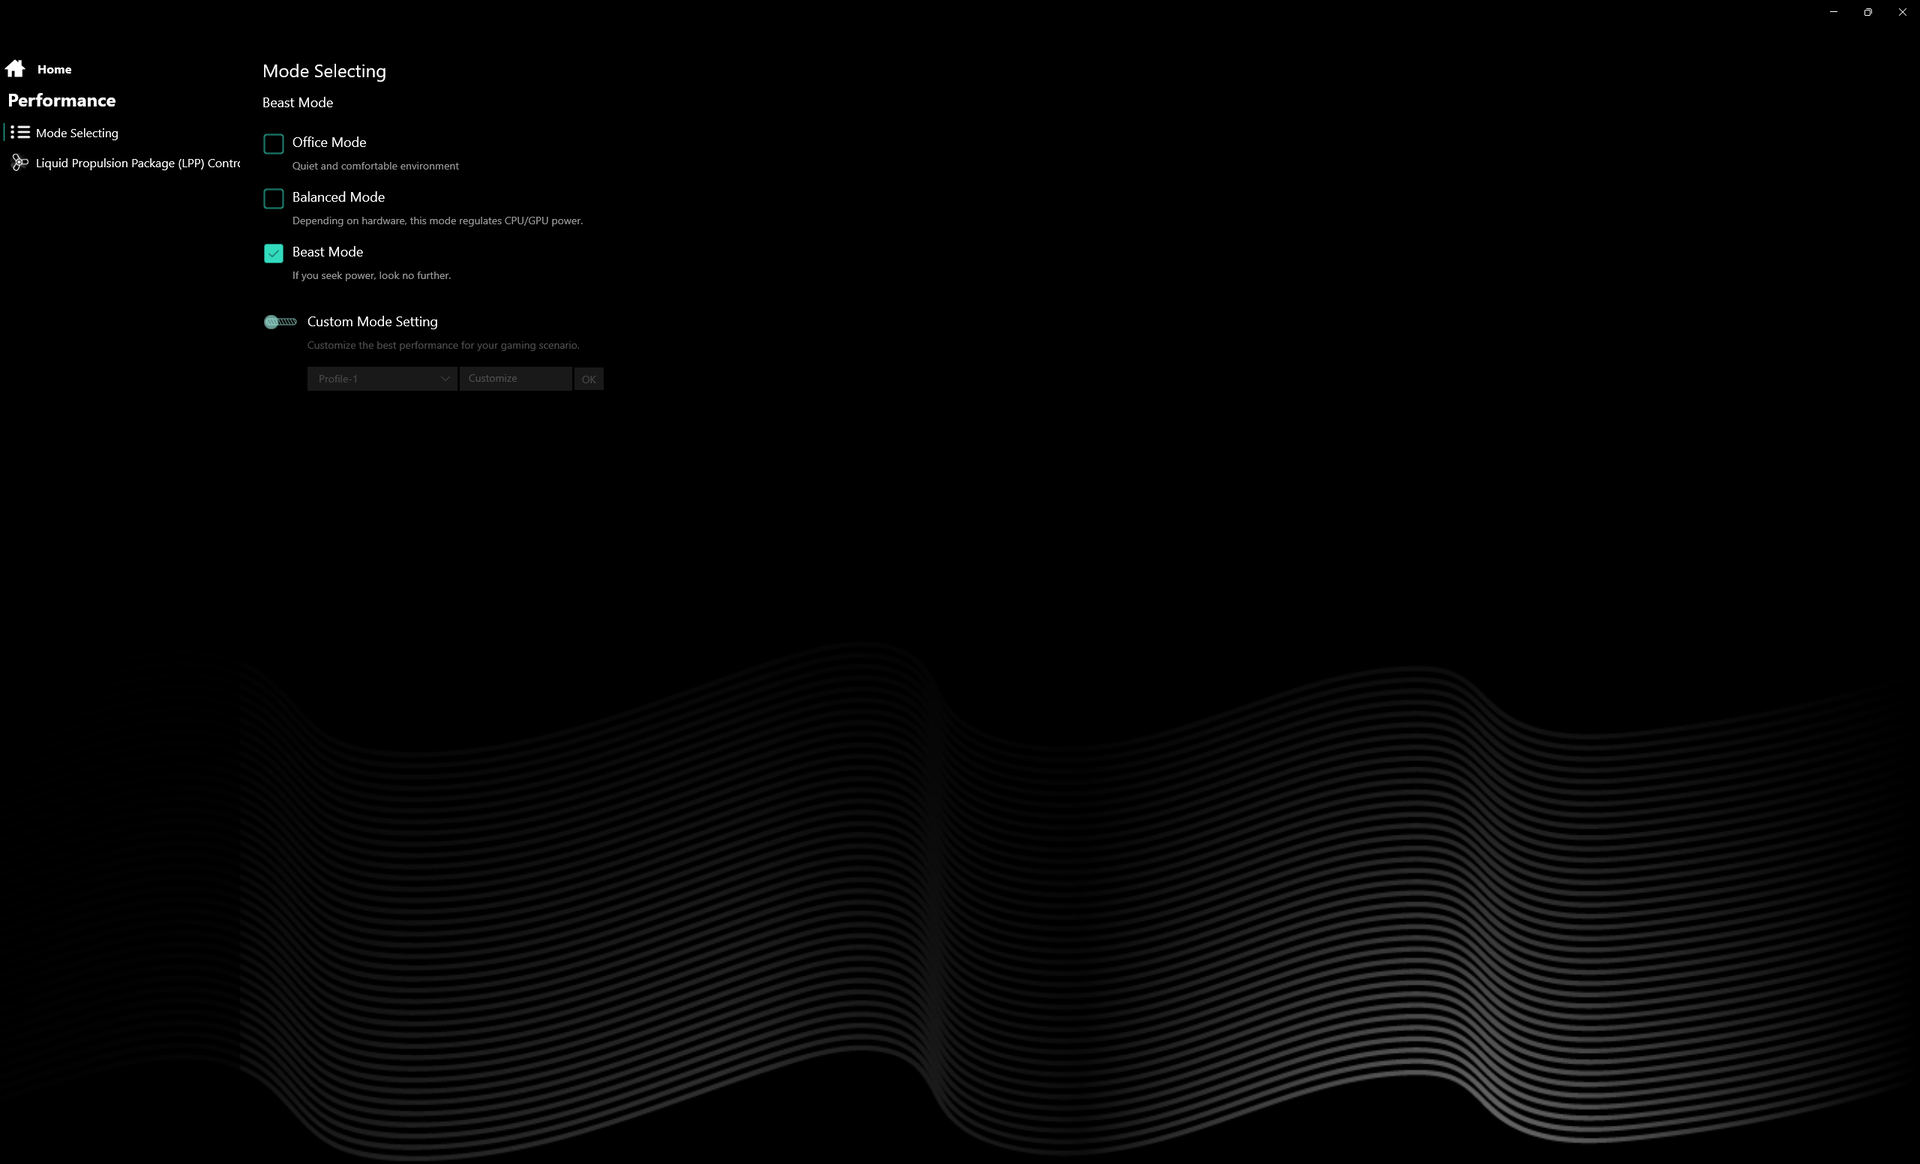
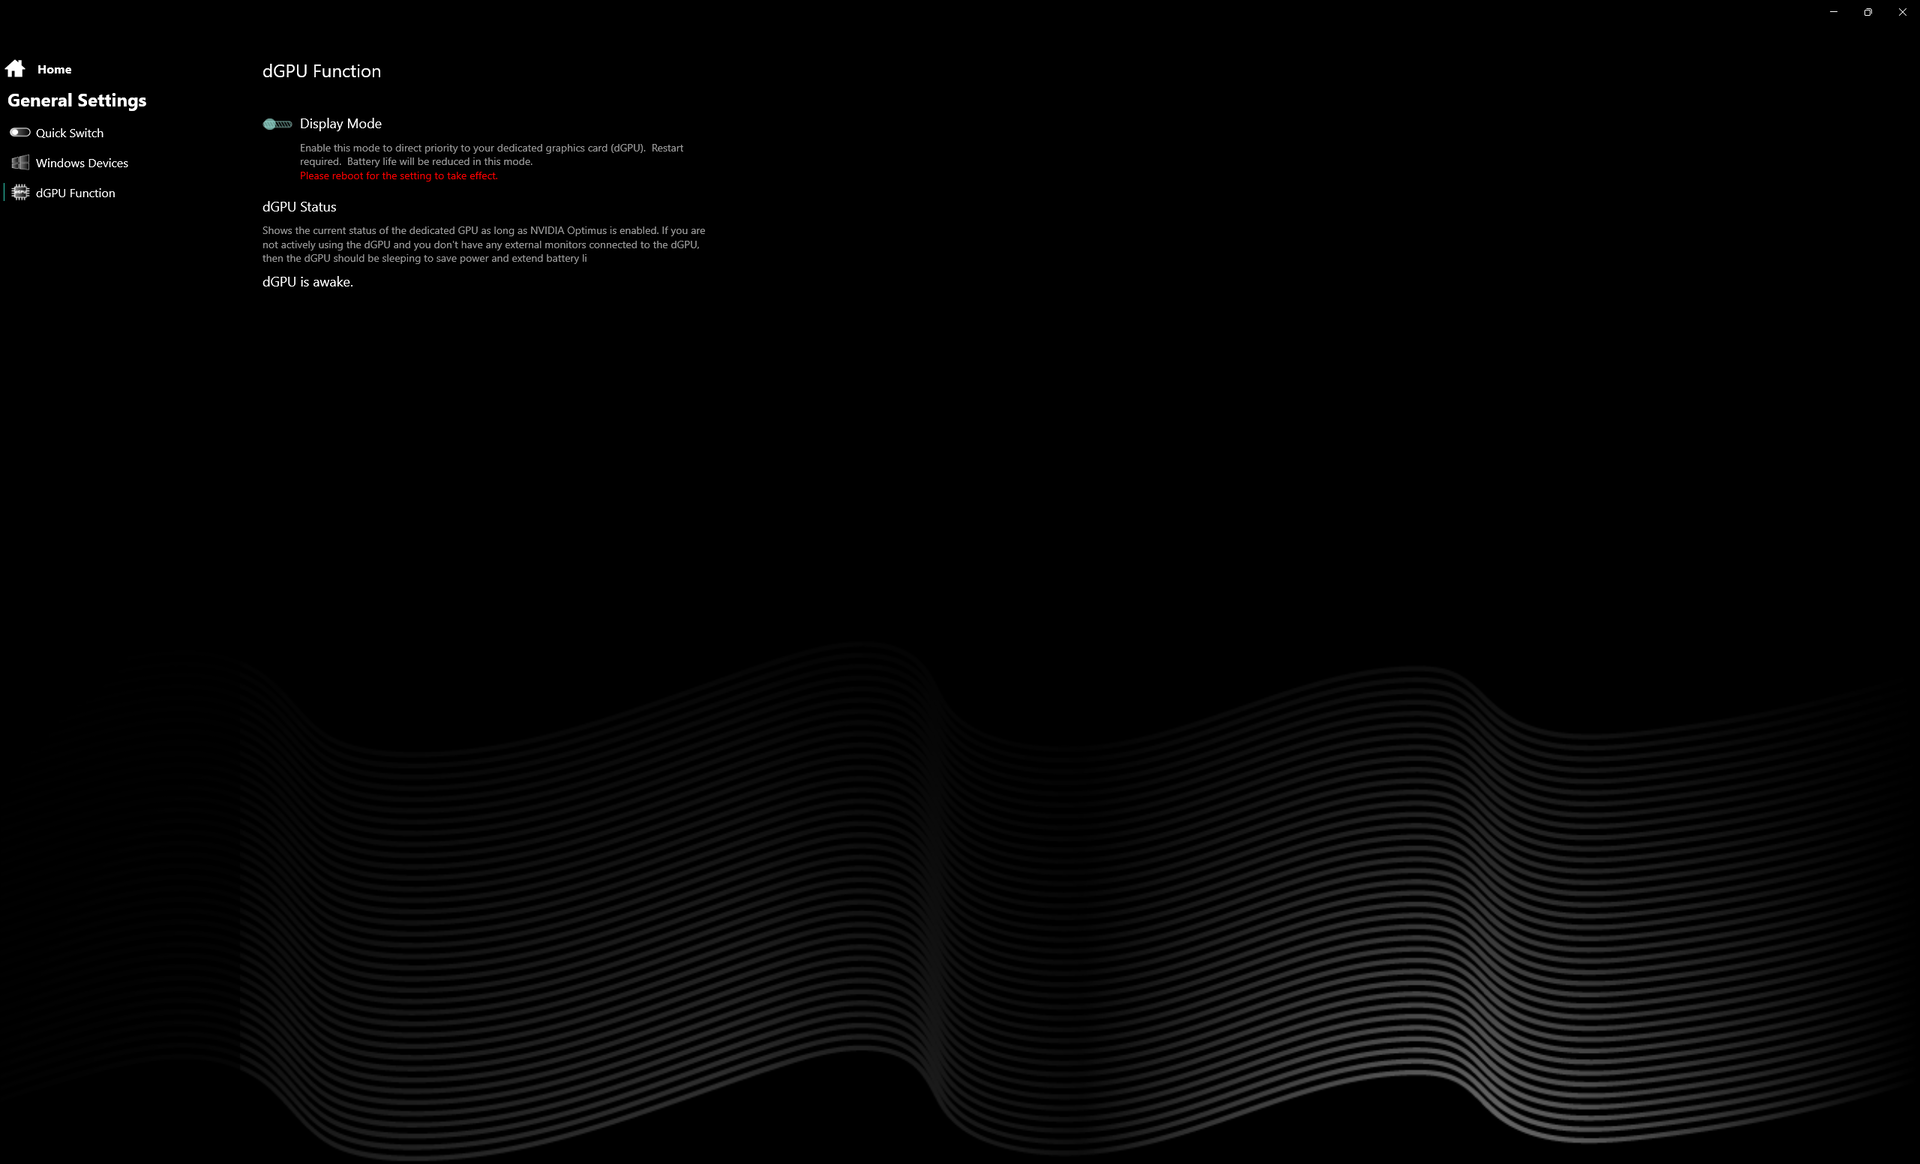
Przed uruchomieniem poniższych benchmarków ustawiliśmy nasze urządzenie w trybie Performance za pośrednictwem systemu Windows oraz w trybie "Beast Mode" za pośrednictwem preinstalowanego oprogramowania Eluktronics Control Center. Ustawiliśmy także system w tryb dGPU poprzez panel kontrolny Nvidii. Posiadacze powinni zapoznać się z Centrum Kontroli, ponieważ jest to centrum przełączania funkcji specyficznych dla danego modelu, takich jak RGB, tryby ładowania baterii, tryby wydajności, tryb chłodzenia cieczą i inne. Obsługiwany jest zaawansowany Optimus (MUX).
W naszym testowym egzemplarzu wystąpiło kilka problemów, w tym puste ekrany startowe, co najmniej jedno zawieszenie systemu podczas gry oraz automatyczne restarty, gdy CPU i GPU są maksymalnie obciążone przez dłuższy czas. Pierwszy problem rozwiązaliśmy poprzez wyłączenie funkcji Quick Boot w menu BIOS-u, ale takie problemy nie powinny występować w ogóle.
Procesor
Wydajność procesora jest tylko o 1-2% niższa niż w przypadku 13. generacji Core i9-13950HX w MSI Titan GT77, więc w większości scenariuszy mogą one być równie dobrze równoważne. Przeskakując z Ryzen 9 6900HX do naszego Core i9-13900HX zwiększa wydajność wielowątkową o niezwykłe 2x do 2,5x. Procesor 12. generacji Core i7-12700Hktóry nadal jest powszechnie stosowany w wielu laptopach do gier z wyższej półki cenowej, jest o około 50 procent wolniejszy.
Trwałość wydajności jest doskonała, bez większych spadków wydajności lub zachowań cyklicznych w czasie.
Cinebench R15 Multi Loop
Cinebench R23: Multi Core | Single Core
Cinebench R20: CPU (Multi Core) | CPU (Single Core)
Cinebench R15: CPU Multi 64Bit | CPU Single 64Bit
Blender: v2.79 BMW27 CPU
7-Zip 18.03: 7z b 4 | 7z b 4 -mmt1
Geekbench 5.5: Multi-Core | Single-Core
HWBOT x265 Benchmark v2.2: 4k Preset
LibreOffice : 20 Documents To PDF
R Benchmark 2.5: Overall mean
| CPU Performance rating | |
| Eluktronics Mech-17 GP2 | |
| MSI Titan GT77 HX 13VI | |
| Razer Blade 18 RTX 4070 | |
| Przeciętny Intel Core i9-13900HX | |
| Corsair One i300 | |
| MSI Titan GT77 12UHS | |
| MSI Pulse GL76 12UGK | |
| MSI Katana 17 B13VFK | |
| Schenker XMG Neo 17 M22 | |
| MSI GS76 Stealth 11UH | |
| HP Omen 16-n0033dx | |
| Schenker XMG Core 17 (Early 2021) | |
| Cinebench R23 / Multi Core | |
| MSI Titan GT77 HX 13VI | |
| Eluktronics Mech-17 GP2 | |
| Razer Blade 18 RTX 4070 | |
| Przeciętny Intel Core i9-13900HX (24270 - 32623, n=23) | |
| Corsair One i300 | |
| MSI Titan GT77 12UHS | |
| MSI Pulse GL76 12UGK | |
| MSI Katana 17 B13VFK | |
| Schenker XMG Neo 17 M22 | |
| HP Omen 16-n0033dx | |
| MSI GS76 Stealth 11UH | |
| Schenker XMG Core 17 (Early 2021) | |
| Cinebench R23 / Single Core | |
| MSI Titan GT77 HX 13VI | |
| Eluktronics Mech-17 GP2 | |
| Razer Blade 18 RTX 4070 | |
| Przeciętny Intel Core i9-13900HX (1867 - 2105, n=20) | |
| Corsair One i300 | |
| MSI Titan GT77 12UHS | |
| MSI Katana 17 B13VFK | |
| MSI Pulse GL76 12UGK | |
| MSI GS76 Stealth 11UH | |
| Schenker XMG Neo 17 M22 | |
| HP Omen 16-n0033dx | |
| Schenker XMG Core 17 (Early 2021) | |
| Cinebench R20 / CPU (Multi Core) | |
| MSI Titan GT77 HX 13VI | |
| Eluktronics Mech-17 GP2 | |
| Razer Blade 18 RTX 4070 | |
| Przeciętny Intel Core i9-13900HX (9152 - 12541, n=21) | |
| Corsair One i300 | |
| MSI Titan GT77 12UHS | |
| MSI Pulse GL76 12UGK | |
| MSI Katana 17 B13VFK | |
| Schenker XMG Neo 17 M22 | |
| HP Omen 16-n0033dx | |
| MSI GS76 Stealth 11UH | |
| Schenker XMG Core 17 (Early 2021) | |
| Cinebench R20 / CPU (Single Core) | |
| MSI Titan GT77 HX 13VI | |
| Eluktronics Mech-17 GP2 | |
| Razer Blade 18 RTX 4070 | |
| Przeciętny Intel Core i9-13900HX (722 - 810, n=21) | |
| Corsair One i300 | |
| MSI Titan GT77 12UHS | |
| MSI Katana 17 B13VFK | |
| MSI Pulse GL76 12UGK | |
| MSI GS76 Stealth 11UH | |
| Schenker XMG Neo 17 M22 | |
| HP Omen 16-n0033dx | |
| Schenker XMG Core 17 (Early 2021) | |
| Cinebench R15 / CPU Multi 64Bit | |
| MSI Titan GT77 HX 13VI | |
| Eluktronics Mech-17 GP2 | |
| Przeciętny Intel Core i9-13900HX (3913 - 4970, n=22) | |
| Razer Blade 18 RTX 4070 | |
| MSI Titan GT77 12UHS | |
| Corsair One i300 | |
| MSI Pulse GL76 12UGK | |
| MSI Katana 17 B13VFK | |
| Schenker XMG Neo 17 M22 | |
| HP Omen 16-n0033dx | |
| MSI GS76 Stealth 11UH | |
| Schenker XMG Core 17 (Early 2021) | |
| Cinebench R15 / CPU Single 64Bit | |
| MSI Titan GT77 HX 13VI | |
| Eluktronics Mech-17 GP2 | |
| Razer Blade 18 RTX 4070 | |
| Corsair One i300 | |
| Przeciętny Intel Core i9-13900HX (247 - 304, n=22) | |
| MSI Titan GT77 12UHS | |
| MSI Katana 17 B13VFK | |
| MSI Pulse GL76 12UGK | |
| Schenker XMG Neo 17 M22 | |
| HP Omen 16-n0033dx | |
| MSI GS76 Stealth 11UH | |
| Schenker XMG Core 17 (Early 2021) | |
| Blender / v2.79 BMW27 CPU | |
| Schenker XMG Core 17 (Early 2021) | |
| MSI GS76 Stealth 11UH | |
| HP Omen 16-n0033dx | |
| Schenker XMG Neo 17 M22 | |
| MSI Katana 17 B13VFK | |
| MSI Pulse GL76 12UGK | |
| MSI Titan GT77 12UHS | |
| Corsair One i300 | |
| Przeciętny Intel Core i9-13900HX (101 - 153, n=22) | |
| Razer Blade 18 RTX 4070 | |
| Eluktronics Mech-17 GP2 | |
| MSI Titan GT77 HX 13VI | |
| 7-Zip 18.03 / 7z b 4 | |
| MSI Titan GT77 HX 13VI | |
| Eluktronics Mech-17 GP2 | |
| Razer Blade 18 RTX 4070 | |
| Przeciętny Intel Core i9-13900HX (90675 - 127283, n=21) | |
| Corsair One i300 | |
| MSI Titan GT77 12UHS | |
| MSI Pulse GL76 12UGK | |
| Schenker XMG Neo 17 M22 | |
| MSI Katana 17 B13VFK | |
| HP Omen 16-n0033dx | |
| MSI GS76 Stealth 11UH | |
| Schenker XMG Core 17 (Early 2021) | |
| 7-Zip 18.03 / 7z b 4 -mmt1 | |
| Eluktronics Mech-17 GP2 | |
| MSI Titan GT77 HX 13VI | |
| Razer Blade 18 RTX 4070 | |
| Przeciętny Intel Core i9-13900HX (6340 - 7177, n=21) | |
| Corsair One i300 | |
| MSI Titan GT77 12UHS | |
| Schenker XMG Neo 17 M22 | |
| MSI Katana 17 B13VFK | |
| MSI Pulse GL76 12UGK | |
| HP Omen 16-n0033dx | |
| MSI GS76 Stealth 11UH | |
| Schenker XMG Core 17 (Early 2021) | |
| Geekbench 5.5 / Multi-Core | |
| Eluktronics Mech-17 GP2 | |
| MSI Titan GT77 HX 13VI | |
| Razer Blade 18 RTX 4070 | |
| Przeciętny Intel Core i9-13900HX (17614 - 21075, n=22) | |
| Corsair One i300 | |
| MSI Titan GT77 12UHS | |
| MSI Pulse GL76 12UGK | |
| MSI Katana 17 B13VFK | |
| Schenker XMG Neo 17 M22 | |
| MSI GS76 Stealth 11UH | |
| HP Omen 16-n0033dx | |
| Schenker XMG Core 17 (Early 2021) | |
| Geekbench 5.5 / Single-Core | |
| Eluktronics Mech-17 GP2 | |
| MSI Titan GT77 HX 13VI | |
| Razer Blade 18 RTX 4070 | |
| Przeciętny Intel Core i9-13900HX (1345 - 2093, n=22) | |
| Corsair One i300 | |
| MSI Titan GT77 12UHS | |
| MSI Katana 17 B13VFK | |
| MSI Pulse GL76 12UGK | |
| MSI GS76 Stealth 11UH | |
| Schenker XMG Neo 17 M22 | |
| HP Omen 16-n0033dx | |
| Schenker XMG Core 17 (Early 2021) | |
| HWBOT x265 Benchmark v2.2 / 4k Preset | |
| Eluktronics Mech-17 GP2 | |
| MSI Titan GT77 HX 13VI | |
| Razer Blade 18 RTX 4070 | |
| Przeciętny Intel Core i9-13900HX (23.5 - 34.4, n=22) | |
| Corsair One i300 | |
| MSI Titan GT77 12UHS | |
| MSI Pulse GL76 12UGK | |
| Schenker XMG Neo 17 M22 | |
| MSI Katana 17 B13VFK | |
| HP Omen 16-n0033dx | |
| MSI GS76 Stealth 11UH | |
| Schenker XMG Core 17 (Early 2021) | |
| LibreOffice / 20 Documents To PDF | |
| HP Omen 16-n0033dx | |
| MSI Katana 17 B13VFK | |
| Schenker XMG Core 17 (Early 2021) | |
| Schenker XMG Neo 17 M22 | |
| MSI GS76 Stealth 11UH | |
| MSI Titan GT77 HX 13VI | |
| MSI Pulse GL76 12UGK | |
| Razer Blade 18 RTX 4070 | |
| Przeciętny Intel Core i9-13900HX (32.8 - 51.1, n=21) | |
| MSI Titan GT77 12UHS | |
| Corsair One i300 | |
| Eluktronics Mech-17 GP2 | |
| R Benchmark 2.5 / Overall mean | |
| Schenker XMG Core 17 (Early 2021) | |
| MSI GS76 Stealth 11UH | |
| HP Omen 16-n0033dx | |
| Schenker XMG Neo 17 M22 | |
| MSI Pulse GL76 12UGK | |
| MSI Katana 17 B13VFK | |
| MSI Titan GT77 12UHS | |
| MSI Titan GT77 HX 13VI | |
| Przeciętny Intel Core i9-13900HX (0.375 - 0.4564, n=22) | |
| Razer Blade 18 RTX 4070 | |
| Corsair One i300 | |
| Eluktronics Mech-17 GP2 | |
* ... im mniej tym lepiej
AIDA64: FP32 Ray-Trace | FPU Julia | CPU SHA3 | CPU Queen | FPU SinJulia | FPU Mandel | CPU AES | CPU ZLib | FP64 Ray-Trace | CPU PhotoWorxx
| Performance rating | |
| Eluktronics Mech-17 GP2 | |
| MSI Titan GT77 HX 13VI | |
| Razer Blade 18 RTX 4070 | |
| Przeciętny Intel Core i9-13900HX | |
| Schenker XMG Neo 17 M22 | |
| Alienware m17 R5 (R9 6900HX, RX 6850M XT) | |
| MSI Katana 17 B13VFK | |
| AIDA64 / FP32 Ray-Trace | |
| MSI Titan GT77 HX 13VI | |
| Eluktronics Mech-17 GP2 | |
| Razer Blade 18 RTX 4070 | |
| Przeciętny Intel Core i9-13900HX (17589 - 27615, n=22) | |
| Alienware m17 R5 (R9 6900HX, RX 6850M XT) | |
| Schenker XMG Neo 17 M22 | |
| MSI Katana 17 B13VFK | |
| AIDA64 / FPU Julia | |
| MSI Titan GT77 HX 13VI | |
| Eluktronics Mech-17 GP2 | |
| Razer Blade 18 RTX 4070 | |
| Przeciętny Intel Core i9-13900HX (88686 - 137015, n=22) | |
| Alienware m17 R5 (R9 6900HX, RX 6850M XT) | |
| Schenker XMG Neo 17 M22 | |
| MSI Katana 17 B13VFK | |
| AIDA64 / CPU SHA3 | |
| MSI Titan GT77 HX 13VI | |
| Eluktronics Mech-17 GP2 | |
| Razer Blade 18 RTX 4070 | |
| Przeciętny Intel Core i9-13900HX (4362 - 7029, n=22) | |
| Alienware m17 R5 (R9 6900HX, RX 6850M XT) | |
| Schenker XMG Neo 17 M22 | |
| MSI Katana 17 B13VFK | |
| AIDA64 / CPU Queen | |
| Eluktronics Mech-17 GP2 | |
| MSI Titan GT77 HX 13VI | |
| Razer Blade 18 RTX 4070 | |
| Przeciętny Intel Core i9-13900HX (125644 - 141385, n=22) | |
| Alienware m17 R5 (R9 6900HX, RX 6850M XT) | |
| Schenker XMG Neo 17 M22 | |
| MSI Katana 17 B13VFK | |
| AIDA64 / FPU SinJulia | |
| Eluktronics Mech-17 GP2 | |
| MSI Titan GT77 HX 13VI | |
| Razer Blade 18 RTX 4070 | |
| Przeciętny Intel Core i9-13900HX (12334 - 17179, n=22) | |
| Alienware m17 R5 (R9 6900HX, RX 6850M XT) | |
| Schenker XMG Neo 17 M22 | |
| MSI Katana 17 B13VFK | |
| AIDA64 / FPU Mandel | |
| MSI Titan GT77 HX 13VI | |
| Eluktronics Mech-17 GP2 | |
| Razer Blade 18 RTX 4070 | |
| Przeciętny Intel Core i9-13900HX (43850 - 69202, n=22) | |
| Alienware m17 R5 (R9 6900HX, RX 6850M XT) | |
| Schenker XMG Neo 17 M22 | |
| MSI Katana 17 B13VFK | |
| AIDA64 / CPU AES | |
| Eluktronics Mech-17 GP2 | |
| Przeciętny Intel Core i9-13900HX (89413 - 237881, n=22) | |
| MSI Titan GT77 HX 13VI | |
| Schenker XMG Neo 17 M22 | |
| Razer Blade 18 RTX 4070 | |
| MSI Katana 17 B13VFK | |
| Alienware m17 R5 (R9 6900HX, RX 6850M XT) | |
| AIDA64 / CPU ZLib | |
| MSI Titan GT77 HX 13VI | |
| Eluktronics Mech-17 GP2 | |
| Razer Blade 18 RTX 4070 | |
| Przeciętny Intel Core i9-13900HX (1284 - 1958, n=22) | |
| Alienware m17 R5 (R9 6900HX, RX 6850M XT) | |
| Schenker XMG Neo 17 M22 | |
| MSI Katana 17 B13VFK | |
| AIDA64 / FP64 Ray-Trace | |
| MSI Titan GT77 HX 13VI | |
| Eluktronics Mech-17 GP2 | |
| Razer Blade 18 RTX 4070 | |
| Przeciętny Intel Core i9-13900HX (9481 - 15279, n=22) | |
| Alienware m17 R5 (R9 6900HX, RX 6850M XT) | |
| Schenker XMG Neo 17 M22 | |
| MSI Katana 17 B13VFK | |
| AIDA64 / CPU PhotoWorxx | |
| Razer Blade 18 RTX 4070 | |
| Przeciętny Intel Core i9-13900HX (42994 - 51994, n=22) | |
| Eluktronics Mech-17 GP2 | |
| MSI Titan GT77 HX 13VI | |
| MSI Katana 17 B13VFK | |
| Alienware m17 R5 (R9 6900HX, RX 6850M XT) | |
| Schenker XMG Neo 17 M22 | |
Wydajność systemu
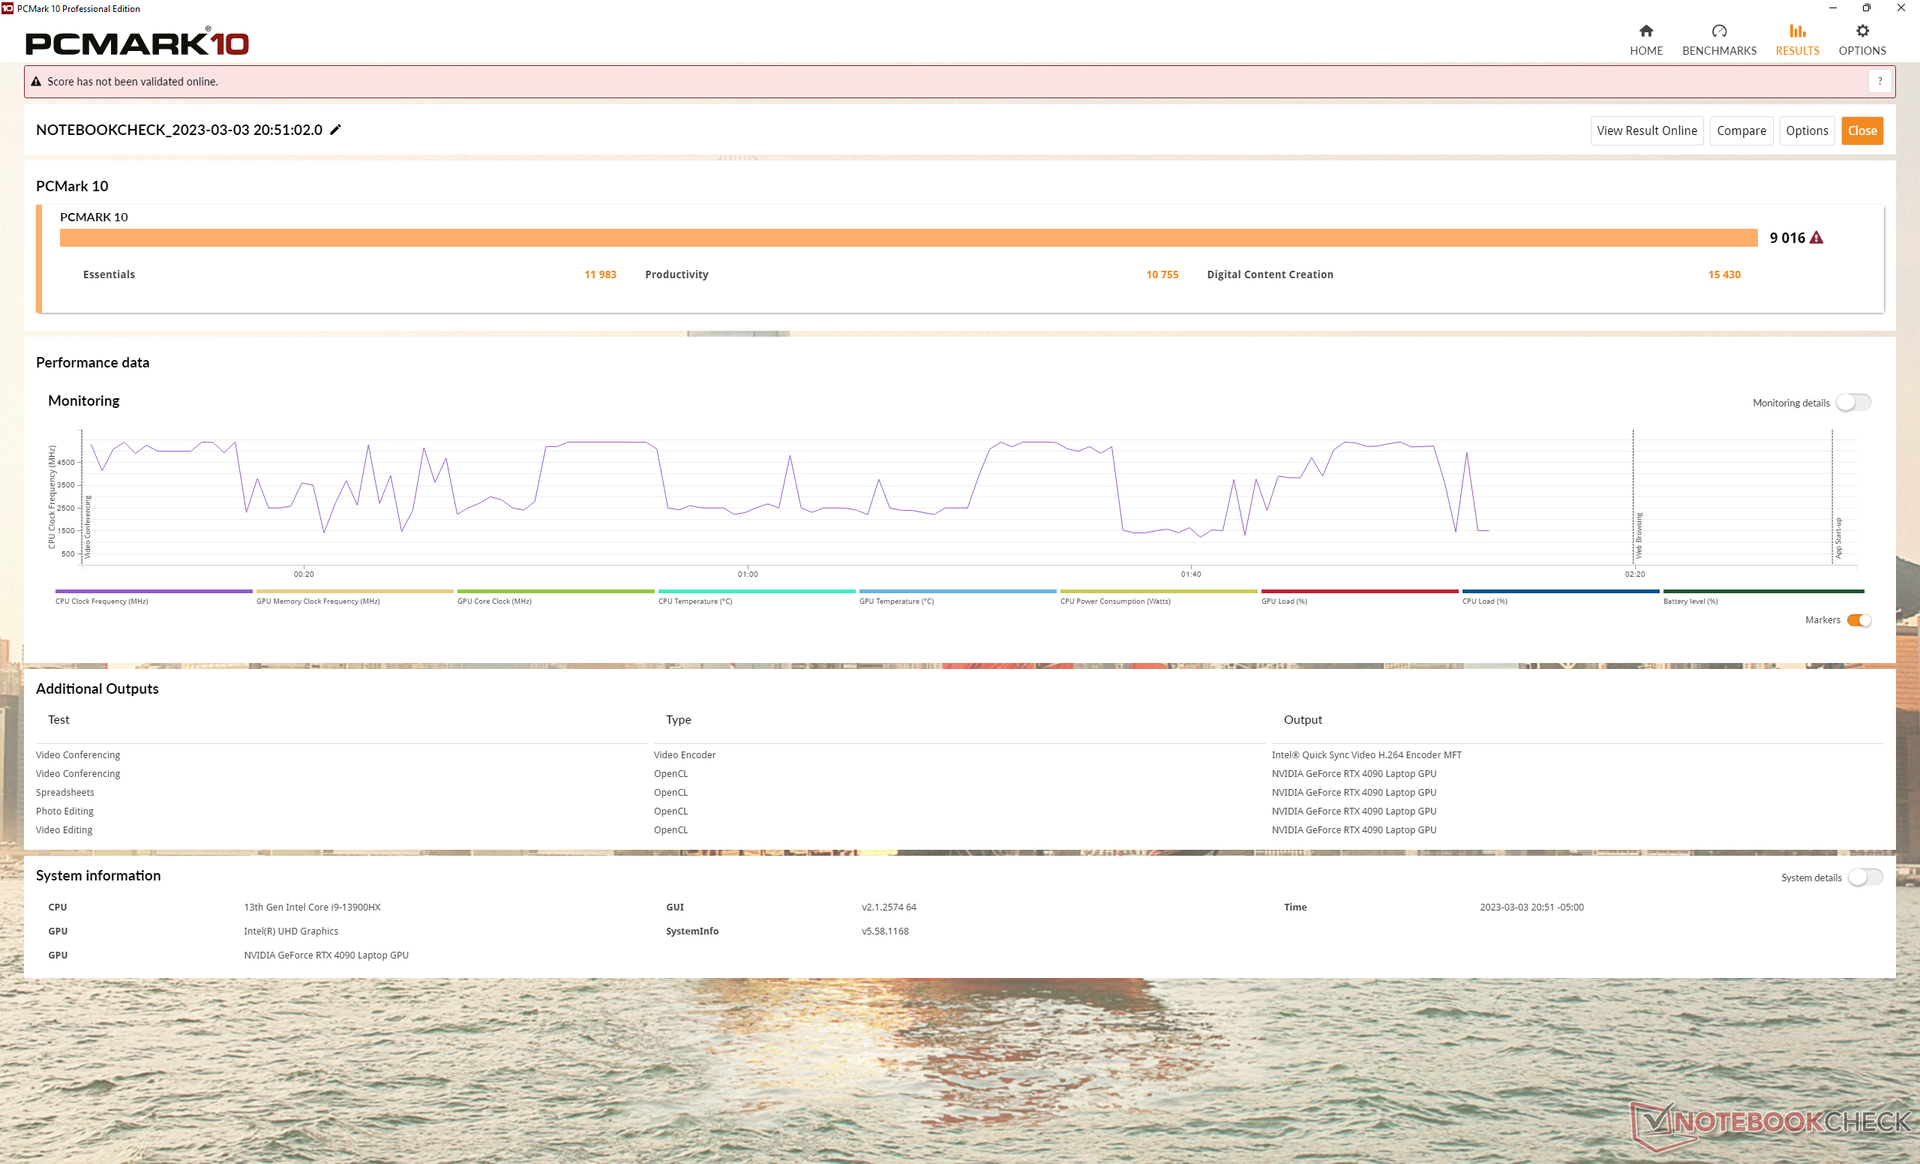
Wyniki PCMark są jednymi z najwyższych w naszej bazie danych, rywalizując z MSI Titan GT77. Zwłaszcza jego wynik w Digital Content Creation jest o prawie 70 procent wyższy niż w zeszłorocznym modelu RTX 3080 Ti ze względu na wzrost wydajności graficznej.
CrossMark: Overall | Productivity | Creativity | Responsiveness
| PCMark 10 / Score | |
| Eluktronics Mech-17 GP2 | |
| MSI Titan GT77 HX 13VI | |
| Przeciętny Intel Core i9-13900HX, NVIDIA GeForce RTX 4090 Laptop GPU (7690 - 9331, n=8) | |
| Razer Blade 18 RTX 4070 | |
| Alienware m17 R5 (R9 6900HX, RX 6850M XT) | |
| MSI Katana 17 B13VFK | |
| Schenker XMG Neo 17 M22 | |
| PCMark 10 / Essentials | |
| Eluktronics Mech-17 GP2 | |
| MSI Titan GT77 HX 13VI | |
| Razer Blade 18 RTX 4070 | |
| Przeciętny Intel Core i9-13900HX, NVIDIA GeForce RTX 4090 Laptop GPU (10972 - 11983, n=8) | |
| MSI Katana 17 B13VFK | |
| Alienware m17 R5 (R9 6900HX, RX 6850M XT) | |
| Schenker XMG Neo 17 M22 | |
| PCMark 10 / Productivity | |
| Eluktronics Mech-17 GP2 | |
| Przeciętny Intel Core i9-13900HX, NVIDIA GeForce RTX 4090 Laptop GPU (9038 - 11680, n=8) | |
| MSI Titan GT77 HX 13VI | |
| Razer Blade 18 RTX 4070 | |
| Schenker XMG Neo 17 M22 | |
| MSI Katana 17 B13VFK | |
| Alienware m17 R5 (R9 6900HX, RX 6850M XT) | |
| PCMark 10 / Digital Content Creation | |
| MSI Titan GT77 HX 13VI | |
| Eluktronics Mech-17 GP2 | |
| Przeciętny Intel Core i9-13900HX, NVIDIA GeForce RTX 4090 Laptop GPU (10605 - 16395, n=8) | |
| Alienware m17 R5 (R9 6900HX, RX 6850M XT) | |
| Razer Blade 18 RTX 4070 | |
| MSI Katana 17 B13VFK | |
| Schenker XMG Neo 17 M22 | |
| CrossMark / Overall | |
| Eluktronics Mech-17 GP2 | |
| MSI Titan GT77 HX 13VI | |
| Razer Blade 18 RTX 4070 | |
| Przeciętny Intel Core i9-13900HX, NVIDIA GeForce RTX 4090 Laptop GPU (1825 - 2295, n=8) | |
| MSI Katana 17 B13VFK | |
| Schenker XMG Neo 17 M22 | |
| Alienware m17 R5 (R9 6900HX, RX 6850M XT) | |
| CrossMark / Productivity | |
| Eluktronics Mech-17 GP2 | |
| MSI Titan GT77 HX 13VI | |
| Razer Blade 18 RTX 4070 | |
| Przeciętny Intel Core i9-13900HX, NVIDIA GeForce RTX 4090 Laptop GPU (1666 - 2166, n=8) | |
| MSI Katana 17 B13VFK | |
| Schenker XMG Neo 17 M22 | |
| Alienware m17 R5 (R9 6900HX, RX 6850M XT) | |
| CrossMark / Creativity | |
| Eluktronics Mech-17 GP2 | |
| MSI Titan GT77 HX 13VI | |
| Razer Blade 18 RTX 4070 | |
| Przeciętny Intel Core i9-13900HX, NVIDIA GeForce RTX 4090 Laptop GPU (2162 - 2514, n=8) | |
| MSI Katana 17 B13VFK | |
| Schenker XMG Neo 17 M22 | |
| Alienware m17 R5 (R9 6900HX, RX 6850M XT) | |
| CrossMark / Responsiveness | |
| Razer Blade 18 RTX 4070 | |
| MSI Titan GT77 HX 13VI | |
| Eluktronics Mech-17 GP2 | |
| Przeciętny Intel Core i9-13900HX, NVIDIA GeForce RTX 4090 Laptop GPU (1441 - 2275, n=8) | |
| MSI Katana 17 B13VFK | |
| Schenker XMG Neo 17 M22 | |
| Alienware m17 R5 (R9 6900HX, RX 6850M XT) | |
| PCMark 10 Score | 9016 pkt. | |
Pomoc | ||
| AIDA64 / Memory Copy | |
| Razer Blade 18 RTX 4070 | |
| Przeciętny Intel Core i9-13900HX (67716 - 79193, n=22) | |
| Eluktronics Mech-17 GP2 | |
| MSI Titan GT77 HX 13VI | |
| MSI Katana 17 B13VFK | |
| Alienware m17 R5 (R9 6900HX, RX 6850M XT) | |
| Schenker XMG Neo 17 M22 | |
| AIDA64 / Memory Read | |
| Razer Blade 18 RTX 4070 | |
| Przeciętny Intel Core i9-13900HX (73998 - 88462, n=22) | |
| Eluktronics Mech-17 GP2 | |
| MSI Titan GT77 HX 13VI | |
| MSI Katana 17 B13VFK | |
| Schenker XMG Neo 17 M22 | |
| Alienware m17 R5 (R9 6900HX, RX 6850M XT) | |
| AIDA64 / Memory Write | |
| Razer Blade 18 RTX 4070 | |
| Przeciętny Intel Core i9-13900HX (65472 - 77045, n=22) | |
| Eluktronics Mech-17 GP2 | |
| MSI Titan GT77 HX 13VI | |
| Schenker XMG Neo 17 M22 | |
| Alienware m17 R5 (R9 6900HX, RX 6850M XT) | |
| MSI Katana 17 B13VFK | |
| AIDA64 / Memory Latency | |
| MSI Katana 17 B13VFK | |
| Alienware m17 R5 (R9 6900HX, RX 6850M XT) | |
| MSI Titan GT77 HX 13VI | |
| Schenker XMG Neo 17 M22 | |
| Eluktronics Mech-17 GP2 | |
| Przeciętny Intel Core i9-13900HX (75.3 - 91.1, n=22) | |
| Razer Blade 18 RTX 4070 | |
* ... im mniej tym lepiej
Opóźnienie DPC
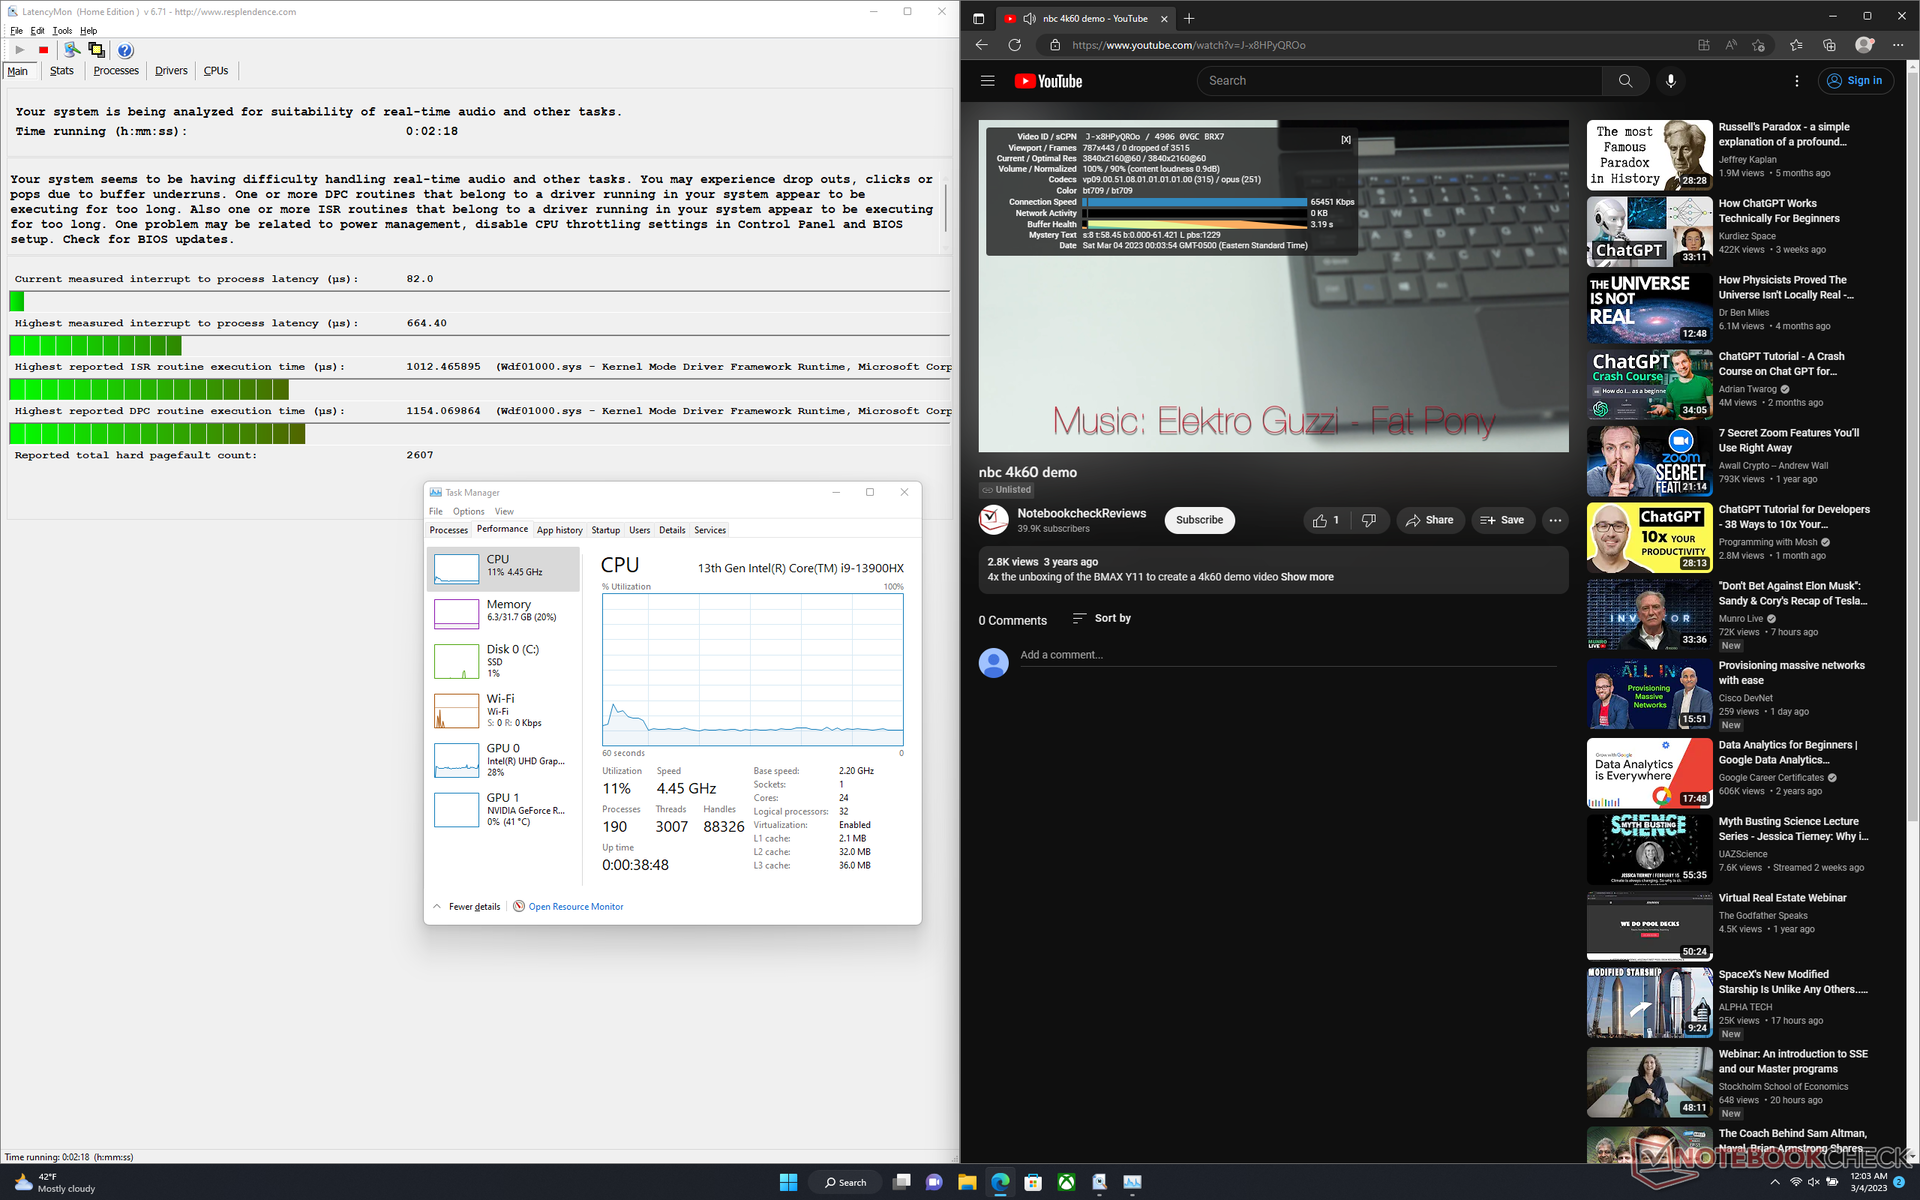
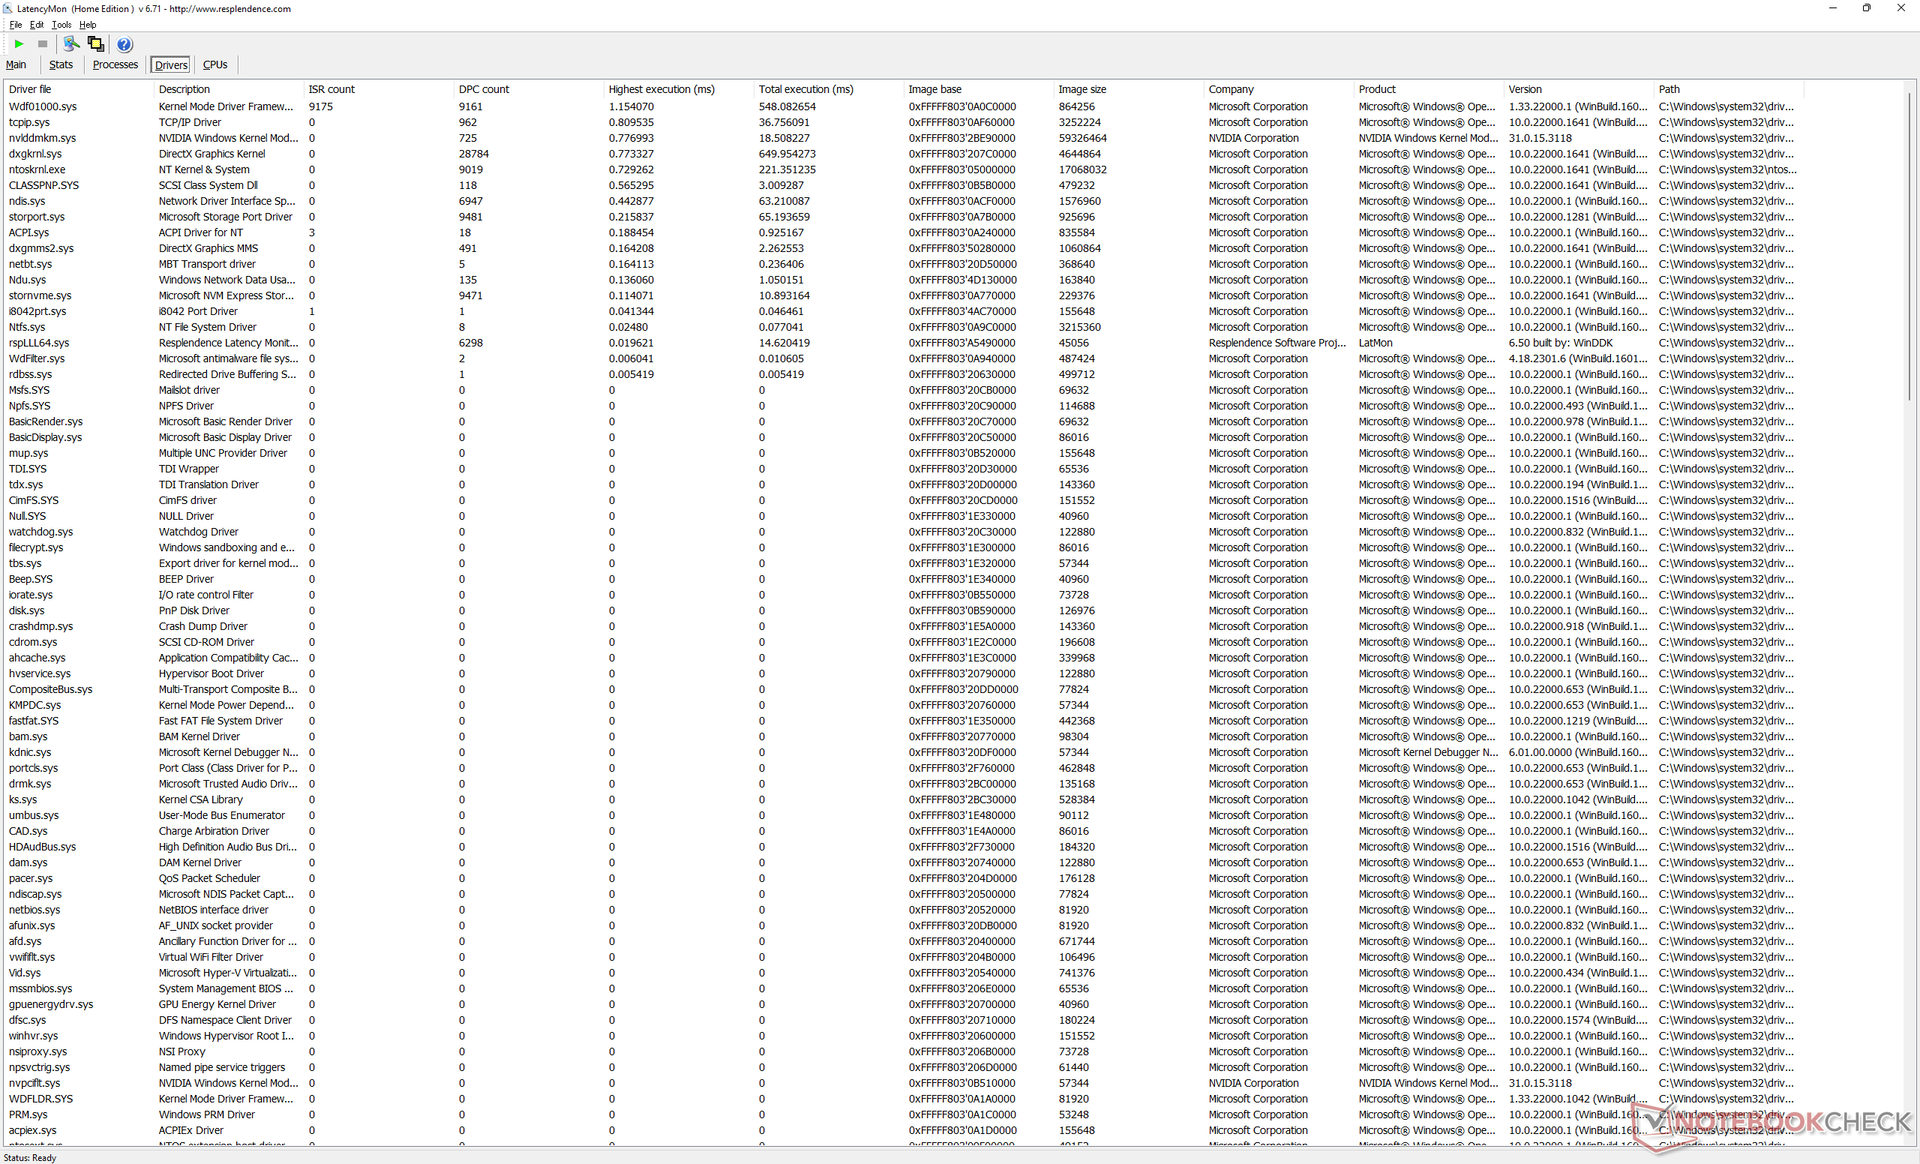
LatencyMon ujawnia drobne problemy z DPC podczas otwierania wielu kart przeglądarki na naszej stronie głównej. odtwarzanie wideo w rozdzielczości 4K przy 60 FPS jest poza tym perfekcyjne i nie ma żadnych opuszczonych klatek.
| DPC Latencies / LatencyMon - interrupt to process latency (max), Web, Youtube, Prime95 | |
| MSI Titan GT77 HX 13VI | |
| Schenker XMG Neo 17 M22 | |
| MSI Katana 17 B13VFK | |
| Alienware m17 R5 (R9 6900HX, RX 6850M XT) | |
| Razer Blade 18 RTX 4070 | |
| Eluktronics Mech-17 GP2 | |
* ... im mniej tym lepiej
Urządzenia do przechowywania danych
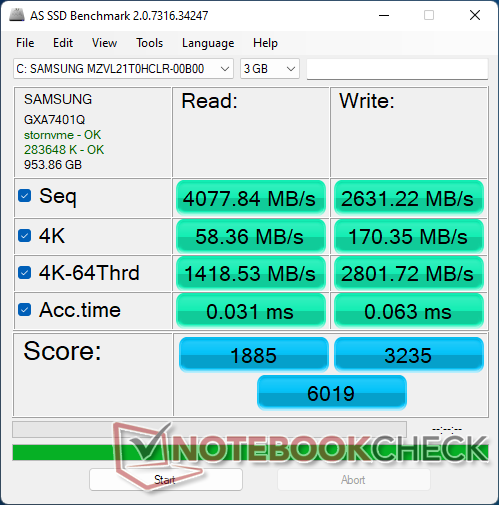
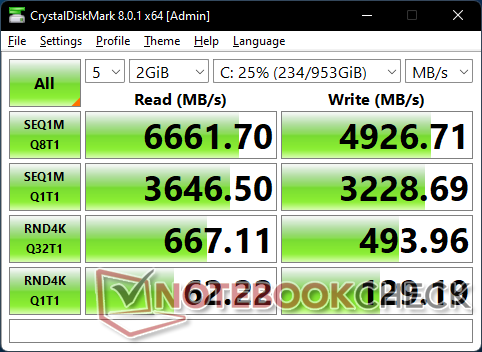
Nasze urządzenie jest dostarczane z dyskiem 1 TB Samsung PM9A1 MZVL21T0HCLR który jest jednym z najszybszych konsumenckich dysków SSD PCIe4 x4 NVMe dostępnych obecnie na rynku. Niestety, dysk w naszym egzemplarzu wykazuje problemy z utrzymaniem maksymalnych prędkości transferu przez dłuższy czas, co pokazuje poniższy wykres testu warunków skrajnych. Dla porównania, Razer Blade 15 z tym samym dyskiem Samsunga jest w stanie utrzymać transfer na poziomie 6700 MB/s bez żadnych problemów.

| Drive Performance rating - Percent | |
| Schenker XMG Neo 17 M22 | |
| MSI Titan GT77 HX 13VI | |
| Razer Blade 18 RTX 4070 | |
| MSI Katana 17 B13VFK | |
| Eluktronics Mech-17 GP2 | |
| Alienware m17 R5 (R9 6900HX, RX 6850M XT) | |
* ... im mniej tym lepiej
Disk Throttling: DiskSpd Read Loop, Queue Depth 8
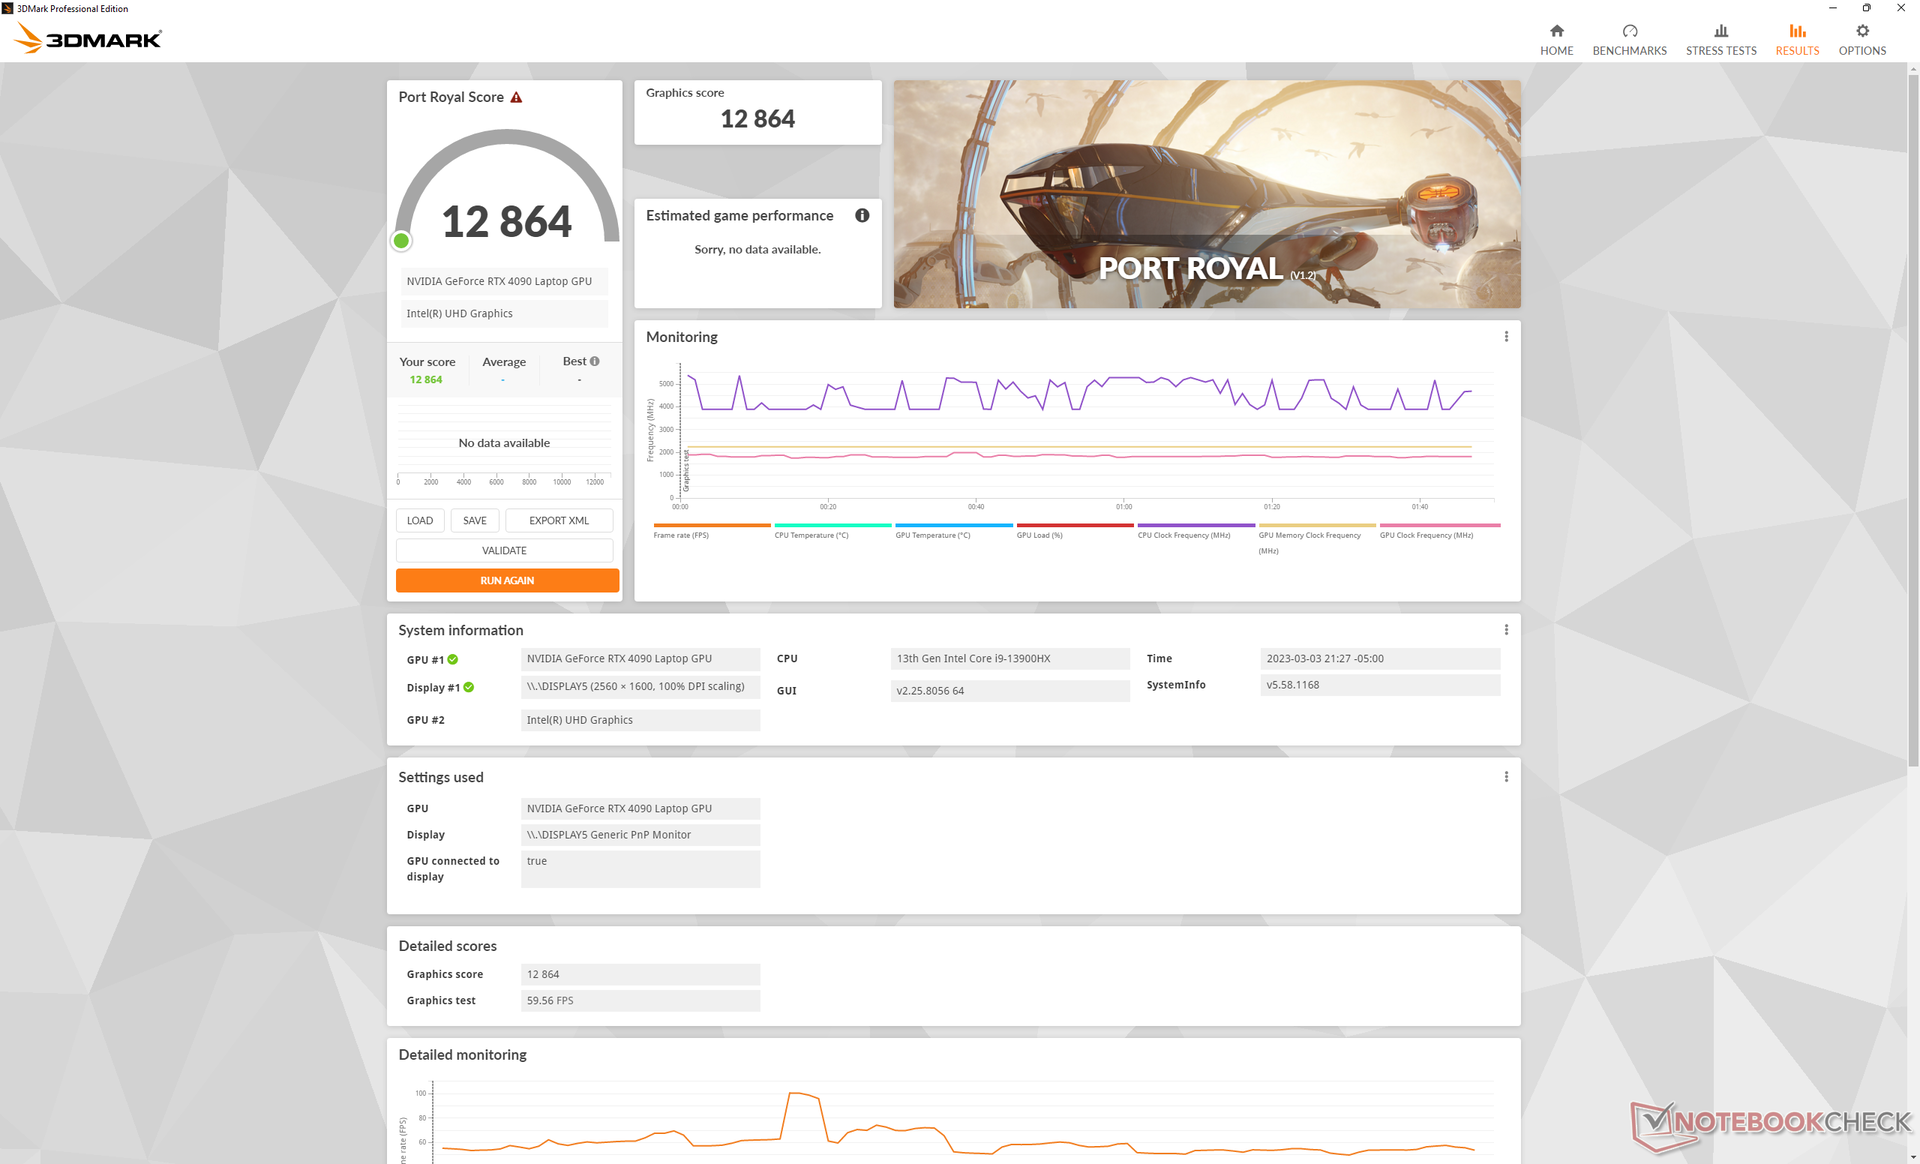
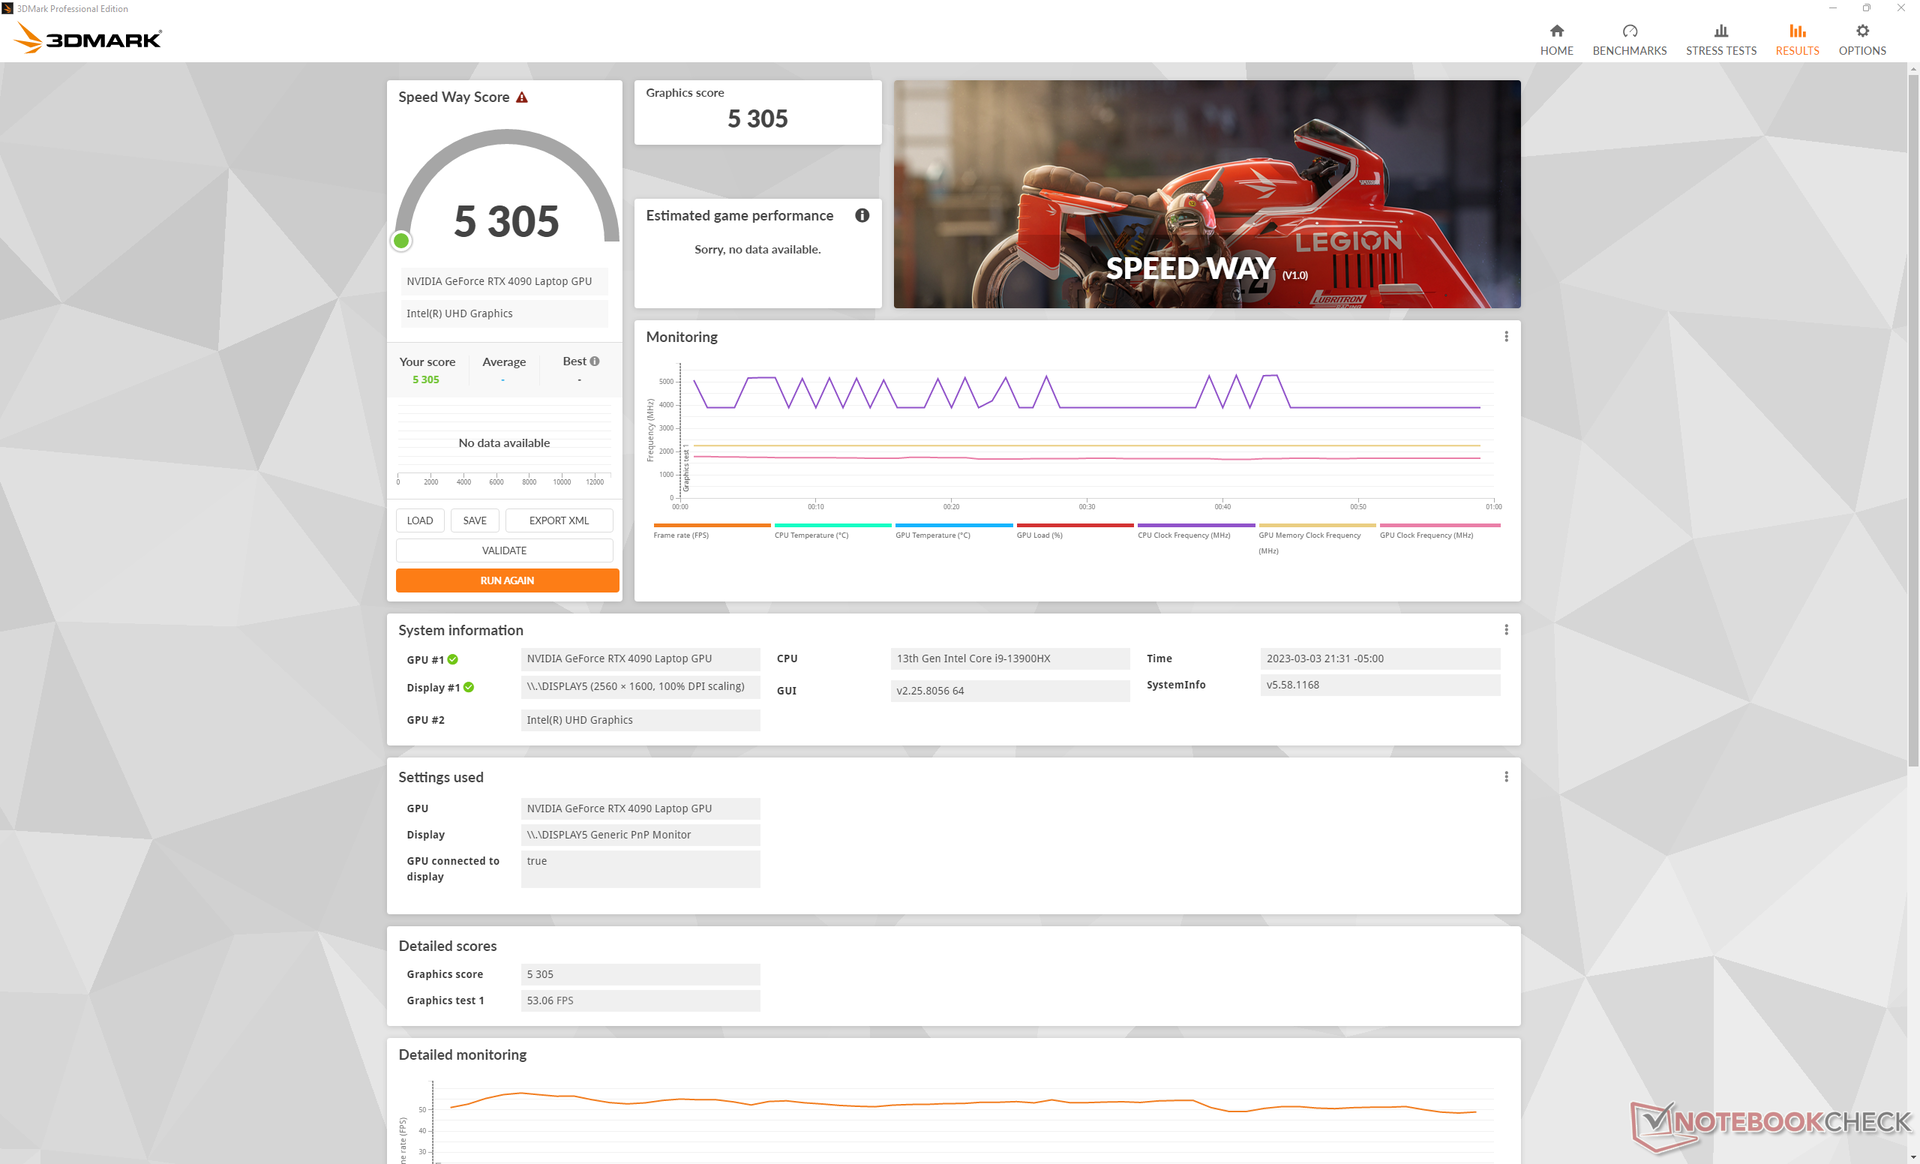
Wydajność GPU
Ogólna wydajność jest o około 40 do 60 procent szybsza niż w przypadku mobilnego RTX 3080 Ti aby być mniej więcej na równi z desktopowym RTX 3080 Ti. Włączenie DLSS 3 w obsługiwanych tytułach zwiększa wydajność jeszcze bardziej o 2x do 3x, choć z potencjalnymi artefaktami graficznymi.
Większość gier może działać w natywnym 4K i 60 FPS, jeśli efekty RT nie są obsługiwane lub są wyłączone. Wyjątkiem są bardzo wymagające tytuły, takie jak Cyberpunk 2077 czy F1 22, gdzie liczba klatek na sekundę oscyluje w granicach 40-50 FPS. W tym przypadku G-Sync i DLSS mogą się przydać, by zredukować tearing i zwiększyć wydajność.
Wybór konfiguracji RTX 4080 lub RTX 4070 zamiast RTX 4090 obniży wydajność grafiki odpowiednio o 10-15 procent i 40-45 procent. Tym samym delta wydajności pomiędzy 4090 a 4080 jest znacznie mniejsza niż delta wydajności pomiędzy 4080 a 4070, nawet jeśli różnica w cenie wynosi stałe 500 dolarów pomiędzy poszczególnymi etapami.
| 3DMark Performance rating - Percent | |
| Schenker XMG SECTOR, i9 13900K, RTX 4090 | |
| MSI Titan GT77 HX 13VI | |
| Eluktronics Mech-17 GP2 | |
| Przeciętny NVIDIA GeForce RTX 4090 Laptop GPU | |
| Corsair One i300 -1! | |
| Razer Blade 16 Early 2023 | |
| MSI Titan GT77 12UHS -1! | |
| Schenker XMG Neo 17 M22 -1! | |
| MSI Katana 17 B13VFK -2! | |
| Razer Blade 18 RTX 4070 | |
| MSI GS76 Stealth 11UH -2! | |
| MSI Pulse GL76 12UGK | |
| HP Omen 16-n0033dx | |
| Schenker XMG Core 17 (Early 2021) -1! | |
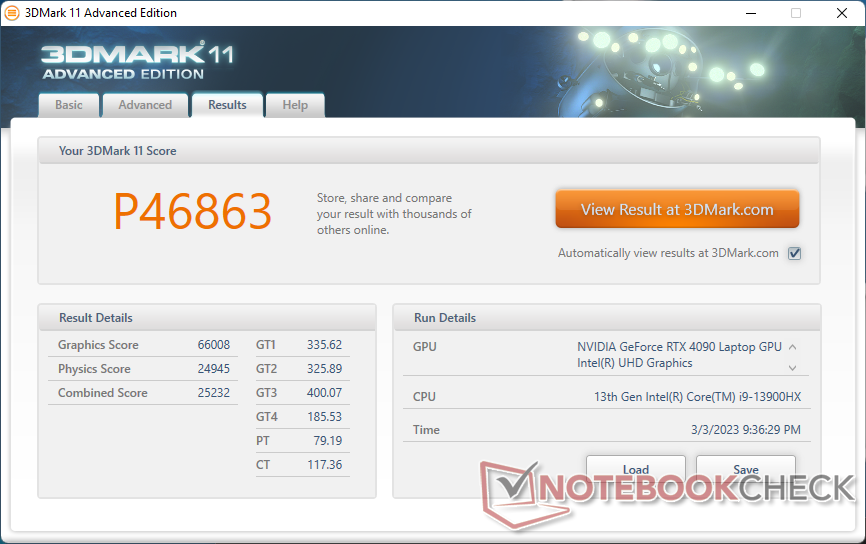
| 3DMark 11 - 1280x720 Performance GPU | |
| Schenker XMG SECTOR, i9 13900K, RTX 4090 | |
| MSI Titan GT77 HX 13VI | |
| Eluktronics Mech-17 GP2 | |
| Przeciętny NVIDIA GeForce RTX 4090 Laptop GPU (54073 - 73027, n=42) | |
| Corsair One i300 | |
| Razer Blade 16 Early 2023 | |
| MSI Titan GT77 12UHS | |
| Schenker XMG Neo 17 M22 | |
| Razer Blade 18 RTX 4070 | |
| MSI Katana 17 B13VFK | |
| MSI GS76 Stealth 11UH | |
| MSI Pulse GL76 12UGK | |
| HP Omen 16-n0033dx | |
| Schenker XMG Core 17 (Early 2021) | |
| 3DMark 11 Performance | 46863 pkt. | |
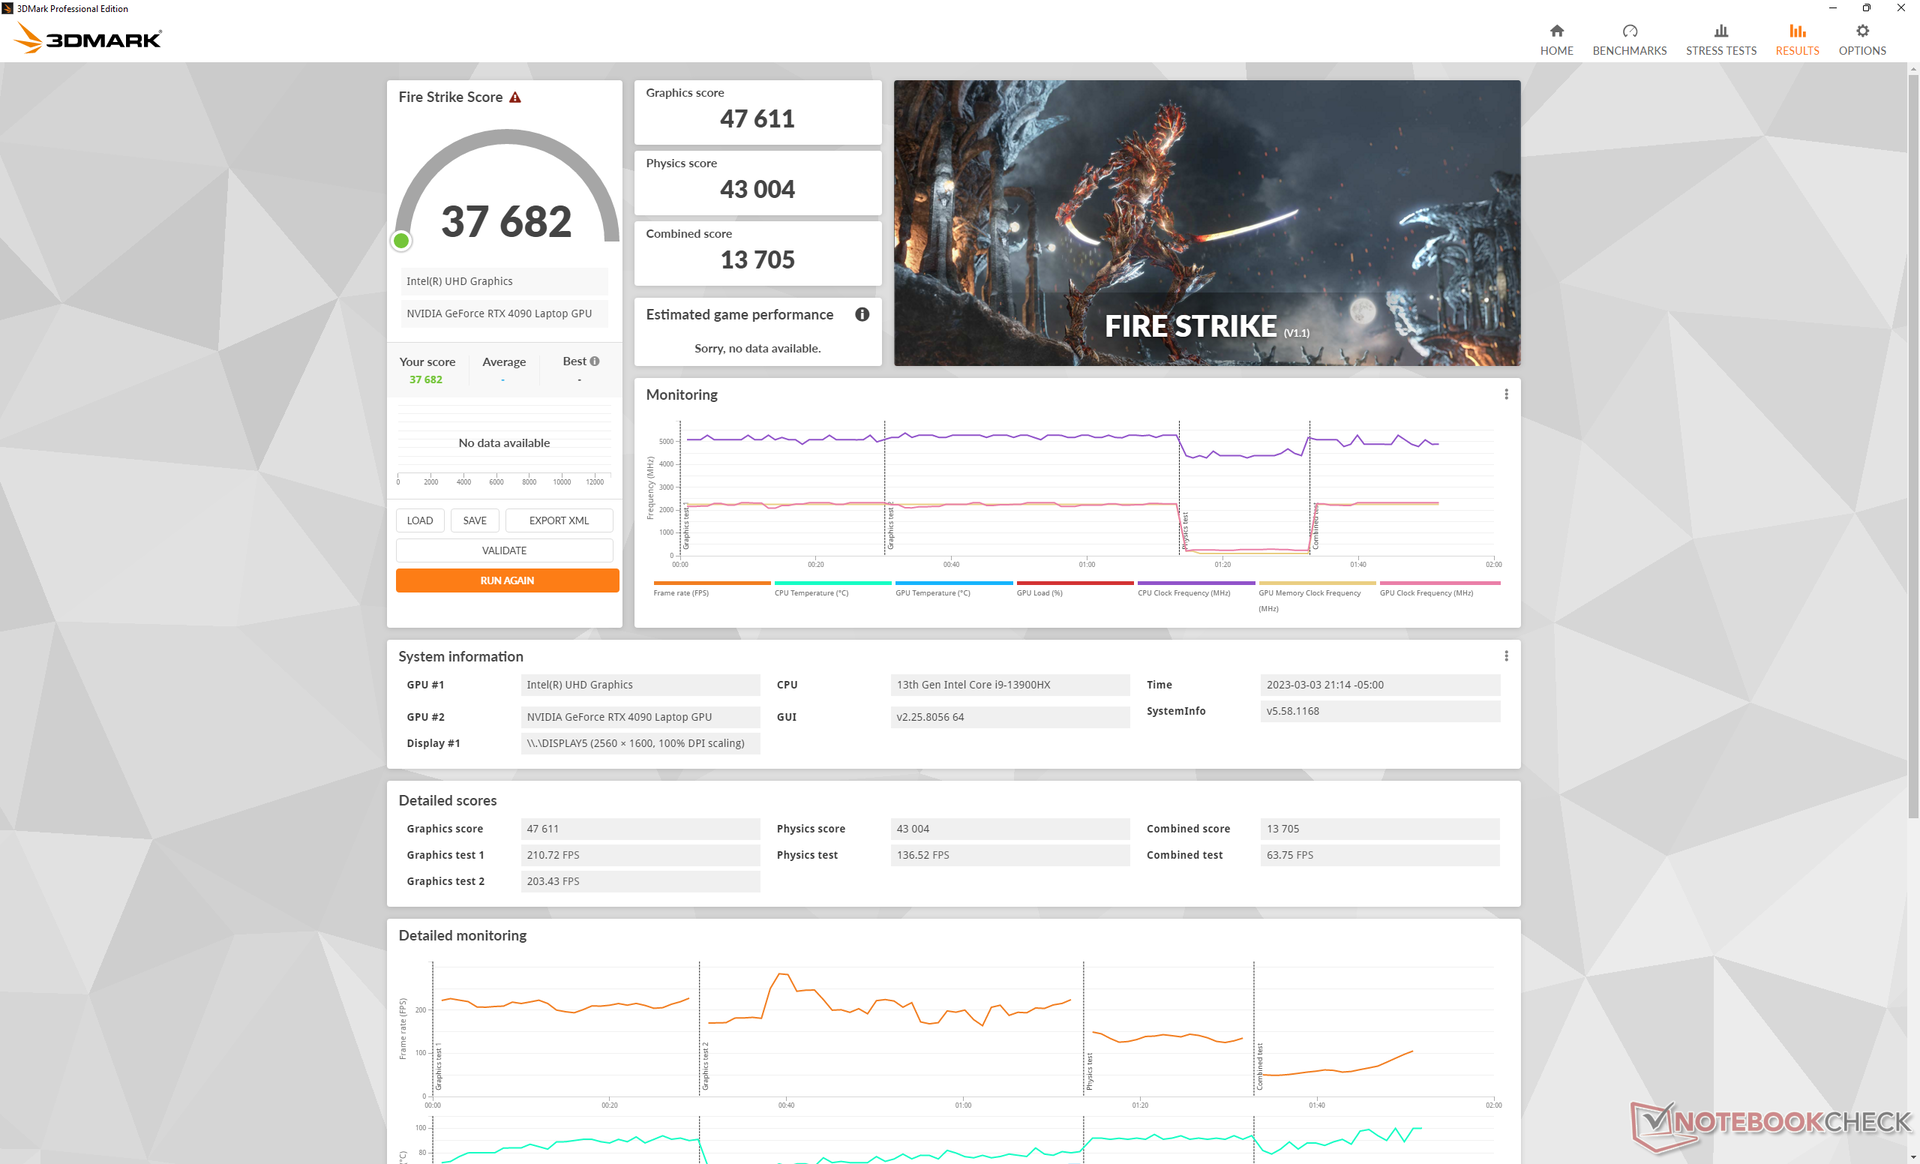
| 3DMark Fire Strike Score | 37682 pkt. | |
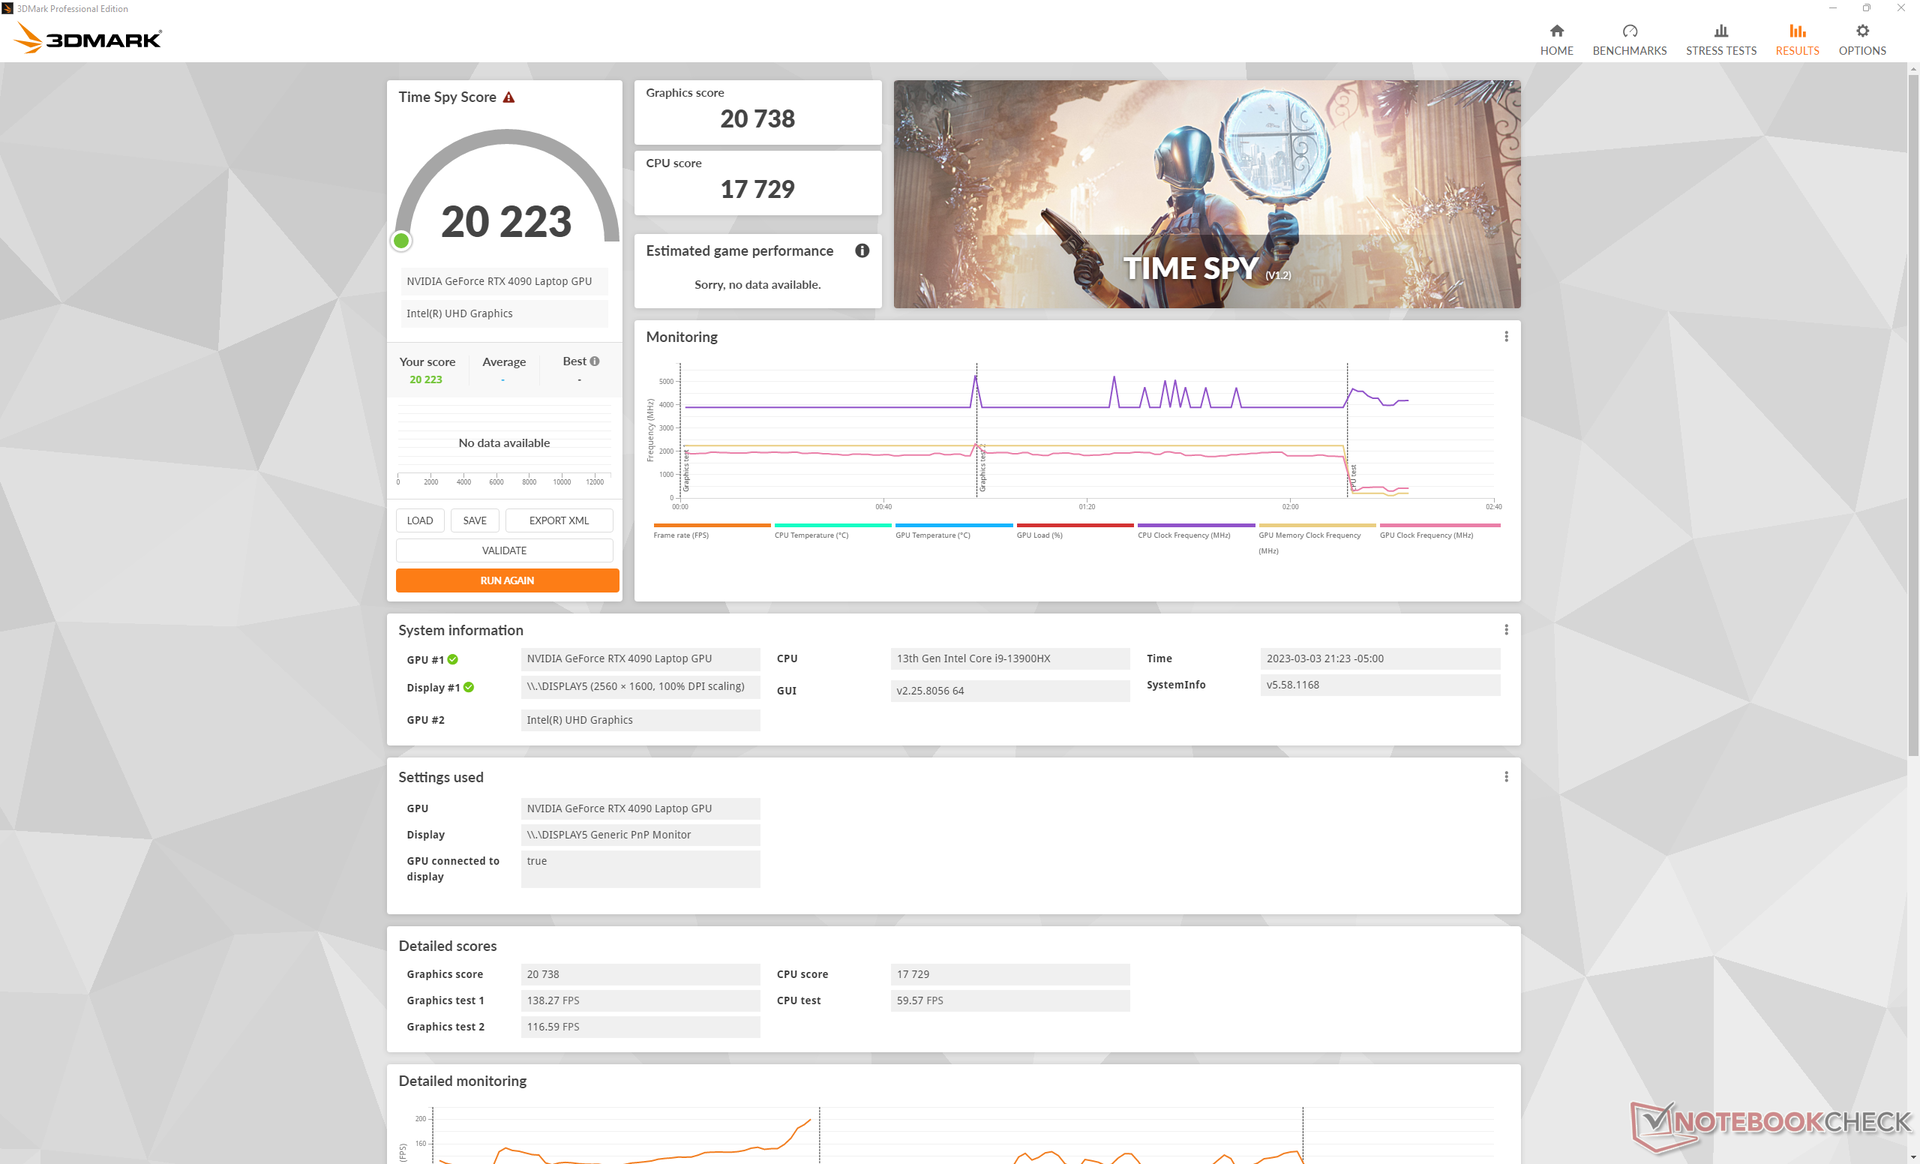
| 3DMark Time Spy Score | 20223 pkt. | |
Pomoc | ||
* ... im mniej tym lepiej
| Performance rating - Percent | |
| Schenker XMG SECTOR, i9 13900K, RTX 4090 | |
| Eluktronics Mech-17 GP2 | |
| Corsair One i300 -1! | |
| MSI Titan GT77 12UHS | |
| Razer Blade 18 RTX 4070 | |
| MSI Katana 17 B13VFK | |
| Schenker XMG Neo 17 M22 -1! | |
| MSI Pulse GL76 12UGK | |
| MSI GS76 Stealth 11UH -1! | |
| Schenker XMG Core 17 (Early 2021) -1! | |
| HP Omen 16-n0033dx -1! | |
| The Witcher 3 - 1920x1080 Ultra Graphics & Postprocessing (HBAO+) | |
| Schenker XMG SECTOR, i9 13900K, RTX 4090 | |
| Eluktronics Mech-17 GP2 | |
| Corsair One i300 | |
| MSI Titan GT77 12UHS | |
| Schenker XMG Neo 17 M22 | |
| Razer Blade 18 RTX 4070 | |
| MSI Katana 17 B13VFK | |
| MSI GS76 Stealth 11UH | |
| MSI Pulse GL76 12UGK | |
| HP Omen 16-n0033dx | |
| Schenker XMG Core 17 (Early 2021) | |
| GTA V - 1920x1080 Highest AA:4xMSAA + FX AF:16x | |
| Schenker XMG SECTOR, i9 13900K, RTX 4090 | |
| Eluktronics Mech-17 GP2 | |
| Corsair One i300 | |
| MSI Titan GT77 12UHS | |
| Razer Blade 18 RTX 4070 | |
| MSI Katana 17 B13VFK | |
| MSI Pulse GL76 12UGK | |
| Schenker XMG Neo 17 M22 | |
| MSI GS76 Stealth 11UH | |
| Schenker XMG Core 17 (Early 2021) | |
| Final Fantasy XV Benchmark - 1920x1080 High Quality | |
| Schenker XMG SECTOR, i9 13900K, RTX 4090 | |
| Eluktronics Mech-17 GP2 | |
| Corsair One i300 | |
| MSI Titan GT77 12UHS | |
| Schenker XMG Neo 17 M22 | |
| Razer Blade 18 RTX 4070 | |
| MSI Katana 17 B13VFK | |
| MSI Pulse GL76 12UGK | |
| MSI GS76 Stealth 11UH | |
| HP Omen 16-n0033dx | |
| Schenker XMG Core 17 (Early 2021) | |
| Strange Brigade - 1920x1080 ultra AA:ultra AF:16 | |
| Schenker XMG SECTOR, i9 13900K, RTX 4090 | |
| Eluktronics Mech-17 GP2 | |
| Corsair One i300 | |
| MSI Titan GT77 12UHS | |
| Razer Blade 18 RTX 4070 | |
| Schenker XMG Neo 17 M22 | |
| MSI Katana 17 B13VFK | |
| HP Omen 16-n0033dx | |
| MSI GS76 Stealth 11UH | |
| MSI Pulse GL76 12UGK | |
| Schenker XMG Core 17 (Early 2021) | |
| Dota 2 Reborn - 1920x1080 ultra (3/3) best looking | |
| Schenker XMG SECTOR, i9 13900K, RTX 4090 | |
| Corsair One i300 | |
| Eluktronics Mech-17 GP2 | |
| Razer Blade 18 RTX 4070 | |
| MSI Titan GT77 12UHS | |
| MSI Katana 17 B13VFK | |
| MSI Pulse GL76 12UGK | |
| MSI GS76 Stealth 11UH | |
| Schenker XMG Neo 17 M22 | |
| Schenker XMG Core 17 (Early 2021) | |
| HP Omen 16-n0033dx | |
| X-Plane 11.11 - 1920x1080 high (fps_test=3) | |
| Schenker XMG SECTOR, i9 13900K, RTX 4090 | |
| Eluktronics Mech-17 GP2 | |
| Razer Blade 18 RTX 4070 | |
| Corsair One i300 | |
| MSI Titan GT77 12UHS | |
| MSI Katana 17 B13VFK | |
| MSI Pulse GL76 12UGK | |
| MSI GS76 Stealth 11UH | |
| Schenker XMG Neo 17 M22 | |
| Schenker XMG Core 17 (Early 2021) | |
| HP Omen 16-n0033dx | |
| Cyberpunk 2077 1.6 - 1920x1080 Ultra Preset | |
| Schenker XMG SECTOR, i9 13900K, RTX 4090 | |
| Eluktronics Mech-17 GP2 | |
| MSI Titan GT77 12UHS | |
| Razer Blade 18 RTX 4070 | |
| MSI Katana 17 B13VFK | |
| MSI Pulse GL76 12UGK | |
| HP Omen 16-n0033dx | |
Witcher 3 FPS Chart
| low | med. | high | ultra | QHD | 4K | |
|---|---|---|---|---|---|---|
| GTA V (2015) | 187.5 | 187.2 | 186.5 | 149.8 | 146.3 | 180.2 |
| The Witcher 3 (2015) | 717.7 | 617.3 | 449 | 216.3 | 167.6 | |
| Dota 2 Reborn (2015) | 243 | 216 | 205 | 192.5 | 186.7 | |
| Final Fantasy XV Benchmark (2018) | 233 | 230 | 194.9 | 157.1 | 90.8 | |
| X-Plane 11.11 (2018) | 212 | 188.8 | 146.4 | 124.7 | ||
| Strange Brigade (2018) | 656 | 508 | 465 | 421 | 315 | 163.4 |
| Metro Exodus (2019) | 240.1 | 207.1 | 173.8 | 146.5 | 127.7 | 82.1 |
| Borderlands 3 (2019) | 284.2 | 269.7 | 238.5 | 179.7 | 129.4 | 72.2 |
| Cyberpunk 2077 1.6 (2022) | 191.1 | 178.6 | 166.9 | 159.7 | 101.3 | 47.8 |
| F1 22 (2022) | 375 | 358 | 322 | 140.6 | 91.8 | 45.3 |
Emisje
Szum systemu
Choć w porównaniu z zeszłorocznym modelem wprowadzono poprawki do rozwiązania chłodzącego, ogólny hałas wentylatorów pozostaje mniej więcej taki sam. Wewnętrzne wentylatory są zawsze aktywne, niezależnie od ustawień i obciążenia ekranu. Jeśli nie korzystamy z żadnych intensywnych aplikacji, zalecamy tryb biurowy lub zrównoważony, ponieważ wentylatory stają się wtedy wyraźnie cichsze i bardziej ospałe.
Podczas gry w trybie Performance lub "Beast" hałas wentylatorów oscyluje w granicach 50-52 dB(A), czyli podobnie jak w przypadku Alienware m17 R5 lub Razer Blade 18 w podobnych warunkach. Słuchawki są niemal koniecznością w przypadku hałasu wentylatora powyżej 50 dB(A) podczas gry.
Ciekły metal Thermal Grizzly jest standardem we wszystkich konfiguracjach.
Hałas
| luz |
| 28 / 28 / 30.4 dB |
| obciążenie |
| 41 / 52.6 dB |
 | ||
30 dB cichy 40 dB(A) słyszalny 50 dB(A) irytujący |
||
min: | ||
| Eluktronics Mech-17 GP2 GeForce RTX 4090 Laptop GPU, i9-13900HX, Samsung PM9A1 MZVL21T0HCLR | Schenker XMG Neo 17 M22 GeForce RTX 3080 Ti Laptop GPU, R9 6900HX, Samsung SSD 980 Pro 1TB MZ-V8P1T0BW | MSI Katana 17 B13VFK GeForce RTX 4060 Laptop GPU, i7-13620H, Micron 2400 MTFDKBA1T0QFM | MSI Titan GT77 HX 13VI GeForce RTX 4090 Laptop GPU, i9-13950HX, Samsung PM9A1 MZVL22T0HBLB | Alienware m17 R5 (R9 6900HX, RX 6850M XT) Radeon RX 6850M XT, R9 6900HX, SSSTC CA6-8D1024 | Razer Blade 18 RTX 4070 GeForce RTX 4070 Laptop GPU, i9-13950HX, SSSTC CA6-8D1024 | |
|---|---|---|---|---|---|---|
| Noise | -8% | -6% | -7% | 10% | 9% | |
| wyłączone / środowisko * (dB) | 25.2 | 26 -3% | 24.5 3% | 24.6 2% | 23 9% | 23.5 7% |
| Idle Minimum * (dB) | 28 | 26 7% | 24.5 12% | 29.2 -4% | 23 18% | 23.8 15% |
| Idle Average * (dB) | 28 | 29 -4% | 24.5 12% | 29.2 -4% | 28.11 -0% | 23.8 15% |
| Idle Maximum * (dB) | 30.4 | 40 -32% | 40 -32% | 29.2 4% | 28.11 8% | 26.8 12% |
| Load Average * (dB) | 41 | 47 -15% | 48.3 -18% | 50.7 -24% | 30.62 25% | 37.3 9% |
| Witcher 3 ultra * (dB) | 50.7 | 52 -3% | 56 -10% | 53.3 -5% | 49.75 2% | 48 5% |
| Load Maximum * (dB) | 52.6 | 54 -3% | 59.1 -12% | 61 -16% | 50.17 5% | 53.5 -2% |
* ... im mniej tym lepiej
Temperatura
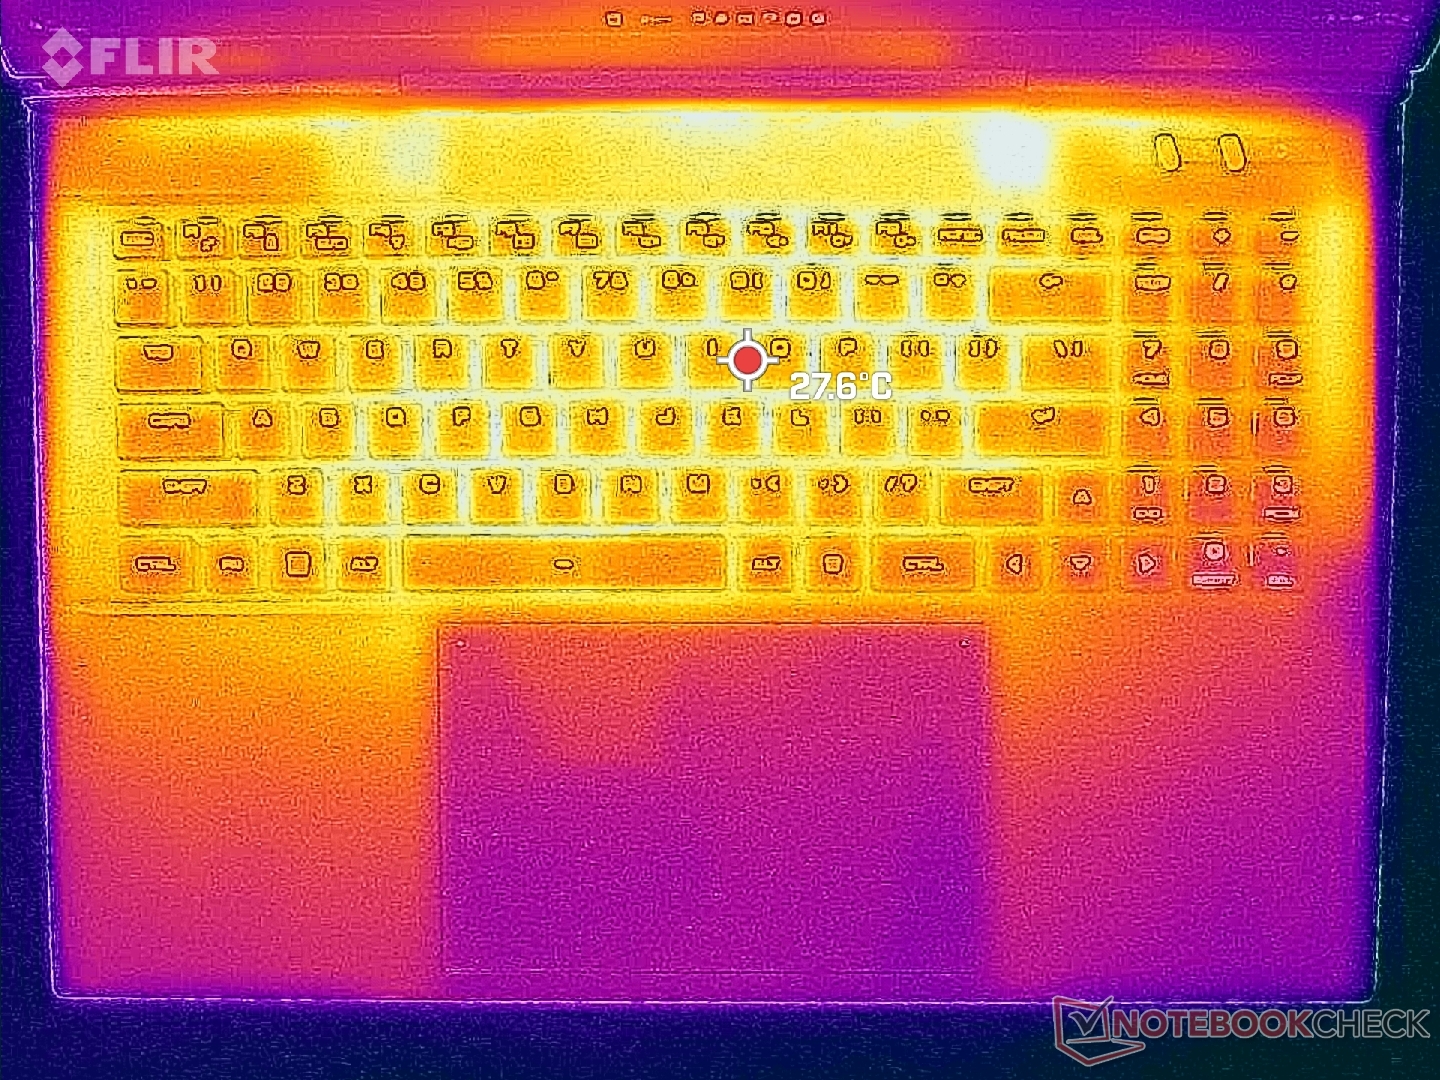
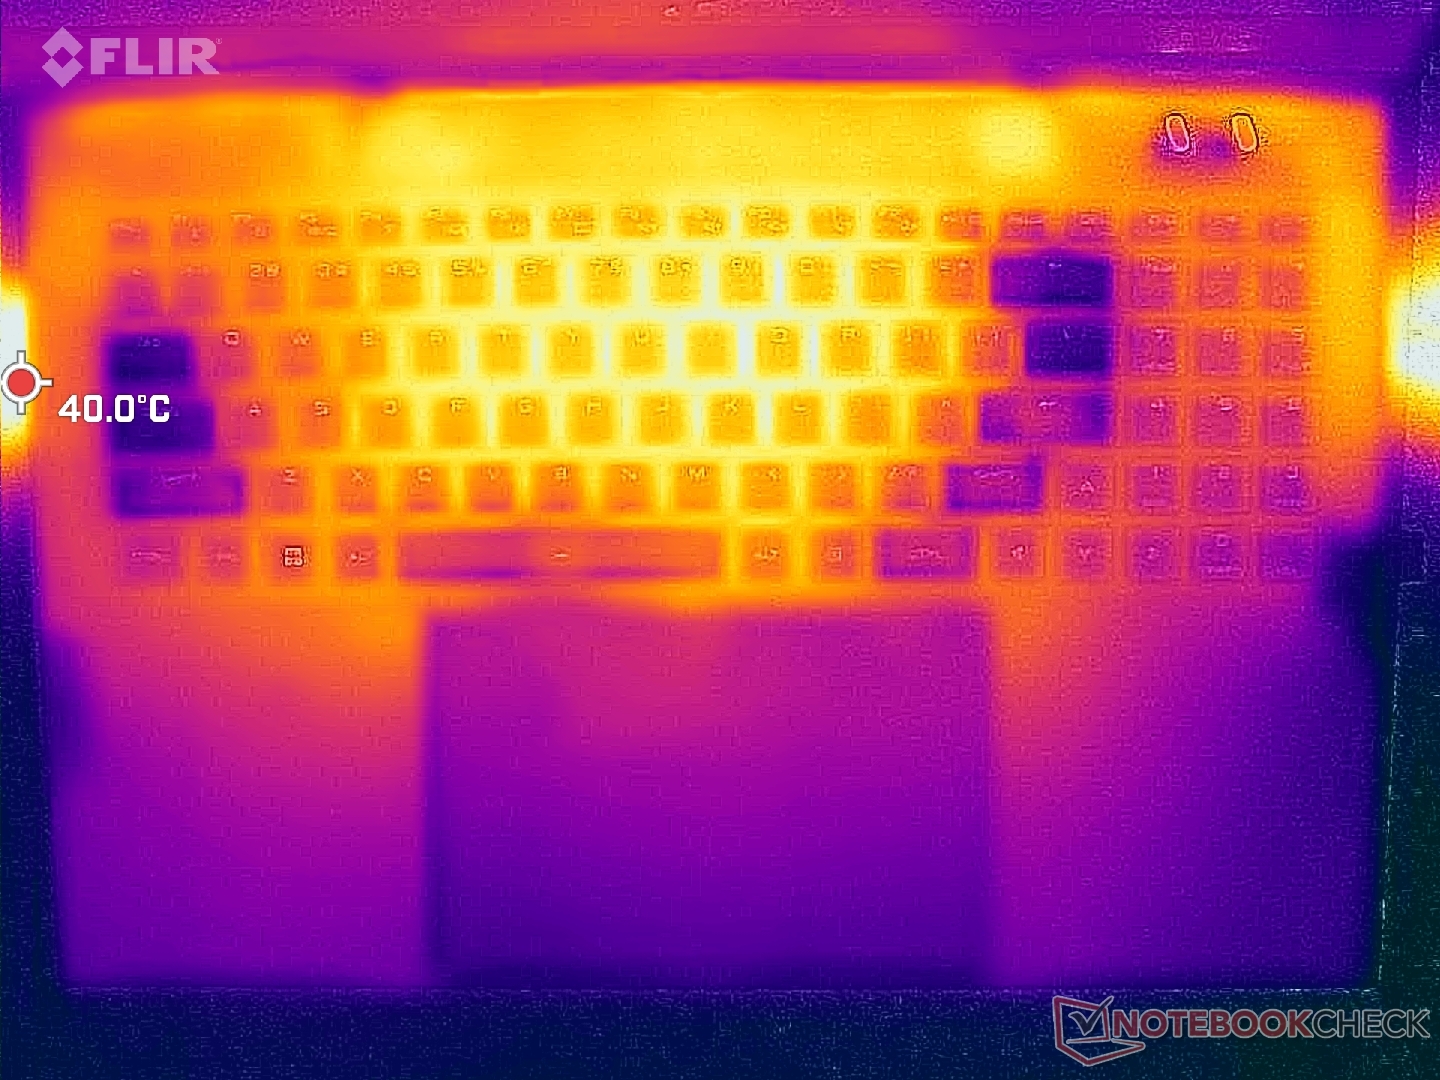
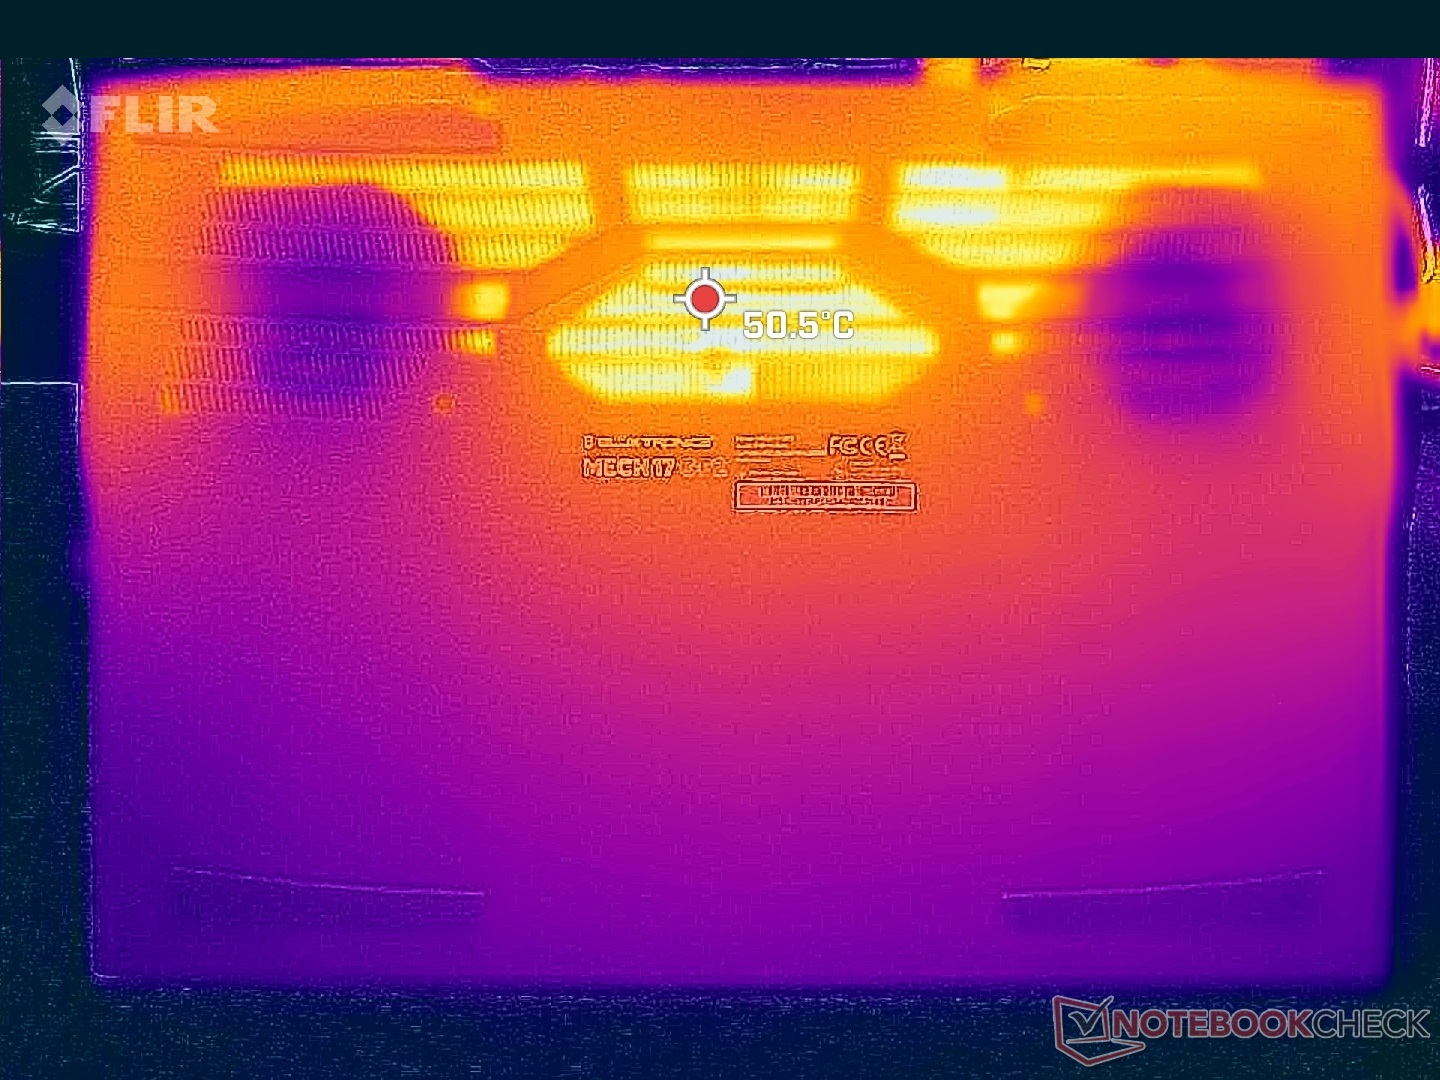
Temperatury powierzchni są najcieplejsze na środku i najchłodniejsze po bokach klawiatury i w miejscach oparcia dłoni. Świeże powietrze dostaje się przez klawisze WASD, by schłodzić palce podczas gry. Temperatury w gorących punktach od 39 do 44 stopni Celsjusza są chłodniejsze od tych, które odnotowaliśmy w modelu Alienware m17 R5 gdzie gorące punkty osiągały od 50 do 57 C w podobnych warunkach gry.
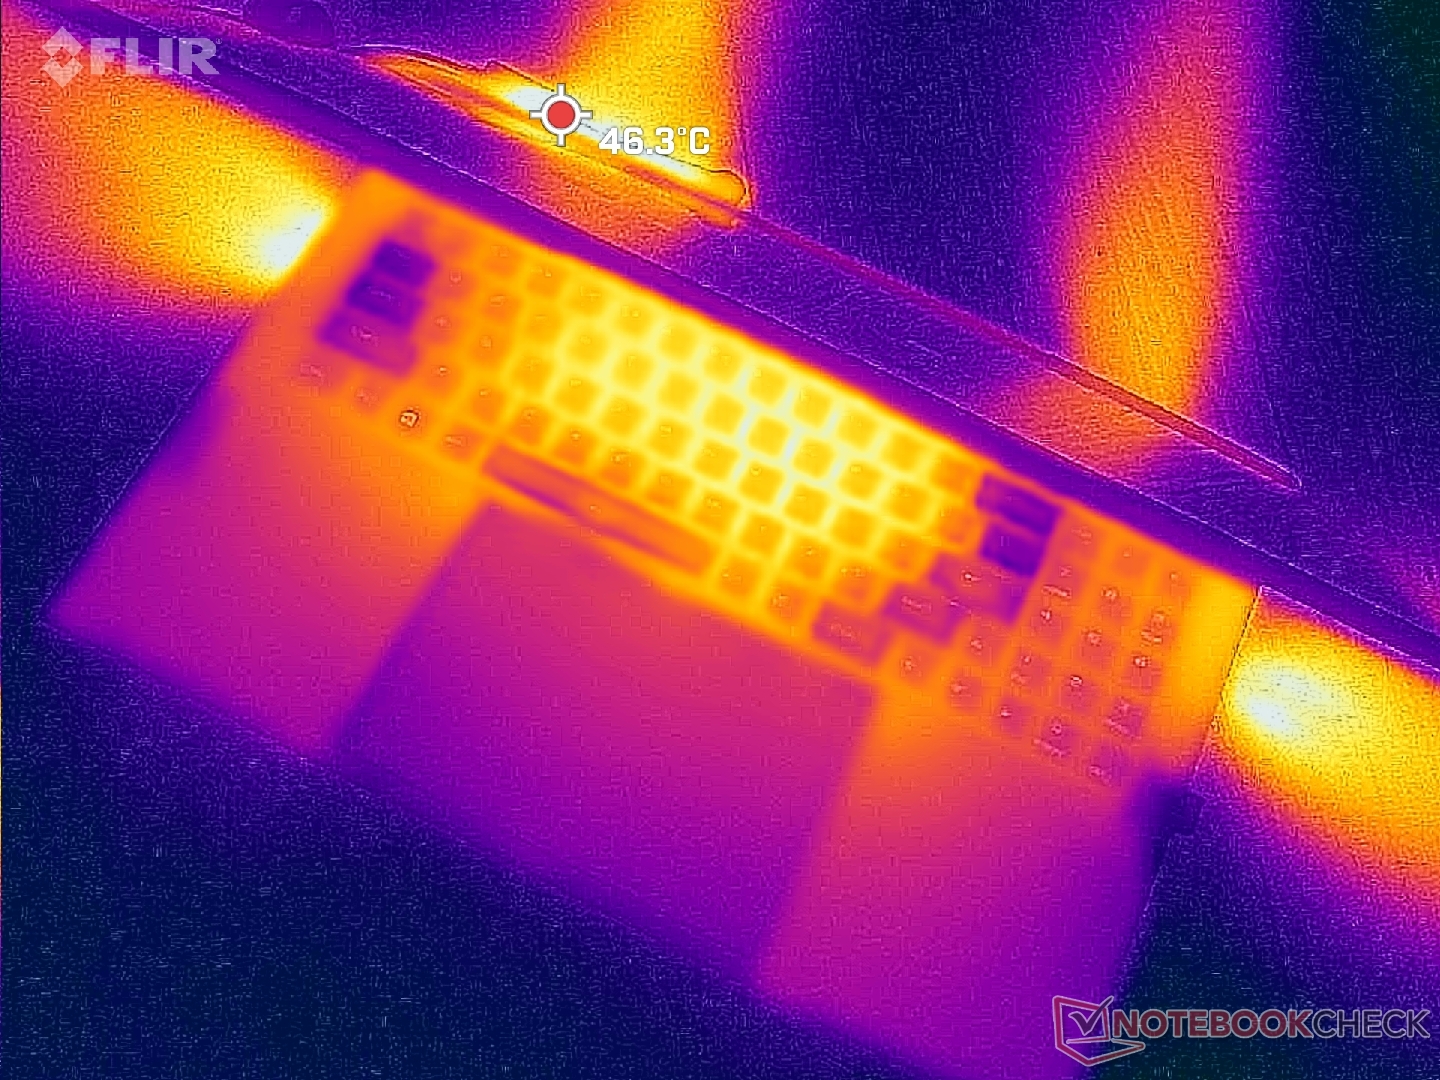
(+) Maksymalna temperatura w górnej części wynosi 39 °C / 102 F, w porównaniu do średniej 40.4 °C / 105 F , począwszy od 21.2 do 68.8 °C dla klasy Gaming.
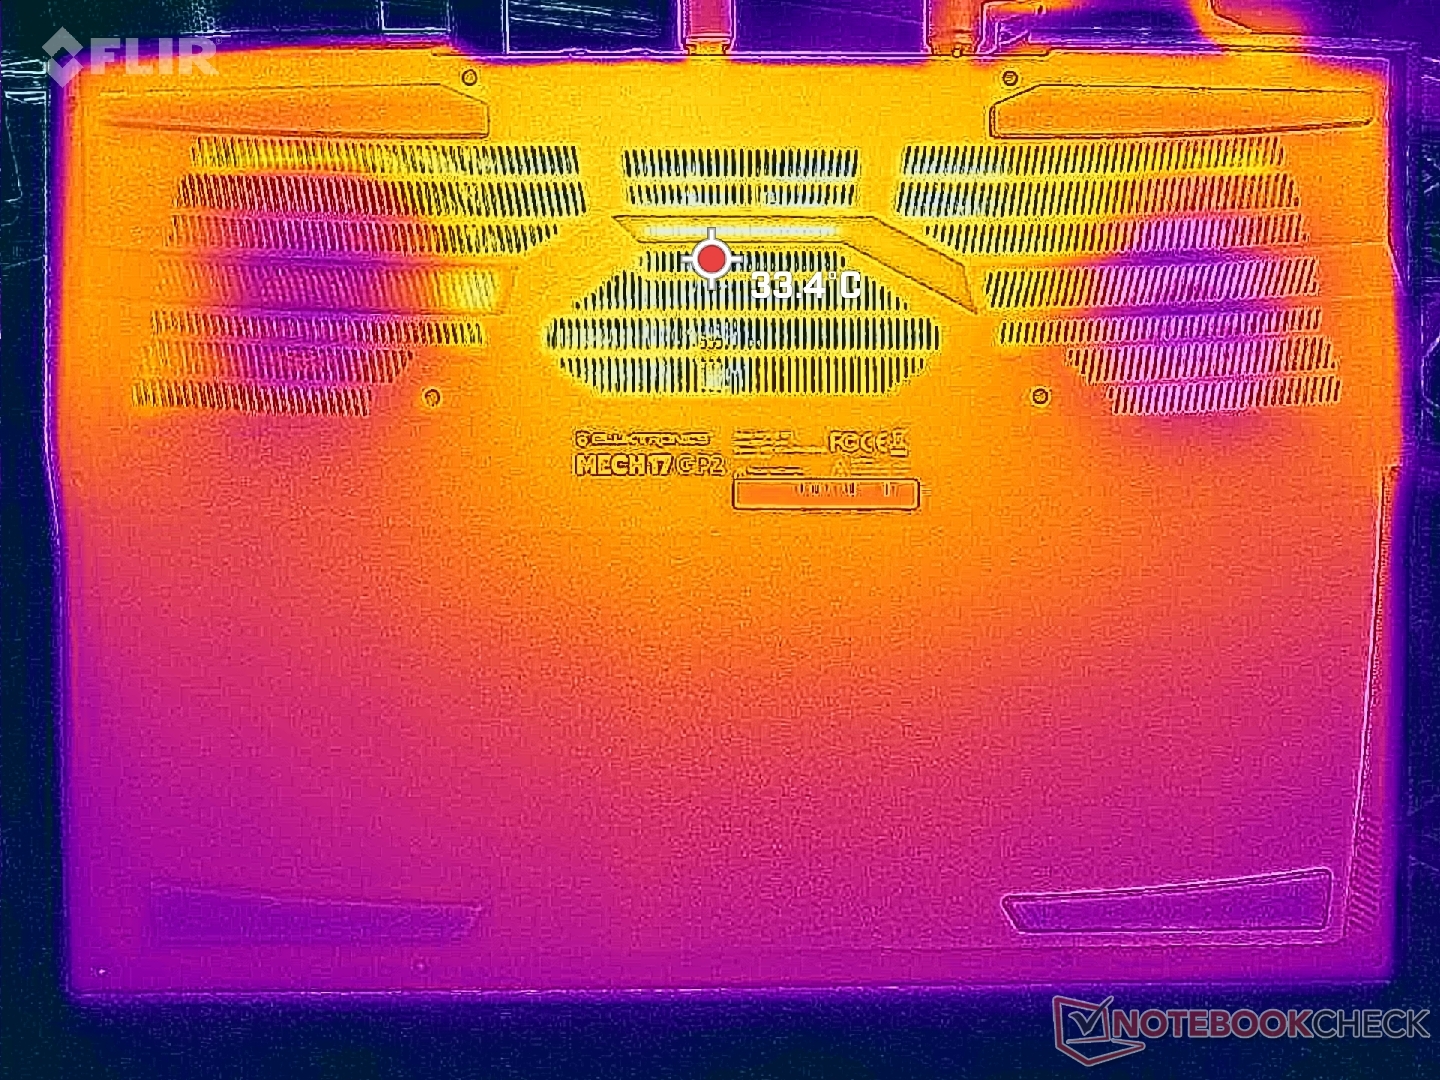
(±) Dno nagrzewa się maksymalnie do 44 °C / 111 F, w porównaniu do średniej 43.2 °C / 110 F
(+) W stanie bezczynności średnia temperatura górnej części wynosi 27.5 °C / 82 F, w porównaniu ze średnią temperaturą urządzenia wynoszącą 33.9 °C / ### class_avg_f### F.
(+) Podpórki pod nadgarstki i touchpad są chłodniejsze niż temperatura skóry i maksymalnie 25 °C / 77 F i dlatego są chłodne w dotyku.
(+) Średnia temperatura obszaru podparcia dłoni w podobnych urządzeniach wynosiła 28.8 °C / 83.8 F (+3.8 °C / 6.8 F).
| Eluktronics Mech-17 GP2 Intel Core i9-13900HX, NVIDIA GeForce RTX 4090 Laptop GPU | Schenker XMG Neo 17 M22 AMD Ryzen 9 6900HX, NVIDIA GeForce RTX 3080 Ti Laptop GPU | MSI Katana 17 B13VFK Intel Core i7-13620H, NVIDIA GeForce RTX 4060 Laptop GPU | MSI Titan GT77 HX 13VI Intel Core i9-13950HX, NVIDIA GeForce RTX 4090 Laptop GPU | Alienware m17 R5 (R9 6900HX, RX 6850M XT) AMD Ryzen 9 6900HX, AMD Radeon RX 6850M XT | Razer Blade 18 RTX 4070 Intel Core i9-13950HX, NVIDIA GeForce RTX 4070 Laptop GPU | |
|---|---|---|---|---|---|---|
| Heat | -13% | -7% | 4% | -14% | 1% | |
| Maximum Upper Side * (°C) | 39 | 49 -26% | 41.6 -7% | 40.6 -4% | 53 -36% | 39.2 -1% |
| Maximum Bottom * (°C) | 44 | 52 -18% | 43.1 2% | 41.1 7% | 56 -27% | 35.6 19% |
| Idle Upper Side * (°C) | 31 | 30 3% | 32 -3% | 26.2 15% | 30 3% | 31.8 -3% |
| Idle Bottom * (°C) | 29.8 | 33 -11% | 35.8 -20% | 30.3 -2% | 29 3% | 33.2 -11% |
* ... im mniej tym lepiej
Stress Test
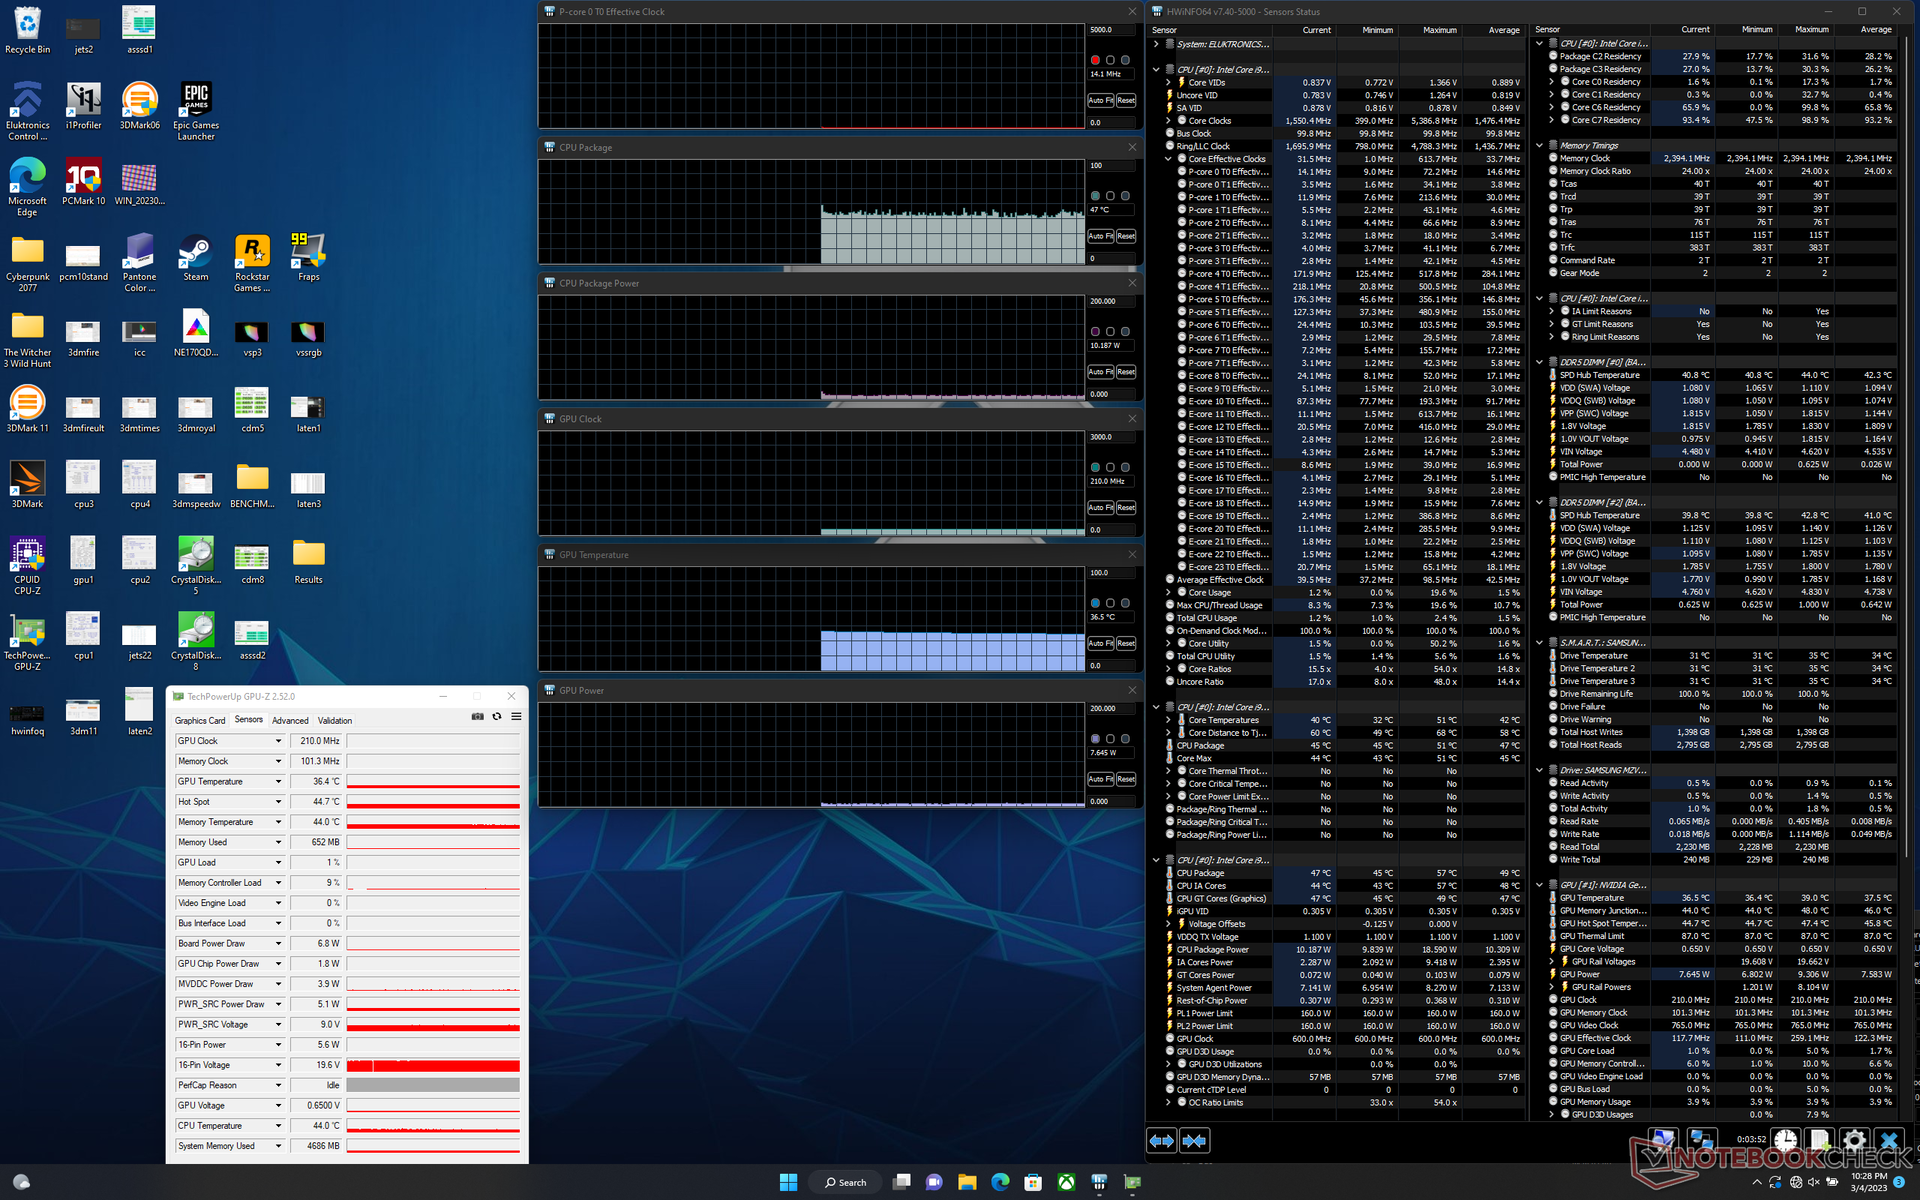
Podczas obciążenia pod Prime95, CPU zwiększało swoje taktowanie do 4,7 GHz, 160 W i 96 C tylko przez sekundę lub dwie, po czym natychmiast spadało do 4,1 GHz i 107 W. Temperatura rdzenia pozostawała jednak bardzo wysoka i wynosiła 96 C. Po kilku kolejnych minutach, częstotliwość taktowania spadała dalej do 3,4 GHz przy minimalnych zmianach temperatury i poboru mocy na płycie.
Częstotliwość taktowania GPU, temperatura i pobór mocy ustabilizowały się na poziomie 2310 MHz, 80 C i 169 W, odpowiednio podczas pracy Witcher 3. Procesor graficzny jest przystosowany do poboru mocy 175 W, więc rzeczywisty pobór 169 W jest bardzo zbliżony. Temperatura procesora pozostaje niestety wysoka i wynosi 96 C w porównaniu do 85 C lub 66 C w przypadku Razer Blade 18(RTX 4070) lub MSI GT77, odpowiednio.
Jednoczesne uruchomienie Prime95 i FurMark przez więcej niż kilka minut za każdym razem powoduje awarię naszego urządzenia. Podejrzewamy, że za automatyczne wyłączanie i ponowne uruchamianie odpowiadają wysokie temperatury rdzeni. Większość innych laptopów dławiłaby wydajność pod tak ekstremalnym obciążeniem, by uniknąć awarii.
Praca na zasilaniu akumulatorowym poważnie ogranicza wydajność. W teście Fire Strike na akumulatorze wyniki fizyki i grafiki wyniosły odpowiednio 11430 i 11496 pkt. wobec 43004 i 47611 pkt. na zasilaniu sieciowym.
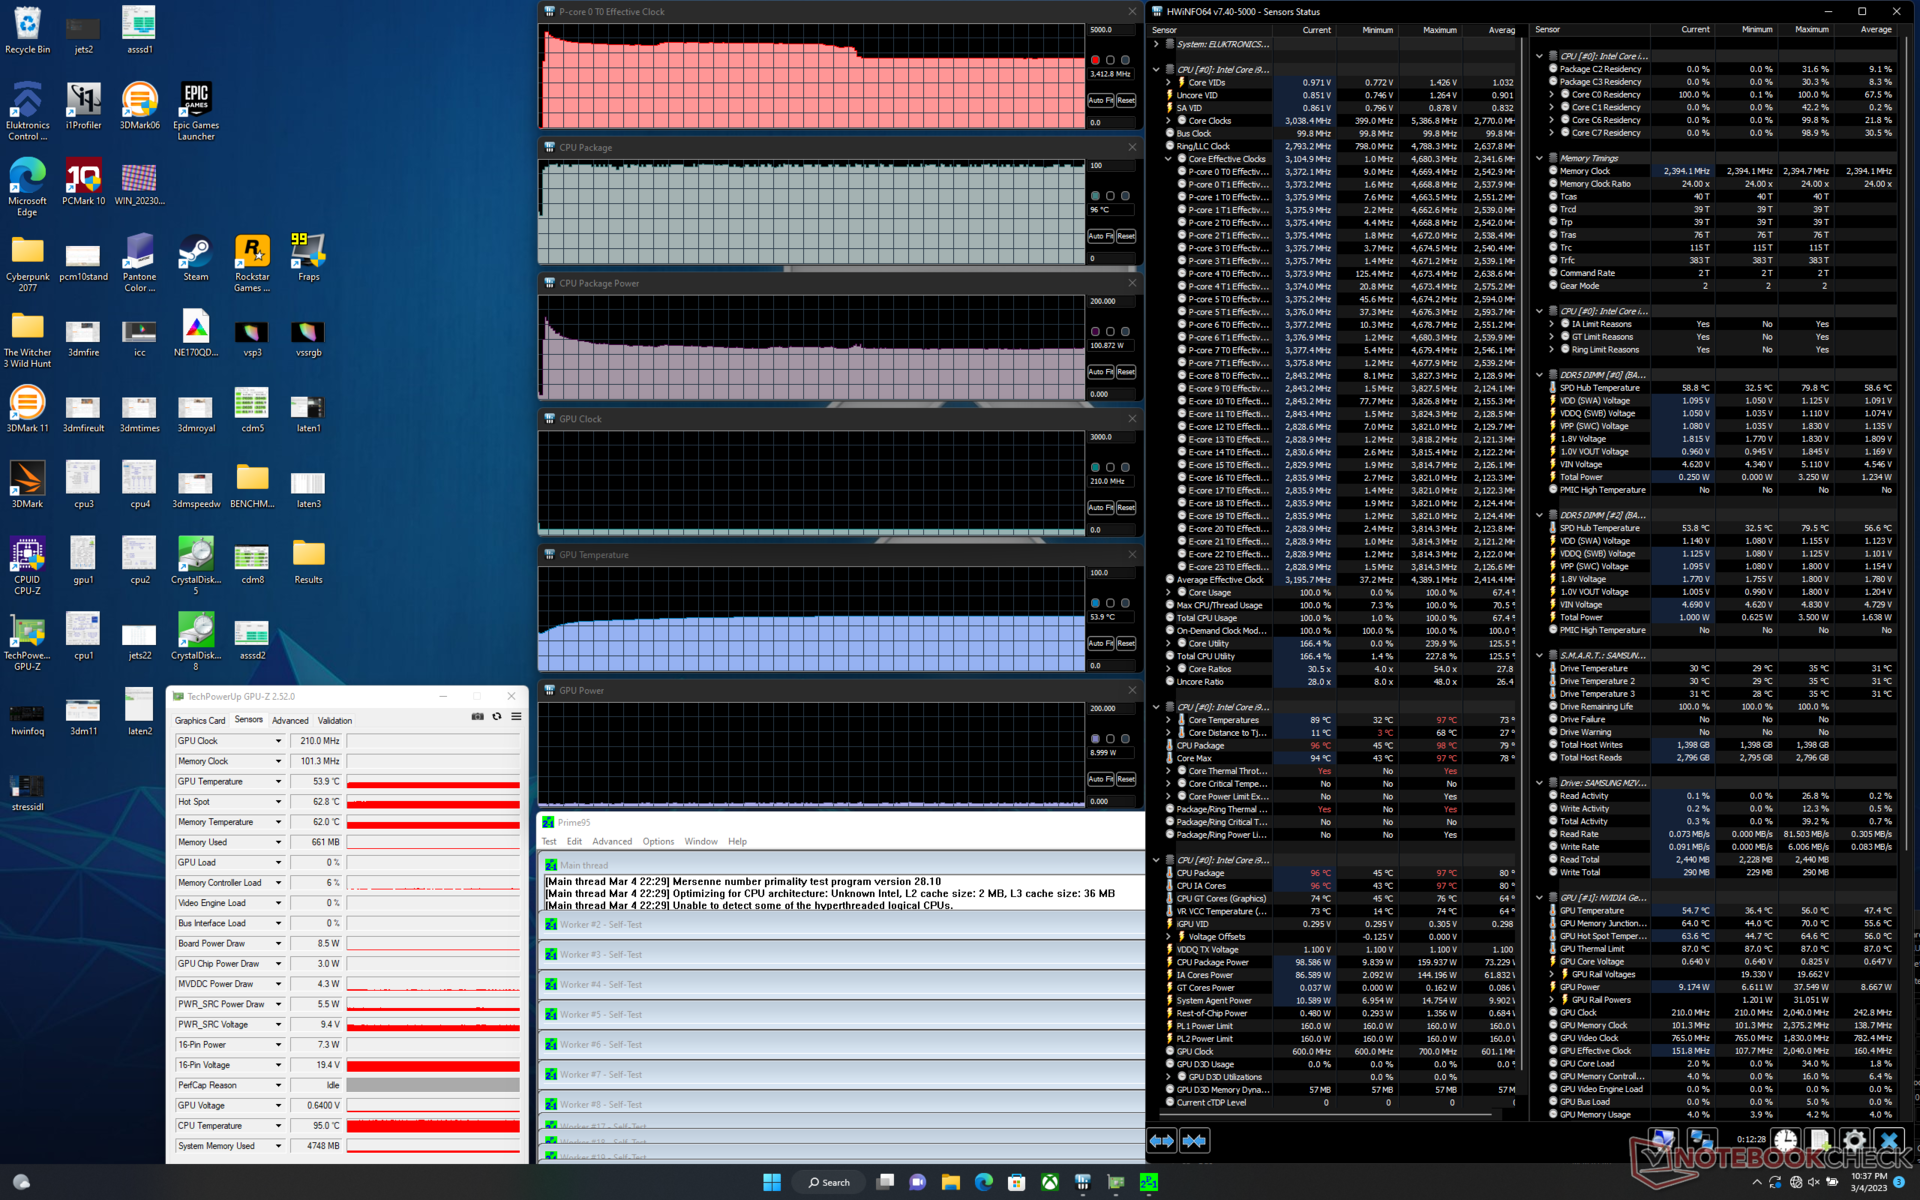
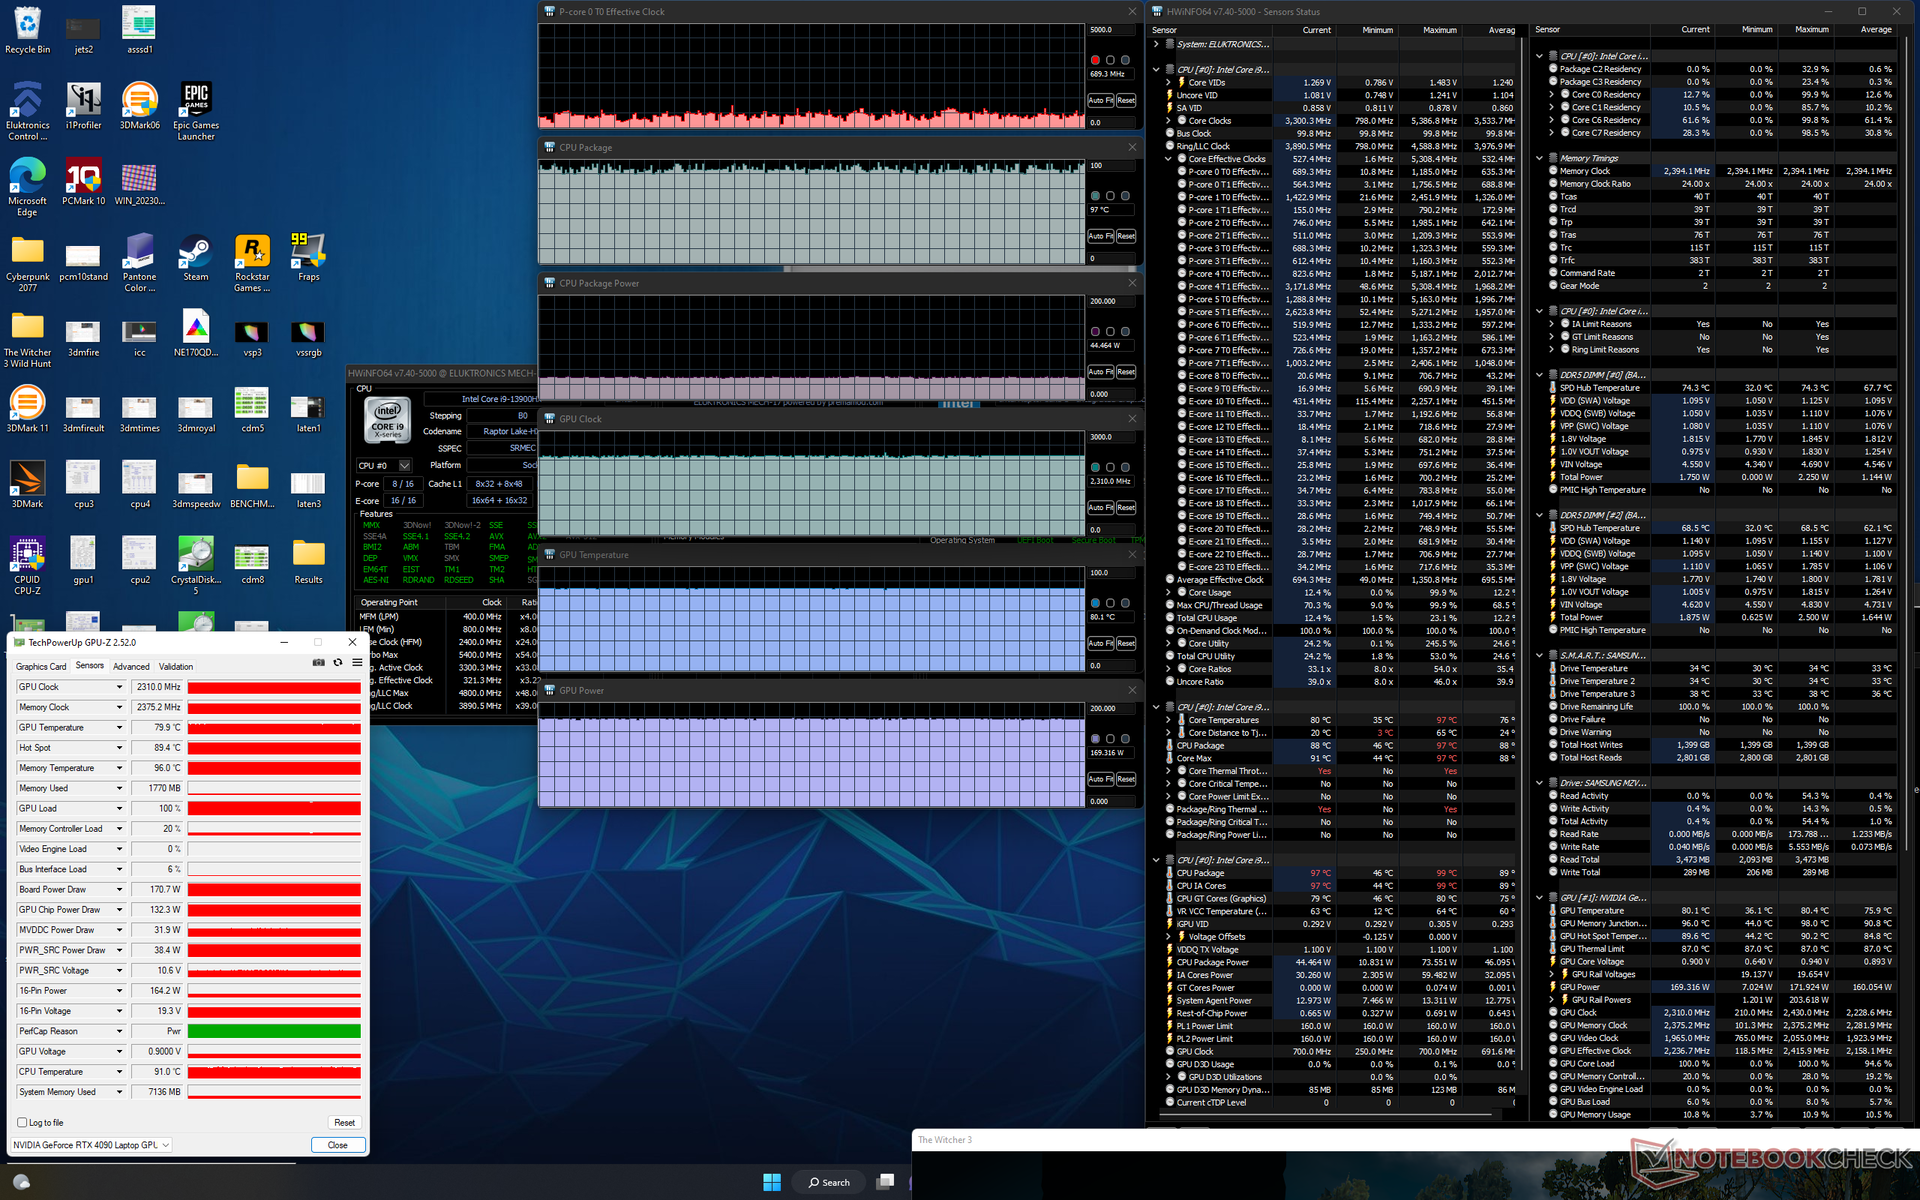
| ZegarCPU (GHz) | Zegar GPU (MHz) | Średnia temperatura CPU (°C) | Średnia temperatura GPU (°C) | |
| System w stanie bezczynności | -- | -- | 47 | 37 |
| Prime95 Stress | 3.4 | -- | 96 | 54 |
| Witcher 3 Stress | ~0,7 | 2310 | 97 | 80 |
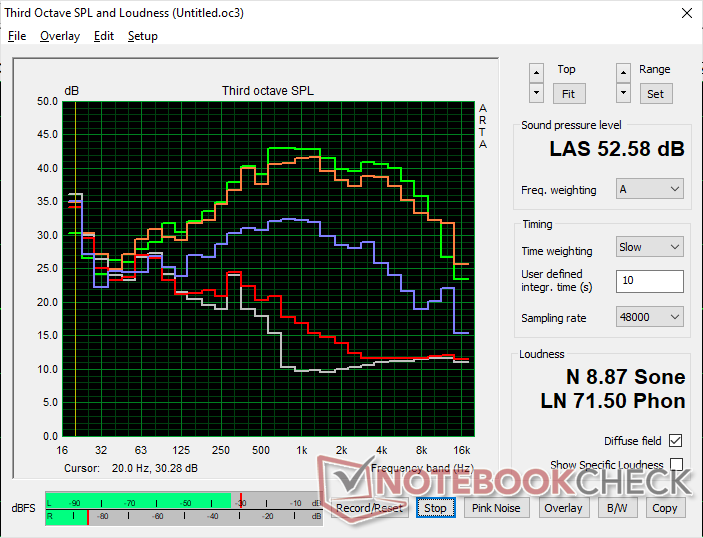
Mówcy
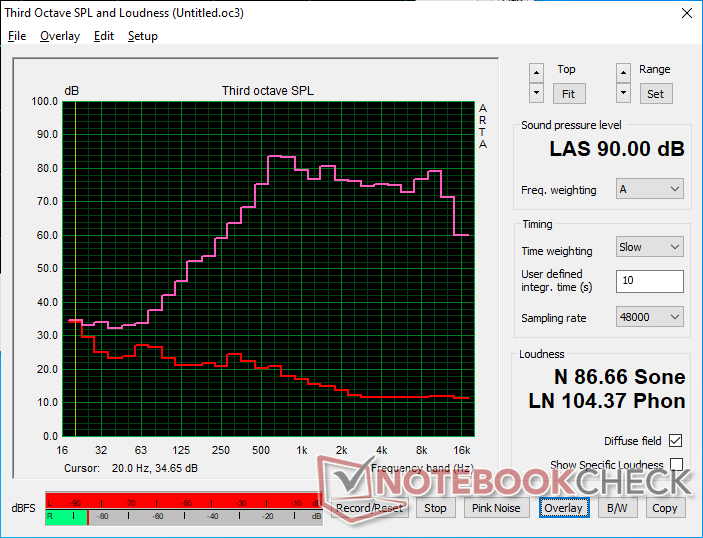
Eluktronics Mech-17 GP2 analiza dźwięku
(+) | głośniki mogą odtwarzać stosunkowo głośno (90 dB)
Bas 100 - 315 Hz
(-) | prawie brak basu - średnio 22.5% niższa od mediany
(±) | liniowość basu jest średnia (7.3% delta do poprzedniej częstotliwości)
Średnie 400 - 2000 Hz
(+) | zbalansowane środki średnie - tylko 4.4% od mediany
(±) | liniowość środka jest średnia (7.4% delta do poprzedniej częstotliwości)
Wysokie 2–16 kHz
(+) | zrównoważone maksima - tylko 1.3% od mediany
(+) | wzloty są liniowe (2.7% delta do poprzedniej częstotliwości)
Ogólnie 100 - 16.000 Hz
(±) | liniowość ogólnego dźwięku jest średnia (15% różnicy w stosunku do mediany)
W porównaniu do tej samej klasy
» 32% wszystkich testowanych urządzeń w tej klasie było lepszych, 6% podobnych, 62% gorszych
» Najlepszy miał deltę 6%, średnia wynosiła ###średnia###%, najgorsza wynosiła 132%
W porównaniu do wszystkich testowanych urządzeń
» 21% wszystkich testowanych urządzeń było lepszych, 4% podobnych, 75% gorszych
» Najlepszy miał deltę 4%, średnia wynosiła ###średnia###%, najgorsza wynosiła 134%
Apple MacBook Pro 16 2021 M1 Pro analiza dźwięku
(+) | głośniki mogą odtwarzać stosunkowo głośno (84.7 dB)
Bas 100 - 315 Hz
(+) | dobry bas - tylko 3.8% od mediany
(+) | bas jest liniowy (5.2% delta do poprzedniej częstotliwości)
Średnie 400 - 2000 Hz
(+) | zbalansowane środki średnie - tylko 1.3% od mediany
(+) | średnie są liniowe (2.1% delta do poprzedniej częstotliwości)
Wysokie 2–16 kHz
(+) | zrównoważone maksima - tylko 1.9% od mediany
(+) | wzloty są liniowe (2.7% delta do poprzedniej częstotliwości)
Ogólnie 100 - 16.000 Hz
(+) | ogólny dźwięk jest liniowy (4.6% różnicy w stosunku do mediany)
W porównaniu do tej samej klasy
» 0% wszystkich testowanych urządzeń w tej klasie było lepszych, 0% podobnych, 100% gorszych
» Najlepszy miał deltę 5%, średnia wynosiła ###średnia###%, najgorsza wynosiła 45%
W porównaniu do wszystkich testowanych urządzeń
» 0% wszystkich testowanych urządzeń było lepszych, 0% podobnych, 100% gorszych
» Najlepszy miał deltę 4%, średnia wynosiła ###średnia###%, najgorsza wynosiła 134%
Zarządzanie energią
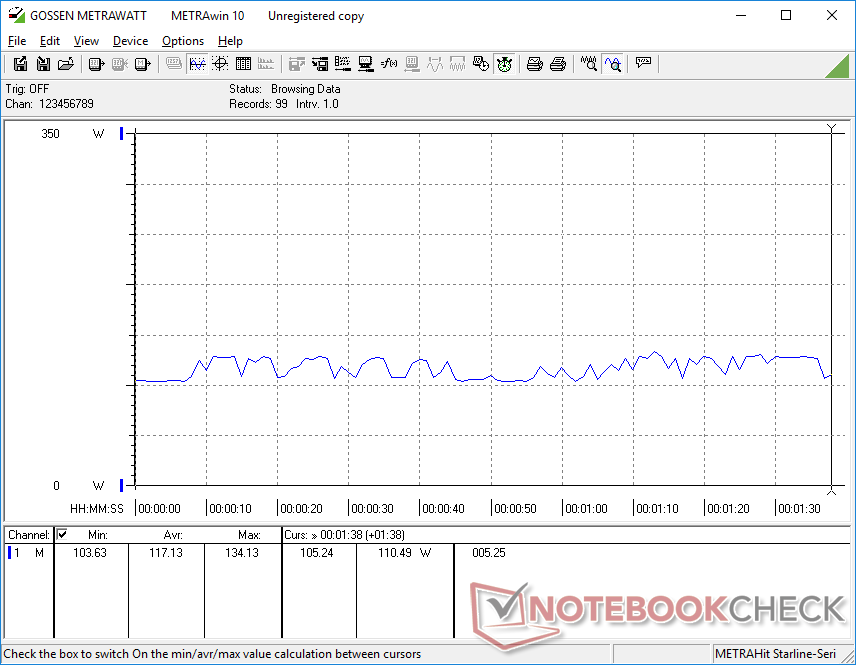
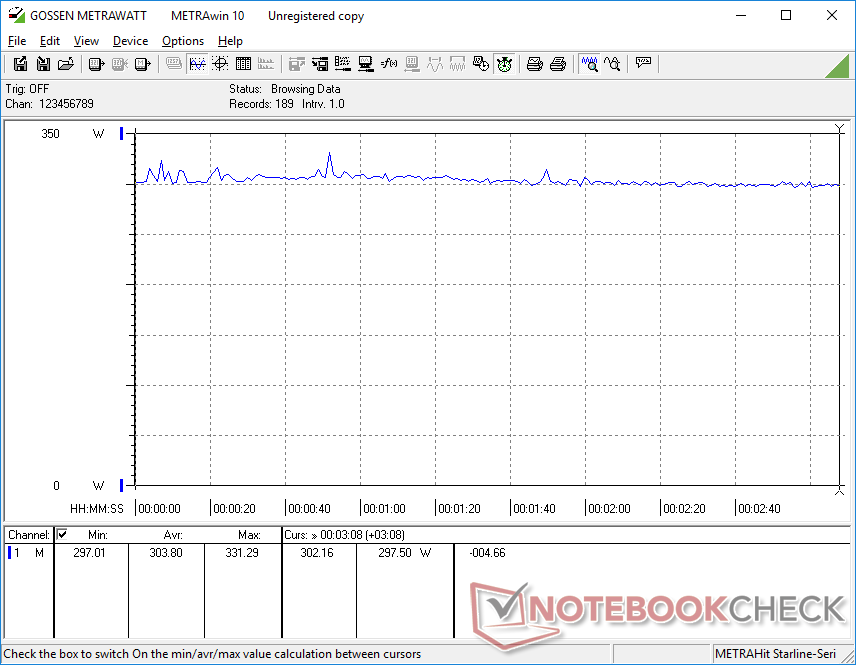
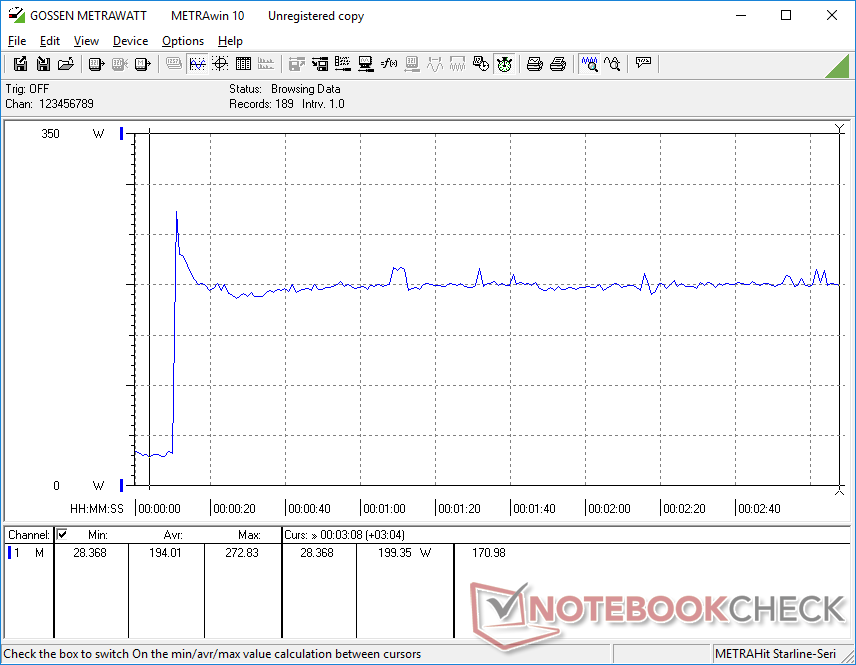
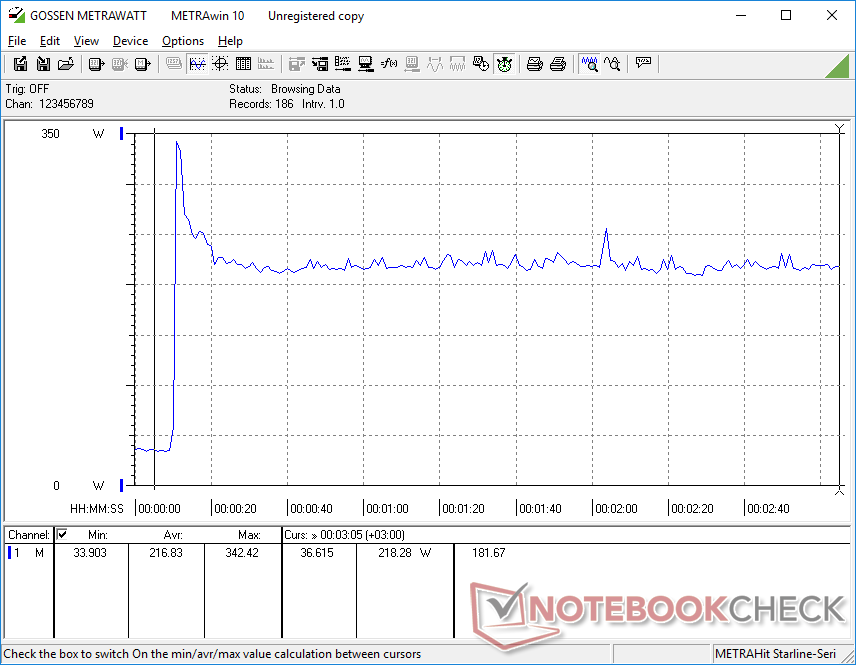
Pobór mocy
Ogólne zużycie energii jest wyraźnie wyższe niż to, które odnotowaliśmy w modelu 2022 AMD-Ampere. Przykładowo, podczas pracy na biegu jałowym na pulpicie pobór mocy wynosi od 14 do 37 W, w porównaniu z 7-17 W w wersji 2022. Gry wymagają o 37% więcej energii na naszym egzemplarzu 2023, ale wydajność w przeliczeniu na wat jest nadal bardzo dobra, ponieważ użytkownicy otrzymują od 40 do 60% więcej wydajności graficznej w porównaniu z mobilnym RTX 3080 Ti.
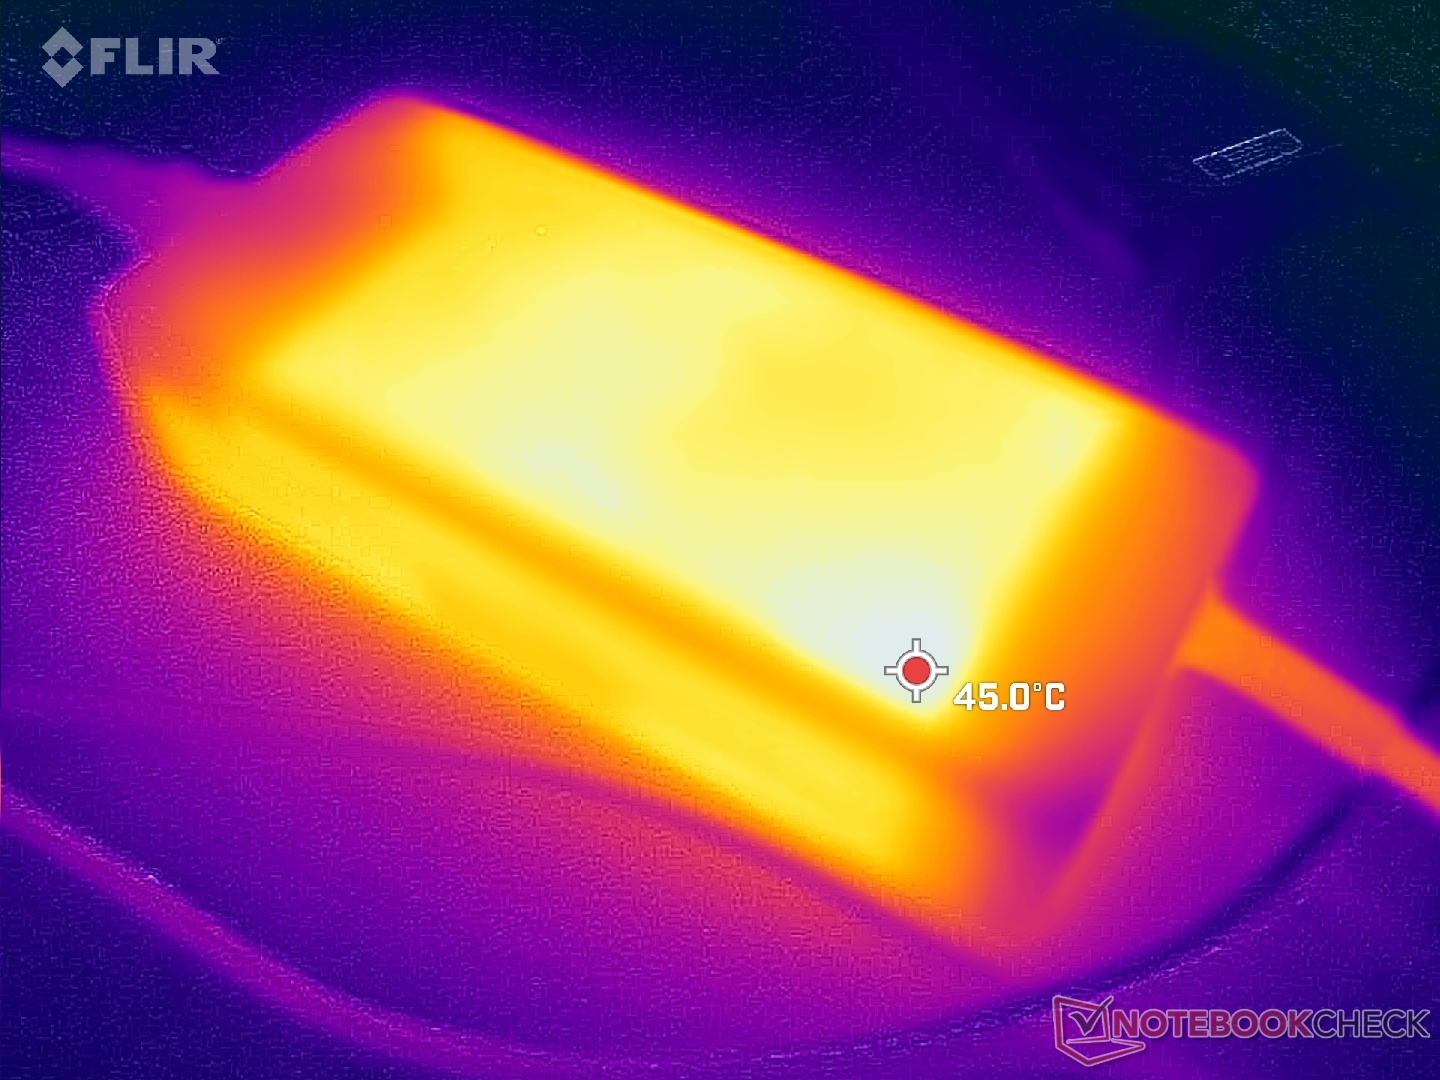
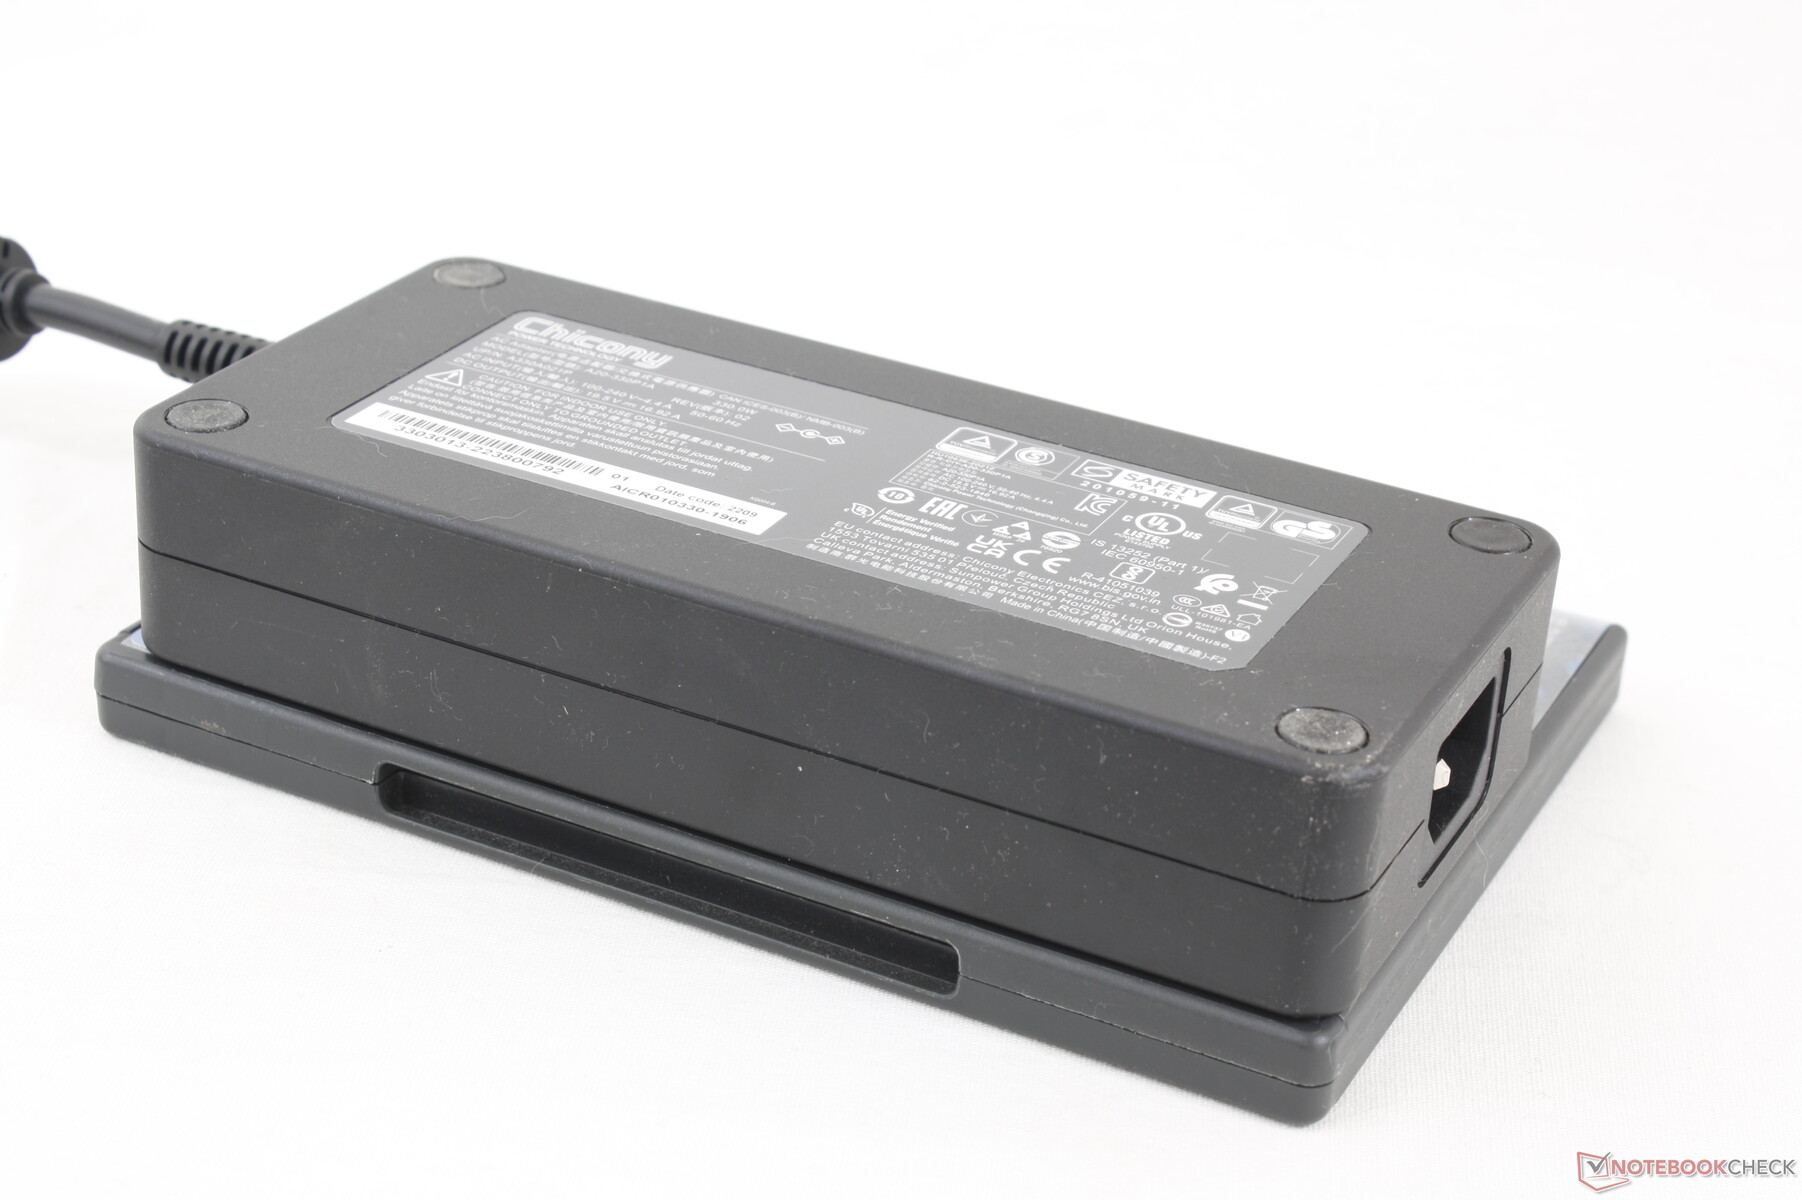
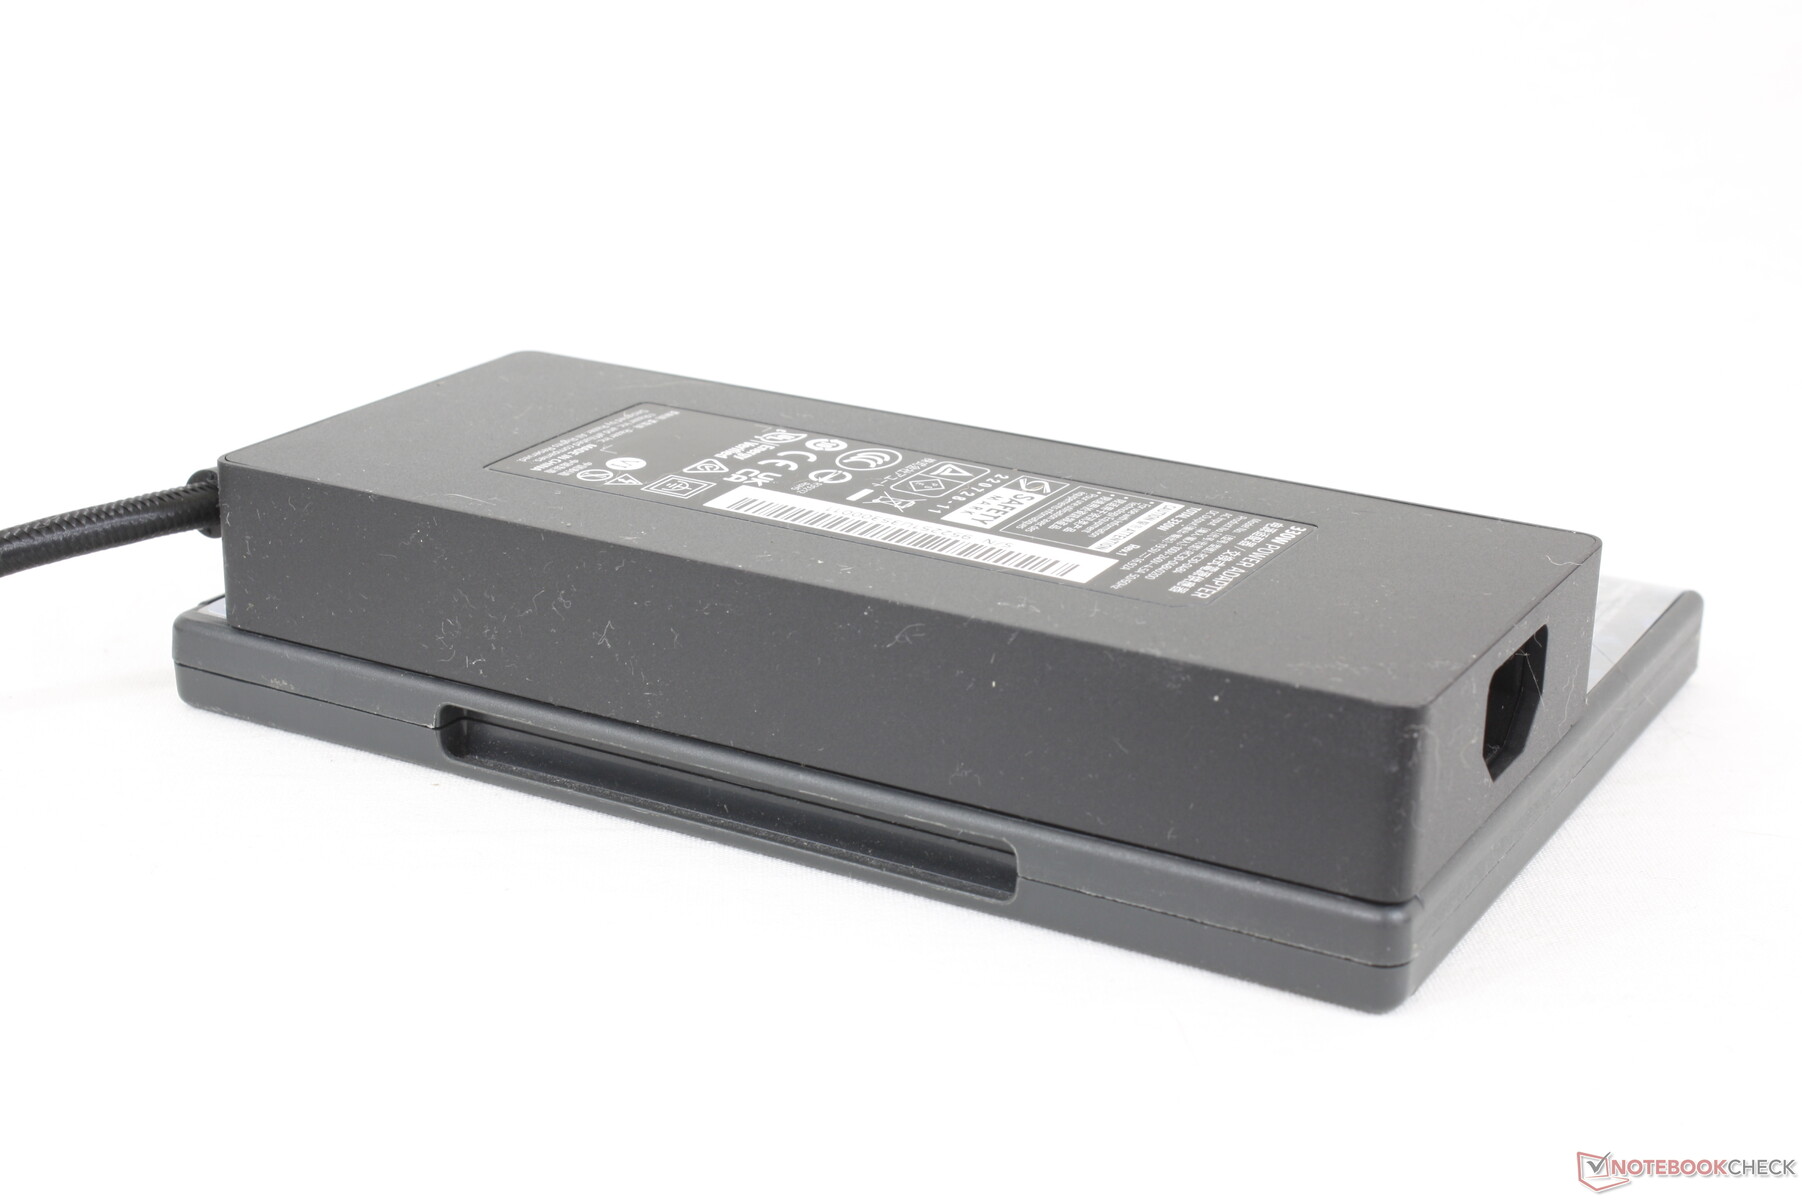
Zasilacz AC o mocy 330 W jest większy niż zasilacz AC o mocy 330 W dla nowego Razer Blade (~18,5 x 8,5 x 3,6 cm vs. ~18 x 7,5 x 2,5 cm), ponieważ Eluktronics i Uniwill nie przeszły jeszcze na ładowanie GaN. Udało nam się zarejestrować chwilowe maksymalne zużycie energii na poziomie 343 W, gdy CPU i GPU są wykorzystywane w 100 procentach.
| wyłączony / stan wstrzymania | |
| luz | |
| obciążenie |
|
Legenda:
min: | |
| Eluktronics Mech-17 GP2 i9-13900HX, GeForce RTX 4090 Laptop GPU, Samsung PM9A1 MZVL21T0HCLR, IPS, 2560x1600, 17" | Schenker XMG Neo 17 M22 R9 6900HX, GeForce RTX 3080 Ti Laptop GPU, Samsung SSD 980 Pro 1TB MZ-V8P1T0BW, IPS, 2560x1600, 17" | MSI Katana 17 B13VFK i7-13620H, GeForce RTX 4060 Laptop GPU, Micron 2400 MTFDKBA1T0QFM, IPS LED, 1920x1080, 17.3" | MSI Titan GT77 HX 13VI i9-13950HX, GeForce RTX 4090 Laptop GPU, Samsung PM9A1 MZVL22T0HBLB, Mini-LED, 3840x2160, 17.3" | Alienware m17 R5 (R9 6900HX, RX 6850M XT) R9 6900HX, Radeon RX 6850M XT, SSSTC CA6-8D1024, IPS, 3840x2160, 17" | Razer Blade 18 RTX 4070 i9-13950HX, GeForce RTX 4070 Laptop GPU, SSSTC CA6-8D1024, IPS, 2560x1600, 18" | |
|---|---|---|---|---|---|---|
| Power Consumption | 35% | 35% | 1% | 24% | -24% | |
| Idle Minimum * (Watt) | 14 | 7 50% | 12.2 13% | 14 -0% | 13 7% | 24.5 -75% |
| Idle Average * (Watt) | 19.3 | 11 43% | 14.9 23% | 21.6 -12% | 16.5 15% | 34.1 -77% |
| Idle Maximum * (Watt) | 36.8 | 17 54% | 15.8 57% | 24.8 33% | 17 54% | 47.7 -30% |
| Load Average * (Watt) | 117.2 | 92 22% | 85.22 27% | 122.5 -5% | 93 21% | 140 -19% |
| Witcher 3 ultra * (Watt) | 304 | 221 27% | 151.1 50% | 265 13% | 239 21% | 202 34% |
| Load Maximum * (Watt) | 342.5 | 306 11% | 212.8 38% | 418 -22% | 251 27% | 261 24% |
* ... im mniej tym lepiej
Power Consumption Witcher 3 / Stresstest
Power Consumption external Monitor
Czas pracy na baterii
Czas pracy w sieci WLAN jest o kilka godzin krótszy, niż w zasilanym przez AMD zeszłorocznym Neo 17 M22, i wynosi łącznie nieco ponad 5 godzin. Oba testowane egzemplarze były ustawione na zrównoważony profil zasilania z aktywnym Optimusem na iGPU.
Ładowanie od stanu pustego do pełnego trwa od 2 do 2,5 godziny. Systemu nie można ładować przez USB-C.
| Eluktronics Mech-17 GP2 i9-13900HX, GeForce RTX 4090 Laptop GPU, 99 Wh | Schenker XMG Neo 17 M22 R9 6900HX, GeForce RTX 3080 Ti Laptop GPU, 99 Wh | MSI Katana 17 B13VFK i7-13620H, GeForce RTX 4060 Laptop GPU, 53.5 Wh | MSI Titan GT77 HX 13VI i9-13950HX, GeForce RTX 4090 Laptop GPU, 99.9 Wh | Alienware m17 R5 (R9 6900HX, RX 6850M XT) R9 6900HX, Radeon RX 6850M XT, 97 Wh | Razer Blade 18 RTX 4070 i9-13950HX, GeForce RTX 4070 Laptop GPU, 91.7 Wh | |
|---|---|---|---|---|---|---|
| Czasy pracy | 76% | -43% | 4% | -6% | -22% | |
| WiFi v1.3 (h) | 5.1 | 9 76% | 2.9 -43% | 5.3 4% | 4.8 -6% | 4 -22% |
| Reader / Idle (h) | 12 | 7 | ||||
| H.264 (h) | 6.6 | 6 | 4.9 | |||
| Load (h) | 1.8 | 1 | 1.4 | 1.8 | 1.3 |
Za
Przeciw
Werdykt - Podkręcanie ciepła trochę zbyt dosłownie
Mech-17 GP2 jest o 7 procent mniejszy i 17 procent lżejszy od MSI GT77 HX Titan oferując przy tym niemal taką samą wydajność. W efekcie jest gęsto upakowany, ale może o trochę za dużo. Temperatury procesora podczas uruchamiania gier są wyjątkowo wysokie nawet jak na laptop gamingowy. Choć zakres ~97 C jest technicznie "bezpieczny" dla procesora Intela, to jednak jest cieplejszy niż w zeszłorocznym modelu i nie do końca komfortowy dla użytkownika końcowego. Wysoką temperaturę rdzenia można być może złagodzić poprzez wykorzystanie zewnętrznej stacji dokującej z chłodnicą wodną, ale laptop nie powinien polegać na opcjonalnym akcesorium dla optymalnego chłodzenia.
Wysoka wydajność za cenę wysokich temperatur rdzenia.
Poza wysoką wydajnością na objętość czynnikiem wyróżniającym ten model jest również cena. Mech-17 GP2 jest jednym z niewielu laptopów GeForce 40, które są dostarczane z opcją barebones, co oznacza, że możesz zaoszczędzić kilkaset dolarów, jeśli możesz zaopatrzyć się we własną pamięć RAM, dysk SSD i system operacyjny. 2999 USD za jeden z najszybszych laptopów do gier na rynku to nie jest mało; należy tylko uważać na temperatury rdzenia.
Cena i dostępność
Amazon wysyła teraz mech-17 GP2 z RTX 4090 za 4400 USD w komplecie z pamięcią RAM i pamięcią masową. Alternatywnie, użytkownicy mogą kupić bezpośrednio od Eluktronics dla bardziej konfigurowalnych opcji.
Eluktronics Mech-17 GP2
- 08/03/2023 v7 (old)
Allen Ngo
Przezroczystość
Wyboru urządzeń do recenzji dokonuje nasza redakcja. Próbka testowa została udostępniona autorowi jako pożyczka od producenta lub sprzedawcy detalicznego na potrzeby tej recenzji. Pożyczkodawca nie miał wpływu na tę recenzję, producent nie otrzymał też kopii tej recenzji przed publikacją. Nie było obowiązku publikowania tej recenzji. Jako niezależna firma medialna, Notebookcheck nie podlega władzy producentów, sprzedawców detalicznych ani wydawców.
Tak testuje Notebookcheck
Każdego roku Notebookcheck niezależnie sprawdza setki laptopów i smartfonów, stosując standardowe procedury, aby zapewnić porównywalność wszystkich wyników. Od około 20 lat stale rozwijamy nasze metody badawcze, ustanawiając przy tym standardy branżowe. W naszych laboratoriach testowych doświadczeni technicy i redaktorzy korzystają z wysokiej jakości sprzętu pomiarowego. Testy te obejmują wieloetapowy proces walidacji. Nasz kompleksowy system ocen opiera się na setkach uzasadnionych pomiarów i benchmarków, co pozwala zachować obiektywizm.Price comparison

