Recenzja laptopa Acer Swift Edge 16 Ryzen 7 7840U: Procesor Zen 4 i podbicie OLED 3,2K 120 Hz

Acer Swift Edge SFE16 został odświeżony w tym sezonie, aby obsługiwać nowy procesor Zen 4 Ryzen 7 7840U w porównaniu z Zen 3+ Ryzen 7 7735U wydanym zaledwie kilka miesięcy wcześniej. Zaktualizowany model otrzymał również nowy panel Samsung OLED 120 Hz 3,2K zamiast panelu 4K 60 Hz w konfiguracji Zen 3+.
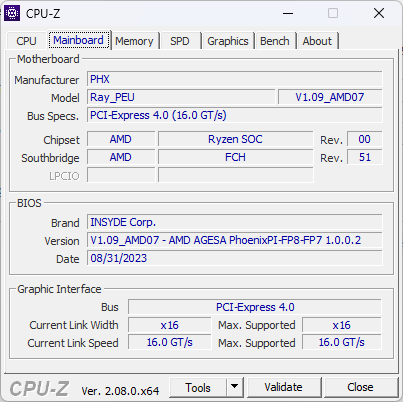
Poza powyższymi różnicami w CPU i GPU, zarówno Swift Edge SFE16 Zen 4, jak i Swift Edge SFE16 Zen 3+ wykorzystują podobną konstrukcję obudowy z kilkoma różnicami, które odnotujemy w tej recenzji. Wewnętrznie jednak wiele aspektów płyty głównej uległo zmianie. Zalecamy sprawdzenie naszą recenzję Swift Edge SFE16 Zen 3+ aby dowiedzieć się więcej o fizycznych cechach tego modelu.
Alternatywy dla Swift Edge obejmują inne lekkie 16-calowe ultrabooki, takie jak LG Gram 16, Samsung Galaxy Book3 Pro 16,Asus VivoBook 16lubHuawei MateBook 16s.
Swift Edge 16 nie powinien być mylony z Swift X 16, który jest grubszym laptopem z szybszymi procesorami z serii H i dedykowaną grafiką GeForce RTX.
Więcej recenzji Acer:
Potencjalni konkurenci w porównaniu
Ocena | Data | Model | Waga | Wysokość | Rozmiar | Rezolucja | Cena |
|---|---|---|---|---|---|---|---|
| 88.6 % v7 (old) | 10/2023 | Acer Swift Edge SFE16 Ryzen 7 7840U R7 7840U, Radeon 780M | 1.2 kg | 13 mm | 16.00" | 3200x2000 | |
| 87.5 % v7 (old) | 06/2023 | Acer Swift Edge SFE16-42-R1GM R7 7735U, Radeon 680M | 1.2 kg | 13.95 mm | 16.00" | 3840x2400 | |
| 88 % v7 (old) | 08/2023 | Lenovo Slim Pro 9i 16IRP8 i9-13905H, GeForce RTX 4050 Laptop GPU | 2.2 kg | 18.2 mm | 16.00" | 3200x2000 | |
| 86.3 % v7 (old) | 05/2023 | Asus VivoBook Pro 16 i7-12700H, GeForce RTX 3050 Ti Laptop GPU | 1.9 kg | 20 mm | 16.00" | 2560x1600 | |
| 89.4 % v7 (old) | 04/2023 | Samsung Galaxy Book3 Ultra 16 i7-13700H, GeForce RTX 4050 Laptop GPU | 1.8 kg | 16.5 mm | 16.00" | 2880x1800 | |
| 86.4 % v7 (old) | Huawei MateBook 16s i7 i7-12700H, Iris Xe G7 96EUs | 2 kg | 17.8 mm | 16.00" | 2520x1680 |
Przypadek
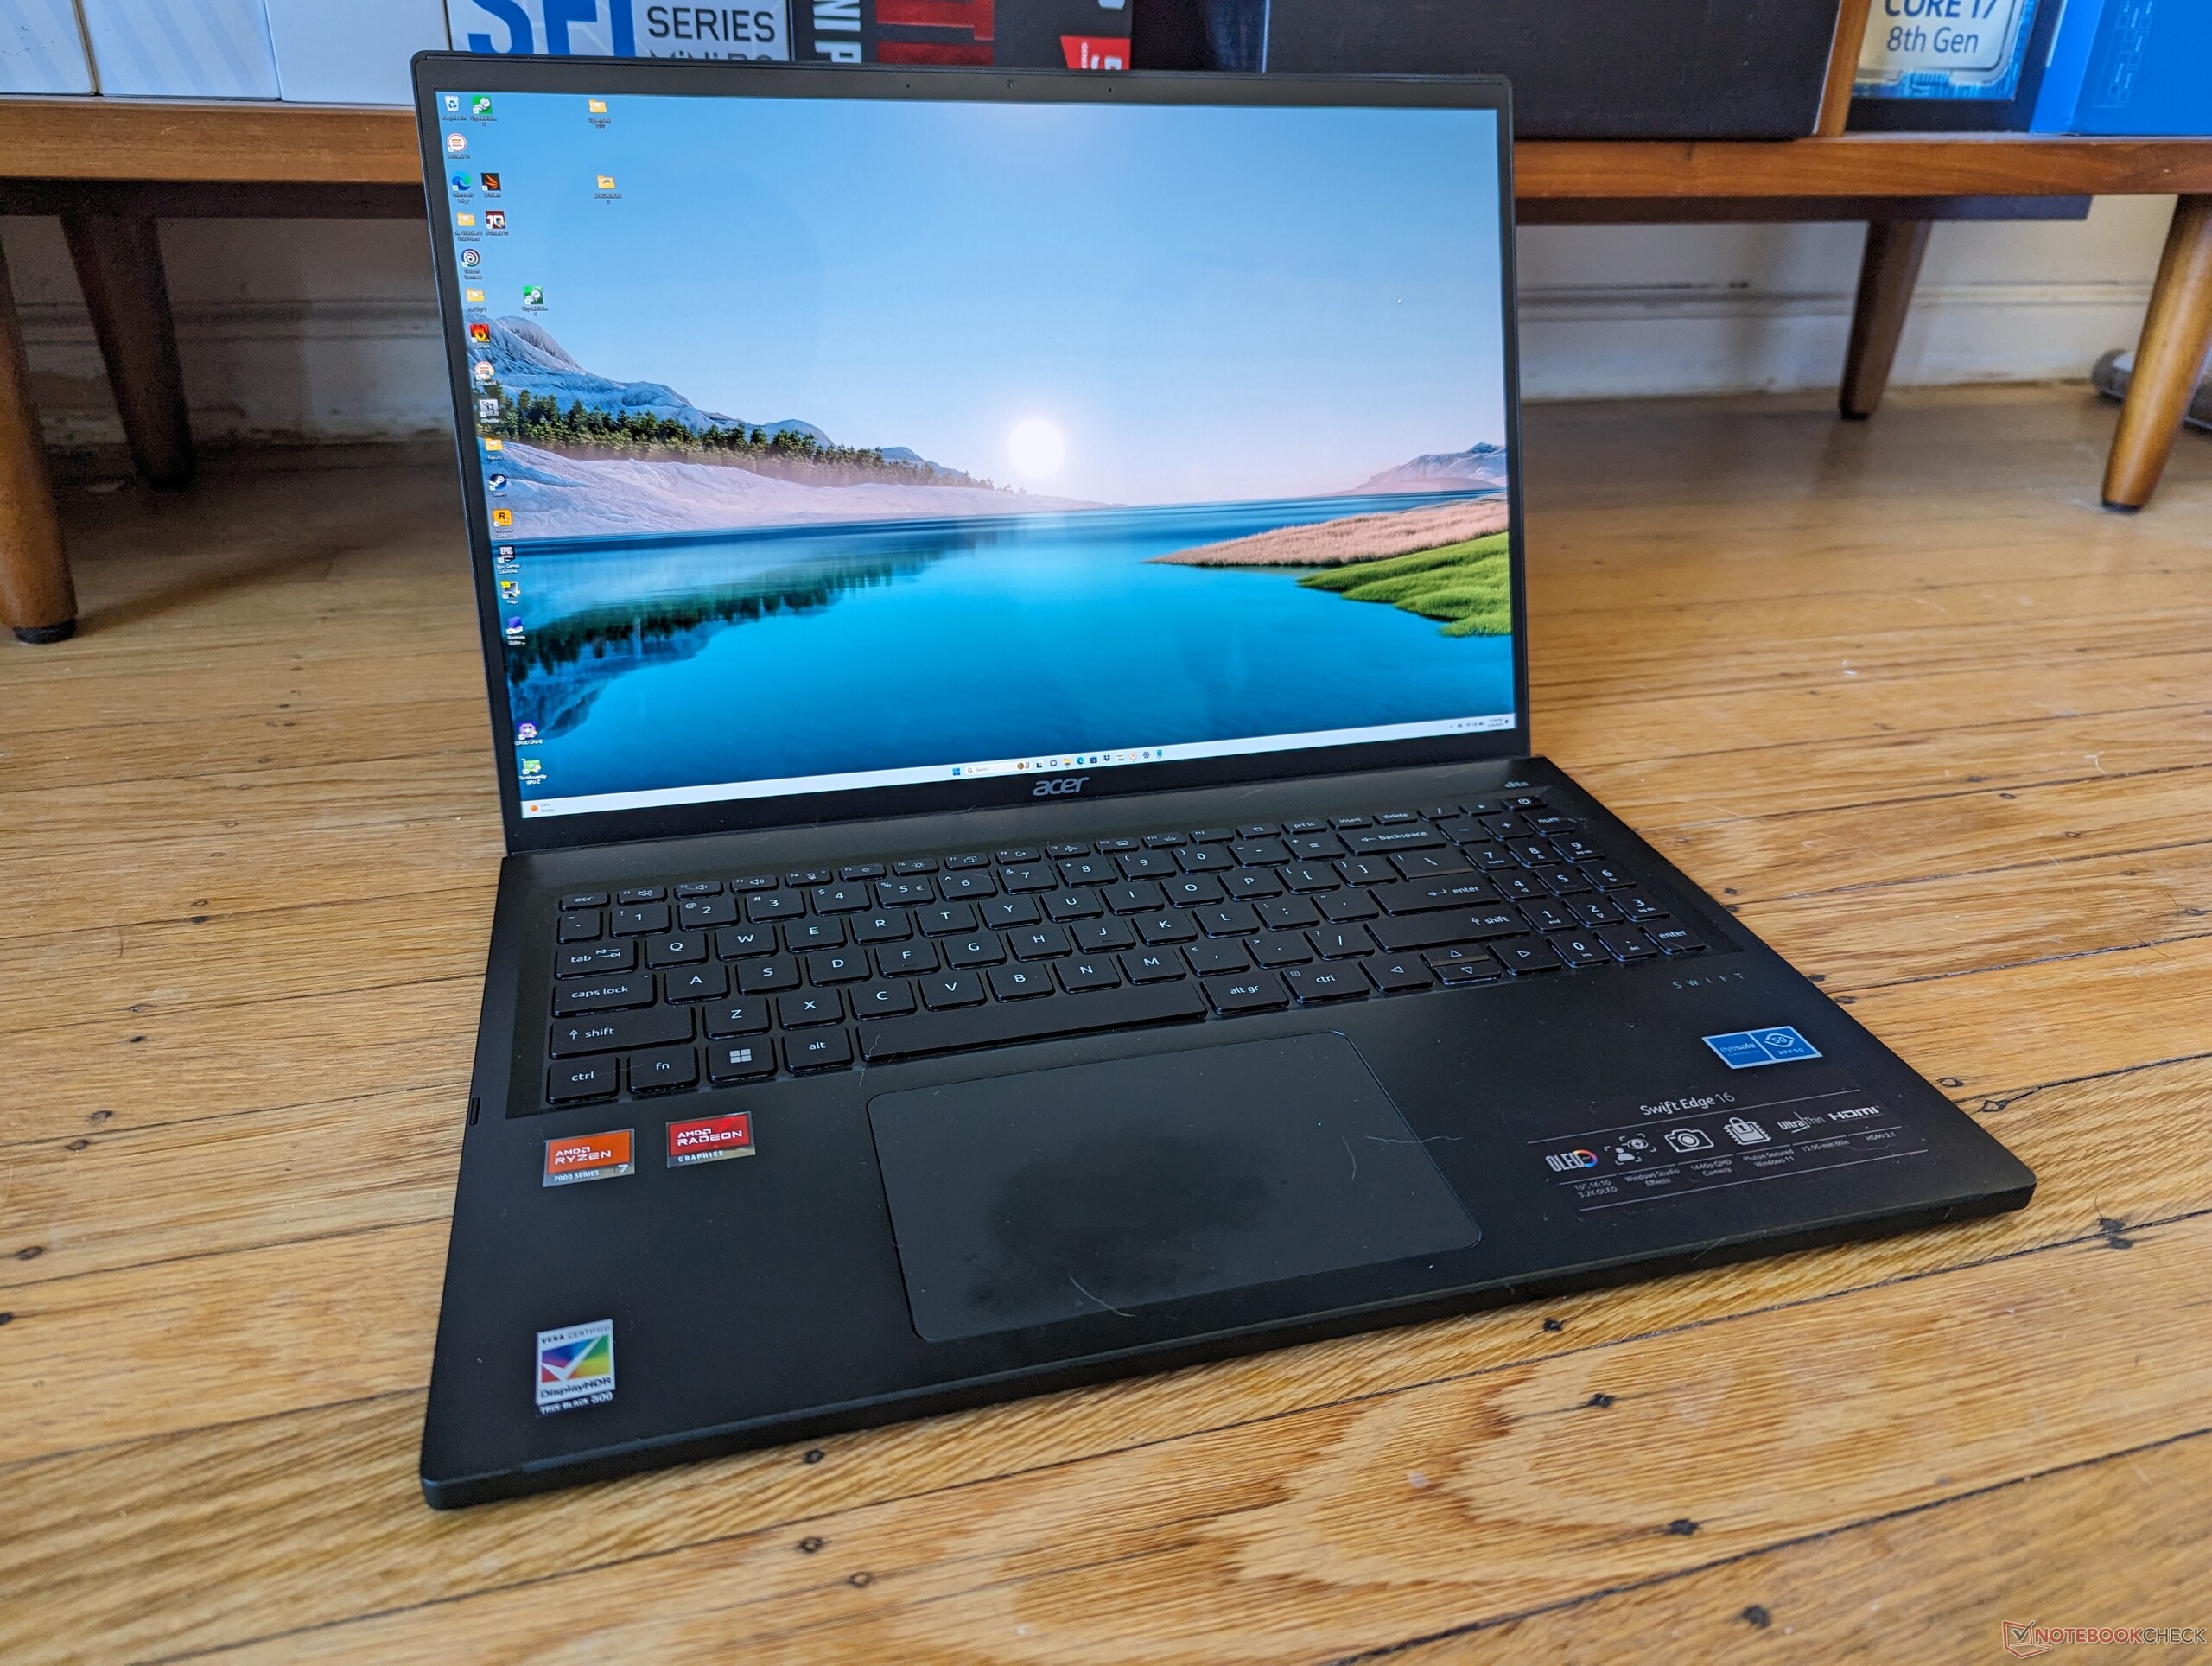
Swift Edge 16 Zen 4 może na pierwszy rzut oka wyglądać identycznie jak Swift Edge 16 Zen 3+, ale zmiany zewnętrzne są zauważalne po bliższym przyjrzeniu się. Po pierwsze, w nowszej wersji zintegrowano klawiaturę numeryczną, podczas gdy brakowało jej w wersji Zen 3+. Po drugie, zniknęły kratki wentylacyjne nad pierwszym rzędem klawiszy klawiatury, a przednia krawędź jest teraz ciągła, bez żadnych nacięć. Ta ostatnia zmiana jest o tyle dziwna, że utrudnia otwieranie pokrywy.
Poza tym model ten wykorzystuje te same gładkie magnezowe i aluminiowe materiały obudowy, te same porty i rozmieszczenie oraz ten sam rozmiar clickpada co poprzednio. Wymiary są tym razem nieco szersze i jeszcze cieńsze, ale różnice są trudne do zauważenia w praktyce.
Czytnik kart SD
Acer dodał czytnik MicroSD, podczas gdy funkcji tej brakowało w konfiguracji Ryzen 7 7735U. Jednak szybkość transferu jest około 3x wolniejsza niż w przypadku czytników kart SD w konkurencyjnych modelach, takich jakAsus VivoBook Pro 16 lub Samsung Galaxy Book3 Ultra 16.
| SD Card Reader | |
| average JPG Copy Test (av. of 3 runs) | |
| Lenovo Slim Pro 9i 16IRP8 (PNY EliteX-Pro60 V60 256 GB) | |
| Samsung Galaxy Book3 Ultra 16 (AV PRO microSD 128 GB V60) | |
| Asus VivoBook Pro 16 (AV Pro SD microSD 128 GB V60) | |
| Acer Swift Edge SFE16 Ryzen 7 7840U (AV Pro V60) | |
| maximum AS SSD Seq Read Test (1GB) | |
| Lenovo Slim Pro 9i 16IRP8 (PNY EliteX-Pro60 V60 256 GB) | |
| Samsung Galaxy Book3 Ultra 16 (AV PRO microSD 128 GB V60) | |
| Asus VivoBook Pro 16 (AV Pro SD microSD 128 GB V60) | |
| Acer Swift Edge SFE16 Ryzen 7 7840U (AV Pro V60) | |
Komunikacja
Moduł MediaTek ma niezwykle wolne prędkości transmisji w Wi-Fi 6, podobne do tego, co zaobserwowaliśmy w konfiguracji Zen 3+. Prędkości Wi-Fi 6E są poza tym doskonałe po sparowaniu z naszą siecią Asus AXE11000 6 GHz.
| Networking | |
| iperf3 transmit AXE11000 | |
| Samsung Galaxy Book3 Ultra 16 | |
| Asus VivoBook Pro 16 | |
| Lenovo Slim Pro 9i 16IRP8 | |
| Acer Swift Edge SFE16-42-R1GM | |
| Acer Swift Edge SFE16 Ryzen 7 7840U | |
| iperf3 receive AXE11000 | |
| Samsung Galaxy Book3 Ultra 16 | |
| Acer Swift Edge SFE16 Ryzen 7 7840U | |
| Lenovo Slim Pro 9i 16IRP8 | |
| Acer Swift Edge SFE16-42-R1GM | |
| iperf3 transmit AXE11000 6GHz | |
| Huawei MateBook 16s i7 | |
| Lenovo Slim Pro 9i 16IRP8 | |
| Acer Swift Edge SFE16-42-R1GM | |
| Acer Swift Edge SFE16 Ryzen 7 7840U | |
| iperf3 receive AXE11000 6GHz | |
| Asus VivoBook Pro 16 | |
| Huawei MateBook 16s i7 | |
| Acer Swift Edge SFE16-42-R1GM | |
| Lenovo Slim Pro 9i 16IRP8 | |
| Acer Swift Edge SFE16 Ryzen 7 7840U | |
Kamera internetowa
Kamera internetowa ma efektywną rozdzielczość 3,7 MP z nagrywaniem do 1440p30 w porównaniu z 2,1 MP i nagrywaniem 1080p30 w konfiguracji Zen 3+, co zapewnia nieco ostrzejszy obraz.
Nadal nie ma wbudowanej migawki prywatności kamery internetowej ani obsługi podczerwieni.


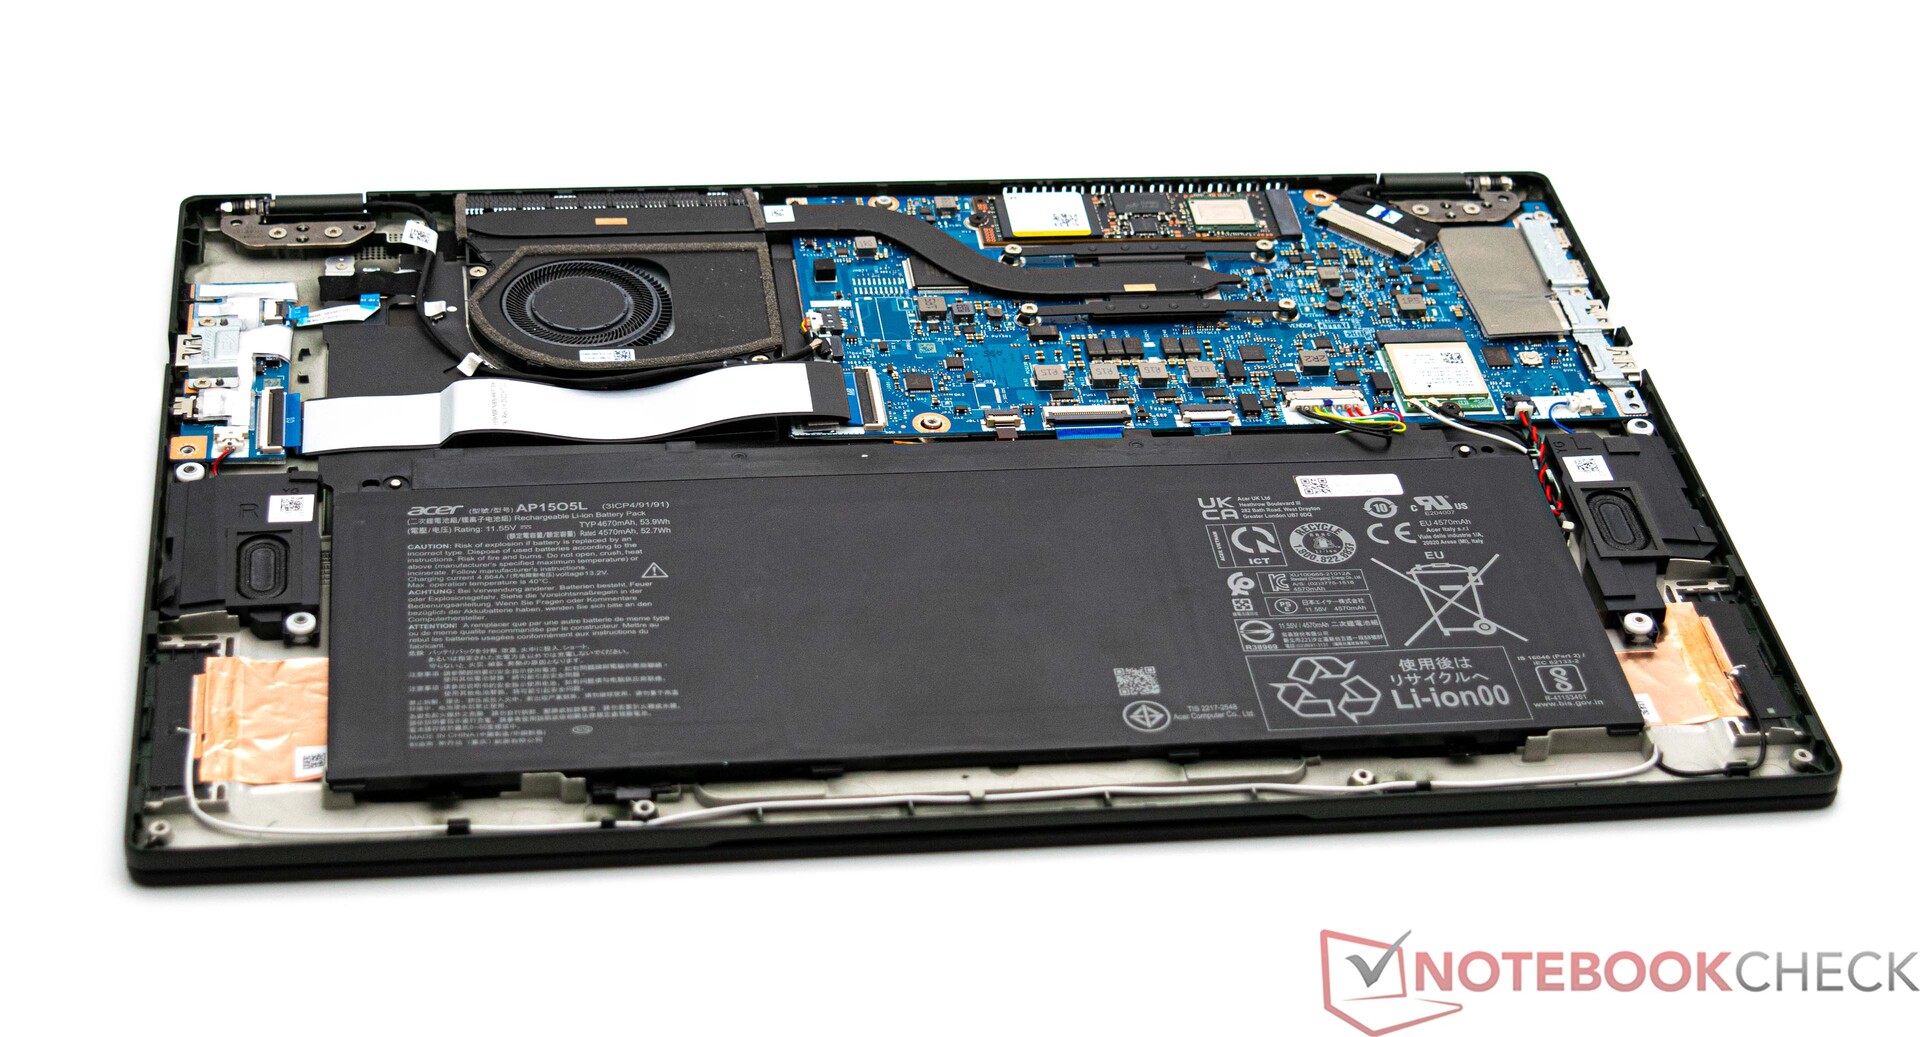
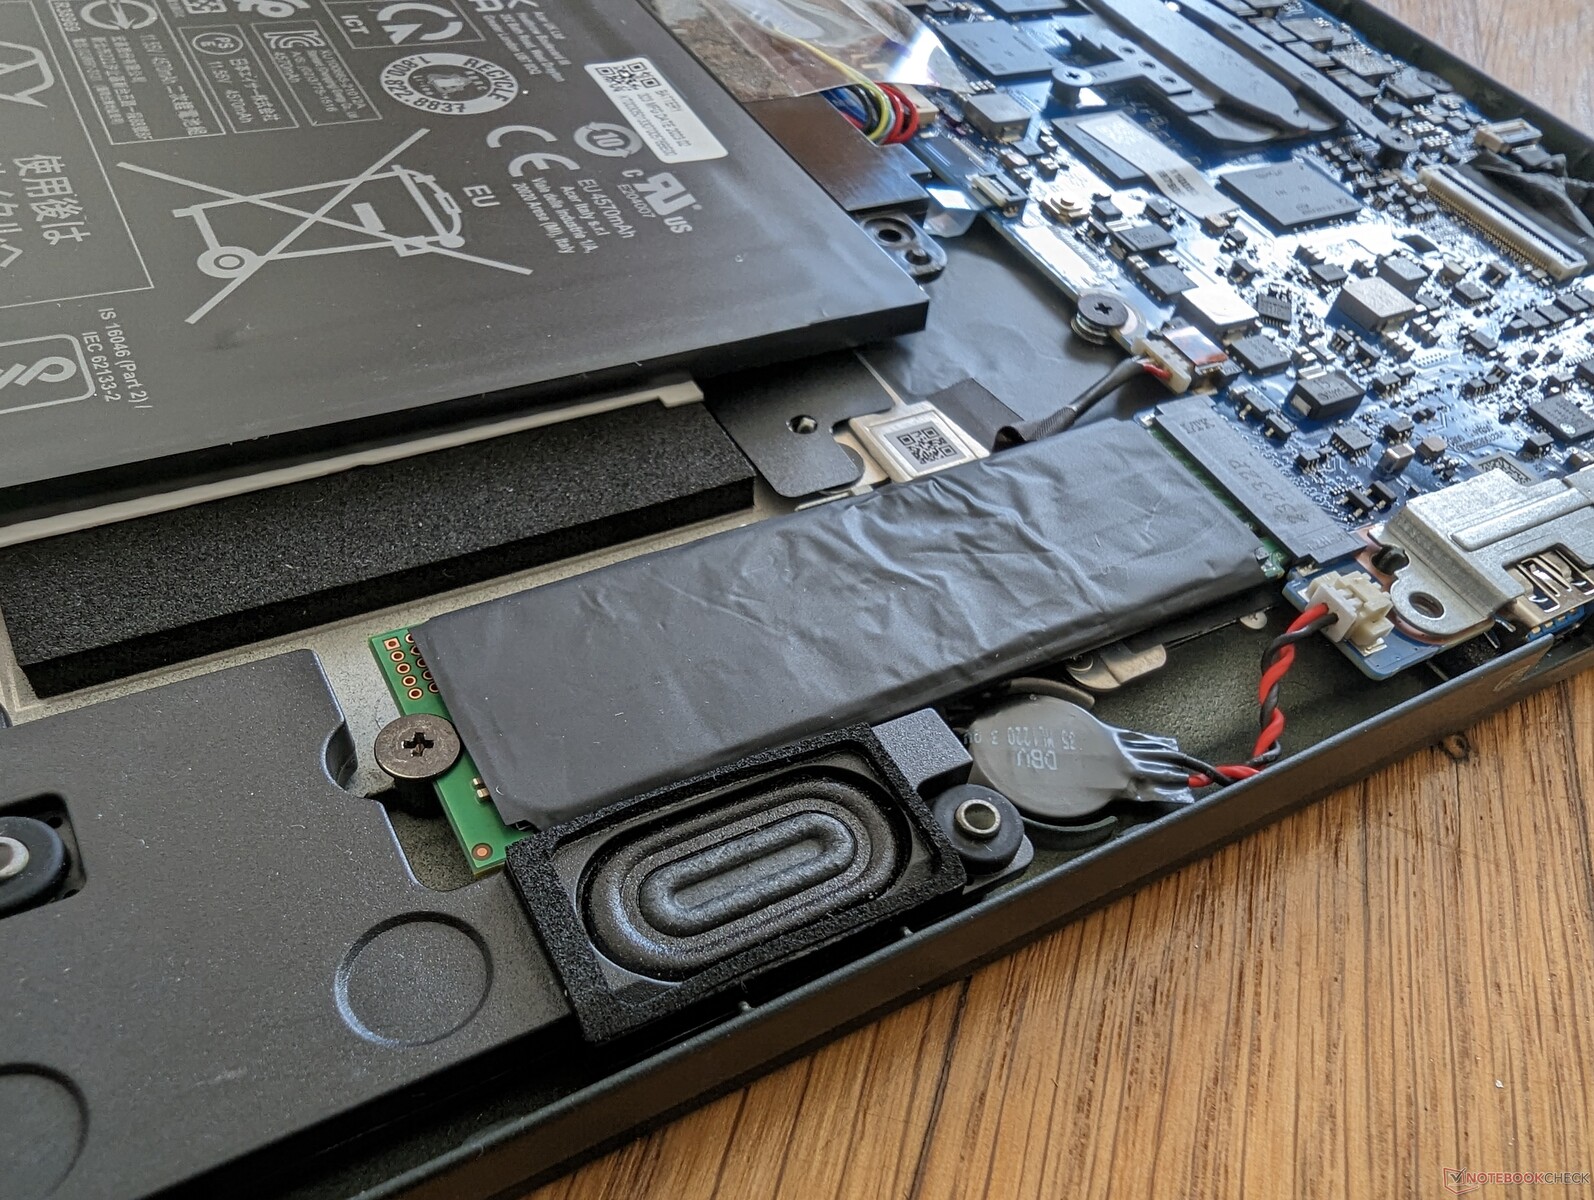
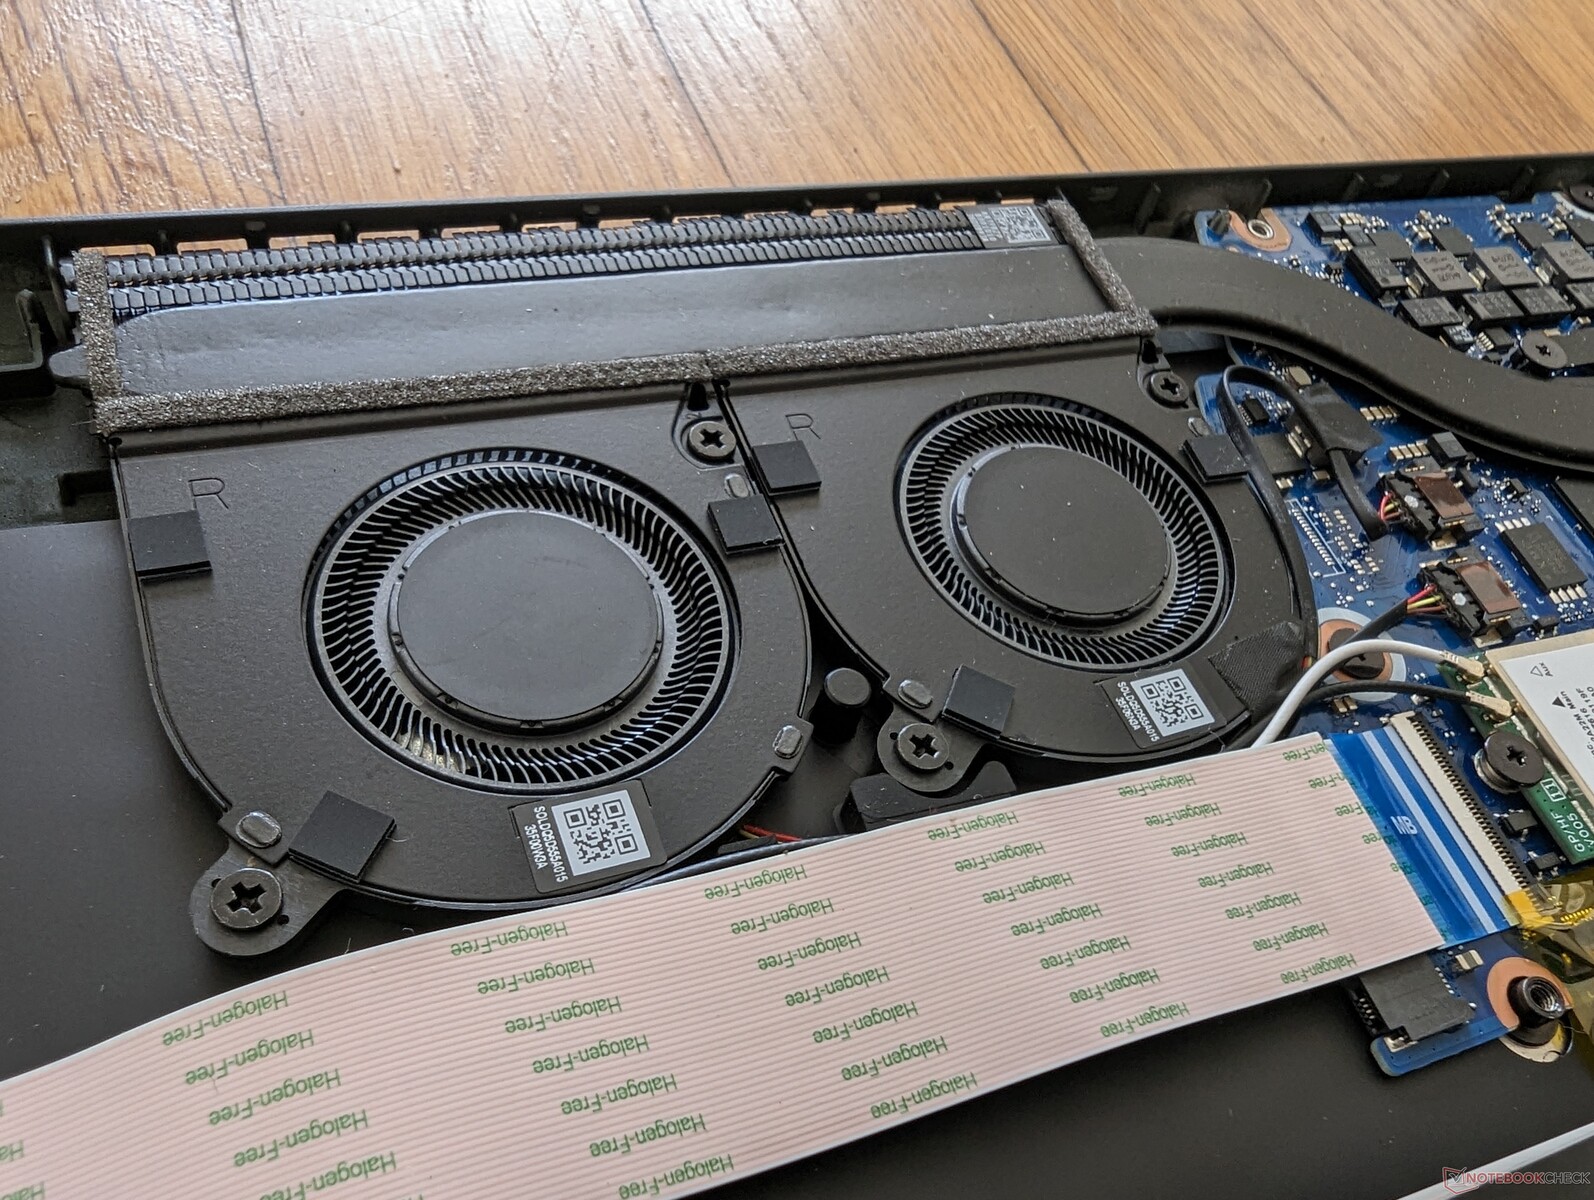
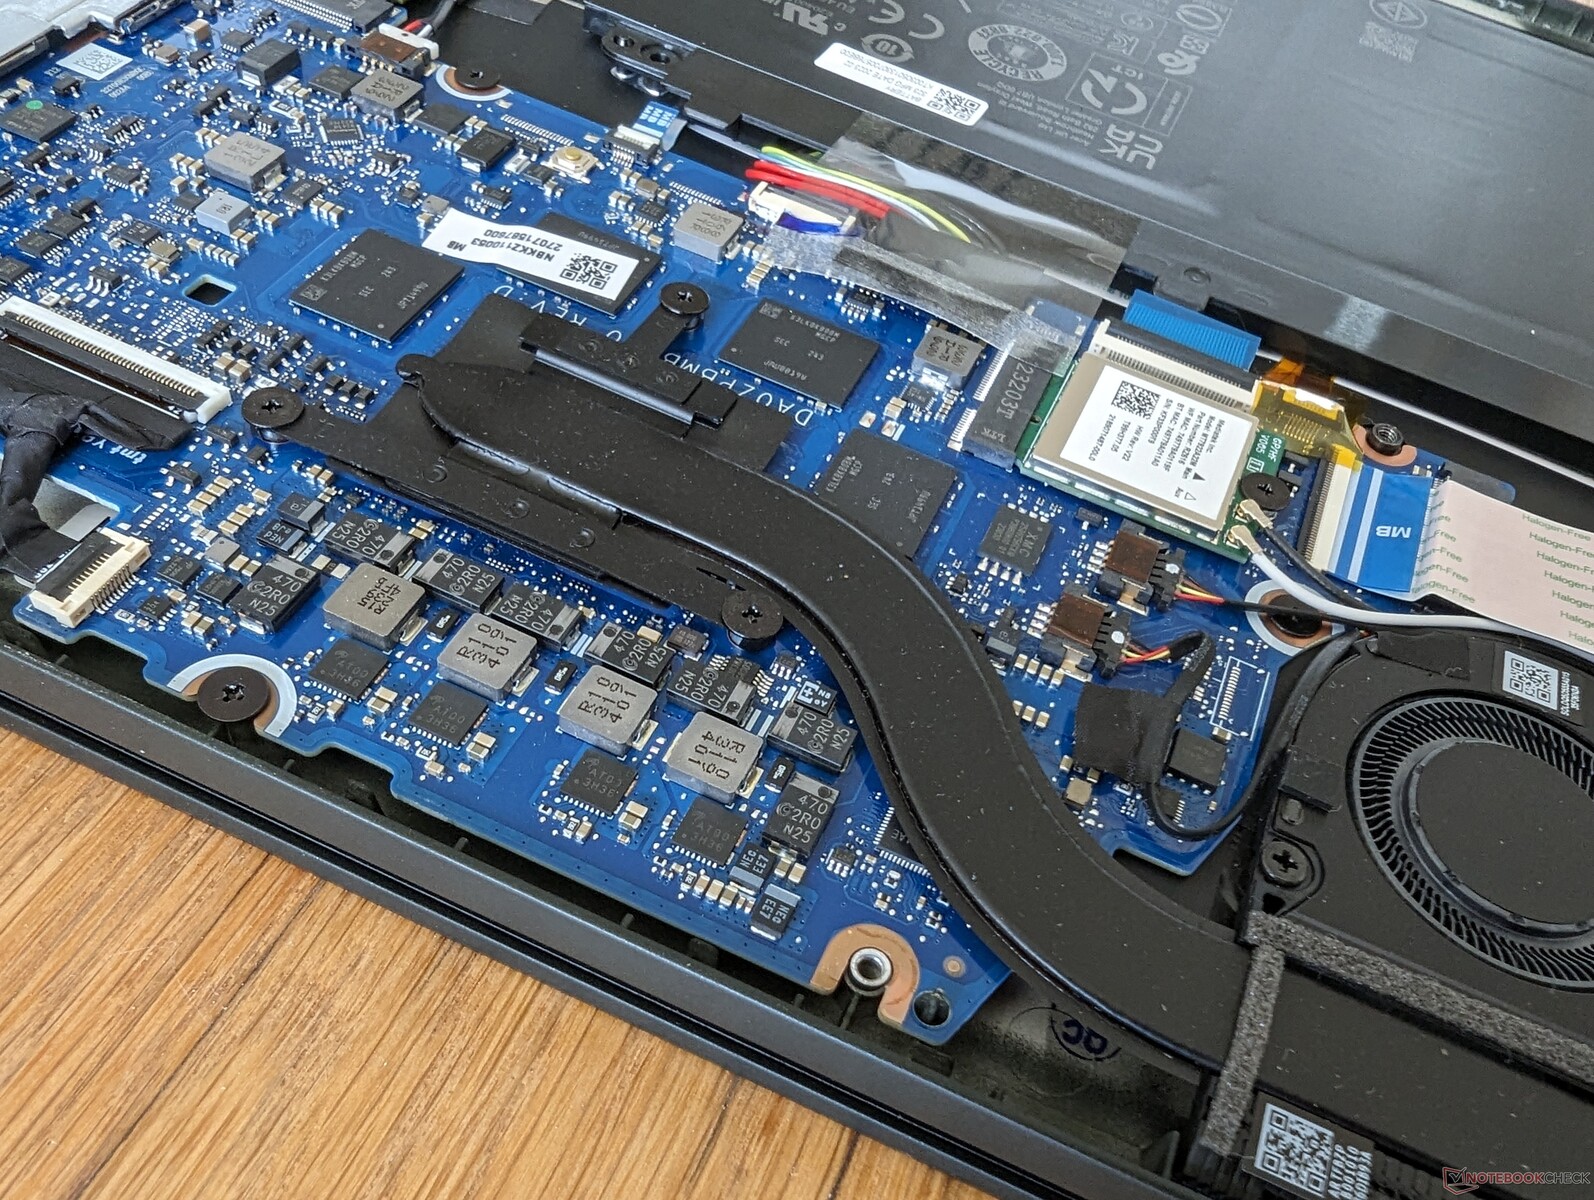
Konserwacja
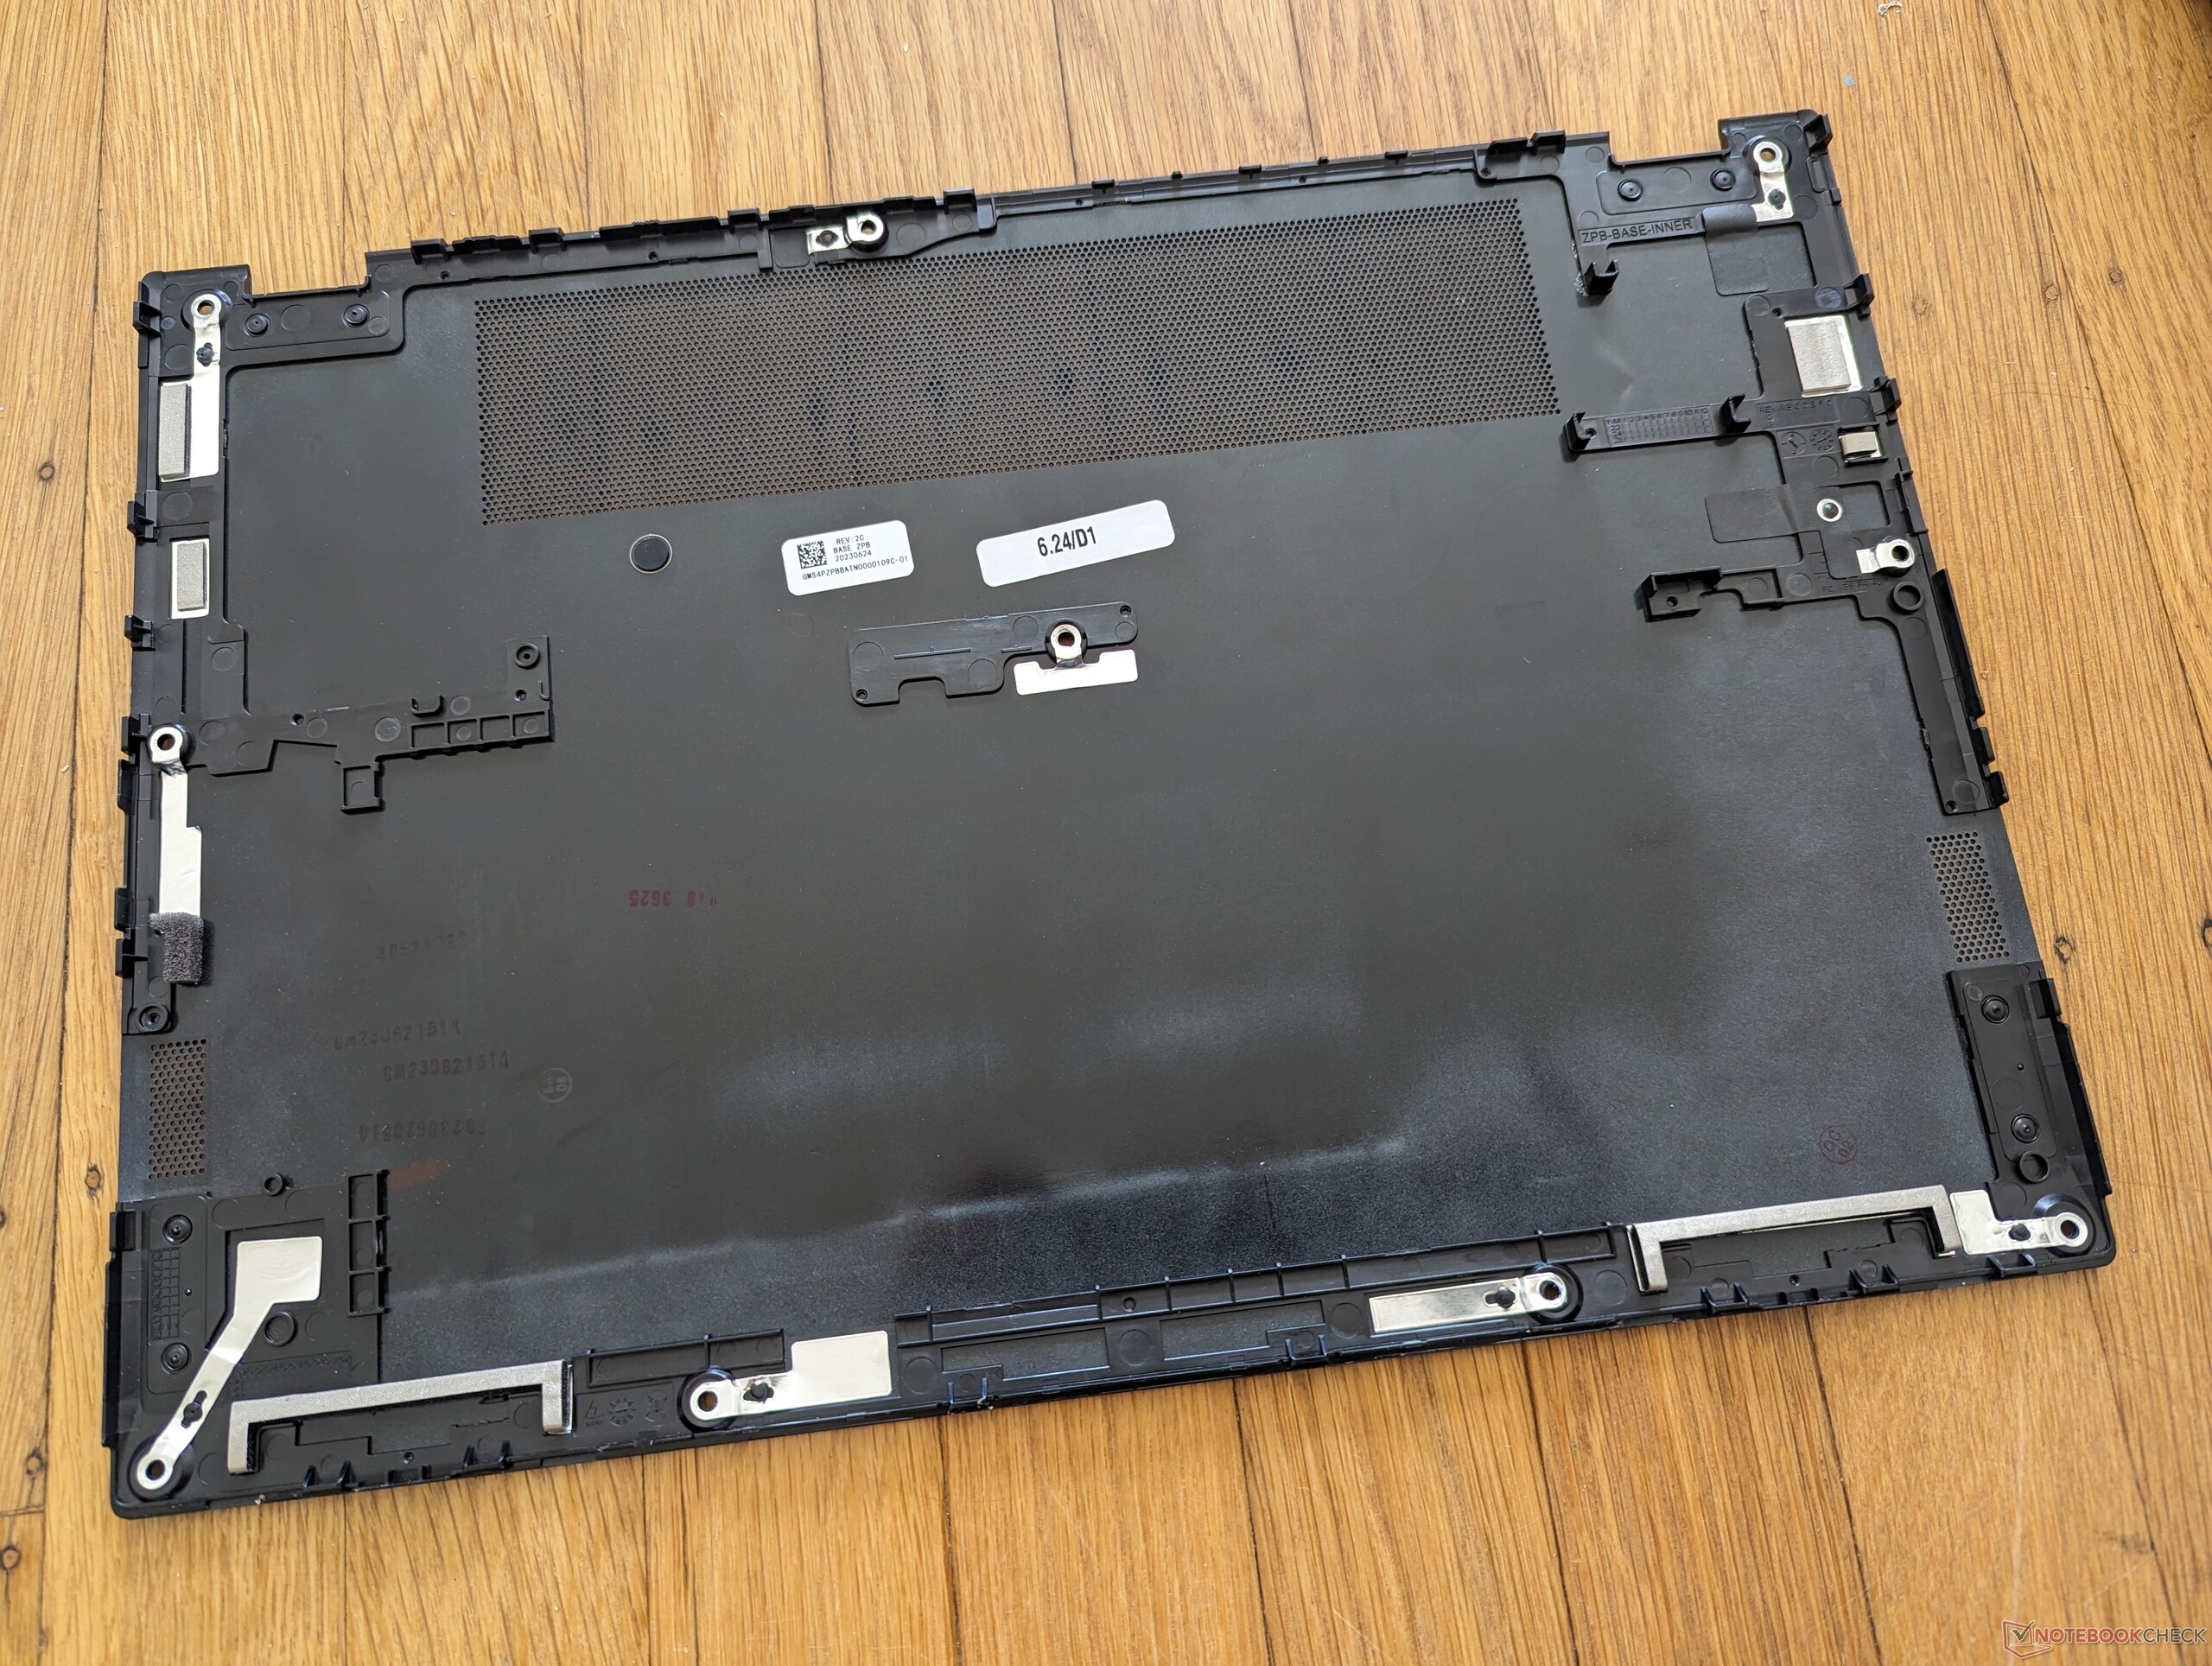
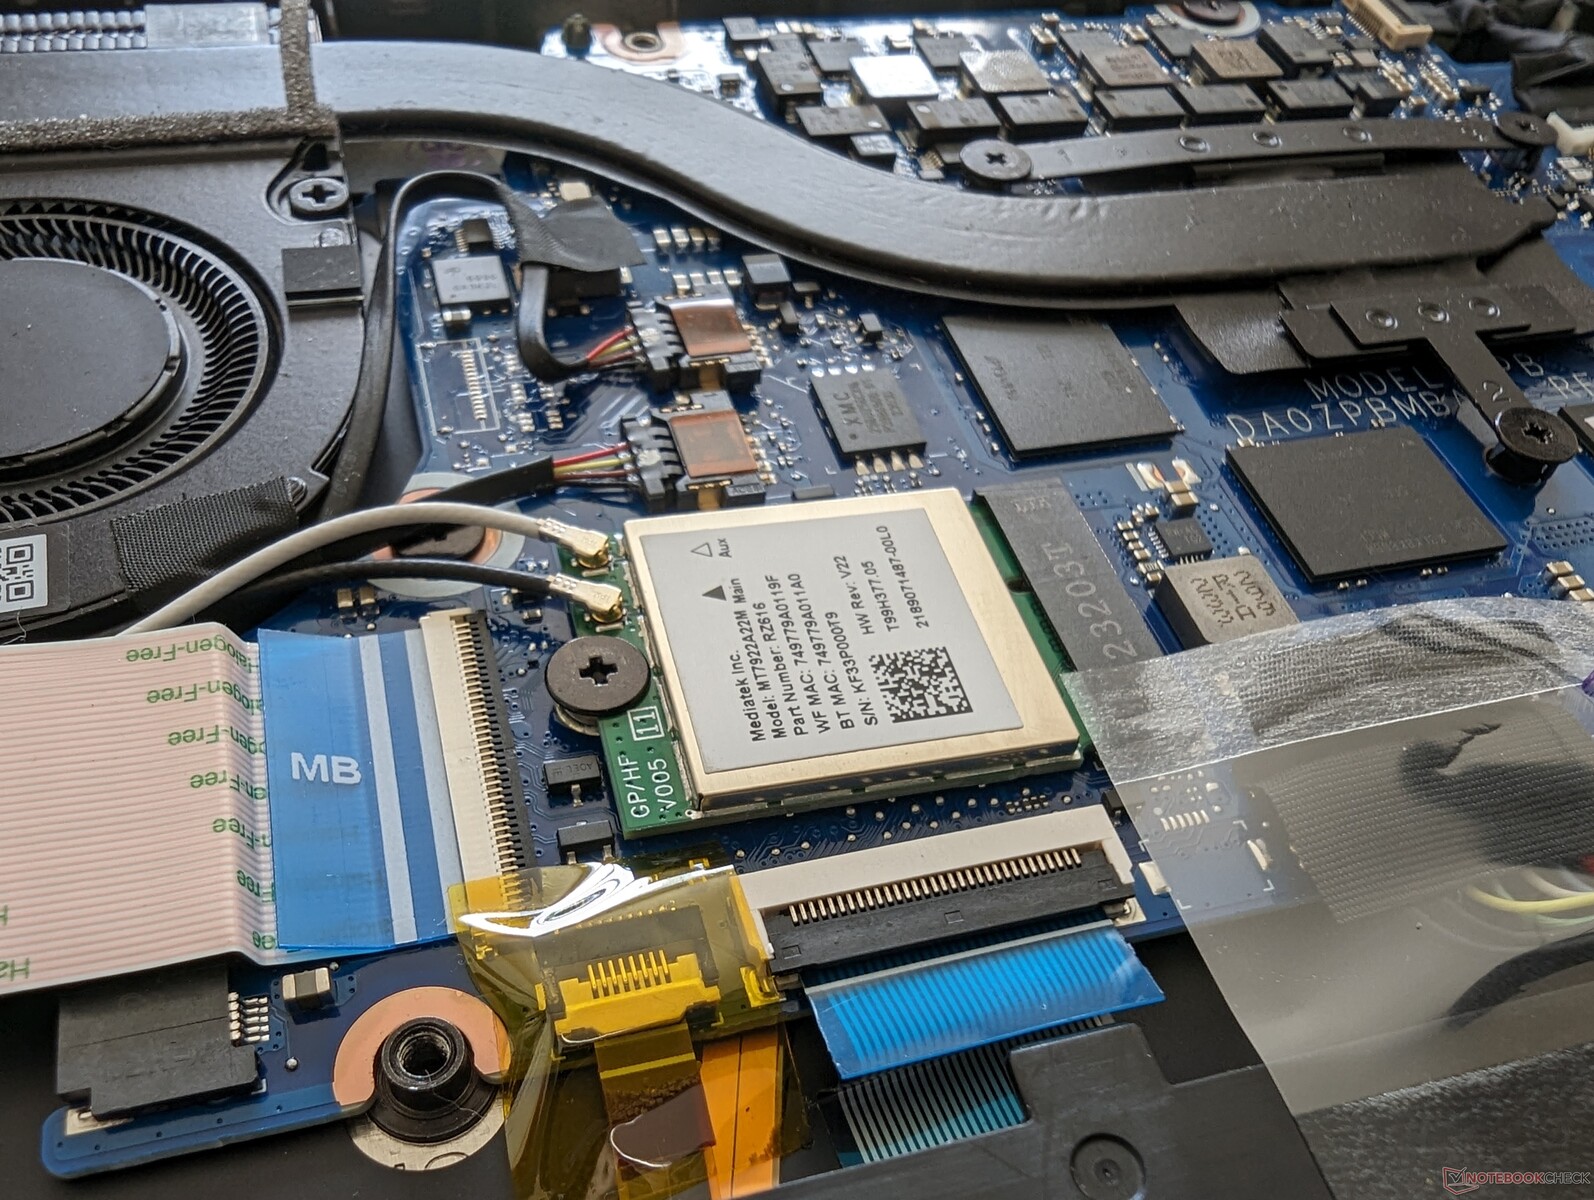
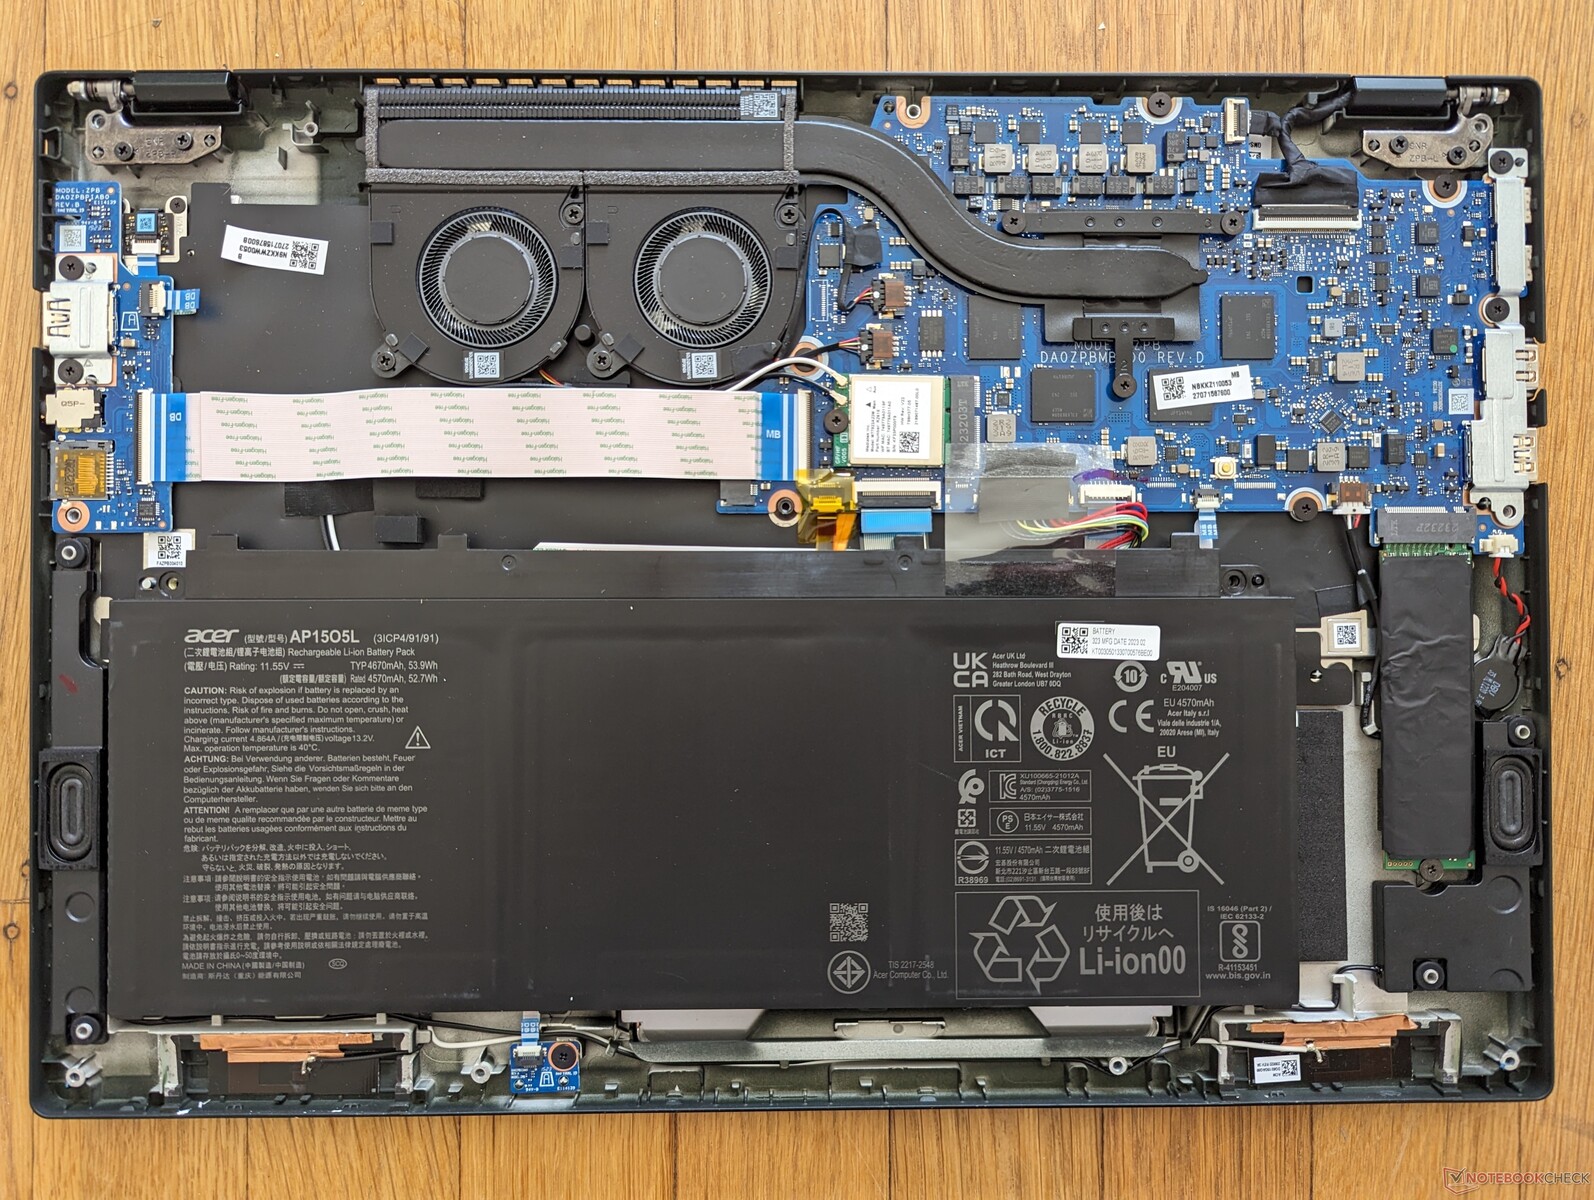
Dolny panel można łatwo otworzyć za pomocą klucza Torx. Wentylatory i płyta główna zmieniły się dość znacząco między modelami Zen 3+ i Zen 4, co pokazują poniższe zdjęcia. Na przykład dysk SSD znajduje się teraz obok akumulatora.
Akcesoria i gwarancja
W pudełku nie ma żadnych dodatków poza dokumentacją i zasilaczem sieciowym. W przypadku zakupu w Stanach Zjednoczonych obowiązuje roczna ograniczona gwarancja producenta.
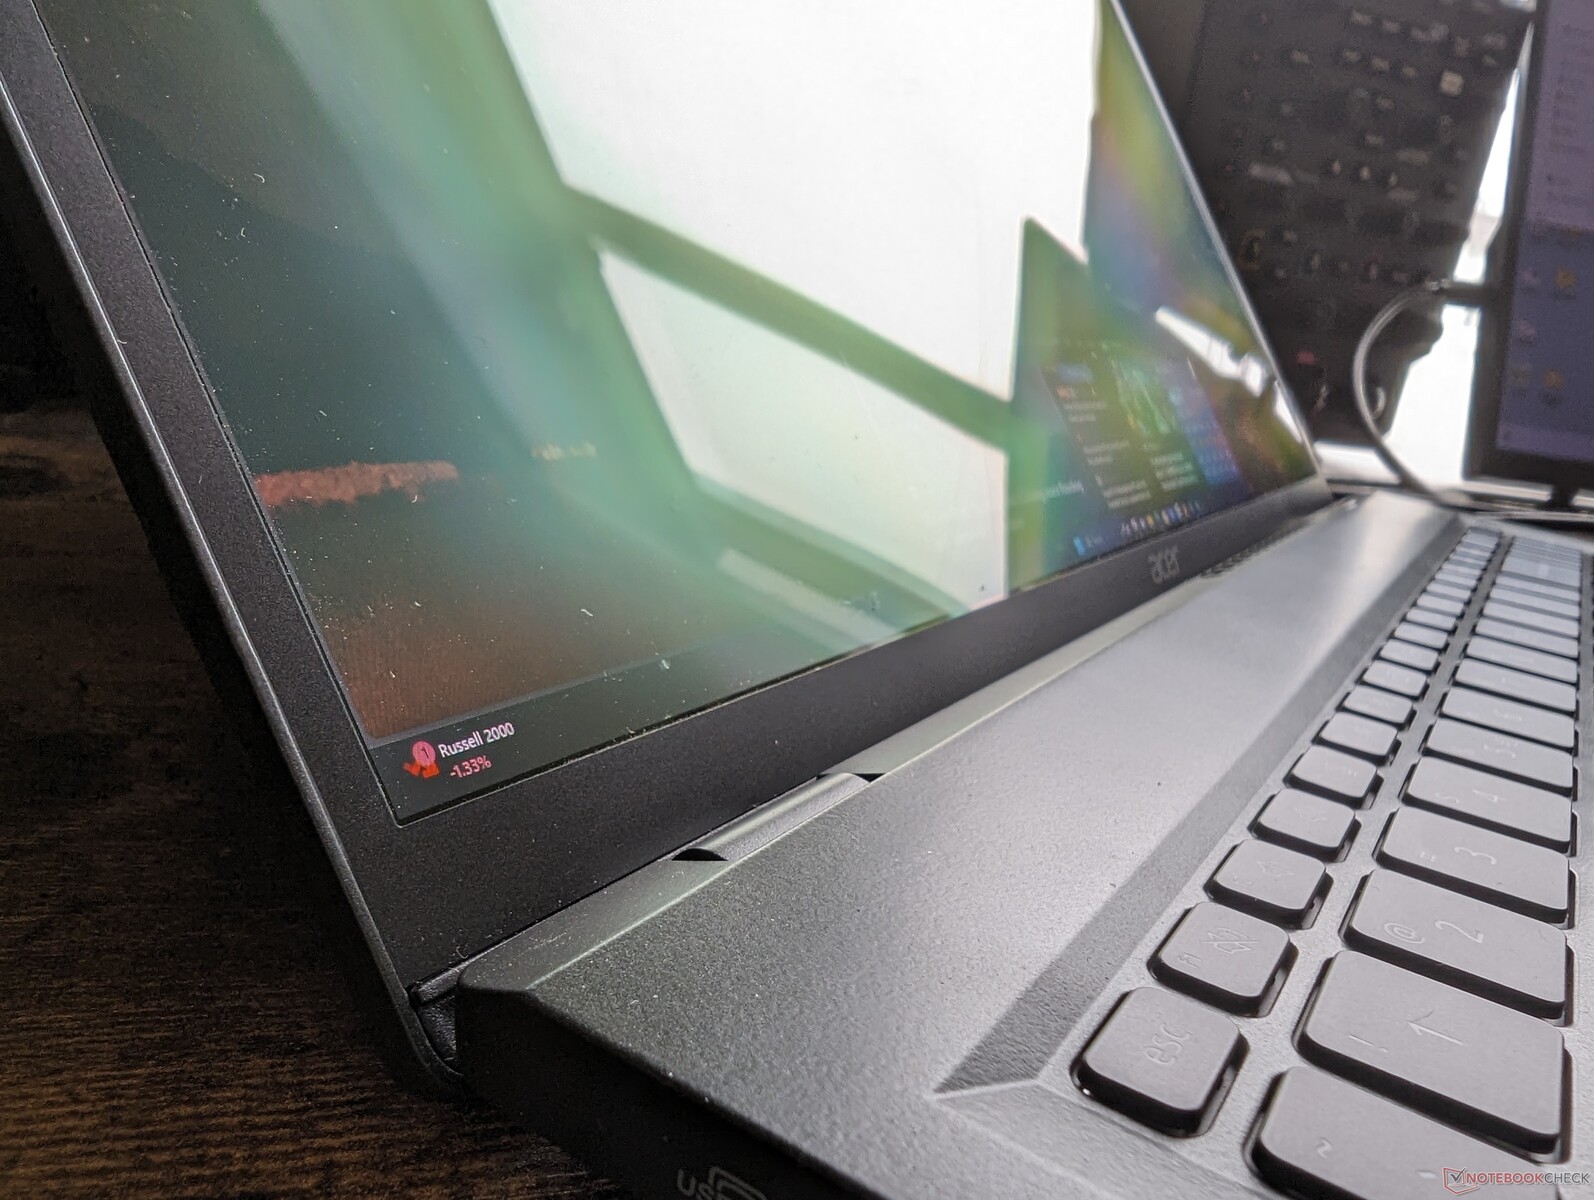
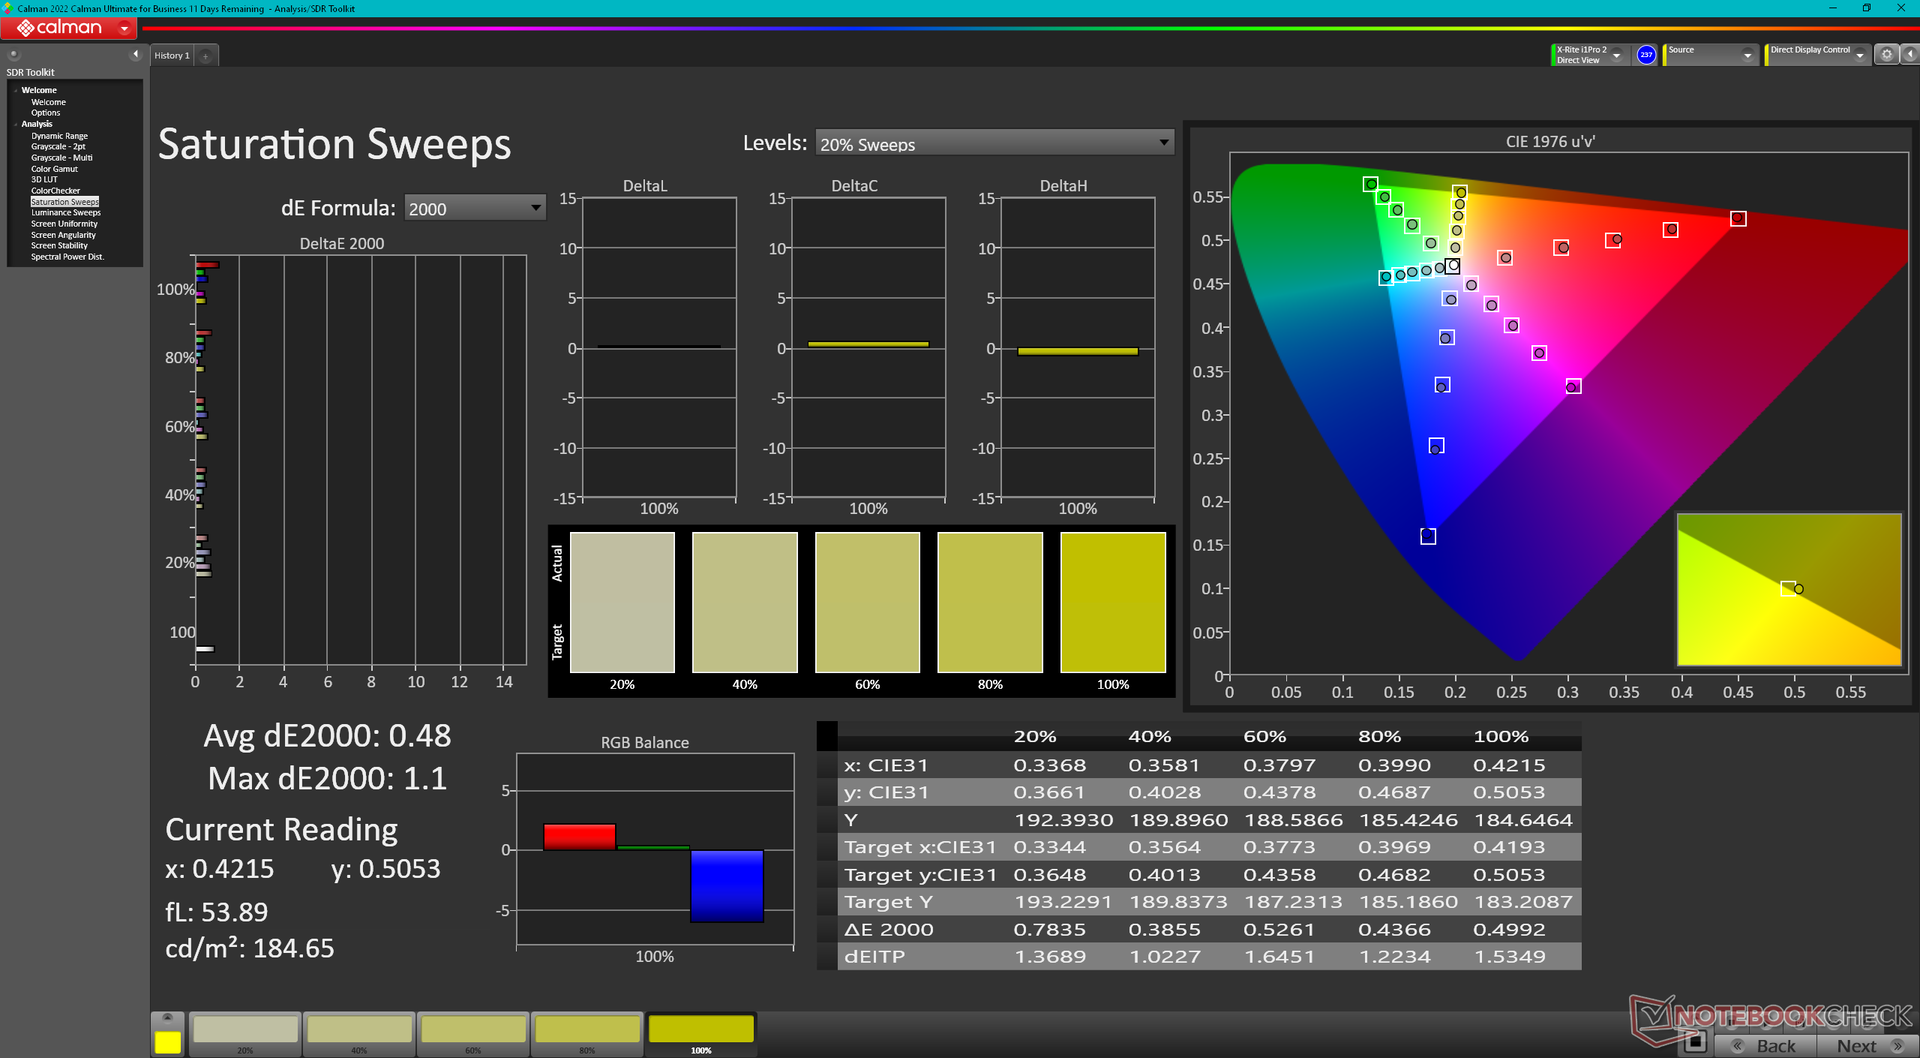
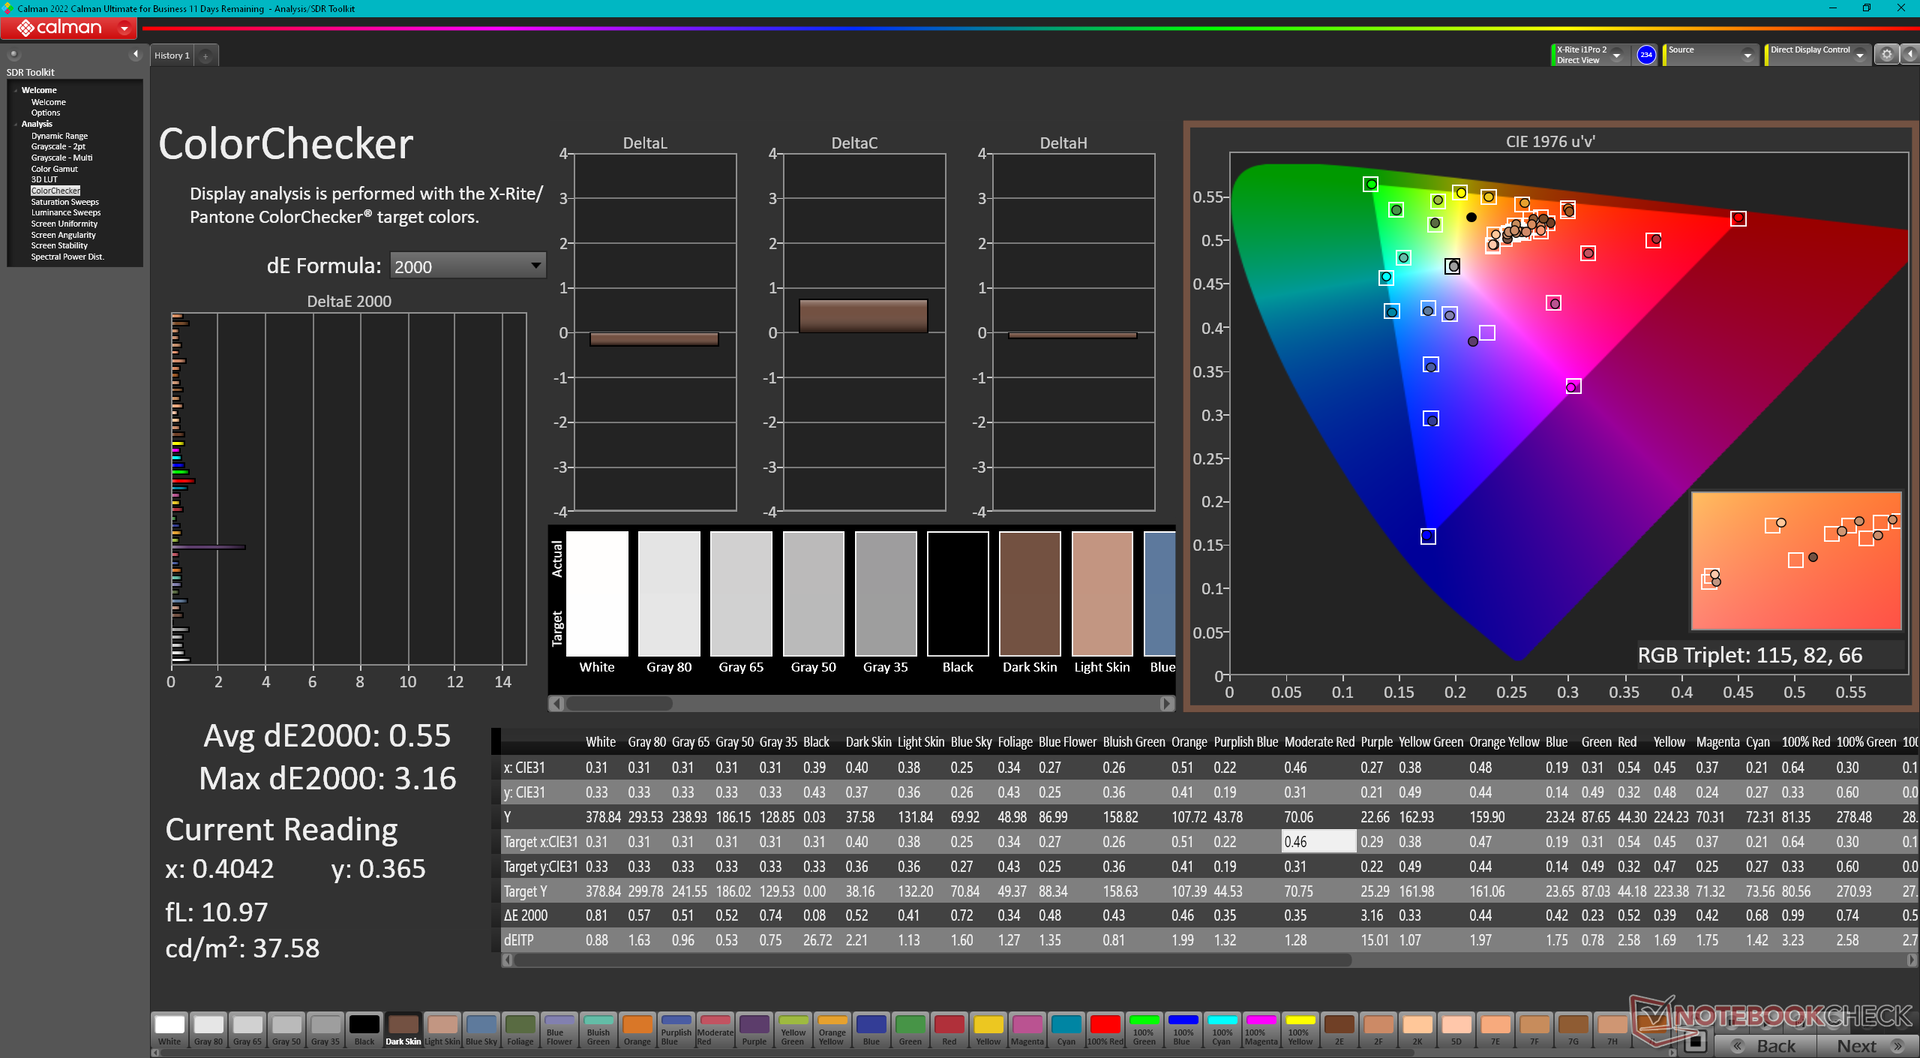
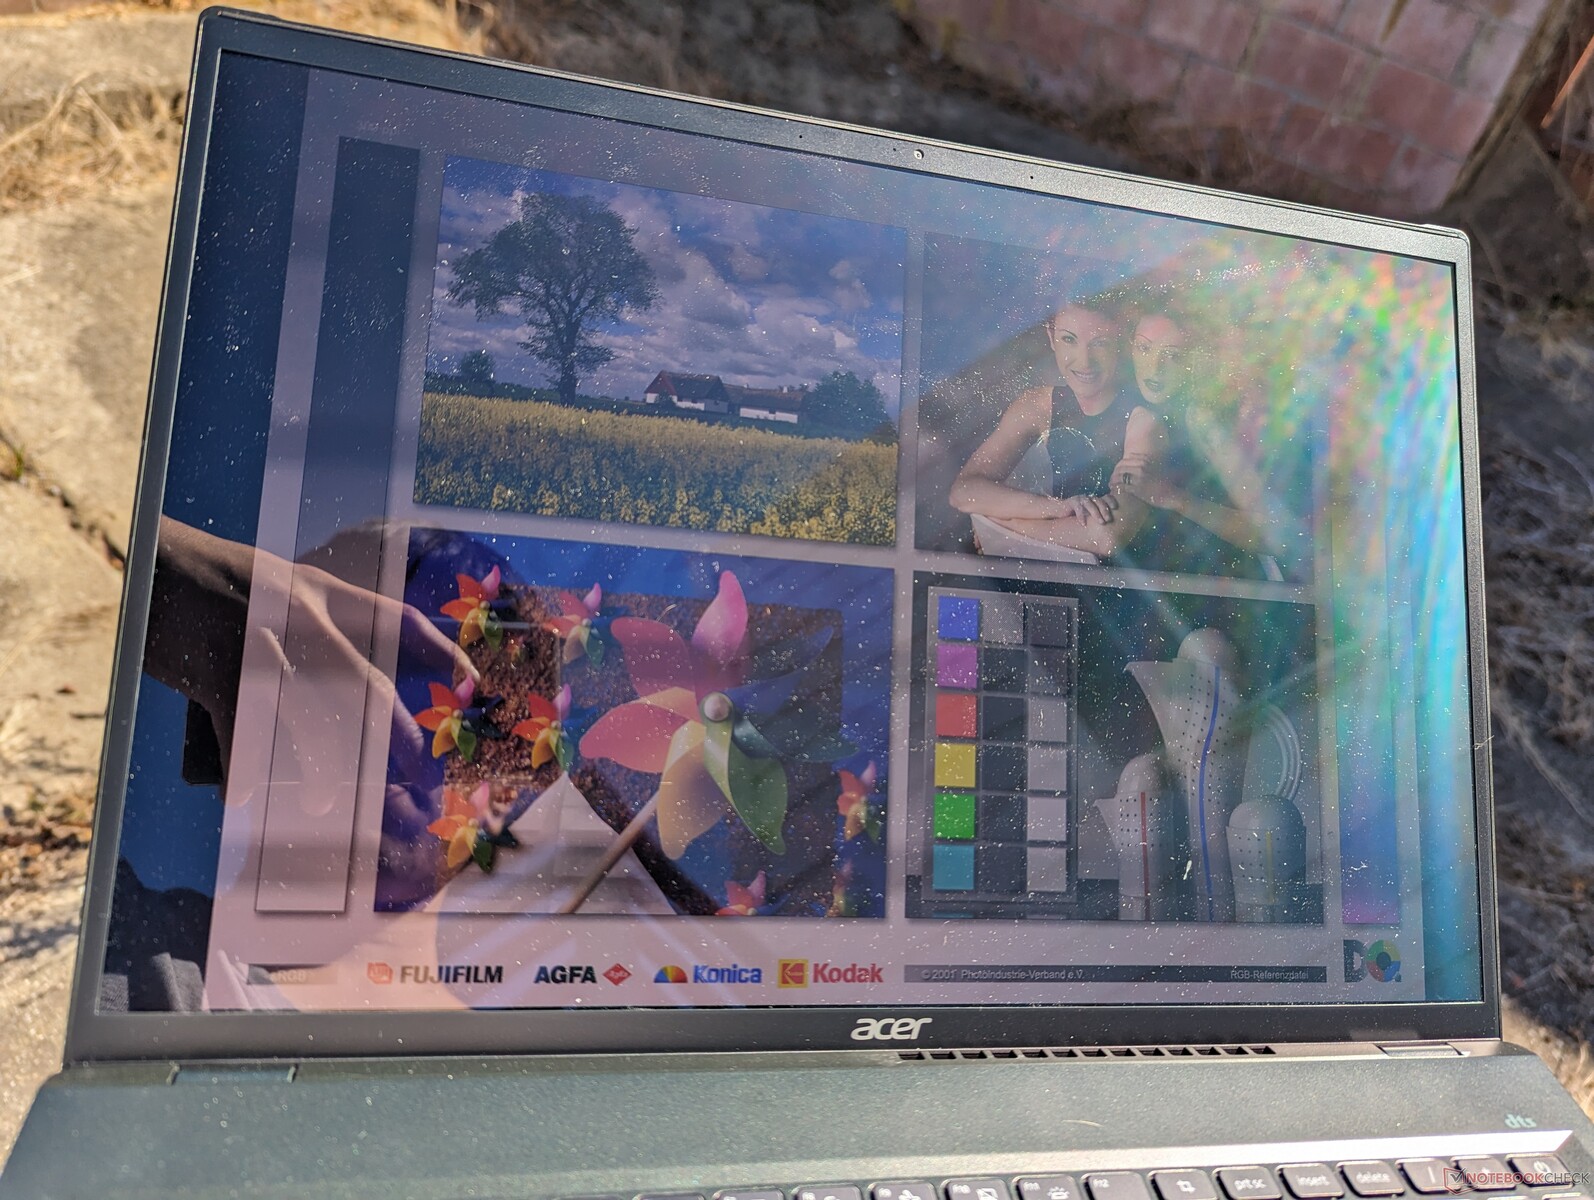
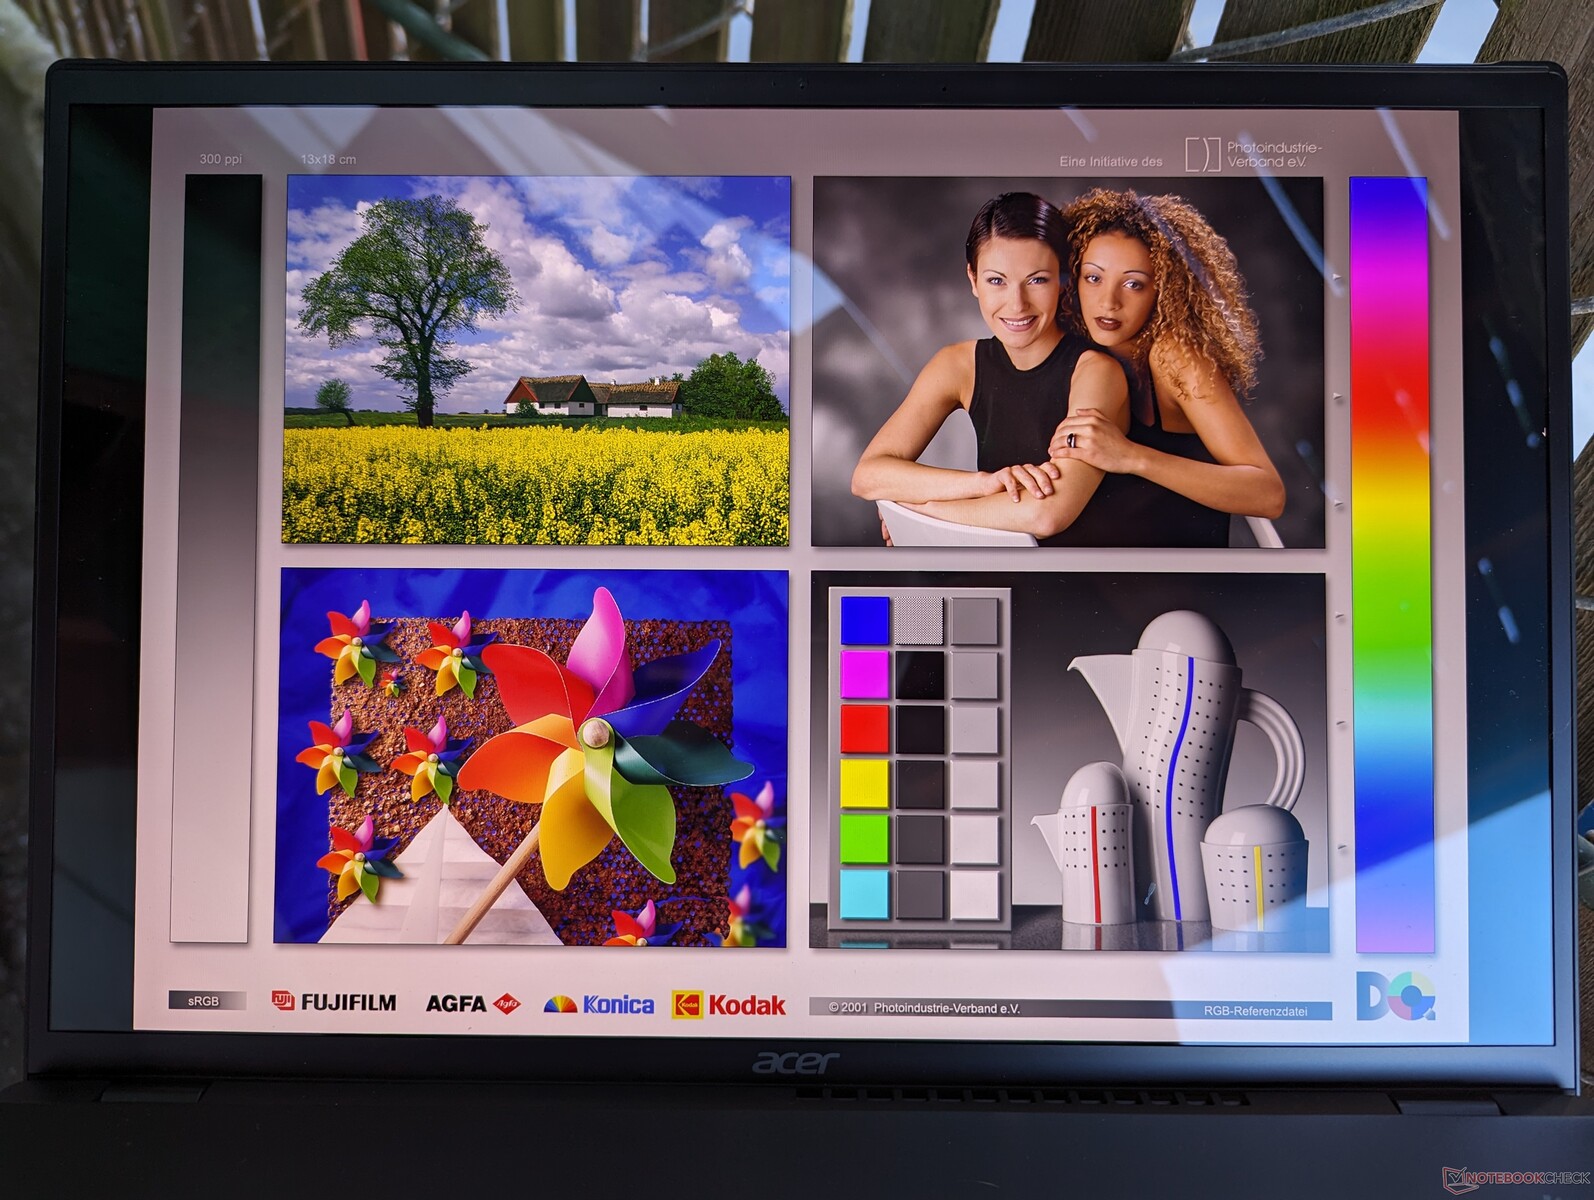
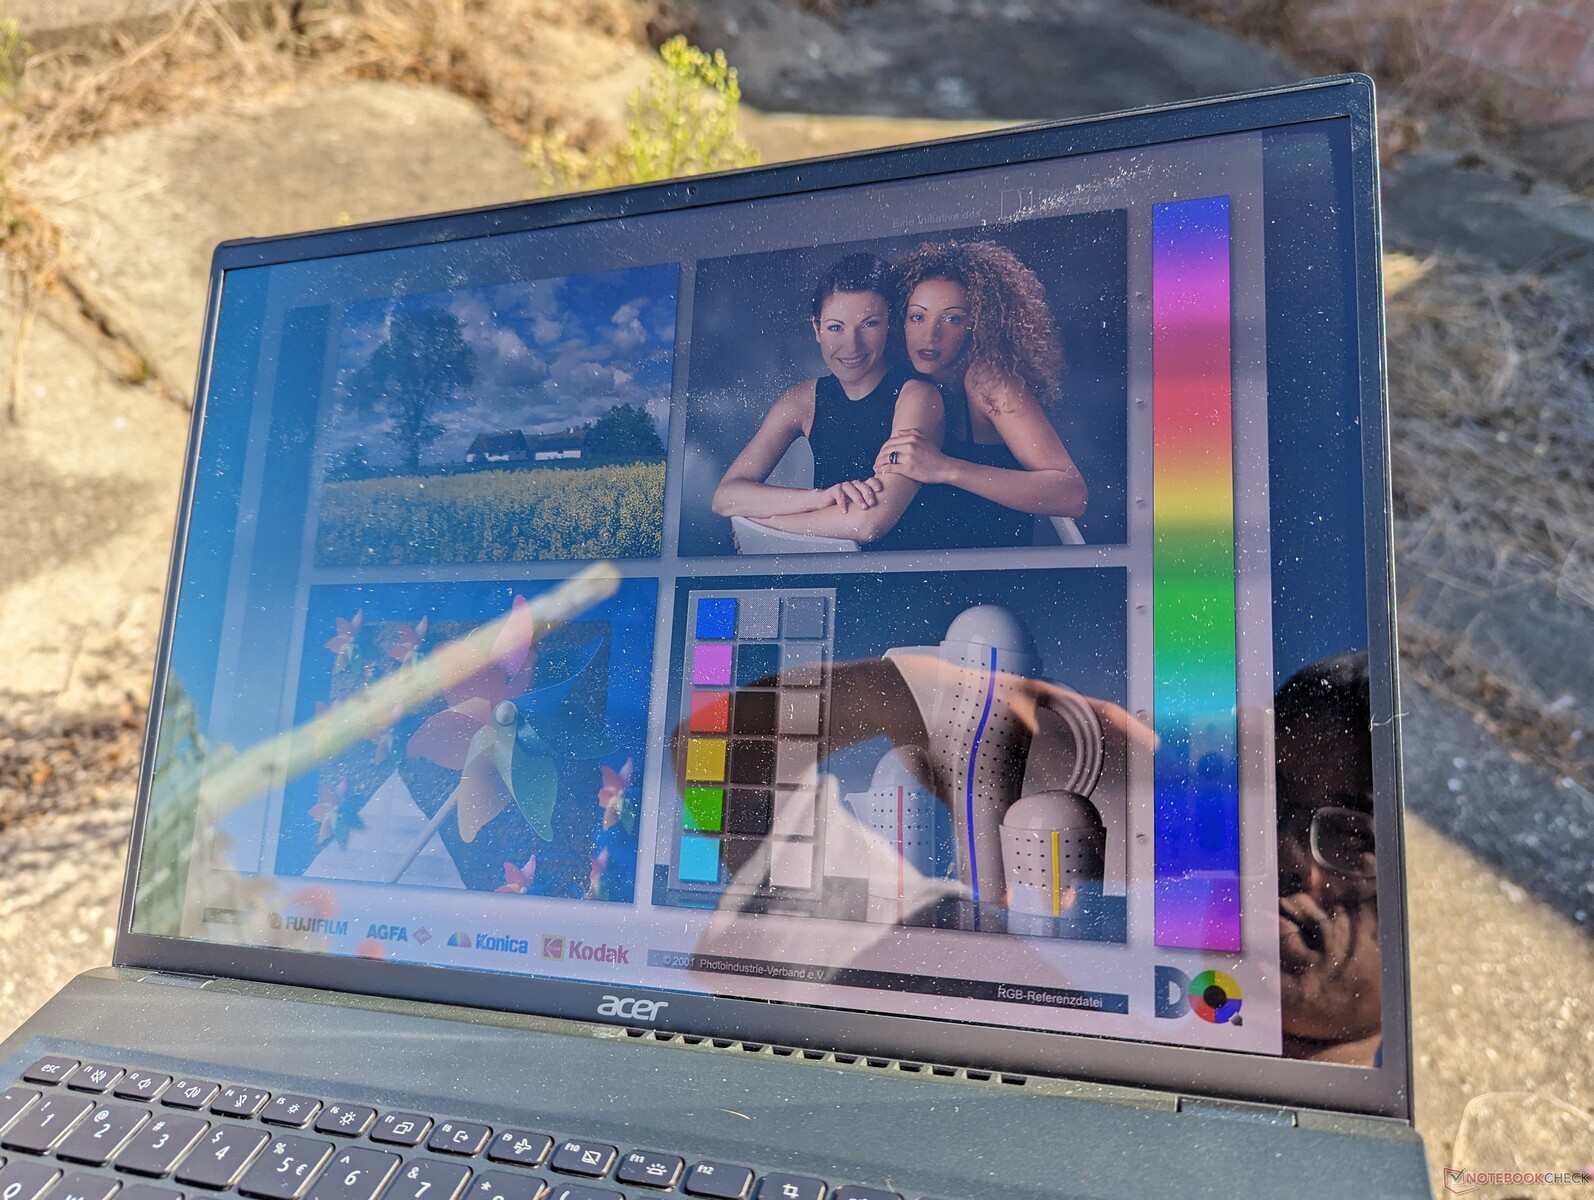
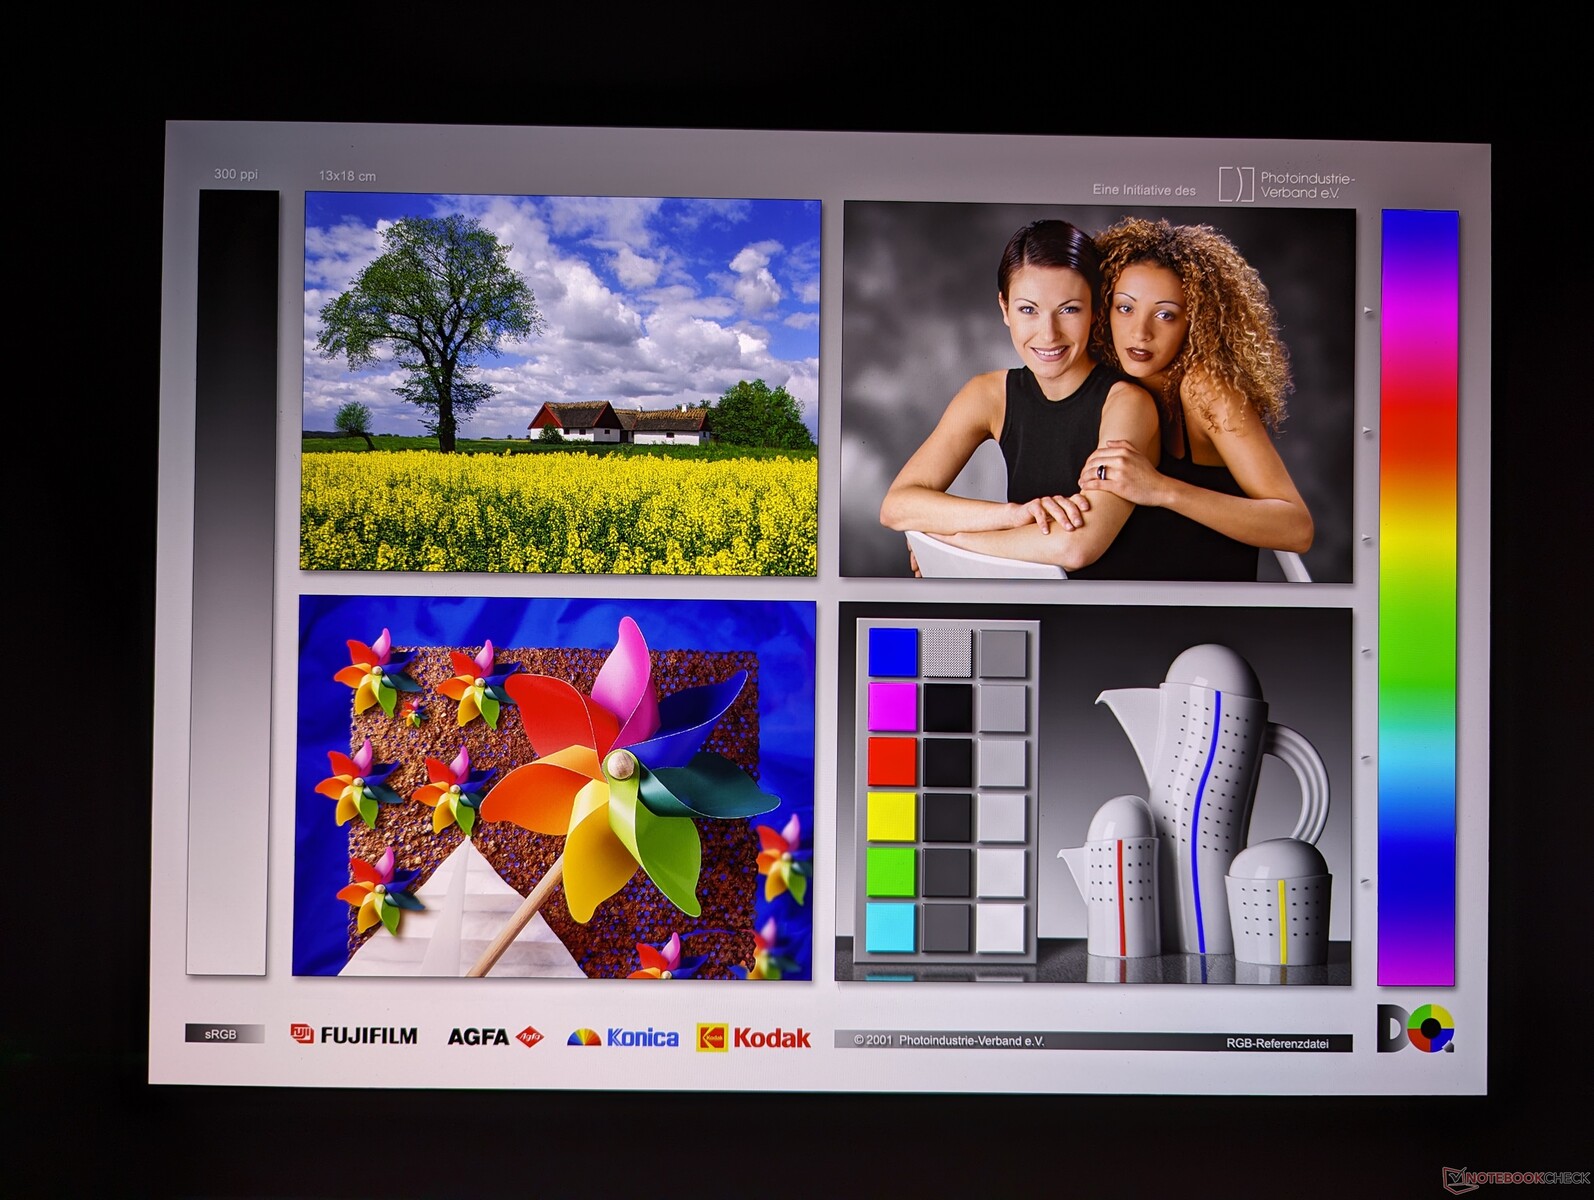
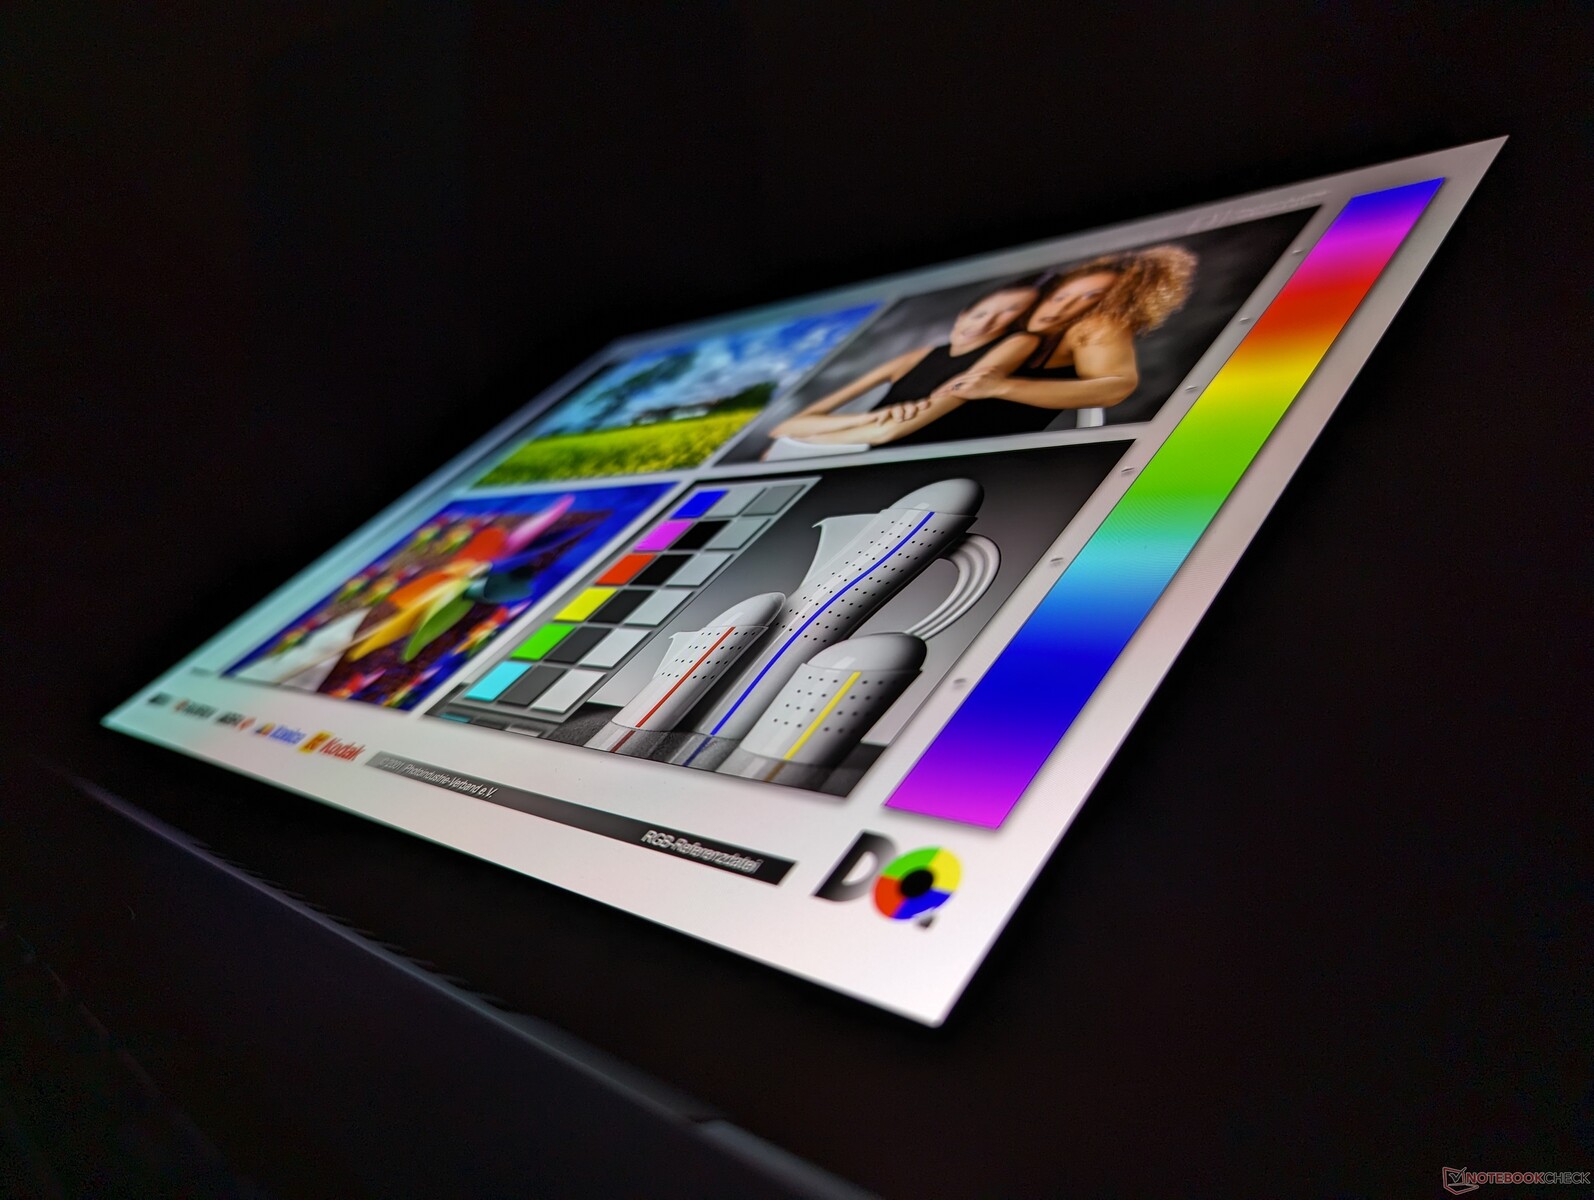
Wyświetlacz
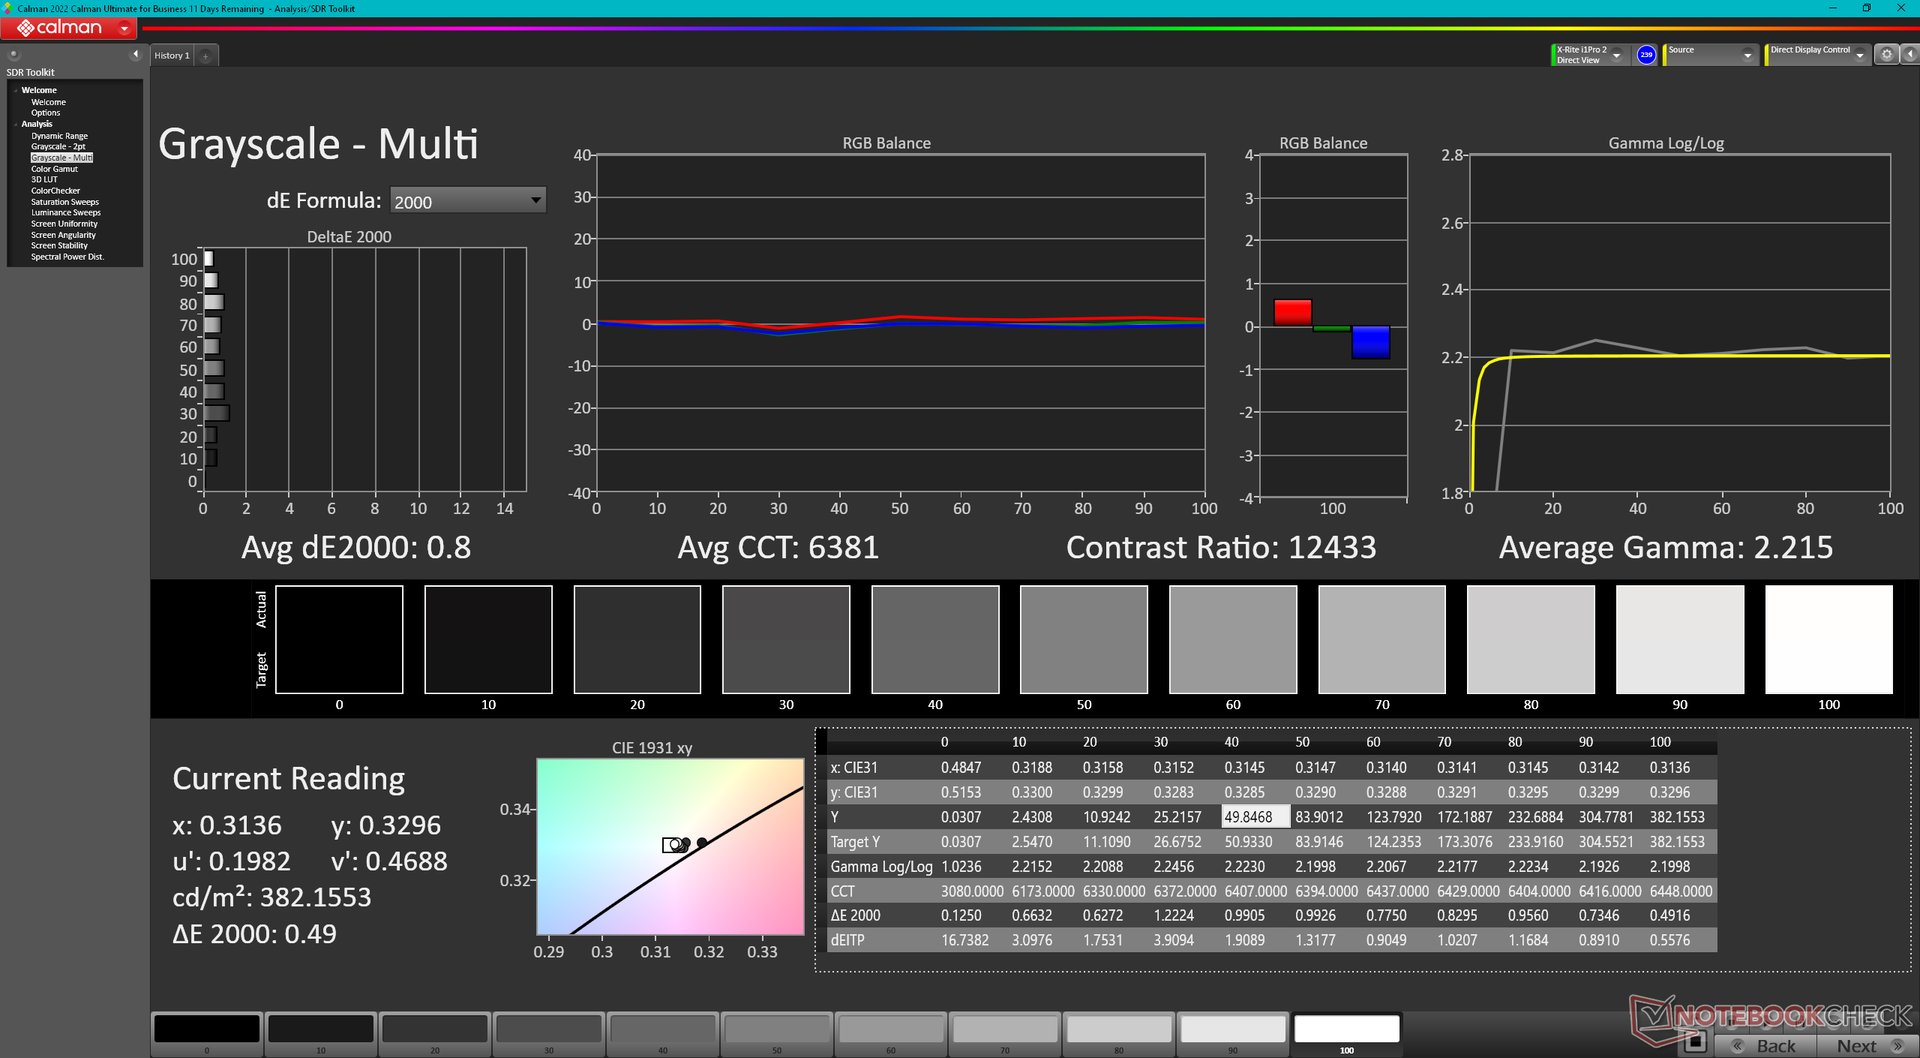
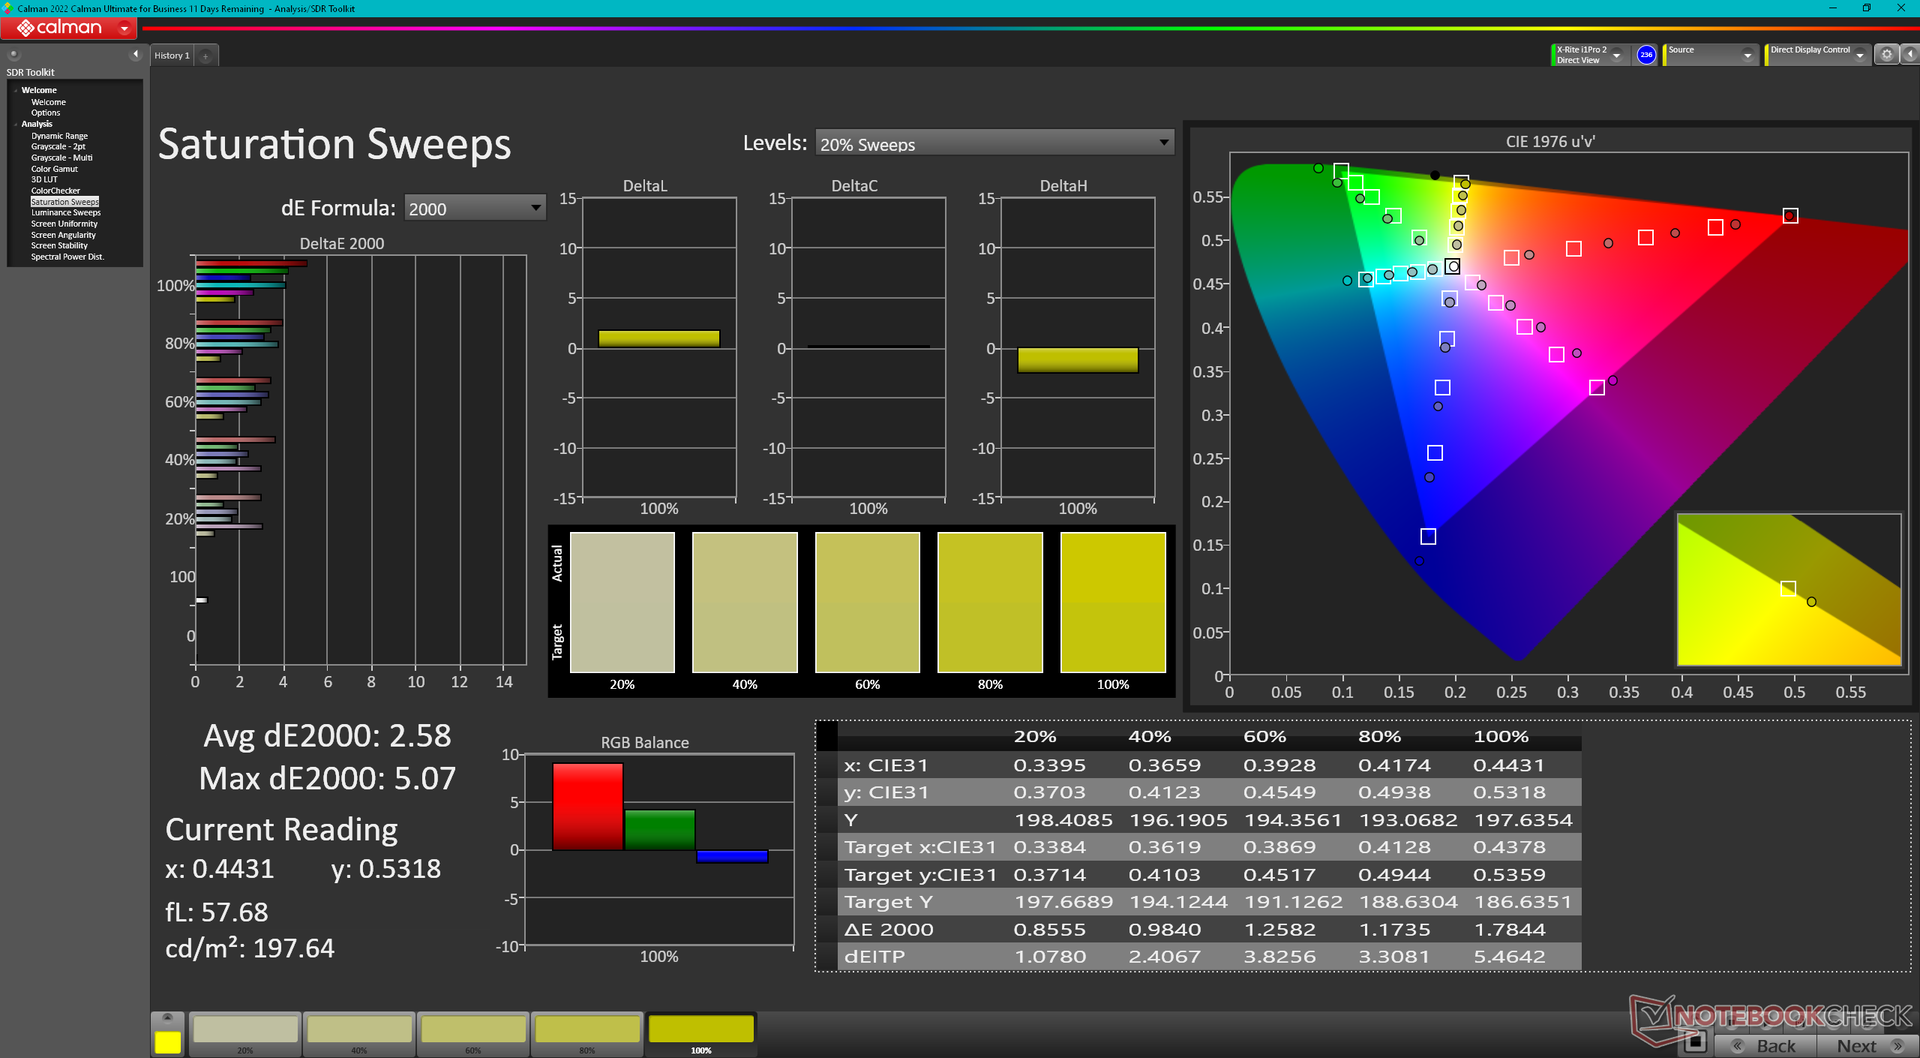
Nasza jednostka jest dostarczana z wyświetlaczem OLED 3200 x 2000 120 Hz zamiast wyświetlacza OLED 3840 x 2400 60 Hz z naszej wcześniejszej recenzji Zen 3+ Swift Edge 16. Oba panele Samsunga oferują podobne pokrycie kolorów, poziomy jasności, poziomy czerni i bardzo szybkie czasy reakcji. Opcja wyższej rozdzielczości może być bardziej przydatna w przypadku niektórych aplikacji, takich jak Excel lub wielozadaniowe okna side-by-side, ale trudno jest wrócić do 60 Hz, gdy przyzwyczaisz się do szybszej częstotliwości odświeżania 120 Hz naszej opcji niższej rozdzielczości 3.2K. W przypadku gier wyświetlacz 120 Hz oznacza, że możesz celować w 40 FPS zamiast 30 FPS bez martwienia się o rozrywanie ekranu.

| |||||||||||||||||||||||||
rozświetlenie: 98 %
na akumulatorze: 379.8 cd/m²
kontrast: ∞:1 (czerń: 0 cd/m²)
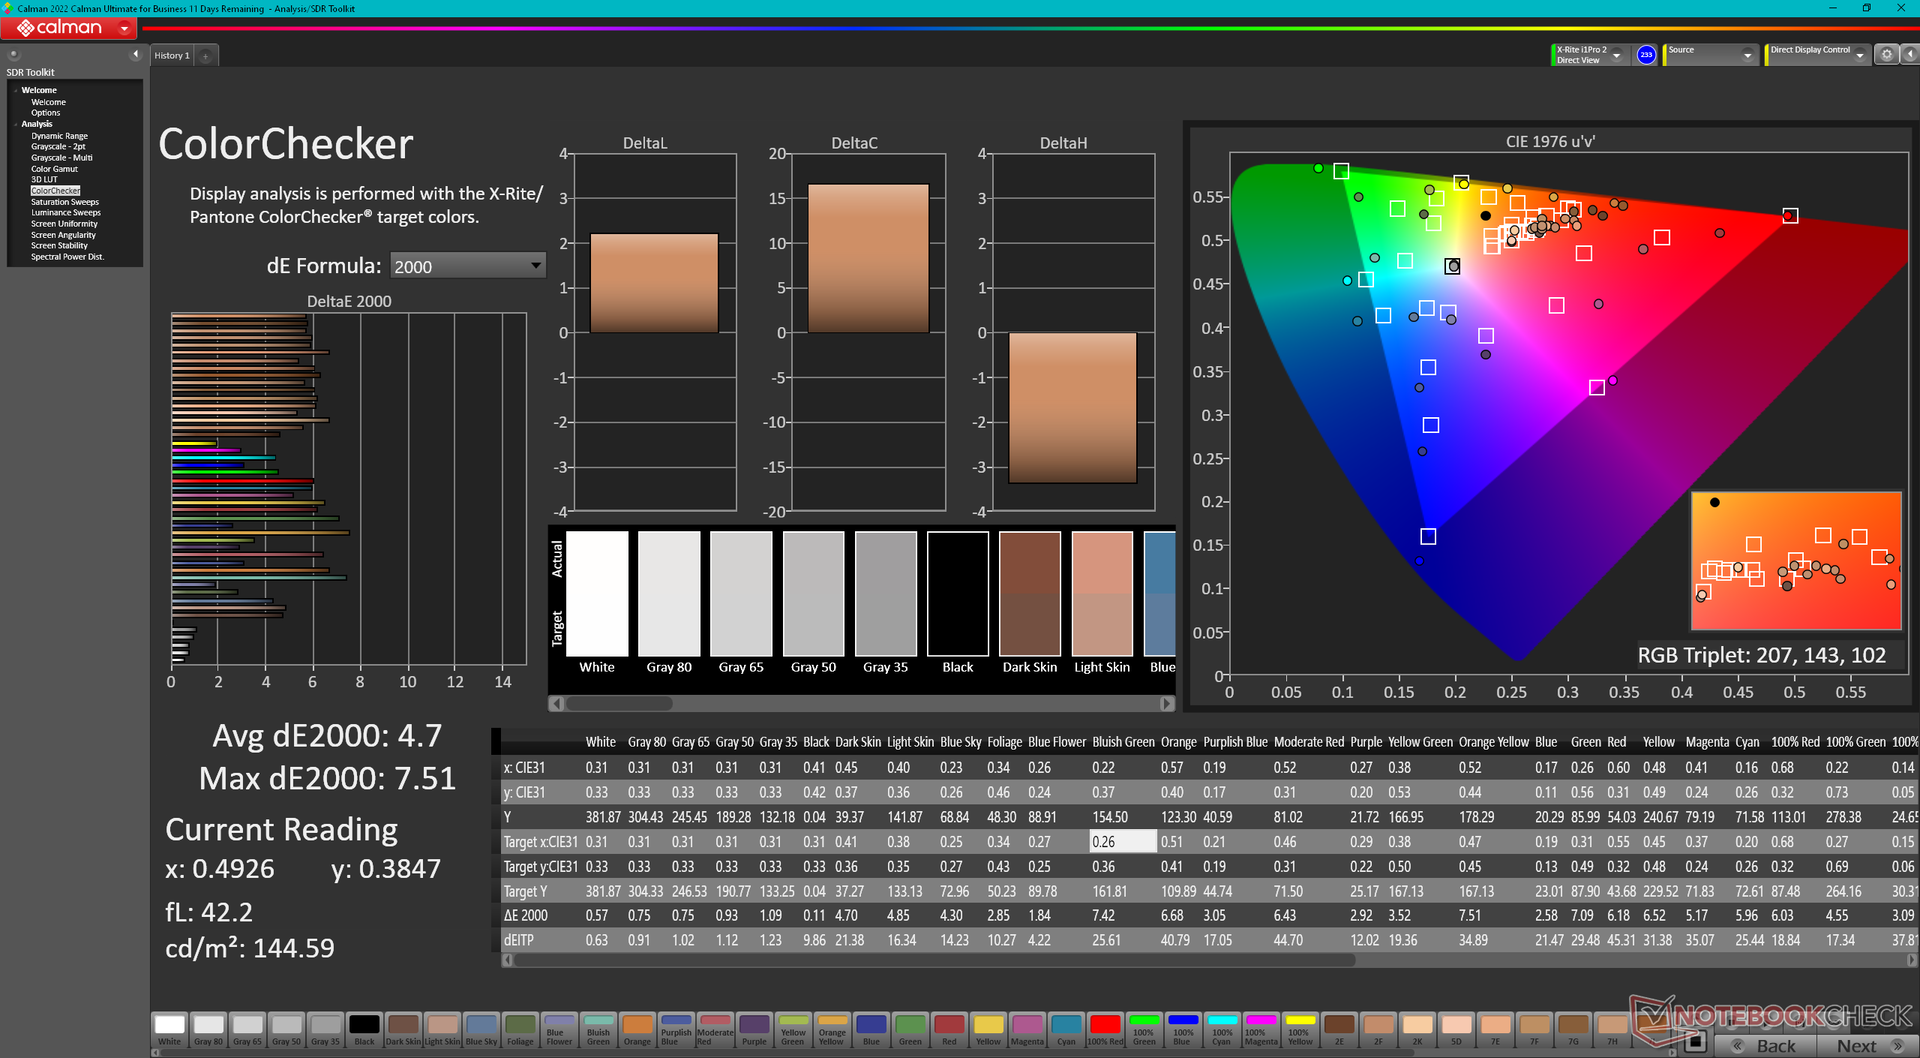
ΔE ColorChecker Calman: 4.7 | ∀{0.5-29.43 Ø4.71}
calibrated: 0.55
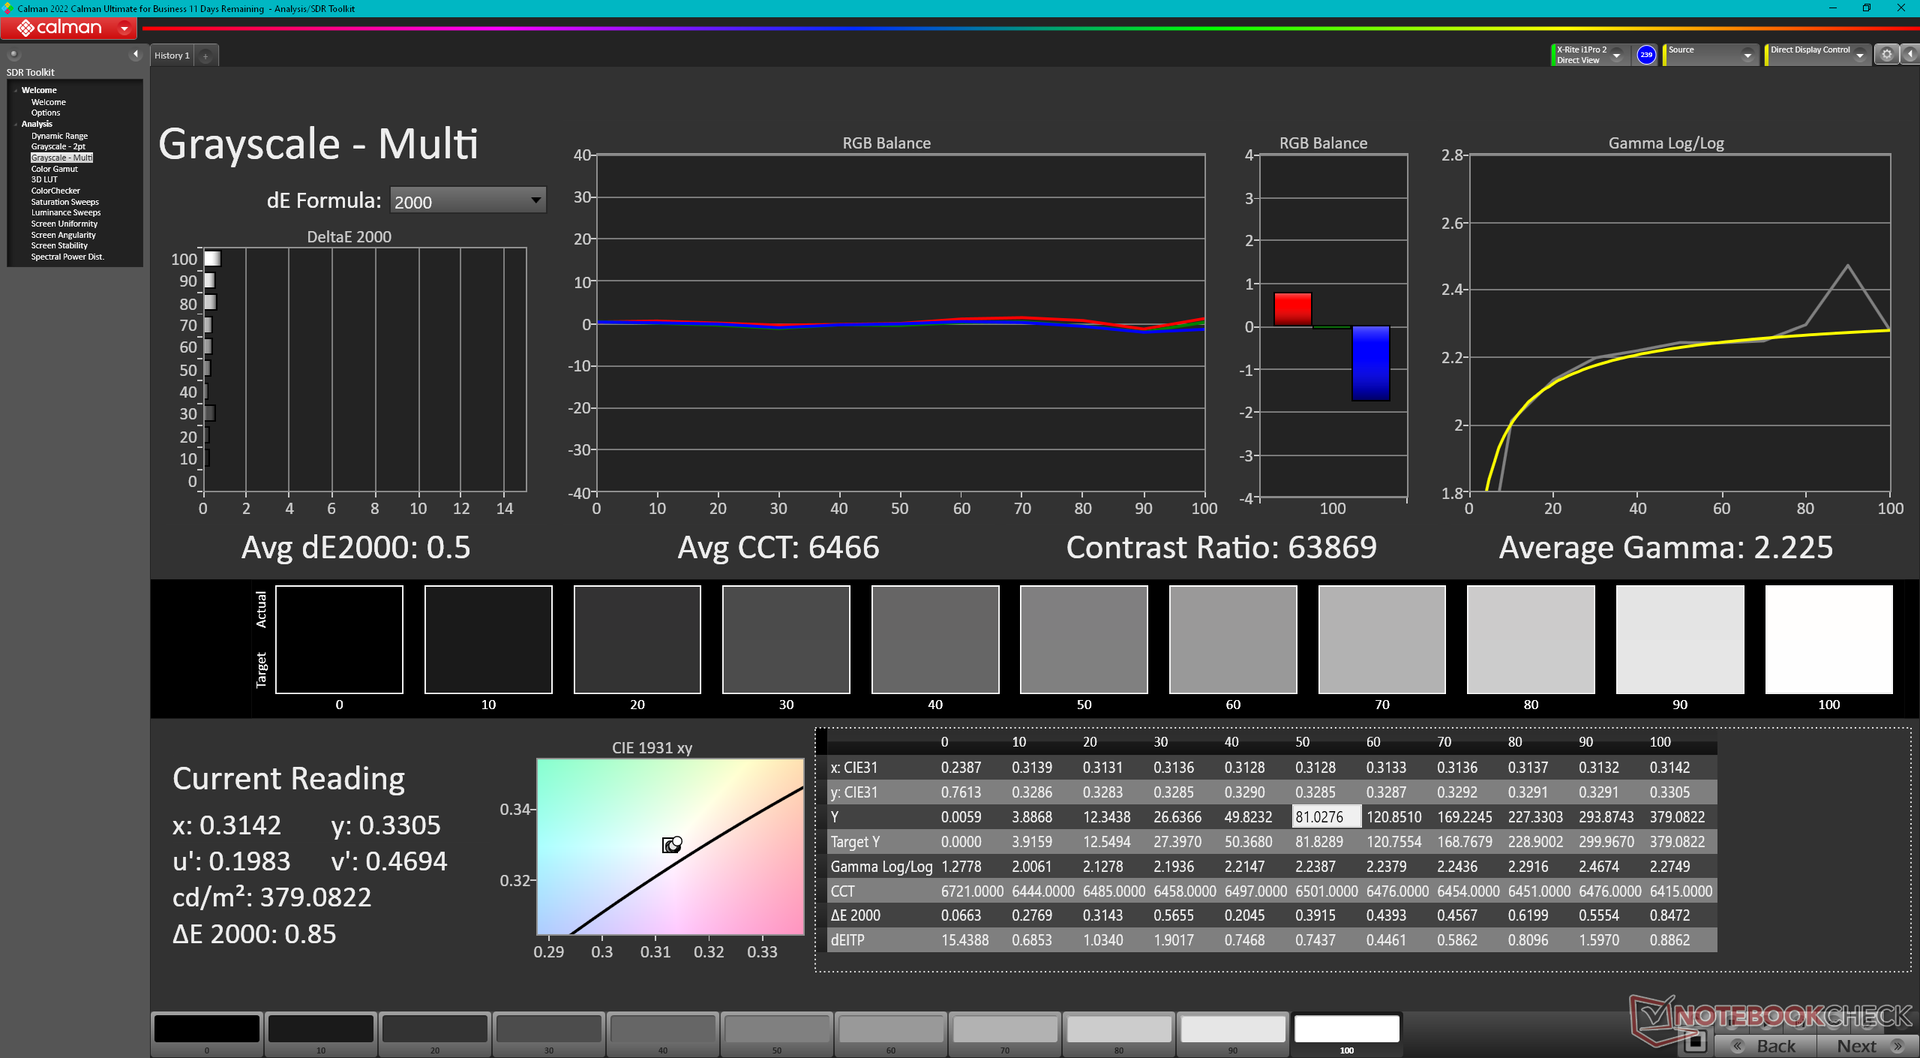
ΔE Greyscale Calman: 0.8 | ∀{0.09-98 Ø4.96}
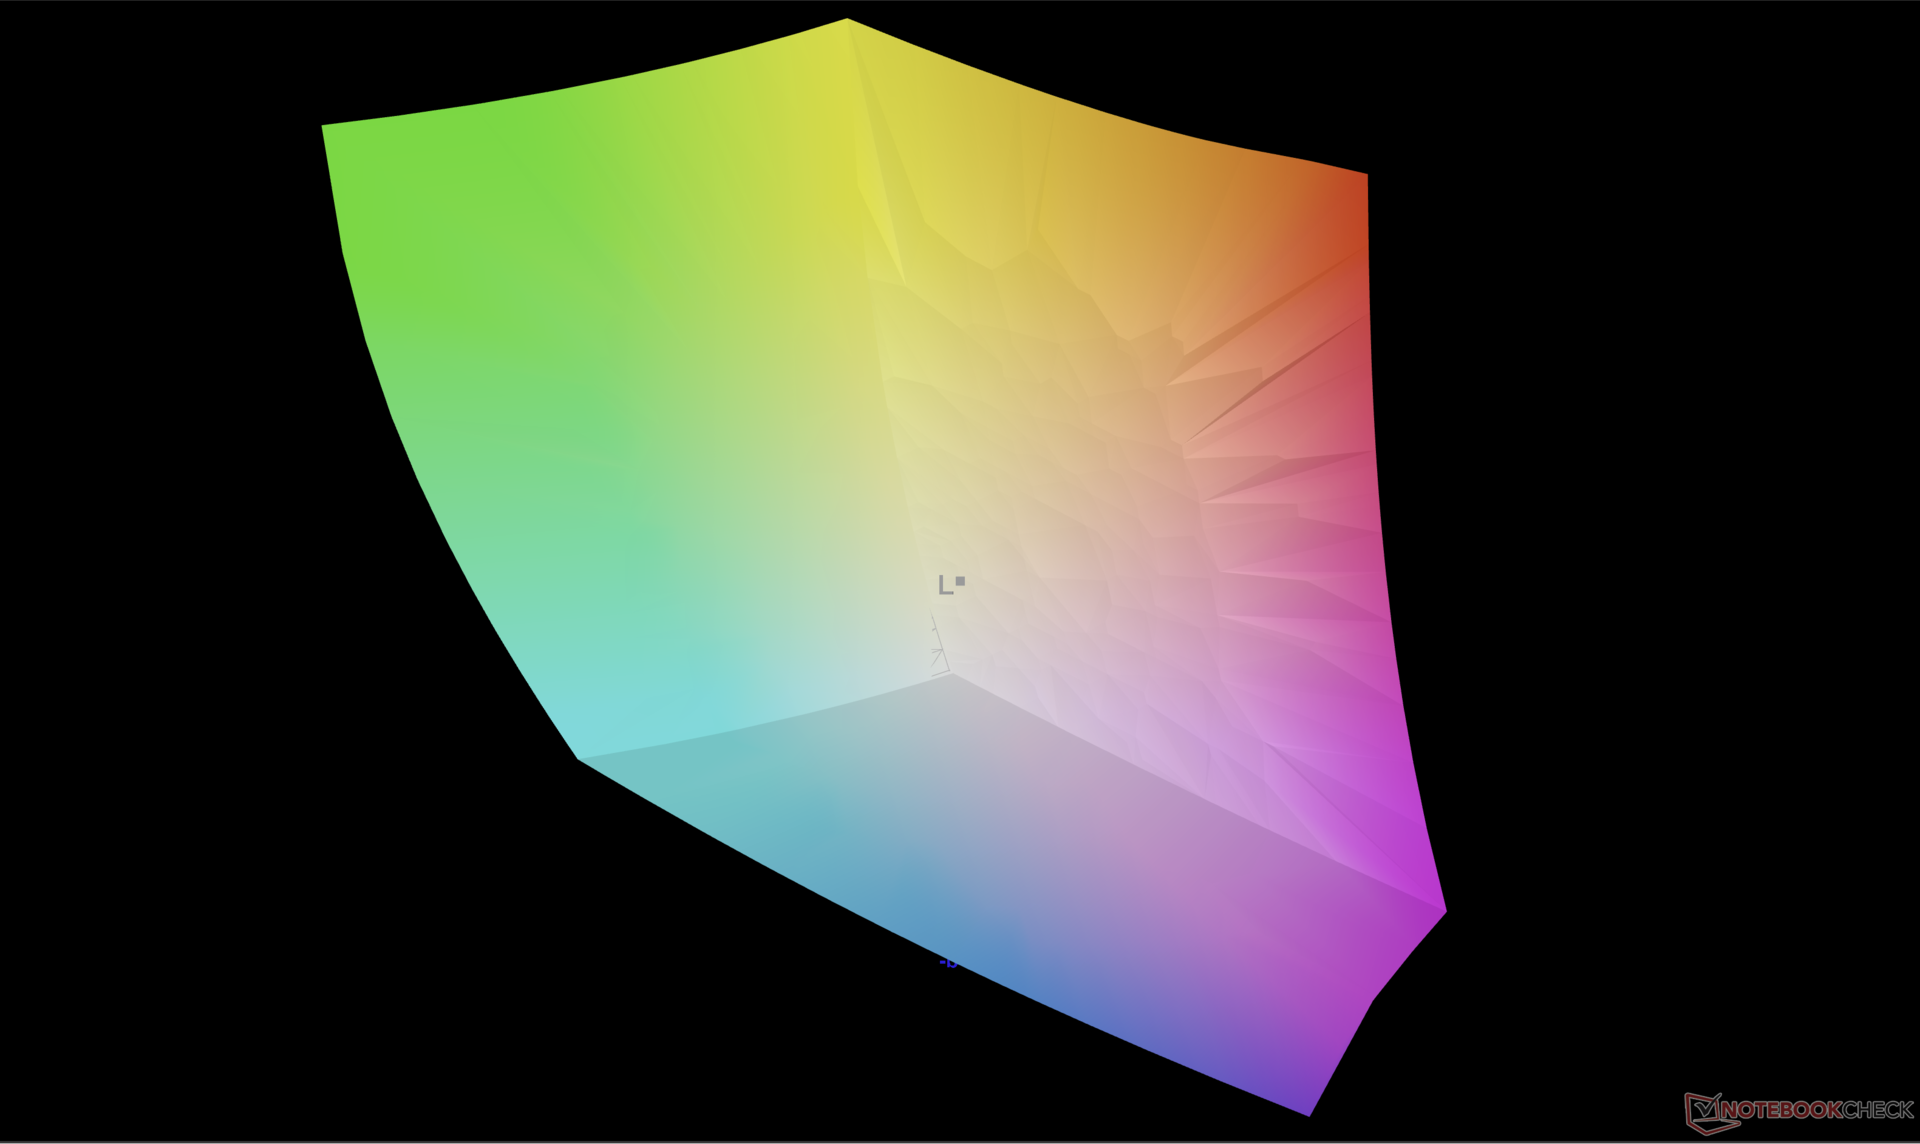
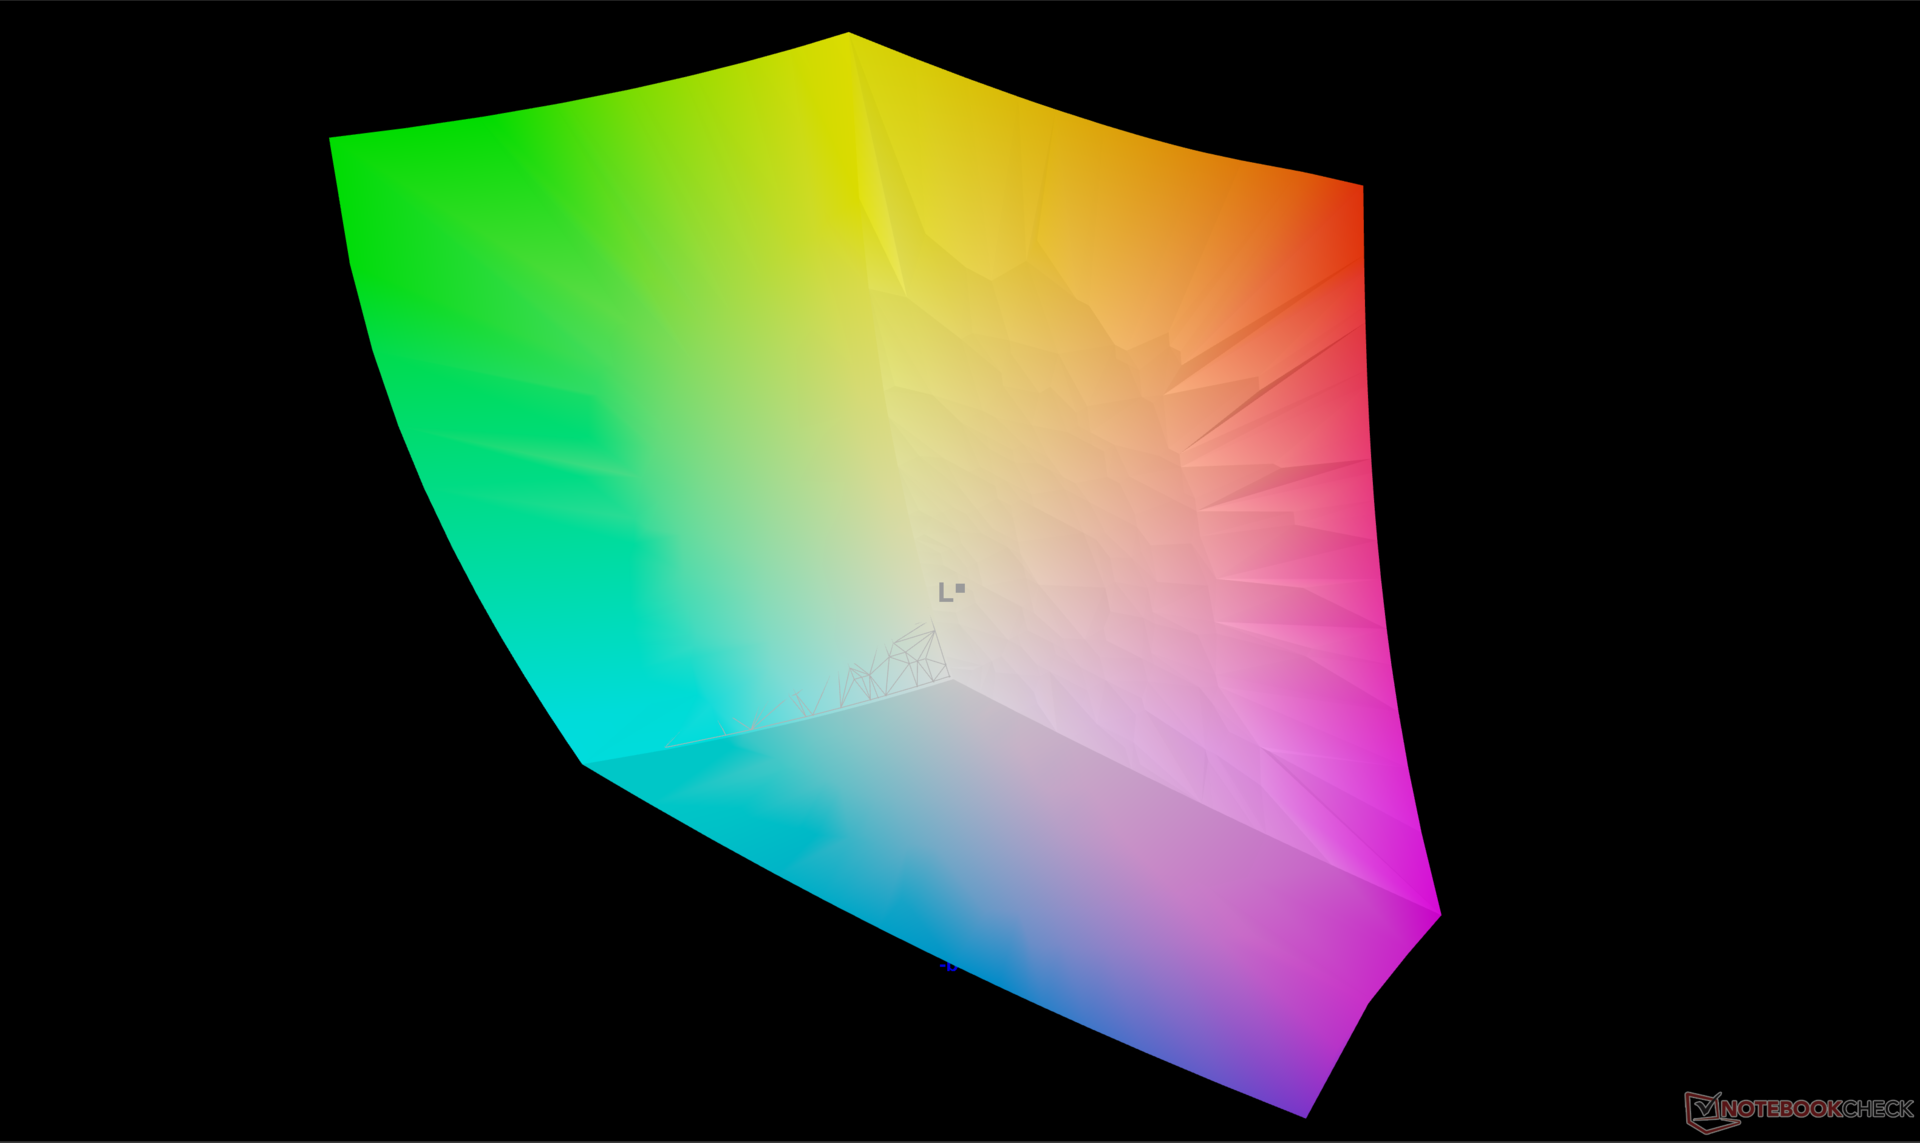
100% AdobeRGB 1998 (Argyll 3D)
100% sRGB (Argyll 3D)
99.9% Display P3 (Argyll 3D)
Gamma: 2.22
CCT: 6381 K
| Acer Swift Edge SFE16 Ryzen 7 7840U Samsung ATNA60BX03-0, OLED, 3200x2000, 16" | Acer Swift Edge SFE16-42-R1GM Samsung SDC4168, OLED, 3840x2400, 16" | Lenovo Slim Pro 9i 16IRP8 LEN160-3.2K, Mini-LED, 3200x2000, 16" | Asus VivoBook Pro 16 Au Optronics B160QAN02.L, IPS, 2560x1600, 16" | Samsung Galaxy Book3 Ultra 16 Samsung ATNA60CL03-0, AMOLED, 2880x1800, 16" | Huawei MateBook 16s i7 BOE XS TV160DKT-NH0, IPS, 2520x1680, 16" | |
|---|---|---|---|---|---|---|
| Display | -1% | -7% | -5% | -1% | -24% | |
| Display P3 Coverage (%) | 99.9 | 99.7 0% | 95.1 -5% | 98.5 -1% | 99.9 0% | 64.5 -35% |
| sRGB Coverage (%) | 100 | 100 0% | 99.9 0% | 99.9 0% | 100 0% | 96.7 -3% |
| AdobeRGB 1998 Coverage (%) | 100 | 97.2 -3% | 84.6 -15% | 86.1 -14% | 96.3 -4% | 66.6 -33% |
| Response Times | -226% | -1588% | -476% | 25% | -4192% | |
| Response Time Grey 50% / Grey 80% * (ms) | 0.57 ? | 2 ? -251% | 14 ? -2356% | 2 ? -251% | 0.49 ? 14% | 35.7 ? -6163% |
| Response Time Black / White * (ms) | 1 ? | 3 ? -200% | 9.2 ? -820% | 8 ? -700% | 0.65 ? 35% | 23.2 ? -2220% |
| PWM Frequency (Hz) | 238.8 | 239 ? | 5784 ? | 240 ? | ||
| Screen | -66% | -198% | -42% | -49% | -3% | |
| Brightness middle (cd/m²) | 379.8 | 369 -3% | 627.4 65% | 504 33% | 400 5% | 311 -18% |
| Brightness (cd/m²) | 383 | 371 -3% | 618 61% | 465 21% | 399 4% | 319 -17% |
| Brightness Distribution (%) | 98 | 97 -1% | 95 -3% | 87 -11% | 93 -5% | 91 -7% |
| Black Level * (cd/m²) | 0.19 | 0.35 | 0.03 | 0.17 | ||
| Colorchecker dE 2000 * | 4.7 | 2.3 51% | 5.84 -24% | 1.83 61% | 2.3 51% | 1 79% |
| Colorchecker dE 2000 max. * | 7.51 | 4.37 42% | 10.22 -36% | 5.51 27% | 4.15 45% | 1.7 77% |
| Colorchecker dE 2000 calibrated * | 0.55 | 2.87 -422% | 4.45 -709% | 1.34 -144% | 1.66 -202% | 0.8 -45% |
| Greyscale dE 2000 * | 0.8 | 1.83 -129% | 6.7 -738% | 3.02 -278% | 2.7 -238% | 1.5 -88% |
| Gamma | 2.22 99% | 2.39 92% | 2.77 79% | 2.39 92% | 2.266 97% | 2.15 102% |
| CCT | 6381 102% | 6392 102% | 5795 112% | 6688 97% | 7047 92% | 6432 101% |
| Contrast (:1) | 3302 | 1440 | 13333 | 1829 | ||
| Całkowita średnia (program / ustawienia) | -98% /
-77% | -598% /
-382% | -174% /
-105% | -8% /
-25% | -1406% /
-706% |
* ... im mniej tym lepiej
Wyświetl czasy reakcji
| ↔ Czas reakcji od czerni do bieli | ||
|---|---|---|
| 1 ms ... wzrost ↗ i spadek ↘ łącznie | ↗ 0.55 ms wzrost | 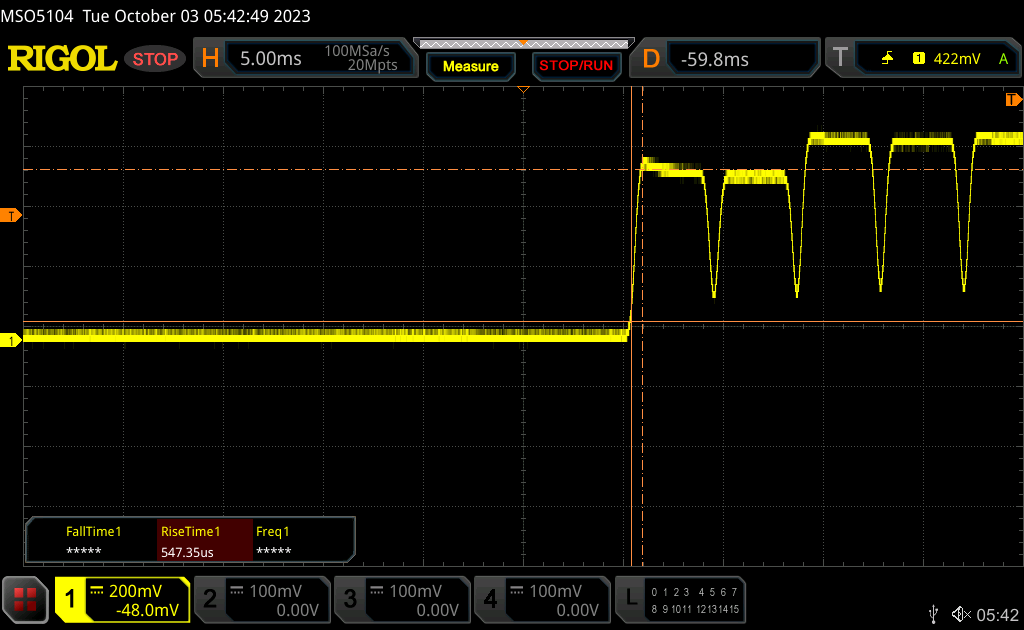 |
| ↘ 0.45 ms upadek | ||
| W naszych testach ekran wykazuje bardzo szybką reakcję i powinien bardzo dobrze nadawać się do szybkich gier. Dla porównania, wszystkie testowane urządzenia wahają się od 0.1 (minimum) do 240 (maksimum) ms. » 4 % wszystkich urządzeń jest lepszych. Oznacza to, że zmierzony czas reakcji jest lepszy od średniej wszystkich testowanych urządzeń (19.8 ms). | ||
| ↔ Czas reakcji 50% szarości do 80% szarości | ||
| 0.57 ms ... wzrost ↗ i spadek ↘ łącznie | ↗ 0.28 ms wzrost | 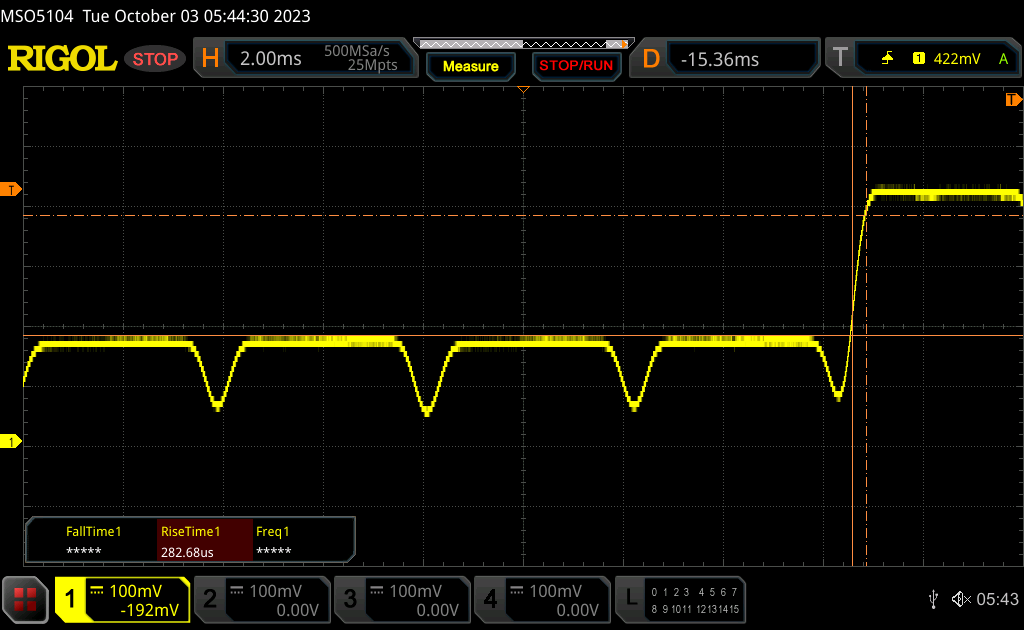 |
| ↘ 0.29 ms upadek | ||
| W naszych testach ekran wykazuje bardzo szybką reakcję i powinien bardzo dobrze nadawać się do szybkich gier. Dla porównania, wszystkie testowane urządzenia wahają się od 0.165 (minimum) do 636 (maksimum) ms. » 1 % wszystkich urządzeń jest lepszych. Oznacza to, że zmierzony czas reakcji jest lepszy od średniej wszystkich testowanych urządzeń (31 ms). | ||
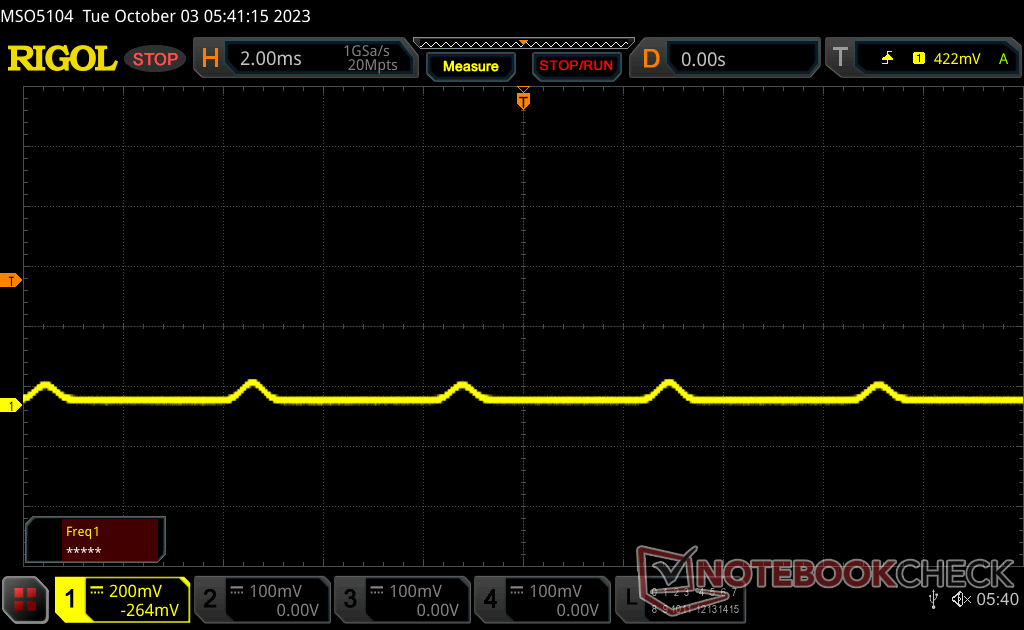
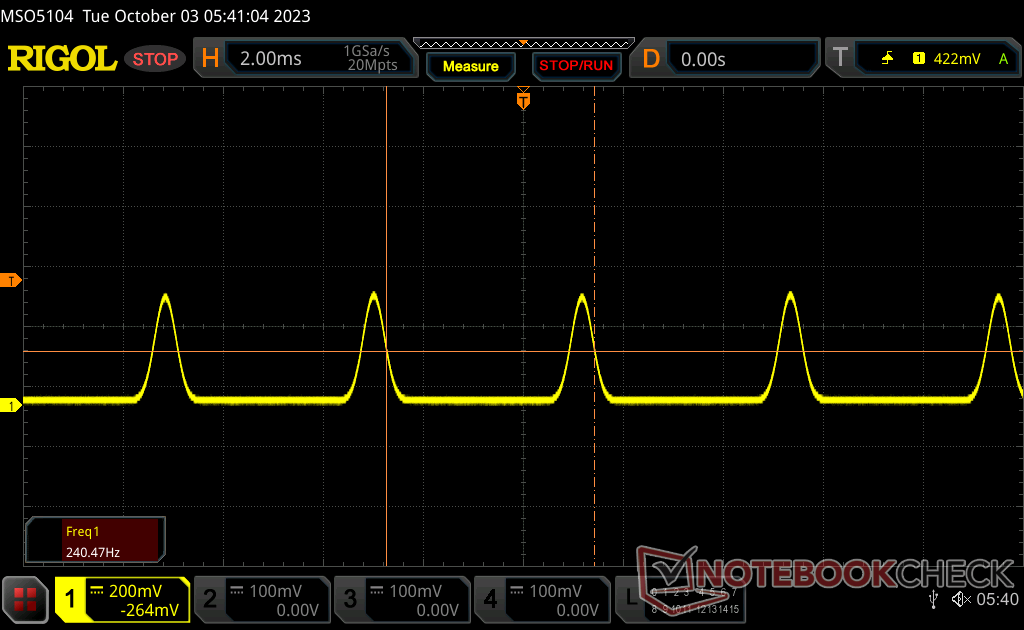
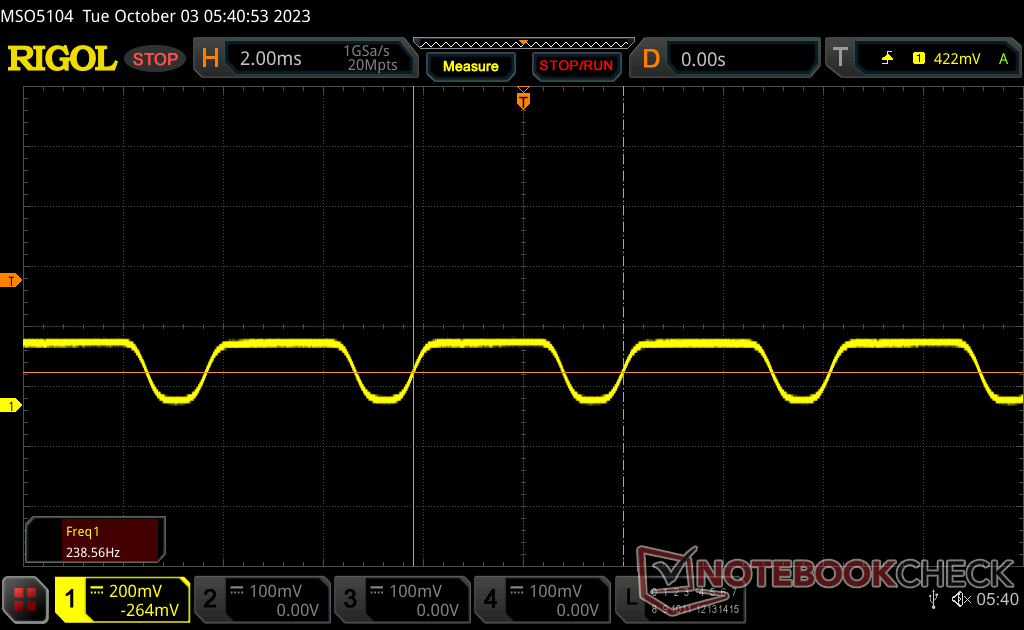
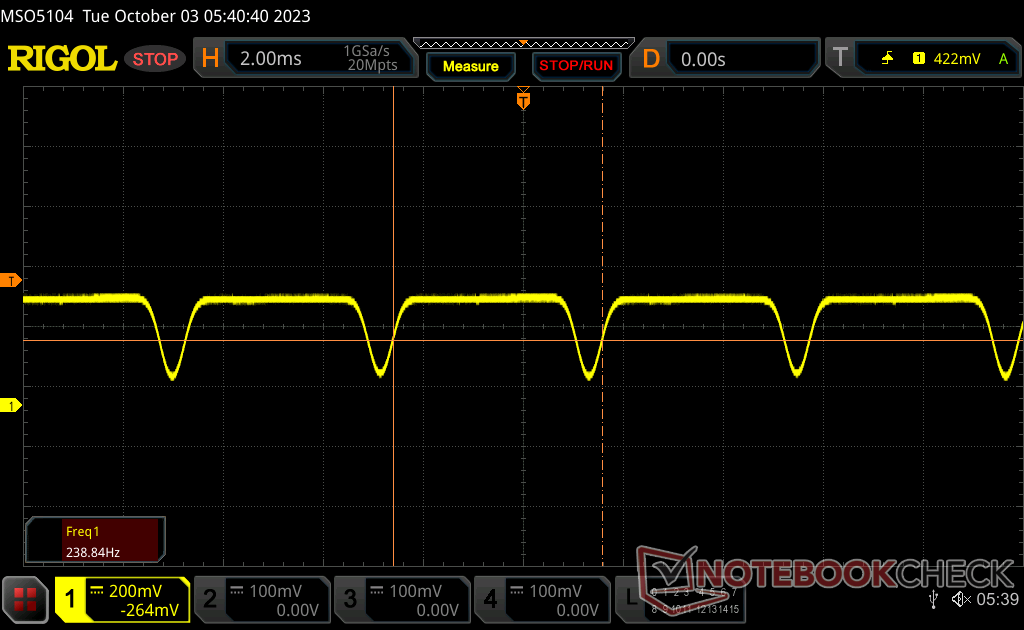
Migotanie ekranu / PWM (modulacja szerokości impulsu)
| Wykryto migotanie ekranu/wykryto PWM | 238.8 Hz | 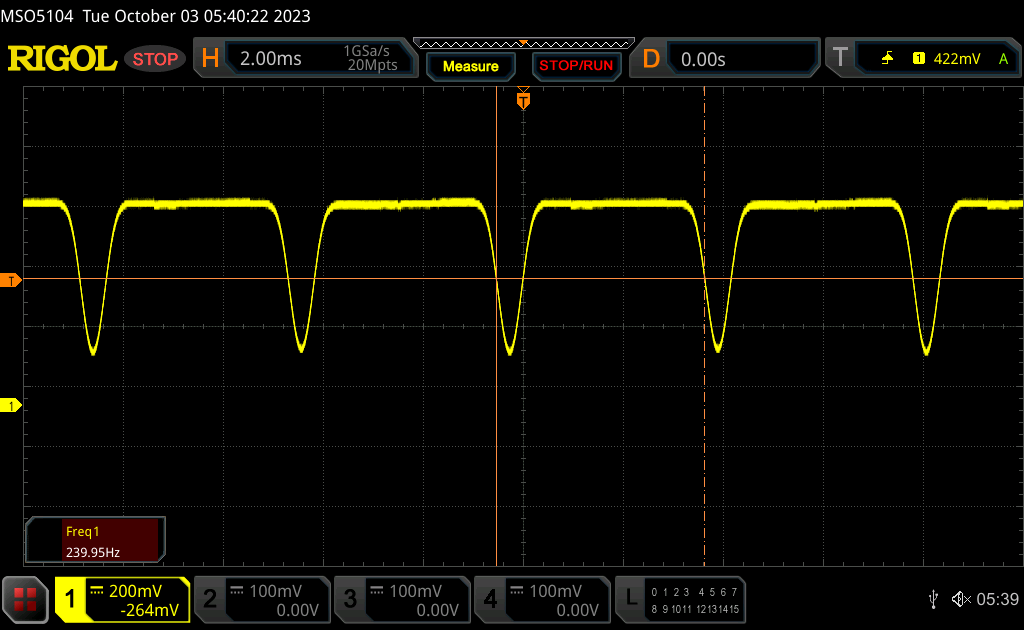 | |
Podświetlenie wyświetlacza miga z częstotliwością 238.8 Hz (najgorszy przypadek, np. przy użyciu PWM) . Częstotliwość 238.8 Hz jest stosunkowo niska, więc wrażliwi użytkownicy prawdopodobnie zauważą migotanie i odczują zmęczenie oczu przy podanym ustawieniu jasności i poniżej. Dla porównania: 52 % wszystkich testowanych urządzeń nie używa PWM do przyciemniania wyświetlacza. Jeśli wykryto PWM, zmierzono średnio 7754 (minimum: 5 - maksimum: 343500) Hz. | |||
Stała modulacja szerokości impulsu 238 Hz jest obecna na wszystkich poziomach jasności, w tym nawet na maksymalnym ustawieniu. Takie zachowanie jest powszechne w wyświetlaczach OLED, od smartfonów po laptopy.

Wydajność
Warunki testowania
Przed uruchomieniem poniższych testów porównawczych ustawiliśmy system Windows na tryb wydajności. Acer nie zawiera specjalistycznego oprogramowania do regulacji wydajności lub wyświetlania, w przeciwieństwie do serii Asus VivoBook.
FreeSync nie jest obsługiwany na wewnętrznym wyświetlaczu.
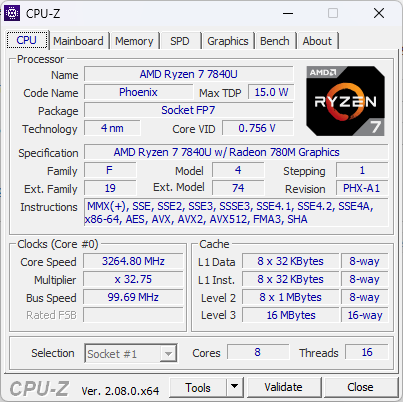
Procesor
Wydajność wielowątkowa jest nieznacznie, ale konsekwentnie za większością innych laptopów z tym samym Ryzen 7 7840U. Najnowszy AMD Framework Laptop 13.5działałby na przykład o 15 procent szybciej. Rozbieżność wynika ze słabszego potencjału Turbo Core procesora w Acerze, wynikającego z jego małego rozwiązania chłodzącego w stosunku do dużego 16-calowego ekranu. Wyniki CineBench R15 xT spadłyby nawet o 21 procent w czasie, jak pokazuje nasz wykres porównawczy poniżej.
Ogólna wydajność jest nadal wyższa niż w przypadku Zen 3+ Ryzen 7 7735U w starszym Acer Swift Edge SFE16-42-R1GM o około 15 procent zarówno w obciążeniach jedno-, jak i wielowątkowych, pomimo dławienia.
Cinebench R15 Multi Loop
Cinebench R23: Multi Core | Single Core
Cinebench R20: CPU (Multi Core) | CPU (Single Core)
Cinebench R15: CPU Multi 64Bit | CPU Single 64Bit
Blender: v2.79 BMW27 CPU
7-Zip 18.03: 7z b 4 | 7z b 4 -mmt1
Geekbench 5.5: Multi-Core | Single-Core
HWBOT x265 Benchmark v2.2: 4k Preset
LibreOffice : 20 Documents To PDF
R Benchmark 2.5: Overall mean
| CPU Performance rating | |
| Lenovo Slim Pro 9i 16IRP8 | |
| Lenovo Legion Pro 5 16ARX8 | |
| Framework Laptop 13.5 13th Gen Intel | |
| Samsung Galaxy Book3 Ultra 16 | |
| Lenovo Legion 5 Pro 16ARH7H RTX 3070 Ti | |
| Acer Swift Edge SFE16 Ryzen 7 7840U | |
| Asus VivoBook Pro 16 | |
| Przeciętny AMD Ryzen 7 7840U | |
| Średnia w klasie Office | |
| Lenovo IdeaPad Flex 5 16ABR G8 | |
| Lenovo ThinkPad T14s G3 21BR00CDGE | |
| Microsoft Surface Laptop 5 15, i7-1255U | |
| Acer Swift Edge SFE16-42-R1GM | |
| LG Gram 16Z90Q | |
| LG Gram 16 (2021) | |
| Cinebench R23 / Single Core | |
| Lenovo Slim Pro 9i 16IRP8 | |
| Framework Laptop 13.5 13th Gen Intel | |
| Lenovo Legion Pro 5 16ARX8 | |
| Asus VivoBook Pro 16 | |
| Acer Swift Edge SFE16 Ryzen 7 7840U | |
| Samsung Galaxy Book3 Ultra 16 | |
| Średnia w klasie Office (708 - 2130, n=76, ostatnie 2 lata) | |
| Lenovo ThinkPad T14s G3 21BR00CDGE | |
| Microsoft Surface Laptop 5 15, i7-1255U | |
| Przeciętny AMD Ryzen 7 7840U (1373 - 1742, n=10) | |
| LG Gram 16Z90Q | |
| Lenovo Legion 5 Pro 16ARH7H RTX 3070 Ti | |
| Acer Swift Edge SFE16-42-R1GM | |
| Lenovo IdeaPad Flex 5 16ABR G8 | |
| LG Gram 16 (2021) | |
| Cinebench R20 / CPU (Multi Core) | |
| Lenovo Slim Pro 9i 16IRP8 | |
| Lenovo Legion Pro 5 16ARX8 | |
| Samsung Galaxy Book3 Ultra 16 | |
| Lenovo Legion 5 Pro 16ARH7H RTX 3070 Ti | |
| Asus VivoBook Pro 16 | |
| Framework Laptop 13.5 13th Gen Intel | |
| Przeciętny AMD Ryzen 7 7840U (4469 - 5917, n=10) | |
| Acer Swift Edge SFE16 Ryzen 7 7840U | |
| Średnia w klasie Office (648 - 8840, n=75, ostatnie 2 lata) | |
| Acer Swift Edge SFE16-42-R1GM | |
| Lenovo IdeaPad Flex 5 16ABR G8 | |
| Lenovo ThinkPad T14s G3 21BR00CDGE | |
| Microsoft Surface Laptop 5 15, i7-1255U | |
| LG Gram 16Z90Q | |
| LG Gram 16 (2021) | |
| Cinebench R20 / CPU (Single Core) | |
| Lenovo Slim Pro 9i 16IRP8 | |
| Framework Laptop 13.5 13th Gen Intel | |
| Lenovo Legion Pro 5 16ARX8 | |
| Asus VivoBook Pro 16 | |
| Acer Swift Edge SFE16 Ryzen 7 7840U | |
| Średnia w klasie Office (345 - 816, n=75, ostatnie 2 lata) | |
| Samsung Galaxy Book3 Ultra 16 | |
| Lenovo ThinkPad T14s G3 21BR00CDGE | |
| Microsoft Surface Laptop 5 15, i7-1255U | |
| Przeciętny AMD Ryzen 7 7840U (533 - 678, n=10) | |
| LG Gram 16Z90Q | |
| Lenovo Legion 5 Pro 16ARH7H RTX 3070 Ti | |
| Lenovo IdeaPad Flex 5 16ABR G8 | |
| Acer Swift Edge SFE16-42-R1GM | |
| LG Gram 16 (2021) | |
| Cinebench R15 / CPU Multi 64Bit | |
| Lenovo Legion Pro 5 16ARX8 | |
| Lenovo Slim Pro 9i 16IRP8 | |
| Samsung Galaxy Book3 Ultra 16 | |
| Framework Laptop 13.5 13th Gen Intel | |
| Asus VivoBook Pro 16 | |
| Lenovo Legion 5 Pro 16ARH7H RTX 3070 Ti | |
| Acer Swift Edge SFE16 Ryzen 7 7840U | |
| Przeciętny AMD Ryzen 7 7840U (1025 - 2439, n=12) | |
| Lenovo IdeaPad Flex 5 16ABR G8 | |
| Średnia w klasie Office (250 - 3380, n=77, ostatnie 2 lata) | |
| Acer Swift Edge SFE16-42-R1GM | |
| Lenovo ThinkPad T14s G3 21BR00CDGE | |
| Microsoft Surface Laptop 5 15, i7-1255U | |
| LG Gram 16Z90Q | |
| LG Gram 16 (2021) | |
| Cinebench R15 / CPU Single 64Bit | |
| Lenovo Legion Pro 5 16ARX8 | |
| Lenovo Slim Pro 9i 16IRP8 | |
| Framework Laptop 13.5 13th Gen Intel | |
| Acer Swift Edge SFE16 Ryzen 7 7840U | |
| Przeciętny AMD Ryzen 7 7840U (217 - 272, n=10) | |
| Asus VivoBook Pro 16 | |
| Średnia w klasie Office (99.5 - 316, n=77, ostatnie 2 lata) | |
| Lenovo Legion 5 Pro 16ARH7H RTX 3070 Ti | |
| Samsung Galaxy Book3 Ultra 16 | |
| Lenovo ThinkPad T14s G3 21BR00CDGE | |
| Microsoft Surface Laptop 5 15, i7-1255U | |
| Acer Swift Edge SFE16-42-R1GM | |
| Lenovo IdeaPad Flex 5 16ABR G8 | |
| LG Gram 16Z90Q | |
| LG Gram 16 (2021) | |
| Geekbench 5.5 / Single-Core | |
| Lenovo Legion Pro 5 16ARX8 | |
| Framework Laptop 13.5 13th Gen Intel | |
| Lenovo Slim Pro 9i 16IRP8 | |
| Acer Swift Edge SFE16 Ryzen 7 7840U | |
| Średnia w klasie Office (811 - 2175, n=73, ostatnie 2 lata) | |
| Przeciętny AMD Ryzen 7 7840U (1355 - 1933, n=10) | |
| Samsung Galaxy Book3 Ultra 16 | |
| Asus VivoBook Pro 16 | |
| Microsoft Surface Laptop 5 15, i7-1255U | |
| LG Gram 16Z90Q | |
| Lenovo ThinkPad T14s G3 21BR00CDGE | |
| Lenovo Legion 5 Pro 16ARH7H RTX 3070 Ti | |
| Acer Swift Edge SFE16-42-R1GM | |
| LG Gram 16 (2021) | |
| Lenovo IdeaPad Flex 5 16ABR G8 | |
| HWBOT x265 Benchmark v2.2 / 4k Preset | |
| Lenovo Legion Pro 5 16ARX8 | |
| Lenovo Slim Pro 9i 16IRP8 | |
| Lenovo Legion 5 Pro 16ARH7H RTX 3070 Ti | |
| Samsung Galaxy Book3 Ultra 16 | |
| Przeciętny AMD Ryzen 7 7840U (14.4 - 18.6, n=10) | |
| Acer Swift Edge SFE16 Ryzen 7 7840U | |
| Asus VivoBook Pro 16 | |
| Framework Laptop 13.5 13th Gen Intel | |
| Średnia w klasie Office (2.21 - 26, n=76, ostatnie 2 lata) | |
| Acer Swift Edge SFE16-42-R1GM | |
| Lenovo IdeaPad Flex 5 16ABR G8 | |
| Microsoft Surface Laptop 5 15, i7-1255U | |
| Lenovo ThinkPad T14s G3 21BR00CDGE | |
| LG Gram 16Z90Q | |
| LG Gram 16 (2021) | |
| LibreOffice / 20 Documents To PDF | |
| Acer Swift Edge SFE16-42-R1GM | |
| Średnia w klasie Office (39.9 - 102.3, n=76, ostatnie 2 lata) | |
| LG Gram 16Z90Q | |
| Lenovo Legion 5 Pro 16ARH7H RTX 3070 Ti | |
| Lenovo IdeaPad Flex 5 16ABR G8 | |
| Przeciętny AMD Ryzen 7 7840U (43.4 - 67.1, n=10) | |
| Samsung Galaxy Book3 Ultra 16 | |
| Asus VivoBook Pro 16 | |
| LG Gram 16 (2021) | |
| Microsoft Surface Laptop 5 15, i7-1255U | |
| Lenovo ThinkPad T14s G3 21BR00CDGE | |
| Acer Swift Edge SFE16 Ryzen 7 7840U | |
| Lenovo Slim Pro 9i 16IRP8 | |
| Framework Laptop 13.5 13th Gen Intel | |
| Lenovo Legion Pro 5 16ARX8 | |
| R Benchmark 2.5 / Overall mean | |
| LG Gram 16 (2021) | |
| LG Gram 16Z90Q | |
| Lenovo IdeaPad Flex 5 16ABR G8 | |
| Średnia w klasie Office (0.393 - 0.888, n=76, ostatnie 2 lata) | |
| Acer Swift Edge SFE16-42-R1GM | |
| Lenovo ThinkPad T14s G3 21BR00CDGE | |
| Microsoft Surface Laptop 5 15, i7-1255U | |
| Lenovo Legion 5 Pro 16ARH7H RTX 3070 Ti | |
| Samsung Galaxy Book3 Ultra 16 | |
| Asus VivoBook Pro 16 | |
| Przeciętny AMD Ryzen 7 7840U (0.4559 - 0.581, n=11) | |
| Acer Swift Edge SFE16 Ryzen 7 7840U | |
| Framework Laptop 13.5 13th Gen Intel | |
| Lenovo Legion Pro 5 16ARX8 | |
| Lenovo Slim Pro 9i 16IRP8 | |
Cinebench R23: Multi Core | Single Core
Cinebench R20: CPU (Multi Core) | CPU (Single Core)
Cinebench R15: CPU Multi 64Bit | CPU Single 64Bit
Blender: v2.79 BMW27 CPU
7-Zip 18.03: 7z b 4 | 7z b 4 -mmt1
Geekbench 5.5: Multi-Core | Single-Core
HWBOT x265 Benchmark v2.2: 4k Preset
LibreOffice : 20 Documents To PDF
R Benchmark 2.5: Overall mean
* ... im mniej tym lepiej
AIDA64: FP32 Ray-Trace | FPU Julia | CPU SHA3 | CPU Queen | FPU SinJulia | FPU Mandel | CPU AES | CPU ZLib | FP64 Ray-Trace | CPU PhotoWorxx
| Performance rating | |
| Lenovo Slim Pro 9i 16IRP8 | |
| Przeciętny AMD Ryzen 7 7840U | |
| Acer Swift Edge SFE16 Ryzen 7 7840U | |
| Samsung Galaxy Book3 Ultra 16 | |
| Asus VivoBook Pro 16 | |
| Acer Swift Edge SFE16-42-R1GM | |
| Huawei MateBook 16s i7 | |
| AIDA64 / FP32 Ray-Trace | |
| Przeciętny AMD Ryzen 7 7840U (17924 - 25901, n=11) | |
| Lenovo Slim Pro 9i 16IRP8 | |
| Acer Swift Edge SFE16 Ryzen 7 7840U | |
| Asus VivoBook Pro 16 | |
| Samsung Galaxy Book3 Ultra 16 | |
| Acer Swift Edge SFE16-42-R1GM | |
| Huawei MateBook 16s i7 | |
| AIDA64 / FPU Julia | |
| Lenovo Slim Pro 9i 16IRP8 | |
| Przeciętny AMD Ryzen 7 7840U (78360 - 109745, n=11) | |
| Acer Swift Edge SFE16 Ryzen 7 7840U | |
| Asus VivoBook Pro 16 | |
| Acer Swift Edge SFE16-42-R1GM | |
| Samsung Galaxy Book3 Ultra 16 | |
| Huawei MateBook 16s i7 | |
| AIDA64 / CPU SHA3 | |
| Lenovo Slim Pro 9i 16IRP8 | |
| Przeciętny AMD Ryzen 7 7840U (3519 - 4847, n=11) | |
| Acer Swift Edge SFE16 Ryzen 7 7840U | |
| Asus VivoBook Pro 16 | |
| Samsung Galaxy Book3 Ultra 16 | |
| Acer Swift Edge SFE16-42-R1GM | |
| Huawei MateBook 16s i7 | |
| AIDA64 / CPU Queen | |
| Lenovo Slim Pro 9i 16IRP8 | |
| Asus VivoBook Pro 16 | |
| Samsung Galaxy Book3 Ultra 16 | |
| Przeciętny AMD Ryzen 7 7840U (83206 - 114294, n=10) | |
| Acer Swift Edge SFE16 Ryzen 7 7840U | |
| Huawei MateBook 16s i7 | |
| Acer Swift Edge SFE16-42-R1GM | |
| AIDA64 / FPU SinJulia | |
| Przeciętny AMD Ryzen 7 7840U (11969 - 14822, n=11) | |
| Acer Swift Edge SFE16 Ryzen 7 7840U | |
| Lenovo Slim Pro 9i 16IRP8 | |
| Acer Swift Edge SFE16-42-R1GM | |
| Samsung Galaxy Book3 Ultra 16 | |
| Asus VivoBook Pro 16 | |
| Huawei MateBook 16s i7 | |
| AIDA64 / FPU Mandel | |
| Przeciętny AMD Ryzen 7 7840U (40720 - 58482, n=11) | |
| Lenovo Slim Pro 9i 16IRP8 | |
| Acer Swift Edge SFE16 Ryzen 7 7840U | |
| Acer Swift Edge SFE16-42-R1GM | |
| Asus VivoBook Pro 16 | |
| Samsung Galaxy Book3 Ultra 16 | |
| Huawei MateBook 16s i7 | |
| AIDA64 / CPU AES | |
| Przeciętny AMD Ryzen 7 7840U (53018 - 166333, n=11) | |
| Lenovo Slim Pro 9i 16IRP8 | |
| Huawei MateBook 16s i7 | |
| Samsung Galaxy Book3 Ultra 16 | |
| Asus VivoBook Pro 16 | |
| Acer Swift Edge SFE16 Ryzen 7 7840U | |
| Acer Swift Edge SFE16-42-R1GM | |
| AIDA64 / CPU ZLib | |
| Lenovo Slim Pro 9i 16IRP8 | |
| Samsung Galaxy Book3 Ultra 16 | |
| Asus VivoBook Pro 16 | |
| Przeciętny AMD Ryzen 7 7840U (801 - 1047, n=11) | |
| Acer Swift Edge SFE16 Ryzen 7 7840U | |
| Huawei MateBook 16s i7 | |
| Acer Swift Edge SFE16-42-R1GM | |
| AIDA64 / FP64 Ray-Trace | |
| Przeciętny AMD Ryzen 7 7840U (9347 - 13846, n=11) | |
| Lenovo Slim Pro 9i 16IRP8 | |
| Acer Swift Edge SFE16 Ryzen 7 7840U | |
| Asus VivoBook Pro 16 | |
| Samsung Galaxy Book3 Ultra 16 | |
| Acer Swift Edge SFE16-42-R1GM | |
| Huawei MateBook 16s i7 | |
| AIDA64 / CPU PhotoWorxx | |
| Lenovo Slim Pro 9i 16IRP8 | |
| Samsung Galaxy Book3 Ultra 16 | |
| Huawei MateBook 16s i7 | |
| Przeciętny AMD Ryzen 7 7840U (26206 - 38173, n=11) | |
| Acer Swift Edge SFE16 Ryzen 7 7840U | |
| Acer Swift Edge SFE16-42-R1GM | |
| Asus VivoBook Pro 16 | |
Wydajność systemu
CrossMark: Overall | Productivity | Creativity | Responsiveness
| PCMark 10 / Score | |
| Lenovo Slim Pro 9i 16IRP8 | |
| Acer Swift Edge SFE16 Ryzen 7 7840U | |
| Samsung Galaxy Book3 Ultra 16 | |
| Asus VivoBook Pro 16 | |
| Przeciętny AMD Ryzen 7 7840U, AMD Radeon 780M (5866 - 7157, n=10) | |
| Huawei MateBook 16s i7 | |
| Acer Swift Edge SFE16-42-R1GM | |
| PCMark 10 / Essentials | |
| Huawei MateBook 16s i7 | |
| Lenovo Slim Pro 9i 16IRP8 | |
| Acer Swift Edge SFE16 Ryzen 7 7840U | |
| Samsung Galaxy Book3 Ultra 16 | |
| Przeciętny AMD Ryzen 7 7840U, AMD Radeon 780M (9068 - 11081, n=10) | |
| Asus VivoBook Pro 16 | |
| Acer Swift Edge SFE16-42-R1GM | |
| PCMark 10 / Productivity | |
| Acer Swift Edge SFE16 Ryzen 7 7840U | |
| Lenovo Slim Pro 9i 16IRP8 | |
| Acer Swift Edge SFE16-42-R1GM | |
| Asus VivoBook Pro 16 | |
| Przeciętny AMD Ryzen 7 7840U, AMD Radeon 780M (7323 - 10099, n=10) | |
| Samsung Galaxy Book3 Ultra 16 | |
| Huawei MateBook 16s i7 | |
| PCMark 10 / Digital Content Creation | |
| Lenovo Slim Pro 9i 16IRP8 | |
| Samsung Galaxy Book3 Ultra 16 | |
| Asus VivoBook Pro 16 | |
| Acer Swift Edge SFE16 Ryzen 7 7840U | |
| Przeciętny AMD Ryzen 7 7840U, AMD Radeon 780M (7204 - 8987, n=10) | |
| Acer Swift Edge SFE16-42-R1GM | |
| Huawei MateBook 16s i7 | |
| CrossMark / Overall | |
| Huawei MateBook 16s i7 | |
| Acer Swift Edge SFE16 Ryzen 7 7840U | |
| Lenovo Slim Pro 9i 16IRP8 | |
| Asus VivoBook Pro 16 | |
| Samsung Galaxy Book3 Ultra 16 | |
| Przeciętny AMD Ryzen 7 7840U, AMD Radeon 780M (1256 - 1804, n=10) | |
| Acer Swift Edge SFE16-42-R1GM | |
| CrossMark / Productivity | |
| Huawei MateBook 16s i7 | |
| Acer Swift Edge SFE16 Ryzen 7 7840U | |
| Asus VivoBook Pro 16 | |
| Lenovo Slim Pro 9i 16IRP8 | |
| Przeciętny AMD Ryzen 7 7840U, AMD Radeon 780M (1261 - 1798, n=10) | |
| Samsung Galaxy Book3 Ultra 16 | |
| Acer Swift Edge SFE16-42-R1GM | |
| CrossMark / Creativity | |
| Lenovo Slim Pro 9i 16IRP8 | |
| Huawei MateBook 16s i7 | |
| Acer Swift Edge SFE16 Ryzen 7 7840U | |
| Asus VivoBook Pro 16 | |
| Samsung Galaxy Book3 Ultra 16 | |
| Przeciętny AMD Ryzen 7 7840U, AMD Radeon 780M (1251 - 1835, n=10) | |
| Acer Swift Edge SFE16-42-R1GM | |
| CrossMark / Responsiveness | |
| Huawei MateBook 16s i7 | |
| Acer Swift Edge SFE16 Ryzen 7 7840U | |
| Asus VivoBook Pro 16 | |
| Samsung Galaxy Book3 Ultra 16 | |
| Lenovo Slim Pro 9i 16IRP8 | |
| Przeciętny AMD Ryzen 7 7840U, AMD Radeon 780M (1082 - 1775, n=10) | |
| Acer Swift Edge SFE16-42-R1GM | |
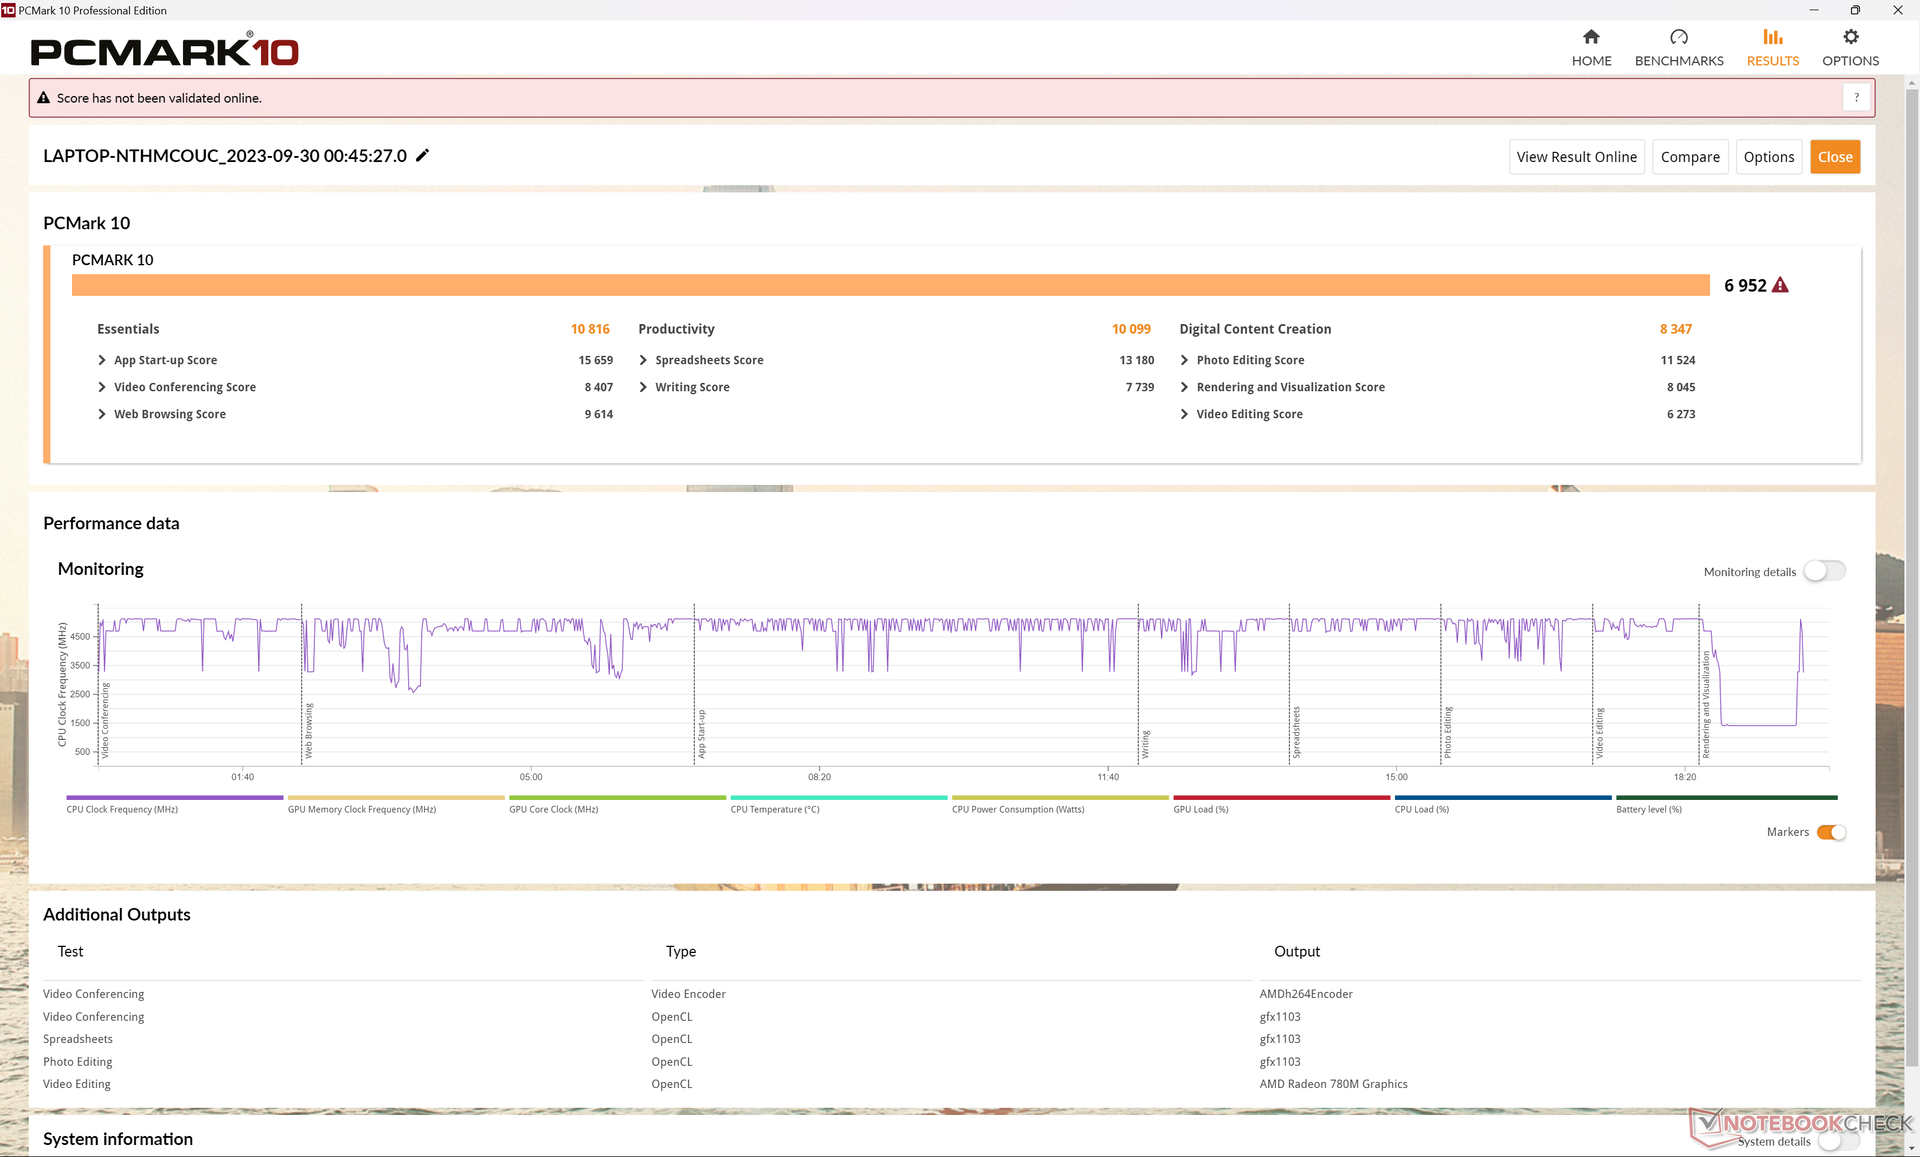
| PCMark 10 Score | 6952 pkt. | |
Pomoc | ||
| AIDA64 / Memory Copy | |
| Lenovo Slim Pro 9i 16IRP8 | |
| Samsung Galaxy Book3 Ultra 16 | |
| Huawei MateBook 16s i7 | |
| Acer Swift Edge SFE16 Ryzen 7 7840U | |
| Przeciętny AMD Ryzen 7 7840U (43255 - 70532, n=12) | |
| Acer Swift Edge SFE16-42-R1GM | |
| Asus VivoBook Pro 16 | |
| AIDA64 / Memory Read | |
| Lenovo Slim Pro 9i 16IRP8 | |
| Samsung Galaxy Book3 Ultra 16 | |
| Huawei MateBook 16s i7 | |
| Acer Swift Edge SFE16 Ryzen 7 7840U | |
| Przeciętny AMD Ryzen 7 7840U (37399 - 61602, n=11) | |
| Acer Swift Edge SFE16-42-R1GM | |
| Asus VivoBook Pro 16 | |
| AIDA64 / Memory Write | |
| Acer Swift Edge SFE16 Ryzen 7 7840U | |
| Lenovo Slim Pro 9i 16IRP8 | |
| Samsung Galaxy Book3 Ultra 16 | |
| Przeciętny AMD Ryzen 7 7840U (46797 - 92289, n=13) | |
| Huawei MateBook 16s i7 | |
| Acer Swift Edge SFE16-42-R1GM | |
| Asus VivoBook Pro 16 | |
| AIDA64 / Memory Latency | |
| Przeciętny AMD Ryzen 7 7840U (90 - 137.2, n=12) | |
| Acer Swift Edge SFE16 Ryzen 7 7840U | |
| Huawei MateBook 16s i7 | |
| Lenovo Slim Pro 9i 16IRP8 | |
| Acer Swift Edge SFE16-42-R1GM | |
| Samsung Galaxy Book3 Ultra 16 | |
| Asus VivoBook Pro 16 | |
* ... im mniej tym lepiej
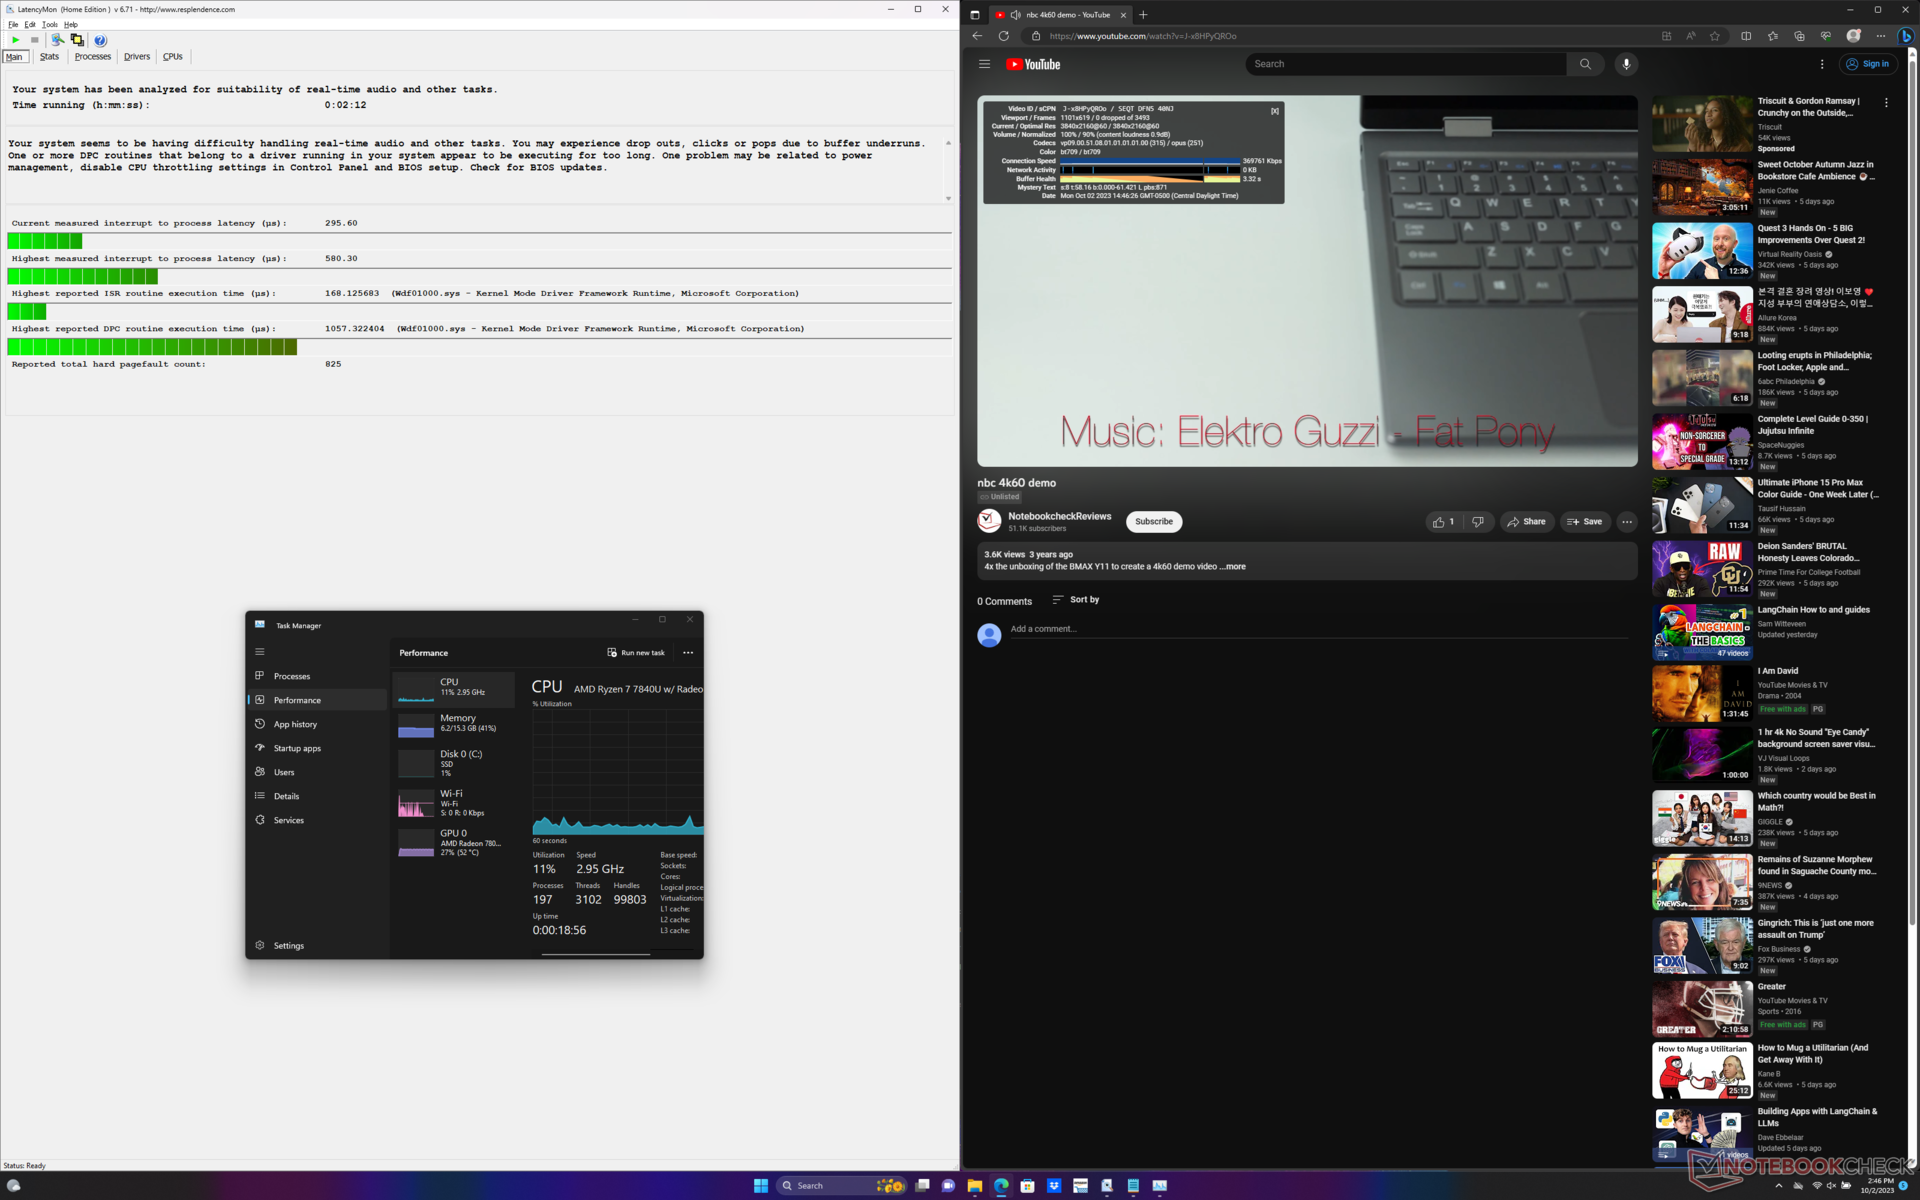
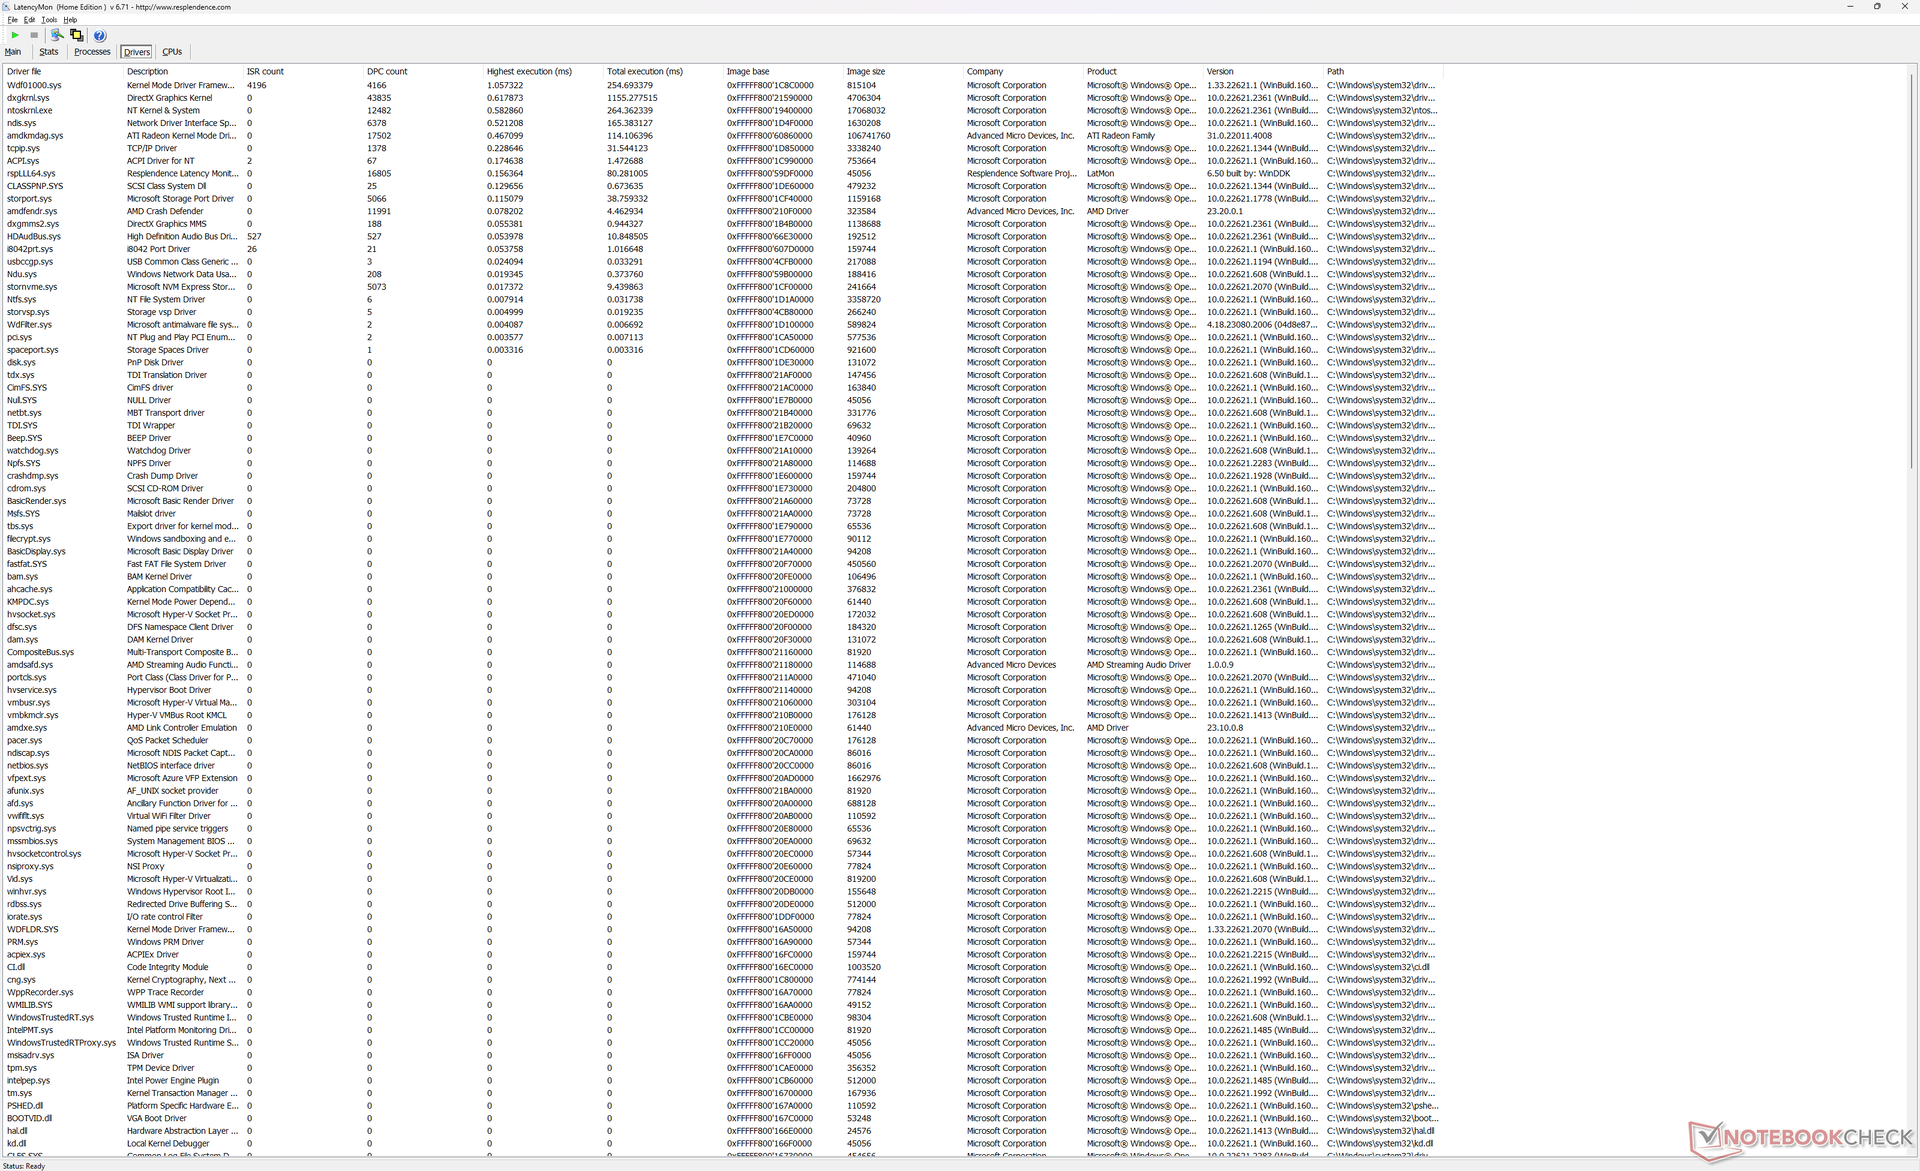
Opóźnienie DPC
LatencyMon nie wykazuje żadnych poważnych problemów z DPC podczas otwierania wielu kart przeglądarki na naszej stronie głównej. odtwarzanie wideo 4K przy 60 FPS jest również idealne i nie odnotowano żadnych spadków klatek.
| DPC Latencies / LatencyMon - interrupt to process latency (max), Web, Youtube, Prime95 | |
| Samsung Galaxy Book3 Ultra 16 | |
| Acer Swift Edge SFE16-42-R1GM | |
| Asus VivoBook Pro 16 | |
| Lenovo Slim Pro 9i 16IRP8 | |
| Acer Swift Edge SFE16 Ryzen 7 7840U | |
* ... im mniej tym lepiej
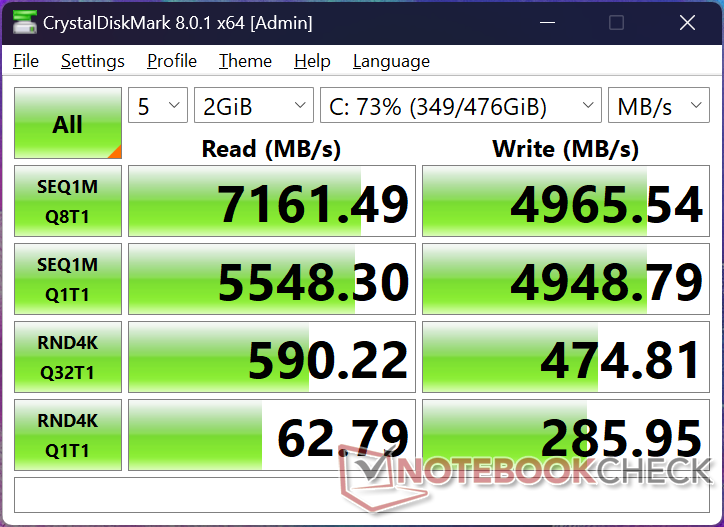
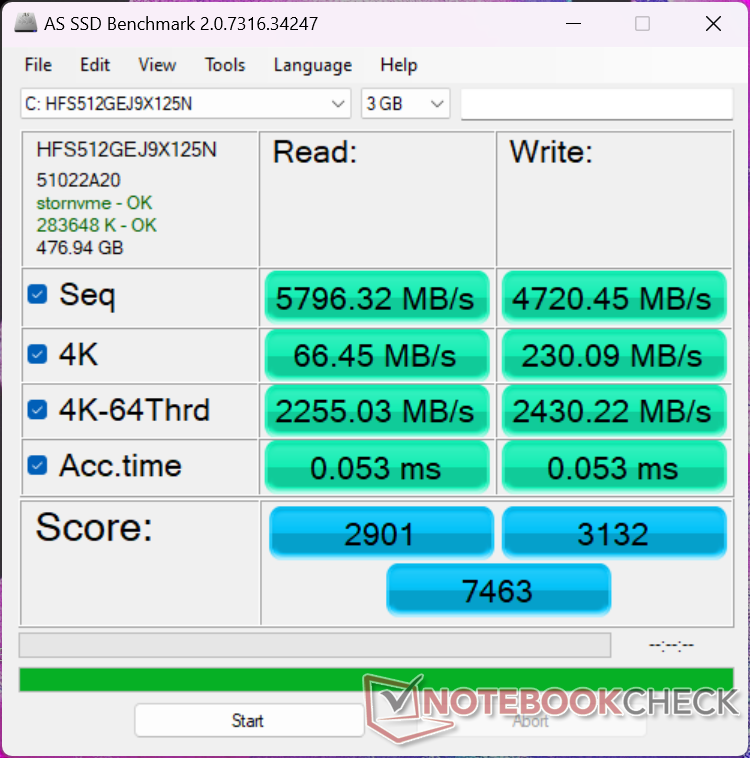
Urządzenia pamięci masowej
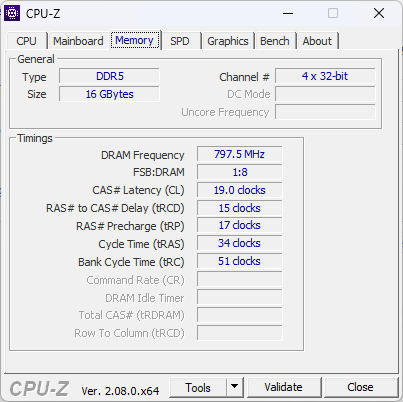
Nasza jednostka testowa jest dostarczana z SK hynix HFS512GEJ9X125N który na papierze rywalizuje z Samsung PM9A1. W rzeczywistości jednak dysk w naszej jednostce spadał do 3500 MB/s po zaledwie kilku minutach obciążenia, jak pokazano na poniższym wykresie. Takie zachowanie zaobserwowaliśmy również na naszym starszym Swift Edge 16, co sugeruje, że dyski cierpią z powodu nieodpowiedniego chłodzenia lub rozpraszania ciepła.

| Drive Performance rating - Percent | |
| Acer Swift Edge SFE16 Ryzen 7 7840U | |
| Samsung Galaxy Book3 Ultra 16 | |
| Acer Swift Edge SFE16-42-R1GM | |
| Lenovo Slim Pro 9i 16IRP8 | |
| Huawei MateBook 16s i7 | |
| Asus VivoBook Pro 16 | |
* ... im mniej tym lepiej
Disk Throttling: DiskSpd Read Loop, Queue Depth 8
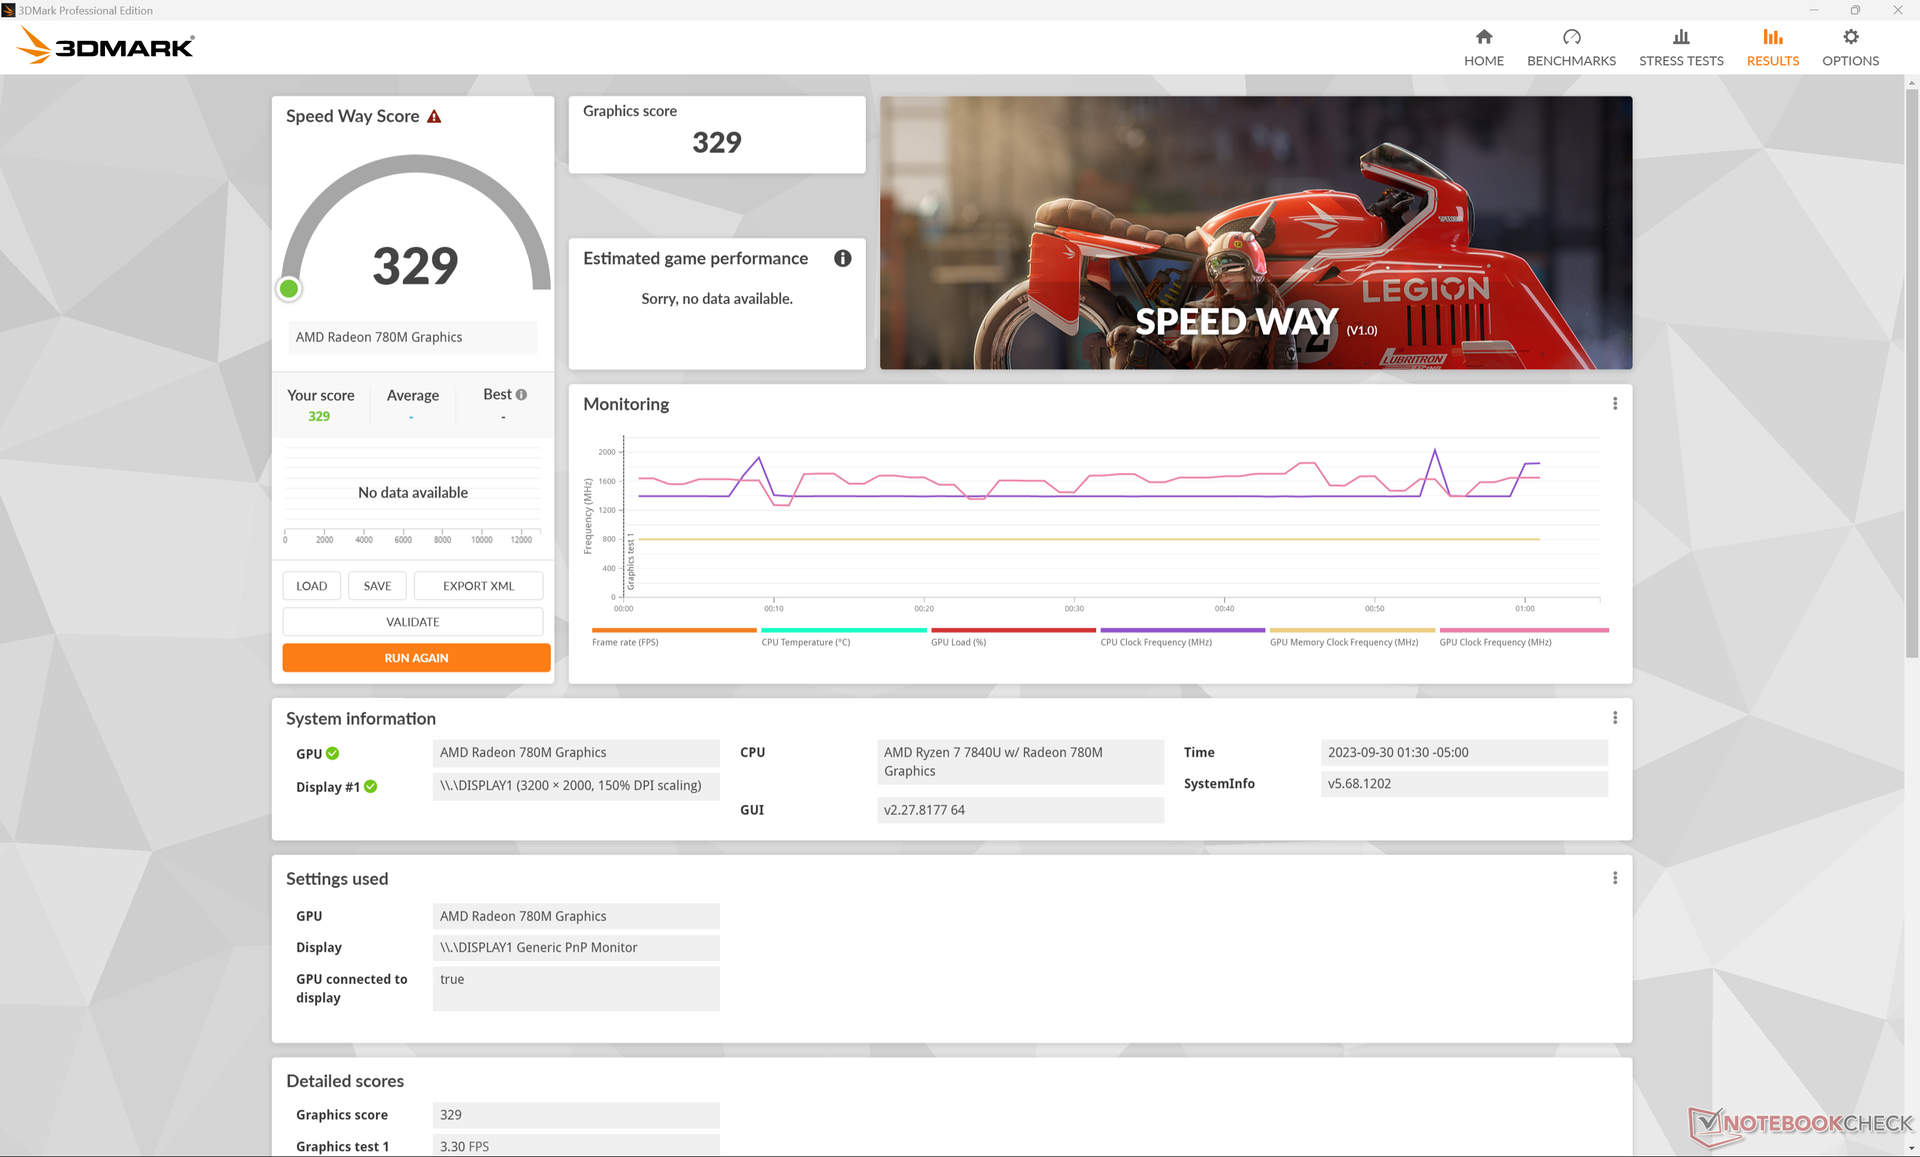
Wydajność GPU
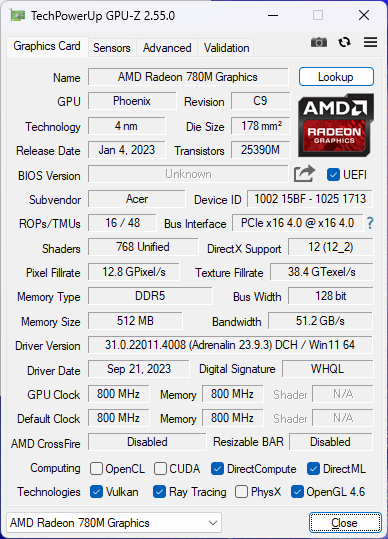
Model 2022 Radeon 680M był już ogromnym wzrostem w stosunku do wcześniejszej serii RX Vega, więc 2023 Radeon 780M jest raczej drobnym odświeżeniem z marginalnymi ulepszeniami. W tym przypadku Radeon 780M w naszym Acerze jest tylko o kilka punktów procentowych szybszy niż 680M w konfiguracji Zen 3+.
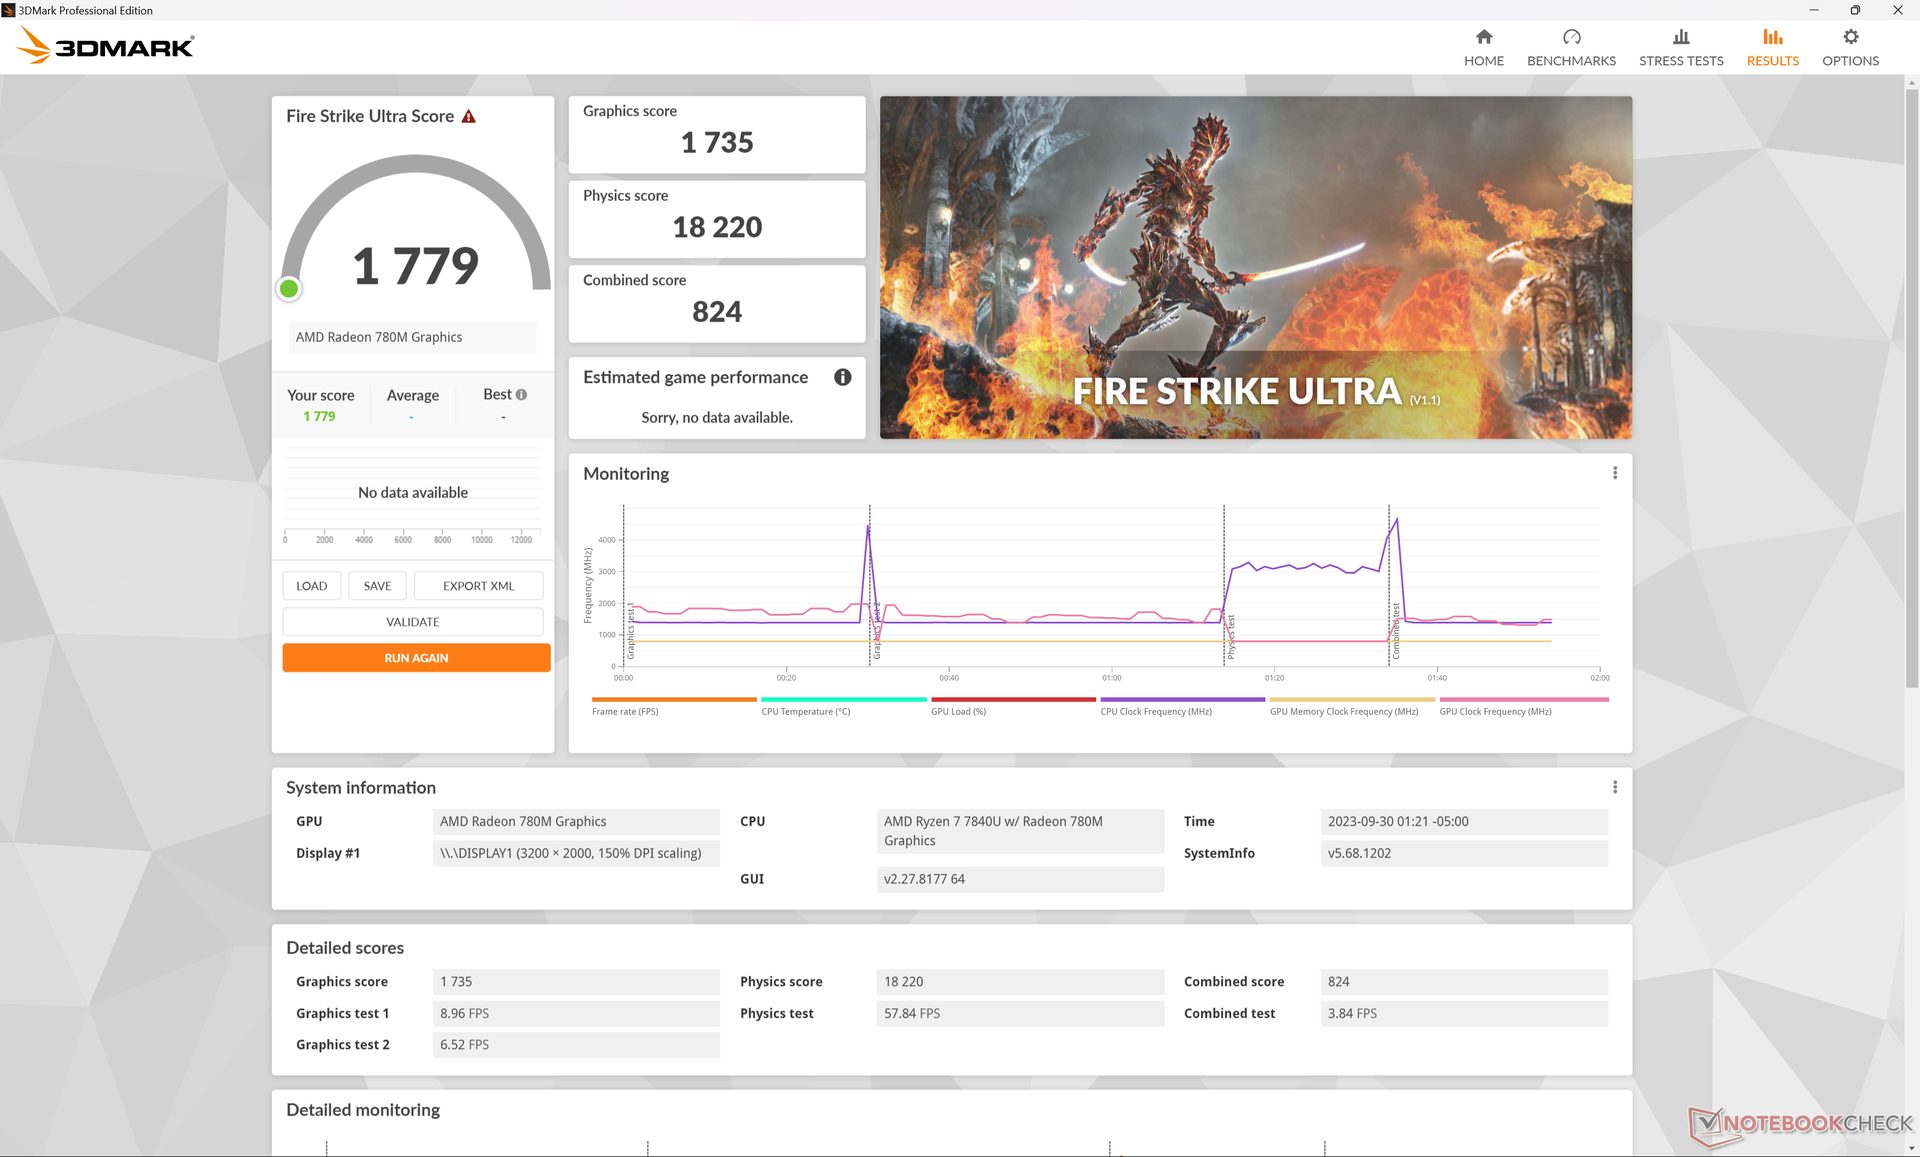
Ustawienie systemu na tryb zrównoważony zamiast trybu wydajności lub praca na zasilaniu bateryjnym wpłynie na ogólną wydajność, jak pokazuje poniższa tabela wyników Fire Strike.
| Profil zasilania | Wynik grafiki | Wynik fizyki | Wynik łączny |
| Tryb wydajności | 7156 | 20127 | 2511 |
| Tryb zrównoważony | 4682 (-37%) | 15022 (-25%) | 1726 (-31%) |
| Zasilanie bateryjne | 4982 (-33%) | 14856 (-26%) | 1734 (-31%) |
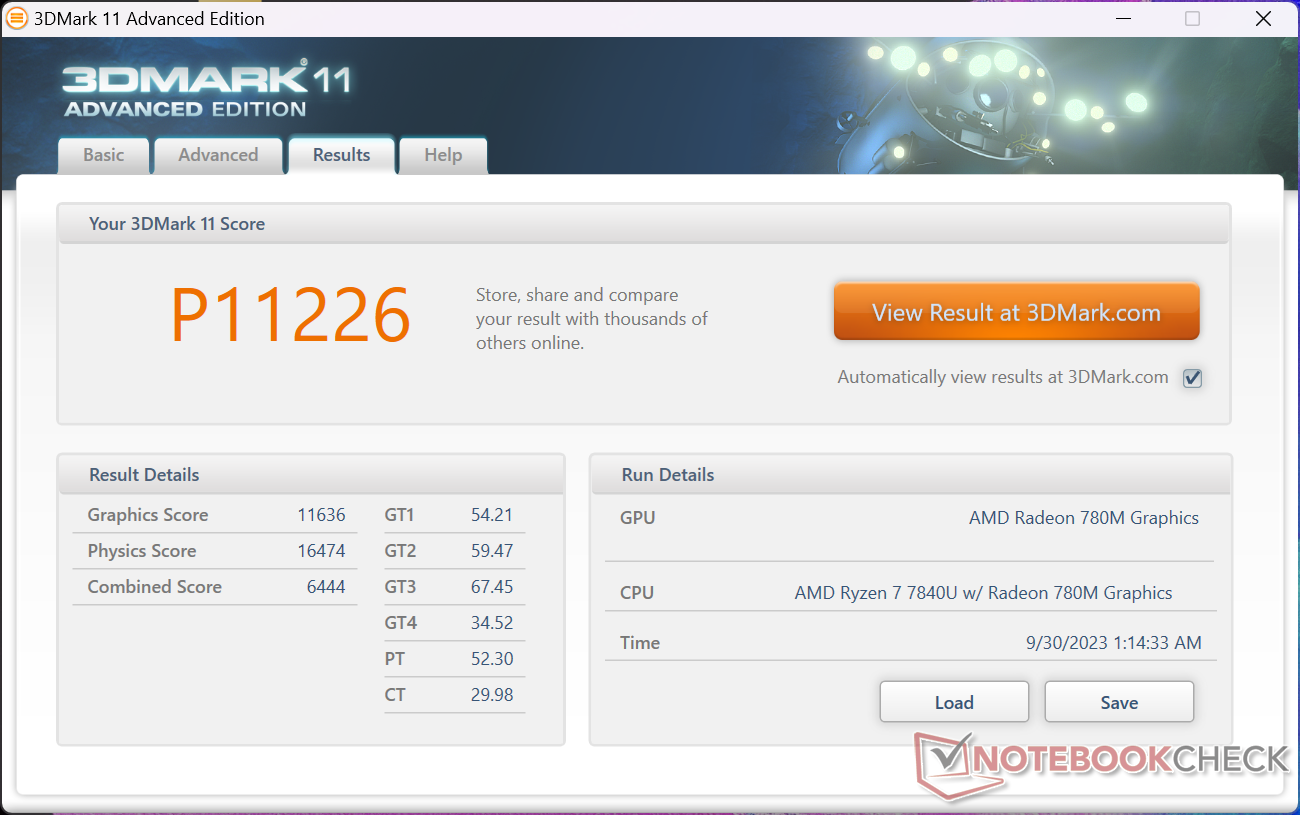
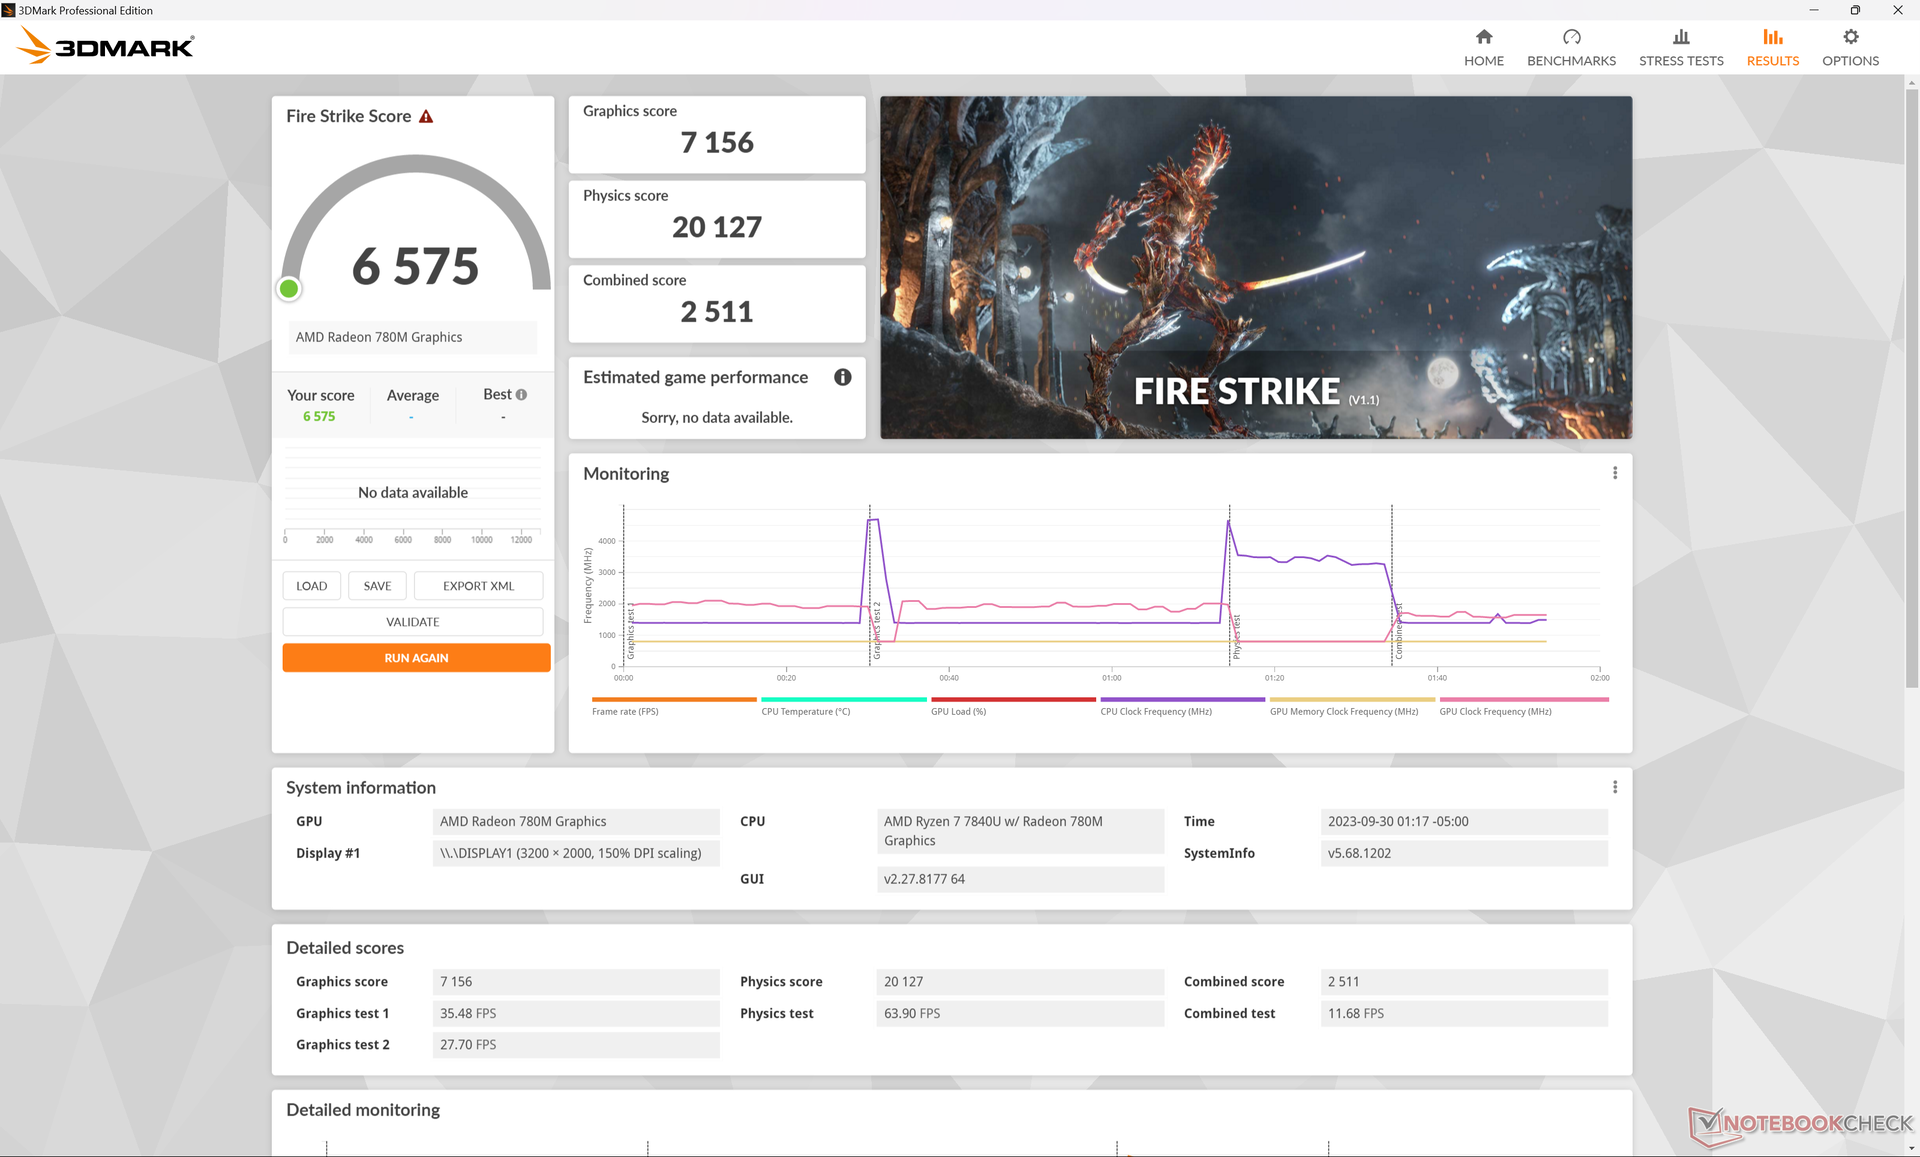
| 3DMark 11 Performance | 11226 pkt. | |
| 3DMark Fire Strike Score | 6575 pkt. | |
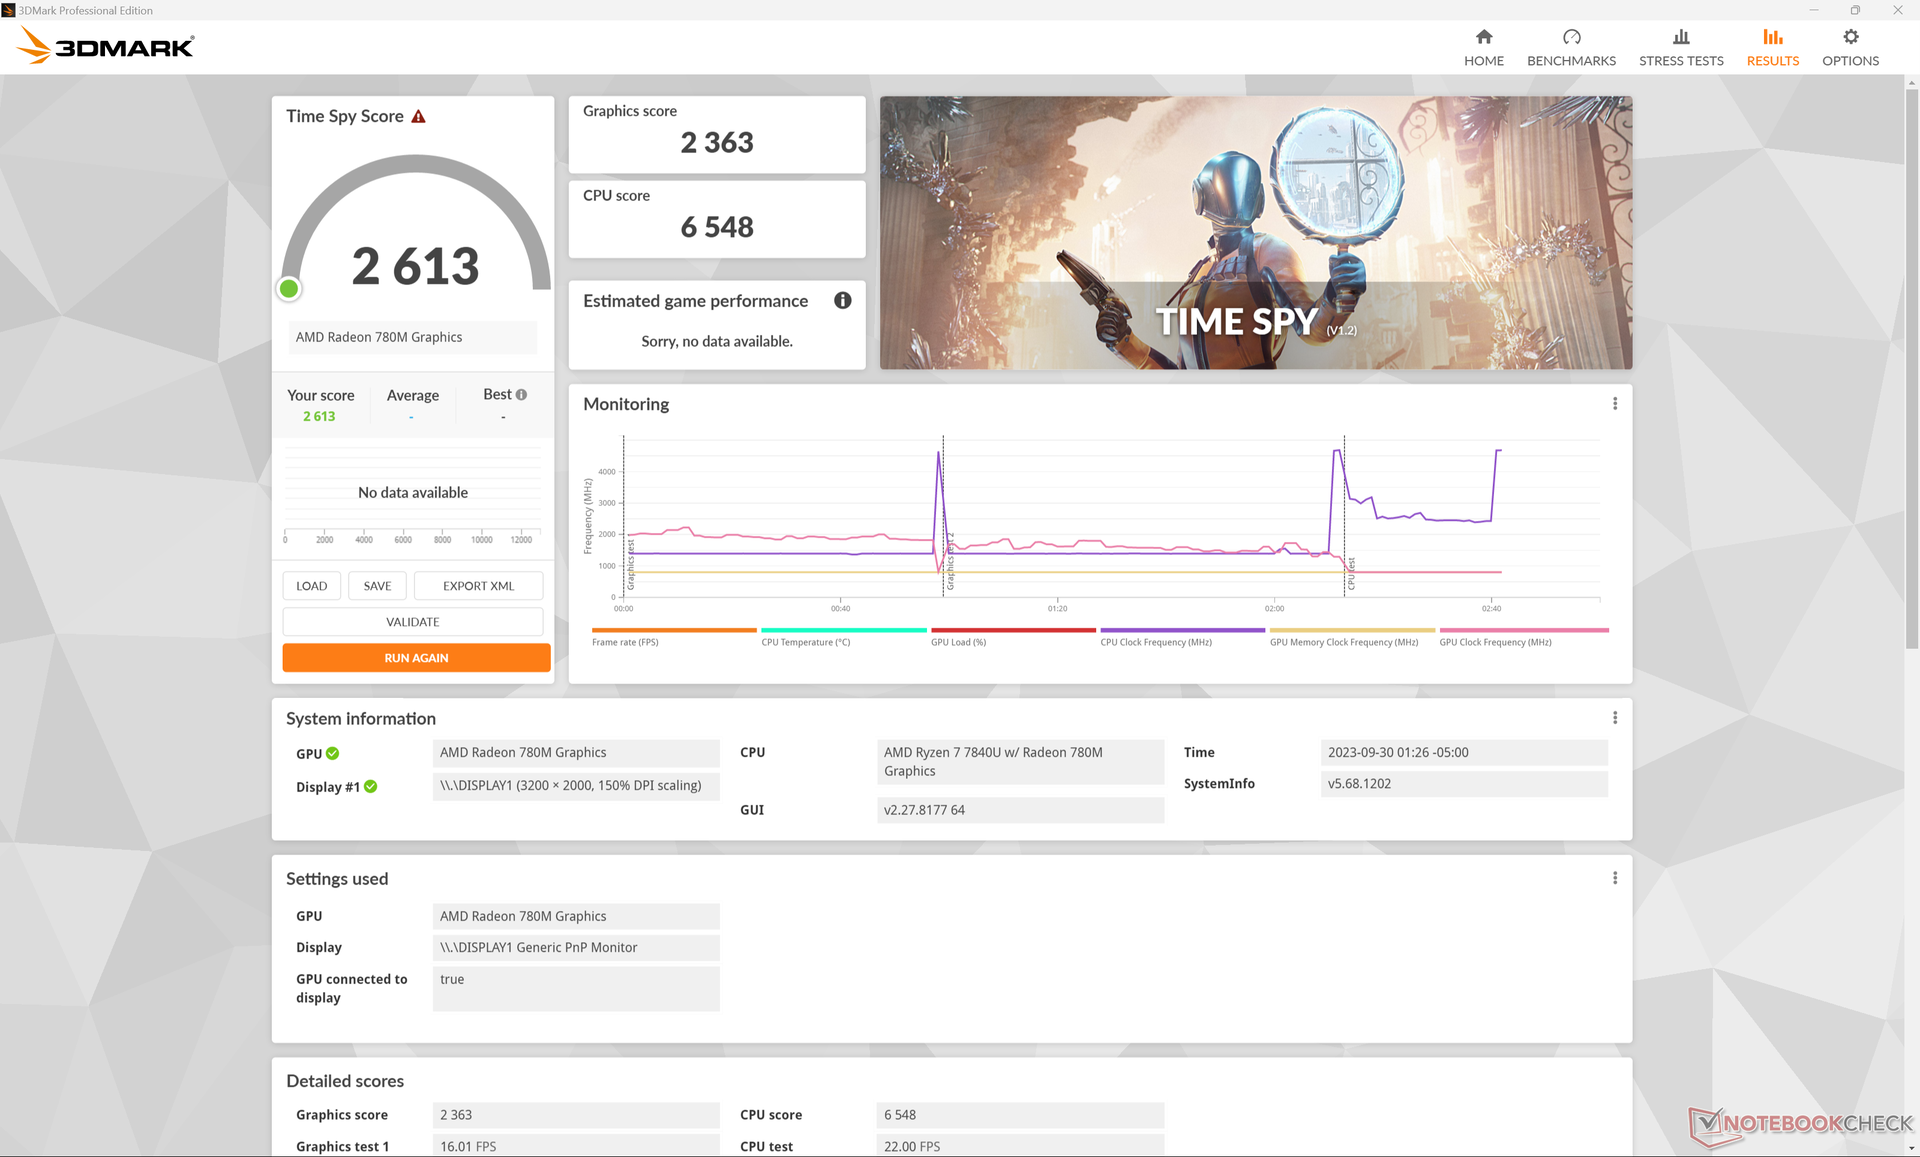
| 3DMark Time Spy Score | 2613 pkt. | |
Pomoc | ||
* ... im mniej tym lepiej
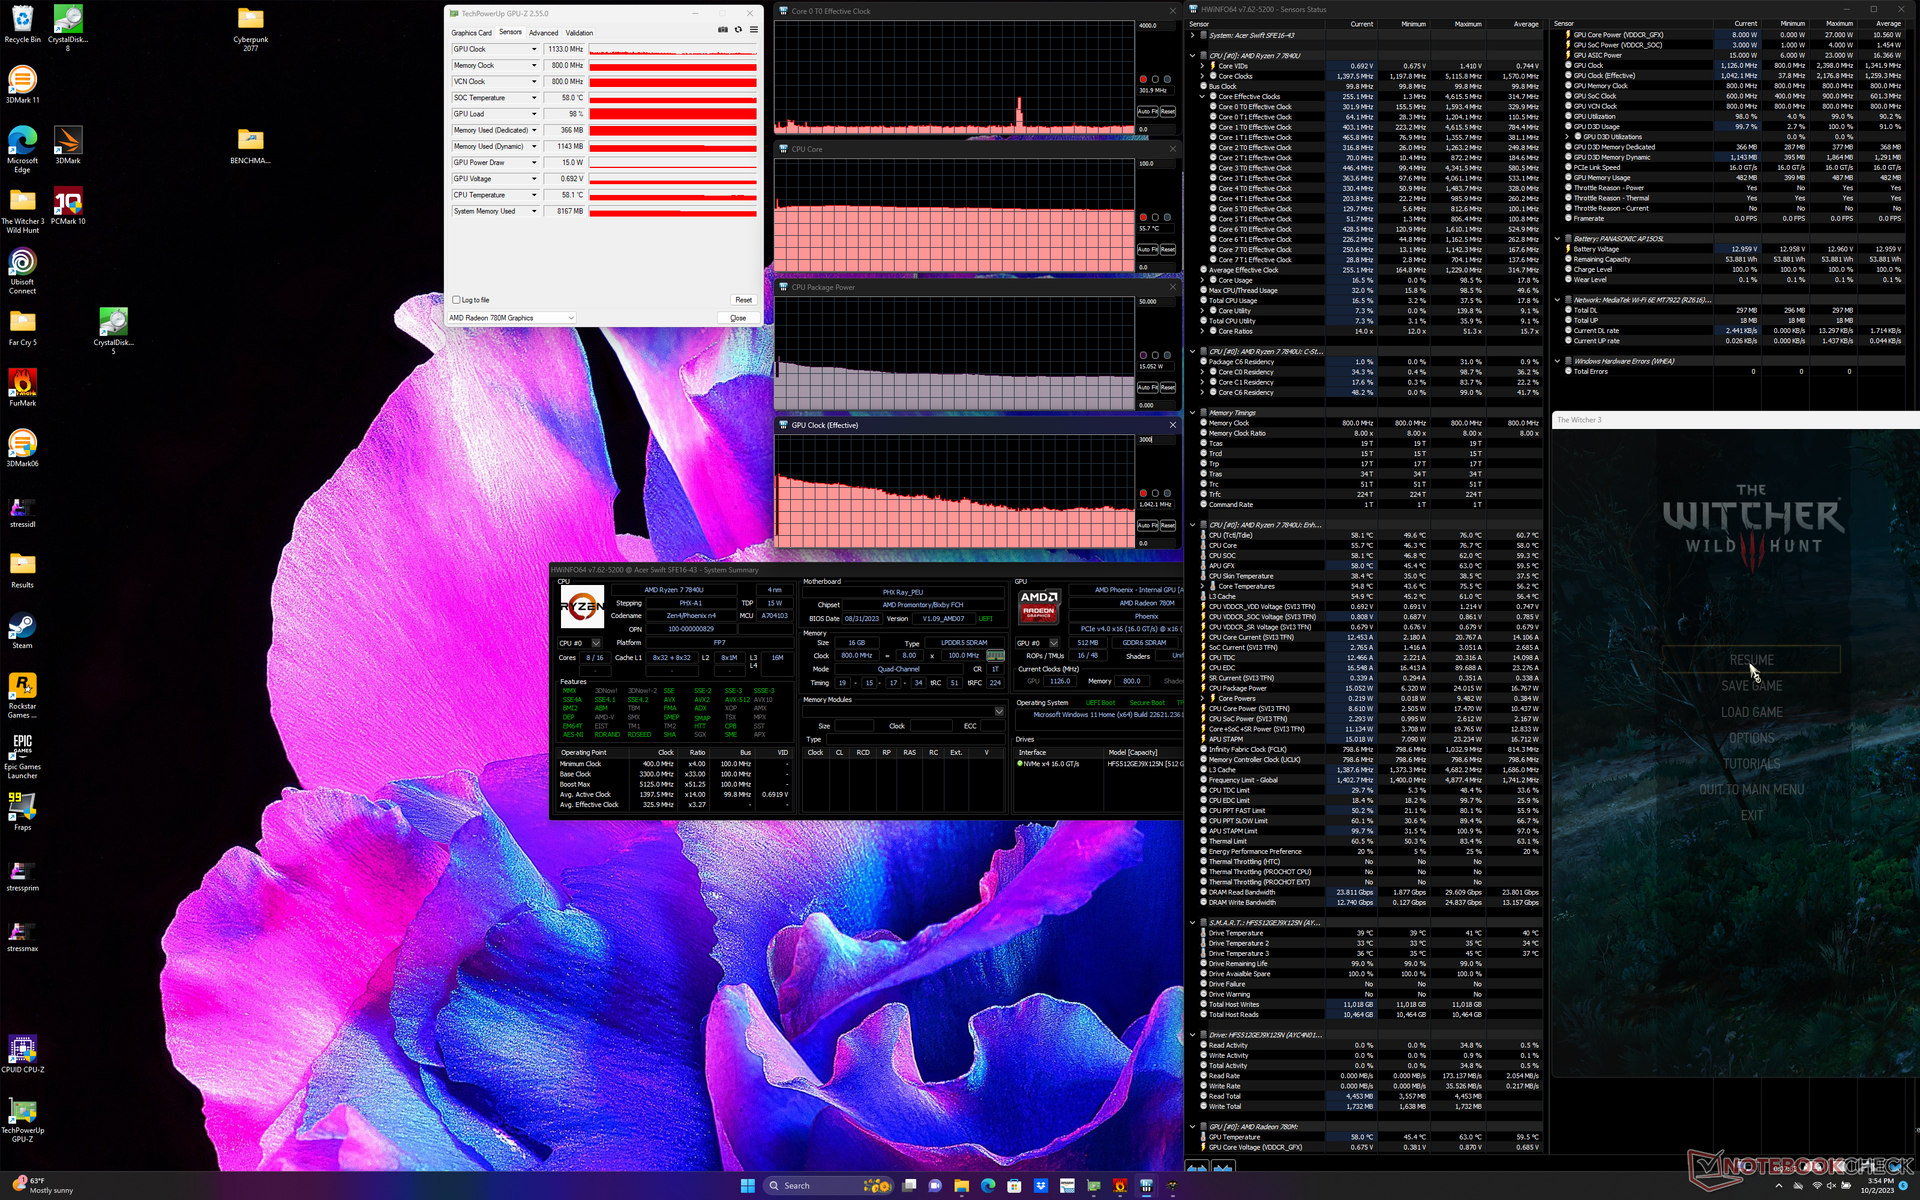
Wydajność GPU również spadała z czasem, podobnie do tego, co zaobserwowaliśmy podczas wykonywania powyższego testu pętli CineBench R15 xT. Podczas pracy na biegu jałowym Witcher 3na przykład, liczba klatek na sekundę zaczynała się od 45 FPS, po czym ostatecznie zwalniała i stabilizowała się w niskim zakresie 30 FPS.
Witcher 3 FPS Chart
| low | med. | high | ultra | |
|---|---|---|---|---|
| GTA V (2015) | 139.3 | 53.9 | 21 | |
| The Witcher 3 (2015) | 109.8 | 36.1 | 20.4 | |
| Dota 2 Reborn (2015) | 128.1 | 101.5 | 66.8 | 61.4 |
| Final Fantasy XV Benchmark (2018) | 50.5 | 27.4 | 21.2 | |
| X-Plane 11.11 (2018) | 49.1 | 37 | 30.3 | |
| Far Cry 5 (2018) | 53 | 28 | 26 | 24 |
| Strange Brigade (2018) | 139.8 | 60.6 | 49.5 | 41.3 |
| Cyberpunk 2077 1.6 (2022) | 26.7 | 20.8 | 17.3 | 15.9 |
| Tiny Tina's Wonderlands (2022) | 34.3 | 28.4 | 18.6 | 16.5 |
| F1 22 (2022) | 65.4 | 62.1 | 42.6 | 9.92 |
Emisje
Hałas systemowy
Hałas wentylatorów tak naprawdę nie zmienił się w stosunku do konfiguracji Zen 3+, nawet pomimo zmiany liczby wentylatorów. Jest to niefortunne, ponieważ wentylator w naszej jednostce testowej Zen 3+ pulsowałby często i głośno, gdy tylko wprowadzono by większe obciążenia, a nasza jednostka Zen 4 nie byłaby inna. Hałas wentylatora regularnie oscyluje wokół 28 dB(A) na cichym tle 24 dB(A) podczas przeglądania stron internetowych lub przesyłania strumieniowego, podczas gdy większe obciążenia ustabilizowałyby się na poziomie 41 dB(A), podobnie jak wcześniej.
Hałas
| luz |
| 24.1 / 24.3 / 28 dB |
| obciążenie |
| 41 / 40.9 dB |
 | ||
30 dB cichy 40 dB(A) słyszalny 50 dB(A) irytujący |
||
min: | ||
| Acer Swift Edge SFE16 Ryzen 7 7840U Radeon 780M, R7 7840U, SK hynix HFS512GEJ9X125N | Acer Swift Edge SFE16-42-R1GM Radeon 680M, R7 7735U, Micron 3400 1TB MTFDKBA1T0TFH | Lenovo Slim Pro 9i 16IRP8 GeForce RTX 4050 Laptop GPU, i9-13905H, Samsung PM9A1 MZVL21T0HCLR | Asus VivoBook Pro 16 GeForce RTX 3050 Ti Laptop GPU, i7-12700H, Intel SSD 670p SSDPEKNU010TZ | Samsung Galaxy Book3 Ultra 16 GeForce RTX 4050 Laptop GPU, i7-13700H, Samsung PM9A1 MZVL2512HCJQ | Huawei MateBook 16s i7 Iris Xe G7 96EUs, i7-12700H, Silicon Motion PCIe-8 SSD | |
|---|---|---|---|---|---|---|
| Noise | -7% | -1% | -15% | -3% | 4% | |
| wyłączone / środowisko * (dB) | 23.4 | 25.7 -10% | 22.7 3% | 25.2 -8% | 25 -7% | 24 -3% |
| Idle Minimum * (dB) | 24.1 | 25.7 -7% | 22.7 6% | 25.2 -5% | 26 -8% | 24 -0% |
| Idle Average * (dB) | 24.3 | 27 -11% | 22.7 7% | 25.2 -4% | 27 -11% | 25.2 -4% |
| Idle Maximum * (dB) | 28 | 29.3 -5% | 27.5 2% | 25.2 10% | 28 -0% | 27.2 3% |
| Load Average * (dB) | 41 | 42.3 -3% | 28.9 30% | 55.1 -34% | 40 2% | 34.8 15% |
| Witcher 3 ultra * (dB) | 40.9 | 52.6 -29% | 39 5% | 34.8 15% | ||
| Load Maximum * (dB) | 40.9 | 42.7 -4% | 52.5 -28% | 61.5 -50% | 41 -0% | 39 5% |
* ... im mniej tym lepiej
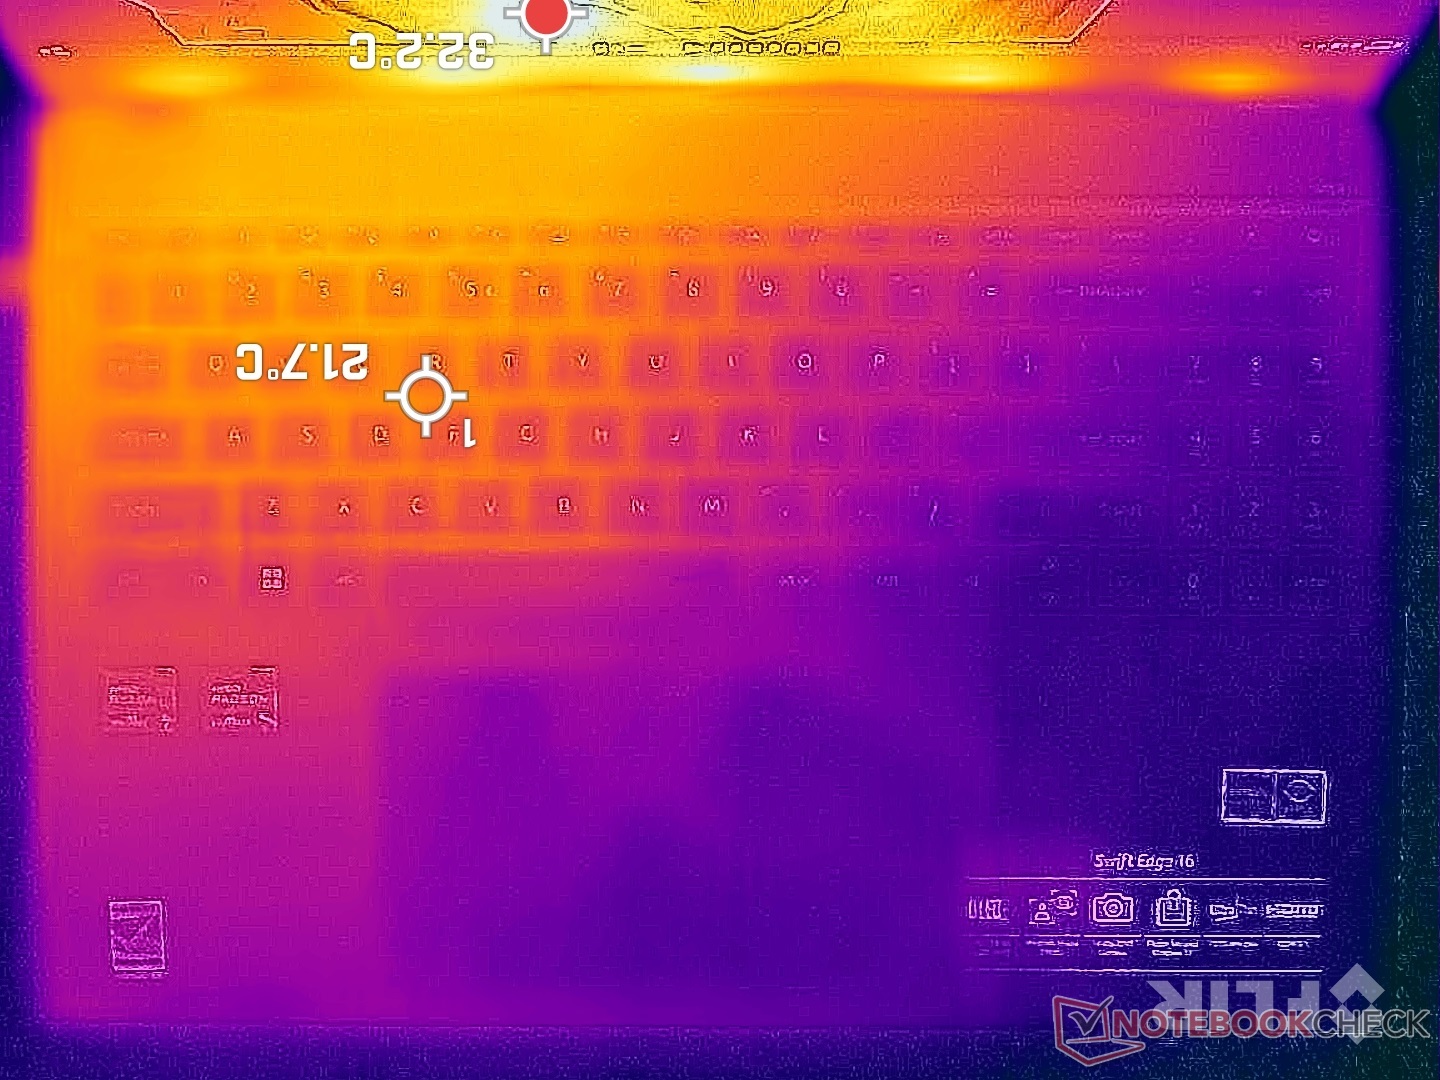
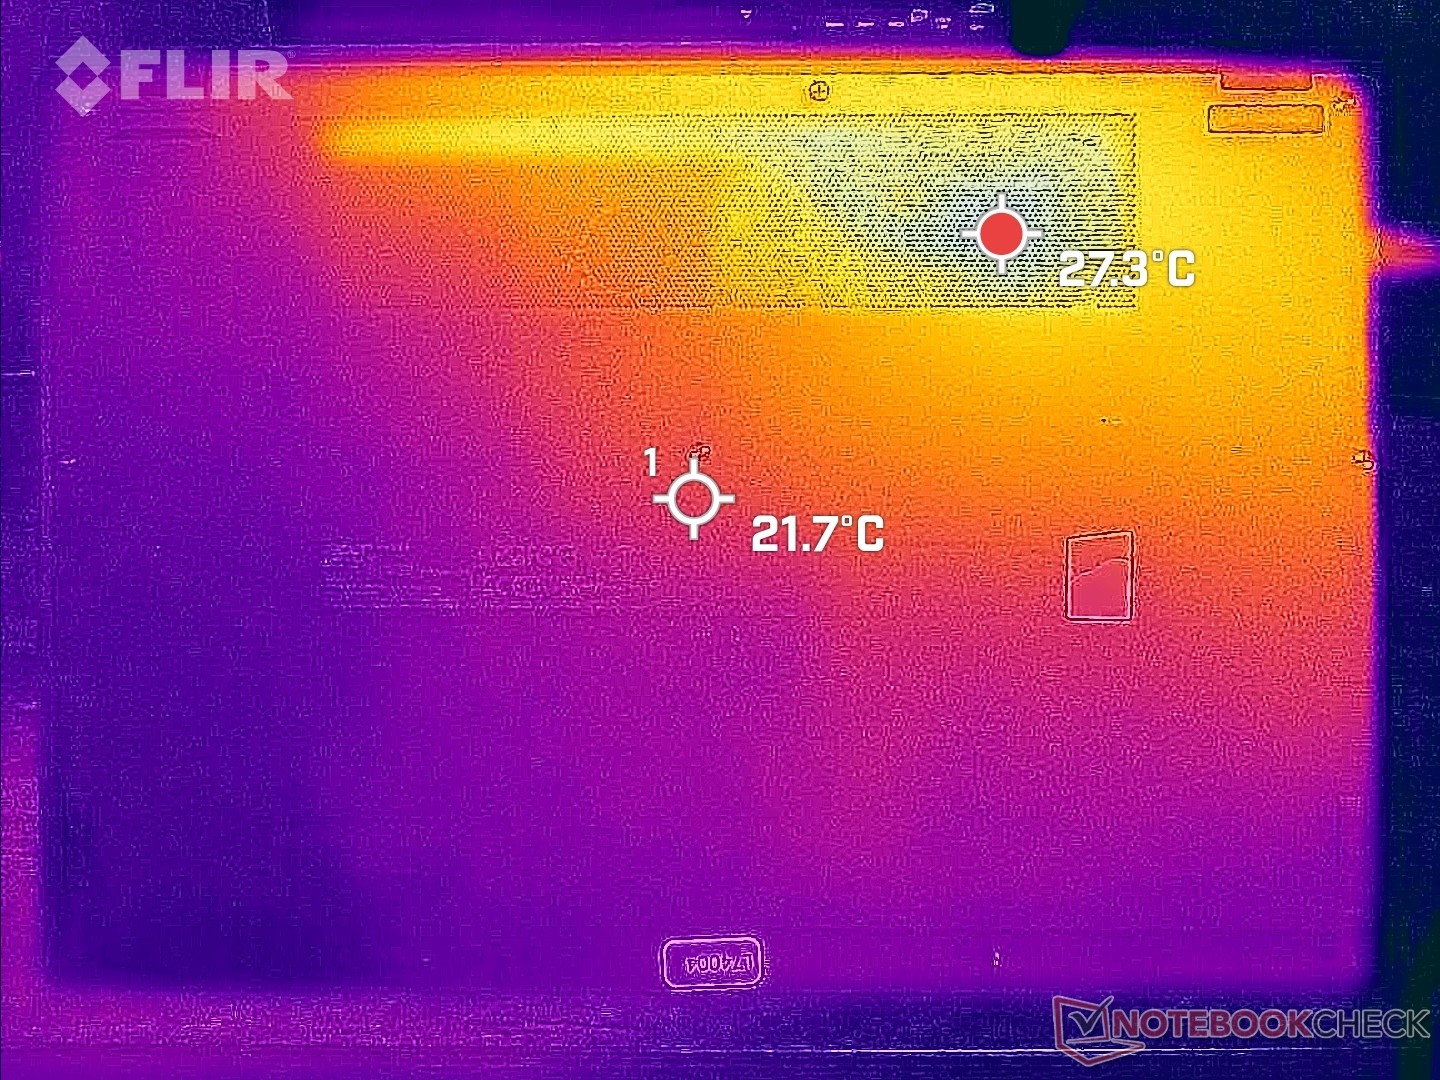
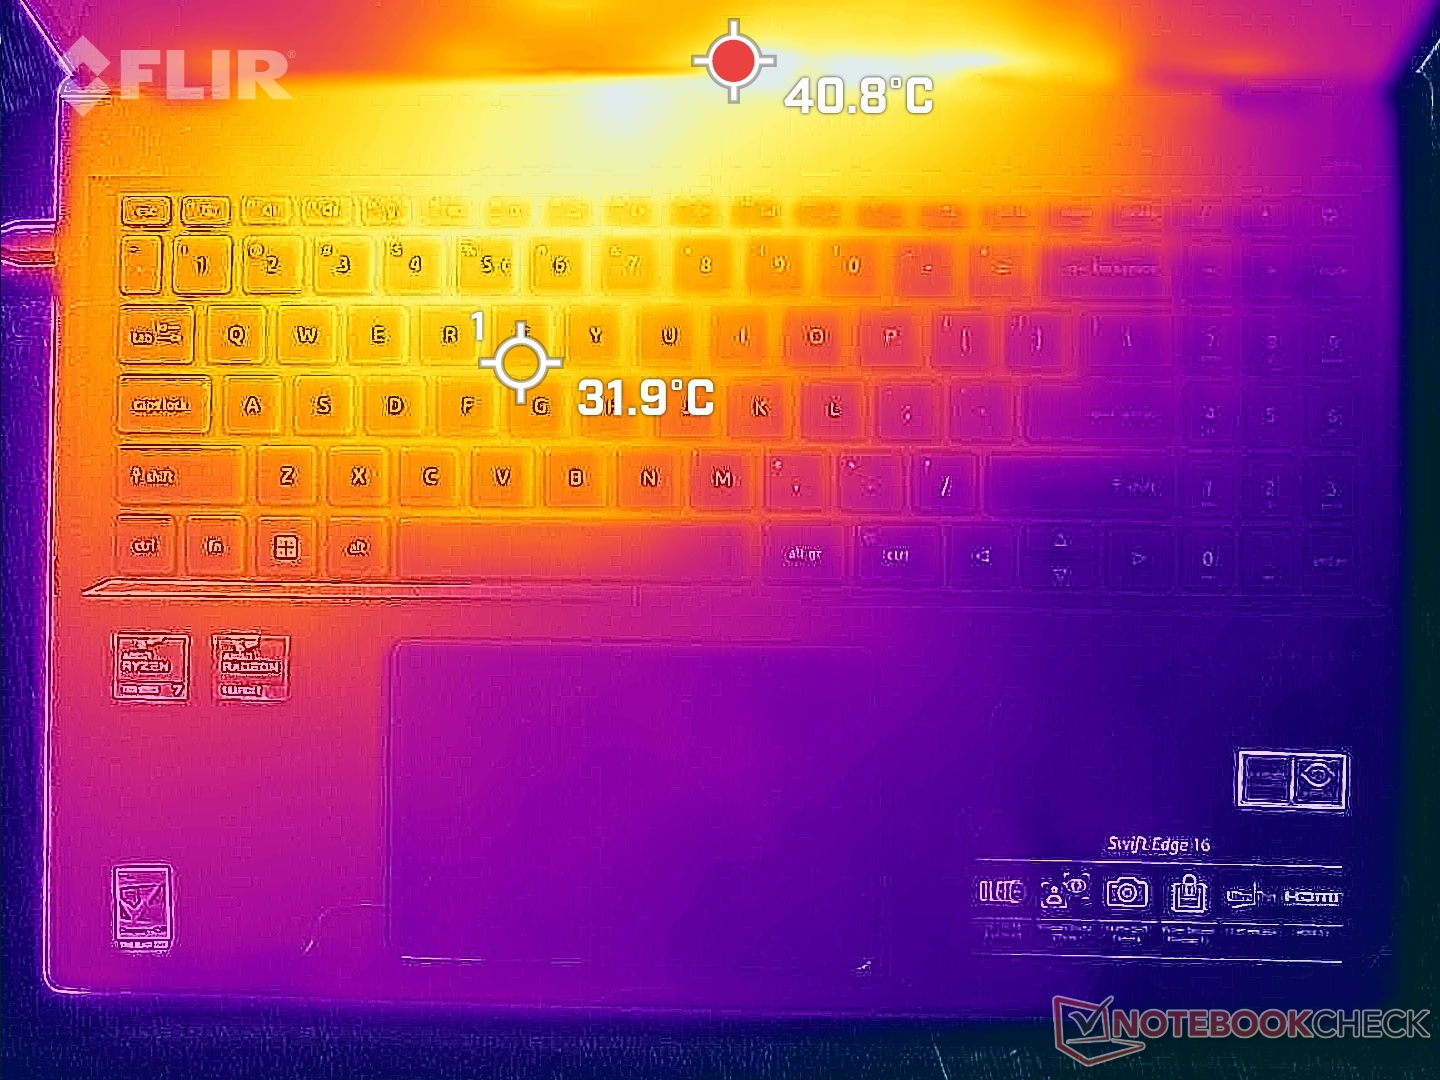
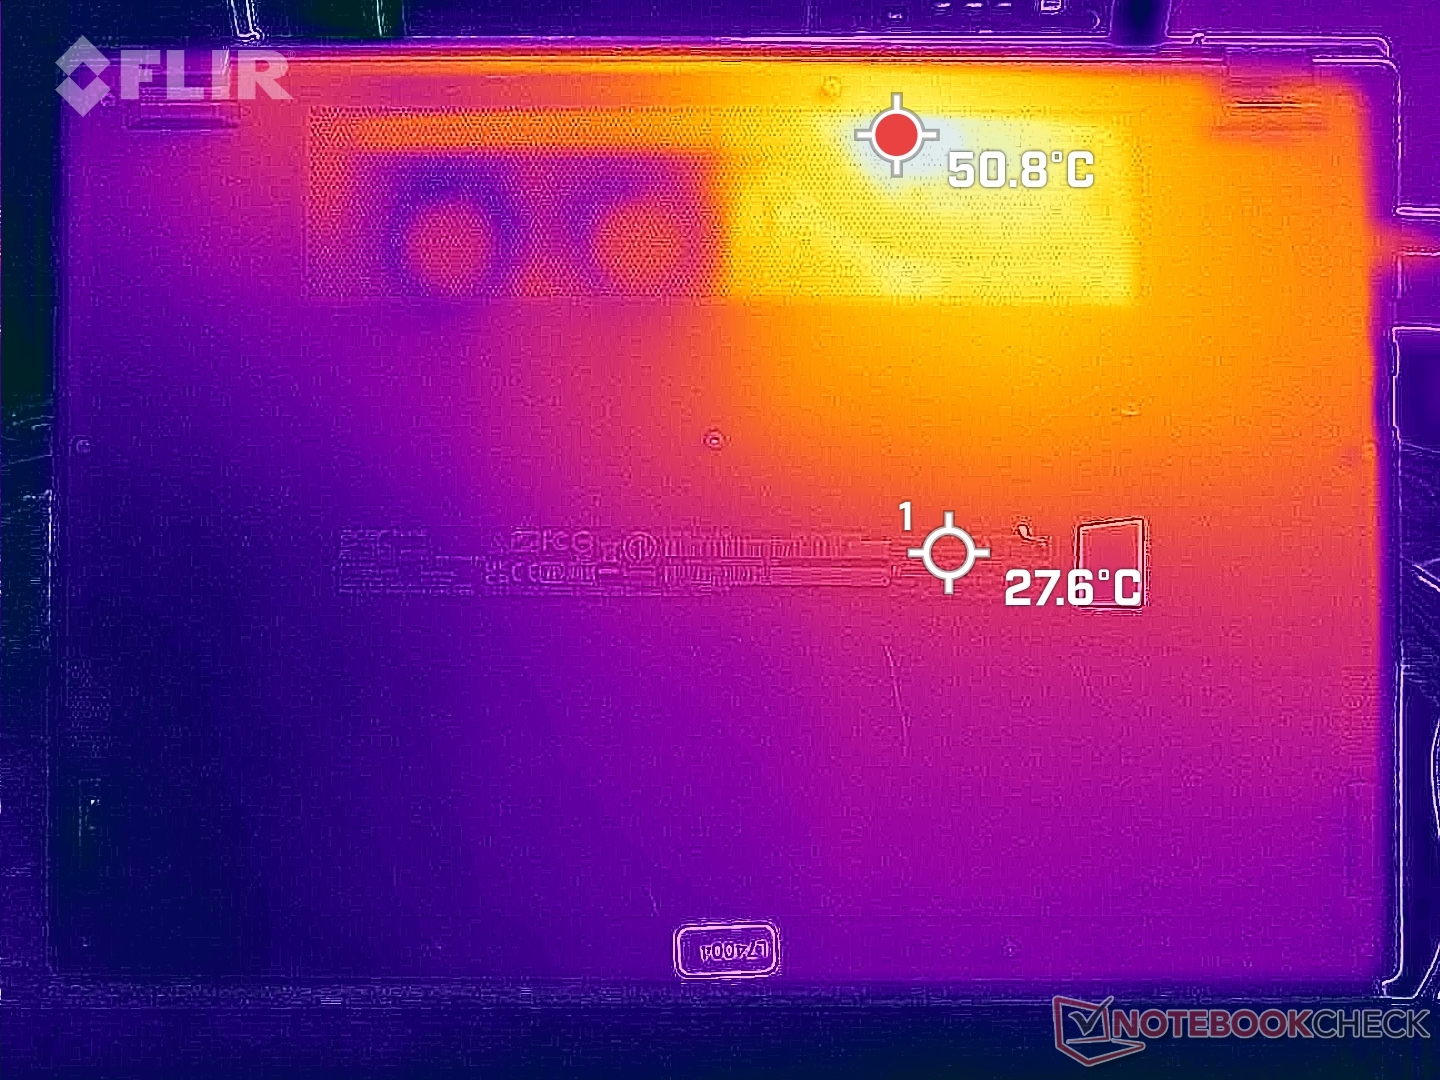
Temperatura
Temperatury powierzchniowe nie są znacząco niższe lub wyższe od tych, które odnotowaliśmy na konfiguracji Konfiguracji Ryzen 7 7735U. Gorące punkty na spodzie nadal osiągają ponad 50 C w pobliżu otworów wentylacyjnych, podczas gdy górna powierzchnia w pobliżu zawiasów może wynosić od 40 C do 50 C w zależności od kąta pokrywy. Jest mało prawdopodobne, aby dłonie dotykały tych gorących obszarów przez dłuższy czas podczas grania.
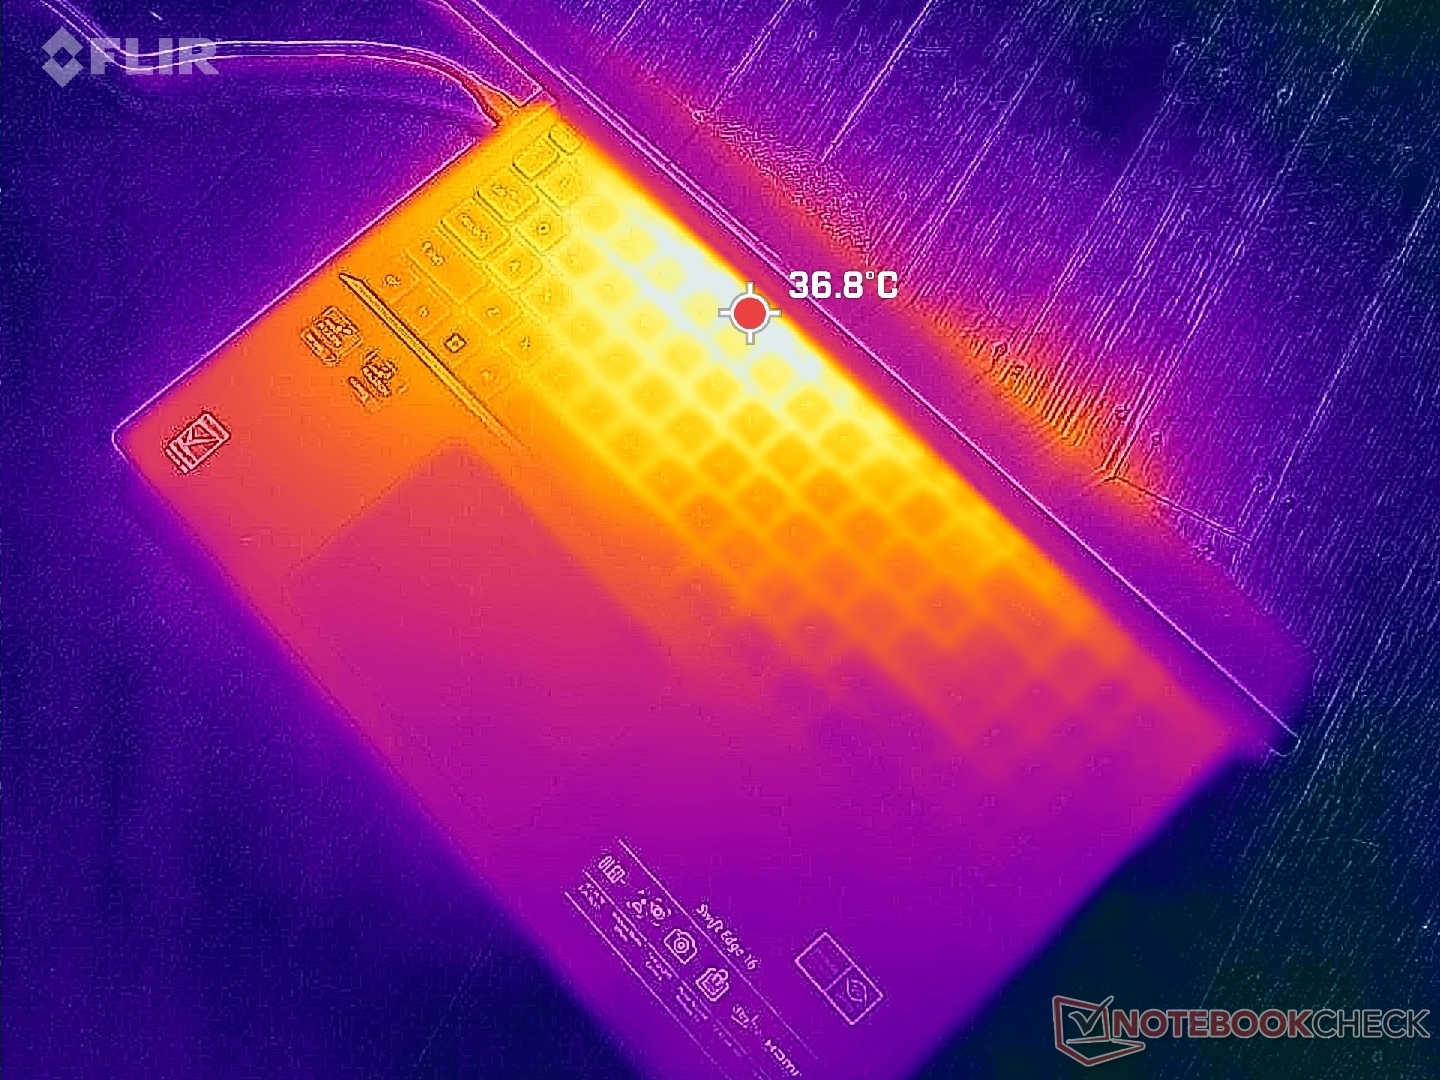
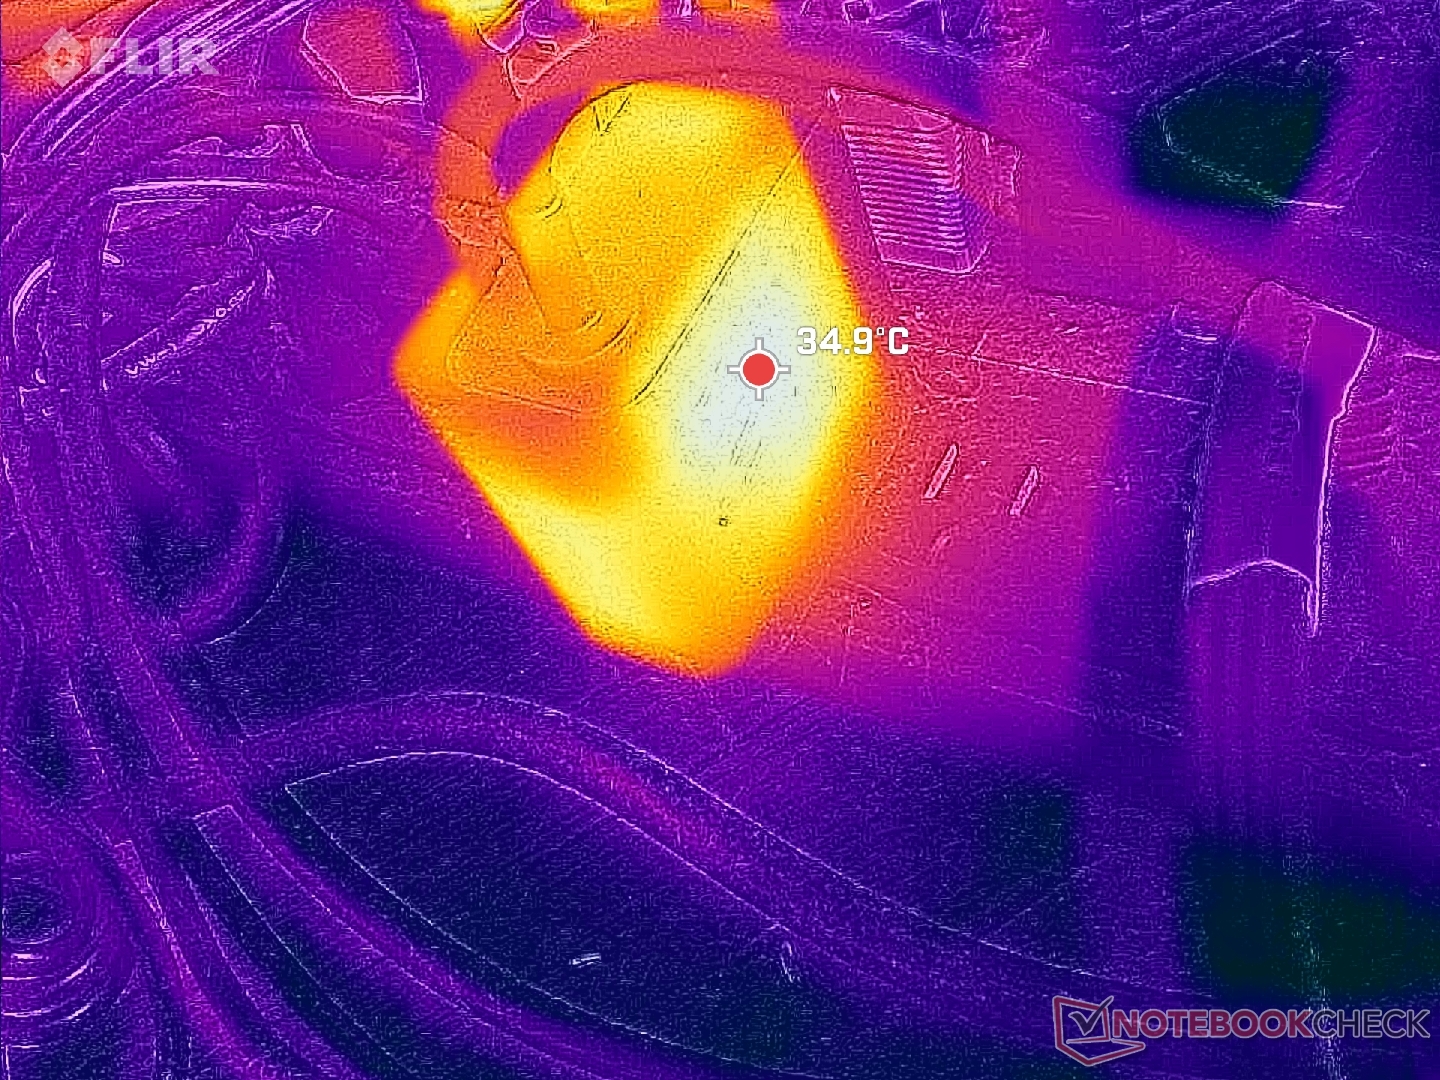
(±) Maksymalna temperatura w górnej części wynosi 41.6 °C / 107 F, w porównaniu do średniej 34.3 °C / 94 F , począwszy od 21.2 do 62.5 °C dla klasy Office.
(-) Dno nagrzewa się maksymalnie do 46.6 °C / 116 F, w porównaniu do średniej 36.8 °C / 98 F
(+) W stanie bezczynności średnia temperatura górnej części wynosi 27 °C / 81 F, w porównaniu ze średnią temperaturą urządzenia wynoszącą 29.5 °C / ### class_avg_f### F.
(+) Podpórki pod nadgarstki i touchpad są chłodniejsze niż temperatura skóry i maksymalnie 26.6 °C / 79.9 F i dlatego są chłodne w dotyku.
(±) Średnia temperatura obszaru podparcia dłoni w podobnych urządzeniach wynosiła 27.5 °C / 81.5 F (+0.9 °C / 1.6 F).
| Acer Swift Edge SFE16 Ryzen 7 7840U AMD Ryzen 7 7840U, AMD Radeon 780M | Acer Swift Edge SFE16-42-R1GM AMD Ryzen 7 7735U, AMD Radeon 680M | Lenovo Slim Pro 9i 16IRP8 Intel Core i9-13905H, NVIDIA GeForce RTX 4050 Laptop GPU | Asus VivoBook Pro 16 Intel Core i7-12700H, NVIDIA GeForce RTX 3050 Ti Laptop GPU | Samsung Galaxy Book3 Ultra 16 Intel Core i7-13700H, NVIDIA GeForce RTX 4050 Laptop GPU | Huawei MateBook 16s i7 Intel Core i7-12700H, Intel Iris Xe Graphics G7 96EUs | |
|---|---|---|---|---|---|---|
| Heat | -7% | 3% | -13% | 12% | 1% | |
| Maximum Upper Side * (°C) | 41.6 | 49.4 -19% | 37.8 9% | 44.2 -6% | 41 1% | 40.9 2% |
| Maximum Bottom * (°C) | 46.6 | 44.7 4% | 44.8 4% | 53 -14% | 44 6% | 48.3 -4% |
| Idle Upper Side * (°C) | 30.4 | 34 -12% | 30.6 -1% | 32.1 -6% | 23 24% | 29.2 4% |
| Idle Bottom * (°C) | 31 | 31.6 -2% | 31 -0% | 38.4 -24% | 26 16% | 30.4 2% |
* ... im mniej tym lepiej
Test warunków skrajnych
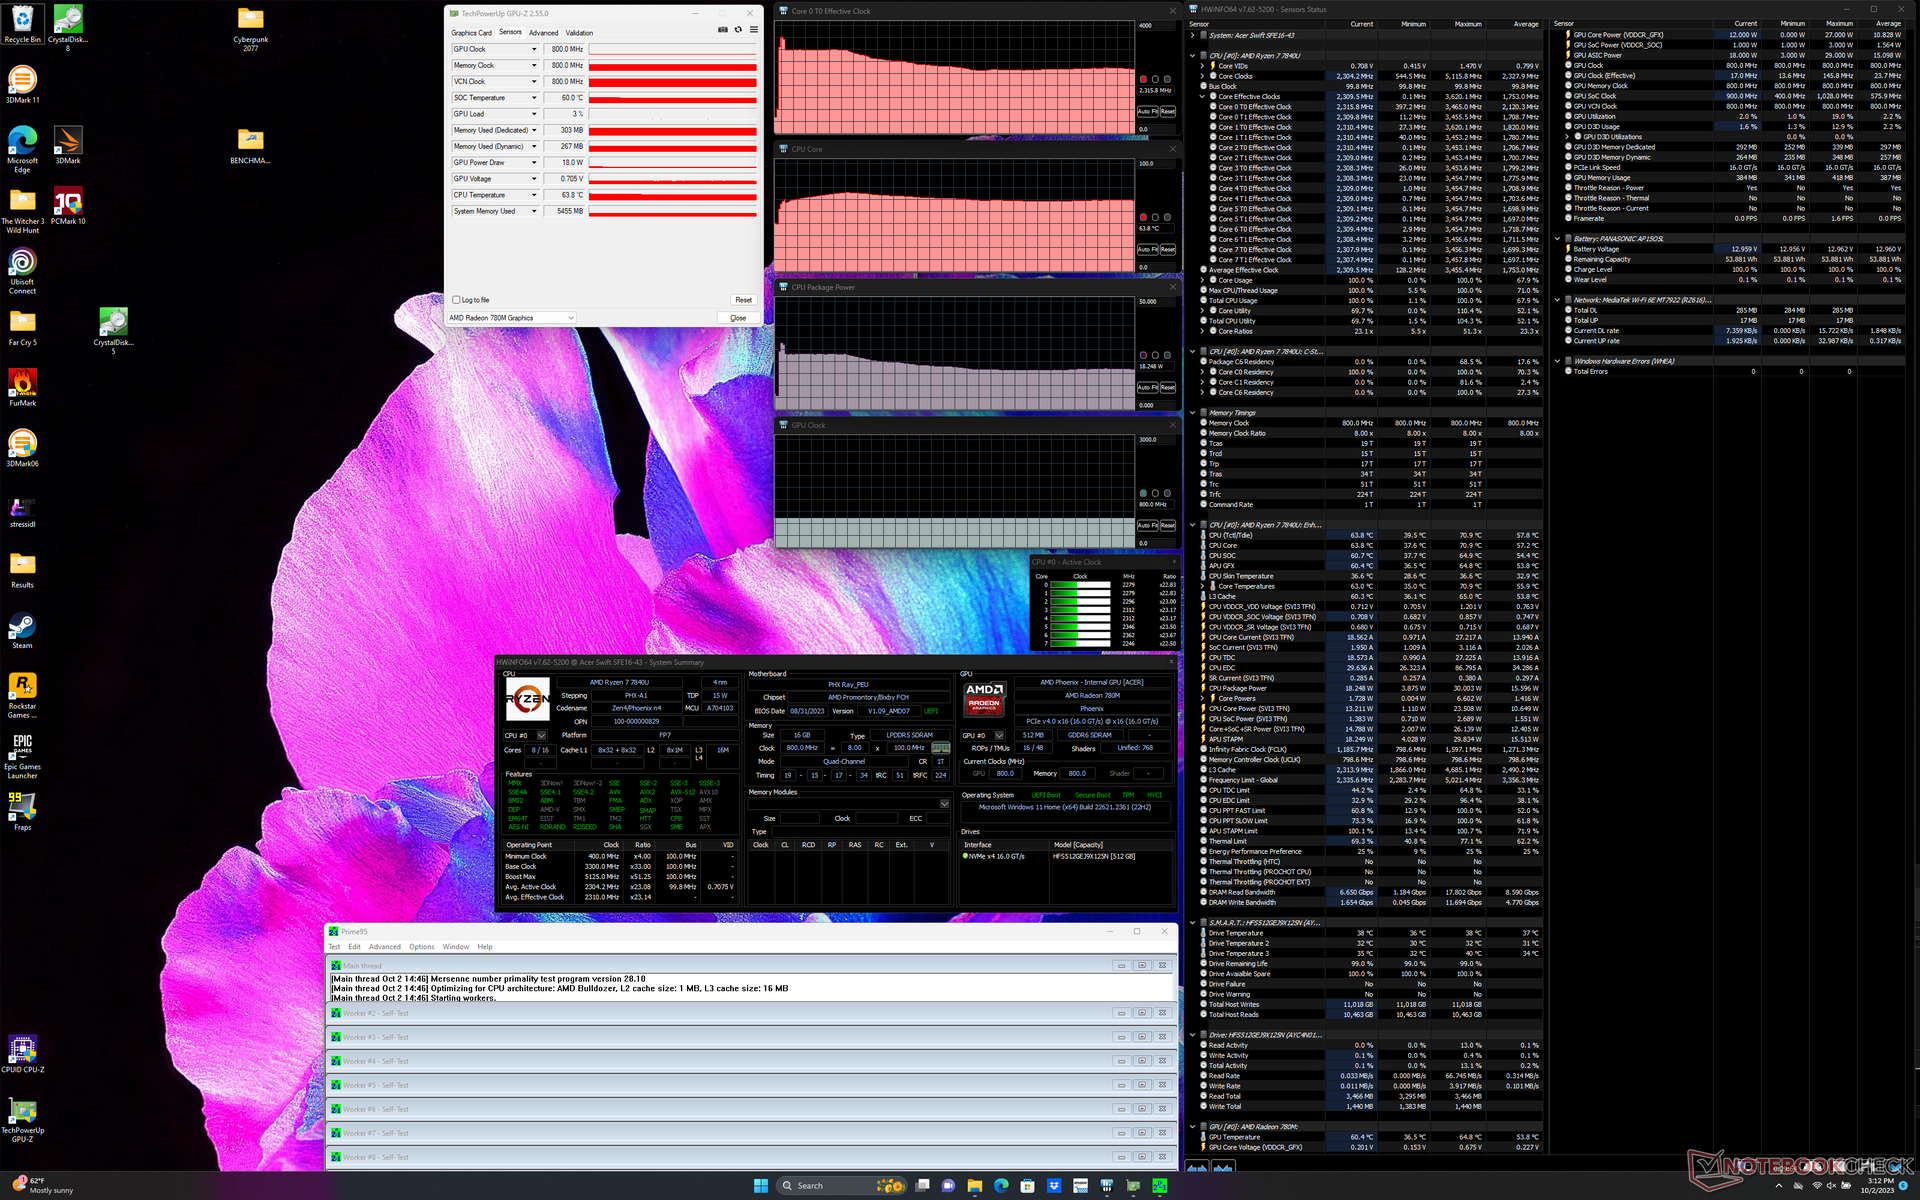
Ograniczony potencjał Turbo Core Acer można zaobserwować podczas testów obciążeniowych z benchmarkami. Częstotliwość taktowania i pobór mocy z płyty podczas inicjowania stresu Prime95 wzrosłyby odpowiednio do 3,5 GHz i 30 W, a następnie stopniowo spadały do zaledwie 2,3 GHz i 18 W w ciągu następnej minuty. Temperatura rdzenia również ustabilizowała się na stosunkowo niskim poziomie 64 C. Powtarzając ten test na AMD Framework Laptop 13.5 z tym samym procesorem dałoby wyższe wartości na poziomie 3,2 GHz, 35 W i 85 C w porównaniu.
Temperatura rdzenia podczas pracy Witcher 3 ustabilizowałaby się na poziomie zaledwie 56 C lub około 15 C niższym niż w przypadku wspomnianego wyżej Framework. Wyraźnie widać, że system przedkłada niższe temperatury powierzchni nad wyższą wydajność.
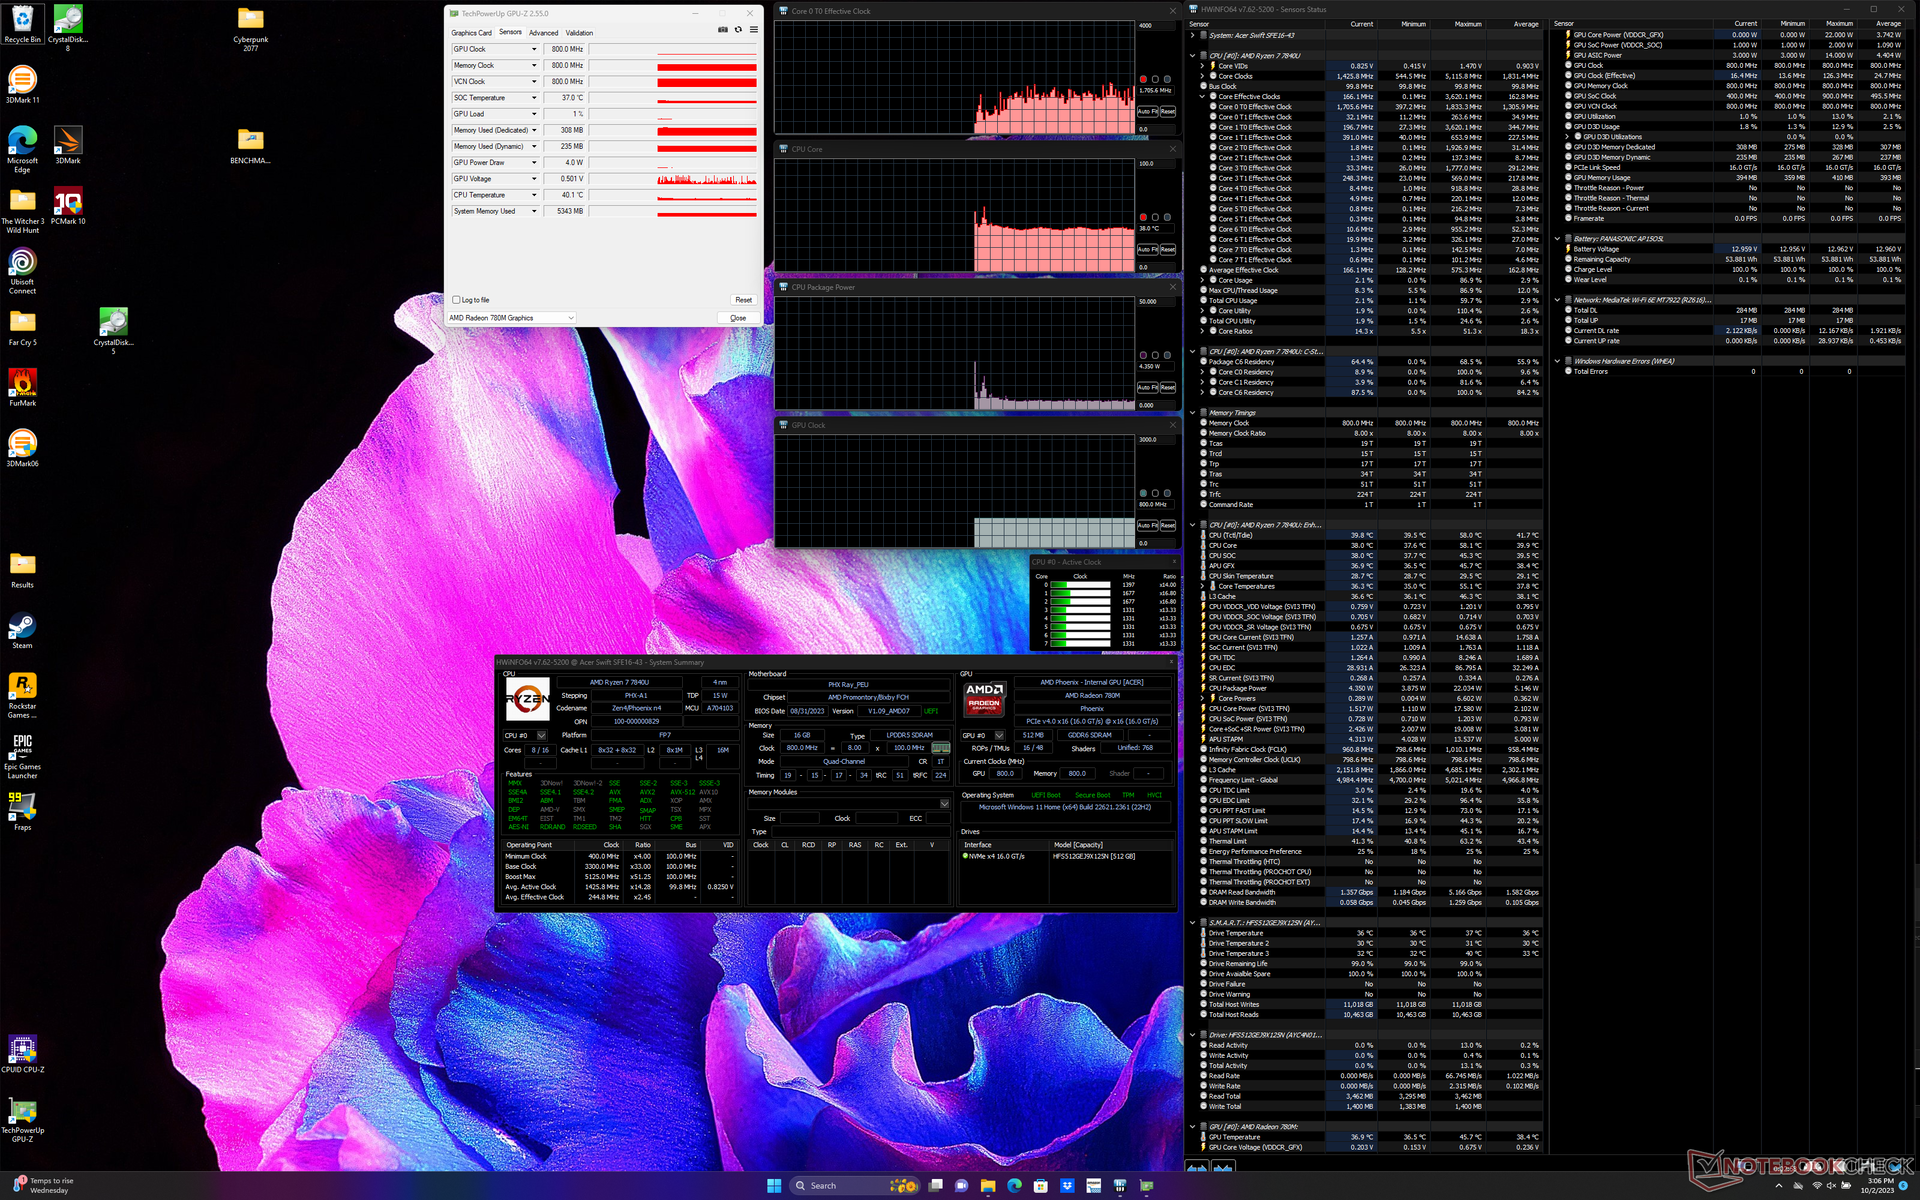
| Taktowanie CPU (GHz) | Taktowanie GPU (MHz) | Średnia temperatura CPU (°C) | |
| System bezczynności | -- | -- | 38 |
| Prime95Stress | 2.3 | -- | 64 |
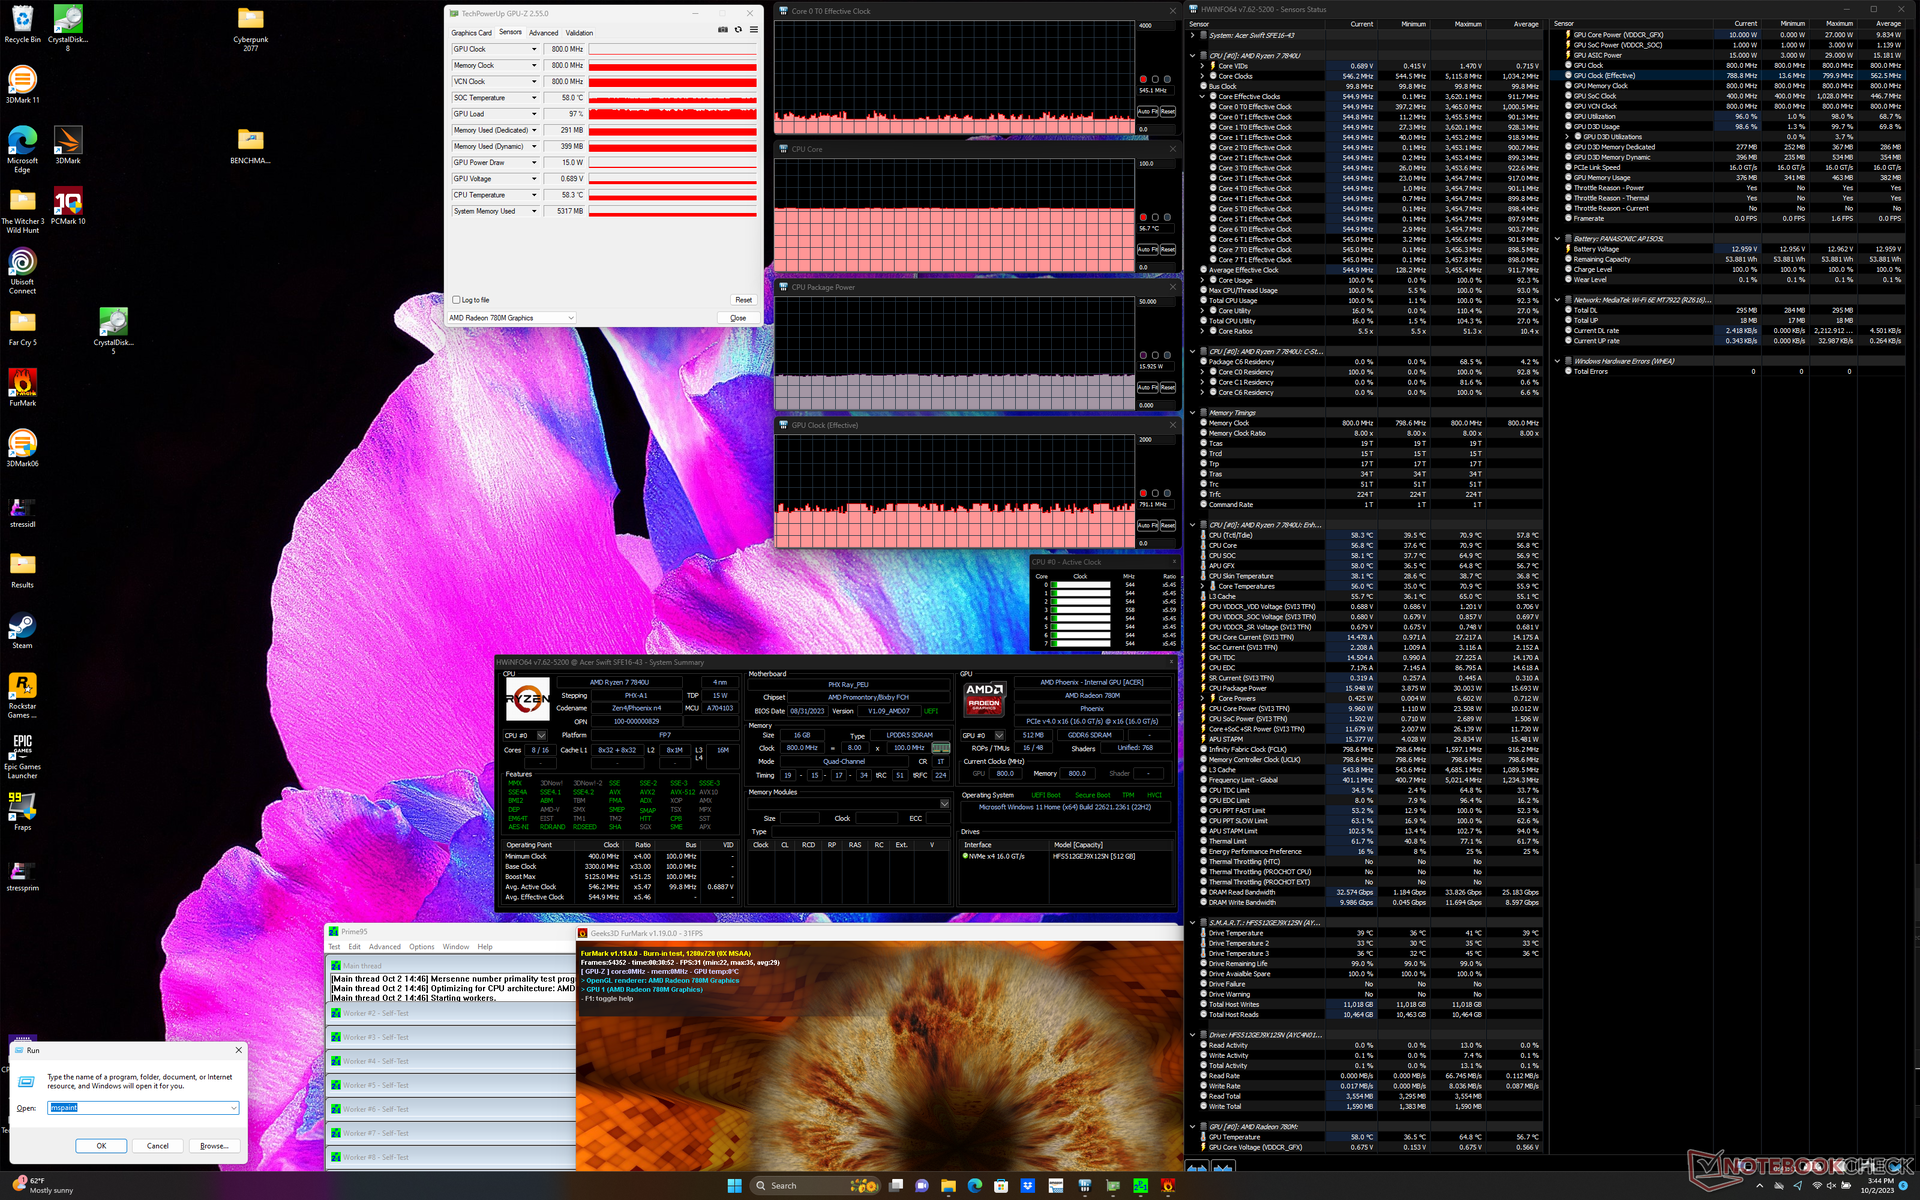
| Prime95+ FurMark Stress | 0.5 | 791 | 57 |
| Witcher 3 Stres | 0.3 | 1042 | 56 |
Głośniki
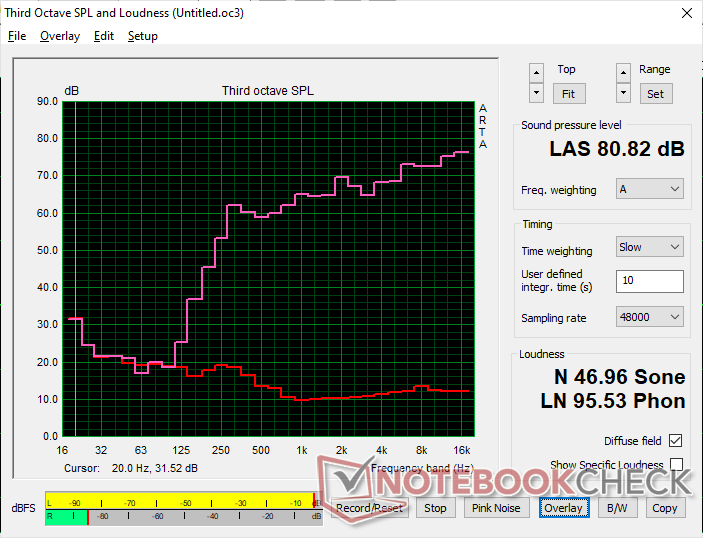
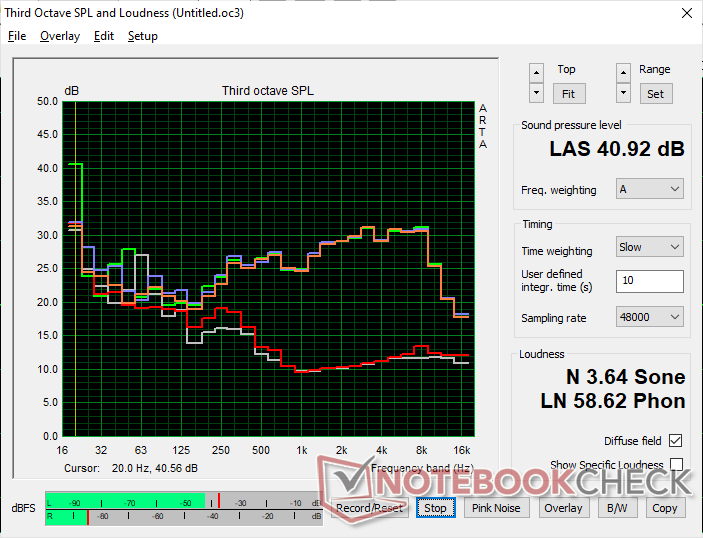
Acer Swift Edge SFE16 Ryzen 7 7840U analiza dźwięku
(±) | głośność głośnika jest średnia, ale dobra (80.8 dB)
Bas 100 - 315 Hz
(-) | prawie brak basu - średnio 24.5% niższa od mediany
(±) | liniowość basu jest średnia (14.2% delta do poprzedniej częstotliwości)
Średnie 400 - 2000 Hz
(+) | zbalansowane środki średnie - tylko 2.9% od mediany
(+) | średnie są liniowe (3.5% delta do poprzedniej częstotliwości)
Wysokie 2–16 kHz
(+) | zrównoważone maksima - tylko 4.8% od mediany
(+) | wzloty są liniowe (3.7% delta do poprzedniej częstotliwości)
Ogólnie 100 - 16.000 Hz
(±) | liniowość ogólnego dźwięku jest średnia (19.8% różnicy w stosunku do mediany)
W porównaniu do tej samej klasy
» 41% wszystkich testowanych urządzeń w tej klasie było lepszych, 9% podobnych, 50% gorszych
» Najlepszy miał deltę 7%, średnia wynosiła ###średnia###%, najgorsza wynosiła 53%
W porównaniu do wszystkich testowanych urządzeń
» 51% wszystkich testowanych urządzeń było lepszych, 7% podobnych, 42% gorszych
» Najlepszy miał deltę 4%, średnia wynosiła ###średnia###%, najgorsza wynosiła 134%
Apple MacBook Pro 16 2021 M1 Pro analiza dźwięku
(+) | głośniki mogą odtwarzać stosunkowo głośno (84.7 dB)
Bas 100 - 315 Hz
(+) | dobry bas - tylko 3.8% od mediany
(+) | bas jest liniowy (5.2% delta do poprzedniej częstotliwości)
Średnie 400 - 2000 Hz
(+) | zbalansowane środki średnie - tylko 1.3% od mediany
(+) | średnie są liniowe (2.1% delta do poprzedniej częstotliwości)
Wysokie 2–16 kHz
(+) | zrównoważone maksima - tylko 1.9% od mediany
(+) | wzloty są liniowe (2.7% delta do poprzedniej częstotliwości)
Ogólnie 100 - 16.000 Hz
(+) | ogólny dźwięk jest liniowy (4.6% różnicy w stosunku do mediany)
W porównaniu do tej samej klasy
» 0% wszystkich testowanych urządzeń w tej klasie było lepszych, 0% podobnych, 100% gorszych
» Najlepszy miał deltę 5%, średnia wynosiła ###średnia###%, najgorsza wynosiła 45%
W porównaniu do wszystkich testowanych urządzeń
» 0% wszystkich testowanych urządzeń było lepszych, 0% podobnych, 100% gorszych
» Najlepszy miał deltę 4%, średnia wynosiła ###średnia###%, najgorsza wynosiła 134%
Zarządzanie energią
Zużycie energii
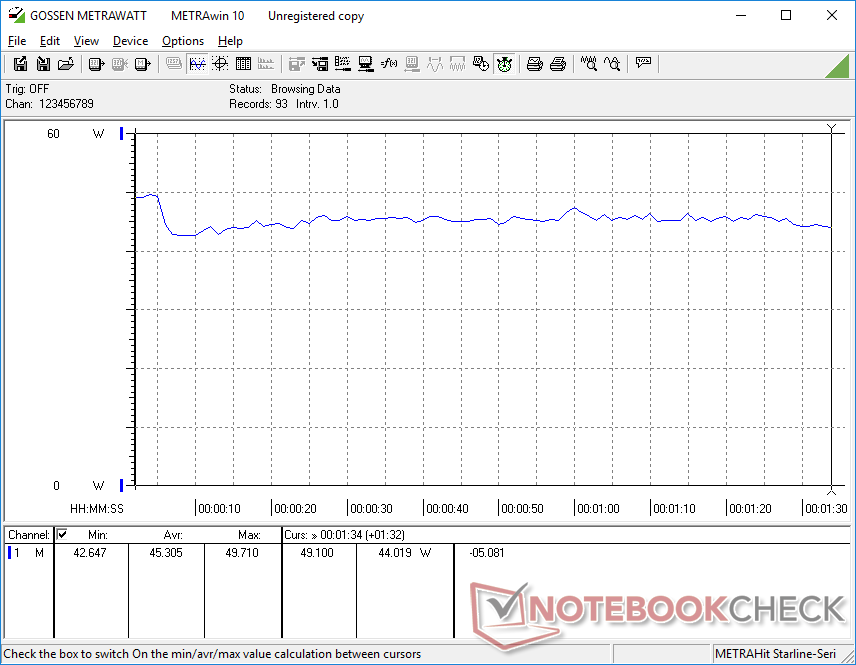
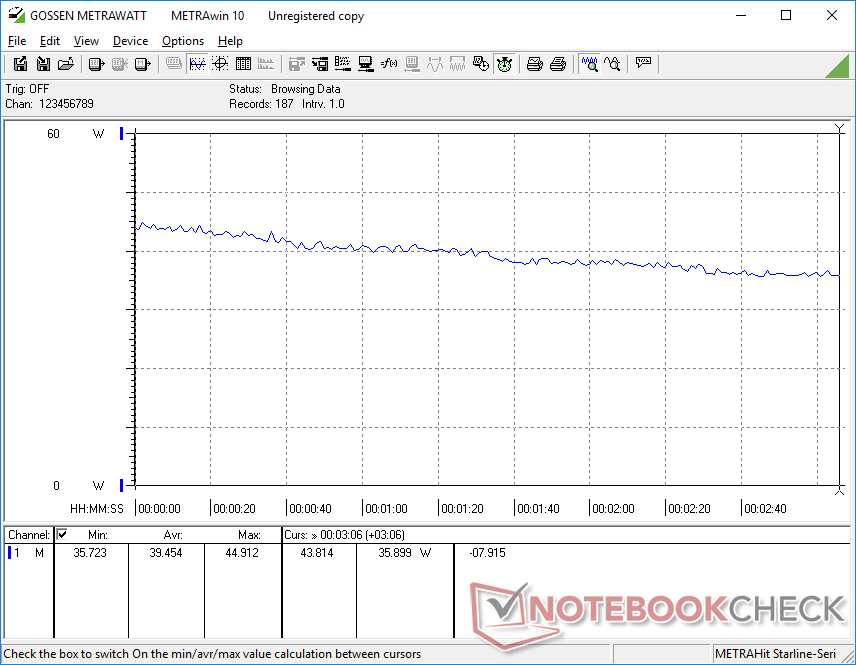
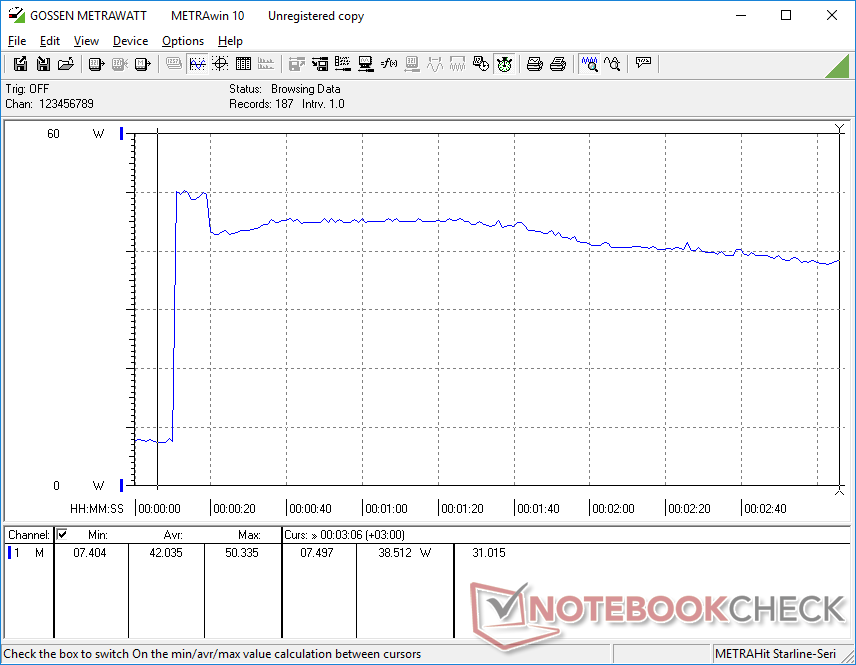
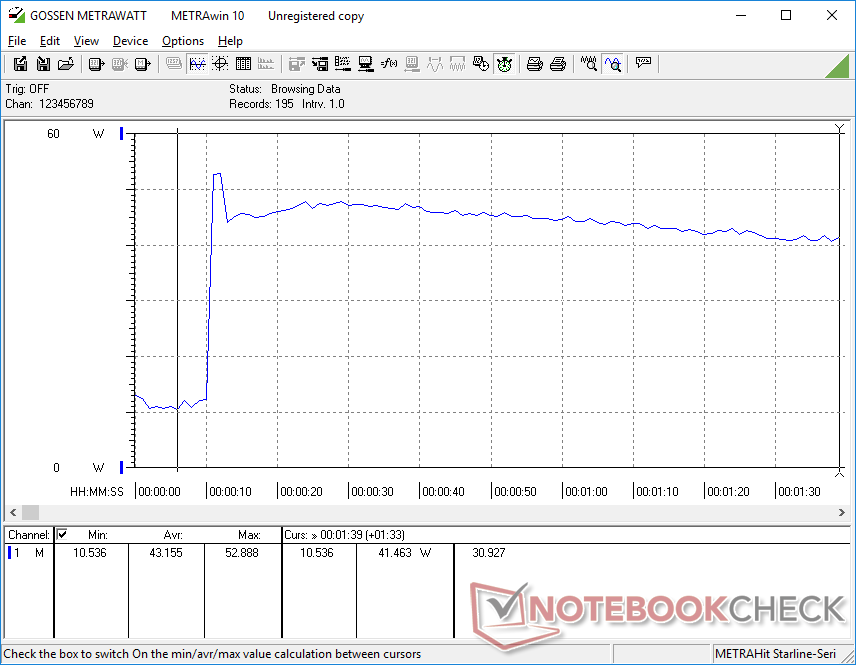
Zużycie energii na biegu jałowym jest wyższe niż w większości innych laptopów ze zintegrowanymi procesorami graficznymi ze względu na wysoką częstotliwość odświeżania 120 Hz i panel OLED w naszej konfiguracji Acer, które są znane z większego zapotrzebowania na energię niż zwykłe 60 Hz IPS. Wyświetlanie całkowicie białego obrazu przy 120 Hz zużyłoby aż 19 W w porównaniu do mniej niż połowy w przypadku Framework Laptop 13.5.
I odwrotnie, zużycie energii podczas grania byłoby niższe niż oczekiwano ze względu na tendencje procesora do dławienia. Zużycie energii zaczynało się od wysokiego poziomu na początku testu, a następnie stopniowo spadało w miarę upływu czasu, jak pokazano na poniższych wykresach, aby zasugerować dławienie wydajności.
| wyłączony / stan wstrzymania | |
| luz | |
| obciążenie |
|
Legenda:
min: | |
| Acer Swift Edge SFE16 Ryzen 7 7840U R7 7840U, Radeon 780M, SK hynix HFS512GEJ9X125N, OLED, 3200x2000, 16" | Acer Swift Edge SFE16-42-R1GM R7 7735U, Radeon 680M, Micron 3400 1TB MTFDKBA1T0TFH, OLED, 3840x2400, 16" | Lenovo Slim Pro 9i 16IRP8 i9-13905H, GeForce RTX 4050 Laptop GPU, Samsung PM9A1 MZVL21T0HCLR, Mini-LED, 3200x2000, 16" | Asus VivoBook Pro 16 i7-12700H, GeForce RTX 3050 Ti Laptop GPU, Intel SSD 670p SSDPEKNU010TZ, IPS, 2560x1600, 16" | Samsung Galaxy Book3 Ultra 16 i7-13700H, GeForce RTX 4050 Laptop GPU, Samsung PM9A1 MZVL2512HCJQ, AMOLED, 2880x1800, 16" | Huawei MateBook 16s i7 i7-12700H, Iris Xe G7 96EUs, Silicon Motion PCIe-8 SSD, IPS, 2520x1680, 16" | |
|---|---|---|---|---|---|---|
| Power Consumption | 4% | -166% | -102% | -15% | -30% | |
| Idle Minimum * (Watt) | 7.1 | 8.6 -21% | 16 -125% | 8.7 -23% | 3 58% | 6.8 4% |
| Idle Average * (Watt) | 10.1 | 7.7 24% | 30 -197% | 13.1 -30% | 5 50% | 13.2 -31% |
| Idle Maximum * (Watt) | 18.6 | 9.3 50% | 30.4 -63% | 18.3 2% | 11 41% | 13.8 26% |
| Load Average * (Watt) | 45.3 | 47.9 -6% | 78.9 -74% | 116 -156% | 72 -59% | 75.2 -66% |
| Witcher 3 ultra * (Watt) | 39.5 | 46.3 -17% | 155.3 -293% | 117.6 -198% | 69.7 -76% | 56.1 -42% |
| Load Maximum * (Watt) | 52.9 | 56 -6% | 180.4 -241% | 162 -206% | 108 -104% | 90.6 -71% |
* ... im mniej tym lepiej
Power Consumption Witcher 3 / Stresstest
Power Consumption external Monitor
Żywotność baterii
Czas pracy w sieci WLAN jest krótszy od tego, który zarejestrowaliśmy na naszym poprzednim urządzeniu o prawie dwie pełne godziny, nawet gdy oba są ustawione na te same ustawienia profilu zasilania i warunki przeglądarki. Częstotliwość odświeżania 120 Hz jest prawdopodobnie czynnikiem przyczyniającym się do różnic w żywotności baterii.
| Acer Swift Edge SFE16 Ryzen 7 7840U R7 7840U, Radeon 780M, 54 Wh | Acer Swift Edge SFE16-42-R1GM R7 7735U, Radeon 680M, 54 Wh | Lenovo Slim Pro 9i 16IRP8 i9-13905H, GeForce RTX 4050 Laptop GPU, 75 Wh | Asus VivoBook Pro 16 i7-12700H, GeForce RTX 3050 Ti Laptop GPU, 70 Wh | Samsung Galaxy Book3 Ultra 16 i7-13700H, GeForce RTX 4050 Laptop GPU, 76 Wh | Huawei MateBook 16s i7 i7-12700H, Iris Xe G7 96EUs, 84 Wh | |
|---|---|---|---|---|---|---|
| Czasy pracy | 30% | 18% | 30% | 71% | 45% | |
| WiFi v1.3 (h) | 5.6 | 7.3 30% | 6.6 18% | 7.3 30% | 9.6 71% | 8.1 45% |
| Reader / Idle (h) | 10.9 | 18.2 | ||||
| H.264 (h) | 8.6 | 13.4 | 9.3 | |||
| Load (h) | 1.5 | 1.8 | 1.9 |
Za
Przeciw
Werdykt - drobne, ale zauważalne ulepszenia
The Zen 3+ Swift Edge 16 był już jednym z naszych ulubionych 16-calowych laptopów, a zaktualizowana konfiguracja Zen 4 tylko utwierdza nas w tym przekonaniu. Poziom mocy procesora, a zwłaszcza dostępnej mocy GPU, jest wysoki, biorąc pod uwagę niską wagę i cienki profil. Tymczasem wyświetlacz OLED 3,2K 120 Hz jest jednym z najlepszych, jakie widzieliśmy w jakimkolwiek laptopie multimedialnym do przetwarzania tekstu, edycji, przeglądania, wideo, a nawet gier. Jeśli chcesz zmaksymalizować wydajność i jakość wyświetlania, jednocześnie minimalizując wagę, to Swift Edge 16 naprawdę trafia w dziesiątkę.
Ryzen 7 7840U oferuje przyzwoity wzrost wydajności w stosunku do i tak już świetnej konfiguracji Ryzen 7 7735U Swift Edge 16. Użytkownicy pokochają OLED 120 Hz i niską wagę, ale przeciętny czas pracy na baterii i ograniczanie wydajności mogą irytować zaawansowanych użytkowników.
Ograniczenia pojawiają się, gdy spojrzymy poza procesor i wyświetlacz. Ponieważ laptop jest niezwykle lekki jak na swój rozmiar, niektóre funkcje musiały zostać usunięte lub zredukowane, takie jak mniejsze rozwiązanie chłodzące, mniejsza pojemność baterii i brak Gorilla Glass lub ekranu dotykowego, aby utrzymać niską wagę. W rezultacie procesor działa nieco wolniej niż oczekiwano, czas pracy na baterii jest tylko przeciętny, dysk SSD dławi się pod obciążeniem, a wyświetlacz jest bardziej podatny na skręcanie i chybotanie niż byśmy chcieli. Rozbudowa jest również ograniczona, ponieważ pamięć RAM jest wlutowana i obsługiwany jest tylko jeden wewnętrzny dysk SSD.
Jeśli absolutnie potrzebujesz mocy procesorów z serii H i kart graficznych GeForce RTX, możesz rozważyć cięższy model Swift X 16, Asus VivoBook Pro 16lubGalaxy Book3 Ultra 16 zamiast tego. Stali podróżnicy będą mieli więcej do polubienia w Swift Edge 16, ponieważ mogą bardziej regularnie wykorzystywać niską wagę systemu bez poświęcania jakości wyświetlania lub zbyt dużej wydajności.
Cena i dostępność
Recenzowany Acer Swift Edge SFE16 z procesorem Ryzen 7 7840U jest już powszechnie dostępny w sklepie Best Buy w cenie 1300 USD.
Acer Swift Edge SFE16 Ryzen 7 7840U
- 06/10/2023 v7 (old)
Allen Ngo
Przezroczystość
Wyboru urządzeń do recenzji dokonuje nasza redakcja. Próbka testowa została udostępniona autorowi jako pożyczka od producenta lub sprzedawcy detalicznego na potrzeby tej recenzji. Pożyczkodawca nie miał wpływu na tę recenzję, producent nie otrzymał też kopii tej recenzji przed publikacją. Nie było obowiązku publikowania tej recenzji. Jako niezależna firma medialna, Notebookcheck nie podlega władzy producentów, sprzedawców detalicznych ani wydawców.
Tak testuje Notebookcheck
Każdego roku Notebookcheck niezależnie sprawdza setki laptopów i smartfonów, stosując standardowe procedury, aby zapewnić porównywalność wszystkich wyników. Od około 20 lat stale rozwijamy nasze metody badawcze, ustanawiając przy tym standardy branżowe. W naszych laboratoriach testowych doświadczeni technicy i redaktorzy korzystają z wysokiej jakości sprzętu pomiarowego. Testy te obejmują wieloetapowy proces walidacji. Nasz kompleksowy system ocen opiera się na setkach uzasadnionych pomiarów i benchmarków, co pozwala zachować obiektywizm.Price comparison

