Recenzja laptopa Lenovo IdeaPad 5 Pro 16ARH7: Ryzen 5 6600HS spotyka się z dobrym wyświetlaczem 16:10

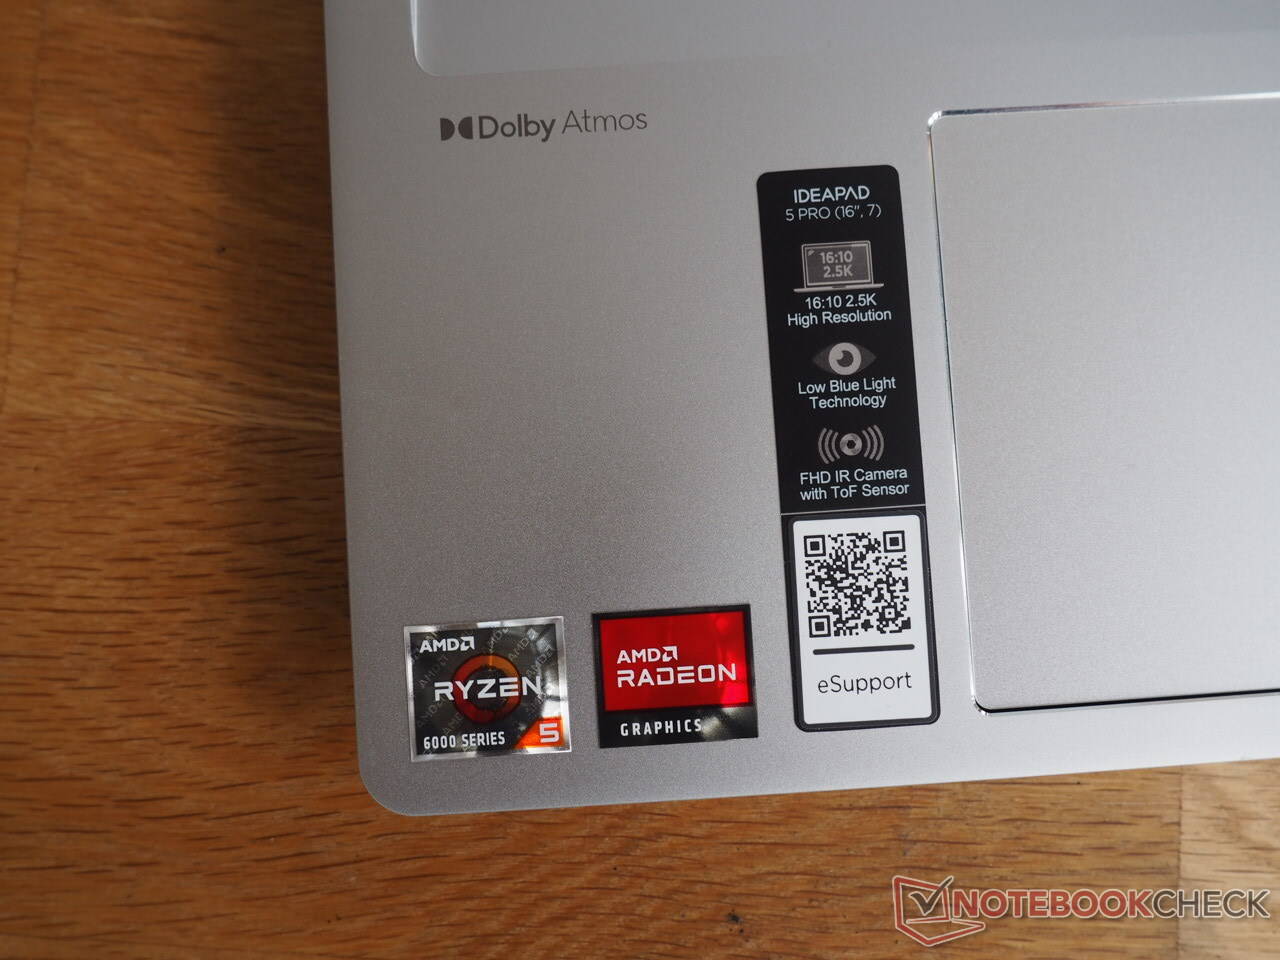
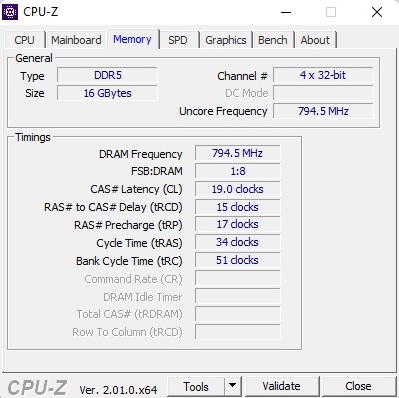
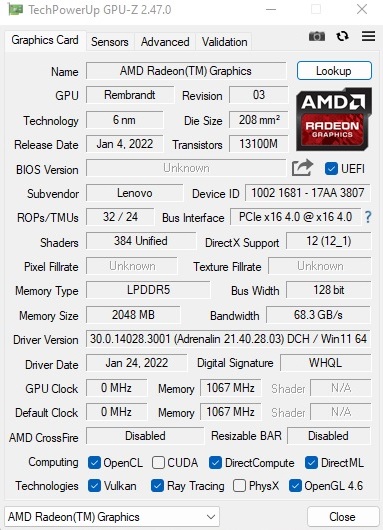
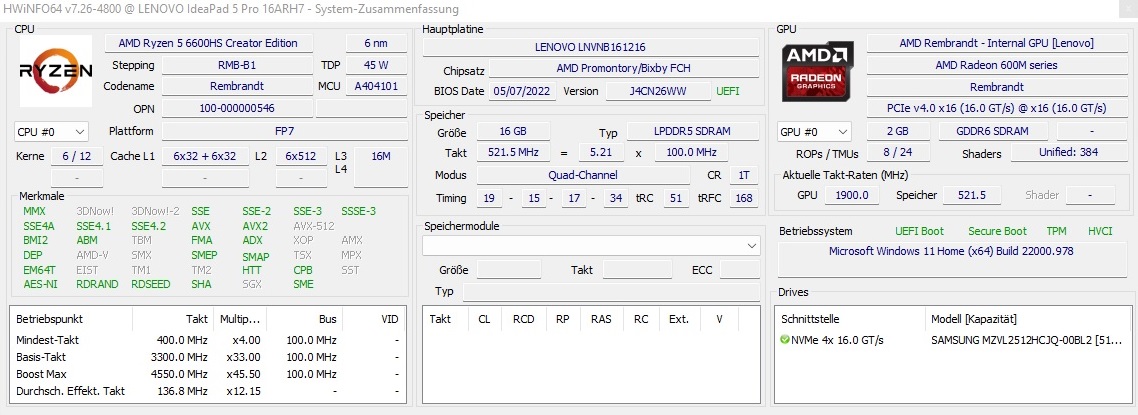
Testowany model 16ARH7 nie jest zbyt przystępny cenowo jak na oferowaną wydajność, biorąc pod uwagę jego cenę wynoszącą prawie 1000 euro (~998 dolarów). Z drugiej strony, 16-calowy laptop punktuje wysoką jakością i pierwszorzędnym wyświetlaczem. Według producenta zastosowany tu ekran IPS oferuje 350 cd/m², 120 Hz i 100% sRGB. Rozdzielczość 2.560 x 1.600 pikseli również nie jest niczym zdrożnym. Jako pamięć masowa zastosowano 512-GB dysk SSD NVMe, a pamięć robocza DDR5, która niestety jest wlutowana i nie można jej rozszerzyć, oferuje 16 GB. Jak już wspomniano, w przypadku procesora Lenovo zdecydowało się na dość rzadko spotykany m.in Ryzen 5 6600HSktóry wykorzystuje m.in Radeon 660M.
Do konkurentów IdeaPad 5 Pro należą inne 16-calowe laptopy, np Huawei MateBook D16,Acer Swift 3 SF316-51,LG Gram 16, orazLenovo Yoga 7 16IAP7które wykorzystują różne procesory, ale ich akcelerator graficzny to porównywalnie szybki Iris Xe G7z 96 EU.
Potencjalni konkurenci w porównaniu
Ocena | Data | Model | Waga | Wysokość | Rozmiar | Rezolucja | Cena |
|---|---|---|---|---|---|---|---|
| 85.7 % v7 (old) | 10/2022 | Lenovo IdeaPad 5 Pro 16ARH7 R5 6600HS, Radeon 660M | 1.9 kg | 18.4 mm | 16.00" | 2560x1600 | |
| 83.6 % v7 (old) | Huawei MateBook D 16 2022 i7-12700H, Iris Xe G7 96EUs | 1.7 kg | 18.4 mm | 16.00" | 1920x1200 | ||
| 86.4 % v7 (old) | Acer Swift 3 SF316-51 i7-11370H, Iris Xe G7 96EUs | 1.7 kg | 15.9 mm | 16.10" | 1920x1080 | ||
| 86.3 % v7 (old) | LG Gram 16 (2021) i7-1165G7, Iris Xe G7 96EUs | 1.2 kg | 16.8 mm | 16.00" | 2560x1600 | ||
| 88.7 % v7 (old) | Lenovo Yoga 7 16IAP7 i7-1260P, Iris Xe G7 96EUs | 2 kg | 19.2 mm | 16.00" | 2560x1600 |
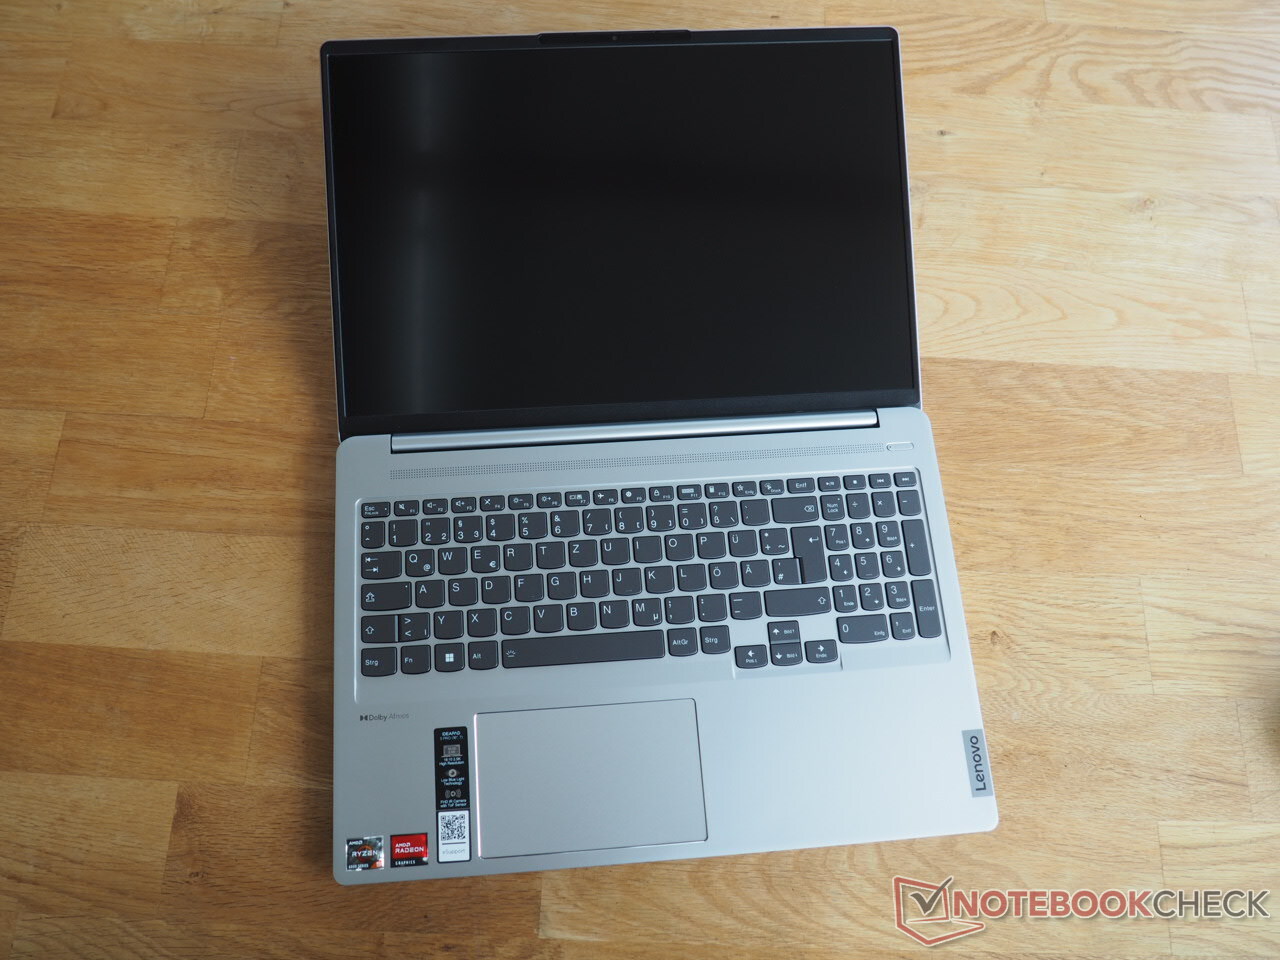
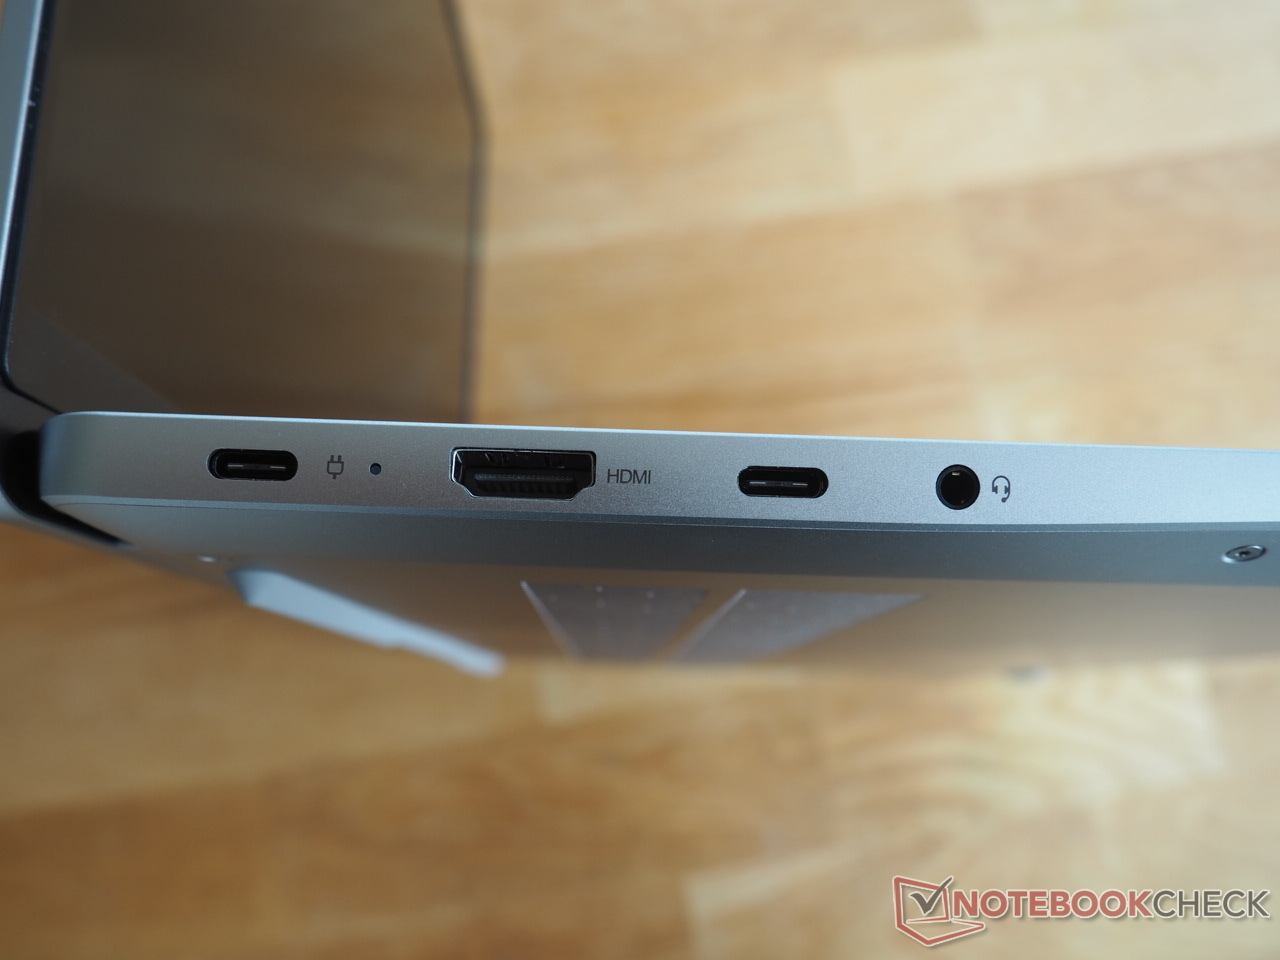
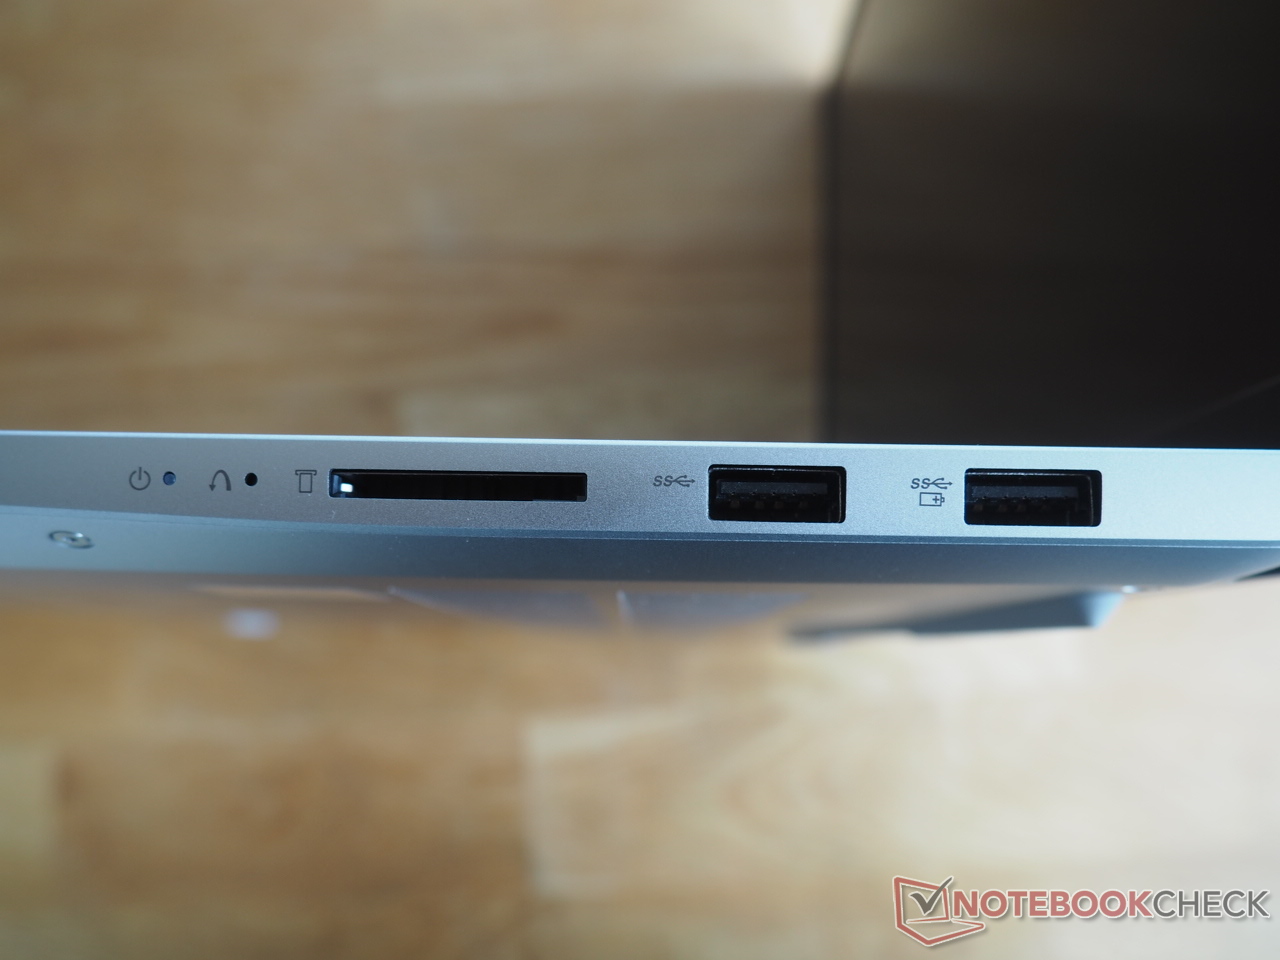
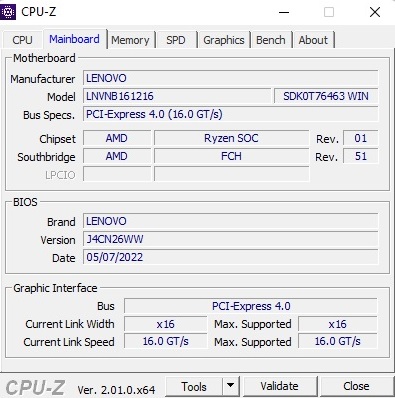
Ponieważ obudowa jest w dużej mierze identyczna z testowanym już 5 Pro 16IHU6 z Core i5-11300Horaz GeForce MX450a połączenia są również podobne z wyjątkiem jednego szczegółu (port USB-C 3.2 Gen2 musi się obejść bez obsługi Thunderbolt), nie będziemy tutaj ponownie omawiać obudowy, osprzętu połączeniowego i urządzeń wejściowych. Odpowiednie informacje można znaleźć w recenzji modelu rodzeństwa.
Czytnik kart SD
| SD Card Reader - average JPG Copy Test (av. of 3 runs) | |
| Średnia w klasie Multimedia (23 - 531, n=43, ostatnie 2 lata) | |
| Lenovo Yoga 7 16IAP7 (Toshiba Exceria Pro SDXC 64 GB UHS-II) | |
| Lenovo IdeaPad 5 Pro 16ARH7 (AV PRO microSD 128 GB V60) | |
| LG Gram 16 (2021) (Toshiba Exceria Pro M501 microSDXC 64GB) | |
Komunikacja
| Networking | |
| iperf3 transmit AXE11000 | |
| Huawei MateBook D 16 2022 | |
| Średnia w klasie Multimedia (606 - 1978, n=61, ostatnie 2 lata) | |
| Lenovo IdeaPad 5 Pro 16ARH7 | |
| Przeciętny Realtek RTL8852BE (536 - 943, n=70) | |
| iperf3 receive AXE11000 | |
| Huawei MateBook D 16 2022 | |
| Średnia w klasie Multimedia (682 - 1818, n=61, ostatnie 2 lata) | |
| Przeciętny Realtek RTL8852BE (455 - 985, n=71) | |
| Lenovo IdeaPad 5 Pro 16ARH7 | |
Kamera internetowa


Wyświetl
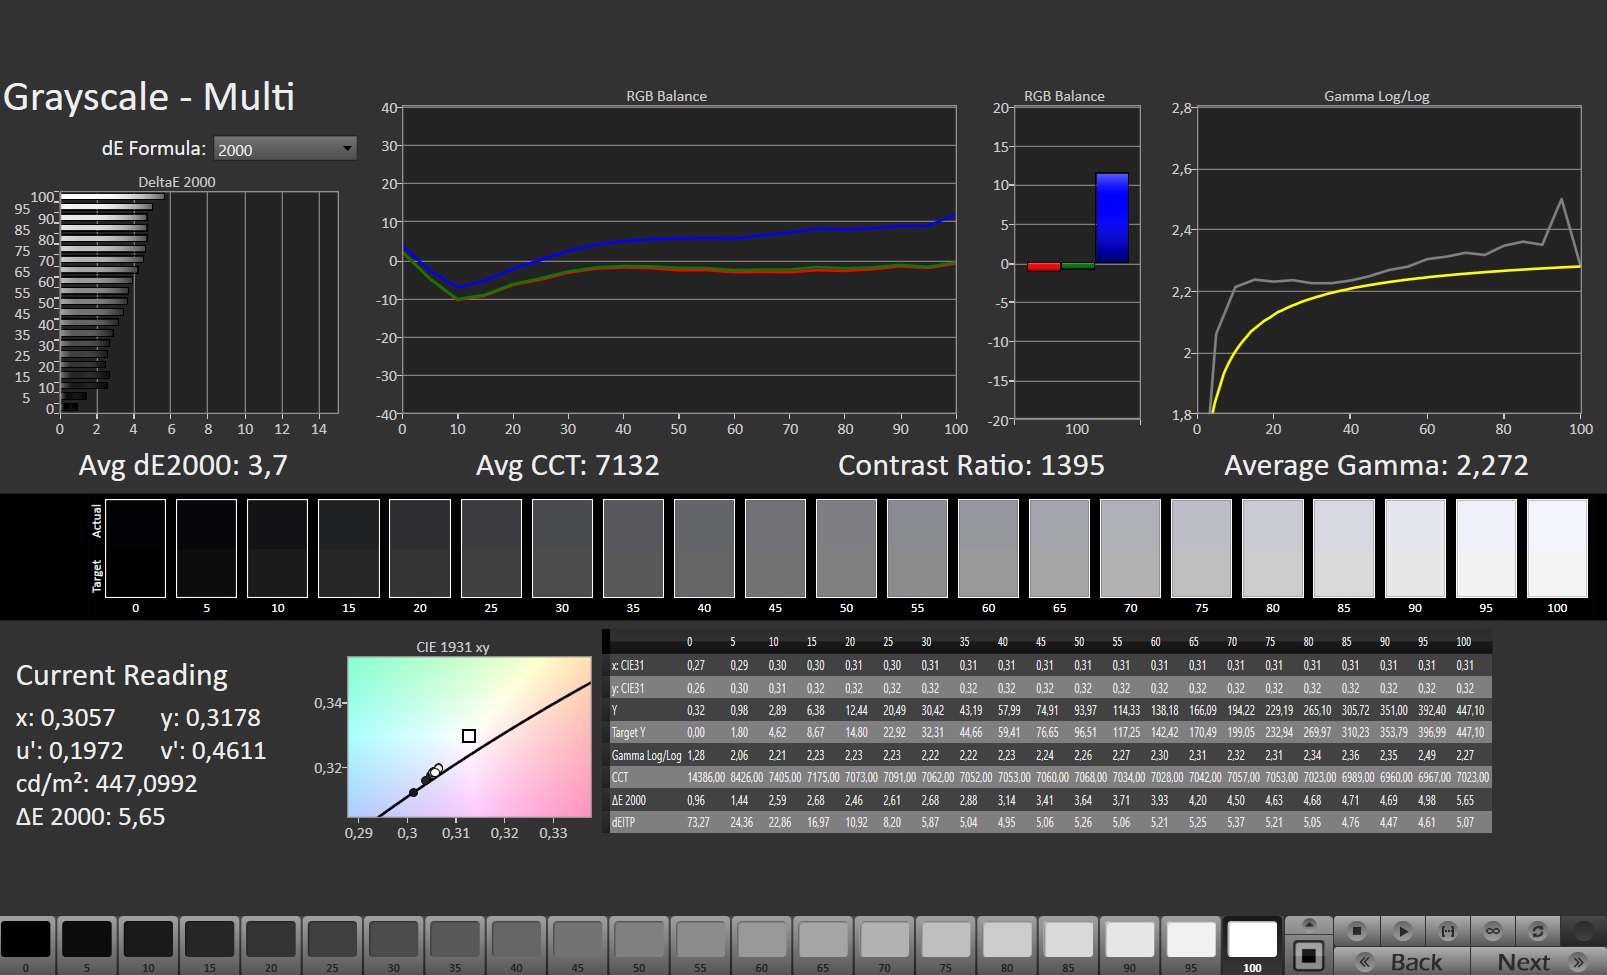
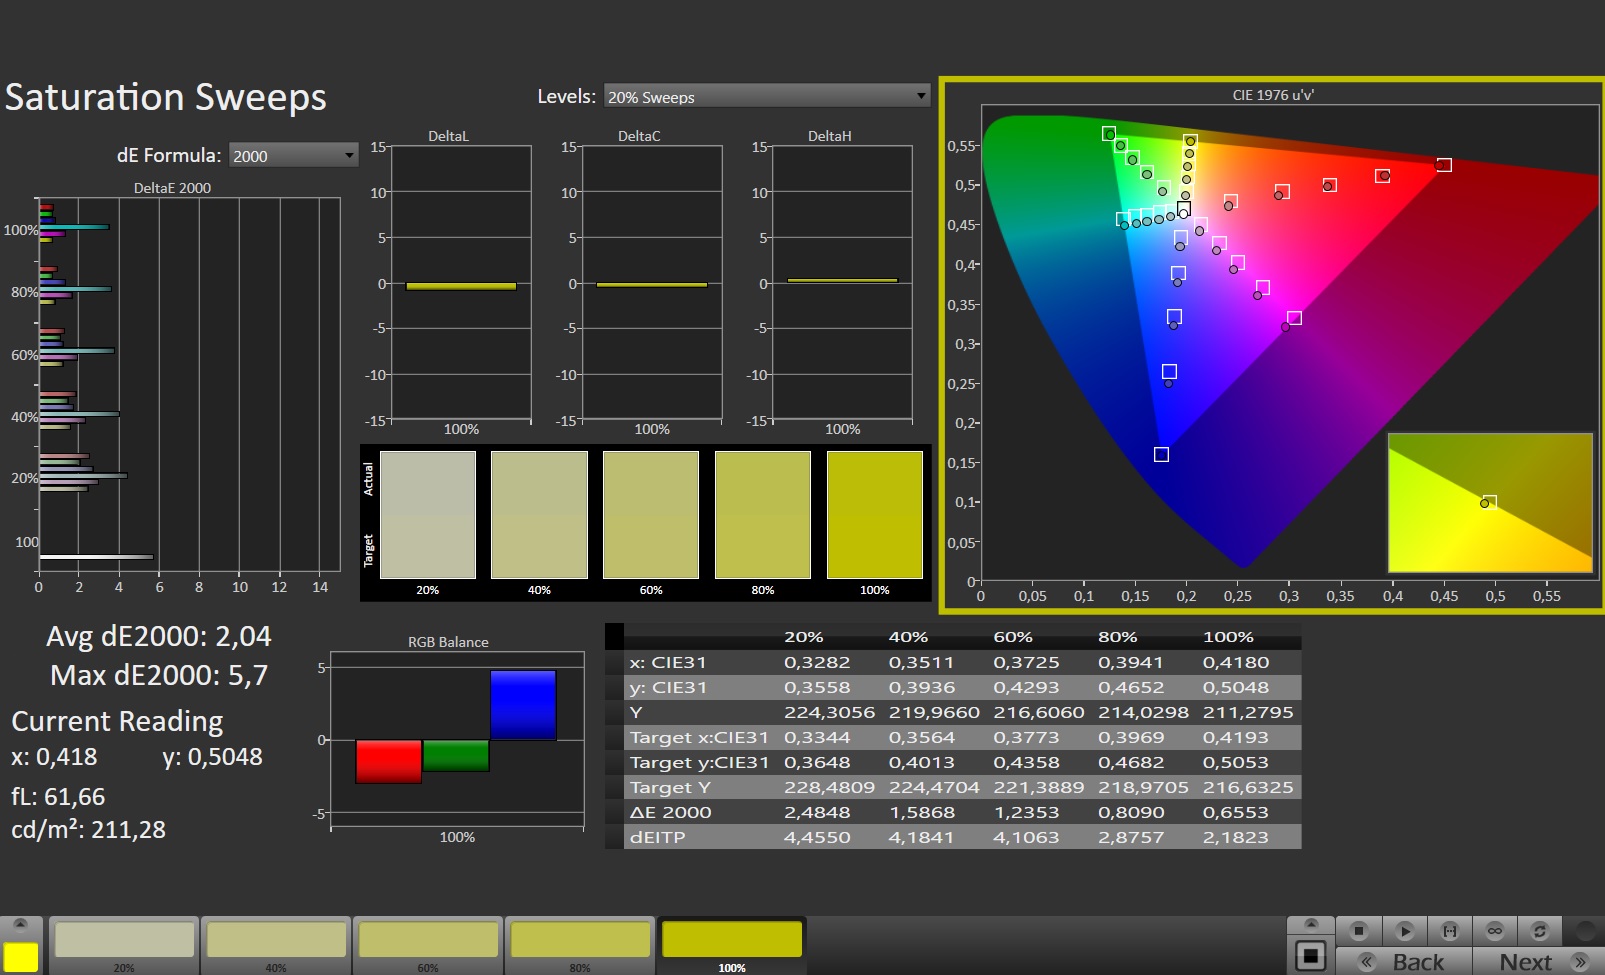
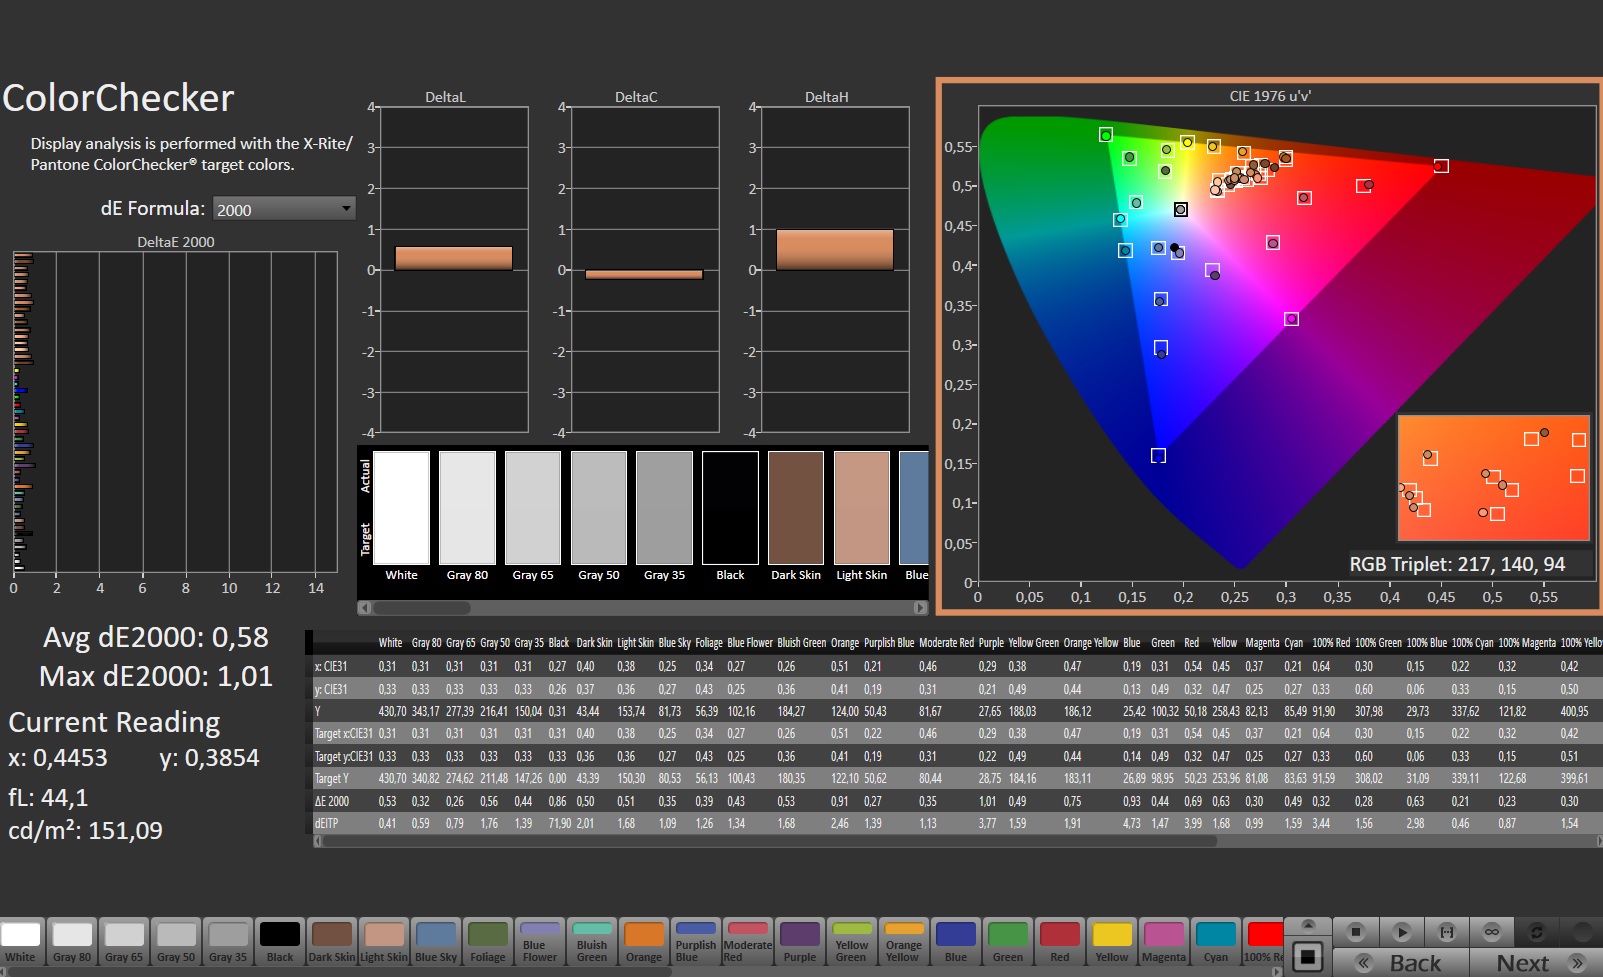
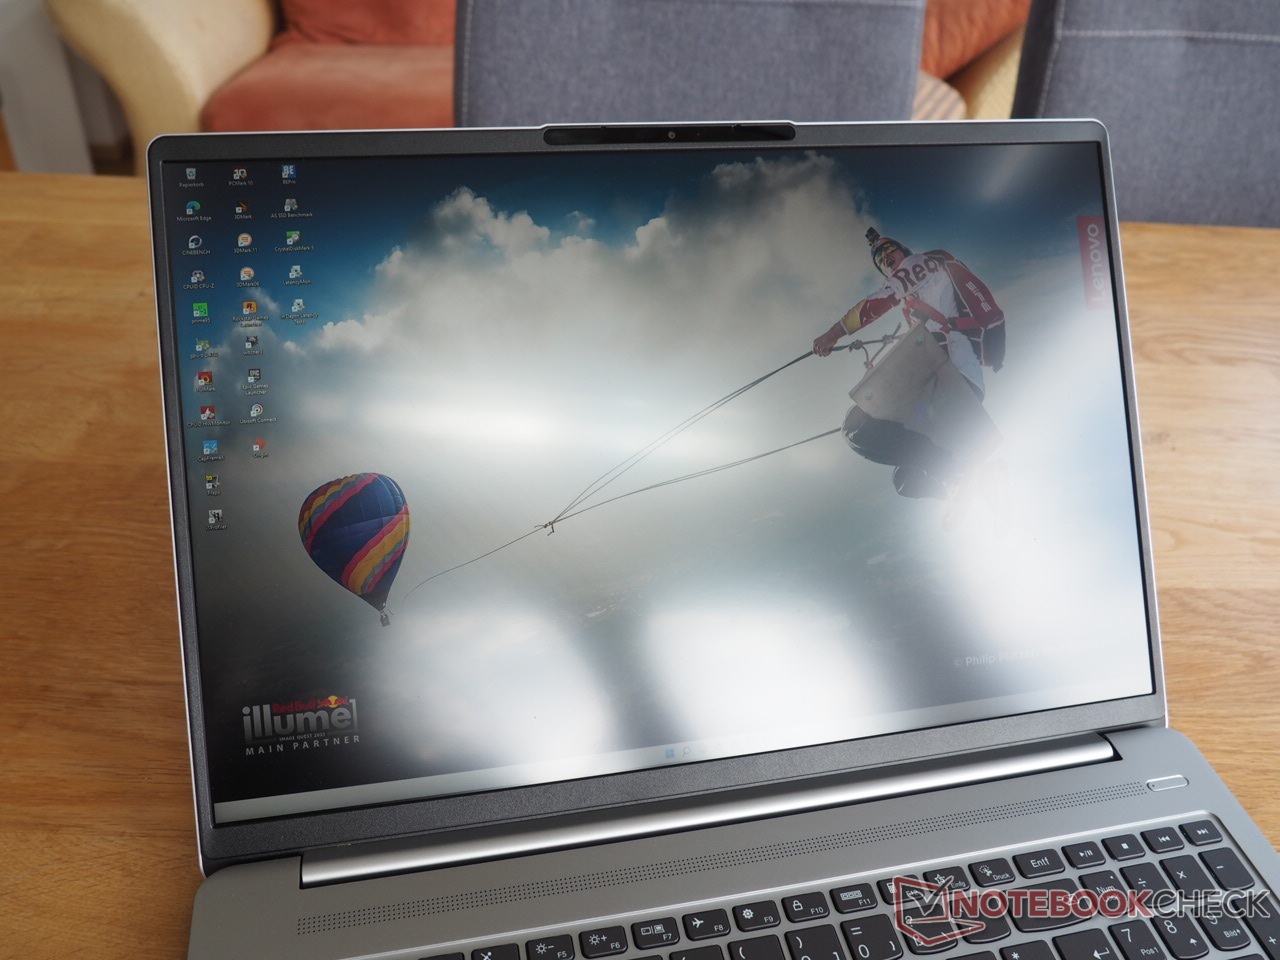
Jednym z największych wyróżników i argumentów zakupu 16ARH7 jest doskonały wyświetlacz, który nie popełnia nawet jednej wpadki w żadnej dyscyplinie.
| |||||||||||||||||||||||||
rozświetlenie: 91 %
na akumulatorze: 415 cd/m²
kontrast: 1297:1 (czerń: 0.32 cd/m²)
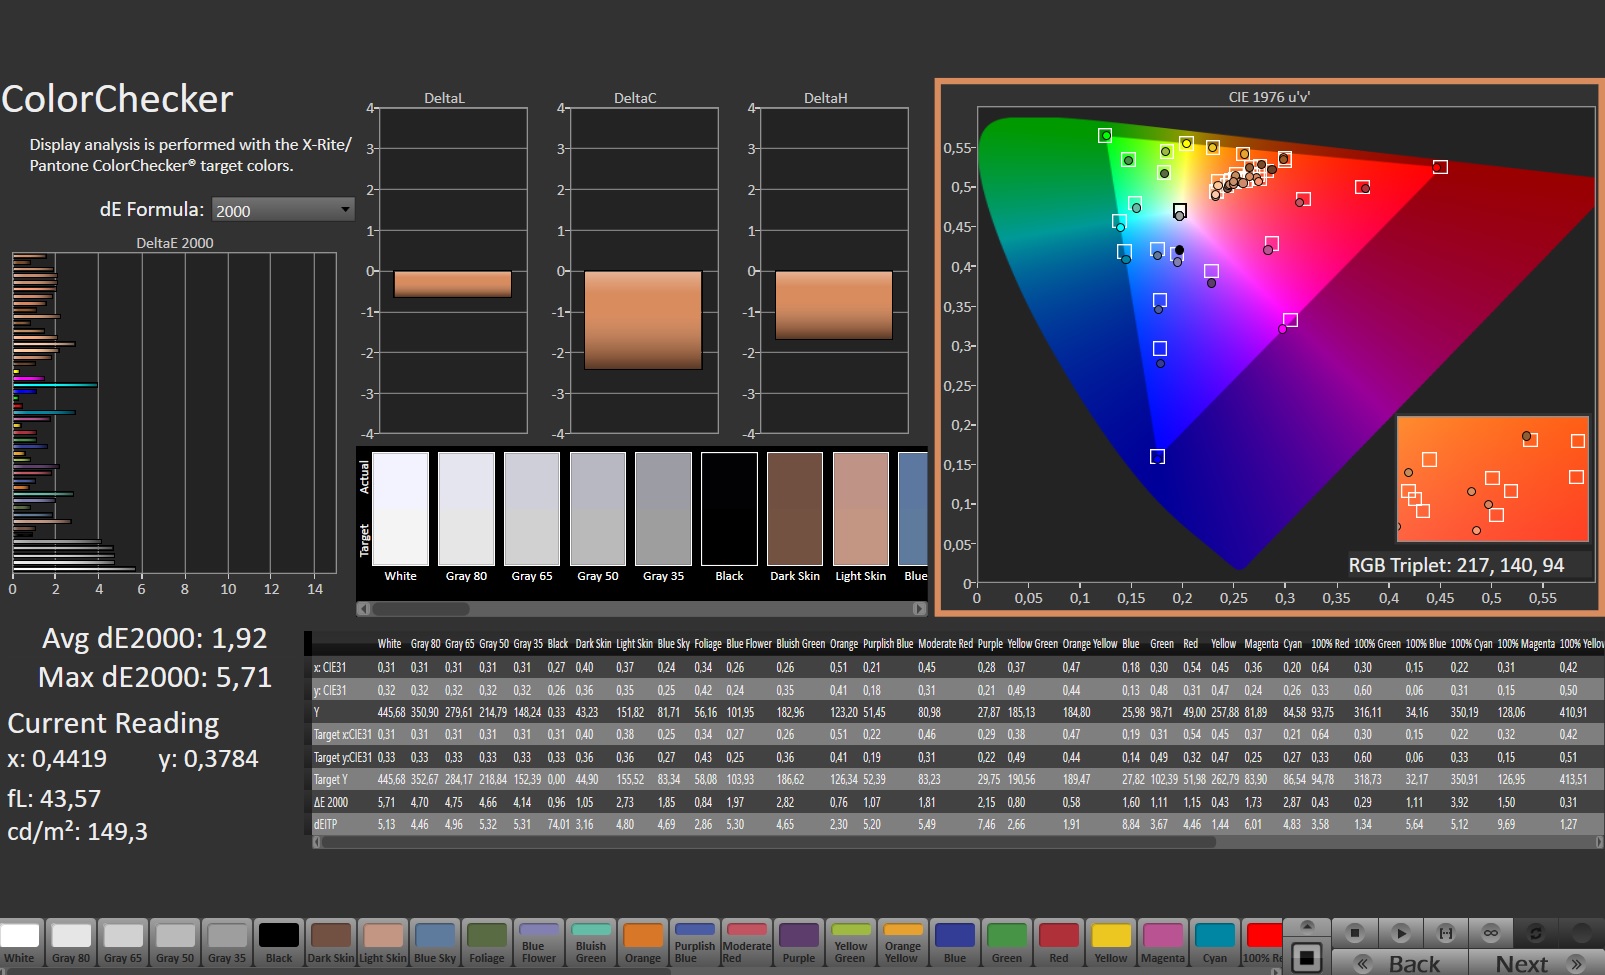
ΔE ColorChecker Calman: 1.92 | ∀{0.5-29.43 Ø4.73}
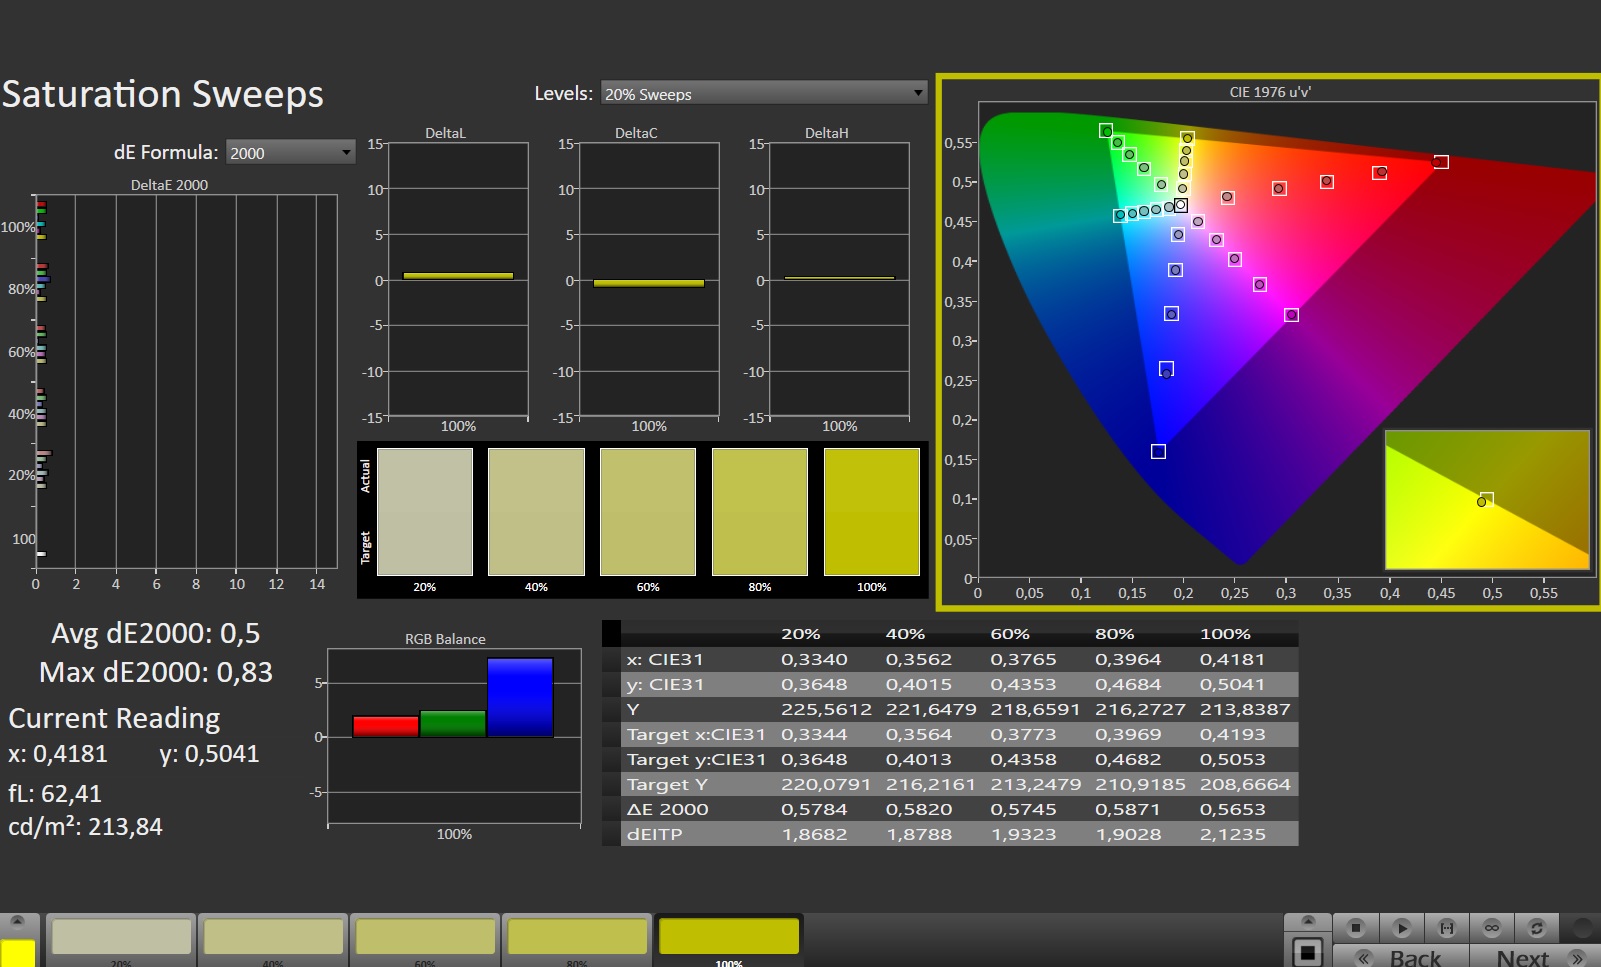
calibrated: 0.58
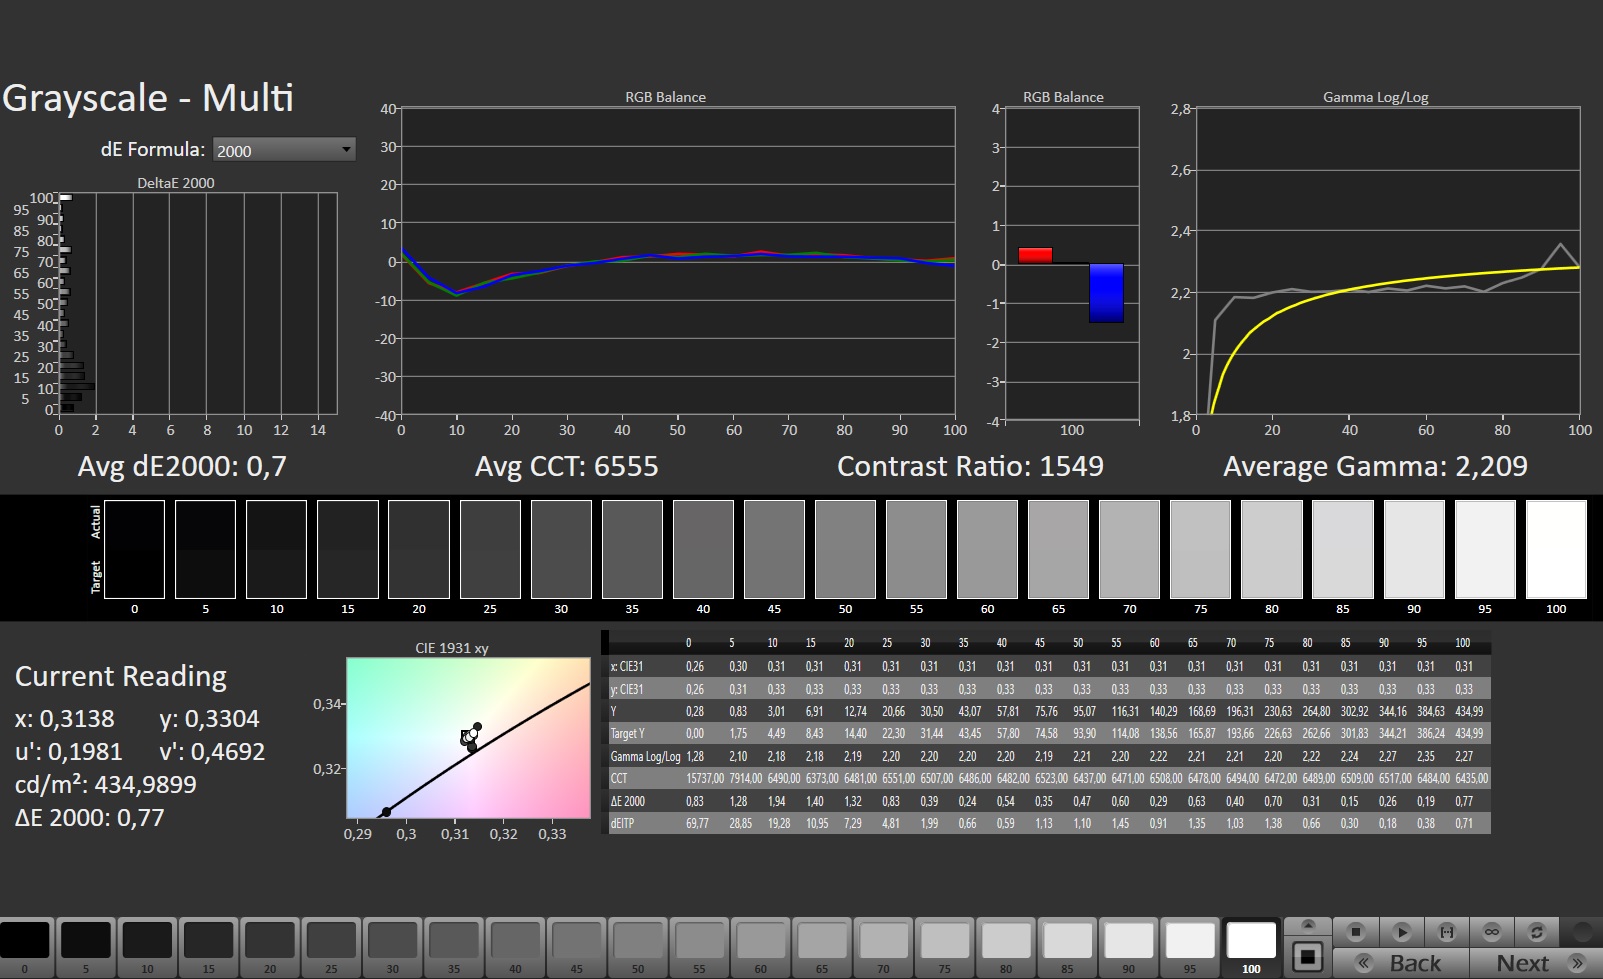
ΔE Greyscale Calman: 3.7 | ∀{0.09-98 Ø4.97}
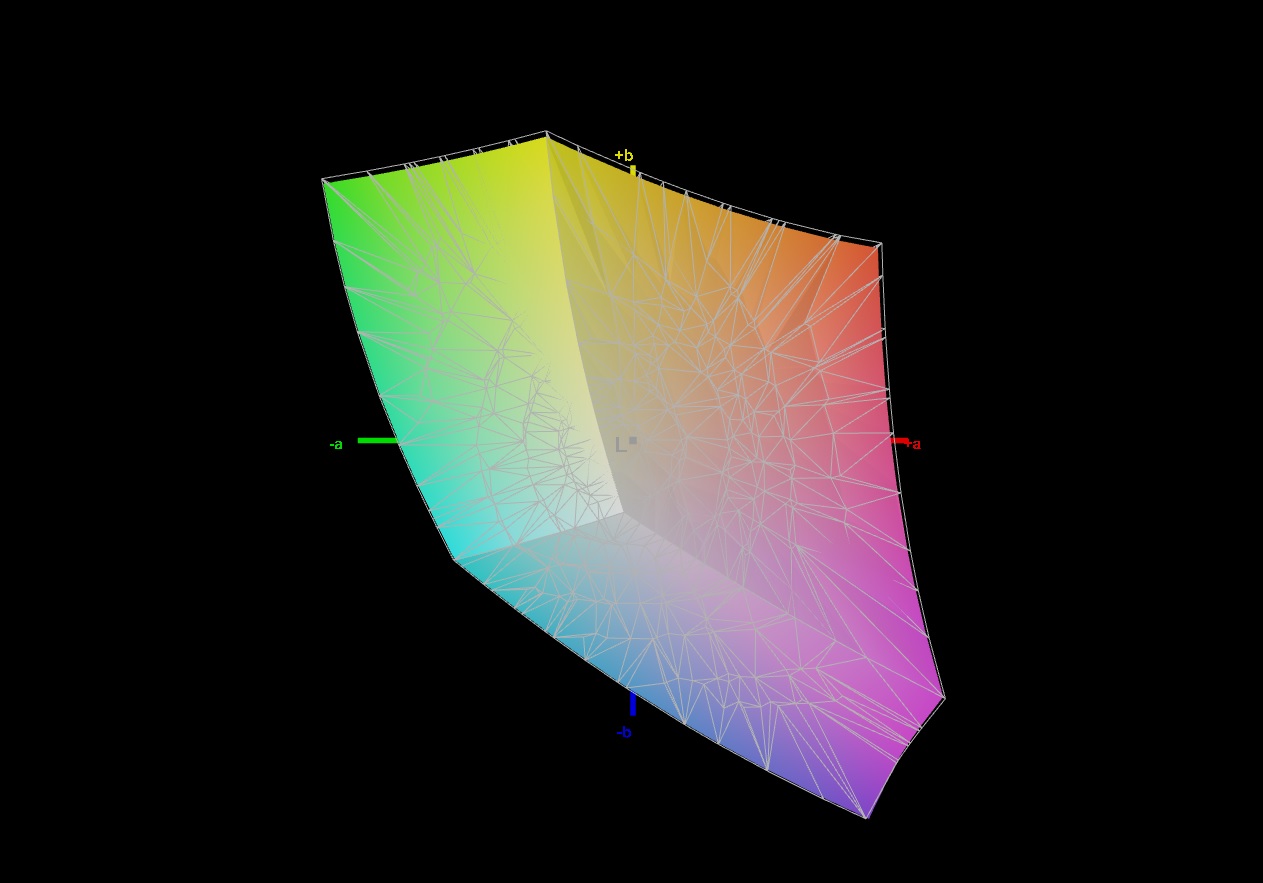
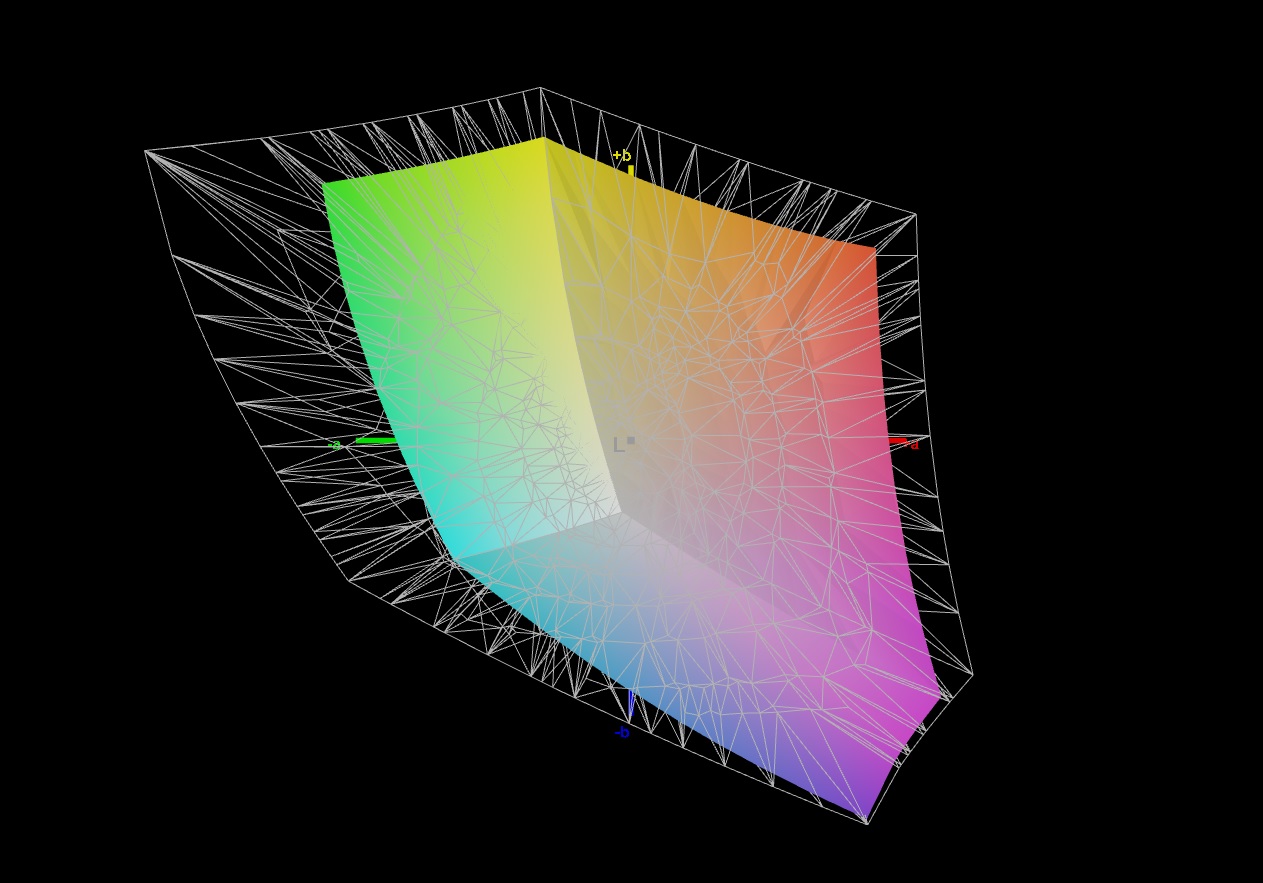
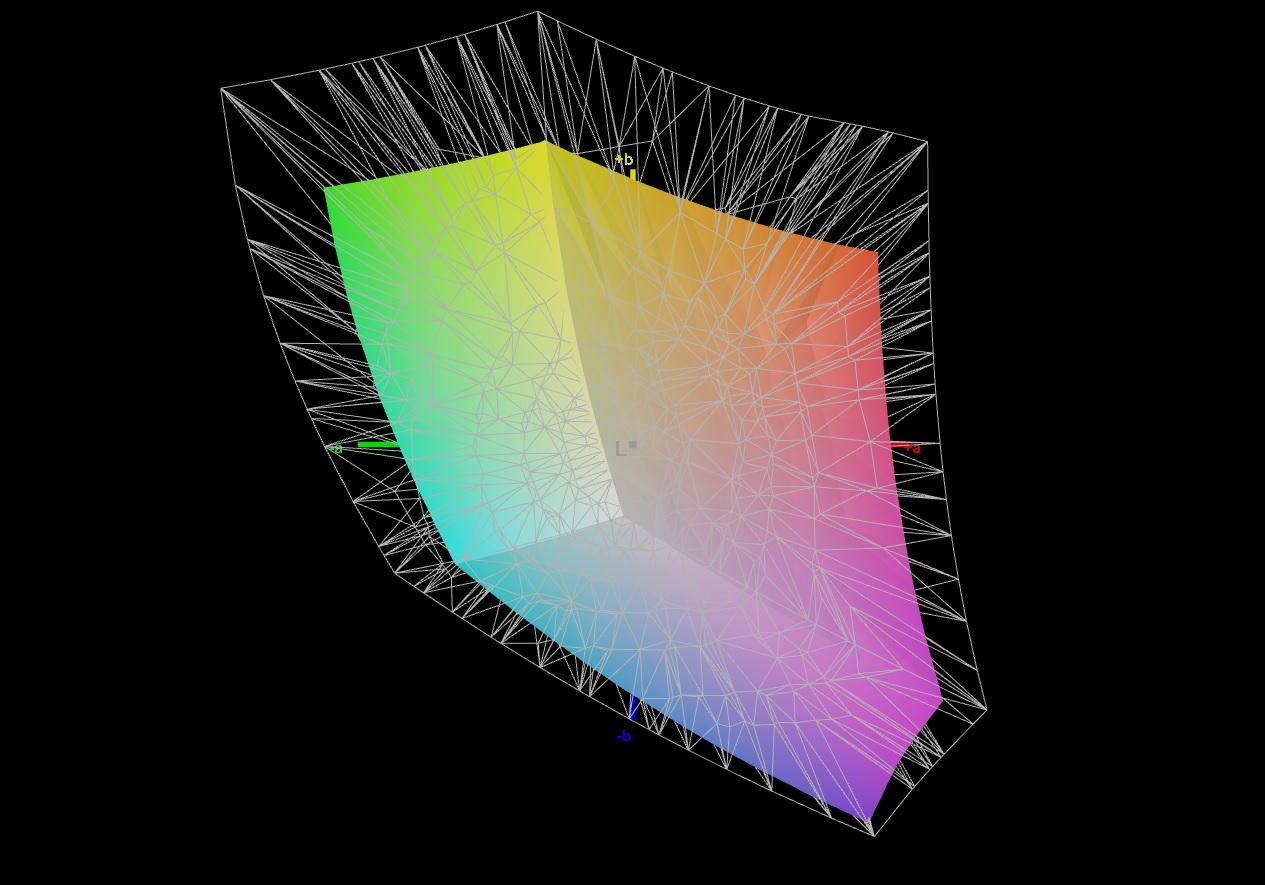
67.2% AdobeRGB 1998 (Argyll 3D)
98% sRGB (Argyll 3D)
65% Display P3 (Argyll 3D)
Gamma: 2.272
CCT: 7132 K
| Lenovo IdeaPad 5 Pro 16ARH7 AUO B160QAN02.H, IPS, 2560x1600, 16" | Huawei MateBook D 16 2022 BOE NV160WUM-NH0, IPS, 1920x1200, 16" | Acer Swift 3 SF316-51 Chi Mei CMN160B, IPS, 1920x1080, 16.1" | LG Gram 16 (2021) LG Philips LP160WQ1-SPA1, IPS, 2560x1600, 16" | Lenovo Yoga 7 16IAP7 Lenovo LEN160WQXGA, IPS, 2560x1600, 16" | |
|---|---|---|---|---|---|
| Display | 1% | 2% | 25% | 1% | |
| Display P3 Coverage (%) | 65 | 66.2 2% | 66.6 2% | 95.8 47% | 67 3% |
| sRGB Coverage (%) | 98 | 96.4 -2% | 99.5 2% | 99.8 2% | 95.7 -2% |
| AdobeRGB 1998 Coverage (%) | 67.2 | 68.3 2% | 68.5 2% | 83.8 25% | 69.3 3% |
| Response Times | -140% | -155% | -197% | -202% | |
| Response Time Grey 50% / Grey 80% * (ms) | 14.1 ? | 30.5 ? -116% | 32 ? -127% | 44 ? -212% | 36 ? -155% |
| Response Time Black / White * (ms) | 7.1 ? | 18.7 ? -163% | 20 ? -182% | 20 ? -182% | 24.8 ? -249% |
| PWM Frequency (Hz) | 2500 ? | ||||
| Screen | -25% | 15% | -83% | -3% | |
| Brightness middle (cd/m²) | 415 | 319 -23% | 304 -27% | 331 -20% | 393.7 -5% |
| Brightness (cd/m²) | 409 | 317 -22% | 284 -31% | 309 -24% | 367 -10% |
| Brightness Distribution (%) | 91 | 90 -1% | 88 -3% | 88 -3% | 84 -8% |
| Black Level * (cd/m²) | 0.32 | 0.23 28% | 0.165 48% | 0.22 31% | 0.38 -19% |
| Contrast (:1) | 1297 | 1387 7% | 1842 42% | 1505 16% | 1036 -20% |
| Colorchecker dE 2000 * | 1.92 | 3.4 -77% | 1.44 25% | 4.64 -142% | 1.97 -3% |
| Colorchecker dE 2000 max. * | 5.71 | 8.1 -42% | 3.62 37% | 9.82 -72% | 5.46 4% |
| Colorchecker dE 2000 calibrated * | 0.58 | 0.8 -38% | 3.16 -445% | 0.62 -7% | |
| Greyscale dE 2000 * | 3.7 | 5.7 -54% | 2.6 30% | 6.9 -86% | 2.1 43% |
| Gamma | 2.272 97% | 2.1 105% | 2.41 91% | 2.34 94% | 2.1 105% |
| CCT | 7132 91% | 7433 87% | 6527 100% | 7904 82% | 6461 101% |
| Color Space (Percent of AdobeRGB 1998) (%) | 68.5 | 75.1 | |||
| Color Space (Percent of sRGB) (%) | 99.5 | 100 | |||
| Całkowita średnia (program / ustawienia) | -55% /
-36% | -46% /
-14% | -85% /
-76% | -68% /
-30% |
* ... im mniej tym lepiej
16-calowy wyświetlacz pracuje w formacie 16:10 i zapewnia całkiem ostry obraz, dzięki dość wysokiej rozdzielczości 2560 x 1600 pikseli. Pokrycie 100% sRGB również budzi szacunek, ale to samo osiągają tutaj wszyscy konkurenci. Pod względem czasu reakcji żaden z konkurentów nie jest jednak w stanie dotrzymać kroku IdeaPadowi 5. Około 7 ms czerni do bieli i 14 ms szarości do szarości to inaczej czas znany bardziej z laptopów gamingowych. Nie ma w tym nic dziwnego, skoro Lenovo wyposażyło 16-calowy laptop w panel 120-Hz.
Pod względem jasności IdeaPad również plasuje się na szczycie. Średnia 409 cd/m² to niezwykle dobra wartość, która pozwala na korzystanie z niego także na zewnątrz. Kąty widzenia są na typowym dla IPS poziomie, więc są również obfite.
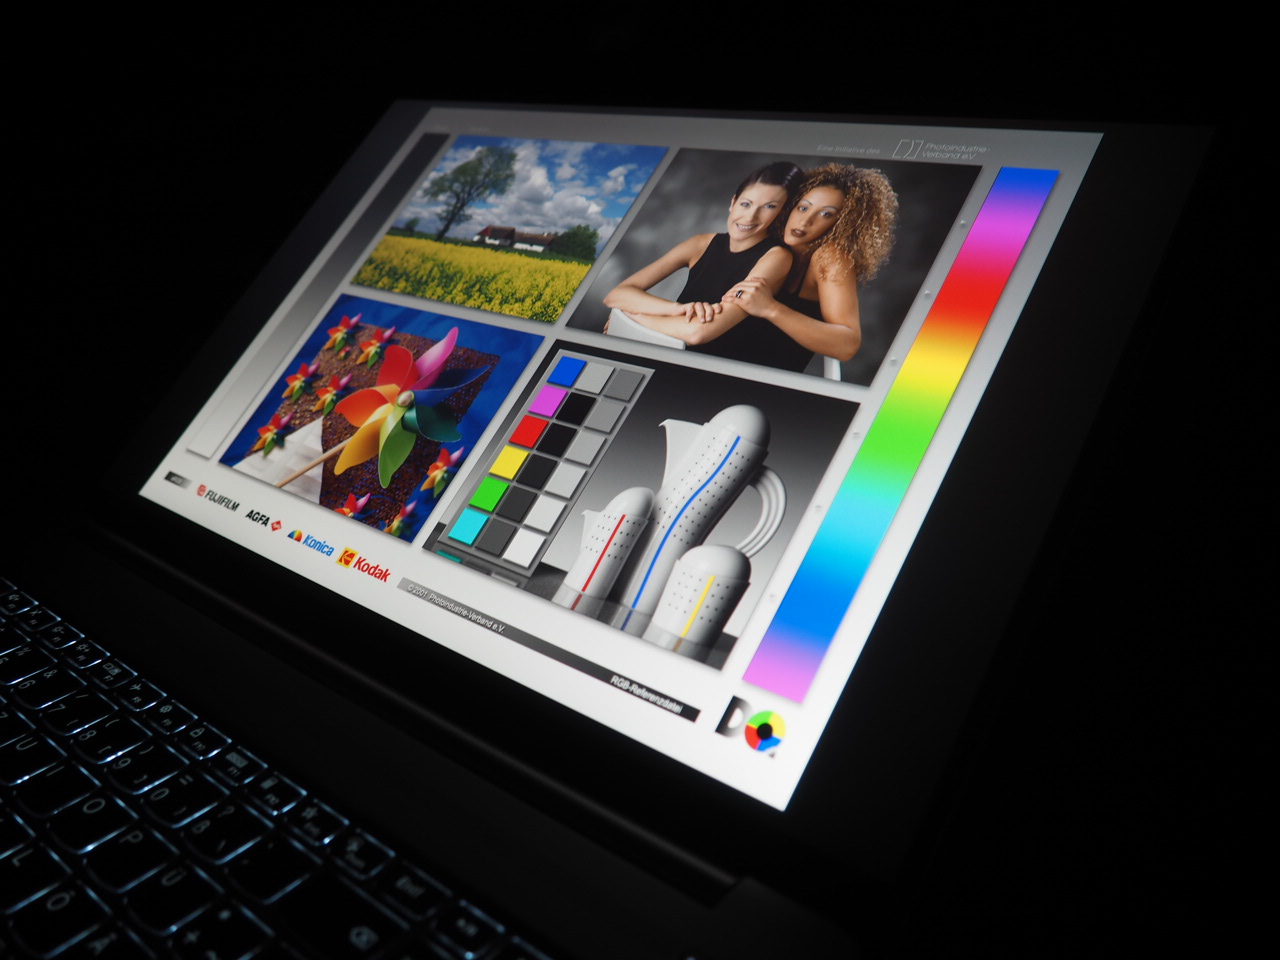
Lenovo należy się również pochwała za wysoką dokładność odwzorowania kolorów. Już w stanie dostawy wyświetlacz generuje bardzo naturalne kolory, które można nawet jeszcze bardziej poprawić poprzez kalibrację. Wartość czerni na poziomie 0,32 cd/m² i kontrast 1 297:1 również nie dają powodów do narzekań, nawet jeśli nie są wystarczające, by zająć tu najwyższą pozycję.
Wyświetl czasy reakcji
| ↔ Czas reakcji od czerni do bieli | ||
|---|---|---|
| 7.1 ms ... wzrost ↗ i spadek ↘ łącznie | ↗ 3 ms wzrost | 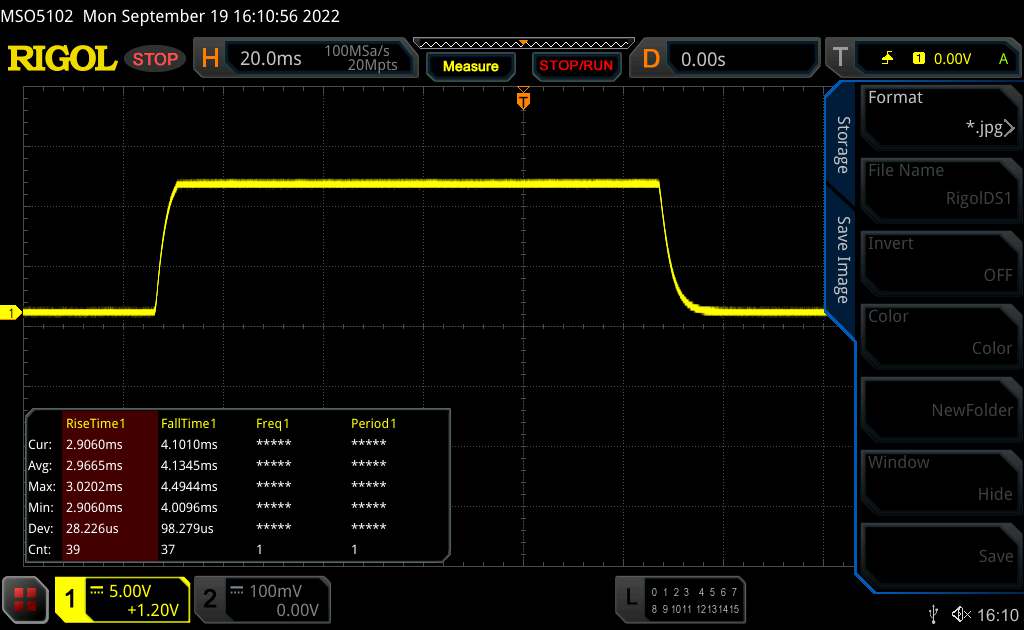 |
| ↘ 4.1 ms upadek | ||
| W naszych testach ekran wykazuje bardzo szybką reakcję i powinien bardzo dobrze nadawać się do szybkich gier. Dla porównania, wszystkie testowane urządzenia wahają się od 0.1 (minimum) do 240 (maksimum) ms. » 21 % wszystkich urządzeń jest lepszych. Oznacza to, że zmierzony czas reakcji jest lepszy od średniej wszystkich testowanych urządzeń (19.9 ms). | ||
| ↔ Czas reakcji 50% szarości do 80% szarości | ||
| 14.1 ms ... wzrost ↗ i spadek ↘ łącznie | ↗ 6.7 ms wzrost | 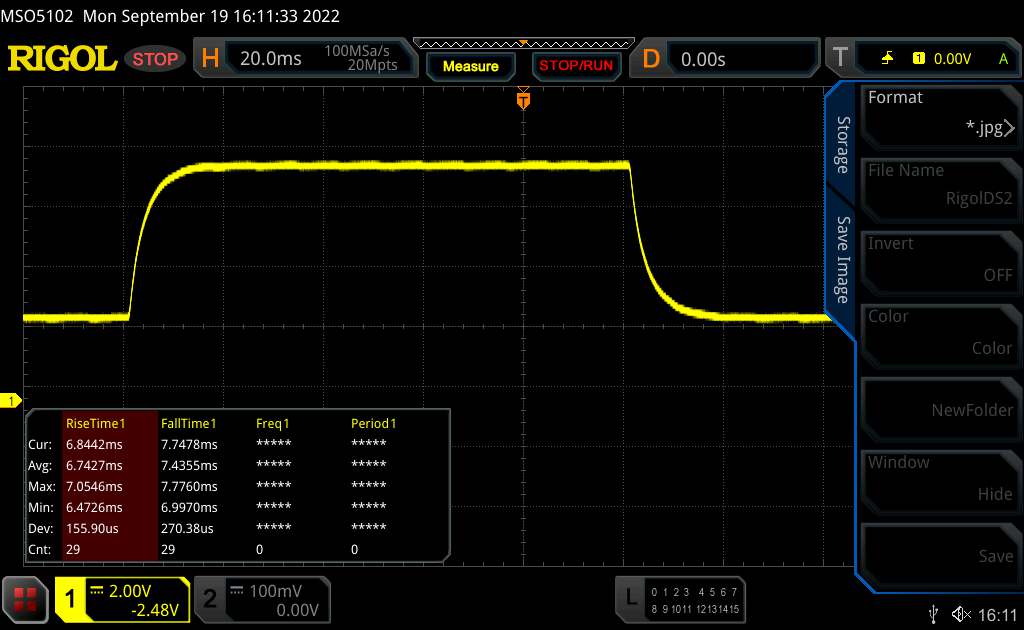 |
| ↘ 7.4 ms upadek | ||
| W naszych testach ekran wykazuje dobry współczynnik reakcji, ale może być zbyt wolny dla graczy rywalizujących ze sobą. Dla porównania, wszystkie testowane urządzenia wahają się od 0.165 (minimum) do 636 (maksimum) ms. » 28 % wszystkich urządzeń jest lepszych. Oznacza to, że zmierzony czas reakcji jest lepszy od średniej wszystkich testowanych urządzeń (31.1 ms). | ||
Migotanie ekranu / PWM (modulacja szerokości impulsu)
| Migotanie ekranu/nie wykryto PWM |  | ||
Dla porównania: 52 % wszystkich testowanych urządzeń nie używa PWM do przyciemniania wyświetlacza. Jeśli wykryto PWM, zmierzono średnio 7798 (minimum: 5 - maksimum: 343500) Hz. | |||
Wydajność
Wydajność IdeaPad 5 Pro 16ARH7 można uznać za średnią. Procesor heksa-rdzeniowy powinien zapewnić wystarczającą wydajność w przyszłych latach, podobnie jak 16 GB pamięci RAM i dysk SSD NVMe. Zgodnie z oczekiwaniami, 16-calowe urządzenie wykazuje pewne słabości w zakresie prędkości 3D.
Warunki badania
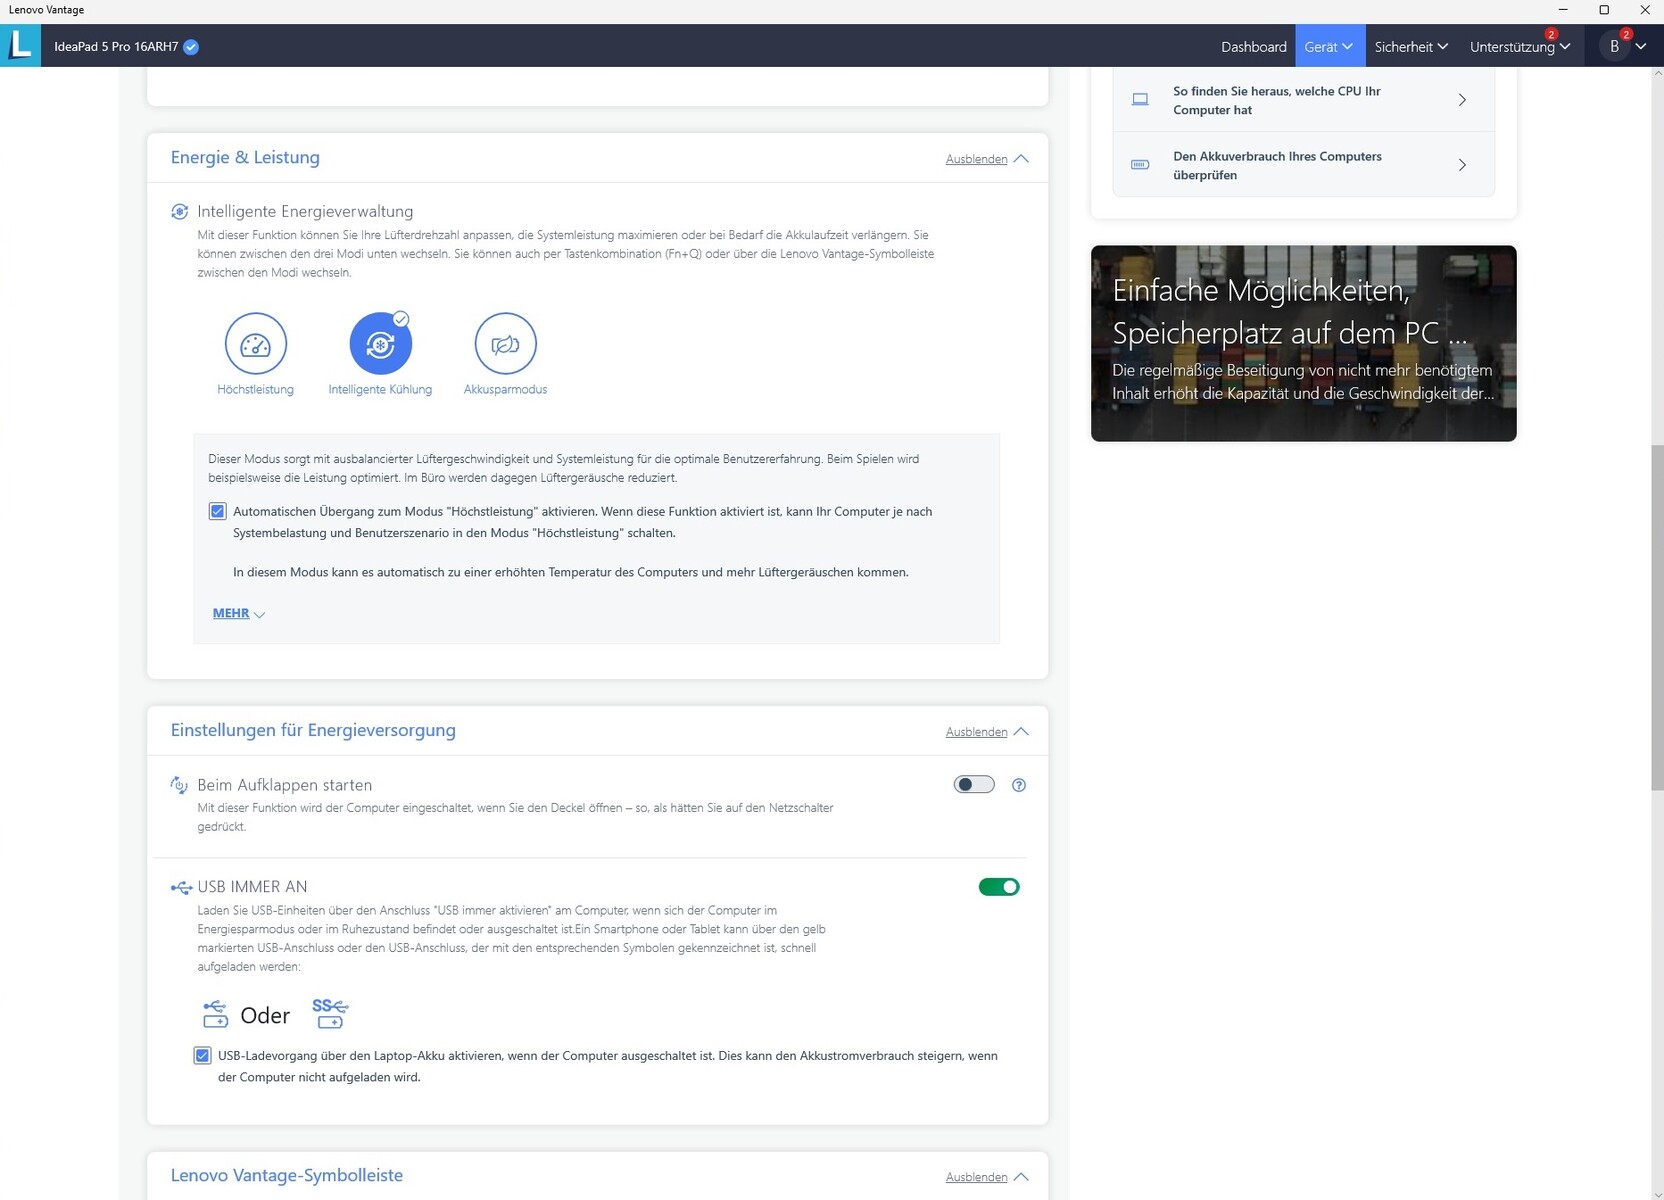
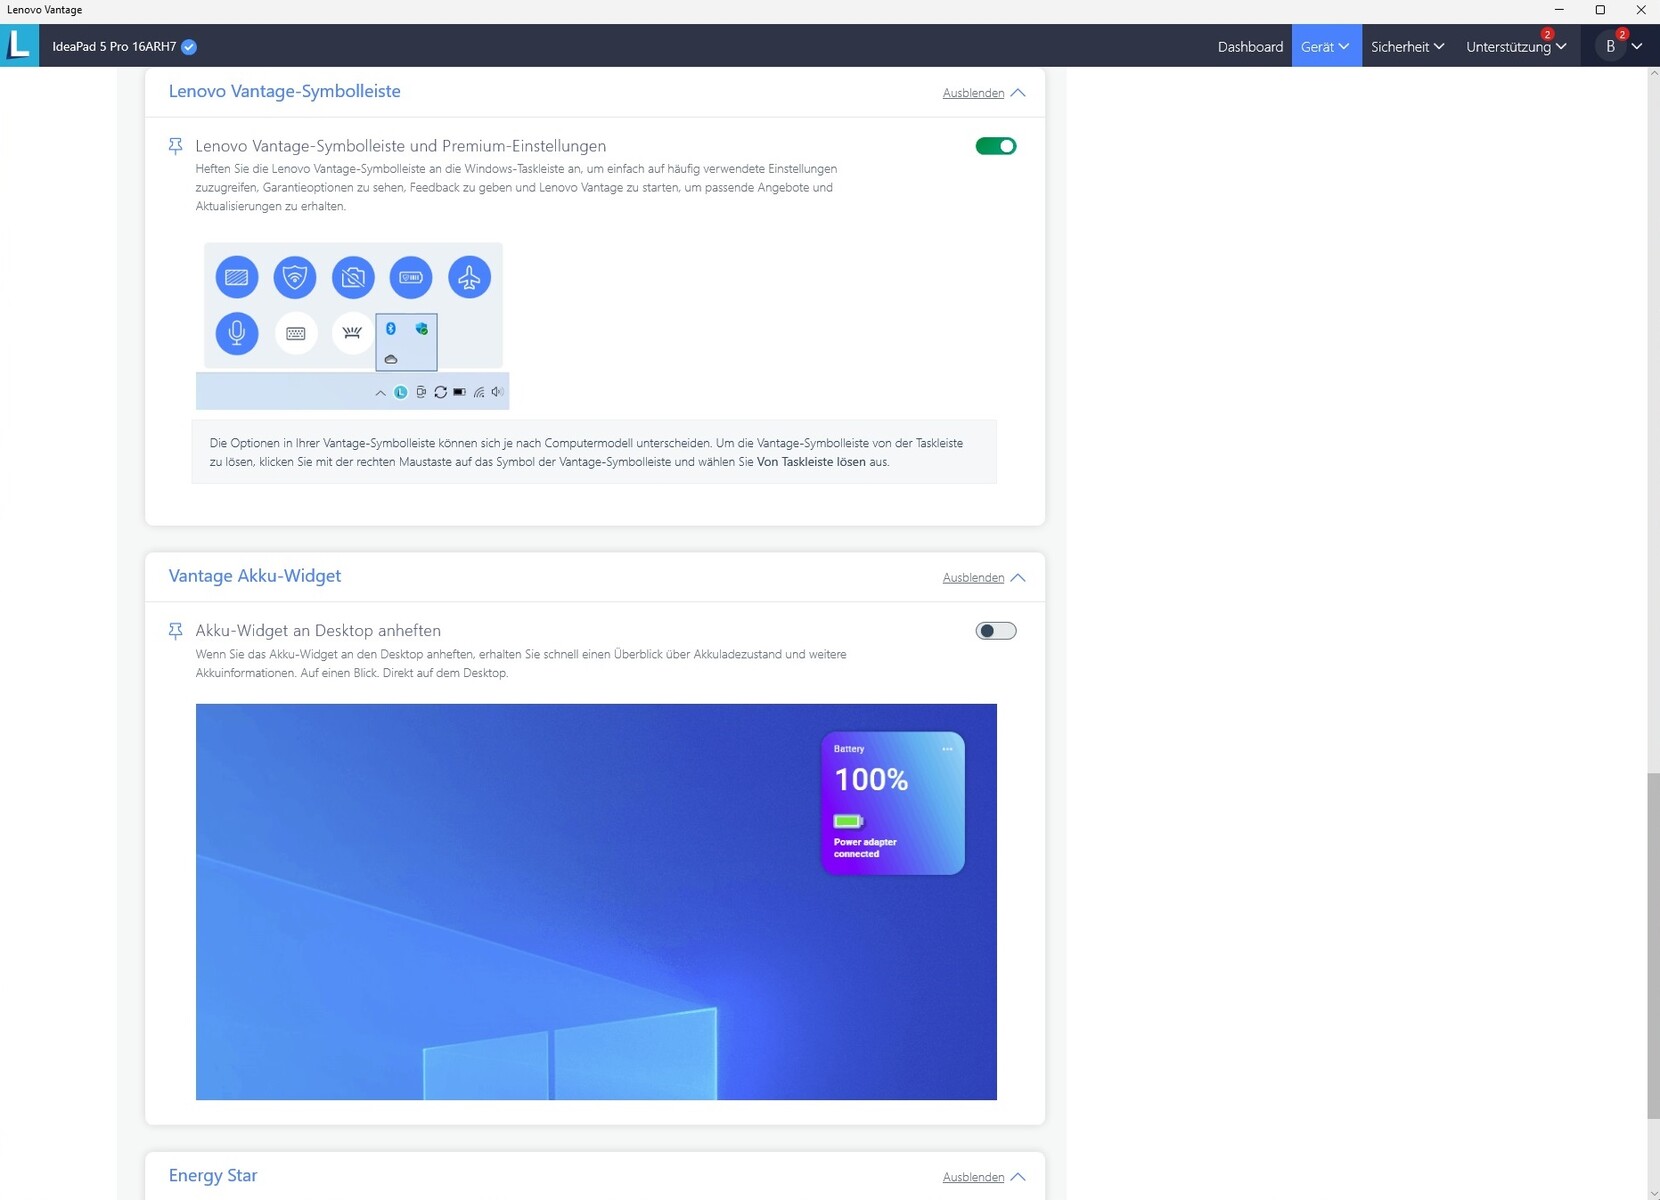
Preinstalowane oprogramowanie Lenovo Vantage oferuje dużą liczbę opcji, aby dostosować system do osobistych preferencji. Szczególnie istotna w tym względzie jest pozycja "Power & Performance", która zawiera trzy profile (patrz zrzut ekranu). Wszystkie nasze pomiary zostały wykonane przy użyciu trybu "Intelligent Cooling" z zaznaczonym polem "Automatically switch to High Performance mode". Ma to pozwolić systemowi na wykorzystanie jego pełnej wydajności w wymagających zadaniach, bez zbędnego hałasu i nadmiernego zużycia energii podczas prostych zadań, takich jak praca biurowa, wideo czy praca w sieci.
Procesor
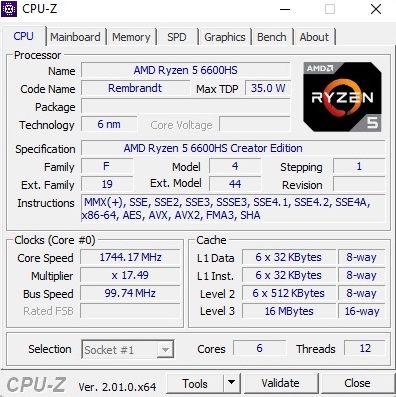
Ryzen 5 6600HS to aktualny sześciordzeniowy model z generacji Rembrandt od AMD, który próbuje przyciągnąć klientów 16 MB pamięci podręcznej L3 i taktowaniem do 4,5 GHz. 6-nm układ jest w stanie pracować równolegle na 12 wątkach poprzez SMT. AMD podaje TDP na poziomie 35 W, co mieści się pomiędzy klasycznymi procesorami wydajnościowymi (ponad 40 W) a wersjami energooszczędnymi (poniżej 30 W). W naszym teście pętli z Cinebench R15 model 6600HS uderzył w dobrą figurę. W przeciwieństwie do wielu innych laptopów prędkość obrotowa pozostaje bardzo stała, co przemawia za układem chłodzenia. Stała wydajność znacznie wyprzedza m.in Core i7-1260P, Core i7-1165G7, oraz Core i7-11370H. Układ AMD osiąga wyniki bardziej na poziomie np Core i7-12700H.
Cinebench R15 Multi Constant Load Test
| CPU Performance rating - Percent | |
| Średnia w klasie Multimedia | |
| Huawei MateBook D 16 2022 | |
| Lenovo Yoga 7 16IAP7 | |
| Lenovo IdeaPad 5 Pro 16ARH7 | |
| Przeciętny AMD Ryzen 5 6600HS | |
| Acer Swift 3 SF316-51 | |
| LG Gram 16 (2021) | |
| Cinebench R23 | |
| Multi Core | |
| Średnia w klasie Multimedia (4861 - 33362, n=81, ostatnie 2 lata) | |
| Huawei MateBook D 16 2022 | |
| Lenovo Yoga 7 16IAP7 | |
| Lenovo IdeaPad 5 Pro 16ARH7 | |
| Przeciętny AMD Ryzen 5 6600HS (n=1) | |
| Acer Swift 3 SF316-51 | |
| LG Gram 16 (2021) | |
| Single Core | |
| Średnia w klasie Multimedia (1128 - 2459, n=73, ostatnie 2 lata) | |
| Huawei MateBook D 16 2022 | |
| Lenovo Yoga 7 16IAP7 | |
| Acer Swift 3 SF316-51 | |
| Lenovo IdeaPad 5 Pro 16ARH7 | |
| Przeciętny AMD Ryzen 5 6600HS (n=1) | |
| LG Gram 16 (2021) | |
| Cinebench R20 | |
| CPU (Multi Core) | |
| Średnia w klasie Multimedia (1887 - 12912, n=64, ostatnie 2 lata) | |
| Huawei MateBook D 16 2022 | |
| Lenovo Yoga 7 16IAP7 | |
| Lenovo IdeaPad 5 Pro 16ARH7 | |
| Przeciętny AMD Ryzen 5 6600HS (n=1) | |
| Acer Swift 3 SF316-51 | |
| LG Gram 16 (2021) | |
| CPU (Single Core) | |
| Średnia w klasie Multimedia (425 - 853, n=64, ostatnie 2 lata) | |
| Huawei MateBook D 16 2022 | |
| Lenovo Yoga 7 16IAP7 | |
| Acer Swift 3 SF316-51 | |
| Lenovo IdeaPad 5 Pro 16ARH7 | |
| Przeciętny AMD Ryzen 5 6600HS (n=1) | |
| LG Gram 16 (2021) | |
| Cinebench R15 | |
| CPU Multi 64Bit | |
| Średnia w klasie Multimedia (856 - 5224, n=68, ostatnie 2 lata) | |
| Huawei MateBook D 16 2022 | |
| Huawei MateBook D 16 2022 | |
| Lenovo Yoga 7 16IAP7 | |
| Lenovo IdeaPad 5 Pro 16ARH7 | |
| Przeciętny AMD Ryzen 5 6600HS (n=1) | |
| Acer Swift 3 SF316-51 | |
| LG Gram 16 (2021) | |
| CPU Single 64Bit | |
| Średnia w klasie Multimedia (184.8 - 326, n=66, ostatnie 2 lata) | |
| Huawei MateBook D 16 2022 | |
| Lenovo Yoga 7 16IAP7 | |
| Lenovo IdeaPad 5 Pro 16ARH7 | |
| Przeciętny AMD Ryzen 5 6600HS (n=1) | |
| Acer Swift 3 SF316-51 | |
| LG Gram 16 (2021) | |
| Blender - v2.79 BMW27 CPU | |
| LG Gram 16 (2021) | |
| Acer Swift 3 SF316-51 | |
| Lenovo Yoga 7 16IAP7 | |
| Lenovo IdeaPad 5 Pro 16ARH7 | |
| Przeciętny AMD Ryzen 5 6600HS (n=1) | |
| Huawei MateBook D 16 2022 | |
| Średnia w klasie Multimedia (100 - 557, n=65, ostatnie 2 lata) | |
| 7-Zip 18.03 | |
| 7z b 4 | |
| Średnia w klasie Multimedia (29095 - 130368, n=62, ostatnie 2 lata) | |
| Huawei MateBook D 16 2022 | |
| Lenovo Yoga 7 16IAP7 | |
| Lenovo IdeaPad 5 Pro 16ARH7 | |
| Przeciętny AMD Ryzen 5 6600HS (n=1) | |
| Acer Swift 3 SF316-51 | |
| LG Gram 16 (2021) | |
| 7z b 4 -mmt1 | |
| Średnia w klasie Multimedia (3666 - 7545, n=63, ostatnie 2 lata) | |
| Huawei MateBook D 16 2022 | |
| Lenovo Yoga 7 16IAP7 | |
| Acer Swift 3 SF316-51 | |
| Lenovo IdeaPad 5 Pro 16ARH7 | |
| Przeciętny AMD Ryzen 5 6600HS (n=1) | |
| LG Gram 16 (2021) | |
| Geekbench 5.5 | |
| Multi-Core | |
| Średnia w klasie Multimedia (4652 - 20422, n=62, ostatnie 2 lata) | |
| Huawei MateBook D 16 2022 | |
| Lenovo Yoga 7 16IAP7 | |
| Lenovo IdeaPad 5 Pro 16ARH7 | |
| Przeciętny AMD Ryzen 5 6600HS (n=1) | |
| Acer Swift 3 SF316-51 | |
| LG Gram 16 (2021) | |
| Single-Core | |
| Średnia w klasie Multimedia (805 - 2974, n=62, ostatnie 2 lata) | |
| Huawei MateBook D 16 2022 | |
| Lenovo Yoga 7 16IAP7 | |
| Acer Swift 3 SF316-51 | |
| LG Gram 16 (2021) | |
| Lenovo IdeaPad 5 Pro 16ARH7 | |
| Przeciętny AMD Ryzen 5 6600HS (n=1) | |
| HWBOT x265 Benchmark v2.2 - 4k Preset | |
| Średnia w klasie Multimedia (5.26 - 36.1, n=63, ostatnie 2 lata) | |
| Huawei MateBook D 16 2022 | |
| Lenovo Yoga 7 16IAP7 | |
| Lenovo IdeaPad 5 Pro 16ARH7 | |
| Przeciętny AMD Ryzen 5 6600HS (n=1) | |
| Acer Swift 3 SF316-51 | |
| LG Gram 16 (2021) | |
| LibreOffice - 20 Documents To PDF | |
| Lenovo IdeaPad 5 Pro 16ARH7 | |
| Przeciętny AMD Ryzen 5 6600HS (n=1) | |
| Średnia w klasie Multimedia (23.9 - 146.7, n=64, ostatnie 2 lata) | |
| Lenovo Yoga 7 16IAP7 | |
| LG Gram 16 (2021) | |
| Acer Swift 3 SF316-51 | |
| Huawei MateBook D 16 2022 | |
| R Benchmark 2.5 - Overall mean | |
| LG Gram 16 (2021) | |
| Acer Swift 3 SF316-51 | |
| Lenovo IdeaPad 5 Pro 16ARH7 | |
| Przeciętny AMD Ryzen 5 6600HS (n=1) | |
| Średnia w klasie Multimedia (0.3604 - 0.947, n=63, ostatnie 2 lata) | |
| Lenovo Yoga 7 16IAP7 | |
| Huawei MateBook D 16 2022 | |
* ... im mniej tym lepiej
AIDA64: FP32 Ray-Trace | FPU Julia | CPU SHA3 | CPU Queen | FPU SinJulia | FPU Mandel | CPU AES | CPU ZLib | FP64 Ray-Trace | CPU PhotoWorxx
| Performance rating | |
| Średnia w klasie Multimedia | |
| Huawei MateBook D 16 2022 | |
| Lenovo IdeaPad 5 Pro 16ARH7 | |
| Przeciętny AMD Ryzen 5 6600HS | |
| Lenovo Yoga 7 16IAP7 | |
| LG Gram 16 (2021) | |
| AIDA64 / FP32 Ray-Trace | |
| Średnia w klasie Multimedia (2214 - 50388, n=60, ostatnie 2 lata) | |
| Lenovo IdeaPad 5 Pro 16ARH7 | |
| Przeciętny AMD Ryzen 5 6600HS (n=1) | |
| Huawei MateBook D 16 2022 | |
| Lenovo Yoga 7 16IAP7 | |
| LG Gram 16 (2021) | |
| AIDA64 / FPU Julia | |
| Średnia w klasie Multimedia (12867 - 201874, n=61, ostatnie 2 lata) | |
| Lenovo IdeaPad 5 Pro 16ARH7 | |
| Przeciętny AMD Ryzen 5 6600HS (n=1) | |
| Huawei MateBook D 16 2022 | |
| Lenovo Yoga 7 16IAP7 | |
| LG Gram 16 (2021) | |
| AIDA64 / CPU SHA3 | |
| Średnia w klasie Multimedia (653 - 8623, n=61, ostatnie 2 lata) | |
| Huawei MateBook D 16 2022 | |
| Lenovo IdeaPad 5 Pro 16ARH7 | |
| Przeciętny AMD Ryzen 5 6600HS (n=1) | |
| Lenovo Yoga 7 16IAP7 | |
| LG Gram 16 (2021) | |
| AIDA64 / CPU Queen | |
| Huawei MateBook D 16 2022 | |
| Lenovo Yoga 7 16IAP7 | |
| Lenovo IdeaPad 5 Pro 16ARH7 | |
| Przeciętny AMD Ryzen 5 6600HS (n=1) | |
| Średnia w klasie Multimedia (13483 - 181505, n=49, ostatnie 2 lata) | |
| LG Gram 16 (2021) | |
| AIDA64 / FPU SinJulia | |
| Lenovo IdeaPad 5 Pro 16ARH7 | |
| Przeciętny AMD Ryzen 5 6600HS (n=1) | |
| Średnia w klasie Multimedia (1240 - 28794, n=61, ostatnie 2 lata) | |
| Huawei MateBook D 16 2022 | |
| Lenovo Yoga 7 16IAP7 | |
| LG Gram 16 (2021) | |
| AIDA64 / FPU Mandel | |
| Średnia w klasie Multimedia (6395 - 105740, n=60, ostatnie 2 lata) | |
| Lenovo IdeaPad 5 Pro 16ARH7 | |
| Przeciętny AMD Ryzen 5 6600HS (n=1) | |
| Huawei MateBook D 16 2022 | |
| Lenovo Yoga 7 16IAP7 | |
| LG Gram 16 (2021) | |
| AIDA64 / CPU AES | |
| Huawei MateBook D 16 2022 | |
| Średnia w klasie Multimedia (13243 - 126790, n=61, ostatnie 2 lata) | |
| LG Gram 16 (2021) | |
| Lenovo Yoga 7 16IAP7 | |
| Lenovo IdeaPad 5 Pro 16ARH7 | |
| Przeciętny AMD Ryzen 5 6600HS (n=1) | |
| AIDA64 / CPU ZLib | |
| Średnia w klasie Multimedia (167.2 - 2022, n=61, ostatnie 2 lata) | |
| Huawei MateBook D 16 2022 | |
| Lenovo IdeaPad 5 Pro 16ARH7 | |
| Przeciętny AMD Ryzen 5 6600HS (n=1) | |
| Lenovo Yoga 7 16IAP7 | |
| LG Gram 16 (2021) | |
| AIDA64 / FP64 Ray-Trace | |
| Średnia w klasie Multimedia (1014 - 26875, n=61, ostatnie 2 lata) | |
| Lenovo IdeaPad 5 Pro 16ARH7 | |
| Przeciętny AMD Ryzen 5 6600HS (n=1) | |
| Huawei MateBook D 16 2022 | |
| Lenovo Yoga 7 16IAP7 | |
| LG Gram 16 (2021) | |
| AIDA64 / CPU PhotoWorxx | |
| Średnia w klasie Multimedia (12860 - 88154, n=61, ostatnie 2 lata) | |
| LG Gram 16 (2021) | |
| Lenovo Yoga 7 16IAP7 | |
| Huawei MateBook D 16 2022 | |
| Lenovo IdeaPad 5 Pro 16ARH7 | |
| Przeciętny AMD Ryzen 5 6600HS (n=1) | |
Wydajność systemu
Według PCMark 10 IdeaPad 5 Pro plasuje się na drugim miejscu pod względem wydajności systemu, niewiele ustępując Huawei MateBook D16. Komputer ten również subiektywnie reaguje komfortowo szybko.
CrossMark: Overall | Productivity | Creativity | Responsiveness
| PCMark 10 / Score | |
| Średnia w klasie Multimedia (4325 - 10386, n=58, ostatnie 2 lata) | |
| Huawei MateBook D 16 2022 | |
| Lenovo IdeaPad 5 Pro 16ARH7 | |
| Lenovo Yoga 7 16IAP7 | |
| Acer Swift 3 SF316-51 | |
| LG Gram 16 (2021) | |
| PCMark 10 / Essentials | |
| Huawei MateBook D 16 2022 | |
| Lenovo Yoga 7 16IAP7 | |
| Średnia w klasie Multimedia (8025 - 11664, n=57, ostatnie 2 lata) | |
| Acer Swift 3 SF316-51 | |
| LG Gram 16 (2021) | |
| Lenovo IdeaPad 5 Pro 16ARH7 | |
| PCMark 10 / Productivity | |
| Średnia w klasie Multimedia (7323 - 18233, n=57, ostatnie 2 lata) | |
| Lenovo IdeaPad 5 Pro 16ARH7 | |
| Huawei MateBook D 16 2022 | |
| Acer Swift 3 SF316-51 | |
| Lenovo Yoga 7 16IAP7 | |
| LG Gram 16 (2021) | |
| PCMark 10 / Digital Content Creation | |
| Średnia w klasie Multimedia (3651 - 16240, n=57, ostatnie 2 lata) | |
| Lenovo Yoga 7 16IAP7 | |
| Huawei MateBook D 16 2022 | |
| Lenovo IdeaPad 5 Pro 16ARH7 | |
| Acer Swift 3 SF316-51 | |
| LG Gram 16 (2021) | |
| CrossMark / Overall | |
| Huawei MateBook D 16 2022 | |
| Średnia w klasie Multimedia (866 - 2728, n=67, ostatnie 2 lata) | |
| Lenovo Yoga 7 16IAP7 | |
| CrossMark / Productivity | |
| Huawei MateBook D 16 2022 | |
| Średnia w klasie Multimedia (931 - 2489, n=67, ostatnie 2 lata) | |
| Lenovo Yoga 7 16IAP7 | |
| CrossMark / Creativity | |
| Średnia w klasie Multimedia (907 - 3465, n=67, ostatnie 2 lata) | |
| Huawei MateBook D 16 2022 | |
| Lenovo Yoga 7 16IAP7 | |
| CrossMark / Responsiveness | |
| Huawei MateBook D 16 2022 | |
| Średnia w klasie Multimedia (605 - 2024, n=67, ostatnie 2 lata) | |
| Lenovo Yoga 7 16IAP7 | |
| PCMark 10 Score | 5855 pkt. | |
Pomoc | ||
| AIDA64 / Memory Copy | |
| Średnia w klasie Multimedia (21158 - 132135, n=61, ostatnie 2 lata) | |
| Lenovo Yoga 7 16IAP7 | |
| LG Gram 16 (2021) | |
| Huawei MateBook D 16 2022 | |
| Lenovo IdeaPad 5 Pro 16ARH7 | |
| Przeciętny AMD Ryzen 5 6600HS (n=1) | |
| AIDA64 / Memory Read | |
| Średnia w klasie Multimedia (19699 - 174586, n=61, ostatnie 2 lata) | |
| Lenovo Yoga 7 16IAP7 | |
| LG Gram 16 (2021) | |
| Huawei MateBook D 16 2022 | |
| Lenovo IdeaPad 5 Pro 16ARH7 | |
| Przeciętny AMD Ryzen 5 6600HS (n=1) | |
| AIDA64 / Memory Write | |
| Lenovo IdeaPad 5 Pro 16ARH7 | |
| Przeciętny AMD Ryzen 5 6600HS (n=1) | |
| Średnia w klasie Multimedia (17733 - 134998, n=61, ostatnie 2 lata) | |
| LG Gram 16 (2021) | |
| Lenovo Yoga 7 16IAP7 | |
| Huawei MateBook D 16 2022 | |
| AIDA64 / Memory Latency | |
| Lenovo IdeaPad 5 Pro 16ARH7 | |
| Przeciętny AMD Ryzen 5 6600HS (n=1) | |
| Średnia w klasie Multimedia (7 - 535, n=60, ostatnie 2 lata) | |
| Huawei MateBook D 16 2022 | |
| Lenovo Yoga 7 16IAP7 | |
| LG Gram 16 (2021) | |
* ... im mniej tym lepiej
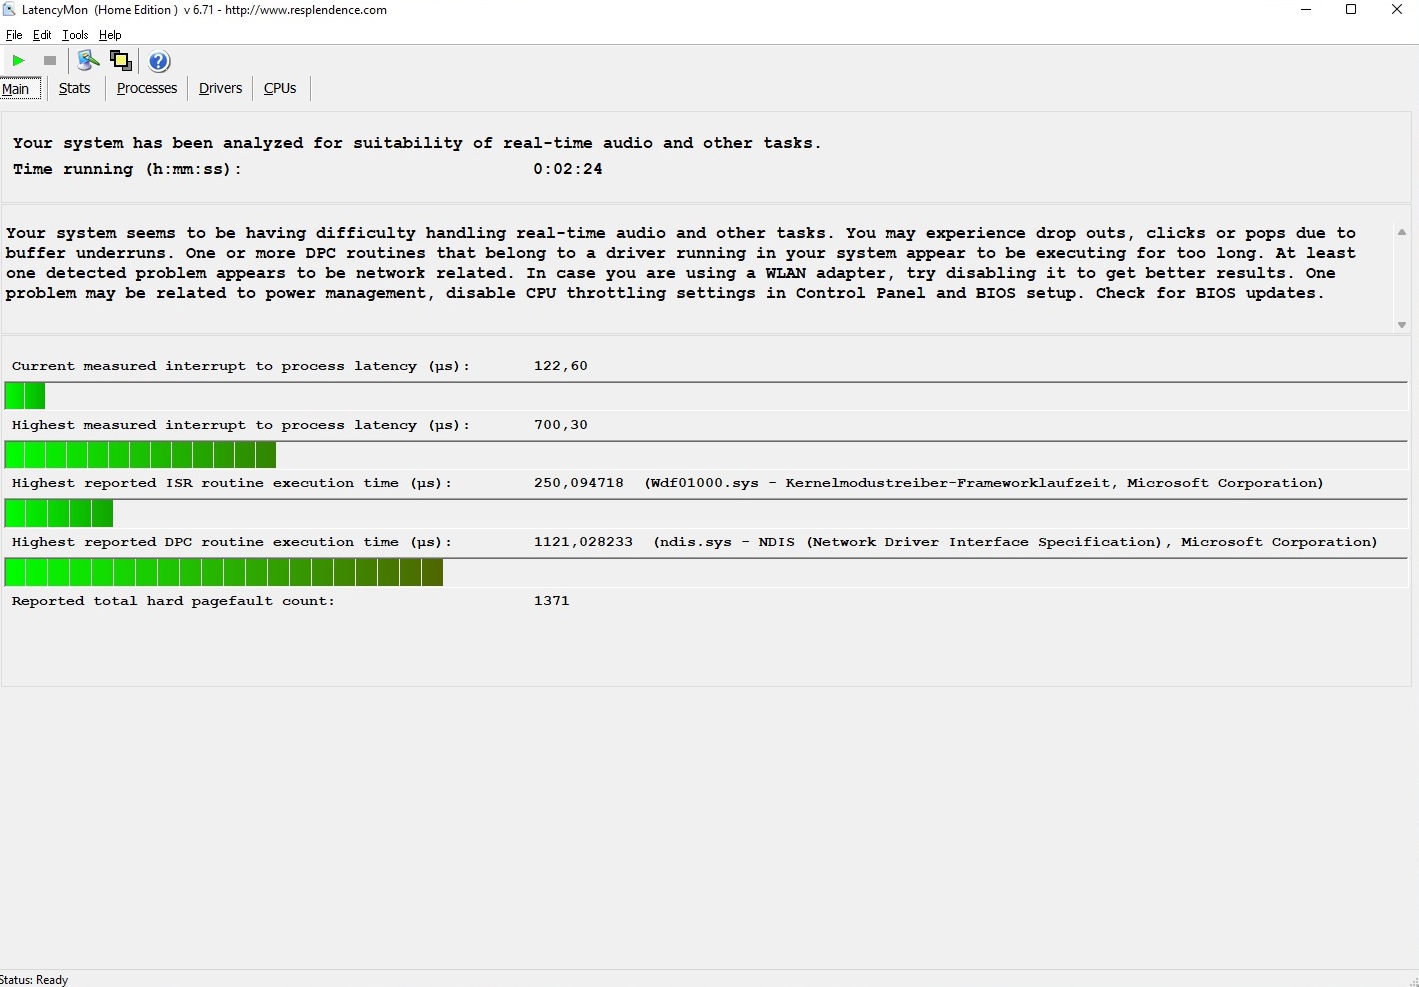
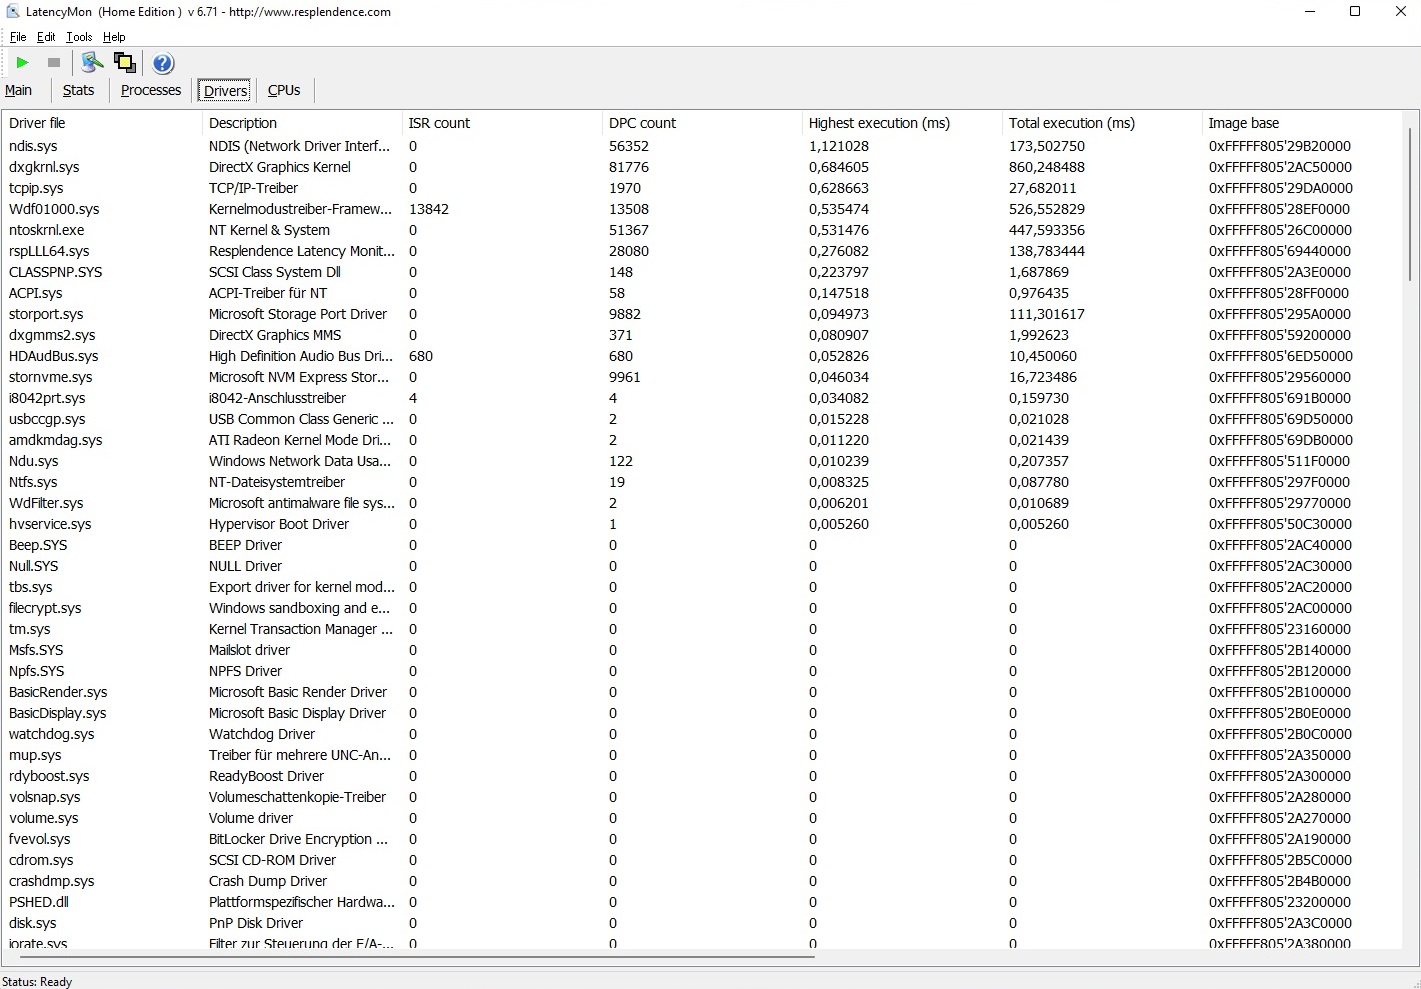
Opóźnienia DPC
16-calowy laptop ujawnia pewne drobne słabości w zakresie latencji. Według narzędzia LatencyMon laptop ten - podobnie jak wielu jego konkurentów - nie nadaje się idealnie do przetwarzania audio i wideo w czasie rzeczywistym.
| DPC Latencies / LatencyMon - interrupt to process latency (max), Web, Youtube, Prime95 | |
| Huawei MateBook D 16 2022 | |
| Lenovo Yoga 7 16IAP7 | |
| Lenovo IdeaPad 5 Pro 16ARH7 | |
| Acer Swift 3 SF316-51 | |
| LG Gram 16 (2021) | |
* ... im mniej tym lepiej
Rozwiązanie w zakresie przechowywania
Rozwiązanie pamięci masowej zapewnia mieszaną wydajność. Podczas gdy nasze zmierzone wartości wydajności, prędkości podczas sekwencyjnego odczytu i zapisu itd. są dość przekonujące, po chwili w teście długoterminowym z DiskSpd widzimy pewne silne odchylenia. Nie powinniście jednak zauważyć problemu, chyba że stawiacie jakieś stałe, ciężkie wymagania dyskowi SSD M.2 o pojemności 512 GB od Samsunga (model PM9A1).

| Drive Performance rating - Percent | |
| Przeciętny Samsung PM9A1 MZVL2512HCJQ | |
| Średnia w klasie Multimedia | |
| LG Gram 16 (2021) | |
| Lenovo IdeaPad 5 Pro 16ARH7 | |
| Huawei MateBook D 16 2022 | |
| Lenovo Yoga 7 16IAP7 | |
| Acer Swift 3 SF316-51 | |
* ... im mniej tym lepiej
Constant Performance Reading: DiskSpd Read Loop, Queue Depth 8
Karta graficzna
Jako że 16ARH7 nie oferuje dedykowanej karty graficznej, zintegrowany z procesorem Radeon 660M musi poradzić sobie ze wszystkimi obliczeniami graficznymi. Jak pokazują pomiary 3D, wydajność jest podobna do tej, jaką zapewnia Iris Xe Graphics G7 z 96 EU, który jest zintegrowany w niektórych modelach Tiger Lake i Alder Lake od Intela. Wsparcie sterowników przemawiałoby jednak raczej za AMD, z naszego doświadczenia (słowo kluczowe: gry).
| 3DMark Performance rating - Percent | |
| Średnia w klasie Multimedia | |
| Acer Swift 3 SF316-51 | |
| Huawei MateBook D 16 2022 | |
| Lenovo IdeaPad 5 Pro 16ARH7 | |
| LG Gram 16 (2021) | |
| Lenovo Yoga 7 16IAP7 | |
| Przeciętny AMD Radeon 660M | |
| 3DMark 11 - 1280x720 Performance GPU | |
| Średnia w klasie Multimedia (3765 - 60002, n=62, ostatnie 2 lata) | |
| Huawei MateBook D 16 2022 | |
| Acer Swift 3 SF316-51 | |
| Lenovo IdeaPad 5 Pro 16ARH7 | |
| Lenovo Yoga 7 16IAP7 | |
| Przeciętny AMD Radeon 660M (4636 - 7184, n=13) | |
| LG Gram 16 (2021) | |
| 3DMark | |
| 1280x720 Cloud Gate Standard Graphics | |
| Średnia w klasie Multimedia (16765 - 143501, n=34, ostatnie 2 lata) | |
| Lenovo IdeaPad 5 Pro 16ARH7 | |
| Acer Swift 3 SF316-51 | |
| Przeciętny AMD Radeon 660M (21857 - 33949, n=12) | |
| Huawei MateBook D 16 2022 | |
| LG Gram 16 (2021) | |
| Lenovo Yoga 7 16IAP7 | |
| 1920x1080 Fire Strike Graphics | |
| Średnia w klasie Multimedia (2328 - 48907, n=66, ostatnie 2 lata) | |
| Acer Swift 3 SF316-51 | |
| Huawei MateBook D 16 2022 | |
| LG Gram 16 (2021) | |
| Lenovo IdeaPad 5 Pro 16ARH7 | |
| Lenovo Yoga 7 16IAP7 | |
| Przeciętny AMD Radeon 660M (3447 - 4993, n=13) | |
| 2560x1440 Time Spy Graphics | |
| Średnia w klasie Multimedia (696 - 19403, n=67, ostatnie 2 lata) | |
| Huawei MateBook D 16 2022 | |
| Acer Swift 3 SF316-51 | |
| LG Gram 16 (2021) | |
| Lenovo Yoga 7 16IAP7 | |
| Lenovo IdeaPad 5 Pro 16ARH7 | |
| Przeciętny AMD Radeon 660M (1016 - 1588, n=13) | |
| 3DMark 11 Performance | 7360 pkt. | |
| 3DMark Ice Storm Standard Score | 169560 pkt. | |
| 3DMark Cloud Gate Standard Score | 24524 pkt. | |
| 3DMark Fire Strike Score | 4664 pkt. | |
| 3DMark Time Spy Score | 1776 pkt. | |
Pomoc | ||
Wydajność w grach
To, że Radeon 660M nie może być uznany za kartę graficzną do gier, nie powinno dziwić. Nawet przy zmniejszeniu rozdzielczości z natywnej 2 560 x 1 600 pikseli do Full-HD, czyli 1 920 x 1 080, wiele współczesnych gier zacina się także na minimalnych ustawieniach detali (na przykład, God of War, Elex 2, oraz Dying Light 2). Aby uzyskać w połowie płynny obraz, musisz albo znacznie zmniejszyć rozdzielczość, albo ograniczyć się do starszych lub mniej wymagających obliczeniowo gier. Te, w które będziesz mógł wtedy grać na średnich lub wysokich ustawieniach detali (na przykład,Dota 2, Star Wars Squadronsoraz GRID Legends).
| The Witcher 3 | |
| 1920x1080 High Graphics & Postprocessing (Nvidia HairWorks Off) | |
| Średnia w klasie Multimedia (22 - 224, n=13, ostatnie 2 lata) | |
| Huawei MateBook D 16 2022 | |
| Acer Swift 3 SF316-51 | |
| Lenovo Yoga 7 16IAP7 | |
| Lenovo IdeaPad 5 Pro 16ARH7 | |
| Przeciętny AMD Radeon 660M (18.5 - 28.6, n=10) | |
| LG Gram 16 (2021) | |
| 1920x1080 Ultra Graphics & Postprocessing (HBAO+) | |
| Średnia w klasie Multimedia (11 - 121, n=13, ostatnie 2 lata) | |
| Acer Swift 3 SF316-51 | |
| LG Gram 16 (2021) | |
| Lenovo IdeaPad 5 Pro 16ARH7 | |
| Przeciętny AMD Radeon 660M (12.3 - 17.9, n=10) | |
| Huawei MateBook D 16 2022 | |
| Lenovo Yoga 7 16IAP7 | |
W przeciwieństwie do wydajności CPU, wydajność GPU nie jest stała w dłuższym okresie czasu. W naszym 60-minutowym teście zThe Witcher 3 (FHD/Ultra), widzieliśmy pewne wahania liczby klatek na sekundę, co widać na poniższym wykresie. Z drugiej strony LG Gram 16 musi zmagać się z jeszcze mocniejszymi i częstszymi skokami wydajności.
The Witcher 3 FPS Chart
| low | med. | high | ultra | |
|---|---|---|---|---|
| GTA V (2015) | 133.9 | 118.5 | 40 | 17.2 |
| The Witcher 3 (2015) | 93.2 | 58.5 | 28.6 | 15.3 |
| Dota 2 Reborn (2015) | 114.5 | 98.5 | 65.8 | 55.4 |
| Final Fantasy XV Benchmark (2018) | 53.4 | 23.8 | 16.3 | |
| X-Plane 11.11 (2018) | 49.2 | 37.4 | 33.8 | |
| Far Cry 5 (2018) | 63 | 30 | 26 | |
| Strange Brigade (2018) | 114.4 | 43.3 | 33.9 | 28.6 |
| Hunt Showdown (2020) | 70.8 | 24.2 | 19.2 | |
| Doom Eternal (2020) | 86.9 | 36.2 | 34.2 | |
| Gears Tactics (2020) | 132 | 47.4 | 28.5 | |
| Death Stranding (2020) | 58.1 | 30.6 | 29.1 | |
| Crysis Remastered (2020) | 88.1 | 39.2 | 10.9 | |
| Serious Sam 4 (2020) | 113 | 29.2 | 24.1 | |
| Mafia Definitive Edition (2020) | 48.2 | 20.7 | 19.1 | |
| Star Wars Squadrons (2020) | 170.4 | 66.6 | 57.4 | |
| Watch Dogs Legion (2020) | 49 | 26 | 22 | |
| Dirt 5 (2020) | 68.6 | 24.2 | 17.8 | |
| Assassin´s Creed Valhalla (2020) | 52 | 26 | 19 | |
| Yakuza Like a Dragon (2020) | 64.7 | 21.2 | 21.1 | |
| Hitman 3 (2021) | 91.1 | 34.5 | 30.5 | |
| Outriders (2021) | 35.3 | 30.4 | 27.9 | |
| Resident Evil Village (2021) | 75.3 | 33.4 | 29.9 | |
| Mass Effect Legendary Edition (2021) | 70 | 38.9 | ||
| Days Gone (2021) | 50 | 25.3 | 22.2 | |
| Deathloop (2021) | 45.5 | 23.3 | 18.1 | |
| Alan Wake Remastered (2021) | 53.6 | 32.7 | 26.4 | |
| Far Cry 6 (2021) | 50 | 21 | 18 | |
| Back 4 Blood (2021) | 104.3 | 40.4 | 34.3 | |
| Guardians of the Galaxy (2021) | 0 gra nie chce się uruchomić | 0 gra nie chce się uruchomić | 0 gra nie chce się uruchomić | |
| Riders Republic (2021) | 56 | 30 | 23 | |
| Forza Horizon 5 (2021) | 92 | 39 | 32 | |
| Farming Simulator 22 (2021) | 102 | 57.1 | 38.9 | |
| Halo Infinite (2021) | 39.6 | 20.3 | 17.1 | |
| God of War (2022) | 21.7 | 17.5 | 12.6 | |
| Rainbow Six Extraction (2022) | 45 | 35 | 30 | |
| Dying Light 2 (2022) | 19.7 | 15.4 | 12.4 | |
| GRID Legends (2022) | 71 | 53.4 | 40.4 | |
| Elden Ring (2022) | 39.6 | 29.9 | 26.9 | |
| Cyberpunk 2077 1.6 (2022) | 27 | 24 | 15 | |
| Elex 2 (2022) | 22.5 | 19.3 | 15.8 | |
| Ghostwire Tokyo (2022) | 25.9 | 24 | 23.9 | |
| Tiny Tina's Wonderlands (2022) | 34.2 | 27 | 17.6 | |
| Vampire Bloodhunt (2022) | 0 gra nie chce się uruchomić (crash) | 0 gra nie chce się uruchomić (crash) | 0 gra nie chce się uruchomić (crash) | |
| F1 22 (2022) | 48 | 42 | 28 | |
| The Quarry (2022) | 24.5 | 18 | 14.4 |
Emisje
Emisja hałasu
W dłuższych okresach czasu IdeaPad 5 Pro pozostaje bardzo cichy. Podczas pracy w stanie bezczynności wentylatory często pozostają wyłączone. Kiedy się włączają, poziom jest dość niski i wynosi od 26 do 28 dB(A), co raczej nie powinno nikogo drażnić. Pod obciążeniem 16-calowy laptop jest również dość cichy, a podczas The Witcher 3 i stress testu zmierzyliśmy jedynie 35 dB(A) dochodzące z urządzenia. Nieco bardziej zaskoczył natomiast poziom hałasu w benchmarku 3DMark 06, gdzie wentylatory rozkręciły się do 44 dB(A), co odpowiada znacznie bardziej odczuwalnemu szumowi.
Hałas
| luz |
| 25 / 26 / 28 dB |
| obciążenie |
| 44 / 35 dB |
 | ||
30 dB cichy 40 dB(A) słyszalny 50 dB(A) irytujący |
||
min: | ||
| Lenovo IdeaPad 5 Pro 16ARH7 R5 6600HS, Radeon 660M | Huawei MateBook D 16 2022 i7-12700H, Iris Xe G7 96EUs | Acer Swift 3 SF316-51 i7-11370H, Iris Xe G7 96EUs | LG Gram 16 (2021) i7-1165G7, Iris Xe G7 96EUs | Lenovo Yoga 7 16IAP7 i7-1260P, Iris Xe G7 96EUs | |
|---|---|---|---|---|---|
| Noise | -3% | 1% | 7% | 3% | |
| wyłączone / środowisko * (dB) | 25 | 24.2 3% | 26 -4% | 26 -4% | 23.6 6% |
| Idle Minimum * (dB) | 25 | 24.2 3% | 26 -4% | 26 -4% | 23.6 6% |
| Idle Average * (dB) | 26 | 25.8 1% | 26 -0% | 26 -0% | 23.6 9% |
| Idle Maximum * (dB) | 28 | 30.5 -9% | 27.7 1% | 26 7% | 23.6 16% |
| Load Average * (dB) | 44 | 39.8 10% | 32.7 26% | 30.8 30% | 37.7 14% |
| Witcher 3 ultra * (dB) | 35 | 39.8 -14% | 40 -14% | ||
| Load Maximum * (dB) | 35 | 39.8 -14% | 39 -11% | 31.1 11% | 40.2 -15% |
* ... im mniej tym lepiej
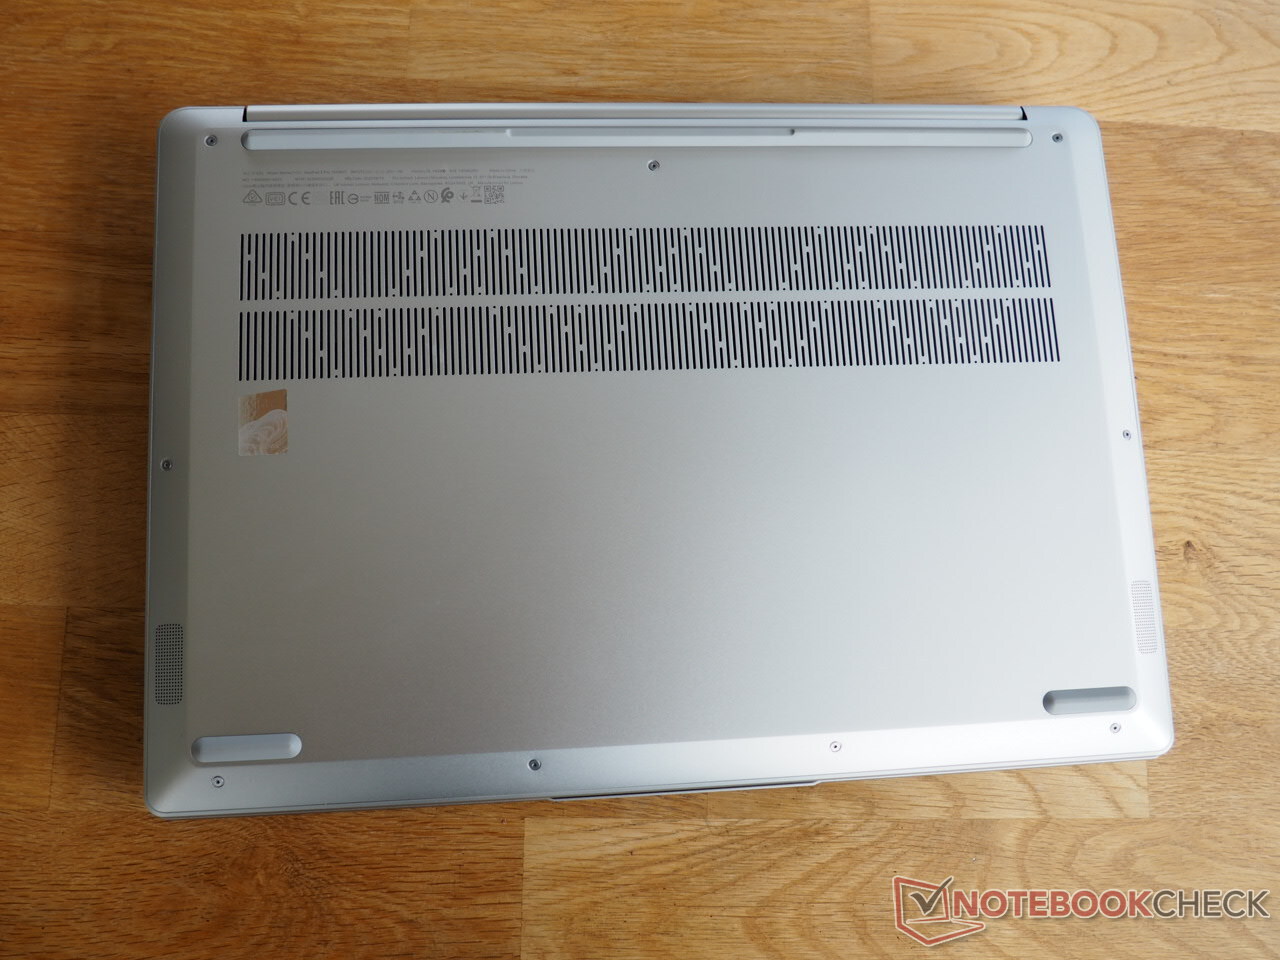
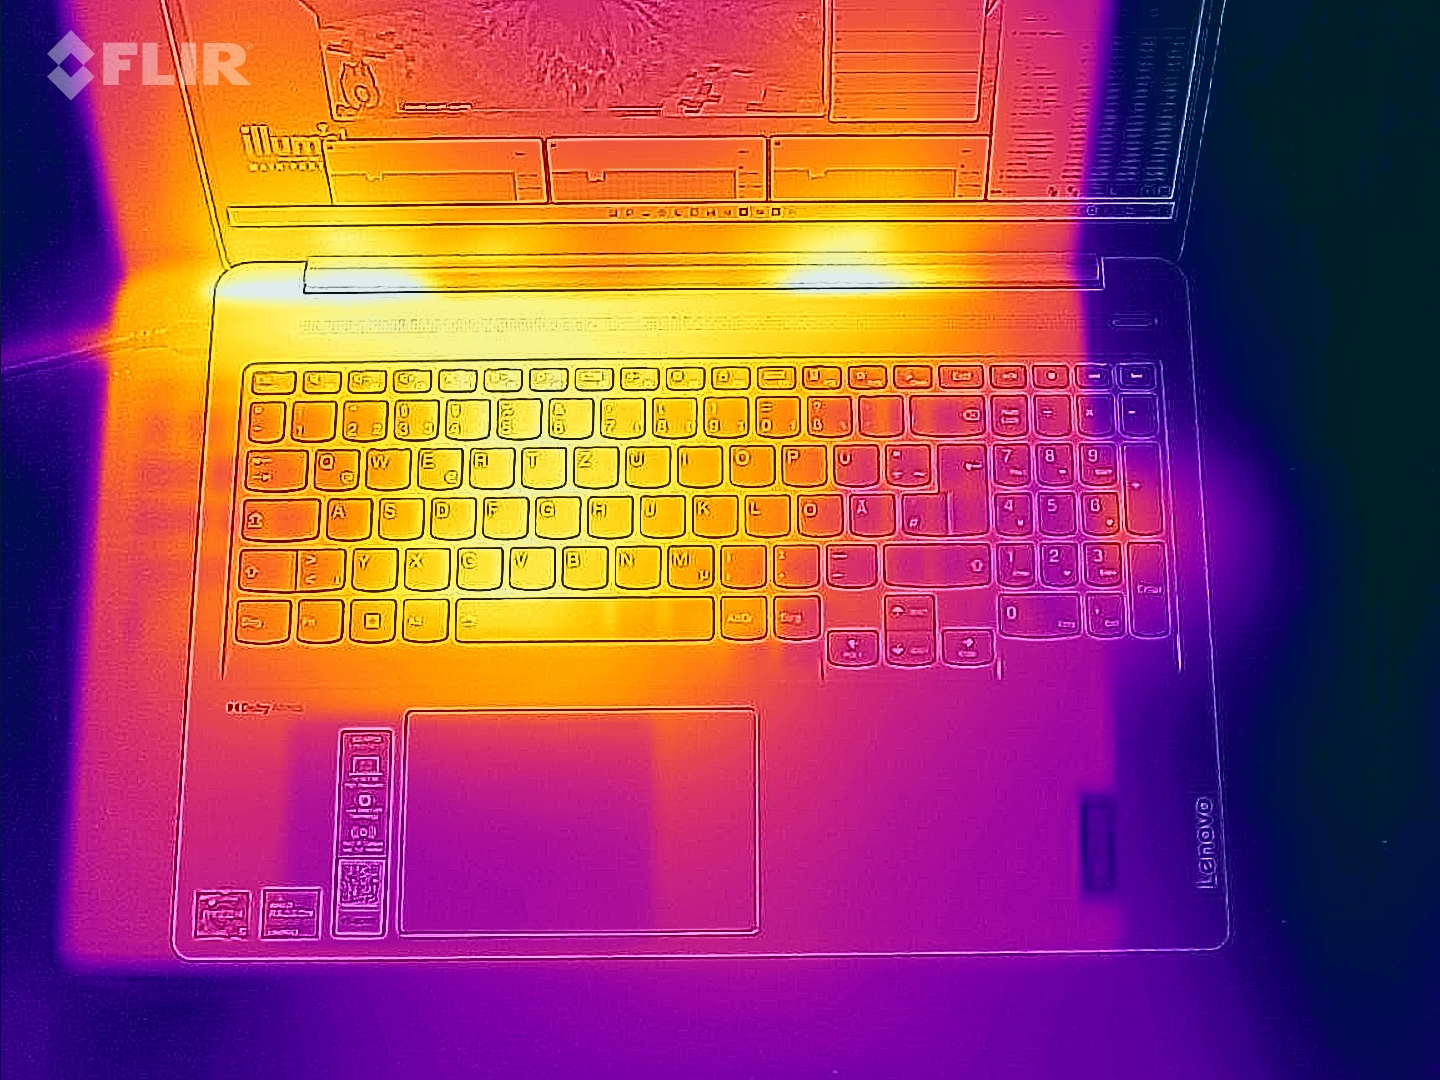
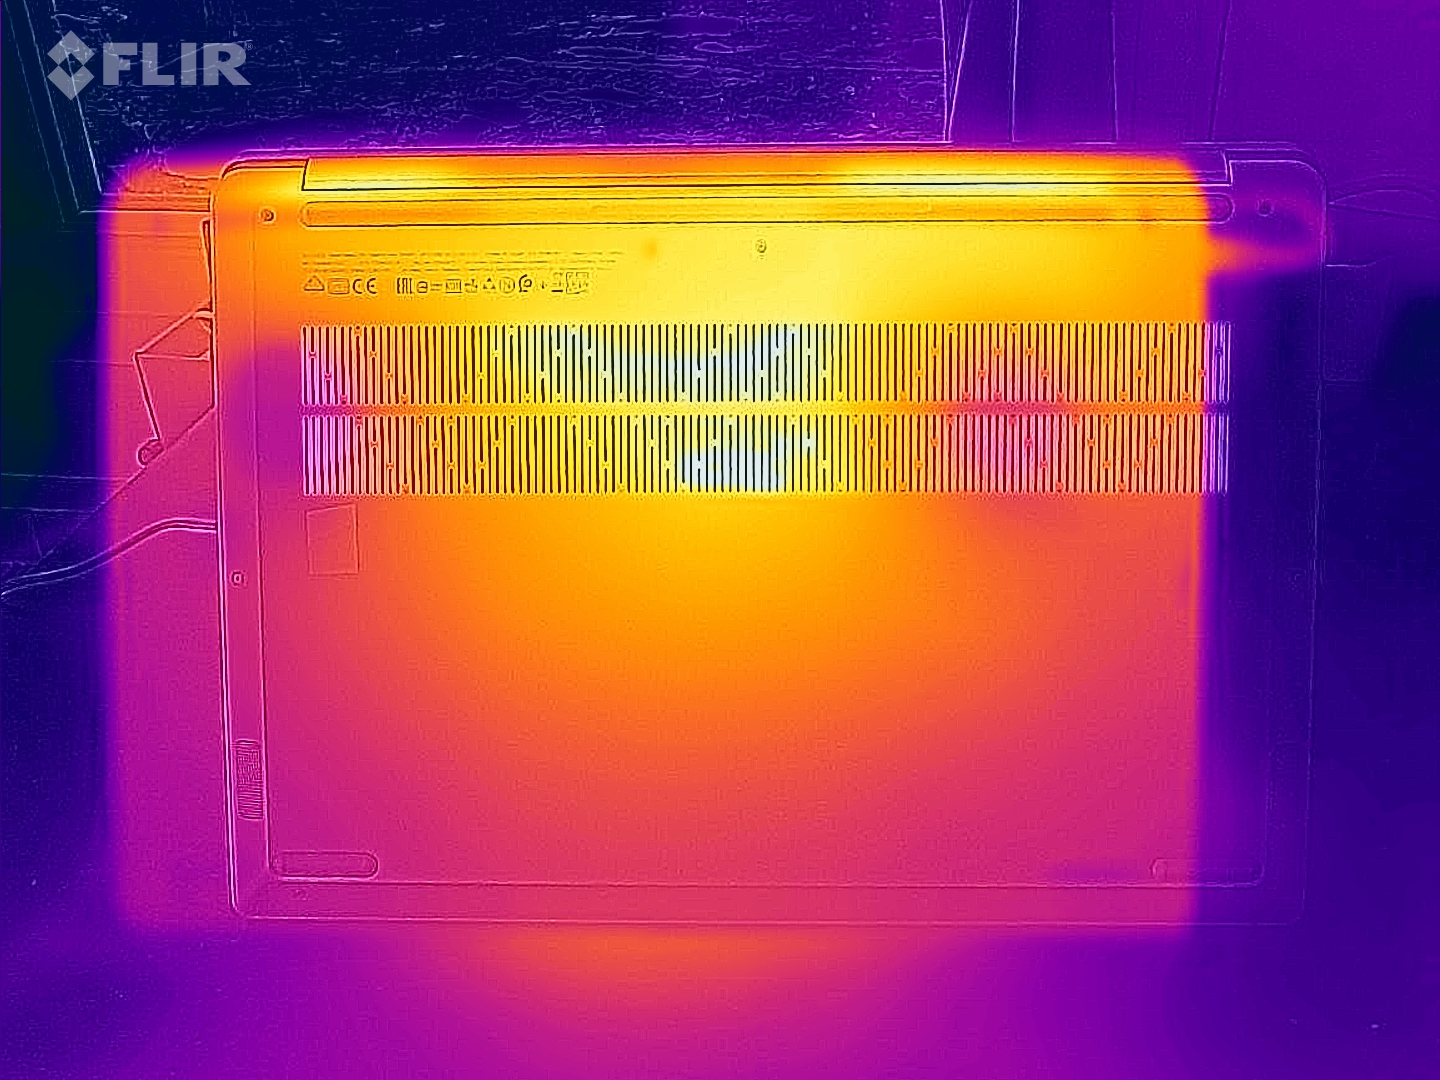
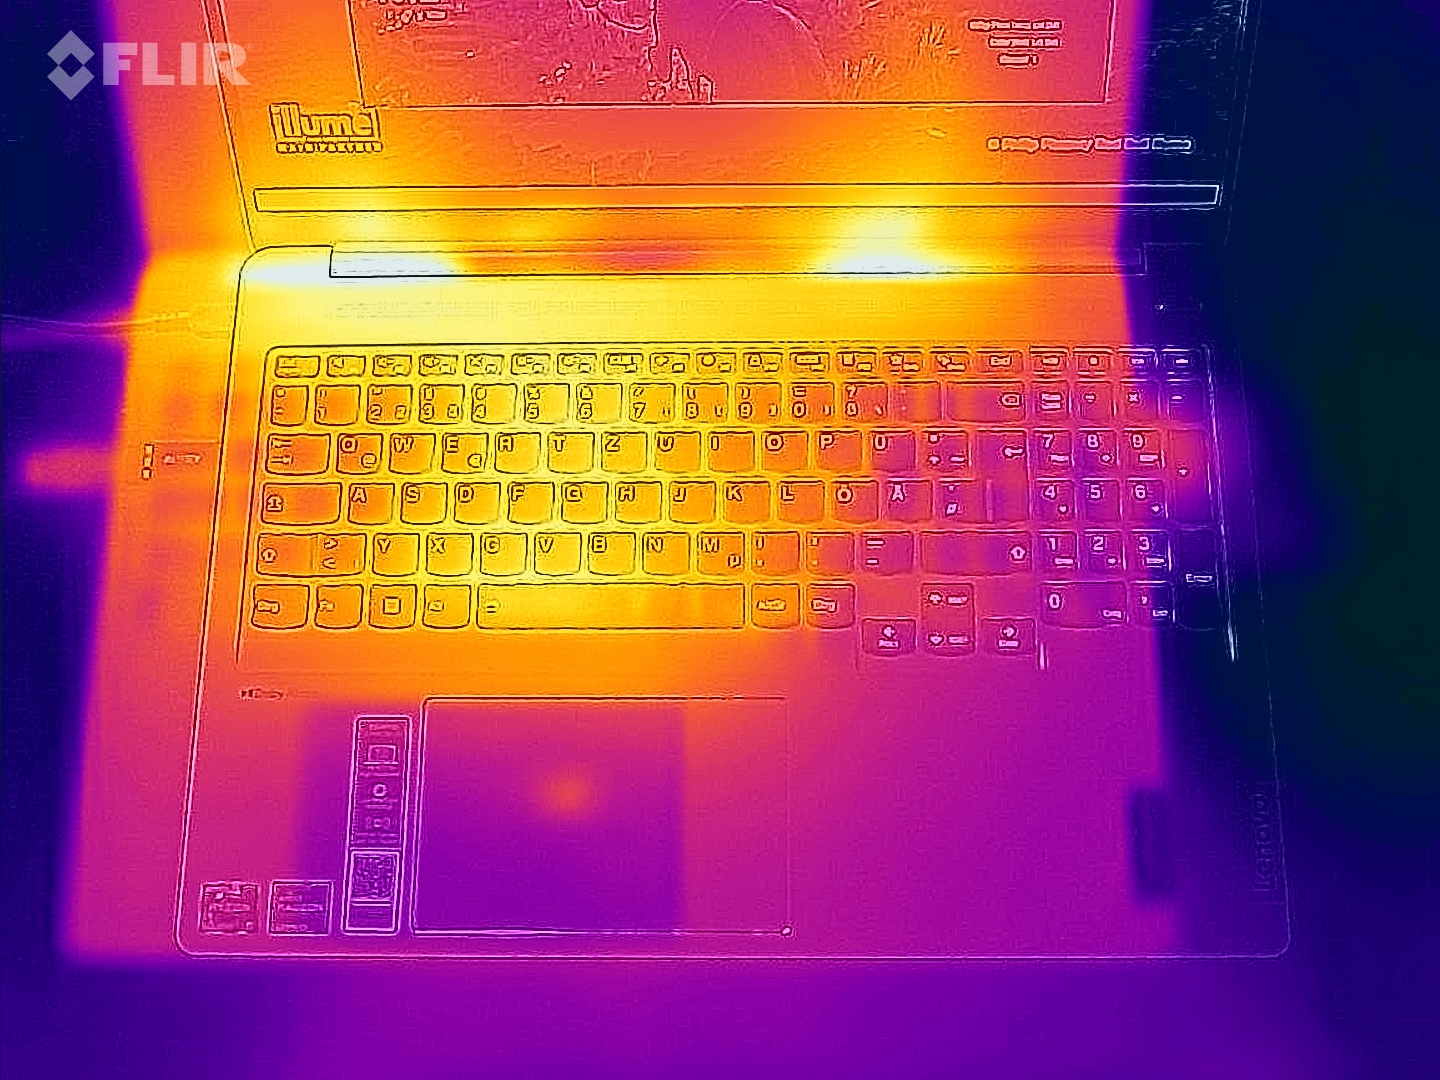
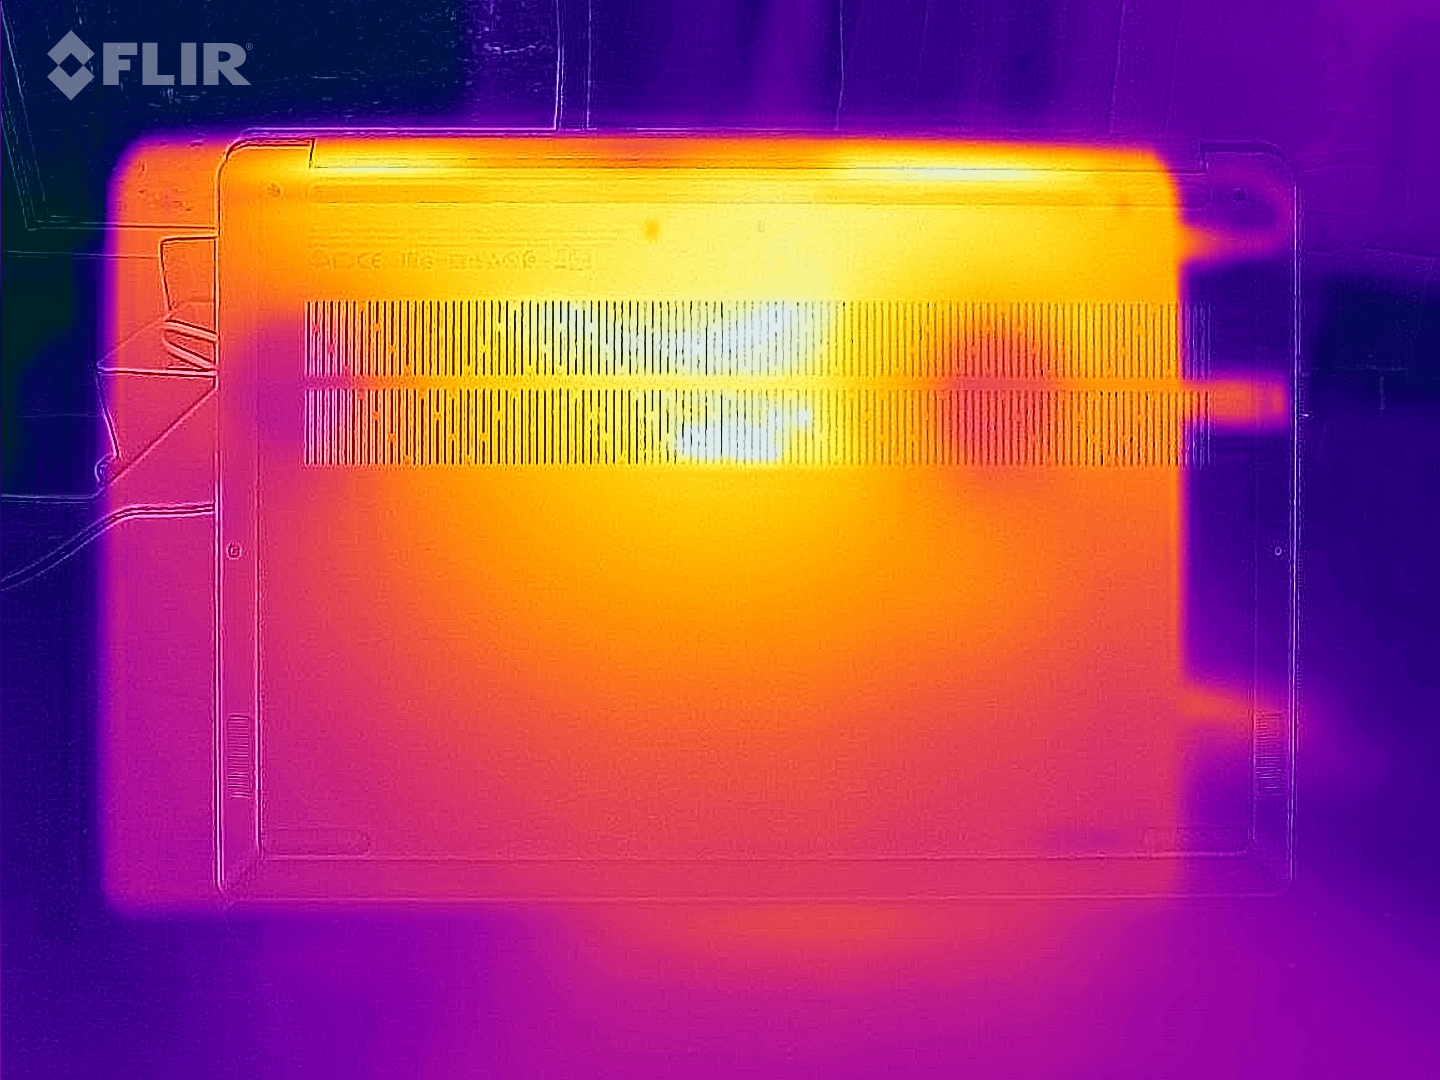
Temperatury
Kształtowanie się temperatur jest podobne do tego, jakie obserwujemy u konkurencji. Maksymalnie 46 °C (115 °F) na górze i 48 °C (118 °F) na spodzie obudowy nie są ani szczególnie wysokie, ani szczególnie niskie. Podczas pracy w trybie jałowym cała obudowa pozostaje chłodniejsza niż 30 °C (86 °F), więc dobrze nadaje się do komfortowego pisania lub przeglądania stron internetowych.
(-) Maksymalna temperatura w górnej części wynosi 46 °C / 115 F, w porównaniu do średniej 36.8 °C / 98 F , począwszy od 21 do 71 °C dla klasy Multimedia.
(-) Dno nagrzewa się maksymalnie do 48 °C / 118 F, w porównaniu do średniej 39.1 °C / 102 F
(+) W stanie bezczynności średnia temperatura górnej części wynosi 26 °C / 79 F, w porównaniu ze średnią temperaturą urządzenia wynoszącą 31.3 °C / ### class_avg_f### F.
(±) Podczas gry w Wiedźmina 3 średnia temperatura górnej części wynosi 34.6 °C / 94 F, w porównaniu do średniej temperatury urządzenia wynoszącej 31.3 °C / ## #class_avg_f### F.
(±) Podpórki pod nadgarstki i touchpad mogą się bardzo nagrzać w dotyku, maksymalnie do 36 °C / 96.8 F.
(-) Średnia temperatura obszaru podparcia dłoni w podobnych urządzeniach wynosiła 28.7 °C / 83.7 F (-7.3 °C / -13.1 F).
| Lenovo IdeaPad 5 Pro 16ARH7 R5 6600HS, Radeon 660M | Huawei MateBook D 16 2022 i7-12700H, Iris Xe G7 96EUs | Acer Swift 3 SF316-51 i7-11370H, Iris Xe G7 96EUs | LG Gram 16 (2021) i7-1165G7, Iris Xe G7 96EUs | Lenovo Yoga 7 16IAP7 i7-1260P, Iris Xe G7 96EUs | |
|---|---|---|---|---|---|
| Heat | -1% | -3% | 5% | 22% | |
| Maximum Upper Side * (°C) | 46 | 41.8 9% | 40 13% | 46.9 -2% | 39 15% |
| Maximum Bottom * (°C) | 48 | 47.3 1% | 47 2% | 45.1 6% | 34.2 29% |
| Idle Upper Side * (°C) | 28 | 28.3 -1% | 30.1 -8% | 26.4 6% | 21.2 24% |
| Idle Bottom * (°C) | 27 | 30.2 -12% | 31.6 -17% | 24.1 11% | 21.6 20% |
* ... im mniej tym lepiej
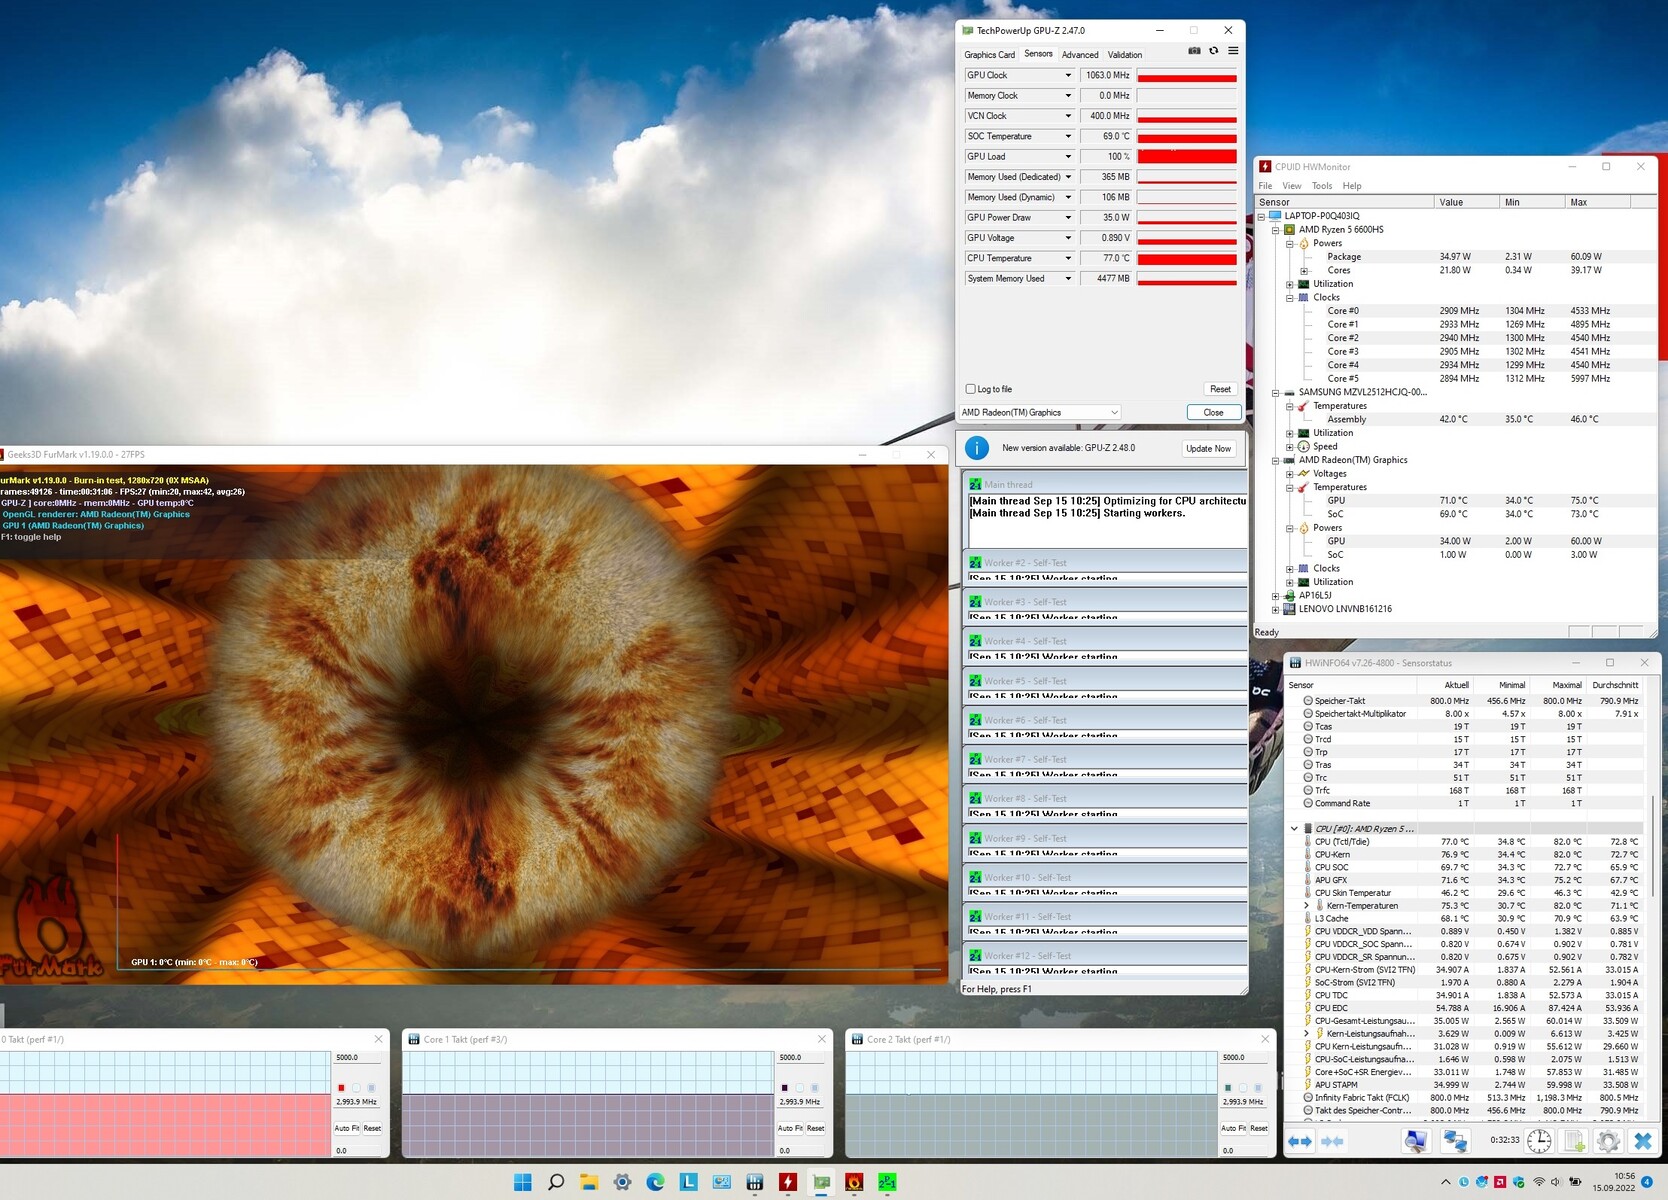
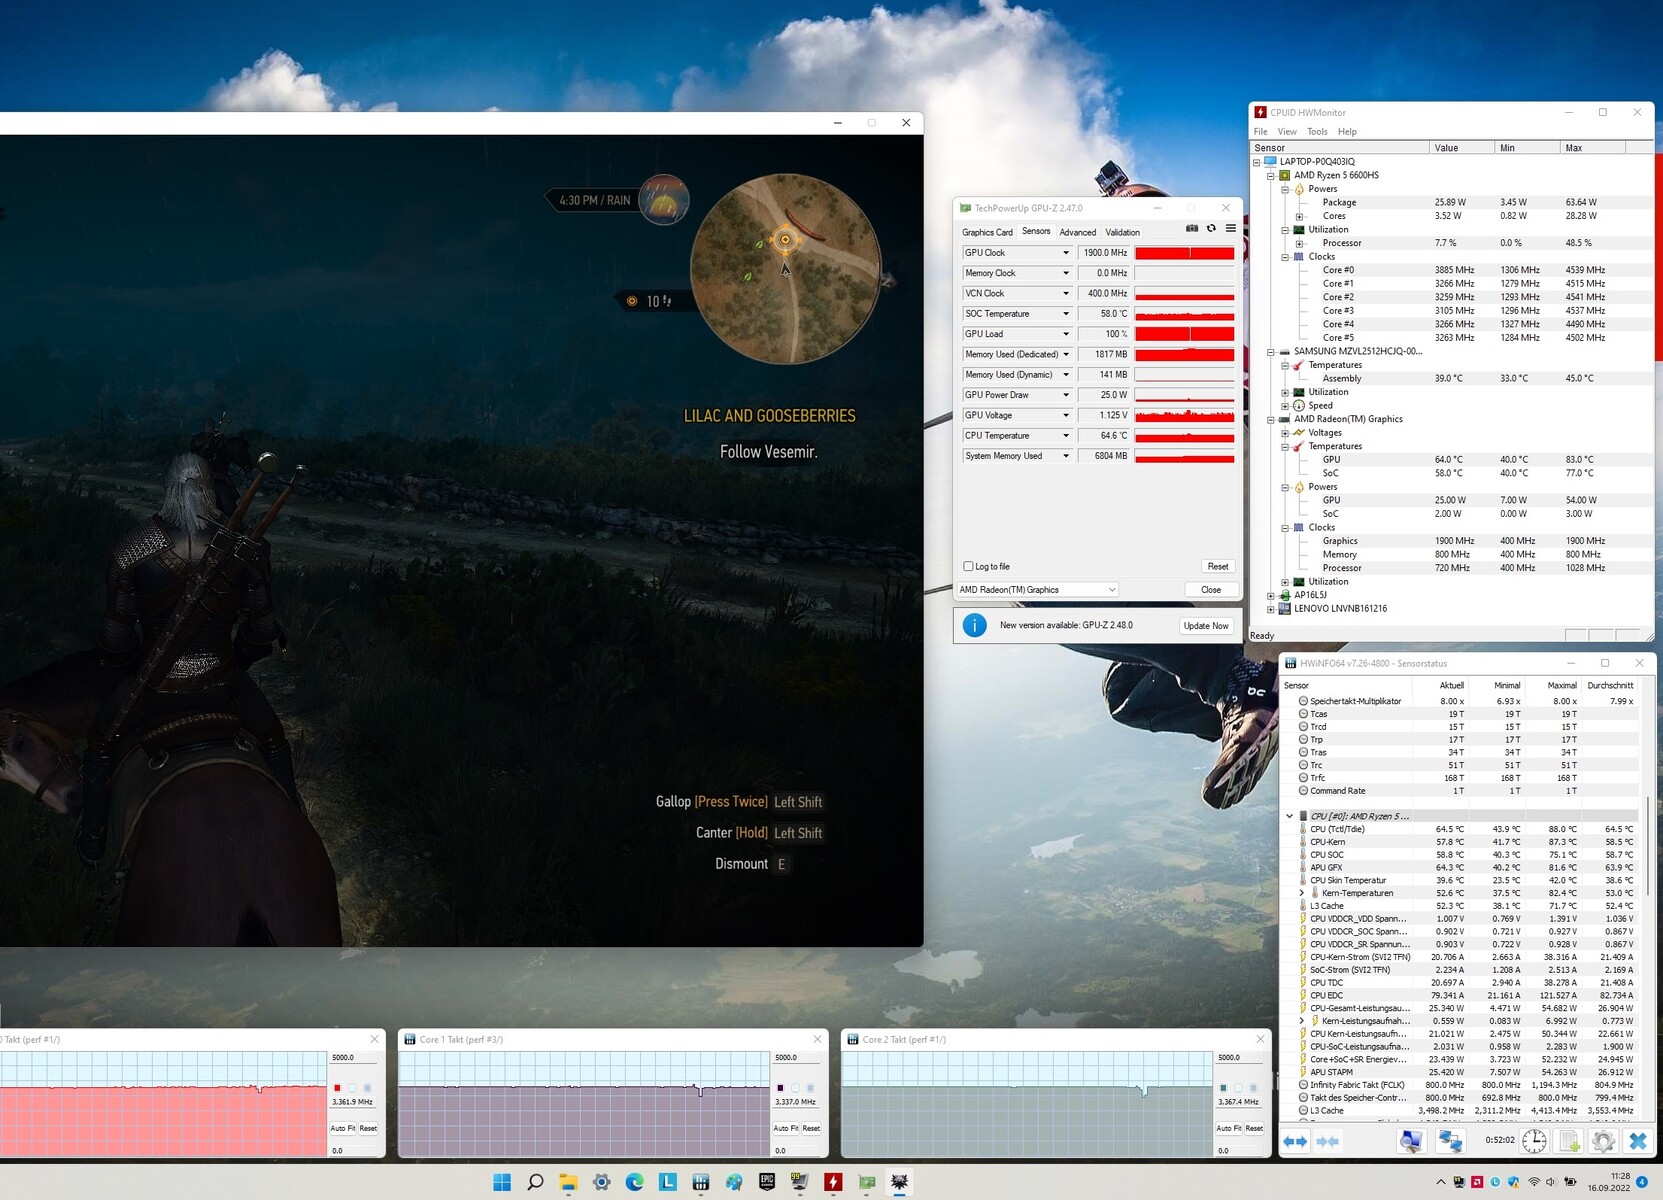
Stress Test
Podczas gdy Radeon 660M działa z maksymalną prędkością 1 900 MHz w naszym teście The Witcher 3, prędkość zegara wyrównuje się do około 1 060 MHz pod pełnym obciążeniem za pomocą narzędzi Furmark i Prime95. W tym samym czasie Ryzen 5 6600HS osiąga około 3,0 GHz zamiast 3,4 GHz, co jest solidnym wynikiem w sytuacji dłuższego stresu.
Mówca
Lenovo IdeaPad 5 Pro 16ARH7 analiza dźwięku
(±) | głośność głośnika jest średnia, ale dobra (77 dB)
Bas 100 - 315 Hz
(±) | zredukowany bas - średnio 13.1% niższy od mediany
(±) | liniowość basu jest średnia (8.8% delta do poprzedniej częstotliwości)
Średnie 400 - 2000 Hz
(±) | wyższe średnie - średnio 7.5% wyższe niż mediana
(+) | średnie są liniowe (6.6% delta do poprzedniej częstotliwości)
Wysokie 2–16 kHz
(+) | zrównoważone maksima - tylko 2.3% od mediany
(+) | wzloty są liniowe (6.9% delta do poprzedniej częstotliwości)
Ogólnie 100 - 16.000 Hz
(±) | liniowość ogólnego dźwięku jest średnia (17.7% różnicy w stosunku do mediany)
W porównaniu do tej samej klasy
» 51% wszystkich testowanych urządzeń w tej klasie było lepszych, 7% podobnych, 42% gorszych
» Najlepszy miał deltę 5%, średnia wynosiła ###średnia###%, najgorsza wynosiła 45%
W porównaniu do wszystkich testowanych urządzeń
» 35% wszystkich testowanych urządzeń było lepszych, 8% podobnych, 57% gorszych
» Najlepszy miał deltę 4%, średnia wynosiła ###średnia###%, najgorsza wynosiła 134%
Huawei MateBook D 16 2022 analiza dźwięku
(±) | głośność głośnika jest średnia, ale dobra (76 dB)
Bas 100 - 315 Hz
(-) | prawie brak basu - średnio 17.7% niższa od mediany
(±) | liniowość basu jest średnia (9.8% delta do poprzedniej częstotliwości)
Średnie 400 - 2000 Hz
(+) | zbalansowane środki średnie - tylko 1.9% od mediany
(+) | średnie są liniowe (5.6% delta do poprzedniej częstotliwości)
Wysokie 2–16 kHz
(+) | zrównoważone maksima - tylko 4.4% od mediany
(+) | wzloty są liniowe (3.1% delta do poprzedniej częstotliwości)
Ogólnie 100 - 16.000 Hz
(±) | liniowość ogólnego dźwięku jest średnia (16.2% różnicy w stosunku do mediany)
W porównaniu do tej samej klasy
» 41% wszystkich testowanych urządzeń w tej klasie było lepszych, 7% podobnych, 51% gorszych
» Najlepszy miał deltę 5%, średnia wynosiła ###średnia###%, najgorsza wynosiła 45%
W porównaniu do wszystkich testowanych urządzeń
» 26% wszystkich testowanych urządzeń było lepszych, 6% podobnych, 68% gorszych
» Najlepszy miał deltę 4%, średnia wynosiła ###średnia###%, najgorsza wynosiła 134%
Zarządzanie energią
Pobór mocy
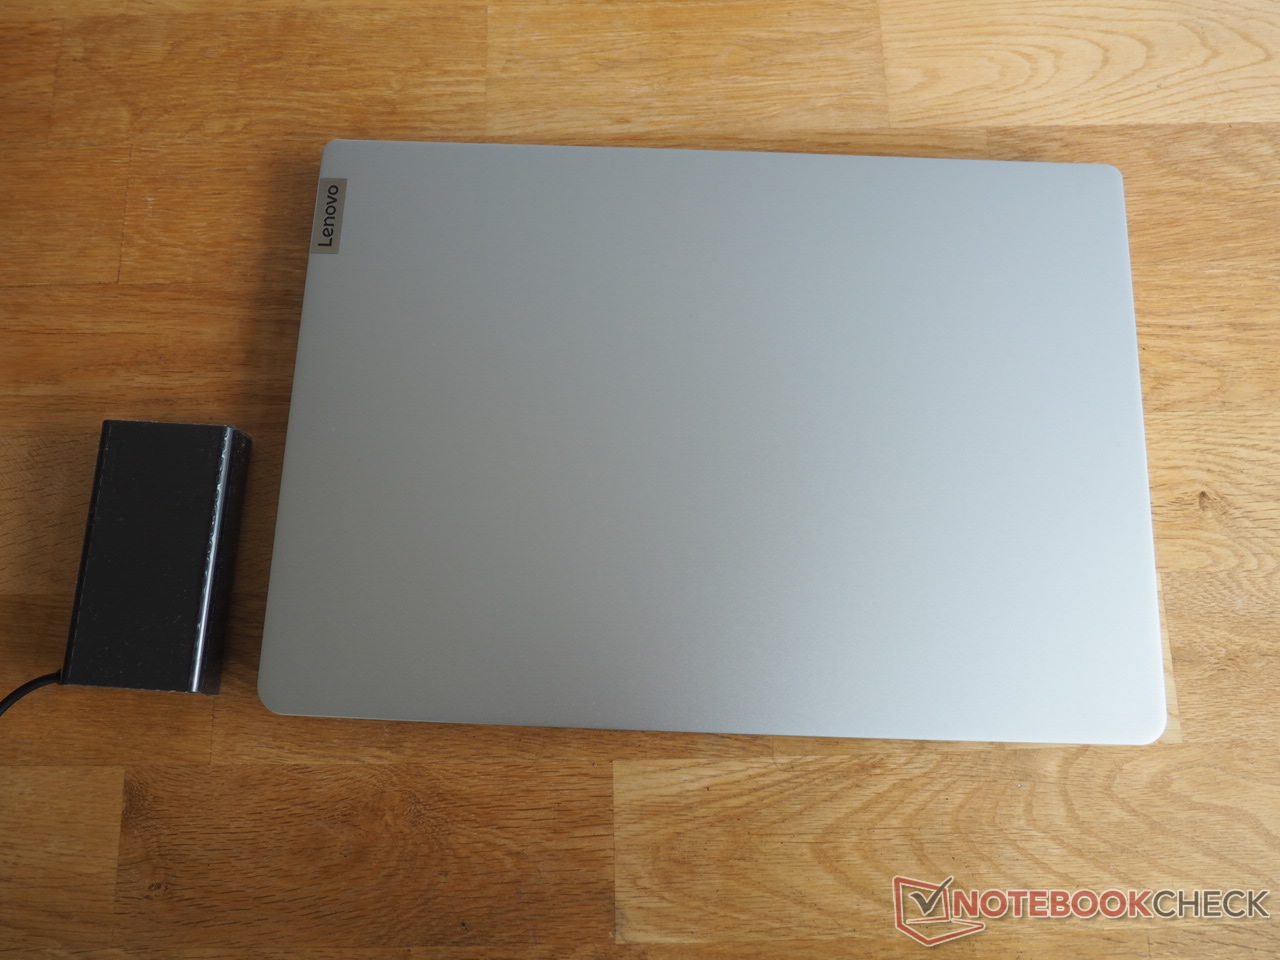
Pobór mocy również jest niepozorny. Jak na oferowaną wydajność, od 4 do 13 watów podczas pracy jałowej i od 43 do 88 watów pod obciążeniem jest w porządku. Dołączony do zestawu, przyjemnie kompaktowy i lekki 100-watowy zasilacz ma wystarczające rozmiary.
| wyłączony / stan wstrzymania | |
| luz | |
| obciążenie |
|
Legenda:
min: | |
| Lenovo IdeaPad 5 Pro 16ARH7 R5 6600HS, Radeon 660M | Huawei MateBook D 16 2022 i7-12700H, Iris Xe G7 96EUs | Acer Swift 3 SF316-51 i7-11370H, Iris Xe G7 96EUs | LG Gram 16 (2021) i7-1165G7, Iris Xe G7 96EUs | Lenovo Yoga 7 16IAP7 i7-1260P, Iris Xe G7 96EUs | Średnia w klasie Multimedia | |
|---|---|---|---|---|---|---|
| Power Consumption | -20% | 18% | 16% | -11% | -23% | |
| Idle Minimum * (Watt) | 4 | 6.1 -53% | 4.8 -20% | 3.8 5% | 6.6 -65% | 5.71 ? -43% |
| Idle Average * (Watt) | 7 | 10.6 -51% | 7.4 -6% | 9 -29% | 8.3 -19% | 10.1 ? -44% |
| Idle Maximum * (Watt) | 13 | 11.5 12% | 9 31% | 11.3 13% | 9.8 25% | 12.4 ? 5% |
| Load Average * (Watt) | 61 | 65.5 -7% | 34.9 43% | 35.2 42% | 66 -8% | 65 ? -7% |
| Witcher 3 ultra * (Watt) | 42.8 | 61.2 -43% | 34.9 18% | 52 -21% | ||
| Load Maximum * (Watt) | 88 | 68.4 22% | 51.4 42% | 43.5 51% | 67.1 24% | 112.2 ? -28% |
* ... im mniej tym lepiej
Power Consumption The Witcher 3 / Stress Test
Power Consumption With External Monitor
Czas pracy na baterii
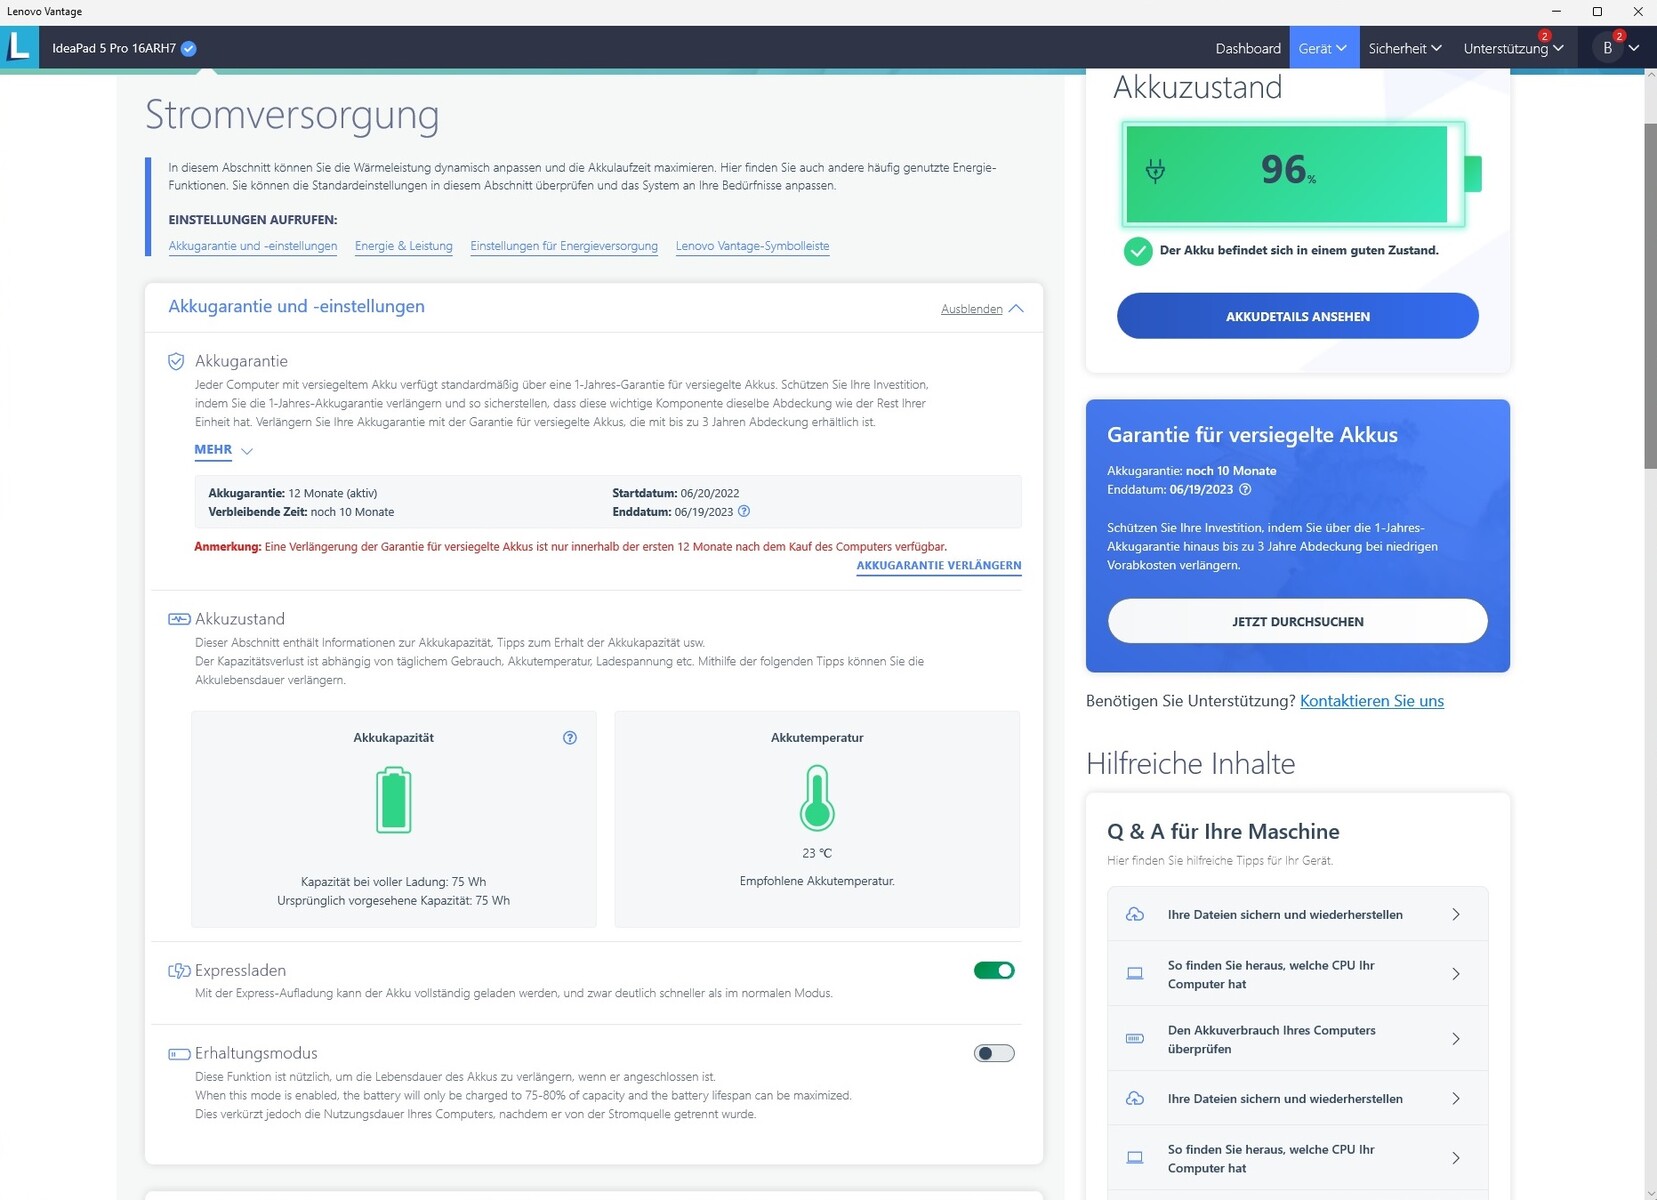
Poza jakością wyświetlacza kolejna mocna strona IdeaPada 5 Pro leży w czasach pracy na akumulatorze. W naszym standaryzowanym teście WLAN z jasnością zmniejszoną do 150 cd/m² akumulator o pojemności 75 Wh (konkurenci: od 56 do 80 Wh) wytrzymał prawie 10 godzin. Dłuższe podróże nie powinny więc stanowić dla tego laptopa żadnego problemu.
| Lenovo IdeaPad 5 Pro 16ARH7 R5 6600HS, Radeon 660M, 75 Wh | Huawei MateBook D 16 2022 i7-12700H, Iris Xe G7 96EUs, 60 Wh | Acer Swift 3 SF316-51 i7-11370H, Iris Xe G7 96EUs, 56 Wh | LG Gram 16 (2021) i7-1165G7, Iris Xe G7 96EUs, 80 Wh | Lenovo Yoga 7 16IAP7 i7-1260P, Iris Xe G7 96EUs, 71 Wh | Średnia w klasie Multimedia | |
|---|---|---|---|---|---|---|
| Czasy pracy | -28% | 0% | 60% | -19% | 22% | |
| WiFi v1.3 (h) | 9.8 | 7.1 -28% | 9.8 0% | 15.7 60% | 7.9 -19% | 12 ? 22% |
| Reader / Idle (h) | 20.1 | 28.6 | 12.2 | 25.2 ? | ||
| H.264 (h) | 10.3 | 20.1 | 16.4 ? | |||
| Witcher 3 ultra (h) | 2.2 | |||||
| Load (h) | 1.7 | 4.3 | 1.9 | 1.675 ? |
Za
Przeciw
Werdykt
IdeaPad 5 Pro 16ARH7 okazuje się udanym urządzeniem uniwersalnym, które poza zastosowaniami 3D zawsze uderza w dobrą lub bardzo dobrą sylwetkę.
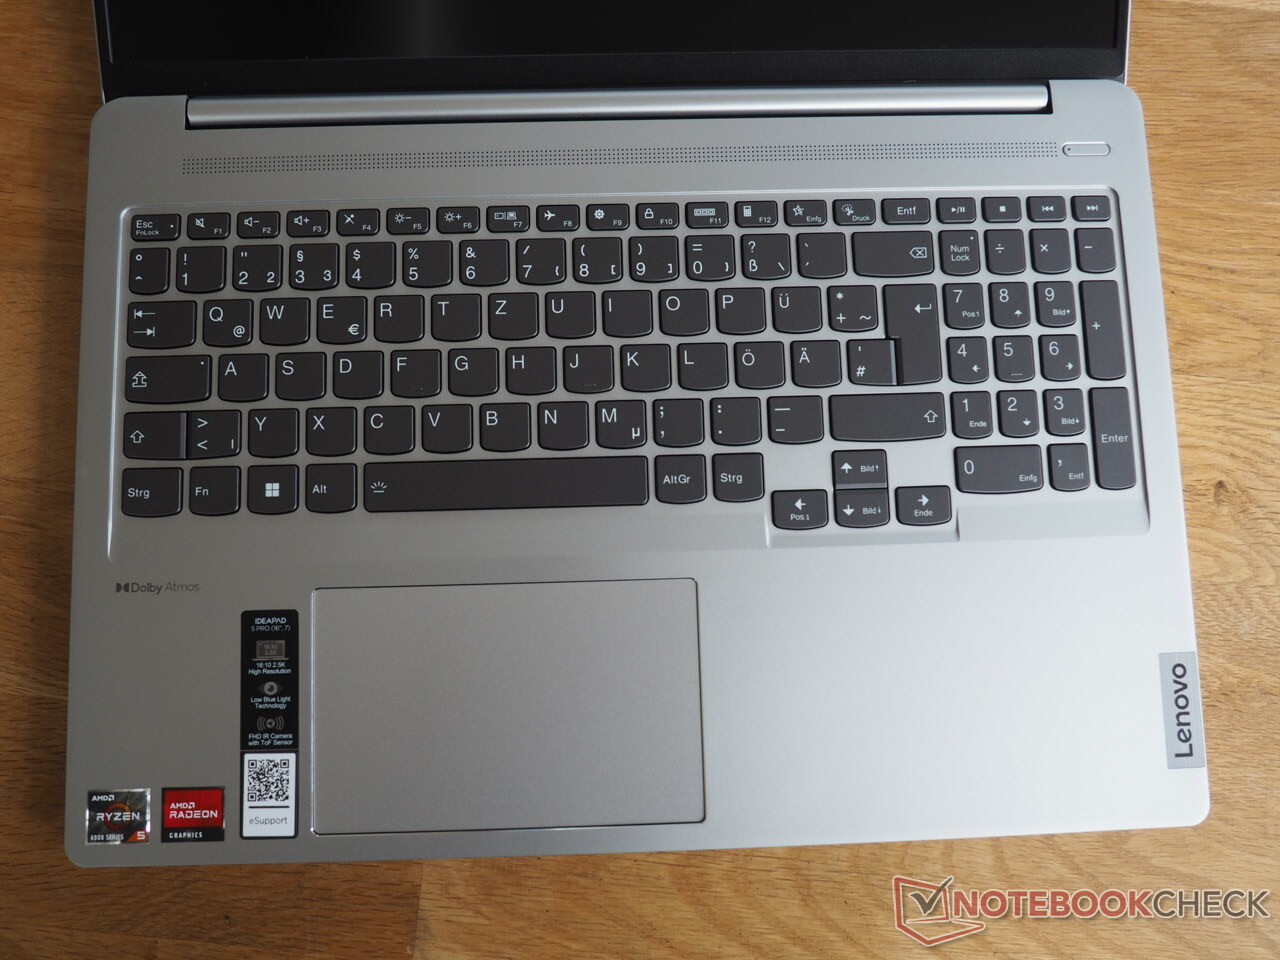
Zaczyna się to od eleganckiej metalowej obudowy, która nie jest szczególnie lekka, ale dość solidna, dając wrażenie wysokiej jakości. Również urządzenia wejściowe są lepsze niż u wielu konkurentów. Zarówno klawiatura jak i touchpad są atrakcyjne i wygodne. Ponadto wydajność dot Ryzen 5 6600HSjest w stanie bez problemu dotrzymać kroku konkurentom Intela.
Dodatkowe punkty dodatnie zdobywają pokaźne czasy pracy na akumulatorze oraz jasny ekran 16:10, który punktuje również wysoką dokładnością odwzorowania kolorów, krótką reakcją i ostrym wyświetlaniem obrazu (2560 x 1600 pikseli).
Krótko mówiąc, osoby poszukujące uniwersalnego i mobilnego 16-calowego laptopa z dobrym wyświetlaczem trafiają tutaj dokładnie pod właściwy adres.
Cena i dostępność
Lenovo IdeaPad 5 Pro 16ARH7 jest dostępny na przykład w Amazon w cenie 1 169 dolarów.
Lenovo IdeaPad 5 Pro 16ARH7
- 20/09/2022 v7 (old)
Florian Glaser
Price comparison

