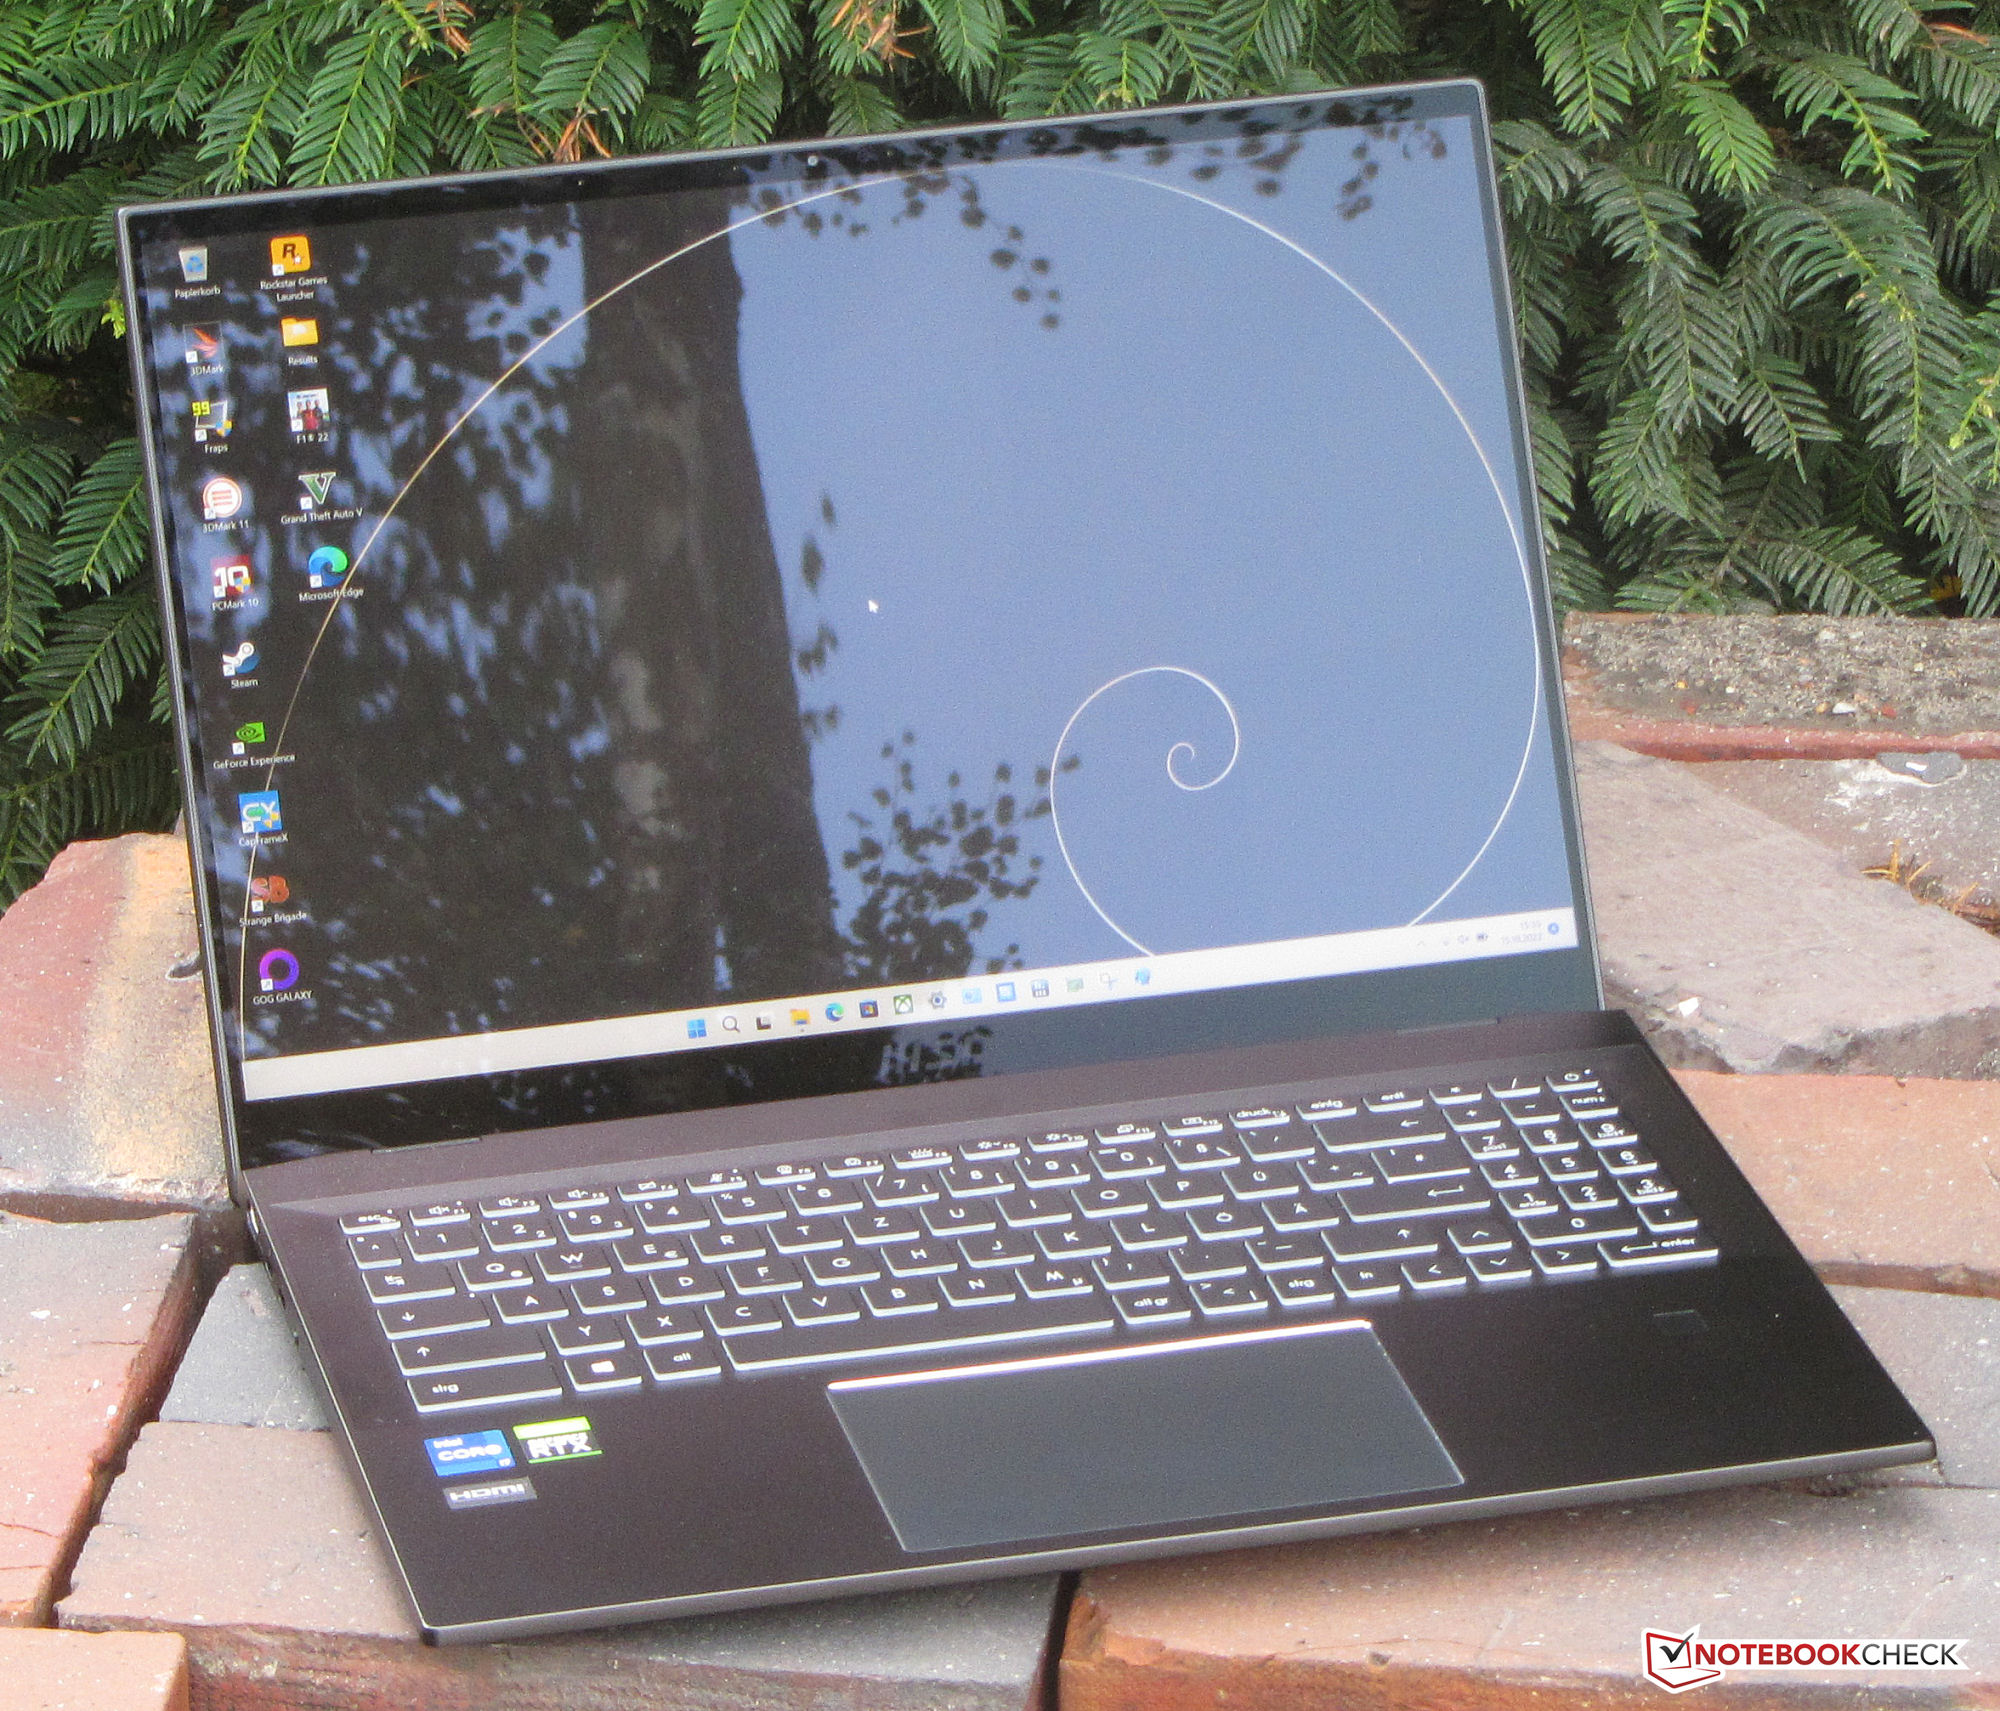
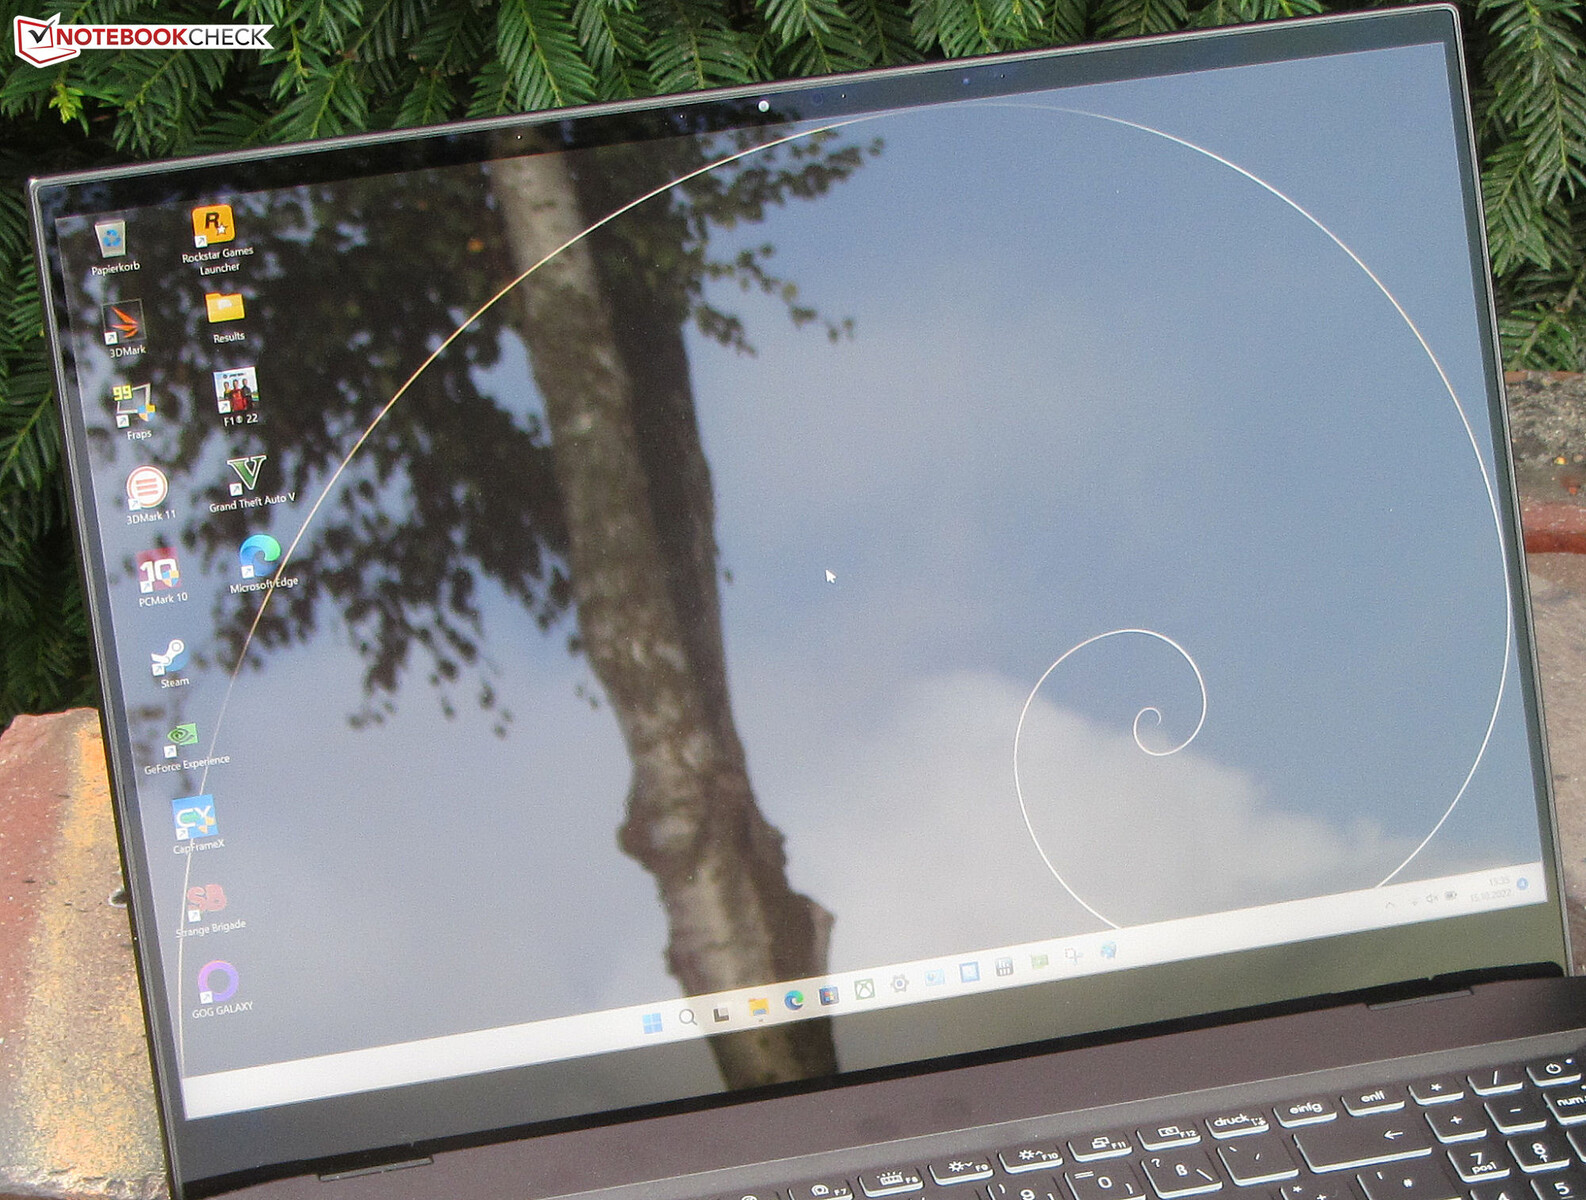
Recenzja MSI Summit E16 Flip: laptop 2 w 1 z piórkiem, wyświetlaczem 16:10 i RTX 3050 Ti
Wraz z modelem Summit E16 Flip firma MSI oferuje laptop 2w1, którego cechą wyróżniającą jest połączenie 16-calowego wyświetlacza dotykowego w formacie 16:10 oraz średniej klasy układu graficznego. W naszej bazie danych nie ma bezpośrednich konkurentów, gdyż odpowiadające im konwertory zazwyczaj nie oferują dedykowanych układów graficznych. Rozszerzony zestaw konkurentów obejmuje takie urządzenia jak np Asus ExpertBook B2 Flip B2502FBA, a także.Samsung Galaxy Book Pro 360 15 NP950QDB, oraz Dell Inspiron 16 7620 2-in-1.
Potencjalni konkurenci w porównaniu
Ocena | Data | Model | Waga | Wysokość | Rozmiar | Rezolucja | Cena |
|---|---|---|---|---|---|---|---|
| 84.2 % v7 (old) | 10/2022 | MSI Summit E16 Flip A12UDT-031 i7-1280P, GeForce RTX 3050 Ti Laptop GPU | 1.9 kg | 16.85 mm | 16.00" | 2560x1600 | |
| 83.3 % v7 (old) | 10/2022 | Asus ExpertBook B2 Flip B2502FBA-N80141X i7-1260P, Iris Xe G7 96EUs | 1.9 kg | 19.9 mm | 15.60" | 1920x1080 | |
| 85.7 % v7 (old) | Dell Inspiron 16 7620 2-in-1 i7-1260P, Iris Xe G7 96EUs | 2.1 kg | 18.41 mm | 16.00" | 1920x1200 | ||
| 86.6 % v7 (old) | Samsung Galaxy Book Pro 360 15 NP950QDB-KC3DE i5-1135G7, Iris Xe G7 80EUs | 1.4 kg | 11 mm | 15.60" | 1920x1080 |
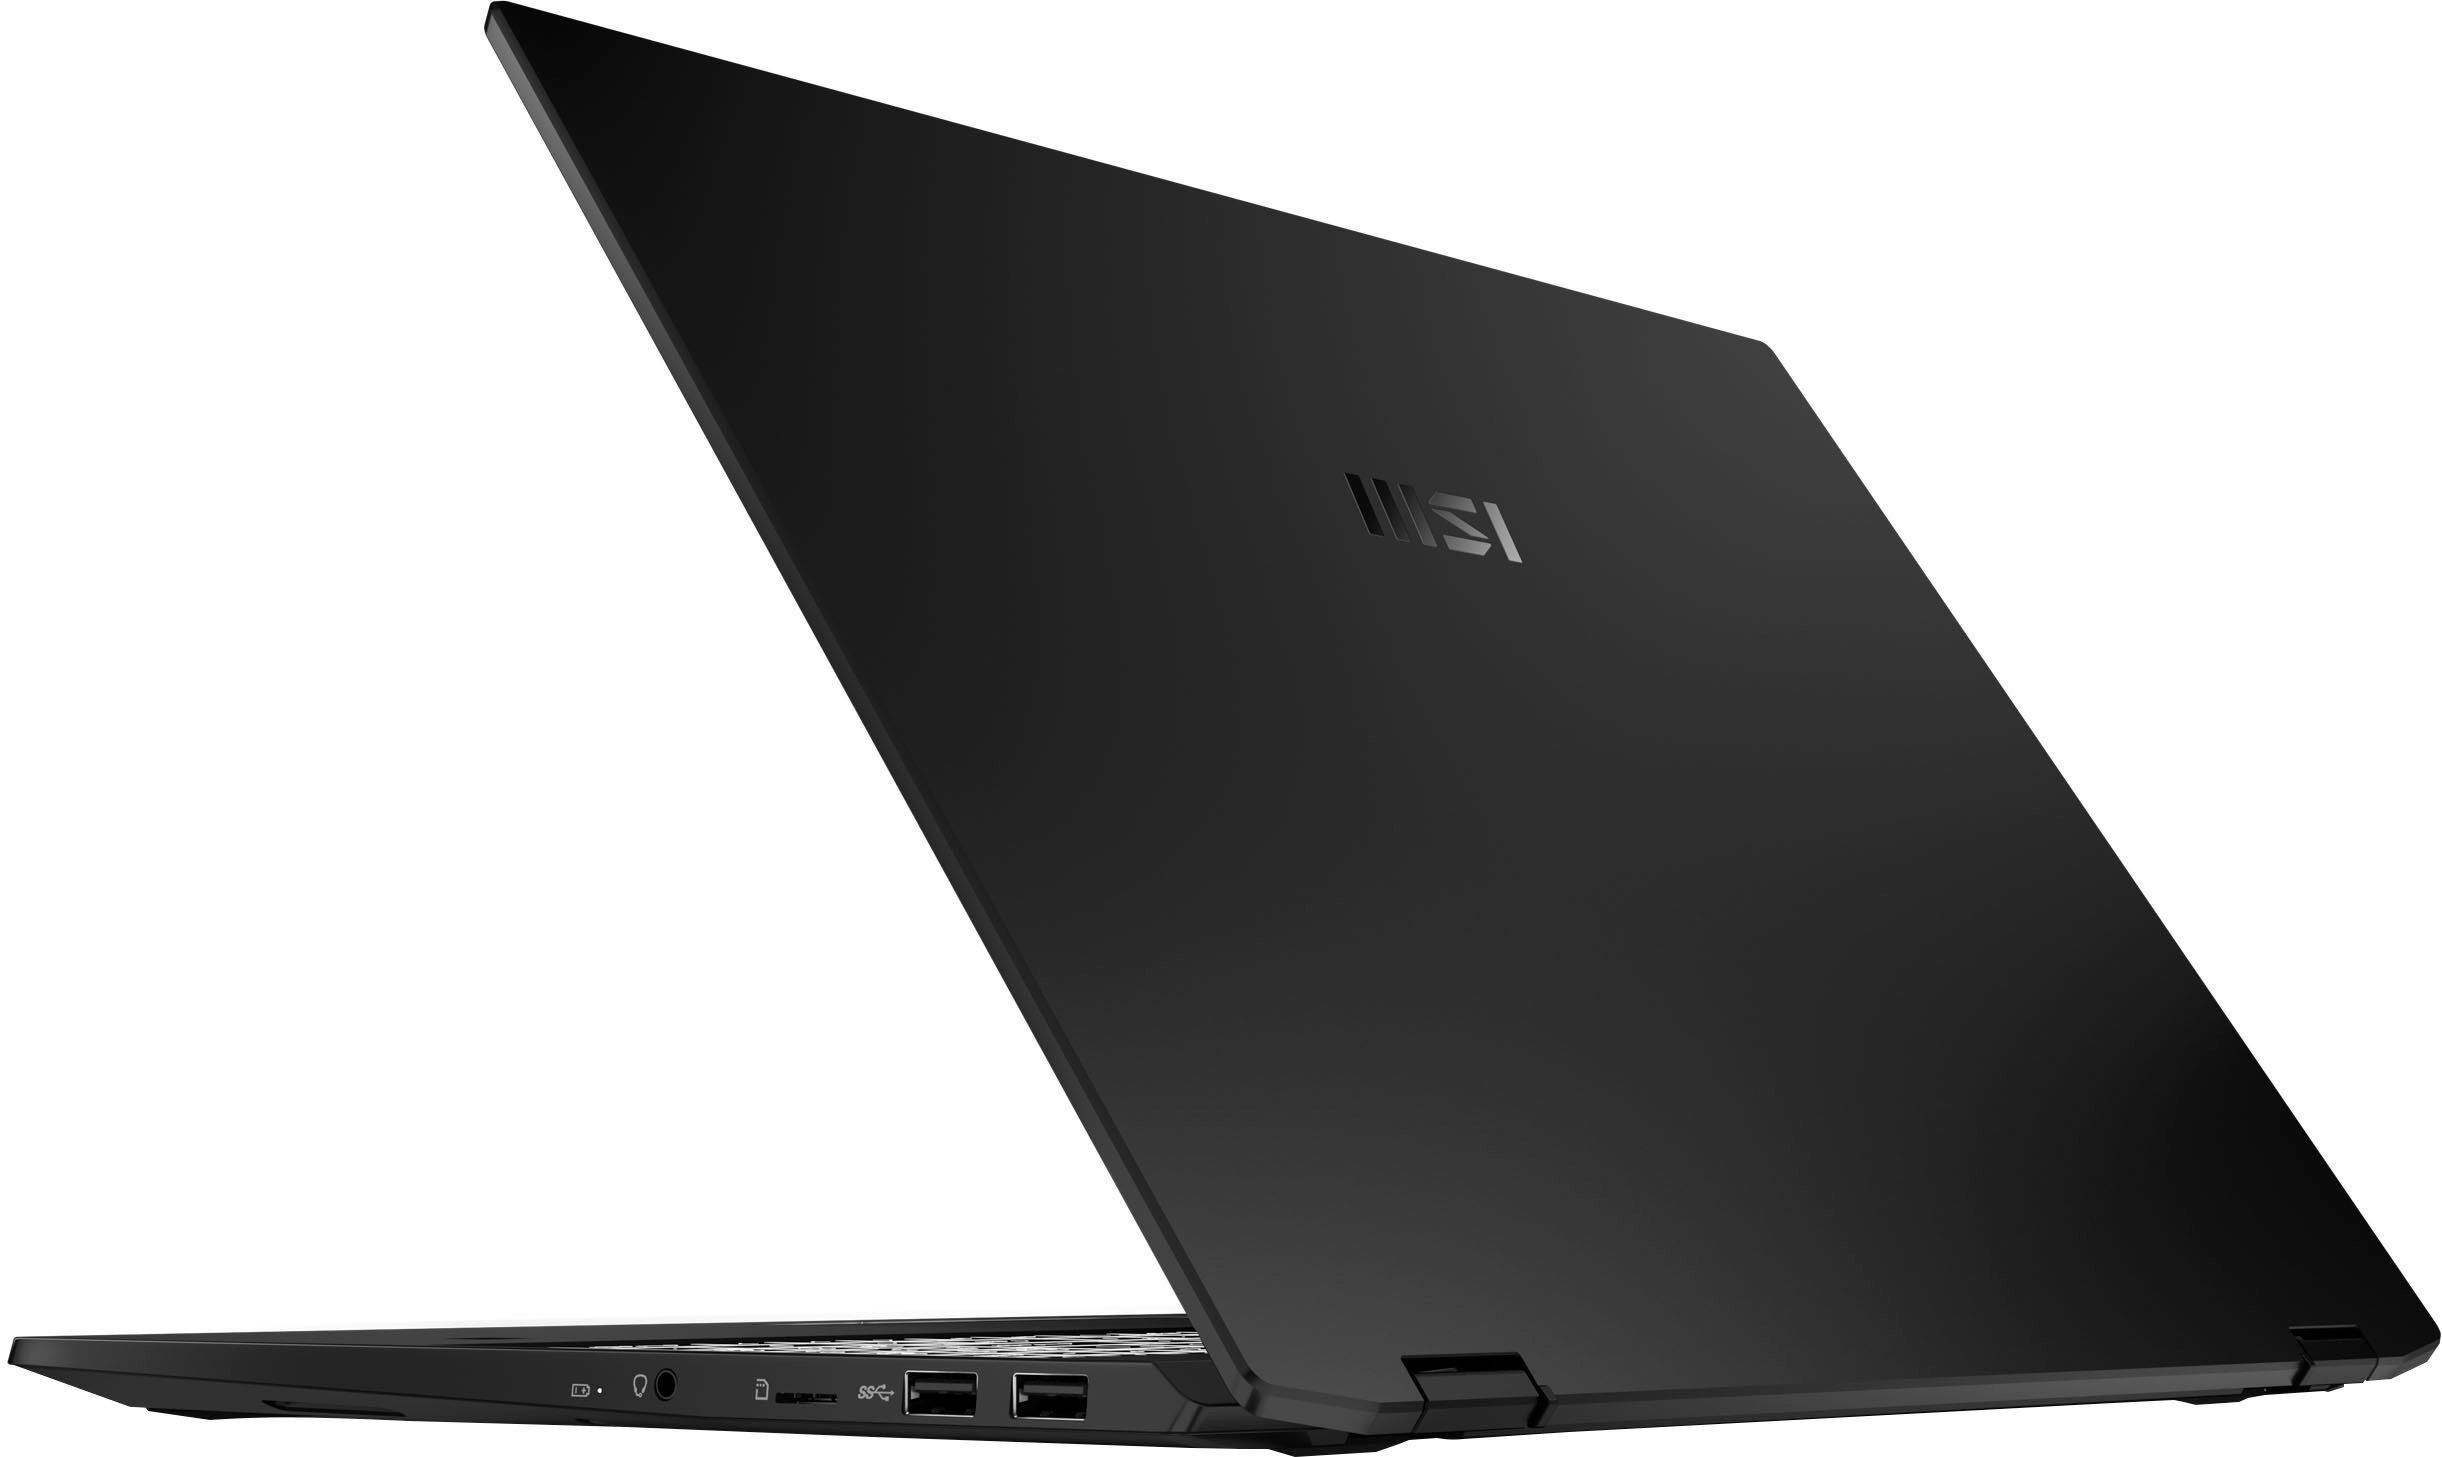
Obudowa i sprzęt - MSI Flip oferuje Thunderbolt 4
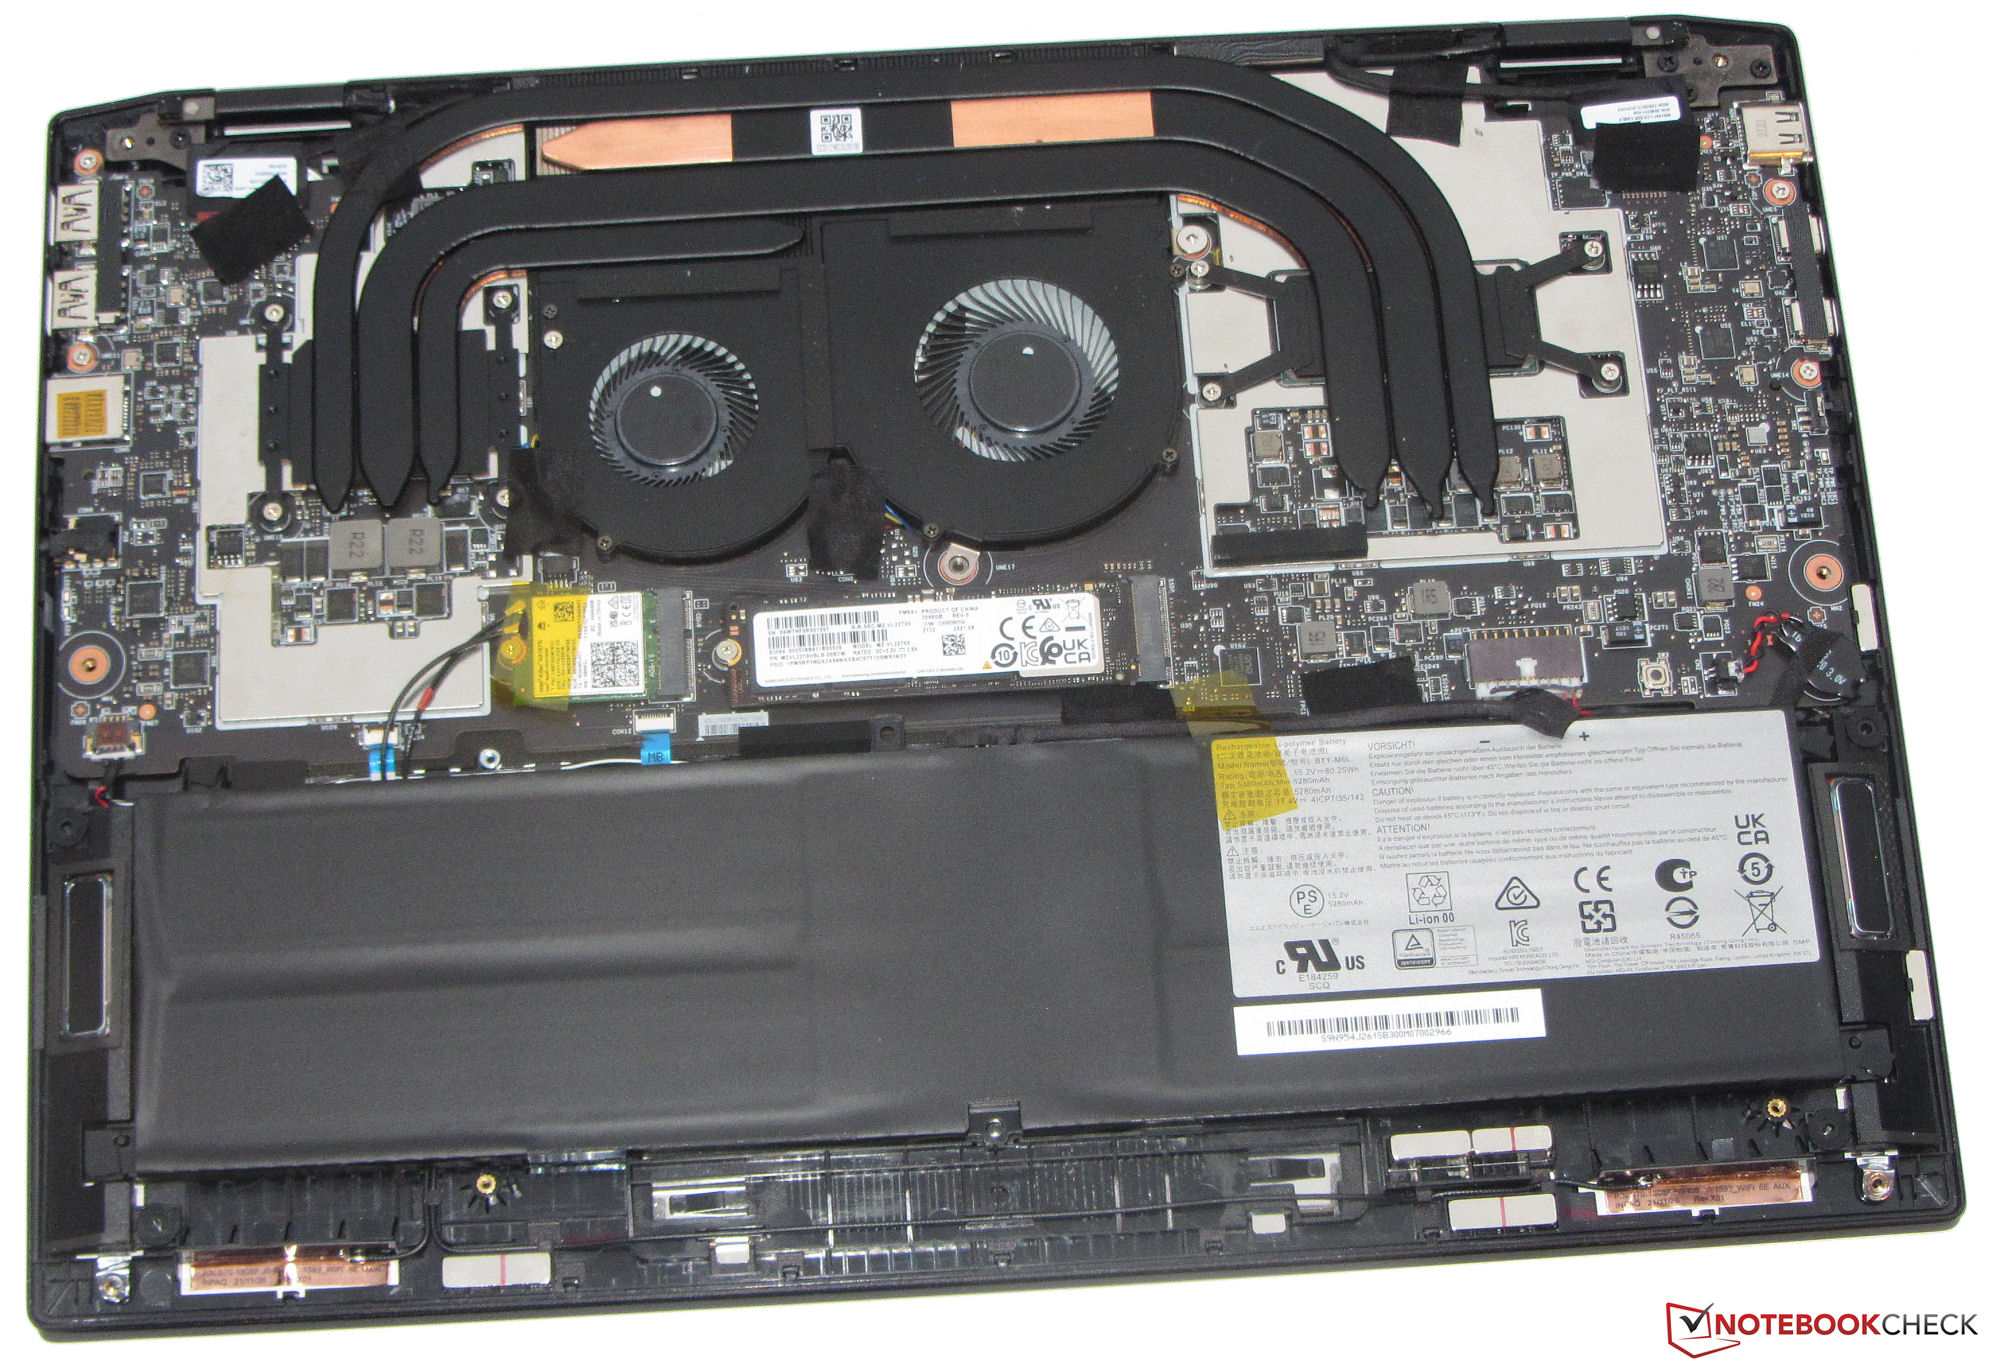
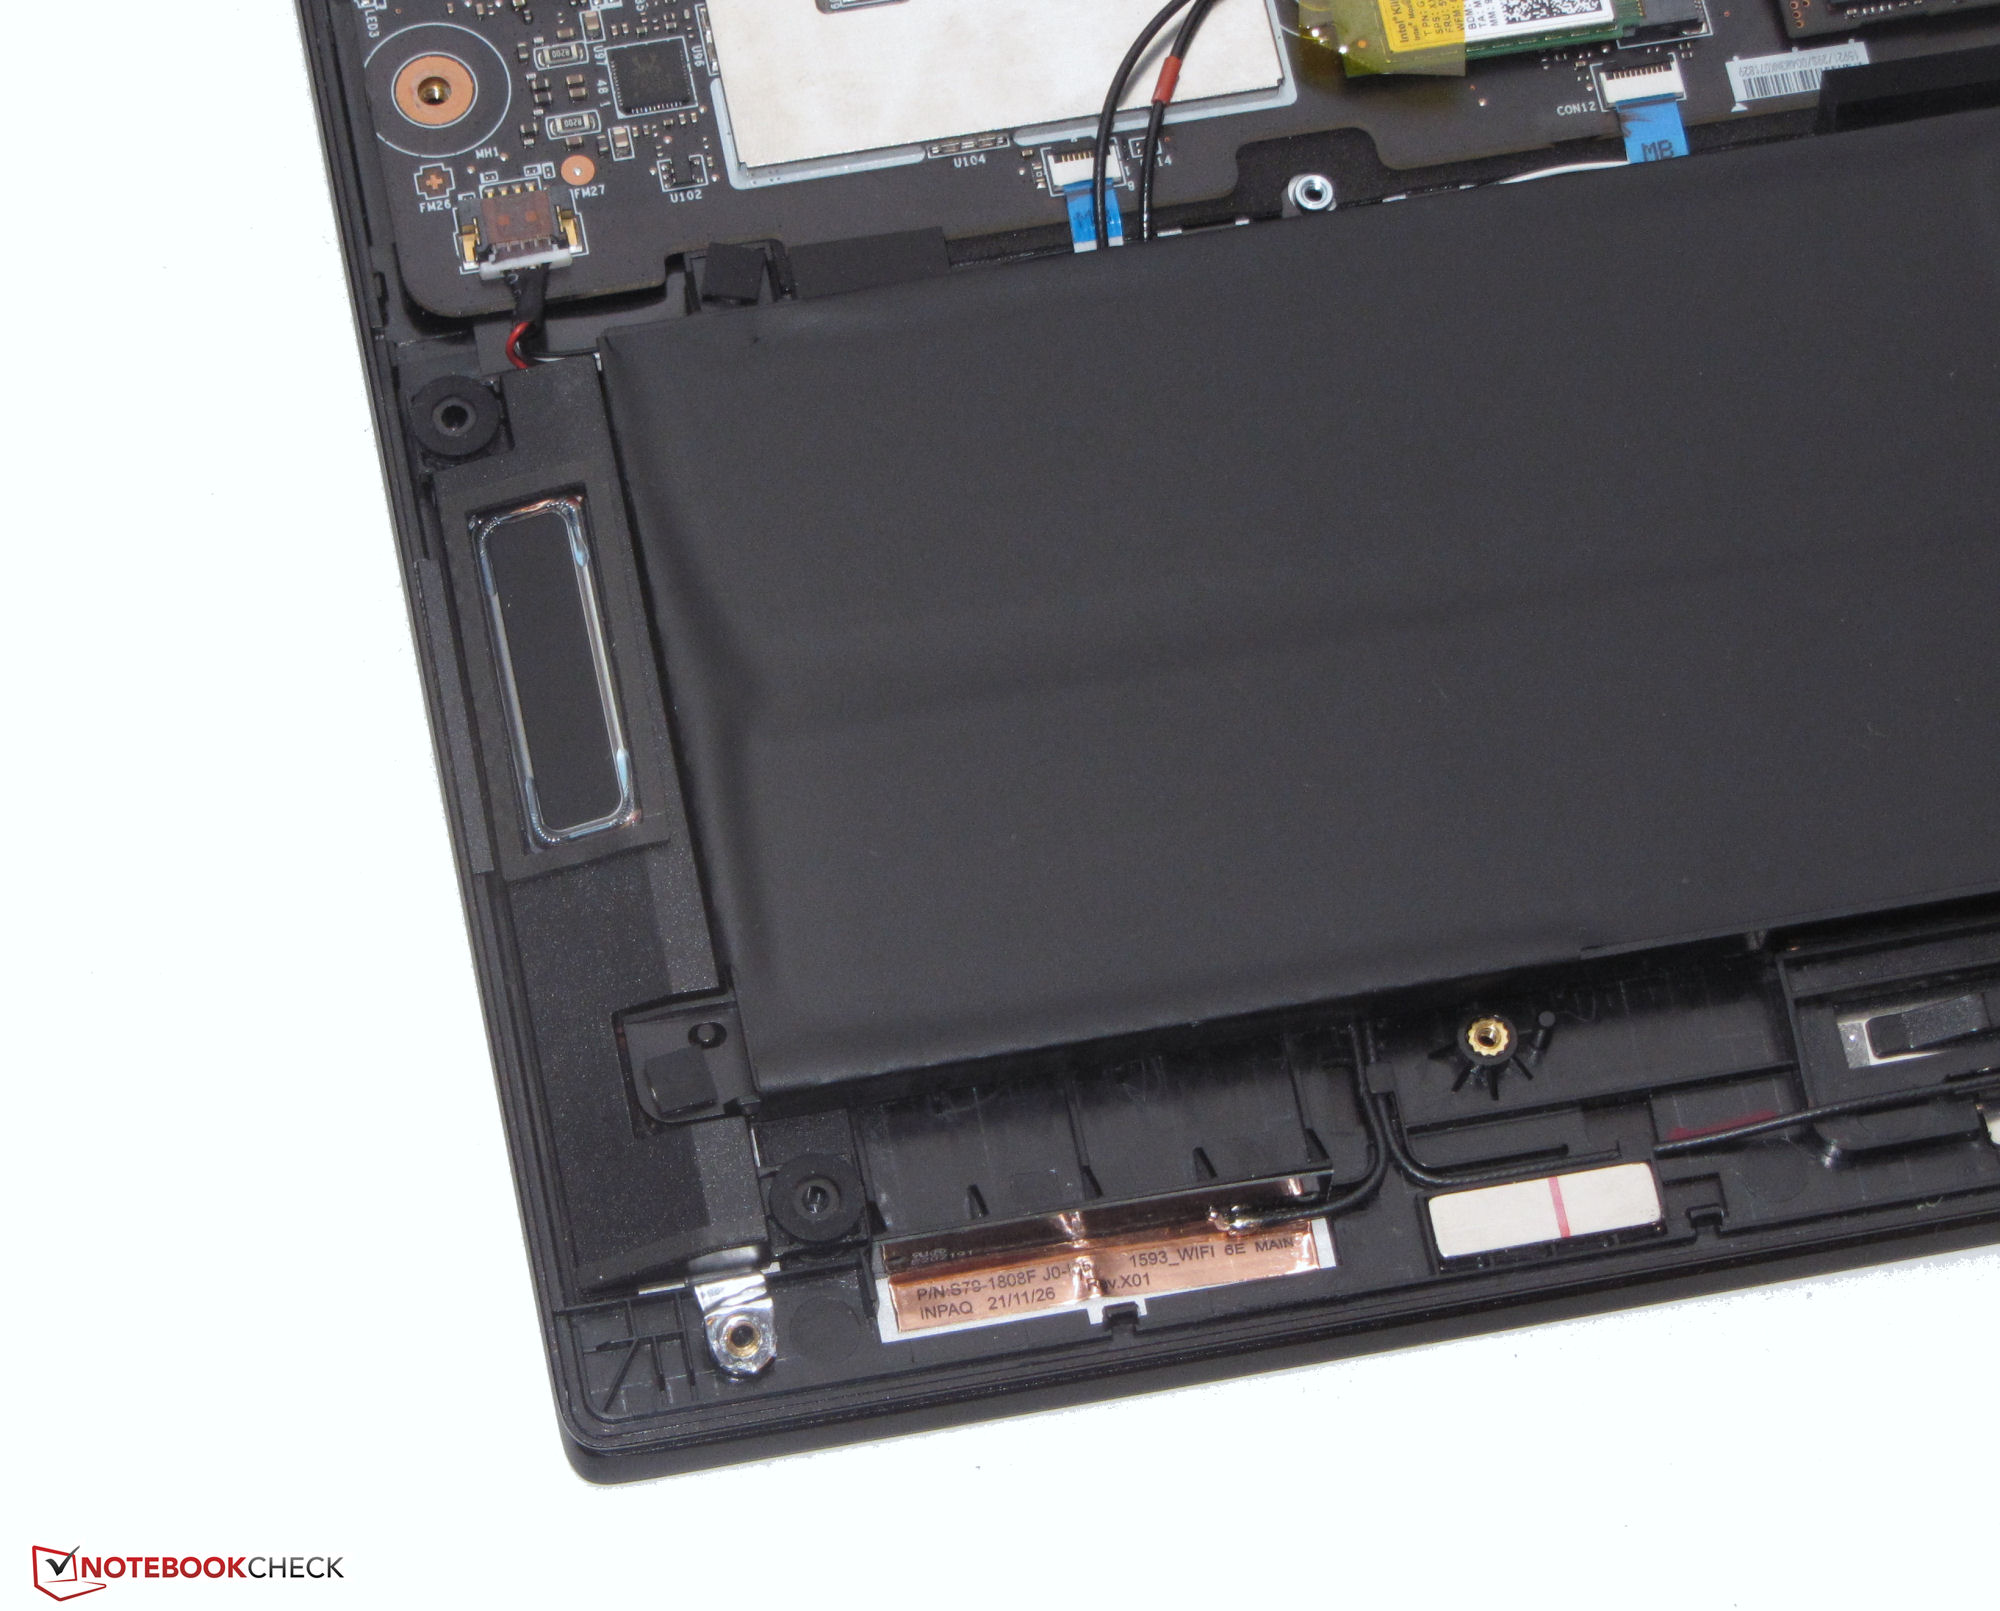
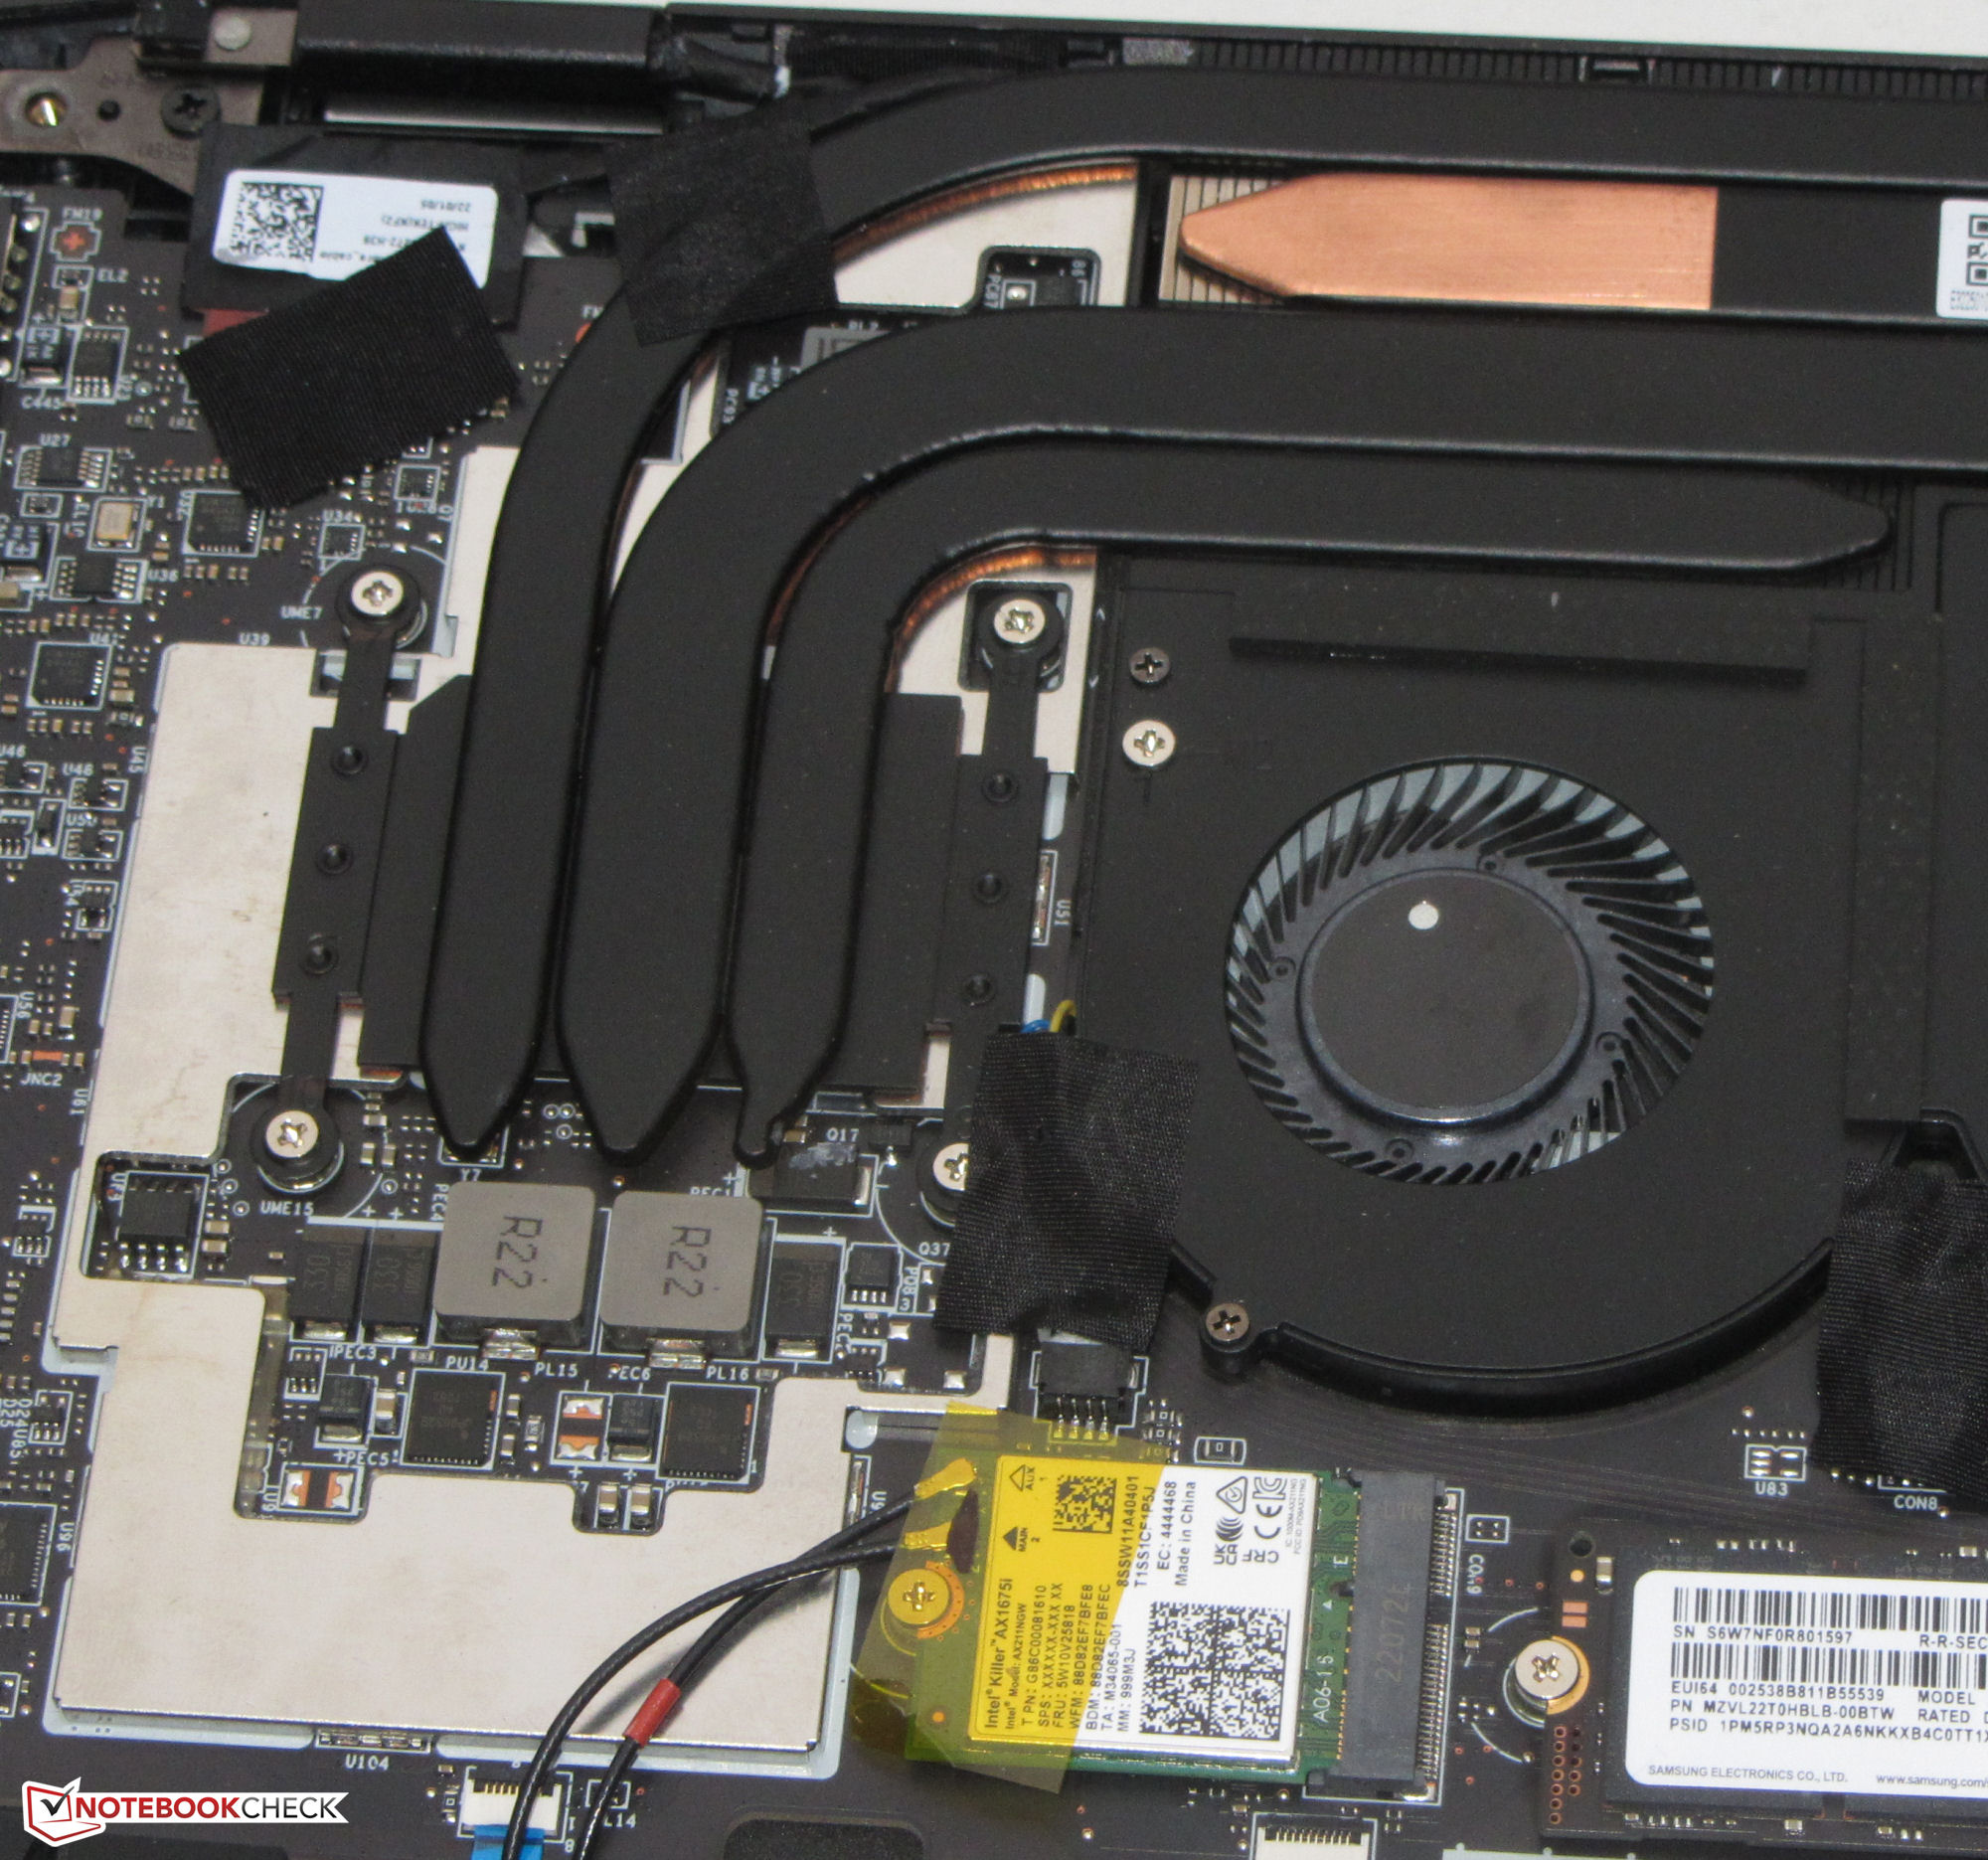
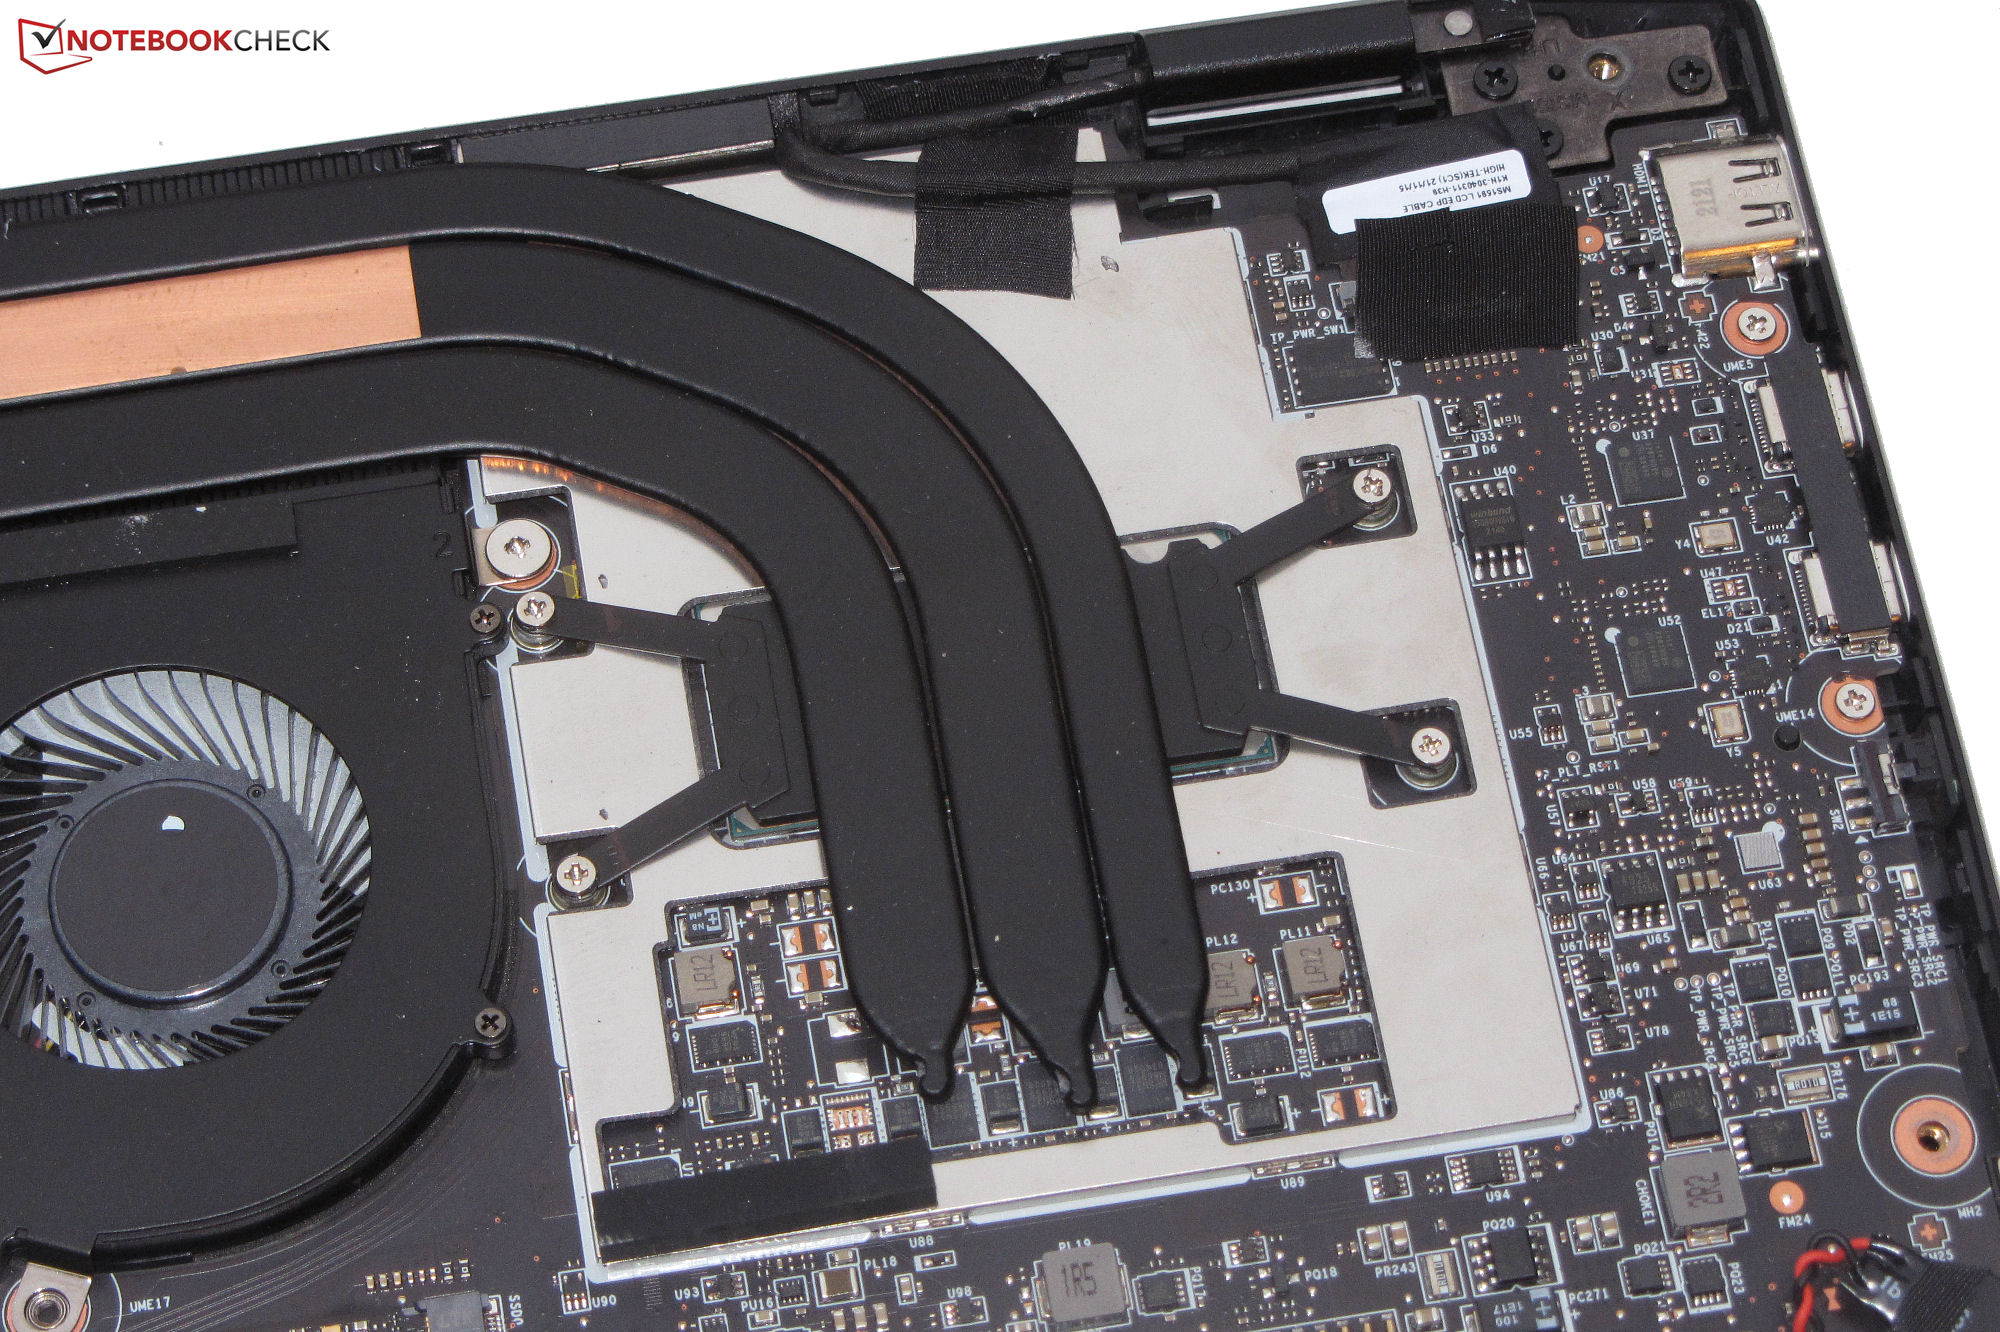
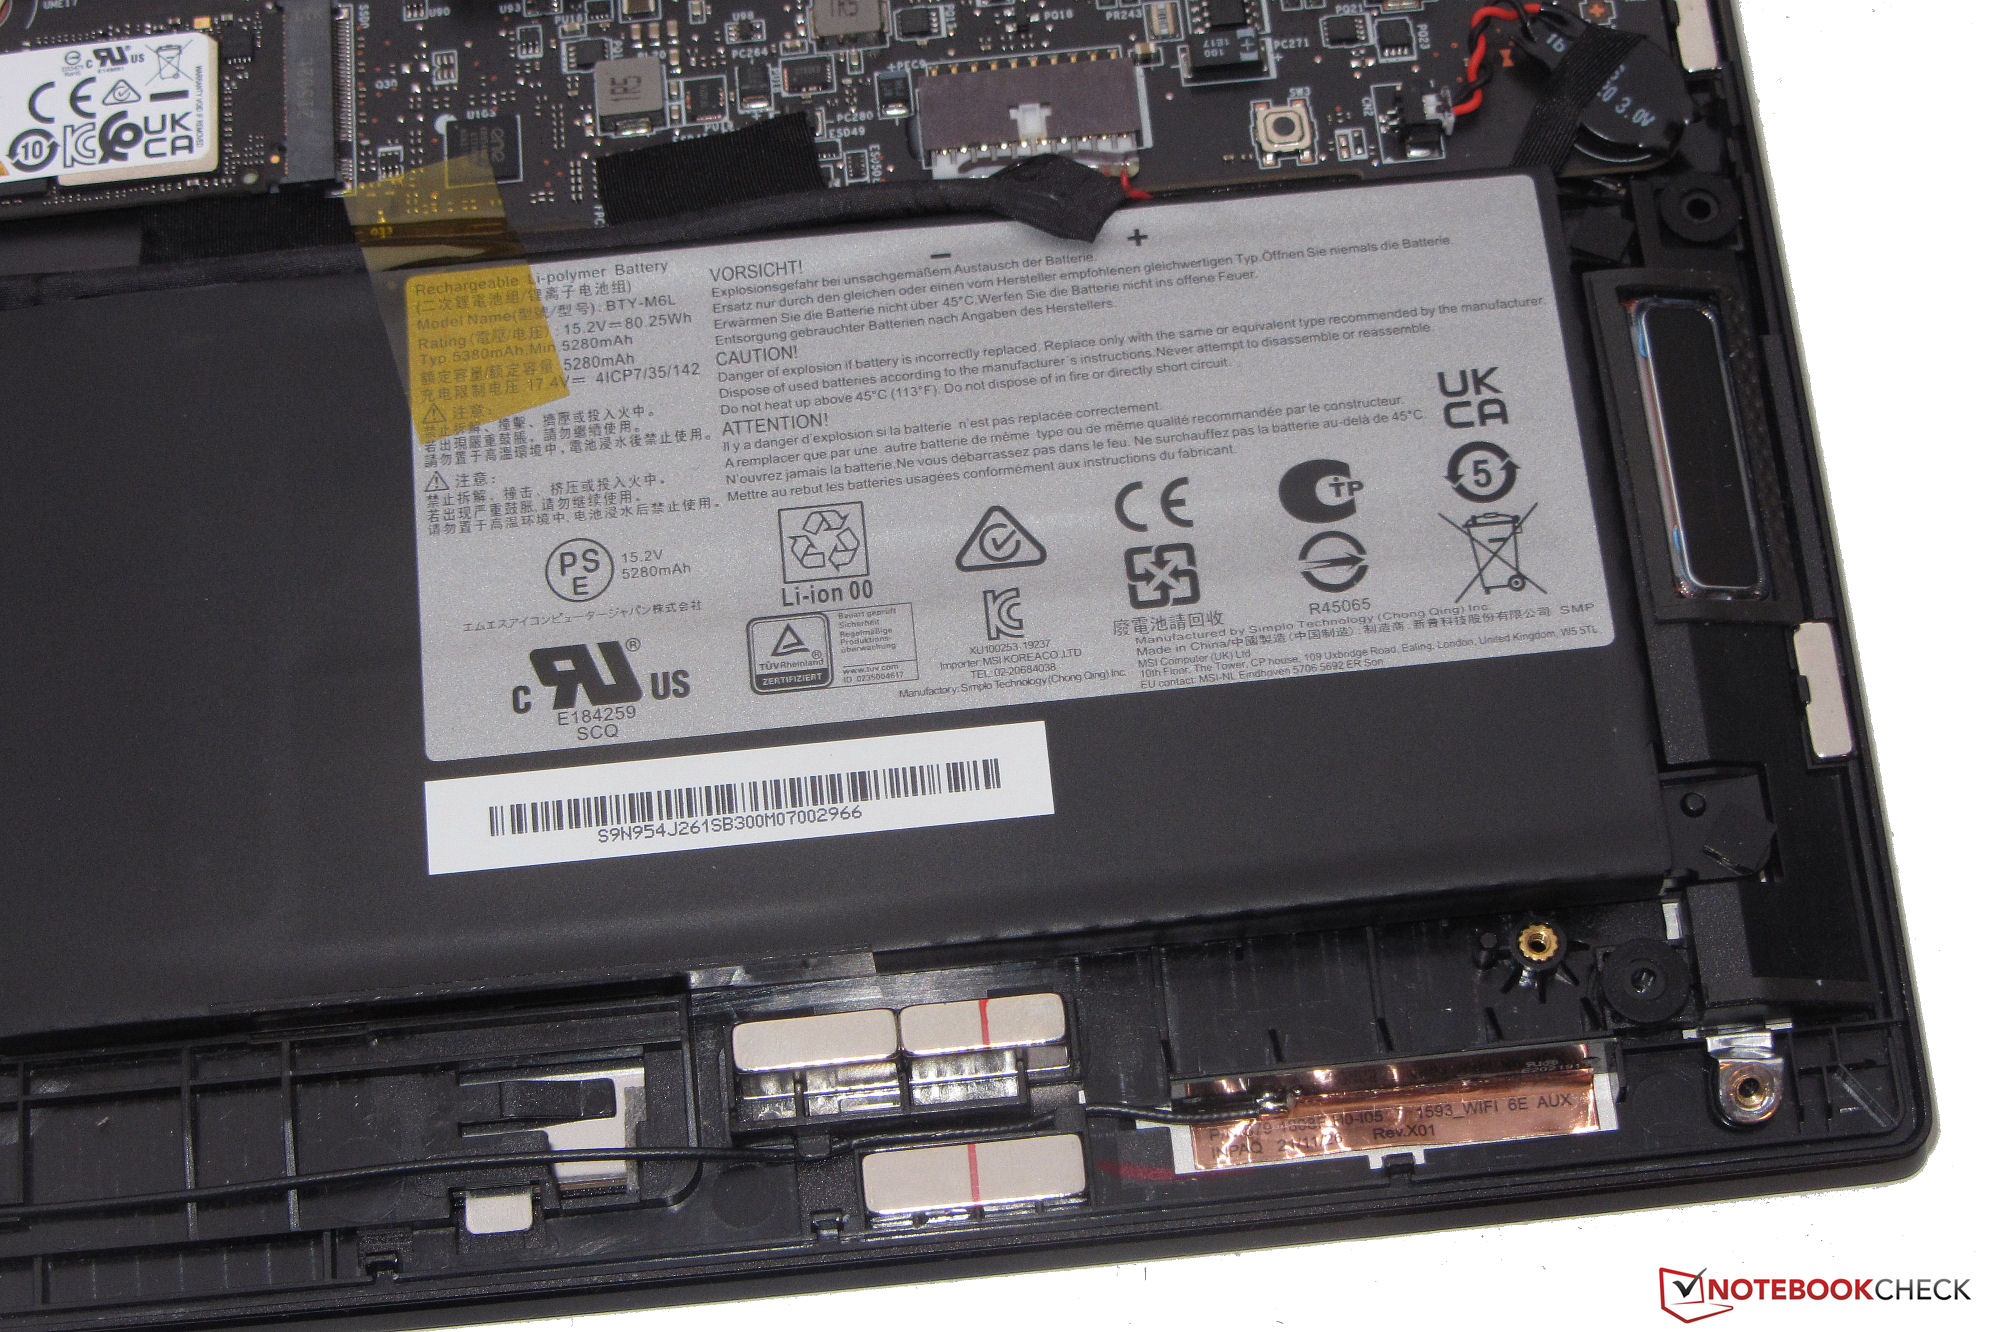
Smukła, czarna, metalowa obudowa E16 nie wykazuje żadnych wad w wykonaniu. Nie stwierdzamy nadmiernych szczelin czy wypukłości materiału. Co prawda wieko i jednostka zasadnicza mogą się lekko wypaczyć, ale pozostaje to w granicach rozsądku. Na gładkich, matowych powierzchniach obudowy widać nieco odciski palców. Akumulator, który jest przykręcony, a nie przyklejony, jak i reszta wnętrza są dostępne po łatwym zdjęciu spodu obudowy
E16 zawiera dwa złącza USB-A (USB 3.2 Gen 2) i dwa złącza USB-C (Thunderbolt 4; Power Delivery, Displayport). 16-calowy laptop oferuje w sumie trzy wyjścia wideo (2x DP, 1x HDMI). Czytnik kart pamięci microSD należy do szybszych przedstawicieli tego typu (przy użyciu naszej referencyjnej karty pamięci AV PRO SD 128 GB V60). Wbudowana kamerka internetowa (2,1 MP, IR, maks. 1920 x 1080 pikseli) nie posiada mechanicznej osłony. Zamiast tego na lewej stronie obudowy znajduje się przycisk włączania/wyłączania
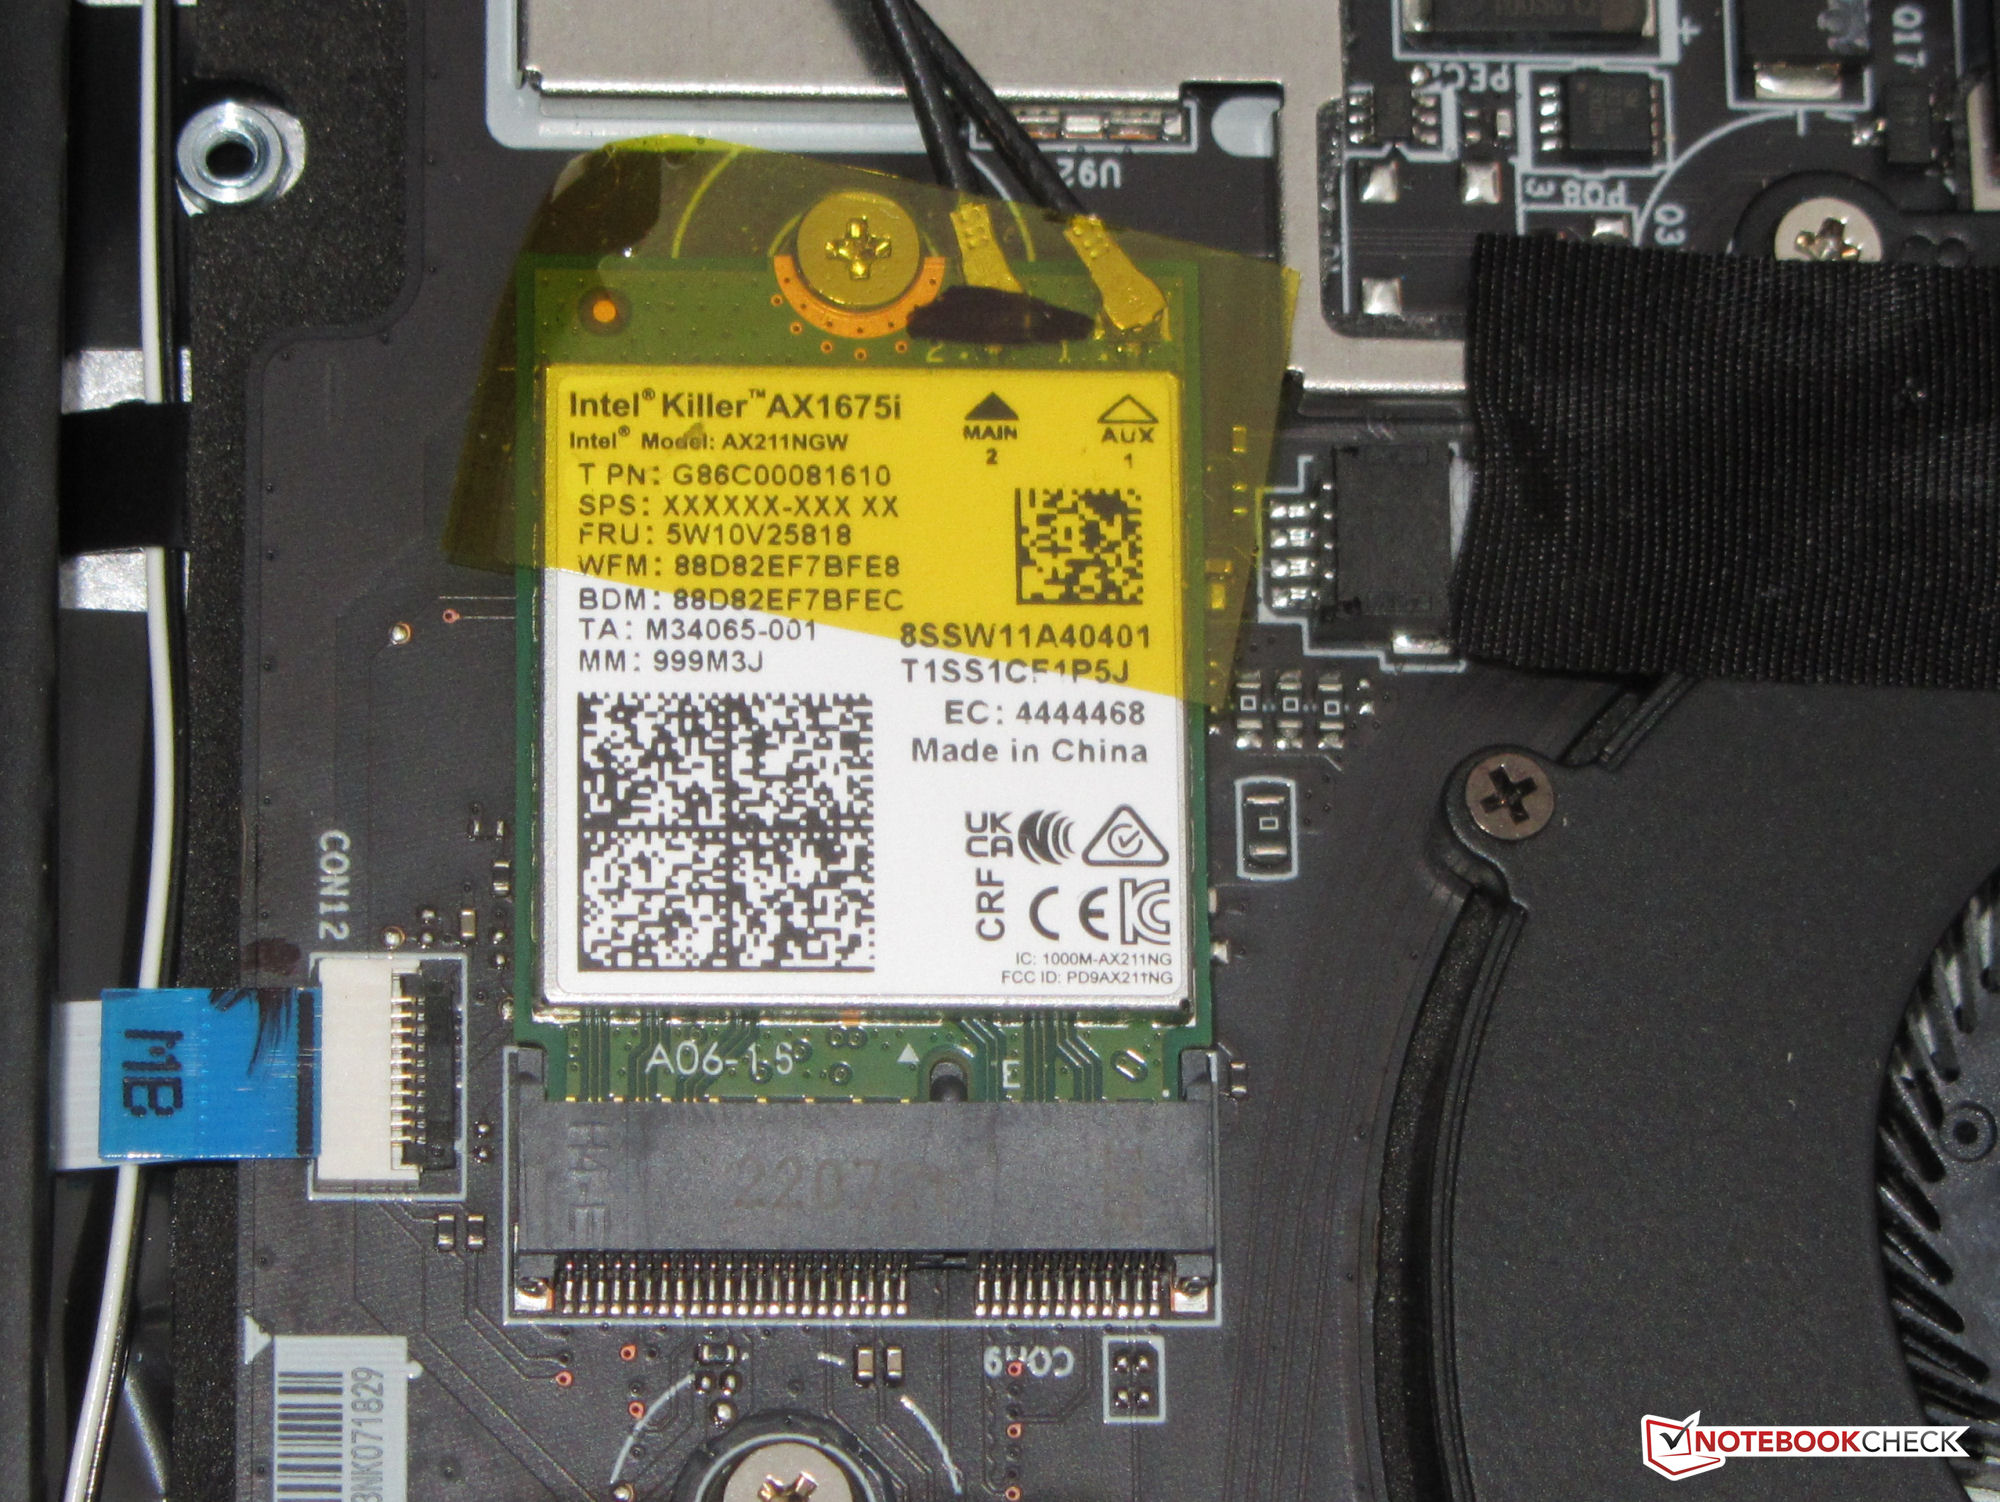
Prędkości transferu WLAN, które określamy w optymalnych warunkach (bez dodatkowych urządzeń WLAN w pobliżu oraz z laptopem i komputerem serwerowym w bliskiej odległości), okazują się znakomite i odpowiadają możliwościom układu WiFi (Killer Wi-Fi 6E AX1675i; 802.11 ax).


| SD Card Reader | |
| average JPG Copy Test (av. of 3 runs) | |
| MSI Summit E16 Flip A12UDT-031 (AV Pro SD microSD 128 GB V60) | |
| Średnia w klasie Convertible (28.1 - 197, n=23, ostatnie 2 lata) | |
| Samsung Galaxy Book Pro 360 15 NP950QDB-KC3DE (AV Pro SD microSD 128 GB V60) | |
| Dell Inspiron 16 7620 2-in-1 (Toshiba Exceria Pro SDXC 64 GB UHS-II) | |
| maximum AS SSD Seq Read Test (1GB) | |
| MSI Summit E16 Flip A12UDT-031 (AV Pro SD microSD 128 GB V60) | |
| Średnia w klasie Convertible (28.9 - 254, n=22, ostatnie 2 lata) | |
| Dell Inspiron 16 7620 2-in-1 (Toshiba Exceria Pro SDXC 64 GB UHS-II) | |
| Samsung Galaxy Book Pro 360 15 NP950QDB-KC3DE (AV Pro SD microSD 128 GB V60) | |
| Networking | |
| iperf3 transmit AX12 | |
| Przeciętny Killer Wi-Fi 6E AX1675i 160MHz Wireless Network Adapter (986 - 1257, n=2) | |
| Samsung Galaxy Book Pro 360 15 NP950QDB-KC3DE | |
| iperf3 receive AX12 | |
| Samsung Galaxy Book Pro 360 15 NP950QDB-KC3DE | |
| Przeciętny Killer Wi-Fi 6E AX1675i 160MHz Wireless Network Adapter (1137 - 1270, n=2) | |
| iperf3 receive AXE11000 | |
| MSI Summit E16 Flip A12UDT-031 | |
| Przeciętny Killer Wi-Fi 6E AX1675i 160MHz Wireless Network Adapter (872 - 1714, n=29) | |
| Średnia w klasie Convertible (492 - 1755, n=47, ostatnie 2 lata) | |
| iperf3 transmit AXE11000 | |
| MSI Summit E16 Flip A12UDT-031 | |
| Przeciętny Killer Wi-Fi 6E AX1675i 160MHz Wireless Network Adapter (797 - 1622, n=27) | |
| Średnia w klasie Convertible (131.3 - 1845, n=46, ostatnie 2 lata) | |


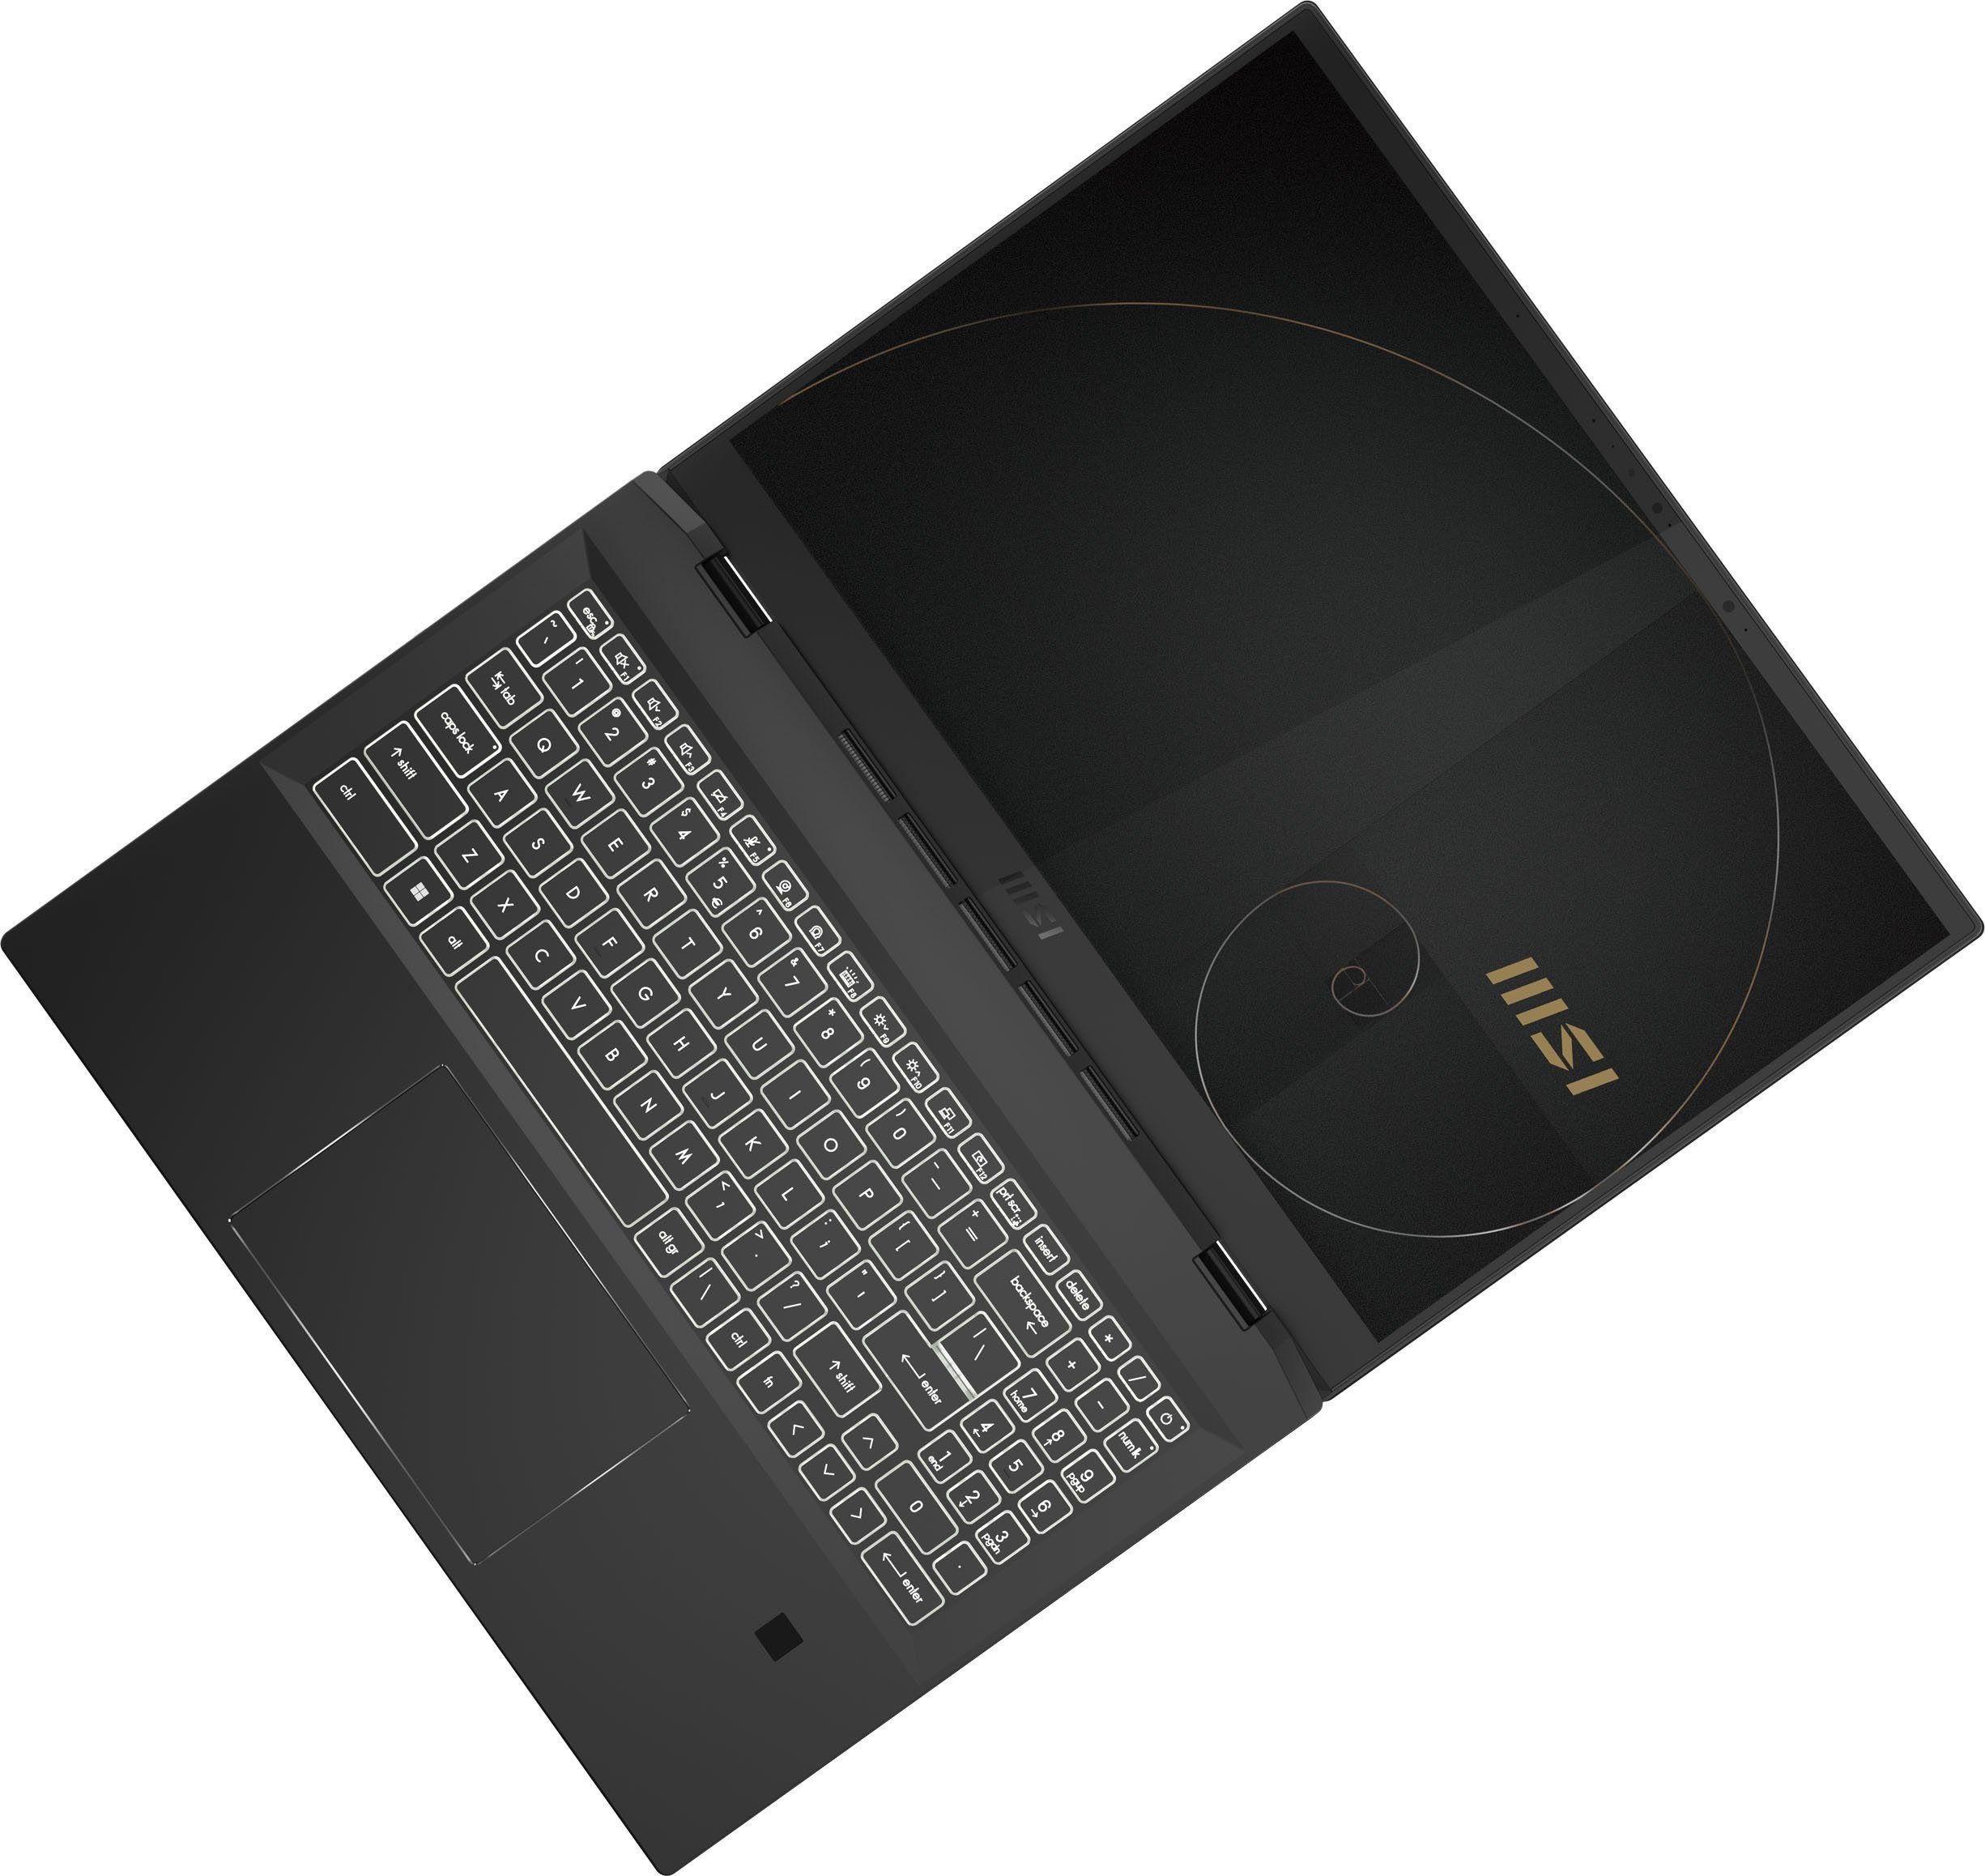
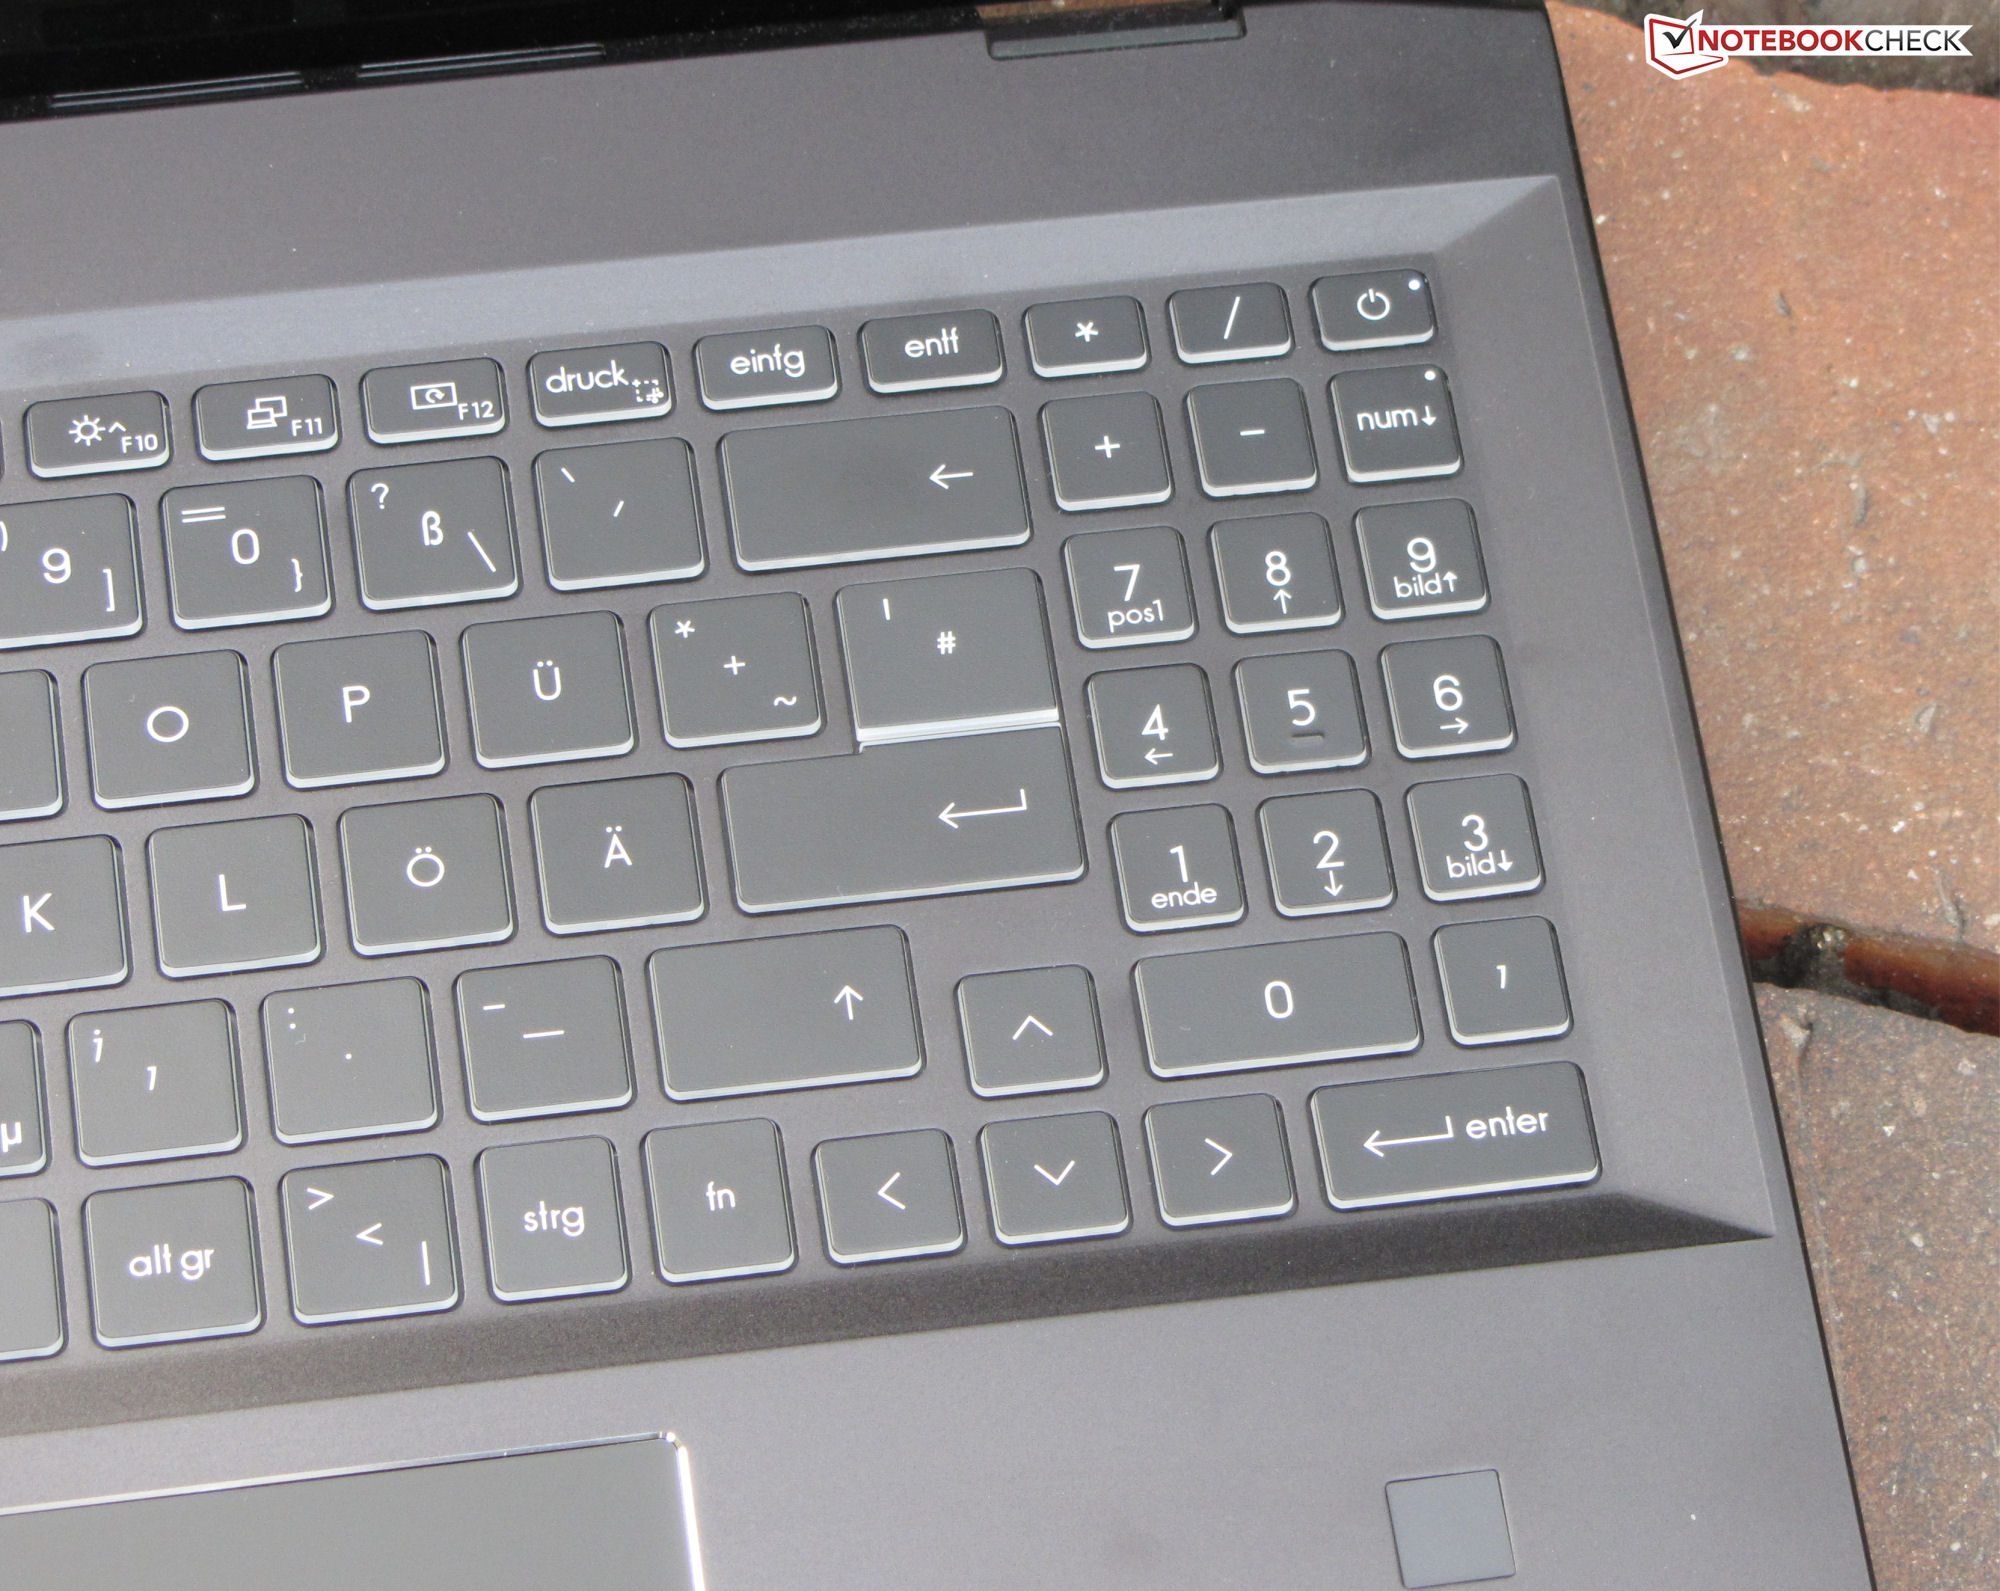
Urządzenia wejściowe - Urządzenie Summit 16 zawiera pióro wejściowe
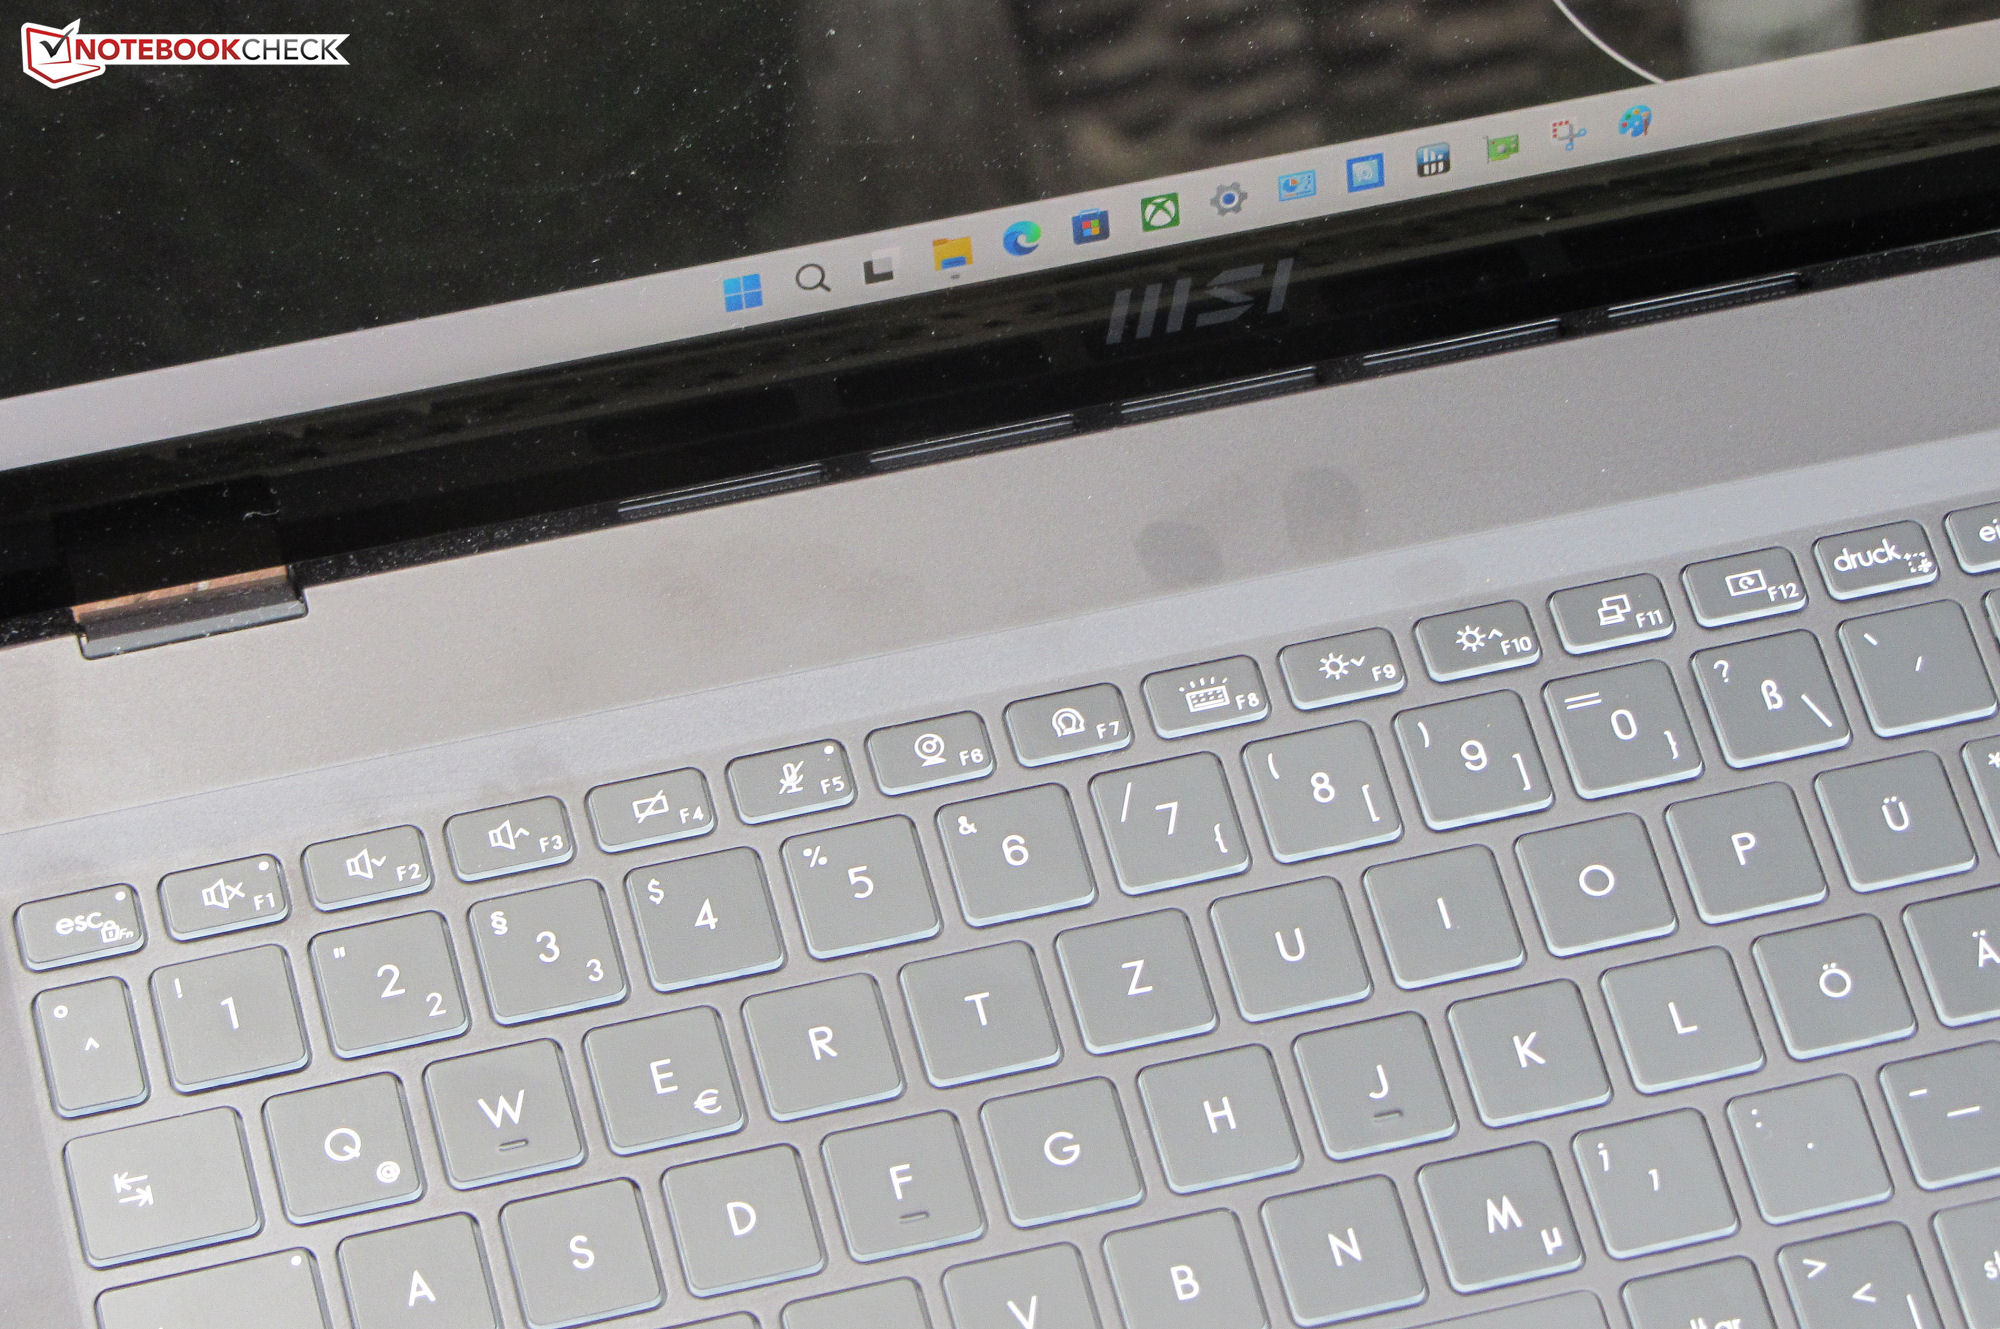
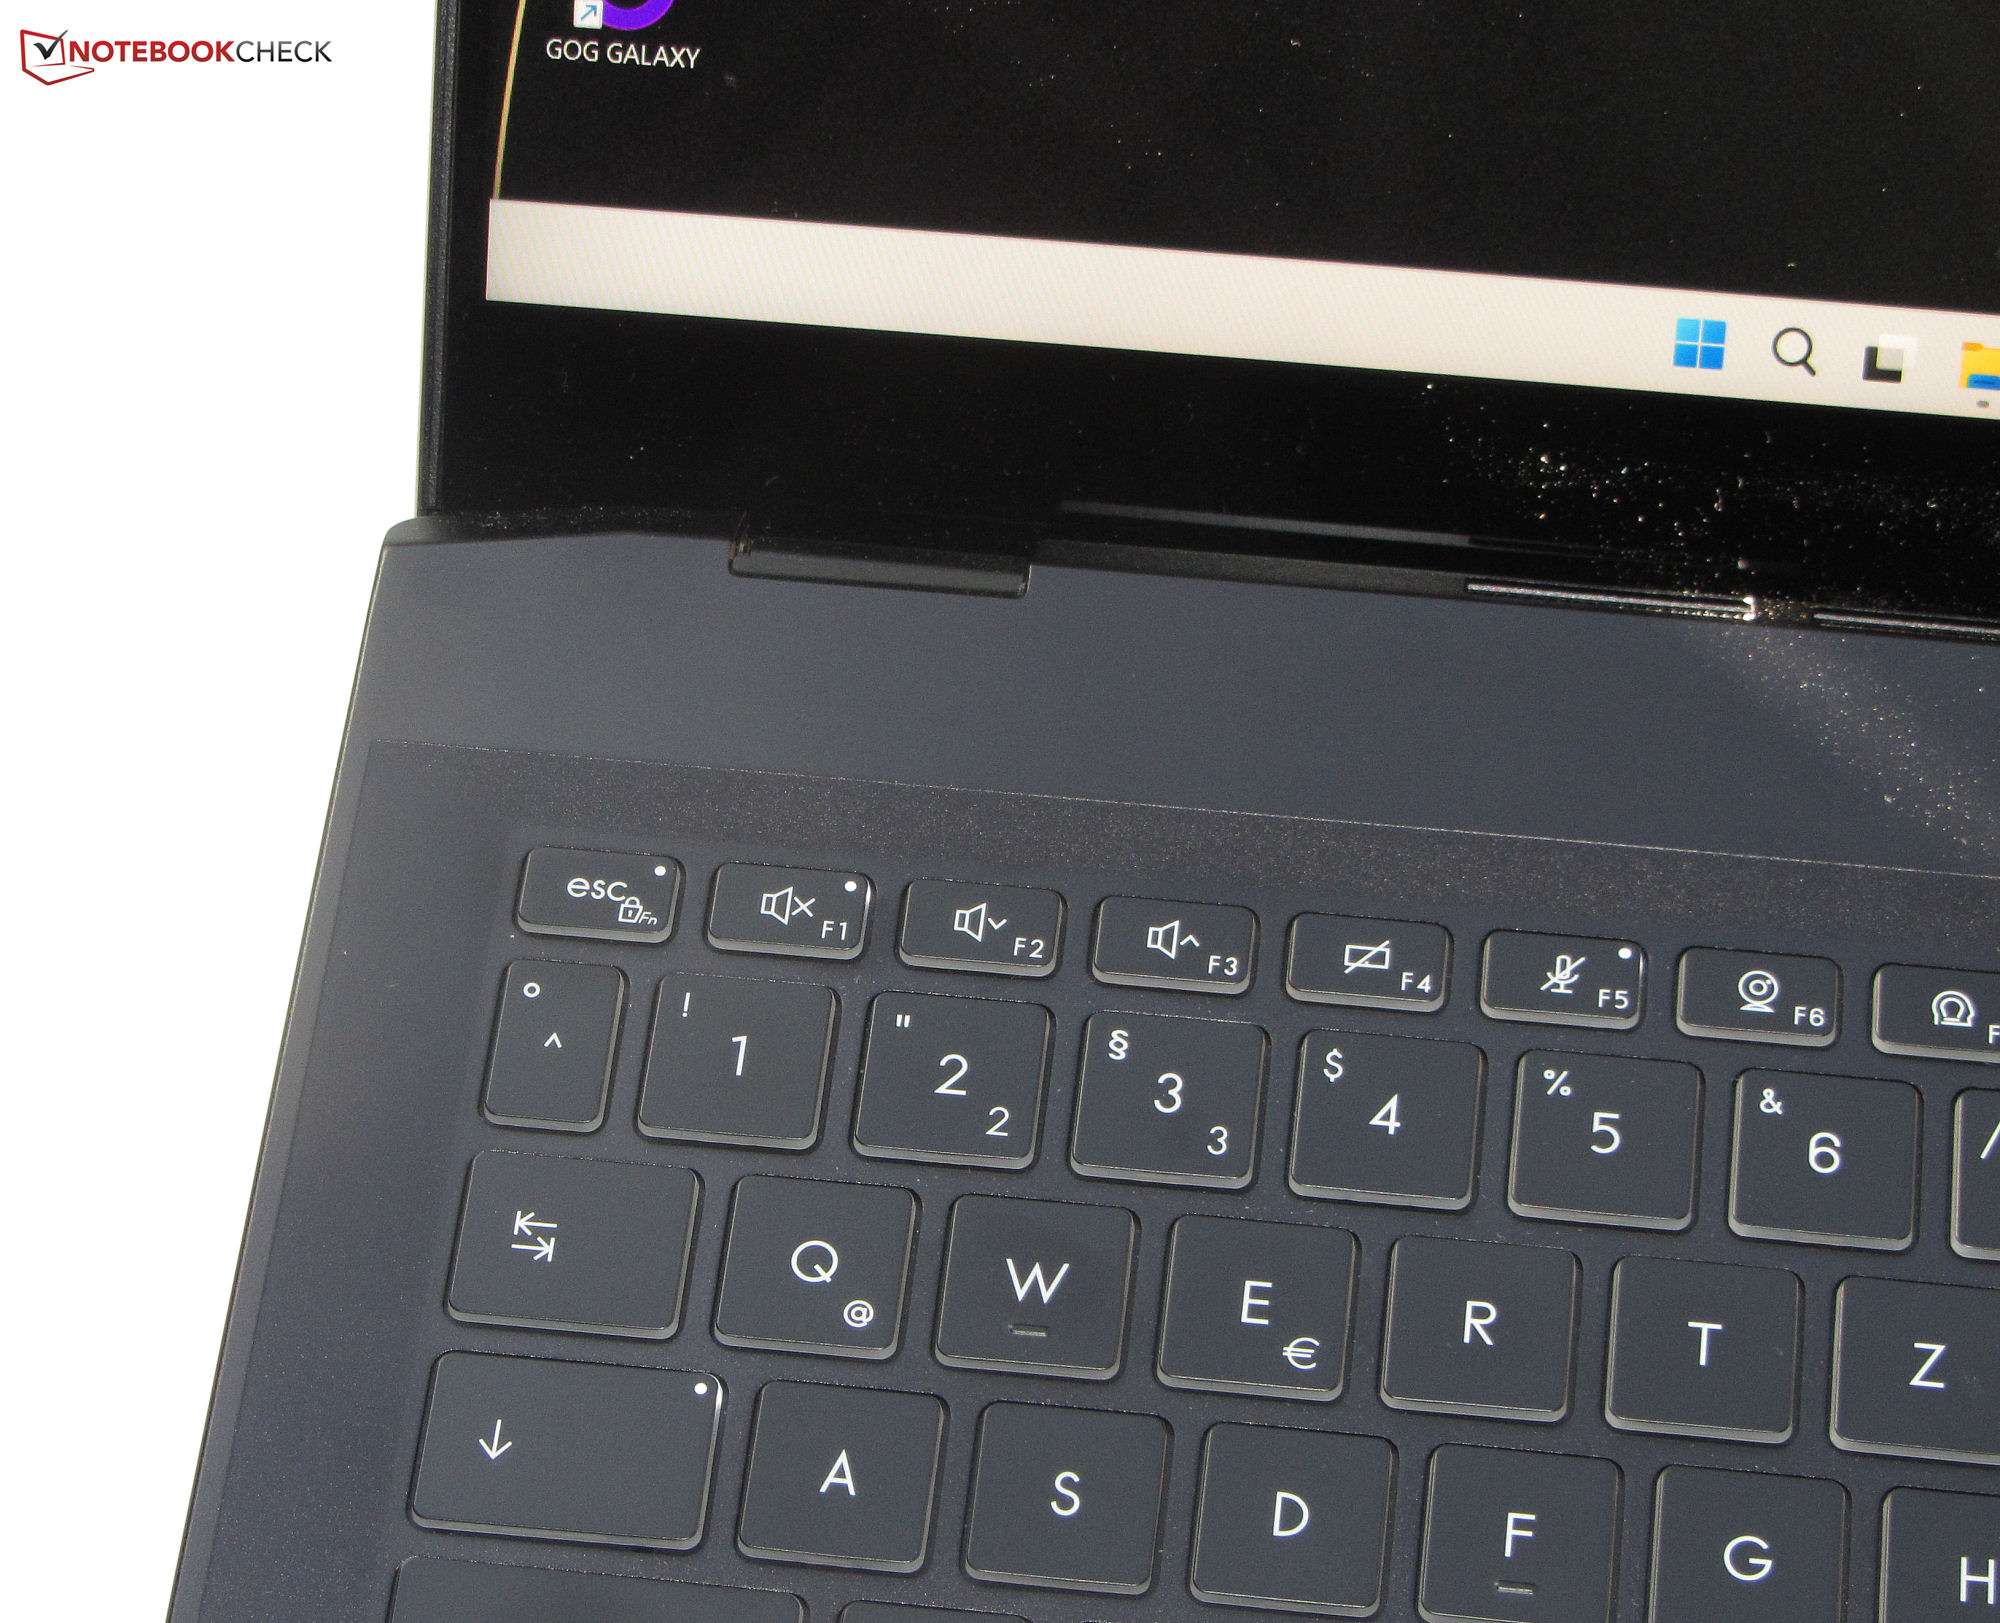
Płaskie, gładkie klawisze klawiatury chiclet (trzystopniowe podświetlenie) oferują krótki skok i wyraźny punkt nacisku. Podoba nam się ich opór. Podczas pisania klawiatura ma co najwyżej minimalne podanie, więc nie powodowało to żadnej irytacji. Ogólnie rzecz biorąc, MSI dostarcza tutaj klawiaturę, która nadaje się do codziennych zadań.
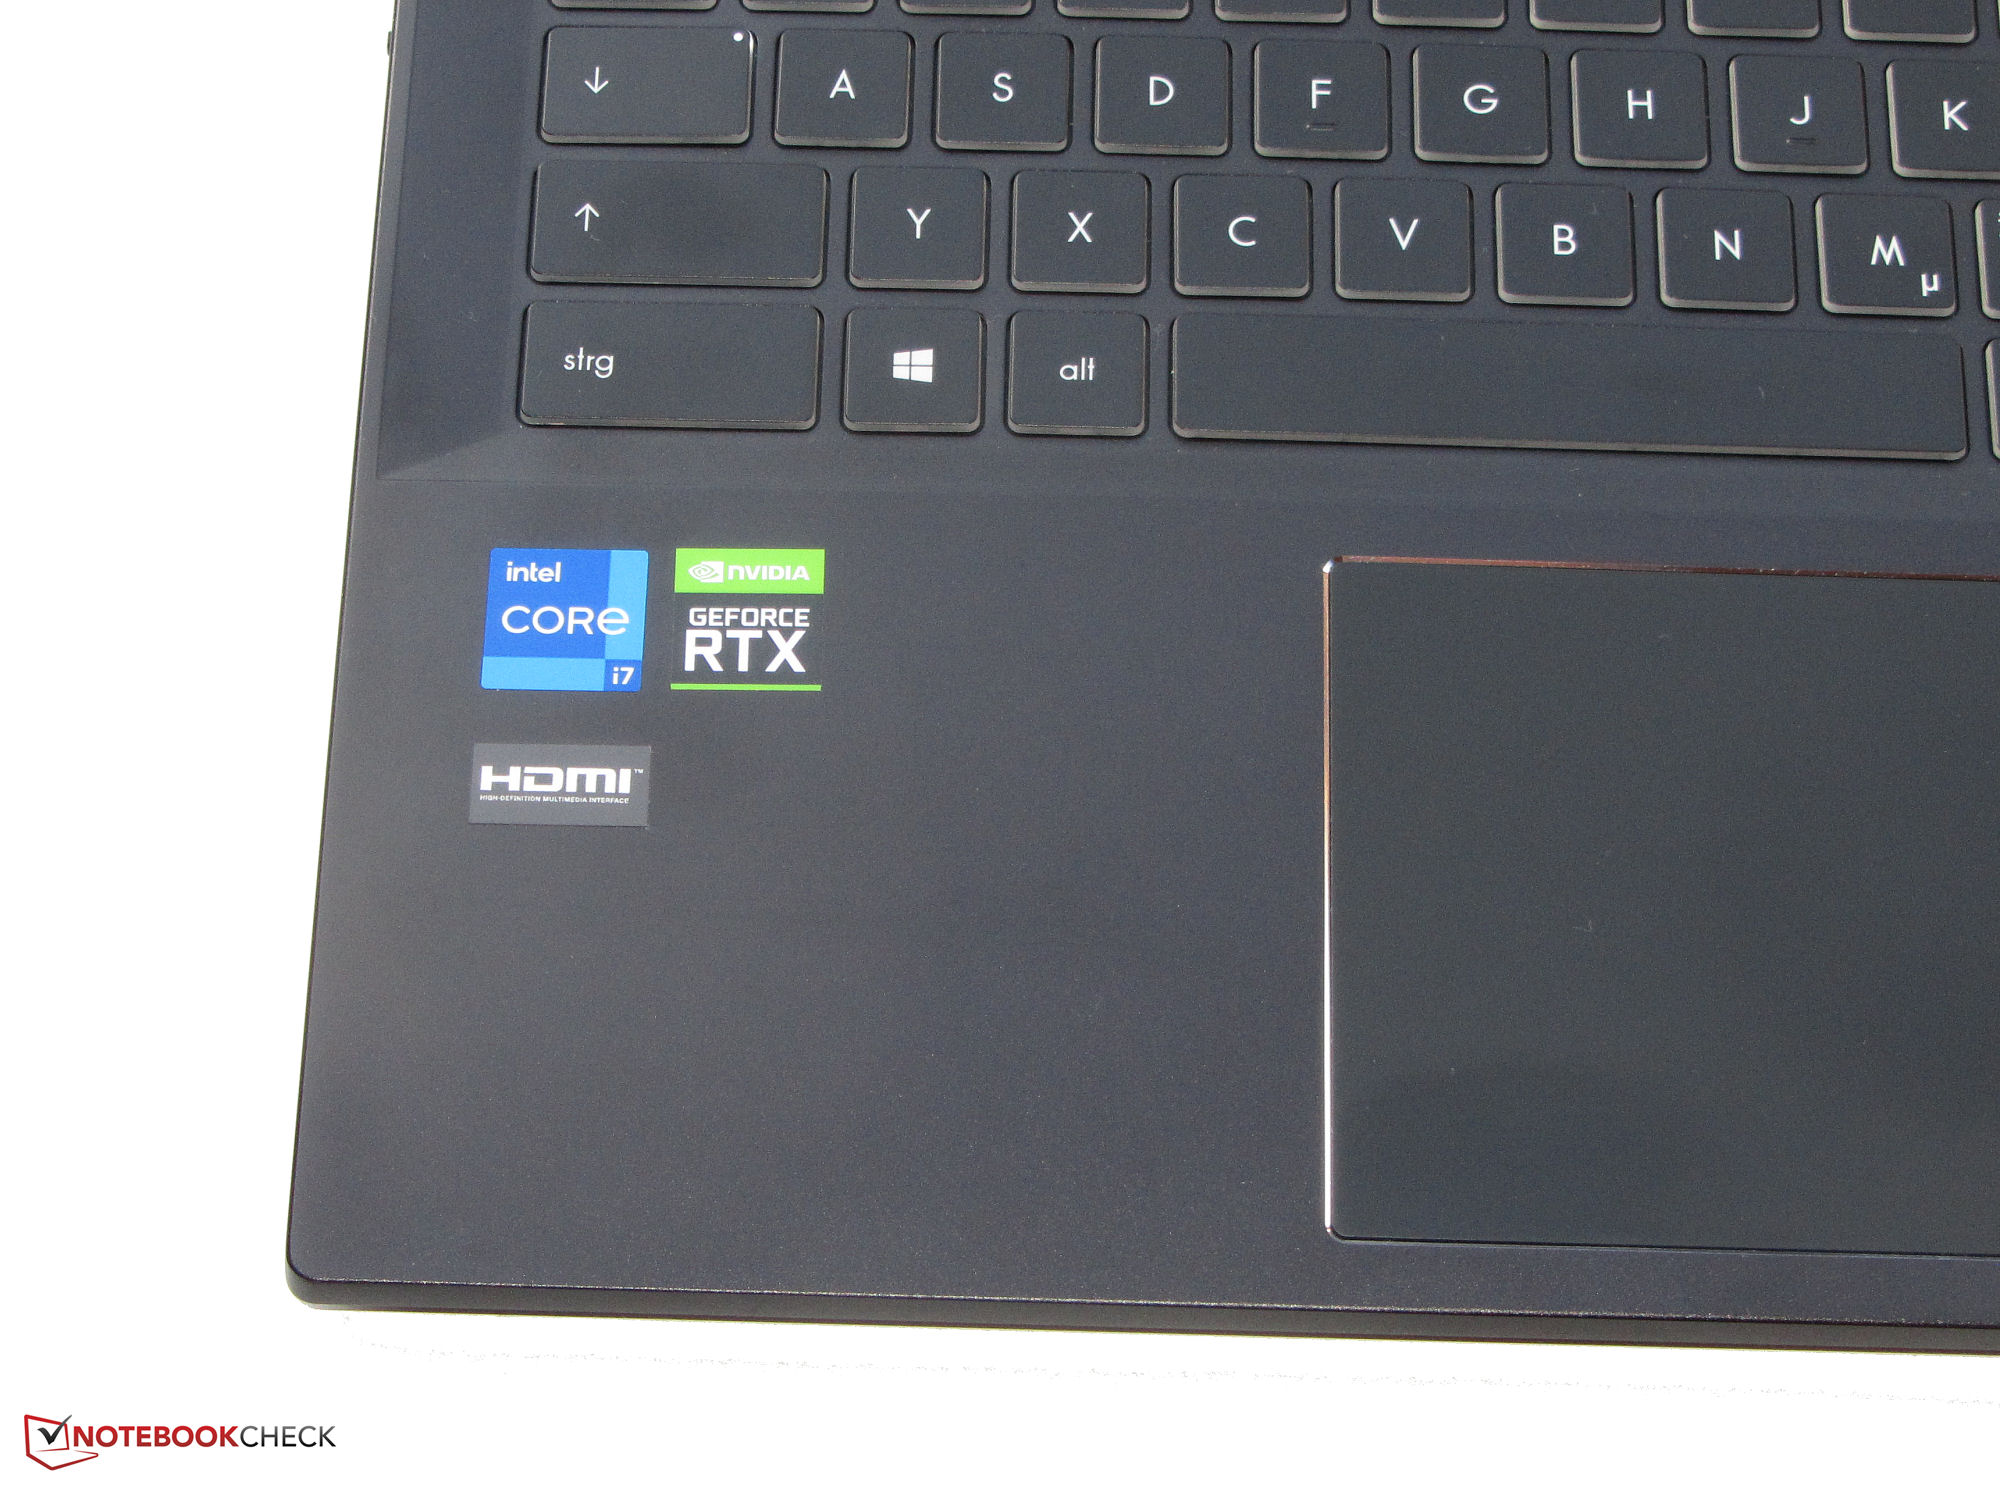
Gładka powierzchnia obsługującego multitouch ClickPada (~13 x 8,2 cm, ~5,1 x 3,2 cala) ułatwia przesuwanie palców. ClickPad reaguje również na wejścia w narożnikach. Ma krótki skok i wyraźny punkt nacisku.
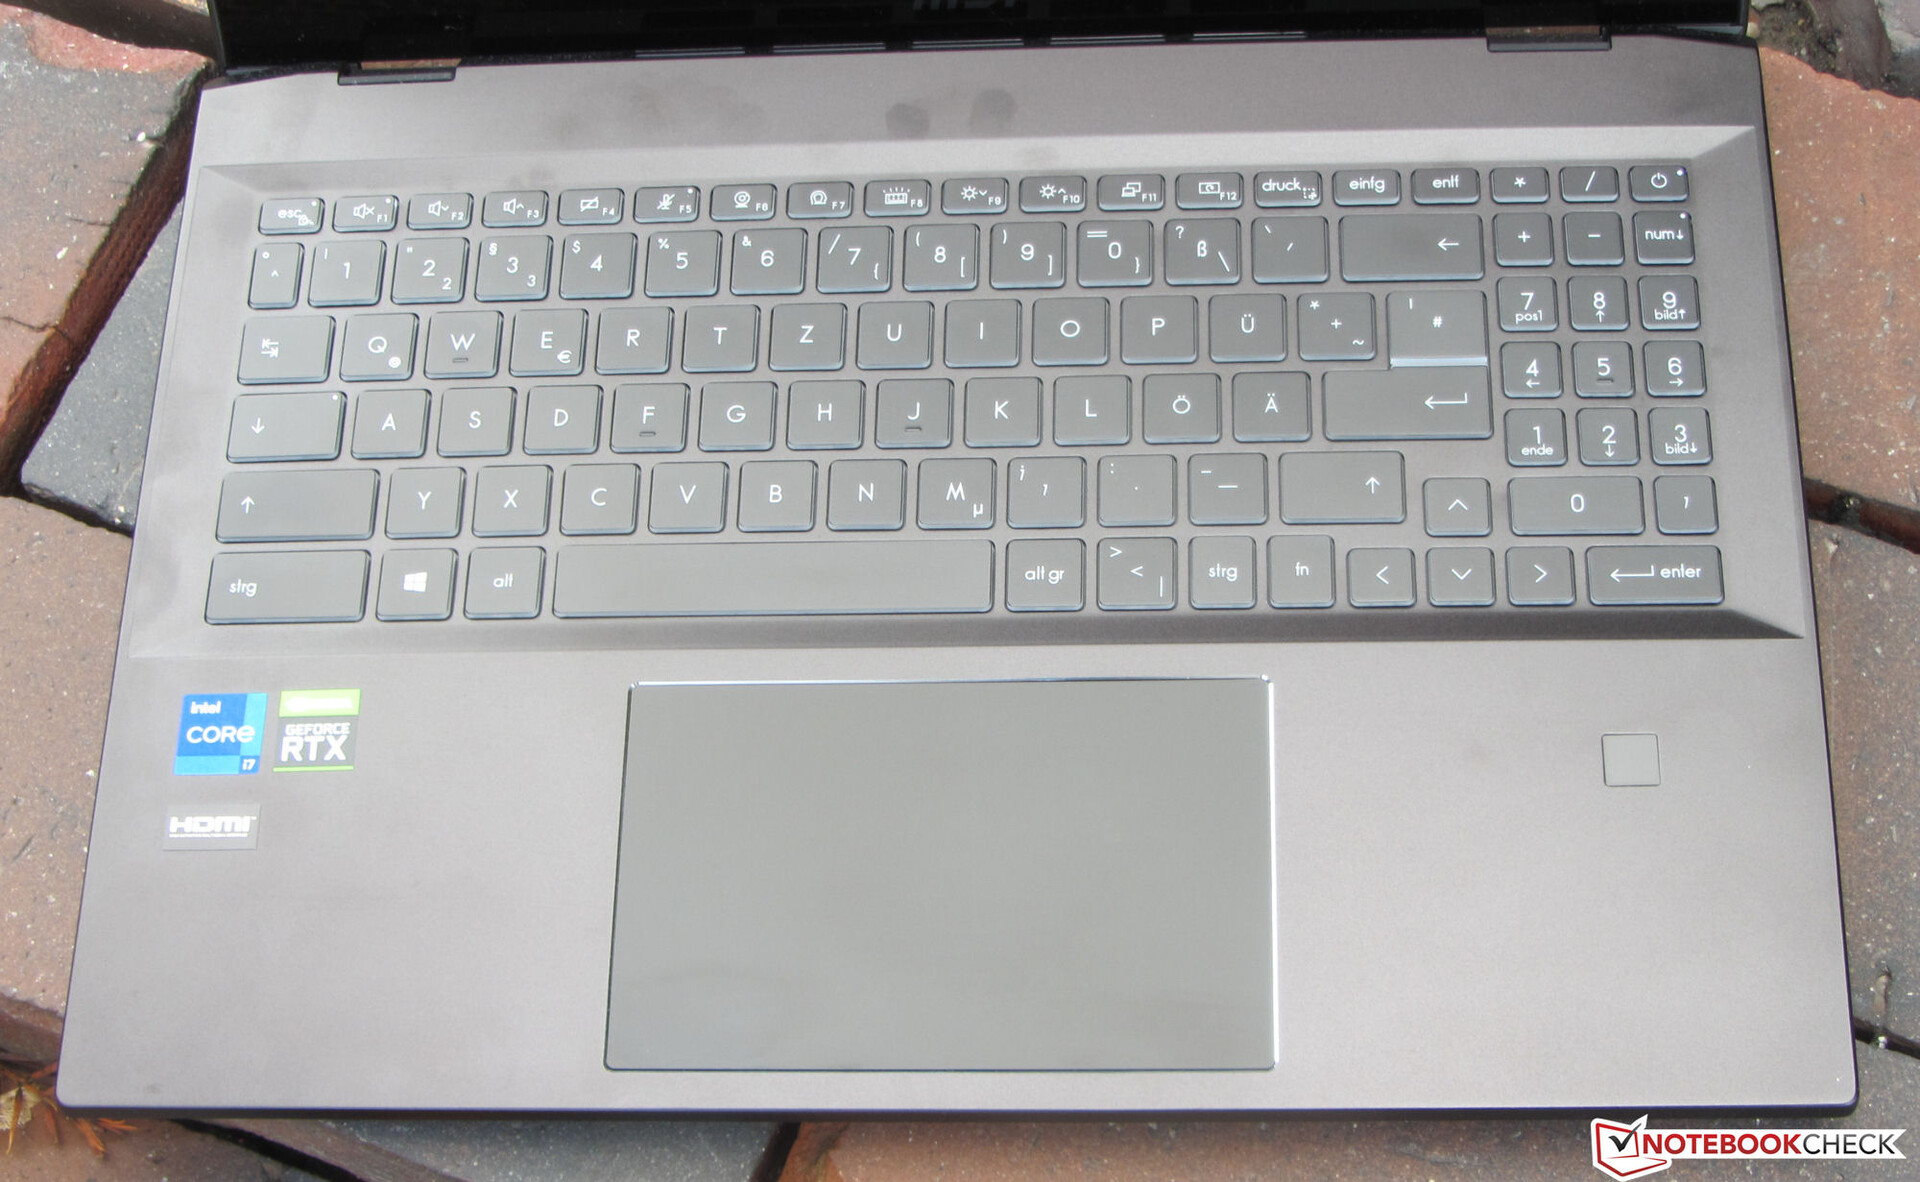
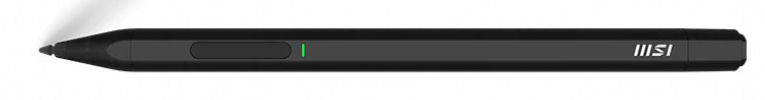
Ekran dotykowy (10 punktów dotyku) można obsługiwać palcami lub dołączonym do zestawu piórkiem wejściowym MSI (1P 14; MPP 2.0). To ostatnie dobrze leży w dłoni, a końcówka pióra łatwo ślizga się po ekranie. Pióro można przymocować magnetycznie do lewej strony jednostki zasadniczej. Wbudowany akumulator jest ładowany przez dołączony kabel USB-A do USB-C. W zestawie są też dodatkowe końcówki pióra.
Wyświetlacz - IPS na pokładzie

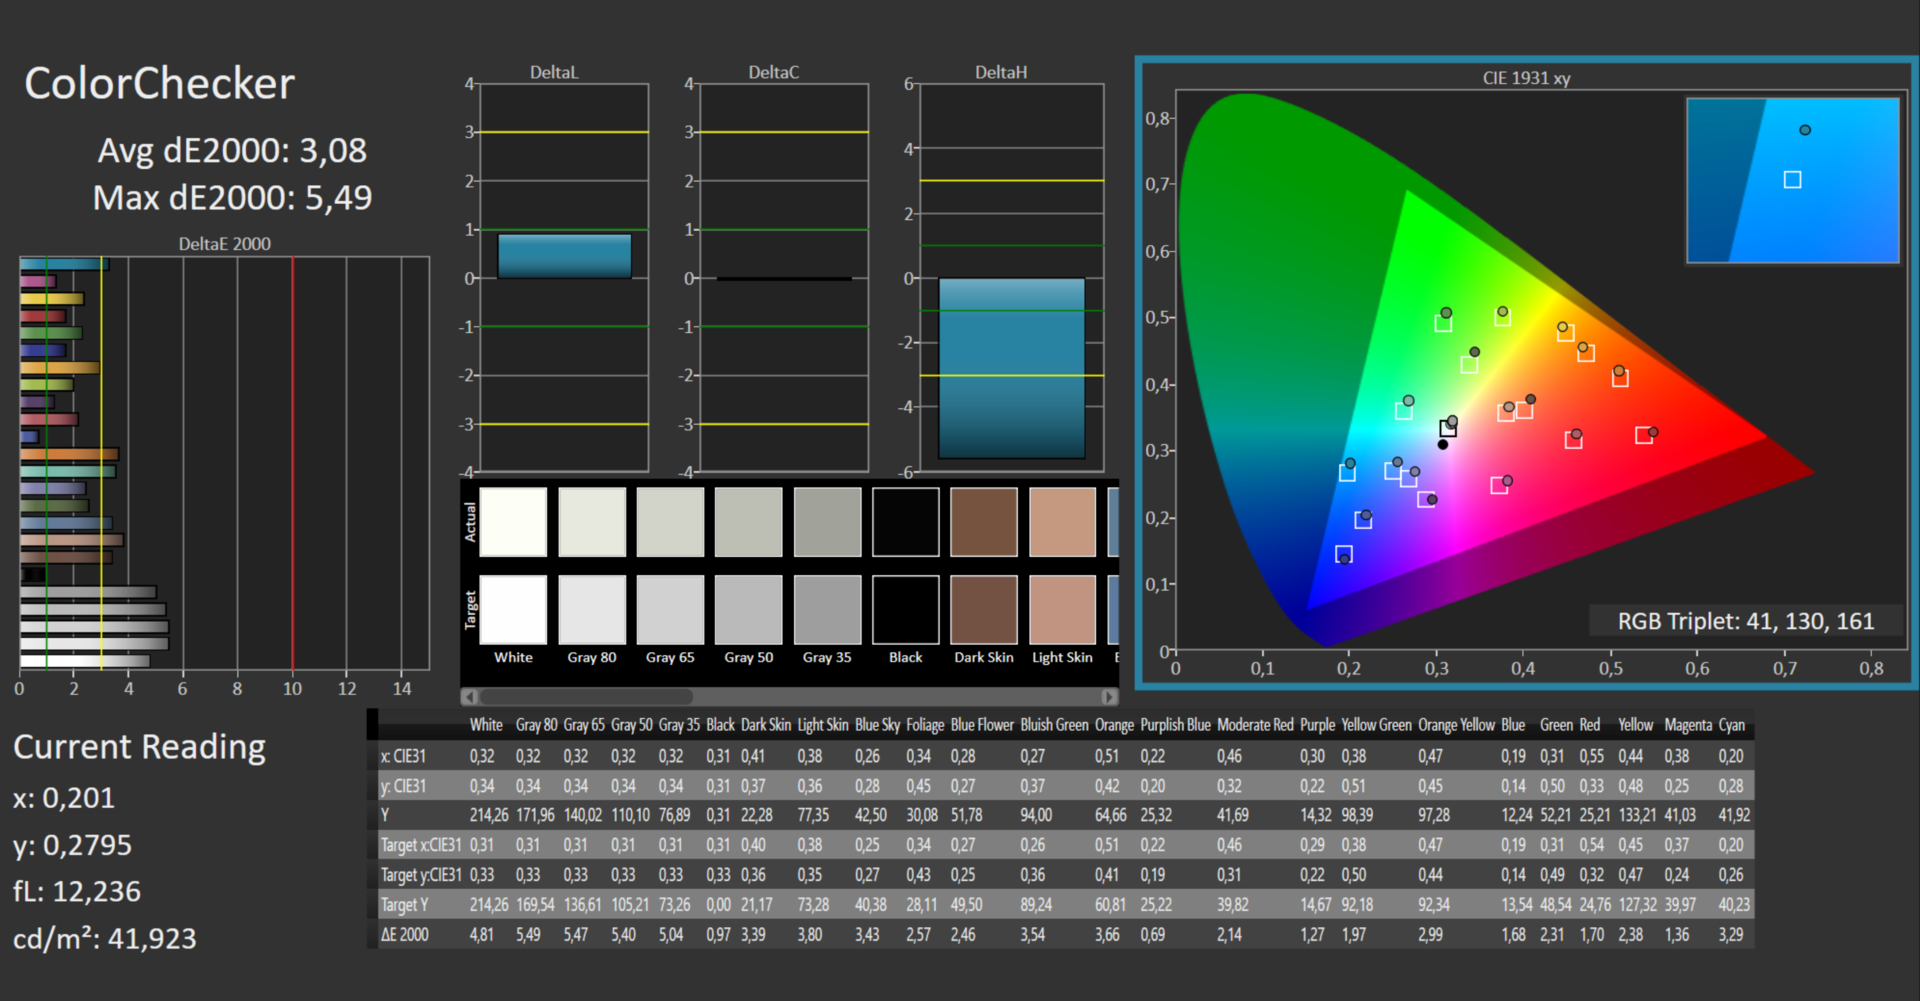
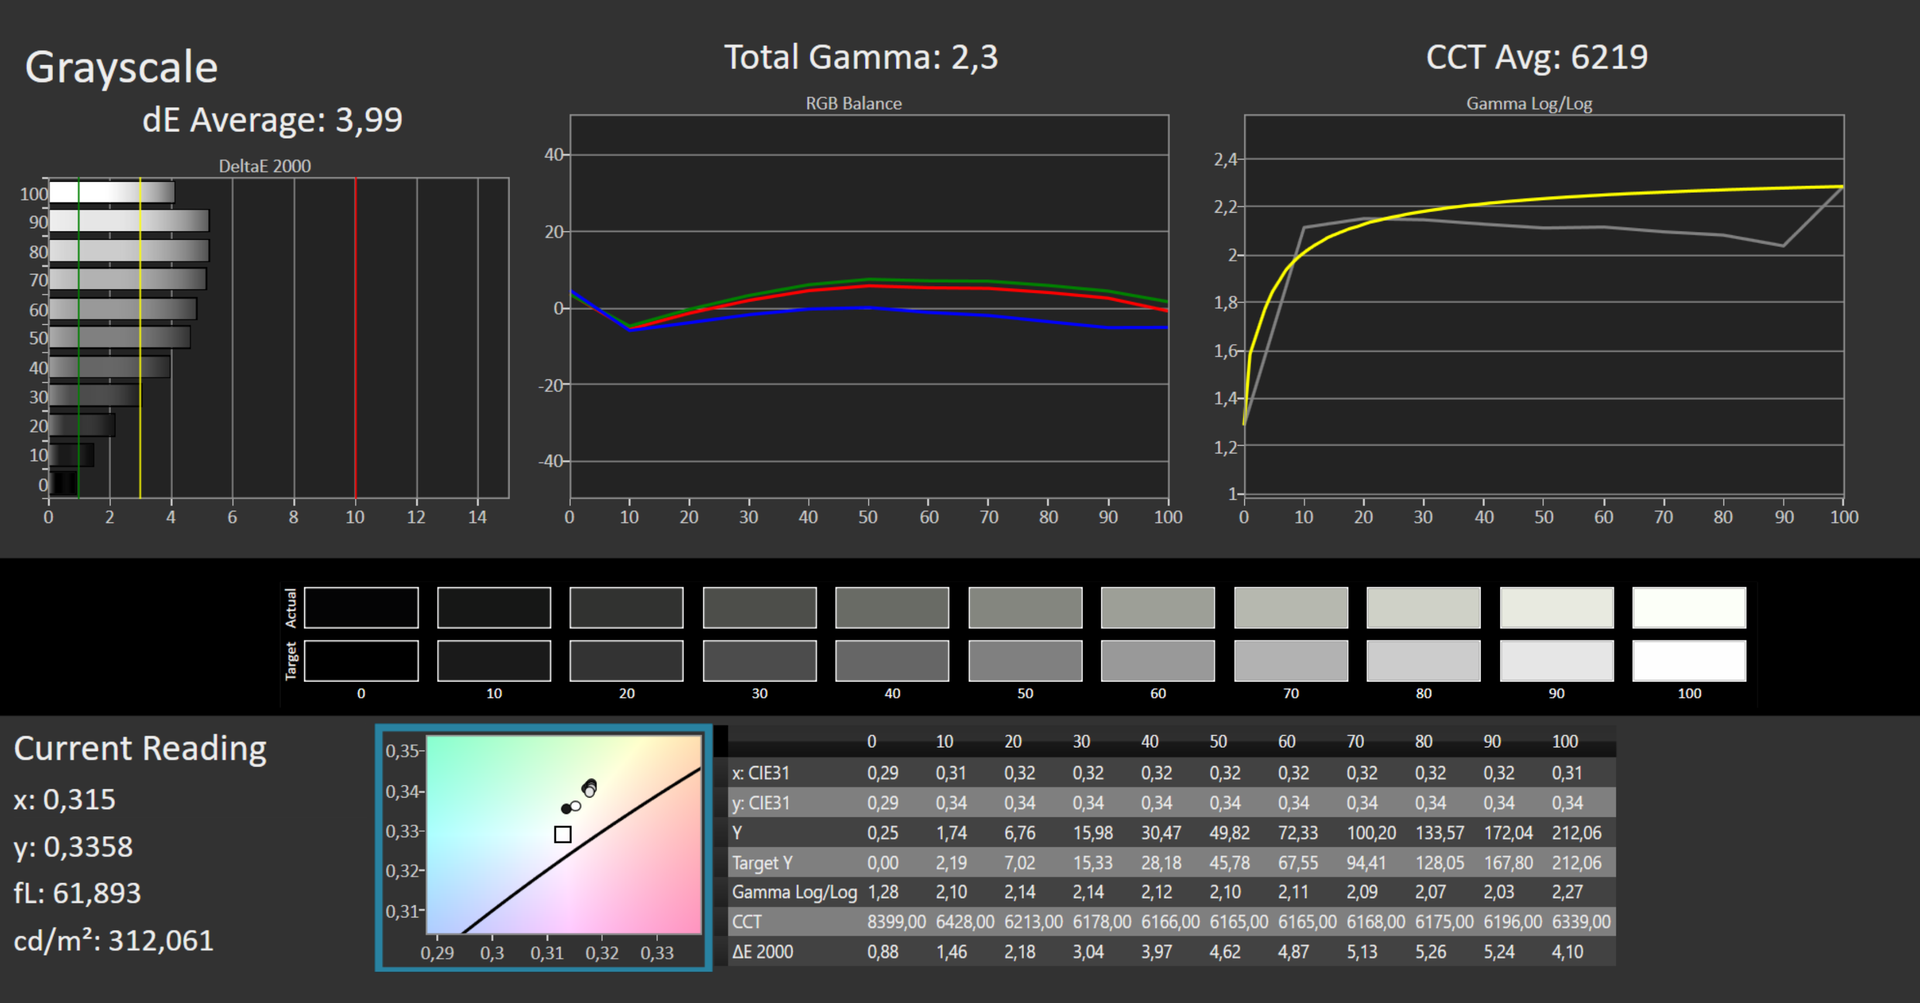
O ile kontrast 1121:1 refleksującego wyświetlacza 16-calowego (2560 x 1600 pikseli) spełnia założony cel (> 1000:1), o tyle jasność maksymalna okazuje się nieco niska i wynosi 294,3 cd/m². Za dobre uważamy wartości powyżej 300 cd/m². Panel o częstotliwości 165 Hz oferuje krótkie czasy reakcji. Nie zauważamy żadnego migotania PWM.
| |||||||||||||||||||||||||
rozświetlenie: 89 %
na akumulatorze: 314 cd/m²
kontrast: 1121:1 (czerń: 0.28 cd/m²)
ΔE ColorChecker Calman: 3.08 | ∀{0.5-29.43 Ø4.72}
calibrated: 0.88
ΔE Greyscale Calman: 3.99 | ∀{0.09-98 Ø4.97}
86.5% AdobeRGB 1998 (Argyll 3D)
100% sRGB (Argyll 3D)
98.9% Display P3 (Argyll 3D)
Gamma: 2.3
CCT: 6219 K
| MSI Summit E16 Flip A12UDT-031 AU Optronics B16QAN02.N, IPS, 2560x1600, 16" | Asus ExpertBook B2 Flip B2502FBA-N80141X AU Optronics B156HAN02.1, IPS, 1920x1080, 15.6" | Samsung Galaxy Book Pro 360 15 NP950QDB-KC3DE SDC4159, OLED, 1920x1080, 15.6" | Dell Inspiron 16 7620 2-in-1 BOE NV16N45, IPS, 1920x1200, 16" | |
|---|---|---|---|---|
| Display | -54% | 5% | -19% | |
| Display P3 Coverage (%) | 98.9 | 37.2 -62% | 99.9 1% | 67 -32% |
| sRGB Coverage (%) | 100 | 55.8 -44% | 100 0% | 95.9 -4% |
| AdobeRGB 1998 Coverage (%) | 86.5 | 38.4 -56% | 97.6 13% | 69.3 -20% |
| Response Times | -101% | 82% | -139% | |
| Response Time Grey 50% / Grey 80% * (ms) | 13 ? | 32 ? -146% | 2 ? 85% | 32 ? -146% |
| Response Time Black / White * (ms) | 9 ? | 14 ? -56% | 2 ? 78% | 20.8 ? -131% |
| PWM Frequency (Hz) | 60 | |||
| Screen | -68% | 48% | -20% | |
| Brightness middle (cd/m²) | 314 | 239 -24% | 290 -8% | 320.7 2% |
| Brightness (cd/m²) | 294 | 221 -25% | 290 -1% | 309 5% |
| Brightness Distribution (%) | 89 | 89 0% | 99 11% | 90 1% |
| Black Level * (cd/m²) | 0.28 | 0.51 -82% | 0.05 82% | 0.36 -29% |
| Contrast (:1) | 1121 | 469 -58% | 5800 417% | 891 -21% |
| Colorchecker dE 2000 * | 3.08 | 5.66 -84% | 1.84 40% | 4.18 -36% |
| Colorchecker dE 2000 max. * | 5.49 | 20.35 -271% | 3.83 30% | 8.48 -54% |
| Colorchecker dE 2000 calibrated * | 0.88 | 2.69 -206% | 0.77 12% | |
| Greyscale dE 2000 * | 3.99 | 3.89 3% | 1.24 69% | 6.3 -58% |
| Gamma | 2.3 96% | 2.43 91% | 2.2 100% | 2.21 100% |
| CCT | 6219 105% | 6183 105% | 6686 97% | 6258 104% |
| Całkowita średnia (program / ustawienia) | -74% /
-70% | 45% /
44% | -59% /
-37% |
* ... im mniej tym lepiej
W stanie dostawy ekran wyświetla kolory bardzo dokładnie. Przy wartości 3,08 odchylenie kolorów ledwie mija się z celem DeltaE < 3. Kalibracja obniża odchylenie do 0,88 i zapewnia bardziej zrównoważone wyświetlanie skali szarości. Przestrzeń kolorów sRGB jest odwzorowywana całkowicie, przestrzeń kolorów DCI P3 prawie całkowicie, a przestrzeń kolorów Adobe RGB w 87%.
Stworzony przez nas profil kolorów można pobrać i używać za darmo. Link znajduje się w polu informacyjnym powyżej na wyświetlaczu
Wyświetl czasy reakcji
| ↔ Czas reakcji od czerni do bieli | ||
|---|---|---|
| 9 ms ... wzrost ↗ i spadek ↘ łącznie | ↗ 5 ms wzrost |  |
| ↘ 4 ms upadek | ||
| W naszych testach ekran wykazuje szybki czas reakcji i powinien nadawać się do gier. Dla porównania, wszystkie testowane urządzenia wahają się od 0.1 (minimum) do 240 (maksimum) ms. » 25 % wszystkich urządzeń jest lepszych. Oznacza to, że zmierzony czas reakcji jest lepszy od średniej wszystkich testowanych urządzeń (19.8 ms). | ||
| ↔ Czas reakcji 50% szarości do 80% szarości | ||
| 13 ms ... wzrost ↗ i spadek ↘ łącznie | ↗ 6 ms wzrost |  |
| ↘ 7 ms upadek | ||
| W naszych testach ekran wykazuje dobry współczynnik reakcji, ale może być zbyt wolny dla graczy rywalizujących ze sobą. Dla porównania, wszystkie testowane urządzenia wahają się od 0.165 (minimum) do 636 (maksimum) ms. » 26 % wszystkich urządzeń jest lepszych. Oznacza to, że zmierzony czas reakcji jest lepszy od średniej wszystkich testowanych urządzeń (31 ms). | ||
Migotanie ekranu / PWM (modulacja szerokości impulsu)
| Migotanie ekranu/nie wykryto PWM |  | ||
Dla porównania: 52 % wszystkich testowanych urządzeń nie używa PWM do przyciemniania wyświetlacza. Jeśli wykryto PWM, zmierzono średnio 7781 (minimum: 5 - maksimum: 343500) Hz. | |||
Kąty widzenia panelu IPS są stabilne i można go odczytać z każdej pozycji. Na zewnątrz odblaskowa powierzchnia wyświetlacza utrudnia jego odczyt.
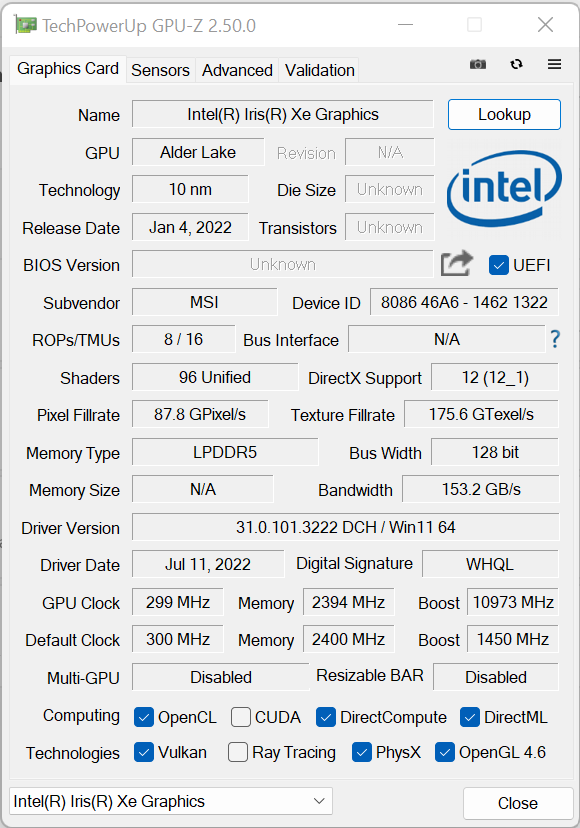
Wydajność - Alder Lake spotyka Ampere
Summit E16 Flip oferuje więcej niż wystarczającą wydajność obliczeniową do zadań biurowych i internetowych. Dedykowany procesor graficzny przyspiesza działanie aplikacji intensywnie wykorzystujących grafikę i umożliwia granie w gry komputerowe.
Warunki badania
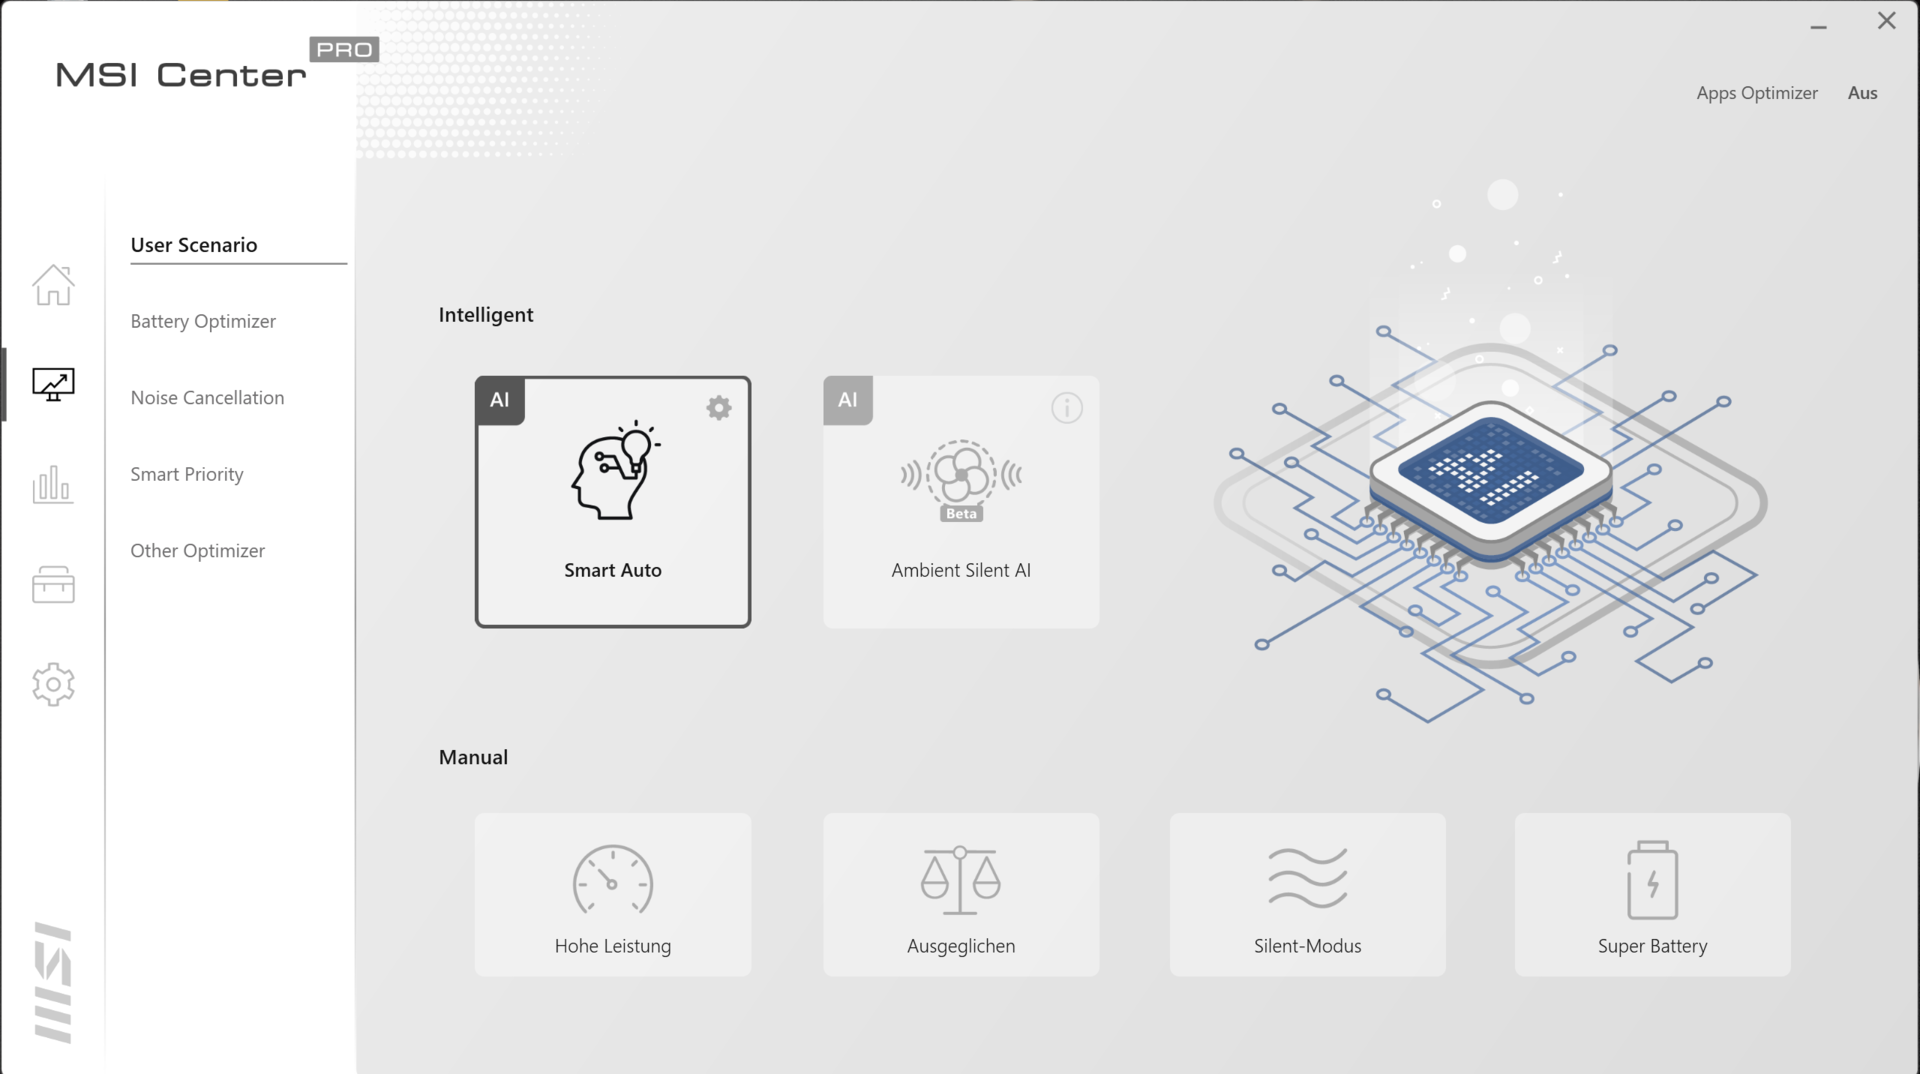
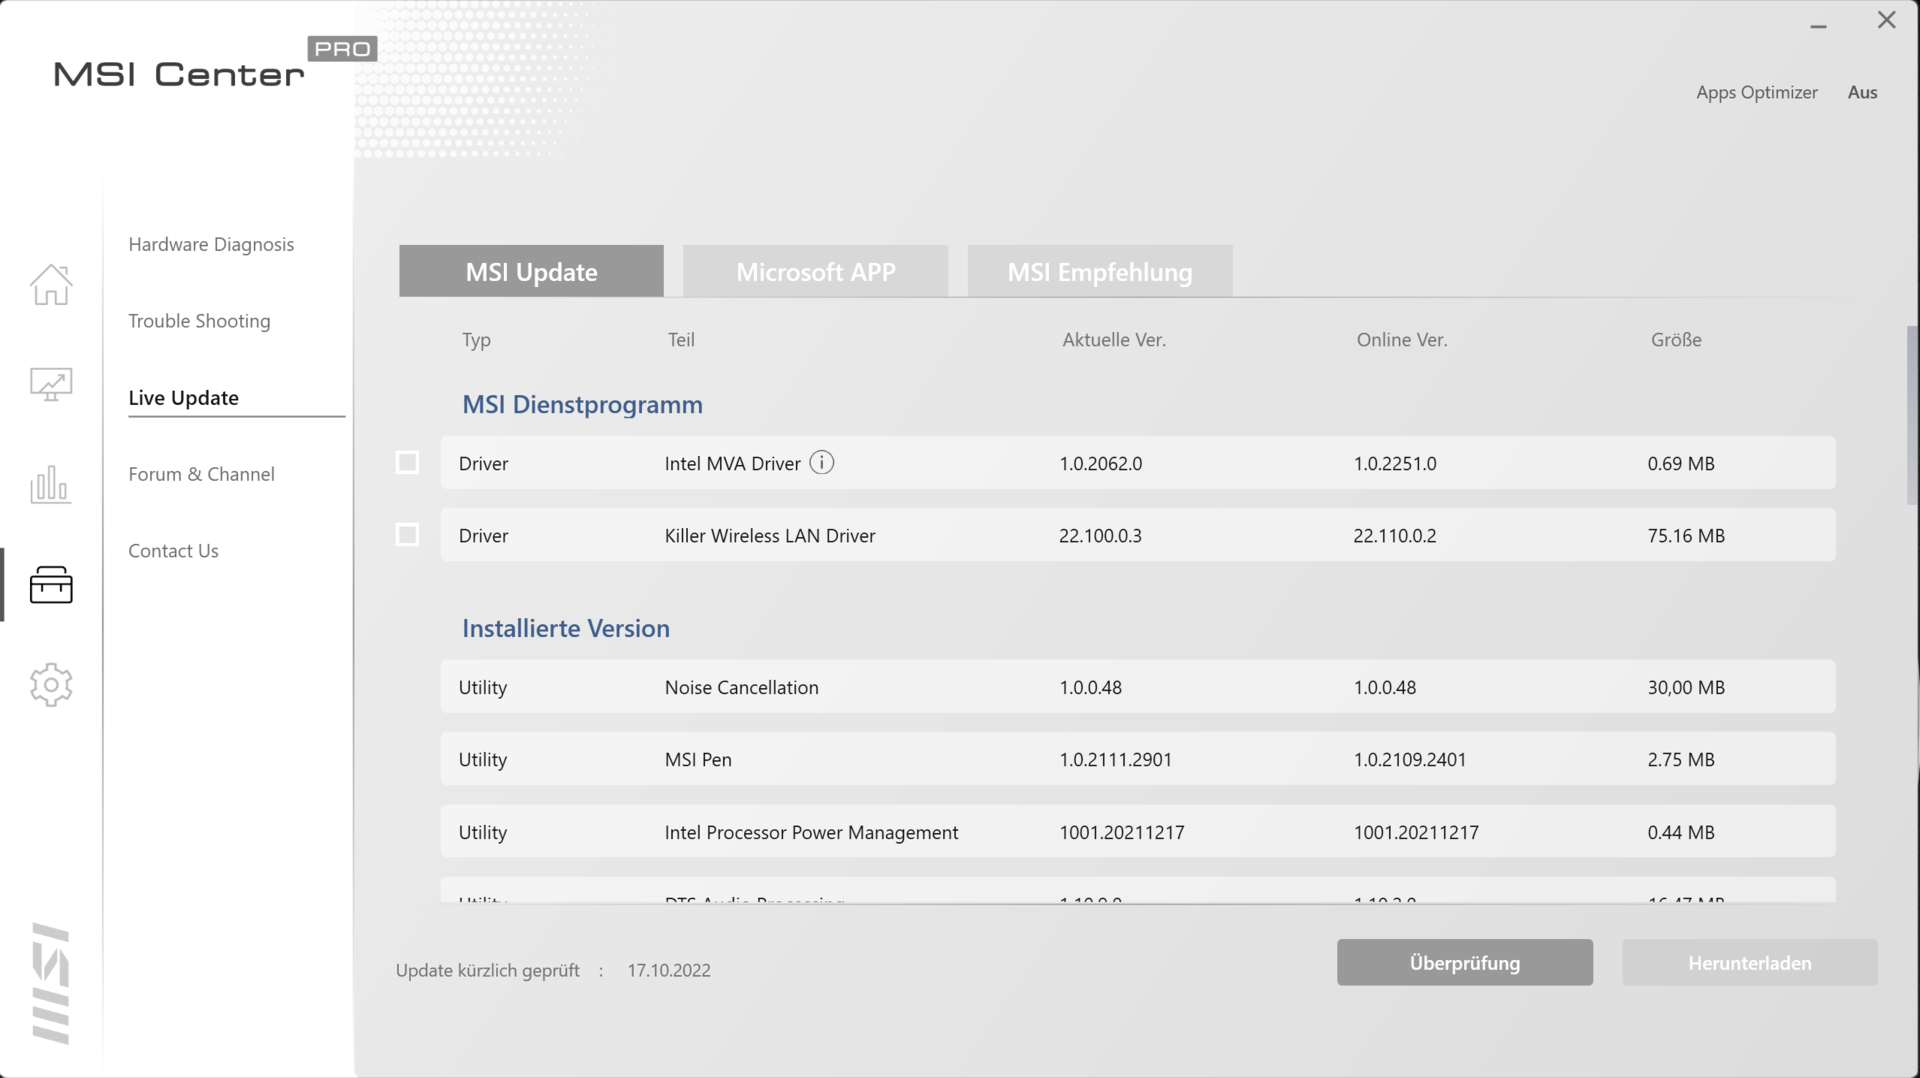
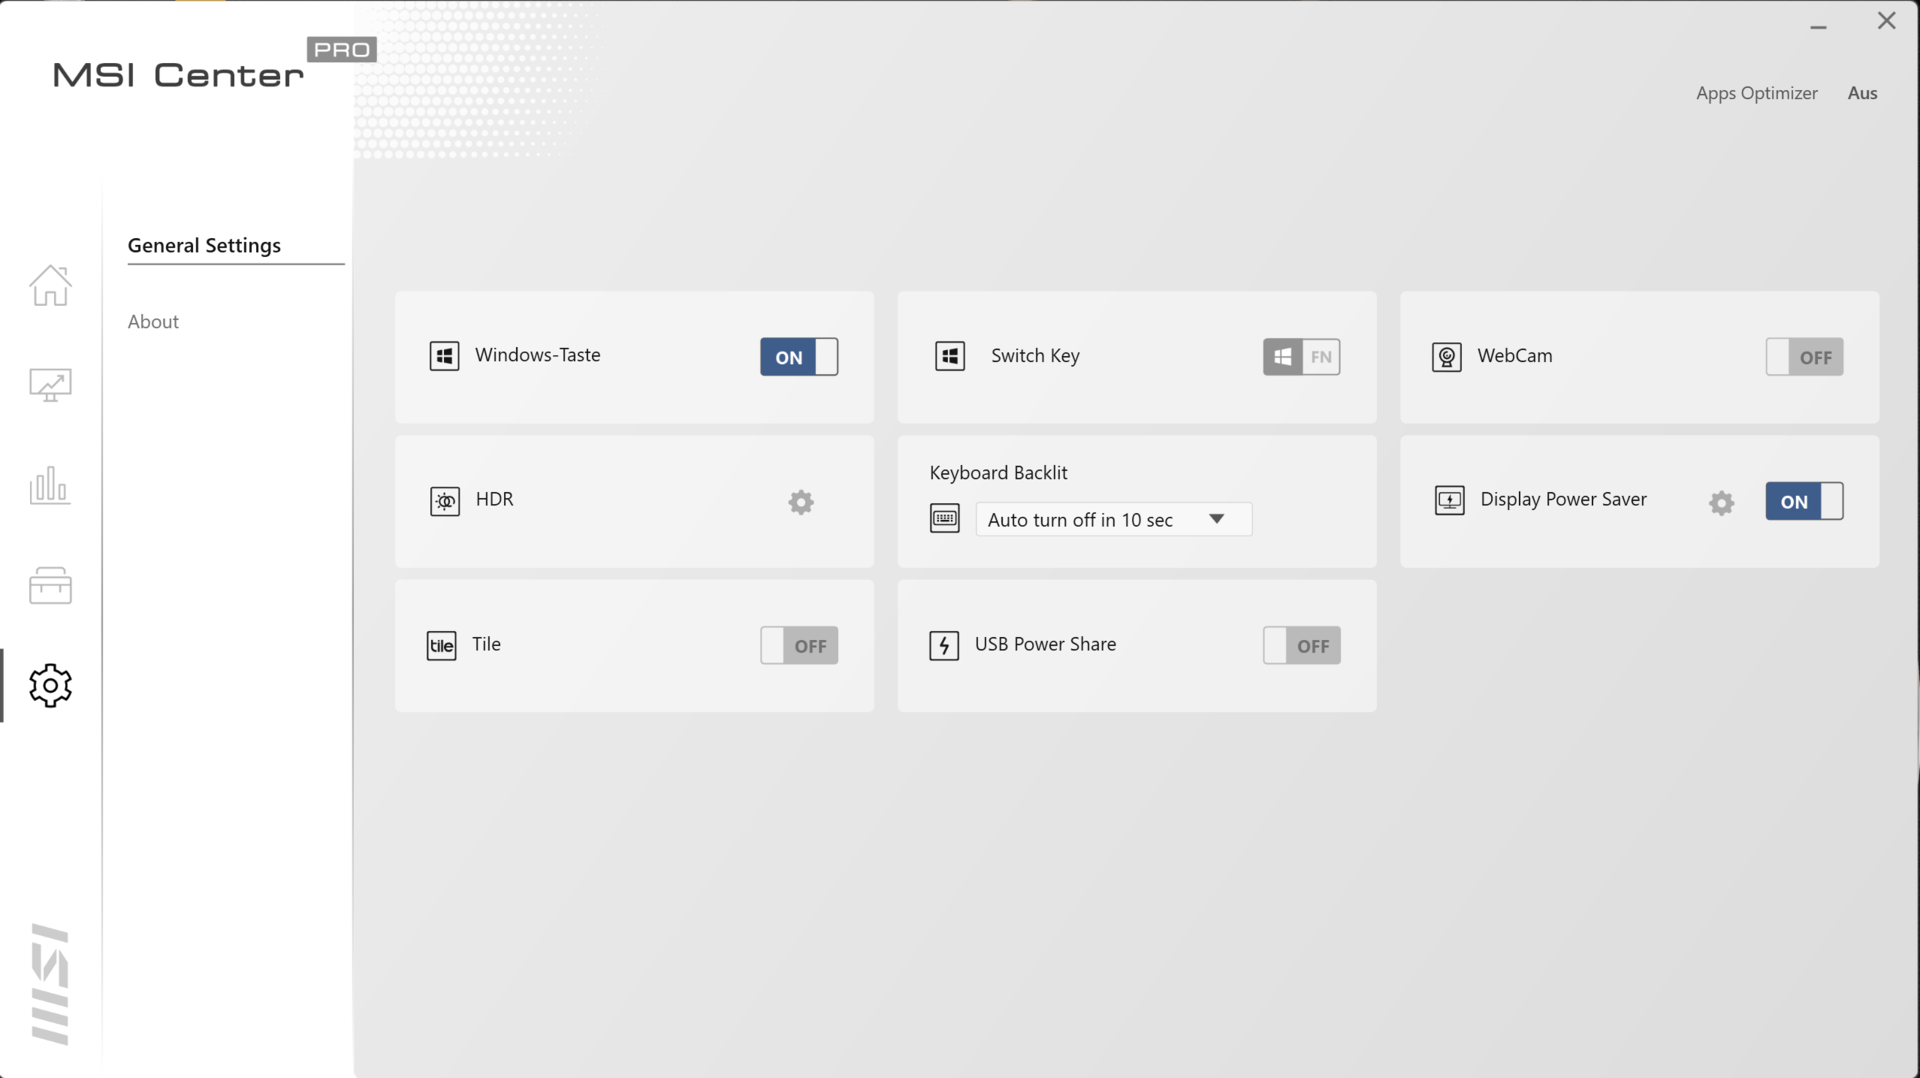
Preinstalowane oprogramowanie MSI Center Pro (patrz zdjęcia) oraz klawisz F7 pozwalają na przełączanie się pomiędzy czterema profilami zasilania (High Performance, Balanced, Silent Mode, Super Battery) laptopa. Kiedy korzysta się z nadrzędnej, opartej na sztucznej inteligencji funkcji"Smart Auto", tak jak w naszym przypadku, MSI Center automatycznie wybiera profil pasujący do danego scenariusza. Profile wpływają tylko na wydajność CPU, a nie na wydajność GPU.
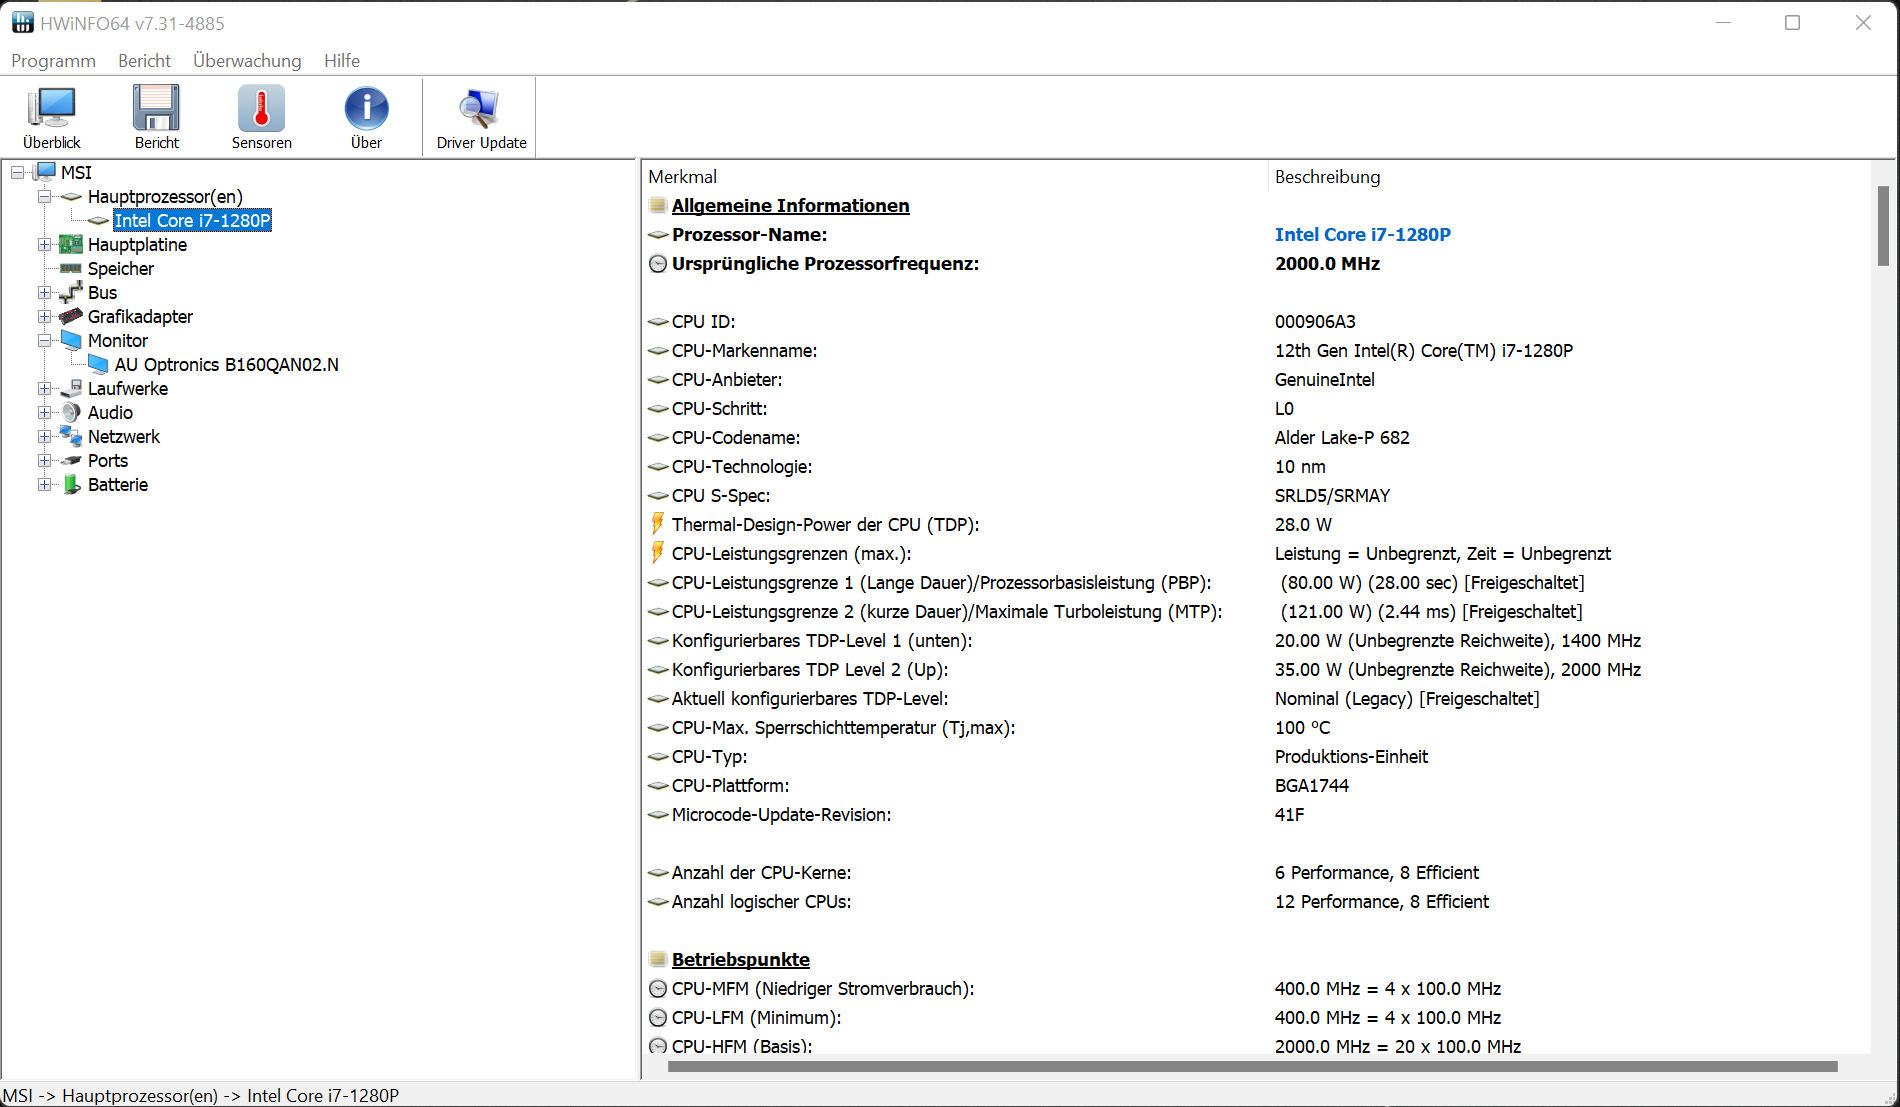
Procesor
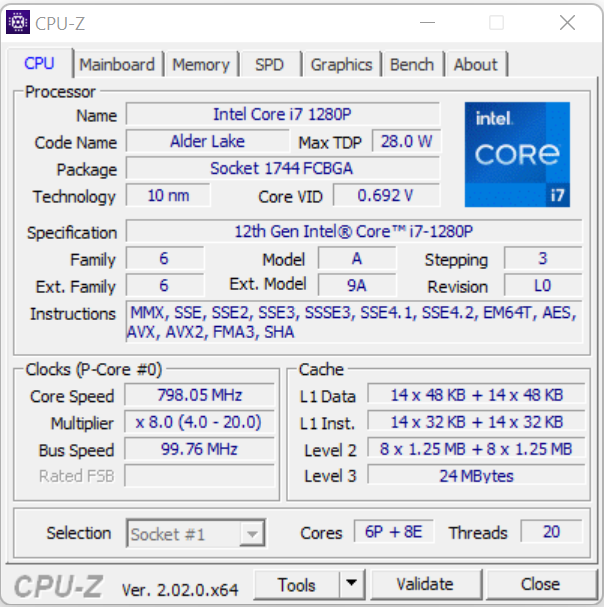
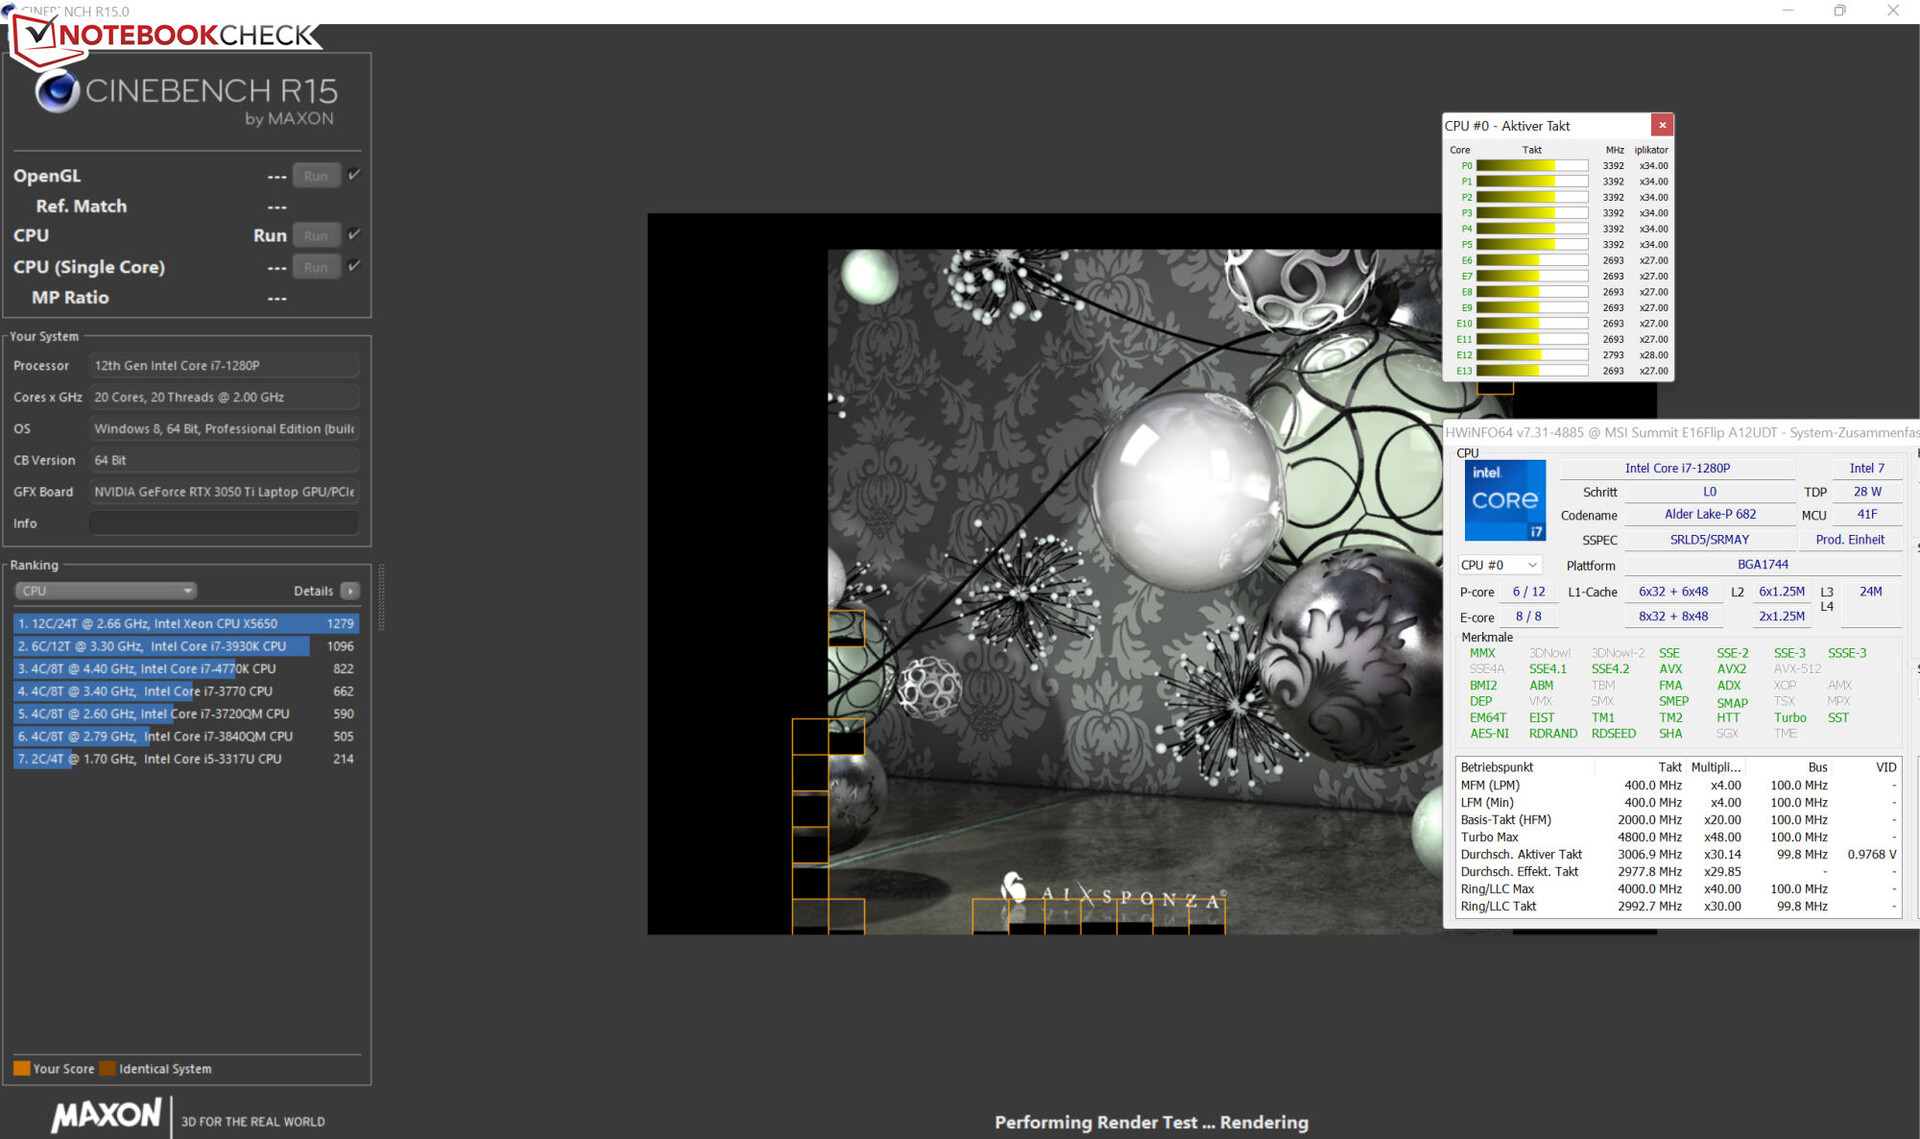
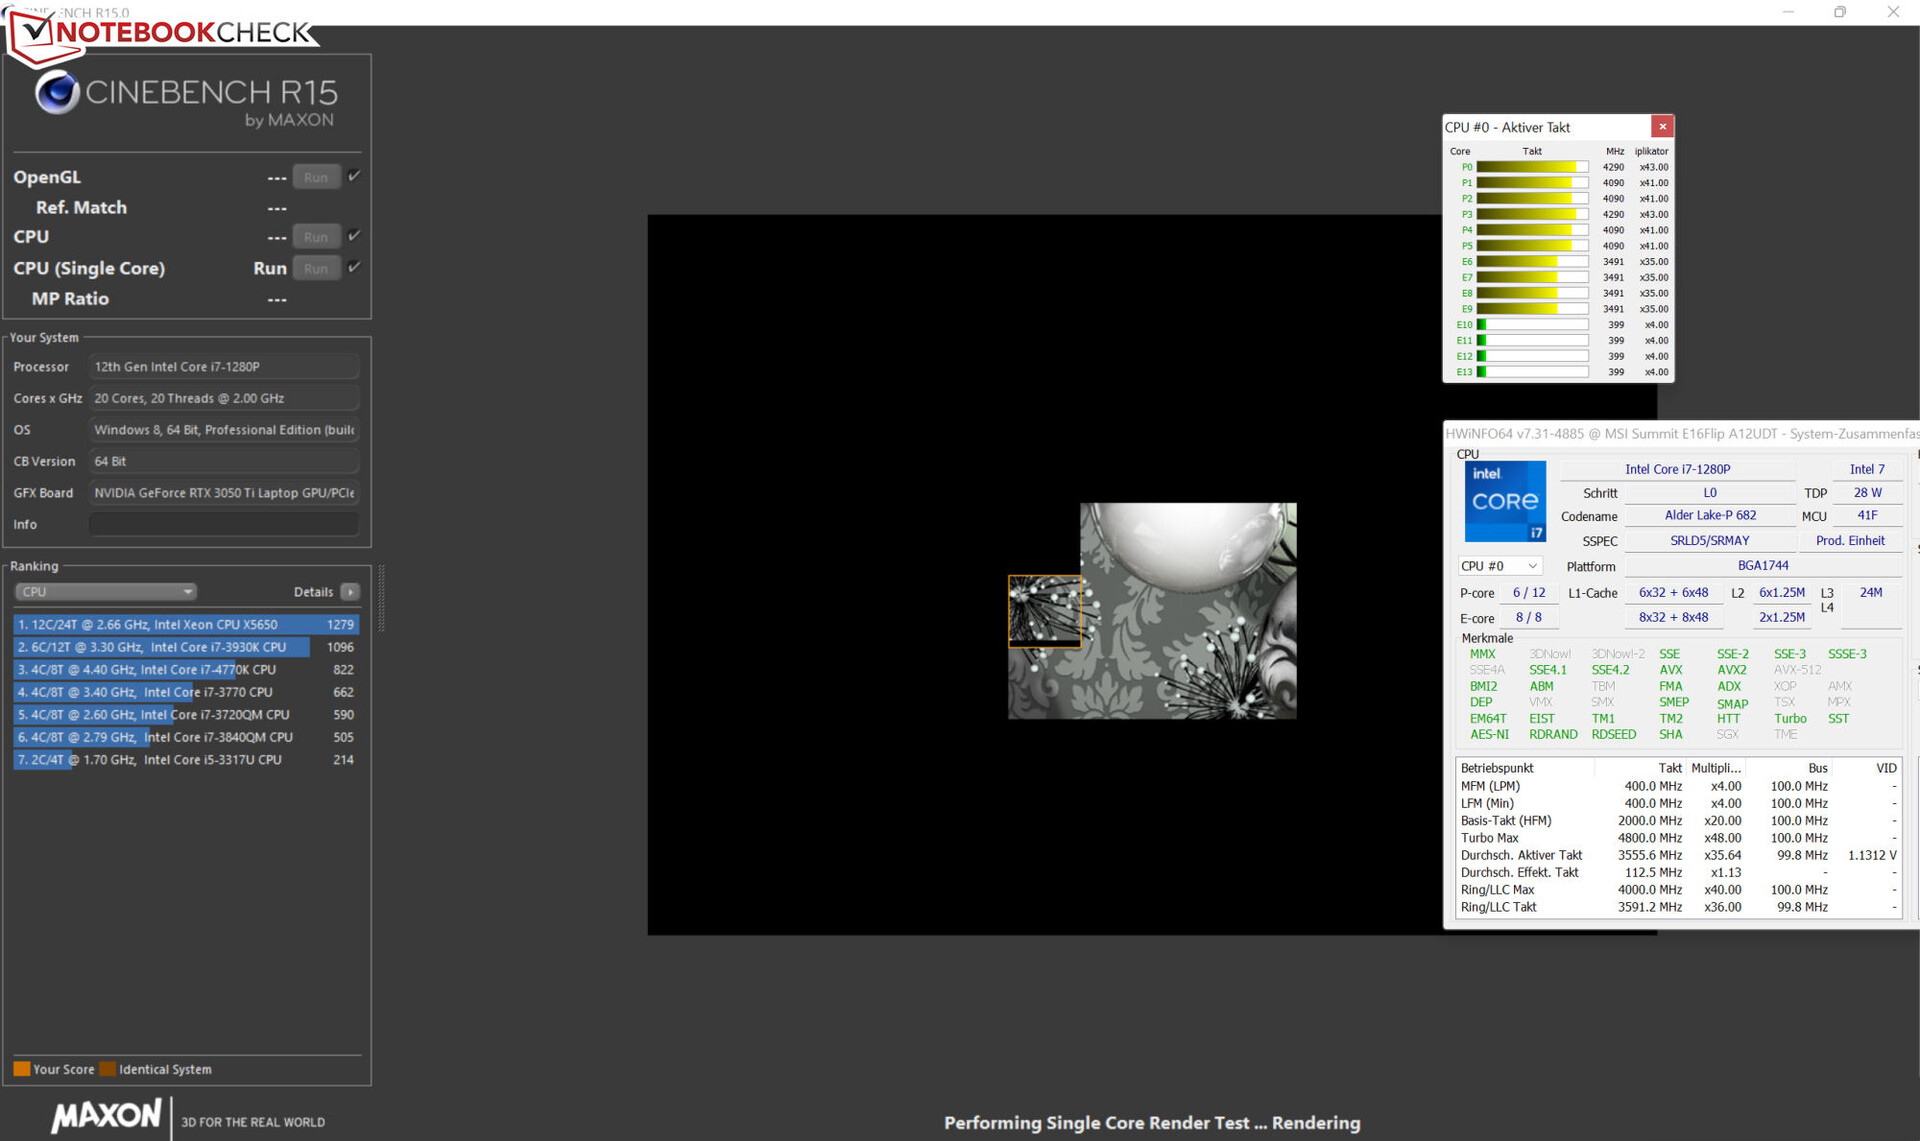
Alder LakeCore-i7-1280Pprocesor składa się z 6 rdzeni Performance (hyperthreading, od 2,4 do 4,8 GHz) i 8 rdzeni Efficiency (bez hyperthreadingu, od 1,8 do 3,7 GHz), co daje łącznie 20 logicznych rdzeni CPU.
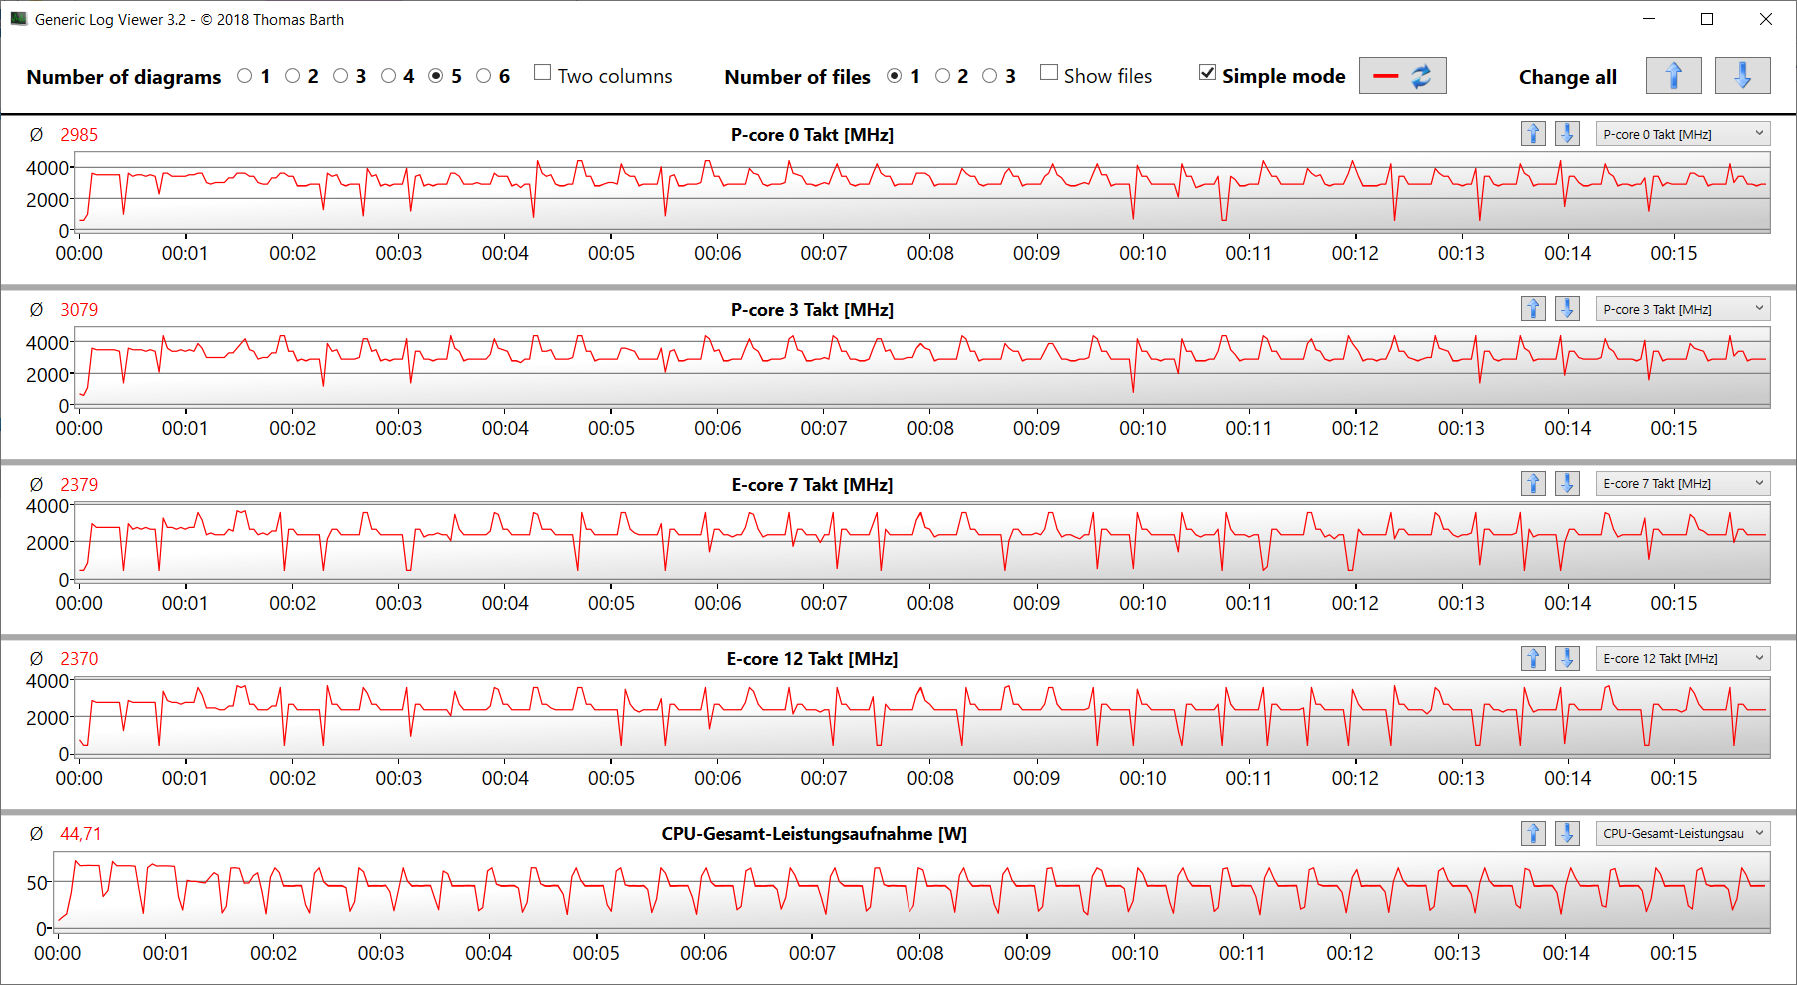
Procesor przechodzi w teście wielowątkowym benchmarku Cinebench R15 z taktowaniem w średnim zakresie Turbo (P: 3,3 - 3,4 GHz, E: 2,8 - 2,9 GHz). W teście jednowątkowym zastosowano pełne taktowanie Turbo (P: 3,5 - 4,8 GHz, E: 400 MHz - 3,5 GHz). W trybie pracy na akumulatorze prędkości taktowania są minimalnie niższe. Używamy tutaj profilu "Wysoka wydajność". Podczas korzystania z pozostałych trzech profili zasilania prędkości taktowania są w części znacznie niższe
Test pętli CB15 potwierdza wprawdzie stałe wykorzystanie prędkości Turbo procesora, ale po trzecim przebiegu prędkość taktowania nieco spada.
Cinebench R15 Multi Constant Load Test
| CPU Performance rating - Percent | |
| Przeciętny Intel Core i7-1280P | |
| MSI Summit E16 Flip A12UDT-031 | |
| Średnia w klasie Convertible | |
| Dell Inspiron 16 7620 2-in-1 | |
| Asus ExpertBook B2 Flip B2502FBA-N80141X | |
| Samsung Galaxy Book Pro 360 15 NP950QDB-KC3DE | |
| Cinebench R23 | |
| Multi Core | |
| MSI Summit E16 Flip A12UDT-031 | |
| Przeciętny Intel Core i7-1280P (8632 - 14803, n=8) | |
| Średnia w klasie Convertible (1317 - 30959, n=50, ostatnie 2 lata) | |
| Dell Inspiron 16 7620 2-in-1 | |
| Asus ExpertBook B2 Flip B2502FBA-N80141X | |
| Samsung Galaxy Book Pro 360 15 NP950QDB-KC3DE | |
| Single Core | |
| Średnia w klasie Convertible (740 - 2188, n=50, ostatnie 2 lata) | |
| Przeciętny Intel Core i7-1280P (1609 - 1787, n=7) | |
| Dell Inspiron 16 7620 2-in-1 | |
| MSI Summit E16 Flip A12UDT-031 | |
| Asus ExpertBook B2 Flip B2502FBA-N80141X | |
| Samsung Galaxy Book Pro 360 15 NP950QDB-KC3DE | |
| Cinebench R20 | |
| CPU (Multi Core) | |
| MSI Summit E16 Flip A12UDT-031 | |
| Przeciętny Intel Core i7-1280P (3283 - 5415, n=8) | |
| Średnia w klasie Convertible (595 - 12102, n=50, ostatnie 2 lata) | |
| Dell Inspiron 16 7620 2-in-1 | |
| Asus ExpertBook B2 Flip B2502FBA-N80141X | |
| Samsung Galaxy Book Pro 360 15 NP950QDB-KC3DE | |
| CPU (Single Core) | |
| Średnia w klasie Convertible (273 - 834, n=50, ostatnie 2 lata) | |
| Przeciętny Intel Core i7-1280P (615 - 701, n=8) | |
| Dell Inspiron 16 7620 2-in-1 | |
| MSI Summit E16 Flip A12UDT-031 | |
| Asus ExpertBook B2 Flip B2502FBA-N80141X | |
| Samsung Galaxy Book Pro 360 15 NP950QDB-KC3DE | |
| Cinebench R15 | |
| CPU Multi 64Bit | |
| MSI Summit E16 Flip A12UDT-031 | |
| Przeciętny Intel Core i7-1280P (1905 - 2332, n=7) | |
| Średnia w klasie Convertible (478 - 4940, n=49, ostatnie 2 lata) | |
| Dell Inspiron 16 7620 2-in-1 | |
| Asus ExpertBook B2 Flip B2502FBA-N80141X | |
| Samsung Galaxy Book Pro 360 15 NP950QDB-KC3DE | |
| CPU Single 64Bit | |
| Średnia w klasie Convertible (149.8 - 317, n=49, ostatnie 2 lata) | |
| Dell Inspiron 16 7620 2-in-1 | |
| MSI Summit E16 Flip A12UDT-031 | |
| Przeciętny Intel Core i7-1280P (203 - 258, n=7) | |
| Asus ExpertBook B2 Flip B2502FBA-N80141X | |
| Samsung Galaxy Book Pro 360 15 NP950QDB-KC3DE | |
| Blender - v2.79 BMW27 CPU | |
| Samsung Galaxy Book Pro 360 15 NP950QDB-KC3DE | |
| Asus ExpertBook B2 Flip B2502FBA-N80141X | |
| Średnia w klasie Convertible (105 - 1051, n=49, ostatnie 2 lata) | |
| Dell Inspiron 16 7620 2-in-1 | |
| MSI Summit E16 Flip A12UDT-031 | |
| Przeciętny Intel Core i7-1280P (259 - 309, n=7) | |
| 7-Zip 18.03 | |
| 7z b 4 | |
| Przeciętny Intel Core i7-1280P (45292 - 53710, n=7) | |
| MSI Summit E16 Flip A12UDT-031 | |
| Średnia w klasie Convertible (12977 - 121368, n=49, ostatnie 2 lata) | |
| Dell Inspiron 16 7620 2-in-1 | |
| Asus ExpertBook B2 Flip B2502FBA-N80141X | |
| Samsung Galaxy Book Pro 360 15 NP950QDB-KC3DE | |
| 7z b 4 -mmt1 | |
| Przeciętny Intel Core i7-1280P (4995 - 5874, n=7) | |
| Dell Inspiron 16 7620 2-in-1 | |
| Asus ExpertBook B2 Flip B2502FBA-N80141X | |
| Średnia w klasie Convertible (3672 - 6655, n=49, ostatnie 2 lata) | |
| MSI Summit E16 Flip A12UDT-031 | |
| Samsung Galaxy Book Pro 360 15 NP950QDB-KC3DE | |
| Geekbench 5.5 | |
| Multi-Core | |
| Przeciętny Intel Core i7-1280P (9623 - 11811, n=7) | |
| Średnia w klasie Convertible (1608 - 22023, n=49, ostatnie 2 lata) | |
| MSI Summit E16 Flip A12UDT-031 | |
| Dell Inspiron 16 7620 2-in-1 | |
| Asus ExpertBook B2 Flip B2502FBA-N80141X | |
| Samsung Galaxy Book Pro 360 15 NP950QDB-KC3DE | |
| Single-Core | |
| Średnia w klasie Convertible (806 - 2275, n=49, ostatnie 2 lata) | |
| Asus ExpertBook B2 Flip B2502FBA-N80141X | |
| Przeciętny Intel Core i7-1280P (1571 - 1802, n=7) | |
| Dell Inspiron 16 7620 2-in-1 | |
| MSI Summit E16 Flip A12UDT-031 | |
| Samsung Galaxy Book Pro 360 15 NP950QDB-KC3DE | |
| HWBOT x265 Benchmark v2.2 - 4k Preset | |
| Średnia w klasie Convertible (3.43 - 36.2, n=49, ostatnie 2 lata) | |
| Przeciętny Intel Core i7-1280P (9.62 - 14.5, n=5) | |
| MSI Summit E16 Flip A12UDT-031 | |
| Dell Inspiron 16 7620 2-in-1 | |
| Asus ExpertBook B2 Flip B2502FBA-N80141X | |
| Samsung Galaxy Book Pro 360 15 NP950QDB-KC3DE | |
| LibreOffice - 20 Documents To PDF | |
| Średnia w klasie Convertible (42.5 - 84.3, n=49, ostatnie 2 lata) | |
| Samsung Galaxy Book Pro 360 15 NP950QDB-KC3DE | |
| MSI Summit E16 Flip A12UDT-031 | |
| Przeciętny Intel Core i7-1280P (41 - 61.6, n=8) | |
| Dell Inspiron 16 7620 2-in-1 | |
| Asus ExpertBook B2 Flip B2502FBA-N80141X | |
| R Benchmark 2.5 - Overall mean | |
| Samsung Galaxy Book Pro 360 15 NP950QDB-KC3DE | |
| MSI Summit E16 Flip A12UDT-031 | |
| Dell Inspiron 16 7620 2-in-1 | |
| Średnia w klasie Convertible (0.3915 - 0.84, n=49, ostatnie 2 lata) | |
| Asus ExpertBook B2 Flip B2502FBA-N80141X | |
| Przeciętny Intel Core i7-1280P (0.4505 - 0.512, n=7) | |
* ... im mniej tym lepiej
AIDA64: FP32 Ray-Trace | FPU Julia | CPU SHA3 | CPU Queen | FPU SinJulia | FPU Mandel | CPU AES | CPU ZLib | FP64 Ray-Trace | CPU PhotoWorxx
| Performance rating | |
| MSI Summit E16 Flip A12UDT-031 | |
| Średnia w klasie Convertible | |
| Przeciętny Intel Core i7-1280P | |
| Samsung Galaxy Book Pro 360 15 NP950QDB-KC3DE | |
| Dell Inspiron 16 7620 2-in-1 | |
| Asus ExpertBook B2 Flip B2502FBA-N80141X | |
| AIDA64 / FP32 Ray-Trace | |
| Średnia w klasie Convertible (1480 - 64158, n=49, ostatnie 2 lata) | |
| MSI Summit E16 Flip A12UDT-031 | |
| Przeciętny Intel Core i7-1280P (7466 - 13068, n=6) | |
| Samsung Galaxy Book Pro 360 15 NP950QDB-KC3DE | |
| Asus ExpertBook B2 Flip B2502FBA-N80141X | |
| Dell Inspiron 16 7620 2-in-1 | |
| AIDA64 / FPU Julia | |
| MSI Summit E16 Flip A12UDT-031 | |
| Średnia w klasie Convertible (11392 - 184800, n=49, ostatnie 2 lata) | |
| Przeciętny Intel Core i7-1280P (38904 - 66081, n=6) | |
| Asus ExpertBook B2 Flip B2502FBA-N80141X | |
| Samsung Galaxy Book Pro 360 15 NP950QDB-KC3DE | |
| Dell Inspiron 16 7620 2-in-1 | |
| AIDA64 / CPU SHA3 | |
| MSI Summit E16 Flip A12UDT-031 | |
| Średnia w klasie Convertible (797 - 8291, n=49, ostatnie 2 lata) | |
| Przeciętny Intel Core i7-1280P (1826 - 2992, n=6) | |
| Samsung Galaxy Book Pro 360 15 NP950QDB-KC3DE | |
| Dell Inspiron 16 7620 2-in-1 | |
| Asus ExpertBook B2 Flip B2502FBA-N80141X | |
| AIDA64 / CPU Queen | |
| MSI Summit E16 Flip A12UDT-031 | |
| Przeciętny Intel Core i7-1280P (80180 - 100358, n=6) | |
| Dell Inspiron 16 7620 2-in-1 | |
| Średnia w klasie Convertible (14686 - 148874, n=41, ostatnie 2 lata) | |
| Asus ExpertBook B2 Flip B2502FBA-N80141X | |
| Samsung Galaxy Book Pro 360 15 NP950QDB-KC3DE | |
| AIDA64 / FPU SinJulia | |
| MSI Summit E16 Flip A12UDT-031 | |
| Przeciętny Intel Core i7-1280P (5880 - 8571, n=6) | |
| Średnia w klasie Convertible (1120 - 29155, n=49, ostatnie 2 lata) | |
| Dell Inspiron 16 7620 2-in-1 | |
| Asus ExpertBook B2 Flip B2502FBA-N80141X | |
| Samsung Galaxy Book Pro 360 15 NP950QDB-KC3DE | |
| AIDA64 / FPU Mandel | |
| MSI Summit E16 Flip A12UDT-031 | |
| Średnia w klasie Convertible (4929 - 97193, n=49, ostatnie 2 lata) | |
| Przeciętny Intel Core i7-1280P (18907 - 32766, n=6) | |
| Samsung Galaxy Book Pro 360 15 NP950QDB-KC3DE | |
| Asus ExpertBook B2 Flip B2502FBA-N80141X | |
| Dell Inspiron 16 7620 2-in-1 | |
| AIDA64 / CPU AES | |
| Samsung Galaxy Book Pro 360 15 NP950QDB-KC3DE | |
| MSI Summit E16 Flip A12UDT-031 | |
| Przeciętny Intel Core i7-1280P (40691 - 99367, n=6) | |
| Średnia w klasie Convertible (5271 - 190280, n=49, ostatnie 2 lata) | |
| Dell Inspiron 16 7620 2-in-1 | |
| Asus ExpertBook B2 Flip B2502FBA-N80141X | |
| AIDA64 / CPU ZLib | |
| MSI Summit E16 Flip A12UDT-031 | |
| Przeciętny Intel Core i7-1280P (540 - 880, n=6) | |
| Średnia w klasie Convertible (218 - 2017, n=49, ostatnie 2 lata) | |
| Dell Inspiron 16 7620 2-in-1 | |
| Asus ExpertBook B2 Flip B2502FBA-N80141X | |
| Samsung Galaxy Book Pro 360 15 NP950QDB-KC3DE | |
| AIDA64 / FP64 Ray-Trace | |
| Średnia w klasie Convertible (1169 - 34297, n=49, ostatnie 2 lata) | |
| MSI Summit E16 Flip A12UDT-031 | |
| Przeciętny Intel Core i7-1280P (4006 - 7184, n=6) | |
| Samsung Galaxy Book Pro 360 15 NP950QDB-KC3DE | |
| Asus ExpertBook B2 Flip B2502FBA-N80141X | |
| Dell Inspiron 16 7620 2-in-1 | |
| AIDA64 / CPU PhotoWorxx | |
| Średnia w klasie Convertible (14193 - 85327, n=49, ostatnie 2 lata) | |
| Przeciętny Intel Core i7-1280P (36663 - 48416, n=6) | |
| MSI Summit E16 Flip A12UDT-031 | |
| Samsung Galaxy Book Pro 360 15 NP950QDB-KC3DE | |
| Asus ExpertBook B2 Flip B2502FBA-N80141X | |
| Dell Inspiron 16 7620 2-in-1 | |
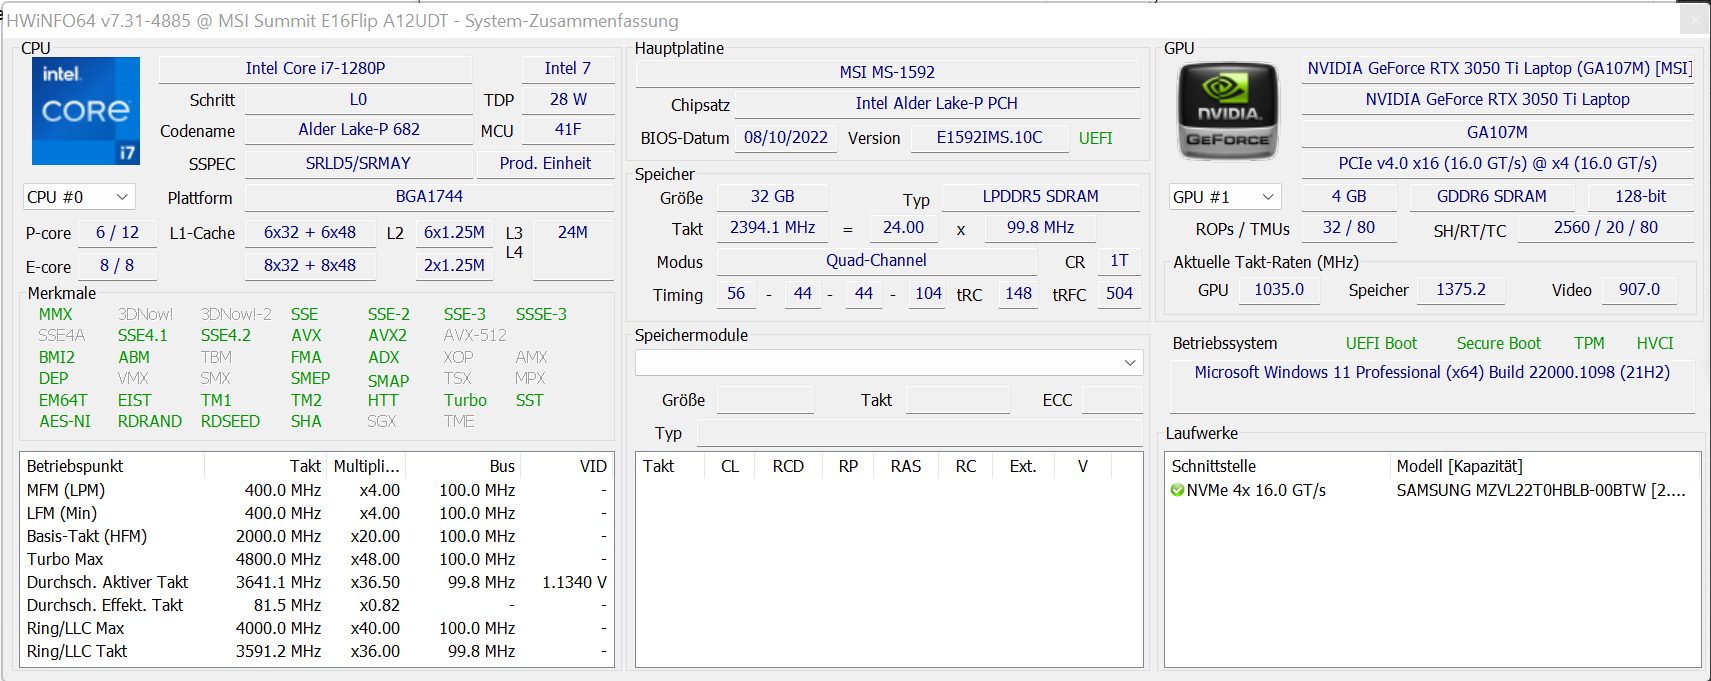
Wydajność systemu
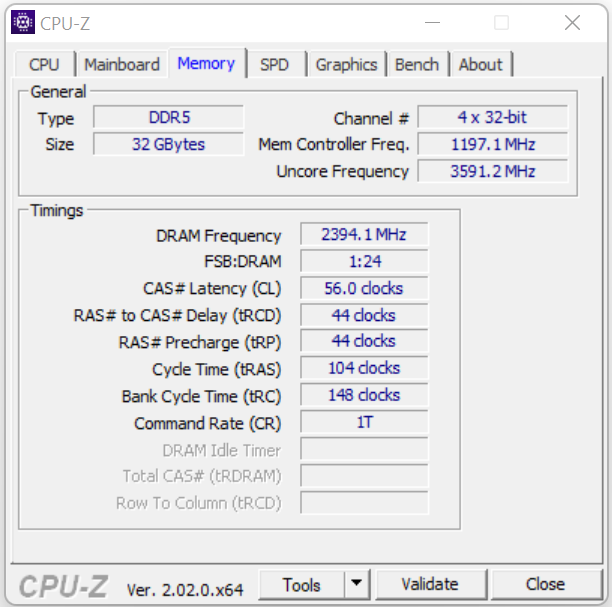
Płynnie działający system zapewnia więcej niż wystarczającą wydajność dla aplikacji biurowych i internetowych. Dedykowany rdzeń graficzny pozwala również na uruchamianie zadań intensywnie wykorzystujących grafikę. Transfery pamięci roboczej są na normalnym poziomie dla pamięci LPDDR5-4800 (tryb dwukanałowy, lutowany, bez banków pamięci). Towarzyszą temu bardzo dobre wyniki w programie PC-Mark.
CrossMark: Overall | Productivity | Creativity | Responsiveness
| PCMark 10 / Score | |
| Średnia w klasie Convertible (3229 - 10123, n=46, ostatnie 2 lata) | |
| Przeciętny Intel Core i7-1280P, NVIDIA GeForce RTX 3050 Ti Laptop GPU (5984 - 6379, n=2) | |
| MSI Summit E16 Flip A12UDT-031 | |
| Dell Inspiron 16 7620 2-in-1 | |
| Samsung Galaxy Book Pro 360 15 NP950QDB-KC3DE | |
| Asus ExpertBook B2 Flip B2502FBA-N80141X | |
| PCMark 10 / Essentials | |
| Średnia w klasie Convertible (7233 - 12222, n=46, ostatnie 2 lata) | |
| Przeciętny Intel Core i7-1280P, NVIDIA GeForce RTX 3050 Ti Laptop GPU (9687 - 10227, n=2) | |
| MSI Summit E16 Flip A12UDT-031 | |
| Samsung Galaxy Book Pro 360 15 NP950QDB-KC3DE | |
| Dell Inspiron 16 7620 2-in-1 | |
| Asus ExpertBook B2 Flip B2502FBA-N80141X | |
| PCMark 10 / Productivity | |
| Średnia w klasie Convertible (5062 - 17914, n=46, ostatnie 2 lata) | |
| Przeciętny Intel Core i7-1280P, NVIDIA GeForce RTX 3050 Ti Laptop GPU (7521 - 9165, n=2) | |
| MSI Summit E16 Flip A12UDT-031 | |
| Samsung Galaxy Book Pro 360 15 NP950QDB-KC3DE | |
| Asus ExpertBook B2 Flip B2502FBA-N80141X | |
| Dell Inspiron 16 7620 2-in-1 | |
| PCMark 10 / Digital Content Creation | |
| Średnia w klasie Convertible (2496 - 16551, n=46, ostatnie 2 lata) | |
| MSI Summit E16 Flip A12UDT-031 | |
| Przeciętny Intel Core i7-1280P, NVIDIA GeForce RTX 3050 Ti Laptop GPU (7518 - 7980, n=2) | |
| Dell Inspiron 16 7620 2-in-1 | |
| Asus ExpertBook B2 Flip B2502FBA-N80141X | |
| Samsung Galaxy Book Pro 360 15 NP950QDB-KC3DE | |
| CrossMark / Overall | |
| Przeciętny Intel Core i7-1280P, NVIDIA GeForce RTX 3050 Ti Laptop GPU (1652 - 1671, n=2) | |
| MSI Summit E16 Flip A12UDT-031 | |
| Średnia w klasie Convertible (524 - 2274, n=50, ostatnie 2 lata) | |
| Dell Inspiron 16 7620 2-in-1 | |
| Asus ExpertBook B2 Flip B2502FBA-N80141X | |
| CrossMark / Productivity | |
| Przeciętny Intel Core i7-1280P, NVIDIA GeForce RTX 3050 Ti Laptop GPU (1583 - 1618, n=2) | |
| MSI Summit E16 Flip A12UDT-031 | |
| Średnia w klasie Convertible (554 - 1942, n=50, ostatnie 2 lata) | |
| Asus ExpertBook B2 Flip B2502FBA-N80141X | |
| Dell Inspiron 16 7620 2-in-1 | |
| CrossMark / Creativity | |
| Średnia w klasie Convertible (550 - 2949, n=50, ostatnie 2 lata) | |
| MSI Summit E16 Flip A12UDT-031 | |
| Przeciętny Intel Core i7-1280P, NVIDIA GeForce RTX 3050 Ti Laptop GPU (1752 - 1761, n=2) | |
| Dell Inspiron 16 7620 2-in-1 | |
| Asus ExpertBook B2 Flip B2502FBA-N80141X | |
| CrossMark / Responsiveness | |
| Przeciętny Intel Core i7-1280P, NVIDIA GeForce RTX 3050 Ti Laptop GPU (1550 - 1594, n=2) | |
| MSI Summit E16 Flip A12UDT-031 | |
| Asus ExpertBook B2 Flip B2502FBA-N80141X | |
| Średnia w klasie Convertible (381 - 1719, n=50, ostatnie 2 lata) | |
| Dell Inspiron 16 7620 2-in-1 | |
| PCMark 10 Score | 5984 pkt. | |
Pomoc | ||
| AIDA64 / Memory Copy | |
| Średnia w klasie Convertible (23880 - 161475, n=49, ostatnie 2 lata) | |
| Przeciętny Intel Core i7-1280P (56337 - 73486, n=6) | |
| MSI Summit E16 Flip A12UDT-031 | |
| Samsung Galaxy Book Pro 360 15 NP950QDB-KC3DE | |
| Asus ExpertBook B2 Flip B2502FBA-N80141X | |
| Dell Inspiron 16 7620 2-in-1 | |
| AIDA64 / Memory Read | |
| Średnia w klasie Convertible (19931 - 131960, n=49, ostatnie 2 lata) | |
| Przeciętny Intel Core i7-1280P (63221 - 73719, n=6) | |
| MSI Summit E16 Flip A12UDT-031 | |
| Samsung Galaxy Book Pro 360 15 NP950QDB-KC3DE | |
| Asus ExpertBook B2 Flip B2502FBA-N80141X | |
| Dell Inspiron 16 7620 2-in-1 | |
| AIDA64 / Memory Write | |
| Średnia w klasie Convertible (17473 - 216896, n=49, ostatnie 2 lata) | |
| Samsung Galaxy Book Pro 360 15 NP950QDB-KC3DE | |
| Przeciętny Intel Core i7-1280P (58729 - 68247, n=6) | |
| MSI Summit E16 Flip A12UDT-031 | |
| Asus ExpertBook B2 Flip B2502FBA-N80141X | |
| Dell Inspiron 16 7620 2-in-1 | |
| AIDA64 / Memory Latency | |
| MSI Summit E16 Flip A12UDT-031 | |
| Średnia w klasie Convertible (6.9 - 536, n=48, ostatnie 2 lata) | |
| Przeciętny Intel Core i7-1280P (93.1 - 153.3, n=6) | |
| Samsung Galaxy Book Pro 360 15 NP950QDB-KC3DE | |
| Asus ExpertBook B2 Flip B2502FBA-N80141X | |
* ... im mniej tym lepiej
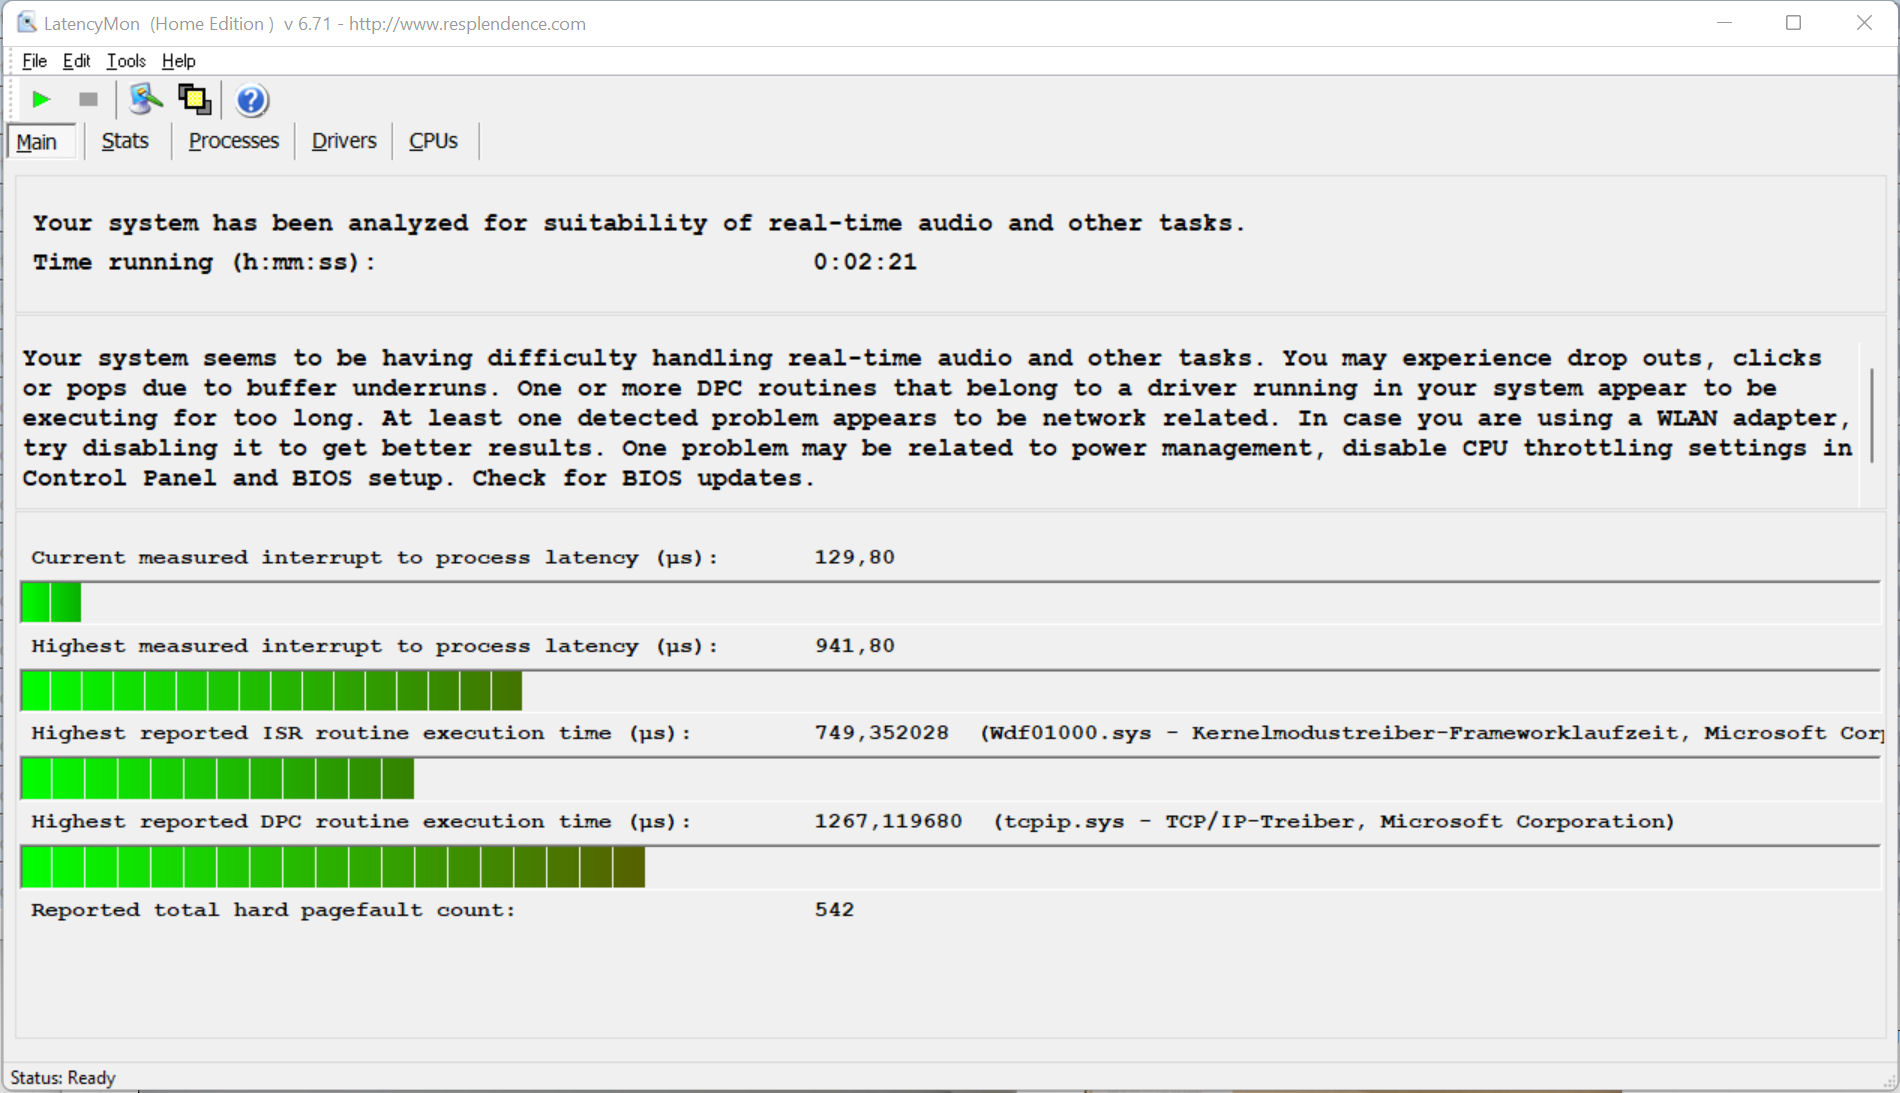
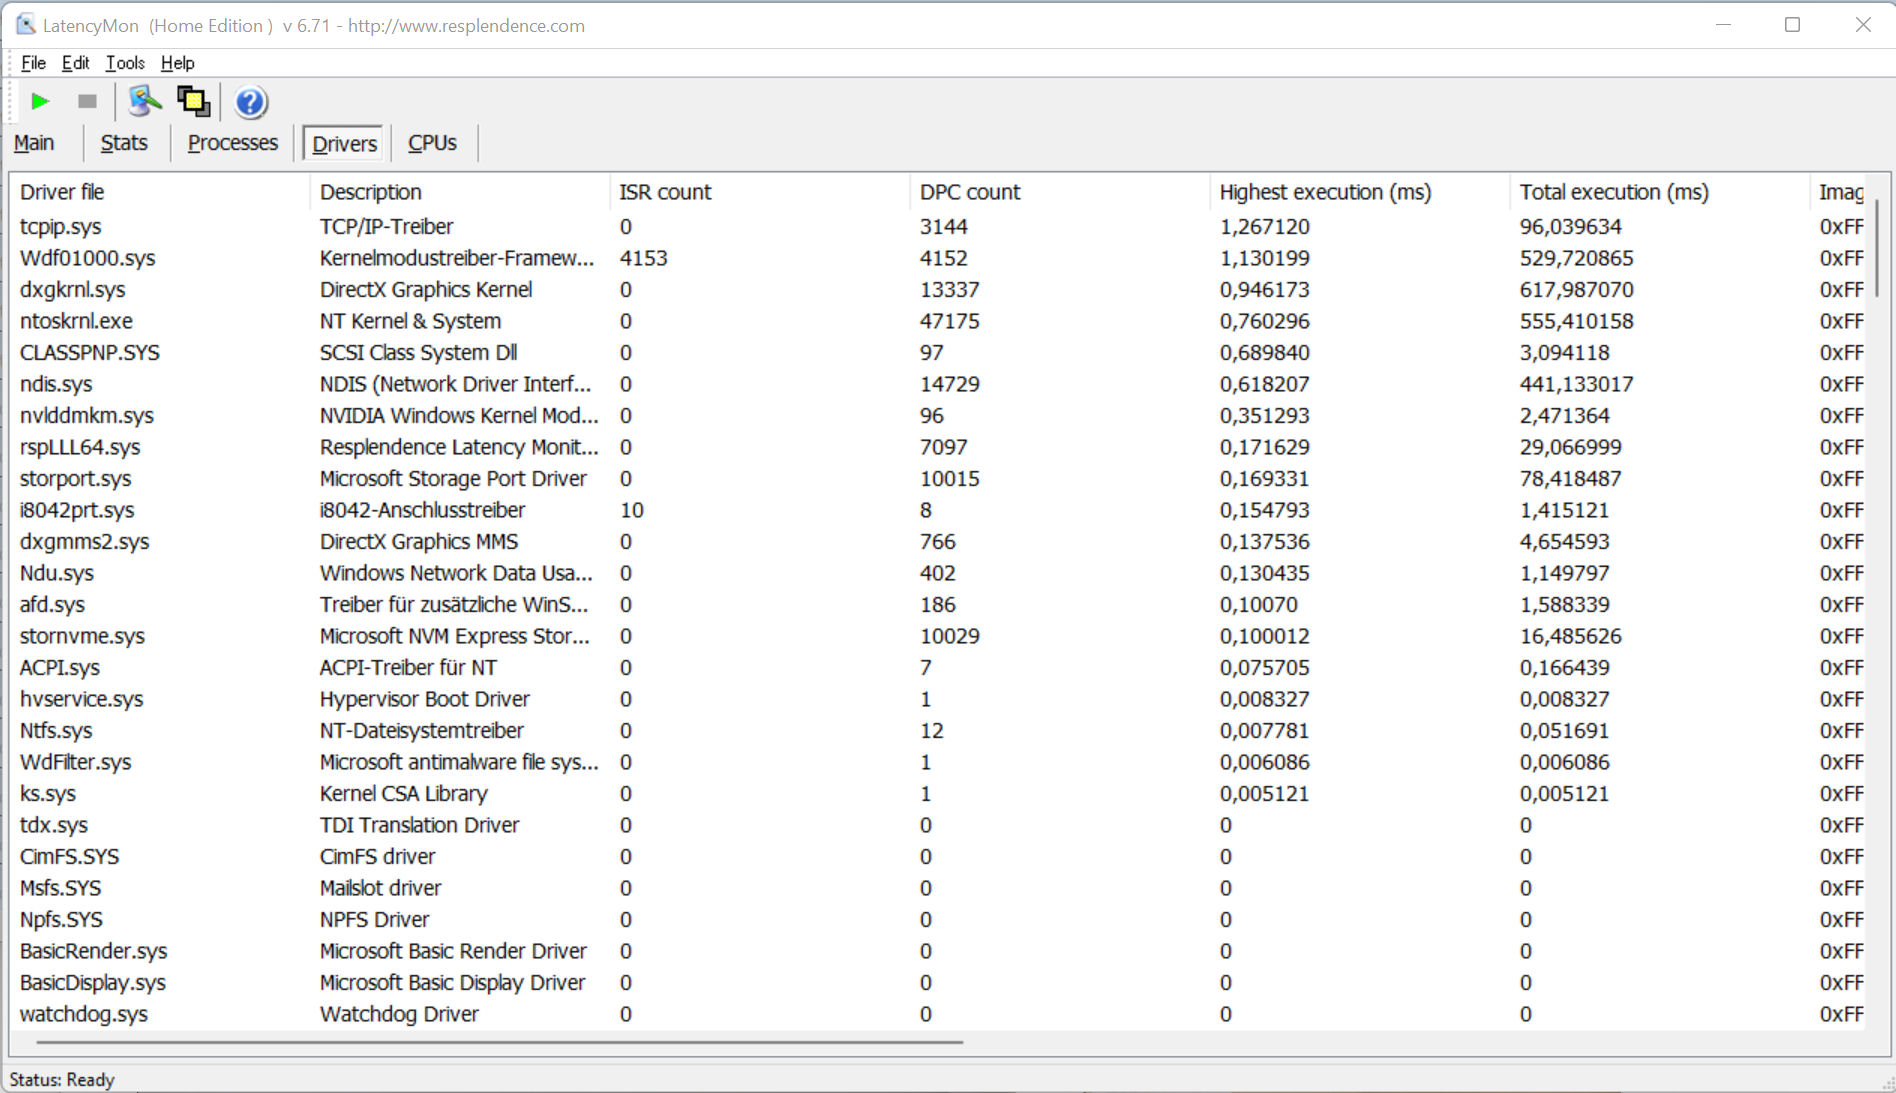
Opóźnienia DPC
Standardowy test Latency Monitor (przeglądanie stron internetowych, odtwarzanie filmów 4k, Prime95 High Load) ujawnia pewne widoczne zachowania w latencjach DCP. System nie wydaje się być przystosowany do przetwarzania wideo i audio w czasie rzeczywistym. Niektóre przyszłe aktualizacje oprogramowania mogą przynieść pewne ulepszenia lub nawet pogorszyć sytuację.
| DPC Latencies / LatencyMon - interrupt to process latency (max), Web, Youtube, Prime95 | |
| Samsung Galaxy Book Pro 360 15 NP950QDB-KC3DE | |
| MSI Summit E16 Flip A12UDT-031 | |
| Asus ExpertBook B2 Flip B2502FBA-N80141X | |
| Dell Inspiron 16 7620 2-in-1 | |
* ... im mniej tym lepiej
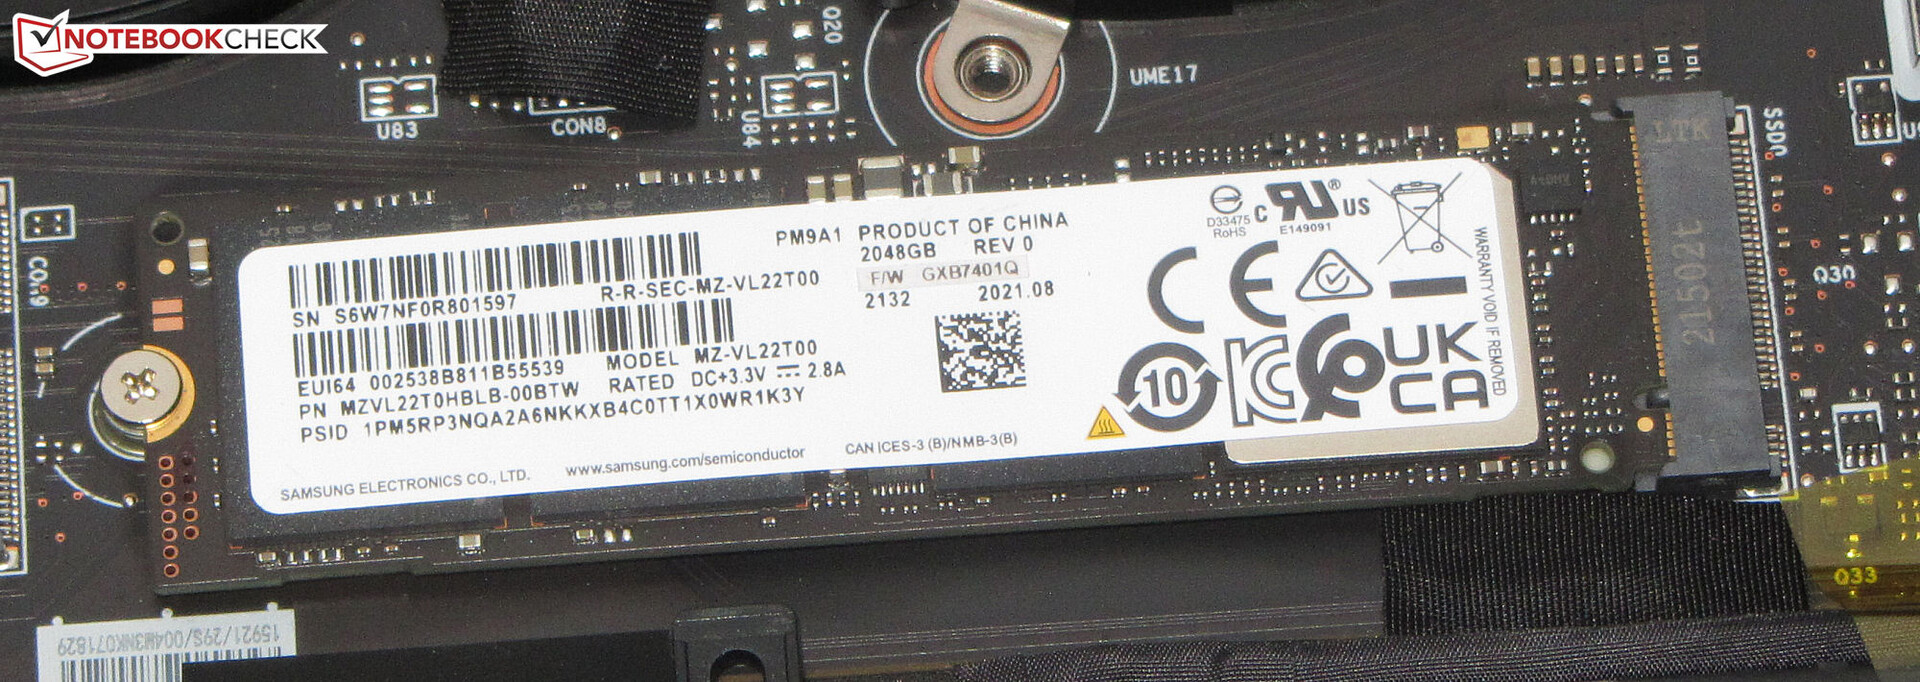
Rozwiązanie w zakresie przechowywania
Jako dysk systemowy służy dysk SSD PCIe 4 (M.2-2280) od Samsunga o pojemności 2 TB. Prędkości transferu okazują się znakomite.

| Drive Performance rating - Percent | |
| Asus ExpertBook B2 Flip B2502FBA-N80141X | |
| MSI Summit E16 Flip A12UDT-031 | |
| Przeciętny Samsung PM9A1 MZVL22T0HBLB | |
| Średnia w klasie Convertible | |
| Samsung Galaxy Book Pro 360 15 NP950QDB-KC3DE | |
| Dell Inspiron 16 7620 2-in-1 | |
* ... im mniej tym lepiej
Constant Performance Reading: DiskSpd Read Loop, Queue Depth 8
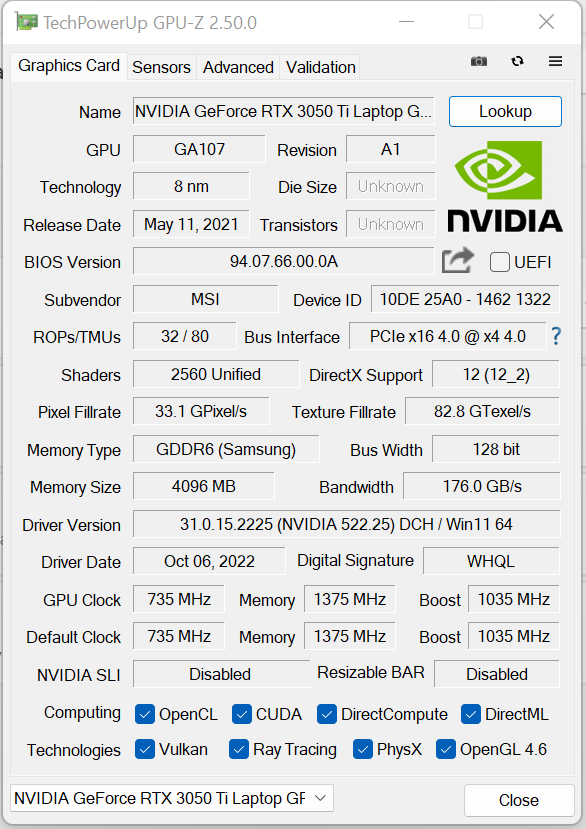
Karta graficzna
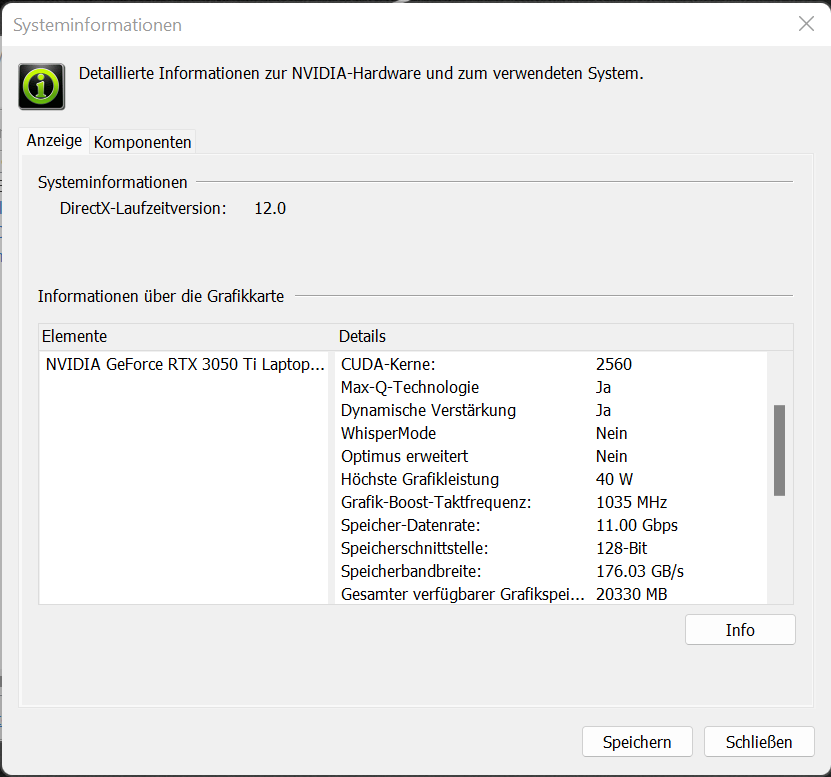
Mimo ustawienia TGP na poziomie 40 W na dole możliwości, wbudowany GeForce RTX 3050 Ti LaptopgPU (VRAM: 4 GB GDDR6) zapewnia wyniki w benchmarkach i liczbę klatek na sekundę, które zbliżają się do średniej dla ustalonego do tej pory RTX 3050 Ti. TGP nie jest jednak w pełni wykorzystywany, co pokazuje test Witcher 3.
Omawiany laptop pozwala na rozgrywkę w rozdzielczości FHD na ustawieniach wysokich do maksymalnych. Korzystanie z pełnej rozdzielczości wyświetlacza wymaga często zmniejszenia ustawień. Kabriolet nie oferuje trybu dGPU.

| 3DMark Performance rating - Percent | |
| Dell Inspiron 16 Plus 7620 | |
| Asus Zenbook Pro 15 OLED UM535Q | |
| MSI Summit E16 Flip A12UDT-031 | |
| Przeciętny NVIDIA GeForce RTX 3050 Ti Laptop GPU | |
| Średnia w klasie Convertible | |
| Samsung Galaxy Book Pro 360 15 NP950QDB-KC3DE -1! | |
| Dell Inspiron 16 7620 2-in-1 | |
| Asus ExpertBook B2 Flip B2502FBA-N80141X | |
| 3DMark 11 - 1280x720 Performance GPU | |
| Dell Inspiron 16 Plus 7620 | |
| MSI Summit E16 Flip A12UDT-031 | |
| Przeciętny NVIDIA GeForce RTX 3050 Ti Laptop GPU (7952 - 20905, n=27) | |
| Asus Zenbook Pro 15 OLED UM535Q | |
| Średnia w klasie Convertible (1505 - 40732, n=49, ostatnie 2 lata) | |
| Dell Inspiron 16 7620 2-in-1 | |
| Asus ExpertBook B2 Flip B2502FBA-N80141X | |
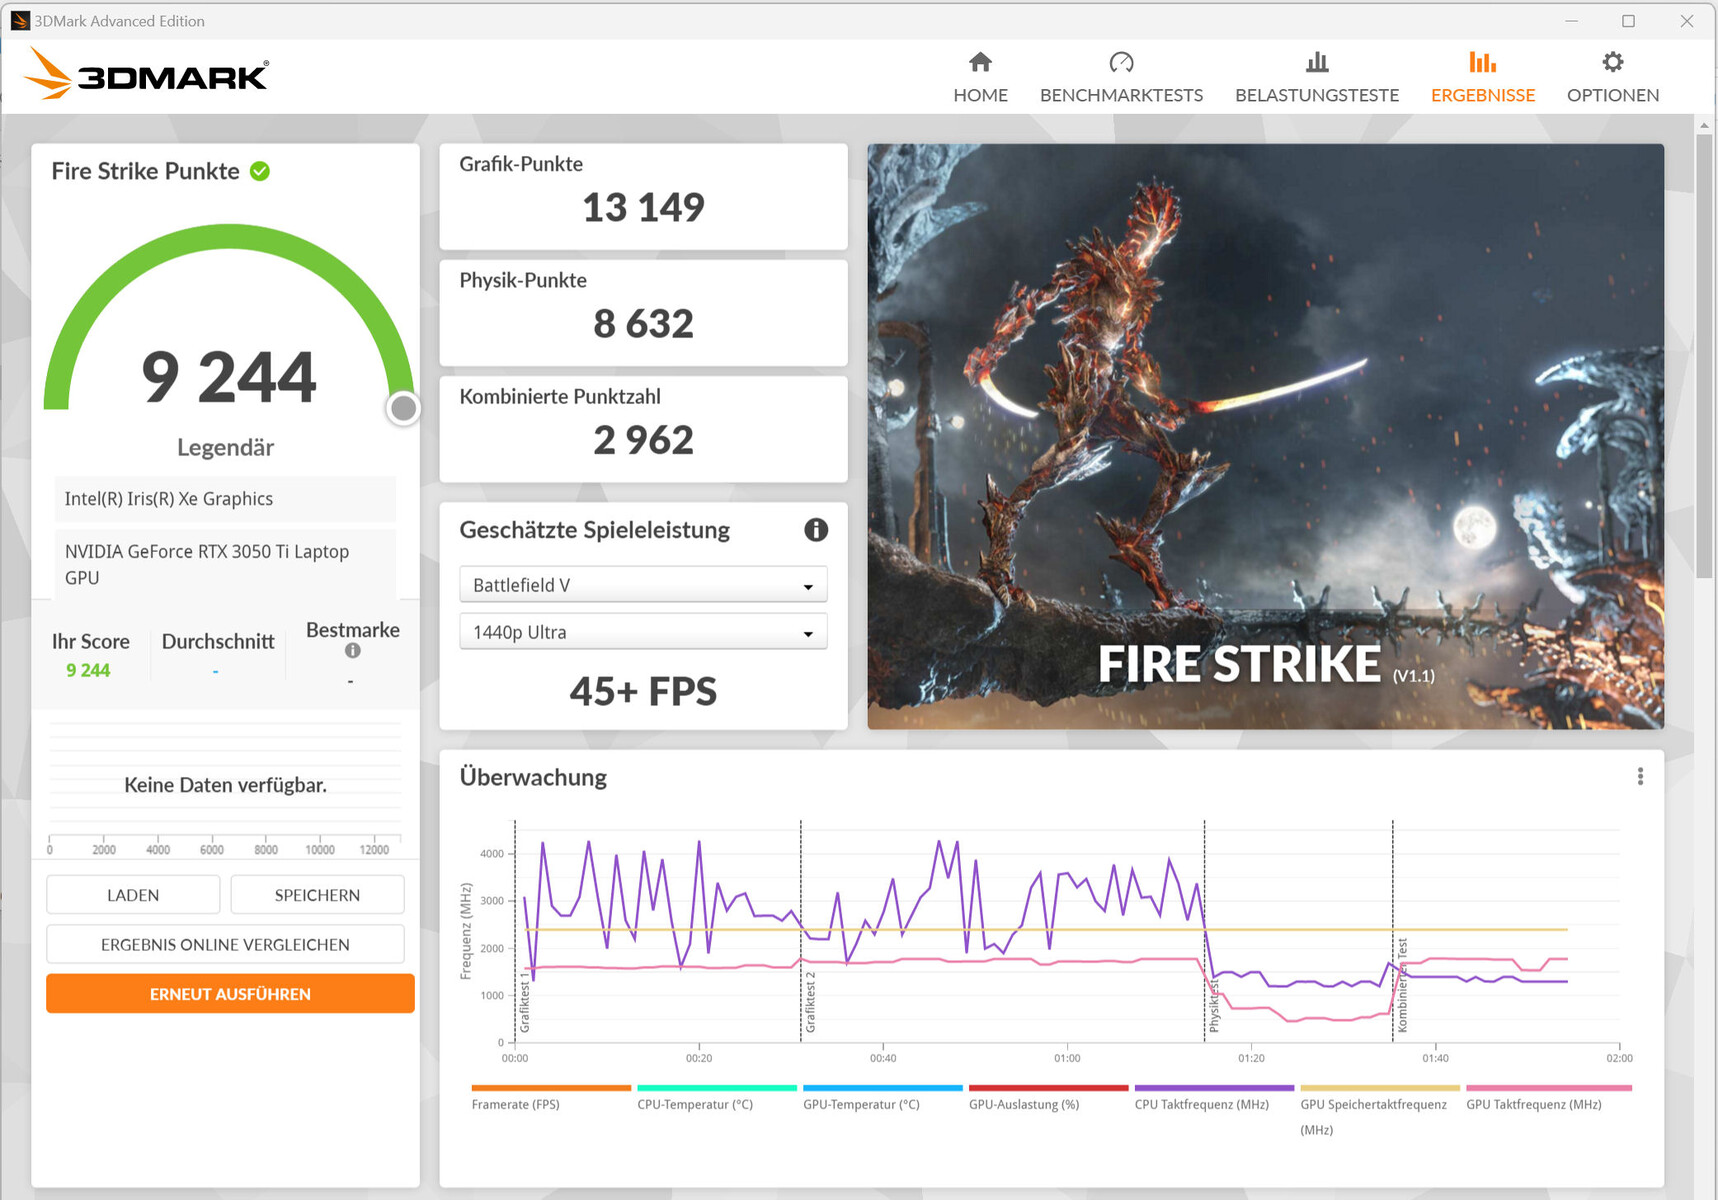
| 3DMark 11 Performance | 17757 pkt. | |
| 3DMark Cloud Gate Standard Score | 42521 pkt. | |
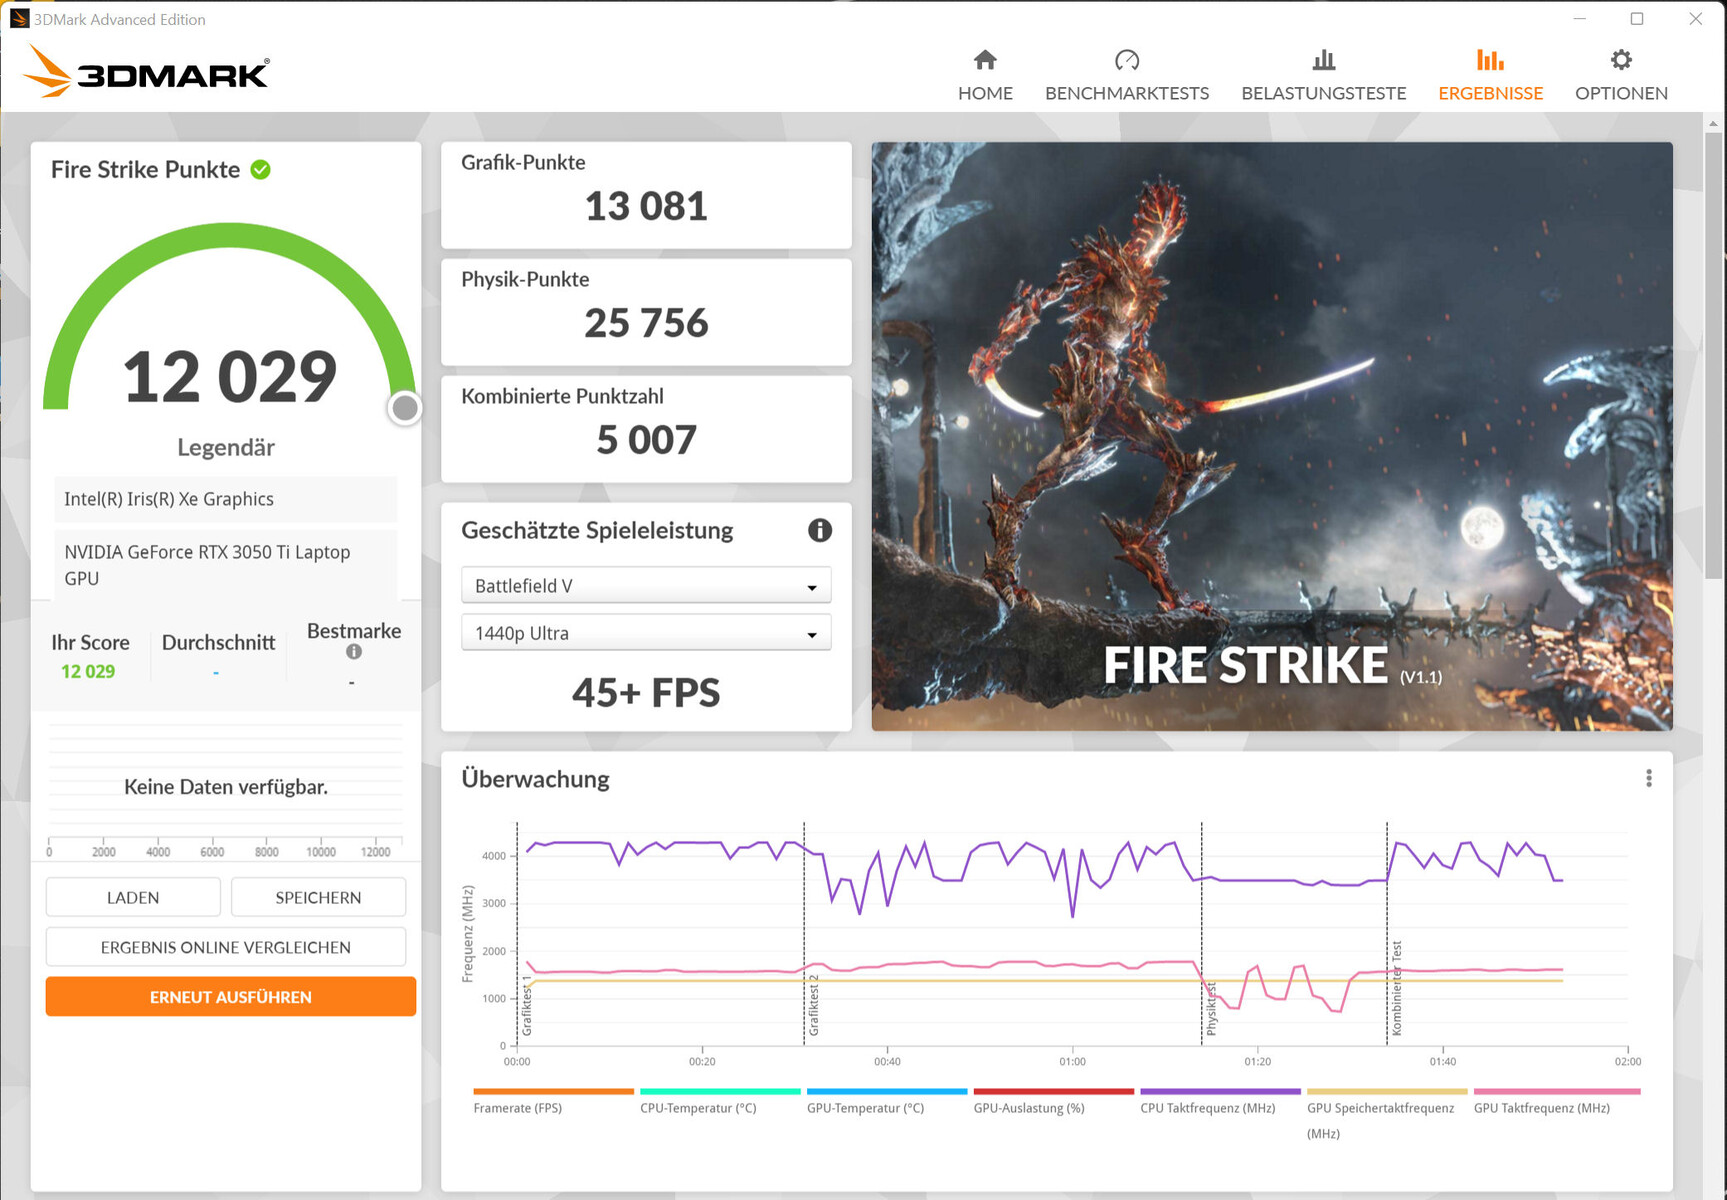
| 3DMark Fire Strike Score | 12029 pkt. | |
| 3DMark Time Spy Score | 5563 pkt. | |
Pomoc | ||
| Blender | |
| v3.3 Classroom OPTIX/RTX | |
| MSI Summit E16 Flip A12UDT-031 | |
| v3.3 Classroom CUDA | |
| MSI Summit E16 Flip A12UDT-031 | |
| v3.3 Classroom CPU | |
| Asus ExpertBook B2 Flip B2502FBA-N80141X | |
| Średnia w klasie Convertible (159 - 2067, n=50, ostatnie 2 lata) | |
| MSI Summit E16 Flip A12UDT-031 | |
* ... im mniej tym lepiej
| The Witcher 3 - 1920x1080 Ultra Graphics & Postprocessing (HBAO+) | |
| Dell Inspiron 16 Plus 7620 | |
| Asus Zenbook Pro 15 OLED UM535Q | |
| Przeciętny NVIDIA GeForce RTX 3050 Ti Laptop GPU (19 - 58.5, n=29) | |
| MSI Summit E16 Flip A12UDT-031 | |
| Średnia w klasie Convertible (11 - 101, n=6, ostatnie 2 lata) | |
| Dell Inspiron 16 7620 2-in-1 | |
| Asus ExpertBook B2 Flip B2502FBA-N80141X | |
| Dota 2 Reborn - 1920x1080 ultra (3/3) best looking | |
| Dell Inspiron 16 Plus 7620 | |
| MSI Summit E16 Flip A12UDT-031 | |
| Przeciętny NVIDIA GeForce RTX 3050 Ti Laptop GPU (67.3 - 145, n=27) | |
| Asus Zenbook Pro 15 OLED UM535Q | |
| Średnia w klasie Convertible (18.8 - 142, n=50, ostatnie 2 lata) | |
| Dell Inspiron 16 7620 2-in-1 | |
| Samsung Galaxy Book Pro 360 15 NP950QDB-KC3DE | |
| Asus ExpertBook B2 Flip B2502FBA-N80141X | |
| X-Plane 11.11 - 1920x1080 high (fps_test=3) | |
| Dell Inspiron 16 Plus 7620 | |
| MSI Summit E16 Flip A12UDT-031 | |
| Przeciętny NVIDIA GeForce RTX 3050 Ti Laptop GPU (48.8 - 100.6, n=27) | |
| Asus Zenbook Pro 15 OLED UM535Q | |
| Dell Inspiron 16 7620 2-in-1 | |
| Średnia w klasie Convertible (12.8 - 76.7, n=48, ostatnie 2 lata) | |
| Samsung Galaxy Book Pro 360 15 NP950QDB-KC3DE | |
| Asus ExpertBook B2 Flip B2502FBA-N80141X | |
| Final Fantasy XV Benchmark | |
| 1920x1080 High Quality | |
| Dell Inspiron 16 Plus 7620 | |
| Przeciętny NVIDIA GeForce RTX 3050 Ti Laptop GPU (23.5 - 106, n=24) | |
| Asus Zenbook Pro 15 OLED UM535Q | |
| MSI Summit E16 Flip A12UDT-031 | |
| Średnia w klasie Convertible (4.48 - 86.6, n=46, ostatnie 2 lata) | |
| Samsung Galaxy Book Pro 360 15 NP950QDB-KC3DE | |
| Dell Inspiron 16 7620 2-in-1 | |
| 2560x1440 High Quality | |
| Średnia w klasie Convertible (23.2 - 63.6, n=7, ostatnie 2 lata) | |
| Dell Inspiron 16 Plus 7620 | |
| MSI Summit E16 Flip A12UDT-031 | |
| Przeciętny NVIDIA GeForce RTX 3050 Ti Laptop GPU (18.4 - 53.1, n=11) | |
| Samsung Galaxy Book Pro 360 15 NP950QDB-KC3DE | |
| GTA V | |
| 1920x1080 Highest AA:4xMSAA + FX AF:16x | |
| Dell Inspiron 16 Plus 7620 | |
| Asus Zenbook Pro 15 OLED UM535Q | |
| Przeciętny NVIDIA GeForce RTX 3050 Ti Laptop GPU (27.8 - 75.6, n=26) | |
| MSI Summit E16 Flip A12UDT-031 | |
| Średnia w klasie Convertible (7.14 - 90.6, n=41, ostatnie 2 lata) | |
| Samsung Galaxy Book Pro 360 15 NP950QDB-KC3DE | |
| Dell Inspiron 16 7620 2-in-1 | |
| 2560x1440 Highest AA:4xMSAA + FX AF:16x | |
| Dell Inspiron 16 Plus 7620 | |
| Średnia w klasie Convertible (22.3 - 68.6, n=4, ostatnie 2 lata) | |
| MSI Summit E16 Flip A12UDT-031 | |
| Przeciętny NVIDIA GeForce RTX 3050 Ti Laptop GPU (22.8 - 53.4, n=9) | |
| Strange Brigade | |
| 1920x1080 ultra AA:ultra AF:16 | |
| Dell Inspiron 16 Plus 7620 | |
| MSI Summit E16 Flip A12UDT-031 | |
| Asus Zenbook Pro 15 OLED UM535Q | |
| Przeciętny NVIDIA GeForce RTX 3050 Ti Laptop GPU (34.8 - 101.3, n=25) | |
| Średnia w klasie Convertible (10.8 - 176.8, n=45, ostatnie 2 lata) | |
| Dell Inspiron 16 7620 2-in-1 | |
| Asus ExpertBook B2 Flip B2502FBA-N80141X | |
| 2560x1440 ultra AA:ultra AF:16 | |
| Średnia w klasie Convertible (35.7 - 113.1, n=5, ostatnie 2 lata) | |
| Dell Inspiron 16 Plus 7620 | |
| MSI Summit E16 Flip A12UDT-031 | |
| Przeciętny NVIDIA GeForce RTX 3050 Ti Laptop GPU (28.1 - 69.1, n=10) | |
| F1 22 - 1920x1080 High Preset AA:T AF:16x | |
| Przeciętny NVIDIA GeForce RTX 3050 Ti Laptop GPU (48 - 113, n=7) | |
| MSI Summit E16 Flip A12UDT-031 | |
| Średnia w klasie Convertible (23 - 70.3, n=12, ostatnie 2 lata) | |
The Witcher 3 FPS Chart
| low | med. | high | ultra | QHD | |
|---|---|---|---|---|---|
| GTA V (2015) | 179.7 | 173.8 | 114.3 | 57.1 | 41.4 |
| The Witcher 3 (2015) | 186.1 | 109.3 | 63.7 | 46.4 | |
| Dota 2 Reborn (2015) | 134.8 | 122.8 | 117.9 | 114.1 | |
| Final Fantasy XV Benchmark (2018) | 104.9 | 59.2 | 44.9 | 35.1 | |
| X-Plane 11.11 (2018) | 125.7 | 105.9 | 88.1 | ||
| Strange Brigade (2018) | 270 | 114.8 | 104.9 | 88.2 | 66.2 |
| F1 22 (2022) | 122.2 | 107.9 | 79.2 | 29.3 | 13.7 |
Emisje i zarządzanie energią - laptop 2 w 1 robi się bardzo głośny pod obciążeniem
Emisja hałasu
W codziennej pracy (Biuro, Internet) oba wentylatory nie wytwarzają nadmiernego hałasu, a nawet mogą sporadycznie milczeć. Pod średnim i dużym obciążeniem robią się jednak dość głośne, osiągając maksymalne natężenie hałasu 49,3 dB(A) lub 48,2 dB(A) podczas stress testu.
Do cichszej pracy laptop oferuje profile "Silent Mode" i "Super Battery", ale idzie to kosztem wydajności obliczeniowej. Akumulator "Super Battery" gwarantuje najniższy poziom hałasu, ale zapewnia też najniższą wydajność.
Hałas
| luz |
| 25 / 25 / 28.9 dB |
| obciążenie |
| 49.3 / 48.2 dB |
 | ||
30 dB cichy 40 dB(A) słyszalny 50 dB(A) irytujący |
||
min: | ||
| MSI Summit E16 Flip A12UDT-031 GeForce RTX 3050 Ti Laptop GPU, i7-1280P, Samsung PM9A1 MZVL22T0HBLB | Asus ExpertBook B2 Flip B2502FBA-N80141X Iris Xe G7 96EUs, i7-1260P, Samsung PM9A1 MZVL21T0HCLR | Samsung Galaxy Book Pro 360 15 NP950QDB-KC3DE Iris Xe G7 80EUs, i5-1135G7, Samsung PM991 MZVLQ256HAJD | Dell Inspiron 16 7620 2-in-1 Iris Xe G7 96EUs, i7-1260P, Toshiba KBG40ZNS512G NVMe | |
|---|---|---|---|---|
| Noise | -1% | 10% | 16% | |
| wyłączone / środowisko * (dB) | 25 | 26 -4% | 25 -0% | 23.2 7% |
| Idle Minimum * (dB) | 25 | 26.6 -6% | 25 -0% | 23.5 6% |
| Idle Average * (dB) | 25 | 27 -8% | 25 -0% | 23.5 6% |
| Idle Maximum * (dB) | 28.9 | 27 7% | 25 13% | 23.5 19% |
| Load Average * (dB) | 49.3 | 46.7 5% | 32.7 34% | 29.4 40% |
| Load Maximum * (dB) | 48.2 | 46.7 3% | 42 13% | 39.7 18% |
| Witcher 3 ultra * (dB) | 35.6 |
* ... im mniej tym lepiej
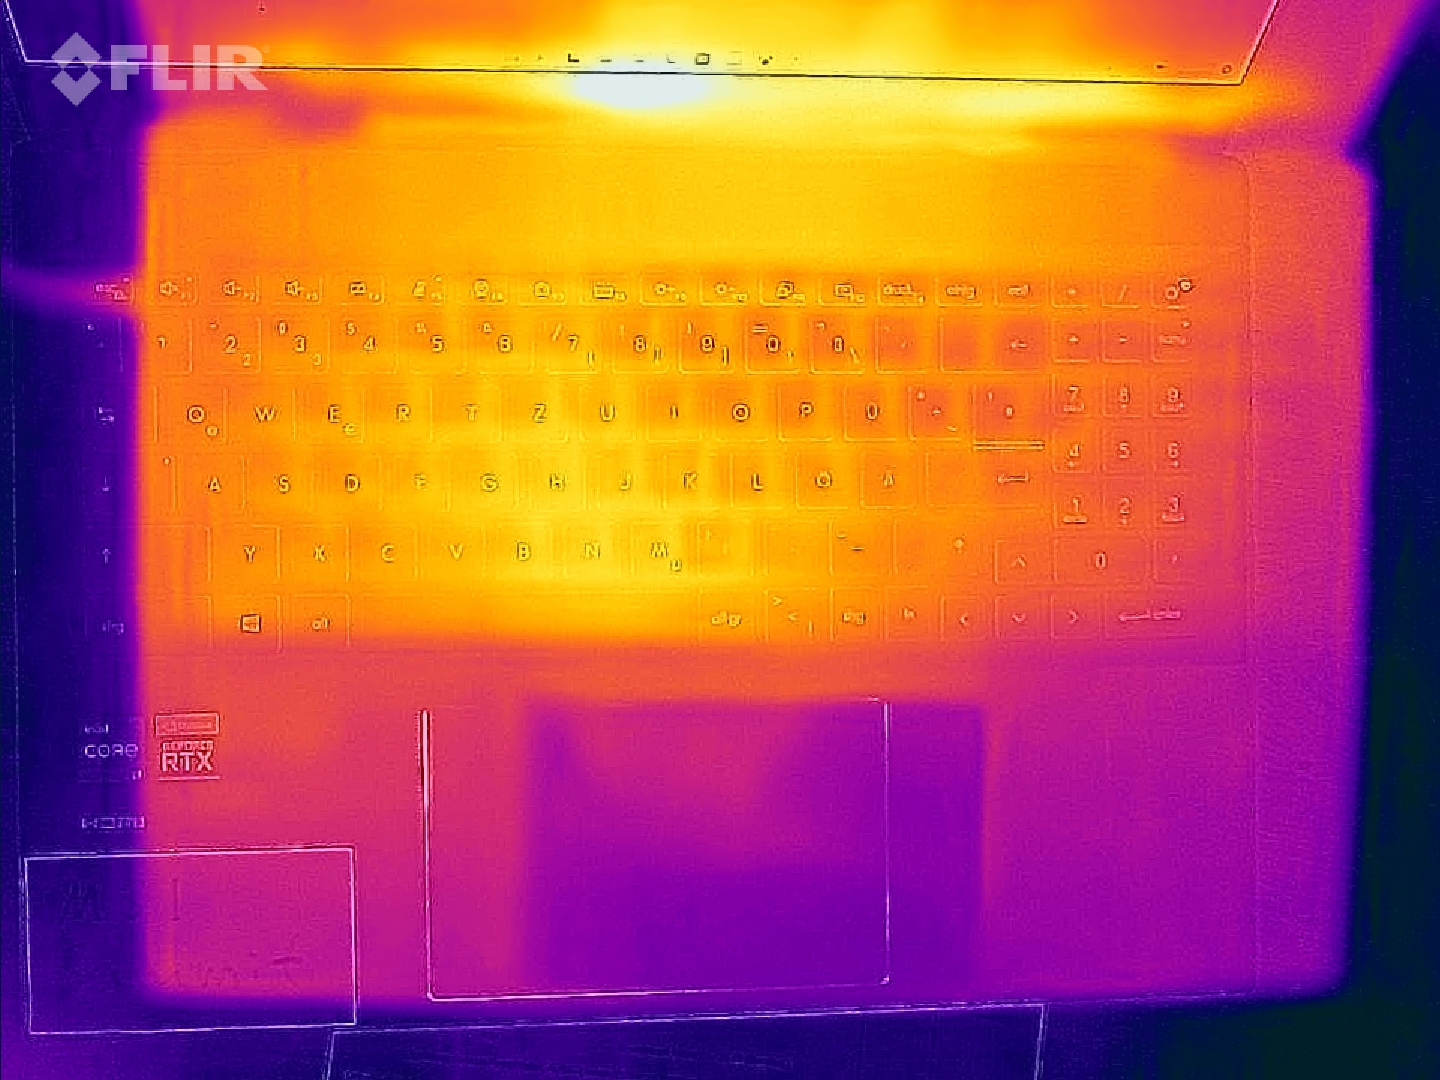
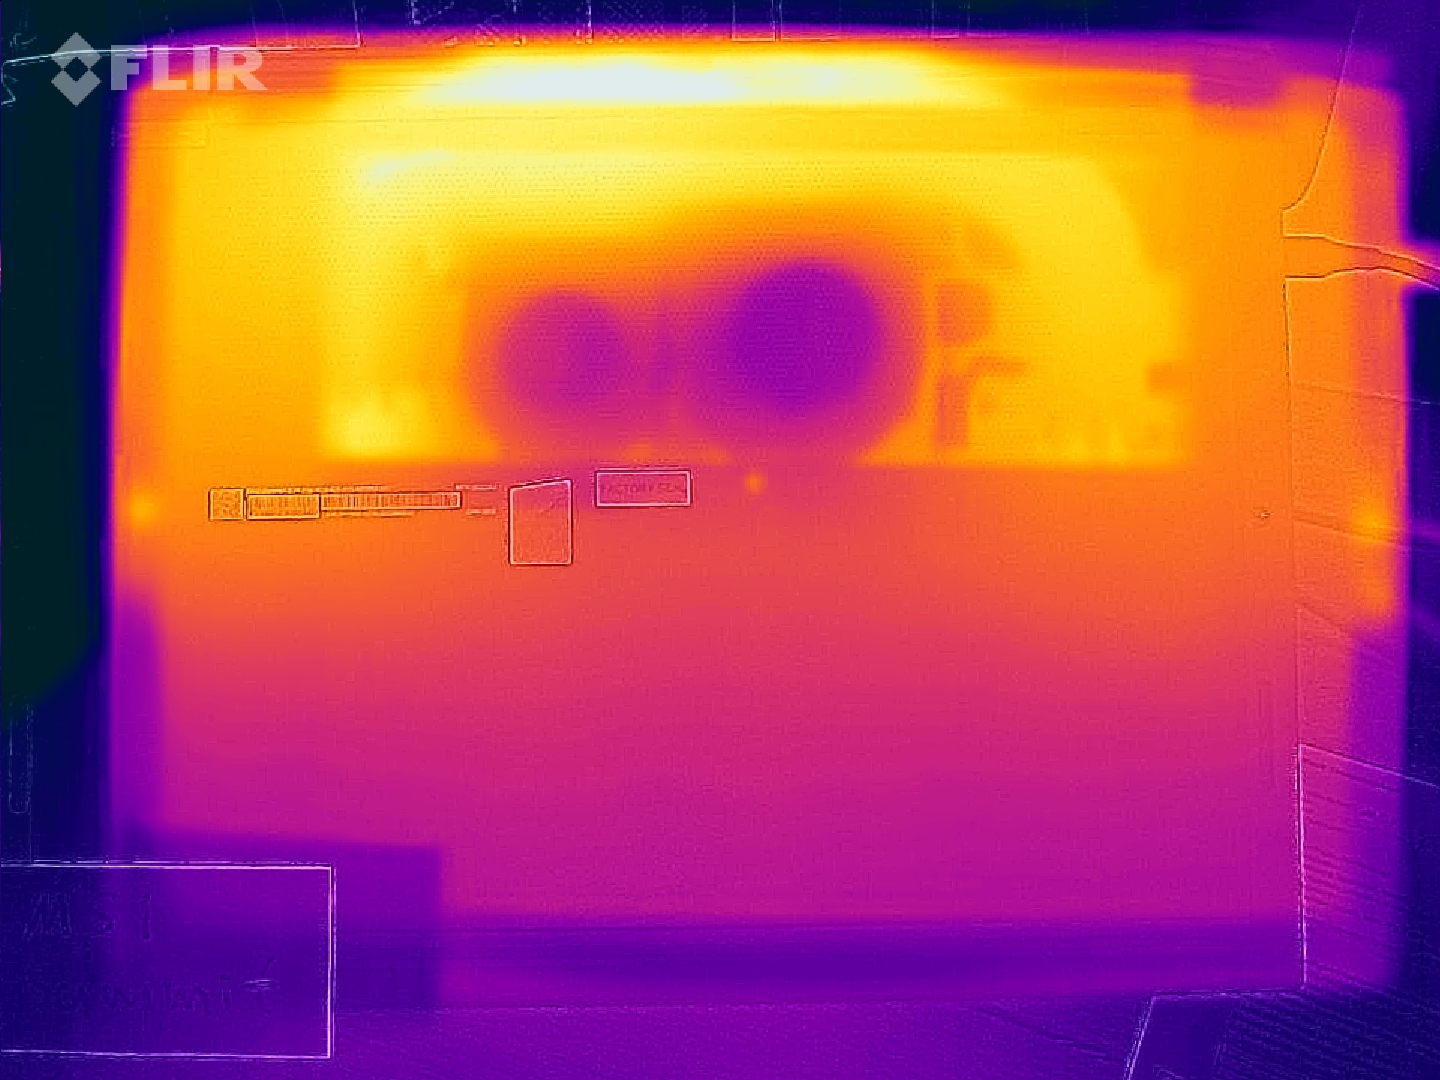
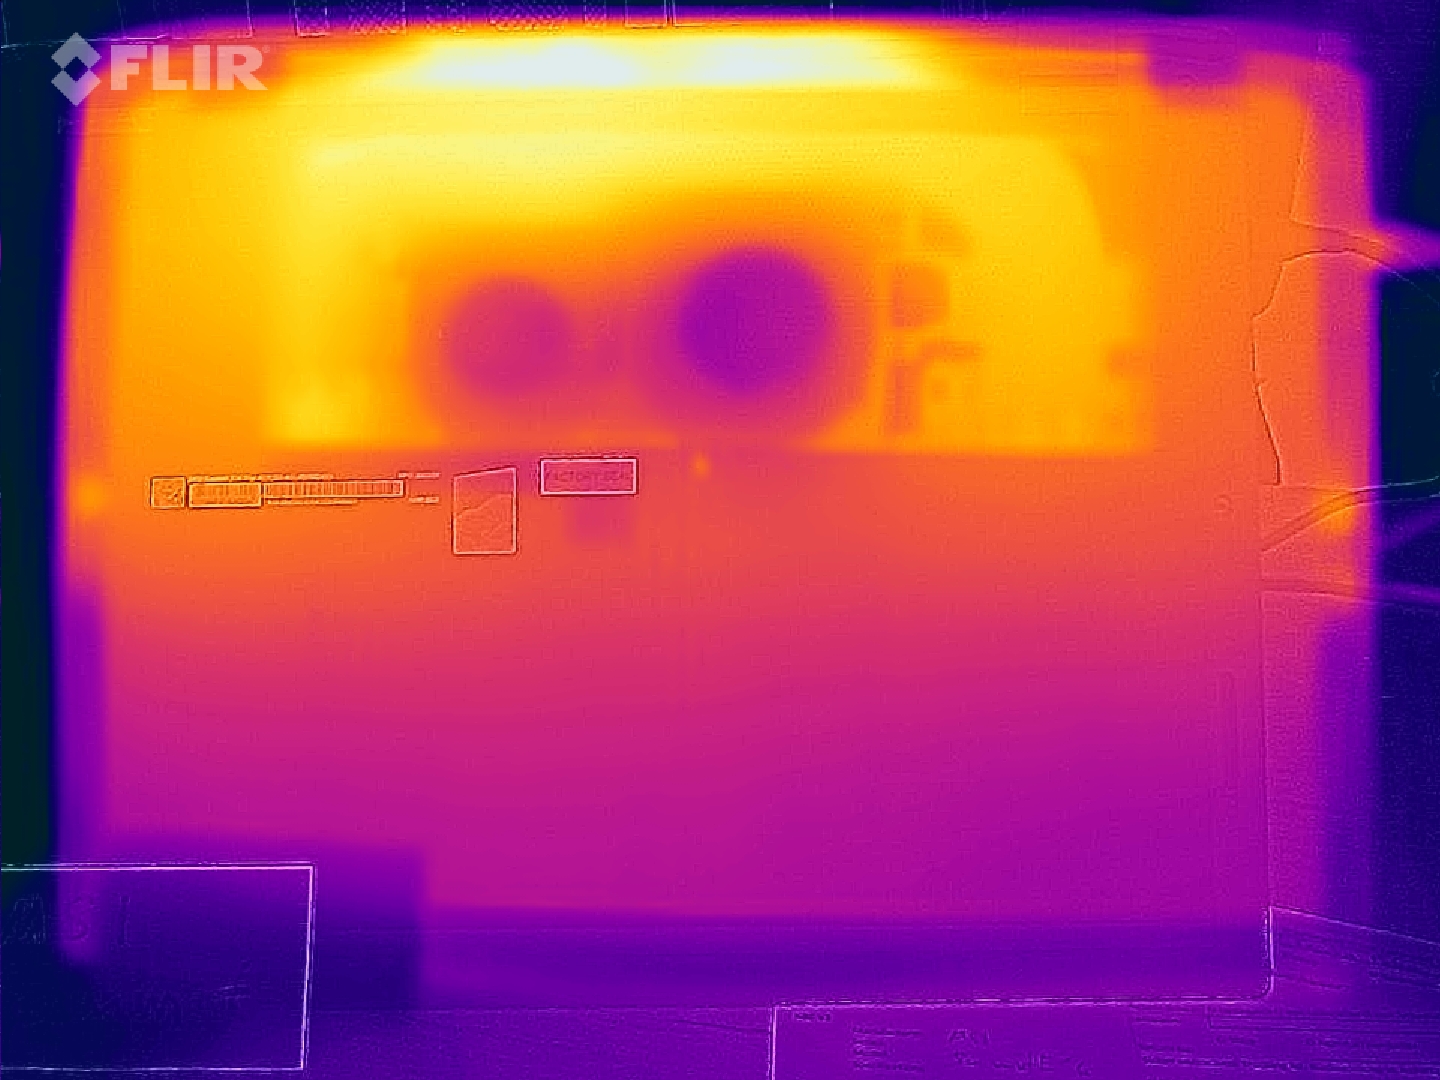
Temperatury
Pod obciążeniem (stress test, The Witcher 3) laptop nagrzewa się zauważalnie, ale nie nadmiernie. W pozostałych przypadkach temperatury utrzymują się w zielonym zakresie.
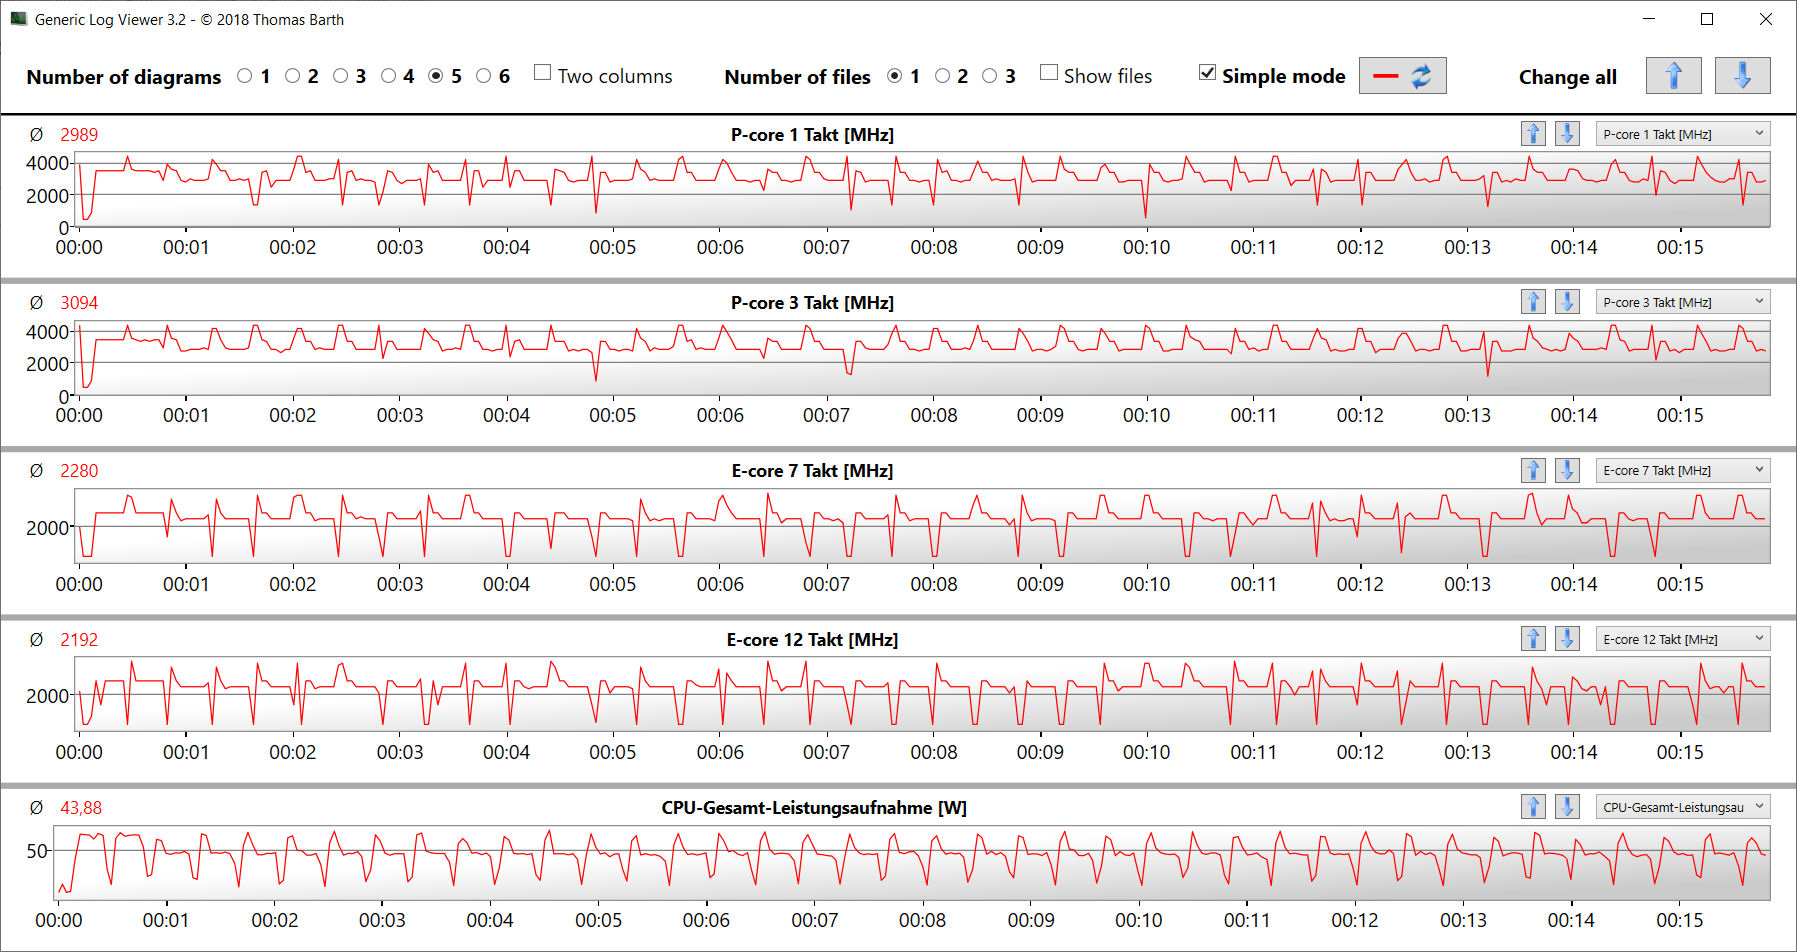
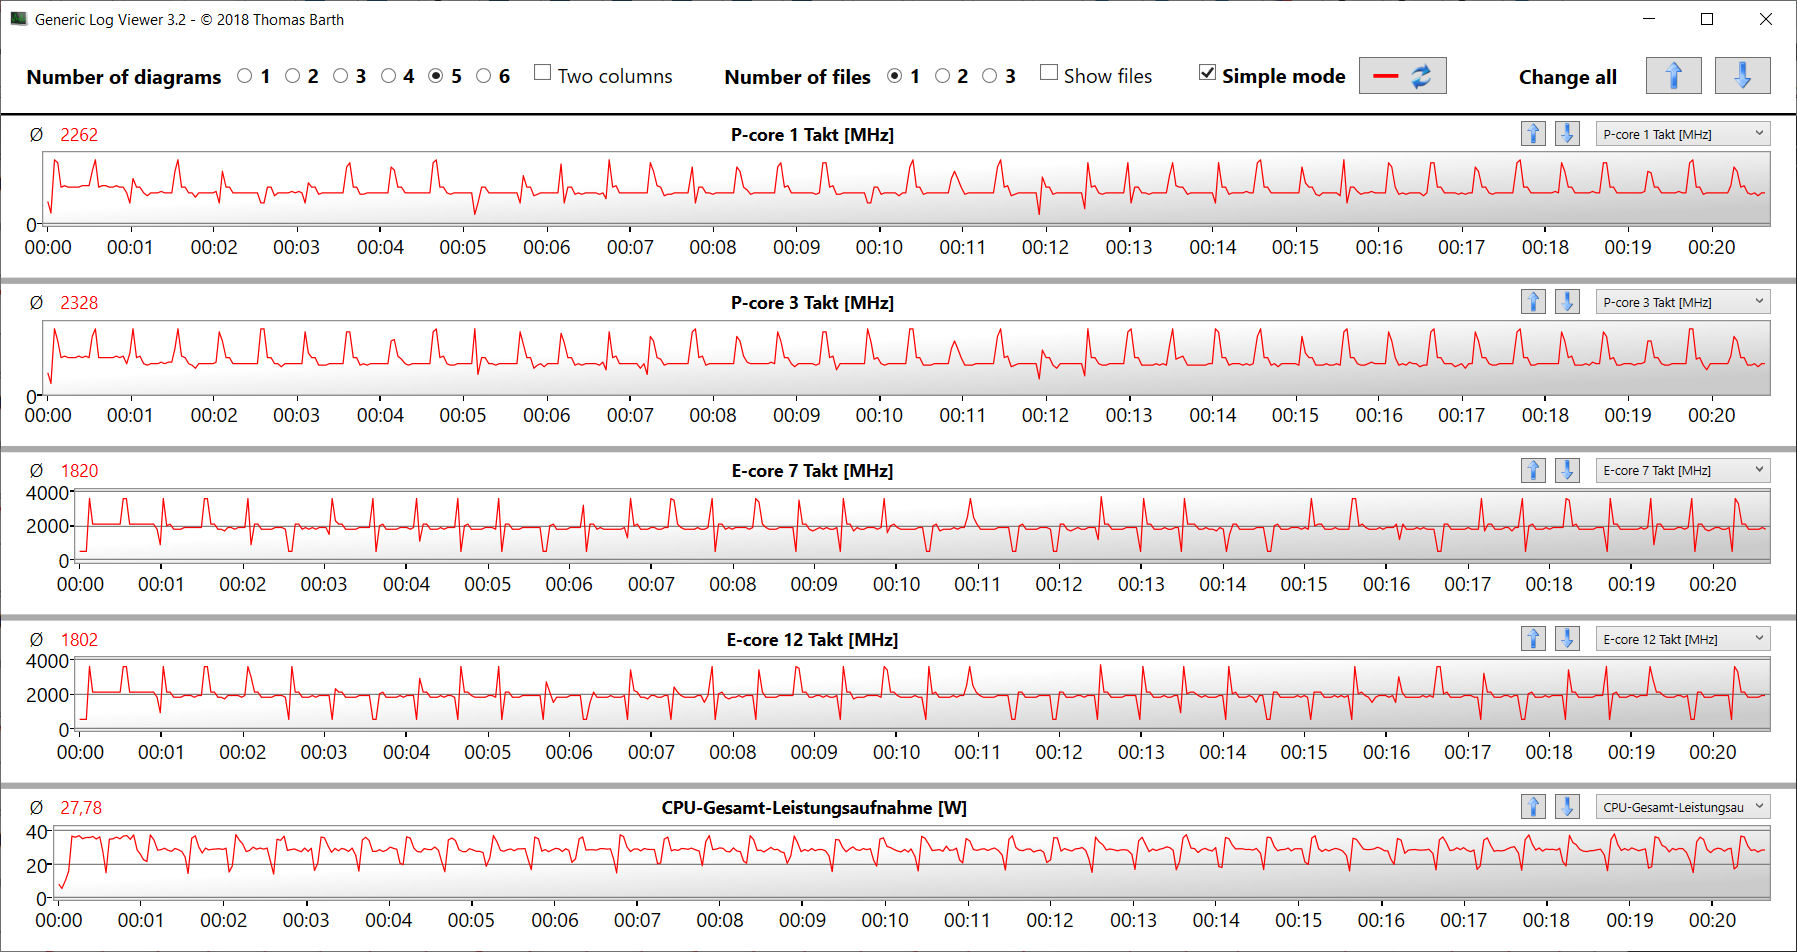
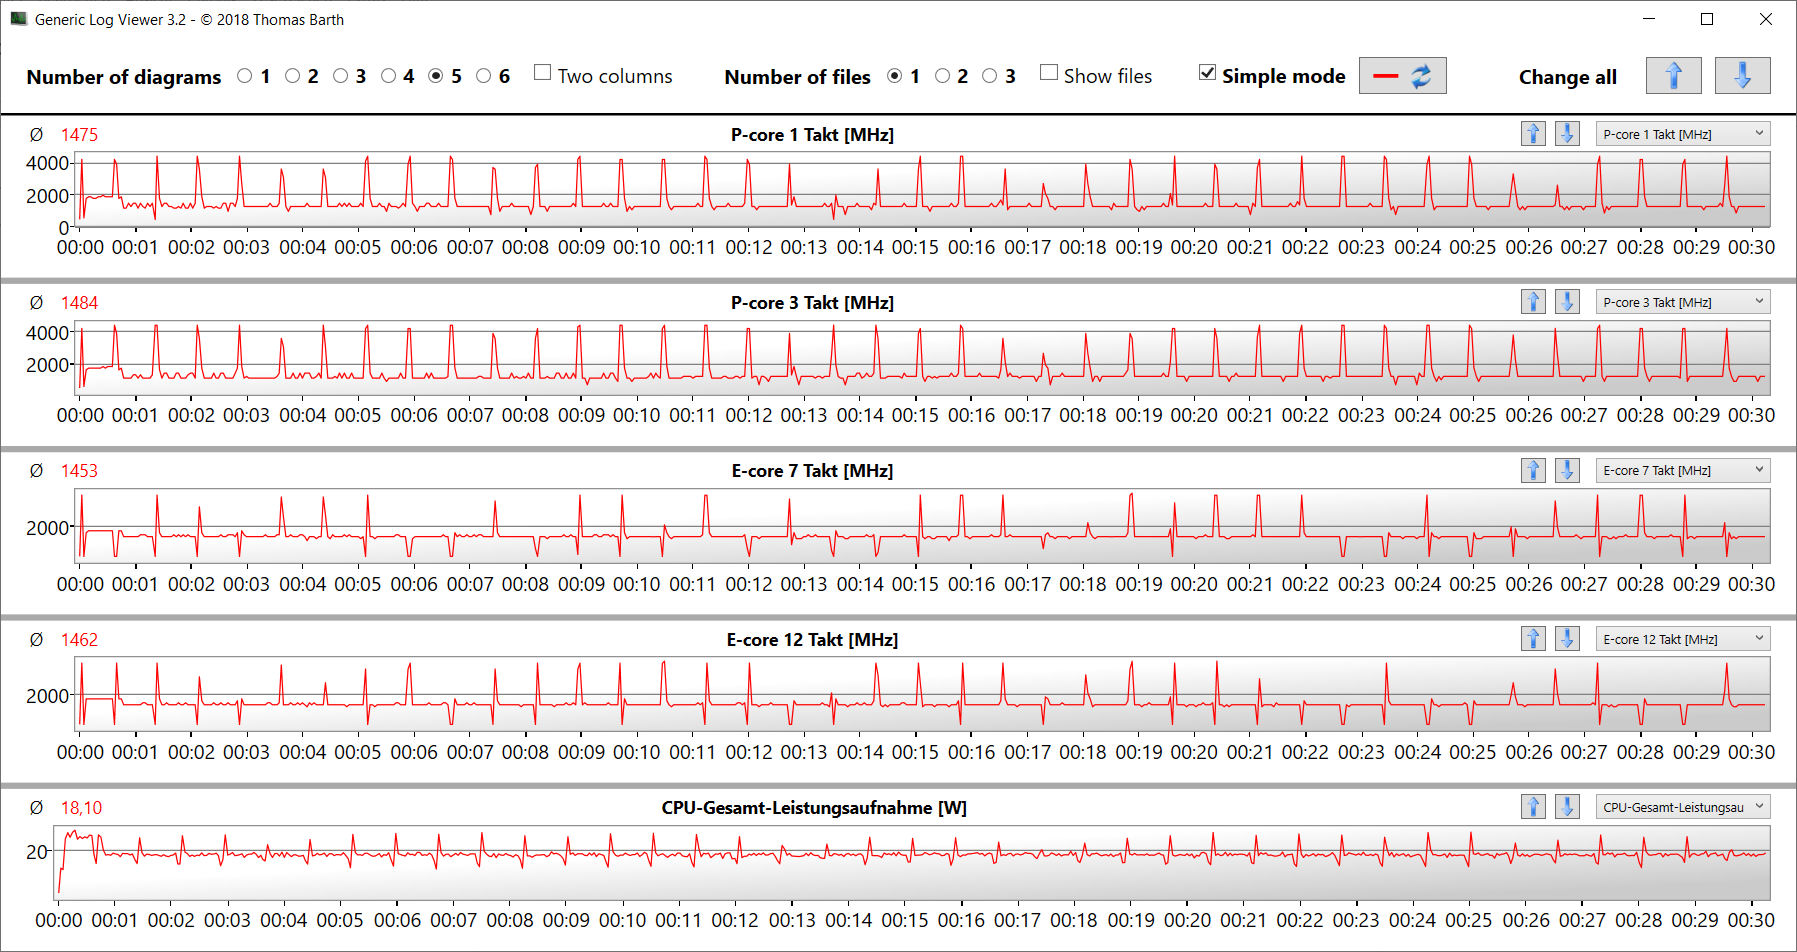
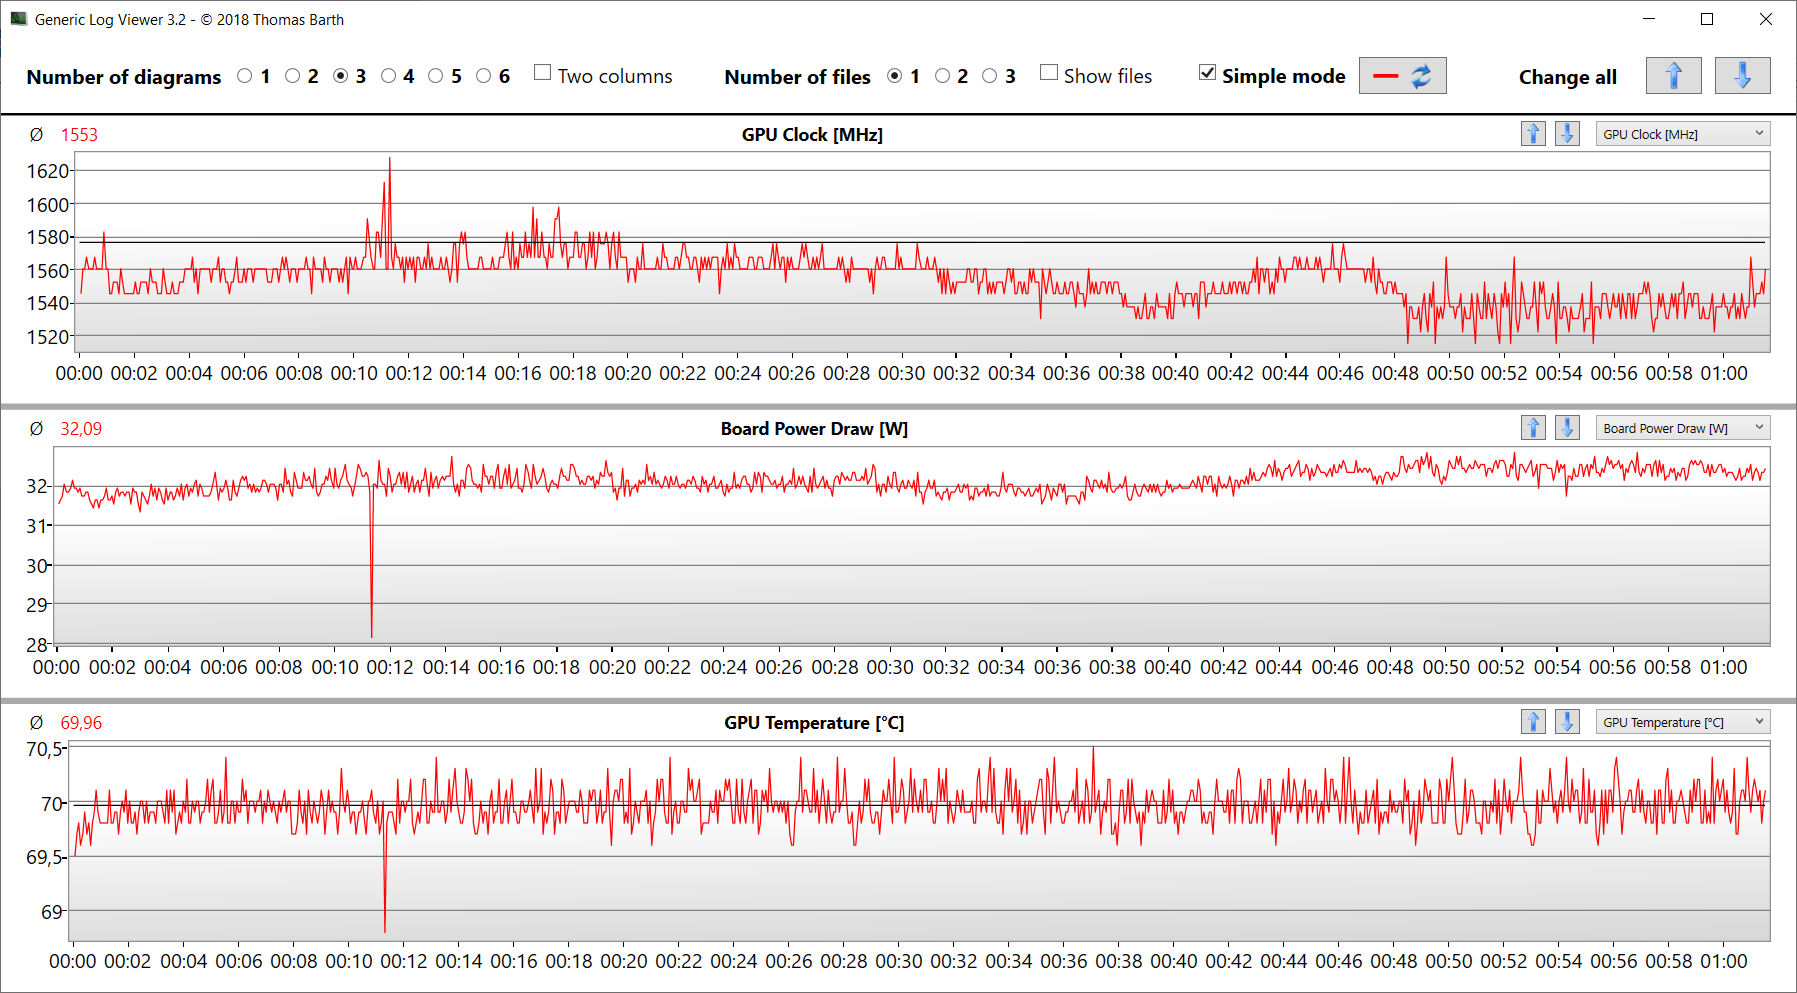
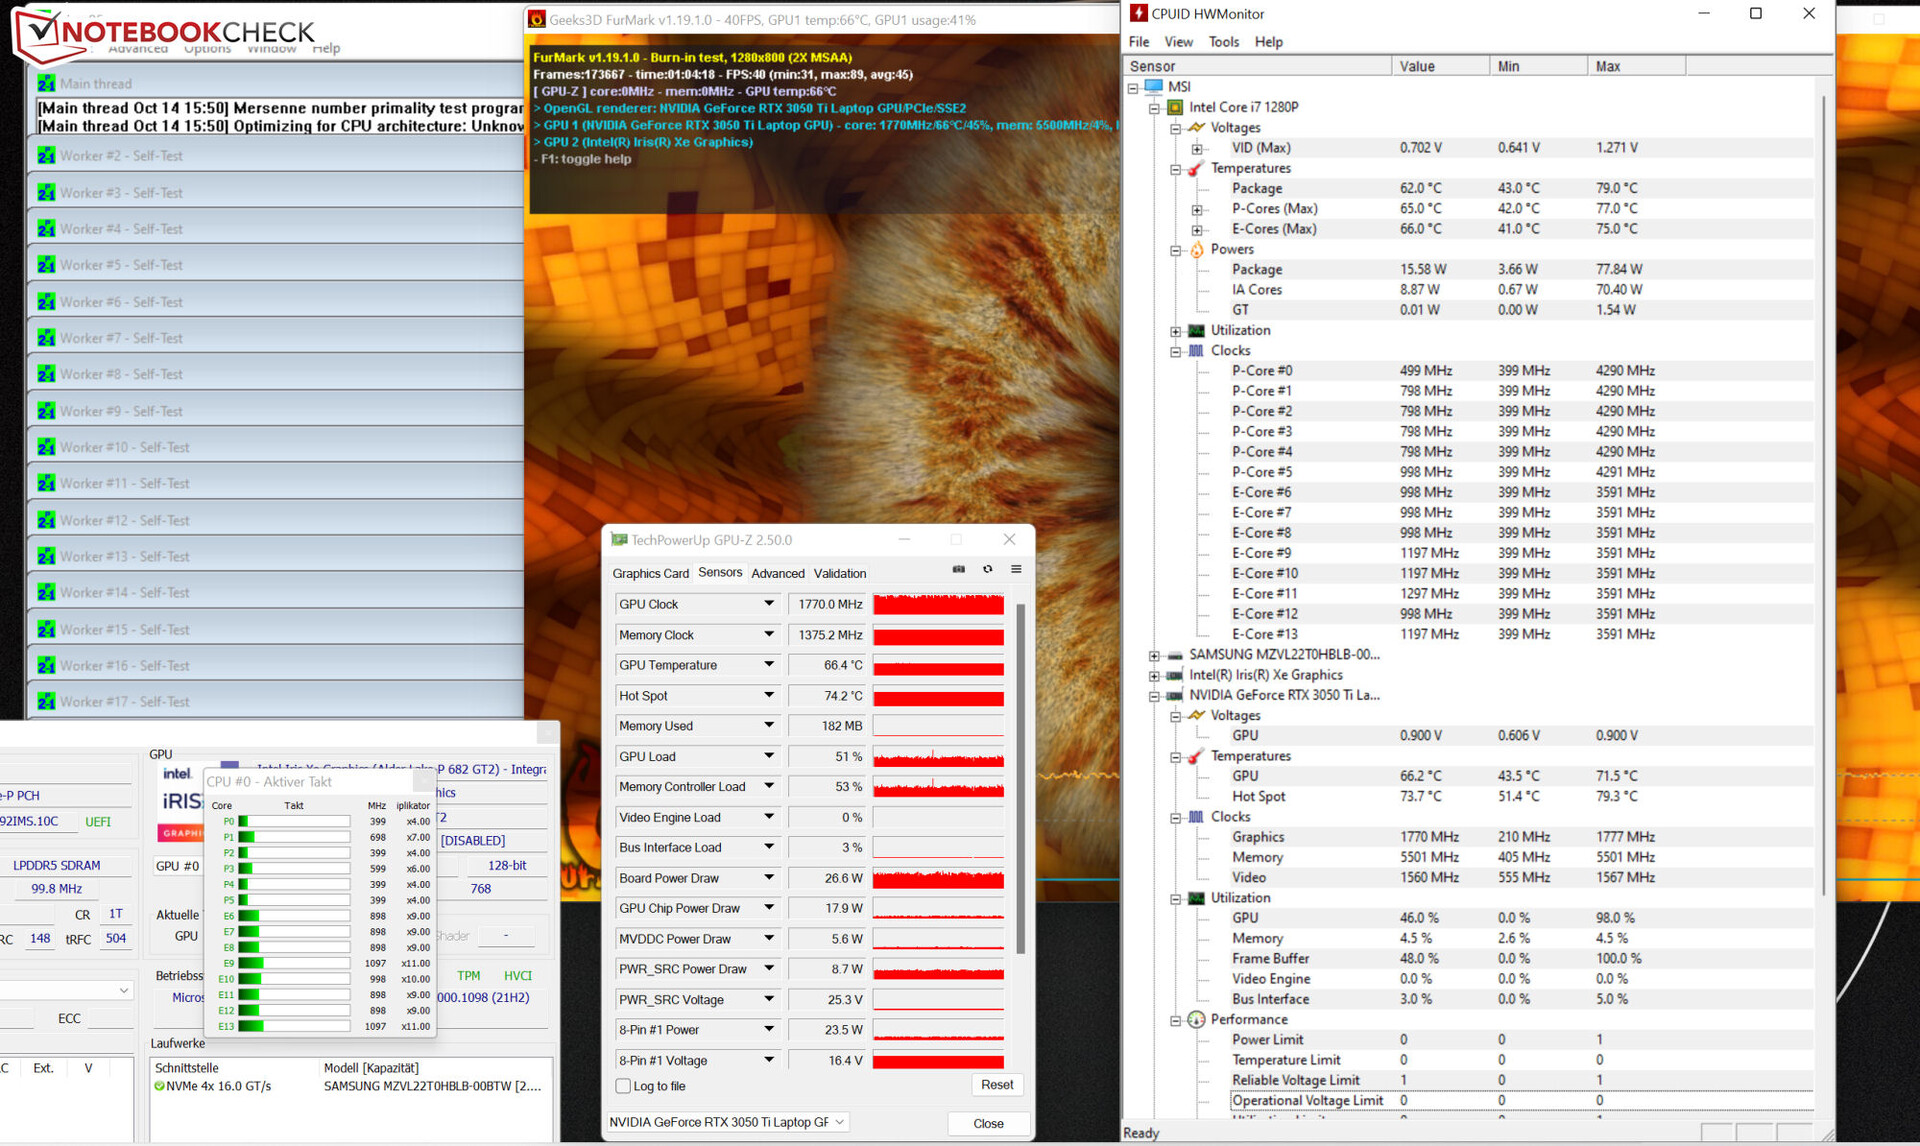
Test stresu (Prime95 i Furmark działające stale) reprezentuje ekstremalny scenariusz, który wykorzystujemy do oceny stabilności systemu pod pełnym obciążeniem. Procesor rozpoczyna test z niskim taktowaniem (P: 1,6 - 2,8 GHz; E: 1,6 - 1,7 GHz), a rdzeń graficzny pracuje z częstotliwością 1400 - 1800 MHz. Podczas gdy prędkość CPU spada w trakcie kontynuacji testu, prędkość GPU stabilizuje się na wysokim poziomie.
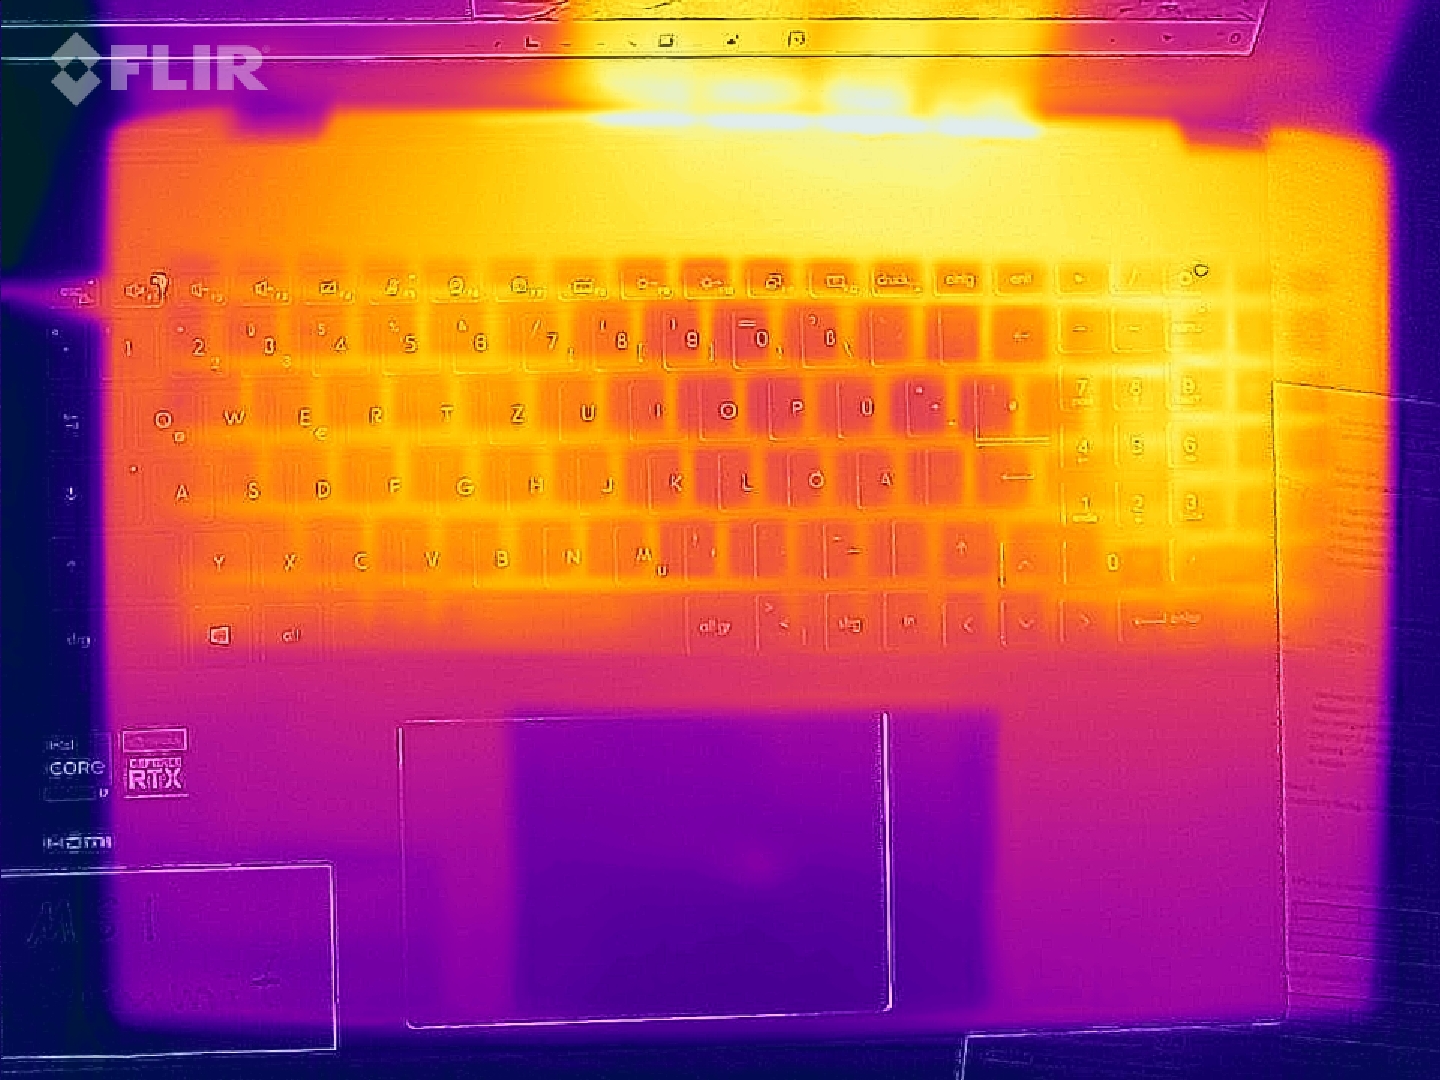
(-) Maksymalna temperatura w górnej części wynosi 49.2 °C / 121 F, w porównaniu do średniej 35.4 °C / 96 F , począwszy od 19.6 do 60 °C dla klasy Convertible.
(-) Dno nagrzewa się maksymalnie do 50.2 °C / 122 F, w porównaniu do średniej 36.9 °C / 98 F
(+) W stanie bezczynności średnia temperatura górnej części wynosi 27.6 °C / 82 F, w porównaniu ze średnią temperaturą urządzenia wynoszącą 30.3 °C / ### class_avg_f### F.
(-) Podczas gry w Wiedźmina 3 średnia temperatura górnej części wynosi 39.1 °C / 102 F, w porównaniu do średniej temperatury urządzenia wynoszącej 30.3 °C / ## #class_avg_f### F.
(+) Podparcia dłoni i touchpad osiągają maksymalną temperaturę skóry (33.7 °C / 92.7 F) i dlatego nie są gorące.
(-) Średnia temperatura obszaru podparcia dłoni w podobnych urządzeniach wynosiła 28 °C / 82.4 F (-5.7 °C / -10.3 F).
| MSI Summit E16 Flip A12UDT-031 Intel Core i7-1280P, NVIDIA GeForce RTX 3050 Ti Laptop GPU | Asus ExpertBook B2 Flip B2502FBA-N80141X Intel Core i7-1260P, Intel Iris Xe Graphics G7 96EUs | Samsung Galaxy Book Pro 360 15 NP950QDB-KC3DE Intel Core i5-1135G7, Intel Iris Xe Graphics G7 80EUs | Dell Inspiron 16 7620 2-in-1 Intel Core i7-1260P, Intel Iris Xe Graphics G7 96EUs | |
|---|---|---|---|---|
| Heat | 5% | 14% | -1% | |
| Maximum Upper Side * (°C) | 49.2 | 36.6 26% | 42.6 13% | 42.2 14% |
| Maximum Bottom * (°C) | 50.2 | 42.2 16% | 40.8 19% | 47.4 6% |
| Idle Upper Side * (°C) | 29.4 | 31.3 -6% | 25.9 12% | 32.2 -10% |
| Idle Bottom * (°C) | 30 | 34.8 -16% | 26.1 13% | 33.6 -12% |
* ... im mniej tym lepiej
Mówcy
Głośniki stereo wytwarzają przyzwoity dźwięk, który zawiera mało basów.
MSI Summit E16 Flip A12UDT-031 analiza dźwięku
(±) | głośność głośnika jest średnia, ale dobra (79.8 dB)
Bas 100 - 315 Hz
(-) | prawie brak basu - średnio 23.6% niższa od mediany
(-) | bas nie jest liniowy (15.1% delta do poprzedniej częstotliwości)
Średnie 400 - 2000 Hz
(±) | wyższe średnie - średnio 5.6% wyższe niż mediana
(±) | liniowość środka jest średnia (7.4% delta do poprzedniej częstotliwości)
Wysokie 2–16 kHz
(±) | wyższe maksima - średnio 5.6% wyższe od mediany
(+) | wzloty są liniowe (4.5% delta do poprzedniej częstotliwości)
Ogólnie 100 - 16.000 Hz
(±) | liniowość ogólnego dźwięku jest średnia (22.6% różnicy w stosunku do mediany)
W porównaniu do tej samej klasy
» 68% wszystkich testowanych urządzeń w tej klasie było lepszych, 5% podobnych, 27% gorszych
» Najlepszy miał deltę 6%, średnia wynosiła ###średnia###%, najgorsza wynosiła 57%
W porównaniu do wszystkich testowanych urządzeń
» 67% wszystkich testowanych urządzeń było lepszych, 6% podobnych, 28% gorszych
» Najlepszy miał deltę 4%, średnia wynosiła ###średnia###%, najgorsza wynosiła 134%
Dell Inspiron 16 7620 2-in-1 analiza dźwięku
(+) | głośniki mogą odtwarzać stosunkowo głośno (89.8 dB)
Bas 100 - 315 Hz
(-) | prawie brak basu - średnio 15.3% niższa od mediany
(±) | liniowość basu jest średnia (8.8% delta do poprzedniej częstotliwości)
Średnie 400 - 2000 Hz
(+) | zbalansowane środki średnie - tylko 3.3% od mediany
(+) | średnie są liniowe (4.8% delta do poprzedniej częstotliwości)
Wysokie 2–16 kHz
(+) | zrównoważone maksima - tylko 3.2% od mediany
(+) | wzloty są liniowe (5% delta do poprzedniej częstotliwości)
Ogólnie 100 - 16.000 Hz
(+) | ogólny dźwięk jest liniowy (11.5% różnicy w stosunku do mediany)
W porównaniu do tej samej klasy
» 10% wszystkich testowanych urządzeń w tej klasie było lepszych, 3% podobnych, 88% gorszych
» Najlepszy miał deltę 6%, średnia wynosiła ###średnia###%, najgorsza wynosiła 57%
W porównaniu do wszystkich testowanych urządzeń
» 8% wszystkich testowanych urządzeń było lepszych, 2% podobnych, 90% gorszych
» Najlepszy miał deltę 4%, średnia wynosiła ###średnia###%, najgorsza wynosiła 134%
Pobór mocy
Ogólnie rzecz biorąc, pobór mocy waha się na normalnym poziomie dla zastosowanego tu sprzętu. O ile przez test Witcher 3 laptop przebiega ze stałym poborem mocy, o tyle podczas testów obciążeniowych pobór regularnie spada na krótki czas. Dołączony do zestawu zasilacz (100 W) jest wystarczająco pojemny.
| wyłączony / stan wstrzymania | |
| luz | |
| obciążenie |
|
Legenda:
min: | |
Power Consumption The Witcher 3 / Stress Test
Power Consumption With External Monitor
Czas pracy na baterii
W naszym realistycznym teście WLAN 16-calowiec osiągnął na akumulatorze czas pracy 7:08 h. Test ten symuluje obciążenie podczas renderowania stron internetowych za pomocą skryptu.
| Battery Runtime - WiFi Websurfing | |
| Dell Inspiron 16 7620 2-in-1 | |
| Średnia w klasie Convertible (5.08 - 22, n=52, ostatnie 2 lata) | |
| Samsung Galaxy Book Pro 360 15 NP950QDB-KC3DE | |
| MSI Summit E16 Flip A12UDT-031 | |
| Asus ExpertBook B2 Flip B2502FBA-N80141X | |
Za
Przeciw
Werdykt - Laptop 2 w 1 do mobilnej pracy twórczej
Summit E16 Flip to laptop 2w1 z segmentu biznesowego, który skierowany jest przede wszystkim do kreatywnych użytkowników. MSI połączyło 16-calowy ekran dotykowy w formacie 16:10 z wydajnym procesorem graficznym klasy średniej.
Choć laptop 2 w 1 od MSI nie jest przeznaczony dla każdego, to z pewnością powinien przyciągnąć kilku zwolenników.
StronaCore i7-1280Poraz GeForce RTX 3050 Tisą w stanie pracować stale z wysokim taktowaniem. Wydajność GPU osiąga niemal średnią wartość dla grafiki RTX 3050 Ti. Choć laptop nie nagrzewa się nadmiernie pod obciążeniem, potrafi zrobić się dość głośny. W codziennej eksploatacji wszystko pozostaje jednak cichsze.
Dotykowy wyświetlacz (2 560 x 1 600 pikseli) pokrywa przestrzeń barw DCI-P3. Towarzyszą temu stabilne kąty widzenia, dobre odwzorowanie kolorów, krótkie czasy reakcji i niezły poziom kontrastu. Niestety, panel ma powierzchnię odbijającą światło. Poza tym jasność maksymalna mogłaby być wyższa. Ekran dotykowy można obsługiwać zarówno palcami, jak i dołączonym do zestawu piórkiem wejściowym MSI.
Mimo swoich rozmiarów możemy zaświadczyć o pewnej mobilności urządzenia. Cały pakiet wnosi na wagę około 1,9 kg (~4,2 lb). E16 udaje się uzyskać czas pracy w sieci WLAN na poziomie około 7 godzin z 82-Wh baterii, co jest całkiem niezłą wartością, biorąc pod uwagę wyposażenie sprzętowe.
W naszej bazie nie ma bezpośredniego konkurenta dla E16. Najbliżej w tej kategorii może być m.in Dell Inspiron 16 7620 "2 w 1, który jest opcjonalnie dostępny zGeForce MX550rdzeniem graficznym. Ponadto urządzenie to punktuje znacznie lepszymi czasami pracy na akumulatorze i wymienną/rozszerzalną pamięcią roboczą.
Cena i dostępność
MSI Summit E16 Flip A12UDT jest dostępny w sklepie Amazon w cenie 1849 dol, na przykład.
MSI Summit E16 Flip A12UDT-031
- 19/10/2022 v7 (old)
Sascha Mölck
Price comparison

