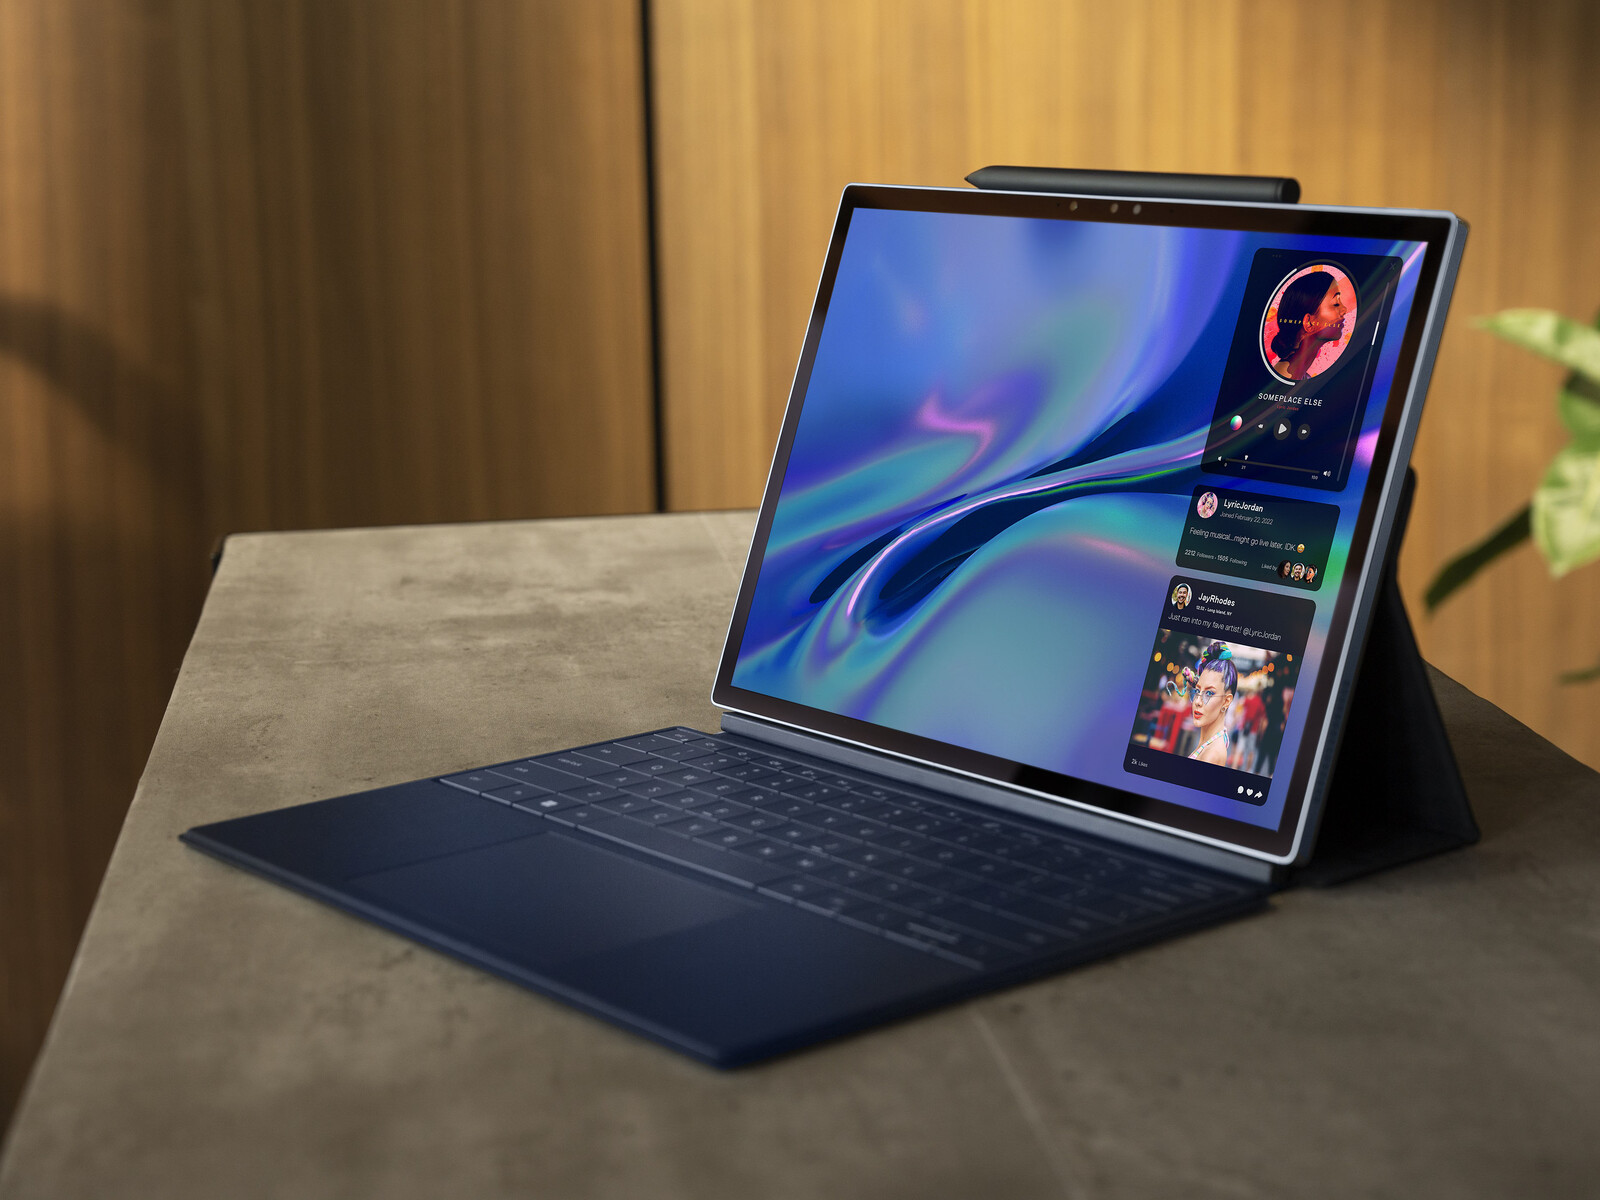
Dell Surface Pro 8: recenzja kabrioletu XPS 13 9315 2 w 1
Na targach CES 2022 firma Dell zaprezentowała trzy różne modele XPS 13: model XPS 13 9320 Plus "clamshell, XPS 13 9315 "clamshell, oraz XPS 13 9315 2-in-1. Po zapoznaniu się z dwoma modelami clamshell, jesteśmy gotowi zająć się modelem 2-w-1, który tak się składa, że jest pierwszym odłączanym modelem XPS w historii pierwszym odłączanym modelem XPS od prawie dekady.
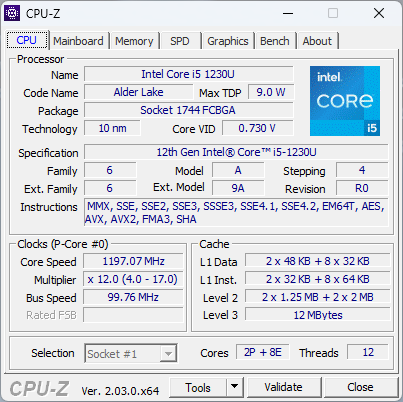
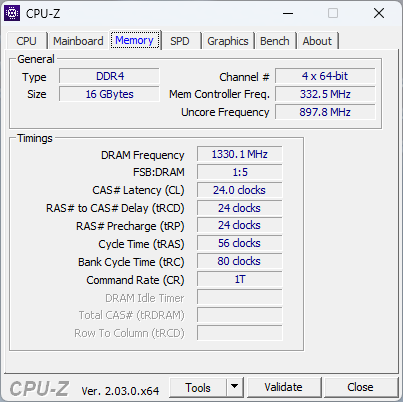
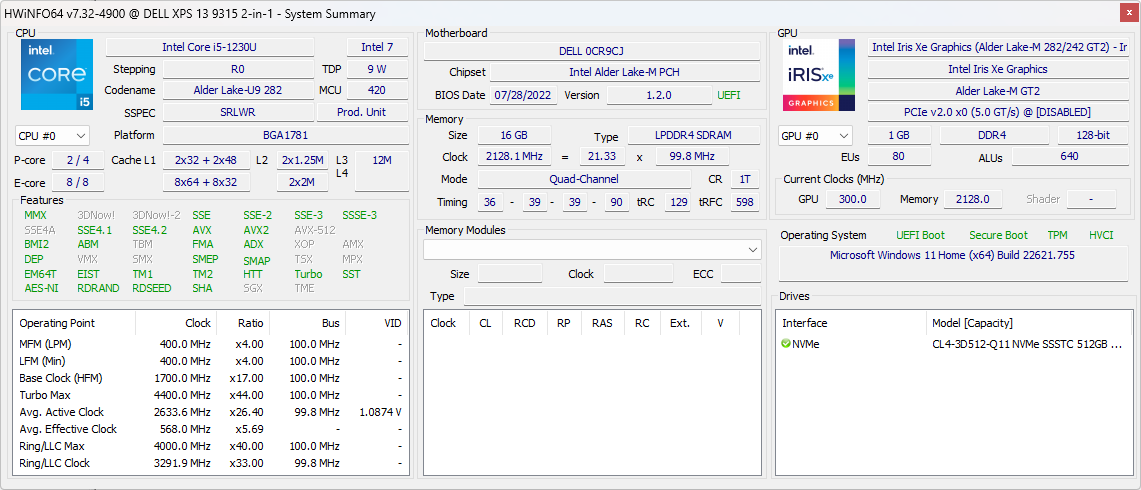
Nasza recenzowana konfiguracja jest wyposażona w procesor 12. generacji Alder Lake Core i5-1230U, 16 GB LPDDR4x RAM i 512 GB NVMe SSD w cenie około 1400 USD. Inne SKU z procesorem Core i7-1250U, 5G eSIM i różnymi pojemnościami RAM/SSD są również dostępne, ale wszystkie opcje inaczej pochodzą z tego samego ekranu dotykowego 3:2 2880 x 1920 IPS.
Bezpośrednimi konkurentami w tej przestrzeni są inne tablety z systemem Windows lub urządzenia przenośne, w szczególności Microsoft Surface Pro 8 i droższy HP Elite x2 w mniejszym stopniu.
Więcej recenzji Della:
Potencjalni konkurenci w porównaniu
Ocena | Data | Model | Waga | Wysokość | Rozmiar | Rezolucja | Cena |
|---|---|---|---|---|---|---|---|
| 90.1 % v7 (old) | 11/2022 | Dell XPS 13 9315 2-in-1 Core i5-1230U i5-1230U, Iris Xe G7 80EUs | 764 g | 7.4 mm | 13.00" | 2880x1920 | |
| 87.3 % v7 (old) | 09/2022 | Dell XPS 13 Plus 9320 i7-1280P OLED i7-1280P, Iris Xe G7 96EUs | 1.3 kg | 15.28 mm | 13.40" | 3456x2160 | |
| 89.1 % v7 (old) | 06/2024 | Microsoft Surface Pro 8, i7-1185G7 i7-1185G7, Iris Xe G7 96EUs | 891 g | 8.5 mm | 13.00" | 2880x1920 | |
| 90.3 % v7 (old) | HP Spectre x360 13.5 14t-ef000 i7-1255U, Iris Xe G7 96EUs | 1.4 kg | 17 mm | 13.50" | 3000x2000 | ||
| 86.1 % v7 (old) | Lenovo ThinkBook Plus Gen2 Core i5 i5-1130G7, Iris Xe G7 80EUs | 1.2 kg | 13.9 mm | 13.30" | 2560x1600 | ||
| 92.3 % v7 (old) | 07/2024 | Apple MacBook Air M2 Entry M2, M2 8-Core GPU | 1.2 kg | 11.3 mm | 13.60" | 2560x1664 |
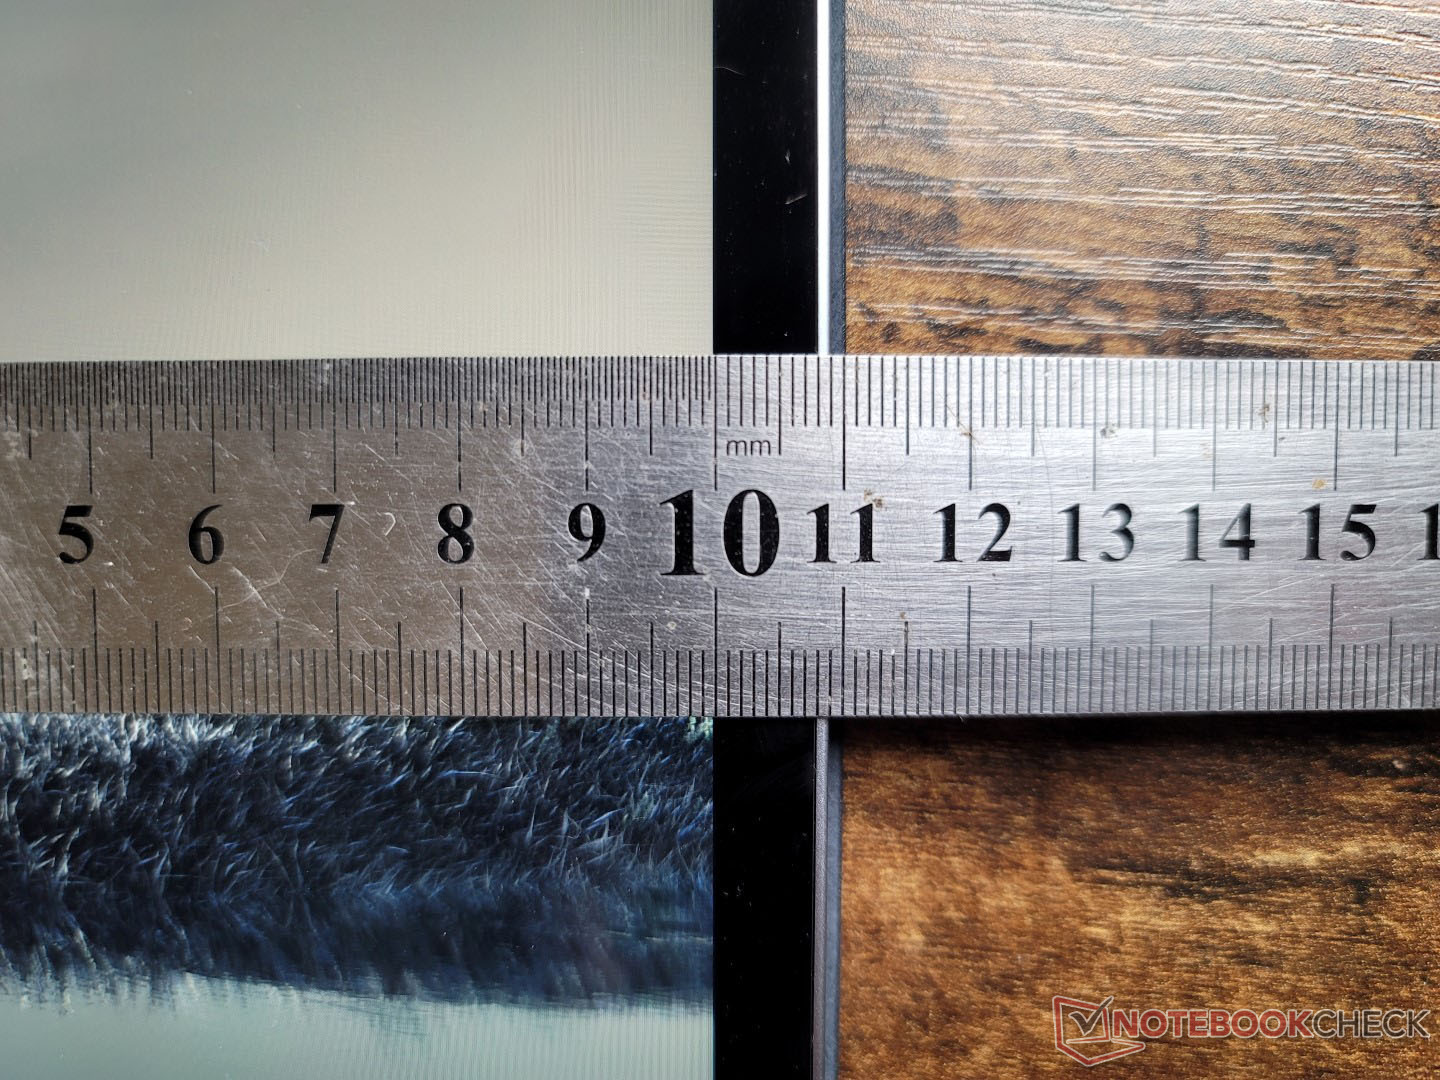
Etui - lżejsze niż Surface Pro 8
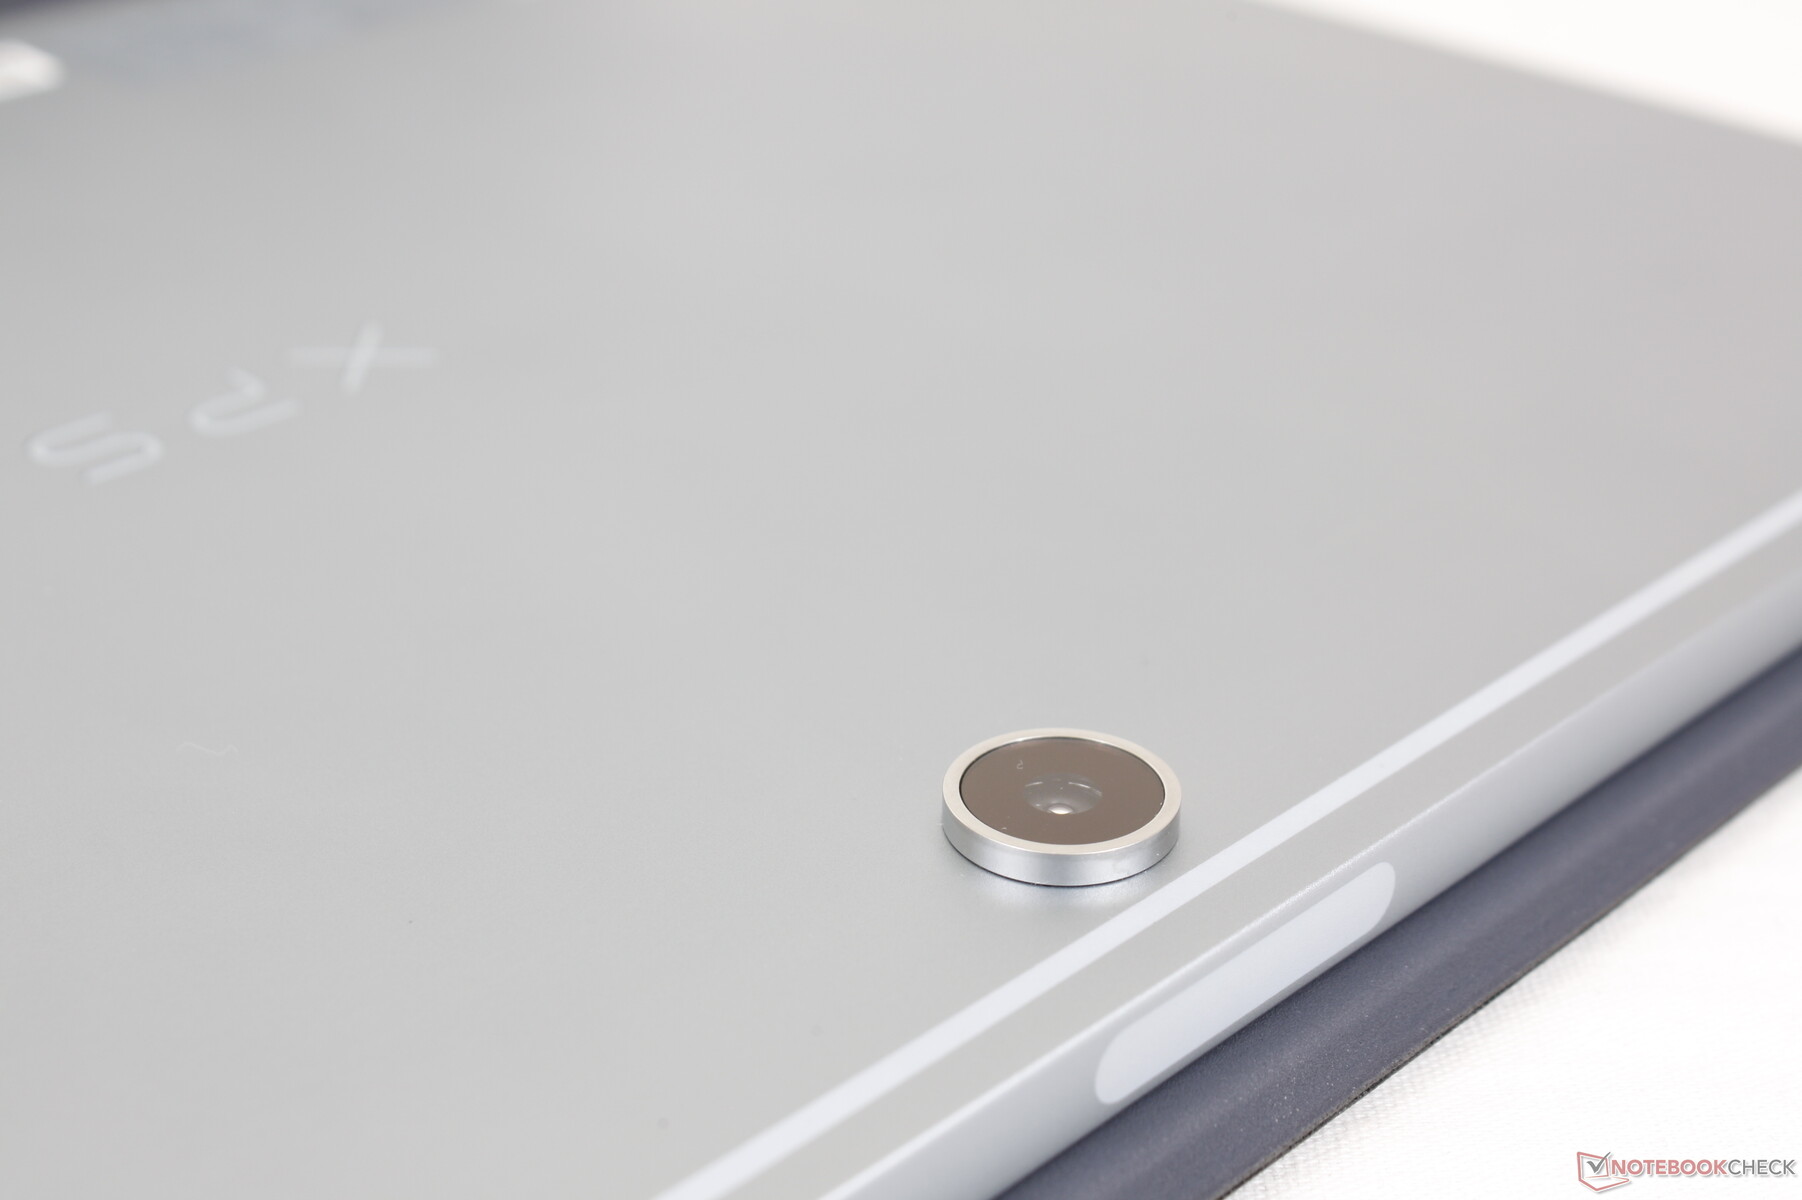
Szkielet jest aluminiowy z tyłu i na krawędziach, podczas gdy przód to szkło Gorilla Glass od krawędzi do krawędzi. Jest to solidne, wysokiej jakości matowe wykończenie, jak można się spodziewać, z kolorem i fakturą podobną do zewnętrznych pokryw w XPS 13 9300 czy serii XPS 15. Przy próbie wykręcenia urządzenia występuje bardzo lekkie odkształcenie, ale nie jest ono na tyle duże, by budziło niepokój.
Naciskanie na środek pleców powoduje lekkie wgłębienia i słyszalne odgłosy. Jest to prawdopodobnie spowodowane małą szczeliną powietrzną między zewnętrzną powłoką a wewnętrznymi komponentami, która ponownie nie jest niczym niepokojącym.
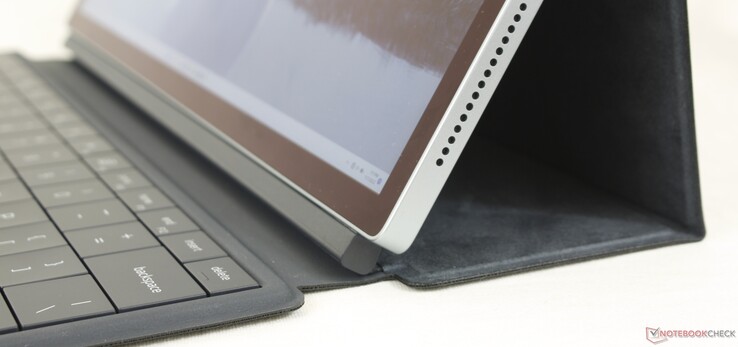
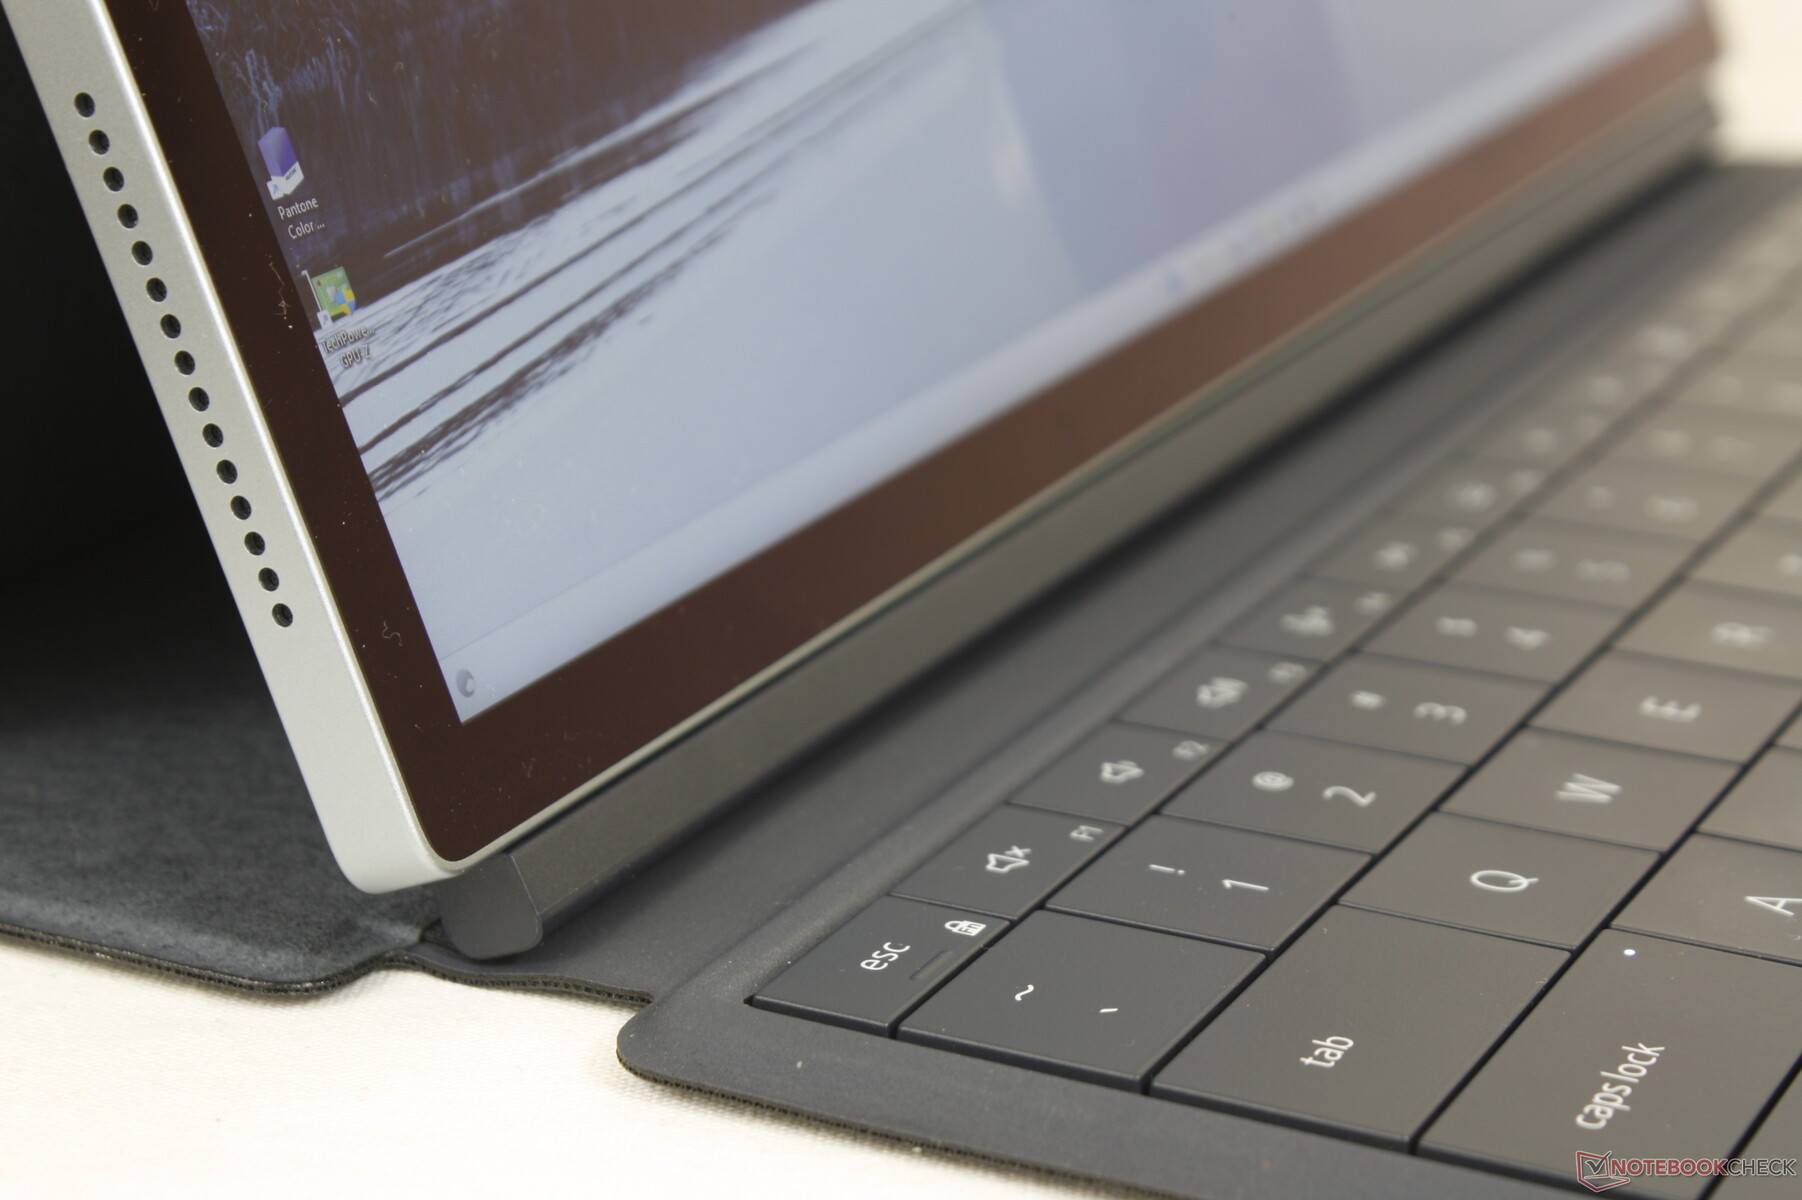
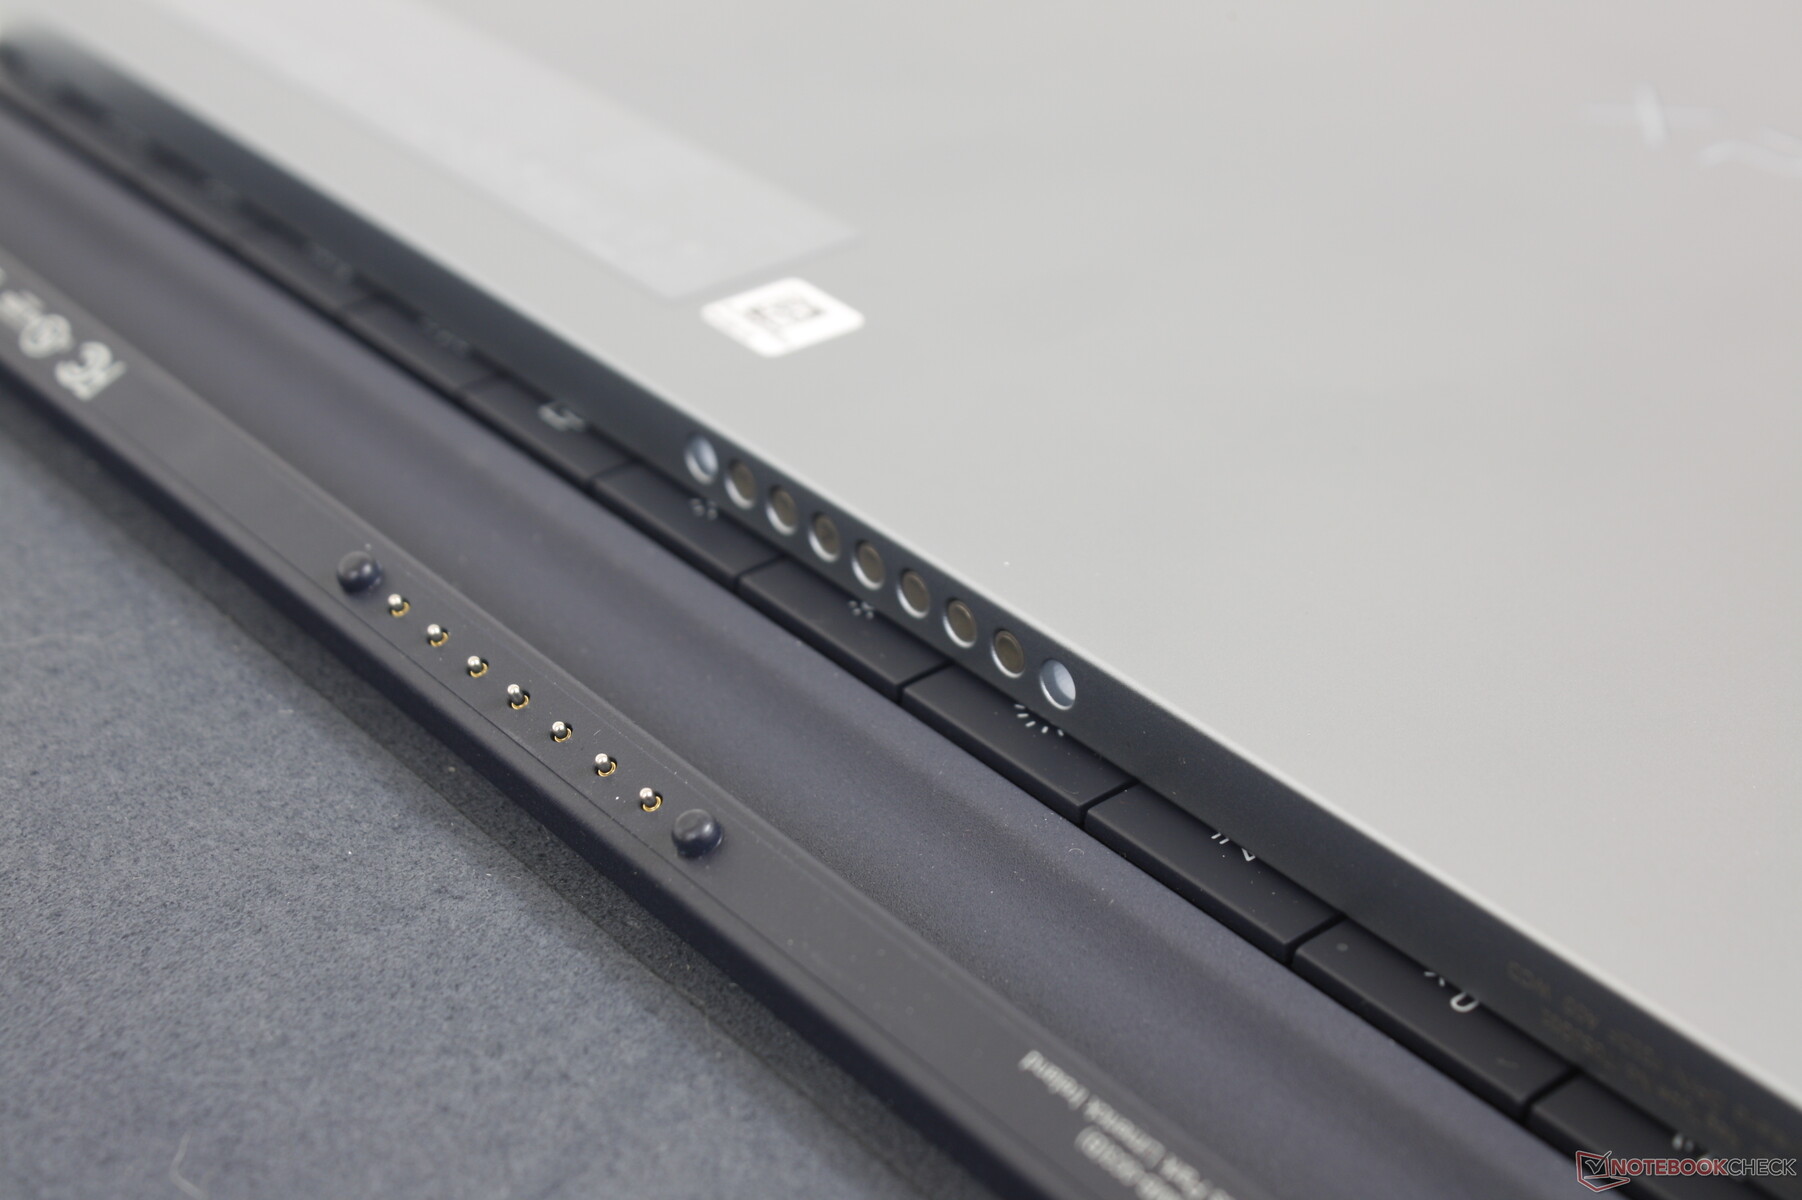
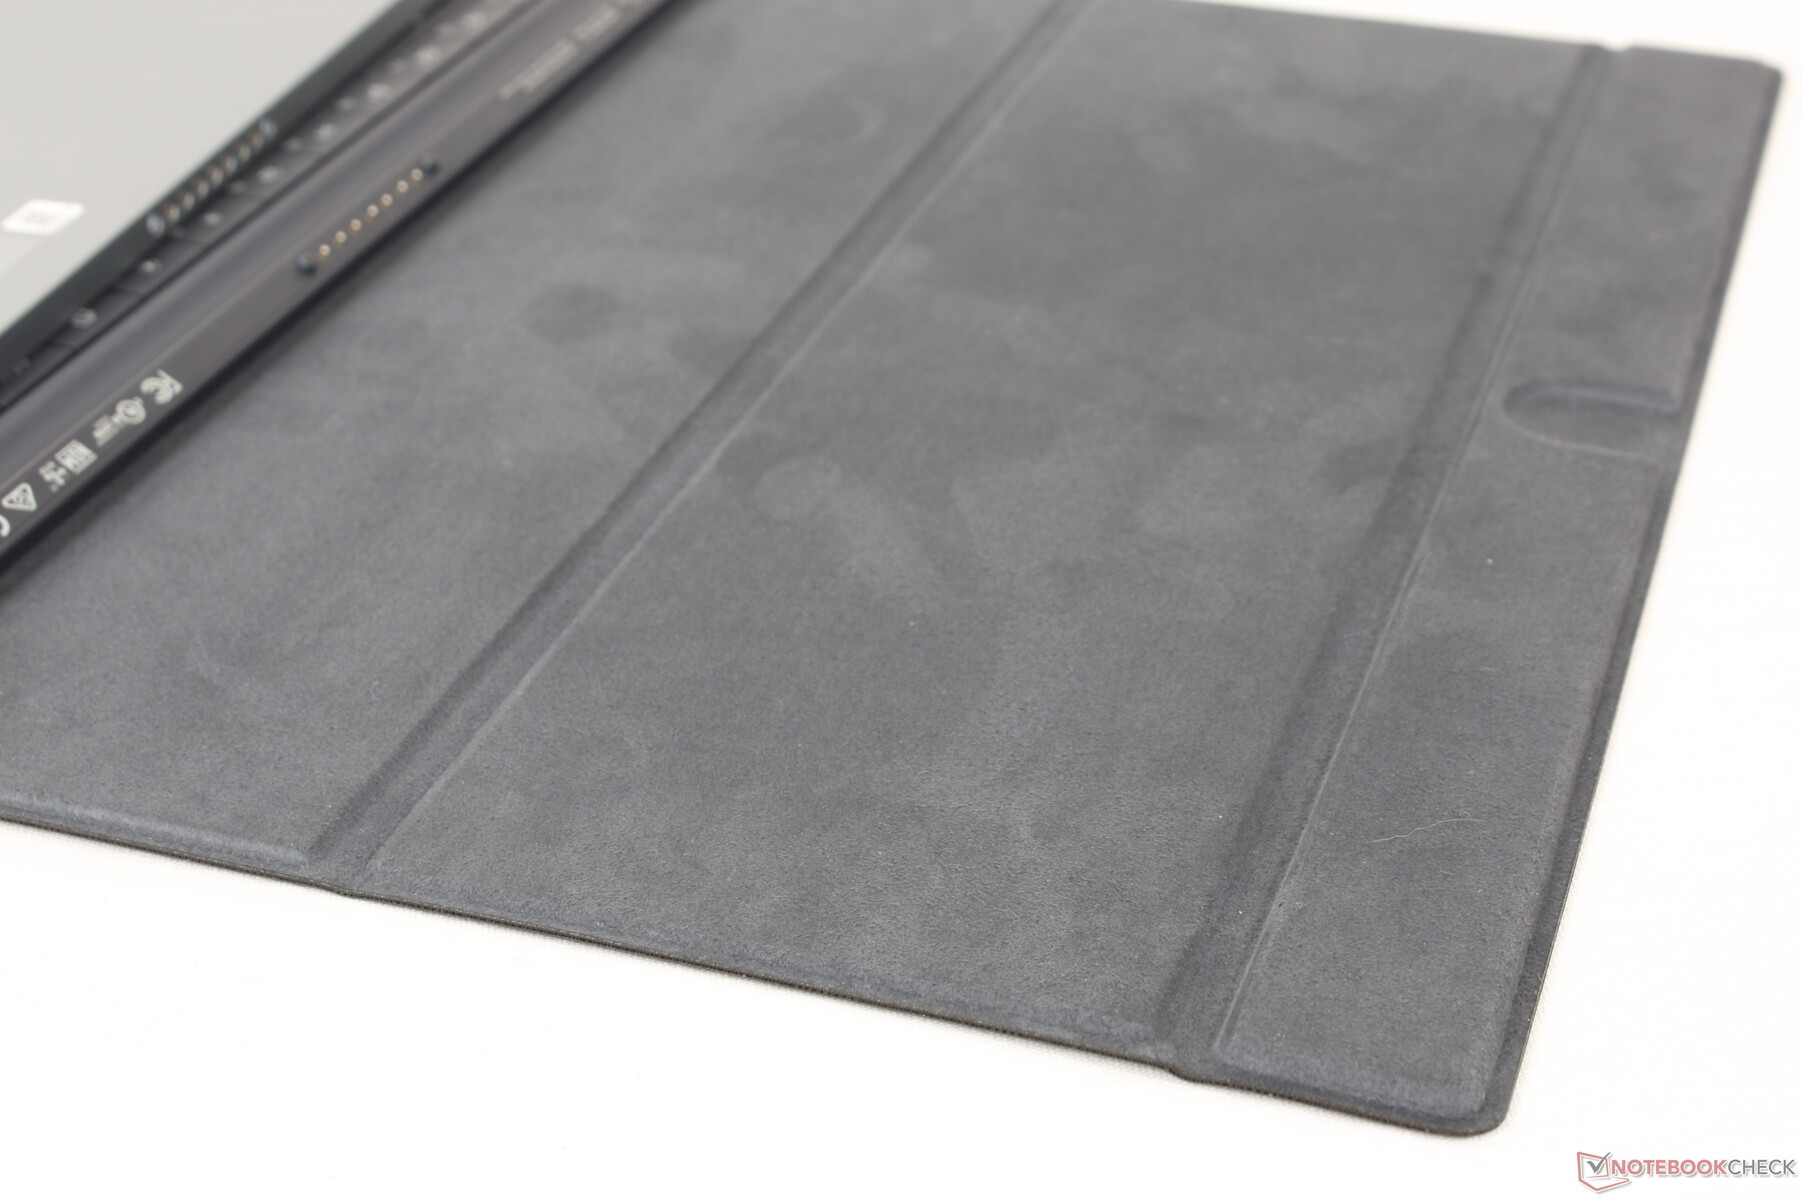
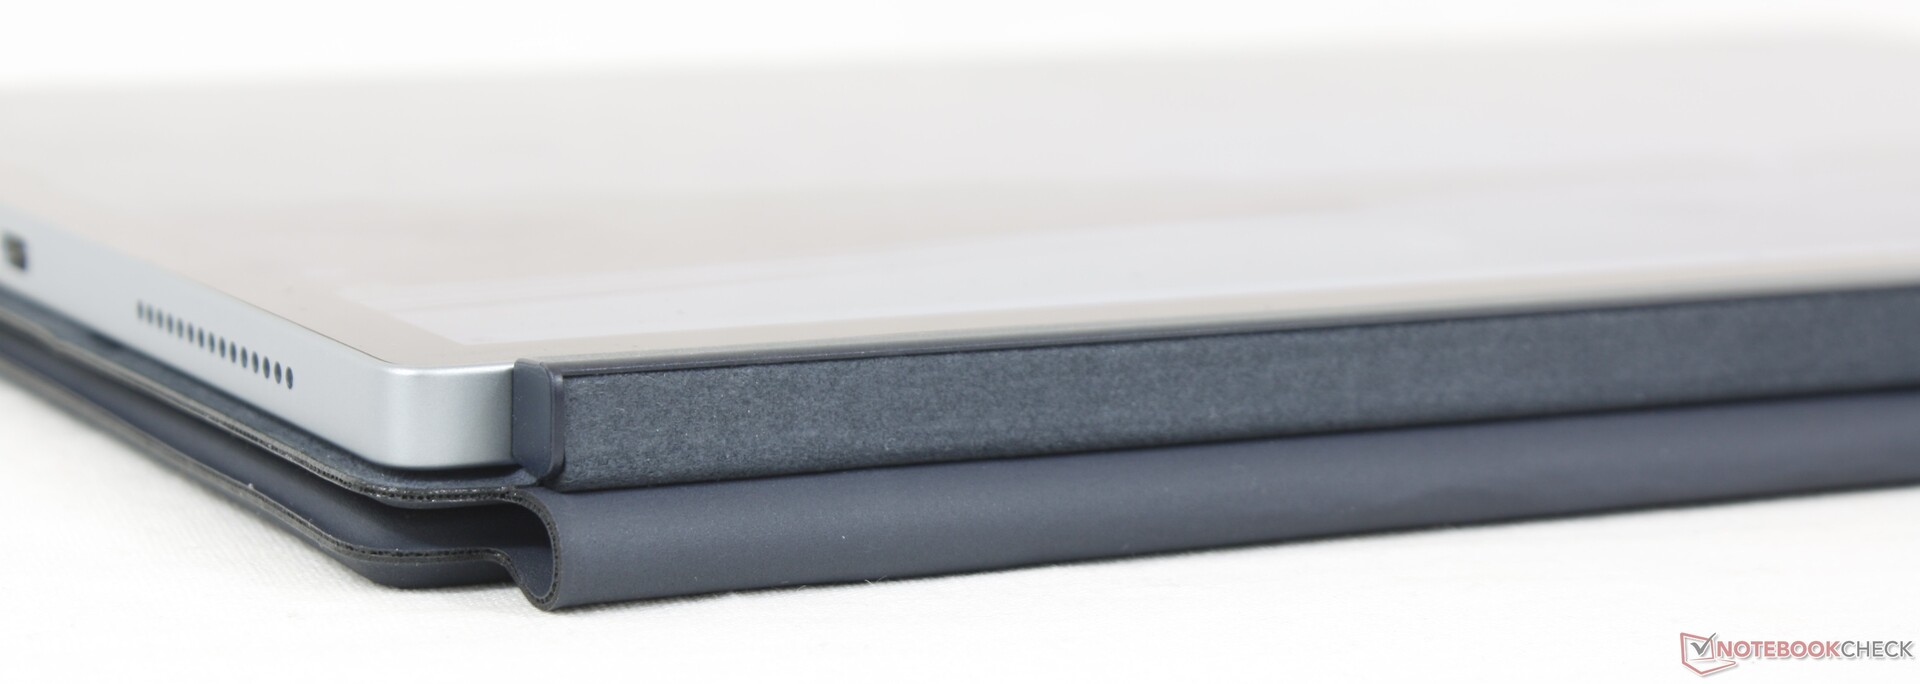
Magnetyczna stacja dokująca klawiatury (lub folio) to miękki w dotyku materiał, nie różniący się od powierzchni Alcantary w stacji dokującej klawiatury Surface Pro 8. Rozwiązanie Della różni się jednak znacząco od wersji Microsoftu, ponieważ zawiera tylną pokrywę, podczas gdy Surface Pro Type Cover to tylko klawiatura i touchpad. Ten tył oferuje dodatkową ochronę przed otarciami i zarysowaniami kosztem dodatkowej wagi.
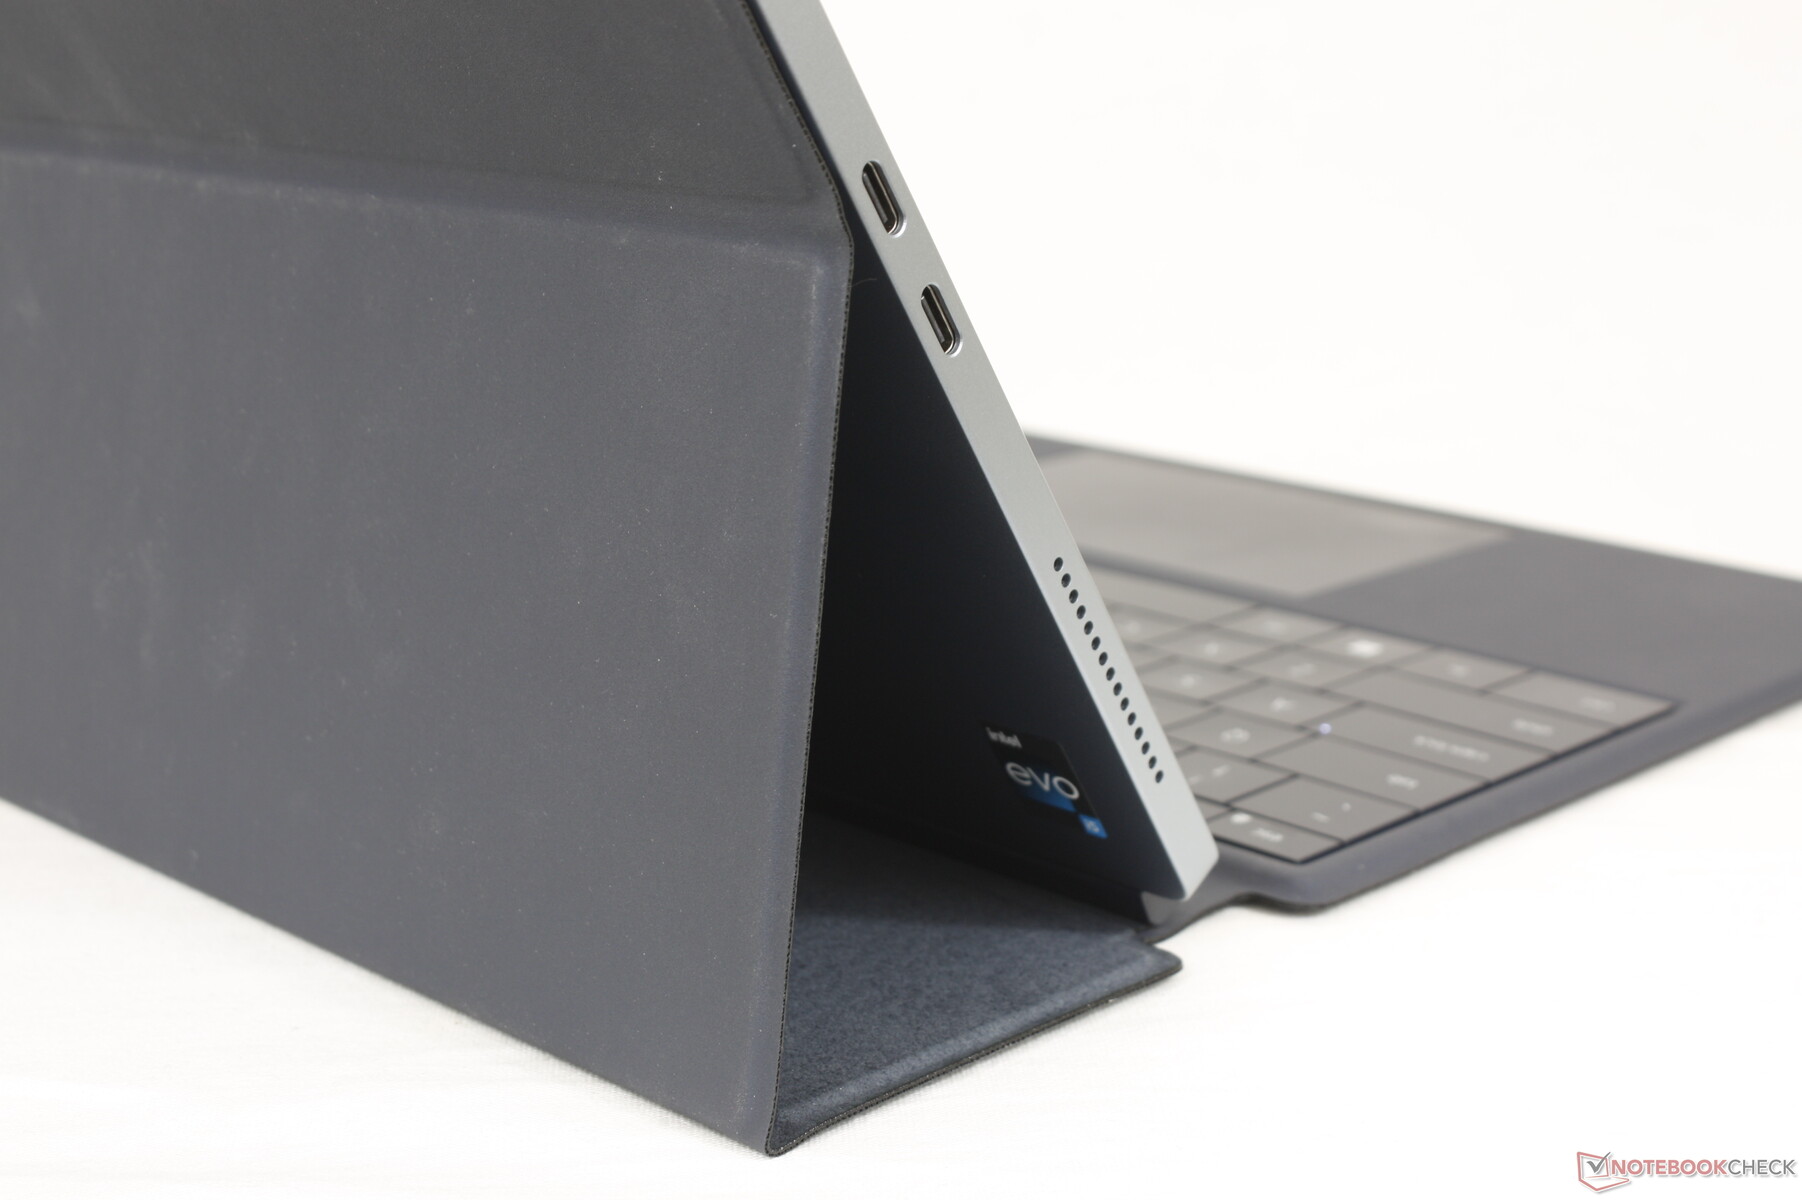
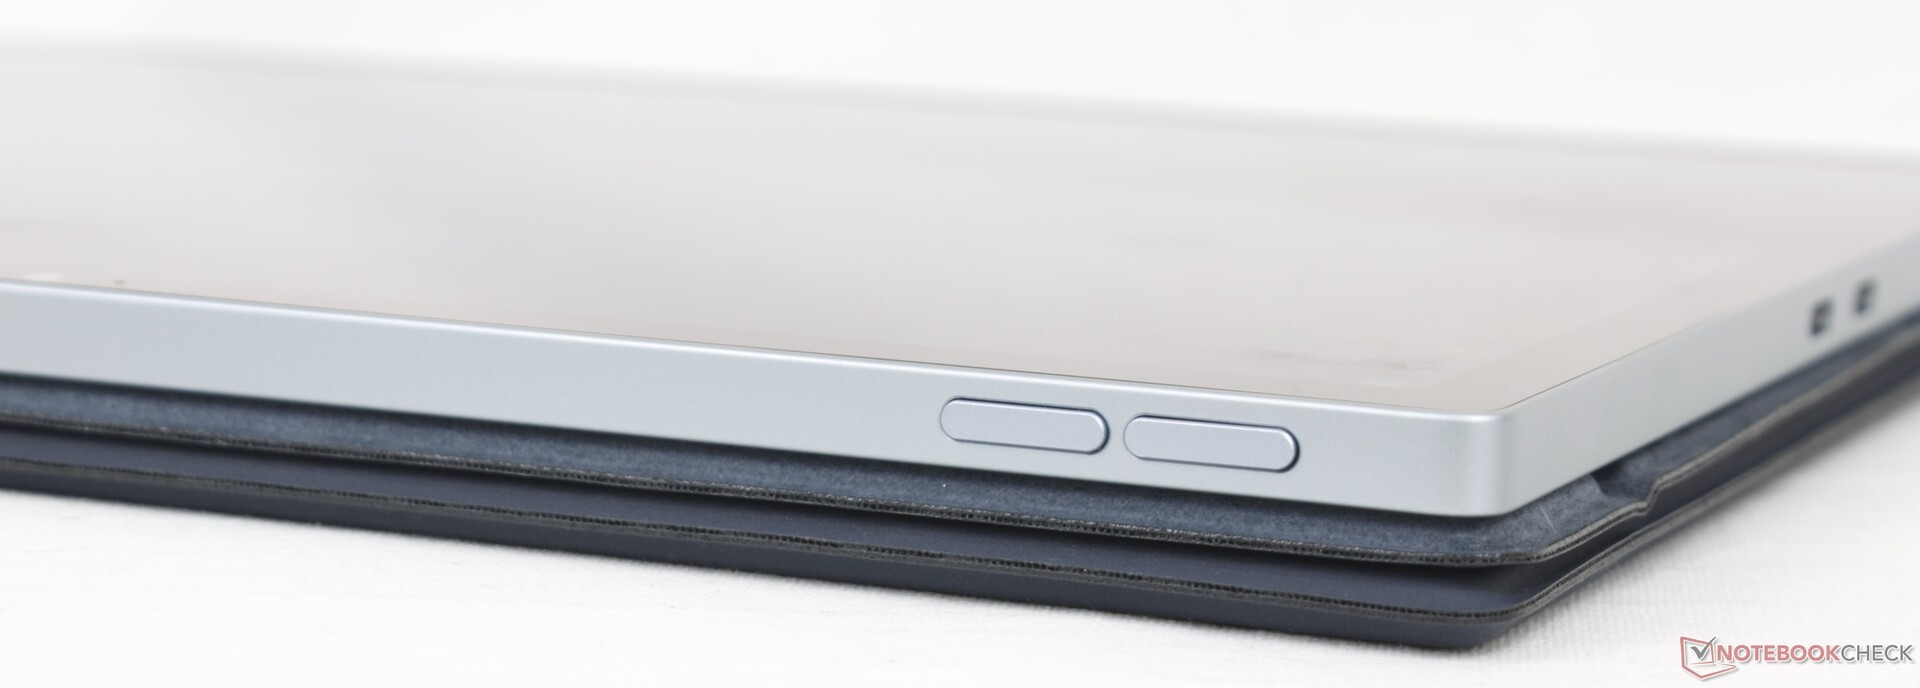
Aby zakotwiczyć tablet Della w trybie laptopa, tylna część folio może być regulowana tylko do 100, 115 i 125 stopni, podczas gdy zawias w Surface Pro 8 może poruszać się bardziej swobodnie. Innymi słowy, XPS 13 9315 2-w-1 wymaga opcjonalnej stacji dokującej folio, by się podeprzeć, podczas gdy Surface Pro 8 ma wygodniejszą wbudowaną podstawkę.
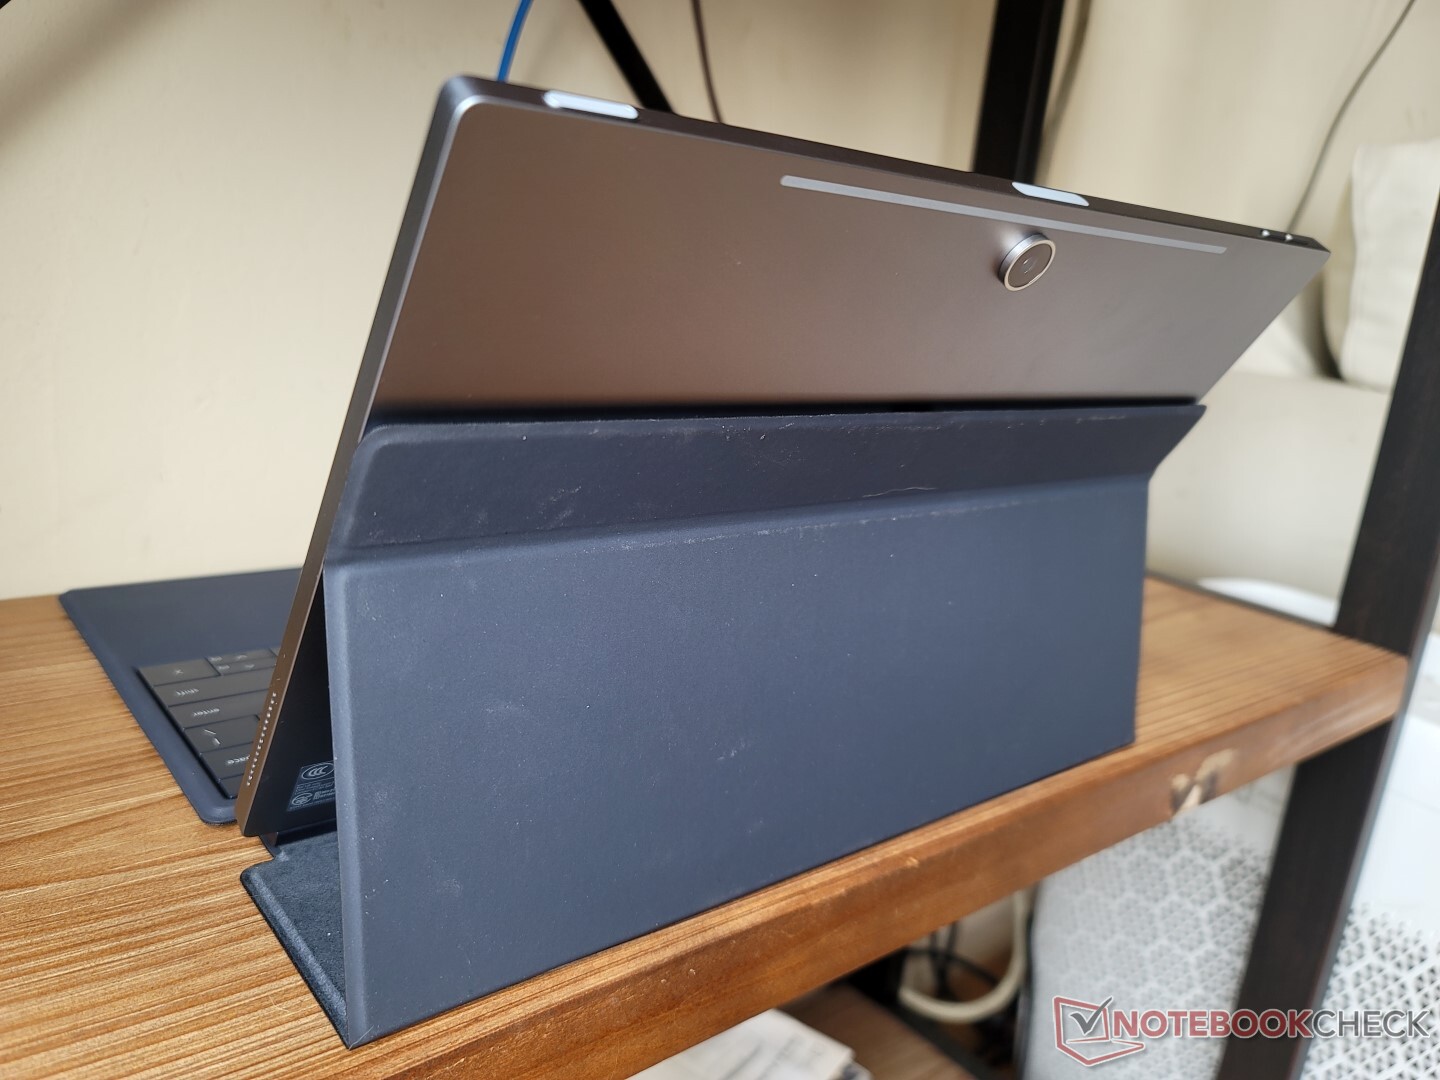
Tablet sam w sobie jest bardzo lekki - waży zaledwie 764 g, w porównaniu do prawie 900 g w przypadku Surface Pro 8. Znaczna część oszczędności w wadze może być przypisana do bezwentylatorowej konstrukcji Dell, podczas gdy model Microsoft zawiera wentylator dla lepszego chłodzenia. Łączna waga tabletu i obudowy wynosi 1305 g, co jest wartością zbliżoną do wielu 13,5-calowych obudów, jak np.HP Spectre x360 13.5.
Konfiguracje 5G tabletu XPS 13 9315 2-w-1 są nieco grubsze o 4/10 milimetra (7,8 vs. 7,4 mm). Wszystkie opcje są wciąż cieńsze od Surface Pro 8 o włos, a jednocześnie mają niemal identyczną długość i szerokość.
Łączność - brak gniazda audio
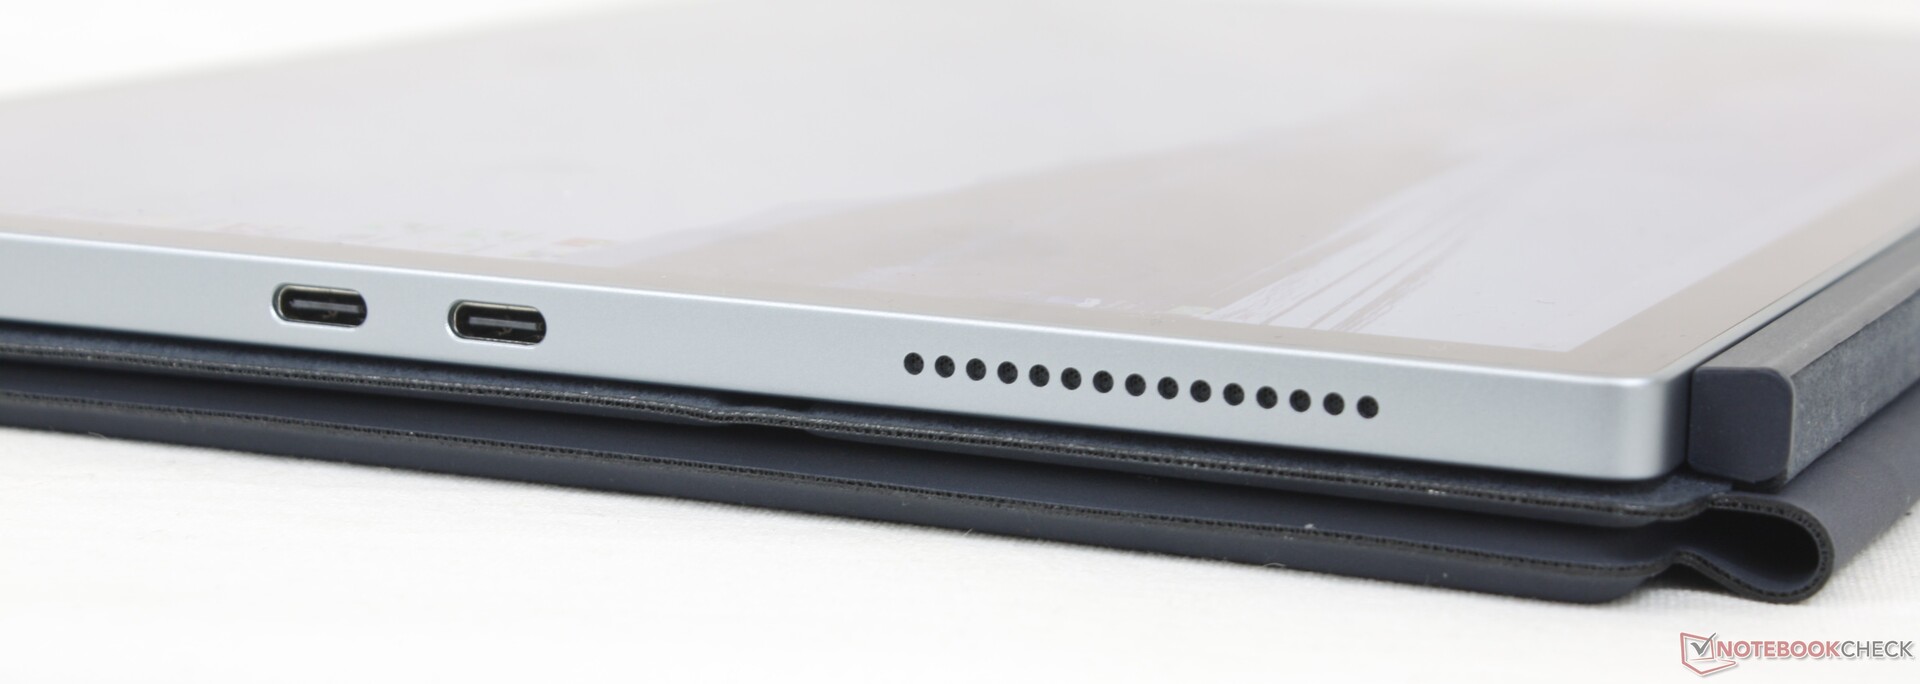
Wzdłuż lewej krawędzi znajdują się tylko dwa porty USB-C, z których każdy jest kompatybilny z urządzeniami Thunderbolt 4. Użytkownicy mają mieć stacje dokujące i adaptery gotowe, aby lepiej wykorzystać te dwa porty. Należy pamiętać, że nie ma nawet 3,5 mm gniazda audio, podczas gdy Surface Pro 8 zawiera jeden.
Komunikacja
Standardem jest Intel 1675 AX211, który zapewnia zgodność z Wi-Fi 6E i Bluetooth 5.2. Szybkość transferu jest szybka i stabilna po sparowaniu z naszą siecią 6 GHz, ale średnie prędkości odbioru są nieco wolniejsze niż oczekiwaliśmy.
| Networking | |
| iperf3 transmit AX12 | |
| Microsoft Surface Pro 8, i7-1185G7 | |
| Lenovo ThinkBook Plus Gen2 Core i5 | |
| iperf3 receive AX12 | |
| Microsoft Surface Pro 8, i7-1185G7 | |
| Lenovo ThinkBook Plus Gen2 Core i5 | |
| iperf3 receive AXE11000 6GHz | |
| HP Spectre x360 13.5 14t-ef000 | |
| Dell XPS 13 9315 2-in-1 Core i5-1230U | |
| iperf3 receive AXE11000 | |
| Apple MacBook Air M2 Entry | |
| iperf3 transmit AXE11000 | |
| Apple MacBook Air M2 Entry | |
| iperf3 transmit AXE11000 6GHz | |
| HP Spectre x360 13.5 14t-ef000 | |
| Dell XPS 13 9315 2-in-1 Core i5-1230U | |
Kamera internetowa
Tylna kamera ma 11 MP, co, być może nieprzypadkowo, jest o 1 MP więcej niż kamera w Surface Pro 8. Jakość obrazu jest znacznie ostrzejsza niż cokolwiek w kamerze internetowej laptopa, nawet jeśli dokładność kolorów nadal ma długą drogę do przebycia.
Podczerwień jest obecna dla wsparcia Windows Hello. Nie ma niestety migawki kamery internetowej dla ochrony prywatności.


Akcesoria i gwarancja
W pudełku detalicznym znajdują się dwa poręczne adaptery USB-C do konwersji na USB-A i 3,5 mm audio. Podobnie jak w przypadku Microsoftu i jego serii tabletów Surface Pro, jednak odłączana podstawa klawiatury i magnetyczny aktywny rysik są sprzedawane oddzielnie za dodatkowe 100 USD każdy. Innymi słowy, jeśli chcesz mieć zarówno podstawę klawiatury, jak i pióro, musisz dodać 200 USD do ceny początkowej.
W przypadku zakupu w USA obowiązuje standardowa roczna ograniczona gwarancja producenta.
Urządzenia wejściowe - jedna z najwygodniejszych odłączanych klawiatur
Klawiatura
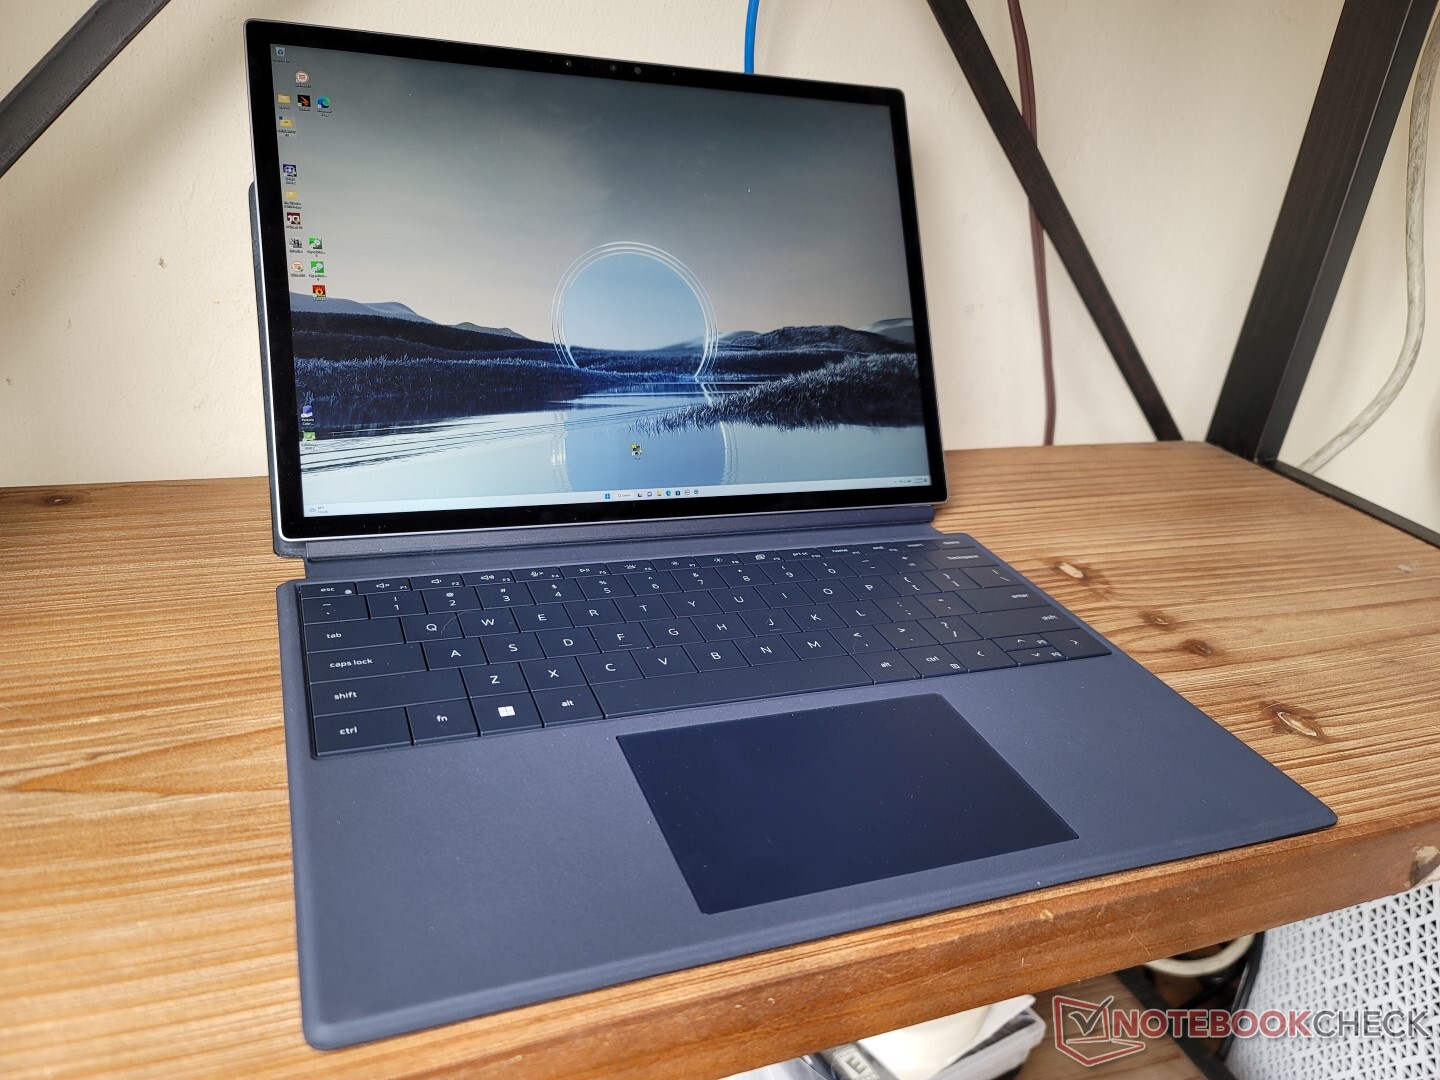
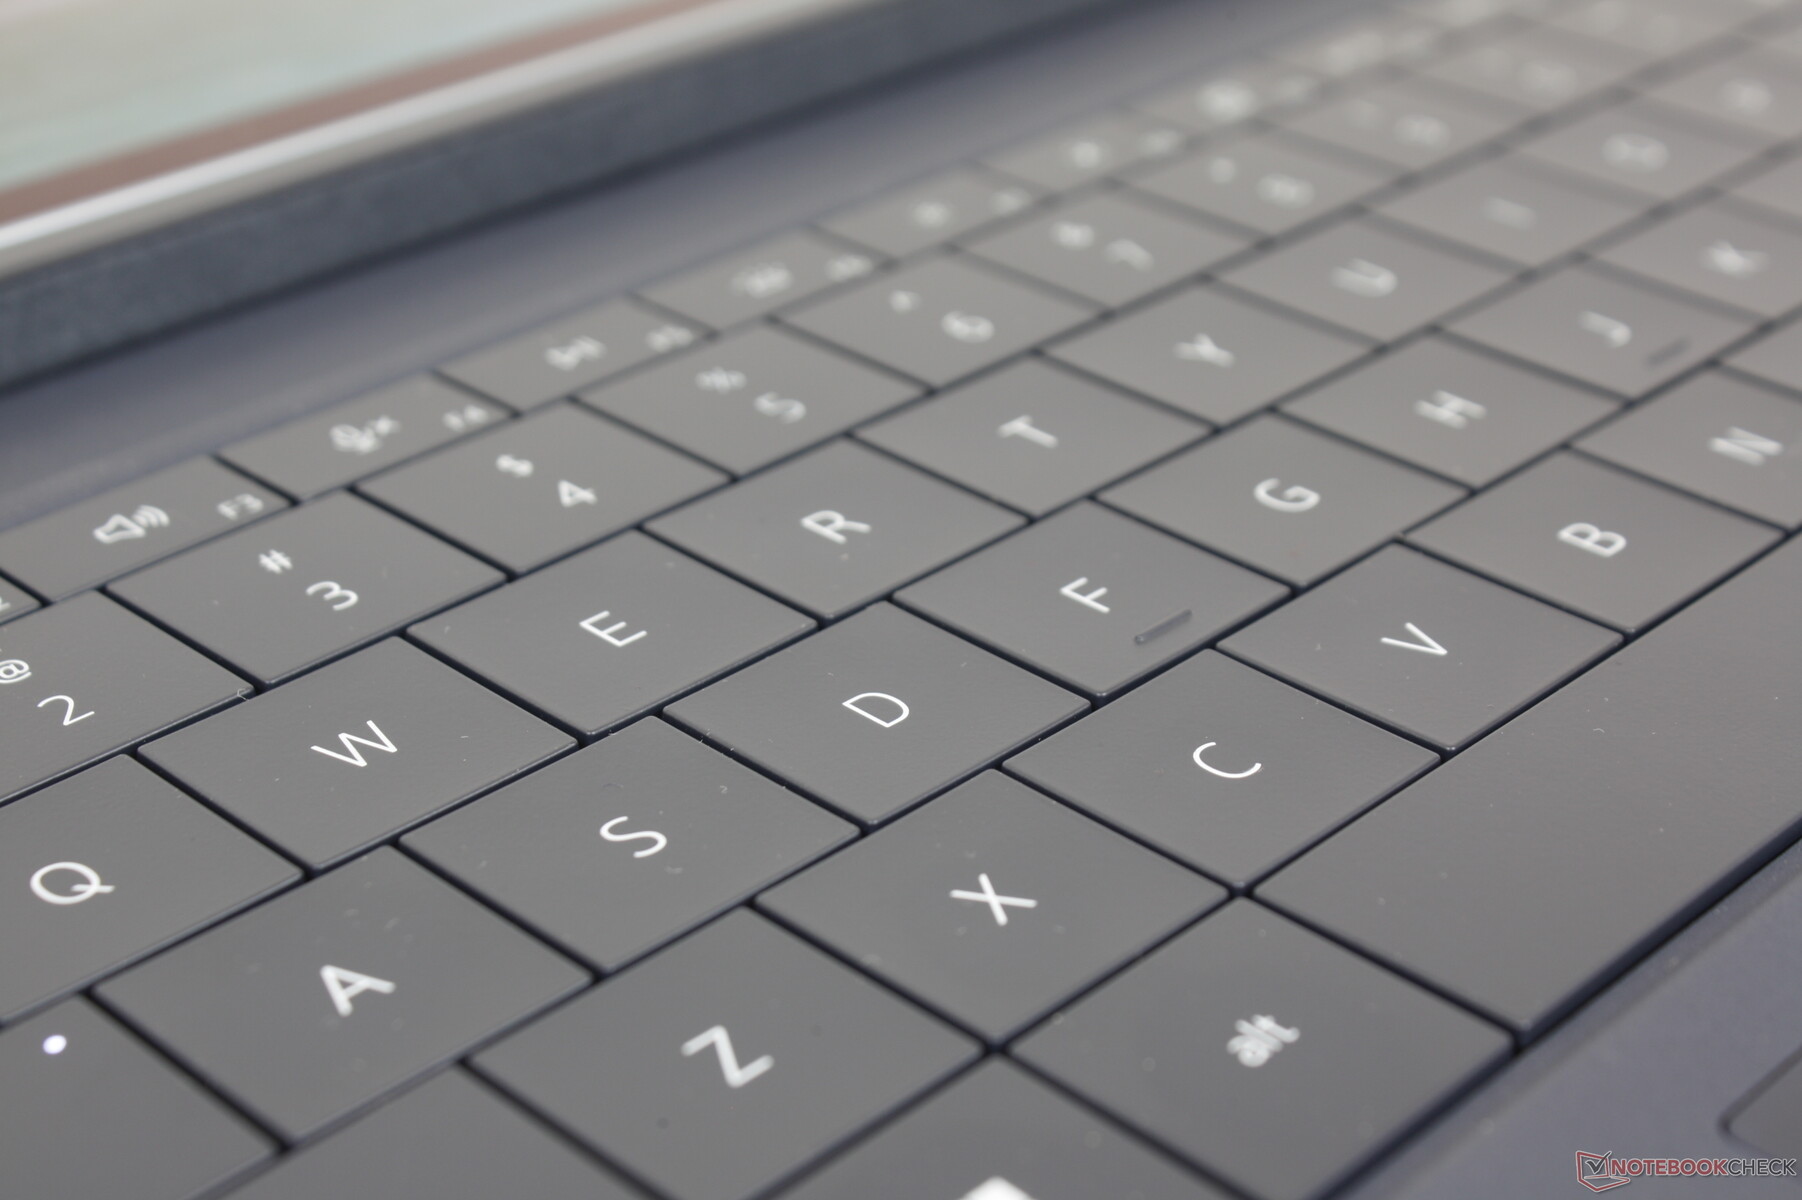
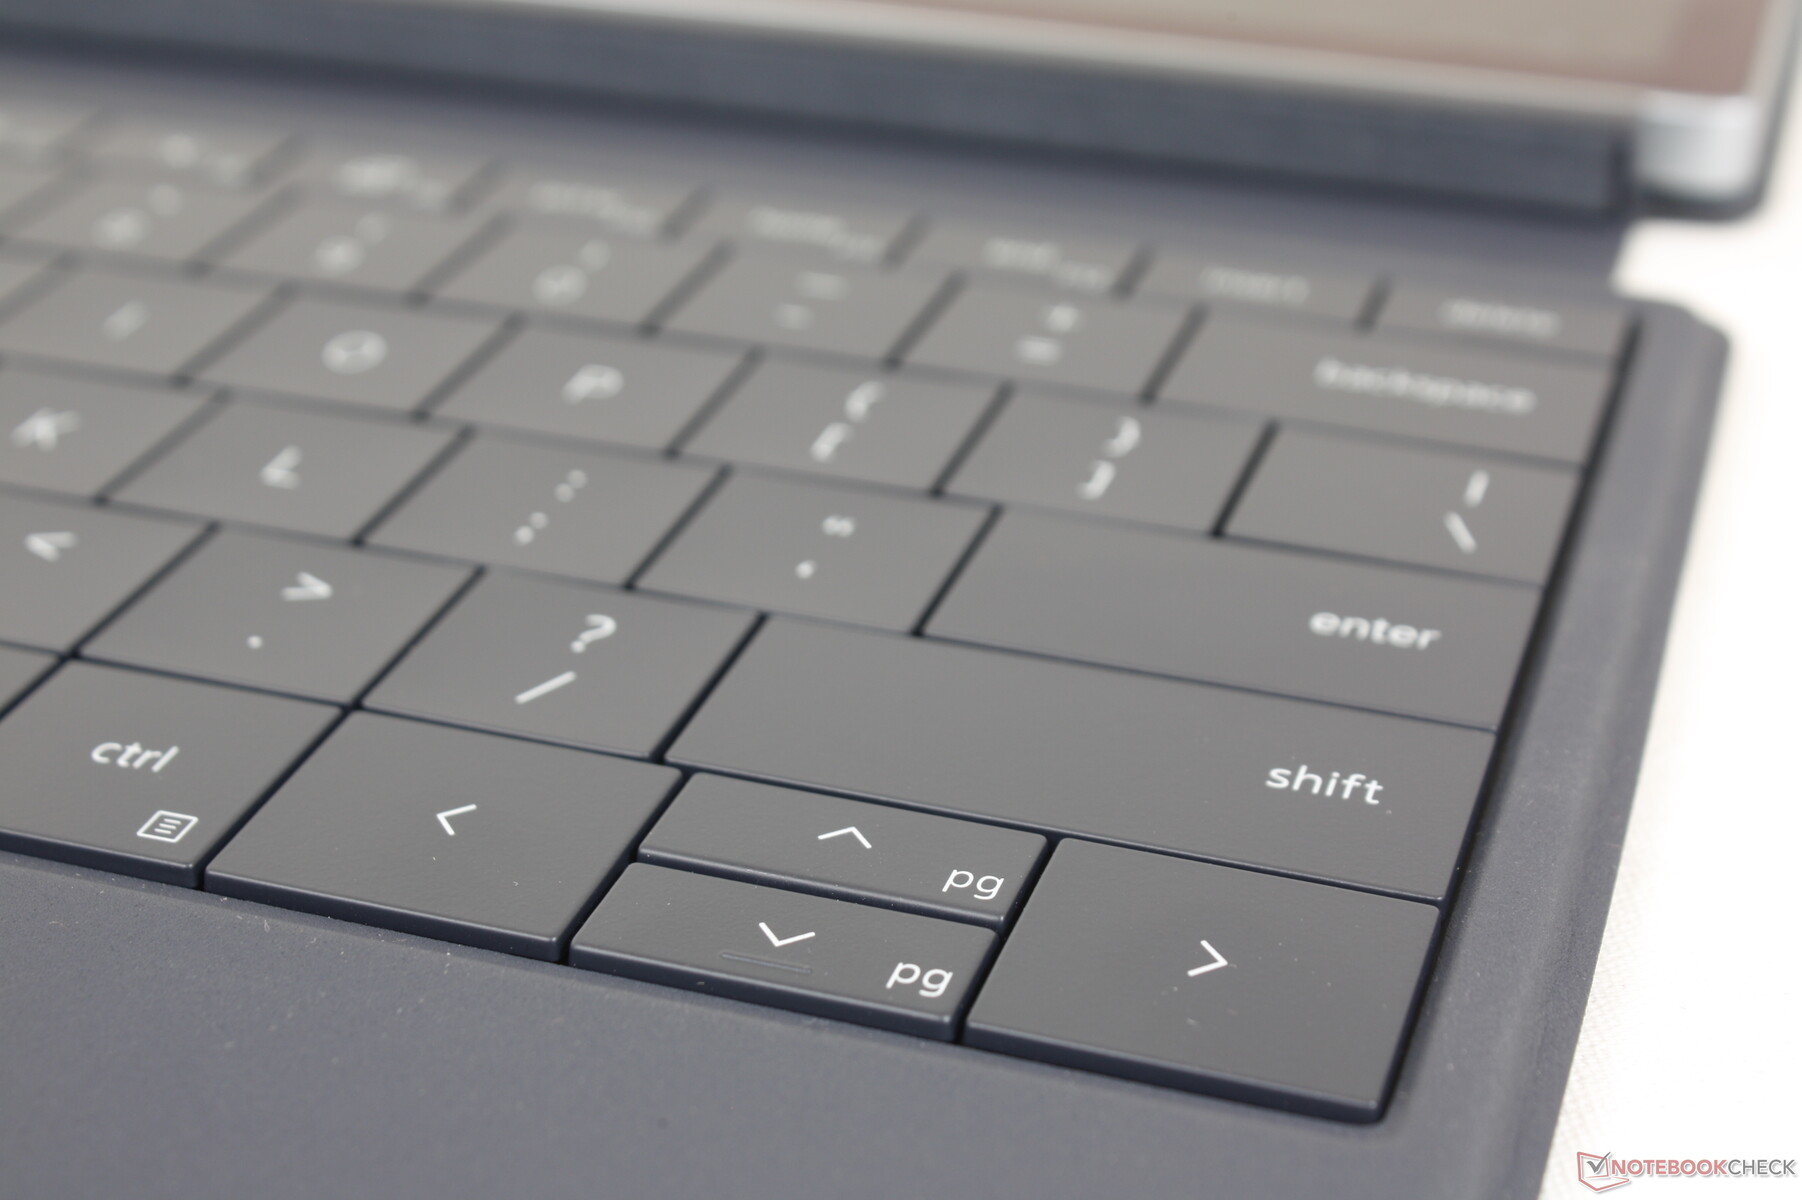
Klawiatura jest wzorowana na klawiaturze w XPS 13 Plus 9320 a więc pod względem skoku i sprzężenia zwrotnego są niemal takie same. Niektórzy mogą uznać skok klawiszy na poziomie 1,0 mm za zbyt płytki, ale ogólne odczucia są i tak o wiele lepsze, niż można by się spodziewać po odłączanej podstawie, gdyż wiele klawiatur z tej kategorii słynie ze słabego sprzężenia zwrotnego, niskiej jakości i gąbczastych klawiszy. Klawiatura XPS 13 9315 2-w-1 jest jak dotąd najbardziej zbliżona do klawiatury prawdziwego ultrabooka
Mimo to układ klawiatury nie jest identyczny jak w modelu XPS 13 Plus 9320. Ta ostatnia klawiatura jest nieco szersza, a jednocześnie zawiera zarówno przycisk zasilania, jak i pojemnościowy rząd poleceń funkcyjnych. Stylistyka czcionek i białe podświetlenie są poza tym zasadniczo identyczne.
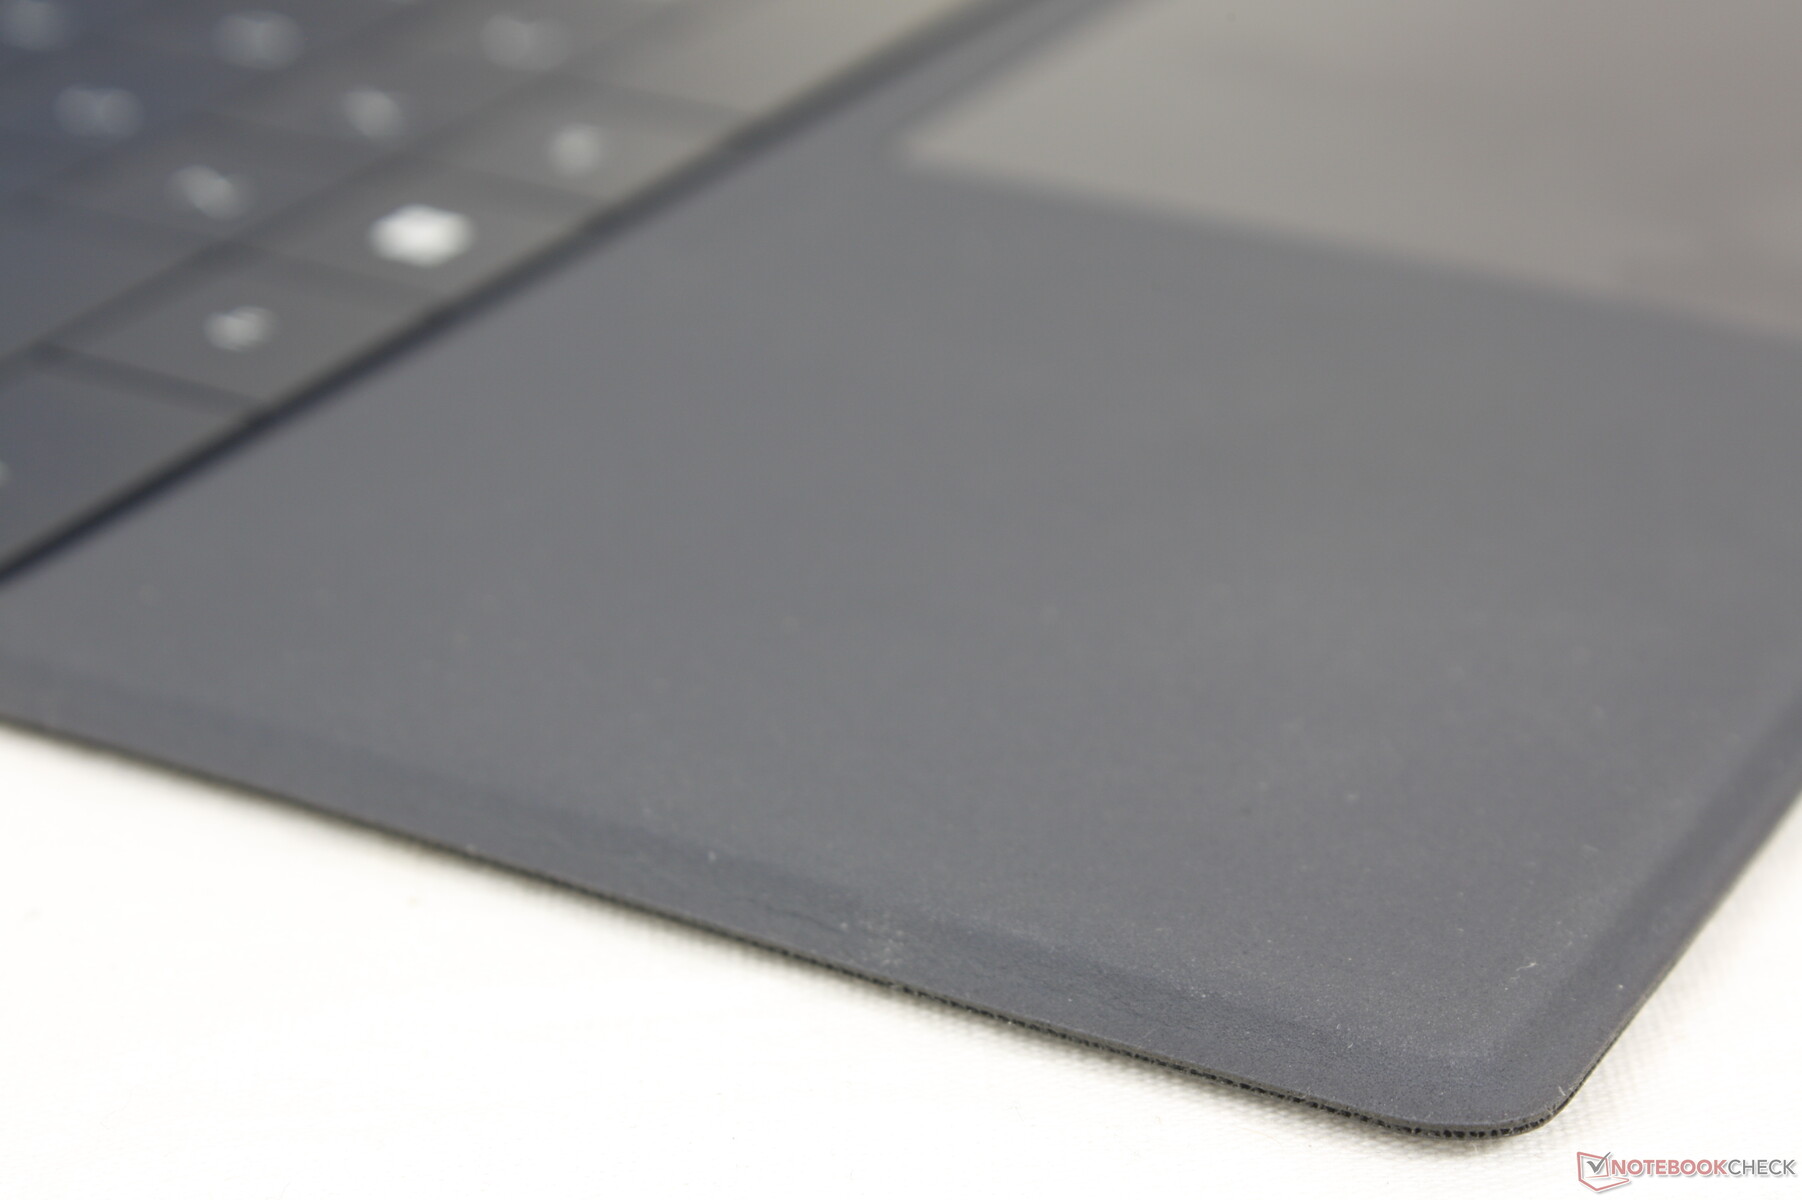
Touchpad
Klawiatura jest większa niż ta w Surface Pro (11,4 x 7,5 vs. 10,2 x 5,3 cm), by łatwiej było przewijać i wykonywać wejścia wielodotykowe. Jego powierzchnia jest całkowicie gładka i w bardzo niewielkim stopniu klei się nawet podczas szybkich ruchów pod prysznicem. Sprzężenie zwrotne przy klikaniu jest jednak dużo płytsze, niż w większości laptopów, i dlatego nie jest tak satysfakcjonujące w użyciu, jak gładzik w bardziej tradycyjnych XPS 13 9315 clamshell.


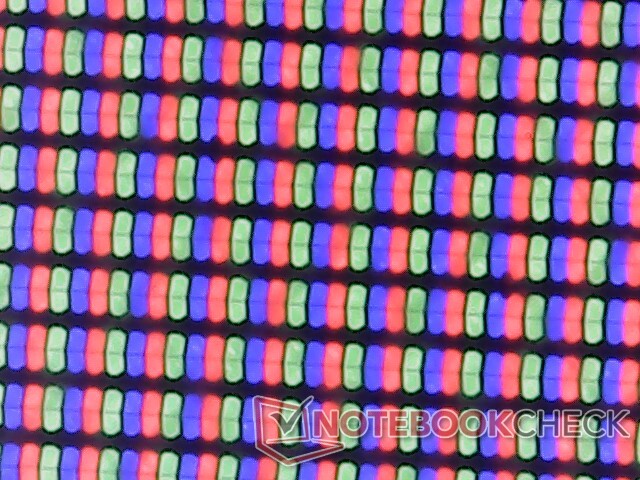
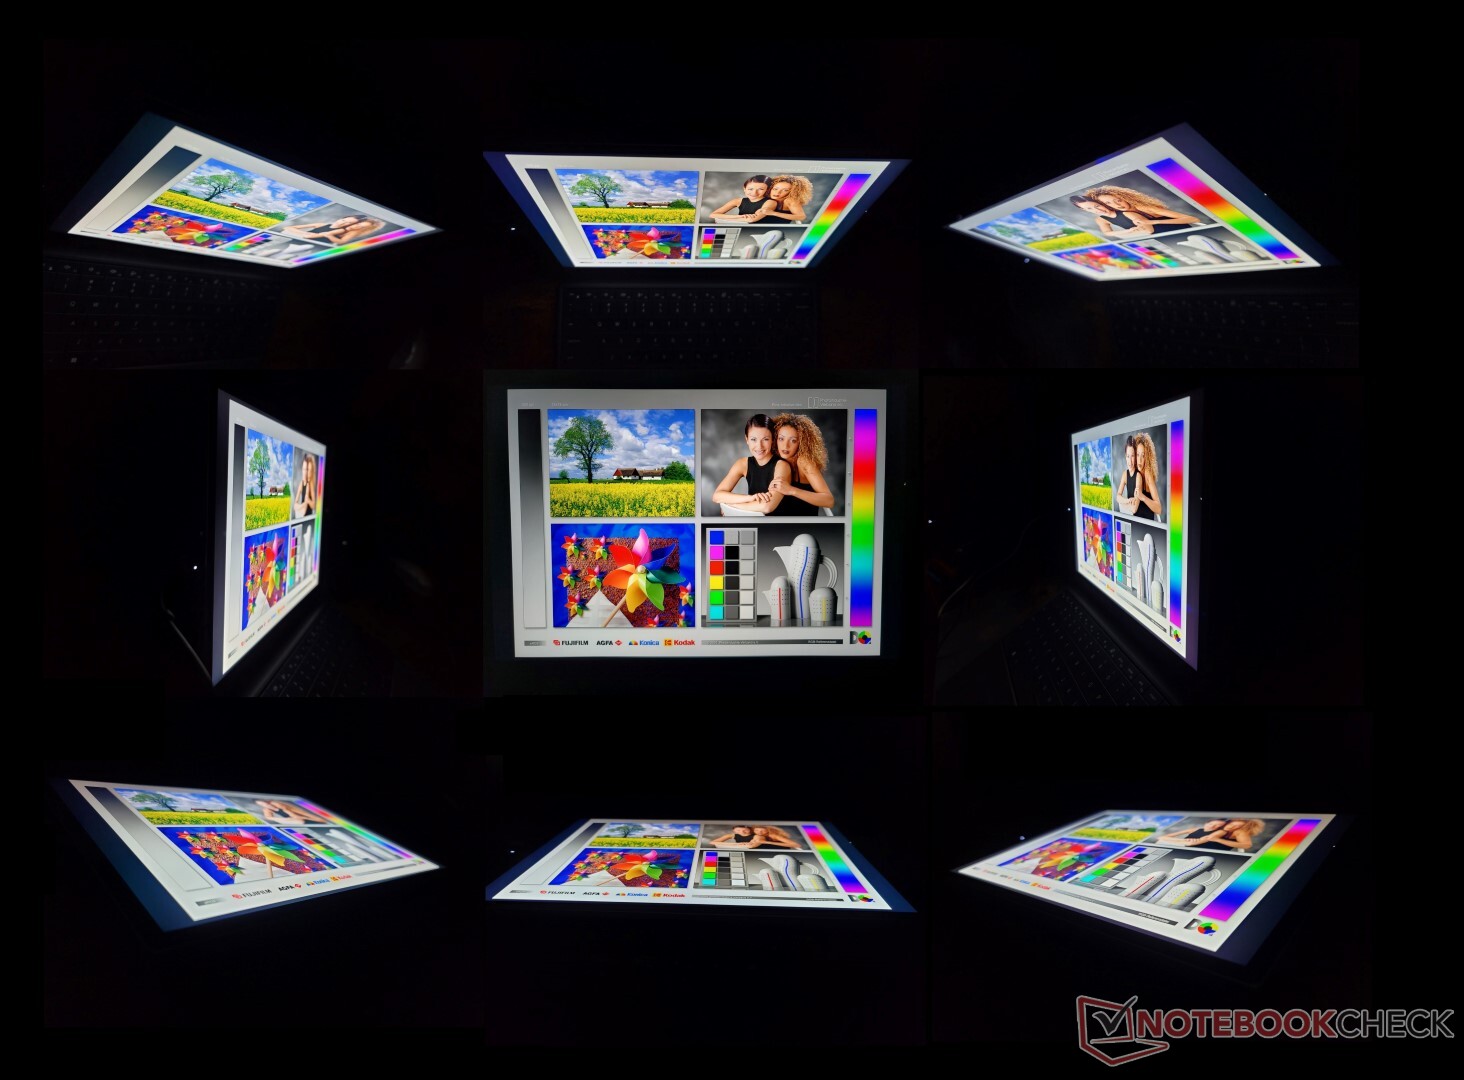
Wyświetlacz - tylko 60 Hz
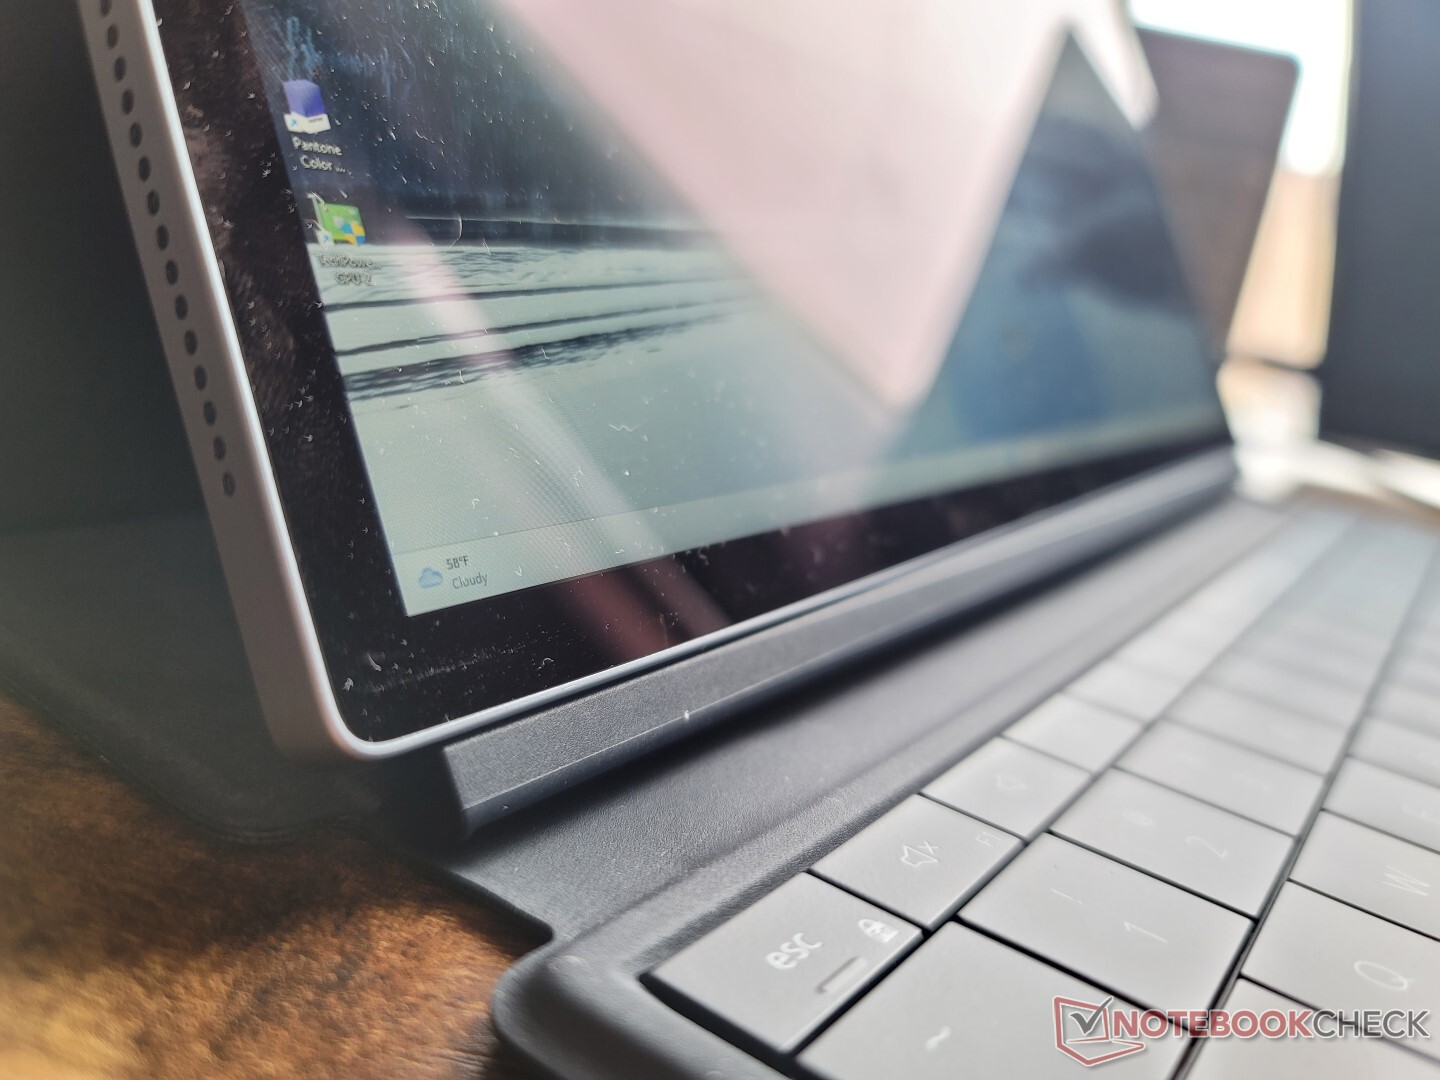
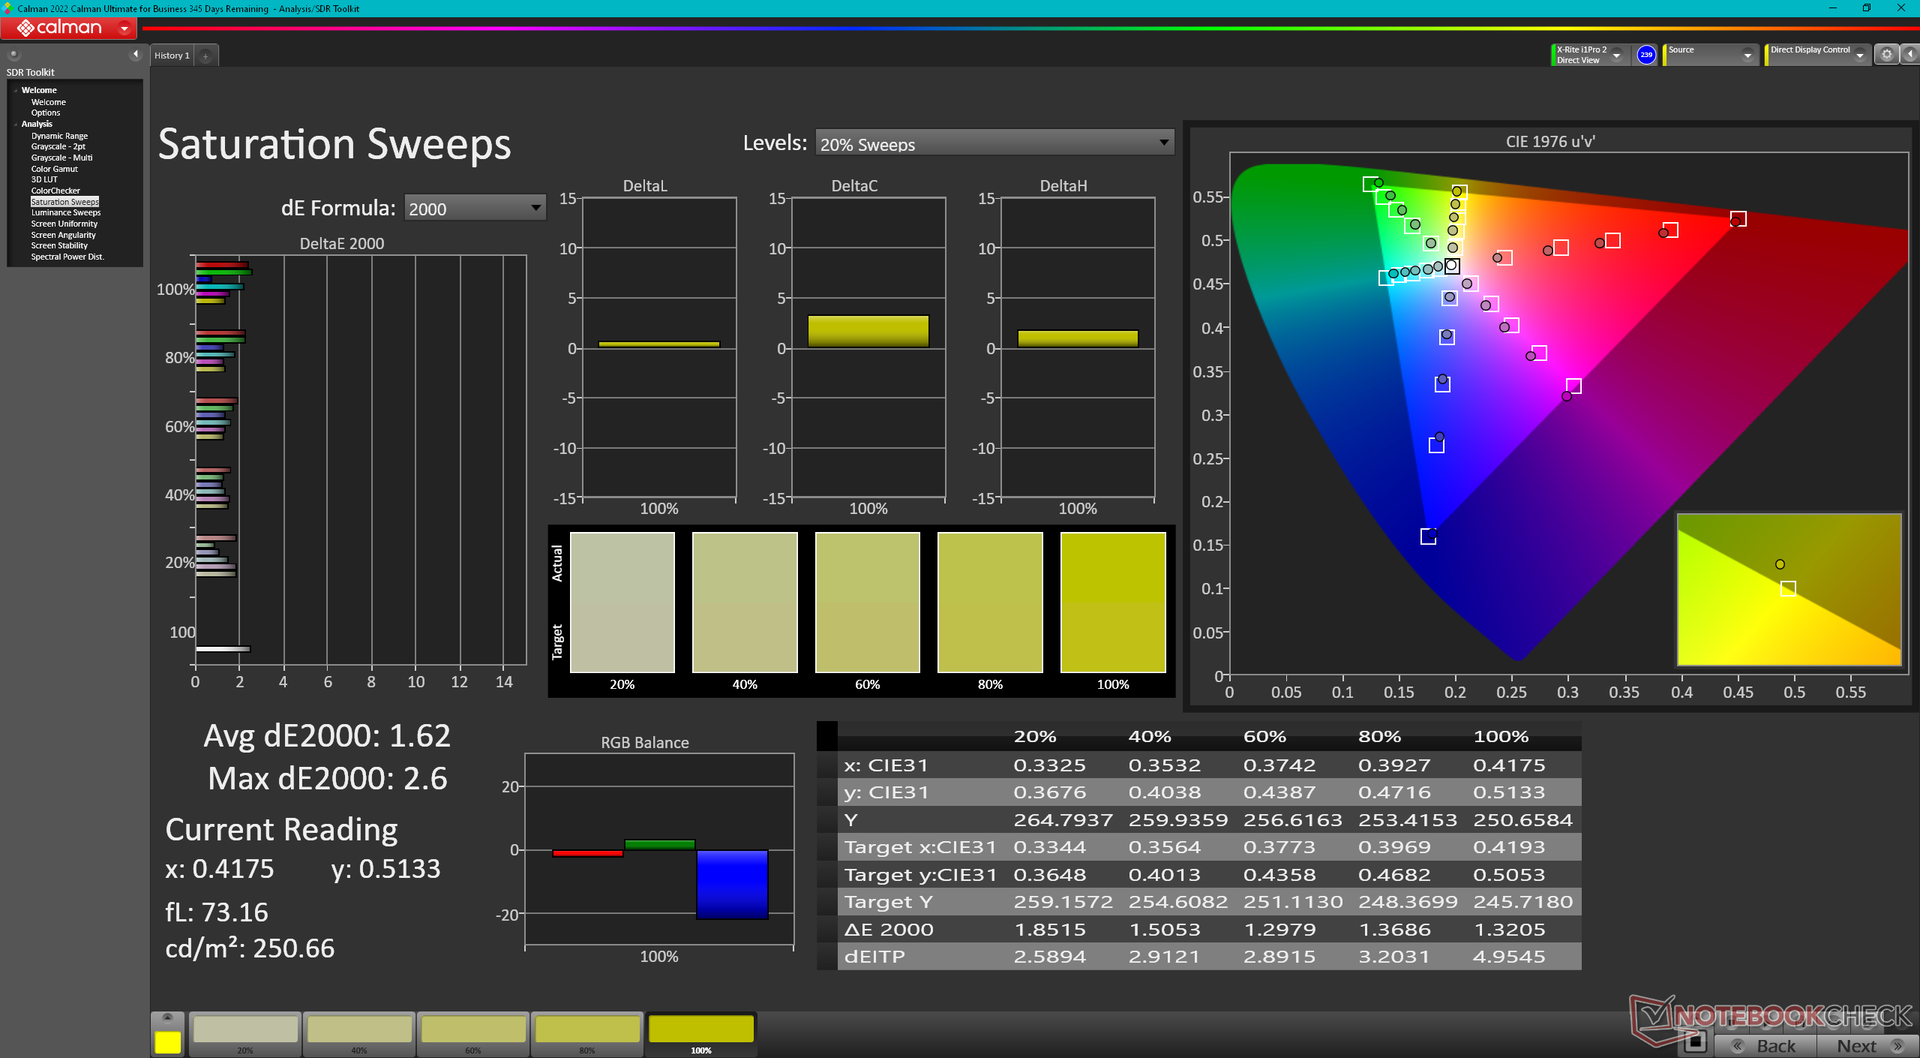
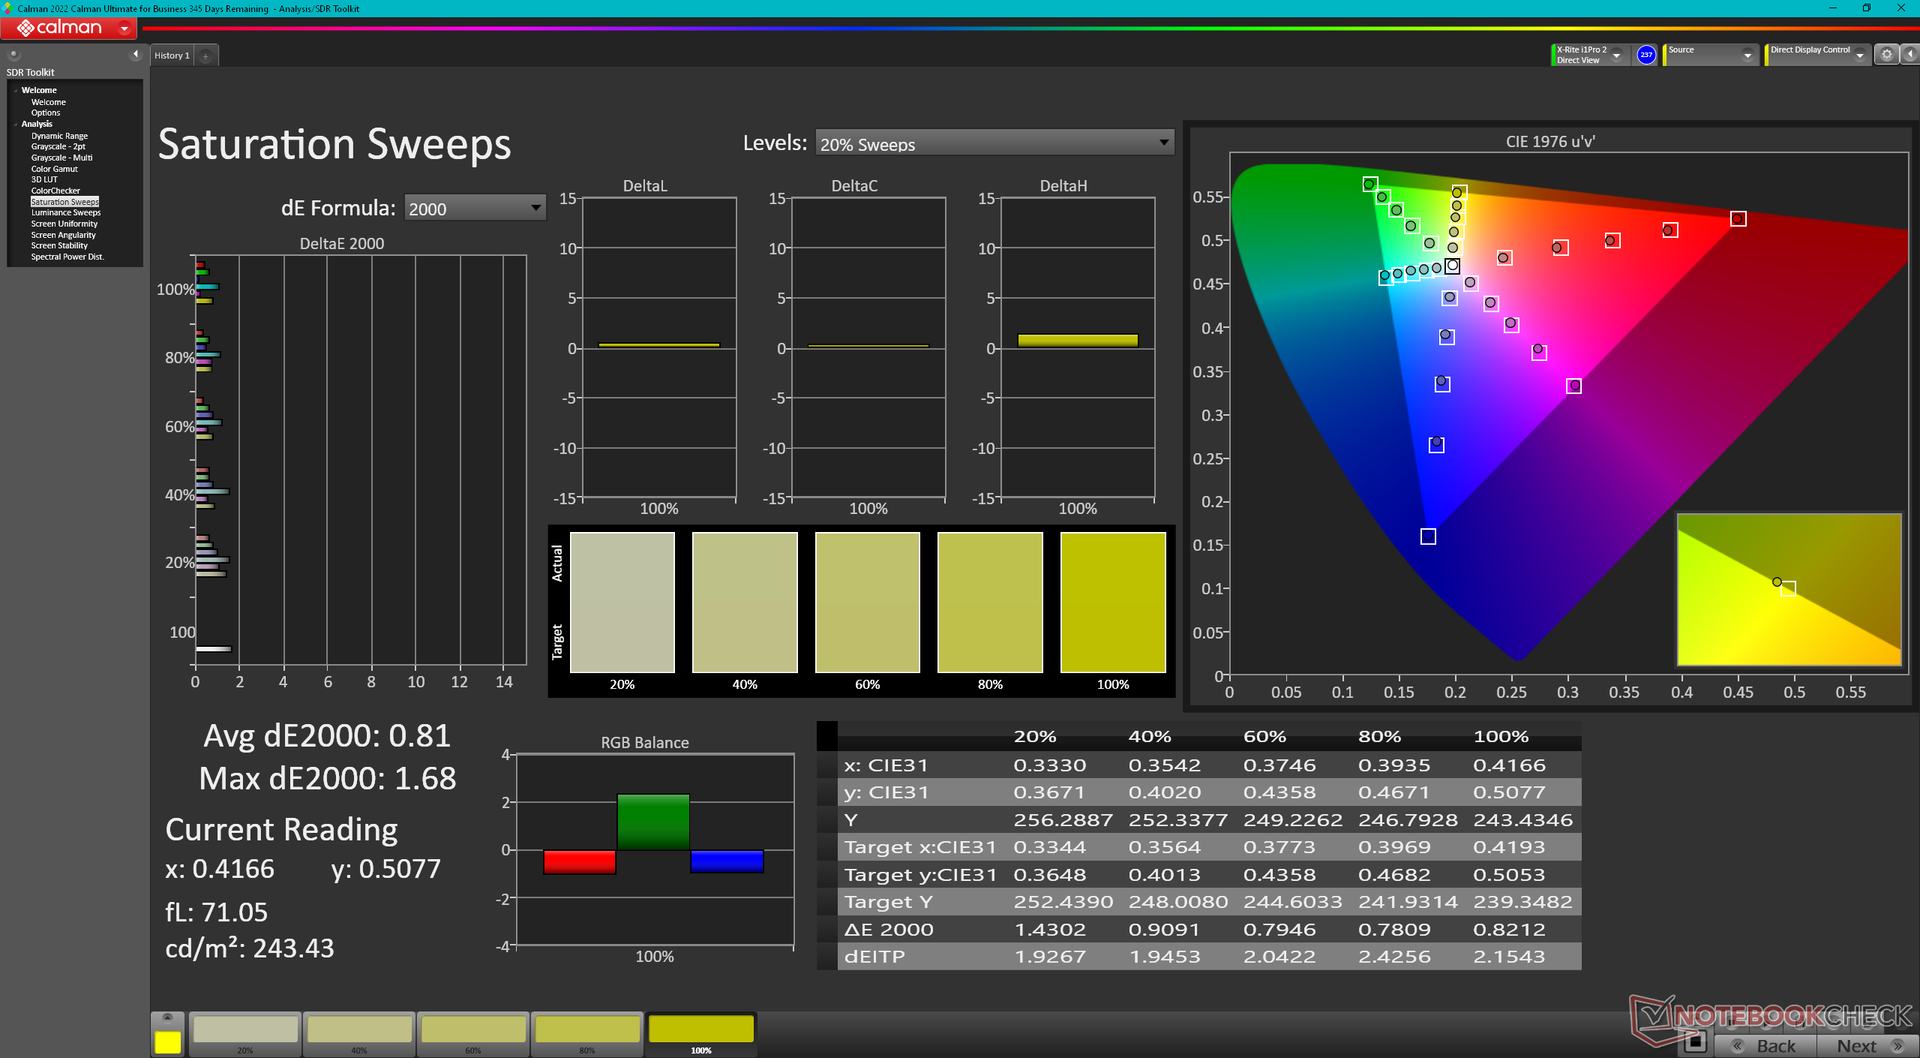
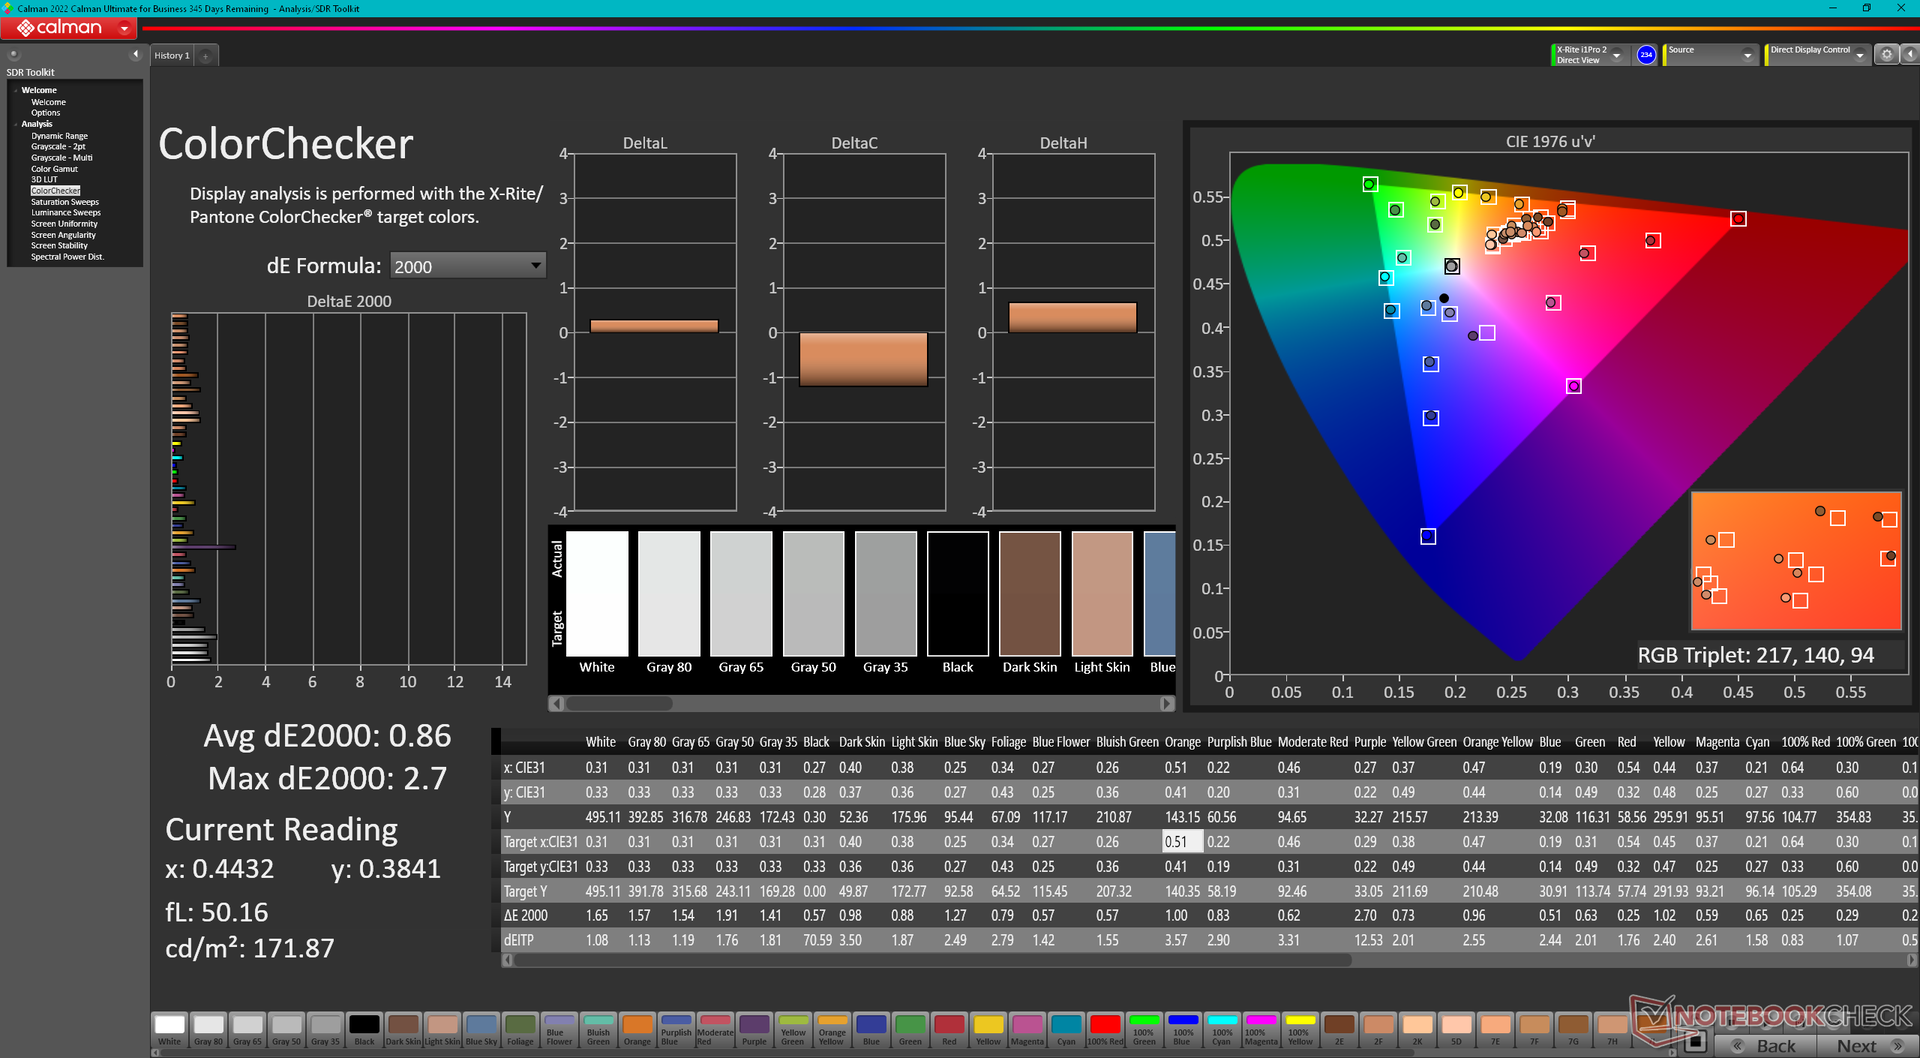
Dell reklamuje 500-nitowy wyświetlacz z pełnym pokryciem sRGB, co możemy potwierdzić własnymi, niezależnymi pomiarami. Współczynnik kontrastu jest również bardzo dobry jak na panel IPS i wynosi około 1500:1, a na niższych poziomach jasności nie występuje PWM w przeciwieństwie do odpowiednika Microsoftu. Wrażenia wizualne są odpowiednie dla high-endowego tabletu z Windowsem przynajmniej na pierwszy rzut oka.
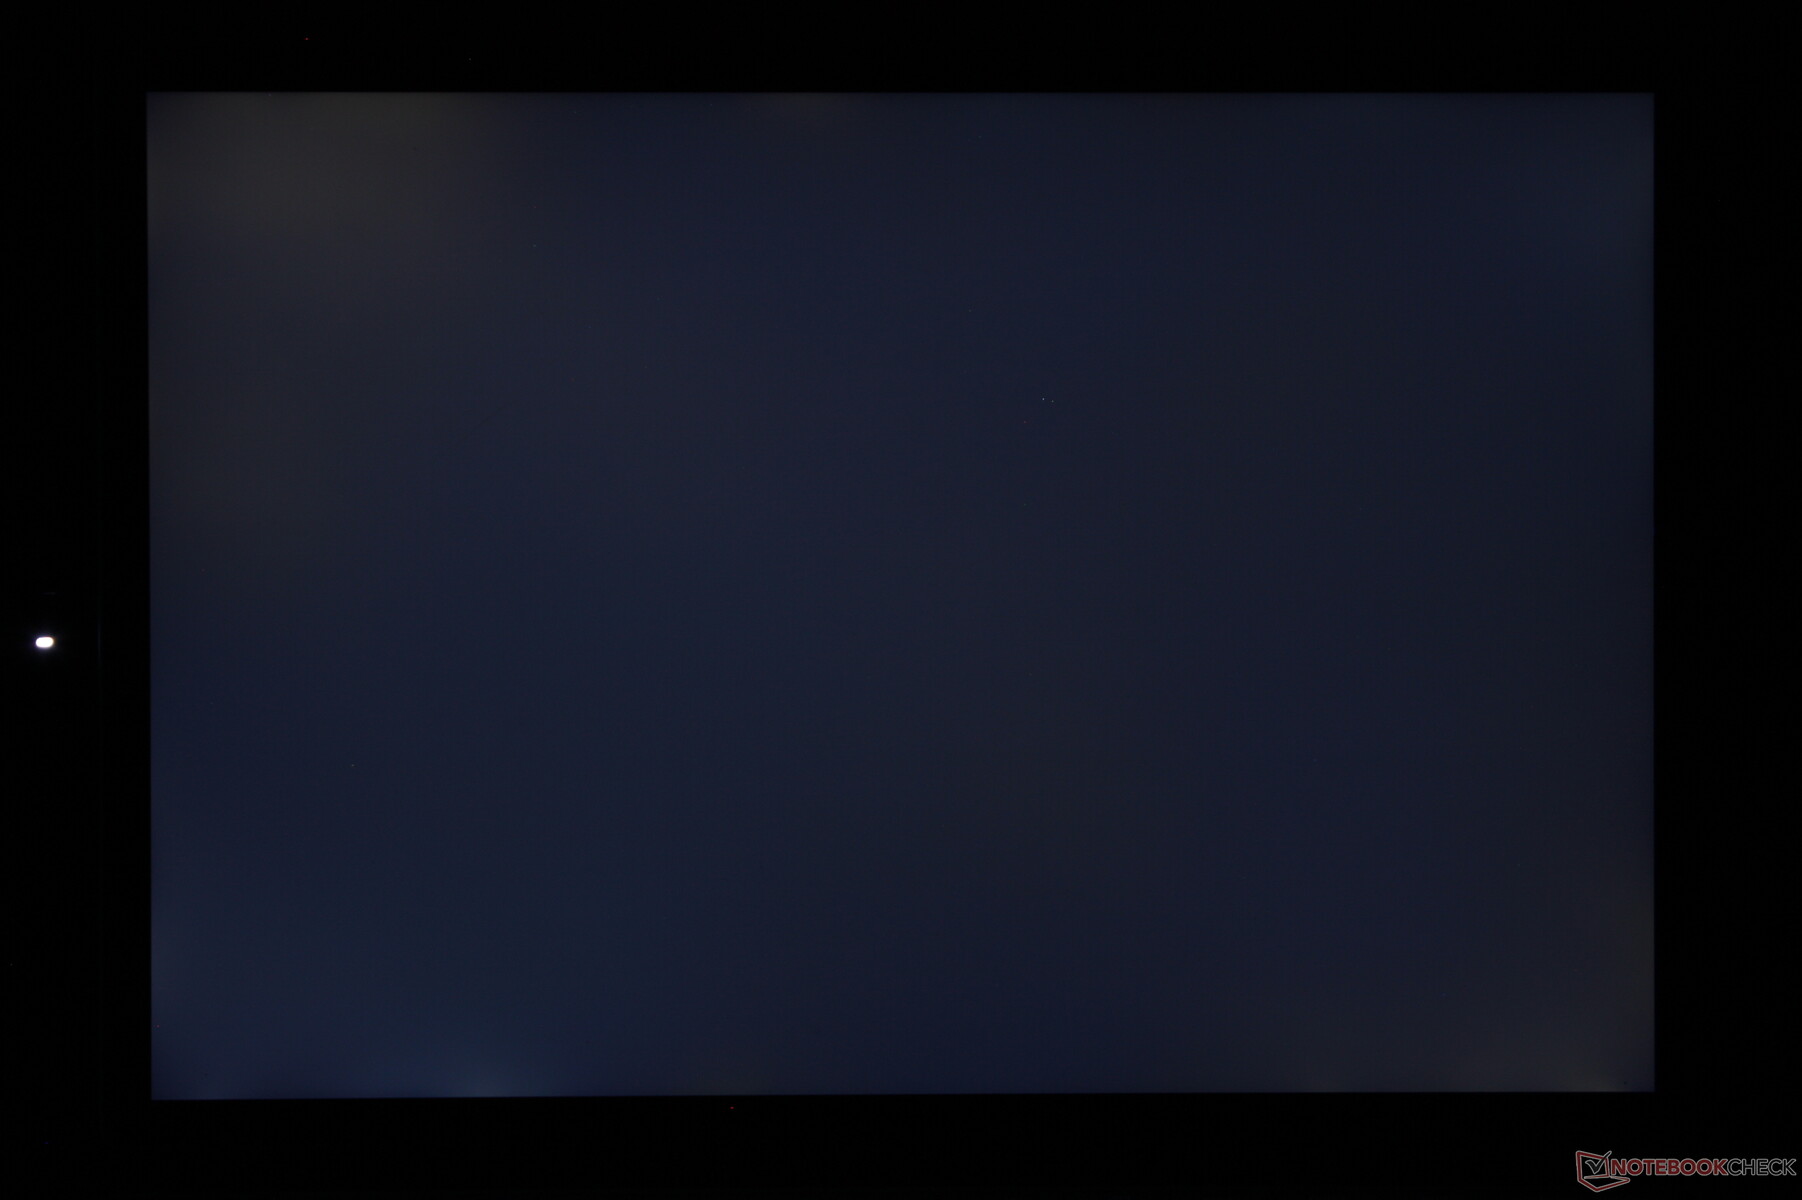
Warto wspomnieć o dwóch zauważalnych wadach. Po pierwsze, czasy reakcji czerni i szarości są stosunkowo wolne, co powoduje zauważalny ghosting podczas przesuwania kursora lub przewijania stron internetowych. Po drugie, równomierność jasności mogłaby być lepsza, gdyż lewa górna część ekranu jest o około 50 nitów jaśniejsza od prawej dolnej. Nie jest to nic wielkiego, ale opcja OLED mogłaby łatwo rozwiązać oba te problemy.
Chcielibyśmy zobaczyć panele o wyższej częstotliwości odświeżania i być może pełne kolory P3 na przyszłych SKUs. Surface Pro 8, na przykład, ma opcje częstotliwości odświeżania 120 Hz, aby zwiększyć reakcję UI. Tymczasem użytkownicy będą musieli rozważyć laptopy typu clamshell, takie jak Dell XPS 13 Plus 9320 lub Asus VivoBook aby znaleźć funkcje OLED w tym momencie.
| |||||||||||||||||||||||||
rozświetlenie: 87 %
na akumulatorze: 507 cd/m²
kontrast: 1491:1 (czerń: 0.34 cd/m²)
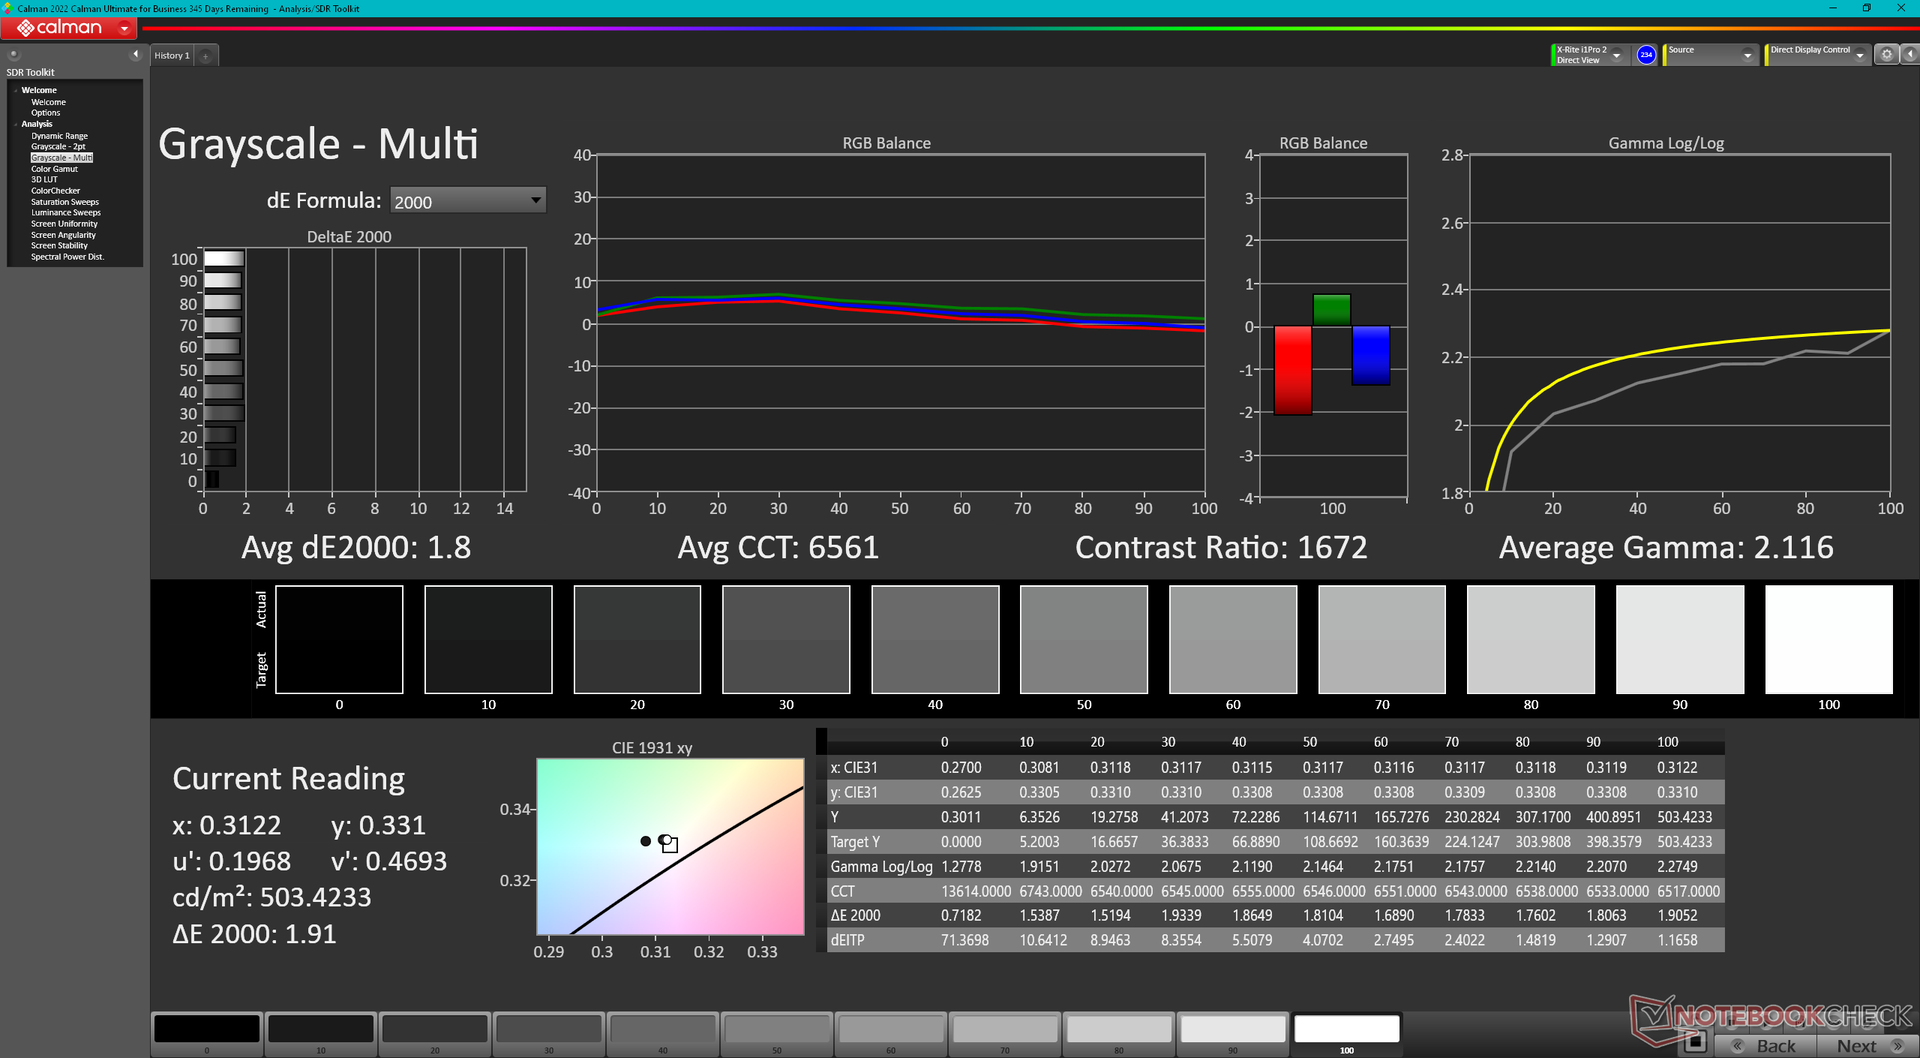
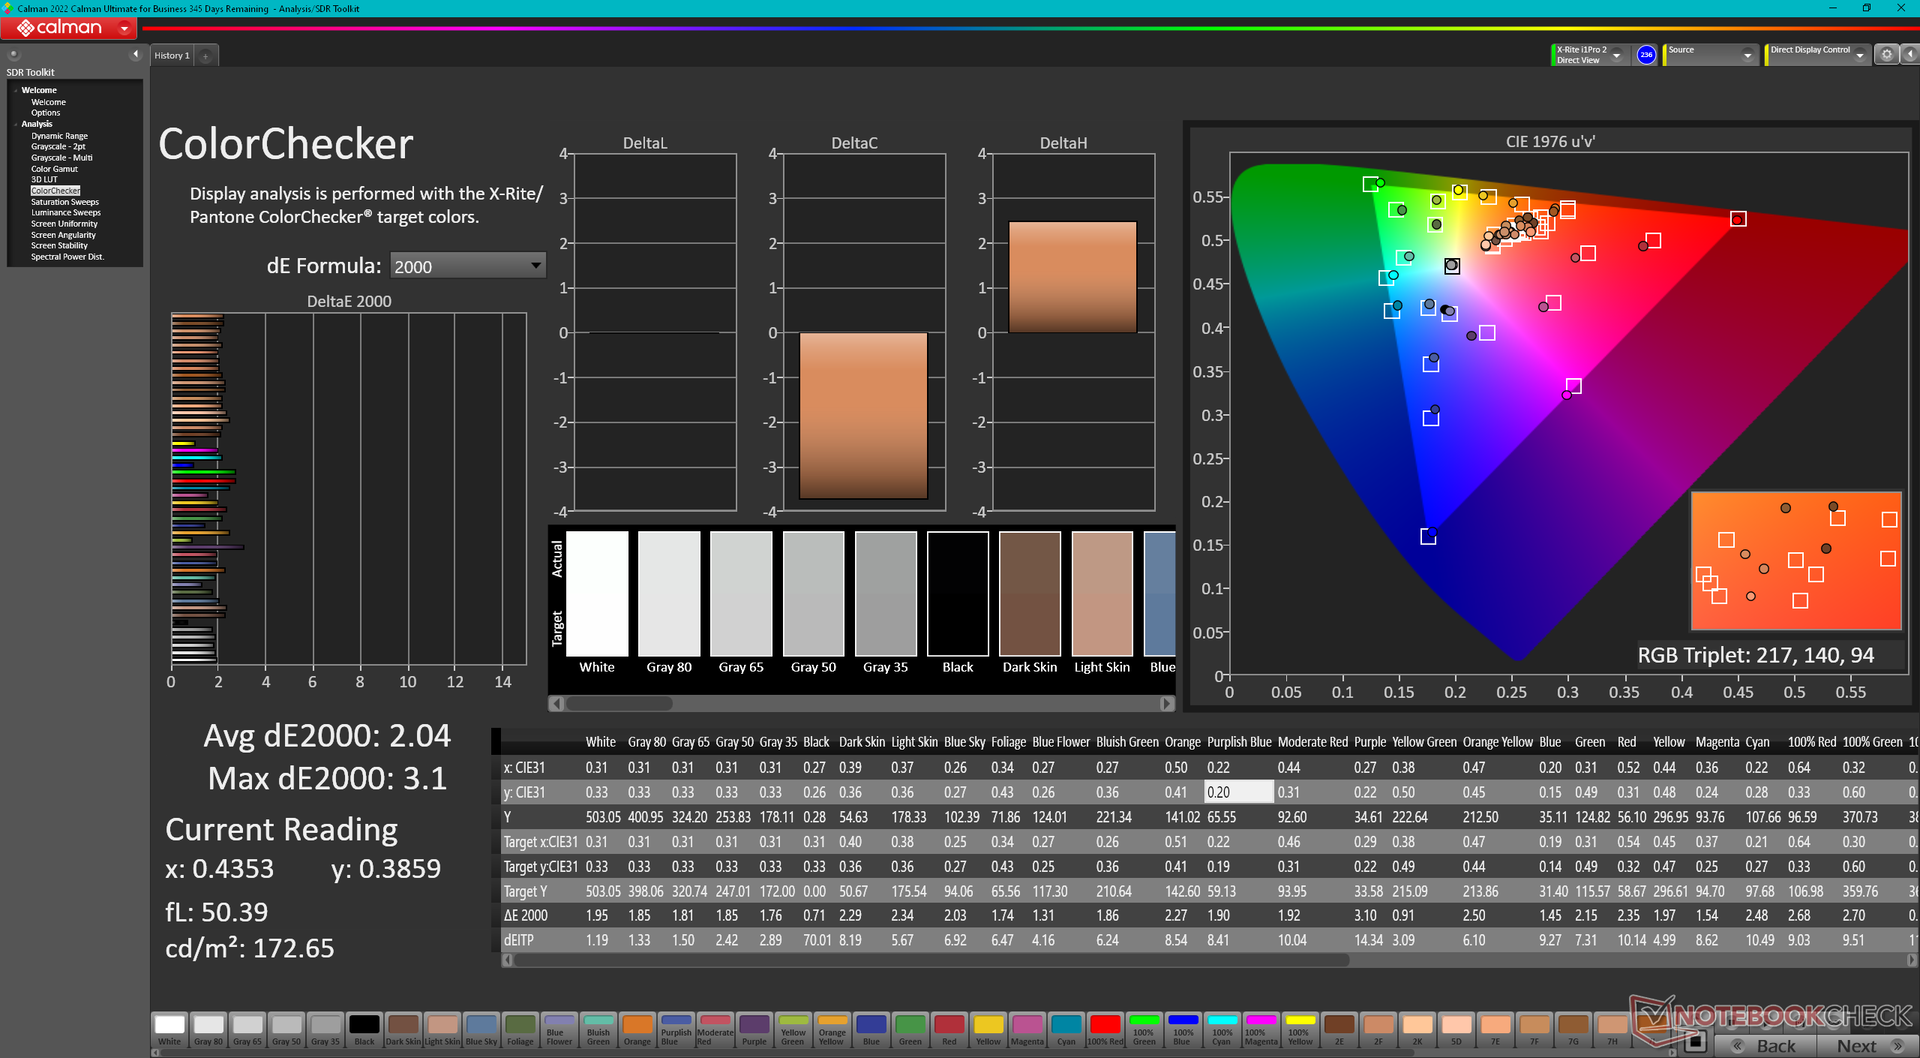
ΔE ColorChecker Calman: 2.04 | ∀{0.5-29.43 Ø4.72}
calibrated: 0.86
ΔE Greyscale Calman: 1.8 | ∀{0.09-98 Ø4.97}
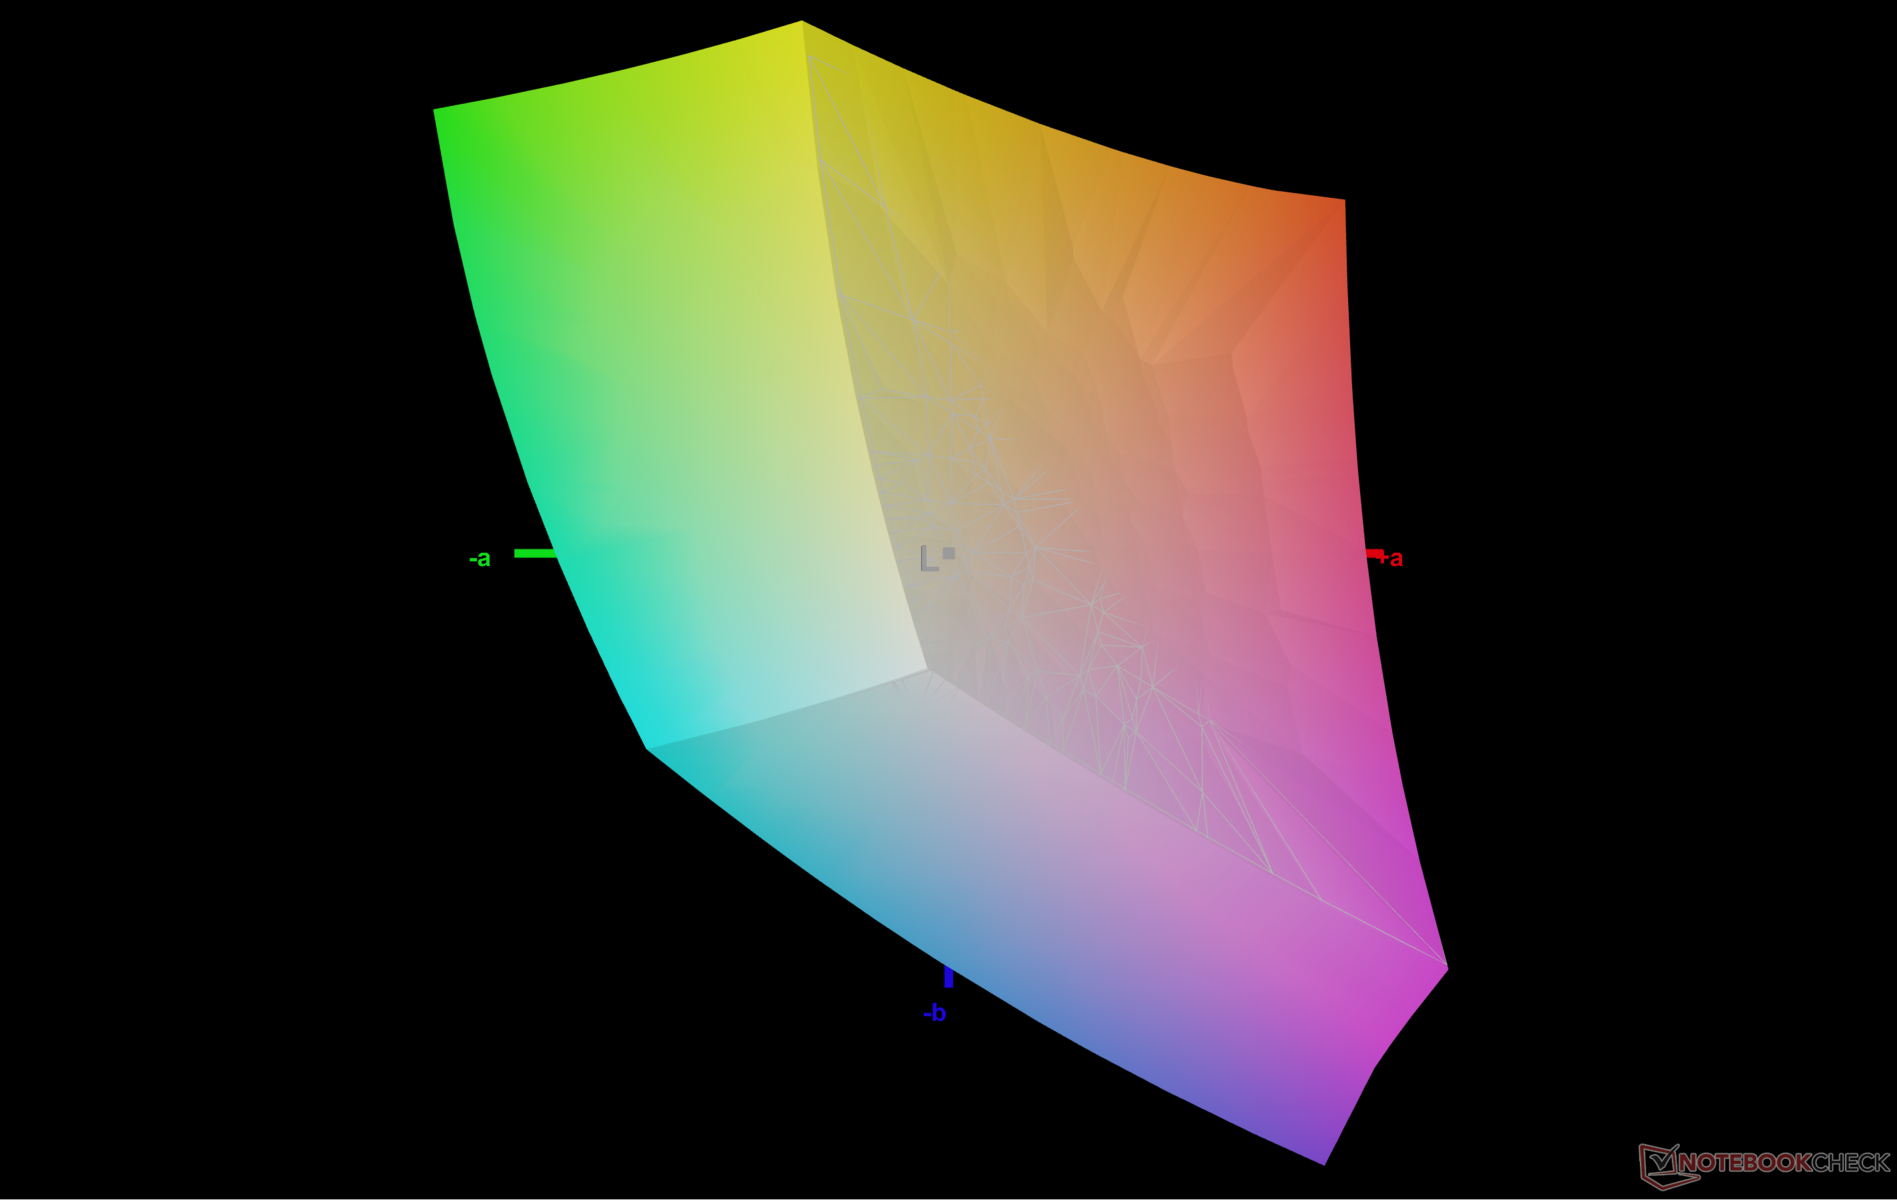
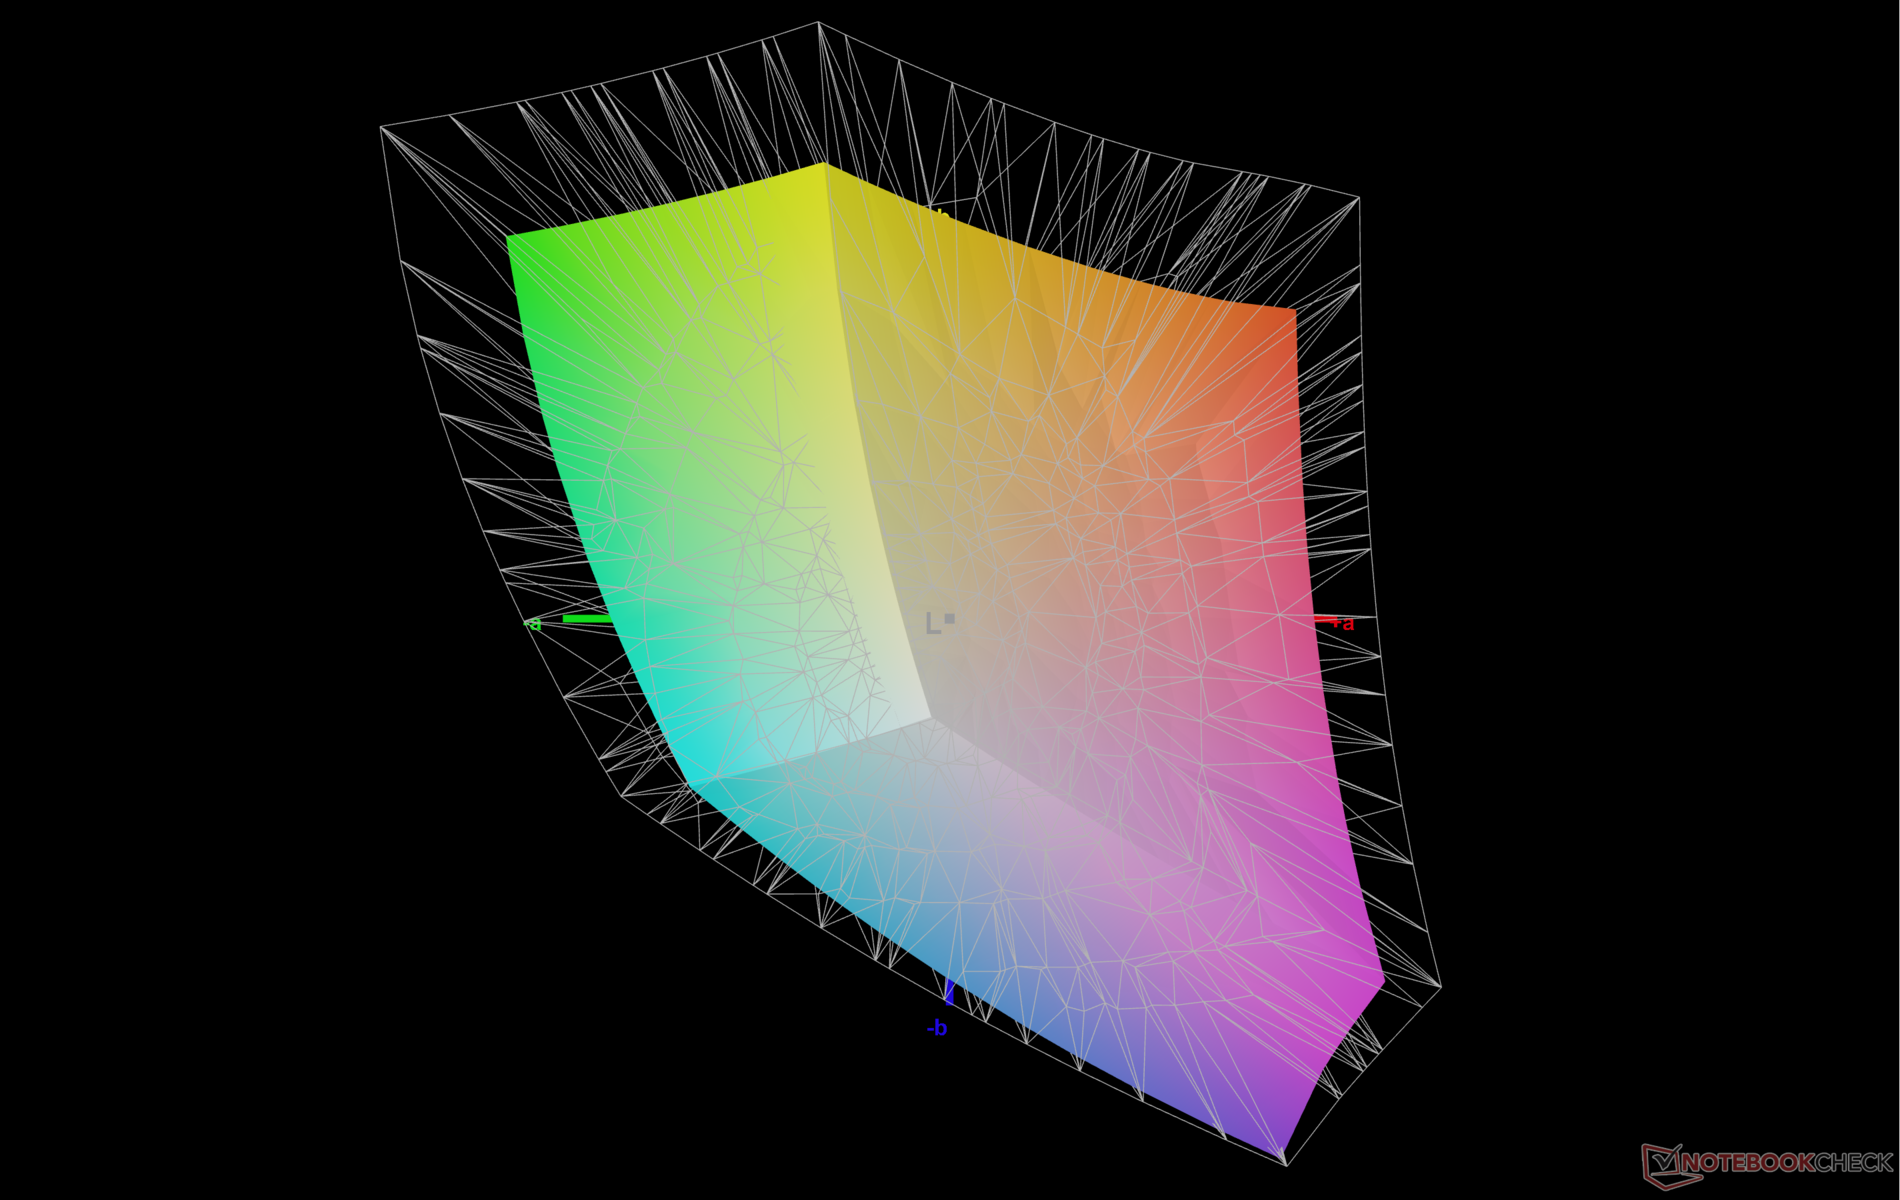
72.6% AdobeRGB 1998 (Argyll 3D)
99.8% sRGB (Argyll 3D)
70.7% Display P3 (Argyll 3D)
Gamma: 2.12
CCT: 6561 K
| Dell XPS 13 9315 2-in-1 Core i5-1230U BOE NE13A1M, IPS, 2880x1920, 13" | Dell XPS 13 Plus 9320 i7-1280P OLED Samsung 134XK04, OLED, 3456x2160, 13.4" | Microsoft Surface Pro 8, i7-1185G7 LP129WT212166, IPS, 2880x1920, 13" | HP Spectre x360 13.5 14t-ef000 SDC4160, OLED, 3000x2000, 13.5" | Lenovo ThinkBook Plus Gen2 Core i5 CSOT T3 MND307DA1-5 (LCD), IPS, E-Ink, 2560x1600, 13.3" | Apple MacBook Air M2 Entry IPS, 2560x1664, 13.6" | |
|---|---|---|---|---|---|---|
| Display | 26% | 6% | 22% | -1% | 20% | |
| Display P3 Coverage (%) | 70.7 | 99.5 41% | 78.2 11% | 99.9 41% | 70.1 -1% | 98.4 39% |
| sRGB Coverage (%) | 99.8 | 100 0% | 100 0% | 100 0% | 98 -2% | 99.9 0% |
| AdobeRGB 1998 Coverage (%) | 72.6 | 98.4 36% | 77.6 7% | 90.8 25% | 72.2 -1% | 87.6 21% |
| Response Times | 93% | 1% | 94% | -5% | 13% | |
| Response Time Grey 50% / Grey 80% * (ms) | 44 ? | 2.6 ? 94% | 46.4 ? -5% | 1.9 ? 96% | 42.8 ? 3% | 32.9 ? 25% |
| Response Time Black / White * (ms) | 24.8 ? | 2.1 ? 92% | 23.2 ? 6% | 2.16 ? 91% | 28 ? -13% | 24.9 ? -0% |
| PWM Frequency (Hz) | 59.5 | 29760 ? | 60.2 ? | |||
| Screen | -27% | -19% | -29% | -36% | 5% | |
| Brightness middle (cd/m²) | 507 | 371.8 -27% | 444 -12% | 351.7 -31% | 404 -20% | 526 4% |
| Brightness (cd/m²) | 486 | 374 -23% | 451 -7% | 351 -28% | 388 -20% | 486 0% |
| Brightness Distribution (%) | 87 | 98 13% | 91 5% | 87 0% | 94 8% | 87 0% |
| Black Level * (cd/m²) | 0.34 | 0.43 -26% | 0.24 29% | 0.38 -12% | ||
| Contrast (:1) | 1491 | 1033 -31% | 1683 13% | 1384 -7% | ||
| Colorchecker dE 2000 * | 2.04 | 2.37 -16% | 2 2% | 1.78 13% | 3.1 -52% | 1.3 36% |
| Colorchecker dE 2000 max. * | 3.1 | 6.1 -97% | 3.2 -3% | 6.14 -98% | 6.9 -123% | 2.7 13% |
| Colorchecker dE 2000 calibrated * | 0.86 | 1.7 -98% | 1.3 -51% | 0.7 19% | ||
| Greyscale dE 2000 * | 1.8 | 2 -11% | 1.8 -0% | 2.3 -28% | 3.7 -106% | 2 -11% |
| Gamma | 2.12 104% | 2.29 96% | 2.11 104% | 2.11 104% | 2.26 97% | 2.25 98% |
| CCT | 6561 99% | 6261 104% | 6417 101% | 6683 97% | 5936 110% | 6858 95% |
| Całkowita średnia (program / ustawienia) | 31% /
9% | -4% /
-11% | 29% /
7% | -14% /
-24% | 13% /
9% |
* ... im mniej tym lepiej
Wyświetlacz jest już dobrze skalibrowany po wyjęciu z pudełka, a średnie wartości DeltaE w skali szarości i kolorze wynoszą odpowiednio 1,8 i 2,04. Kalibracja wyświetlacza za pomocą kolorymetru X-Rite pozwoliłaby obniżyć średnie wartości do 1,3 i 0,86, ale dla większości użytkowników kalibracja nie będzie konieczna.

Wyświetl czasy reakcji
| ↔ Czas reakcji od czerni do bieli | ||
|---|---|---|
| 24.8 ms ... wzrost ↗ i spadek ↘ łącznie | ↗ 11.6 ms wzrost | 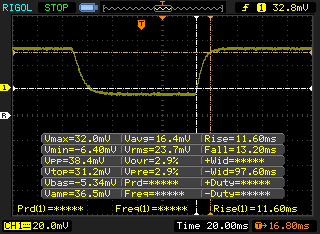 |
| ↘ 13.2 ms upadek | ||
| W naszych testach ekran wykazuje dobry współczynnik reakcji, ale może być zbyt wolny dla graczy rywalizujących ze sobą. Dla porównania, wszystkie testowane urządzenia wahają się od 0.1 (minimum) do 240 (maksimum) ms. » 58 % wszystkich urządzeń jest lepszych. Oznacza to, że zmierzony czas reakcji jest gorszy od średniej wszystkich testowanych urządzeń (19.9 ms). | ||
| ↔ Czas reakcji 50% szarości do 80% szarości | ||
| 44 ms ... wzrost ↗ i spadek ↘ łącznie | ↗ 23.6 ms wzrost | 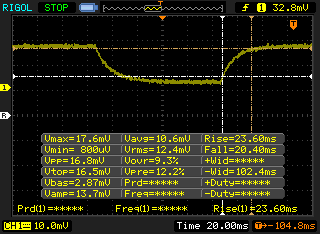 |
| ↘ 20.4 ms upadek | ||
| W naszych testach ekran wykazuje powolne tempo reakcji, co będzie niezadowalające dla graczy. Dla porównania, wszystkie testowane urządzenia wahają się od 0.165 (minimum) do 636 (maksimum) ms. » 73 % wszystkich urządzeń jest lepszych. Oznacza to, że zmierzony czas reakcji jest gorszy od średniej wszystkich testowanych urządzeń (31.1 ms). | ||
Migotanie ekranu / PWM (modulacja szerokości impulsu)
| Migotanie ekranu/nie wykryto PWM | 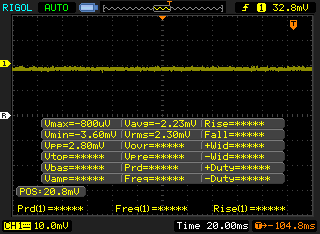 | ||
Dla porównania: 52 % wszystkich testowanych urządzeń nie używa PWM do przyciemniania wyświetlacza. Jeśli wykryto PWM, zmierzono średnio 7784 (minimum: 5 - maksimum: 343500) Hz. | |||
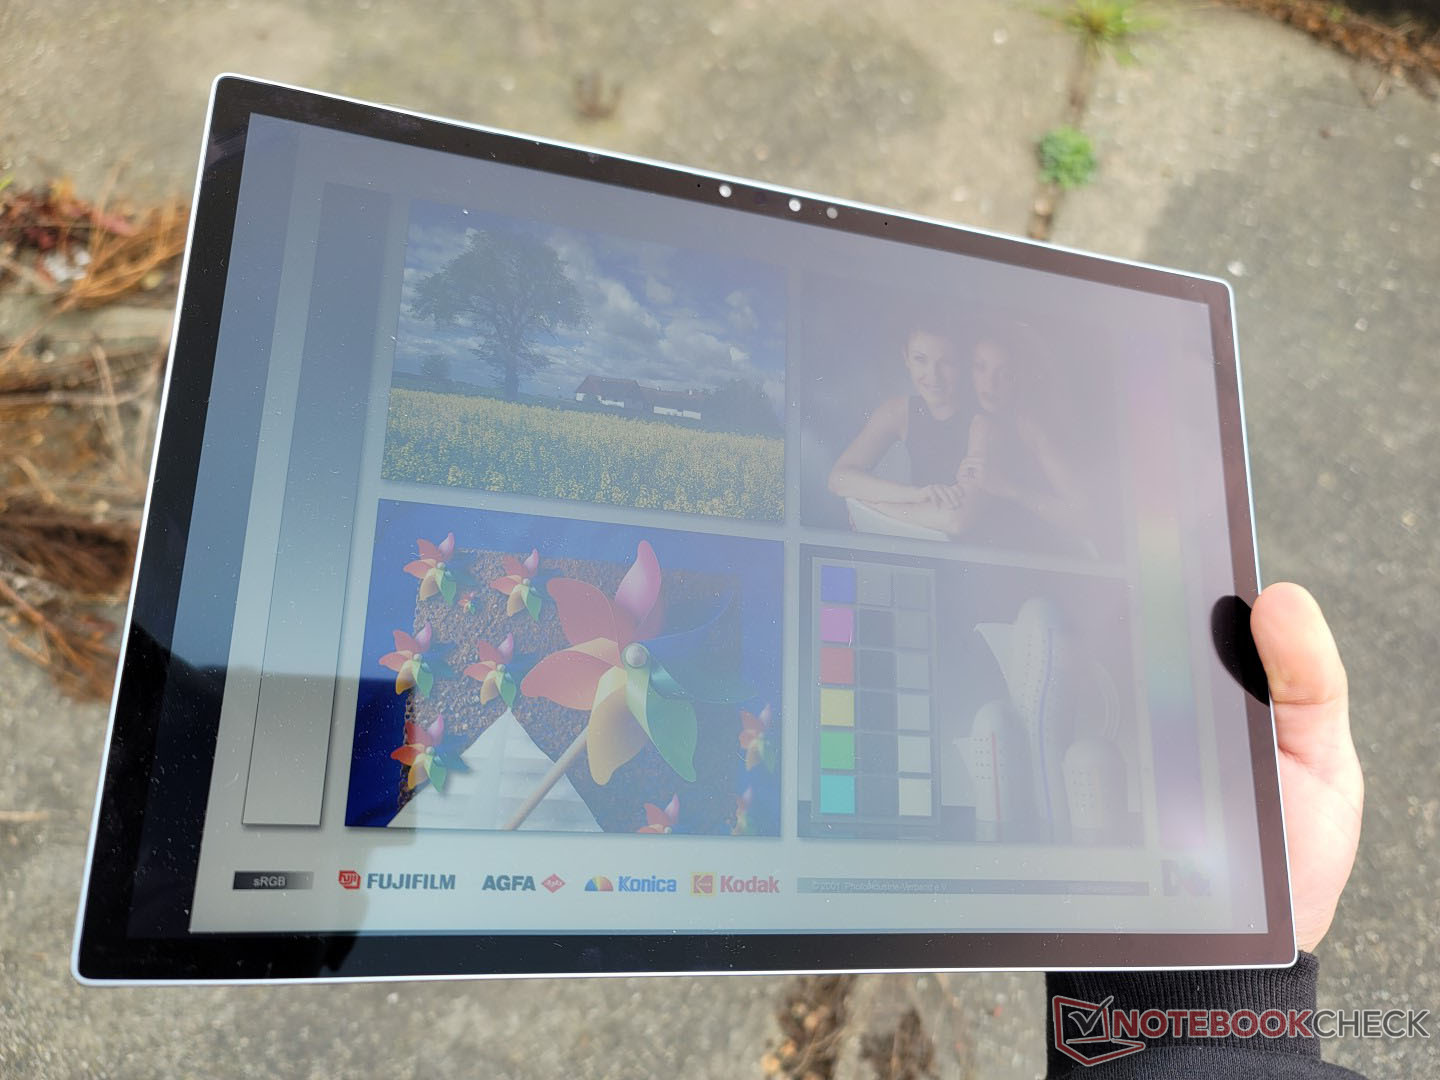
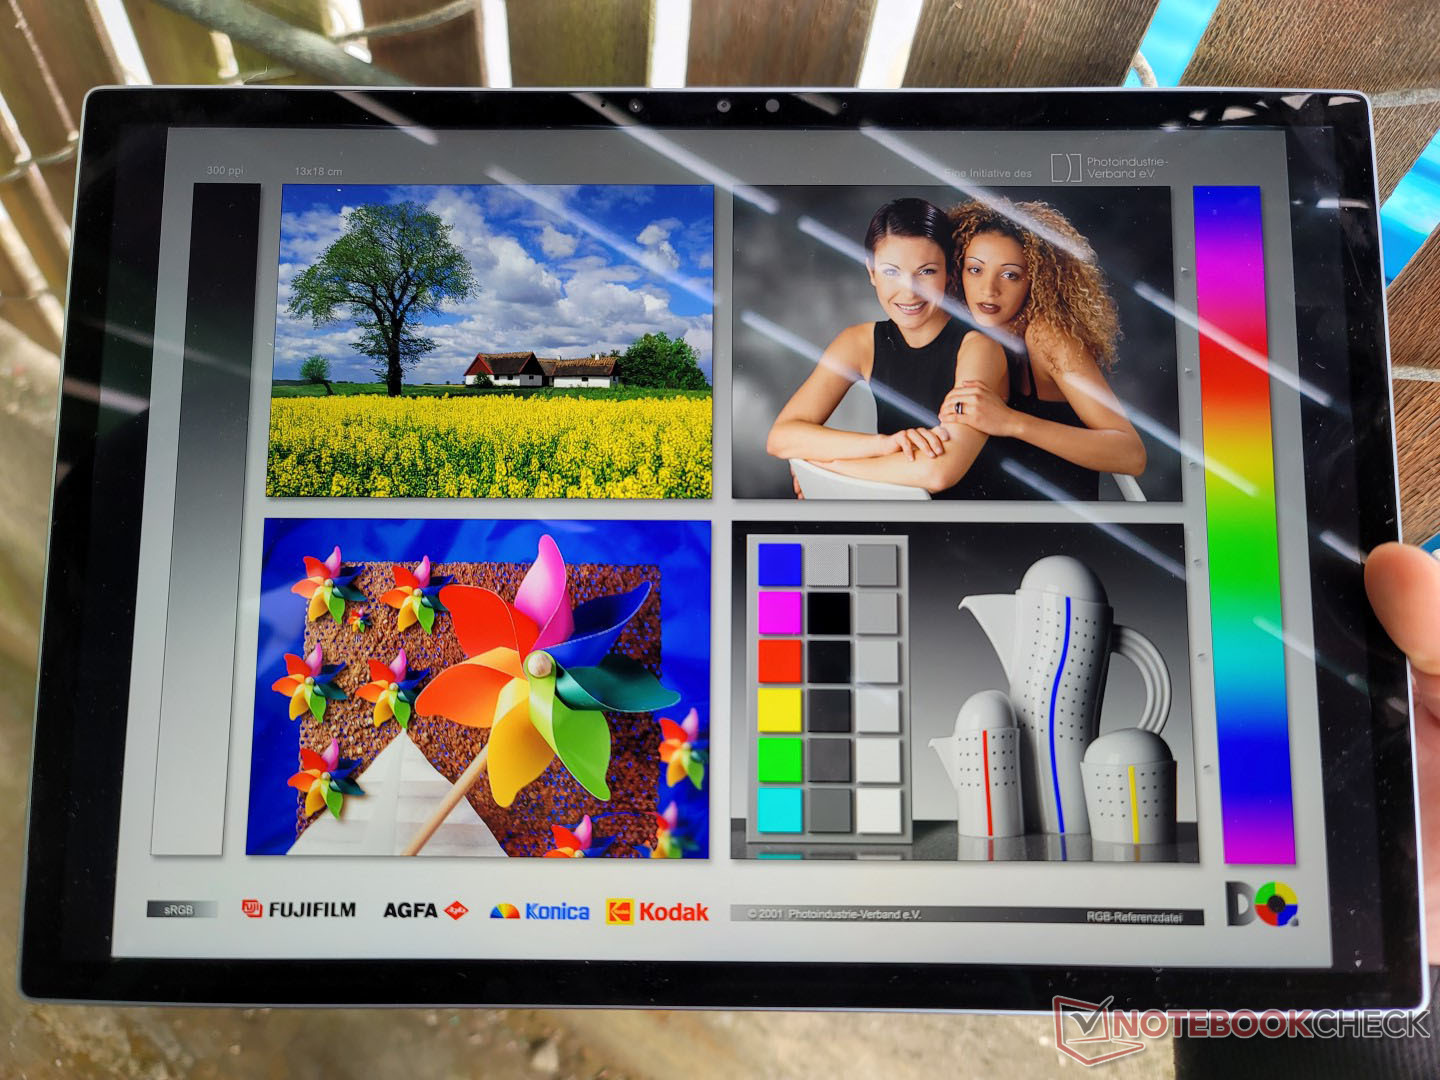
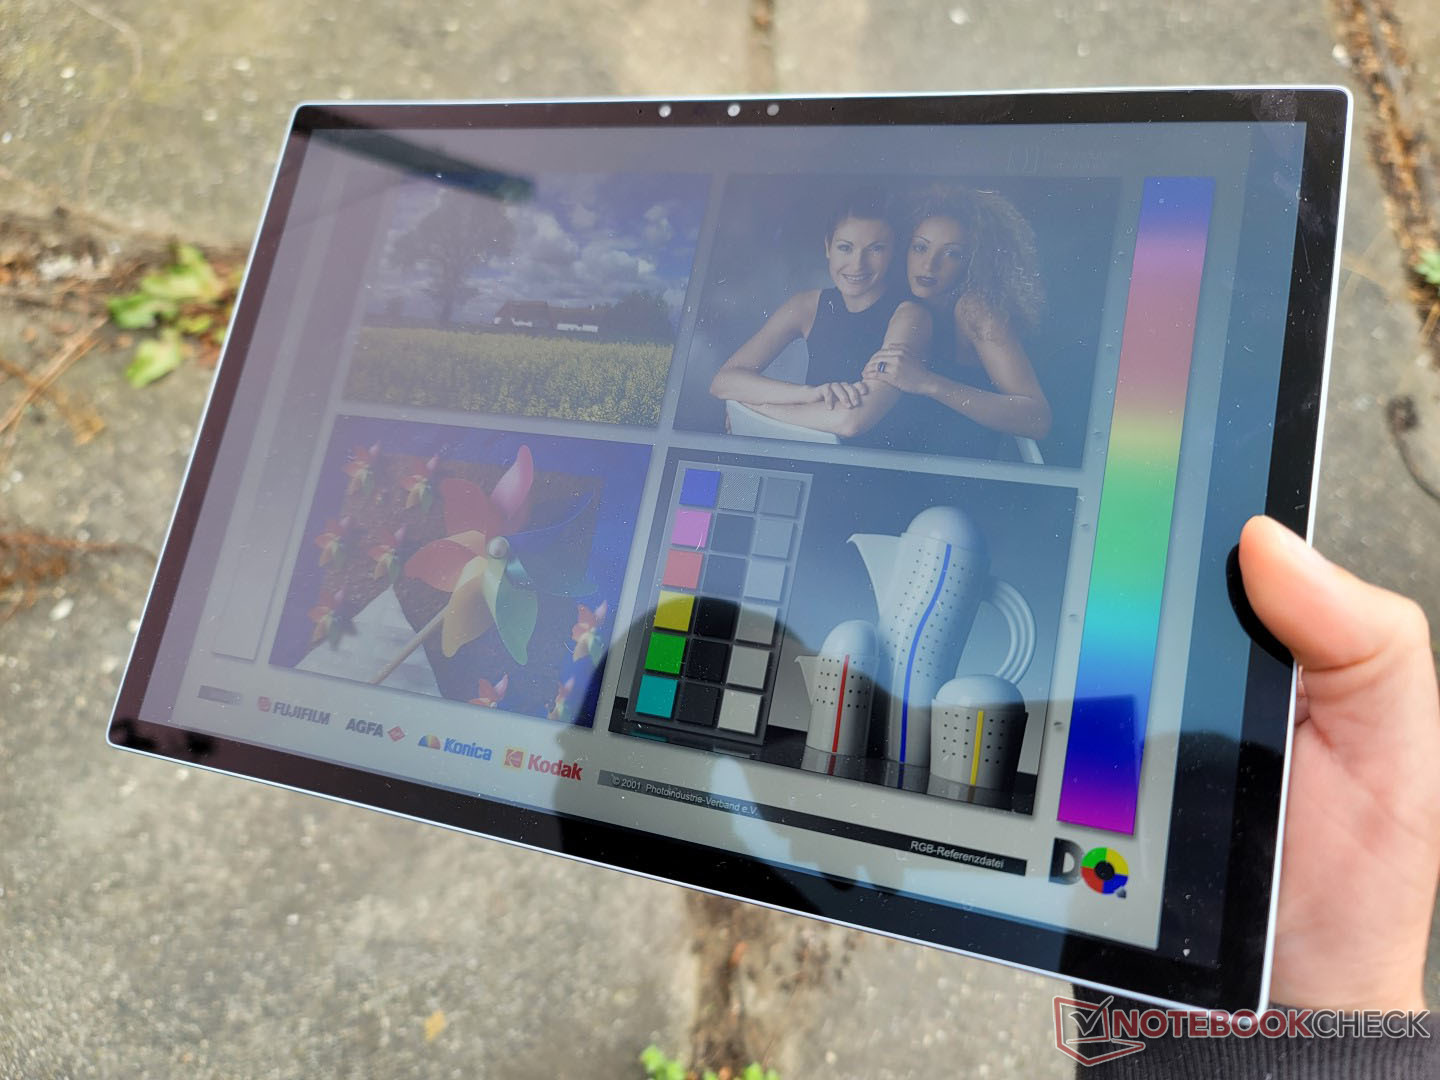
Odblaski są wszechobecne i w zasadzie nie do uniknięcia na błyszczącym ekranie dotykowym. Wyświetlacz jest na szczęście wystarczająco jasny, aby utrzymać odblaski na minimalnym poziomie podczas pracy na zewnątrz w cieniu. Jeśli jednak pracujemy w jasnych warunkach, kolory i wrażenia z oglądania szybko się pogarszają. Niektóre modele HP Elite x2 mają opcje wyświetlacza 1000-nitowego, co sprawiłoby, że byłby on 2x jaśniejszy od Della, co ułatwiłoby czytelność na zewnątrz.
Wydajność - dobra wydajność CPU, średnia wydajność GPU
Warunki badania
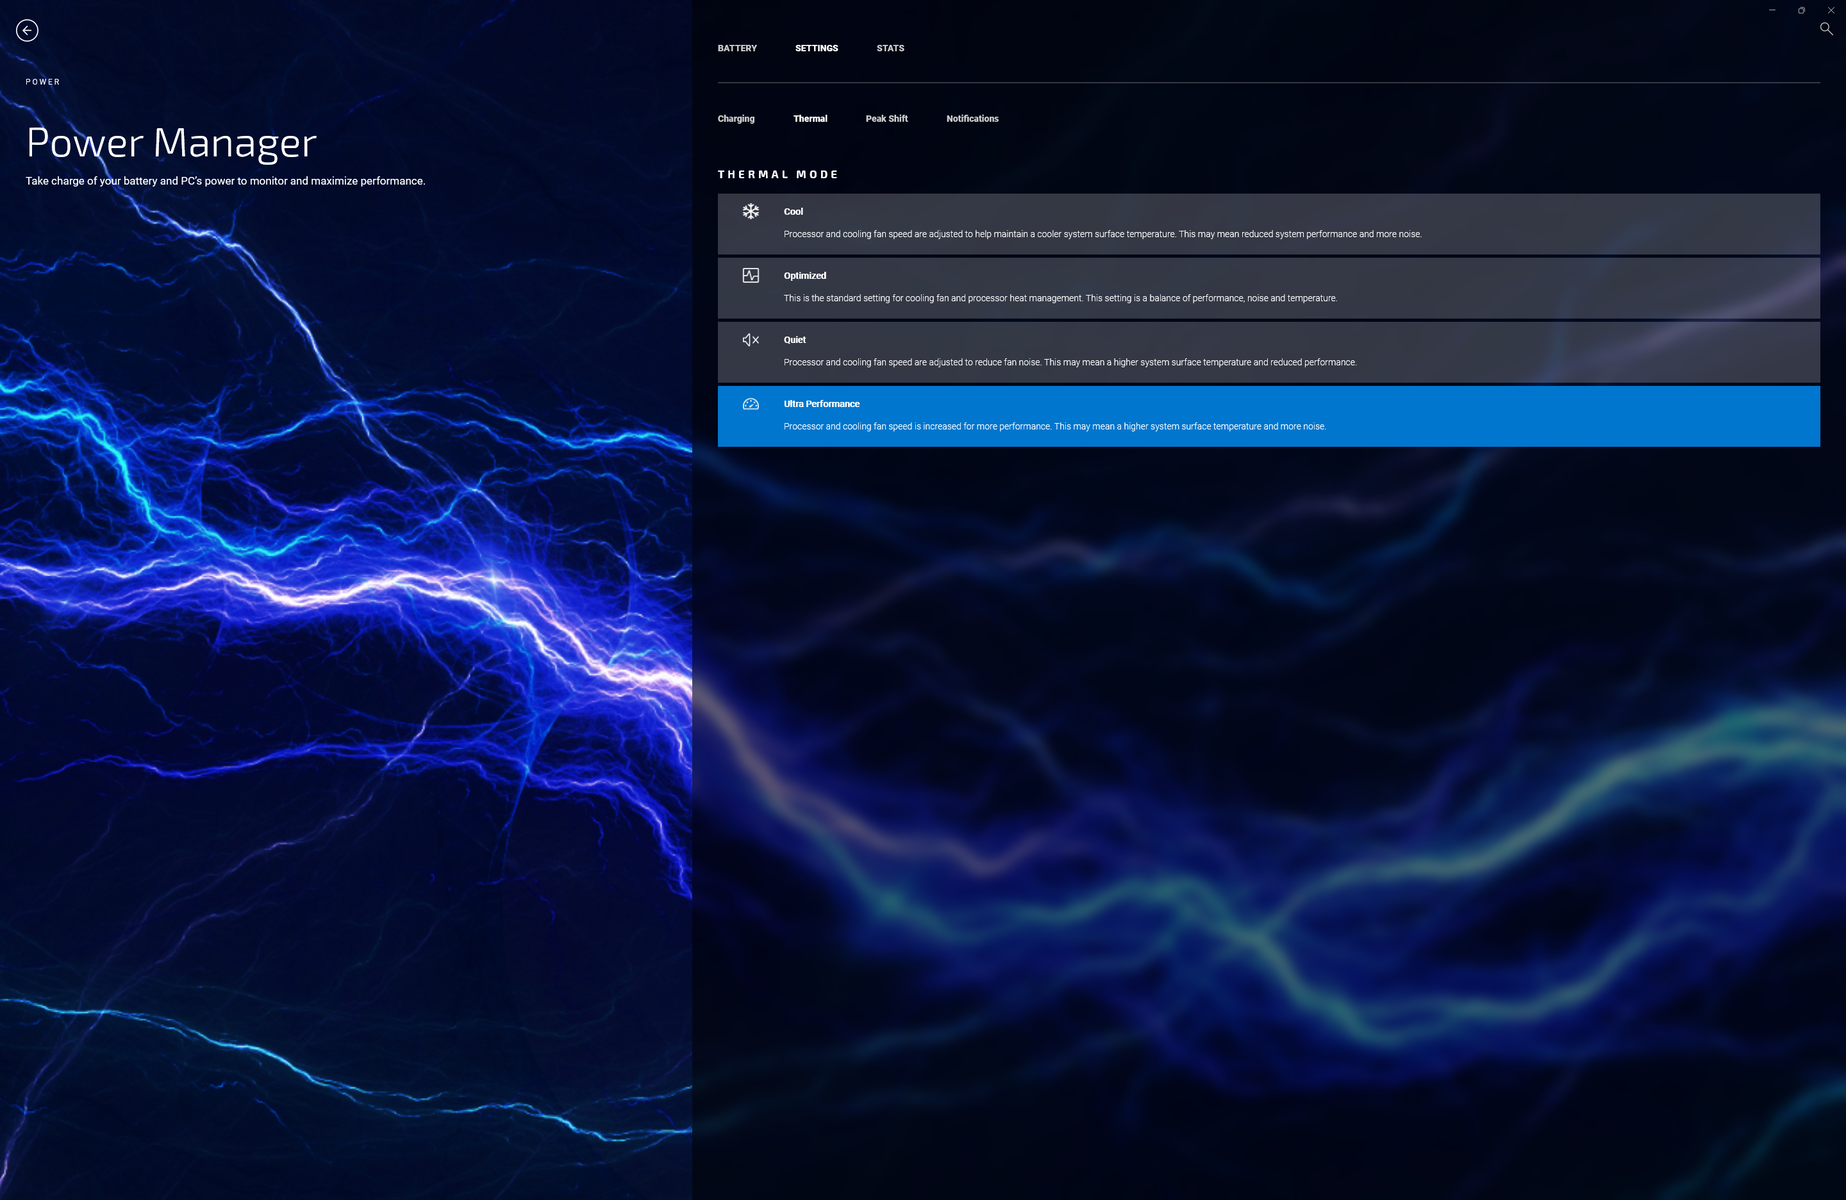
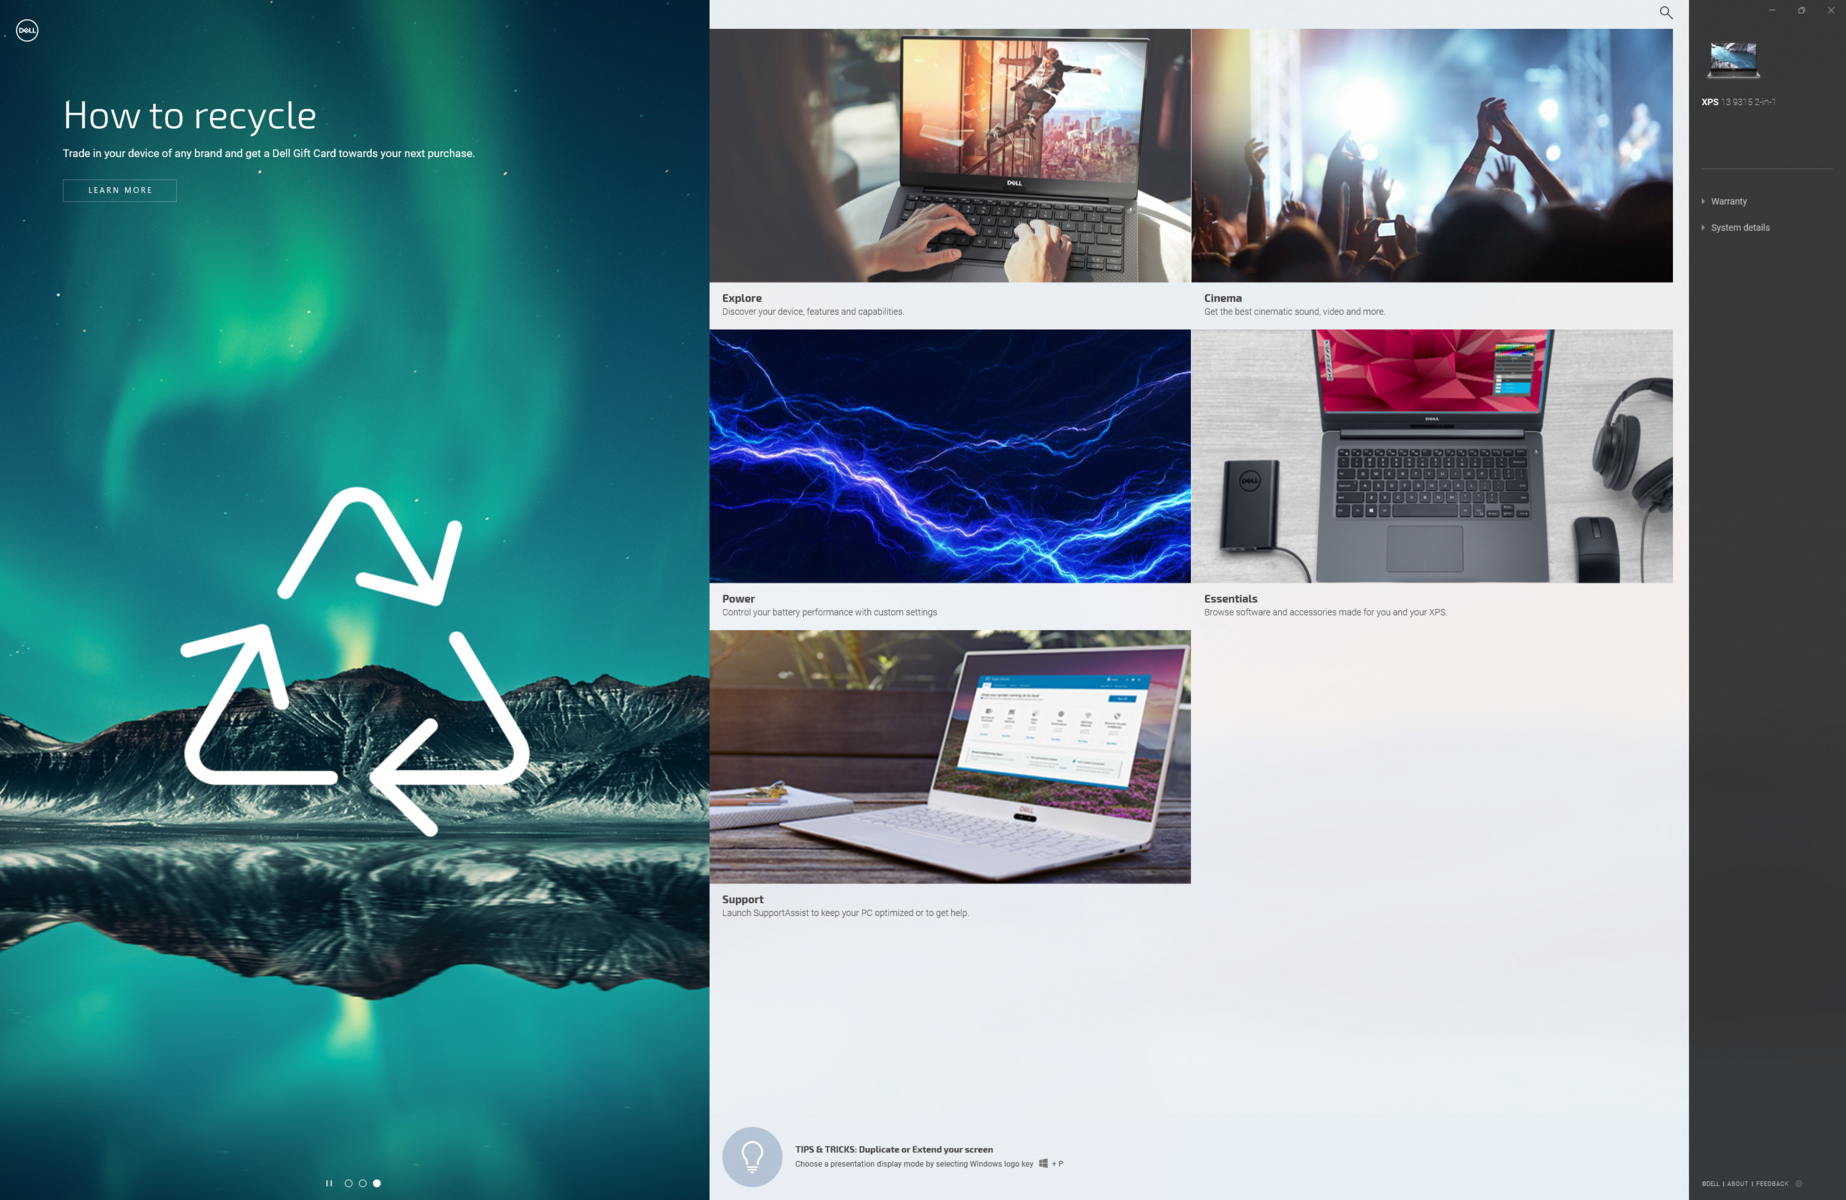
Przed przeprowadzeniem poniższych benchmarków ustawiliśmy nasze urządzenie w trybie "Ultra performance" i "Best performance", odpowiednio za pomocą Dell Power Manager i Windows. Właściciele powinni zapoznać się z oprogramowaniem My Dell, ponieważ jest to centrum kontroli umożliwiające dostosowanie sposobu ładowania, wydajności systemu, powiadomień i innych elementów, jak pokazano na poniższych zrzutach ekranu.
Procesor
W XPS 13 9315 2-in-1 zastosowano ten sam Core i5-1230U Który znajduje się w modelu XPS 13 9315 clamshell. Można by się spodziewać, że model clamshell będzie działał nieco szybciej od modelu 2-w-1, ale jest odwrotnie. Nasze wyniki poniżej pokazują, że XPS 13 9315 2-in-1 konsekwentnie wyprzedza XPS 13 9315 clamshell ze znacznym marginesem około 70 procent w wielowątkowych obciążeniach roboczych. Wyniki są na tyle szerokie, że wyprzedzają nawet Core i7-1185G7 w Surface Pro 8.
Aktualizacja do Core i7-1250U Może zwiększyć wydajność o około 5 procent, jak wynika z naszych doświadczeń z najnowszym HP Envy x360 13. Aby uzyskać znacznie większą wydajność, warto rozważyć model XPS 13 Plus 9320 i jego opcje procesora z serii P.
Trwałość wydajności jest w XPS 13 9315 2-w-1 ograniczona, gdyż jest to konstrukcja bez wentylatora. Na przykład podczas pracy w pętli CineBench R15 xT początkowy wynik 1252 punktów z czasem spadł do 750 punktów, co oznacza spadek wydajności o 40 procent. Mimo to wydajność jest o około 50 procent wyższa od tego samego procesora w XPS 13 9315 clamshell, nawet po uwzględnieniu throttlingu w obu maszynach.
Cinebench R15 Multi Loop
Cinebench R23: Multi Core | Single Core
Cinebench R15: CPU Multi 64Bit | CPU Single 64Bit
Blender: v2.79 BMW27 CPU
7-Zip 18.03: 7z b 4 | 7z b 4 -mmt1
Geekbench 5.5: Multi-Core | Single-Core
HWBOT x265 Benchmark v2.2: 4k Preset
LibreOffice : 20 Documents To PDF
R Benchmark 2.5: Overall mean
| Cinebench R20 / CPU (Multi Core) | |
| Dell XPS 13 Plus 9320 i7-1280P OLED | |
| HP Spectre x360 13.5 14t-ef000 | |
| Dell XPS 13 9315 2-in-1 Core i5-1230U | |
| Apple MacBook Air M2 Entry | |
| Microsoft Surface Pro 8, i7-1185G7 | |
| Dell XPS 13 9315, i5-1230U | |
| Lenovo ThinkBook Plus Gen2 Core i5 | |
| Cinebench R20 / CPU (Single Core) | |
| HP Spectre x360 13.5 14t-ef000 | |
| Dell XPS 13 Plus 9320 i7-1280P OLED | |
| Dell XPS 13 9315 2-in-1 Core i5-1230U | |
| Microsoft Surface Pro 8, i7-1185G7 | |
| Lenovo ThinkBook Plus Gen2 Core i5 | |
| Dell XPS 13 9315, i5-1230U | |
| Apple MacBook Air M2 Entry | |
| Cinebench R23 / Multi Core | |
| Dell XPS 13 Plus 9320 i7-1280P OLED | |
| Apple MacBook Air M2 Entry | |
| HP Spectre x360 13.5 14t-ef000 | |
| Dell XPS 13 9315 2-in-1 Core i5-1230U | |
| Microsoft Surface Pro 8, i7-1185G7 | |
| Dell XPS 13 9315, i5-1230U | |
| Lenovo ThinkBook Plus Gen2 Core i5 | |
| Cinebench R23 / Single Core | |
| HP Spectre x360 13.5 14t-ef000 | |
| Dell XPS 13 Plus 9320 i7-1280P OLED | |
| Apple MacBook Air M2 Entry | |
| Microsoft Surface Pro 8, i7-1185G7 | |
| Dell XPS 13 9315 2-in-1 Core i5-1230U | |
| Dell XPS 13 9315, i5-1230U | |
| Lenovo ThinkBook Plus Gen2 Core i5 | |
| Cinebench R15 / CPU Multi 64Bit | |
| Dell XPS 13 Plus 9320 i7-1280P OLED | |
| HP Spectre x360 13.5 14t-ef000 | |
| Dell XPS 13 9315 2-in-1 Core i5-1230U | |
| Apple MacBook Air M2 Entry | |
| Microsoft Surface Pro 8, i7-1185G7 | |
| Lenovo ThinkBook Plus Gen2 Core i5 | |
| Lenovo ThinkBook Plus Gen2 Core i5 | |
| Dell XPS 13 9315, i5-1230U | |
| Cinebench R15 / CPU Single 64Bit | |
| HP Spectre x360 13.5 14t-ef000 | |
| Dell XPS 13 Plus 9320 i7-1280P OLED | |
| Microsoft Surface Pro 8, i7-1185G7 | |
| Apple MacBook Air M2 Entry | |
| Dell XPS 13 9315 2-in-1 Core i5-1230U | |
| Lenovo ThinkBook Plus Gen2 Core i5 | |
| Lenovo ThinkBook Plus Gen2 Core i5 | |
| Dell XPS 13 9315, i5-1230U | |
| Blender / v2.79 BMW27 CPU | |
| Lenovo ThinkBook Plus Gen2 Core i5 | |
| Apple MacBook Air M2 Entry | |
| Microsoft Surface Pro 8, i7-1185G7 | |
| Dell XPS 13 9315 2-in-1 Core i5-1230U | |
| HP Spectre x360 13.5 14t-ef000 | |
| Dell XPS 13 Plus 9320 i7-1280P OLED | |
| 7-Zip 18.03 / 7z b 4 | |
| Dell XPS 13 Plus 9320 i7-1280P OLED | |
| HP Spectre x360 13.5 14t-ef000 | |
| Dell XPS 13 9315 2-in-1 Core i5-1230U | |
| Microsoft Surface Pro 8, i7-1185G7 | |
| Dell XPS 13 9315, i5-1230U | |
| Lenovo ThinkBook Plus Gen2 Core i5 | |
| 7-Zip 18.03 / 7z b 4 -mmt1 | |
| HP Spectre x360 13.5 14t-ef000 | |
| Microsoft Surface Pro 8, i7-1185G7 | |
| Dell XPS 13 Plus 9320 i7-1280P OLED | |
| Dell XPS 13 9315 2-in-1 Core i5-1230U | |
| Lenovo ThinkBook Plus Gen2 Core i5 | |
| Dell XPS 13 9315, i5-1230U | |
| Geekbench 5.5 / Multi-Core | |
| Dell XPS 13 Plus 9320 i7-1280P OLED | |
| Apple MacBook Air M2 Entry | |
| HP Spectre x360 13.5 14t-ef000 | |
| Dell XPS 13 9315 2-in-1 Core i5-1230U | |
| Dell XPS 13 9315, i5-1230U | |
| Microsoft Surface Pro 8, i7-1185G7 | |
| Lenovo ThinkBook Plus Gen2 Core i5 | |
| Geekbench 5.5 / Single-Core | |
| Apple MacBook Air M2 Entry | |
| Dell XPS 13 Plus 9320 i7-1280P OLED | |
| HP Spectre x360 13.5 14t-ef000 | |
| Dell XPS 13 9315, i5-1230U | |
| Microsoft Surface Pro 8, i7-1185G7 | |
| Dell XPS 13 9315 2-in-1 Core i5-1230U | |
| Lenovo ThinkBook Plus Gen2 Core i5 | |
| HWBOT x265 Benchmark v2.2 / 4k Preset | |
| Dell XPS 13 Plus 9320 i7-1280P OLED | |
| HP Spectre x360 13.5 14t-ef000 | |
| Dell XPS 13 9315 2-in-1 Core i5-1230U | |
| Microsoft Surface Pro 8, i7-1185G7 | |
| LibreOffice / 20 Documents To PDF | |
| Lenovo ThinkBook Plus Gen2 Core i5 | |
| Dell XPS 13 9315 2-in-1 Core i5-1230U | |
| Microsoft Surface Pro 8, i7-1185G7 | |
| Dell XPS 13 Plus 9320 i7-1280P OLED | |
| HP Spectre x360 13.5 14t-ef000 | |
| R Benchmark 2.5 / Overall mean | |
| Lenovo ThinkBook Plus Gen2 Core i5 | |
| Microsoft Surface Pro 8, i7-1185G7 | |
| Dell XPS 13 9315 2-in-1 Core i5-1230U | |
| Dell XPS 13 Plus 9320 i7-1280P OLED | |
| HP Spectre x360 13.5 14t-ef000 | |
* ... im mniej tym lepiej
AIDA64: FP32 Ray-Trace | FPU Julia | CPU SHA3 | CPU Queen | FPU SinJulia | FPU Mandel | CPU AES | CPU ZLib | FP64 Ray-Trace | CPU PhotoWorxx
| Performance rating | |
| Dell XPS 13 Plus 9320 i7-1280P OLED | |
| HP Spectre x360 13.5 14t-ef000 | |
| Microsoft Surface Pro 8, i7-1185G7 | |
| Dell XPS 13 9315 2-in-1 Core i5-1230U | |
| Lenovo ThinkBook Plus Gen2 Core i5 | |
| Przeciętny Intel Core i5-1230U | |
| AIDA64 / FP32 Ray-Trace | |
| Dell XPS 13 Plus 9320 i7-1280P OLED | |
| HP Spectre x360 13.5 14t-ef000 | |
| Microsoft Surface Pro 8, i7-1185G7 | |
| Dell XPS 13 9315 2-in-1 Core i5-1230U | |
| Lenovo ThinkBook Plus Gen2 Core i5 | |
| Przeciętny Intel Core i5-1230U (2344 - 6360, n=3) | |
| AIDA64 / FPU Julia | |
| Dell XPS 13 Plus 9320 i7-1280P OLED | |
| HP Spectre x360 13.5 14t-ef000 | |
| Dell XPS 13 9315 2-in-1 Core i5-1230U | |
| Microsoft Surface Pro 8, i7-1185G7 | |
| Lenovo ThinkBook Plus Gen2 Core i5 | |
| Przeciętny Intel Core i5-1230U (11867 - 31714, n=3) | |
| AIDA64 / CPU SHA3 | |
| Dell XPS 13 Plus 9320 i7-1280P OLED | |
| HP Spectre x360 13.5 14t-ef000 | |
| Microsoft Surface Pro 8, i7-1185G7 | |
| Dell XPS 13 9315 2-in-1 Core i5-1230U | |
| Lenovo ThinkBook Plus Gen2 Core i5 | |
| Przeciętny Intel Core i5-1230U (772 - 1711, n=3) | |
| AIDA64 / CPU Queen | |
| Dell XPS 13 Plus 9320 i7-1280P OLED | |
| HP Spectre x360 13.5 14t-ef000 | |
| Dell XPS 13 9315 2-in-1 Core i5-1230U | |
| Microsoft Surface Pro 8, i7-1185G7 | |
| Przeciętny Intel Core i5-1230U (30824 - 52533, n=3) | |
| Lenovo ThinkBook Plus Gen2 Core i5 | |
| AIDA64 / FPU SinJulia | |
| Dell XPS 13 Plus 9320 i7-1280P OLED | |
| Microsoft Surface Pro 8, i7-1185G7 | |
| HP Spectre x360 13.5 14t-ef000 | |
| Dell XPS 13 9315 2-in-1 Core i5-1230U | |
| Lenovo ThinkBook Plus Gen2 Core i5 | |
| Przeciętny Intel Core i5-1230U (2269 - 3947, n=3) | |
| AIDA64 / FPU Mandel | |
| Dell XPS 13 Plus 9320 i7-1280P OLED | |
| HP Spectre x360 13.5 14t-ef000 | |
| Microsoft Surface Pro 8, i7-1185G7 | |
| Dell XPS 13 9315 2-in-1 Core i5-1230U | |
| Lenovo ThinkBook Plus Gen2 Core i5 | |
| Przeciętny Intel Core i5-1230U (6379 - 15896, n=3) | |
| AIDA64 / CPU AES | |
| HP Spectre x360 13.5 14t-ef000 | |
| Lenovo ThinkBook Plus Gen2 Core i5 | |
| Dell XPS 13 Plus 9320 i7-1280P OLED | |
| Microsoft Surface Pro 8, i7-1185G7 | |
| Dell XPS 13 9315 2-in-1 Core i5-1230U | |
| Przeciętny Intel Core i5-1230U (18011 - 31941, n=3) | |
| AIDA64 / CPU ZLib | |
| Dell XPS 13 Plus 9320 i7-1280P OLED | |
| HP Spectre x360 13.5 14t-ef000 | |
| Dell XPS 13 9315 2-in-1 Core i5-1230U | |
| Przeciętny Intel Core i5-1230U (229 - 495, n=3) | |
| Lenovo ThinkBook Plus Gen2 Core i5 | |
| Microsoft Surface Pro 8, i7-1185G7 | |
| AIDA64 / FP64 Ray-Trace | |
| Dell XPS 13 Plus 9320 i7-1280P OLED | |
| HP Spectre x360 13.5 14t-ef000 | |
| Microsoft Surface Pro 8, i7-1185G7 | |
| Dell XPS 13 9315 2-in-1 Core i5-1230U | |
| Lenovo ThinkBook Plus Gen2 Core i5 | |
| Przeciętny Intel Core i5-1230U (1328 - 3305, n=3) | |
| AIDA64 / CPU PhotoWorxx | |
| Dell XPS 13 Plus 9320 i7-1280P OLED | |
| HP Spectre x360 13.5 14t-ef000 | |
| Lenovo ThinkBook Plus Gen2 Core i5 | |
| Microsoft Surface Pro 8, i7-1185G7 | |
| Dell XPS 13 9315 2-in-1 Core i5-1230U | |
| Przeciętny Intel Core i5-1230U (17516 - 37042, n=3) | |
Wydajność systemu
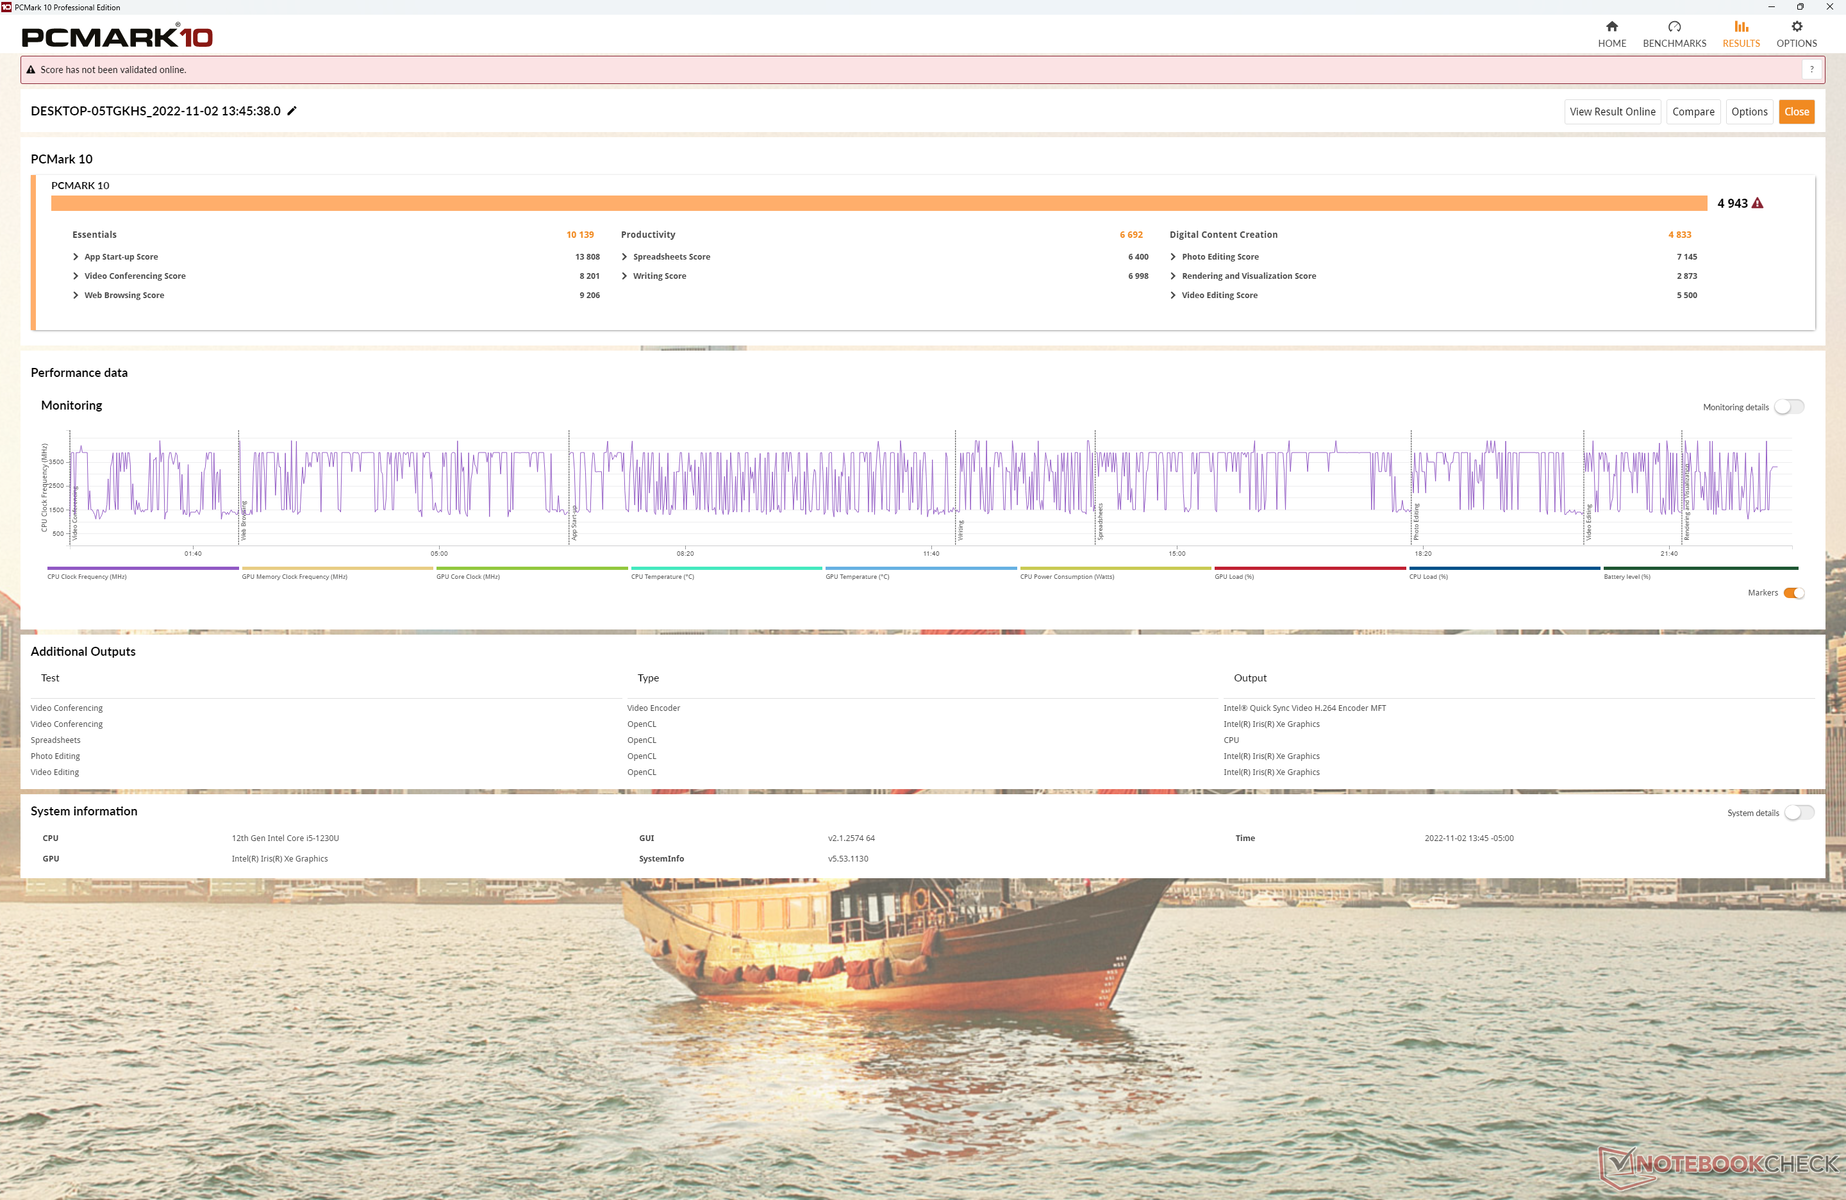
Wyniki PCMark 10 są porównywalne z wynikami Surface Pro 8, z wyjątkiem podtestu Digital Content Creation, w którym wydajność grafiki ma największe znaczenie. Zgadza się to z wynikami naszego testu GPU, w którym XPS 13 9315 2-w-1 wykazał się wolniejszą niż przeciętna wydajnością grafiki w tej kategorii.
CrossMark: Overall | Productivity | Creativity | Responsiveness
| PCMark 10 / Score | |
| Dell XPS 13 Plus 9320 i7-1280P OLED | |
| HP Spectre x360 13.5 14t-ef000 | |
| Microsoft Surface Pro 8, i7-1185G7 | |
| Dell XPS 13 9315 2-in-1 Core i5-1230U | |
| Przeciętny Intel Core i5-1230U, Intel Iris Xe Graphics G7 80EUs (4001 - 4943, n=3) | |
| Lenovo ThinkBook Plus Gen2 Core i5 | |
| PCMark 10 / Essentials | |
| HP Spectre x360 13.5 14t-ef000 | |
| Dell XPS 13 Plus 9320 i7-1280P OLED | |
| Lenovo ThinkBook Plus Gen2 Core i5 | |
| Dell XPS 13 9315 2-in-1 Core i5-1230U | |
| Microsoft Surface Pro 8, i7-1185G7 | |
| Przeciętny Intel Core i5-1230U, Intel Iris Xe Graphics G7 80EUs (8348 - 10139, n=3) | |
| PCMark 10 / Productivity | |
| HP Spectre x360 13.5 14t-ef000 | |
| Dell XPS 13 Plus 9320 i7-1280P OLED | |
| Dell XPS 13 9315 2-in-1 Core i5-1230U | |
| Microsoft Surface Pro 8, i7-1185G7 | |
| Przeciętny Intel Core i5-1230U, Intel Iris Xe Graphics G7 80EUs (5735 - 6692, n=3) | |
| Lenovo ThinkBook Plus Gen2 Core i5 | |
| PCMark 10 / Digital Content Creation | |
| Dell XPS 13 Plus 9320 i7-1280P OLED | |
| Microsoft Surface Pro 8, i7-1185G7 | |
| HP Spectre x360 13.5 14t-ef000 | |
| Dell XPS 13 9315 2-in-1 Core i5-1230U | |
| Przeciętny Intel Core i5-1230U, Intel Iris Xe Graphics G7 80EUs (3632 - 4833, n=3) | |
| Lenovo ThinkBook Plus Gen2 Core i5 | |
| CrossMark / Overall | |
| Dell XPS 13 Plus 9320 i7-1280P OLED | |
| HP Spectre x360 13.5 14t-ef000 | |
| Apple MacBook Air M2 Entry | |
| Microsoft Surface Pro 8, i7-1185G7 | |
| Dell XPS 13 9315 2-in-1 Core i5-1230U | |
| Przeciętny Intel Core i5-1230U, Intel Iris Xe Graphics G7 80EUs (1117 - 1383, n=3) | |
| CrossMark / Productivity | |
| Dell XPS 13 Plus 9320 i7-1280P OLED | |
| HP Spectre x360 13.5 14t-ef000 | |
| Microsoft Surface Pro 8, i7-1185G7 | |
| Apple MacBook Air M2 Entry | |
| Dell XPS 13 9315 2-in-1 Core i5-1230U | |
| Przeciętny Intel Core i5-1230U, Intel Iris Xe Graphics G7 80EUs (1187 - 1356, n=3) | |
| CrossMark / Creativity | |
| Dell XPS 13 Plus 9320 i7-1280P OLED | |
| Apple MacBook Air M2 Entry | |
| HP Spectre x360 13.5 14t-ef000 | |
| Microsoft Surface Pro 8, i7-1185G7 | |
| Dell XPS 13 9315 2-in-1 Core i5-1230U | |
| Przeciętny Intel Core i5-1230U, Intel Iris Xe Graphics G7 80EUs (1095 - 1469, n=3) | |
| CrossMark / Responsiveness | |
| Dell XPS 13 Plus 9320 i7-1280P OLED | |
| HP Spectre x360 13.5 14t-ef000 | |
| Dell XPS 13 9315 2-in-1 Core i5-1230U | |
| Przeciętny Intel Core i5-1230U, Intel Iris Xe Graphics G7 80EUs (990 - 1224, n=3) | |
| Microsoft Surface Pro 8, i7-1185G7 | |
| Apple MacBook Air M2 Entry | |
| PCMark 10 Score | 4943 pkt. | |
Pomoc | ||
| AIDA64 / Memory Copy | |
| Dell XPS 13 Plus 9320 i7-1280P OLED | |
| HP Spectre x360 13.5 14t-ef000 | |
| Dell XPS 13 9315 2-in-1 Core i5-1230U | |
| Microsoft Surface Pro 8, i7-1185G7 | |
| Lenovo ThinkBook Plus Gen2 Core i5 | |
| Przeciętny Intel Core i5-1230U (32539 - 60944, n=3) | |
| AIDA64 / Memory Read | |
| Dell XPS 13 Plus 9320 i7-1280P OLED | |
| Lenovo ThinkBook Plus Gen2 Core i5 | |
| HP Spectre x360 13.5 14t-ef000 | |
| Microsoft Surface Pro 8, i7-1185G7 | |
| Dell XPS 13 9315 2-in-1 Core i5-1230U | |
| Przeciętny Intel Core i5-1230U (31342 - 60435, n=3) | |
| AIDA64 / Memory Write | |
| Dell XPS 13 9315 2-in-1 Core i5-1230U | |
| Lenovo ThinkBook Plus Gen2 Core i5 | |
| HP Spectre x360 13.5 14t-ef000 | |
| Dell XPS 13 Plus 9320 i7-1280P OLED | |
| Microsoft Surface Pro 8, i7-1185G7 | |
| Przeciętny Intel Core i5-1230U (33224 - 65665, n=3) | |
| AIDA64 / Memory Latency | |
| Dell XPS 13 9315 2-in-1 Core i5-1230U | |
| Dell XPS 13 Plus 9320 i7-1280P OLED | |
| Microsoft Surface Pro 8, i7-1185G7 | |
| HP Spectre x360 13.5 14t-ef000 | |
| Lenovo ThinkBook Plus Gen2 Core i5 | |
| Przeciętny Intel Core i5-1230U (104.3 - 105.3, n=3) | |
* ... im mniej tym lepiej
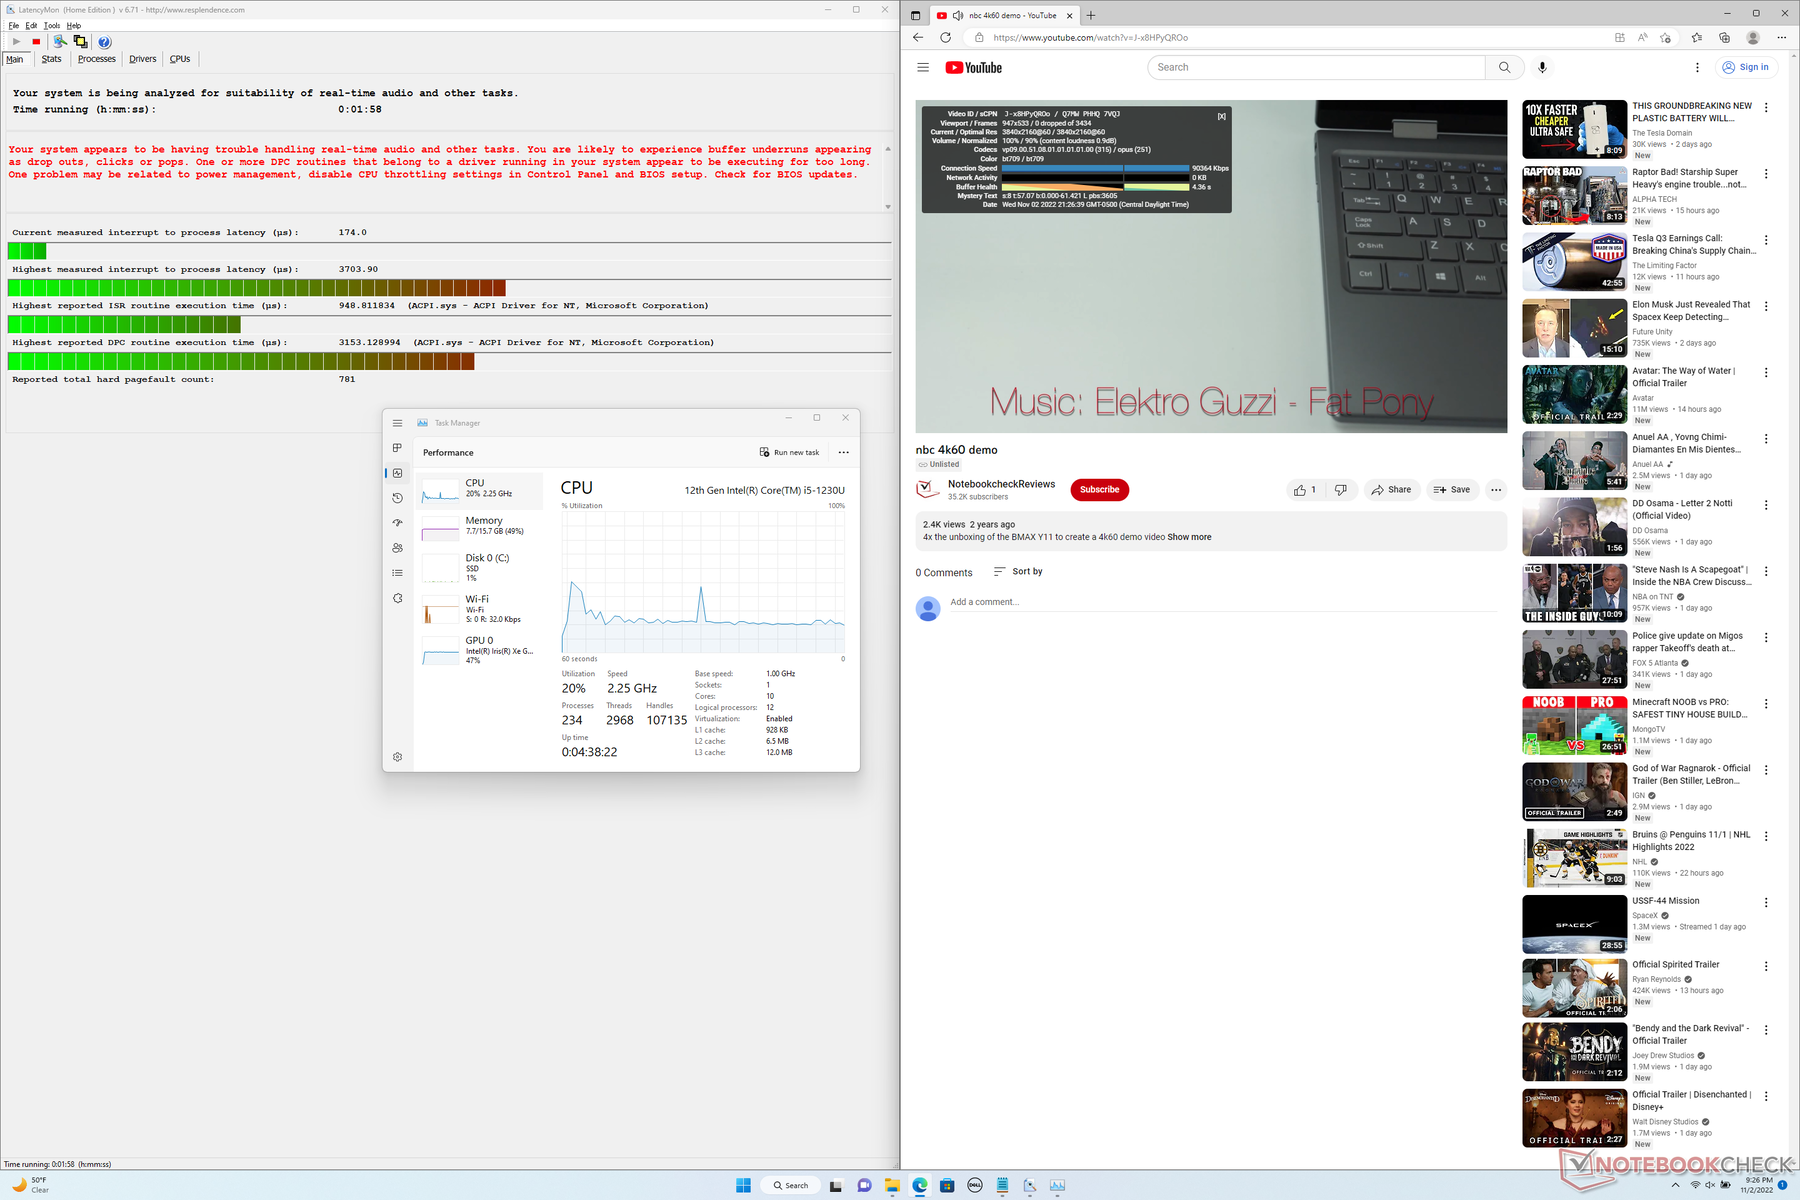
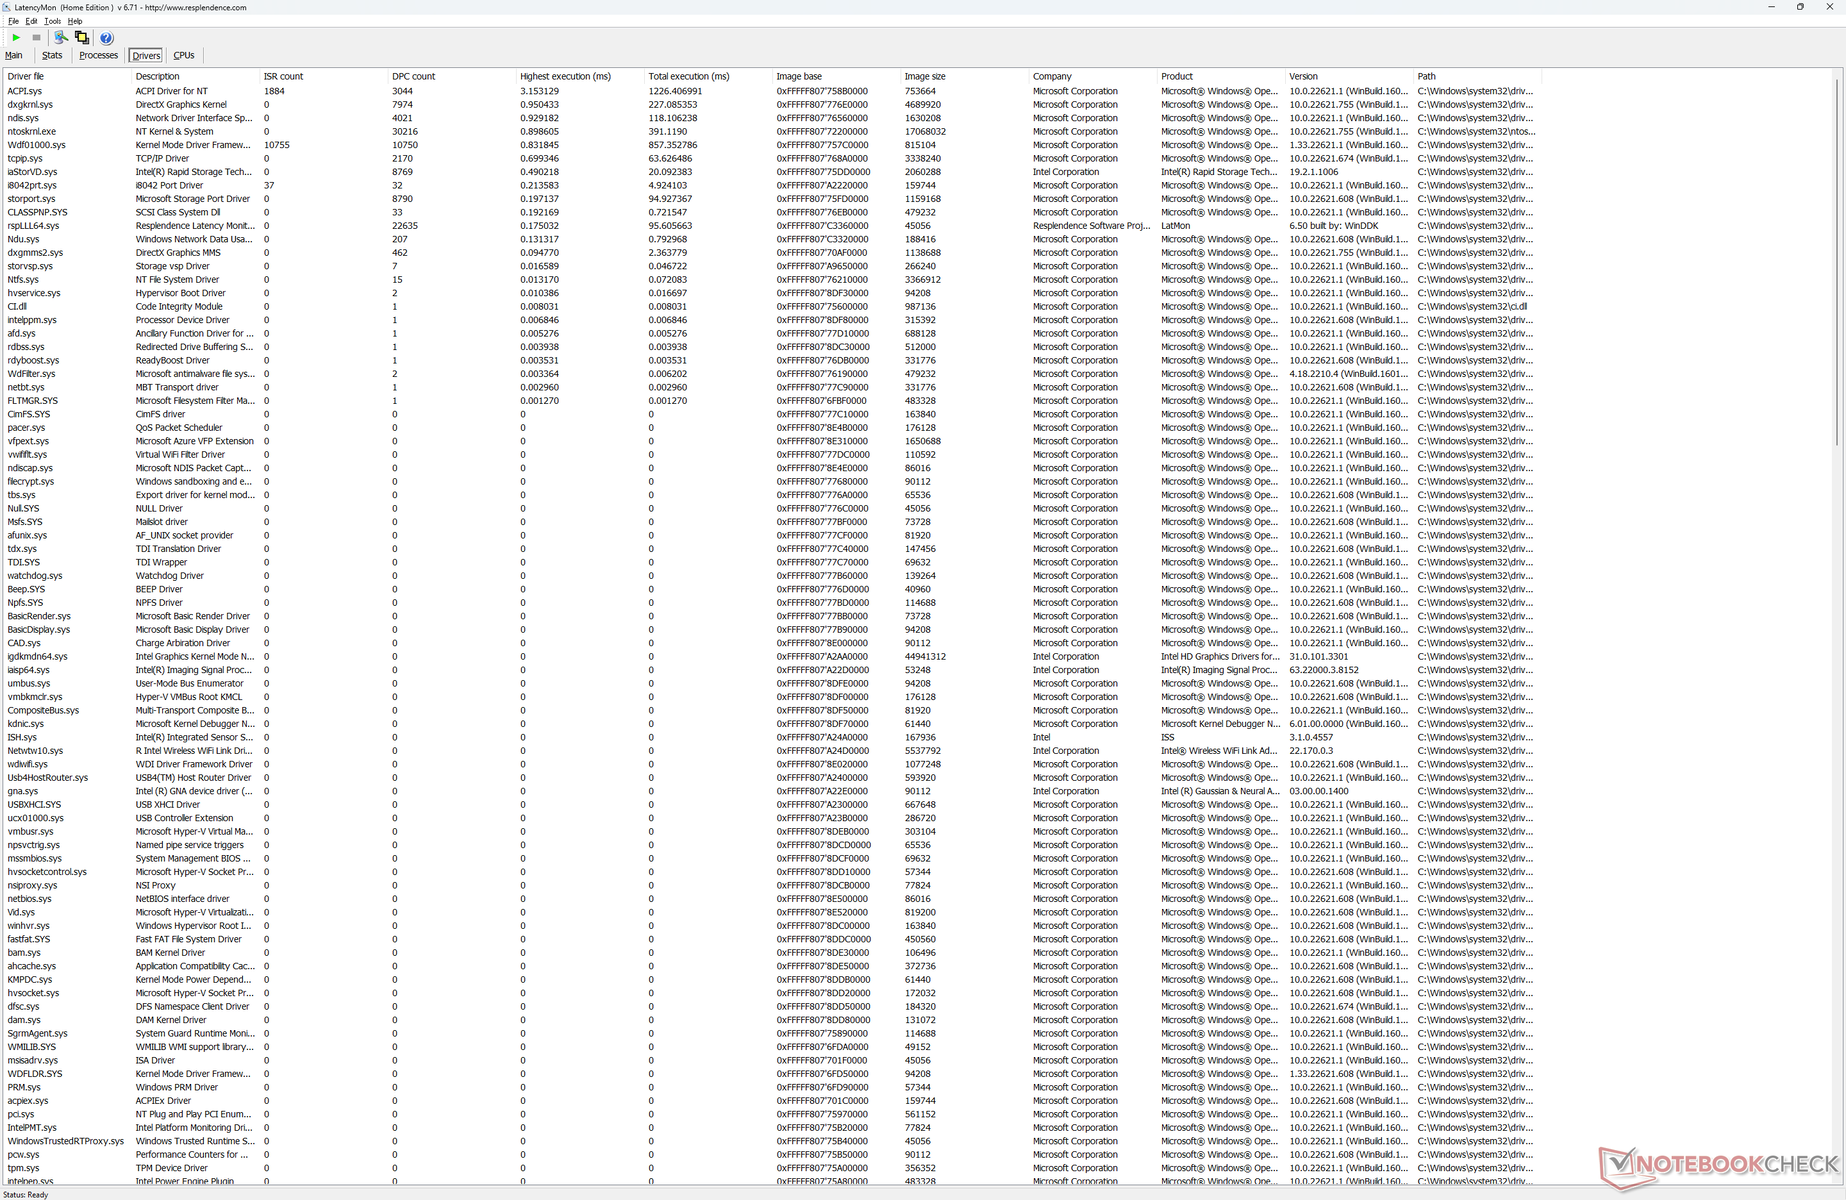
Opóźnienie DPC
LatencyMon ujawnia problemy z DPC podczas otwierania wielu kart przeglądarki na naszej stronie głównej. odtwarzanie wideo w rozdzielczości 4K przy 60 FPS jest poza tym perfekcyjne i nie ma żadnych opuszczonych klatek.
| DPC Latencies / LatencyMon - interrupt to process latency (max), Web, Youtube, Prime95 | |
| Dell XPS 13 9315 2-in-1 Core i5-1230U | |
| Lenovo ThinkBook Plus Gen2 Core i5 | |
| HP Spectre x360 13.5 14t-ef000 | |
| Microsoft Surface Pro 8, i7-1185G7 | |
| Dell XPS 13 Plus 9320 i7-1280P OLED | |
* ... im mniej tym lepiej
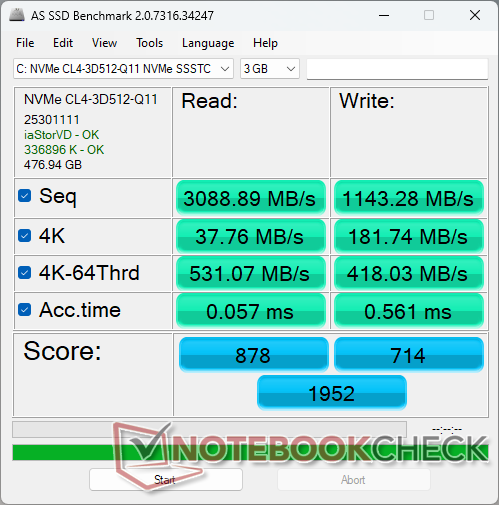
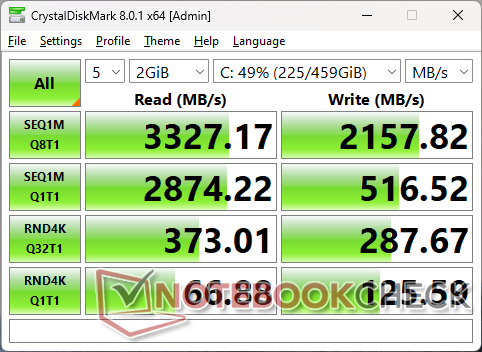
Urządzenia pamięci masowej - PCIe4 przy prędkości PCIe3
Dell oferuje opcje pamięci masowej PCIe4 x4 o pojemności 256 GB, 512 GB i 1 TB. Niestety, wydajność jest bliższa większości dysków PCIe3 x4 niż PCIe4 x4. Benchmarki, takie jak CrystalDiskMark i DiskSpd, wykazują maksymalne prędkości odczytu i zapisu na poziomie odpowiednio tylko 3300 MB/s i 2200 MB/s, w porównaniu z 7000 MB/s lub szybciej w przypadku m.in Samsung 980 Pro Seria PCIe4 x4. Mimo to przedział 3000 MB/s jest więcej niż wystarczający, biorąc pod uwagę obudowę i procesor z serii Core U.

| Drive Performance rating - Percent | |
| Lenovo ThinkBook Plus Gen2 Core i5 | |
| Dell XPS 13 Plus 9320 i7-1280P OLED | |
| HP Spectre x360 13.5 14t-ef000 | |
| Microsoft Surface Pro 8, i7-1185G7 | |
| Dell XPS 13 9315 2-in-1 Core i5-1230U | |
* ... im mniej tym lepiej
Disk Throttling: DiskSpd Read Loop, Queue Depth 8
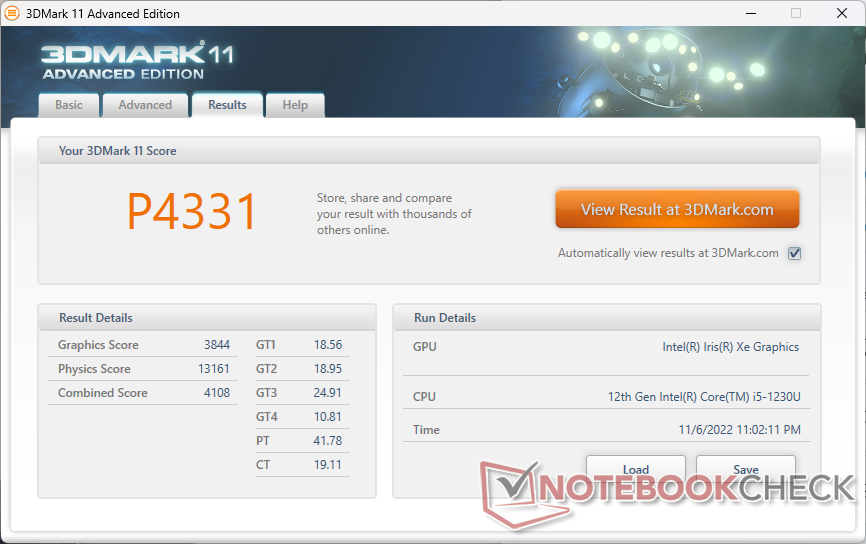
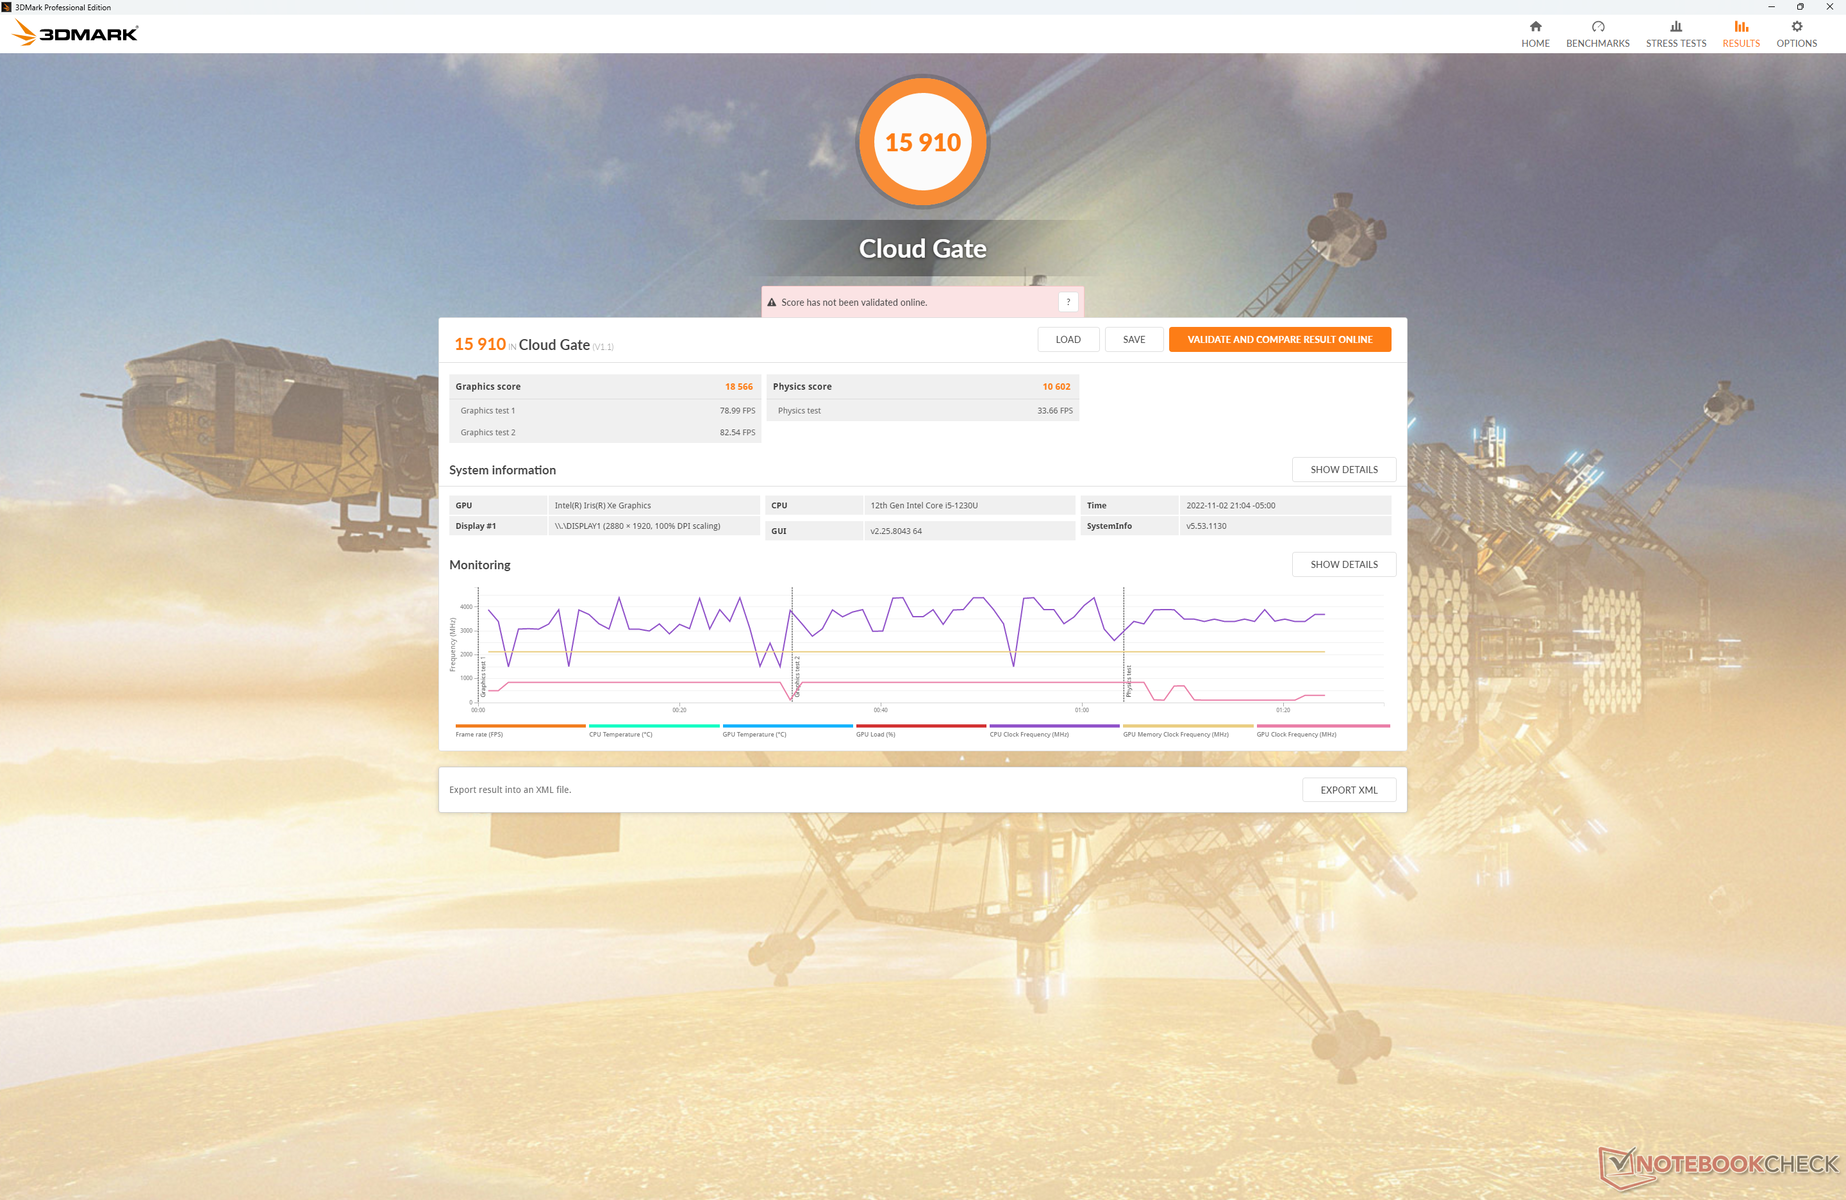
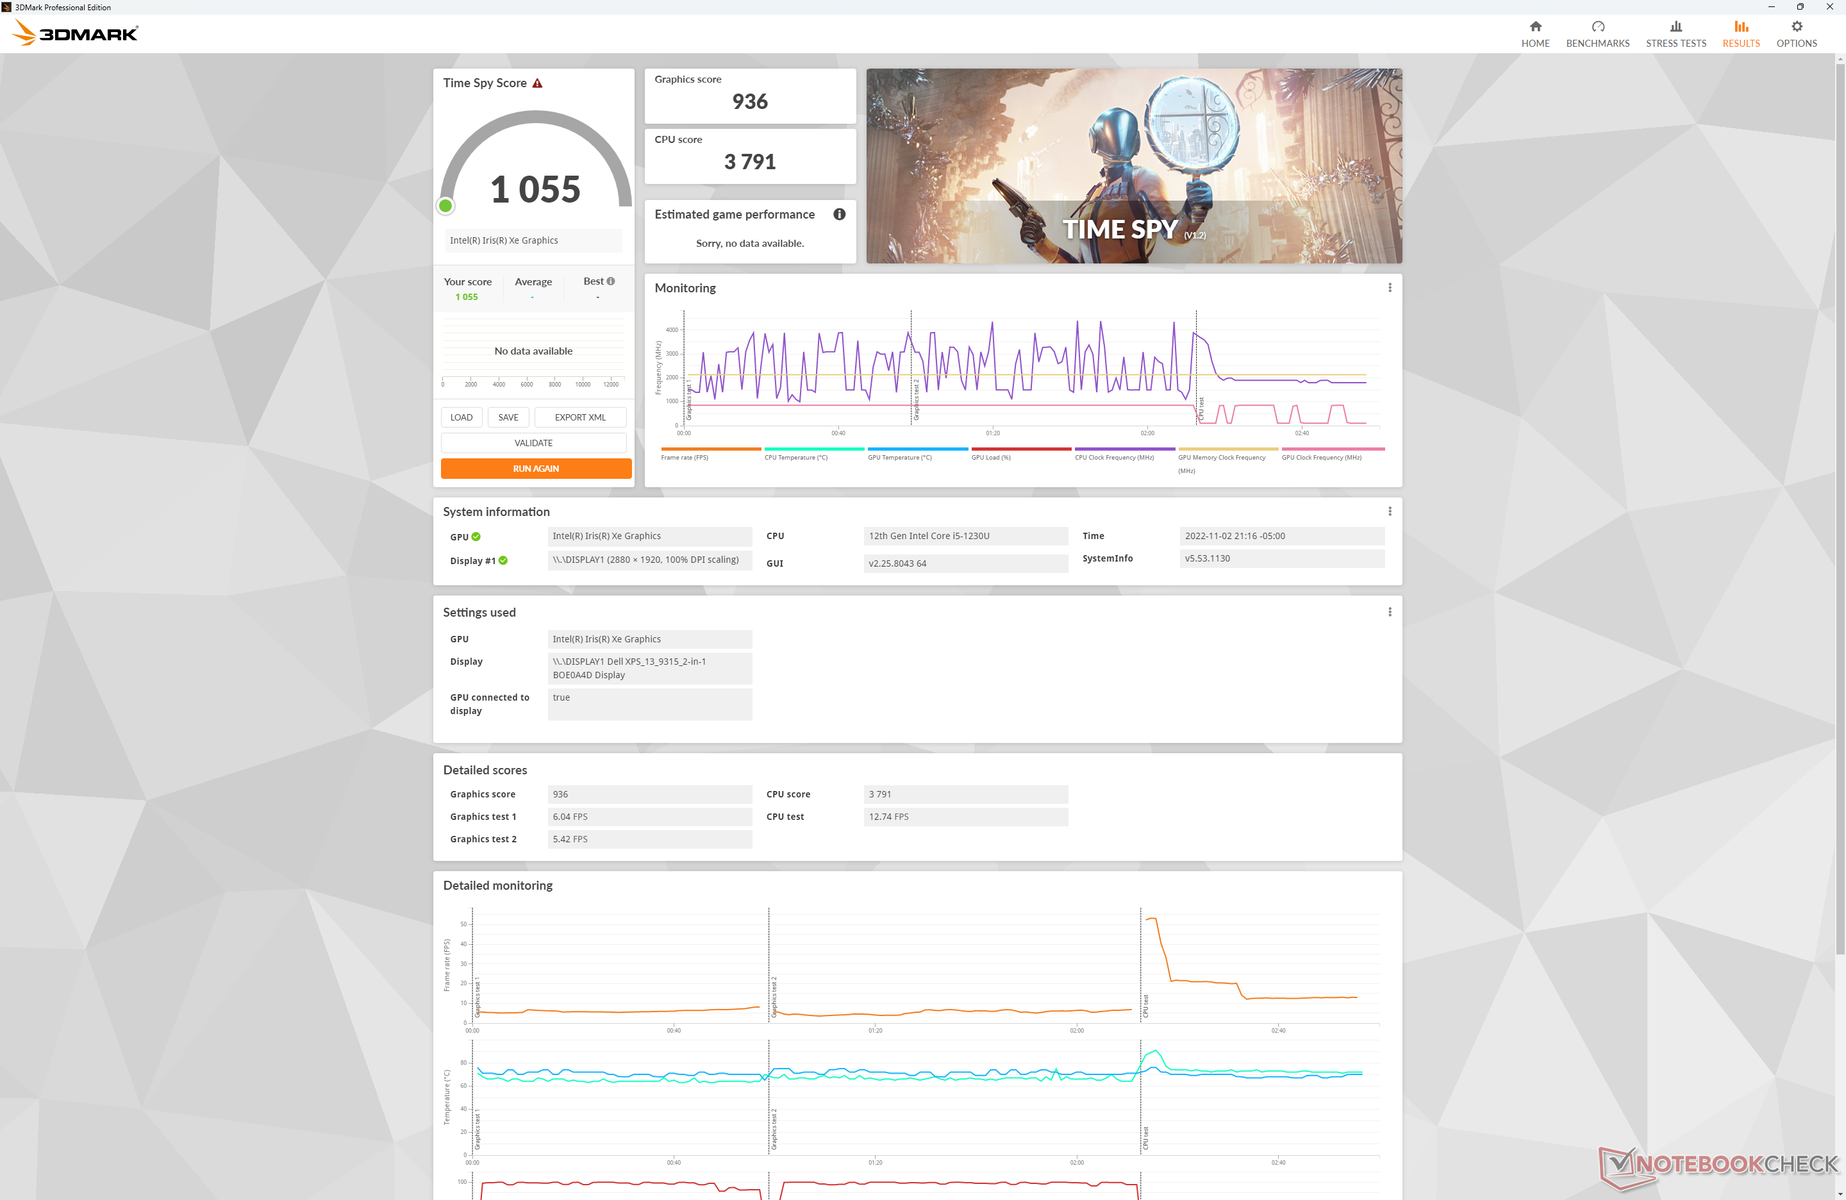
Wydajność GPU
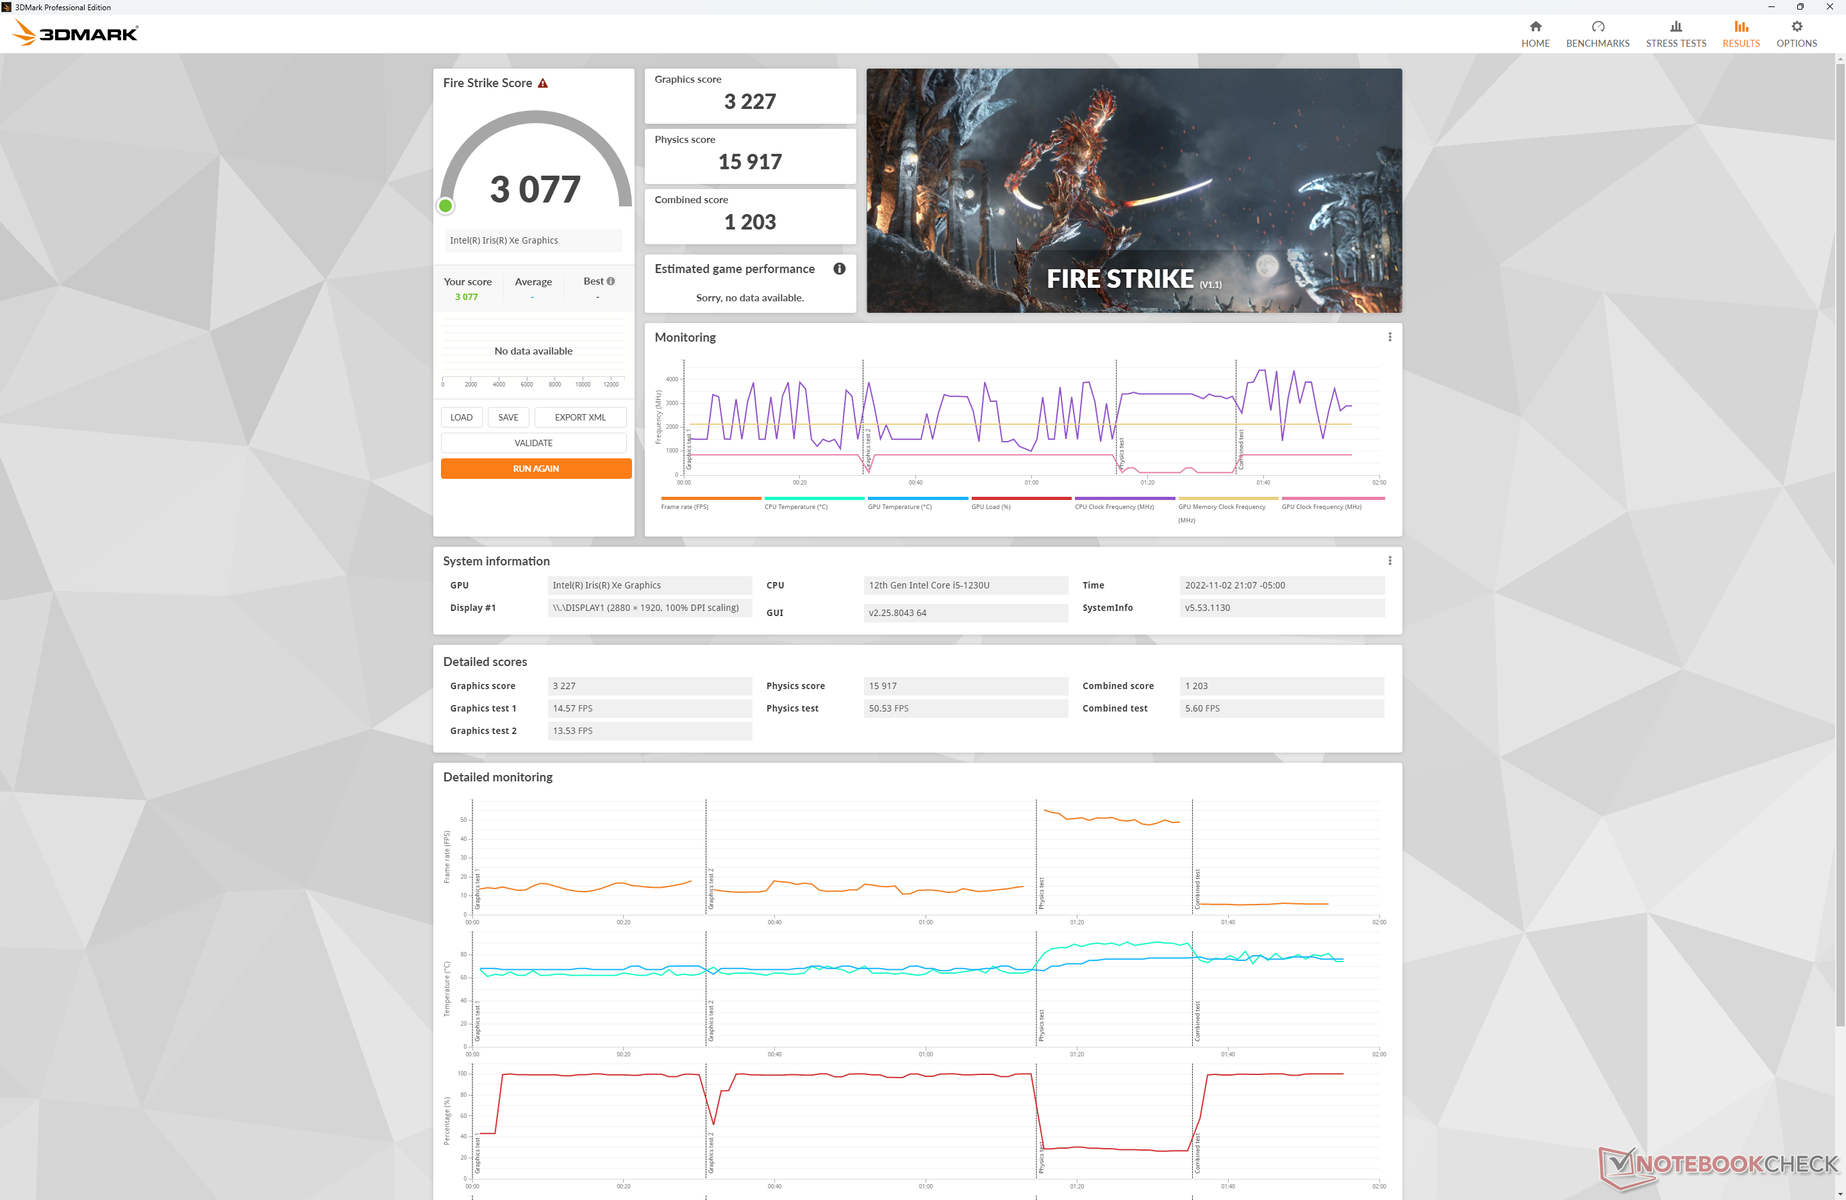
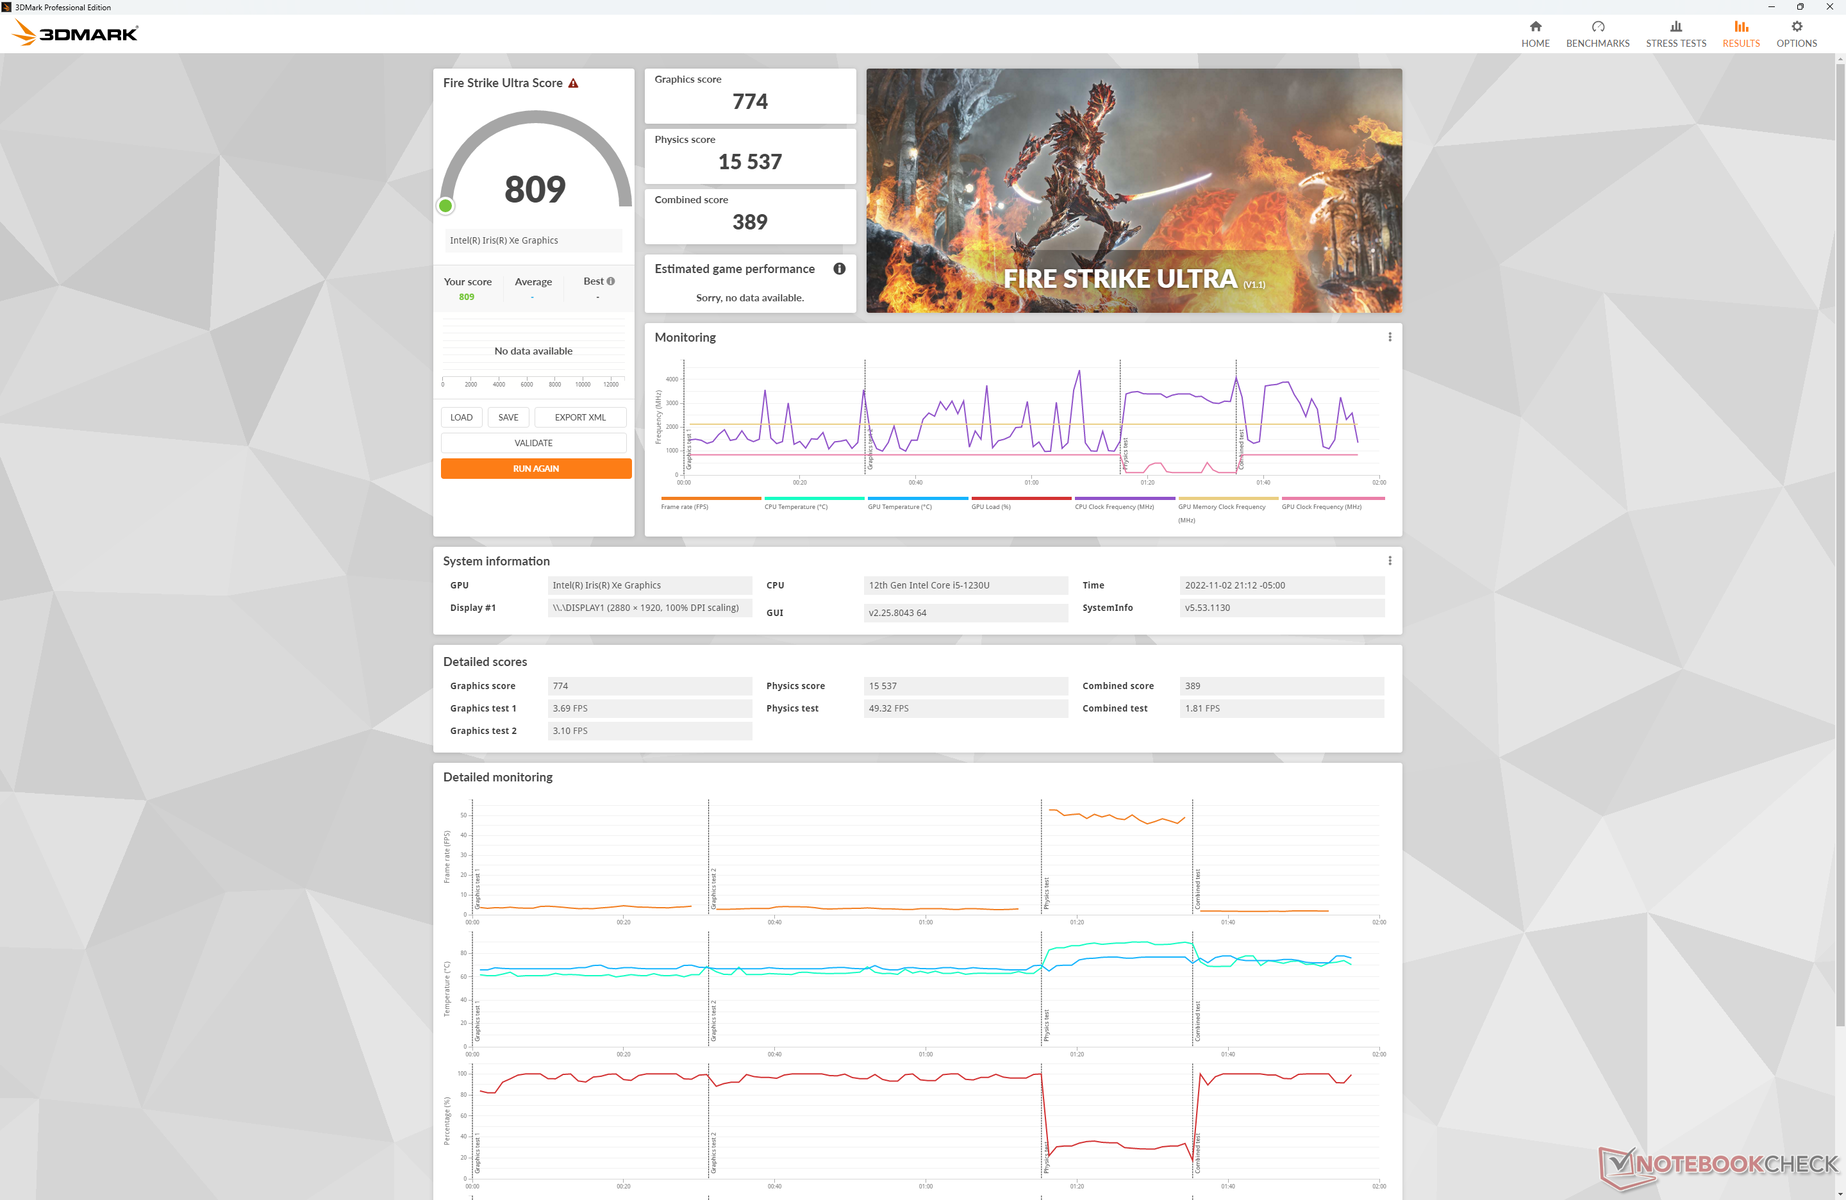
O ile wydajność procesora jest lepsza od oczekiwań, o tyle wydajność grafiki nie jest już tak dobra. wyniki 3DMark są o około 10-20% wolniejsze od przeciętnego laptopa z naszej bazy danych z tym samym zintegrowanym Iris Xe 80 EUby być porównywalne z zeszłorocznymThinkBook Plus Gen 2. Gaming jest nadal możliwy, jeśli tylko na najniższych ustawieniach.
Aktualizacja do SKU Core i7-1250U z Iris Xe 96 EUs ma zwiększyć wydajność graficzną o około 36 procent na podstawie naszych doświadczeń z HP Envy x360 13. Istnieją konfiguracje z tylko 8 GB RAM zamiast 16 GB, których nie polecamy, bo inaczej wydajność grafiki ucierpi jeszcze bardziej.
| 3DMark | |
| 1920x1080 Fire Strike Graphics | |
| Microsoft Surface Pro 8, i7-1185G7 | |
| Dell XPS 13 Plus 9320 i7-1280P OLED | |
| HP Spectre x360 13.5 14t-ef000 | |
| HP Envy x360 13-bf0013dx | |
| Przeciętny Intel Iris Xe Graphics G7 80EUs (1560 - 5398, n=114) | |
| Lenovo ThinkBook Plus Gen2 Core i5 | |
| Dell XPS 13 9315 2-in-1 Core i5-1230U | |
| 2560x1440 Time Spy Graphics | |
| Dell XPS 13 Plus 9320 i7-1280P OLED | |
| Microsoft Surface Pro 8, i7-1185G7 | |
| HP Spectre x360 13.5 14t-ef000 | |
| HP Envy x360 13-bf0013dx | |
| Przeciętny Intel Iris Xe Graphics G7 80EUs (561 - 1576, n=111) | |
| Lenovo ThinkBook Plus Gen2 Core i5 | |
| Dell XPS 13 9315 2-in-1 Core i5-1230U | |
| 2560x1440 Time Spy Score | |
| Dell XPS 13 Plus 9320 i7-1280P OLED | |
| Microsoft Surface Pro 8, i7-1185G7 | |
| HP Spectre x360 13.5 14t-ef000 | |
| HP Envy x360 13-bf0013dx | |
| Przeciętny Intel Iris Xe Graphics G7 80EUs (630 - 1791, n=111) | |
| Lenovo ThinkBook Plus Gen2 Core i5 | |
| Dell XPS 13 9315 2-in-1 Core i5-1230U | |
| 3DMark 11 - 1280x720 Performance GPU | |
| Dell XPS 13 Plus 9320 i7-1280P OLED | |
| Microsoft Surface Pro 8, i7-1185G7 | |
| HP Spectre x360 13.5 14t-ef000 | |
| Przeciętny Intel Iris Xe Graphics G7 80EUs (2246 - 6579, n=112) | |
| HP Envy x360 13-bf0013dx | |
| Lenovo ThinkBook Plus Gen2 Core i5 | |
| Dell XPS 13 9315 2-in-1 Core i5-1230U | |
| 3DMark 11 Performance | 4331 pkt. | |
| 3DMark Cloud Gate Standard Score | 15910 pkt. | |
| 3DMark Fire Strike Score | 3077 pkt. | |
| 3DMark Time Spy Score | 1055 pkt. | |
Pomoc | ||
| Blender - v3.3 Classroom CPU | |
| Dell XPS 13 9315 2-in-1 Core i5-1230U | |
| Przeciętny Intel Iris Xe Graphics G7 80EUs (463 - 3047, n=53) | |
| HP Spectre x360 13.5 14t-ef000 | |
| Apple MacBook Air M2 Entry | |
| Dell XPS 13 Plus 9320 i7-1280P OLED | |
* ... im mniej tym lepiej
| Final Fantasy XV Benchmark - 1280x720 Lite Quality | |
| Microsoft Surface Pro 8, i7-1185G7 | |
| Dell XPS 13 Plus 9320 i7-1280P OLED | |
| HP Spectre x360 13.5 14t-ef000 | |
| Przeciętny Intel Iris Xe Graphics G7 80EUs (8.32 - 45.6, n=107) | |
| Dell XPS 13 9315 2-in-1 Core i5-1230U | |
| X-Plane 11.11 | |
| 1280x720 low (fps_test=1) | |
| Dell XPS 13 Plus 9320 i7-1280P OLED | |
| HP Spectre x360 13.5 14t-ef000 | |
| Lenovo ThinkBook Plus Gen2 Core i5 | |
| Przeciętny Intel Iris Xe Graphics G7 80EUs (9.12 - 74.4, n=111) | |
| Microsoft Surface Pro 8, i7-1185G7 | |
| Dell XPS 13 9315 2-in-1 Core i5-1230U | |
| 1920x1080 med (fps_test=2) | |
| HP Spectre x360 13.5 14t-ef000 | |
| Dell XPS 13 Plus 9320 i7-1280P OLED | |
| Microsoft Surface Pro 8, i7-1185G7 | |
| Przeciętny Intel Iris Xe Graphics G7 80EUs (6.45 - 40.5, n=112) | |
| Dell XPS 13 9315 2-in-1 Core i5-1230U | |
| Lenovo ThinkBook Plus Gen2 Core i5 | |
| 1920x1080 high (fps_test=3) | |
| Dell XPS 13 Plus 9320 i7-1280P OLED | |
| HP Spectre x360 13.5 14t-ef000 | |
| Microsoft Surface Pro 8, i7-1185G7 | |
| Przeciętny Intel Iris Xe Graphics G7 80EUs (5.55 - 36.3, n=110) | |
| Dell XPS 13 9315 2-in-1 Core i5-1230U | |
| Lenovo ThinkBook Plus Gen2 Core i5 | |
Liczba klatek na sekundę jest stała podczas pracy na biegu jałowym Witcher 3 co oznacza, że nie ma żadnych poważnych działań zakłócających w tle. Doświadczyliśmy jednego przypadku, w którym wydajność spadła do 36 FPS, po czym wróciła do normy, ale na szczęście był to tylko wyjątek.
Witcher 3 FPS Chart
| low | med. | high | ultra | |
|---|---|---|---|---|
| GTA V (2015) | 60.9 | 38.4 | 11.7 | 6.06 |
| The Witcher 3 (2015) | 57.7 | 38.9 | 19.9 | 8.5 |
| Dota 2 Reborn (2015) | 101.2 | 75.8 | 37.6 | 34.2 |
| Final Fantasy XV Benchmark (2018) | 27 | |||
| X-Plane 11.11 (2018) | 31.2 | 25.1 | 22 |
Emisja - bez wentylatorów!
Szum systemu
Podczas gdy Surface Pro 8 wykorzystuje wewnętrzny wentylator do chłodzenia, XPS 13 9315 2-in-1 jest chłodzony pasywnie we wszystkich konfiguracjach, w tym z procesorem Core i7 SKU. Nie ma tu żadnego szumu wentylatora ani odgłosu cewki, co sprawia, że system jest całkowicie bezgłośny.
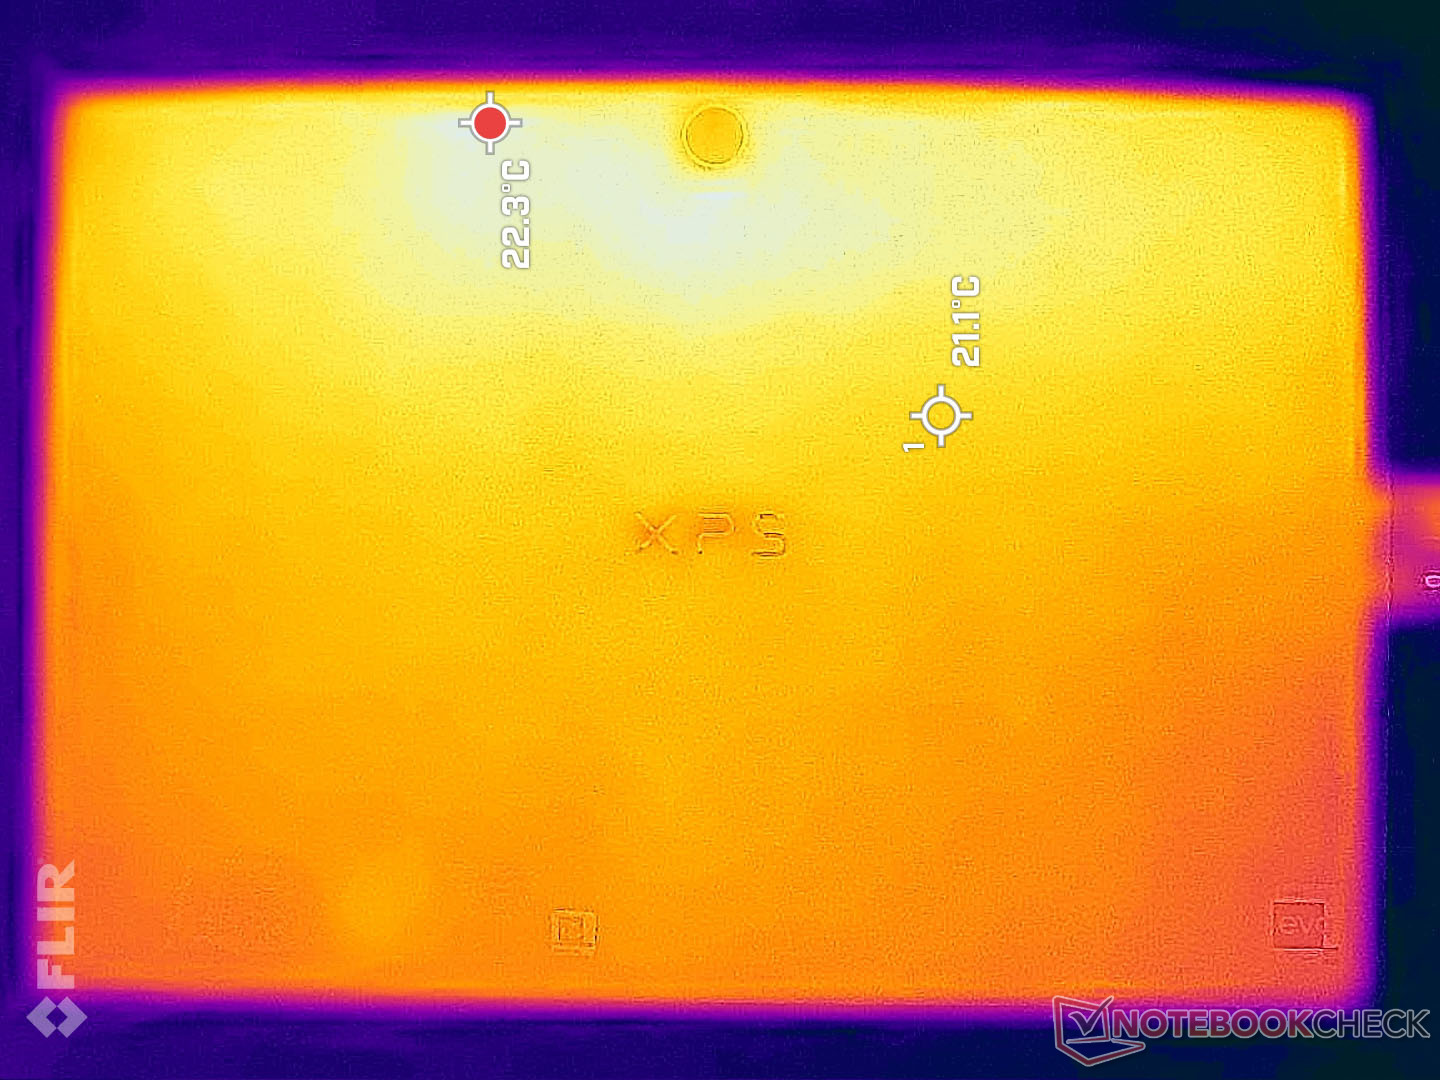
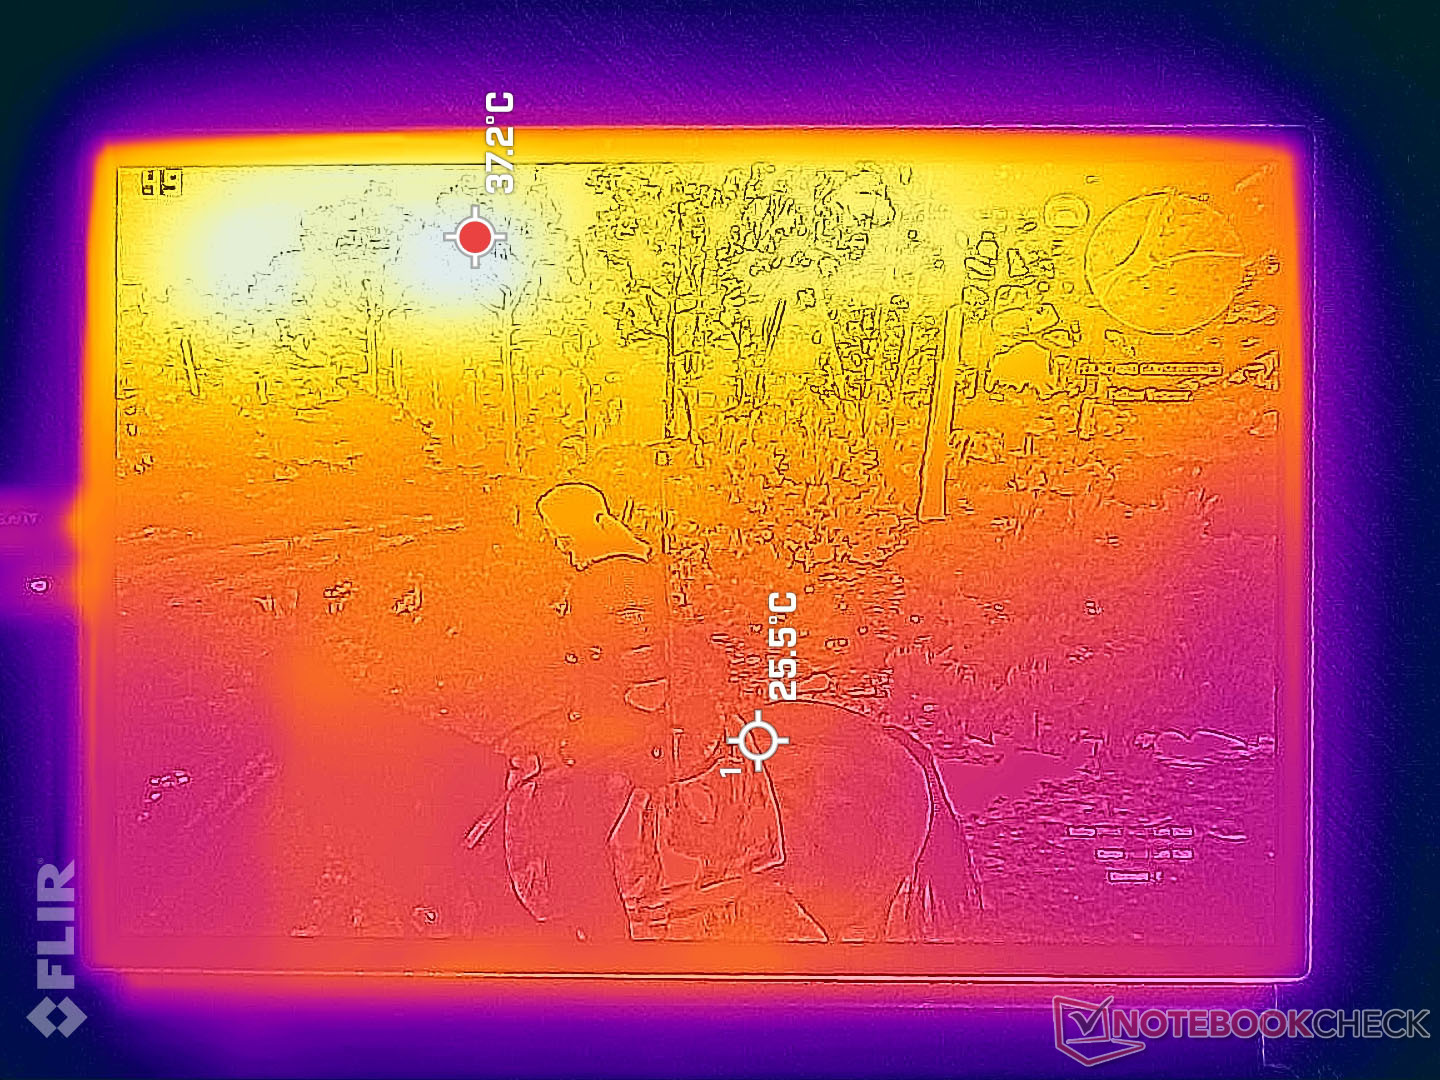
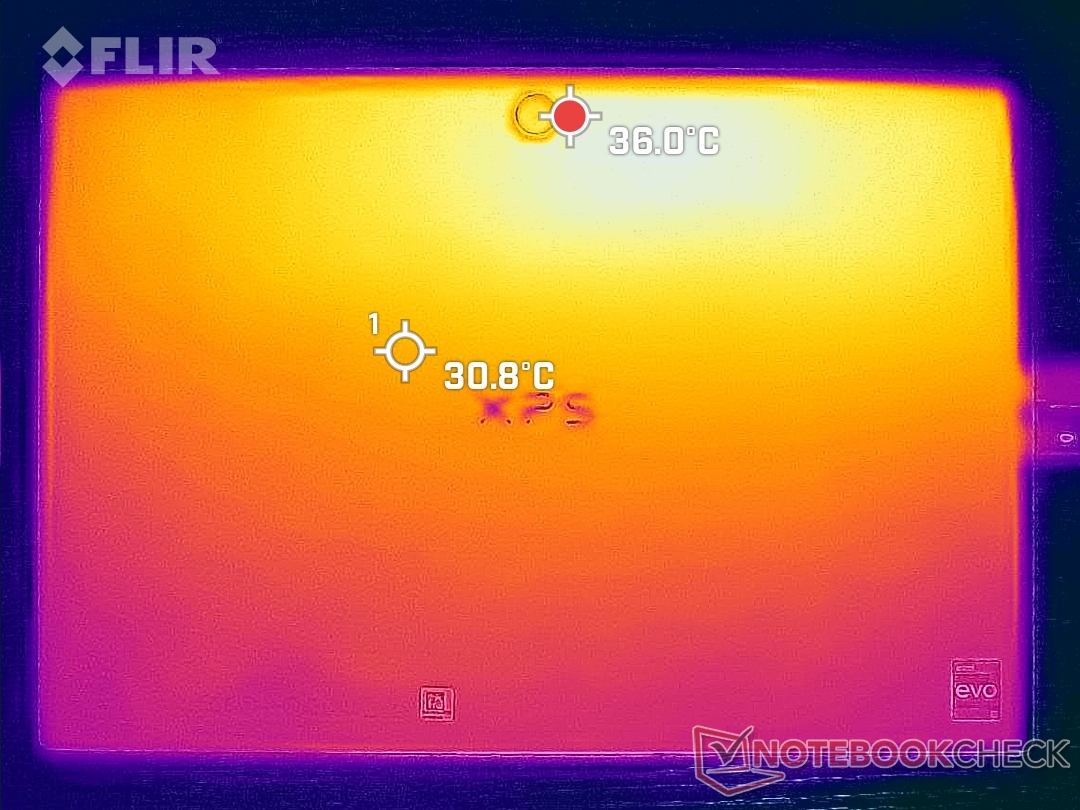
Temperatura
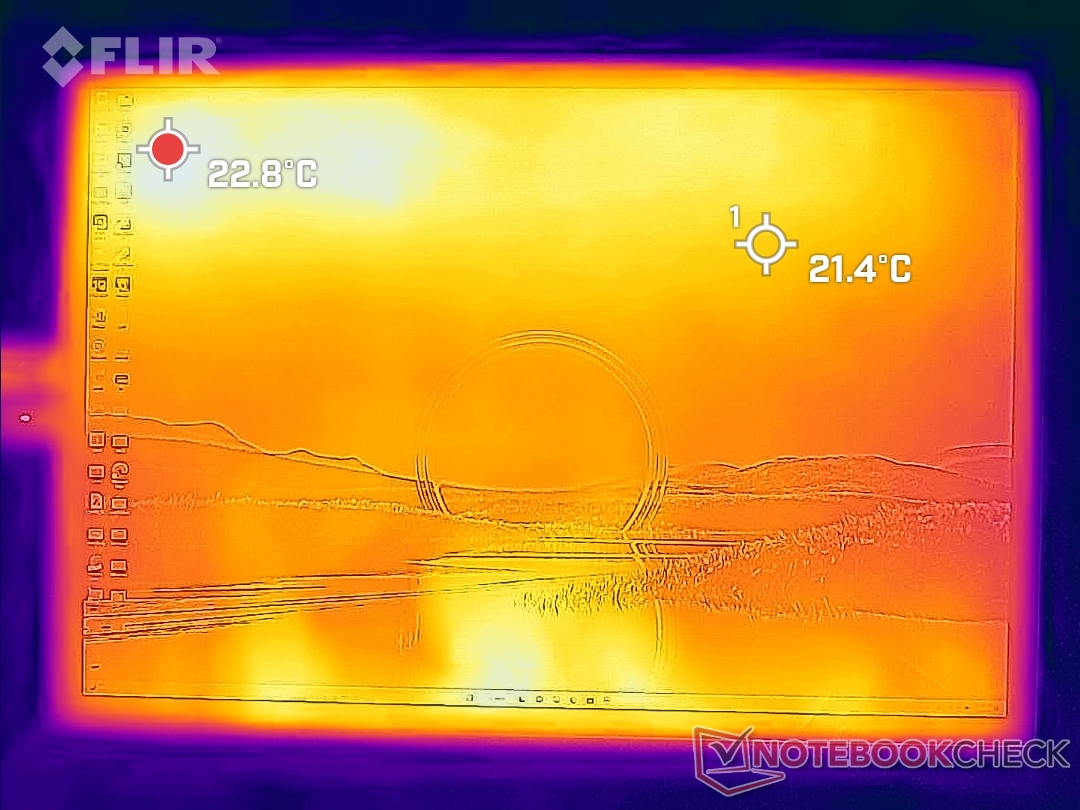
Temperatury powierzchni są ogólnie cieplejsze wzdłuż górnej połowy urządzenia, podczas gdy dolna połowa jest wyraźnie chłodniejsza. Gorące punkty z przodu i z tyłu mogą osiągnąć odpowiednio 42 i 39 stopni Celsjusza, w porównaniu z zaledwie 30 stopniami w chłodniejszych miejscach. Urządzenie nigdy nie staje się niewygodne w trzymaniu, bez względu na orientację czy ułożenie. Ogólne temperatury są znacznie niższe od tych, które odnotowaliśmy na Surface Pro 8, gdzie cały przód i tył urządzenia może osiągnąć od 43 C do 48 C.
(±) Maksymalna temperatura w górnej części wynosi 41.8 °C / 107 F, w porównaniu do średniej 35.4 °C / 96 F , począwszy od 19.6 do 60 °C dla klasy Convertible.
(+) Dno nagrzewa się maksymalnie do 38.2 °C / 101 F, w porównaniu do średniej 36.9 °C / 98 F
(+) W stanie bezczynności średnia temperatura górnej części wynosi 25.5 °C / 78 F, w porównaniu ze średnią temperaturą urządzenia wynoszącą 30.3 °C / ### class_avg_f### F.
(+) Podpórki pod nadgarstki i touchpad są chłodniejsze niż temperatura skóry i maksymalnie 29.8 °C / 85.6 F i dlatego są chłodne w dotyku.
(±) Średnia temperatura obszaru podparcia dłoni w podobnych urządzeniach wynosiła 28 °C / 82.4 F (-1.8 °C / -3.2 F).
| Dell XPS 13 9315 2-in-1 Core i5-1230U Intel Core i5-1230U, Intel Iris Xe Graphics G7 80EUs | Microsoft Surface Pro 8, i7-1185G7 Intel Core i7-1185G7, Intel Iris Xe Graphics G7 96EUs | HP Spectre x360 13.5 14t-ef000 Intel Core i7-1255U, Intel Iris Xe Graphics G7 96EUs | Lenovo ThinkBook Plus Gen2 Core i5 Intel Core i5-1130G7, Intel Iris Xe Graphics G7 80EUs | Apple MacBook Air M2 Entry Apple M2, Apple M2 8-Core GPU | |
|---|---|---|---|---|---|
| Heat | -2% | 14% | -11% | 1% | |
| Maximum Upper Side * (°C) | 41.8 | 45 -8% | 36.4 13% | 42 -0% | 44.5 -6% |
| Maximum Bottom * (°C) | 38.2 | 47.2 -24% | 37 3% | 44.5 -16% | 44.4 -16% |
| Idle Upper Side * (°C) | 27.4 | 24.1 12% | 20.8 24% | 29.8 -9% | 23.9 13% |
| Idle Bottom * (°C) | 27.2 | 23.4 14% | 22.6 17% | 31.9 -17% | 23.6 13% |
* ... im mniej tym lepiej
Stress Test
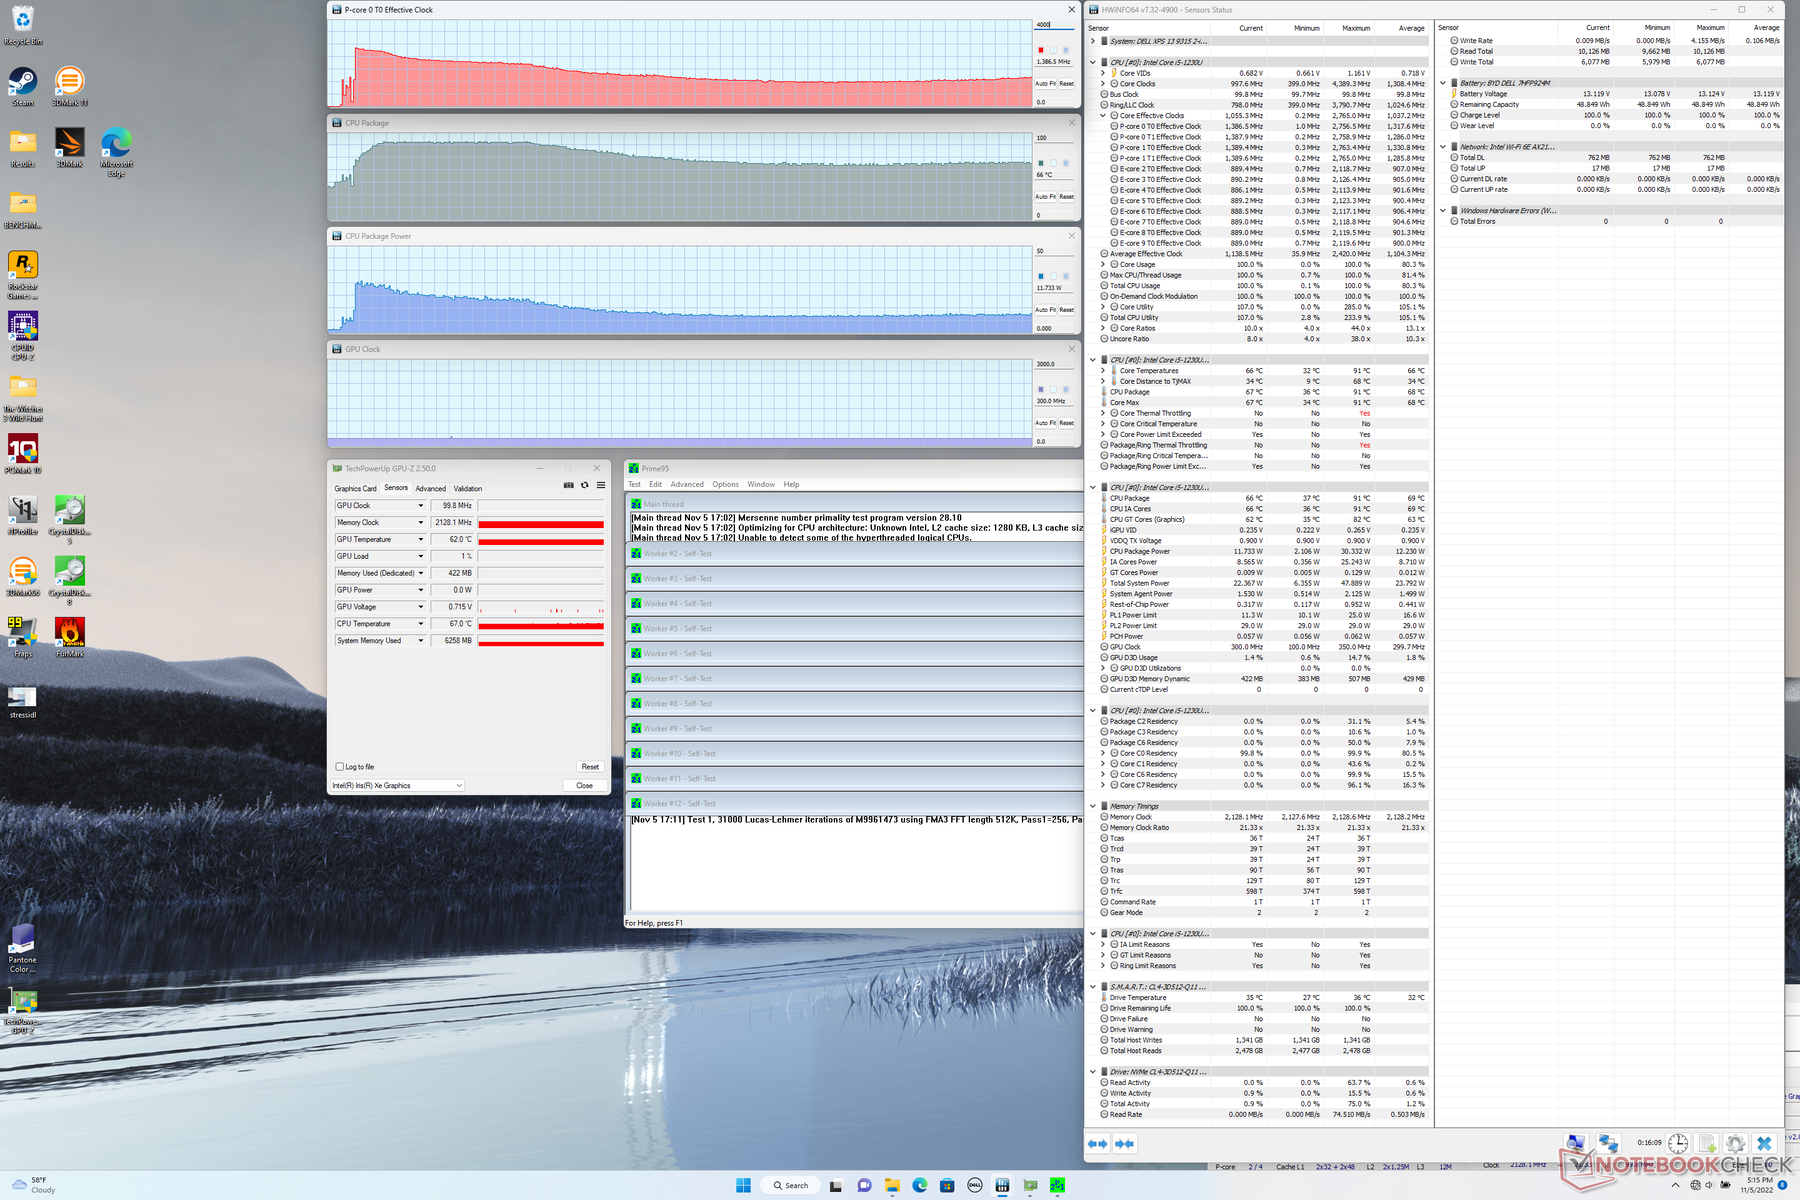
Pod wpływem stresu związanego z Prime95, procesor zwiększał częstotliwość taktowania do 2,7 GHz i 29 W przez około 20 sekund lub do momentu, gdy temperatura rdzenia osiągała 90 C. Następnie częstotliwość taktowania i pobór mocy na płycie systematycznie spadały, aż w końcu ustabilizowały się na poziomie 1,4 GHz i 12 W, odpowiednio, w celu utrzymania znacznie niższej temperatury rdzenia 66 C. Ograniczone częstotliwości taktowania nie są niespodziewane, jeśli weźmiemy pod uwagę konstrukcję bez wentylatora i współczynnik kształtu tabletu. Powtórzenie tego testu na chłodzonym wentylatorem Surface Pro 8 pozwoliłoby uzyskać wyższy pobór mocy procesora - 26 W, ale przy podobnej temperaturze rdzenia wynoszącej 65 C.
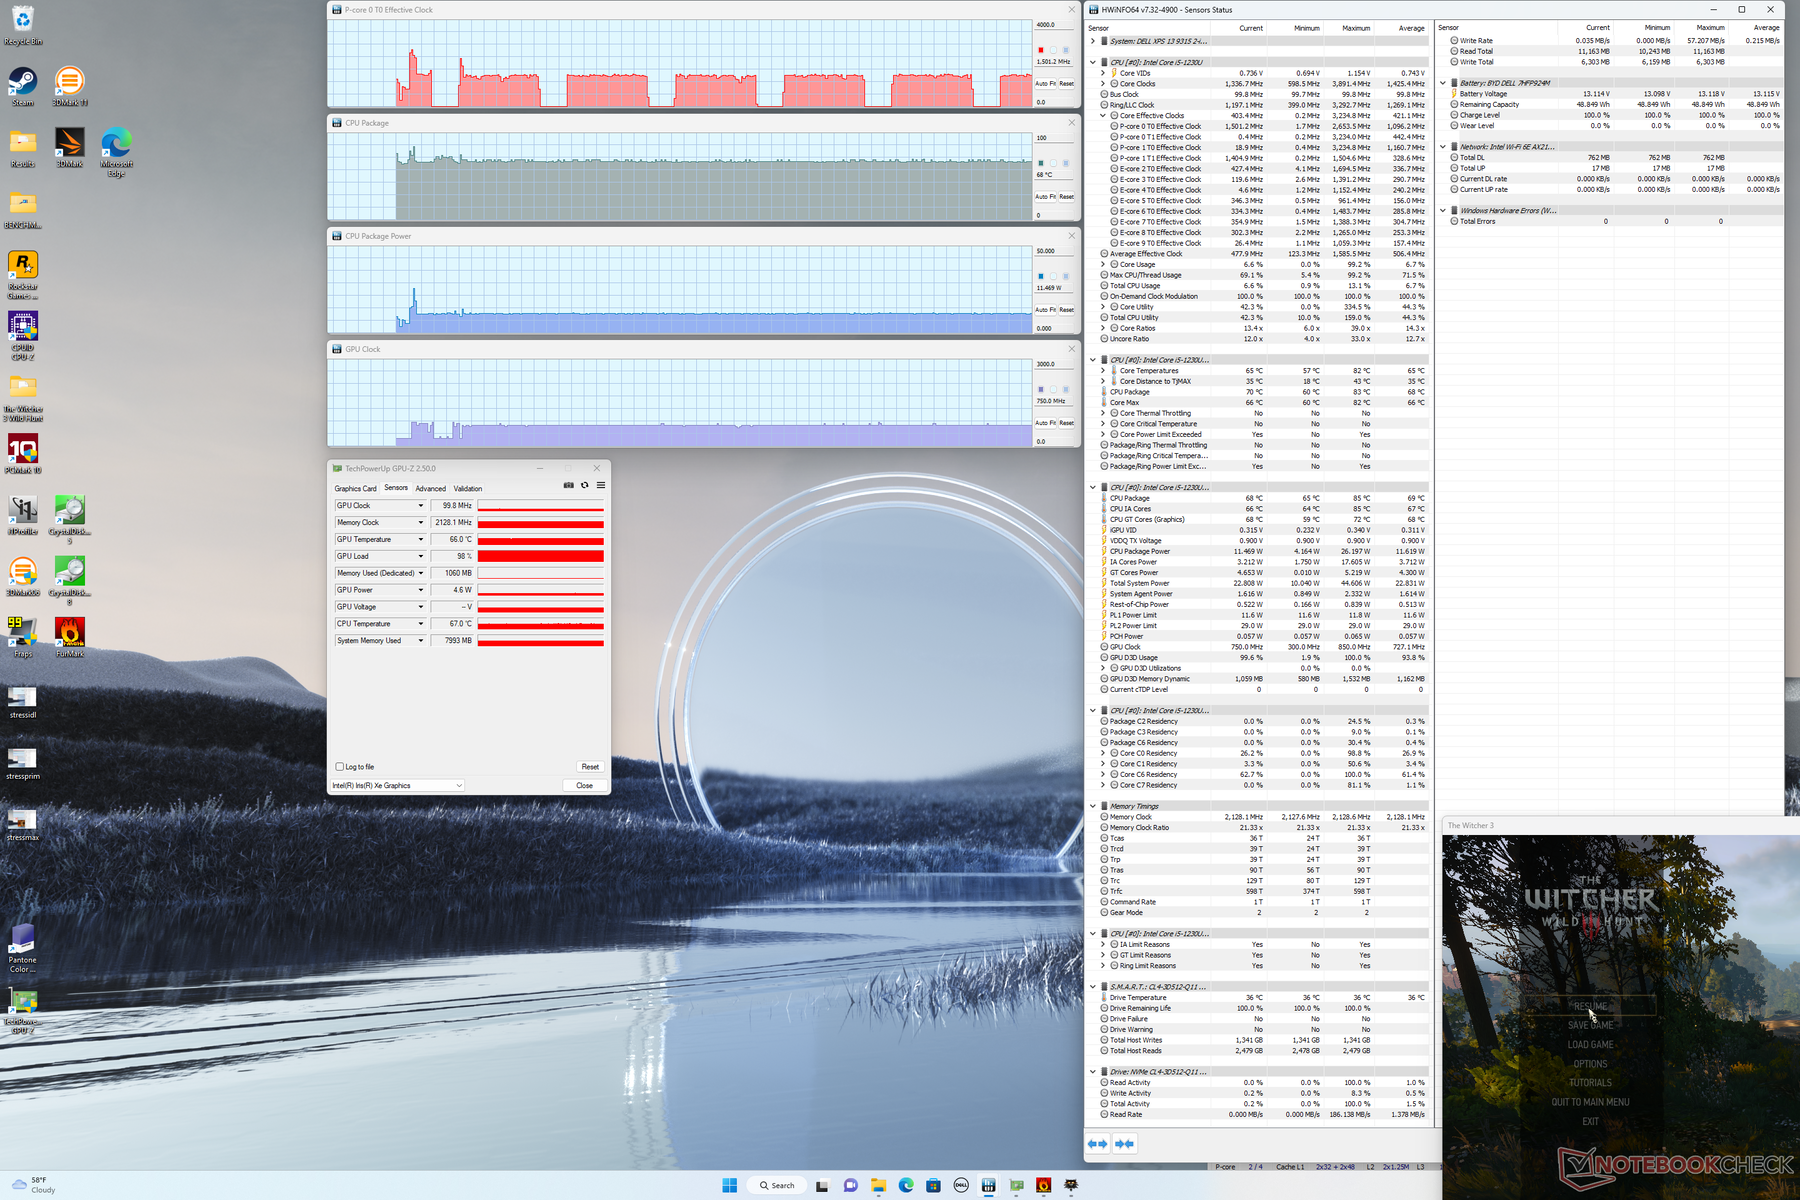
Częstotliwość taktowania GPU ustabilizowała się na poziomie 750 MHz podczas pracy Witcher 3 w porównaniu z 1147 MHz w dużo szybszym modelu XPS 14 9320 z procesorem Core i7.
Wydajność procesora nie jest sztucznie dławiona podczas pracy na zasilaniu akumulatorowym. wyniki 3DMark 11 uzyskane na zasilaniu akumulatorowym i sieciowym są niemal identyczne.
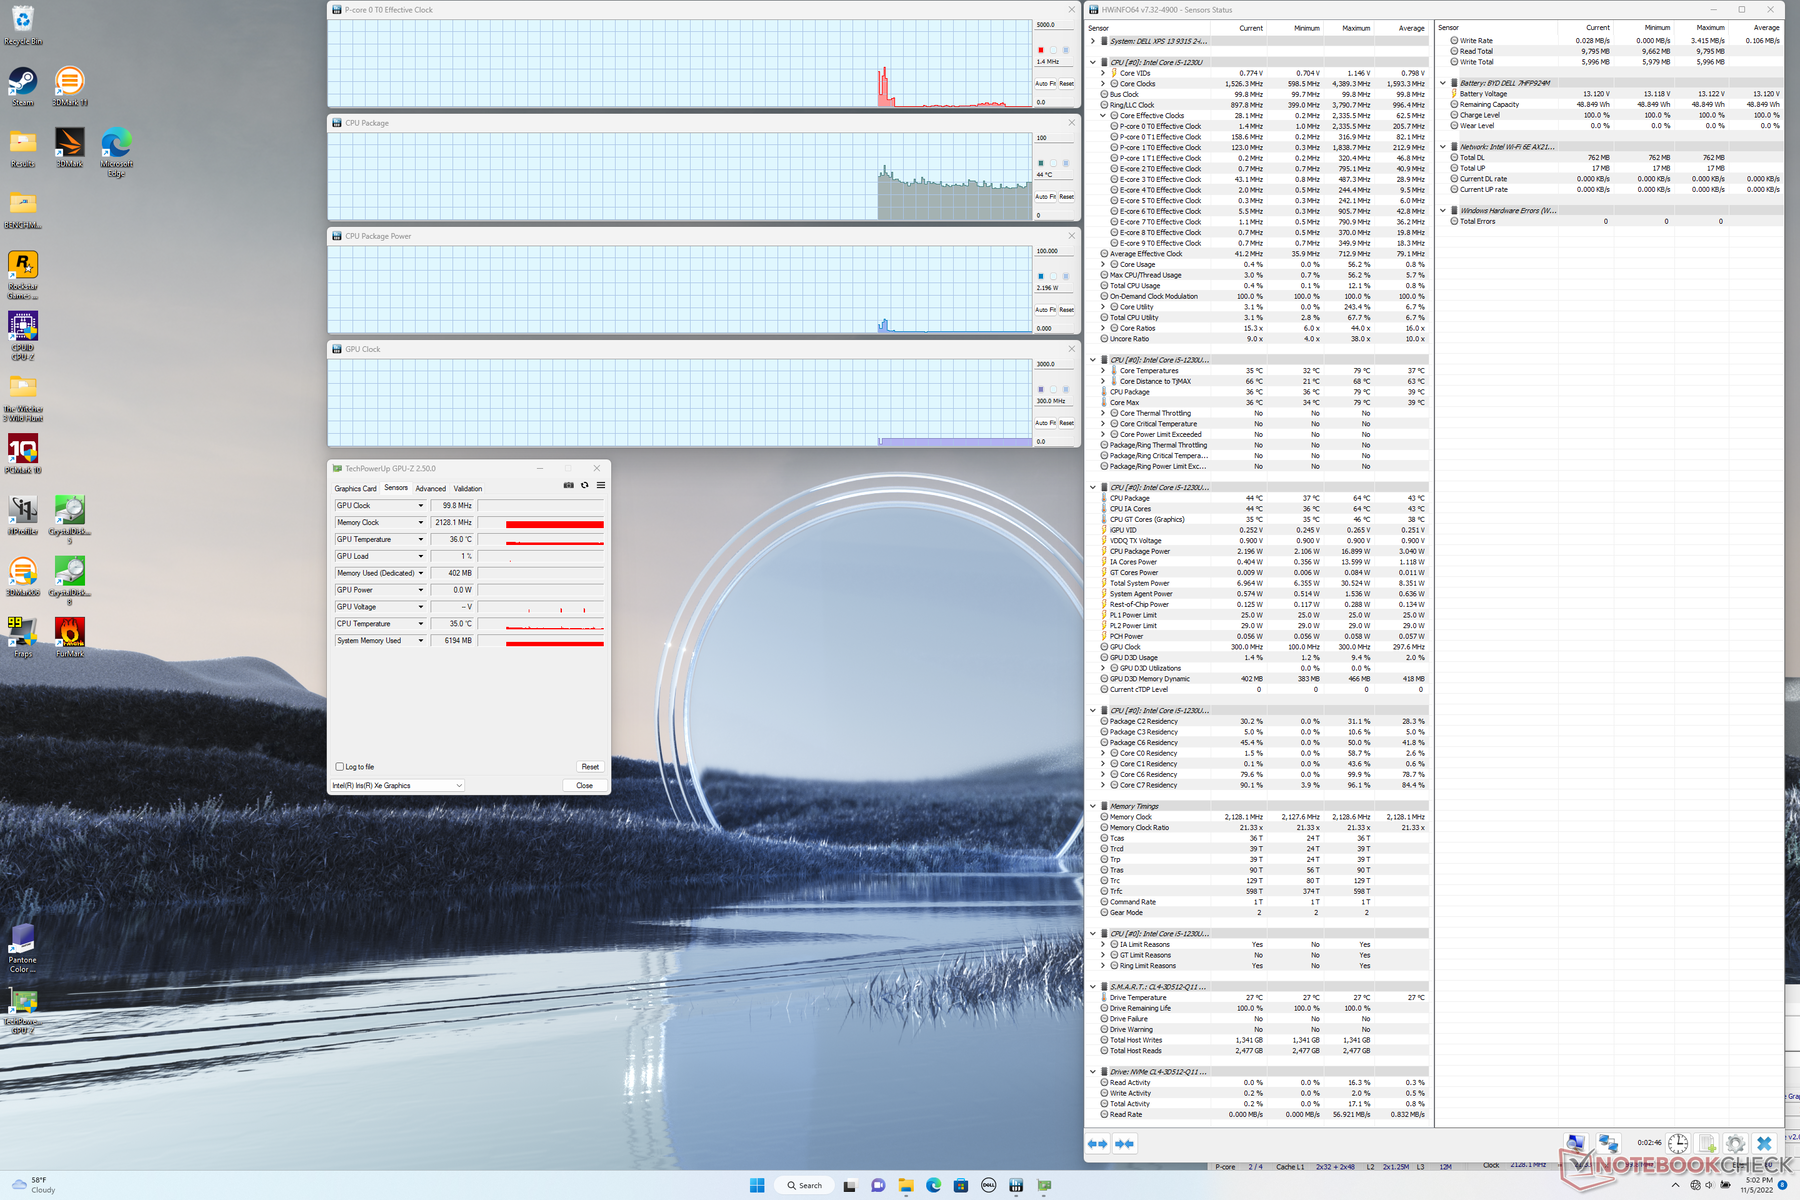
| ZegarCPU (GHz) | Zegar GPU (MHz) | Średnia temperatura CPU (°C) | |
| System w stanie bezczynności | -- | -- | 44 |
| Prime95 Stress | 1.4 | -- | 66 |
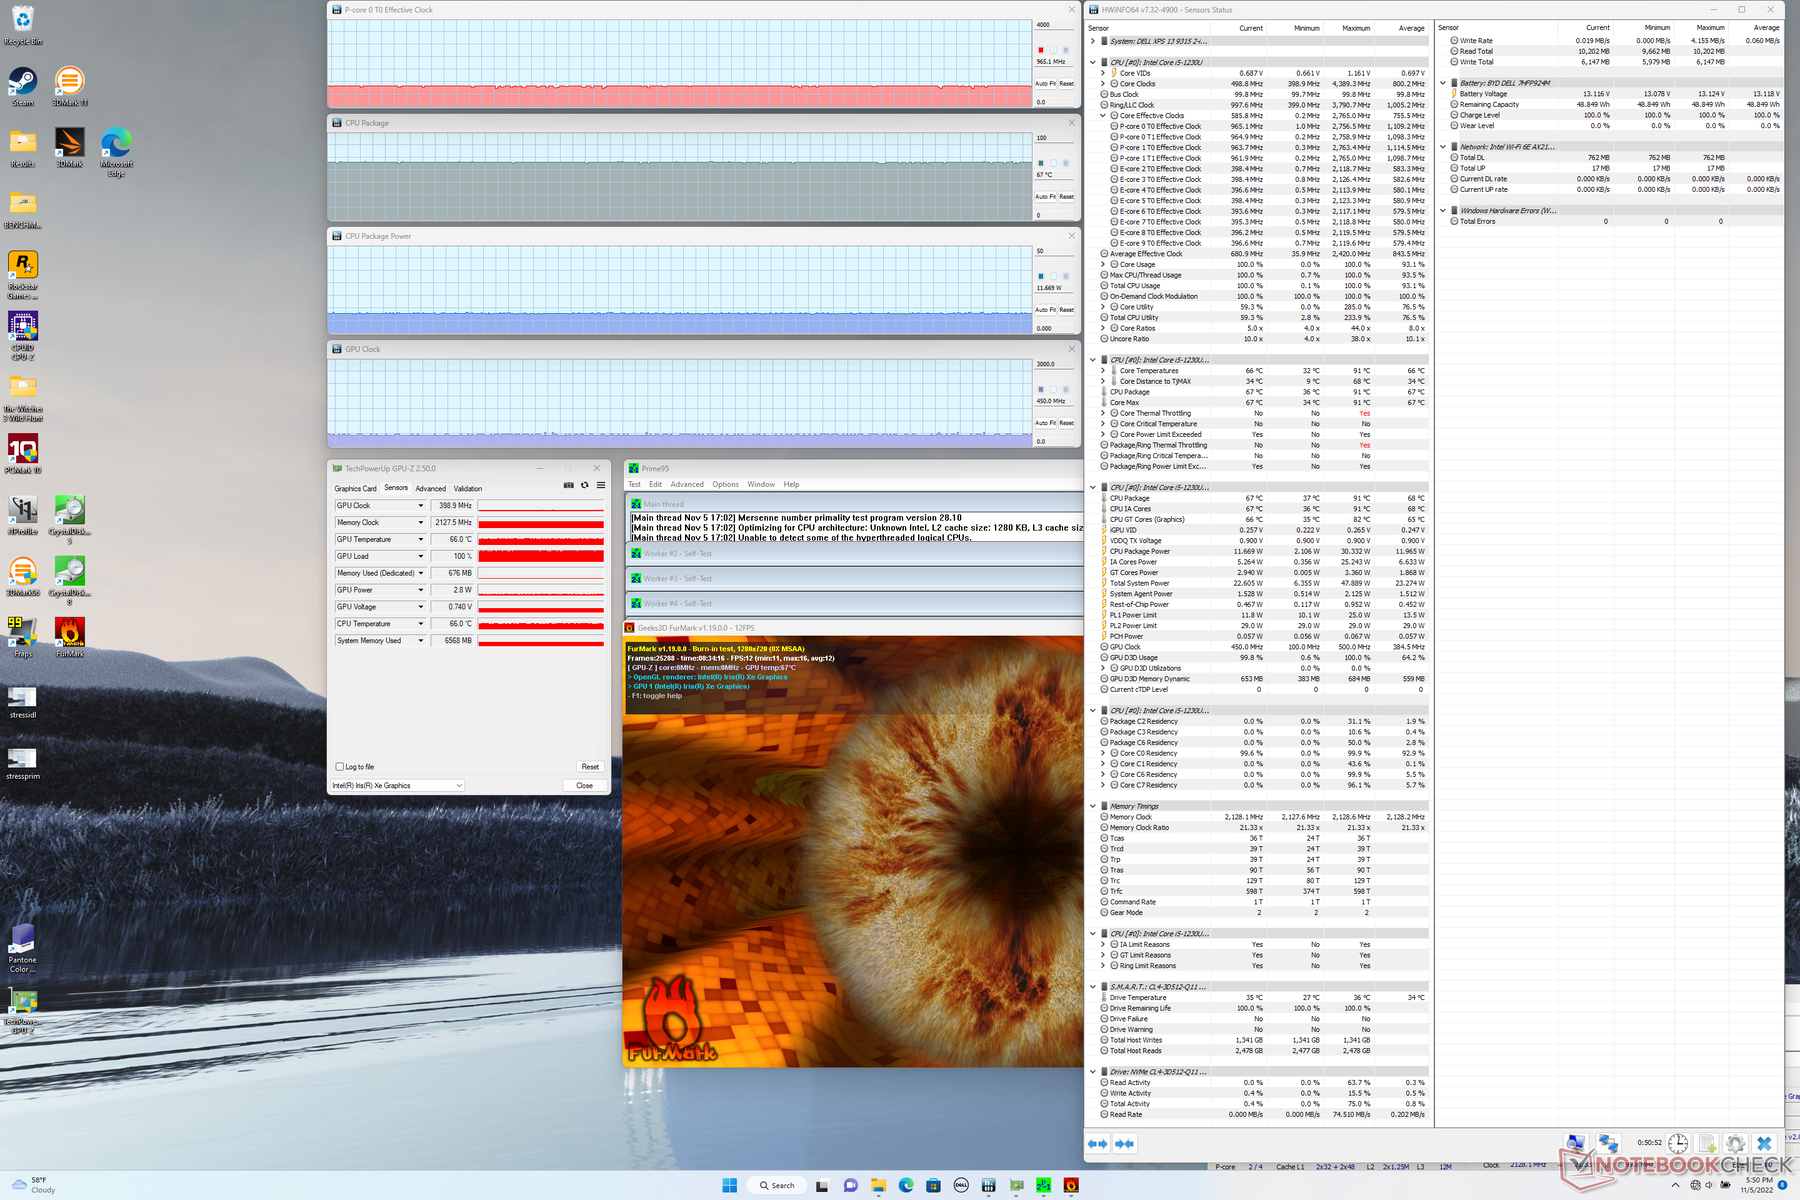
| Prime95 + FurMark Stress | 1.0 | 450 | 67 |
| Witcher 3 Stress | ~1.5 | 750 | 68 |
Mówcy
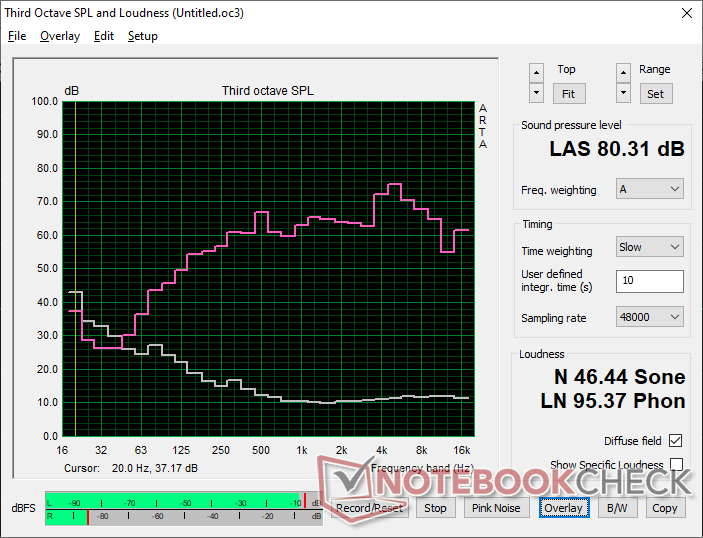
Dell XPS 13 9315 2-in-1 Core i5-1230U analiza dźwięku
(±) | głośność głośnika jest średnia, ale dobra (80.3 dB)
Bas 100 - 315 Hz
(±) | zredukowany bas - średnio 8.9% niższy od mediany
(+) | bas jest liniowy (5.7% delta do poprzedniej częstotliwości)
Średnie 400 - 2000 Hz
(+) | zbalansowane środki średnie - tylko 2.2% od mediany
(+) | średnie są liniowe (5.2% delta do poprzedniej częstotliwości)
Wysokie 2–16 kHz
(±) | wyższe maksima - średnio 5.5% wyższe od mediany
(+) | wzloty są liniowe (6.8% delta do poprzedniej częstotliwości)
Ogólnie 100 - 16.000 Hz
(+) | ogólny dźwięk jest liniowy (11.9% różnicy w stosunku do mediany)
W porównaniu do tej samej klasy
» 11% wszystkich testowanych urządzeń w tej klasie było lepszych, 3% podobnych, 85% gorszych
» Najlepszy miał deltę 6%, średnia wynosiła ###średnia###%, najgorsza wynosiła 57%
W porównaniu do wszystkich testowanych urządzeń
» 9% wszystkich testowanych urządzeń było lepszych, 2% podobnych, 89% gorszych
» Najlepszy miał deltę 4%, średnia wynosiła ###średnia###%, najgorsza wynosiła 134%
Apple MacBook Pro 16 2021 M1 Pro analiza dźwięku
(+) | głośniki mogą odtwarzać stosunkowo głośno (84.7 dB)
Bas 100 - 315 Hz
(+) | dobry bas - tylko 3.8% od mediany
(+) | bas jest liniowy (5.2% delta do poprzedniej częstotliwości)
Średnie 400 - 2000 Hz
(+) | zbalansowane środki średnie - tylko 1.3% od mediany
(+) | średnie są liniowe (2.1% delta do poprzedniej częstotliwości)
Wysokie 2–16 kHz
(+) | zrównoważone maksima - tylko 1.9% od mediany
(+) | wzloty są liniowe (2.7% delta do poprzedniej częstotliwości)
Ogólnie 100 - 16.000 Hz
(+) | ogólny dźwięk jest liniowy (4.6% różnicy w stosunku do mediany)
W porównaniu do tej samej klasy
» 0% wszystkich testowanych urządzeń w tej klasie było lepszych, 0% podobnych, 100% gorszych
» Najlepszy miał deltę 5%, średnia wynosiła ###średnia###%, najgorsza wynosiła 45%
W porównaniu do wszystkich testowanych urządzeń
» 0% wszystkich testowanych urządzeń było lepszych, 0% podobnych, 100% gorszych
» Najlepszy miał deltę 4%, średnia wynosiła ###średnia###%, najgorsza wynosiła 134%
Zarządzanie energią - bardzo wydajne energetycznie
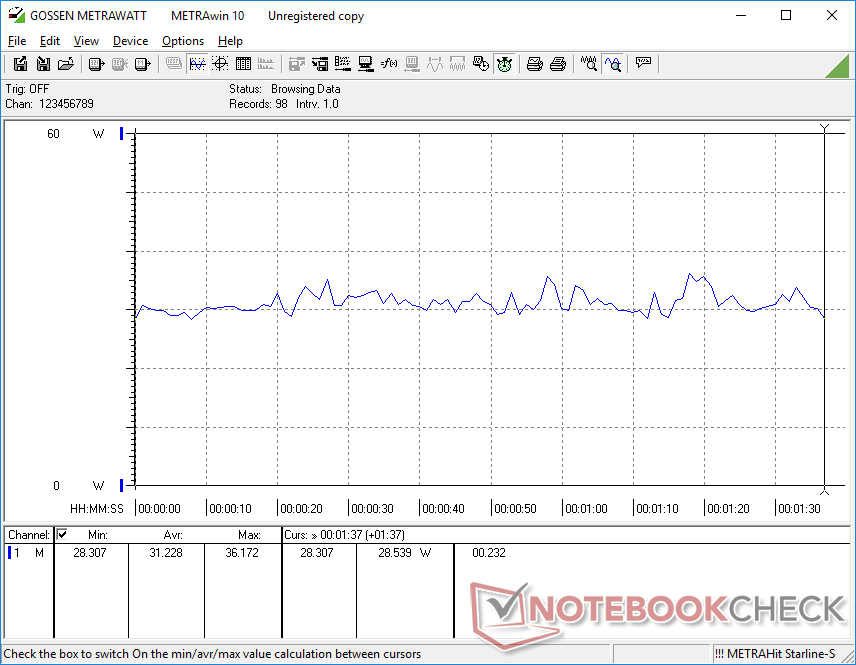
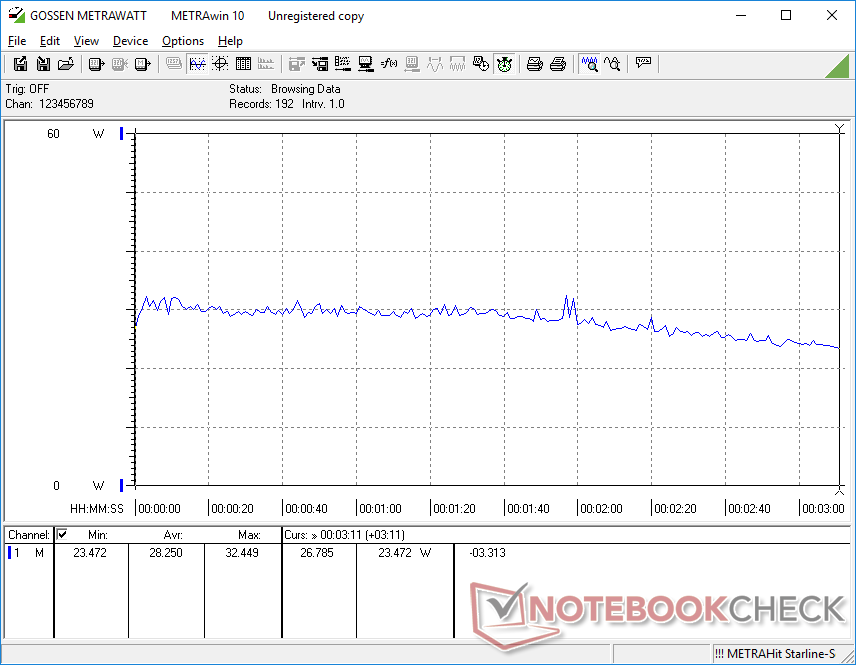
Pobór mocy
Praca na biegu jałowym na pulpicie przy najniższym ustawieniu jasności zużywa zaledwie 5 W, podczas gdy maksymalne ustawienie jasności wymagałoby około 3 W więcej. Wyniki są bardzo zbliżone do tych, które odnotowaliśmy na ThinkBook Plus Gen 2 wyposażonym w ten sam procesor Core i5-1230U pod podobnym obciążeniem. Surface Pro 8 Core i7 pobiera o ponad 50 procent więcej energii przy dużym obciążeniu, gdyż oferuje znacznie szybszą wydajność grafiki niż nasz SKU Core i5 Della
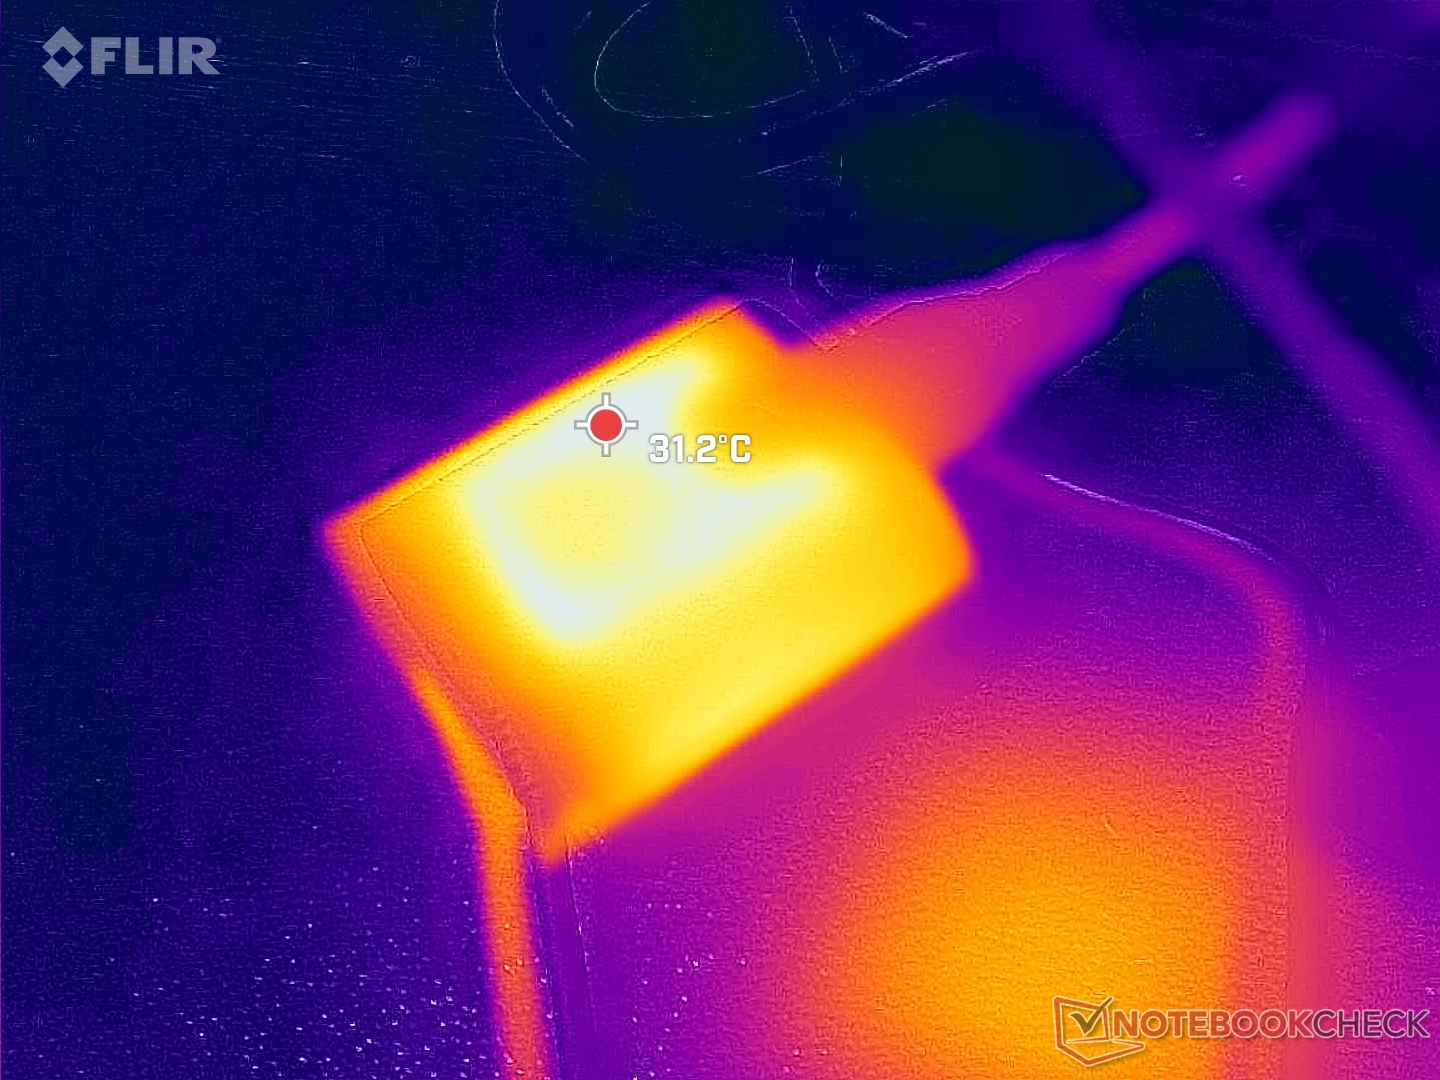
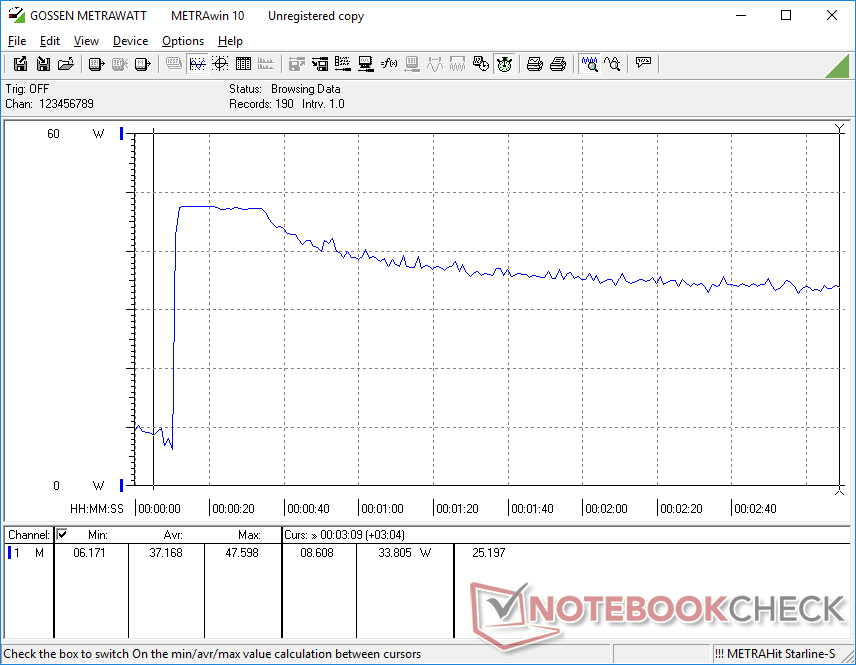
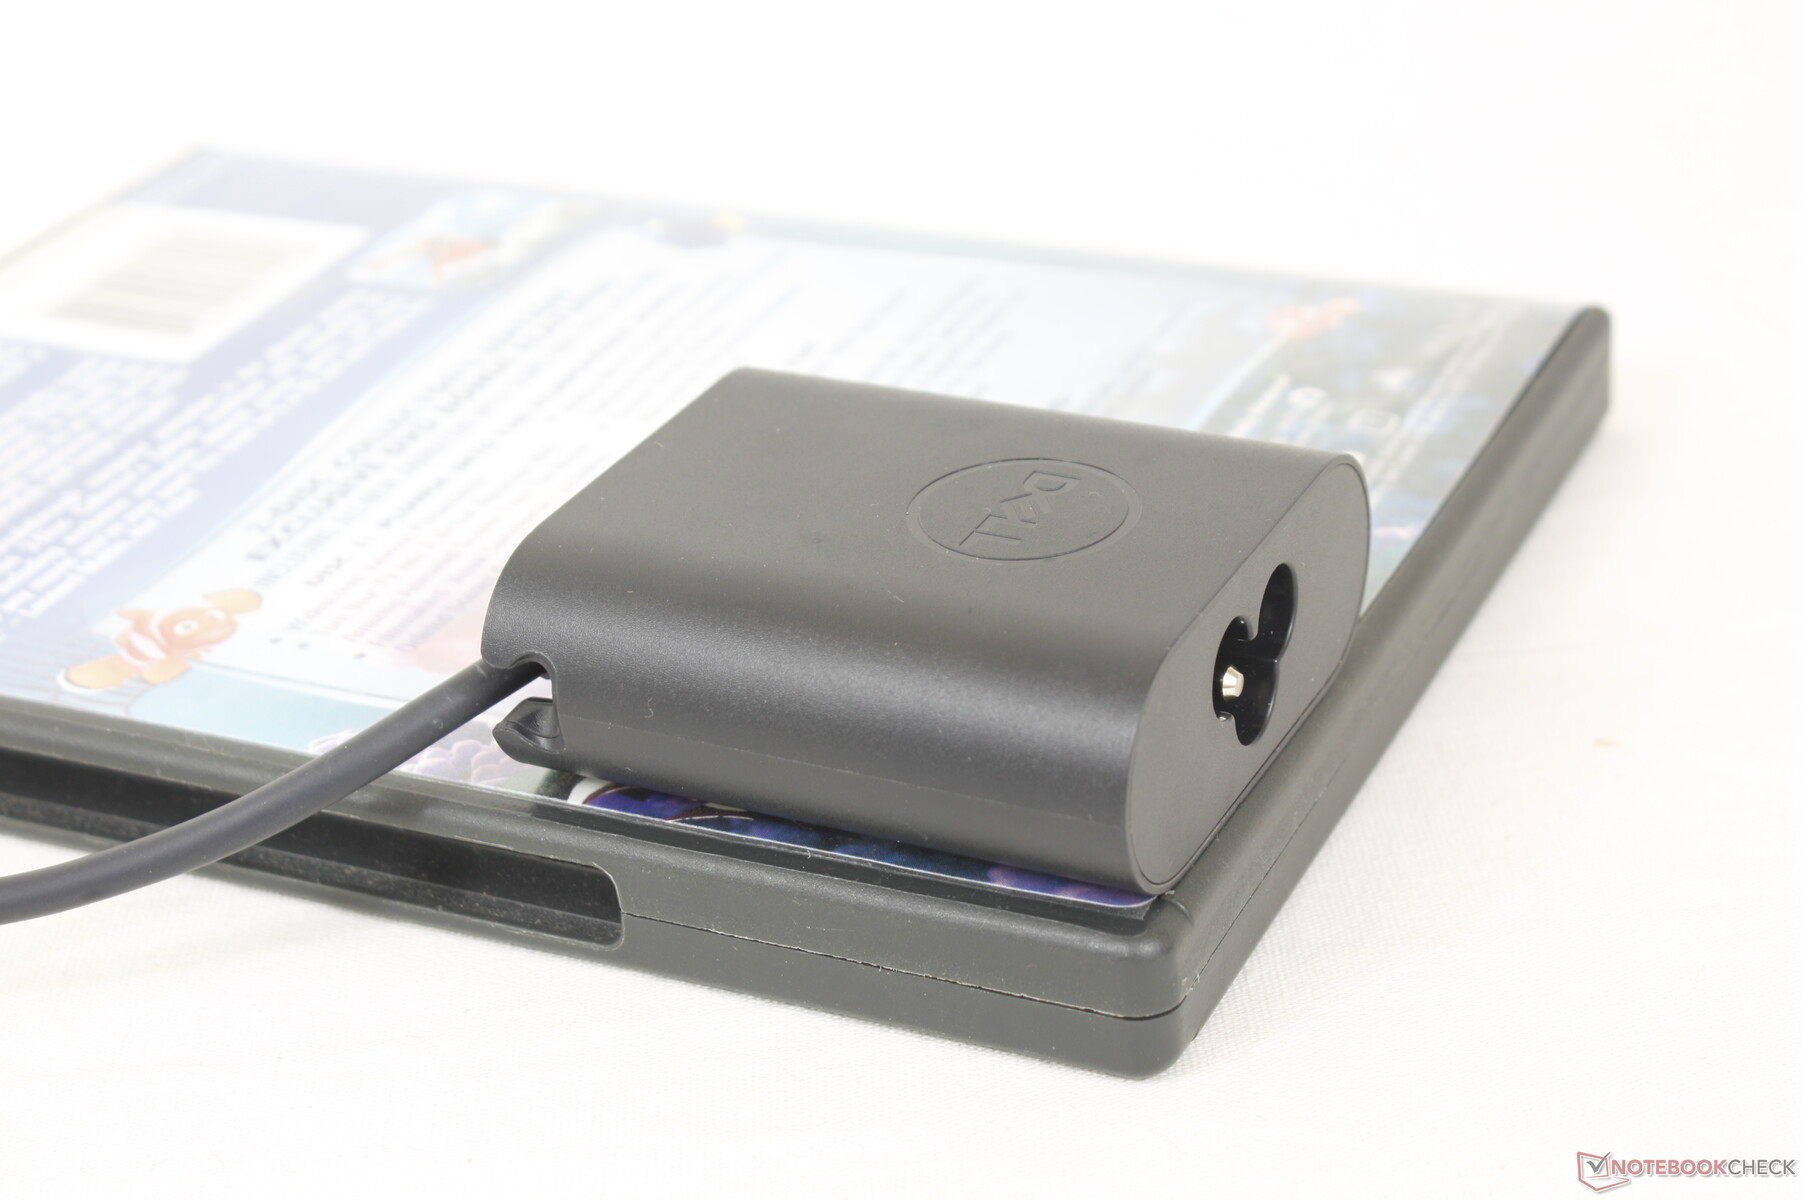
Jesteśmy w stanie zarejestrować maksymalny pobór 48 W z małego (~6 x 5,5 x 2,2 cm) adaptera AC USB-C 45 W. Ten wskaźnik jest tylko tymczasowy, jak pokazują nasze wykresy poniżej, ponieważ CPU Turbo Boost jest ograniczony.

| wyłączony / stan wstrzymania | |
| luz | |
| obciążenie |
|
Legenda:
min: | |
| Dell XPS 13 9315 2-in-1 Core i5-1230U i5-1230U, Iris Xe G7 80EUs, , IPS, 2880x1920, 13" | Dell XPS 13 Plus 9320 i7-1280P OLED i7-1280P, Iris Xe G7 96EUs, WDC PC SN810 512GB, OLED, 3456x2160, 13.4" | Microsoft Surface Pro 8, i7-1185G7 i7-1185G7, Iris Xe G7 96EUs, Toshiba KBG40ZNS256G NVMe, IPS, 2880x1920, 13" | HP Spectre x360 13.5 14t-ef000 i7-1255U, Iris Xe G7 96EUs, Micron 3400 1TB MTFDKBA1T0TFH, OLED, 3000x2000, 13.5" | Lenovo ThinkBook Plus Gen2 Core i5 i5-1130G7, Iris Xe G7 80EUs, Samsung PM9A1 MZVL2512HCJQ, IPS, E-Ink, 2560x1600, 13.3" | Apple MacBook Air M2 Entry M2, M2 8-Core GPU, Apple SSD AP0256Z, IPS, 2560x1664, 13.6" | |
|---|---|---|---|---|---|---|
| Power Consumption | -46% | -23% | -19% | -5% | 13% | |
| Idle Minimum * (Watt) | 5.2 | 6.5 -25% | 3.9 25% | 4 23% | 5 4% | 1.87 64% |
| Idle Average * (Watt) | 7.9 | 7.8 1% | 8.5 -8% | 4.9 38% | 7.9 -0% | 9.2 -16% |
| Idle Maximum * (Watt) | 8 | 13 -63% | 9.8 -23% | 12.5 -56% | 8.3 -4% | 9.3 -16% |
| Load Average * (Watt) | 31.2 | 56.6 -81% | 48 -54% | 48.1 -54% | 30.9 1% | 28.5 9% |
| Witcher 3 ultra * (Watt) | 28.2 | 49.2 -74% | 41.5 -47% | 35.8 -27% | 25.2 11% | 27.4 3% |
| Load Maximum * (Watt) | 47.6 | 63 -32% | 63 -32% | 65.2 -37% | 66.8 -40% | 31 35% |
* ... im mniej tym lepiej
Power Consumption Witcher 3 / Stresstest
Power Consumption external Monitor
Czas pracy na baterii
Akumulator o pojemności 49,5 Wh jest tylko nieco mniejszy od akumulatorów o pojemności 51,5 Wh i 53 Wh w Surface Pro 8 i ThinkBook Plus Gen 2. Czasy pracy są mimo wszystko znakomite - prawie 9 godzin realnego korzystania z sieci WLAN w porównaniu z ~8 godzinami w wymienionych alternatywach Microsoftu i Lenovo.
Ładowanie od pustej do pełnej pojemności trwa około 2 do 2,5 godziny.
| Dell XPS 13 9315 2-in-1 Core i5-1230U i5-1230U, Iris Xe G7 80EUs, 49.5 Wh | Dell XPS 13 Plus 9320 i7-1280P OLED i7-1280P, Iris Xe G7 96EUs, 55 Wh | Microsoft Surface Pro 8, i7-1185G7 i7-1185G7, Iris Xe G7 96EUs, 51.5 Wh | HP Spectre x360 13.5 14t-ef000 i7-1255U, Iris Xe G7 96EUs, 66 Wh | Lenovo ThinkBook Plus Gen2 Core i5 i5-1130G7, Iris Xe G7 80EUs, 53 Wh | Apple MacBook Air M2 Entry M2, M2 8-Core GPU, 52.6 Wh | |
|---|---|---|---|---|---|---|
| Czasy pracy | -36% | -28% | 16% | -16% | 45% | |
| Reader / Idle (h) | 13.6 | 20.4 50% | ||||
| WiFi v1.3 (h) | 9 | 5.8 -36% | 7.6 -16% | 8 -11% | 7.6 -16% | 15.2 69% |
| Load (h) | 2 | 1.2 -40% | 2.2 10% | 2.4 20% | ||
| H.264 (h) | 10.1 | 16.5 |
Za
Przeciw
Werdykt - XPS czy Surface Pro?
XPS 13 9315 2-in-1 to jak dotąd najlepszy konkurent dla m.in Microsoft Surface Pro serii. Niektóre aspekty są lepsze od modelu Microsoftu, a inne gorsze. Zwłaszcza odłączana podstawa klawiatury oferuje twardsze klawisze, większy clickpad i lepszą ochronę przed zarysowaniami. Sam tablet jest również cieńszy i lżejszy od Surface Pro 8 bez konieczności dokonywania drastycznych cięć w wydajności procesora. W rzeczywistości Core i5-1230U w Dellu radzi sobie podobnie do Core i7-1185G7 w Surface Pro 8, pomimo pozbawionej wentylatorów konstrukcji Della. Producent obiecuje 5G eSIM SKUs w najbliższej przyszłości, jak również podczas gdy nie ma takich opcji dla Surface Pro w czasie pisania
Nadal istnieje garść powodów, aby rozważyć model Microsoft zamiast Dell. Dla jednego, Surface Pro 8 integruje 3,5 mm jack audio, które niektórzy użytkownicy mogą docenić. Wydajność graficzna jest również znacznie szybsza, gdyż procesor graficzny w Dellu ma tendencję do osiągania gorszych wyników nawet w porównaniu z innymi laptopami z podobną zintegrowaną grafiką. Brak opcji wyświetlania obrazu w 120 Hz jest chyba najbardziej zauważalny, gdyż sprawia, że tablet Dell wydaje się być bardziej toporny i mniej responsywny. Ograniczenie 60 Hz nie było wielkim problemem w przeszłości, ale staje się bardziej utrudnieniem teraz, gdy laptopy o wysokiej częstotliwości odświeżania, monitory i smartfony są powszechne
Surface Pro bez nazwy Surface Pro. XPS 13 9315 2-w-1 przebija Microsoft Surface Pro Type Cover pod względem komfortu, ale ekran dotykowy 60 Hz sprawia wrażenie przestarzałego w porównaniu z Surface Pro 8 120 Hz.
Jeśli zamierzasz dużo pisać i wysyłać e-maile, to XPS 13 9315 2-w-1 może być lepszym wyborem ze względu na lepszą stację dokującą z klawiaturą. Jeśli zamierzasz częściej korzystać z ekranu dotykowego w trybie tabletu, to wyższa częstotliwość odświeżania i responsywność wyświetlacza Surface Pro jest trudna do przejścia. Jeśli Dell może w przyszłości zaoferować dodatkowe opcje wyświetlacza, to jego seria XPS 13 9315 2-w-1 może być znacznie łatwiejszą rekomendacją dla większej liczby scenariuszy użytkowania.
Cena i dostępność
XPS 13 9315 2-in-1 będzie powszechnie dostępny 14 listopada. Sprzedawcy, tacy jak Amazon, już teraz wystawiają niektóre jednostki SKU na sprzedaż w przedsprzedaży. Najlepszym miejscem do złożenia zamówienia jest obecnie Dell, gdzie ceny zaczynają się od 1000 USD bez stacji dokującej z klawiaturą czy pióra.
Dell XPS 13 9315 2-in-1 Core i5-1230U
- 08/11/2022 v7 (old)
Allen Ngo
Price comparison

