2022 Recenzja laptopa HP Envy 16: Dla multimediów, graczy, twórców i wszystkich pomiędzy
Envy 16 zastępuje zeszłoroczny 15.6-calowy Envy 15 przenosząc się do nowej 16-calowej obudowy wraz z najnowszymi procesorami Intel 12. generacji oraz opcjami dyskretnej grafiki Nvidii i Intela. W przeciwieństwie do tańszej serii Pavilion, seria Envy jest domem dla wyższej klasy modeli prosumenckich o ogólnie wyższej wydajności, mniejszej ilości plastiku i lepszej jakości wykonania
Nasza konkretna konfiguracja to high-end SKU z Core i7-12700H, GeForce RTX 3060 i ekranem dotykowym OLED 2400p za około 1700 USD. Inne konfiguracje są dostępne z wolniejszym Core i5-12500H, szybszym i9-12900H, grafiką Intel Arc A370M lub ekranem 1600p IPS w cenie od 1180 do 2380 USD
Alternatywą dla Envy 16 są inne wysokiej klasy laptopy prosumenckie, np Dell XPS 15 "Series, , MacBook Pro 16,Huawei MateBook 16s, lubLG Gram 16.
Więcej recenzji HP:
Potencjalni konkurenci w porównaniu
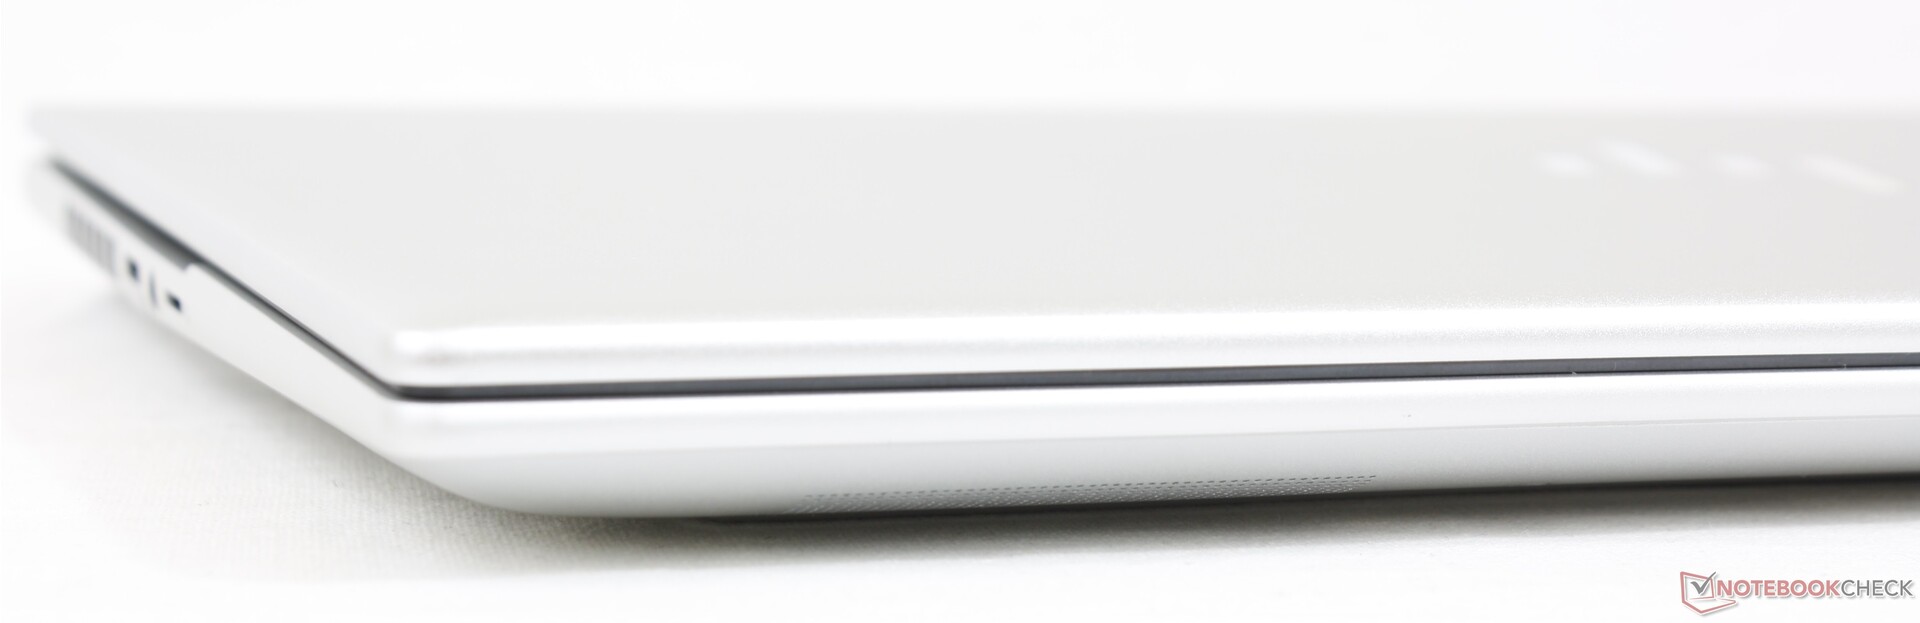
Case - Te same kolory z mnóstwem zmian
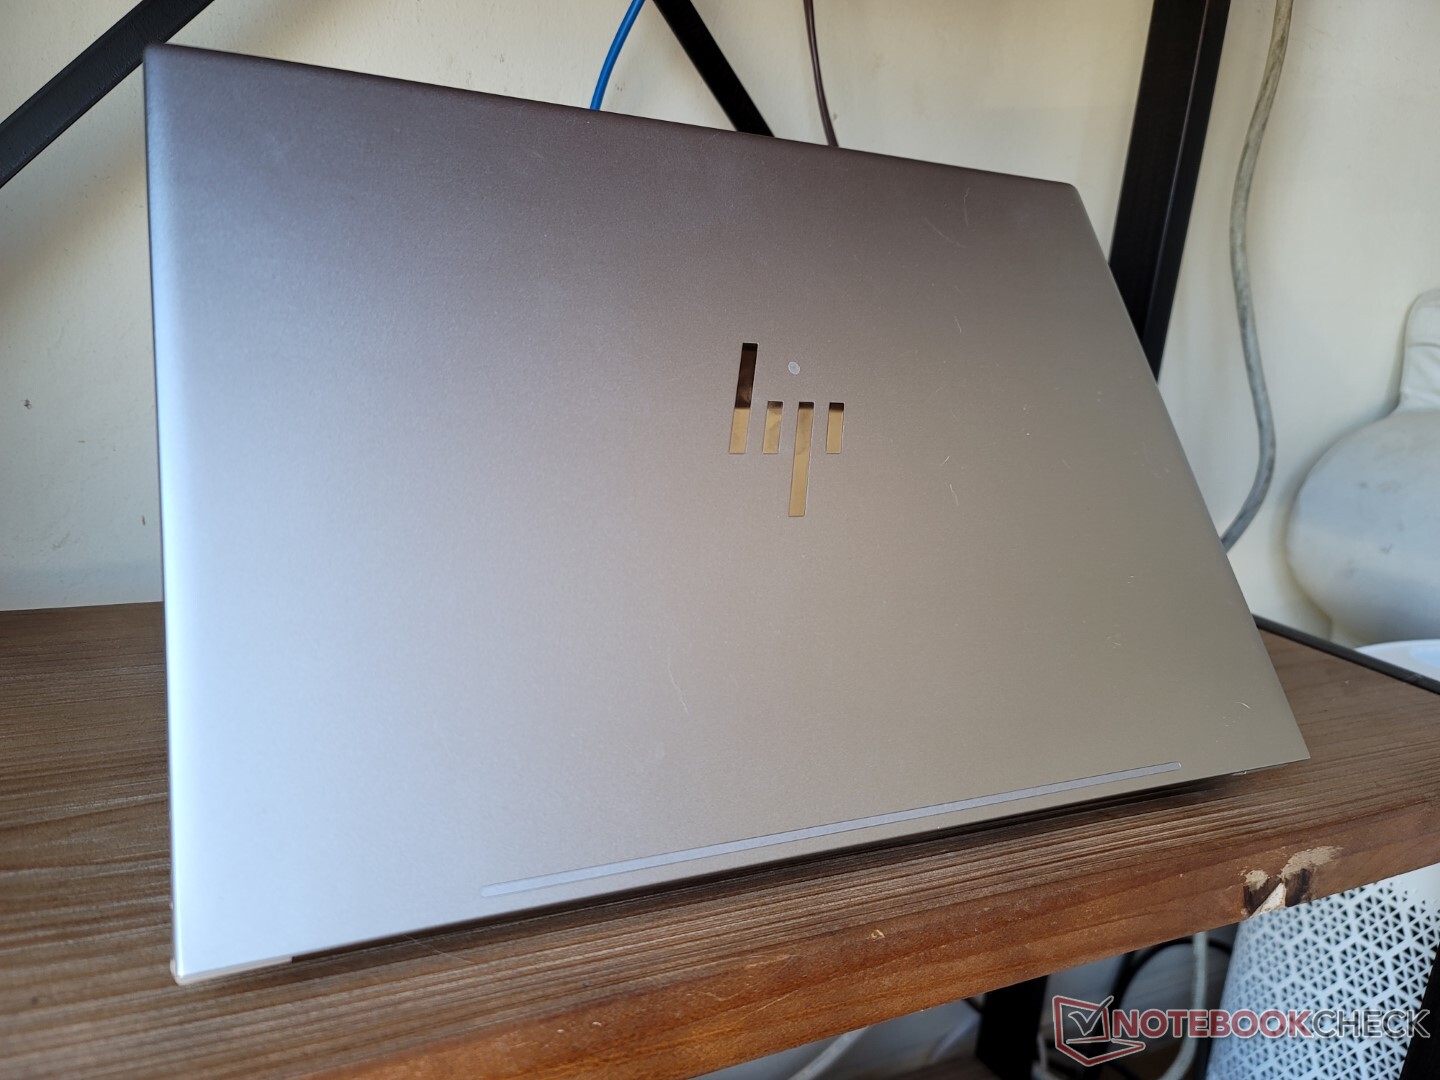
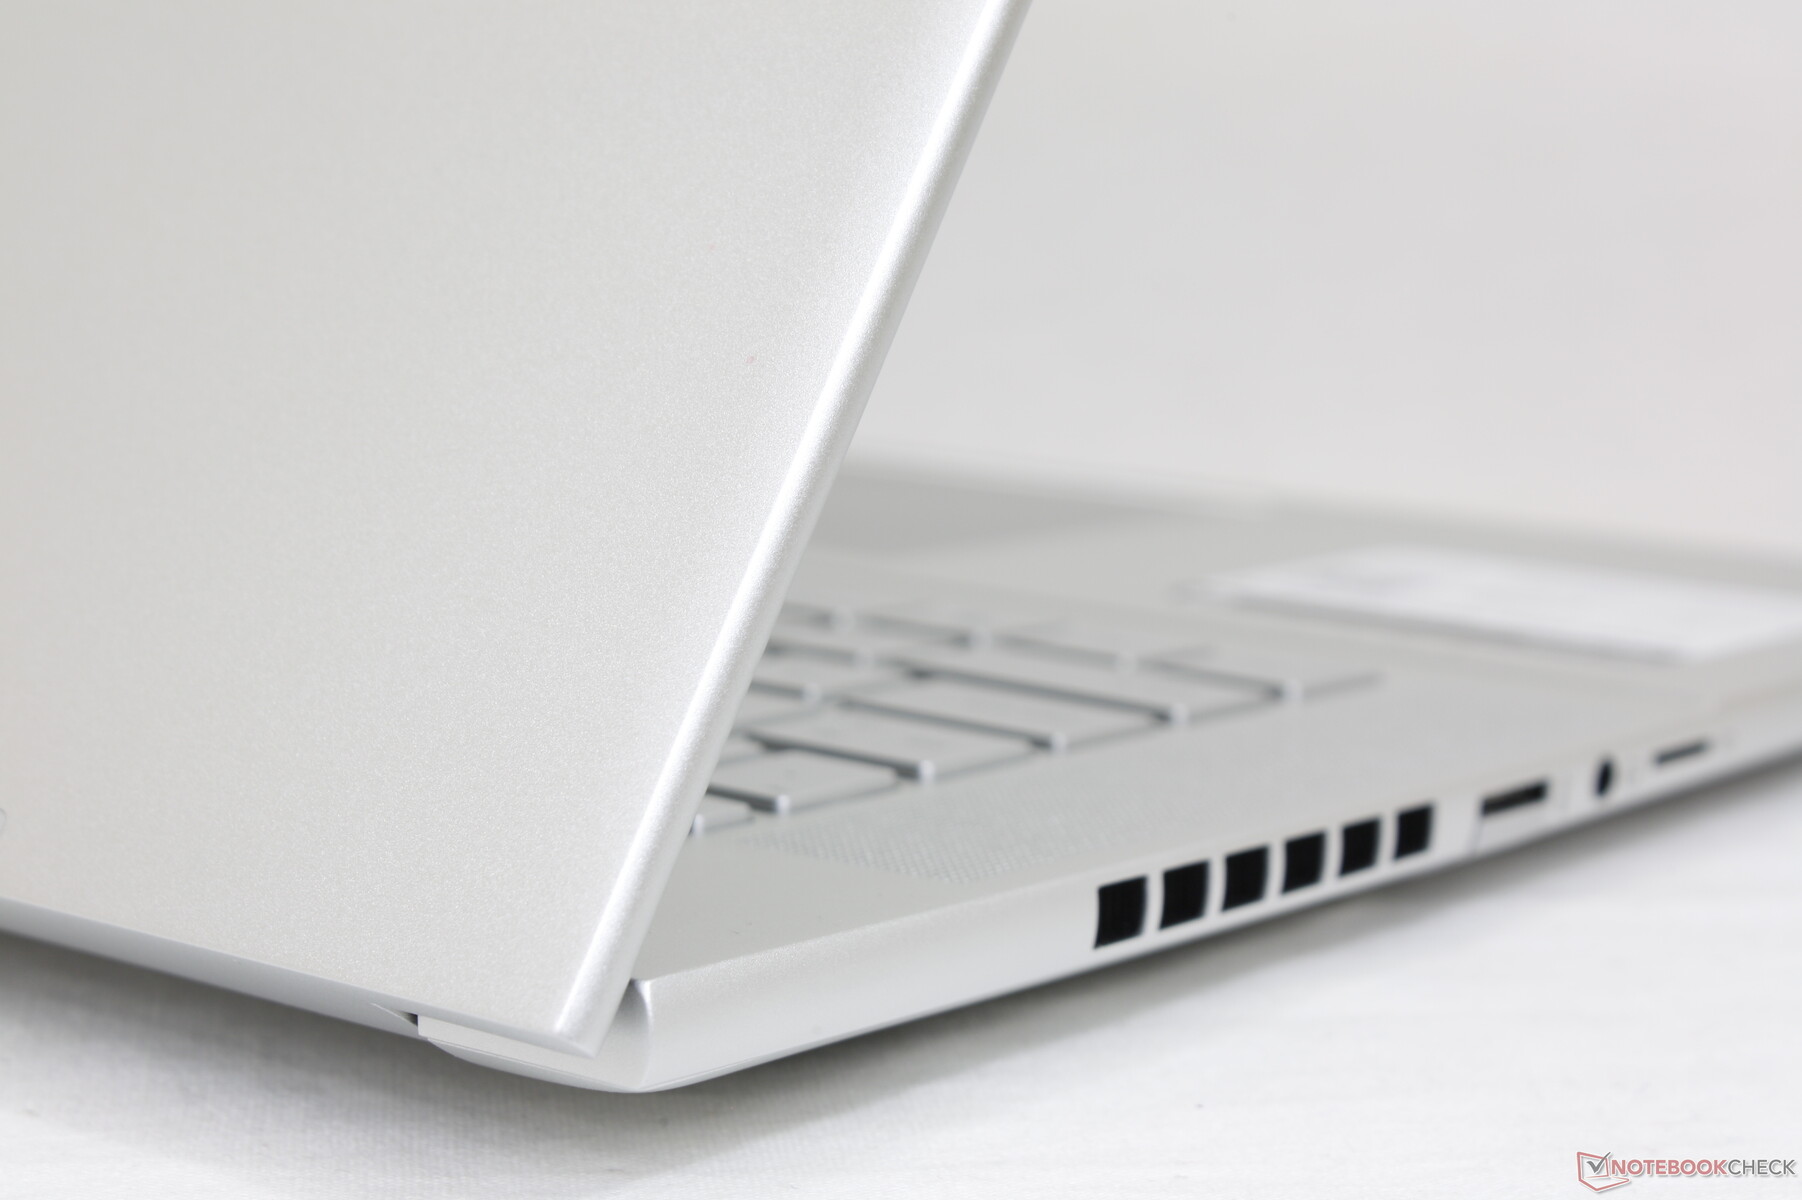
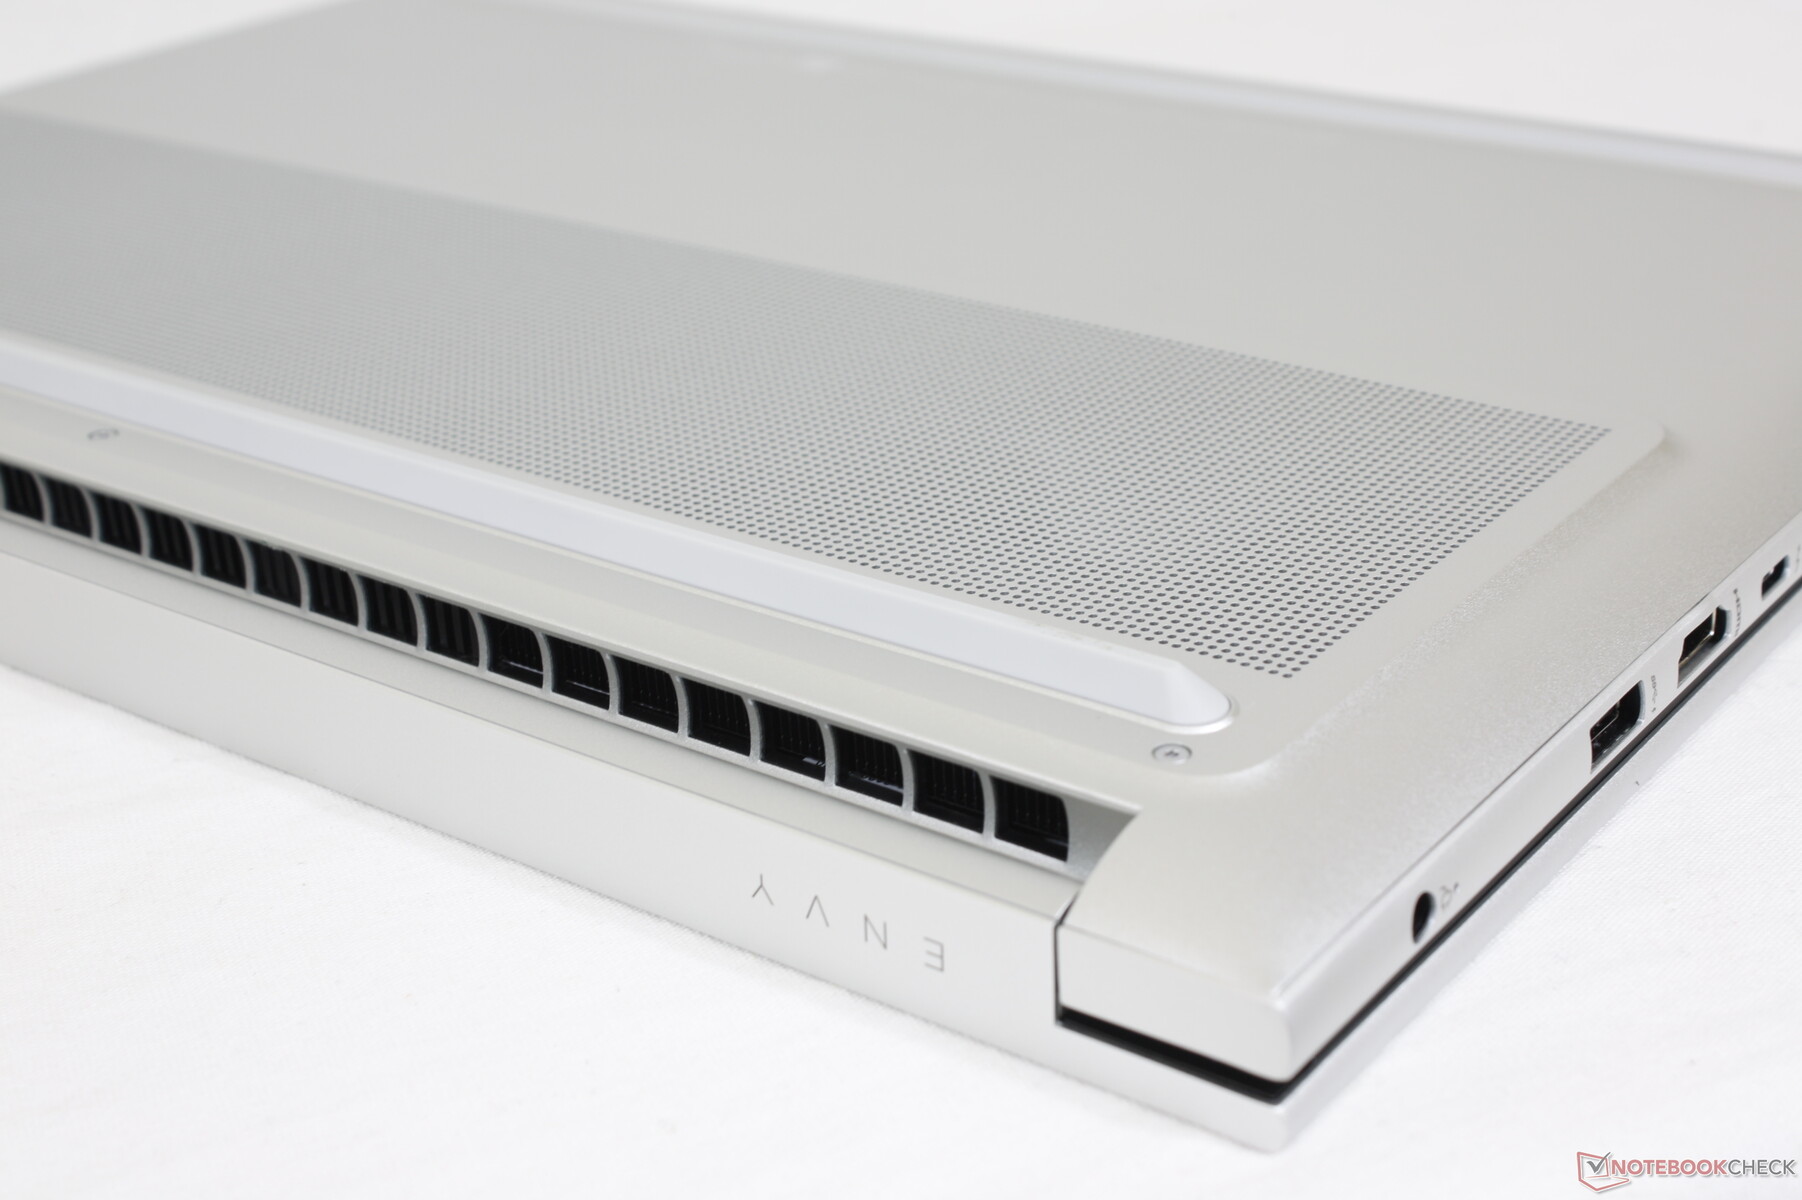
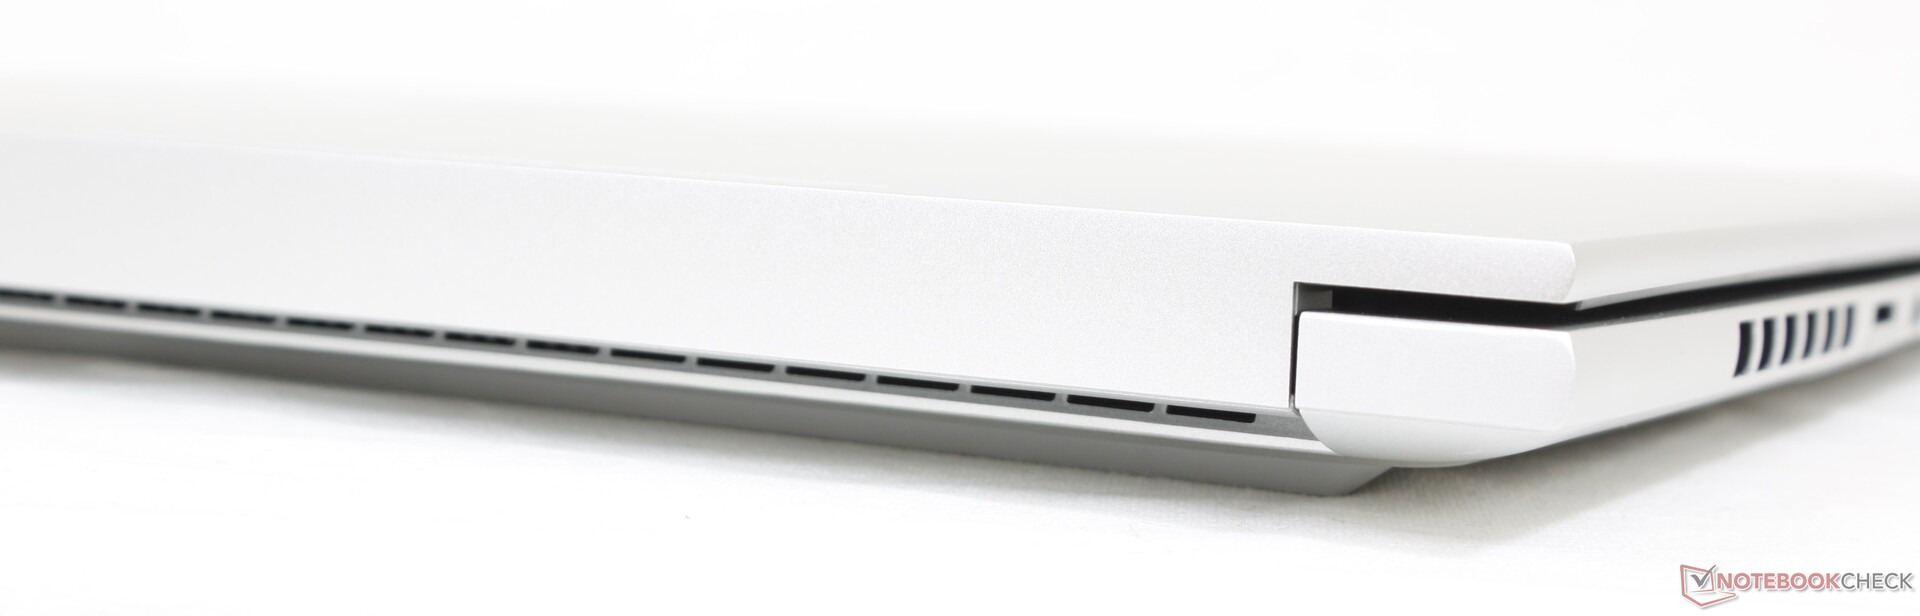
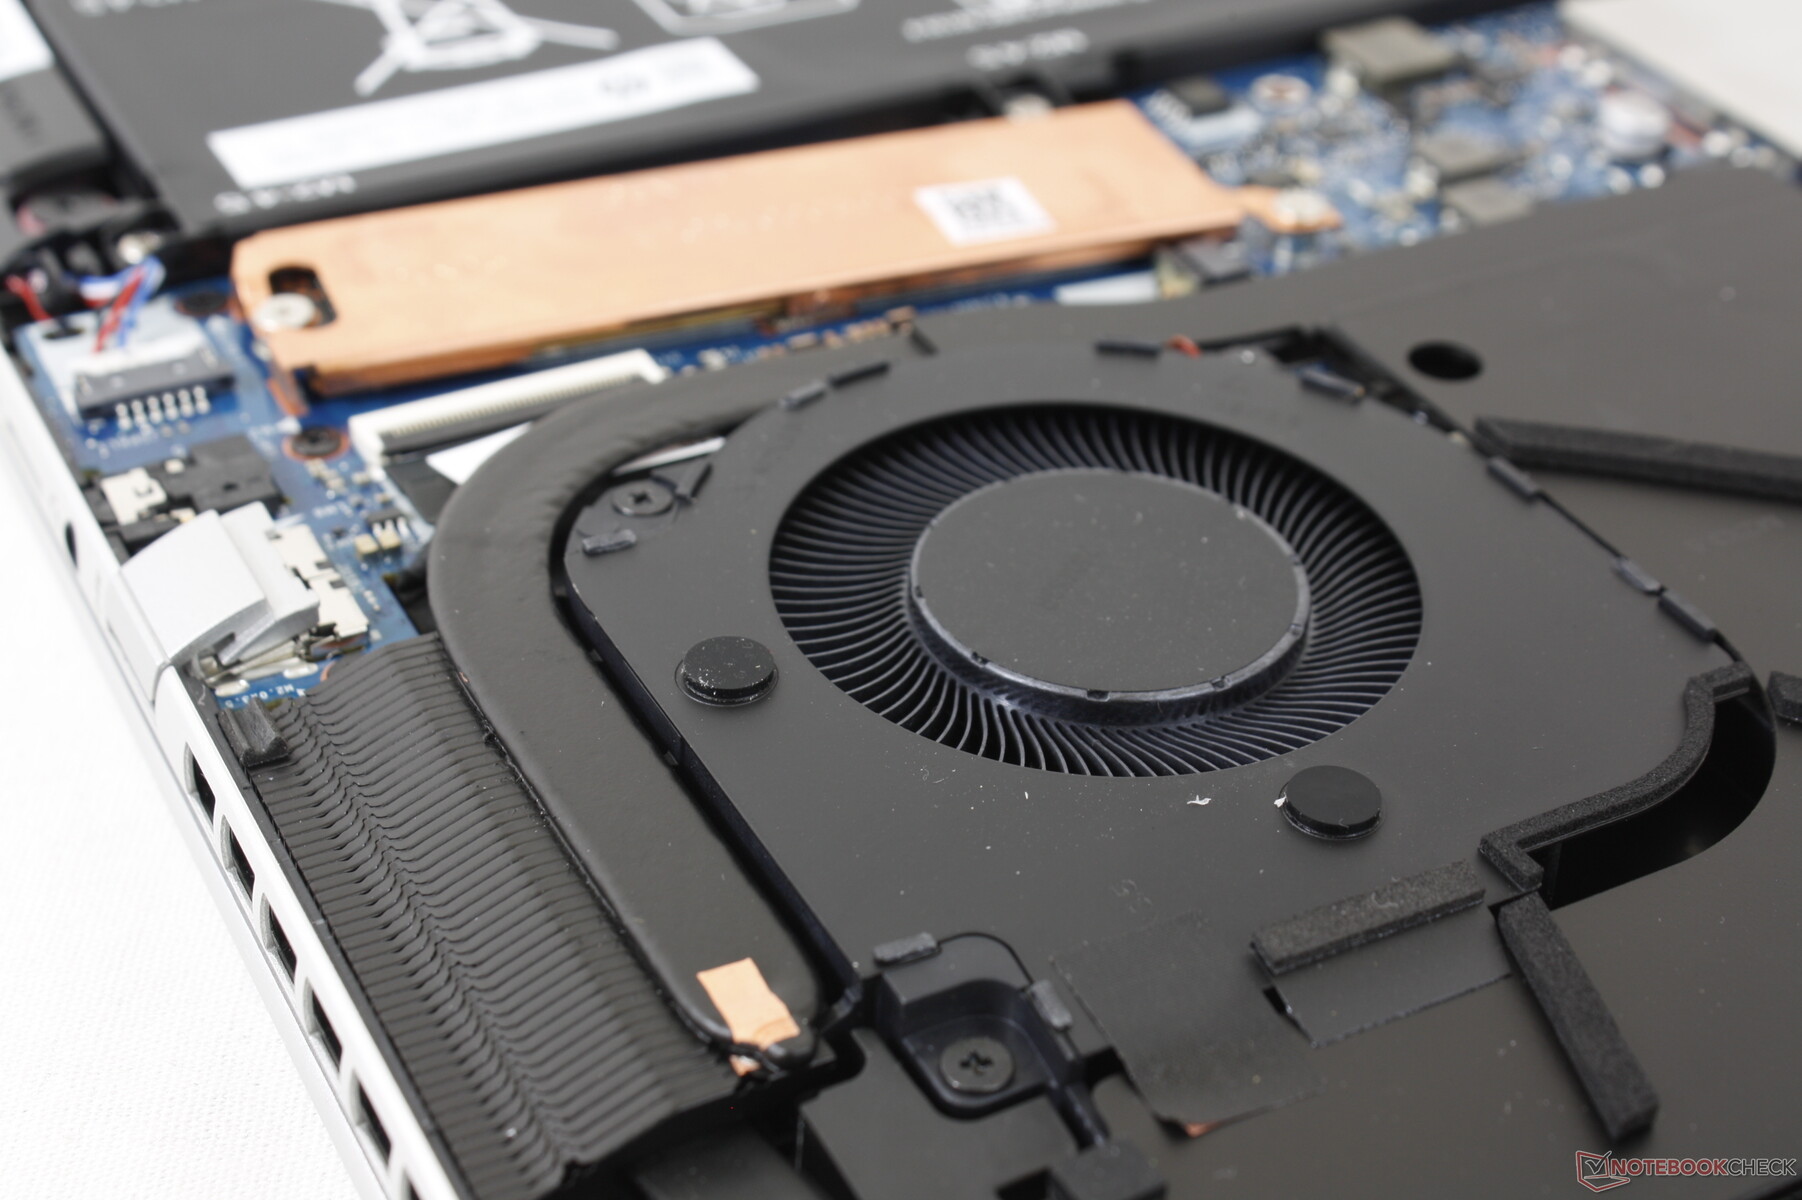
Envy 16 może na pierwszy rzut oka wyglądać jak Envy 15 ze względu na podobną kolorystykę, ale w rzeczywistości wprowadzono wiele zmian zarówno wewnątrz, jak i na zewnątrz. Najbardziej zauważalne jest to, że Envy 16 jest bardziej zaokrąglony na krawędziach i rogach w przeciwieństwie do ostrej i płaskiej konstrukcji Envy 15. Tymczasem część wentylacyjna dolnej ścianki jest podniesiona, a nie płaska, co widać na poniższych zdjęciach. Przeprojektowano także pokład podparcia dłoni i maskownice głośników. Niektóre z tych zmian wydają się być powierzchowne, podczas gdy inne powinny poprawić możliwości chłodzenia tego modelu.
Jakość obudowy pozostaje tak samo mocna jak w przypadku m.in 2020 Envy 15 pomimo zwiększenia rozmiaru. Podstawa wykazuje tylko niewielkie skręcenia i wypaczenia, a wieko jest dość sztywne ze względu na szkło od krawędzi do krawędzi i aluminiowy podkład. Zawiasy mogłyby być jednak sztywniejsze, gdyż pokrywa chwieje się podczas regulacji kątów bardziej, niż w przypadku modelu ZenBook Pro czy Razer Blade 15.
Model 2022 jest grubszy, cięższy i większy od modelu 2020, co pokazuje poniższy wykres porównawczy. Większy rozmiar nie jest może niespodziewany, biorąc pod uwagę przeskok z 15,6-calowej matrycy do 16-calowej. Mimo to HP jest wciąż nieco większy i cięższy od wielu konkurencyjnych 16-calowych laptopów multimedialnych, w tym MacBooka Pro 16, Huawei MateBook 16s czyDell Inspiron 16 Plus 7610.

Porównanie wielkości
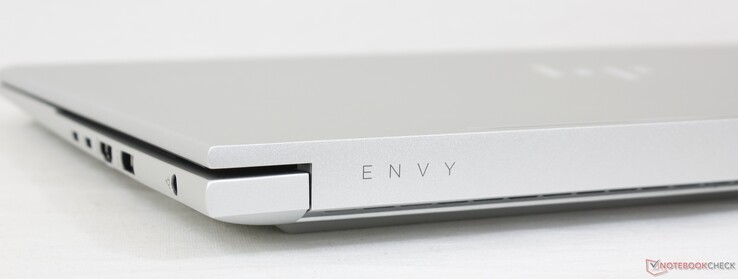
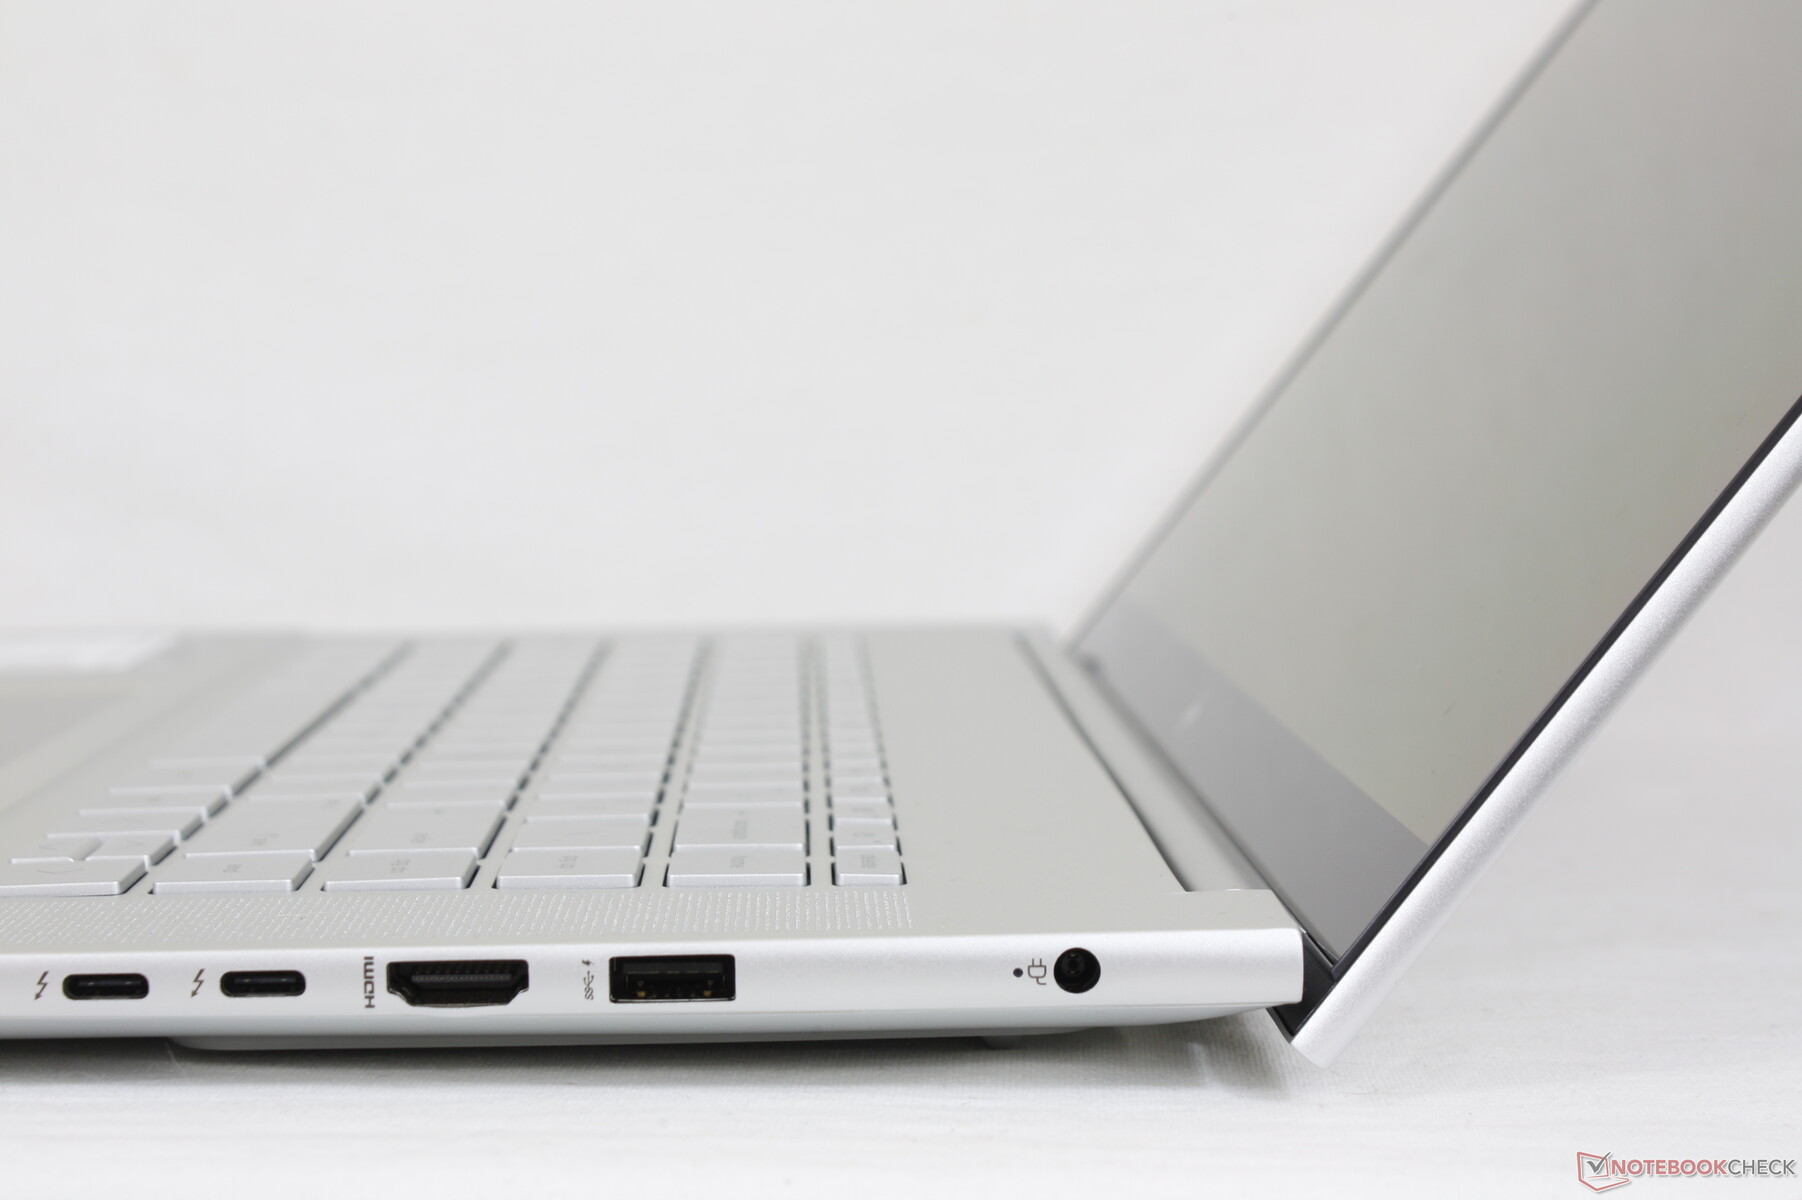
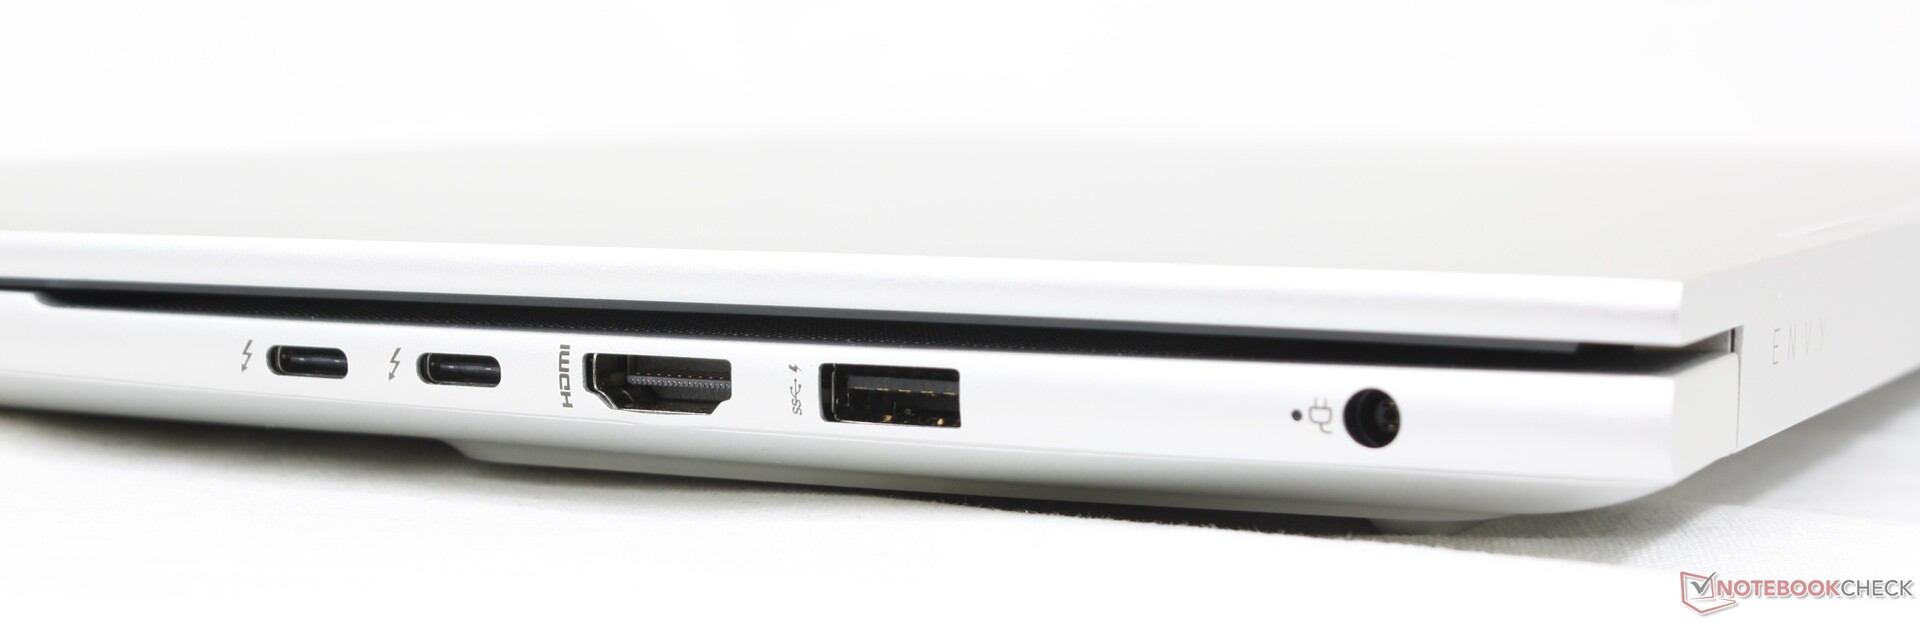
Łączność - Standardowa obsługa Thunderbolt 4
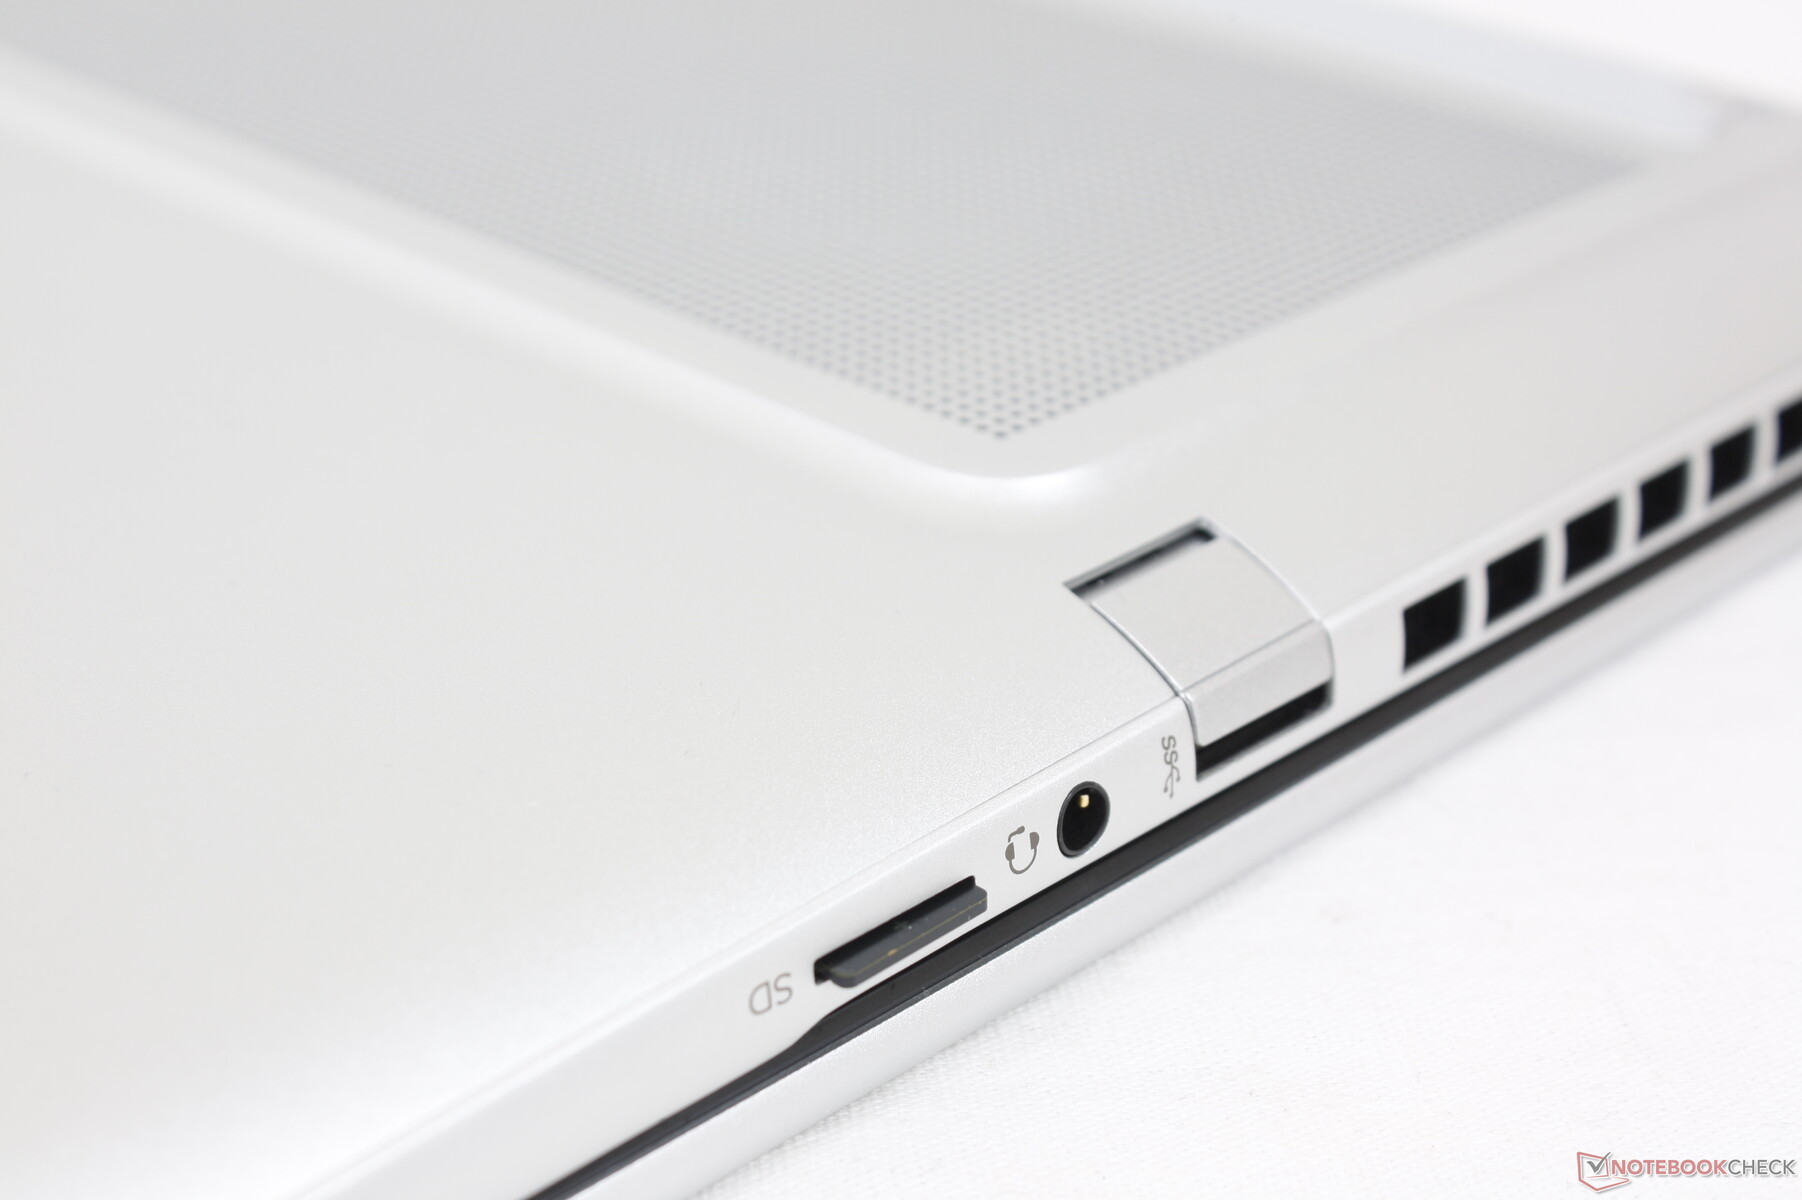
Wszystkie porty z Envy 15 z 2020 roku powróciły w tej rewizji z 2022 roku, aczkolwiek w zmienionej kolejności. Większość portów znajduje się teraz wzdłuż prawej krawędzi obudowy zamiast lewej, na dobre i na złe. Irytujący jest fakt, że nadal nie ma gniazda blokady Kensington.
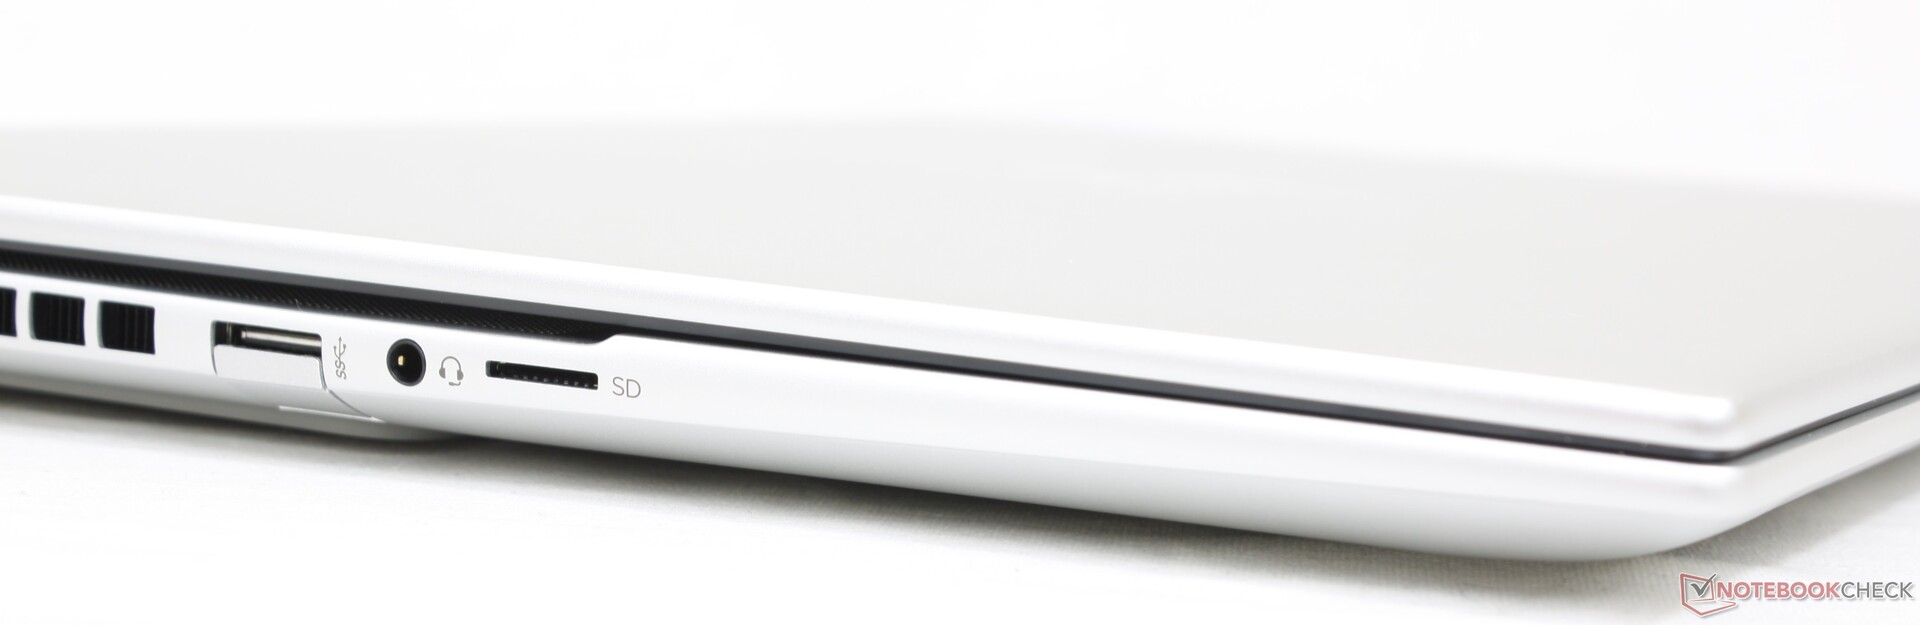
Czytnik kart SD
Szybkość transferu ze zintegrowanego czytnika MicroSD jest przeciętna. Przeniesienie 1 GB zdjęć z naszej karty testowej UHS-II na pulpit zajmuje około 17 sekund.
| SD Card Reader | |
| average JPG Copy Test (av. of 3 runs) | |
| Apple MacBook Pro 16 2021 M1 Pro (Angelbird AV Pro V60) | |
| Lenovo ThinkBook 16 G4+ IAP (Angelbird AV Pro V60) | |
| MSI Creator Z16P B12UHST (AV PRO microSD 128 GB V60) | |
| HP Envy 16 h0112nr (AV Pro SD microSD 128 GB V60) | |
| Dell Inspiron 16 Plus 7610-MHJ8F (AV Pro SD microSD 128 GB V60) | |
| maximum AS SSD Seq Read Test (1GB) | |
| Lenovo ThinkBook 16 G4+ IAP (Angelbird AV Pro V60) | |
| HP Envy 16 h0112nr (AV Pro SD microSD 128 GB V60) | |
| Dell Inspiron 16 Plus 7610-MHJ8F (AV Pro SD microSD 128 GB V60) | |
Komunikacja
Intel AX211 zapewnia standardowo łączność Wi-Fi 6E i Bluetooth 5.2. Nie doświadczyliśmy żadnych problemów z niezawodnością podczas sparowania z naszą siecią 6 GHz.
| Networking | |
| iperf3 transmit AX12 | |
| Dell Inspiron 16 Plus 7610-MHJ8F | |
| Apple MacBook Pro 16 2021 M1 Pro | |
| iperf3 receive AX12 | |
| Dell Inspiron 16 Plus 7610-MHJ8F | |
| Apple MacBook Pro 16 2021 M1 Pro | |
| iperf3 receive AXE11000 6GHz | |
| Huawei MateBook 16s i7 | |
| HP Envy 16 h0112nr | |
| iperf3 receive AXE11000 | |
| MSI Creator Z16P B12UHST | |
| Lenovo ThinkBook 16 G4+ IAP | |
| Apple MacBook Pro 16 2021 M1 Pro | |
| iperf3 transmit AXE11000 6GHz | |
| Huawei MateBook 16s i7 | |
| HP Envy 16 h0112nr | |
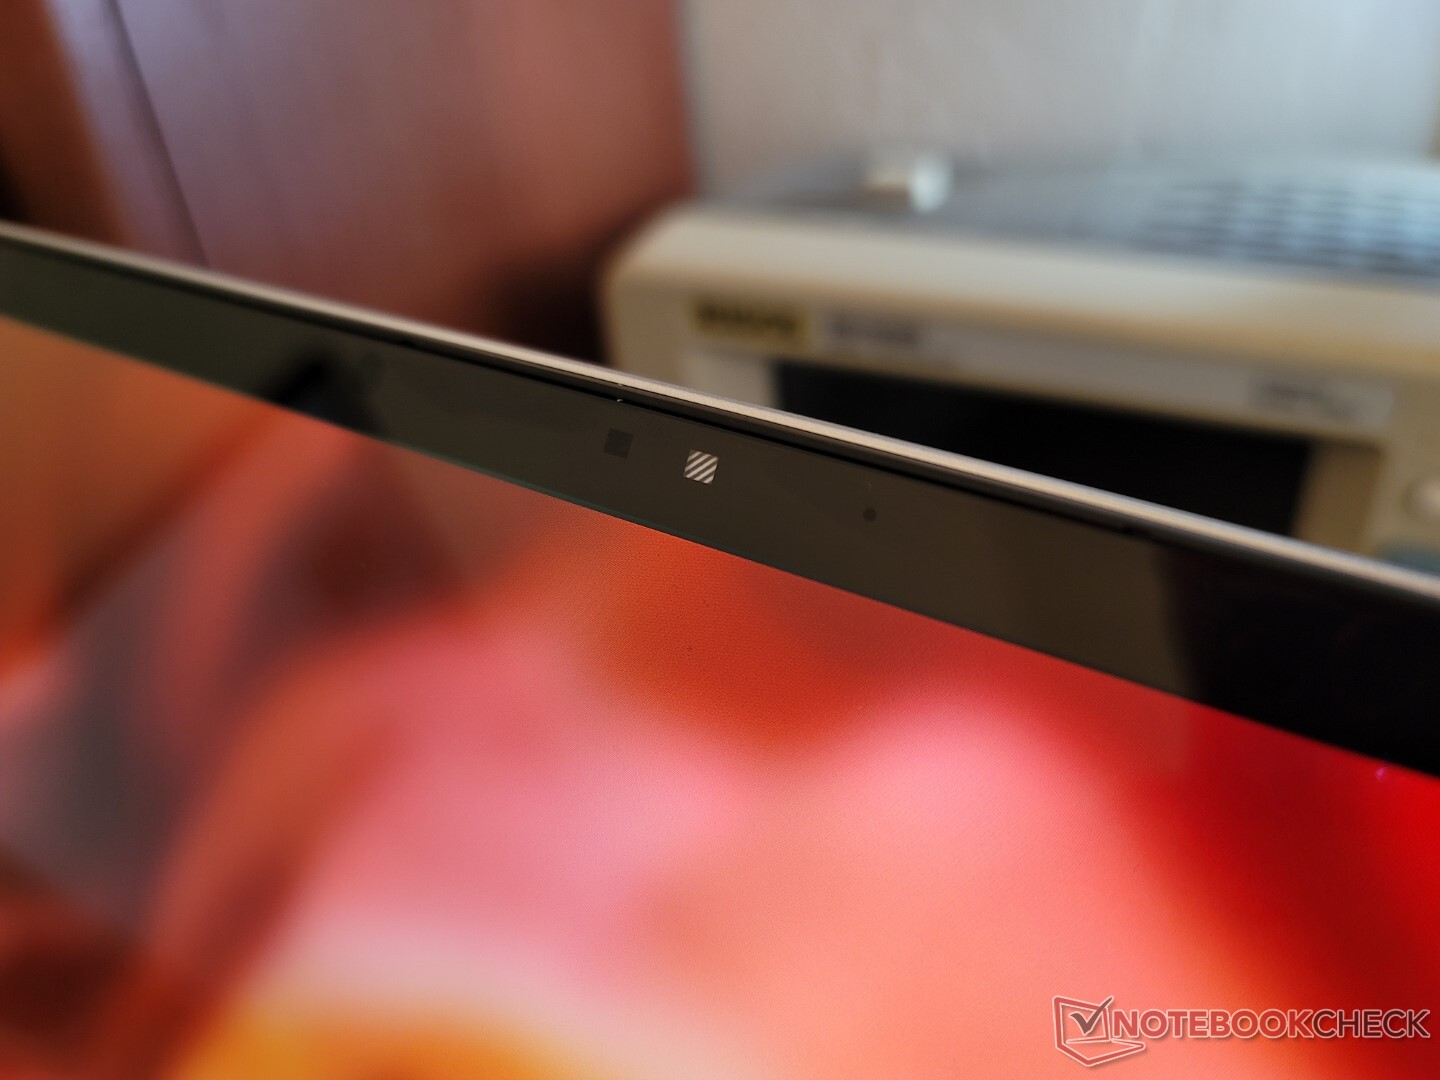
Kamera internetowa - 5 MP!
System integruje 5 MP aparat podobny do tego z najnowszego Spectre i EliteBook. Jakość obrazu jest zauważalnie ostrzejsza niż w większości innych laptopów, w których kamerki 1 MP i 2 MP są nadal normą.
W standardzie jest migawka z kamerą internetową, a także IR for Hello support.


Konserwacja
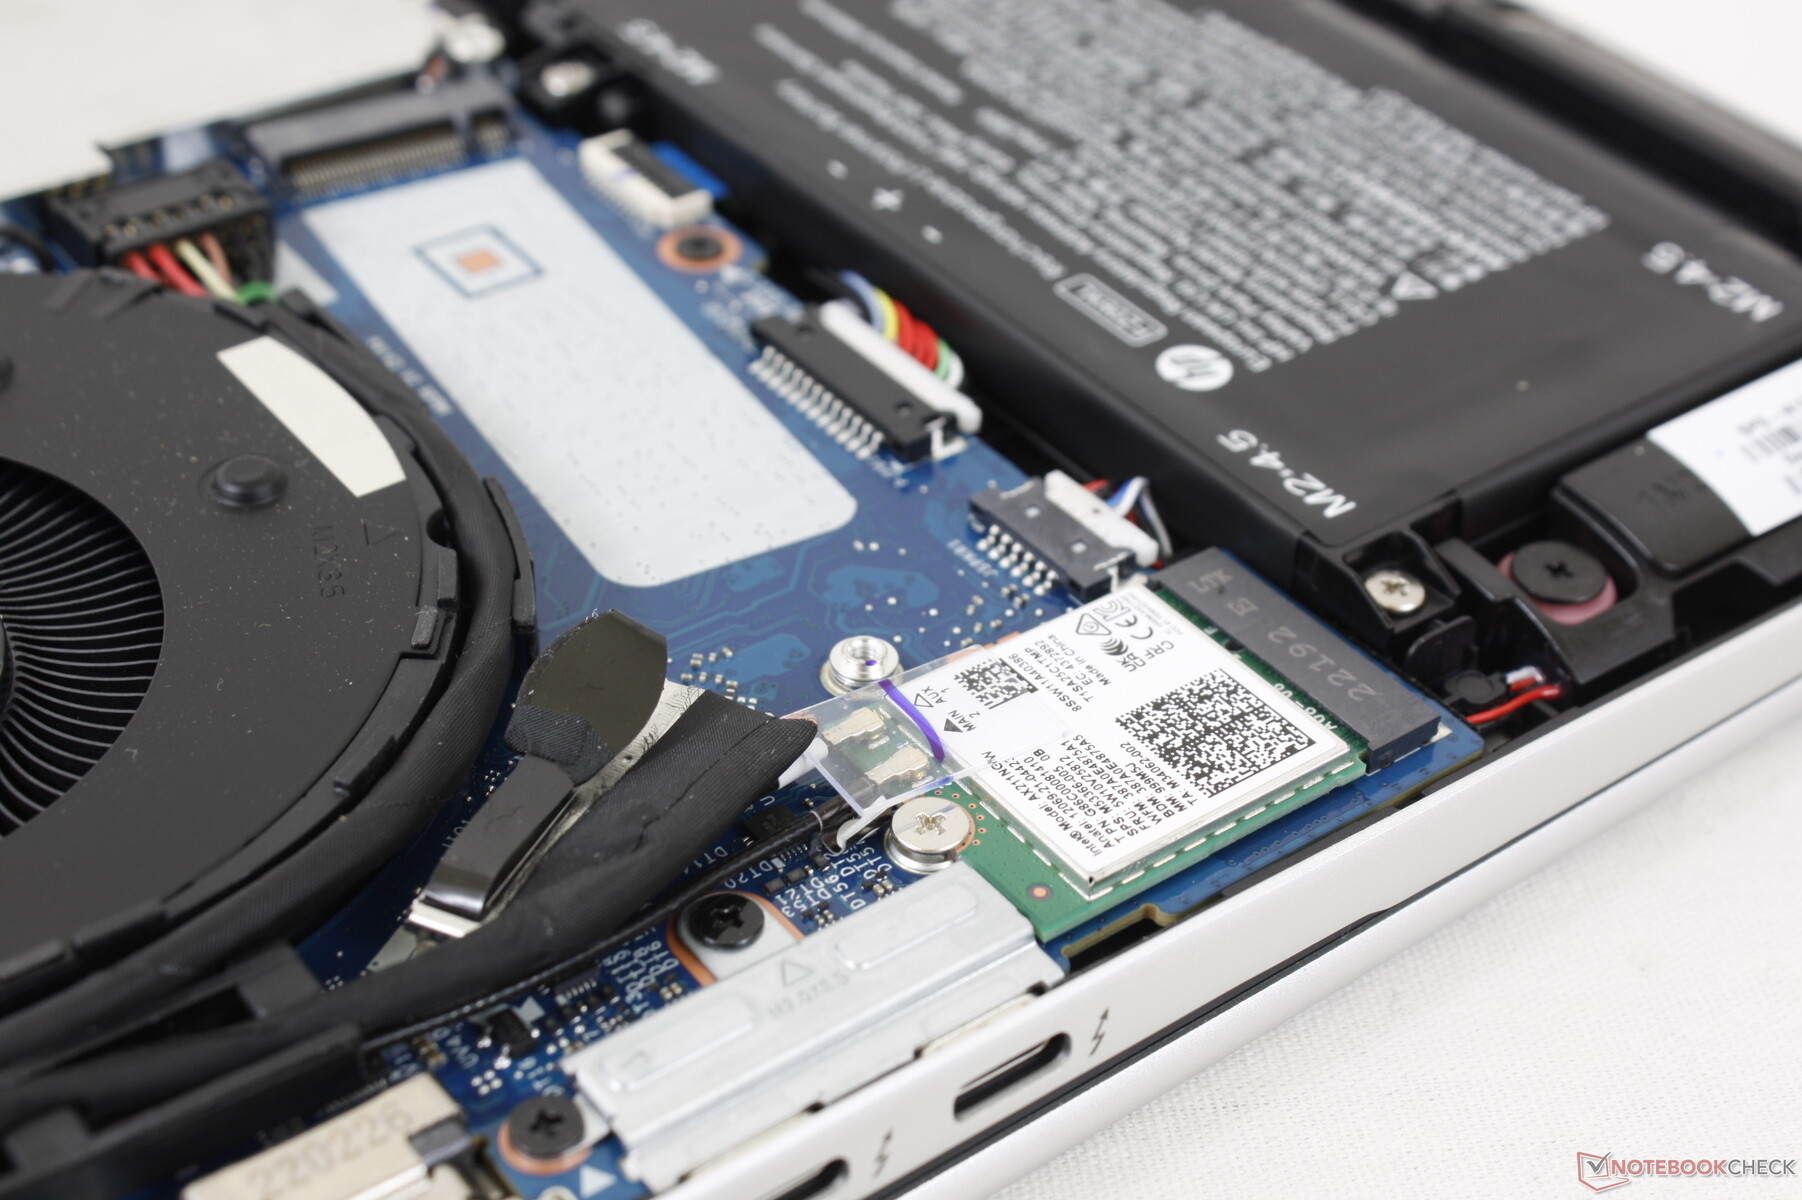
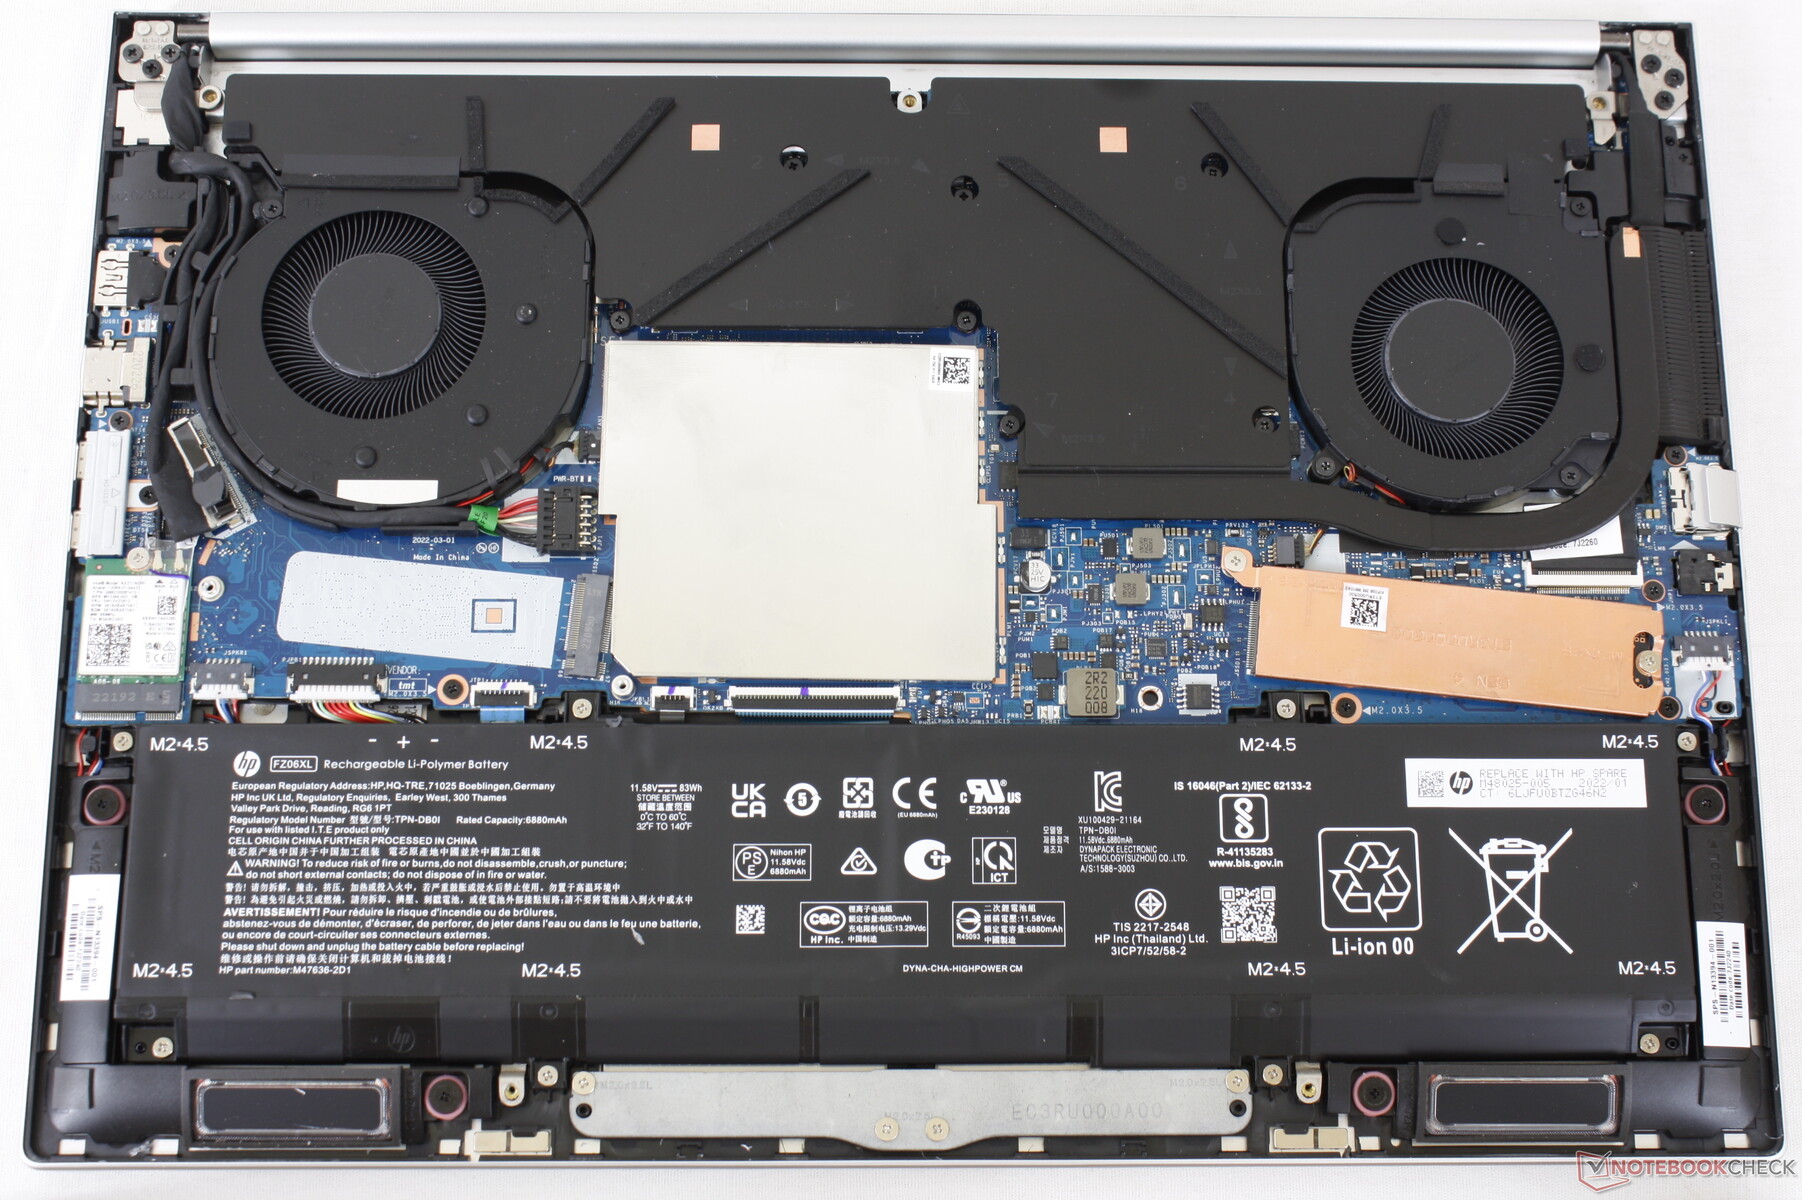
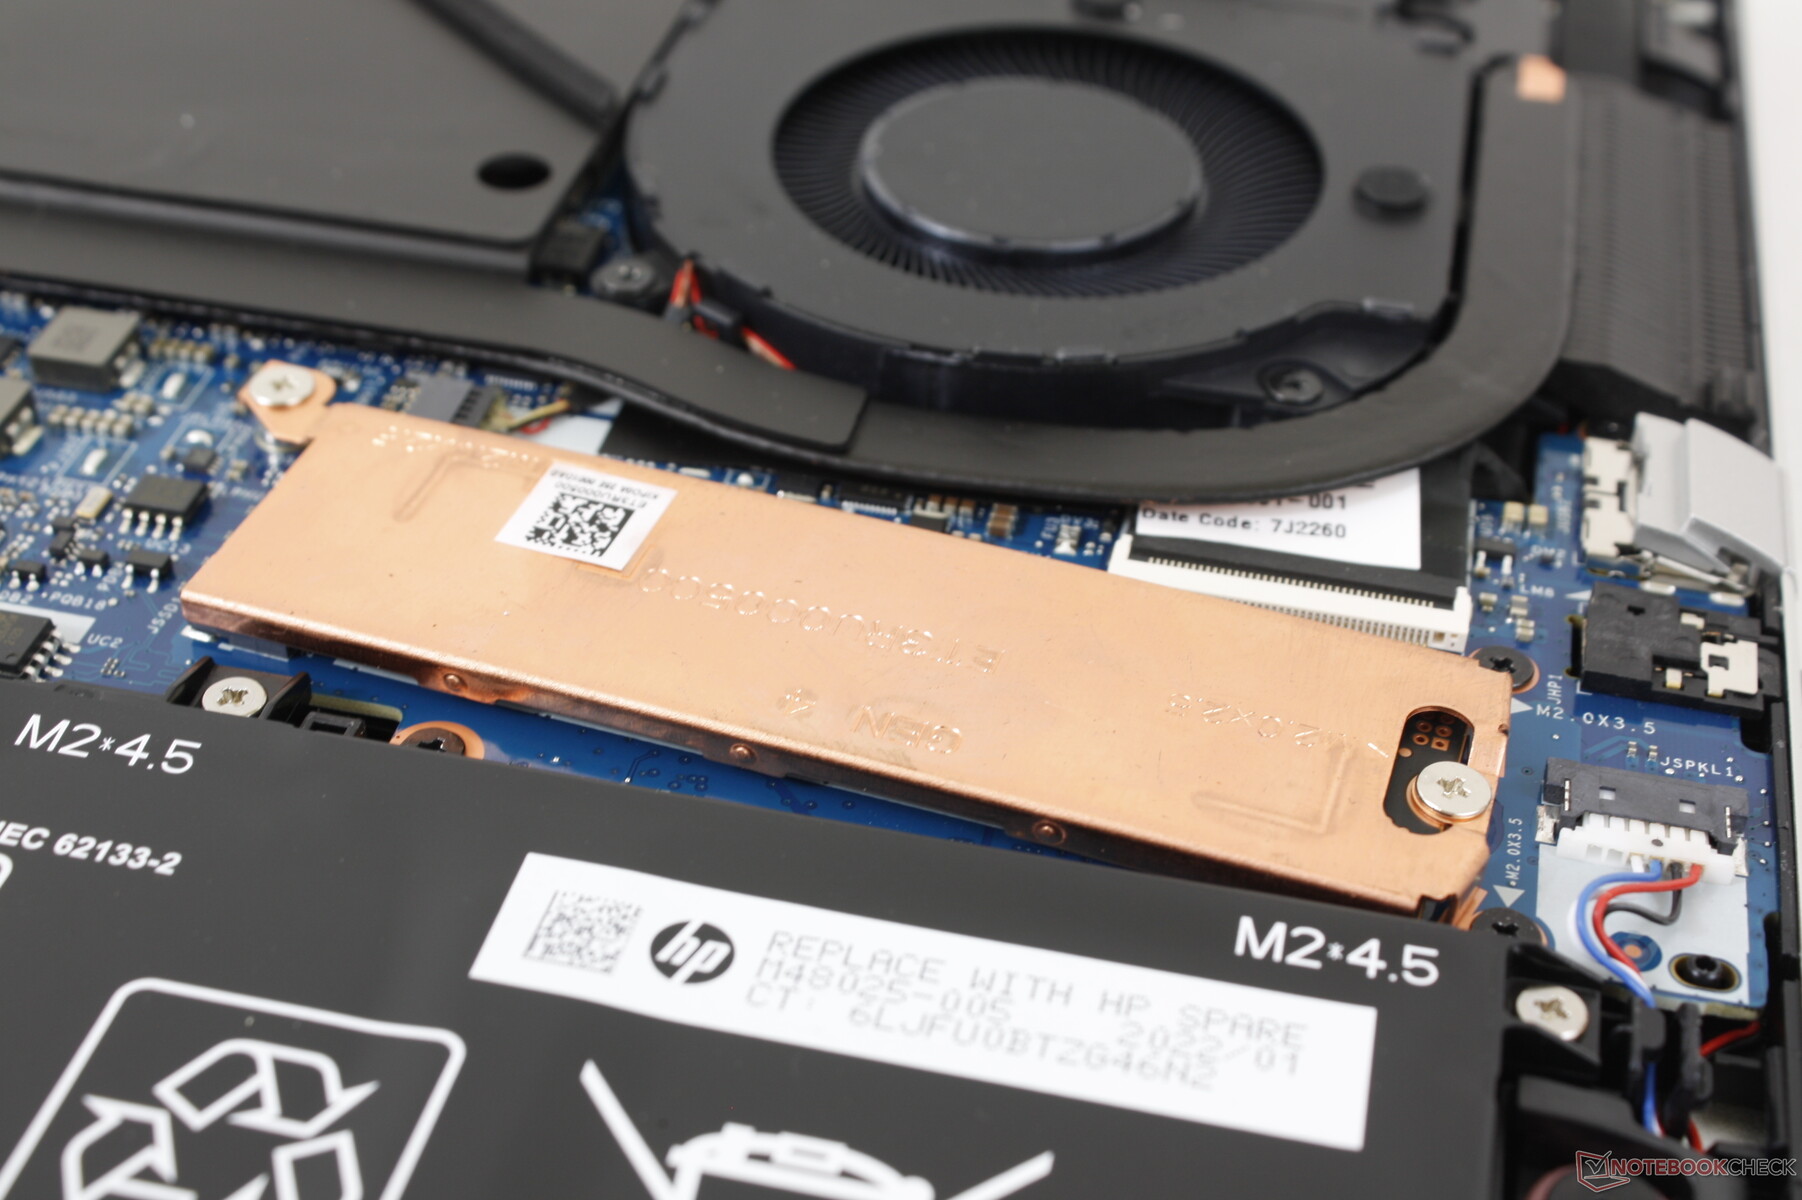
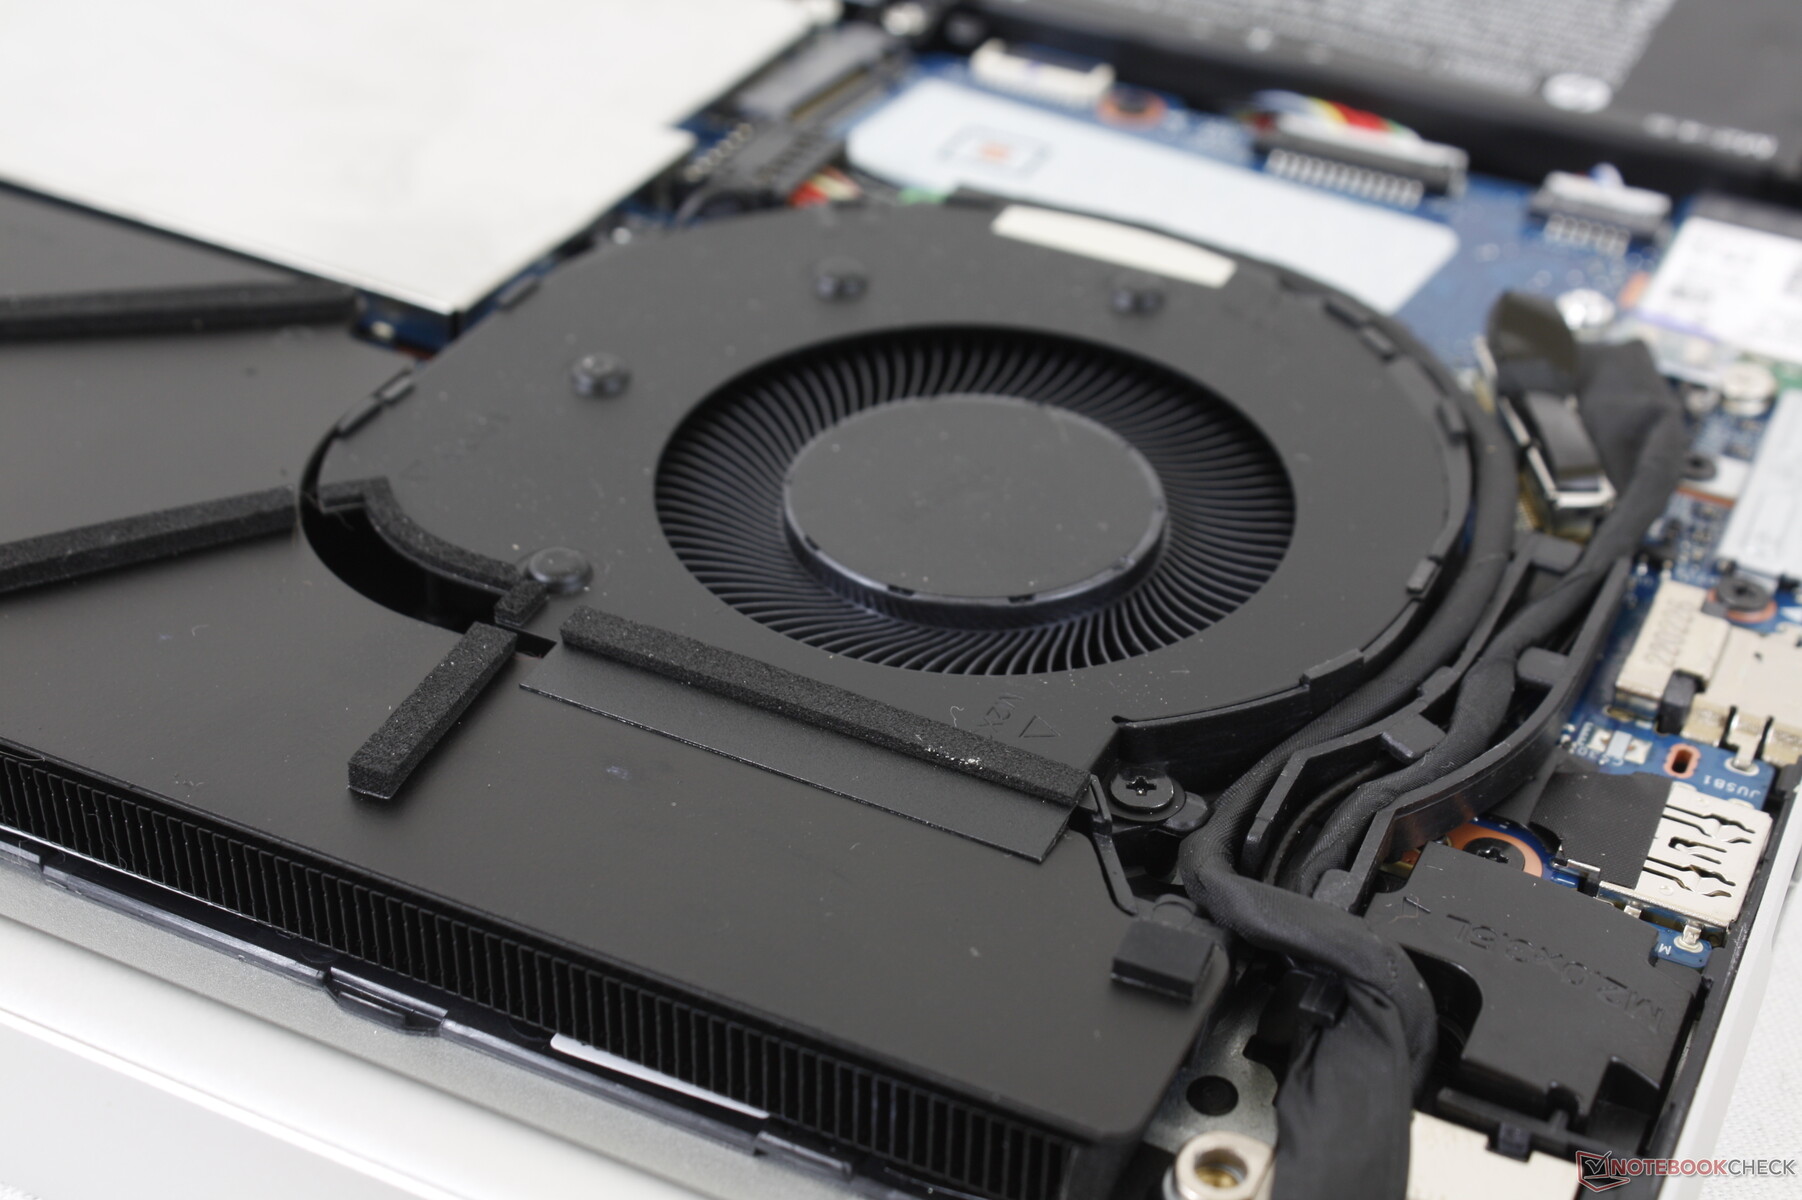
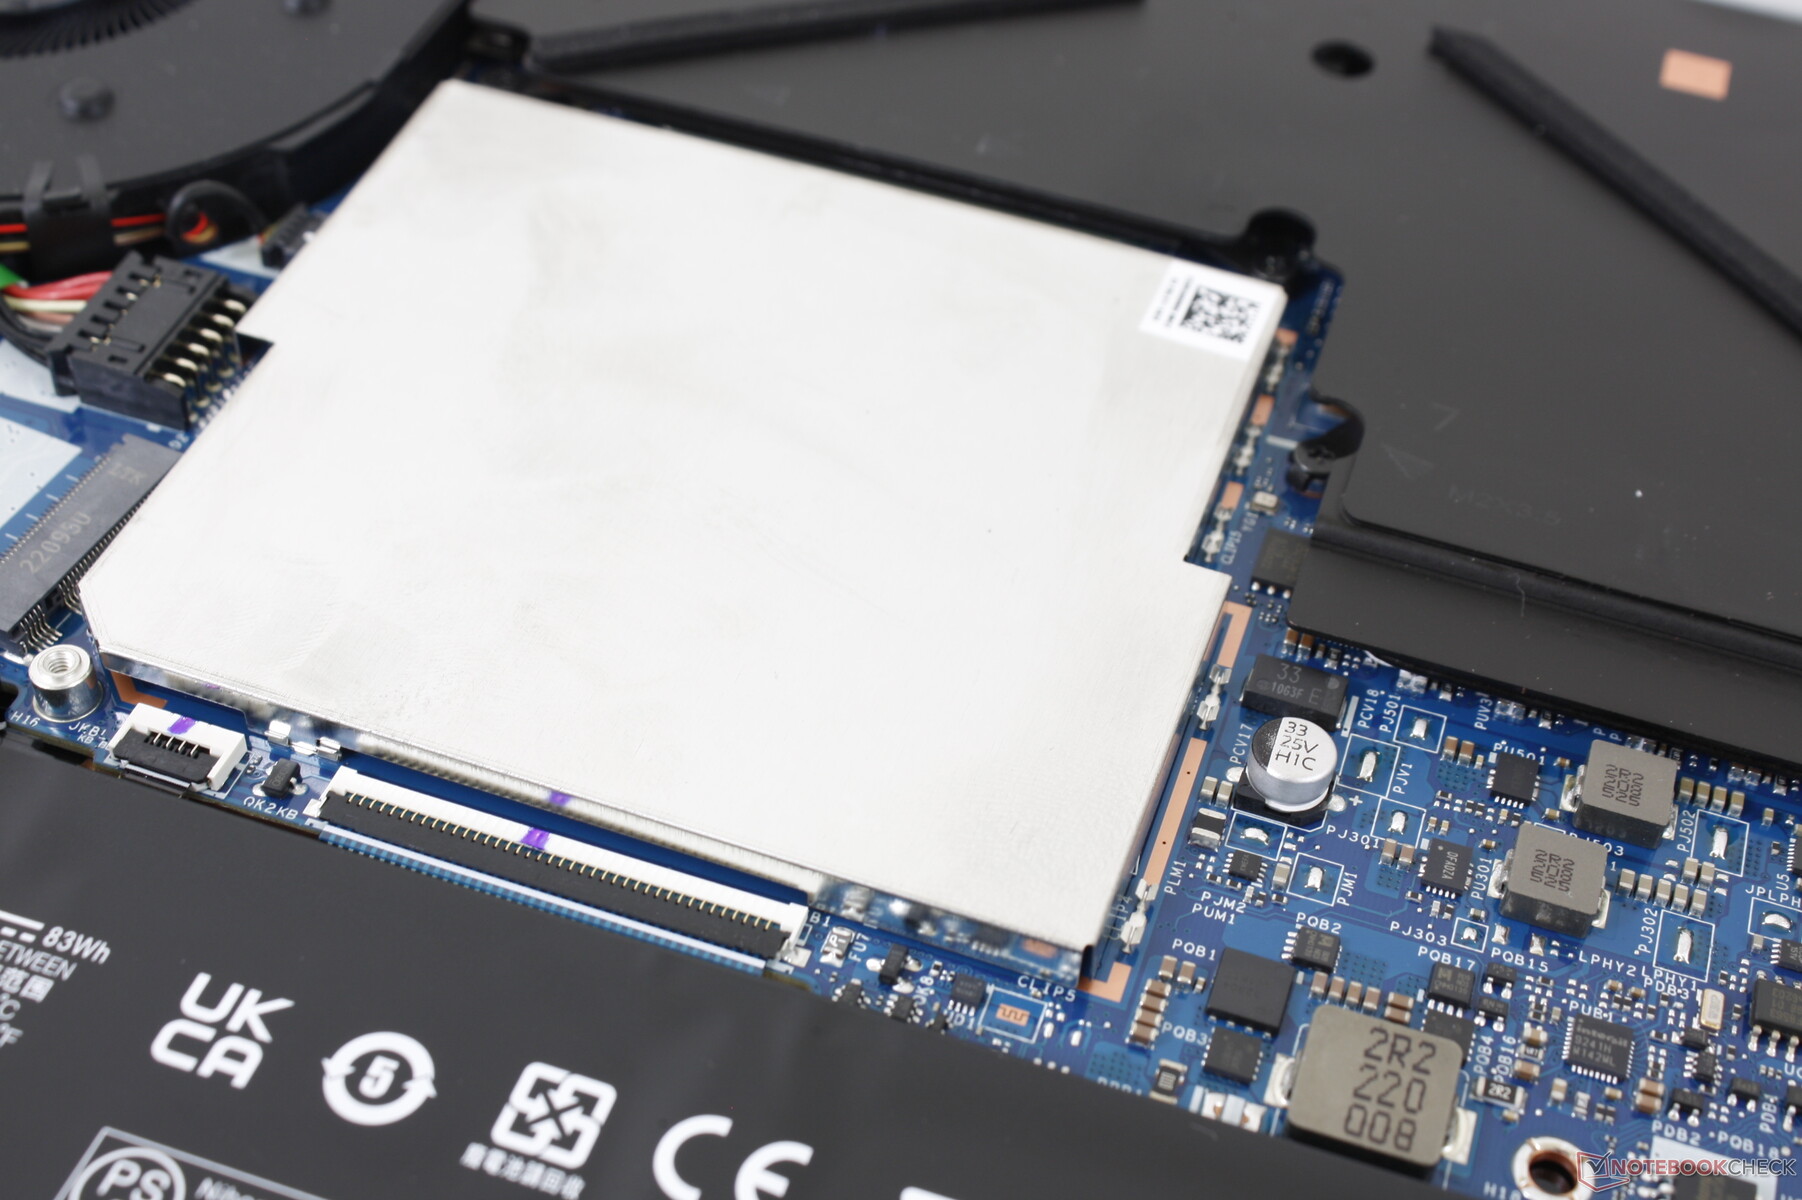
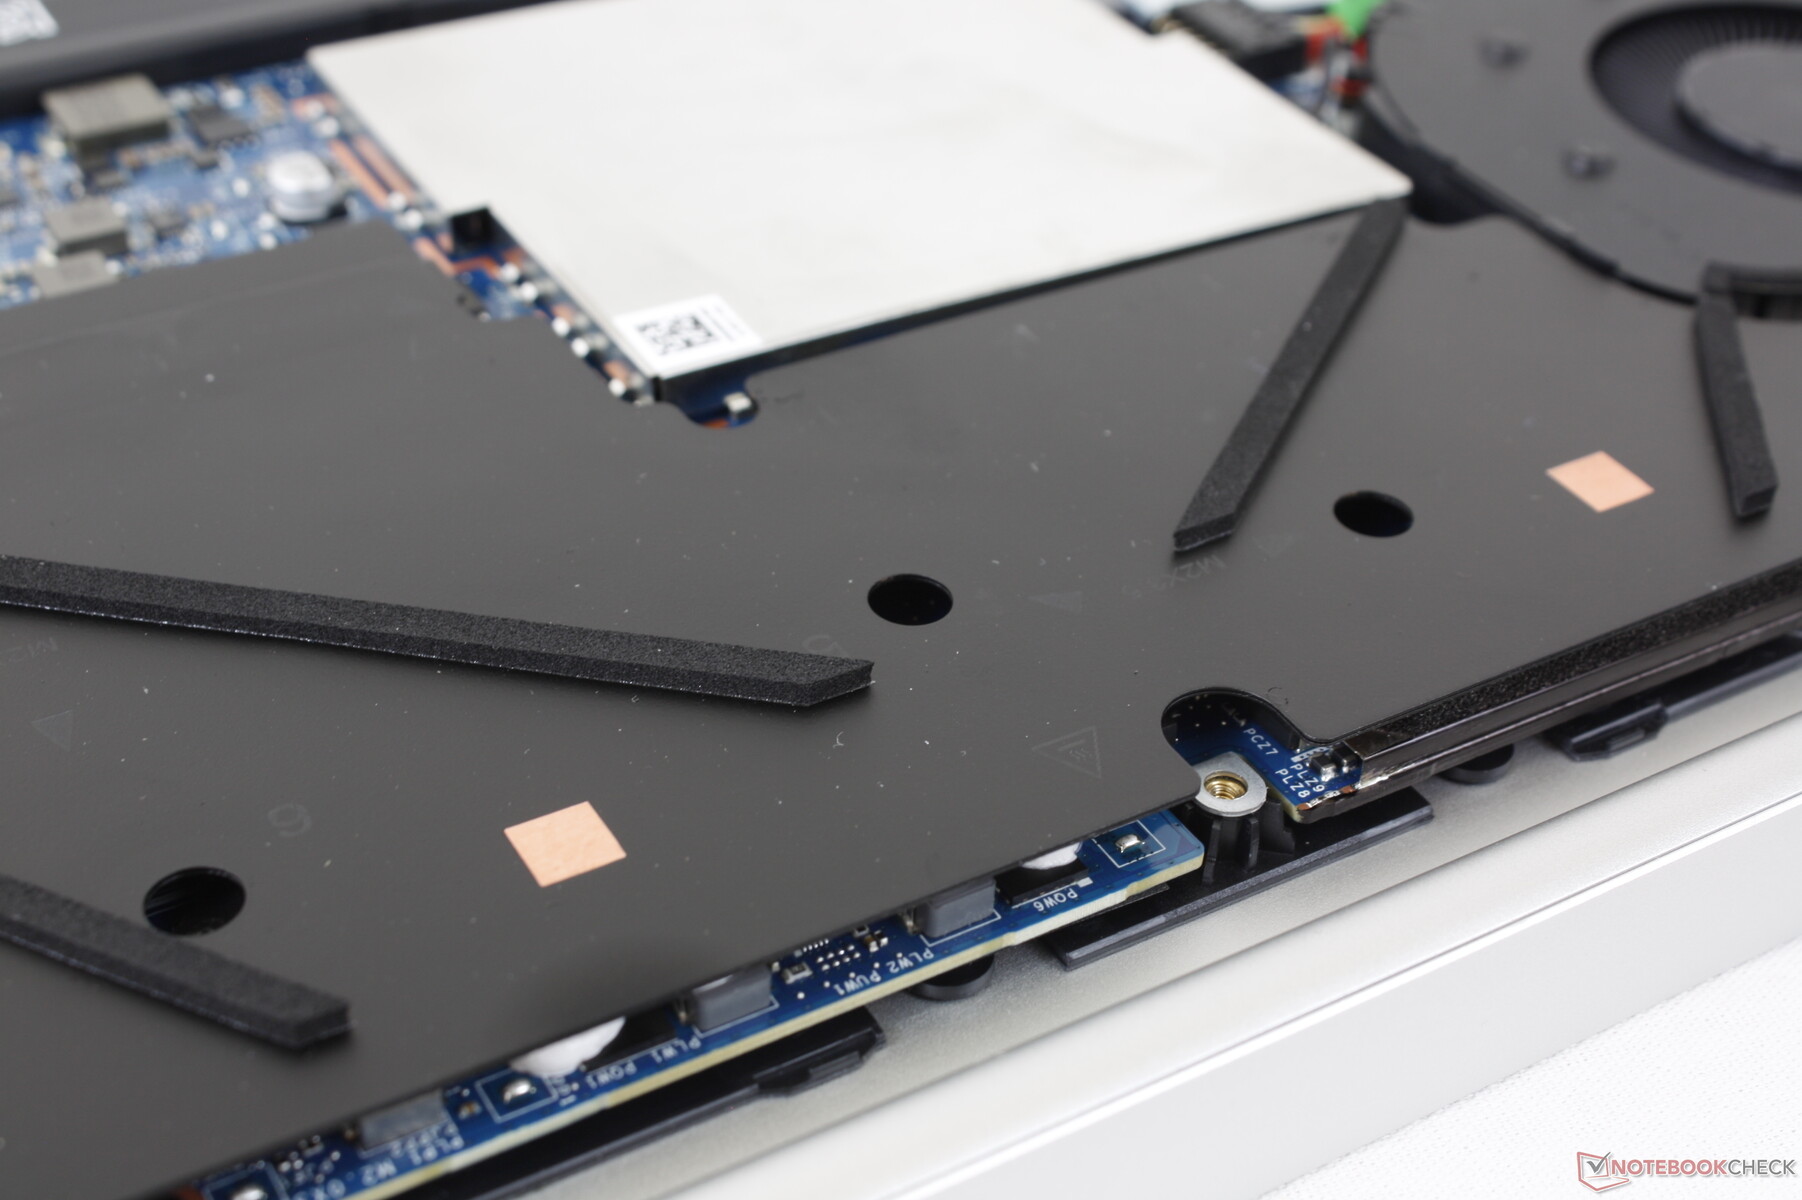
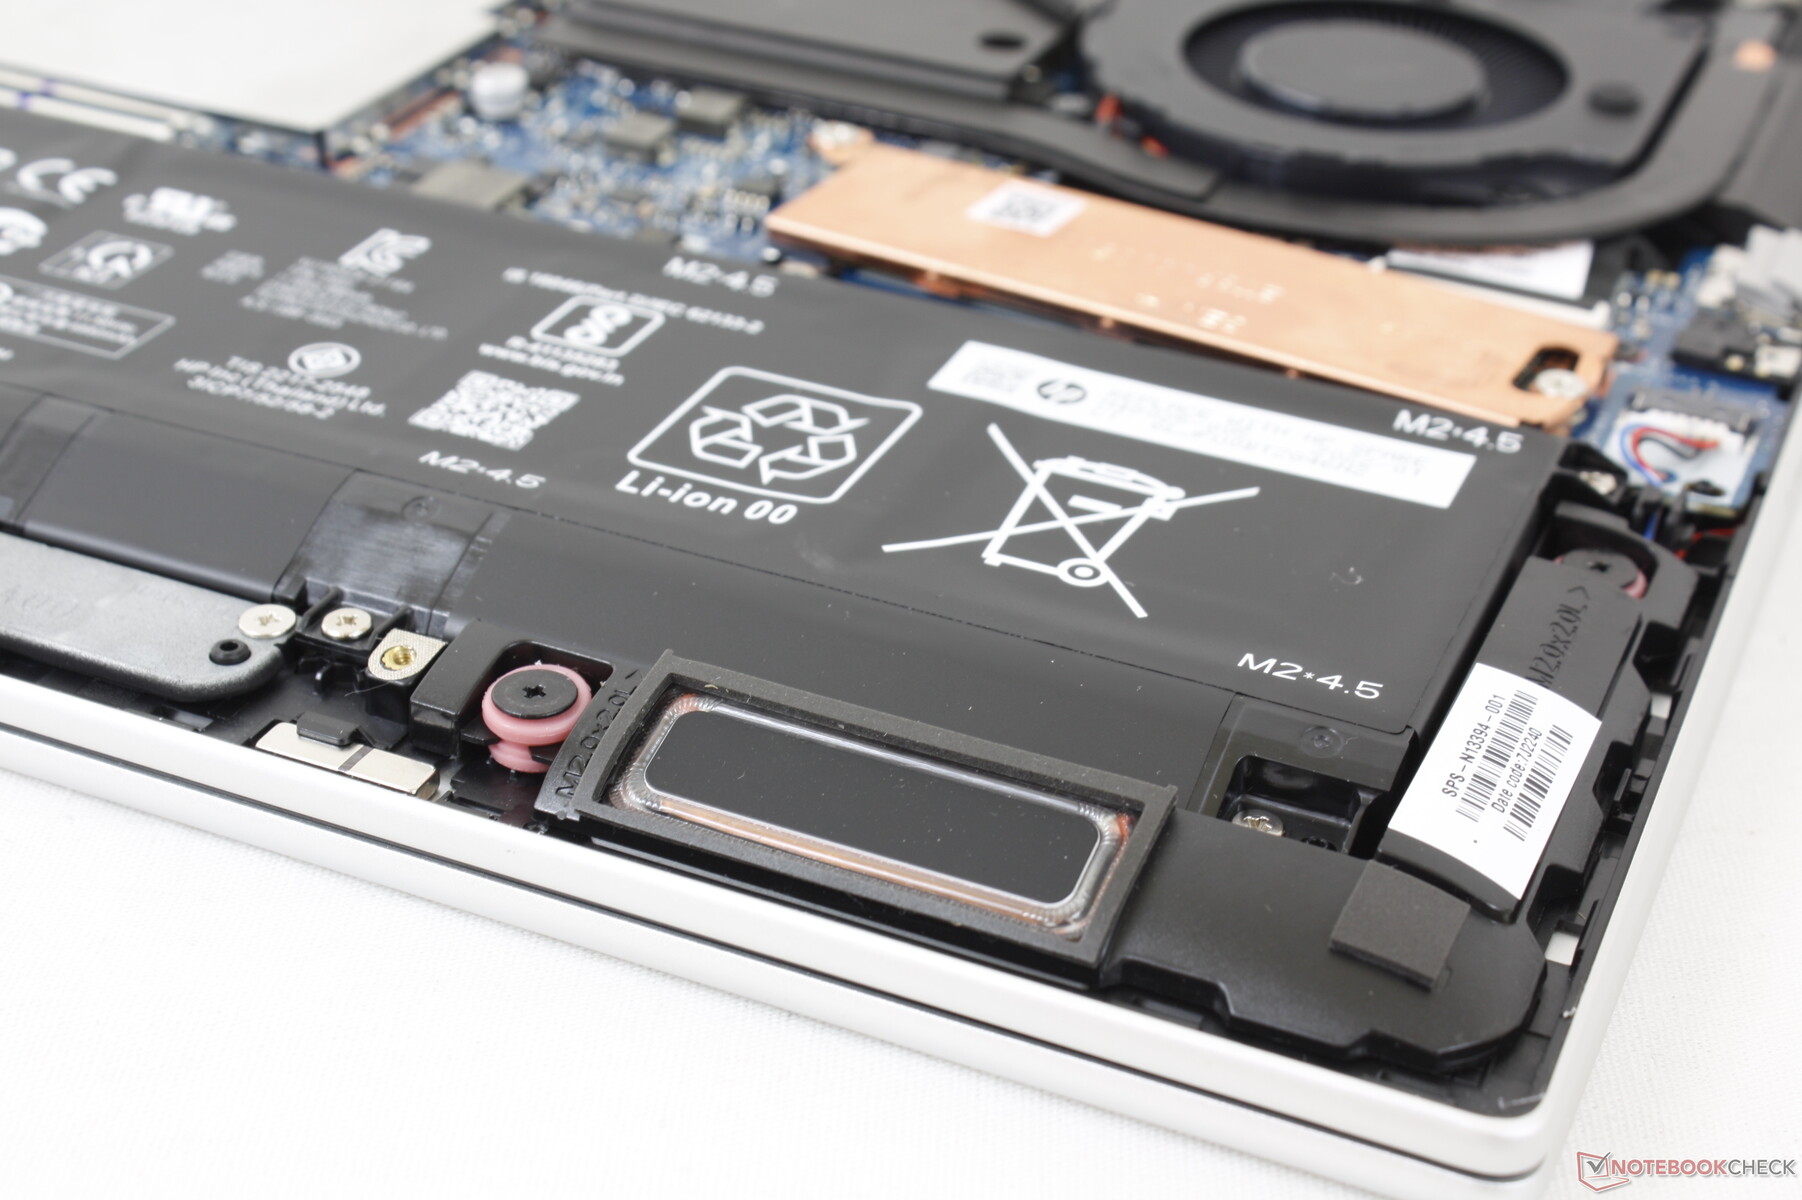
Dolny panel jest zabezpieczony tylko 5 śrubami Torx, co ułatwia serwisowanie. Firma HP udostępniła na stronie bardzo pomocny film w serwisie YouTube jak rozłożyć laptopa krok po kroku. Po wejściu do środka użytkownicy mają dostęp do 2x gniazd SODIMM, 2x gniazd pamięci masowej oraz modułu WLAN.
Akcesoria i gwarancja
W pudełku nie ma żadnych dodatków poza zasilaczem sieciowym i dokumentacją. W przypadku zakupu w USA obowiązuje roczna ograniczona gwarancja.
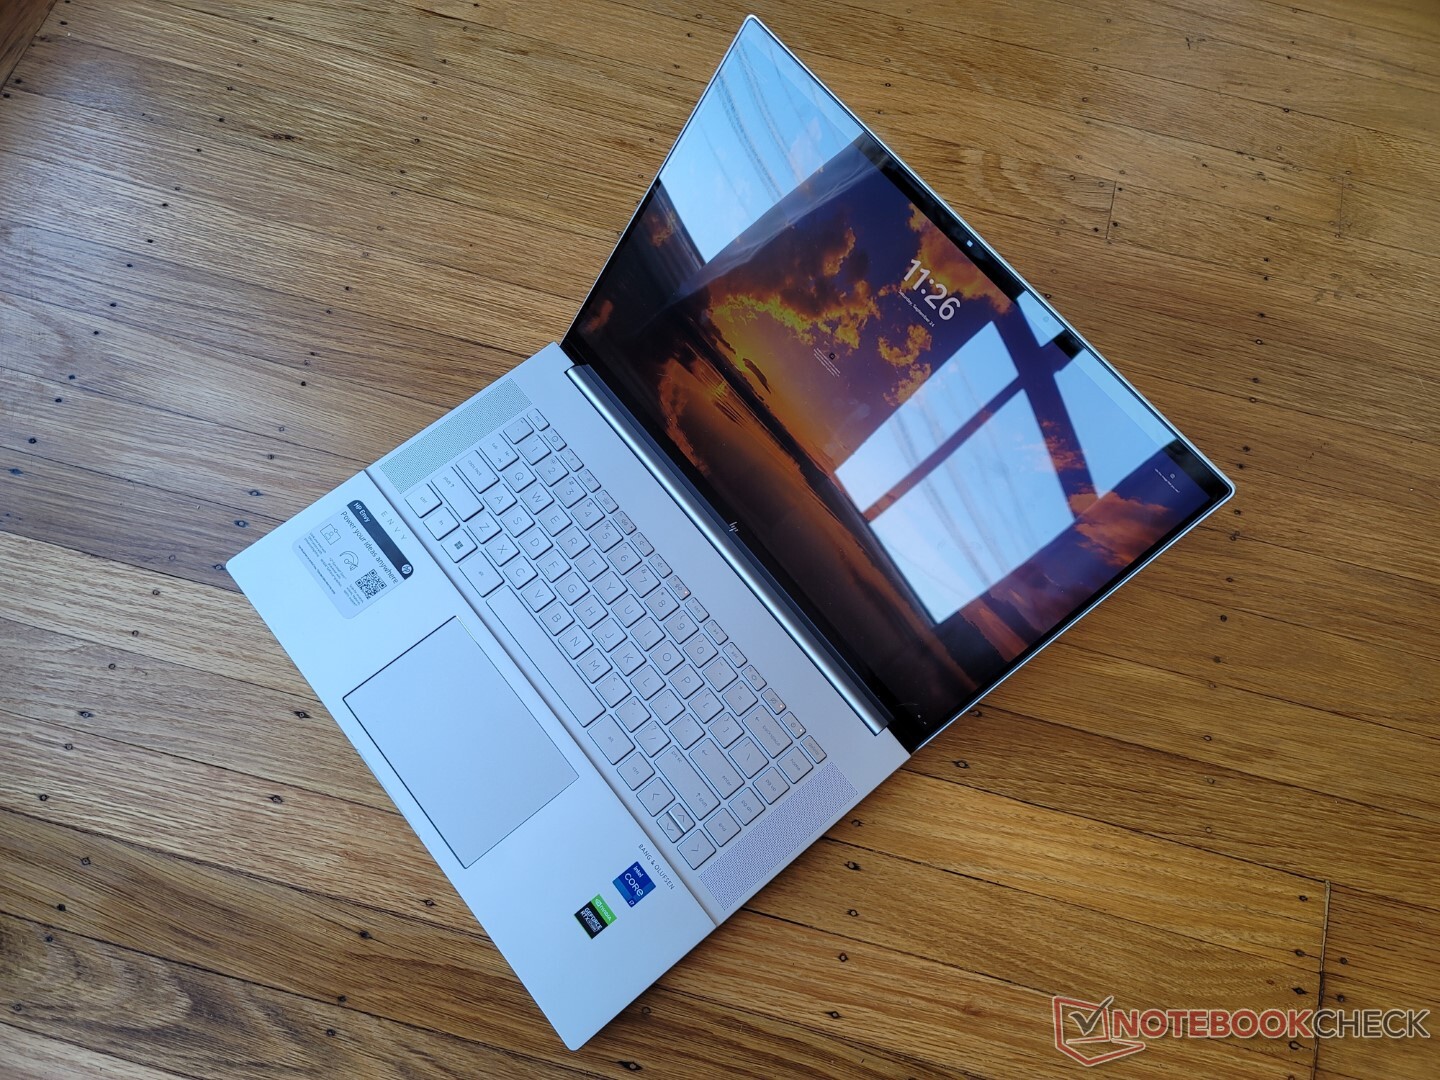
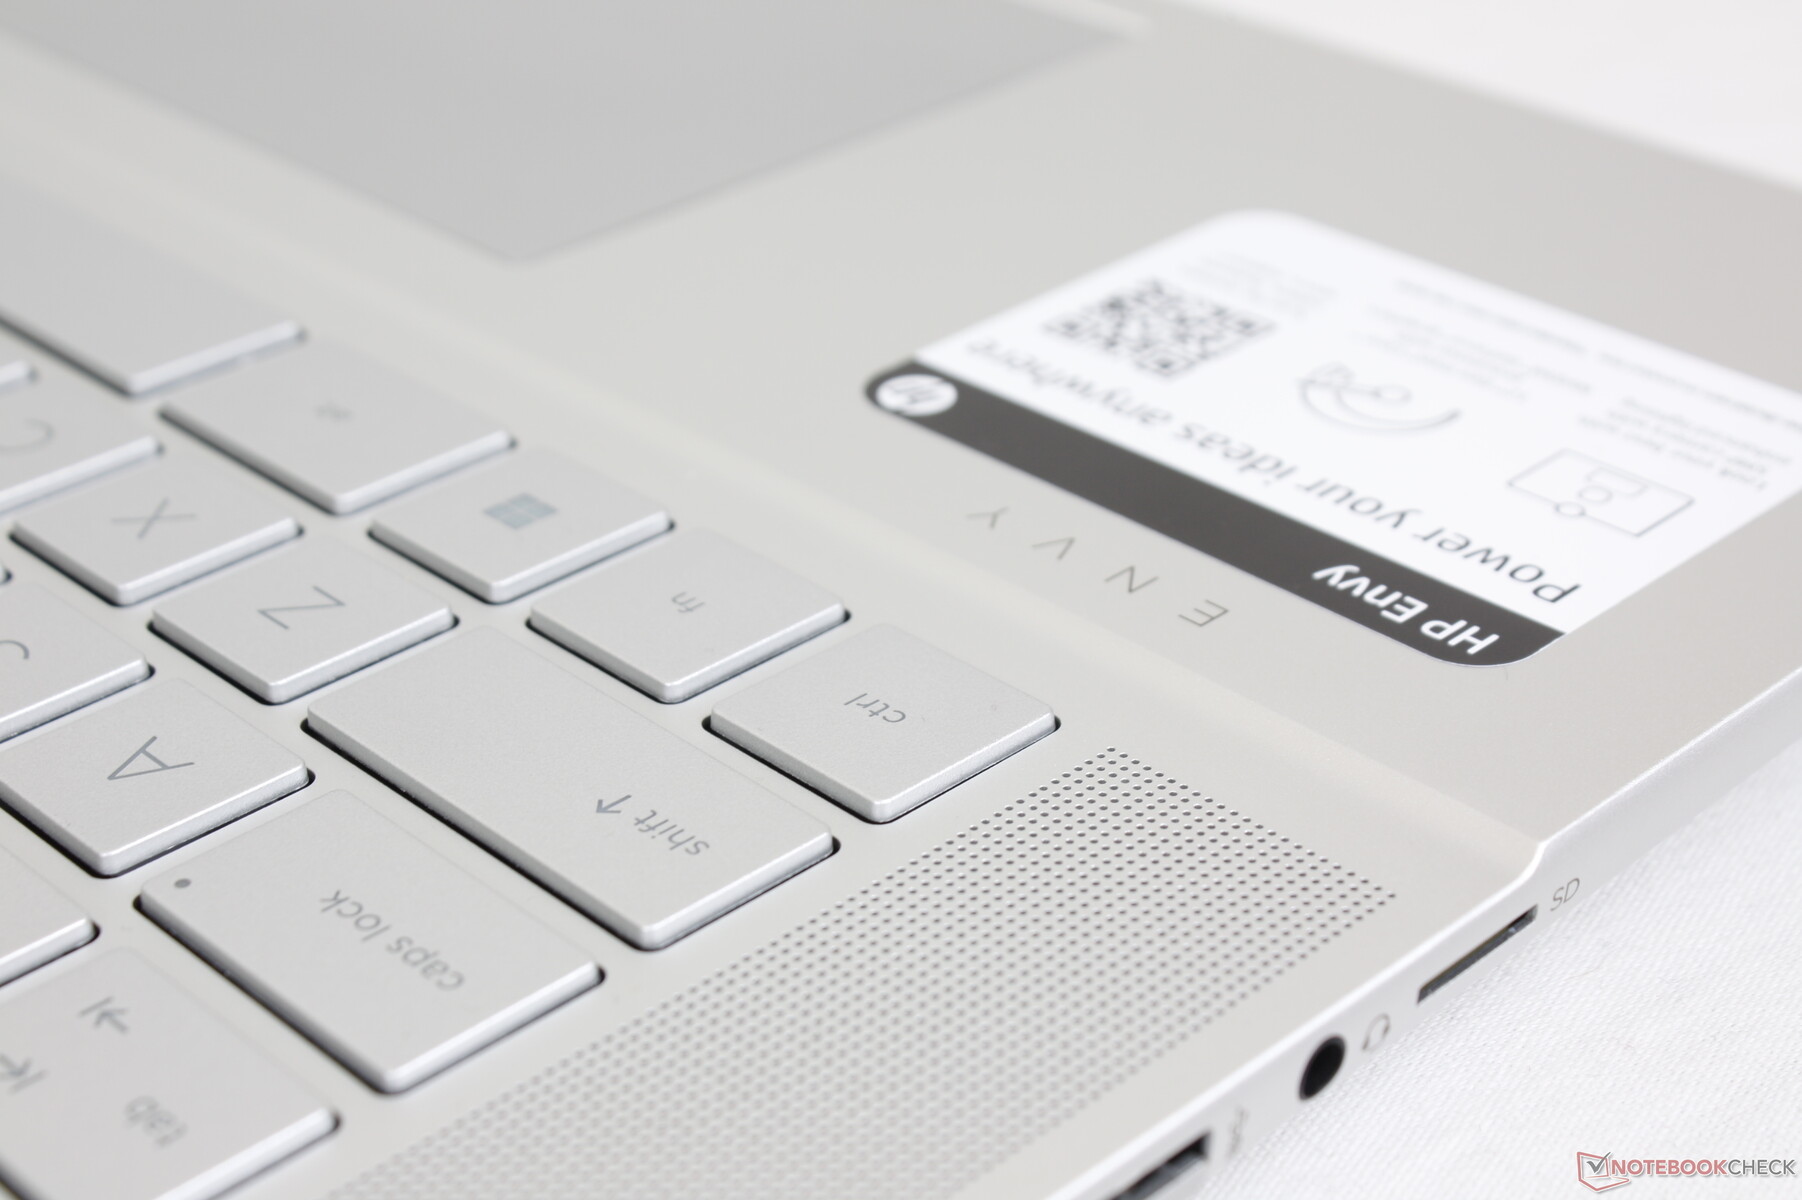
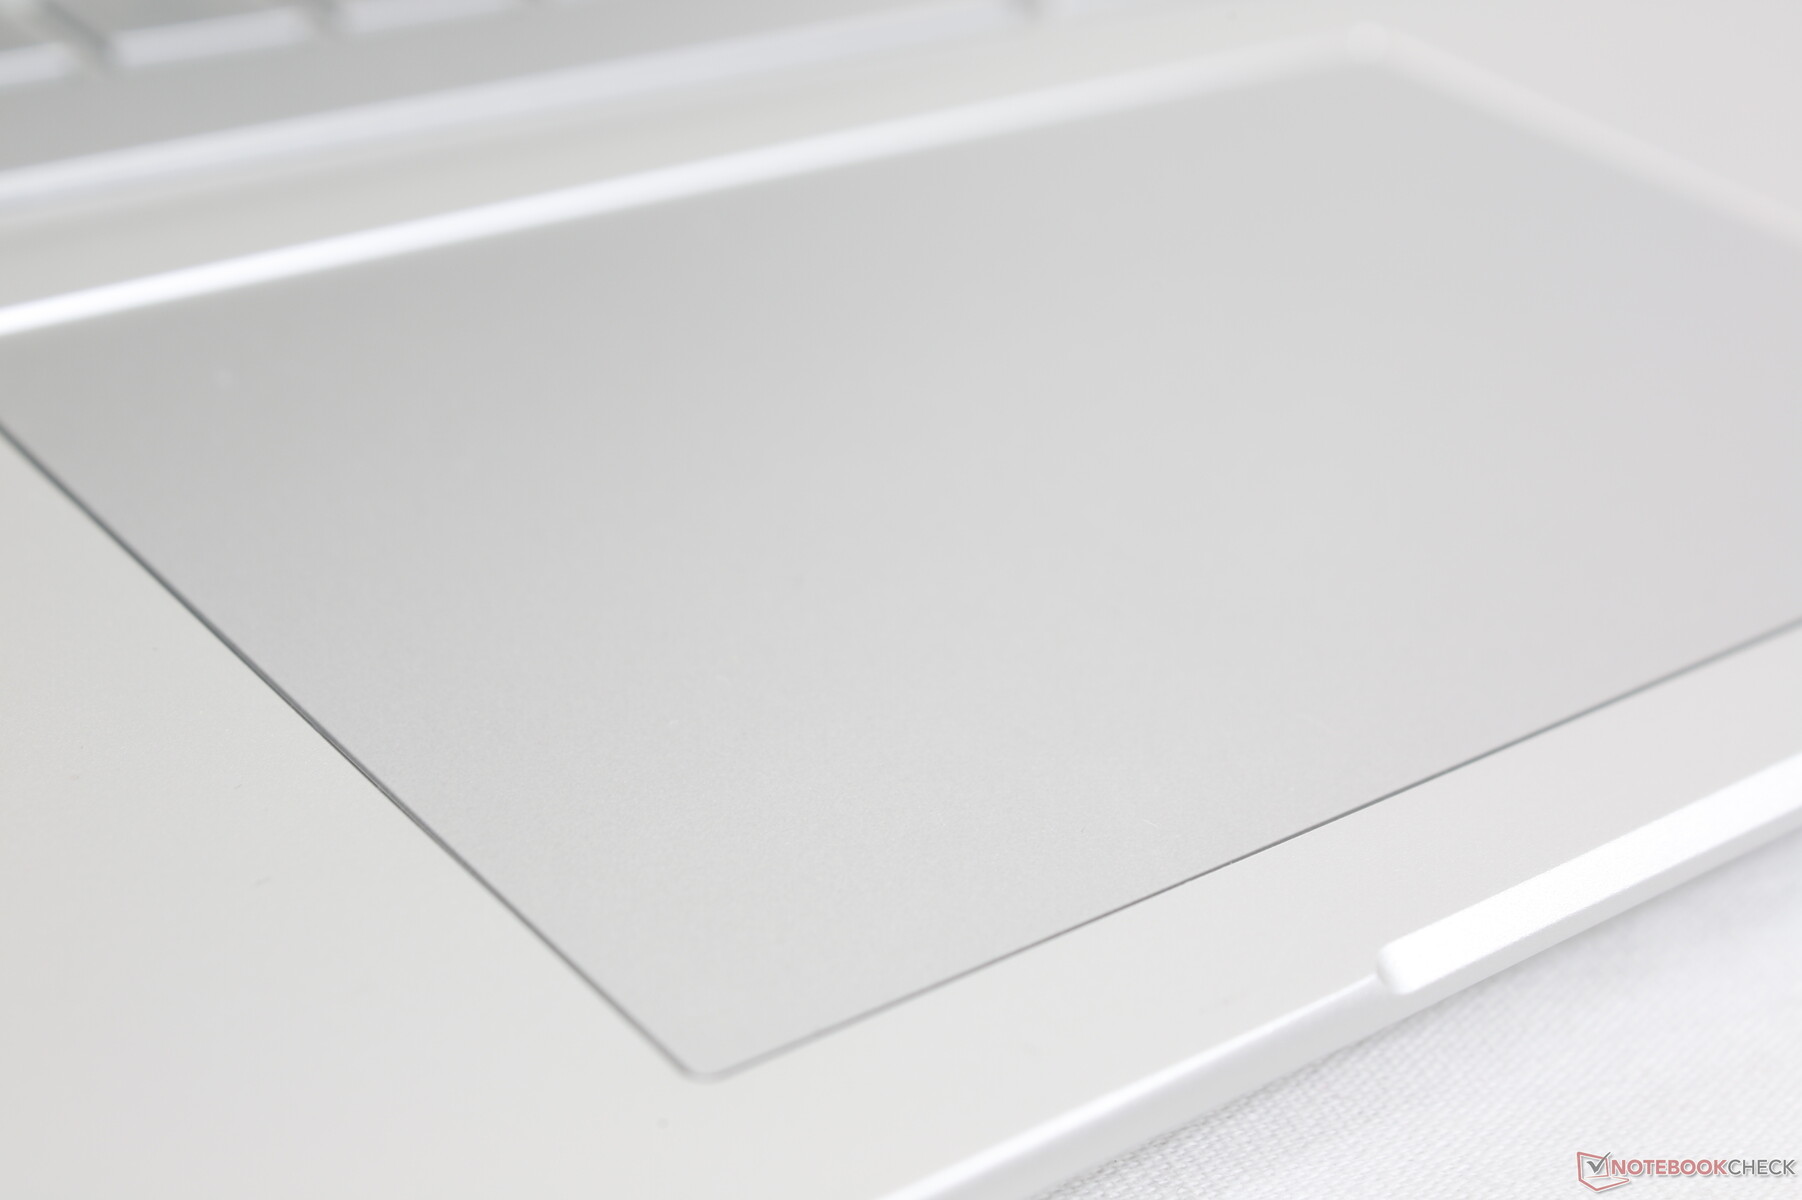
Urządzenia wejściowe - większy touchpad, znana klawiatura
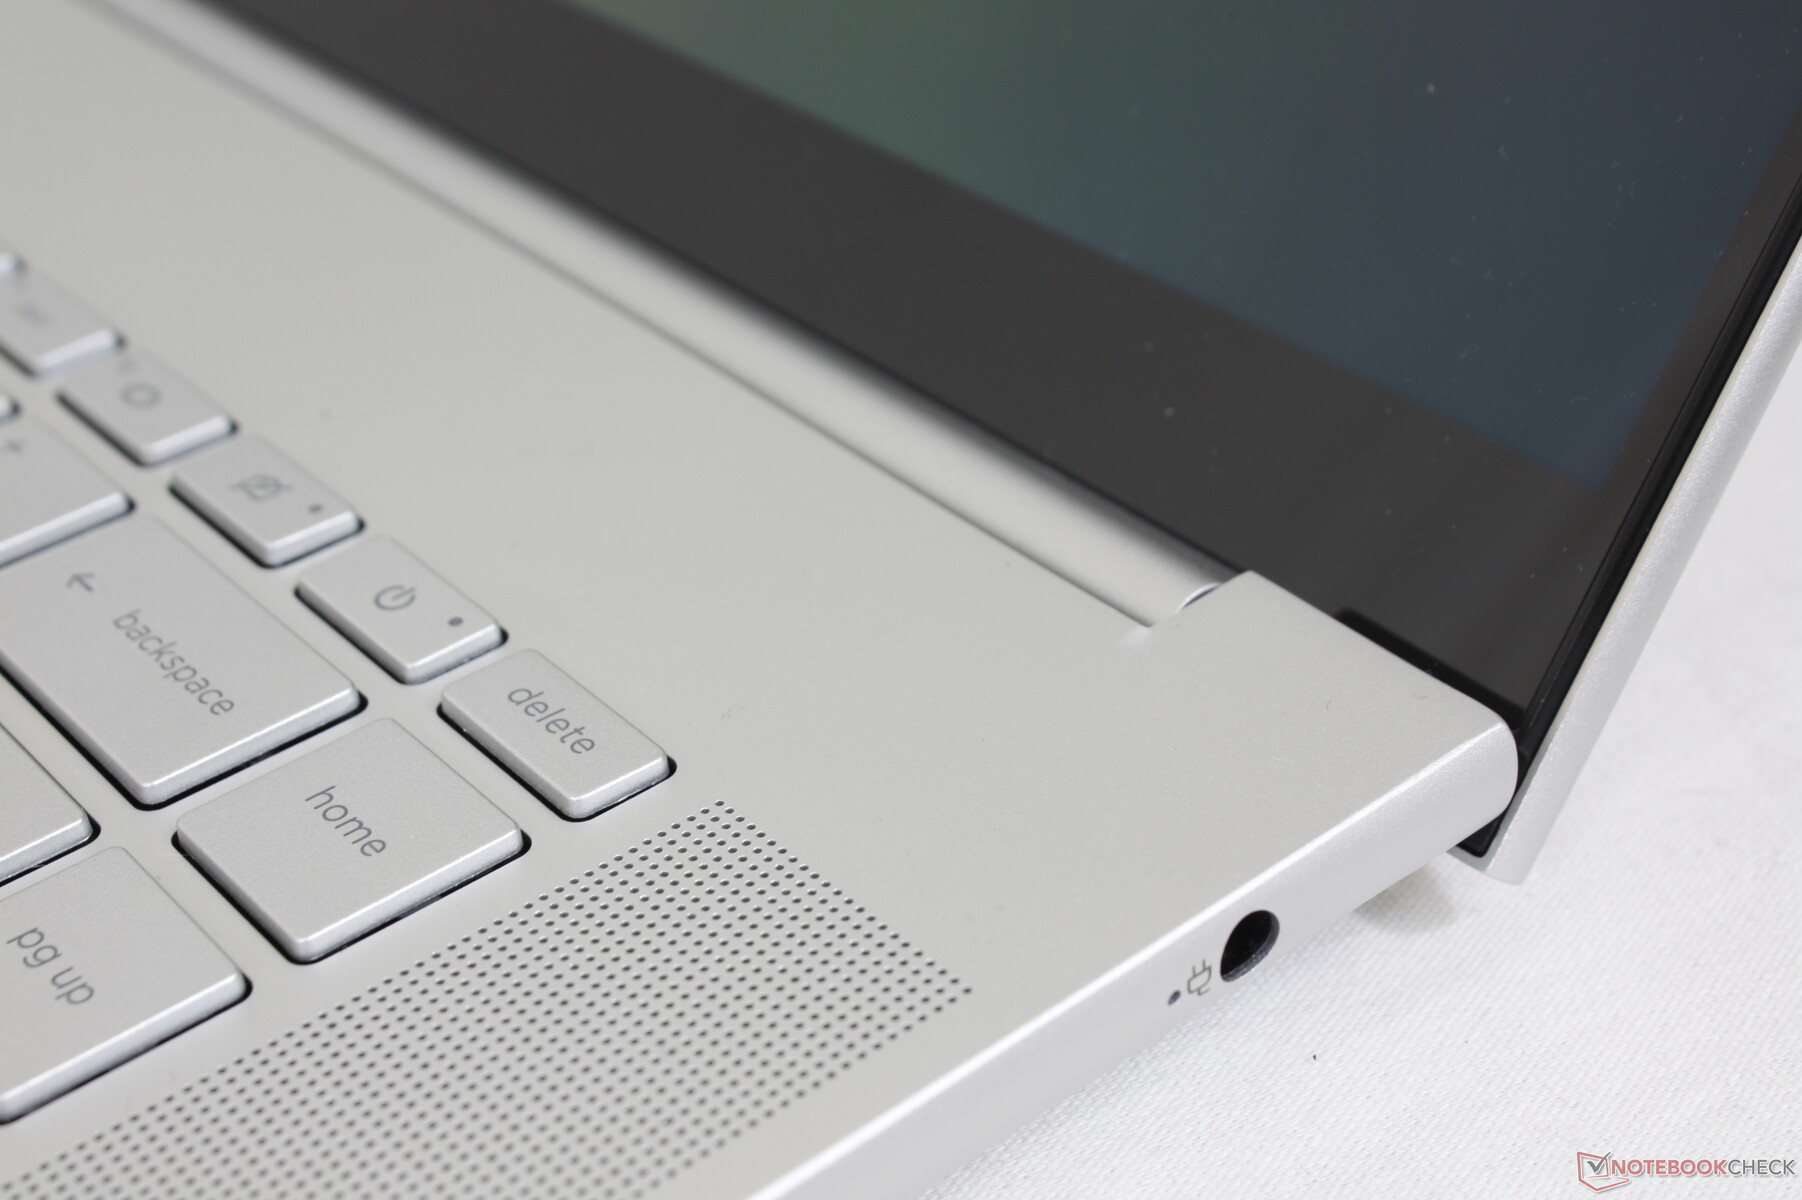
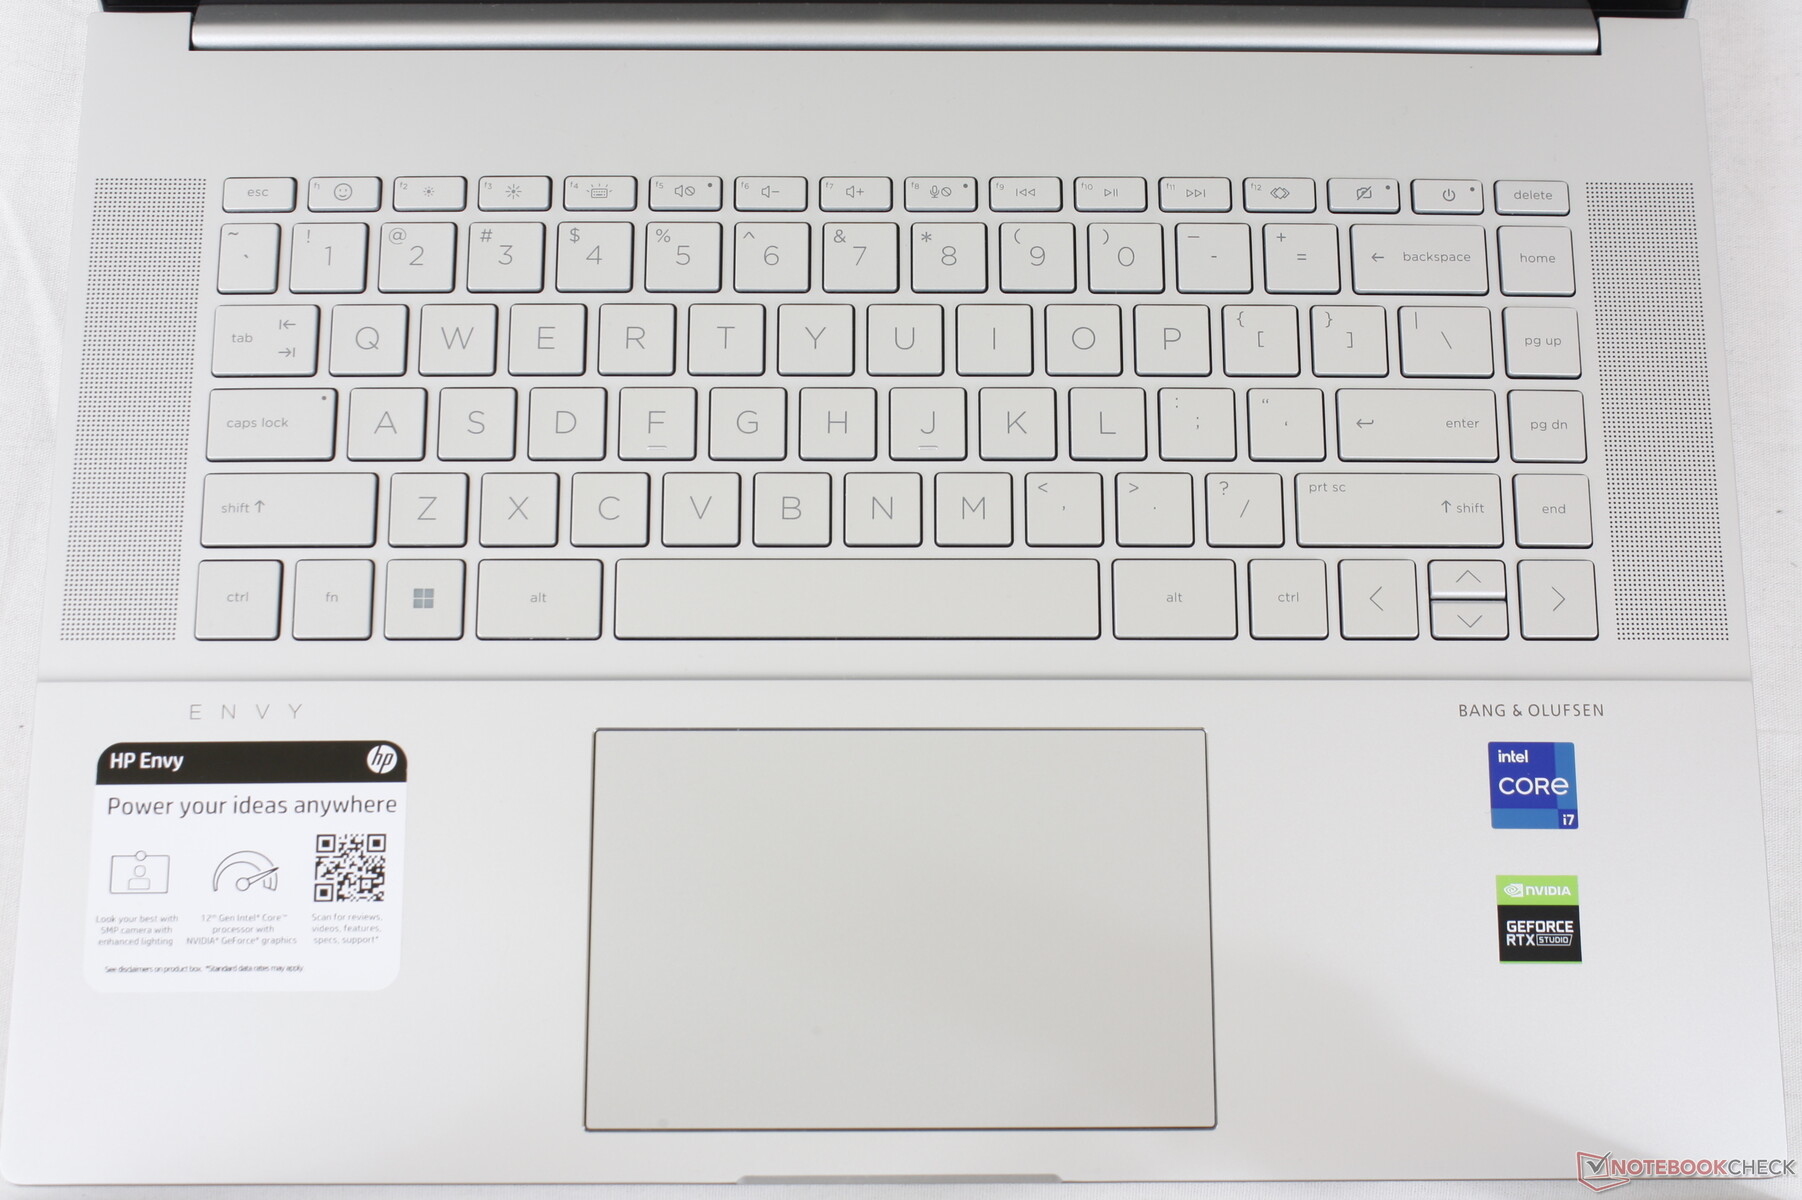
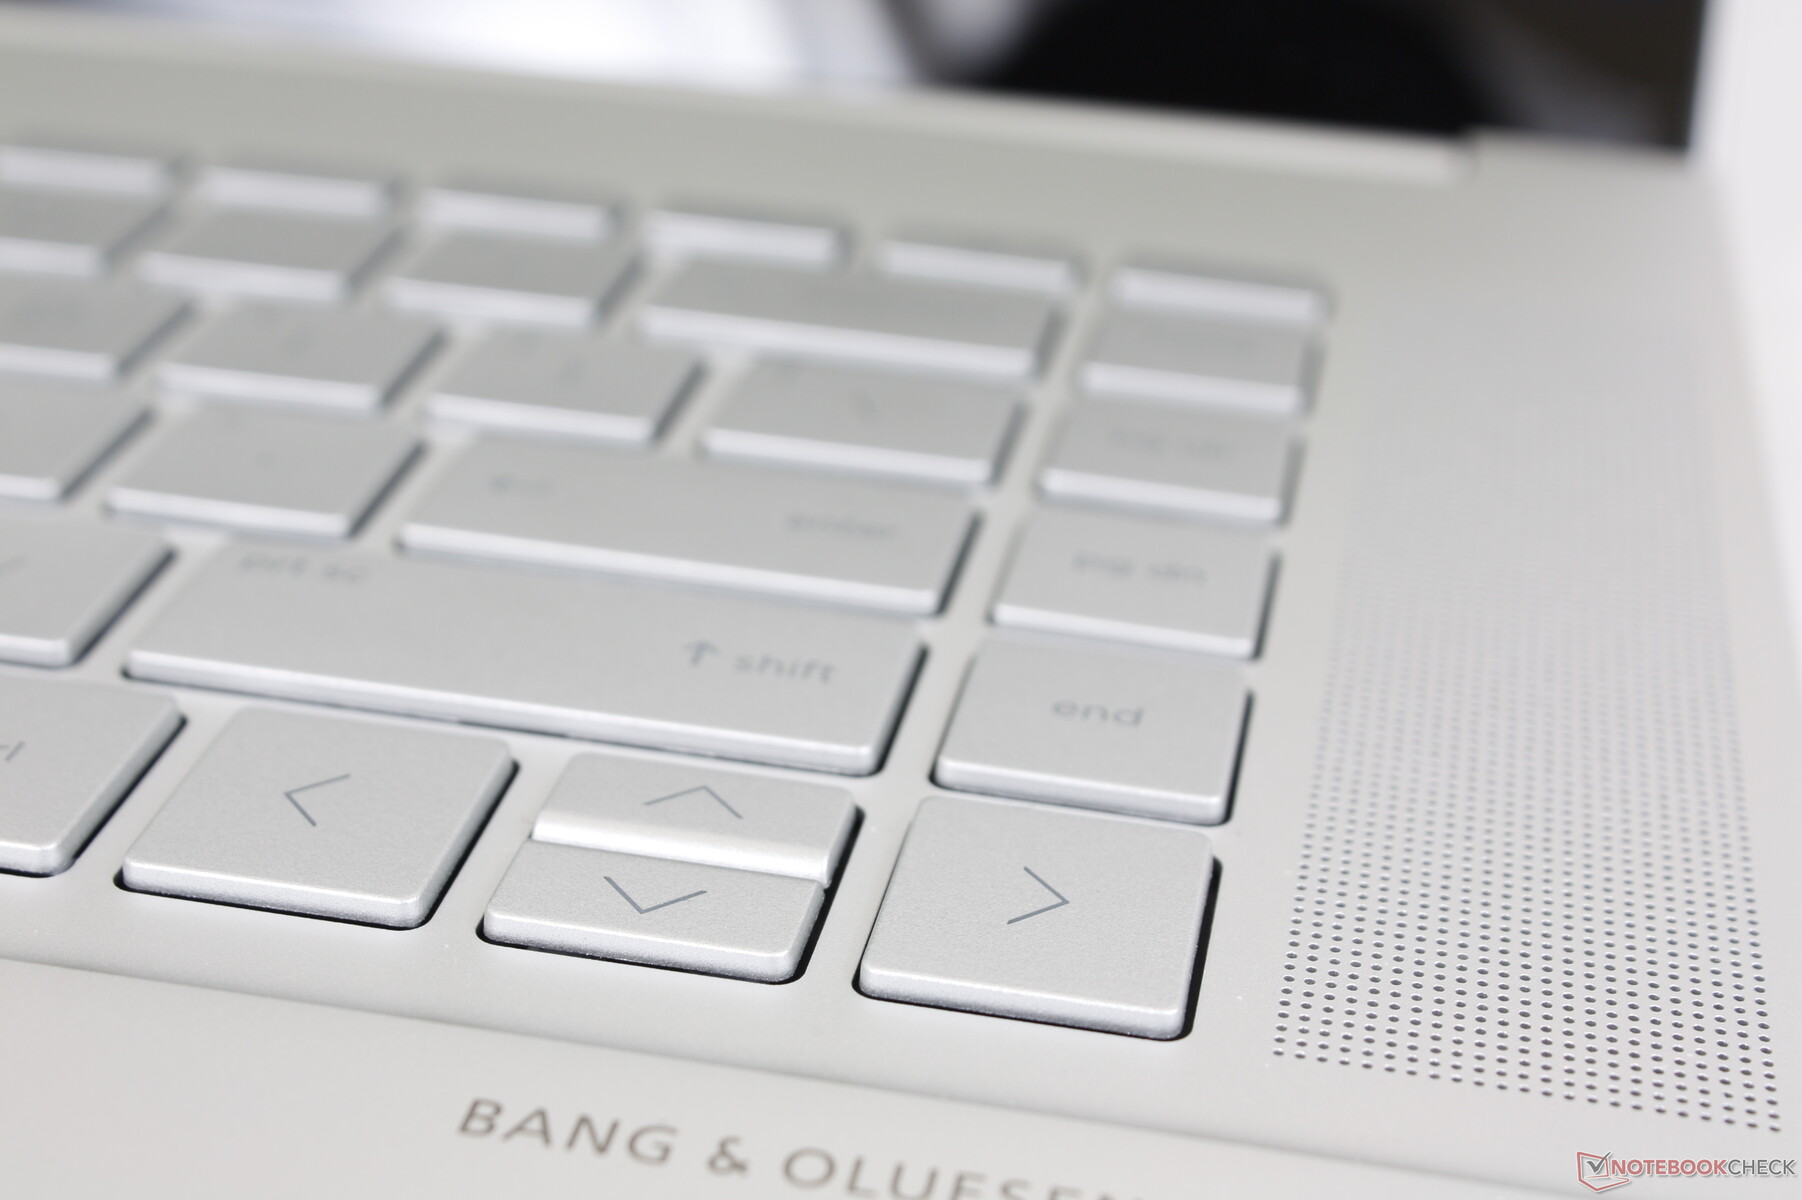
Klawiatura
HP nie wprowadziło żadnych zmian w sprzężeniu zwrotnym czy odczuciu klawiatury w porównaniu z Envy 15 z 2020 roku. Z jednej strony, użytkownicy przyzwyczajeni do klawiatur Envy nie będą mieli żadnych problemów, ale z drugiej strony, wolelibyśmy doświadczenie pisania bliższe twardszym i bardziej satysfakcjonującym klawiszom Spectre 15 lub EliteBook spectre 15 lub EliteBook
Warto wspomnieć o dwóch drobnych powierzchownych zmianach. Funkcja drugorzędna klawisza F12 została zmieniona na funkcję "System Event Utility", która jest w zasadzie klawiszem szybkiego uruchamiania HP Command Center, Omen Gaming Hub, myHP i HP Palette. Po drugie, drugorzędna funkcja klawisza F1 uruchamia teraz wyskakujące okienko do wyboru emojis i GIF-ów, podobnie jak na najnowszym Pavilion.
Touchpad
Klawiatura jest większa, niż w ustępującym Envy 15 (12,5 x 8 cm vs. 11,5 x 7,5 cm). Jej powierzchnia jest gładka i prawie pozbawiona tekstury, a przy wolniejszym ślizganiu się po niej w celu uzyskania dokładniejszych kliknięć - tylko minimalnie lepka. Tymczasem kliknięcie na płytce jest stosunkowo miękkie i ciche, jak na gąbkę. Mocniejszy i bardziej satysfakcjonujący klik byłby łatwiejszy w użyciu.

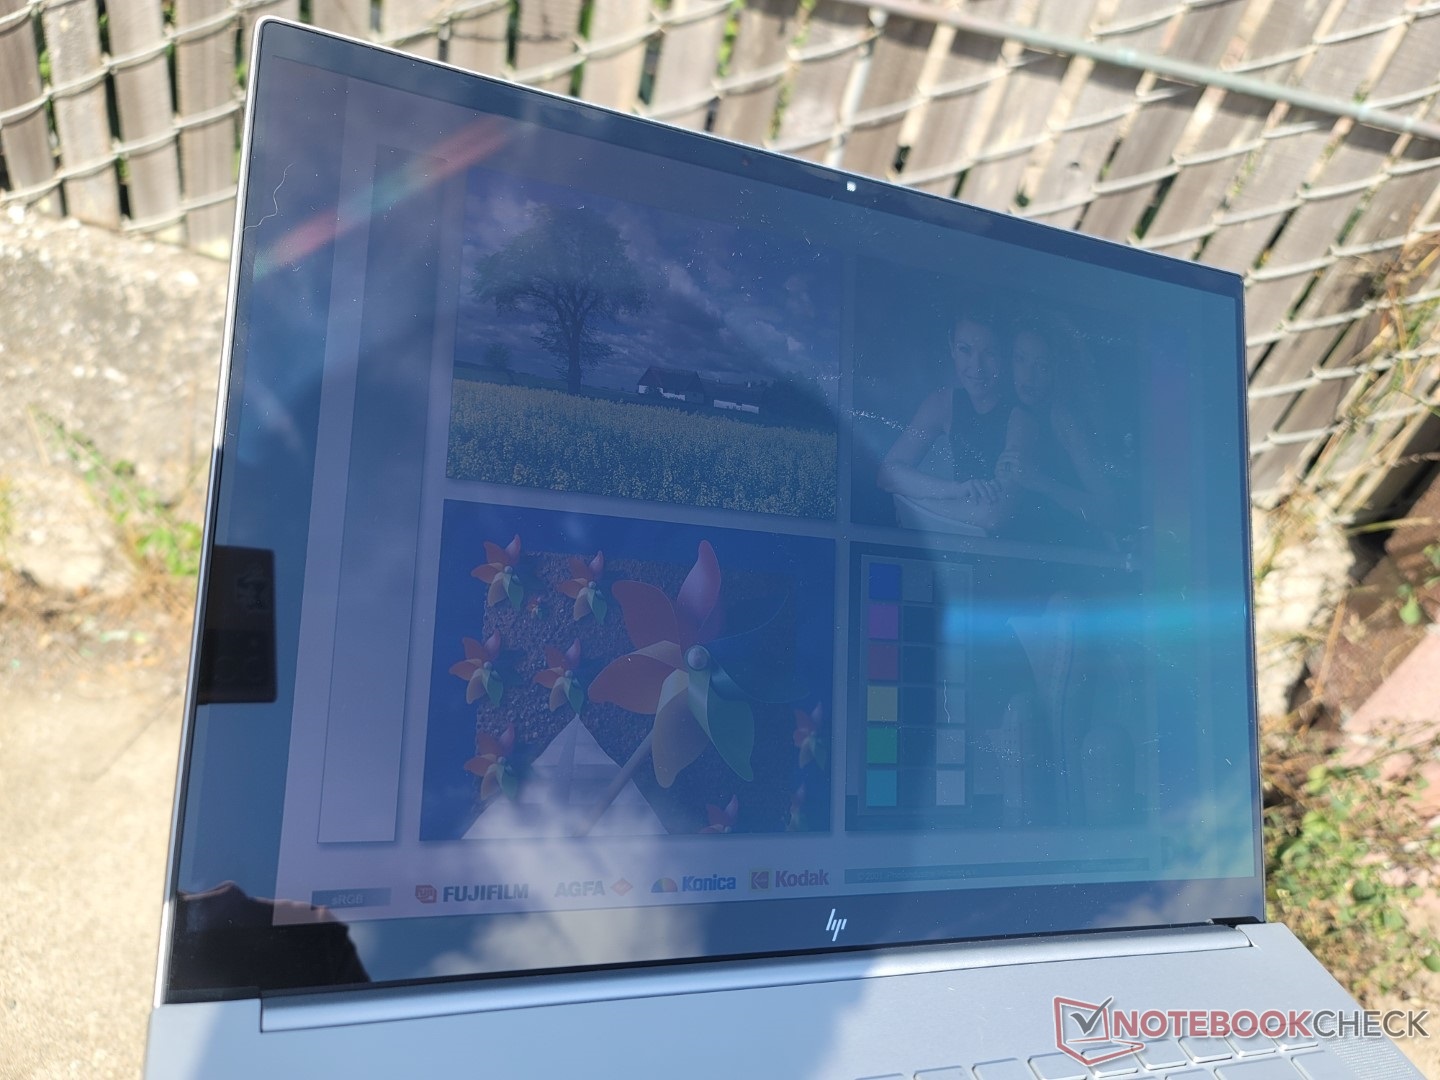
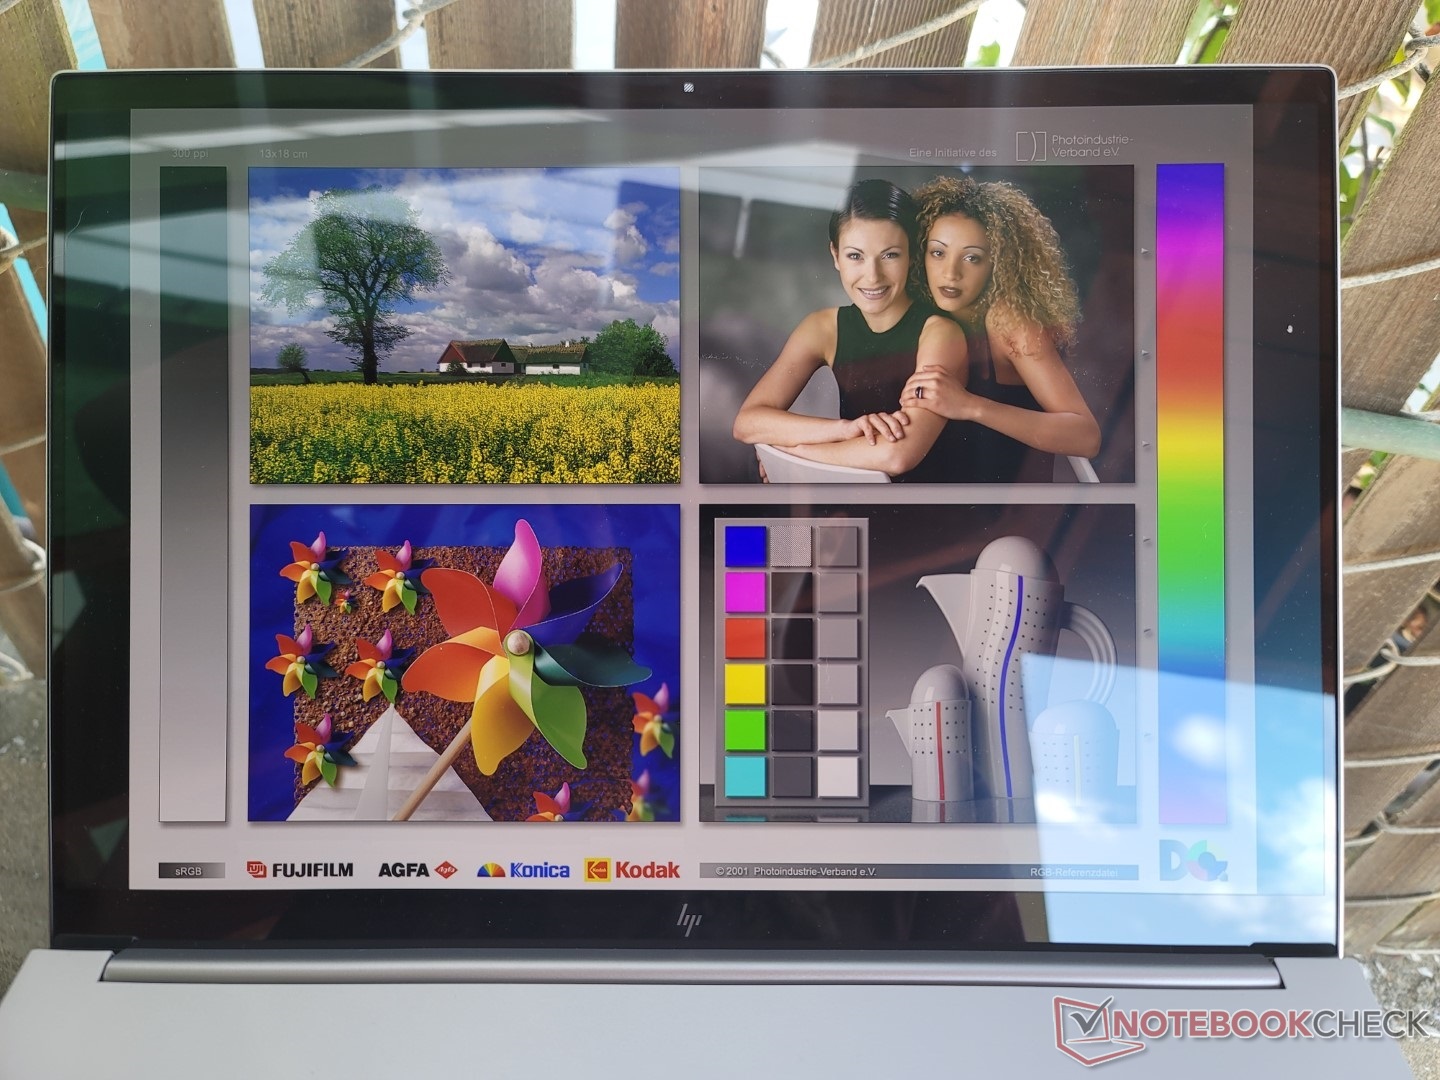
Wyświetlacz - IPS czy OLED?
Dostępne są dwie opcje wyświetlania
- 2560 x 1600, 120 Hz, IPS, 100% sRGB
- 3840 x 2400, 60 Hz, OLED, 100% P3
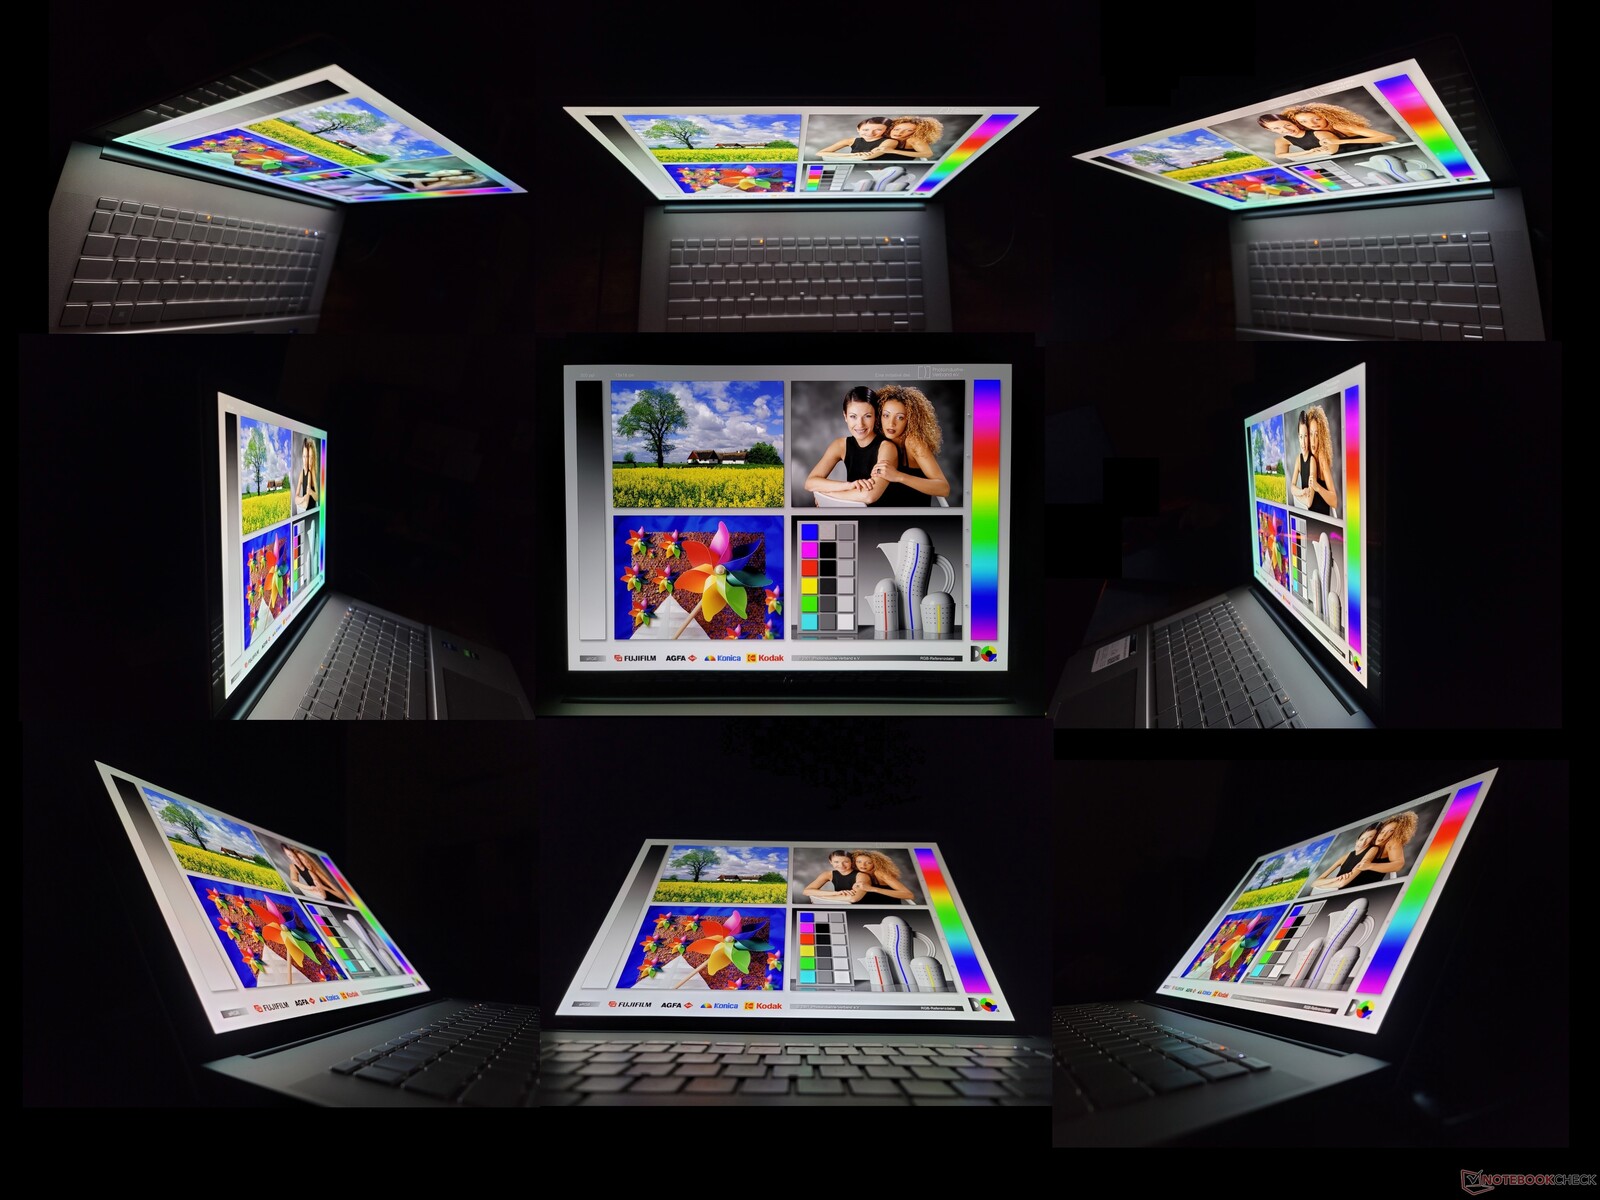
Nasze pomiary poniżej odzwierciedlają tylko opcję OLED. Jego główne zalety to głębsze kolory, czarny jak smoła współczynnik kontrastu i znacznie szybsze czasy reakcji w czerni i szarości w porównaniu z IPS kosztem wyższego zużycia energii i migotania ekranu, które może dotyczyć niewielkiego podzbioru użytkowników.
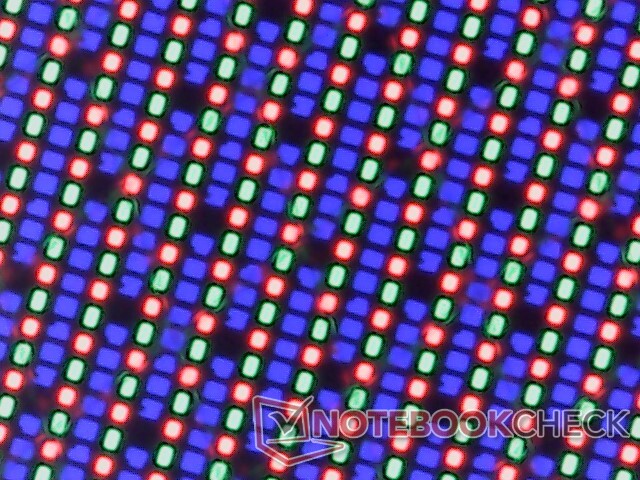
Jakość obrazu jest ostra, ale z zauważalnym ziarnem kolorów, które staje się bardziej widoczne podczas wyświetlania białych kolorów przy wysokich ustawieniach jasności. Opcja IPS może być lepsza dla osób, które nie potrzebują kolorów P3, gdyż częstotliwość odświeżania 120 Hz oferuje znacznie płynniejsze wrażenia.

| |||||||||||||||||||||||||
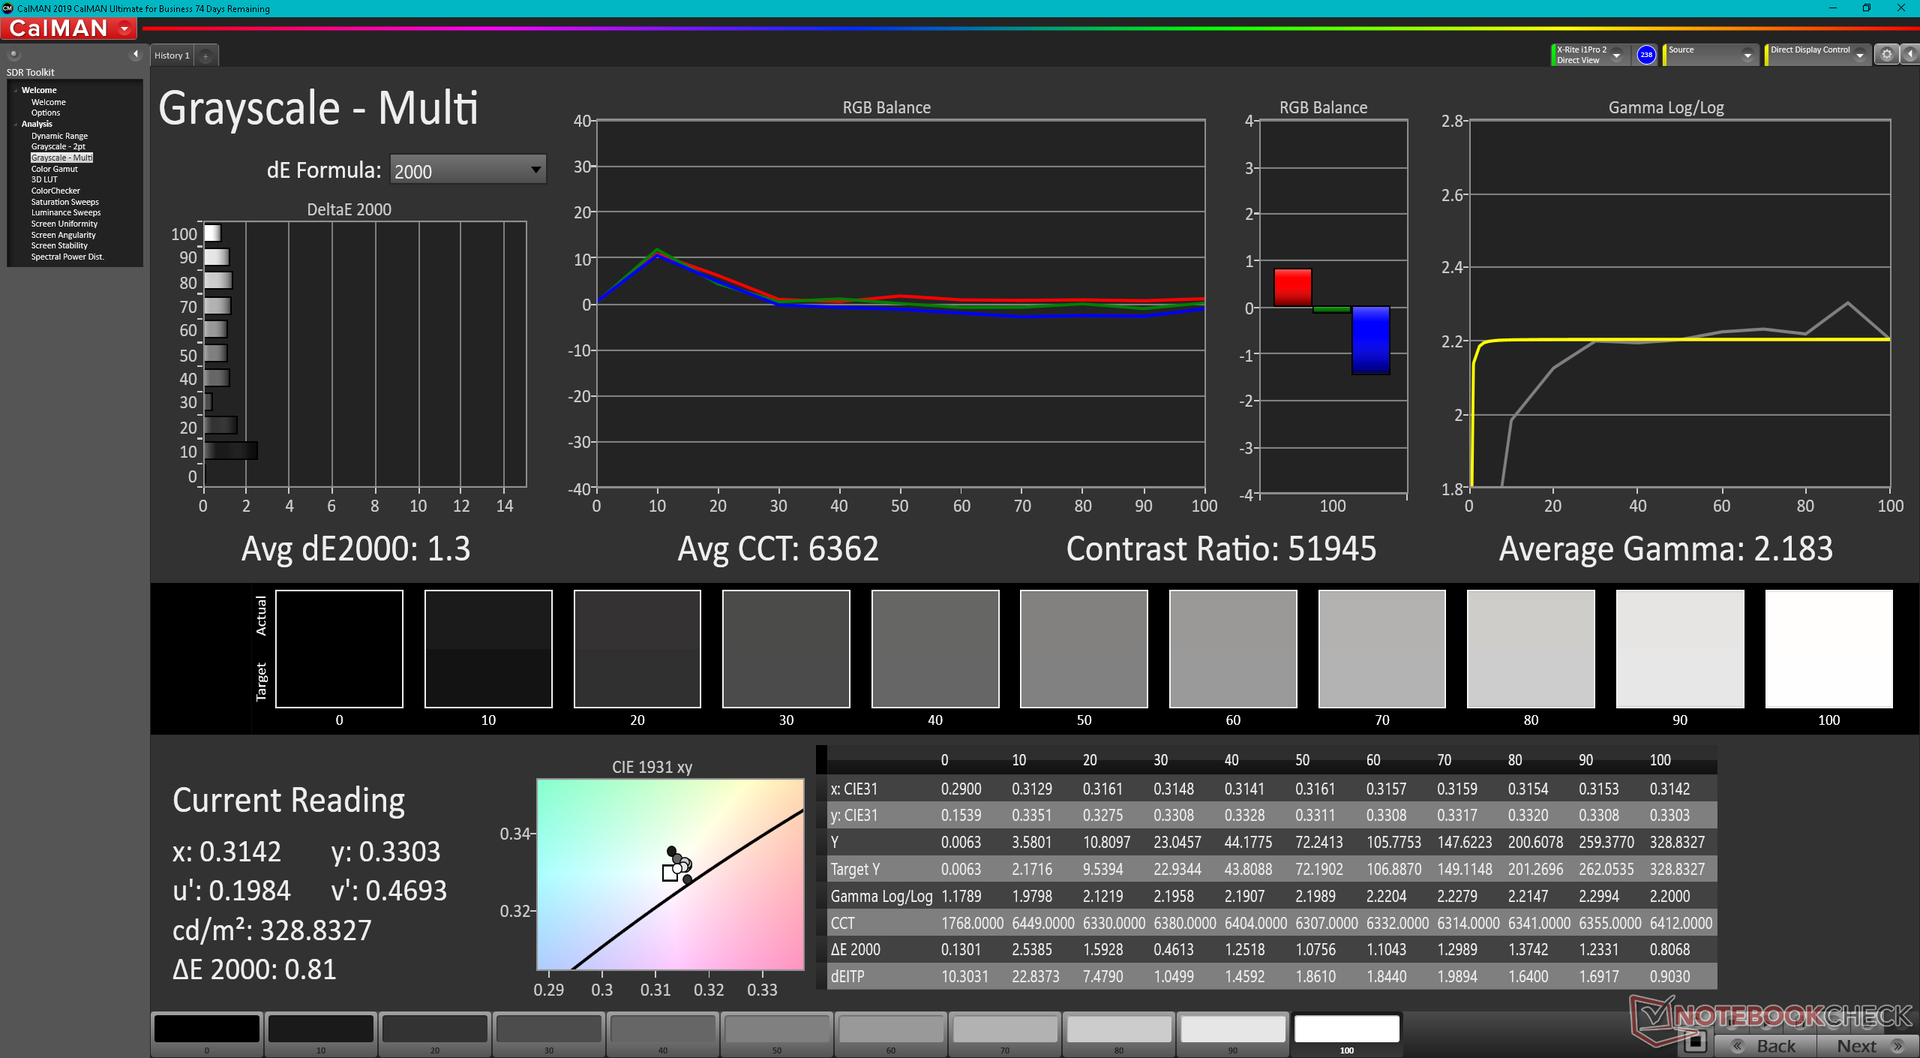
rozświetlenie: 97 %
na akumulatorze: 328.8 cd/m²
kontrast: ∞:1 (czerń: 0 cd/m²)
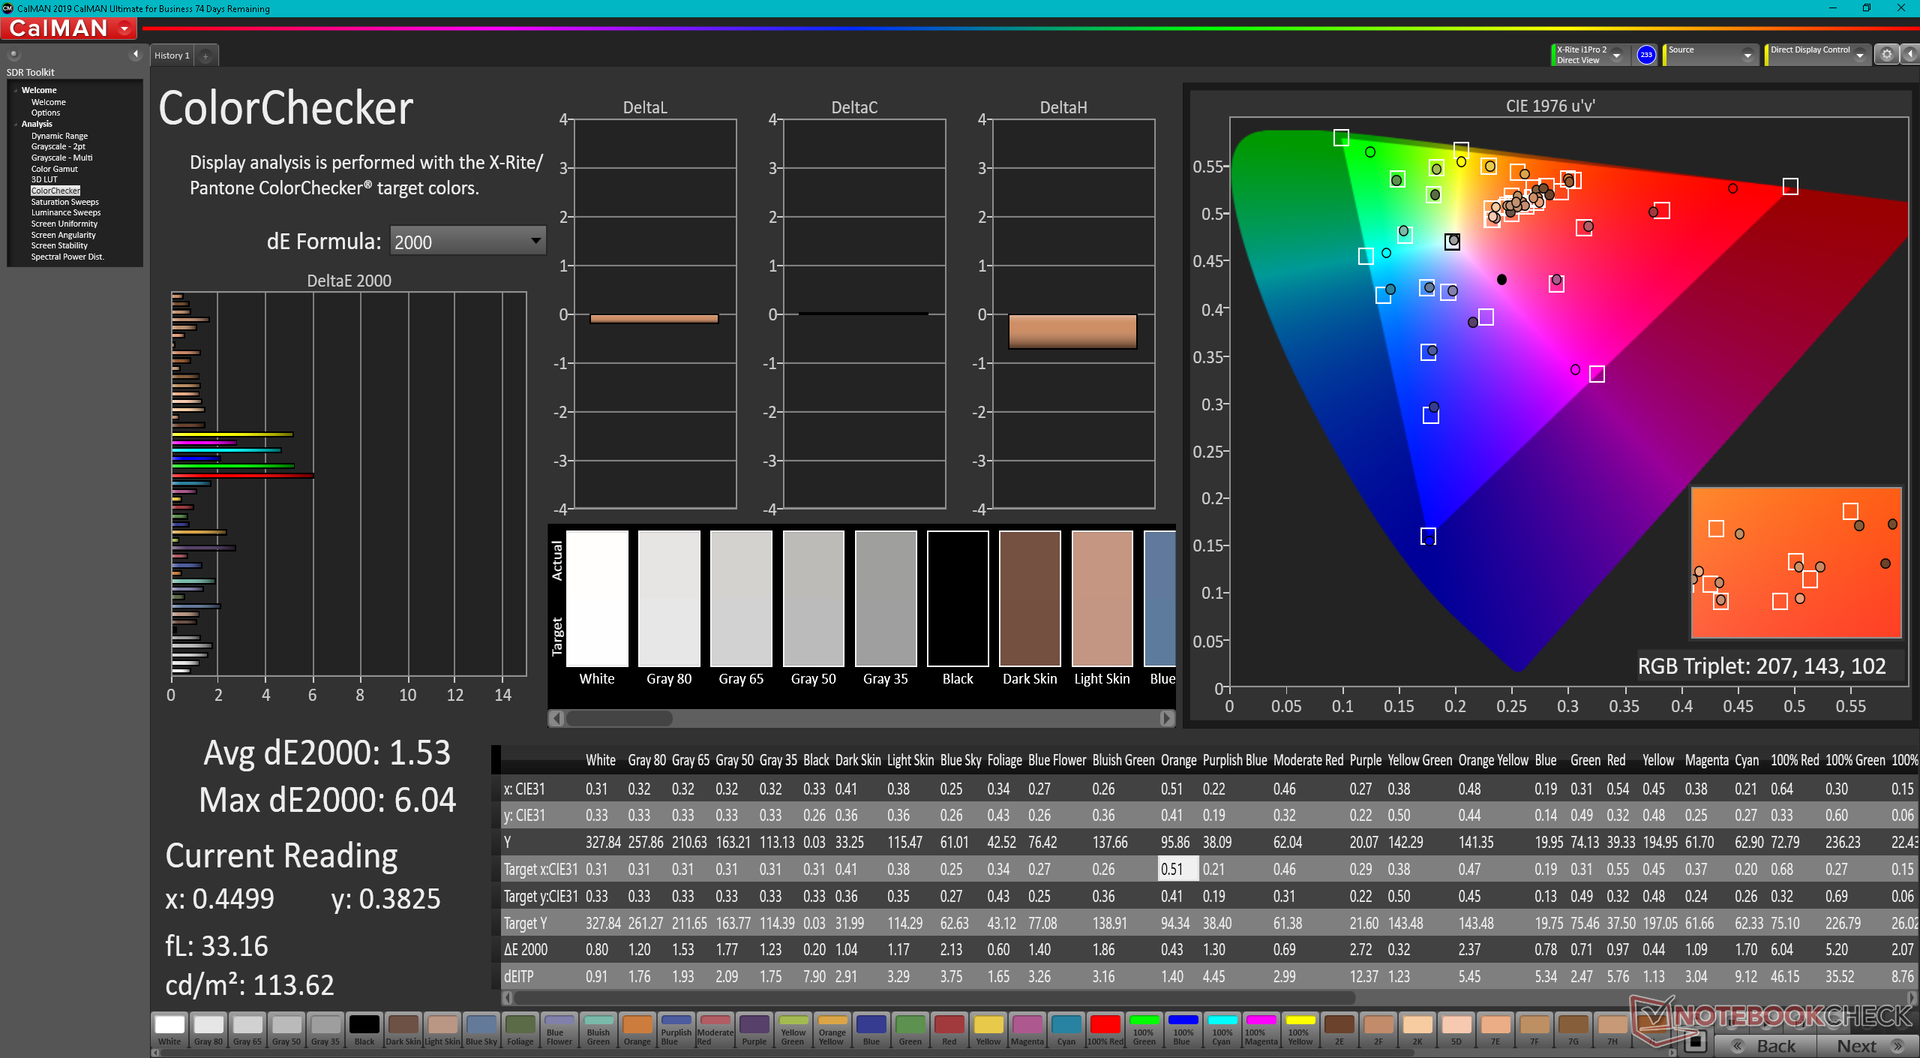
ΔE ColorChecker Calman: 1.53 | ∀{0.5-29.43 Ø4.71}
ΔE Greyscale Calman: 1.3 | ∀{0.09-98 Ø4.96}
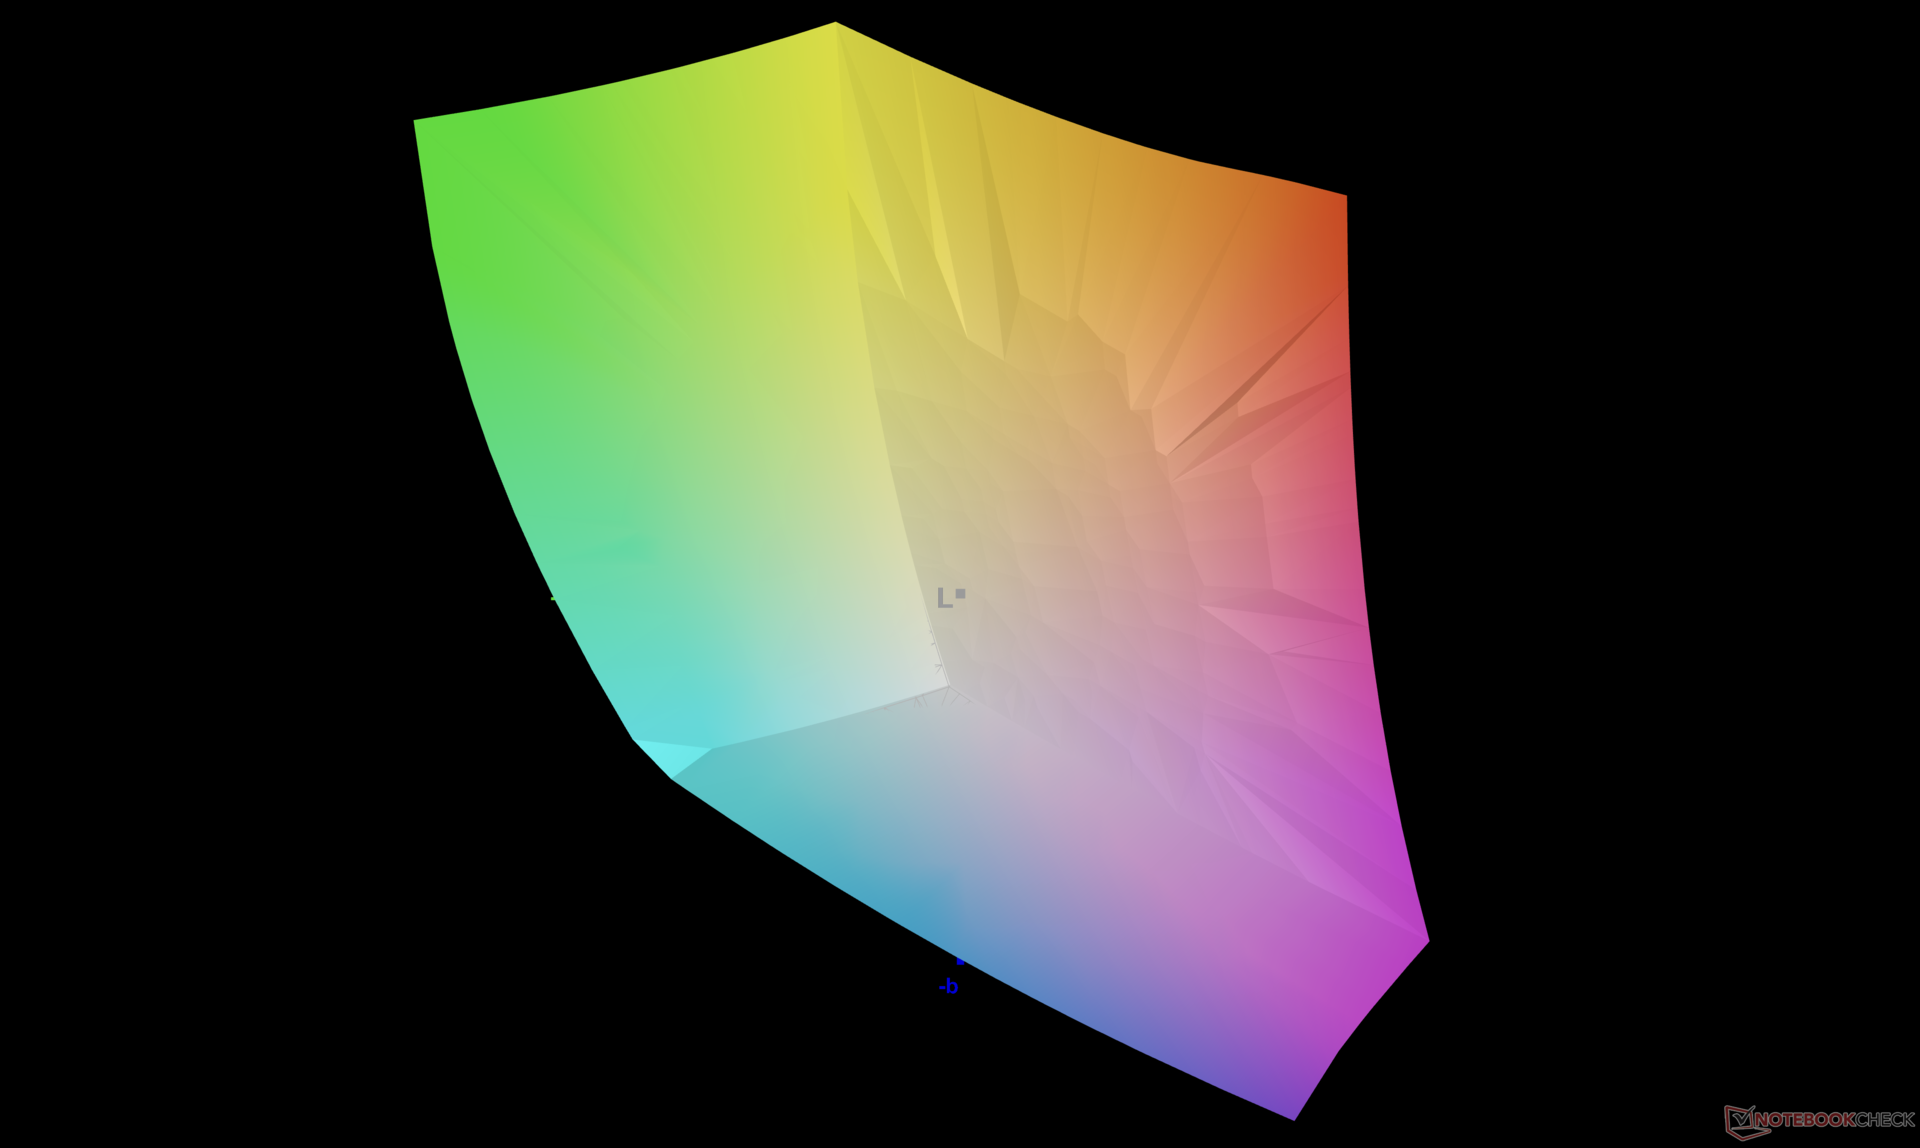
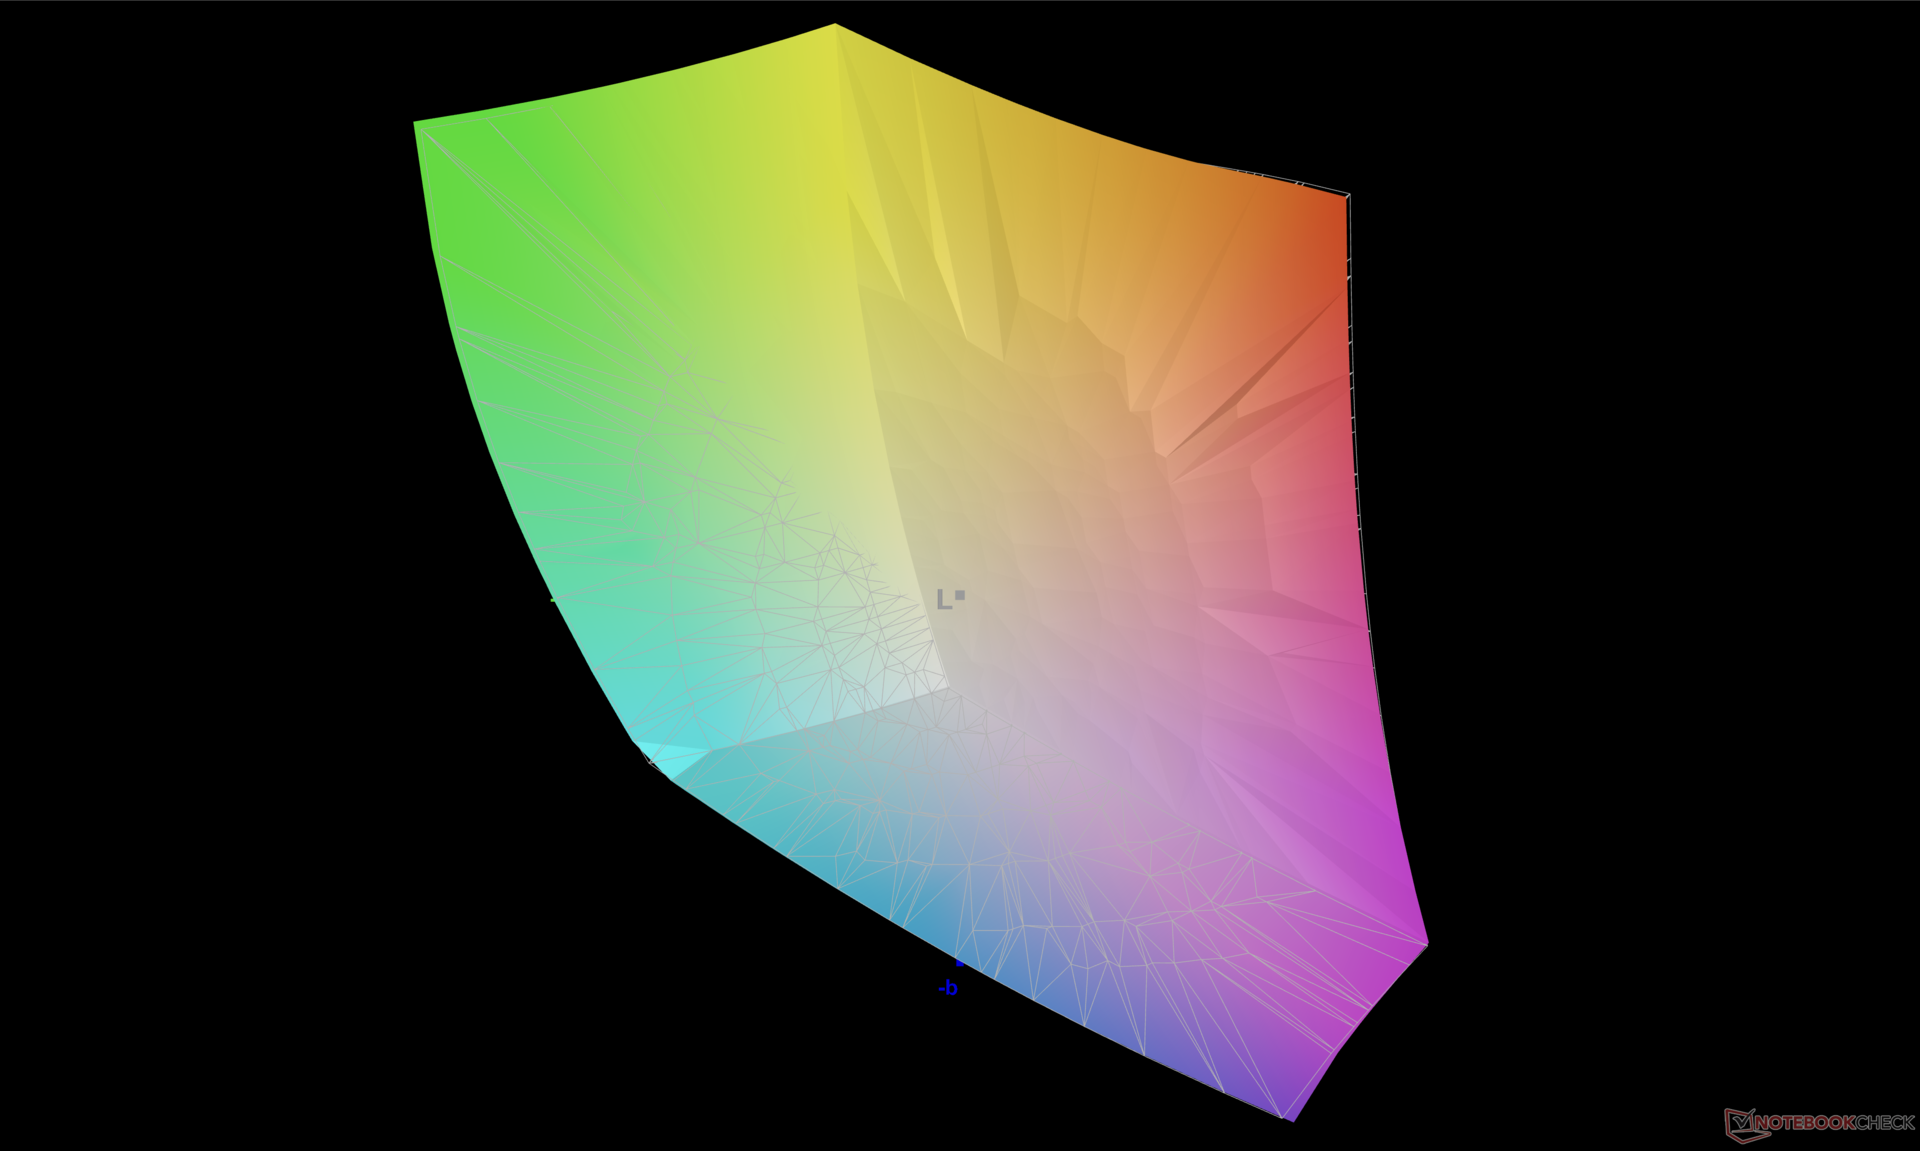
88% AdobeRGB 1998 (Argyll 3D)
100% sRGB (Argyll 3D)
99.3% Display P3 (Argyll 3D)
Gamma: 2.18
CCT: 6362 K
| HP Envy 16 h0112nr Samsung SDC4174, OLED, 3840x2400, 16" | Lenovo ThinkBook 16 G4+ IAP LEN160WQXGA, IPS, 2560x1600, 16" | MSI Creator Z16P B12UHST AUOD298, IPS True Pixel (~100% DCI-P3), 2560x1600, 16" | Dell Inspiron 16 Plus 7610-MHJ8F AU Optronics B160QAN, AUO9F91, IPS, 3072x1920, 16" | Apple MacBook Pro 16 2021 M1 Pro Liquid Retina XDR, Mini-LED, 3456x2234, 16.2" | Huawei MateBook 16s i7 BOE XS TV160DKT-NH0, IPS, 2520x1680, 16" | |
|---|---|---|---|---|---|---|
| Display | -17% | -1% | -13% | 0% | -21% | |
| Display P3 Coverage (%) | 99.3 | 69.6 -30% | 97.6 -2% | 75 -24% | 99.1 0% | 64.5 -35% |
| sRGB Coverage (%) | 100 | 97.5 -2% | 99.9 0% | 100 0% | 100 0% | 96.7 -3% |
| AdobeRGB 1998 Coverage (%) | 88 | 71.7 -19% | 86.8 -1% | 76 -14% | 88 0% | 66.6 -24% |
| Response Times | -1160% | -391% | -2092% | -3381% | -1403% | |
| Response Time Grey 50% / Grey 80% * (ms) | 2 ? | 32.7 ? -1535% | 12.9 ? -545% | 54 ? -2600% | 42.8 ? -2040% | 35.7 ? -1685% |
| Response Time Black / White * (ms) | 1.9 ? | 16.8 ? -784% | 6.4 ? -237% | 32 ? -1584% | 91.6 ? -4721% | 23.2 ? -1121% |
| PWM Frequency (Hz) | 240.4 ? | 14880 | ||||
| Screen | -36% | -17% | -37% | 15% | 13% | |
| Brightness middle (cd/m²) | 328.8 | 371 13% | 428 30% | 290 -12% | 514 56% | 311 -5% |
| Brightness (cd/m²) | 332 | 357 8% | 394 19% | 285 -14% | 497 50% | 319 -4% |
| Brightness Distribution (%) | 97 | 91 -6% | 86 -11% | 88 -9% | 95 -2% | 91 -6% |
| Black Level * (cd/m²) | 0.23 | 0.42 | 0.21 | 0.02 | 0.17 | |
| Colorchecker dE 2000 * | 1.53 | 2.6 -70% | 1.67 -9% | 2.57 -68% | 1.4 8% | 1 35% |
| Colorchecker dE 2000 max. * | 6.04 | 4.4 27% | 5.71 5% | 4.78 21% | 2.8 54% | 1.7 72% |
| Greyscale dE 2000 * | 1.3 | 3.7 -185% | 3.1 -138% | 3.14 -142% | 2.3 -77% | 1.5 -15% |
| Gamma | 2.18 101% | 2.32 95% | 2.195 100% | 2.34 94% | 2.27 97% | 2.15 102% |
| CCT | 6362 102% | 7271 89% | 6498 100% | 6408 101% | 6792 96% | 6432 101% |
| Contrast (:1) | 1613 | 1019 | 1381 | 25700 | 1829 | |
| Colorchecker dE 2000 calibrated * | 1.3 | 0.71 | 1.89 | 0.8 | ||
| Całkowita średnia (program / ustawienia) | -404% /
-235% | -136% /
-81% | -714% /
-404% | -1122% /
-607% | -470% /
-254% |
* ... im mniej tym lepiej
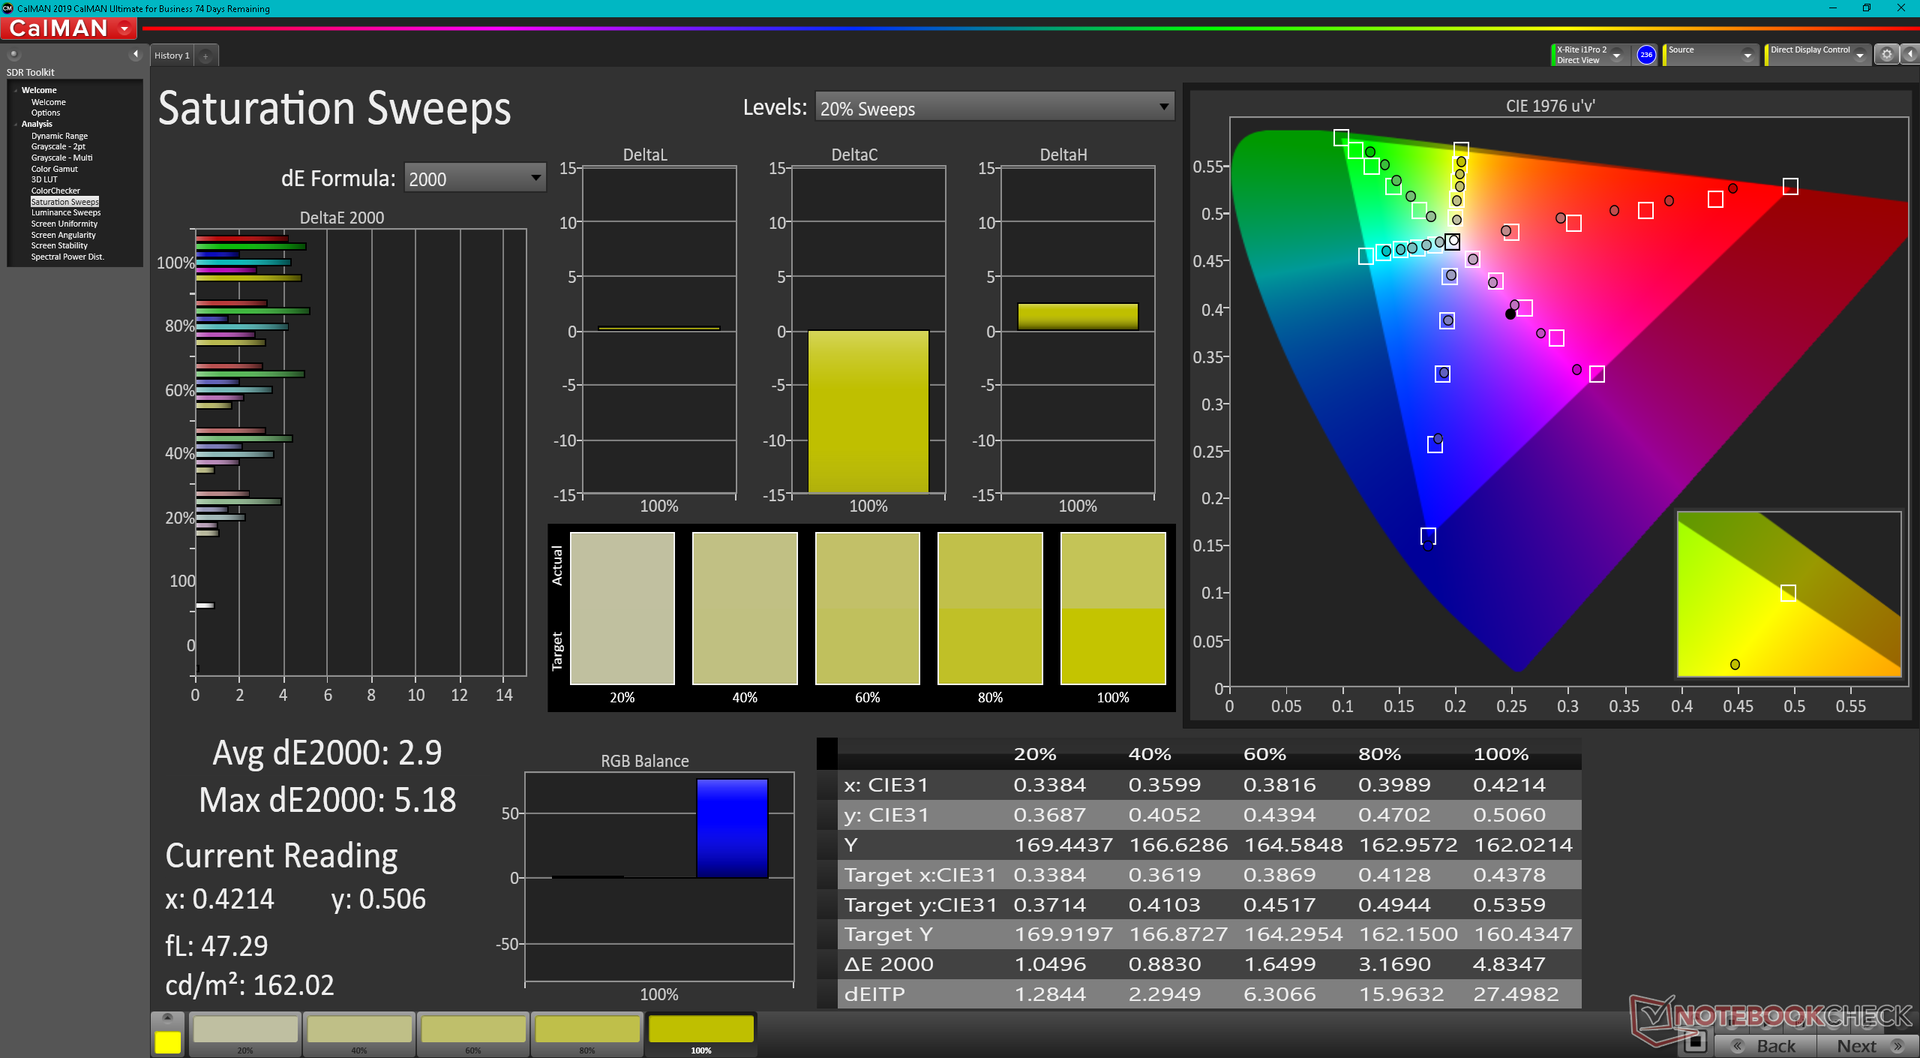
Panel jest po wyjęciu z pudełka skalibrowany względem standardu P3, a średnie wartości DeltaE dla skali szarości i kolorów wynoszą odpowiednio 1,3 i 1,53. Kolory wydają się być bardziej niedokładne przy wyższych poziomach nasycenia niż przy niższych.
Wyświetl czasy reakcji
| ↔ Czas reakcji od czerni do bieli | ||
|---|---|---|
| 1.9 ms ... wzrost ↗ i spadek ↘ łącznie | ↗ 0.8 ms wzrost |  |
| ↘ 1.1 ms upadek | ||
| W naszych testach ekran wykazuje bardzo szybką reakcję i powinien bardzo dobrze nadawać się do szybkich gier. Dla porównania, wszystkie testowane urządzenia wahają się od 0.1 (minimum) do 240 (maksimum) ms. » 11 % wszystkich urządzeń jest lepszych. Oznacza to, że zmierzony czas reakcji jest lepszy od średniej wszystkich testowanych urządzeń (19.8 ms). | ||
| ↔ Czas reakcji 50% szarości do 80% szarości | ||
| 2 ms ... wzrost ↗ i spadek ↘ łącznie | ↗ 1 ms wzrost |  |
| ↘ 1 ms upadek | ||
| W naszych testach ekran wykazuje bardzo szybką reakcję i powinien bardzo dobrze nadawać się do szybkich gier. Dla porównania, wszystkie testowane urządzenia wahają się od 0.165 (minimum) do 636 (maksimum) ms. » 10 % wszystkich urządzeń jest lepszych. Oznacza to, że zmierzony czas reakcji jest lepszy od średniej wszystkich testowanych urządzeń (31 ms). | ||
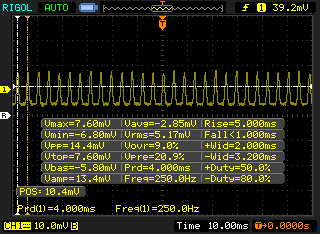
Migotanie ekranu / PWM (modulacja szerokości impulsu)
| Wykryto migotanie ekranu/wykryto PWM | 240.4 Hz | ≤ 100 % ustawienia jasności |  |
Podświetlenie wyświetlacza miga z częstotliwością 240.4 Hz (najgorszy przypadek, np. przy użyciu PWM) Wykryto migotanie przy ustawieniu jasności 100 % i poniżej. Powyżej tego ustawienia jasności nie powinno być żadnego migotania ani PWM. Częstotliwość 240.4 Hz jest stosunkowo niska, więc wrażliwi użytkownicy prawdopodobnie zauważą migotanie i odczują zmęczenie oczu przy podanym ustawieniu jasności i poniżej. Dla porównania: 52 % wszystkich testowanych urządzeń nie używa PWM do przyciemniania wyświetlacza. Jeśli wykryto PWM, zmierzono średnio 7757 (minimum: 5 - maksimum: 343500) Hz. | |||
Migotanie lub modulacja szerokości impulsu jest obecna na wszystkich poziomach jasności, podobnie jak w przypadku paneli OLED dla najnowszych Asus VivoBook lub ZenBook. Częstotliwość wynosi 240,4 Hz od 0 do 40 procent jasności i 60 Hz od 41 do 100 procent jasności.

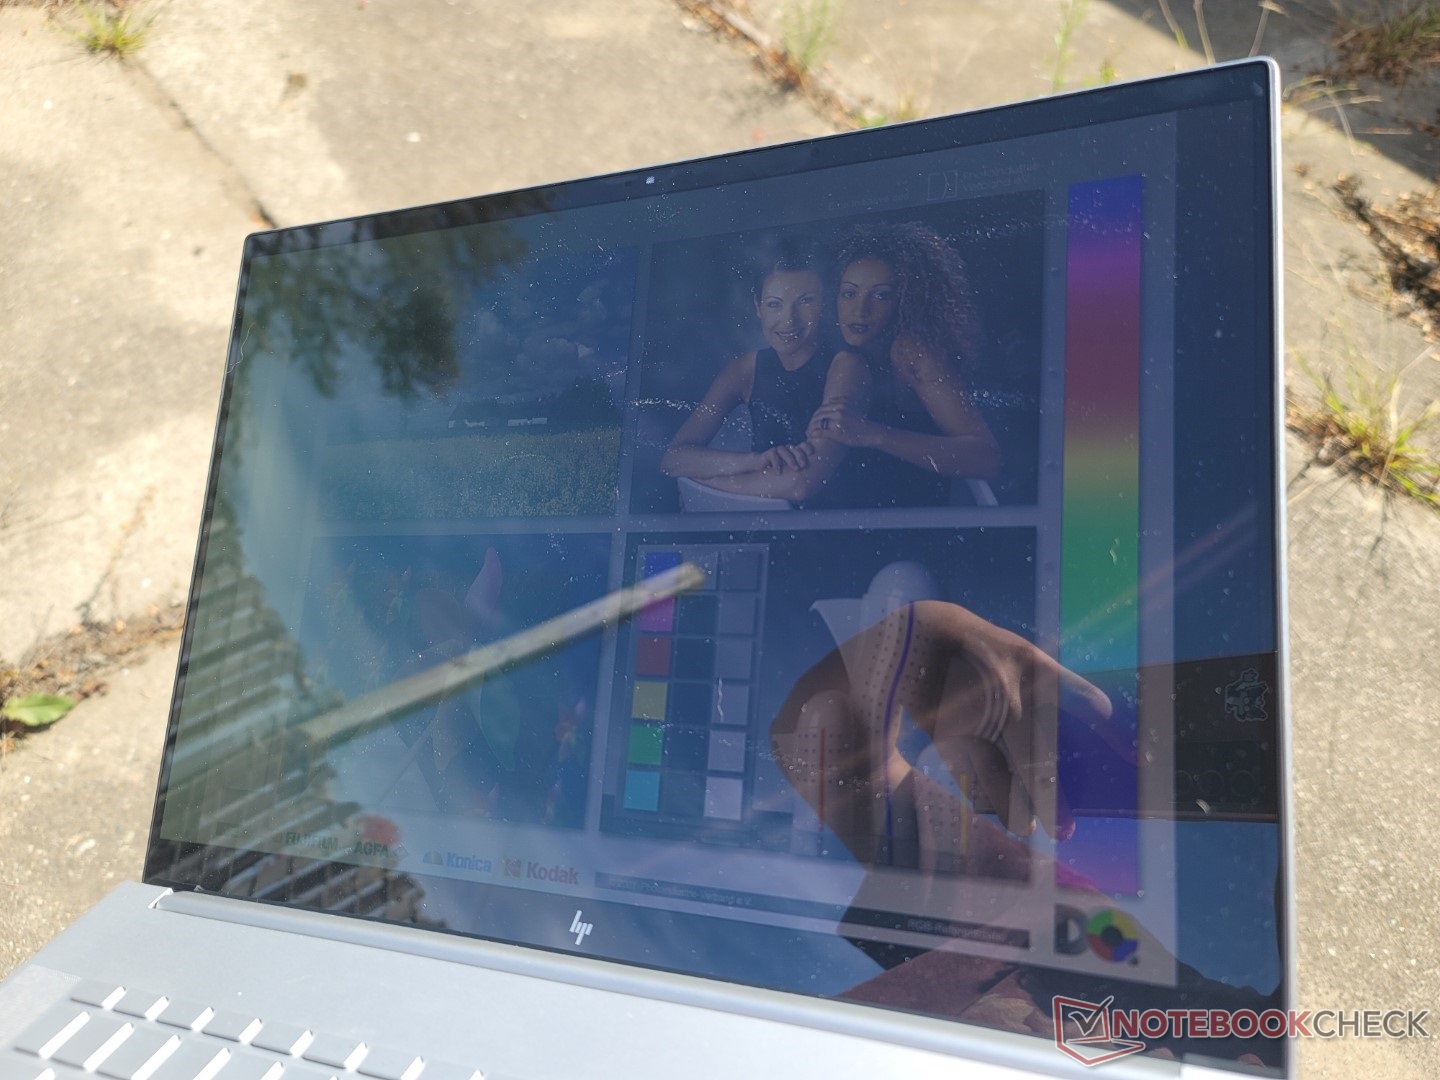
Odblaski są nieuniknione w większości warunków zewnętrznych. Błyszczący wyświetlacz nie jest prawie tak jasny jak wyświetlacz w MacBooku Pro 16. Przy nieco ponad 320 nitach maksymalnych jest to jeden z najciemniejszych paneli OLED na rynku.
Wydajność - Intel 12th Gen Core H
Warunki badania
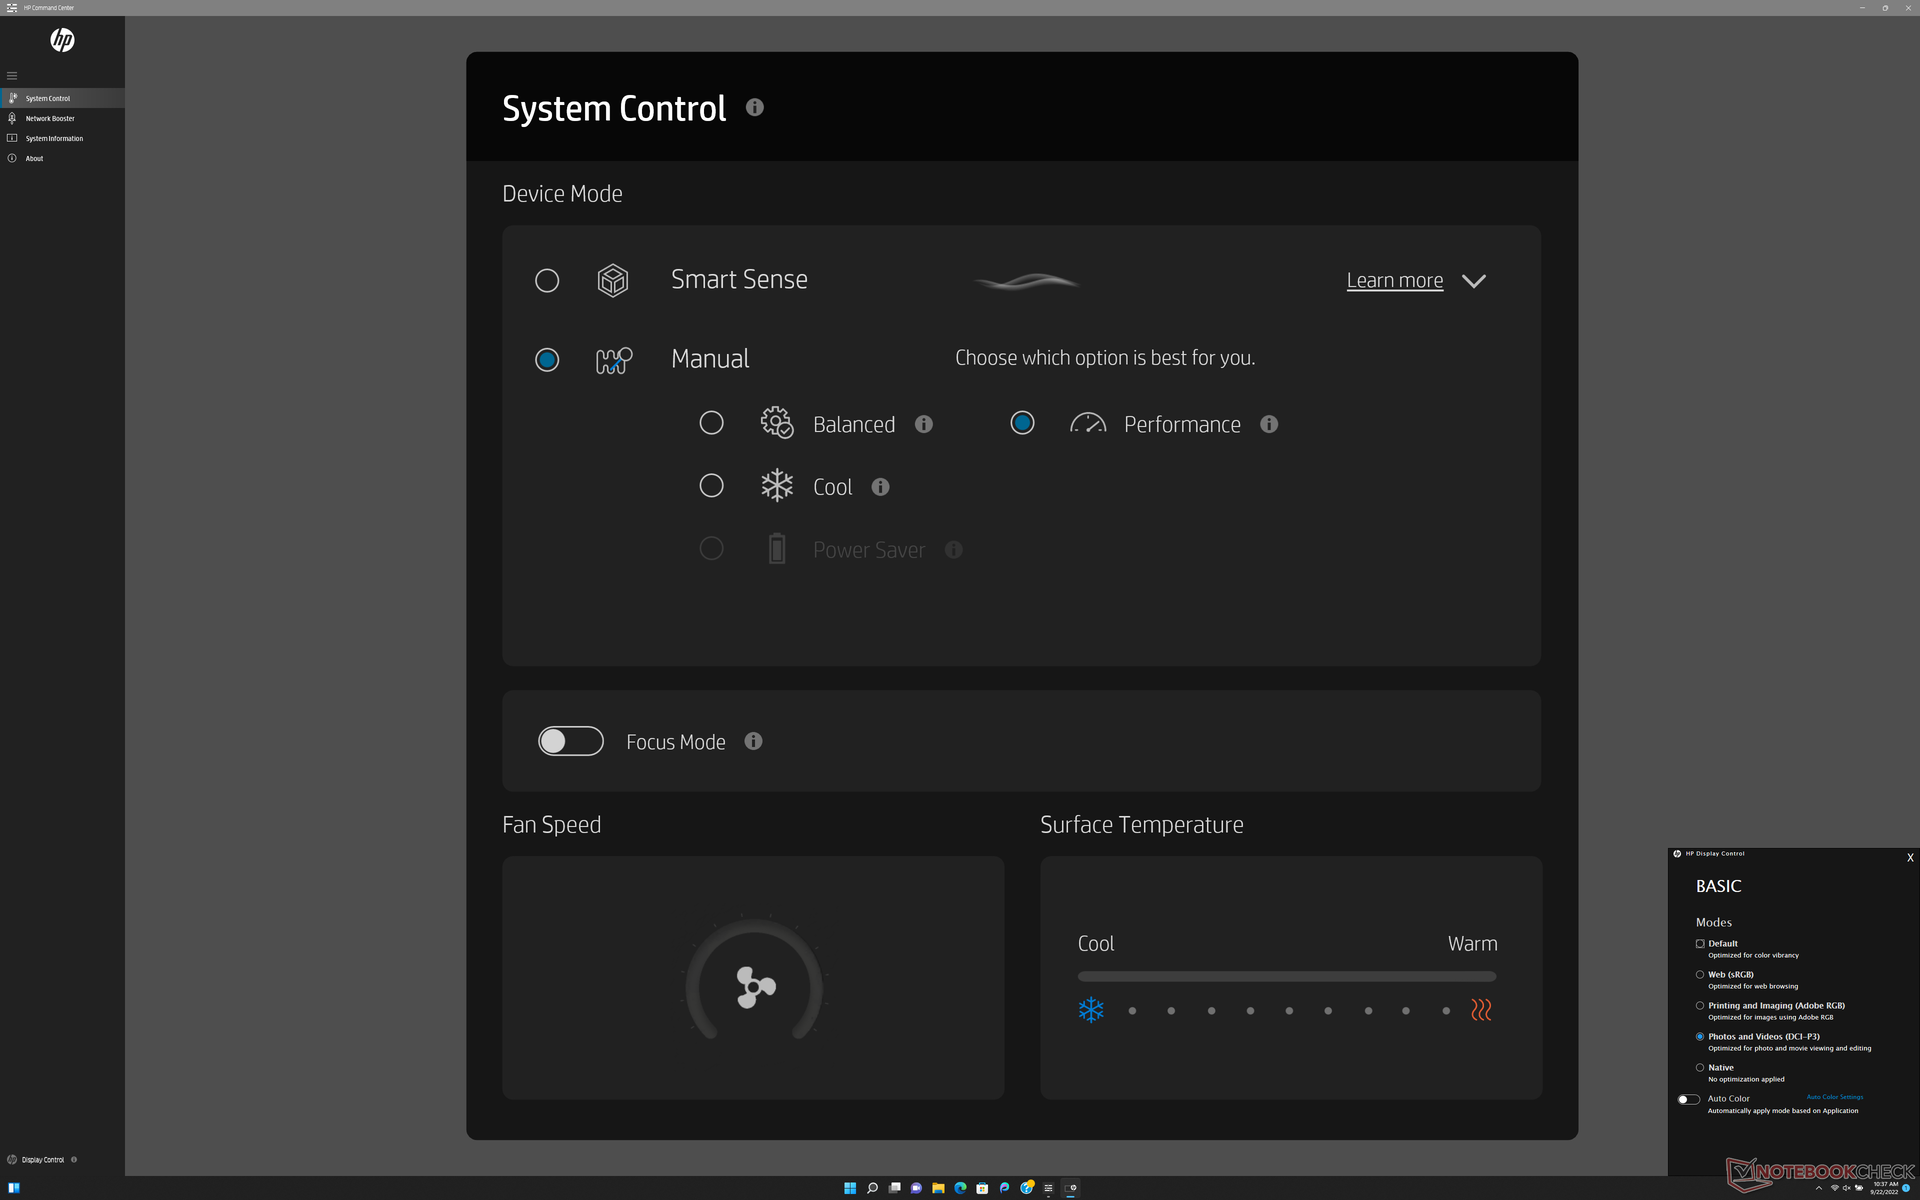
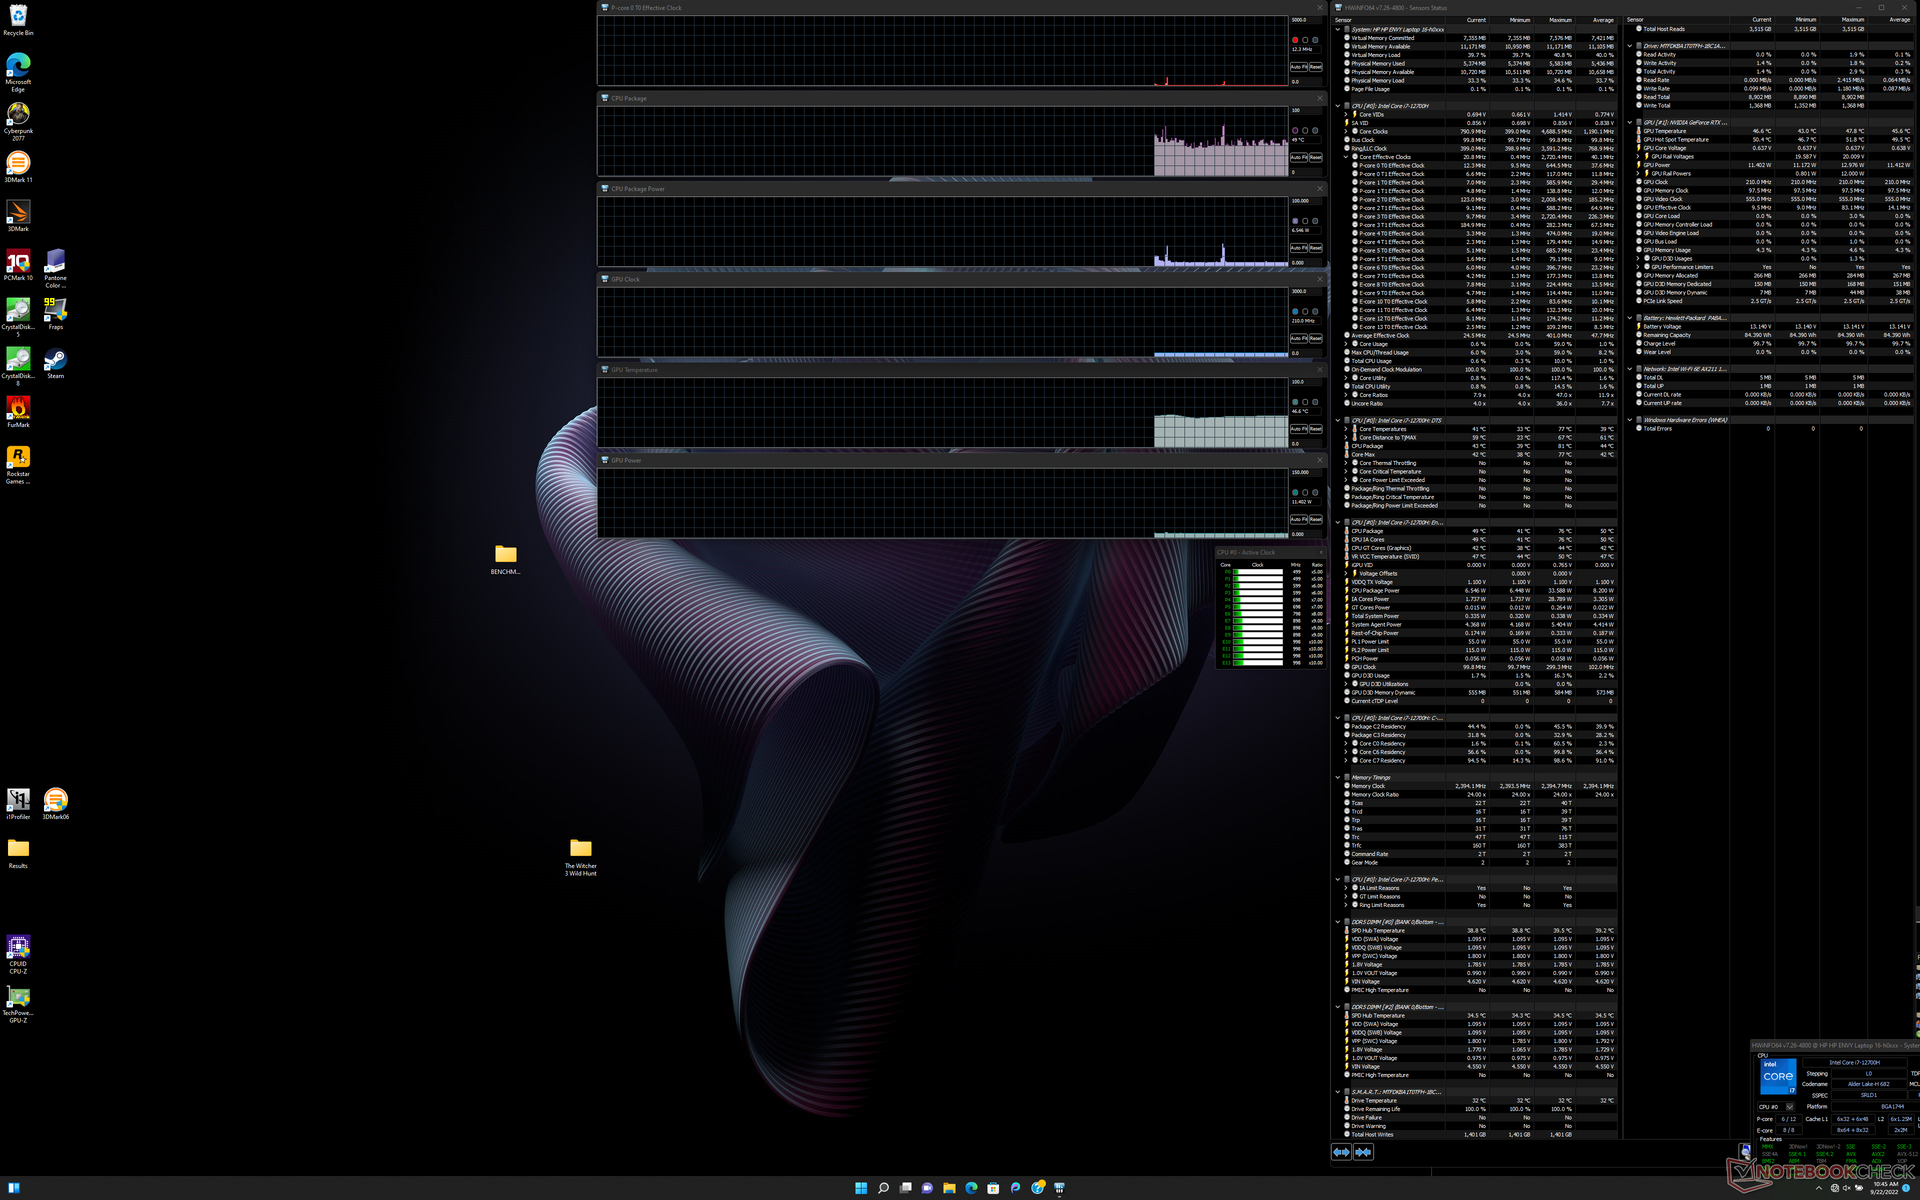
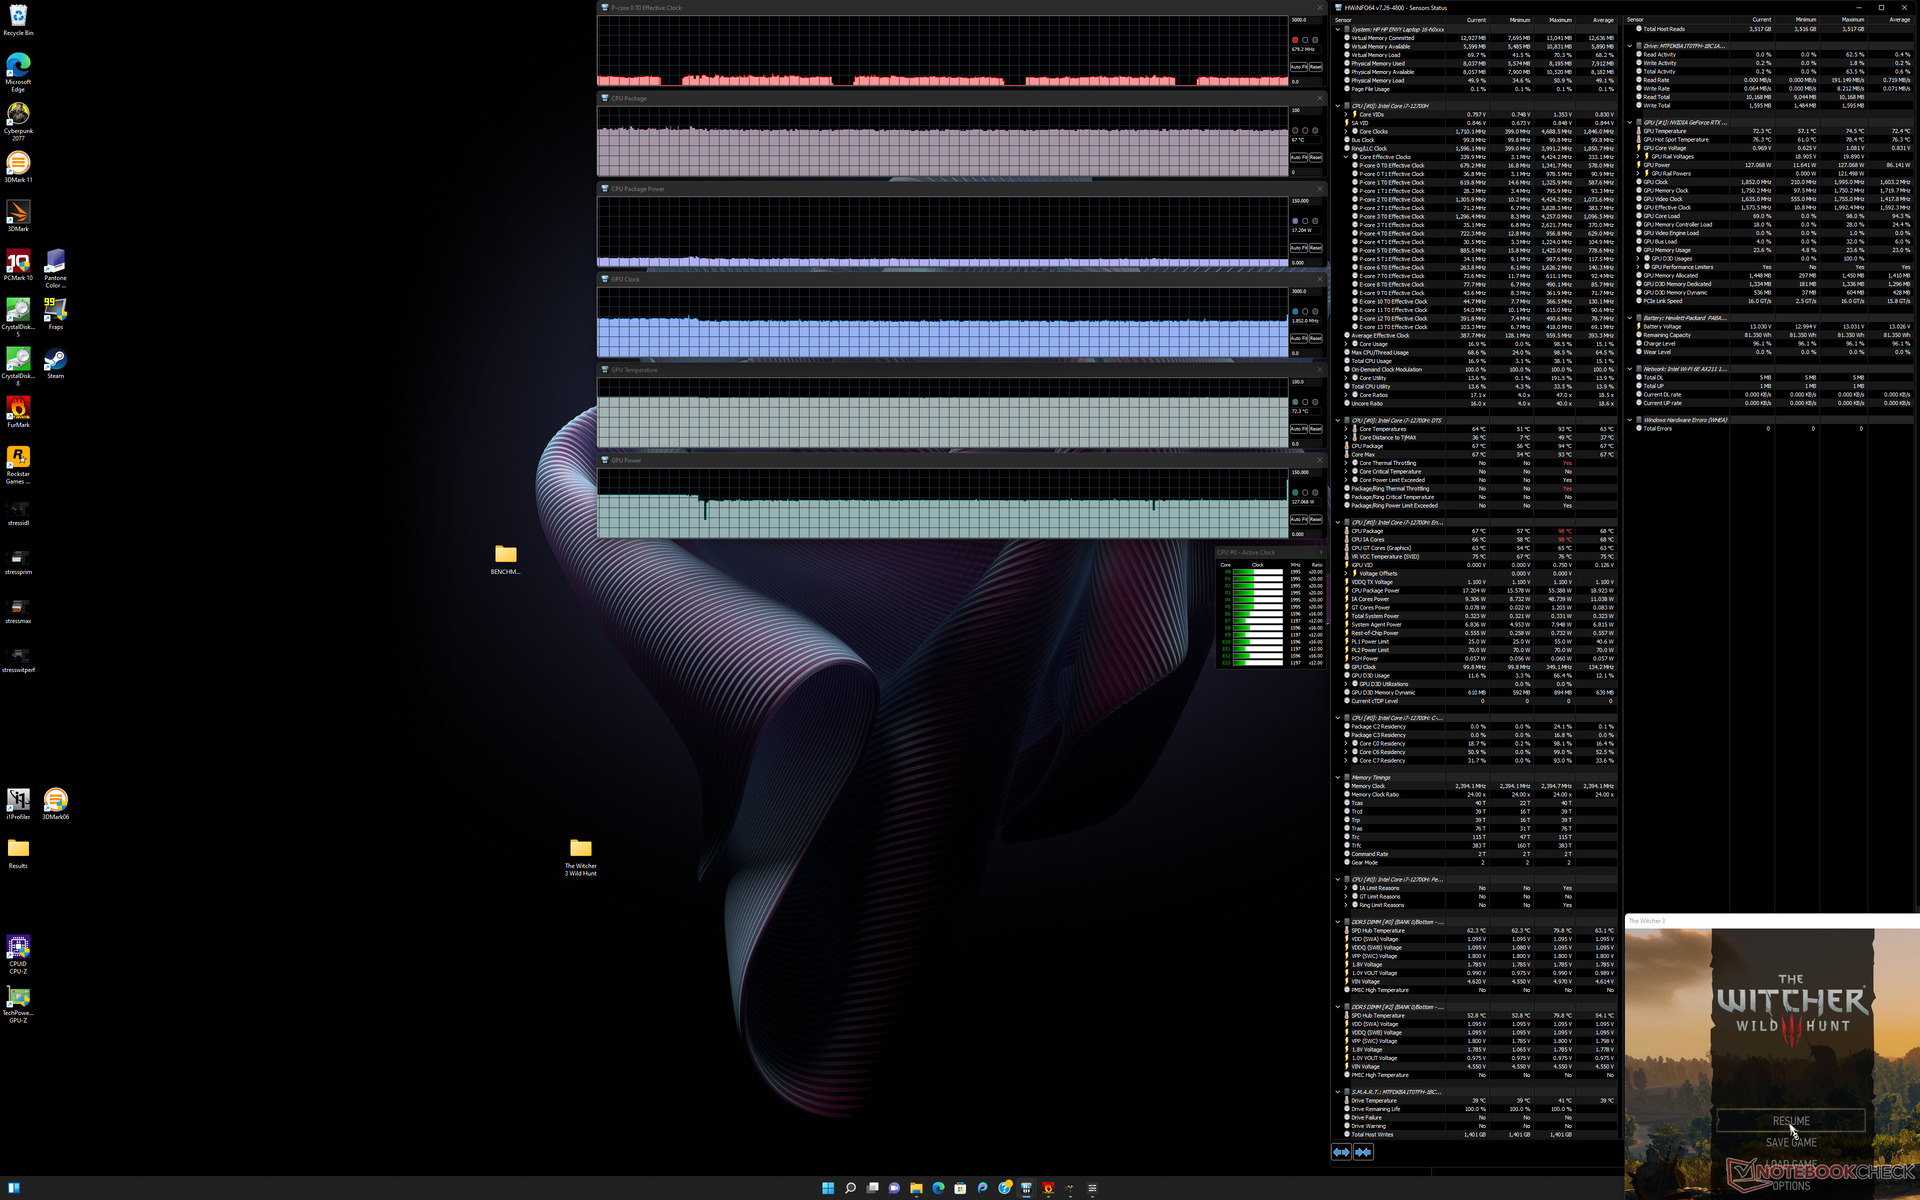
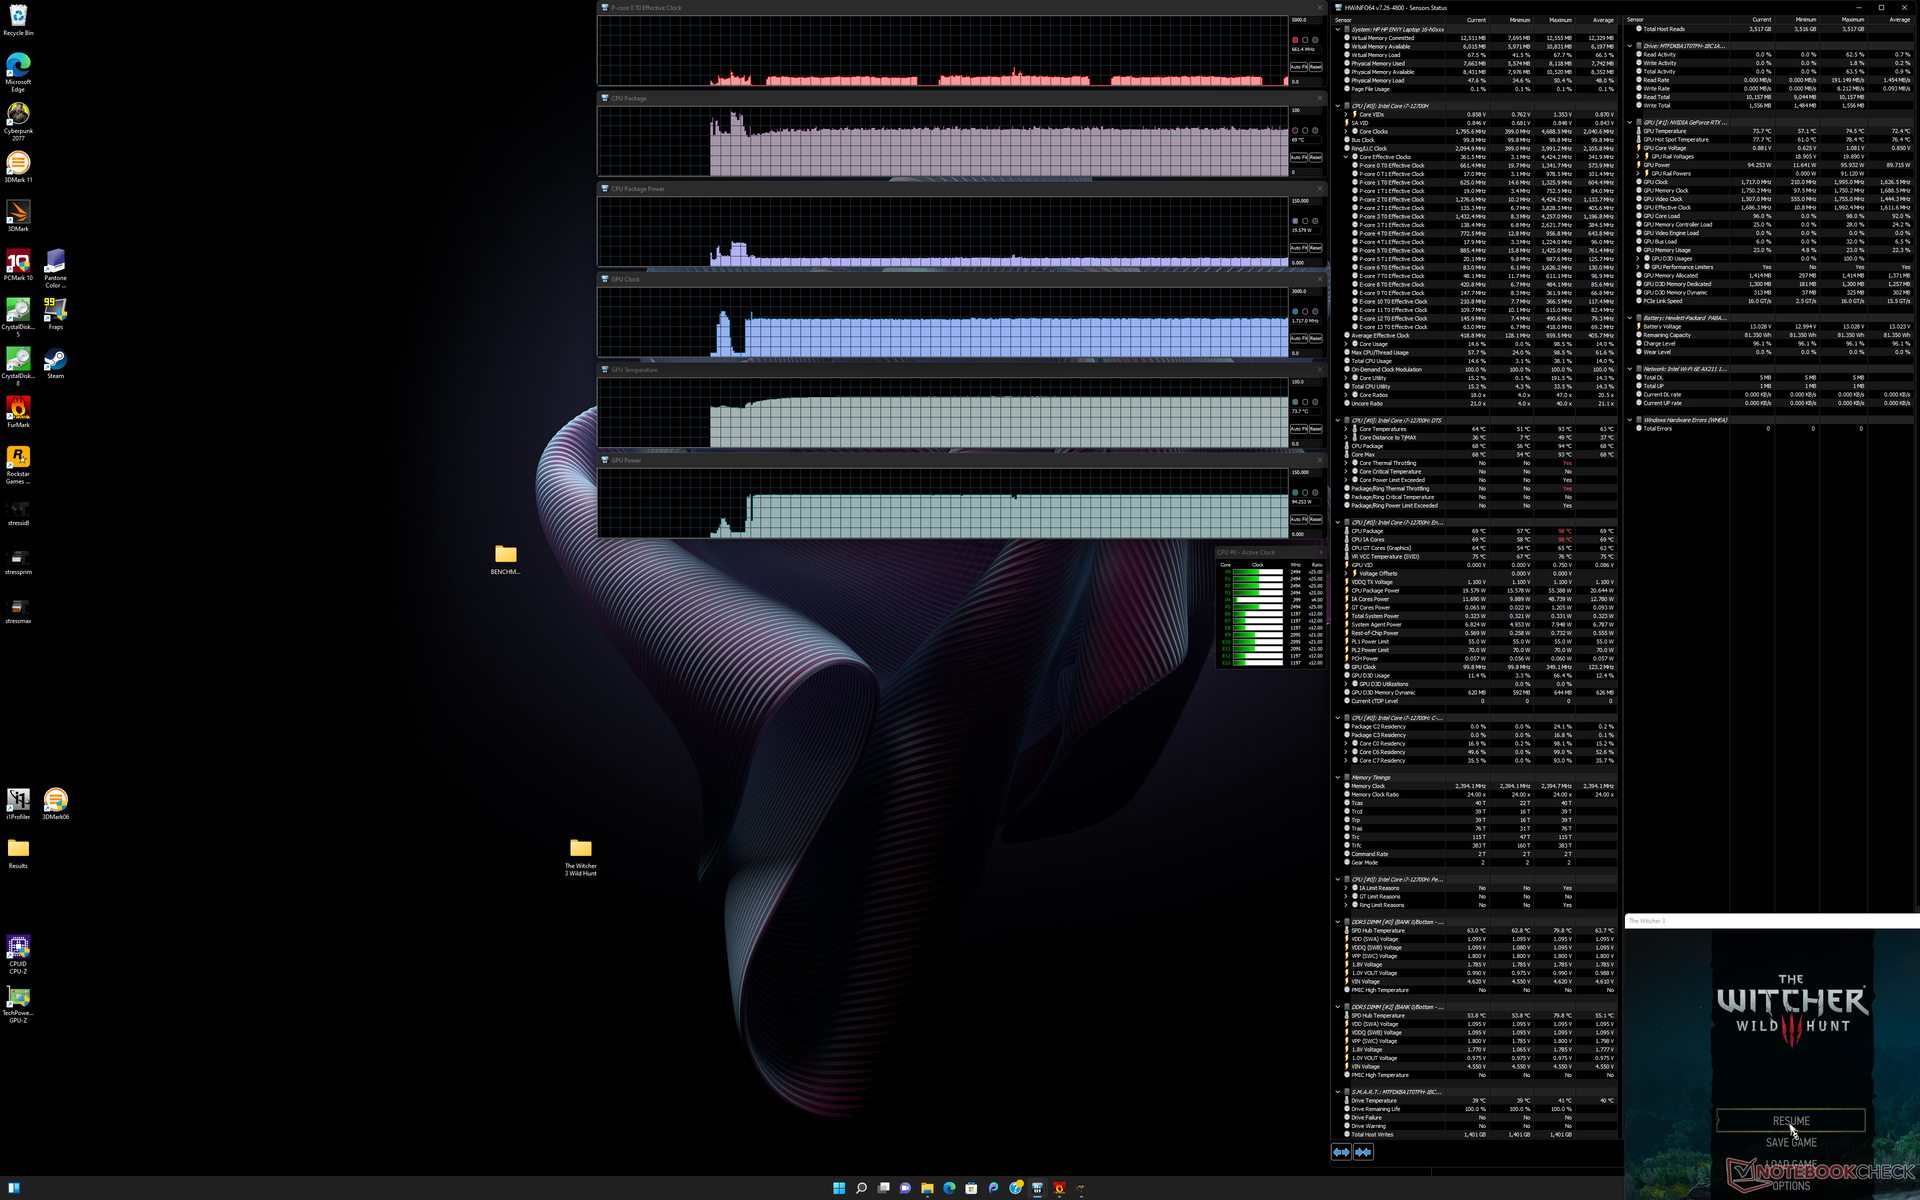
Przed uruchomieniem poniższych benchmarków ustawiliśmy nasze urządzenie w trybie Performance zarówno przez system Windows jak i oprogramowanie HP Command Center. HP Command Center to centrum kontroli profili zasilania i kolorów wyświetlania, jak widać na poniższym zrzucie ekranu.
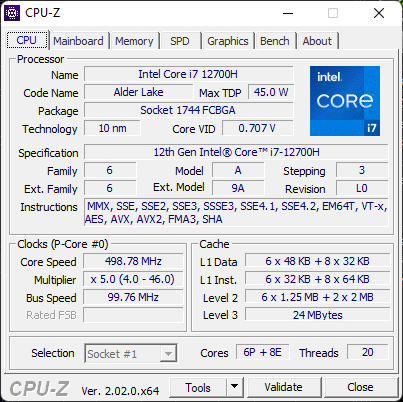
Procesor
Wydajność wielowątkowa jest o około 15 procent wolniejsza od przeciętnego laptopa z naszej bazy danych wyposażonego w ten sam Core i7-12700H CPU. Na przykład Lenovo Legion Slim 7 16 jest w stanie uruchomić ten sam procesor szybciej nawet po uwzględnieniu ewentualnego throttlingu. Mimo to wydajność jest wciąż znacznie lepsza od 10. gen.Core i7-10750H w Envy 15 z 2020 roku o około 60 procent
Aktualizacja do Core i9-12900H Ma zwiększyć wydajność wielowątkową nawet o 30-40% w stosunku do jednostki SKU Core i7-12700H.
Cinebench R15 Multi Loop
Cinebench R23: Multi Core | Single Core
Cinebench R15: CPU Multi 64Bit | CPU Single 64Bit
Blender: v2.79 BMW27 CPU
7-Zip 18.03: 7z b 4 | 7z b 4 -mmt1
Geekbench 5.5: Multi-Core | Single-Core
HWBOT x265 Benchmark v2.2: 4k Preset
LibreOffice : 20 Documents To PDF
R Benchmark 2.5: Overall mean
| Cinebench R20 / CPU (Multi Core) | |
| MSI GE67 HX 12UGS | |
| MSI Creator Z16P B12UHST | |
| Przeciętny Intel Core i7-12700H (1576 - 7407, n=64) | |
| Lenovo Legion 7 16ARHA7 | |
| Asus ROG Flow X16 GV601RW-M5082W | |
| HP Envy 16 h0112nr | |
| HP Omen 16-c0077ng | |
| Schenker XMG Apex 15 Max | |
| Dell Inspiron 16 Plus 7610-MHJ8F | |
| Lenovo Legion C7 15IMH05 82EH0030GE | |
| Lenovo ThinkPad X1 Nano Gen 2 Core i7-1280P | |
| Asus ProArt StudioBook Pro 15 W500G5T | |
| HP Envy 15-ep0098nr | |
| Apple MacBook Pro 16 2021 M1 Pro | |
| Cinebench R20 / CPU (Single Core) | |
| MSI Creator Z16P B12UHST | |
| HP Envy 16 h0112nr | |
| Przeciętny Intel Core i7-12700H (300 - 704, n=64) | |
| MSI GE67 HX 12UGS | |
| Lenovo ThinkPad X1 Nano Gen 2 Core i7-1280P | |
| Lenovo Legion 7 16ARHA7 | |
| Asus ROG Flow X16 GV601RW-M5082W | |
| Dell Inspiron 16 Plus 7610-MHJ8F | |
| Schenker XMG Apex 15 Max | |
| HP Omen 16-c0077ng | |
| Lenovo Legion C7 15IMH05 82EH0030GE | |
| Asus ProArt StudioBook Pro 15 W500G5T | |
| HP Envy 15-ep0098nr | |
| Apple MacBook Pro 16 2021 M1 Pro | |
| Cinebench R23 / Multi Core | |
| MSI GE67 HX 12UGS | |
| MSI Creator Z16P B12UHST | |
| Przeciętny Intel Core i7-12700H (4032 - 19330, n=64) | |
| Lenovo Legion 7 16ARHA7 | |
| Asus ROG Flow X16 GV601RW-M5082W | |
| HP Envy 16 h0112nr | |
| Apple MacBook Pro 16 2021 M1 Pro | |
| HP Omen 16-c0077ng | |
| Dell Inspiron 16 Plus 7610-MHJ8F | |
| Schenker XMG Apex 15 Max | |
| Lenovo Legion C7 15IMH05 82EH0030GE | |
| Lenovo ThinkPad X1 Nano Gen 2 Core i7-1280P | |
| Cinebench R23 / Single Core | |
| MSI Creator Z16P B12UHST | |
| MSI GE67 HX 12UGS | |
| HP Envy 16 h0112nr | |
| Przeciętny Intel Core i7-12700H (778 - 1826, n=63) | |
| Lenovo ThinkPad X1 Nano Gen 2 Core i7-1280P | |
| Lenovo Legion 7 16ARHA7 | |
| Apple MacBook Pro 16 2021 M1 Pro | |
| Asus ROG Flow X16 GV601RW-M5082W | |
| Dell Inspiron 16 Plus 7610-MHJ8F | |
| Schenker XMG Apex 15 Max | |
| HP Omen 16-c0077ng | |
| Lenovo Legion C7 15IMH05 82EH0030GE | |
| Cinebench R15 / CPU Multi 64Bit | |
| MSI GE67 HX 12UGS | |
| MSI Creator Z16P B12UHST | |
| HP Envy 16 h0112nr | |
| Przeciętny Intel Core i7-12700H (1379 - 2916, n=70) | |
| Lenovo Legion 7 16ARHA7 | |
| Asus ROG Flow X16 GV601RW-M5082W | |
| Lenovo ThinkPad X1 Nano Gen 2 Core i7-1280P | |
| HP Omen 16-c0077ng | |
| Dell Inspiron 16 Plus 7610-MHJ8F | |
| Schenker XMG Apex 15 Max | |
| Apple MacBook Pro 16 2021 M1 Pro | |
| Lenovo Legion C7 15IMH05 82EH0030GE | |
| HP Envy 15-ep0098nr | |
| Asus ProArt StudioBook Pro 15 W500G5T | |
| Cinebench R15 / CPU Single 64Bit | |
| MSI Creator Z16P B12UHST | |
| MSI GE67 HX 12UGS | |
| HP Envy 16 h0112nr | |
| Przeciętny Intel Core i7-12700H (113 - 263, n=65) | |
| Lenovo Legion 7 16ARHA7 | |
| Schenker XMG Apex 15 Max | |
| Asus ROG Flow X16 GV601RW-M5082W | |
| Lenovo ThinkPad X1 Nano Gen 2 Core i7-1280P | |
| HP Omen 16-c0077ng | |
| Dell Inspiron 16 Plus 7610-MHJ8F | |
| Apple MacBook Pro 16 2021 M1 Pro | |
| Lenovo Legion C7 15IMH05 82EH0030GE | |
| HP Envy 15-ep0098nr | |
| Asus ProArt StudioBook Pro 15 W500G5T | |
| Blender / v2.79 BMW27 CPU | |
| Asus ProArt StudioBook Pro 15 W500G5T | |
| HP Envy 15-ep0098nr | |
| Lenovo Legion C7 15IMH05 82EH0030GE | |
| Dell Inspiron 16 Plus 7610-MHJ8F | |
| Lenovo ThinkPad X1 Nano Gen 2 Core i7-1280P | |
| Schenker XMG Apex 15 Max | |
| HP Omen 16-c0077ng | |
| HP Envy 16 h0112nr | |
| Przeciętny Intel Core i7-12700H (168 - 732, n=63) | |
| Asus ROG Flow X16 GV601RW-M5082W | |
| Lenovo Legion 7 16ARHA7 | |
| MSI Creator Z16P B12UHST | |
| Apple MacBook Pro 16 2021 M1 Pro | |
| MSI GE67 HX 12UGS | |
| 7-Zip 18.03 / 7z b 4 | |
| MSI GE67 HX 12UGS | |
| MSI Creator Z16P B12UHST | |
| Schenker XMG Apex 15 Max | |
| Lenovo Legion 7 16ARHA7 | |
| Asus ROG Flow X16 GV601RW-M5082W | |
| Przeciętny Intel Core i7-12700H (22844 - 73067, n=63) | |
| HP Envy 16 h0112nr | |
| Lenovo ThinkPad X1 Nano Gen 2 Core i7-1280P | |
| Lenovo Legion C7 15IMH05 82EH0030GE | |
| Dell Inspiron 16 Plus 7610-MHJ8F | |
| Asus ProArt StudioBook Pro 15 W500G5T | |
| HP Envy 15-ep0098nr | |
| 7-Zip 18.03 / 7z b 4 -mmt1 | |
| Schenker XMG Apex 15 Max | |
| MSI Creator Z16P B12UHST | |
| HP Envy 16 h0112nr | |
| Asus ROG Flow X16 GV601RW-M5082W | |
| Lenovo Legion 7 16ARHA7 | |
| Przeciętny Intel Core i7-12700H (2743 - 5972, n=63) | |
| MSI GE67 HX 12UGS | |
| Lenovo ThinkPad X1 Nano Gen 2 Core i7-1280P | |
| HP Omen 16-c0077ng | |
| Lenovo Legion C7 15IMH05 82EH0030GE | |
| Dell Inspiron 16 Plus 7610-MHJ8F | |
| Asus ProArt StudioBook Pro 15 W500G5T | |
| HP Envy 15-ep0098nr | |
| Geekbench 5.5 / Multi-Core | |
| MSI Creator Z16P B12UHST | |
| MSI GE67 HX 12UGS | |
| HP Envy 16 h0112nr | |
| Apple MacBook Pro 16 2021 M1 Pro | |
| Przeciętny Intel Core i7-12700H (5144 - 13745, n=64) | |
| Lenovo ThinkPad X1 Nano Gen 2 Core i7-1280P | |
| Lenovo Legion 7 16ARHA7 | |
| Asus ROG Flow X16 GV601RW-M5082W | |
| Schenker XMG Apex 15 Max | |
| Lenovo Legion C7 15IMH05 82EH0030GE | |
| Dell Inspiron 16 Plus 7610-MHJ8F | |
| Dell Inspiron 16 Plus 7610-MHJ8F | |
| Dell Inspiron 16 Plus 7610-MHJ8F | |
| HP Omen 16-c0077ng | |
| HP Envy 15-ep0098nr | |
| Asus ProArt StudioBook Pro 15 W500G5T | |
| Geekbench 5.5 / Single-Core | |
| MSI Creator Z16P B12UHST | |
| Lenovo ThinkPad X1 Nano Gen 2 Core i7-1280P | |
| HP Envy 16 h0112nr | |
| Apple MacBook Pro 16 2021 M1 Pro | |
| MSI GE67 HX 12UGS | |
| Przeciętny Intel Core i7-12700H (803 - 1851, n=64) | |
| Lenovo Legion 7 16ARHA7 | |
| Dell Inspiron 16 Plus 7610-MHJ8F | |
| Dell Inspiron 16 Plus 7610-MHJ8F | |
| Dell Inspiron 16 Plus 7610-MHJ8F | |
| Schenker XMG Apex 15 Max | |
| Asus ROG Flow X16 GV601RW-M5082W | |
| HP Omen 16-c0077ng | |
| Lenovo Legion C7 15IMH05 82EH0030GE | |
| HP Envy 15-ep0098nr | |
| Asus ProArt StudioBook Pro 15 W500G5T | |
| HWBOT x265 Benchmark v2.2 / 4k Preset | |
| MSI GE67 HX 12UGS | |
| MSI Creator Z16P B12UHST | |
| Lenovo Legion 7 16ARHA7 | |
| Przeciętny Intel Core i7-12700H (4.67 - 21.8, n=64) | |
| Asus ROG Flow X16 GV601RW-M5082W | |
| HP Omen 16-c0077ng | |
| HP Envy 16 h0112nr | |
| Schenker XMG Apex 15 Max | |
| Dell Inspiron 16 Plus 7610-MHJ8F | |
| Lenovo Legion C7 15IMH05 82EH0030GE | |
| HP Envy 15-ep0098nr | |
| Lenovo ThinkPad X1 Nano Gen 2 Core i7-1280P | |
| Asus ProArt StudioBook Pro 15 W500G5T | |
| LibreOffice / 20 Documents To PDF | |
| HP Omen 16-c0077ng | |
| Asus ProArt StudioBook Pro 15 W500G5T | |
| Asus ROG Flow X16 GV601RW-M5082W | |
| Lenovo Legion C7 15IMH05 82EH0030GE | |
| Lenovo Legion 7 16ARHA7 | |
| Schenker XMG Apex 15 Max | |
| HP Envy 15-ep0098nr | |
| Przeciętny Intel Core i7-12700H (34.2 - 95.3, n=63) | |
| Dell Inspiron 16 Plus 7610-MHJ8F | |
| Lenovo ThinkPad X1 Nano Gen 2 Core i7-1280P | |
| HP Envy 16 h0112nr | |
| MSI GE67 HX 12UGS | |
| MSI Creator Z16P B12UHST | |
| R Benchmark 2.5 / Overall mean | |
| Asus ProArt StudioBook Pro 15 W500G5T | |
| HP Envy 15-ep0098nr | |
| Lenovo Legion C7 15IMH05 82EH0030GE | |
| Dell Inspiron 16 Plus 7610-MHJ8F | |
| HP Omen 16-c0077ng | |
| Schenker XMG Apex 15 Max | |
| Asus ROG Flow X16 GV601RW-M5082W | |
| Lenovo Legion 7 16ARHA7 | |
| Lenovo ThinkPad X1 Nano Gen 2 Core i7-1280P | |
| Przeciętny Intel Core i7-12700H (0.4441 - 1.052, n=63) | |
| MSI GE67 HX 12UGS | |
| HP Envy 16 h0112nr | |
| MSI Creator Z16P B12UHST | |
Cinebench R23: Multi Core | Single Core
Cinebench R15: CPU Multi 64Bit | CPU Single 64Bit
Blender: v2.79 BMW27 CPU
7-Zip 18.03: 7z b 4 | 7z b 4 -mmt1
Geekbench 5.5: Multi-Core | Single-Core
HWBOT x265 Benchmark v2.2: 4k Preset
LibreOffice : 20 Documents To PDF
R Benchmark 2.5: Overall mean
* ... im mniej tym lepiej
AIDA64: FP32 Ray-Trace | FPU Julia | CPU SHA3 | CPU Queen | FPU SinJulia | FPU Mandel | CPU AES | CPU ZLib | FP64 Ray-Trace | CPU PhotoWorxx
| Performance rating | |
| Lenovo ThinkBook 16 G4+ IAP | |
| HP Envy 16 h0112nr | |
| MSI Creator Z16P B12UHST | |
| Przeciętny Intel Core i7-12700H | |
| Dell Inspiron 16 Plus 7610-MHJ8F | |
| Huawei MateBook 16s i7 | |
| AIDA64 / FP32 Ray-Trace | |
| Lenovo ThinkBook 16 G4+ IAP | |
| HP Envy 16 h0112nr | |
| Przeciętny Intel Core i7-12700H (2585 - 17957, n=64) | |
| Dell Inspiron 16 Plus 7610-MHJ8F | |
| MSI Creator Z16P B12UHST | |
| Huawei MateBook 16s i7 | |
| AIDA64 / FPU Julia | |
| Lenovo ThinkBook 16 G4+ IAP | |
| HP Envy 16 h0112nr | |
| Dell Inspiron 16 Plus 7610-MHJ8F | |
| Przeciętny Intel Core i7-12700H (12439 - 90760, n=64) | |
| MSI Creator Z16P B12UHST | |
| Huawei MateBook 16s i7 | |
| AIDA64 / CPU SHA3 | |
| Dell Inspiron 16 Plus 7610-MHJ8F | |
| Lenovo ThinkBook 16 G4+ IAP | |
| Przeciętny Intel Core i7-12700H (833 - 4242, n=64) | |
| MSI Creator Z16P B12UHST | |
| HP Envy 16 h0112nr | |
| Huawei MateBook 16s i7 | |
| AIDA64 / CPU Queen | |
| MSI Creator Z16P B12UHST | |
| Lenovo ThinkBook 16 G4+ IAP | |
| HP Envy 16 h0112nr | |
| Przeciętny Intel Core i7-12700H (57923 - 103202, n=63) | |
| Huawei MateBook 16s i7 | |
| Dell Inspiron 16 Plus 7610-MHJ8F | |
| AIDA64 / FPU SinJulia | |
| MSI Creator Z16P B12UHST | |
| Lenovo ThinkBook 16 G4+ IAP | |
| Przeciętny Intel Core i7-12700H (3249 - 9939, n=64) | |
| Dell Inspiron 16 Plus 7610-MHJ8F | |
| HP Envy 16 h0112nr | |
| Huawei MateBook 16s i7 | |
| AIDA64 / FPU Mandel | |
| Lenovo ThinkBook 16 G4+ IAP | |
| Dell Inspiron 16 Plus 7610-MHJ8F | |
| HP Envy 16 h0112nr | |
| Przeciętny Intel Core i7-12700H (7135 - 44760, n=64) | |
| MSI Creator Z16P B12UHST | |
| Huawei MateBook 16s i7 | |
| AIDA64 / CPU AES | |
| Dell Inspiron 16 Plus 7610-MHJ8F | |
| HP Envy 16 h0112nr | |
| MSI Creator Z16P B12UHST | |
| Przeciętny Intel Core i7-12700H (31839 - 144360, n=64) | |
| Lenovo ThinkBook 16 G4+ IAP | |
| Huawei MateBook 16s i7 | |
| AIDA64 / CPU ZLib | |
| MSI Creator Z16P B12UHST | |
| Lenovo ThinkBook 16 G4+ IAP | |
| Przeciętny Intel Core i7-12700H (305 - 1171, n=64) | |
| HP Envy 16 h0112nr | |
| Dell Inspiron 16 Plus 7610-MHJ8F | |
| Huawei MateBook 16s i7 | |
| AIDA64 / FP64 Ray-Trace | |
| Lenovo ThinkBook 16 G4+ IAP | |
| HP Envy 16 h0112nr | |
| Przeciętny Intel Core i7-12700H (1437 - 9692, n=64) | |
| Dell Inspiron 16 Plus 7610-MHJ8F | |
| MSI Creator Z16P B12UHST | |
| Huawei MateBook 16s i7 | |
| AIDA64 / CPU PhotoWorxx | |
| Huawei MateBook 16s i7 | |
| MSI Creator Z16P B12UHST | |
| Lenovo ThinkBook 16 G4+ IAP | |
| HP Envy 16 h0112nr | |
| Przeciętny Intel Core i7-12700H (12863 - 52207, n=64) | |
| Dell Inspiron 16 Plus 7610-MHJ8F | |
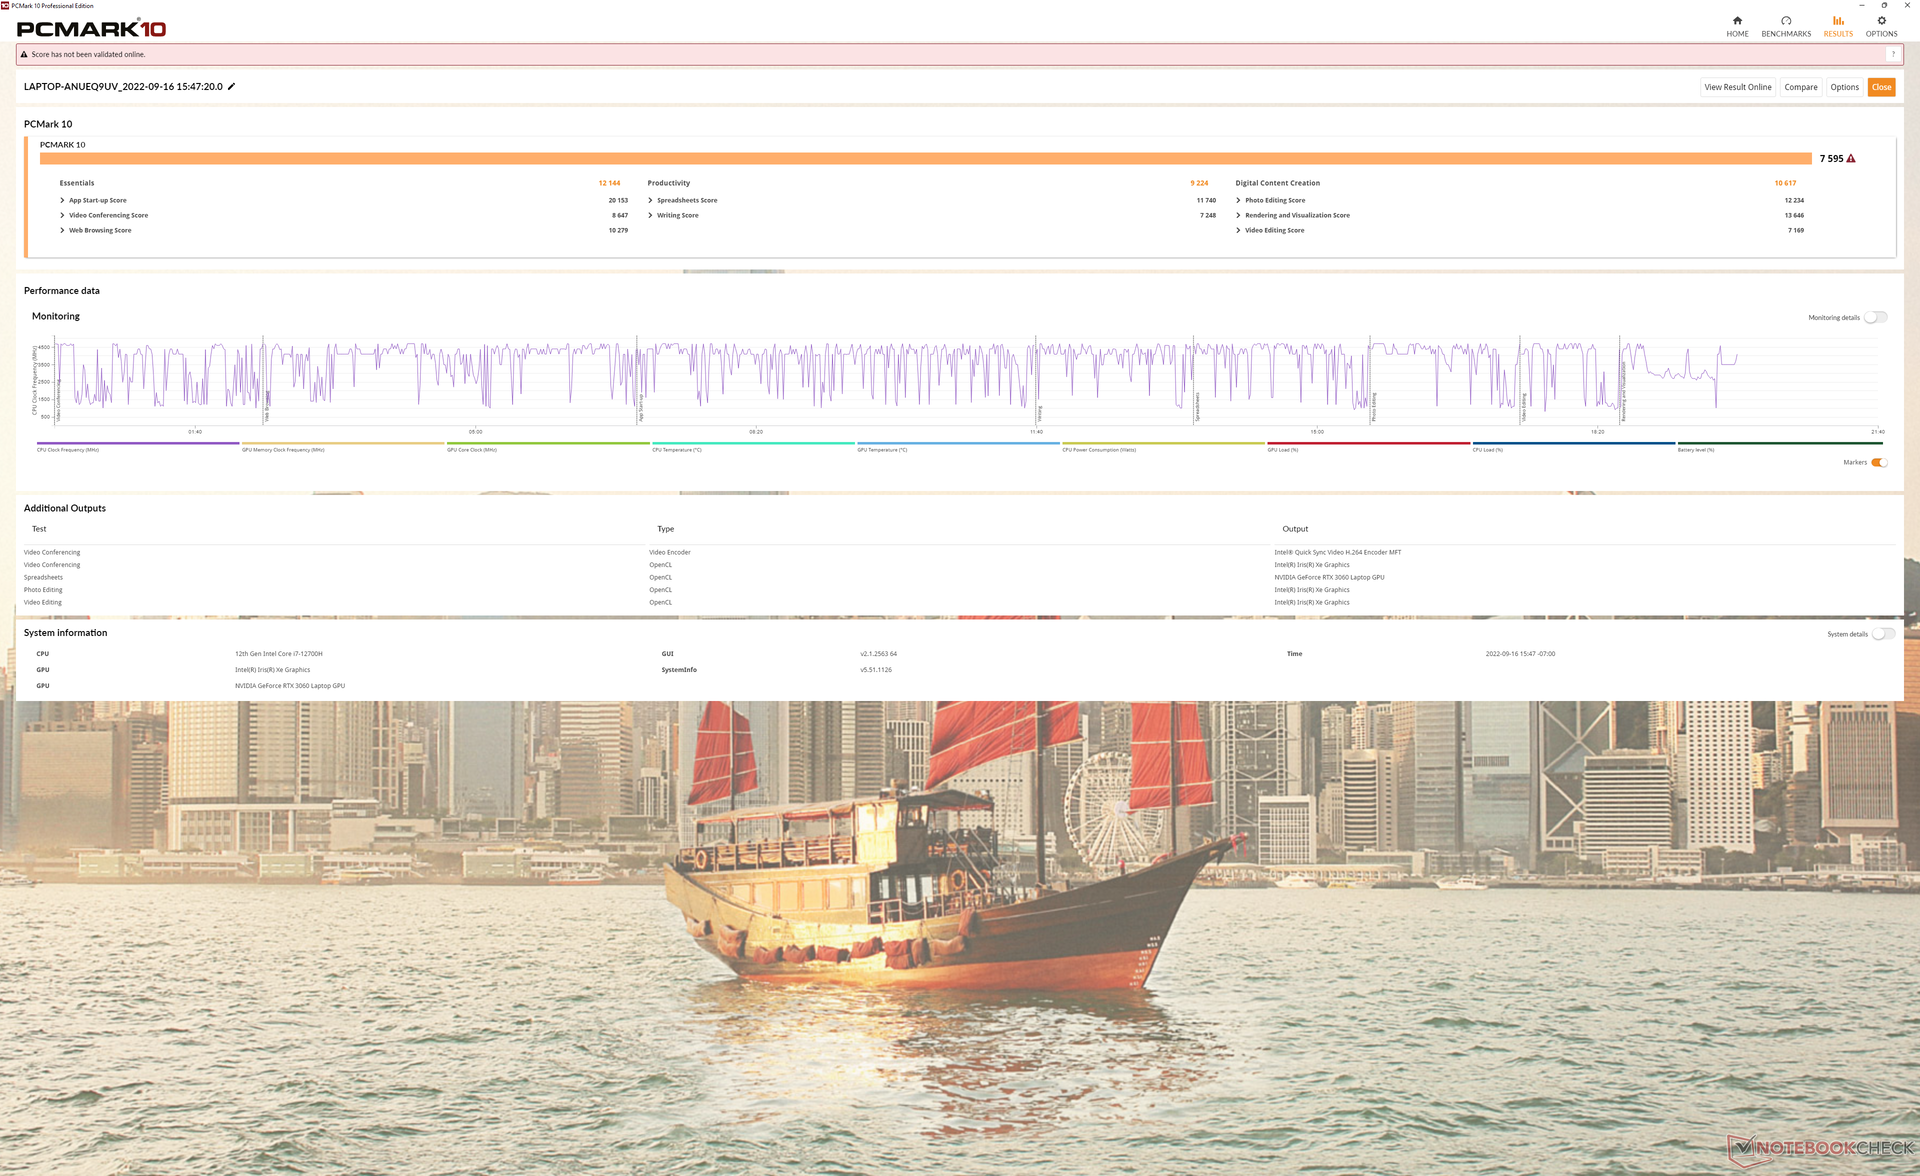
Wydajność systemu
Wyniki PCMark konsekwentnie wyprzedzają Envy 15 z 2020 roku o szeroki margines. Podejrzewamy, że odejście od Intel Optane odegrało dużą rolę w zwiększeniu wyników.
CrossMark: Overall | Productivity | Creativity | Responsiveness
| PCMark 10 / Score | |
| MSI Creator Z16P B12UHST | |
| HP Envy 16 h0112nr | |
| Przeciętny Intel Core i7-12700H, NVIDIA GeForce RTX 3060 Laptop GPU (5986 - 8156, n=12) | |
| Huawei MateBook 16s i7 | |
| HP Envy 15-ep0098nr | |
| Dell Inspiron 16 Plus 7610-MHJ8F | |
| PCMark 10 / Essentials | |
| HP Envy 16 h0112nr | |
| Huawei MateBook 16s i7 | |
| MSI Creator Z16P B12UHST | |
| Przeciętny Intel Core i7-12700H, NVIDIA GeForce RTX 3060 Laptop GPU (9289 - 12144, n=12) | |
| Dell Inspiron 16 Plus 7610-MHJ8F | |
| HP Envy 15-ep0098nr | |
| PCMark 10 / Productivity | |
| MSI Creator Z16P B12UHST | |
| HP Envy 16 h0112nr | |
| Przeciętny Intel Core i7-12700H, NVIDIA GeForce RTX 3060 Laptop GPU (6161 - 10362, n=12) | |
| Huawei MateBook 16s i7 | |
| HP Envy 15-ep0098nr | |
| Dell Inspiron 16 Plus 7610-MHJ8F | |
| PCMark 10 / Digital Content Creation | |
| MSI Creator Z16P B12UHST | |
| Przeciętny Intel Core i7-12700H, NVIDIA GeForce RTX 3060 Laptop GPU (8950 - 12554, n=12) | |
| HP Envy 16 h0112nr | |
| Huawei MateBook 16s i7 | |
| HP Envy 15-ep0098nr | |
| Dell Inspiron 16 Plus 7610-MHJ8F | |
| CrossMark / Overall | |
| Huawei MateBook 16s i7 | |
| HP Envy 16 h0112nr | |
| Przeciętny Intel Core i7-12700H, NVIDIA GeForce RTX 3060 Laptop GPU (1649 - 2017, n=11) | |
| Lenovo ThinkBook 16 G4+ IAP | |
| Apple MacBook Pro 16 2021 M1 Pro | |
| CrossMark / Productivity | |
| Huawei MateBook 16s i7 | |
| HP Envy 16 h0112nr | |
| Przeciętny Intel Core i7-12700H, NVIDIA GeForce RTX 3060 Laptop GPU (1536 - 1958, n=11) | |
| Lenovo ThinkBook 16 G4+ IAP | |
| Apple MacBook Pro 16 2021 M1 Pro | |
| CrossMark / Creativity | |
| Apple MacBook Pro 16 2021 M1 Pro | |
| HP Envy 16 h0112nr | |
| Huawei MateBook 16s i7 | |
| Lenovo ThinkBook 16 G4+ IAP | |
| Przeciętny Intel Core i7-12700H, NVIDIA GeForce RTX 3060 Laptop GPU (1816 - 2084, n=11) | |
| CrossMark / Responsiveness | |
| Huawei MateBook 16s i7 | |
| Przeciętny Intel Core i7-12700H, NVIDIA GeForce RTX 3060 Laptop GPU (1210 - 2207, n=11) | |
| HP Envy 16 h0112nr | |
| Lenovo ThinkBook 16 G4+ IAP | |
| Apple MacBook Pro 16 2021 M1 Pro | |
| PCMark 10 Score | 7595 pkt. | |
Pomoc | ||
| AIDA64 / Memory Copy | |
| Huawei MateBook 16s i7 | |
| Lenovo ThinkBook 16 G4+ IAP | |
| MSI Creator Z16P B12UHST | |
| HP Envy 16 h0112nr | |
| Przeciętny Intel Core i7-12700H (25615 - 80511, n=64) | |
| Dell Inspiron 16 Plus 7610-MHJ8F | |
| AIDA64 / Memory Read | |
| Lenovo ThinkBook 16 G4+ IAP | |
| Huawei MateBook 16s i7 | |
| MSI Creator Z16P B12UHST | |
| HP Envy 16 h0112nr | |
| Przeciętny Intel Core i7-12700H (25586 - 79442, n=64) | |
| Dell Inspiron 16 Plus 7610-MHJ8F | |
| AIDA64 / Memory Write | |
| MSI Creator Z16P B12UHST | |
| Huawei MateBook 16s i7 | |
| HP Envy 16 h0112nr | |
| Lenovo ThinkBook 16 G4+ IAP | |
| Przeciętny Intel Core i7-12700H (23679 - 88660, n=64) | |
| Dell Inspiron 16 Plus 7610-MHJ8F | |
| AIDA64 / Memory Latency | |
| Lenovo ThinkBook 16 G4+ IAP | |
| Huawei MateBook 16s i7 | |
| Dell Inspiron 16 Plus 7610-MHJ8F | |
| MSI Creator Z16P B12UHST | |
| HP Envy 16 h0112nr | |
| Przeciętny Intel Core i7-12700H (76.2 - 133.9, n=62) | |
* ... im mniej tym lepiej
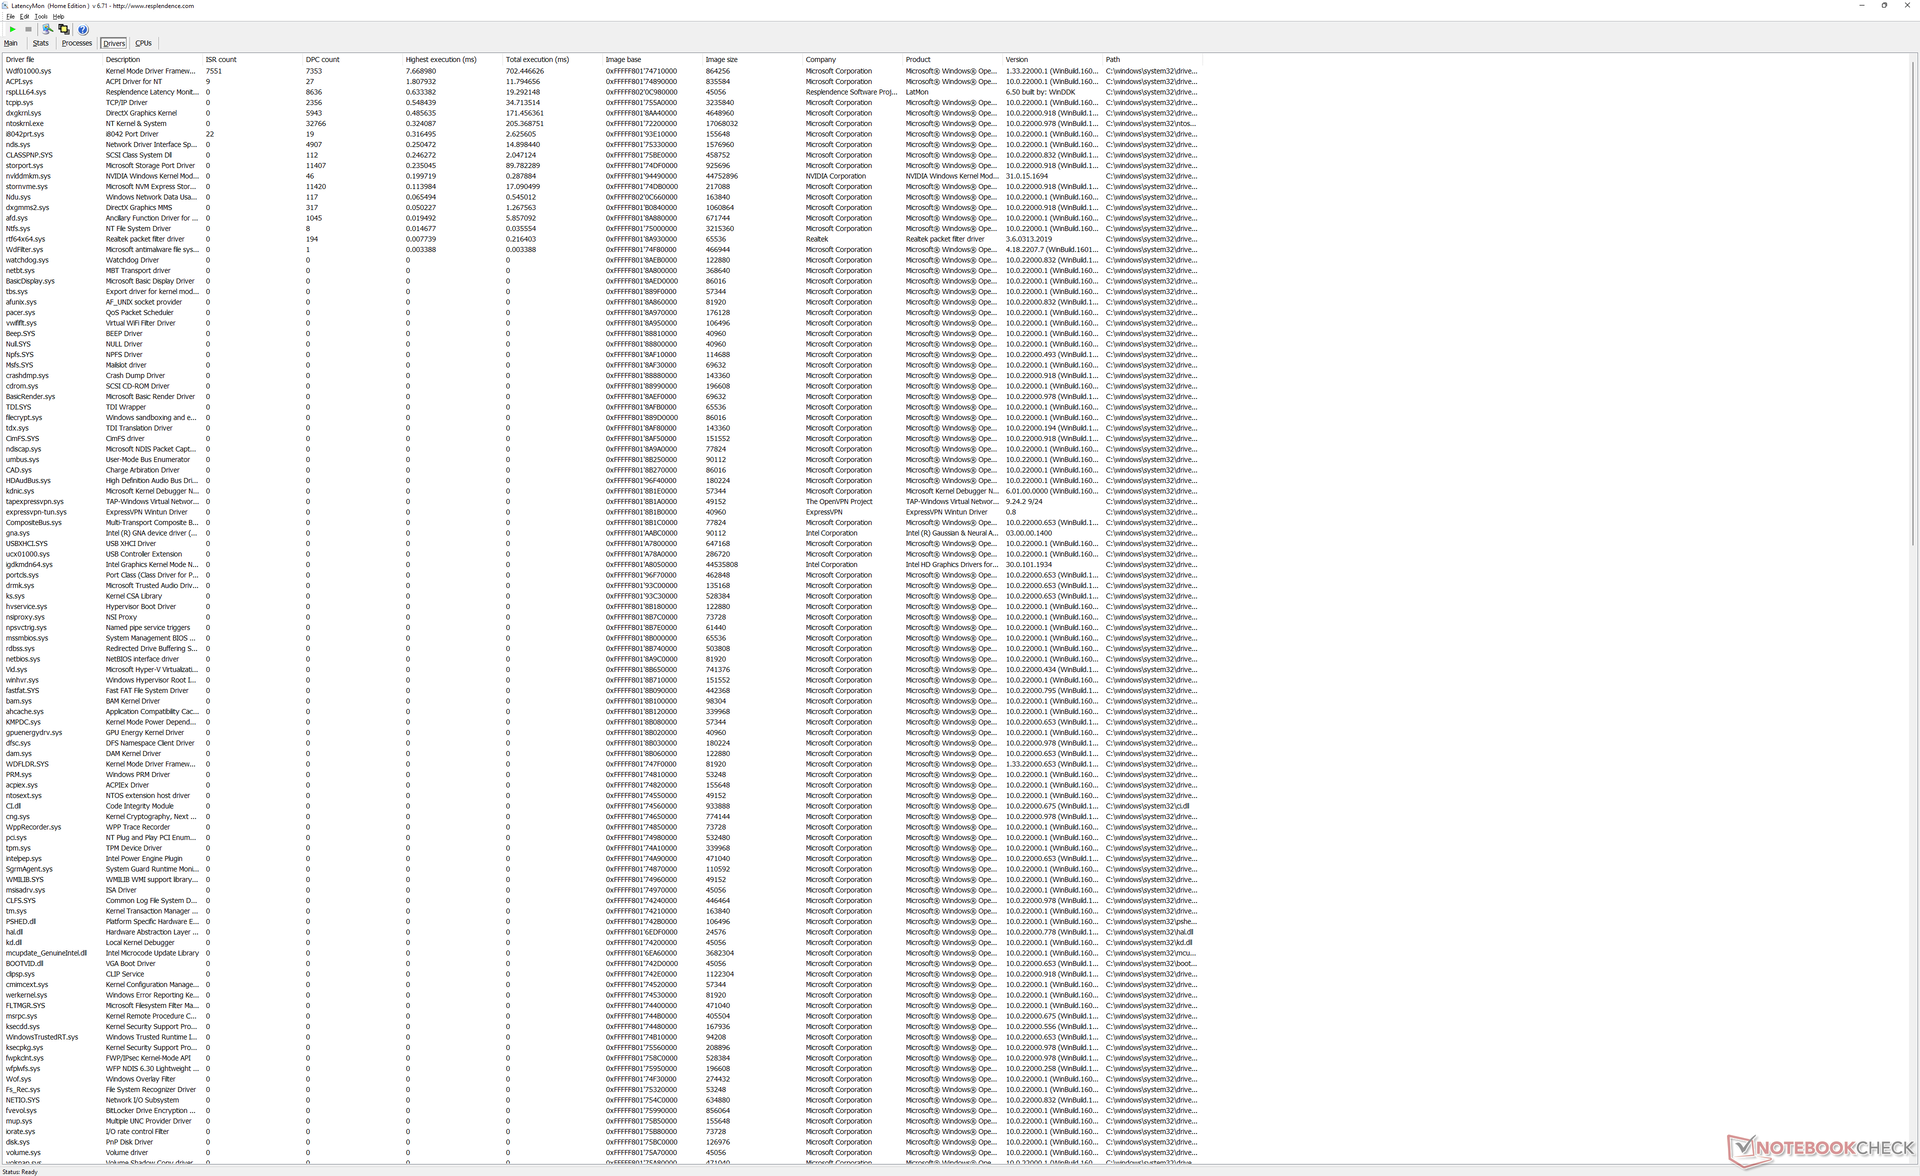
Opóźnienie DPC
LatencyMon ujawnia problemy z DPC podczas otwierania wielu kart przeglądarki na naszej stronie głównej. odtwarzanie wideo 4K przy 60 FPS jest również niedoskonałe - podczas naszego minutowego filmu testowego spadły 3 klatki.
| DPC Latencies / LatencyMon - interrupt to process latency (max), Web, Youtube, Prime95 | |
| Lenovo ThinkBook 16 G4+ IAP | |
| HP Envy 16 h0112nr | |
| MSI Creator Z16P B12UHST | |
* ... im mniej tym lepiej
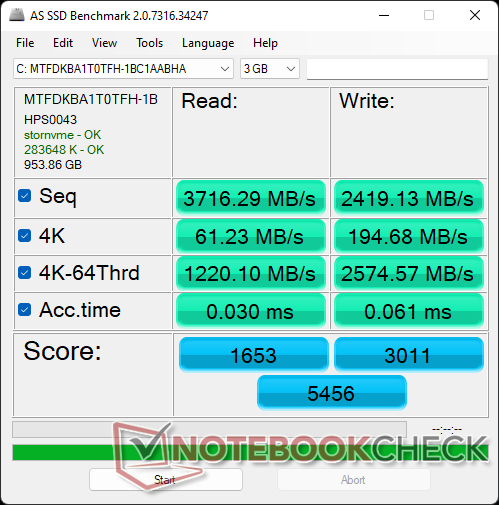
Urządzenia pamięci masowej - obsługa RAID 0
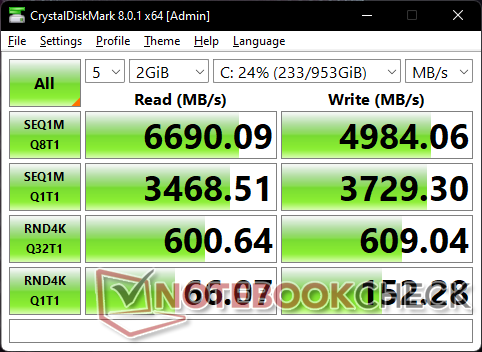
Nasz testowy egzemplarz jest wyposażony w ten samMicron 3400 PCIe4 x4 NVMe SSD, który można znaleźć w wielu innych systemach klasy high-end, m.in MSI Stealth GS77 lub HP Spectre x360 13.5. W naszym teście dysk nie wykazywał żadnych problemów z dławieniem, ale szybkość zapisu nie jest tak duża jak w konkurencyjnej serii Samsung PM9A1.
HP dołącza tylko jedną pokrywę dysku SSD, mimo że ma dwa gniazda SSD. Jeżeli planujesz zainstalować drugi dysk, jest duża szansa, że będzie on pracował w cieplejszych temperaturach.

| Drive Performance rating - Percent | |
| MSI Creator Z16P B12UHST | |
| HP Envy 16 h0112nr | |
| Huawei MateBook 16s i7 | |
| Lenovo ThinkBook 16 G4+ IAP | |
| Dell Inspiron 16 Plus 7610-MHJ8F -1! | |
| DiskSpd | |
| seq read | |
| MSI Creator Z16P B12UHST | |
| HP Envy 16 h0112nr | |
| Huawei MateBook 16s i7 | |
| Lenovo ThinkBook 16 G4+ IAP | |
| Dell Inspiron 16 Plus 7610-MHJ8F | |
| seq write | |
| MSI Creator Z16P B12UHST | |
| HP Envy 16 h0112nr | |
| Lenovo ThinkBook 16 G4+ IAP | |
| Huawei MateBook 16s i7 | |
| Dell Inspiron 16 Plus 7610-MHJ8F | |
| seq q8 t1 read | |
| MSI Creator Z16P B12UHST | |
| HP Envy 16 h0112nr | |
| Huawei MateBook 16s i7 | |
| Lenovo ThinkBook 16 G4+ IAP | |
| seq q8 t1 write | |
| HP Envy 16 h0112nr | |
| MSI Creator Z16P B12UHST | |
| Lenovo ThinkBook 16 G4+ IAP | |
| Huawei MateBook 16s i7 | |
| Dell Inspiron 16 Plus 7610-MHJ8F | |
| 4k q1 t1 read | |
| MSI Creator Z16P B12UHST | |
| Huawei MateBook 16s i7 | |
| Lenovo ThinkBook 16 G4+ IAP | |
| Dell Inspiron 16 Plus 7610-MHJ8F | |
| HP Envy 16 h0112nr | |
| 4k q1 t1 write | |
| Huawei MateBook 16s i7 | |
| MSI Creator Z16P B12UHST | |
| Dell Inspiron 16 Plus 7610-MHJ8F | |
| Lenovo ThinkBook 16 G4+ IAP | |
| HP Envy 16 h0112nr | |
| 4k q32 t16 read | |
| MSI Creator Z16P B12UHST | |
| Huawei MateBook 16s i7 | |
| HP Envy 16 h0112nr | |
| Lenovo ThinkBook 16 G4+ IAP | |
| Dell Inspiron 16 Plus 7610-MHJ8F | |
| 4k q32 t16 write | |
| MSI Creator Z16P B12UHST | |
| Huawei MateBook 16s i7 | |
| HP Envy 16 h0112nr | |
| Lenovo ThinkBook 16 G4+ IAP | |
| Dell Inspiron 16 Plus 7610-MHJ8F | |
| AS SSD | |
| Score Total | |
| MSI Creator Z16P B12UHST | |
| HP Envy 16 h0112nr | |
| Lenovo ThinkBook 16 G4+ IAP | |
| Huawei MateBook 16s i7 | |
| Dell Inspiron 16 Plus 7610-MHJ8F | |
| Score Read | |
| MSI Creator Z16P B12UHST | |
| HP Envy 16 h0112nr | |
| Huawei MateBook 16s i7 | |
| Lenovo ThinkBook 16 G4+ IAP | |
| Dell Inspiron 16 Plus 7610-MHJ8F | |
| Score Write | |
| MSI Creator Z16P B12UHST | |
| HP Envy 16 h0112nr | |
| Lenovo ThinkBook 16 G4+ IAP | |
| Huawei MateBook 16s i7 | |
| Dell Inspiron 16 Plus 7610-MHJ8F | |
| Seq Read | |
| MSI Creator Z16P B12UHST | |
| HP Envy 16 h0112nr | |
| Lenovo ThinkBook 16 G4+ IAP | |
| Huawei MateBook 16s i7 | |
| Dell Inspiron 16 Plus 7610-MHJ8F | |
| Seq Write | |
| MSI Creator Z16P B12UHST | |
| HP Envy 16 h0112nr | |
| Huawei MateBook 16s i7 | |
| Lenovo ThinkBook 16 G4+ IAP | |
| Dell Inspiron 16 Plus 7610-MHJ8F | |
| 4K Read | |
| MSI Creator Z16P B12UHST | |
| HP Envy 16 h0112nr | |
| Huawei MateBook 16s i7 | |
| Lenovo ThinkBook 16 G4+ IAP | |
| Dell Inspiron 16 Plus 7610-MHJ8F | |
| 4K Write | |
| Huawei MateBook 16s i7 | |
| Lenovo ThinkBook 16 G4+ IAP | |
| MSI Creator Z16P B12UHST | |
| Dell Inspiron 16 Plus 7610-MHJ8F | |
| HP Envy 16 h0112nr | |
| 4K-64 Read | |
| MSI Creator Z16P B12UHST | |
| Huawei MateBook 16s i7 | |
| HP Envy 16 h0112nr | |
| Lenovo ThinkBook 16 G4+ IAP | |
| Dell Inspiron 16 Plus 7610-MHJ8F | |
| 4K-64 Write | |
| MSI Creator Z16P B12UHST | |
| HP Envy 16 h0112nr | |
| Lenovo ThinkBook 16 G4+ IAP | |
| Huawei MateBook 16s i7 | |
| Dell Inspiron 16 Plus 7610-MHJ8F | |
| Access Time Read | |
| Dell Inspiron 16 Plus 7610-MHJ8F | |
| MSI Creator Z16P B12UHST | |
| HP Envy 16 h0112nr | |
| Lenovo ThinkBook 16 G4+ IAP | |
| Huawei MateBook 16s i7 | |
| Access Time Write | |
| Lenovo ThinkBook 16 G4+ IAP | |
| HP Envy 16 h0112nr | |
| Dell Inspiron 16 Plus 7610-MHJ8F | |
| MSI Creator Z16P B12UHST | |
| Huawei MateBook 16s i7 | |
* ... im mniej tym lepiej
Disk Throttling: DiskSpd Read Loop, Queue Depth 8
Wydajność GPU - 95 W TGP GeForce RTX 3060
Wydajność graficzna jest o około 5 procent wolniejsza od przeciętnego laptopa z naszej bazy danych wyposażonego w ten sam GeForce RTX 3060. Deficyt jest na tyle niewielki, że użytkownicy raczej nie zauważą.
Modernizacja z mniejszego Arc A370M do modelu GeForce RTX 3060 da użytkownikom ponad dwukrotnie większą wydajność graficzną.
Uruchomienie trybu zrównoważonego zamiast trybu wydajnościowego obniża wydajność grafiki o 6 procent przy znacznie cichszych wentylatorach, co opisaliśmy w sekcji Hałas systemowy.

| 3DMark | |
| 1920x1080 Fire Strike Graphics | |
| Lenovo Legion 7 16ARHA7 | |
| Schenker XMG Apex 15 Max | |
| MSI Creator Z16P B12UHST | |
| Asus ROG Flow X16 GV601RW-M5082W | |
| HP Omen 16-c0077ng | |
| Przeciętny NVIDIA GeForce RTX 3060 Laptop GPU (16354 - 23109, n=49) | |
| HP Envy 16 h0112nr | |
| Lenovo Legion C7 15IMH05 82EH0030GE | |
| Asus ZenBook Flip 15 Q539ZD | |
| Lenovo ThinkPad X1 Nano Gen 2 Core i7-1280P | |
| Dell Inspiron 16 Plus 7610-MHJ8F | |
| 2560x1440 Time Spy Graphics | |
| Lenovo Legion 7 16ARHA7 | |
| Asus ROG Flow X16 GV601RW-M5082W | |
| MSI Creator Z16P B12UHST | |
| Schenker XMG Apex 15 Max | |
| HP Omen 16-c0077ng | |
| Przeciętny NVIDIA GeForce RTX 3060 Laptop GPU (6285 - 9235, n=49) | |
| HP Envy 16 h0112nr | |
| Lenovo Legion C7 15IMH05 82EH0030GE | |
| Asus ZenBook Flip 15 Q539ZD | |
| Lenovo ThinkPad X1 Nano Gen 2 Core i7-1280P | |
| Dell Inspiron 16 Plus 7610-MHJ8F | |
| 2560x1440 Time Spy Score | |
| Lenovo Legion 7 16ARHA7 | |
| MSI Creator Z16P B12UHST | |
| Asus ROG Flow X16 GV601RW-M5082W | |
| Schenker XMG Apex 15 Max | |
| HP Omen 16-c0077ng | |
| Przeciętny NVIDIA GeForce RTX 3060 Laptop GPU (6473 - 9677, n=50) | |
| HP Envy 16 h0112nr | |
| Lenovo Legion C7 15IMH05 82EH0030GE | |
| Asus ZenBook Flip 15 Q539ZD | |
| Lenovo ThinkPad X1 Nano Gen 2 Core i7-1280P | |
| Dell Inspiron 16 Plus 7610-MHJ8F | |
| 3DMark 11 - 1280x720 Performance GPU | |
| Lenovo Legion 7 16ARHA7 | |
| Asus ROG Flow X16 GV601RW-M5082W | |
| Schenker XMG Apex 15 Max | |
| HP Omen 16-c0077ng | |
| HP Envy 16 h0112nr | |
| Przeciętny NVIDIA GeForce RTX 3060 Laptop GPU (13799 - 30772, n=43) | |
| Lenovo Legion C7 15IMH05 82EH0030GE | |
| MSI Creator Z16P B12UHST | |
| Asus ZenBook Flip 15 Q539ZD | |
| Lenovo ThinkPad X1 Nano Gen 2 Core i7-1280P | |
| Dell Inspiron 16 Plus 7610-MHJ8F | |
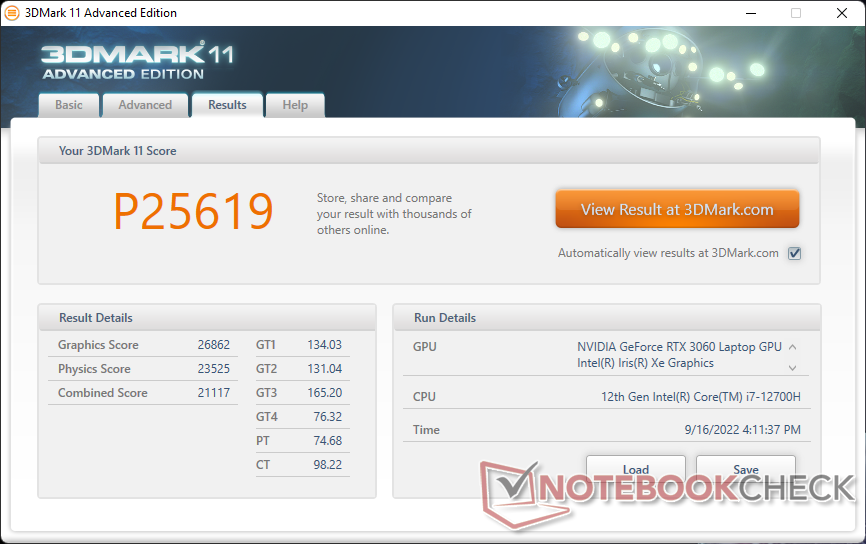
| 3DMark 11 Performance | 25619 pkt. | |
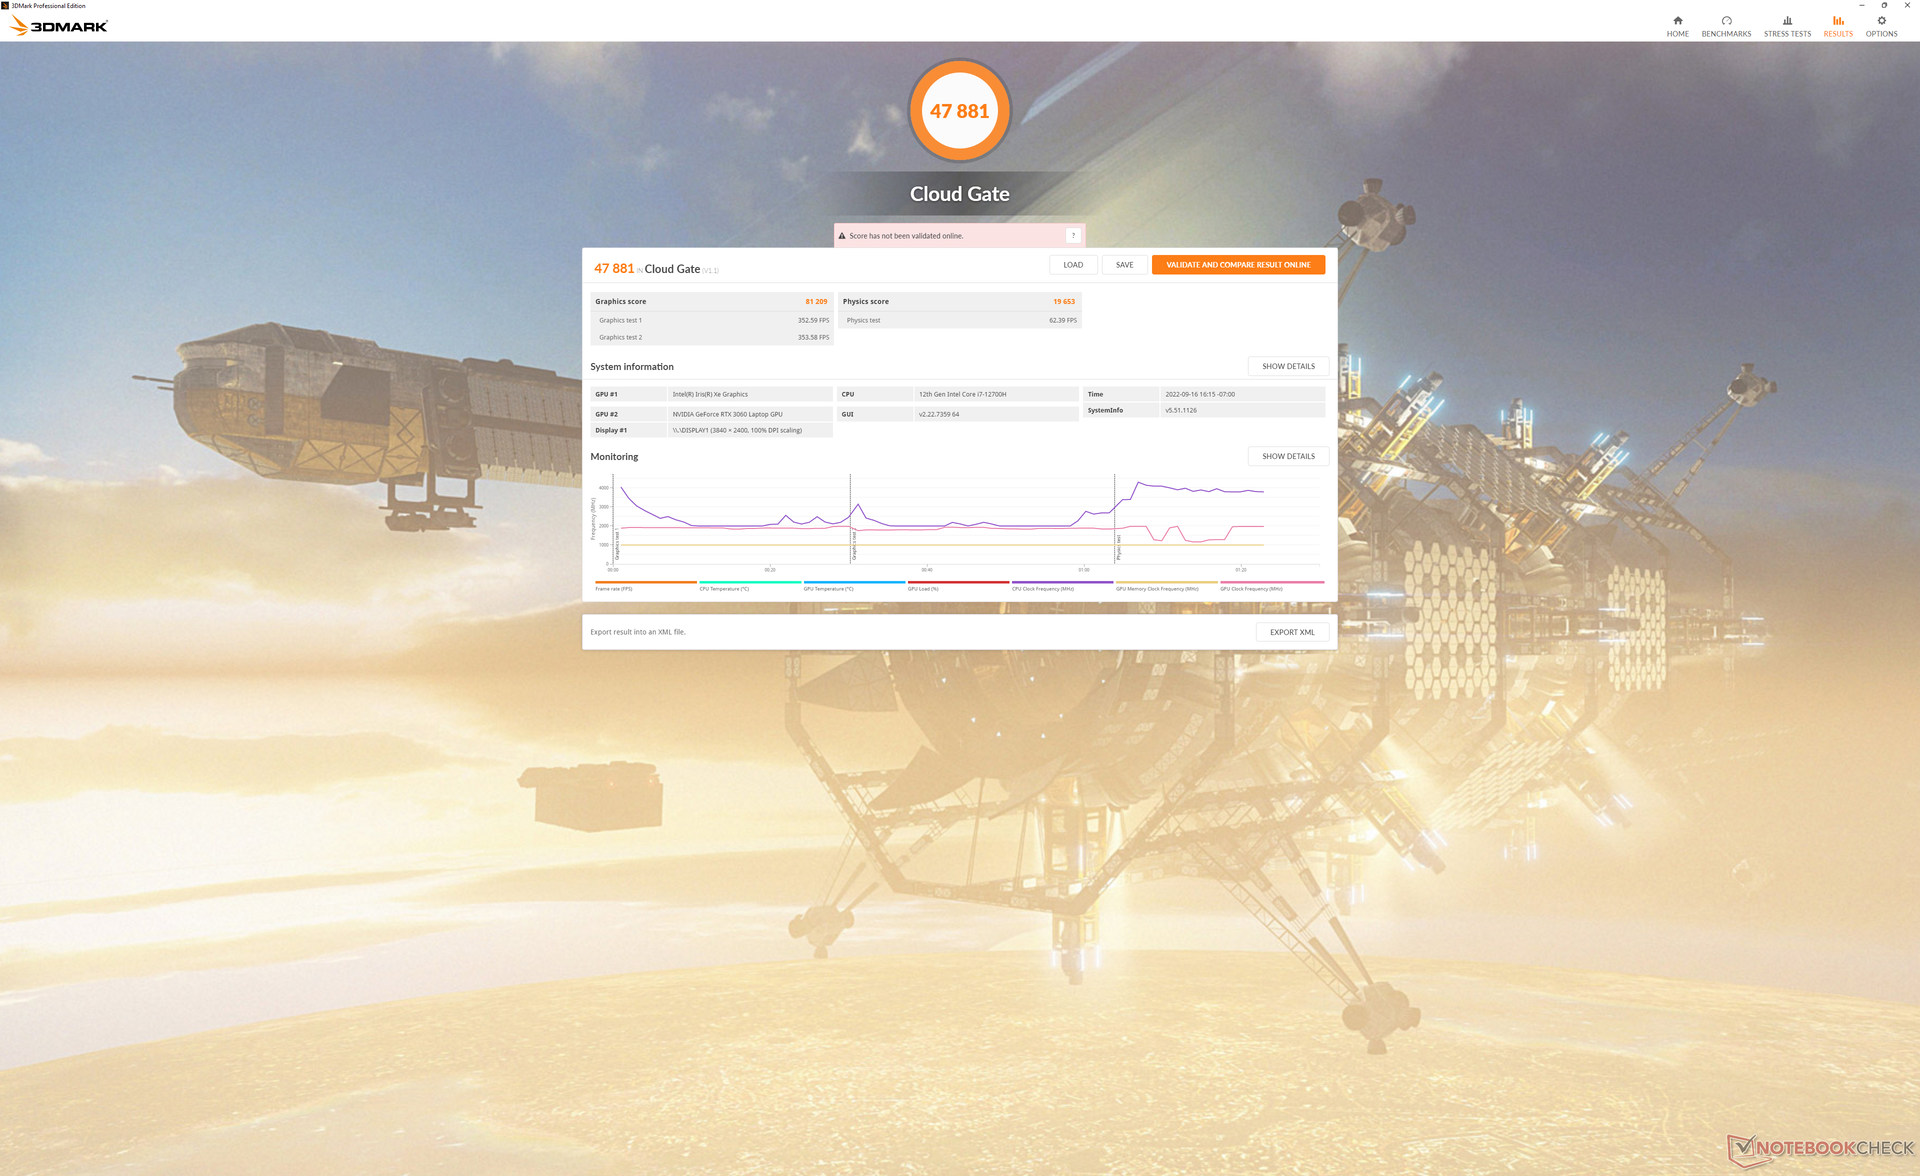
| 3DMark Cloud Gate Standard Score | 47881 pkt. | |
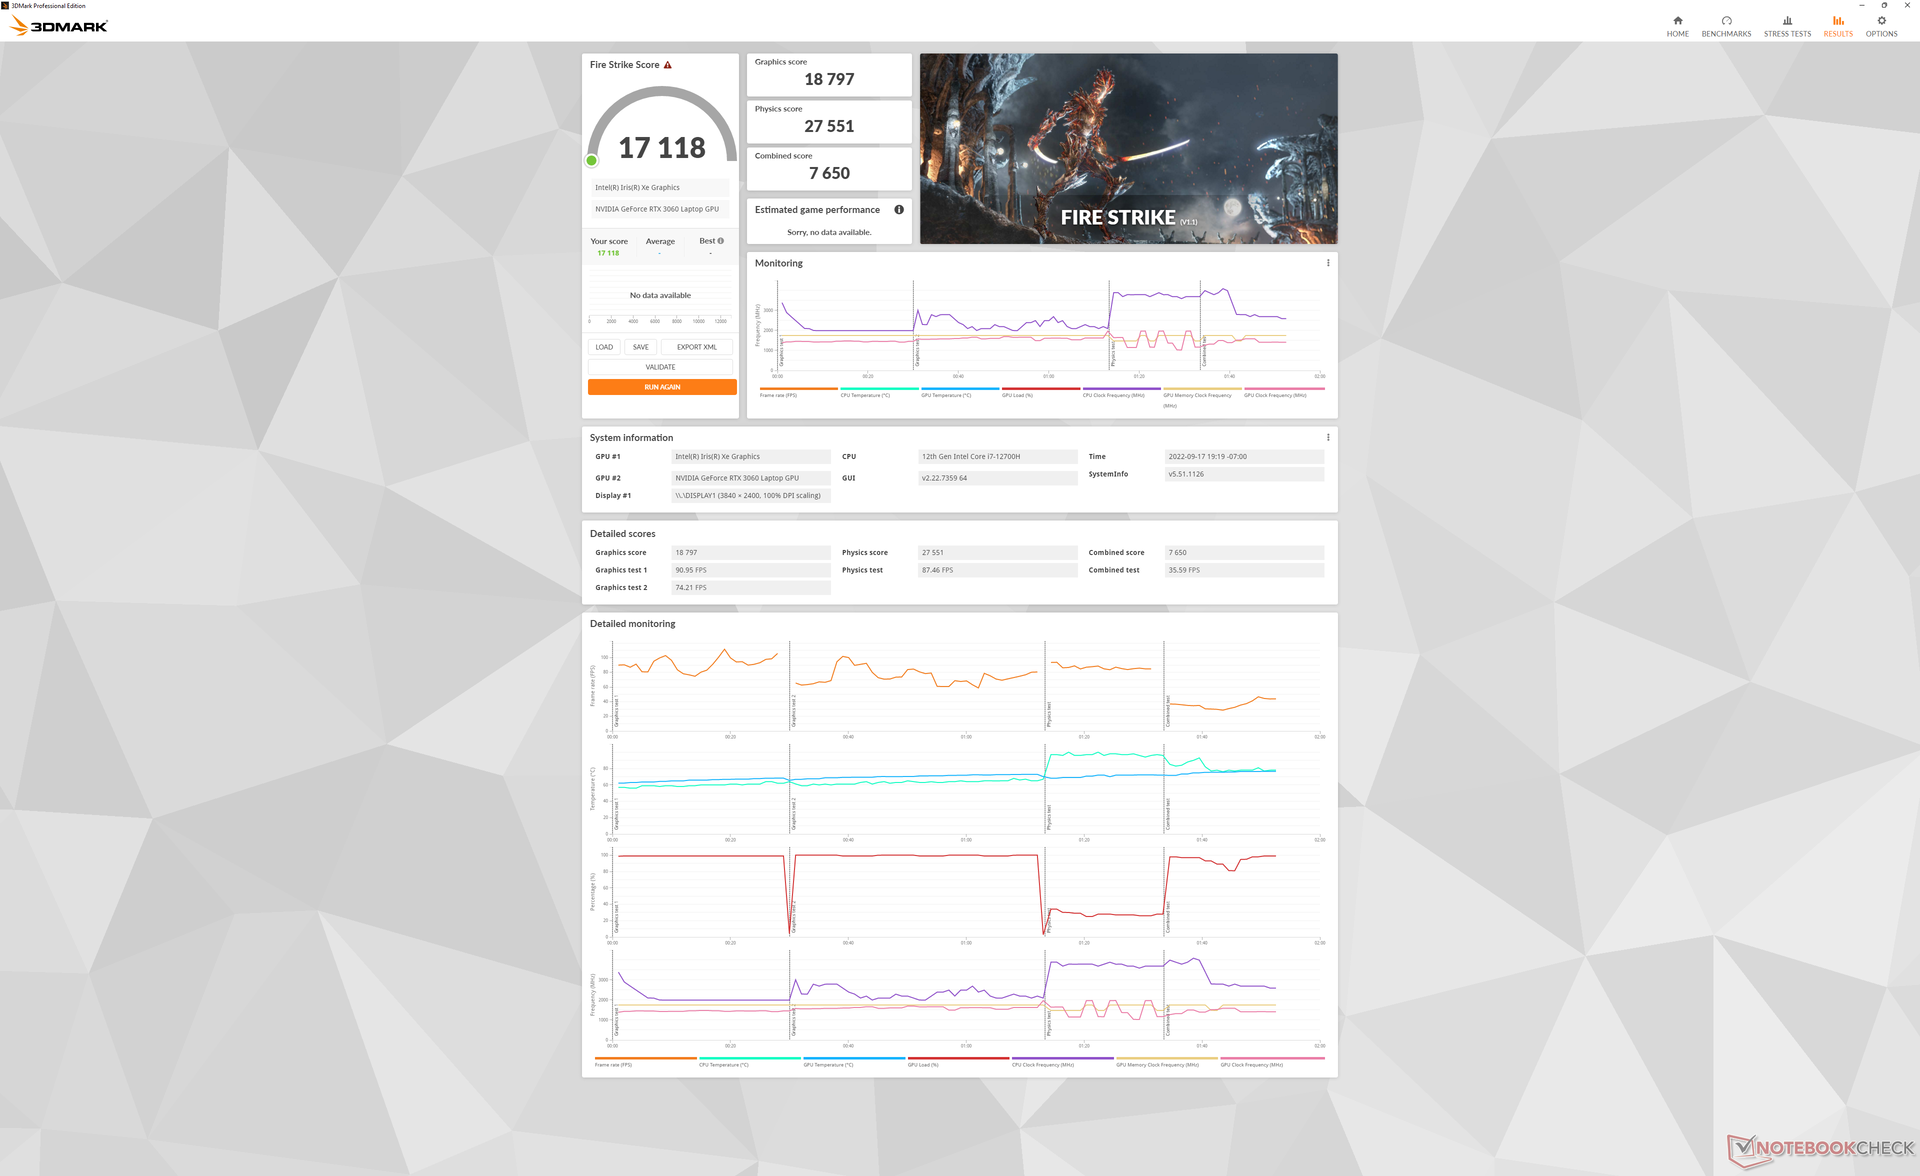
| 3DMark Fire Strike Score | 17118 pkt. | |
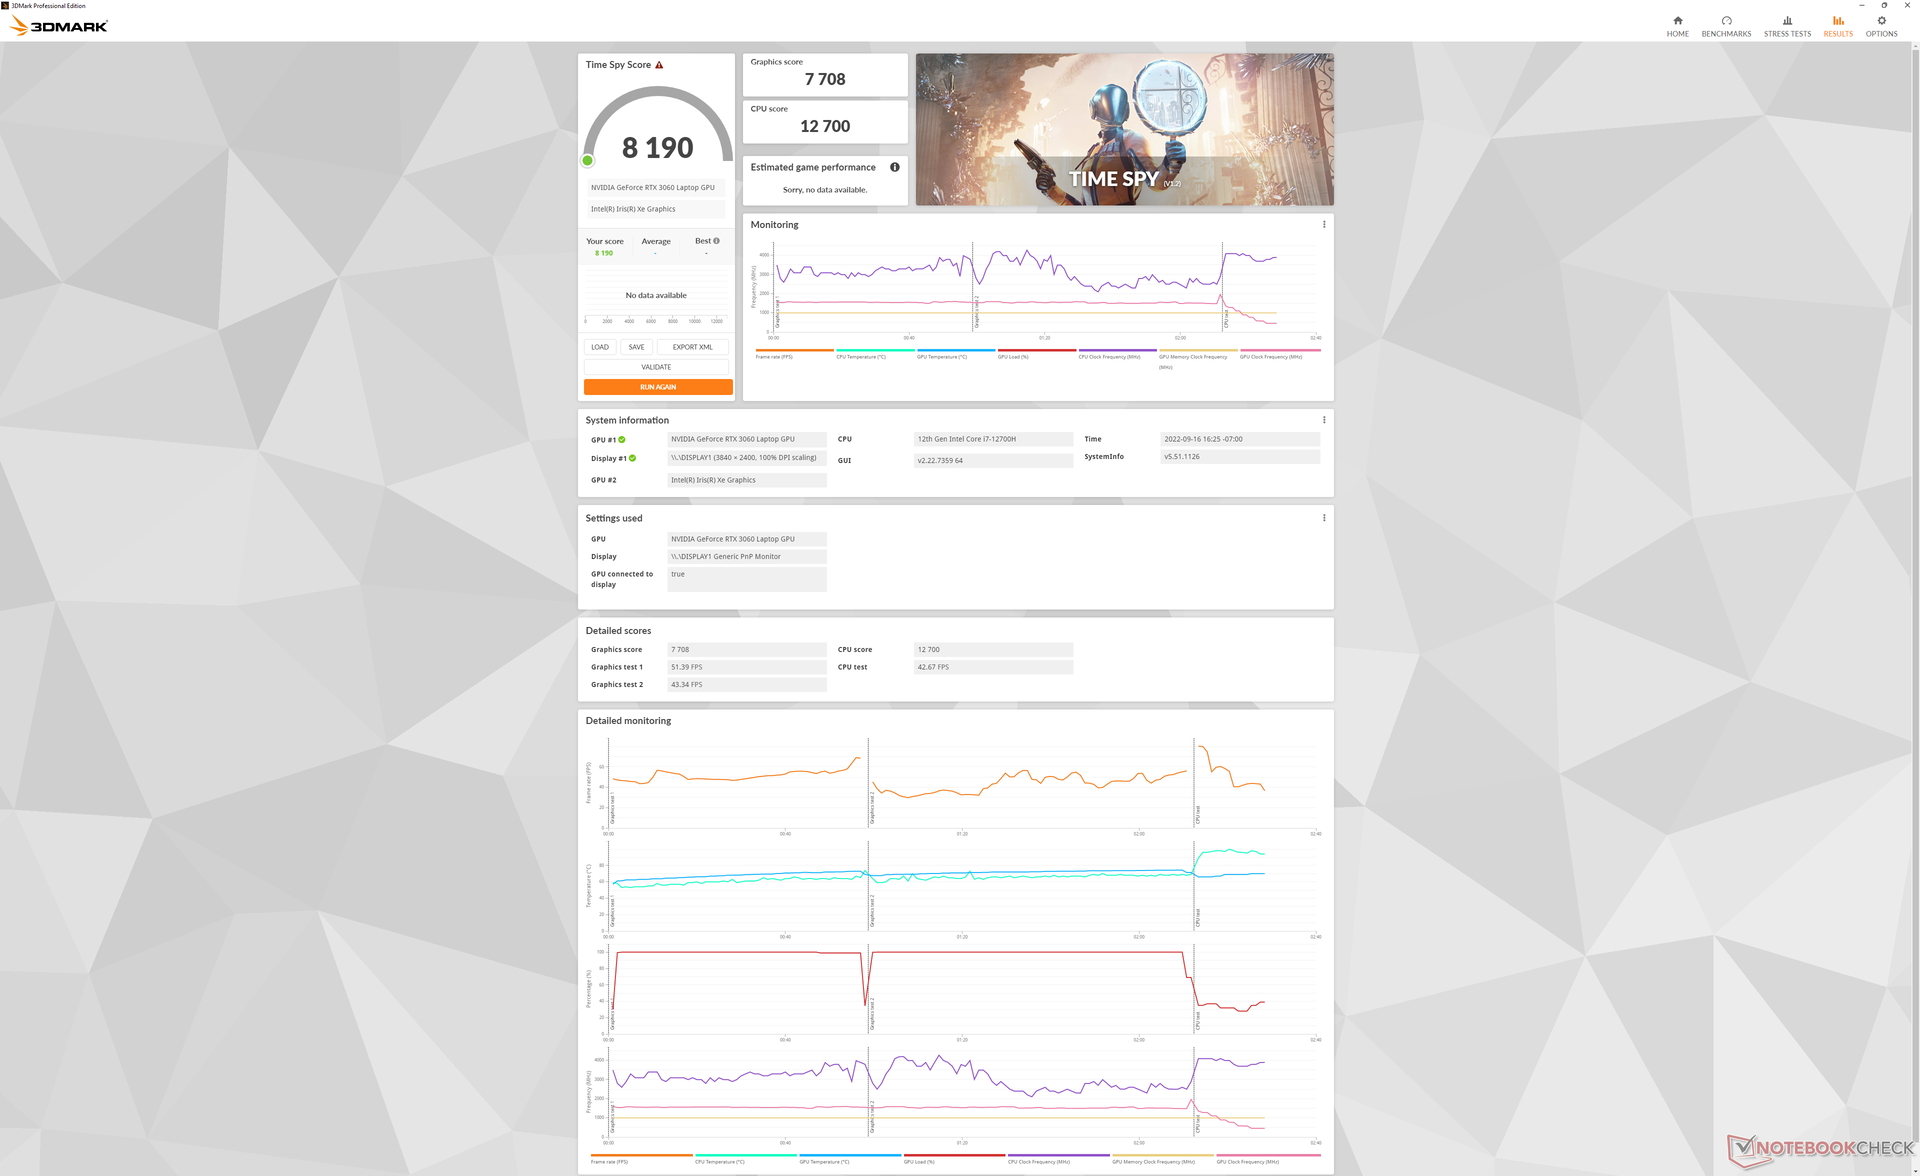
| 3DMark Time Spy Score | 8190 pkt. | |
Pomoc | ||
| The Witcher 3 | |
| 1024x768 Low Graphics & Postprocessing | |
| Schenker XMG Apex 15 Max | |
| HP Envy 16 h0112nr | |
| Lenovo Legion 7 16ARHA7 | |
| Przeciętny NVIDIA GeForce RTX 3060 Laptop GPU (221 - 449, n=35) | |
| Lenovo Legion C7 15IMH05 82EH0030GE | |
| Lenovo ThinkPad X1 Nano Gen 2 Core i7-1280P | |
| Dell Inspiron 16 Plus 7610-MHJ8F | |
| 1366x768 Medium Graphics & Postprocessing | |
| Schenker XMG Apex 15 Max | |
| Asus ROG Flow X16 GV601RW-M5082W | |
| HP Envy 16 h0112nr | |
| Lenovo Legion 7 16ARHA7 | |
| Przeciętny NVIDIA GeForce RTX 3060 Laptop GPU (204 - 296, n=33) | |
| Lenovo Legion C7 15IMH05 82EH0030GE | |
| Lenovo ThinkPad X1 Nano Gen 2 Core i7-1280P | |
| Dell Inspiron 16 Plus 7610-MHJ8F | |
| 1920x1080 High Graphics & Postprocessing (Nvidia HairWorks Off) | |
| Lenovo Legion 7 16ARHA7 | |
| Schenker XMG Apex 15 Max | |
| Asus ROG Flow X16 GV601RW-M5082W | |
| HP Envy 16 h0112nr | |
| MSI Creator Z16P B12UHST | |
| Przeciętny NVIDIA GeForce RTX 3060 Laptop GPU (81 - 186.8, n=41) | |
| HP Omen 16-c0077ng | |
| Lenovo Legion C7 15IMH05 82EH0030GE | |
| Lenovo ThinkPad X1 Nano Gen 2 Core i7-1280P | |
| Dell Inspiron 16 Plus 7610-MHJ8F | |
| 1920x1080 Ultra Graphics & Postprocessing (HBAO+) | |
| Lenovo Legion 7 16ARHA7 | |
| Schenker XMG Apex 15 Max | |
| Asus ROG Flow X16 GV601RW-M5082W | |
| HP Omen 16-c0077ng | |
| HP Envy 16 h0112nr | |
| Przeciętny NVIDIA GeForce RTX 3060 Laptop GPU (58.2 - 91.5, n=48) | |
| Lenovo Legion C7 15IMH05 82EH0030GE | |
| MSI Creator Z16P B12UHST | |
| Lenovo ThinkPad X1 Nano Gen 2 Core i7-1280P | |
| Dell Inspiron 16 Plus 7610-MHJ8F | |
| 3840x2160 High Graphics & Postprocessing (Nvidia HairWorks Off) | |
| HP Envy 16 h0112nr | |
| Przeciętny NVIDIA GeForce RTX 3060 Laptop GPU (26 - 59.3, n=5) | |
| Cyberpunk 2077 1.6 | |
| 1920x1080 Low Preset | |
| Lenovo Legion 7 16ARHA7 | |
| HP Envy 16 h0112nr | |
| Przeciętny NVIDIA GeForce RTX 3060 Laptop GPU (80 - 135.7, n=14) | |
| Lenovo ThinkPad X1 Nano Gen 2 Core i7-1280P | |
| 1920x1080 Medium Preset | |
| Lenovo Legion 7 16ARHA7 | |
| Asus ROG Flow X16 GV601RW-M5082W | |
| HP Envy 16 h0112nr | |
| Przeciętny NVIDIA GeForce RTX 3060 Laptop GPU (68 - 118, n=14) | |
| Lenovo ThinkPad X1 Nano Gen 2 Core i7-1280P | |
| 1920x1080 High Preset | |
| Lenovo Legion 7 16ARHA7 | |
| Asus ROG Flow X16 GV601RW-M5082W | |
| HP Envy 16 h0112nr | |
| Przeciętny NVIDIA GeForce RTX 3060 Laptop GPU (42.2 - 87.7, n=14) | |
| Lenovo ThinkPad X1 Nano Gen 2 Core i7-1280P | |
| 1920x1080 Ultra Preset | |
| Lenovo Legion 7 16ARHA7 | |
| Asus ROG Flow X16 GV601RW-M5082W | |
| Przeciętny NVIDIA GeForce RTX 3060 Laptop GPU (40 - 78.8, n=16) | |
| HP Envy 16 h0112nr | |
| Lenovo ThinkPad X1 Nano Gen 2 Core i7-1280P | |
| 3840x2160 Ultra Preset | |
| HP Envy 16 h0112nr | |
| Przeciętny NVIDIA GeForce RTX 3060 Laptop GPU (11 - 17.9, n=4) | |
| X-Plane 11.11 | |
| 1280x720 low (fps_test=1) | |
| Schenker XMG Apex 15 Max | |
| HP Envy 16 h0112nr | |
| Przeciętny NVIDIA GeForce RTX 3060 Laptop GPU (83.6 - 157.1, n=48) | |
| Lenovo Legion C7 15IMH05 82EH0030GE | |
| Asus ROG Flow X16 GV601RW-M5082W | |
| Lenovo Legion 7 16ARHA7 | |
| Lenovo ThinkPad X1 Nano Gen 2 Core i7-1280P | |
| Dell Inspiron 16 Plus 7610-MHJ8F | |
| 1920x1080 med (fps_test=2) | |
| Schenker XMG Apex 15 Max | |
| HP Envy 16 h0112nr | |
| Lenovo Legion C7 15IMH05 82EH0030GE | |
| Przeciętny NVIDIA GeForce RTX 3060 Laptop GPU (73 - 138.3, n=48) | |
| Asus ROG Flow X16 GV601RW-M5082W | |
| Lenovo Legion 7 16ARHA7 | |
| Lenovo ThinkPad X1 Nano Gen 2 Core i7-1280P | |
| Dell Inspiron 16 Plus 7610-MHJ8F | |
| 1920x1080 high (fps_test=3) | |
| Schenker XMG Apex 15 Max | |
| HP Envy 16 h0112nr | |
| MSI Creator Z16P B12UHST | |
| Lenovo Legion C7 15IMH05 82EH0030GE | |
| Przeciętny NVIDIA GeForce RTX 3060 Laptop GPU (61.9 - 109.3, n=48) | |
| Asus ROG Flow X16 GV601RW-M5082W | |
| HP Omen 16-c0077ng | |
| Lenovo Legion 7 16ARHA7 | |
| Lenovo ThinkPad X1 Nano Gen 2 Core i7-1280P | |
| Dell Inspiron 16 Plus 7610-MHJ8F | |
| 3840x2160 high (fps_test=3) | |
| Przeciętny NVIDIA GeForce RTX 3060 Laptop GPU (58.5 - 92.3, n=12) | |
| HP Envy 16 h0112nr | |
| Dell Inspiron 16 Plus 7610-MHJ8F | |
| Dota 2 Reborn | |
| 1280x720 min (0/3) fastest | |
| Schenker XMG Apex 15 Max | |
| HP Envy 16 h0112nr | |
| Przeciętny NVIDIA GeForce RTX 3060 Laptop GPU (112.5 - 204, n=49) | |
| Lenovo Legion C7 15IMH05 82EH0030GE | |
| Lenovo Legion 7 16ARHA7 | |
| Asus ROG Flow X16 GV601RW-M5082W | |
| Dell Inspiron 16 Plus 7610-MHJ8F | |
| Dell Inspiron 16 Plus 7610-MHJ8F | |
| Lenovo ThinkPad X1 Nano Gen 2 Core i7-1280P | |
| 1366x768 med (1/3) | |
| Schenker XMG Apex 15 Max | |
| HP Envy 16 h0112nr | |
| Przeciętny NVIDIA GeForce RTX 3060 Laptop GPU (106 - 177.4, n=49) | |
| Lenovo Legion C7 15IMH05 82EH0030GE | |
| Asus ROG Flow X16 GV601RW-M5082W | |
| Lenovo Legion 7 16ARHA7 | |
| Dell Inspiron 16 Plus 7610-MHJ8F | |
| Dell Inspiron 16 Plus 7610-MHJ8F | |
| Lenovo ThinkPad X1 Nano Gen 2 Core i7-1280P | |
| 1920x1080 high (2/3) | |
| Schenker XMG Apex 15 Max | |
| MSI Creator Z16P B12UHST | |
| HP Envy 16 h0112nr | |
| Przeciętny NVIDIA GeForce RTX 3060 Laptop GPU (98.9 - 169.2, n=49) | |
| Lenovo Legion C7 15IMH05 82EH0030GE | |
| Asus ROG Flow X16 GV601RW-M5082W | |
| HP Omen 16-c0077ng | |
| Lenovo Legion 7 16ARHA7 | |
| Lenovo ThinkPad X1 Nano Gen 2 Core i7-1280P | |
| Dell Inspiron 16 Plus 7610-MHJ8F | |
| 1920x1080 ultra (3/3) best looking | |
| MSI Creator Z16P B12UHST | |
| Schenker XMG Apex 15 Max | |
| HP Envy 16 h0112nr | |
| Przeciętny NVIDIA GeForce RTX 3060 Laptop GPU (90.7 - 154.8, n=49) | |
| Lenovo Legion C7 15IMH05 82EH0030GE | |
| Asus ROG Flow X16 GV601RW-M5082W | |
| HP Omen 16-c0077ng | |
| Lenovo Legion 7 16ARHA7 | |
| Lenovo ThinkPad X1 Nano Gen 2 Core i7-1280P | |
| Dell Inspiron 16 Plus 7610-MHJ8F | |
| Dell Inspiron 16 Plus 7610-MHJ8F | |
| 3840x2160 ultra (3/3) best looking | |
| Przeciętny NVIDIA GeForce RTX 3060 Laptop GPU (46.9 - 107, n=11) | |
| HP Envy 16 h0112nr | |
| Dell Inspiron 16 Plus 7610-MHJ8F | |
Witcher 3 FPS Chart
| low | med. | high | ultra | QHD | 4K | |
|---|---|---|---|---|---|---|
| GTA V (2015) | 185.6 | 181.2 | 174.1 | 103.3 | 76.7 | |
| The Witcher 3 (2015) | 402.3 | 264 | 161.2 | 82.8 | 55.1 | |
| Dota 2 Reborn (2015) | 180.6 | 164.8 | 149.1 | 139 | 46.9 | |
| Final Fantasy XV Benchmark (2018) | 177.2 | 111.7 | 83.9 | 62 | 34.6 | |
| X-Plane 11.11 (2018) | 140.3 | 127 | 103 | 60.5 | ||
| Strange Brigade (2018) | 418 | 202 | 162 | 140.4 | 103.5 | |
| Cyberpunk 2077 1.6 (2022) | 115.7 | 94.4 | 72.3 | 59.5 | 17.9 |
Emisje
Szum systemu - tak głośny jak w wielu laptopach do gier
Hałas wentylatorów ma tendencję do pulsowania, jeśli ustawiony jest profil zrównoważonej mocy lub wyższy. Podczas przeglądania stron internetowych lub odtwarzania filmów należy spodziewać się wentylatorów o natężeniu od 30 do 34 dB(A) na tle cichego tła o natężeniu 22,8 dB(A). Inne 16-calowe laptopy, jak np.Huawei MateBook 16s czy MacBook Pro 16 są w stanie zachować ciszę na dłużej niż Envy 16.
Podczas pracy w 3DMarku 06 wentylatory potrafią być głośne nawet o 41 dB(A) w porównaniu z zaledwie 26 dB(A) i 34 dB(A) w wymienionych wcześniej Apple i Huawei
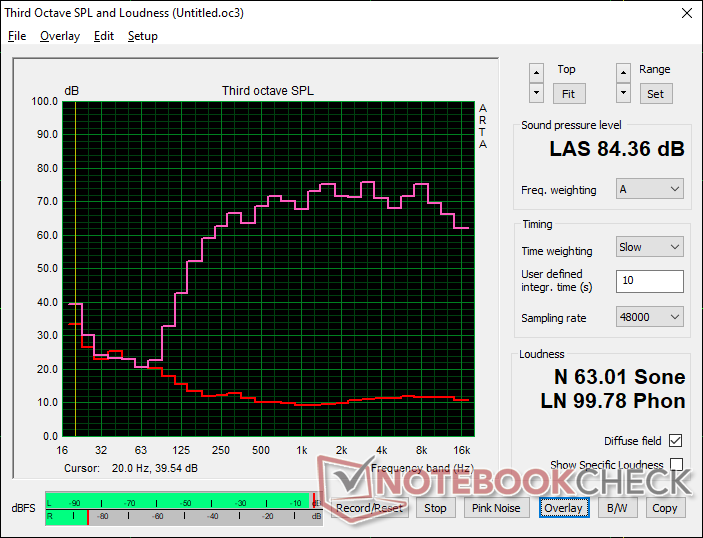
Szum wentylatorów staje się jeszcze głośniejszy i wynosi nieco ponad 51 dB(A), gdy uruchomimy Witcher 3 w trybie Performance. W trybie zrównoważonym hałas spadłby do 41,6 dB(A), ale wydajność grafiki byłaby o 5-10% niższa, jak wspomniano powyżej. Ogólnie rzecz biorąc, jest to dość głośny laptop, jeśli chce się wykorzystać jego wydajność.
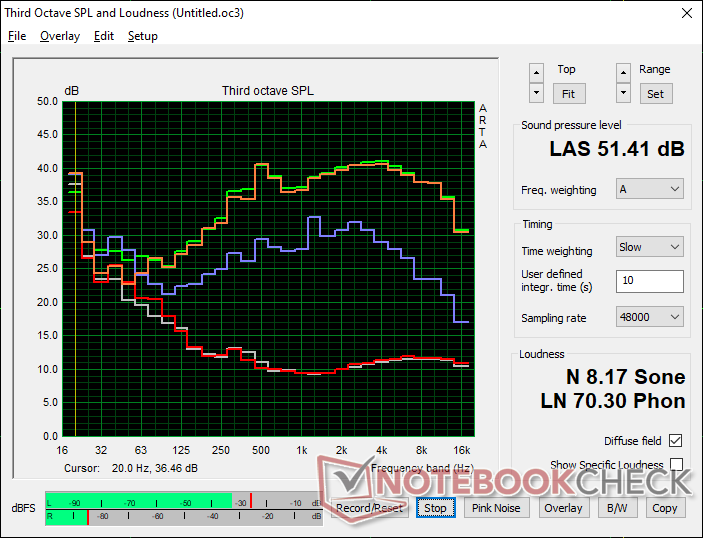
Hałas
| luz |
| 22.9 / 22.9 / 30.5 dB |
| obciążenie |
| 41.4 / 51.4 dB |
 | ||
30 dB cichy 40 dB(A) słyszalny 50 dB(A) irytujący |
||
min: | ||
| HP Envy 16 h0112nr GeForce RTX 3060 Laptop GPU, i7-12700H, Micron 3400 1TB MTFDKBA1T0TFH | Lenovo ThinkBook 16 G4+ IAP GeForce RTX 2050 Mobile, i7-12700H, Micron 2450 1TB MTFDKCD1T0TFK | MSI Creator Z16P B12UHST GeForce RTX 3080 Ti Laptop GPU, i9-12900H, Samsung PM9A1 MZVL22T0HBLB | Dell Inspiron 16 Plus 7610-MHJ8F UHD Graphics Xe 32EUs (Tiger Lake-H), i7-11800H, OM3PDP3-AD NVMe KDI 512GB | Apple MacBook Pro 16 2021 M1 Pro M1 Pro 16-Core GPU, M1 Pro, Apple SSD AP1024R | Huawei MateBook 16s i7 Iris Xe G7 96EUs, i7-12700H, Silicon Motion PCIe-8 SSD | |
|---|---|---|---|---|---|---|
| Noise | 1% | -5% | -1% | 10% | 9% | |
| wyłączone / środowisko * (dB) | 22.8 | 24.2 -6% | 26 -14% | 26.3 -15% | 24.7 -8% | 24 -5% |
| Idle Minimum * (dB) | 22.9 | 24.2 -6% | 27 -18% | 26.3 -15% | 24.7 -8% | 24 -5% |
| Idle Average * (dB) | 22.9 | 24.2 -6% | 29 -27% | 26.3 -15% | 24.7 -8% | 25.2 -10% |
| Idle Maximum * (dB) | 30.5 | 24.2 21% | 31 -2% | 24.7 19% | 27.2 11% | |
| Load Average * (dB) | 41.4 | 47 -14% | 43 -4% | 33 20% | 26.1 37% | 34.8 16% |
| Witcher 3 ultra * (dB) | 51.1 | 47 8% | 43 16% | 44 14% | 34.8 32% | |
| Load Maximum * (dB) | 51.4 | 47 9% | 46 11% | 49.2 4% | 37.4 27% | 39 24% |
* ... im mniej tym lepiej
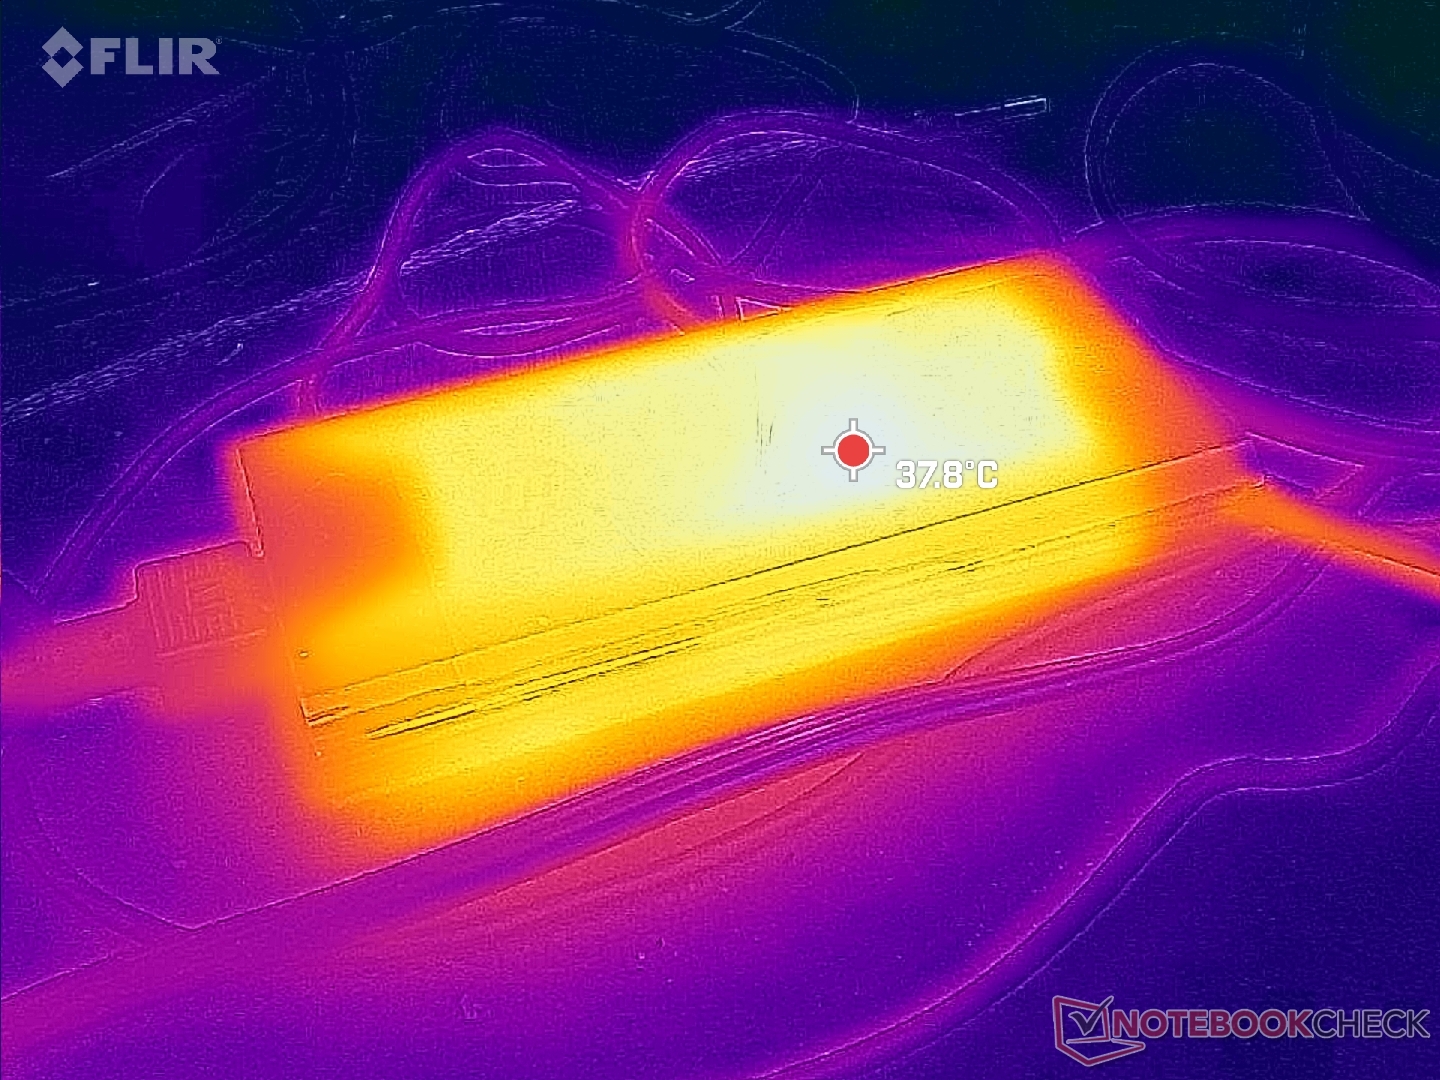
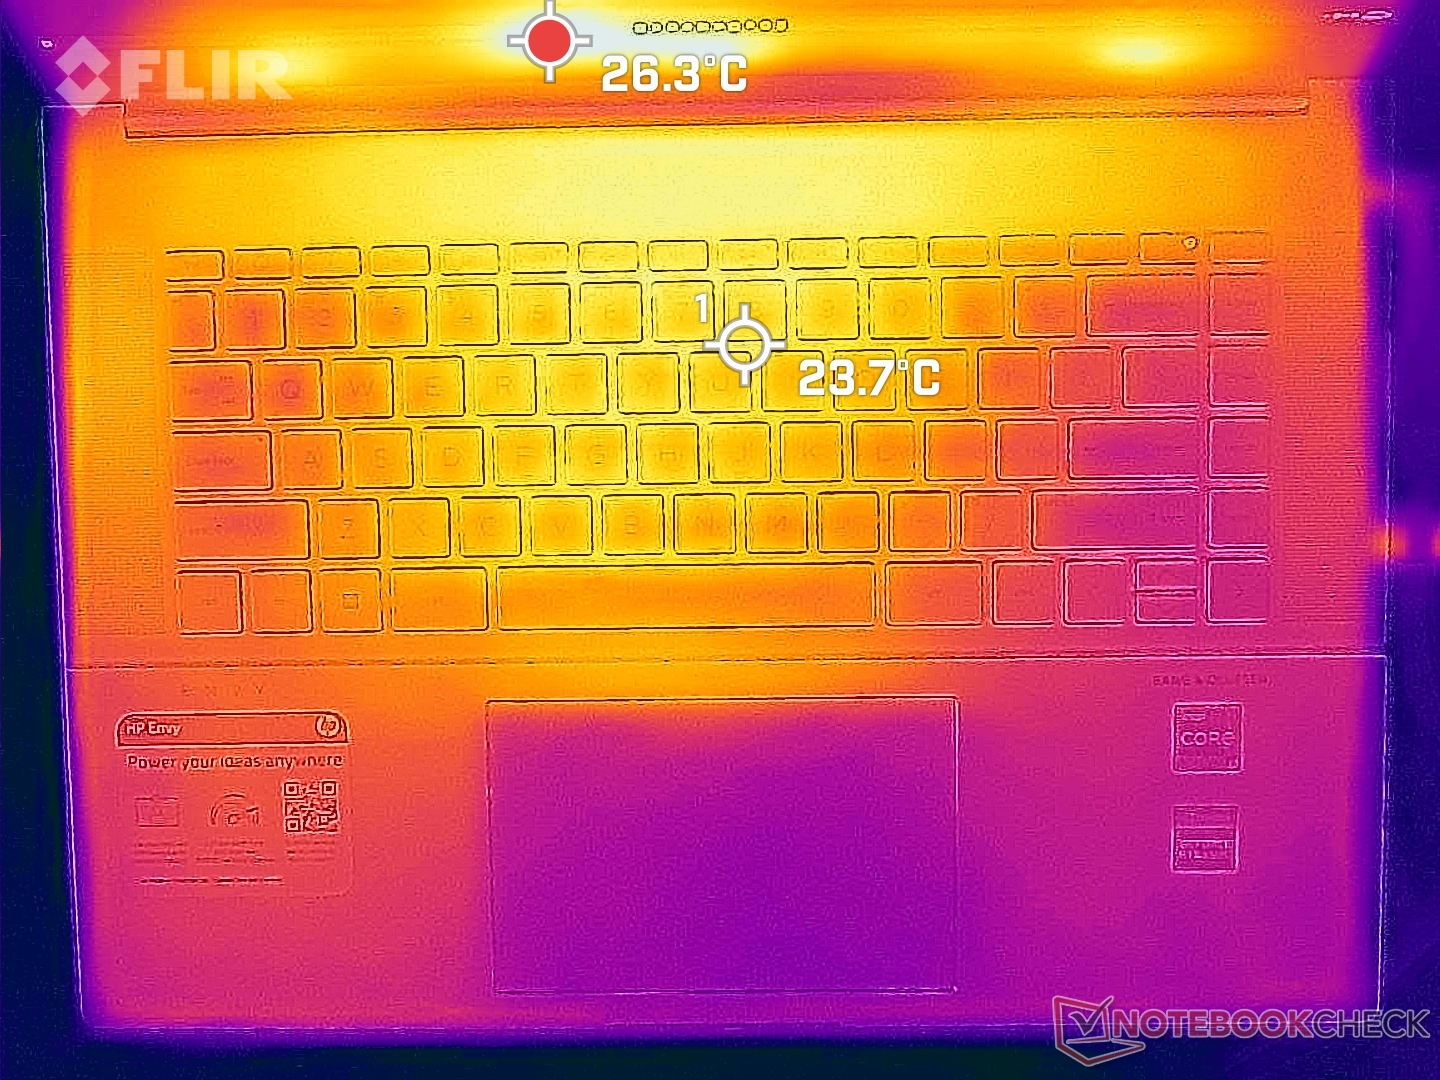
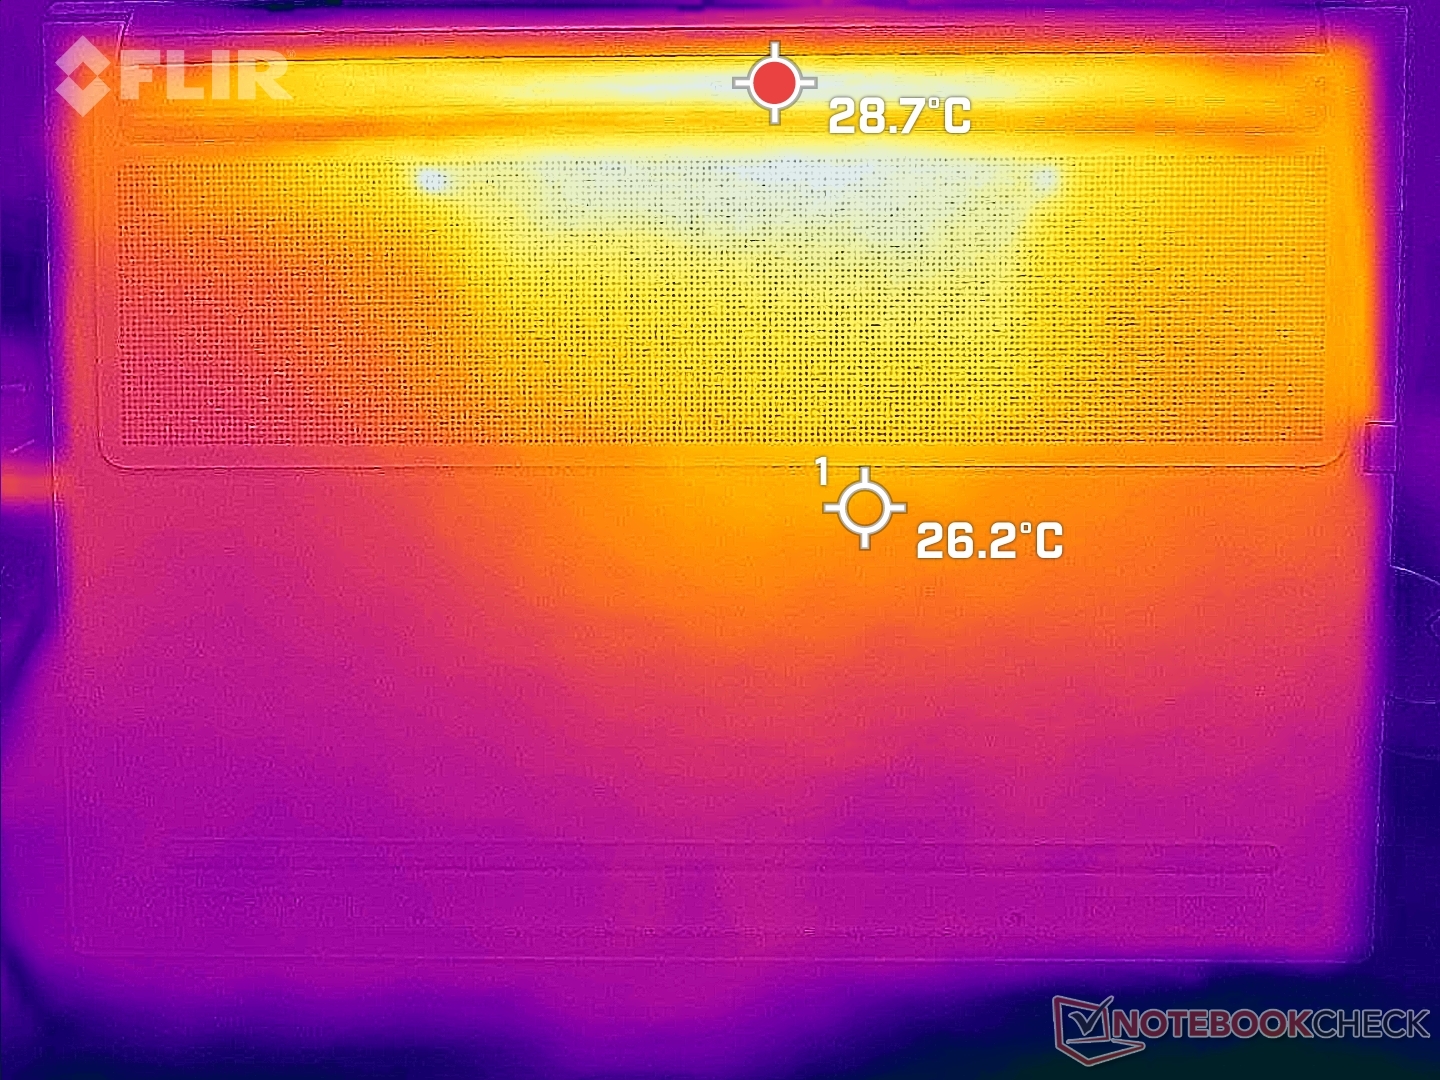
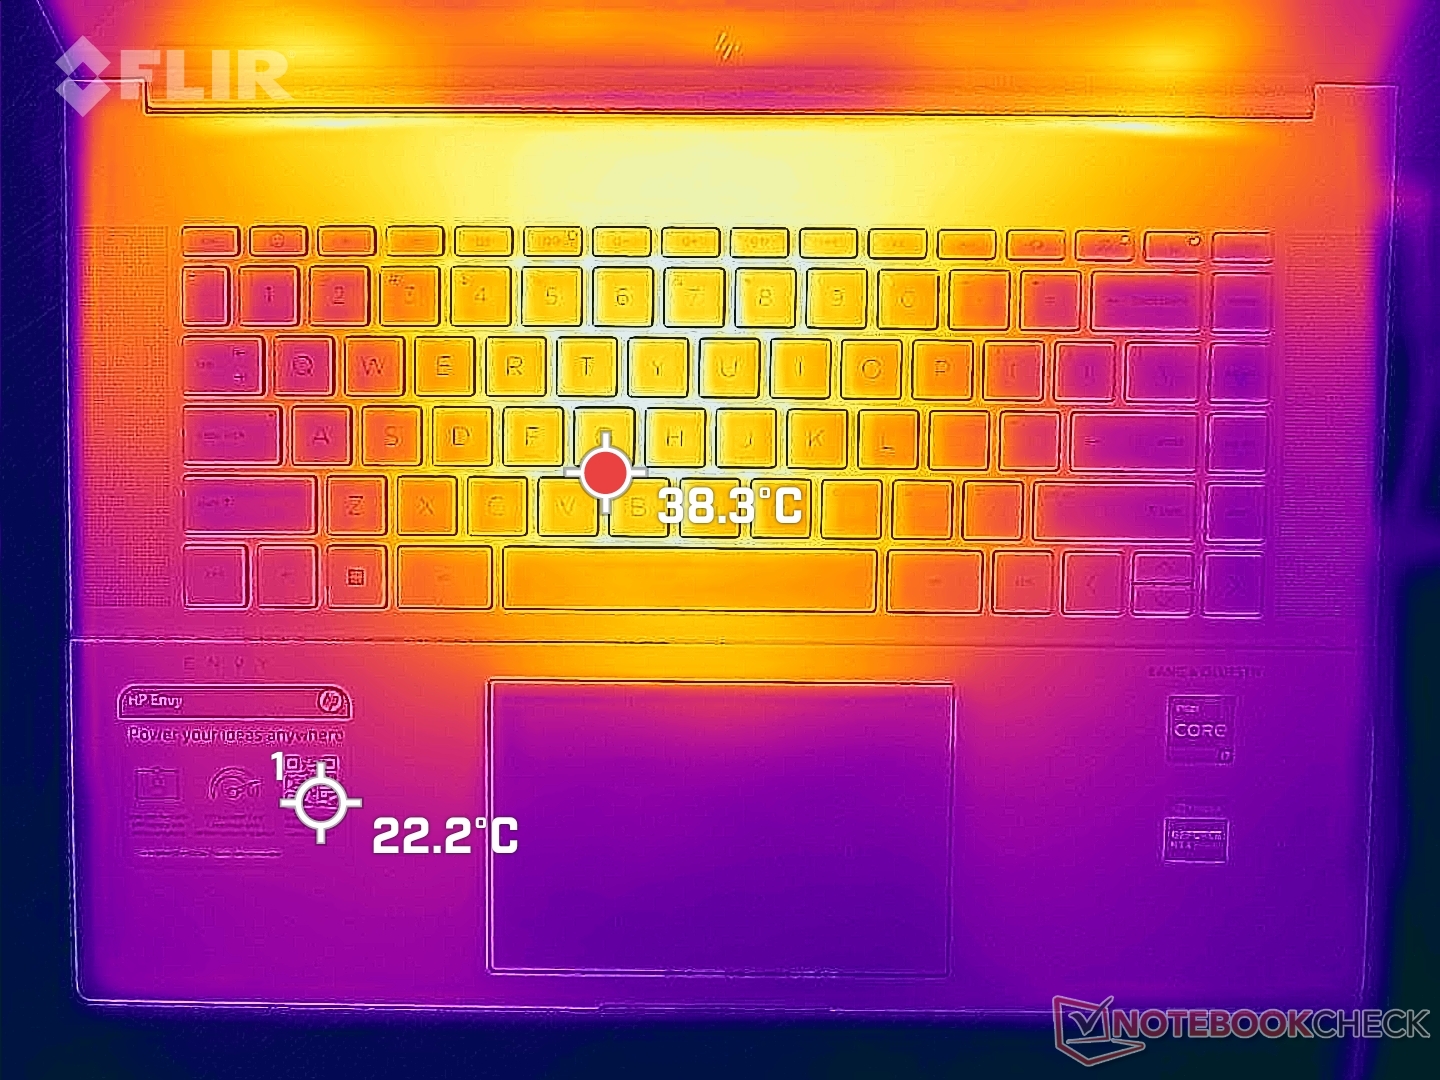
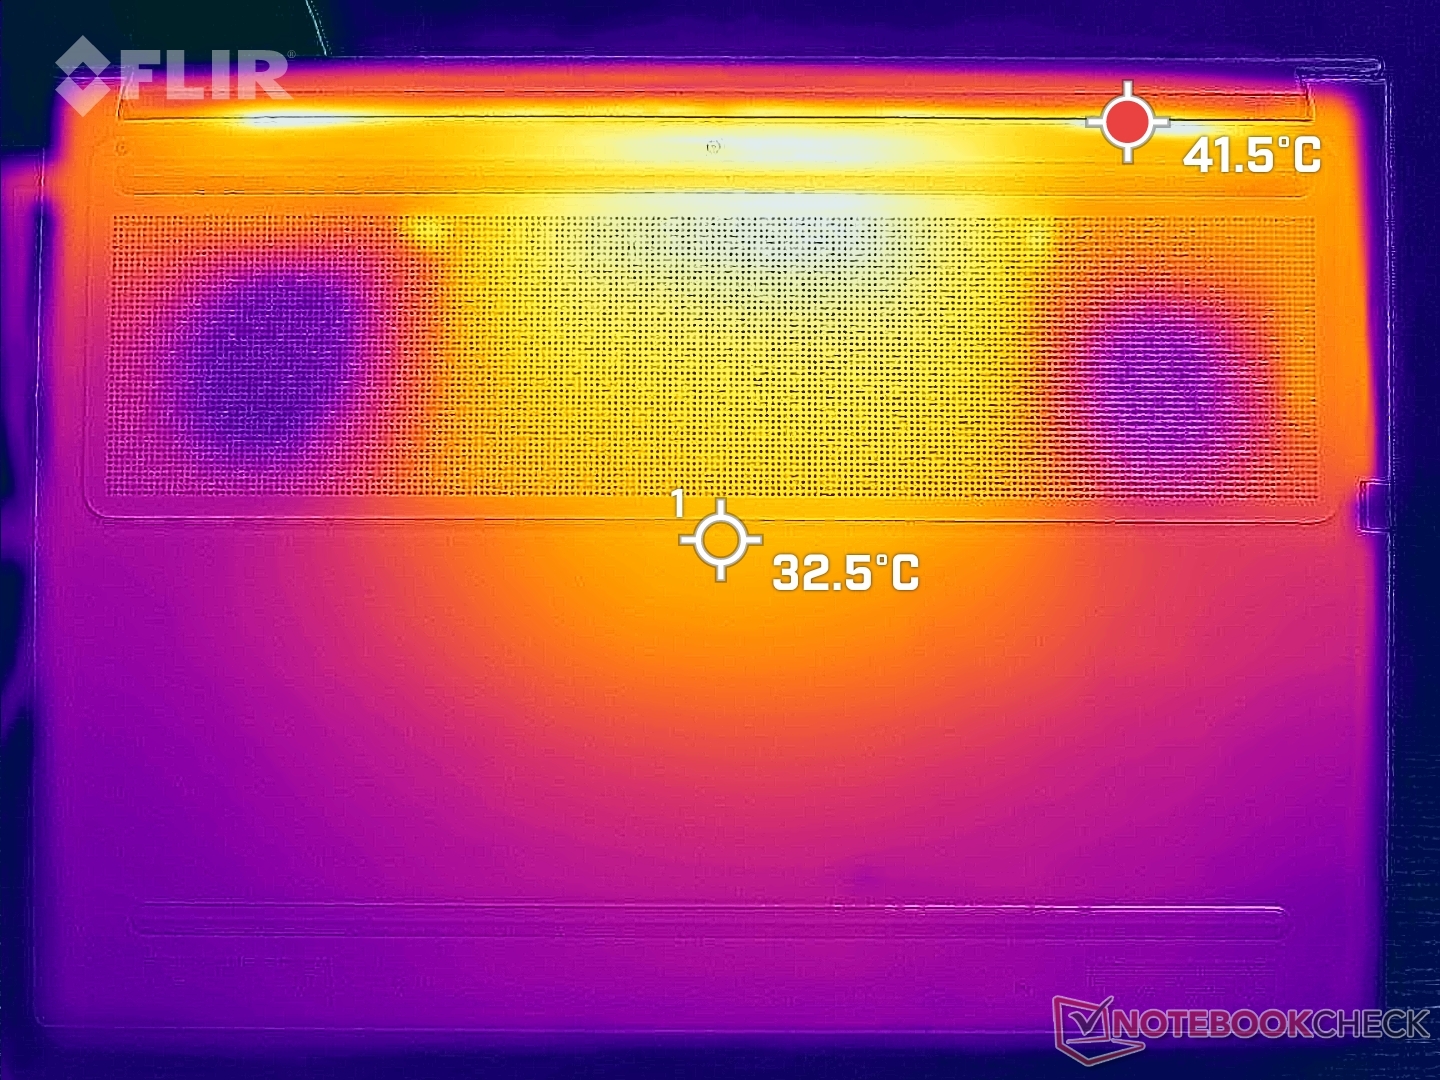
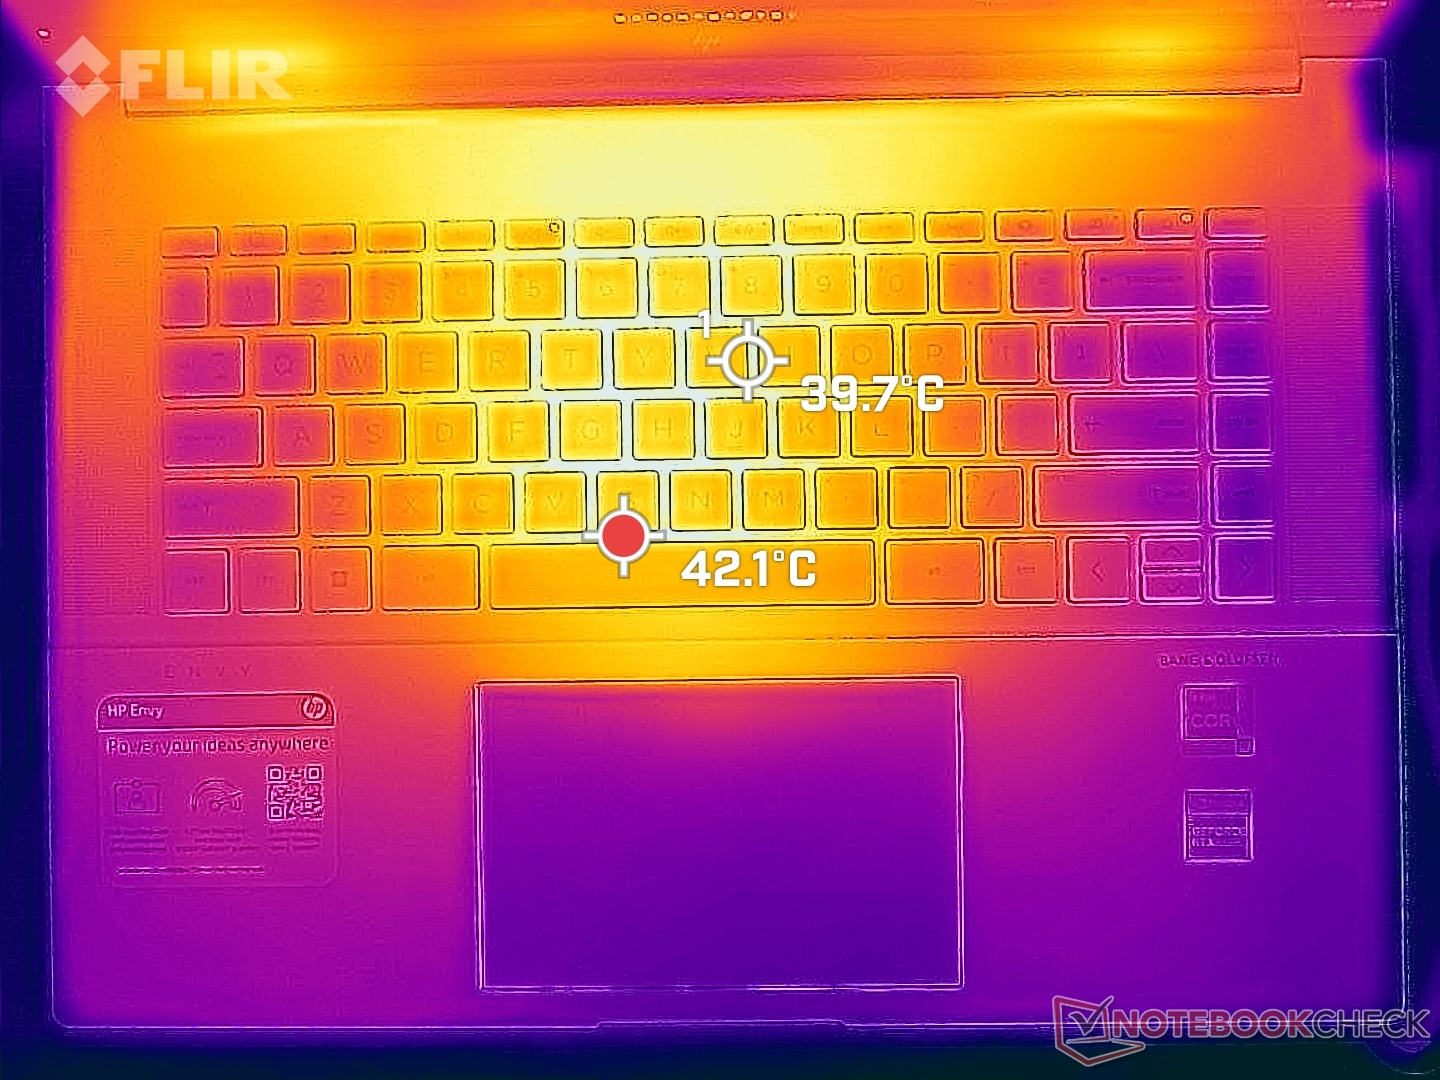
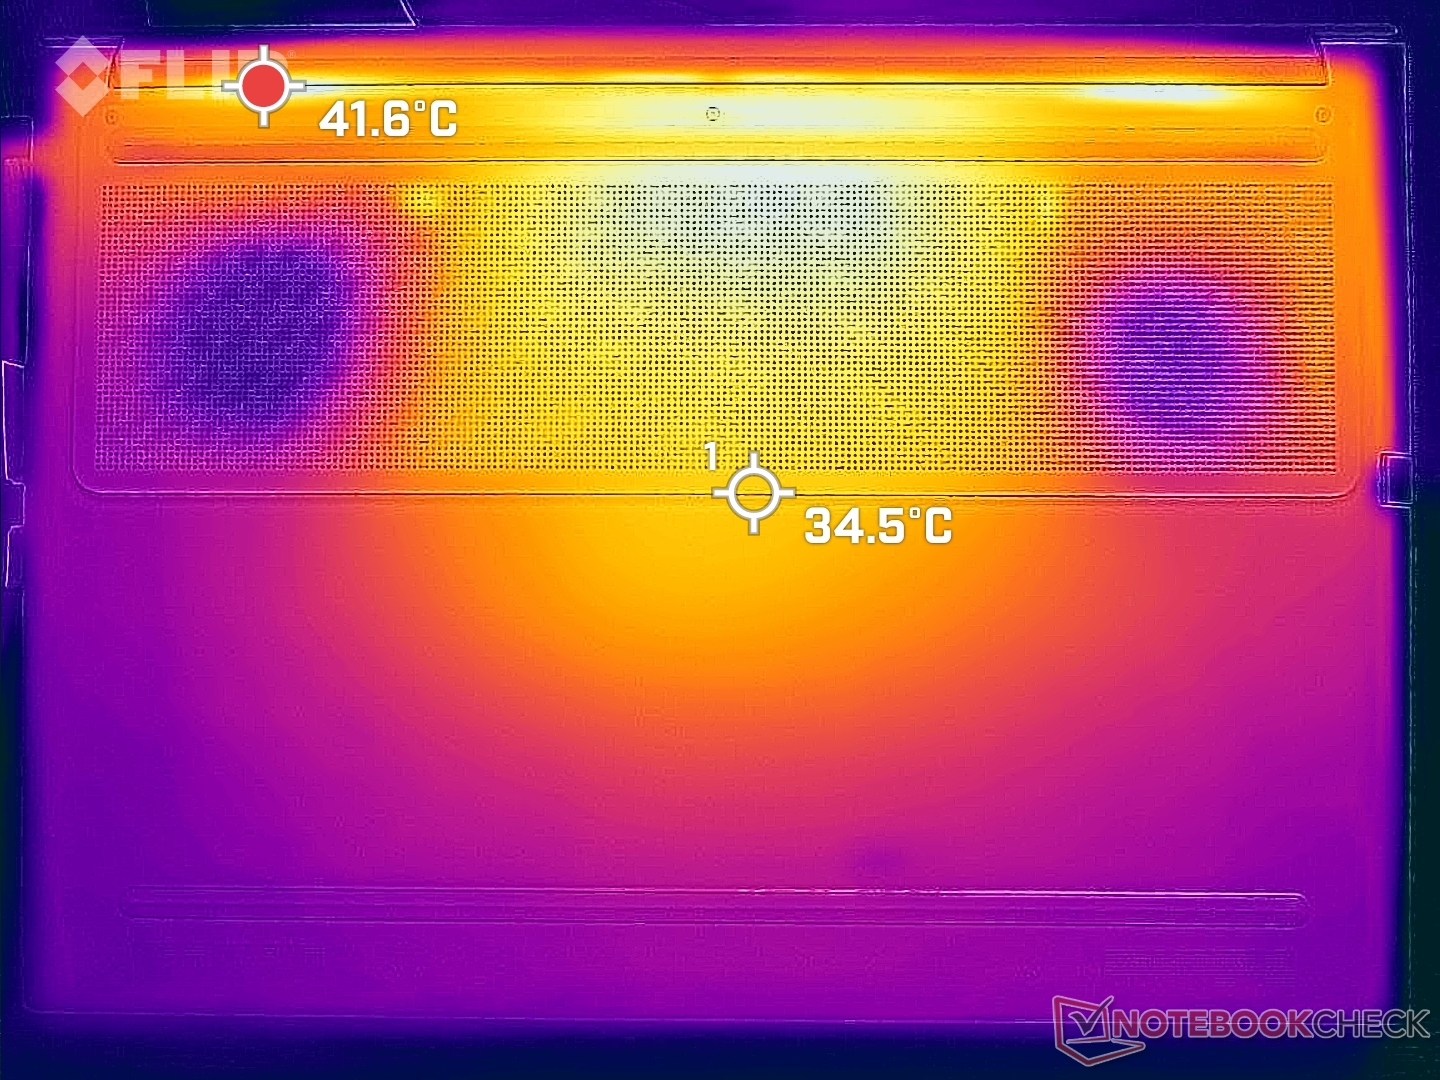
Temperatura
Temperatury powierzchni są dość ciepłe nawet w stanie spoczynku na pulpicie bez uruchomionych aplikacji. Gorące punkty w tych warunkach mogą osiągnąć 33 C zarówno na górze, jak i na dole, w porównaniu do zaledwie 26 C w modelu ThinkBook 16 G4. Przy dużym obciążeniu te same obszary mogą osiągnąć ponad 45 C. Miejsca oparcia dłoni pozostają względnie chłodne, ale spód może być nieprzyjemny dla skóry.
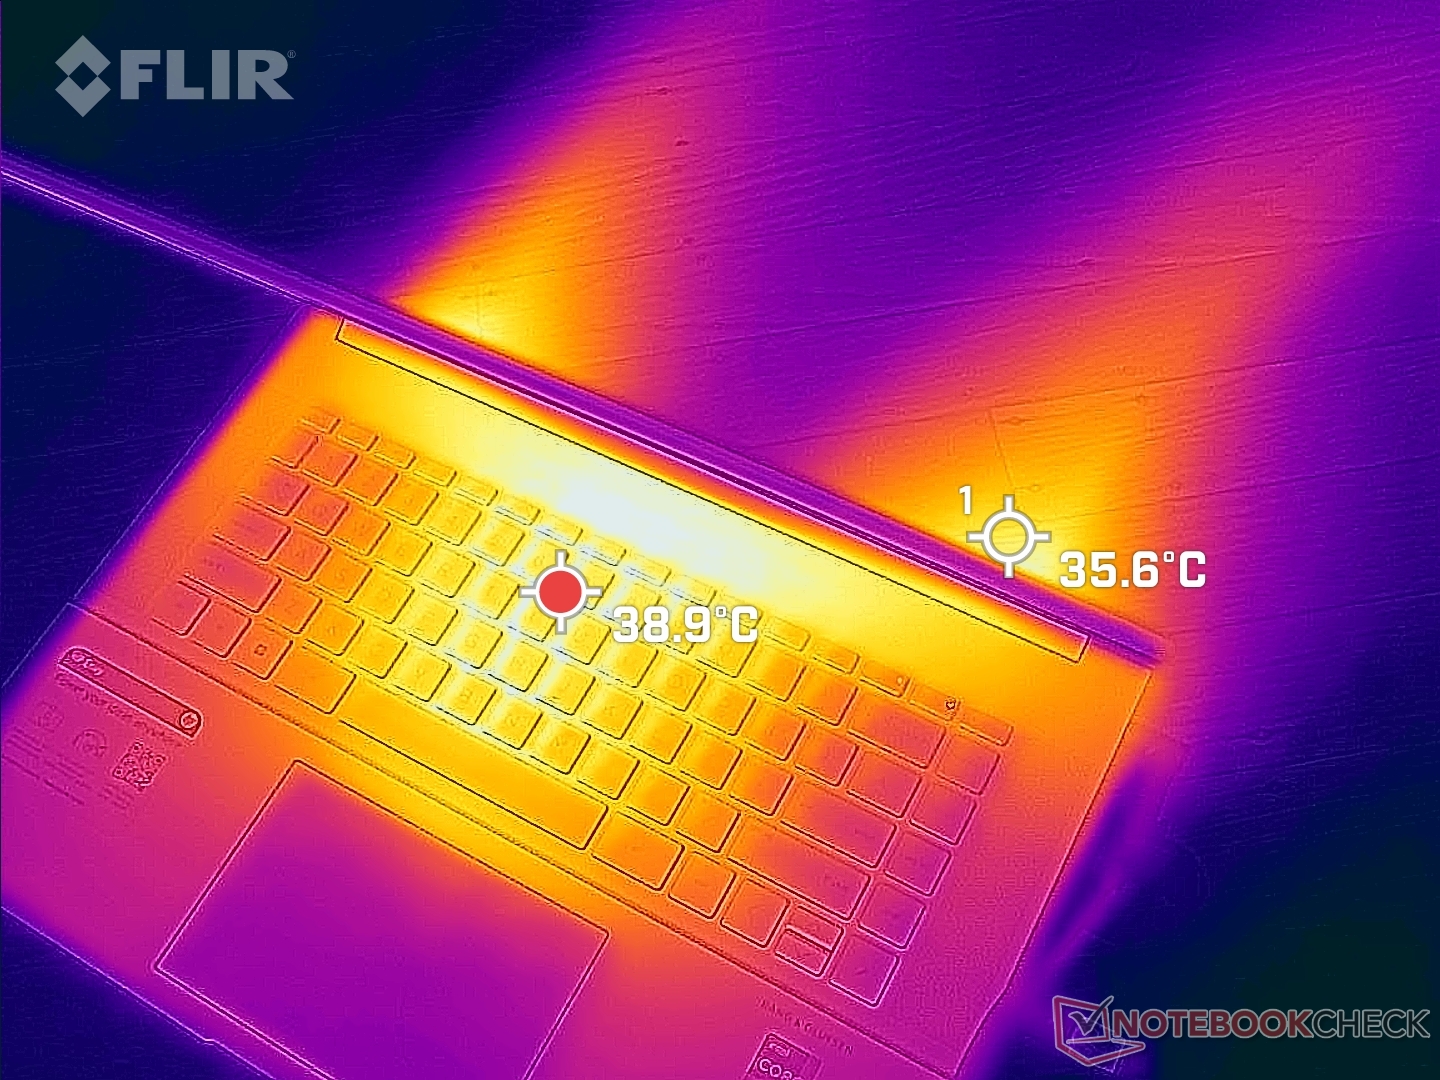
(-) Maksymalna temperatura w górnej części wynosi 45.2 °C / 113 F, w porównaniu do średniej 36.8 °C / 98 F , począwszy od 21 do 71 °C dla klasy Multimedia.
(±) Dno nagrzewa się maksymalnie do 44 °C / 111 F, w porównaniu do średniej 39.1 °C / 102 F
(+) W stanie bezczynności średnia temperatura górnej części wynosi 31 °C / 88 F, w porównaniu ze średnią temperaturą urządzenia wynoszącą 31.3 °C / ### class_avg_f### F.
(±) Podczas gry w Wiedźmina 3 średnia temperatura górnej części wynosi 33.6 °C / 92 F, w porównaniu do średniej temperatury urządzenia wynoszącej 31.3 °C / ## #class_avg_f### F.
(+) Podpórki pod nadgarstki i touchpad są chłodniejsze niż temperatura skóry i maksymalnie 29.8 °C / 85.6 F i dlatego są chłodne w dotyku.
(±) Średnia temperatura obszaru podparcia dłoni w podobnych urządzeniach wynosiła 28.7 °C / 83.7 F (-1.1 °C / -1.9 F).
| HP Envy 16 h0112nr Intel Core i7-12700H, NVIDIA GeForce RTX 3060 Laptop GPU | Lenovo ThinkBook 16 G4+ IAP Intel Core i7-12700H, NVIDIA GeForce RTX 2050 Mobile | MSI Creator Z16P B12UHST Intel Core i9-12900H, NVIDIA GeForce RTX 3080 Ti Laptop GPU | Dell Inspiron 16 Plus 7610-MHJ8F Intel Core i7-11800H, Intel UHD Graphics Xe 32EUs (Tiger Lake-H) | Apple MacBook Pro 16 2021 M1 Pro Apple M1 Pro, Apple M1 Pro 16-Core GPU | Huawei MateBook 16s i7 Intel Core i7-12700H, Intel Iris Xe Graphics G7 96EUs | |
|---|---|---|---|---|---|---|
| Heat | 8% | -20% | 4% | 19% | 5% | |
| Maximum Upper Side * (°C) | 45.2 | 42.9 5% | 67 -48% | 43.4 4% | 41 9% | 40.9 10% |
| Maximum Bottom * (°C) | 44 | 50.6 -15% | 69 -57% | 45.1 -3% | 39 11% | 48.3 -10% |
| Idle Upper Side * (°C) | 33.6 | 26 23% | 29 14% | 30.6 9% | 24 29% | 29.2 13% |
| Idle Bottom * (°C) | 32.6 | 26.5 19% | 29 11% | 31.1 5% | 24 26% | 30.4 7% |
* ... im mniej tym lepiej
Stress Test - ograniczone Turbo Boost
Uruchomienie Prime95 powoduje skokowe zwiększenie częstotliwości taktowania CPU, temperatury i poboru mocy do 3,7 GHz, 80 C i 115 W, trwające około 15 sekund. Następnie temperatura procesora spadała i stabilizowała się na poziomie 2,1 do 2,2 GHz, 66 C i 55 W. Dla porównania, ten sam test przeprowadzono na MSI GS77 z tym samym procesorem Core i7-12700H uzyskano wyższe stabilne częstotliwości taktowania i temperatury rdzenia, odpowiednio 2,7-3,0 GHz i 96 C. HP może obrać bezpieczniejszą drogę w przypadku Envy 16 poprzez zastosowanie wolniejszych częstotliwości taktowania Turbo Boost w celu utrzymania niższych temperatur.
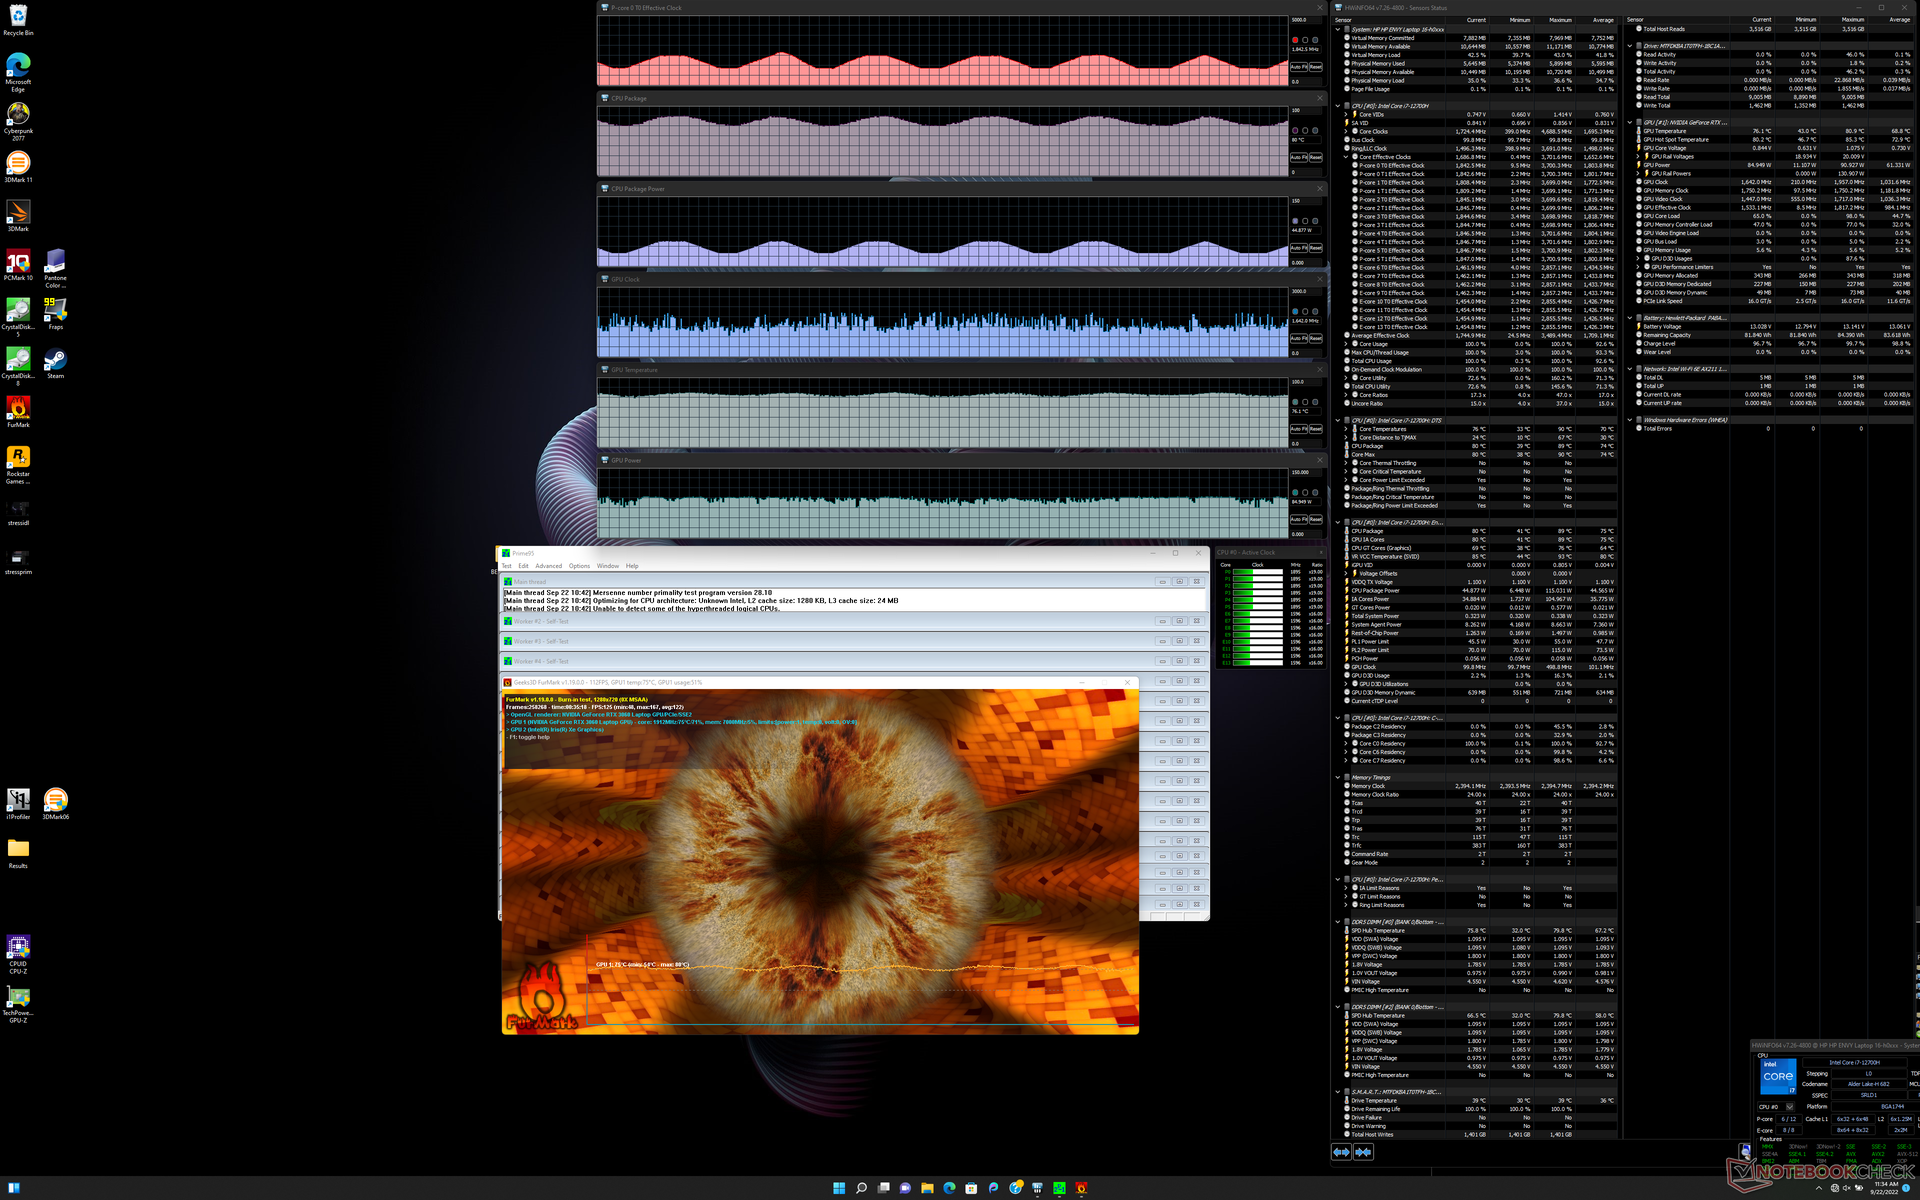
Częstotliwości taktowania GPU, temperatura i pobór mocy na płycie głównej ustabilizowałyby się na poziomie 1717 MHz, 74 C i 94 W, odpowiednio, podczas pracy w trybie Performance Witcher 3 w trybie Performance. W trybie zrównoważonym temperatura spada do 1542 MHz, 72 C i 80 W. Użytkownicy będą musieli znieść maksymalny hałas wentylatora, jeśli chcą w pełni wykorzystać możliwości GPU.
Praca na zasilaniu bateryjnym ogranicza wydajność. Test Fire Strike na akumulatorze przyniósłby wyniki z dziedziny fizyki i grafiki w wysokości odpowiednio 17295 i 10572 punktów, w porównaniu z 28353 i 19890 punktami na zasilaniu sieciowym.
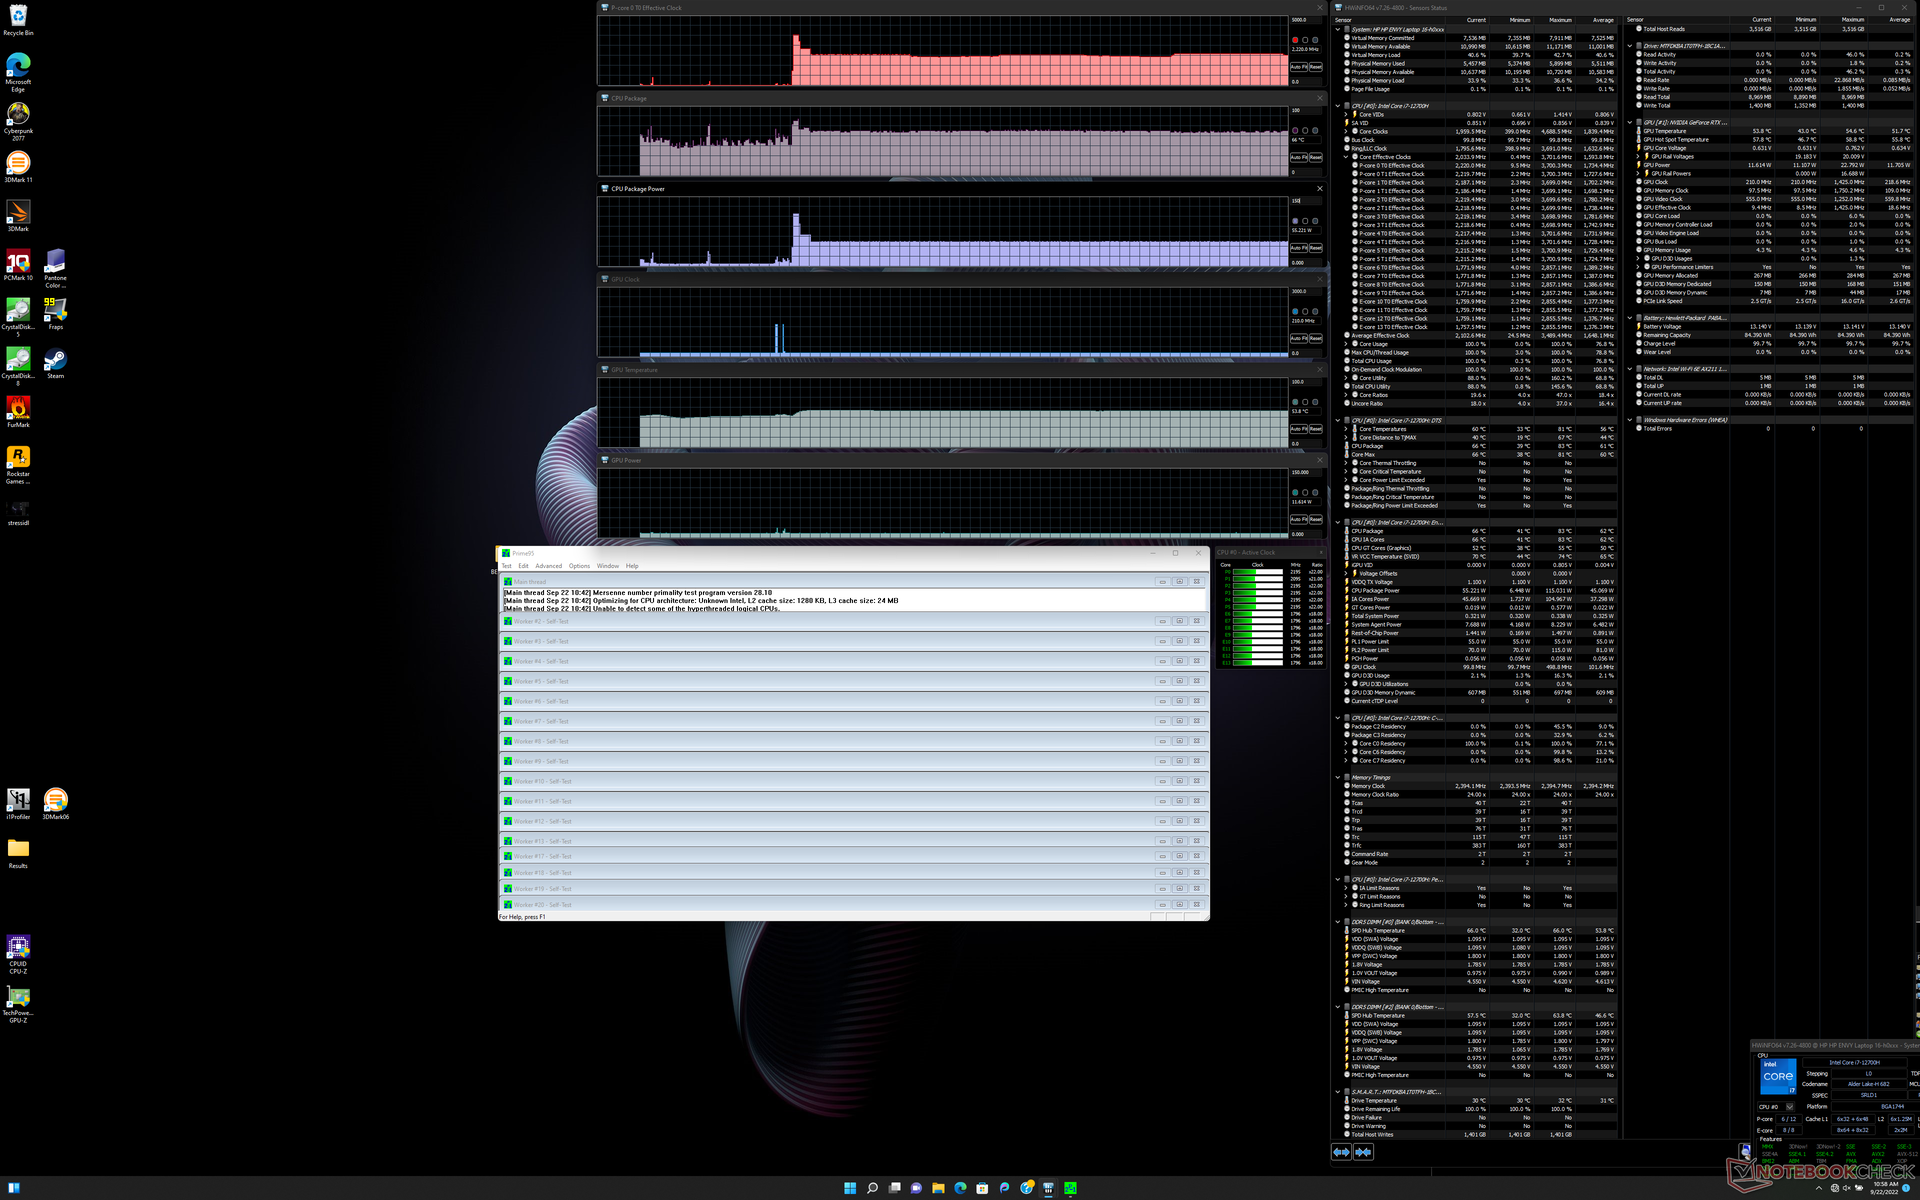
| ZegarCPU (GHz) | Zegar GPU (MHz) | Średnia temperatura CPU (°C) | Średnia temperatura GPU (°C) | |
| System w stanie bezczynności | -- | -- | 49 | 47 |
| Prime95 Stress | 2.1 - 2.2 | -- | 66 | 54 |
| Prime95 + FurMark Stress | 1.2 - 2.2 | ~1642 | 74 - 87 | 76 |
| Witcher 3 Stres (tryb zrównoważony) | 0,67 | 1542 | 67 | 72 |
| Witcher 3 Stres(tryb Performance) | 0,67 | 1717 | 69 | 74 |
Mówcy
HP Envy 16 h0112nr analiza dźwięku
(+) | głośniki mogą odtwarzać stosunkowo głośno (84.4 dB)
Bas 100 - 315 Hz
(-) | prawie brak basu - średnio 15.9% niższa od mediany
(±) | liniowość basu jest średnia (12.8% delta do poprzedniej częstotliwości)
Średnie 400 - 2000 Hz
(+) | zbalansowane środki średnie - tylko 3.1% od mediany
(+) | średnie są liniowe (5.5% delta do poprzedniej częstotliwości)
Wysokie 2–16 kHz
(+) | zrównoważone maksima - tylko 3.4% od mediany
(+) | wzloty są liniowe (6.3% delta do poprzedniej częstotliwości)
Ogólnie 100 - 16.000 Hz
(+) | ogólny dźwięk jest liniowy (12.1% różnicy w stosunku do mediany)
W porównaniu do tej samej klasy
» 22% wszystkich testowanych urządzeń w tej klasie było lepszych, 3% podobnych, 76% gorszych
» Najlepszy miał deltę 5%, średnia wynosiła ###średnia###%, najgorsza wynosiła 45%
W porównaniu do wszystkich testowanych urządzeń
» 10% wszystkich testowanych urządzeń było lepszych, 2% podobnych, 88% gorszych
» Najlepszy miał deltę 4%, średnia wynosiła ###średnia###%, najgorsza wynosiła 134%
Apple MacBook Pro 16 2021 M1 Pro analiza dźwięku
(+) | głośniki mogą odtwarzać stosunkowo głośno (84.7 dB)
Bas 100 - 315 Hz
(+) | dobry bas - tylko 3.8% od mediany
(+) | bas jest liniowy (5.2% delta do poprzedniej częstotliwości)
Średnie 400 - 2000 Hz
(+) | zbalansowane środki średnie - tylko 1.3% od mediany
(+) | średnie są liniowe (2.1% delta do poprzedniej częstotliwości)
Wysokie 2–16 kHz
(+) | zrównoważone maksima - tylko 1.9% od mediany
(+) | wzloty są liniowe (2.7% delta do poprzedniej częstotliwości)
Ogólnie 100 - 16.000 Hz
(+) | ogólny dźwięk jest liniowy (4.6% różnicy w stosunku do mediany)
W porównaniu do tej samej klasy
» 0% wszystkich testowanych urządzeń w tej klasie było lepszych, 0% podobnych, 100% gorszych
» Najlepszy miał deltę 5%, średnia wynosiła ###średnia###%, najgorsza wynosiła 45%
W porównaniu do wszystkich testowanych urządzeń
» 0% wszystkich testowanych urządzeń było lepszych, 0% podobnych, 100% gorszych
» Najlepszy miał deltę 4%, średnia wynosiła ###średnia###%, najgorsza wynosiła 134%
Zarządzanie energią
Pobór mocy
Podczas pracy na biegu jałowym na pulpicie pobierane jest od 10 do 28 W w zależności od poziomu jasności, profilu zasilania i ustawienia Optimus w porównaniu z zaledwie 9-18 W w Envy 15 z 2020 roku ze względu na bardziej wymagający panel OLED i procesor 12. generacji. Należy pamiętać, że niektóre kolory wymagają więcej energii niż inne na panelu OLED, co zostało szczegółowo opisane tutaj szczegółowo opisane tutaj.
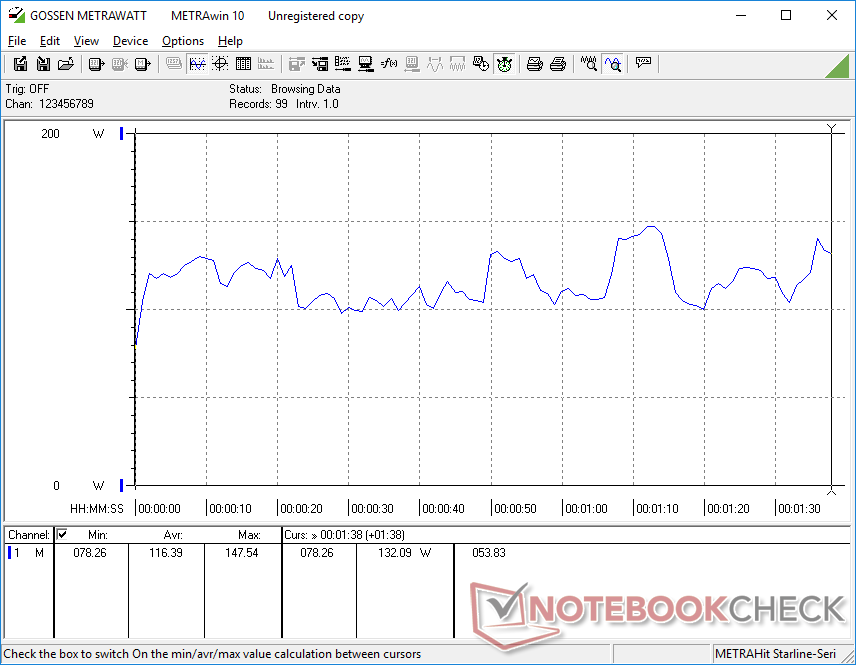
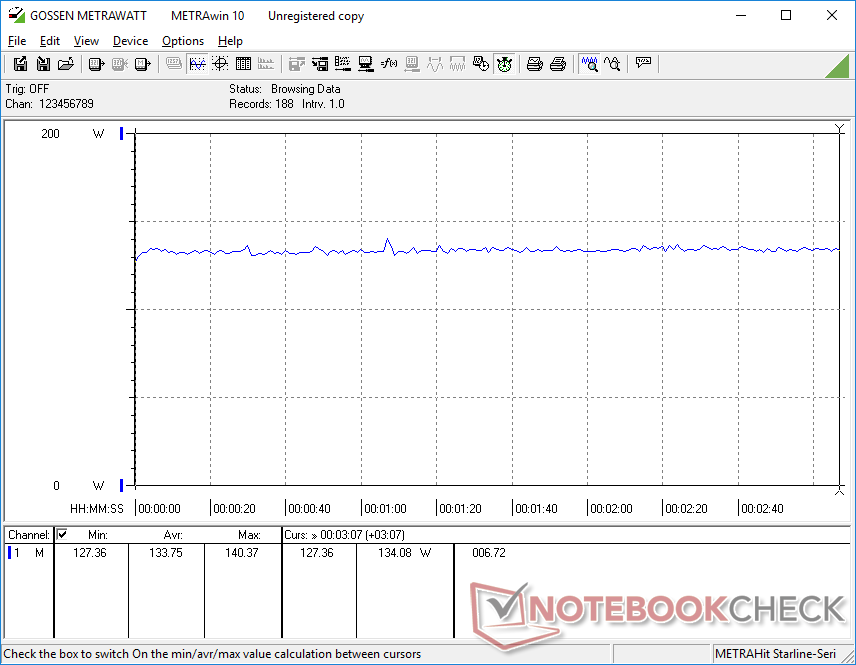
Pobór mocy w grach jest wysoki i wynosi około 134 W, co jest porównywalne doMSI Creator Z16P z szybszym procesorem Core i9-12900H i GPU RTX 3080 Ti lub Lenovo Legion Slim 7 16 z tym samym procesorem Core i7 i GPU. W porównaniu z modelem 2020 Envy 15 zużycie jest jednak tylko o około 7 procent wyższe w grach, mimo o 20-30 procent szybszej wydajności graficznej zapewniającej wyższą wydajność na wat.
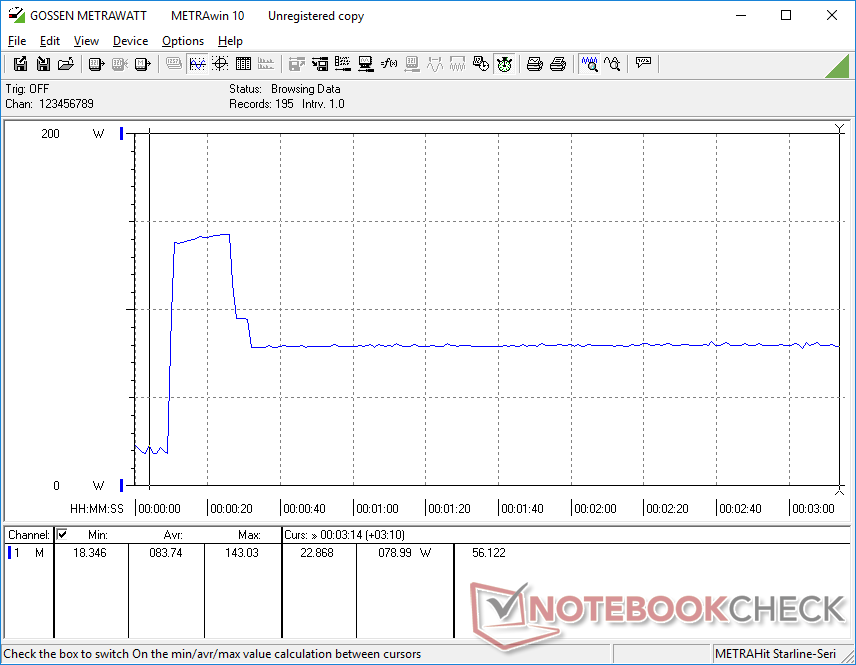
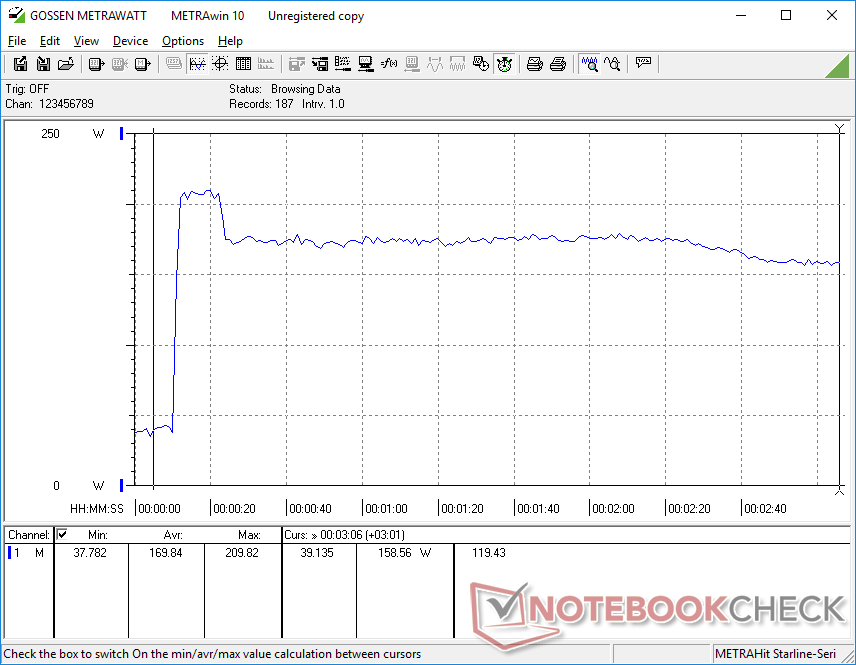
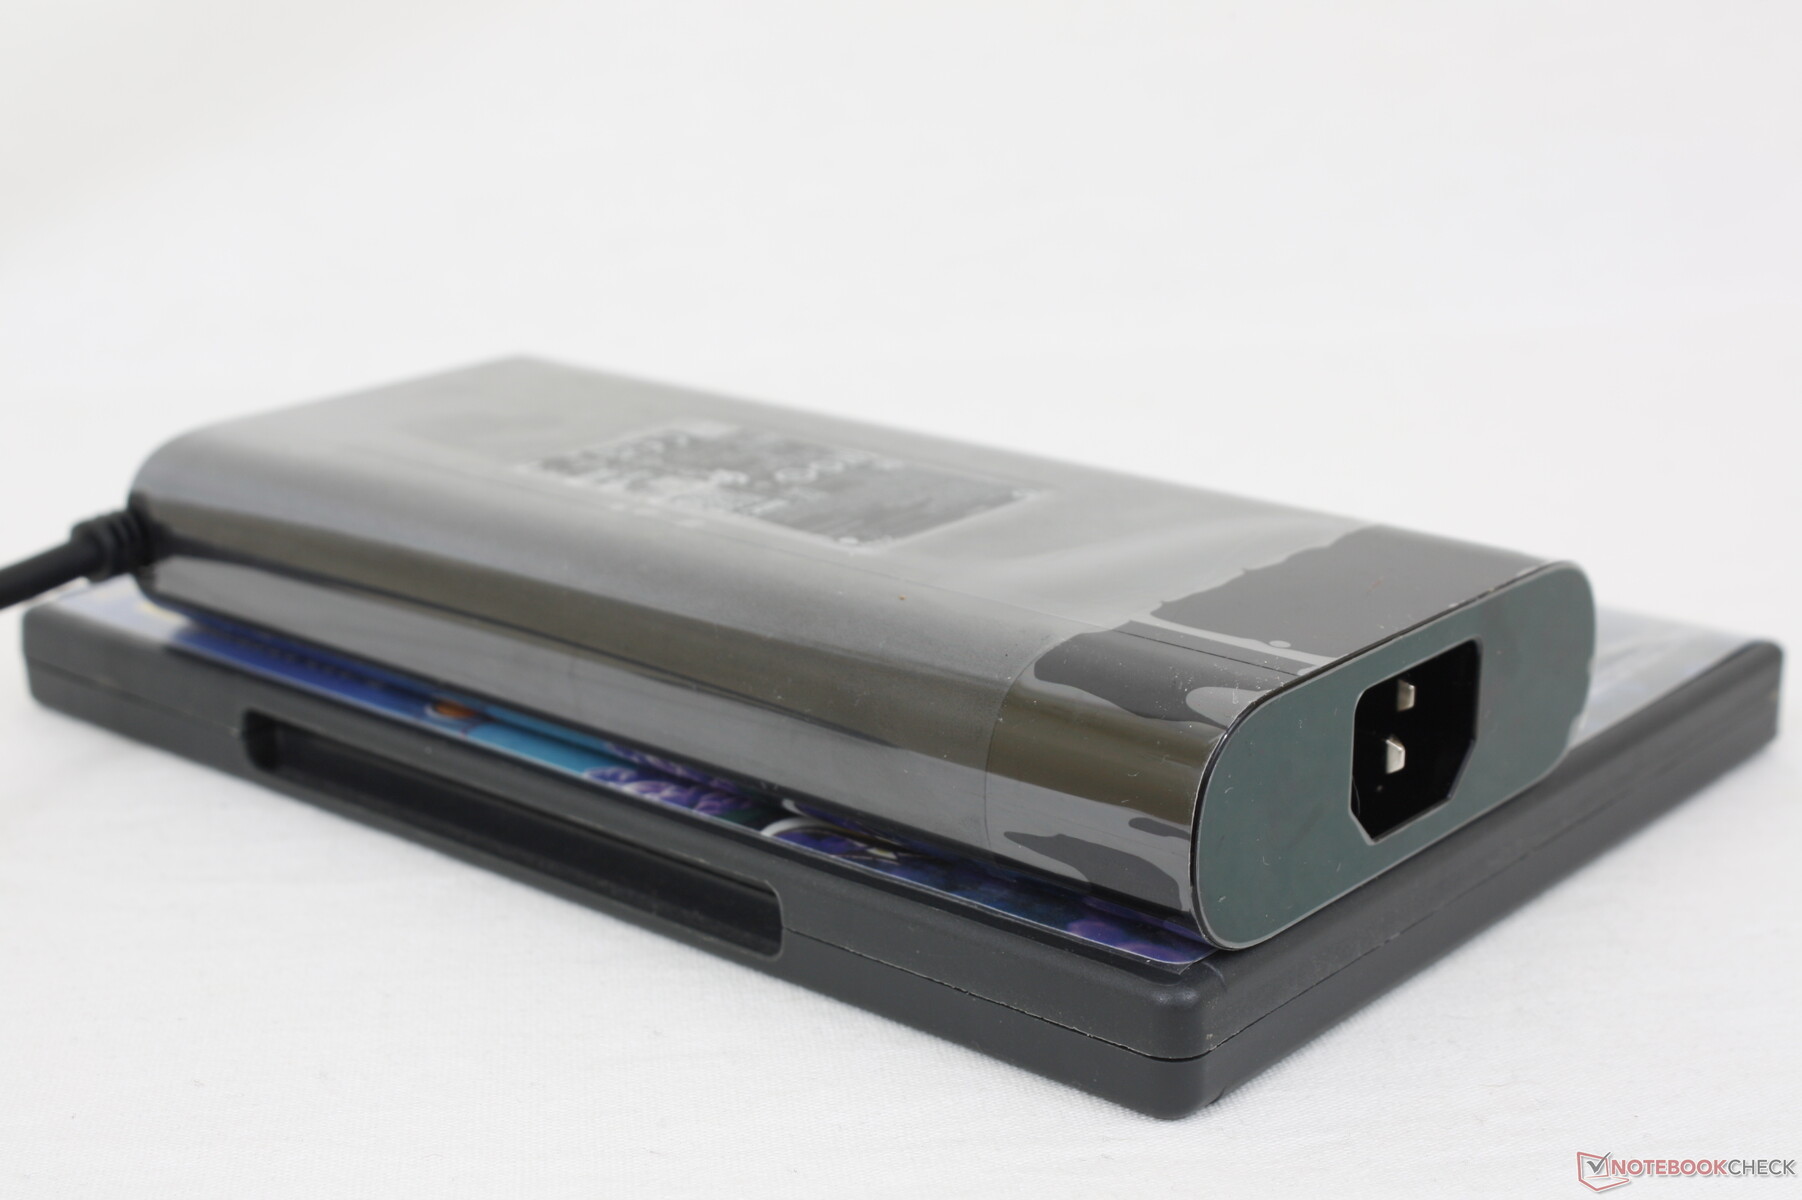
Udało nam się zmierzyć chwilowy maksymalny pobór 209,8 W ze średniej wielkości (~16,5 x 7,8 x 2,5 cm) 200 W zasilacza AC, gdy CPU i GPU są wykorzystywane w 100 procentach. Przy ekstremalnym obciążeniu zużycie stabilizuje się na poziomie około 160 W.
| wyłączony / stan wstrzymania | |
| luz | |
| obciążenie |
|
Legenda:
min: | |
| HP Envy 16 h0112nr i7-12700H, GeForce RTX 3060 Laptop GPU, Micron 3400 1TB MTFDKBA1T0TFH, OLED, 3840x2400, 16" | Lenovo ThinkBook 16 G4+ IAP i7-12700H, GeForce RTX 2050 Mobile, Micron 2450 1TB MTFDKCD1T0TFK, IPS, 2560x1600, 16" | MSI Creator Z16P B12UHST i9-12900H, GeForce RTX 3080 Ti Laptop GPU, Samsung PM9A1 MZVL22T0HBLB, IPS True Pixel (~100% DCI-P3), 2560x1600, 16" | Dell Inspiron 16 Plus 7610-MHJ8F i7-11800H, UHD Graphics Xe 32EUs (Tiger Lake-H), OM3PDP3-AD NVMe KDI 512GB, IPS, 3072x1920, 16" | Apple MacBook Pro 16 2021 M1 Pro M1 Pro, M1 Pro 16-Core GPU, Apple SSD AP1024R, Mini-LED, 3456x2234, 16.2" | Huawei MateBook 16s i7 i7-12700H, Iris Xe G7 96EUs, Silicon Motion PCIe-8 SSD, IPS, 2520x1680, 16" | |
|---|---|---|---|---|---|---|
| Power Consumption | 36% | -11% | 50% | 33% | 35% | |
| Idle Minimum * (Watt) | 10 | 5 50% | 11 -10% | 5.4 46% | 5 50% | 6.8 32% |
| Idle Average * (Watt) | 10.9 | 11.2 -3% | 17 -56% | 9.8 10% | 15.1 -39% | 13.2 -21% |
| Idle Maximum * (Watt) | 27.8 | 11.6 58% | 26 6% | 14 50% | 15.5 44% | 13.8 50% |
| Load Average * (Watt) | 116.4 | 89.3 23% | 124 -7% | 44 62% | 54 54% | 75.2 35% |
| Witcher 3 ultra * (Watt) | 133.7 | 83 38% | 133.5 -0% | 44 67% | 56.1 58% | |
| Load Maximum * (Watt) | 209.8 | 102 51% | 212 -1% | 76.8 63% | 90 57% | 90.6 57% |
* ... im mniej tym lepiej
Power Consumption Witcher 3 / Stresstest
Power Consumption external Monitor
Czas pracy na baterii
Czas pracy w sieci WLAN jest porównywalny z MateBookiem 16s i7 czy ThinkBookiem 16 G4+ IAP i wynosi około 8 godzin. Wydajność akumulatora pozostaje identyczna jak w Envy 15 z 2020 roku, mimo przejścia na większy rozmiar ekranu.
Ładowanie od pustego do pełnego za pomocą dołączonego adaptera beczkowego trwa około 1,5 godziny. System nie może być ładowany przez USB-C, mimo tego, co może twierdzić oficjalna specyfikacja. Po podłączeniu ładowarki 100 W USB-C system po prostu dałby ostrzeżenie, aby zamiast tego użyć ładowarki o większej pojemności. Skontaktowaliśmy się z HP w celu uzyskania wyjaśnień i odpowiednio zaktualizujemy tę sekcję.
| HP Envy 16 h0112nr i7-12700H, GeForce RTX 3060 Laptop GPU, 83 Wh | Lenovo ThinkBook 16 G4+ IAP i7-12700H, GeForce RTX 2050 Mobile, 71 Wh | MSI Creator Z16P B12UHST i9-12900H, GeForce RTX 3080 Ti Laptop GPU, 90 Wh | Dell Inspiron 16 Plus 7610-MHJ8F i7-11800H, UHD Graphics Xe 32EUs (Tiger Lake-H), 86 Wh | Apple MacBook Pro 16 2021 M1 Pro M1 Pro, M1 Pro 16-Core GPU, 99.6 Wh | Huawei MateBook 16s i7 i7-12700H, Iris Xe G7 96EUs, 84 Wh | |
|---|---|---|---|---|---|---|
| Czasy pracy | -1% | -36% | 67% | 114% | 11% | |
| Reader / Idle (h) | 17.8 | 22.5 26% | ||||
| WiFi v1.3 (h) | 7.9 | 8.2 4% | 5.2 -34% | 9.5 20% | 16.9 114% | 8.1 3% |
| Load (h) | 1.6 | 1.5 -6% | 1 -37% | 4.1 156% | 1.9 19% | |
| H.264 (h) | 12.6 | 5.8 | 17.5 | 9.3 | ||
| WiFi (h) | 9.5 |
Za
Przeciw
Werdykt - Jak budżetowy MacBook Pro 16
Envy 16 jest oczywiście szybszy od starszego Envy 15, ale niektóre z wad, o których wspominaliśmy w przypadku Envy 15, nie zostały jeszcze rozwiązane. Jest wiele ulepszeń, takich jak kamera internetowa, głośniki, łączność bezprzewodowa, rozmiar gładzika i czas pracy na baterii, ale inne rzeczy, takie jak głośne wentylatory, brak blokady Kensington, gąbczasty gładzik i stosunkowo słabe zawiasy, nie są w tym roku lepsze. Poprawa tych słabych obszarów pomogłaby wzmocnić Envy 16 wobec takich konkurentów, jak np MacBook Pro 16 lub Dell Inspiron 16 Plus. System jest też jednym z większych i cięższych 16-calowych laptopów na rynku, co może odstraszać podróżników i studentów
HP Envy 16 jest o prawie 1000 dolarów tańszy od bazowego MacBooka Pro 16, a jednocześnie oferuje konkurencyjne funkcje wydajnościowe i kolory. Jest to jednak dość głośny i ciężki system.
Użytkownicy, których nie odstrasza waga, przekonają się, że Envy 16 to wszechstronny system o wydajności, rozmiarze ekranu i kolorach odpowiednich do gier i edycji. Szczególnie doceniamy to, jak łatwo jest dodać więcej pamięci masowej lub pamięci RAM w razie potrzeby. Jeśli jednak Twoje zadania nie wymagają dużej mocy, to warto rozważyć znacznie lżejsze 16-calowe opcje, jak np LG Gram 16 lub Huawei MateBook 16s.
Cena i dostępność
Envy 16 jest już dostępny u największych sprzedawców detalicznych, w tym w Newegg, Best Buy, Costco, Micro Center oraz HP.com w różnych konfiguracjach. Naszą konkretną konfigurację można znaleźć na stronie Micro Center za 1700 USD, podczas gdy jednostki SKU Intel Arc A370M można znaleźć gdzie indziej.
HP Envy 16 h0112nr
- 24/09/2022 v7 (old)
Allen Ngo
Price comparison

