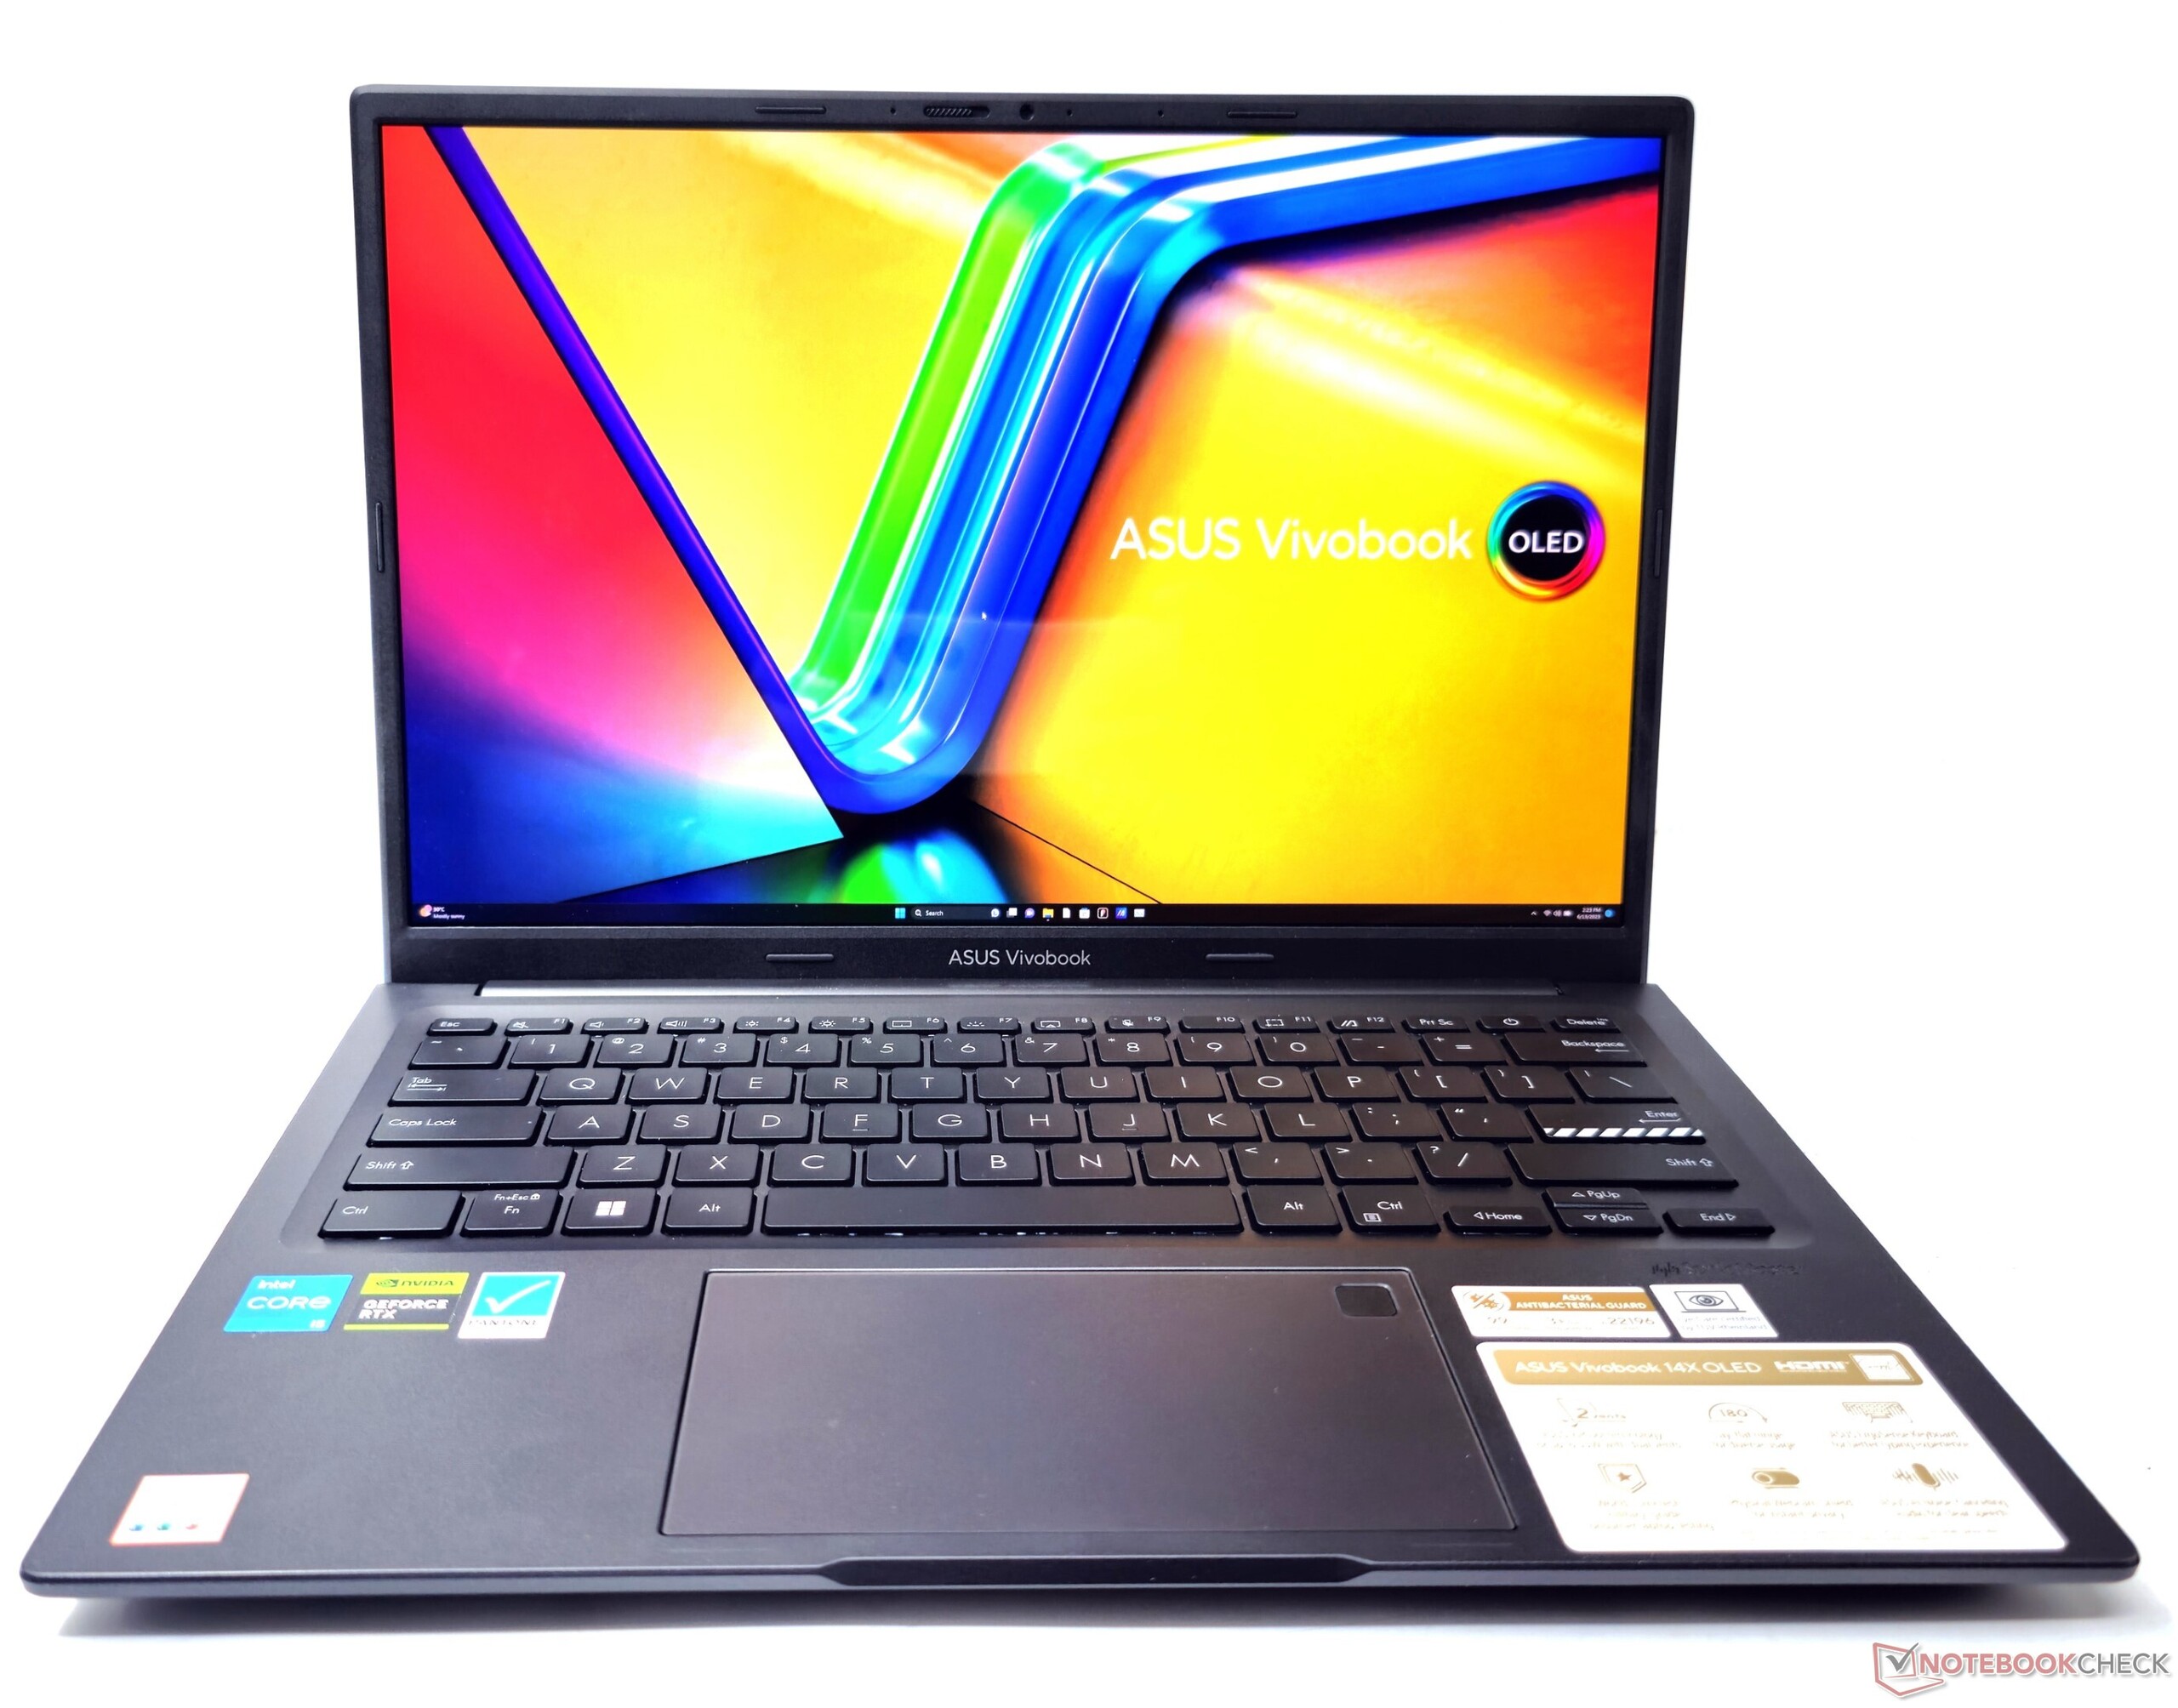
Recenzja laptopa Asus VivoBook 14X OLED K3405: Niedrogi laptop multimedialny z procesorem Core i5-13500H i żywym wyświetlaczem OLED 2,8K

Asus wprowadził w tym roku na rynek kilka zmodernizowanych VivoBooków. Podczas gdy nowy VivoBook 15X oferuje opcje Intel Raptor Lake-P i AMD Ryzen 7030U Barcelo-R, podczas gdy VivoBook Pro 16Xpodnosi poprzeczkę aż do Core i9-13980HX. Teraz skupiamy się na VivoBook 14X, który jest wyposażony w procesor Raptor Lake-H45.
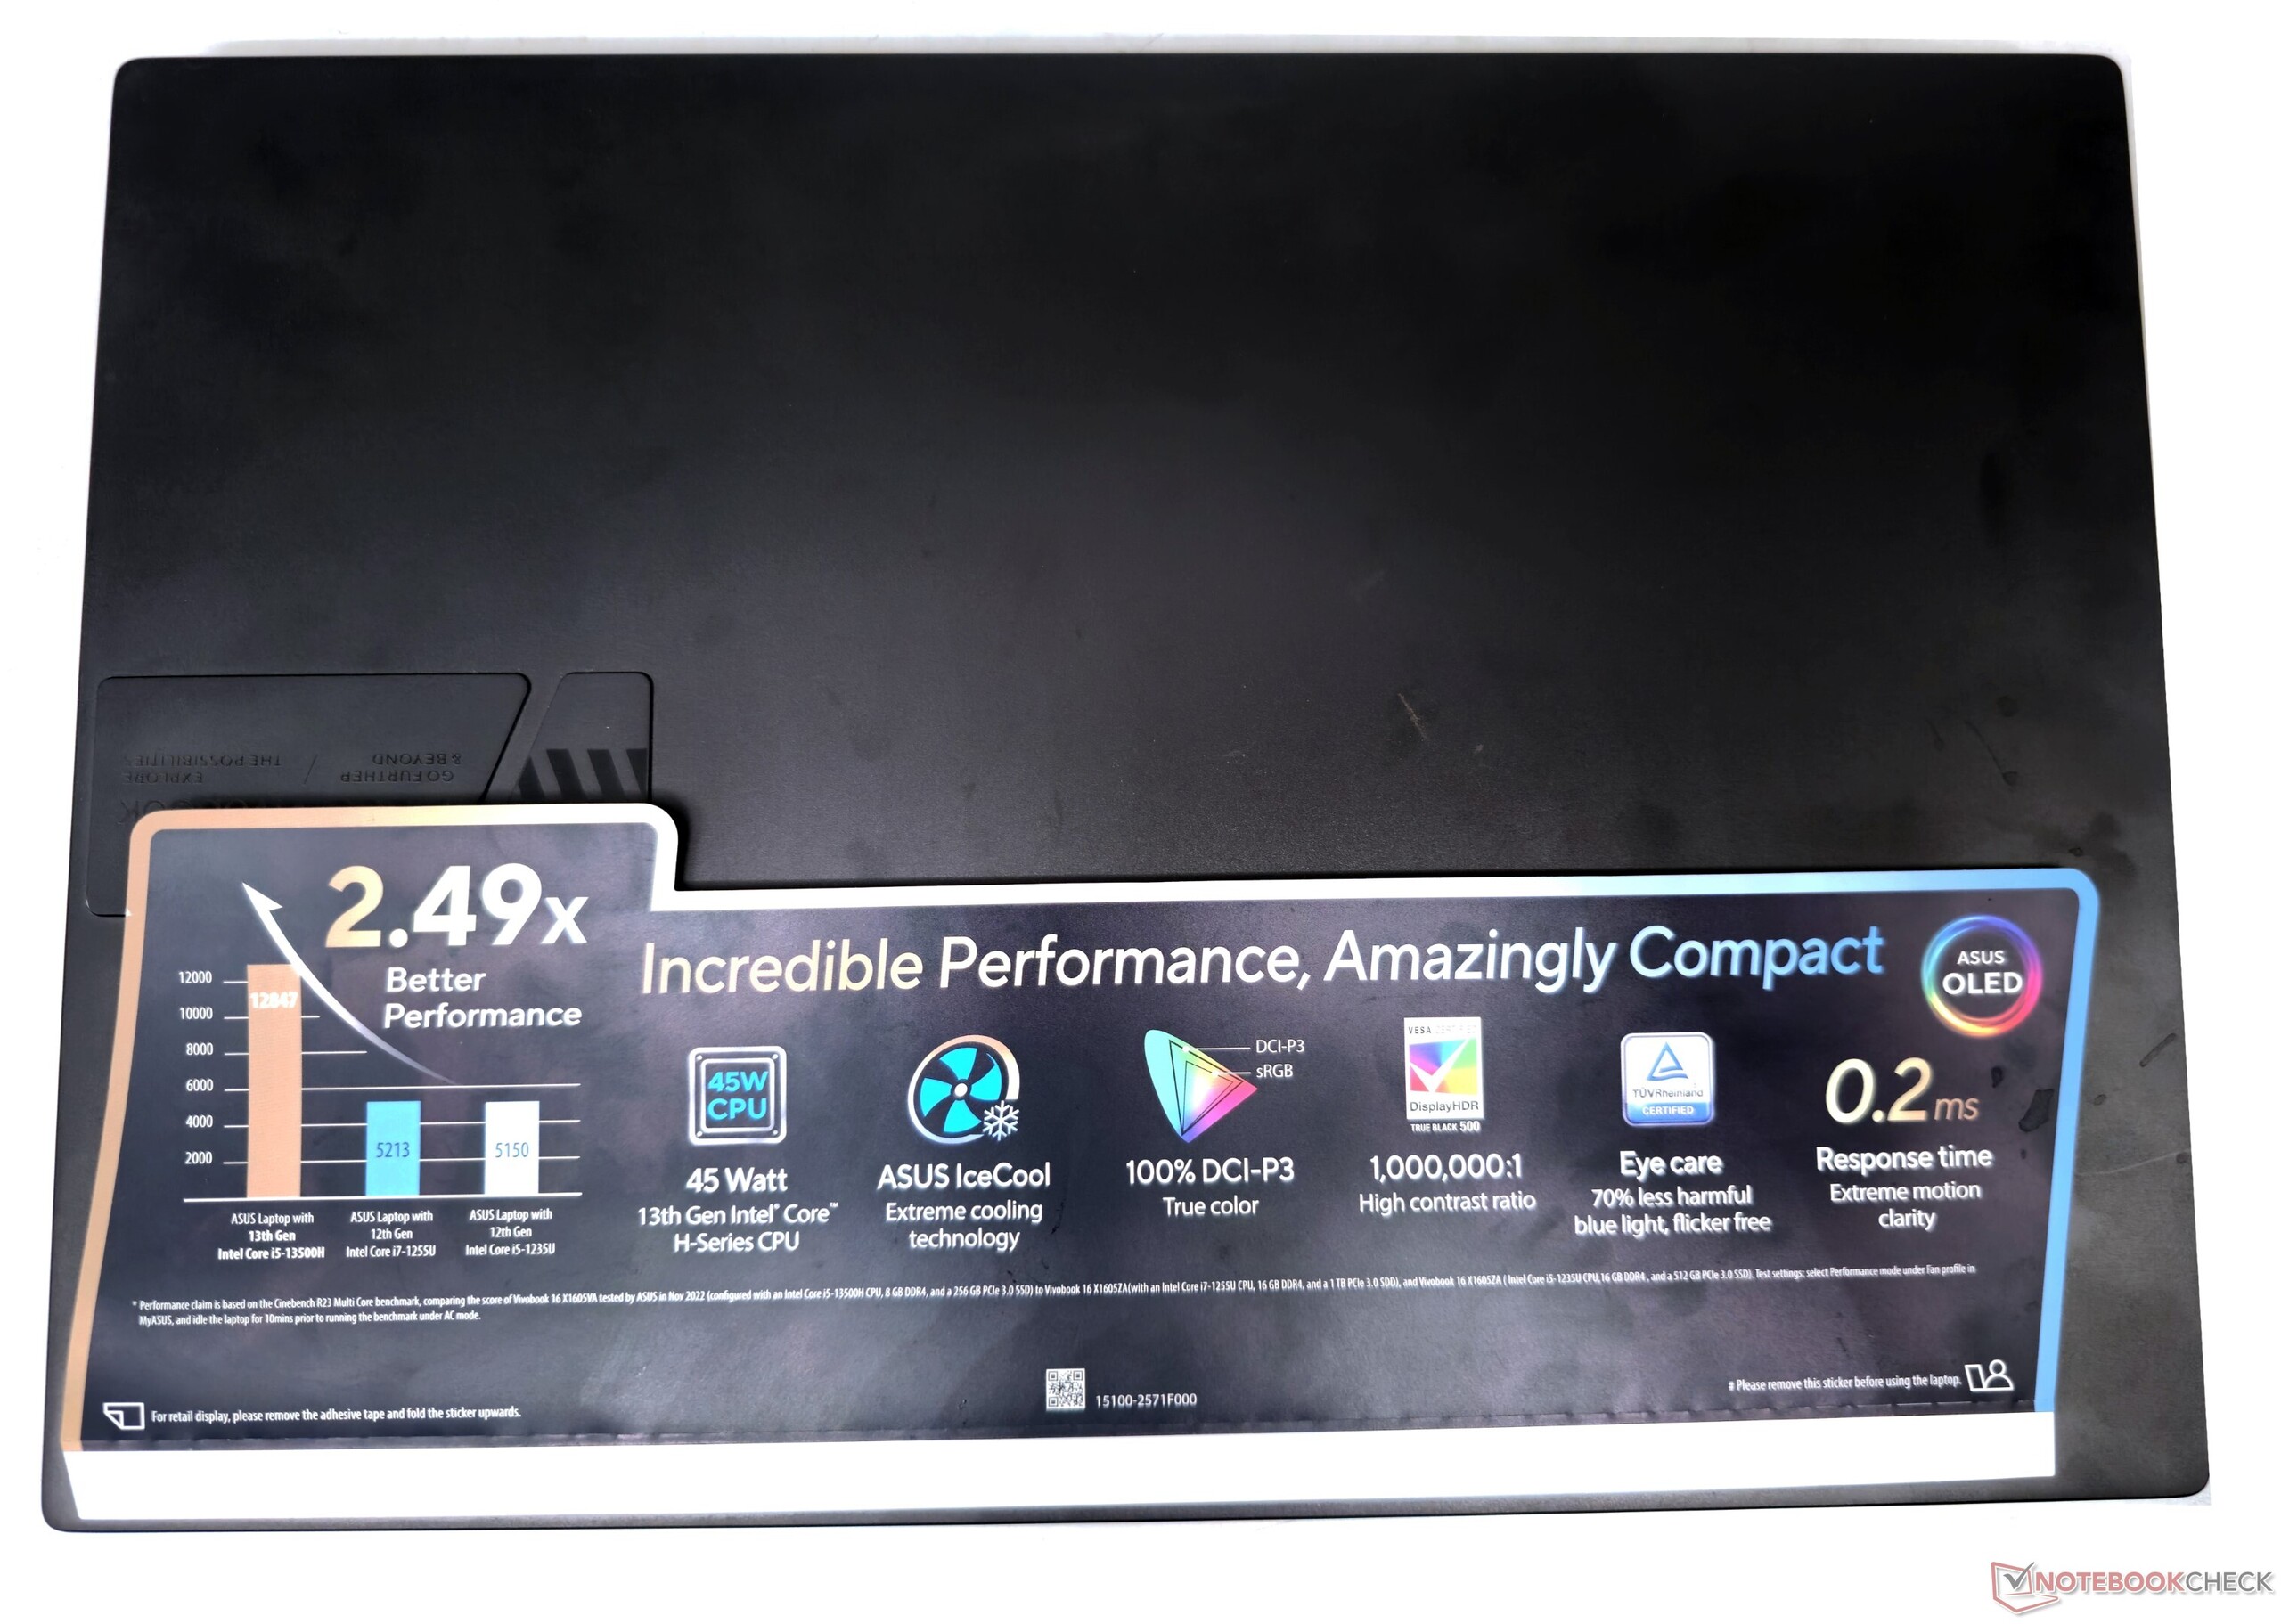
VivoBook 14X oferuje nam pierwsze spojrzenie na procesorIntel Core i5-13500Hw połączeniu z procesoremNvidia GeForce RTX 3050 Laptop GPU. OLED-y stały się teraz mniej więcej podstawą VivoBooków, z wyjątkiem kilku low-endowych SKU. W tym przypadku VivoBook 14X może pochwalić się 14-calowym wyświetlaczem OLED 2,8K z częstotliwością odświeżania 90 Hz.
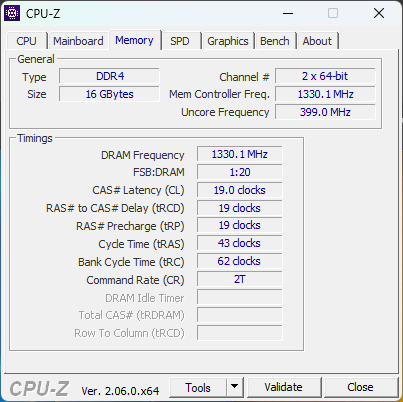
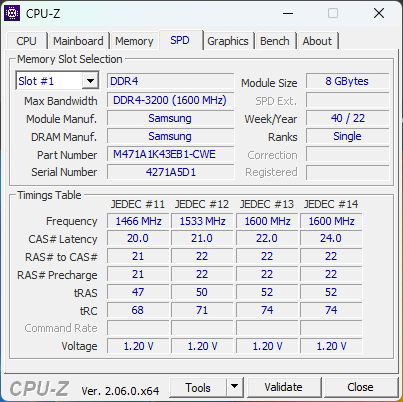
Asus wyposaża również laptopa w 16 GB pamięci RAM DDR4-3200, Wi-Fi 6E i dysk SSD NVMe o pojemności 512 GB. Ta konfiguracja kosztuje 96 990 jenów (1 172 USD).
Potencjalni konkurenci w porównaniu
Ocena | Data | Model | Waga | Wysokość | Rozmiar | Rezolucja | Cena |
|---|---|---|---|---|---|---|---|
| 85.6 % v7 (old) | 08/2023 | Asus VivoBook 14X K3405 i5-13500H, GeForce RTX 3050 4GB Laptop GPU | 1.4 kg | 18.9 mm | 14.00" | 2880x1800 | |
| 86.3 % v7 (old) | 07/2023 | Acer Swift X SFX14-71G i7-13700H, GeForce RTX 4050 Laptop GPU | 1.5 kg | 17.9 mm | 14.50" | 2880x1800 | |
| 85.4 % v7 (old) | 07/2023 | MSI Stealth 14 Studio A13V i7-13700H, GeForce RTX 4050 Laptop GPU | 1.7 kg | 19 mm | 14.00" | 2560x1600 | |
| 89.4 % v7 (old) | 05/2023 | Gigabyte Aero 14 OLED BMF i7-13700H, GeForce RTX 4050 Laptop GPU | 1.4 kg | 17 mm | 14.00" | 2880x1800 | |
| 89.2 % v7 (old) | 04/2023 | Lenovo Slim Pro 7 14ARP8 R7 7735HS, GeForce RTX 3050 6GB Laptop GPU | 1.6 kg | 15.6 mm | 14.50" | 2560x1600 | |
| 88.8 % v7 (old) | 10/2022 | Schenker Vision 14 2022 RTX 3050 Ti i7-12700H, GeForce RTX 3050 Ti Laptop GPU | 1.3 kg | 16.6 mm | 14.00" | 2880x1800 |
Podwozie: Lekkie, ale użytkowe
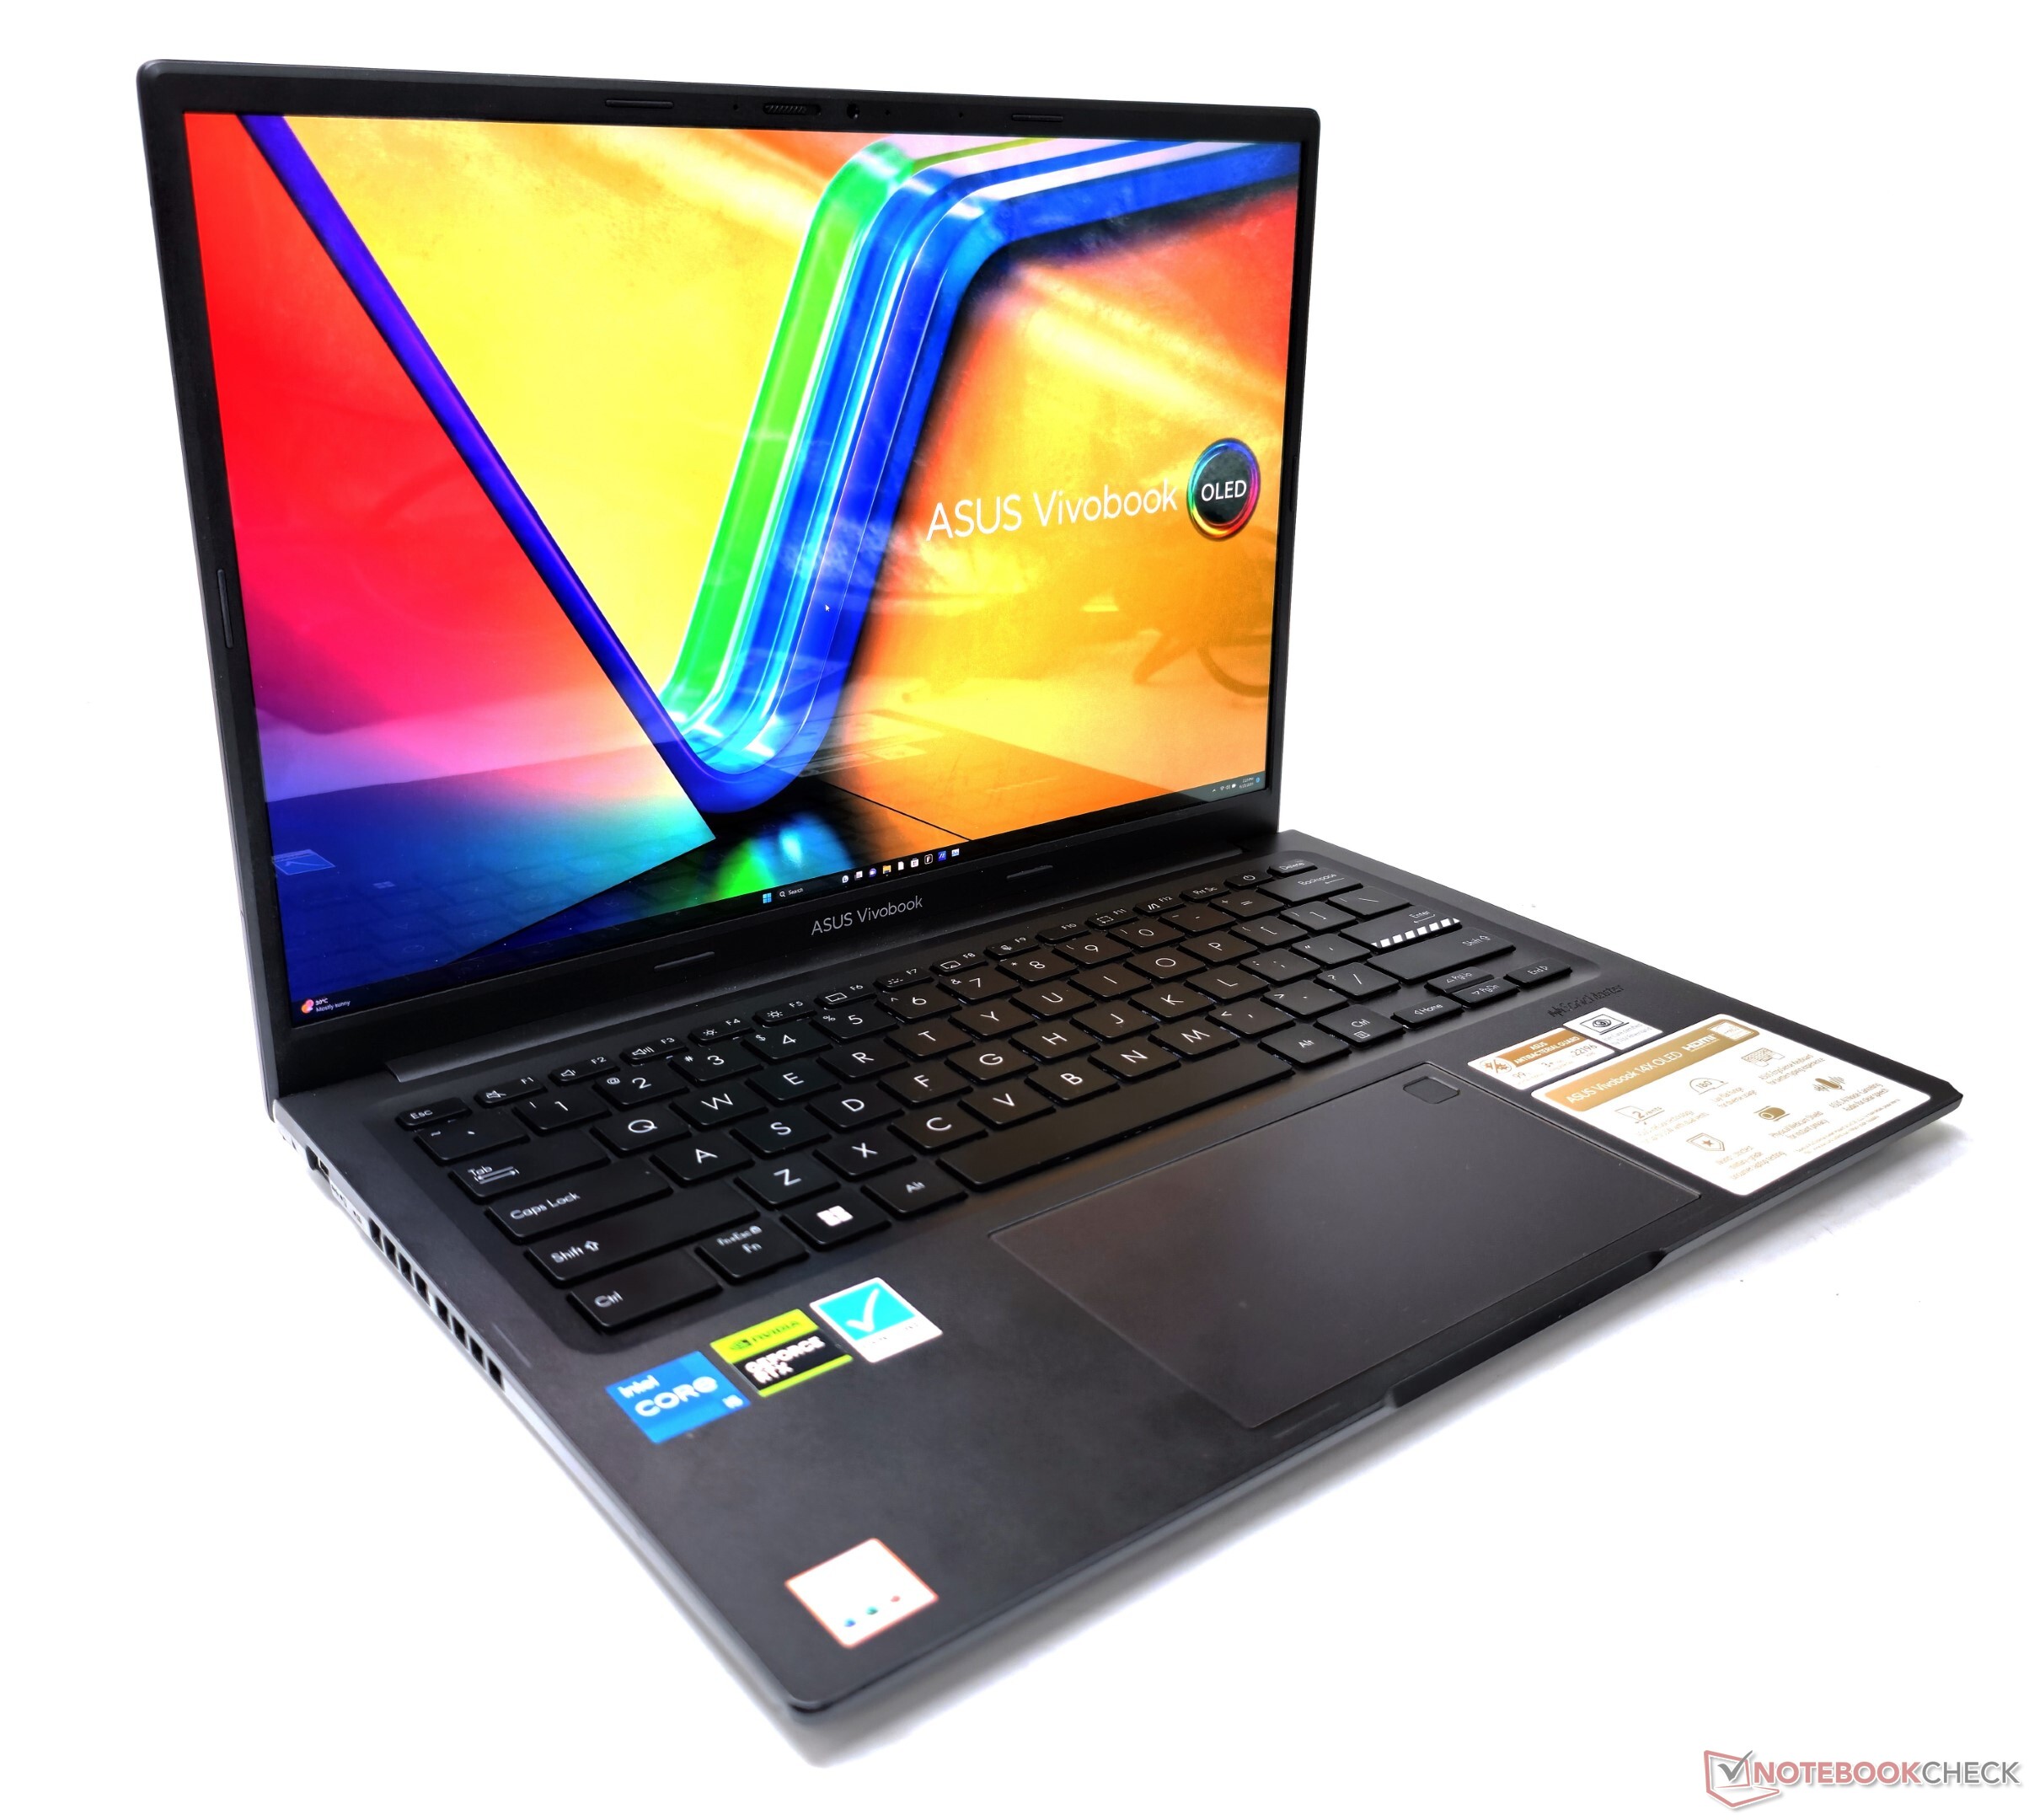
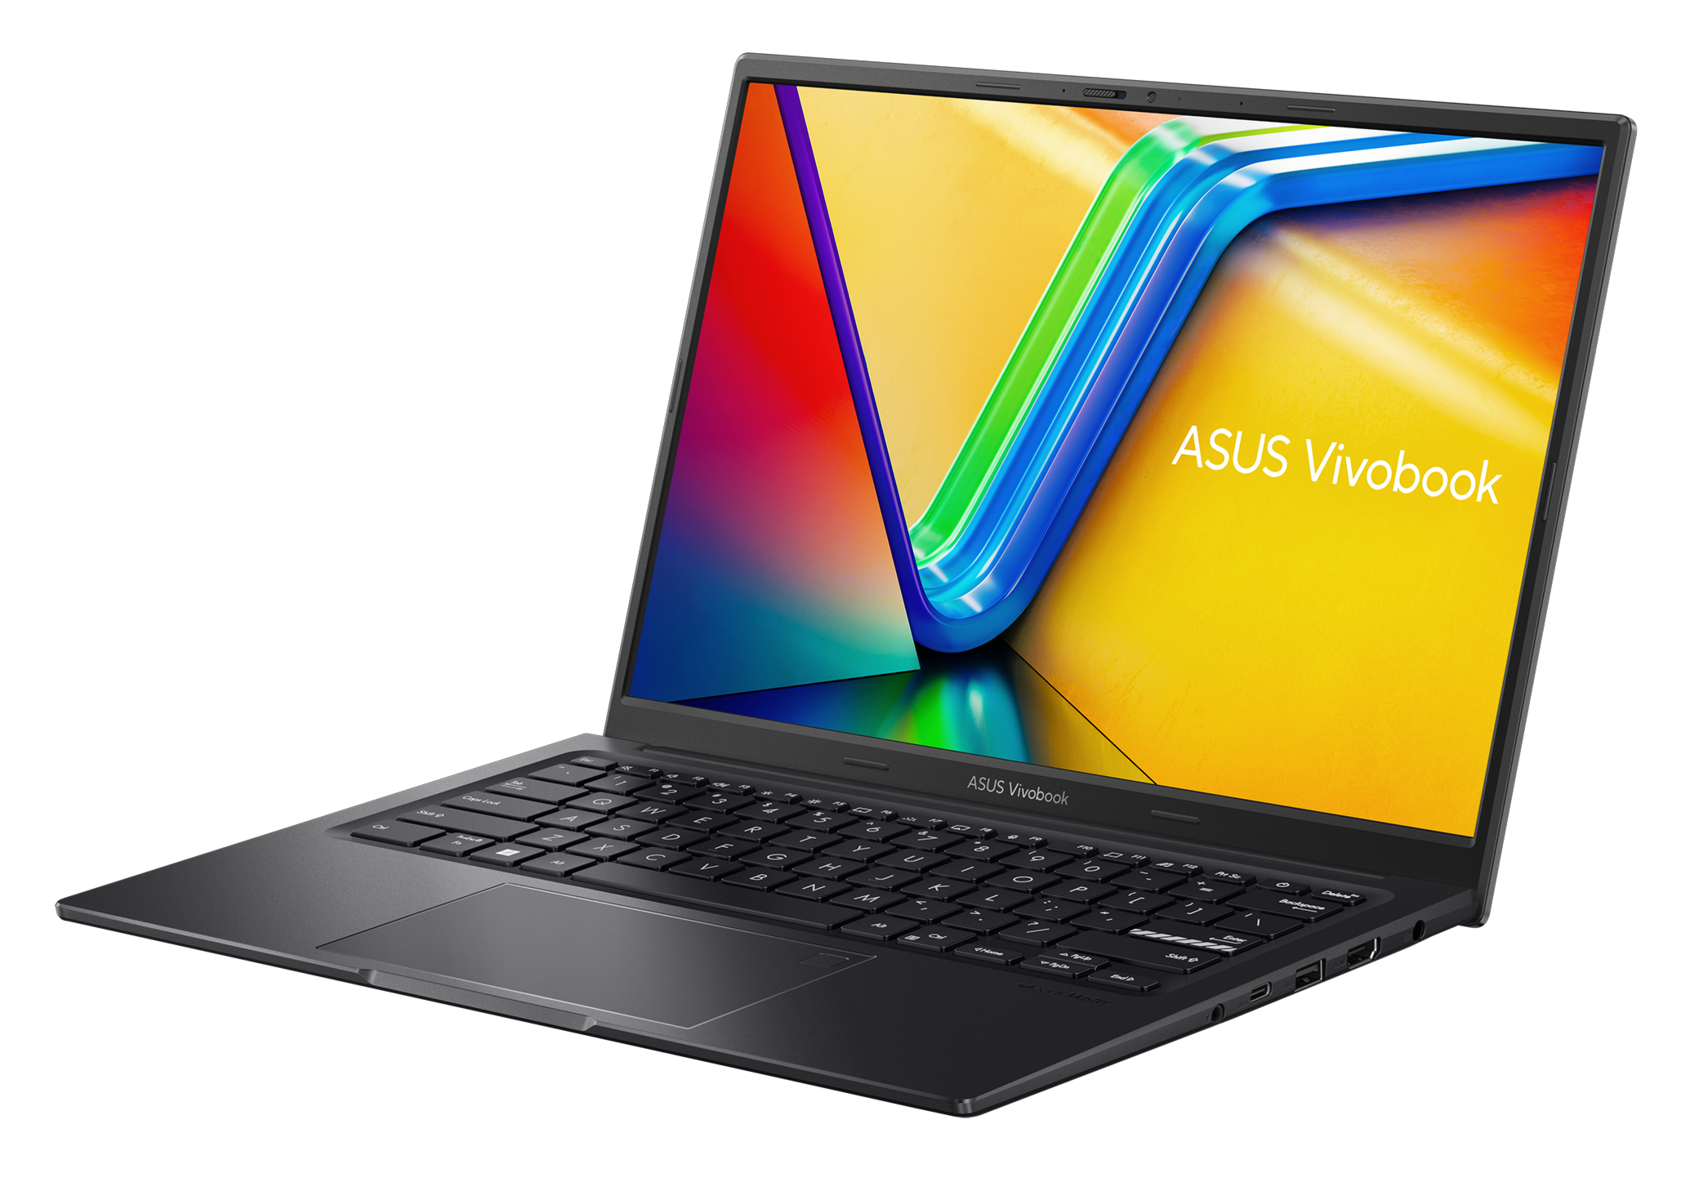
Podobnie jak VivoBook 15X, Asus oferuje VivoBook 14X w dwóch opcjach kolorystycznych: Cool Silver i Indie Black (nasz wariant). Jak to zwykle bywa w przypadku VivoBooków, ważąca 1,4 kg obudowa ma przede wszystkim plastikową konstrukcję, podczas gdy metalowa pokrywa zawiera charakterystyczne logo VivoBook.
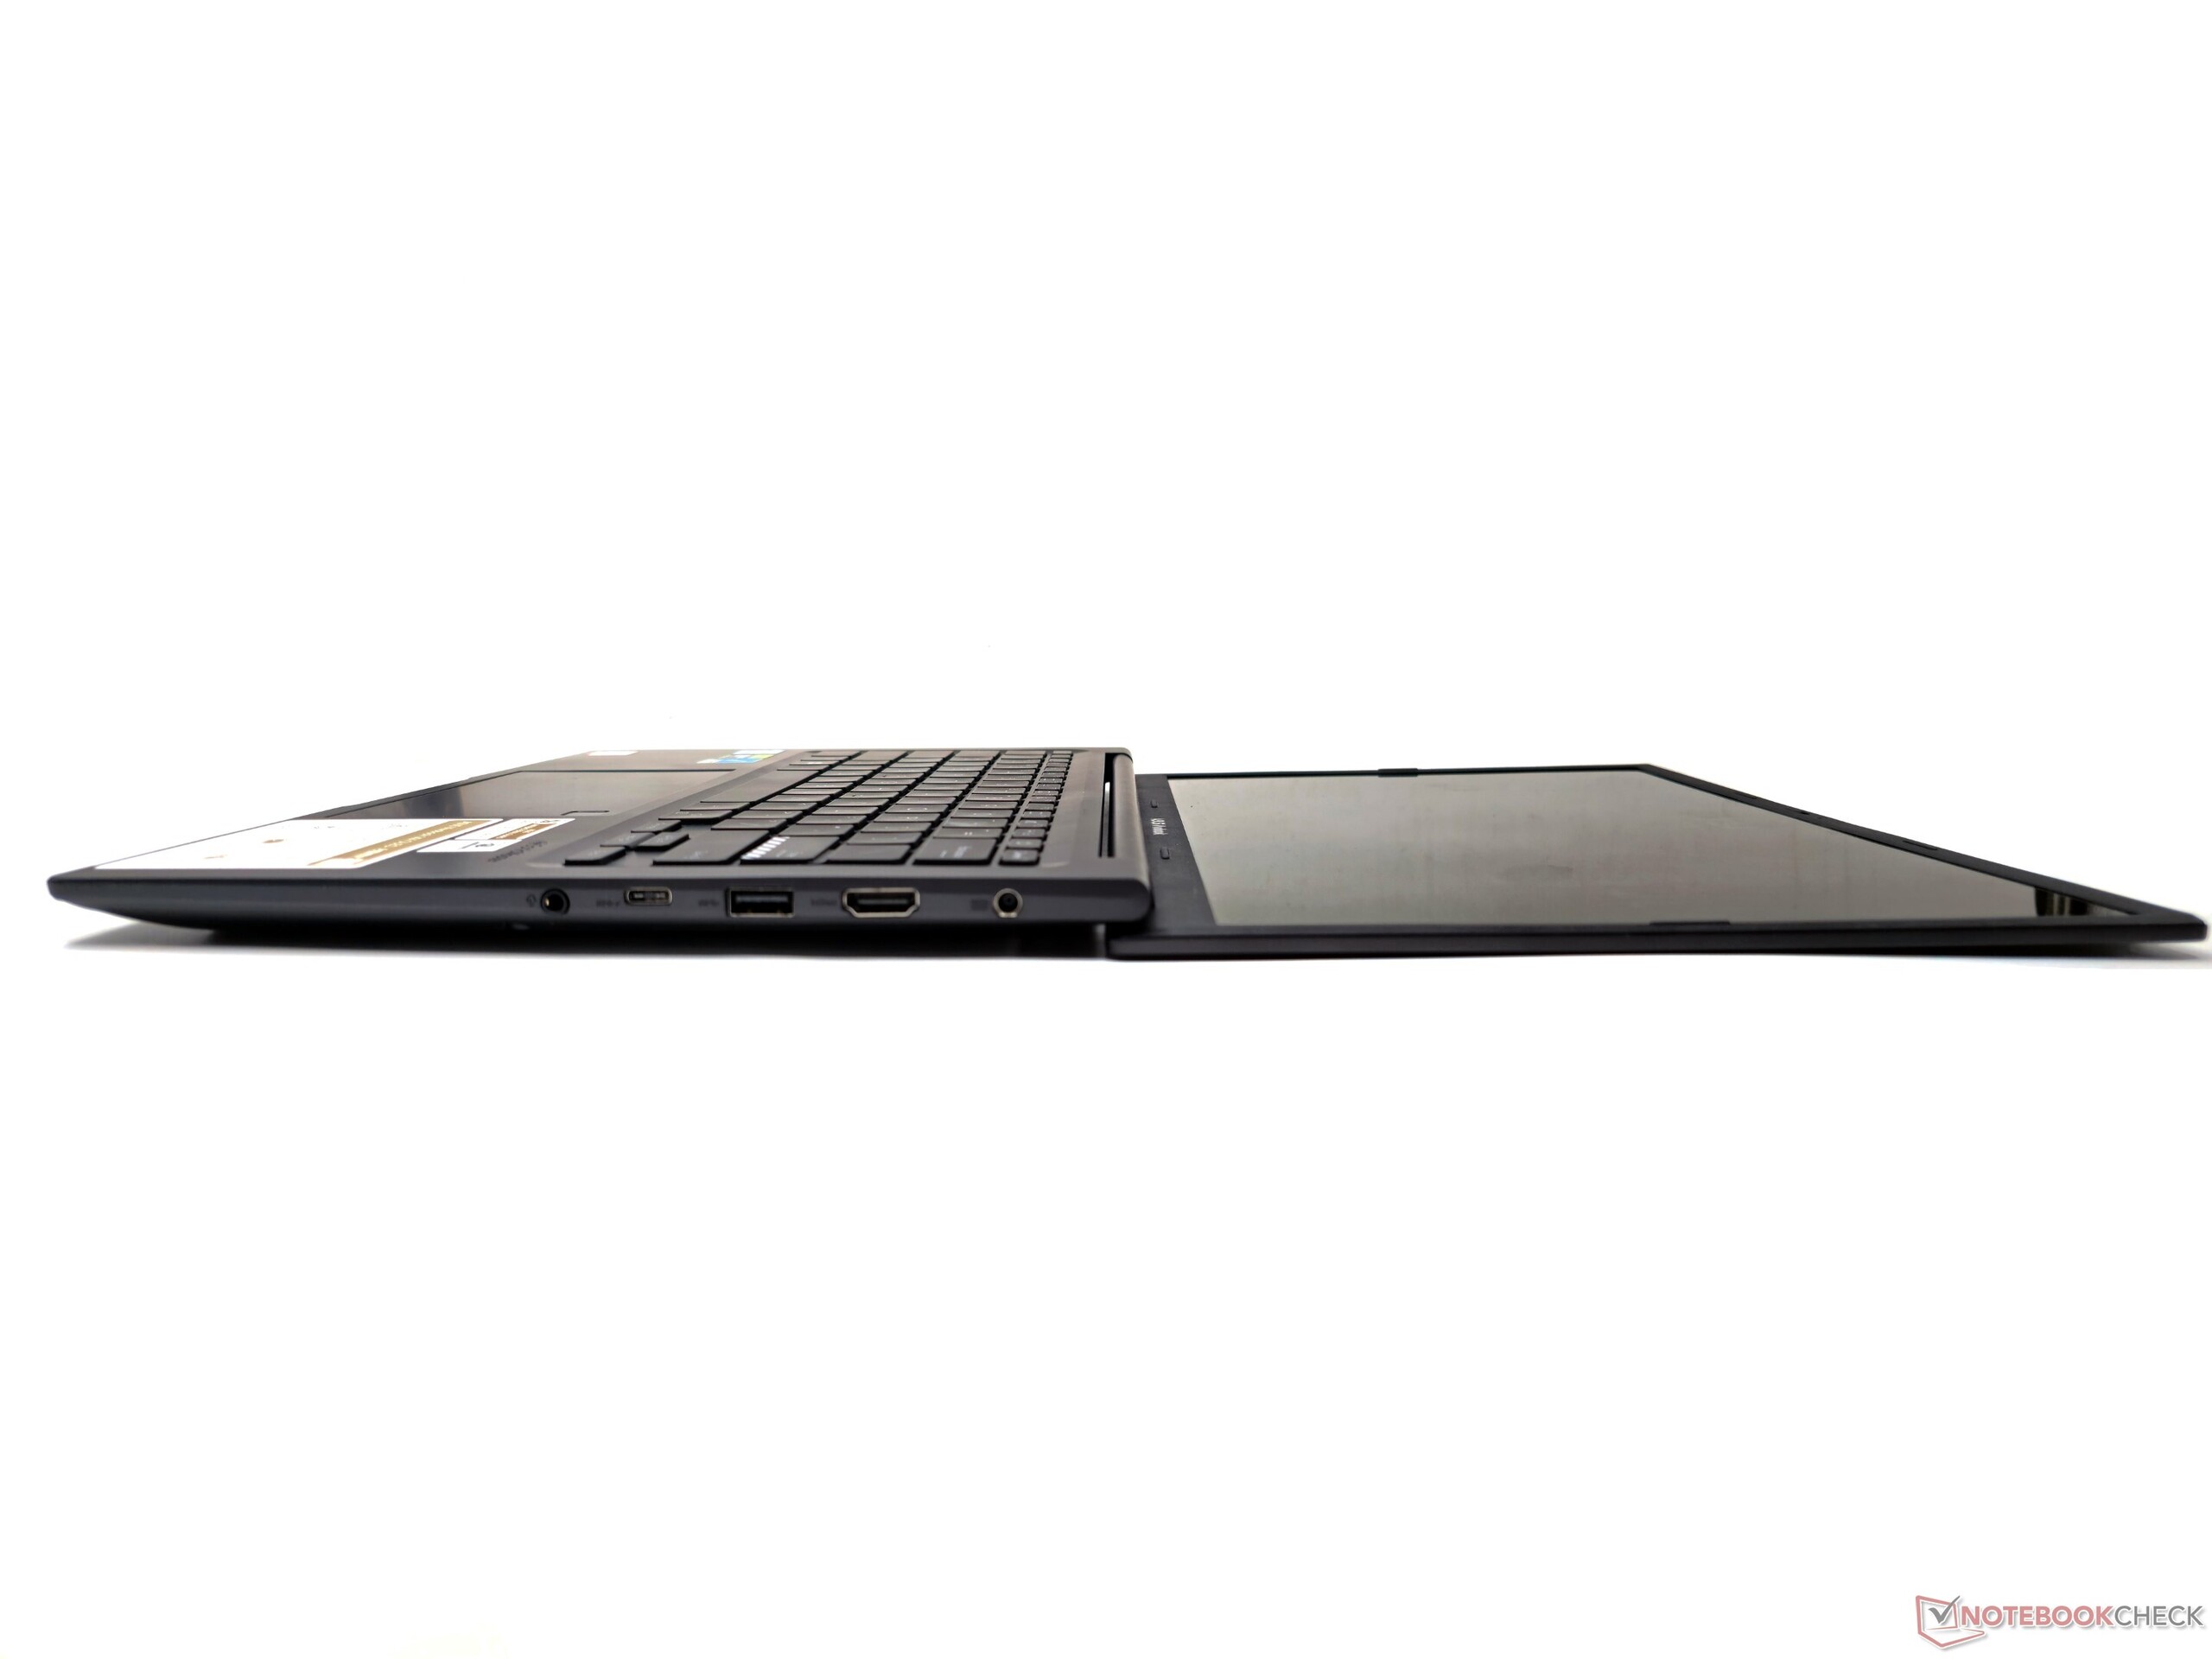
Otwarcie pokrywy wyświetlacza jest bardzo proste i wymaga tylko jednego palca, a laptop pozostaje stabilny bez przesuwania. Wyświetlacz można położyć płasko pod kątem 180°. Wyświetlacz i klawiatura nieco się uginają, ale nie powinno to stanowić problemu podczas normalnego użytkowania.
Zawiasy są solidne, bez skrzypienia i nadmiernego oporu. Asus zastosował również ochronę antybakteryjną, która ma hamować rozwój bakterii przez co najmniej trzy lata. Asus twierdzi również, że laptop spełnia standardy wytrzymałości MIL-STD-810H.
Łączność: Wi-Fi 6E nie spełnia oczekiwań
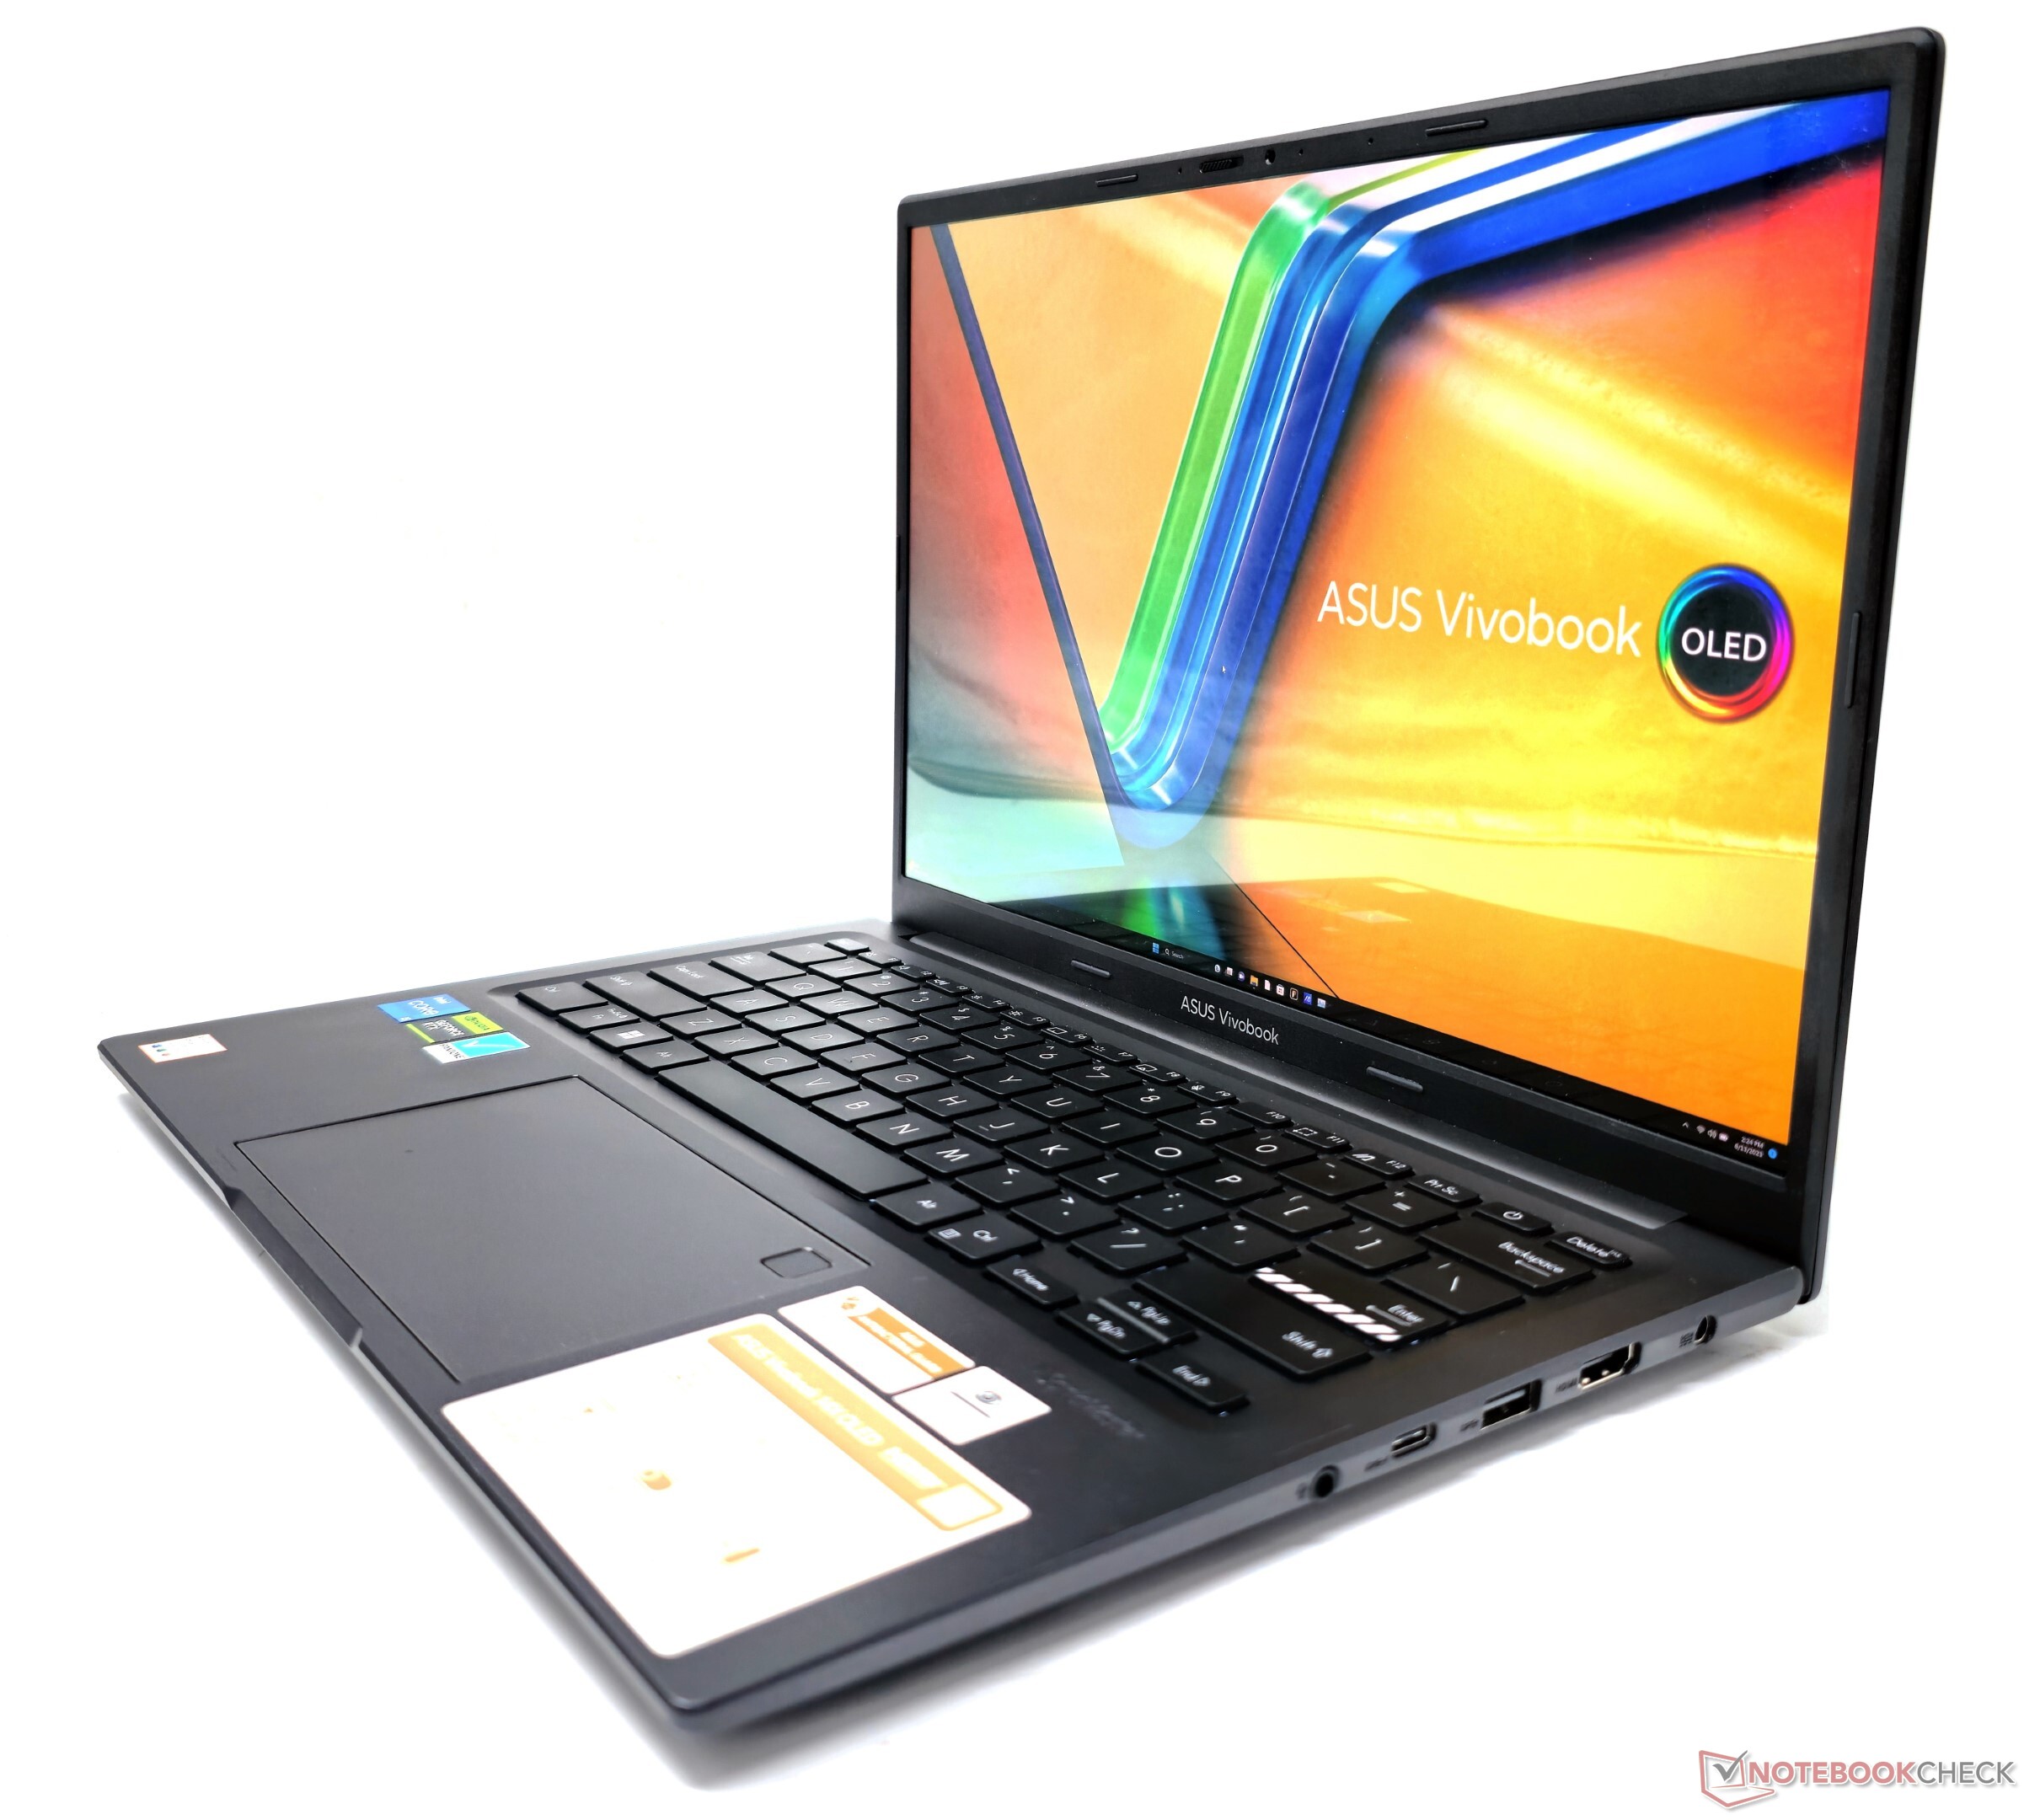
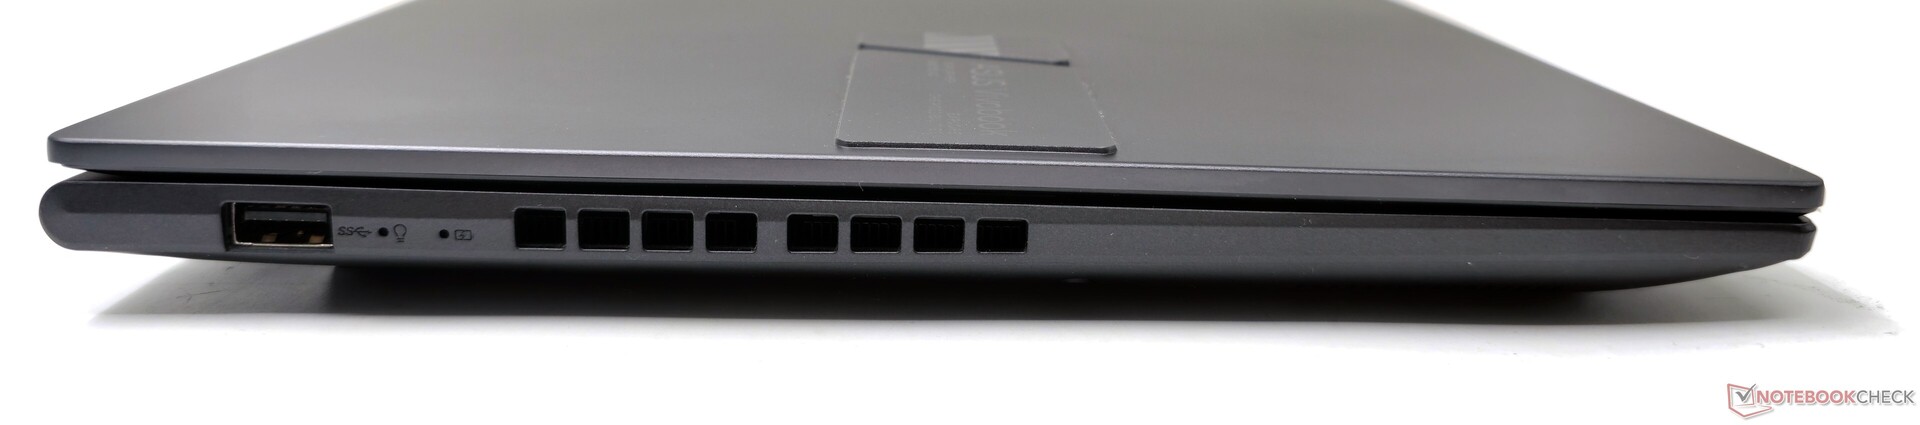
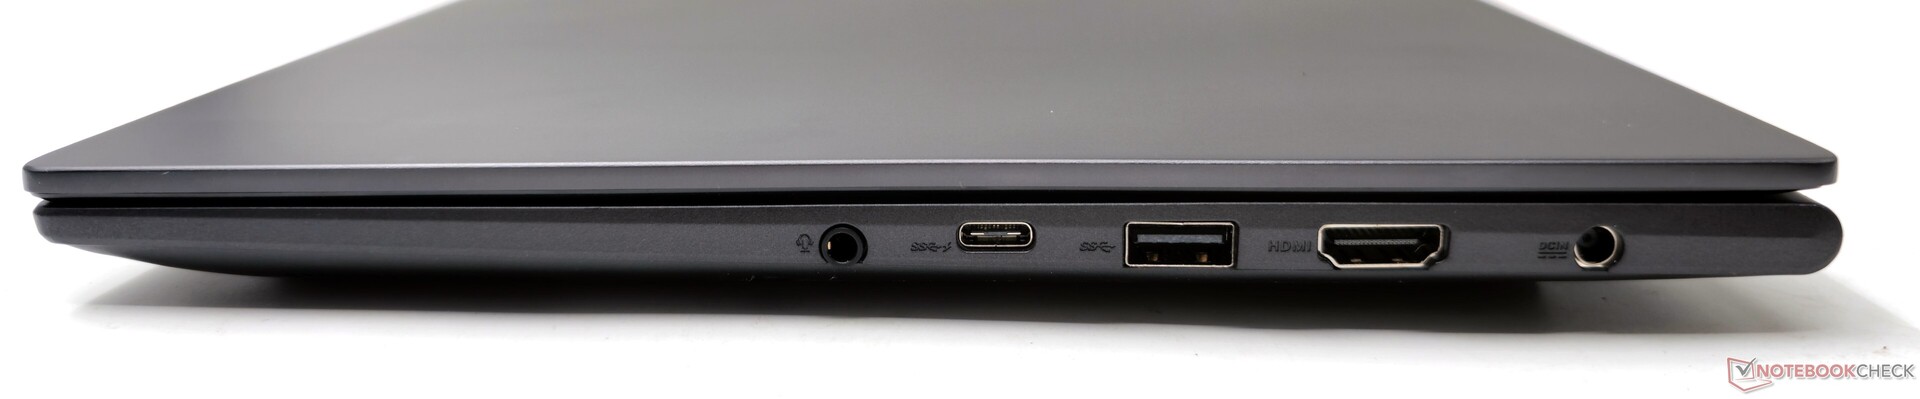
Rozmieszczenie portów przypomina to, co widzieliśmy wcześniej w VivoBook 15X. Po lewej stronie znajduje się pojedynczy port USB 3.2 Gen1 Type-A, podczas gdy pozostałe są umieszczone po prawej stronie.
Takie jednostronne rozmieszczenie portów może być uciążliwe, zwłaszcza podczas korzystania z zewnętrznej myszy i jeśli zamierzasz podłączyć wiele urządzeń peryferyjnych. Odstępy między portami są jednak wystarczające i nie powodują żadnych problemów z łącznością.
Komunikacja
Karta Intel Wi-Fi 6E AX211 wykazuje doskonałą wydajność w paśmie 5 GHz bez zauważalnych spadków podczas testów z naszym referencyjnym routerem Asus ROG Rapture GT-AXE11000.
Tego samego nie można jednak powiedzieć o paśmie 6 GHz, które wykazuje niespójną wydajność z regularnymi spadkami przepustowości podczas testu.
Dla porównania Gigabyte Aero 14 OLED z kartą Intel Wi-Fi 6E AX210 radzi sobie dobrze w obu pasmach.
| Networking / iperf3 transmit AXE11000 | |
| Asus VivoBook 14X K3405 (iperf 3.1.3) | |
| Acer Swift X SFX14-71G | |
| Gigabyte Aero 14 OLED BMF (iperf 3.1.3) | |
| MSI Stealth 14 Studio A13V | |
| Schenker Vision 14 2022 RTX 3050 Ti (iperf 3.1.3) | |
| Średnia w klasie Multimedia (606 - 1978, n=61, ostatnie 2 lata) | |
| Lenovo Slim Pro 7 14ARP8 (iperf 3.1.3) | |
| Przeciętny Intel Wi-Fi 6E AX211 (64 - 1921, n=276) | |
| Networking / iperf3 receive AXE11000 | |
| Asus VivoBook 14X K3405 (iperf 3.1.3) | |
| Gigabyte Aero 14 OLED BMF (iperf 3.1.3) | |
| Schenker Vision 14 2022 RTX 3050 Ti (iperf 3.1.3) | |
| MSI Stealth 14 Studio A13V | |
| Acer Swift X SFX14-71G | |
| Lenovo Slim Pro 7 14ARP8 (iperf 3.1.3) | |
| Przeciętny Intel Wi-Fi 6E AX211 (582 - 1890, n=276) | |
| Średnia w klasie Multimedia (682 - 1818, n=61, ostatnie 2 lata) | |
| Networking / iperf3 transmit AXE11000 6GHz | |
| Gigabyte Aero 14 OLED BMF (iperf 3.1.3) | |
| Średnia w klasie Multimedia (869 - 2373, n=25, ostatnie 2 lata) | |
| Asus VivoBook 14X K3405 (iperf 3.1.3) | |
| Przeciętny Intel Wi-Fi 6E AX211 (385 - 1851, n=226) | |
| Networking / iperf3 receive AXE11000 6GHz | |
| Gigabyte Aero 14 OLED BMF (iperf 3.1.3) | |
| Średnia w klasie Multimedia (1212 - 2361, n=25, ostatnie 2 lata) | |
| Asus VivoBook 14X K3405 (iperf 3.1.3) | |
| Przeciętny Intel Wi-Fi 6E AX211 (700 - 1857, n=226) | |
Kamera internetowa
Zintegrowana kamera internetowa 720p w VivoBook 14X wykazuje słabą ostrość i znaczne odchylenia kolorów. Test X-Rite ColorChecker Passport wykazał najwyższą wartość Delta E wynoszącą 22,45 dla koloru Purplish Blue.
Chociaż kamera internetowa może wystarczyć do okazjonalnych połączeń wideo, Asus powinien był wyposażyć laptopa w moduł 1080p, aby poprawić jakość.
Fizyczna migawka kamery internetowej zapewnia dodatkową prywatność.


Bezpieczeństwo
Logowanie biometryczne ułatwia skaner linii papilarnych wbudowany w touchpad. Dodatkowo obecny jest również moduł TPM 2.0.
Akcesoria i gwarancja
W pudełku nie ma żadnych dodatkowych akcesoriów poza zasilaczem 90 W i zwykłą dokumentacją.
W Indiach Asus oferuje VivoBook 14X z roczną standardową gwarancją. Osoby, które zakupią laptopa przed 31 sierpnia 2023 r., mogą również skorzystać z korzyści Back to College które obejmują kilka opcji przedłużenia gwarancji i lokalnej ochrony przed przypadkowymi uszkodzeniami w zakresie od ₹99 do ₹2 999.
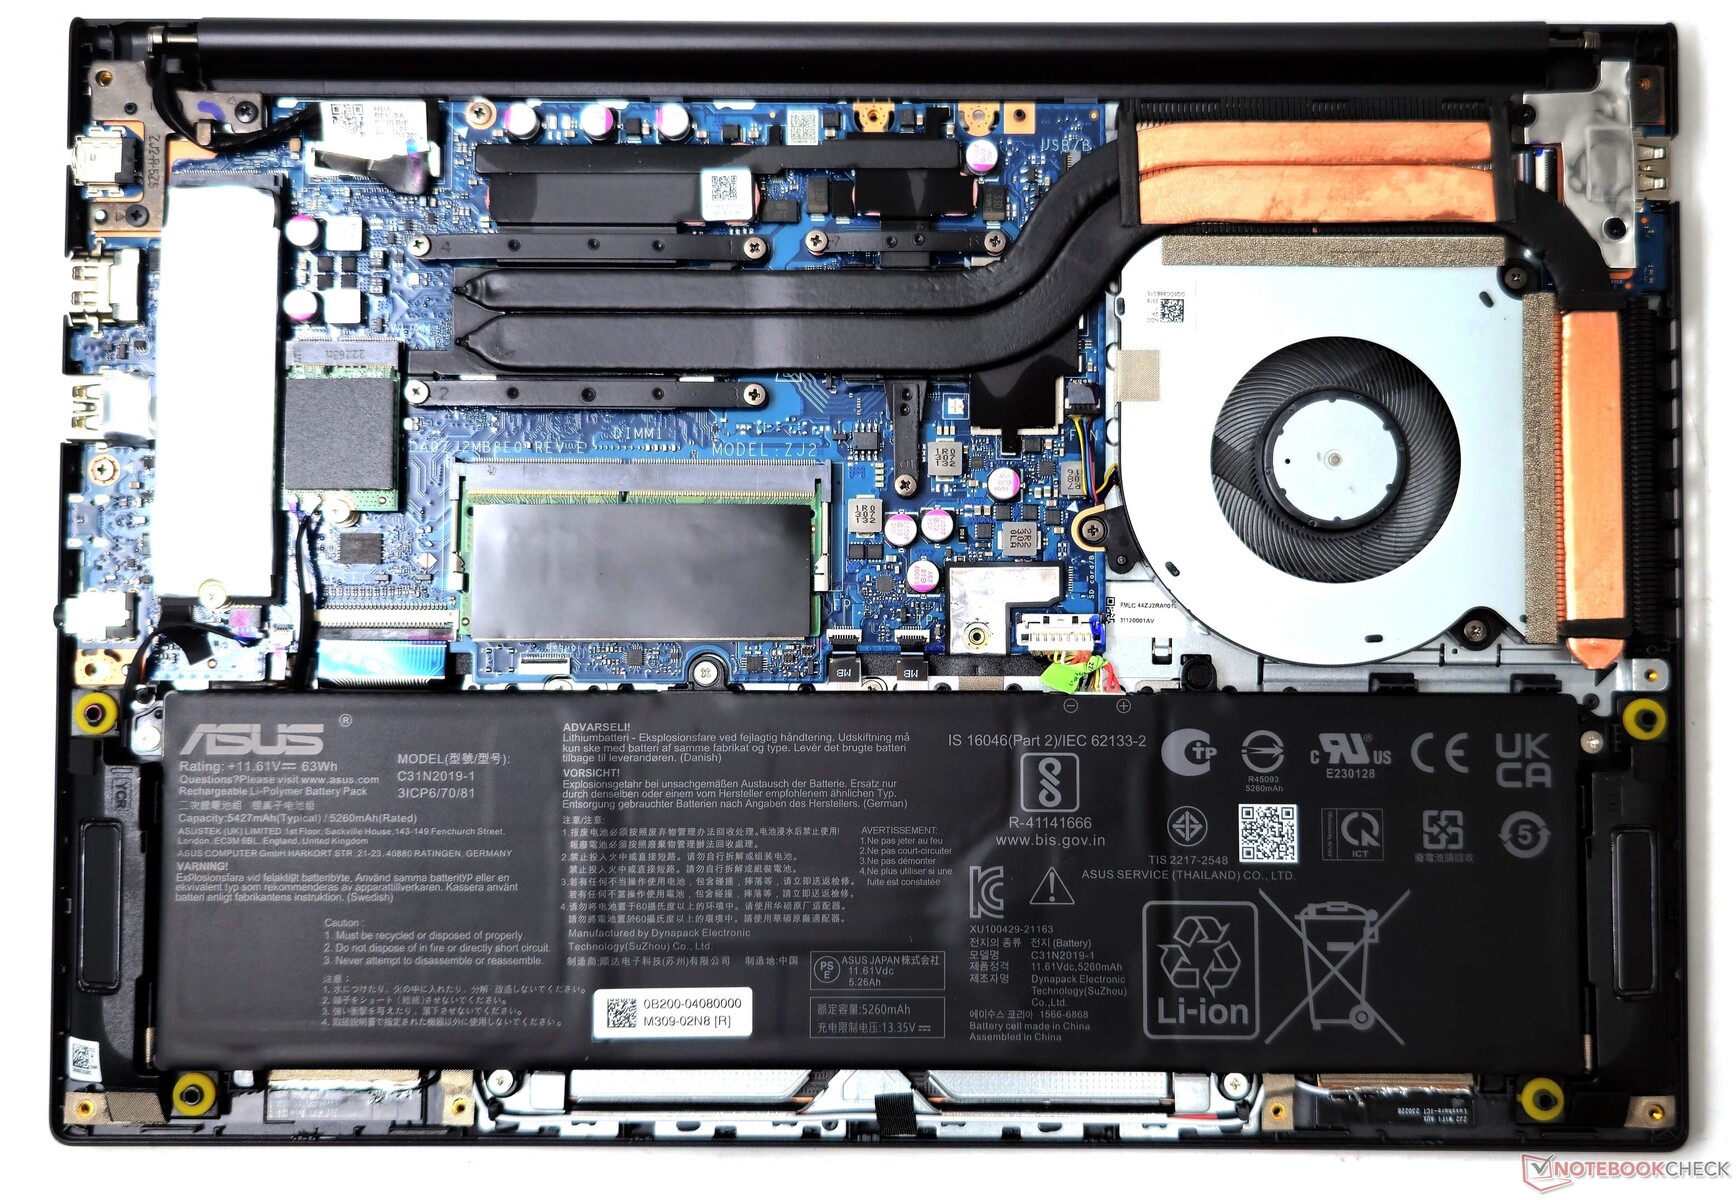
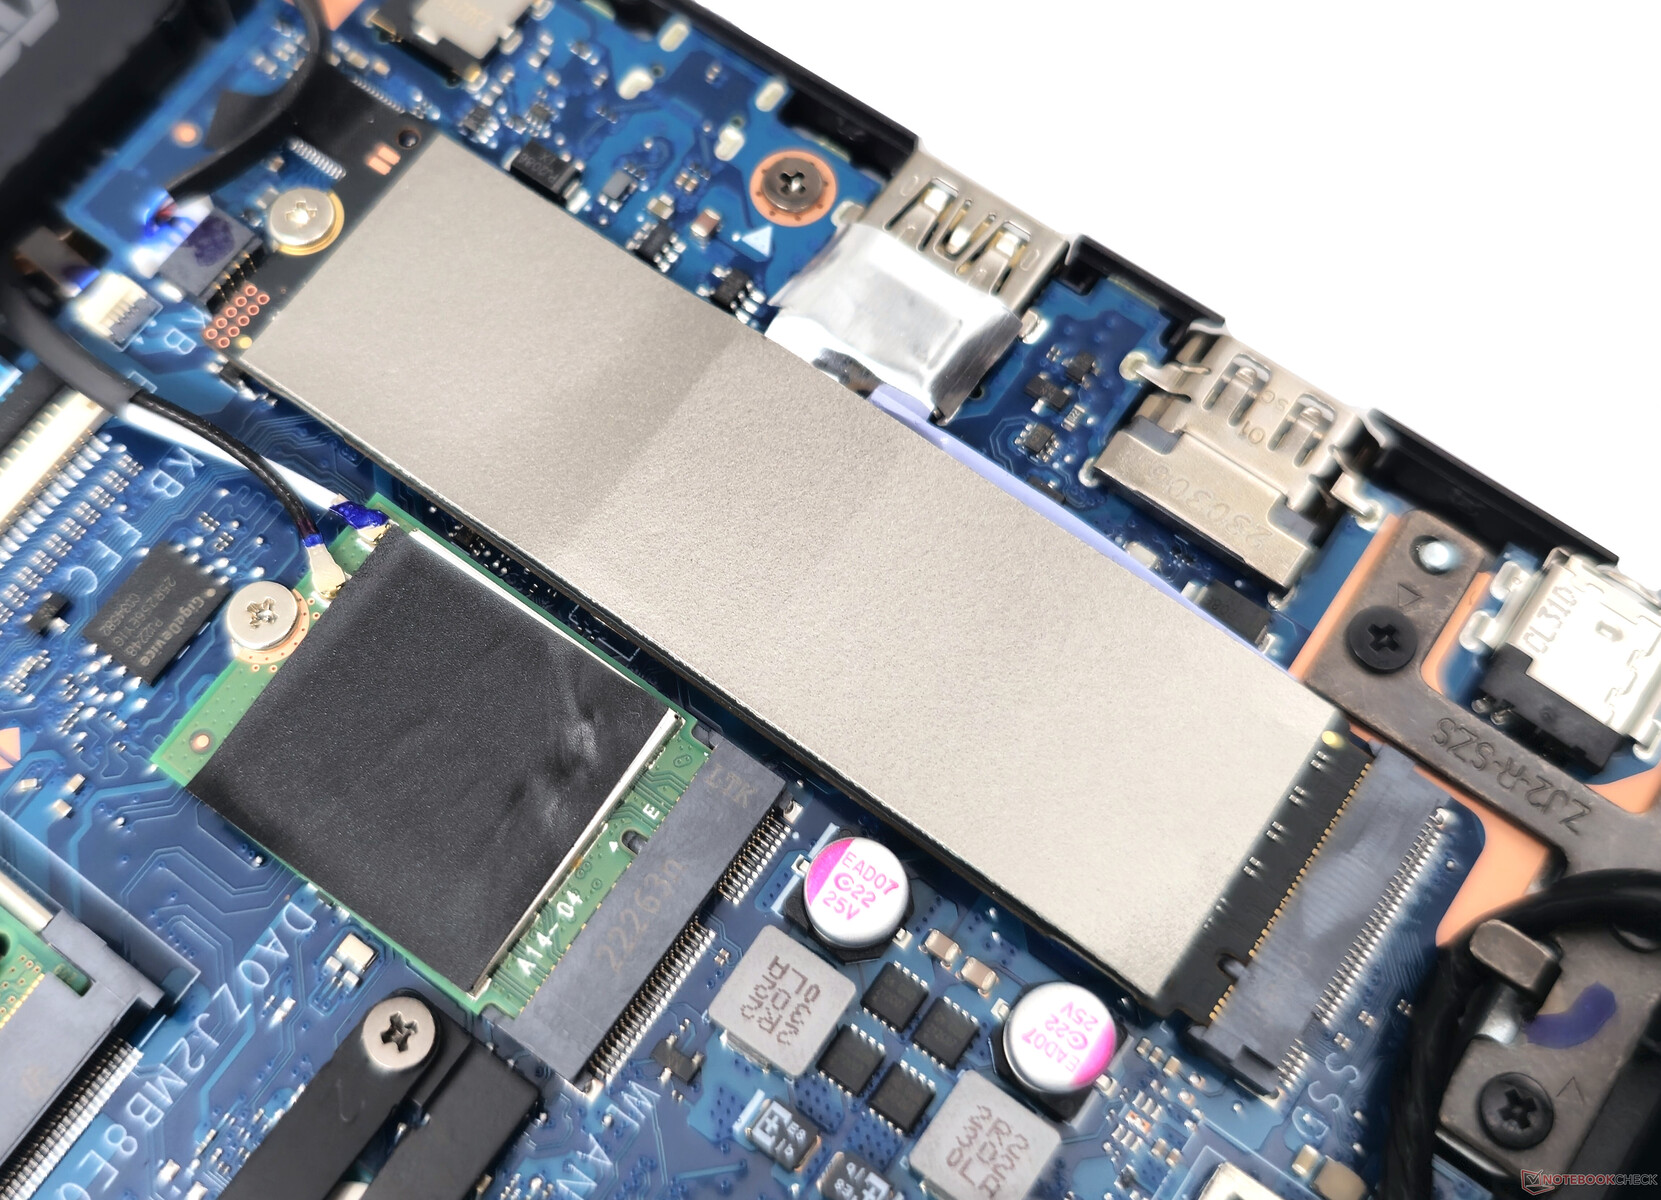
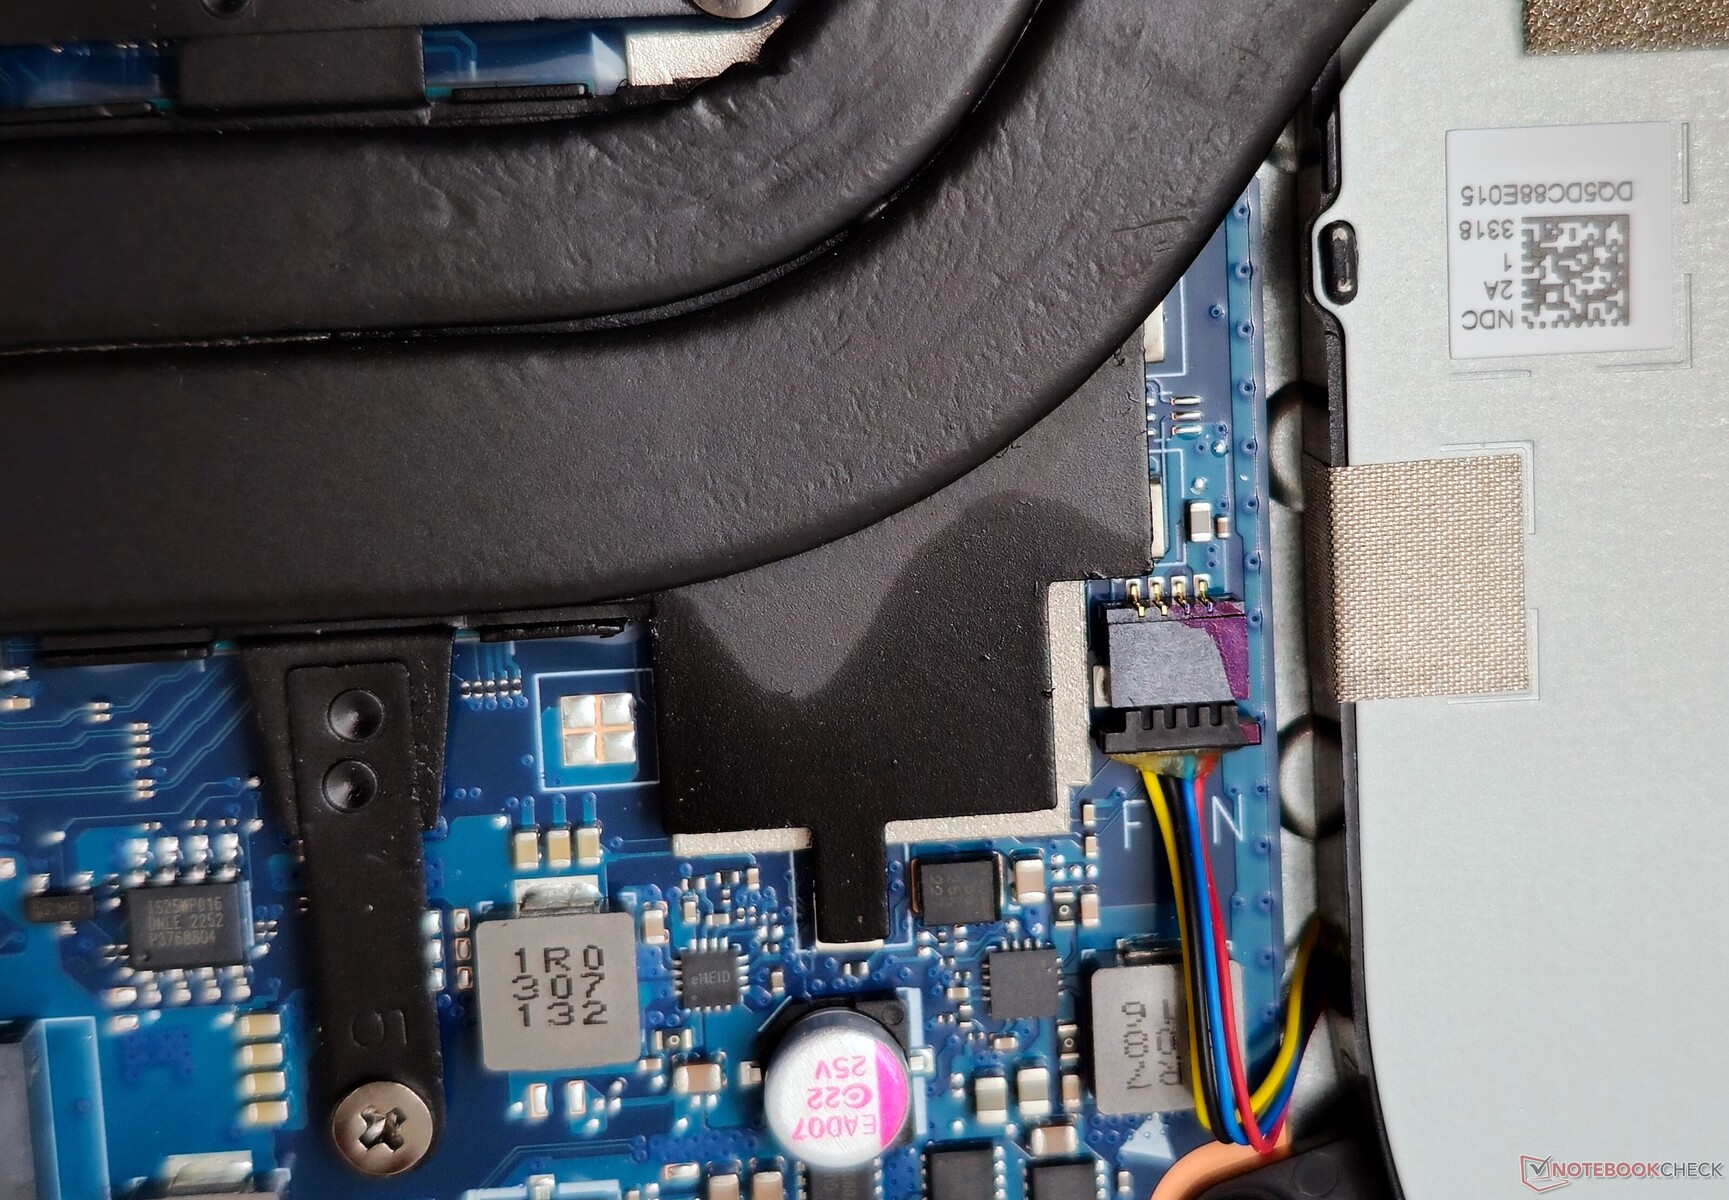
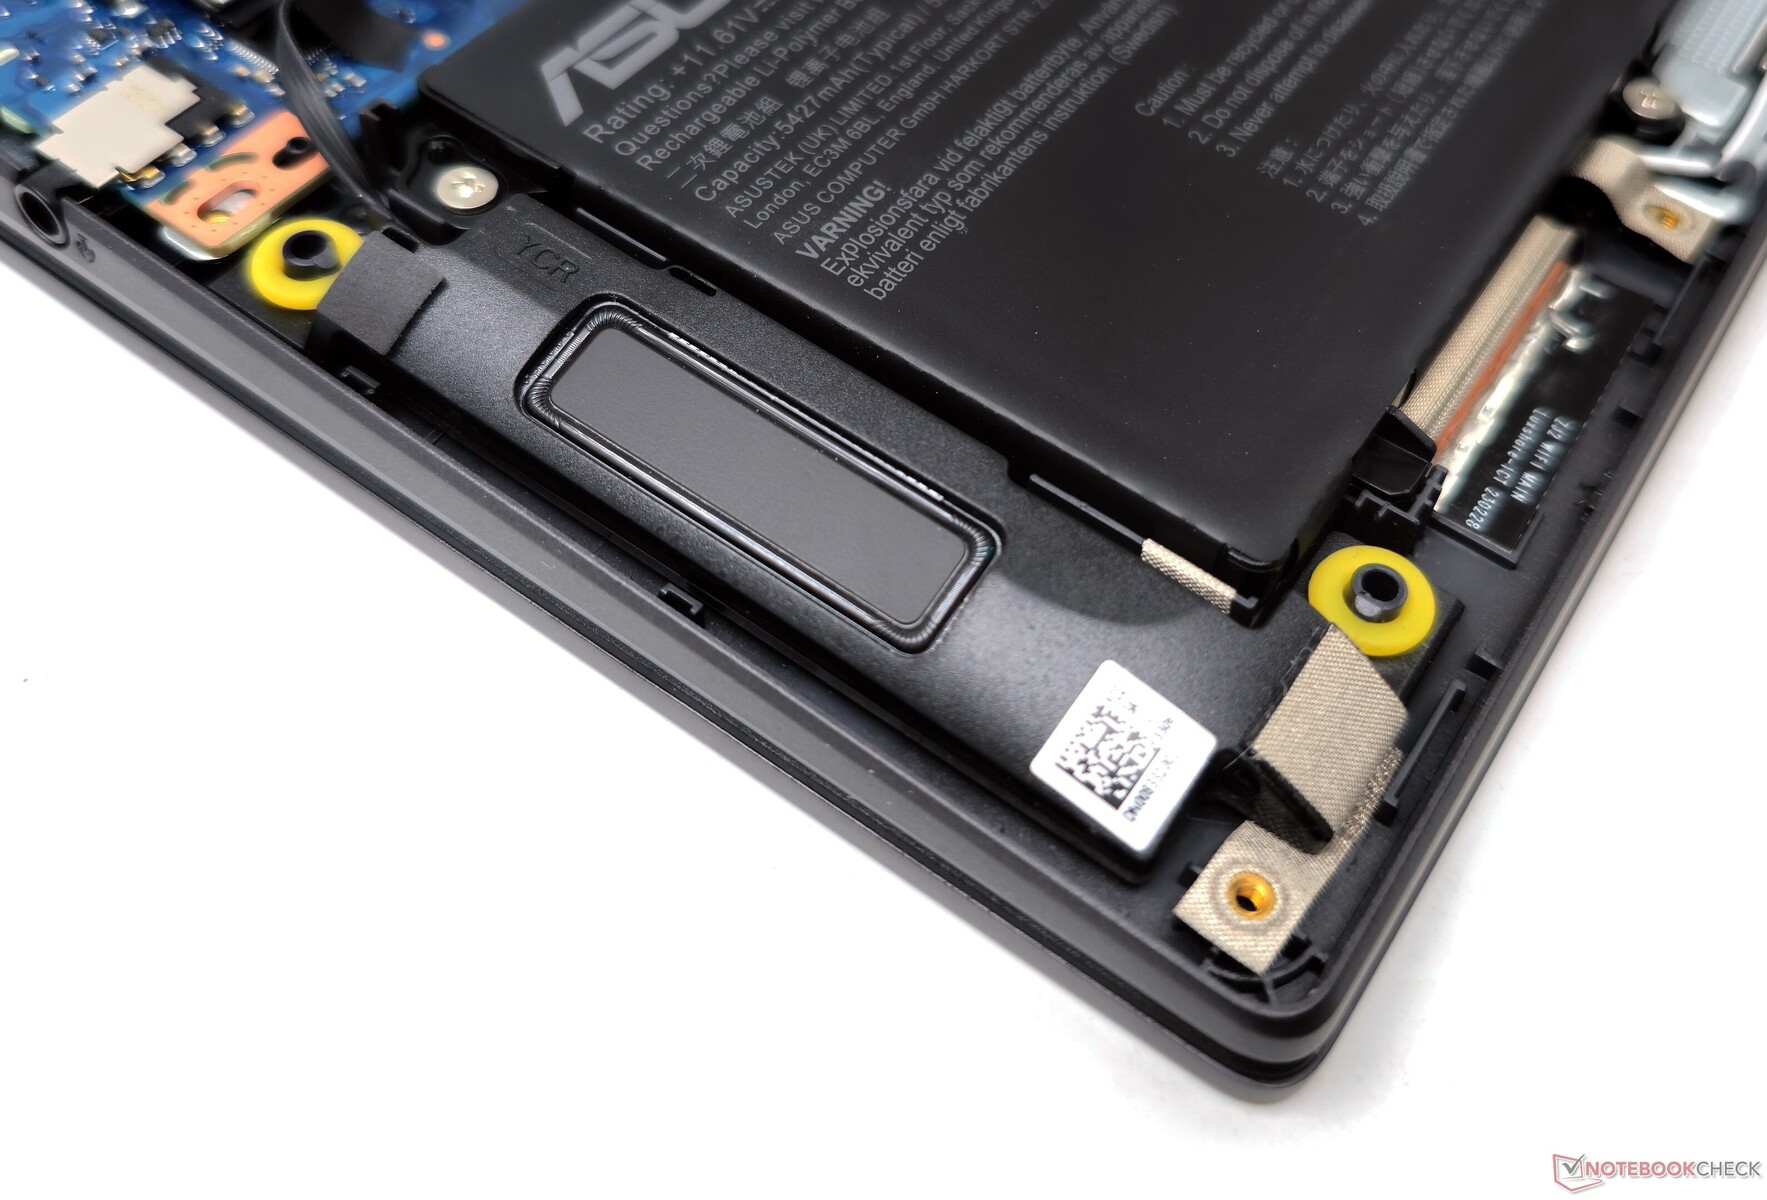
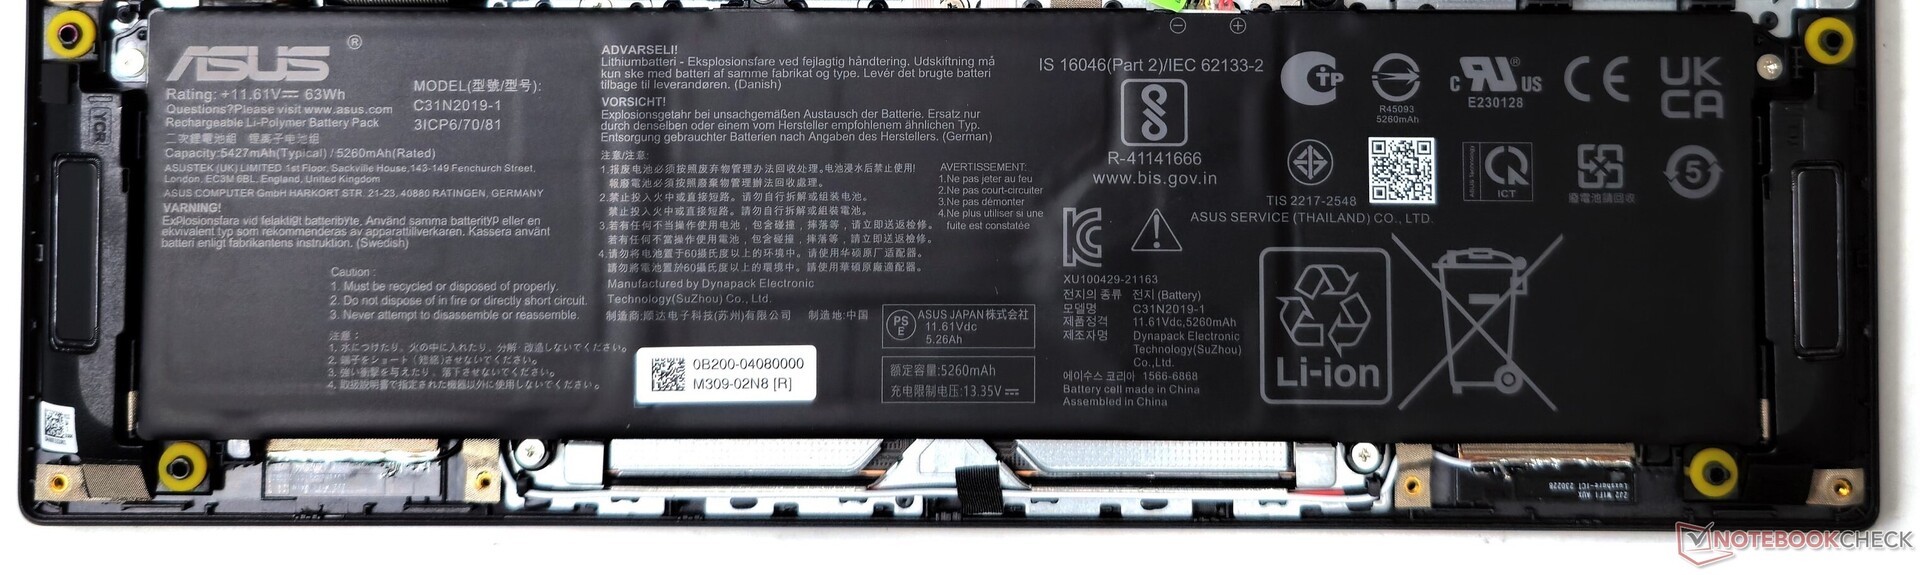
Konserwacja
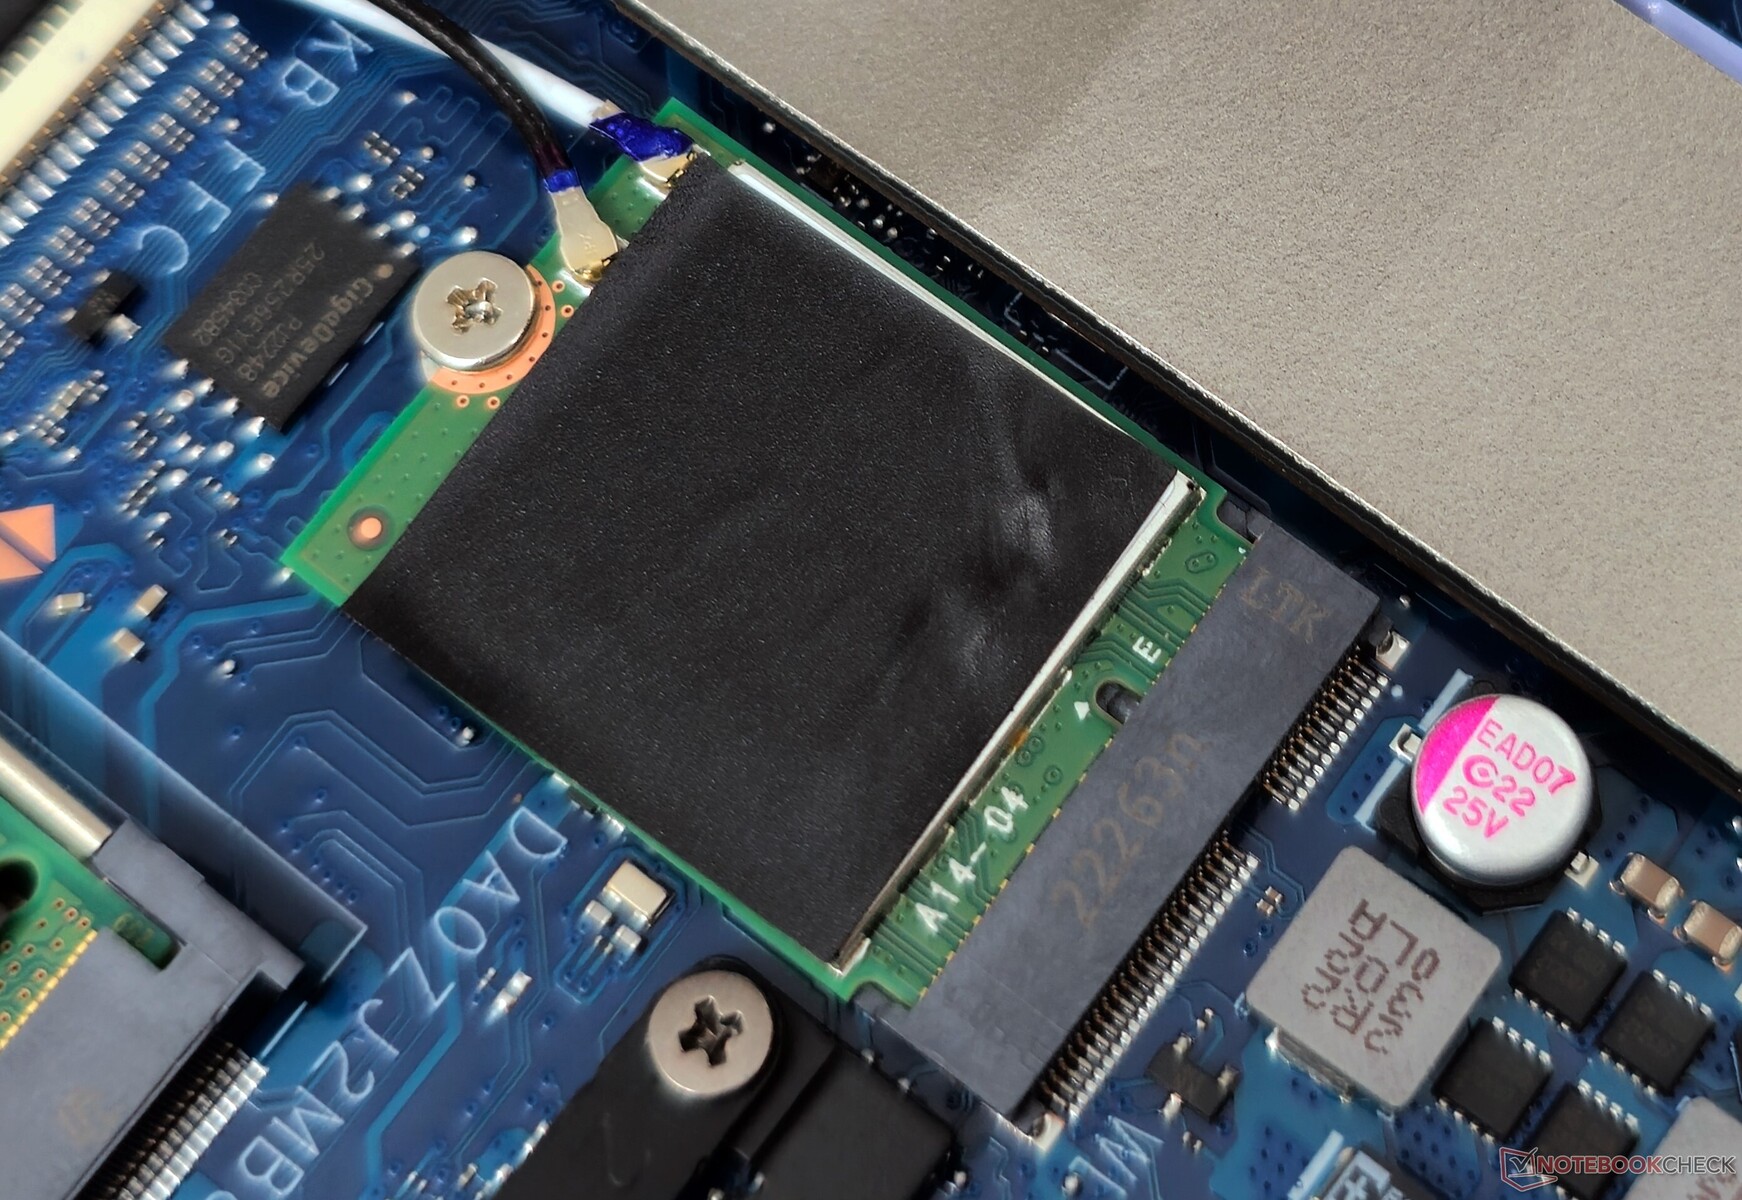
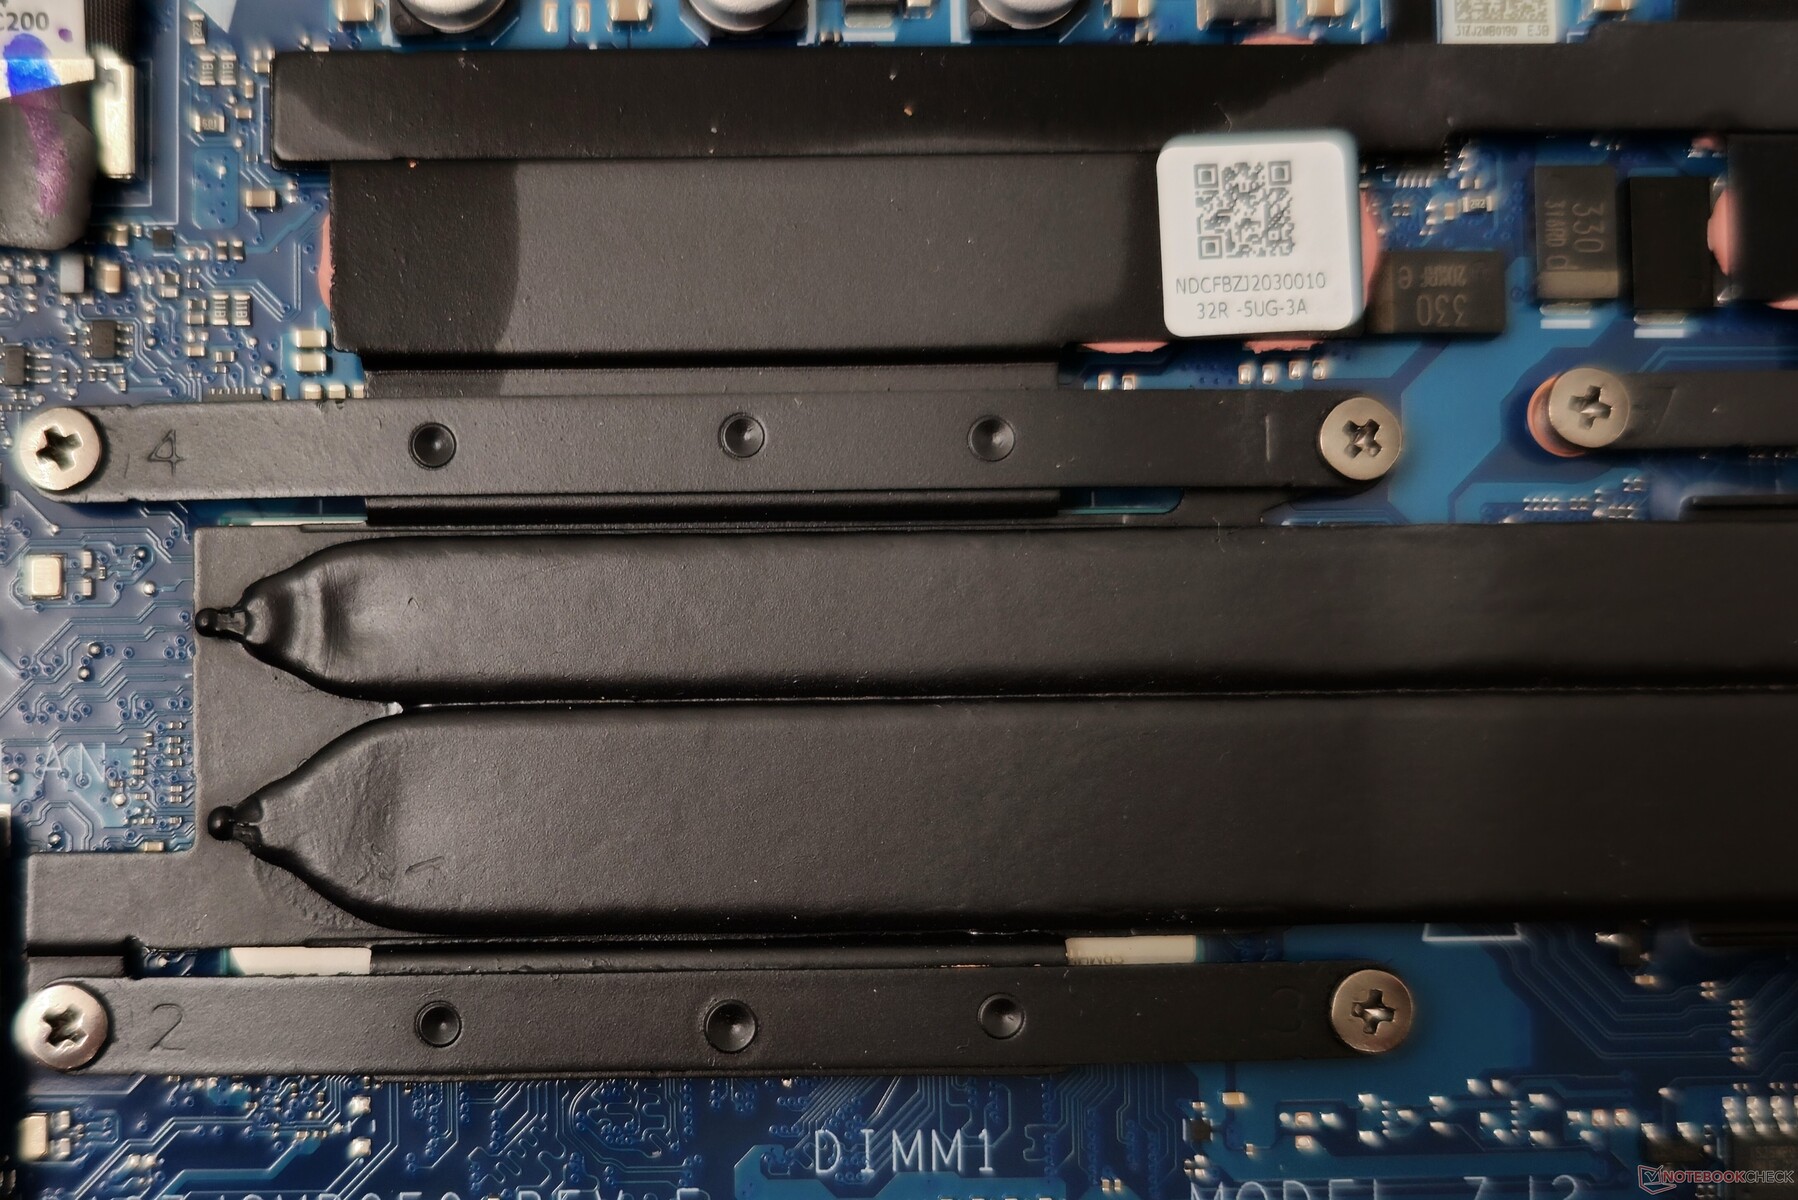
Dostęp do podzespołów wewnętrznych wymaga odkręcenia siedmiu śrub PH0 z tylnego panelu. Po wejściu do środka można łatwo wymienić kartę WLAN i dysk SSD NVMe.
Warto zauważyć, że 8 GB pamięci RAM jest przylutowane do płyty głównej, co oznacza, że można zaktualizować tylko jedno gniazdo SO-DIMM. Baterię można odkręcić i wymienić w razie potrzeby.
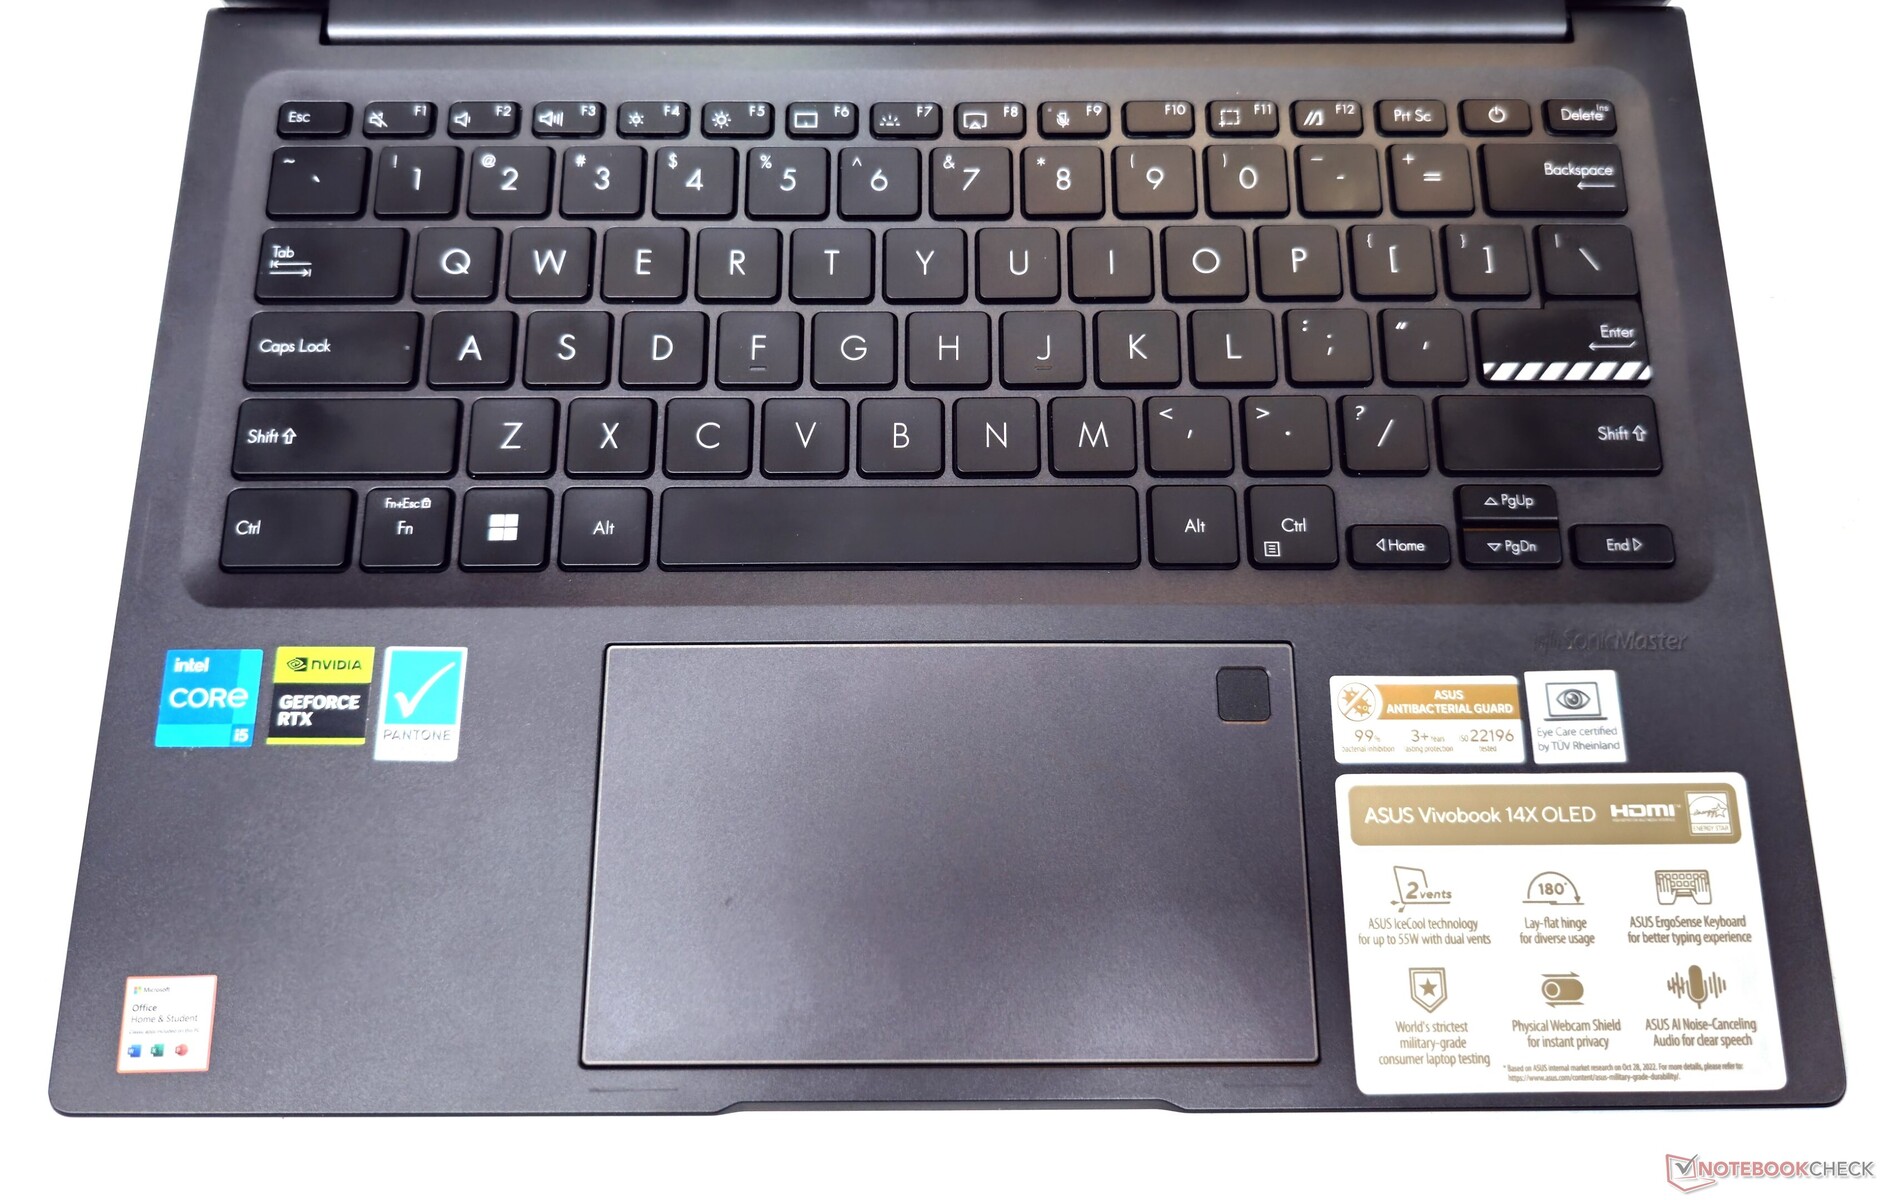
Urządzenia wejściowe: Przyzwoita klawiatura i touchpad
Klawiatura
VivoBook 14X jest wyposażony w coś, co Asus nazywa klawiaturą ErgoSense, oferującą skok klawiszy na poziomie 1,4 mm. Pisanie na tej klawiaturze jest wygodnym doświadczeniem, dzięki wypukłym nasadkom klawiszy i dobrze rozmieszczonym klawiszom.
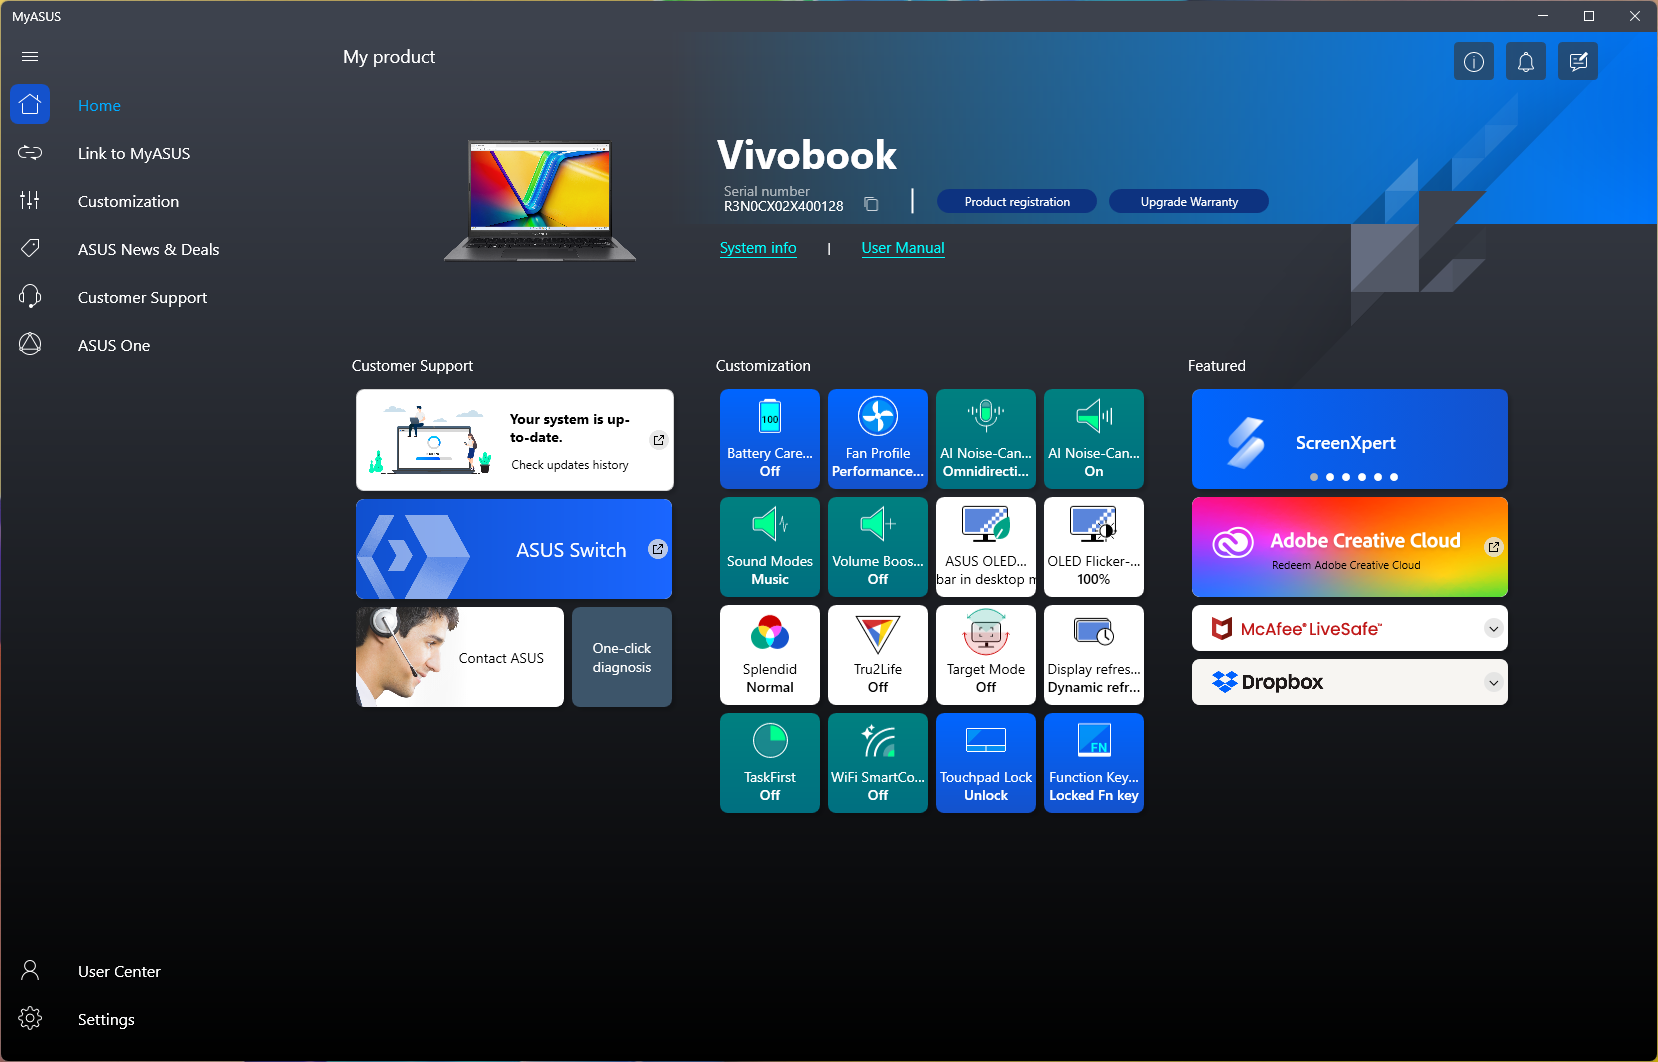
Górny rząd zawiera zarówno klawisze F1-F12, jak i klawisze specjalne, których podstawowe funkcje można skonfigurować za pomocą aplikacji MyAsus. Klawisze strzałek mogą wydawać się nieco ciasne, ale jest to typowe dla laptopów w tej obudowie. Trzystopniowe podświetlenie zapewnia przyzwoitą czytelność w ciemnym otoczeniu.
Touchpad
Touchpad w VivoBook 14X ma wymiary 7,5 cm x 13 cm, co zapewnia wystarczającą przestrzeń do nawigacji i zapewnia płynne przesuwanie.
Cała powierzchnia służy jako lewy przycisk myszy, a kliknięcia są responsywne i stosunkowo ciche.
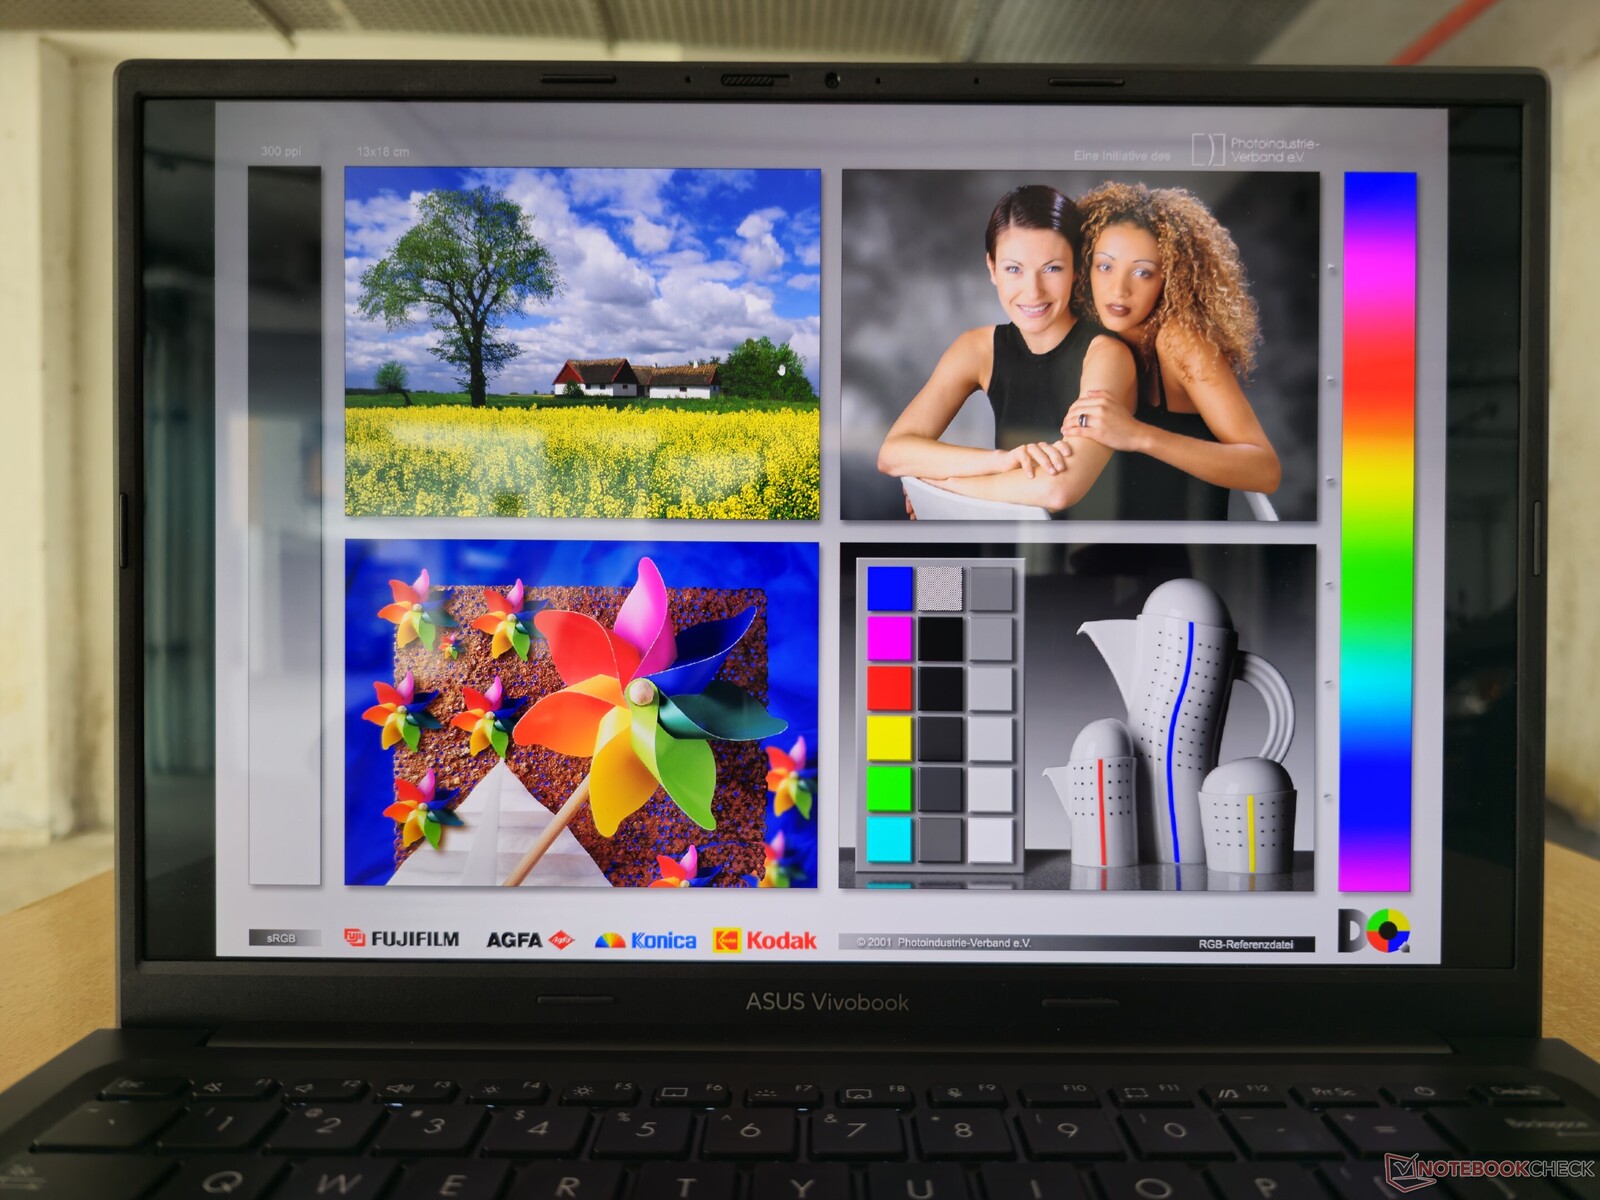
Wyświetlacz: 2,8K OLED z HDR i 90 Hz PWM
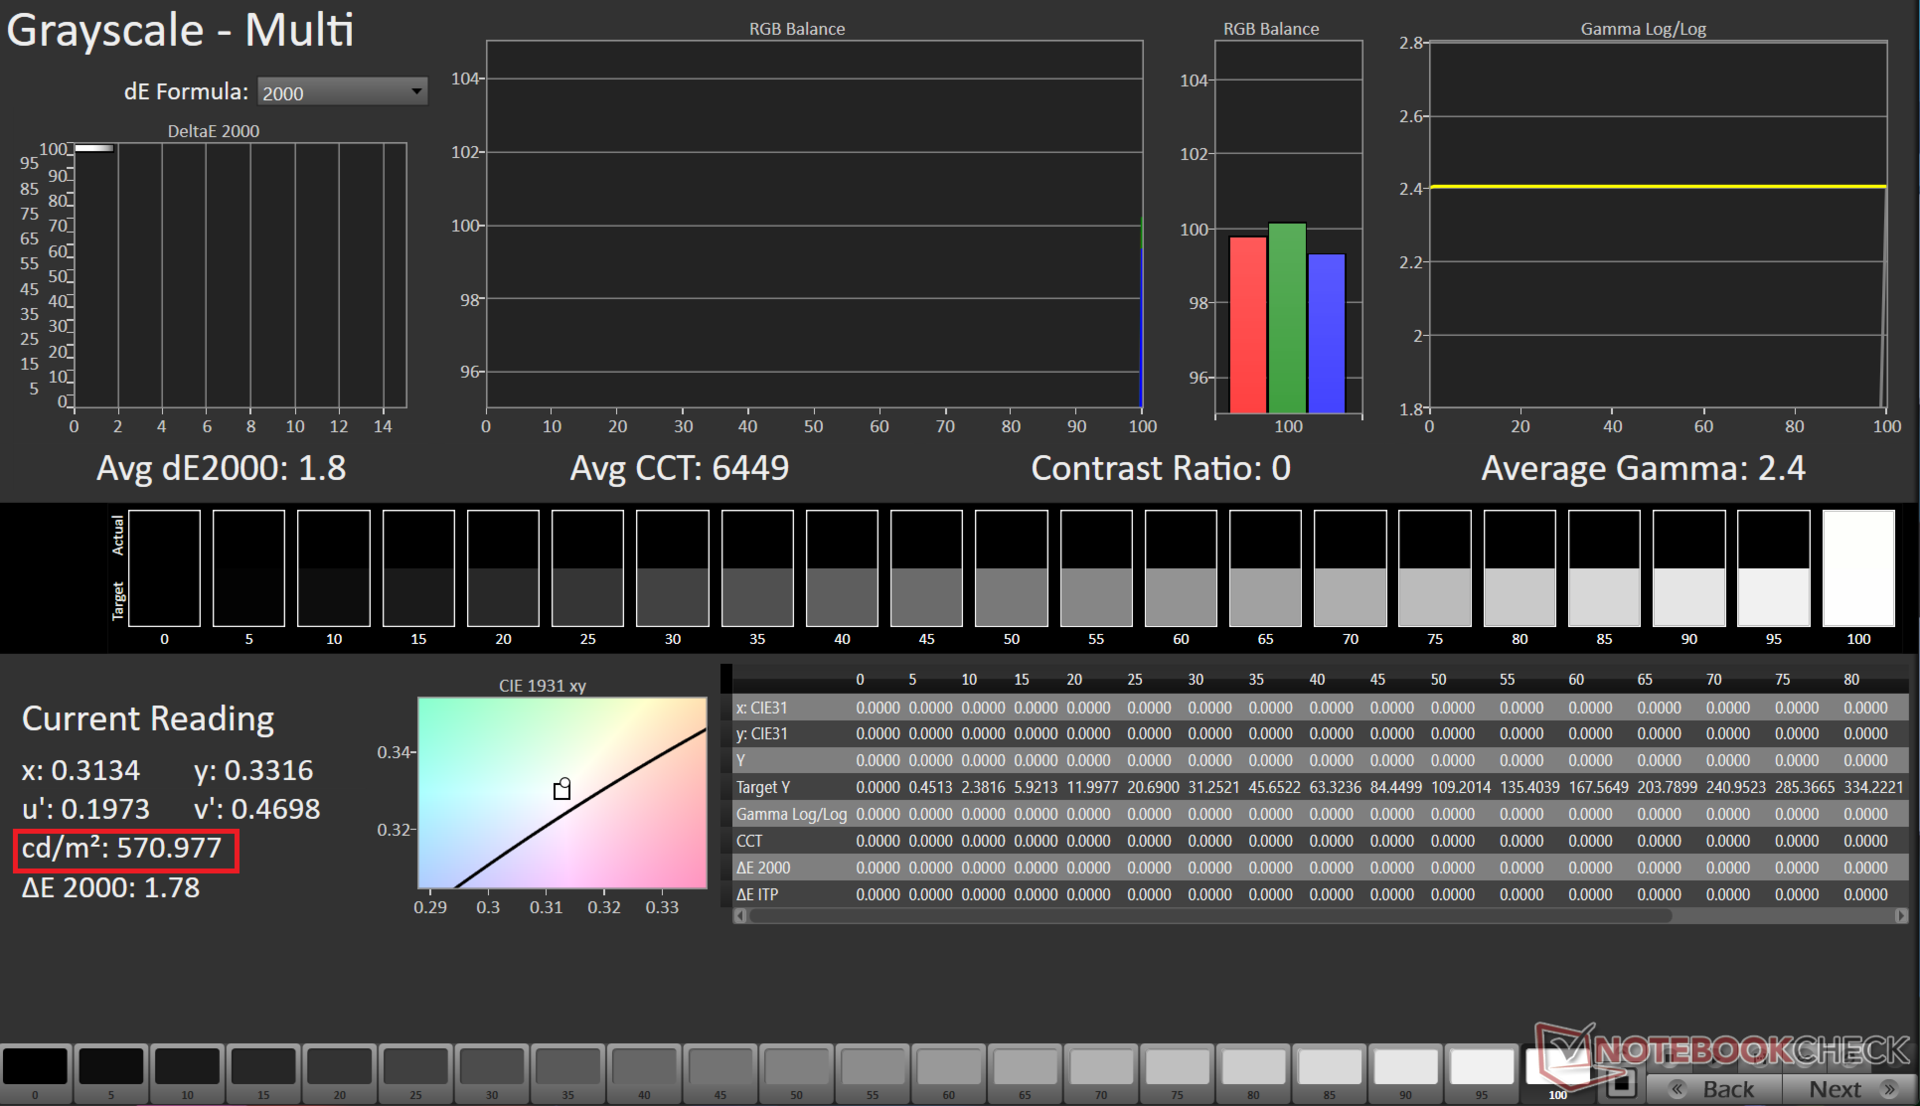
Panel Samsung OLED 2880 x 1800 16:10 90 Hz w VivoBook 14X oferuje dobry rozkład jasności i zasadniczo nieskończony współczynnik kontrastu.
Zmierzyliśmy maksymalną jasność 373 nitów w trybie SDR. Wyświetlacz posiada certyfikat VESA DisplayHDR True Black 600 i mogliśmy zmierzyć do 571 nitów podczas odtwarzania treści HDR. Nie ma krwawienia podświetlenia, biorąc pod uwagę, że jest to wyświetlacz OLED.
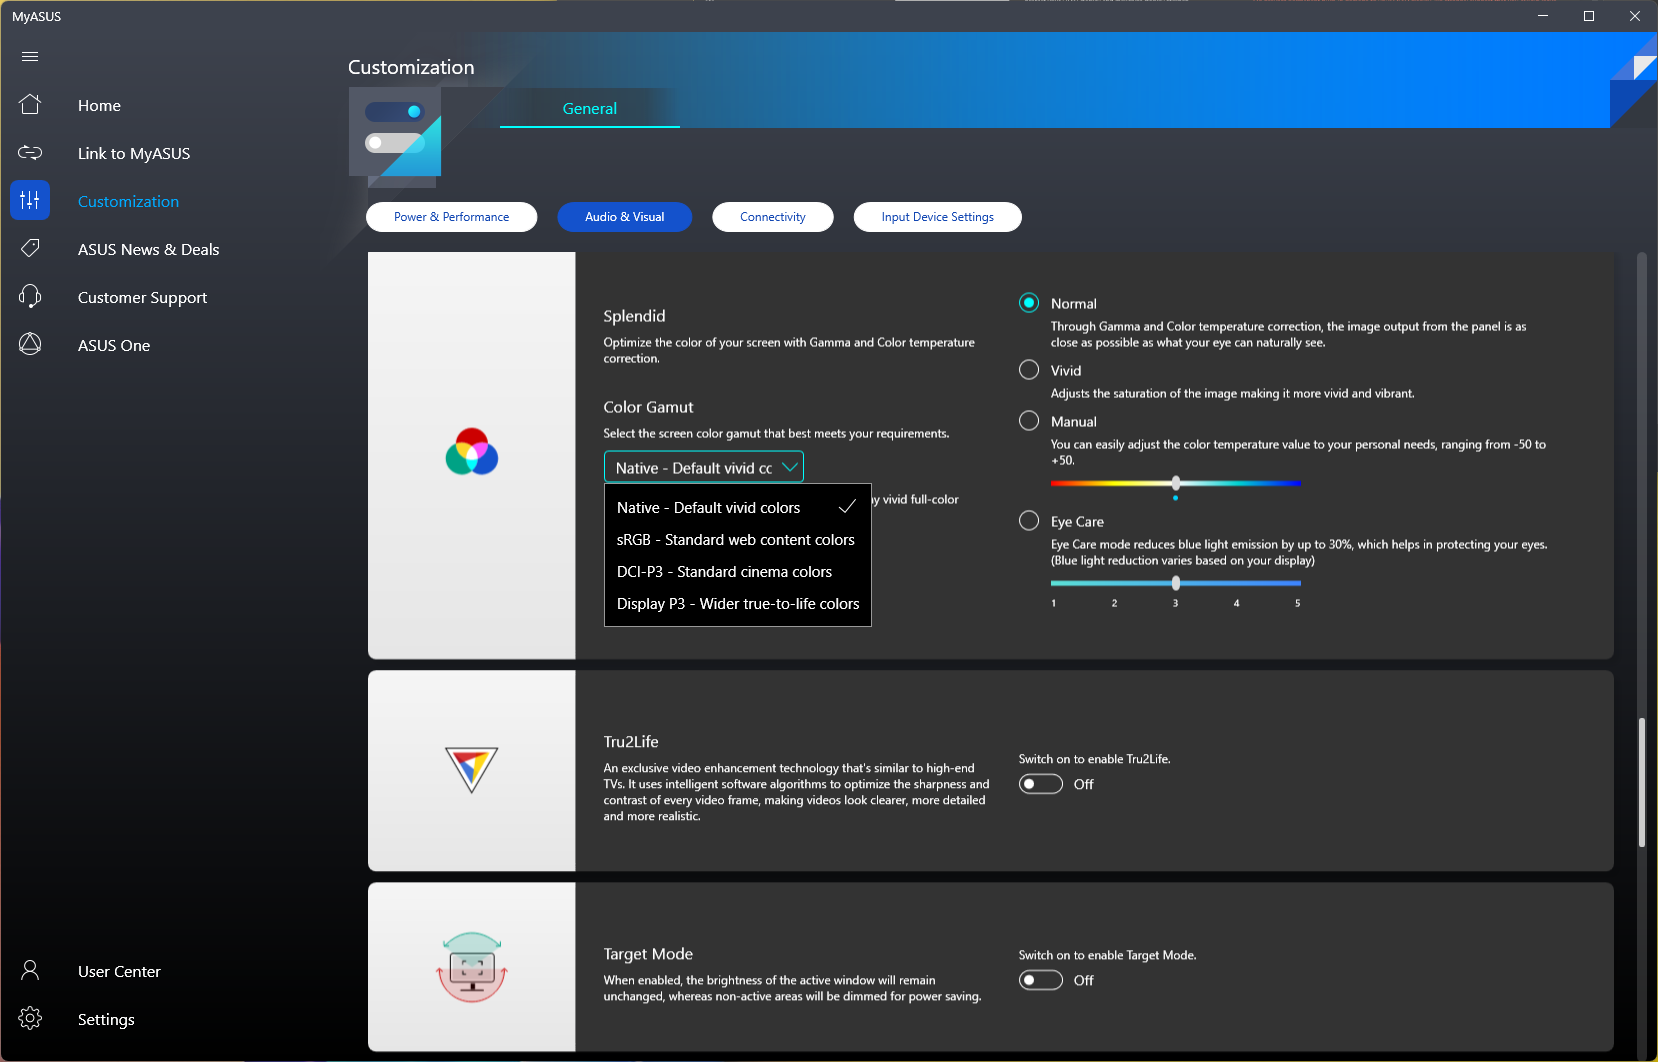
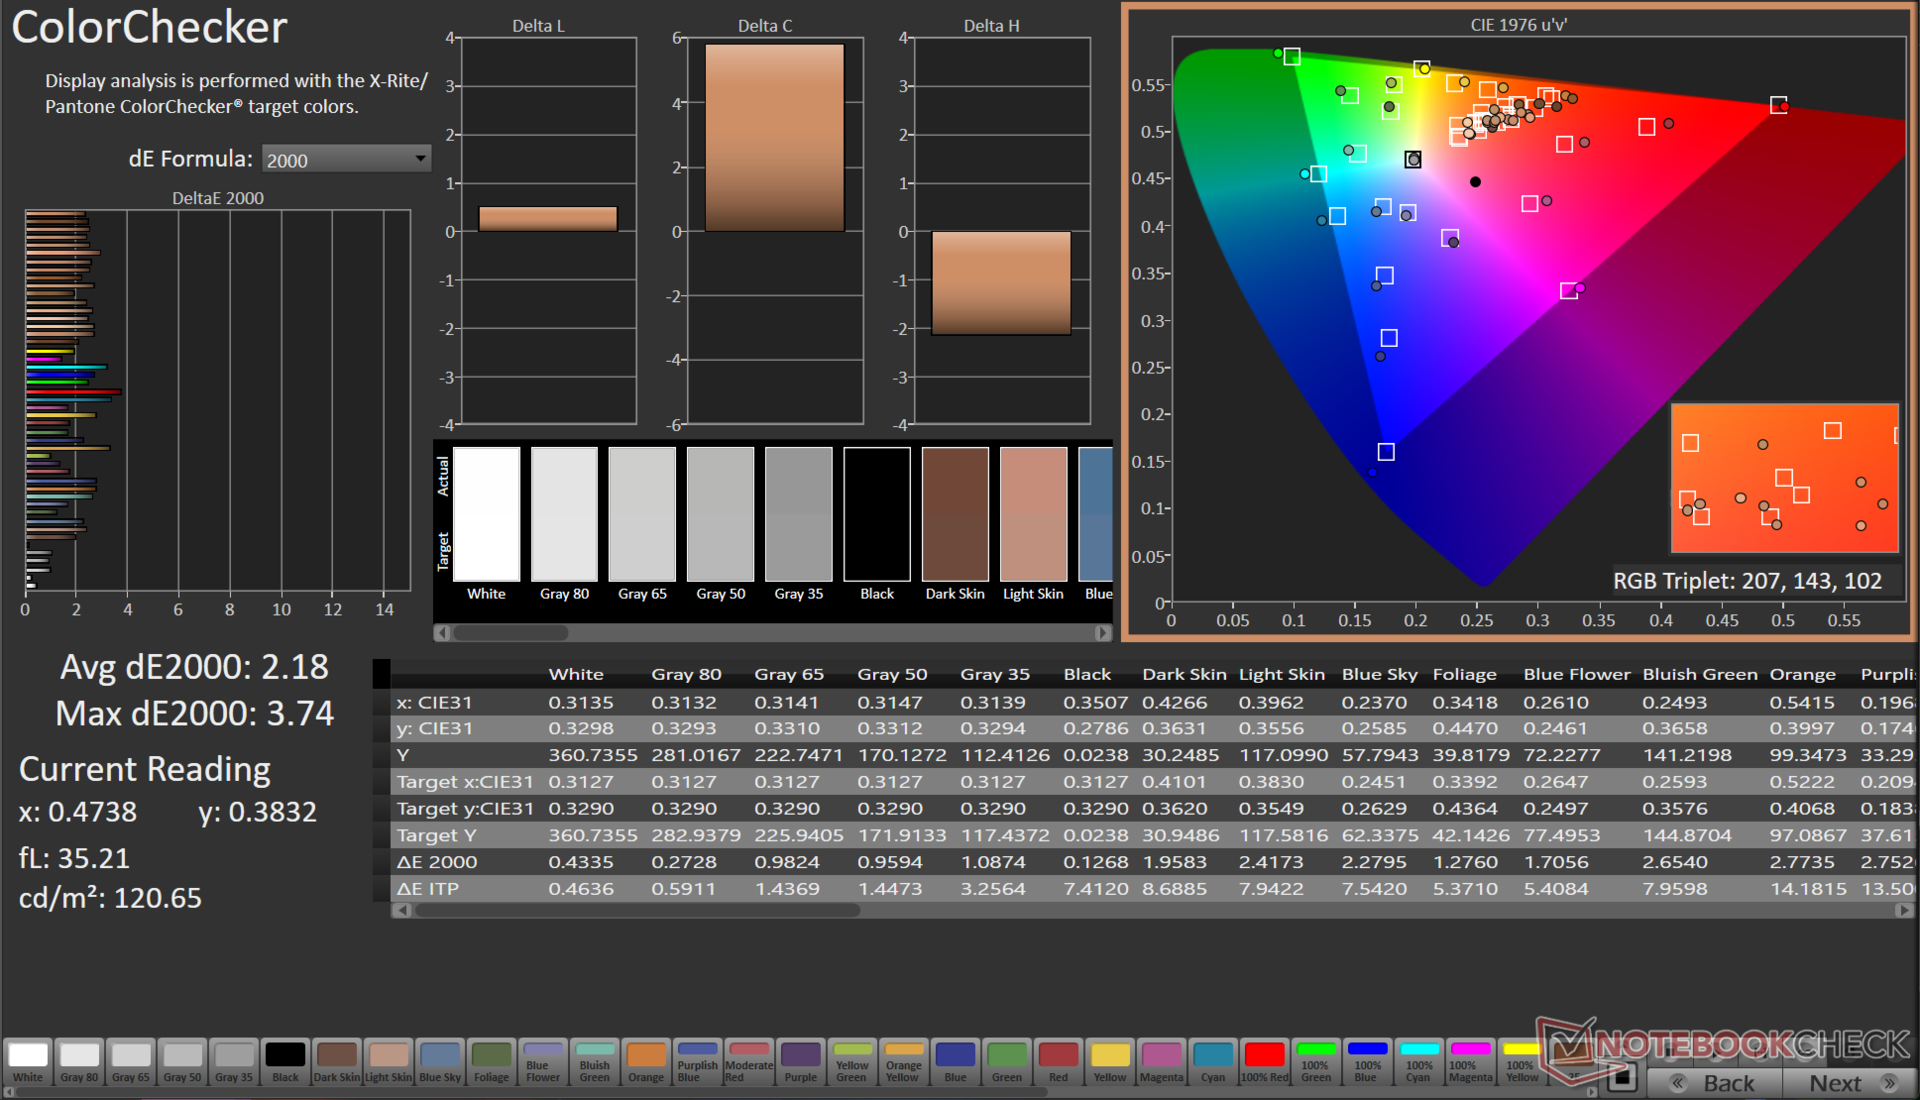
Aplikacja MyAsus oferuje kilka opcji wyświetlania. Wszystkie testy przeprowadziliśmy przy użyciu fabrycznego trybu normalnego z natywną gamą kolorów.

| |||||||||||||||||||||||||
rozświetlenie: 85 %
na akumulatorze: 367 cd/m²
kontrast: ∞:1 (czerń: 0 cd/m²)
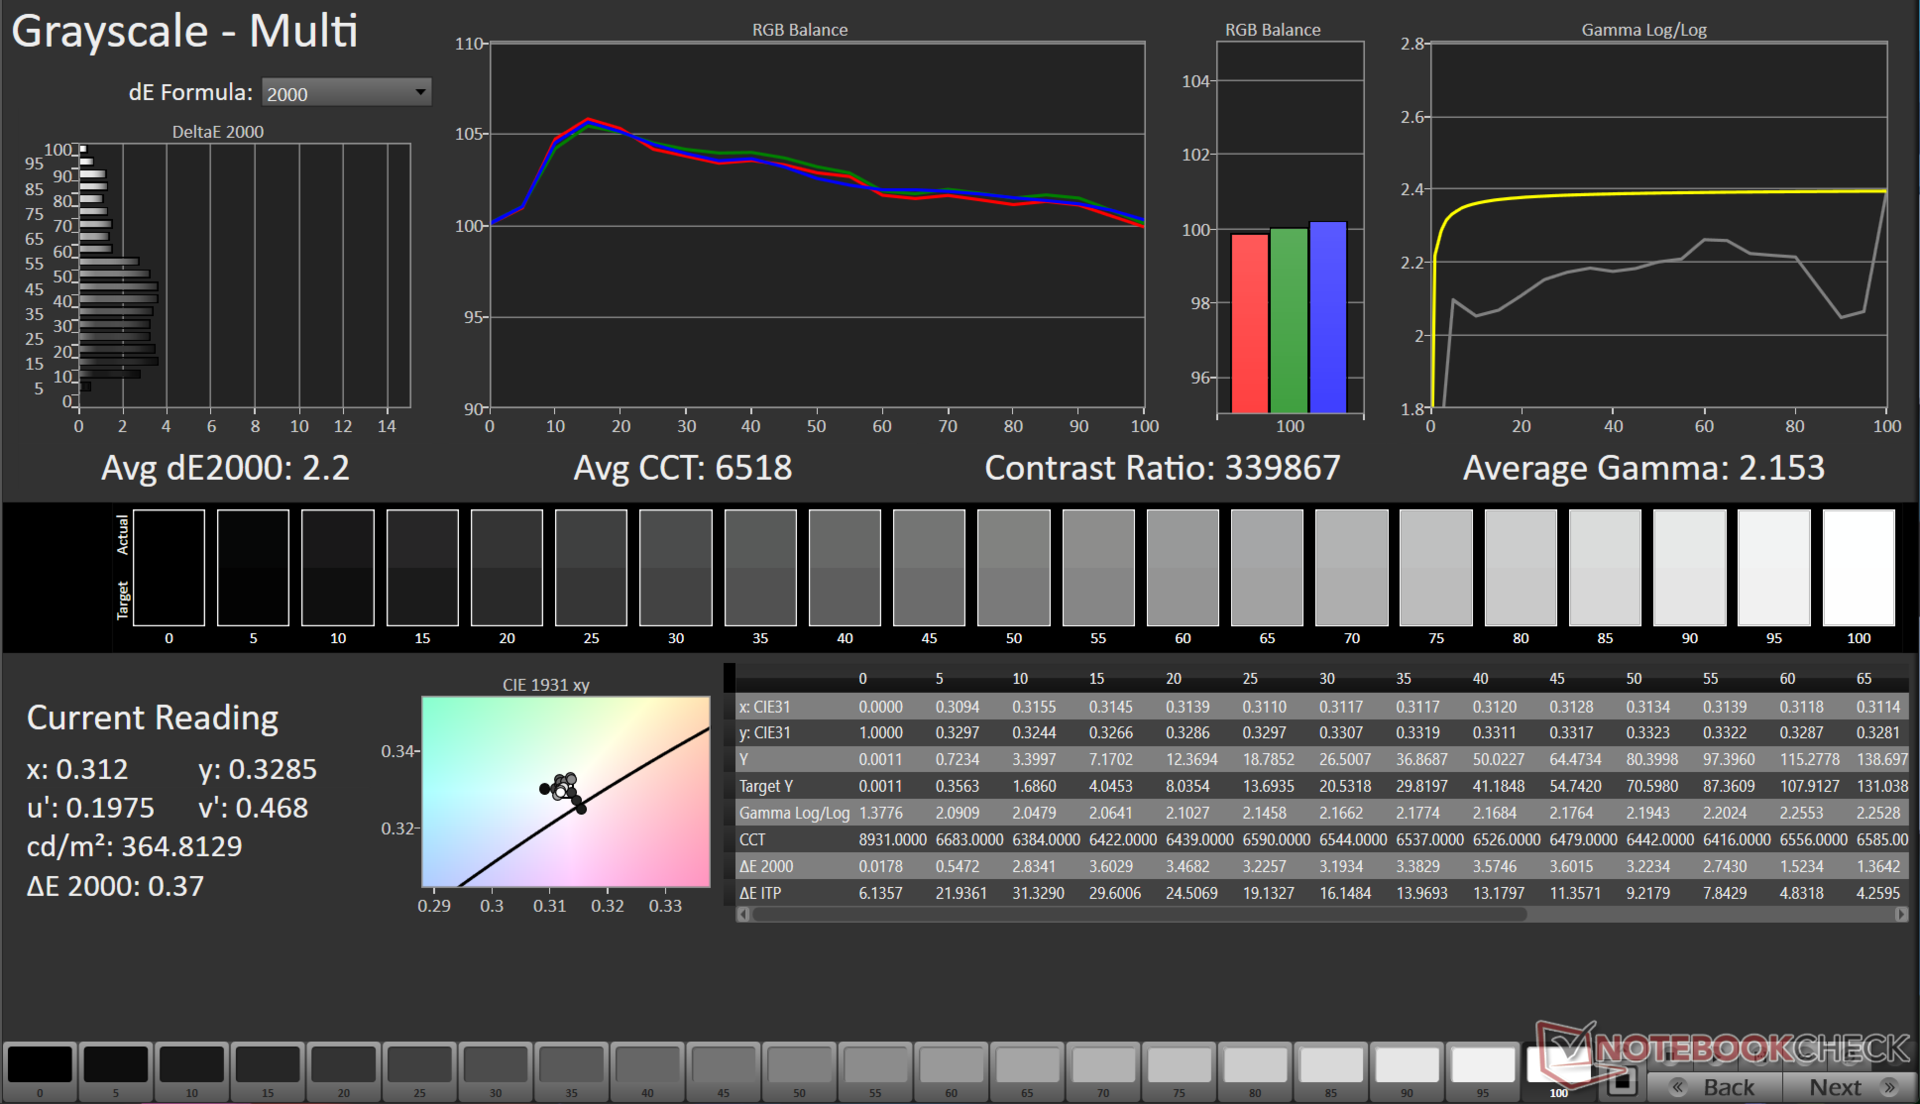
ΔE ColorChecker Calman: 2.85 | ∀{0.5-29.43 Ø4.73}
calibrated: 2.18
ΔE Greyscale Calman: 2.2 | ∀{0.09-98 Ø4.97}
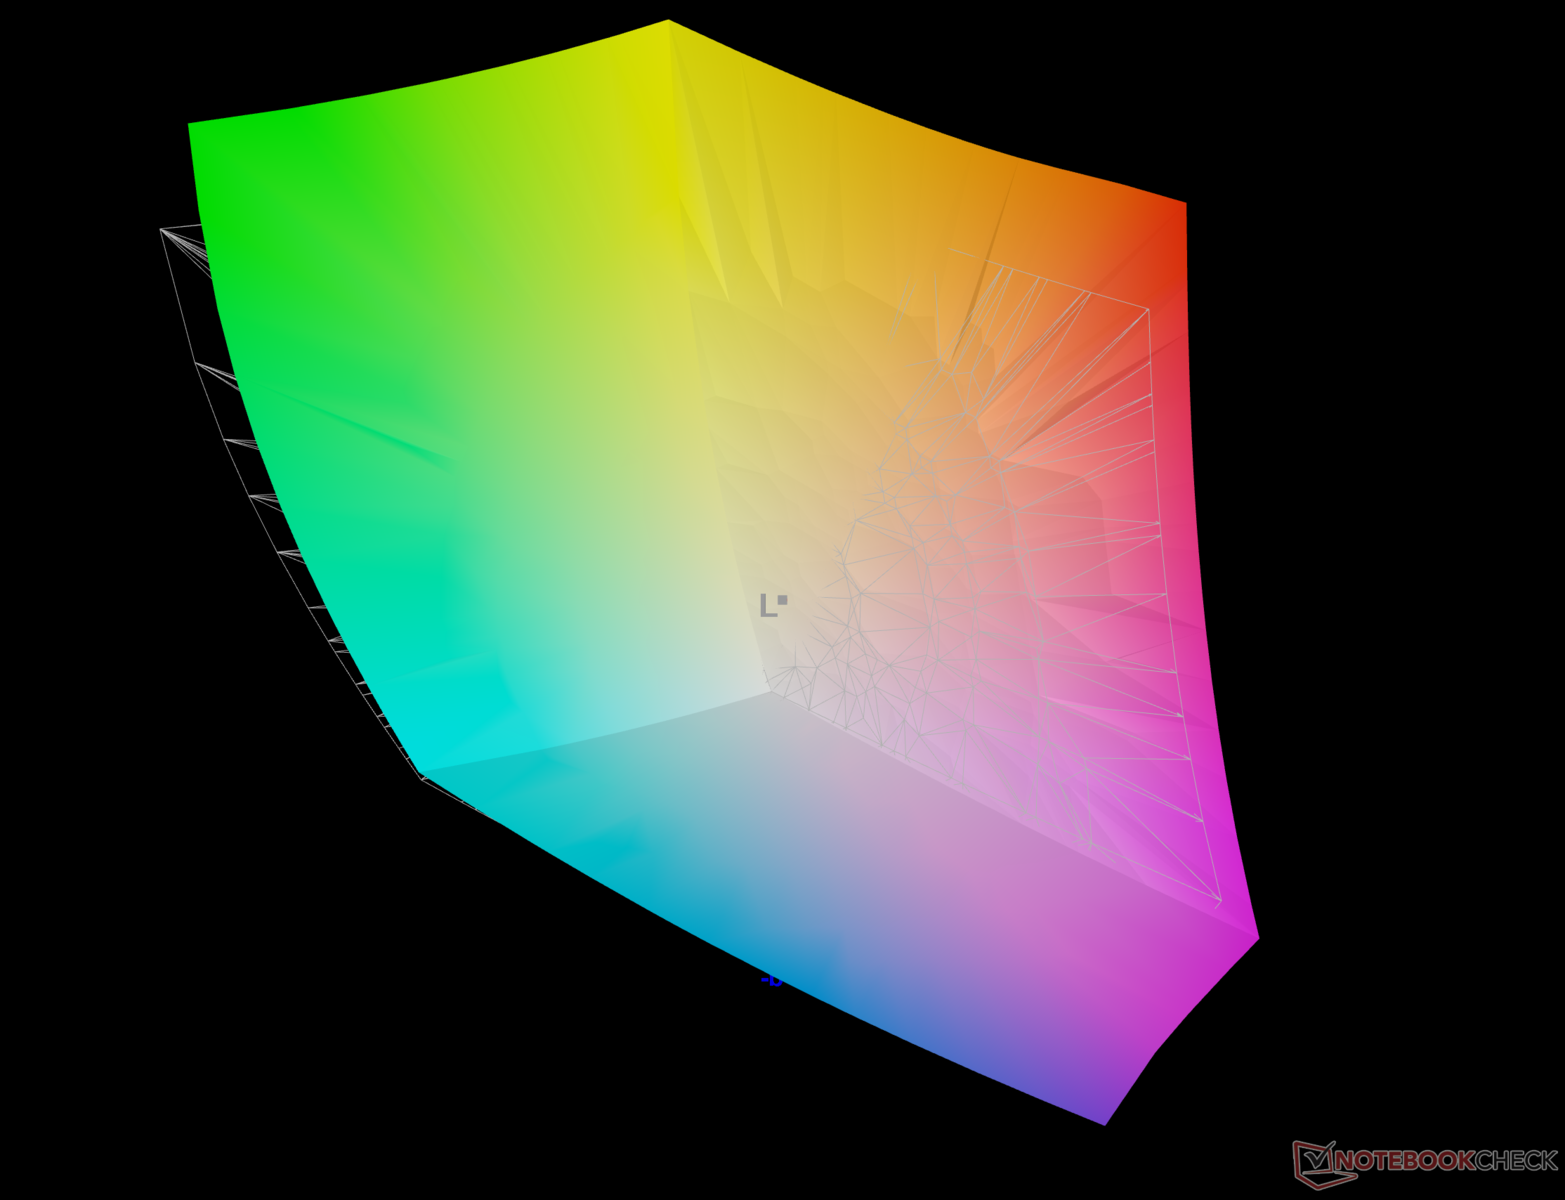
96.5% AdobeRGB 1998 (Argyll 3D)
100% sRGB (Argyll 3D)
99.9% Display P3 (Argyll 3D)
Gamma: 2.15
CCT: 6518 K
| Asus VivoBook 14X K3405 Samsung ATNA40YK07-1, , 2880x1800, 14" | Acer Swift X SFX14-71G ATNA45AF03-0, OLED, 2880x1800, 14.5" | MSI Stealth 14 Studio A13V B140QAN06.T, IPS, 2560x1600, 14" | Gigabyte Aero 14 OLED BMF Samsung SDC4192 (ATNA40YK14-0), OLED, 2880x1800, 14" | Lenovo Slim Pro 7 14ARP8 LEN89C1, IPS, 2560x1600, 14.5" | Schenker Vision 14 2022 RTX 3050 Ti MNE007ZA1-1, IPS, 2880x1800, 14" | |
|---|---|---|---|---|---|---|
| Display | 0% | -5% | -3% | -17% | -17% | |
| Display P3 Coverage (%) | 99.9 | 99.9 0% | 96.2 -4% | 99.8 0% | 72.9 -27% | 74.1 -26% |
| sRGB Coverage (%) | 100 | 99.9 0% | 99.6 0% | 100 0% | 98.2 -2% | 97.4 -3% |
| AdobeRGB 1998 Coverage (%) | 96.5 | 96.2 0% | 85.3 -12% | 88.7 -8% | 74.6 -23% | 75.3 -22% |
| Response Times | 81% | -159% | -13% | -1350% | -1320% | |
| Response Time Grey 50% / Grey 80% * (ms) | 1.15 ? | 0.4 ? 65% | 5.5 ? -378% | 2.4 ? -109% | 31.8 ? -2665% | 31.5 ? -2639% |
| Response Time Black / White * (ms) | 14.4 ? | 0.6 ? 96% | 5.8 ? 60% | 2.4 ? 83% | 19.3 ? -34% | 14.5 ? -1% |
| PWM Frequency (Hz) | 90.02 ? | 240 ? | 300 | |||
| Screen | 15% | 3% | 45% | -16% | -14% | |
| Brightness middle (cd/m²) | 369 | 388 5% | 419 14% | 423 15% | 344.7 -7% | 421 14% |
| Brightness (cd/m²) | 364 | 390 7% | 402 10% | 427 17% | 334 -8% | 416 14% |
| Brightness Distribution (%) | 85 | 98 15% | 89 5% | 98 15% | 92 8% | 89 5% |
| Black Level * (cd/m²) | 0.43 | 0.1 | 0.31 | 0.28 | ||
| Colorchecker dE 2000 * | 2.85 | 2.2 23% | 2.3 19% | 0.55 81% | 3.01 -6% | 3.2 -12% |
| Colorchecker dE 2000 max. * | 4.22 | 3.9 8% | 5.8 -37% | 1.15 73% | 6.3 -49% | 5.5 -30% |
| Colorchecker dE 2000 calibrated * | 2.18 | 1.9 13% | 0.9 59% | 1.15 47% | 0.83 62% | 2 8% |
| Greyscale dE 2000 * | 2.2 | 1.4 36% | 3.3 -50% | 0.69 69% | 4.6 -109% | 4.4 -100% |
| Gamma | 2.15 102% | 2.22 99% | 2.14 103% | 2.42 91% | 2.28 96% | 2.22 99% |
| CCT | 6518 100% | 6380 102% | 6550 99% | 6479 100% | 6420 101% | 6384 102% |
| Contrast (:1) | 974 | 4230 | 1112 | 1504 | ||
| Całkowita średnia (program / ustawienia) | 32% /
22% | -54% /
-26% | 10% /
24% | -461% /
-238% | -450% /
-233% |
* ... im mniej tym lepiej
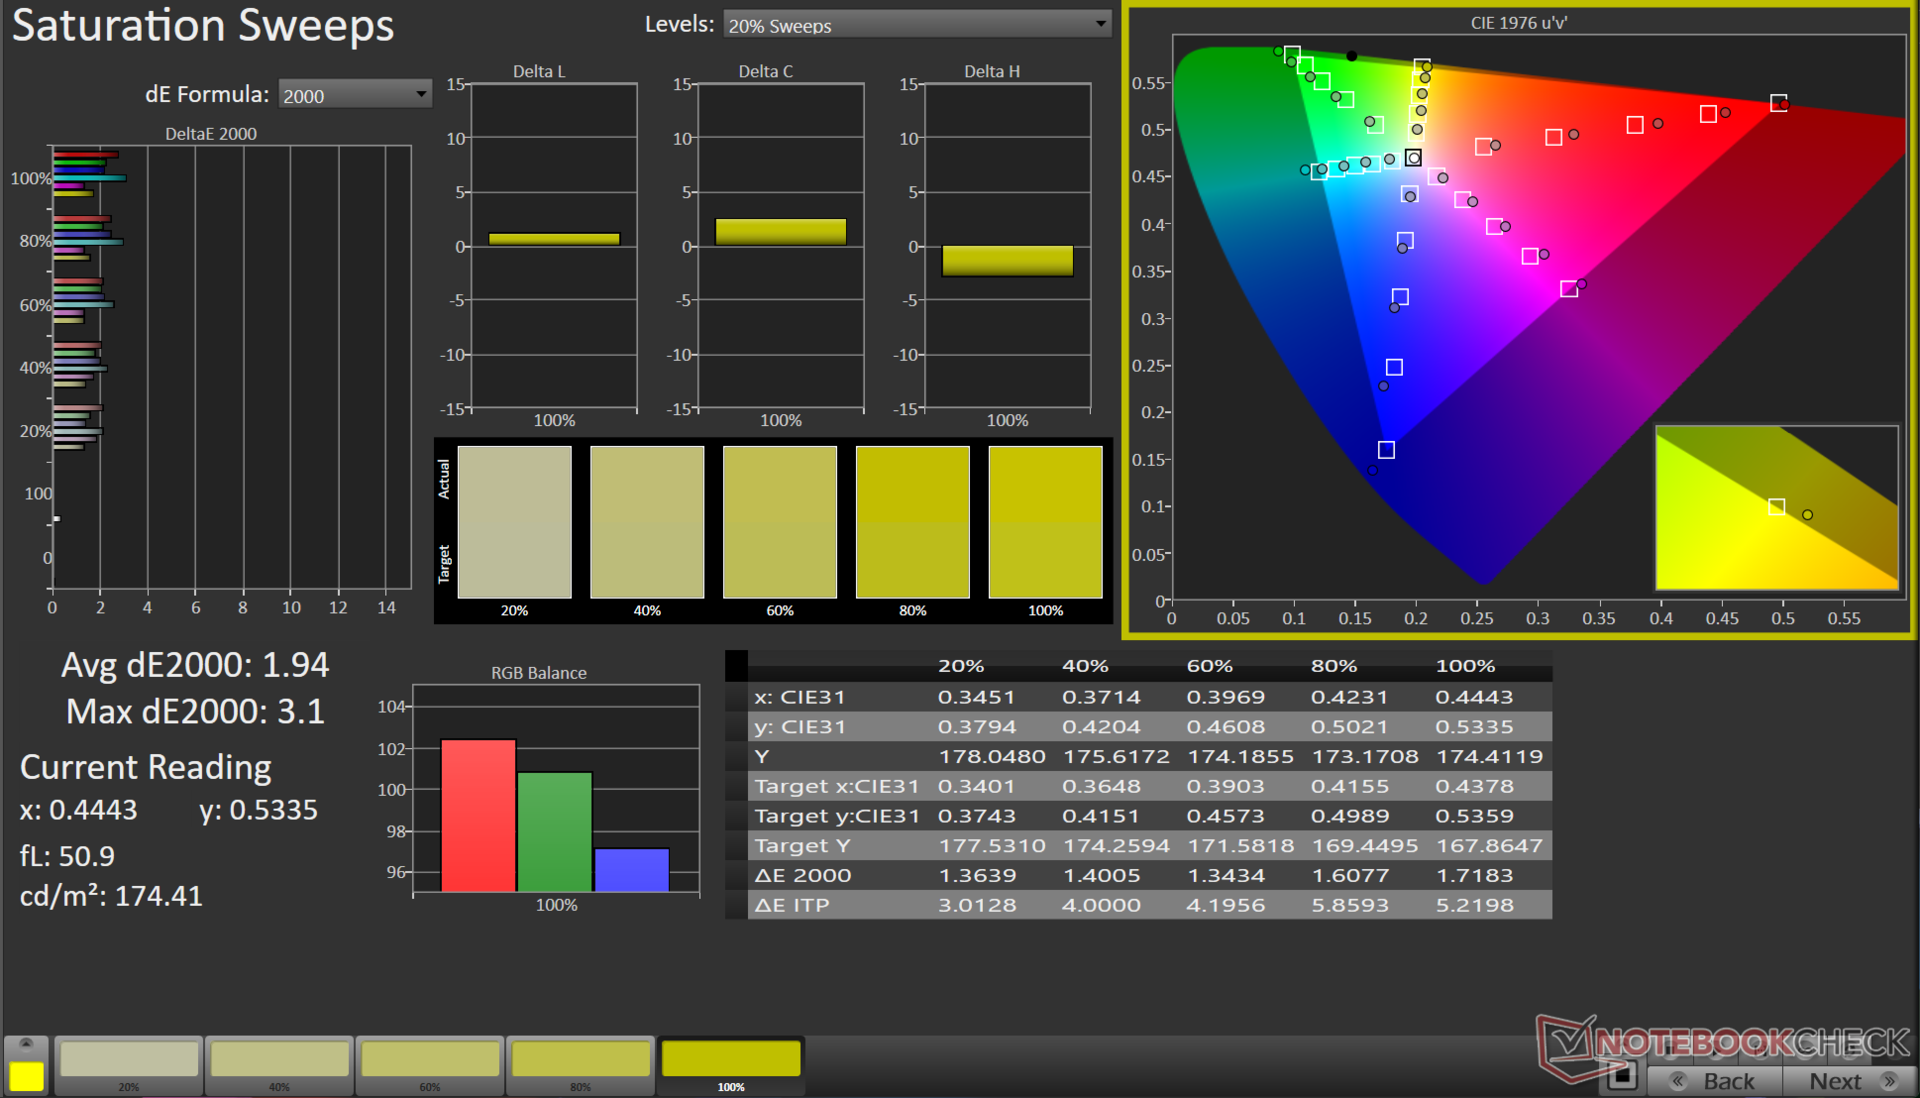
Twórcy treści będą zadowoleni z imponującego pokrycia przez VivoBook 14X całej przestrzeni barw sRGB (100%), a także niemal pełnego pokrycia gam kolorów Adobe RGB (96,5%) i Display P3 (99,9%).


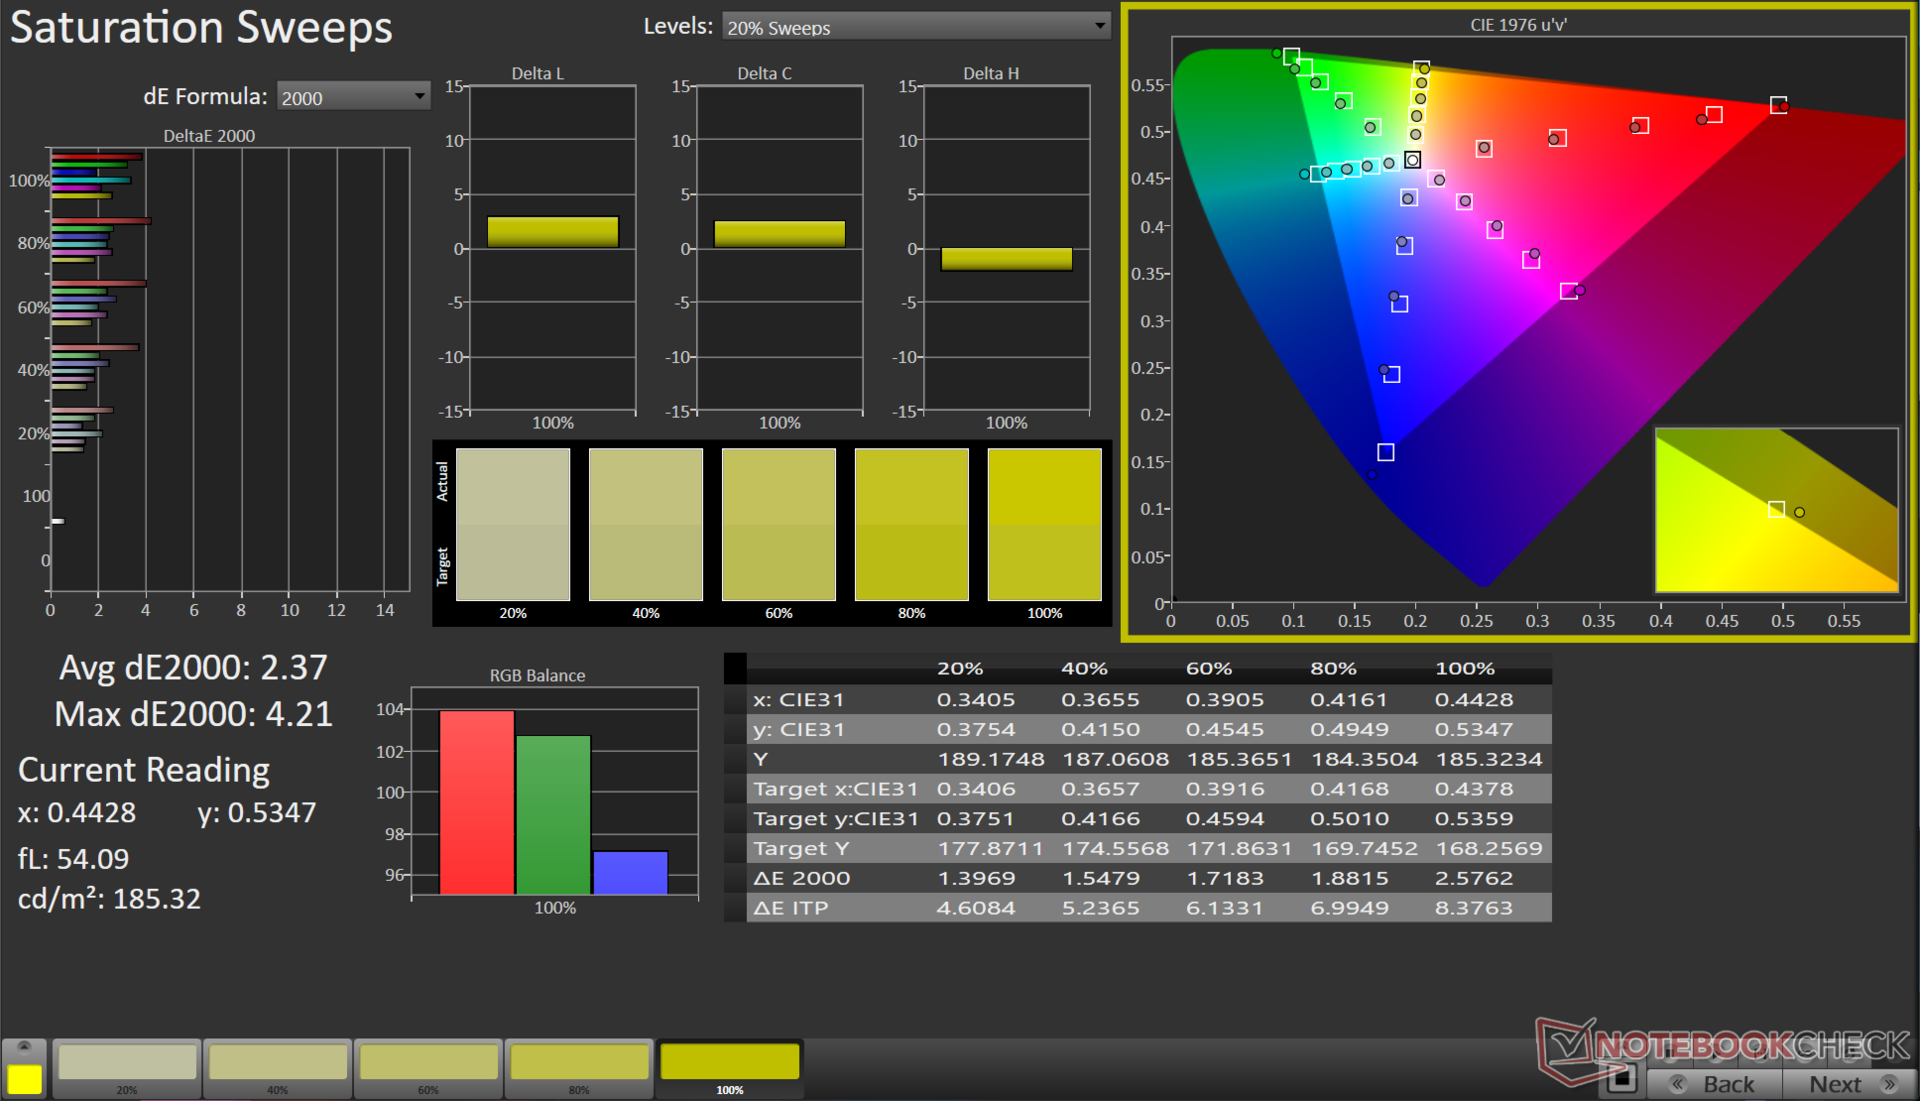
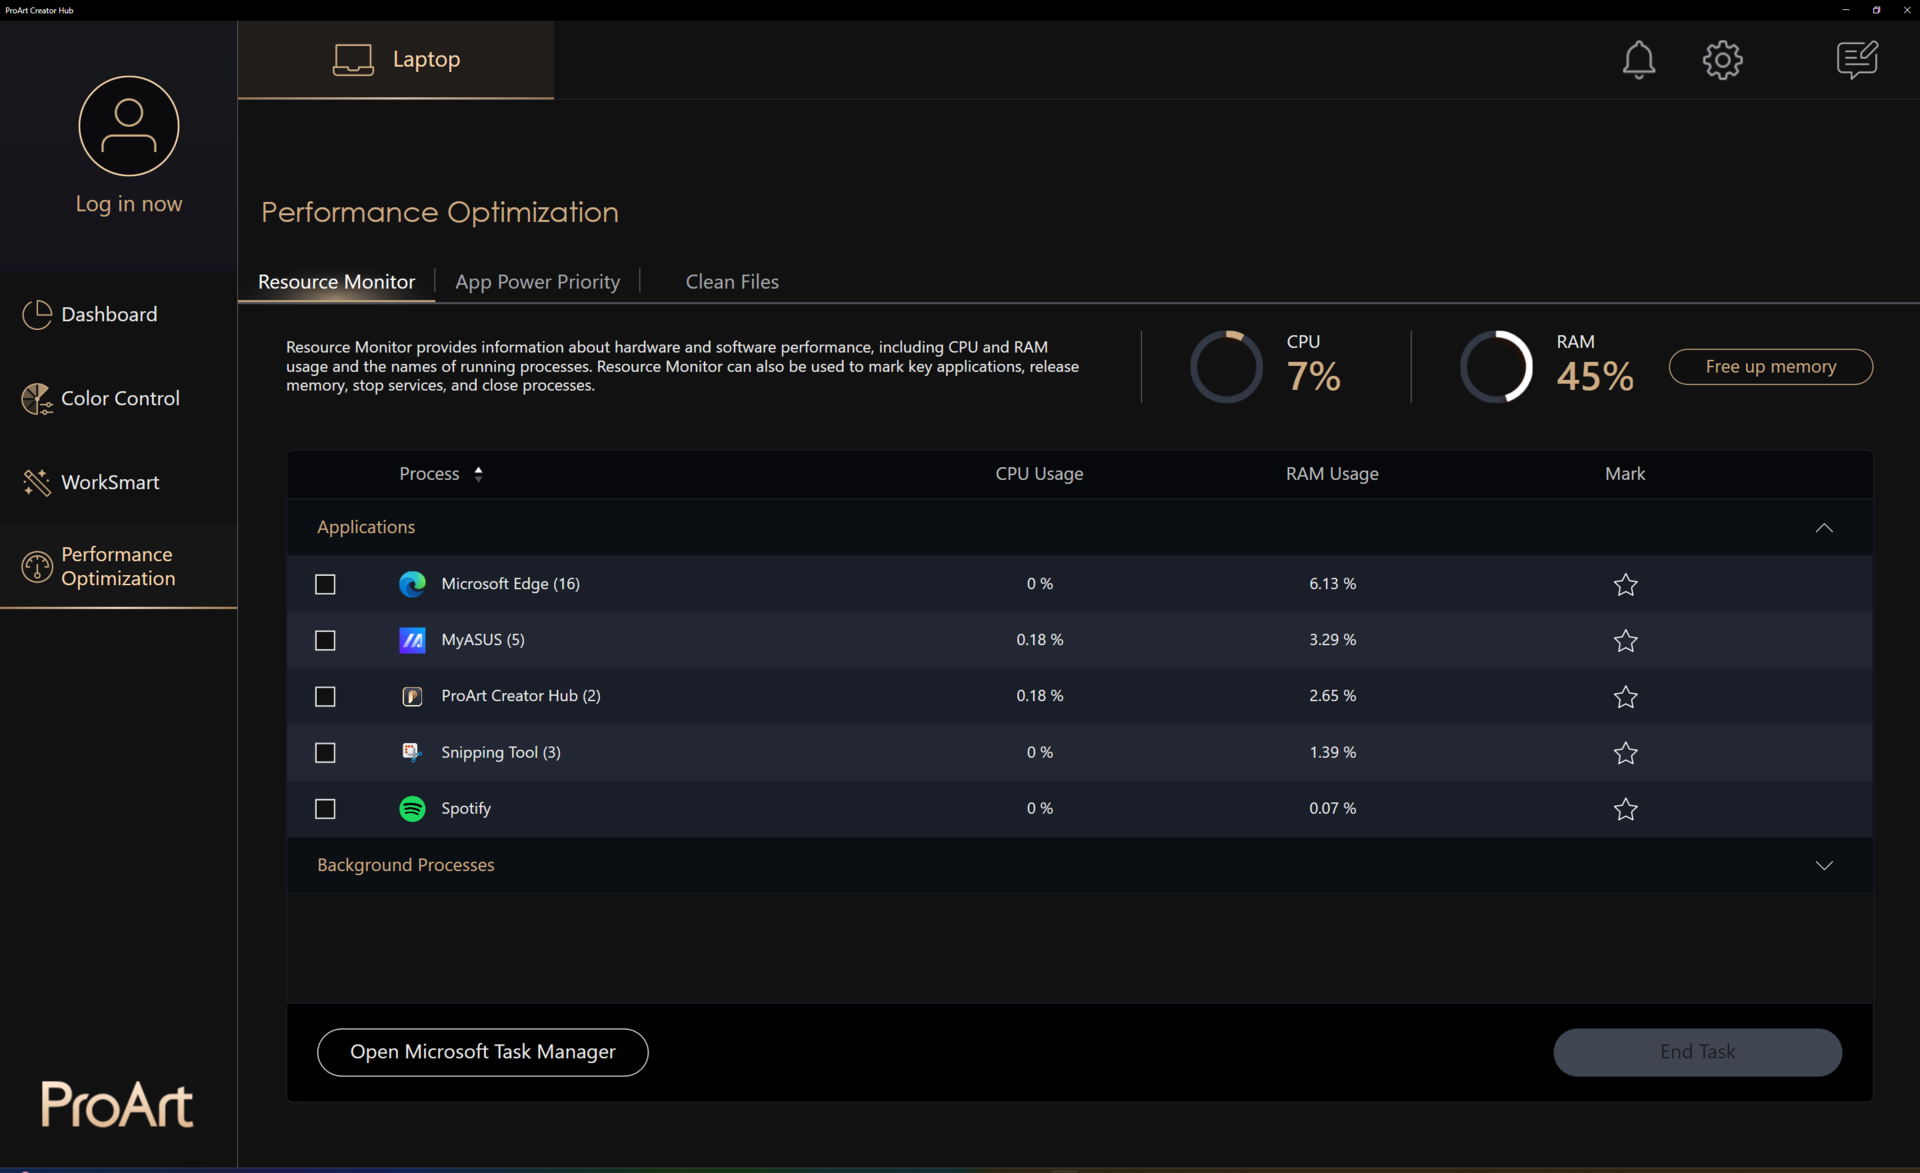
Przeprowadziliśmy kalibrację kolorów w przestrzeni barw Display P3. VivoBook 14X już po wyjęciu z pudełka wykazuje niskie wartości Delta E w skali szarości i ColorChecker. Możesz również użyć ProArt Creator Hub i kompatybilnego kalibratora X-Rite i1Display, aby przeprowadzić własną kalibrację.
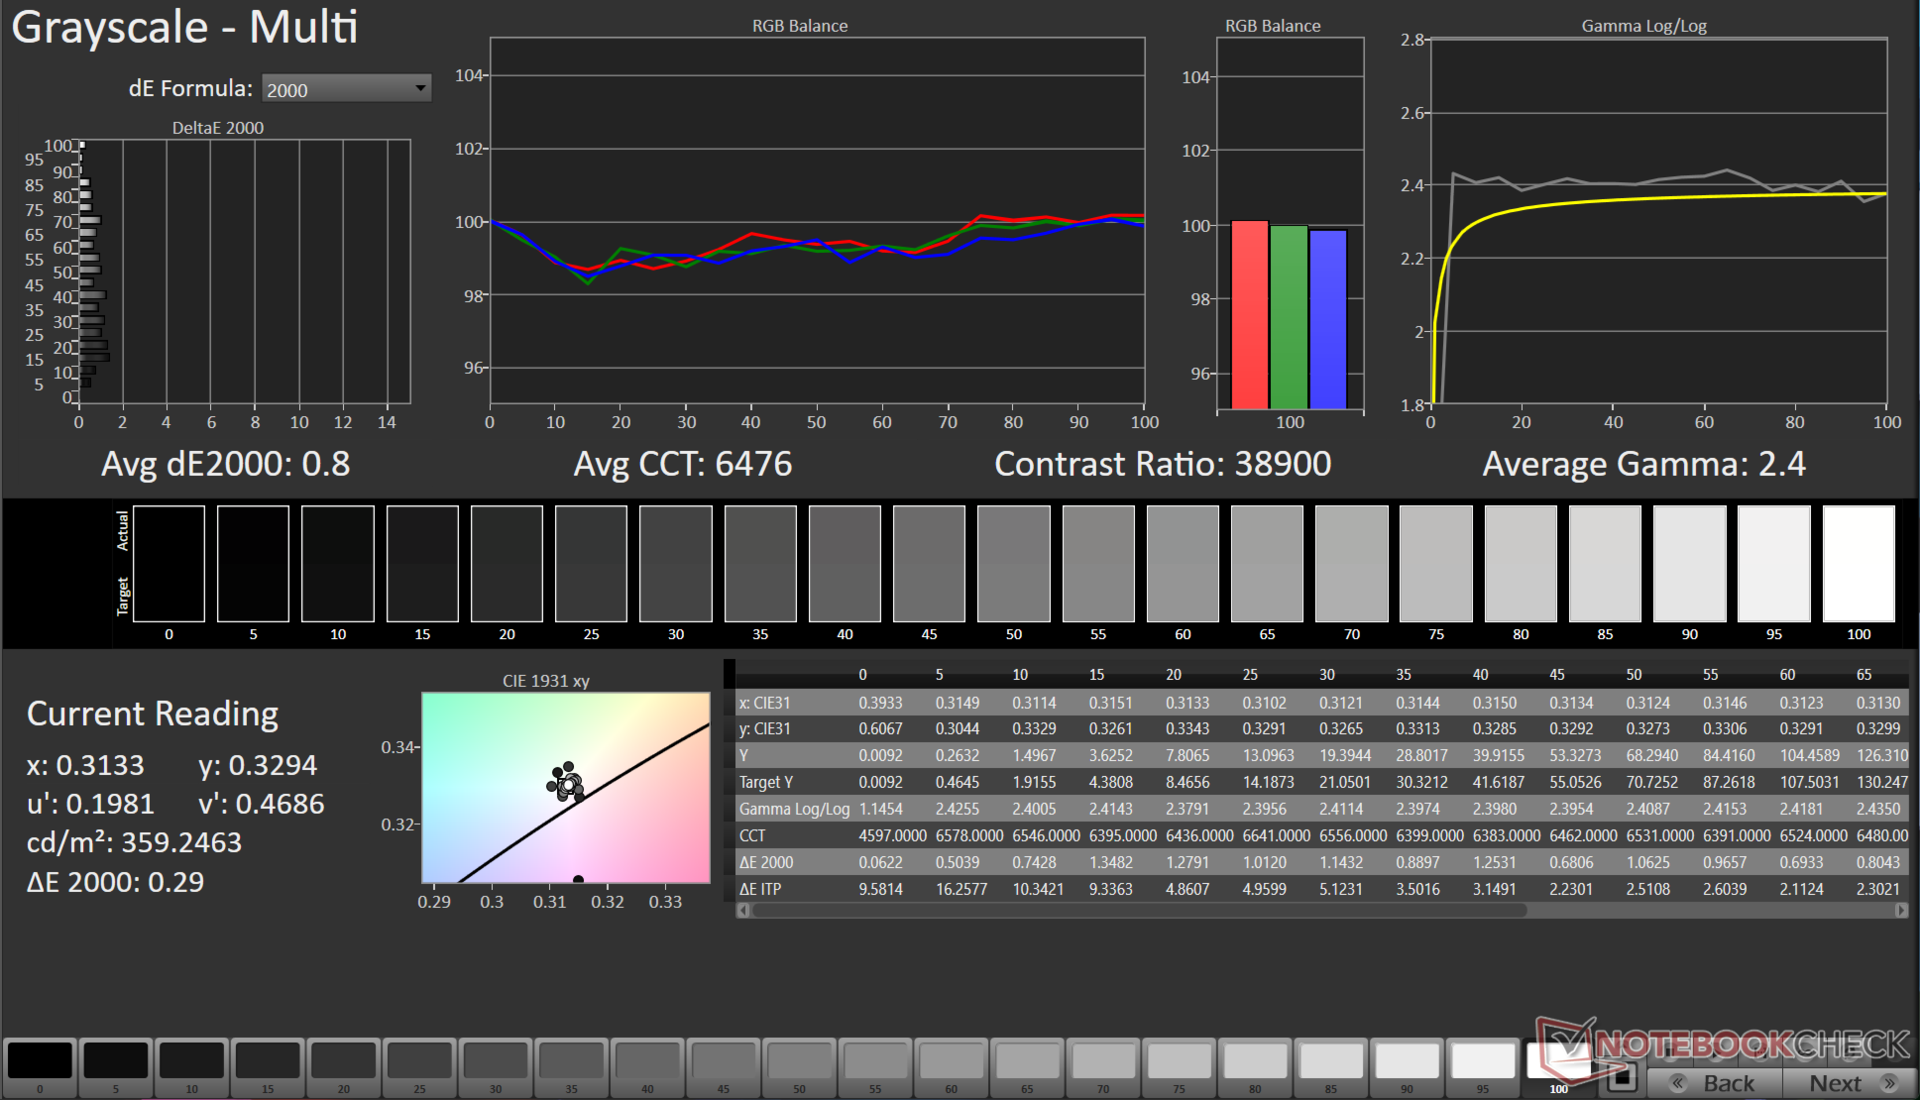
Korzystając z naszego spektrofotometru X-Rite i1Basic Pro 3 i oprogramowania Calman Ultimate od Portrait Displays, mogliśmy osiągnąć znacznie niższy Delta E wynoszący 0,8 w skali szarości. Jednak w przypadku wartości ColorChecker zaobserwowano jedynie marginalną poprawę.
Skalibrowany plik ICC można pobrać z linku powyżej.

Wyświetl czasy reakcji
| ↔ Czas reakcji od czerni do bieli | ||
|---|---|---|
| 14.4 ms ... wzrost ↗ i spadek ↘ łącznie | ↗ 12.8 ms wzrost | 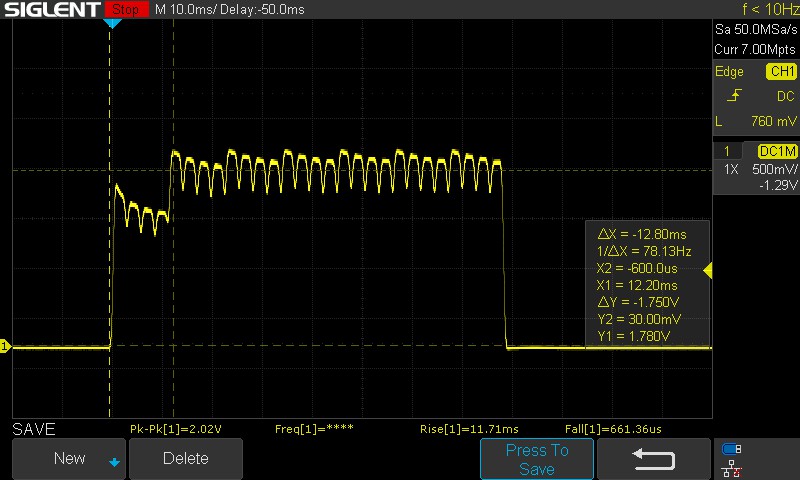 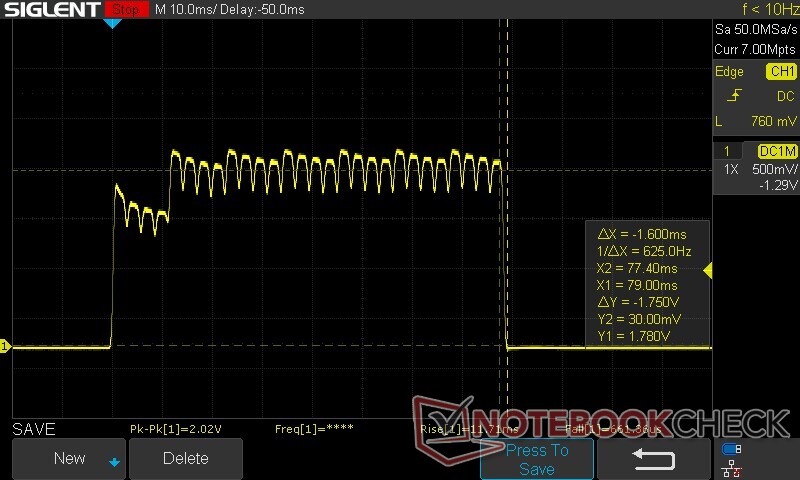 |
| ↘ 1.6 ms upadek | ||
| W naszych testach ekran wykazuje dobry współczynnik reakcji, ale może być zbyt wolny dla graczy rywalizujących ze sobą. Dla porównania, wszystkie testowane urządzenia wahają się od 0.1 (minimum) do 240 (maksimum) ms. » 35 % wszystkich urządzeń jest lepszych. Oznacza to, że zmierzony czas reakcji jest lepszy od średniej wszystkich testowanych urządzeń (19.9 ms). | ||
| ↔ Czas reakcji 50% szarości do 80% szarości | ||
| 1.15 ms ... wzrost ↗ i spadek ↘ łącznie | ↗ 0.57 ms wzrost | 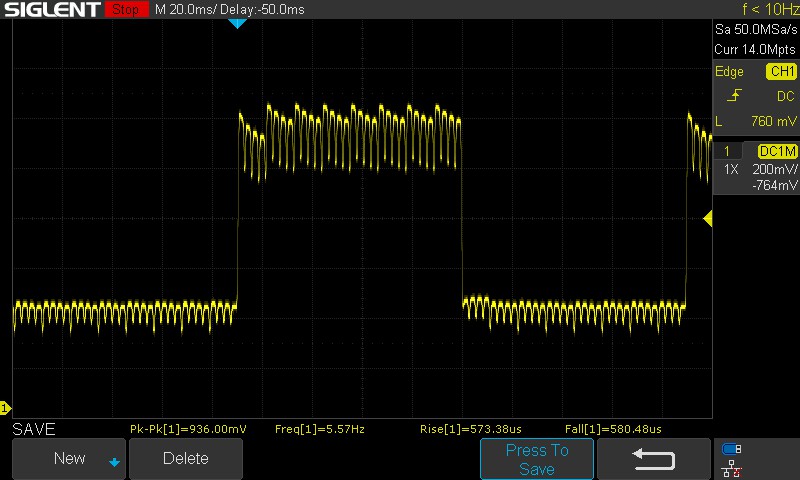 |
| ↘ 0.58 ms upadek | ||
| W naszych testach ekran wykazuje bardzo szybką reakcję i powinien bardzo dobrze nadawać się do szybkich gier. Dla porównania, wszystkie testowane urządzenia wahają się od 0.165 (minimum) do 636 (maksimum) ms. » 5 % wszystkich urządzeń jest lepszych. Oznacza to, że zmierzony czas reakcji jest lepszy od średniej wszystkich testowanych urządzeń (31.1 ms). | ||
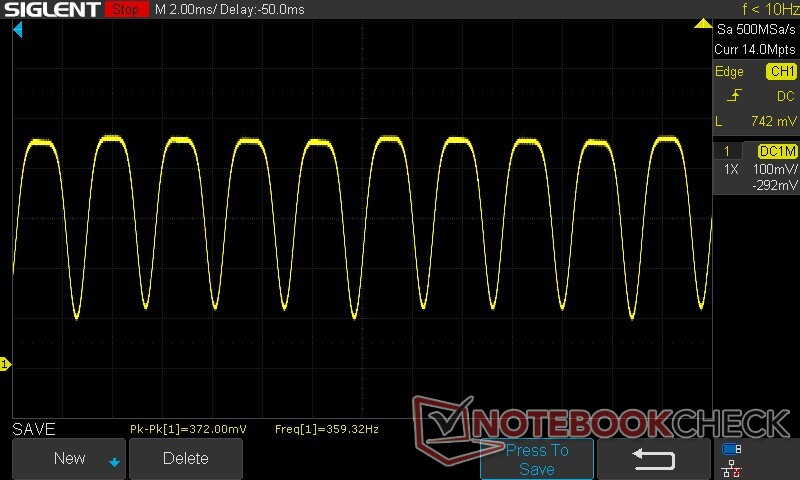
Pomiar ręczny był konieczny do oszacowania czasu reakcji ze względu na migotanie tła. Przejście od 100% czerni do 100% bieli zajmuje 14,4 ms, co jest nieco wyższą wartością dla panelu OLED. Jednak przejścia od 50% szarości do 80% szarości są znacznie szybsze i wynoszą 1,15 ms.
Migotanie ekranu / PWM (modulacja szerokości impulsu)
| Wykryto migotanie ekranu/wykryto PWM | 90.02 Hz | 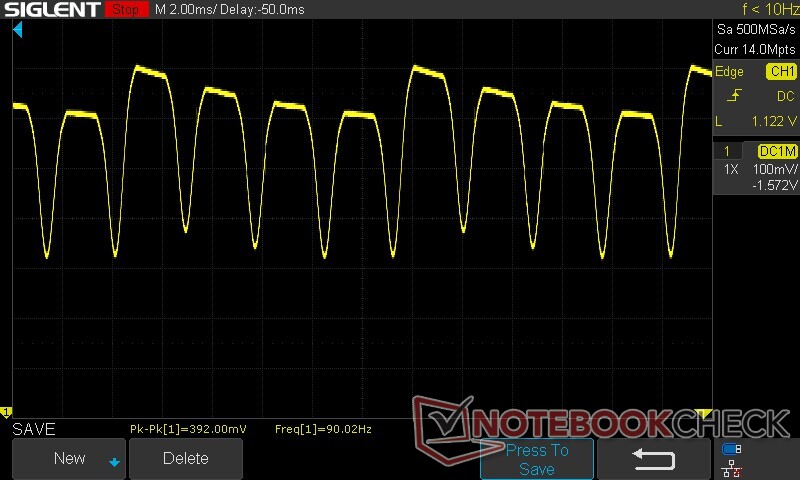 | |
| ≤ 100 jasność cd/m² | |||
Podświetlenie wyświetlacza miga z częstotliwością 90.02 Hz (najgorszy przypadek, np. przy użyciu PWM) Wykryto migotanie przy ustawieniu jasności 100 cd/m² i poniżej. Powyżej tego ustawienia jasności nie powinno być żadnego migotania ani PWM. Częstotliwość 90.02 Hz jest bardzo niska, więc migotanie może powodować zmęczenie oczu i bóle głowy po dłuższym użytkowaniu. Migotanie występuje przy stosunkowo niskich ustawieniach jasności, dlatego długotrwałe użytkowanie przy tym ustawieniu jasności lub niższym może powodować zmęczenie oczu. Dla porównania: 52 % wszystkich testowanych urządzeń nie używa PWM do przyciemniania wyświetlacza. Jeśli wykryto PWM, zmierzono średnio 7798 (minimum: 5 - maksimum: 343500) Hz. | |||
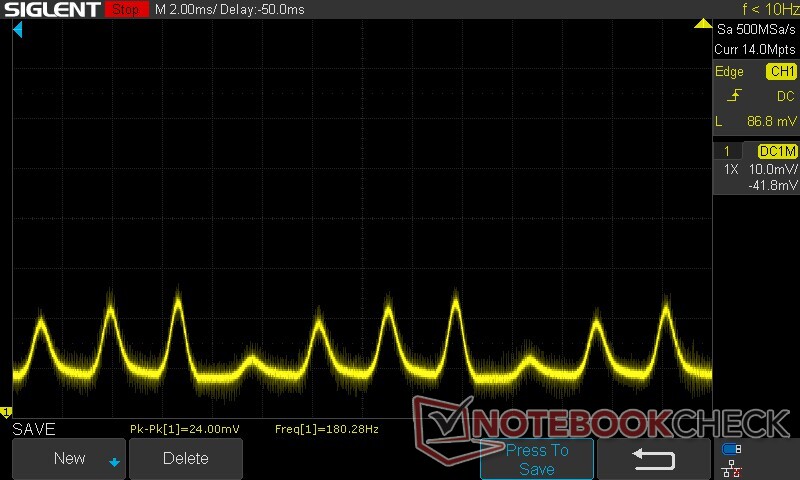
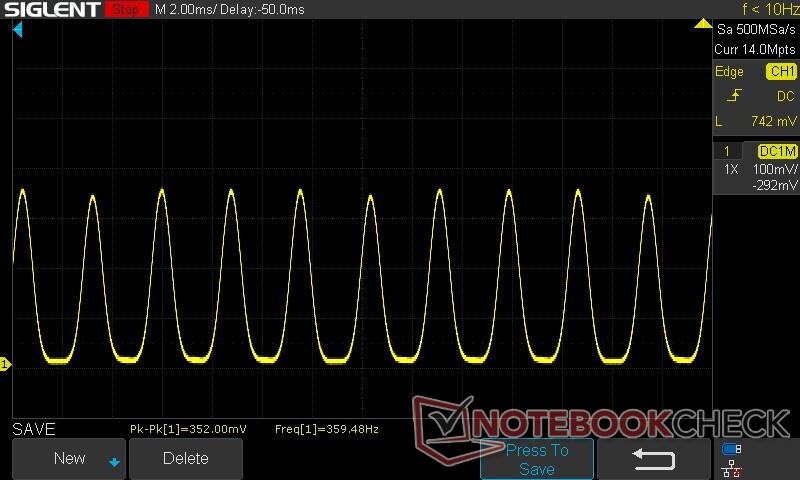
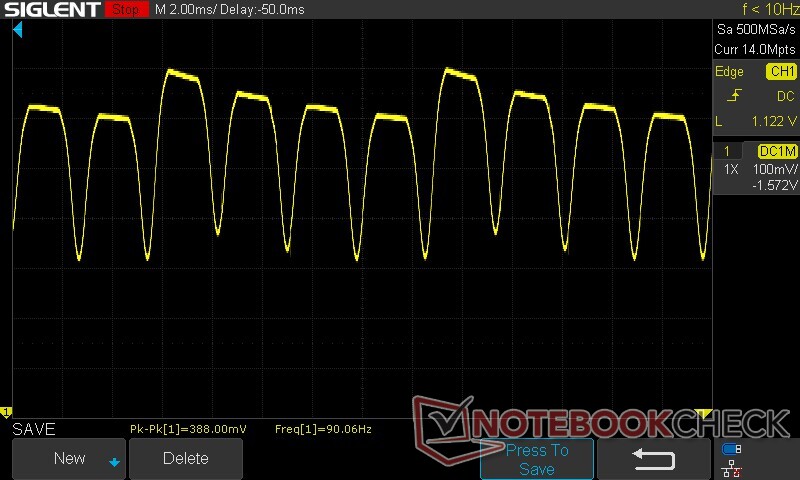
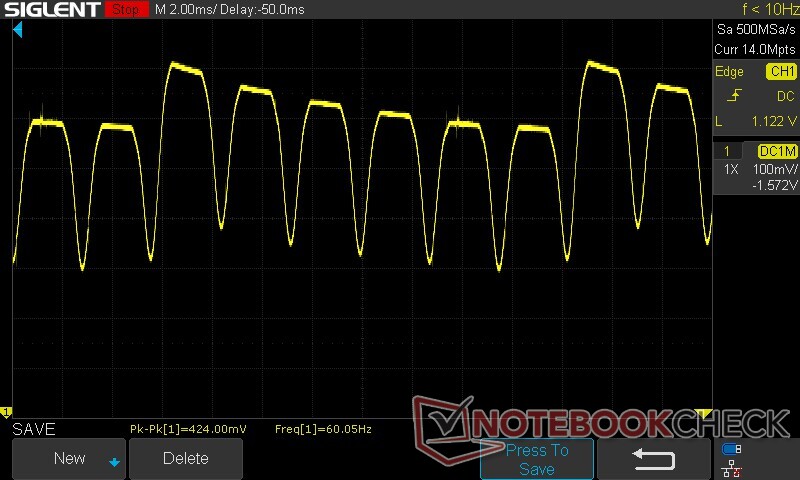
Panel wykorzystuje ściemnianie DC 90 Hz w zakresie od 75% do 100% jasności. Poniżej 75% panel przełącza się na częstotliwość PWM około 360 Hz.
Przyciemnianie DC 90 Hz powinno być stosunkowo mniej uciążliwe dla oczu w porównaniu do migotania PWM. Częstotliwość ta spada do 60 Hz przy odpowiedniej częstotliwości odświeżania.
Zalecamy ustawienie poziomów jasności powyżej 50%, aby zminimalizować zmęczenie wzroku.

Aby uzyskać więcej informacji, sprawdź "Dlaczego PWM to taki ból głowy" i "Analiza: DC Dimming vs PWM - Czy można przyciemniać wyświetlacze AMOLED bez migotania?". Przegląd zmierzonych PWM we wszystkich recenzowanych urządzeniach można znaleźć w naszej Tabela rankingowa PWM.
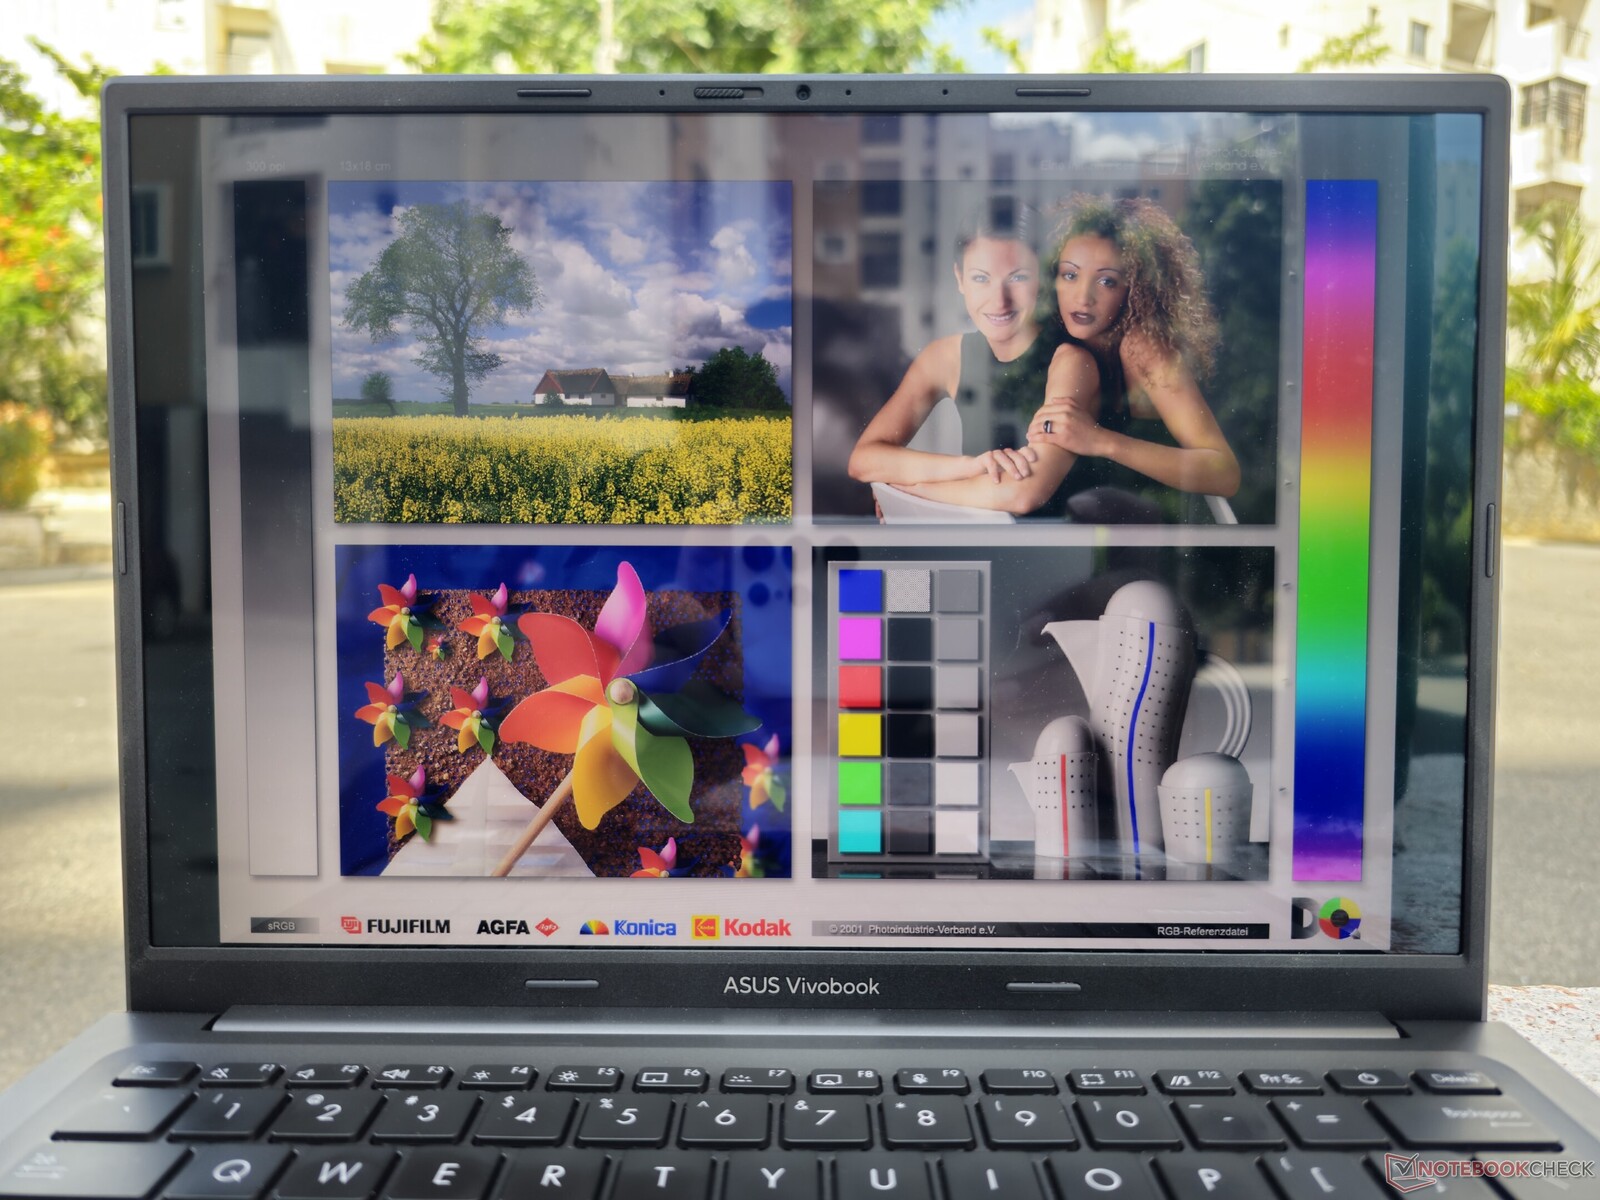
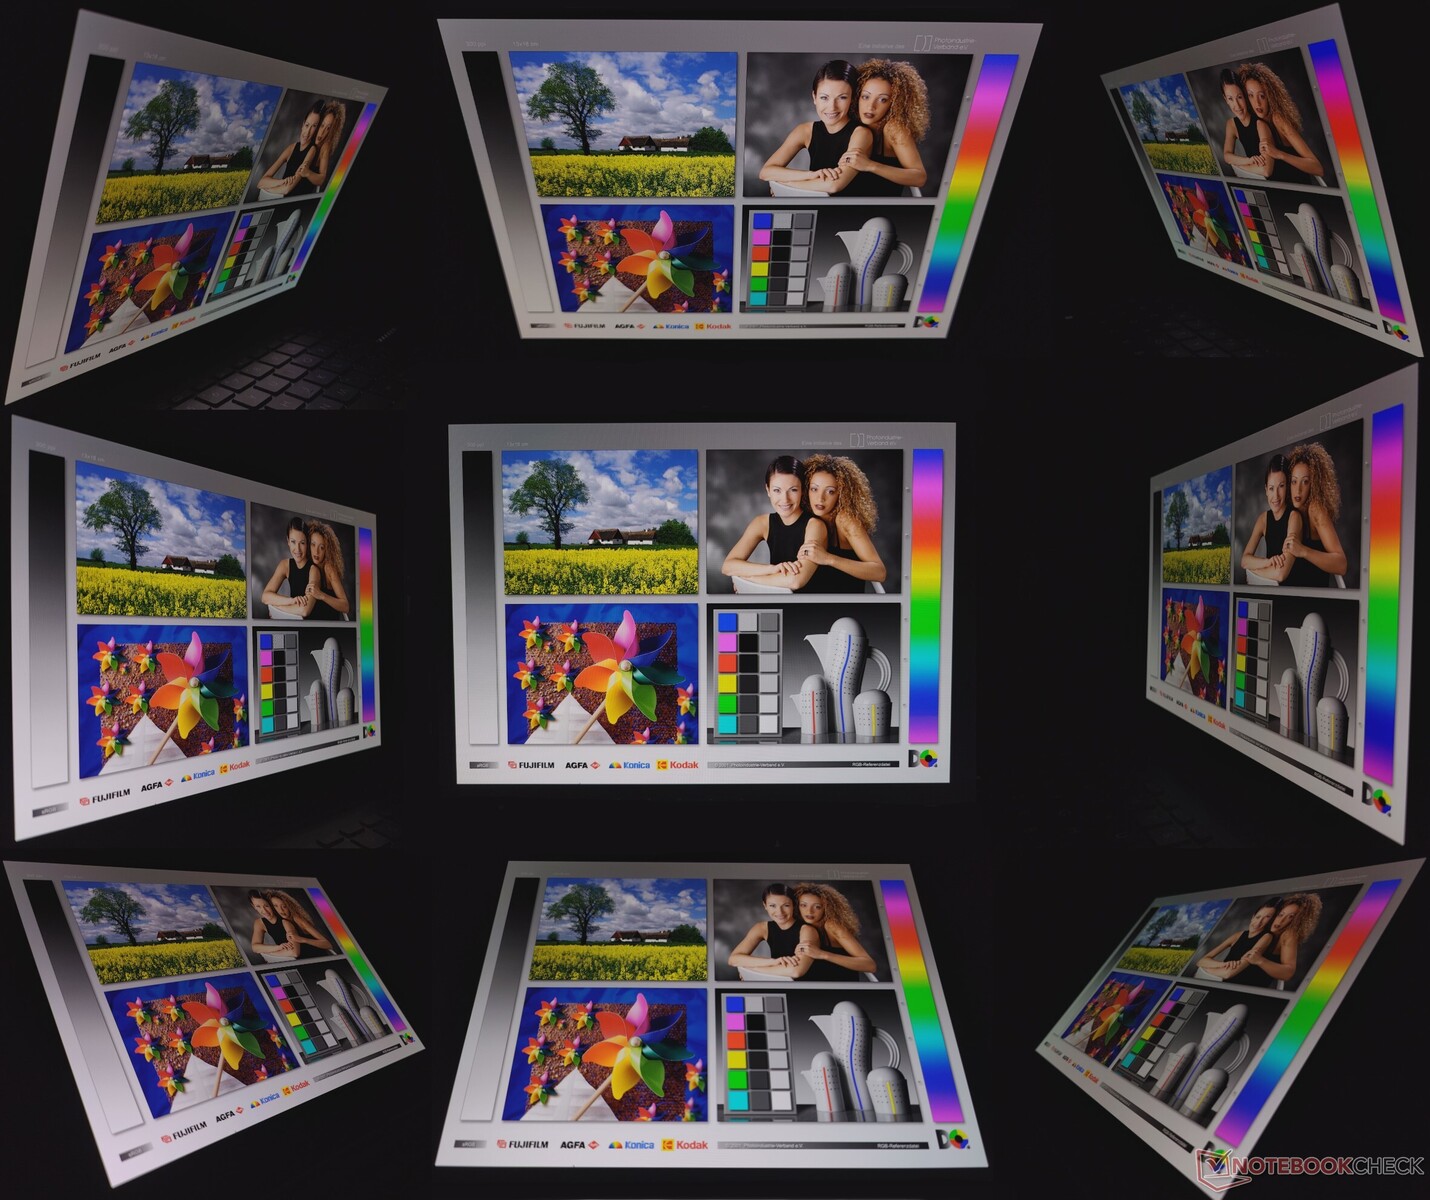
Oglądanie na zewnątrz w świetle słonecznym może być irytujące ze względu na błyszczący ekran. Kąty widzenia są dobre z minimalną utratą jasności pod ekstremalnymi kątami i bez widocznego zielonego zabarwienia.
Wydajność: Zawieszony Core i5-13500H z lekkim throttlingiem
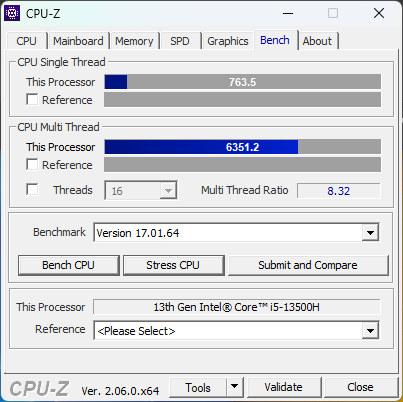
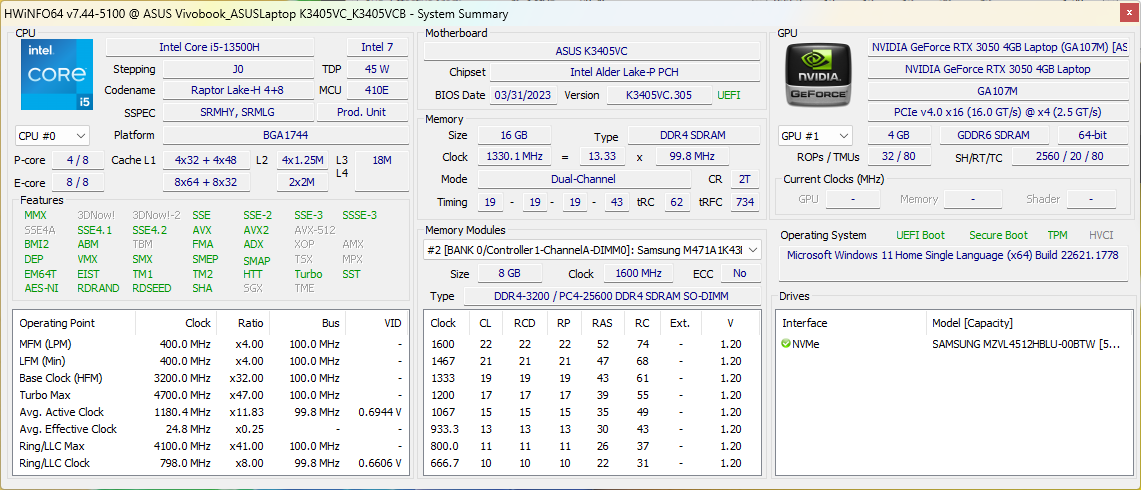
Nasz Asus VivoBook 14X OLED jest napędzany przez Intel Core i5-13500H CPU i Nvidia GeForce RTX 3050 4 GB GPU do laptopów. Jednostki SKU RTX 3050 można skonfigurować z procesorem Core i5-13500H lub Core i9-13900H.
An RTX 2050 Mobile jest również dostępna, ale tylko z procesorem Core i5-13500H.
Warunki testowania
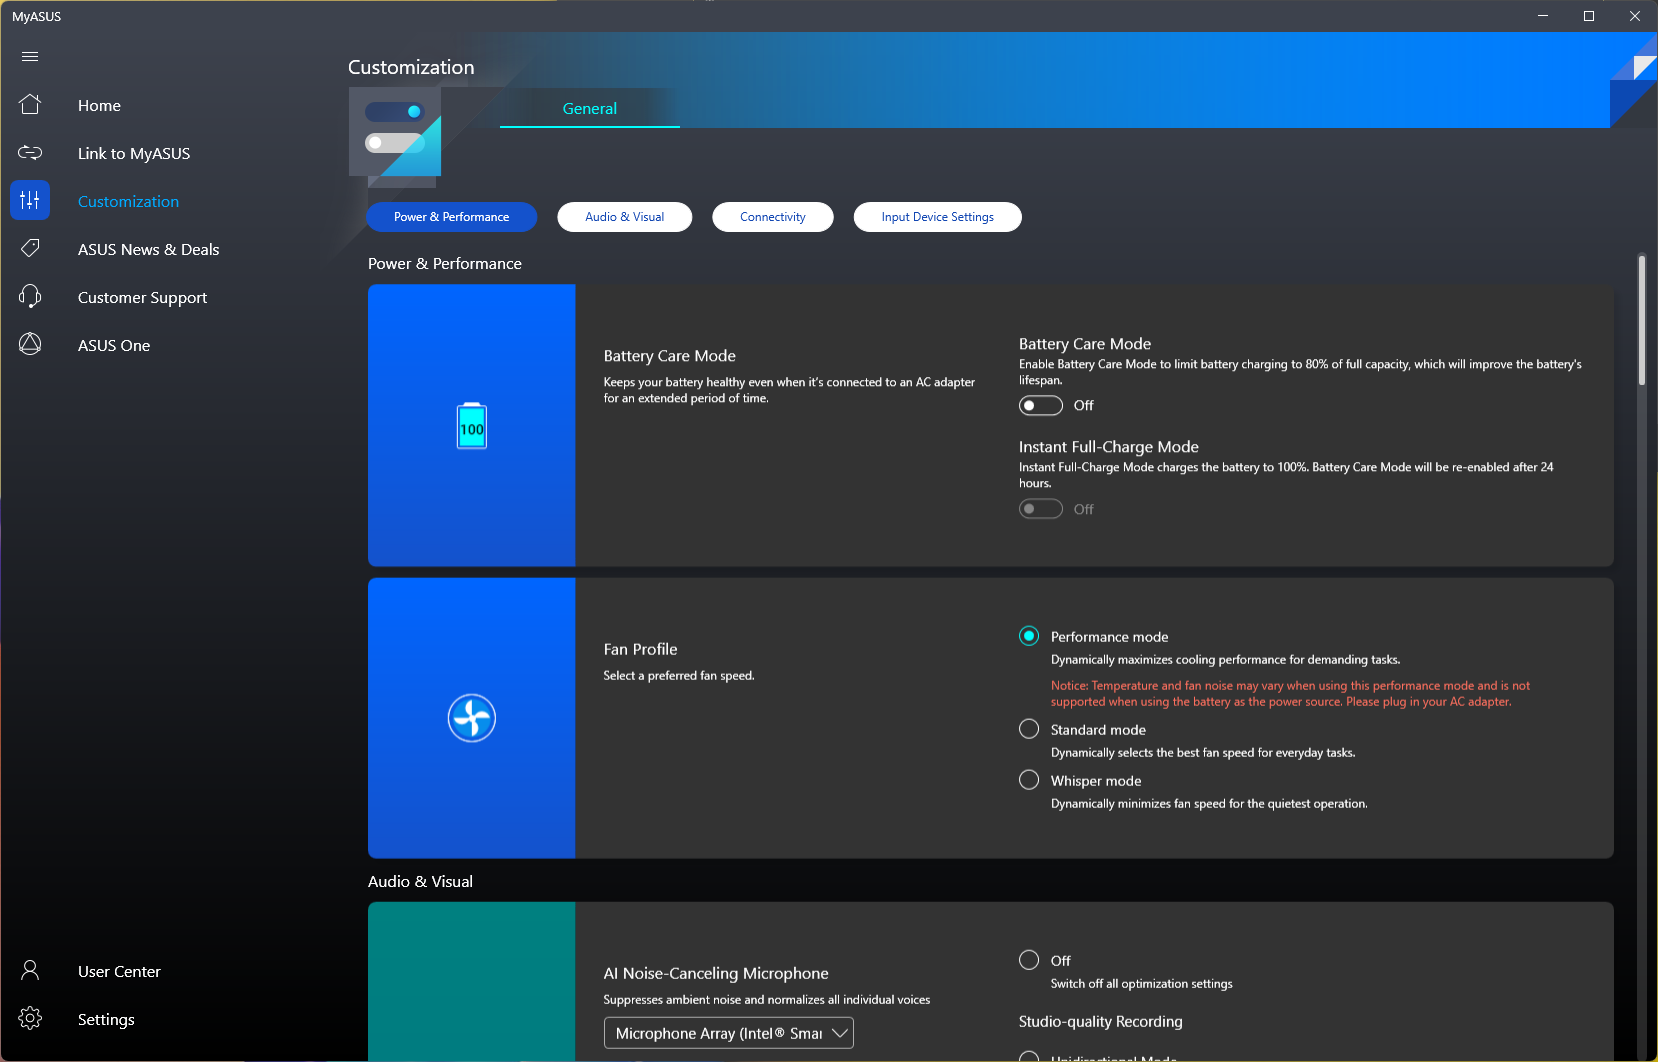
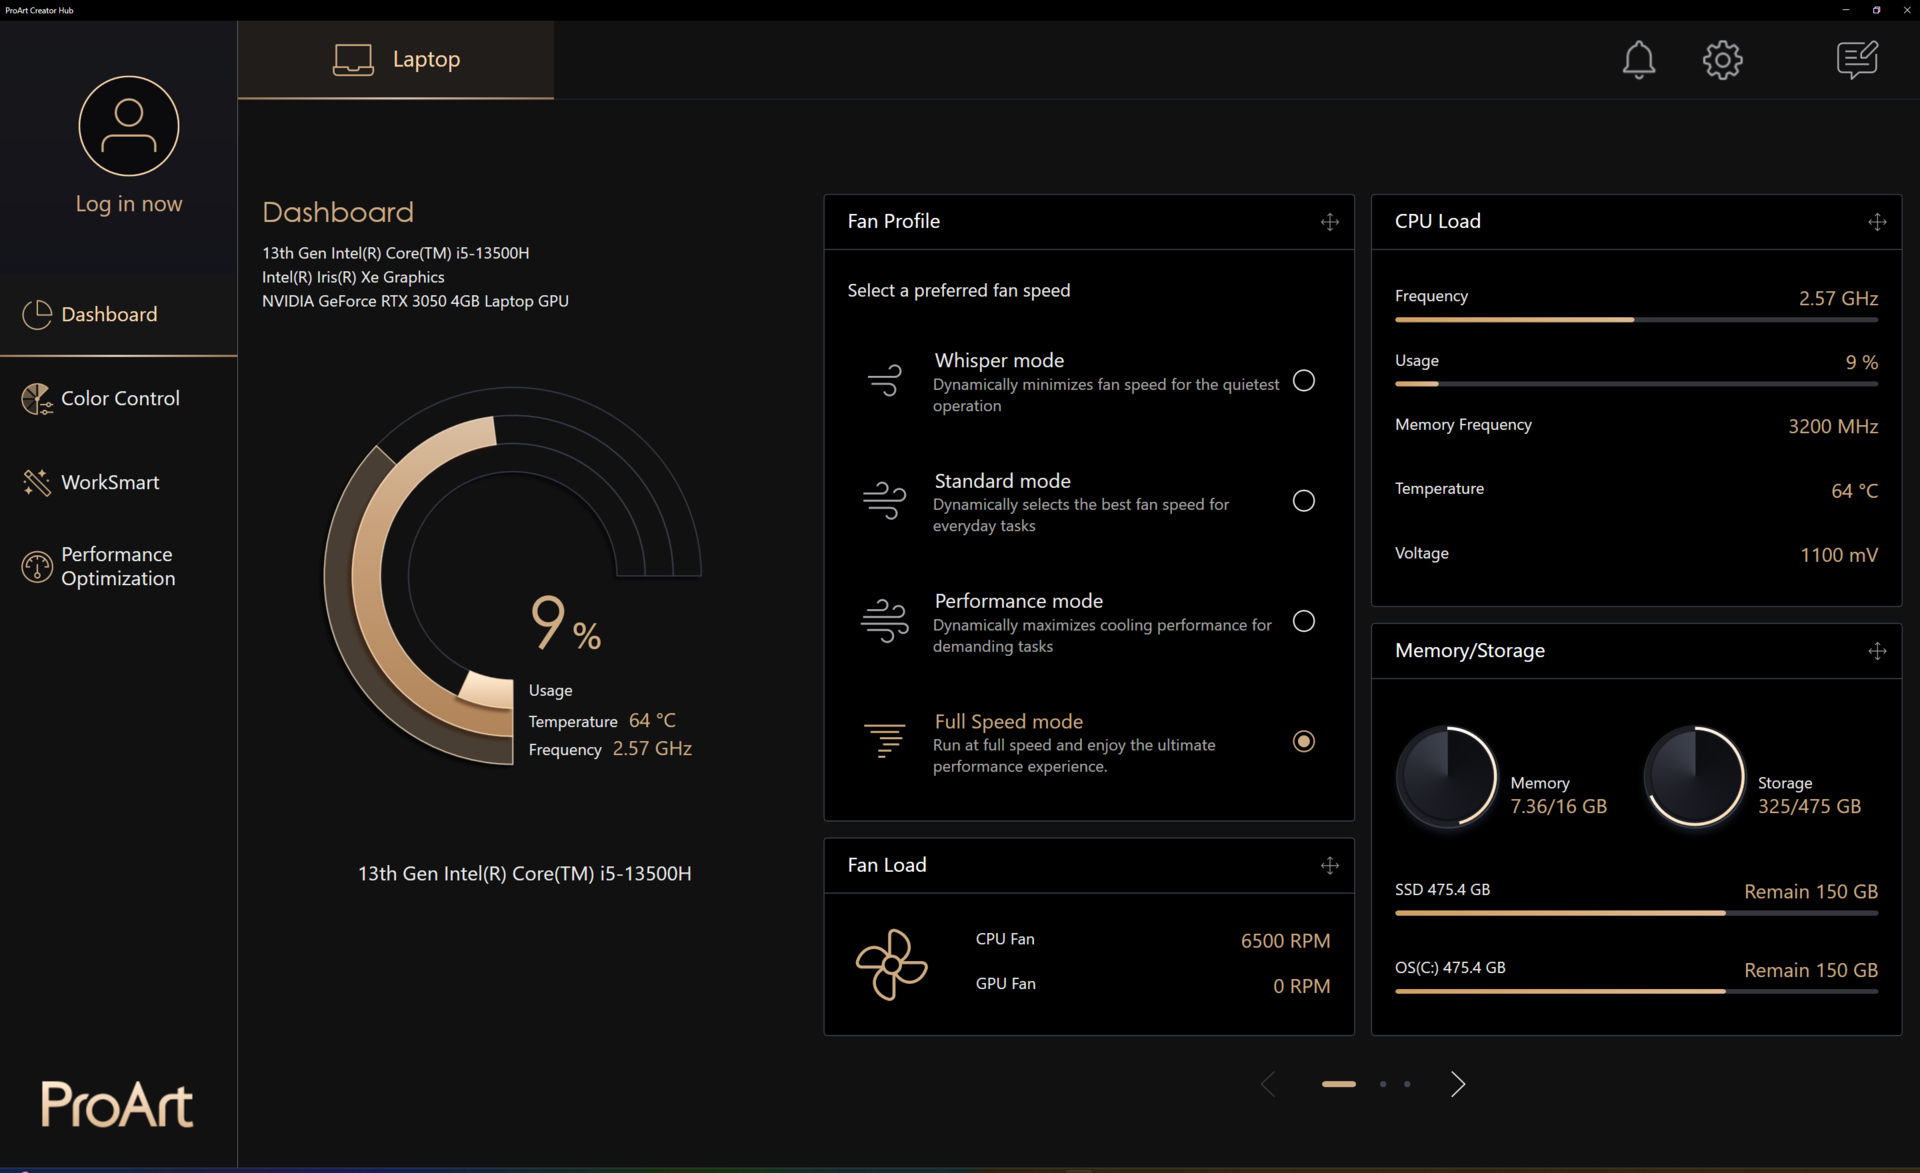
Asus redundantnie rozdziela ustawienia wydajności pomiędzy aplikację MyAsus i ProArt Creator Hub, chociaż aplikacja MyAsus powinna być wystarczająca w większości przypadków. Aby uzyskać dostęp do trybu Full Speed, konieczne będzie jednak skorzystanie z ProArt Creator Hub.
Wykorzystaliśmy tryb Full Speed do wszystkich testów wydajności, a tryb Standardowy do testów baterii.
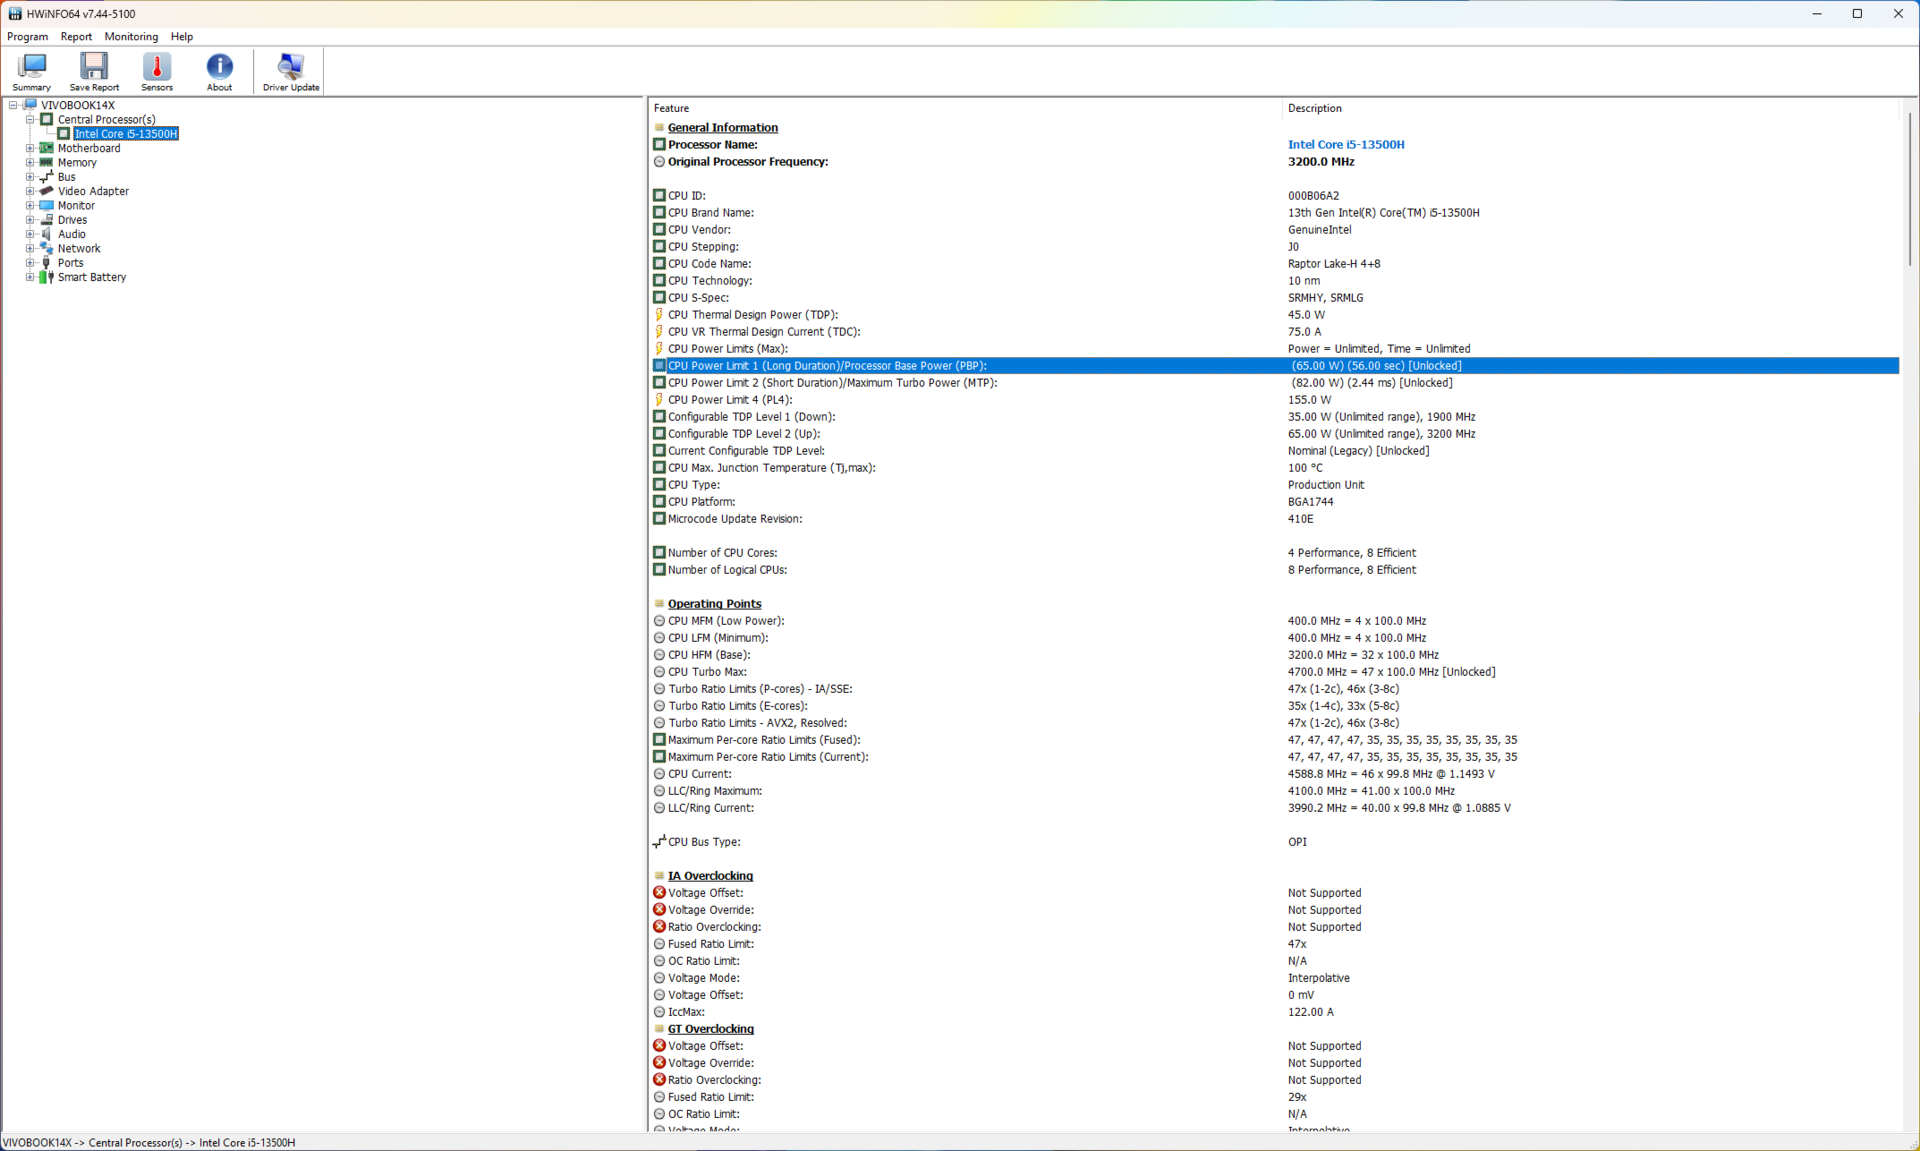
Poniższa tabela ilustruje, jak wartości PL1 i PL2 procesora Core i5-13500H różnią się w zależności od wybranego ustawienia wydajności.
| Tryb wydajności | PL1 (PBP) / Tau | PL2 (MTP) / Tau |
|---|---|---|
| Whisper | 30 W / 56 s | 54 W / 2,44 ms |
| Standard | 50 W / 56 s | 82 W / 2,44 ms |
| Wydajność | 55 W / 56 s | 82 W / 2,44 ms |
| Pełna prędkość | 65 W / 56 s | 82 W / 2,44 ms |
Procesor
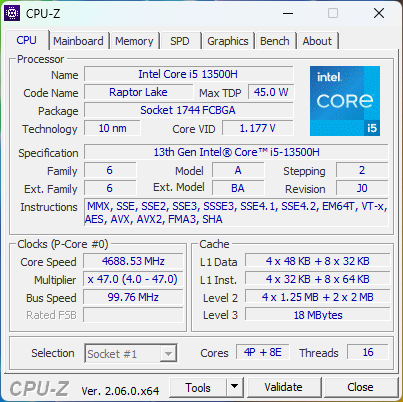
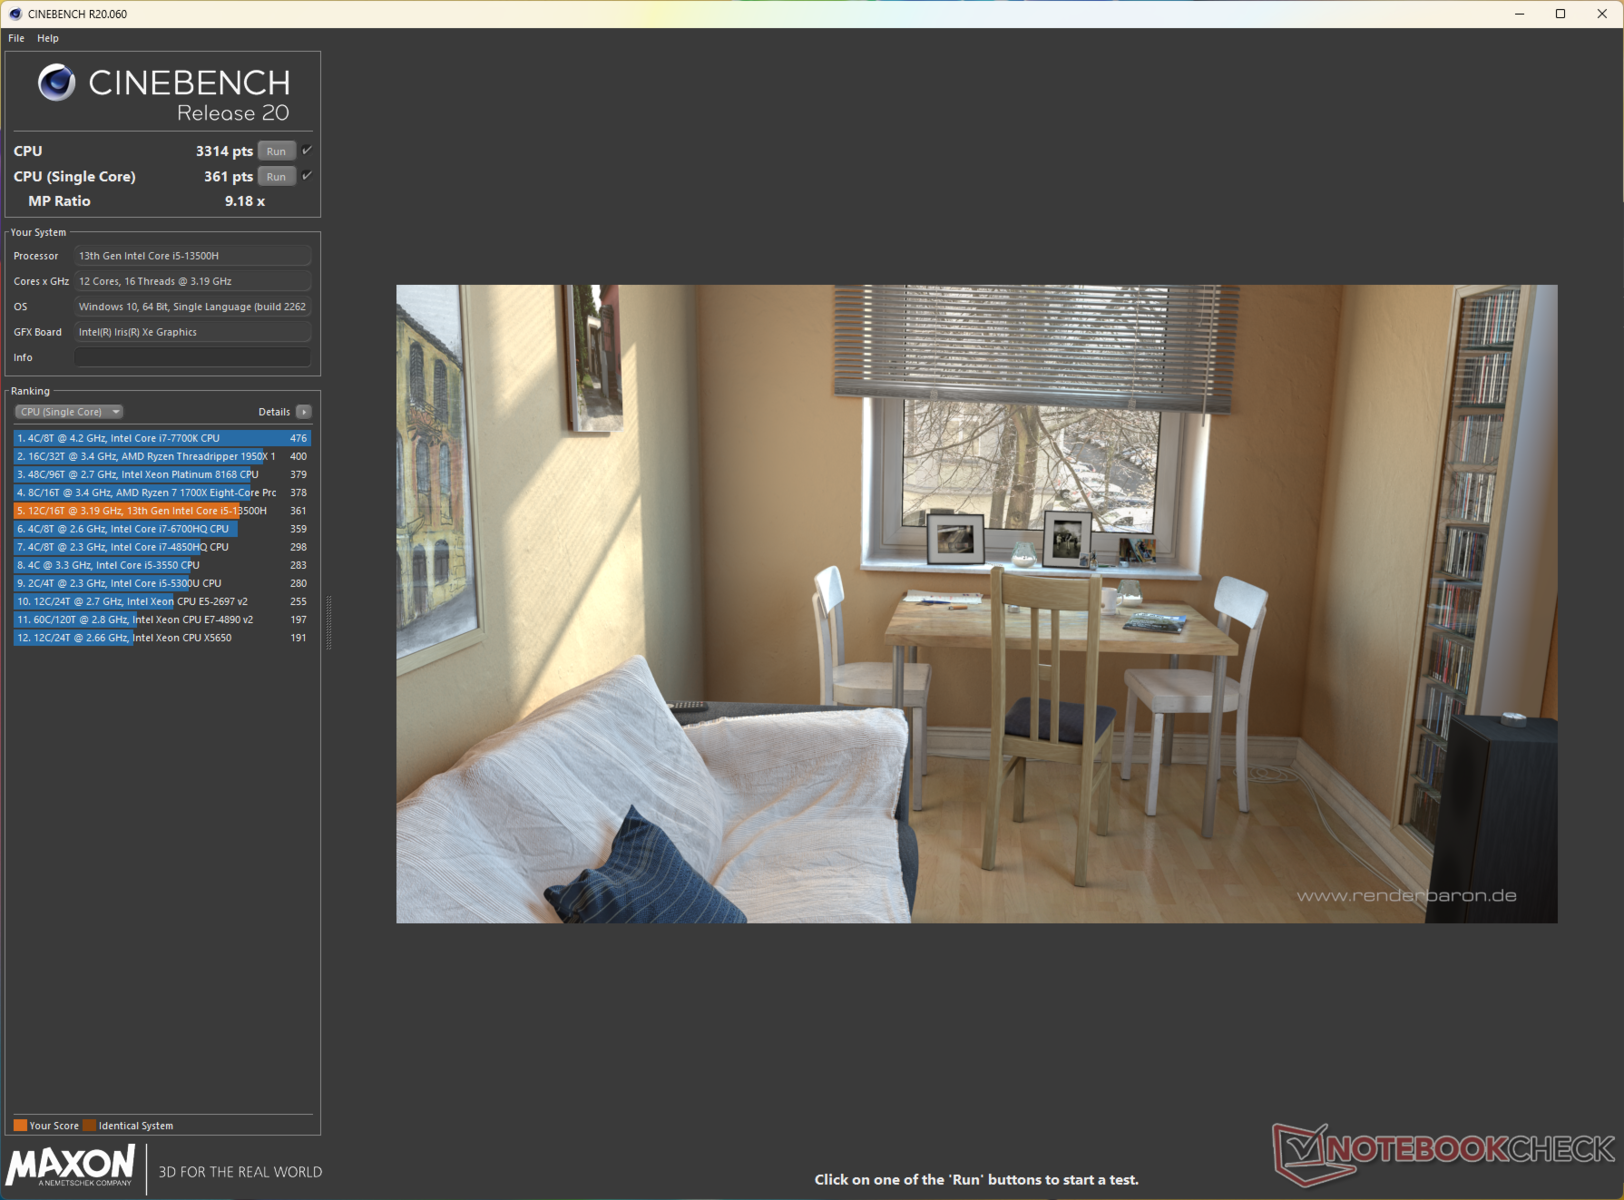
Core i5-13500H oferuje 12 rdzeni (4P + 8E) i 16 wątków z przyspieszeniem pojedynczego rdzenia do 4,7 GHz i TDP wynoszącym 45 W. Ogólna wydajność procesora jest w dużej mierze zgodna z modelem Core i7-12700Hale wypada około 10% gorzej niżCore i7-13700H w MSI Stealth 14 Studio.
To powiedziawszy, wydajność procesora spada o około 18% pod koniec wielordzeniowego testu pętli Cinebench R15. Jednak ten throttling nie jest tak drastyczny w porównaniu do tego, co obserwujemy w przypadku Core i7-13700H w MSI Stealth 14 Studio.Acer Swift X SFX14.
Cinebench R15 Multi Loop
Cinebench R23: Multi Core | Single Core
Cinebench R20: CPU (Multi Core) | CPU (Single Core)
Cinebench R15: CPU Multi 64Bit | CPU Single 64Bit
Blender: v2.79 BMW27 CPU
7-Zip 18.03: 7z b 4 | 7z b 4 -mmt1
Geekbench 5.5: Multi-Core | Single-Core
HWBOT x265 Benchmark v2.2: 4k Preset
LibreOffice : 20 Documents To PDF
R Benchmark 2.5: Overall mean
| CPU Performance rating | |
| Średnia w klasie Multimedia | |
| MSI Stealth 14 Studio A13V | |
| Gigabyte Aero 14 OLED BMF | |
| Acer Swift X SFX14-71G | |
| Schenker Vision 14 2022 RTX 3050 Ti | |
| Przeciętny Intel Core i5-13500H | |
| Asus VivoBook 14X K3405 | |
| Lenovo Slim Pro 7 14ARP8 | |
| Cinebench R23 / Multi Core | |
| MSI Stealth 14 Studio A13V | |
| Średnia w klasie Multimedia (4861 - 33362, n=81, ostatnie 2 lata) | |
| Acer Swift X SFX14-71G | |
| Schenker Vision 14 2022 RTX 3050 Ti | |
| Przeciętny Intel Core i5-13500H (13542 - 16335, n=5) | |
| Asus VivoBook 14X K3405 | |
| Gigabyte Aero 14 OLED BMF | |
| Lenovo Slim Pro 7 14ARP8 | |
| Cinebench R23 / Single Core | |
| Średnia w klasie Multimedia (1128 - 2459, n=73, ostatnie 2 lata) | |
| Acer Swift X SFX14-71G | |
| Gigabyte Aero 14 OLED BMF | |
| Przeciętny Intel Core i5-13500H (1704 - 1799, n=5) | |
| Asus VivoBook 14X K3405 | |
| Schenker Vision 14 2022 RTX 3050 Ti | |
| MSI Stealth 14 Studio A13V | |
| Lenovo Slim Pro 7 14ARP8 | |
| Cinebench R20 / CPU (Multi Core) | |
| MSI Stealth 14 Studio A13V | |
| Średnia w klasie Multimedia (1887 - 12912, n=64, ostatnie 2 lata) | |
| Acer Swift X SFX14-71G | |
| Schenker Vision 14 2022 RTX 3050 Ti | |
| Asus VivoBook 14X K3405 | |
| Przeciętny Intel Core i5-13500H (5108 - 6212, n=5) | |
| Gigabyte Aero 14 OLED BMF | |
| Lenovo Slim Pro 7 14ARP8 | |
| Cinebench R20 / CPU (Single Core) | |
| Acer Swift X SFX14-71G | |
| Średnia w klasie Multimedia (425 - 853, n=64, ostatnie 2 lata) | |
| Gigabyte Aero 14 OLED BMF | |
| Schenker Vision 14 2022 RTX 3050 Ti | |
| Przeciętny Intel Core i5-13500H (655 - 687, n=5) | |
| Asus VivoBook 14X K3405 | |
| MSI Stealth 14 Studio A13V | |
| Lenovo Slim Pro 7 14ARP8 | |
| Cinebench R15 / CPU Multi 64Bit | |
| MSI Stealth 14 Studio A13V | |
| Średnia w klasie Multimedia (856 - 5224, n=68, ostatnie 2 lata) | |
| Gigabyte Aero 14 OLED BMF | |
| Acer Swift X SFX14-71G | |
| Przeciętny Intel Core i5-13500H (2234 - 2475, n=5) | |
| Asus VivoBook 14X K3405 | |
| Schenker Vision 14 2022 RTX 3050 Ti | |
| Lenovo Slim Pro 7 14ARP8 | |
| Cinebench R15 / CPU Single 64Bit | |
| Średnia w klasie Multimedia (184.8 - 326, n=66, ostatnie 2 lata) | |
| Acer Swift X SFX14-71G | |
| Gigabyte Aero 14 OLED BMF | |
| Schenker Vision 14 2022 RTX 3050 Ti | |
| Przeciętny Intel Core i5-13500H (243 - 261, n=5) | |
| Asus VivoBook 14X K3405 | |
| MSI Stealth 14 Studio A13V | |
| Lenovo Slim Pro 7 14ARP8 | |
| Blender / v2.79 BMW27 CPU | |
| Acer Swift X SFX14-71G | |
| Schenker Vision 14 2022 RTX 3050 Ti | |
| Średnia w klasie Multimedia (100 - 557, n=65, ostatnie 2 lata) | |
| Lenovo Slim Pro 7 14ARP8 | |
| Przeciętny Intel Core i5-13500H (205 - 263, n=6) | |
| Asus VivoBook 14X K3405 | |
| Gigabyte Aero 14 OLED BMF | |
| MSI Stealth 14 Studio A13V | |
| 7-Zip 18.03 / 7z b 4 | |
| MSI Stealth 14 Studio A13V | |
| Średnia w klasie Multimedia (29095 - 130368, n=62, ostatnie 2 lata) | |
| Gigabyte Aero 14 OLED BMF | |
| Acer Swift X SFX14-71G | |
| Lenovo Slim Pro 7 14ARP8 | |
| Przeciętny Intel Core i5-13500H (50846 - 58567, n=6) | |
| Asus VivoBook 14X K3405 | |
| Schenker Vision 14 2022 RTX 3050 Ti | |
| 7-Zip 18.03 / 7z b 4 -mmt1 | |
| Acer Swift X SFX14-71G | |
| Gigabyte Aero 14 OLED BMF | |
| Średnia w klasie Multimedia (3666 - 7545, n=63, ostatnie 2 lata) | |
| Schenker Vision 14 2022 RTX 3050 Ti | |
| Przeciętny Intel Core i5-13500H (5500 - 5885, n=6) | |
| Asus VivoBook 14X K3405 | |
| MSI Stealth 14 Studio A13V | |
| Lenovo Slim Pro 7 14ARP8 | |
| Geekbench 5.5 / Multi-Core | |
| Średnia w klasie Multimedia (4652 - 20422, n=62, ostatnie 2 lata) | |
| MSI Stealth 14 Studio A13V | |
| Acer Swift X SFX14-71G | |
| Schenker Vision 14 2022 RTX 3050 Ti | |
| Gigabyte Aero 14 OLED BMF | |
| Przeciętny Intel Core i5-13500H (9312 - 11465, n=5) | |
| Asus VivoBook 14X K3405 | |
| Lenovo Slim Pro 7 14ARP8 | |
| Geekbench 5.5 / Single-Core | |
| Średnia w klasie Multimedia (805 - 2974, n=62, ostatnie 2 lata) | |
| Gigabyte Aero 14 OLED BMF | |
| Acer Swift X SFX14-71G | |
| Schenker Vision 14 2022 RTX 3050 Ti | |
| Przeciętny Intel Core i5-13500H (1674 - 1762, n=5) | |
| MSI Stealth 14 Studio A13V | |
| Asus VivoBook 14X K3405 | |
| Lenovo Slim Pro 7 14ARP8 | |
| HWBOT x265 Benchmark v2.2 / 4k Preset | |
| Średnia w klasie Multimedia (5.26 - 36.1, n=63, ostatnie 2 lata) | |
| MSI Stealth 14 Studio A13V | |
| Lenovo Slim Pro 7 14ARP8 | |
| Asus VivoBook 14X K3405 | |
| Przeciętny Intel Core i5-13500H (14.4 - 17.9, n=6) | |
| Gigabyte Aero 14 OLED BMF | |
| Schenker Vision 14 2022 RTX 3050 Ti | |
| Acer Swift X SFX14-71G | |
| LibreOffice / 20 Documents To PDF | |
| Lenovo Slim Pro 7 14ARP8 | |
| MSI Stealth 14 Studio A13V | |
| Przeciętny Intel Core i5-13500H (44 - 65.5, n=5) | |
| Średnia w klasie Multimedia (23.9 - 146.7, n=64, ostatnie 2 lata) | |
| Asus VivoBook 14X K3405 | |
| Schenker Vision 14 2022 RTX 3050 Ti | |
| Gigabyte Aero 14 OLED BMF | |
| Acer Swift X SFX14-71G | |
| R Benchmark 2.5 / Overall mean | |
| Lenovo Slim Pro 7 14ARP8 | |
| MSI Stealth 14 Studio A13V | |
| Asus VivoBook 14X K3405 | |
| Przeciętny Intel Core i5-13500H (0.471 - 0.51, n=6) | |
| Średnia w klasie Multimedia (0.3604 - 0.947, n=63, ostatnie 2 lata) | |
| Schenker Vision 14 2022 RTX 3050 Ti | |
| Gigabyte Aero 14 OLED BMF | |
| Acer Swift X SFX14-71G | |
* ... im mniej tym lepiej
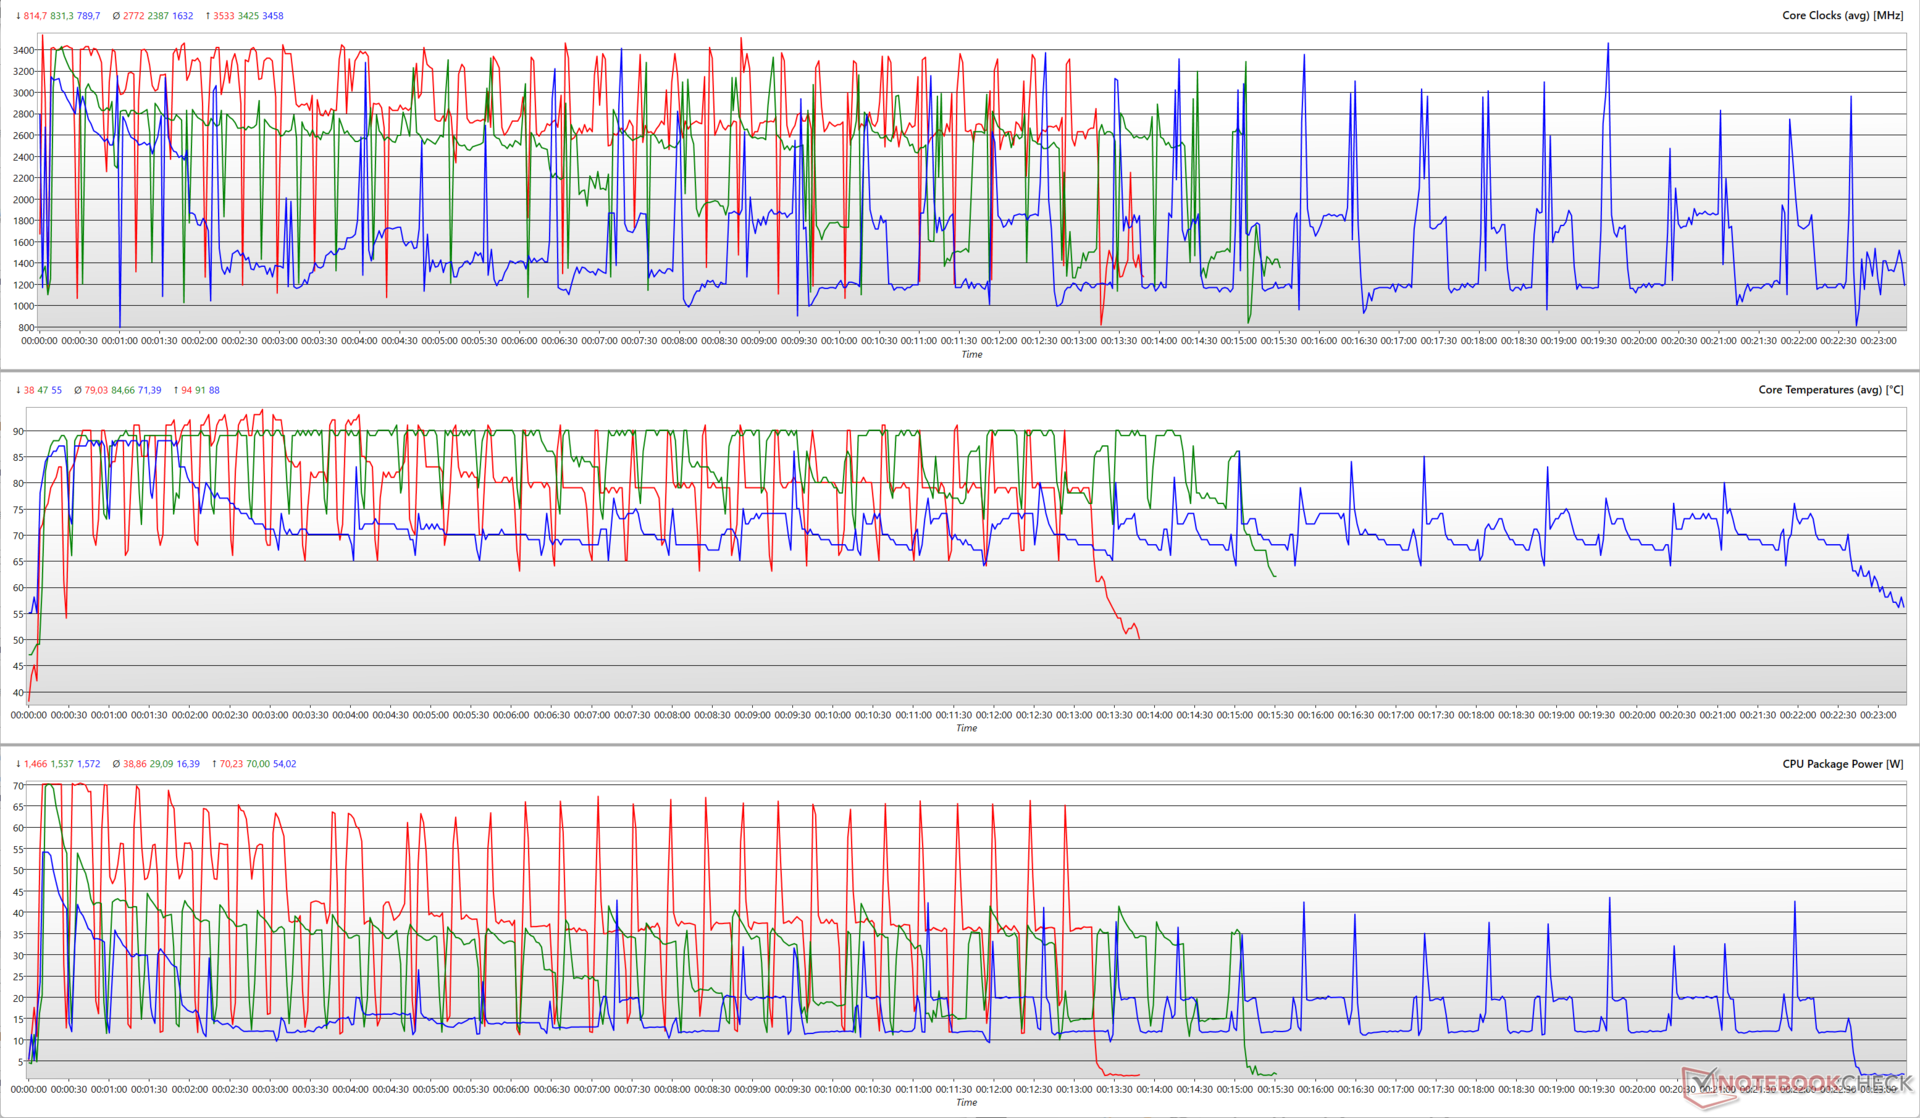
Uruchomienie pętli wielordzeniowej Cinebench R15 w różnych trybach wydajności ujawnia, że implementacja Core i5-13500H w VivoBook 14X nie jest w stanie w pełni wykorzystać przydzielonego budżetu TDP. W profilach Standard i Full Speed zaobserwowana szczytowa moc pakietu wynosi zaledwie 70 W w porównaniu do dozwolonych 82 W.
Dodatkowo, ten poziom mocy jest osiągany tylko podczas początkowej pętli, przy maksymalnym taktowaniu około 3,5 GHz. W trybie Whisper procesor może wykorzystać do 54 W mocy szczytowej, ale średnio tylko około 16 W podczas testu.
Cinebench R20 w trybie bateryjnym notuje spadki wydajności jednordzeniowej i wielordzeniowej odpowiednio o 45% i 41%.
AIDA64: FP32 Ray-Trace | FPU Julia | CPU SHA3 | CPU Queen | FPU SinJulia | FPU Mandel | CPU AES | CPU ZLib | FP64 Ray-Trace | CPU PhotoWorxx
| Performance rating | |
| MSI Stealth 14 Studio A13V | |
| Średnia w klasie Multimedia | |
| Gigabyte Aero 14 OLED BMF | |
| Lenovo Slim Pro 7 14ARP8 | |
| Asus VivoBook 14X K3405 | |
| Przeciętny Intel Core i5-13500H | |
| Schenker Vision 14 2022 RTX 3050 Ti | |
| Acer Swift X SFX14-71G | |
| AIDA64 / FP32 Ray-Trace | |
| Średnia w klasie Multimedia (2214 - 50388, n=60, ostatnie 2 lata) | |
| MSI Stealth 14 Studio A13V | |
| Lenovo Slim Pro 7 14ARP8 | |
| Asus VivoBook 14X K3405 | |
| Przeciętny Intel Core i5-13500H (11081 - 15390, n=6) | |
| Gigabyte Aero 14 OLED BMF | |
| Schenker Vision 14 2022 RTX 3050 Ti | |
| Acer Swift X SFX14-71G | |
| AIDA64 / FPU Julia | |
| Lenovo Slim Pro 7 14ARP8 | |
| MSI Stealth 14 Studio A13V | |
| Średnia w klasie Multimedia (12867 - 201874, n=61, ostatnie 2 lata) | |
| Asus VivoBook 14X K3405 | |
| Przeciętny Intel Core i5-13500H (56813 - 74251, n=6) | |
| Gigabyte Aero 14 OLED BMF | |
| Schenker Vision 14 2022 RTX 3050 Ti | |
| Acer Swift X SFX14-71G | |
| AIDA64 / CPU SHA3 | |
| Średnia w klasie Multimedia (653 - 8623, n=61, ostatnie 2 lata) | |
| MSI Stealth 14 Studio A13V | |
| Asus VivoBook 14X K3405 | |
| Lenovo Slim Pro 7 14ARP8 | |
| Przeciętny Intel Core i5-13500H (2621 - 3623, n=6) | |
| Gigabyte Aero 14 OLED BMF | |
| Schenker Vision 14 2022 RTX 3050 Ti | |
| Acer Swift X SFX14-71G | |
| AIDA64 / CPU Queen | |
| Gigabyte Aero 14 OLED BMF | |
| MSI Stealth 14 Studio A13V | |
| Acer Swift X SFX14-71G | |
| Schenker Vision 14 2022 RTX 3050 Ti | |
| Lenovo Slim Pro 7 14ARP8 | |
| Przeciętny Intel Core i5-13500H (77835 - 85727, n=6) | |
| Asus VivoBook 14X K3405 | |
| Średnia w klasie Multimedia (13483 - 181505, n=49, ostatnie 2 lata) | |
| AIDA64 / FPU SinJulia | |
| Lenovo Slim Pro 7 14ARP8 | |
| MSI Stealth 14 Studio A13V | |
| Średnia w klasie Multimedia (1240 - 28794, n=61, ostatnie 2 lata) | |
| Gigabyte Aero 14 OLED BMF | |
| Schenker Vision 14 2022 RTX 3050 Ti | |
| Przeciętny Intel Core i5-13500H (7249 - 8086, n=6) | |
| Asus VivoBook 14X K3405 | |
| Acer Swift X SFX14-71G | |
| AIDA64 / FPU Mandel | |
| Lenovo Slim Pro 7 14ARP8 | |
| Średnia w klasie Multimedia (6395 - 105740, n=60, ostatnie 2 lata) | |
| MSI Stealth 14 Studio A13V | |
| Asus VivoBook 14X K3405 | |
| Przeciętny Intel Core i5-13500H (27820 - 38336, n=6) | |
| Gigabyte Aero 14 OLED BMF | |
| Schenker Vision 14 2022 RTX 3050 Ti | |
| Acer Swift X SFX14-71G | |
| AIDA64 / CPU AES | |
| Gigabyte Aero 14 OLED BMF | |
| Asus VivoBook 14X K3405 | |
| Przeciętny Intel Core i5-13500H (62657 - 120493, n=6) | |
| Acer Swift X SFX14-71G | |
| MSI Stealth 14 Studio A13V | |
| Schenker Vision 14 2022 RTX 3050 Ti | |
| Średnia w klasie Multimedia (13243 - 126790, n=61, ostatnie 2 lata) | |
| Lenovo Slim Pro 7 14ARP8 | |
| AIDA64 / CPU ZLib | |
| MSI Stealth 14 Studio A13V | |
| Średnia w klasie Multimedia (167.2 - 2022, n=61, ostatnie 2 lata) | |
| Schenker Vision 14 2022 RTX 3050 Ti | |
| Asus VivoBook 14X K3405 | |
| Przeciętny Intel Core i5-13500H (782 - 992, n=6) | |
| Gigabyte Aero 14 OLED BMF | |
| Lenovo Slim Pro 7 14ARP8 | |
| Acer Swift X SFX14-71G | |
| AIDA64 / FP64 Ray-Trace | |
| Średnia w klasie Multimedia (1014 - 26875, n=61, ostatnie 2 lata) | |
| MSI Stealth 14 Studio A13V | |
| Lenovo Slim Pro 7 14ARP8 | |
| Asus VivoBook 14X K3405 | |
| Przeciętny Intel Core i5-13500H (5955 - 8495, n=6) | |
| Gigabyte Aero 14 OLED BMF | |
| Schenker Vision 14 2022 RTX 3050 Ti | |
| Acer Swift X SFX14-71G | |
| AIDA64 / CPU PhotoWorxx | |
| Gigabyte Aero 14 OLED BMF | |
| Średnia w klasie Multimedia (12860 - 88154, n=61, ostatnie 2 lata) | |
| Acer Swift X SFX14-71G | |
| MSI Stealth 14 Studio A13V | |
| Przeciętny Intel Core i5-13500H (20212 - 37618, n=6) | |
| Schenker Vision 14 2022 RTX 3050 Ti | |
| Lenovo Slim Pro 7 14ARP8 | |
| Asus VivoBook 14X K3405 | |
Wydajność systemu
VivoBook 14X pozostaje w tyle za MSI Stealth 14 w testach PCMark 10 i CrossMark, ale niewiele. Ogólna wydajność systemu w typowym codziennym użytkowaniu jest płynna i responsywna.
CrossMark: Overall | Productivity | Creativity | Responsiveness
AIDA64: Memory Copy | Memory Read | Memory Write | Memory Latency
| PCMark 10 / Score | |
| Średnia w klasie Multimedia (4325 - 10386, n=58, ostatnie 2 lata) | |
| Gigabyte Aero 14 OLED BMF | |
| Acer Swift X SFX14-71G | |
| MSI Stealth 14 Studio A13V | |
| Asus VivoBook 14X K3405 | |
| Przeciętny Intel Core i5-13500H, NVIDIA GeForce RTX 3050 4GB Laptop GPU (n=1) | |
| Schenker Vision 14 2022 RTX 3050 Ti | |
| Lenovo Slim Pro 7 14ARP8 | |
| PCMark 10 / Essentials | |
| Gigabyte Aero 14 OLED BMF | |
| Acer Swift X SFX14-71G | |
| Średnia w klasie Multimedia (8025 - 11664, n=57, ostatnie 2 lata) | |
| Schenker Vision 14 2022 RTX 3050 Ti | |
| MSI Stealth 14 Studio A13V | |
| Asus VivoBook 14X K3405 | |
| Przeciętny Intel Core i5-13500H, NVIDIA GeForce RTX 3050 4GB Laptop GPU (n=1) | |
| Lenovo Slim Pro 7 14ARP8 | |
| PCMark 10 / Productivity | |
| Średnia w klasie Multimedia (7323 - 18233, n=57, ostatnie 2 lata) | |
| Acer Swift X SFX14-71G | |
| Gigabyte Aero 14 OLED BMF | |
| Asus VivoBook 14X K3405 | |
| Przeciętny Intel Core i5-13500H, NVIDIA GeForce RTX 3050 4GB Laptop GPU (n=1) | |
| Schenker Vision 14 2022 RTX 3050 Ti | |
| MSI Stealth 14 Studio A13V | |
| Lenovo Slim Pro 7 14ARP8 | |
| PCMark 10 / Digital Content Creation | |
| MSI Stealth 14 Studio A13V | |
| Średnia w klasie Multimedia (3651 - 16240, n=57, ostatnie 2 lata) | |
| Acer Swift X SFX14-71G | |
| Gigabyte Aero 14 OLED BMF | |
| Lenovo Slim Pro 7 14ARP8 | |
| Schenker Vision 14 2022 RTX 3050 Ti | |
| Asus VivoBook 14X K3405 | |
| Przeciętny Intel Core i5-13500H, NVIDIA GeForce RTX 3050 4GB Laptop GPU (n=1) | |
| CrossMark / Overall | |
| Acer Swift X SFX14-71G | |
| Średnia w klasie Multimedia (866 - 2728, n=67, ostatnie 2 lata) | |
| Gigabyte Aero 14 OLED BMF | |
| MSI Stealth 14 Studio A13V | |
| Schenker Vision 14 2022 RTX 3050 Ti | |
| Asus VivoBook 14X K3405 | |
| Przeciętny Intel Core i5-13500H, NVIDIA GeForce RTX 3050 4GB Laptop GPU (n=1) | |
| Lenovo Slim Pro 7 14ARP8 | |
| CrossMark / Productivity | |
| Acer Swift X SFX14-71G | |
| Gigabyte Aero 14 OLED BMF | |
| Średnia w klasie Multimedia (931 - 2489, n=67, ostatnie 2 lata) | |
| MSI Stealth 14 Studio A13V | |
| Schenker Vision 14 2022 RTX 3050 Ti | |
| Asus VivoBook 14X K3405 | |
| Przeciętny Intel Core i5-13500H, NVIDIA GeForce RTX 3050 4GB Laptop GPU (n=1) | |
| Lenovo Slim Pro 7 14ARP8 | |
| CrossMark / Creativity | |
| Średnia w klasie Multimedia (907 - 3465, n=67, ostatnie 2 lata) | |
| Acer Swift X SFX14-71G | |
| Gigabyte Aero 14 OLED BMF | |
| MSI Stealth 14 Studio A13V | |
| Schenker Vision 14 2022 RTX 3050 Ti | |
| Asus VivoBook 14X K3405 | |
| Przeciętny Intel Core i5-13500H, NVIDIA GeForce RTX 3050 4GB Laptop GPU (n=1) | |
| Lenovo Slim Pro 7 14ARP8 | |
| CrossMark / Responsiveness | |
| Acer Swift X SFX14-71G | |
| Gigabyte Aero 14 OLED BMF | |
| MSI Stealth 14 Studio A13V | |
| Schenker Vision 14 2022 RTX 3050 Ti | |
| Średnia w klasie Multimedia (605 - 2024, n=67, ostatnie 2 lata) | |
| Asus VivoBook 14X K3405 | |
| Przeciętny Intel Core i5-13500H, NVIDIA GeForce RTX 3050 4GB Laptop GPU (n=1) | |
| Lenovo Slim Pro 7 14ARP8 | |
| AIDA64 / Memory Copy | |
| Średnia w klasie Multimedia (21158 - 132135, n=61, ostatnie 2 lata) | |
| Gigabyte Aero 14 OLED BMF | |
| Acer Swift X SFX14-71G | |
| MSI Stealth 14 Studio A13V | |
| Lenovo Slim Pro 7 14ARP8 | |
| Schenker Vision 14 2022 RTX 3050 Ti | |
| Asus VivoBook 14X K3405 | |
| Przeciętny Intel Core i5-13500H, NVIDIA GeForce RTX 3050 4GB Laptop GPU (n=1) | |
| AIDA64 / Memory Read | |
| Średnia w klasie Multimedia (19699 - 174586, n=61, ostatnie 2 lata) | |
| Gigabyte Aero 14 OLED BMF | |
| MSI Stealth 14 Studio A13V | |
| Acer Swift X SFX14-71G | |
| Lenovo Slim Pro 7 14ARP8 | |
| Asus VivoBook 14X K3405 | |
| Przeciętny Intel Core i5-13500H, NVIDIA GeForce RTX 3050 4GB Laptop GPU (n=1) | |
| Schenker Vision 14 2022 RTX 3050 Ti | |
| AIDA64 / Memory Write | |
| Gigabyte Aero 14 OLED BMF | |
| Średnia w klasie Multimedia (17733 - 134998, n=61, ostatnie 2 lata) | |
| Acer Swift X SFX14-71G | |
| Lenovo Slim Pro 7 14ARP8 | |
| MSI Stealth 14 Studio A13V | |
| Schenker Vision 14 2022 RTX 3050 Ti | |
| Asus VivoBook 14X K3405 | |
| Przeciętny Intel Core i5-13500H, NVIDIA GeForce RTX 3050 4GB Laptop GPU (n=1) | |
| AIDA64 / Memory Latency | |
| Średnia w klasie Multimedia (7 - 535, n=60, ostatnie 2 lata) | |
| Lenovo Slim Pro 7 14ARP8 | |
| Acer Swift X SFX14-71G | |
| Gigabyte Aero 14 OLED BMF | |
| Schenker Vision 14 2022 RTX 3050 Ti | |
| Asus VivoBook 14X K3405 | |
| Przeciętny Intel Core i5-13500H, NVIDIA GeForce RTX 3050 4GB Laptop GPU (n=1) | |
| MSI Stealth 14 Studio A13V | |
* ... im mniej tym lepiej
| PCMark 8 Home Score Accelerated v2 | 5514 pkt. | |
| PCMark 8 Work Score Accelerated v2 | 6078 pkt. | |
| PCMark 10 Score | 6645 pkt. | |
Pomoc | ||
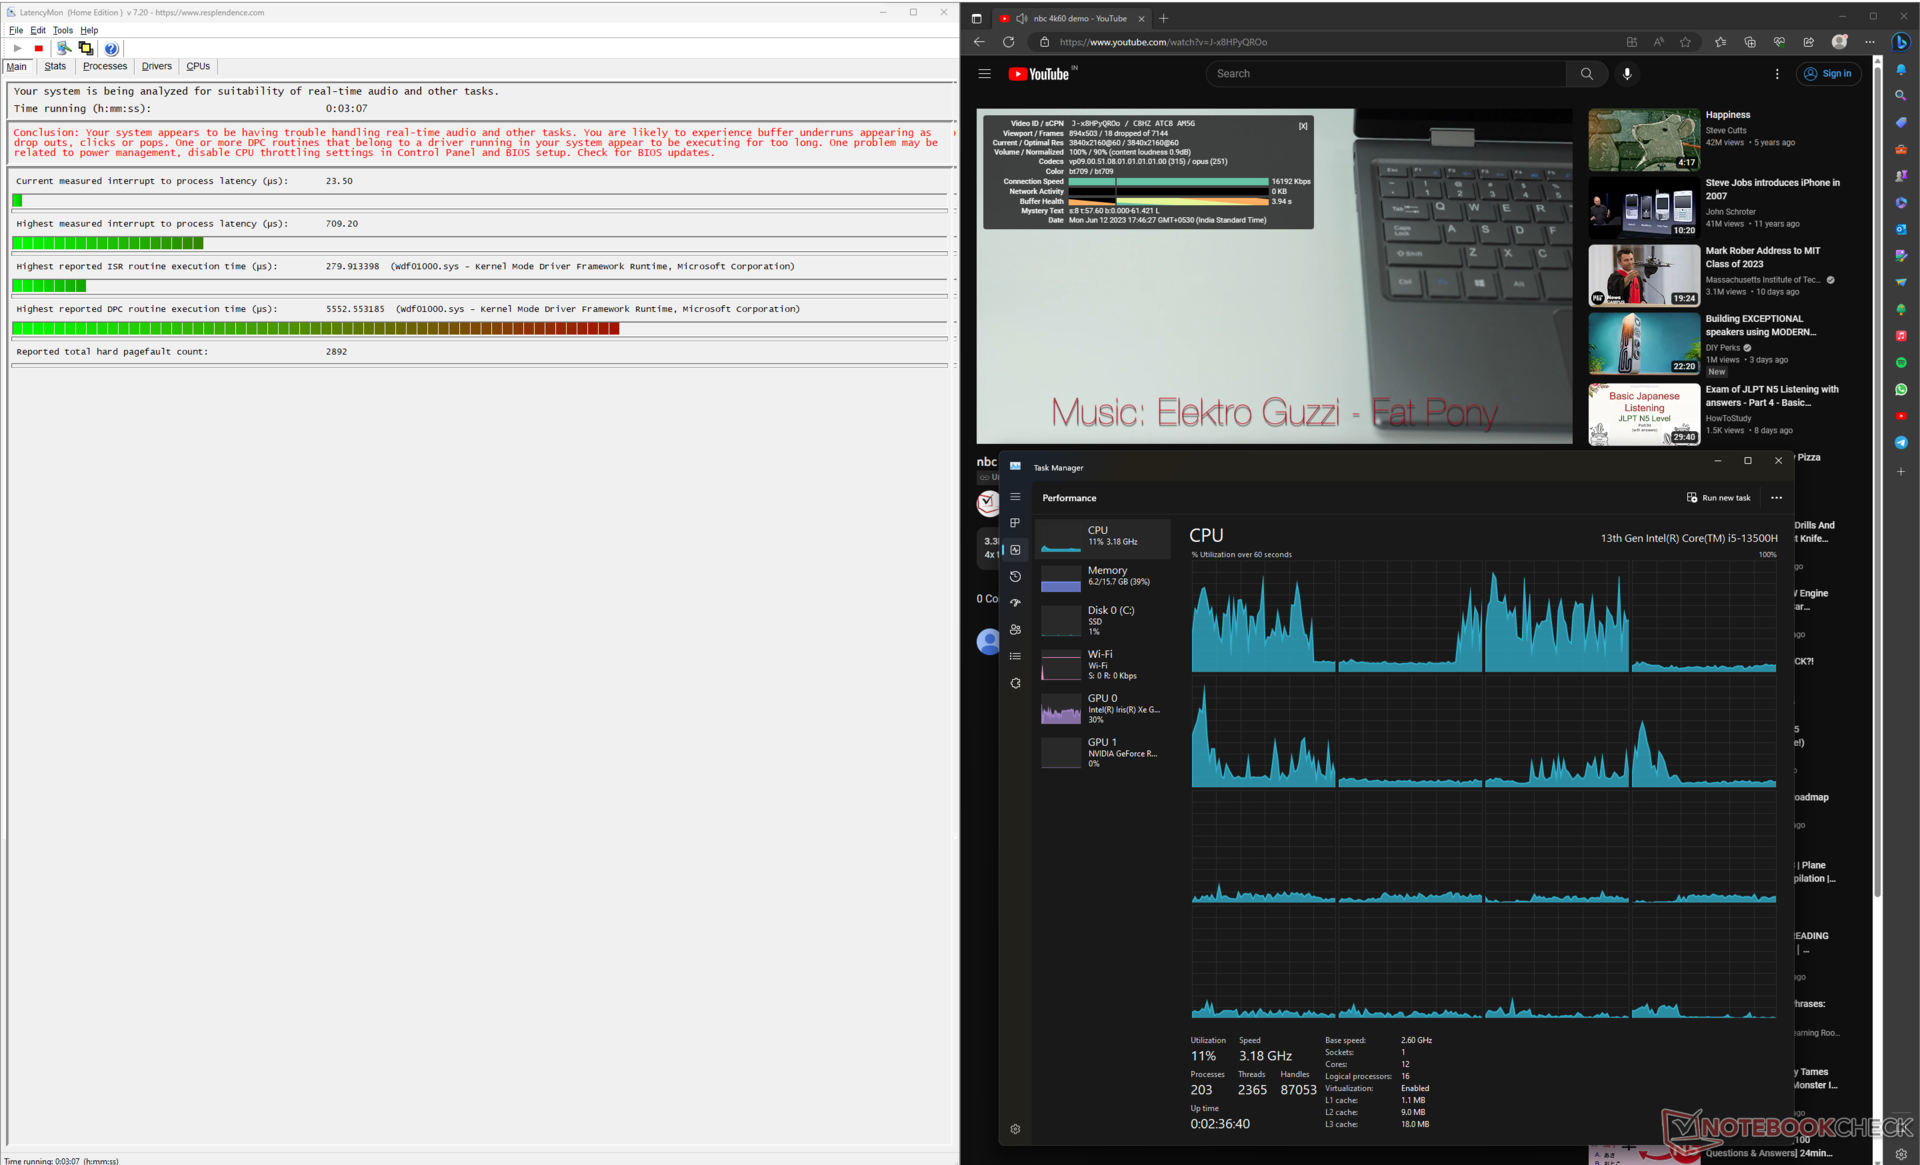
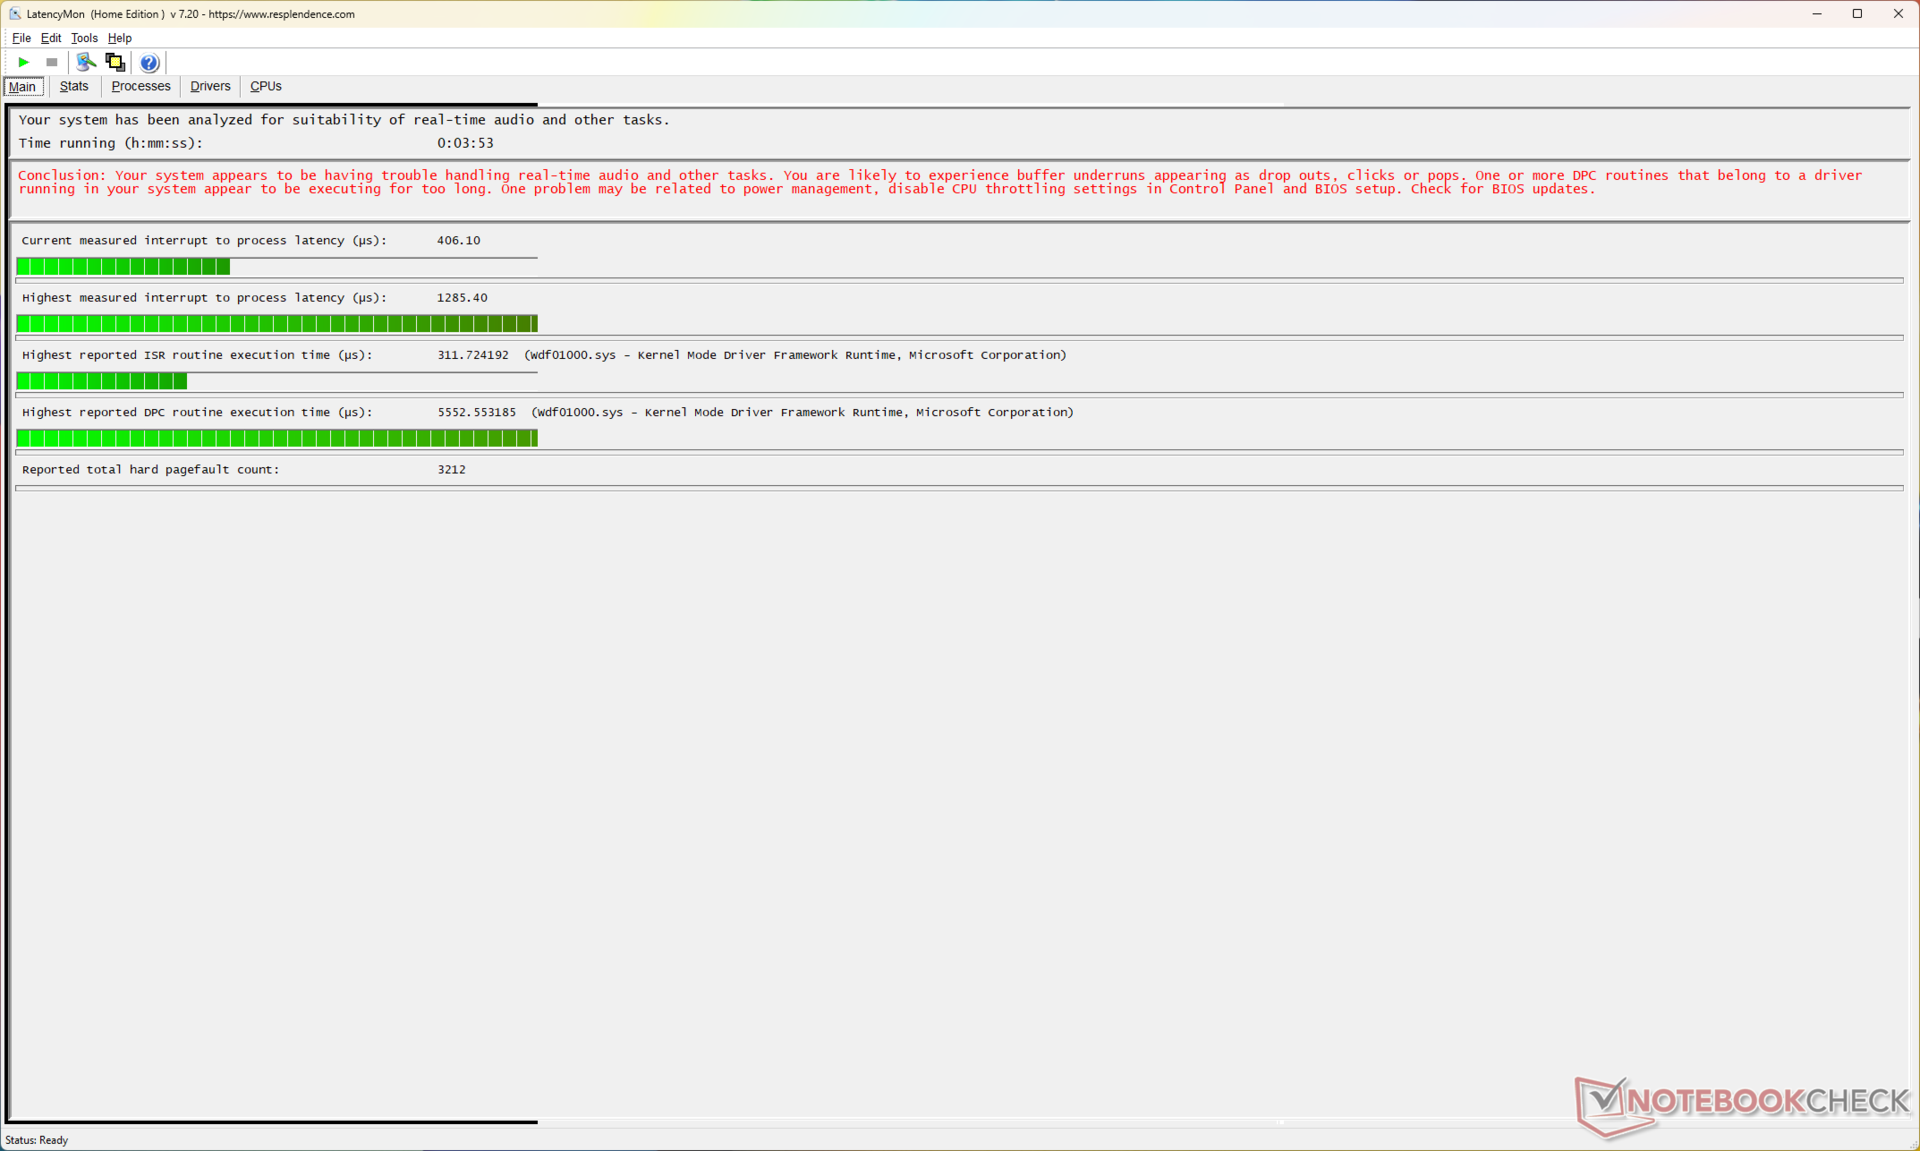
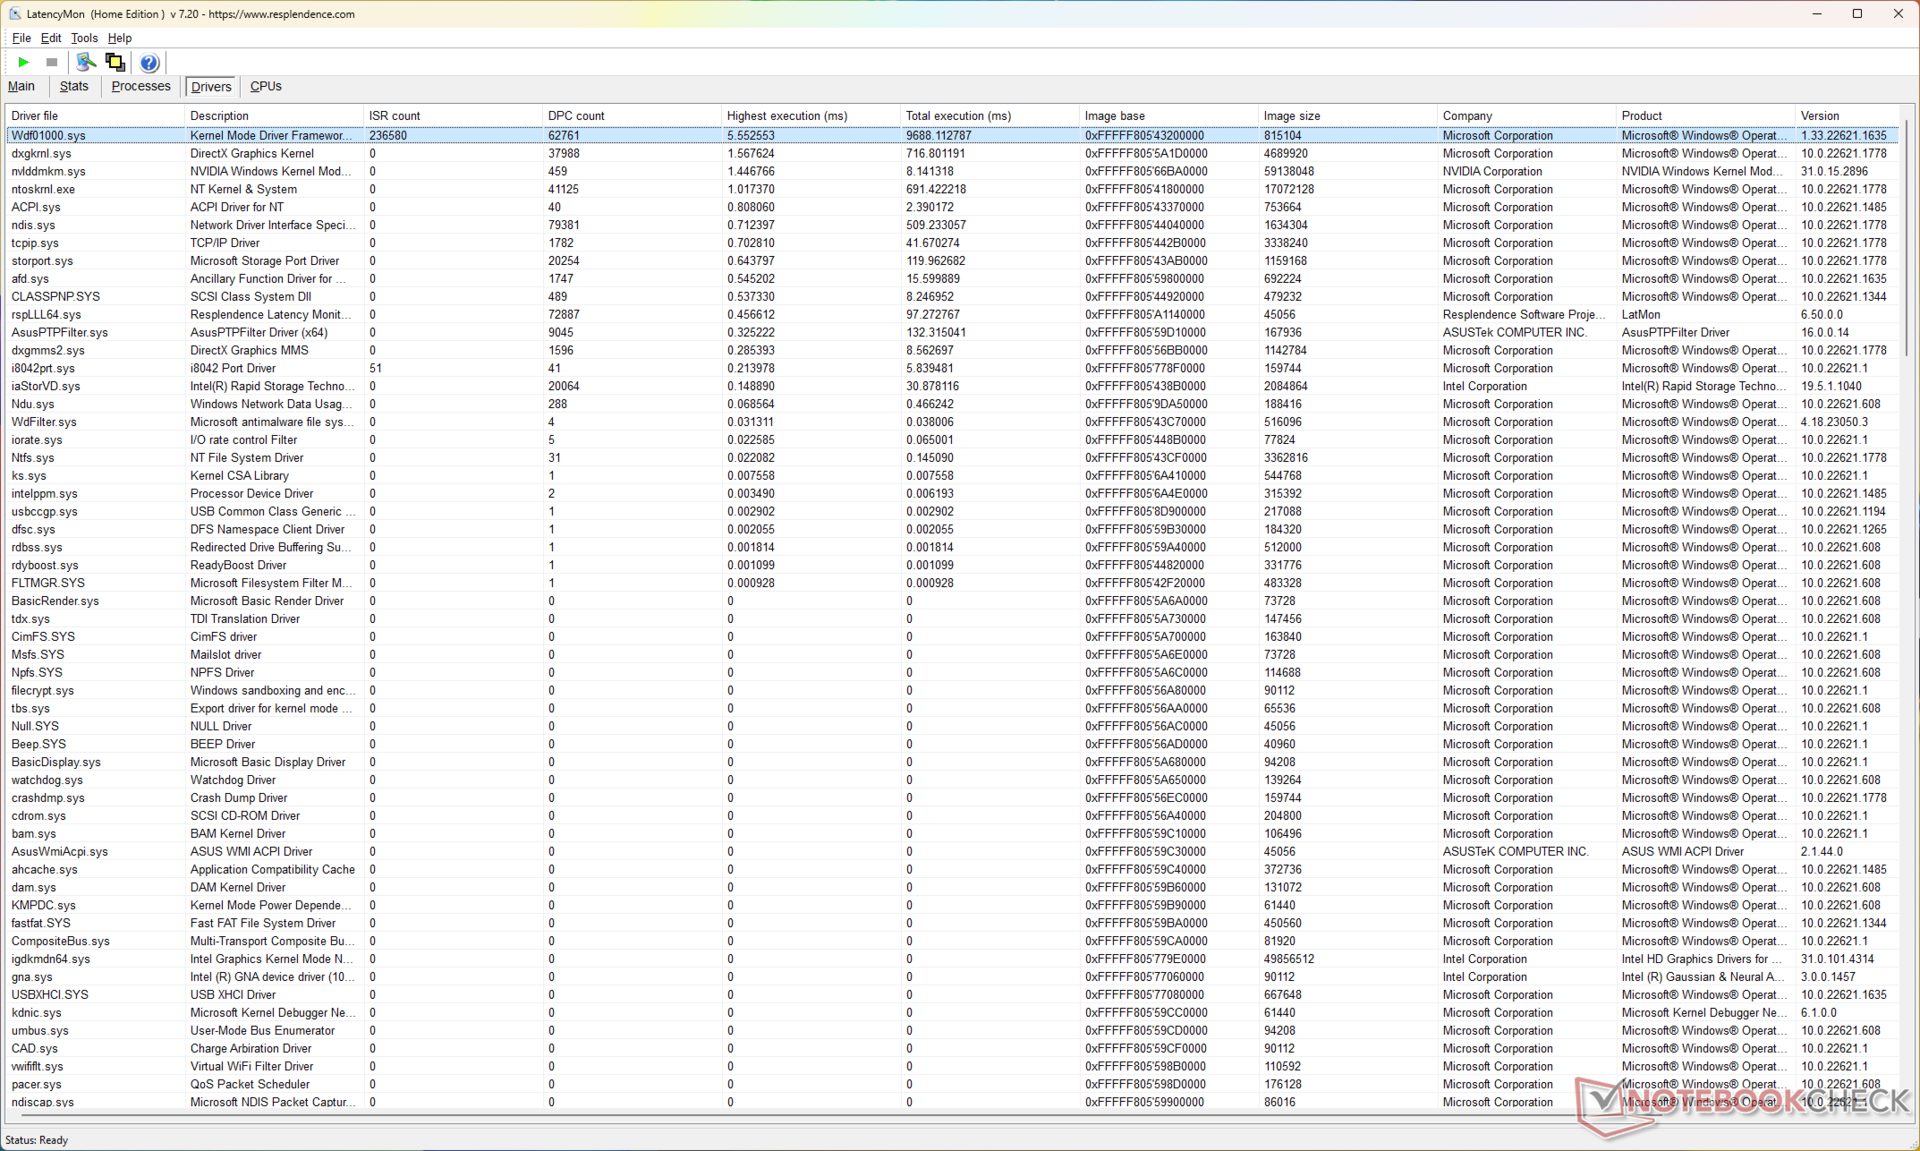
Opóźnienie DPC
Opóźnienia DPC wydają się być na wyższym poziomie. Zmierzone opóźnienie między przerwaniem a procesem wynosiło początkowo 709,20 µs podczas odtwarzania wideo 4K z YouTube.
Wartość ta wzrosła do 1285,40 µs po 10-sekundowym obciążeniu Prime95, co sugeruje, że przepływy pracy w czasie rzeczywistym mogą ulec pogorszeniu pod dużym obciążeniem.
| DPC Latencies / LatencyMon - interrupt to process latency (max), Web, Youtube, Prime95 | |
| Acer Swift X SFX14-71G | |
| Gigabyte Aero 14 OLED BMF | |
| MSI Stealth 14 Studio A13V | |
| Lenovo Slim Pro 7 14ARP8 | |
| Asus VivoBook 14X K3405 | |
| Schenker Vision 14 2022 RTX 3050 Ti | |
* ... im mniej tym lepiej
NaszRanking opóźnień DPCmożna znaleźć więcej porównań opóźnień między recenzowanymi urządzeniami.
Urządzenia pamięci masowej
Zainstalowany dysk Samsung PM9B1 NVMe SSD oferuje zadowalającą wydajność w większości zastosowań. Asus zapewnił podkładkę termiczną pod dyskiem, która pomaga utrzymać względnie stabilną wydajność podczas testu pętli odczytu DiskSpd.
Biorąc to pod uwagę, dysk SSD PM9B1 znacznie ustępuje konkurencji w prawie wszystkich aspektach, z wyjątkiem zapisu 4K. Nie ma możliwości rozbudowy pamięci masowej.

* ... im mniej tym lepiej
Disk Throttling: DiskSpd Read Loop, Queue Depth 8
Więcej porównań wydajności pamięci masowej można znaleźć w naszych Testy porównawcze dysków HDD i SSD strona.
Wydajność GPU
Asus wdraża 40 W Procesor graficzny Nvidia GeForce RTX 3050 4 GB do laptopów w VivoBook 14X. RTX 3050 4 GB jest przestarzały dla urządzenia z 2023 roku z procesorem Intel 13. generacji i widzimy to w syntetycznych i gamingowych testach porównawczych.
Łączna wydajność w 3DMark spadła o 23% w porównaniu do RTX 3050 Ti w teście Schenker Vision 14i o 26% w porównaniu do RTX 3050 6 GB w Lenovo Slim Pro 7.
VivoBook 14X również wypada gorzej o 38% w porównaniu z nowszym 35 W RTX 4050 w Gigabyte Aero 14 OLED.
| 3DMark 11 Performance | 13942 pkt. | |
| 3DMark Ice Storm Standard Score | 70334 pkt. | |
| 3DMark Cloud Gate Standard Score | 36793 pkt. | |
| 3DMark Fire Strike Score | 8504 pkt. | |
| 3DMark Fire Strike Extreme Score | 4371 pkt. | |
| 3DMark Time Spy Score | 3832 pkt. | |
Pomoc | ||
| Blender / v3.3 Classroom OPTIX/RTX | |
| Asus VivoBook 14X K3405 | |
| Przeciętny NVIDIA GeForce RTX 3050 4GB Laptop GPU (53 - 99, n=12) | |
| Lenovo Slim Pro 7 14ARP8 | |
| Schenker Vision 14 2022 RTX 3050 Ti | |
| Średnia w klasie Multimedia (12 - 105, n=24, ostatnie 2 lata) | |
| Gigabyte Aero 14 OLED BMF | |
| Acer Swift X SFX14-71G | |
| MSI Stealth 14 Studio A13V | |
| Blender / v3.3 Classroom CUDA | |
| Asus VivoBook 14X K3405 | |
| Asus VivoBook 14X K3405 | |
| Przeciętny NVIDIA GeForce RTX 3050 4GB Laptop GPU (97 - 152, n=13) | |
| Lenovo Slim Pro 7 14ARP8 | |
| Schenker Vision 14 2022 RTX 3050 Ti | |
| Gigabyte Aero 14 OLED BMF | |
| Średnia w klasie Multimedia (20 - 186, n=24, ostatnie 2 lata) | |
| Acer Swift X SFX14-71G | |
| Blender / v3.3 Classroom CPU | |
| Przeciętny NVIDIA GeForce RTX 3050 4GB Laptop GPU (388 - 937, n=11) | |
| Acer Swift X SFX14-71G | |
| Schenker Vision 14 2022 RTX 3050 Ti | |
| Gigabyte Aero 14 OLED BMF | |
| Asus VivoBook 14X K3405 | |
| Lenovo Slim Pro 7 14ARP8 | |
| Średnia w klasie Multimedia (134.5 - 1042, n=68, ostatnie 2 lata) | |
| MSI Stealth 14 Studio A13V | |
* ... im mniej tym lepiej
Wydajność w grach
VivoBook 14X nie jest skierowany do odbiorców gier, ale nadal jest w stanie przyzwoicie grać w rozdzielczości 1080p Ultra, szczególnie w mniej wymagających tytułach eSportowych.
Zauważalny wzrost liczby klatek na sekundę można uzyskać poprzez wykorzystanie algorytmów skalowania w obsługiwanych grach.
| The Witcher 3 - 1920x1080 Ultra Graphics & Postprocessing (HBAO+) | |
| MSI Stealth 14 Studio A13V | |
| Gigabyte Aero 14 OLED BMF | |
| Gigabyte Aero 14 OLED BMF | |
| Acer Swift X SFX14-71G | |
| Lenovo Slim Pro 7 14ARP8 | |
| Średnia w klasie Multimedia (11 - 121, n=13, ostatnie 2 lata) | |
| Schenker Vision 14 2022 RTX 3050 Ti | |
| Asus VivoBook 14X K3405 | |
| Final Fantasy XV Benchmark - 1920x1080 High Quality | |
| MSI Stealth 14 Studio A13V | |
| Acer Swift X SFX14-71G | |
| Gigabyte Aero 14 OLED BMF | |
| Średnia w klasie Multimedia (7.61 - 144.4, n=66, ostatnie 2 lata) | |
| Lenovo Slim Pro 7 14ARP8 | |
| Schenker Vision 14 2022 RTX 3050 Ti | |
| Asus VivoBook 14X K3405 | |
| Strange Brigade - 1920x1080 ultra AA:ultra AF:16 | |
| MSI Stealth 14 Studio A13V | |
| Acer Swift X SFX14-71G | |
| Gigabyte Aero 14 OLED BMF | |
| Średnia w klasie Multimedia (13.3 - 303, n=66, ostatnie 2 lata) | |
| Schenker Vision 14 2022 RTX 3050 Ti | |
| Asus VivoBook 14X K3405 | |
| Dota 2 Reborn - 1920x1080 ultra (3/3) best looking | |
| MSI Stealth 14 Studio A13V | |
| Gigabyte Aero 14 OLED BMF | |
| Acer Swift X SFX14-71G | |
| Asus VivoBook 14X K3405 | |
| Schenker Vision 14 2022 RTX 3050 Ti | |
| Lenovo Slim Pro 7 14ARP8 | |
| Średnia w klasie Multimedia (29 - 179.9, n=68, ostatnie 2 lata) | |
Wykres Witcher 3 FPS
Nie ma większych zastrzeżeń do chłodzenia GPU, biorąc pod uwagę, że obserwujemy stosunkowo stabilną liczbę klatek na sekundę podczas uruchamiania The Witcher 3 w rozdzielczości 1080p Ultra.
Witcher 3 FPS Chart
| low | med. | high | ultra | QHD | 4K | |
|---|---|---|---|---|---|---|
| GTA V (2015) | 175 | 167.8 | 100.4 | 48.4 | 33.7 | 32 |
| The Witcher 3 (2015) | 150.4 | 68.8 | 70.6 | 40 | 24.4 | |
| Dota 2 Reborn (2015) | 163.4 | 141 | 135.3 | 115.3 | 57.1 | |
| Final Fantasy XV Benchmark (2018) | 99.4 | 52.5 | 37.7 | 27.3 | 15 | |
| X-Plane 11.11 (2018) | 111 | 95.2 | 78.9 | 66.1 | ||
| Far Cry 5 (2018) | 127 | 68 | 61 | 57 | 39 | 19 |
| Strange Brigade (2018) | 179.7 | 78.6 | 65.2 | 57.9 | 41.1 | 23.4 |
| F1 2021 (2021) | 232 | 123.6 | 96 | 44.1 | 32.1 | 12.7 |
| Cyberpunk 2077 1.6 (2022) | 51.7 | 38.2 | 28.4 | 25.3 | 15.6 | 5.57 |
| F1 22 (2022) | 119.4 | 108.5 | 75.2 | 21.3 | 13.2 | 5.9 |
Sprawdź naszą dedykowaną stronę Karta graficzna Nvidia GeForce RTX 3050 do laptopów aby uzyskać więcej informacji i porównać wydajność.
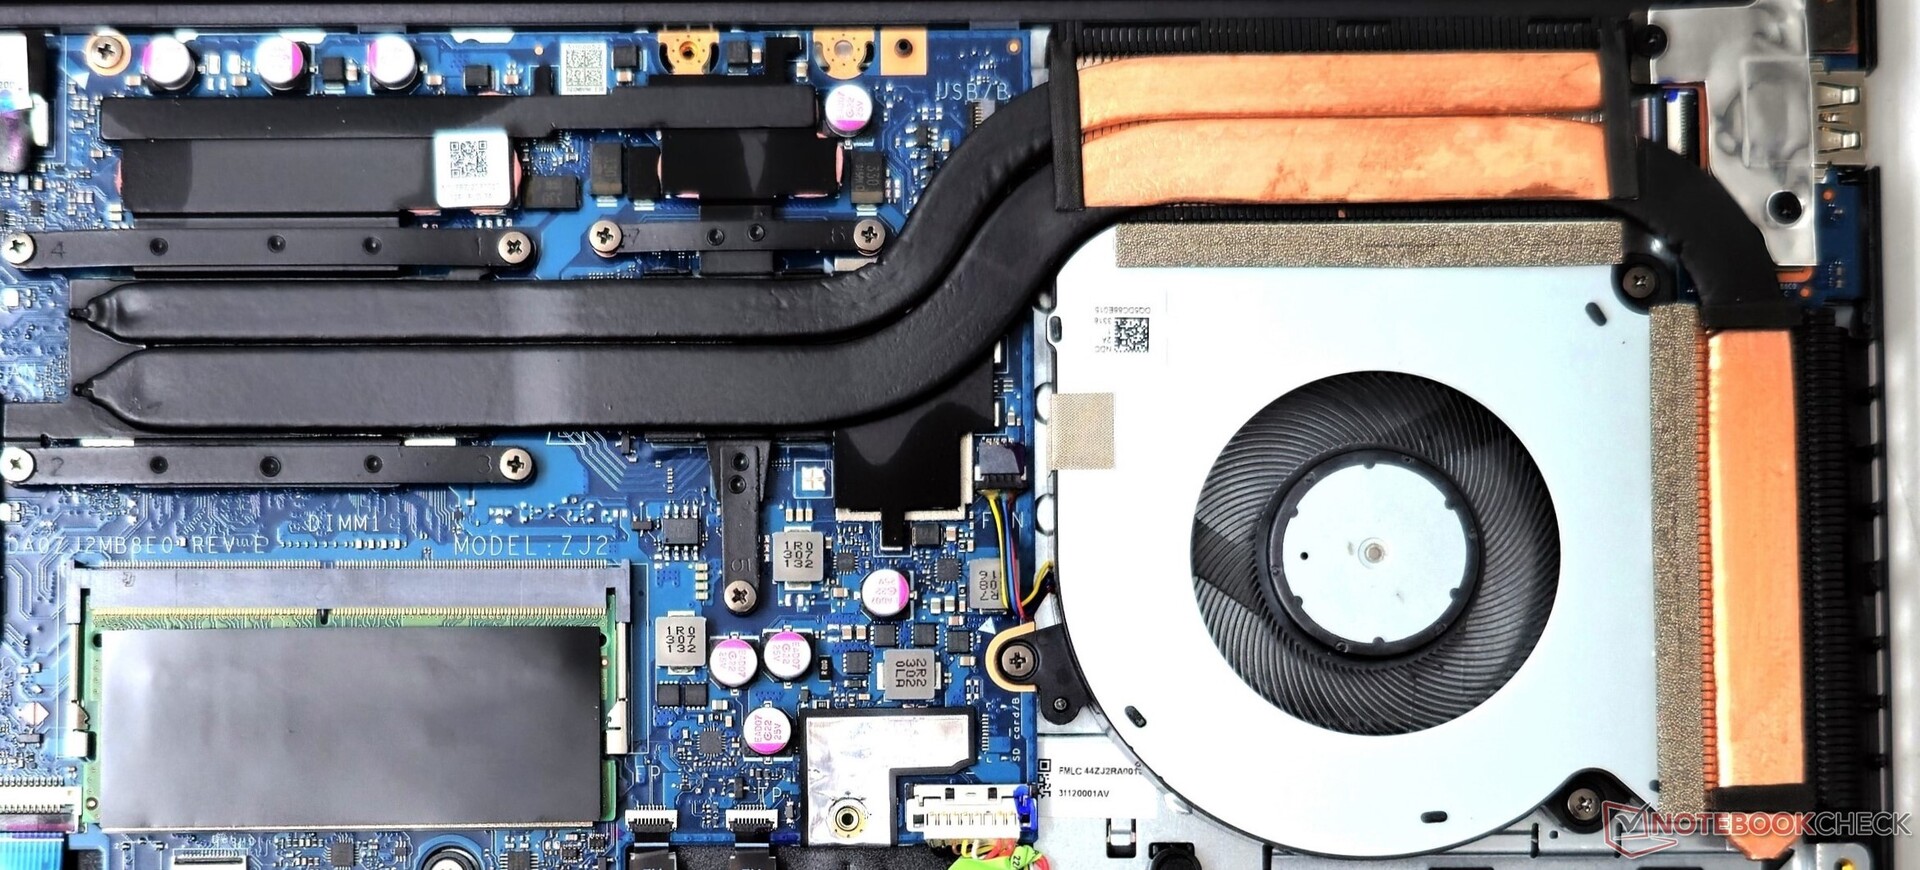
Emisje: Pojedynczy wentylator z podwójną rurką cieplną wciśnięty do oporu
Hałas systemowy
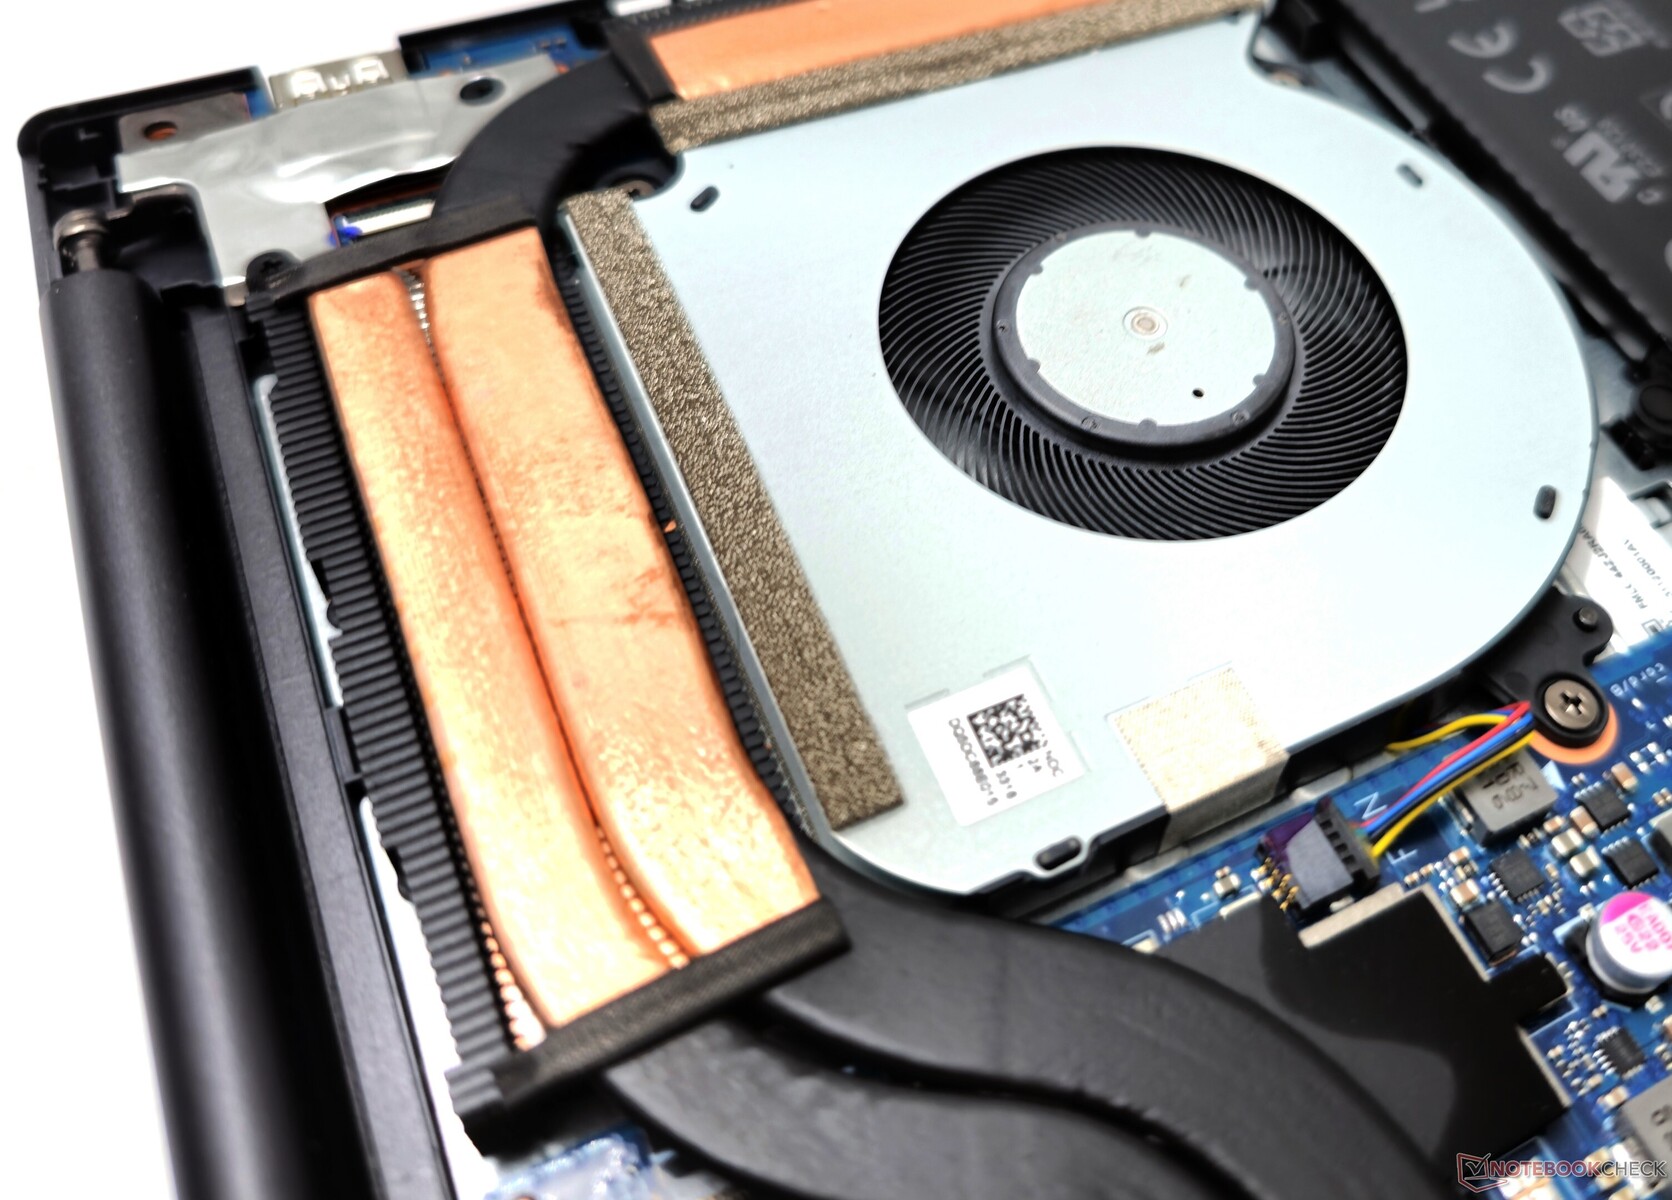
Asus wyposażył VivoBook 14X w pojedynczy wentylator do chłodzenia zarówno procesora, jak i układu graficznego. Podobnie jak w przypadku innych modeli VivoBook, Asus najwyraźniej ustalił limit maksymalnego hałasu wentylatora dla każdego profilu wydajności.
Firma twierdzi, że hałas wentylatora wynosi mniej niż 40 dB(A) w profilu Standard. My zarejestrowaliśmy poziomy ciśnienia akustycznego na poziomie 31 dB(A) w trybie Whisper, 42 dB(A) w Standard i prawie 53 dB(A) w trybie Performance.
Profil trybu pełnej prędkości utrzymuje stały poziom SPL wynoszący prawie 53 dB(A) niezależnie od obciążenia.
Hałas
| luz |
| 22.08 / 22.08 / 22.08 dB |
| obciążenie |
| 52.98 / 52.67 dB |
 | ||
30 dB cichy 40 dB(A) słyszalny 50 dB(A) irytujący |
||
min: | ||
| Tryb wydajności | Bezczynność dB(A) | Średnie obciążenie dB(A) | Maksymalne obciążenie dB(A) | Witcher 3 1080p Ultra dB(A) |
|---|---|---|---|---|
| Whisper | 21,73 | 30,61 | 31,13 | 30,67 / 34 kl |
| Standard | 21,62 | 42,33 | 42,12 | 42,23 / 38 kl |
| Wydajność | 22.08 | 52.98 | 52.67 | 52.65 / 40 fps |
| Asus VivoBook 14X K3405 i5-13500H, GeForce RTX 3050 4GB Laptop GPU | Acer Swift X SFX14-71G i7-13700H, GeForce RTX 4050 Laptop GPU | MSI Stealth 14 Studio A13V i7-13700H, GeForce RTX 4050 Laptop GPU | Gigabyte Aero 14 OLED BMF i7-13700H, GeForce RTX 4050 Laptop GPU | Lenovo Slim Pro 7 14ARP8 R7 7735HS, GeForce RTX 3050 6GB Laptop GPU | Schenker Vision 14 2022 RTX 3050 Ti i7-12700H, GeForce RTX 3050 Ti Laptop GPU | |
|---|---|---|---|---|---|---|
| Noise | -14% | -10% | -11% | 4% | -4% | |
| wyłączone / środowisko * (dB) | 21.46 | 24.8 -16% | 25.3 -18% | 24 -12% | 22.7 -6% | 24.4 -14% |
| Idle Minimum * (dB) | 22.08 | 28.2 -28% | 25.3 -15% | 24 -9% | 22.8 -3% | 24.4 -11% |
| Idle Average * (dB) | 22.08 | 31.8 -44% | 25 -13% | 24 -9% | 22.8 -3% | 24.4 -11% |
| Idle Maximum * (dB) | 22.08 | 31.8 -44% | 33.7 -53% | 35.71 -62% | 22.8 -3% | 27.8 -26% |
| Load Average * (dB) | 52.98 | 38.2 28% | 42.2 20% | 43.8 17% | 43.3 18% | |
| Witcher 3 ultra * (dB) | 52.7 | 50 5% | 51 3% | 40.22 24% | 43.8 17% | 48.2 9% |
| Load Maximum * (dB) | 52.67 | 52.2 1% | 51 3% | 51.93 1% | 47.1 11% | 48.8 7% |
* ... im mniej tym lepiej
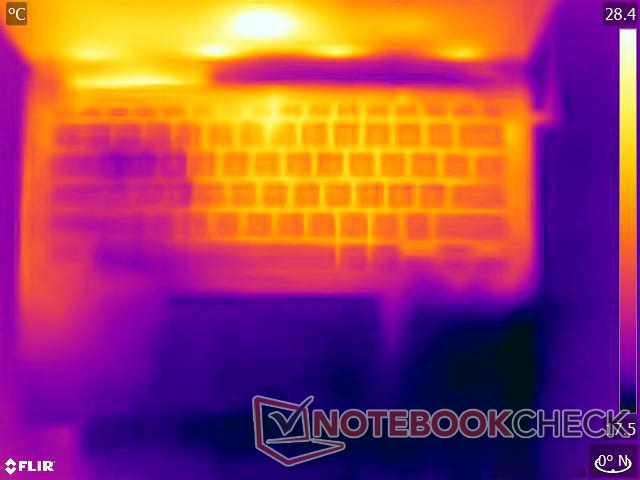
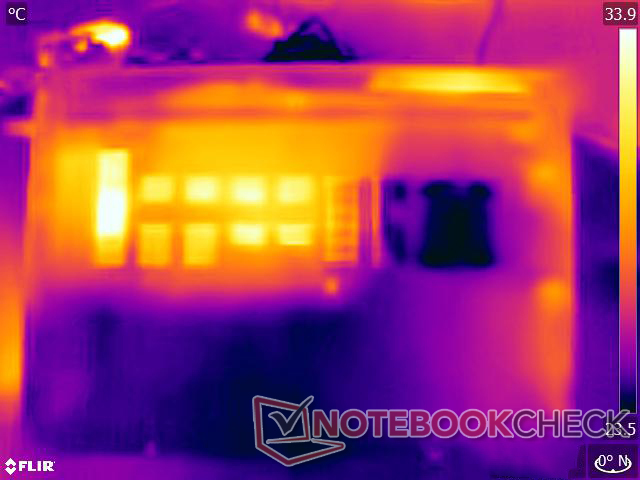
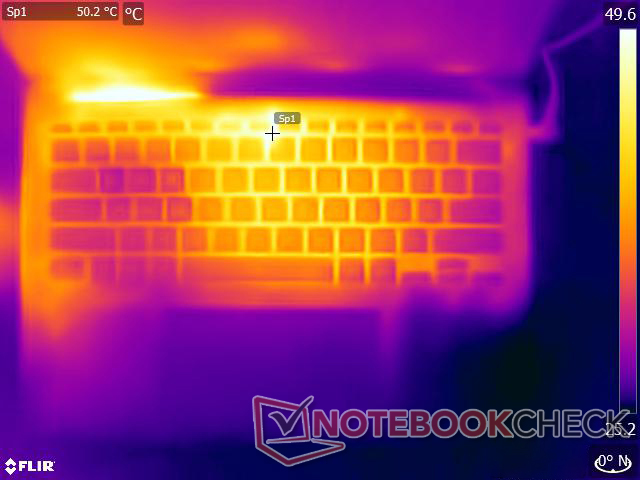
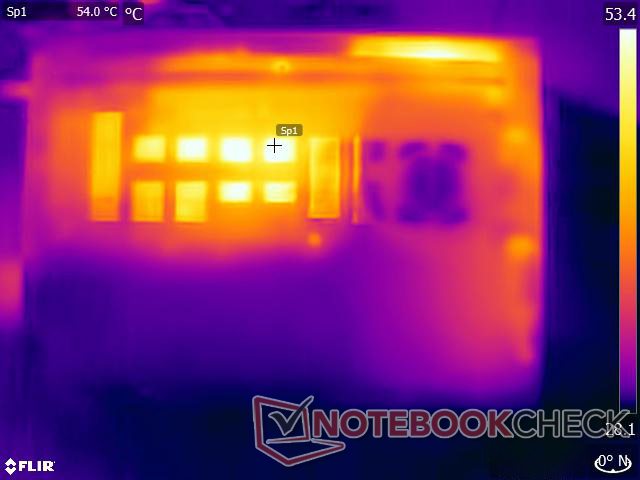
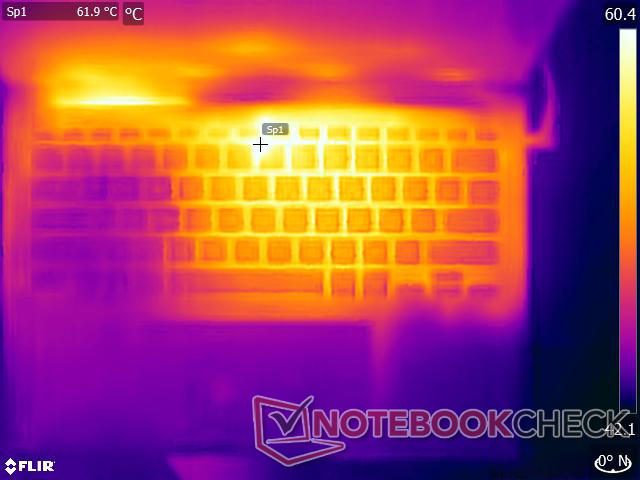
Temperatura
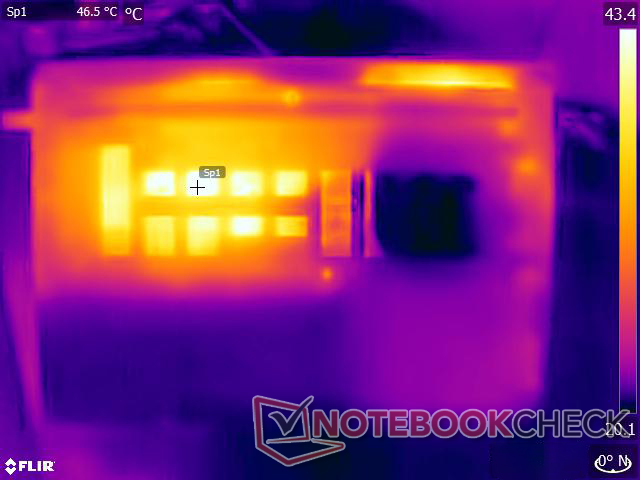
Asus twierdzi, że dzięki nowej konstrukcji wentylatora poprawiła się wydajność cieplna, ale kombinacja pojedynczego wentylatora i dwóch rurek cieplnych ma swoje ograniczenia w utrzymywaniu temperatury powierzchni pod kontrolą podczas obciążenia.
Odnotowaliśmy temperatury do 49 °C na górze i do 54 °C na dole pod maksymalnym obciążeniem. Touchpad i prawy obszar podparcia dłoni pozostają jednak stosunkowo chłodne.
(-) Maksymalna temperatura w górnej części wynosi 49.2 °C / 121 F, w porównaniu do średniej 36.8 °C / 98 F , począwszy od 21 do 71 °C dla klasy Multimedia.
(-) Dno nagrzewa się maksymalnie do 54 °C / 129 F, w porównaniu do średniej 39.1 °C / 102 F
(+) W stanie bezczynności średnia temperatura górnej części wynosi 30.6 °C / 87 F, w porównaniu ze średnią temperaturą urządzenia wynoszącą 31.3 °C / ### class_avg_f### F.
(±) Podczas gry w Wiedźmina 3 średnia temperatura górnej części wynosi 37.8 °C / 100 F, w porównaniu do średniej temperatury urządzenia wynoszącej 31.3 °C / ## #class_avg_f### F.
(+) Podparcia dłoni i touchpad osiągają maksymalną temperaturę skóry (35.4 °C / 95.7 F) i dlatego nie są gorące.
(-) Średnia temperatura obszaru podparcia dłoni w podobnych urządzeniach wynosiła 28.7 °C / 83.7 F (-6.7 °C / -12 F).
| Asus VivoBook 14X K3405 Intel Core i5-13500H, NVIDIA GeForce RTX 3050 4GB Laptop GPU | Acer Swift X SFX14-71G Intel Core i7-13700H, NVIDIA GeForce RTX 4050 Laptop GPU | MSI Stealth 14 Studio A13V Intel Core i7-13700H, NVIDIA GeForce RTX 4050 Laptop GPU | Gigabyte Aero 14 OLED BMF Intel Core i7-13700H, NVIDIA GeForce RTX 4050 Laptop GPU | Lenovo Slim Pro 7 14ARP8 AMD Ryzen 7 7735HS, NVIDIA GeForce RTX 3050 6GB Laptop GPU | Schenker Vision 14 2022 RTX 3050 Ti Intel Core i7-12700H, NVIDIA GeForce RTX 3050 Ti Laptop GPU | |
|---|---|---|---|---|---|---|
| Heat | 16% | -0% | 18% | 21% | 9% | |
| Maximum Upper Side * (°C) | 49.2 | 46.4 6% | 46.9 5% | 42 15% | 42.2 14% | 48.4 2% |
| Maximum Bottom * (°C) | 54 | 49 9% | 56.1 -4% | 52 4% | 49 9% | 57.1 -6% |
| Idle Upper Side * (°C) | 33.6 | 26.5 21% | 33.8 -1% | 26 23% | 24.4 27% | 28.1 16% |
| Idle Bottom * (°C) | 37.6 | 26.6 29% | 37.9 -1% | 27 28% | 25.2 33% | 29 23% |
* ... im mniej tym lepiej
Test warunków skrajnych
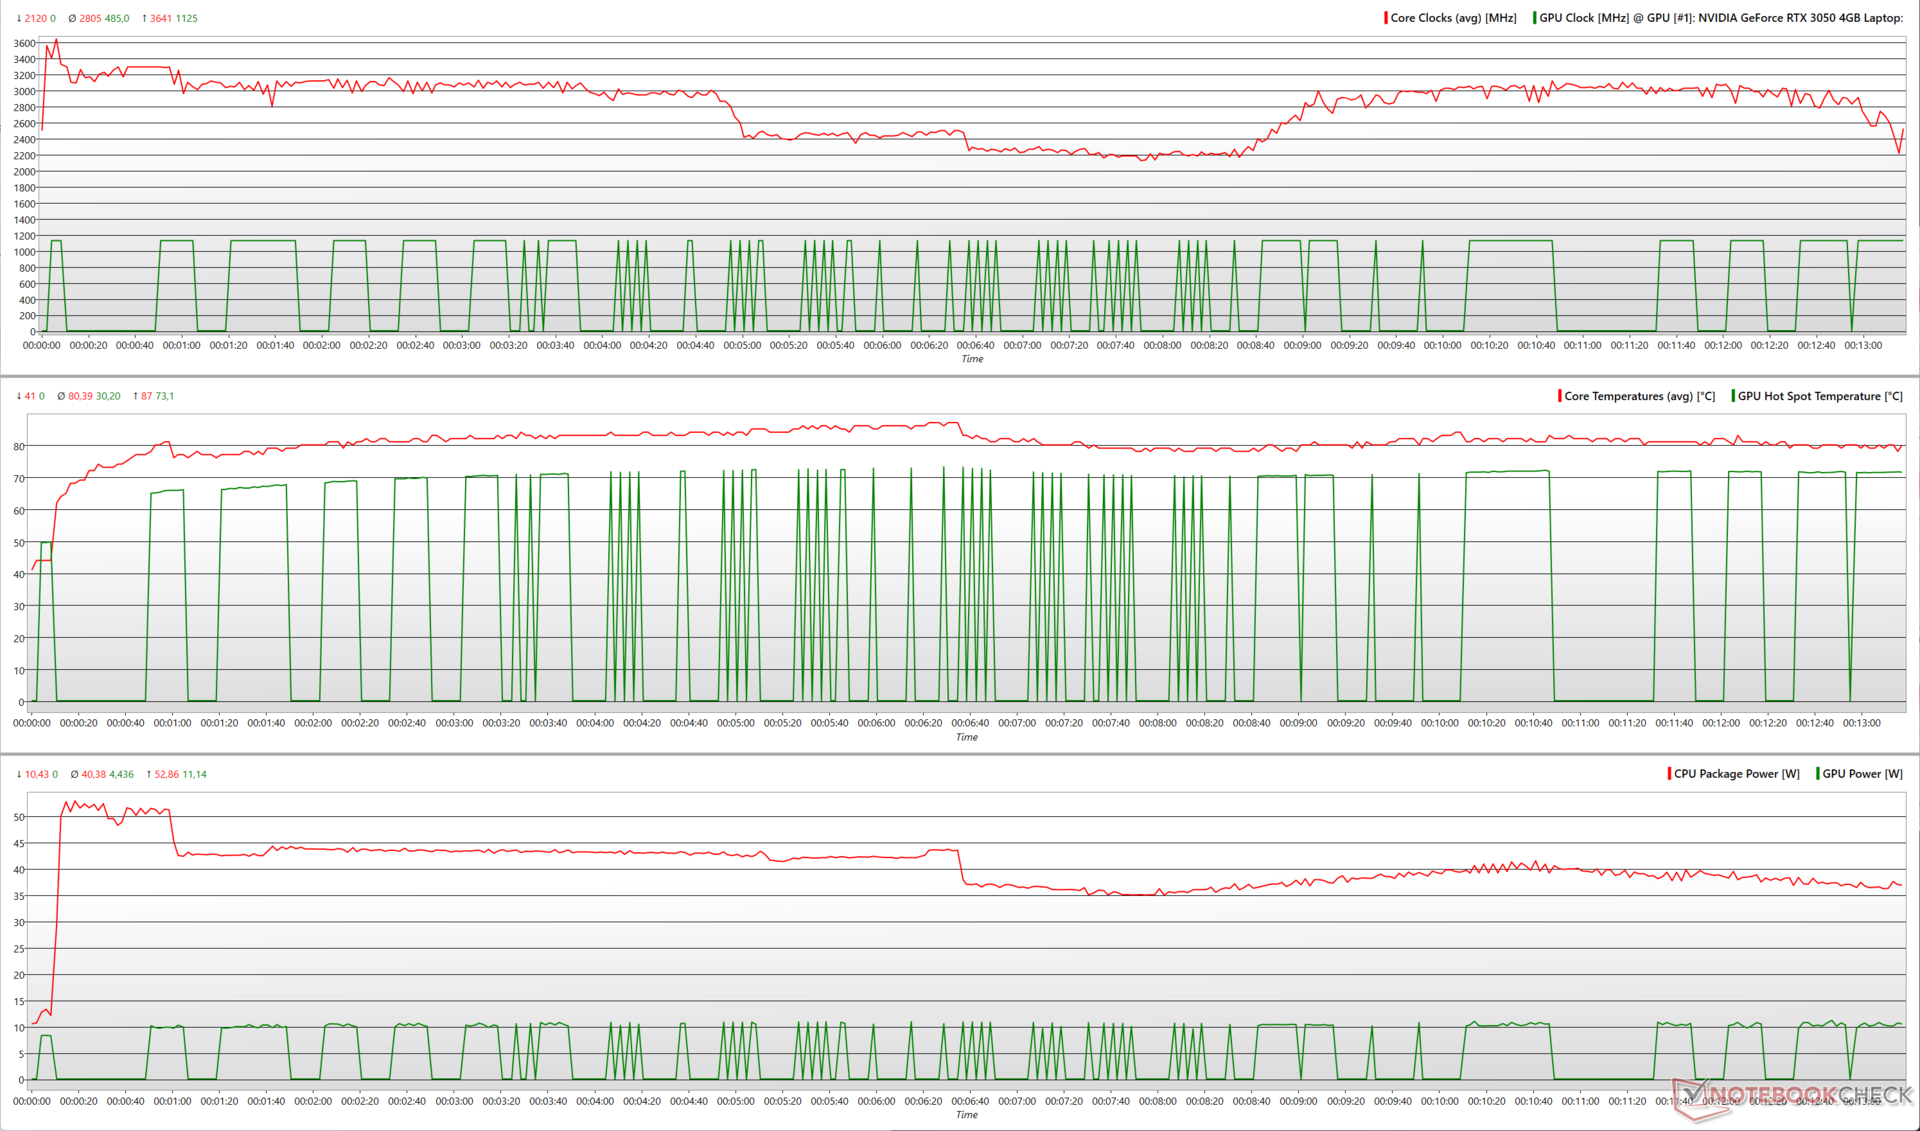
Podczas obciążania VivoBooka 14X za pomocą Prime95 in-place large FFTs, Core i5-13500H osiąga szczytową wartość 3,6 GHz, zużywając przy tym prawie 53 W mocy.
Dodając do tego FurMark, moc szczytowa pakietu CPU spada do 48,6 W i utrzymuje się na poziomie 22 W. RTX 3050 wykazuje średnie taktowanie na poziomie 1 192 MHz, a zużycie energii utrzymuje się na stałym poziomie 34 W.
| Test obciążeniowy | Taktowanie CPU (GHz) | Taktowanie GPU (MHz) | Średnia temperatura CPU (°C) | Średnia temperatura GPU (°C) |
| Bezczynność systemu | 3,8 | 0 | 40 | 25,1 |
| Prime95 | 2.95 | 0 | 80 | 25.3 |
| Prime95 + FurMark | 1.75 | 1,177 | 72 | 68.3 |
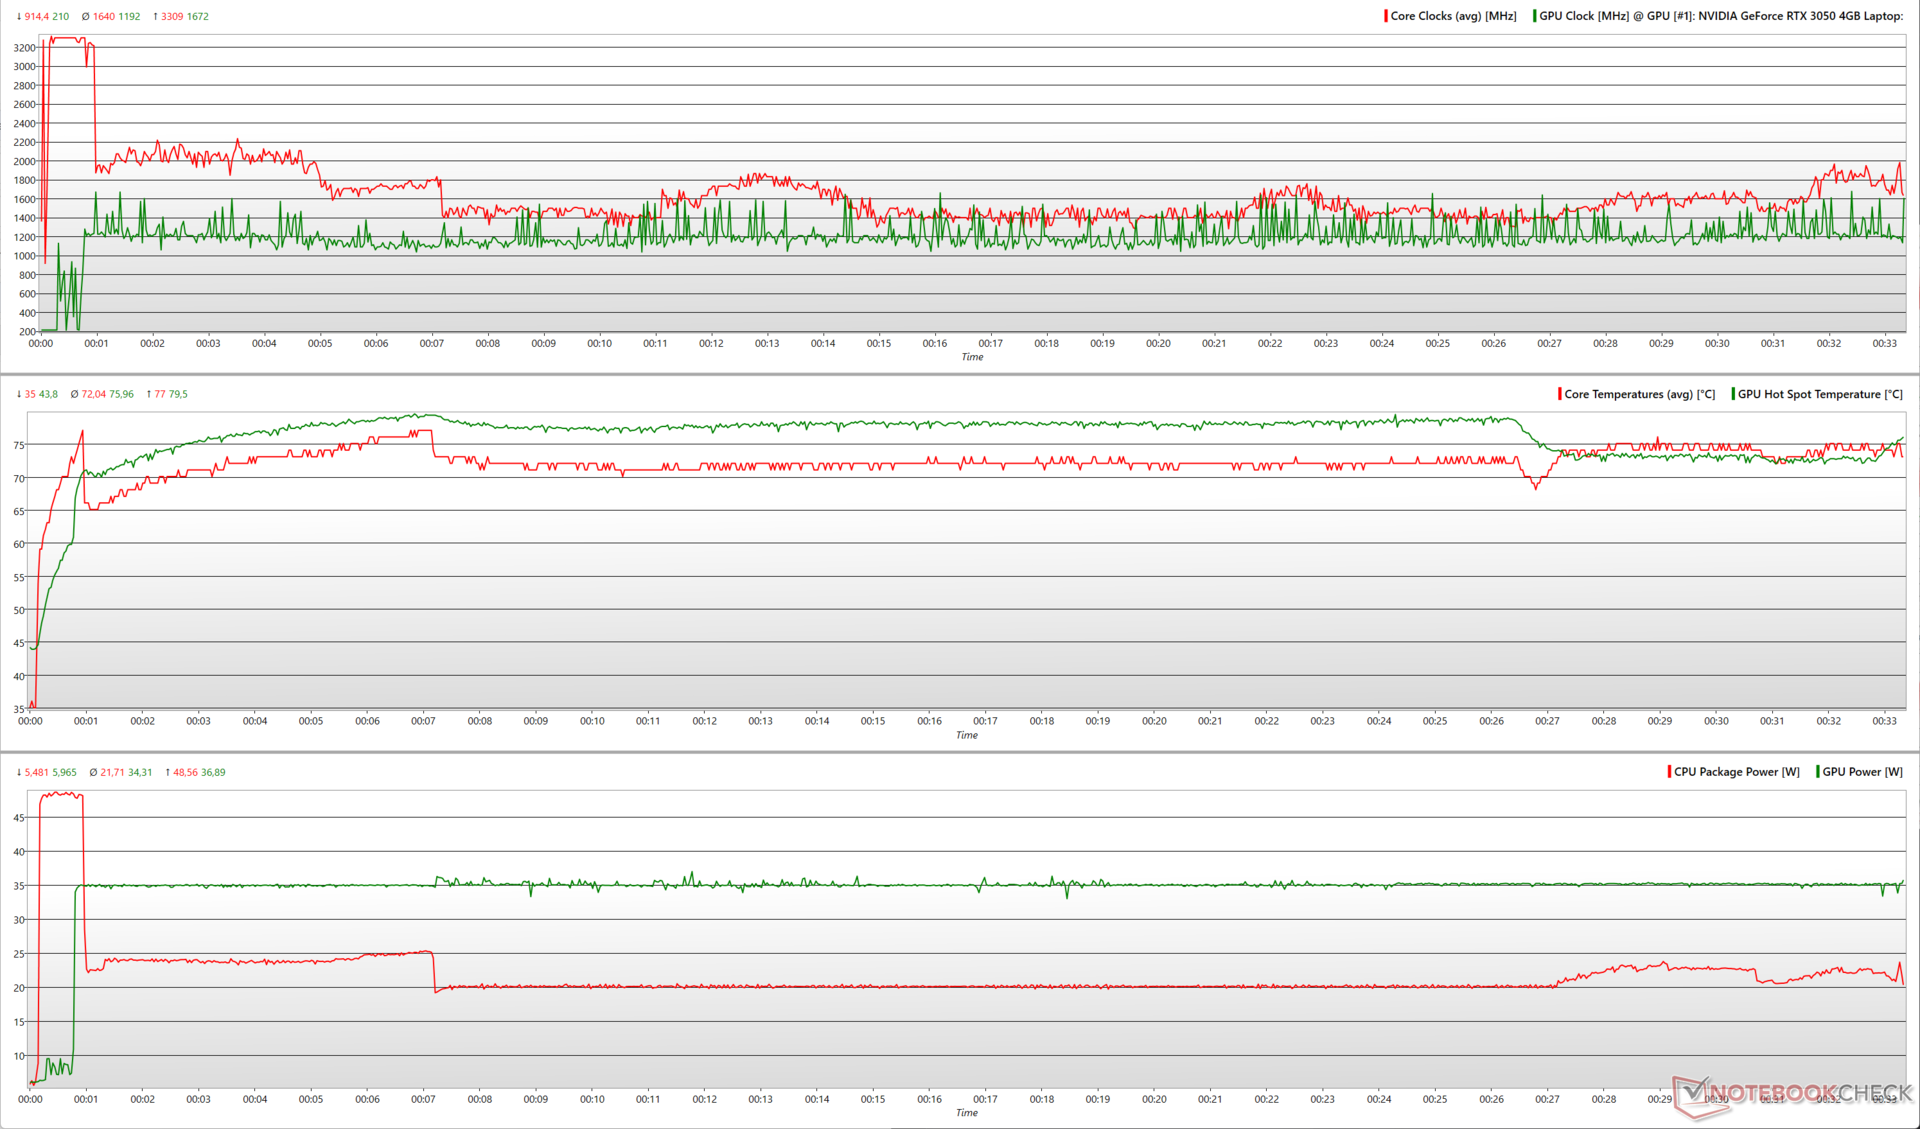
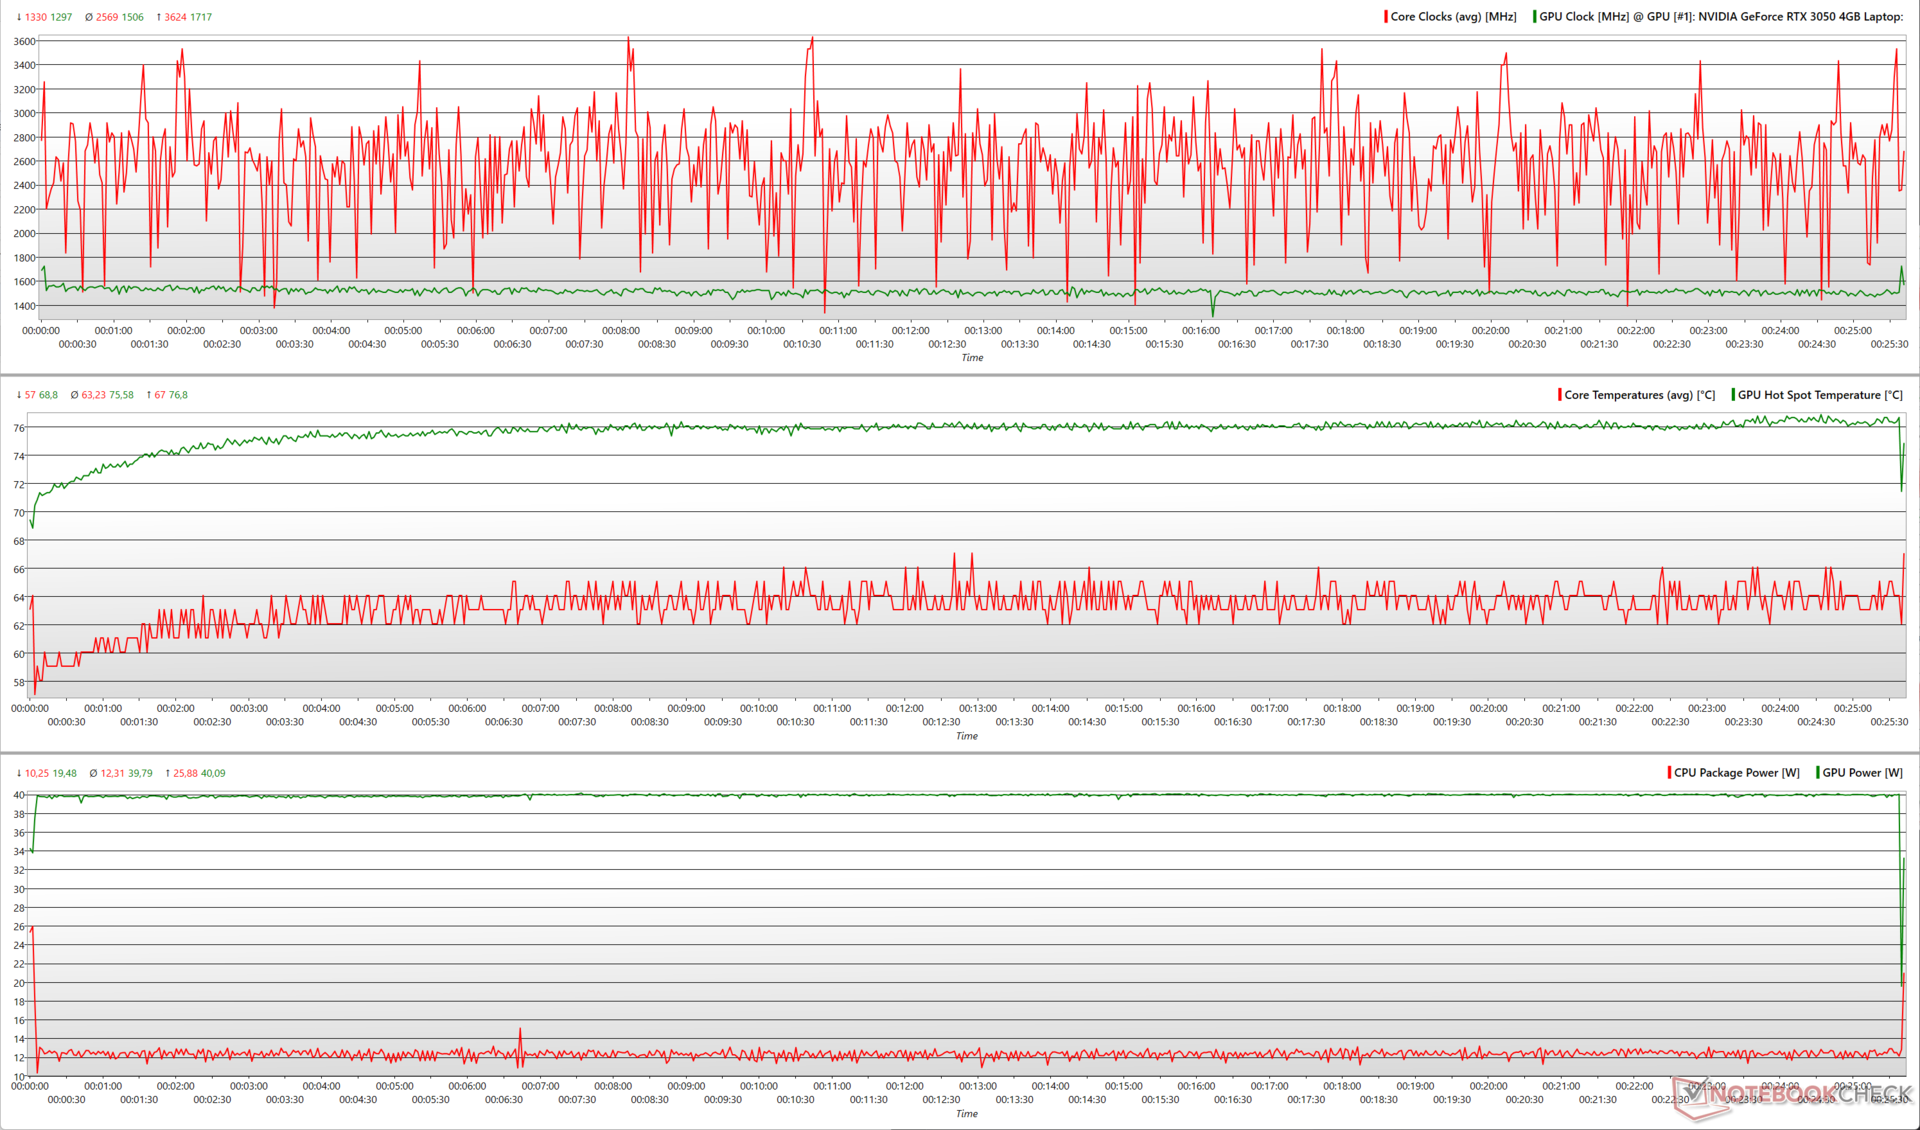
| The Witcher 3 1080p Ultra | 2.56 | 1,506 | 63.2 | 75.6 |
W przypadku Witcher 3 w rozdzielczości 1080p Ultra, RTX 3050 może osiągnąć szczytową wartość 1717 MHz, zużywając przy tym 40 W. Core i5-13500H osiąga średnio 12 W, uzyskując średnie taktowanie około 2,6 GHz.
Według Asusa, system chłodzenia VivoBook 14X może pozwolić sobie na łączne TDP 55 W z CPU i GPU. Nasze testy obciążeniowe potwierdzają to twierdzenie, ponieważ obserwujemy średnie zużycie energii na poziomie 56 W podczas uruchamiania Prime95 + FurMark i 52 W podczas testu obciążeniowego The Witcher 3.
Głośniki
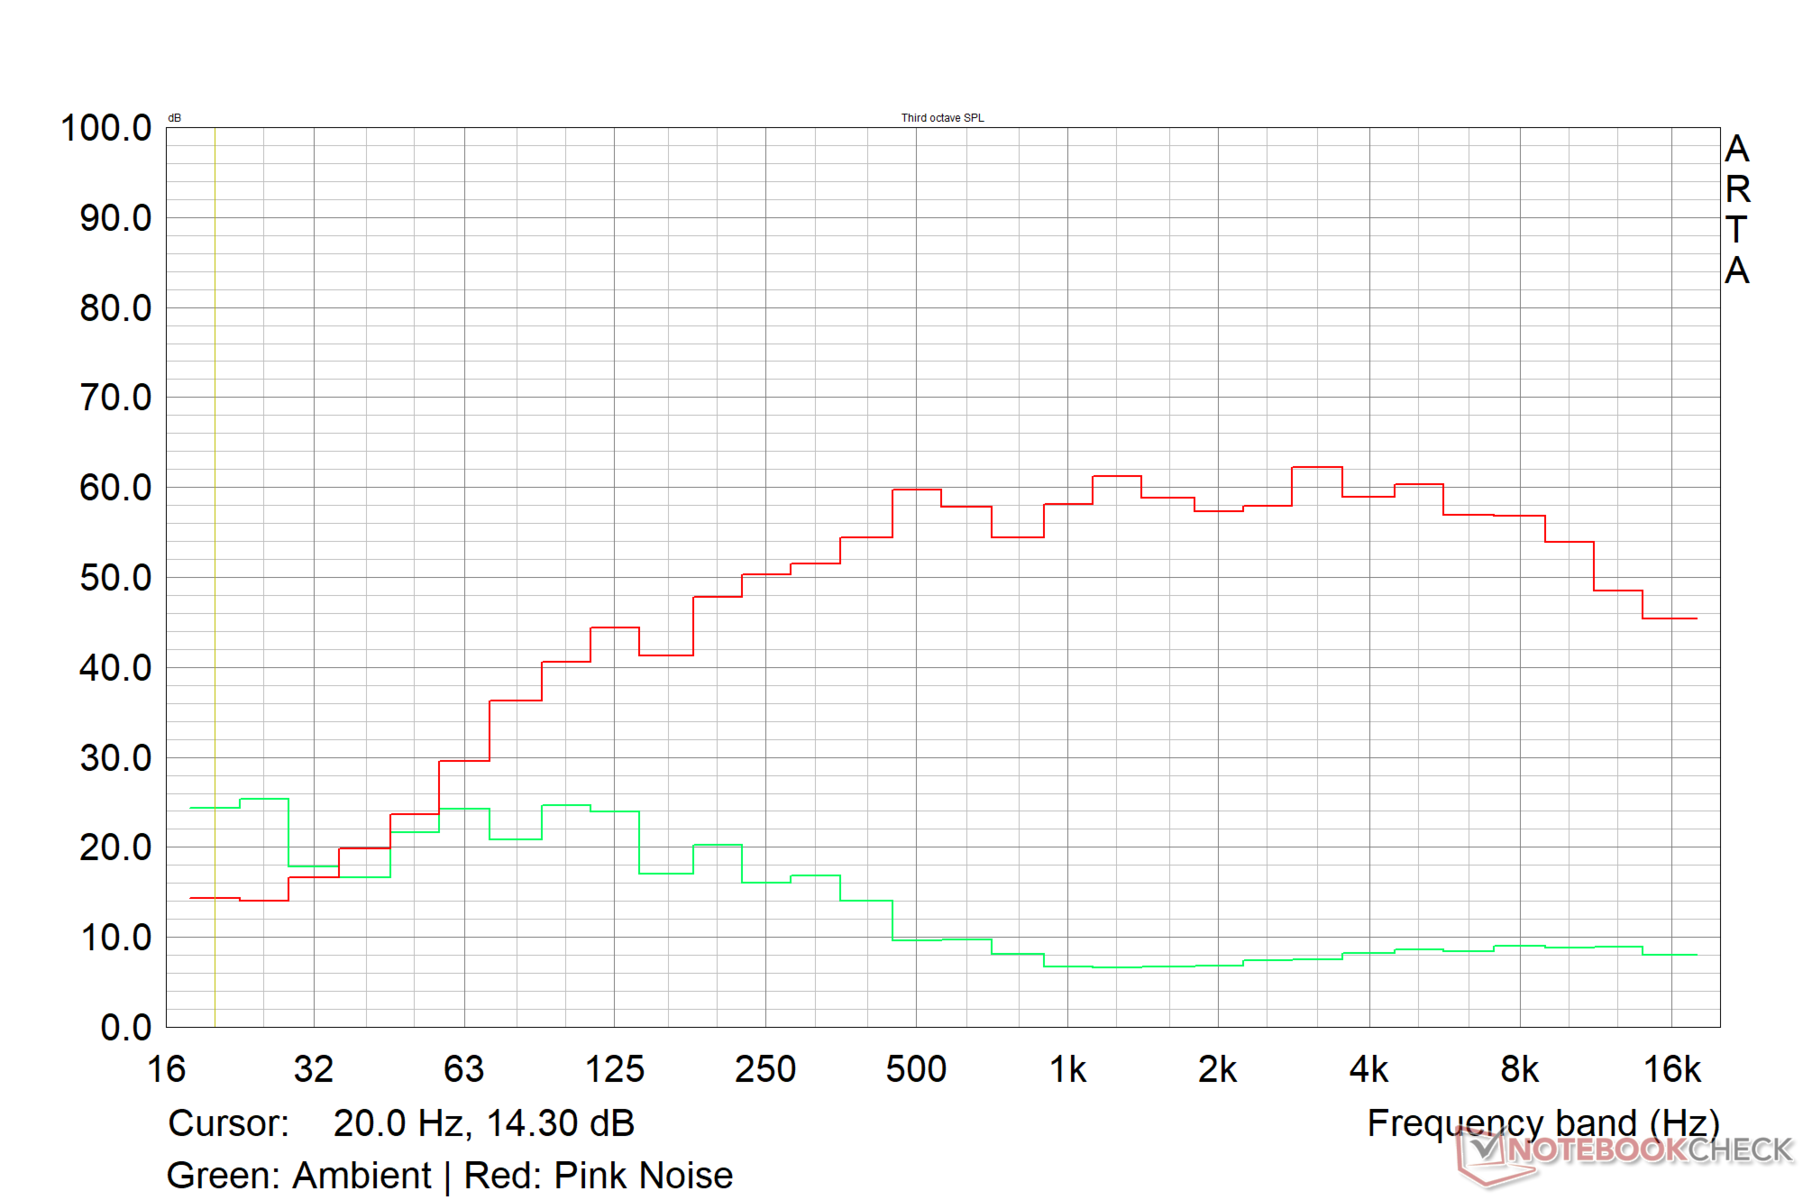
Przy szczytowej głośności 70,7 db(A), głośniki stereo VivoBook 14X nie są odpowiednio głośne. To powiedziawszy, strojenie Dirac może pozwolić sobie na pewną ilość basów przy zachowaniu zrównoważonych średnich i wysokich tonów.
Użytkownicy mogą uzyskać znacznie lepsze wrażenia dźwiękowe, podłączając zewnętrzne urządzenia audio za pomocą gniazda audio 3,5 mm lub przez Bluetooth 5.3.
Asus VivoBook 14X K3405 analiza dźwięku
(-) | niezbyt głośne głośniki (###wartość### dB)
Bas 100 - 315 Hz
(±) | zredukowany bas - średnio 10.8% niższy od mediany
(±) | liniowość basu jest średnia (7.4% delta do poprzedniej częstotliwości)
Średnie 400 - 2000 Hz
(+) | zbalansowane środki średnie - tylko 2.1% od mediany
(+) | średnie są liniowe (6.3% delta do poprzedniej częstotliwości)
Wysokie 2–16 kHz
(+) | zrównoważone maksima - tylko 2.2% od mediany
(+) | wzloty są liniowe (4.8% delta do poprzedniej częstotliwości)
Ogólnie 100 - 16.000 Hz
(+) | ogólny dźwięk jest liniowy (13.2% różnicy w stosunku do mediany)
W porównaniu do tej samej klasy
» 27% wszystkich testowanych urządzeń w tej klasie było lepszych, 5% podobnych, 68% gorszych
» Najlepszy miał deltę 5%, średnia wynosiła ###średnia###%, najgorsza wynosiła 45%
W porównaniu do wszystkich testowanych urządzeń
» 13% wszystkich testowanych urządzeń było lepszych, 3% podobnych, 84% gorszych
» Najlepszy miał deltę 4%, średnia wynosiła ###średnia###%, najgorsza wynosiła 134%
Apple MacBook Pro 16 2021 M1 Pro analiza dźwięku
(+) | głośniki mogą odtwarzać stosunkowo głośno (84.7 dB)
Bas 100 - 315 Hz
(+) | dobry bas - tylko 3.8% od mediany
(+) | bas jest liniowy (5.2% delta do poprzedniej częstotliwości)
Średnie 400 - 2000 Hz
(+) | zbalansowane środki średnie - tylko 1.3% od mediany
(+) | średnie są liniowe (2.1% delta do poprzedniej częstotliwości)
Wysokie 2–16 kHz
(+) | zrównoważone maksima - tylko 1.9% od mediany
(+) | wzloty są liniowe (2.7% delta do poprzedniej częstotliwości)
Ogólnie 100 - 16.000 Hz
(+) | ogólny dźwięk jest liniowy (4.6% różnicy w stosunku do mediany)
W porównaniu do tej samej klasy
» 0% wszystkich testowanych urządzeń w tej klasie było lepszych, 0% podobnych, 100% gorszych
» Najlepszy miał deltę 5%, średnia wynosiła ###średnia###%, najgorsza wynosiła 45%
W porównaniu do wszystkich testowanych urządzeń
» 0% wszystkich testowanych urządzeń było lepszych, 0% podobnych, 100% gorszych
» Najlepszy miał deltę 4%, średnia wynosiła ###średnia###%, najgorsza wynosiła 134%
Zarządzanie energią: Oszczędna praca na biegu jałowym i pod obciążeniem
Zużycie energii
Połączenie Core i5-13500H i RTX 3050 jest dość ekonomiczne pod względem zużycia energii w porównaniu do konkurencji. VivoBook 14X OLED jest w stanie w pełni wykorzystać dostarczony zasilacz 90 W przy maksymalnym obciążeniu.
Podczas gdy Lenovo Slim Pro 7 z procesoremRyzen 7 7735HSi RTX 3050 6 GB wykazuje o 8% niższy pobór mocy przy średnim obciążeniu, ale wykazuje wyższe pobory podczas bezczynności, grania i maksymalnego obciążenia.
| wyłączony / stan wstrzymania | |
| luz | |
| obciążenie |
|
Legenda:
min: | |
| Asus VivoBook 14X K3405 i5-13500H, GeForce RTX 3050 4GB Laptop GPU, , 2880x1800, 14" | Acer Swift X SFX14-71G i7-13700H, GeForce RTX 4050 Laptop GPU, OLED, 2880x1800, 14.5" | MSI Stealth 14 Studio A13V i7-13700H, GeForce RTX 4050 Laptop GPU, IPS, 2560x1600, 14" | Gigabyte Aero 14 OLED BMF i7-13700H, GeForce RTX 4050 Laptop GPU, OLED, 2880x1800, 14" | Lenovo Slim Pro 7 14ARP8 R7 7735HS, GeForce RTX 3050 6GB Laptop GPU, IPS, 2560x1600, 14.5" | Schenker Vision 14 2022 RTX 3050 Ti i7-12700H, GeForce RTX 3050 Ti Laptop GPU, IPS, 2880x1800, 14" | Przeciętny NVIDIA GeForce RTX 3050 4GB Laptop GPU | Średnia w klasie Multimedia | |
|---|---|---|---|---|---|---|---|---|
| Power Consumption | -30% | -100% | -14% | -36% | -26% | -37% | -16% | |
| Idle Minimum * (Watt) | 4.96 | 8.4 -69% | 10.4 -110% | 7.4 -49% | 7.6 -53% | 7.5 -51% | 7.17 ? -45% | 5.71 ? -15% |
| Idle Average * (Watt) | 7.54 | 11.5 -53% | 19.1 -153% | 8.3 -10% | 12.2 -62% | 10.4 -38% | 10.4 ? -38% | 10.1 ? -34% |
| Idle Maximum * (Watt) | 9.31 | 11.9 -28% | 19.4 -108% | 8.7 7% | 12.8 -37% | 11.4 -22% | 14.8 ? -59% | 12.4 ? -33% |
| Load Average * (Watt) | 83.4 | 84.9 -2% | 95.9 -15% | 76 9% | 76.5 8% | 83.3 -0% | 89.7 ? -8% | 65 ? 22% |
| Witcher 3 ultra * (Watt) | 73.3 | 83.6 -14% | 141.6 -93% | 70 5% | 89.5 -22% | 92.7 -26% | ||
| Load Maximum * (Watt) | 91.74 | 104.2 -14% | 203 -121% | 132 -44% | 135.7 -48% | 110.3 -20% | 124.8 ? -36% | 112.2 ? -22% |
* ... im mniej tym lepiej
Power Consumption: The Witcher 3 / Stress test
Power Consumption: External monitor
Żywotność baterii
Bateria VivoBook 14X o pojemności 63 Whr nie oferuje nadzwyczajnej żywotności, ale powinna wystarczyć na większość standardowego dnia pracy przed koniecznością ponownego naładowania.
Bateria wystarcza na prawie 10,5 godziny odtwarzania wideo 1080p H.264 przy jasności 150 nitów, co jest imponujące. Jednak wytrzymałość laptopa w grach jest znacznie krótsza i wynosi nieco ponad godzinę.
Dołączony zasilacz jest w stanie uzupełnić baterię laptopa od 0% do 60% w około 50 minut.
| Asus VivoBook 14X K3405 i5-13500H, GeForce RTX 3050 4GB Laptop GPU, 63 Wh | Acer Swift X SFX14-71G i7-13700H, GeForce RTX 4050 Laptop GPU, 76 Wh | MSI Stealth 14 Studio A13V i7-13700H, GeForce RTX 4050 Laptop GPU, 72 Wh | Gigabyte Aero 14 OLED BMF i7-13700H, GeForce RTX 4050 Laptop GPU, 63 Wh | Lenovo Slim Pro 7 14ARP8 R7 7735HS, GeForce RTX 3050 6GB Laptop GPU, 73 Wh | Schenker Vision 14 2022 RTX 3050 Ti i7-12700H, GeForce RTX 3050 Ti Laptop GPU, 99.8 Wh | Średnia w klasie Multimedia | |
|---|---|---|---|---|---|---|---|
| Czasy pracy | -17% | -17% | 15% | 30% | 41% | 53% | |
| H.264 (h) | 10.4 | 9.5 -9% | 6.6 -37% | 11.1 7% | 16.4 ? 58% | ||
| WiFi v1.3 (h) | 8.1 | 7.7 -5% | 6.3 -22% | 7.6 -6% | 10.5 30% | 10.1 25% | 12 ? 48% |
| Witcher 3 ultra (h) | 1.3 | ||||||
| Load (h) | 1.1 | 0.7 -36% | 1.2 9% | 1.5 36% | 2.1 91% | 1.675 ? 52% | |
| Reader / Idle (h) | 11.3 | 25.2 ? |
Za
Przeciw
Werdykt: Wszechstronny laptop multimedialny z wieloma możliwościami ulepszeń
Asus VivoBook 14X K3405 oferuje wydajność i sprawność, jakie zapewnia procesor Intel Core i5-13500Hw eleganckiej i lekkiej obudowie.
Laptop oferuje przyzwoitą łączność, ale wydajność Wi-Fi 6E wymaga dalszych udoskonaleń. Brakuje również złącza Thunderbolt 4.
Asus wykorzystuje panel Samsung OLED 2,8K 90 Hz w VivoBook 14X, który wykazuje doskonałą charakterystykę kolorów dla początkujących redaktorów. Panel cierpi z powodu PWM przy niższych poziomach jasności, ale wykorzystuje DC Dimming, aby nieco zrekompensować migotanie przy wyższym oświetleniu.
Asus VivoBook 14X nie krzyczy mocą i z pewnością może skorzystać z ulepszeń GPU i chłodzenia, ale jest to dobrze wyposażony laptop multimedialny, który pozwala również na lekkie granie na boku"
W naszych testach Core i5-13500H ma pewne zalety, ale obudowa i ograniczenia chłodzenia VivoBook 14X nie pozwalają procesorowi w pełni rozwinąć mięśni. Karta graficzna RTX 4050 o mocy 35 W byłaby wisienką na torcie, ale jest prawdopodobne, że Asus zdecydował się na starzejącą się RTX 3050, aby obniżyć koszty
.Chcielibyśmy również zobaczyć, jak Asus przechodzi na system chłodzenia z dwoma wentylatorami w nadchodzących iteracjach, ponieważ rozwiązanie z jednym wentylatorem w VivoBook 14X może szybko osiągnąć swoje granice.
Pomimo tych ograniczeń, Asus VivoBook 14X pozostaje atrakcyjnym laptopem multimedialnym wyższej klasy średniej w pobliżu 1 100 € (poniżej 1 00 000 €). Realną alternatywą jest Lenovo Slim Pro 7, który oferuje ekran dotykowy IPS 2,5K i Ryzen 7 7735HS.
Gigabyte Aero 14 OLED z 35 W RTX 4050 i Core i7-13700H oferuje bardziej nowoczesną konfigurację, pod warunkiem, że jesteś skłonny wydać więcej.
Cena i dostępność
Przetestowana kombinacja Core i5-13500 i RTX 3050 w VivoBook 14X OLED kosztuje 96 990 jenów, a jedynym sposobem na jej zakup jest sklep internetowy Asus India.
Amazon India i Flipkart oferują tylko SKU Core i5-13500H i RTX 2050, który kosztuje około 82 000 jenów. Amazon US i Best Buy US również wydają się mieć tylko SKU RTX 2050 z panelami OLED FHD + za około 850 USD.
Asus VivoBook 14X K3405
- 07/08/2023 v7 (old)
Vaidyanathan Subramaniam
Przezroczystość
Wyboru urządzeń do recenzji dokonuje nasza redakcja. Próbka testowa została udostępniona autorowi jako pożyczka od producenta lub sprzedawcy detalicznego na potrzeby tej recenzji. Pożyczkodawca nie miał wpływu na tę recenzję, producent nie otrzymał też kopii tej recenzji przed publikacją. Nie było obowiązku publikowania tej recenzji. Jako niezależna firma medialna, Notebookcheck nie podlega władzy producentów, sprzedawców detalicznych ani wydawców.
Tak testuje Notebookcheck
Każdego roku Notebookcheck niezależnie sprawdza setki laptopów i smartfonów, stosując standardowe procedury, aby zapewnić porównywalność wszystkich wyników. Od około 20 lat stale rozwijamy nasze metody badawcze, ustanawiając przy tym standardy branżowe. W naszych laboratoriach testowych doświadczeni technicy i redaktorzy korzystają z wysokiej jakości sprzętu pomiarowego. Testy te obejmują wieloetapowy proces walidacji. Nasz kompleksowy system ocen opiera się na setkach uzasadnionych pomiarów i benchmarków, co pozwala zachować obiektywizm.Price comparison

