

Notebookcheck Logo
Teaser

Recenzja EliteBook X Flip G2i 14 AI: Najmocniejszy jak dotąd konwertowalny laptop firmy HP jest jednocześnie jednym z najdroższych

Debiut wydajnościowy procesora Core Ultra 7 366H.

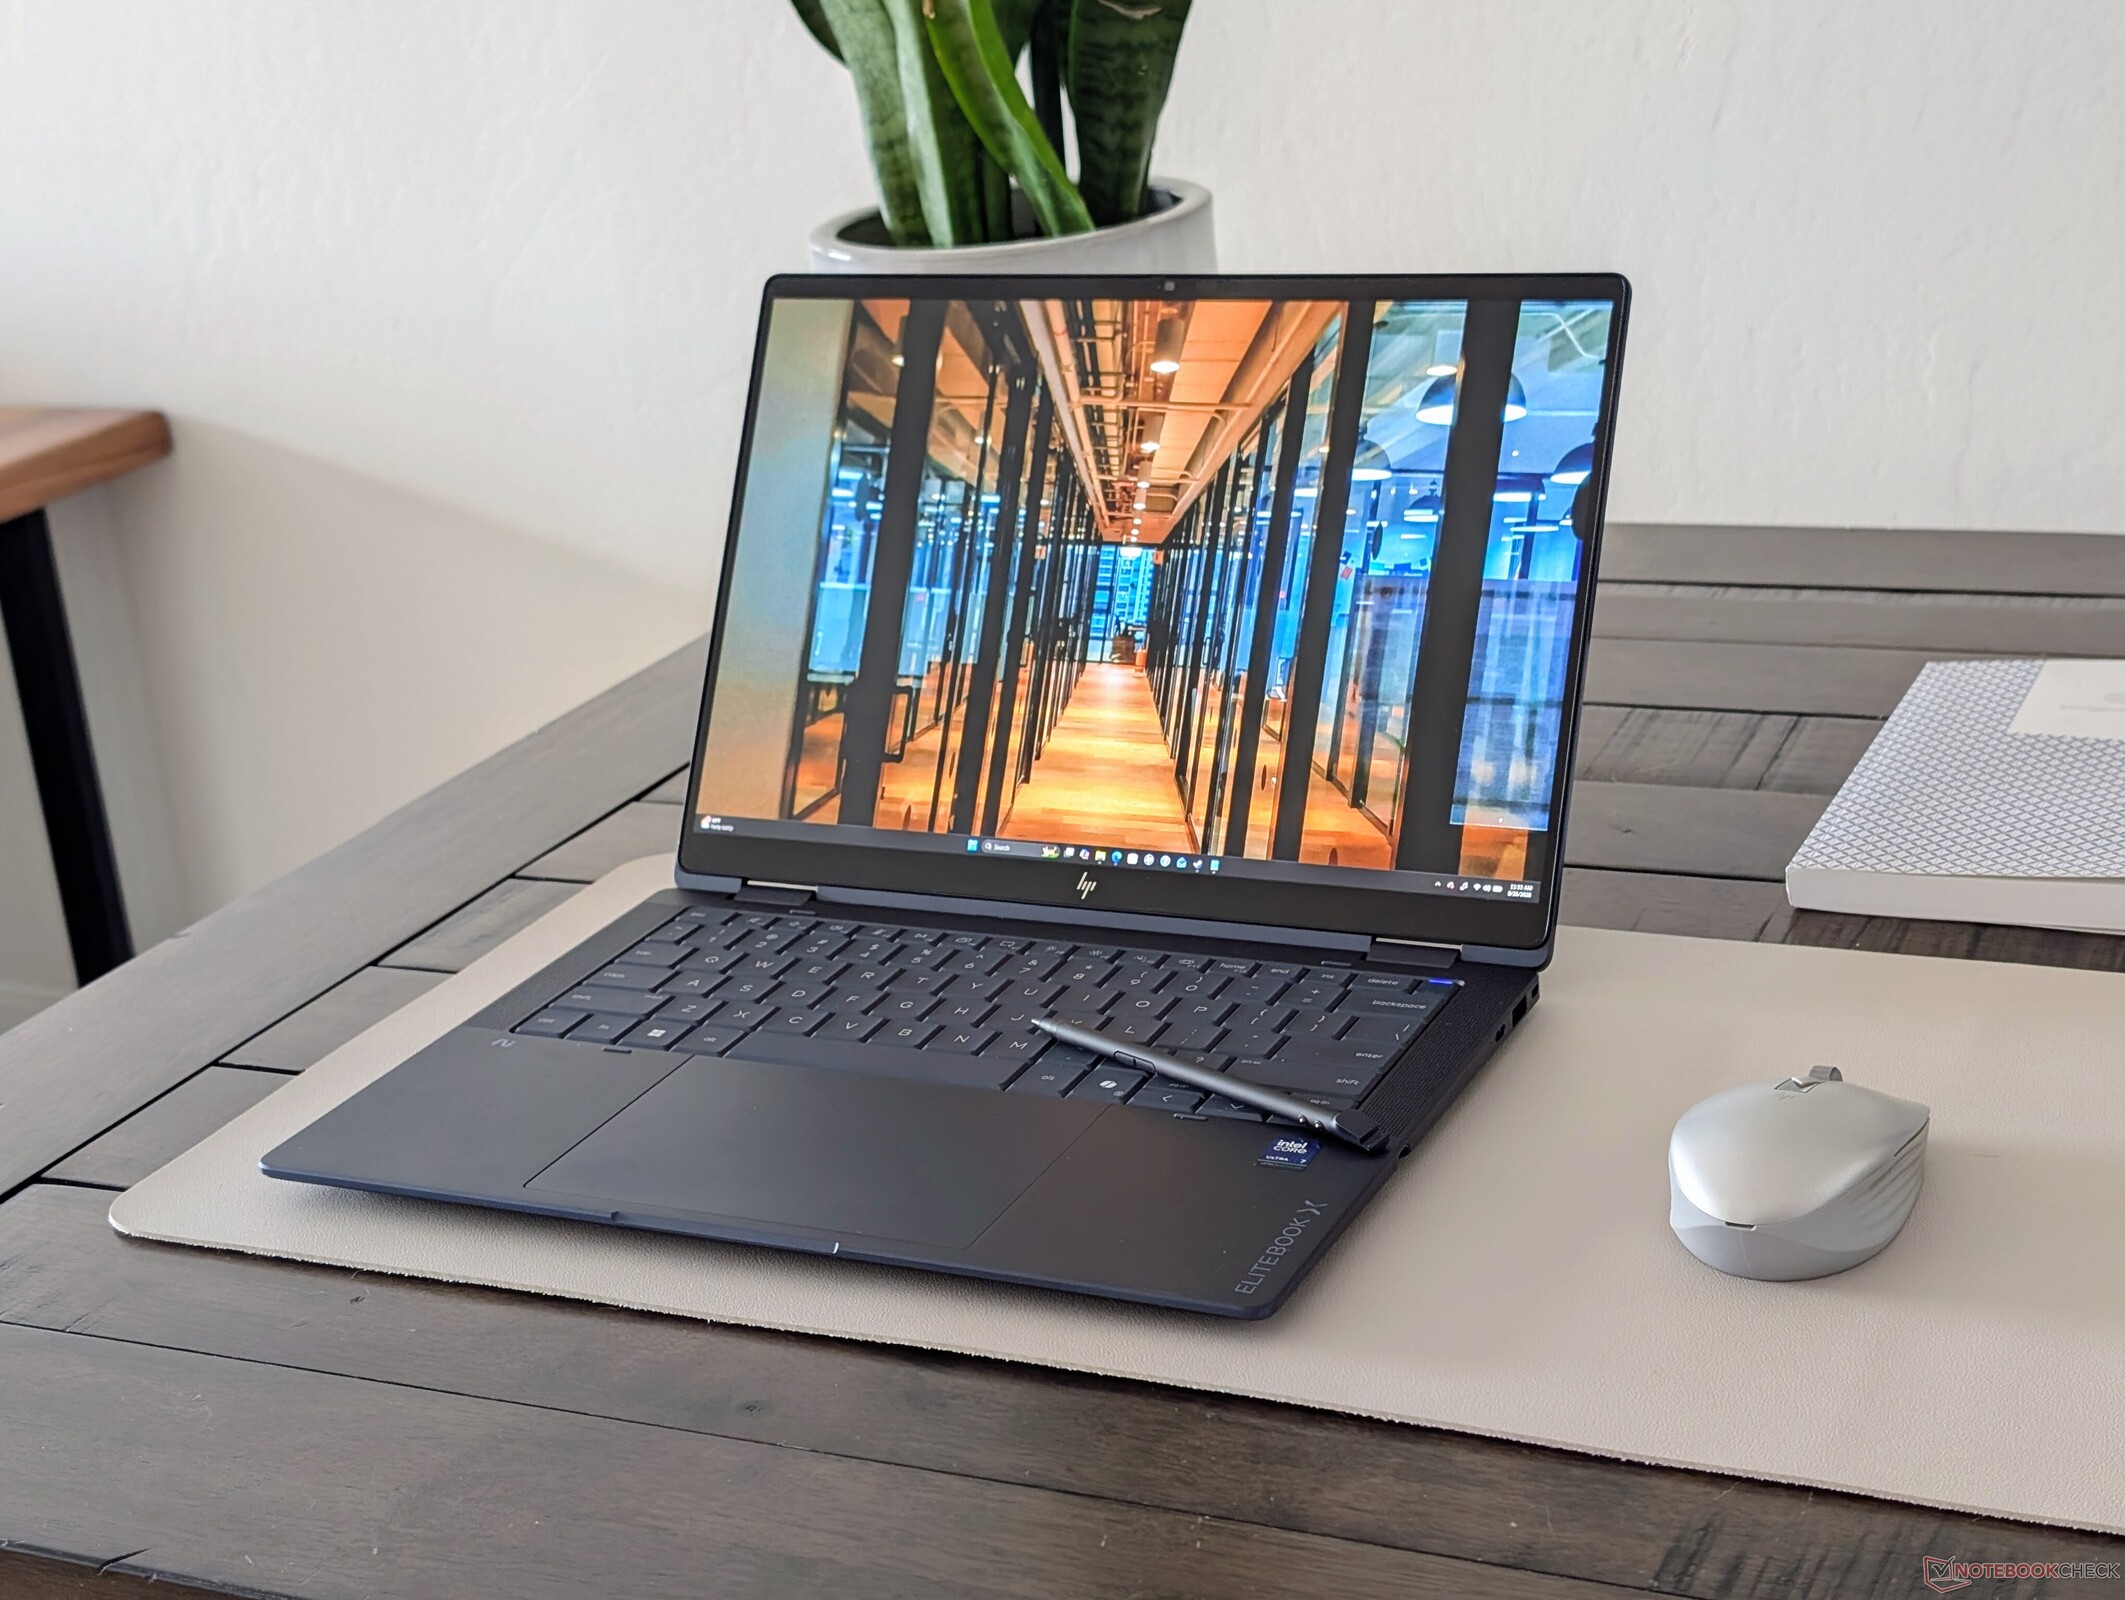
Nowy model EliteBook X Flip G2i 14 wprowadza kilka zmian w stosunku do modelu EliteBook X Flip G1i 14, w tym opcje z procesorem Intel Panther Lake oraz nowy, zintegrowany uchwyt na rysik. Jednak przy cenie wynoszącej 3000 dolarów lub więcej ten konwertowalny laptop nie należy do najtańszych.
Allen Ngo, 👁 Allen Ngo (tłumaczenie DeepL / Ninh Duy) Opublikowany 🇺🇸 🇳🇱 ...
Convertible / 2-in-1 Panther Lake Business Laptop / Notebook

Werdykt — Elegancki, ale nie tani

Modele HP EliteBook z serii X, 1000 i Ultra zazwyczaj osiągają bardzo dobre wyniki w naszych testach, a model EliteBook X Flip G2i 14 podtrzymuje tę tendencję. Urządzenia te konsekwentnie oferują efektowny wygląd zewnętrzny bez uszczerbku dla liczby portów, czasu pracy na baterii, konfiguracji, jakości dźwięku oraz jednych z najwygodniejszych klawiatur wśród laptopów biznesowych. Szczególnie liczba opcji wyświetlaczy może być oszałamiająca w porównaniu z większością innych urządzeń typu convertible. W tym roku niewielkie zmiany sprawiają, że nowy laptop EliteBook typu convertible jest jeszcze lżejszy i bardziej przyjazny w podróży niż dotychczas, zwłaszcza dla użytkowników rysika.

Należy zwrócić uwagę na kilka pułapek. Użytkownicy, którzy oczekują najwyższej jakości obrazu, powinni rozważyć konfiguracje z wyświetlaczem BrightView zamiast opcji matowych, charakteryzujących się większym ziarnem. Temperatura rdzeni procesora może również znacznie wzrosnąć podczas wykonywania bardziej wymagających zadań. Zaawansowani użytkownicy powinni rozważyć konfiguracje z procesorem Core Ultra X7, zapewniające znacznie większą wydajność graficzną niż w zeszłorocznym modelu.

Oczywiście cena staje się coraz większym problemem, ponieważ ceny modeli HP zaczynają się od 2200 dolarów, a w przypadku konfiguracji testowanego egzemplarza sięgają ponad 3500 dolarów. Alternatywne rozwiązania, takie jak Dell Pro 14 Plus 2-w-1, są dostępne w znacznie niższych cenach, nawet jeśli są grubsze i wyposażone w wolniejsze procesory Lunar Lake.

Za

+ Ekran dotykowy OLED z obsługą jasnego obrazu HDR
+ solidna, profesjonalna obudowa zewnętrzna
+ wbudowany schowek na rysik
+ głośne głośniki wewnętrzne
+ szeroki wybór portów

Przeciw

- opcja matowego panelu jest bardziej ziarnista niż oczekiwano
- trwałość technologii Turbo Boost mogłaby być lepsza
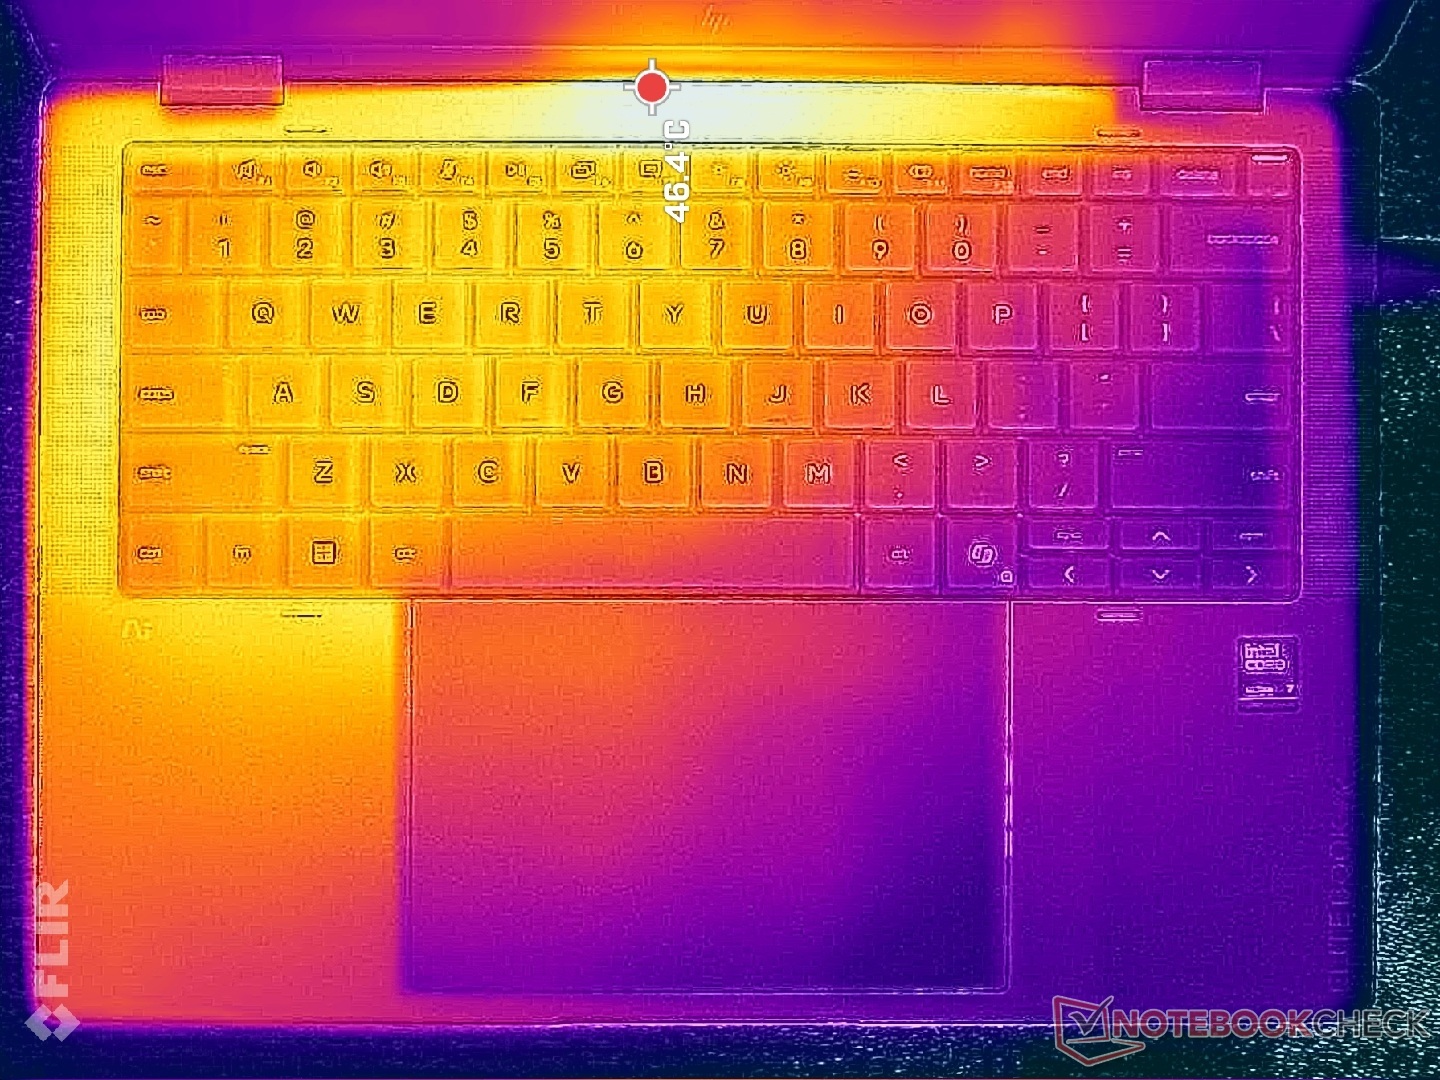
- podpórka pod lewą dłoń może się dość mocno nagrzewać
- rysik może wydawać się zbyt mały lub wąski
- kosztowny

Cena i dostępność

Komputer HP EliteBook X Flip G2i 14 jest obecnie dostępny bezpośrednio u producenta w cenie 3000 dolarów w konfiguracji przedstawionej w niniejszej recenzji. Model ten można również nabyć w sieci Best Buy.

Amazon Logo
$2,679.00
HP EliteBook X Flip G2i 14" Touchscreen Convertible Copilot+ PC 2 in 1 Notebook - WUXGA - Intel Core Ultra 7 Series 3 356H - 32 GB - 1 TB SSD - English Keyboard - Atmospheric Blue - Intel Chip - 1920

EliteBook X Flip G2i 14 stanowi następcę zeszłorocznego modelu EliteBook X Flip G1i 14, oferując zarówno zaktualizowaną konstrukcję, jak i nowsze opcje procesorów Panther Lake. Jest to jeden z najwyższej klasy laptopów konwertowalnych w 14-calowej serii EliteBook firmy HP.

Nasz egzemplarz testowy to konfiguracja z wyższej półki, wyposażona w procesor Core Ultra 7 366H oraz ekran dotykowy OLED o rozdzielczości 1800p, której cena wynosi około 3000–3500 dolarów. Dostępne są również inne wersje wyposażone w procesor Core Ultra X7 lub ekran dotykowy IPS o rozdzielczości 1200p.

Alternatywami są inne flagowe urządzenia typu 2 w 1 przeznaczone dla biznesu, takie jak Dell Latitude 9450 2 w 1, MSI Prestige 14 Flip czy seria Lenovo ThinkPad L13 2 w 1. Serii EliteBook nie należy mylić z serią OmniBook, skierowaną raczej do użytkowników prosumenckich.

Więcej recenzji produktów HP:

Specyfikacje

HP EliteBook X Flip G2i 14 AI (EliteBook X Flip Rodzina)
Procesor
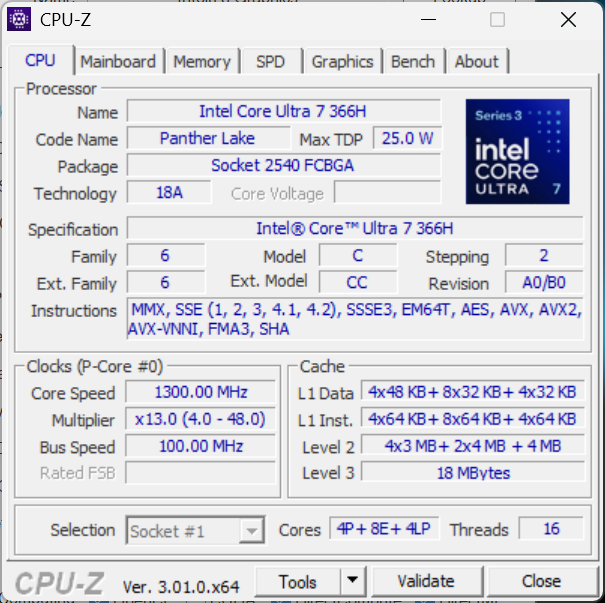
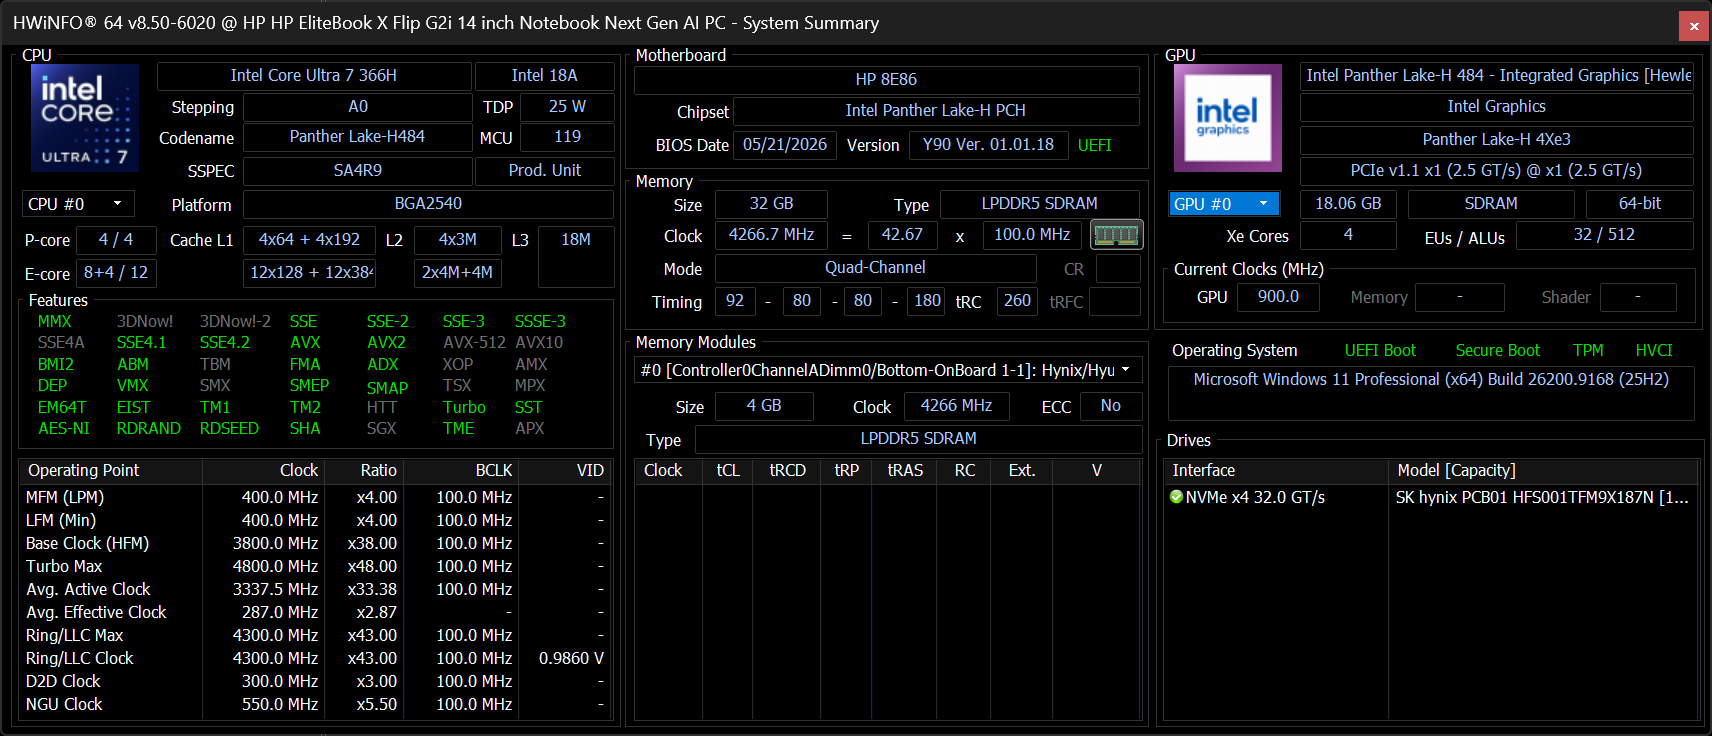
Intel Core Ultra 7 366H 16c/16t, 4 x 4.8 GHz Intel Cougar Cove P-Core, 8 x 3.8 GHz Intel Darkmont E-Core, 4 x 3.4 GHz Intel Darkmont LP E-Core, 66 W PL2 / Short Burst, 40 W PL1 / Sustained, Panther Lake
Karta grafiki
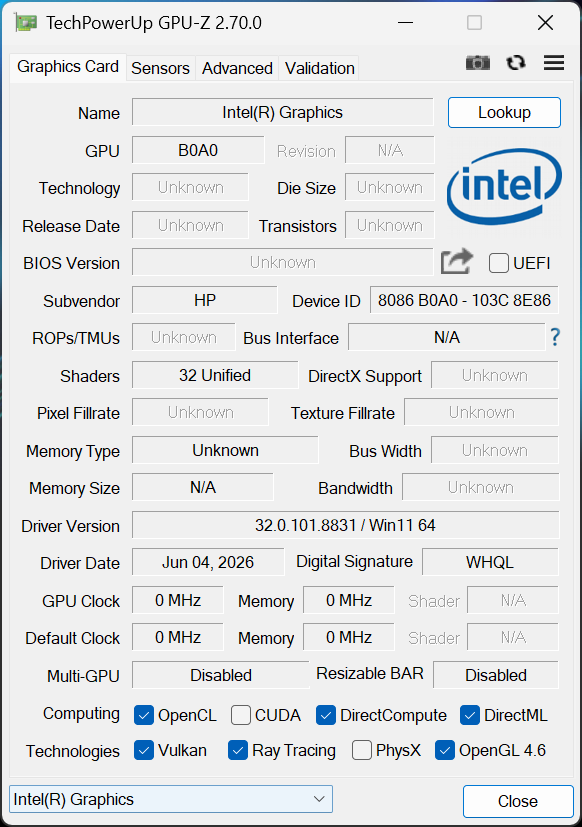
Intel Graphics 4 Xe3 Panther Lake iGPU, rdzeń: 2500 MHz, LPDDR5x, 32.0.101.8831
Pamięć
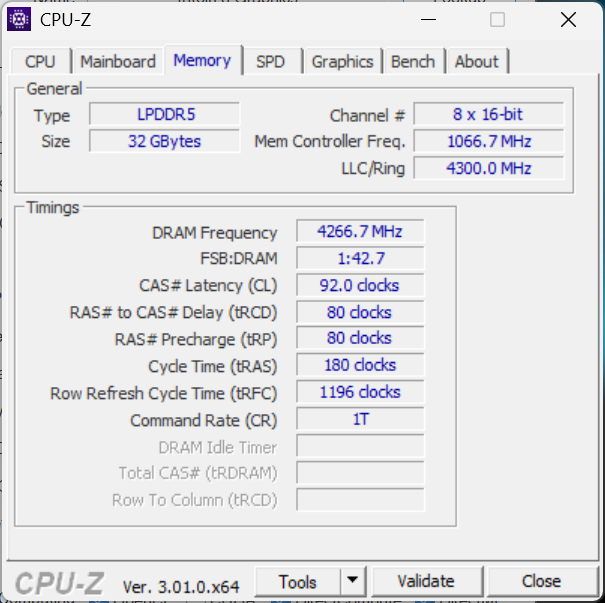
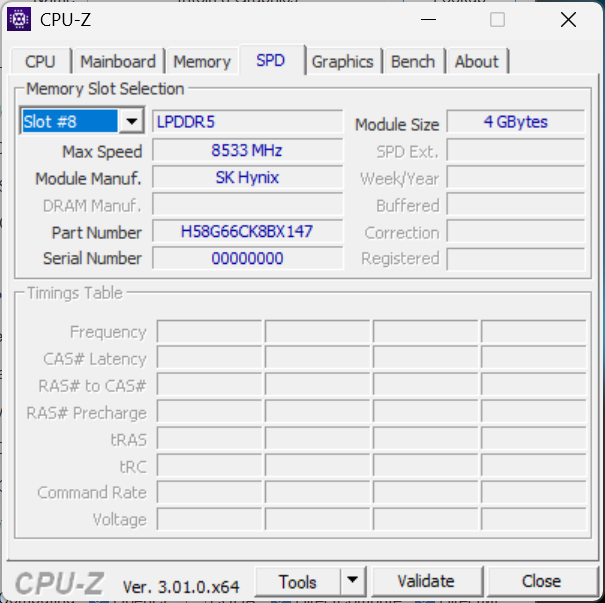
32 GB 
, LPDDR5X-8533 MT, Soldered
Matryca
14.00 cali 16:10, 2880 x 1800 pikseli 243 PPI, 10-point capacitive, natywna obsługa pióra, Samsung SDC422D, OLED, refleksująca: nie, HDR, 120 Hz
Chipset
Intel Panther Lake-H PCH
Karta dźwiękowa
Intel Panther Lake-H PCH - High Definition Audio - AVS (Audio, Voice, Speech)
Złącza
1 USB 3.0, 1 USB 3.1 Gen2, 2 USB4 40 Gbps, 2 Thunderbolt 4, USB-C Power Delivery (PD), 1 HDMI, 3 DisplayPort, gniazda audio: 3.5 mm combo, 1 czytnik linii papilarnych, Czujnik jasności, czujniki: Gyroscope, Hall
Łączność
Intel Wi-Fi 7 BE211 320MHz (a/b/g/n = Wi-Fi 4/ac = Wi-Fi 5/ax = Wi-Fi 6/ Wi-Fi 6E 6 GHz be = Wi-Fi 7), Bluetooth 6
Gabaryty
wysokość x szerokość x głębokość (mm): 17.2 x 312.7 x 219.9
Akumulator
68 Wh litowo-polimerowy
System operacyjny
Microsoft Windows 11 Pro
Kamera
kamerka: 1440p30 w/ IR and privacy shutter
Główny aparat: 5 MPix
Inne
głośniki: Quad, klawiatura: Chiclet, podświetlanie klawiatury: tak, HP Support Assist, HP, 12 miesiące(y) gwarancji
Waga
1.344 kg, zasilacz: 210 g
Cena
3500 USD
Amazon
Uwaga: Producent może używać komponentów pochodzących od różnych dostawców, w tym paneli wyświetlaczy, napędów lub kart pamięci o podobnych specyfikacjach.


Przykład

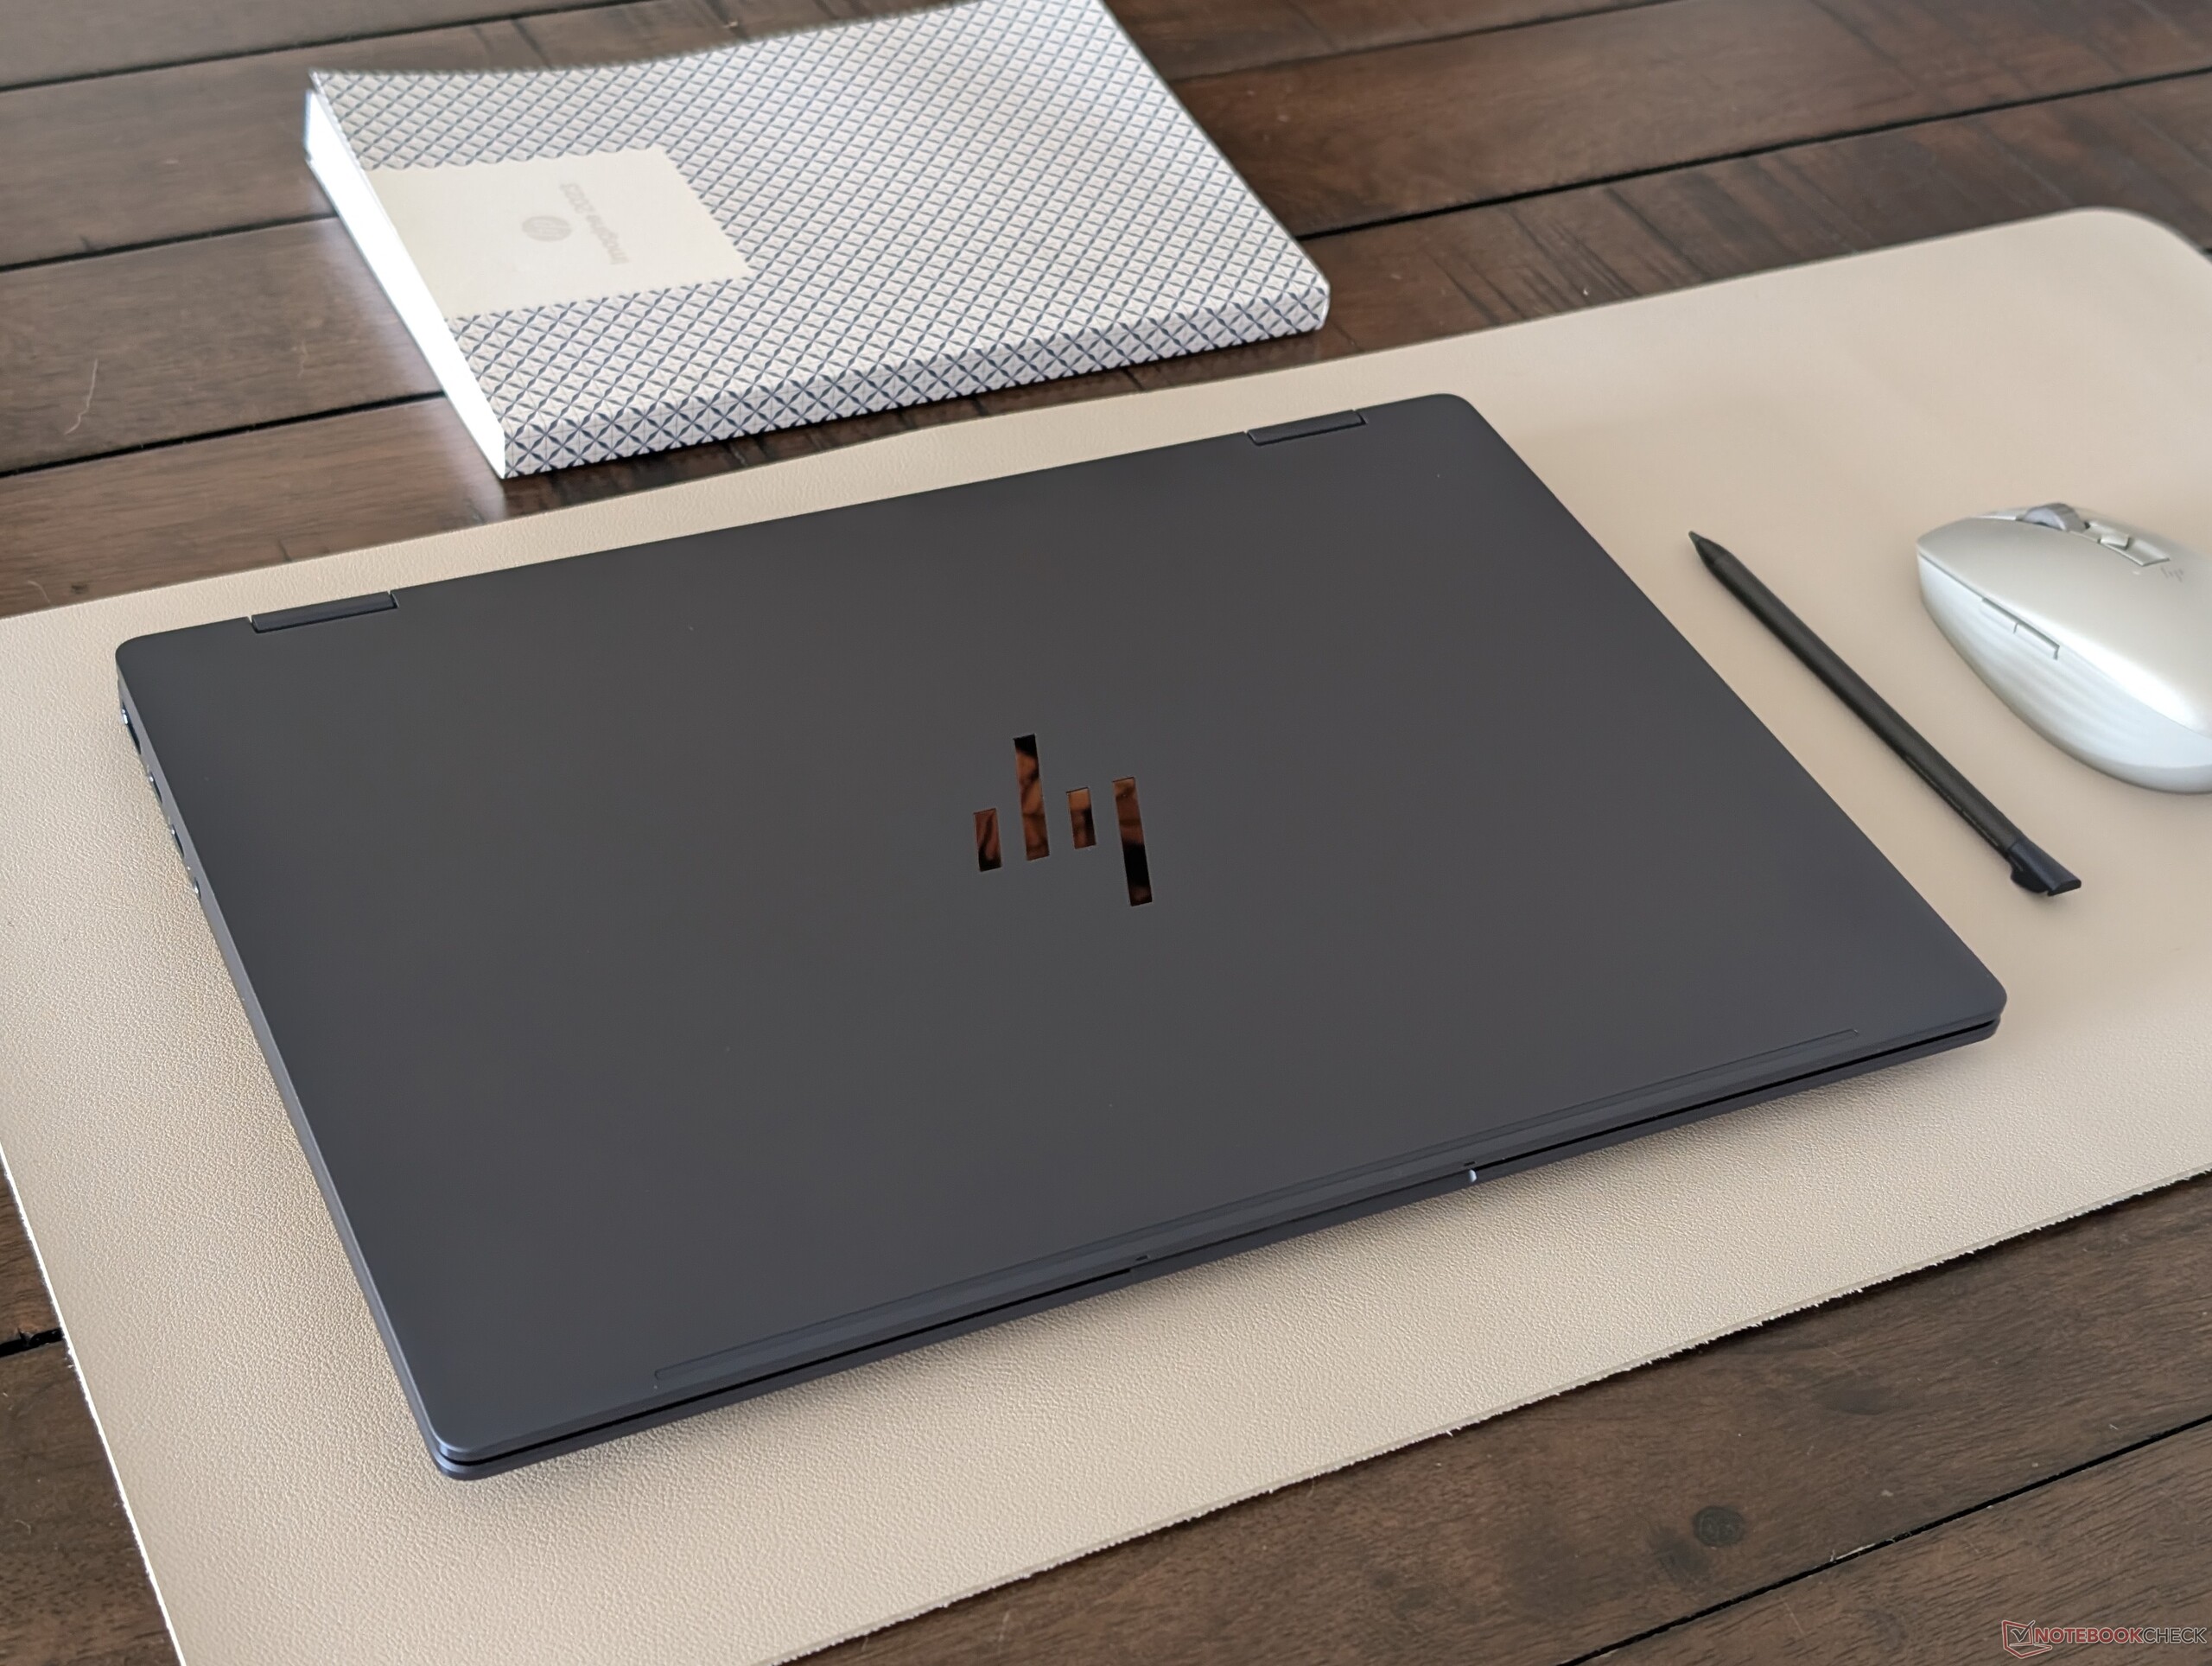
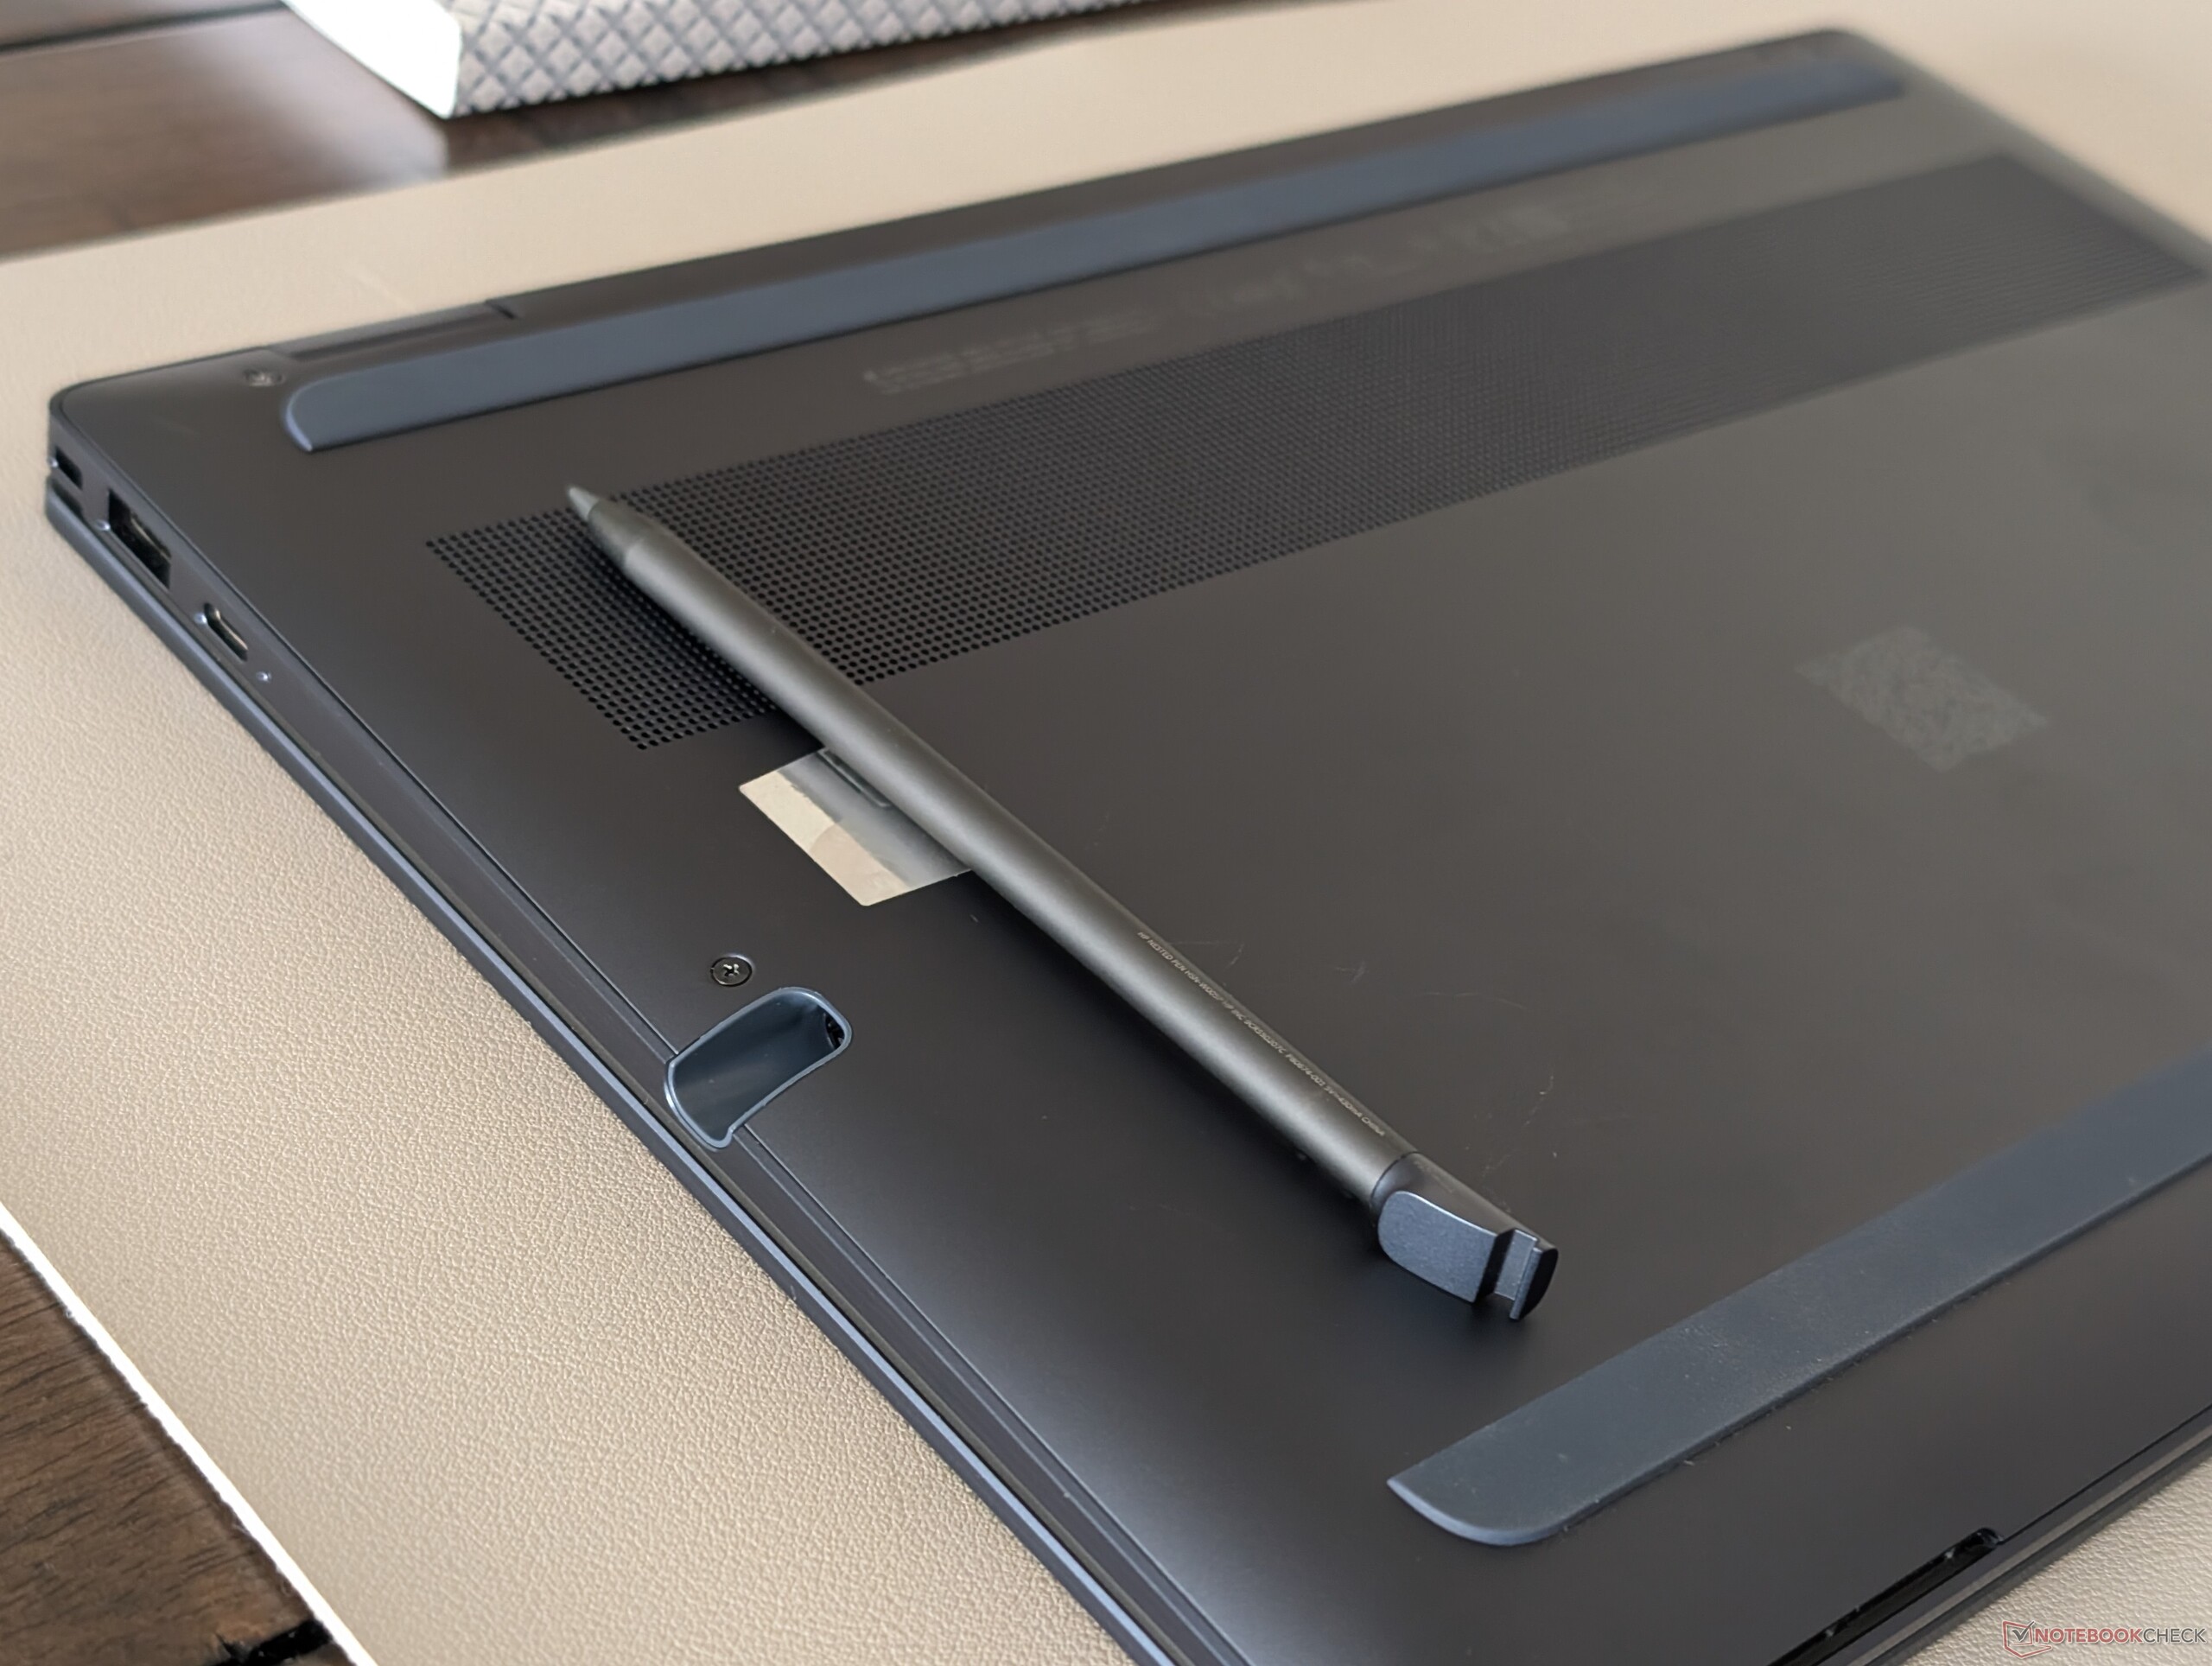
Całkowicie metalowa obudowa zawiera kilka zmian estetycznych w stosunku do zeszłorocznego modelu EliteBook X Flip G1i 14, takich jak bardziej płaskie krawędzie i narożniki, chromowana ramka oraz niewielkie zmiany wizualne w panelu dotykowym i klawiaturze. Co najważniejsze, nowy model posiada teraz wbudowaną kieszeń na pióro wzdłuż prawej krawędzi, umożliwiającą bezpieczne przechowywanie pióra aktywnego, a jednocześnie jest o prawie 200 gramów lżejszy. Pozostałe opcje portów pozostały bez zmian.
Porównanie rozmiarów

317 mm 228 mm 16.5 mm 1.4 kg312.7 mm 219.9 mm 17.2 mm 1.3 kg316 mm 222 mm 13.9 mm 1.4 kg313.9 mm 219.9 mm 14.7 mm 1.5 kg313.9 mm 219.9 mm 14.7 mm 1.5 kg310.5 mm 215 mm 16.28 mm 1.6 kg297 mm 210 mm 1 mm 5.7 g

Łączność

Przednia część: Brak portów
Poprawnie: rysik, USB-C z DisplayPort 1.4 + Power Delivery 3.0 (10 Gb/s), USB-A (5 Gb/s), Nano Lock
Tył: Brak portów
Tył: Brak portów
Po lewej: HDMI 2.1, 2x USB-C Thunderbolt 4 z DisplayPort 2.1 + Power Delivery 3.0, gniazdo słuchawkowe 3,5 mm

Komunikacja

Interfejs WAN jest opcjonalny, tak jak dotychczas. W przypadku konfiguracji bez interfejsu WAN wolne gniazdo M.2 2242 można wykorzystać na dodatkową pamięć masową.

Networking
iperf3 receive AXE11000 6GHz
HP EliteBook X Flip G2i 14 AI
Intel Wi-Fi 7 BE211 320MHz
1617 (1565min - 1650max) MBit/s
HP EliteBook X Flip G1i 14 AI
Intel BE201 320MHz
1553 (782min - 1585max) MBit/s -4%
HP EliteBook x360 1040 G11
Intel Wi-Fi 6E AX211
1486 (1312min - 1573max) MBit/s -8%
Dell Latitude 9450 2-in-1
Intel Wi-Fi 7 BE200 320MHz
1387 (1264min - 1447max) MBit/s -14%
iperf3 transmit AXE11000 6GHz
HP EliteBook X Flip G1i 14 AI
Intel BE201 320MHz
1664 (1521min - 1752max) MBit/s +33%
HP EliteBook x360 1040 G11
Intel Wi-Fi 6E AX211
1408 (1281min - 1531max) MBit/s +13%
HP EliteBook X Flip G2i 14 AI
Intel Wi-Fi 7 BE211 320MHz
1247 (945min - 1408max) MBit/s
Dell Latitude 9450 2-in-1
Intel Wi-Fi 7 BE200 320MHz
1049 (742min - 1160max) MBit/s -16%
01002003004005006007008009001000110012001300140015001600Tooltip
HP EliteBook X Flip G2i 14 AI; iperf3 transmit AXE11000 6GHz; iperf 3.1.3: Ø1247 (945-1408) MBit/s
HP EliteBook X Flip G2i 14 AI; iperf3 receive AXE11000 6GHz; iperf 3.1.3: Ø1616 (1565-1650) MBit/s

Kamera internetowa

ColorChecker
9.4 ∆E
10.6 ∆E
9.3 ∆E
10.5 ∆E
9.1 ∆E
11.7 ∆E
8.4 ∆E
8 ∆E
14.3 ∆E
7.8 ∆E
10.7 ∆E
6.4 ∆E
5.5 ∆E
14.5 ∆E
19.5 ∆E
4.7 ∆E
11.7 ∆E
12.2 ∆E
5.6 ∆E
5.3 ∆E
7.7 ∆E
12.2 ∆E
9.8 ∆E
4 ∆E
ColorChecker HP EliteBook X Flip G2i 14 AI: 9.53 ∆E min: 3.97 - max: 19.48 ∆E

Konserwacja

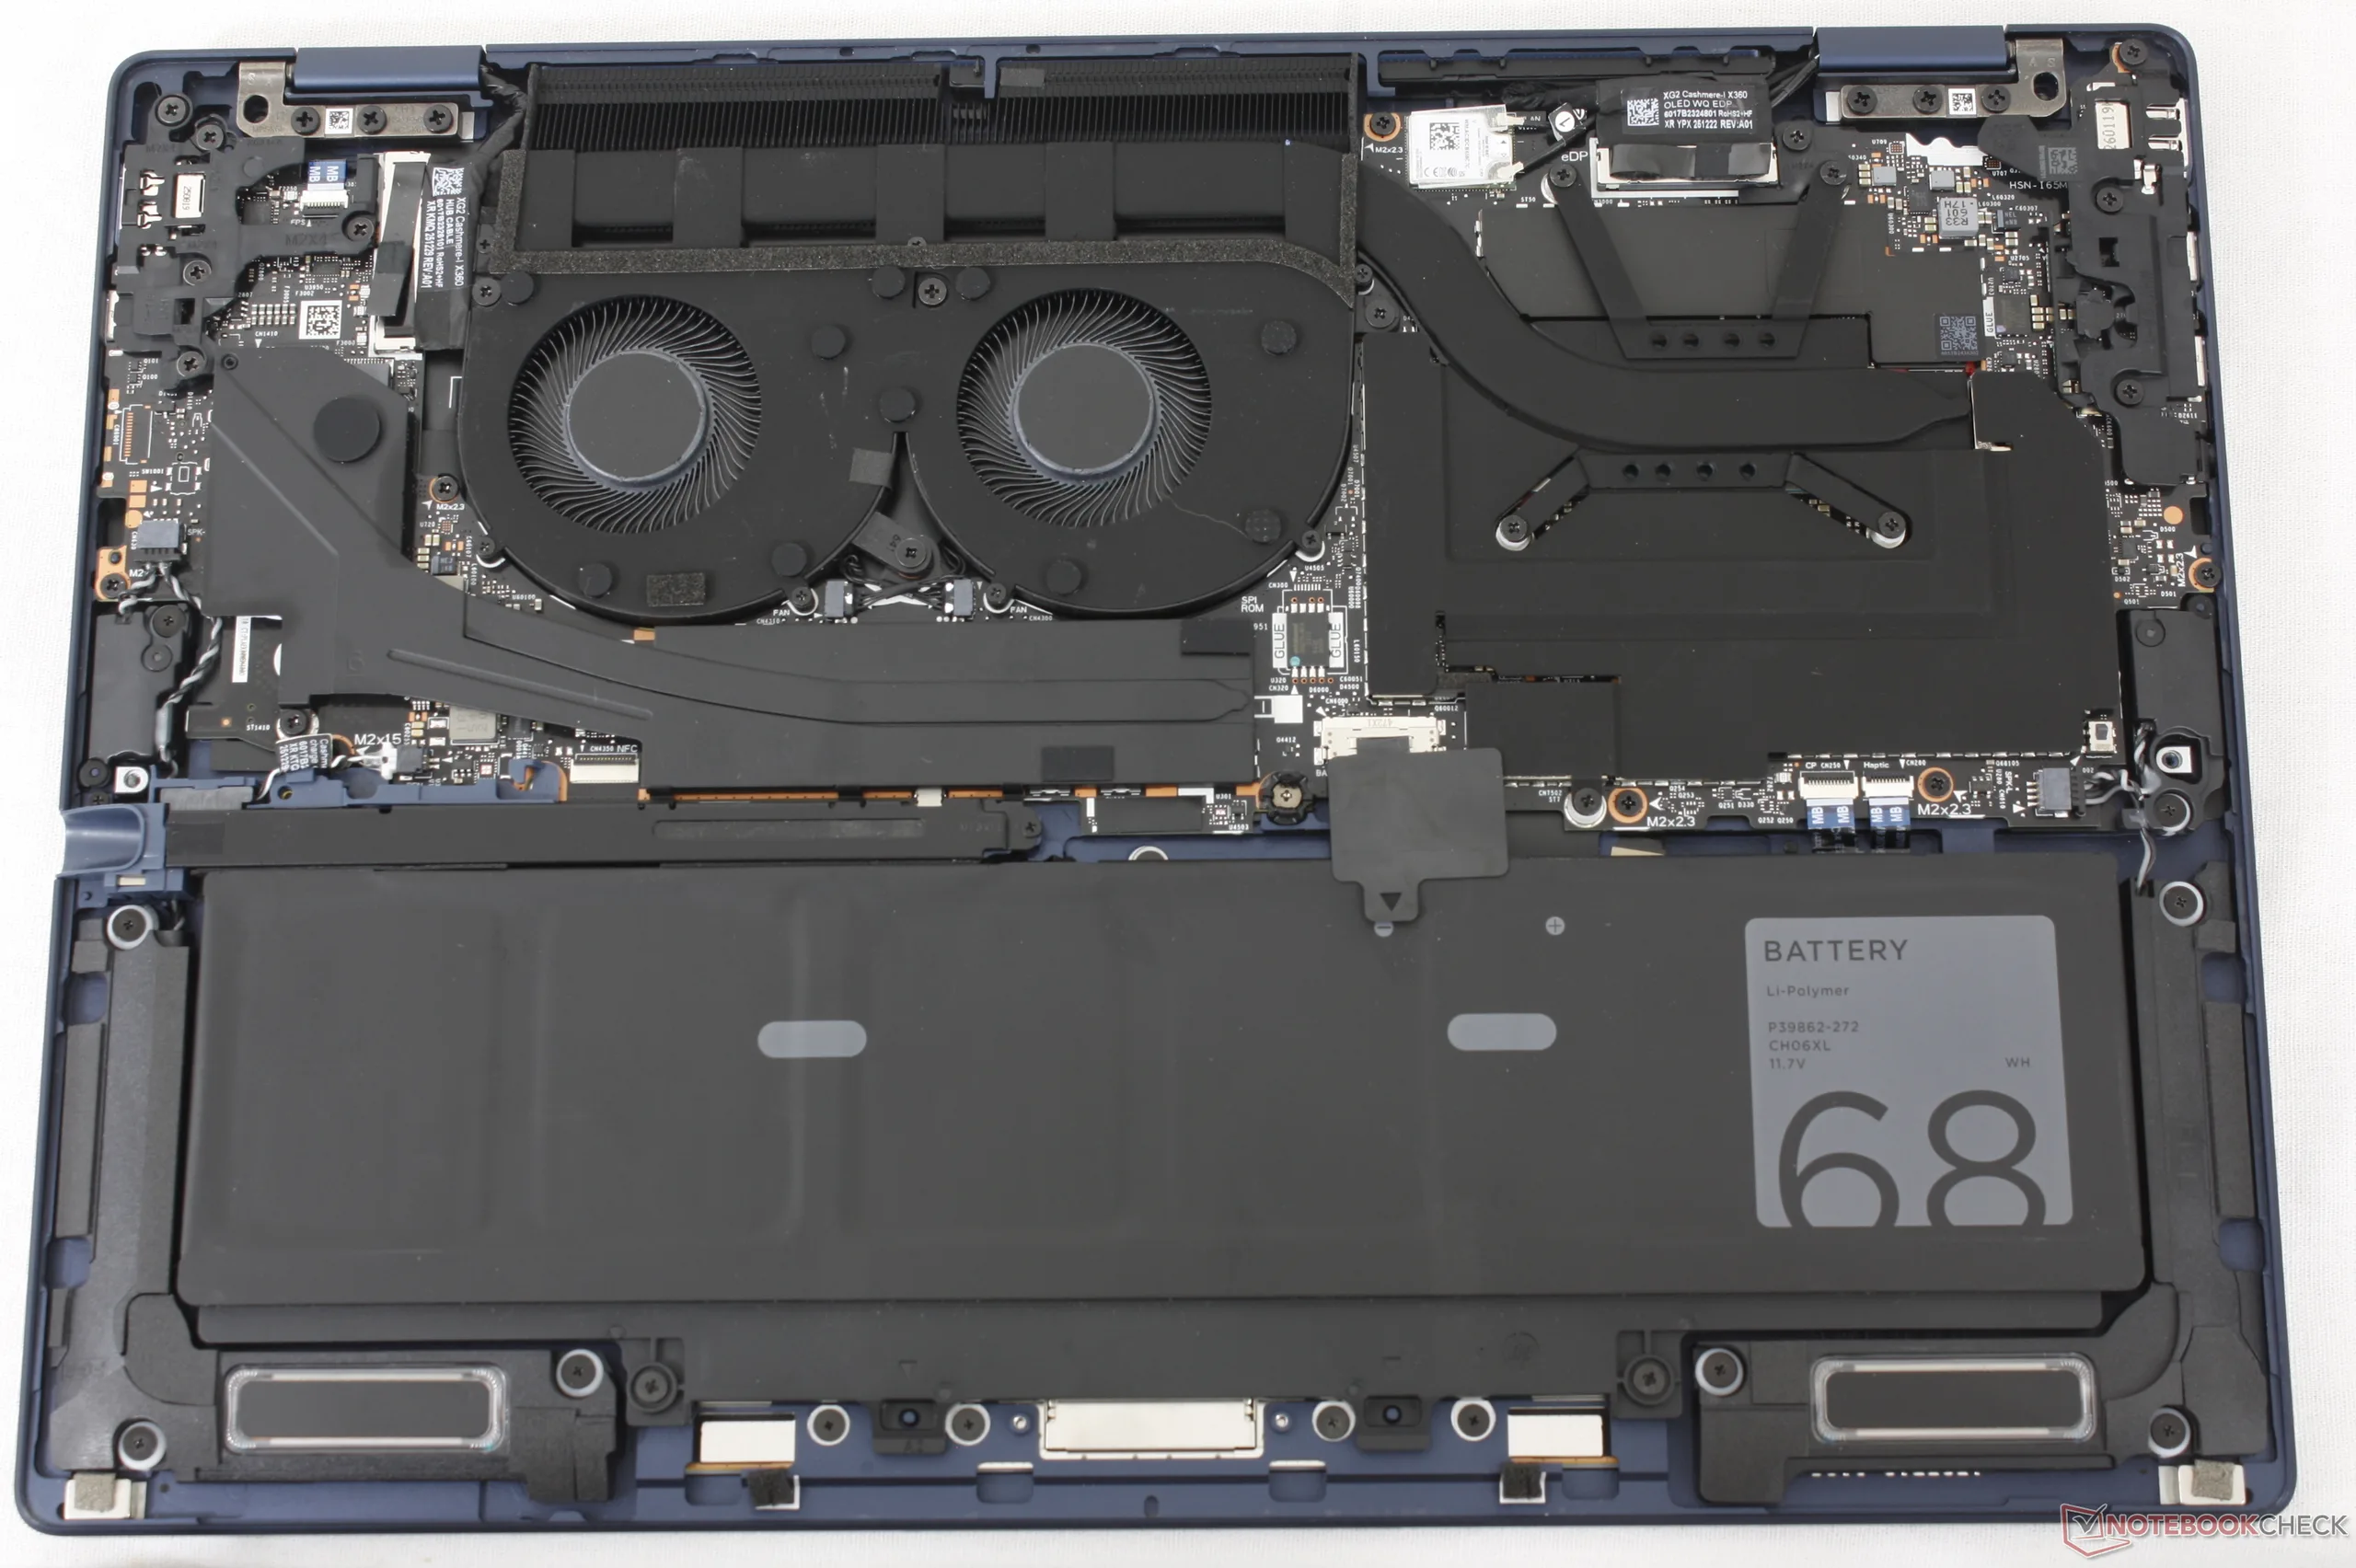
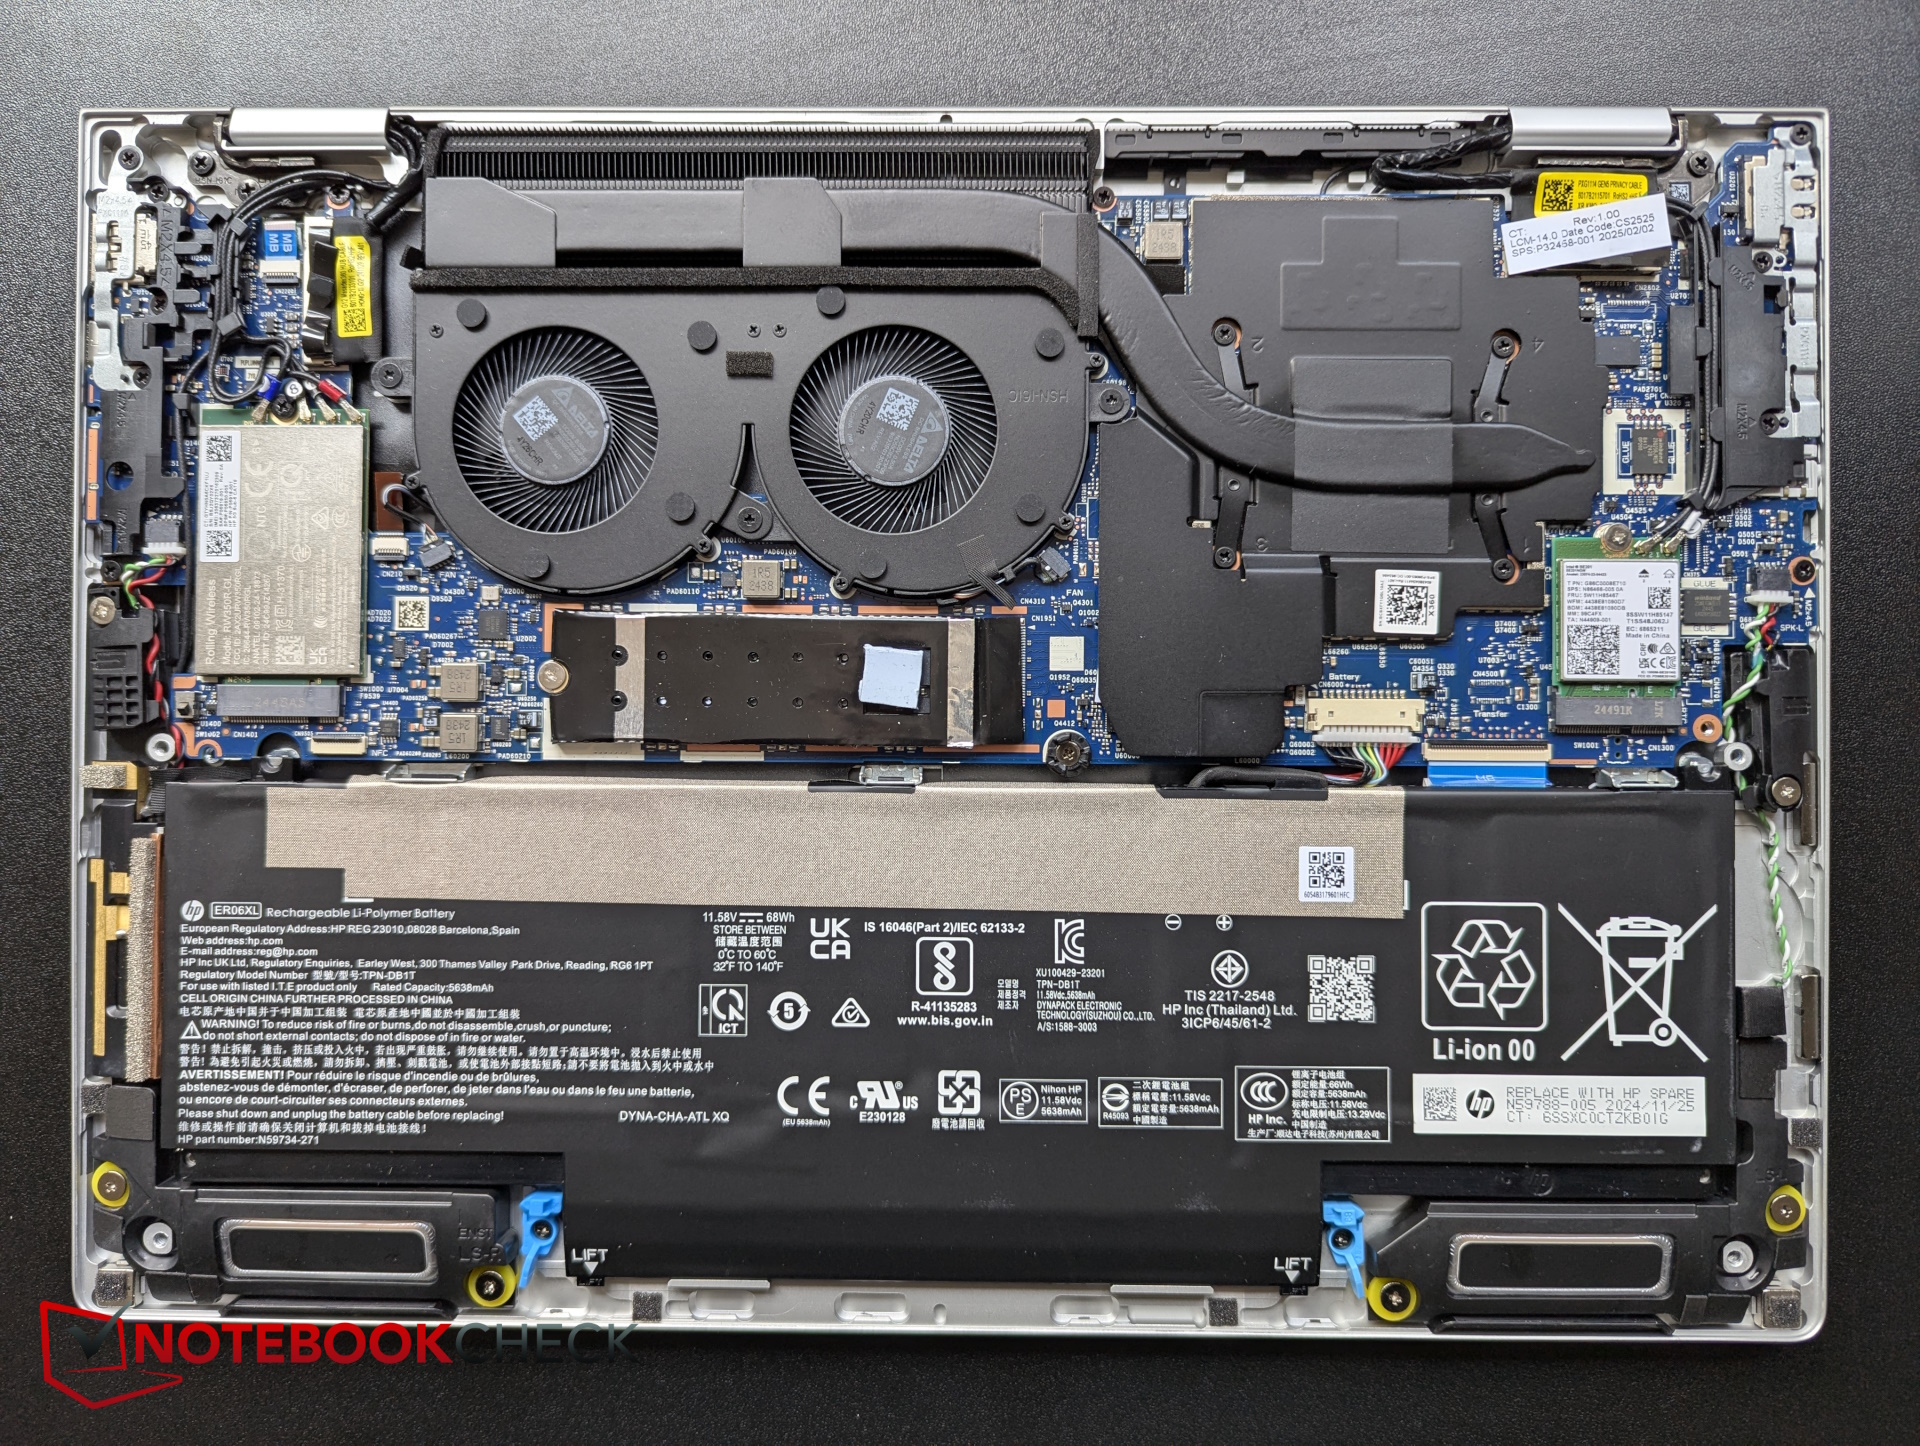
EliteBook X Flip G2i 14. Model ten został wyposażony w dedykowany radiator dla dysku SSD PCIe5 NVMe.
EliteBook X Flip G1i 14 dla porównania

Zrównoważony rozwój

Podobnie jak w przypadku zeszłorocznego modelu G1i, tegoroczny model składa się z tworzywa PCC oraz metali pochodzących z recyklingu w różnych proporcjach. Opakowanie nie zawiera tworzyw sztucznych i nadaje się w całości do recyklingu.

Akcesoria i gwarancja

W zestawie detalicznym znajduje się aktywne pióro stylusowe. W przypadku zakupu w Stanach Zjednoczonych standardowo udzielana jest trzyletnia ograniczona gwarancja producenta.

Urządzenia wejściowe
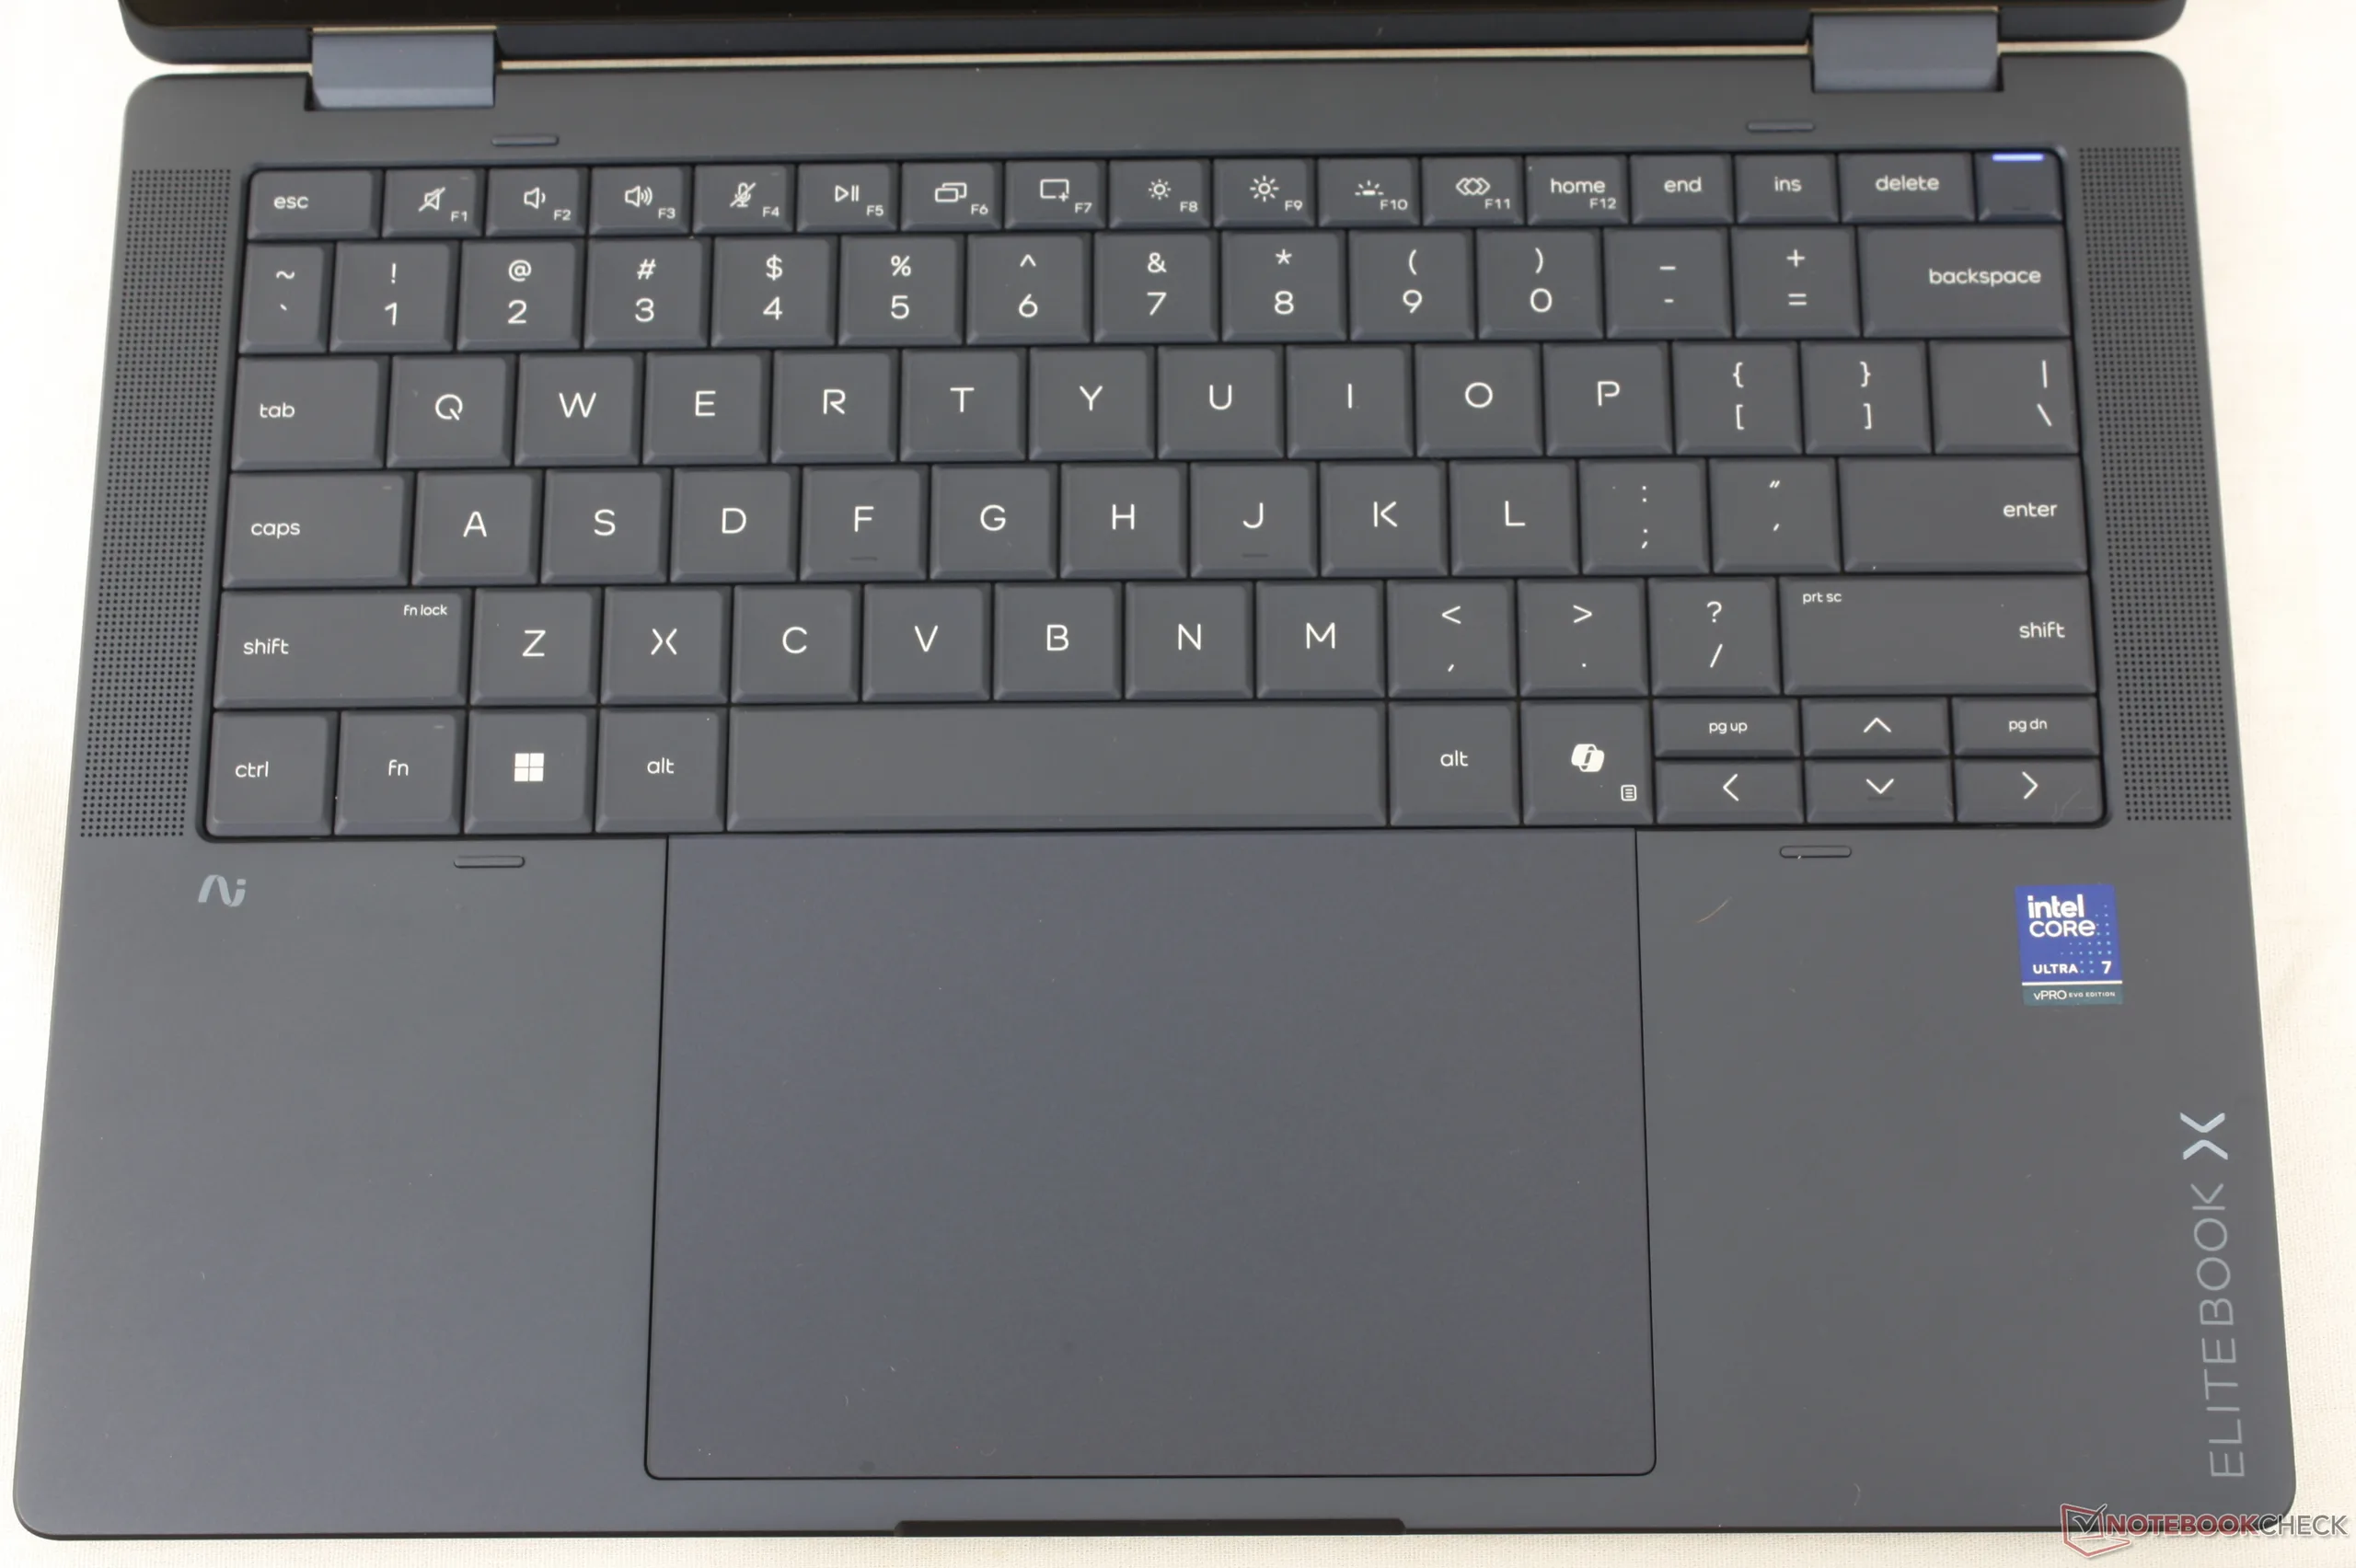
Większy panel dotykowy z efektem haptycznym (13,8 x 9,1 cm). Klawisze typu chiclet z modelu G1i zostały zastąpione klawiszami ze ściętymi krawędziami, przy czym zachowano komfort pisania.

Wyświetl

Matowa nakładka RGB jest zauważalnie bardziej ziarnista niż w przypadku większości innych wyświetlaczy

Dostępne są opcje wyświetlaczy o rozdzielczości 1800p (w technologii OLED) i 1200p (w technologii IPS), a dodatkowe opcje obejmują wyświetlacze Tandem OLED, Sure View oraz wykończenie błyszczące zamiast matowego. Testowany przez nas egzemplarz został wyposażony w droższą opcję: matowy wyświetlacz Tandem OLED o rozdzielczości 1800p i częstotliwości odświeżania 120 Hz. Chociaż specyfikacje techniczne są imponujące, należy pamiętać, że matowa powłoka wydaje się bardziej ziarnista niż w przypadku większości innych matowych paneli, przez co kolory i tekst nie są tak wyraziste ani ostre, jeśli skonfiguruje się EliteBook z matowym wyświetlaczem.

Zgodnie z pomiarami naszego kolorymetru X-Rite maksymalna jasność osiąga wartość 1005 nitów przy włączonej funkcji HDR. W przeciwnym razie jasność treści SDR osiąga maksymalnie 469 nitów.

466.1
cd/m²
465.9
cd/m²
473.4
cd/m²
472.3
cd/m²
468.9
cd/m²
470.8
cd/m²
475.2
cd/m²
468.8
cd/m²
465.8
cd/m²
podświetlenie ekranu
Samsung SDC422D testowany z X-Rite i1Pro 3
maksimum: 475.2 cd/m² (Nits) średnia: 469.7 cd/m² Minimum: 3.57 cd/m²
rozświetlenie: 98 %
na akumulatorze: 468.9 cd/m²
kontrast: ∞:1 (czerń: 0 cd/m²)
ΔE ColorChecker Calman: 3.26 | ∀{0.5-29.43 Ø4.7}
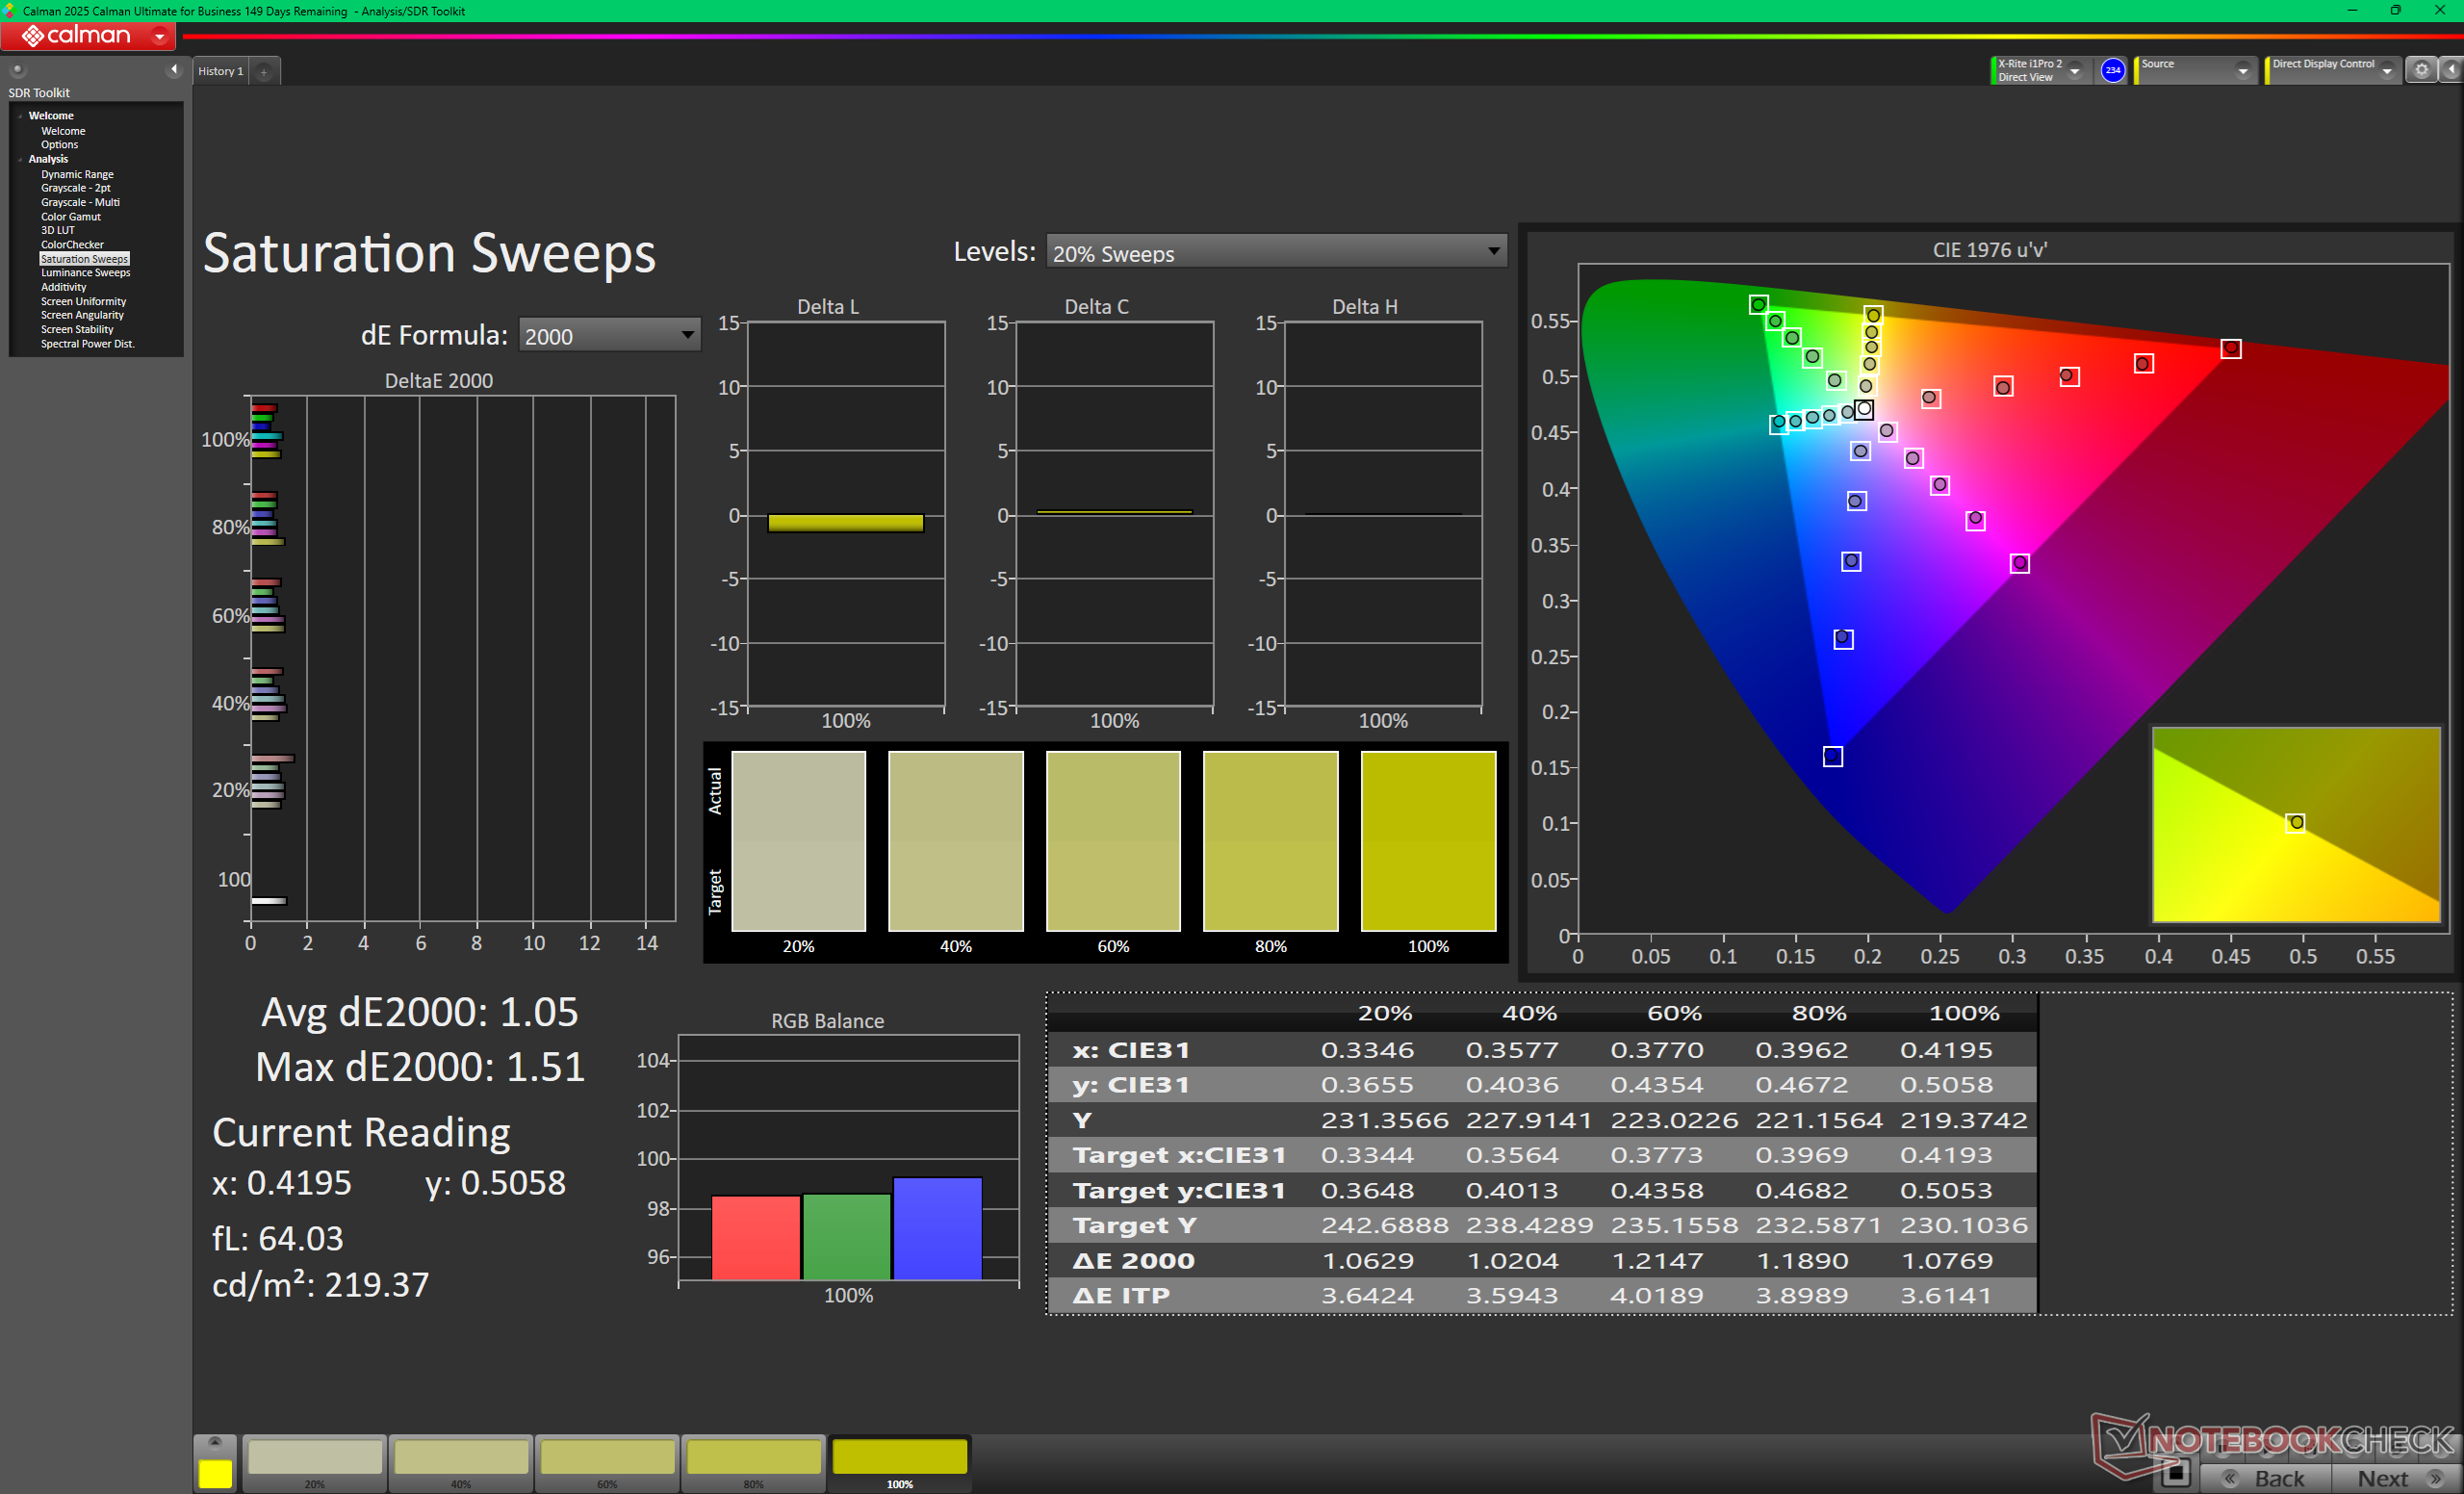
calibrated: 1.05
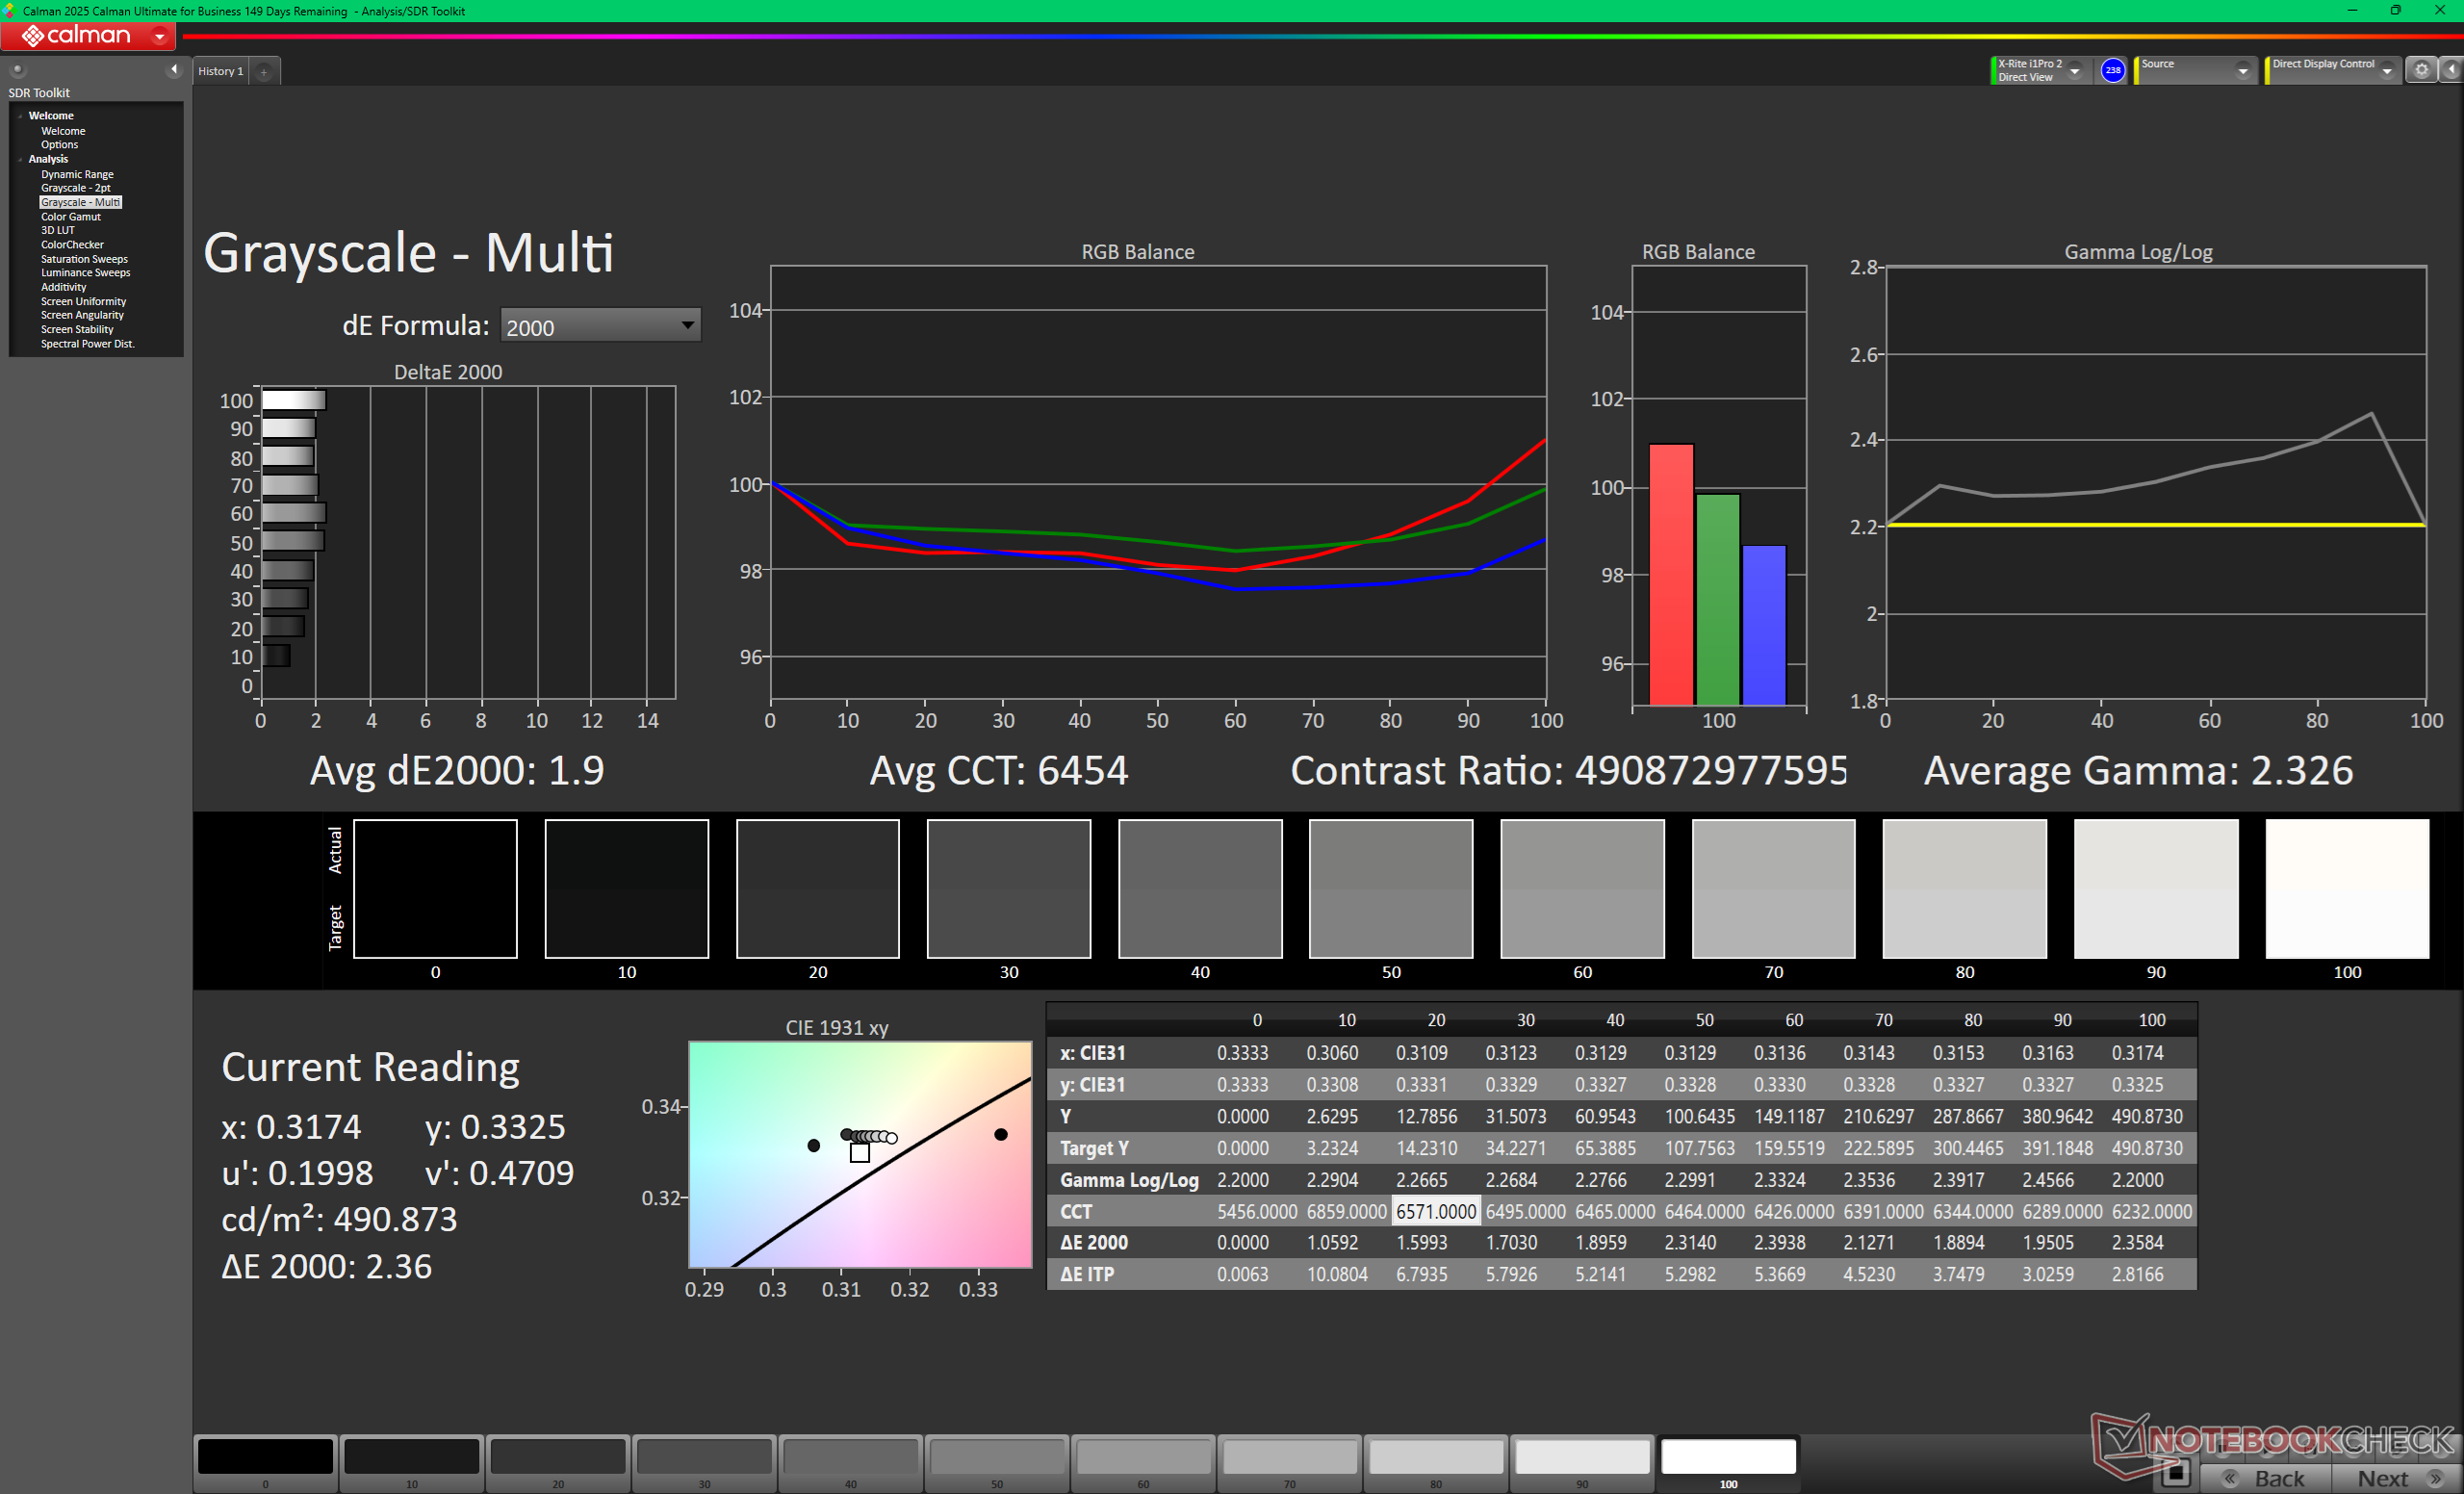
ΔE Greyscale Calman: 1.9 | ∀{0.09-98 Ø4.95}
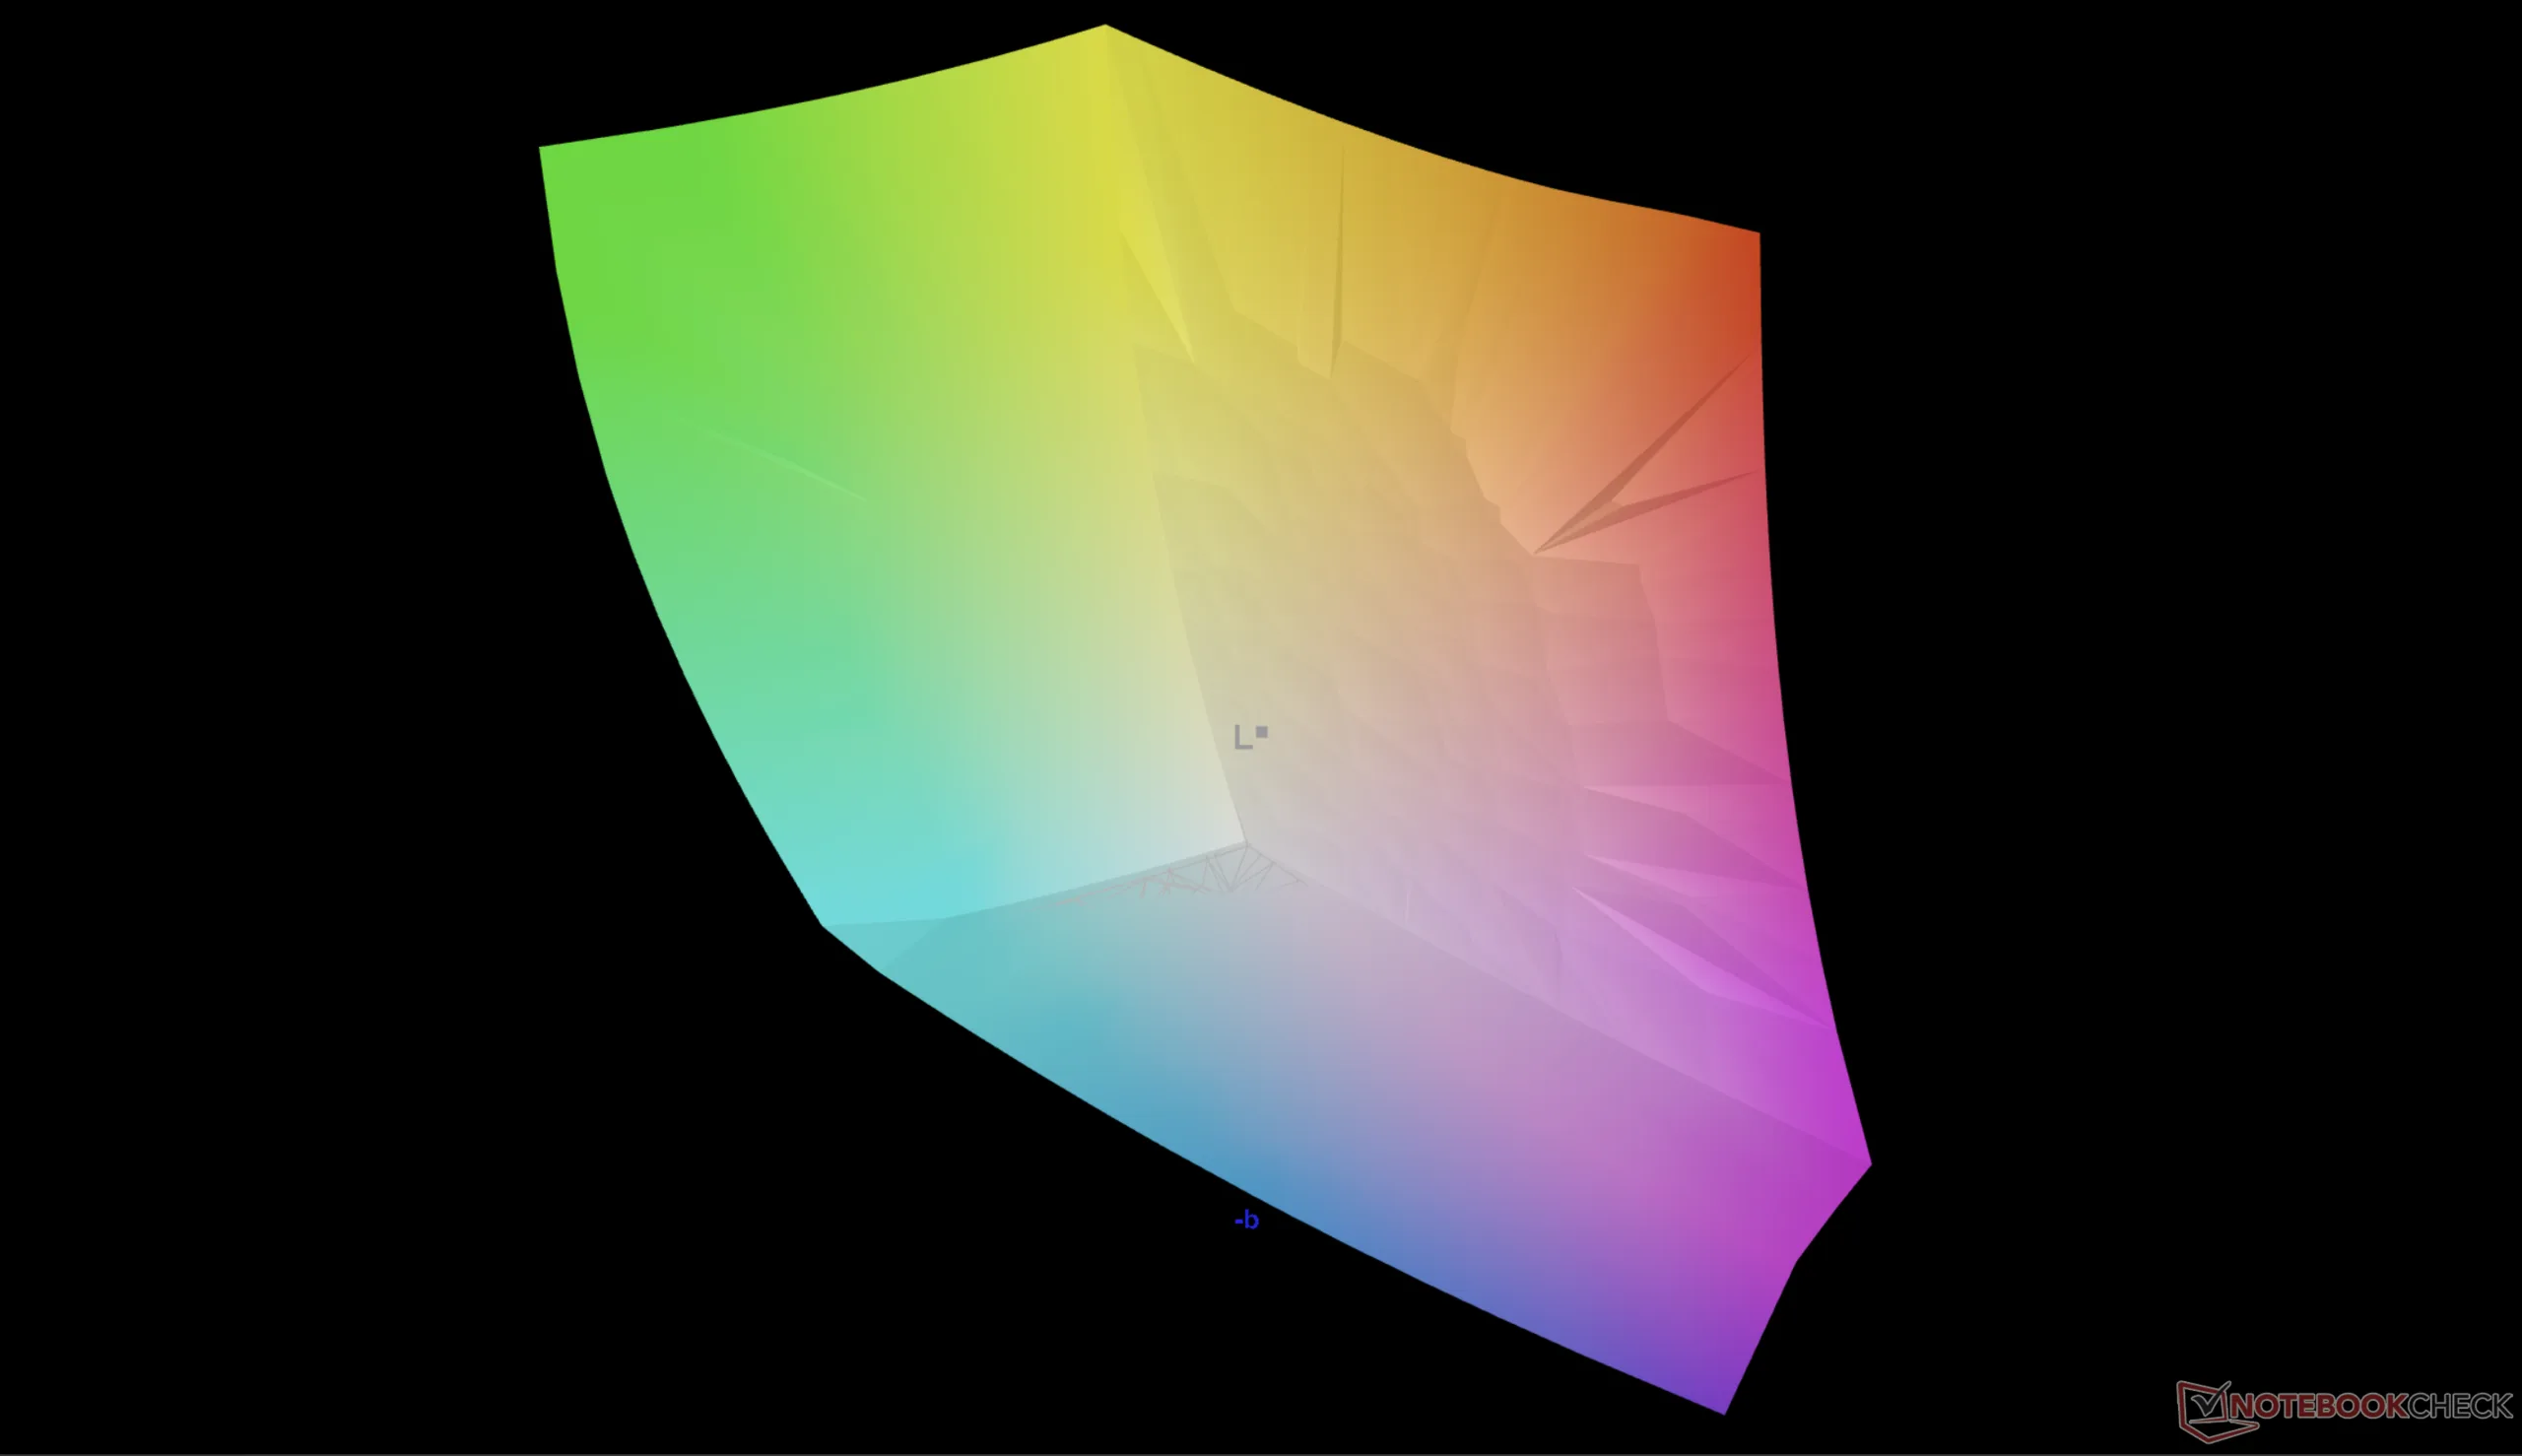
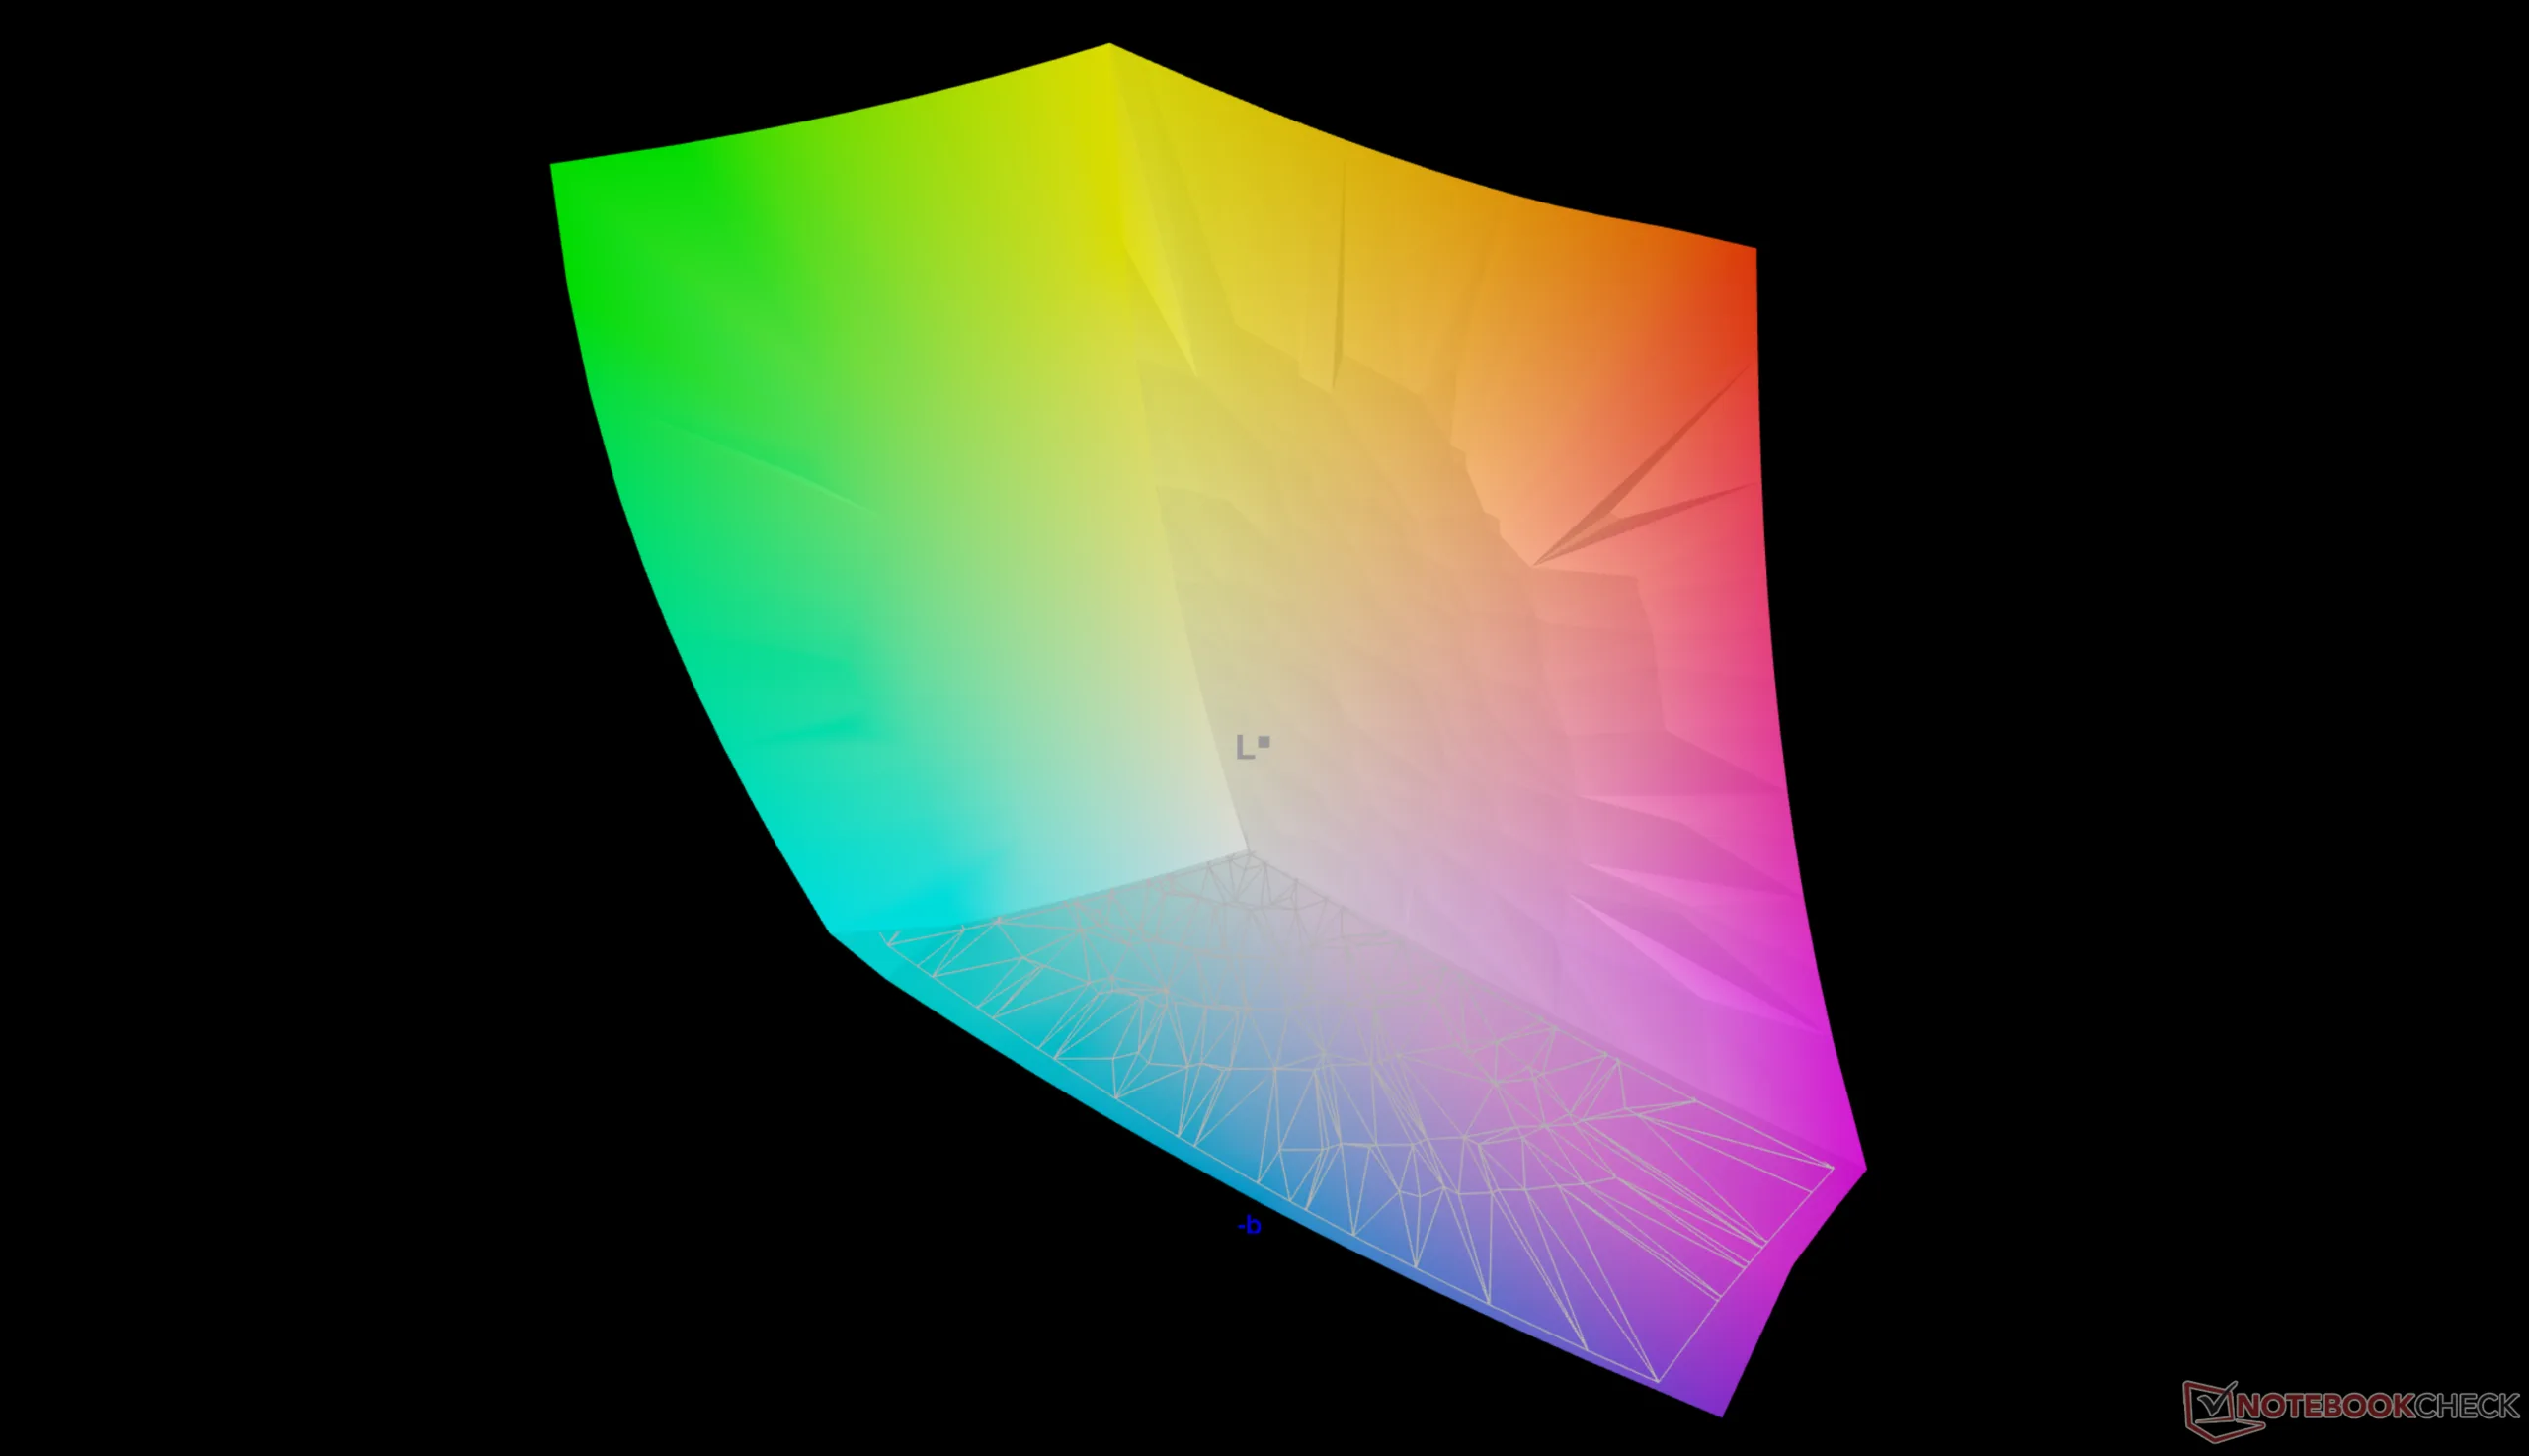
93.5% AdobeRGB 1998 (Argyll 3D)
100% sRGB (Argyll 3D)
99.6% Display P3 (Argyll 3D)
Gamma: 2.33
CCT: 6454 K
HP EliteBook X Flip G2i 14 AI
Samsung SDC422D, OLED, 2880x1800, 14", 120 Hz
HP EliteBook X Flip G1i 14 AI
AUO8FB5, IPS, 1920x1200, 14", 60 Hz
HP EliteBook x360 1040 G11
CMN1474, IPS, 1920x1200, 14", 60 Hz
MSI Prestige 14 Flip AI+ 2026
ATNA40KW05-0, OLED, 1920x1200, 14", 60 Hz
Lenovo Yoga 7 2-in-1 14AKP10
Lenovo LEN140WUXGA, OLED, 1920x1200, 14", 60 Hz
Dell Latitude 9450 2-in-1
AU Optronics B140QAN, IPS, 2560x1600, 14", 60 Hz
Display
-14%
-19%
-1%
2%
-11%
Display P3 Coverage (%)
99.6
76.7
-23%
69
-31%
100
0%
98.5
-1%
80.6
-19%
sRGB Coverage (%)
100
98.2
-2%
99.2
-1%
100
0%
100
0%
100
0%
AdobeRGB 1998 Coverage (%)
93.5
78.2
-16%
71.1
-24%
91.8
-2%
99.9
7%
80.1
-14%
Response Times
-5362%
-6265%
-95%
-67%
-6851%
Response Time Grey 50% / Grey 80% * (ms)
0.62 ?(0.29, 0.33)
49.2 ?(22.2, 27)
-7835%
54.5 ?(24.4, 30.1)
-8690%
1.87 ?(1, 0.87)
-202%
1.5 ?(0.8, 0.7)
-142%
59.6 ?(27.8, 31.8)
-9513%
Response Time Black / White * (ms)
0.83 ?(0.37, 0.46)
24.8 ?(11.4, 13.4)
-2888%
32.7 ?(16.1, 16.6)
-3840%
1.53 ?(0.79, 0.74)
-84%
1.4 ?(0.7, 0.7)
-69%
35.6 ?(17, 18.6)
-4189%
PWM Frequency (Hz)
1001 ?(100)
480 ?(100)
240 ?(90)
PWM Amplitude * (%)
22
22
-0%
20
9%
Screen
-50%
4%
9%
-6%
8%
Brightness middle (cd/m²)
468.9
572
22%
351.3
-25%
292
-38%
360
-23%
501.4
7%
Brightness (cd/m²)
470
541
15%
328
-30%
292
-38%
357
-24%
491
4%
Brightness Distribution (%)
98
78
-20%
86
-12%
98
0%
97
-1%
88
-10%
Black Level * (cd/m²)
0.2
0.24
0.01
0.001
0.32
Colorchecker dE 2000 *
3.26
4.19
-29%
2.29
30%
1.4
57%
2.12
35%
2.52
23%
Colorchecker dE 2000 max. *
6.16
8.65
-40%
4.55
26%
2.2
64%
4.59
25%
4.87
21%
Colorchecker dE 2000 calibrated *
1.05
2.11
-101%
0.49
53%
1.9
-81%
0.45
57%
Greyscale dE 2000 *
1.9
5.65
-197%
2.2
-16%
1.7
11%
1.4
26%
2.8
-47%
Gamma
2.33 94%
2.45 90%
2.13 103%
2.12 104%
2.187 101%
2.17 101%
CCT
6454 101%
5959 109%
6321 103%
6510 100%
6366 102%
6270 104%
Contrast (:1)
2860
1464
29200
360000
1567
Całkowita średnia (program / ustawienia)
-1809% / -926%
-2093% / -1047%
-29% / -19%
-24% / -18%
-2285% / -1140%

* ... im mniej tym lepiej

vs. sRGB
vs. sRGB
vs. P3
vs. P3
Skala szarości przed kalibracją (P3)
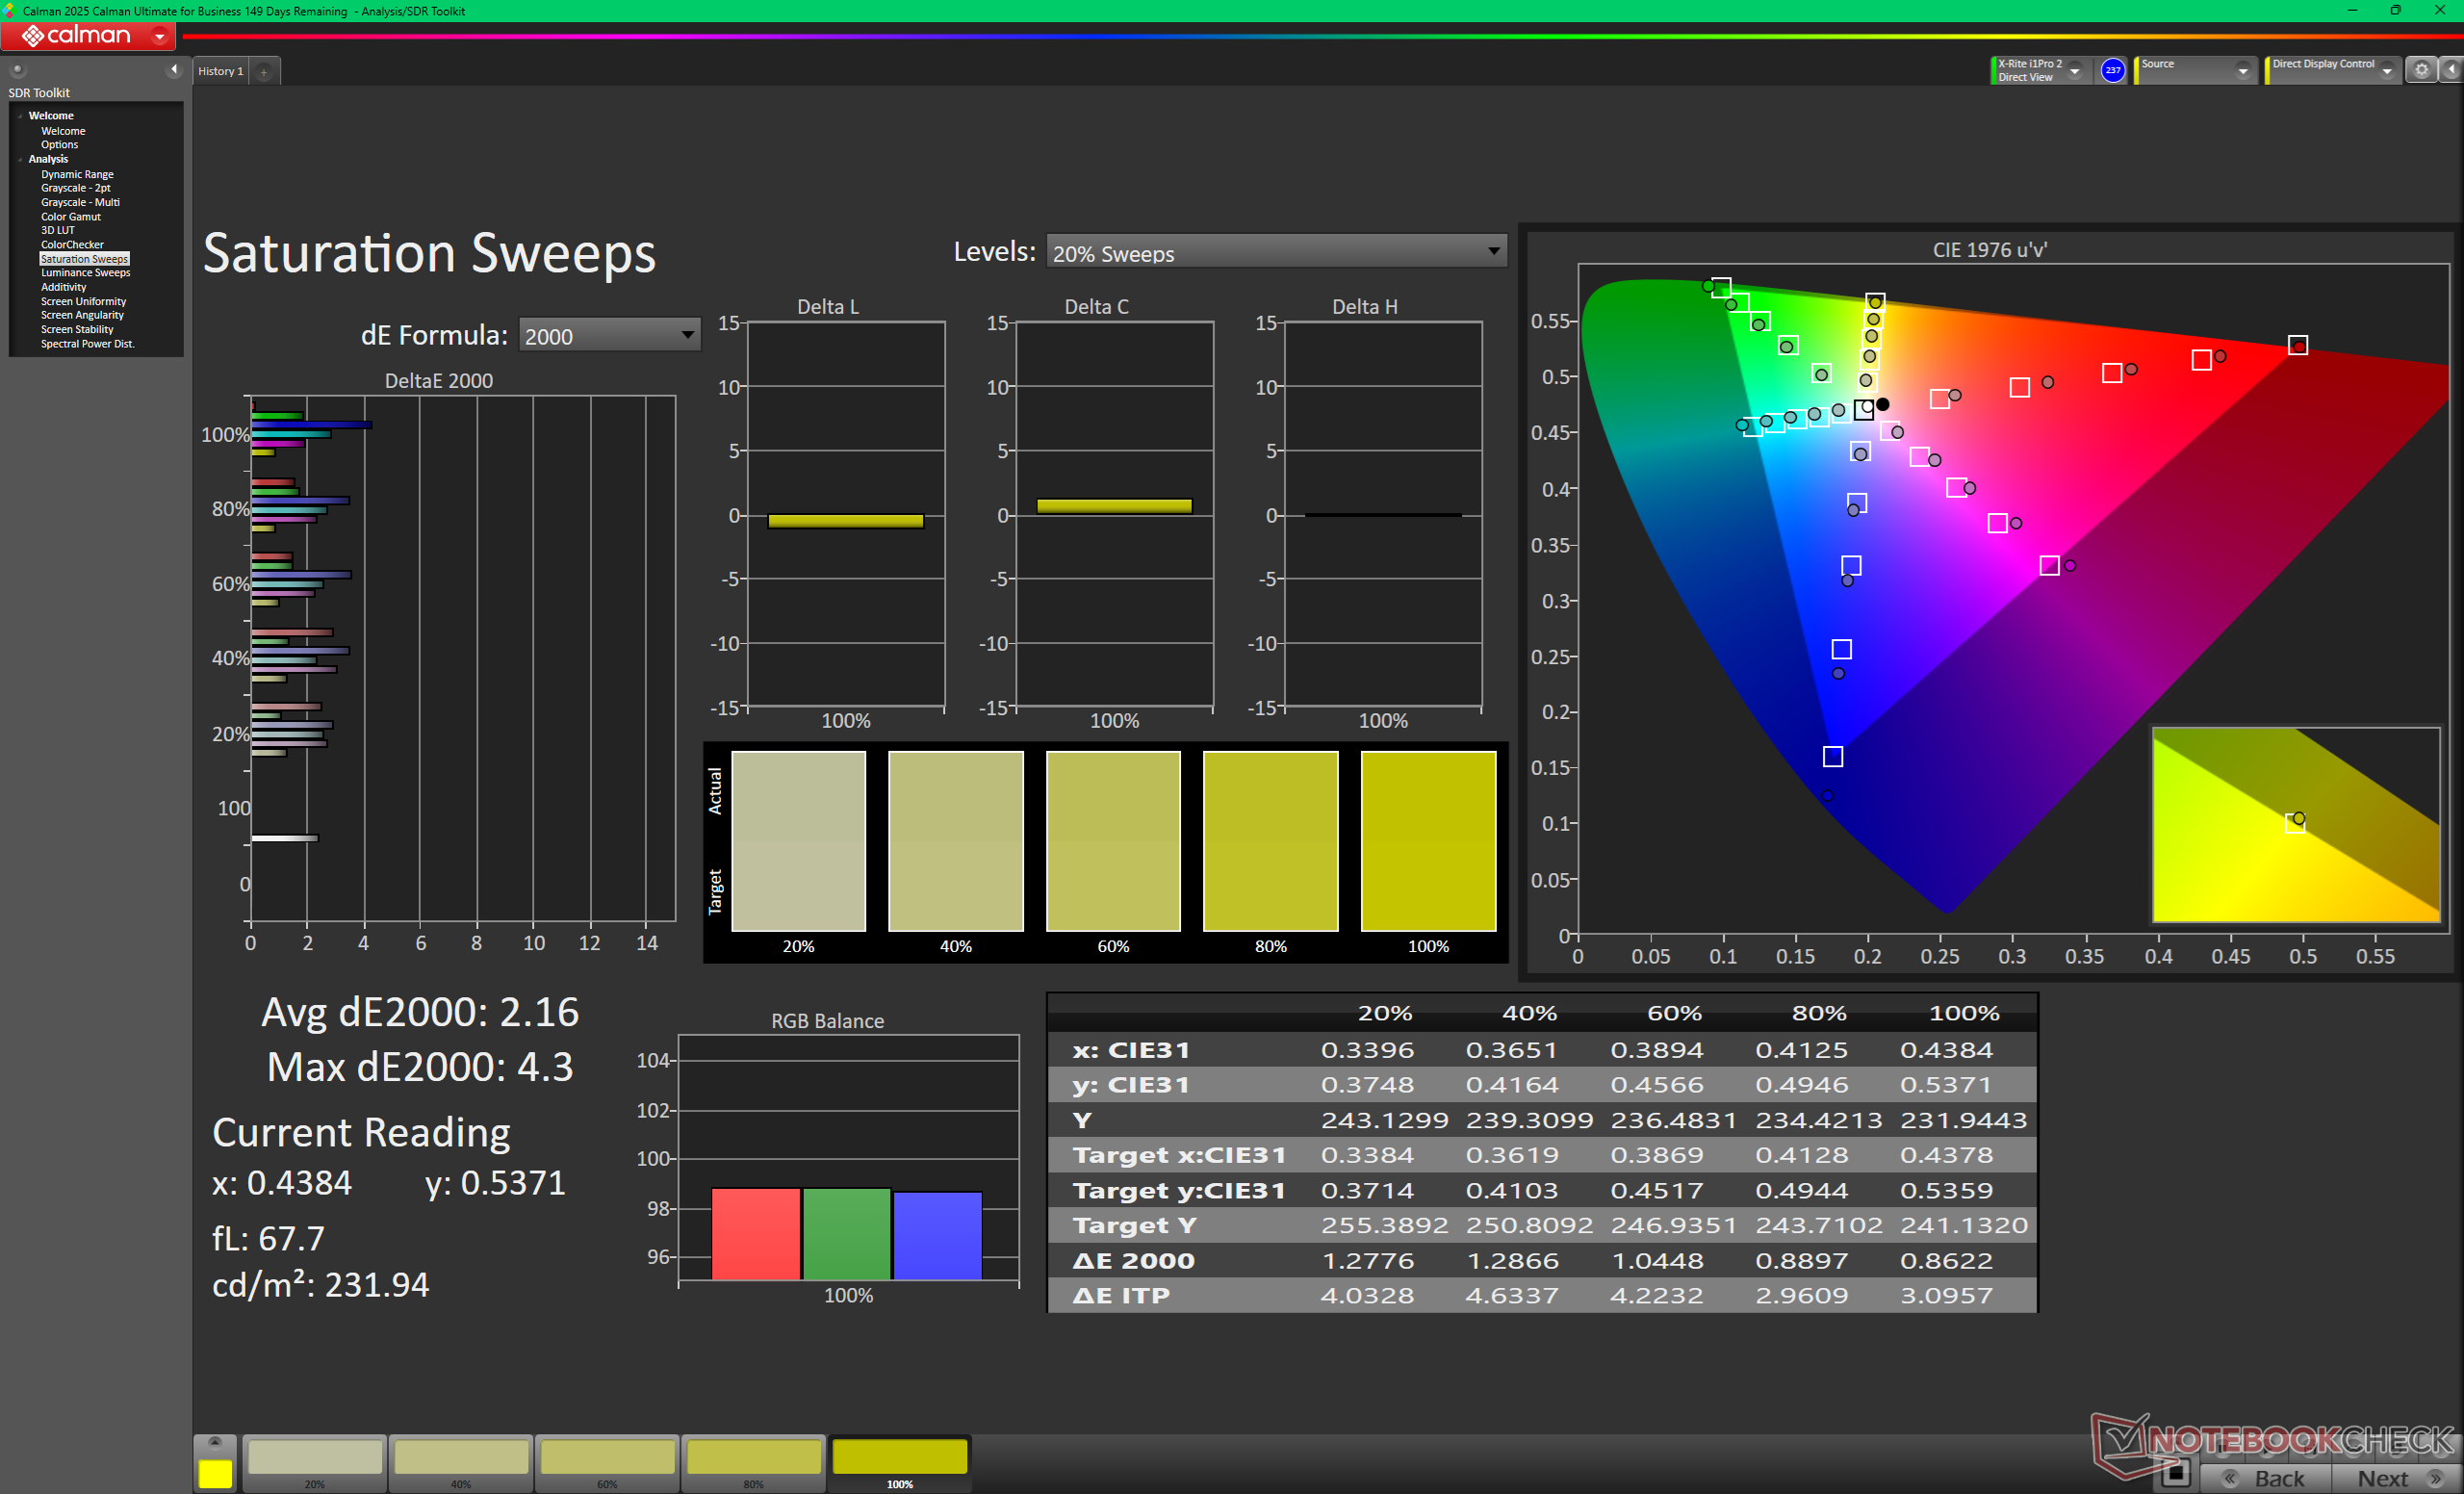
Przebiegi nasycenia przed kalibracją (P3)
ColorChecker przed kalibracją (P3)
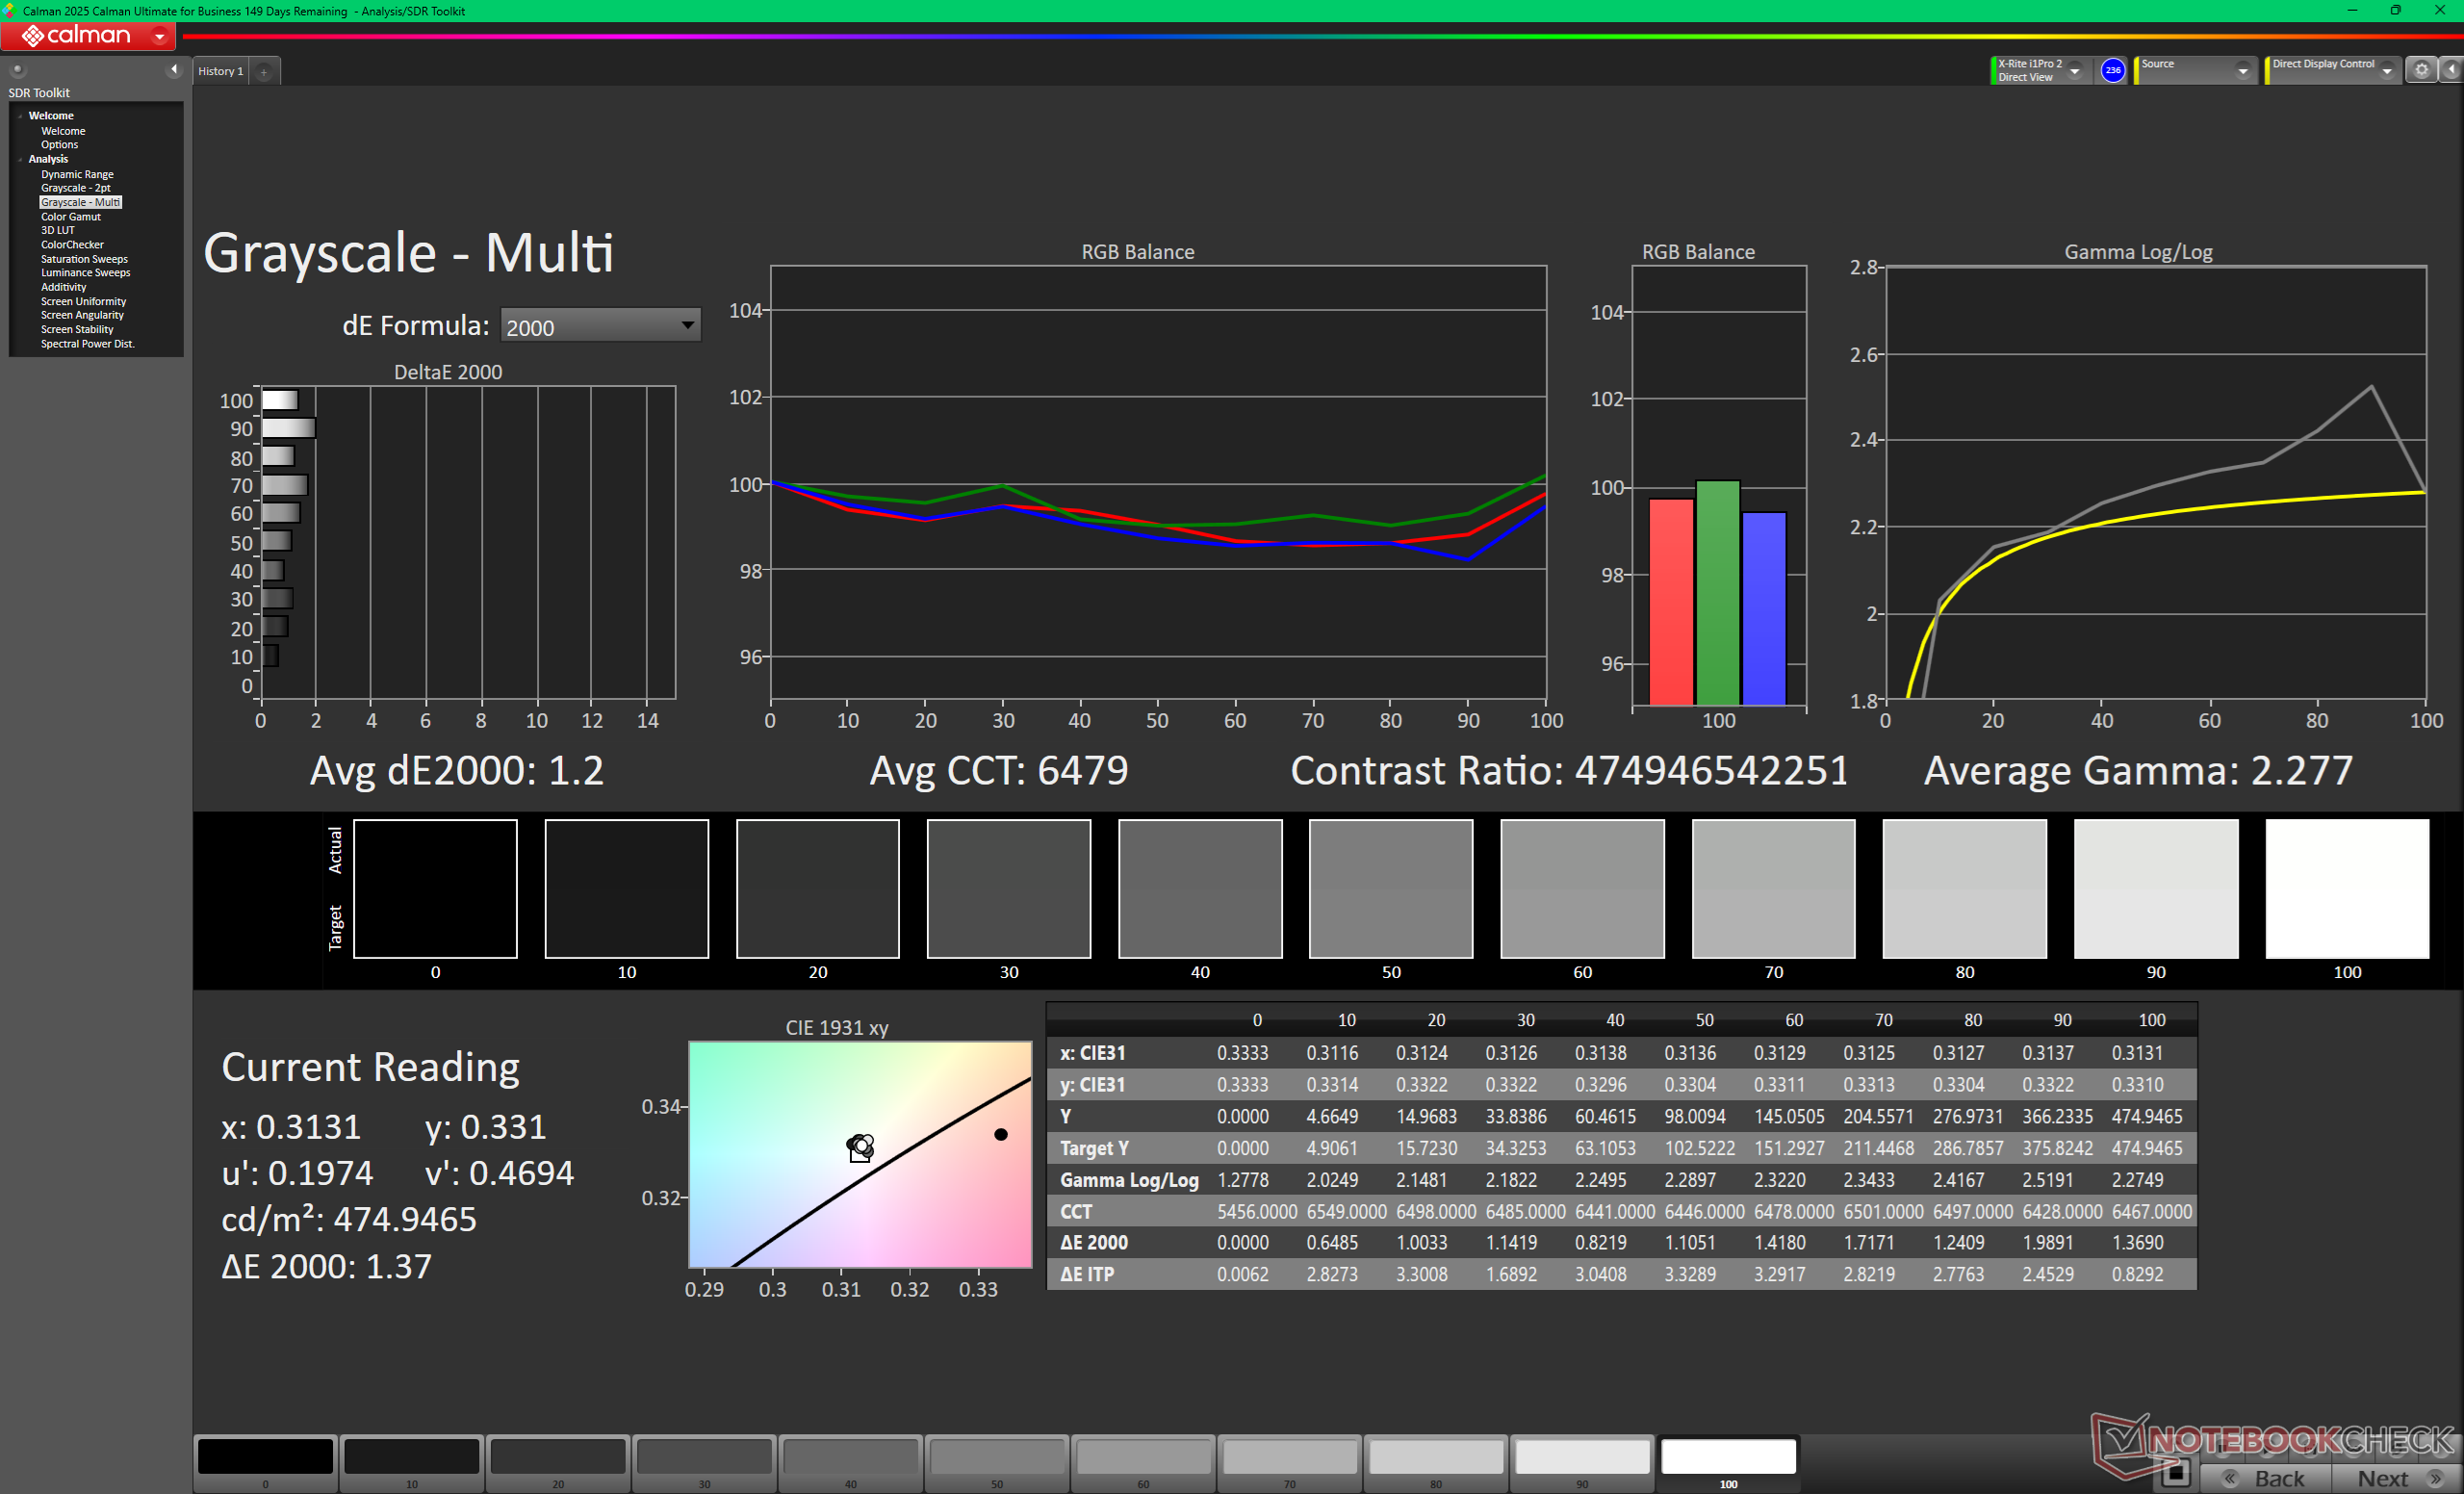
Skala szarości po kalibracji
Przebiegi nasycenia po kalibracji
ColorChecker po kalibracji

Wyświetl czasy reakcji

Czasy reakcji wyświetlacza pokazują, jak szybko ekran może zmieniać kolor z jednego koloru na drugi. Długi czas reakcji może powodować powstawanie powidoków i sprawiać, że poruszające się obiekty będą niewyraźne (duchy). Gracze szybkich tytułów 3D powinni zwrócić szczególną uwagę na szybki czas reakcji.
       Czas reakcji od czerni do bieli
0.83 ms ... wzrost ↗ i spadek ↘ łącznie↗ 0.37 ms wzrost
↘ 0.46 ms upadek
W naszych testach ekran wykazuje bardzo szybką reakcję i powinien bardzo dobrze nadawać się do szybkich gier.
Dla porównania, wszystkie testowane urządzenia wahają się od 0.1 (minimum) do 240 (maksimum) ms. » 3 % wszystkich urządzeń jest lepszych.
Oznacza to, że zmierzony czas reakcji jest lepszy od średniej wszystkich testowanych urządzeń (19.7 ms).
       Czas reakcji 50% szarości do 80% szarości
0.62 ms ... wzrost ↗ i spadek ↘ łącznie↗ 0.29 ms wzrost
↘ 0.33 ms upadek
W naszych testach ekran wykazuje bardzo szybką reakcję i powinien bardzo dobrze nadawać się do szybkich gier.
Dla porównania, wszystkie testowane urządzenia wahają się od 0.13 (minimum) do 636 (maksimum) ms. » 2 % wszystkich urządzeń jest lepszych.
Oznacza to, że zmierzony czas reakcji jest lepszy od średniej wszystkich testowanych urządzeń (30.8 ms).

Migotanie ekranu / PWM (modulacja szerokości impulsu)

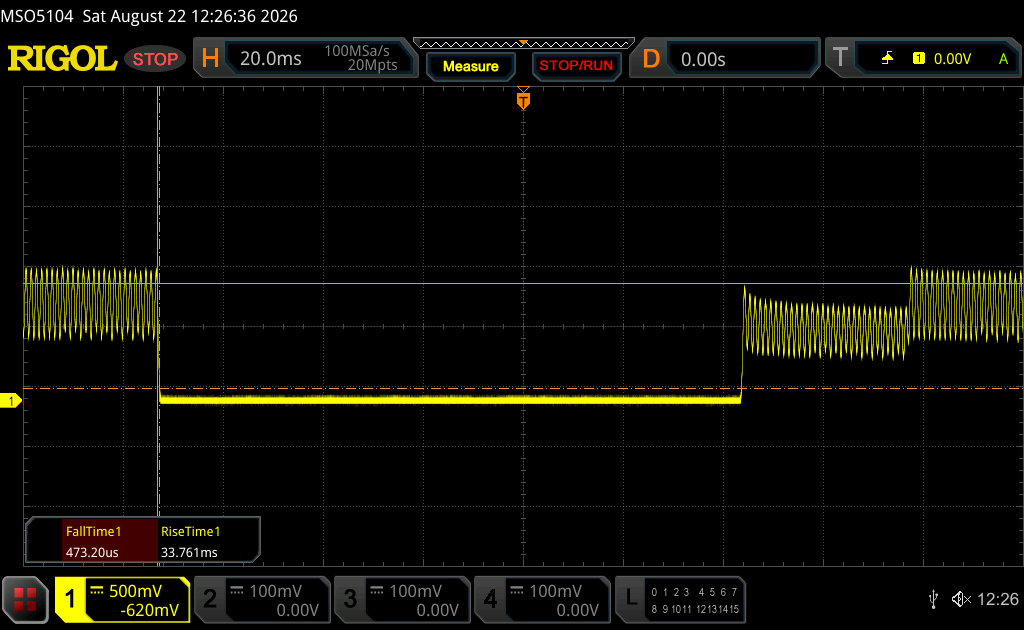
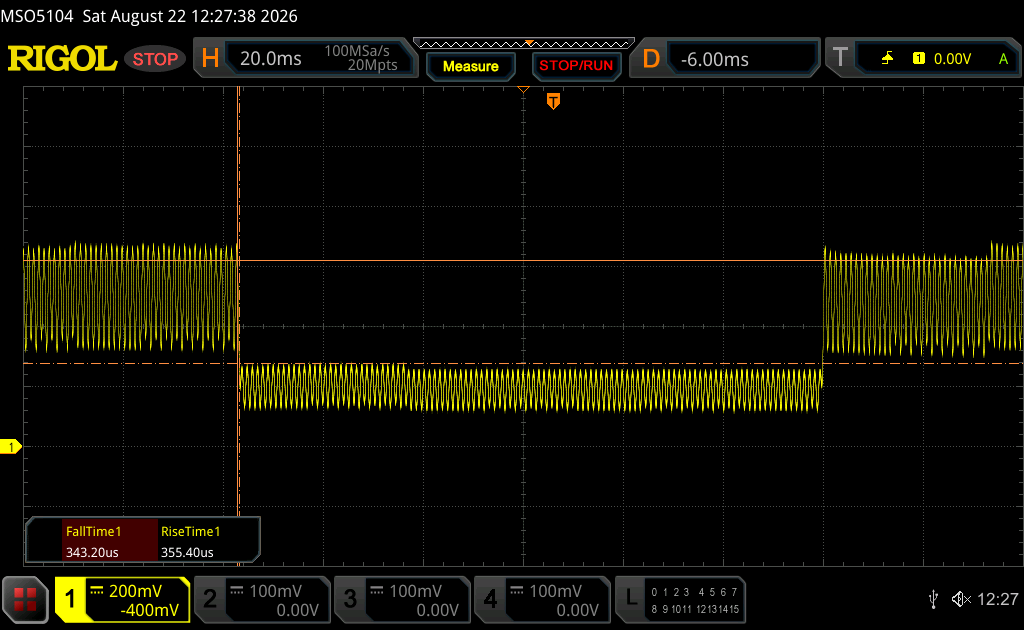
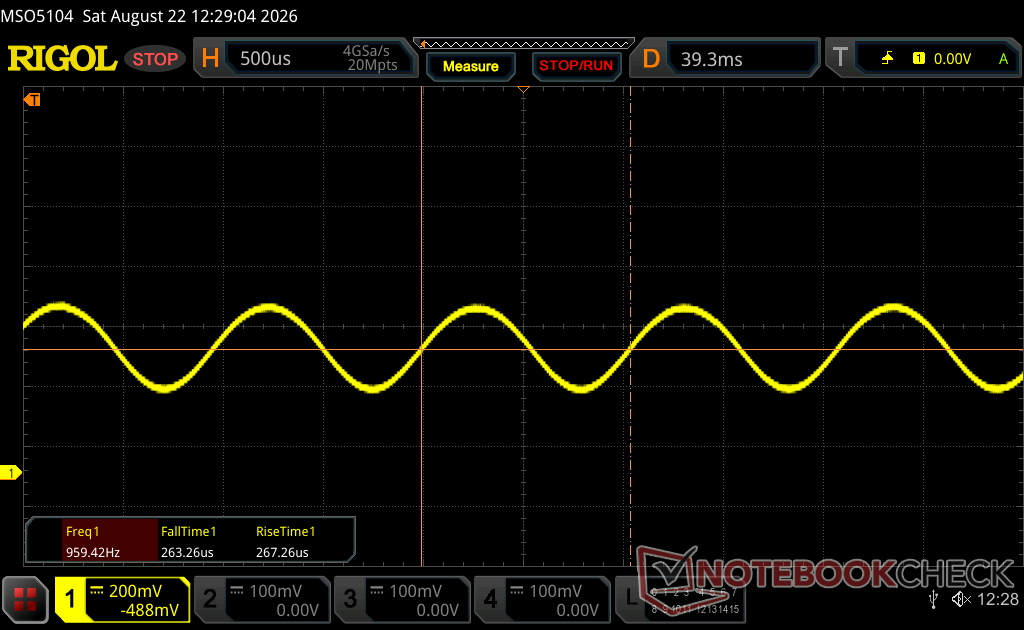
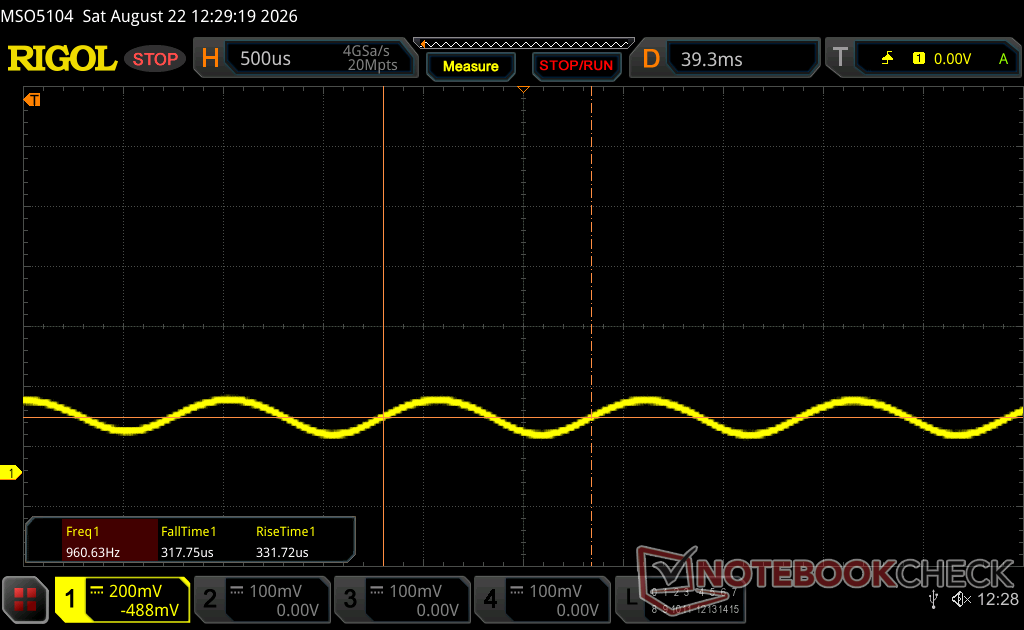
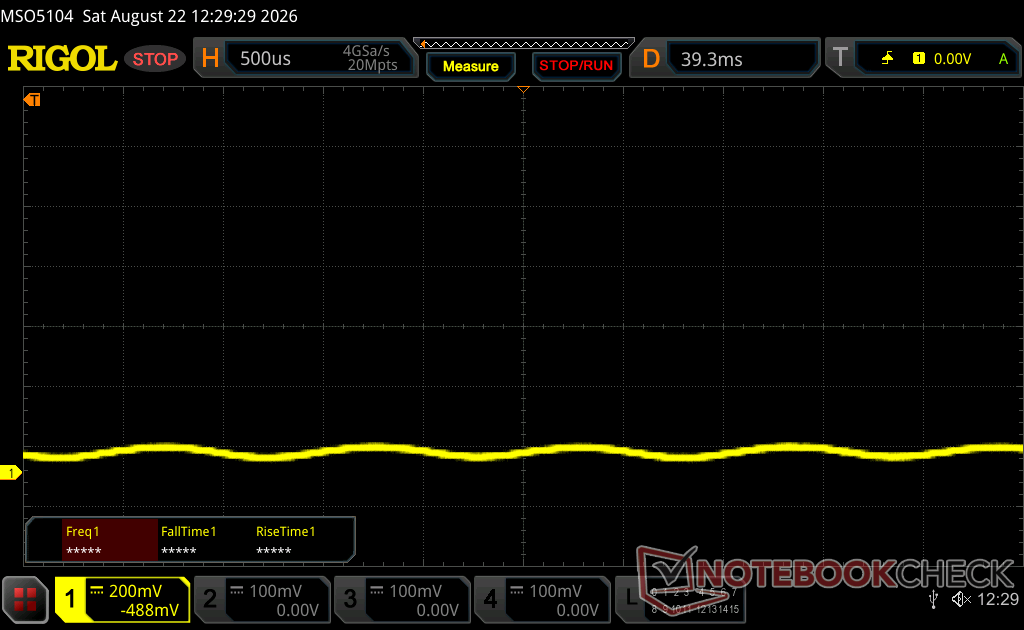
Aby przyciemnić ekran, niektóre notebooki po prostu w krótkich odstępach czasu włączają i wyłączają podświetlenie — jest to metoda zwana modulacją szerokości impulsu (PWM). W idealnym przypadku ta częstotliwość cykli powinna być niewykrywalna dla ludzkiego oka. Jeśli wspomniana częstotliwość jest zbyt niska, użytkownicy o wrażliwych oczach mogą odczuwać zmęczenie lub bóle głowy, a nawet całkowicie zauważyć migotanie.
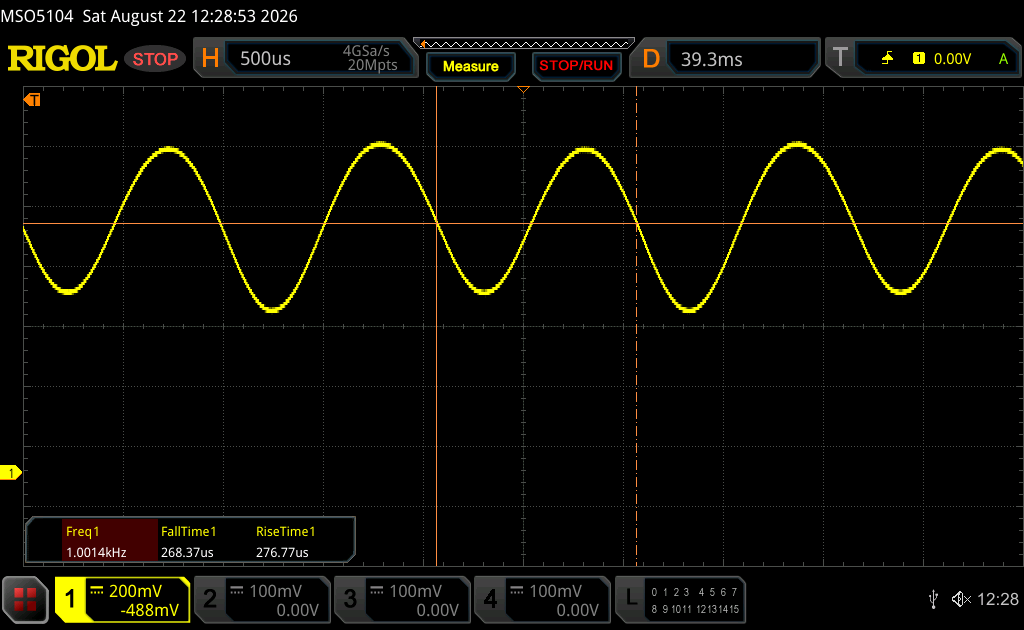
Wykryto migotanie ekranu/wykryto PWM 1001 Hz
Amplitude: 22 %
≤ 100 % ustawienia jasności

Podświetlenie wyświetlacza miga z częstotliwością 1001 Hz (najgorszy przypadek, np. przy użyciu PWM) Wykryto migotanie przy ustawieniu jasności 100 % i poniżej. Powyżej tego ustawienia jasności nie powinno być żadnego migotania ani PWM.

Częstotliwość 1001 Hz jest dość wysoka, więc większość użytkowników wrażliwych na PWM nie powinna zauważyć żadnego migotania.

Dla porównania: 52 % wszystkich testowanych urządzeń nie używa PWM do przyciemniania wyświetlacza. Jeśli wykryto PWM, zmierzono średnio 7683 (minimum: 5 - maksimum: 343500) Hz.

100-procentowa jasność
75 procent jasności
75 procent jasności
50 procent jasności
50 procent jasności
25 procent jasności
25 procent jasności
0 procent jasności
0 procent jasności
Na świeżym powietrzu przy jasnym, zachmurzonym niebie
Na świeżym powietrzu, w cieniu
Na świeżym powietrzu przy jasnym, zachmurzonym niebie
Szerokie kąty widzenia wyświetlaczy OLED

Wydajność

Warunki testowania

Przed uruchomieniem poniższych testów porównawczych ustawiliśmy system Windows oraz oprogramowanie HP w trybie wydajnościowym.

Wydajność procesora

Pod względem czystej wydajności procesora Core Ultra 7 366H plasuje się na równi z Core Ultra X7 358H.

Przejście z podstawowej konfiguracji Core Ultra 5 325 na nasz model Core Ultra 7 366H poprawi wydajność wielowątkową nawet o 80 procent.

Cinebench R15 Multi Loop

06513019526032539045552058565071578084591097510401105117012351300136514301495156016251690175518201885195020152080214522102275234024052470253526002665273027952860292529903055Tooltip
HP EliteBook X Flip G2i 14 AI Intel Core Ultra 7 366H: Ø2603 (2492.68-2986.19) Points
HP EliteBook X Flip G1i 14 AI Intel Core Ultra 7 258V: Ø1351 (1333.02-1503.76) Points
HP EliteBook x360 1040 G11 Intel Core Ultra 7 165H: Ø1922 (1713.06-2466.7) Points
MSI Prestige 14 Flip AI+ 2026 Intel Core Ultra X7 358H: Ø2083 (1828.99-3089.52) Points
Lenovo Yoga 7 2-in-1 14AKP10 AMD Ryzen AI 5 340: Ø1784 (1756.08-1848.6) Points
Dell Latitude 9450 2-in-1 Intel Core Ultra 7 165U: Ø1494 (1433.95-1667.01) Points
CPU Performance rating: Percent
Cinebench 2024: CPU Single Core | CPU Multi Core
Cinebench R23: Multi Core | Single Core
Cinebench R20: CPU (Multi Core) | CPU (Single Core)
Cinebench R15: CPU Multi 64Bit | CPU Single 64Bit
Blender: v2.79 BMW27 CPU
7-Zip 18.03: 7z b 4 | 7z b 4 -mmt1
Geekbench 6.7: Multi-Core | Single-Core
Geekbench 5.5: Multi-Core | Single-Core
HWBOT x265 Benchmark v2.2: 4k Preset
LibreOffice : 20 Documents To PDF
R Benchmark 2.5: Overall mean
CPU Performance rating
HP OmniBook Ultra 14 Core Ultra X9
Intel Core Ultra X9 388H
85.8 pt
HP EliteBook X Flip G2i 14 AI
Intel Core Ultra 7 366H
84.5 pt
Przeciętny Intel Core Ultra 7 366H
 
84.4 pt
MSI Prestige 14 Flip AI+ 2026
Intel Core Ultra X7 358H
83.7 pt
HP EliteBook 8 G2a 14 -2!
AMD Ryzen AI 7 450
77 pt
Honor MagicBook Art 14 2025
Intel Core Ultra 7 255H
76.2 pt
HP EliteBook x360 1040 G11
Intel Core Ultra 7 165H
68.2 pt
Lenovo Yoga 7 2-in-1 14AKP10
AMD Ryzen AI 5 340
65.3 pt
Dell 14S DS14260
Intel Core Ultra 7 355
65.2 pt
Lenovo ThinkPad X1 Carbon Gen 14 21V70075GE
Intel Core Ultra 5 325
63.5 pt
Dell Latitude 9450 2-in-1 -2!
Intel Core Ultra 7 165U
57.4 pt
Lenovo ThinkPad E14 Gen 7 21U2002QGE
Intel Core Ultra 5 228V
55.1 pt
Acer TravelMate P4 14 TMP414-42-TCO-R6KG -2!
AMD Ryzen 5 8540U
55 pt
HP EliteBook X Flip G1i 14 AI -2!
Intel Core Ultra 7 258V
54.8 pt
Cinebench 2024 / CPU Single Core
HP OmniBook Ultra 14 Core Ultra X9
Intel Core Ultra X9 388H
129 Points +4%
HP EliteBook X Flip G2i 14 AI
Intel Core Ultra 7 366H
124.1 Points
Przeciętny Intel Core Ultra 7 366H
  (n=1)
124.1 Points 0%
MSI Prestige 14 Flip AI+ 2026
Intel Core Ultra X7 358H
123.4 Points -1%
Honor MagicBook Art 14 2025
Intel Core Ultra 7 255H
119 Points -4%
Dell 14S DS14260
Intel Core Ultra 7 355
118.2 Points -5%
HP EliteBook 8 G2a 14
AMD Ryzen AI 7 450
118 Points -5%
Lenovo ThinkPad X1 Carbon Gen 14 21V70075GE
Intel Core Ultra 5 325
113.3 Points -9%
Lenovo Yoga 7 2-in-1 14AKP10
AMD Ryzen AI 5 340
112 Points -10%
HP EliteBook x360 1040 G11
Intel Core Ultra 7 165H
103.3 Points -17%
Lenovo ThinkPad E14 Gen 7 21U2002QGE
Intel Core Ultra 5 228V
97.8 Points -21%
Cinebench 2024 / CPU Multi Core
HP EliteBook X Flip G2i 14 AI
Intel Core Ultra 7 366H
1063 Points
Przeciętny Intel Core Ultra 7 366H
  (n=1)
1063 Points 0%
HP OmniBook Ultra 14 Core Ultra X9
Intel Core Ultra X9 388H
1002 Points -6%
MSI Prestige 14 Flip AI+ 2026
Intel Core Ultra X7 358H
996 Points -6%
HP EliteBook 8 G2a 14
AMD Ryzen AI 7 450
870 Points -18%
Honor MagicBook Art 14 2025
Intel Core Ultra 7 255H
810 Points -24%
HP EliteBook x360 1040 G11
Intel Core Ultra 7 165H
764 Points -28%
Lenovo Yoga 7 2-in-1 14AKP10
AMD Ryzen AI 5 340
652 Points -39%
Lenovo ThinkPad X1 Carbon Gen 14 21V70075GE
Intel Core Ultra 5 325
645 Points -39%
Dell 14S DS14260
Intel Core Ultra 7 355
645 Points -39%
Lenovo ThinkPad E14 Gen 7 21U2002QGE
Intel Core Ultra 5 228V
482 Points -55%
Cinebench R23 / Multi Core
HP EliteBook X Flip G2i 14 AI
Intel Core Ultra 7 366H
19284 (17308.1min - 19283.6max) Points
Przeciętny Intel Core Ultra 7 366H
  (n=1)
19284 Points 0%
HP OmniBook Ultra 14 Core Ultra X9
Intel Core Ultra X9 388H
17663 (16042.7min - 17663.2max) Points -8%
MSI Prestige 14 Flip AI+ 2026
Intel Core Ultra X7 358H
17457 Points -9%
Honor MagicBook Art 14 2025
Intel Core Ultra 7 255H
16105 Points -16%
HP EliteBook 8 G2a 14
AMD Ryzen AI 7 450
16101 Points -17%
HP EliteBook x360 1040 G11
Intel Core Ultra 7 165H
14551 (13047.9min - 14551max) Points -25%
Lenovo Yoga 7 2-in-1 14AKP10
AMD Ryzen AI 5 340
12044 Points -38%
Lenovo ThinkPad X1 Carbon Gen 14 21V70075GE
Intel Core Ultra 5 325
10980 Points -43%
Dell 14S DS14260
Intel Core Ultra 7 355
10966 (10330.8min - 10966.4max) Points -43%
Dell Latitude 9450 2-in-1
Intel Core Ultra 7 165U
10797 (9637.37min - 10796.8max) Points -44%
Lenovo ThinkPad E14 Gen 7 21U2002QGE
Intel Core Ultra 5 228V
10077 Points -48%
Acer TravelMate P4 14 TMP414-42-TCO-R6KG
AMD Ryzen 5 8540U
9662 Points -50%
HP EliteBook X Flip G1i 14 AI
Intel Core Ultra 7 258V
9549 Points -50%
Cinebench R23 / Single Core
HP OmniBook Ultra 14 Core Ultra X9
Intel Core Ultra X9 388H
2213 Points +6%
MSI Prestige 14 Flip AI+ 2026
Intel Core Ultra X7 358H
2085 Points 0%
HP EliteBook X Flip G2i 14 AI
Intel Core Ultra 7 366H
2084 Points
Przeciętny Intel Core Ultra 7 366H
  (n=1)
2084 Points 0%
HP EliteBook 8 G2a 14
AMD Ryzen AI 7 450
2031 Points -3%
Honor MagicBook Art 14 2025
Intel Core Ultra 7 255H
1989 Points -5%
Dell 14S DS14260
Intel Core Ultra 7 355
1964 Points -6%
Lenovo Yoga 7 2-in-1 14AKP10
AMD Ryzen AI 5 340
1919 Points -8%
Lenovo ThinkPad X1 Carbon Gen 14 21V70075GE
Intel Core Ultra 5 325
1892 Points -9%
HP EliteBook X Flip G1i 14 AI
Intel Core Ultra 7 258V
1809 Points -13%
Lenovo ThinkPad E14 Gen 7 21U2002QGE
Intel Core Ultra 5 228V
1761 Points -15%
HP EliteBook x360 1040 G11
Intel Core Ultra 7 165H
1759 Points -16%
Dell Latitude 9450 2-in-1
Intel Core Ultra 7 165U
1709 Points -18%
Acer TravelMate P4 14 TMP414-42-TCO-R6KG
AMD Ryzen 5 8540U
1706 Points -18%
Cinebench R20 / CPU (Multi Core)
HP OmniBook Ultra 14 Core Ultra X9
Intel Core Ultra X9 388H
7008 Points +5%
MSI Prestige 14 Flip AI+ 2026
Intel Core Ultra X7 358H
6848 Points +3%
HP EliteBook X Flip G2i 14 AI
Intel Core Ultra 7 366H
6672 Points
Przeciętny Intel Core Ultra 7 366H
  (n=1)
6672 Points 0%
Honor MagicBook Art 14 2025
Intel Core Ultra 7 255H
6356 Points -5%
HP EliteBook 8 G2a 14
AMD Ryzen AI 7 450
6247 Points -6%
HP EliteBook x360 1040 G11
Intel Core Ultra 7 165H
5545 Points -17%
Lenovo Yoga 7 2-in-1 14AKP10
AMD Ryzen AI 5 340
4692 Points -30%
Dell 14S DS14260
Intel Core Ultra 7 355
4282 Points -36%
Lenovo ThinkPad X1 Carbon Gen 14 21V70075GE
Intel Core Ultra 5 325
4250 Points -36%
Dell Latitude 9450 2-in-1
Intel Core Ultra 7 165U
4176 Points -37%
Lenovo ThinkPad E14 Gen 7 21U2002QGE
Intel Core Ultra 5 228V
3927 Points -41%
Acer TravelMate P4 14 TMP414-42-TCO-R6KG
AMD Ryzen 5 8540U
3804 Points -43%
HP EliteBook X Flip G1i 14 AI
Intel Core Ultra 7 258V
3646 Points -45%
Cinebench R20 / CPU (Single Core)
HP OmniBook Ultra 14 Core Ultra X9
Intel Core Ultra X9 388H
832 Points +9%
HP EliteBook 8 G2a 14
AMD Ryzen AI 7 450
792 Points +4%
MSI Prestige 14 Flip AI+ 2026
Intel Core Ultra X7 358H
786 Points +3%
Honor MagicBook Art 14 2025
Intel Core Ultra 7 255H
760 Points 0%
HP EliteBook X Flip G2i 14 AI
Intel Core Ultra 7 366H
760 Points
Przeciętny Intel Core Ultra 7 366H
  (n=1)
760 Points 0%
Lenovo Yoga 7 2-in-1 14AKP10
AMD Ryzen AI 5 340
752 Points -1%
Dell 14S DS14260
Intel Core Ultra 7 355
749 Points -1%
Lenovo ThinkPad X1 Carbon Gen 14 21V70075GE
Intel Core Ultra 5 325
713 Points -6%
HP EliteBook X Flip G1i 14 AI
Intel Core Ultra 7 258V
694 Points -9%
HP EliteBook x360 1040 G11
Intel Core Ultra 7 165H
683 Points -10%
Lenovo ThinkPad E14 Gen 7 21U2002QGE
Intel Core Ultra 5 228V
678 Points -11%
Acer TravelMate P4 14 TMP414-42-TCO-R6KG
AMD Ryzen 5 8540U
669 Points -12%
Dell Latitude 9450 2-in-1
Intel Core Ultra 7 165U
661 Points -13%
Cinebench R15 / CPU Multi 64Bit
MSI Prestige 14 Flip AI+ 2026
Intel Core Ultra X7 358H
3090 (1828.99min - 3089.52max) Points +3%
HP EliteBook X Flip G2i 14 AI
Intel Core Ultra 7 366H
2986 (2492.68min - 2986.19max) Points
Przeciętny Intel Core Ultra 7 366H
  (n=1)
2986 Points 0%
HP OmniBook Ultra 14 Core Ultra X9
Intel Core Ultra X9 388H
2712 (2420.72min - 2711.68max) Points -9%
HP EliteBook x360 1040 G11
Intel Core Ultra 7 165H
2467 (1713.06min - 2466.7max) Points -17%
Honor MagicBook Art 14 2025
Intel Core Ultra 7 255H
2427 (1938.27min - 2427.48max) Points -19%
HP EliteBook 8 G2a 14
AMD Ryzen AI 7 450
2409 (2358.35min - 2409.49max) Points -19%
Lenovo Yoga 7 2-in-1 14AKP10
AMD Ryzen AI 5 340
1849 (1756.08min - 1848.6max) Points -38%
Lenovo ThinkPad X1 Carbon Gen 14 21V70075GE
Intel Core Ultra 5 325
1670 (1603.78min - 1670.43max) Points -44%
Dell Latitude 9450 2-in-1
Intel Core Ultra 7 165U
1667 (1433.95min - 1667.01max) Points -44%
Dell 14S DS14260
Intel Core Ultra 7 355
1666 (1476.23min - 1666.04max) Points -44%
Lenovo ThinkPad E14 Gen 7 21U2002QGE
Intel Core Ultra 5 228V
1535 (1389.95min - 1535.1max) Points -49%
Acer TravelMate P4 14 TMP414-42-TCO-R6KG
AMD Ryzen 5 8540U
1521 (1503.08min - 1521.14max) Points -49%
HP EliteBook X Flip G1i 14 AI
Intel Core Ultra 7 258V
1504 (1333.02min - 1503.76max) Points -50%
Cinebench R15 / CPU Single 64Bit
HP OmniBook Ultra 14 Core Ultra X9
Intel Core Ultra X9 388H
313 Points +6%
HP EliteBook X Flip G2i 14 AI
Intel Core Ultra 7 366H
296 Points
Przeciętny Intel Core Ultra 7 366H
  (n=1)
296 Points 0%
Lenovo Yoga 7 2-in-1 14AKP10
AMD Ryzen AI 5 340
293 Points -1%
MSI Prestige 14 Flip AI+ 2026
Intel Core Ultra X7 358H
292 Points -1%
Dell 14S DS14260
Intel Core Ultra 7 355
292 Points -1%
Honor MagicBook Art 14 2025
Intel Core Ultra 7 255H
291 Points -2%
Lenovo ThinkPad X1 Carbon Gen 14 21V70075GE
Intel Core Ultra 5 325
282 Points -5%
HP EliteBook X Flip G1i 14 AI
Intel Core Ultra 7 258V
273 Points -8%
Lenovo ThinkPad E14 Gen 7 21U2002QGE
Intel Core Ultra 5 228V
273 Points -8%
HP EliteBook x360 1040 G11
Intel Core Ultra 7 165H
257 Points -13%
Dell Latitude 9450 2-in-1
Intel Core Ultra 7 165U
252 Points -15%
Acer TravelMate P4 14 TMP414-42-TCO-R6KG
AMD Ryzen 5 8540U
236 Points -20%
HP EliteBook 8 G2a 14
AMD Ryzen AI 7 450
235 Points -21%
Blender / v2.79 BMW27 CPU
Lenovo ThinkPad E14 Gen 7 21U2002QGE
Intel Core Ultra 5 228V
416 Seconds * -114%
HP EliteBook X Flip G1i 14 AI
Intel Core Ultra 7 258V
365 Seconds * -88%
Acer TravelMate P4 14 TMP414-42-TCO-R6KG
AMD Ryzen 5 8540U
327 Seconds * -69%
Dell Latitude 9450 2-in-1
Intel Core Ultra 7 165U
310 Seconds * -60%
Lenovo ThinkPad X1 Carbon Gen 14 21V70075GE
Intel Core Ultra 5 325
310 Seconds * -60%
Dell 14S DS14260
Intel Core Ultra 7 355
310 Seconds * -60%
Lenovo Yoga 7 2-in-1 14AKP10
AMD Ryzen AI 5 340
269 Seconds * -39%
Honor MagicBook Art 14 2025
Intel Core Ultra 7 255H
234 Seconds * -21%
HP EliteBook x360 1040 G11
Intel Core Ultra 7 165H
231 Seconds * -19%
MSI Prestige 14 Flip AI+ 2026
Intel Core Ultra X7 358H
218 Seconds * -12%
HP EliteBook 8 G2a 14
AMD Ryzen AI 7 450
203 Seconds * -5%
HP OmniBook Ultra 14 Core Ultra X9
Intel Core Ultra X9 388H
198 Seconds * -2%
HP EliteBook X Flip G2i 14 AI
Intel Core Ultra 7 366H
194 Seconds *
Przeciętny Intel Core Ultra 7 366H
  (n=1)
194 Seconds * -0%
7-Zip 18.03 / 7z b 4
HP EliteBook X Flip G2i 14 AI
Intel Core Ultra 7 366H
65690 MIPS
Przeciętny Intel Core Ultra 7 366H
  (n=1)
65690 MIPS 0%
HP OmniBook Ultra 14 Core Ultra X9
Intel Core Ultra X9 388H
62372 MIPS -5%
HP EliteBook 8 G2a 14
AMD Ryzen AI 7 450
59952 MIPS -9%
MSI Prestige 14 Flip AI+ 2026
Intel Core Ultra X7 358H
58746 MIPS -11%
HP EliteBook x360 1040 G11
Intel Core Ultra 7 165H
56997 MIPS -13%
Honor MagicBook Art 14 2025
Intel Core Ultra 7 255H
53955 MIPS -18%
Lenovo Yoga 7 2-in-1 14AKP10
AMD Ryzen AI 5 340
45003 MIPS -31%
Dell Latitude 9450 2-in-1
Intel Core Ultra 7 165U
43441 MIPS -34%
Acer TravelMate P4 14 TMP414-42-TCO-R6KG
AMD Ryzen 5 8540U
39786 MIPS -39%
Lenovo ThinkPad X1 Carbon Gen 14 21V70075GE
Intel Core Ultra 5 325
36228 MIPS -45%
Dell 14S DS14260
Intel Core Ultra 7 355
36122 MIPS -45%
HP EliteBook X Flip G1i 14 AI
Intel Core Ultra 7 258V
32310 MIPS -51%
Lenovo ThinkPad E14 Gen 7 21U2002QGE
Intel Core Ultra 5 228V
28714 MIPS -56%
7-Zip 18.03 / 7z b 4 -mmt1
HP OmniBook Ultra 14 Core Ultra X9
Intel Core Ultra X9 388H
6699 MIPS +8%
MSI Prestige 14 Flip AI+ 2026
Intel Core Ultra X7 358H
6323 MIPS +2%
HP EliteBook X Flip G2i 14 AI
Intel Core Ultra 7 366H
6214 MIPS
Przeciętny Intel Core Ultra 7 366H
  (n=1)
6214 MIPS 0%
Acer TravelMate P4 14 TMP414-42-TCO-R6KG
AMD Ryzen 5 8540U
6202 MIPS 0%
HP EliteBook 8 G2a 14
AMD Ryzen AI 7 450
6192 MIPS 0%
Lenovo Yoga 7 2-in-1 14AKP10
AMD Ryzen AI 5 340
5959 MIPS -4%
Honor MagicBook Art 14 2025
Intel Core Ultra 7 255H
5892 MIPS -5%
Dell 14S DS14260
Intel Core Ultra 7 355
5831 MIPS -6%
Lenovo ThinkPad X1 Carbon Gen 14 21V70075GE
Intel Core Ultra 5 325
5741 MIPS -8%
Lenovo ThinkPad E14 Gen 7 21U2002QGE
Intel Core Ultra 5 228V
5326 MIPS -14%
HP EliteBook x360 1040 G11
Intel Core Ultra 7 165H
5273 MIPS -15%
HP EliteBook X Flip G1i 14 AI
Intel Core Ultra 7 258V
5265 MIPS -15%
Dell Latitude 9450 2-in-1
Intel Core Ultra 7 165U
4938 MIPS -21%
Geekbench 6.7 / Multi-Core
MSI Prestige 14 Flip AI+ 2026
Intel Core Ultra X7 358H
16989 Points 0%
HP EliteBook X Flip G2i 14 AI
Intel Core Ultra 7 366H
16948 Points
Przeciętny Intel Core Ultra 7 366H
  (16080 - 16948, n=3)
16597 Points -2%
HP OmniBook Ultra 14 Core Ultra X9
Intel Core Ultra X9 388H
16568 Points -2%
Honor MagicBook Art 14 2025
Intel Core Ultra 7 255H
14454 Points -15%
HP EliteBook 8 G2a 14
AMD Ryzen AI 7 450
13611 Points -20%
HP EliteBook x360 1040 G11
Intel Core Ultra 7 165H
12265 Points -28%
Dell 14S DS14260
Intel Core Ultra 7 355
11227 Points -34%
Lenovo ThinkPad X1 Carbon Gen 14 21V70075GE
Intel Core Ultra 5 325
11038 Points -35%
Lenovo Yoga 7 2-in-1 14AKP10
AMD Ryzen AI 5 340
10668 Points -37%
Lenovo ThinkPad E14 Gen 7 21U2002QGE
Intel Core Ultra 5 228V
10353 Points -39%
Dell Latitude 9450 2-in-1
Intel Core Ultra 7 165U
9944 Points -41%
HP EliteBook X Flip G1i 14 AI
Intel Core Ultra 7 258V
9311 Points -45%
Acer TravelMate P4 14 TMP414-42-TCO-R6KG
AMD Ryzen 5 8540U
8221 Points -51%
Geekbench 6.7 / Single-Core
HP OmniBook Ultra 14 Core Ultra X9
Intel Core Ultra X9 388H
3027 Points +6%
HP EliteBook 8 G2a 14
AMD Ryzen AI 7 450
2914 Points +2%
MSI Prestige 14 Flip AI+ 2026
Intel Core Ultra X7 358H
2906 Points +2%
Przeciętny Intel Core Ultra 7 366H
  (2853 - 2861, n=2)
2857 Points 0%
HP EliteBook X Flip G2i 14 AI
Intel Core Ultra 7 366H
2853 Points
Honor MagicBook Art 14 2025
Intel Core Ultra 7 255H
2797 Points -2%
Lenovo Yoga 7 2-in-1 14AKP10
AMD Ryzen AI 5 340
2776 Points -3%
Dell 14S DS14260
Intel Core Ultra 7 355
2716 Points -5%
Lenovo ThinkPad X1 Carbon Gen 14 21V70075GE
Intel Core Ultra 5 325
2620 Points -8%
Lenovo ThinkPad E14 Gen 7 21U2002QGE
Intel Core Ultra 5 228V
2605 Points -9%
HP EliteBook X Flip G1i 14 AI
Intel Core Ultra 7 258V
2593 Points -9%
Acer TravelMate P4 14 TMP414-42-TCO-R6KG
AMD Ryzen 5 8540U
2474 Points -13%
HP EliteBook x360 1040 G11
Intel Core Ultra 7 165H
2437 Points -15%
Dell Latitude 9450 2-in-1
Intel Core Ultra 7 165U
2356 Points -17%
Geekbench 5.5 / Multi-Core
HP EliteBook X Flip G2i 14 AI
Intel Core Ultra 7 366H
16949 Points
Przeciętny Intel Core Ultra 7 366H
  (n=1)
16949 Points 0%
MSI Prestige 14 Flip AI+ 2026
Intel Core Ultra X7 358H
16836 Points -1%
HP OmniBook Ultra 14 Core Ultra X9
Intel Core Ultra X9 388H
15933 Points -6%
Honor MagicBook Art 14 2025
Intel Core Ultra 7 255H
13571 Points -20%
HP EliteBook x360 1040 G11
Intel Core Ultra 7 165H
12204 Points -28%
Dell 14S DS14260
Intel Core Ultra 7 355
10000 Points -41%
Lenovo ThinkPad X1 Carbon Gen 14 21V70075GE
Intel Core Ultra 5 325
9990 Points -41%
Lenovo ThinkPad E14 Gen 7 21U2002QGE
Intel Core Ultra 5 228V
9169 Points -46%
Lenovo Yoga 7 2-in-1 14AKP10
AMD Ryzen AI 5 340
8735 Points -48%
Dell Latitude 9450 2-in-1
Intel Core Ultra 7 165U
8719 Points -49%
HP EliteBook X Flip G1i 14 AI
Intel Core Ultra 7 258V
7717 Points -54%
Acer TravelMate P4 14 TMP414-42-TCO-R6KG
AMD Ryzen 5 8540U
6951 Points -59%
Geekbench 5.5 / Single-Core
HP OmniBook Ultra 14 Core Ultra X9
Intel Core Ultra X9 388H
2224 Points +7%
MSI Prestige 14 Flip AI+ 2026
Intel Core Ultra X7 358H
2117 Points +1%
HP EliteBook X Flip G2i 14 AI
Intel Core Ultra 7 366H
2087 Points
Przeciętny Intel Core Ultra 7 366H
  (n=1)
2087 Points 0%
Lenovo Yoga 7 2-in-1 14AKP10
AMD Ryzen AI 5 340
2033 Points -3%
Honor MagicBook Art 14 2025
Intel Core Ultra 7 255H
2015 Points -3%
Dell 14S DS14260
Intel Core Ultra 7 355
2014 Points -3%
Lenovo ThinkPad X1 Carbon Gen 14 21V70075GE
Intel Core Ultra 5 325
1959 Points -6%
Lenovo ThinkPad E14 Gen 7 21U2002QGE
Intel Core Ultra 5 228V
1905 Points -9%
HP EliteBook X Flip G1i 14 AI
Intel Core Ultra 7 258V
1891 Points -9%
HP EliteBook x360 1040 G11
Intel Core Ultra 7 165H
1806 Points -13%
Acer TravelMate P4 14 TMP414-42-TCO-R6KG
AMD Ryzen 5 8540U
1797 Points -14%
Dell Latitude 9450 2-in-1
Intel Core Ultra 7 165U
1735 Points -17%
HWBOT x265 Benchmark v2.2 / 4k Preset
HP EliteBook X Flip G2i 14 AI
Intel Core Ultra 7 366H
21.5 fps
Przeciętny Intel Core Ultra 7 366H
  (n=1)
21.5 fps 0%
HP EliteBook 8 G2a 14
AMD Ryzen AI 7 450
21.2 fps -1%
HP OmniBook Ultra 14 Core Ultra X9
Intel Core Ultra X9 388H
20.6 fps -4%
MSI Prestige 14 Flip AI+ 2026
Intel Core Ultra X7 358H
19.5 fps -9%
Honor MagicBook Art 14 2025
Intel Core Ultra 7 255H
18.3 fps -15%
HP EliteBook x360 1040 G11
Intel Core Ultra 7 165H
16 fps -26%
Dell 14S DS14260
Intel Core Ultra 7 355
14.4 fps -33%
Lenovo ThinkPad X1 Carbon Gen 14 21V70075GE
Intel Core Ultra 5 325
14.3 fps -33%
Lenovo Yoga 7 2-in-1 14AKP10
AMD Ryzen AI 5 340
13.6 fps -37%
Dell Latitude 9450 2-in-1
Intel Core Ultra 7 165U
12.3 fps -43%
HP EliteBook X Flip G1i 14 AI
Intel Core Ultra 7 258V
11.9 fps -45%
Acer TravelMate P4 14 TMP414-42-TCO-R6KG
AMD Ryzen 5 8540U
11.9 fps -45%
Lenovo ThinkPad E14 Gen 7 21U2002QGE
Intel Core Ultra 5 228V
10.6 fps -51%
LibreOffice / 20 Documents To PDF
Lenovo Yoga 7 2-in-1 14AKP10
AMD Ryzen AI 5 340
56.7 s * -8%
HP EliteBook x360 1040 G11
Intel Core Ultra 7 165H
54.8 s * -4%
Acer TravelMate P4 14 TMP414-42-TCO-R6KG
AMD Ryzen 5 8540U
54.1 s * -3%
Lenovo ThinkPad E14 Gen 7 21U2002QGE
Intel Core Ultra 5 228V
54 s * -2%
HP EliteBook X Flip G1i 14 AI
Intel Core Ultra 7 258V
52.7 s * -0%
HP EliteBook X Flip G2i 14 AI
Intel Core Ultra 7 366H
52.7 s *
Przeciętny Intel Core Ultra 7 366H
  (n=1)
52.7 s * -0%
HP OmniBook Ultra 14 Core Ultra X9
Intel Core Ultra X9 388H
45.9 s * +13%
HP EliteBook 8 G2a 14
AMD Ryzen AI 7 450
44.9 s * +15%
MSI Prestige 14 Flip AI+ 2026
Intel Core Ultra X7 358H
44.8 s * +15%
Honor MagicBook Art 14 2025
Intel Core Ultra 7 255H
44.6 s * +15%
Lenovo ThinkPad X1 Carbon Gen 14 21V70075GE
Intel Core Ultra 5 325
43.6 s * +17%
Dell Latitude 9450 2-in-1
Intel Core Ultra 7 165U
43.5 s * +17%
Dell 14S DS14260
Intel Core Ultra 7 355
41.4 s * +21%
R Benchmark 2.5 / Overall mean
Lenovo ThinkPad E14 Gen 7 21U2002QGE
Intel Core Ultra 5 228V
0.492 sec * -14%
Dell Latitude 9450 2-in-1
Intel Core Ultra 7 165U
0.4881 sec * -13%
HP EliteBook X Flip G1i 14 AI
Intel Core Ultra 7 258V
0.4852 sec * -12%
HP EliteBook x360 1040 G11
Intel Core Ultra 7 165H
0.4686 sec * -9%
Acer TravelMate P4 14 TMP414-42-TCO-R6KG
AMD Ryzen 5 8540U
0.4563 sec * -6%
Honor MagicBook Art 14 2025
Intel Core Ultra 7 255H
0.4547 sec * -5%
Lenovo ThinkPad X1 Carbon Gen 14 21V70075GE
Intel Core Ultra 5 325
0.4545 sec * -5%
Dell 14S DS14260
Intel Core Ultra 7 355
0.4363 sec * -1%
HP EliteBook X Flip G2i 14 AI
Intel Core Ultra 7 366H
0.4313 sec *
Przeciętny Intel Core Ultra 7 366H
  (n=1)
0.4313 sec * -0%
MSI Prestige 14 Flip AI+ 2026
Intel Core Ultra X7 358H
0.4279 sec * +1%
Lenovo Yoga 7 2-in-1 14AKP10
AMD Ryzen AI 5 340
0.4262 sec * +1%
HP EliteBook 8 G2a 14
AMD Ryzen AI 7 450
0.4177 sec * +3%
HP OmniBook Ultra 14 Core Ultra X9
Intel Core Ultra X9 388H
0.4045 sec * +6%
CPU Performance rating: Percent
Cinebench 2024: CPU Single Core | CPU Multi Core
Cinebench R23: Multi Core | Single Core
Cinebench R20: CPU (Multi Core) | CPU (Single Core)
Cinebench R15: CPU Multi 64Bit | CPU Single 64Bit
Blender: v2.79 BMW27 CPU
7-Zip 18.03: 7z b 4 | 7z b 4 -mmt1
Geekbench 6.7: Multi-Core | Single-Core
Geekbench 5.5: Multi-Core | Single-Core
HWBOT x265 Benchmark v2.2: 4k Preset
LibreOffice : 20 Documents To PDF
R Benchmark 2.5: Overall mean

* ... im mniej tym lepiej

Cinebench R15 CPU Multi 64Bit
2986 Points
Cinebench R15 OpenGL 64Bit
210 fps
Cinebench R15 Ref. Match 64Bit
97.8 %
Cinebench R15 CPU Single 64Bit
296 Points
Cinebench R20 CPU (Multi Core)
6672 Points
Cinebench R20 CPU (Single Core)
760 Points
Cinebench R23 Multi Core
19284 Points
Cinebench R23 Single Core
2084 Points
Cinebench 2024 CPU Single Core
124.1 Points
Cinebench 2024 CPU Multi Core
1063 Points
Cinebench 2026 CPU Single Thread
509 Points
Cinebench 2026 CPU Multi
4305 Points
Pomoc
Performance rating
HP EliteBook X Flip G2i 14 AI -1!
Intel Core Ultra 7 366H, Intel Graphics 4 Xe3 PTL
94.1 pt
Przeciętny Intel Core Ultra 7 366H -1!
 
94.1 pt
MSI Prestige 14 Flip AI+ 2026 -1!
Intel Core Ultra X7 358H, Arc B390 Panther Lake iGPU
86.4 pt
Lenovo Yoga 7 2-in-1 14AKP10 -1!
AMD Ryzen AI 5 340, Radeon 840M
81.3 pt
HP EliteBook x360 1040 G11 -1!
Intel Core Ultra 7 165H, Arc 8-Core
79.4 pt
HP EliteBook X Flip G1i 14 AI -1!
Intel Core Ultra 7 258V, Arc 140V
58.3 pt
Dell Latitude 9450 2-in-1 -1!
Intel Core Ultra 7 165U, Graphics 4-Core iGPU (Arrow Lake)
57.8 pt
AIDA64 / FP32 Ray-Trace
Lenovo Yoga 7 2-in-1 14AKP10
AMD Ryzen AI 5 340, Radeon 840M (v6.92.6600)
18609 KRay/s +11%
HP EliteBook X Flip G2i 14 AI
Intel Core Ultra 7 366H, Intel Graphics 4 Xe3 PTL (v8.20.8100)
16737 KRay/s
Przeciętny Intel Core Ultra 7 366H
  (n=1)
16737 KRay/s 0%
MSI Prestige 14 Flip AI+ 2026
Intel Core Ultra X7 358H, Arc B390 Panther Lake iGPU (v8.20.8100)
14411 KRay/s -14%
HP EliteBook x360 1040 G11
Intel Core Ultra 7 165H, Arc 8-Core (v6.92.6600)
12864 KRay/s -23%
HP EliteBook X Flip G1i 14 AI
Intel Core Ultra 7 258V, Arc 140V (v6.92.6600)
11722 KRay/s -30%
Dell Latitude 9450 2-in-1
Intel Core Ultra 7 165U, Graphics 4-Core iGPU (Arrow Lake) (v6.92.6600)
9685 KRay/s -42%
AIDA64 / FPU Julia
HP EliteBook X Flip G2i 14 AI
Intel Core Ultra 7 366H, Intel Graphics 4 Xe3 PTL (v8.20.8100)
84589 Points
Przeciętny Intel Core Ultra 7 366H
  (n=1)
84589 Points 0%
MSI Prestige 14 Flip AI+ 2026
Intel Core Ultra X7 358H, Arc B390 Panther Lake iGPU (v8.20.8100)
77348 Points -9%
Lenovo Yoga 7 2-in-1 14AKP10
AMD Ryzen AI 5 340, Radeon 840M (v6.92.6600)
71462 Points -16%
HP EliteBook x360 1040 G11
Intel Core Ultra 7 165H, Arc 8-Core (v6.92.6600)
67576 Points -20%
HP EliteBook X Flip G1i 14 AI
Intel Core Ultra 7 258V, Arc 140V (v6.92.6600)
56010 Points -34%
Dell Latitude 9450 2-in-1
Intel Core Ultra 7 165U, Graphics 4-Core iGPU (Arrow Lake) (v6.92.6600)
46507 Points -45%
AIDA64 / CPU SHA3
HP EliteBook X Flip G2i 14 AI
Intel Core Ultra 7 366H, Intel Graphics 4 Xe3 PTL (v8.20.8100)
4318 MB/s
Przeciętny Intel Core Ultra 7 366H
  (n=1)
4318 MB/s 0%
MSI Prestige 14 Flip AI+ 2026
Intel Core Ultra X7 358H, Arc B390 Panther Lake iGPU (v8.20.8100)
3910 MB/s -9%
HP EliteBook x360 1040 G11
Intel Core Ultra 7 165H, Arc 8-Core (v6.92.6600)
3130 MB/s -28%
Lenovo Yoga 7 2-in-1 14AKP10
AMD Ryzen AI 5 340, Radeon 840M (v6.92.6600)
3007 MB/s -30%
Dell Latitude 9450 2-in-1
Intel Core Ultra 7 165U, Graphics 4-Core iGPU (Arrow Lake) (v6.92.6600)
2507 MB/s -42%
HP EliteBook X Flip G1i 14 AI
Intel Core Ultra 7 258V, Arc 140V (v6.92.6600)
2466 MB/s -43%
AIDA64 / CPU Queen
HP EliteBook x360 1040 G11
Intel Core Ultra 7 165H, Arc 8-Core (v6.92.6600)
82058 Points
Lenovo Yoga 7 2-in-1 14AKP10
AMD Ryzen AI 5 340, Radeon 840M (v6.92.6600)
55142 Points
HP EliteBook X Flip G1i 14 AI
Intel Core Ultra 7 258V, Arc 140V (v6.92.6600)
49554 Points
Dell Latitude 9450 2-in-1
Intel Core Ultra 7 165U, Graphics 4-Core iGPU (Arrow Lake) (v6.92.6600)
45867 Points
AIDA64 / FPU SinJulia
Lenovo Yoga 7 2-in-1 14AKP10
AMD Ryzen AI 5 340, Radeon 840M (v6.92.6600)
9906 Points +41%
HP EliteBook x360 1040 G11
Intel Core Ultra 7 165H, Arc 8-Core (v6.92.6600)
9024 Points +28%
HP EliteBook X Flip G2i 14 AI
Intel Core Ultra 7 366H, Intel Graphics 4 Xe3 PTL (v8.20.8100)
7032 Points
Przeciętny Intel Core Ultra 7 366H
  (n=1)
7032 Points 0%
MSI Prestige 14 Flip AI+ 2026
Intel Core Ultra X7 358H, Arc B390 Panther Lake iGPU (v8.20.8100)
6545 Points -7%
Dell Latitude 9450 2-in-1
Intel Core Ultra 7 165U, Graphics 4-Core iGPU (Arrow Lake) (v6.92.6600)
5776 Points -18%
HP EliteBook X Flip G1i 14 AI
Intel Core Ultra 7 258V, Arc 140V (v6.92.6600)
4411 Points -37%
AIDA64 / FPU Mandel
HP EliteBook X Flip G2i 14 AI
Intel Core Ultra 7 366H, Intel Graphics 4 Xe3 PTL (v8.20.8100)
45501 Points
Przeciętny Intel Core Ultra 7 366H
  (n=1)
45501 Points 0%
MSI Prestige 14 Flip AI+ 2026
Intel Core Ultra X7 358H, Arc B390 Panther Lake iGPU (v8.20.8100)
41482 Points -9%
Lenovo Yoga 7 2-in-1 14AKP10
AMD Ryzen AI 5 340, Radeon 840M (v6.92.6600)
38271 Points -16%
HP EliteBook x360 1040 G11
Intel Core Ultra 7 165H, Arc 8-Core (v6.92.6600)
33246 Points -27%
HP EliteBook X Flip G1i 14 AI
Intel Core Ultra 7 258V, Arc 140V (v6.92.6600)
29703 Points -35%
Dell Latitude 9450 2-in-1
Intel Core Ultra 7 165U, Graphics 4-Core iGPU (Arrow Lake) (v6.92.6600)
23161 Points -49%
AIDA64 / CPU AES
HP EliteBook x360 1040 G11
Intel Core Ultra 7 165H, Arc 8-Core (v6.92.6600)
66655 MB/s +1%
HP EliteBook X Flip G2i 14 AI
Intel Core Ultra 7 366H, Intel Graphics 4 Xe3 PTL (v8.20.8100)
65739 MB/s
Przeciętny Intel Core Ultra 7 366H
  (n=1)
65739 MB/s 0%
Lenovo Yoga 7 2-in-1 14AKP10
AMD Ryzen AI 5 340, Radeon 840M (v6.92.6600)
59709 MB/s -9%
MSI Prestige 14 Flip AI+ 2026
Intel Core Ultra X7 358H, Arc B390 Panther Lake iGPU (v8.20.8100)
58703 MB/s -11%
Dell Latitude 9450 2-in-1
Intel Core Ultra 7 165U, Graphics 4-Core iGPU (Arrow Lake) (v6.92.6600)
48837 MB/s -26%
HP EliteBook X Flip G1i 14 AI
Intel Core Ultra 7 258V, Arc 140V (v6.92.6600)
38074 MB/s -42%
AIDA64 / CPU ZLib
HP EliteBook X Flip G2i 14 AI
Intel Core Ultra 7 366H, Intel Graphics 4 Xe3 PTL (v8.20.8100)
1109 MB/s
Przeciętny Intel Core Ultra 7 366H
  (n=1)
1109 MB/s 0%
MSI Prestige 14 Flip AI+ 2026
Intel Core Ultra X7 358H, Arc B390 Panther Lake iGPU (v8.20.8100)
932 MB/s -16%
HP EliteBook x360 1040 G11
Intel Core Ultra 7 165H, Arc 8-Core (v6.92.6600)
912 MB/s -18%
Lenovo Yoga 7 2-in-1 14AKP10
AMD Ryzen AI 5 340, Radeon 840M (v6.92.6600)
771 MB/s -30%
Dell Latitude 9450 2-in-1
Intel Core Ultra 7 165U, Graphics 4-Core iGPU (Arrow Lake) (v6.92.6600)
732 MB/s -34%
HP EliteBook X Flip G1i 14 AI
Intel Core Ultra 7 258V, Arc 140V (v6.92.6600)
515 MB/s -54%
AIDA64 / FP64 Ray-Trace
Lenovo Yoga 7 2-in-1 14AKP10
AMD Ryzen AI 5 340, Radeon 840M (v6.92.6600)
10029 KRay/s +19%
HP EliteBook X Flip G2i 14 AI
Intel Core Ultra 7 366H, Intel Graphics 4 Xe3 PTL (v8.20.8100)
8411 KRay/s
Przeciętny Intel Core Ultra 7 366H
  (n=1)
8411 KRay/s 0%
MSI Prestige 14 Flip AI+ 2026
Intel Core Ultra X7 358H, Arc B390 Panther Lake iGPU (v8.20.8100)
7625 KRay/s -9%
HP EliteBook x360 1040 G11
Intel Core Ultra 7 165H, Arc 8-Core (v6.92.6600)
6708 KRay/s -20%
HP EliteBook X Flip G1i 14 AI
Intel Core Ultra 7 258V, Arc 140V (v6.92.6600)
5824 KRay/s -31%
Dell Latitude 9450 2-in-1
Intel Core Ultra 7 165U, Graphics 4-Core iGPU (Arrow Lake) (v6.92.6600)
4965 KRay/s -41%
AIDA64 / CPU PhotoWorxx
HP EliteBook X Flip G2i 14 AI
Intel Core Ultra 7 366H, Intel Graphics 4 Xe3 PTL (v8.20.8100)
82840 MPixel/s
Przeciętny Intel Core Ultra 7 366H
  (n=1)
82840 MPixel/s 0%
MSI Prestige 14 Flip AI+ 2026
Intel Core Ultra X7 358H, Arc B390 Panther Lake iGPU (v8.20.8100)
82327 MPixel/s -1%
HP EliteBook X Flip G1i 14 AI
Intel Core Ultra 7 258V, Arc 140V (v6.92.6600)
53630 MPixel/s -35%
Dell Latitude 9450 2-in-1
Intel Core Ultra 7 165U, Graphics 4-Core iGPU (Arrow Lake) (v6.92.6600)
49113 MPixel/s -41%
HP EliteBook x360 1040 G11
Intel Core Ultra 7 165H, Arc 8-Core (v6.92.6600)
48762 MPixel/s -41%
Lenovo Yoga 7 2-in-1 14AKP10
AMD Ryzen AI 5 340, Radeon 840M (v6.92.6600)
39747 MPixel/s -52%
AIDA64 / CPU CheckMate
MSI Prestige 14 Flip AI+ 2026
Intel Core Ultra X7 358H, Arc B390 Panther Lake iGPU (v8.20.8100)
4402 MP/s +2%
HP EliteBook X Flip G2i 14 AI
Intel Core Ultra 7 366H, Intel Graphics 4 Xe3 PTL (v8.20.8100)
4310 MP/s
Przeciętny Intel Core Ultra 7 366H
  (n=1)
4310 MP/s 0%

Wydajność systemu

PCMark 10 Standard
PCMark 10 Standard
Performance rating
HP EliteBook X Flip G2i 14 AI
Intel Graphics 4 Xe3 PTL, Ultra 7 366H
90.9 pt
Przeciętny Intel Core Ultra 7 366H, Intel Graphics 4 Xe3 Panther Lake iGPU
 
90.9 pt
MSI Prestige 14 Flip AI+ 2026 -3!
Arc B390 Panther Lake iGPU, Ultra X7 358H, Phison 1 TB ESR01TBTCCZ-27J
90.4 pt
HP EliteBook x360 1040 G11 -3!
Arc 8-Core, Ultra 7 165H, Kioxia XG8 KXG80ZNV512G
71 pt
Lenovo Yoga 7 2-in-1 14AKP10 -5!
Radeon 840M, Ryzen AI 5 340, WD PC SN7100S SDFPMSL-512G-1101
66.5 pt
HP EliteBook X Flip G1i 14 AI -3!
Arc 140V, Core Ultra 7 258V, Western Digital PC SN5000S SDEPNSJ-1T00-1006
65.5 pt
Dell Latitude 9450 2-in-1 -3!
Graphics 4-Core iGPU (Arrow Lake), Ultra 7 165U
64.8 pt
PCMark 10 / Score
MSI Prestige 14 Flip AI+ 2026
Arc B390 Panther Lake iGPU, Ultra X7 358H, Phison 1 TB ESR01TBTCCZ-27J
9794 Points +11%
HP EliteBook X Flip G2i 14 AI
Intel Graphics 4 Xe3 PTL, Ultra 7 366H
8858 Points
Przeciętny Intel Core Ultra 7 366H, Intel Graphics 4 Xe3 Panther Lake iGPU
  (n=1)
8858 Points 0%
HP EliteBook x360 1040 G11
Arc 8-Core, Ultra 7 165H, Kioxia XG8 KXG80ZNV512G
6983 Points -21%
HP EliteBook X Flip G1i 14 AI
Arc 140V, Core Ultra 7 258V, Western Digital PC SN5000S SDEPNSJ-1T00-1006
6931 Points -22%
Lenovo Yoga 7 2-in-1 14AKP10
Radeon 840M, Ryzen AI 5 340, WD PC SN7100S SDFPMSL-512G-1101
6762 Points -24%
Dell Latitude 9450 2-in-1
Graphics 4-Core iGPU (Arrow Lake), Ultra 7 165U
6156 Points -31%
PCMark 10 / Essentials
Lenovo Yoga 7 2-in-1 14AKP10
Radeon 840M, Ryzen AI 5 340, WD PC SN7100S SDFPMSL-512G-1101
11566 Points +5%
Dell Latitude 9450 2-in-1
Graphics 4-Core iGPU (Arrow Lake), Ultra 7 165U
11238 Points +2%
MSI Prestige 14 Flip AI+ 2026
Arc B390 Panther Lake iGPU, Ultra X7 358H, Phison 1 TB ESR01TBTCCZ-27J
11124 Points +1%
HP EliteBook x360 1040 G11
Arc 8-Core, Ultra 7 165H, Kioxia XG8 KXG80ZNV512G
11052 Points +1%
HP EliteBook X Flip G2i 14 AI
Intel Graphics 4 Xe3 PTL, Ultra 7 366H
10985 Points
Przeciętny Intel Core Ultra 7 366H, Intel Graphics 4 Xe3 Panther Lake iGPU
  (n=1)
10985 Points 0%
HP EliteBook X Flip G1i 14 AI
Arc 140V, Core Ultra 7 258V, Western Digital PC SN5000S SDEPNSJ-1T00-1006
10439 Points -5%
PCMark 10 / Productivity
MSI Prestige 14 Flip AI+ 2026
Arc B390 Panther Lake iGPU, Ultra X7 358H, Phison 1 TB ESR01TBTCCZ-27J
16771 Points +3%
HP EliteBook X Flip G2i 14 AI
Intel Graphics 4 Xe3 PTL, Ultra 7 366H
16234 Points
Przeciętny Intel Core Ultra 7 366H, Intel Graphics 4 Xe3 Panther Lake iGPU
  (n=1)
16234 Points 0%
Lenovo Yoga 7 2-in-1 14AKP10
Radeon 840M, Ryzen AI 5 340, WD PC SN7100S SDFPMSL-512G-1101
9672 Points -40%
HP EliteBook X Flip G1i 14 AI
Arc 140V, Core Ultra 7 258V, Western Digital PC SN5000S SDEPNSJ-1T00-1006
9273 Points -43%
HP EliteBook x360 1040 G11
Arc 8-Core, Ultra 7 165H, Kioxia XG8 KXG80ZNV512G
8722 Points -46%
Dell Latitude 9450 2-in-1
Graphics 4-Core iGPU (Arrow Lake), Ultra 7 165U
8138 Points -50%
PCMark 10 / Digital Content Creation
MSI Prestige 14 Flip AI+ 2026
Arc B390 Panther Lake iGPU, Ultra X7 358H, Phison 1 TB ESR01TBTCCZ-27J
13663 Points +29%
HP EliteBook X Flip G2i 14 AI
Intel Graphics 4 Xe3 PTL, Ultra 7 366H
10577 Points
Przeciętny Intel Core Ultra 7 366H, Intel Graphics 4 Xe3 Panther Lake iGPU
  (n=1)
10577 Points 0%
HP EliteBook x360 1040 G11
Arc 8-Core, Ultra 7 165H, Kioxia XG8 KXG80ZNV512G
9587 Points -9%
HP EliteBook X Flip G1i 14 AI
Arc 140V, Core Ultra 7 258V, Western Digital PC SN5000S SDEPNSJ-1T00-1006
9333 Points -12%
Lenovo Yoga 7 2-in-1 14AKP10
Radeon 840M, Ryzen AI 5 340, WD PC SN7100S SDFPMSL-512G-1101
7499 Points -29%
Dell Latitude 9450 2-in-1
Graphics 4-Core iGPU (Arrow Lake), Ultra 7 165U
6925 Points -35%
CrossMark / Overall
HP EliteBook X Flip G2i 14 AI
Intel Graphics 4 Xe3 PTL, Ultra 7 366H
2152 Points
Przeciętny Intel Core Ultra 7 366H, Intel Graphics 4 Xe3 Panther Lake iGPU
  (n=1)
2152 Points 0%
MSI Prestige 14 Flip AI+ 2026
Arc B390 Panther Lake iGPU, Ultra X7 358H, Phison 1 TB ESR01TBTCCZ-27J
2082 Points -3%
HP EliteBook x360 1040 G11
Arc 8-Core, Ultra 7 165H, Kioxia XG8 KXG80ZNV512G
1690 Points -21%
Lenovo Yoga 7 2-in-1 14AKP10
Radeon 840M, Ryzen AI 5 340, WD PC SN7100S SDFPMSL-512G-1101
1654 Points -23%
HP EliteBook X Flip G1i 14 AI
Arc 140V, Core Ultra 7 258V, Western Digital PC SN5000S SDEPNSJ-1T00-1006
1590 Points -26%
Dell Latitude 9450 2-in-1
Graphics 4-Core iGPU (Arrow Lake), Ultra 7 165U
1516 Points -30%
CrossMark / Productivity
HP EliteBook X Flip G2i 14 AI
Intel Graphics 4 Xe3 PTL, Ultra 7 366H
1957 Points
Przeciętny Intel Core Ultra 7 366H, Intel Graphics 4 Xe3 Panther Lake iGPU
  (n=1)
1957 Points 0%
MSI Prestige 14 Flip AI+ 2026
Arc B390 Panther Lake iGPU, Ultra X7 358H, Phison 1 TB ESR01TBTCCZ-27J
1888 Points -4%
HP EliteBook x360 1040 G11
Arc 8-Core, Ultra 7 165H, Kioxia XG8 KXG80ZNV512G
1615 Points -17%
HP EliteBook X Flip G1i 14 AI
Arc 140V, Core Ultra 7 258V, Western Digital PC SN5000S SDEPNSJ-1T00-1006
1574 Points -20%
Lenovo Yoga 7 2-in-1 14AKP10
Radeon 840M, Ryzen AI 5 340, WD PC SN7100S SDFPMSL-512G-1101
1571 Points -20%
Dell Latitude 9450 2-in-1
Graphics 4-Core iGPU (Arrow Lake), Ultra 7 165U
1479 Points -24%
CrossMark / Creativity
HP EliteBook X Flip G2i 14 AI
Intel Graphics 4 Xe3 PTL, Ultra 7 366H
2481 Points
Przeciętny Intel Core Ultra 7 366H, Intel Graphics 4 Xe3 Panther Lake iGPU
  (n=1)
2481 Points 0%
MSI Prestige 14 Flip AI+ 2026
Arc B390 Panther Lake iGPU, Ultra X7 358H, Phison 1 TB ESR01TBTCCZ-27J
2453 Points -1%
HP EliteBook x360 1040 G11
Arc 8-Core, Ultra 7 165H, Kioxia XG8 KXG80ZNV512G
1909 Points -23%
Lenovo Yoga 7 2-in-1 14AKP10
Radeon 840M, Ryzen AI 5 340, WD PC SN7100S SDFPMSL-512G-1101
1866 Points -25%
HP EliteBook X Flip G1i 14 AI
Arc 140V, Core Ultra 7 258V, Western Digital PC SN5000S SDEPNSJ-1T00-1006
1727 Points -30%
Dell Latitude 9450 2-in-1
Graphics 4-Core iGPU (Arrow Lake), Ultra 7 165U
1620 Points -35%
CrossMark / Responsiveness
HP EliteBook X Flip G2i 14 AI
Intel Graphics 4 Xe3 PTL, Ultra 7 366H
1864 Points
Przeciętny Intel Core Ultra 7 366H, Intel Graphics 4 Xe3 Panther Lake iGPU
  (n=1)
1864 Points 0%
MSI Prestige 14 Flip AI+ 2026
Arc B390 Panther Lake iGPU, Ultra X7 358H, Phison 1 TB ESR01TBTCCZ-27J
1707 Points -8%
HP EliteBook x360 1040 G11
Arc 8-Core, Ultra 7 165H, Kioxia XG8 KXG80ZNV512G
1347 Points -28%
Lenovo Yoga 7 2-in-1 14AKP10
Radeon 840M, Ryzen AI 5 340, WD PC SN7100S SDFPMSL-512G-1101
1344 Points -28%
Dell Latitude 9450 2-in-1
Graphics 4-Core iGPU (Arrow Lake), Ultra 7 165U
1337 Points -28%
HP EliteBook X Flip G1i 14 AI
Arc 140V, Core Ultra 7 258V, Western Digital PC SN5000S SDEPNSJ-1T00-1006
1280 Points -31%
WebXPRT 3 / Overall
MSI Prestige 14 Flip AI+ 2026
Arc B390 Panther Lake iGPU, Ultra X7 358H, Phison 1 TB ESR01TBTCCZ-27J
321 Points 0%
HP EliteBook X Flip G2i 14 AI
Intel Graphics 4 Xe3 PTL, Ultra 7 366H
321 Points
Przeciętny Intel Core Ultra 7 366H, Intel Graphics 4 Xe3 Panther Lake iGPU
  (n=1)
321 Points 0%
HP EliteBook x360 1040 G11
Arc 8-Core, Ultra 7 165H, Kioxia XG8 KXG80ZNV512G
295 Points -8%
Dell Latitude 9450 2-in-1
Graphics 4-Core iGPU (Arrow Lake), Ultra 7 165U
279 Points -13%
HP EliteBook X Flip G1i 14 AI
Arc 140V, Core Ultra 7 258V, Western Digital PC SN5000S SDEPNSJ-1T00-1006
222 Points -31%
WebXPRT 4 / Overall
MSI Prestige 14 Flip AI+ 2026
Arc B390 Panther Lake iGPU, Ultra X7 358H, Phison 1 TB ESR01TBTCCZ-27J
302 Points 0%
HP EliteBook X Flip G2i 14 AI
Intel Graphics 4 Xe3 PTL, Ultra 7 366H
302 Points
Przeciętny Intel Core Ultra 7 366H, Intel Graphics 4 Xe3 Panther Lake iGPU
  (n=1)
302 Points 0%
HP EliteBook x360 1040 G11
Arc 8-Core, Ultra 7 165H, Kioxia XG8 KXG80ZNV512G
267 Points -12%
Dell Latitude 9450 2-in-1
Graphics 4-Core iGPU (Arrow Lake), Ultra 7 165U
254 Points -16%
HP EliteBook X Flip G1i 14 AI
Arc 140V, Core Ultra 7 258V, Western Digital PC SN5000S SDEPNSJ-1T00-1006
199.5 Points -34%
Mozilla Kraken 1.1 / Total
Dell Latitude 9450 2-in-1
Graphics 4-Core iGPU (Arrow Lake), Ultra 7 165U
521 ms * -16%
HP EliteBook x360 1040 G11
Arc 8-Core, Ultra 7 165H, Kioxia XG8 KXG80ZNV512G
514 ms * -14%
HP EliteBook X Flip G1i 14 AI
Arc 140V, Core Ultra 7 258V, Western Digital PC SN5000S SDEPNSJ-1T00-1006
481 ms * -7%
Lenovo Yoga 7 2-in-1 14AKP10
Radeon 840M, Ryzen AI 5 340, WD PC SN7100S SDFPMSL-512G-1101
458 ms * -2%
HP EliteBook X Flip G2i 14 AI
Intel Graphics 4 Xe3 PTL, Ultra 7 366H
451 ms *
Przeciętny Intel Core Ultra 7 366H, Intel Graphics 4 Xe3 Panther Lake iGPU
  (n=1)
451 ms * -0%
MSI Prestige 14 Flip AI+ 2026
Arc B390 Panther Lake iGPU, Ultra X7 358H, Phison 1 TB ESR01TBTCCZ-27J
447 ms * +1%
Geekbench AI / Quantized GPU 1.7
HP EliteBook X Flip G2i 14 AI
Intel Graphics 4 Xe3 PTL, Ultra 7 366H
4509 Points
Przeciętny Intel Core Ultra 7 366H, Intel Graphics 4 Xe3 Panther Lake iGPU
  (n=1)
4509 Points 0%
Geekbench AI / Half Precision GPU 1.7
HP EliteBook X Flip G2i 14 AI
Intel Graphics 4 Xe3 PTL, Ultra 7 366H
12824 Points
Przeciętny Intel Core Ultra 7 366H, Intel Graphics 4 Xe3 Panther Lake iGPU
  (n=1)
12824 Points 0%
Geekbench AI / Single Precision GPU 1.7
HP EliteBook X Flip G2i 14 AI
Intel Graphics 4 Xe3 PTL, Ultra 7 366H
6747 Points
Przeciętny Intel Core Ultra 7 366H, Intel Graphics 4 Xe3 Panther Lake iGPU
  (n=1)
6747 Points 0%

* ... im mniej tym lepiej

PCMark 10 Score
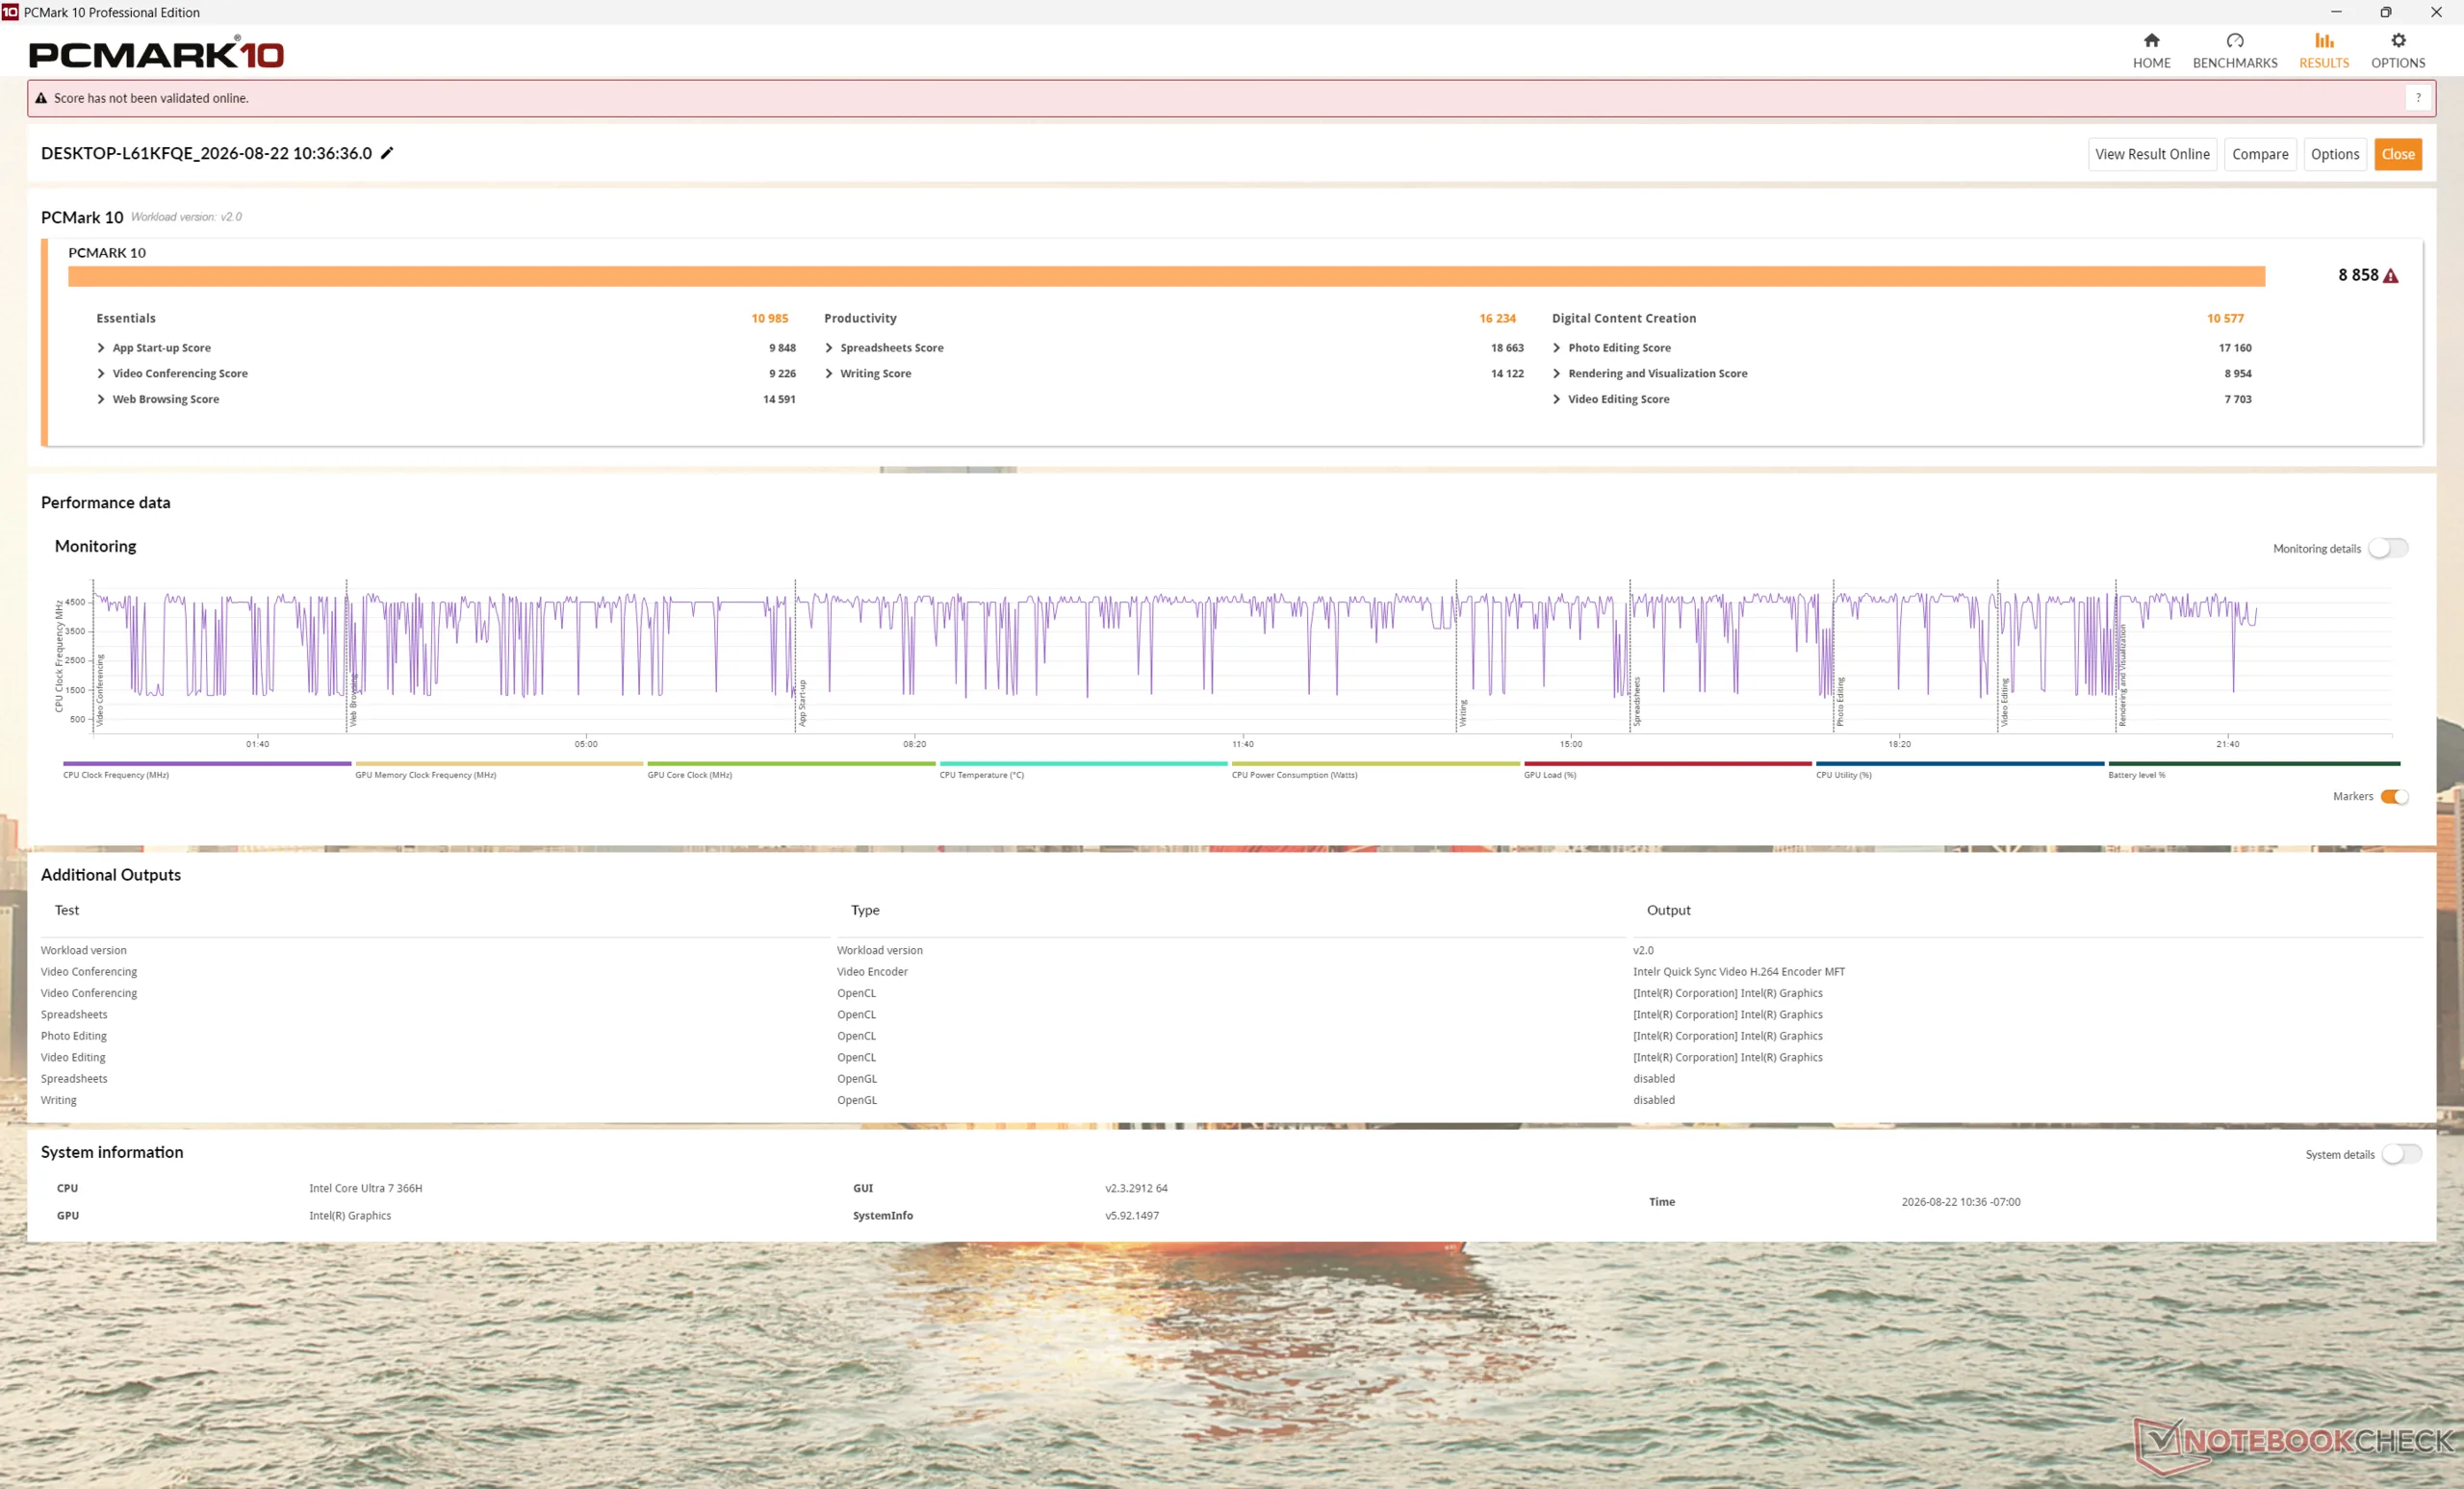
8858 pkt.
Pomoc
AIDA64 / Memory Copy
MSI Prestige 14 Flip AI+ 2026
Intel Core Ultra X7 358H, Arc B390 Panther Lake iGPU
120048 MB/s 0%
HP EliteBook X Flip G2i 14 AI
Intel Core Ultra 7 366H, Intel Graphics 4 Xe3 PTL
120004 MB/s
Przeciętny Intel Core Ultra 7 366H
  (n=1)
120004 MB/s 0%
HP EliteBook X Flip G1i 14 AI
Intel Core Ultra 7 258V, Arc 140V
114336 MB/s -5%
HP EliteBook x360 1040 G11
Intel Core Ultra 7 165H, Arc 8-Core
88831 MB/s -26%
Lenovo Yoga 7 2-in-1 14AKP10
AMD Ryzen AI 5 340, Radeon 840M
86573 MB/s -28%
Dell Latitude 9450 2-in-1
Intel Core Ultra 7 165U, Graphics 4-Core iGPU (Arrow Lake)
84739 MB/s -29%
AIDA64 / Memory Read
MSI Prestige 14 Flip AI+ 2026
Intel Core Ultra X7 358H, Arc B390 Panther Lake iGPU
111477 MB/s +3%
HP EliteBook X Flip G2i 14 AI
Intel Core Ultra 7 366H, Intel Graphics 4 Xe3 PTL
108649 MB/s
Przeciętny Intel Core Ultra 7 366H
  (n=1)
108649 MB/s 0%
HP EliteBook x360 1040 G11
Intel Core Ultra 7 165H, Arc 8-Core
87187 MB/s -20%
HP EliteBook X Flip G1i 14 AI
Intel Core Ultra 7 258V, Arc 140V
84937 MB/s -22%
Lenovo Yoga 7 2-in-1 14AKP10
AMD Ryzen AI 5 340, Radeon 840M
63523 MB/s -42%
Dell Latitude 9450 2-in-1
Intel Core Ultra 7 165U, Graphics 4-Core iGPU (Arrow Lake)
57847 MB/s -47%
AIDA64 / Memory Write
MSI Prestige 14 Flip AI+ 2026
Intel Core Ultra X7 358H, Arc B390 Panther Lake iGPU
120409 MB/s +1%
HP EliteBook X Flip G2i 14 AI
Intel Core Ultra 7 366H, Intel Graphics 4 Xe3 PTL
119571 MB/s
Przeciętny Intel Core Ultra 7 366H
  (n=1)
119571 MB/s 0%
HP EliteBook X Flip G1i 14 AI
Intel Core Ultra 7 258V, Arc 140V
109734 MB/s -8%
Lenovo Yoga 7 2-in-1 14AKP10
AMD Ryzen AI 5 340, Radeon 840M
107475 MB/s -10%
HP EliteBook x360 1040 G11
Intel Core Ultra 7 165H, Arc 8-Core
75839 MB/s -37%
Dell Latitude 9450 2-in-1
Intel Core Ultra 7 165U, Graphics 4-Core iGPU (Arrow Lake)
63397 MB/s -47%
AIDA64 / Memory Latency
Dell Latitude 9450 2-in-1
Intel Core Ultra 7 165U, Graphics 4-Core iGPU (Arrow Lake)
142.6 ns * -59%
HP EliteBook x360 1040 G11
Intel Core Ultra 7 165H, Arc 8-Core
139.2 ns * -56%
Lenovo Yoga 7 2-in-1 14AKP10
AMD Ryzen AI 5 340, Radeon 840M
103.8 ns * -16%
HP EliteBook X Flip G1i 14 AI
Intel Core Ultra 7 258V, Arc 140V
99 ns * -11%
MSI Prestige 14 Flip AI+ 2026
Intel Core Ultra X7 358H, Arc B390 Panther Lake iGPU
89.7 ns * -0%
HP EliteBook X Flip G2i 14 AI
Intel Core Ultra 7 366H, Intel Graphics 4 Xe3 PTL
89.5 ns *
Przeciętny Intel Core Ultra 7 366H
  (n=1)
89.5 ns * -0%

* ... im mniej tym lepiej

Opóźnienie DPC
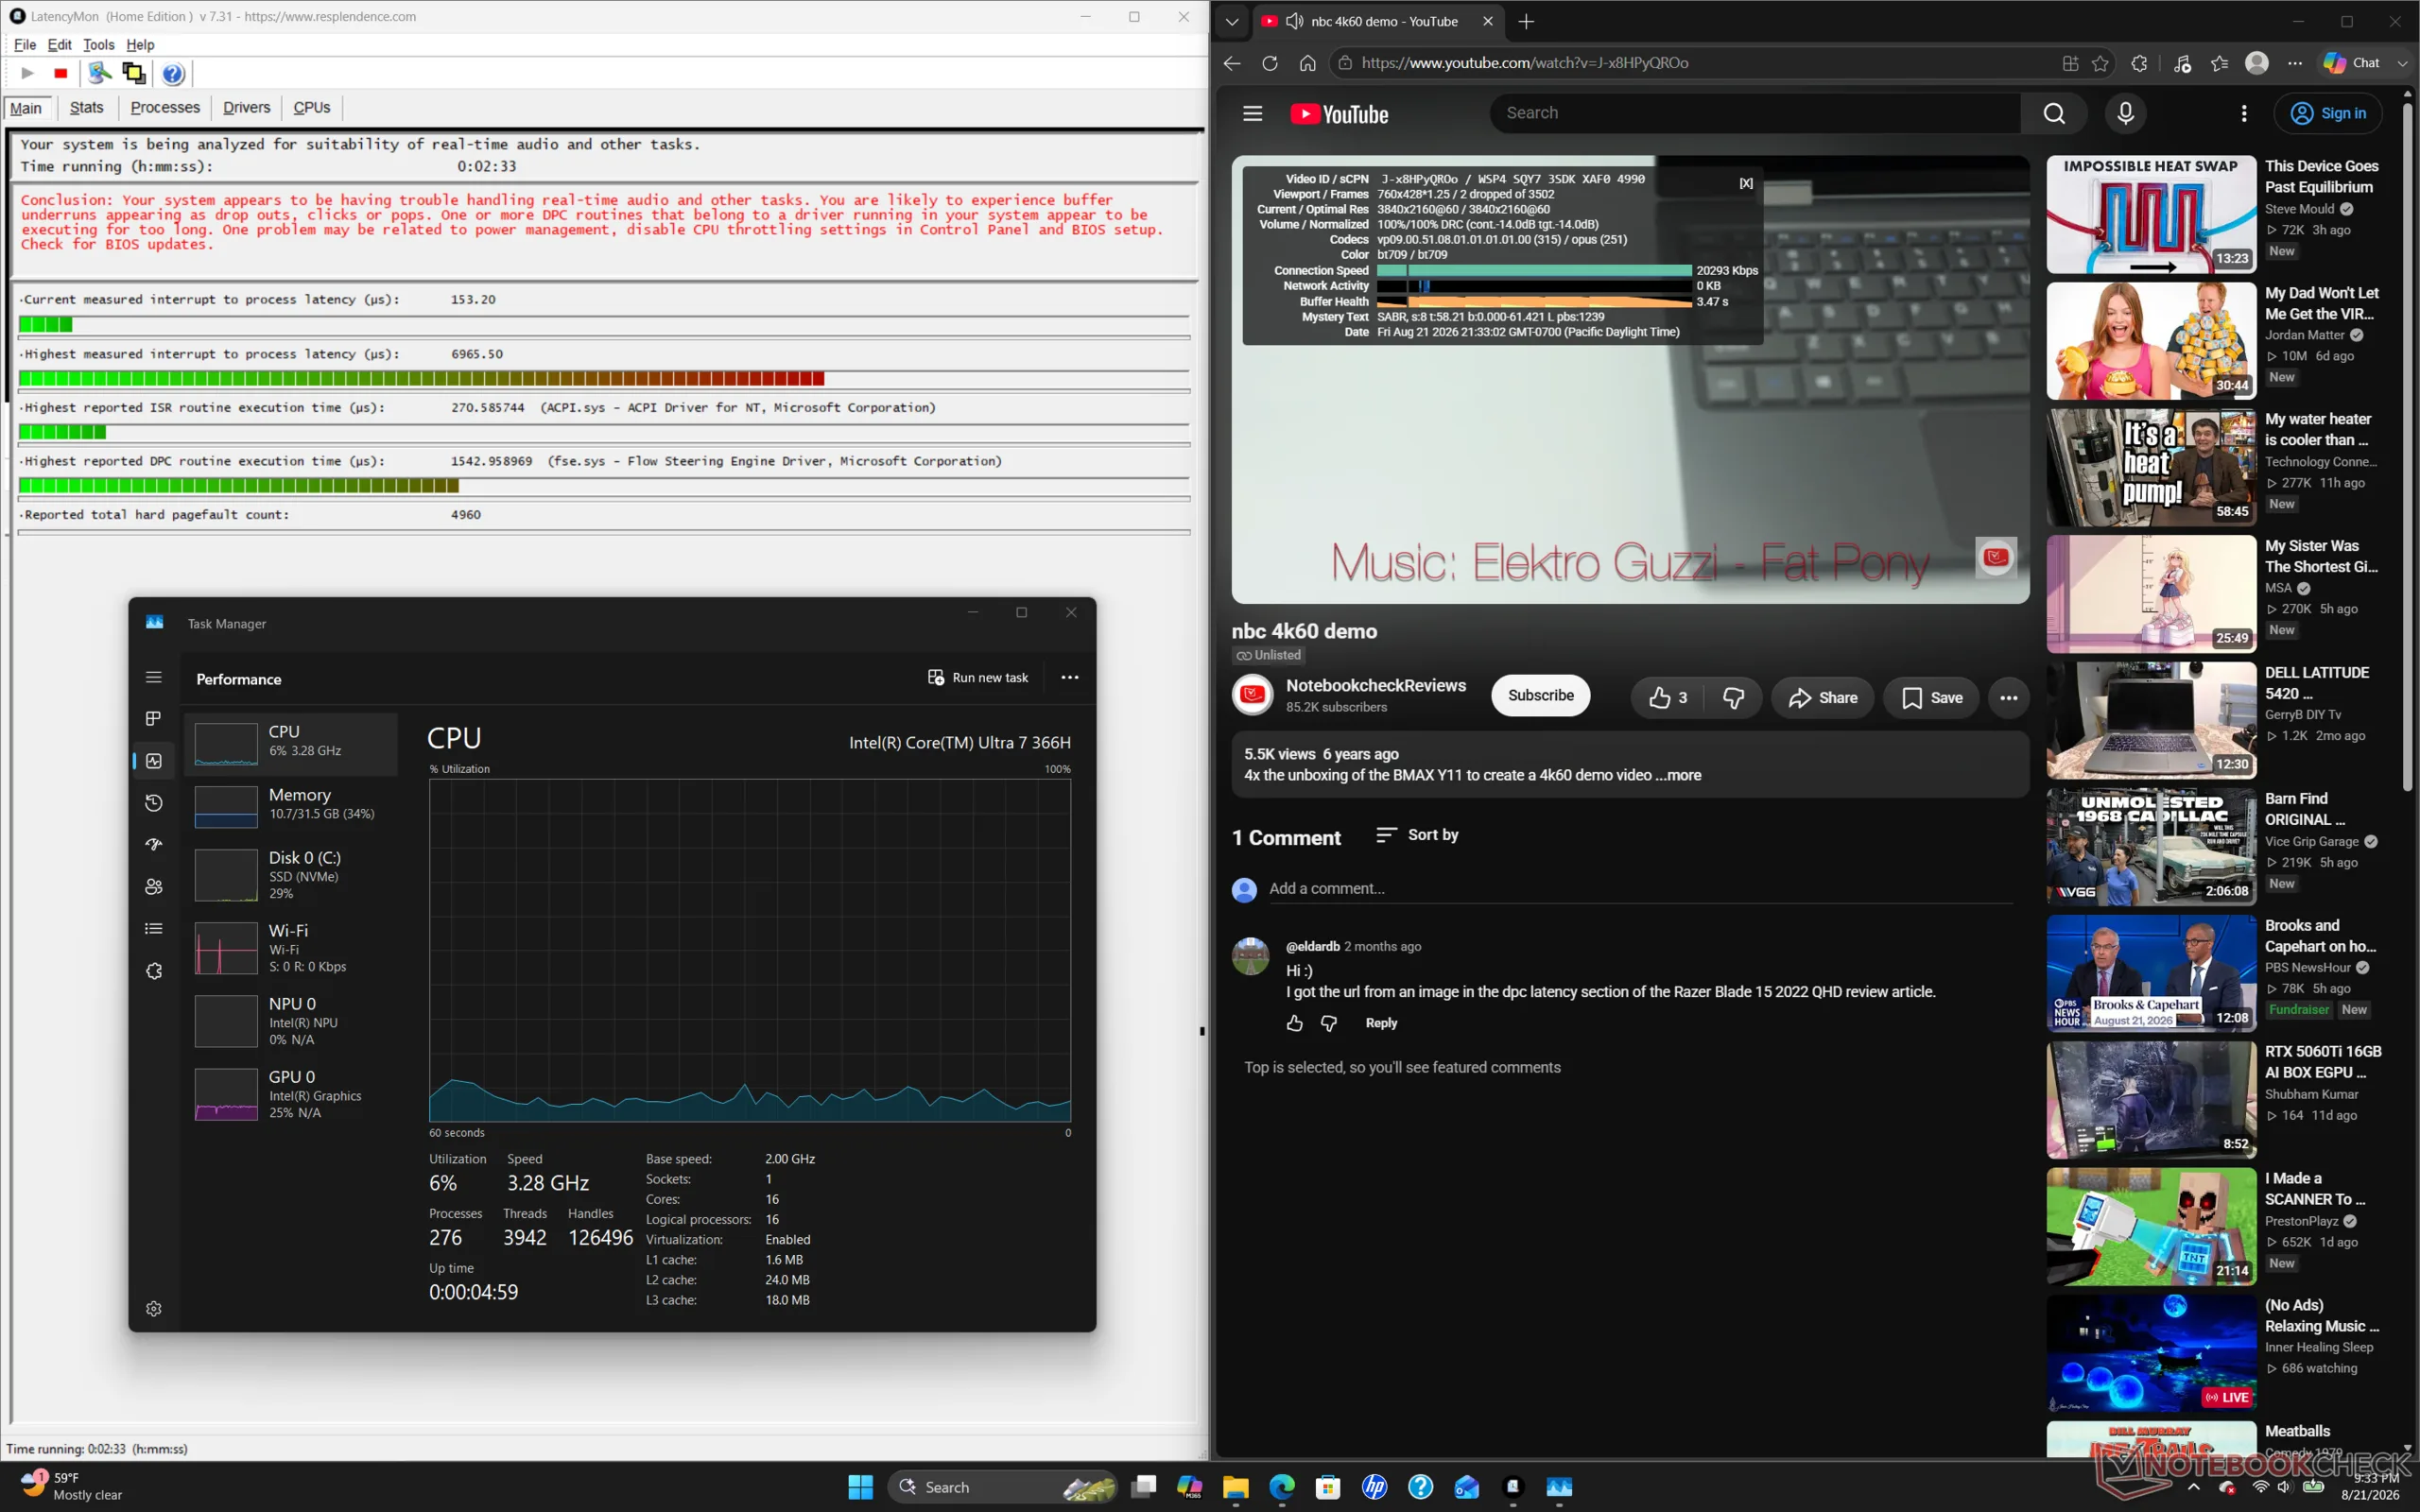
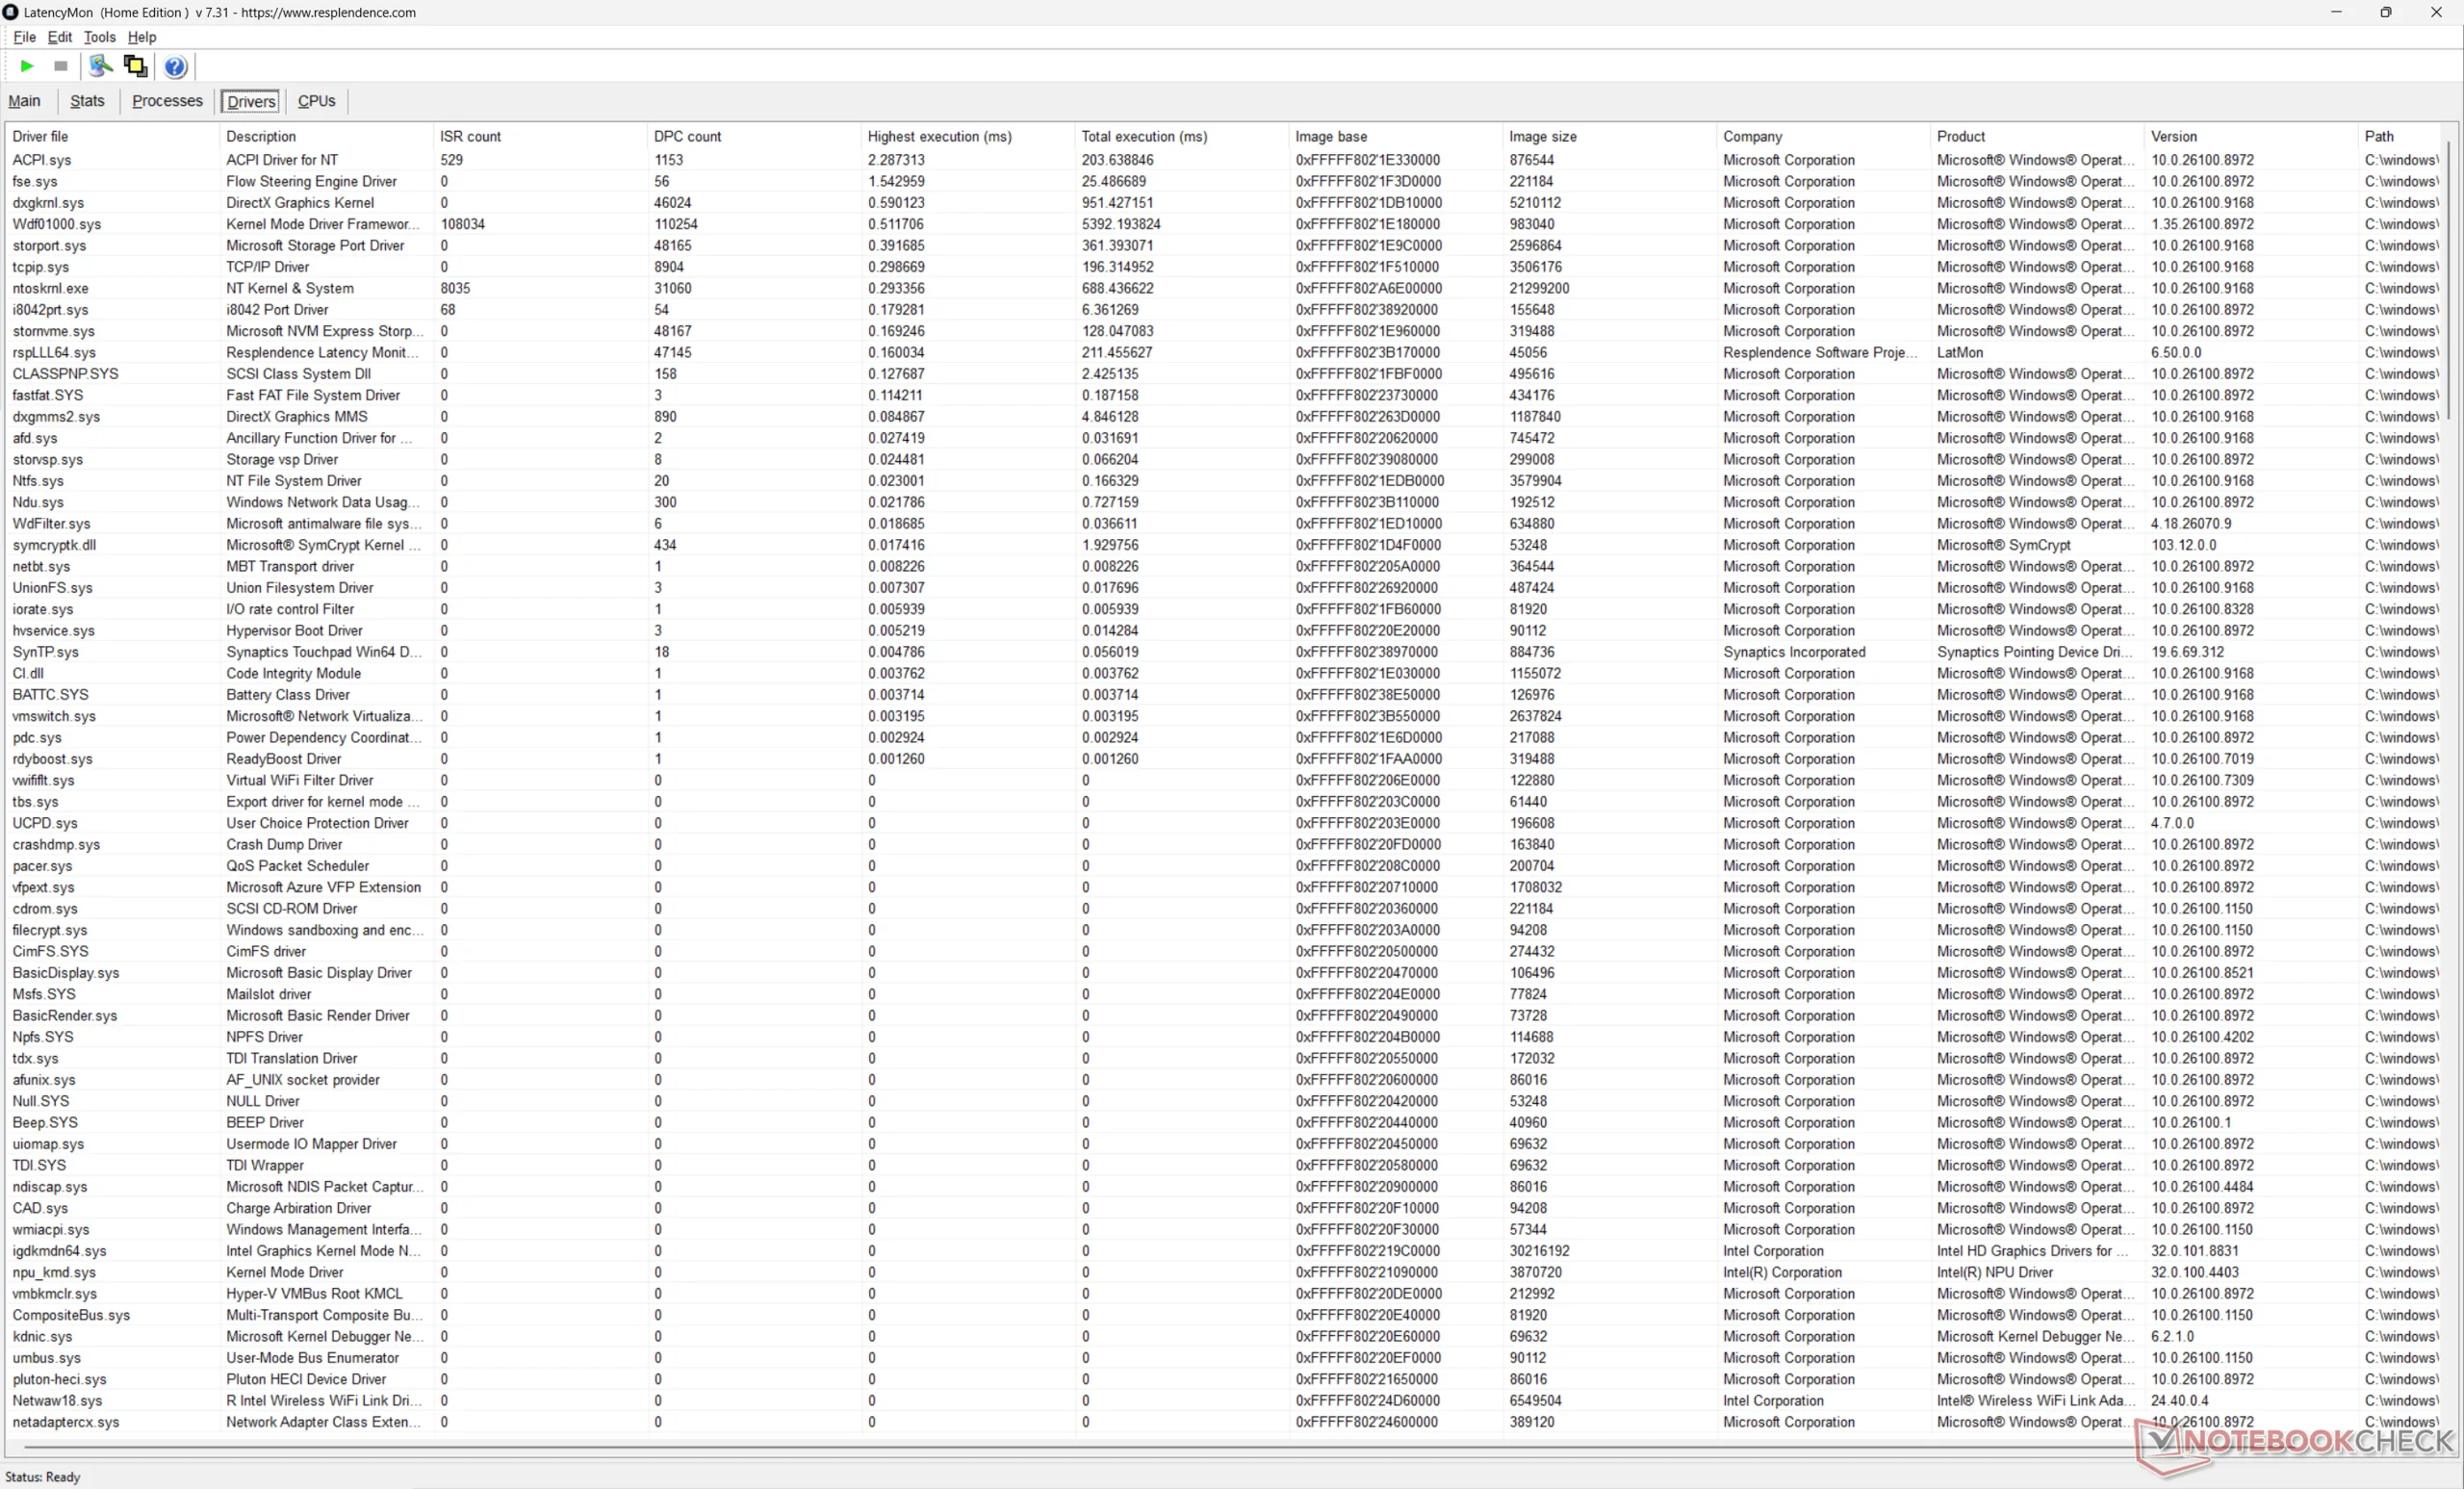
Program LatencyMon wykrywa problemy z DPC oraz dwa utracone klatki podczas odtwarzania wideo w rozdzielczości 4K60
Lista sterowników
Lista sterowników
DPC Latencies / LatencyMon - interrupt to process latency (max), Web, Youtube, Prime95
Lenovo Yoga 7 2-in-1 14AKP10
Radeon 840M, Ryzen AI 5 340, WD PC SN7100S SDFPMSL-512G-1101
16324 μs * -134%
MSI Prestige 14 Flip AI+ 2026
Arc B390 Panther Lake iGPU, Ultra X7 358H, Phison 1 TB ESR01TBTCCZ-27J
11242.2 μs * -61%
HP EliteBook X Flip G2i 14 AI
Intel Graphics 4 Xe3 PTL, Ultra 7 366H
6965.5 μs *
HP EliteBook x360 1040 G11
Arc 8-Core, Ultra 7 165H, Kioxia XG8 KXG80ZNV512G
3053.1 μs * +56%
Dell Latitude 9450 2-in-1
Graphics 4-Core iGPU (Arrow Lake), Ultra 7 165U
1836.7 μs * +74%
HP EliteBook X Flip G1i 14 AI
Arc 140V, Core Ultra 7 258V, Western Digital PC SN5000S SDEPNSJ-1T00-1006
924 μs * +87%

* ... im mniej tym lepiej

Urządzenia pamięci masowej
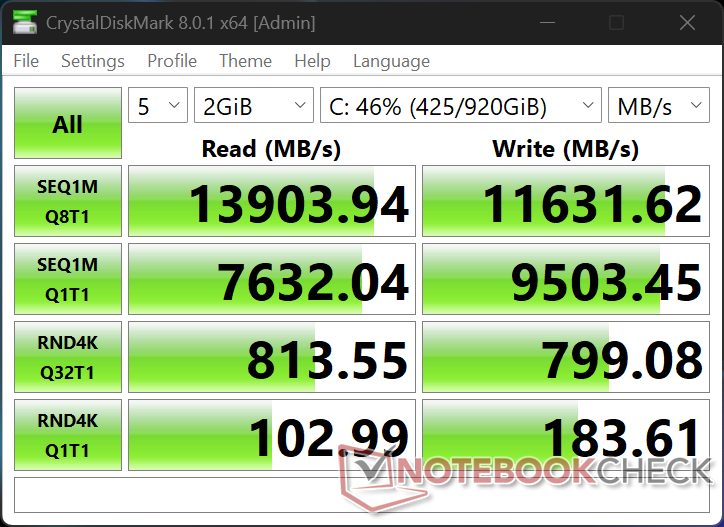
CDM 8
CDM 8

Ponieważ program AS SSD nie uruchomił się na naszym urządzeniu, jego wyniki przedstawiono poniżej.

CDM 5/6 Read Seq Q32T1: 13518 MB/s
CDM 5/6 Write Seq Q32T1: 11552 MB/s
CDM 5/6 Read 4K Q32T1: 833.8 MB/s
CDM 5/6 Write 4K Q32T1: 739.7 MB/s
CDM 5 Read Seq: 7730 MB/s
CDM 5 Write Seq: 8432 MB/s
CDM 5/6 Read 4K: 102.5 MB/s
CDM 5/6 Write 4K: 225.7 MB/s
Drive Performance rating - Percent
HP EliteBook X Flip G2i 14 AI
 
100 pt
MSI Prestige 14 Flip AI+ 2026
Phison 1 TB ESR01TBTCCZ-27J
42.8 pt
Lenovo Yoga 7 2-in-1 14AKP10
WD PC SN7100S SDFPMSL-512G-1101
42.2 pt
HP EliteBook x360 1040 G11
Kioxia XG8 KXG80ZNV512G
40.5 pt
HP EliteBook X Flip G1i 14 AI
Western Digital PC SN5000S SDEPNSJ-1T00-1006
36.6 pt
Dell Latitude 9450 2-in-1
 
34.3 pt
DiskSpd
seq read
HP EliteBook X Flip G2i 14 AI
 
8988 (8719.3min - 8987.55max) MB/s
HP EliteBook x360 1040 G11
Kioxia XG8 KXG80ZNV512G
3371 (3337.83min - 3370.54max) MB/s -62%
MSI Prestige 14 Flip AI+ 2026
Phison 1 TB ESR01TBTCCZ-27J
3262 (3068.55min - 3262.12max) MB/s -64%
Lenovo Yoga 7 2-in-1 14AKP10
WD PC SN7100S SDFPMSL-512G-1101
2472 (2456.72min - 2472.12max) MB/s -72%
Dell Latitude 9450 2-in-1
 
2455 (2420.93min - 2454.72max) MB/s -73%
HP EliteBook X Flip G1i 14 AI
Western Digital PC SN5000S SDEPNSJ-1T00-1006
1080 (987.04min - 1079.61max) MB/s -88%
seq write
HP EliteBook X Flip G2i 14 AI
 
8521 (8378.35min - 8521.15max) MB/s
HP EliteBook X Flip G1i 14 AI
Western Digital PC SN5000S SDEPNSJ-1T00-1006
3699 (2818.18min - 3698.75max) MB/s -57%
Lenovo Yoga 7 2-in-1 14AKP10
WD PC SN7100S SDFPMSL-512G-1101
3252 (914.63min - 3252.05max) MB/s -62%
HP EliteBook x360 1040 G11
Kioxia XG8 KXG80ZNV512G
3104 (2871.13min - 3103.87max) MB/s -64%
Dell Latitude 9450 2-in-1
 
3091 (808.18min - 3091.2max) MB/s -64%
MSI Prestige 14 Flip AI+ 2026
Phison 1 TB ESR01TBTCCZ-27J
2498 (2202.43min - 2498.13max) MB/s -71%
seq q8 t1 read
HP EliteBook X Flip G2i 14 AI
 
13921 (12612.4min - 13921.3max) MB/s
MSI Prestige 14 Flip AI+ 2026
Phison 1 TB ESR01TBTCCZ-27J
6953 (6309.95min - 6953.25max) MB/s -50%
HP EliteBook x360 1040 G11
Kioxia XG8 KXG80ZNV512G
6768 (5543.64min - 6768.44max) MB/s -51%
Lenovo Yoga 7 2-in-1 14AKP10
WD PC SN7100S SDFPMSL-512G-1101
6490 (5612.29min - 6489.66max) MB/s -53%
HP EliteBook X Flip G1i 14 AI
Western Digital PC SN5000S SDEPNSJ-1T00-1006
6378 (5615.12min - 6377.9max) MB/s -54%
Dell Latitude 9450 2-in-1
 
5033 (4388.11min - 5032.75max) MB/s -64%
seq q8 t1 write
HP EliteBook X Flip G2i 14 AI
 
11529 (11440.4min - 11528.7max) MB/s
MSI Prestige 14 Flip AI+ 2026
Phison 1 TB ESR01TBTCCZ-27J
6156 (5973.74min - 6155.56max) MB/s -47%
HP EliteBook X Flip G1i 14 AI
Western Digital PC SN5000S SDEPNSJ-1T00-1006
5588 (4673.08min - 5587.5max) MB/s -52%
HP EliteBook x360 1040 G11
Kioxia XG8 KXG80ZNV512G
4986 (4788.08min - 4985.98max) MB/s -57%
Lenovo Yoga 7 2-in-1 14AKP10
WD PC SN7100S SDFPMSL-512G-1101
4602 (827.56min - 4602.18max) MB/s -60%
Dell Latitude 9450 2-in-1
 
3981 (3754.15min - 3980.6max) MB/s -65%
4k q1 t1 read
HP EliteBook X Flip G2i 14 AI
 
102.1 (96.91min - 102.11max) MB/s
Lenovo Yoga 7 2-in-1 14AKP10
WD PC SN7100S SDFPMSL-512G-1101
68.9 (66.6min - 68.89max) MB/s -33%
MSI Prestige 14 Flip AI+ 2026
Phison 1 TB ESR01TBTCCZ-27J
60.7 (59.39min - 60.67max) MB/s -41%
HP EliteBook x360 1040 G11
Kioxia XG8 KXG80ZNV512G
54.3 (53.37min - 54.27max) MB/s -47%
Dell Latitude 9450 2-in-1
 
44.9 (44.41min - 44.94max) MB/s -56%
HP EliteBook X Flip G1i 14 AI
Western Digital PC SN5000S SDEPNSJ-1T00-1006
42.5 (38.94min - 42.45max) MB/s -58%
4k q1 t1 write
HP EliteBook X Flip G2i 14 AI
 
196 (168.28min - 196.03max) MB/s
MSI Prestige 14 Flip AI+ 2026
Phison 1 TB ESR01TBTCCZ-27J
149.9 (147.25min - 149.91max) MB/s -24%
Lenovo Yoga 7 2-in-1 14AKP10
WD PC SN7100S SDFPMSL-512G-1101
139.3 (130.14min - 139.3max) MB/s -29%
Dell Latitude 9450 2-in-1
 
137.1 (133.04min - 137.08max) MB/s -30%
HP EliteBook X Flip G1i 14 AI
Western Digital PC SN5000S SDEPNSJ-1T00-1006
137 (112.66min - 136.95max) MB/s -30%
HP EliteBook x360 1040 G11
Kioxia XG8 KXG80ZNV512G
125.2 (121.28min - 125.17max) MB/s -36%
4k q32 t16 read
HP EliteBook X Flip G2i 14 AI
 
3174 (2867.61min - 3174.26max) MB/s
Lenovo Yoga 7 2-in-1 14AKP10
WD PC SN7100S SDFPMSL-512G-1101
923 (897.76min - 922.62max) MB/s -71%
HP EliteBook x360 1040 G11
Kioxia XG8 KXG80ZNV512G
810 (739.95min - 809.67max) MB/s -74%
MSI Prestige 14 Flip AI+ 2026
Phison 1 TB ESR01TBTCCZ-27J
660 (601.09min - 659.97max) MB/s -79%
HP EliteBook X Flip G1i 14 AI
Western Digital PC SN5000S SDEPNSJ-1T00-1006
392 (364.53min - 391.85max) MB/s -88%
Dell Latitude 9450 2-in-1
 
358 (353.65min - 357.92max) MB/s -89%
4k q32 t16 write
HP EliteBook X Flip G2i 14 AI
 
2598 (2553.02min - 2597.53max) MB/s
HP EliteBook X Flip G1i 14 AI
Western Digital PC SN5000S SDEPNSJ-1T00-1006
495 (437.32min - 495.19max) MB/s -81%
Lenovo Yoga 7 2-in-1 14AKP10
WD PC SN7100S SDFPMSL-512G-1101
471 (450.22min - 471.19max) MB/s -82%
MSI Prestige 14 Flip AI+ 2026
Phison 1 TB ESR01TBTCCZ-27J
439 (409.05min - 439.47max) MB/s -83%
HP EliteBook x360 1040 G11
Kioxia XG8 KXG80ZNV512G
401 (395.14min - 400.8max) MB/s -85%
Dell Latitude 9450 2-in-1
 
378 (301.45min - 377.68max) MB/s -85%

Ograniczanie wydajności dysku: pętla odczytu DiskSpd, głębokość kolejki 8

0280560840112014001680196022402520280030803360364039204200448047605040532056005880616064406720700072807560784081208400868089609240952098001008010360106401092011200114801176012040123201260012880131601344013720Tooltip
HP EliteBook X Flip G2i 14 AI  ; diskspd 2.0.17 f: Ø13865 (11886.03-13915.23) MB/s
HP EliteBook X Flip G1i 14 AI Western Digital PC SN5000S SDEPNSJ-1T00-1006; diskspd 2.0.17 f: Ø6359 (5579.05-6385.85) MB/s

Wydajność procesora graficznego

Karta graficzna Graphics 4 Xe3 jest tylko nieznacznie szybsza od znacznie starszego modelu Iris Xe G7 96 EU. Jeśli priorytetem jest wydajność graficzna, zalecamy konfigurację z procesorem Core Ultra X7 358H i kartą graficzną Arc B390, co zapewni prawie 2,5-krotny wzrost mocy.

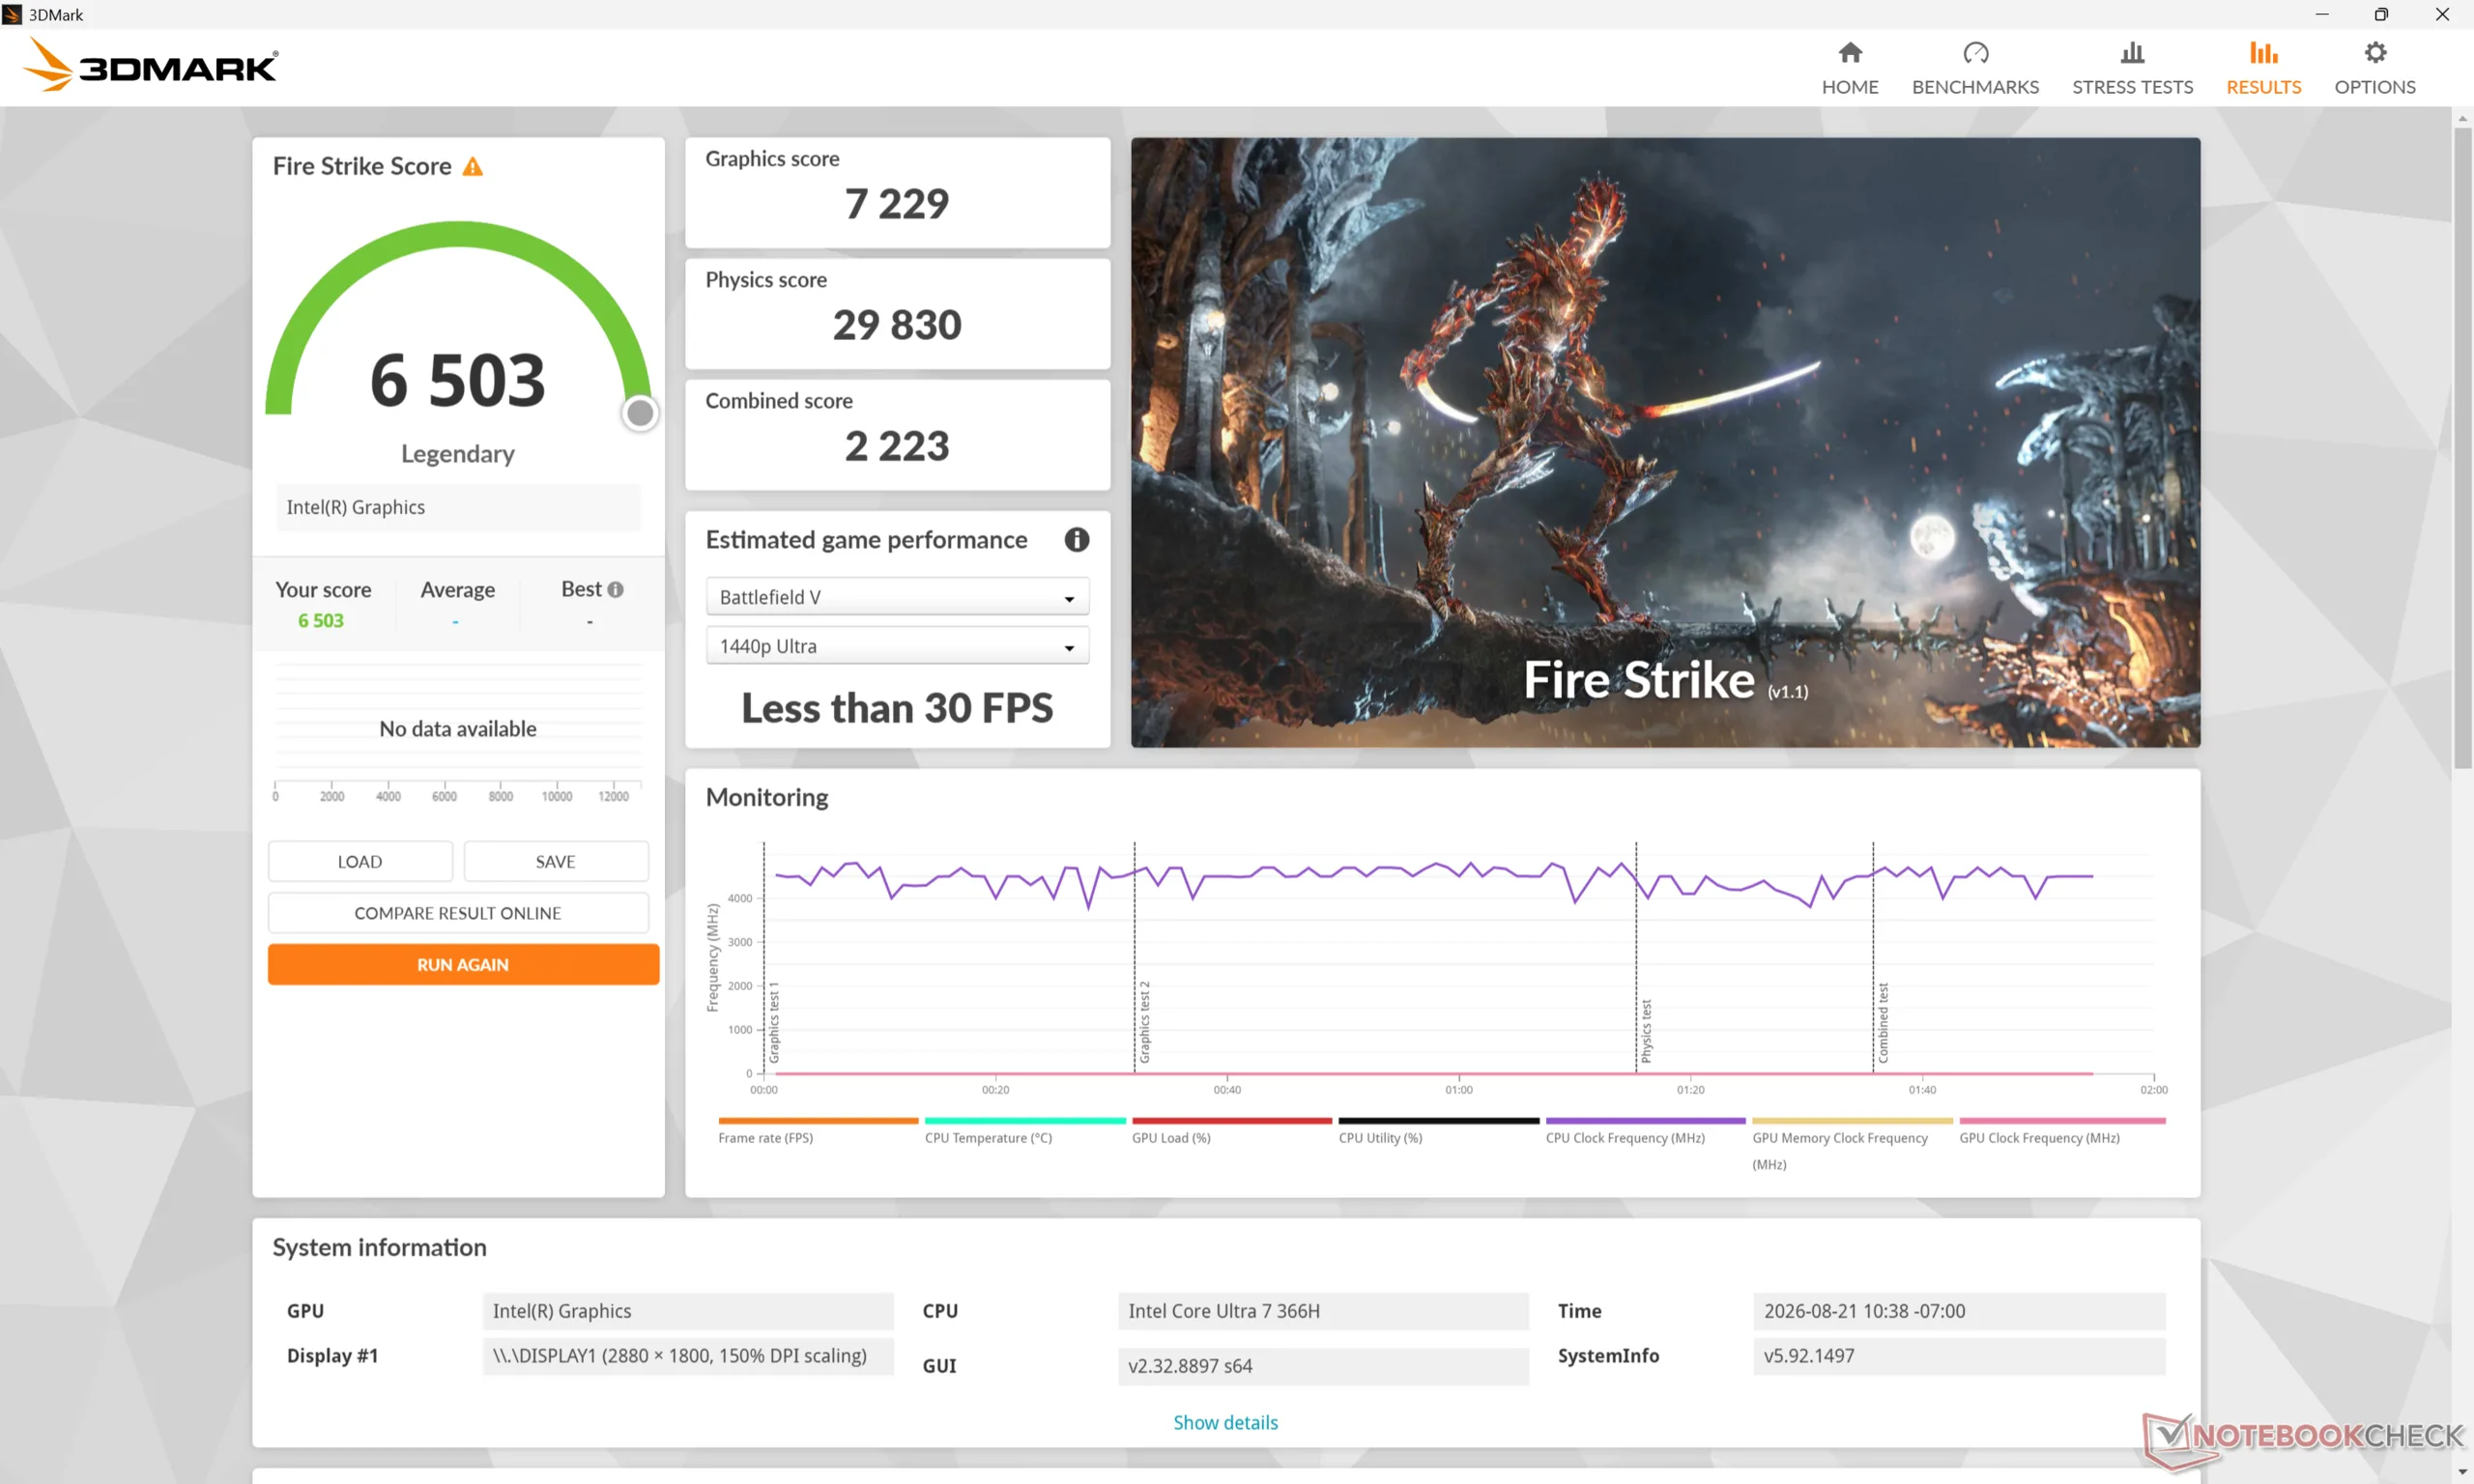
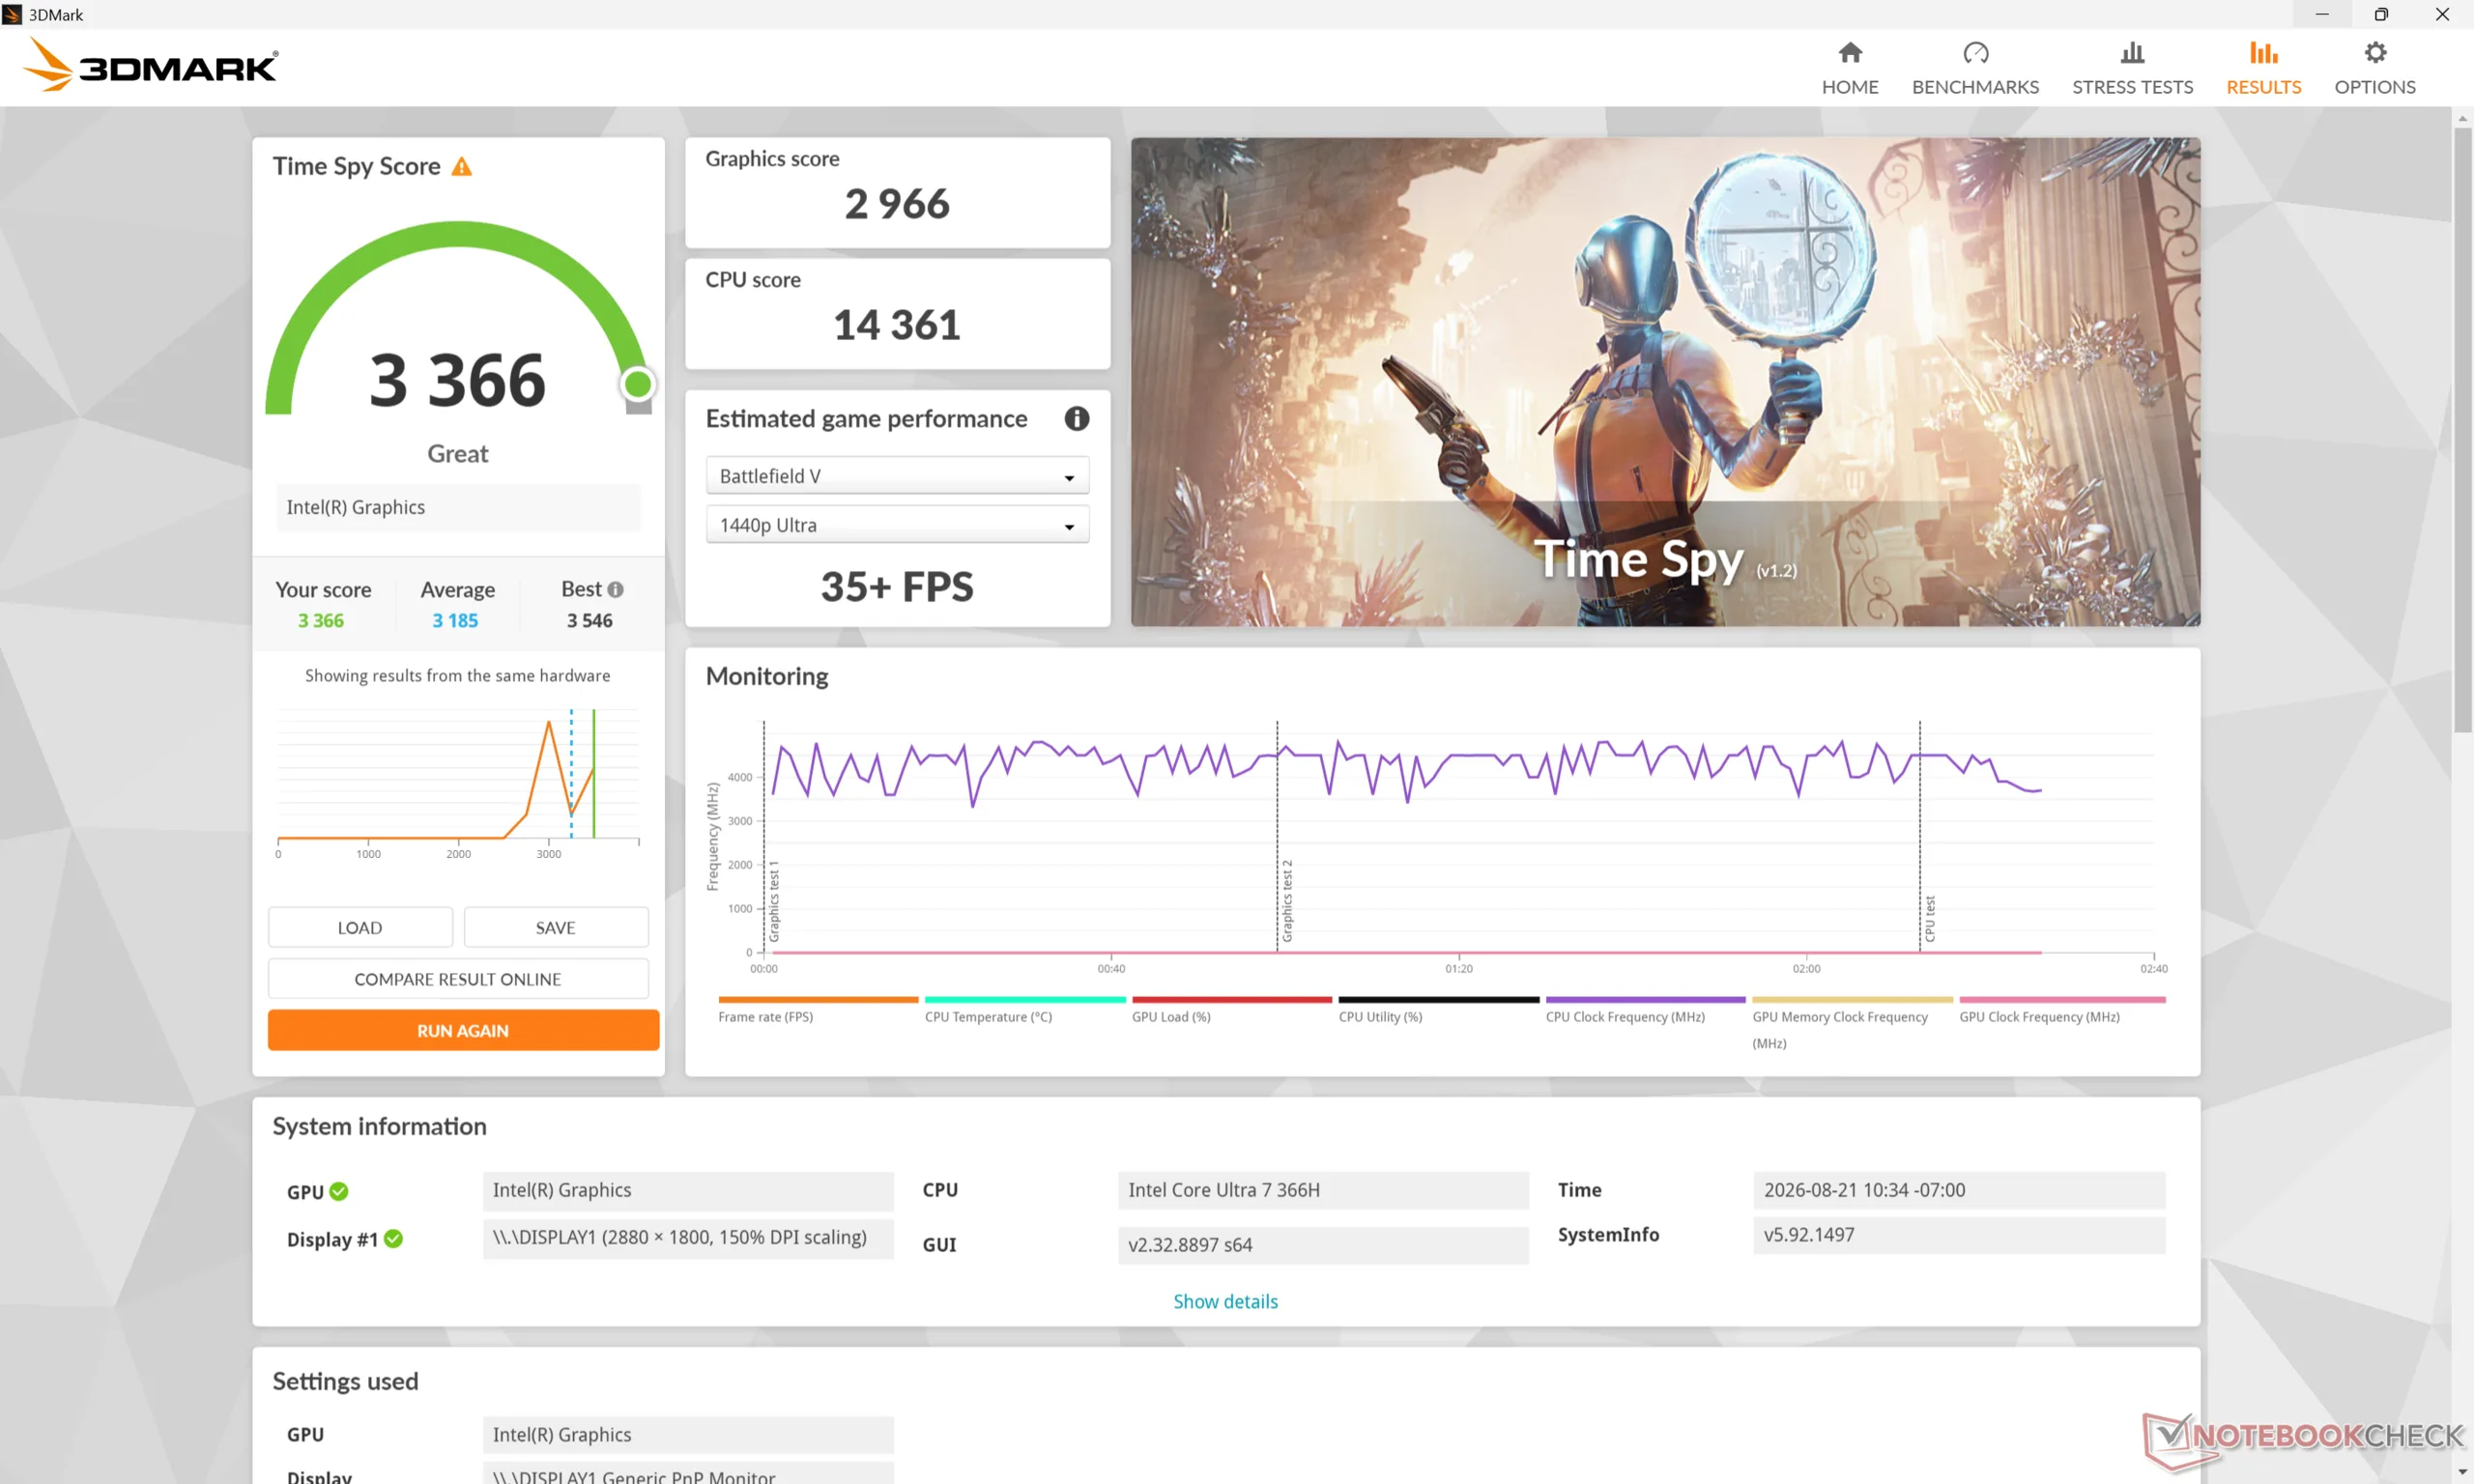
Profil wydajnościWynik grafikiWynik fizykiWynik łączny
Tryb wydajności722929 8302223
Tryb zrównoważony7197292412236
Zasilanie akumulatorowe7183299912260
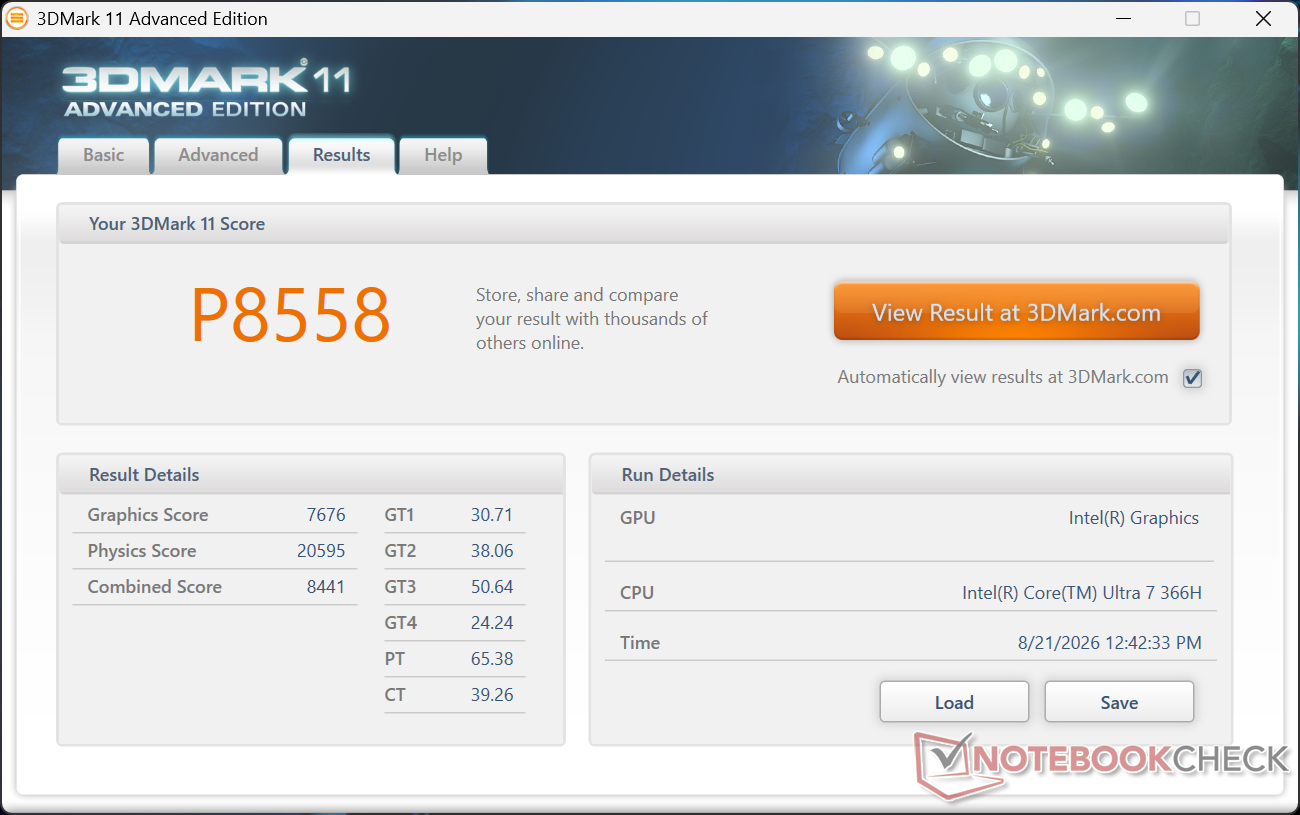
3DMark 11
3DMark 11
Fire Strike
Fire Strike
Time Spy
Time Spy
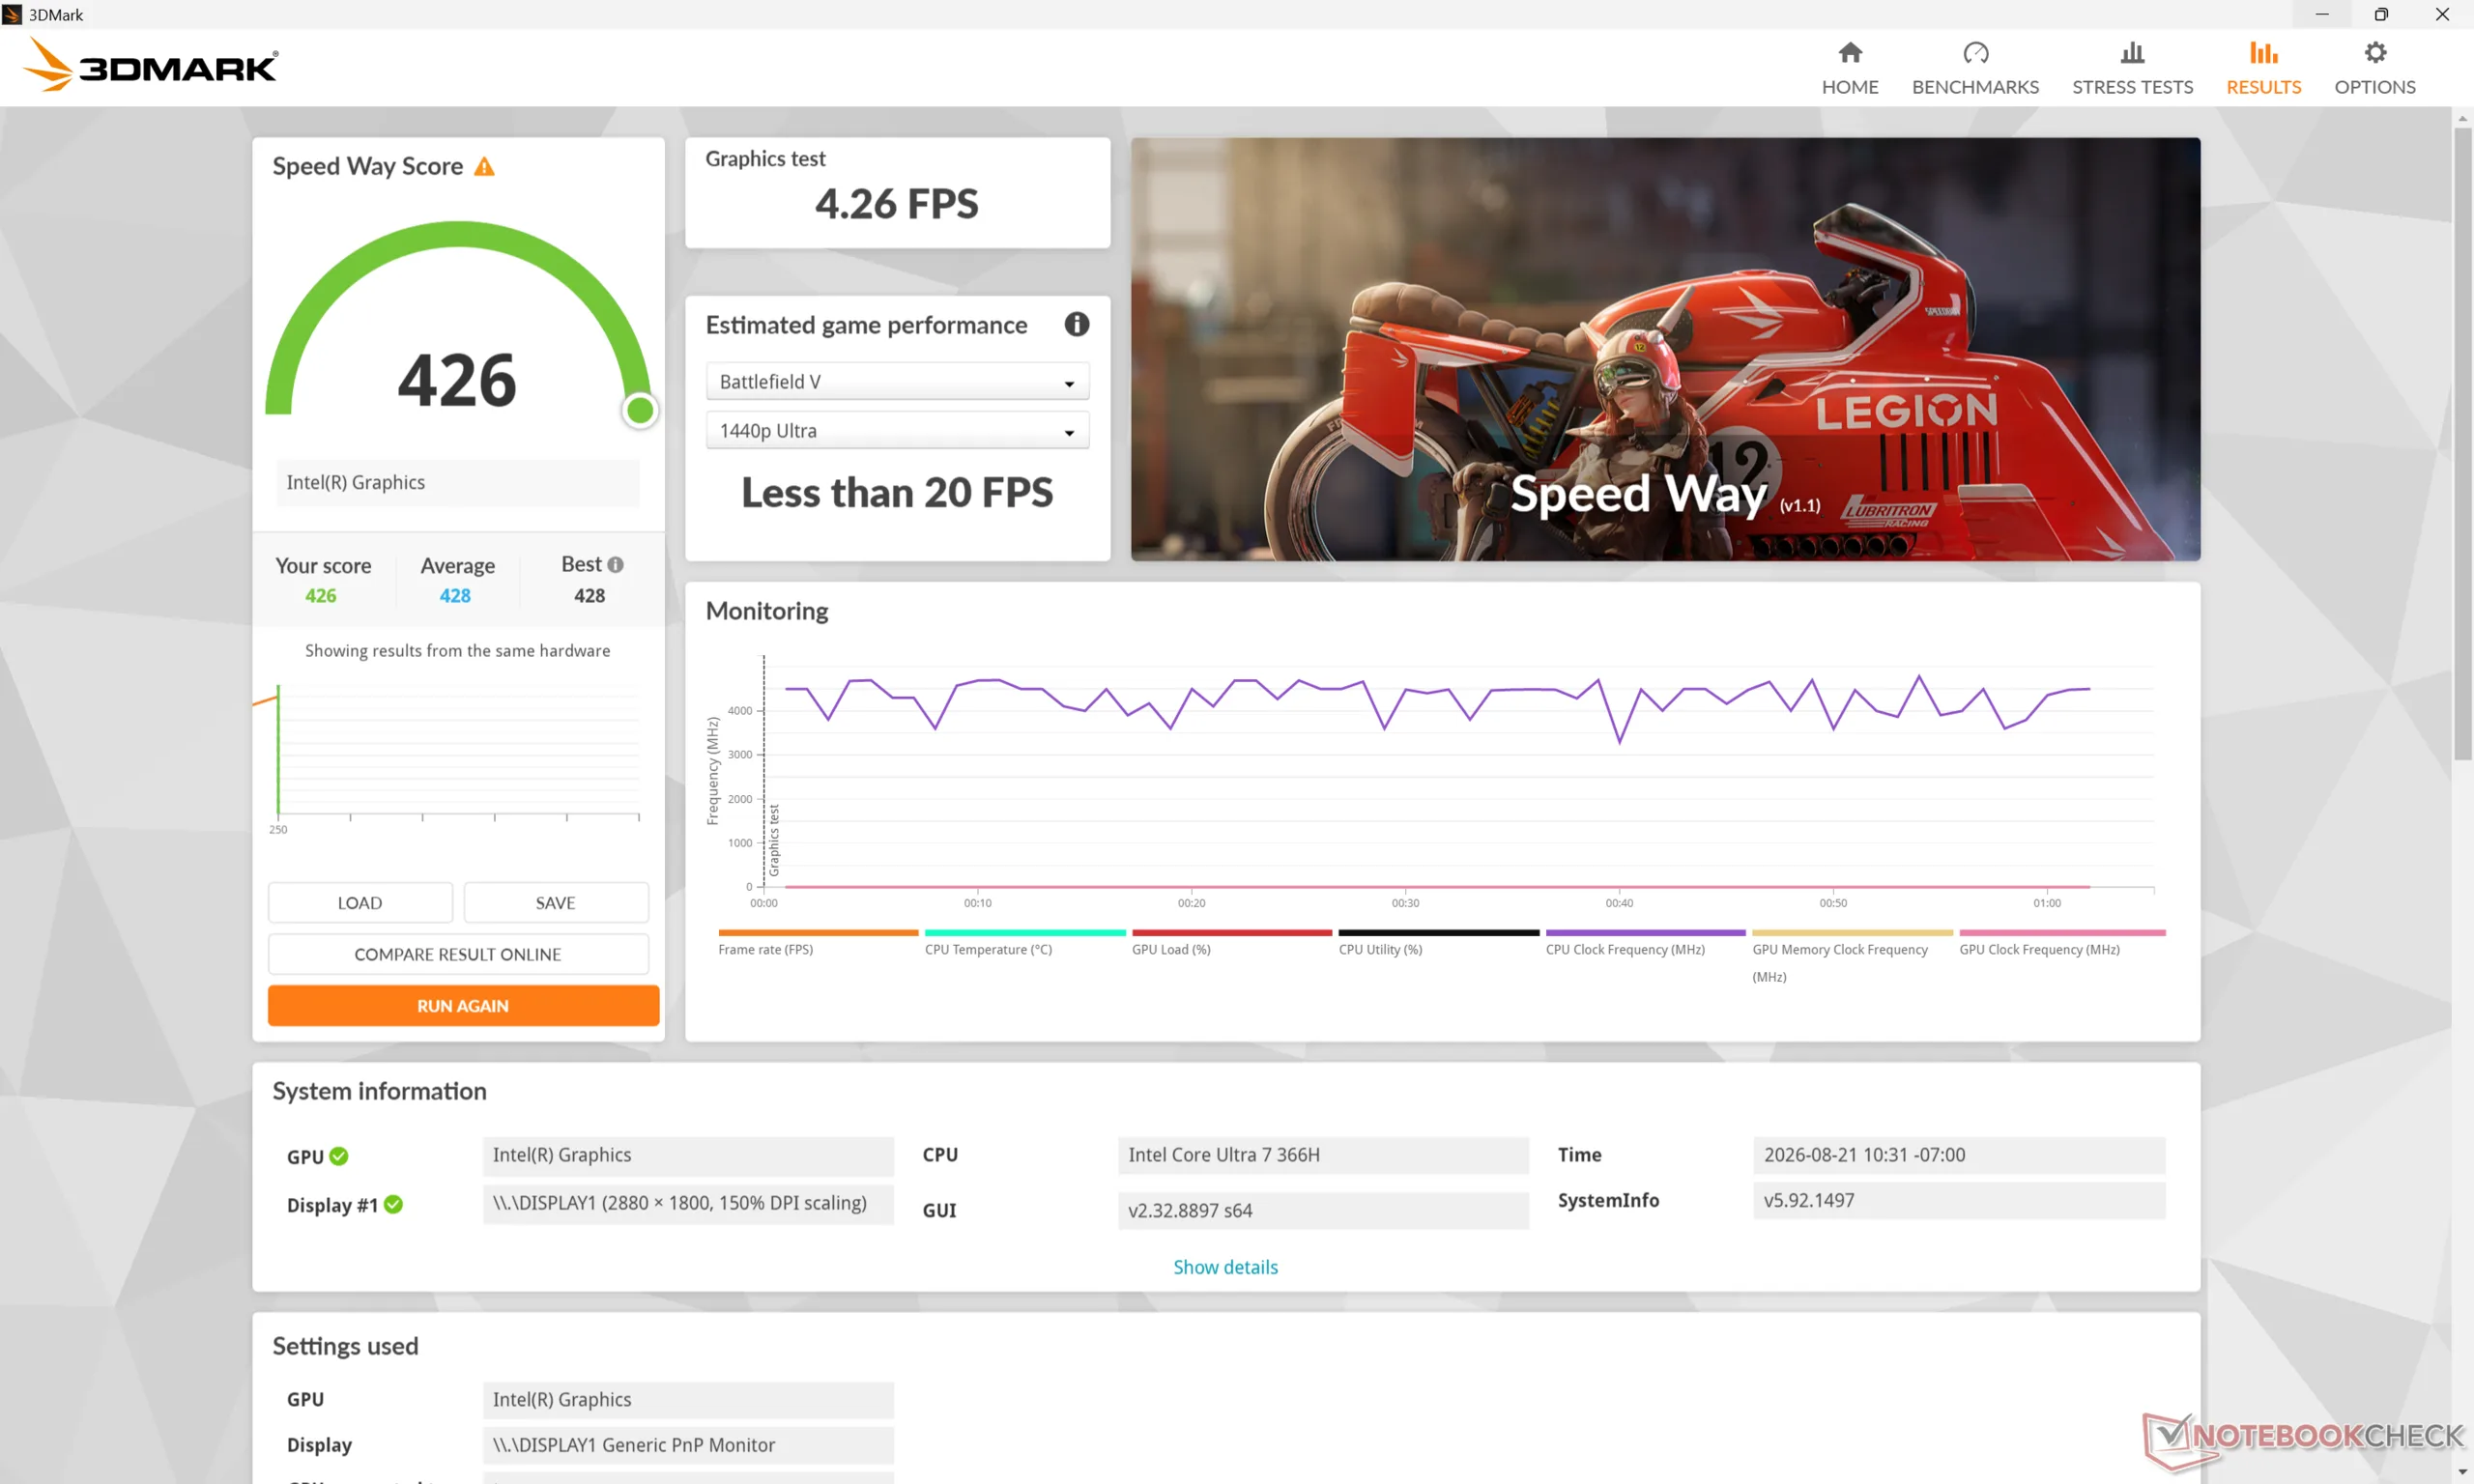
Speed Way
Speed Way
3DMark Performance rating - Percent
MSI Prestige 14 Flip AI+ 2026
Intel Arc B390 12 Xe3 Panther Lake iGPU, Intel Core Ultra X7 358H
99.8 pt
HP OmniBook Ultra 14 Core Ultra X9
Intel Arc B390 12 Xe3 Panther Lake iGPU, Intel Core Ultra X9 388H
94.5 pt
HP EliteBook X Flip G1i 14 AI
Intel Arc Graphics 140V, Intel Core Ultra 7 258V
60.7 pt
Honor MagicBook Art 14 2025
Intel Arc Graphics 140T, Intel Core Ultra 7 255H
56.2 pt
HP EliteBook x360 1040 G11
Intel Arc 8-Core iGPU, Intel Core Ultra 7 165H
55.2 pt
Lenovo ThinkPad E14 Gen 7 21U2002QGE
Intel Arc Graphics 130V, Intel Core Ultra 5 228V
52.1 pt
HP EliteBook 8 G2a 14
AMD Radeon 860M, AMD Ryzen AI 7 450
44.1 pt
HP EliteBook X Flip G2i 14 AI
Intel Graphics 4 Xe3 Panther Lake iGPU, Intel Core Ultra 7 366H
43 pt
Przeciętny Intel Graphics 4 Xe3 Panther Lake iGPU
 
40.9 pt
Dell 14S DS14260
Intel Graphics 4 Xe3 Panther Lake iGPU, Intel Core Ultra 7 355
40.6 pt
Dell Latitude 9450 2-in-1
Intel Graphics 4-Core iGPU (Meteor / Arrow Lake), Intel Core Ultra 7 165U
32.8 pt
Lenovo Yoga 7 2-in-1 14AKP10
AMD Radeon 840M, AMD Ryzen AI 5 340
32.3 pt
Acer TravelMate P4 14 TMP414-42-TCO-R6KG
AMD Radeon 740M, AMD Ryzen 5 8540U
20.8 pt
3DMark 11 - 1280x720 Performance GPU
HP OmniBook Ultra 14 Core Ultra X9
Intel Arc B390 12 Xe3 Panther Lake iGPU, Intel Core Ultra X9 388H
18489 Points +141%
MSI Prestige 14 Flip AI+ 2026
Intel Arc B390 12 Xe3 Panther Lake iGPU, Intel Core Ultra X7 358H
18367 Points +139%
HP EliteBook x360 1040 G11
Intel Arc 8-Core iGPU, Intel Core Ultra 7 165H
12457 Points +62%
HP EliteBook X Flip G1i 14 AI
Intel Arc Graphics 140V, Intel Core Ultra 7 258V
11986 Points +56%
Honor MagicBook Art 14 2025
Intel Arc Graphics 140T, Intel Core Ultra 7 255H
11685 Points +52%
HP EliteBook 8 G2a 14
AMD Radeon 860M, AMD Ryzen AI 7 450
11677 Points +52%
Lenovo ThinkPad E14 Gen 7 21U2002QGE
Intel Arc Graphics 130V, Intel Core Ultra 5 228V
10079 Points +31%
Lenovo Yoga 7 2-in-1 14AKP10
AMD Radeon 840M, AMD Ryzen AI 5 340
8453 Points +10%
HP EliteBook X Flip G2i 14 AI
Intel Graphics 4 Xe3 Panther Lake iGPU, Intel Core Ultra 7 366H
7676 Points
Dell 14S DS14260
Intel Graphics 4 Xe3 Panther Lake iGPU, Intel Core Ultra 7 355
7563 Points -1%
Przeciętny Intel Graphics 4 Xe3 Panther Lake iGPU
  (6268 - 7678, n=15)
7178 Points -6%
Dell Latitude 9450 2-in-1
Intel Graphics 4-Core iGPU (Meteor / Arrow Lake), Intel Core Ultra 7 165U
7055 Points -8%
Acer TravelMate P4 14 TMP414-42-TCO-R6KG
AMD Radeon 740M, AMD Ryzen 5 8540U
5457 Points -29%
3DMark
1920x1080 Fire Strike Graphics
MSI Prestige 14 Flip AI+ 2026
Intel Arc B390 12 Xe3 Panther Lake iGPU, Intel Core Ultra X7 358H
16885 Points +134%
HP OmniBook Ultra 14 Core Ultra X9
Intel Arc B390 12 Xe3 Panther Lake iGPU, Intel Core Ultra X9 388H
16347 Points +126%
HP EliteBook X Flip G1i 14 AI
Intel Arc Graphics 140V, Intel Core Ultra 7 258V
10125 Points +40%
HP EliteBook x360 1040 G11
Intel Arc 8-Core iGPU, Intel Core Ultra 7 165H
8961 Points +24%
Lenovo ThinkPad E14 Gen 7 21U2002QGE
Intel Arc Graphics 130V, Intel Core Ultra 5 228V
8755 Points +21%
Honor MagicBook Art 14 2025
Intel Arc Graphics 140T, Intel Core Ultra 7 255H
8602 Points +19%
HP EliteBook 8 G2a 14
AMD Radeon 860M, AMD Ryzen AI 7 450
7437 Points +3%
HP EliteBook X Flip G2i 14 AI
Intel Graphics 4 Xe3 Panther Lake iGPU, Intel Core Ultra 7 366H
7229 Points
Dell 14S DS14260
Intel Graphics 4 Xe3 Panther Lake iGPU, Intel Core Ultra 7 355
7123 Points -1%
Przeciętny Intel Graphics 4 Xe3 Panther Lake iGPU
  (5688 - 7229, n=15)
6897 Points -5%
Lenovo Yoga 7 2-in-1 14AKP10
AMD Radeon 840M, AMD Ryzen AI 5 340
5606 Points -22%
Dell Latitude 9450 2-in-1
Intel Graphics 4-Core iGPU (Meteor / Arrow Lake), Intel Core Ultra 7 165U
5468 Points -24%
Acer TravelMate P4 14 TMP414-42-TCO-R6KG
AMD Radeon 740M, AMD Ryzen 5 8540U
3421 Points -53%
2560x1440 Time Spy Graphics
MSI Prestige 14 Flip AI+ 2026
Intel Arc B390 12 Xe3 Panther Lake iGPU, Intel Core Ultra X7 358H
6982 Points +135%
HP OmniBook Ultra 14 Core Ultra X9
Intel Arc B390 12 Xe3 Panther Lake iGPU, Intel Core Ultra X9 388H
6288 Points +112%
HP EliteBook X Flip G1i 14 AI
Intel Arc Graphics 140V, Intel Core Ultra 7 258V
4134 Points +39%
Honor MagicBook Art 14 2025
Intel Arc Graphics 140T, Intel Core Ultra 7 255H
3835 Points +29%
Lenovo ThinkPad E14 Gen 7 21U2002QGE
Intel Arc Graphics 130V, Intel Core Ultra 5 228V
3538 Points +19%
HP EliteBook x360 1040 G11
Intel Arc 8-Core iGPU, Intel Core Ultra 7 165H
3458 Points +17%
HP EliteBook X Flip G2i 14 AI
Intel Graphics 4 Xe3 Panther Lake iGPU, Intel Core Ultra 7 366H
2966 Points
Przeciętny Intel Graphics 4 Xe3 Panther Lake iGPU
  (2391 - 3044, n=15)
2871 Points -3%
Dell 14S DS14260
Intel Graphics 4 Xe3 Panther Lake iGPU, Intel Core Ultra 7 355
2714 Points -8%
HP EliteBook 8 G2a 14
AMD Radeon 860M, AMD Ryzen AI 7 450
2355 Points -21%
Dell Latitude 9450 2-in-1
Intel Graphics 4-Core iGPU (Meteor / Arrow Lake), Intel Core Ultra 7 165U
2067 Points -30%
Lenovo Yoga 7 2-in-1 14AKP10
AMD Radeon 840M, AMD Ryzen AI 5 340
1705 Points -43%
Acer TravelMate P4 14 TMP414-42-TCO-R6KG
AMD Radeon 740M, AMD Ryzen 5 8540U
1136 Points -62%
2560x1440 Time Spy Score
MSI Prestige 14 Flip AI+ 2026
Intel Arc B390 12 Xe3 Panther Lake iGPU, Intel Core Ultra X7 358H
7478 Points +122%
HP OmniBook Ultra 14 Core Ultra X9
Intel Arc B390 12 Xe3 Panther Lake iGPU, Intel Core Ultra X9 388H
6806 Points +102%
HP EliteBook X Flip G1i 14 AI
Intel Arc Graphics 140V, Intel Core Ultra 7 258V
4404 Points +31%
Honor MagicBook Art 14 2025
Intel Arc Graphics 140T, Intel Core Ultra 7 255H
4182 Points +24%
Lenovo ThinkPad E14 Gen 7 21U2002QGE
Intel Arc Graphics 130V, Intel Core Ultra 5 228V
3850 Points +14%
HP EliteBook x360 1040 G11
Intel Arc 8-Core iGPU, Intel Core Ultra 7 165H
3807 Points +13%
HP EliteBook X Flip G2i 14 AI
Intel Graphics 4 Xe3 Panther Lake iGPU, Intel Core Ultra 7 366H
3366 Points
Przeciętny Intel Graphics 4 Xe3 Panther Lake iGPU
  (2672 - 3458, n=15)
3201 Points -5%
Dell 14S DS14260
Intel Graphics 4 Xe3 Panther Lake iGPU, Intel Core Ultra 7 355
3012 Points -11%
HP EliteBook 8 G2a 14
AMD Radeon 860M, AMD Ryzen AI 7 450
2659 Points -21%
Dell Latitude 9450 2-in-1
Intel Graphics 4-Core iGPU (Meteor / Arrow Lake), Intel Core Ultra 7 165U
2315 Points -31%
Lenovo Yoga 7 2-in-1 14AKP10
AMD Radeon 840M, AMD Ryzen AI 5 340
1928 Points -43%
Acer TravelMate P4 14 TMP414-42-TCO-R6KG
AMD Radeon 740M, AMD Ryzen 5 8540U
1293 Points -62%
3DMark 11 Performance
8558 pkt.
3DMark Cloud Gate Standard Score
34848 pkt.
3DMark Fire Strike Score
6503 pkt.
3DMark Time Spy Score
3366 pkt.
Pomoc
Blender
v3.3 Classroom CPU
Lenovo ThinkPad E14 Gen 7 21U2002QGE
Intel Arc Graphics 130V, Intel Core Ultra 5 228V
676 Seconds * -114%
HP EliteBook X Flip G1i 14 AI
Intel Arc Graphics 140V, Intel Core Ultra 7 258V
599 Seconds * -90%
Dell Latitude 9450 2-in-1
Intel Graphics 4-Core iGPU (Meteor / Arrow Lake), Intel Core Ultra 7 165U
592 Seconds * -87%
Acer TravelMate P4 14 TMP414-42-TCO-R6KG
AMD Radeon 740M, AMD Ryzen 5 8540U
532 Seconds * -68%
Dell 14S DS14260
Intel Graphics 4 Xe3 Panther Lake iGPU, Intel Core Ultra 7 355
503 Seconds * -59%
Przeciętny Intel Graphics 4 Xe3 Panther Lake iGPU
  (309 - 569, n=15)
451 Seconds * -43%
Lenovo Yoga 7 2-in-1 14AKP10
AMD Radeon 840M, AMD Ryzen AI 5 340
431 Seconds * -36%
HP EliteBook x360 1040 G11
Intel Arc 8-Core iGPU, Intel Core Ultra 7 165H
406 Seconds * -28%
Honor MagicBook Art 14 2025
Intel Arc Graphics 140T, Intel Core Ultra 7 255H
405 Seconds * -28%
MSI Prestige 14 Flip AI+ 2026
Intel Arc B390 12 Xe3 Panther Lake iGPU, Intel Core Ultra X7 358H
389 Seconds * -23%
HP OmniBook Ultra 14 Core Ultra X9
Intel Arc B390 12 Xe3 Panther Lake iGPU, Intel Core Ultra X9 388H
326 Seconds * -3%
HP EliteBook 8 G2a 14
AMD Radeon 860M, AMD Ryzen AI 7 450
316 Seconds * -0%
HP EliteBook X Flip G2i 14 AI
Intel Graphics 4 Xe3 Panther Lake iGPU, Intel Core Ultra 7 366H
316 Seconds *
v3.3 Classroom oneAPI/Intel
HP EliteBook X Flip G1i 14 AI
Intel Arc Graphics 140V, Intel Core Ultra 7 258V
377 Seconds * -63%
Przeciętny Intel Graphics 4 Xe3 Panther Lake iGPU
  (231 - 257, n=6)
242 Seconds * -5%
HP EliteBook X Flip G2i 14 AI
Intel Graphics 4 Xe3 Panther Lake iGPU, Intel Core Ultra 7 366H
231 Seconds *
HP EliteBook x360 1040 G11
Intel Arc 8-Core iGPU, Intel Core Ultra 7 165H
213 Seconds * +8%
HP OmniBook Ultra 14 Core Ultra X9
Intel Arc B390 12 Xe3 Panther Lake iGPU, Intel Core Ultra X9 388H
105 Seconds * +55%
v4.3 Barbershop CPU
Dell 14S DS14260
Intel Graphics 4 Xe3 Panther Lake iGPU, Intel Core Ultra 7 355
2714 Seconds * -74%
Przeciętny Intel Graphics 4 Xe3 Panther Lake iGPU
  (1556 - 2769, n=8)
2398 Seconds * -54%
HP OmniBook Ultra 14 Core Ultra X9
Intel Arc B390 12 Xe3 Panther Lake iGPU, Intel Core Ultra X9 388H
1609 Seconds * -3%
HP EliteBook X Flip G2i 14 AI
Intel Graphics 4 Xe3 Panther Lake iGPU, Intel Core Ultra 7 366H
1556 Seconds *
v4.3 Barbershop oneAPI
Dell 14S DS14260
Intel Graphics 4 Xe3 Panther Lake iGPU, Intel Core Ultra 7 355
956 Seconds * -11%
Przeciętny Intel Graphics 4 Xe3 Panther Lake iGPU
  (823 - 1015, n=8)
914 Seconds * -6%
HP EliteBook X Flip G2i 14 AI
Intel Graphics 4 Xe3 Panther Lake iGPU, Intel Core Ultra 7 366H
862 Seconds *
HP OmniBook Ultra 14 Core Ultra X9
Intel Arc B390 12 Xe3 Panther Lake iGPU, Intel Core Ultra X9 388H
371 Seconds * +57%

* ... im mniej tym lepiej

Performance rating - Percent
MSI Prestige 14 Flip AI+ 2026
Intel Core Ultra X7 358H, Intel Arc B390 12 Xe3 Panther Lake iGPU
100 pt
HP EliteBook X Flip G1i 14 AI
Intel Core Ultra 7 258V, Intel Arc Graphics 140V
76.1 pt
HP EliteBook x360 1040 G11
Intel Core Ultra 7 165H, Intel Arc 8-Core iGPU
63.9 pt
HP EliteBook X Flip G2i 14 AI
Intel Core Ultra 7 366H, Intel Graphics 4 Xe3 Panther Lake iGPU
60.2 pt
Lenovo Yoga 7 2-in-1 14AKP10
AMD Ryzen AI 5 340, AMD Radeon 840M
49.7 pt
Dell Latitude 9450 2-in-1 -1!
Intel Core Ultra 7 165U, Intel Graphics 4-Core iGPU (Meteor / Arrow Lake)
44.7 pt
Cyberpunk 2077 - 1920x1080 Ultra Preset (FSR off)
MSI Prestige 14 Flip AI+ 2026
Intel Core Ultra X7 358H, Intel Arc B390 12 Xe3 Panther Lake iGPU
45.5 (33min) fps +111%
HP EliteBook X Flip G1i 14 AI
Intel Core Ultra 7 258V, Intel Arc Graphics 140V
29.2 (24min) fps +35%
HP EliteBook x360 1040 G11
Intel Core Ultra 7 165H, Intel Arc 8-Core iGPU
21.6 (18.5min) fps 0%
HP EliteBook X Flip G2i 14 AI
Intel Core Ultra 7 366H, Intel Graphics 4 Xe3 Panther Lake iGPU
21.6 (18.5min, 17.5P1) fps
Dell Latitude 9450 2-in-1
Intel Core Ultra 7 165U, Intel Graphics 4-Core iGPU (Meteor / Arrow Lake)
12.7 (9.58min) fps -41%
Lenovo Yoga 7 2-in-1 14AKP10
AMD Ryzen AI 5 340, AMD Radeon 840M
12.2 (10min) fps -44%
Baldur's Gate 3 - 1920x1080 Ultra Preset AA:T
MSI Prestige 14 Flip AI+ 2026
Intel Core Ultra X7 358H, Intel Arc B390 12 Xe3 Panther Lake iGPU
44.6 (38.9min, 39P0.1, 40P1) fps +88%
HP EliteBook X Flip G1i 14 AI
Intel Core Ultra 7 258V, Intel Arc Graphics 140V
31.3 fps +32%
HP EliteBook X Flip G2i 14 AI
Intel Core Ultra 7 366H, Intel Graphics 4 Xe3 Panther Lake iGPU
23.7 (21min, 21.3P0.1, 21.9P1) fps
HP EliteBook x360 1040 G11
Intel Core Ultra 7 165H, Intel Arc 8-Core iGPU
20.4 fps -14%
Lenovo Yoga 7 2-in-1 14AKP10
AMD Ryzen AI 5 340, AMD Radeon 840M
12.8 (7.34min, 7.86P0.1, 10.4P1) fps -46%
Dell Latitude 9450 2-in-1
Intel Core Ultra 7 165U, Intel Graphics 4-Core iGPU (Meteor / Arrow Lake)
10.6 fps -55%
GTA V - 1920x1080 Highest AA:4xMSAA + FX AF:16x
MSI Prestige 14 Flip AI+ 2026
Intel Core Ultra X7 358H, Intel Arc B390 12 Xe3 Panther Lake iGPU
43.4 (10.4min, 31.3P1) fps +99%
HP EliteBook X Flip G1i 14 AI
Intel Core Ultra 7 258V, Intel Arc Graphics 140V
27.3 (9.06min, 21.3P1) fps +25%
HP EliteBook X Flip G2i 14 AI
Intel Core Ultra 7 366H, Intel Graphics 4 Xe3 Panther Lake iGPU
21.8 (7.12min, 16.9P1) fps
Lenovo Yoga 7 2-in-1 14AKP10
AMD Ryzen AI 5 340, AMD Radeon 840M
18.3 (2.13min, 13.7P1) fps -16%
HP EliteBook x360 1040 G11
Intel Core Ultra 7 165H, Intel Arc 8-Core iGPU
17.1 (1.72min, 12.3P1) fps -22%
Final Fantasy XV Benchmark - 1920x1080 High Quality
MSI Prestige 14 Flip AI+ 2026
Intel Core Ultra X7 358H, Intel Arc B390 12 Xe3 Panther Lake iGPU
37.8 fps +39%
HP EliteBook X Flip G1i 14 AI
Intel Core Ultra 7 258V, Intel Arc Graphics 140V
34.2 fps +26%
HP EliteBook x360 1040 G11
Intel Core Ultra 7 165H, Intel Arc 8-Core iGPU
27.5 fps +1%
HP EliteBook X Flip G2i 14 AI
Intel Core Ultra 7 366H, Intel Graphics 4 Xe3 Panther Lake iGPU
27.1 fps
Dell Latitude 9450 2-in-1
Intel Core Ultra 7 165U, Intel Graphics 4-Core iGPU (Meteor / Arrow Lake)
18.2 fps -33%
Lenovo Yoga 7 2-in-1 14AKP10
AMD Ryzen AI 5 340, AMD Radeon 840M
16.7 fps -38%
Strange Brigade - 1920x1080 ultra AA:ultra AF:16
MSI Prestige 14 Flip AI+ 2026
Intel Core Ultra X7 358H, Intel Arc B390 12 Xe3 Panther Lake iGPU
80 (32.4min, 44.3P1) fps +177%
HP EliteBook X Flip G1i 14 AI
Intel Core Ultra 7 258V, Intel Arc Graphics 140V
59.6 (15.2min, 32.1P1) fps +106%
HP EliteBook x360 1040 G11
Intel Core Ultra 7 165H, Intel Arc 8-Core iGPU
47.3 (5.3min, 10.1P1) fps +64%
Lenovo Yoga 7 2-in-1 14AKP10
AMD Ryzen AI 5 340, AMD Radeon 840M
34.2 (13.2min, 17.8P1) fps +18%
Dell Latitude 9450 2-in-1
Intel Core Ultra 7 165U, Intel Graphics 4-Core iGPU (Meteor / Arrow Lake)
33.3 (21.1min, 24.8P1) fps +15%
HP EliteBook X Flip G2i 14 AI
Intel Core Ultra 7 366H, Intel Graphics 4 Xe3 Panther Lake iGPU
28.9 (16.4min, 21.9P1) fps
Dota 2 Reborn - 1920x1080 ultra (3/3) best looking
MSI Prestige 14 Flip AI+ 2026
Intel Core Ultra X7 358H, Intel Arc B390 12 Xe3 Panther Lake iGPU
86.8 (58.4min) fps +12%
HP EliteBook X Flip G1i 14 AI
Intel Core Ultra 7 258V, Intel Arc Graphics 140V
82 (54.6min) fps +6%
HP EliteBook X Flip G2i 14 AI
Intel Core Ultra 7 366H, Intel Graphics 4 Xe3 Panther Lake iGPU
77.3 (40.7min) fps
HP EliteBook x360 1040 G11
Intel Core Ultra 7 165H, Intel Arc 8-Core iGPU
74.4 (47.1min) fps -4%
Lenovo Yoga 7 2-in-1 14AKP10
AMD Ryzen AI 5 340, AMD Radeon 840M
66 (56.4min) fps -15%
Dell Latitude 9450 2-in-1
Intel Core Ultra 7 165U, Intel Graphics 4-Core iGPU (Meteor / Arrow Lake)
57.3 (44min) fps -26%
X-Plane 11.11 - 1920x1080 high (fps_test=3)
MSI Prestige 14 Flip AI+ 2026
Intel Core Ultra X7 358H, Intel Arc B390 12 Xe3 Panther Lake iGPU
41.8 fps +36%
HP EliteBook x360 1040 G11
Intel Core Ultra 7 165H, Intel Arc 8-Core iGPU
40.5 fps +32%
Lenovo Yoga 7 2-in-1 14AKP10
AMD Ryzen AI 5 340, AMD Radeon 840M
36.5 fps +19%
HP EliteBook X Flip G1i 14 AI
Intel Core Ultra 7 258V, Intel Arc Graphics 140V
31.9 fps +4%
HP EliteBook X Flip G2i 14 AI
Intel Core Ultra 7 366H, Intel Graphics 4 Xe3 Panther Lake iGPU
30.7 fps
Dell Latitude 9450 2-in-1
Intel Core Ultra 7 165U, Intel Graphics 4-Core iGPU (Meteor / Arrow Lake)
25.3 fps -18%
F1 24
1920x1080 High Preset AA:T AF:16x
HP OmniBook Ultra 14 Core Ultra X9
Intel Core Ultra X9 388H, Intel Arc B390 12 Xe3 Panther Lake iGPU
101.4 (80min, 70P1) fps +120%
MSI Prestige 14 Flip AI+ 2026
Intel Core Ultra X7 358H, Intel Arc B390 12 Xe3 Panther Lake iGPU
100 (88min, 73P1) fps +117%
Lenovo ThinkPad E14 Gen 7 21U2002QGE
Intel Core Ultra 5 228V, Intel Arc Graphics 130V
55.2 (46min, 46P1) fps +20%
Honor MagicBook Art 14 2025
Intel Core Ultra 7 255H, Intel Arc Graphics 140T
51.7 (37min, 36P1) fps +12%
HP EliteBook X Flip G2i 14 AI
Intel Core Ultra 7 366H, Intel Graphics 4 Xe3 Panther Lake iGPU
46.1 (39min, 37P1) fps
Przeciętny Intel Graphics 4 Xe3 Panther Lake iGPU
  (40.8 - 48, n=10)
44.6 fps -3%
HP EliteBook 8 G2a 14
AMD Ryzen AI 7 450, AMD Radeon 860M
42.8 (35min, 35P1) fps -7%
Dell 14S DS14260
Intel Core Ultra 7 355, Intel Graphics 4 Xe3 Panther Lake iGPU
42.4 (22min, 36P1) fps -8%
Lenovo Yoga 7 2-in-1 14AKP10
AMD Ryzen AI 5 340, AMD Radeon 840M
27 (14min) fps -41%
1920x1080 Ultra High Preset AA:T AF:16x
MSI Prestige 14 Flip AI+ 2026
Intel Core Ultra X7 358H, Intel Arc B390 12 Xe3 Panther Lake iGPU
36.2 (31min, 29P1) fps +143%
HP OmniBook Ultra 14 Core Ultra X9
Intel Core Ultra X9 388H, Intel Arc B390 12 Xe3 Panther Lake iGPU
35.6 (25min, 26P1) fps +139%
Lenovo ThinkPad E14 Gen 7 21U2002QGE
Intel Core Ultra 5 228V, Intel Arc Graphics 130V
18.1 (15min, 15P1) fps +21%
Honor MagicBook Art 14 2025
Intel Core Ultra 7 255H, Intel Arc Graphics 140T
16.4 (8min, 10P1) fps +10%
HP EliteBook X Flip G2i 14 AI
Intel Core Ultra 7 366H, Intel Graphics 4 Xe3 Panther Lake iGPU
14.9 (12min, 12P1) fps
Przeciętny Intel Graphics 4 Xe3 Panther Lake iGPU
  (13.2 - 15.1, n=10)
14.4 fps -3%
Dell 14S DS14260
Intel Core Ultra 7 355, Intel Graphics 4 Xe3 Panther Lake iGPU
14.2 (7min, 11P1) fps -5%
HP EliteBook 8 G2a 14
AMD Ryzen AI 7 450, AMD Radeon 860M
10.6 (8min, 8P1) fps -29%
GTA V
1920x1080 High/On (Advanced Graphics Off) AA:2xMSAA + FX AF:8x
MSI Prestige 14 Flip AI+ 2026
Intel Core Ultra X7 358H, Intel Arc B390 12 Xe3 Panther Lake iGPU
99.7 (7.86min, 66.7P1) fps +90%
HP OmniBook Ultra 14 Core Ultra X9
Intel Core Ultra X9 388H, Intel Arc B390 12 Xe3 Panther Lake iGPU
99.6 (7.57min, 62.5P1) fps +90%
HP EliteBook 8 G2a 14
AMD Ryzen AI 7 450, AMD Radeon 860M
70.3 (9.46min, 50P1) fps +34%
Lenovo ThinkPad E14 Gen 7 21U2002QGE
Intel Core Ultra 5 228V, Intel Arc Graphics 130V
65.8 (7.58min, 50P1) fps +26%
Lenovo ThinkPad X1 Carbon Gen 14 21V70075GE
Intel Core Ultra 5 325, Intel Graphics 4 Xe3 Panther Lake iGPU
52.8 (6.47min, 40P1) fps +1%
Przeciętny Intel Graphics 4 Xe3 Panther Lake iGPU
  (46.6 - 58.2, n=14)
52.5 fps 0%
HP EliteBook X Flip G2i 14 AI
Intel Core Ultra 7 366H, Intel Graphics 4 Xe3 Panther Lake iGPU
52.4 (10min, 41.7P1) fps
HP EliteBook X Flip G1i 14 AI
Intel Core Ultra 7 258V, Intel Arc Graphics 140V
50.6 (9.8min, 34.5P1) fps -3%
Dell 14S DS14260
Intel Core Ultra 7 355, Intel Graphics 4 Xe3 Panther Lake iGPU
50.6 (7.67min, 38.5P1) fps -3%
Lenovo Yoga 7 2-in-1 14AKP10
AMD Ryzen AI 5 340, AMD Radeon 840M
45.4 (3.4min, 33.3P1) fps -13%
HP EliteBook x360 1040 G11
Intel Core Ultra 7 165H, Intel Arc 8-Core iGPU
43.2 (2.29min, 25.6P1) fps -18%
Honor MagicBook Art 14 2025
Intel Core Ultra 7 255H, Intel Arc Graphics 140T
37.3 (8.09min, 29.4P1) fps -29%
Acer TravelMate P4 14 TMP414-42-TCO-R6KG
AMD Ryzen 5 8540U, AMD Radeon 740M
26.5 (2.22min, 18.2P1) fps -49%
1920x1080 Highest AA:4xMSAA + FX AF:16x
HP OmniBook Ultra 14 Core Ultra X9
Intel Core Ultra X9 388H, Intel Arc B390 12 Xe3 Panther Lake iGPU
43.7 (6.57min, 29.4P1) fps +100%
MSI Prestige 14 Flip AI+ 2026
Intel Core Ultra X7 358H, Intel Arc B390 12 Xe3 Panther Lake iGPU
43.4 (10.4min, 31.3P1) fps +99%
HP EliteBook 8 G2a 14
AMD Ryzen AI 7 450, AMD Radeon 860M
29.1 (6.9min, 20.4P1) fps +33%
HP EliteBook X Flip G1i 14 AI
Intel Core Ultra 7 258V, Intel Arc Graphics 140V
27.3 (9.06min, 21.3P1) fps +25%
Lenovo ThinkPad E14 Gen 7 21U2002QGE
Intel Core Ultra 5 228V, Intel Arc Graphics 130V
25.6 (8.2min, 20.8P1) fps +17%
Lenovo ThinkPad X1 Carbon Gen 14 21V70075GE
Intel Core Ultra 5 325, Intel Graphics 4 Xe3 Panther Lake iGPU
21.9 (6.72min, 17.2P1) fps 0%
HP EliteBook X Flip G2i 14 AI
Intel Core Ultra 7 366H, Intel Graphics 4 Xe3 Panther Lake iGPU
21.8 (7.12min, 16.9P1) fps
Przeciętny Intel Graphics 4 Xe3 Panther Lake iGPU
  (18 - 23.8, n=14)
21.2 fps -3%
Dell 14S DS14260
Intel Core Ultra 7 355, Intel Graphics 4 Xe3 Panther Lake iGPU
21 (4.83min, 16.1P1) fps -4%
Lenovo Yoga 7 2-in-1 14AKP10
AMD Ryzen AI 5 340, AMD Radeon 840M
18.3 (2.13min, 13.7P1) fps -16%
HP EliteBook x360 1040 G11
Intel Core Ultra 7 165H, Intel Arc 8-Core iGPU
17.1 (1.72min, 12.3P1) fps -22%
Honor MagicBook Art 14 2025
Intel Core Ultra 7 255H, Intel Arc Graphics 140T
15.7 (5.43min, 12.5P1) fps -28%
Acer TravelMate P4 14 TMP414-42-TCO-R6KG
AMD Ryzen 5 8540U, AMD Radeon 740M
10.2 (2.14min, 7.25P1) fps -53%
Dota 2 Reborn - 1920x1080 ultra (3/3) best looking
HP OmniBook Ultra 14 Core Ultra X9
Intel Core Ultra X9 388H, Intel Arc B390 12 Xe3 Panther Lake iGPU
97 (51.8min) fps +25%
Dell 14S DS14260
Intel Core Ultra 7 355, Intel Graphics 4 Xe3 Panther Lake iGPU
90.7 (54.5min) fps +17%
MSI Prestige 14 Flip AI+ 2026
Intel Core Ultra X7 358H, Intel Arc B390 12 Xe3 Panther Lake iGPU
86.8 (58.4min) fps +12%
Lenovo ThinkPad X1 Carbon Gen 14 21V70075GE
Intel Core Ultra 5 325, Intel Graphics 4 Xe3 Panther Lake iGPU
83.3 (54.4min) fps +8%
HP EliteBook X Flip G1i 14 AI
Intel Core Ultra 7 258V, Intel Arc Graphics 140V
82 (54.6min) fps +6%
HP EliteBook 8 G2a 14
AMD Ryzen AI 7 450, AMD Radeon 860M
81.4 (72.4min) fps +5%
Przeciętny Intel Graphics 4 Xe3 Panther Lake iGPU
  (68.4 - 90.7, n=15)
78.8 fps +2%
HP EliteBook X Flip G2i 14 AI
Intel Core Ultra 7 366H, Intel Graphics 4 Xe3 Panther Lake iGPU
77.3 (40.7min) fps
HP EliteBook x360 1040 G11
Intel Core Ultra 7 165H, Intel Arc 8-Core iGPU
74.4 (47.1min) fps -4%
Honor MagicBook Art 14 2025
Intel Core Ultra 7 255H, Intel Arc Graphics 140T
71.5 (43.5min) fps -8%
Lenovo Yoga 7 2-in-1 14AKP10
AMD Ryzen AI 5 340, AMD Radeon 840M
66 (56.4min) fps -15%
Dell Latitude 9450 2-in-1
Intel Core Ultra 7 165U, Intel Graphics 4-Core iGPU (Meteor / Arrow Lake)
57.3 (44min) fps -26%
Lenovo ThinkPad E14 Gen 7 21U2002QGE
Intel Core Ultra 5 228V, Intel Arc Graphics 130V
52.2 (30.3min) fps -32%
Acer TravelMate P4 14 TMP414-42-TCO-R6KG
AMD Ryzen 5 8540U, AMD Radeon 740M
46.5 (42.2min) fps -40%
Final Fantasy XV Benchmark
1280x720 Lite Quality
HP OmniBook Ultra 14 Core Ultra X9
Intel Core Ultra X9 388H, Intel Arc B390 12 Xe3 Panther Lake iGPU
129.8 fps +87%
MSI Prestige 14 Flip AI+ 2026
Intel Core Ultra X7 358H, Intel Arc B390 12 Xe3 Panther Lake iGPU
107.2 fps +54%
HP EliteBook X Flip G1i 14 AI
Intel Core Ultra 7 258V, Intel Arc Graphics 140V
85.9 fps +24%
Lenovo ThinkPad E14 Gen 7 21U2002QGE
Intel Core Ultra 5 228V, Intel Arc Graphics 130V
85.6 fps +23%
HP EliteBook x360 1040 G11
Intel Core Ultra 7 165H, Intel Arc 8-Core iGPU
73.6 fps +6%
HP EliteBook 8 G2a 14
AMD Ryzen AI 7 450, AMD Radeon 860M
73.4 fps +6%
Lenovo ThinkPad X1 Carbon Gen 14 21V70075GE
Intel Core Ultra 5 325, Intel Graphics 4 Xe3 Panther Lake iGPU
73 fps +5%
HP EliteBook X Flip G2i 14 AI
Intel Core Ultra 7 366H, Intel Graphics 4 Xe3 Panther Lake iGPU
69.4 fps
Przeciętny Intel Graphics 4 Xe3 Panther Lake iGPU
  (58 - 76.4, n=14)
68.4 fps -1%
Honor MagicBook Art 14 2025
Intel Core Ultra 7 255H, Intel Arc Graphics 140T
67.5 fps -3%
Dell 14S DS14260
Intel Core Ultra 7 355, Intel Graphics 4 Xe3 Panther Lake iGPU
66.9 fps -4%
Lenovo Yoga 7 2-in-1 14AKP10
AMD Ryzen AI 5 340, AMD Radeon 840M
61.1 fps -12%
Dell Latitude 9450 2-in-1
Intel Core Ultra 7 165U, Intel Graphics 4-Core iGPU (Meteor / Arrow Lake)
48.2 fps -31%
Acer TravelMate P4 14 TMP414-42-TCO-R6KG
AMD Ryzen 5 8540U, AMD Radeon 740M
35.3 fps -49%
1920x1080 Standard Quality
HP OmniBook Ultra 14 Core Ultra X9
Intel Core Ultra X9 388H, Intel Arc B390 12 Xe3 Panther Lake iGPU
75.2 fps +102%
MSI Prestige 14 Flip AI+ 2026
Intel Core Ultra X7 358H, Intel Arc B390 12 Xe3 Panther Lake iGPU
60.7 fps +63%
HP EliteBook X Flip G1i 14 AI
Intel Core Ultra 7 258V, Intel Arc Graphics 140V
49.4 fps +32%
Lenovo ThinkPad E14 Gen 7 21U2002QGE
Intel Core Ultra 5 228V, Intel Arc Graphics 130V
44 fps +18%
Honor MagicBook Art 14 2025
Intel Core Ultra 7 255H, Intel Arc Graphics 140T
40.6 fps +9%
HP EliteBook x360 1040 G11
Intel Core Ultra 7 165H, Intel Arc 8-Core iGPU
40.3 fps +8%
Lenovo ThinkPad X1 Carbon Gen 14 21V70075GE
Intel Core Ultra 5 325, Intel Graphics 4 Xe3 Panther Lake iGPU
37.5 fps +1%
HP EliteBook X Flip G2i 14 AI
Intel Core Ultra 7 366H, Intel Graphics 4 Xe3 Panther Lake iGPU
37.3 fps
Dell 14S DS14260
Intel Core Ultra 7 355, Intel Graphics 4 Xe3 Panther Lake iGPU
36.2 fps -3%
HP EliteBook 8 G2a 14
AMD Ryzen AI 7 450, AMD Radeon 860M
36.1 fps -3%
Przeciętny Intel Graphics 4 Xe3 Panther Lake iGPU
  (31.5 - 39.5, n=14)
36.1 fps -3%
Dell Latitude 9450 2-in-1
Intel Core Ultra 7 165U, Intel Graphics 4-Core iGPU (Meteor / Arrow Lake)
25.9 fps -31%
Lenovo Yoga 7 2-in-1 14AKP10
AMD Ryzen AI 5 340, AMD Radeon 840M
25.6 fps -31%
Acer TravelMate P4 14 TMP414-42-TCO-R6KG
AMD Ryzen 5 8540U, AMD Radeon 740M
16.9 fps -55%
1920x1080 High Quality
HP OmniBook Ultra 14 Core Ultra X9
Intel Core Ultra X9 388H, Intel Arc B390 12 Xe3 Panther Lake iGPU
54.5 fps +101%
MSI Prestige 14 Flip AI+ 2026
Intel Core Ultra X7 358H, Intel Arc B390 12 Xe3 Panther Lake iGPU
37.8 fps +39%
HP EliteBook X Flip G1i 14 AI
Intel Core Ultra 7 258V, Intel Arc Graphics 140V
34.2 fps +26%
Lenovo ThinkPad E14 Gen 7 21U2002QGE
Intel Core Ultra 5 228V, Intel Arc Graphics 130V
31 fps +14%
Honor MagicBook Art 14 2025
Intel Core Ultra 7 255H, Intel Arc Graphics 140T
29.5 fps +9%
HP EliteBook x360 1040 G11
Intel Core Ultra 7 165H, Intel Arc 8-Core iGPU
27.5 fps +1%
HP EliteBook X Flip G2i 14 AI
Intel Core Ultra 7 366H, Intel Graphics 4 Xe3 Panther Lake iGPU
27.1 fps
Lenovo ThinkPad X1 Carbon Gen 14 21V70075GE
Intel Core Ultra 5 325, Intel Graphics 4 Xe3 Panther Lake iGPU
26.8 fps -1%
HP EliteBook 8 G2a 14
AMD Ryzen AI 7 450, AMD Radeon 860M
26.1 fps -4%
Dell 14S DS14260
Intel Core Ultra 7 355, Intel Graphics 4 Xe3 Panther Lake iGPU
26 fps -4%
Przeciętny Intel Graphics 4 Xe3 Panther Lake iGPU
  (22.5 - 27.2, n=14)
25.8 fps -5%
Dell Latitude 9450 2-in-1
Intel Core Ultra 7 165U, Intel Graphics 4-Core iGPU (Meteor / Arrow Lake)
18.2 fps -33%
Lenovo Yoga 7 2-in-1 14AKP10
AMD Ryzen AI 5 340, AMD Radeon 840M
16.7 fps -38%
Acer TravelMate P4 14 TMP414-42-TCO-R6KG
AMD Ryzen 5 8540U, AMD Radeon 740M
12.6 fps -54%
X-Plane 11.11 - 1920x1080 high (fps_test=3)
HP EliteBook 8 G2a 14
AMD Ryzen AI 7 450, AMD Radeon 860M
43.9 fps +43%
HP OmniBook Ultra 14 Core Ultra X9
Intel Core Ultra X9 388H, Intel Arc B390 12 Xe3 Panther Lake iGPU
42.2 fps +37%
MSI Prestige 14 Flip AI+ 2026
Intel Core Ultra X7 358H, Intel Arc B390 12 Xe3 Panther Lake iGPU
41.8 fps +36%
HP EliteBook x360 1040 G11
Intel Core Ultra 7 165H, Intel Arc 8-Core iGPU
40.5 fps +32%
Lenovo Yoga 7 2-in-1 14AKP10
AMD Ryzen AI 5 340, AMD Radeon 840M
36.5 fps +19%
Honor MagicBook Art 14 2025
Intel Core Ultra 7 255H, Intel Arc Graphics 140T
33.2 fps +8%
HP EliteBook X Flip G1i 14 AI
Intel Core Ultra 7 258V, Intel Arc Graphics 140V
31.9 fps +4%
HP EliteBook X Flip G2i 14 AI
Intel Core Ultra 7 366H, Intel Graphics 4 Xe3 Panther Lake iGPU
30.7 fps
Lenovo ThinkPad E14 Gen 7 21U2002QGE
Intel Core Ultra 5 228V, Intel Arc Graphics 130V
29.2 fps -5%
Przeciętny Intel Graphics 4 Xe3 Panther Lake iGPU
  (22.9 - 33.2, n=15)
28.6 fps -7%
Dell 14S DS14260
Intel Core Ultra 7 355, Intel Graphics 4 Xe3 Panther Lake iGPU
27.8 fps -9%
Lenovo ThinkPad X1 Carbon Gen 14 21V70075GE
Intel Core Ultra 5 325, Intel Graphics 4 Xe3 Panther Lake iGPU
25.5 fps -17%
Dell Latitude 9450 2-in-1
Intel Core Ultra 7 165U, Intel Graphics 4-Core iGPU (Meteor / Arrow Lake)
25.3 fps -18%
Acer TravelMate P4 14 TMP414-42-TCO-R6KG
AMD Ryzen 5 8540U, AMD Radeon 740M
21.9 fps -29%
Strange Brigade
1920x1080 high AA:high AF:8
HP OmniBook Ultra 14 Core Ultra X9
Intel Core Ultra X9 388H, Intel Arc B390 12 Xe3 Panther Lake iGPU
114.9 (46min, 91.6P1) fps +202%
MSI Prestige 14 Flip AI+ 2026
Intel Core Ultra X7 358H, Intel Arc B390 12 Xe3 Panther Lake iGPU
103.3 (57min, 81.7P1) fps +171%
HP EliteBook X Flip G1i 14 AI
Intel Core Ultra 7 258V, Intel Arc Graphics 140V
71.9 (47.3min, 56.8P1) fps +89%
Honor MagicBook Art 14 2025
Intel Core Ultra 7 255H, Intel Arc Graphics 140T
71.4 (40.1min, 53.4P1) fps +87%
Lenovo ThinkPad X1 Carbon Gen 14 21V70075GE
Intel Core Ultra 5 325, Intel Graphics 4 Xe3 Panther Lake iGPU
62 (40.5min, 48.4P1) fps +63%
HP EliteBook x360 1040 G11
Intel Core Ultra 7 165H, Intel Arc 8-Core iGPU
61.7 (7min, 34.8P1) fps +62%
Lenovo ThinkPad E14 Gen 7 21U2002QGE
Intel Core Ultra 5 228V, Intel Arc Graphics 130V
58.4 (37.5min, 45.9P1) fps +53%
Dell 14S DS14260
Intel Core Ultra 7 355, Intel Graphics 4 Xe3 Panther Lake iGPU
56.7 (35.1min, 42.5P1) fps +49%
Przeciętny Intel Graphics 4 Xe3 Panther Lake iGPU
  (35.9 - 64.1, n=11)
55.5 fps +46%
HP EliteBook 8 G2a 14
AMD Ryzen AI 7 450, AMD Radeon 860M
50.5 (37.4min, 40.8P1) fps +33%
Dell Latitude 9450 2-in-1
Intel Core Ultra 7 165U, Intel Graphics 4-Core iGPU (Meteor / Arrow Lake)
41.9 (20.6min, 30.5P1) fps +10%
Lenovo Yoga 7 2-in-1 14AKP10
AMD Ryzen AI 5 340, AMD Radeon 840M
41.1 (24.3min, 30.8P1) fps +8%
HP EliteBook X Flip G2i 14 AI
Intel Core Ultra 7 366H, Intel Graphics 4 Xe3 Panther Lake iGPU
38.1 (27.9min, 29.4P1) fps
1920x1080 ultra AA:ultra AF:16
HP OmniBook Ultra 14 Core Ultra X9
Intel Core Ultra X9 388H, Intel Arc B390 12 Xe3 Panther Lake iGPU
101.3 (43.7min, 74.5P1) fps +251%
MSI Prestige 14 Flip AI+ 2026
Intel Core Ultra X7 358H, Intel Arc B390 12 Xe3 Panther Lake iGPU
80 (32.4min, 44.3P1) fps +177%
HP EliteBook X Flip G1i 14 AI
Intel Core Ultra 7 258V, Intel Arc Graphics 140V
59.6 (15.2min, 32.1P1) fps +106%
Honor MagicBook Art 14 2025
Intel Core Ultra 7 255H, Intel Arc Graphics 140T
57.7 (32.7min, 43P1) fps +100%
Lenovo ThinkPad X1 Carbon Gen 14 21V70075GE
Intel Core Ultra 5 325, Intel Graphics 4 Xe3 Panther Lake iGPU
52.2 (38.1min, 40P1) fps +81%
Lenovo ThinkPad E14 Gen 7 21U2002QGE
Intel Core Ultra 5 228V, Intel Arc Graphics 130V
51.4 (23min, 38P1) fps +78%
Przeciętny Intel Graphics 4 Xe3 Panther Lake iGPU
  (28.9 - 54.6, n=11)
48.1 fps +66%
Dell 14S DS14260
Intel Core Ultra 7 355, Intel Graphics 4 Xe3 Panther Lake iGPU
48 (16.5min, 25.9P1) fps +66%
HP EliteBook x360 1040 G11
Intel Core Ultra 7 165H, Intel Arc 8-Core iGPU
47.3 (5.3min, 10.1P1) fps +64%
HP EliteBook 8 G2a 14
AMD Ryzen AI 7 450, AMD Radeon 860M
44.4 (29.6min, 35.2P1) fps +54%
Lenovo Yoga 7 2-in-1 14AKP10
AMD Ryzen AI 5 340, AMD Radeon 840M
34.2 (13.2min, 17.8P1) fps +18%
Dell Latitude 9450 2-in-1
Intel Core Ultra 7 165U, Intel Graphics 4-Core iGPU (Meteor / Arrow Lake)
33.3 (21.1min, 24.8P1) fps +15%
HP EliteBook X Flip G2i 14 AI
Intel Core Ultra 7 366H, Intel Graphics 4 Xe3 Panther Lake iGPU
28.9 (16.4min, 21.9P1) fps
Baldur's Gate 3
1920x1080 High Preset AA:T
HP OmniBook Ultra 14 Core Ultra X9
Intel Core Ultra X9 388H, Intel Arc B390 12 Xe3 Panther Lake iGPU
54 (47.6min, 48.5P0.1, 49.7P1) fps +122%
MSI Prestige 14 Flip AI+ 2026
Intel Core Ultra X7 358H, Intel Arc B390 12 Xe3 Panther Lake iGPU
47 (40.6min, 40.9P0.1, 42.7P1) fps +93%
HP EliteBook X Flip G1i 14 AI
Intel Core Ultra 7 258V, Intel Arc Graphics 140V
31.8 fps +31%
Lenovo ThinkPad E14 Gen 7 21U2002QGE
Intel Core Ultra 5 228V, Intel Arc Graphics 130V
25.9 (21.9min, 22.2P0.1, 23P1) fps +7%
HP EliteBook X Flip G2i 14 AI
Intel Core Ultra 7 366H, Intel Graphics 4 Xe3 Panther Lake iGPU
24.3 (22min, 22P0.1, 22.4P1) fps
Lenovo ThinkPad X1 Carbon Gen 14 21V70075GE
Intel Core Ultra 5 325, Intel Graphics 4 Xe3 Panther Lake iGPU
22.9 (20.7min, 20.7P0.1, 21P1) fps -6%
Honor MagicBook Art 14 2025
Intel Core Ultra 7 255H, Intel Arc Graphics 140T
21.8 fps -10%
Przeciętny Intel Graphics 4 Xe3 Panther Lake iGPU
  (18 - 24.3, n=14)
21.5 fps -12%
HP EliteBook x360 1040 G11
Intel Core Ultra 7 165H, Intel Arc 8-Core iGPU
21.4 fps -12%
Dell 14S DS14260
Intel Core Ultra 7 355, Intel Graphics 4 Xe3 Panther Lake iGPU
19.4 (17.5min, 17.7P0.1, 18.2P1) fps -20%
HP EliteBook 8 G2a 14
AMD Ryzen AI 7 450, AMD Radeon 860M
18.1 (15.2min, 15.5P0.1, 16.6P1) fps -26%
Lenovo Yoga 7 2-in-1 14AKP10
AMD Ryzen AI 5 340, AMD Radeon 840M
13.3 (11.4min, 11.7P0.1, 12.4P1) fps -45%
Dell Latitude 9450 2-in-1
Intel Core Ultra 7 165U, Intel Graphics 4-Core iGPU (Meteor / Arrow Lake)
11 fps -55%
Acer TravelMate P4 14 TMP414-42-TCO-R6KG
AMD Ryzen 5 8540U, AMD Radeon 740M
10.3 (7.7min, 7.77P0.1, 9.13P1) fps -58%
1920x1080 Ultra Preset AA:T
HP OmniBook Ultra 14 Core Ultra X9
Intel Core Ultra X9 388H, Intel Arc B390 12 Xe3 Panther Lake iGPU
53.5 (48.4min, 49.1P0.1, 50.4P1) fps +126%
MSI Prestige 14 Flip AI+ 2026
Intel Core Ultra X7 358H, Intel Arc B390 12 Xe3 Panther Lake iGPU
44.6 (38.9min, 39P0.1, 40P1) fps +88%
HP EliteBook X Flip G1i 14 AI
Intel Core Ultra 7 258V, Intel Arc Graphics 140V
31.3 fps +32%
Lenovo ThinkPad E14 Gen 7 21U2002QGE
Intel Core Ultra 5 228V, Intel Arc Graphics 130V
24.9 (21.2min, 21.3P0.1, 21.7P1) fps +5%
HP EliteBook X Flip G2i 14 AI
Intel Core Ultra 7 366H, Intel Graphics 4 Xe3 Panther Lake iGPU
23.7 (21min, 21.3P0.1, 21.9P1) fps
Lenovo ThinkPad X1 Carbon Gen 14 21V70075GE
Intel Core Ultra 5 325, Intel Graphics 4 Xe3 Panther Lake iGPU
22.4 (20.3min, 20.4P0.1, 20.6P1) fps -5%
Honor MagicBook Art 14 2025
Intel Core Ultra 7 255H, Intel Arc Graphics 140T
21 fps -11%
Przeciętny Intel Graphics 4 Xe3 Panther Lake iGPU
  (17.7 - 23.7, n=14)
21 fps -11%
HP EliteBook x360 1040 G11
Intel Core Ultra 7 165H, Intel Arc 8-Core iGPU
20.4 fps -14%
Dell 14S DS14260
Intel Core Ultra 7 355, Intel Graphics 4 Xe3 Panther Lake iGPU
19.2 (16.3min, 16.3P0.1, 17.9P1) fps -19%
HP EliteBook 8 G2a 14
AMD Ryzen AI 7 450, AMD Radeon 860M
17.9 (15.2min, 15.3P0.1, 16.4P1) fps -24%
Lenovo Yoga 7 2-in-1 14AKP10
AMD Ryzen AI 5 340, AMD Radeon 840M
12.8 (7.34min, 7.86P0.1, 10.4P1) fps -46%
Dell Latitude 9450 2-in-1
Intel Core Ultra 7 165U, Intel Graphics 4-Core iGPU (Meteor / Arrow Lake)
10.6 fps -55%
Acer TravelMate P4 14 TMP414-42-TCO-R6KG
AMD Ryzen 5 8540U, AMD Radeon 740M
10.1 (7.24min, 7.39P0.1, 8.73P1) fps -57%
Cyberpunk 2077
1280x720 Low Preset (FSR off)
HP OmniBook Ultra 14 Core Ultra X9
Intel Core Ultra X9 388H, Intel Arc B390 12 Xe3 Panther Lake iGPU
102.2 (85.5min, 79.9P1) fps +57%
HP EliteBook X Flip G2i 14 AI
Intel Core Ultra 7 366H, Intel Graphics 4 Xe3 Panther Lake iGPU
65.1 (53.4min, 50.9P1) fps
Przeciętny Intel Graphics 4 Xe3 Panther Lake iGPU
  (58.7 - 66.2, n=8)
62.4 fps -4%
Dell 14S DS14260
Intel Core Ultra 7 355, Intel Graphics 4 Xe3 Panther Lake iGPU
61.3 (49.9min, 46.9P1) fps -6%
HP EliteBook X Flip G1i 14 AI
Intel Core Ultra 7 258V, Intel Arc Graphics 140V
51 (36.6min) fps -22%
HP EliteBook x360 1040 G11
Intel Core Ultra 7 165H, Intel Arc 8-Core iGPU
48.9 (41min) fps -25%
Dell Latitude 9450 2-in-1
Intel Core Ultra 7 165U, Intel Graphics 4-Core iGPU (Meteor / Arrow Lake)
31.7 (16.8min) fps -51%
1920x1080 Low Preset (FSR off)
MSI Prestige 14 Flip AI+ 2026
Intel Core Ultra X7 358H, Intel Arc B390 12 Xe3 Panther Lake iGPU
75 (61.6min) fps +92%
HP OmniBook Ultra 14 Core Ultra X9
Intel Core Ultra X9 388H, Intel Arc B390 12 Xe3 Panther Lake iGPU
74.2 (62.8min, 58.4P1) fps +90%
Lenovo ThinkPad E14 Gen 7 21U2002QGE
Intel Core Ultra 5 228V, Intel Arc Graphics 130V
43 (35.7min) fps +10%
HP EliteBook X Flip G1i 14 AI
Intel Core Ultra 7 258V, Intel Arc Graphics 140V
40.7 (34.3min) fps +4%
HP EliteBook X Flip G2i 14 AI
Intel Core Ultra 7 366H, Intel Graphics 4 Xe3 Panther Lake iGPU
39 (33.1min, 31.5P1) fps
Lenovo ThinkPad X1 Carbon Gen 14 21V70075GE
Intel Core Ultra 5 325, Intel Graphics 4 Xe3 Panther Lake iGPU
38.6 (32.4min) fps -1%
Dell 14S DS14260
Intel Core Ultra 7 355, Intel Graphics 4 Xe3 Panther Lake iGPU
37.3 (31.5min, 30.1P1) fps -4%
Przeciętny Intel Graphics 4 Xe3 Panther Lake iGPU
  (32.7 - 39.4, n=15)
37.1 fps -5%
HP EliteBook 8 G2a 14
AMD Ryzen AI 7 450, AMD Radeon 860M
36.6 (29.4min) fps -6%
HP EliteBook x360 1040 G11
Intel Core Ultra 7 165H, Intel Arc 8-Core iGPU
31.5 (26.7min) fps -19%
Honor MagicBook Art 14 2025
Intel Core Ultra 7 255H, Intel Arc Graphics 140T
30.3 (26min) fps -22%
Lenovo Yoga 7 2-in-1 14AKP10
AMD Ryzen AI 5 340, AMD Radeon 840M
24.8 (21min) fps -36%
Dell Latitude 9450 2-in-1
Intel Core Ultra 7 165U, Intel Graphics 4-Core iGPU (Meteor / Arrow Lake)
20.3 (12.7min) fps -48%
Acer TravelMate P4 14 TMP414-42-TCO-R6KG
AMD Ryzen 5 8540U, AMD Radeon 740M
18.2 (15.4min, 14.7P1) fps -53%
1920x1080 Medium Preset (FSR off)
HP OmniBook Ultra 14 Core Ultra X9
Intel Core Ultra X9 388H, Intel Arc B390 12 Xe3 Panther Lake iGPU
60.1 (51.4min, 48.1P1) fps +102%
MSI Prestige 14 Flip AI+ 2026
Intel Core Ultra X7 358H, Intel Arc B390 12 Xe3 Panther Lake iGPU
59.7 (49.2min) fps +100%
HP EliteBook X Flip G1i 14 AI
Intel Core Ultra 7 258V, Intel Arc Graphics 140V
37.6 (31.8min) fps +26%
Lenovo ThinkPad E14 Gen 7 21U2002QGE
Intel Core Ultra 5 228V, Intel Arc Graphics 130V
33 (28.5min) fps +11%
HP EliteBook X Flip G2i 14 AI
Intel Core Ultra 7 366H, Intel Graphics 4 Xe3 Panther Lake iGPU
29.8 (26min, 24.9P1) fps
Lenovo ThinkPad X1 Carbon Gen 14 21V70075GE
Intel Core Ultra 5 325, Intel Graphics 4 Xe3 Panther Lake iGPU
29.1 (25.1min) fps -2%
HP EliteBook 8 G2a 14
AMD Ryzen AI 7 450, AMD Radeon 860M
28.2 (23.4min) fps -5%
Przeciętny Intel Graphics 4 Xe3 Panther Lake iGPU
  (26 - 29.8, n=15)
28.1 fps -6%
Dell 14S DS14260
Intel Core Ultra 7 355, Intel Graphics 4 Xe3 Panther Lake iGPU
26.4 (23.2min, 22.3P1) fps -11%
HP EliteBook x360 1040 G11
Intel Core Ultra 7 165H, Intel Arc 8-Core iGPU
25.7 (22.2min) fps -14%
Honor MagicBook Art 14 2025
Intel Core Ultra 7 255H, Intel Arc Graphics 140T
25.3 (22.1min) fps -15%
Lenovo Yoga 7 2-in-1 14AKP10
AMD Ryzen AI 5 340, AMD Radeon 840M
18.4 (16min) fps -38%
Dell Latitude 9450 2-in-1
Intel Core Ultra 7 165U, Intel Graphics 4-Core iGPU (Meteor / Arrow Lake)
16.7 (12.8min) fps -44%
Acer TravelMate P4 14 TMP414-42-TCO-R6KG
AMD Ryzen 5 8540U, AMD Radeon 740M
13.8 (11.9min, 11.3P1) fps -54%
1920x1080 High Preset (FSR off)
HP OmniBook Ultra 14 Core Ultra X9
Intel Core Ultra X9 388H, Intel Arc B390 12 Xe3 Panther Lake iGPU
51.9 (44.1min, 41.3P1) fps +103%
MSI Prestige 14 Flip AI+ 2026
Intel Core Ultra X7 358H, Intel Arc B390 12 Xe3 Panther Lake iGPU
49.7 (40min) fps +94%
HP EliteBook X Flip G1i 14 AI
Intel Core Ultra 7 258V, Intel Arc Graphics 140V
33.4 (27.8min) fps +30%
Lenovo ThinkPad E14 Gen 7 21U2002QGE
Intel Core Ultra 5 228V, Intel Arc Graphics 130V
29.2 (24.5min) fps +14%
HP EliteBook X Flip G2i 14 AI
Intel Core Ultra 7 366H, Intel Graphics 4 Xe3 Panther Lake iGPU
25.6 (22.2min, 21.3P1) fps
Lenovo ThinkPad X1 Carbon Gen 14 21V70075GE
Intel Core Ultra 5 325, Intel Graphics 4 Xe3 Panther Lake iGPU
25 (21.1min) fps -2%
HP EliteBook x360 1040 G11
Intel Core Ultra 7 165H, Intel Arc 8-Core iGPU
23.9 (20.8min) fps -7%
Przeciętny Intel Graphics 4 Xe3 Panther Lake iGPU
  (20.7 - 26.1, n=15)
23.7 fps -7%
HP EliteBook 8 G2a 14
AMD Ryzen AI 7 450, AMD Radeon 860M
22.2 (18.2min) fps -13%
Honor MagicBook Art 14 2025
Intel Core Ultra 7 255H, Intel Arc Graphics 140T
21.3 (17.6min) fps -17%
Dell 14S DS14260
Intel Core Ultra 7 355, Intel Graphics 4 Xe3 Panther Lake iGPU
21.2 (18.5min, 17.5P1) fps -17%
Lenovo Yoga 7 2-in-1 14AKP10
AMD Ryzen AI 5 340, AMD Radeon 840M
15.2 (13min) fps -41%
Dell Latitude 9450 2-in-1
Intel Core Ultra 7 165U, Intel Graphics 4-Core iGPU (Meteor / Arrow Lake)
14.4 (10.7min) fps -44%
Acer TravelMate P4 14 TMP414-42-TCO-R6KG
AMD Ryzen 5 8540U, AMD Radeon 740M
10.3 (8.86min, 8.32P1) fps -60%
1920x1080 Ultra Preset (FSR off)
MSI Prestige 14 Flip AI+ 2026
Intel Core Ultra X7 358H, Intel Arc B390 12 Xe3 Panther Lake iGPU
45.5 (33min) fps +111%
HP OmniBook Ultra 14 Core Ultra X9
Intel Core Ultra X9 388H, Intel Arc B390 12 Xe3 Panther Lake iGPU
44.9 (36.5min, 35.1P1) fps +108%
HP EliteBook X Flip G1i 14 AI
Intel Core Ultra 7 258V, Intel Arc Graphics 140V
29.2 (24min) fps +35%
Lenovo ThinkPad E14 Gen 7 21U2002QGE
Intel Core Ultra 5 228V, Intel Arc Graphics 130V
25.4 (21.1min) fps +18%
HP EliteBook x360 1040 G11
Intel Core Ultra 7 165H, Intel Arc 8-Core iGPU
21.6 (18.5min) fps 0%
HP EliteBook X Flip G2i 14 AI
Intel Core Ultra 7 366H, Intel Graphics 4 Xe3 Panther Lake iGPU
21.6 (18.5min, 17.5P1) fps
Lenovo ThinkPad X1 Carbon Gen 14 21V70075GE
Intel Core Ultra 5 325, Intel Graphics 4 Xe3 Panther Lake iGPU
20.8 (17.4min) fps -4%
Przeciętny Intel Graphics 4 Xe3 Panther Lake iGPU
  (16.8 - 21.8, n=15)
20.1 fps -7%
Honor MagicBook Art 14 2025
Intel Core Ultra 7 255H, Intel Arc Graphics 140T
18.6 (15min) fps -14%
HP EliteBook 8 G2a 14
AMD Ryzen AI 7 450, AMD Radeon 860M
18.6 (14.6min) fps -14%
Dell 14S DS14260
Intel Core Ultra 7 355, Intel Graphics 4 Xe3 Panther Lake iGPU
16.8 (14min, 13.1P1) fps -22%
Dell Latitude 9450 2-in-1
Intel Core Ultra 7 165U, Intel Graphics 4-Core iGPU (Meteor / Arrow Lake)
12.7 (9.58min) fps -41%
Lenovo Yoga 7 2-in-1 14AKP10
AMD Ryzen AI 5 340, AMD Radeon 840M
12.2 (10min) fps -44%
Acer TravelMate P4 14 TMP414-42-TCO-R6KG
AMD Ryzen 5 8540U, AMD Radeon 740M
9.26 (7.85min, 7.55P1) fps -57%

Wykres liczby klatek na sekundę w grze „Cyberpunk 2077” w ustawieniach ultra

0510152025303540Tooltip
HP EliteBook X Flip G2i 14 AI Ultra 7 366H, Intel Graphics 4 Xe3 PTL: Ø19.7 (18.5-20.2) fps
HP EliteBook X Flip G1i 14 AI Core Ultra 7 258V, Arc 140V: Ø26.2 (24-41.1) fps
lowmed.highultra
GTA V (2015) 182 170.6 52.4 21.8
Dota 2 Reborn (2015) 129 90 81.6 77.3
Final Fantasy XV Benchmark (2018) 69.4 37.3 27.1
X-Plane 11.11 (2018) 42.2 37.6 30.7
Strange Brigade (2018) 119.6 45.4 38.1 28.9
Baldur's Gate 3 (2023) 33.6 27.7 24.3 23.7
Cyberpunk 2077 (2023) 39 29.8 25.6 21.6
F1 24 (2024) 66.7 62.3 46.1 14.9

Emisje

Hałas systemowy

Wentylatory wewnętrzne pracują cicho podczas wykonywania mało wymagających zadań, takich jak przeglądanie stron internetowych lub strumieniowe odtwarzanie wideo, wykazując minimalne wahania prędkości obrotowej. Jednak gdy pojawia się większe obciążenie, na przykład podczas grania w gry, szybko zwiększają prędkość obrotową i poziom hałasu.
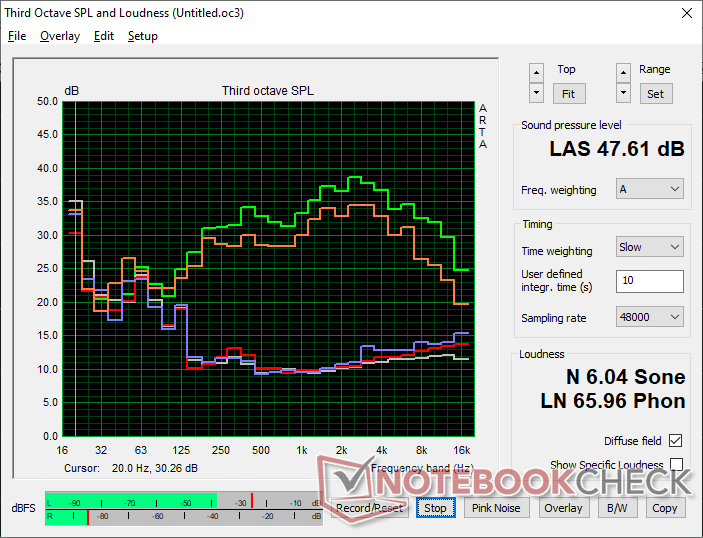
Profil hałasu wentylatora (biały: tło, czerwony: system w stanie spoczynku, niebieski: 3DMark 06, pomarańczowy: Cyberpunk 2077, zielony: obciążenie Prime95 + FurMark)

Hałas

luz
23.3 / 23.3 / 23.8 dB
obciążenie
24 / 47.6 dB
  red to green bar
 
 
30 dB
cichy
40 dB(A)
słyszalny
50 dB(A)
irytujący
 
min: dark, med: mid, max: light   Earthworks M23R, Arta (odległość 15 cm)   hałas otoczenia: 22.8 dB(A)
dB(A) 0102030405060708090Deep BassMiddle BassHigh BassLower RangeMidsHigher MidsLower HighsMid HighsUpper HighsSuper Highs2033.833.130.235.130.32521.923.421.726.1223118.721.820.72120.44022.917.318.820.318.75026.623.120.120.121.36324.623.423.824.125.28022.119.319.320.322.710022.11616.616.520.912523.719.618.919.124.916025.411.810.211.427.520029.51110.710.73125028.611.711.810.931.331528.311.713.211.831.54003011.212.110.734.350028.59.310.29.332.963028.39.510.29.63280028.49.99.41031.31000309.69.99.733.2125032.49.69.99.535.3160034.110.1109.737.3200032.810.810.210.236.6250034.511.110.510.438.7315034.513.411.210.937.8400032.812.811.81136.750003012.811.911.533.8630031.212.812.111.534.6800026.41412.711.632.61000025.513.713.111.9321250023.31413.412.129.81600019.715.413.811.524.8SPL43.92423.322.847.6N4.60.50.50.46median 28.6median 11.7median 11.8median 10.9median 32.6Delta3.21.91.80.82.6hearing rangehide median Fan NoiseHP EliteBook X Flip G2i 14 AI
HP EliteBook X Flip G2i 14 AI
Ultra 7 366H, Intel Graphics 4 Xe3 PTL
HP EliteBook X Flip G1i 14 AI
Core Ultra 7 258V, Arc 140V
HP EliteBook x360 1040 G11
Ultra 7 165H, Arc 8-Core
MSI Prestige 14 Flip AI+ 2026
Ultra X7 358H, Arc B390 Panther Lake iGPU
Lenovo Yoga 7 2-in-1 14AKP10
Ryzen AI 5 340, Radeon 840M
Dell Latitude 9450 2-in-1
Ultra 7 165U, Graphics 4-Core iGPU (Arrow Lake)
Noise
8%
-4%
-11%
-18%
-10%
wyłączone / środowisko * (dB)
22.8
23
-1%
23
-1%
25.4
-11%
25
-10%
23.9
-5%
Idle Minimum * (dB)
23.3
23
1%
23
1%
25.4
-9%
25
-7%
23.9
-3%
Idle Average * (dB)
23.3
23
1%
23
1%
25.4
-9%
27
-16%
23.9
-3%
Idle Maximum * (dB)
23.8
23
3%
23
3%
25.4
-7%
30
-26%
23.9
-0%
Load Average * (dB)
24
27.14
-13%
31
-29%
33.1
-38%
43
-79%
36.4
-52%
Cyberpunk 2077 ultra * (dB)
43.9
31.65
28%
45.7
-4%
46.5
-6%
42
4%
Load Maximum * (dB)
47.6
31.65
34%
47.7
-0%
46.5
2%
44
8%
44.7
6%
Witcher 3 ultra * (dB)
44.7

* ... im mniej tym lepiej

Temperatura
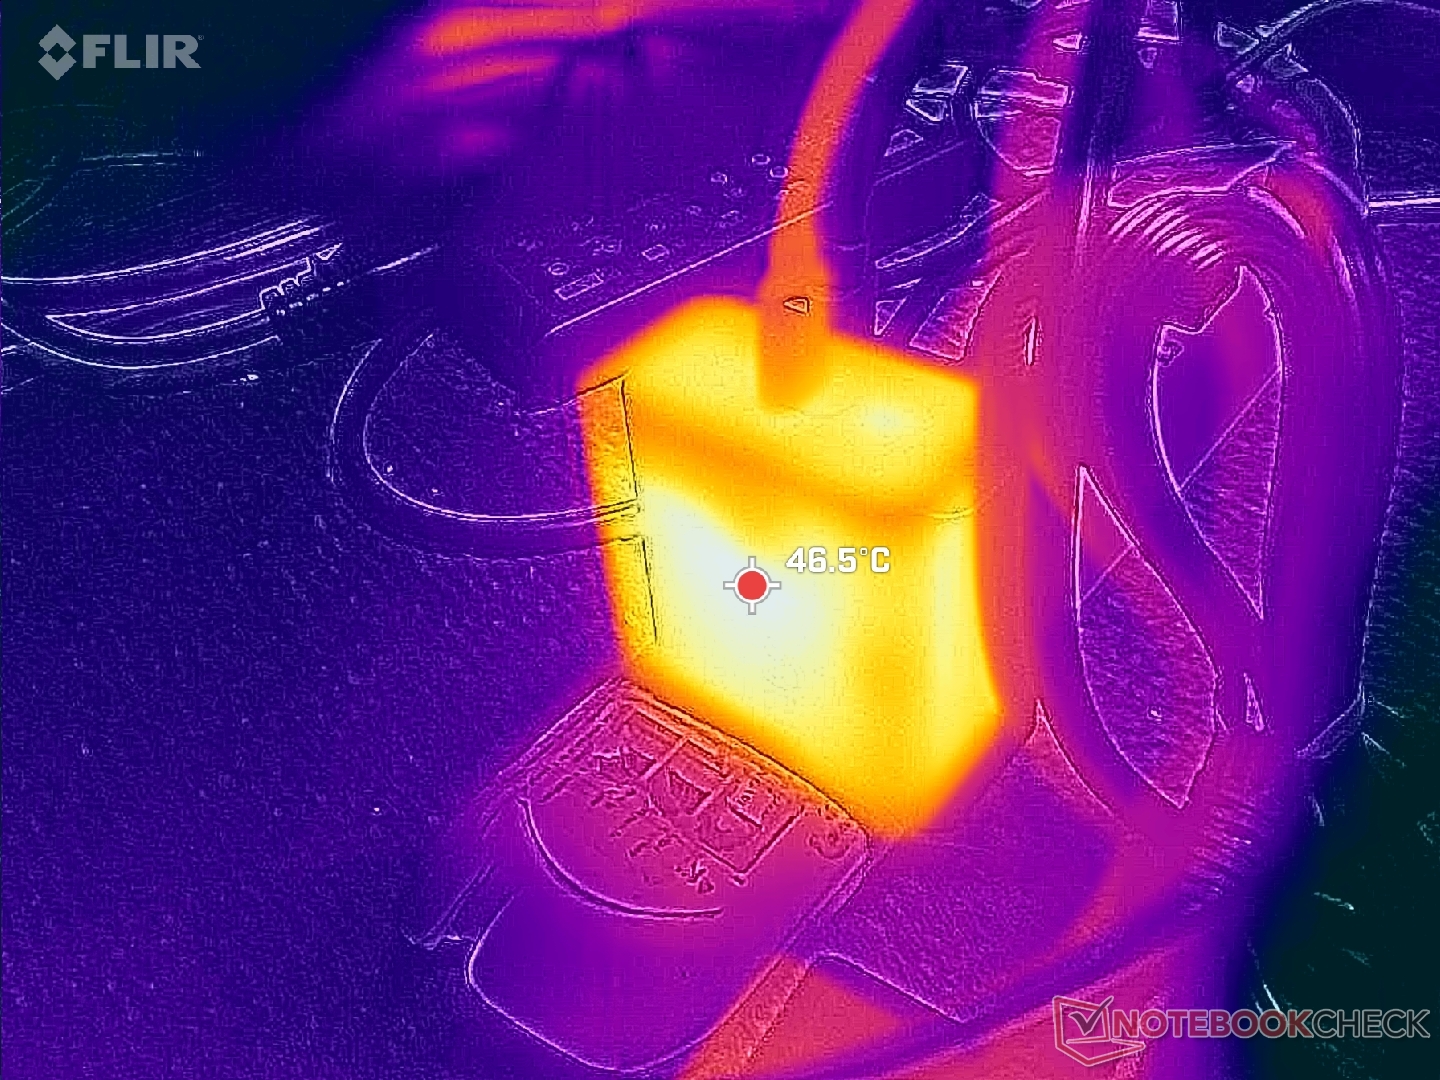
Tylny układ wydechowy
Zasilacz sieciowy osiąga temperaturę powyżej 47°C podczas pracy pod dużym obciążeniem
w stresie
 41 °C43.8 °C39.2 °C 
 39.4 °C40.4 °C32 °C 
 36.6 °C31.2 °C29.6 °C 
maks. w ogóle: 43.8 °C
średnia: 37 °C
32.4 °C39.4 °C43.6 °C
31.6 °C39.8 °C41.2 °C
30.8 °C33.8 °C35.8 °C
maks. w ogóle: 43.6 °C
średnia: 36.5 °C
zasilacz  46 °C | temperatura otoczenia 20 °C | Fluke 62 Mini IR Thermometer
(±) Średnia temperatura górnej części przy maksymalnym obciążeniu wynosi 37 °C / 99 F, w porównaniu do średniej 30.3 °C / ###class_avg_f# ## F dla urządzeń w klasie Convertible.
(±) Maksymalna temperatura w górnej części wynosi 43.8 °C / 111 F, w porównaniu do średniej 35.4 °C / 96 F , począwszy od 19.6 do 60 °C dla klasy Convertible.
(±) Dno nagrzewa się maksymalnie do 43.6 °C / 110 F, w porównaniu do średniej 36.9 °C / 98 F
(+) W stanie bezczynności średnia temperatura górnej części wynosi 24 °C / 75 F, w porównaniu ze średnią temperaturą urządzenia wynoszącą 30.3 °C / ### class_avg_f### F.
(±) Podpórki pod nadgarstki i touchpad mogą się bardzo nagrzać w dotyku, maksymalnie do 36.6 °C / 97.9 F.
(-) Średnia temperatura obszaru podparcia dłoni w podobnych urządzeniach wynosiła 28 °C / 82.4 F (-8.6 °C / -15.5 F).
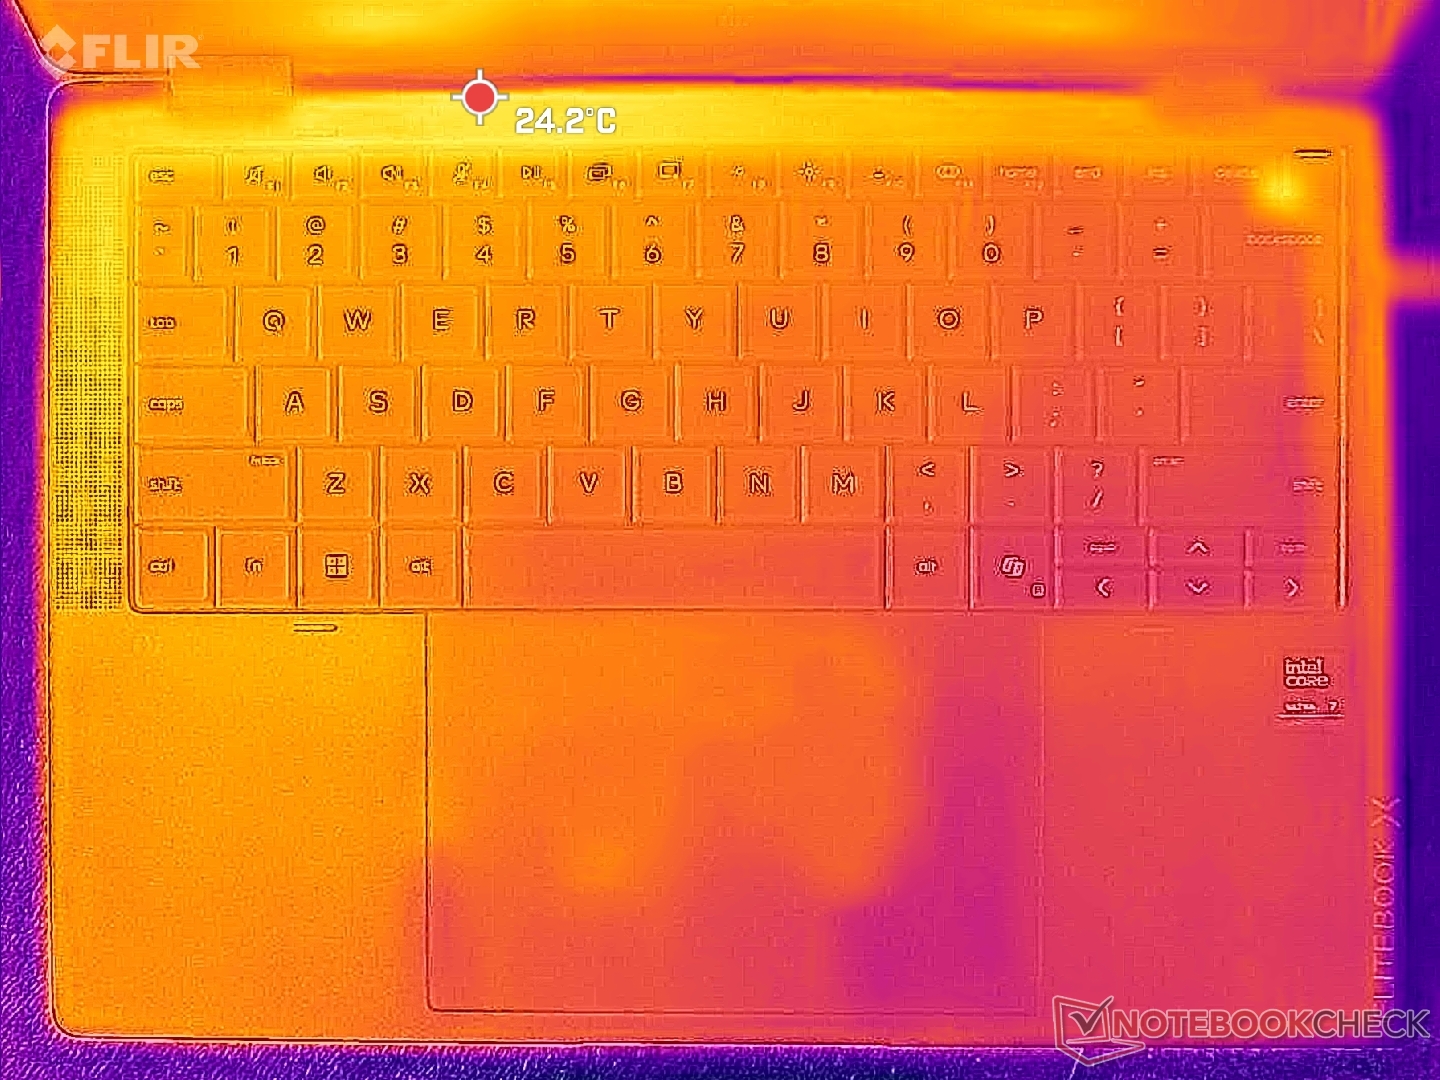
Bezczynność systemu (okładka C)
Stan bezczynności systemu (pokrywa D)
Test obciążeniowy Prime95+FurMark (poziom C)
Test obciążeniowy Prime95+FurMark (poziom D)
HP EliteBook X Flip G2i 14 AI
Ultra 7 366H, Intel Graphics 4 Xe3 PTL
HP EliteBook X Flip G1i 14 AI
Core Ultra 7 258V, Arc 140V
HP EliteBook x360 1040 G11
Ultra 7 165H, Arc 8-Core
MSI Prestige 14 Flip AI+ 2026
Ultra X7 358H, Arc B390 Panther Lake iGPU
Lenovo Yoga 7 2-in-1 14AKP10
Ryzen AI 5 340, Radeon 840M
Dell Latitude 9450 2-in-1
Ultra 7 165U, Graphics 4-Core iGPU (Arrow Lake)
Heat
3%
1%
-3%
-12%
2%
Maximum Upper Side * (°C)
43.8
36
18%
39
11%
47.1
-8%
47
-7%
35.4
19%
Maximum Bottom * (°C)
43.6
41
6%
43.6
-0%
46.2
-6%
49
-12%
37.8
13%
Idle Upper Side * (°C)
24.6
26
-6%
24.4
1%
24.3
1%
28
-14%
27.2
-11%
Idle Bottom * (°C)
25.2
27
-7%
27.4
-9%
24.5
3%
29
-15%
28.2
-12%

* ... im mniej tym lepiej

Test obciążeniowy

Temperatura rdzenia jest wyższa niż oczekiwano podczas wykonywania wymagających zadań, osiągając poziom ponad 80°C, a nawet 90°C. W konsekwencji trwałość działania funkcji Turbo Boost jest ograniczona, co pokazują poniższe zrzuty ekranu, które są zgodne z przedstawionymi powyżej wynikami testu CineBench w trybie pętli.
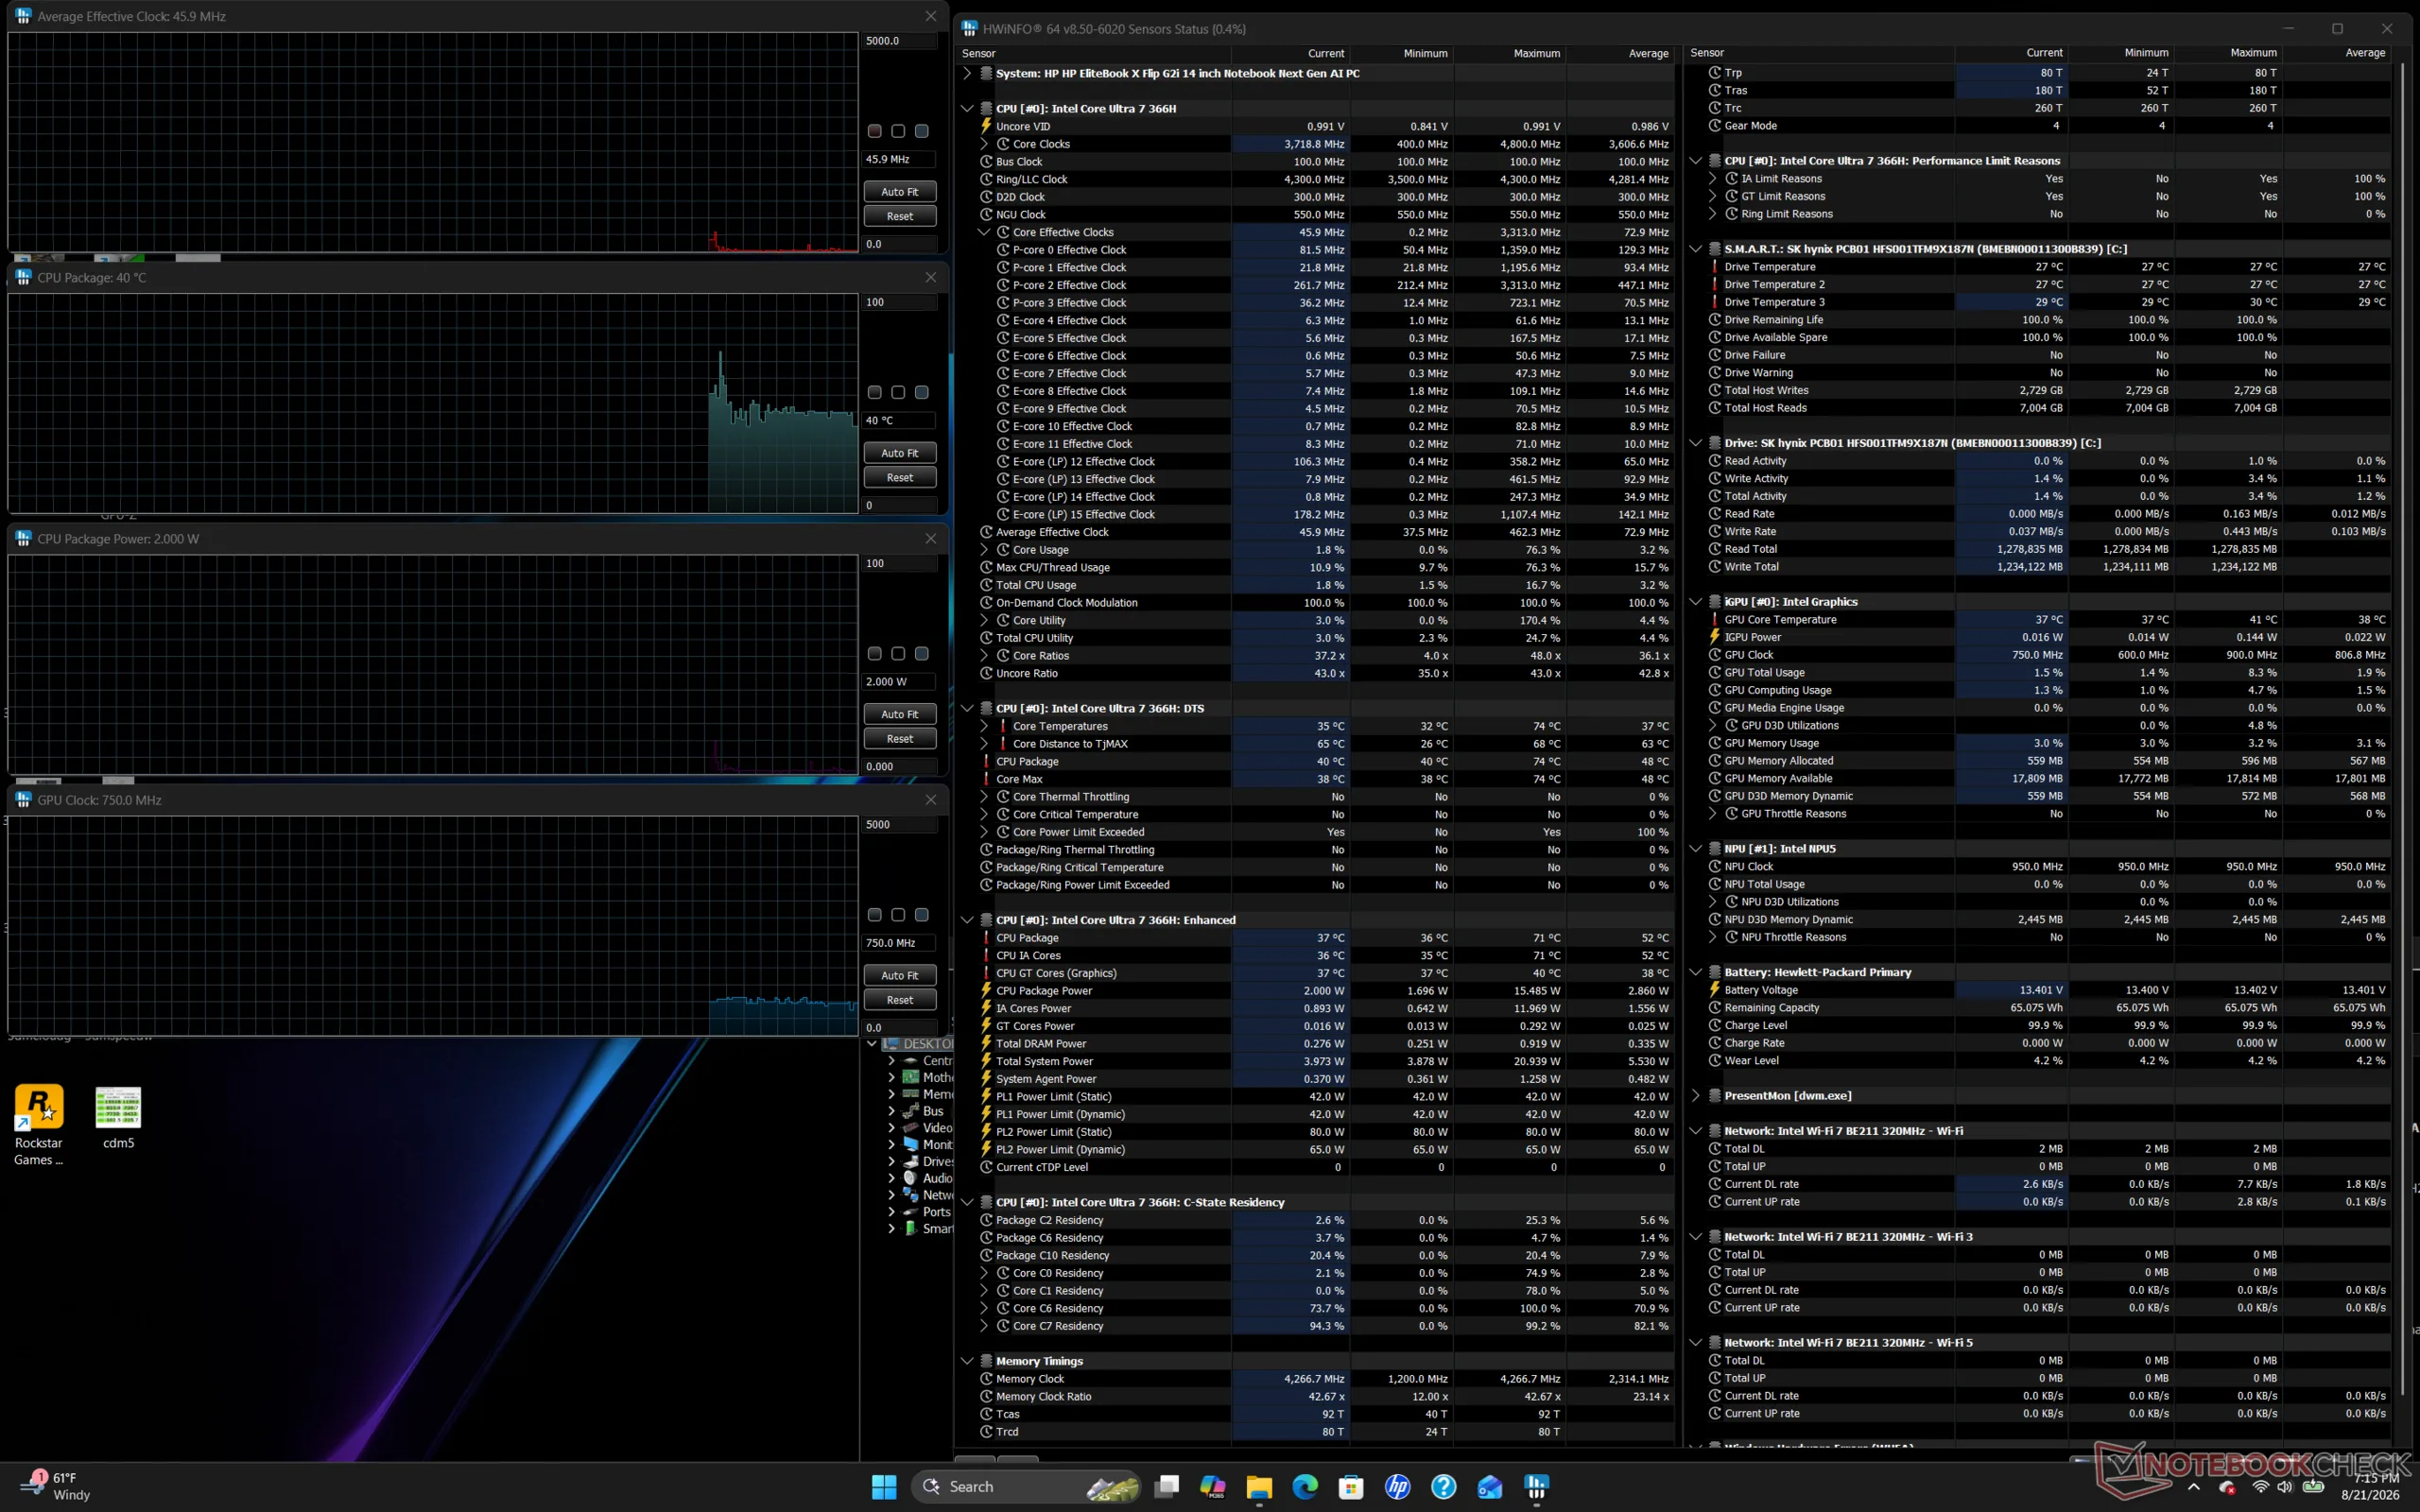
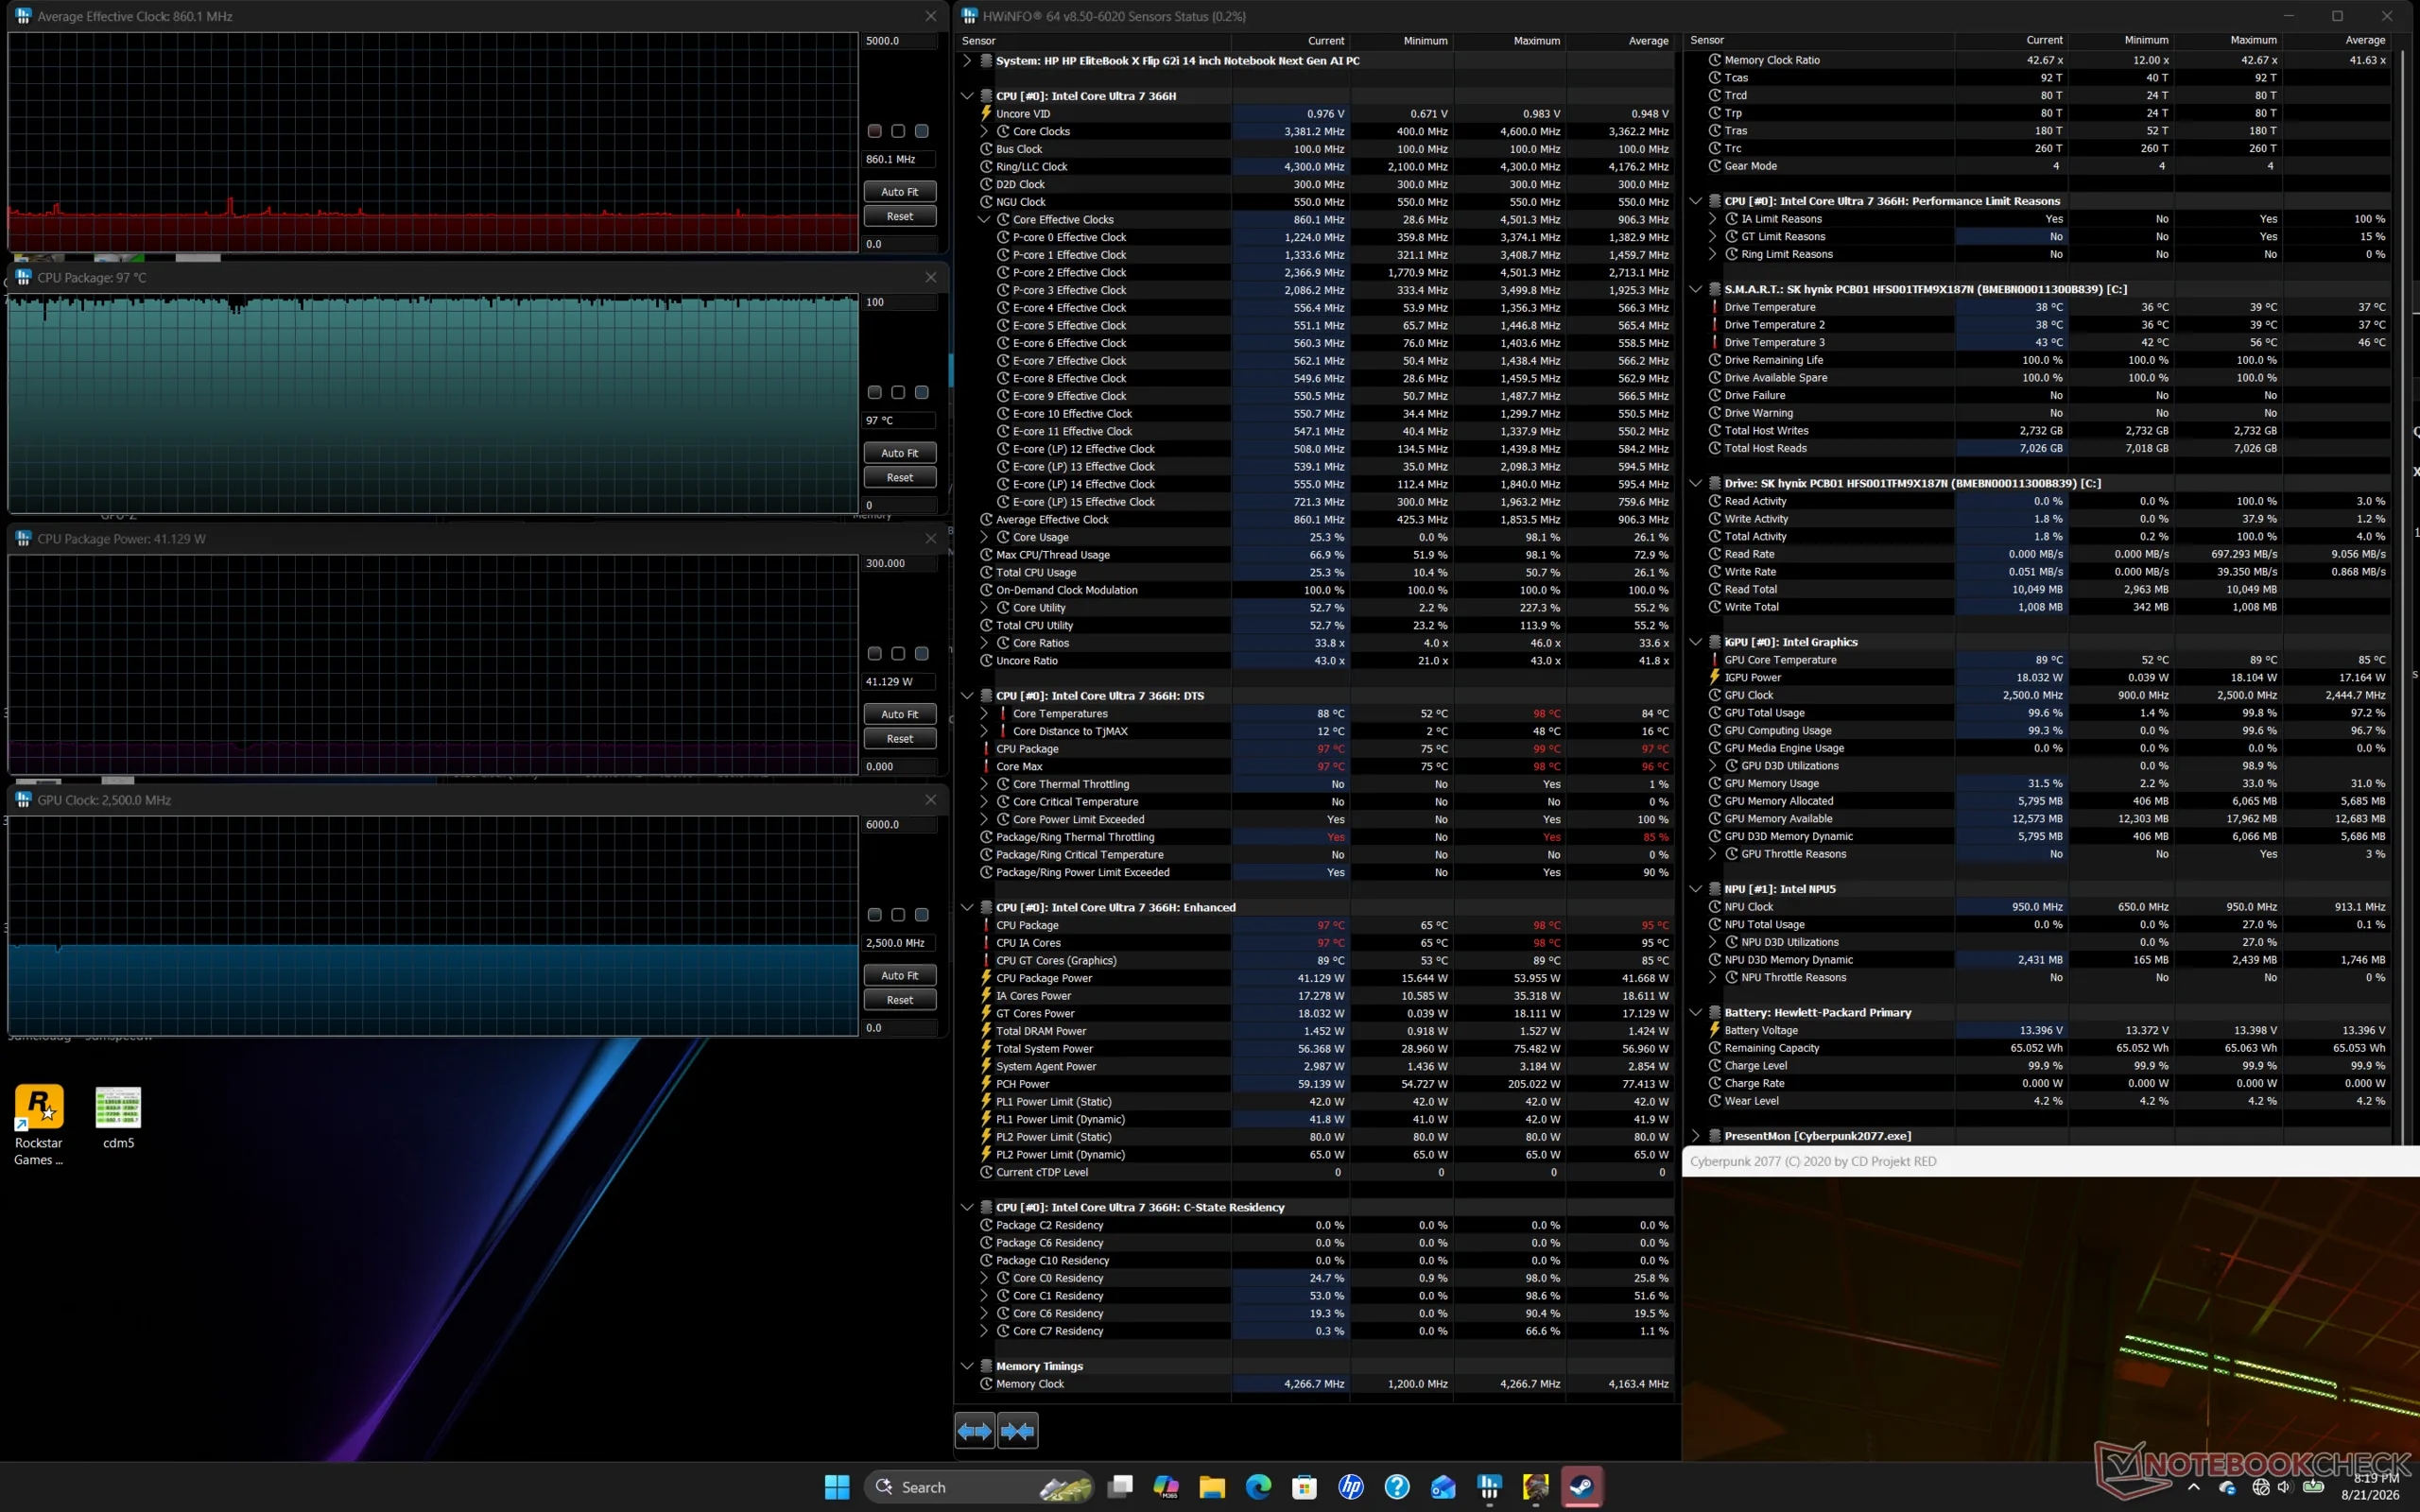
Bezczynność systemu
Bezczynność systemu
Obciążenie w grze Cyberpunk 2077
Test obciążeniowy Prime95
Testy obciążeniowe Prime95 i FurMark
Średnia częstotliwość taktowania procesora (GHz) Częstotliwość taktowania procesora graficznego (MHz) Średnia temperatura procesora (°C) System w stanie spoczynku
--
--
49
Obciążenie programem Prime95
2,3
--
82
Test obciążeniowy Prime95 + FurMark
1,6
1400
89
Test obciążeniowy Cyberpunk 2077
0,9
2500
97

Prelegenci

Szum różowy wskazuje na bardzo głośne głośniki o przyzwoitym odtwarzaniu basów, biorąc pod uwagę formę i rozmiar urządzenia typu convertible.
dB(A) 0102030405060708090Deep BassMiddle BassHigh BassLower RangeMidsHigher MidsLower HighsMid HighsUpper HighsSuper Highs2030.235.72521.724.43120.727.24018.8265020.129.86323.834.78019.344.310016.653.412518.959.816010.268.120010.773.425011.873.831513.276.840012.179.450010.274.663010.276.98009.477.110009.977.612509.976.616001076.7200010.280.2250010.575.9315011.275.4400011.873.7500011.974.3630012.172.5800012.773.61000013.171.91250013.470.21600013.871.9SPL23.388.2N0.583.8median 11.8median 74.6Delta1.82.726.325.821.422.12624.925.127.622.532.523.448.72655.818.860.922.167.2267019.372.317.674.217.774.319.575.31571.711.871.311.27410.574.21072.710.17210.67210.97511.374.811.671.71269.71269.612.371.112.669.61270.111.269.824.784.70.666.6median 12median 71.73.42.2hearing rangehide median Pink NoiseHP EliteBook X Flip G2i 14 AIApple MacBook Pro 16 2021 M1 Pro
Wykres częstotliwości (pola wyboru można zaznaczyć i odznaczyć, aby porównać urządzenia)
HP EliteBook X Flip G2i 14 AI analiza dźwięku

(+) | głośniki mogą odtwarzać stosunkowo głośno (88.2 dB)
Bas 100 - 315 Hz
(±) | zredukowany bas - średnio 7.8% niższy od mediany
(±) | liniowość basu jest średnia (8.6% delta do poprzedniej częstotliwości)
Średnie 400 - 2000 Hz
(+) | zbalansowane środki średnie - tylko 2.8% od mediany
(+) | średnie są liniowe (3% delta do poprzedniej częstotliwości)
Wysokie 2–16 kHz
(+) | zrównoważone maksima - tylko 1.3% od mediany
(+) | wzloty są liniowe (2.7% delta do poprzedniej częstotliwości)
Ogólnie 100 - 16.000 Hz
(+) | ogólny dźwięk jest liniowy (6.9% różnicy w stosunku do mediany)
W porównaniu do tej samej klasy
» 1% wszystkich testowanych urządzeń w tej klasie było lepszych, 1% podobnych, 98% gorszych
» Najlepszy miał deltę 6%, średnia wynosiła ###średnia###%, najgorsza wynosiła 57%
W porównaniu do wszystkich testowanych urządzeń
» 1% wszystkich testowanych urządzeń było lepszych, 0% podobnych, 99% gorszych
» Najlepszy miał deltę 4%, średnia wynosiła ###średnia###%, najgorsza wynosiła 136%

Apple MacBook Pro 16 2021 M1 Pro analiza dźwięku

(+) | głośniki mogą odtwarzać stosunkowo głośno (84.7 dB)
Bas 100 - 315 Hz
(+) | dobry bas - tylko 3.8% od mediany
(+) | bas jest liniowy (5.2% delta do poprzedniej częstotliwości)
Średnie 400 - 2000 Hz
(+) | zbalansowane środki średnie - tylko 1.3% od mediany
(+) | średnie są liniowe (2.1% delta do poprzedniej częstotliwości)
Wysokie 2–16 kHz
(+) | zrównoważone maksima - tylko 1.9% od mediany
(+) | wzloty są liniowe (2.7% delta do poprzedniej częstotliwości)
Ogólnie 100 - 16.000 Hz
(+) | ogólny dźwięk jest liniowy (4.6% różnicy w stosunku do mediany)
W porównaniu do tej samej klasy
» 0% wszystkich testowanych urządzeń w tej klasie było lepszych, 0% podobnych, 100% gorszych
» Najlepszy miał deltę 5%, średnia wynosiła ###średnia###%, najgorsza wynosiła 45%
W porównaniu do wszystkich testowanych urządzeń
» 0% wszystkich testowanych urządzeń było lepszych, 0% podobnych, 100% gorszych
» Najlepszy miał deltę 4%, średnia wynosiła ###średnia###%, najgorsza wynosiła 136%

Zarządzanie energią

Pobór mocy
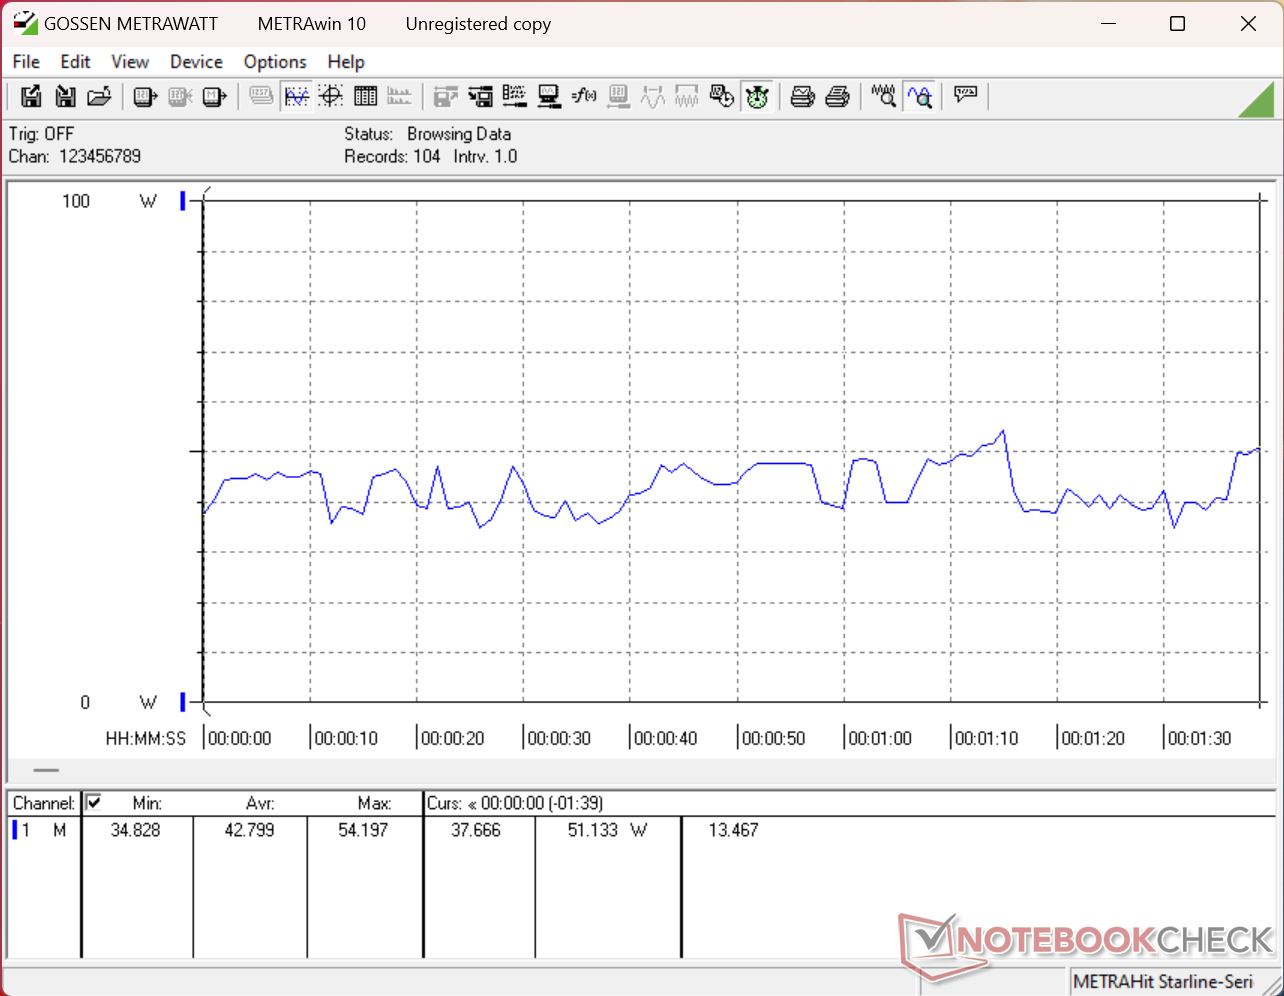
Zużycie energii w programie 3DMark 06
Zużycie zasobów w grze Cyberpunk 2077 w rozdzielczości 1080p w trybie Ultra
Test obciążeniowy Prime95+FurMark rozpoczął się po upływie 10 sekund. System jest dostarczany wraz z uniwersalną zasilaczem USB-C o mocy 100 W.
Zużycie energii wzrastało do 95 W po uruchomieniu testu obciążeniowego Prime95, po czym spadało i stabilizowało się na poziomie 65 W 20 sekund później
Pobór mocy
wyłączony / stan wstrzymaniadarklight 0.3 / 0.68 W
luzdarkmidlight 2.9 / 3.8 / 11.9 W
obciążenie midlight 42.8 / 97.4 W
 color bar
Legenda: min: dark, med: mid, max: light        Metrahit Energy
HP EliteBook X Flip G2i 14 AI
Ultra 7 366H, Intel Graphics 4 Xe3 PTL, , OLED, 2880x1800, 14"
HP EliteBook X Flip G1i 14 AI
Core Ultra 7 258V, Arc 140V, Western Digital PC SN5000S SDEPNSJ-1T00-1006, IPS, 1920x1200, 14"
HP EliteBook x360 1040 G11
Ultra 7 165H, Arc 8-Core, Kioxia XG8 KXG80ZNV512G, IPS, 1920x1200, 14"
MSI Prestige 14 Flip AI+ 2026
Ultra X7 358H, Arc B390 Panther Lake iGPU, Phison 1 TB ESR01TBTCCZ-27J, OLED, 1920x1200, 14"
Lenovo Yoga 7 2-in-1 14AKP10
Ryzen AI 5 340, Radeon 840M, WD PC SN7100S SDFPMSL-512G-1101, OLED, 1920x1200, 14"
Dell Latitude 9450 2-in-1
Ultra 7 165U, Graphics 4-Core iGPU (Arrow Lake), , IPS, 2560x1600, 14"
Power Consumption
2%
19%
11%
0%
-14%
Idle Minimum * (Watt)
2.9
2.9
-0%
1.8
38%
2.8
3%
4
-38%
3.2
-10%
Idle Average * (Watt)
3.8
8.2
-116%
4.4
-16%
4.2
-11%
5
-32%
6.4
-68%
Idle Maximum * (Watt)
11.9
8.6
28%
4.5
62%
4.5
62%
7
41%
10.8
9%
Load Average * (Watt)
42.8
39.6
7%
40.7
5%
48.9
-14%
52
-21%
54.6
-28%
Cyberpunk 2077 ultra * (Watt)
59.6
41.9
30%
56.5
5%
59.9
-1%
54.8
8%
Cyberpunk 2077 ultra external monitor * (Watt)
59.6
36.4
39%
54.6
8%
58.6
2%
52.6
12%
Load Maximum * (Watt)
97.4
70
28%
66
32%
64
34%
68
30%
70.2
28%
Witcher 3 ultra * (Watt)
35.5

* ... im mniej tym lepiej

Zużycie energii w grze Cyberpunk / Test obciążeniowy

05101520253035404550556065707580859095Tooltip
HP EliteBook X Flip G2i 14 AI Ultra 7 366H, Intel Graphics 4 Xe3 PTL; 1280x720 Prime95 28.10 and Furmark 1.25: Ø70.5 (63.9-97.3) Watt
MSI Prestige 14 Flip AI+ 2026 Ultra X7 358H, Arc B390 Panther Lake iGPU; 1280x720 Prime95 28.10 and Furmark 1.25: Ø59.4 (54-64) Watt
HP EliteBook X Flip G2i 14 AI Ultra 7 366H, Intel Graphics 4 Xe3 PTL; Idle 150cd/m2: Ø3.19 (2.31-6.04) Watt
MSI Prestige 14 Flip AI+ 2026 Ultra X7 358H, Arc B390 Panther Lake iGPU; Idle 150cd/m2: Ø3.81 (3.26-5.58) Watt
HP EliteBook X Flip G2i 14 AI Ultra 7 366H, Intel Graphics 4 Xe3 PTL; Cyberpunk 2077 FHD ultra no FSR 150cd: Ø59.6 (57.2-64.2) Watt
MSI Prestige 14 Flip AI+ 2026 Ultra X7 358H, Arc B390 Panther Lake iGPU; Cyberpunk 2077 FHD ultra no FSR 150cd: Ø59.9 (58.3-63.4) Watt

Pobór mocy przez monitor zewnętrzny

051015202530354045505560657075808590Tooltip
HP EliteBook X Flip G2i 14 AI Ultra 7 366H, Intel Graphics 4 Xe3 PTL; Prime95 V2810 Stress (external Monitor): Ø69.2 (62.6-94.9) Watt
HP EliteBook X Flip G1i 14 AI Core Ultra 7 258V, Arc 140V; Prime95 V2810 Stress (external Monitor): Ø41.3 (34.464-51.439) Watt
HP EliteBook X Flip G1i 14 AI Core Ultra 7 258V, Arc 140V; Cinebench R15 Multi (external Monitor): Ø48.8 (48.219-49.408) Watt
HP EliteBook X Flip G2i 14 AI Ultra 7 366H, Intel Graphics 4 Xe3 PTL; Cinebench R23 Multi (external Monitor): Ø74.3 (59.7-89.3) Watt
HP EliteBook X Flip G1i 14 AI Core Ultra 7 258V, Arc 140V; Cinebench R23 Multi (external Monitor): Ø39.6 (34.005-50.067) Watt
HP EliteBook X Flip G2i 14 AI Ultra 7 366H, Intel Graphics 4 Xe3 PTL; 1280x720 FurMark 1.19 GPU Stress Test (external Monitor): Ø51.8 (46.8-58.3) Watt
HP EliteBook X Flip G1i 14 AI Core Ultra 7 258V, Arc 140V; 1280x720 FurMark 1.19 GPU Stress Test (external Monitor): Ø33.8 (32.479-51.267) Watt
HP EliteBook X Flip G2i 14 AI Ultra 7 366H, Intel Graphics 4 Xe3 PTL; Idle 1min (external Monitor): Ø3.12 (2.34-4) Watt
HP EliteBook X Flip G1i 14 AI Core Ultra 7 258V, Arc 140V; Idle 1min (external Monitor): Ø4.28 (4.0247-5.1597) Watt
HP EliteBook X Flip G2i 14 AI Ultra 7 366H, Intel Graphics 4 Xe3 PTL; Cyberpunk 2077 FHD ultra no FSR (external Monitor): Ø59.6 (57.9-70.5) Watt
HP EliteBook X Flip G1i 14 AI Core Ultra 7 258V, Arc 140V; Cyberpunk 2077 FHD ultra no FSR (external Monitor): Ø36.4 (35.372-37.692) Watt

Żywotność baterii

Wydajność akumulatora
WiFi Websurfing
15h 14min
HP EliteBook X Flip G2i 14 AI
Ultra 7 366H, Intel Graphics 4 Xe3 PTL, 68 Wh
HP EliteBook X Flip G1i 14 AI
Core Ultra 7 258V, Arc 140V, 68 Wh
HP EliteBook x360 1040 G11
Ultra 7 165H, Arc 8-Core, 68 Wh
MSI Prestige 14 Flip AI+ 2026
Ultra X7 358H, Arc B390 Panther Lake iGPU, 81 Wh
Lenovo Yoga 7 2-in-1 14AKP10
Ryzen AI 5 340, Radeon 840M, 70 Wh
Dell Latitude 9450 2-in-1
Ultra 7 165U, Graphics 4-Core iGPU (Arrow Lake), 60 Wh
Czasy pracy
21%
7%
29%
-25%
-11%
WiFi v1.3 (h)
15.2
18.4
21%
16.2
7%
19.6
29%
11.4
-25%
13.6
-11%
H.264 (h)
20.6
Load (h)
2.1
1.7
2.4
Reader / Idle (h)
55.9
21.7

Ocena serwisu Notebookcheck

Urządzenie to stanowi ulepszenie w stosunku do oryginalnego modelu EliteBook X Flip G1i 14 niemal pod każdym względem – od wydajności, przez wagę, aż po estetykę – jednak matowy wyświetlacz o ziarnistej powierzchni może niektórym przeszkadzać.

HP EliteBook X Flip G2i 14 AI - 26/08/2026 v8
Allen Ngo

Wykonanie
91 / 98 → 93%
Klawiatura
90%
Myszka
90%
Komunikacja
75 / 74 → 100%
Waga
71 / 20-75 → 93%
Akumulator
90%
Wyświetlacz
92%
Wydajność w grach
52 / 65 → 79%
Wydajność w programach użytkowych
89 / 92 → 97%
AI Performance
90%
Temperatura
90%
Hałas
83%
Głośniki
87 / 91 → 95%
Kamerka
51 / 75 → 67%
Średnio
72%
91%
Convertible - Ważona średnia
CO2 Emissions
No Data
Materials
50%
Packaging
100%
Power Use
86.6%
Repairability
50%
Software Updates
33.3%
Recycle Logo Total Sustainability Score: 53.3%

Porównanie potencjalnych konkurentów

Obraz
Model / recenzja
Cena
Waga
Wysokość
Ekran
1.
90.7%
HP EliteBook X Flip G2i 14 AI
Intel Core Ultra 7 366H ⎘
Intel Graphics 4 Xe3 Panther Lake iGPU ⎘
32 GB Pamięć
Amazon: Cena katalogowa: 3500 USD1.3 kg17.2 mm14.00"
2880x1800
243 PPI
OLED
2.
89.9%
HP EliteBook X Flip G1i 14 AI
Intel Core Ultra 7 258V ⎘
Intel Arc Graphics 140V ⎘
32 GB Pamięć, 1000 GB SSD
Amazon: Cena katalogowa: 2889 Euro1.5 kg14.7 mm14.00"
1920x1200
162 PPI
IPS
3.
87.2%
HP EliteBook x360 1040 G11
Intel Core Ultra 7 165H ⎘
Intel Arc 8-Core iGPU ⎘
16 GB Pamięć, 512 GB SSD
Amazon: Cena katalogowa: 2800 USD1.5 kg14.7 mm14.00"
1920x1200
162 PPI
IPS
4.
84.2%
MSI Prestige 14 Flip AI+ 2026
Intel Core Ultra X7 358H ⎘
Intel Arc B390 12 Xe3 Panther Lake iGPU ⎘
32 GB Pamięć, 1000 GB SSD
Amazon:
1. $1,999.00
msi Prestige 16 Flip AI+ 16"...
2. $2,399.00
EXCaliberPC [2026] MSI Prest...
3. $2,399.00
MSI Prestige 14 Flip AI+ Pre...
Cena katalogowa: 1549€
1.4 kg13.9 mm14.00"
1920x1200
162 PPI
OLED
5.
84.8%
Lenovo Yoga 7 2-in-1 14AKP10
AMD Ryzen AI 5 340 ⎘
AMD Radeon 840M ⎘
16 GB Pamięć, 512 GB SSD
Amazon: Cena katalogowa: 1000 EUR1.4 kg16.5 mm14.00"
1920x1200
162 PPI
OLED
6.
88.3% v7 (old)
Dell Latitude 9450 2-in-1
Intel Core Ultra 7 165U ⎘
Intel Graphics 4-Core iGPU (Meteor / Arrow Lake) ⎘
32 GB Pamięć
Amazon:
Cena katalogowa: 3000 USD
1.6 kg16.28 mm14.00"
2560x1600
216 PPI
IPS

Przezroczystość

Wyboru urządzeń do recenzji dokonuje nasza redakcja. Próbka testowa została udostępniona autorowi jako pożyczka od producenta lub sprzedawcy detalicznego na potrzeby tej recenzji. Pożyczkodawca nie miał wpływu na tę recenzję, producent nie otrzymał też kopii tej recenzji przed publikacją. Nie było obowiązku publikowania tej recenzji. Jako niezależna firma medialna, Notebookcheck nie podlega władzy producentów, sprzedawców detalicznych ani wydawców.

Tak testuje Notebookcheck

Każdego roku Notebookcheck niezależnie sprawdza setki laptopów i smartfonów, stosując standardowe procedury, aby zapewnić porównywalność wszystkich wyników. Od około 20 lat stale rozwijamy nasze metody badawcze, ustanawiając przy tym standardy branżowe. W naszych laboratoriach testowych doświadczeni technicy i redaktorzy korzystają z wysokiej jakości sprzętu pomiarowego. Testy te obejmują wieloetapowy proces walidacji. Nasz kompleksowy system ocen opiera się na setkach uzasadnionych pomiarów i benchmarków, co pozwala zachować obiektywizm.
Google LogoAdd as a preferred source on Google
Mail Logo
> laptopy testy i recenzje notebooki > Laptopy > Recenzja EliteBook X Flip G2i 14 AI: Najmocniejszy jak dotąd konwertowalny laptop firmy HP jest jednocześnie jednym z najdroższych
Allen Ngo, 2026-08-27 (Update: 2026-08-27)