Recenzja laptopa MSI Prestige 13 AI Evo - Core Ultra 7 i OLED o wadze poniżej 1 kg
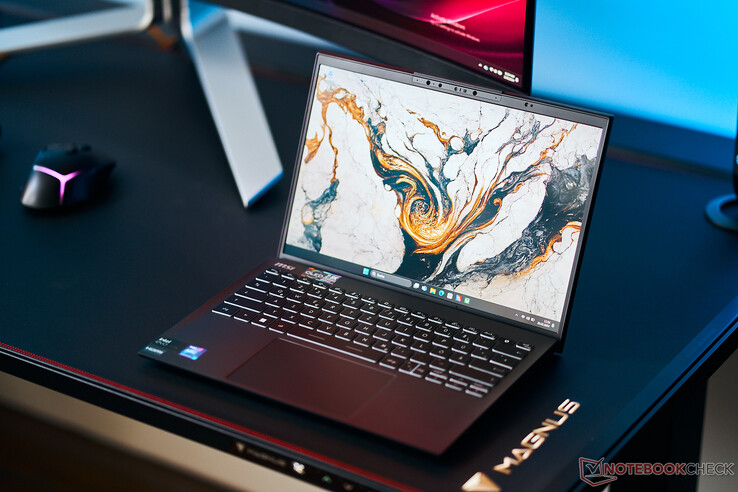
MSI Prestige 13 AI Evo to kompaktowy subnotebook ważący mniej niż 1 kilogram. Nowy model 2024 otrzymał procesor Meteor Lake od Intela, a także moduł Wi-Fi 7. Nasze urządzenie testowe to wariant z procesorem Core Ultra 7 155H, układem graficznym Intel Arc Graphics, 32 GB pamięci RAM, dyskiem SSD 1 TB i wyświetlaczem OLED 2,8K za około 1300 USD.
Potencjalni konkurenci w porównaniu
Ocena | Data | Model | Waga | Wysokość | Rozmiar | Rezolucja | Cena |
|---|---|---|---|---|---|---|---|
| 86.6 % v7 (old) | 03/2024 | MSI Prestige 13 AI Evo Ultra 7 155H, Arc 8-Core | 967 g | 16.9 mm | 13.30" | 2880x1800 | |
| 89.5 % v7 (old) | 08/2023 | Lenovo ThinkPad X1 Nano Gen 3 i7-1360P, Iris Xe G7 96EUs | 989 g | 14.8 mm | 13.00" | 2160x1350 | |
| 90.2 % v7 (old) | 10/2023 | Dell Latitude 13 7340 i5-1345U i5-1345U, Iris Xe G7 80EUs | 1.1 kg | 18.2 mm | 13.30" | 1920x1200 | |
| 91.9 % v7 (old) | 07/2023 | HP Dragonfly G4 i7-1365U, Iris Xe G7 96EUs | 1.1 kg | 16.3 mm | 13.50" | 1920x1280 | |
| 85.4 % v7 (old) | 05/2023 | Asus ZenBook S13 OLED UX5304 i7-1355U, Iris Xe G7 96EUs | 1 kg | 11.8 mm | 13.30" | 2880x1800 |
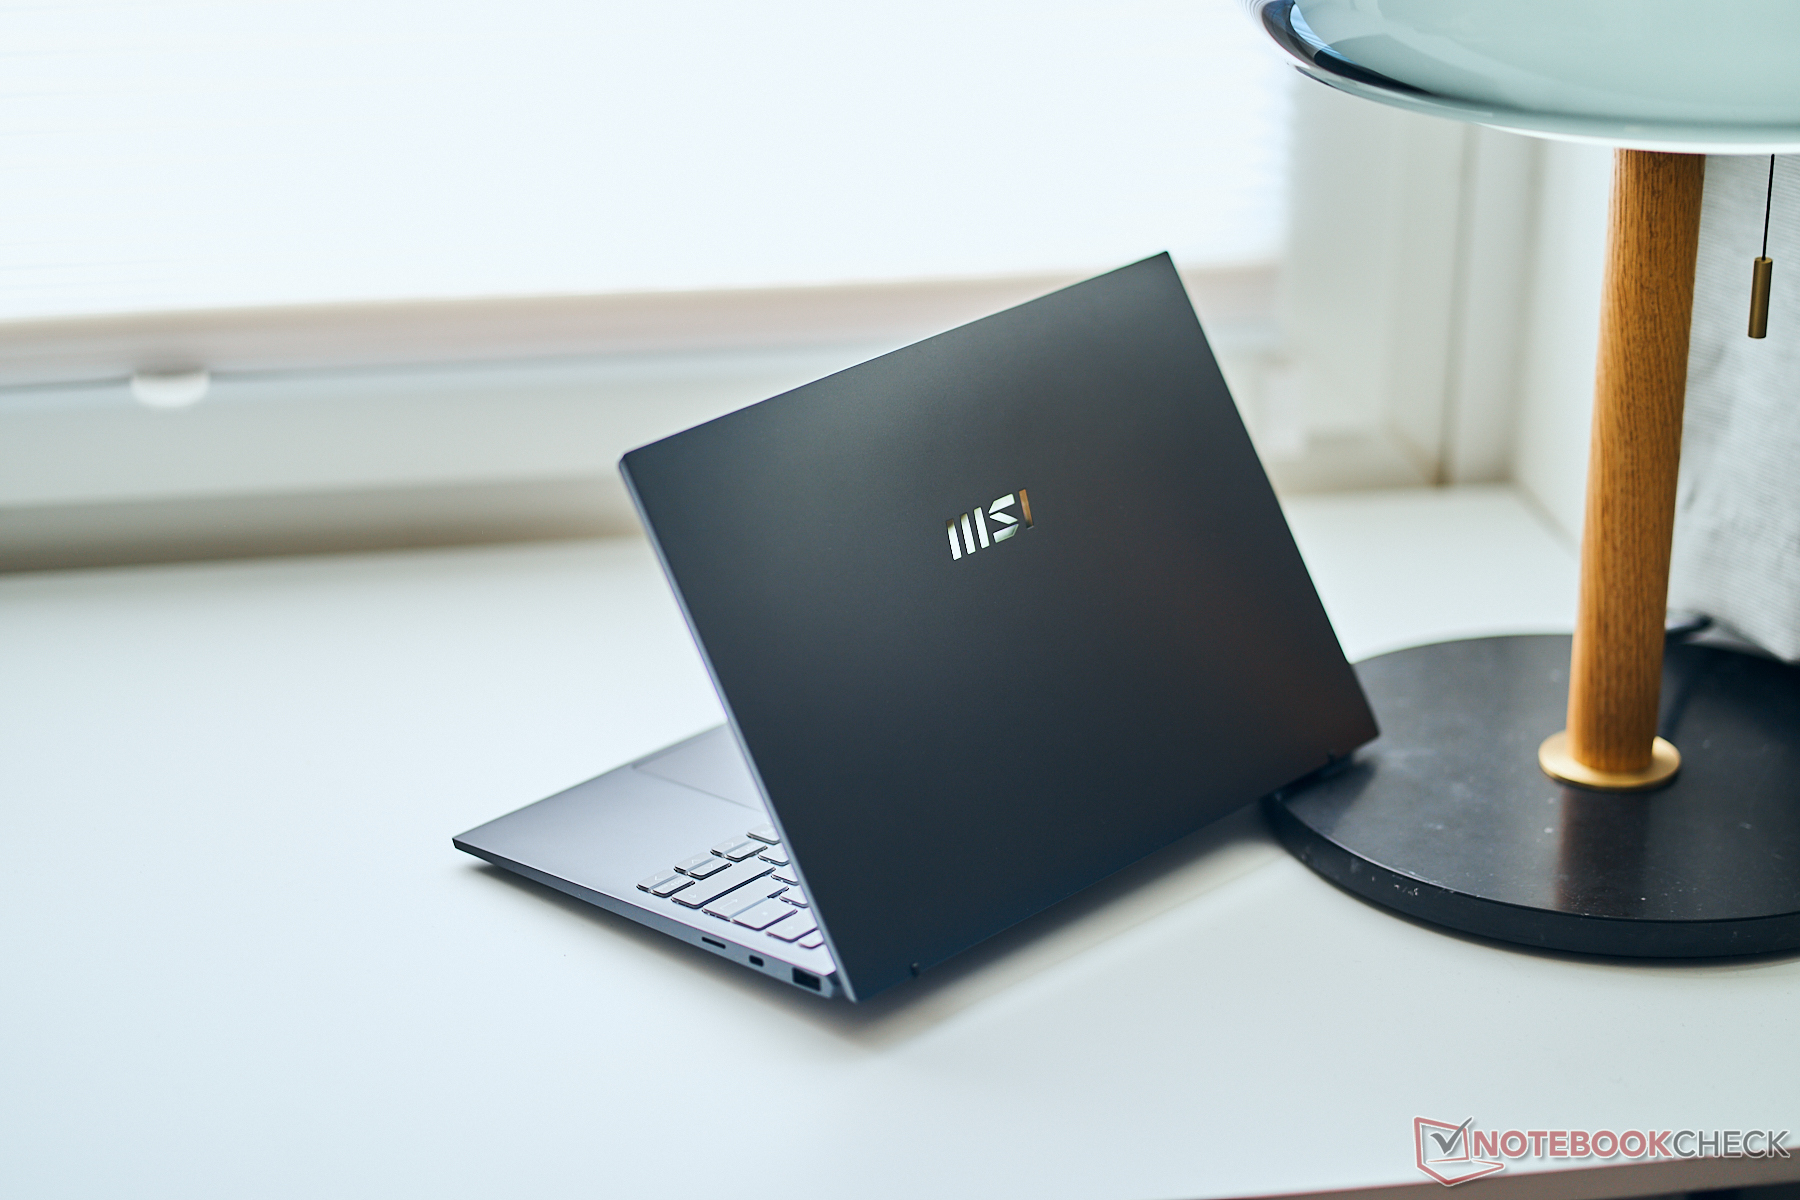
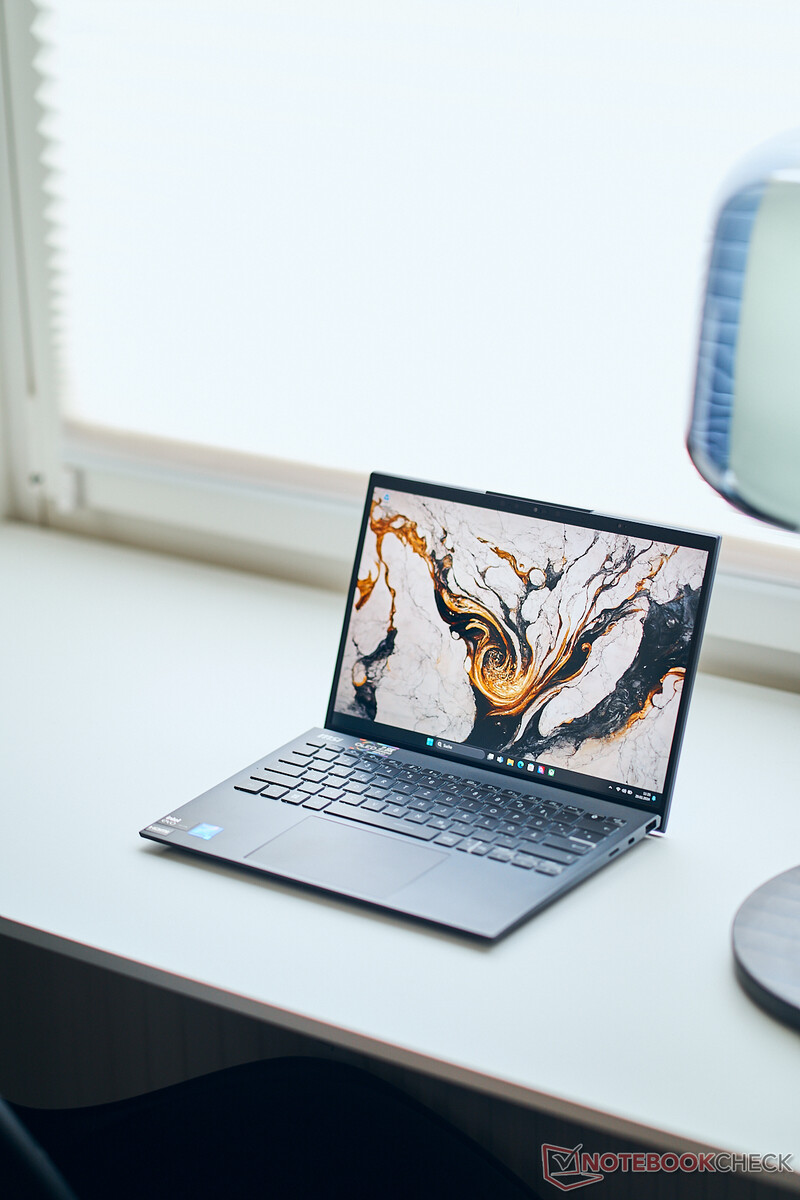
Obudowa - Prestige 13 z obudową ze stopu magnezu
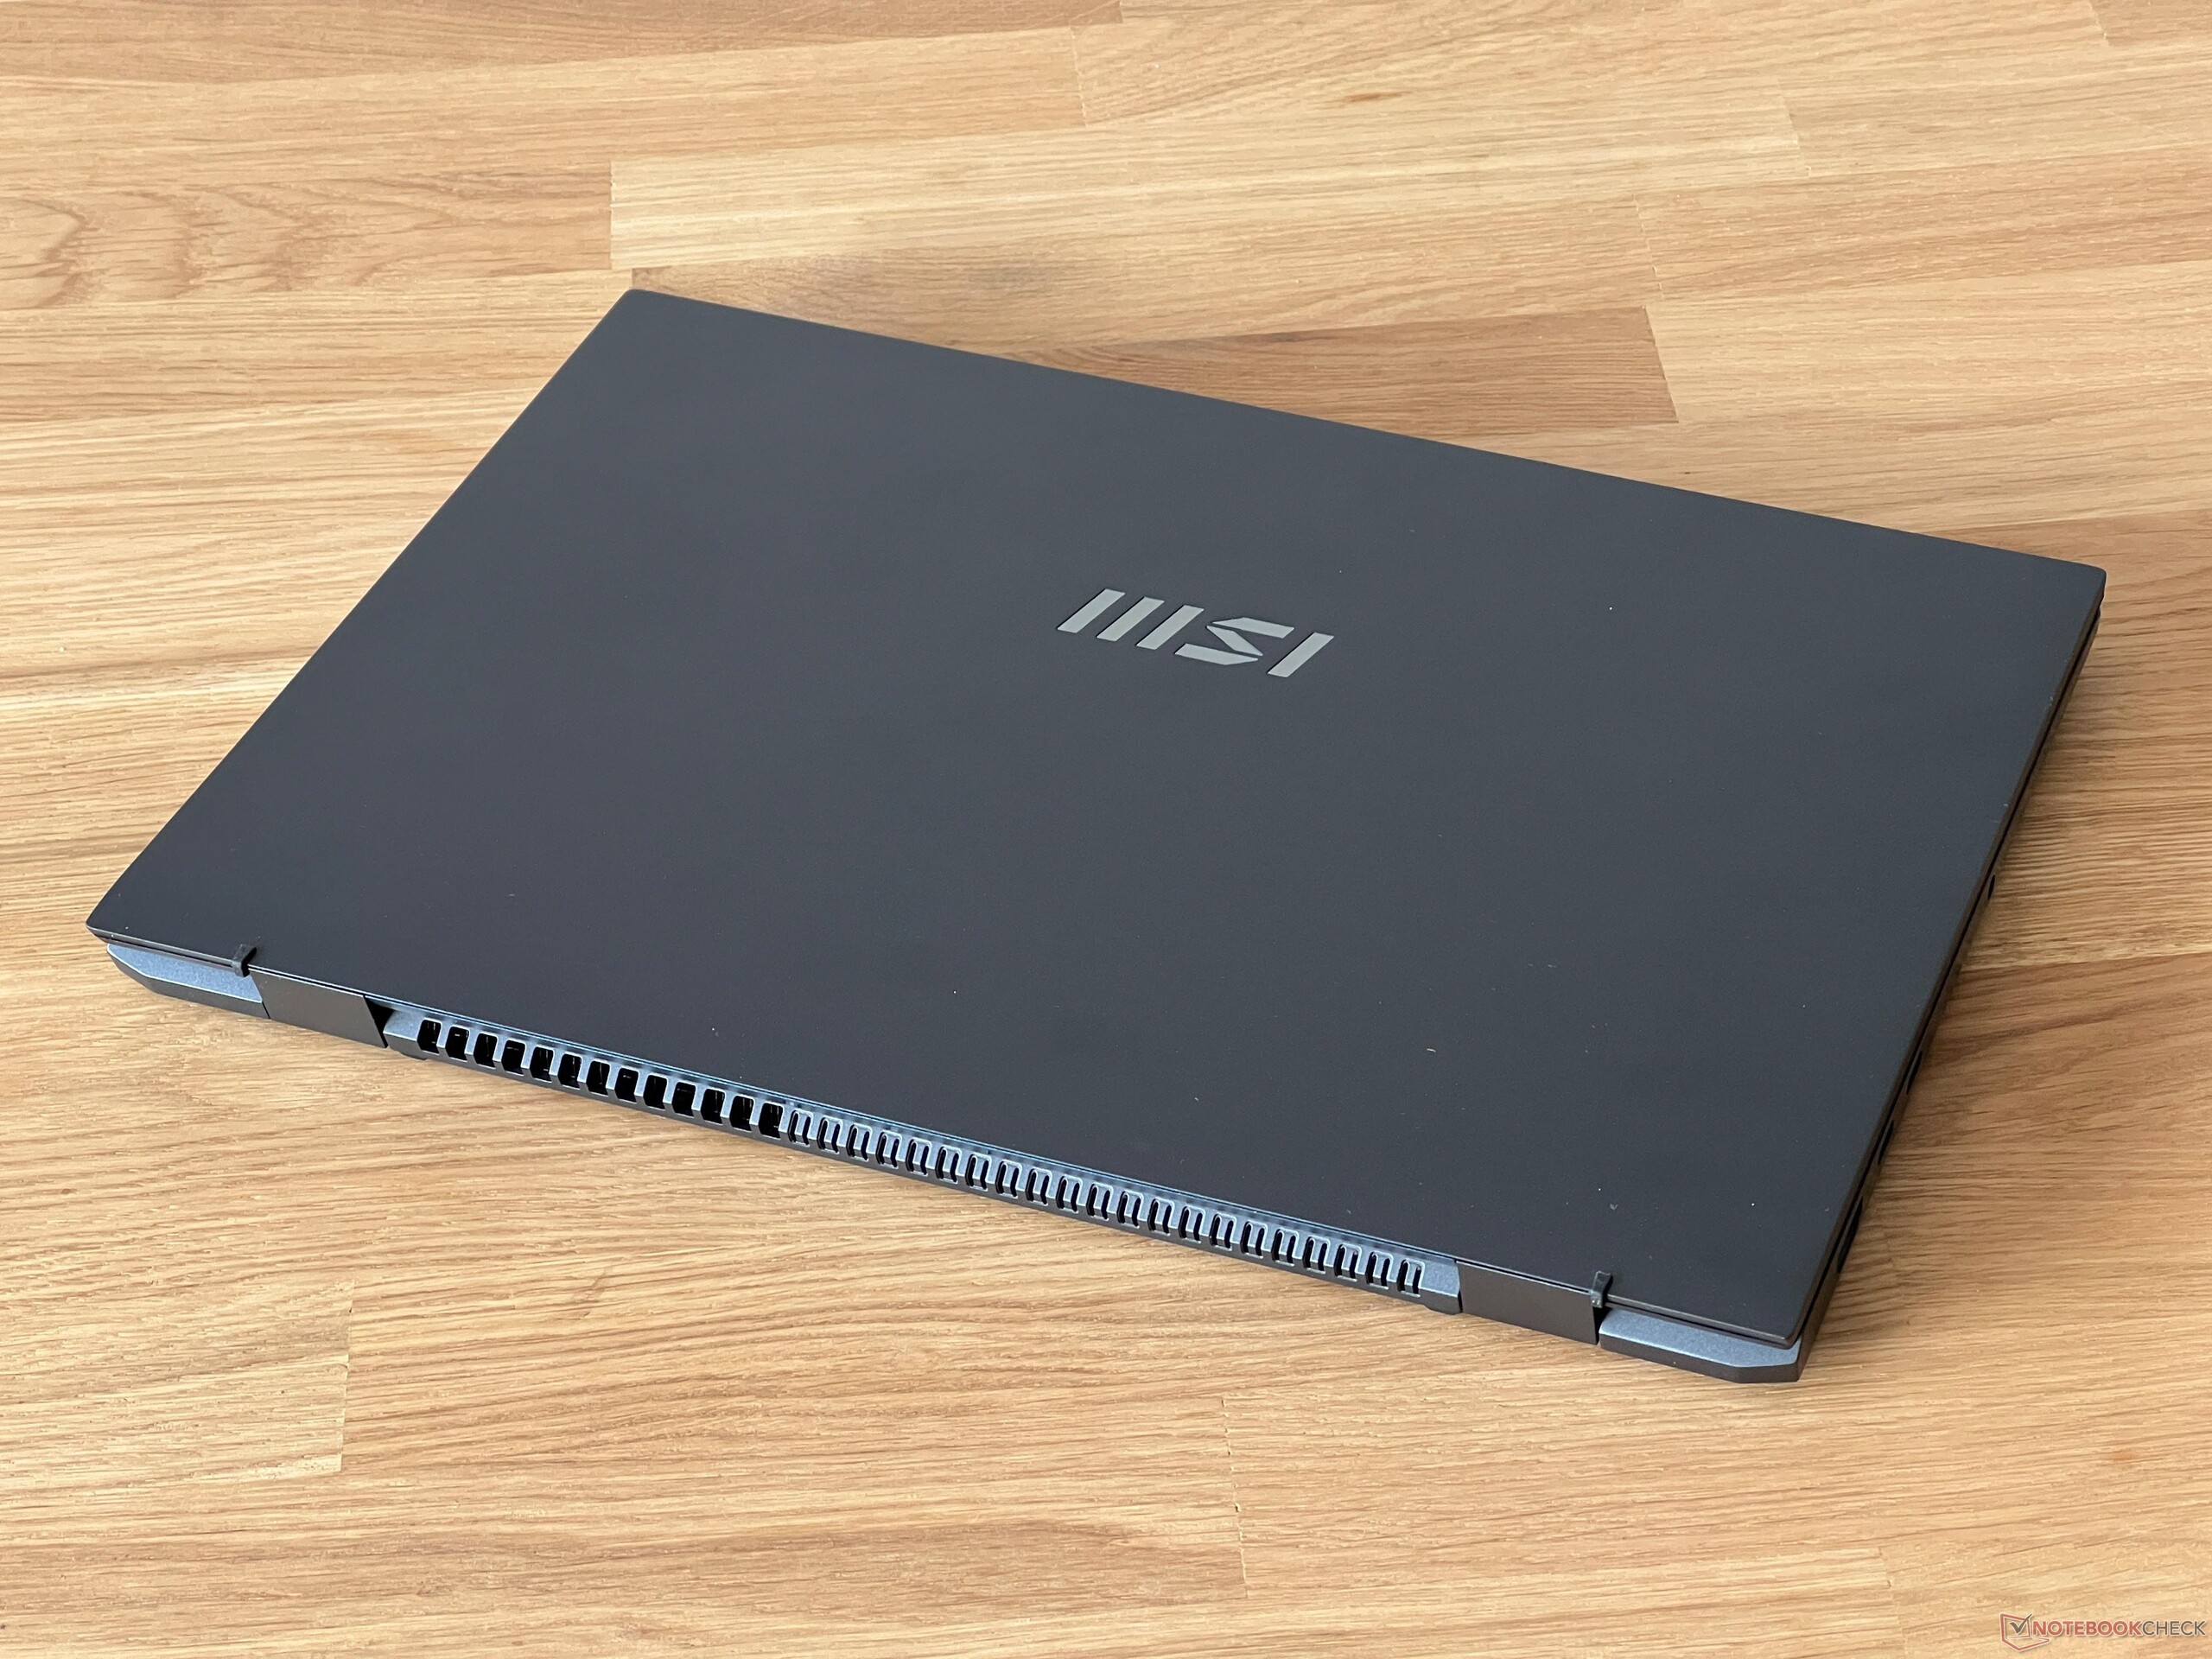
MSI oferuje Prestige 13 w kolorze ciemnoszarym (Stellar Gray) - takim samym jak nasze urządzenie testowe - lub alternatywnie w kolorze białym (Pure White). Obie wersje wykorzystują stop magnezu i aluminium, co prawdopodobnie przyczynia się również do niskiej wagi urządzenia wynoszącej 976 gramów. Przy pierwszym kontakcie z laptopem jesteśmy natychmiast zaskoczeni jego lekkością. Jego powierzchnie są wysokiej jakości i nawet w ciemnym modelu ślady odcisków palców nie wydają się być zbyt dużym problemem. Poza logo MSI, Prestige 13 nie posiada żadnych dodatkowych elementów stylistycznych. Ramki są dość wąskie po obu stronach, ale ramka wzdłuż górnej krawędzi jest dość szeroka ze względu na zainstalowaną kamerę internetową.
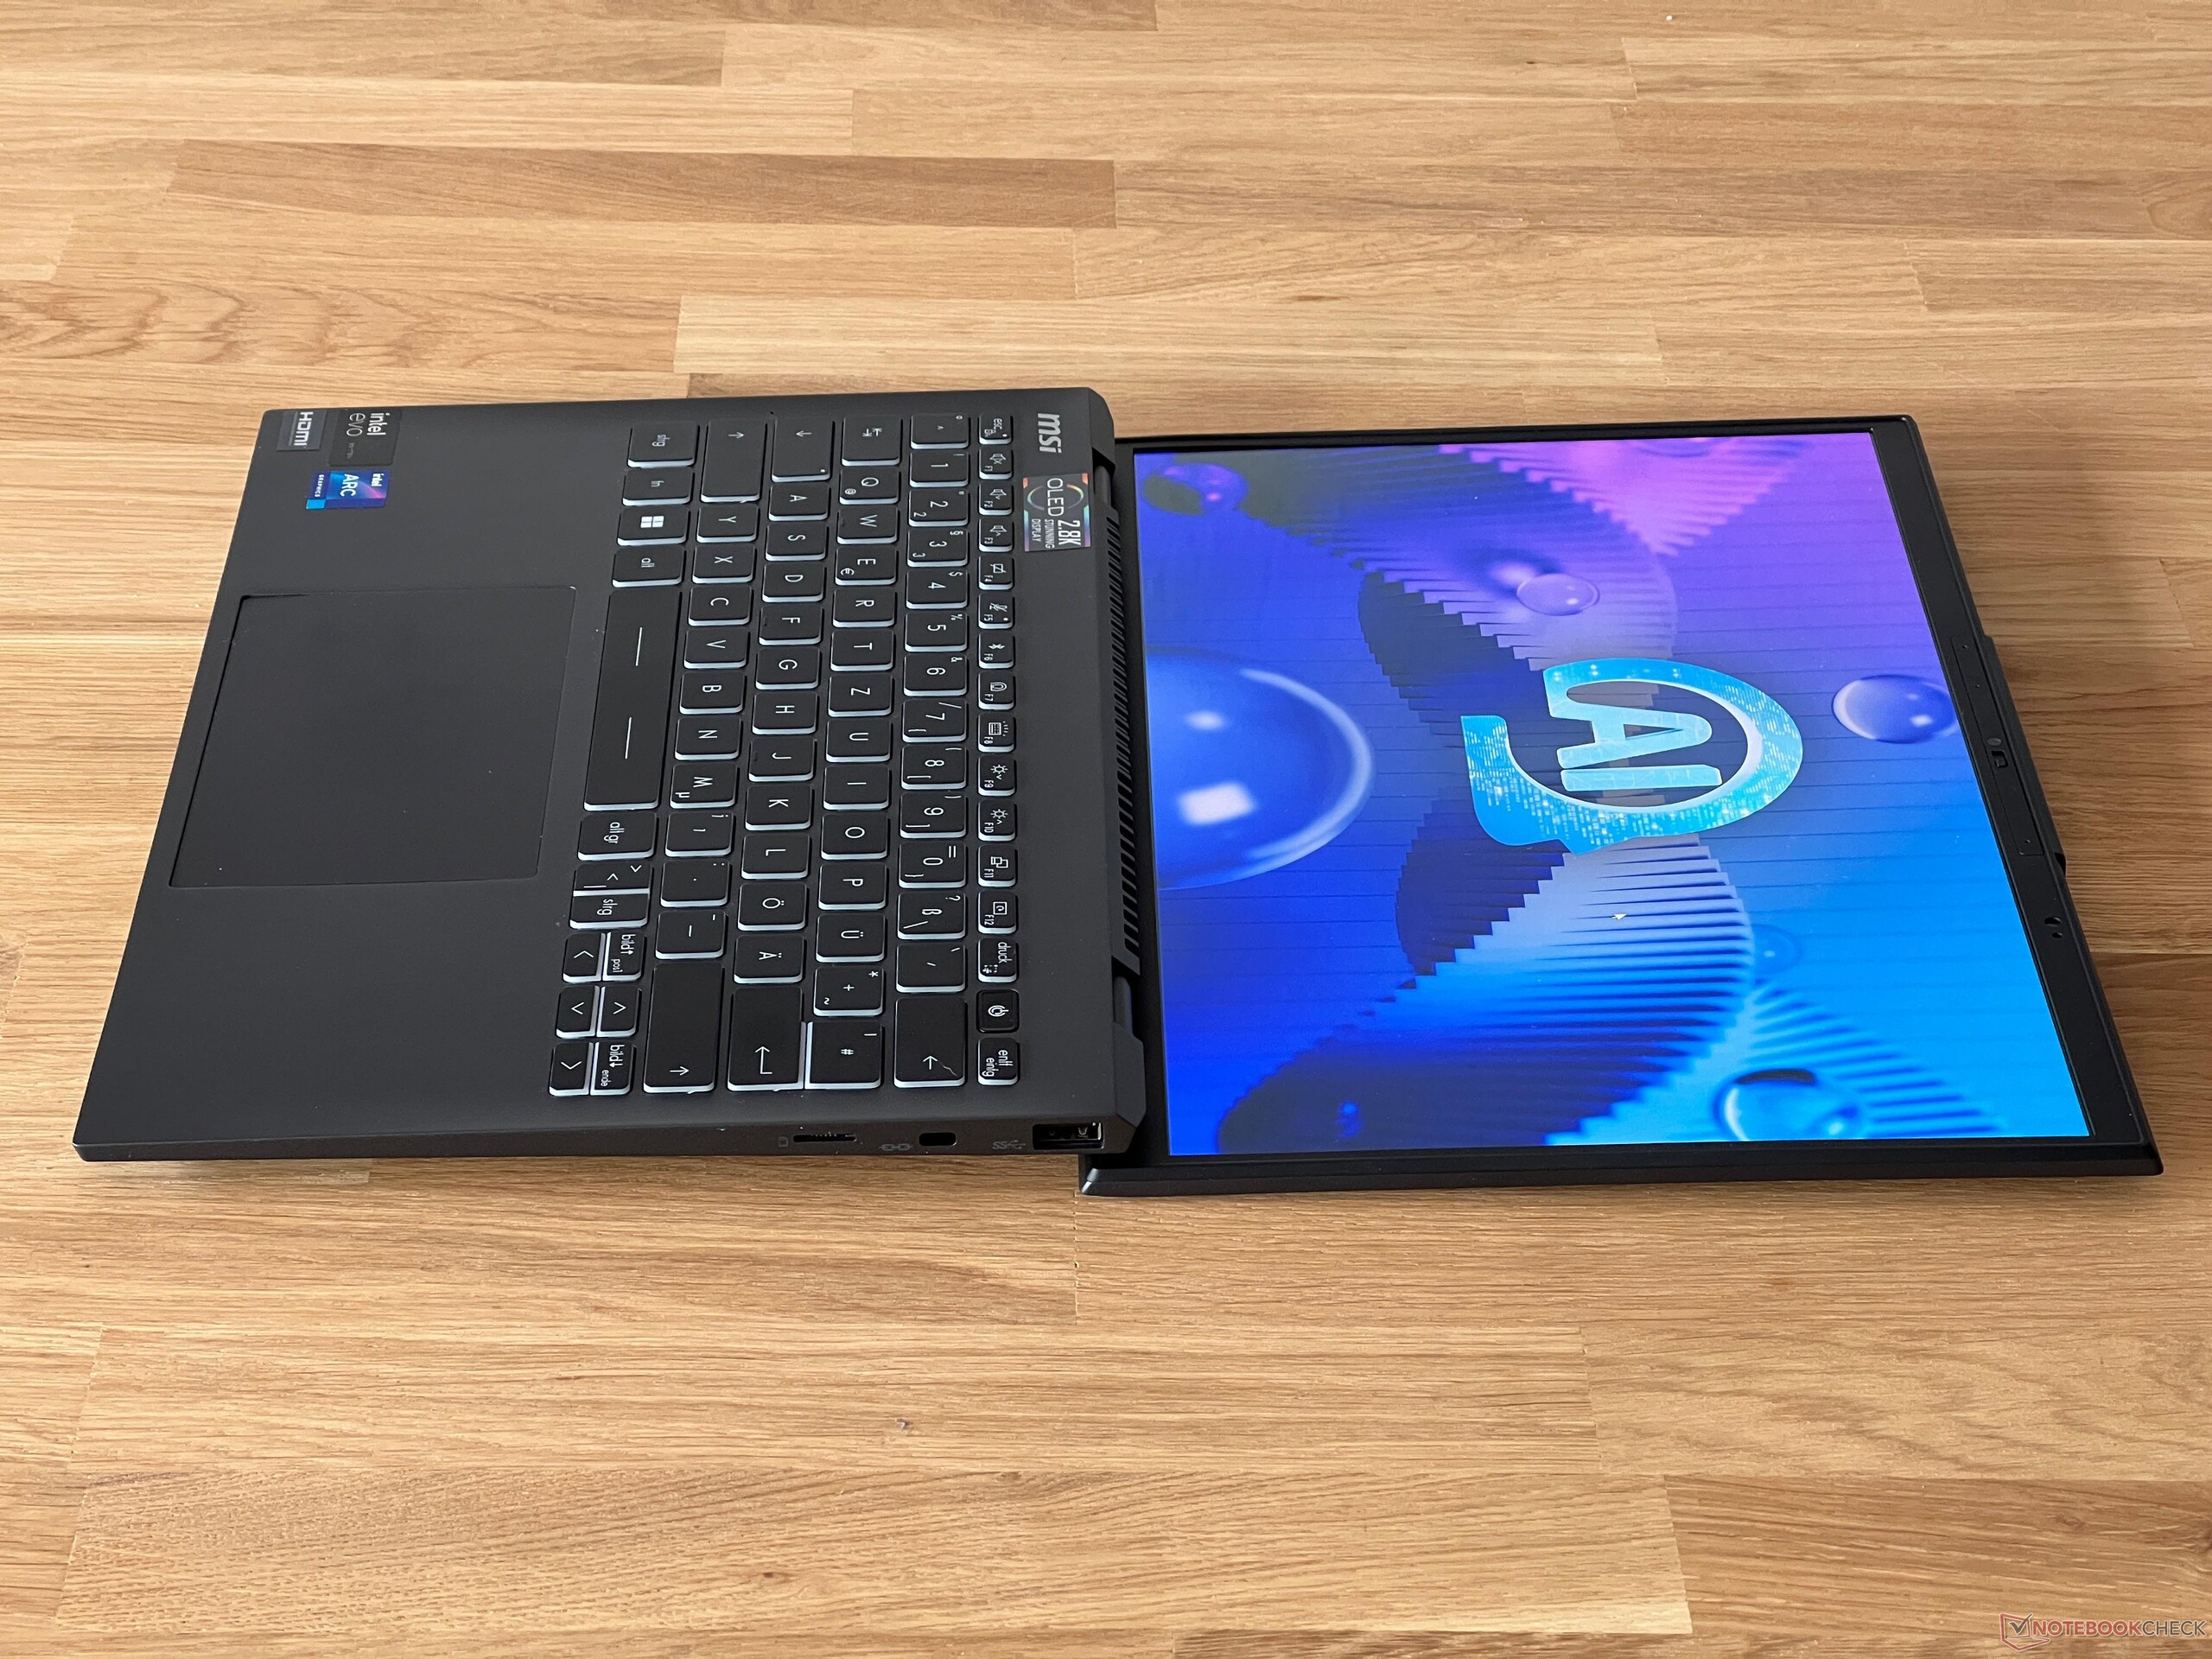
Jest ona dobrze skonstruowana, jednak cierpi na pewne problemy ze stabilnością. Tylna część jednostki bazowej jest lekko unoszona po otwarciu pokrywy, a środkowa część klawiatury może zostać wypaczona do wewnątrz przy odrobinie nacisku. Jednak podczas normalnego pisania nie powinno to stanowić zbyt dużego problemu. Przy lekkim przekręceniu jednostki zasadniczej laptop wydaje zauważalne odgłosy skrzypienia. Zawiasy wyświetlacza są ustawione bardzo ciasno i skutecznie zapobiegają chybotaniu się pokrywy - sprawia to tylko, że nieco trudno jest ją otworzyć jedną ręką. Maksymalny kąt otwarcia wynosi 180 stopni, a sama pokrywa jest bardzo stabilna.
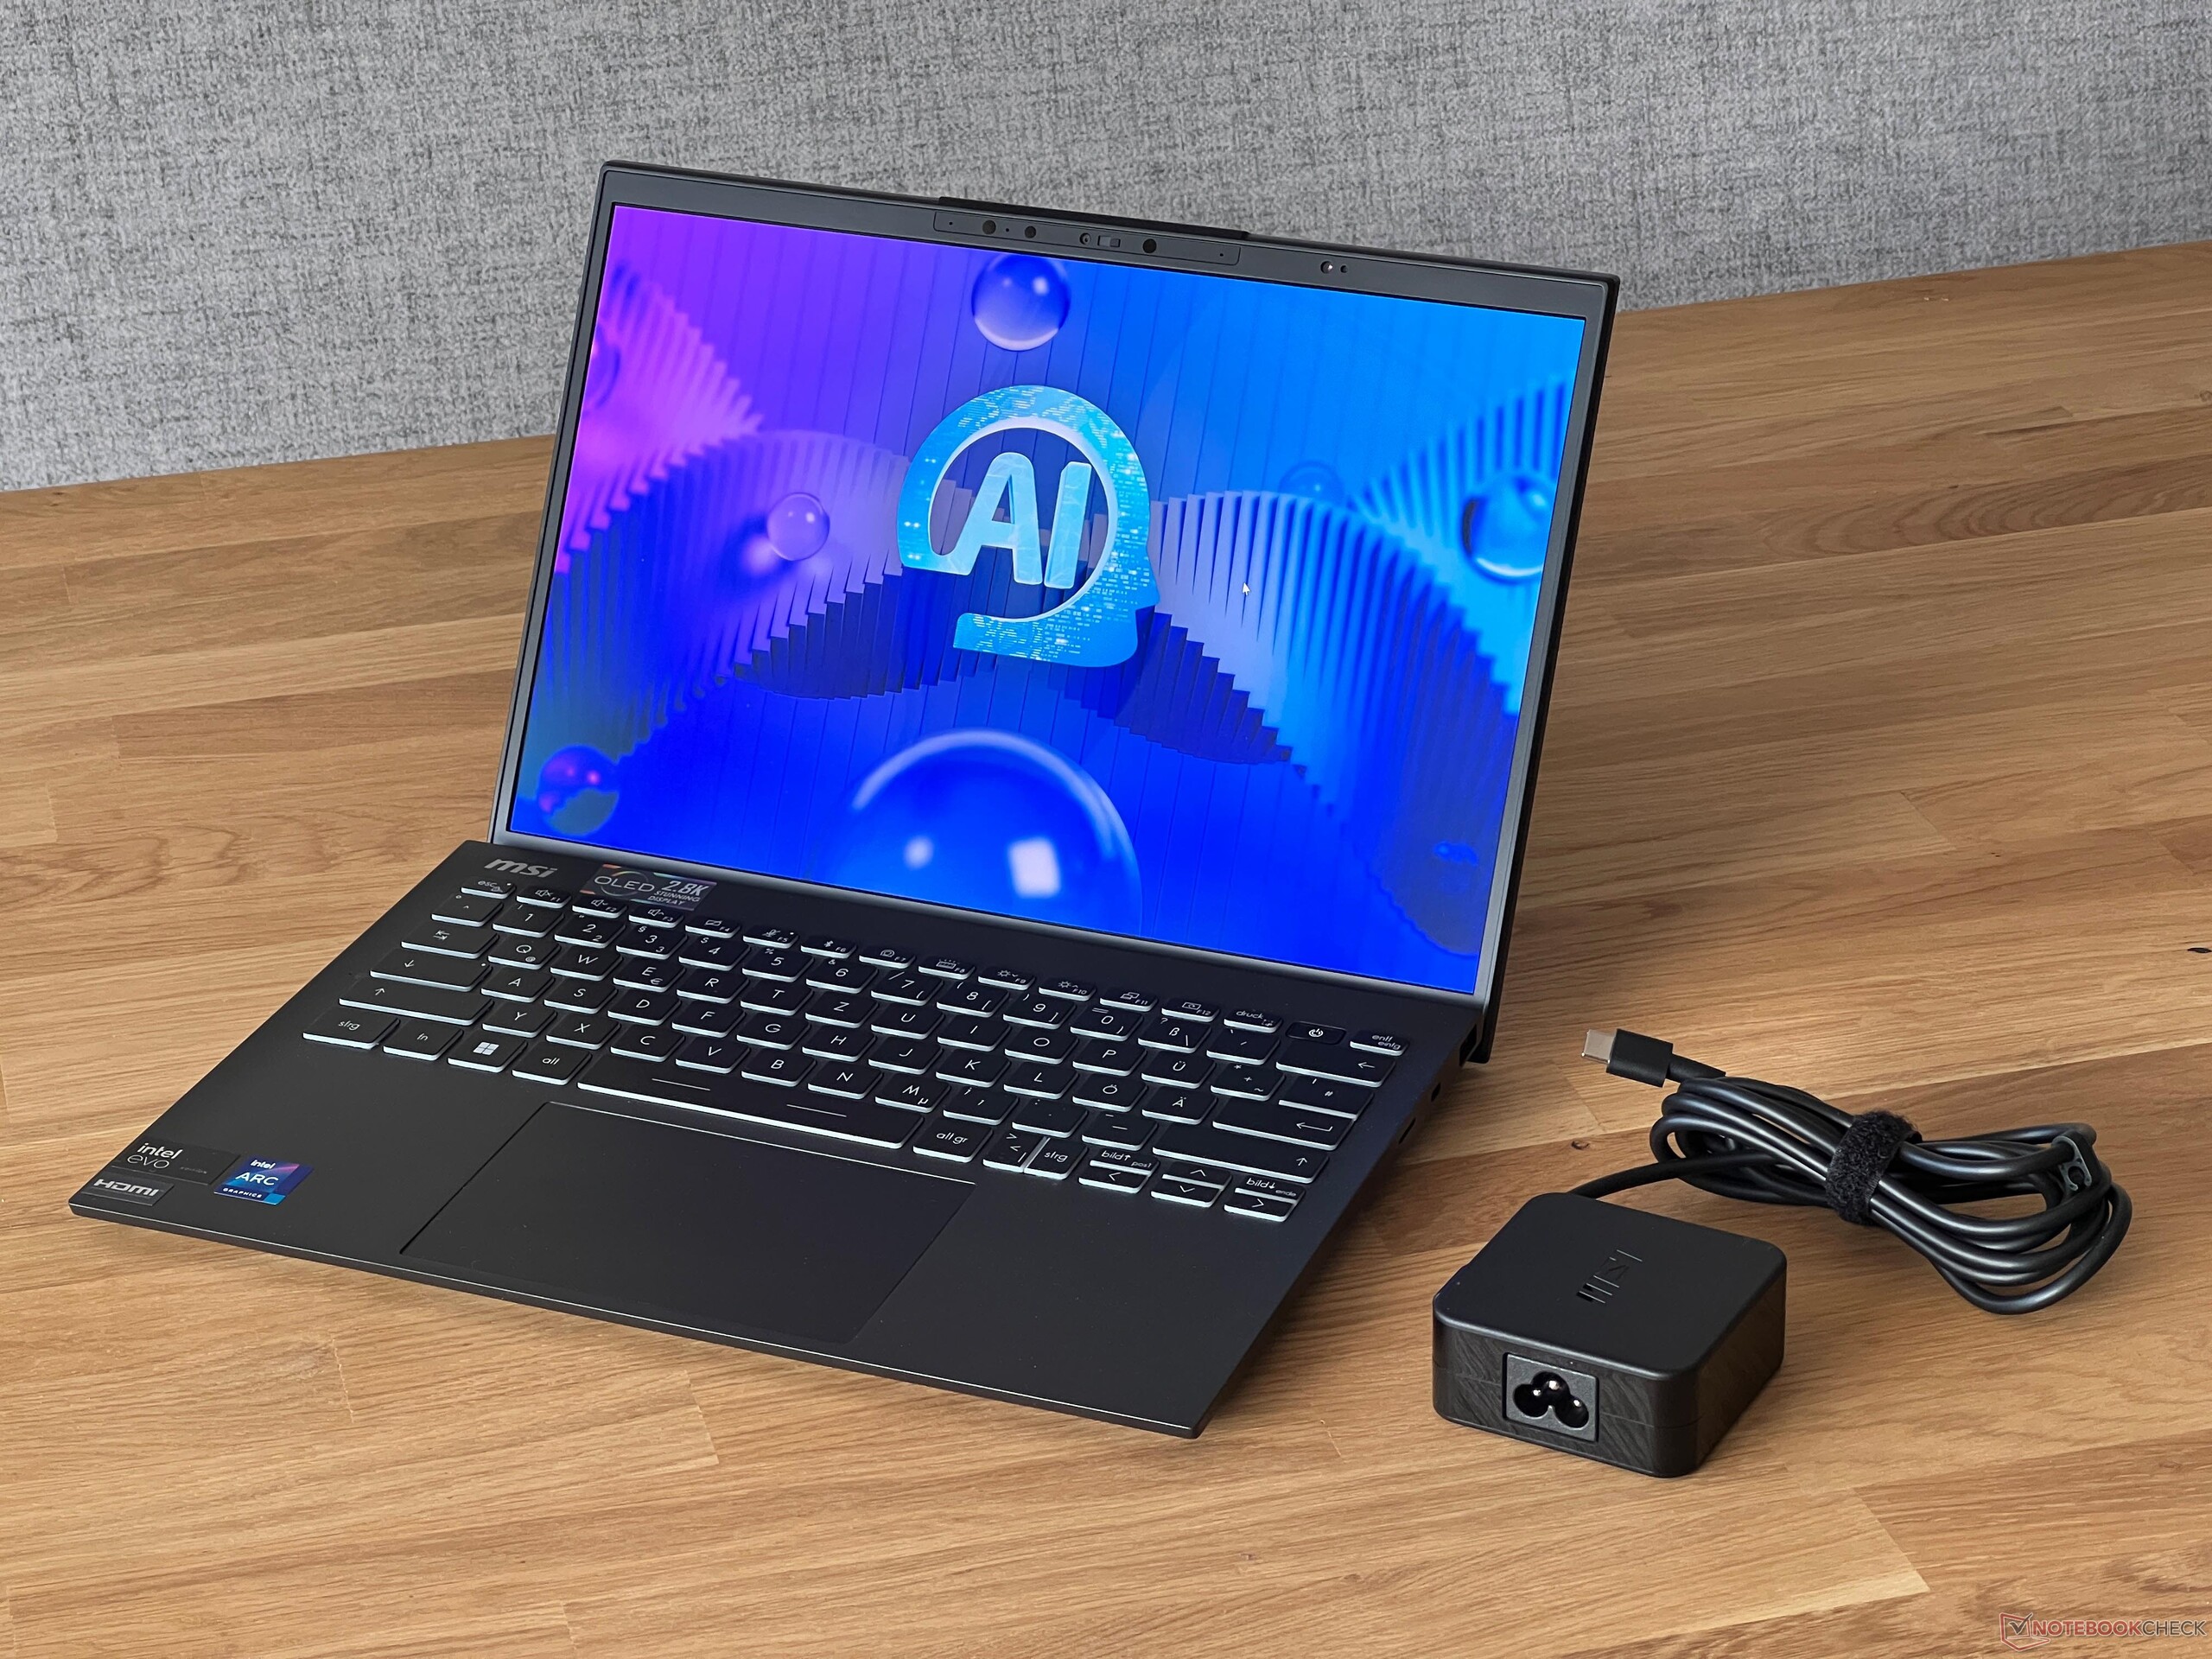
Przy wadze poniżej 1 kilograma, Prestige 13 jest niezwykle lekki, ale to samo można powiedzieć o innych porównywanych urządzeniach. Jeśli chodzi o wymiary, konkurenci również nie zajmują dużo miejsca. Prestige można łatwo schować w każdej torbie. MSI wykorzystuje kompaktowy 65-watowy zasilacz, jednak nie jest to zasilacz wtyczkowy, dlatego jest dość ciężki i waży 341 gramów.
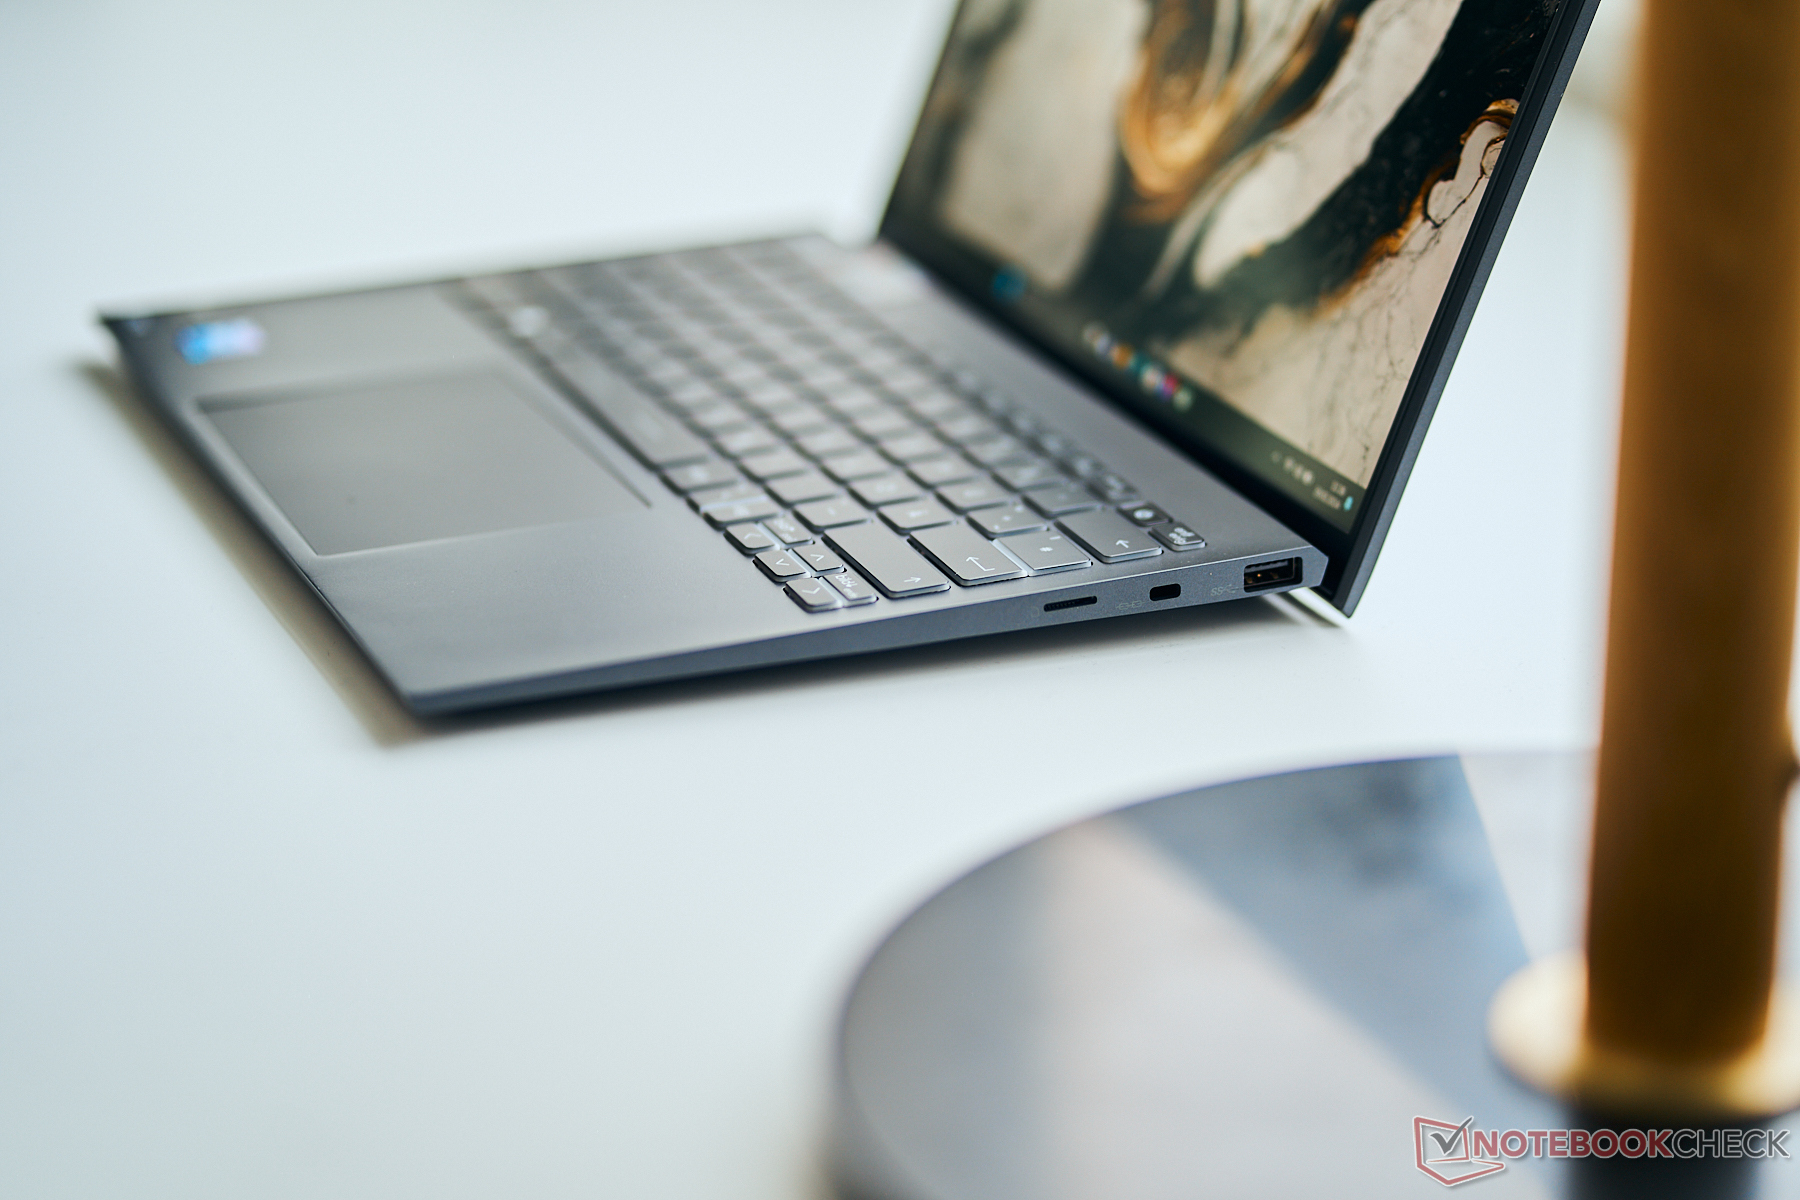
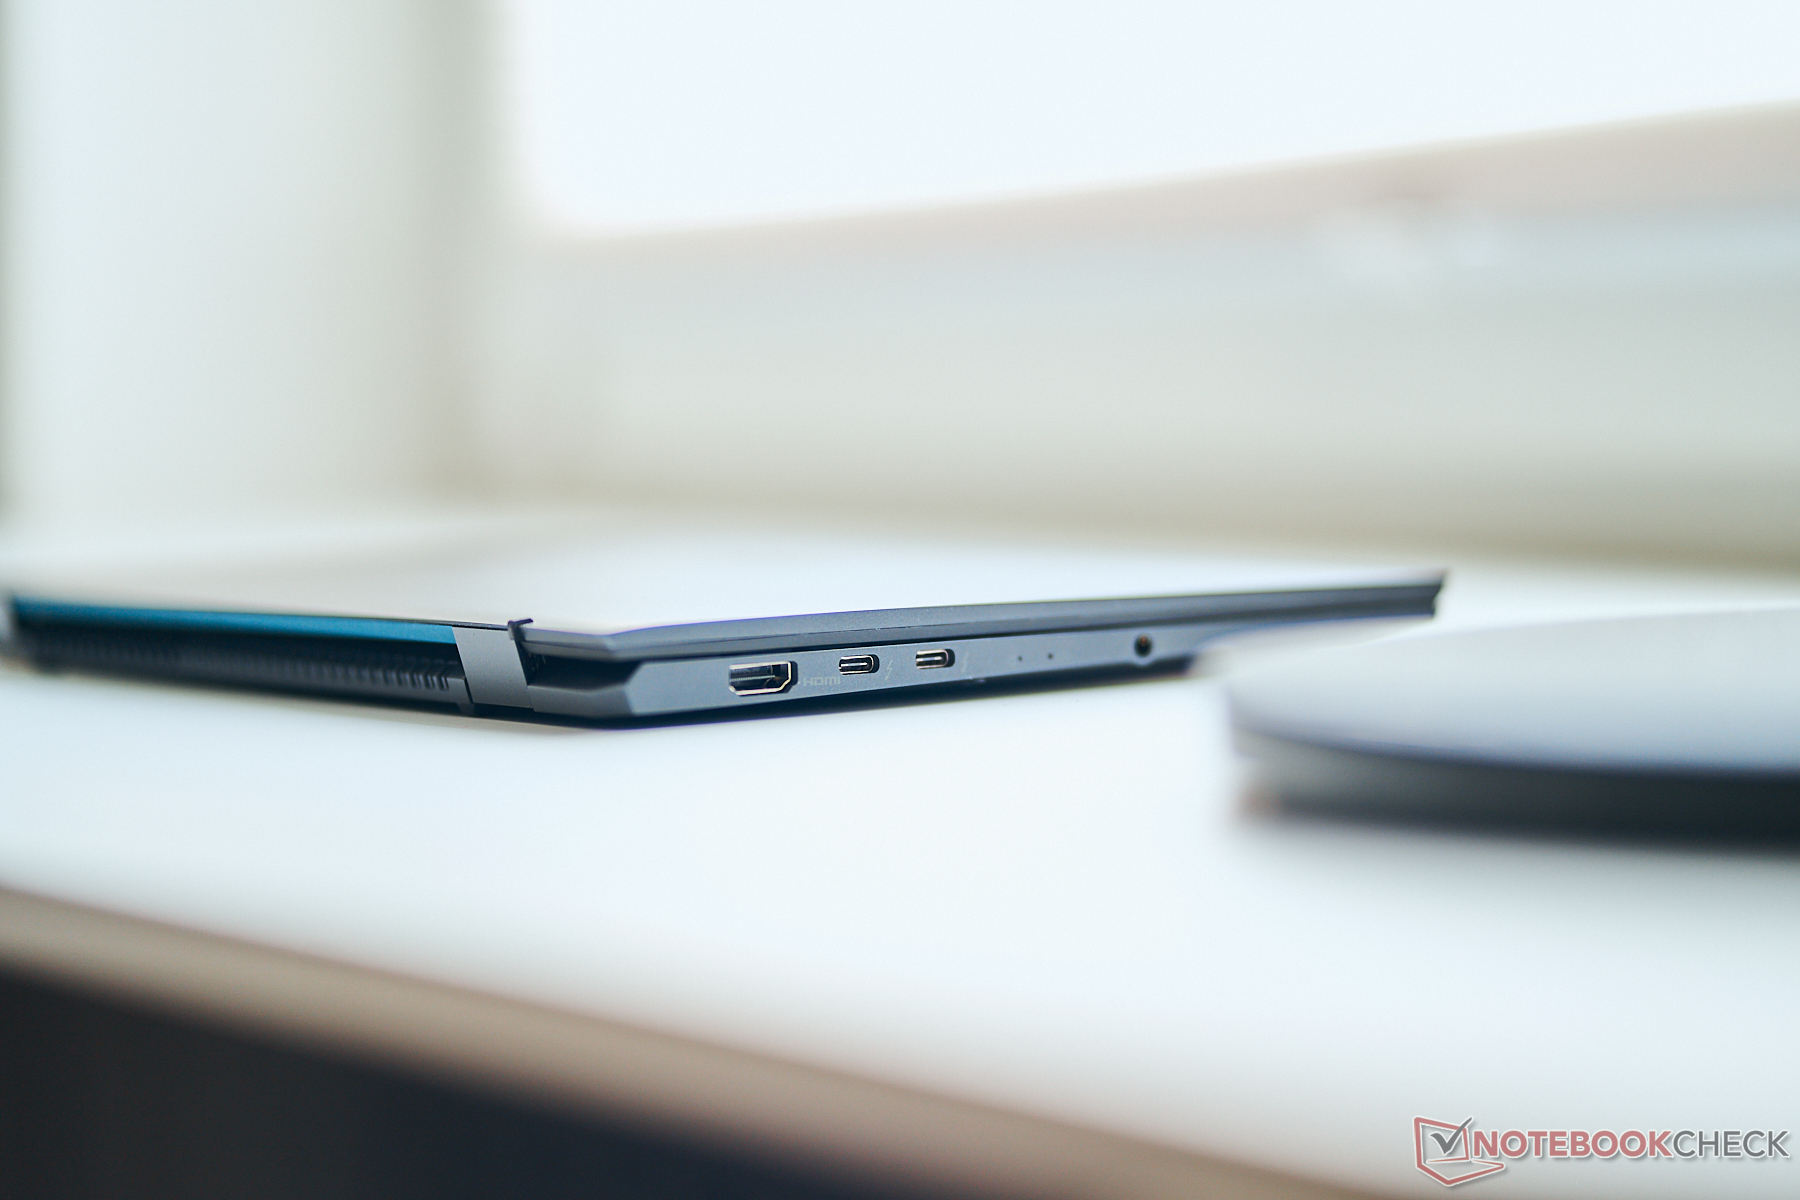
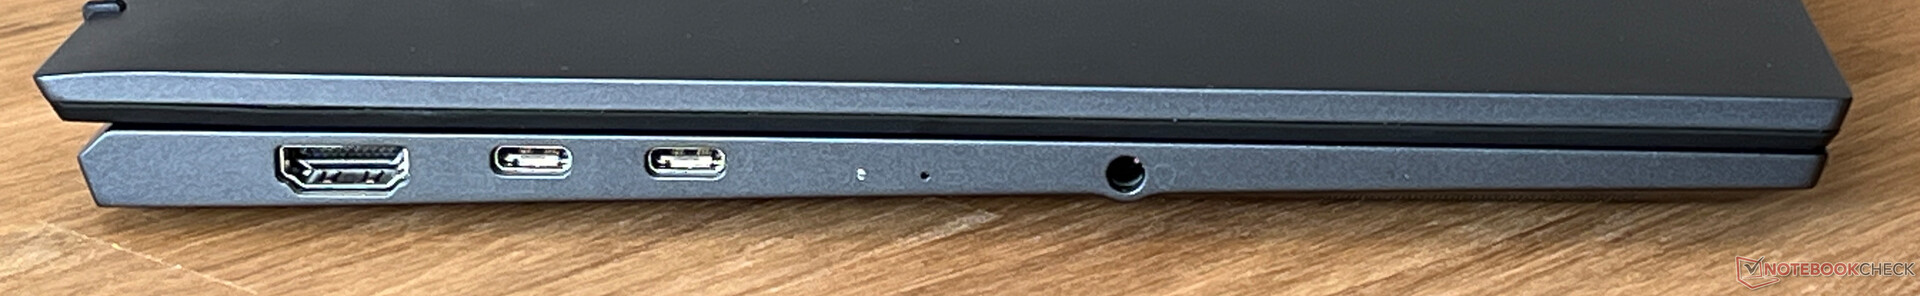
Łączność - MSI z Thunderbolt 4 i HDMI 2.1
Prestige 13 może i jest kompaktowy, ale nadal posiada wszystkie ważne złącza, w tym USB-C, USB-A i w pełni funkcjonalne wyjście HDMI. Podoba nam się również to, jak porty są rozmieszczone w całym laptopie i nie mamy zbyt wiele do krytykowania.
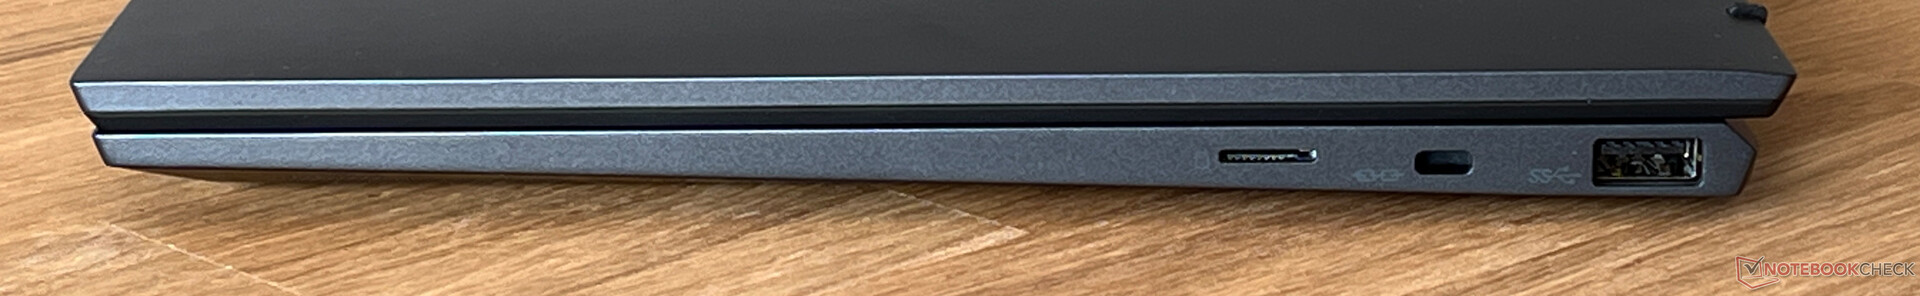
Czytnik kart SD
Po prawej stronie urządzenia znajduje się czytnik kart microSD (mechanizm sprężynowy), który w połączeniu z naszą referencyjną kartą (Angelbird AV Pro V60) osiągał bardzo dobre prędkości transferu. Podczas kopiowania zdjęć odnotowaliśmy średnio ponad 140 MB/s, a maksymalnie ponad 200 MB/s. Żadne z pozostałych urządzeń porównawczych nie posiada czytnika kart.
| SD Card Reader | |
| average JPG Copy Test (av. of 3 runs) | |
| MSI Prestige 13 AI Evo (Angelbird AV Pro V60) | |
| Średnia w klasie Subnotebook (23.7 - 188, n=9, ostatnie 2 lata) | |
| maximum AS SSD Seq Read Test (1GB) | |
| MSI Prestige 13 AI Evo (Angelbird AV Pro V60) | |
| Średnia w klasie Subnotebook (24.9 - 195, n=8, ostatnie 2 lata) | |
Komunikacja
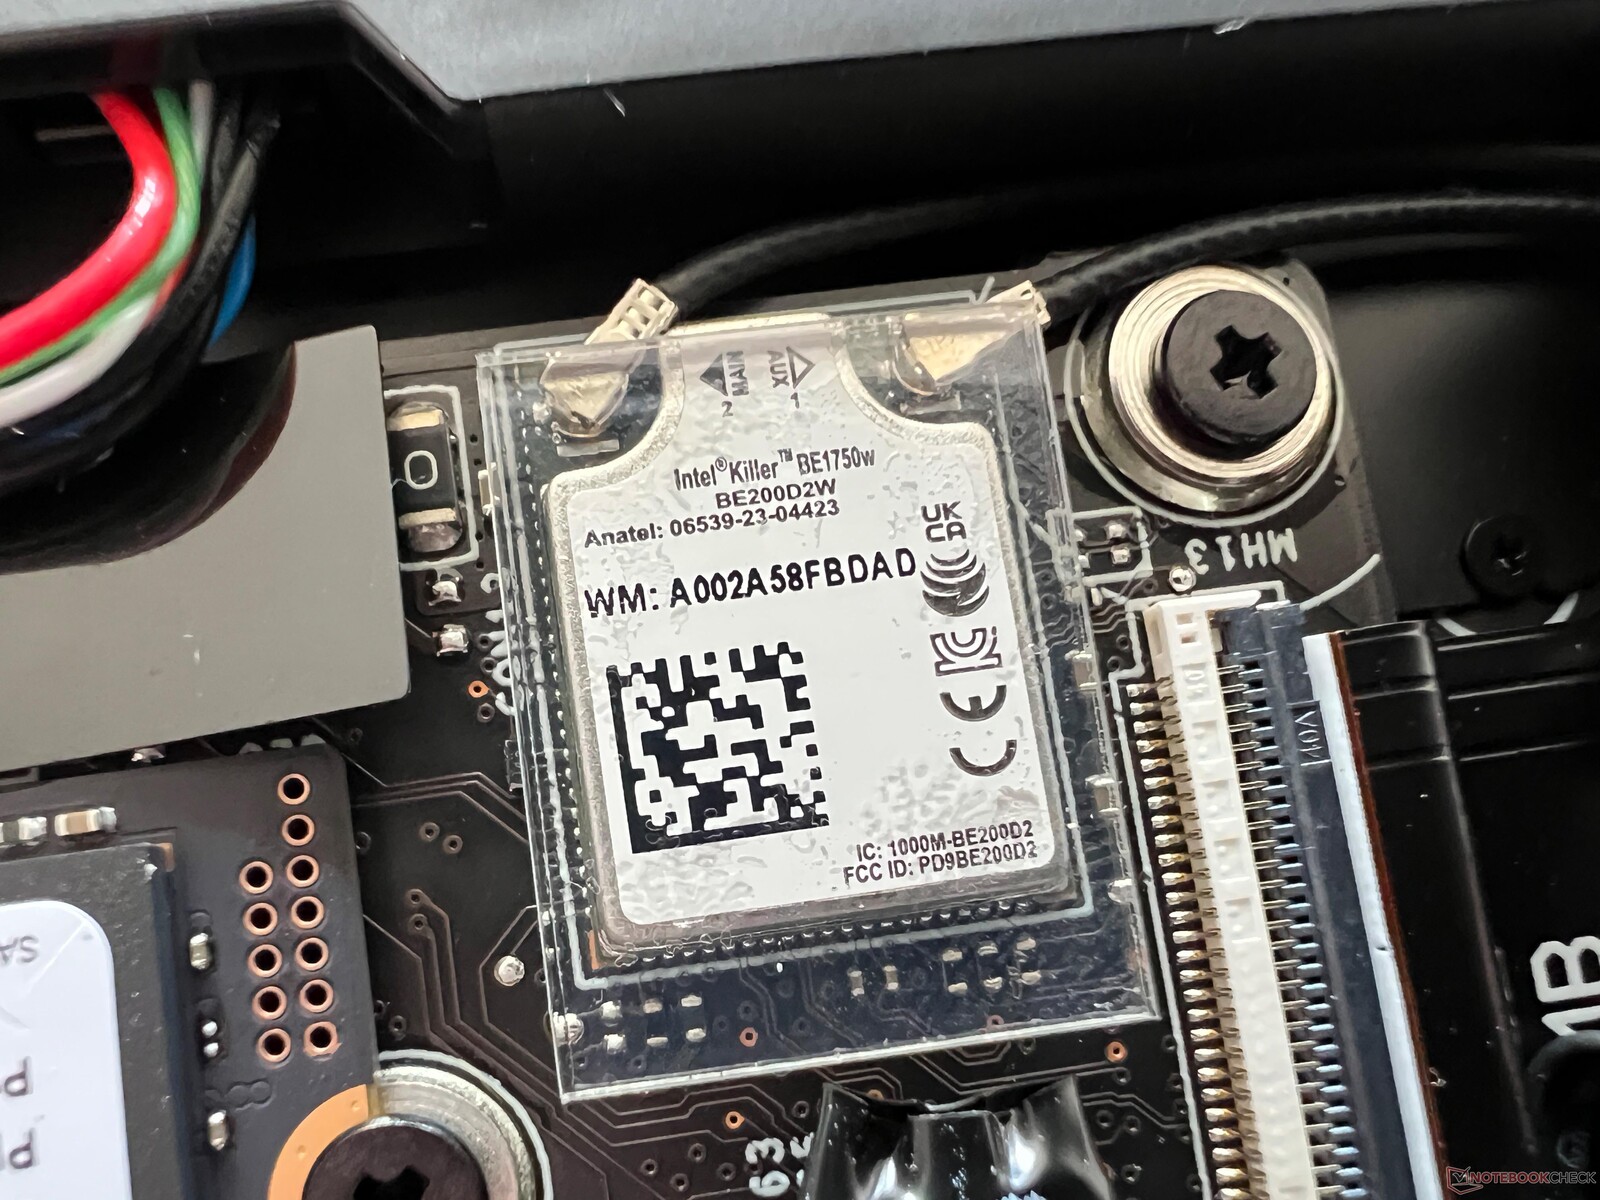
MSI zainstalowało w laptopie nowy moduł Wi-Fi 7 BE1750W (320 MHz) od Intela. Niestety, nie możemy jeszcze skorzystać z nowego standardu przy użyciu naszego obecnego routera referencyjnego. Jednak szybkość transferu przez Wi-Fi 6 była bardzo stabilna i wysoka.
| Networking | |
| MSI Prestige 13 AI Evo | |
| iperf3 transmit AXE11000 | |
| iperf3 receive AXE11000 | |
| Lenovo ThinkPad X1 Nano Gen 3 | |
| iperf3 transmit AXE11000 | |
| iperf3 receive AXE11000 | |
| iperf3 transmit AXE11000 6GHz | |
| iperf3 receive AXE11000 6GHz | |
| Dell Latitude 13 7340 i5-1345U | |
| iperf3 transmit AXE11000 | |
| iperf3 receive AXE11000 | |
| iperf3 transmit AXE11000 6GHz | |
| iperf3 receive AXE11000 6GHz | |
| HP Dragonfly G4 | |
| iperf3 transmit AXE11000 | |
| iperf3 receive AXE11000 | |
| iperf3 transmit AXE11000 6GHz | |
| iperf3 receive AXE11000 6GHz | |
| Asus ZenBook S13 OLED UX5304 | |
| iperf3 transmit AXE11000 | |
| iperf3 receive AXE11000 | |
Kamera internetowa
Kamera internetowa 1080p oferuje przyzwoitą jakość obrazu w dobrych warunkach oświetleniowych i nie posiada mechanicznej osłony. Obsługuje również efekty Windows studio (miękkie tło, kontakt wzrokowy, śledzenie). Ponadto posiada zainstalowaną kamerę na podczerwień do rozpoznawania twarzy poprzez Windows Hello.


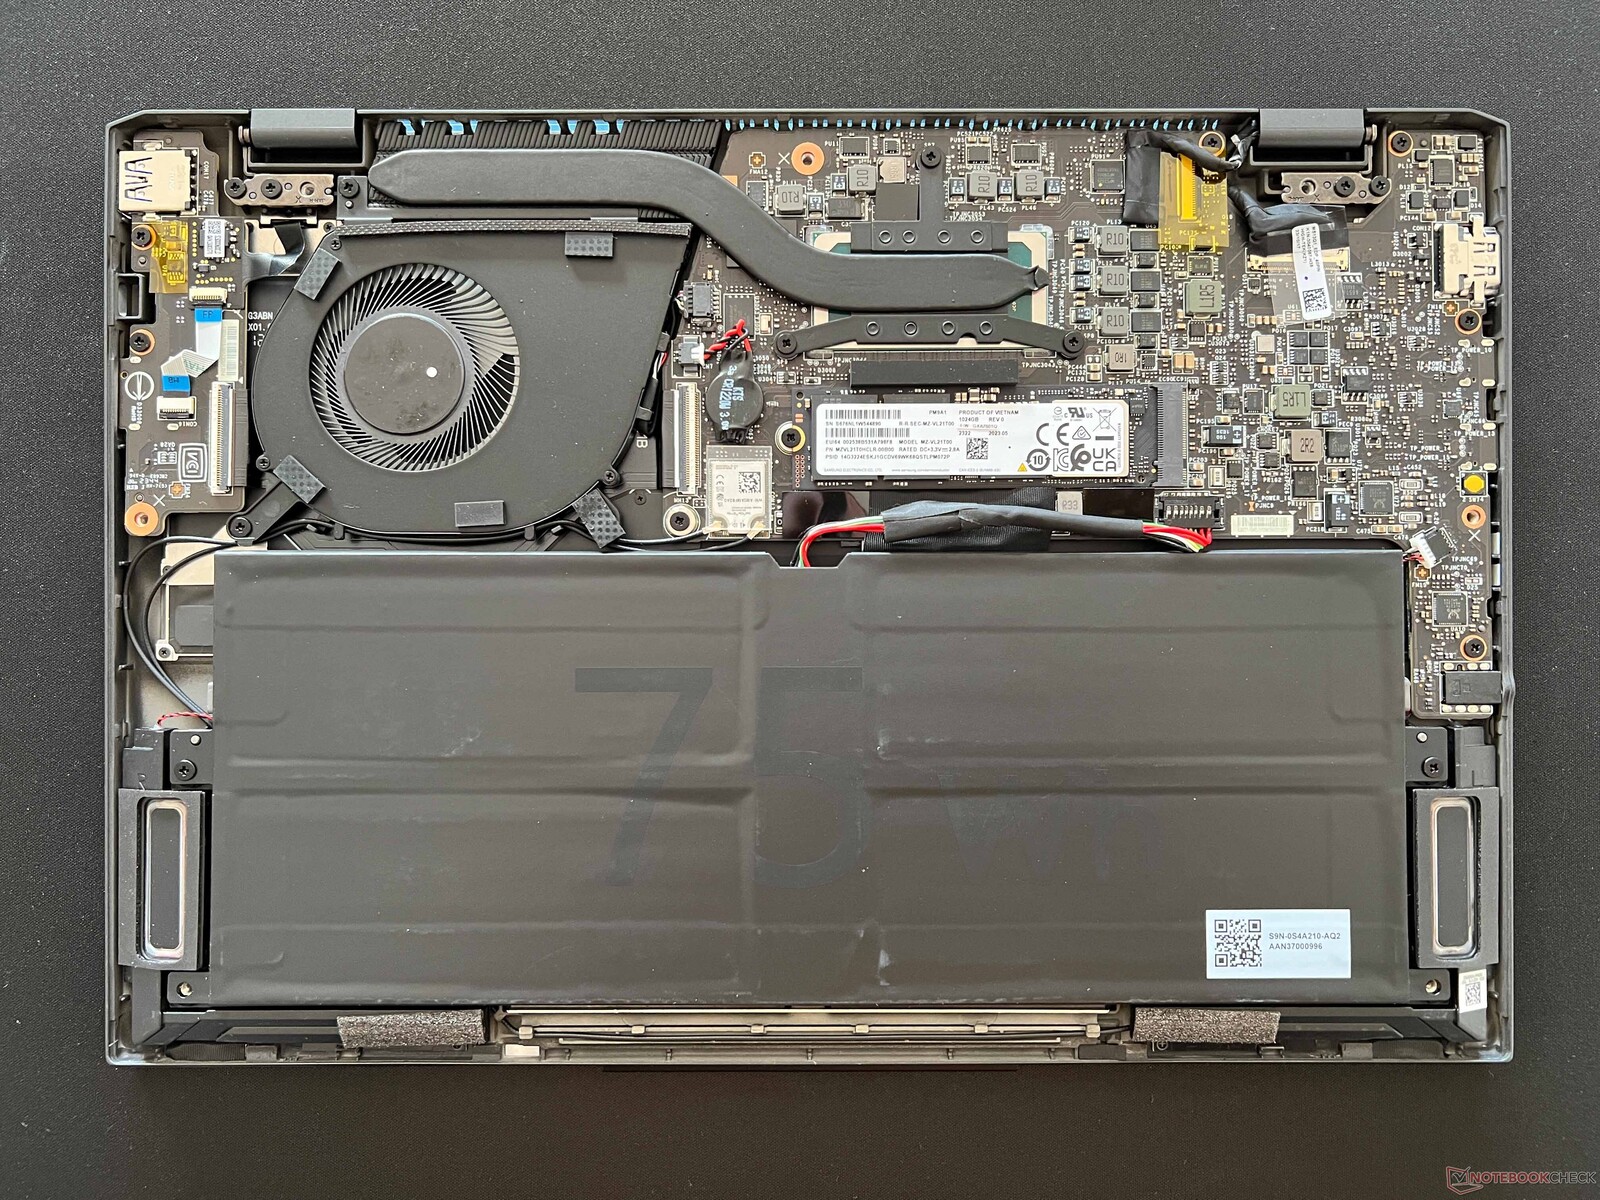
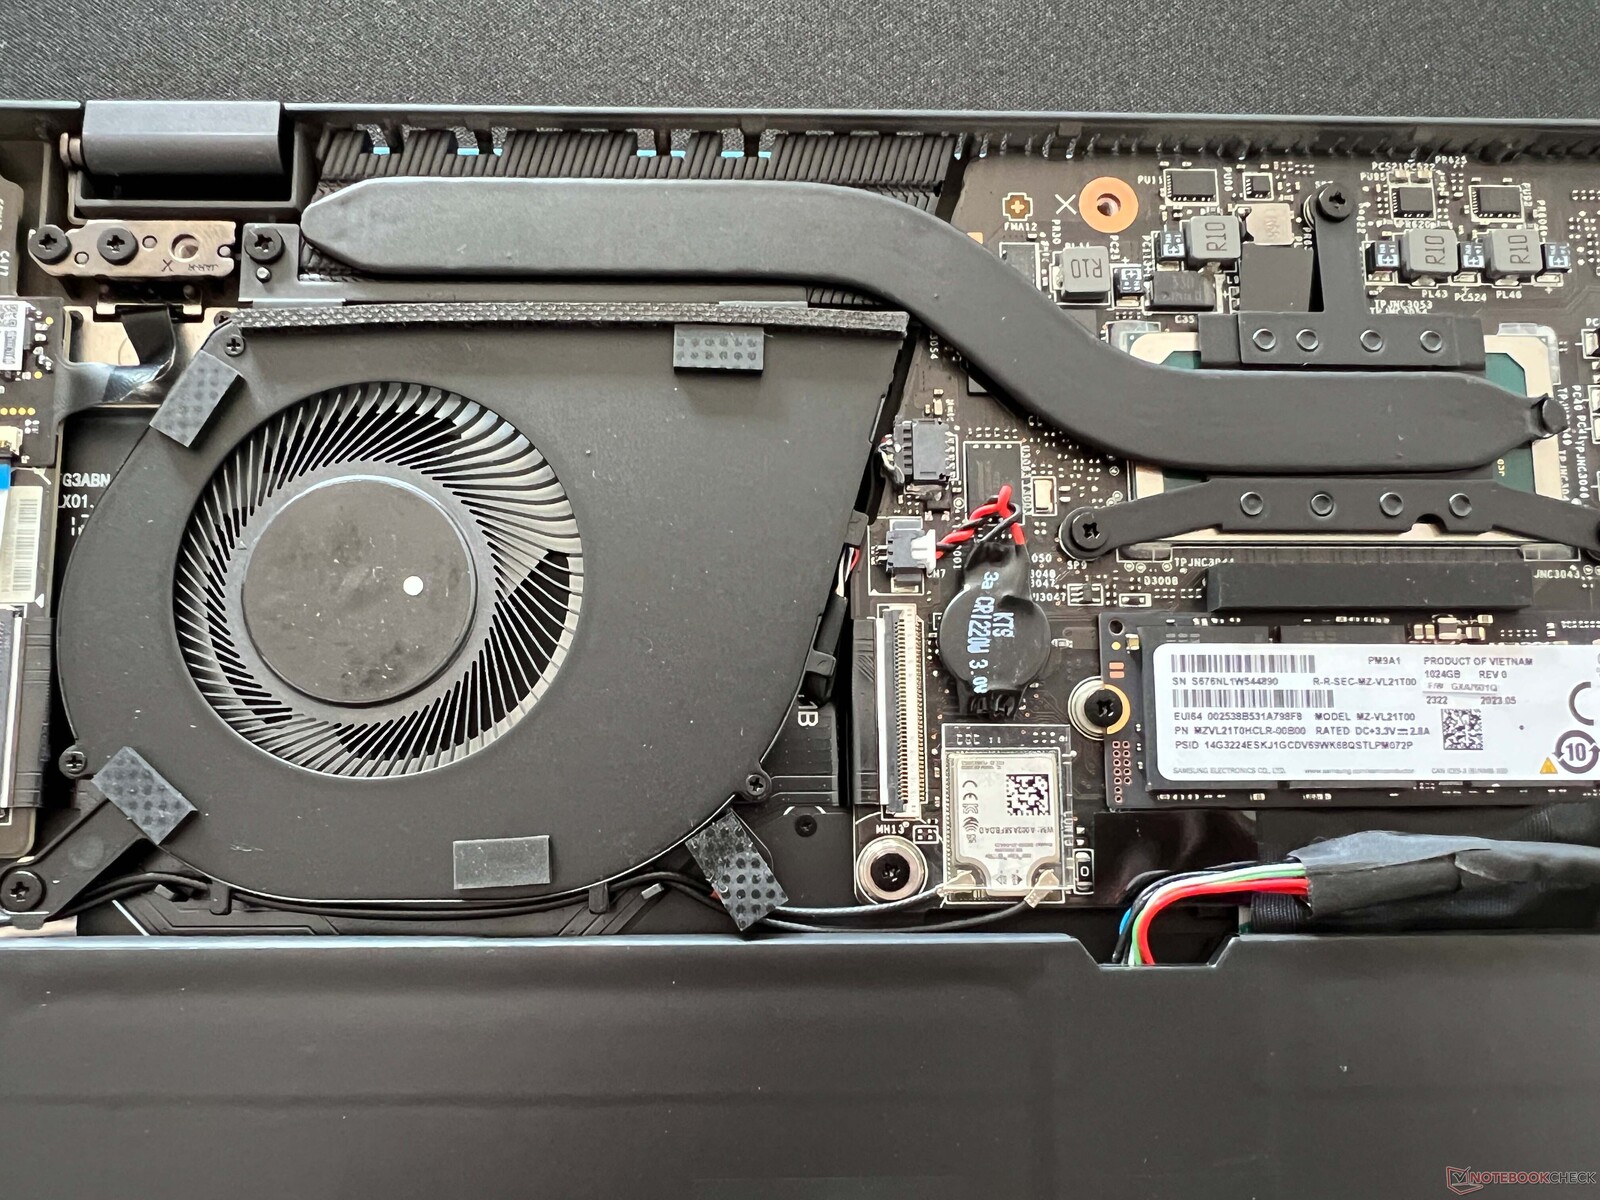
Konserwacja
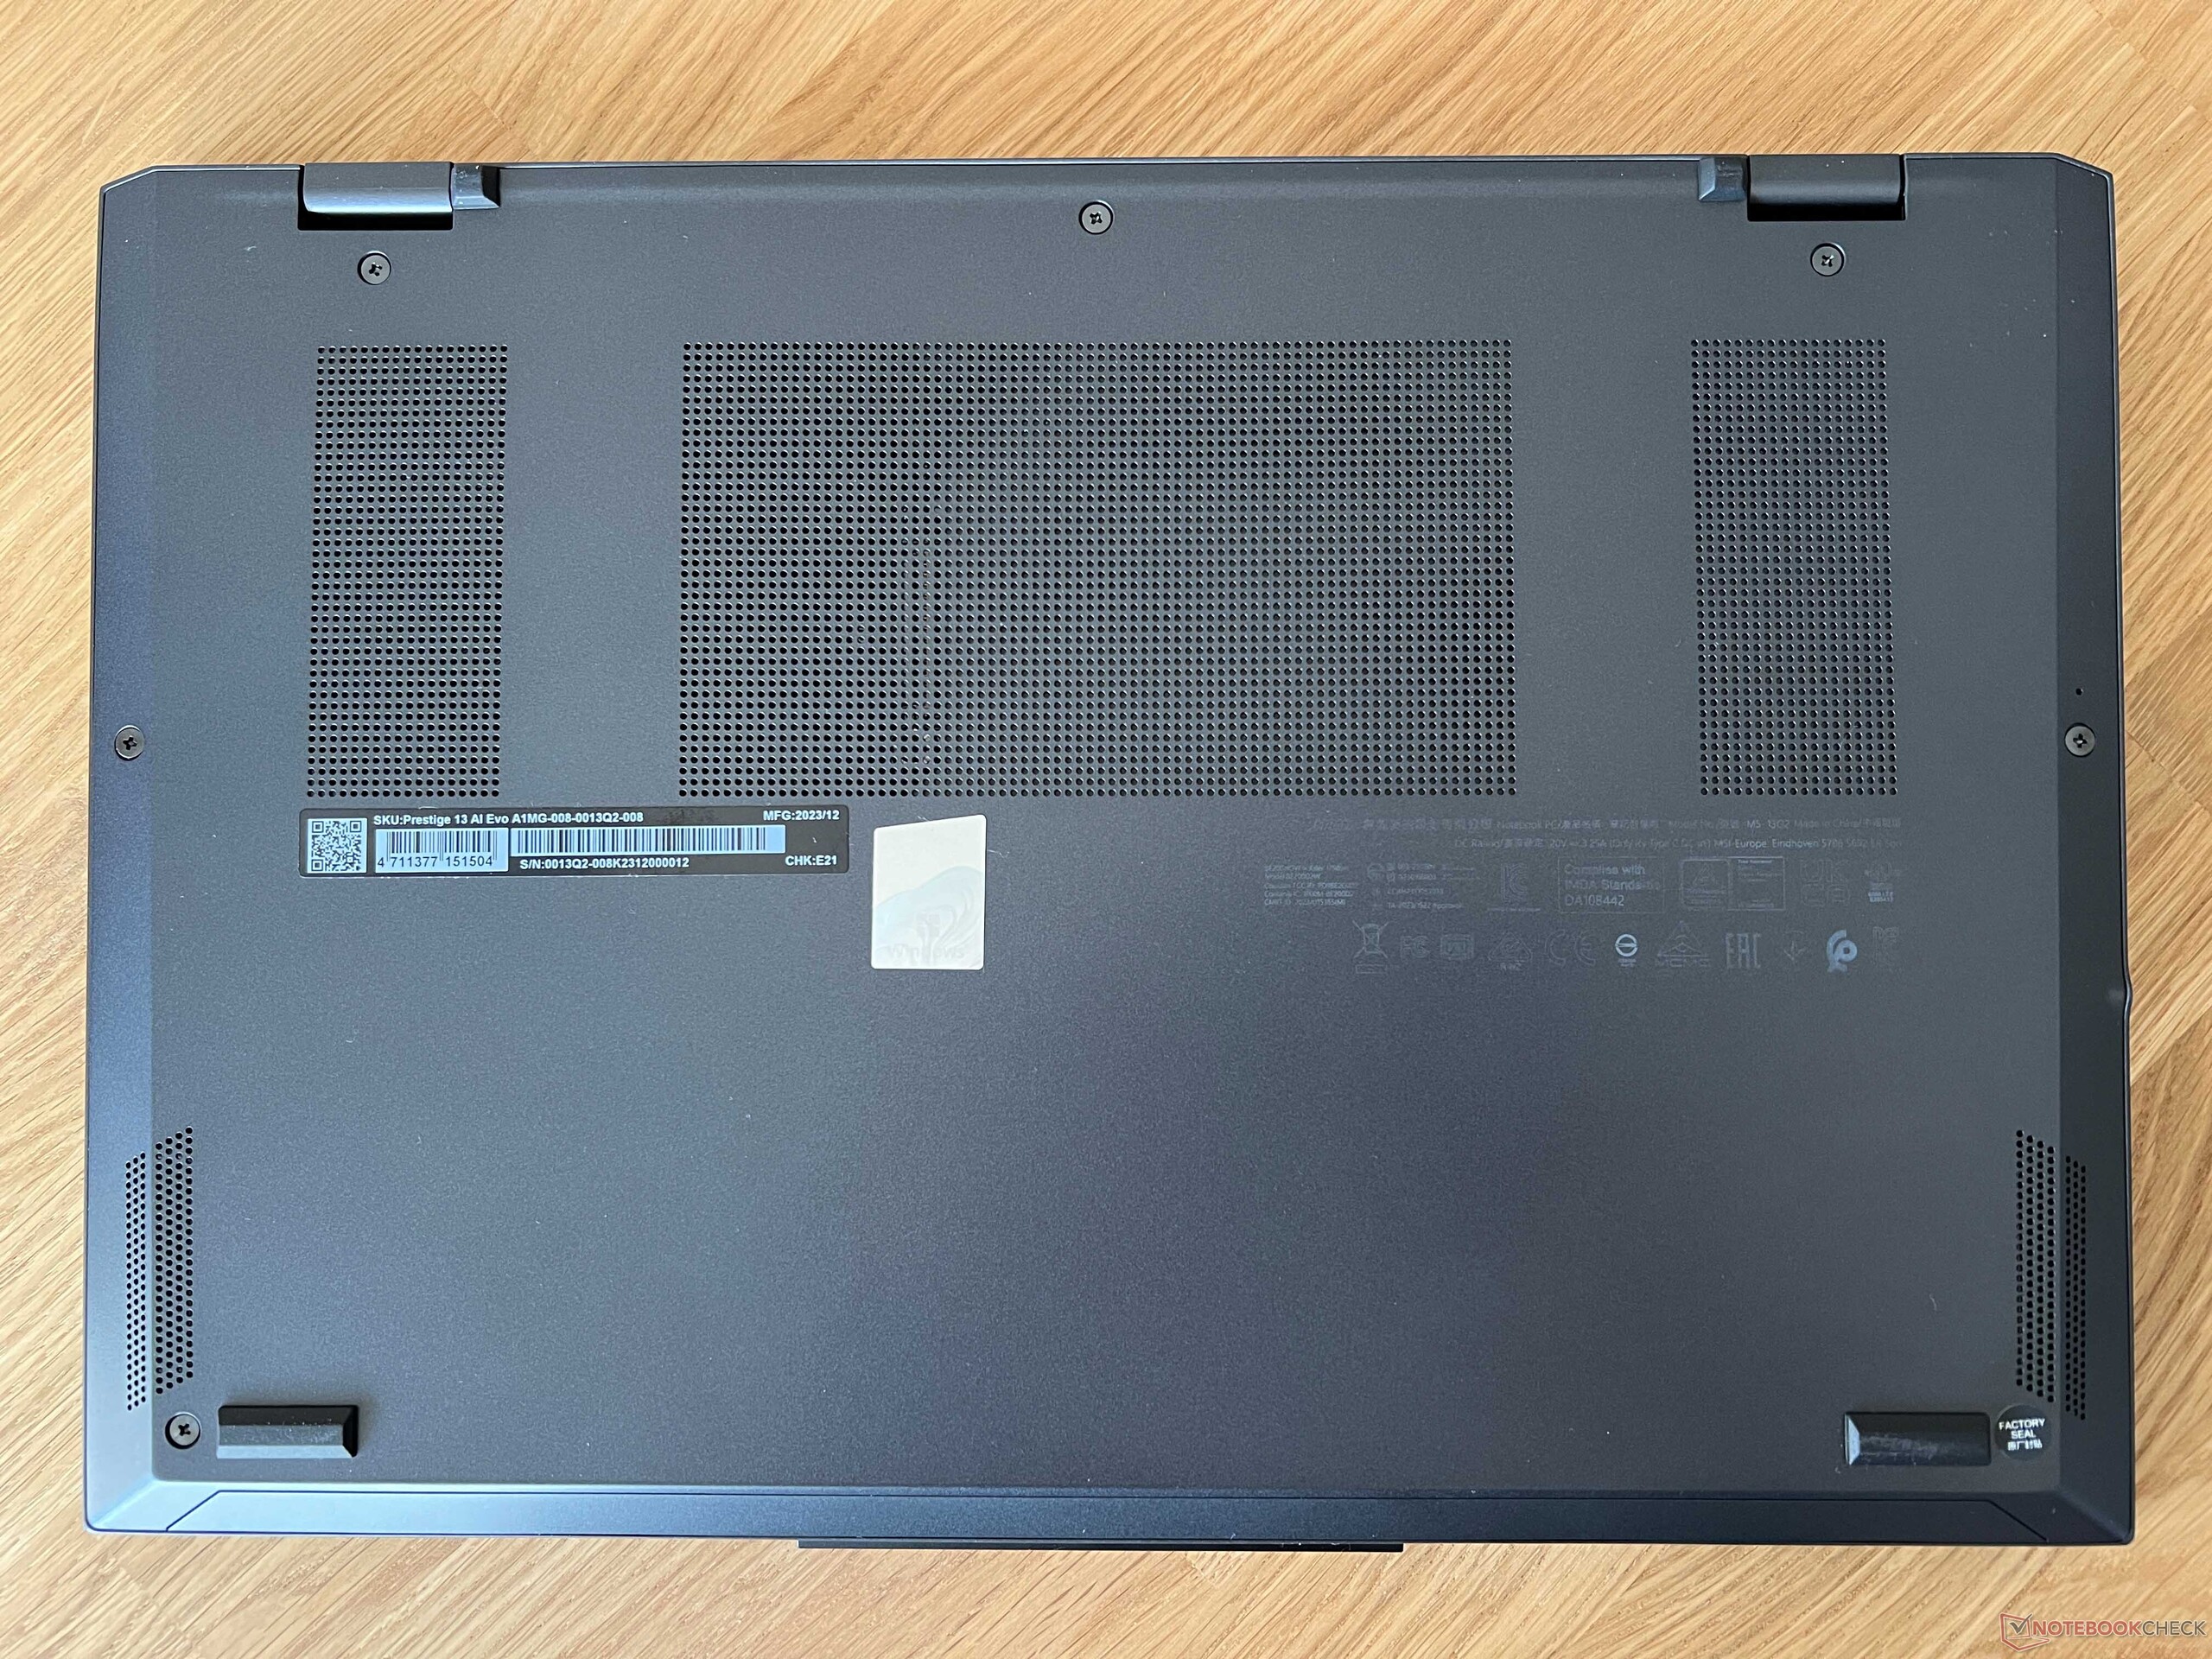
Dolna część obudowy jest zabezpieczona zwykłymi śrubami z łbem krzyżakowym i można ją łatwo zdemontować. Dzięki temu można wyczyścić wentylator oraz wymienić dysk SSD i baterię. Z drugiej strony wszystkie pozostałe komponenty są przylutowane. Dotyczy to również pamięci RAM i modułów WLAN.
Urządzenia wejściowe - Zmniejszona klawiatura
Na czarnej klawiaturze pisze się przeciętnie. Sama mechanika jest precyzyjna, ale klawisze nie są zbyt wysokie (17 mm szerokości, 1,4 mm wysokości), do czego na początku trzeba się przyzwyczaić. Ogólnie rzecz biorąc, układ klawiszy wydaje się dość ciasny, ale przynajmniej MSI zainstalowało dedykowane klawisze zwiększania i zmniejszania obrazu. Przycisk zasilania (w tym skaner linii papilarnych) znajduje się w prawym górnym rogu i znajduje się głębiej w obudowie, co oznacza, że można go łatwo wyczuć. Klawisz usuwania znajduje się po prawej stronie. Białe podświetlenie klawiatury ma trzy poziomy intensywności.

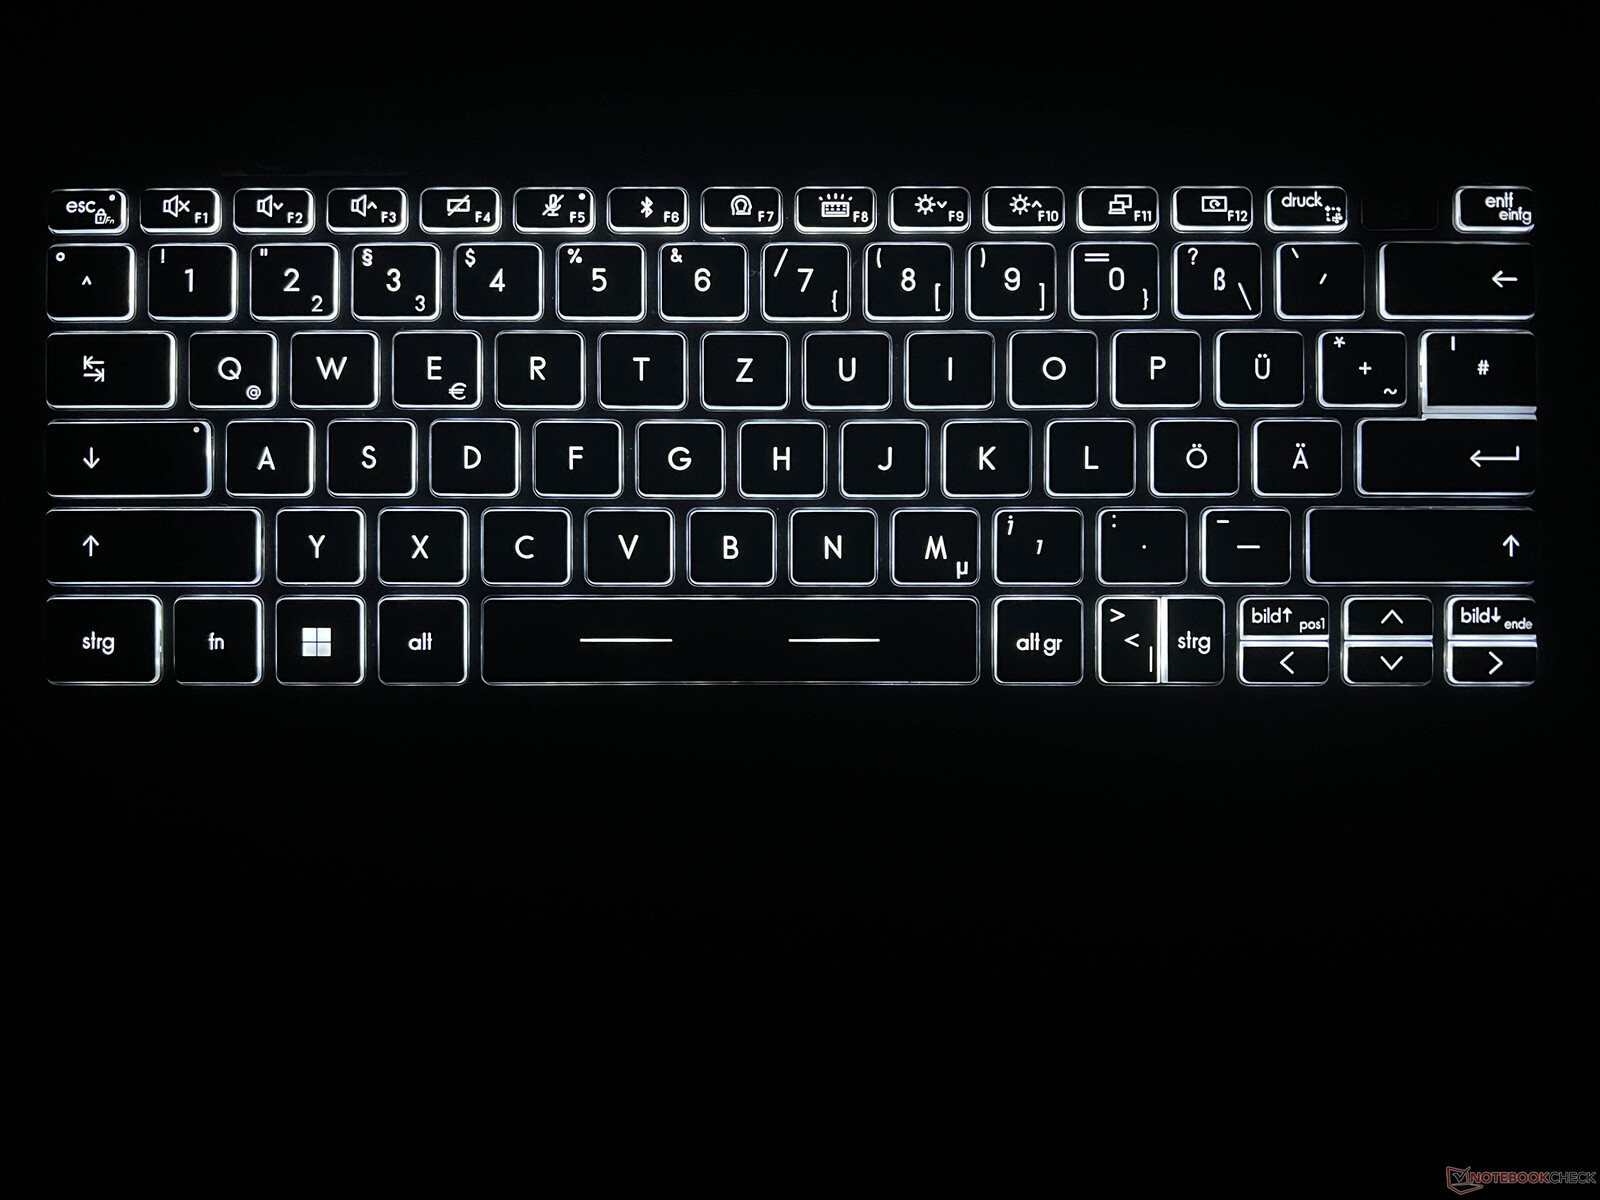
Klawiatura (12 x 7,5 cm) jest przyjemna i gładka i nie mieliśmy żadnych problemów podczas użytkowania. Dolna połowa podkładki może być wciśnięta, a odgłos kliknięcia jest bardzo równomierny. Mógłby być nieco cichszy, ale w żadnym wypadku nie brzmi tanio.
Wyświetlacz - 2,8K OLED bez dotyku
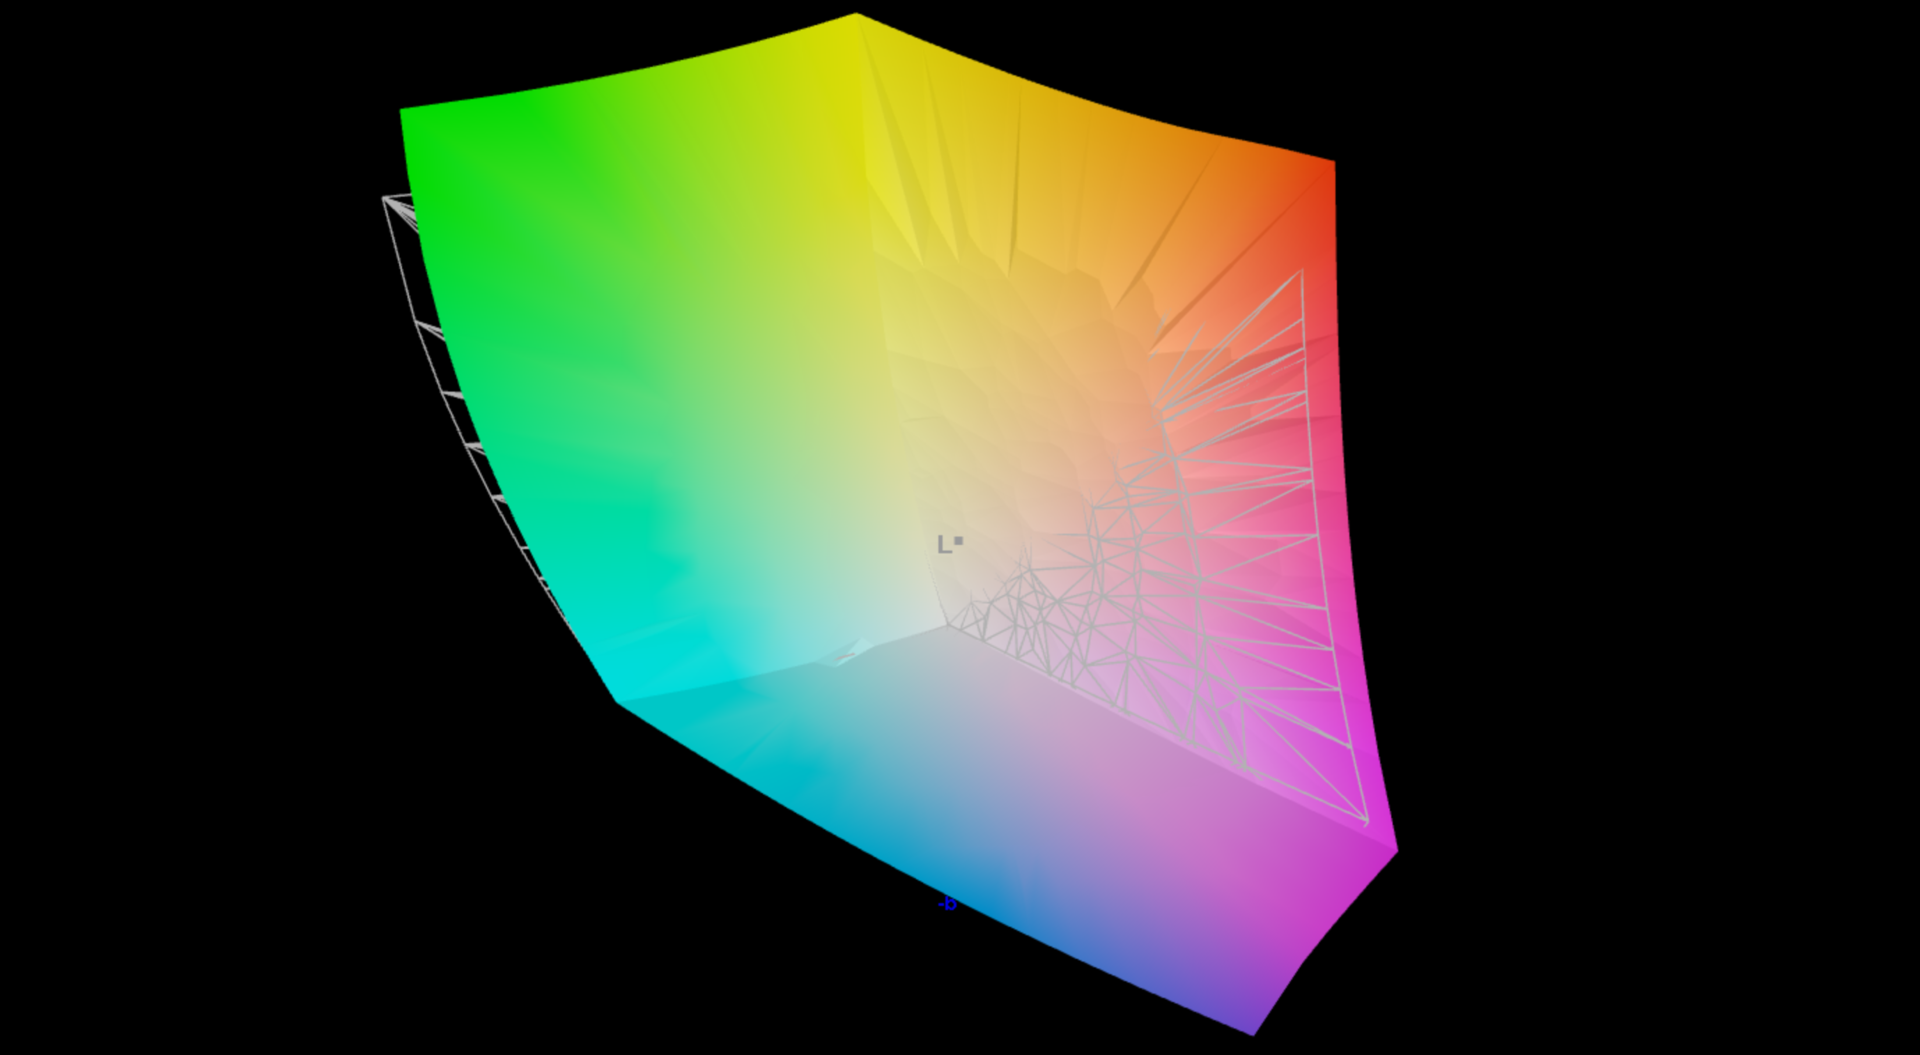
MSI zainstalowało w urządzeniu odblaskowy panel OLED 16:10 o przekątnej 13,3 cala i rozdzielczości 2880 x 1800 pikseli. Subiektywnie, jakość obrazu jest imponująca, a kolory są bardzo żywe. Co więcej, czas reakcji jest bardzo krótki. Jego maksymalna jasność SDR wynosi nieco ponad 400 cd/m², a dzięki niskiej wartości czerni charakteryzuje się wysokim współczynnikiem kontrastu. To również przyczynia się do wysokiej jakości obrazu. Wejścia dotykowe nie są obsługiwane, ale jasność może być automatycznie dostosowywana do warunków oświetlenia otoczenia.
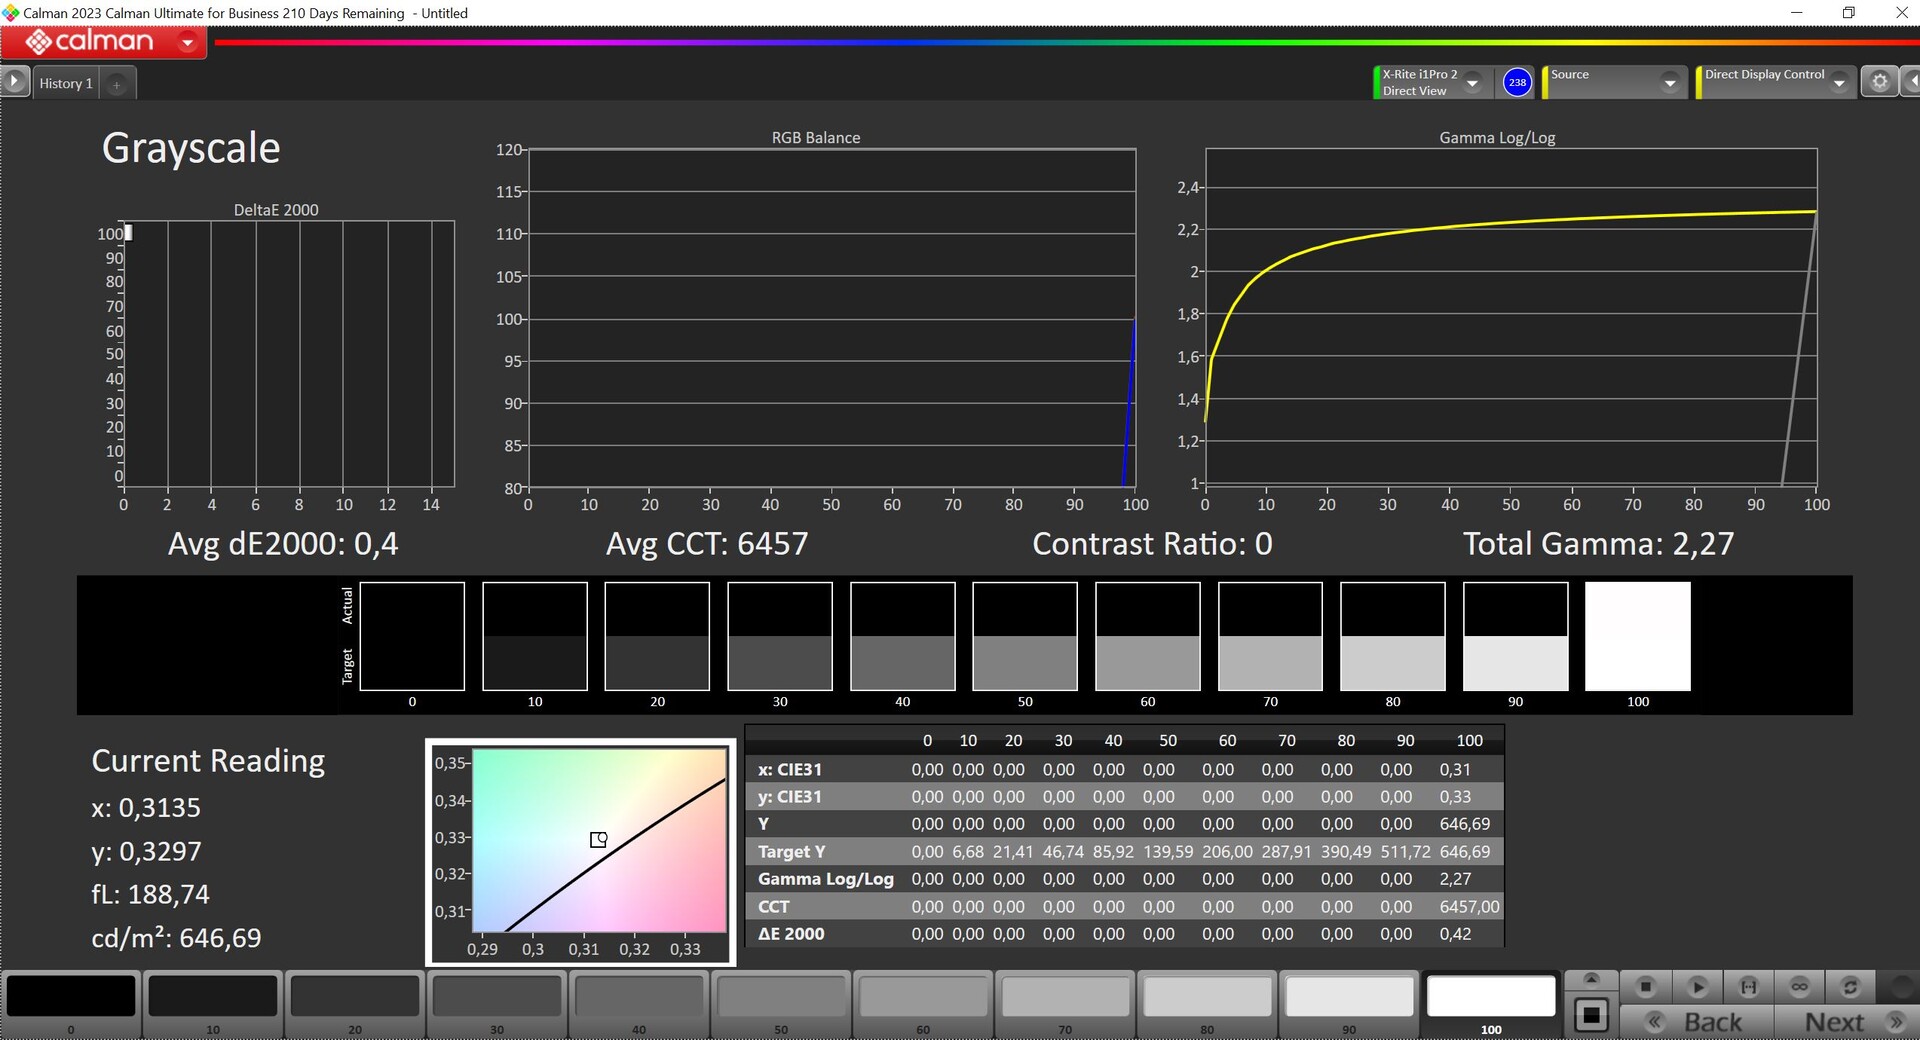
W przypadku korzystania z HDR, maksymalna jasność HDR wzrasta do 647 cd/m² przy wyświetlaniu małych fragmentów obrazu i nieco ponad 500 cd/m² przy wyświetlaniu prawie całkowicie białego obrazu. Podobnie jak w przypadku wszystkich innych laptopów z systemem Windows, należy najpierw ręcznie aktywować tryb HDR, aby zarządzanie kolorami nie działało poprawnie.
| |||||||||||||||||||||||||
rozświetlenie: 98 %
na akumulatorze: 405 cd/m²
kontrast: ∞:1 (czerń: 0 cd/m²)
ΔE ColorChecker Calman: 2.1 | ∀{0.5-29.43 Ø4.71}
ΔE Greyscale Calman: 1.2 | ∀{0.09-98 Ø4.96}
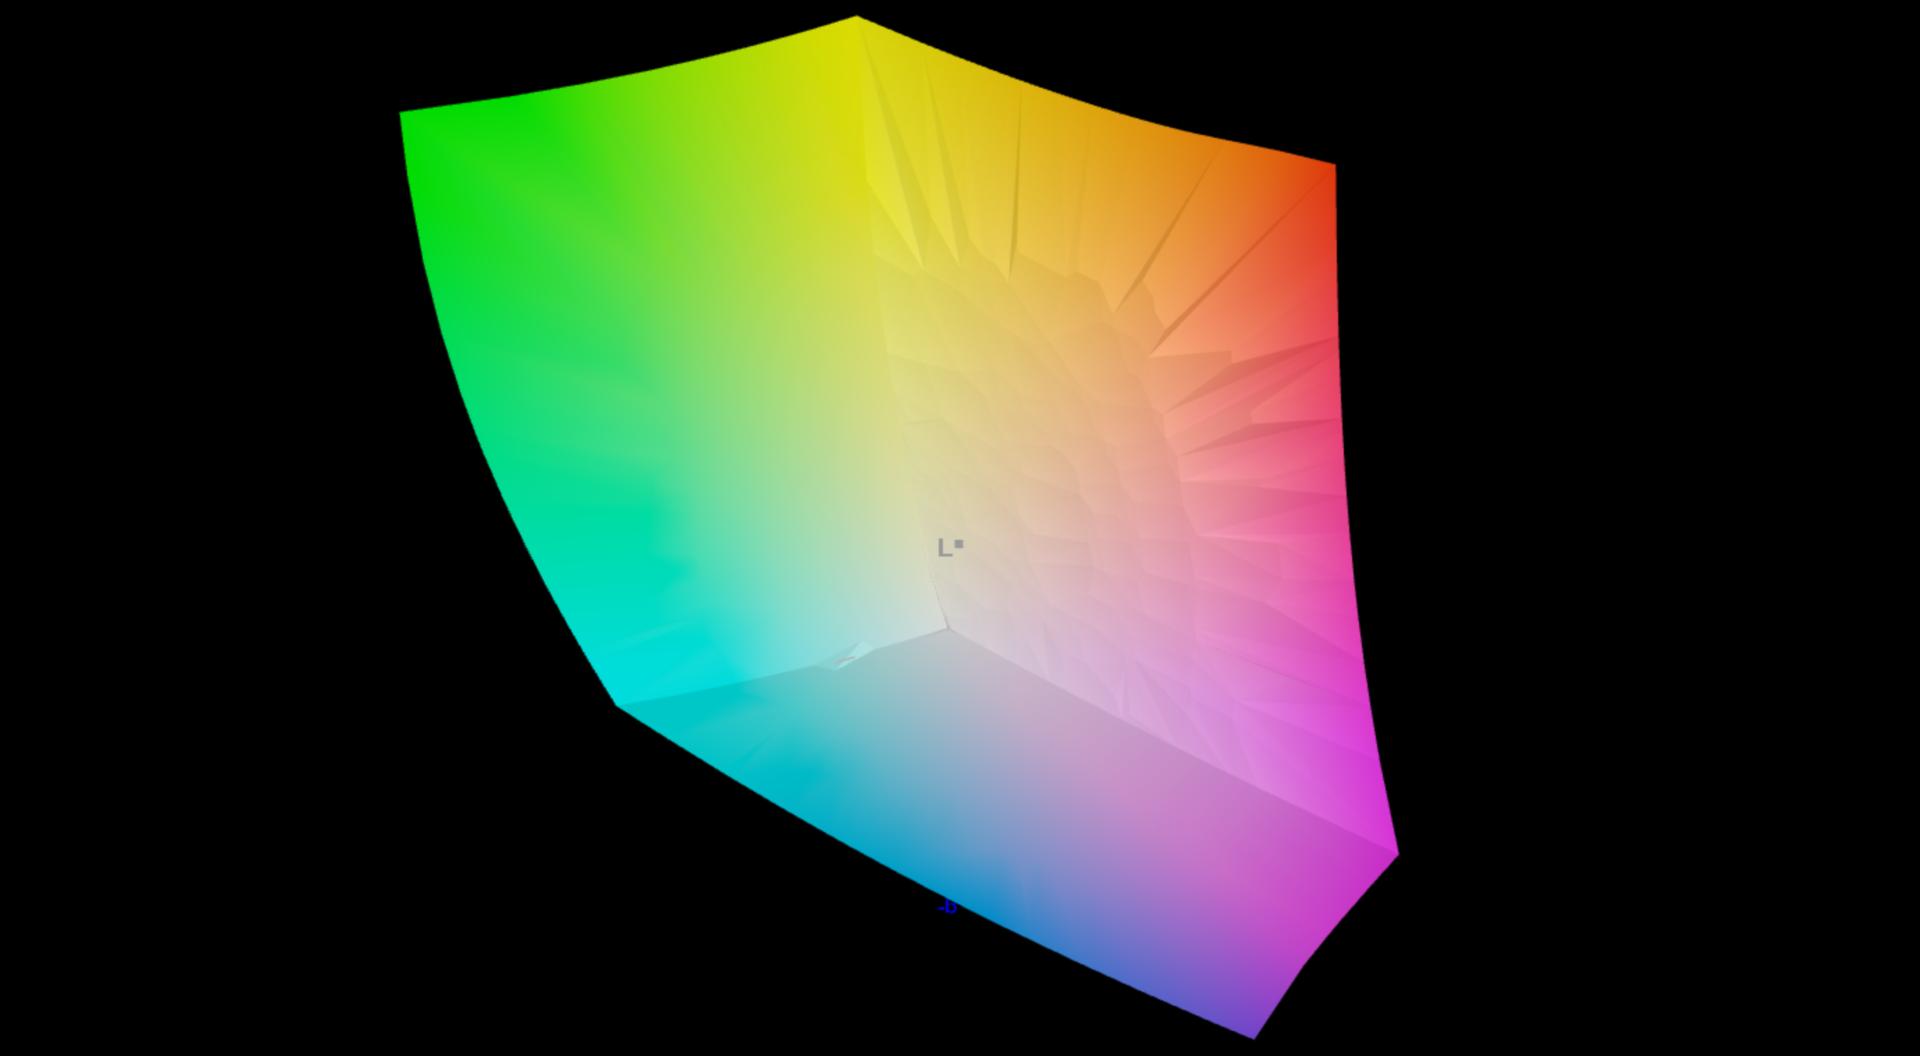
97.8% AdobeRGB 1998 (Argyll 3D)
100% sRGB (Argyll 3D)
99.9% Display P3 (Argyll 3D)
Gamma: 2.16
CCT: 6465 K
| MSI Prestige 13 AI Evo ATNA33AA07-0, OLED, 2880x1800, 13.3" | Lenovo ThinkPad X1 Nano Gen 3 MND007ZA1-3, IPS, 2160x1350, 13" | Dell Latitude 13 7340 i5-1345U Chi Mei 133JCG, IPS, 1920x1200, 13.3" | HP Dragonfly G4 Chi Mei CMN13C0, IPS, 1920x1280, 13.5" | Asus ZenBook S13 OLED UX5304 SDC417B, OLED, 2880x1800, 13.3" | |
|---|---|---|---|---|---|
| Display | -20% | -23% | -21% | -0% | |
| Display P3 Coverage (%) | 99.9 | 68.5 -31% | 65.9 -34% | 68.4 -32% | 99.7 0% |
| sRGB Coverage (%) | 100 | 99.5 0% | 96.8 -3% | 98.3 -2% | 100 0% |
| AdobeRGB 1998 Coverage (%) | 97.8 | 69.7 -29% | 67.8 -31% | 70.4 -28% | 96.9 -1% |
| Response Times | -2092% | -2565% | -2572% | -21% | |
| Response Time Grey 50% / Grey 80% * (ms) | 1.54 ? | 39.9 ? -2491% | 51 ? -3212% | 48.8 ? -3069% | 2 ? -30% |
| Response Time Black / White * (ms) | 1.44 ? | 25.8 ? -1692% | 29.04 ? -1917% | 31.3 ? -2074% | 1.6 ? -11% |
| PWM Frequency (Hz) | 240 ? | 240 ? | |||
| Screen | -1% | -65% | -14% | 13% | |
| Brightness middle (cd/m²) | 404 | 461.2 14% | 471 17% | 408.8 1% | 361 -11% |
| Brightness (cd/m²) | 407 | 428 5% | 437 7% | 399 -2% | 365 -10% |
| Brightness Distribution (%) | 98 | 86 -12% | 87 -11% | 90 -8% | 98 0% |
| Black Level * (cd/m²) | 0.29 | 0.2033 | 0.32 | ||
| Colorchecker dE 2000 * | 2.1 | 1.79 15% | 3.24 -54% | 2.02 4% | 1.2 43% |
| Colorchecker dE 2000 max. * | 4.3 | 3.3 23% | 7.19 -67% | 3.84 11% | 1.9 56% |
| Greyscale dE 2000 * | 1.2 | 1.8 -50% | 4.6 -283% | 2.3 -92% | 1.2 -0% |
| Gamma | 2.16 102% | 2.24 98% | 2.2 100% | 2.27 97% | |
| CCT | 6465 101% | 6588 99% | 6520 100% | 6203 105% | 6486 100% |
| Contrast (:1) | 1590 | 2317 | 1278 | ||
| Colorchecker dE 2000 calibrated * | 0.47 | 1.08 | 0.61 | ||
| Całkowita średnia (program / ustawienia) | -704% /
-386% | -884% /
-508% | -869% /
-481% | -3% /
3% |
* ... im mniej tym lepiej
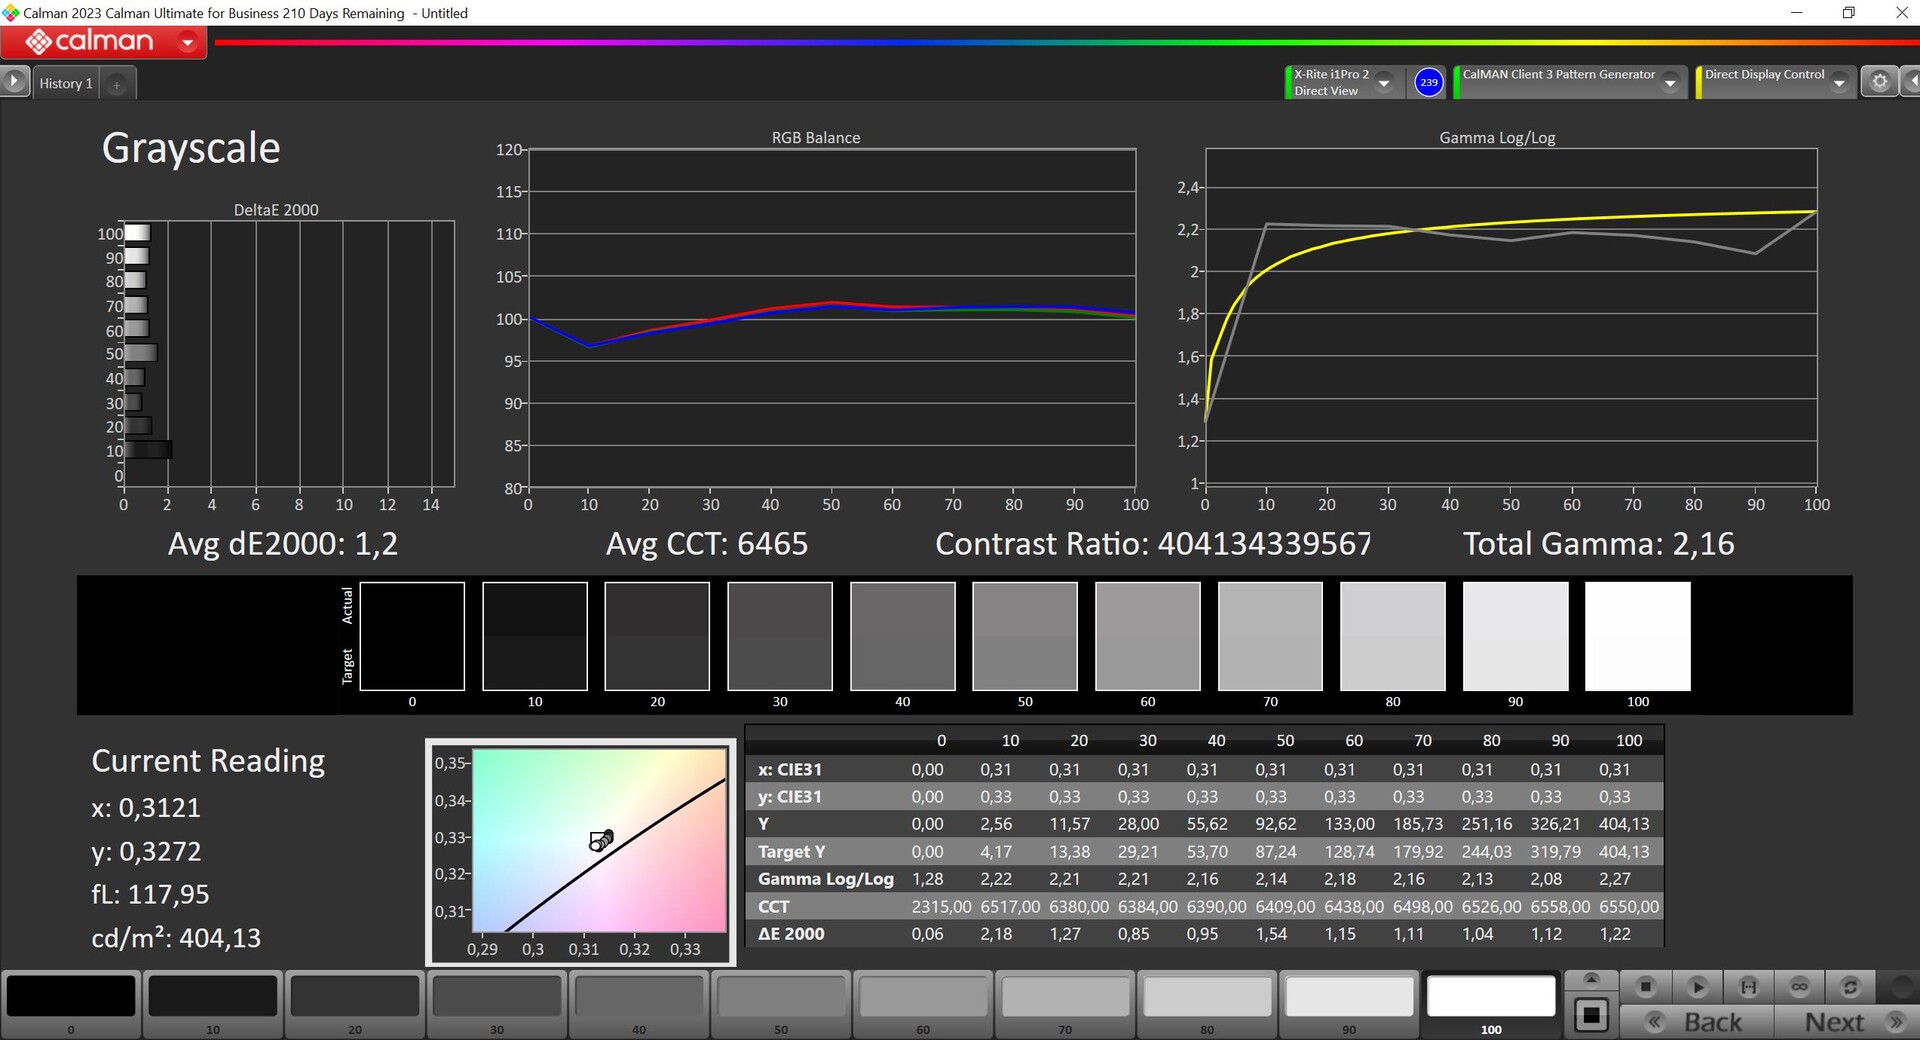
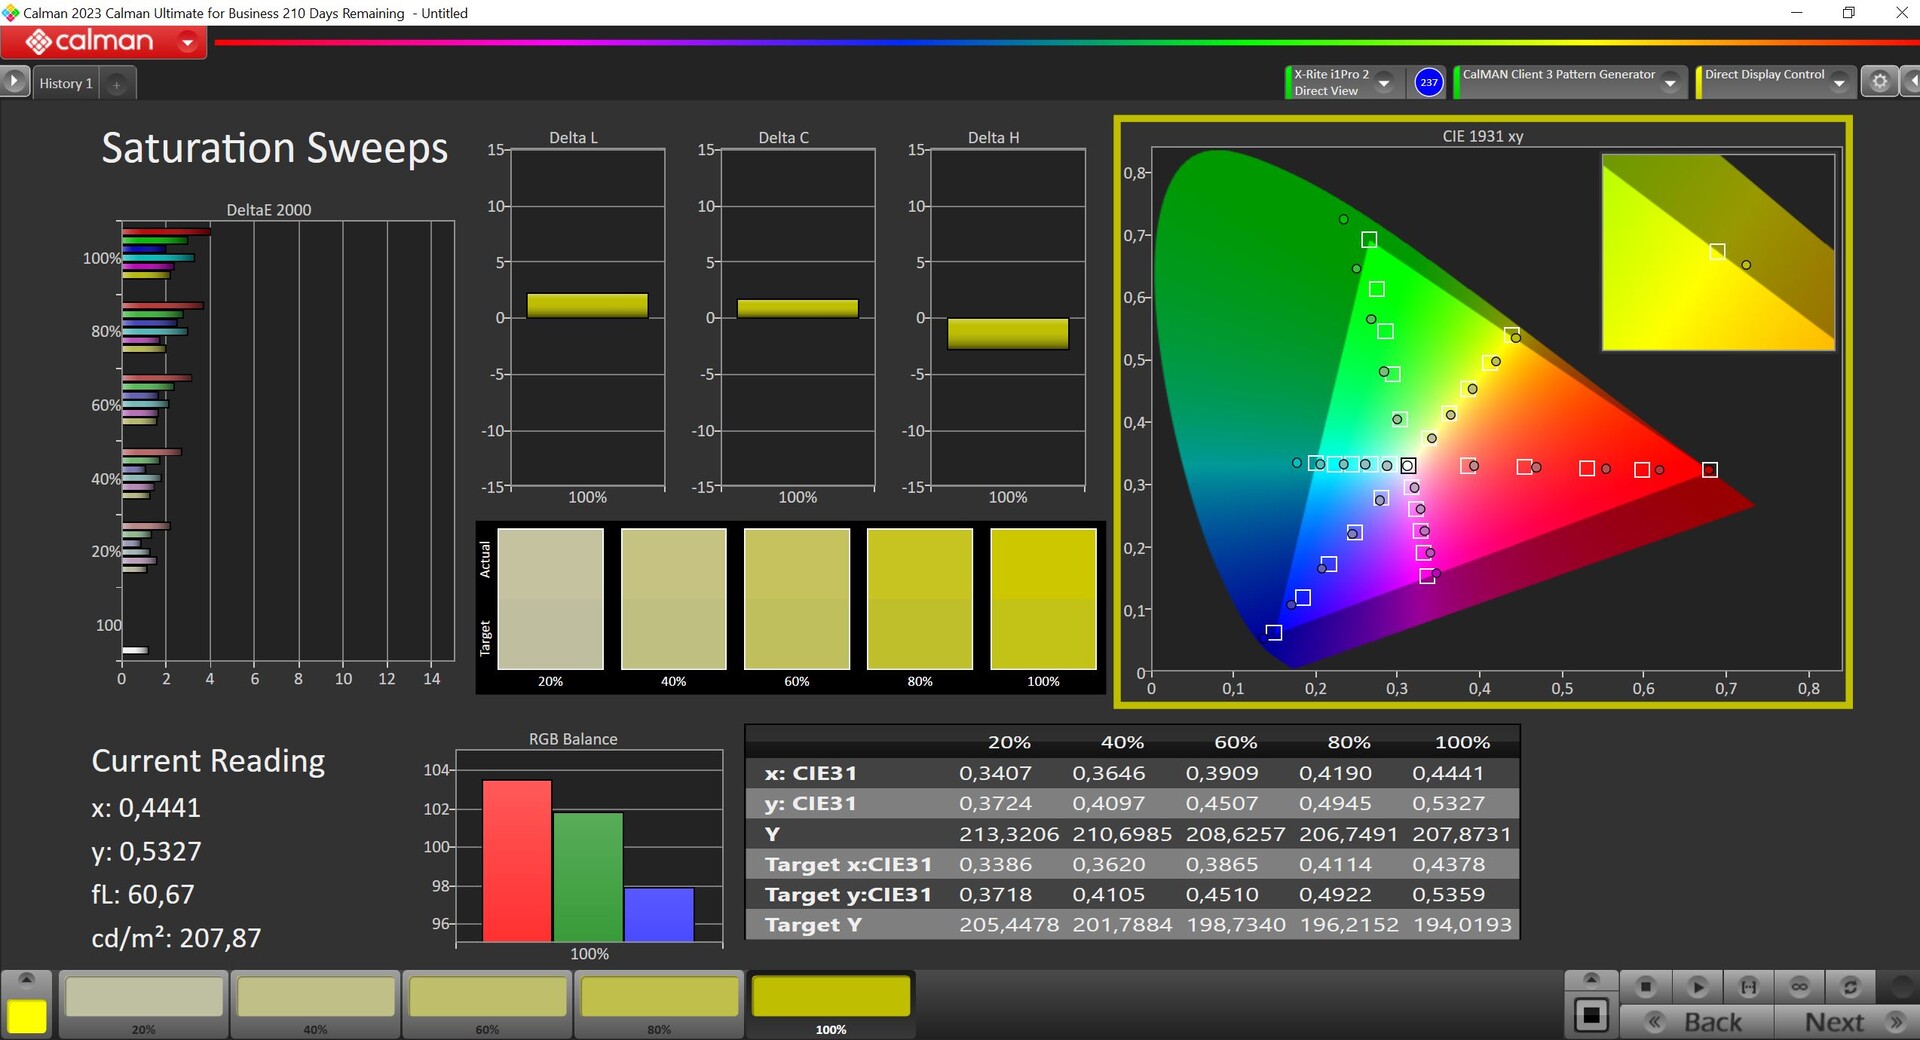
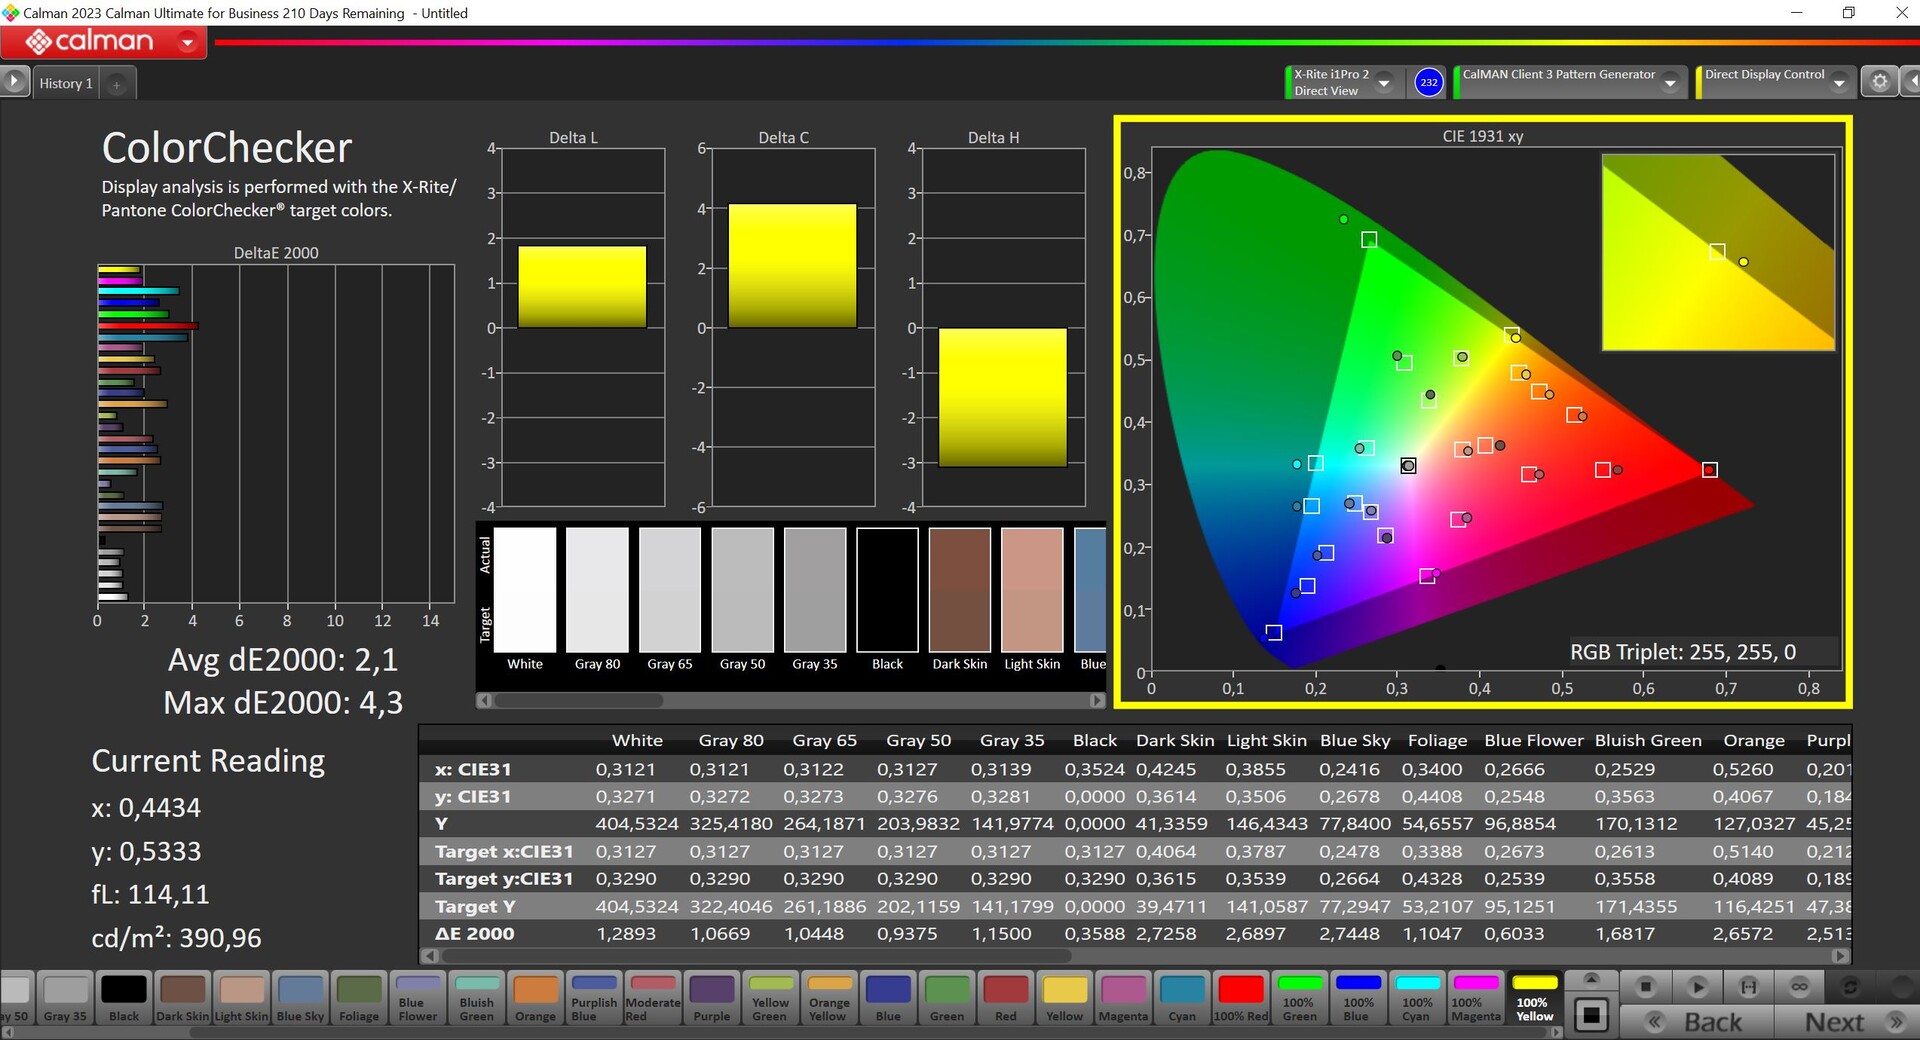
Przeanalizowaliśmy panel za pomocą profesjonalnego oprogramowania CalMAN (X-Rite i1 Pro2) i od razu po wyjęciu z pudełka zapewnił on dobry obraz. Nie zauważyliśmy żadnych odcieni kolorów, a jego temperatura barwowa również była dokładna - tylko niektóre kolory (100%) przekraczały ważne odchylenie DeltaE-2000 wynoszące 3 (w porównaniu do wartości referencyjnej P3). Nie byliśmy w stanie skorygować tego poprzez kalibrację, a MSI nie oferuje profilu sRGB. W rezultacie Prestige 13 nie nadaje się najlepiej do edycji zdjęć.

Wyświetl czasy reakcji
| ↔ Czas reakcji od czerni do bieli | ||
|---|---|---|
| 1.44 ms ... wzrost ↗ i spadek ↘ łącznie | ↗ 0.73 ms wzrost | 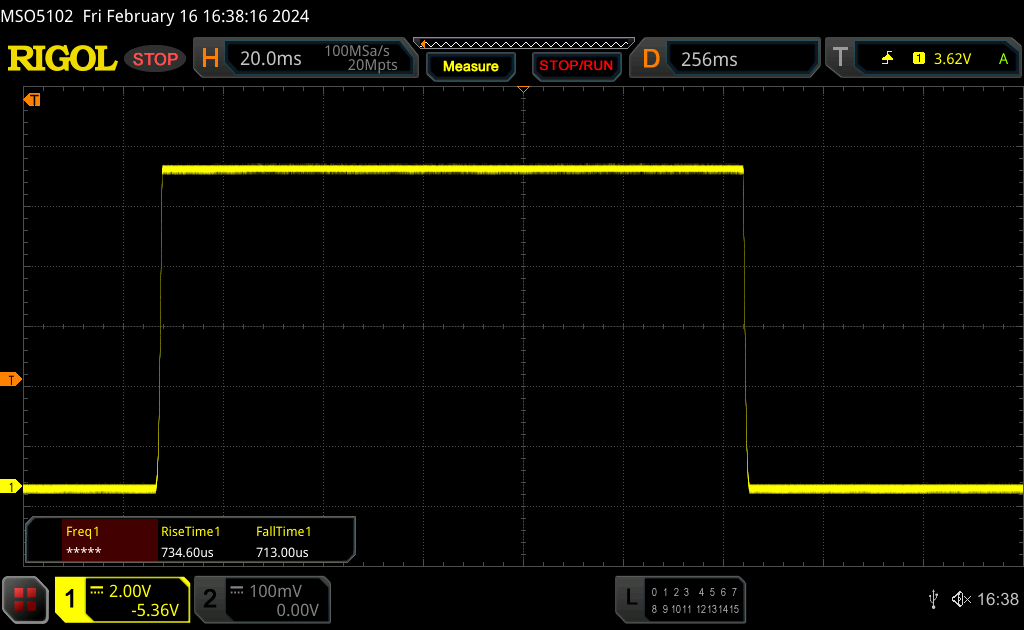 |
| ↘ 0.71 ms upadek | ||
| W naszych testach ekran wykazuje bardzo szybką reakcję i powinien bardzo dobrze nadawać się do szybkich gier. Dla porównania, wszystkie testowane urządzenia wahają się od 0.1 (minimum) do 240 (maksimum) ms. » 9 % wszystkich urządzeń jest lepszych. Oznacza to, że zmierzony czas reakcji jest lepszy od średniej wszystkich testowanych urządzeń (19.8 ms). | ||
| ↔ Czas reakcji 50% szarości do 80% szarości | ||
| 1.54 ms ... wzrost ↗ i spadek ↘ łącznie | ↗ 0.79 ms wzrost | 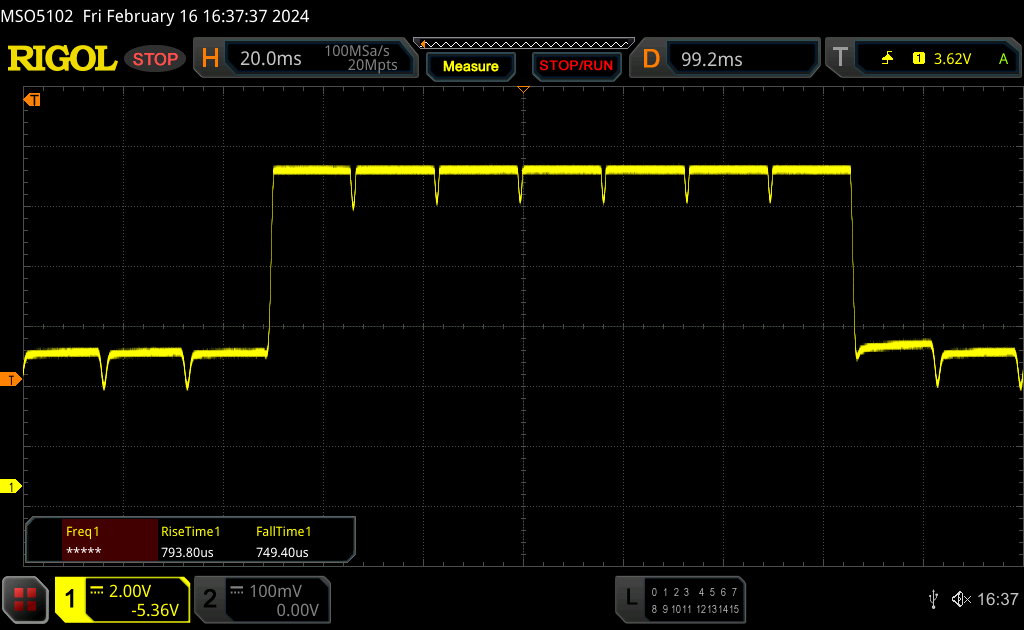 |
| ↘ 0.75 ms upadek | ||
| W naszych testach ekran wykazuje bardzo szybką reakcję i powinien bardzo dobrze nadawać się do szybkich gier. Dla porównania, wszystkie testowane urządzenia wahają się od 0.165 (minimum) do 636 (maksimum) ms. » 8 % wszystkich urządzeń jest lepszych. Oznacza to, że zmierzony czas reakcji jest lepszy od średniej wszystkich testowanych urządzeń (31 ms). | ||
Migotanie ekranu / PWM (modulacja szerokości impulsu)
| Wykryto migotanie ekranu/wykryto PWM | 240 Hz | ≤ 42 % ustawienia jasności | 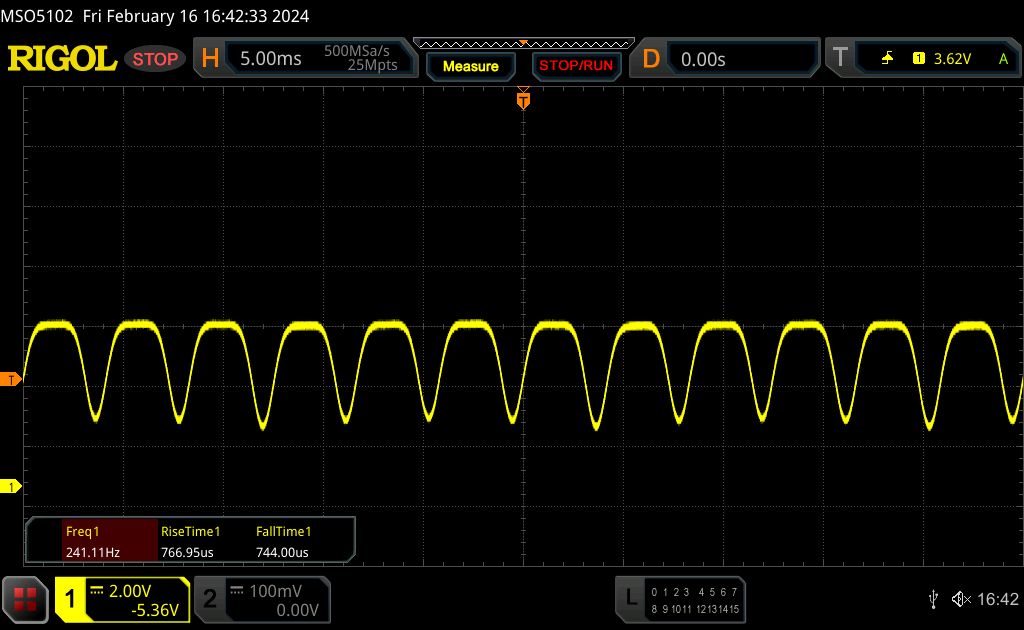 |
Podświetlenie wyświetlacza miga z częstotliwością 240 Hz (najgorszy przypadek, np. przy użyciu PWM) Wykryto migotanie przy ustawieniu jasności 42 % i poniżej. Powyżej tego ustawienia jasności nie powinno być żadnego migotania ani PWM. Częstotliwość 240 Hz jest stosunkowo niska, więc wrażliwi użytkownicy prawdopodobnie zauważą migotanie i odczują zmęczenie oczu przy podanym ustawieniu jasności i poniżej. Dla porównania: 52 % wszystkich testowanych urządzeń nie używa PWM do przyciemniania wyświetlacza. Jeśli wykryto PWM, zmierzono średnio 7747 (minimum: 5 - maksimum: 343500) Hz. | |||
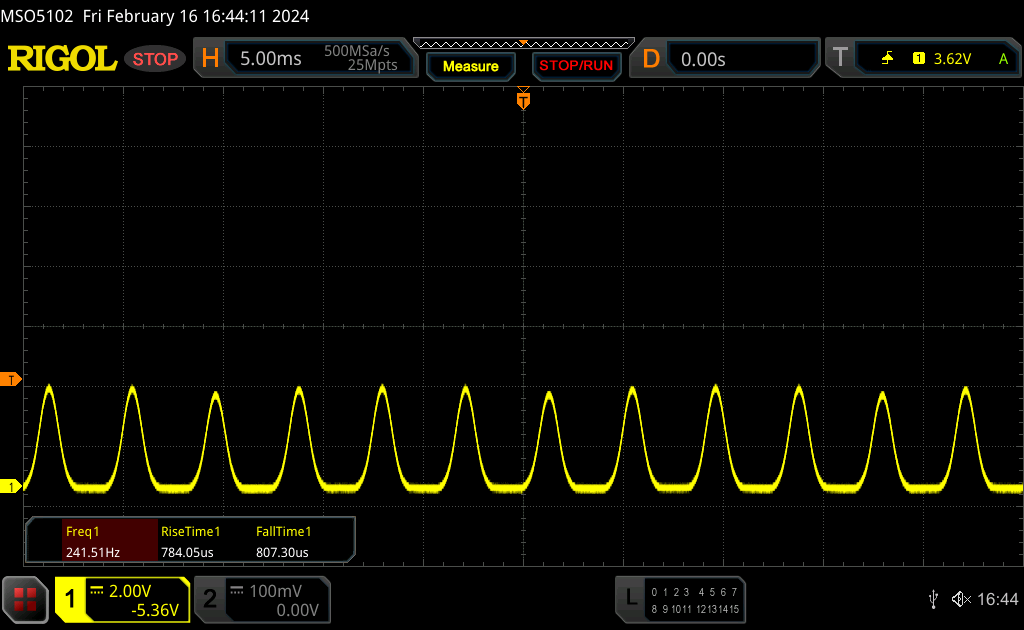
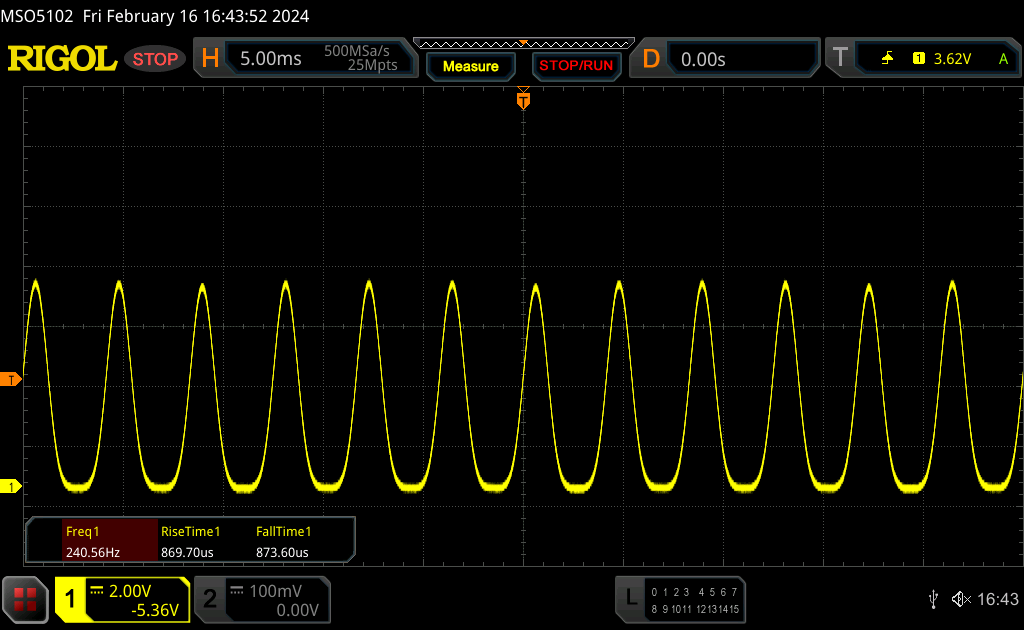
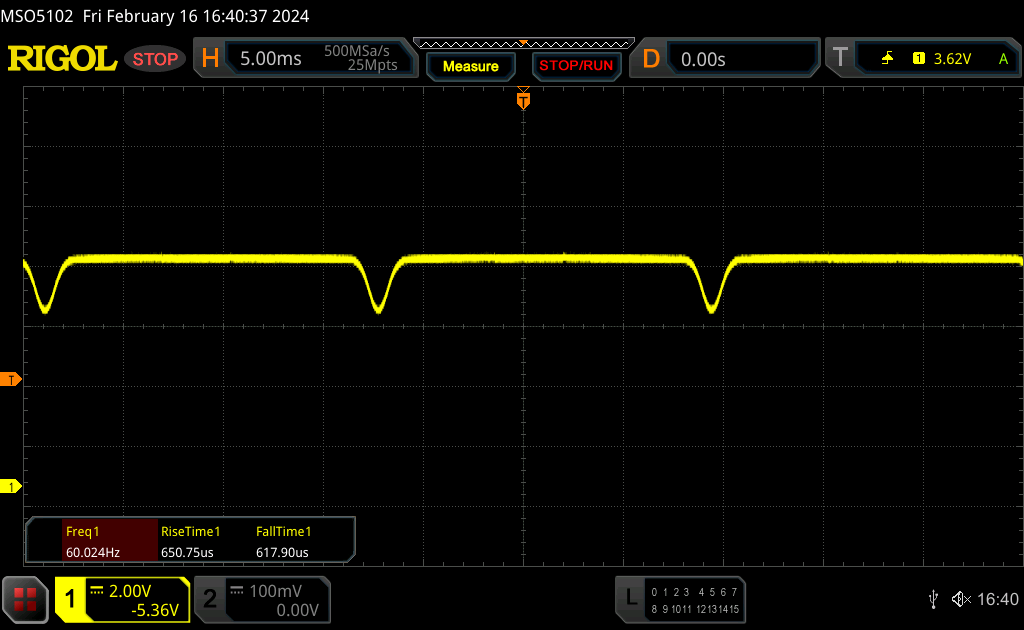
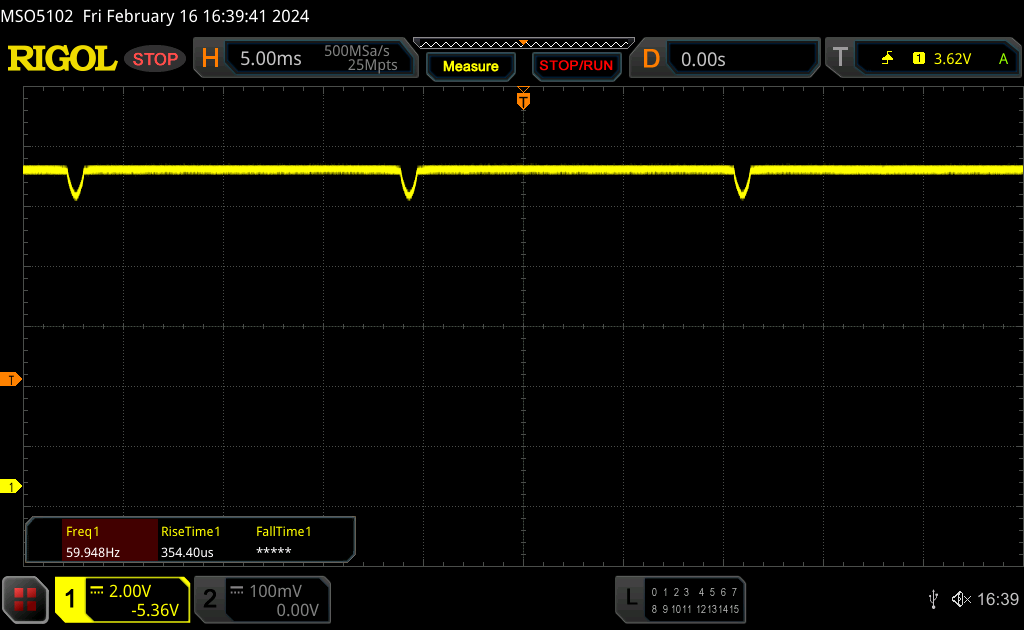
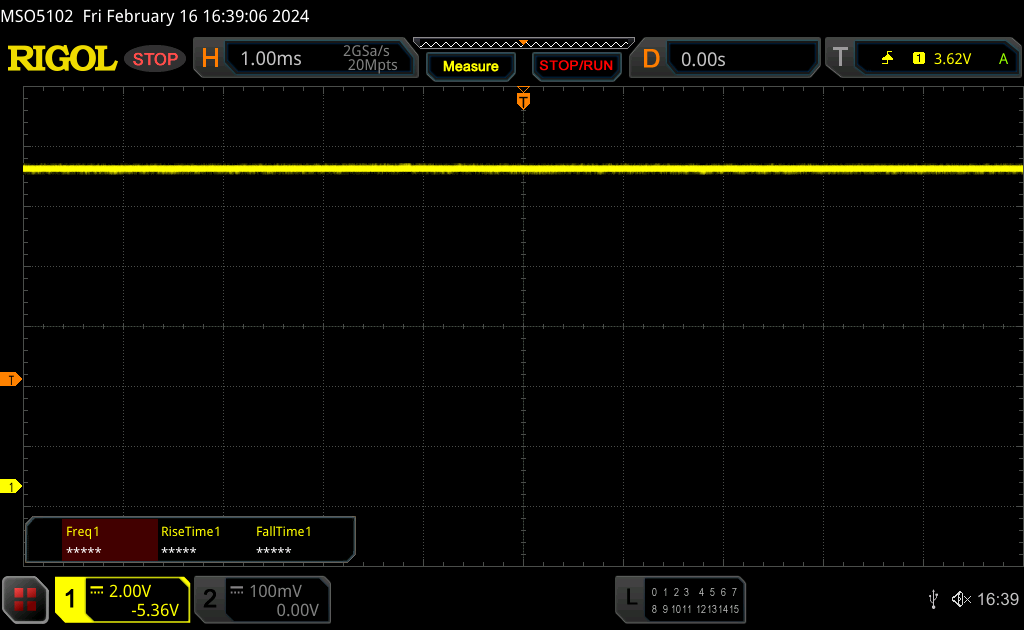
Z zastosowanym PWM, zmierzyliśmy ściemnianie DC przy 60 Hz w zakresie jasności 43-84%; przy 42% lub mniej, potencjalnie bardziej szkodliwe migotanie PWM przy 240 Hz wchodzi w grę.
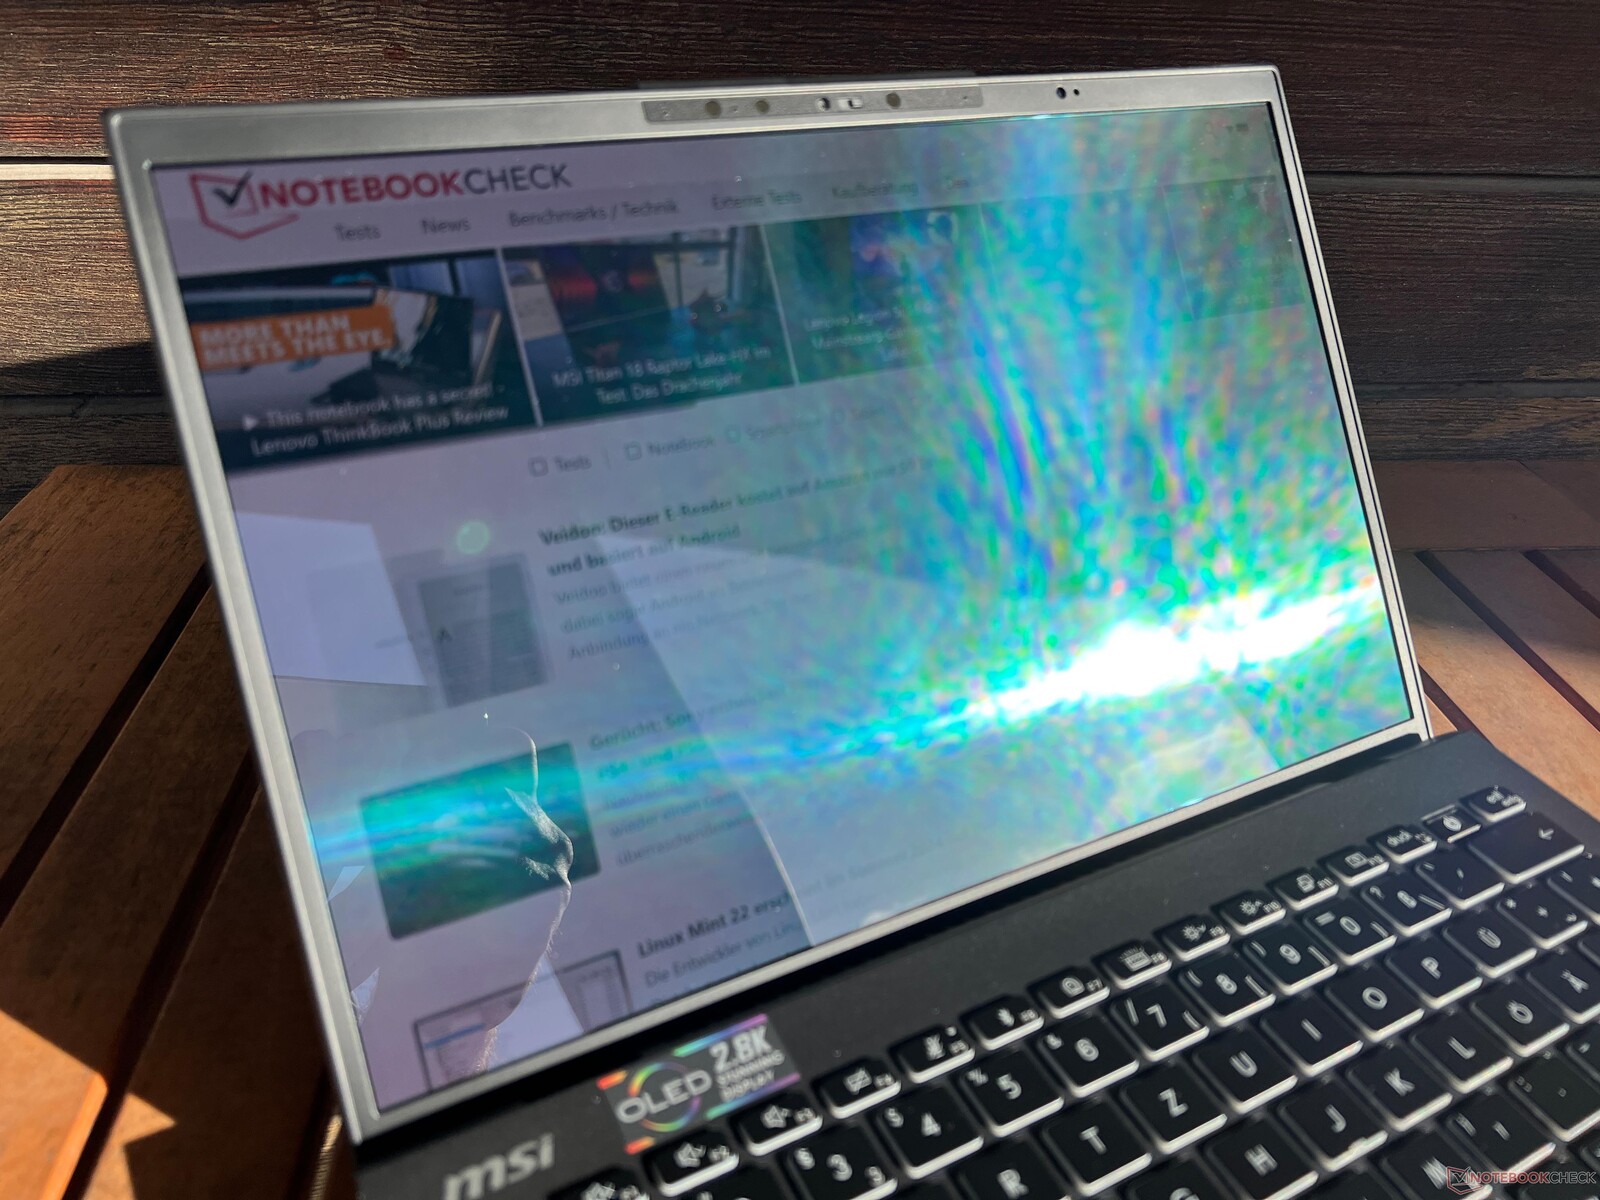
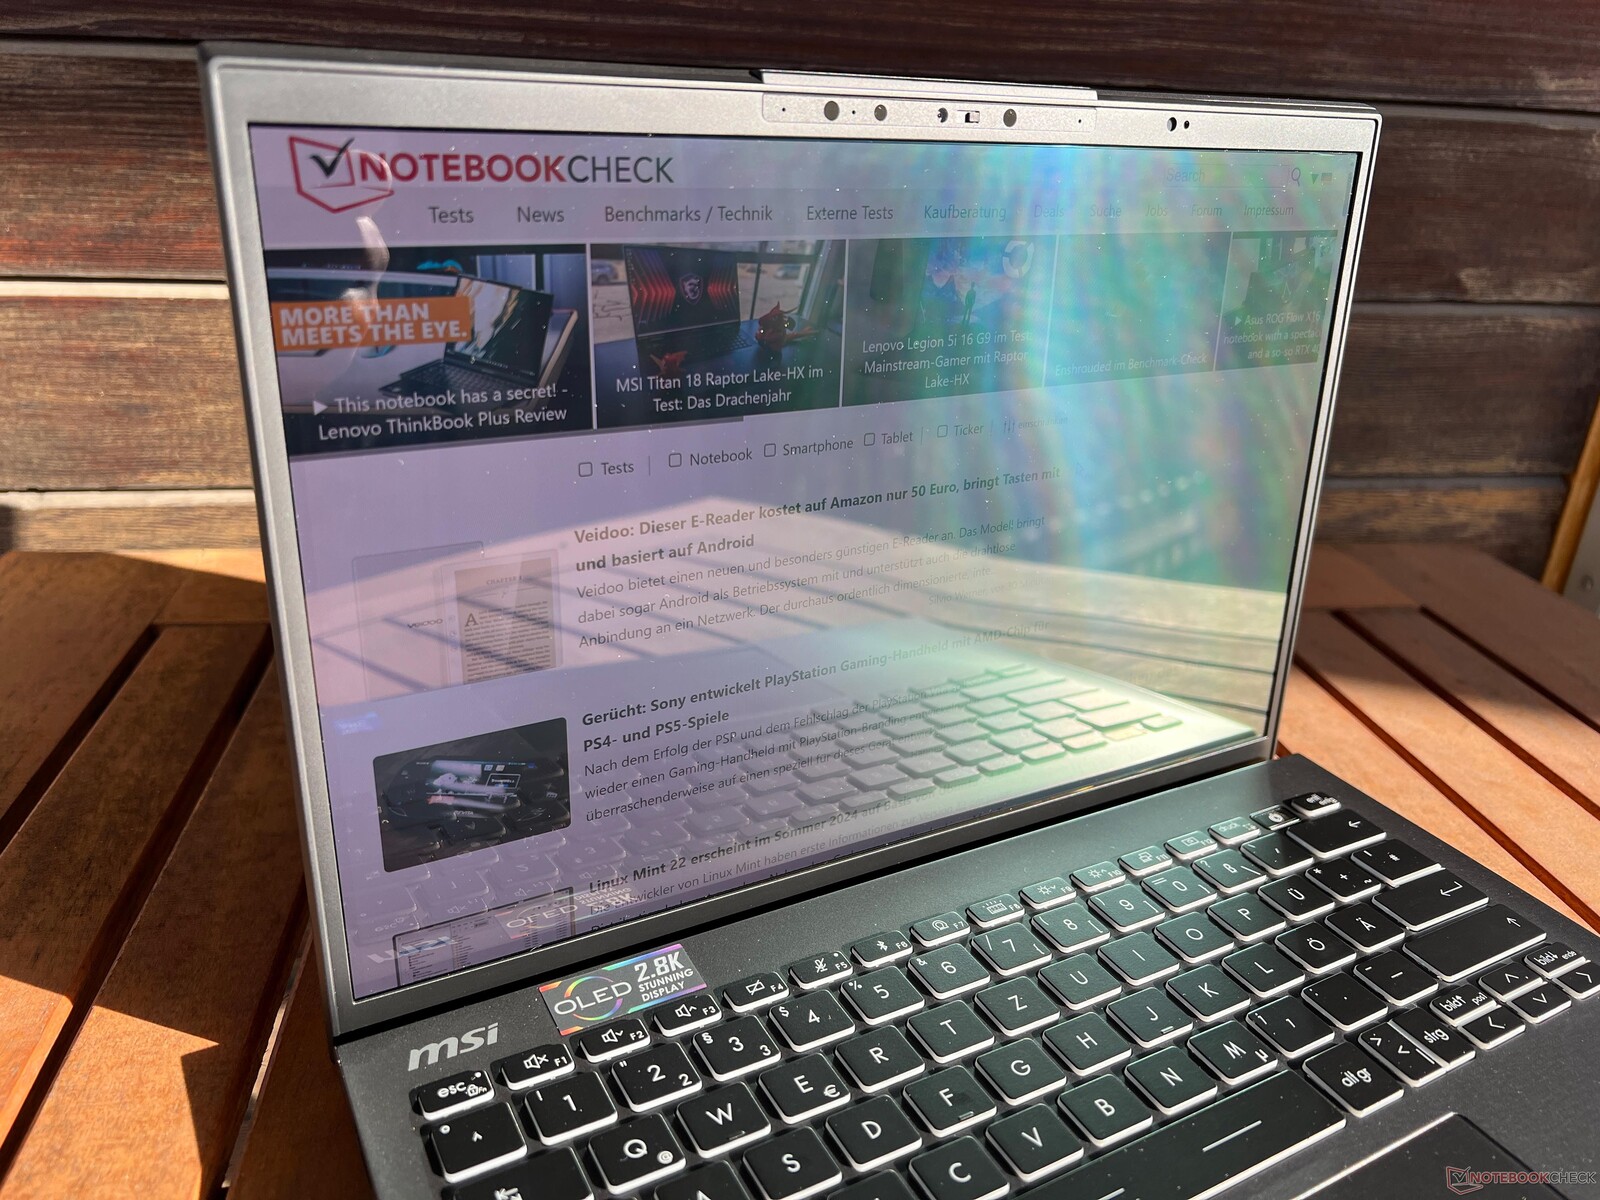

W jasnym otoczeniu odbicia szybko stają się problemem na błyszczącym wyświetlaczu. Stabilność kąta widzenia jest świetna - tylko ekstremalne kąty powodują typowe dla OLED niebieskie migotanie.

Wydajność - Meteor Lake-H przy 20 watach
Warunki testowania
Preinstalowany MSI Center oferuje wiele profili energetycznych, przy czym nie zauważyliśmy żadnych dużych różnic pomiędzy poszczególnymi profilami (z wyjątkiem trybu cichego ). Następnie przeprowadziliśmy następujące testy porównawcze i pomiary przy użyciu trybu MSI AI Engine, który jest również ustawiony jako standard.
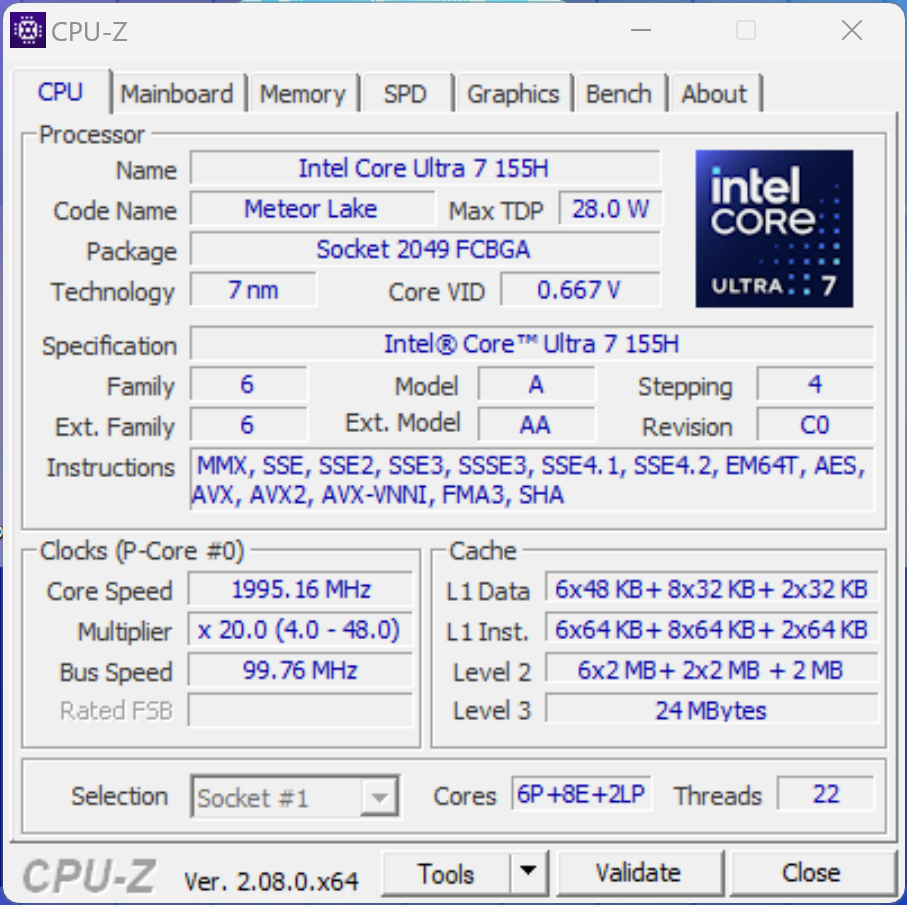
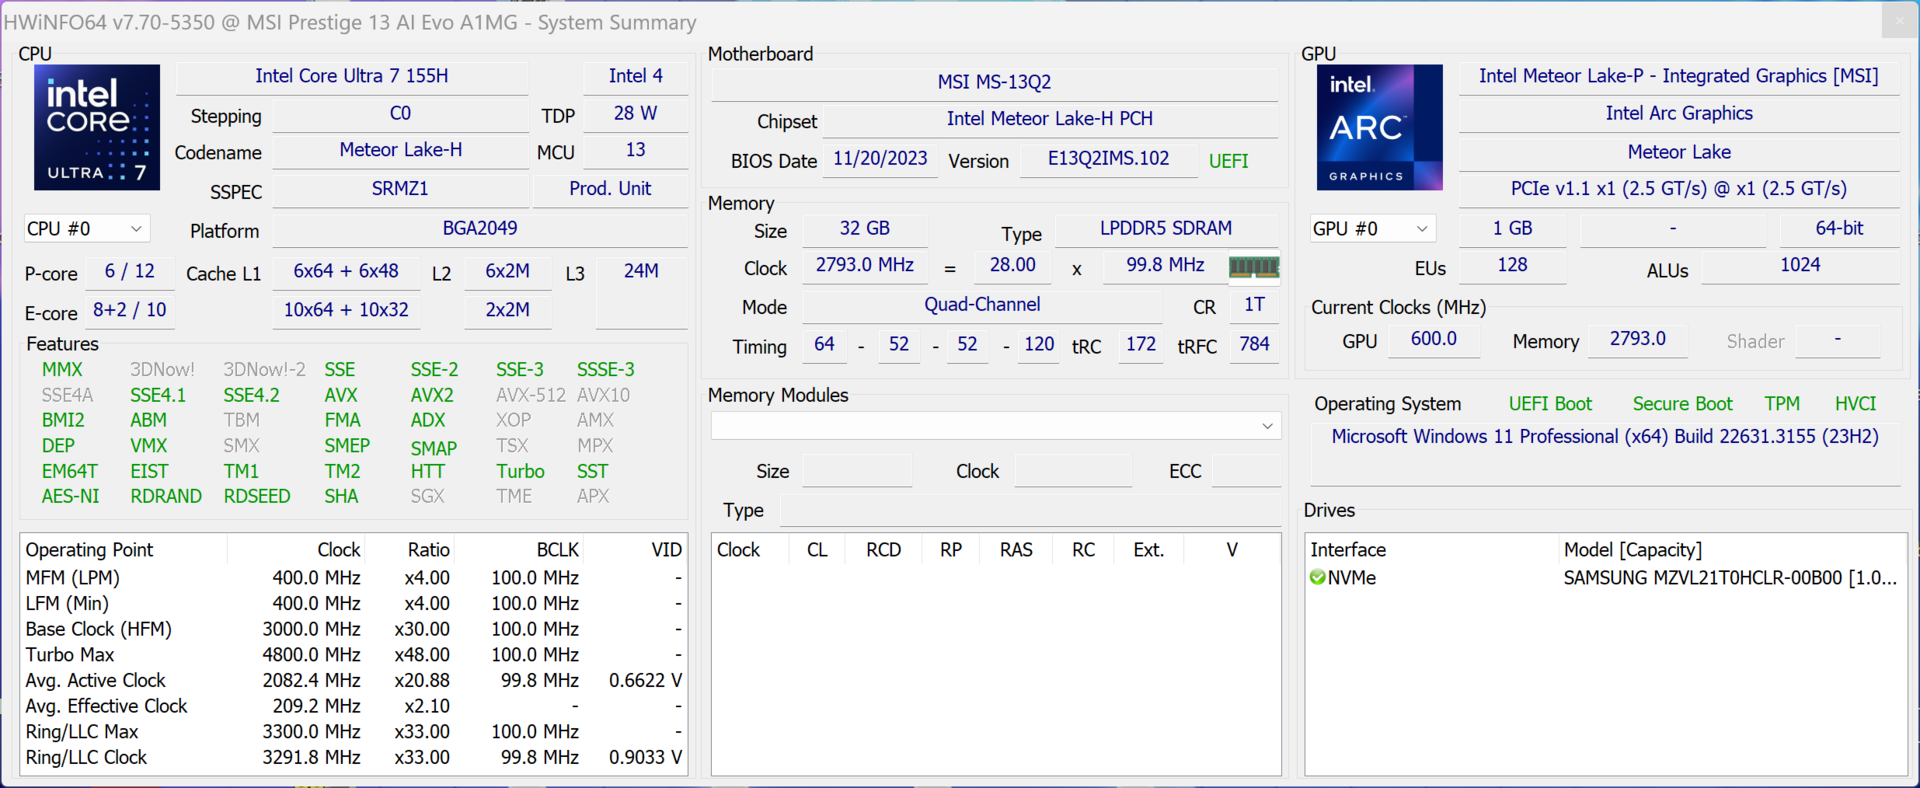
Procesor - Core Ultra 7 155H
MSI wyposażyło laptopa w nowy procesor Meteor-Lake Core Ultra 7 155H od Intela, który może być używany w obszarze TDP od 28 do 115 watów. W przypadku Prestige 13 odnotowaliśmy maksymalnie 64 waty przez około 30 sekund, gdy urządzenie było chłodne, po czym jego zużycie spadło do 20 watów. Procesor z serii U byłby prawdopodobnie lepszym wyborem, ale ponieważ te CPU posiadają tylko 2 szybkie rdzenie P, ich wydajność jest raczej skromna. Pod krótkotrwałym obciążeniem (co jest znacznie bardziej prawdopodobne w przypadku subnotebooka), jego wydajność wielordzeniowa jest oczywiście bardzo dobra. Wydajność jednordzeniowa jest w porządku, ale w tym aspekcie procesory Meteor-Lake nie wykazują żadnej przewagi nad starymi modelami Raptor-Lake. Podczas pracy na baterii, wydajność procesora pozostaje na stałym poziomie. Więcej testów porównawczych procesorów można znaleźć tutaj.
Cinebench R15 Multi continuous test
Cinebench R23: Multi Core | Single Core
Cinebench R20: CPU (Multi Core) | CPU (Single Core)
Cinebench R15: CPU Multi 64Bit | CPU Single 64Bit
Blender: v2.79 BMW27 CPU
7-Zip 18.03: 7z b 4 | 7z b 4 -mmt1
Geekbench 6.7: Multi-Core | Single-Core
Geekbench 5.5: Multi-Core | Single-Core
HWBOT x265 Benchmark v2.2: 4k Preset
LibreOffice : 20 Documents To PDF
R Benchmark 2.5: Overall mean
| CPU Performance rating | |
| Przeciętny Intel Core Ultra 7 155H | |
| Średnia w klasie Subnotebook | |
| MSI Prestige 13 AI Evo | |
| Lenovo ThinkPad X1 Nano Gen 3 | |
| HP Dragonfly G4 -2! | |
| Asus ZenBook S13 OLED UX5304 -2! | |
| Dell Latitude 13 7340 i5-1345U -2! | |
| Cinebench R23 / Multi Core | |
| Przeciętny Intel Core Ultra 7 155H (9769 - 19007, n=52) | |
| Średnia w klasie Subnotebook (1555 - 21812, n=60, ostatnie 2 lata) | |
| MSI Prestige 13 AI Evo | |
| Lenovo ThinkPad X1 Nano Gen 3 | |
| Dell Latitude 13 7340 i5-1345U | |
| HP Dragonfly G4 | |
| Asus ZenBook S13 OLED UX5304 | |
| Cinebench R23 / Single Core | |
| HP Dragonfly G4 | |
| Średnia w klasie Subnotebook (358 - 2213, n=61, ostatnie 2 lata) | |
| Asus ZenBook S13 OLED UX5304 | |
| Przeciętny Intel Core Ultra 7 155H (1496 - 1815, n=52) | |
| Dell Latitude 13 7340 i5-1345U | |
| Lenovo ThinkPad X1 Nano Gen 3 | |
| MSI Prestige 13 AI Evo | |
| Cinebench R20 / CPU (Multi Core) | |
| Przeciętny Intel Core Ultra 7 155H (3798 - 7409, n=50) | |
| Średnia w klasie Subnotebook (579 - 8541, n=57, ostatnie 2 lata) | |
| MSI Prestige 13 AI Evo | |
| Lenovo ThinkPad X1 Nano Gen 3 | |
| Dell Latitude 13 7340 i5-1345U | |
| HP Dragonfly G4 | |
| Asus ZenBook S13 OLED UX5304 | |
| Cinebench R20 / CPU (Single Core) | |
| HP Dragonfly G4 | |
| Asus ZenBook S13 OLED UX5304 | |
| Lenovo ThinkPad X1 Nano Gen 3 | |
| Przeciętny Intel Core Ultra 7 155H (601 - 696, n=50) | |
| Dell Latitude 13 7340 i5-1345U | |
| Średnia w klasie Subnotebook (128 - 832, n=57, ostatnie 2 lata) | |
| MSI Prestige 13 AI Evo | |
| Cinebench R15 / CPU Multi 64Bit | |
| Przeciętny Intel Core Ultra 7 155H (1932 - 2880, n=56) | |
| MSI Prestige 13 AI Evo | |
| Średnia w klasie Subnotebook (327 - 3345, n=57, ostatnie 2 lata) | |
| Lenovo ThinkPad X1 Nano Gen 3 | |
| Asus ZenBook S13 OLED UX5304 | |
| HP Dragonfly G4 | |
| Dell Latitude 13 7340 i5-1345U | |
| Cinebench R15 / CPU Single 64Bit | |
| Średnia w klasie Subnotebook (72.4 - 322, n=57, ostatnie 2 lata) | |
| HP Dragonfly G4 | |
| Przeciętny Intel Core Ultra 7 155H (99.6 - 268, n=52) | |
| Asus ZenBook S13 OLED UX5304 | |
| MSI Prestige 13 AI Evo | |
| Dell Latitude 13 7340 i5-1345U | |
| Lenovo ThinkPad X1 Nano Gen 3 | |
| Blender / v2.79 BMW27 CPU | |
| Dell Latitude 13 7340 i5-1345U | |
| Asus ZenBook S13 OLED UX5304 | |
| Asus ZenBook S13 OLED UX5304 | |
| HP Dragonfly G4 | |
| Lenovo ThinkPad X1 Nano Gen 3 | |
| Średnia w klasie Subnotebook (159 - 2271, n=58, ostatnie 2 lata) | |
| MSI Prestige 13 AI Evo | |
| Przeciętny Intel Core Ultra 7 155H (175 - 381, n=47) | |
| 7-Zip 18.03 / 7z b 4 | |
| Przeciętny Intel Core Ultra 7 155H (41739 - 70254, n=50) | |
| Średnia w klasie Subnotebook (11668 - 77867, n=57, ostatnie 2 lata) | |
| MSI Prestige 13 AI Evo | |
| HP Dragonfly G4 | |
| Lenovo ThinkPad X1 Nano Gen 3 | |
| Asus ZenBook S13 OLED UX5304 | |
| Dell Latitude 13 7340 i5-1345U | |
| 7-Zip 18.03 / 7z b 4 -mmt1 | |
| HP Dragonfly G4 | |
| Lenovo ThinkPad X1 Nano Gen 3 | |
| Asus ZenBook S13 OLED UX5304 | |
| Średnia w klasie Subnotebook (2643 - 6699, n=59, ostatnie 2 lata) | |
| MSI Prestige 13 AI Evo | |
| Przeciętny Intel Core Ultra 7 155H (4594 - 5621, n=50) | |
| Dell Latitude 13 7340 i5-1345U | |
| Geekbench 6.7 / Multi-Core | |
| Średnia w klasie Subnotebook (2244 - 20325, n=63, ostatnie 2 lata) | |
| Przeciętny Intel Core Ultra 7 155H (7732 - 13656, n=55) | |
| Lenovo ThinkPad X1 Nano Gen 3 | |
| MSI Prestige 13 AI Evo | |
| Geekbench 6.7 / Single-Core | |
| Średnia w klasie Subnotebook (960 - 4195, n=62, ostatnie 2 lata) | |
| Lenovo ThinkPad X1 Nano Gen 3 | |
| MSI Prestige 13 AI Evo | |
| Przeciętny Intel Core Ultra 7 155H (1901 - 2473, n=52) | |
| Geekbench 5.5 / Multi-Core | |
| Przeciętny Intel Core Ultra 7 155H (10017 - 13556, n=52) | |
| Średnia w klasie Subnotebook (2557 - 17218, n=48, ostatnie 2 lata) | |
| MSI Prestige 13 AI Evo | |
| Lenovo ThinkPad X1 Nano Gen 3 | |
| HP Dragonfly G4 | |
| Asus ZenBook S13 OLED UX5304 | |
| Dell Latitude 13 7340 i5-1345U | |
| Geekbench 5.5 / Single-Core | |
| Średnia w klasie Subnotebook (726 - 2224, n=48, ostatnie 2 lata) | |
| HP Dragonfly G4 | |
| Lenovo ThinkPad X1 Nano Gen 3 | |
| Asus ZenBook S13 OLED UX5304 | |
| MSI Prestige 13 AI Evo | |
| Przeciętny Intel Core Ultra 7 155H (1462 - 1824, n=52) | |
| Dell Latitude 13 7340 i5-1345U | |
| HWBOT x265 Benchmark v2.2 / 4k Preset | |
| Przeciętny Intel Core Ultra 7 155H (9.93 - 21.2, n=50) | |
| Średnia w klasie Subnotebook (0.97 - 25.1, n=57, ostatnie 2 lata) | |
| MSI Prestige 13 AI Evo | |
| Lenovo ThinkPad X1 Nano Gen 3 | |
| HP Dragonfly G4 | |
| Asus ZenBook S13 OLED UX5304 | |
| Dell Latitude 13 7340 i5-1345U | |
| LibreOffice / 20 Documents To PDF | |
| Średnia w klasie Subnotebook (39.9 - 220, n=56, ostatnie 2 lata) | |
| Lenovo ThinkPad X1 Nano Gen 3 | |
| Przeciętny Intel Core Ultra 7 155H (37.5 - 79.2, n=49) | |
| Asus ZenBook S13 OLED UX5304 | |
| HP Dragonfly G4 | |
| MSI Prestige 13 AI Evo | |
| Dell Latitude 13 7340 i5-1345U | |
| R Benchmark 2.5 / Overall mean | |
| Średnia w klasie Subnotebook (0.4024 - 1.456, n=58, ostatnie 2 lata) | |
| Dell Latitude 13 7340 i5-1345U | |
| Lenovo ThinkPad X1 Nano Gen 3 | |
| Przeciętny Intel Core Ultra 7 155H (0.4457 - 0.53, n=49) | |
| Asus ZenBook S13 OLED UX5304 | |
| MSI Prestige 13 AI Evo | |
| HP Dragonfly G4 | |
* ... im mniej tym lepiej
AIDA64: FP32 Ray-Trace | FPU Julia | CPU SHA3 | CPU Queen | FPU SinJulia | FPU Mandel | CPU AES | CPU ZLib | FP64 Ray-Trace | CPU PhotoWorxx
| Performance rating | |
| Przeciętny Intel Core Ultra 7 155H | |
| Średnia w klasie Subnotebook | |
| MSI Prestige 13 AI Evo | |
| Lenovo ThinkPad X1 Nano Gen 3 | |
| HP Dragonfly G4 | |
| Asus ZenBook S13 OLED UX5304 | |
| Dell Latitude 13 7340 i5-1345U | |
| AIDA64 / FP32 Ray-Trace | |
| Średnia w klasie Subnotebook (1135 - 32888, n=58, ostatnie 2 lata) | |
| Przeciętny Intel Core Ultra 7 155H (6670 - 18470, n=50) | |
| Lenovo ThinkPad X1 Nano Gen 3 | |
| HP Dragonfly G4 | |
| MSI Prestige 13 AI Evo | |
| Asus ZenBook S13 OLED UX5304 | |
| Dell Latitude 13 7340 i5-1345U | |
| AIDA64 / FPU Julia | |
| Przeciętny Intel Core Ultra 7 155H (40905 - 93181, n=50) | |
| Średnia w klasie Subnotebook (5218 - 123315, n=58, ostatnie 2 lata) | |
| MSI Prestige 13 AI Evo | |
| Lenovo ThinkPad X1 Nano Gen 3 | |
| HP Dragonfly G4 | |
| Asus ZenBook S13 OLED UX5304 | |
| Dell Latitude 13 7340 i5-1345U | |
| AIDA64 / CPU SHA3 | |
| Przeciętny Intel Core Ultra 7 155H (1940 - 4436, n=50) | |
| Średnia w klasie Subnotebook (444 - 5287, n=58, ostatnie 2 lata) | |
| MSI Prestige 13 AI Evo | |
| Lenovo ThinkPad X1 Nano Gen 3 | |
| HP Dragonfly G4 | |
| Asus ZenBook S13 OLED UX5304 | |
| Dell Latitude 13 7340 i5-1345U | |
| AIDA64 / CPU Queen | |
| Lenovo ThinkPad X1 Nano Gen 3 | |
| Przeciętny Intel Core Ultra 7 155H (64698 - 94181, n=50) | |
| HP Dragonfly G4 | |
| Asus ZenBook S13 OLED UX5304 | |
| MSI Prestige 13 AI Evo | |
| Dell Latitude 13 7340 i5-1345U | |
| Średnia w klasie Subnotebook (10579 - 95002, n=49, ostatnie 2 lata) | |
| AIDA64 / FPU SinJulia | |
| Przeciętny Intel Core Ultra 7 155H (5639 - 10647, n=50) | |
| Średnia w klasie Subnotebook (744 - 18418, n=58, ostatnie 2 lata) | |
| MSI Prestige 13 AI Evo | |
| Lenovo ThinkPad X1 Nano Gen 3 | |
| HP Dragonfly G4 | |
| Asus ZenBook S13 OLED UX5304 | |
| Dell Latitude 13 7340 i5-1345U | |
| AIDA64 / FPU Mandel | |
| Przeciętny Intel Core Ultra 7 155H (18236 - 47685, n=50) | |
| Średnia w klasie Subnotebook (3341 - 65433, n=58, ostatnie 2 lata) | |
| MSI Prestige 13 AI Evo | |
| Lenovo ThinkPad X1 Nano Gen 3 | |
| HP Dragonfly G4 | |
| Asus ZenBook S13 OLED UX5304 | |
| Dell Latitude 13 7340 i5-1345U | |
| AIDA64 / CPU AES | |
| Przeciętny Intel Core Ultra 7 155H (45713 - 152179, n=50) | |
| Średnia w klasie Subnotebook (638 - 96917, n=58, ostatnie 2 lata) | |
| MSI Prestige 13 AI Evo | |
| Lenovo ThinkPad X1 Nano Gen 3 | |
| HP Dragonfly G4 | |
| Asus ZenBook S13 OLED UX5304 | |
| Dell Latitude 13 7340 i5-1345U | |
| AIDA64 / CPU ZLib | |
| Przeciętny Intel Core Ultra 7 155H (557 - 1250, n=50) | |
| Średnia w klasie Subnotebook (164.9 - 1379, n=58, ostatnie 2 lata) | |
| MSI Prestige 13 AI Evo | |
| Lenovo ThinkPad X1 Nano Gen 3 | |
| HP Dragonfly G4 | |
| Asus ZenBook S13 OLED UX5304 | |
| Dell Latitude 13 7340 i5-1345U | |
| AIDA64 / FP64 Ray-Trace | |
| Średnia w klasie Subnotebook (610 - 17495, n=58, ostatnie 2 lata) | |
| Przeciętny Intel Core Ultra 7 155H (3569 - 9802, n=50) | |
| Lenovo ThinkPad X1 Nano Gen 3 | |
| MSI Prestige 13 AI Evo | |
| HP Dragonfly G4 | |
| Asus ZenBook S13 OLED UX5304 | |
| Dell Latitude 13 7340 i5-1345U | |
| AIDA64 / CPU PhotoWorxx | |
| Średnia w klasie Subnotebook (6569 - 85600, n=58, ostatnie 2 lata) | |
| Przeciętny Intel Core Ultra 7 155H (32719 - 54223, n=50) | |
| Lenovo ThinkPad X1 Nano Gen 3 | |
| MSI Prestige 13 AI Evo | |
| Asus ZenBook S13 OLED UX5304 | |
| HP Dragonfly G4 | |
| Dell Latitude 13 7340 i5-1345U | |
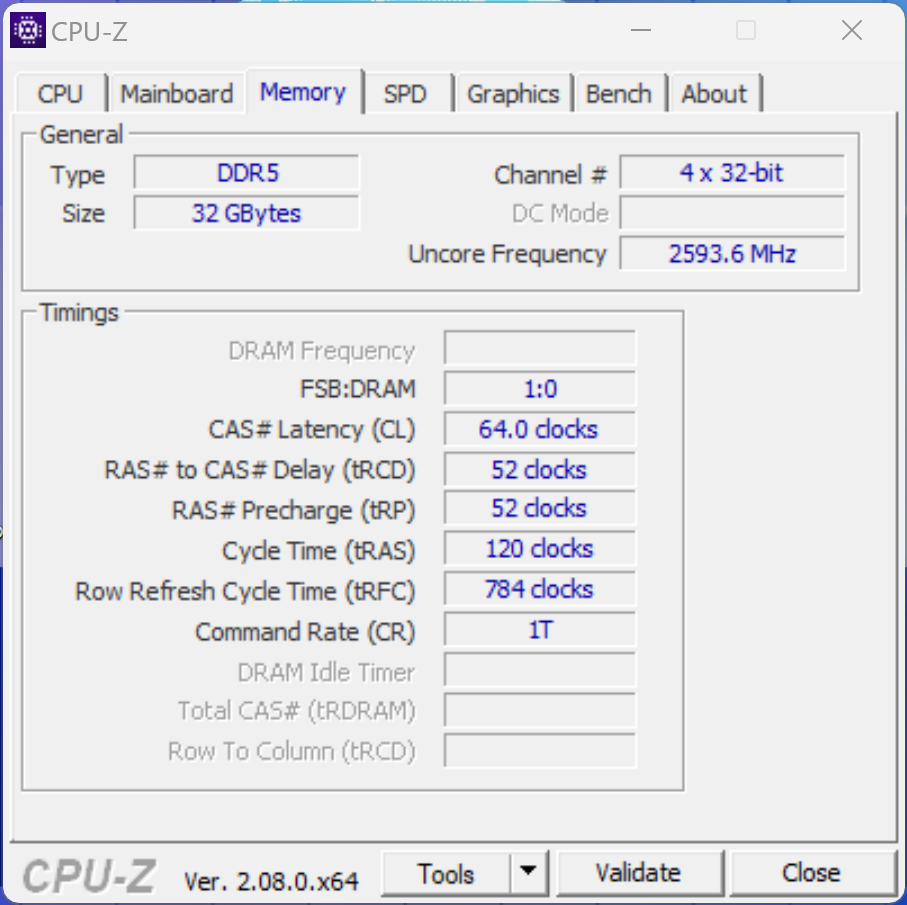
Wydajność systemu
W codziennym użytkowaniu kompaktowy Prestige 13 jest szybkim i szybko reagującym towarzyszem, co jest po części zasługą pamięci masowej SSD. Pamięć RAM w naszym testowym egzemplarzu wynosi 32 GB, co powinno wystarczyć użytkownikom w nadchodzących latach. Podczas naszych testów nie mieliśmy żadnych problemów ze stabilnością systemu.
CrossMark: Overall | Productivity | Creativity | Responsiveness
WebXPRT 3: Overall
WebXPRT 4: Overall
Mozilla Kraken 1.1: Total
| PCMark 10 / Score | |
| Średnia w klasie Subnotebook (4920 - 9939, n=45, ostatnie 2 lata) | |
| Przeciętny Intel Core Ultra 7 155H, Intel Arc 8-Core iGPU (4809 - 7529, n=34) | |
| MSI Prestige 13 AI Evo | |
| Lenovo ThinkPad X1 Nano Gen 3 | |
| HP Dragonfly G4 | |
| Asus ZenBook S13 OLED UX5304 | |
| Dell Latitude 13 7340 i5-1345U | |
| PCMark 10 / Essentials | |
| HP Dragonfly G4 | |
| Lenovo ThinkPad X1 Nano Gen 3 | |
| Asus ZenBook S13 OLED UX5304 | |
| Przeciętny Intel Core Ultra 7 155H, Intel Arc 8-Core iGPU (7605 - 11289, n=34) | |
| Średnia w klasie Subnotebook (8552 - 11646, n=45, ostatnie 2 lata) | |
| Dell Latitude 13 7340 i5-1345U | |
| MSI Prestige 13 AI Evo | |
| PCMark 10 / Productivity | |
| Średnia w klasie Subnotebook (5435 - 16606, n=45, ostatnie 2 lata) | |
| Przeciętny Intel Core Ultra 7 155H, Intel Arc 8-Core iGPU (6042 - 10591, n=34) | |
| MSI Prestige 13 AI Evo | |
| Lenovo ThinkPad X1 Nano Gen 3 | |
| HP Dragonfly G4 | |
| Asus ZenBook S13 OLED UX5304 | |
| Dell Latitude 13 7340 i5-1345U | |
| PCMark 10 / Digital Content Creation | |
| Średnia w klasie Subnotebook (5722 - 13779, n=45, ostatnie 2 lata) | |
| Przeciętny Intel Core Ultra 7 155H, Intel Arc 8-Core iGPU (4985 - 10709, n=34) | |
| MSI Prestige 13 AI Evo | |
| Lenovo ThinkPad X1 Nano Gen 3 | |
| HP Dragonfly G4 | |
| Asus ZenBook S13 OLED UX5304 | |
| Dell Latitude 13 7340 i5-1345U | |
| CrossMark / Overall | |
| Lenovo ThinkPad X1 Nano Gen 3 | |
| Średnia w klasie Subnotebook (365 - 2356, n=60, ostatnie 2 lata) | |
| Przeciętny Intel Core Ultra 7 155H, Intel Arc 8-Core iGPU (1366 - 1903, n=34) | |
| HP Dragonfly G4 | |
| Asus ZenBook S13 OLED UX5304 | |
| Dell Latitude 13 7340 i5-1345U | |
| MSI Prestige 13 AI Evo | |
| CrossMark / Productivity | |
| Lenovo ThinkPad X1 Nano Gen 3 | |
| HP Dragonfly G4 | |
| Przeciętny Intel Core Ultra 7 155H, Intel Arc 8-Core iGPU (1291 - 1798, n=33) | |
| Średnia w klasie Subnotebook (364 - 2277, n=60, ostatnie 2 lata) | |
| Asus ZenBook S13 OLED UX5304 | |
| Dell Latitude 13 7340 i5-1345U | |
| MSI Prestige 13 AI Evo | |
| CrossMark / Creativity | |
| Lenovo ThinkPad X1 Nano Gen 3 | |
| Średnia w klasie Subnotebook (372 - 2743, n=60, ostatnie 2 lata) | |
| Przeciętny Intel Core Ultra 7 155H, Intel Arc 8-Core iGPU (1519 - 1929, n=33) | |
| HP Dragonfly G4 | |
| Asus ZenBook S13 OLED UX5304 | |
| Dell Latitude 13 7340 i5-1345U | |
| MSI Prestige 13 AI Evo | |
| CrossMark / Responsiveness | |
| Lenovo ThinkPad X1 Nano Gen 3 | |
| Przeciętny Intel Core Ultra 7 155H, Intel Arc 8-Core iGPU (939 - 1802, n=33) | |
| Asus ZenBook S13 OLED UX5304 | |
| HP Dragonfly G4 | |
| Średnia w klasie Subnotebook (312 - 1854, n=60, ostatnie 2 lata) | |
| Dell Latitude 13 7340 i5-1345U | |
| MSI Prestige 13 AI Evo | |
| WebXPRT 3 / Overall | |
| Średnia w klasie Subnotebook (156 - 530, n=56, ostatnie 2 lata) | |
| Lenovo ThinkPad X1 Nano Gen 3 | |
| HP Dragonfly G4 | |
| Asus ZenBook S13 OLED UX5304 | |
| Przeciętny Intel Core Ultra 7 155H, Intel Arc 8-Core iGPU (252 - 299, n=34) | |
| MSI Prestige 13 AI Evo | |
| WebXPRT 4 / Overall | |
| Średnia w klasie Subnotebook (132 - 378, n=61, ostatnie 2 lata) | |
| Lenovo ThinkPad X1 Nano Gen 3 | |
| HP Dragonfly G4 | |
| Asus ZenBook S13 OLED UX5304 | |
| Przeciętny Intel Core Ultra 7 155H, Intel Arc 8-Core iGPU (166.4 - 309, n=29) | |
| MSI Prestige 13 AI Evo | |
| Mozilla Kraken 1.1 / Total | |
| Dell Latitude 13 7340 i5-1345U | |
| MSI Prestige 13 AI Evo | |
| Przeciętny Intel Core Ultra 7 155H, Intel Arc 8-Core iGPU (517 - 614, n=35) | |
| Asus ZenBook S13 OLED UX5304 | |
| Lenovo ThinkPad X1 Nano Gen 3 | |
| HP Dragonfly G4 | |
| Średnia w klasie Subnotebook (234 - 1104, n=61, ostatnie 2 lata) | |
* ... im mniej tym lepiej
| PCMark 10 Score | 5952 pkt. | |
Pomoc | ||
| AIDA64 / Memory Copy | |
| Średnia w klasie Subnotebook (14554 - 131023, n=58, ostatnie 2 lata) | |
| Przeciętny Intel Core Ultra 7 155H (62397 - 96791, n=50) | |
| MSI Prestige 13 AI Evo | |
| Lenovo ThinkPad X1 Nano Gen 3 | |
| Asus ZenBook S13 OLED UX5304 | |
| HP Dragonfly G4 | |
| Dell Latitude 13 7340 i5-1345U | |
| AIDA64 / Memory Read | |
| Średnia w klasie Subnotebook (15948 - 127174, n=58, ostatnie 2 lata) | |
| Przeciętny Intel Core Ultra 7 155H (60544 - 90647, n=50) | |
| MSI Prestige 13 AI Evo | |
| Lenovo ThinkPad X1 Nano Gen 3 | |
| Asus ZenBook S13 OLED UX5304 | |
| HP Dragonfly G4 | |
| Dell Latitude 13 7340 i5-1345U | |
| AIDA64 / Memory Write | |
| Lenovo ThinkPad X1 Nano Gen 3 | |
| Średnia w klasie Subnotebook (15709 - 135141, n=58, ostatnie 2 lata) | |
| MSI Prestige 13 AI Evo | |
| Przeciętny Intel Core Ultra 7 155H (58692 - 93451, n=50) | |
| Asus ZenBook S13 OLED UX5304 | |
| Dell Latitude 13 7340 i5-1345U | |
| HP Dragonfly G4 | |
| AIDA64 / Memory Latency | |
| MSI Prestige 13 AI Evo | |
| Przeciętny Intel Core Ultra 7 155H (116.2 - 233, n=50) | |
| Dell Latitude 13 7340 i5-1345U | |
| Średnia w klasie Subnotebook (6.1 - 159.9, n=56, ostatnie 2 lata) | |
| Lenovo ThinkPad X1 Nano Gen 3 | |
| HP Dragonfly G4 | |
| Asus ZenBook S13 OLED UX5304 | |
* ... im mniej tym lepiej
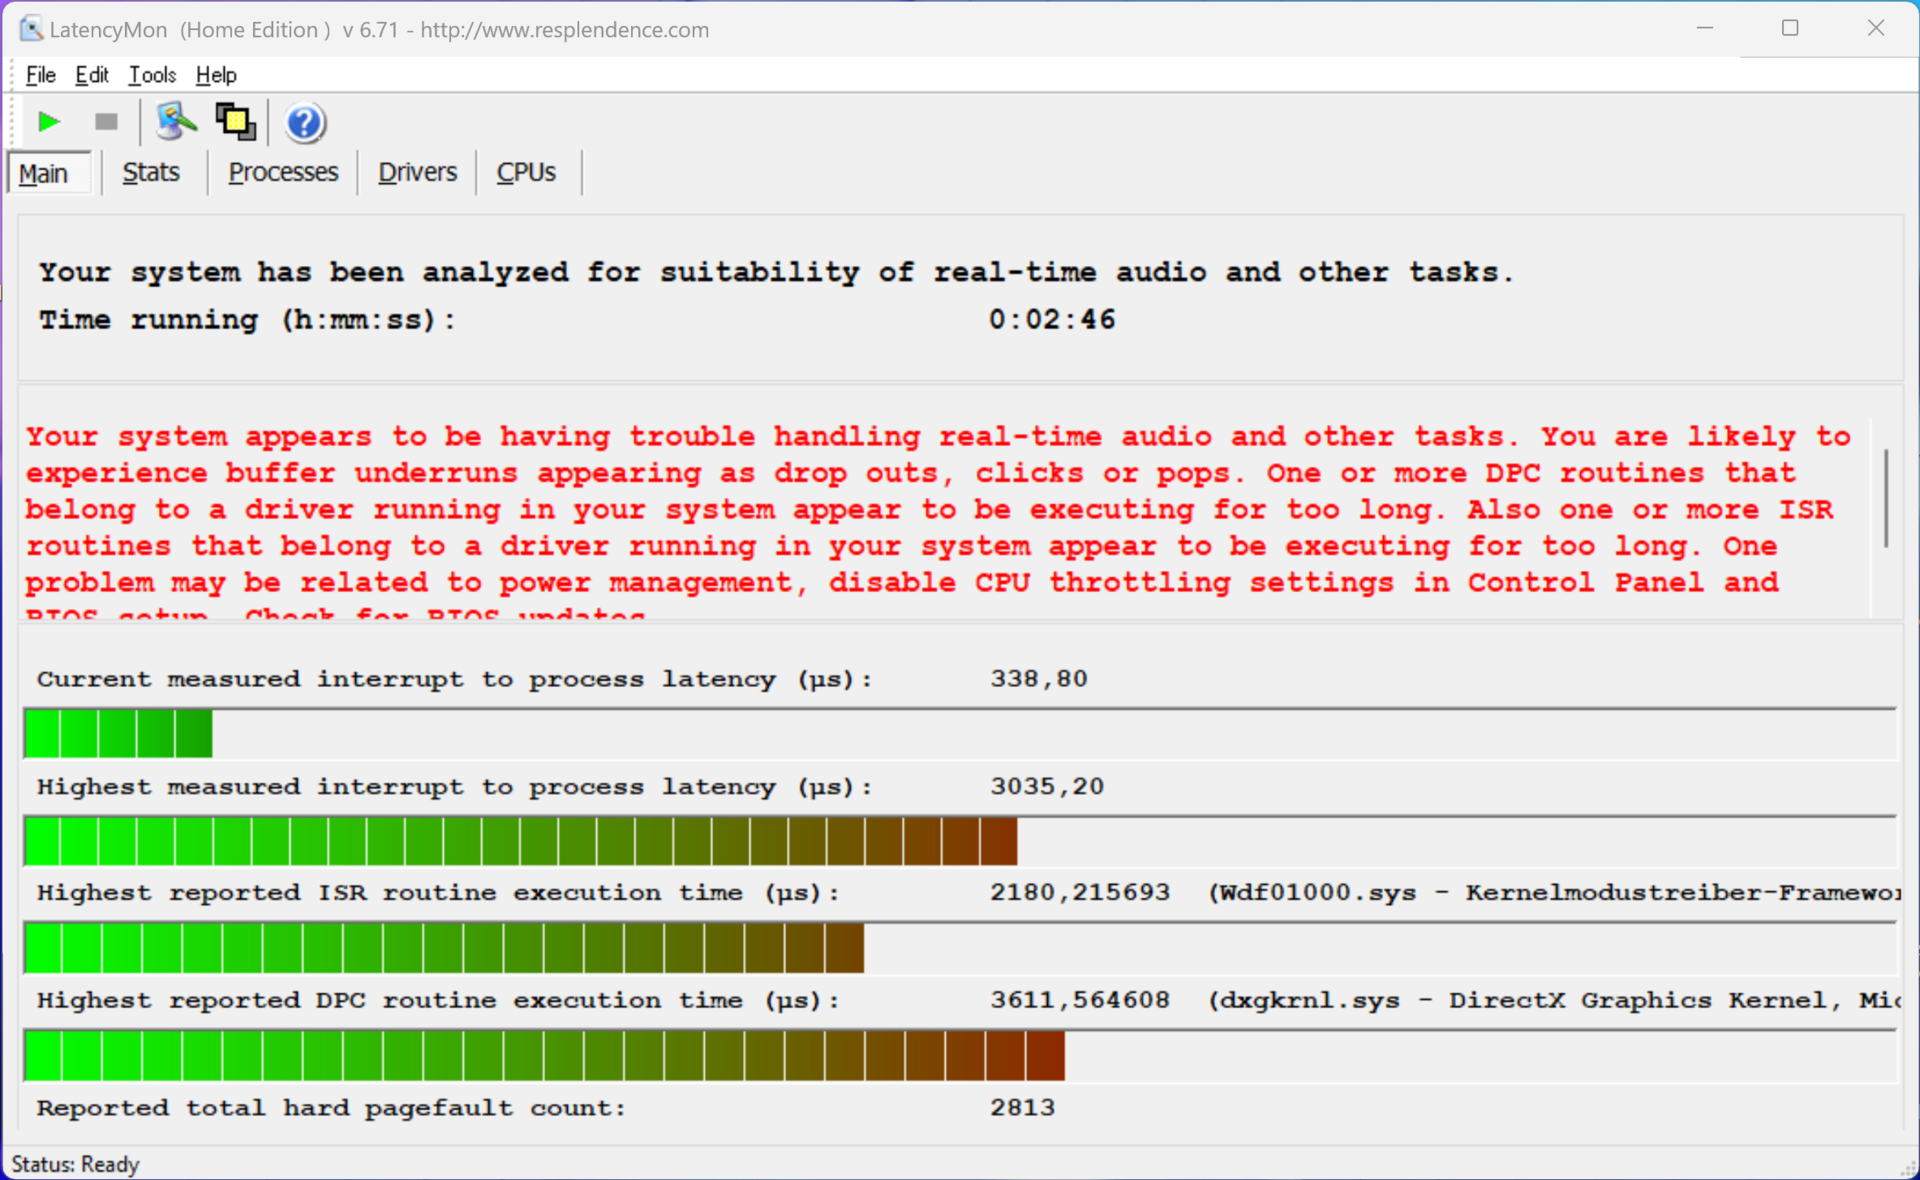
Opóźnienie DPC
W naszym ustandaryzowanym teście opóźnień (surfowanie po sieci, odtwarzanie YouTube w 4K, obciążenie CPU), urządzenie testowe z aktualną wersją BIOS-u wykazało pewne ograniczenia podczas korzystania z aplikacji audio w czasie rzeczywistym.
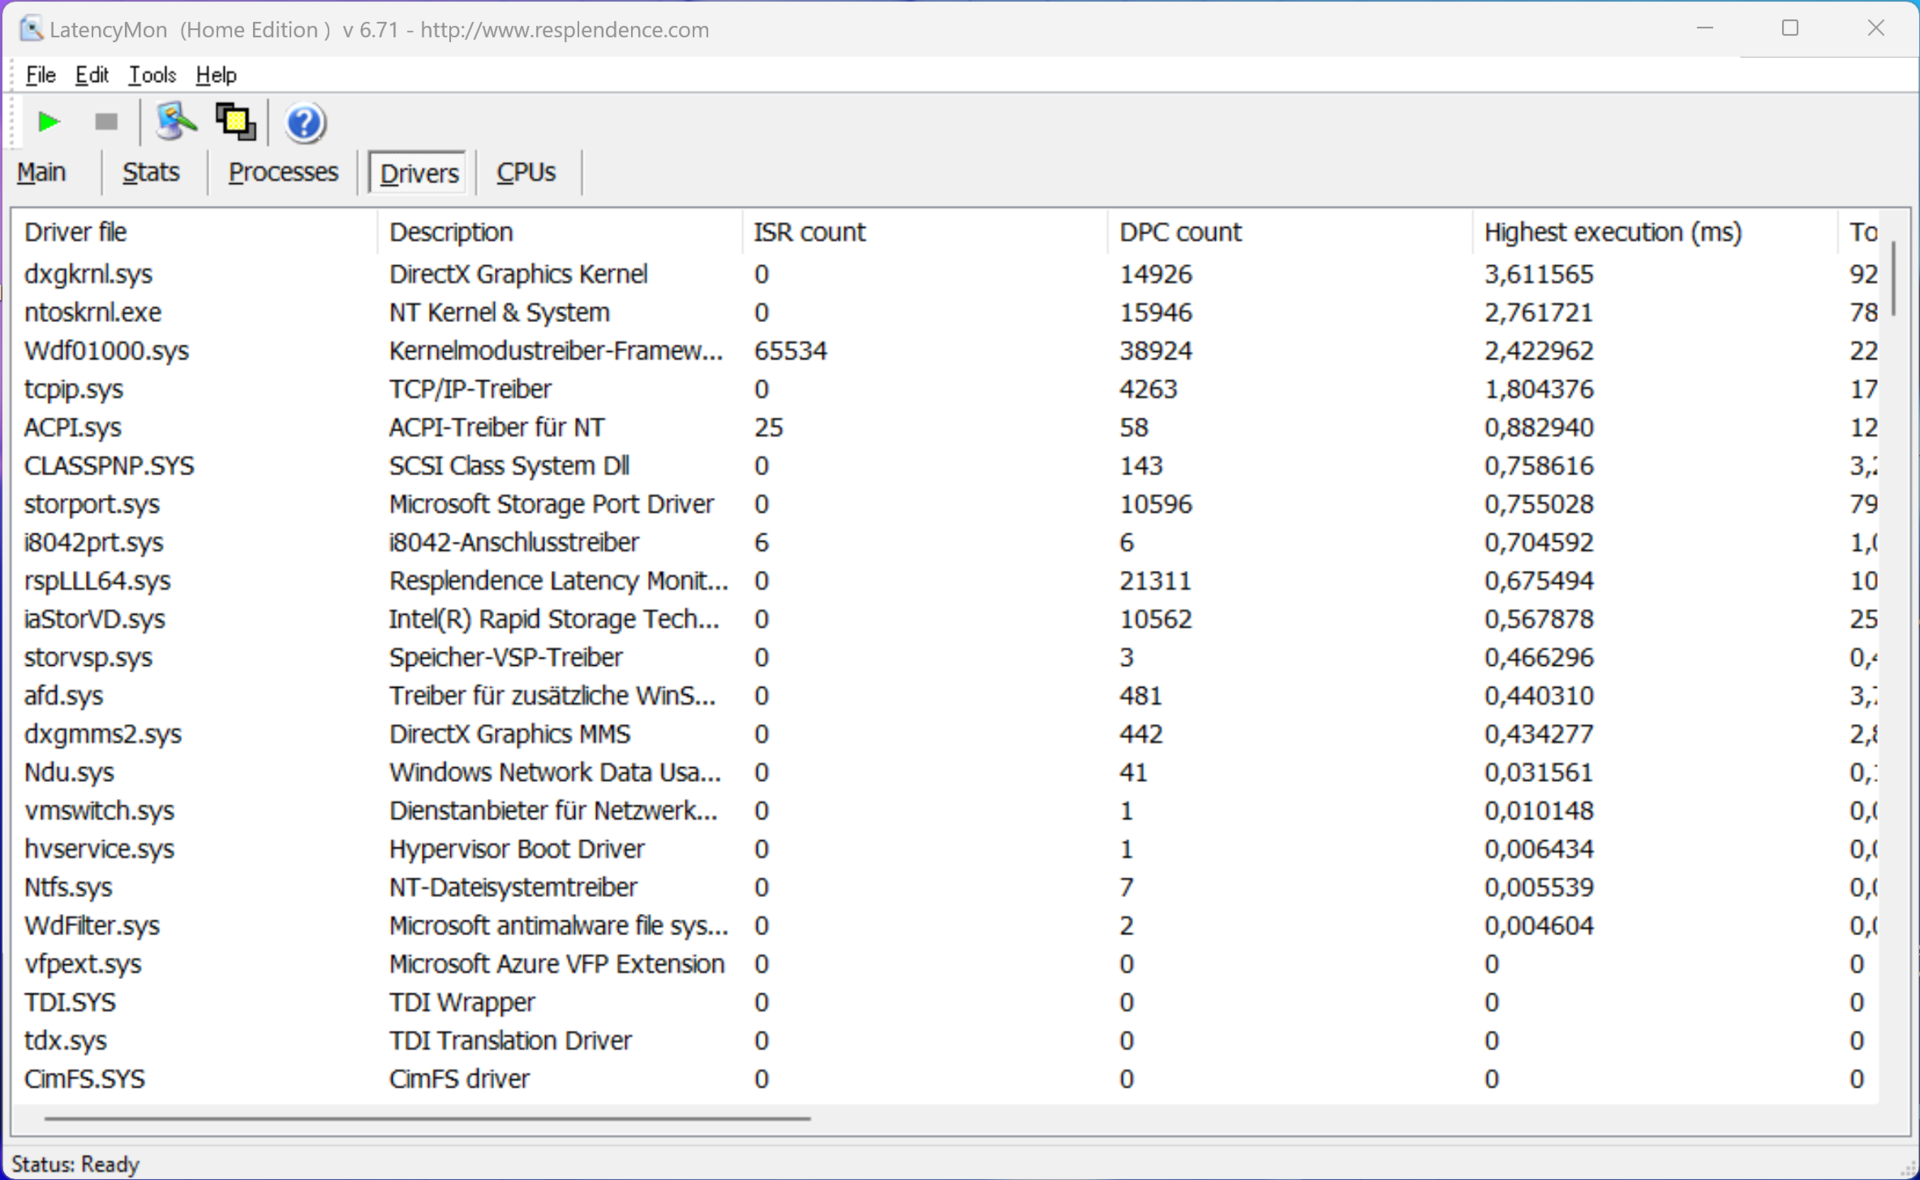
| DPC Latencies / LatencyMon - interrupt to process latency (max), Web, Youtube, Prime95 | |
| MSI Prestige 13 AI Evo | |
| Lenovo ThinkPad X1 Nano Gen 3 | |
| Dell Latitude 13 7340 i5-1345U | |
| Asus ZenBook S13 OLED UX5304 | |
| HP Dragonfly G4 | |
* ... im mniej tym lepiej
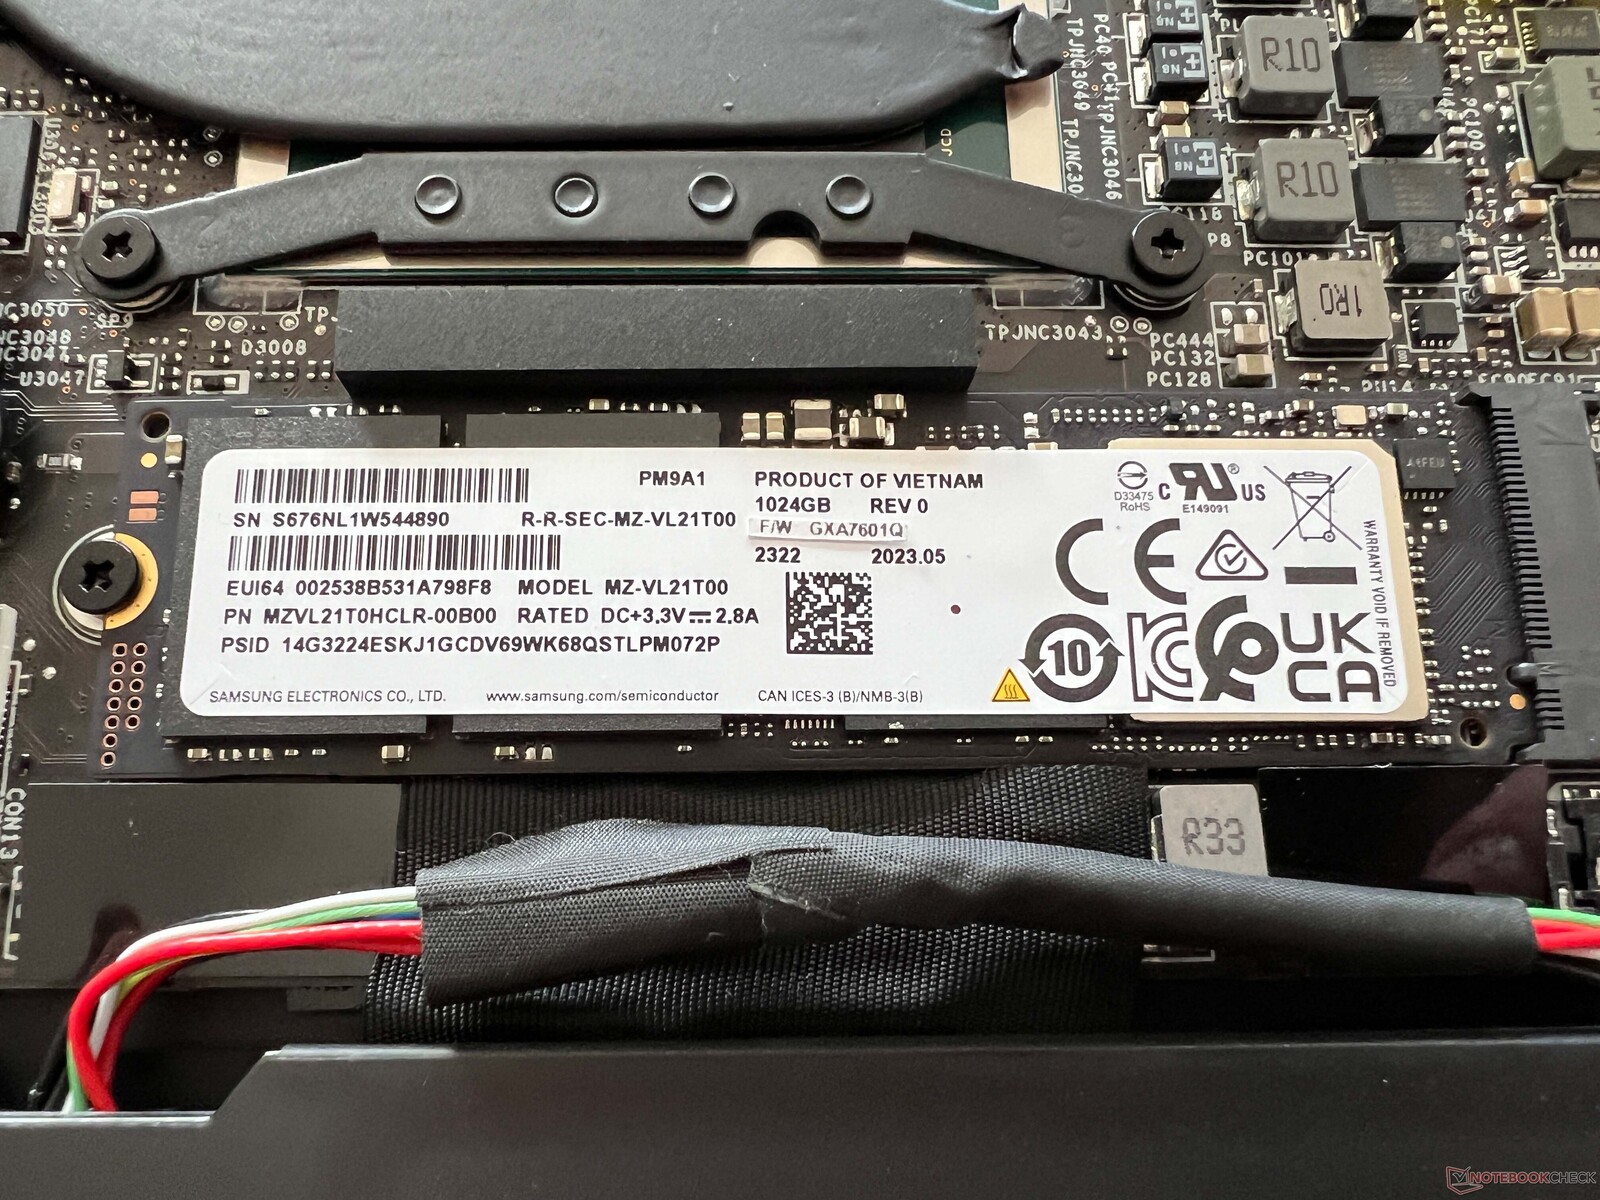
Urządzenia pamięci masowej
Nasze urządzenie testowe jest wyposażone w wersję 1-TB Samsung PM9A1 (wersja OEM 980 Pro), która jest bardzo szybkim urządzeniem pamięci masowej. Jego wydajność nie pozostaje jednak stała pod stałym obciążeniem, ale nie powinno to stanowić żadnego problemu podczas codziennego użytkowania. Po pierwszym uruchomieniu urządzenia użytkownicy mają do dyspozycji 864 GB wolnego miejsca. Więcej testów porównawczych SSD można znaleźć tutaj.

* ... im mniej tym lepiej
Reading continuous performance: DiskSpd Read Loop, Queue Depth 8
Karta graficzna
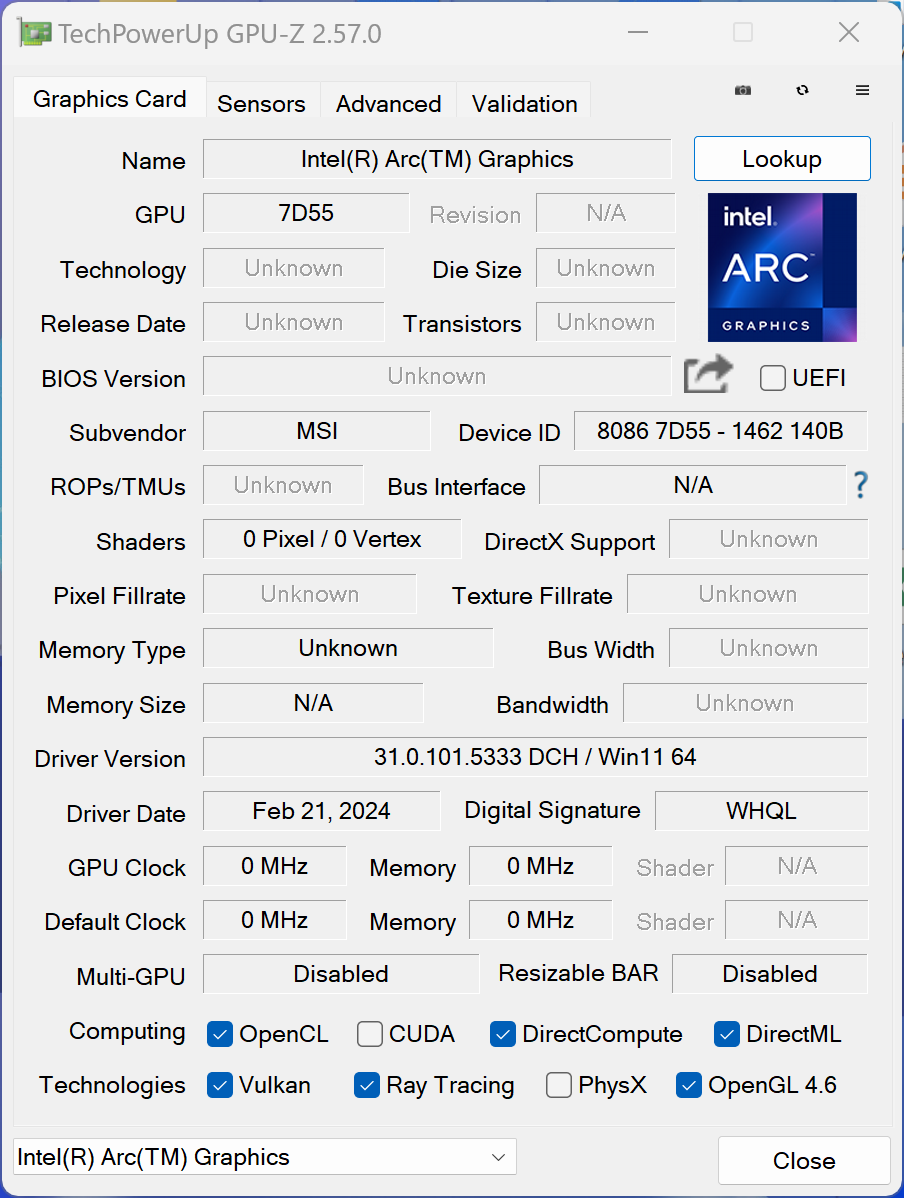
W połączeniu z Core Ultra 7 155Hnowy układ graficzny Intel Arc Graphics oferuje 8 rdzeni Xe, jednak jego całkowita wydajność graficzna w MSI Prestige 13 była najgorsza ze wszystkich nowych laptopów Meteor-Lake, które przetestowaliśmy do tej pory (-32% w porównaniu do średniej w naszej bazie danych). Nawet w syntetycznych testach porównawczych MSI tylko nieznacznie wyprzedziło starego Iris Xe Graphics G7. Jeśli chodzi o codzienne zadania, takie jak odtwarzanie filmów w wysokiej rozdzielczości, MSI nie ma żadnych problemów, ale po prostu nie może w pełni wykorzystać nowego iGPU.
Chcemy wspomnieć o jednym pozytywnym aspekcie, a mianowicie o tym, że MSI nie cierpiał na takie same spadki klatek podczas testów gier, jak na przykład Zenbook 14 lub HP Spectre x360 14. Jego wydajność w grach jest ogólnie dość niska, ale jest przynajmniej stabilna. W przypadku korzystania z baterii jego wydajność również pozostaje na stałym poziomie, a dalsze testy porównawcze można znaleźć tutaj.
| 3DMark 11 Performance | 8505 pkt. | |
| 3DMark Fire Strike Score | 5203 pkt. | |
| 3DMark Time Spy Score | 2178 pkt. | |
Pomoc | ||
| Blender / v3.3 Classroom CPU | |
| Dell Latitude 13 7340 i5-1345U | |
| Asus ZenBook S13 OLED UX5304 | |
| HP Dragonfly G4 | |
| Lenovo ThinkPad X1 Nano Gen 3 | |
| MSI Prestige 13 AI Evo | |
| Średnia w klasie Subnotebook (241 - 861, n=60, ostatnie 2 lata) | |
| Przeciętny Intel Arc 8-Core iGPU (294 - 692, n=43) | |
* ... im mniej tym lepiej
| Performance rating - Percent | |
| Średnia w klasie Subnotebook | |
| MSI Prestige 13 AI Evo | |
| HP Dragonfly G4 | |
| Lenovo ThinkPad X1 Nano Gen 3 -1! | |
| Asus ZenBook S13 OLED UX5304 | |
| Dell Latitude 13 7340 i5-1345U | |
| The Witcher 3 - 1920x1080 Ultra Graphics & Postprocessing (HBAO+) | |
| Średnia w klasie Subnotebook (13.9 - 34.6, n=13, ostatnie 2 lata) | |
| HP Dragonfly G4 | |
| MSI Prestige 13 AI Evo | |
| Lenovo ThinkPad X1 Nano Gen 3 | |
| Asus ZenBook S13 OLED UX5304 | |
| Dell Latitude 13 7340 i5-1345U | |
| GTA V - 1920x1080 Highest AA:4xMSAA + FX AF:16x | |
| Średnia w klasie Subnotebook (10.7 - 43.7, n=56, ostatnie 2 lata) | |
| HP Dragonfly G4 | |
| MSI Prestige 13 AI Evo | |
| Asus ZenBook S13 OLED UX5304 | |
| Dell Latitude 13 7340 i5-1345U | |
| Final Fantasy XV Benchmark - 1920x1080 High Quality | |
| Średnia w klasie Subnotebook (11.6 - 54.5, n=54, ostatnie 2 lata) | |
| MSI Prestige 13 AI Evo | |
| HP Dragonfly G4 | |
| Asus ZenBook S13 OLED UX5304 | |
| Lenovo ThinkPad X1 Nano Gen 3 | |
| Dell Latitude 13 7340 i5-1345U | |
| Strange Brigade - 1920x1080 ultra AA:ultra AF:16 | |
| Średnia w klasie Subnotebook (19 - 101.3, n=50, ostatnie 2 lata) | |
| MSI Prestige 13 AI Evo | |
| HP Dragonfly G4 | |
| Asus ZenBook S13 OLED UX5304 | |
| Dell Latitude 13 7340 i5-1345U | |
| Lenovo ThinkPad X1 Nano Gen 3 | |
| Dota 2 Reborn - 1920x1080 ultra (3/3) best looking | |
| Średnia w klasie Subnotebook (13 - 97, n=61, ostatnie 2 lata) | |
| HP Dragonfly G4 | |
| MSI Prestige 13 AI Evo | |
| Asus ZenBook S13 OLED UX5304 | |
| Dell Latitude 13 7340 i5-1345U | |
| Lenovo ThinkPad X1 Nano Gen 3 | |
| X-Plane 11.11 - 1920x1080 high (fps_test=3) | |
| Średnia w klasie Subnotebook (20.7 - 50.5, n=53, ostatnie 2 lata) | |
| MSI Prestige 13 AI Evo | |
| Lenovo ThinkPad X1 Nano Gen 3 | |
| HP Dragonfly G4 | |
| Asus ZenBook S13 OLED UX5304 | |
| Dell Latitude 13 7340 i5-1345U | |
Witcher 3 FPS diagram
| low | med. | high | ultra | |
|---|---|---|---|---|
| GTA V (2015) | 99.1 | 93.8 | 26.2 | 9.97 |
| The Witcher 3 (2015) | 92 | 59 | 36 | 14.5 |
| Dota 2 Reborn (2015) | 89.9 | 75.9 | 57.7 | 53.3 |
| Final Fantasy XV Benchmark (2018) | 43.8 | 28 | 17 | |
| X-Plane 11.11 (2018) | 47.4 | 37.7 | 32.1 | |
| Far Cry 5 (2018) | 47 | 33 | 31 | 28 |
| Strange Brigade (2018) | 121 | 53 | 41 | 32 |
| F1 2021 (2021) | 94.8 | 50.8 | 41.3 | 20.3 |
| F1 22 (2022) | 59.1 | 49.6 | 36.8 | 9.33 |
| F1 23 (2023) | 44.1 | 36.3 | 27.1 | 7.45 |
Emisje - Słabe głośniki
Emisja hałasu
Laptop MSI posiada jednostkę chłodzącą składającą się z jednej rurki cieplnej i jednego wentylatora, który niestety często działa z niską prędkością, nawet gdy urządzenie jest bezczynne. Choć warkot nie jest irytujący, to w cichszym otoczeniu zdecydowanie go słychać. Pod obciążeniem wentylator szybko osiągnął 32 dB(A), a podczas testu obciążeniowego odnotowaliśmy 40 dB(A). To wcale nie jest cicho i, jak się okazało, nasza próbka testowa była najgłośniejsza w polu porównawczym. Korzystając z funkcji CoolerBooster, mały wentylator osiągnął nawet 51 dB(A). Nie odnotowaliśmy żadnych dodatkowych odgłosów elektronicznych.
Hałas
| luz |
| 23.4 / 26.9 / 26.9 dB |
| obciążenie |
| 32 / 40.3 dB |
 | ||
30 dB cichy 40 dB(A) słyszalny 50 dB(A) irytujący |
||
min: | ||
| MSI Prestige 13 AI Evo Arc 8-Core, Ultra 7 155H, Samsung PM9A1 MZVL21T0HCLR | Lenovo ThinkPad X1 Nano Gen 3 Iris Xe G7 96EUs, i7-1360P, Lenovo UMIS AM6A0 RPJTJ512MKP1QDQ | Dell Latitude 13 7340 i5-1345U Iris Xe G7 80EUs, i5-1345U, Kioxia BG5 KBG50ZNS512G | HP Dragonfly G4 Iris Xe G7 96EUs, i7-1365U, Micron 3400 MTFDKBA512TFH 512GB | Asus ZenBook S13 OLED UX5304 Iris Xe G7 96EUs, i7-1355U, Samsung PM9A1 MZVL21T0HCLR | |
|---|---|---|---|---|---|
| Noise | 3% | -1% | 6% | -2% | |
| wyłączone / środowisko * (dB) | 23.4 | 22.9 2% | 25.02 -7% | 23.3 -0% | 23.3 -0% |
| Idle Minimum * (dB) | 23.4 | 23 2% | 25.02 -7% | 23.5 -0% | 23.3 -0% |
| Idle Average * (dB) | 26.9 | 23 14% | 25.02 7% | 23.5 13% | 23.3 13% |
| Idle Maximum * (dB) | 26.9 | 23 14% | 25.02 7% | 26.8 -0% | 23.3 13% |
| Load Average * (dB) | 32 | 32.8 -2% | 35.07 -10% | 27.2 15% | 37.7 -18% |
| Witcher 3 ultra * (dB) | 32 | 36.9 -15% | 32.7 -2% | 40.1 -25% | |
| Load Maximum * (dB) | 40.3 | 36.9 8% | 38.2 5% | 35 13% | 40.1 -0% |
* ... im mniej tym lepiej
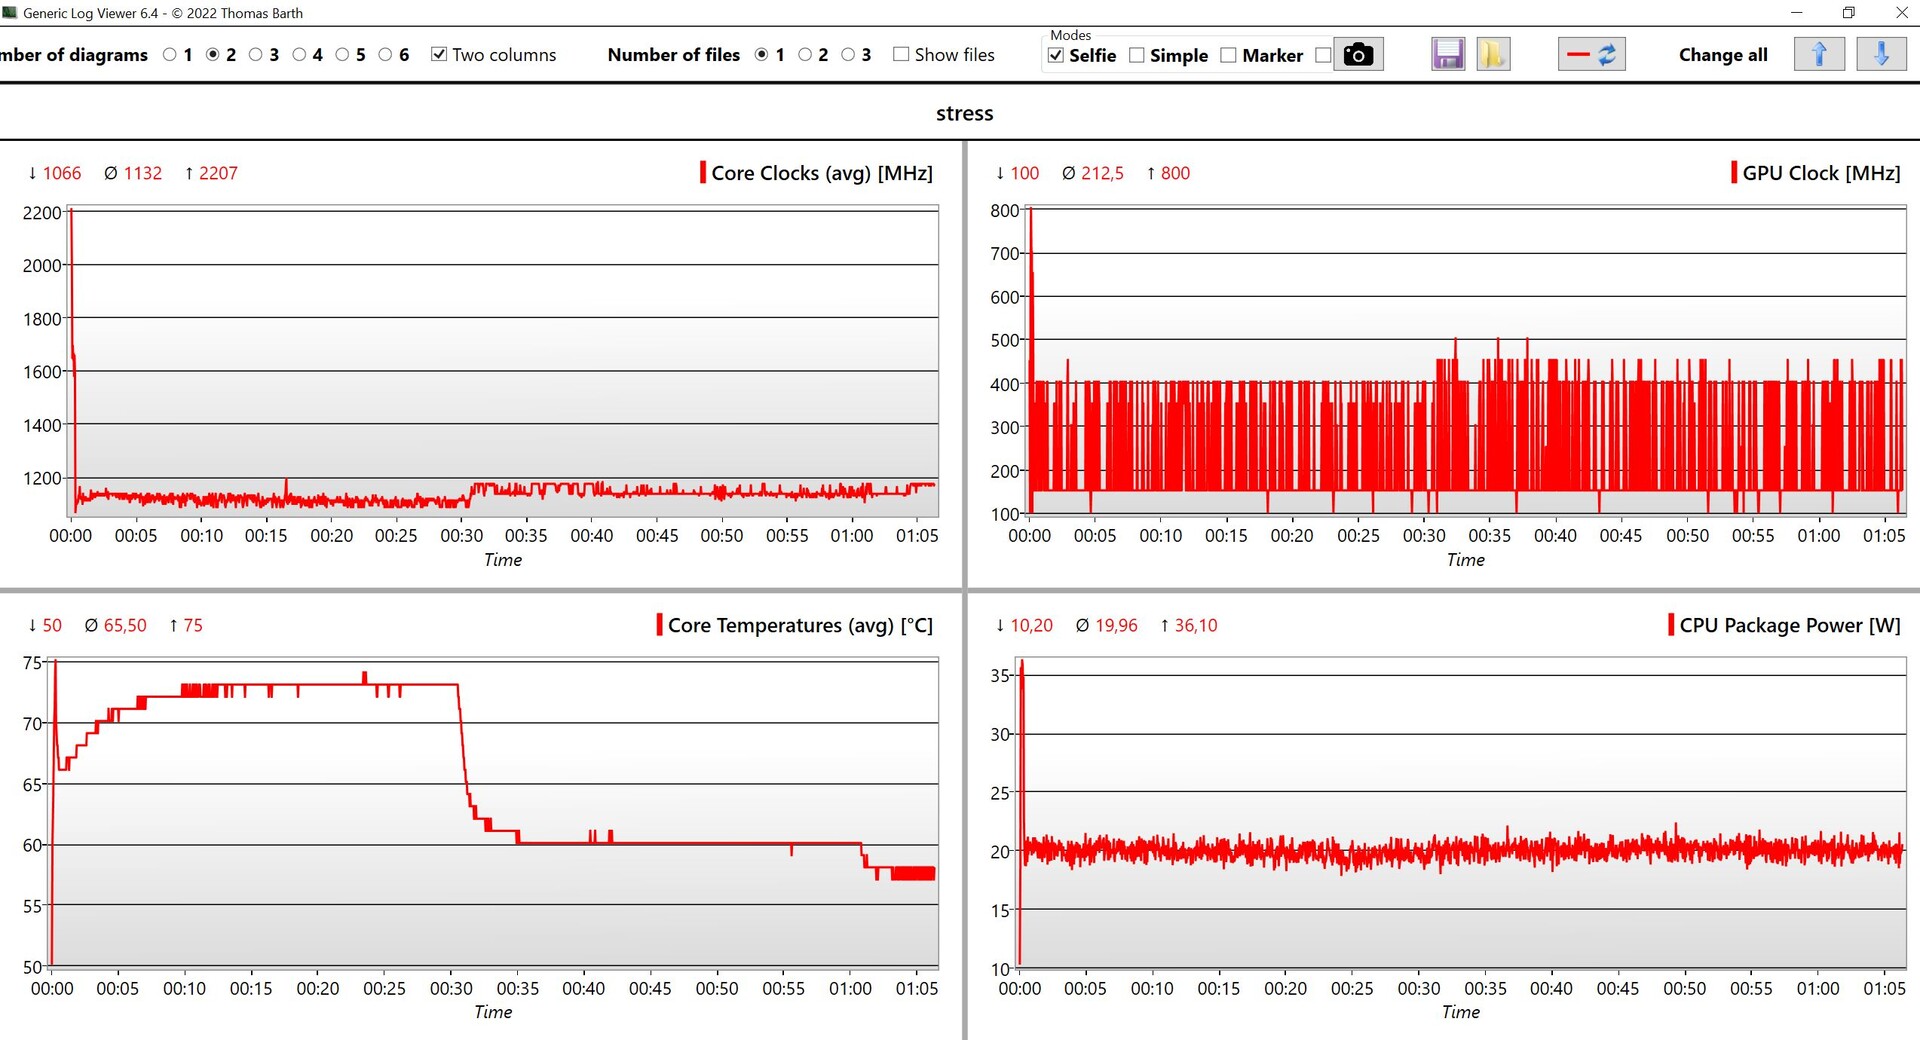
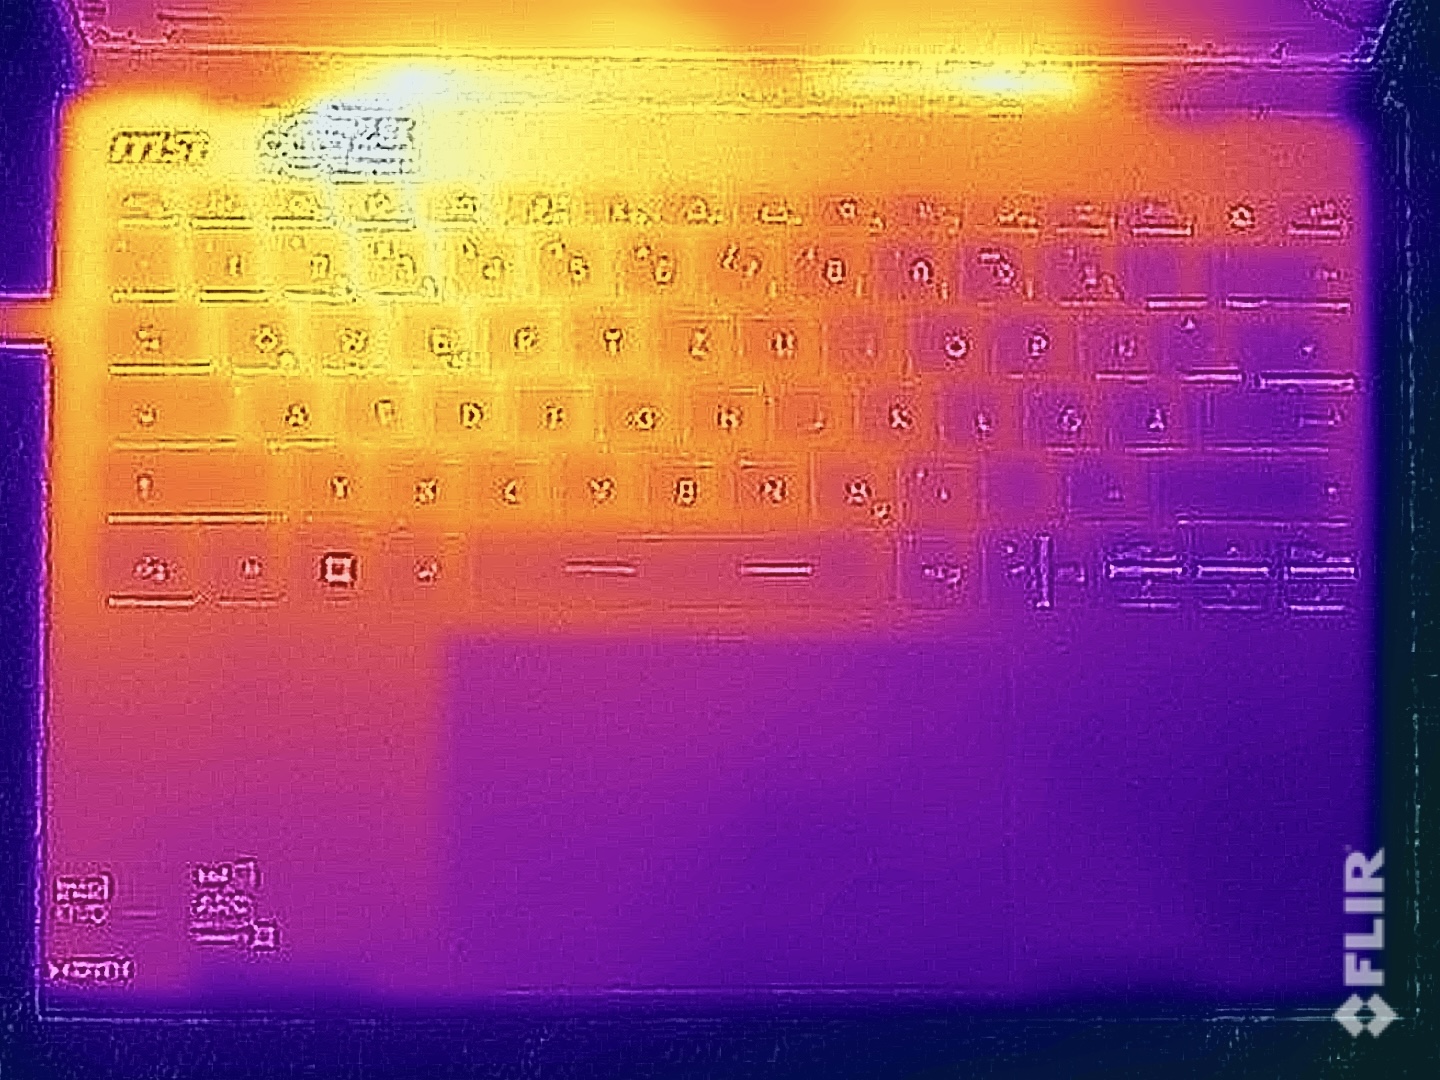
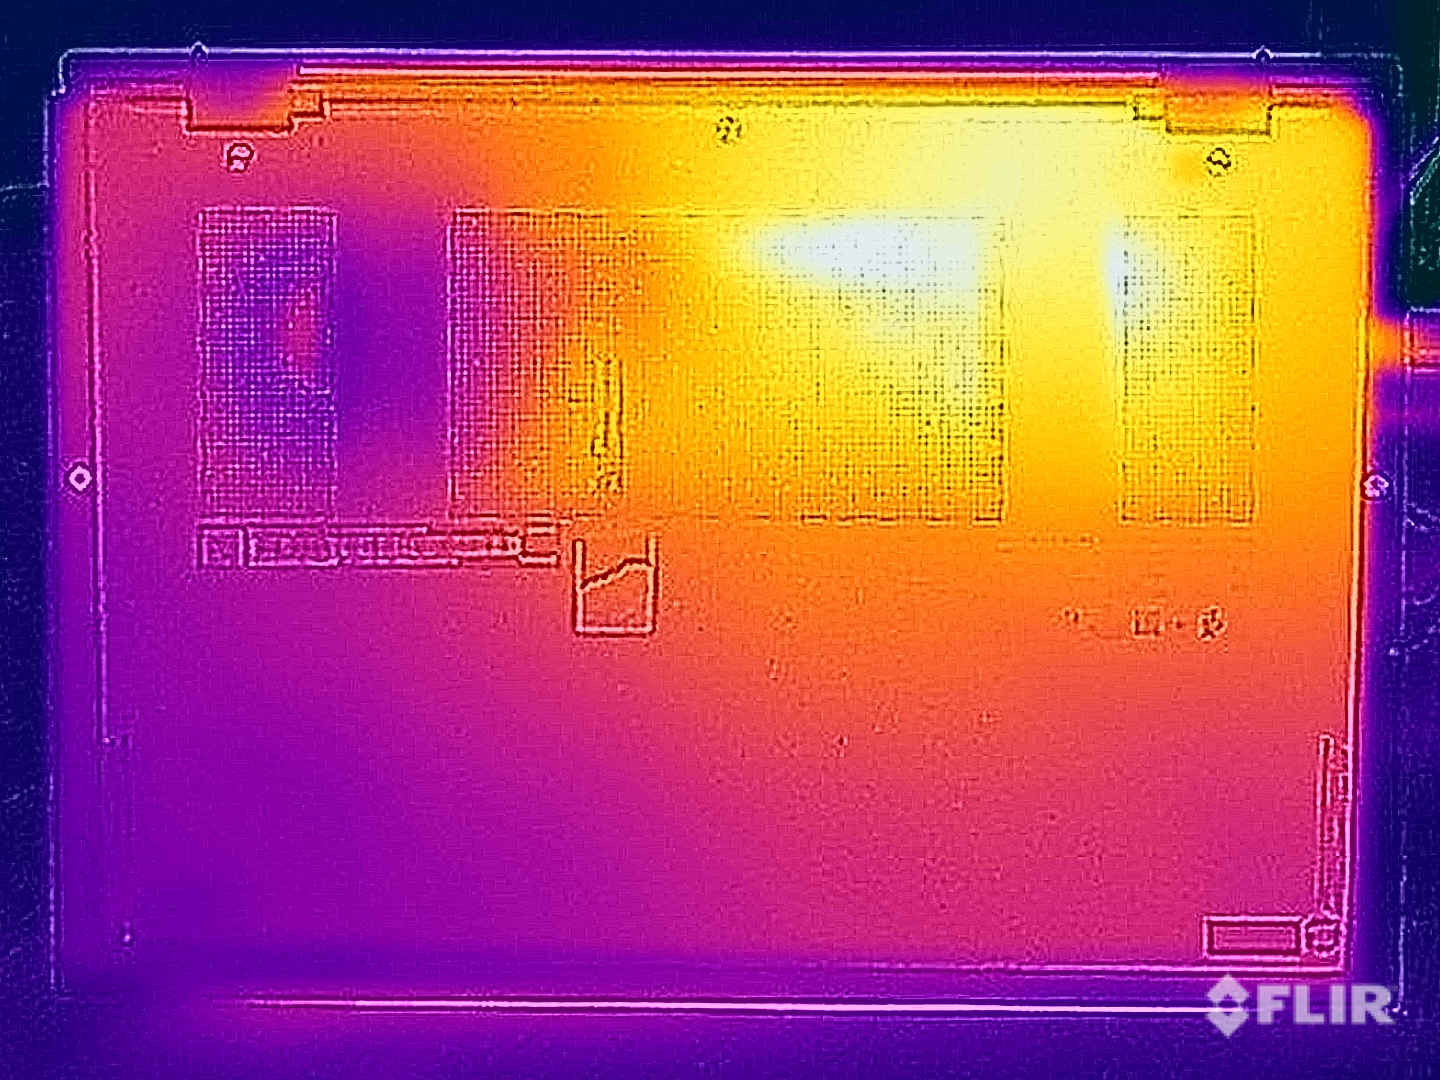
Temperatura
W codziennym użytkowaniu Prestige 13 pozostaje w większości chłodny i nawet podczas testu obciążeniowego zmierzyliśmy maksymalnie 40 °C na górze i na dole jednostki bazowej. Chłodnica znajduje się po lewej stronie, dlatego też ten obszar nagrzewa się najbardziej. Podczas testu obciążeniowego pobór mocy procesora szybko wyrównał się do 20 watów, a następnie utrzymał się na tym poziomie.
(±) Maksymalna temperatura w górnej części wynosi 40.9 °C / 106 F, w porównaniu do średniej 35.9 °C / 97 F , począwszy od 21.4 do 59 °C dla klasy Subnotebook.
(±) Dno nagrzewa się maksymalnie do 40.4 °C / 105 F, w porównaniu do średniej 39.2 °C / 103 F
(+) W stanie bezczynności średnia temperatura górnej części wynosi 23.3 °C / 74 F, w porównaniu ze średnią temperaturą urządzenia wynoszącą 30.8 °C / ### class_avg_f### F.
(+) Podczas gry w Wiedźmina 3 średnia temperatura górnej części wynosi 30.9 °C / 88 F, w porównaniu do średniej temperatury urządzenia wynoszącej 30.8 °C / ## #class_avg_f### F.
(+) Podpórki pod nadgarstki i touchpad są chłodniejsze niż temperatura skóry i maksymalnie 27.9 °C / 82.2 F i dlatego są chłodne w dotyku.
(±) Średnia temperatura obszaru podparcia dłoni w podobnych urządzeniach wynosiła 28.2 °C / 82.8 F (+0.3 °C / 0.6 F).
| MSI Prestige 13 AI Evo Intel Core Ultra 7 155H, Intel Arc 8-Core iGPU | Lenovo ThinkPad X1 Nano Gen 3 Intel Core i7-1360P, Intel Iris Xe Graphics G7 96EUs | Dell Latitude 13 7340 i5-1345U Intel Core i5-1345U, Intel Iris Xe Graphics G7 80EUs | HP Dragonfly G4 Intel Core i7-1365U, Intel Iris Xe Graphics G7 96EUs | Asus ZenBook S13 OLED UX5304 Intel Core i7-1355U, Intel Iris Xe Graphics G7 96EUs | |
|---|---|---|---|---|---|
| Heat | -4% | -1% | -5% | -9% | |
| Maximum Upper Side * (°C) | 40.9 | 44 -8% | 34.3 16% | 38.6 6% | 43.1 -5% |
| Maximum Bottom * (°C) | 40.4 | 43.2 -7% | 37.6 7% | 40.4 -0% | 45 -11% |
| Idle Upper Side * (°C) | 25 | 25.6 -2% | 28.4 -14% | 28.2 -13% | 27.3 -9% |
| Idle Bottom * (°C) | 25.5 | 25.6 -0% | 28.8 -13% | 29 -14% | 27.8 -9% |
* ... im mniej tym lepiej
Głośniki
Głośniki stereo należą do słabszych stron kompaktowego subnotebooka. Ich maksymalna głośność może być przyzwoita, ale sam dźwięk nie ma zbyt dużego wymiaru i wyraźnie brakuje im tego, co jest w stanie zaoferować wielu konkurentów urządzenia.
MSI Prestige 13 AI Evo analiza dźwięku
(±) | głośność głośnika jest średnia, ale dobra (81.8 dB)
Bas 100 - 315 Hz
(-) | prawie brak basu - średnio 20.5% niższa od mediany
(±) | liniowość basu jest średnia (8.4% delta do poprzedniej częstotliwości)
Średnie 400 - 2000 Hz
(±) | wyższe średnie - średnio 6.1% wyższe niż mediana
(+) | średnie są liniowe (5.9% delta do poprzedniej częstotliwości)
Wysokie 2–16 kHz
(+) | zrównoważone maksima - tylko 4.7% od mediany
(+) | wzloty są liniowe (5.4% delta do poprzedniej częstotliwości)
Ogólnie 100 - 16.000 Hz
(±) | liniowość ogólnego dźwięku jest średnia (19% różnicy w stosunku do mediany)
W porównaniu do tej samej klasy
» 58% wszystkich testowanych urządzeń w tej klasie było lepszych, 6% podobnych, 36% gorszych
» Najlepszy miał deltę 5%, średnia wynosiła ###średnia###%, najgorsza wynosiła 53%
W porównaniu do wszystkich testowanych urządzeń
» 45% wszystkich testowanych urządzeń było lepszych, 7% podobnych, 48% gorszych
» Najlepszy miał deltę 4%, średnia wynosiła ###średnia###%, najgorsza wynosiła 134%
Dell Latitude 13 7340 i5-1345U analiza dźwięku
(+) | głośniki mogą odtwarzać stosunkowo głośno (83 dB)
Bas 100 - 315 Hz
(±) | zredukowany bas - średnio 6.2% niższy od mediany
(±) | liniowość basu jest średnia (9.6% delta do poprzedniej częstotliwości)
Średnie 400 - 2000 Hz
(+) | zbalansowane środki średnie - tylko 2.3% od mediany
(+) | średnie są liniowe (5.1% delta do poprzedniej częstotliwości)
Wysokie 2–16 kHz
(±) | wyższe maksima - średnio 5.6% wyższe od mediany
(±) | liniowość wysokich wartości jest średnia (7.9% delta do poprzedniej częstotliwości)
Ogólnie 100 - 16.000 Hz
(+) | ogólny dźwięk jest liniowy (9% różnicy w stosunku do mediany)
W porównaniu do tej samej klasy
» 4% wszystkich testowanych urządzeń w tej klasie było lepszych, 1% podobnych, 95% gorszych
» Najlepszy miał deltę 5%, średnia wynosiła ###średnia###%, najgorsza wynosiła 53%
W porównaniu do wszystkich testowanych urządzeń
» 3% wszystkich testowanych urządzeń było lepszych, 1% podobnych, 96% gorszych
» Najlepszy miał deltę 4%, średnia wynosiła ###średnia###%, najgorsza wynosiła 134%
HP Dragonfly G4 analiza dźwięku
(+) | głośniki mogą odtwarzać stosunkowo głośno (84.4 dB)
Bas 100 - 315 Hz
(±) | zredukowany bas - średnio 8.4% niższy od mediany
(±) | liniowość basu jest średnia (11.6% delta do poprzedniej częstotliwości)
Średnie 400 - 2000 Hz
(+) | zbalansowane środki średnie - tylko 2.3% od mediany
(+) | średnie są liniowe (4.8% delta do poprzedniej częstotliwości)
Wysokie 2–16 kHz
(+) | zrównoważone maksima - tylko 3.2% od mediany
(+) | wzloty są liniowe (4.6% delta do poprzedniej częstotliwości)
Ogólnie 100 - 16.000 Hz
(+) | ogólny dźwięk jest liniowy (9.1% różnicy w stosunku do mediany)
W porównaniu do tej samej klasy
» 4% wszystkich testowanych urządzeń w tej klasie było lepszych, 1% podobnych, 95% gorszych
» Najlepszy miał deltę 5%, średnia wynosiła ###średnia###%, najgorsza wynosiła 53%
W porównaniu do wszystkich testowanych urządzeń
» 3% wszystkich testowanych urządzeń było lepszych, 1% podobnych, 96% gorszych
» Najlepszy miał deltę 4%, średnia wynosiła ###średnia###%, najgorsza wynosiła 134%
Zarządzanie energią - Dobra wytrzymałość dzięki baterii 75 Wh
Zużycie energii
Podczas pomiarów zużycia energii nie zauważyliśmy żadnych niedociągnięć, a maksymalne zużycie energii w trybie bezczynności wynosi około 9 watów. Podobnie jak w przypadku wszystkich paneli OLED, należy ustawić ciemniejsze obrazy tła i korzystać z trybu ciemnego systemu Windows, aby zminimalizować zużycie energii. Pod obciążeniem zasilacz osiąga limit 65 watów przez krótki czas, po czym szybko równoważy się na poziomie 33 watów i podczas testu warunków skrajnych pozostał na tym poziomie.
| wyłączony / stan wstrzymania | |
| luz | |
| obciążenie |
|
Legenda:
min: | |
| MSI Prestige 13 AI Evo Ultra 7 155H, Arc 8-Core, Samsung PM9A1 MZVL21T0HCLR, OLED, 2880x1800, 13.3" | Lenovo ThinkPad X1 Nano Gen 3 i7-1360P, Iris Xe G7 96EUs, Lenovo UMIS AM6A0 RPJTJ512MKP1QDQ, IPS, 2160x1350, 13" | Dell Latitude 13 7340 i5-1345U i5-1345U, Iris Xe G7 80EUs, Kioxia BG5 KBG50ZNS512G, IPS, 1920x1200, 13.3" | HP Dragonfly G4 i7-1365U, Iris Xe G7 96EUs, Micron 3400 MTFDKBA512TFH 512GB, IPS, 1920x1280, 13.5" | Asus ZenBook S13 OLED UX5304 i7-1355U, Iris Xe G7 96EUs, Samsung PM9A1 MZVL21T0HCLR, OLED, 2880x1800, 13.3" | Przeciętny Intel Arc 8-Core iGPU | Średnia w klasie Subnotebook | |
|---|---|---|---|---|---|---|---|
| Power Consumption | 6% | 3% | -1% | -3% | -28% | 5% | |
| Idle Minimum * (Watt) | 4.5 | 3.3 27% | 2.37 47% | 4.1 9% | 5.8 -29% | 5.31 ? -18% | 3.76 ? 16% |
| Idle Average * (Watt) | 8 | 6.5 19% | 6.19 23% | 7.5 6% | 8.5 -6% | 8.56 ? -7% | 6.54 ? 18% |
| Idle Maximum * (Watt) | 8.7 | 7.1 18% | 14.1 -62% | 8.2 6% | 8.8 -1% | 11.9 ? -37% | 7.89 ? 9% |
| Load Average * (Watt) | 36.1 | 40.7 -13% | 36.3 -1% | 35.5 2% | 35.1 3% | 53.6 ? -48% | 42 ? -16% |
| Witcher 3 ultra * (Watt) | 29.7 | 37 -25% | 24.9 16% | 37.5 -26% | 27.6 7% | ||
| Load Maximum * (Watt) | 65 | 58.6 10% | 69.13 -6% | 66.5 -2% | 59.5 8% | 84.2 ? -30% | 64.8 ? -0% |
* ... im mniej tym lepiej
Power consumption Witcher 3 / stress test
Power consumption with external monitor
Czas trwania
Pomimo niskiej wagi, MSI zainstalowało baterię o pojemności 75 Wh, która zapewnia dobre czasy pracy pomimo panelu OLED laptopa. Chociaż jego odpowiedniki IPS zazwyczaj działają jeszcze dłużej, był w stanie pokonać Zenbook S13 OLED od Asusa na niewielką odległość. Podczas naszego testu WLAN przy 150 cd/m² (57% maksymalnej jasności SDR urządzenia) próbka testowa działała przez ~ 11,5 godziny, a przy pełnej jasności przez ~ 7,5 godziny. Możliwe jest odtwarzanie filmów przez 16,5 godziny (150 cd/m²), podczas gdy wideo HDR przy pełnej jasności może być odtwarzane przez 6 godzin. Jedno pełne ładowanie trwa 220 minut przy włączonym urządzeniu, przy czym 80% pojemności jest dostępne po 114 minutach.
| MSI Prestige 13 AI Evo Ultra 7 155H, Arc 8-Core, 75 Wh | Lenovo ThinkPad X1 Nano Gen 3 i7-1360P, Iris Xe G7 96EUs, 49.5 Wh | Dell Latitude 13 7340 i5-1345U i5-1345U, Iris Xe G7 80EUs, 57 Wh | HP Dragonfly G4 i7-1365U, Iris Xe G7 96EUs, 68 Wh | Asus ZenBook S13 OLED UX5304 i7-1355U, Iris Xe G7 96EUs, 63 Wh | Średnia w klasie Subnotebook | |
|---|---|---|---|---|---|---|
| Czasy pracy | -33% | 17% | 26% | -11% | -6% | |
| H.264 (h) | 16.7 | 13.8 -17% | 15.4 ? -8% | |||
| WiFi v1.3 (h) | 11.6 | 7.8 -33% | 15 29% | 15.9 37% | 11.3 -3% | 14 ? 21% |
| Load (h) | 2.8 | 2.9 4% | 3.2 14% | 2.4 -14% | 1.969 ? -30% |
Za
Przeciw
Werdykt - MSI Prestige 13 imponuje niską wagą i panelem OLED

Nowy MSI Prestige 13 AI Evo wyraźnie koncentruje się na przenośności i pod tym względem nasze testowe urządzenie z lekką konstrukcją i dobrymi czasami pracy okazuje się sukcesem. Co więcej, jego panel OLED oferuje wyjątkową jakość obrazu, w tym pewne zalety w porównaniu z wieloma modelami IPS - jednak w żadnym wypadku nie jest idealny, jeśli celem jest edycja zdjęć. Jeśli często pracują Państwo w podróży, to błyszczące refleksy panelu mogą również przeszkadzać.
Jego dane techniczne w postaci nowego Core Ultra 7 155H obiecują dużą wydajność, ale w rzeczywistości jest to najwolniejszy model Meteor-Lake-H, jaki do tej pory testowaliśmy. Do codziennego użytku powinien być wystarczający w wielu przypadkach, ale nie należy zapominać, jak daleko urządzenie pozostaje od rzeczywistego potencjału wydajności (CPU i GPU). Jego pamięci RAM nie można rozbudować, ale i tak 32 GB powinno być więcej niż wystarczające dla większości użytkowników (w końcu nie jest to stacja robocza).
MSI Prestige 13 AI Evo waży mniej niż 1 kilogram, a mimo to nie musi się obejść bez świetnych czasów pracy, mnóstwa portów i panelu OLED. Pomimo procesora Meteor Lake, wydajność urządzenia nadal nie jest najlepsza, a ponadto jego chłodnica jest prawie zawsze aktywna w codziennym użytkowaniu.
Jeśli chodzi o porty i łączność laptopa, w tym Wi-Fi 7 i szybki czytnik kart, nie mamy na co narzekać, chociaż jego kompaktowa obudowa wymaga również pewnych kompromisów. Obejmuje to jego jednostkę chłodzącą składającą się tylko z jednego wentylatora, który jest również prawie zawsze aktywny, co sprawia, że naprawdę ciche urządzenie jest rzadkością. Ponadto, jego klawiatura wydaje się nieco ciasna, nawet jeśli sama mechanika jest w porządku. Wreszcie, jego słabe głośniki pozostawiają więcej do życzenia, a konkurencja oferuje kilka wyraźnych zalet pod tym względem.
The HP Dragonfly G4 jest prawdopodobnie największym konkurentem Prestige 13 i oprócz lepszych głośników, oferuje również lepszą klawiaturę i dłuższy czas pracy - ale z kolei ma panel IPS (bez PWM) o niższej rozdzielczości i subiektywnie gorszej jakości obrazu. Jego cena MRSP jest wyższa, ale być może uda się Państwu znaleźć go taniej w Internecie.
Cena i dostępność
MSI Prestige 13 AI Evo można obecnie znaleźć na Amazon w cenie 1 280,71 USD.
MSI Prestige 13 AI Evo
- 06/03/2024 v7 (old)
Andreas Osthoff
Przezroczystość
Wyboru urządzeń do recenzji dokonuje nasza redakcja. Próbka testowa została udostępniona autorowi jako pożyczka od producenta lub sprzedawcy detalicznego na potrzeby tej recenzji. Pożyczkodawca nie miał wpływu na tę recenzję, producent nie otrzymał też kopii tej recenzji przed publikacją. Nie było obowiązku publikowania tej recenzji. Jako niezależna firma medialna, Notebookcheck nie podlega władzy producentów, sprzedawców detalicznych ani wydawców.
Tak testuje Notebookcheck
Każdego roku Notebookcheck niezależnie sprawdza setki laptopów i smartfonów, stosując standardowe procedury, aby zapewnić porównywalność wszystkich wyników. Od około 20 lat stale rozwijamy nasze metody badawcze, ustanawiając przy tym standardy branżowe. W naszych laboratoriach testowych doświadczeni technicy i redaktorzy korzystają z wysokiej jakości sprzętu pomiarowego. Testy te obejmują wieloetapowy proces walidacji. Nasz kompleksowy system ocen opiera się na setkach uzasadnionych pomiarów i benchmarków, co pozwala zachować obiektywizm.Price comparison

