Recenzja Acer Swift Go 14 - Meteor Lake Core Ultra 7 imponuje rdzeniem AI
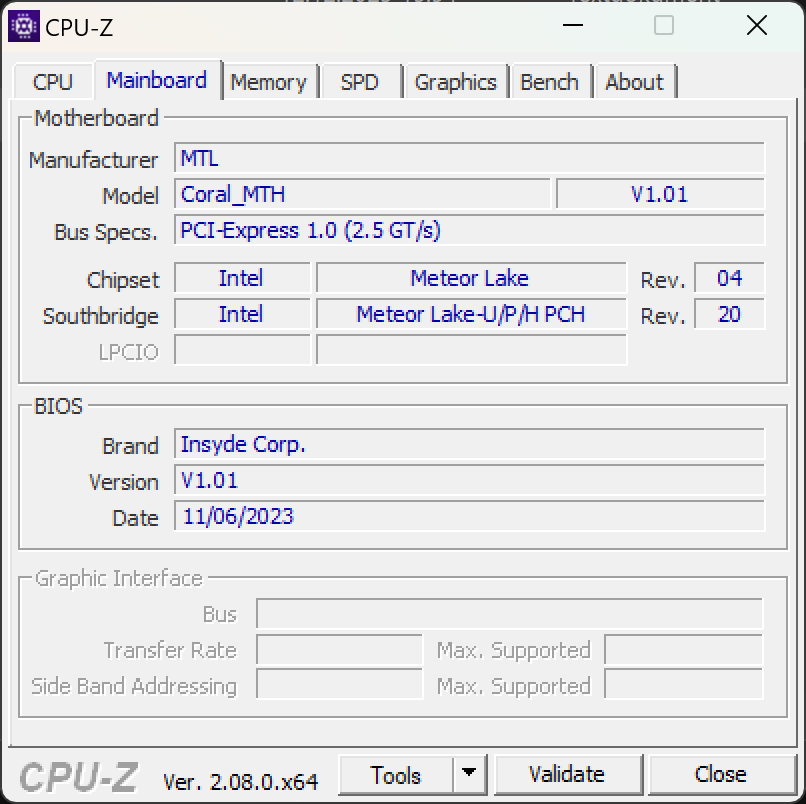
Nie minęły nawet dwa miesiące, odkąd recenzowaliśmy Acer Swift Go 14. Tamten zaimponował nam dobrą wydajnością w przystępnej cenie. Nasze obecne urządzenie testowe jest wyposażone w najnowszą generację procesorów Intela. Acer Swift Go 14 - który będzie dostępny wiosną przyszłego roku - jest wyposażony w procesor Intel Core Ultra 155H. Ze sprzętowego punktu widzenia Acer dostarczył nam laptopa opartego na standardowej specyfikacji urządzenia. Jednak do wiosny nadal będą wprowadzane drobne ulepszenia w oprogramowaniu towarzyszącym, zarządzaniu wydajnością i BIOS-ie. Z tego powodu wstrzymamy się z przyznaniem oceny, dopóki nie zobaczymy, jakie przyszłe ulepszenia najnowszej generacji procesorów Intela przyniosą temu modelowi premium z wyświetlaczem OLED.
W niektórych testach porównawczych odnotowaliśmy ponad dwukrotnie wyższą wydajność w porównaniu do poprzednika, który był wyposażony w procesor Intel Core i5-1335U. Ponadto, nowa jednostka iGPU Arc Intela bez wątpienia zadowoli wielu graczy, ponieważ grafika Intela jest teraz co najmniej na równi z Radeonem RX 780M.
Sam Intel często porównuje swoje nowe procesory z AMD Ryzen R7 7840U i z tego powodu w ramach naszego porównania przyjrzymy się HP Pavillon Plus 14, który jest wyposażony zarówno w warianty procesorów Intel, jak i AMD. Dość nietypowym przedstawicielem może być Ayaneo Air 1S, ale to urządzenie jest również wyposażone w potężny konkurencyjny układ AMD. I wreszcie, LG Gram 2w1 i Acer Swift Go 14 SFG14-71 z procesorem 13. generacji zamykają naszą znakomitą grupę.
Potencjalni konkurenci w porównaniu
Ocena | Data | Model | Waga | Wysokość | Rozmiar | Rezolucja | Cena |
|---|---|---|---|---|---|---|---|
v (old) | 12/2023 | Acer Swift Go 14 SFG14-72 Ultra 7 155H, Arc 8-Core | 1.3 kg | 14.9 mm | 14.00" | 2880x1800 | |
| 85.6 % v7 (old) | 11/2023 | Acer Swift Go 14 SFG14-71 i5-1335U, Iris Xe G7 80EUs | 1.3 kg | 14.9 mm | 14.00" | 2880x1800 | |
| 85.8 % v7 (old) | 11/2023 | LG Gram 2in1 16 16T90R - G.AA78G i7-1360P, Iris Xe G7 96EUs | 1.5 kg | 17.2 mm | 16.00" | 2560x1600 | |
| 87.5 % v7 (old) | 12/2023 | HP Pavilion Plus 14-ew0153TU i7-1355U, Iris Xe G7 96EUs | 1.4 kg | 17.5 mm | 14.00" | 2880x1800 | |
| 90.4 % v7 (old) | 12/2023 | Lenovo ThinkPad T14 G4 21K4S02000 R7 PRO 7840U, Radeon 780M | 1.5 kg | 17.9 mm | 14.00" | 1920x1200 | |
| 88.2 % v7 (old) | 10/2023 | Ayaneo Air 1S Retro Power R7 7840U, Radeon 780M | 443.8 g | 21 mm | 5.50" | 1920x1080 | |
| 87.8 % v7 (old) | 11/2023 | HP Pavilion Plus 14-ey0095cl R7 7840U, Radeon 780M | 1.4 kg | 18.8 mm | 14.00" | 2880x1800 |
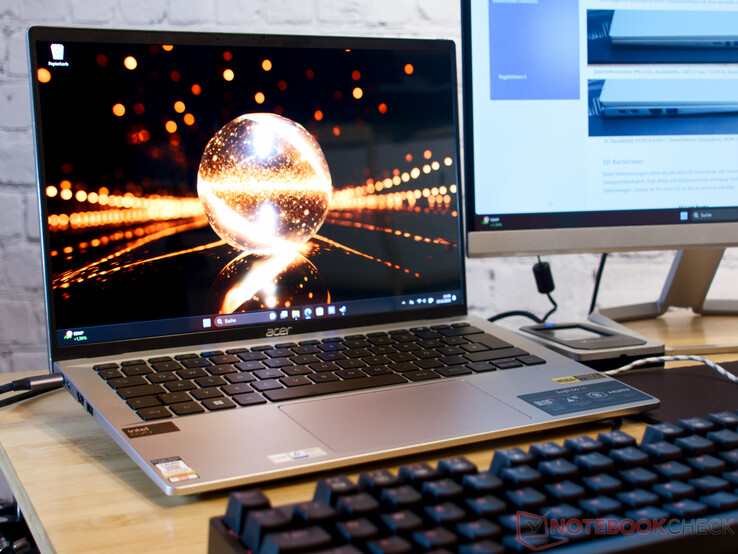
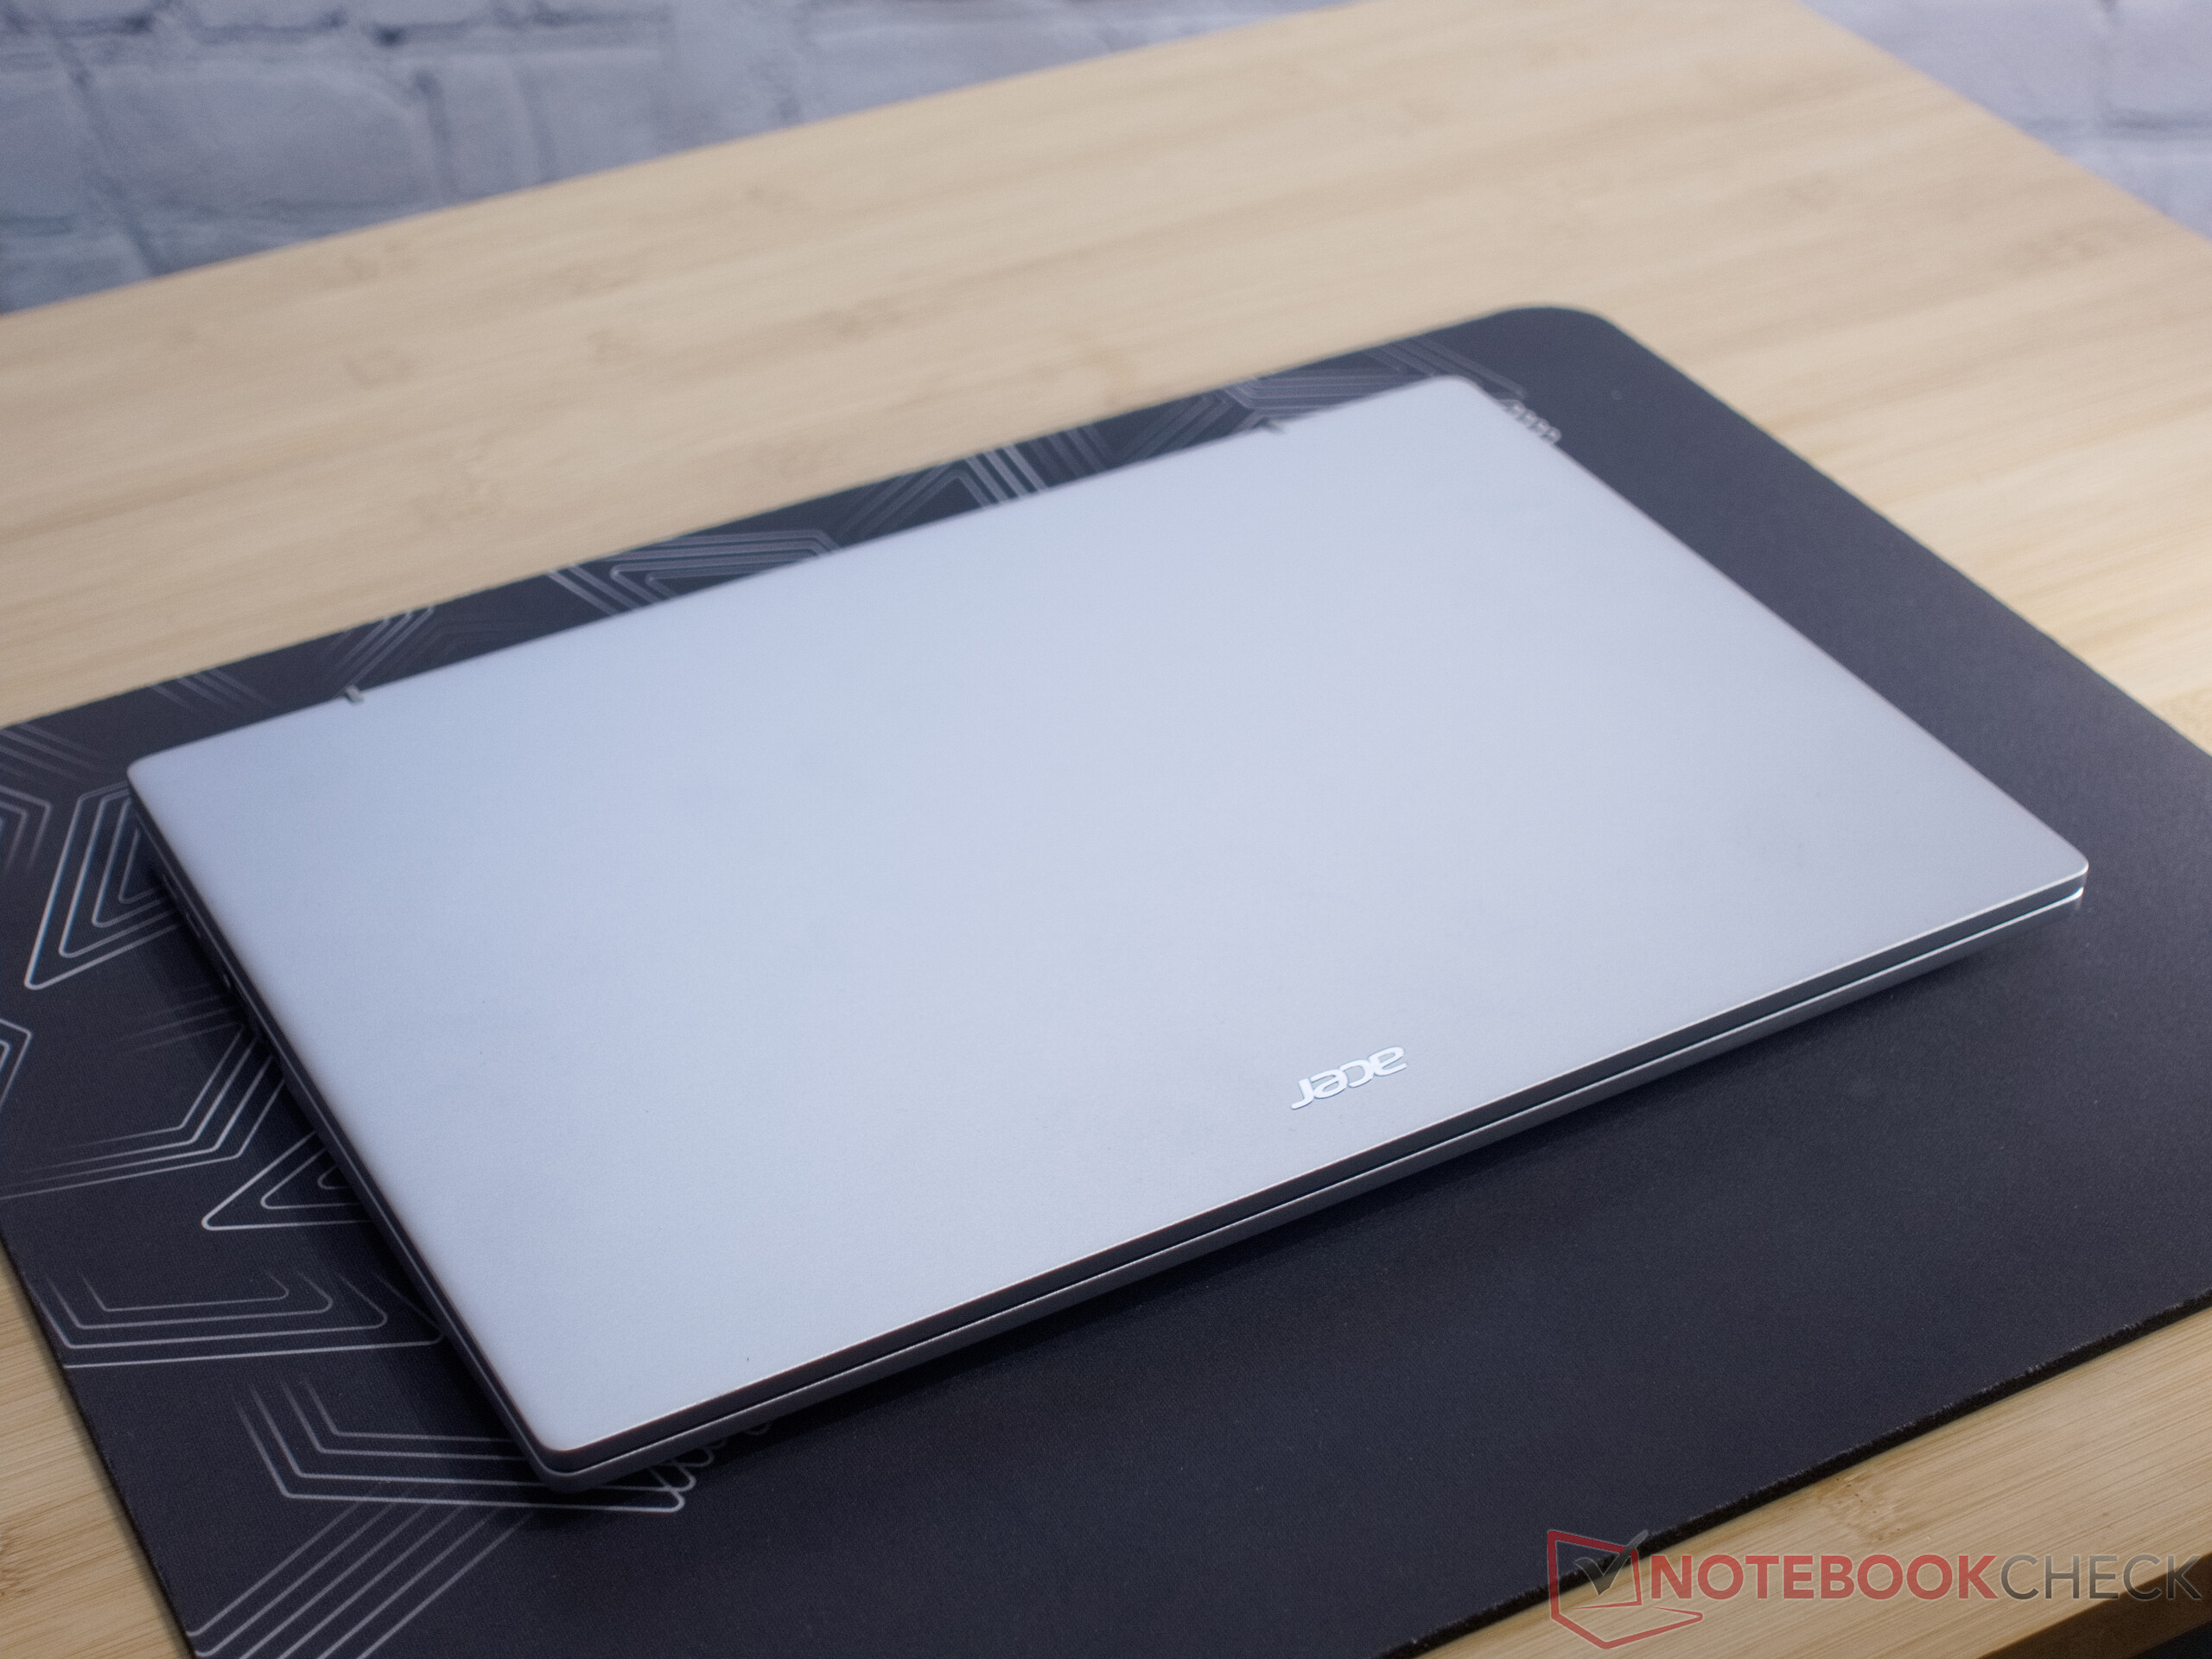
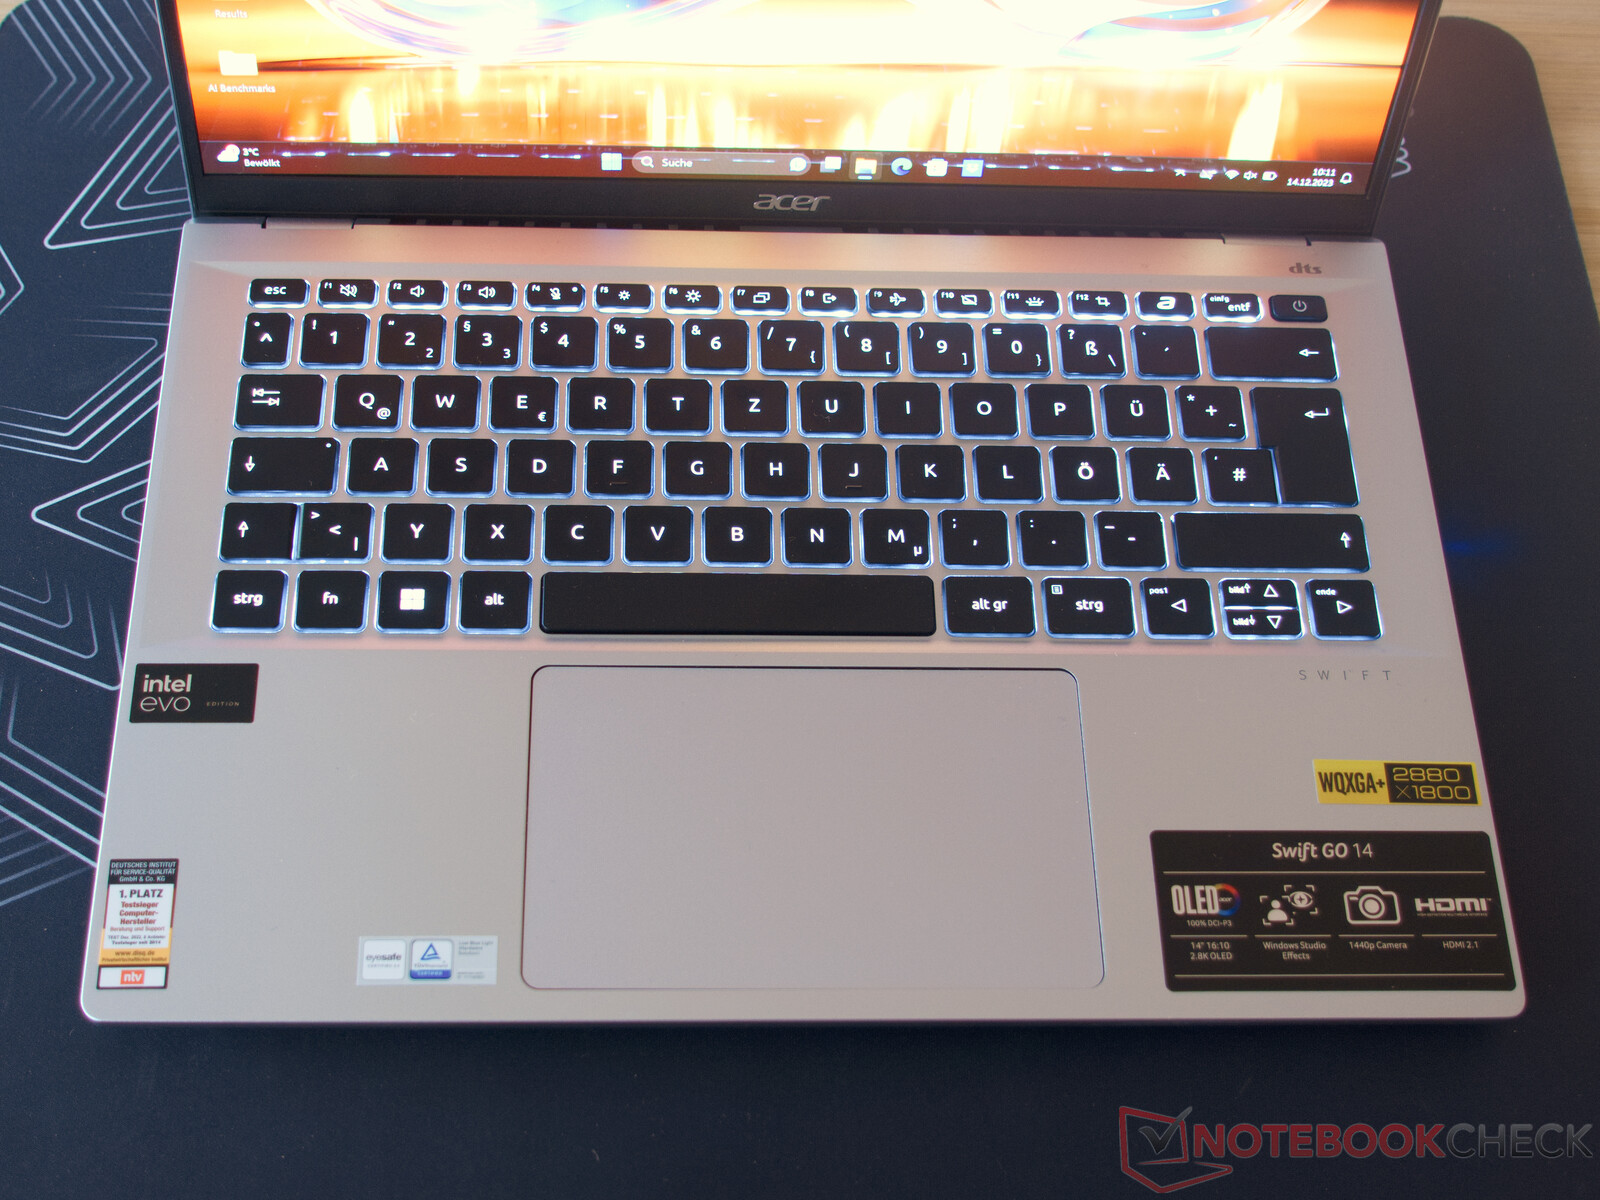
Obudowa - aluminium kątowe
Chociaż pierwsze wrażenia sugerowałyby, że urządzenie nie przeszło żadnych zmian, to jednak zauważyliśmy, że Acer dokonał szczegółowych ulepszeń aluminiowej obudowy. Kątowa konstrukcja ramki nie ujawnia żadnych wad produkcyjnych, co oznacza, że moglibyśmy niemal skopiować i wkleić cały opis poprzednika. Acer zdołał jednak zainstalować znacznie większy touchpad, co skutkuje zauważalną poprawą użyteczności laptopa.
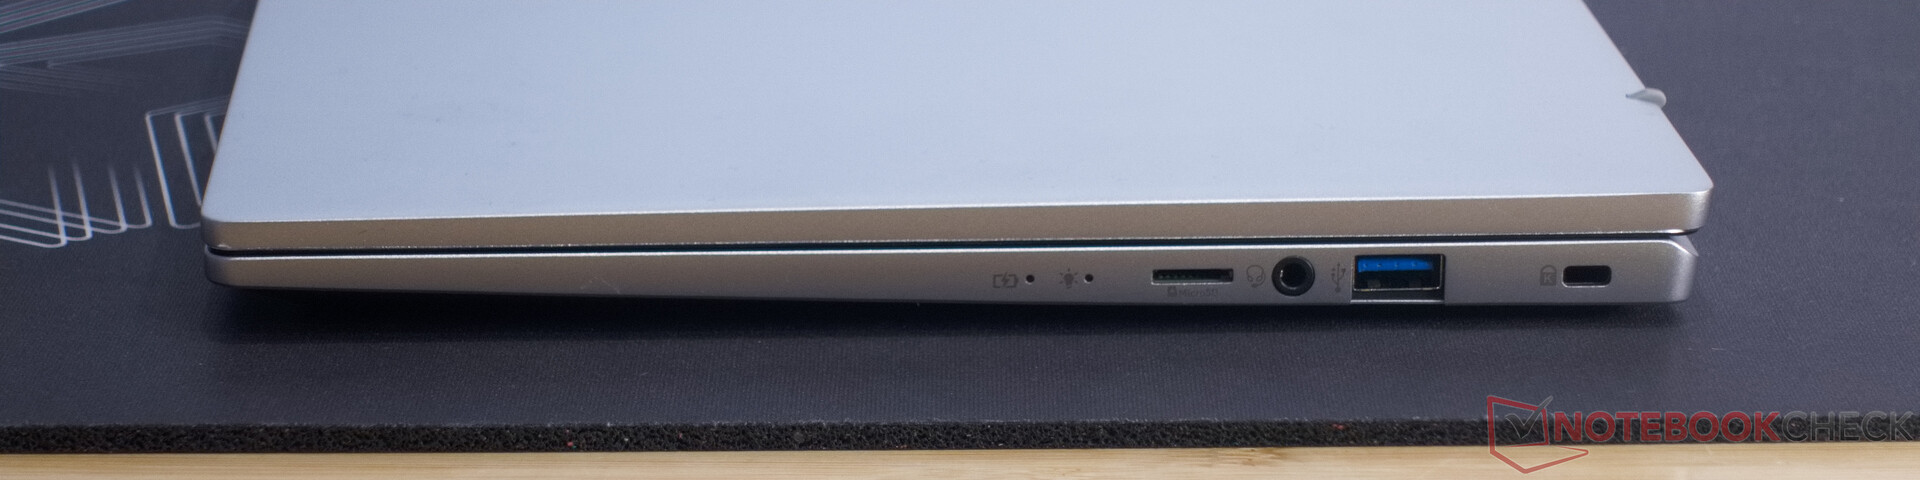
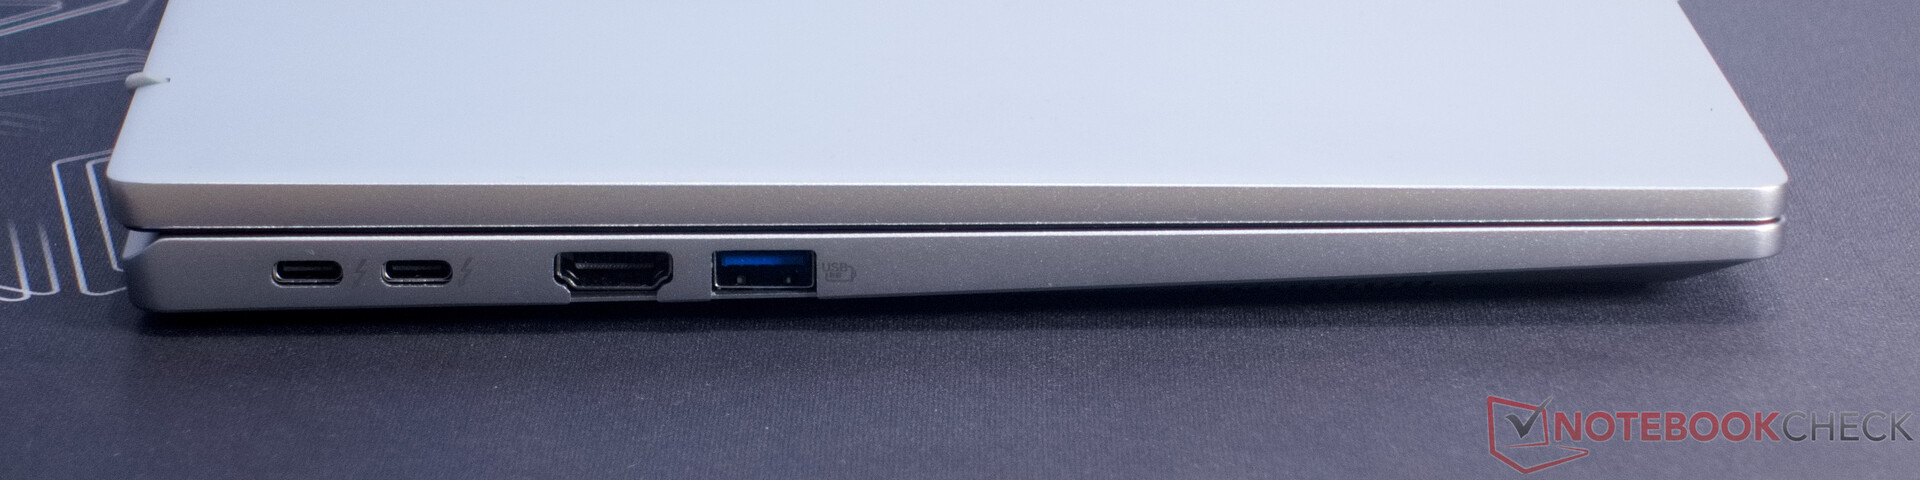
Cechy - zabójcze Wi-Fi i doskonała kamera internetowa
Do małego laptopa można podłączyć do trzech monitorów za pośrednictwem HDMI 2.1 i obu portów Thunderbolt 4. Obecny procesor Intel Meteor Lake obsługuje wyjście do czterech monitorów jednocześnie. Podobnie, Acer zdołał nawet pomieścić czytnik kart microSD, a nawet mini gniazdo Kensington Lock.
Czytnik kart SD
Nie widać żadnych ulepszeń w czytniku kart microSD. Z wolną prędkością odczytu 28 MB/s jest porównywalny z zeszłorocznym modelem i nadaje się tylko do niewielkich ilości danych. Nasz AV Pro microSD jest do dziesięciu razy szybszy.
| SD Card Reader | |
| average JPG Copy Test (av. of 3 runs) | |
| Średnia w klasie Subnotebook (23.7 - 188, n=9, ostatnie 2 lata) | |
| Acer Swift Go 14 SFG14-72 | |
| maximum AS SSD Seq Read Test (1GB) | |
| Średnia w klasie Subnotebook (24.9 - 195, n=8, ostatnie 2 lata) | |
| Acer Swift Go 14 SFG14-72 | |
Komunikacja
Korzystając z iPerf3 i Asus GT-AXE11000, w naszym teście Wi-Fi, Acer Swift Go wykazał znacznie wyższe prędkości transferu zarówno w sieciach 5 GHz, jak i 6 GHz. Przy prędkości do 1,9 GBit/s, wysyłanie i pobieranie danych do sieci domowej odbywa się w szybkim tempie.
Kamera internetowa
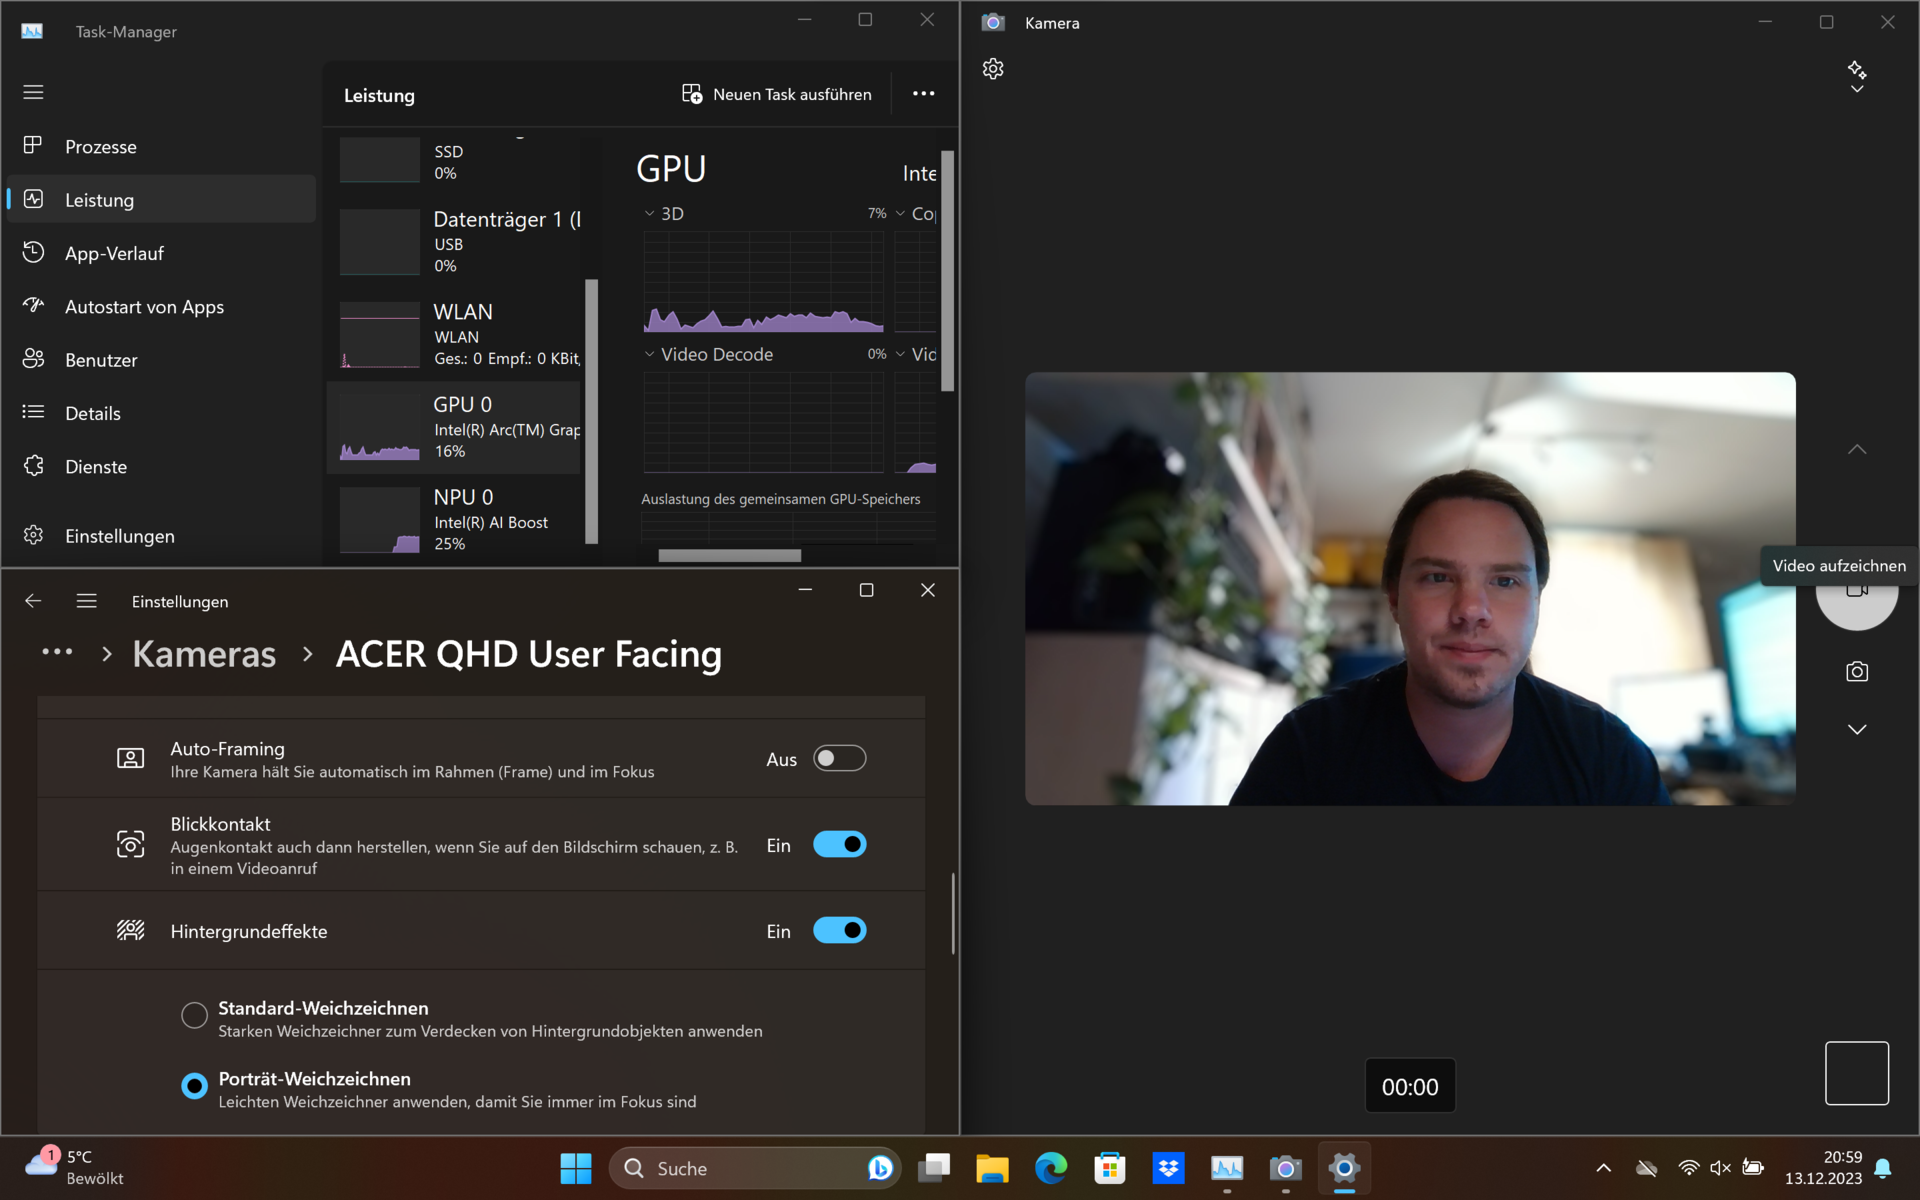
Kamera internetowa Acer Swift Go o rozdzielczości QHD zapewnia bardzo imponujące rezultaty. Jakość obrazu można nawet nieco poprawić dzięki procesorowi Intel NPU i efektom Windows Studio. Jednak to opodatkowuje iGPU i, jak można się spodziewać, wentylatory Acer Swift Go dają o sobie znać zarówno szybko, jak i głośno.


Bezpieczeństwo
Na pokładzie znajduje się czujnik linii papilarnych, gniazdo Kensington Lock i TPM 2.0. Oznacza to, że wszystkie podstawowe wymagania bezpieczeństwa dotyczące fizycznej kradzieży i ochrony dostępu są spełnione.
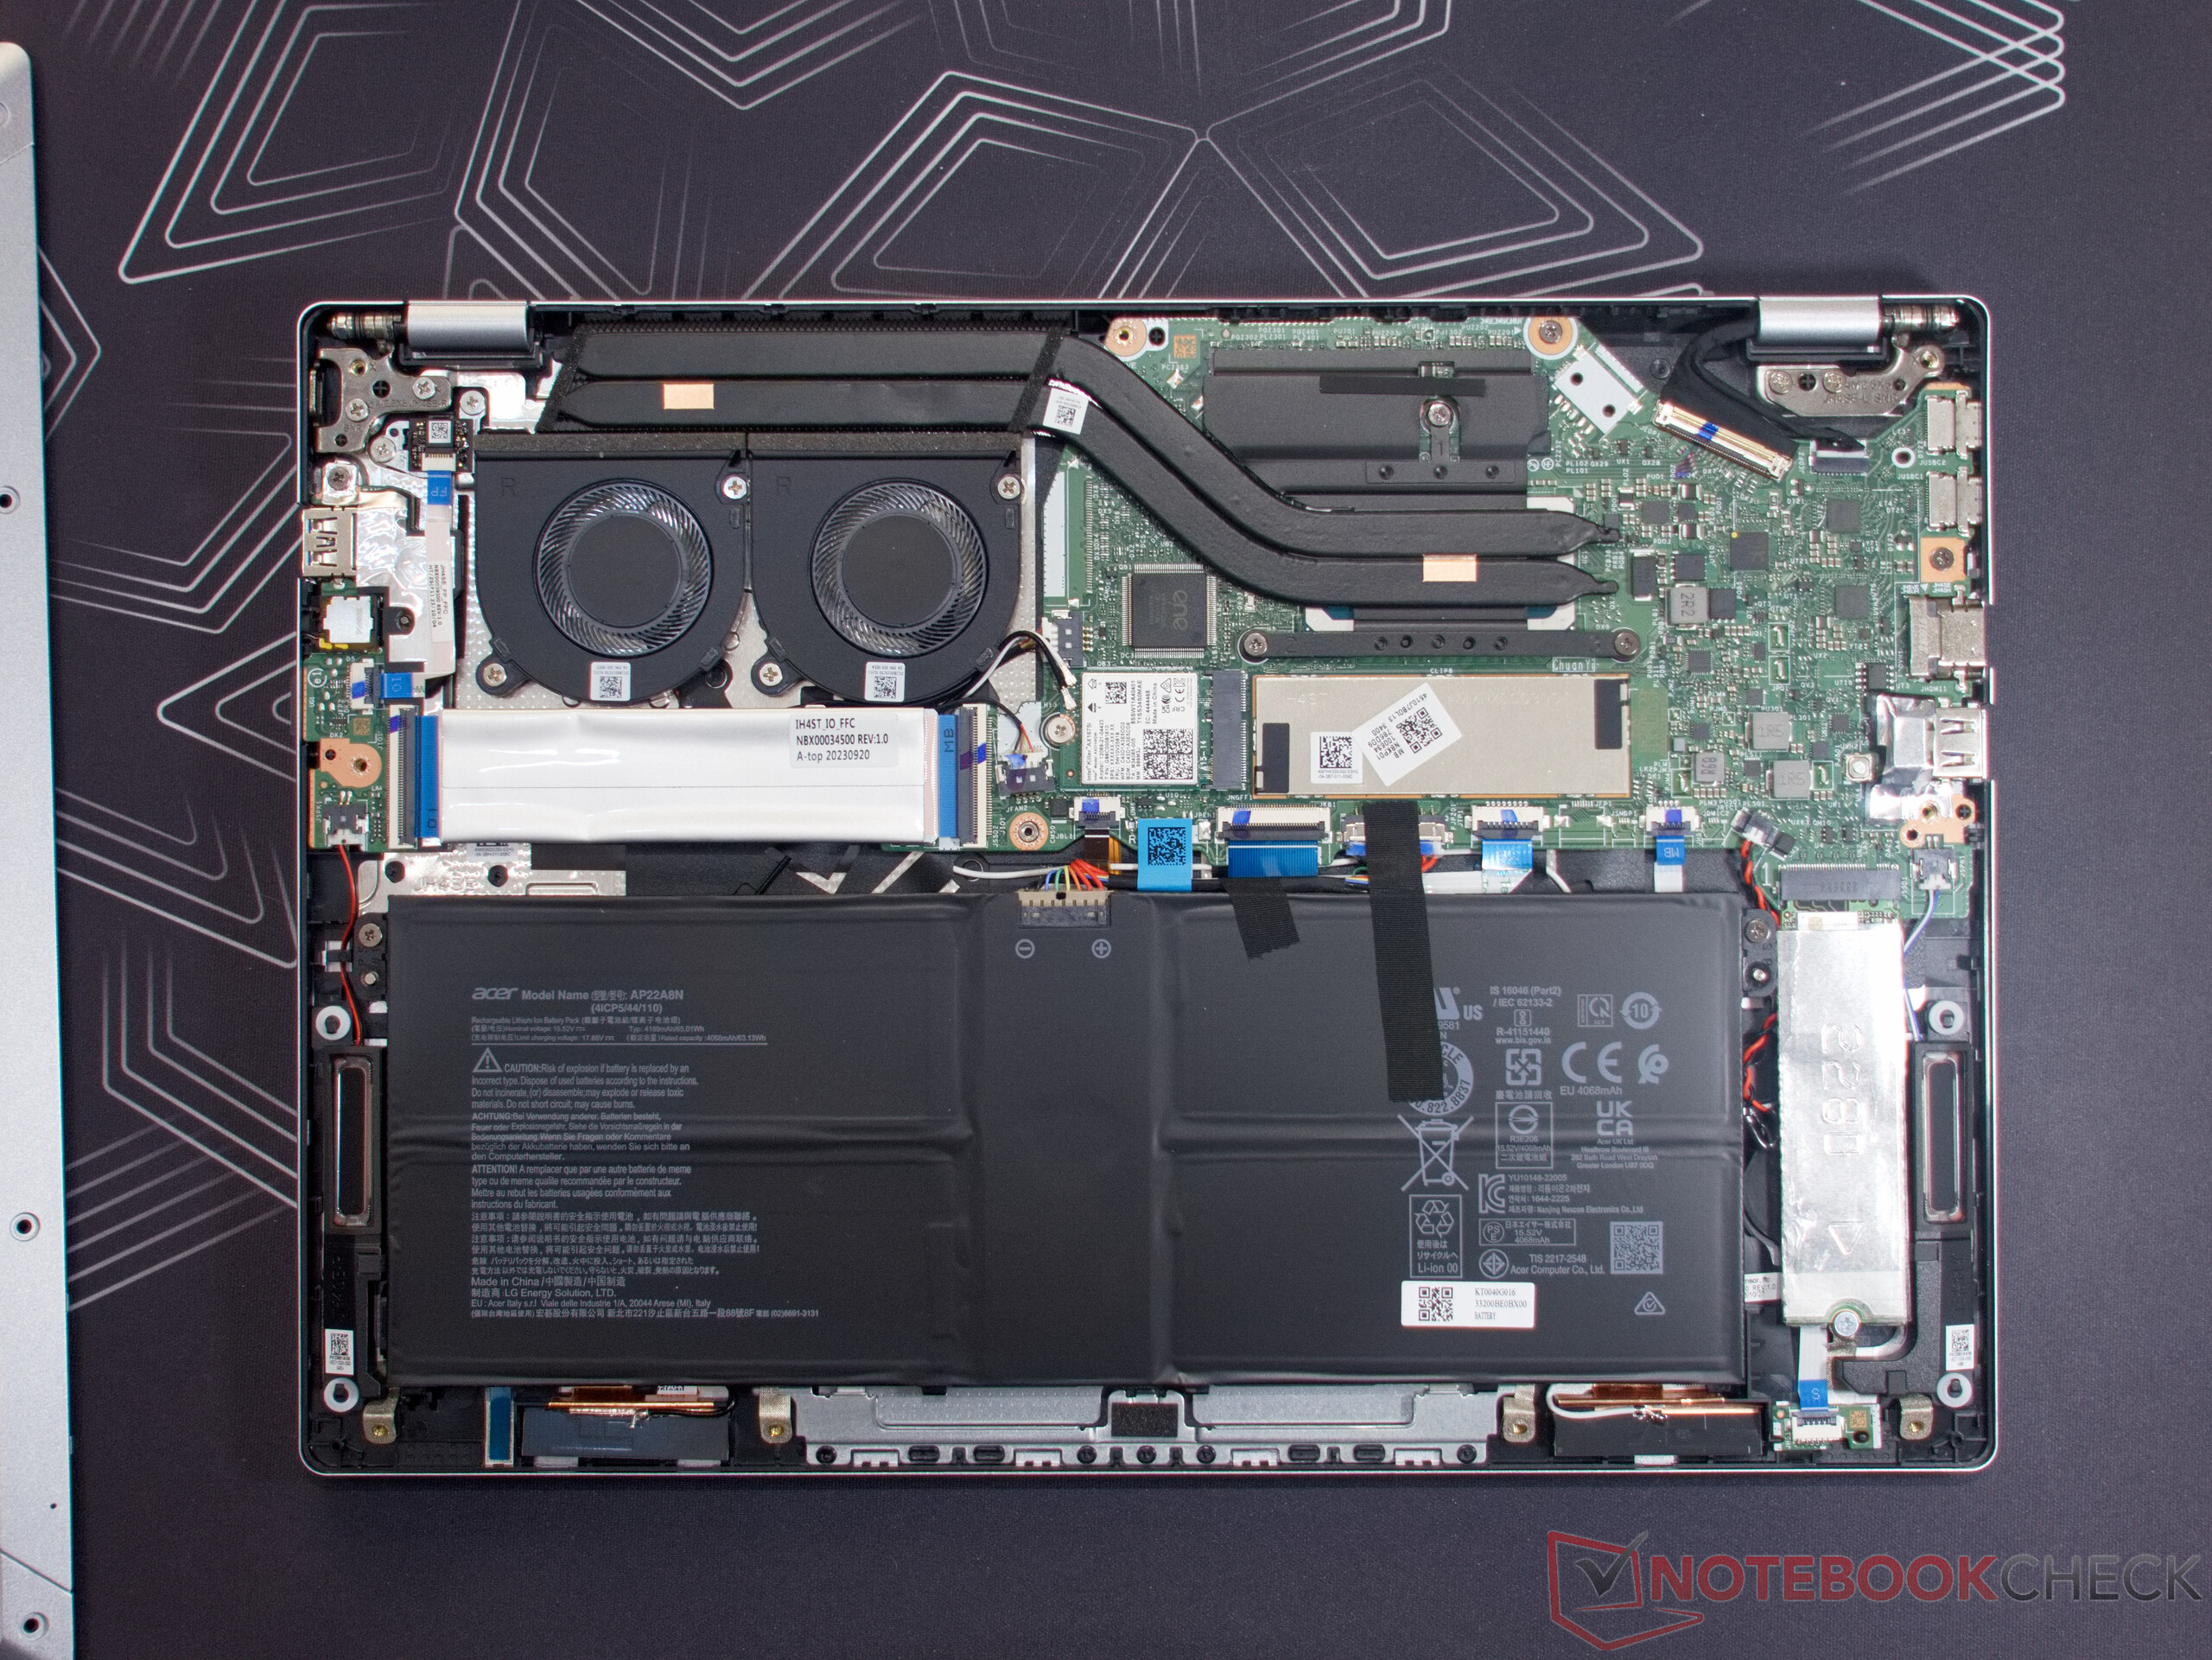
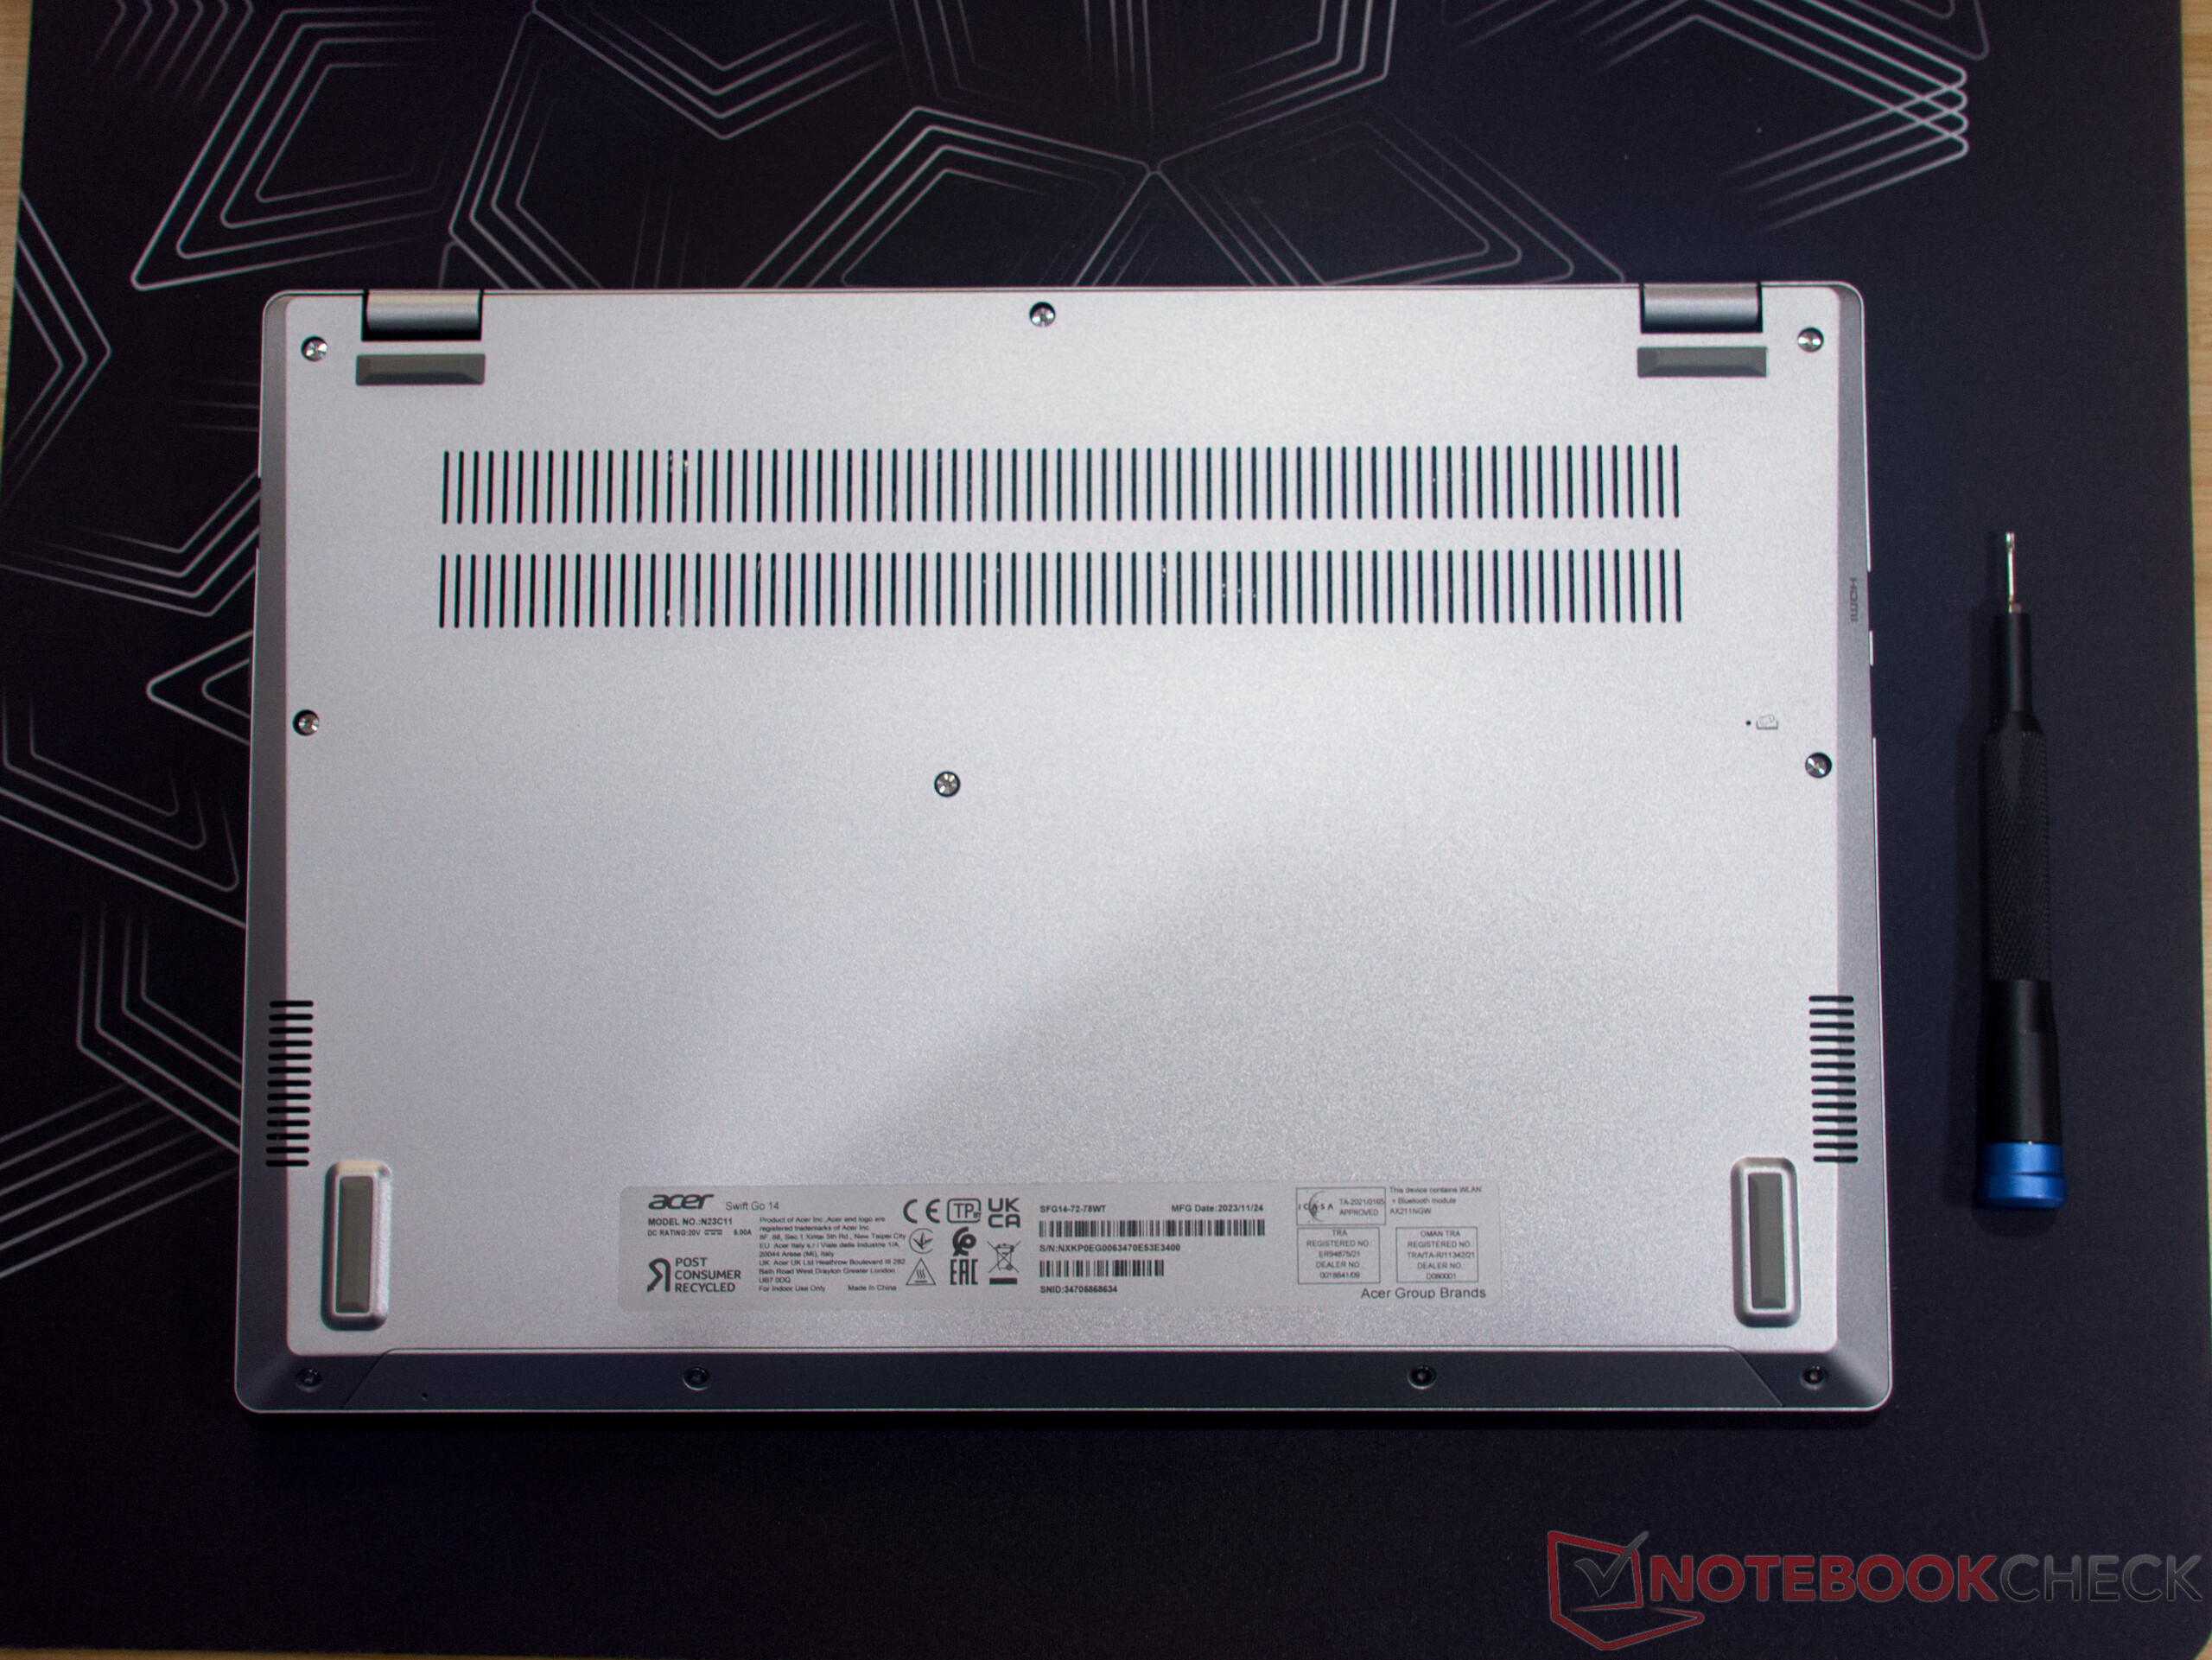
Konserwacja
Do otwarcia Acer Swift Go potrzebowaliśmy śrubokręta TX5 i przyssawki. Podobnie jak w przypadku poprzednikawewnątrz laptopa znajdziemy wiele opcji konserwacyjnych. Dostępne są dwa gniazda M.2 (jedno zajęte), a także zainstalowany moduł Wi-Fi. Wentylatory można łatwo wyjąć w celu wyczyszczenia. Jedynie pojemna pamięć RAM 32 GB jest przylutowana. Nawiasem mówiąc, wolne gniazdo M.2 można znaleźć pod kablem taśmowym obok wentylatorów.
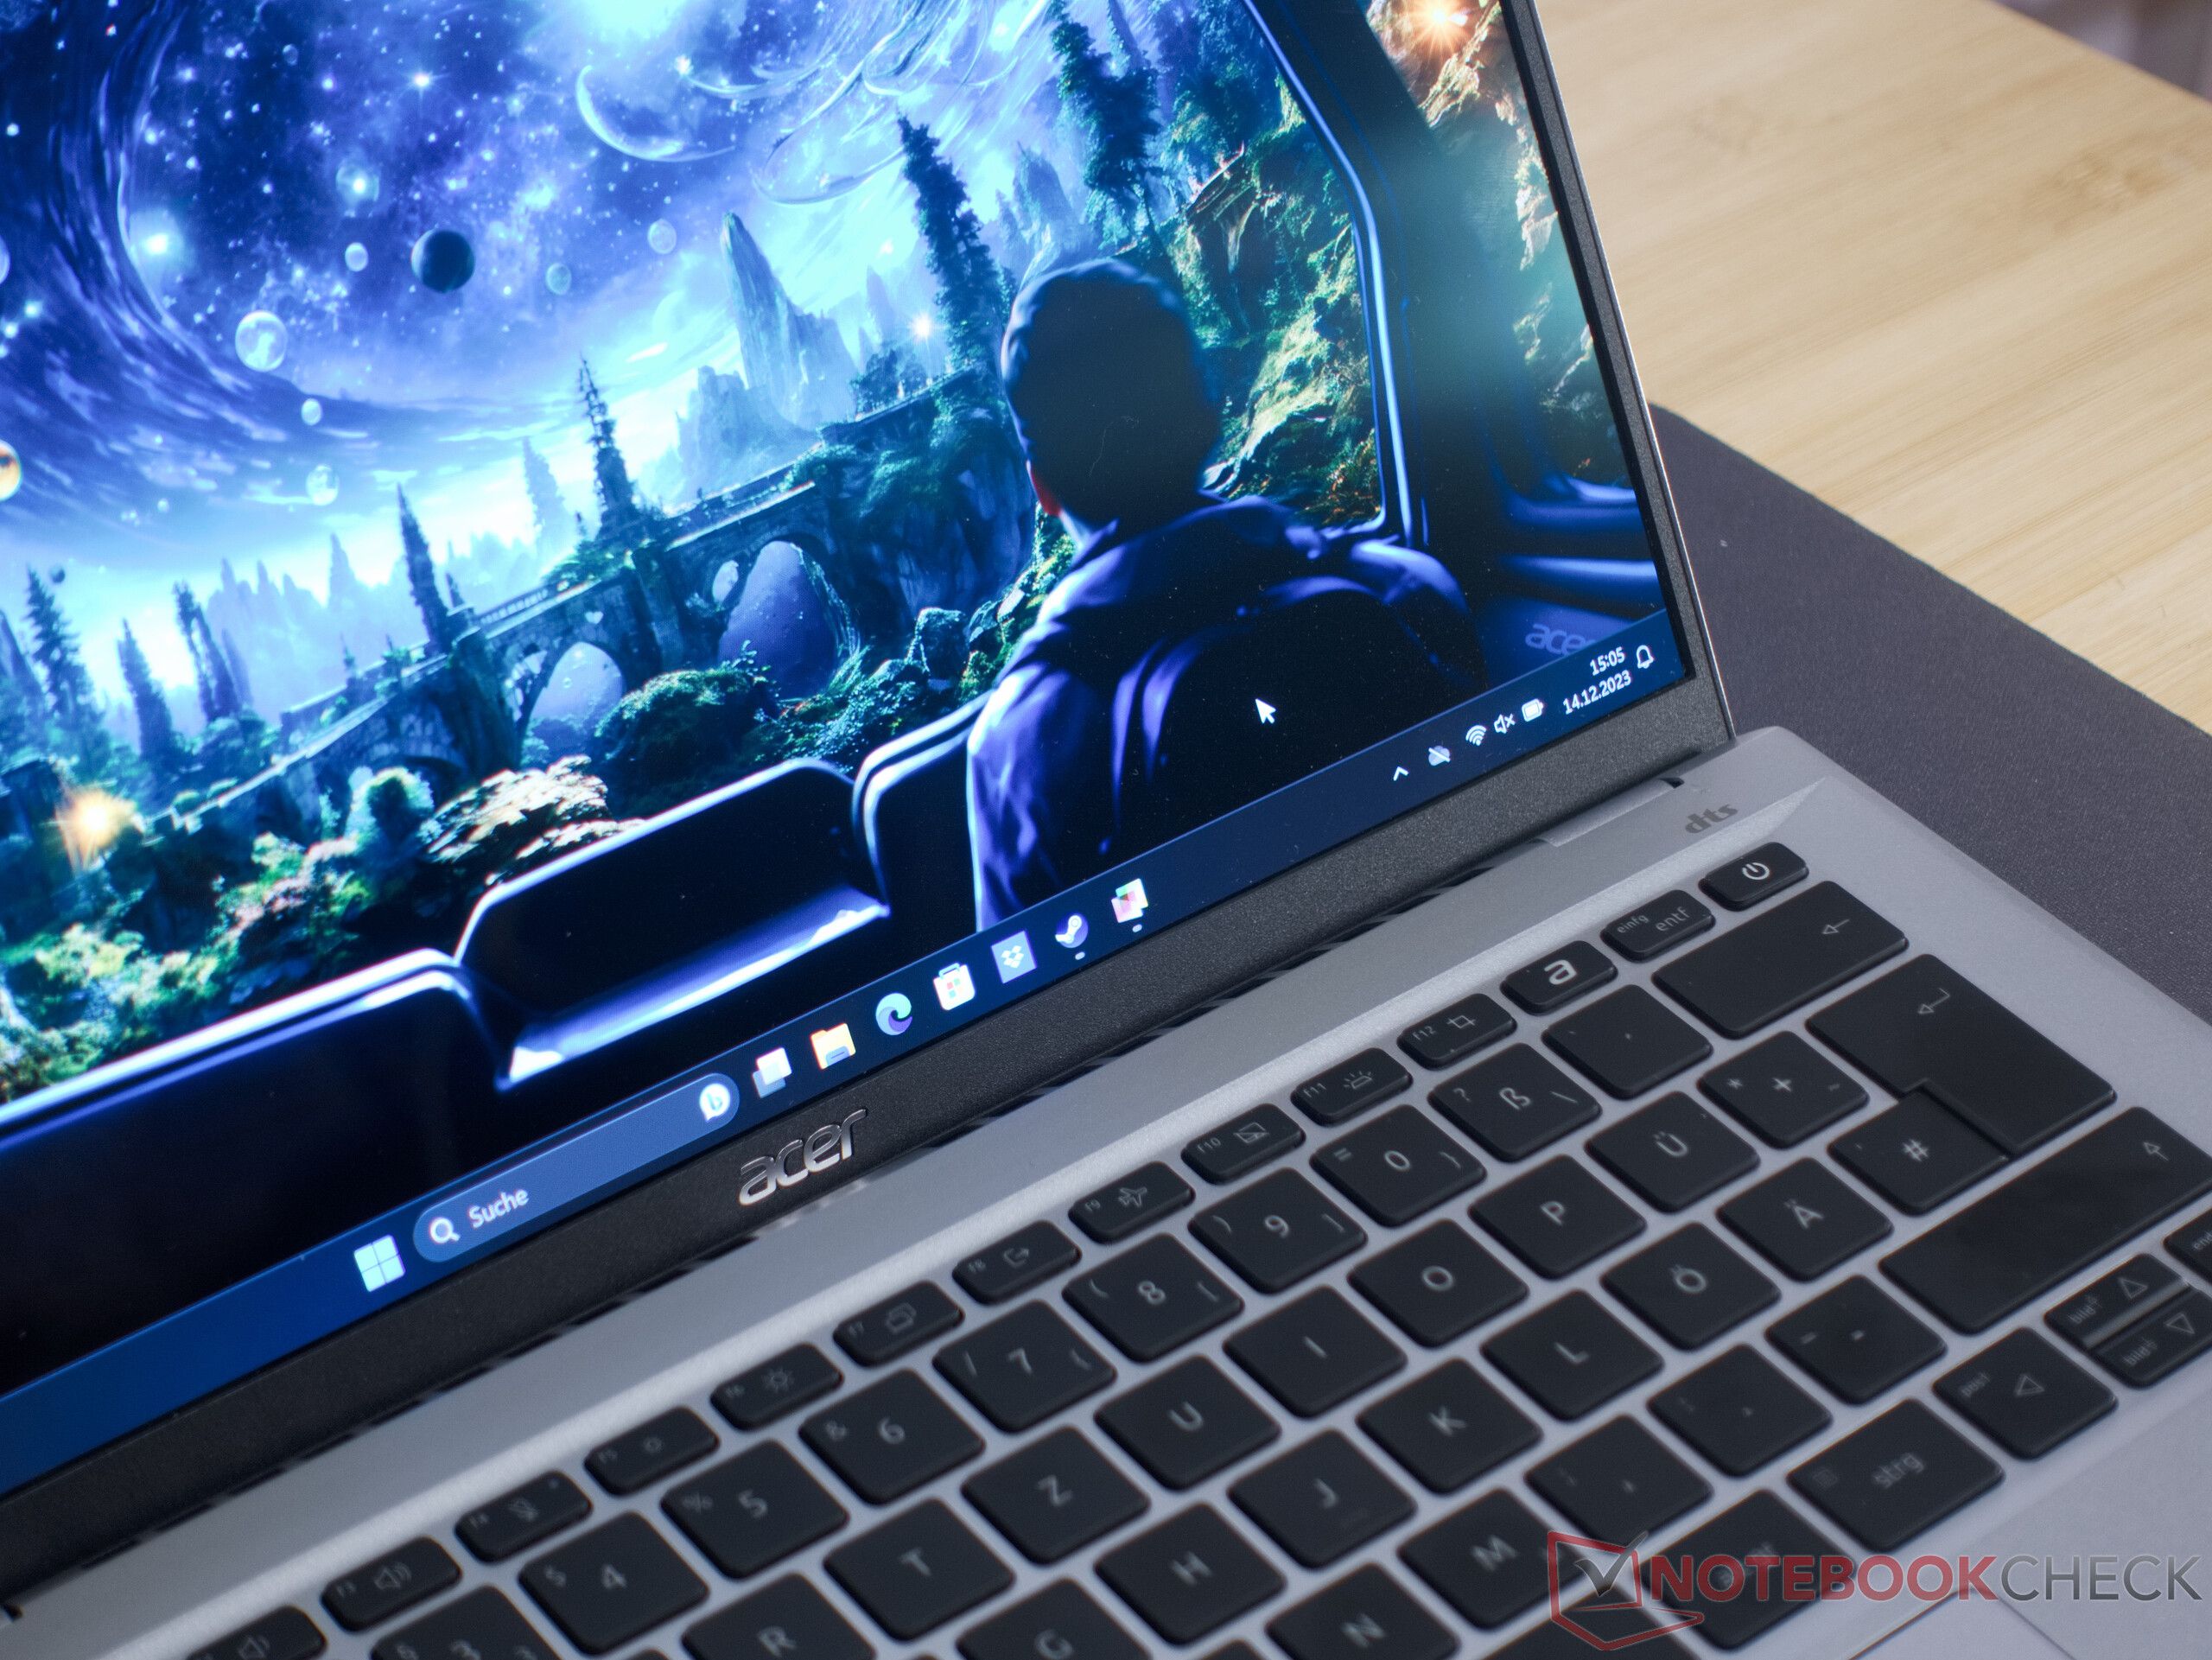
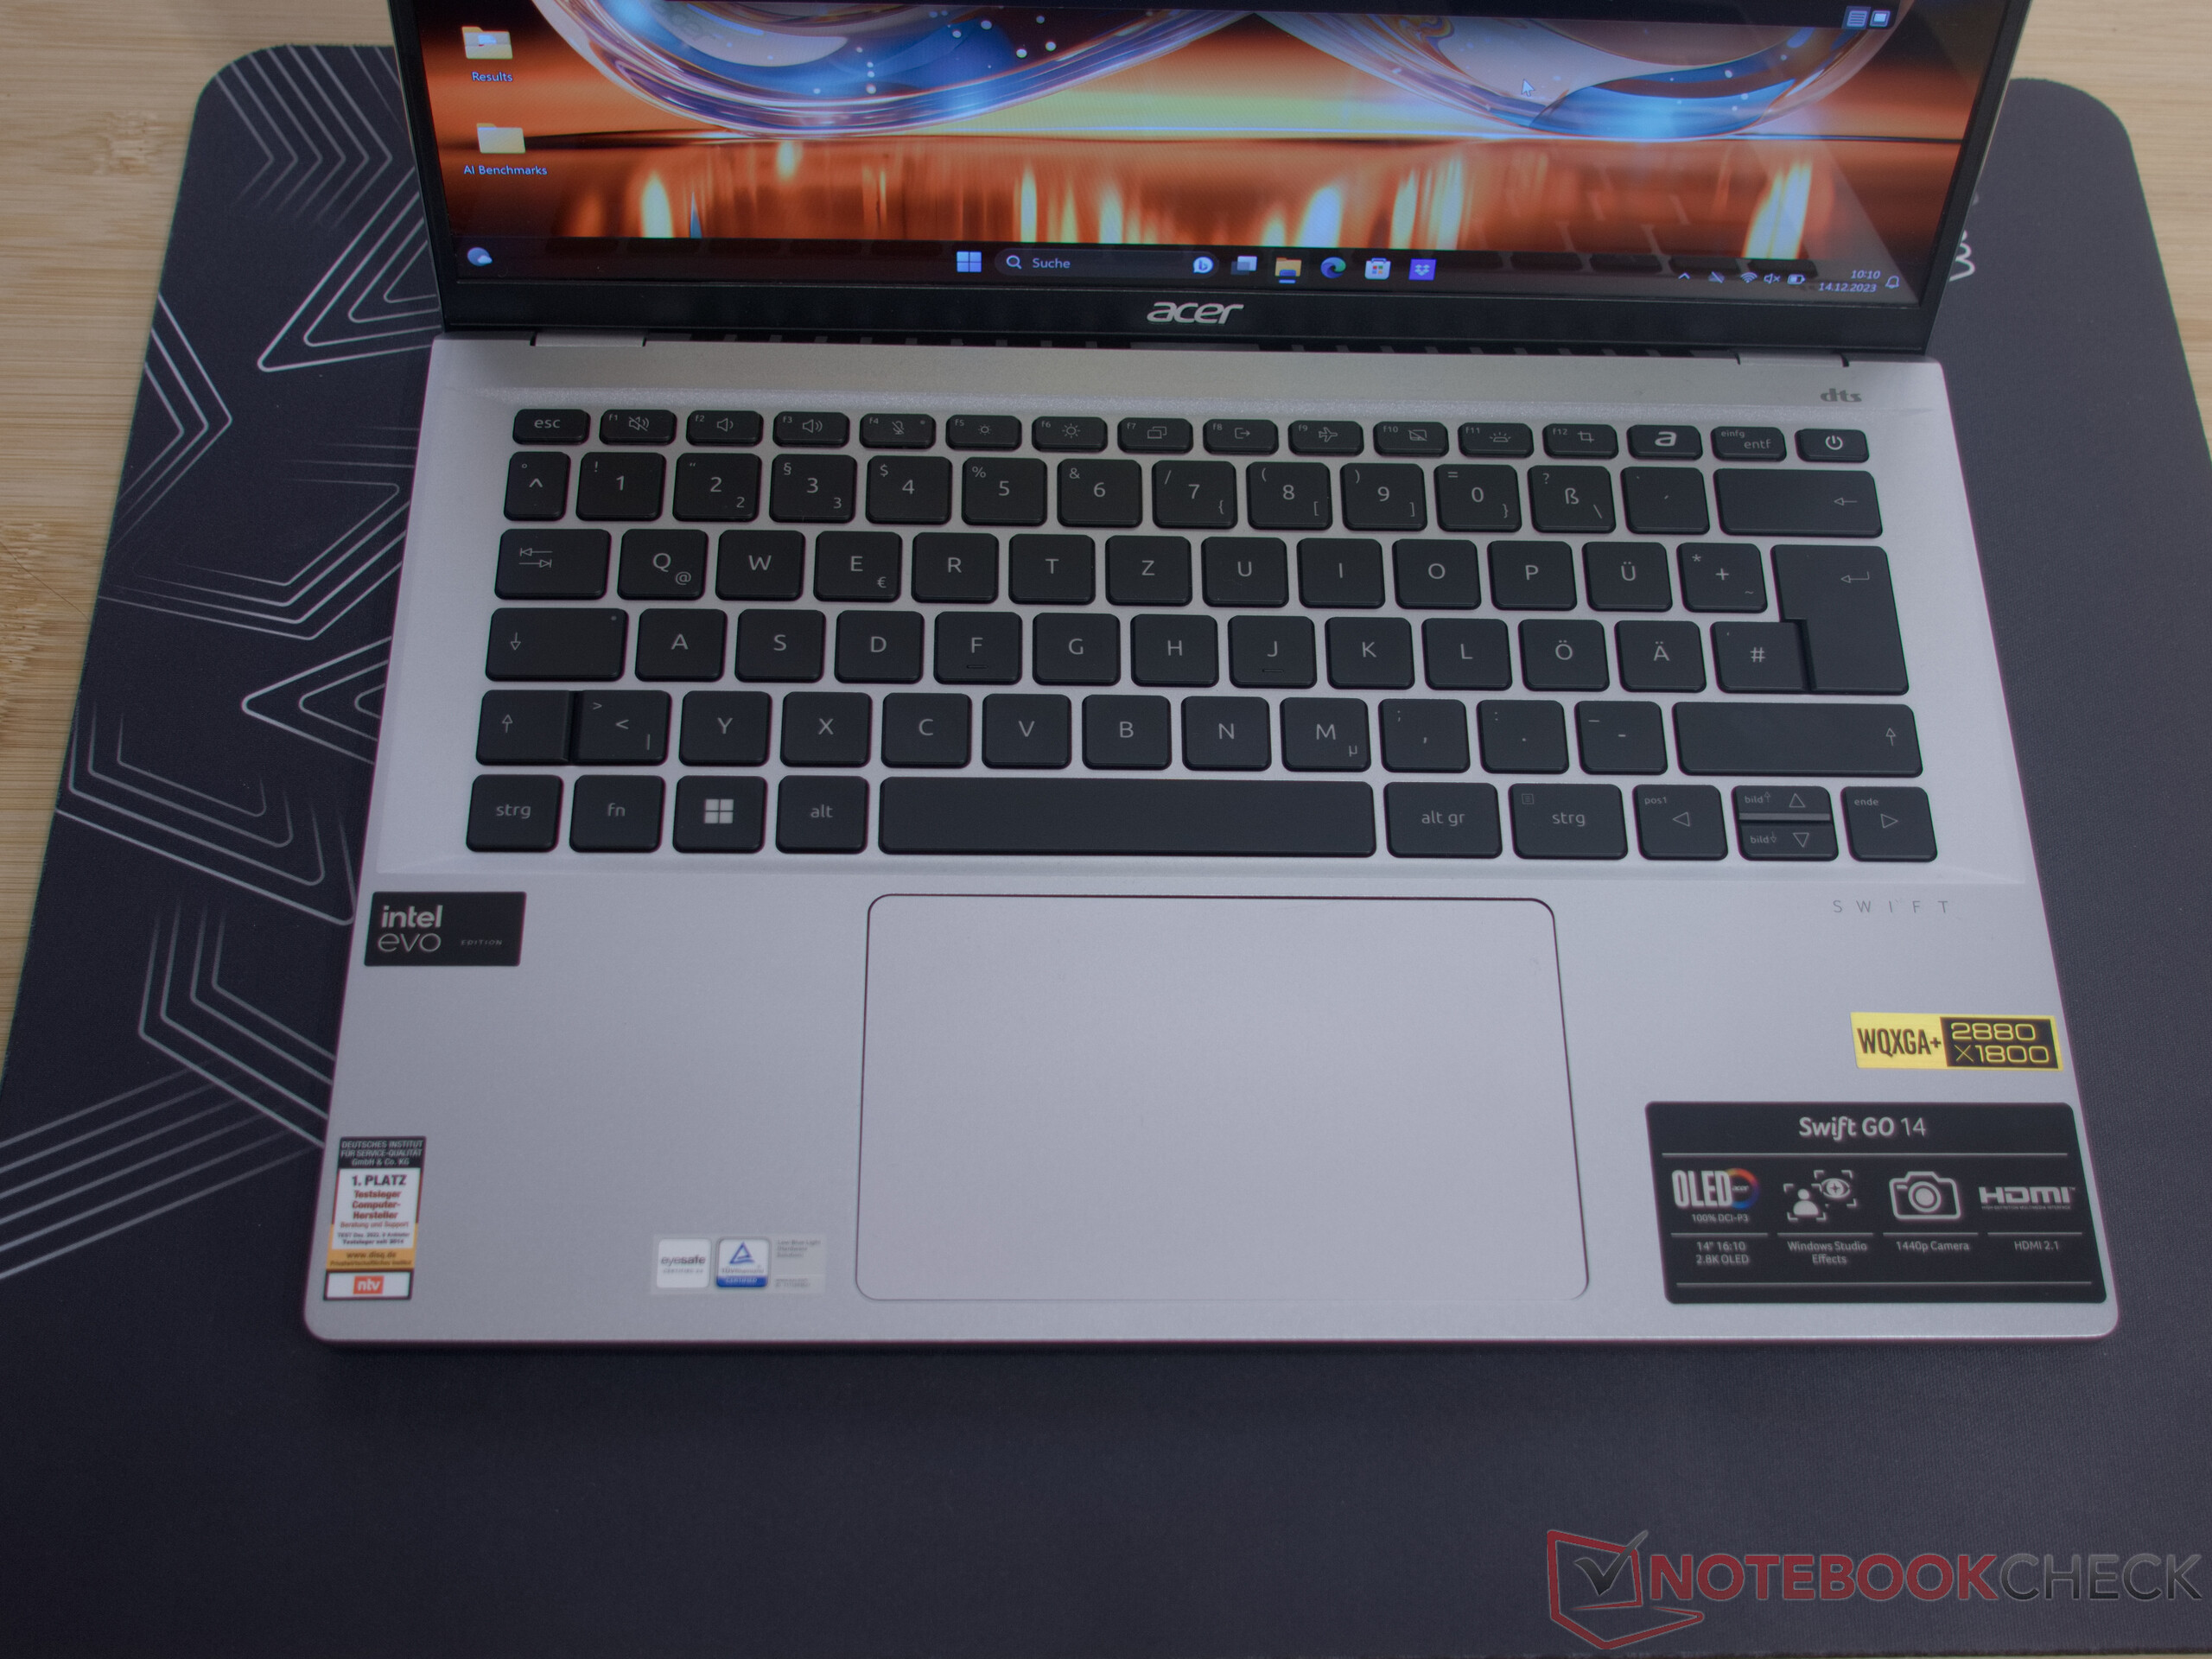
Urządzenia wejściowe - Duży touchpad
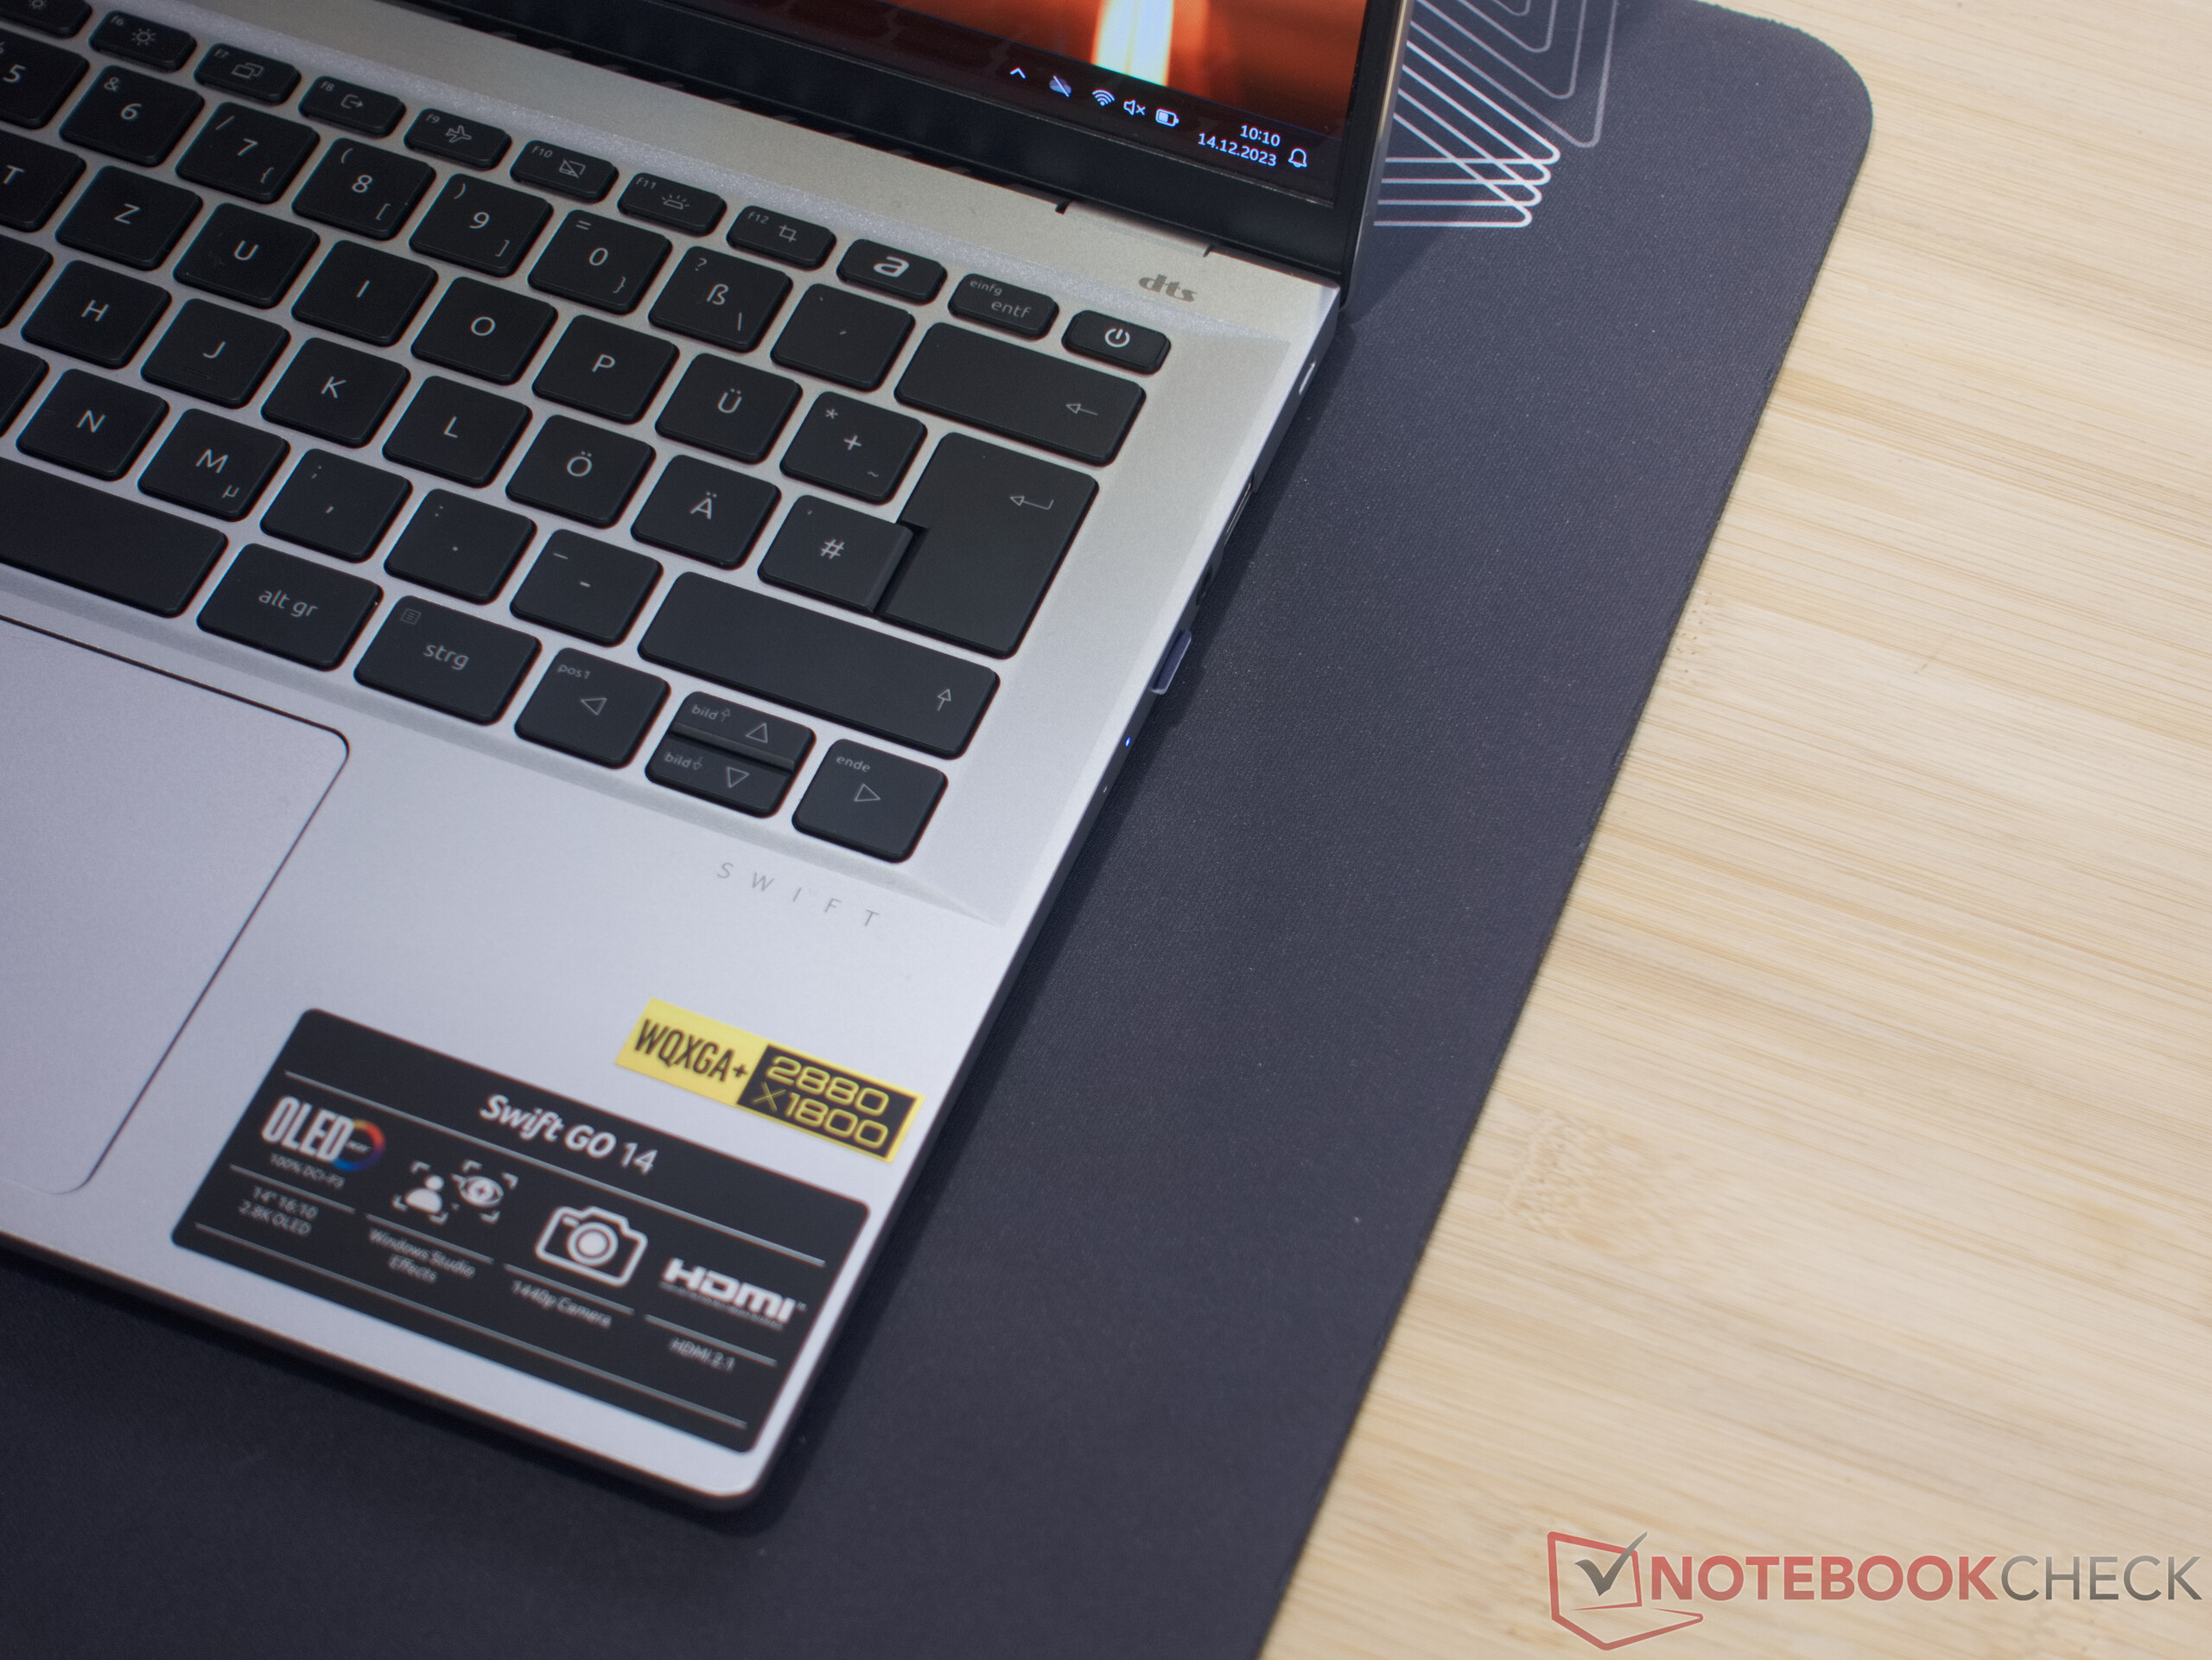
Klawiatura
Przede wszystkim podświetlany punkt nacisku klawiszy mógłby być nieco wyraźniejszy. Poza tym, klawiatura oferuje przyjemne wrażenia z pisania. W ciemnym otoczeniu podświetlenie klawiszy można regulować na dwóch poziomach. Podobnie jak w przypadku poprzednika, górna powłoka również może być lekko wygięta, co może irytować niektórych użytkowników podczas mocnego naciskania klawiszy.
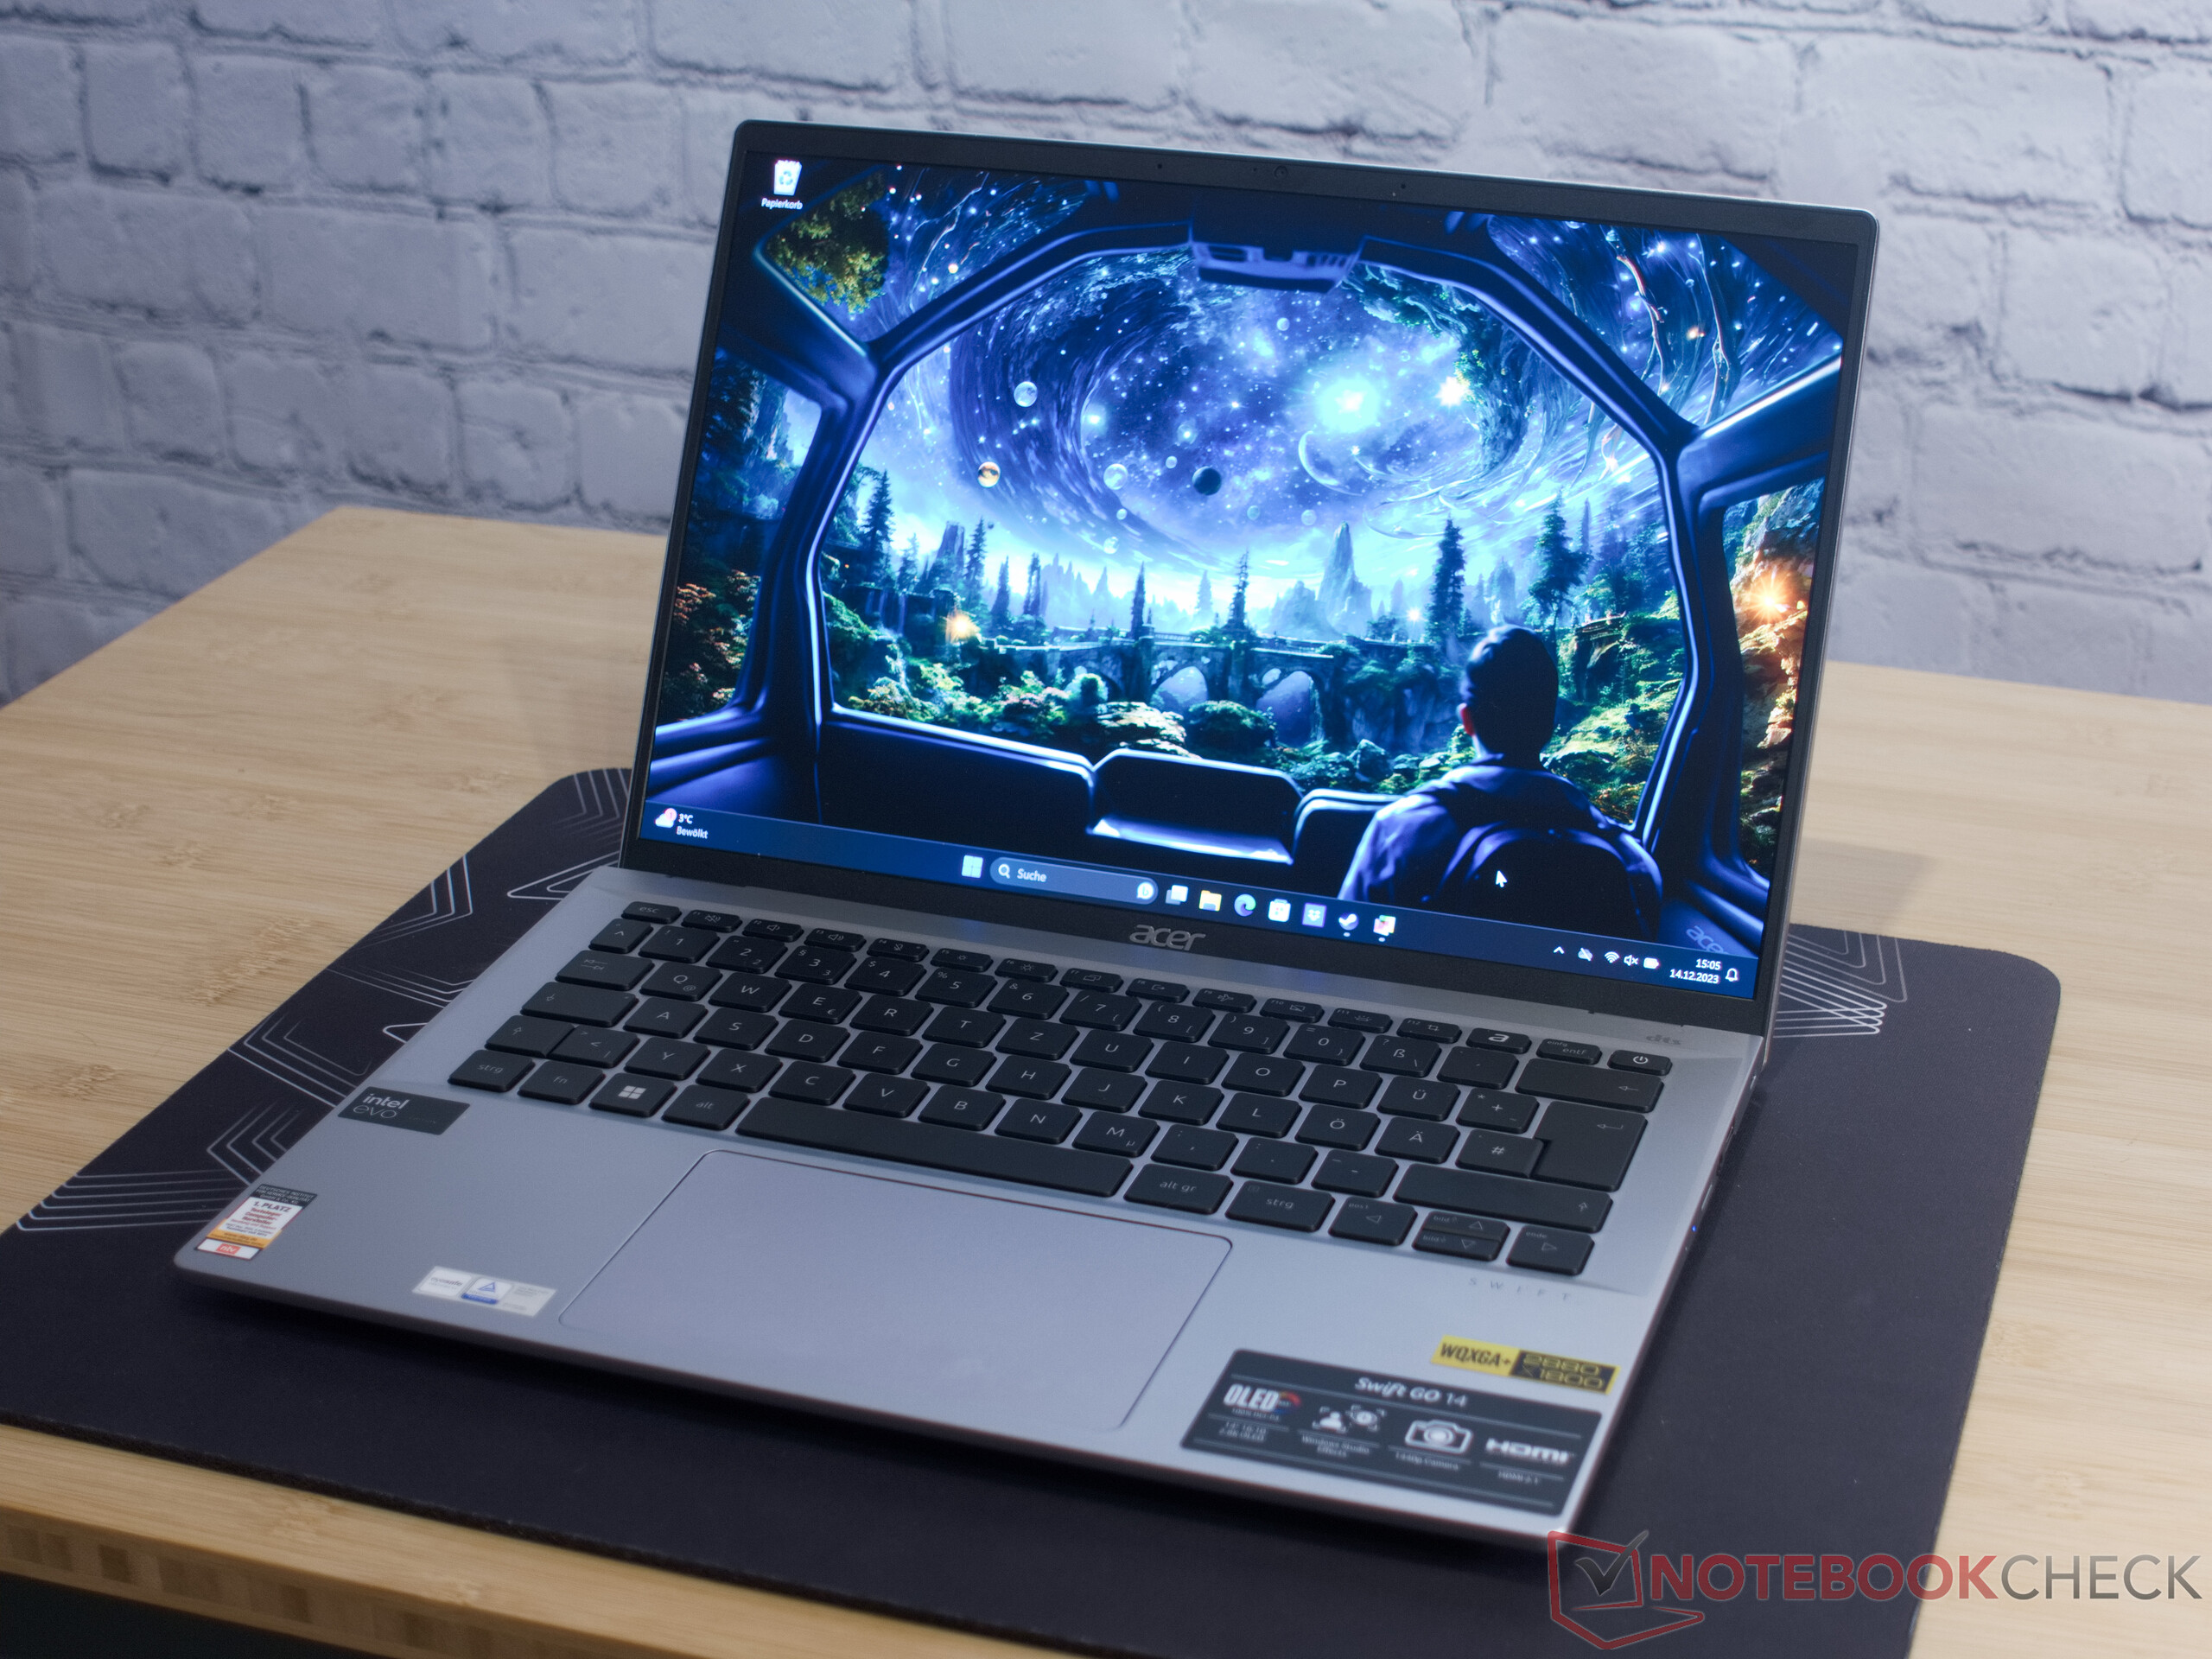
Panel dotykowy
W nowej wersji Acer znacznie zwiększył rozmiar touchpada Swift Go 14, ale promienie w rogach pozostały. Ta zmiana nie tylko korzystnie wpływa na wygląd. W praktyce wiele czynności, takich jak przeciąganie i upuszczanie oraz kopiowanie, jest łatwiejszych do wykonania. Teraz o wymiarach 12 x 8 cm, touchpad oferuje znacznie więcej miejsca na wprowadzanie danych i sterowanie gestami.
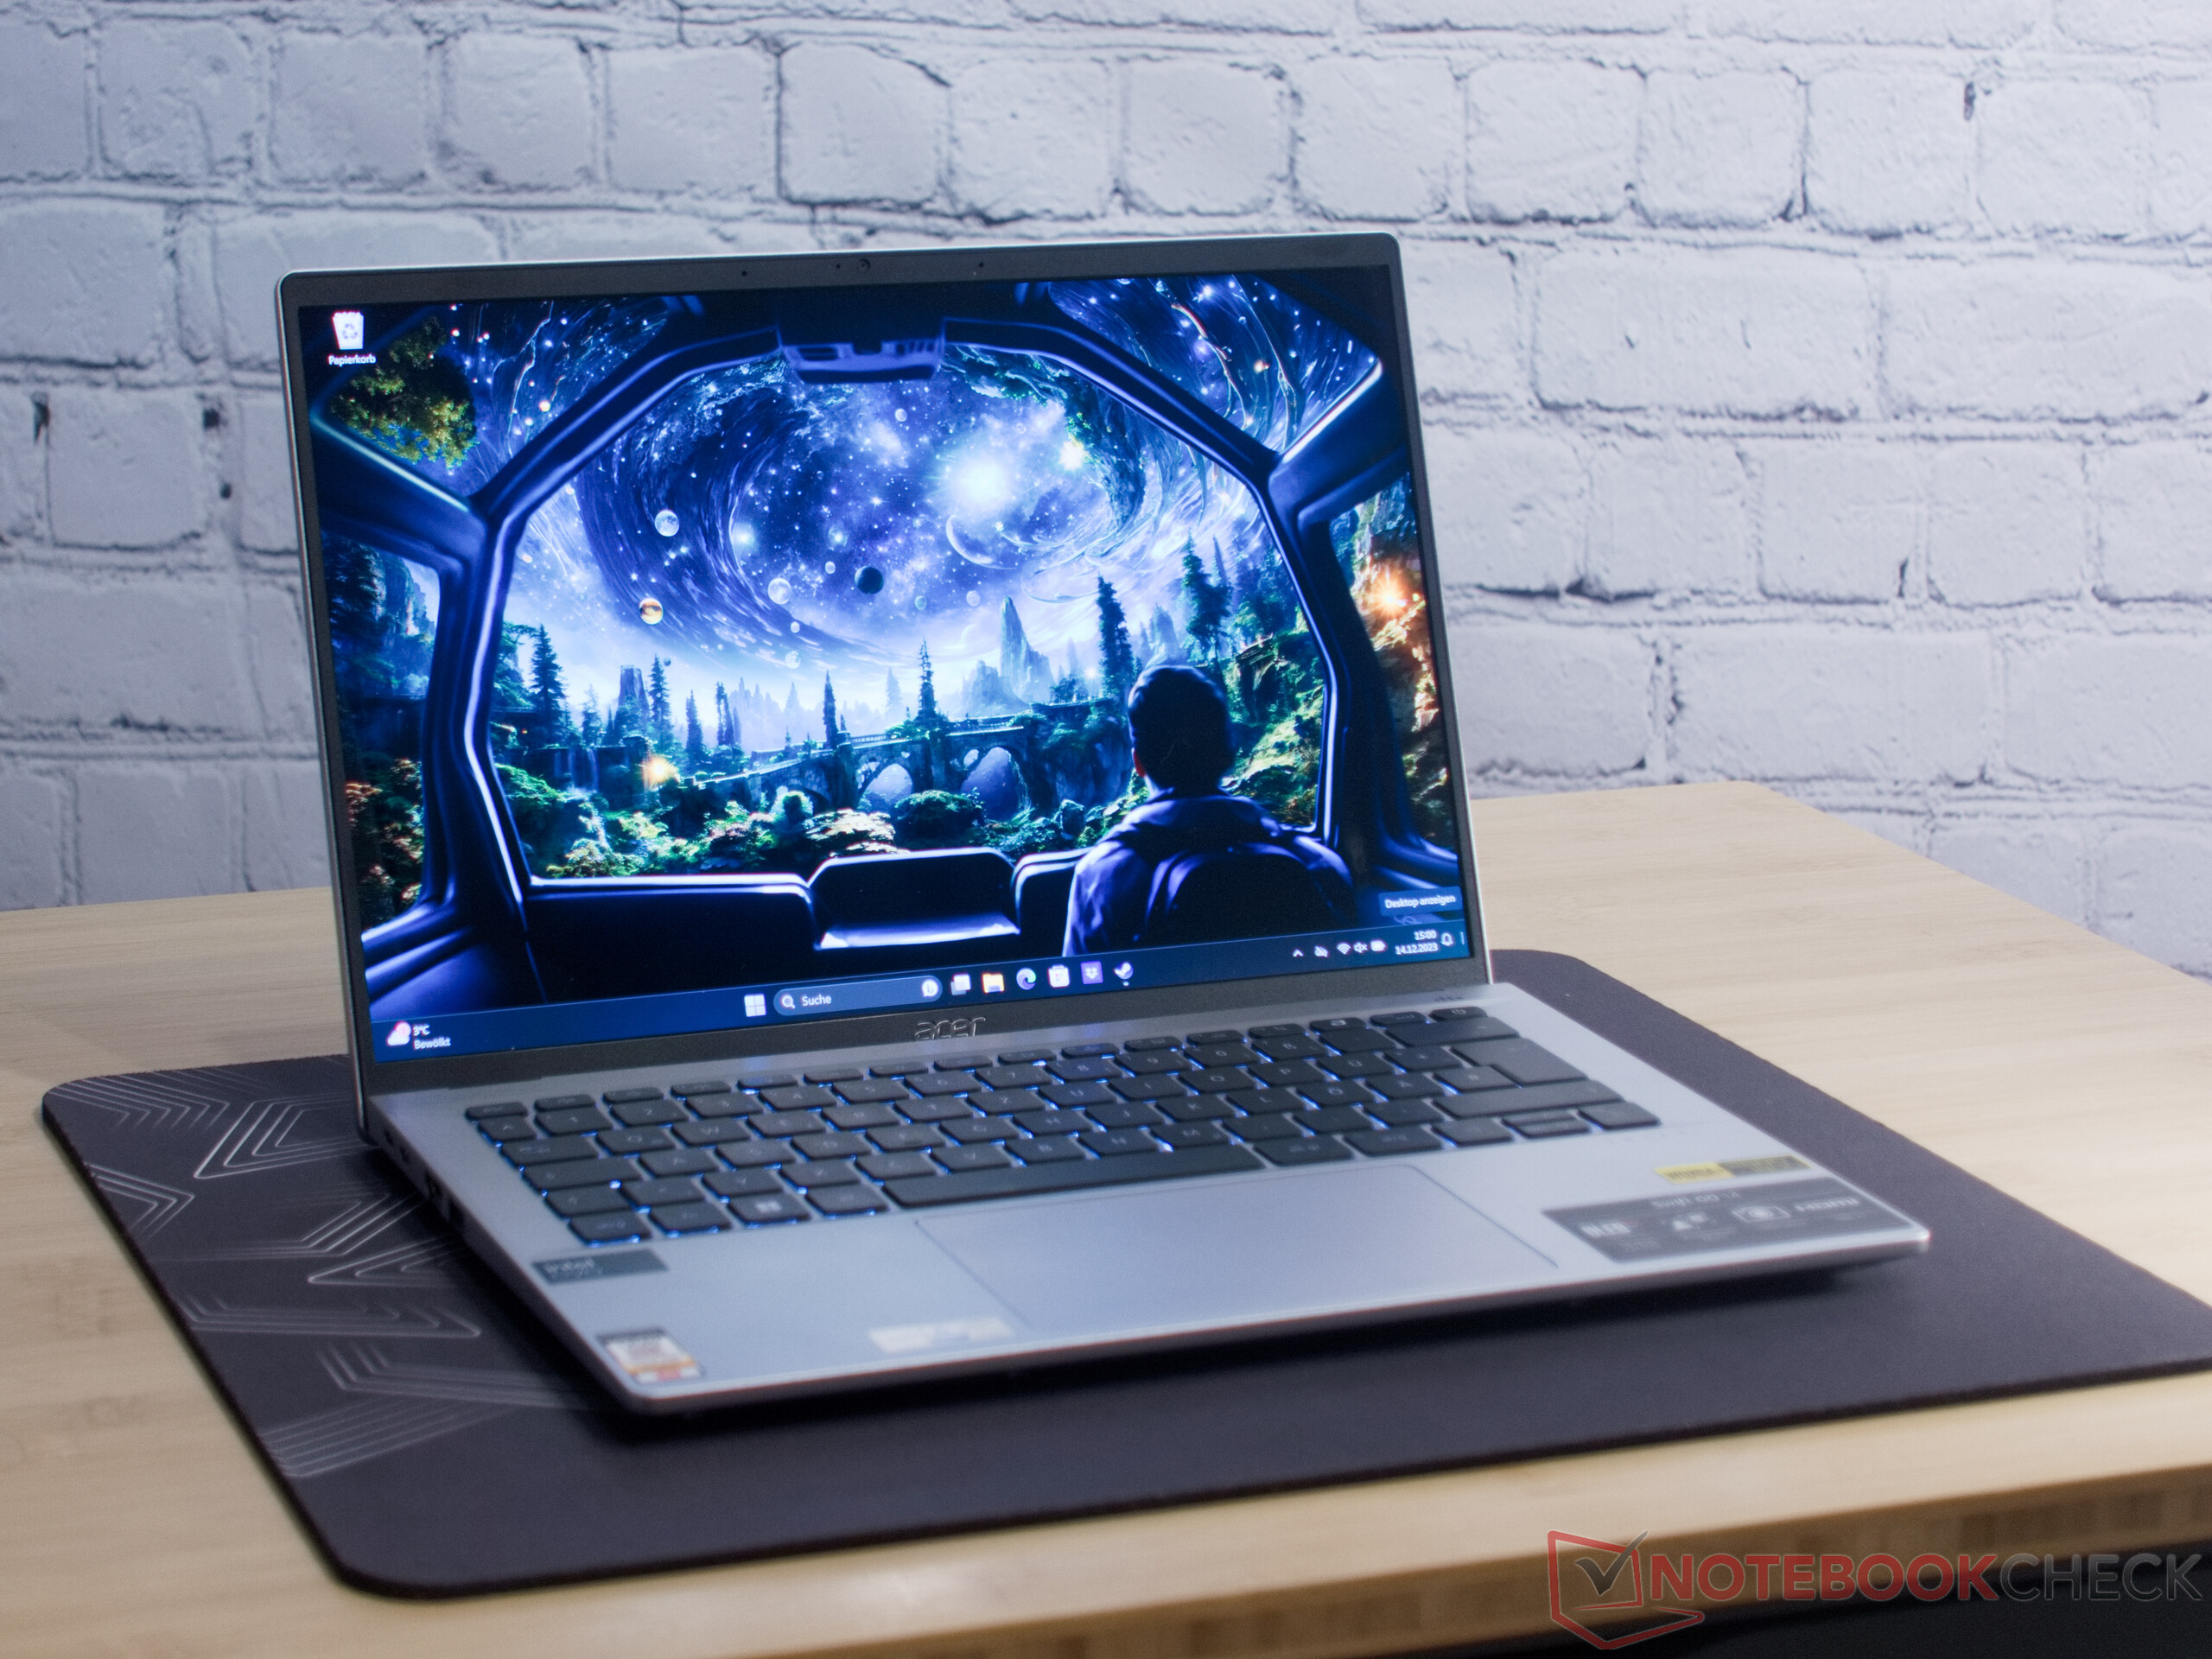
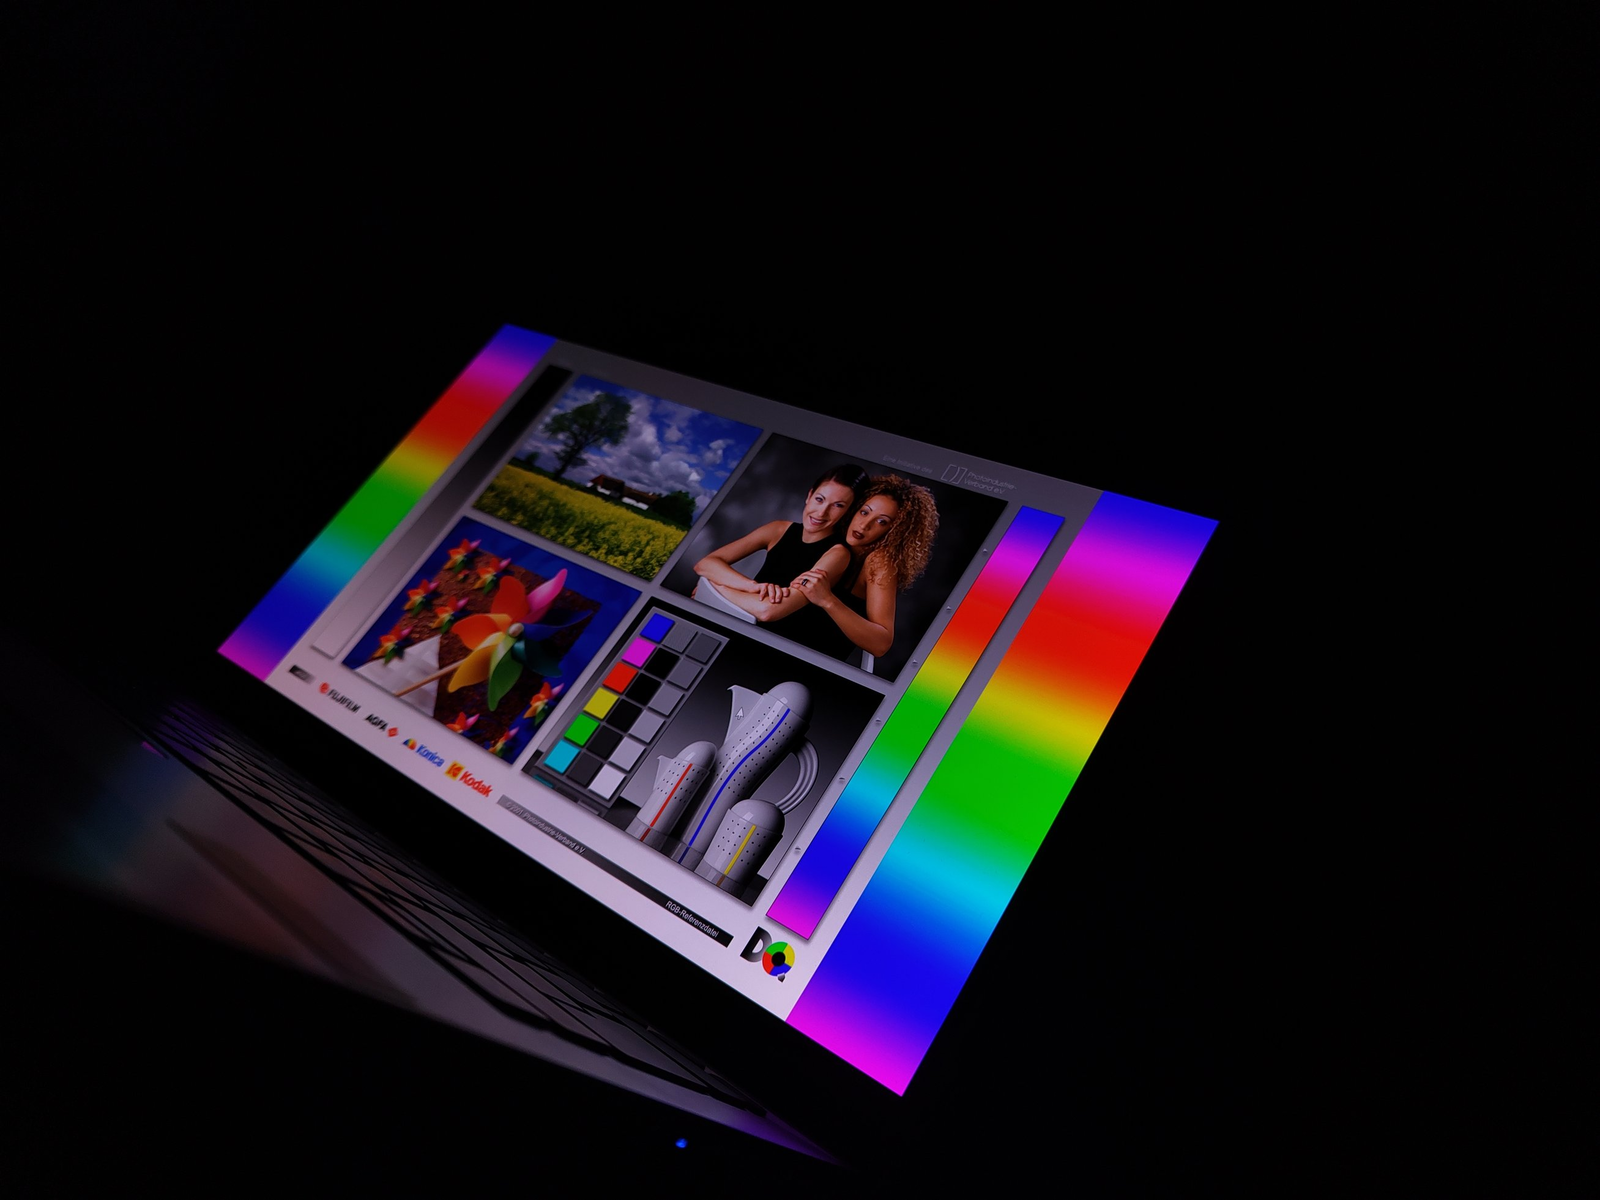
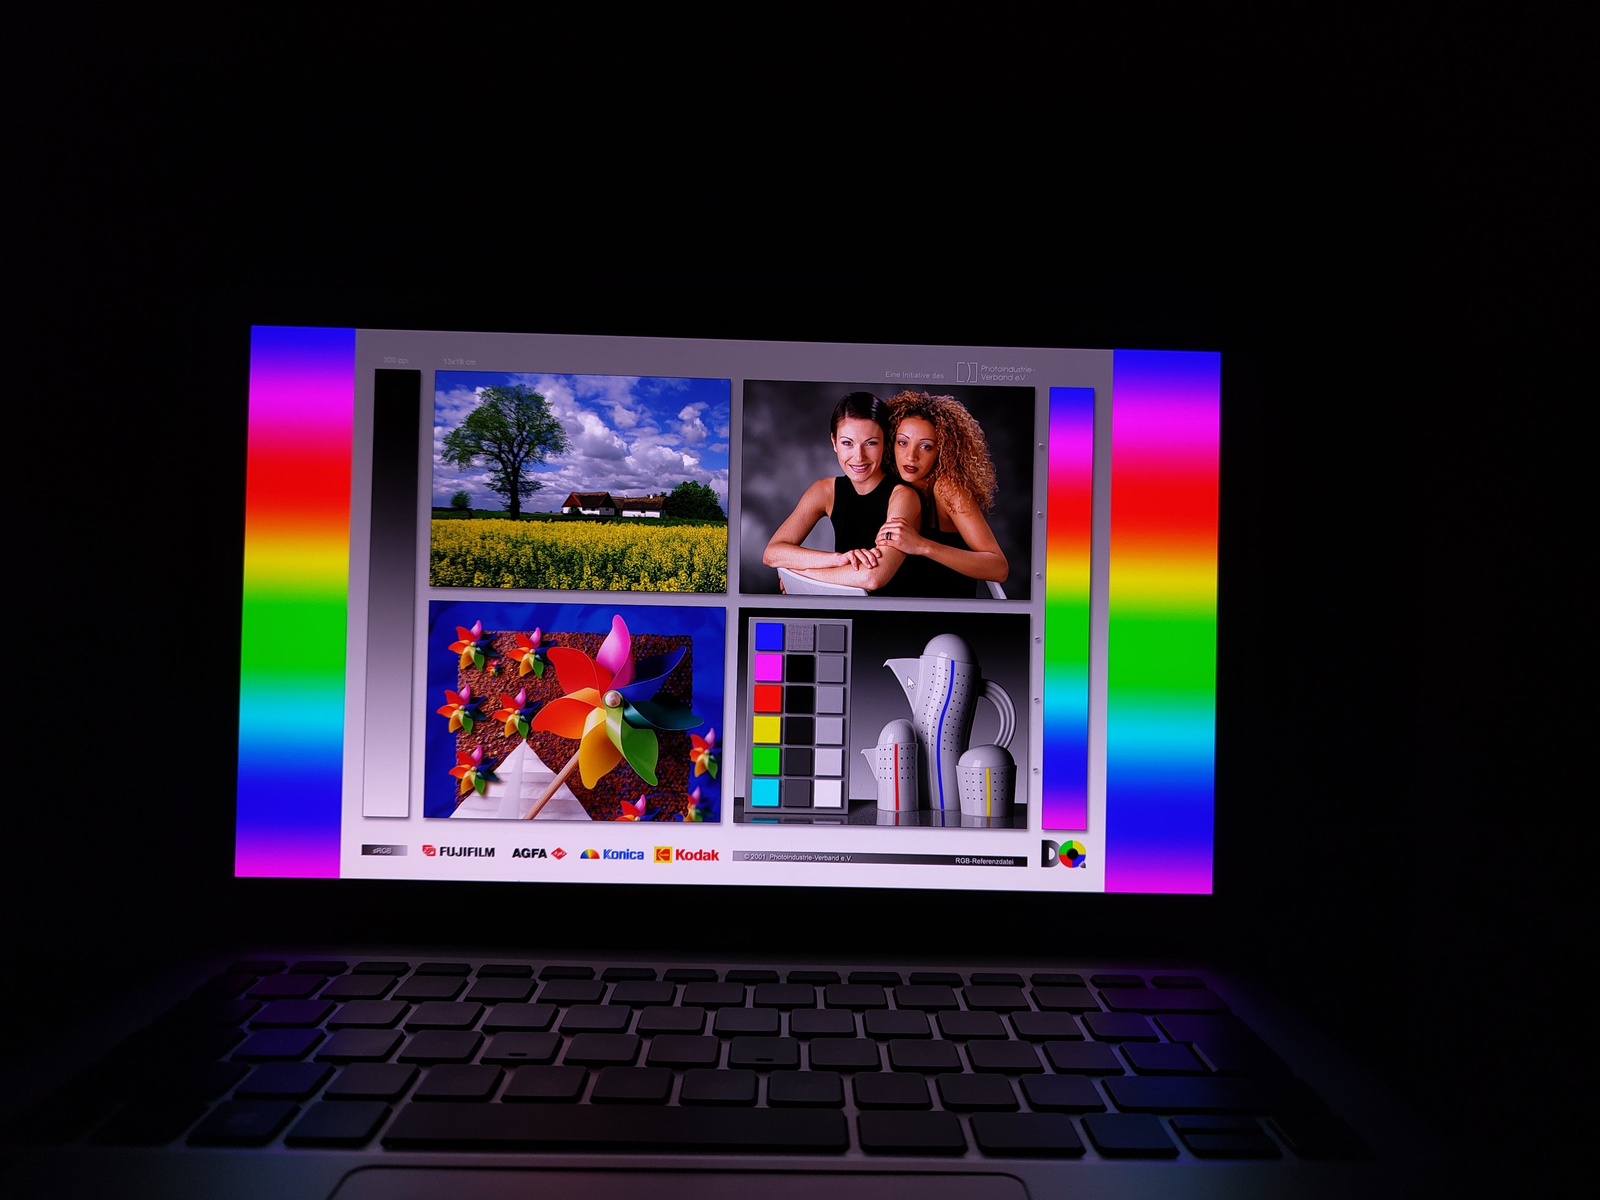
Wyświetlacz - 2.8K, 90Hz OLED i HDR500
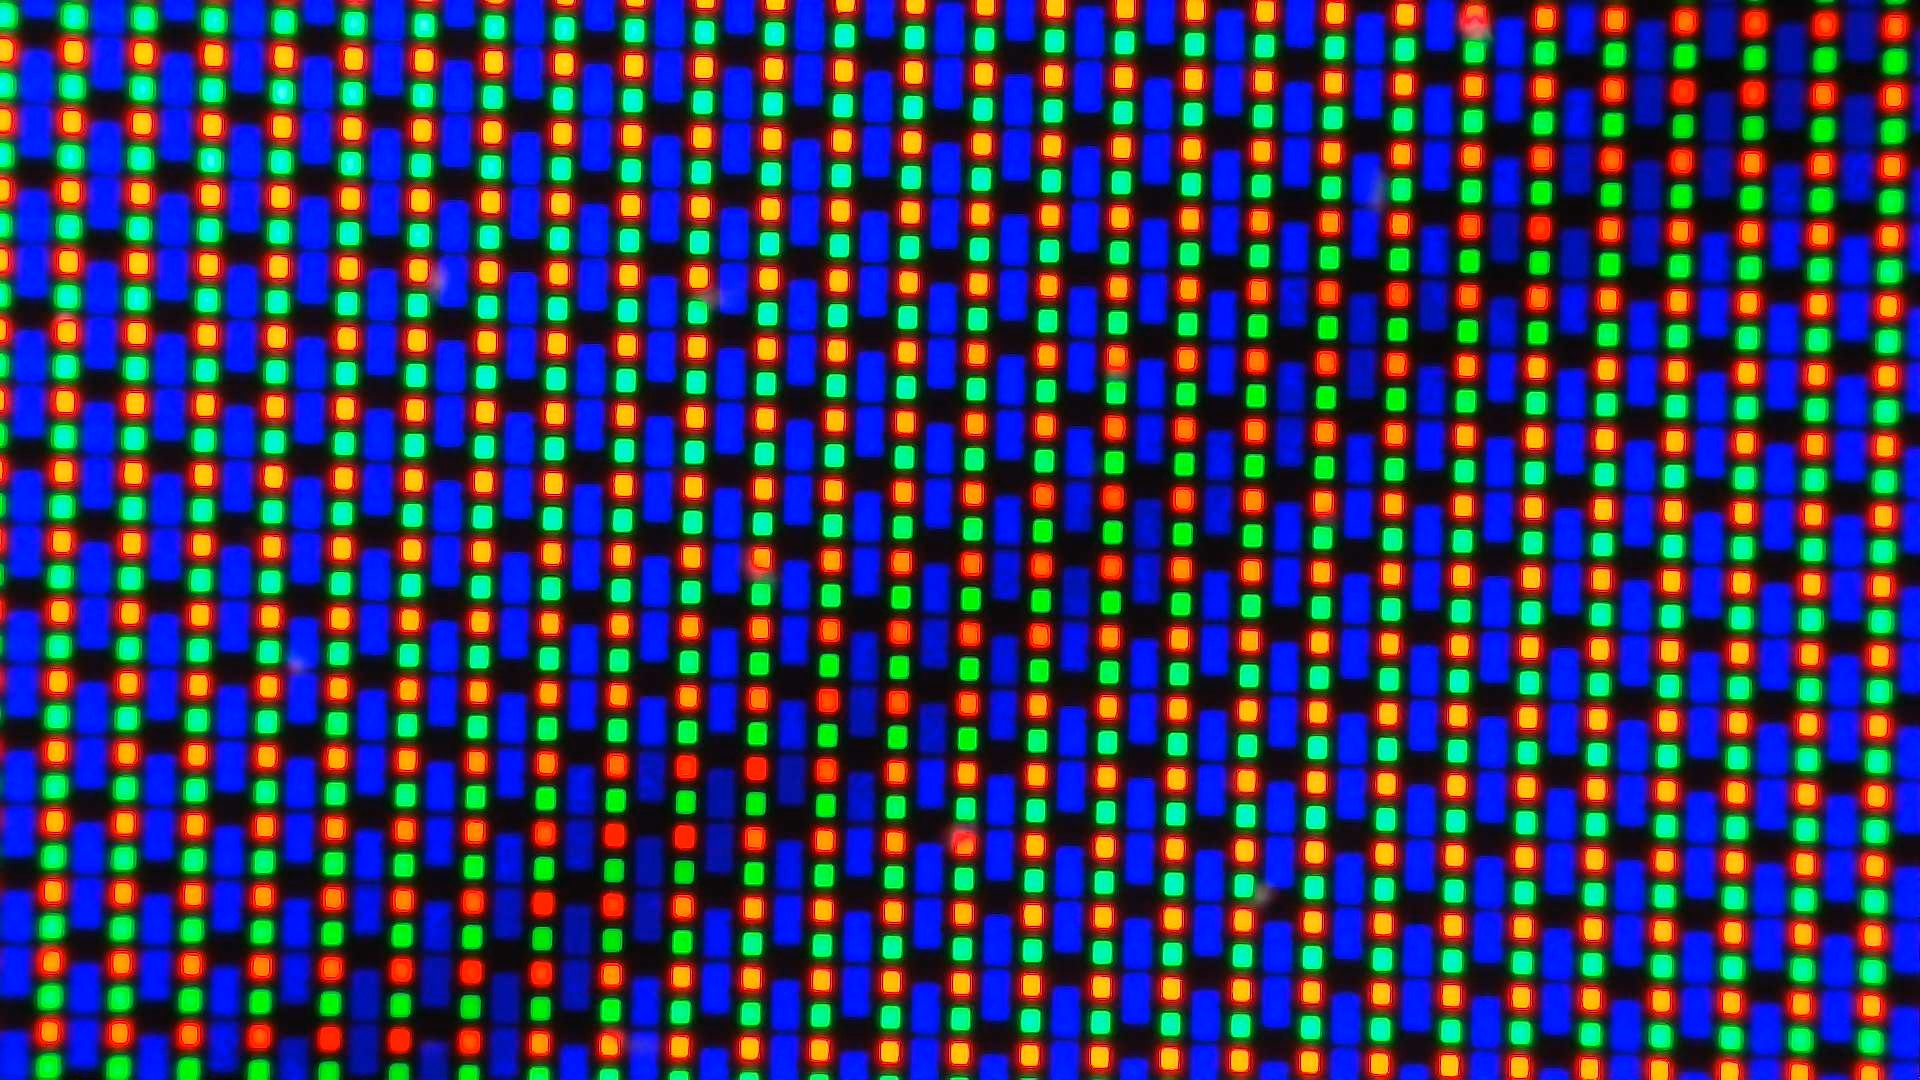
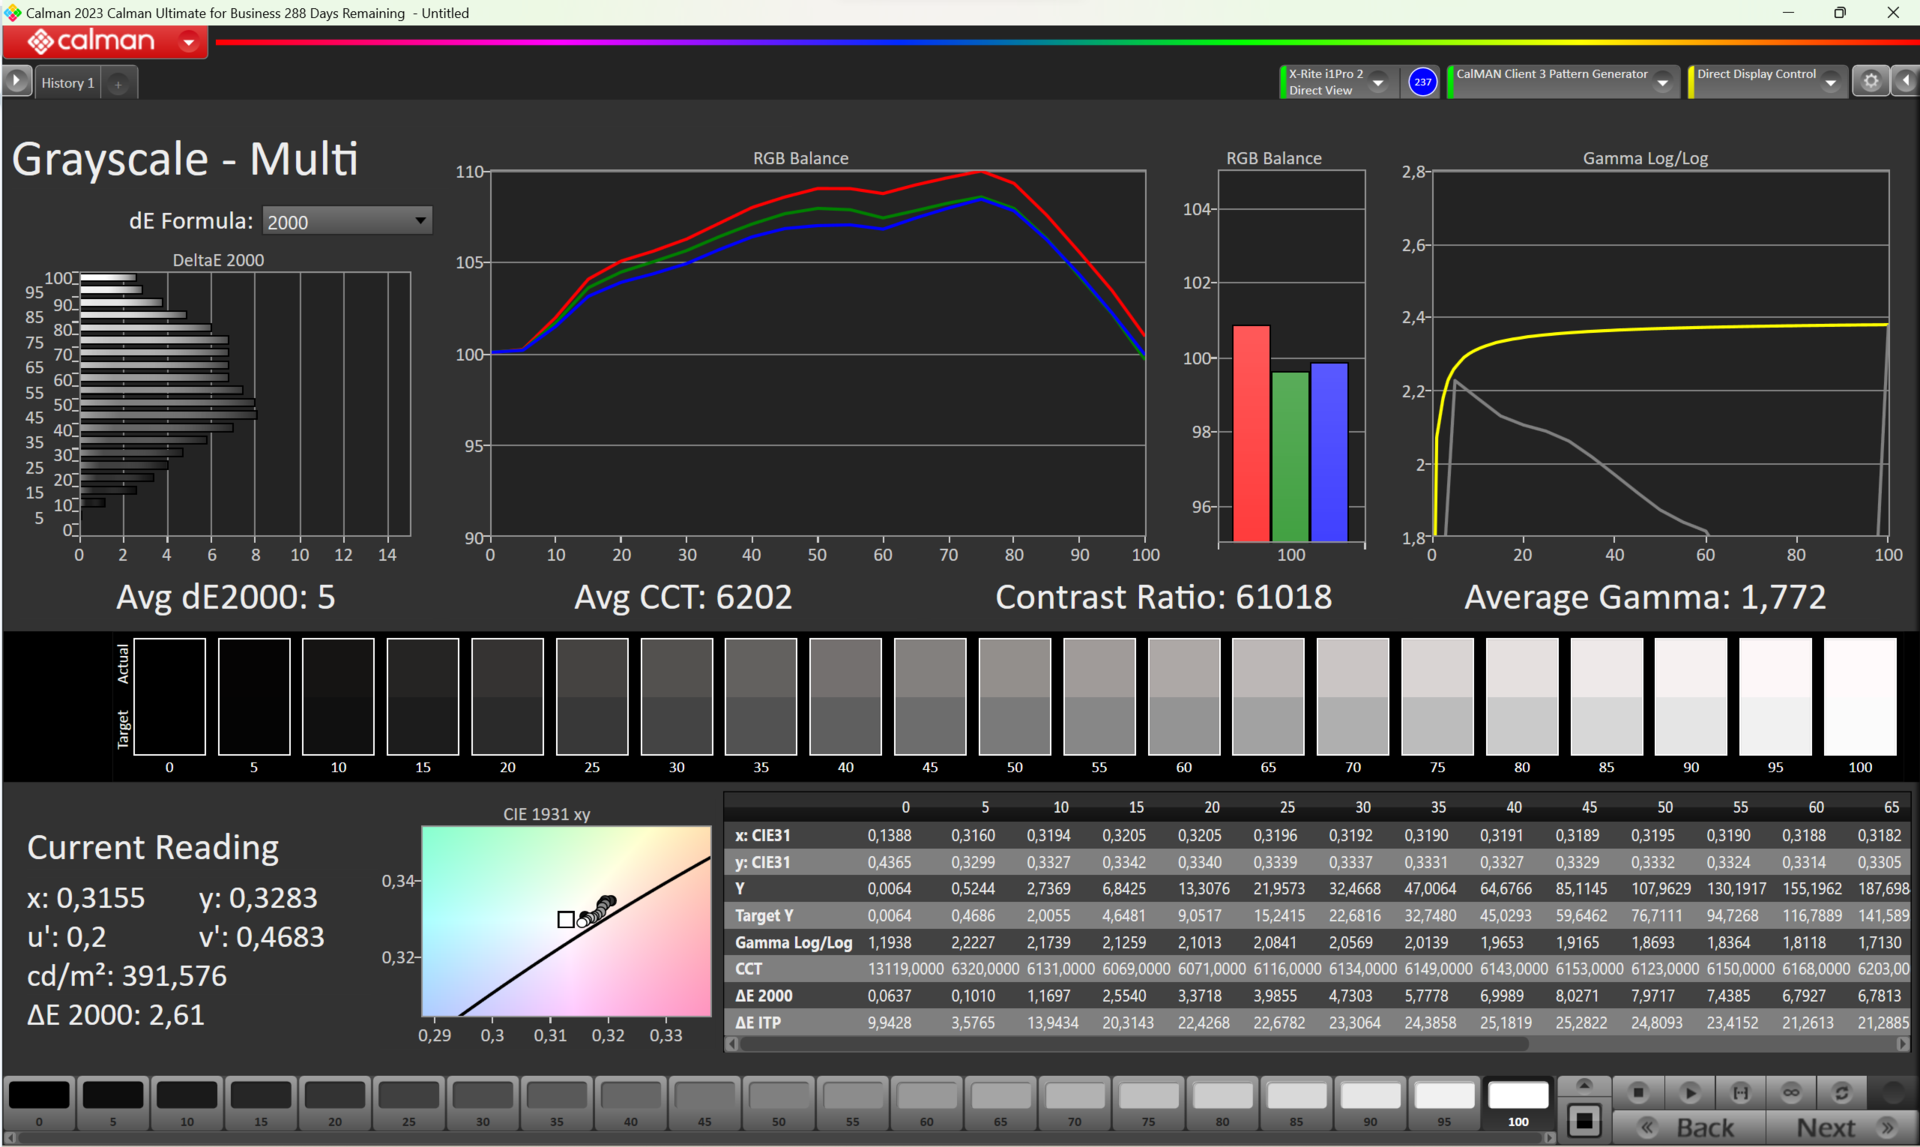
Model Acer Swift Go z procesorem Meteor Lake jest teraz wyposażony w znacznie jaśniejszy panel OLED. Może on osiągnąć 400 cd/m², a nawet więcej, podczas wyświetlania treści HDR. Głęboka czerń i wysoki poziom kontrastu są standardem dla tego typu technologii wyświetlania. Jasność jest równomierna, a przy rozdzielczości 2,8K, w 14-calowym (około 36 cm) ekranie o proporcjach 16:10 trudno dostrzec pojedyncze piksele gołym okiem. To wszystko sprawia, że możemy cieszyć się wspaniałą jakością obrazu, który może błyszczeć zarówno na zewnątrz, jak i przy oświetleniu studyjnym.
Nowa aplikacja AcerSense dla Swift Go oferuje więcej profili wyświetlania. Nie zaobserwowaliśmy jednak jeszcze żadnych zmian w mierzonych wartościach w różnych profilach. Jak wspomniano na początku, Acer wciąż pracuje nad ostatecznymi szczegółami laptopa.
| |||||||||||||||||||||||||
rozświetlenie: 98 %
na akumulatorze: 385 cd/m²
kontrast: 9440:1 (czerń: 0.0411 cd/m²)
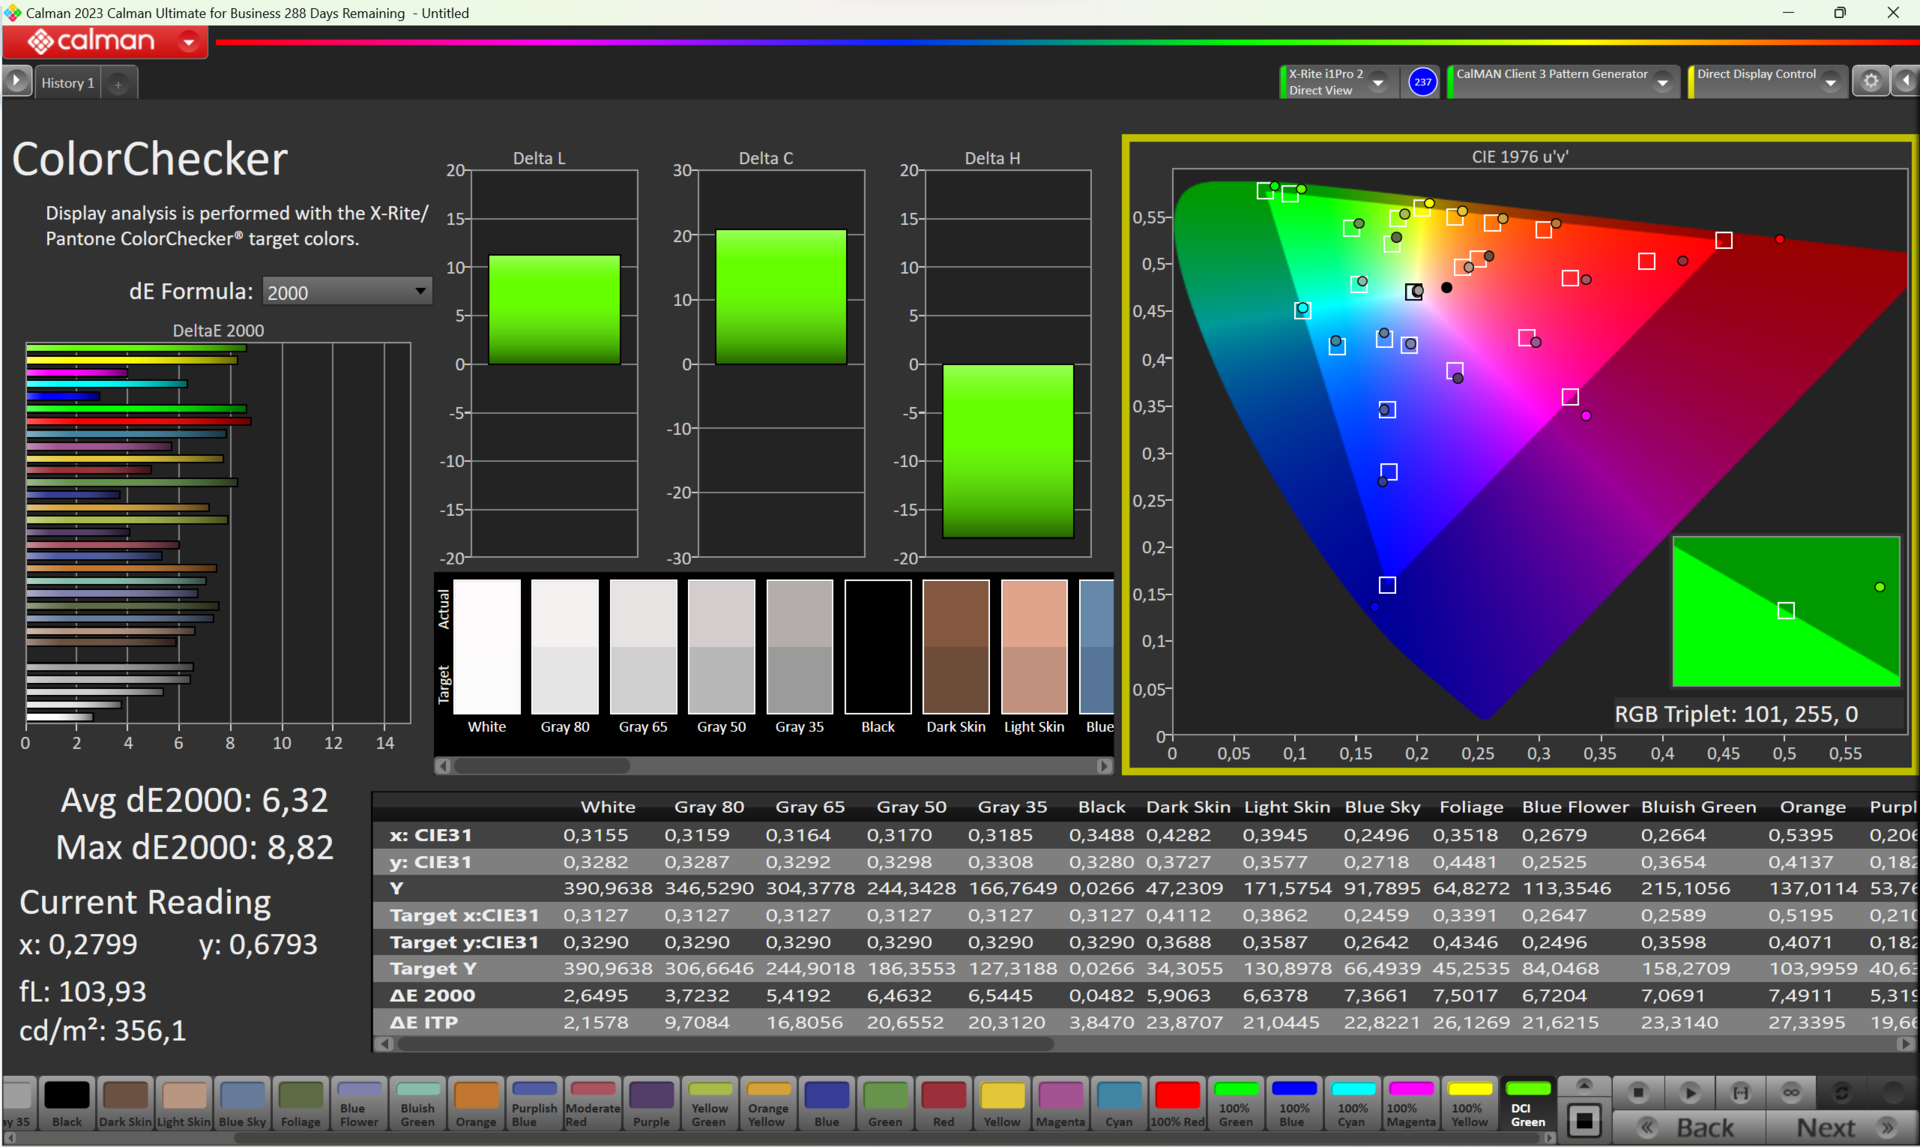
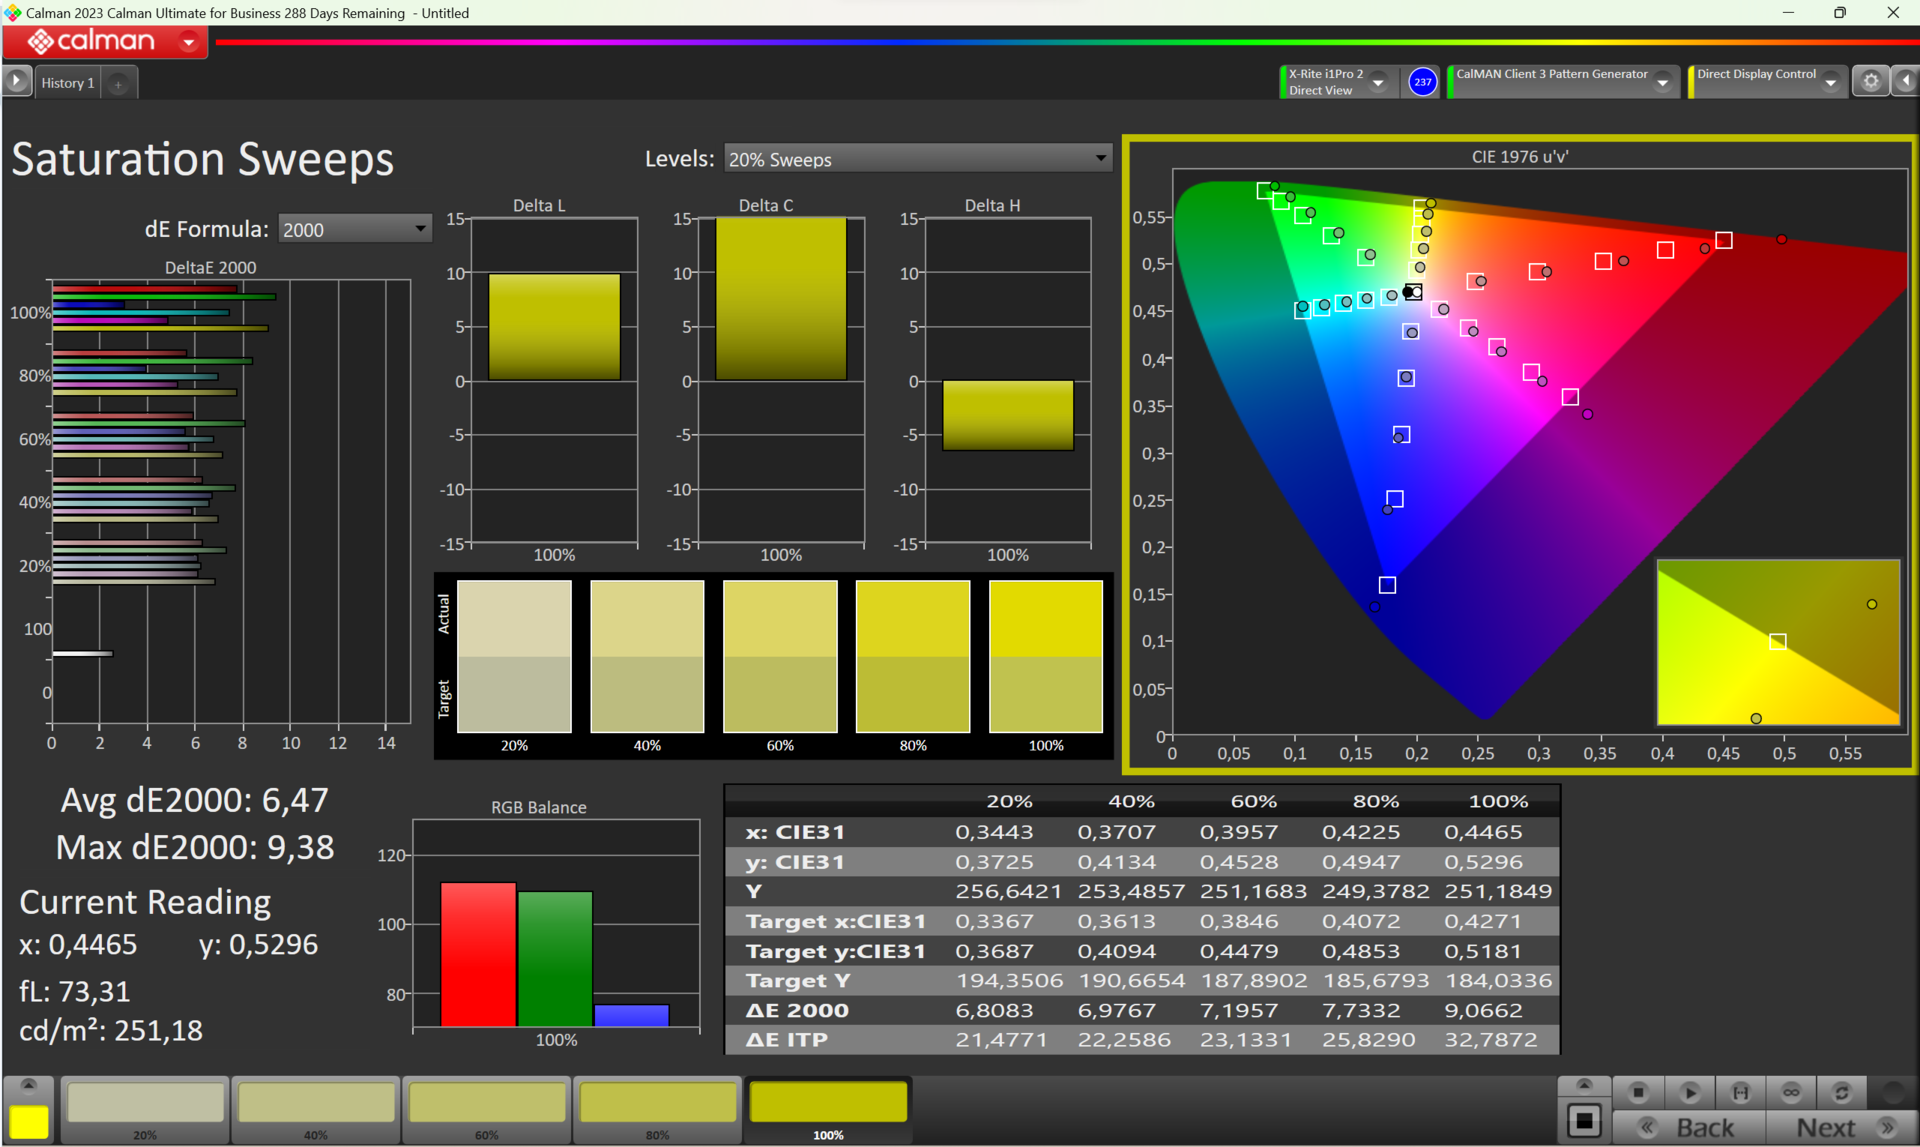
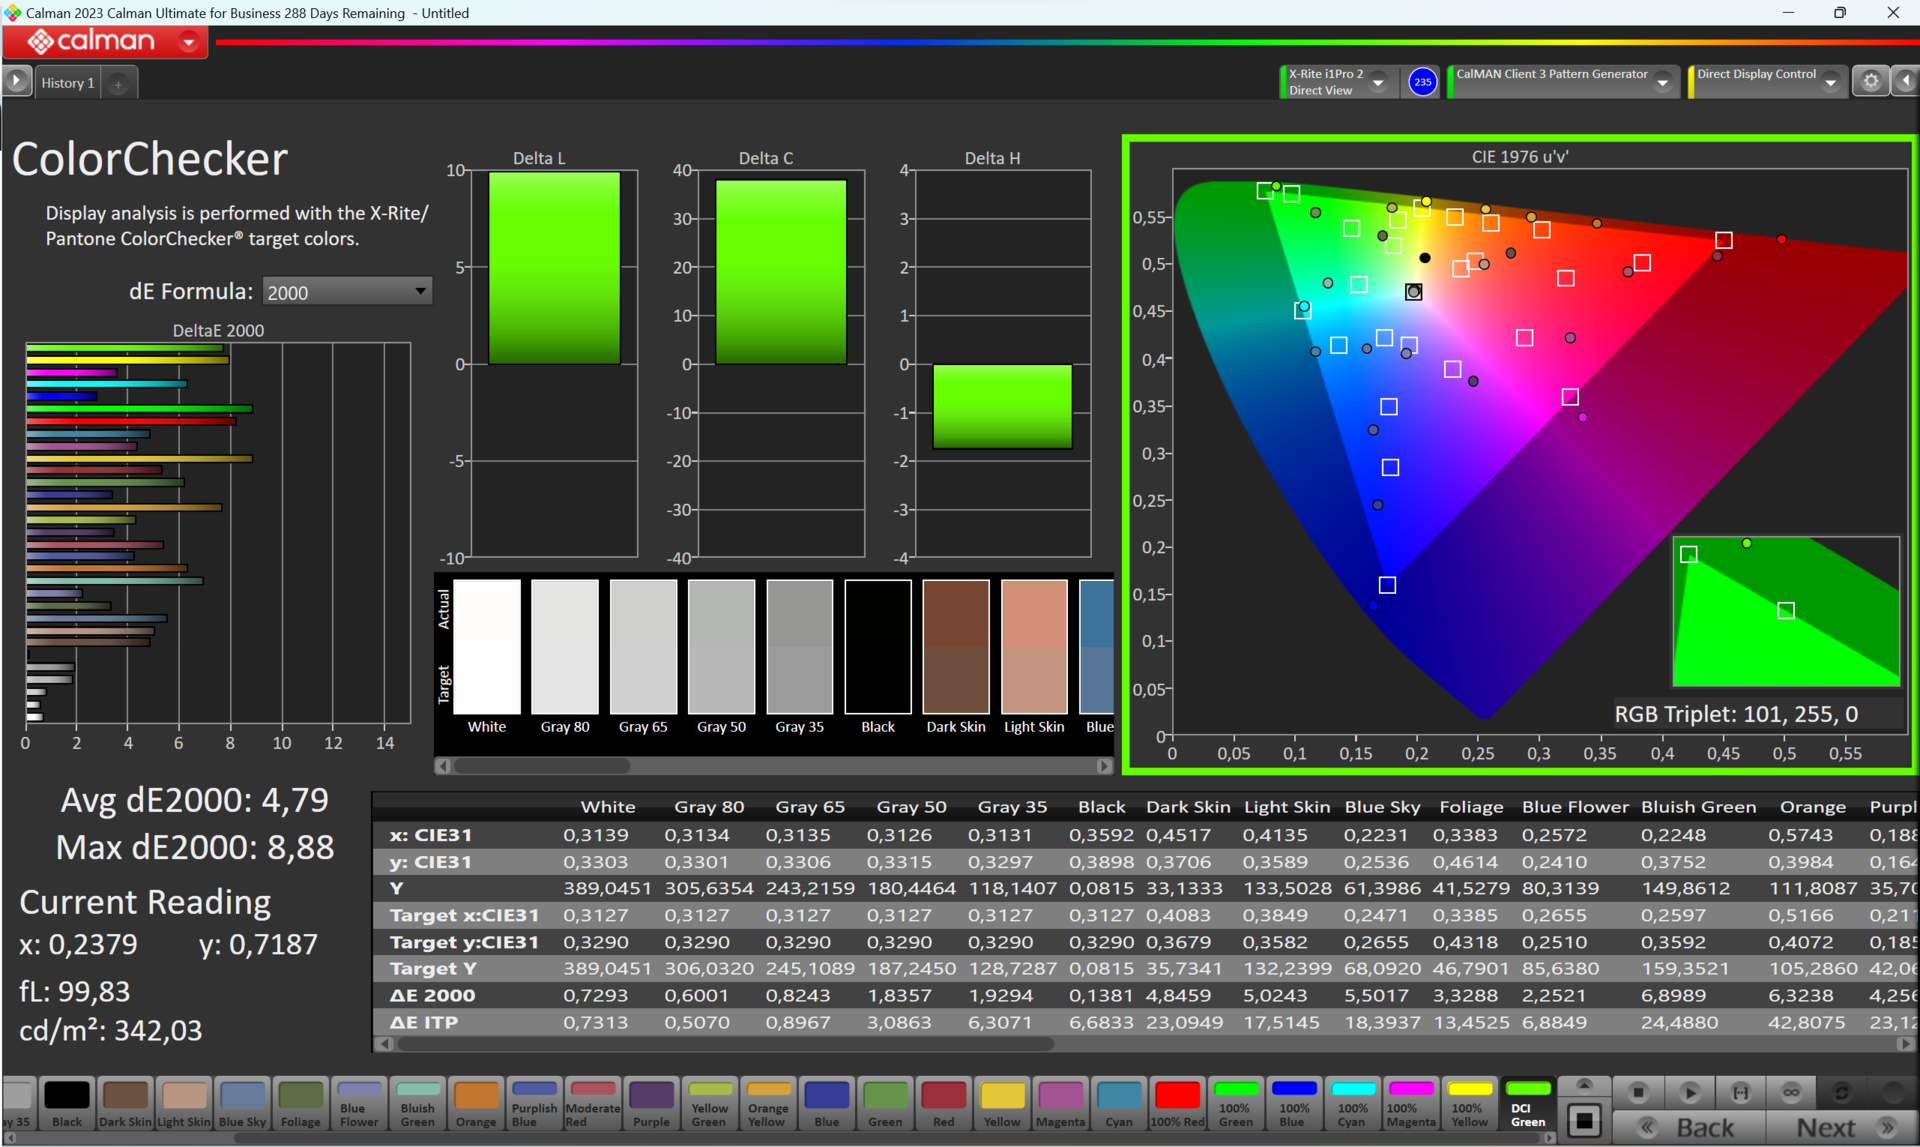
ΔE ColorChecker Calman: 6.32 | ∀{0.5-29.43 Ø4.72}
calibrated: 4.79
ΔE Greyscale Calman: 2.61 | ∀{0.09-98 Ø4.97}
98.56% AdobeRGB 1998 (Argyll 3D)
99.99% sRGB (Argyll 3D)
99.75% Display P3 (Argyll 3D)
Gamma: 1.772
CCT: 6202 K
| Acer Swift Go 14 SFG14-72 ATNA40YK11-0, OLED, 2880x1800, 14" | LG Gram 2in1 16 16T90R - G.AA78G LP160WQ1-SPB2, IPS, 2560x1600, 16" | HP Pavilion Plus 14-ew0153TU Samsung SDC4197, OLED, 2880x1800, 14" | Lenovo ThinkPad T14 G4 21K4S02000 MNE007JA1-1, IPS LED, 1920x1200, 14" | Ayaneo Air 1S Retro Power Ayaneo-OLED, OLED, 1920x1080, 5.5" | HP Pavilion Plus 14-ey0095cl Samsung SDC4197, OLED, 2880x1800, 14" | |
|---|---|---|---|---|---|---|
| Display | -6% | -3% | -22% | 0% | -1% | |
| Display P3 Coverage (%) | 99.75 | 96.5 -3% | 97.9 -2% | 67.1 -33% | 99.85 0% | 99.8 0% |
| sRGB Coverage (%) | 99.99 | 99.9 0% | 99.6 0% | 97.8 -2% | 100 0% | 100 0% |
| AdobeRGB 1998 Coverage (%) | 98.56 | 84.6 -14% | 92.1 -7% | 69.4 -30% | 99.71 1% | 95.8 -3% |
| Response Times | -856% | -182% | -871% | -20% | 78% | |
| Response Time Grey 50% / Grey 80% * (ms) | 2.2 ? | 38.4 ? -1645% | 10.8 ? -391% | 38.4 ? -1645% | 4.4 ? -100% | 0.82 ? 63% |
| Response Time Black / White * (ms) | 12.8 ? | 21.4 ? -67% | 9.29 ? 27% | 25.1 ? -96% | 5 ? 61% | 0.95 ? 93% |
| PWM Frequency (Hz) | 300 | 120 ? | 240 ? | 504.7 ? | ||
| Screen | -107% | 65% | -32% | -42% | 29% | |
| Brightness middle (cd/m²) | 388 | 329 -15% | 387 0% | 398 3% | 331 -15% | 384 -1% |
| Brightness (cd/m²) | 391 | 310 -21% | 387 -1% | 379 -3% | 339 -13% | 386 -1% |
| Brightness Distribution (%) | 98 | 88 -10% | 97 -1% | 90 -8% | 90 -8% | 98 0% |
| Black Level * (cd/m²) | 0.0411 | 0.39 -849% | 0.01 76% | 0.23 -460% | 0.07 -70% | |
| Contrast (:1) | 9440 | 844 -91% | 38700 310% | 1730 -82% | 4729 -50% | |
| Colorchecker dE 2000 * | 6.32 | 3.52 44% | 2.03 68% | 1.3 79% | 4.76 25% | 4.06 36% |
| Colorchecker dE 2000 max. * | 8.82 | 6.96 21% | 3.86 56% | 3.1 65% | 9.2 -4% | 6.73 24% |
| Colorchecker dE 2000 calibrated * | 4.79 | 1.15 76% | 1.6 67% | 1.2 75% | 5.04 -5% | 0.49 90% |
| Greyscale dE 2000 * | 2.61 | 5.75 -120% | 2.3 12% | 1.4 46% | 8.79 -237% | 1.1 58% |
| Gamma | 1.772 124% | 2.137 103% | 2.23 99% | 2.26 97% | 2.155 102% | 2.26 97% |
| CCT | 6202 105% | 7584 86% | 6523 100% | 6448 101% | 7571 86% | 6331 103% |
| Całkowita średnia (program / ustawienia) | -323% /
-192% | -40% /
15% | -308% /
-149% | -21% /
-30% | 35% /
30% |
* ... im mniej tym lepiej


Wszystkie trzy przestrzenie kolorów są prawie całkowicie pokryte przez doskonały OLED. Jedynie przestrzeni barw Adobe RGB brakuje 3% do doskonałości.
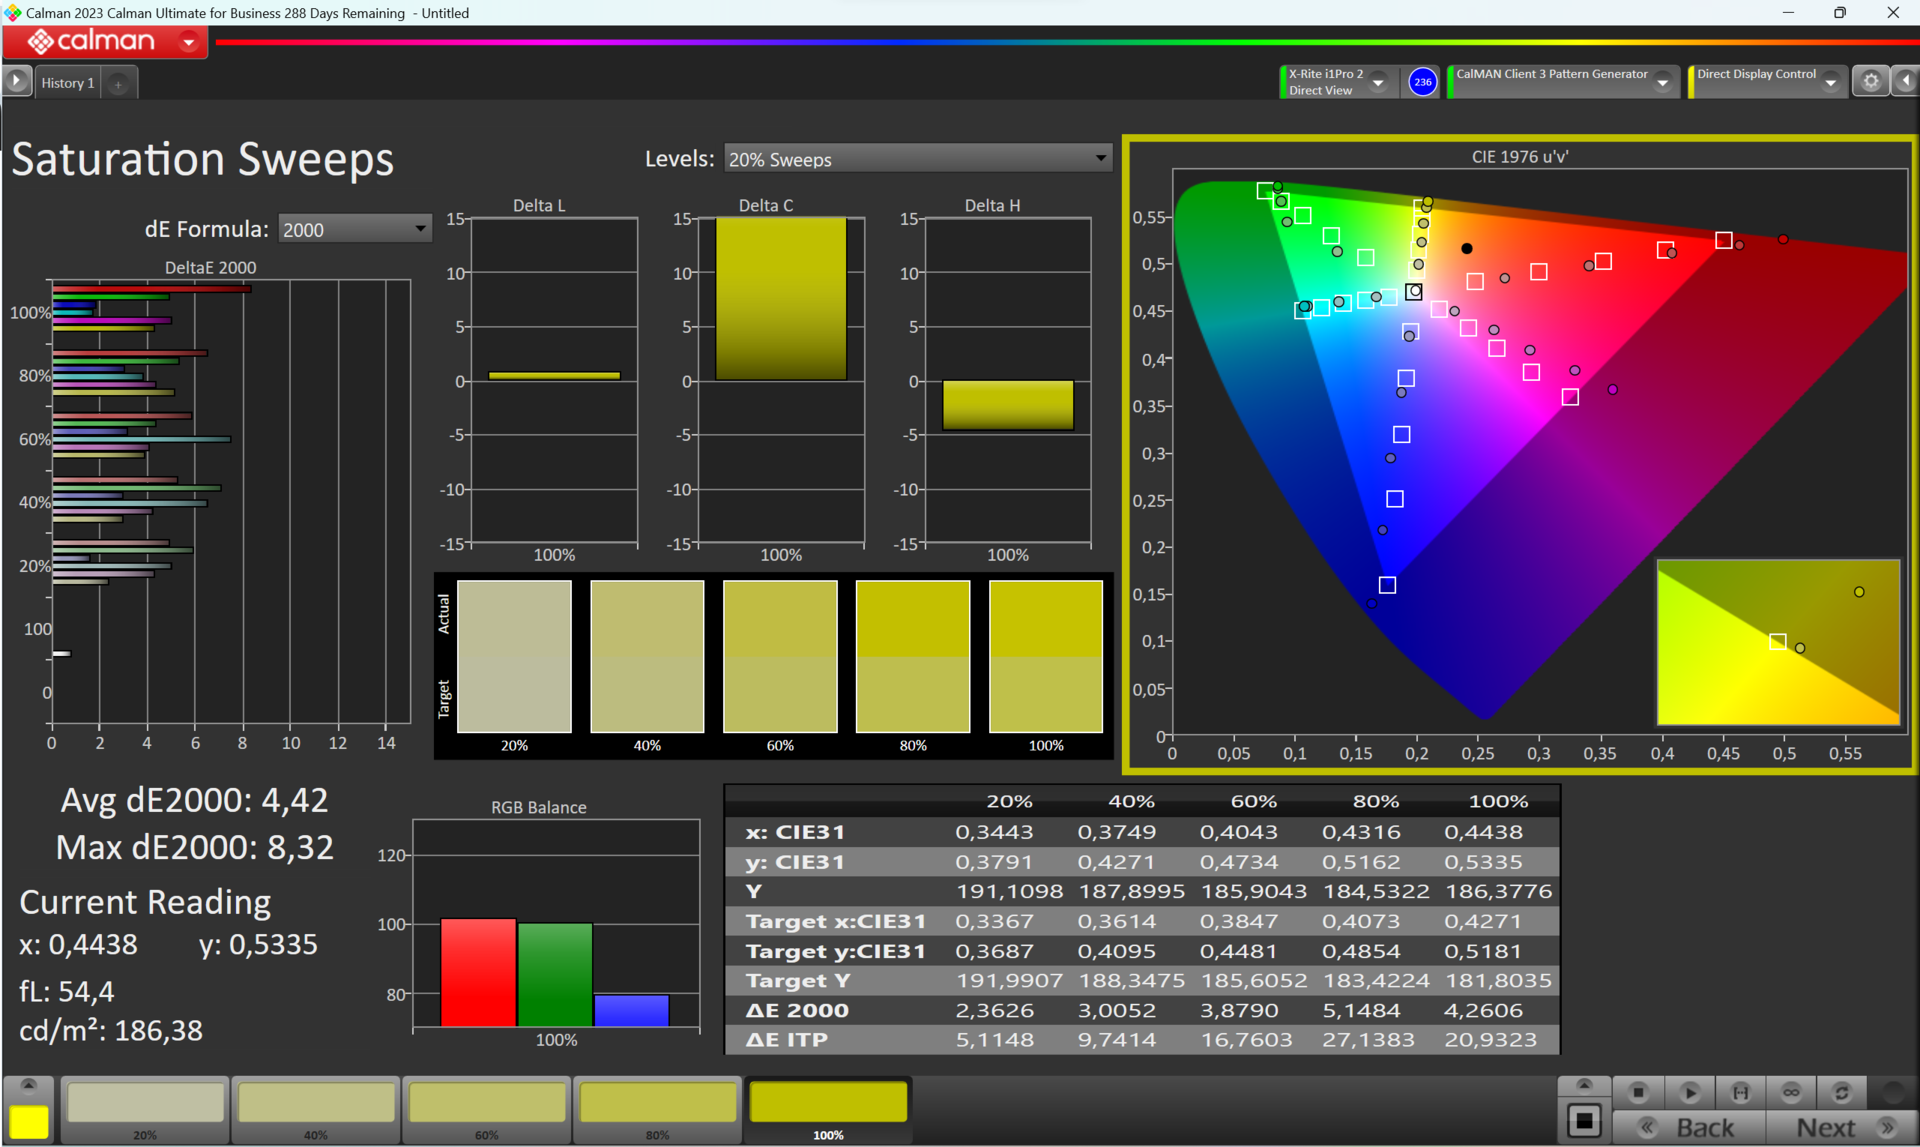
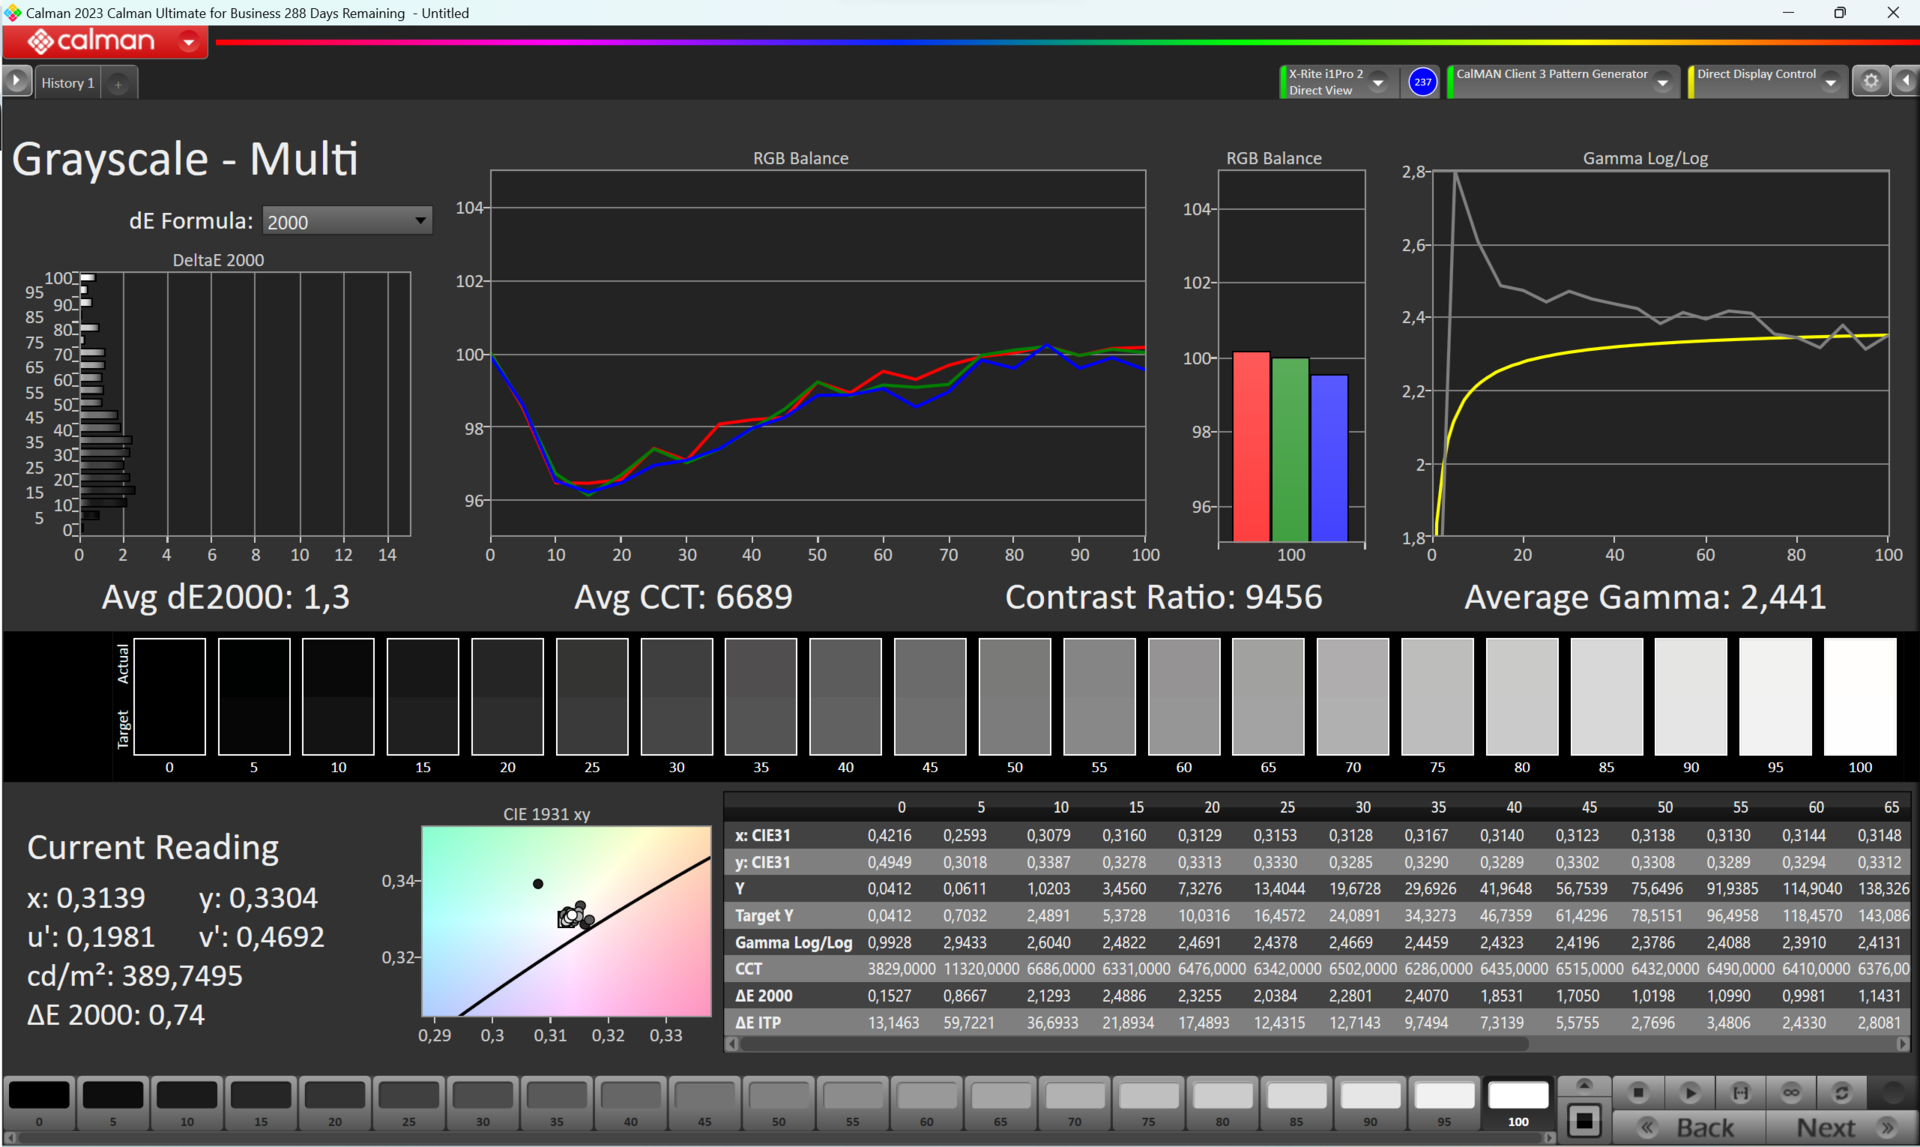
Do tej pory różne profile wyświetlaczy nie wykazały poprawy w zakresie zmierzonych odchyleń kolorów, które w obecnym stanie są nadal bardzo wysokie. Przykładowo, w przestrzeni barw Adobe RGB, nasz własny profil ICC zapewnia niewielką poprawę odwzorowania kolorów. Możemy również założyć, że Acer wprowadzi ulepszenia w tym obszarze w gotowym oprogramowaniu.
Wyświetl czasy reakcji
| ↔ Czas reakcji od czerni do bieli | ||
|---|---|---|
| 12.8 ms ... wzrost ↗ i spadek ↘ łącznie | ↗ 11.8 ms wzrost |  |
| ↘ 1 ms upadek | ||
| W naszych testach ekran wykazuje dobry współczynnik reakcji, ale może być zbyt wolny dla graczy rywalizujących ze sobą. Dla porównania, wszystkie testowane urządzenia wahają się od 0.1 (minimum) do 240 (maksimum) ms. » 33 % wszystkich urządzeń jest lepszych. Oznacza to, że zmierzony czas reakcji jest lepszy od średniej wszystkich testowanych urządzeń (19.8 ms). | ||
| ↔ Czas reakcji 50% szarości do 80% szarości | ||
| 2.2 ms ... wzrost ↗ i spadek ↘ łącznie | ↗ 1 ms wzrost |  |
| ↘ 1.2 ms upadek | ||
| W naszych testach ekran wykazuje bardzo szybką reakcję i powinien bardzo dobrze nadawać się do szybkich gier. Dla porównania, wszystkie testowane urządzenia wahają się od 0.165 (minimum) do 636 (maksimum) ms. » 11 % wszystkich urządzeń jest lepszych. Oznacza to, że zmierzony czas reakcji jest lepszy od średniej wszystkich testowanych urządzeń (31 ms). | ||
Migotanie ekranu / PWM (modulacja szerokości impulsu)
| Wykryto migotanie ekranu/wykryto PWM | 300 Hz |  | |
Podświetlenie wyświetlacza miga z częstotliwością 300 Hz (najgorszy przypadek, np. przy użyciu PWM) . Częstotliwość 300 Hz jest stosunkowo wysoka, więc większość użytkowników wrażliwych na PWM nie powinna zauważyć żadnego migotania. Istnieją jednak doniesienia, że niektórzy użytkownicy są nadal wrażliwi na PWM przy częstotliwości 500 Hz i wyższej, więc należy zachować ostrożność. Dla porównania: 52 % wszystkich testowanych urządzeń nie używa PWM do przyciemniania wyświetlacza. Jeśli wykryto PWM, zmierzono średnio 7778 (minimum: 5 - maksimum: 343500) Hz. | |||
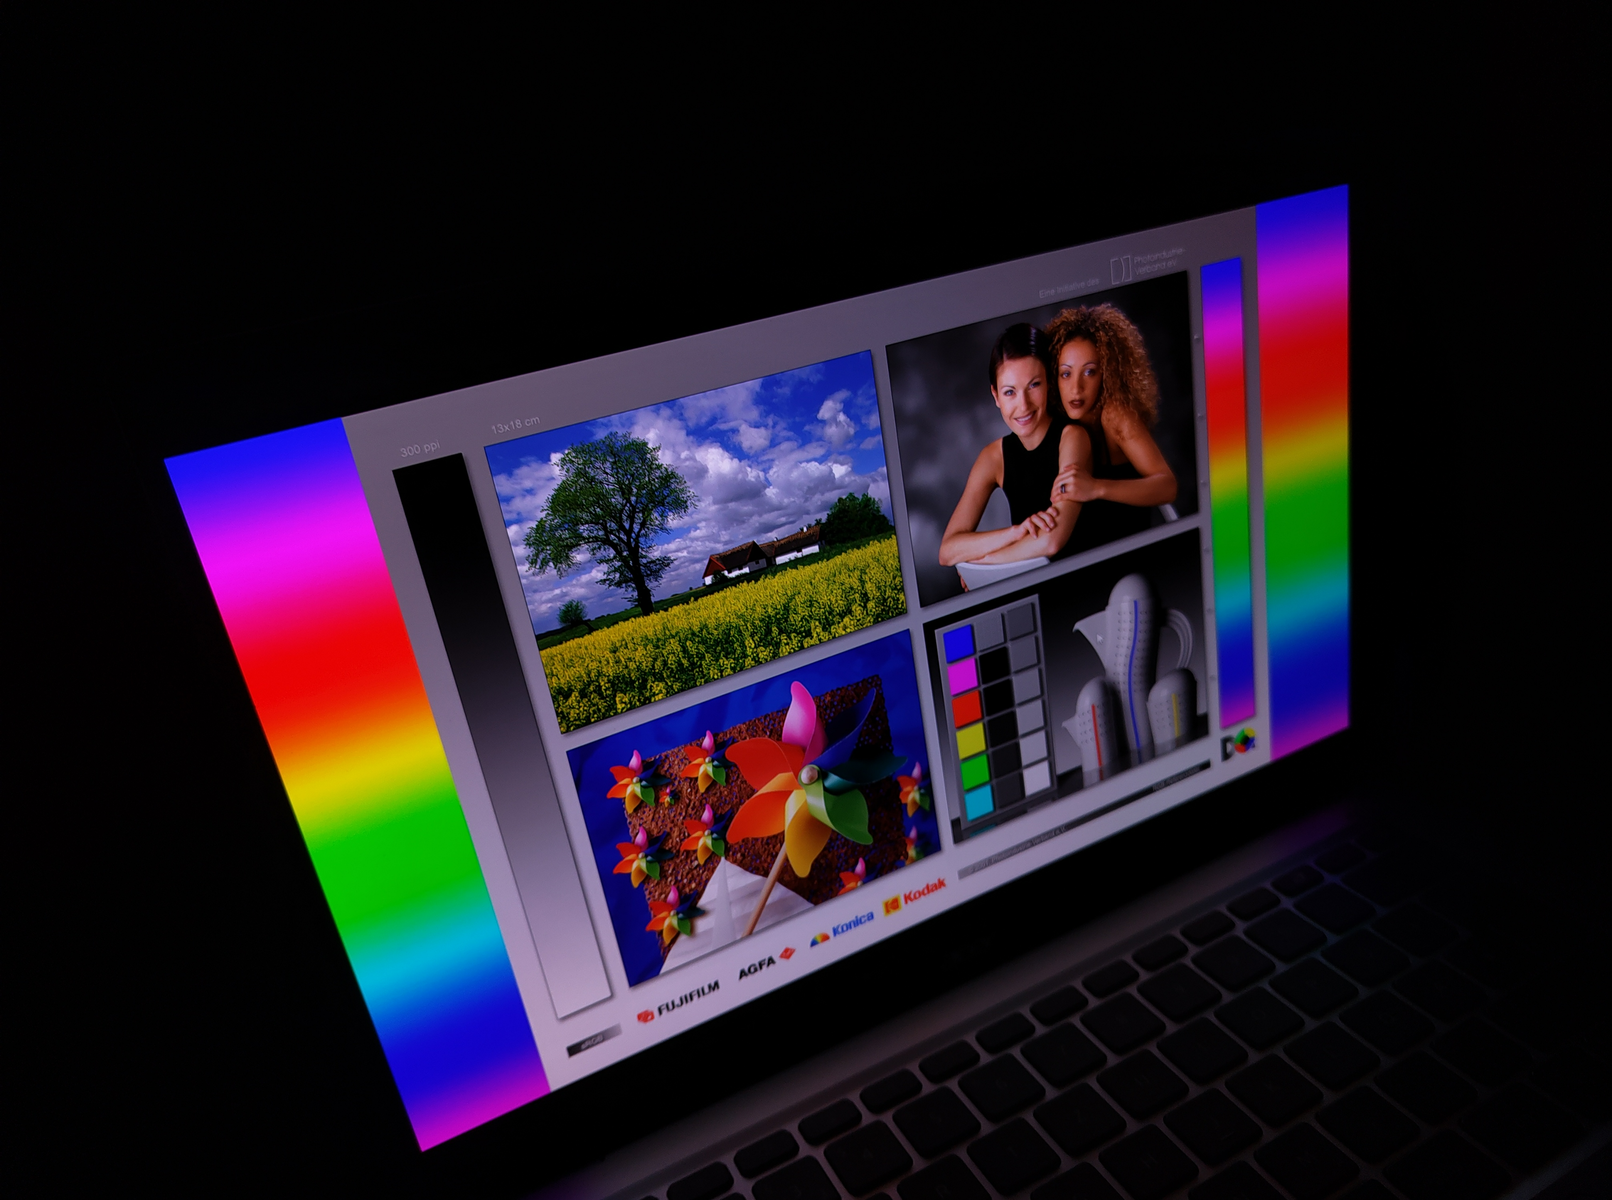
Dzięki wysokiej jasności Acer Swift Go dobrze radzi sobie w sytuacjach zewnętrznych, pomimo posiadania błyszczącego wyświetlacza. Analiza kąta widzenia również nie wykazała żadnych nieprawidłowości.
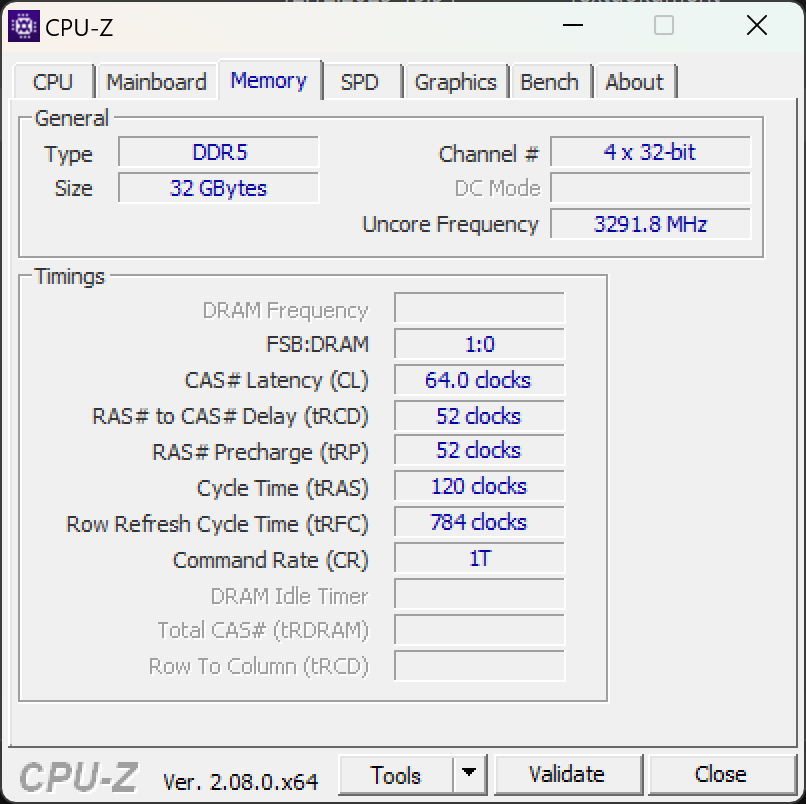
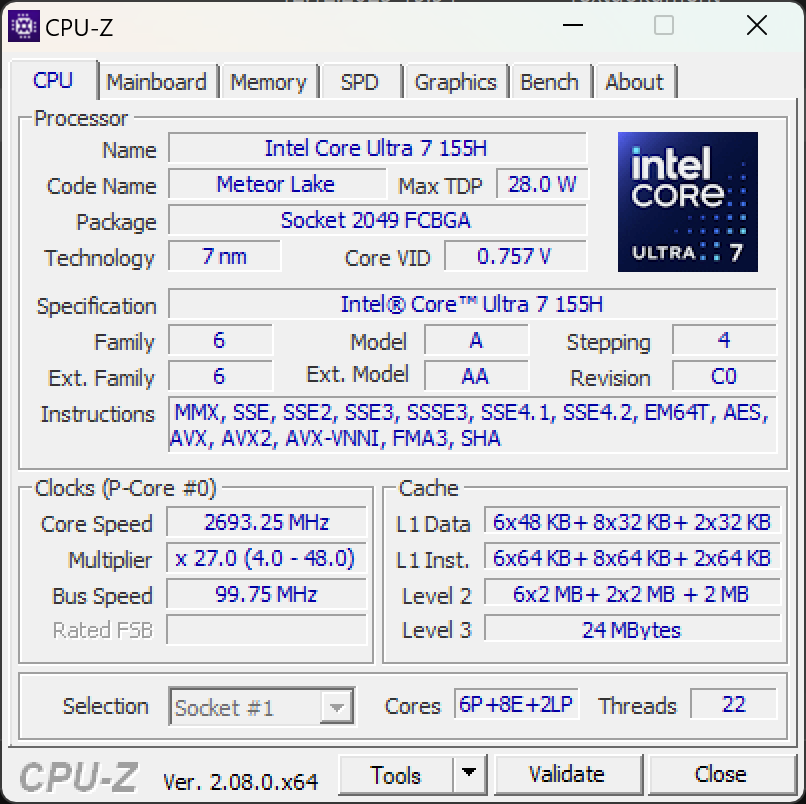
Wydajność - Meteor Lake przekształca Swift Go w małą maszynę do gier
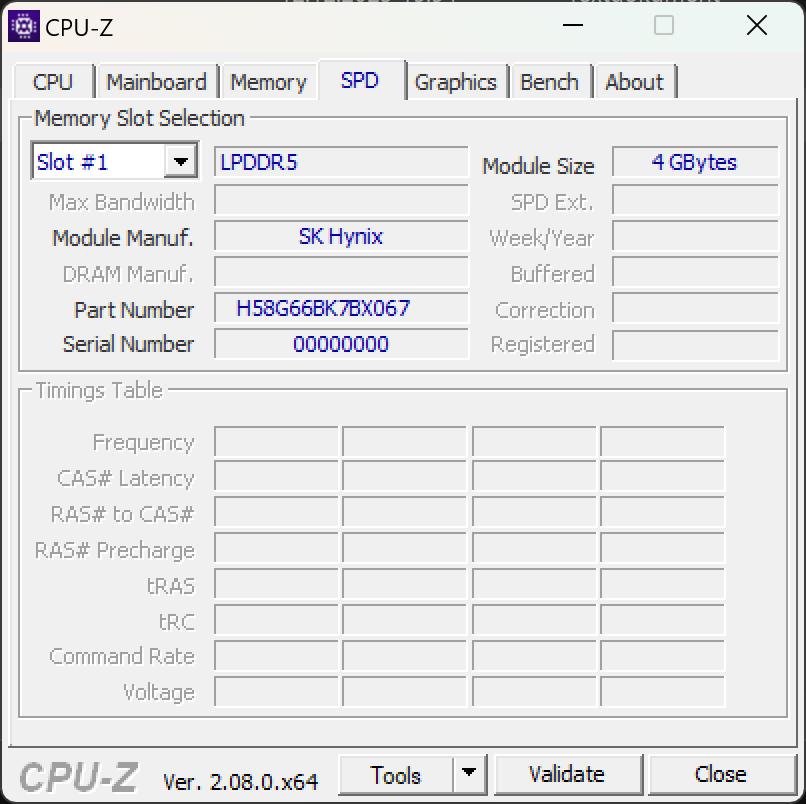
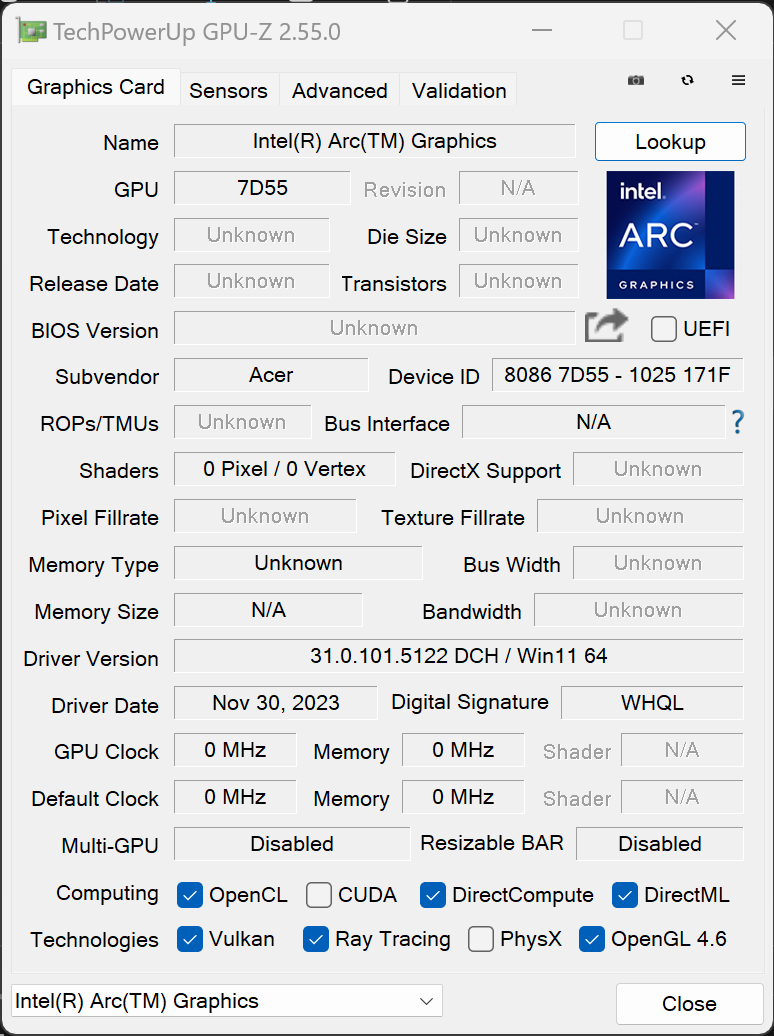
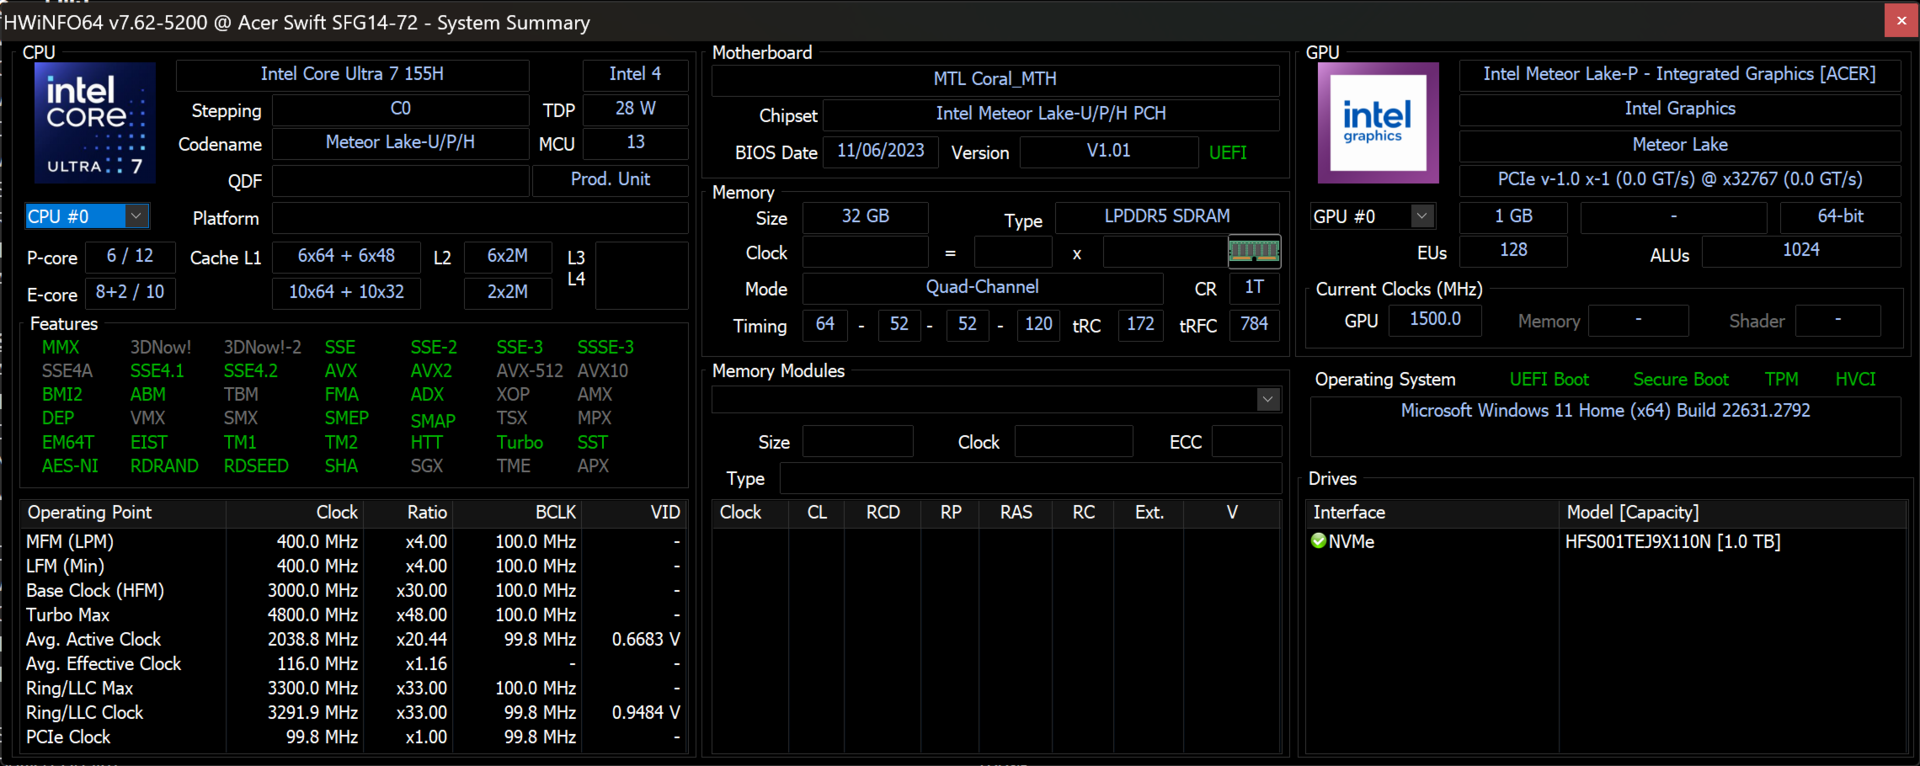
Nowy Acer Swift Go 14 oferuje procesor Intel Meteor Lake. Po raz pierwszy, procesor Intel Core Ultra 7 155H jest również domem dla Arc iGPU z ośmioma rdzeniami i NPU. Urządzenie uzupełniają 32 GB pamięci RAM DDR5 i dysk SSD SK Hynix NVMe o pojemności 1 TB.

Warunki testu
Jak wspomnieliśmy na początku, Acer Swift Go 14, z którym mamy do czynienia, to urządzenie odpowiadające standardowej specyfikacji sprzętowej. Oprogramowanie i firmware naszej recenzowanej maszyny nie są jeszcze do końca dopracowane. Na przykład w naszym Swift Go 14 wartości dla wydajności boost były początkowo skonfigurowane nieco za wysoko. W trakcie testów mieliśmy również problemy z preinstalowaną aplikacją AlterView, która tworzy atrakcyjne wizualnie tła 3D. Po ożywionej wymianie zdań z firmą Acer, zdecydowaliśmy się usunąć to oprogramowanie. Byliśmy również w stanie obniżyć PL2 do 55 watów, pozostawiając PL1 na poziomie 45 watów, a wszystko to przy pomocy TechPowerUp's Throttle Stop. Pomogło to laptopowi działać znacznie lepiej i stabilniej. Acer podejmie się znacznie bardziej szczegółowego dostrojenia, jeśli chodzi o ostateczne zarządzanie wydajnością. Powinno to zaowocować lepszą wydajnością laptopa niż obecnie.
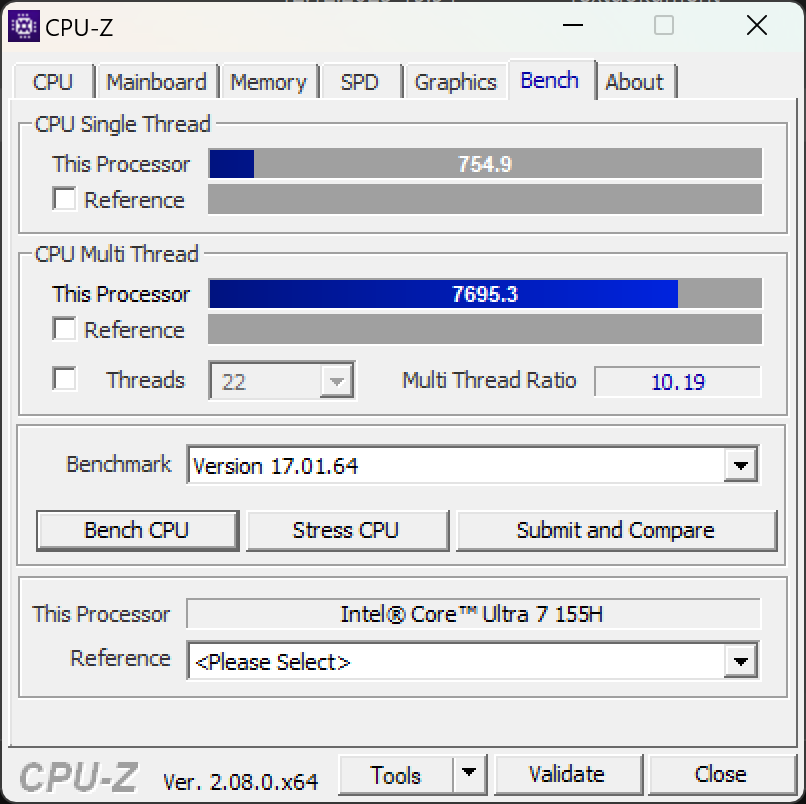
Procesor
Nowy procesor Intela przynosi ze sobą kilka długo oczekiwanych zmian. Po raz pierwszy układ wykonany w procesie produkcyjnym 7 nm oferuje teraz NPU i nowe Arc iGPU. Procesor Core Ultra 7 155H zawiera sześć rdzeni P, osiem rdzeni E i dwa dodatkowe rdzenie LP E, które mają być szczególnie energooszczędne. Oznacza to, że dostępne są łącznie 22 wątki.
Najnowsza generacja procesorów Intela nie cieszy się wyraźną przewagą wydajnościową nad swoim najbardziej podobnym poprzednikiem 13. generacji. Mamy tutaj do czynienia z dwoma urządzeniami z Intel Core i7-13700H. Podobnie, oferuje on sześć rdzeni P i osiem E. Brakuje tylko obu rdzeni E o niskim poborze mocy. Najnowszy procesor Intela zazwyczaj wypada dobrze na tle swojego bezpośredniego konkurenta, czyli AMD Ryzen 7 7840U. W ostatnim czasie (i co zaskakujące), czerwona drużyna ma teraz nos z przodu, jeśli chodzi o wydajność jednordzeniową w Cinebench R23. Opublikowaliśmy już szczegółową analizę nowej generacji procesorów.
Cinebench R15 Multi Continuous Test
Cinebench R23: Multi Core | Single Core
Cinebench R20: CPU (Multi Core) | CPU (Single Core)
Cinebench R15: CPU Multi 64Bit | CPU Single 64Bit
Blender: v2.79 BMW27 CPU
7-Zip 18.03: 7z b 4 | 7z b 4 -mmt1
Geekbench 5.5: Multi-Core | Single-Core
HWBOT x265 Benchmark v2.2: 4k Preset
LibreOffice : 20 Documents To PDF
R Benchmark 2.5: Overall mean
| CPU Performance rating | |
| Przeciętny Intel Core Ultra 7 155H | |
| Acer Swift Go 14 SFG14-72 | |
| Lenovo ThinkPad T14 G4 21K4S02000 | |
| HP Pavilion Plus 14-ey0095cl | |
| Ayaneo Air 1S Retro Power | |
| Średnia w klasie Subnotebook | |
| LG Gram 2in1 16 16T90R - G.AA78G | |
| HP Pavilion Plus 14-ew0153TU | |
| Acer Swift Go 14 SFG14-71 | |
| Cinebench R23 / Multi Core | |
| Acer Swift Go 14 SFG14-72 | |
| Przeciętny Intel Core Ultra 7 155H (9769 - 19007, n=52) | |
| Lenovo ThinkPad T14 G4 21K4S02000 | |
| Średnia w klasie Subnotebook (1555 - 21812, n=59, ostatnie 2 lata) | |
| Ayaneo Air 1S Retro Power | |
| HP Pavilion Plus 14-ey0095cl | |
| LG Gram 2in1 16 16T90R - G.AA78G | |
| Acer Swift Go 14 SFG14-71 | |
| HP Pavilion Plus 14-ew0153TU | |
| Cinebench R23 / Single Core | |
| Acer Swift Go 14 SFG14-72 | |
| Lenovo ThinkPad T14 G4 21K4S02000 | |
| HP Pavilion Plus 14-ew0153TU | |
| Średnia w klasie Subnotebook (358 - 2213, n=60, ostatnie 2 lata) | |
| Przeciętny Intel Core Ultra 7 155H (1496 - 1815, n=52) | |
| Ayaneo Air 1S Retro Power | |
| LG Gram 2in1 16 16T90R - G.AA78G | |
| HP Pavilion Plus 14-ey0095cl | |
| Acer Swift Go 14 SFG14-71 | |
| Cinebench R20 / CPU (Multi Core) | |
| Przeciętny Intel Core Ultra 7 155H (3798 - 7409, n=50) | |
| Acer Swift Go 14 SFG14-72 | |
| Lenovo ThinkPad T14 G4 21K4S02000 | |
| Ayaneo Air 1S Retro Power | |
| Średnia w klasie Subnotebook (579 - 8541, n=56, ostatnie 2 lata) | |
| LG Gram 2in1 16 16T90R - G.AA78G | |
| HP Pavilion Plus 14-ey0095cl | |
| HP Pavilion Plus 14-ew0153TU | |
| Acer Swift Go 14 SFG14-71 | |
| Cinebench R20 / CPU (Single Core) | |
| Lenovo ThinkPad T14 G4 21K4S02000 | |
| Acer Swift Go 14 SFG14-72 | |
| Ayaneo Air 1S Retro Power | |
| Przeciętny Intel Core Ultra 7 155H (601 - 696, n=50) | |
| HP Pavilion Plus 14-ew0153TU | |
| LG Gram 2in1 16 16T90R - G.AA78G | |
| Średnia w klasie Subnotebook (128 - 832, n=56, ostatnie 2 lata) | |
| HP Pavilion Plus 14-ey0095cl | |
| Acer Swift Go 14 SFG14-71 | |
| Cinebench R15 / CPU Multi 64Bit | |
| Acer Swift Go 14 SFG14-72 | |
| Przeciętny Intel Core Ultra 7 155H (1932 - 2880, n=56) | |
| LG Gram 2in1 16 16T90R - G.AA78G | |
| Lenovo ThinkPad T14 G4 21K4S02000 | |
| Średnia w klasie Subnotebook (327 - 3345, n=56, ostatnie 2 lata) | |
| HP Pavilion Plus 14-ey0095cl | |
| Ayaneo Air 1S Retro Power | |
| Acer Swift Go 14 SFG14-71 | |
| HP Pavilion Plus 14-ew0153TU | |
| Cinebench R15 / CPU Single 64Bit | |
| Lenovo ThinkPad T14 G4 21K4S02000 | |
| HP Pavilion Plus 14-ey0095cl | |
| Ayaneo Air 1S Retro Power | |
| Średnia w klasie Subnotebook (72.4 - 322, n=56, ostatnie 2 lata) | |
| Acer Swift Go 14 SFG14-72 | |
| Przeciętny Intel Core Ultra 7 155H (99.6 - 268, n=52) | |
| LG Gram 2in1 16 16T90R - G.AA78G | |
| HP Pavilion Plus 14-ew0153TU | |
| Acer Swift Go 14 SFG14-71 | |
| Blender / v2.79 BMW27 CPU | |
| HP Pavilion Plus 14-ew0153TU | |
| Acer Swift Go 14 SFG14-71 | |
| Średnia w klasie Subnotebook (159 - 2271, n=57, ostatnie 2 lata) | |
| LG Gram 2in1 16 16T90R - G.AA78G | |
| HP Pavilion Plus 14-ey0095cl | |
| Ayaneo Air 1S Retro Power | |
| Lenovo ThinkPad T14 G4 21K4S02000 | |
| Przeciętny Intel Core Ultra 7 155H (175 - 381, n=47) | |
| Acer Swift Go 14 SFG14-72 | |
| 7-Zip 18.03 / 7z b 4 | |
| Acer Swift Go 14 SFG14-72 | |
| Przeciętny Intel Core Ultra 7 155H (41739 - 70254, n=50) | |
| Lenovo ThinkPad T14 G4 21K4S02000 | |
| Ayaneo Air 1S Retro Power | |
| HP Pavilion Plus 14-ey0095cl | |
| Średnia w klasie Subnotebook (11668 - 77867, n=56, ostatnie 2 lata) | |
| LG Gram 2in1 16 16T90R - G.AA78G | |
| Acer Swift Go 14 SFG14-71 | |
| HP Pavilion Plus 14-ew0153TU | |
| 7-Zip 18.03 / 7z b 4 -mmt1 | |
| HP Pavilion Plus 14-ey0095cl | |
| Lenovo ThinkPad T14 G4 21K4S02000 | |
| Ayaneo Air 1S Retro Power | |
| Średnia w klasie Subnotebook (2643 - 6699, n=58, ostatnie 2 lata) | |
| HP Pavilion Plus 14-ew0153TU | |
| Przeciętny Intel Core Ultra 7 155H (4594 - 5621, n=50) | |
| Acer Swift Go 14 SFG14-72 | |
| Acer Swift Go 14 SFG14-71 | |
| LG Gram 2in1 16 16T90R - G.AA78G | |
| Geekbench 5.5 / Multi-Core | |
| Przeciętny Intel Core Ultra 7 155H (10017 - 13556, n=52) | |
| Acer Swift Go 14 SFG14-72 | |
| Średnia w klasie Subnotebook (2557 - 17218, n=48, ostatnie 2 lata) | |
| LG Gram 2in1 16 16T90R - G.AA78G | |
| Lenovo ThinkPad T14 G4 21K4S02000 | |
| HP Pavilion Plus 14-ey0095cl | |
| HP Pavilion Plus 14-ew0153TU | |
| Acer Swift Go 14 SFG14-71 | |
| Ayaneo Air 1S Retro Power | |
| Geekbench 5.5 / Single-Core | |
| Średnia w klasie Subnotebook (726 - 2224, n=48, ostatnie 2 lata) | |
| Lenovo ThinkPad T14 G4 21K4S02000 | |
| HP Pavilion Plus 14-ey0095cl | |
| HP Pavilion Plus 14-ew0153TU | |
| Przeciętny Intel Core Ultra 7 155H (1462 - 1824, n=52) | |
| Acer Swift Go 14 SFG14-72 | |
| Ayaneo Air 1S Retro Power | |
| LG Gram 2in1 16 16T90R - G.AA78G | |
| Acer Swift Go 14 SFG14-71 | |
| HWBOT x265 Benchmark v2.2 / 4k Preset | |
| Przeciętny Intel Core Ultra 7 155H (9.93 - 21.2, n=50) | |
| Acer Swift Go 14 SFG14-72 | |
| Lenovo ThinkPad T14 G4 21K4S02000 | |
| HP Pavilion Plus 14-ey0095cl | |
| Ayaneo Air 1S Retro Power | |
| Średnia w klasie Subnotebook (0.97 - 25.1, n=56, ostatnie 2 lata) | |
| LG Gram 2in1 16 16T90R - G.AA78G | |
| Acer Swift Go 14 SFG14-71 | |
| HP Pavilion Plus 14-ew0153TU | |
| LibreOffice / 20 Documents To PDF | |
| Acer Swift Go 14 SFG14-71 | |
| LG Gram 2in1 16 16T90R - G.AA78G | |
| Średnia w klasie Subnotebook (39.9 - 220, n=55, ostatnie 2 lata) | |
| HP Pavilion Plus 14-ew0153TU | |
| Acer Swift Go 14 SFG14-72 | |
| HP Pavilion Plus 14-ey0095cl | |
| Przeciętny Intel Core Ultra 7 155H (37.5 - 79.2, n=49) | |
| Ayaneo Air 1S Retro Power | |
| Lenovo ThinkPad T14 G4 21K4S02000 | |
| R Benchmark 2.5 / Overall mean | |
| LG Gram 2in1 16 16T90R - G.AA78G | |
| Średnia w klasie Subnotebook (0.4024 - 1.456, n=57, ostatnie 2 lata) | |
| Acer Swift Go 14 SFG14-71 | |
| Acer Swift Go 14 SFG14-72 | |
| Przeciętny Intel Core Ultra 7 155H (0.4457 - 0.53, n=49) | |
| HP Pavilion Plus 14-ew0153TU | |
| Lenovo ThinkPad T14 G4 21K4S02000 | |
| Ayaneo Air 1S Retro Power | |
| HP Pavilion Plus 14-ey0095cl | |
* ... im mniej tym lepiej
AIDA64: FP32 Ray-Trace | FPU Julia | CPU SHA3 | CPU Queen | FPU SinJulia | FPU Mandel | CPU AES | CPU ZLib | FP64 Ray-Trace | CPU PhotoWorxx
| Performance rating | |
| Lenovo ThinkPad T14 G4 21K4S02000 | |
| HP Pavilion Plus 14-ey0095cl | |
| Ayaneo Air 1S Retro Power | |
| Acer Swift Go 14 SFG14-72 | |
| Przeciętny Intel Core Ultra 7 155H | |
| Średnia w klasie Subnotebook | |
| LG Gram 2in1 16 16T90R - G.AA78G | |
| Acer Swift Go 14 SFG14-71 | |
| HP Pavilion Plus 14-ew0153TU | |
| AIDA64 / FP32 Ray-Trace | |
| Lenovo ThinkPad T14 G4 21K4S02000 | |
| Ayaneo Air 1S Retro Power | |
| HP Pavilion Plus 14-ey0095cl | |
| Średnia w klasie Subnotebook (1135 - 32888, n=57, ostatnie 2 lata) | |
| Acer Swift Go 14 SFG14-72 | |
| Przeciętny Intel Core Ultra 7 155H (6670 - 18470, n=50) | |
| LG Gram 2in1 16 16T90R - G.AA78G | |
| LG Gram 2in1 16 16T90R - G.AA78G | |
| Acer Swift Go 14 SFG14-71 | |
| HP Pavilion Plus 14-ew0153TU | |
| AIDA64 / FPU Julia | |
| Lenovo ThinkPad T14 G4 21K4S02000 | |
| HP Pavilion Plus 14-ey0095cl | |
| Ayaneo Air 1S Retro Power | |
| Acer Swift Go 14 SFG14-72 | |
| Przeciętny Intel Core Ultra 7 155H (40905 - 93181, n=50) | |
| Średnia w klasie Subnotebook (5218 - 123315, n=57, ostatnie 2 lata) | |
| LG Gram 2in1 16 16T90R - G.AA78G | |
| Acer Swift Go 14 SFG14-71 | |
| HP Pavilion Plus 14-ew0153TU | |
| AIDA64 / CPU SHA3 | |
| Lenovo ThinkPad T14 G4 21K4S02000 | |
| Ayaneo Air 1S Retro Power | |
| HP Pavilion Plus 14-ey0095cl | |
| Acer Swift Go 14 SFG14-72 | |
| Przeciętny Intel Core Ultra 7 155H (1940 - 4436, n=50) | |
| Średnia w klasie Subnotebook (444 - 5287, n=57, ostatnie 2 lata) | |
| LG Gram 2in1 16 16T90R - G.AA78G | |
| Acer Swift Go 14 SFG14-71 | |
| HP Pavilion Plus 14-ew0153TU | |
| AIDA64 / CPU Queen | |
| Lenovo ThinkPad T14 G4 21K4S02000 | |
| HP Pavilion Plus 14-ey0095cl | |
| Ayaneo Air 1S Retro Power | |
| Acer Swift Go 14 SFG14-72 | |
| Przeciętny Intel Core Ultra 7 155H (64698 - 94181, n=50) | |
| LG Gram 2in1 16 16T90R - G.AA78G | |
| Średnia w klasie Subnotebook (10579 - 95002, n=50, ostatnie 2 lata) | |
| HP Pavilion Plus 14-ew0153TU | |
| Acer Swift Go 14 SFG14-71 | |
| AIDA64 / FPU SinJulia | |
| Lenovo ThinkPad T14 G4 21K4S02000 | |
| Ayaneo Air 1S Retro Power | |
| HP Pavilion Plus 14-ey0095cl | |
| Acer Swift Go 14 SFG14-72 | |
| Przeciętny Intel Core Ultra 7 155H (5639 - 10647, n=50) | |
| LG Gram 2in1 16 16T90R - G.AA78G | |
| Średnia w klasie Subnotebook (744 - 18418, n=57, ostatnie 2 lata) | |
| HP Pavilion Plus 14-ew0153TU | |
| Acer Swift Go 14 SFG14-71 | |
| AIDA64 / FPU Mandel | |
| Lenovo ThinkPad T14 G4 21K4S02000 | |
| HP Pavilion Plus 14-ey0095cl | |
| Ayaneo Air 1S Retro Power | |
| Acer Swift Go 14 SFG14-72 | |
| Przeciętny Intel Core Ultra 7 155H (18236 - 47685, n=50) | |
| Średnia w klasie Subnotebook (3341 - 65433, n=57, ostatnie 2 lata) | |
| LG Gram 2in1 16 16T90R - G.AA78G | |
| Acer Swift Go 14 SFG14-71 | |
| HP Pavilion Plus 14-ew0153TU | |
| AIDA64 / CPU AES | |
| Lenovo ThinkPad T14 G4 21K4S02000 | |
| LG Gram 2in1 16 16T90R - G.AA78G | |
| Przeciętny Intel Core Ultra 7 155H (45713 - 152179, n=50) | |
| Acer Swift Go 14 SFG14-72 | |
| Ayaneo Air 1S Retro Power | |
| HP Pavilion Plus 14-ey0095cl | |
| Średnia w klasie Subnotebook (638 - 96917, n=57, ostatnie 2 lata) | |
| Acer Swift Go 14 SFG14-71 | |
| HP Pavilion Plus 14-ew0153TU | |
| AIDA64 / CPU ZLib | |
| Przeciętny Intel Core Ultra 7 155H (557 - 1250, n=50) | |
| Acer Swift Go 14 SFG14-72 | |
| Lenovo ThinkPad T14 G4 21K4S02000 | |
| HP Pavilion Plus 14-ey0095cl | |
| Ayaneo Air 1S Retro Power | |
| LG Gram 2in1 16 16T90R - G.AA78G | |
| Średnia w klasie Subnotebook (164.9 - 1379, n=57, ostatnie 2 lata) | |
| Acer Swift Go 14 SFG14-71 | |
| HP Pavilion Plus 14-ew0153TU | |
| AIDA64 / FP64 Ray-Trace | |
| Lenovo ThinkPad T14 G4 21K4S02000 | |
| HP Pavilion Plus 14-ey0095cl | |
| Ayaneo Air 1S Retro Power | |
| Średnia w klasie Subnotebook (610 - 17495, n=57, ostatnie 2 lata) | |
| Acer Swift Go 14 SFG14-72 | |
| Przeciętny Intel Core Ultra 7 155H (3569 - 9802, n=50) | |
| LG Gram 2in1 16 16T90R - G.AA78G | |
| Acer Swift Go 14 SFG14-71 | |
| HP Pavilion Plus 14-ew0153TU | |
| AIDA64 / CPU PhotoWorxx | |
| Średnia w klasie Subnotebook (6569 - 85600, n=57, ostatnie 2 lata) | |
| Przeciętny Intel Core Ultra 7 155H (32719 - 54223, n=50) | |
| Acer Swift Go 14 SFG14-72 | |
| LG Gram 2in1 16 16T90R - G.AA78G | |
| Lenovo ThinkPad T14 G4 21K4S02000 | |
| HP Pavilion Plus 14-ew0153TU | |
| Acer Swift Go 14 SFG14-71 | |
| HP Pavilion Plus 14-ey0095cl | |
| Ayaneo Air 1S Retro Power | |
Wydajność systemu
Według Intela, nowa jednostka Arc iGPU jest w głównej mierze odpowiedzialna za znaczną poprawę wydajności graficznej. Staje się to jasne, gdy tylko spojrzymy na sekcję tworzenia treści cyfrowych w PCMark 10. W tym obszarze Swift Go 14 i jego Arc iGPU są imponujące. Ogólnie rzecz biorąc, wydajność systemu Acer Swift Go 14 jest znacznie wyższa niż jego poprzednika i większości urządzeń porównawczych. Oznacza to, że mamy do czynienia z potężnym urządzeniem, które nie ma powodu, by wycofywać się nawet w obliczu aplikacji 3D.
CrossMark: Overall | Productivity | Creativity | Responsiveness
WebXPRT 3: Overall
WebXPRT 4: Overall
Mozilla Kraken 1.1: Total
| PCMark 10 / Score | |
| Średnia w klasie Subnotebook (4920 - 9939, n=44, ostatnie 2 lata) | |
| Lenovo ThinkPad T14 G4 21K4S02000 | |
| Przeciętny Intel Core Ultra 7 155H, Intel Arc 8-Core iGPU (4809 - 7529, n=34) | |
| Acer Swift Go 14 SFG14-72 | |
| HP Pavilion Plus 14-ey0095cl | |
| Ayaneo Air 1S Retro Power | |
| LG Gram 2in1 16 16T90R - G.AA78G | |
| HP Pavilion Plus 14-ew0153TU | |
| Acer Swift Go 14 SFG14-71 | |
| PCMark 10 / Essentials | |
| LG Gram 2in1 16 16T90R - G.AA78G | |
| Lenovo ThinkPad T14 G4 21K4S02000 | |
| Przeciętny Intel Core Ultra 7 155H, Intel Arc 8-Core iGPU (7605 - 11289, n=34) | |
| Średnia w klasie Subnotebook (8552 - 11646, n=44, ostatnie 2 lata) | |
| Acer Swift Go 14 SFG14-72 | |
| HP Pavilion Plus 14-ew0153TU | |
| Acer Swift Go 14 SFG14-71 | |
| HP Pavilion Plus 14-ey0095cl | |
| Ayaneo Air 1S Retro Power | |
| PCMark 10 / Productivity | |
| Lenovo ThinkPad T14 G4 21K4S02000 | |
| HP Pavilion Plus 14-ey0095cl | |
| Średnia w klasie Subnotebook (5435 - 16606, n=44, ostatnie 2 lata) | |
| Przeciętny Intel Core Ultra 7 155H, Intel Arc 8-Core iGPU (6042 - 10591, n=34) | |
| Acer Swift Go 14 SFG14-72 | |
| Ayaneo Air 1S Retro Power | |
| Acer Swift Go 14 SFG14-71 | |
| HP Pavilion Plus 14-ew0153TU | |
| LG Gram 2in1 16 16T90R - G.AA78G | |
| PCMark 10 / Digital Content Creation | |
| Średnia w klasie Subnotebook (5722 - 13779, n=44, ostatnie 2 lata) | |
| Acer Swift Go 14 SFG14-72 | |
| Przeciętny Intel Core Ultra 7 155H, Intel Arc 8-Core iGPU (4985 - 10709, n=34) | |
| Lenovo ThinkPad T14 G4 21K4S02000 | |
| HP Pavilion Plus 14-ey0095cl | |
| Ayaneo Air 1S Retro Power | |
| LG Gram 2in1 16 16T90R - G.AA78G | |
| HP Pavilion Plus 14-ew0153TU | |
| Acer Swift Go 14 SFG14-71 | |
| CrossMark / Overall | |
| Lenovo ThinkPad T14 G4 21K4S02000 | |
| Przeciętny Intel Core Ultra 7 155H, Intel Arc 8-Core iGPU (1366 - 1903, n=34) | |
| Średnia w klasie Subnotebook (365 - 2356, n=59, ostatnie 2 lata) | |
| Acer Swift Go 14 SFG14-72 | |
| HP Pavilion Plus 14-ew0153TU | |
| LG Gram 2in1 16 16T90R - G.AA78G | |
| HP Pavilion Plus 14-ey0095cl | |
| Acer Swift Go 14 SFG14-71 | |
| Ayaneo Air 1S Retro Power | |
| CrossMark / Productivity | |
| Lenovo ThinkPad T14 G4 21K4S02000 | |
| Przeciętny Intel Core Ultra 7 155H, Intel Arc 8-Core iGPU (1291 - 1798, n=33) | |
| Średnia w klasie Subnotebook (364 - 2277, n=59, ostatnie 2 lata) | |
| HP Pavilion Plus 14-ew0153TU | |
| HP Pavilion Plus 14-ey0095cl | |
| Acer Swift Go 14 SFG14-72 | |
| LG Gram 2in1 16 16T90R - G.AA78G | |
| Acer Swift Go 14 SFG14-71 | |
| Ayaneo Air 1S Retro Power | |
| CrossMark / Creativity | |
| Średnia w klasie Subnotebook (372 - 2743, n=59, ostatnie 2 lata) | |
| Lenovo ThinkPad T14 G4 21K4S02000 | |
| Przeciętny Intel Core Ultra 7 155H, Intel Arc 8-Core iGPU (1519 - 1929, n=33) | |
| Acer Swift Go 14 SFG14-72 | |
| HP Pavilion Plus 14-ey0095cl | |
| HP Pavilion Plus 14-ew0153TU | |
| LG Gram 2in1 16 16T90R - G.AA78G | |
| Acer Swift Go 14 SFG14-71 | |
| Ayaneo Air 1S Retro Power | |
| CrossMark / Responsiveness | |
| LG Gram 2in1 16 16T90R - G.AA78G | |
| Acer Swift Go 14 SFG14-71 | |
| Przeciętny Intel Core Ultra 7 155H, Intel Arc 8-Core iGPU (939 - 1802, n=33) | |
| Lenovo ThinkPad T14 G4 21K4S02000 | |
| Acer Swift Go 14 SFG14-72 | |
| HP Pavilion Plus 14-ew0153TU | |
| Średnia w klasie Subnotebook (312 - 1854, n=59, ostatnie 2 lata) | |
| HP Pavilion Plus 14-ey0095cl | |
| Ayaneo Air 1S Retro Power | |
| WebXPRT 3 / Overall | |
| Średnia w klasie Subnotebook (156 - 530, n=55, ostatnie 2 lata) | |
| Lenovo ThinkPad T14 G4 21K4S02000 | |
| HP Pavilion Plus 14-ey0095cl | |
| Acer Swift Go 14 SFG14-72 | |
| Przeciętny Intel Core Ultra 7 155H, Intel Arc 8-Core iGPU (252 - 299, n=34) | |
| HP Pavilion Plus 14-ew0153TU | |
| LG Gram 2in1 16 16T90R - G.AA78G | |
| Acer Swift Go 14 SFG14-71 | |
| Ayaneo Air 1S Retro Power | |
| WebXPRT 4 / Overall | |
| Średnia w klasie Subnotebook (132 - 378, n=60, ostatnie 2 lata) | |
| HP Pavilion Plus 14-ew0153TU | |
| Przeciętny Intel Core Ultra 7 155H, Intel Arc 8-Core iGPU (166.4 - 309, n=29) | |
| HP Pavilion Plus 14-ey0095cl | |
| Ayaneo Air 1S Retro Power | |
| Mozilla Kraken 1.1 / Total | |
| LG Gram 2in1 16 16T90R - G.AA78G | |
| HP Pavilion Plus 14-ey0095cl | |
| Acer Swift Go 14 SFG14-71 | |
| Acer Swift Go 14 SFG14-71 | |
| Przeciętny Intel Core Ultra 7 155H, Intel Arc 8-Core iGPU (517 - 614, n=35) | |
| Acer Swift Go 14 SFG14-72 | |
| Lenovo ThinkPad T14 G4 21K4S02000 | |
| Ayaneo Air 1S Retro Power | |
| HP Pavilion Plus 14-ew0153TU | |
| Średnia w klasie Subnotebook (234 - 1104, n=60, ostatnie 2 lata) | |
* ... im mniej tym lepiej
| PCMark 10 Score | 6625 pkt. | |
Pomoc | ||
| AIDA64 / Memory Copy | |
| Średnia w klasie Subnotebook (14554 - 131023, n=57, ostatnie 2 lata) | |
| Przeciętny Intel Core Ultra 7 155H (62397 - 96791, n=50) | |
| Acer Swift Go 14 SFG14-72 | |
| AIDA64 / Memory Read | |
| Średnia w klasie Subnotebook (15948 - 127174, n=57, ostatnie 2 lata) | |
| Przeciętny Intel Core Ultra 7 155H (60544 - 90647, n=50) | |
| Acer Swift Go 14 SFG14-72 | |
| AIDA64 / Memory Write | |
| Średnia w klasie Subnotebook (15709 - 135141, n=57, ostatnie 2 lata) | |
| Acer Swift Go 14 SFG14-72 | |
| Przeciętny Intel Core Ultra 7 155H (58692 - 93451, n=50) | |
| AIDA64 / Memory Latency | |
| Acer Swift Go 14 SFG14-72 | |
| Przeciętny Intel Core Ultra 7 155H (116.2 - 233, n=50) | |
| Średnia w klasie Subnotebook (6.1 - 159.9, n=55, ostatnie 2 lata) | |
* ... im mniej tym lepiej
Pamięć masowa
W Swift Go 14 nowy dysk SSD NVMe od SK Hynix spełnia swoje zadanie i udaje mu się osiągnąć średnie lub wysokie prędkości transferu w każdym teście porównawczym. W pętli DiskSpd, w której wydajność pamięci masowej jest analizowana przez dłuższy czas, prędkość odczytu nieznacznie spada.

* ... im mniej tym lepiej
Continuous Performance Read: DiskSpd Read Loop, Queue Depth 8
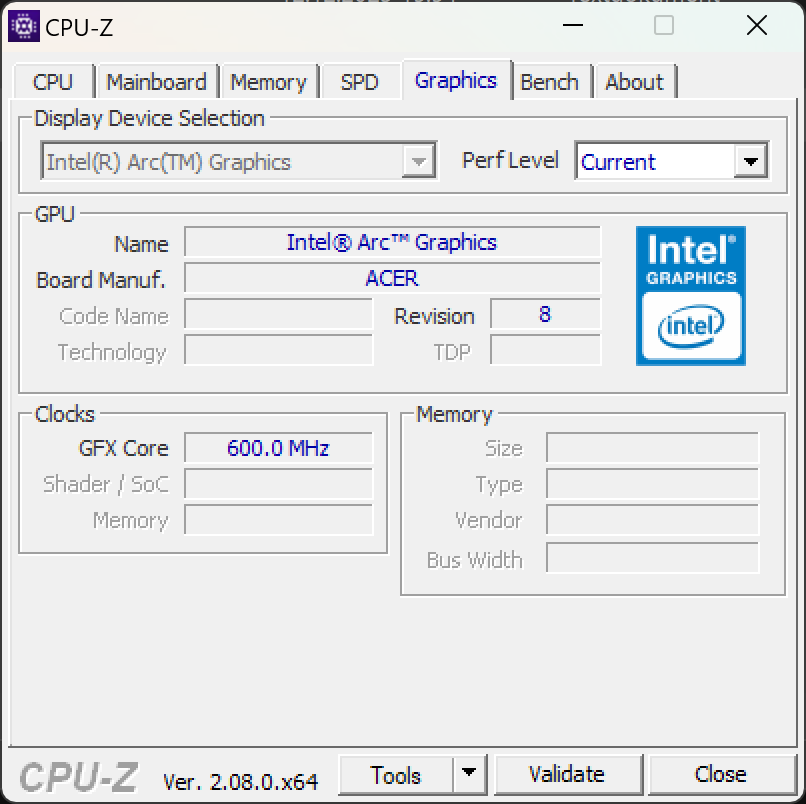
Karta graficzna
Według Intela, wydajność graficzna nowego procesora do laptopów ma być dwukrotnie wyższa niż w przypadku 13. generacji. W każdym razie, nasze pierwsze testy porównawcze potwierdzają bardzo wysoką wydajność z ośmiordzeniowym Arc iGPU udało się nawet przekonująco pokonać AMD Radeon 780M. Dedykowane układy GPU Intela do laptopów wypadają słabo w naszej analizie. Nawet pomijając wydajność 3D, wydajność iGPU Acer Swift Go jest zdumiewająco wysoka.
| 3DMark 06 Standard Score | pkt. | |
| 3DMark Vantage P Result | 43185 pkt. | |
| 3DMark 11 Performance | 13075 pkt. | |
| 3DMark Ice Storm Standard Score | 157591 pkt. | |
| 3DMark Cloud Gate Standard Score | 29783 pkt. | |
| 3DMark Fire Strike Score | 8314 pkt. | |
| 3DMark Time Spy Score | 3471 pkt. | |
Pomoc | ||
* ... im mniej tym lepiej
Wydajność w grach
Dzięki znacznie ulepszonej grafice Intel Core Ultra 7 155H robi wrażenie podczas grania, o ile nie przesadzi się z ustawieniami jakości lub rozdzielczości. Gry Full HD w średniej lub wysokiej jakości są grywalne przy ponad 60 klatkach na sekundę w większości testowanych przez nas gier. Oznacza to, że można obejść się bez typu dGPU występującego w wielu laptopach, takich jak GeForce RTX 2050 lub Arc 530M.
| The Witcher 3 - 1920x1080 Ultra Graphics & Postprocessing (HBAO+) | |
| Ayaneo Air 1S Retro Power | |
| HP Pavilion Plus 14-ey0095cl | |
| Lenovo ThinkPad T14 G4 21K4S02000 | |
| Średnia w klasie Subnotebook (13.9 - 34.6, n=13, ostatnie 2 lata) | |
| Acer Swift Go 14 SFG14-72 | |
| LG Gram 2in1 16 16T90R - G.AA78G | |
| HP Pavilion Plus 14-ew0153TU | |
| Acer Swift Go 14 SFG14-71 | |
Prawie dwukrotny wzrost wydajności graficznej staje się oczywisty, gdy spojrzymy na liczbę klatek na sekundę w grze The Witcher 3 w ustawieniach ultra-jakości. Swift Go 14 zapewnia prawie dwa razy więcej klatek na sekundę niż Schenker Vision 14.
Witcher 3 FPS diagram
| low | med. | high | ultra | QHD | |
|---|---|---|---|---|---|
| GTA V (2015) | 124.1 | 120.8 | 34.8 | 13.1 | |
| The Witcher 3 (2015) | 23.3 | ||||
| Dota 2 Reborn (2015) | 99.4 | 90.4 | 76 | 73.4 | |
| Final Fantasy XV Benchmark (2018) | 42.8 | 32.1 | 18.2 | 14 | |
| X-Plane 11.11 (2018) | 54.5 | 42.5 | 36.1 | ||
| Far Cry 5 (2018) | 35 | 33 | |||
| Strange Brigade (2018) | 141.9 | 60.6 | 52 | 43.2 | |
| Horizon Zero Dawn (2020) | 33 | 28 () | 26 | ||
| Dying Light 2 (2022) | 31.1 | 29.9 | |||
| Hogwarts Legacy (2023) | 25.7 | 19.3 | 15.6 | ||
| F1 23 (2023) | 64.6 | 59 | 35.9 | 12.2 | |
| Ratchet & Clank Rift Apart (2023) | 28.4 | 29 | 25.9 | 21.1 | |
| Starfield (2023) | 11.5 | ||||
| Baldur's Gate 3 (2023) | 22.8 | 20.6 | 19.1 | ||
| Cyberpunk 2077 (2023) | 34.1 | 29.6 | 24 | 13.1 | |
| EA Sports WRC (2023) | 35.8 | 26.6 | 24.7 | 22.4 |
Wydajność NPU
Jednostka przetwarzania neuronowego znajduje się wewnątrz Intel Core Ultra 7 155H. Ta część procesora ma za zadanie bardzo wydajnie przetwarzać aplikacje AI. Oznacza to, że modele takie jak Stable Diffusion lub modele językowe mogą już działać na urządzeniu. Korzystając z benchmarku UL Procyon AI Interface, zestawiliśmy GPU z NPU i jednocześnie sprawdziliśmy zużycie energii. W obu scenariuszach szybko stało się jasne, że wydajność NPU była tylko nieznacznie niższa niż Arc iGPU, jeśli chodzi o przetwarzanie sieci neuronowych, ale zapotrzebowanie na energię było prawie o połowę niższe. To zdecydowanie sprawia, że akcelerator AI jest bardziej wydajny niż układ graficzny dla tych samych aplikacji.
Dlatego też możliwe jest, że wiele aplikacji AI, które obecnie działają w chmurze, może wkrótce działać lokalnie na samym laptopie, w energooszczędny sposób, bez potrzeby połączenia z Internetem.
Power consumption UL Procyon Ai Inference benchmark on an external monitor
| UL Procyon for Windows | |
| Acer Swift Go 14 SFG14-72 | |
| Overall Score Integer NPU | |
| Overall Score Integer GPU | |
Firma Intel uprzejmie dostarczyła nam wersję Gimp, która zawiera już Stable Diffusion z obsługą OpenVINO i NPU. Po długiej konfiguracji program do zamiany tekstu na obraz działał zaskakująco szybko. Do tej pory możliwe było uruchomienie Stable Diffusion na kartach graficznych Arc.


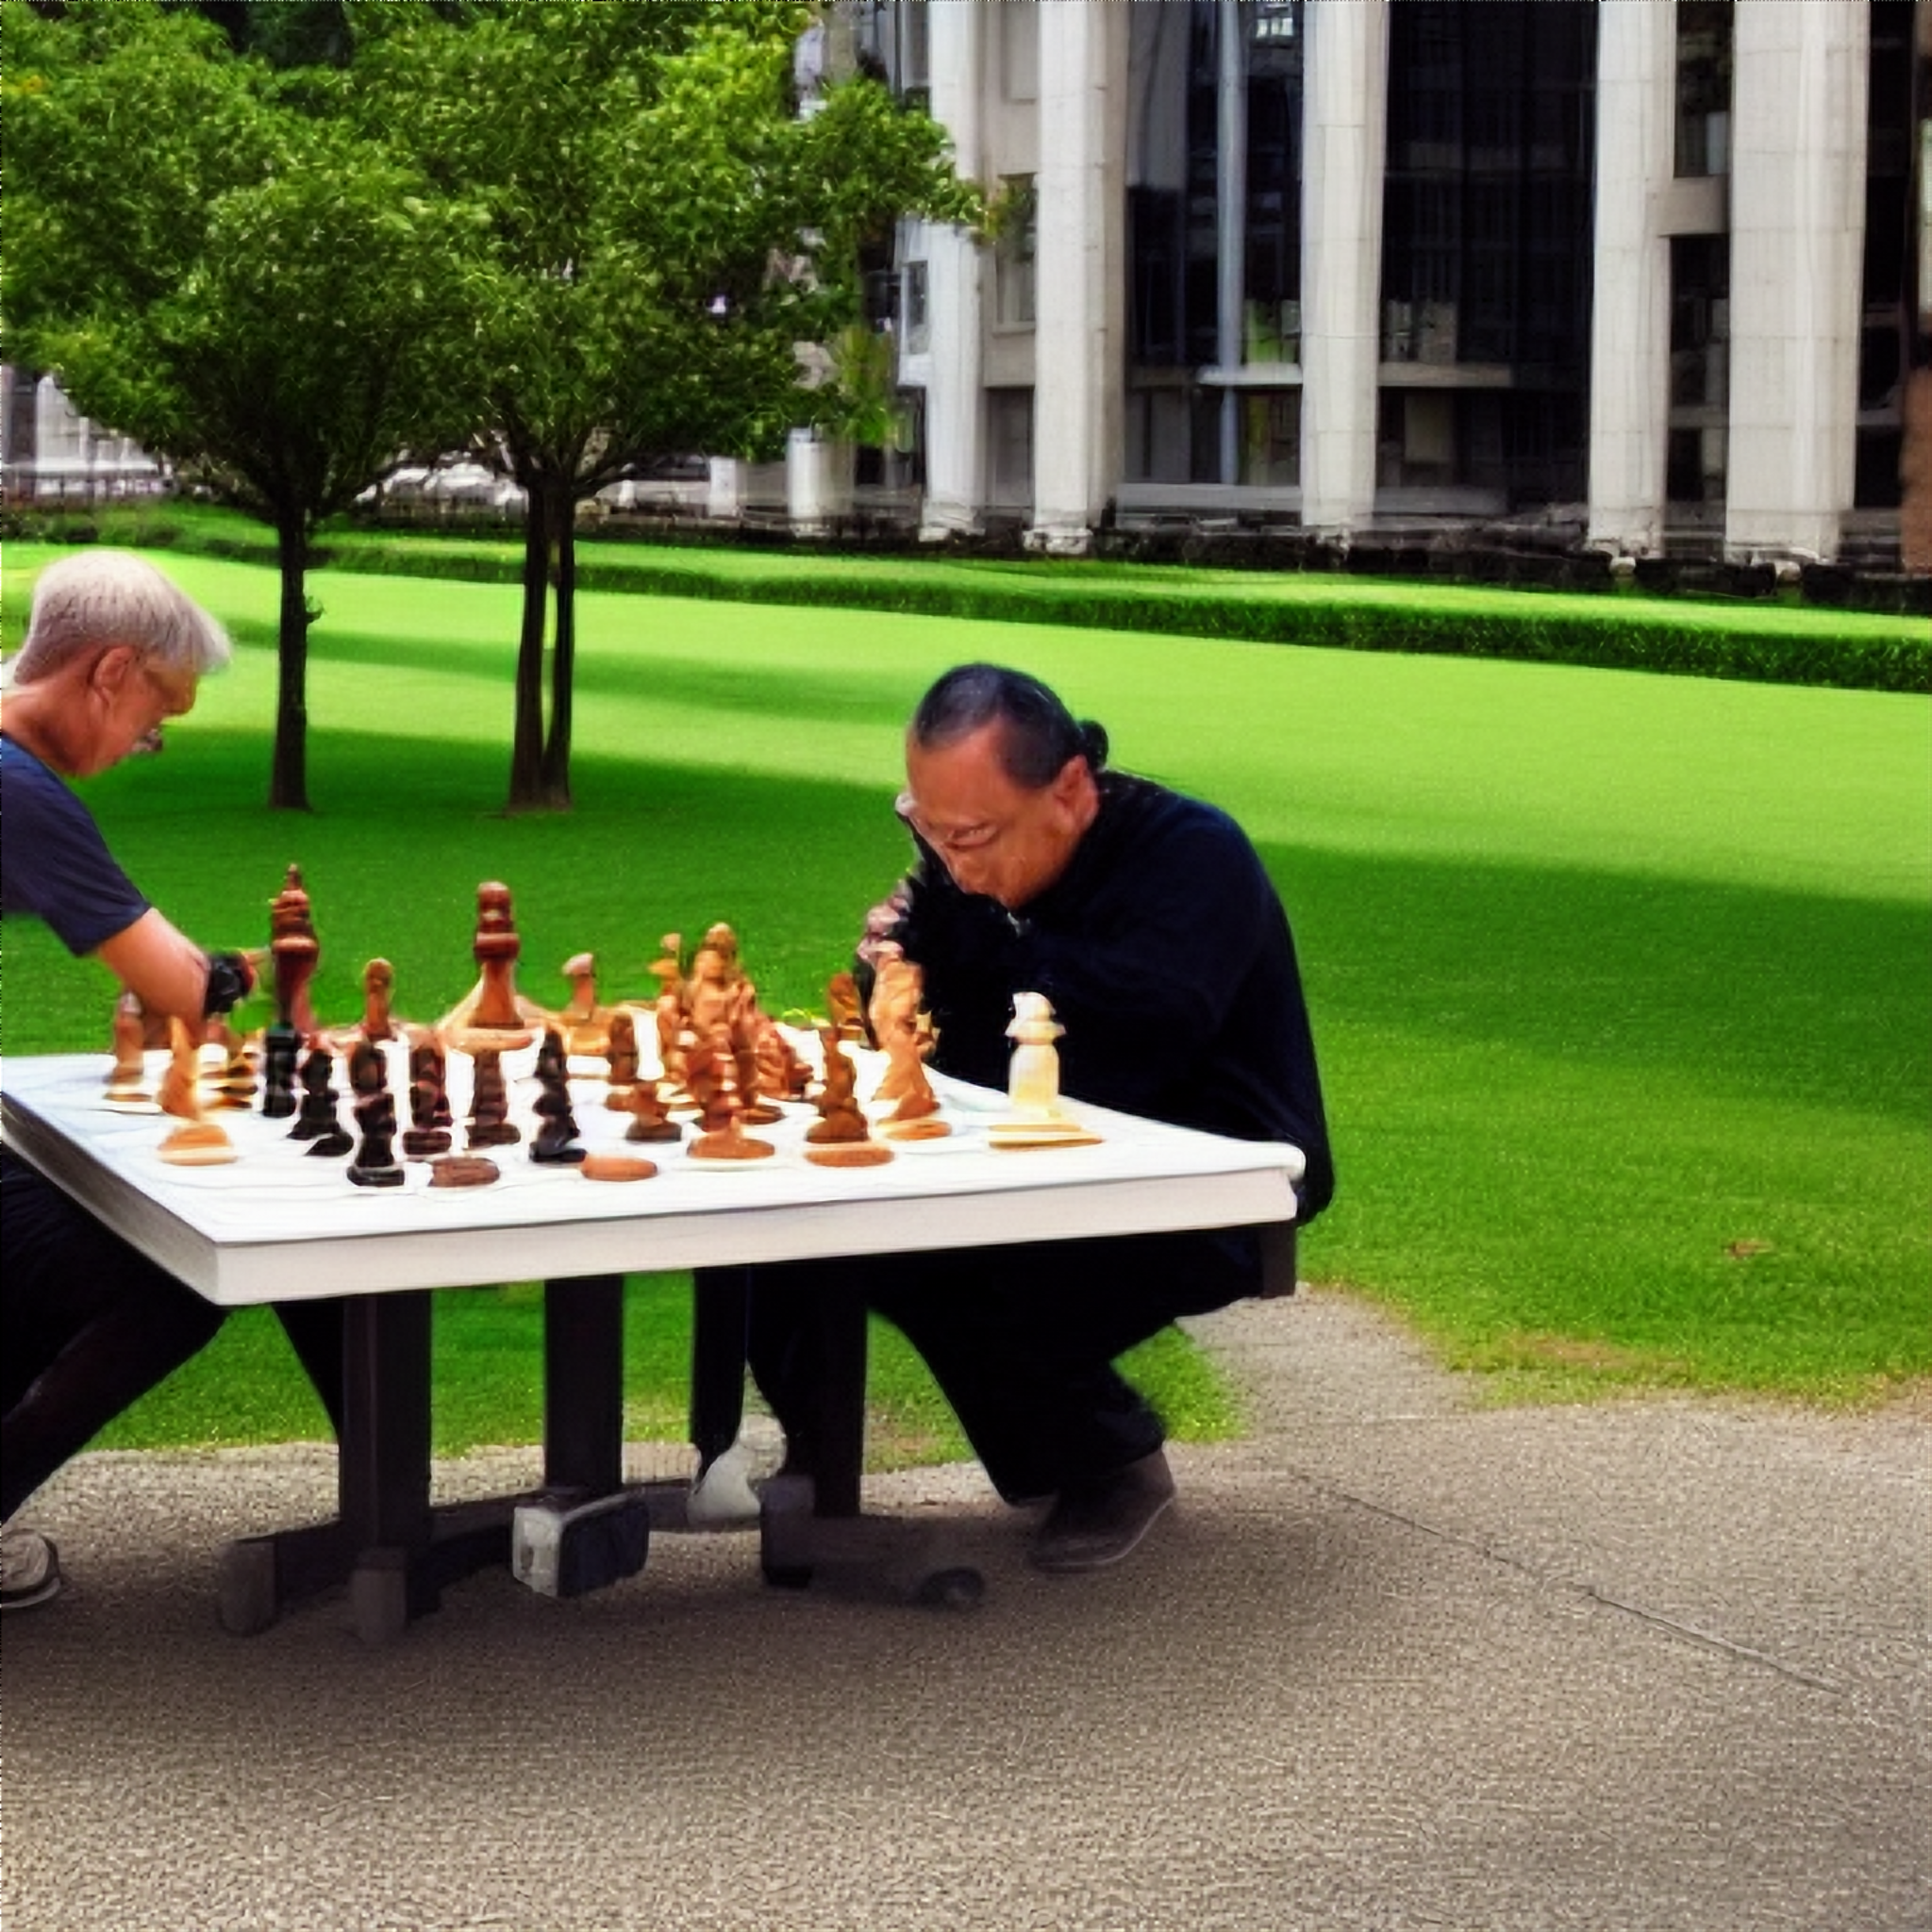

Trzeba przyznać, że nie każdy obraz stworzony przez sieć neuronową jest szczególnie użyteczny. Stable Diffusion ma ograniczoną zdolność do obsługi twarzy, stóp i dłoni oglądanych z dużej odległości. Zadania, jakie stawiają Państwo przed programem, powinny być jednak zdefiniowane tak jasno, jak to tylko możliwe. Niezbędne jest pewne doświadczenie w tej dziedzinie, aby upewnić się, że otrzymają Państwo to, o co prosili.
Emisje - pozostają w większości ciche
Emisja hałasu
Pomimo wysokiej wydajności, nowy Acer Swift Go nie stał się głośniejszy. Przy prawie 45 dB(A) pod pełnym obciążeniem nie można nazwać go cichym, ale jest znośny. Acer Swift Go radzi sobie z małymi i średnimi zadaniami zazwyczaj bez słyszalnej obecności wentylatora.
Hałas
| luz |
| 25 / 25 / 26.2 dB |
| obciążenie |
| 35.7 / 45.5 dB |
 | ||
30 dB cichy 40 dB(A) słyszalny 50 dB(A) irytujący |
||
min: | ||
| Acer Swift Go 14 SFG14-72 Arc 8-Core, Ultra 7 155H, SK hynix HFS001TEJ9X110NA | Acer Swift Go 14 SFG14-71 Iris Xe G7 80EUs, i5-1335U, WD PC SN740 SDDQNQD-512G-1014 | LG Gram 2in1 16 16T90R - G.AA78G Iris Xe G7 96EUs, i7-1360P, Samsung PM9A1 MZVL21T0HCLR | HP Pavilion Plus 14-ew0153TU Iris Xe G7 96EUs, i7-1355U, SK hynix PC801 HFS001TEJ9X101N | Lenovo ThinkPad T14 G4 21K4S02000 Radeon 780M, R7 PRO 7840U, Samsung PM9A1a MZVL21T0HDLU | Ayaneo Air 1S Retro Power Radeon 780M, R7 7840U, Ayaneo CyberThunder-2TB | HP Pavilion Plus 14-ey0095cl Radeon 780M, R7 7840U, WDC PC SN810 1TB | |
|---|---|---|---|---|---|---|---|
| Noise | 4% | 5% | 20% | 14% | 3% | 6% | |
| wyłączone / środowisko * (dB) | 25 | 24.9 -0% | 25.1 -0% | 19.35 23% | 23.1 8% | 23 8% | 23.4 6% |
| Idle Minimum * (dB) | 25 | 24.9 -0% | 25.1 -0% | 20.57 18% | 23.1 8% | 24.7 1% | 24.1 4% |
| Idle Average * (dB) | 25 | 24.9 -0% | 25.1 -0% | 20.57 18% | 23.1 8% | 25.2 -1% | 24.1 4% |
| Idle Maximum * (dB) | 26.2 | 24.9 5% | 26.1 -0% | 20.57 21% | 23.1 12% | 25.2 4% | 25.3 3% |
| Load Average * (dB) | 35.7 | 31.9 11% | 31.4 12% | 32.18 10% | 26.5 26% | 32.1 10% | 33.4 6% |
| Load Maximum * (dB) | 45.5 | 43.2 5% | 36.6 20% | 32.26 29% | 35.78 21% | 47.1 -4% | 39.4 13% |
| Witcher 3 ultra * (dB) | 43.2 | 41.1 | 29.44 | 35.7 | 39.4 |
* ... im mniej tym lepiej
Temperatura
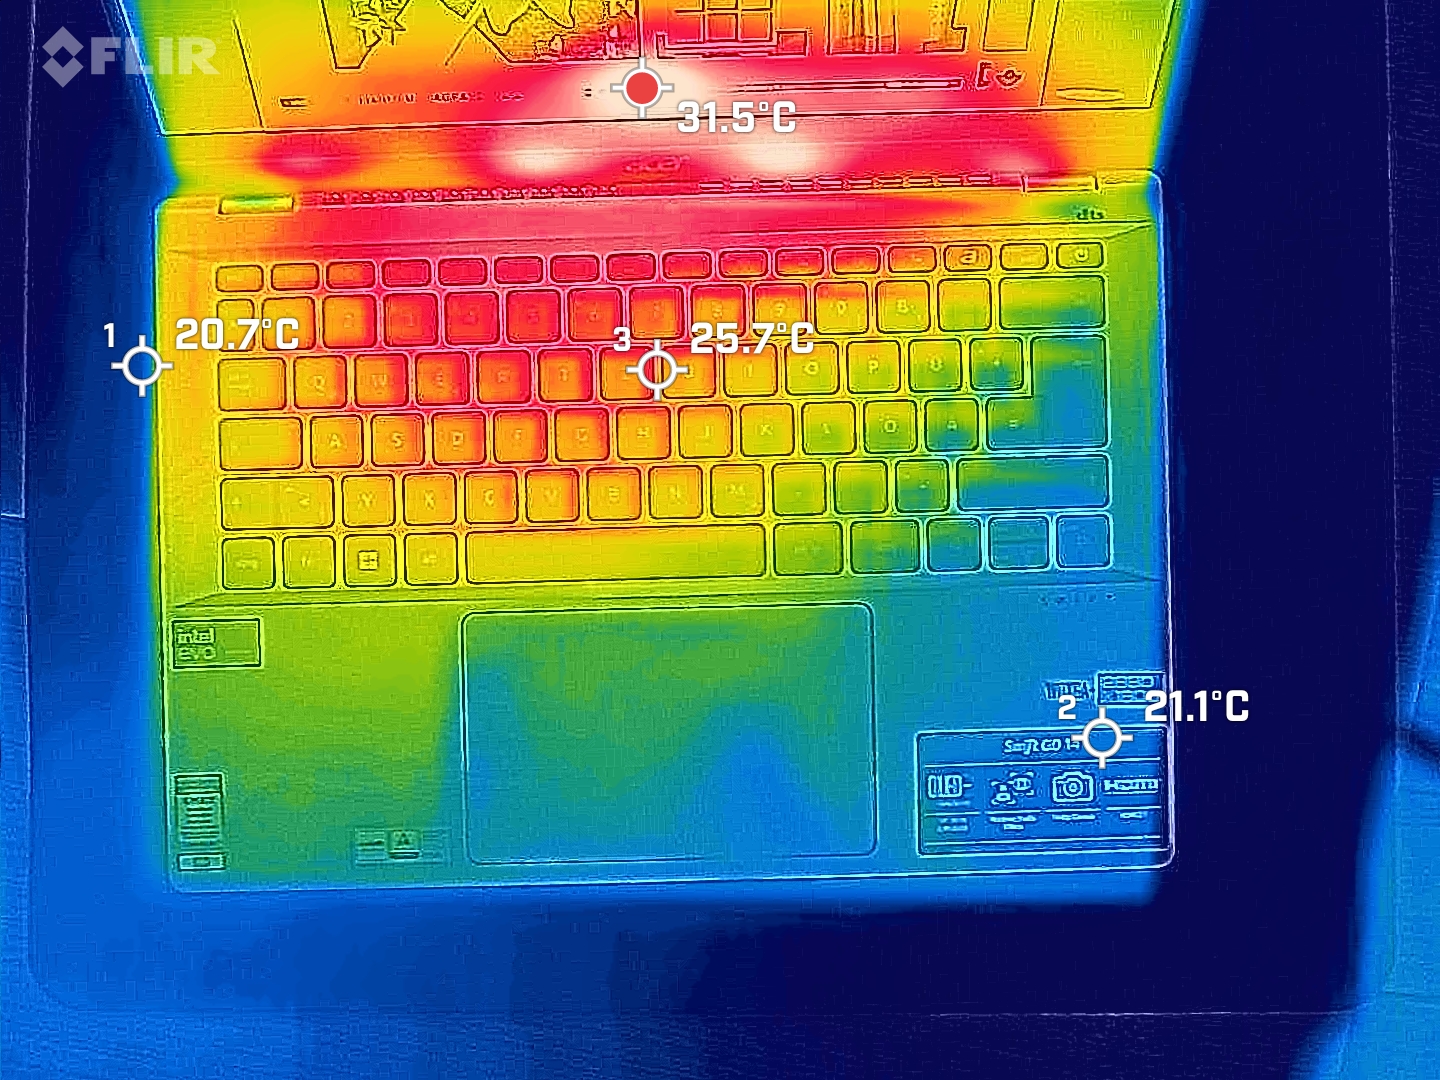
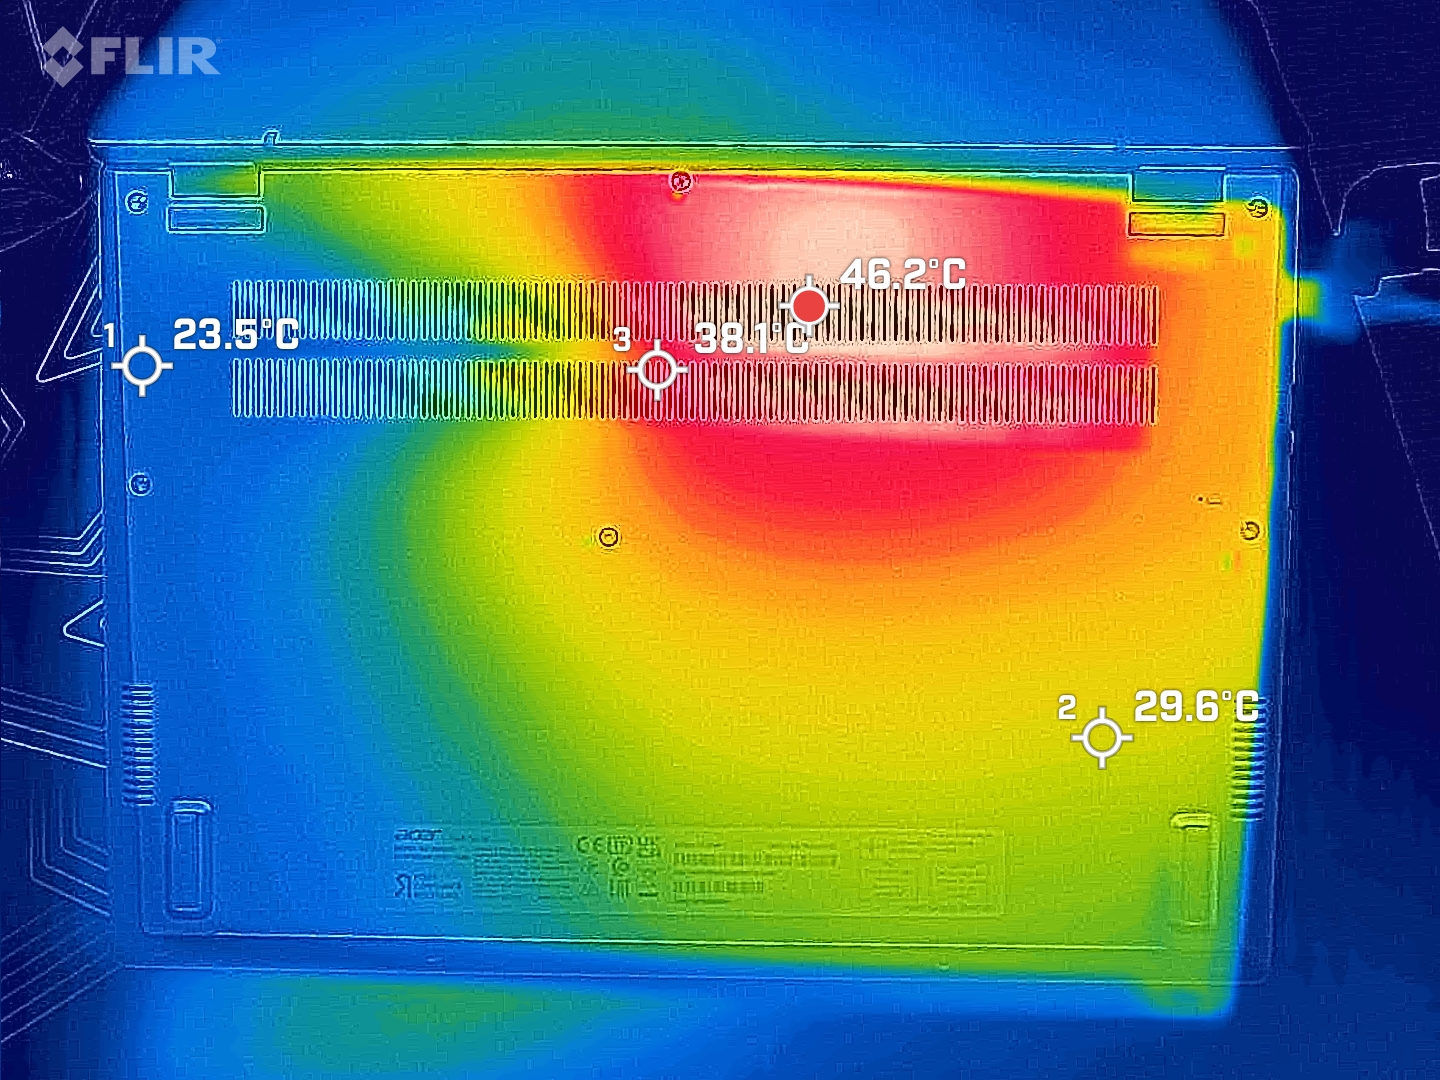
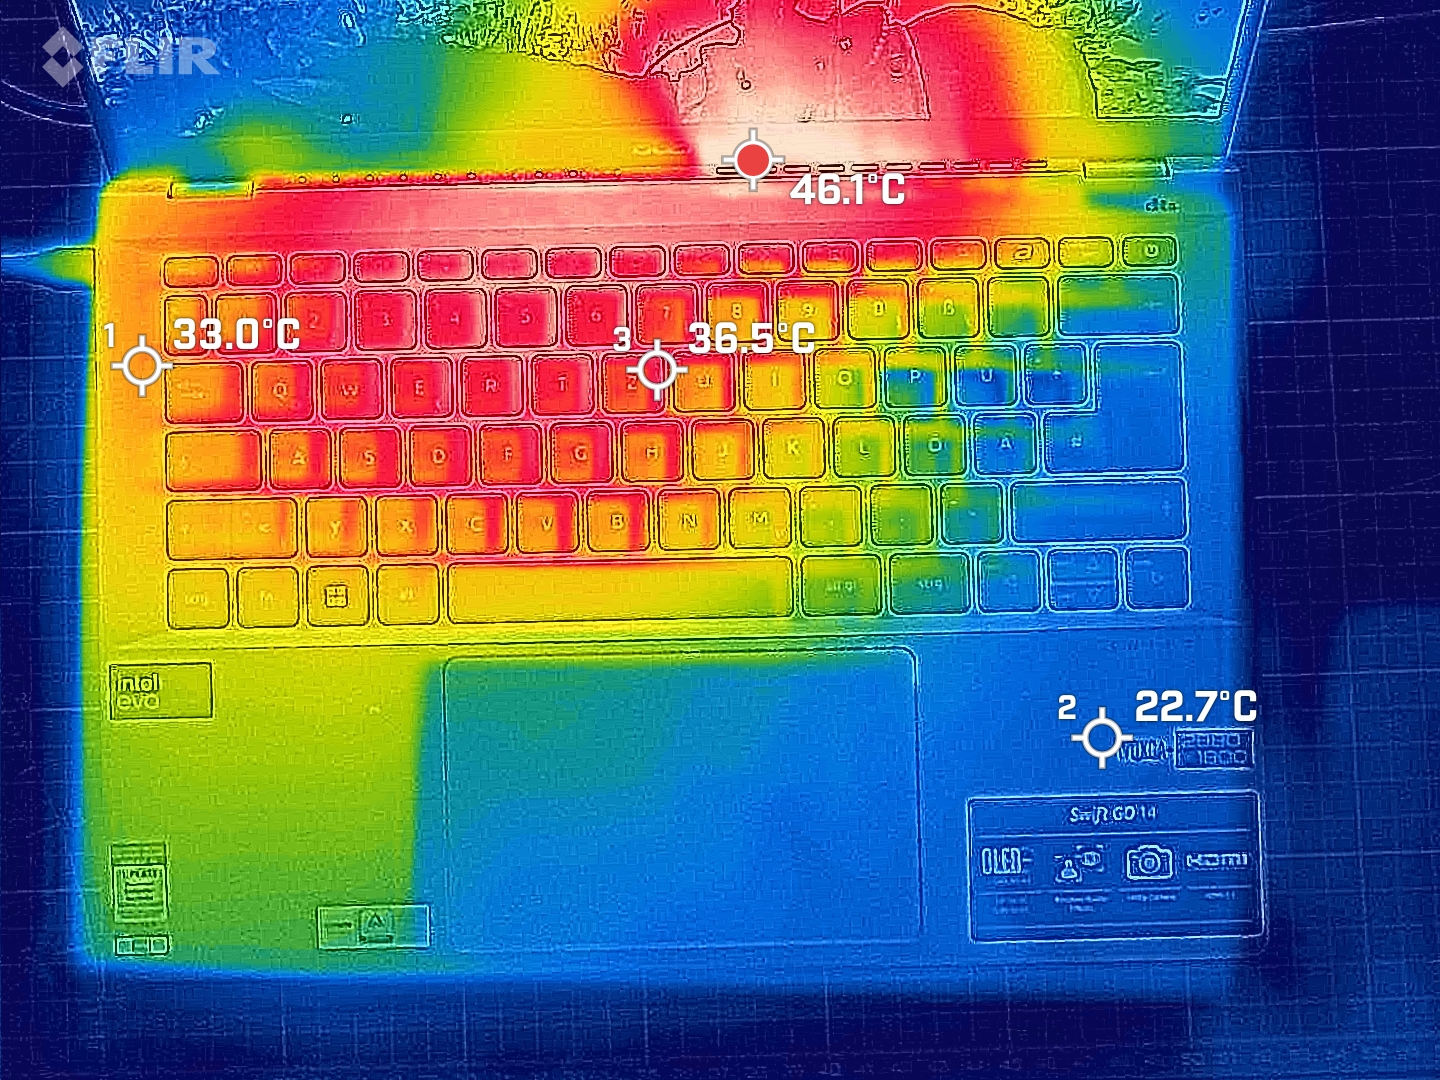
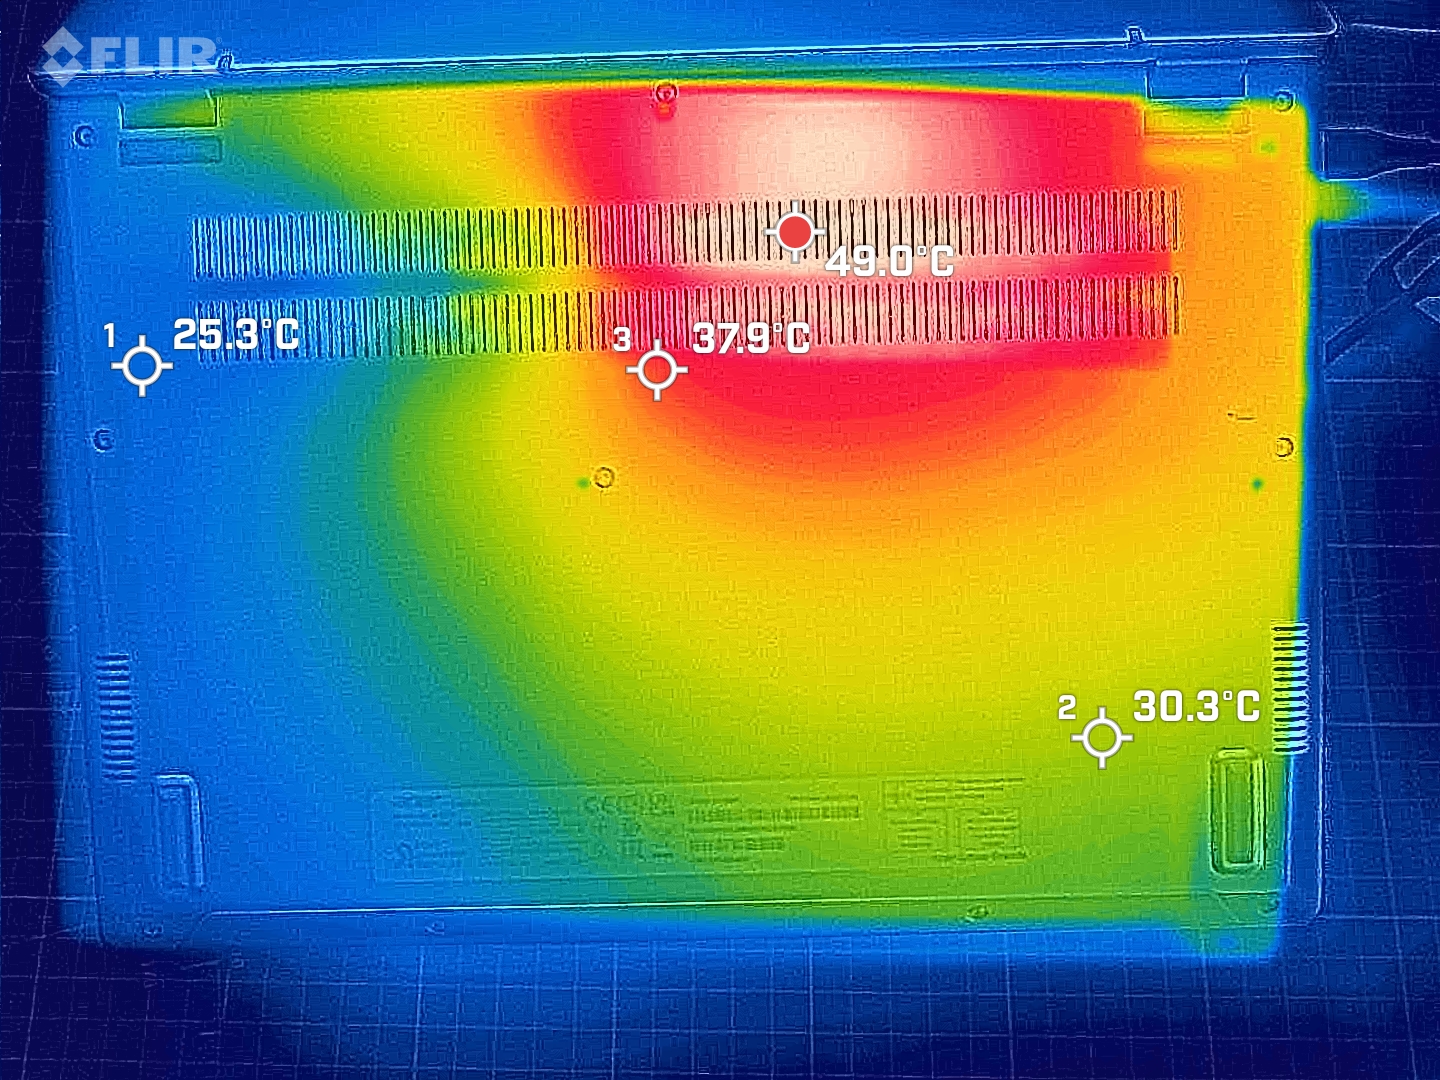
Niestety, to co się nie zmieniło, to bardzo wysokie temperatury powierzchni laptopa, które zmierzyliśmy podczas testów. Pasek za klawiaturą zdołał nawet osiągnąć 40 °C. Jednak najbardziej nagrzewającym się obszarem jest ekran, na który kierowane jest wydmuchiwane przez wentylator powietrze. Pomimo tego, podczas normalnej pracy, gdy surfujemy po Internecie lub korzystamy z aplikacji biurowych, powierzchnia laptopa nagrzewa się jedynie do temperatury niewiele przekraczającej temperaturę pokojową.
(+) Maksymalna temperatura w górnej części wynosi 36.5 °C / 98 F, w porównaniu do średniej 35.9 °C / 97 F , począwszy od 21.4 do 59 °C dla klasy Subnotebook.
(-) Dno nagrzewa się maksymalnie do 49.5 °C / 121 F, w porównaniu do średniej 39.2 °C / 103 F
(+) W stanie bezczynności średnia temperatura górnej części wynosi 22.6 °C / 73 F, w porównaniu ze średnią temperaturą urządzenia wynoszącą 30.8 °C / ### class_avg_f### F.
(+) Podpórki pod nadgarstki i touchpad są chłodniejsze niż temperatura skóry i maksymalnie 26.2 °C / 79.2 F i dlatego są chłodne w dotyku.
(±) Średnia temperatura obszaru podparcia dłoni w podobnych urządzeniach wynosiła 28.2 °C / 82.8 F (+2 °C / 3.6 F).
| Acer Swift Go 14 SFG14-72 Intel Core Ultra 7 155H, Intel Arc 8-Core iGPU | Acer Swift Go 14 SFG14-71 Intel Core i5-1335U, Intel Iris Xe Graphics G7 80EUs | LG Gram 2in1 16 16T90R - G.AA78G Intel Core i7-1360P, Intel Iris Xe Graphics G7 96EUs | HP Pavilion Plus 14-ew0153TU Intel Core i7-1355U, Intel Iris Xe Graphics G7 96EUs | Lenovo ThinkPad T14 G4 21K4S02000 AMD Ryzen 7 PRO 7840U, AMD Radeon 780M | Ayaneo Air 1S Retro Power AMD Ryzen 7 7840U, AMD Radeon 780M | HP Pavilion Plus 14-ey0095cl AMD Ryzen 7 7840U, AMD Radeon 780M | |
|---|---|---|---|---|---|---|---|
| Heat | -2% | -22% | 4% | 3% | -30% | 12% | |
| Maximum Upper Side * (°C) | 36.5 | 44.8 -23% | 55 -51% | 36.6 -0% | 43.5 -19% | 55 -51% | 39 -7% |
| Maximum Bottom * (°C) | 49.5 | 34.8 30% | 55.4 -12% | 37.2 25% | 47.4 4% | 53.2 -7% | 35.8 28% |
| Idle Upper Side * (°C) | 25.5 | 30.7 -20% | 34.9 -37% | 31.6 -24% | 24.9 2% | 37.1 -45% | 25.2 1% |
| Idle Bottom * (°C) | 35 | 32.5 7% | 30 14% | 30 14% | 26 26% | 40.1 -15% | 25.6 27% |
* ... im mniej tym lepiej
Test warunków skrajnych
Jak już wspomnieliśmy, ustawiliśmy wydajność procesora na poziomie nieco niższym niż wartość ustawiona przez firmę Acer. Nasz test obciążeniowy wykazał, że ustawienie ciągłej wydajności Core Ultra 7 (PL1) jest nieco zbyt wysokie. Po pewnym czasie osiada na poziomie około 43 watów zamiast 45, ale udaje mu się utrzymać swój poziom wydajności na dłuższą metę.
Głośniki
Ogólnie rzecz biorąc, głośniki Acer Swift Go brzmią dobrze. Jedynie basy mogłyby być nieco mocniejsze. Nie byliśmy w stanie dostrzec różnicy w stosunku do poprzednik.
Acer Swift Go 14 SFG14-72 analiza dźwięku
(+) | głośniki mogą odtwarzać stosunkowo głośno (86.7 dB)
Bas 100 - 315 Hz
(-) | prawie brak basu - średnio 29.6% niższa od mediany
(±) | liniowość basu jest średnia (13.8% delta do poprzedniej częstotliwości)
Średnie 400 - 2000 Hz
(±) | wyższe średnie - średnio 6.4% wyższe niż mediana
(+) | średnie są liniowe (5.4% delta do poprzedniej częstotliwości)
Wysokie 2–16 kHz
(±) | wyższe maksima - średnio 5.7% wyższe od mediany
(±) | liniowość wysokich wartości jest średnia (7.4% delta do poprzedniej częstotliwości)
Ogólnie 100 - 16.000 Hz
(±) | liniowość ogólnego dźwięku jest średnia (22.6% różnicy w stosunku do mediany)
W porównaniu do tej samej klasy
» 77% wszystkich testowanych urządzeń w tej klasie było lepszych, 4% podobnych, 18% gorszych
» Najlepszy miał deltę 5%, średnia wynosiła ###średnia###%, najgorsza wynosiła 53%
W porównaniu do wszystkich testowanych urządzeń
» 67% wszystkich testowanych urządzeń było lepszych, 6% podobnych, 28% gorszych
» Najlepszy miał deltę 4%, średnia wynosiła ###średnia###%, najgorsza wynosiła 134%
Acer Swift Go 14 SFG14-71 analiza dźwięku
(+) | głośniki mogą odtwarzać stosunkowo głośno (82.1 dB)
Bas 100 - 315 Hz
(-) | prawie brak basu - średnio 29.2% niższa od mediany
(±) | liniowość basu jest średnia (11.1% delta do poprzedniej częstotliwości)
Średnie 400 - 2000 Hz
(+) | zbalansowane środki średnie - tylko 3.9% od mediany
(+) | średnie są liniowe (6.5% delta do poprzedniej częstotliwości)
Wysokie 2–16 kHz
(+) | zrównoważone maksima - tylko 2.1% od mediany
(+) | wzloty są liniowe (5% delta do poprzedniej częstotliwości)
Ogólnie 100 - 16.000 Hz
(±) | liniowość ogólnego dźwięku jest średnia (20.4% różnicy w stosunku do mediany)
W porównaniu do tej samej klasy
» 45% wszystkich testowanych urządzeń w tej klasie było lepszych, 10% podobnych, 45% gorszych
» Najlepszy miał deltę 7%, średnia wynosiła ###średnia###%, najgorsza wynosiła 53%
W porównaniu do wszystkich testowanych urządzeń
» 53% wszystkich testowanych urządzeń było lepszych, 8% podobnych, 39% gorszych
» Najlepszy miał deltę 4%, średnia wynosiła ###średnia###%, najgorsza wynosiła 134%
Zarządzanie energią - Meteor Lake może być ekonomiczne
Zużycie energii
Mówi się, że nowe procesory Intel Meteor Lake są znacznie bardziej energooszczędne niż ich poprzednicy. Nie było to dla nas całkowicie oczywiste w naszych testach, ale po raz kolejny podkreśla to status beta zainstalowanego oprogramowania. Silne wahania są widoczne w prawie każdym pomiarze energii, co wskazuje na mniejsze skoki obciążenia.
| wyłączony / stan wstrzymania | |
| luz | |
| obciążenie |
|
Legenda:
min: | |
| Acer Swift Go 14 SFG14-72 Ultra 7 155H, Arc 8-Core, SK hynix HFS001TEJ9X110NA, OLED, 2880x1800, 14" | LG Gram 2in1 16 16T90R - G.AA78G i7-1360P, Iris Xe G7 96EUs, Samsung PM9A1 MZVL21T0HCLR, IPS, 2560x1600, 16" | HP Pavilion Plus 14-ew0153TU i7-1355U, Iris Xe G7 96EUs, SK hynix PC801 HFS001TEJ9X101N, OLED, 2880x1800, 14" | Lenovo ThinkPad T14 G4 21K4S02000 R7 PRO 7840U, Radeon 780M, Samsung PM9A1a MZVL21T0HDLU, IPS LED, 1920x1200, 14" | Ayaneo Air 1S Retro Power R7 7840U, Radeon 780M, Ayaneo CyberThunder-2TB, OLED, 1920x1080, 5.5" | HP Pavilion Plus 14-ey0095cl R7 7840U, Radeon 780M, WDC PC SN810 1TB, OLED, 2880x1800, 14" | Przeciętny Intel Arc 8-Core iGPU | Średnia w klasie Subnotebook | |
|---|---|---|---|---|---|---|---|---|
| Power Consumption | 9% | 14% | 38% | 22% | 15% | 3% | 28% | |
| Idle Minimum * (Watt) | 5.5 | 5.5 -0% | 6.7 -22% | 3.3 40% | 7.01 -27% | 6 -9% | 5.36 ? 3% | 3.86 ? 30% |
| Idle Average * (Watt) | 10.1 | 7.2 29% | 7.16 29% | 5.6 45% | 7.91 22% | 6.5 36% | 8.53 ? 16% | 6.61 ? 35% |
| Idle Maximum * (Watt) | 11.2 | 12.9 -15% | 11.17 -0% | 6.1 46% | 12.3 -10% | 13.9 -24% | 11.8 ? -5% | 8 ? 29% |
| Load Average * (Watt) | 45.9 | 55 -20% | 46.5 -1% | 40.1 13% | 19.66 57% | 41.9 9% | 53.7 ? -17% | 42.2 ? 8% |
| Witcher 3 ultra * (Watt) | 60.9 | 47 23% | 37.2 39% | 41.4 32% | 38.2 37% | 43.9 28% | ||
| Load Maximum * (Watt) | 104.1 | 63.6 39% | 64.36 38% | 51.8 50% | 50 52% | 50.8 51% | 84.4 ? 19% | 64.5 ? 38% |
* ... im mniej tym lepiej
Power consumption Witcher 3 / stress test
Power consumption with an external monitor
Żywotność baterii
Acer Swift Go 14, wyposażony w procesor Intel Meteor Lake i baterię o pojemności 65 Wh, w teście surfowania po Internecie przez Wi-Fi nie osiągnął nawet ośmiu godzin. Według naszych pomiarów energii, to panel OLED zużywa najwięcej energii podczas surfowania. Odwiedzanie stron internetowych i uruchamianie aplikacji w trybie ciemnym powinno znacznie poprawić czas pracy. W przypadku poprzednika możliwe było uzyskanie prawie 45 dodatkowych minut pracy.
| Acer Swift Go 14 SFG14-72 Ultra 7 155H, Arc 8-Core, 65 Wh | Acer Swift Go 14 SFG14-71 i5-1335U, Iris Xe G7 80EUs, 54.6 Wh | LG Gram 2in1 16 16T90R - G.AA78G i7-1360P, Iris Xe G7 96EUs, 80 Wh | HP Pavilion Plus 14-ew0153TU i7-1355U, Iris Xe G7 96EUs, 68 Wh | Lenovo ThinkPad T14 G4 21K4S02000 R7 PRO 7840U, Radeon 780M, 52.5 Wh | Ayaneo Air 1S Retro Power R7 7840U, Radeon 780M, 37.5 Wh | HP Pavilion Plus 14-ey0095cl R7 7840U, Radeon 780M, 68 Wh | Średnia w klasie Subnotebook | |
|---|---|---|---|---|---|---|---|---|
| Czasy pracy | -5% | 58% | 20% | 48% | -17% | 37% | 70% | |
| WiFi v1.3 (h) | 8 | 7.6 -5% | 11.9 49% | 9.6 20% | 12.2 53% | 5.9 -26% | 8.5 6% | 14 ? 75% |
| Load (h) | 1.2 | 2 67% | 1.7 42% | 1.1 -8% | 2 67% | 1.969 ? 64% | ||
| H.264 (h) | 12 | 3.1 | 15.4 ? | |||||
| Gaming (h) | 1.2 | |||||||
| Reader / Idle (h) | 16.9 | 28.6 ? |
Za
Przeciw
Werdykt - Nie tylko biuro

Acer dostarczył nam Swift Go 14 na długo przed pojawieniem się urządzenia na rynku, a to oznacza, że nie wszystko działa idealnie. Mieliśmy już jednak okazję zapoznać się z najnowszą generacją procesorów Intela i byliśmy pod wrażeniem wysokiej wydajności graficznej układu Meteor Lake. Będziemy obserwować zmiany w urządzeniu do wiosny przyszłego roku, a następnie wydamy ostateczny werdykt w sprawie Swift Go 14 (2024). Niemniej jednak już teraz zwróciliśmy uwagę, że kompaktowa maszyna korzysta ze znacznie mocniejszego Core Ultra 7. Zwiększona wydajność graficzna pozwala laptopowi i jego doskonałemu wyświetlaczowi OLED cieszyć się szerszym spektrum zastosowań. To przynajmniej sprawia, że gry i edycja wideo stają się możliwe. Rdzeń NPU w procesorze Meteor Lake również był w stanie zademonstrować swoją moc w naszych testach.
Ważący 1,3 kg Acer Swift Go 14 to lekka potęga, która w swojej eleganckiej obudowie kryje sporą moc. Procesor Intel Meteor Lake zapewnia znacznie szerszy zakres zastosowań.
Nie ma wątpliwości, że Swift Go 14 to urządzenie mobilne. Dzięki Thunderbolt 4, HDMI 2.1 i kilku dodatkowym portom, łączności nie brakuje. Wkrótce pojawią się inne alternatywy z procesorami Meteor Lake, a Asus już oferuje taki chipset w swoim ZenBooku 14. Każdy, kto jest zbyt niecierpliwy, aby czekać na laptopy z procesorami Intela, powinien przyjrzeć się 14-calowym maszynom z AMD Ryzen 7 7840U, takim jak HP Pavilion Plus 14.
Cena i dostępność
Swift Go 14 ma być dostępny od lutego 2024 roku. Jak dotąd w Niemczech ogłoszono przewidywaną cenę zakupu wynoszącą nieco poniżej 1000 euro.
Przezroczystość
Wyboru urządzeń do recenzji dokonuje nasza redakcja. Próbka testowa została udostępniona autorowi jako pożyczka od producenta lub sprzedawcy detalicznego na potrzeby tej recenzji. Pożyczkodawca nie miał wpływu na tę recenzję, producent nie otrzymał też kopii tej recenzji przed publikacją. Nie było obowiązku publikowania tej recenzji. Jako niezależna firma medialna, Notebookcheck nie podlega władzy producentów, sprzedawców detalicznych ani wydawców.
Tak testuje Notebookcheck
Każdego roku Notebookcheck niezależnie sprawdza setki laptopów i smartfonów, stosując standardowe procedury, aby zapewnić porównywalność wszystkich wyników. Od około 20 lat stale rozwijamy nasze metody badawcze, ustanawiając przy tym standardy branżowe. W naszych laboratoriach testowych doświadczeni technicy i redaktorzy korzystają z wysokiej jakości sprzętu pomiarowego. Testy te obejmują wieloetapowy proces walidacji. Nasz kompleksowy system ocen opiera się na setkach uzasadnionych pomiarów i benchmarków, co pozwala zachować obiektywizm.Price comparison

