Notebookcheck Logo

Testy Intel Core Ultra 5 338H i Arc B370 - Prawie tak szybki jak Arc B390

Intel Core Ultra 5 338H z Arc B370
ⓘ Intel
Intel Core Ultra 5 338H z Arc B370
Mieliśmy okazję przetestować wydajność nowego procesora Intel Core Ultra 5 338H wraz z kartą graficzną Arc B370 z 10 rdzeniami Xe w kilku benchmarkach. Wyniki są bardzo obiecujące, a różnica w wydajności w porównaniu do Arc B390 jest niewielka.
AI Arc CPU GPU Intel Panther Lake Laptop / Notebook Review Snippet

Przyjrzeliśmy się już nowej architekturze Panther Lake Intela i przeanalizowaliśmy zarówno wydajność, jak i efektywność nowych procesorów nowych procesorów i szybkiej karty graficznej Arc B390. Rezultatem był ogromny wzrost wydajności GPU w porównaniu do poprzednich zintegrowanych GPU, takich jak Intel Arc Graphics 140V/140T lub AMD Radeon 890M. We wszystkich testach porównawczych można zauważyć przewagę na poziomie około 70%.

Nasze testy były ograniczone do modeli CPU z najszybszym GPU Arc B390 w momencie premiery, ale teraz mieliśmy również okazję przeprowadzić kilka testów z Arc B370. Naszą jednostką testową była próbka inżynieryjna, w której procesor pracował przy stałym limicie mocy wynoszącym 35 W.

Przegląd Intel Panther Lake
ⓘ Intel
Przegląd Intel Panther Lake

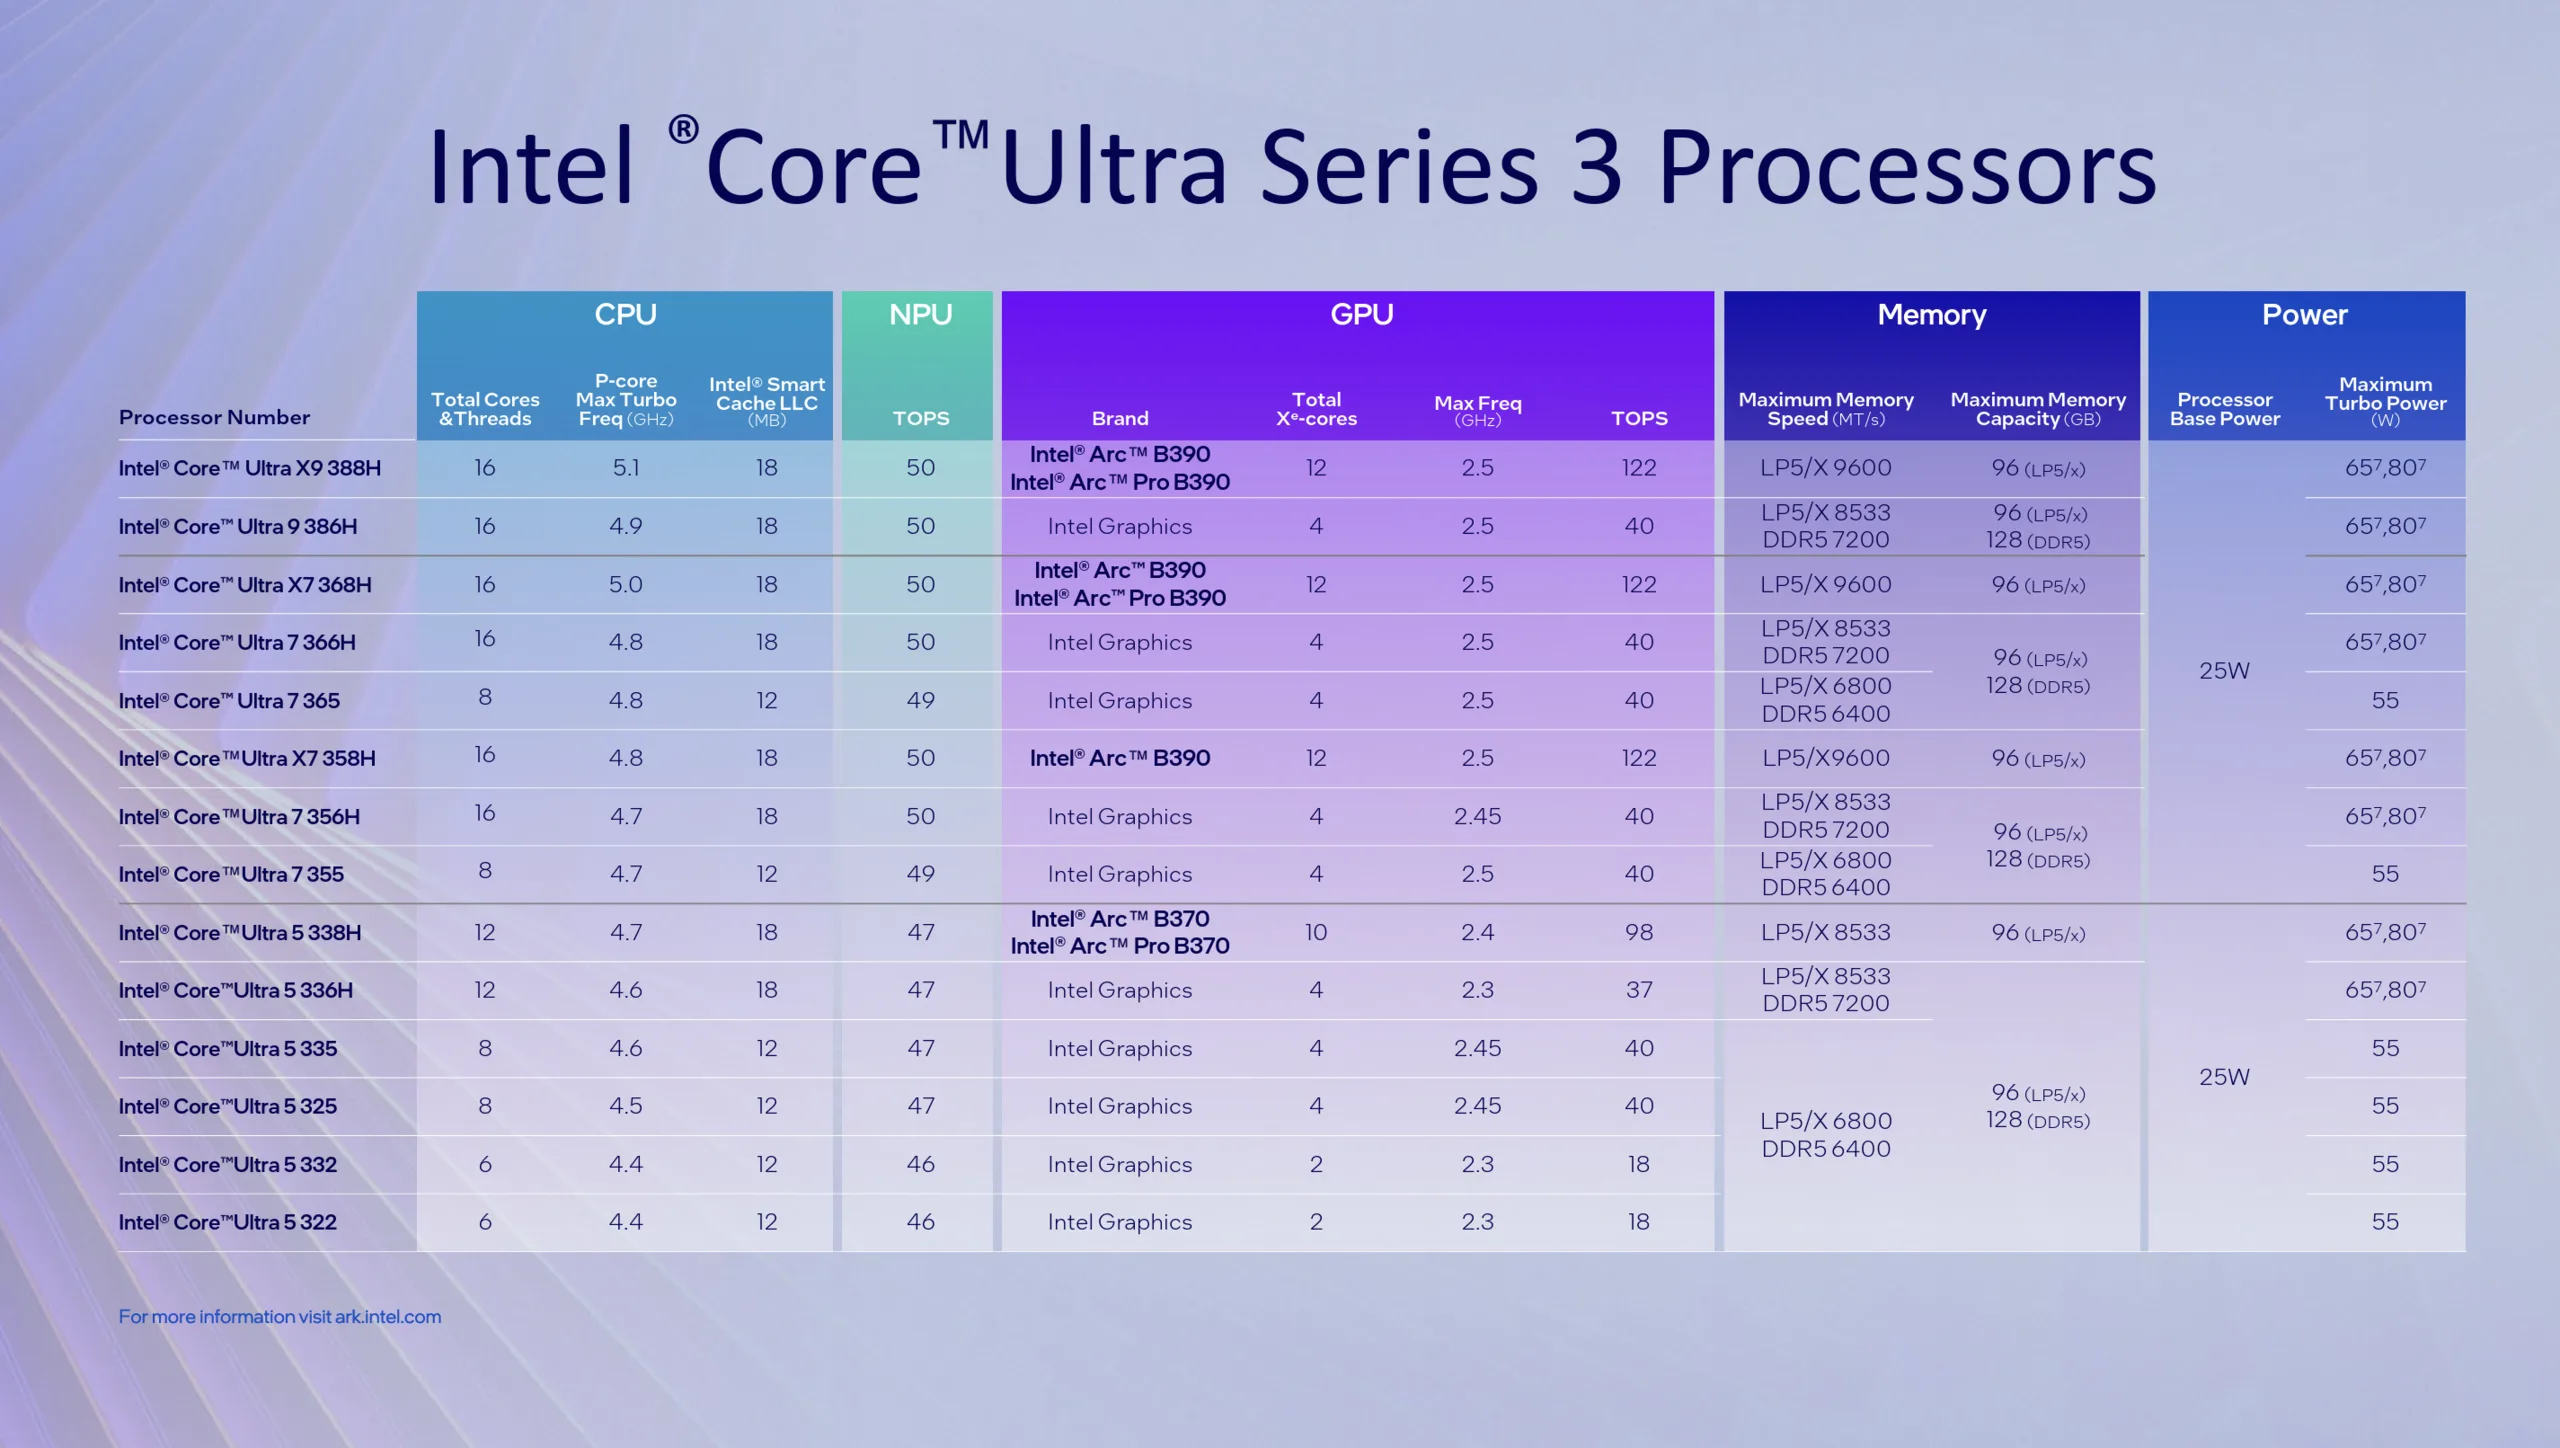
Core Ultra 5 338H oferuje 12 rdzeni, w tym cztery szybkie rdzenie taktowane zegarem do 4,7 GHz. Zintegrowany GPU to Arc B370, który posiada 10 rdzeni Xe, a więc o dwa mniej w porównaniu do Arc B390. Maksymalne taktowanie GPU jest również nieco niższe i wynosi 2,4 w porównaniu do 2,5 GHz. Podobnie jak modele z GPU Arc B390, Core Ultra 5 338H jest dostępny tylko z sodlerowaną pamięcią RAM (do 8533 MHz).

Wydajność procesora

Patrząc na wydajność procesora, nowy Core Ultra 5 338H radzi sobie dobrze i jest mniej więcej na równi z nowym AMD Ryzen AI 9 465 przy porównywalnych wartościach TDP (45/35W), który sprawdziliśmy w Asus Zenbook S16. Intel nieznacznie wyprzedza w testach jednordzeniowych, podczas gdy układ AMD oferuje lepszą wydajność wielordzeniową.

Performance rating: Percent
Cinebench 2024: CPU Single Core | CPU Multi Core
Geekbench 6.5: Single-Core | Multi-Core
Performance rating
Apple M4 Pro 12-Core
MacBook Pro 14 2024 M4 Pro Entry, 0, 0
93.9 pt
Apple M5 10-Core
MacBook Pro 14 2025 M5, 30.5, 27.5
92.5 pt
Apple M4 10-Core
MacBook Pro 14 2024 M4, 24, 24
78.6 pt
Intel Core Ultra X9 388H
ZenBook Duo UX8407AA, 64, 46
75.7 pt
Intel Core Ultra 7 255H
RedmiBook Pro 14 2025, 115, 45
72.6 pt
Intel Core Ultra X7 358H
ExpertBook Ultra B9406CAA, 63, 41
71.9 pt
AMD Ryzen AI 9 HX 370
ProArt P16 H7606WI, 0, 0
70.7 pt
Qualcomm Snapdragon X Elite X1E-84-100
Galaxy Book4 Edge 16 X1E-84-100, 0, 0
66.5 pt
Qualcomm Snapdragon X Elite X1E-80-100
MagicBook Art 14 Snapdragon, 50, 35
66.1 pt
AMD Ryzen AI 7 350
IdeaPad Pro 5 14AKP G10, 65, 65
65.3 pt
AMD Ryzen AI 9 465
ZenBook S16 UM5606GA, 45, 35
65.2 pt
AMD Ryzen AI 9 365
Yoga Pro 7 14ASP G9, 60, 54
65.1 pt
AMD Ryzen AI 7 350
Yoga Pro 7 14AKP G10, 85, 70
65 pt
Intel Core Ultra 9 285H
ZenBook Duo OLED UX8406CA, 60, 35
63.8 pt
Intel Core Ultra 5 338H
Core Ultra 5 338H Engineering Sample, 35, 35
63.1 pt
AMD Ryzen AI 9 HX 370
Zenbook S 16 UM5606-RK333W, 33, 28
63 pt
Intel Core Ultra 7 255H
MagicBook Art 14 2025, 40, 26
62.8 pt
Qualcomm Snapdragon X Elite X1E-78-100
OmniBook X 14, 0, 0
58.2 pt
Intel Core Ultra 7 268V
Surface Pro OLED Lunar Lake, 37, 30
56.8 pt
Intel Core Ultra 7 268V
Surface Laptop 7 15 Lunar Lake, 37, 30
56.2 pt
Intel Core Ultra 7 258V
Yoga 7 14 2in1 G10, 37, 25
54.8 pt
Intel Core Ultra 7 258V
ThinkPad X9-15 Aura Edition, 37, 25
54.6 pt
Qualcomm Snapdragon X Plus X1P-42-100
Surface Laptop 13, 45, 35
53 pt
Intel Core Ultra 5 228V
ThinkPad T14s Gen 6 Intel, 35, 20
49.9 pt
Qualcomm Snapdragon X X1-26-100
ZenBook A14 UX3407QA, 0, 0
48.4 pt
Cinebench 2024 / CPU Single Core
Apple M5 10-Core
MacBook Pro 14 2025 M5, 30.5, 27.5
200 Points +63%
Apple M4 Pro 12-Core
MacBook Pro 14 2024 M4 Pro Entry, 0, 0
176 Points +44%
Apple M4 10-Core
MacBook Pro 14 2024 M4, 24, 24
174 Points +42%
Intel Core Ultra X9 388H
ZenBook Duo UX8407AA, 64, 46
129.8 Points +6%
Intel Core Ultra 7 255H
RedmiBook Pro 14 2025, 115, 45
127.6 Points +4%
Qualcomm Snapdragon X Elite X1E-84-100
Galaxy Book4 Edge 16 X1E-84-100, 0, 0
127 Points +4%
Intel Core Ultra 9 285H
ZenBook Duo OLED UX8406CA, 60, 35
127 Points +4%
Intel Core Ultra 7 268V
Surface Pro OLED Lunar Lake, 37, 30
124.9 Points +2%
Intel Core Ultra X7 358H
ExpertBook Ultra B9406CAA, 63, 41
124.2 Points +1%
Intel Core Ultra 7 268V
Surface Laptop 7 15 Lunar Lake, 37, 30
123.3 Points +1%
Qualcomm Snapdragon X Elite X1E-80-100
MagicBook Art 14 Snapdragon, 50, 35
123 Points 0%
Intel Core Ultra 5 338H
Core Ultra 5 338H Engineering Sample, 35, 35
122.4 Points
Intel Core Ultra 7 258V
Yoga 7 14 2in1 G10, 37, 25
121 Points -1%
Intel Core Ultra 7 258V
ThinkPad X9-15 Aura Edition, 37, 25
119.7 Points -2%
Intel Core Ultra 7 255H
MagicBook Art 14 2025, 40, 26
119 Points -3%
AMD Ryzen AI 7 350
IdeaPad Pro 5 14AKP G10, 65, 65
116.5 Points -5%
AMD Ryzen AI 9 HX 370
ProArt P16 H7606WI, 0, 0
116 Points -5%
AMD Ryzen AI 7 350
Yoga Pro 7 14AKP G10, 85, 70
115.2 Points -6%
AMD Ryzen AI 9 465
ZenBook S16 UM5606GA, 45, 35
115 Points -6%
AMD Ryzen AI 9 HX 370
Zenbook S 16 UM5606-RK333W, 33, 28
113.6 Points -7%
AMD Ryzen AI 9 365
Yoga Pro 7 14ASP G9, 60, 54
113.5 Points -7%
Intel Core Ultra 5 228V
ThinkPad T14s Gen 6 Intel, 35, 20
112.5 Points -8%
Qualcomm Snapdragon X Plus X1P-42-100
Surface Laptop 13, 45, 35
109 Points -11%
Qualcomm Snapdragon X Elite X1E-78-100
OmniBook X 14, 0, 0
108 Points -12%
Qualcomm Snapdragon X X1-26-100
ZenBook A14 UX3407QA, 0, 0
96 Points -22%
Cinebench 2024 / CPU Multi Core
Apple M4 Pro 12-Core
MacBook Pro 14 2024 M4 Pro Entry, 0, 0
1435 Points +66%
Apple M4 Pro 12-Core
MacBook Pro 14 2024 M4 Pro Entry, 0, 0
1403 Points +63%
AMD Ryzen AI 9 HX 370
ProArt P16 H7606WI, 0, 0
1213 Points +41%
Apple M5 10-Core
MacBook Pro 14 2025 M5, 30.5, 27.5
1172 Points +36%
Intel Core Ultra X9 388H
ZenBook Duo UX8407AA, 64, 46
1172 Points +36%
Intel Core Ultra X7 358H
ExpertBook Ultra B9406CAA, 63, 41
1125 Points +30%
Intel Core Ultra 7 255H
RedmiBook Pro 14 2025, 115, 45
1053 Points +22%
AMD Ryzen AI 9 365
Yoga Pro 7 14ASP G9, 60, 54
996 Points +15%
Apple M4 10-Core
MacBook Pro 14 2024 M4, 24, 24
986 Points +14%
AMD Ryzen AI 7 350
IdeaPad Pro 5 14AKP G10, 65, 65
977 Points +13%
AMD Ryzen AI 7 350
Yoga Pro 7 14AKP G10, 85, 70
973 Points +13%
AMD Ryzen AI 9 465
ZenBook S16 UM5606GA, 45, 35
953 Points +10%
Qualcomm Snapdragon X Elite X1E-80-100
MagicBook Art 14 Snapdragon, 50, 35
926 Points +7%
AMD Ryzen AI 9 HX 370
Zenbook S 16 UM5606-RK333W, 33, 28
921 Points +7%
Qualcomm Snapdragon X Elite X1E-84-100
Galaxy Book4 Edge 16 X1E-84-100, 0, 0
866 Points 0%
Intel Core Ultra 5 338H
Core Ultra 5 338H Engineering Sample, 35, 35
863 Points
Qualcomm Snapdragon X Elite X1E-78-100
OmniBook X 14, 0, 0
840 Points -3%
Intel Core Ultra 7 255H
MagicBook Art 14 2025, 40, 26
810 Points -6%
Intel Core Ultra 9 285H
ZenBook Duo OLED UX8406CA, 60, 35
740 Points -14%
Qualcomm Snapdragon X Plus X1P-42-100
Surface Laptop 13, 45, 35
723 Points -16%
Qualcomm Snapdragon X X1-26-100
ZenBook A14 UX3407QA, 0, 0
646 Points -25%
Intel Core Ultra 7 268V
Surface Pro OLED Lunar Lake, 37, 30
619 Points -28%
Intel Core Ultra 7 268V
Surface Laptop 7 15 Lunar Lake, 37, 30
600 Points -30%
Intel Core Ultra 7 258V
Yoga 7 14 2in1 G10, 37, 25
580 Points -33%
Intel Core Ultra 7 258V
ThinkPad X9-15 Aura Edition, 37, 25
574 Points -33%
Intel Core Ultra 5 228V
ThinkPad T14s Gen 6 Intel, 35, 20
506 Points -41%
Geekbench 6.5 / Single-Core
Apple M5 10-Core
MacBook Pro 14 2025 M5, 30.5, 27.5
4326 Points +52%
Apple M4 Pro 12-Core
MacBook Pro 14 2024 M4 Pro Entry, 0, 0
3844 Points +35%
Apple M4 Pro 12-Core
MacBook Pro 14 2024 M4 Pro Entry, 0, 0
3837 Points +35%
Apple M4 10-Core
MacBook Pro 14 2024 M4, 24, 24
3673 Points +29%
Intel Core Ultra X9 388H
ZenBook Duo UX8407AA, 64, 46
3020 Points +6%
Intel Core Ultra 7 255H
RedmiBook Pro 14 2025, 115, 45
2923 Points +3%
AMD Ryzen AI 7 350
IdeaPad Pro 5 14AKP G10, 65, 65
2874 Points +1%
Intel Core Ultra 7 268V
Surface Laptop 7 15 Lunar Lake, 37, 30
2871 Points +1%
AMD Ryzen AI 9 HX 370
ProArt P16 H7606WI, 0, 0
2857 Points +1%
Intel Core Ultra 7 268V
Surface Pro OLED Lunar Lake, 37, 30
2855 Points 0%
AMD Ryzen AI 7 350
Yoga Pro 7 14AKP G10, 85, 70
2854 Points 0%
Intel Core Ultra 5 338H
Core Ultra 5 338H Engineering Sample, 35, 35
2841 Points
Intel Core Ultra X7 358H
ExpertBook Ultra B9406CAA, 63, 41
2836 Points 0%
Qualcomm Snapdragon X Elite X1E-84-100
Galaxy Book4 Edge 16 X1E-84-100, 0, 0
2834 Points 0%
AMD Ryzen AI 9 465
ZenBook S16 UM5606GA, 45, 35
2834 Points 0%
AMD Ryzen AI 9 365
Yoga Pro 7 14ASP G9, 60, 54
2815 Points -1%
Qualcomm Snapdragon X Elite X1E-80-100
MagicBook Art 14 Snapdragon, 50, 35
2813 Points -1%
Intel Core Ultra 7 255H
MagicBook Art 14 2025, 40, 26
2797 Points -2%
Intel Core Ultra 7 258V
ThinkPad X9-15 Aura Edition, 37, 25
2795 Points -2%
Intel Core Ultra 7 258V
Yoga 7 14 2in1 G10, 37, 25
2789 Points -2%
AMD Ryzen AI 9 HX 370
Zenbook S 16 UM5606-RK333W, 33, 28
2785 Points -2%
Intel Core Ultra 9 285H
ZenBook Duo OLED UX8406CA, 60, 35
2781 Points -2%
Intel Core Ultra 5 228V
ThinkPad T14s Gen 6 Intel, 35, 20
2562 Points -10%
Qualcomm Snapdragon X Elite X1E-78-100
OmniBook X 14, 0, 0
2454 Points -14%
Qualcomm Snapdragon X Plus X1P-42-100
Surface Laptop 13, 45, 35
2287 Points -20%
Qualcomm Snapdragon X X1-26-100
ZenBook A14 UX3407QA, 0, 0
2126 Points -25%
Geekbench 6.5 / Multi-Core
Apple M4 Pro 12-Core
MacBook Pro 14 2024 M4 Pro Entry, 0, 0
20458 Points +53%
Apple M4 Pro 12-Core
MacBook Pro 14 2024 M4 Pro Entry, 0, 0
20385 Points +52%
Apple M5 10-Core
MacBook Pro 14 2025 M5, 30.5, 27.5
18054 Points +35%
Intel Core Ultra X9 388H
ZenBook Duo UX8407AA, 64, 46
17694 Points +32%
Intel Core Ultra 7 255H
RedmiBook Pro 14 2025, 115, 45
17489 Points +31%
Intel Core Ultra X7 358H
ExpertBook Ultra B9406CAA, 63, 41
16674 Points +25%
Qualcomm Snapdragon X Elite X1E-84-100
Galaxy Book4 Edge 16 X1E-84-100, 0, 0
15665 Points +17%
Intel Core Ultra 9 285H
ZenBook Duo OLED UX8406CA, 60, 35
15476 Points +16%
AMD Ryzen AI 9 HX 370
ProArt P16 H7606WI, 0, 0
15221 Points +14%
Apple M4 10-Core
MacBook Pro 14 2024 M4, 24, 24
15128 Points +13%
Qualcomm Snapdragon X Elite X1E-80-100
MagicBook Art 14 Snapdragon, 50, 35
14998 Points +12%
AMD Ryzen AI 9 465
ZenBook S16 UM5606GA, 45, 35
14562 Points +9%
Intel Core Ultra 7 255H
MagicBook Art 14 2025, 40, 26
14454 Points +8%
AMD Ryzen AI 9 365
Yoga Pro 7 14ASP G9, 60, 54
14118 Points +6%
AMD Ryzen AI 7 350
Yoga Pro 7 14AKP G10, 85, 70
14028 Points +5%
AMD Ryzen AI 7 350
IdeaPad Pro 5 14AKP G10, 65, 65
13988 Points +5%
AMD Ryzen AI 9 HX 370
Zenbook S 16 UM5606-RK333W, 33, 28
13648 Points +2%
Intel Core Ultra 5 338H
Core Ultra 5 338H Engineering Sample, 35, 35
13368 Points
Qualcomm Snapdragon X Elite X1E-78-100
OmniBook X 14, 0, 0
12971 Points -3%
Intel Core Ultra 7 268V
Surface Pro OLED Lunar Lake, 37, 30
11388 Points -15%
Intel Core Ultra 7 268V
Surface Laptop 7 15 Lunar Lake, 37, 30
11279 Points -16%
Qualcomm Snapdragon X Plus X1P-42-100
Surface Laptop 13, 45, 35
11125 Points -17%
Intel Core Ultra 7 258V
ThinkPad X9-15 Aura Edition, 37, 25
11037 Points -17%
Intel Core Ultra 7 258V
Yoga 7 14 2in1 G10, 37, 25
11027 Points -18%
Qualcomm Snapdragon X X1-26-100
ZenBook A14 UX3407QA, 0, 0
10550 Points -21%
Intel Core Ultra 5 228V
ThinkPad T14s Gen 6 Intel, 35, 20
10036 Points -25%
Performance rating: Percent
Cinebench 2024: CPU Single Core | CPU Multi Core
Geekbench 6.5: Single-Core | Multi-Core

Wydajność GPU

Zgodnie z oczekiwaniami, Arc B370 został pokonany przez Arc B390 w syntetycznych testach porównawczych, ale limity mocy również odgrywają tutaj rolę i przyjrzymy się im bliżej w następnej sekcji. Wyniki Arc B370 są ogólnie bardzo obiecujące i widać dużą przewagę nad poprzednimi iGPU od Intela (Arc Graphics 140V/140T) jak i AMD (Radeon 890M).

3DMark / Time Spy Graphics
AMD Radeon 8060S
Asus ROG Flow Z13 GZ302EA-RU073W, 80
10224 Points +72%
NVIDIA GeForce RTX 4060 Laptop GPU
Schenker Key 14 (M24), 100
10144 Points +71%
NVIDIA GeForce RTX 4060 Laptop GPU
Asus ROG Zephyrus G16 GA605WV, 80
9286 Points +57%
NVIDIA GeForce RTX 5050 Laptop
Lenovo Yoga Pro 9 16IAH10 RTX 5050, 100
9122 Points +54%
AMD Radeon 8050S
HP ZBook Ultra G1a A3ZQ0ET,
8898 Points +50%
NVIDIA GeForce RTX 4050 Laptop GPU
Lenovo IdeaPad Pro 5 16IMH G9 RTX 4050, 90
8574 Points +45%
NVIDIA GeForce RTX 4050 Laptop GPU
Lenovo Yoga Pro 7 14IMH9, RTX 4050, 60
7342 Points +24%
Intel Arc B390 12 Xe3 Panther Lake iGPU
Asus ZenBook Duo UX8407AA, 0
7190 Points +21%
Intel Arc B390 12 Xe3 Panther Lake iGPU
Asus ExpertBook Ultra B9406CAA, 0
6679 Points +13%
Intel Arc B370 10 Xe3 Panther Lake iGPU
Intel Core Ultra 5 338H Engineering Sample, 0
5933 Points
NVIDIA GeForce RTX 4050 Laptop GPU
Dell XPS 14 2024 OLED, 30
5107 Points -14%
NVIDIA GeForce RTX 3050 Ti Laptop GPU
Schenker Vision 14 2022 RTX 3050 Ti, 45
4773 Points -20%
NVIDIA GeForce RTX 3050 6GB Laptop GPU
Asus V16 V3607V, 65
4571 Points -23%
Intel Arc Graphics 140V
Microsoft Surface Laptop 7 15 Lunar Lake, 0
4415 Points -26%
Intel Arc Graphics 140T
MSI Prestige 16 AI Evo B2HMG, 0
4194 Points -29%
Intel Arc Graphics 140V
MSI Claw 8 AI+, 0
4118 Points -31%
Intel Arc Graphics 130V
Lenovo ThinkPad E14 Gen 7 21U2002QGE, 0
3538 Points -40%
AMD Radeon 890M
Asus Zenbook S 16 UM5606-RK333W, 0
3421 Points -42%
AMD Radeon 890M
MSI Claw A8 BZ2EM, 0
3331 Points -44%
AMD Radeon 860M
Lenovo ThinkPad X13 G6 AMD, 0
2804 Points -53%
AMD Radeon 780M
Lenovo IdeaPad Slim 3 14 AHP G10, 0
2569 Points -57%
Qualcomm SD X Adreno X1-85 4.6 TFLOPS
Samsung Galaxy Book4 Edge 16 X1E-84-100, 0
1989 Points -66%
Qualcomm SD X Adreno X1-45 1.7 TFLOPS
Microsoft Surface Pro 12, 0
936 Points -84%
Qualcomm SD X Adreno X1-85 3.8 TFLOPS
HP OmniBook X 14, 0
804 Points -86%
3DMark / Fire Strike Graphics
NVIDIA GeForce RTX 4060 Laptop GPU
Schenker Key 14 (M24), 100
26499 Points +80%
AMD Radeon 8060S
Asus ROG Flow Z13 GZ302EA-RU073W, 80
25992 Points +77%
NVIDIA GeForce RTX 5050 Laptop
Lenovo Yoga Pro 9 16IAH10 RTX 5050, 100
25400 Points +73%
NVIDIA GeForce RTX 4060 Laptop GPU
Asus ROG Zephyrus G16 GA605WV, 80
23753 Points +62%
AMD Radeon 8050S
HP ZBook Ultra G1a A3ZQ0ET,
23521 Points +60%
NVIDIA GeForce RTX 4050 Laptop GPU
Lenovo IdeaPad Pro 5 16IMH G9 RTX 4050, 90
23210 Points +58%
NVIDIA GeForce RTX 4050 Laptop GPU
Lenovo Yoga Pro 7 14IMH9, RTX 4050, 60
19853 Points +35%
Intel Arc B390 12 Xe3 Panther Lake iGPU
Asus ZenBook Duo UX8407AA, 0
17498 Points +19%
Intel Arc B390 12 Xe3 Panther Lake iGPU
Asus ExpertBook Ultra B9406CAA, 0
17054 Points +16%
Intel Arc B370 10 Xe3 Panther Lake iGPU
Intel Core Ultra 5 338H Engineering Sample, 0
14699 Points
NVIDIA GeForce RTX 4050 Laptop GPU
Dell XPS 14 2024 OLED, 30
13591 Points -8%
NVIDIA GeForce RTX 3050 Ti Laptop GPU
Schenker Vision 14 2022 RTX 3050 Ti, 45
12349 Points -16%
NVIDIA GeForce RTX 3050 6GB Laptop GPU
Asus V16 V3607V, 65
11986 Points -18%
Intel Arc Graphics 140V
Microsoft Surface Laptop 7 15 Lunar Lake, 0
10476 Points -29%
Intel Arc Graphics 140V
MSI Claw 8 AI+, 0
9971 Points -32%
AMD Radeon 890M
MSI Claw A8 BZ2EM, 0
9472 Points -36%
Intel Arc Graphics 140T
MSI Prestige 16 AI Evo B2HMG, 0
9173 Points -38%
Intel Arc Graphics 130V
Lenovo ThinkPad E14 Gen 7 21U2002QGE, 0
8755 Points -40%
AMD Radeon 890M
Asus Zenbook S 16 UM5606-RK333W, 0
8188 Points -44%
AMD Radeon 860M
Lenovo ThinkPad X13 G6 AMD, 0
7391 Points -50%
AMD Radeon 780M
Lenovo IdeaPad Slim 3 14 AHP G10, 0
7317 Points -50%
Qualcomm SD X Adreno X1-85 4.6 TFLOPS
Samsung Galaxy Book4 Edge 16 X1E-84-100, 0
6982 Points -53%
Qualcomm SD X Adreno X1-85 3.8 TFLOPS
Honor MagicBook Art 14 Snapdragon, 0
6043 Points -59%
Qualcomm SD X Adreno X1-45 1.7 TFLOPS
Microsoft Surface Pro 12, 0
3736 Points -75%
Qualcomm SD X Adreno X1-85 3.8 TFLOPS
HP OmniBook X 14, 0
3239 Points -78%
3DMark / Steel Nomad Score
NVIDIA GeForce RTX 4060 Laptop GPU
Schenker Key 14 (M24), 100
2236 Points +63%
NVIDIA GeForce RTX 5050 Laptop
Lenovo Yoga Pro 9 16IAH10 RTX 5050, 100
2046 Points +49%
NVIDIA GeForce RTX 4060 Laptop GPU
Asus ROG Zephyrus G16 GA605WV, 80
2025 Points +47%
AMD Radeon 8060S
Asus ROG Flow Z13 GZ302EA-RU073W, 80
1874 Points +36%
NVIDIA GeForce RTX 4050 Laptop GPU
Lenovo IdeaPad Pro 5 16IMH G9 RTX 4050, 90
1873 Points +36%
Intel Arc B390 12 Xe3 Panther Lake iGPU
Asus ZenBook Duo UX8407AA, 0
1667 Points +21%
Apple M4 Pro 16-Core GPU
Apple MacBook Pro 14 2024 M4 Pro Entry, 0
1620 Points +18%
NVIDIA GeForce RTX 4050 Laptop GPU
Lenovo Yoga Pro 7 14IMH9, RTX 4050, 60
1561 Points +13%
Intel Arc B370 10 Xe3 Panther Lake iGPU
Intel Core Ultra 5 338H Engineering Sample, 0
1376 Points
Apple M5 10-Core GPU
Apple MacBook Pro 14 2025 M5, 19
1125 Points -18%
Intel Arc Graphics 140T
MSI Prestige 16 AI Evo B2HMG, 0
919 Points -33%
Intel Arc Graphics 140V
Microsoft Surface Laptop 7 15 Lunar Lake, 0
910 Points -34%
Intel Arc Graphics 140V
MSI Claw 8 AI+, 0
812 Points -41%
AMD Radeon 890M
MSI Claw A8 BZ2EM, 0
597 Points -57%
Qualcomm SD X Adreno X1-85 4.6 TFLOPS
Samsung Galaxy Book4 Edge 16 X1E-84-100, 0
590 Points -57%
AMD Radeon 890M
Asus Zenbook S 16 UM5606-RK333W, 0
557 Points -60%
Qualcomm SD X Adreno X1-85 3.8 TFLOPS
Honor MagicBook Art 14 Snapdragon, 0
512 Points -63%
AMD Radeon 860M
Lenovo ThinkPad X13 G6 AMD, 0
462 Points -66%
AMD Radeon 780M
Lenovo IdeaPad Slim 3 14 AHP G10, 0
407 Points -70%
Qualcomm SD X Adreno X1-85 3.8 TFLOPS
HP OmniBook X 14, 0
253 Points -82%
Qualcomm SD X Adreno X1-45 1.7 TFLOPS
Microsoft Surface Pro 12, 0
228 Points -83%
3DMark / Steel Nomad Light Score
NVIDIA GeForce RTX 4060 Laptop GPU
Schenker Key 14 (M24), 100
9967 Points +86%
AMD Radeon 8060S
Asus ROG Flow Z13 GZ302EA-RU073W, 80
9653 Points +80%
NVIDIA GeForce RTX 4060 Laptop GPU
Asus ROG Zephyrus G16 GA605WV, 80
9201 Points +72%
Apple M4 Pro 20-Core GPU
Apple MacBook Pro 16 2024 M4 Pro, 32
7781 Points +45%
NVIDIA GeForce RTX 4050 Laptop GPU
Lenovo Yoga Pro 7 14IMH9, RTX 4050, 60
7254 Points +35%
Apple M4 Pro 16-Core GPU
Apple MacBook Pro 14 2024 M4 Pro Entry, 0
6851 Points +28%
Intel Arc B390 12 Xe3 Panther Lake iGPU
Asus ZenBook Duo UX8407AA, 0
6338 Points +18%
Intel Arc B370 10 Xe3 Panther Lake iGPU
Intel Core Ultra 5 338H Engineering Sample, 0
5354 Points
Apple M5 10-Core GPU
Apple MacBook Pro 14 2025 M5, 19
5221 Points -2%
Intel Arc Graphics 140T
MSI Prestige 16 AI Evo B2HMG, 0
3692 Points -31%
Intel Arc Graphics 140V
Microsoft Surface Laptop 7 15 Lunar Lake, 0
3555 Points -34%
Intel Arc Graphics 140V
MSI Claw 8 AI+, 0
3289 Points -39%
AMD Radeon 890M
MSI Claw A8 BZ2EM, 0
3228 Points -40%
AMD Radeon 890M
Asus Zenbook S 16 UM5606-RK333W, 0
3198 Points -40%
Intel Arc Graphics 130V
Lenovo ThinkPad E14 Gen 7 21U2002QGE, 0
2670 Points -50%
Qualcomm SD X Adreno X1-85 4.6 TFLOPS
Samsung Galaxy Book4 Edge 16 X1E-84-100, 0
2467 Points -54%
AMD Radeon 860M
Lenovo ThinkPad X13 G6 AMD, 0
2454 Points -54%
AMD Radeon 780M
Lenovo IdeaPad Slim 3 14 AHP G10, 0
2447 Points -54%
Qualcomm SD X Adreno X1-85 3.8 TFLOPS
Honor MagicBook Art 14 Snapdragon, 0
2231 Points -58%
Qualcomm SD X Adreno X1-45 1.7 TFLOPS
Microsoft Surface Pro 12, 0
1097 Points -80%
Qualcomm SD X Adreno X1-85 3.8 TFLOPS
HP OmniBook X 14, 0
1034 Points -81%

Przyjrzeliśmy się również wydajności przy niższych wartościach TDP. Wydajność Arc B370 jest praktycznie identyczna z Arc B390 przy 20 W, podczas gdy deficyt wynosi zaledwie 6% przy 35 W.

Time Spy Graphics
20 W 28 W 35 W
Core Ultra X9 388H z Arc B390 4,567 punktów 5,600 punktów 6,321 punktów
Core Ultra X7 358H z Arc B390 4,334 punktów 5,330 punktów 6,296 punktów
Core Ultra 5 338H z Arc B370 4,476 punktów 5,474 punktów 5,933 punktów

Pierwsze wrażenia

Pierwsze wrażenia z użytkowania nowego Core Ultra 5 338H z GPU Arc B370 są pozytywne. Ogólna wydajność procesora (jedno- i wielordzeniowego łącznie) jest na równi z nowym AMD Ryzen AI 9 465 w podobnych konfiguracjach TDP. Arc B370 kontynuuje dobre wrażenia z Arc B390, a ogólna różnica nie jest tak duża w zakresie TDP do 35 W, który byliśmy w stanie przetestować do tej pory. Różnica w wydajności będzie prawdopodobnie nieco większa przy wyższych limitach mocy.

Na bardziej kompleksowe testy będziemy musieli jeszcze trochę poczekać, a pierwszych egzemplarzy detalicznych z nowym Core Ultra 5 338H i Arc B370 spodziewamy się w ciągu najbliższych kilku tygodni.

Please share our article, every link counts!
Mail Logo
> laptopy testy i recenzje notebooki > Nowinki > Archiwum v2 > Archiwum 2026 02 > Testy Intel Core Ultra 5 338H i Arc B370 - Prawie tak szybki jak Arc B390
Andreas Osthoff, 2026-02-13 (Update: 2026-02-14)