Laptop Schenker Vision 14 w recenzji - masywny upgrade wydajności Core i7-12700H
W zeszłym roku Schenker wypuścił bardzo interesujący 14-calowy laptop, który błyszczy ekstremalną przenośnością dzięki niskiej wadze nieco ponad 1 kg (2,2 lbs) o nazwie Vision 14, nie idąc jednocześnie na kompromis w kwestii dobrego wyboru portów czy wydajności. Na początku tego roku urządzenie zostało odświeżone z procesorem Intel Tiger Lake-H35 wraz z bardziej efektywnym rozwiązaniem chłodzenia, które obejmuje ciekły metal, jak również dedykowany GeForce RTX 3050 Ti Opcja GPU. Nasze główne zastrzeżenia do wspomnianego laptopa dotyczyły miernej wydajności procesora Intela 11. generacji oraz stosunkowo krótkiego czasu pracy na baterii.
Choć Schenker zapowiedział odświeżenie Vision 14 kilka miesięcy temu, dopiero teraz dostaliśmy szansę na jego recenzję ze względu na problemy z łańcuchem dostaw. Wbrew naszemu pierwszemu wrażeniu, nowe urządzenie jest dość poważną aktualizacją, która dodatkowo została wyposażona w opcję potężnej baterii o pojemności 99 Wh i wymagała pewnych zmian w układzie międzymagazynowym. Dodatkowo, starszy czterordzeniowy procesor z generacji Tiger Lake został zastąpiony przez aktualny model Alder Lake. W przeciwieństwie do większości innych urządzeń w tej kategorii, Schenker nie zdecydował się na procesor Alder Lake-P (28W TDP), a zamiast tego wybrał 45-watowy procesor Core i7-12700H.
Dzięki uprzejmości firmy Schenker otrzymaliśmy dwie wersje Vision 14; jedną z dedykowanym GPU GeForce i jedną bez niego. Ponieważ pod innymi względami są one identyczne (Core i7-12700H, panel 3K, bateria 99-Wh), w tej recenzji wymienimy drobne różnice, zamiast recenzować oba urządzenia osobno. Cena nowego Vision 14 z iGPU zaczyna się od ~1659 USD, natomiast model z RTX 3050 Ti można kupić od około 1931 USD. Modele można skonfigurować z szeroką gamą dostępnych opcji pamięci RAM i dysków SSD; nasze urządzenie testowe jest wyposażone w 32 GB pamięci RAM i 1-TB dysk SSD PCIe-4.0 (Samsung 980 Pro) za około 2200 USD.
Potencjalni konkurenci w porównaniu
Ocena | Data | Model | Waga | Wysokość | Rozmiar | Rezolucja | Cena |
|---|---|---|---|---|---|---|---|
| 88.8 % v7 (old) | 10/2022 | Schenker Vision 14 2022 RTX 3050 Ti i7-12700H, GeForce RTX 3050 Ti Laptop GPU | 1.3 kg | 16.6 mm | 14.00" | 2880x1800 | |
| 90.3 % v7 (old) | 10/2022 | Huawei MateBook X Pro 2022 i7-1260P, Iris Xe G7 96EUs | 1.3 kg | 15.6 mm | 14.20" | 3120x2080 | |
| 90.6 % v7 (old) | Lenovo Yoga 9i 14 2022 i7-1260P i7-1260P, Iris Xe G7 96EUs | 1.4 kg | 15.25 mm | 14.00" | 3840x2400 | ||
| 87.2 % v7 (old) | 09/2022 | Dell Inspiron 14 Plus 7420 i7-12700H, GeForce RTX 3050 4GB Laptop GPU | 1.7 kg | 18.87 mm | 14.00" | 2240x1400 | |
| 86.3 % v7 (old) | Asus Vivobook Pro 14 M3401QC-KM007T R5 5600H, GeForce RTX 3050 4GB Laptop GPU | 1.5 kg | 19 mm | 14.00" | 2880x1800 | ||
| 92.7 % v7 (old) | 11/2024 | Apple MacBook Pro 14 2021 M1 Pro Entry M1 Pro 8-Core, M1 Pro 14-Core GPU | 1.6 kg | 15.5 mm | 14.20" | 3024x1964 |
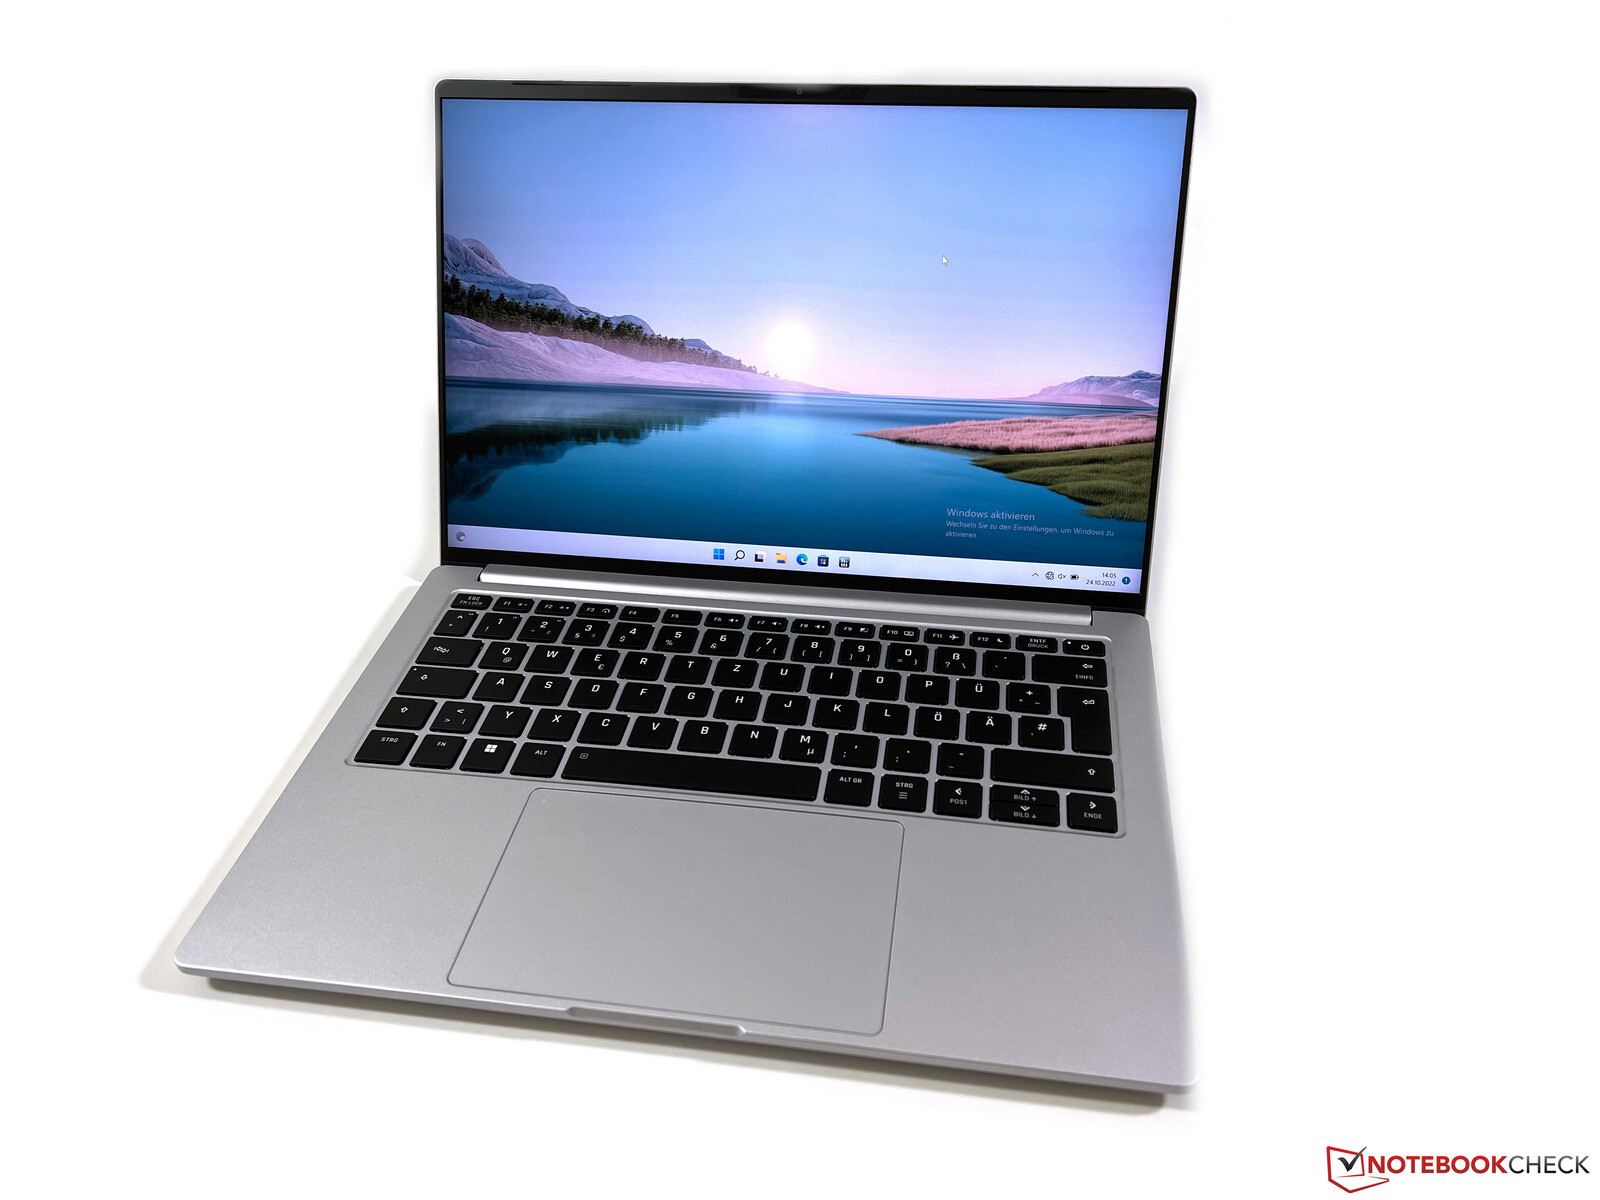
Etui - Magnesium Vision 14 w dwóch kolorach
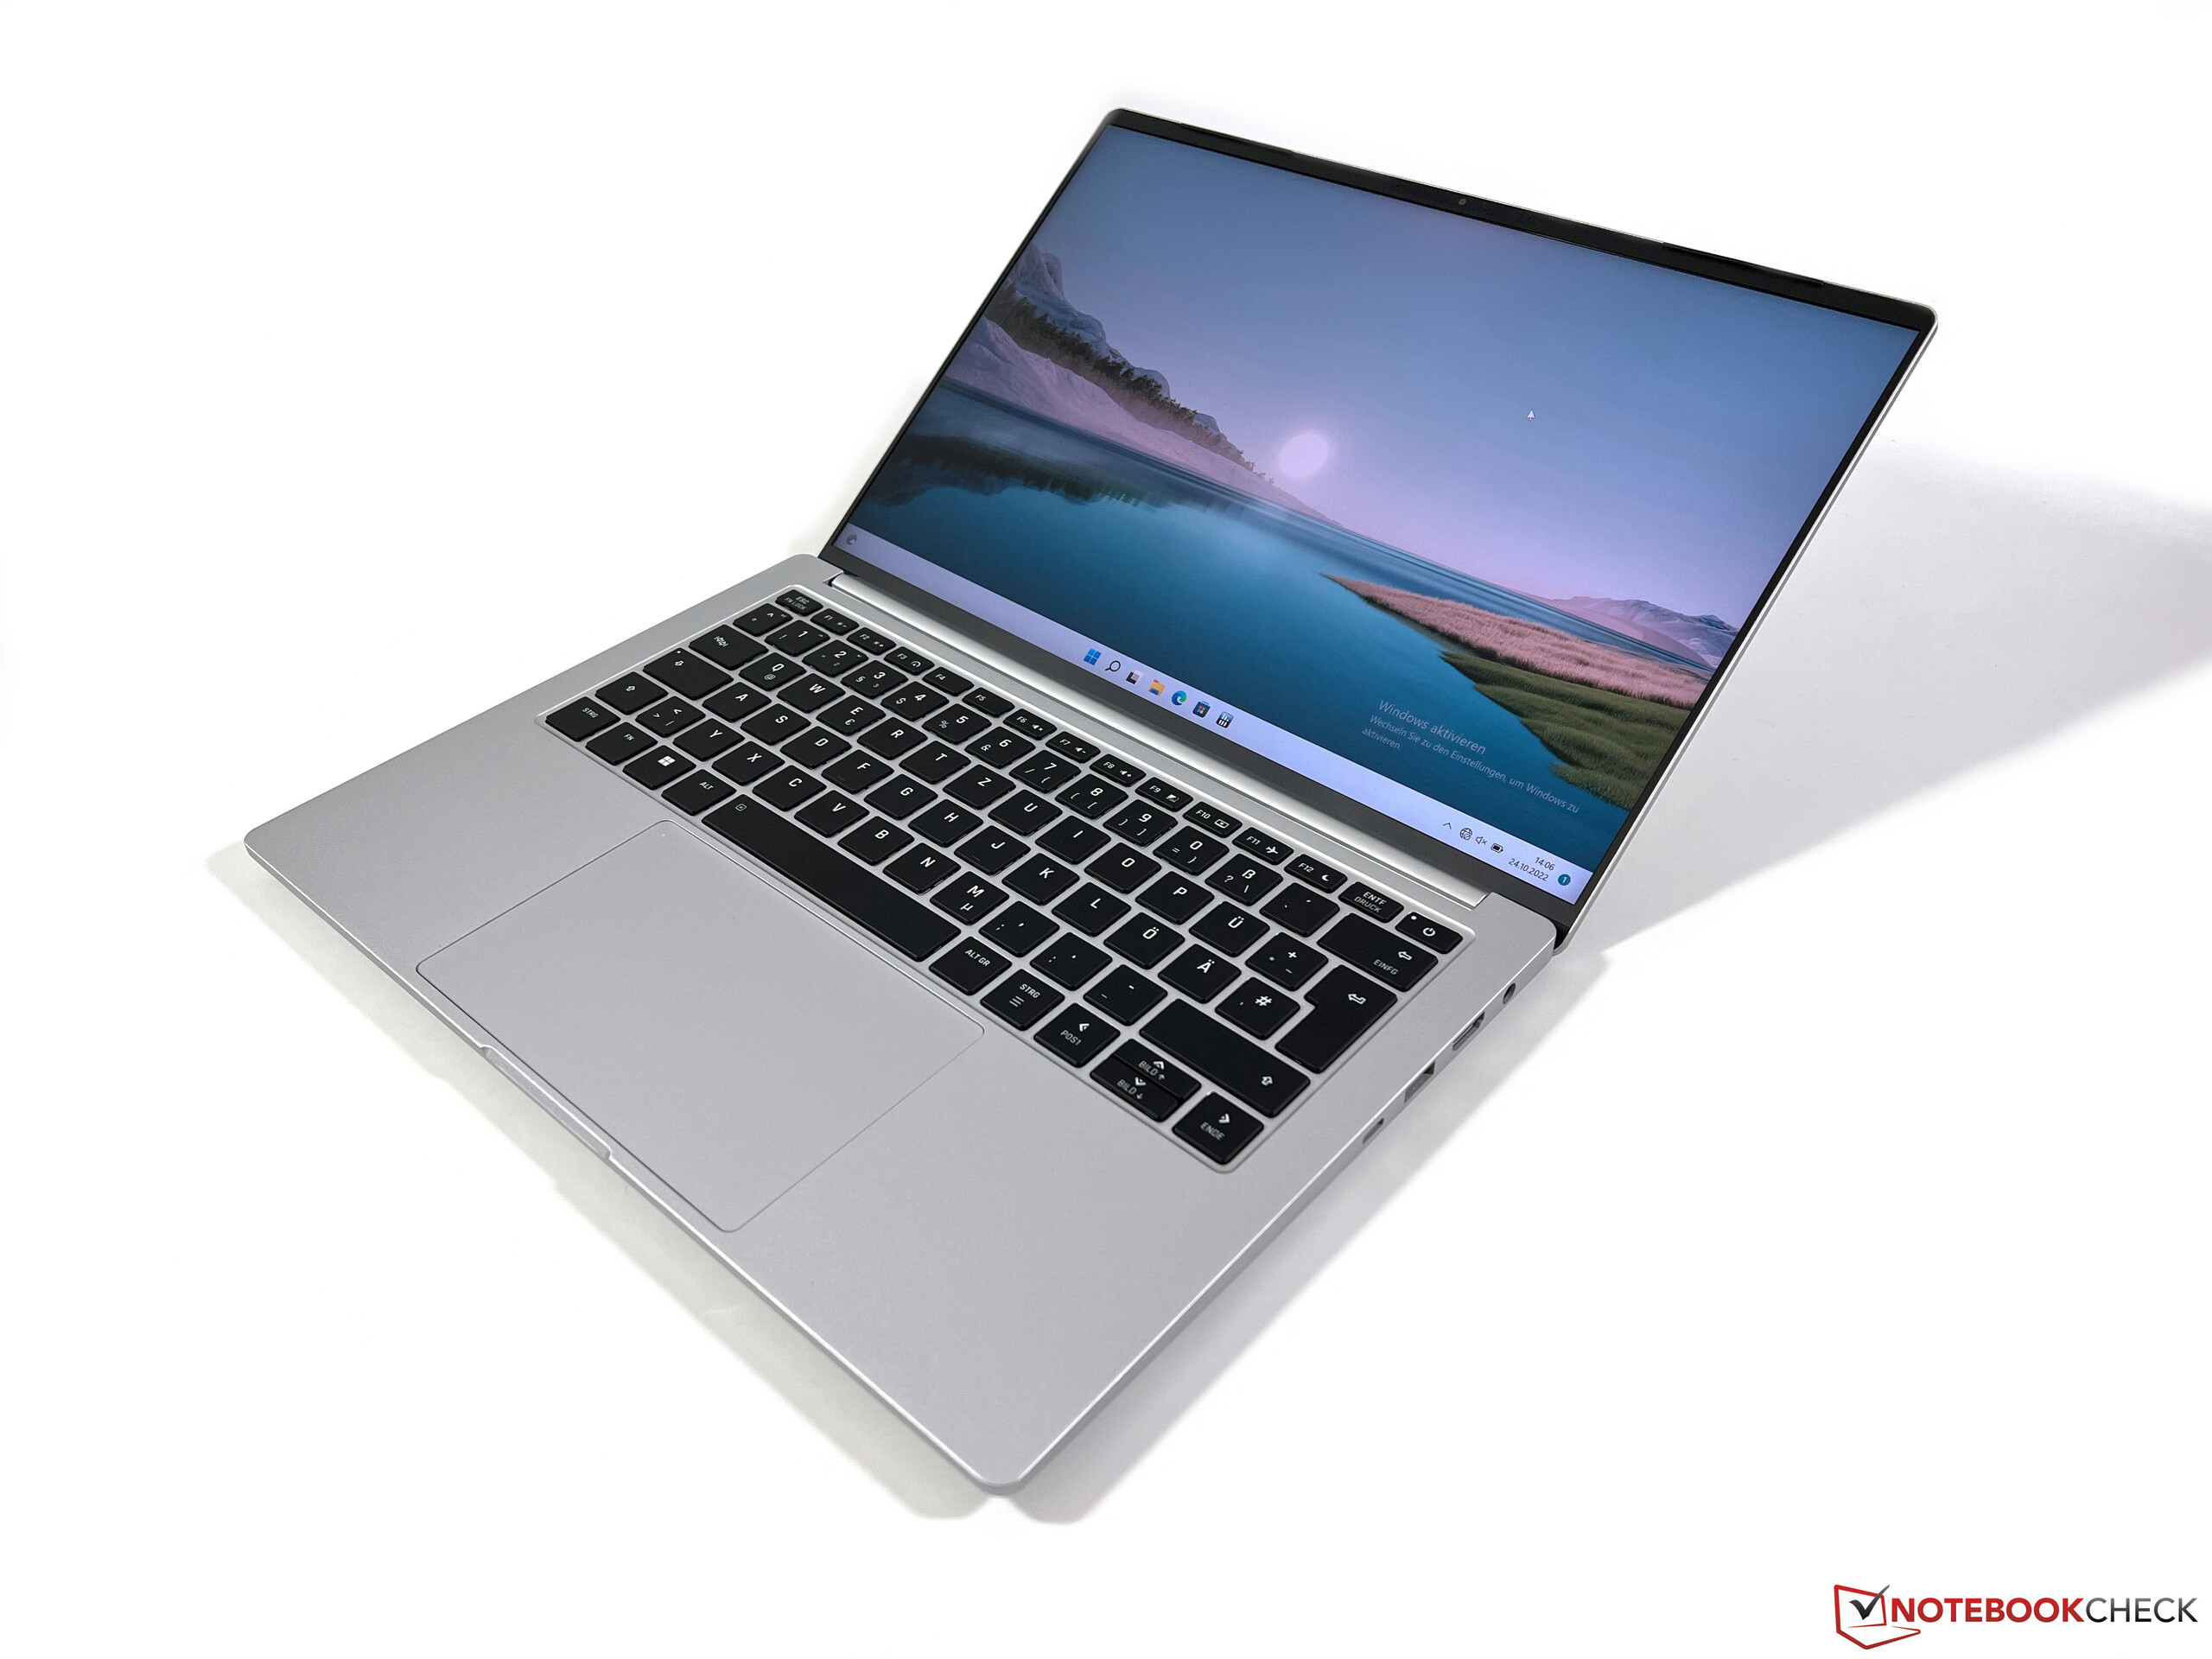
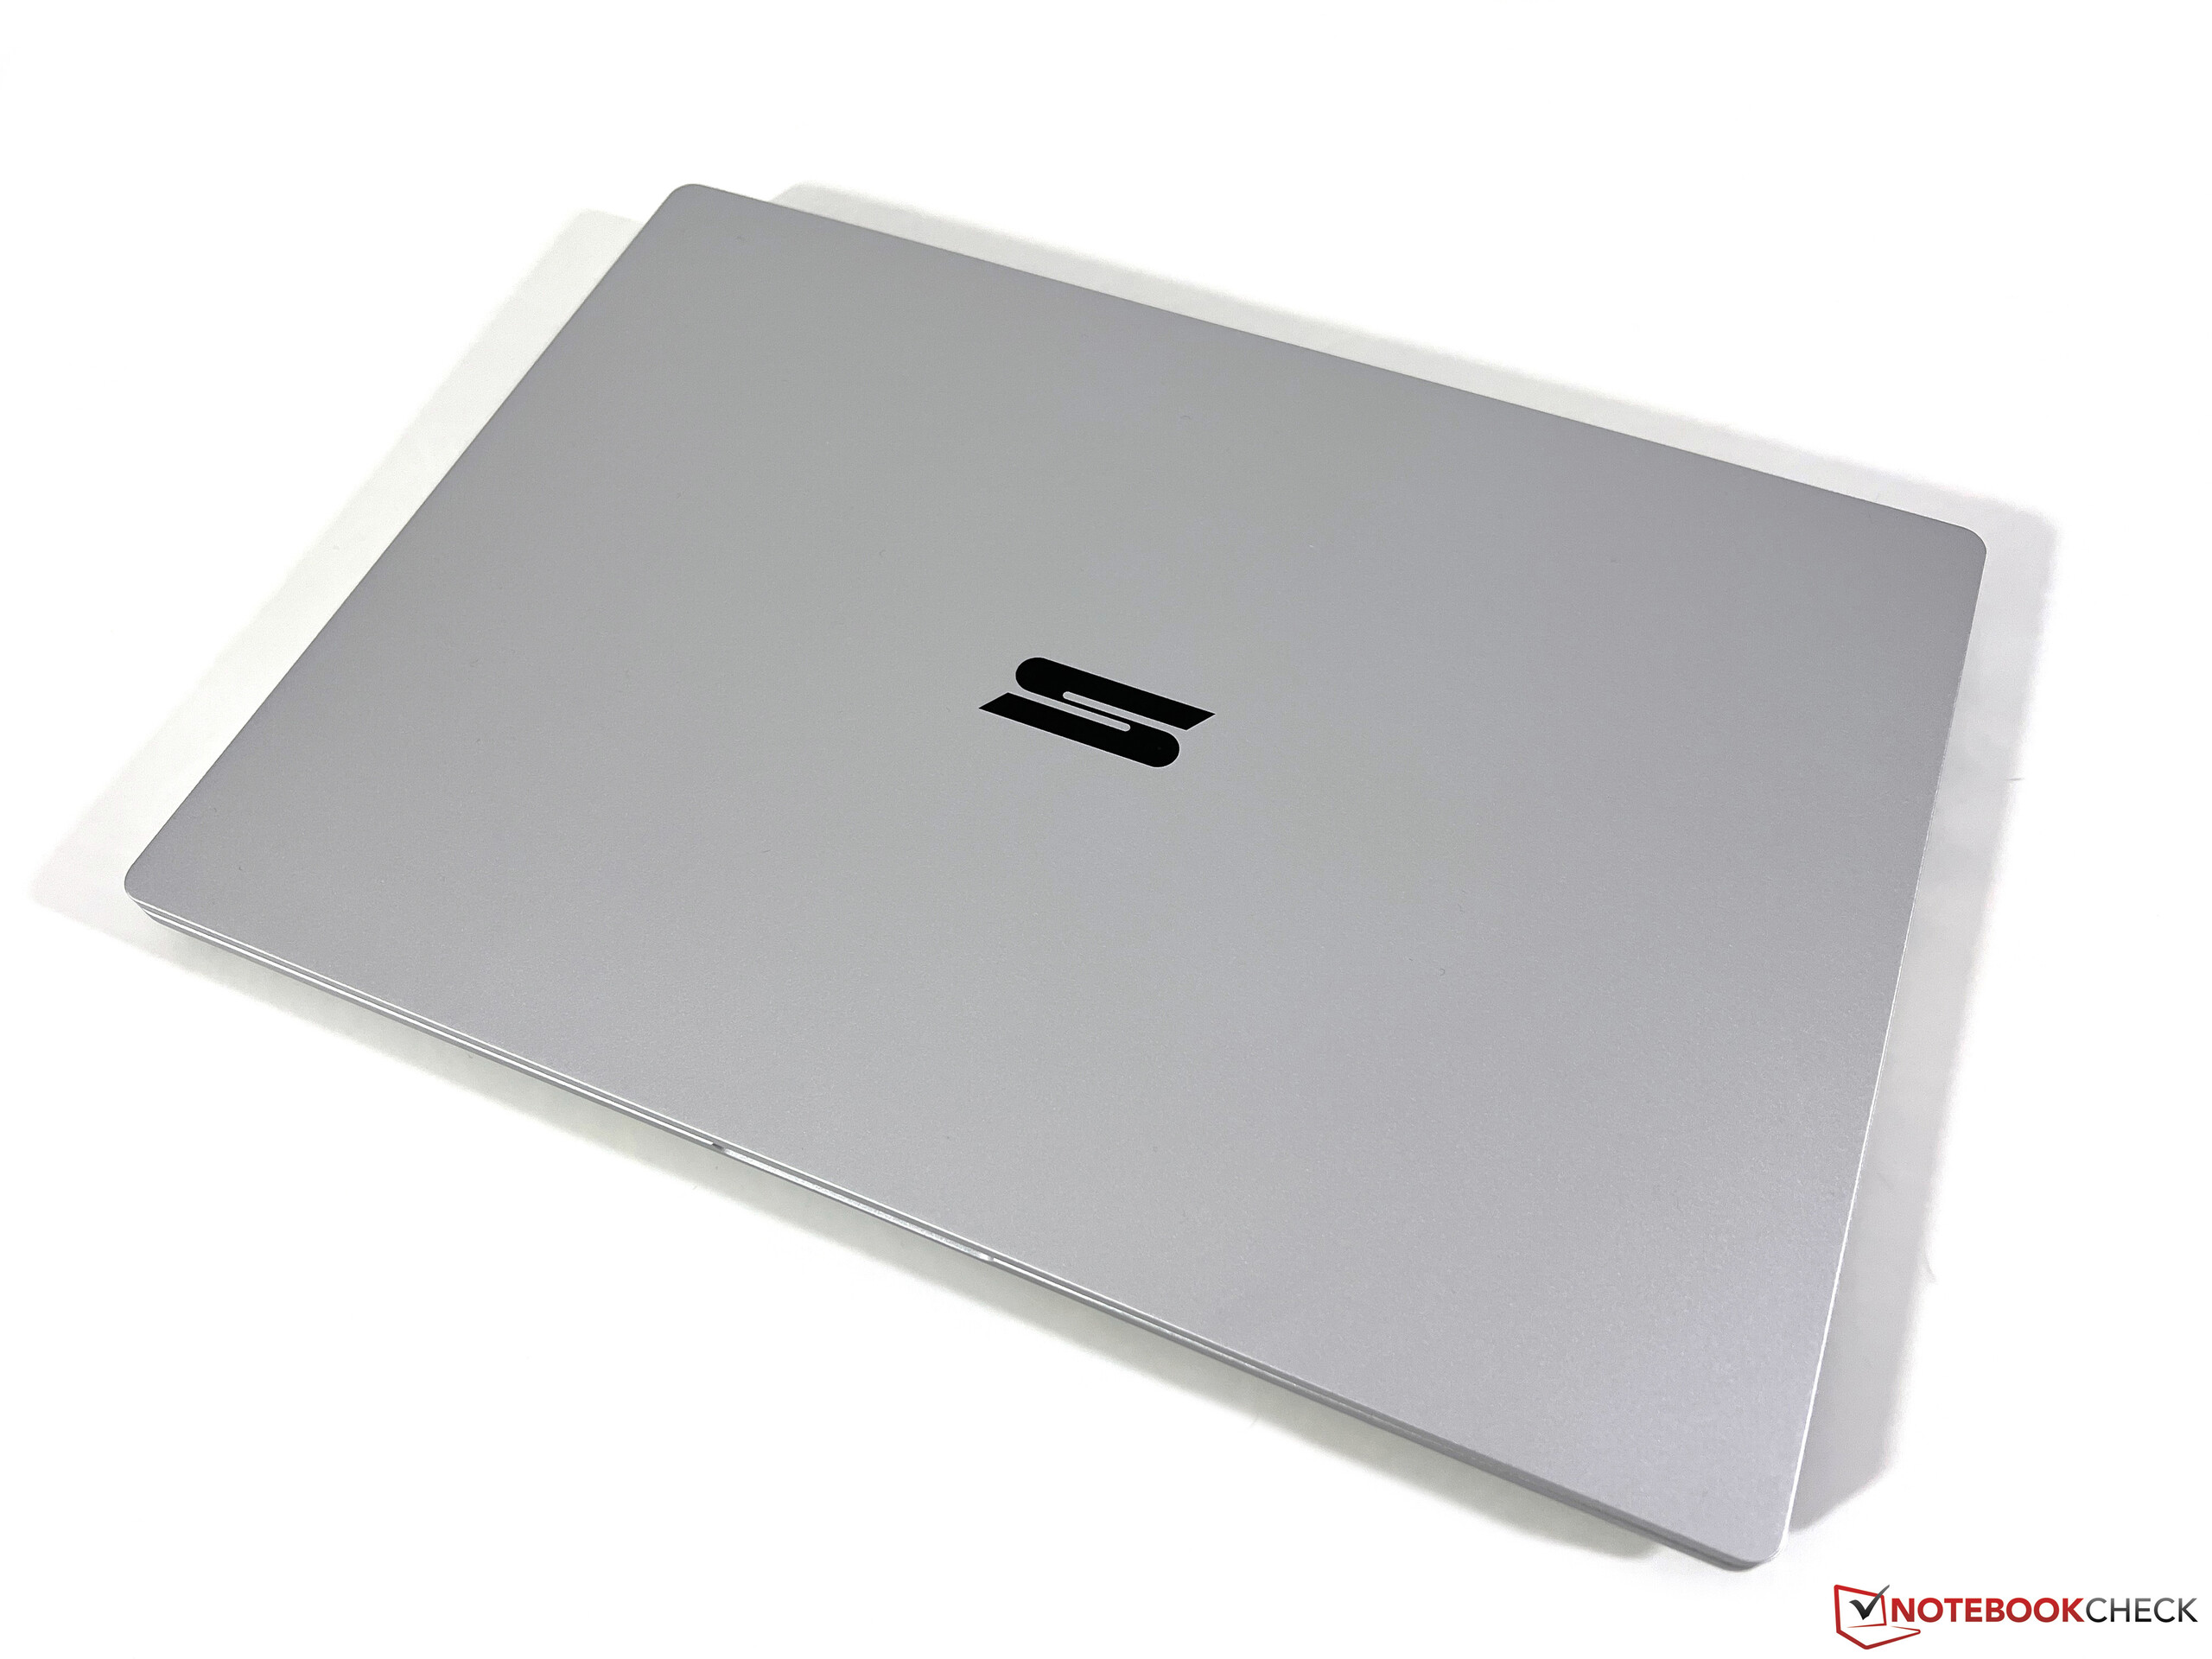
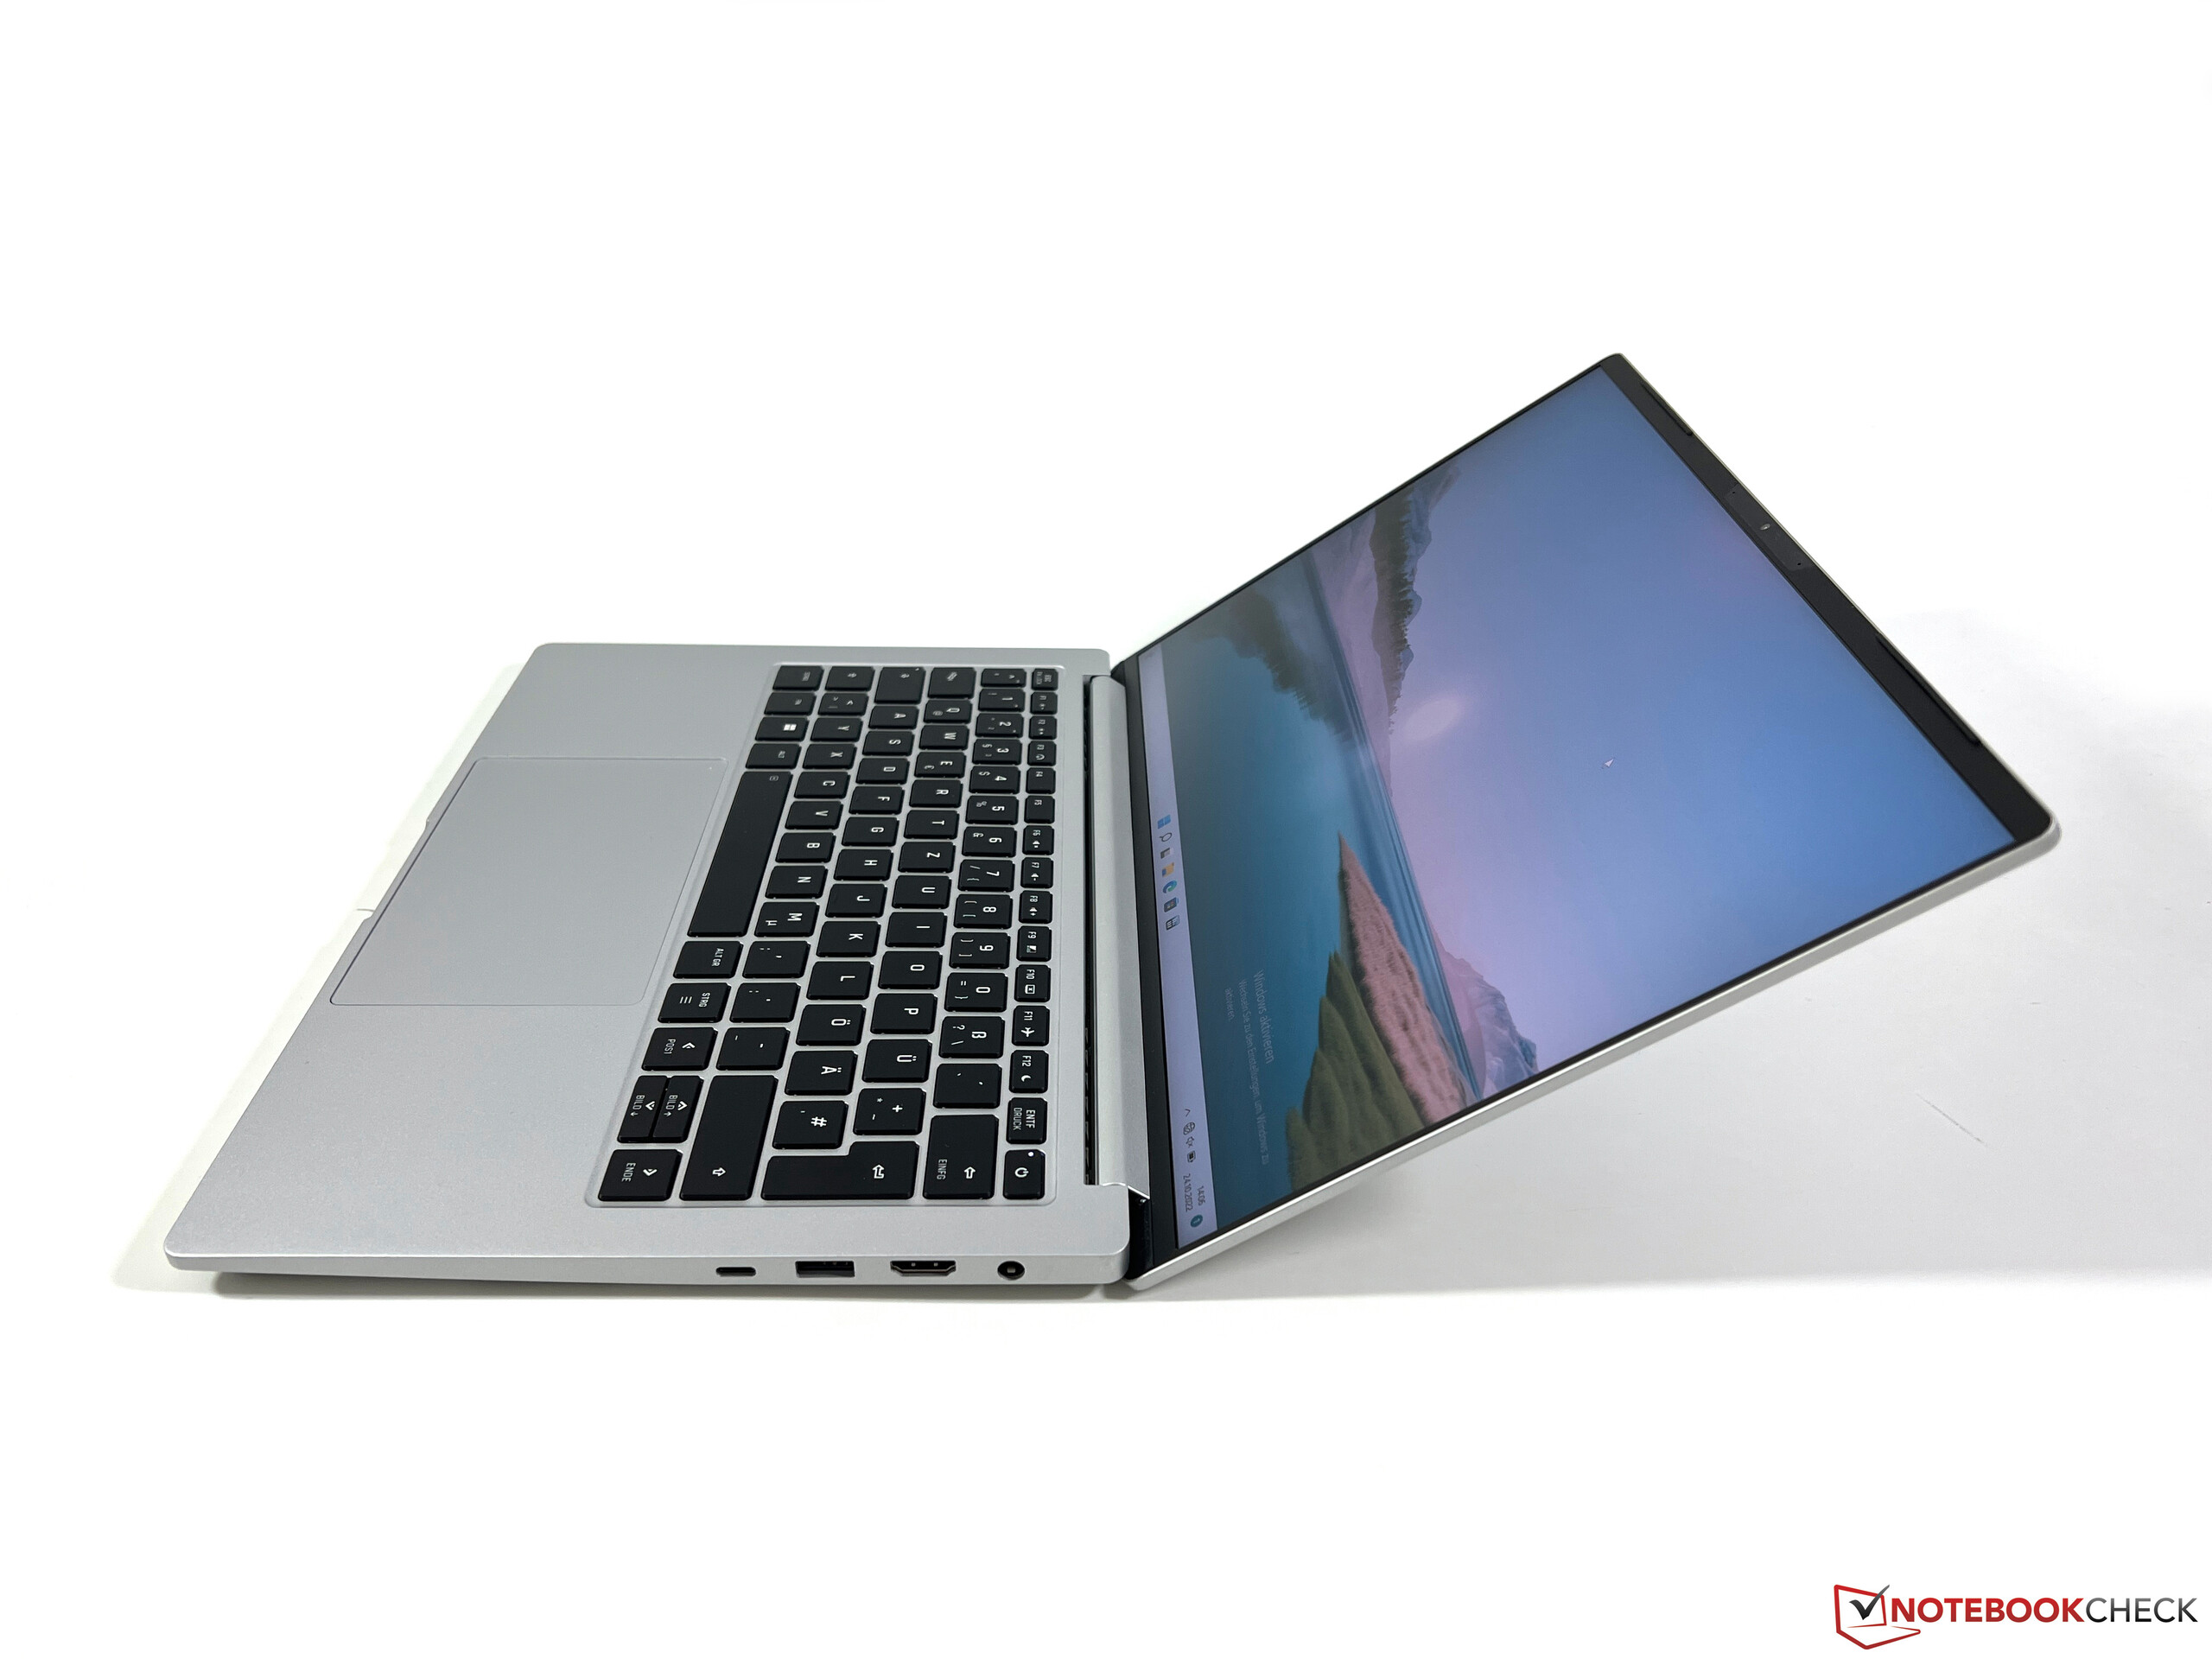
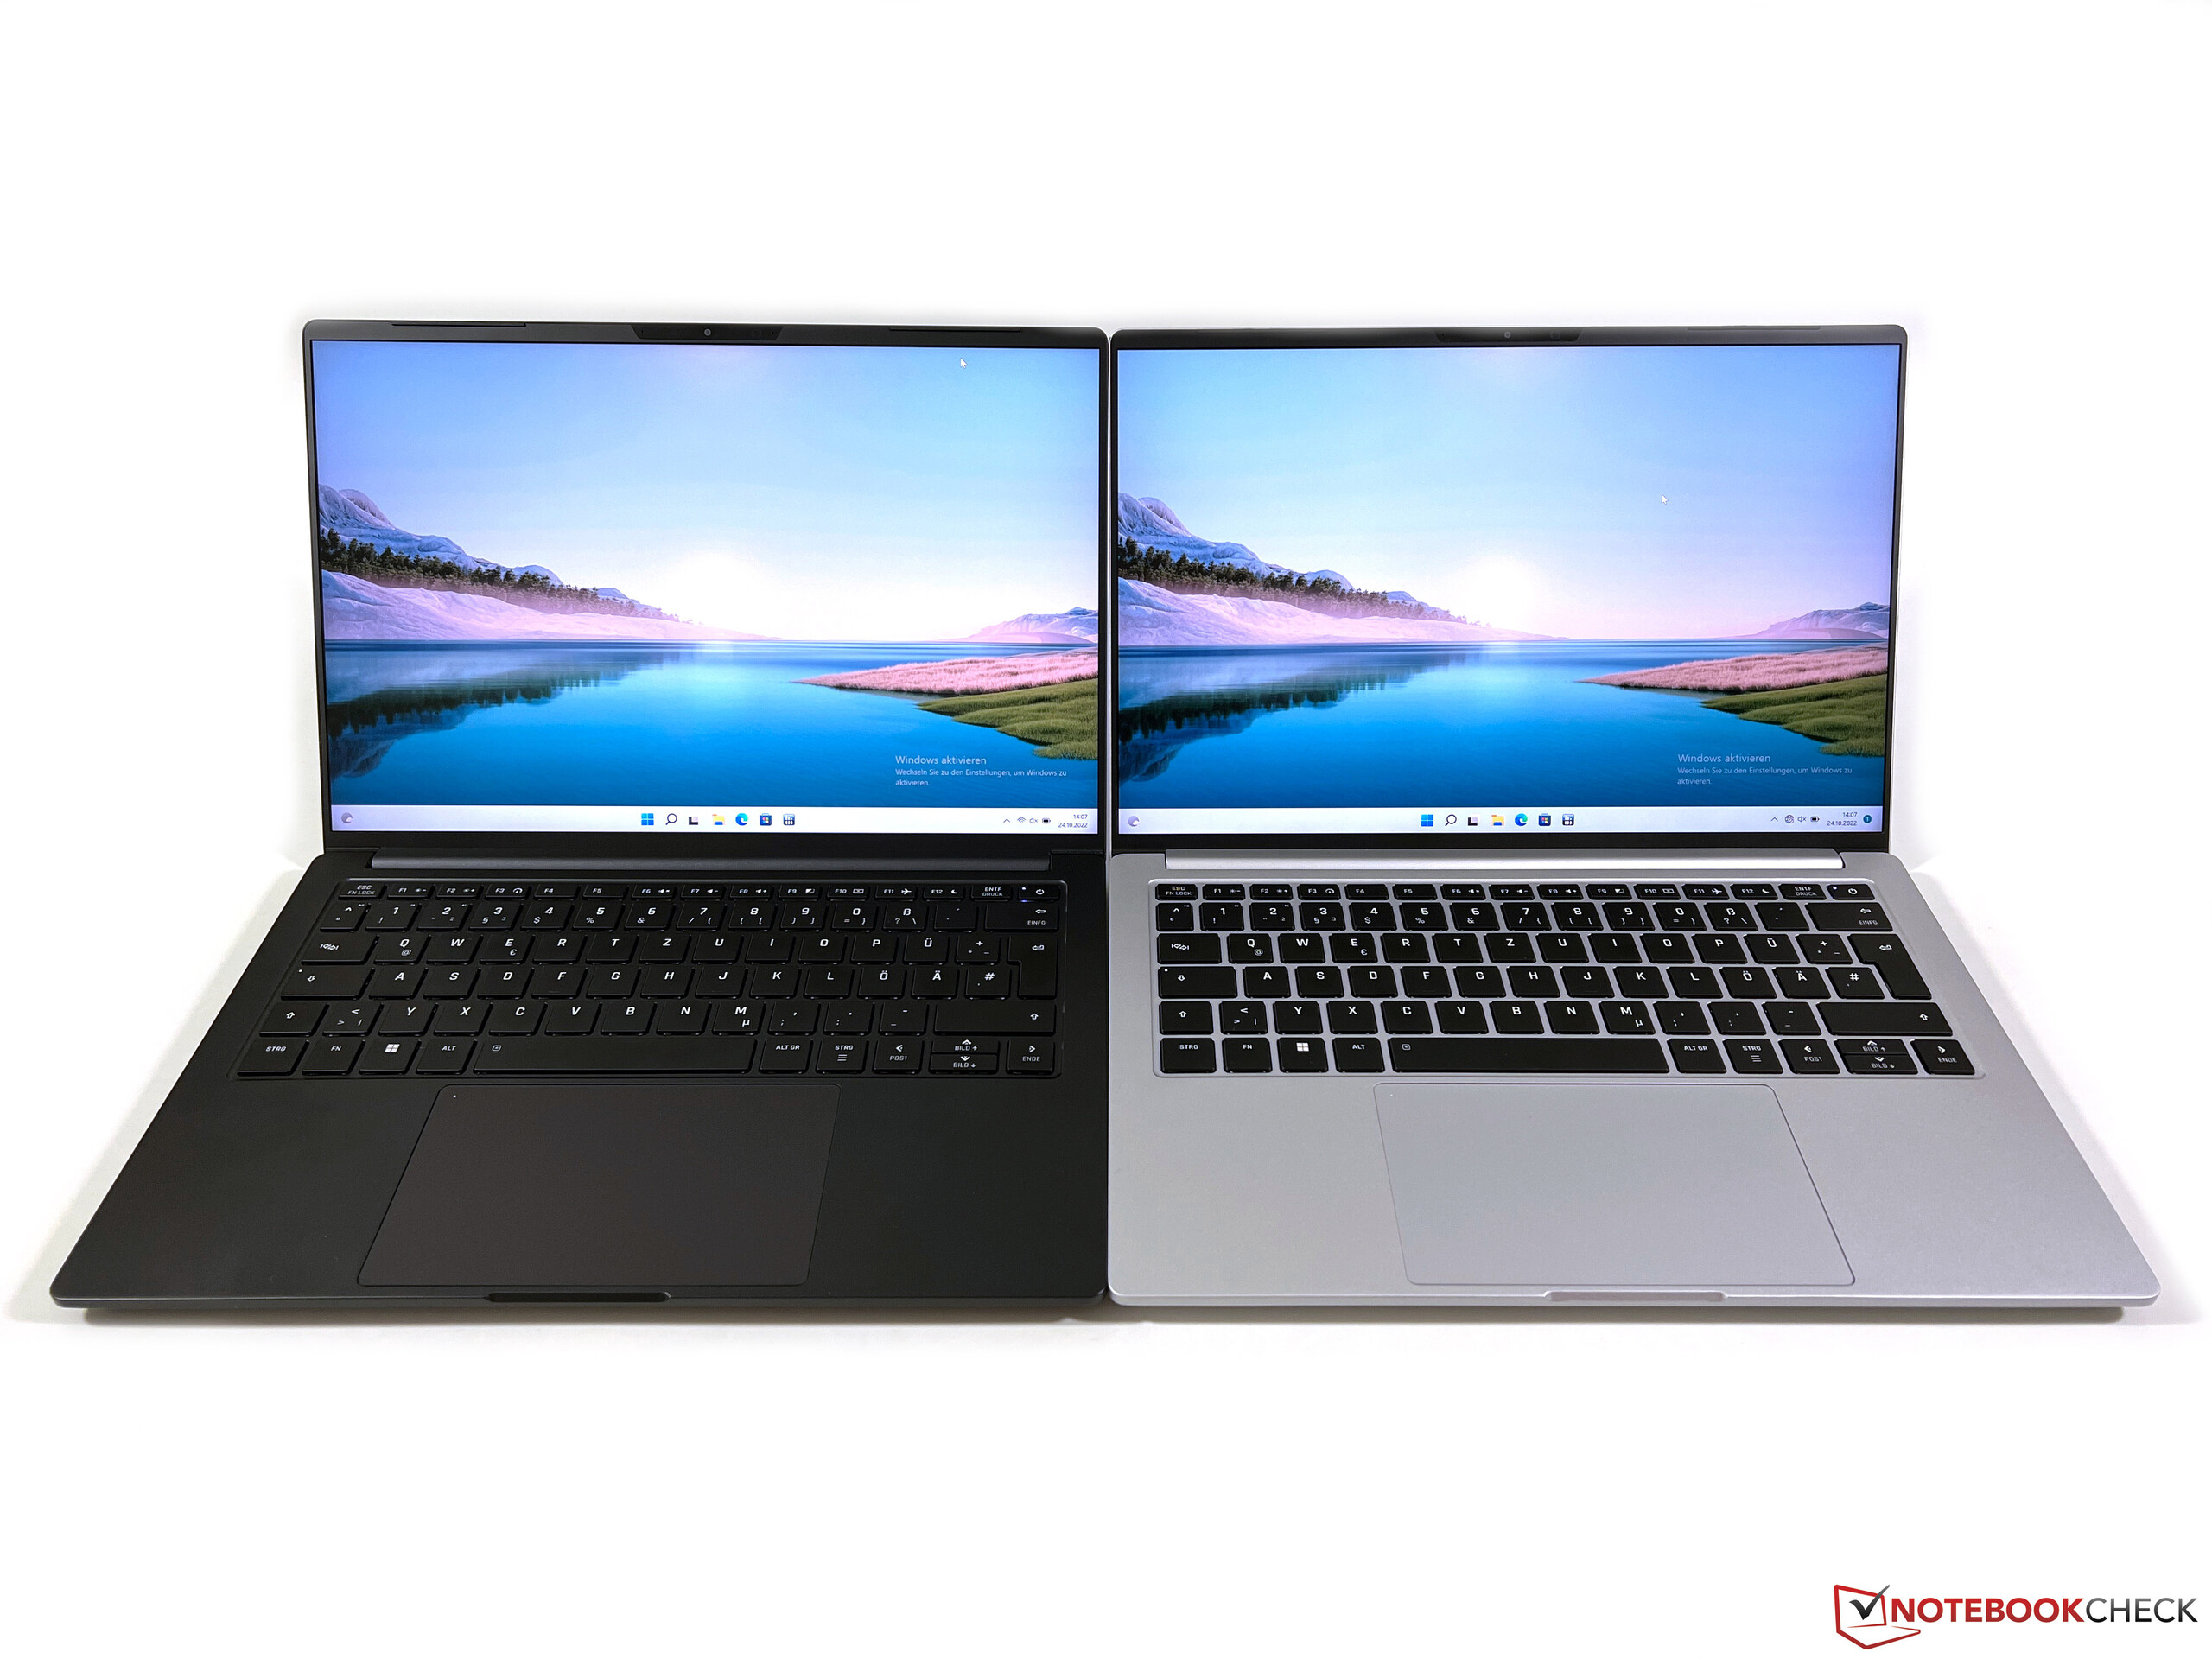
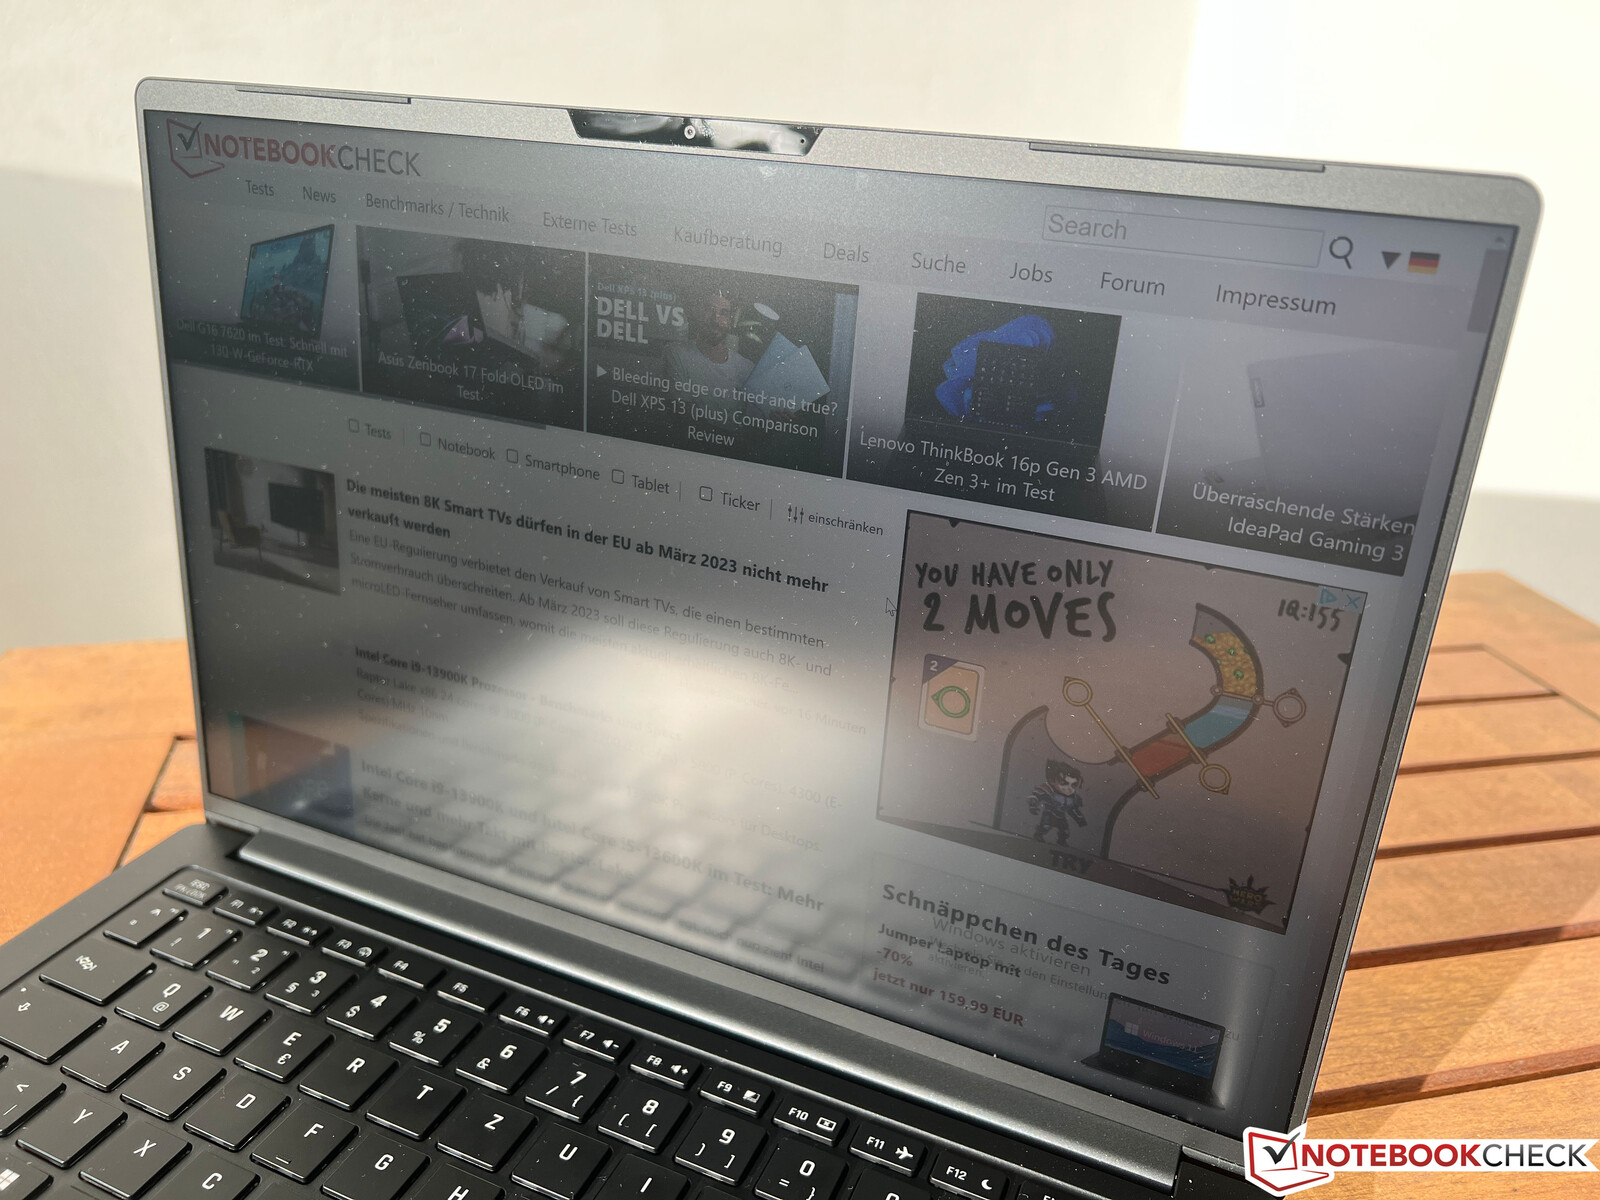
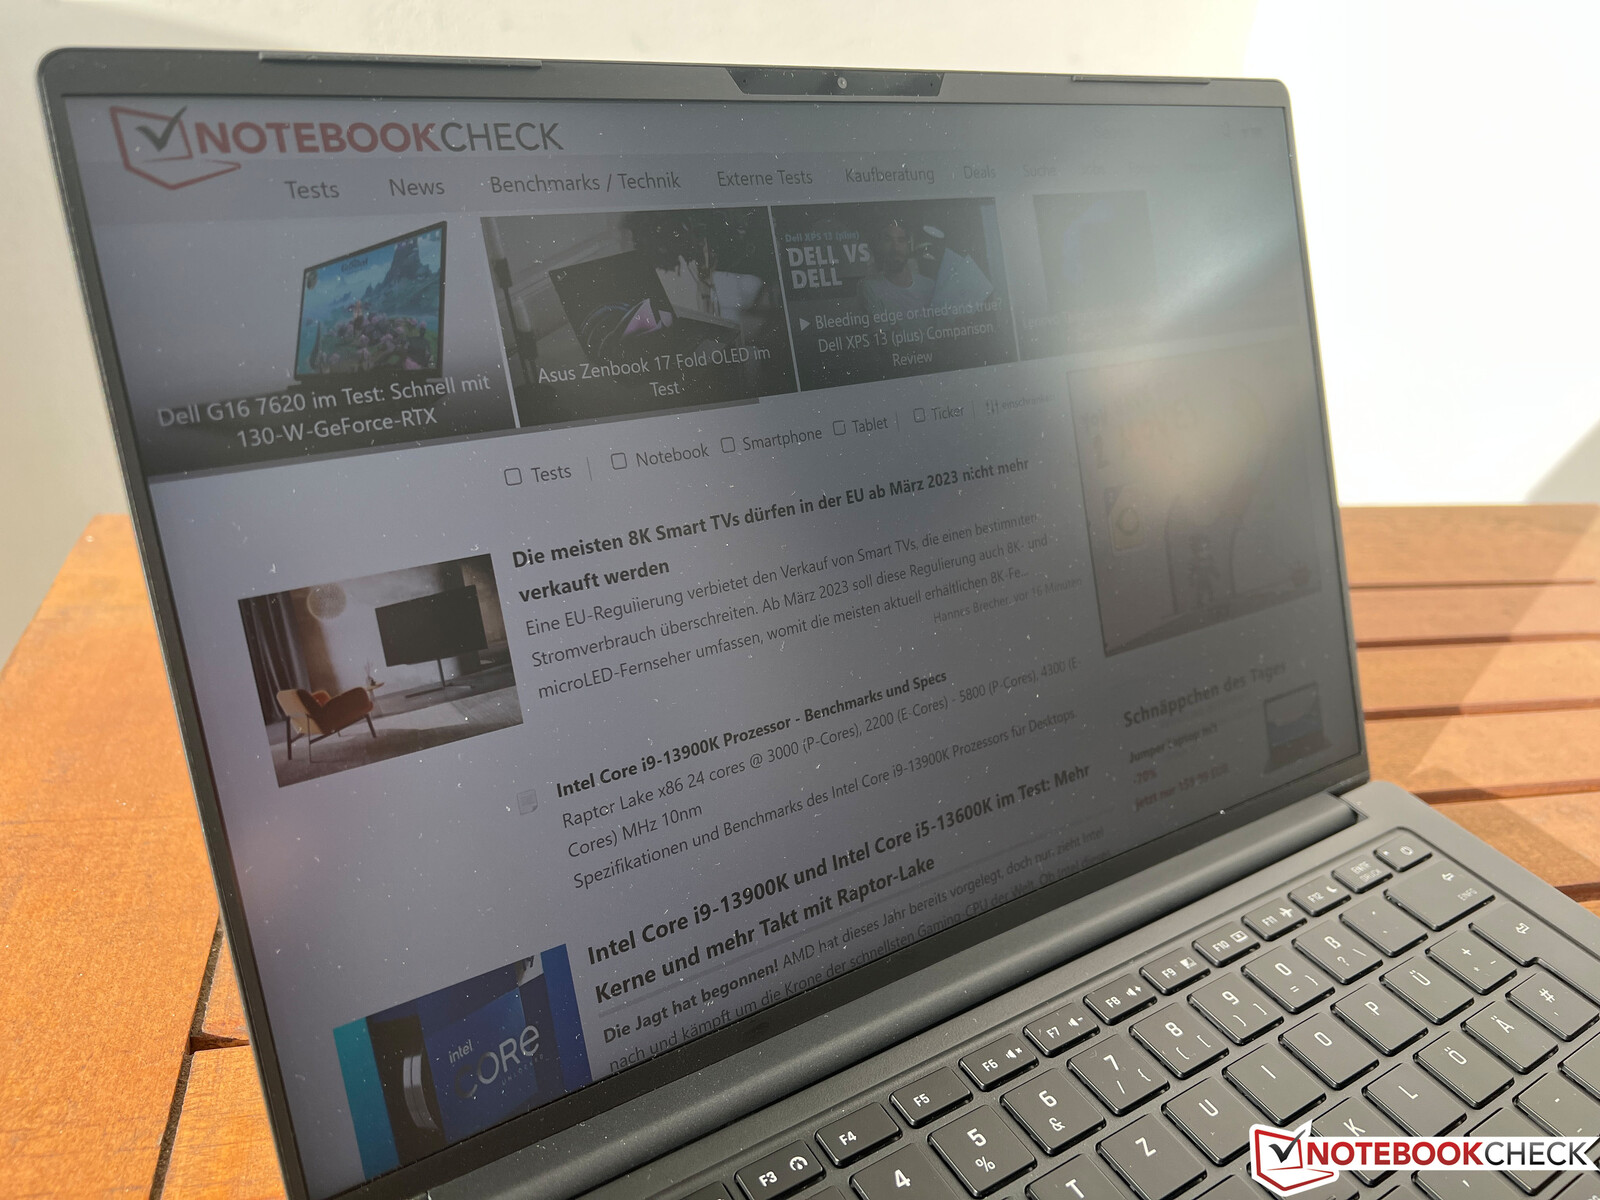
Ogólny projekt Schenker Vision 14 pozostał niezmieniony i dostępne są modele w kolorze czarnym i srebrnym. O ile ramki wyświetlacza składają się z plastiku, o tyle pozostałe części (wieko, jednostka zasadnicza) są wykonane ze stopu magnezu. Sztywność nadal jest doskonała, ale ekran jest bardzo cienki, przez co jest dość elastyczny, o czym świadczą zniekształcenia występujące przy wywieraniu skupionego nacisku na tylną część pokrywy. Podczas codziennego użytkowania nie ma żadnych ograniczeń.
Słabym punktem Vision 14 pozostaje zawias. Co prawda poprawiono twardość zawiasu (~0,32 Nm vs. 0,25 Nm w poprzedniku poprzedniku) według Schenkera, to nadal występuje zauważalne terkotanie podczas regulacji kąta nachylenia (do 160 stopni). Otwieranie wyświetlacza jedną ręką jest możliwe zarówno w nowym jak i starym modelu. Wersja srebrna mniej podatna na odciski palców i tłuszcz niż model czarny podczas codziennego użytkowania.
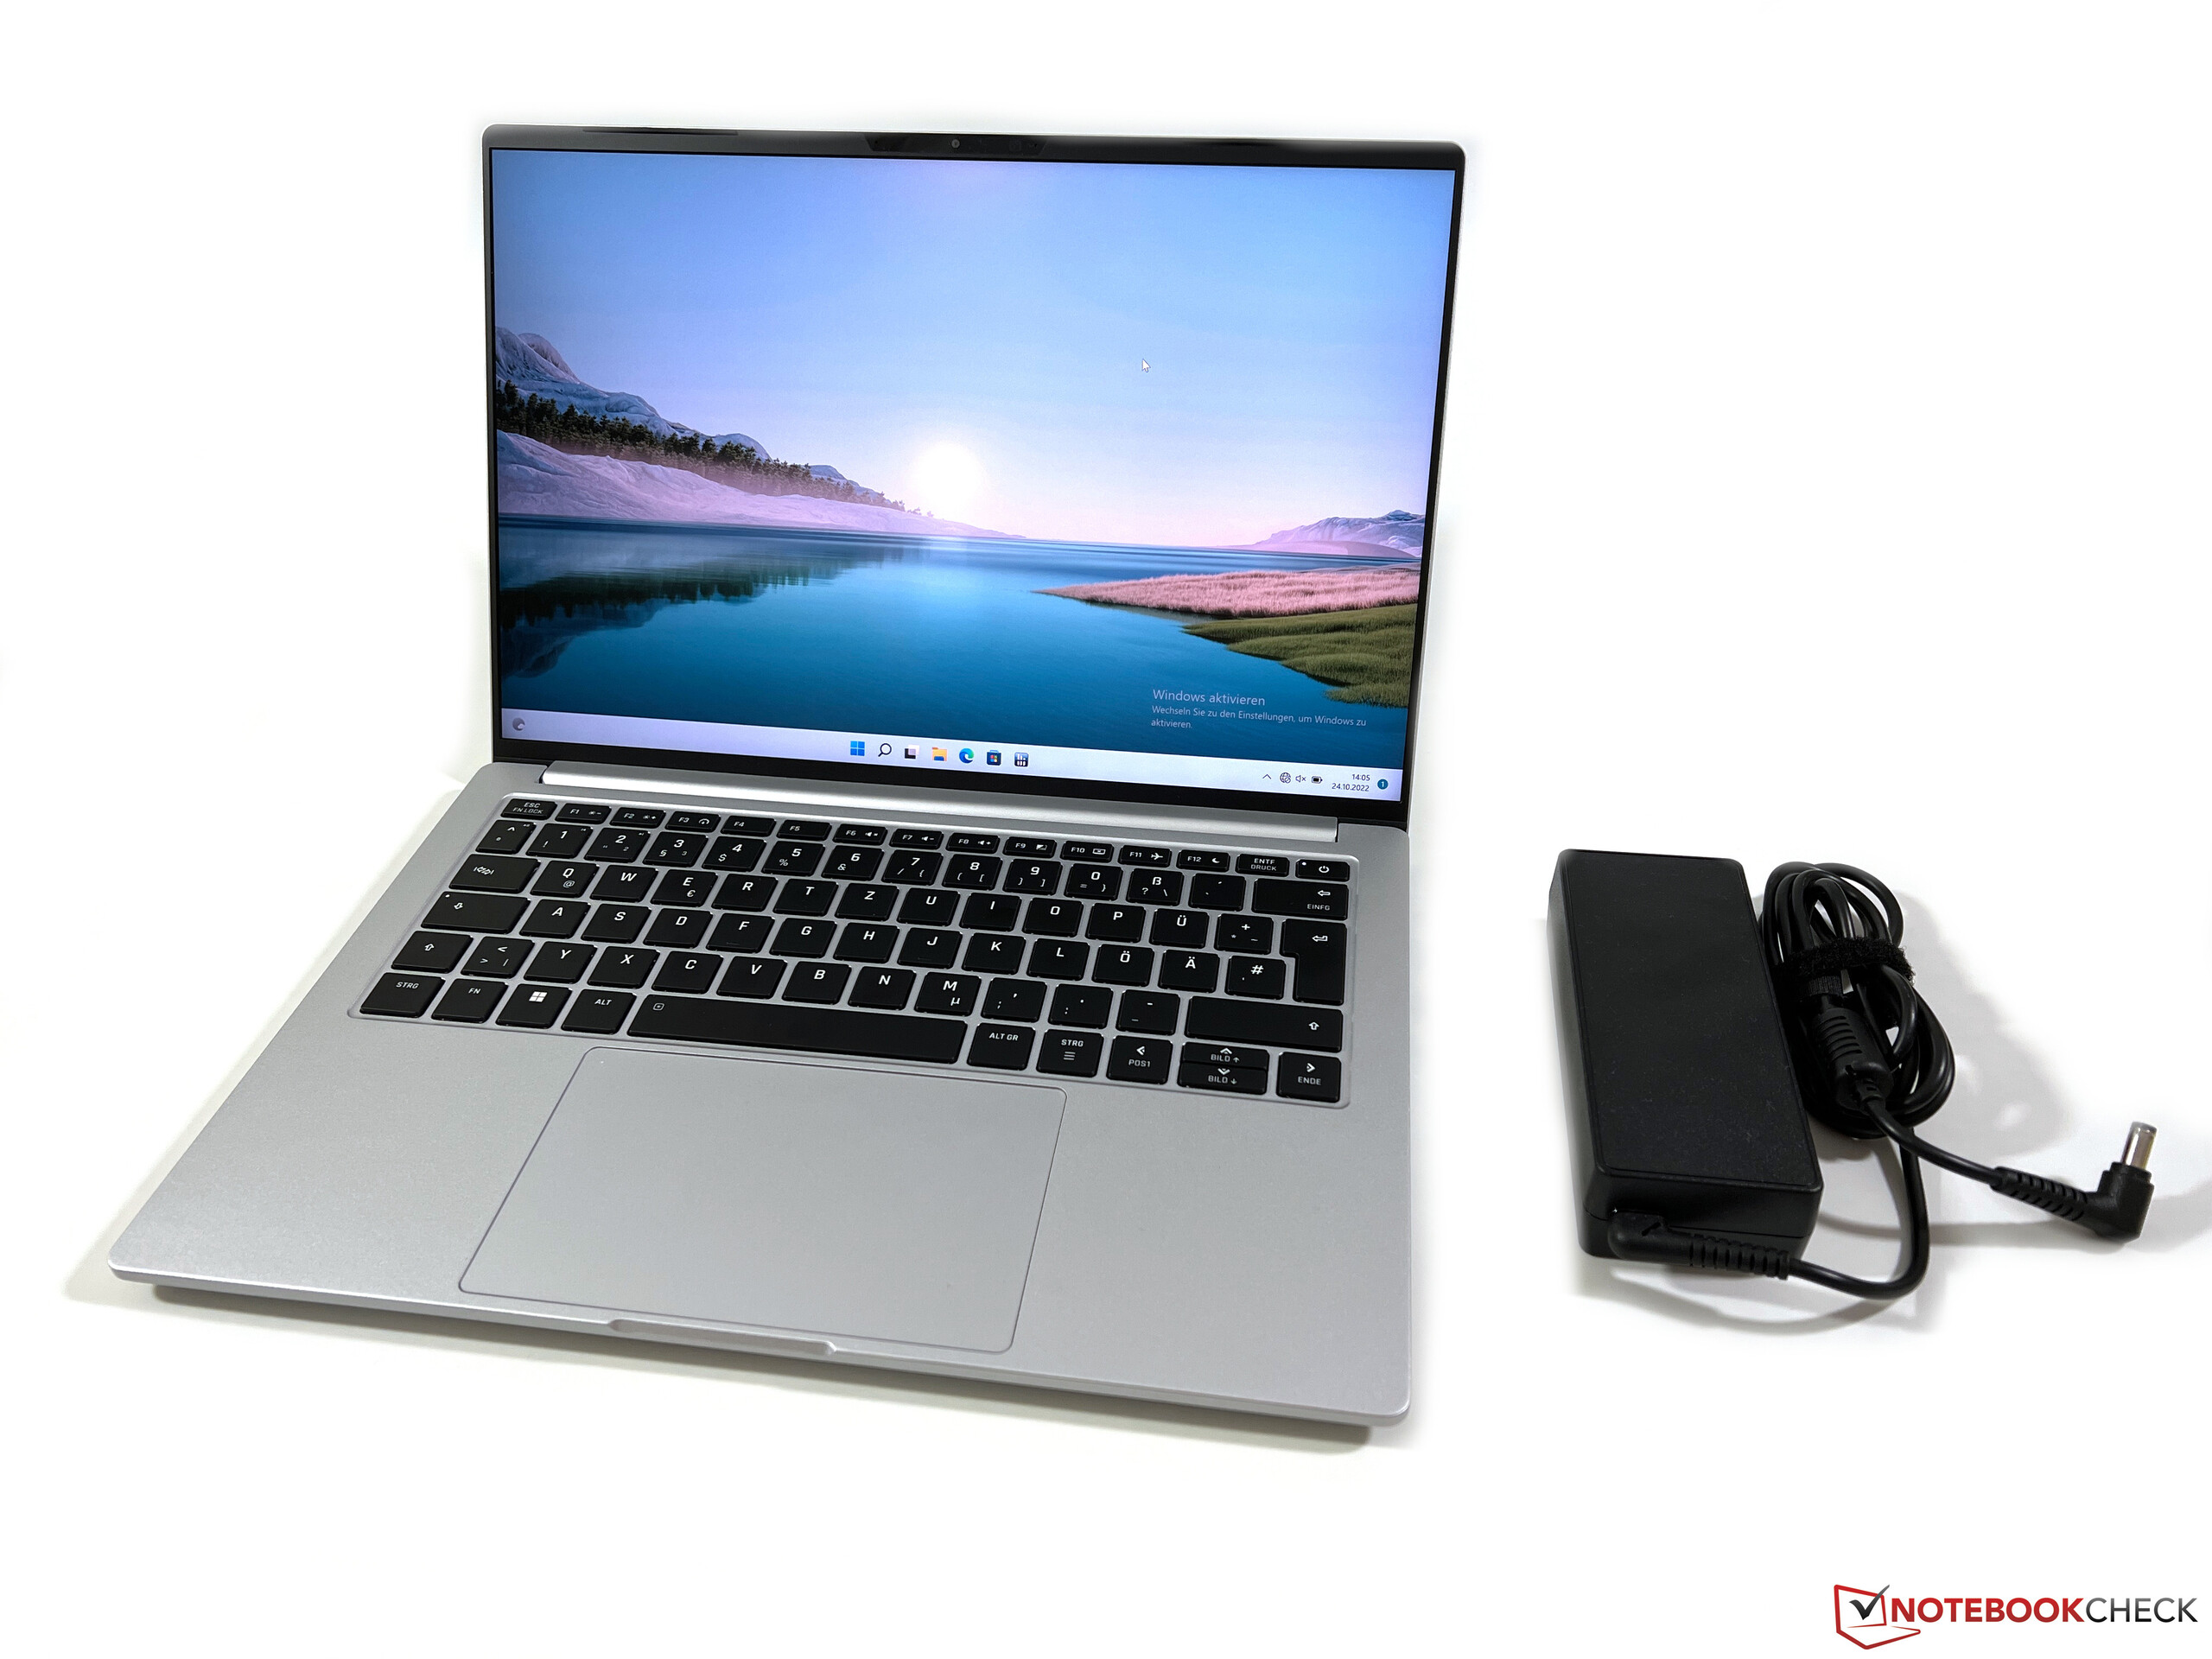
Z baterią 99-Wh i kartą GeForce RTX 3050 Ti, waga naszego urządzenia testowego wynosząca 1310 g (~2,89 lbs) przekracza wagę jego poprzednika o prawie 200 g (~0,44 lbs), co czyni go najcięższym skejtem Vision 14. Lżejszy model 53-Wh (~1,1 kg / ~2,43 lbs). Przy 1269 g (~2,80 lbs), 99-Wh wariant Vision 14 bez RTX 3050 Ti jest tylko minimalnie lżejszy. Tymczasem nowe modele 99-Wh są również grubsze o 1 mm (16,6 vs. 15,6 mm / 0,65 vs. 0,61 in).
Porównawczo, nawet najwyższa konfiguracja naszego testowego urządzenia waży zauważalnie mniej niż inne urządzenia w naszym zestawieniu z dedykowanymi kartami graficznymi. Przy wadze 513 g (~1,13 lbs), dołączony zasilacz AC jest stosunkowo ciężki.
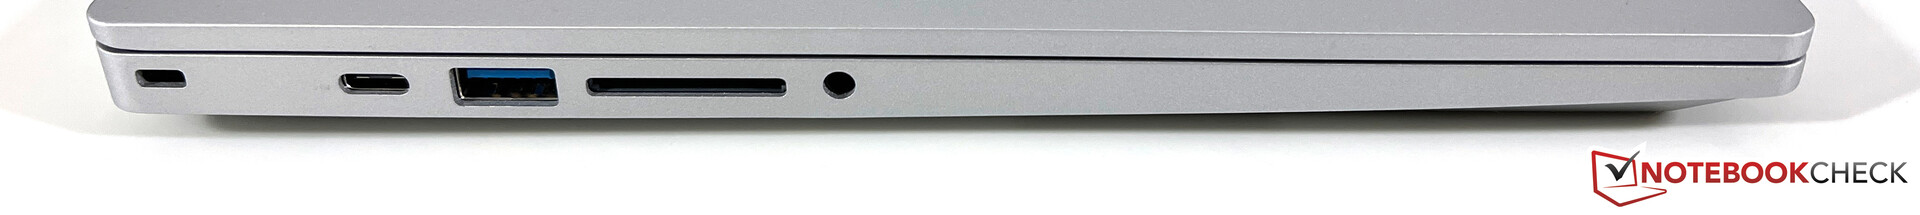
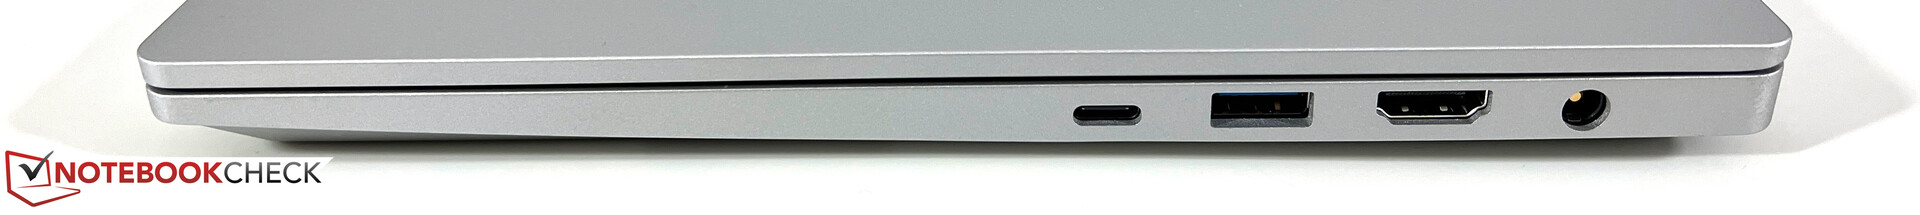
Łączność - Vision 14 z Thunderbolt 4 i czytnikiem kart
Nie zaszły żadne zmiany w zakresie łączności, co oznacza, że użytkownicy nadal korzystają z tego samego, obfitego wyboru portów, który obejmuje Thunderbolt 4. Dostępny jest także pełnowymiarowy czytnik kart. Schenker nadal korzysta z modułu Intel AX201 Wi-Fi, który w naszych testach osiąga dobre prędkości transferu. Ponieważ konfiguracja anteny w Vision 14 nie obsługuje sieci 6-GHz, moduły Wi-Fi 6E (takie jak AX211) nie są dostępne.
| SD Card Reader | |
| average JPG Copy Test (av. of 3 runs) | |
| Apple MacBook Pro 14 2021 M1 Pro Entry (AV PRO V60) | |
| Schenker Vision 14 (Angelbird AV Pro V60) | |
| Średnia w klasie Subnotebook (23.7 - 188, n=9, ostatnie 2 lata) | |
| Schenker Vision 14 2022 RTX 3050 Ti | |
| Asus Vivobook Pro 14 M3401QC-KM007T (AV Pro SD microSD 128 GB V60) | |
| Dell Inspiron 14 Plus 7420 (AV PRO microSD 128 GB V60) | |
| maximum AS SSD Seq Read Test (1GB) | |
| Średnia w klasie Subnotebook (24.9 - 195, n=8, ostatnie 2 lata) | |
| Schenker Vision 14 (Angelbird AV Pro V60) | |
| Schenker Vision 14 2022 RTX 3050 Ti | |
| Asus Vivobook Pro 14 M3401QC-KM007T (AV Pro SD microSD 128 GB V60) | |
| Dell Inspiron 14 Plus 7420 (AV PRO microSD 128 GB V60) | |
| Networking | |
| iperf3 receive AXE11000 | |
| Schenker Vision 14 2022 RTX 3050 Ti | |
| Średnia w klasie Subnotebook (504 - 1827, n=52, ostatnie 2 lata) | |
| Przeciętny Intel Wi-Fi 6 AX201 (390 - 1734, n=79) | |
| iperf3 transmit AXE11000 | |
| Schenker Vision 14 2022 RTX 3050 Ti | |
| Średnia w klasie Subnotebook (467 - 1811, n=52, ostatnie 2 lata) | |
| Przeciętny Intel Wi-Fi 6 AX201 (438 - 1715, n=74) | |
| iperf3 receive AXE11000 6GHz | |
| Huawei MateBook X Pro 2022 | |
| Średnia w klasie Subnotebook (1250 - 1784, n=24, ostatnie 2 lata) | |
| Lenovo Yoga 9i 14 2022 i7-1260P | |
| Dell Inspiron 14 Plus 7420 | |
| Przeciętny Intel Wi-Fi 6 AX201 (390 - 1670, n=3) | |
| Asus Vivobook Pro 14 M3401QC-KM007T | |
| iperf3 transmit AXE11000 6GHz | |
| Huawei MateBook X Pro 2022 | |
| Lenovo Yoga 9i 14 2022 i7-1260P | |
| Dell Inspiron 14 Plus 7420 | |
| Średnia w klasie Subnotebook (524 - 1797, n=24, ostatnie 2 lata) | |
| Przeciętny Intel Wi-Fi 6 AX201 (745 - 1252, n=3) | |
| Asus Vivobook Pro 14 M3401QC-KM007T | |
Kamera internetowa
Sensor kamerki został ulepszony ze starszego 720p do wersji 1080p. Poprawia to nieco ostrość obrazu, jednocześnie utrzymując odchylenia kolorów na dość niskim poziomie.


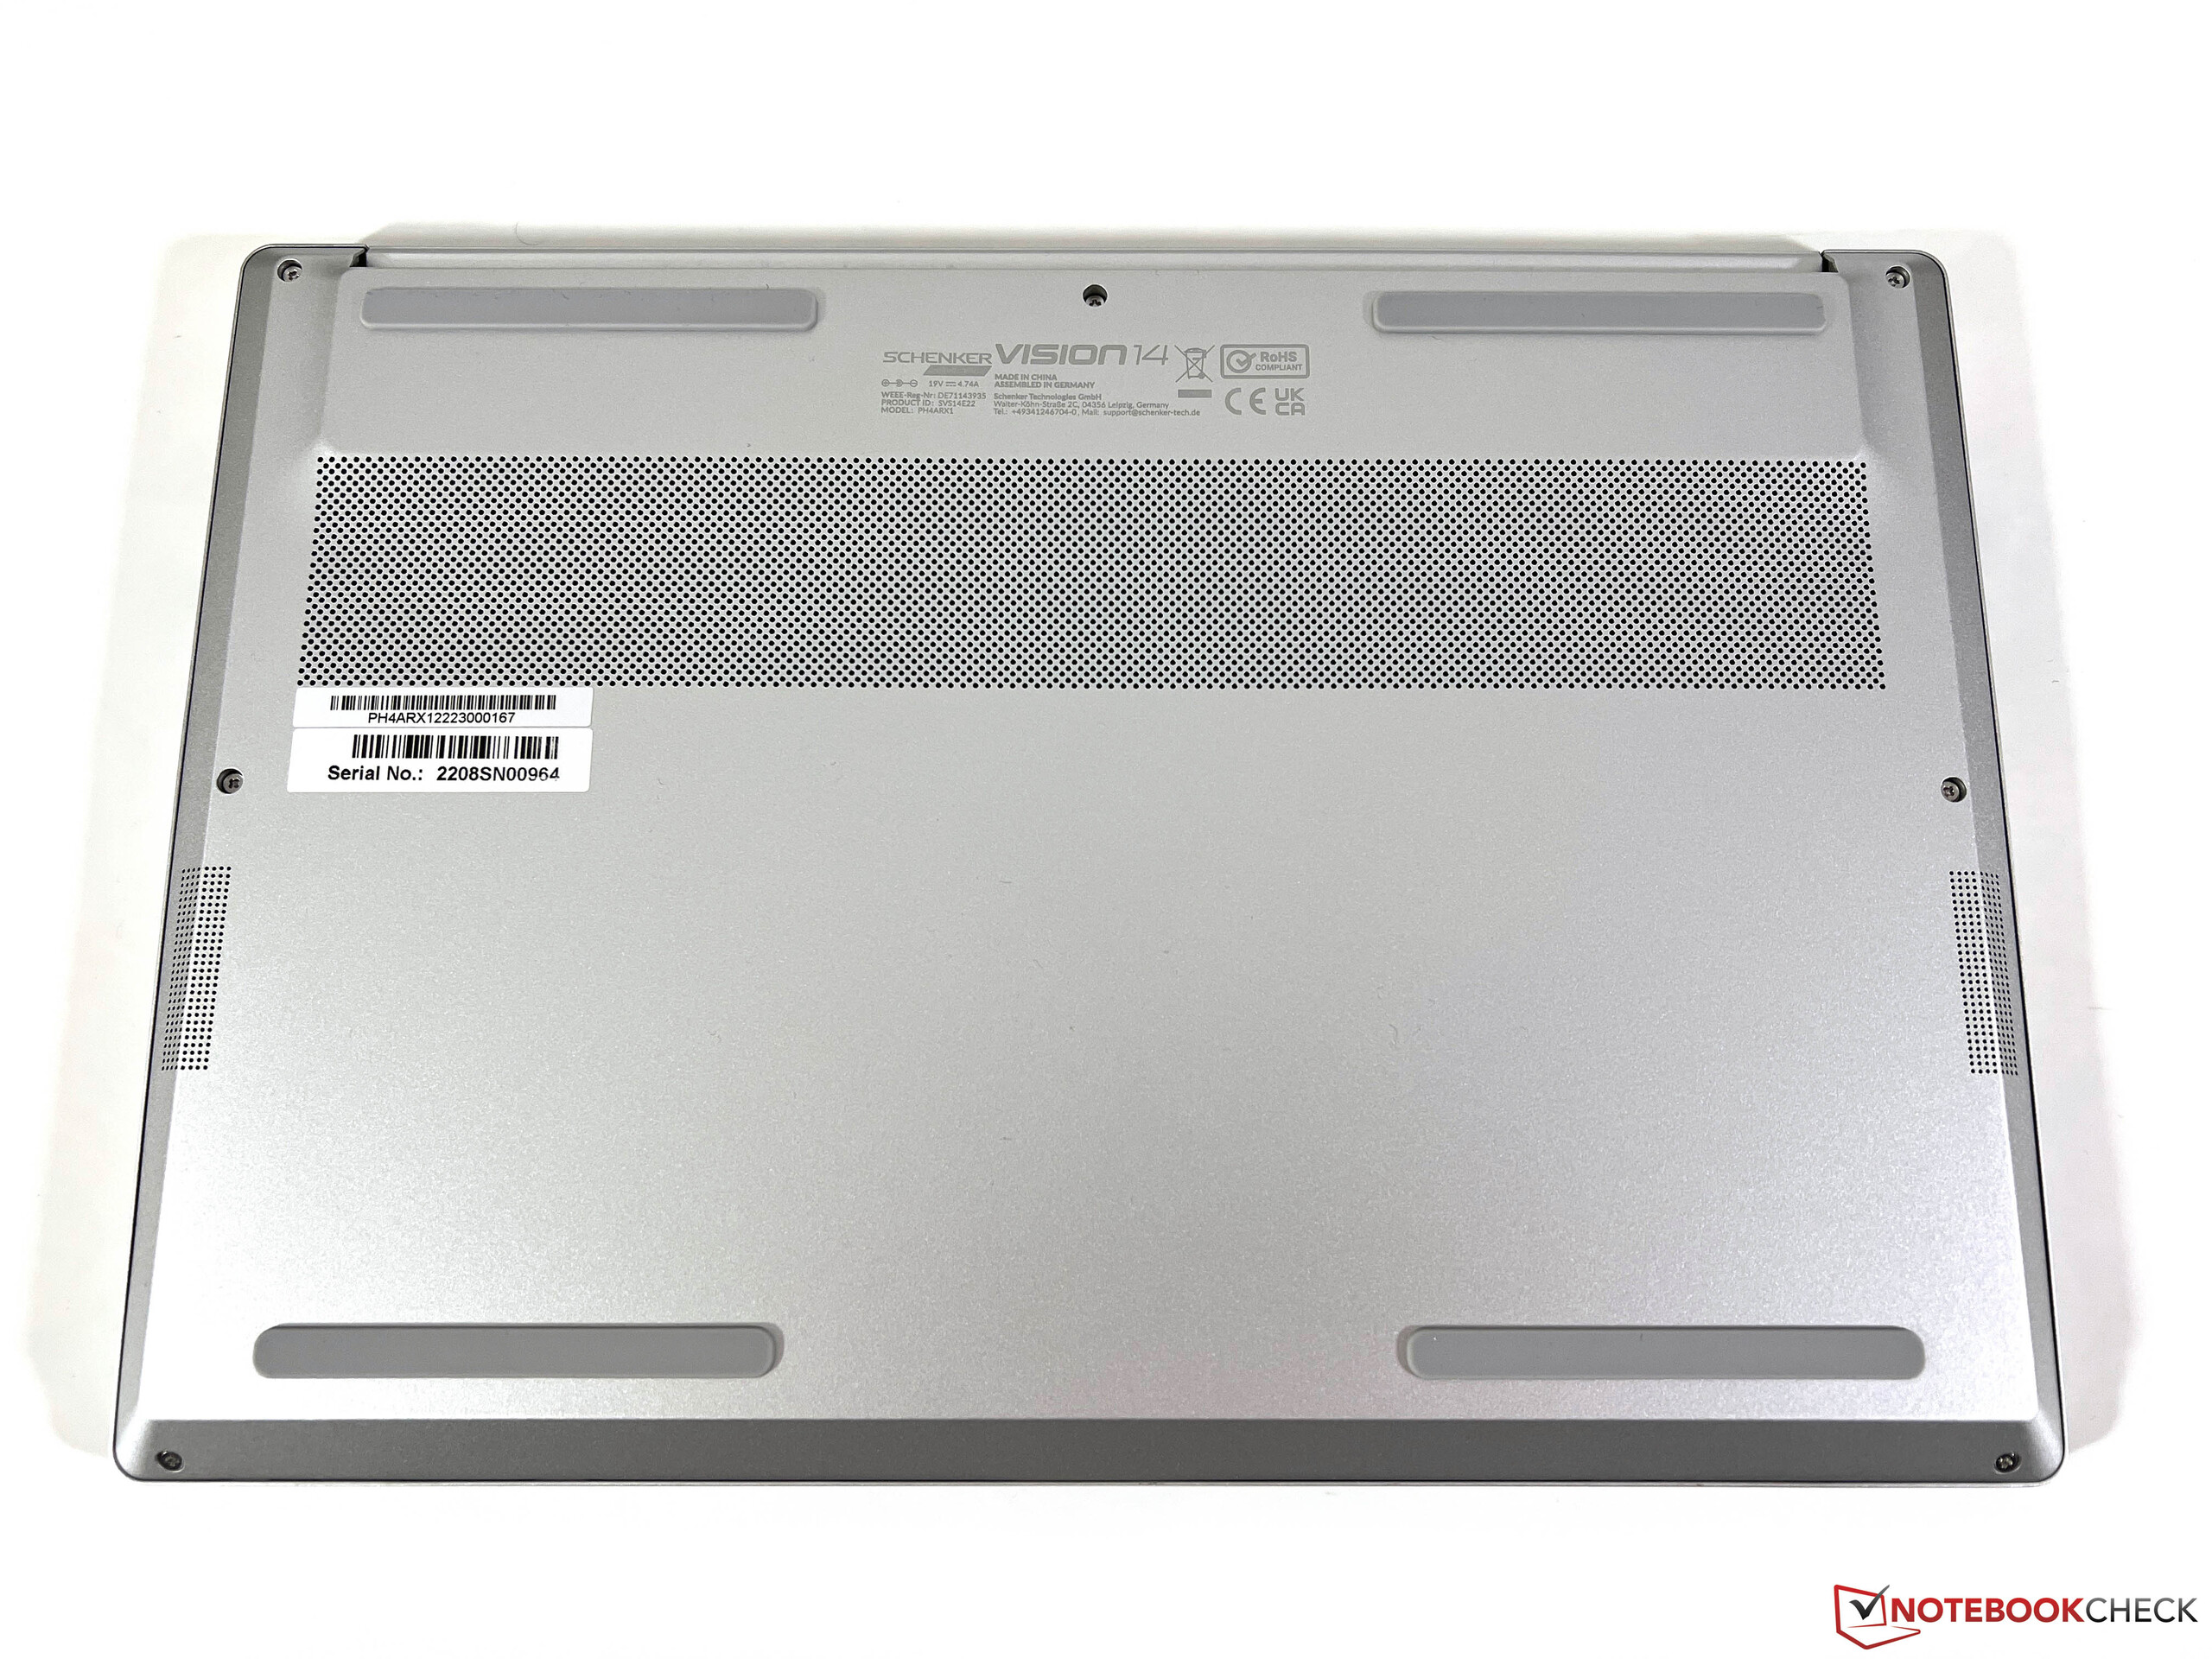
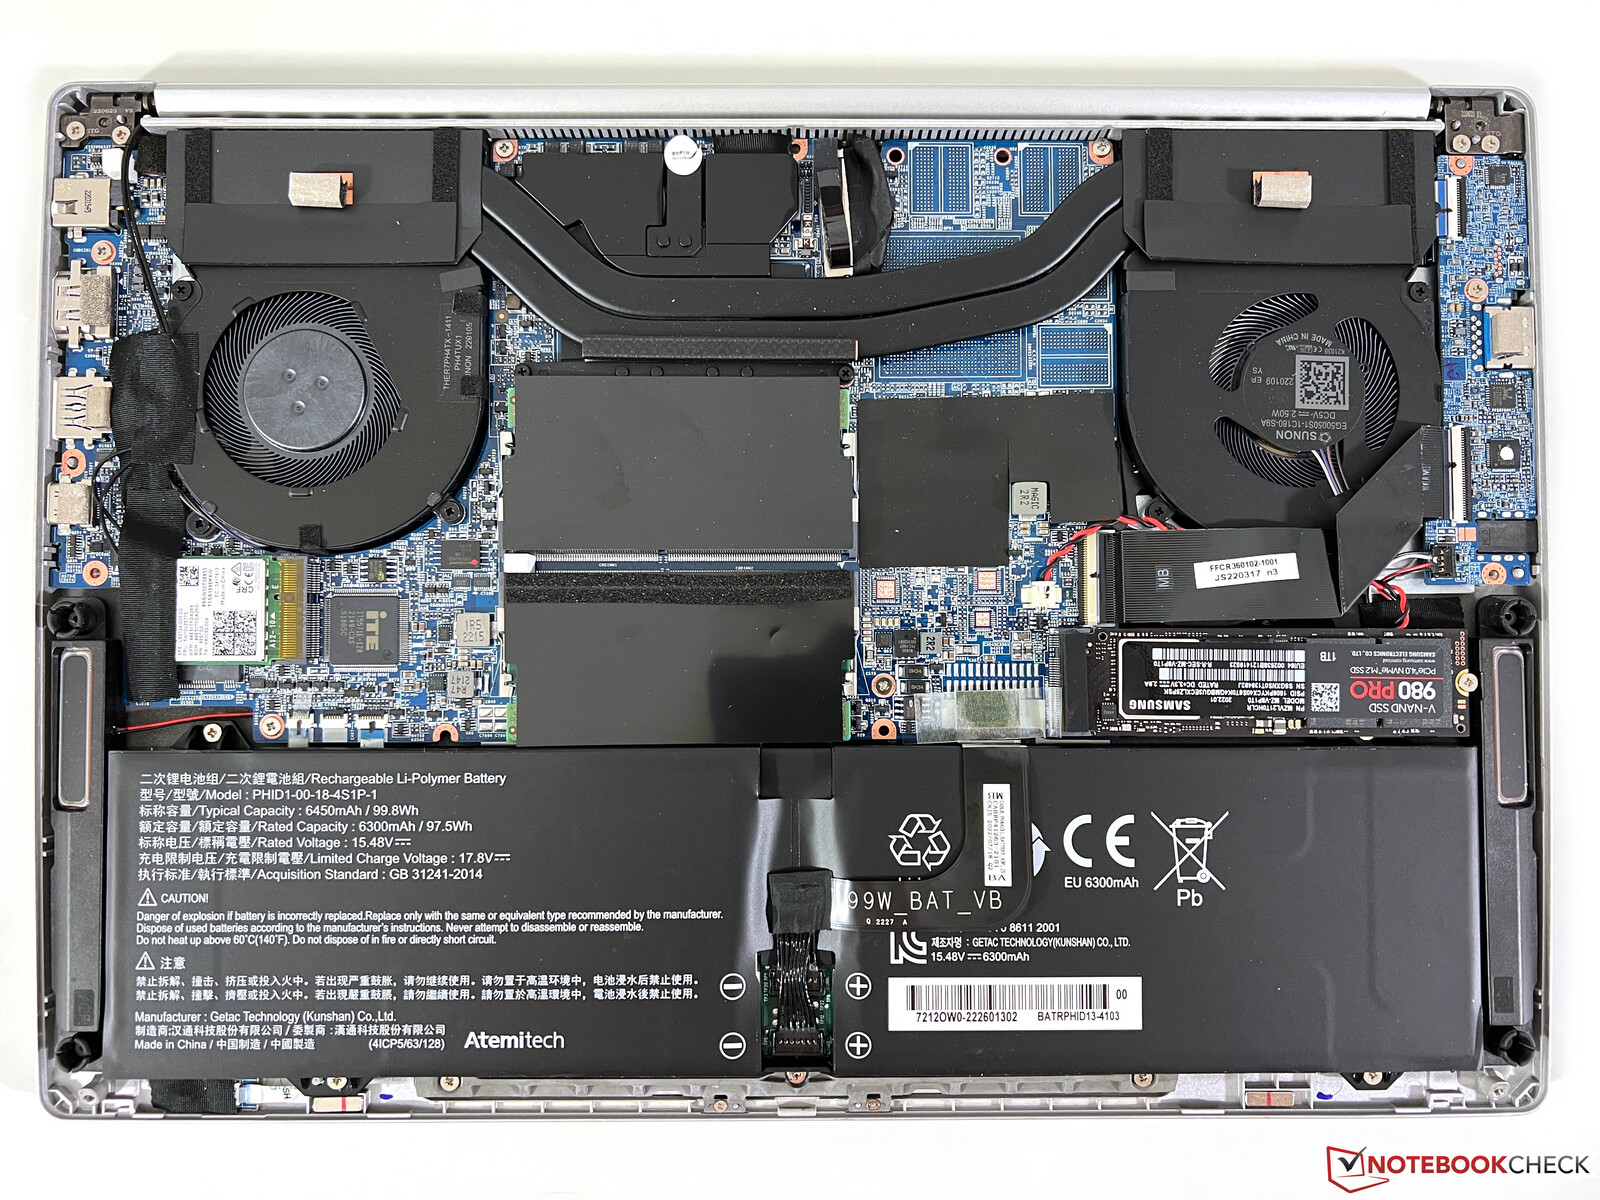
Konserwacja
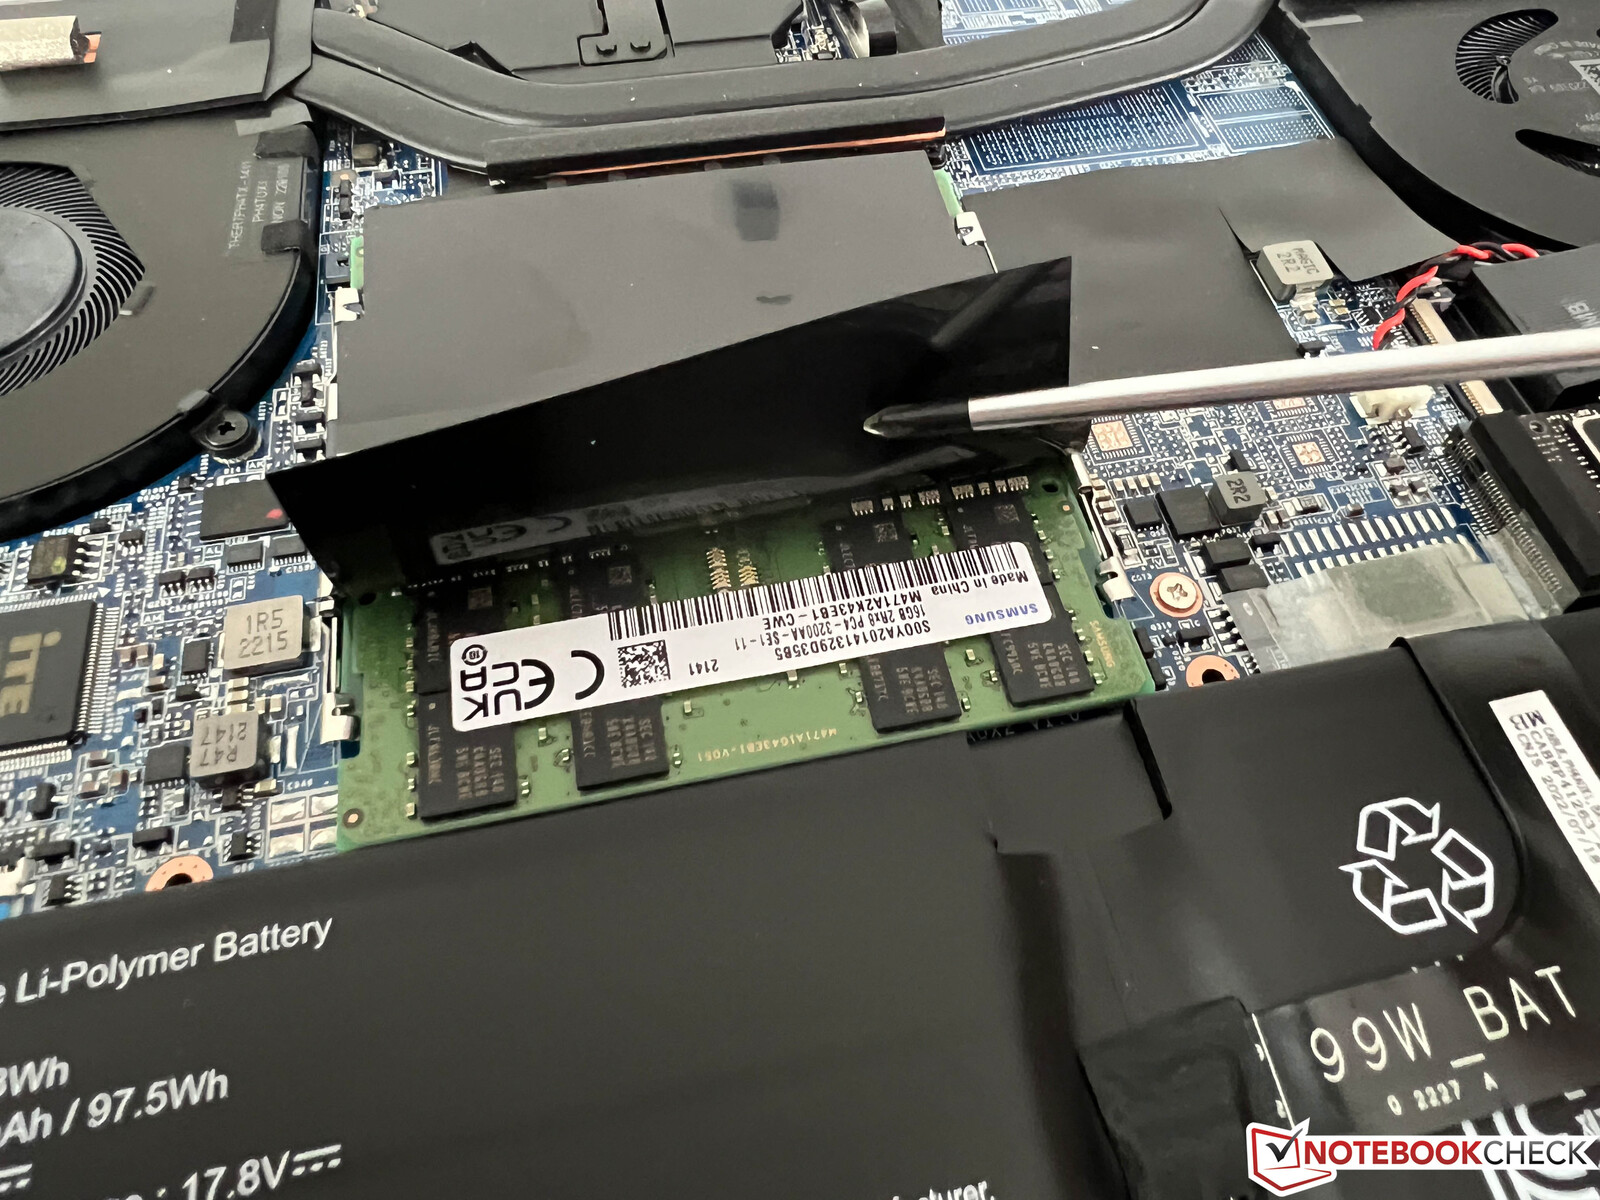
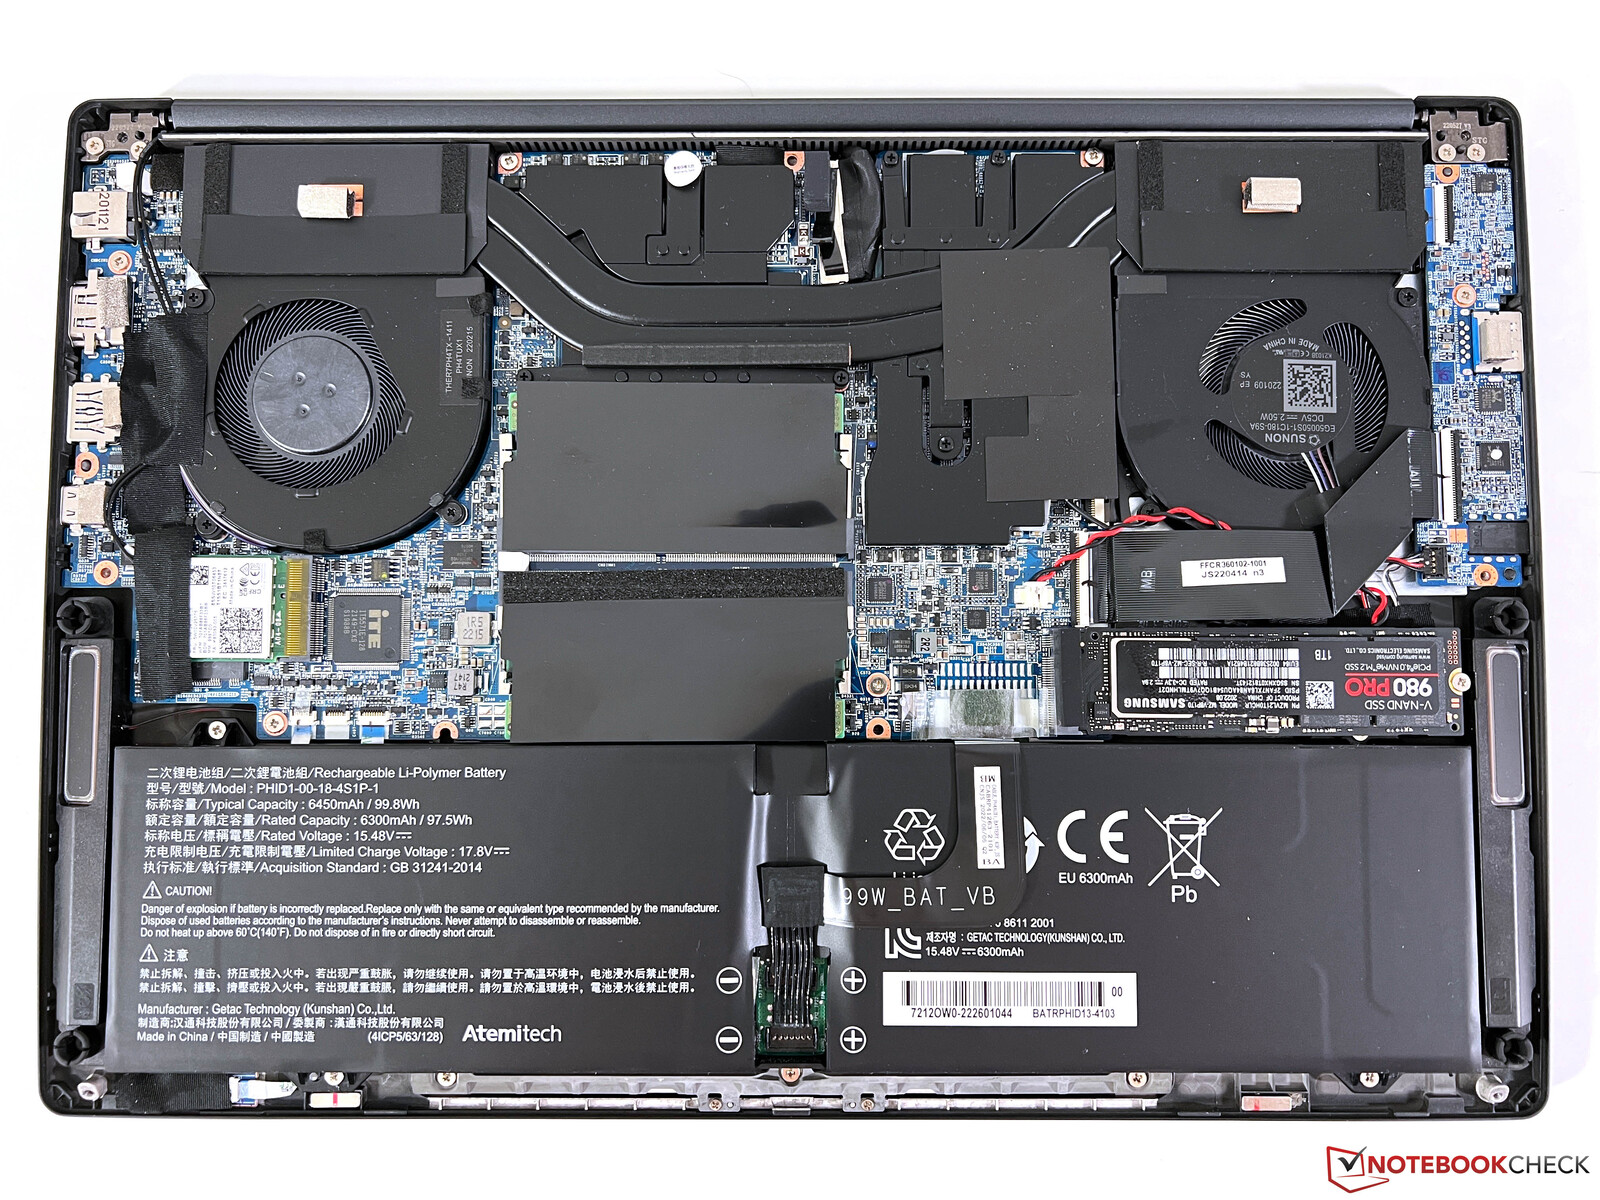
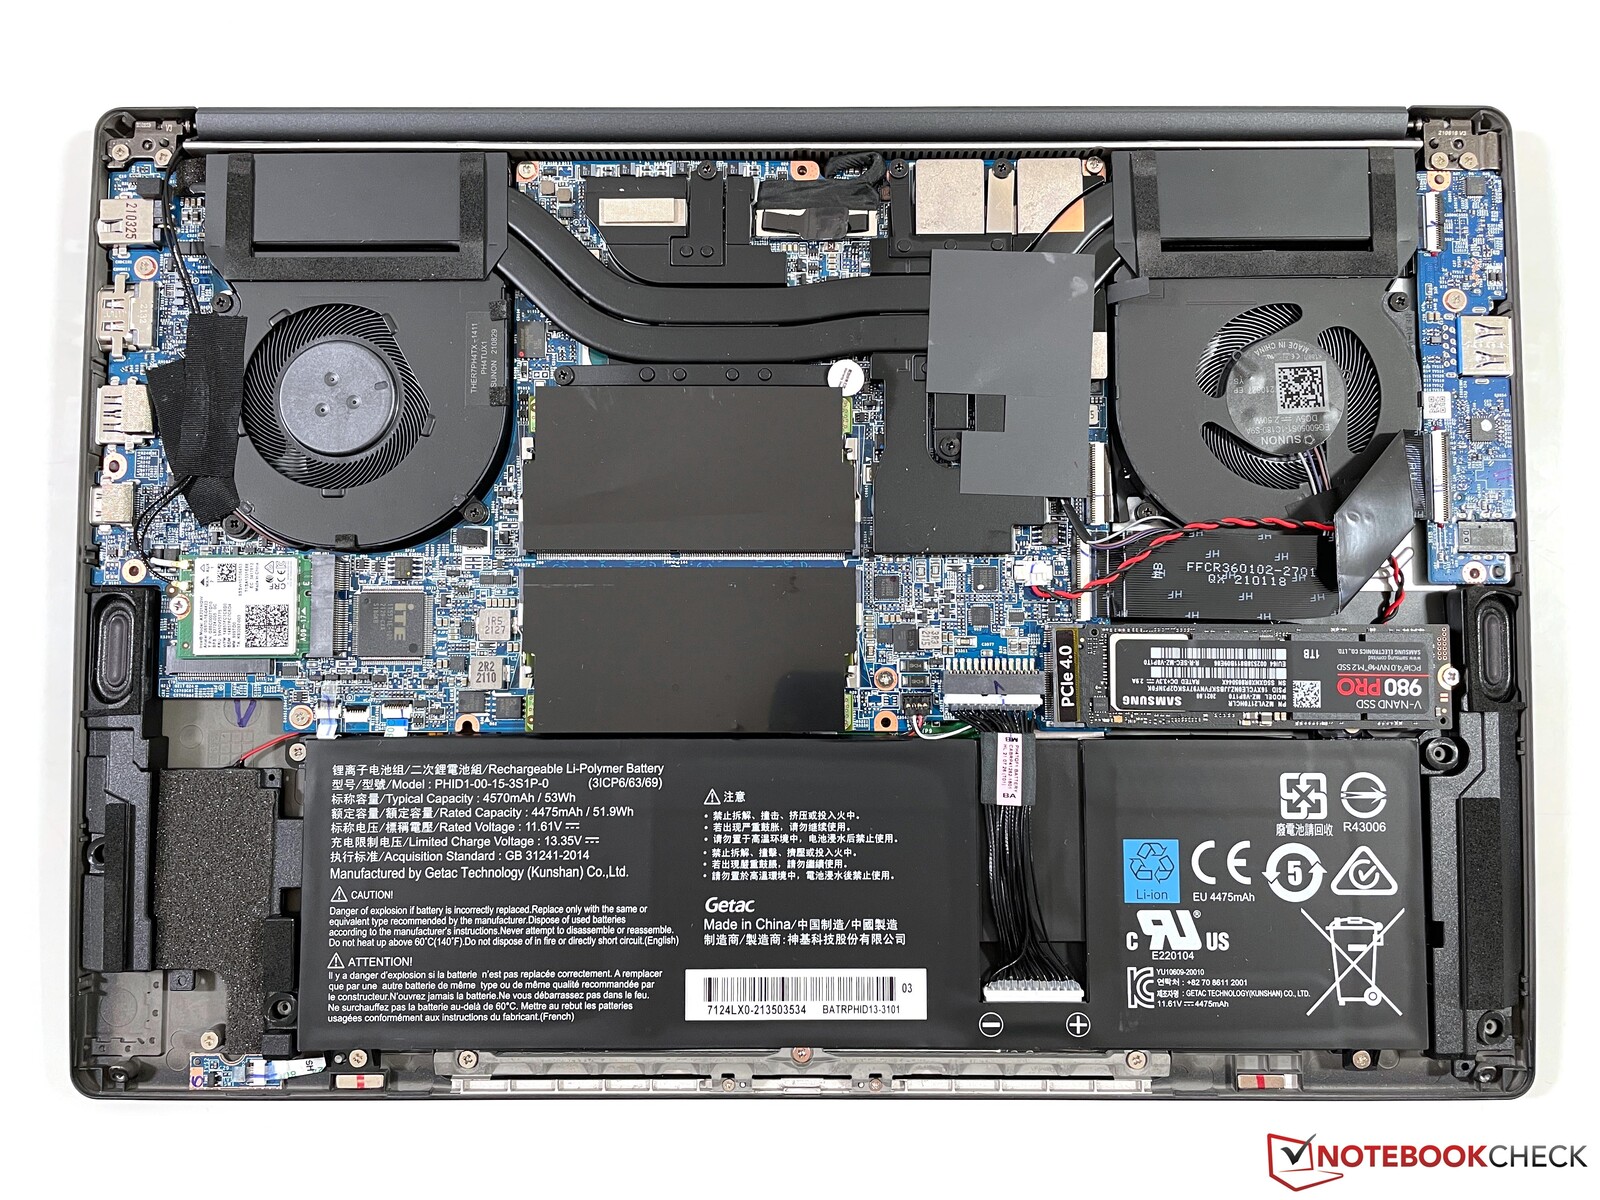
Dolną płytę można łatwo zdjąć, aby natychmiast odsłonić nową 99-Wh w środku, a także kilka zbieżnych zmian na płycie głównej i w głośnikach. Oznacza to, że nowa bateria nie pasuje do poprzednich modeli Vision 14. Warto zauważyć, że w modelach z większą baterią nie jest dostępny dodatkowy slot M.2-2280. Pamięć RAM i moduł Wi-Fi można jeszcze rozbudować.
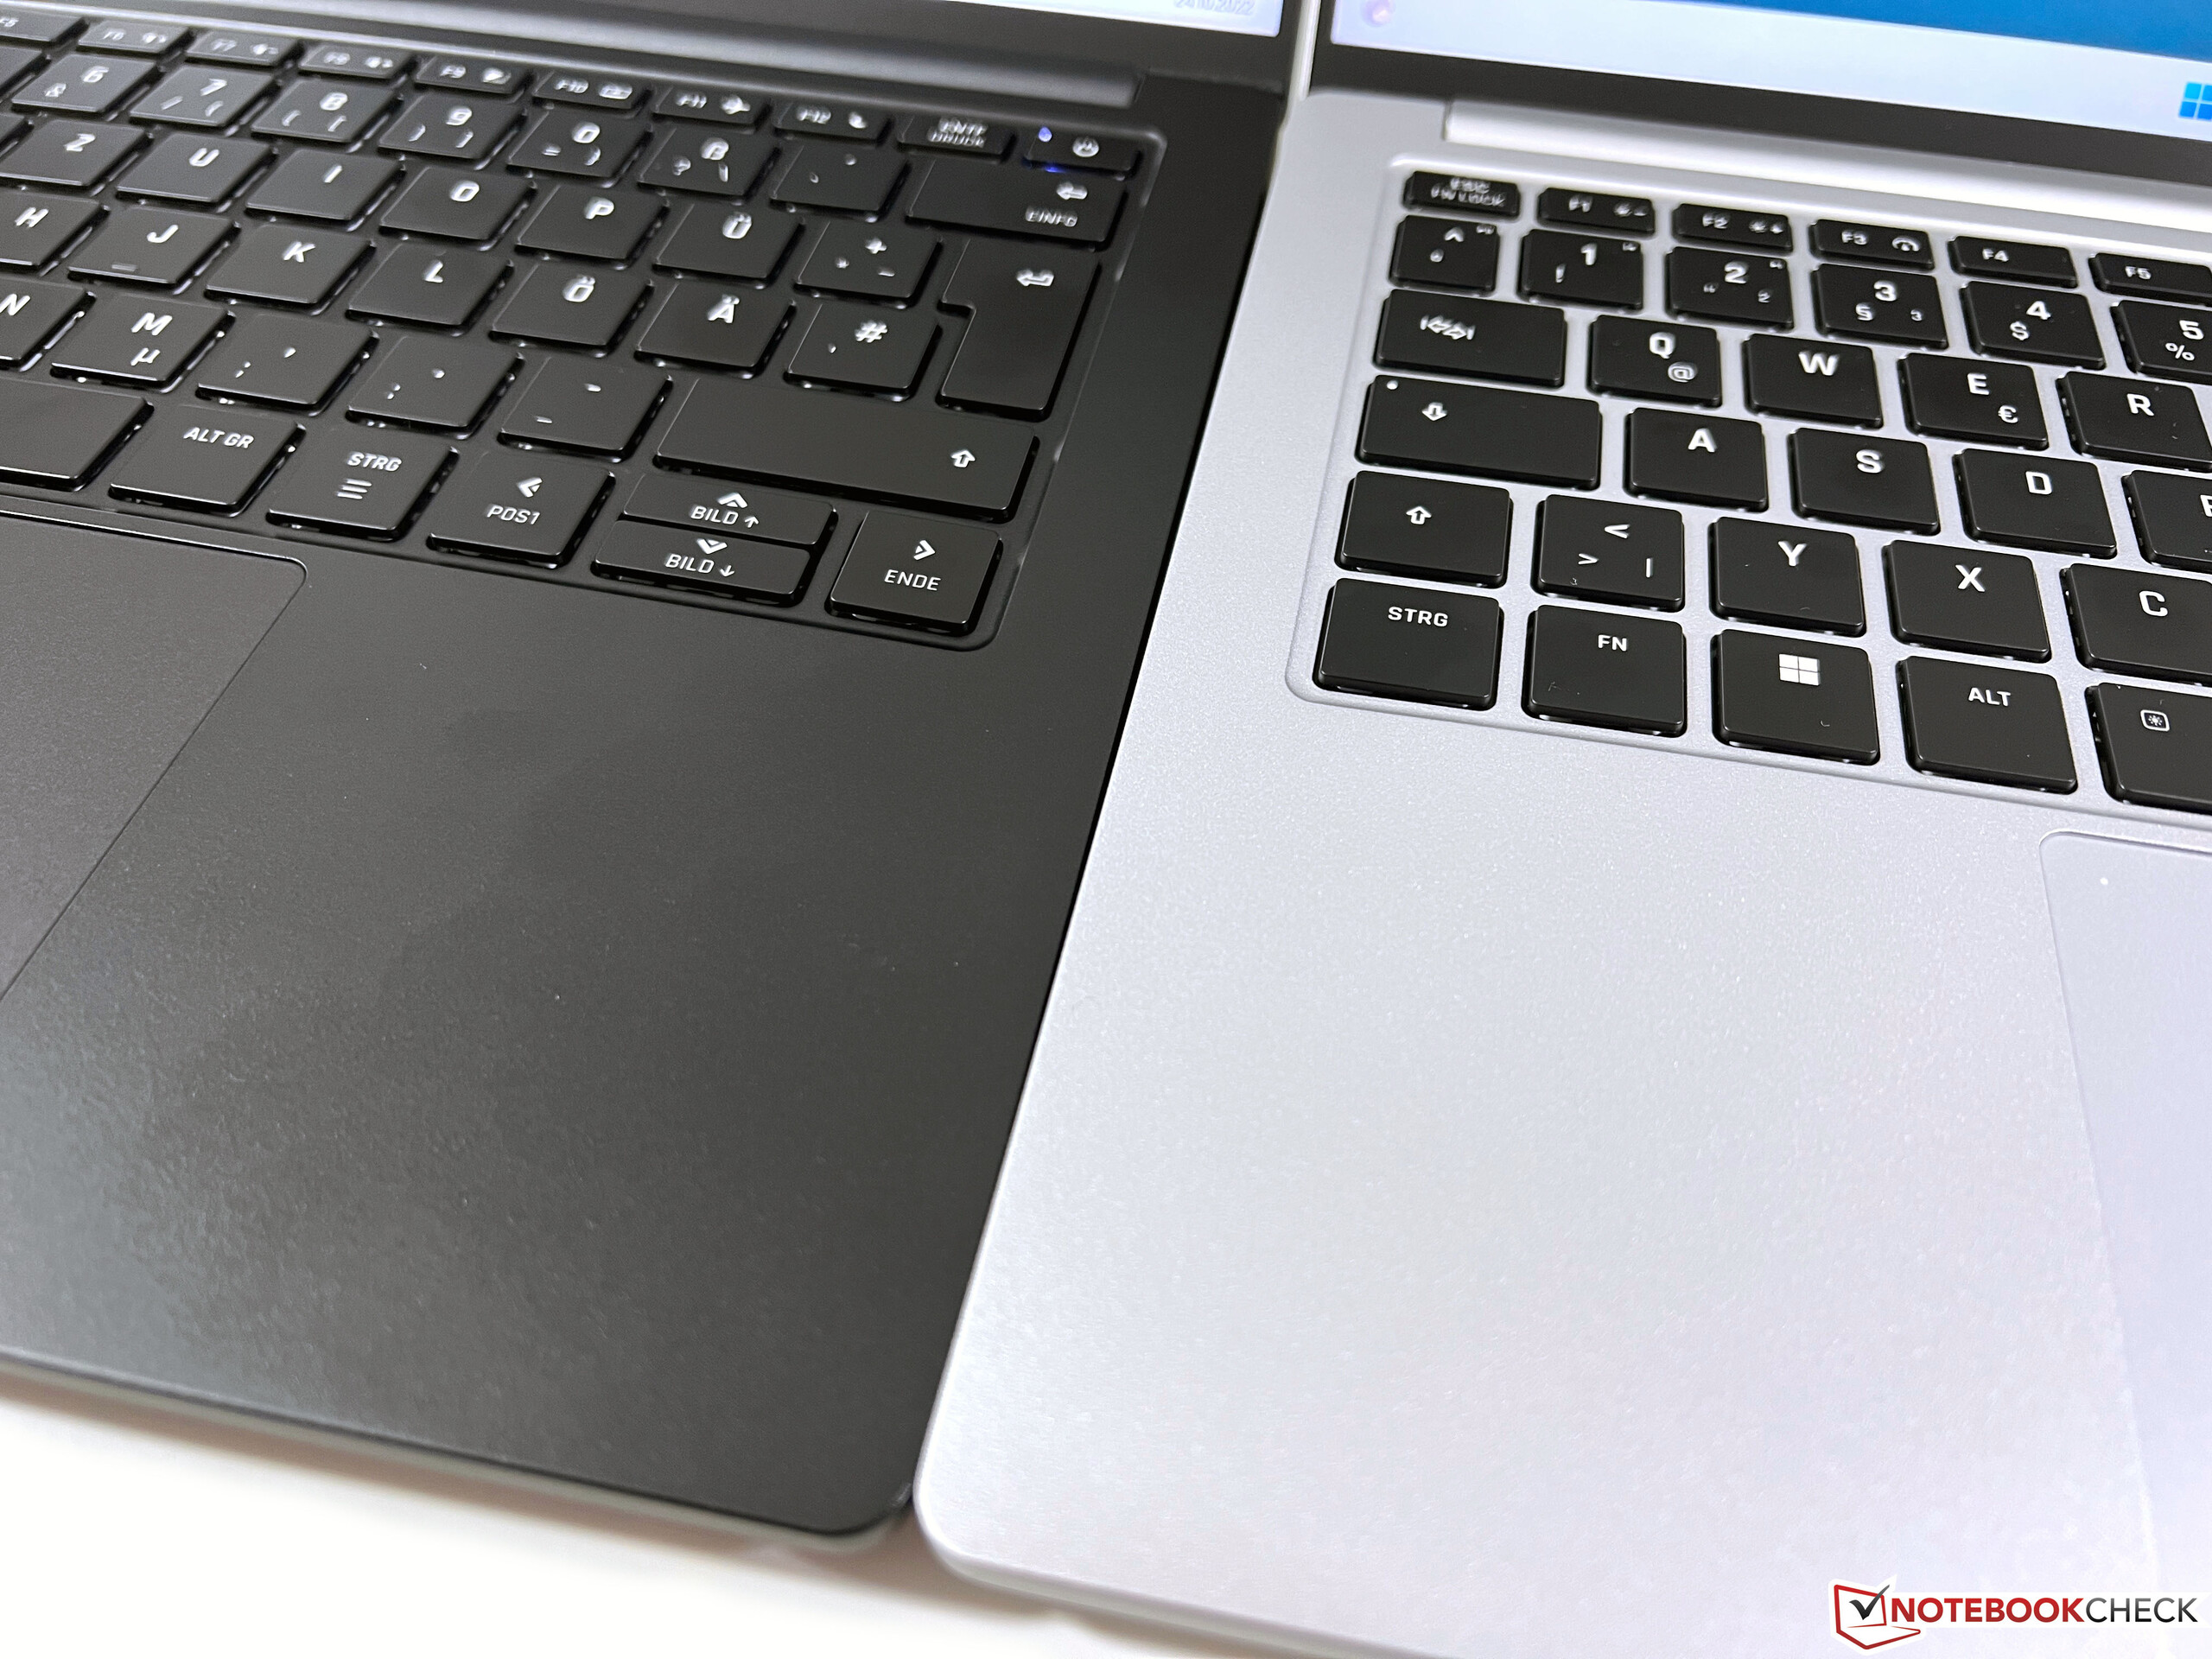
Urządzenia wejściowe - podświetlana klawiatura i szklany touchpad
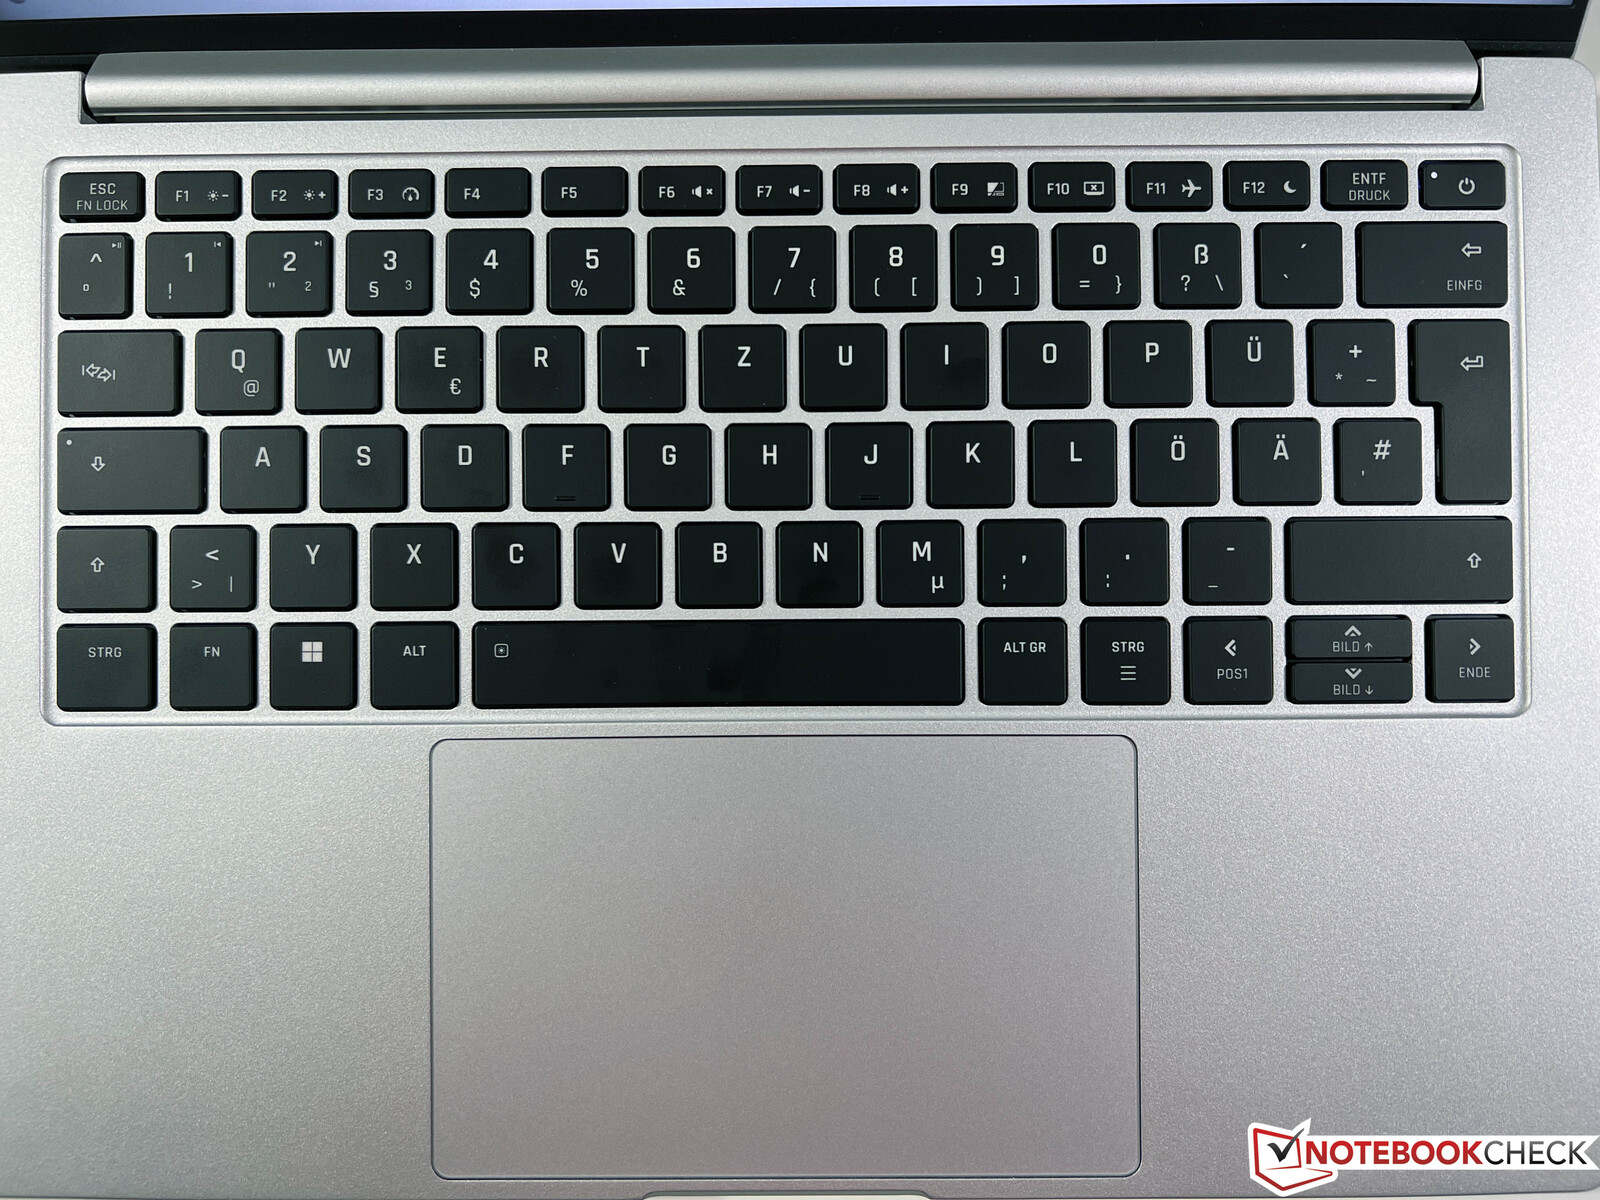
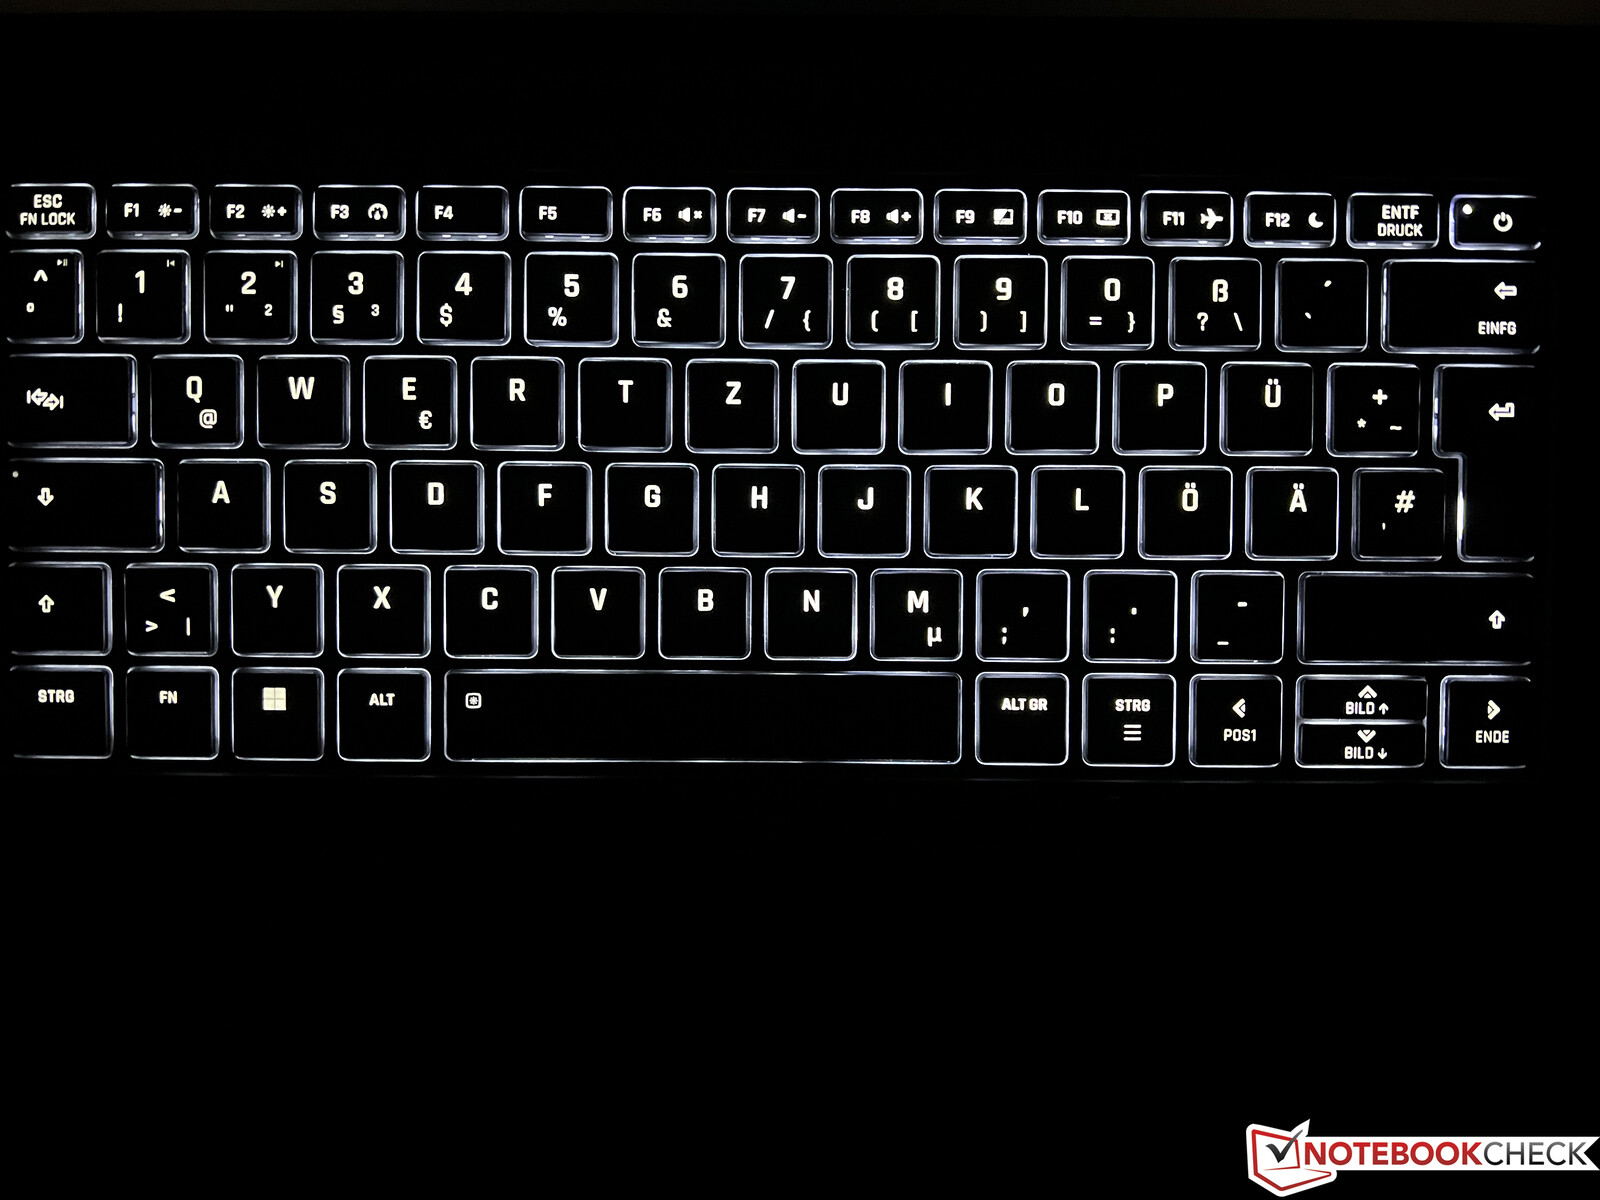
Urządzenia wejściowe pozostają bez zmian w porównaniu z poprzedniego modelu. Podświetlana klawiatura oferuje wygodne pisanie z cichym klekotem klawiszy. Szklany touchpad (13 x 8 cm / 5,12 x 3,15 cala) też jest dobry, ale jego kliknięcia są bardzo głośne.
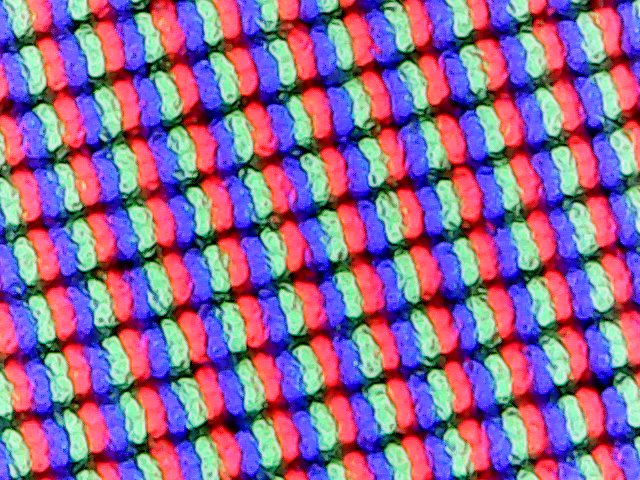
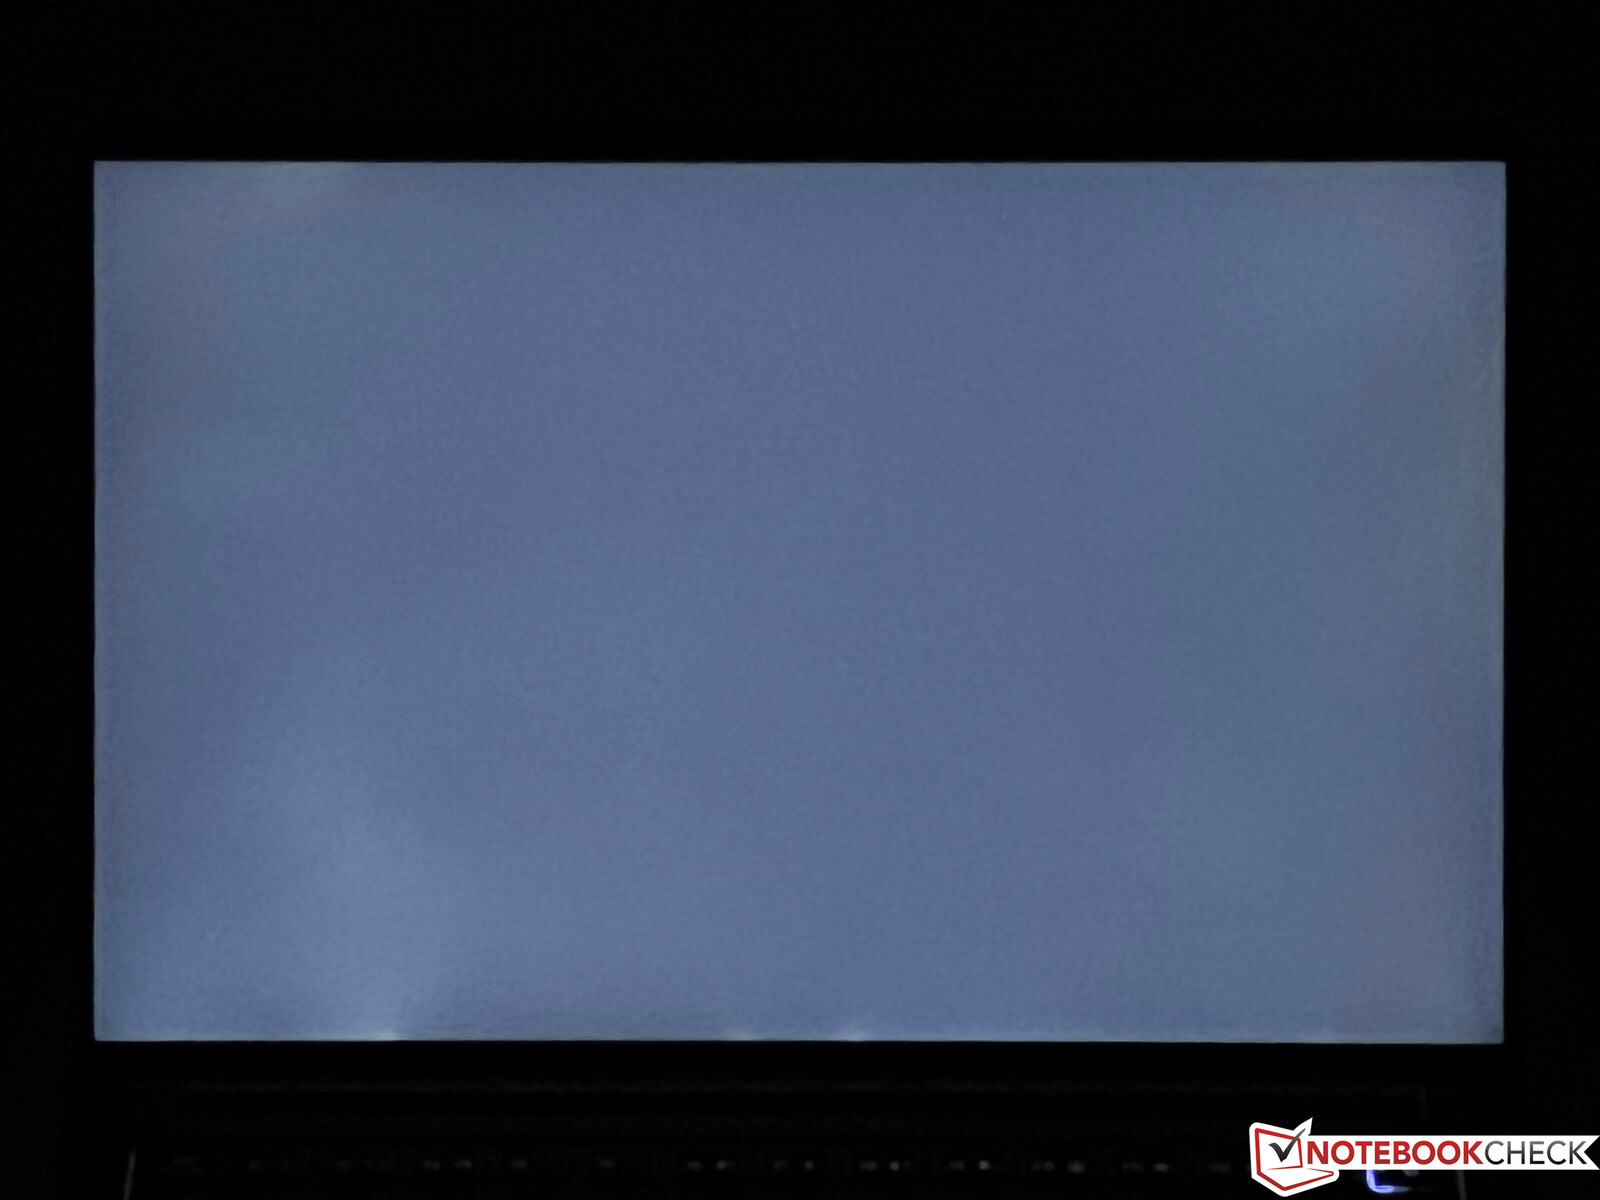
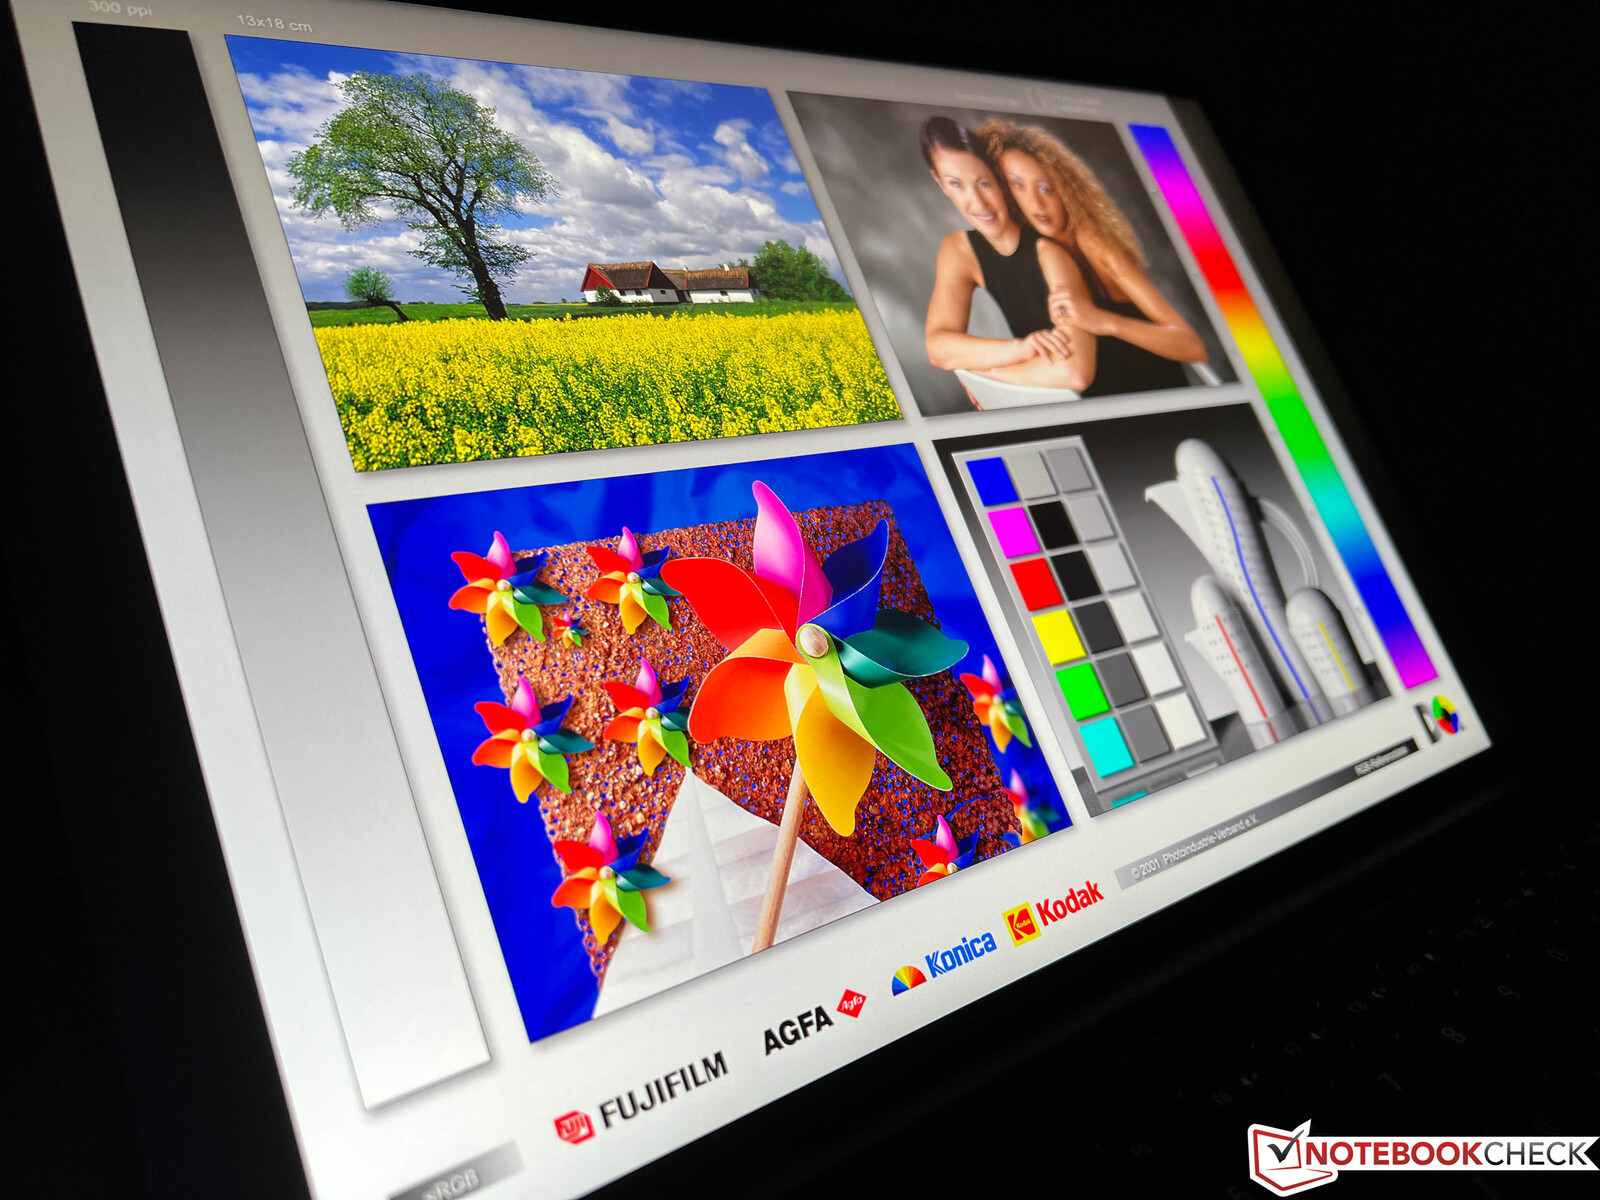
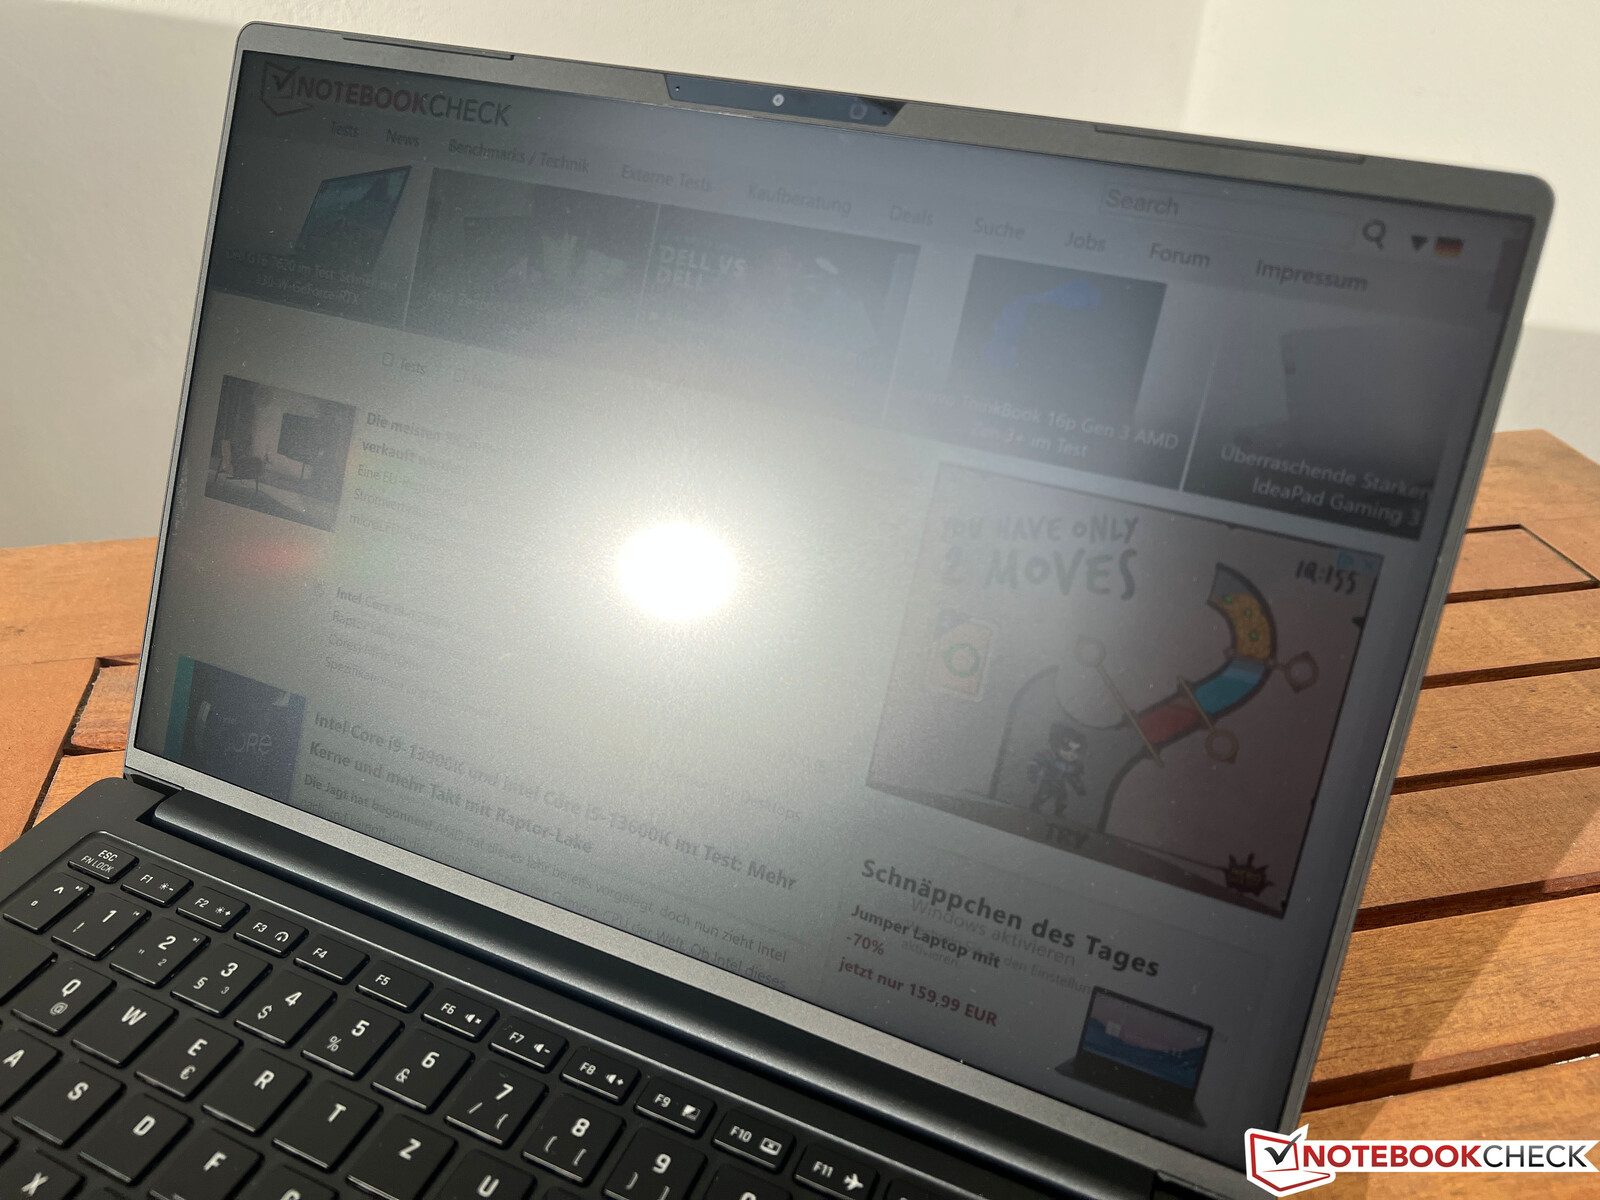
Wyświetlacz - Vision 14 Still z 3K IPS i 90 Hz
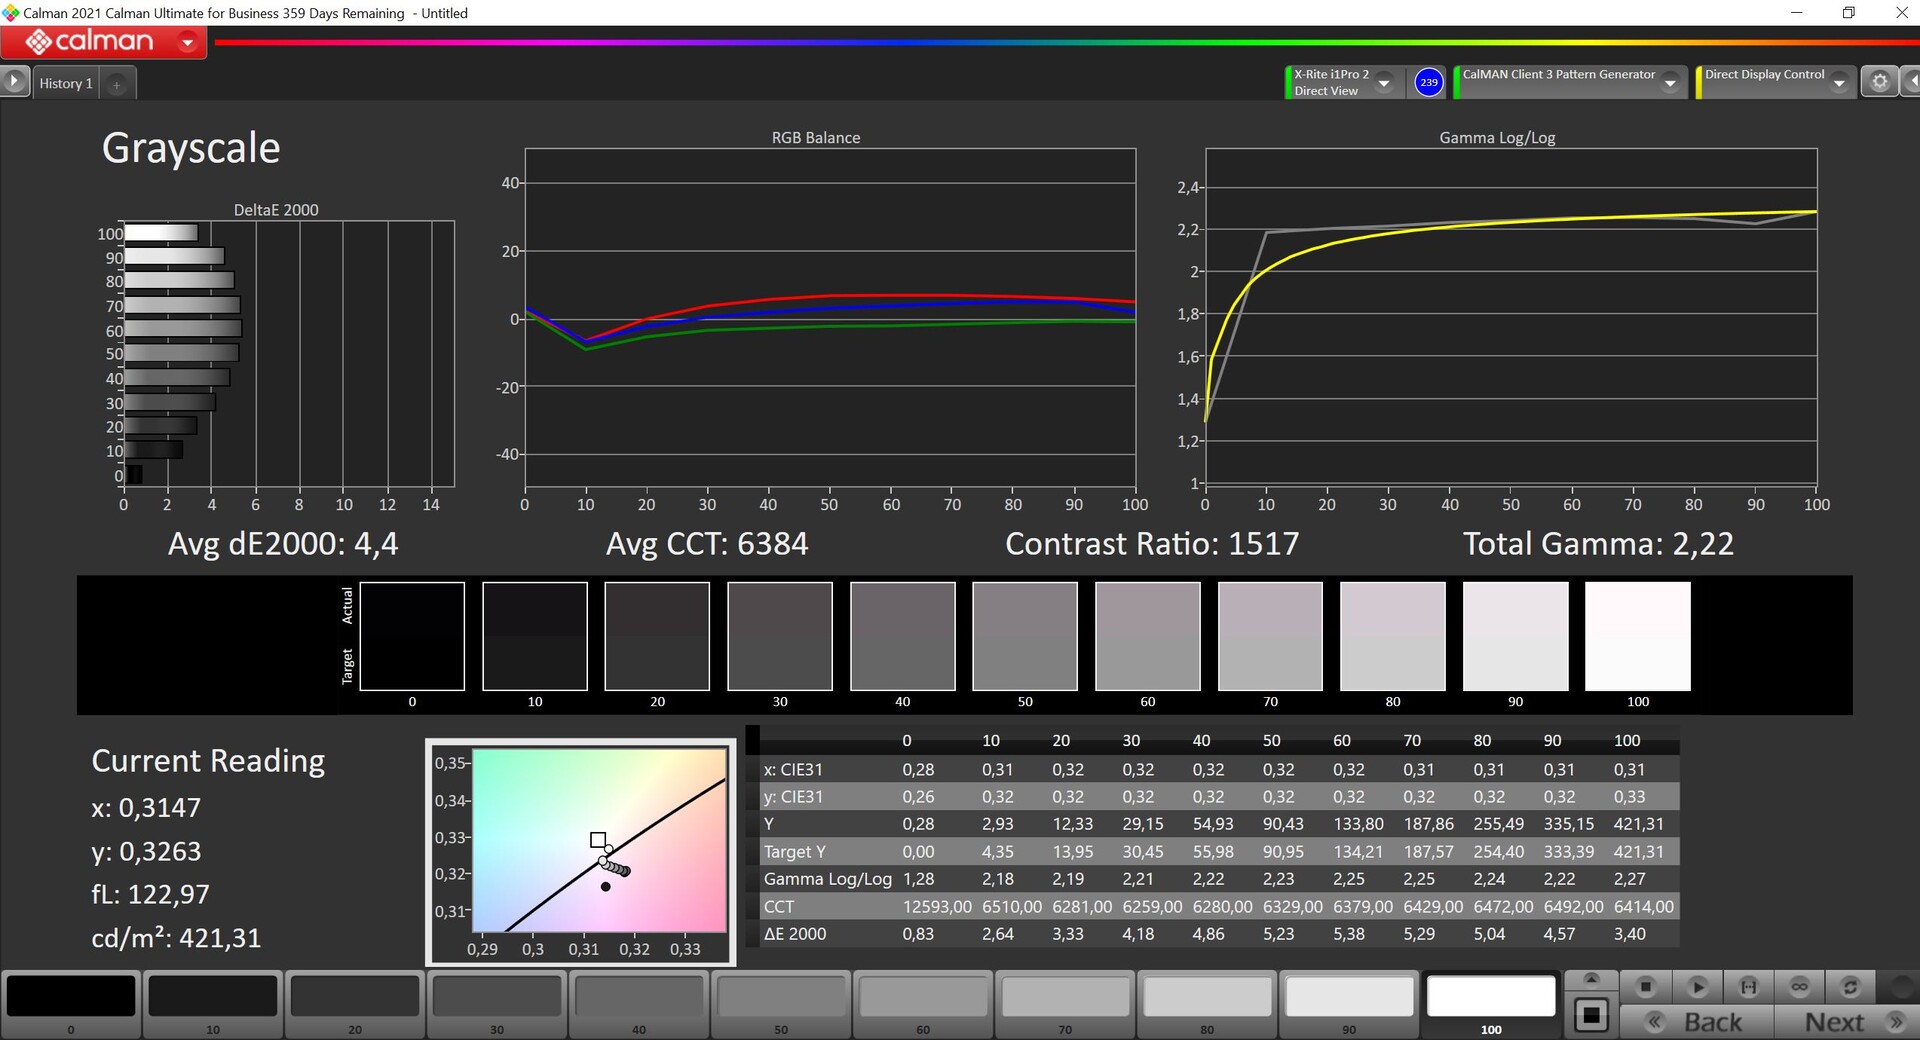
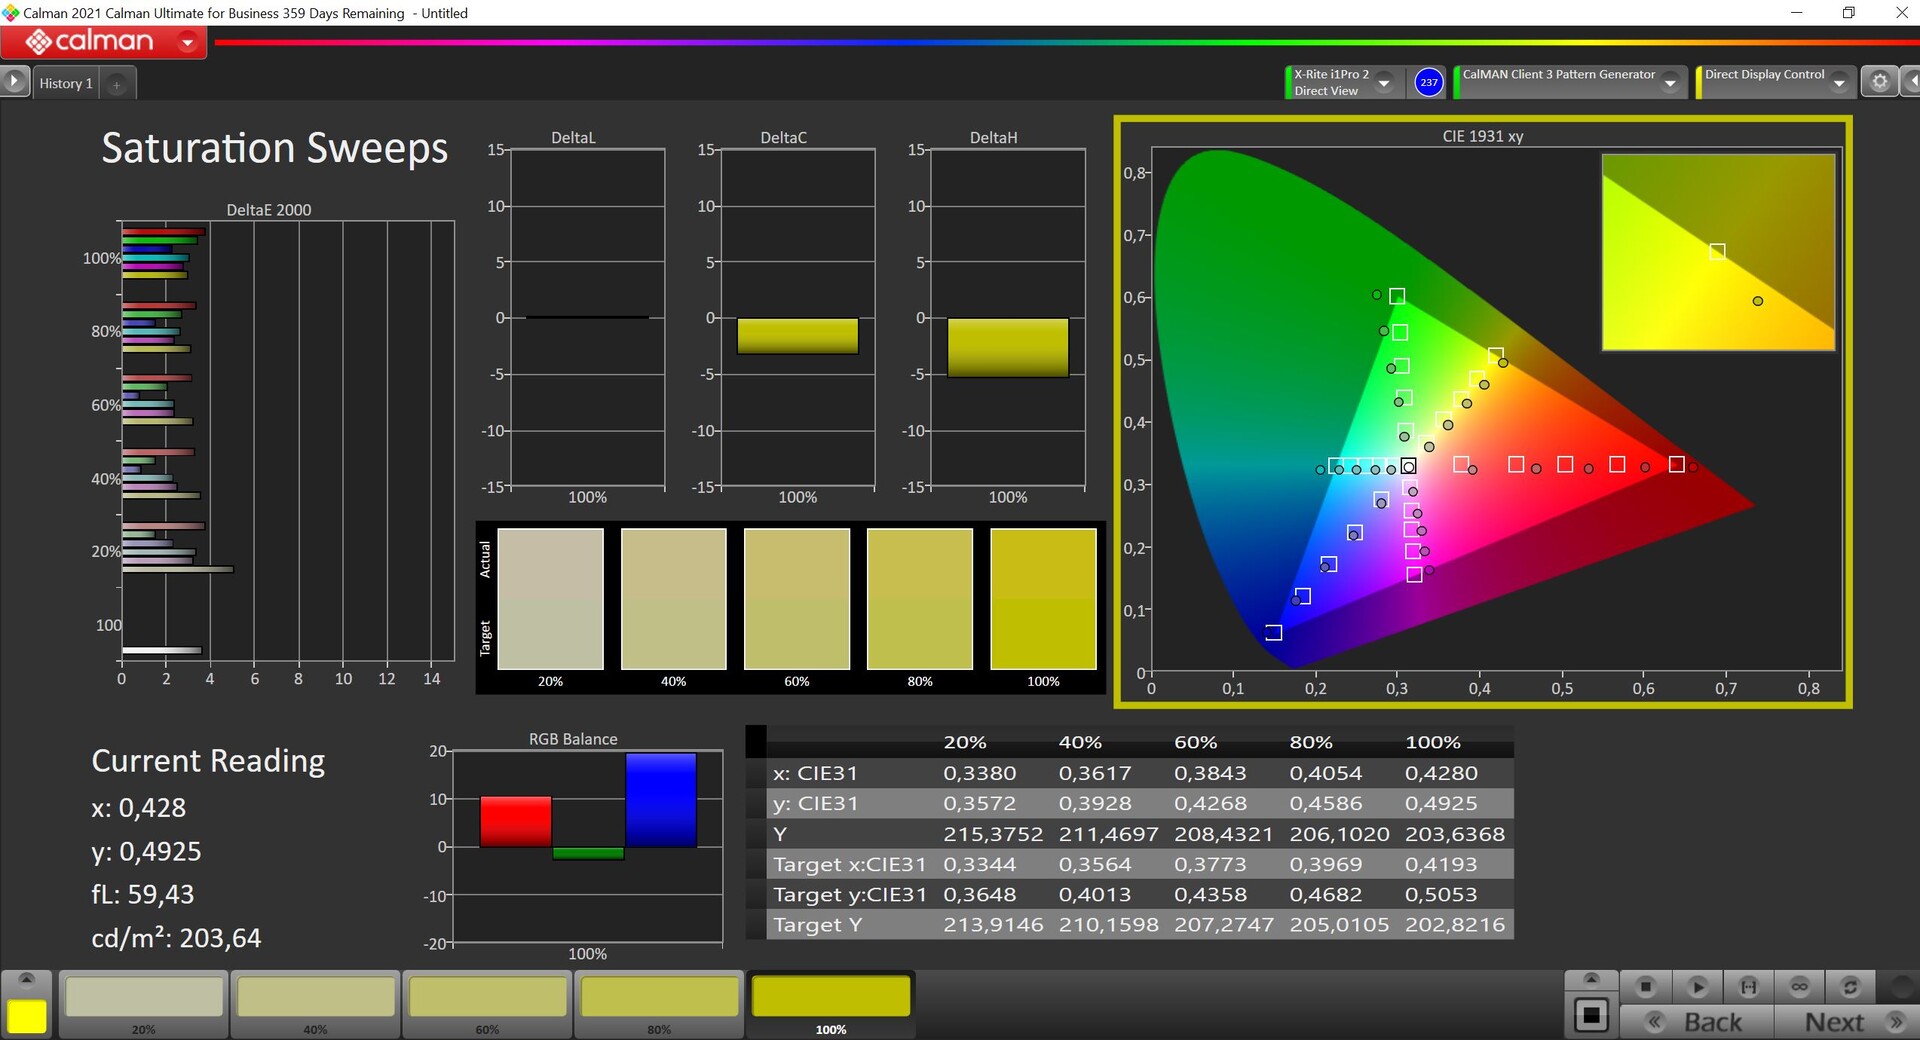
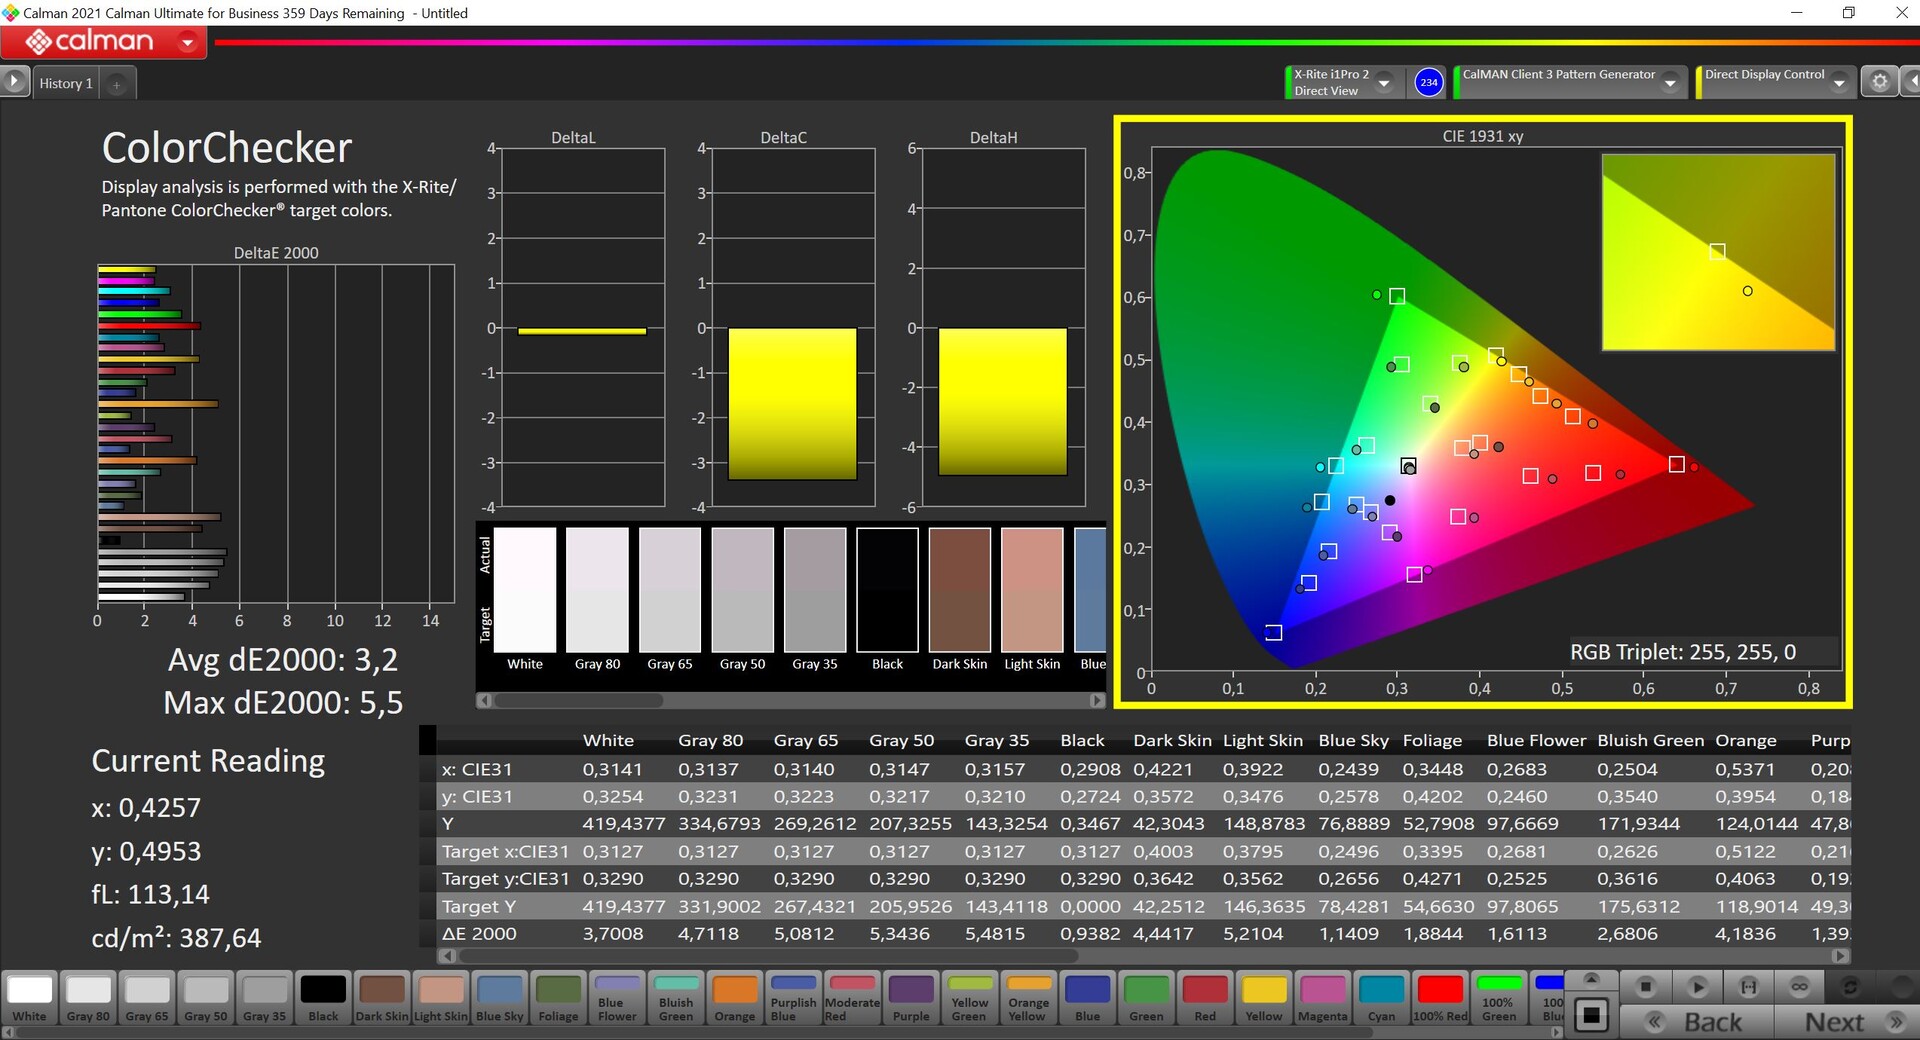
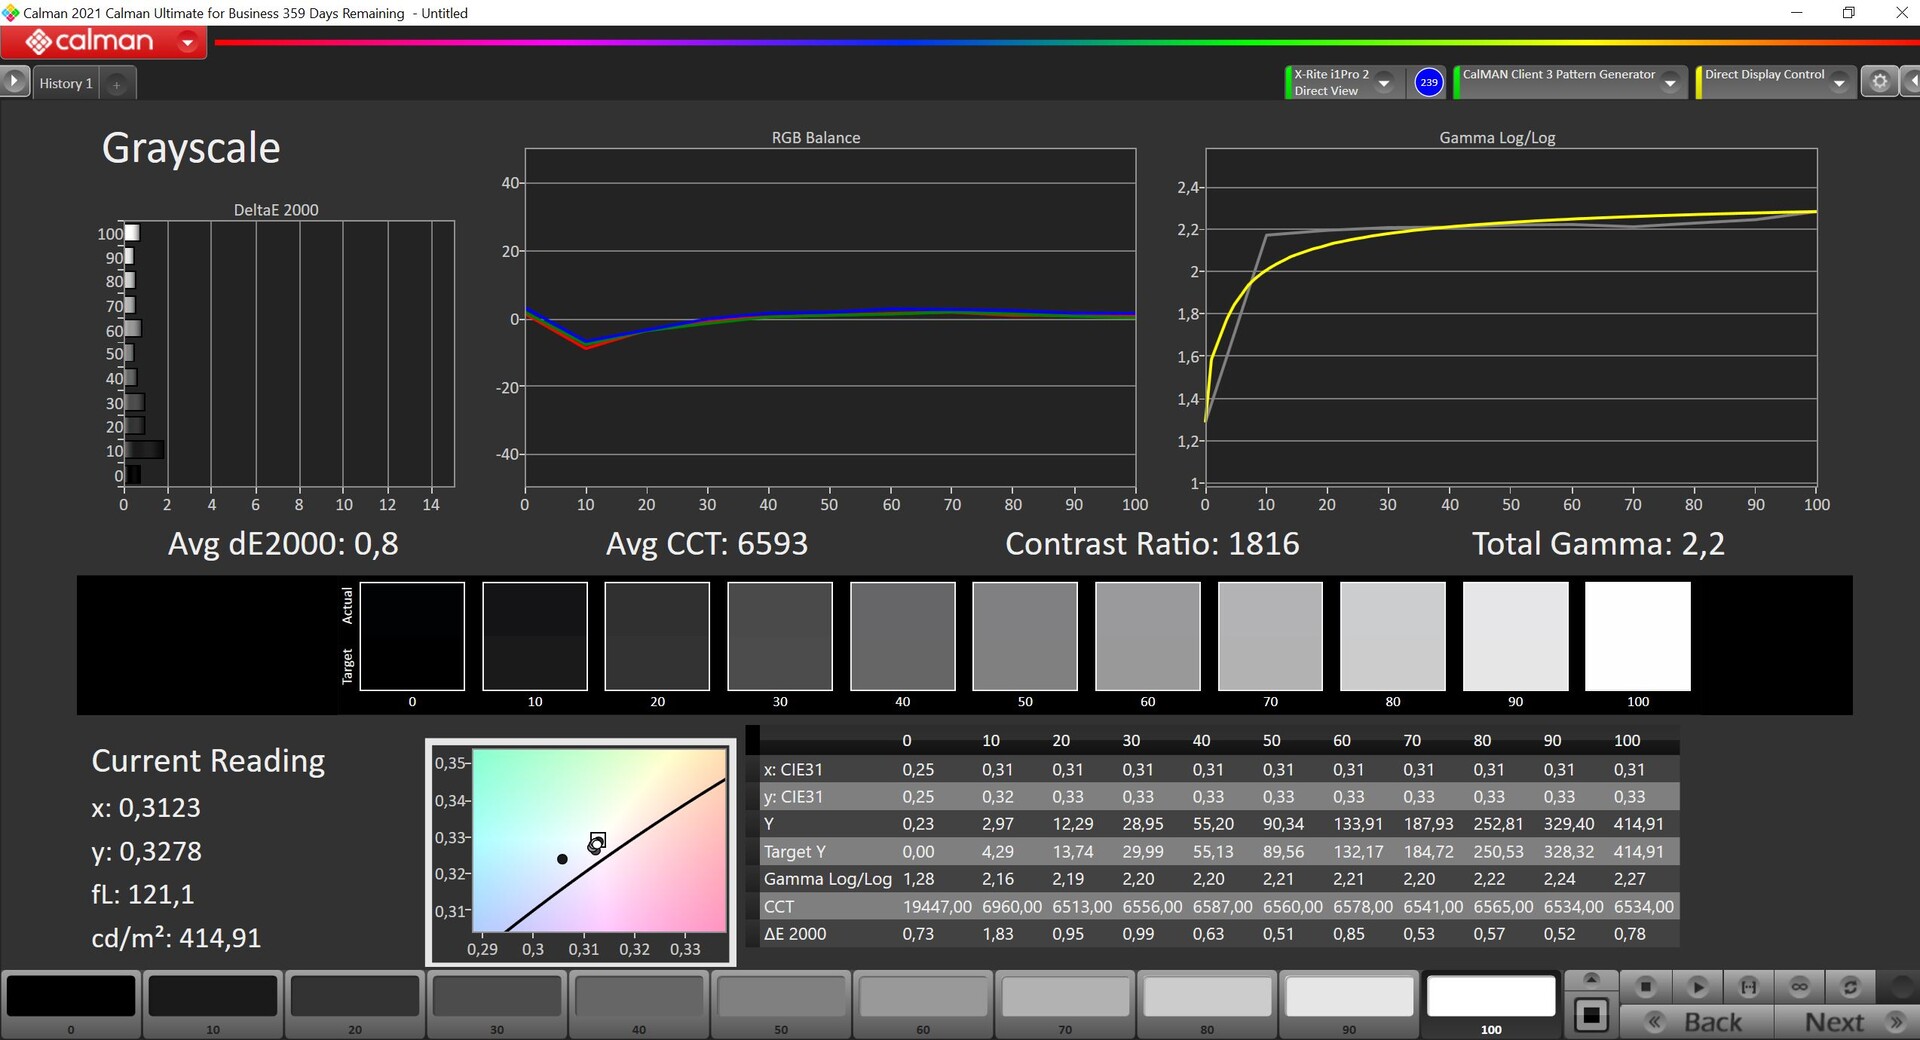
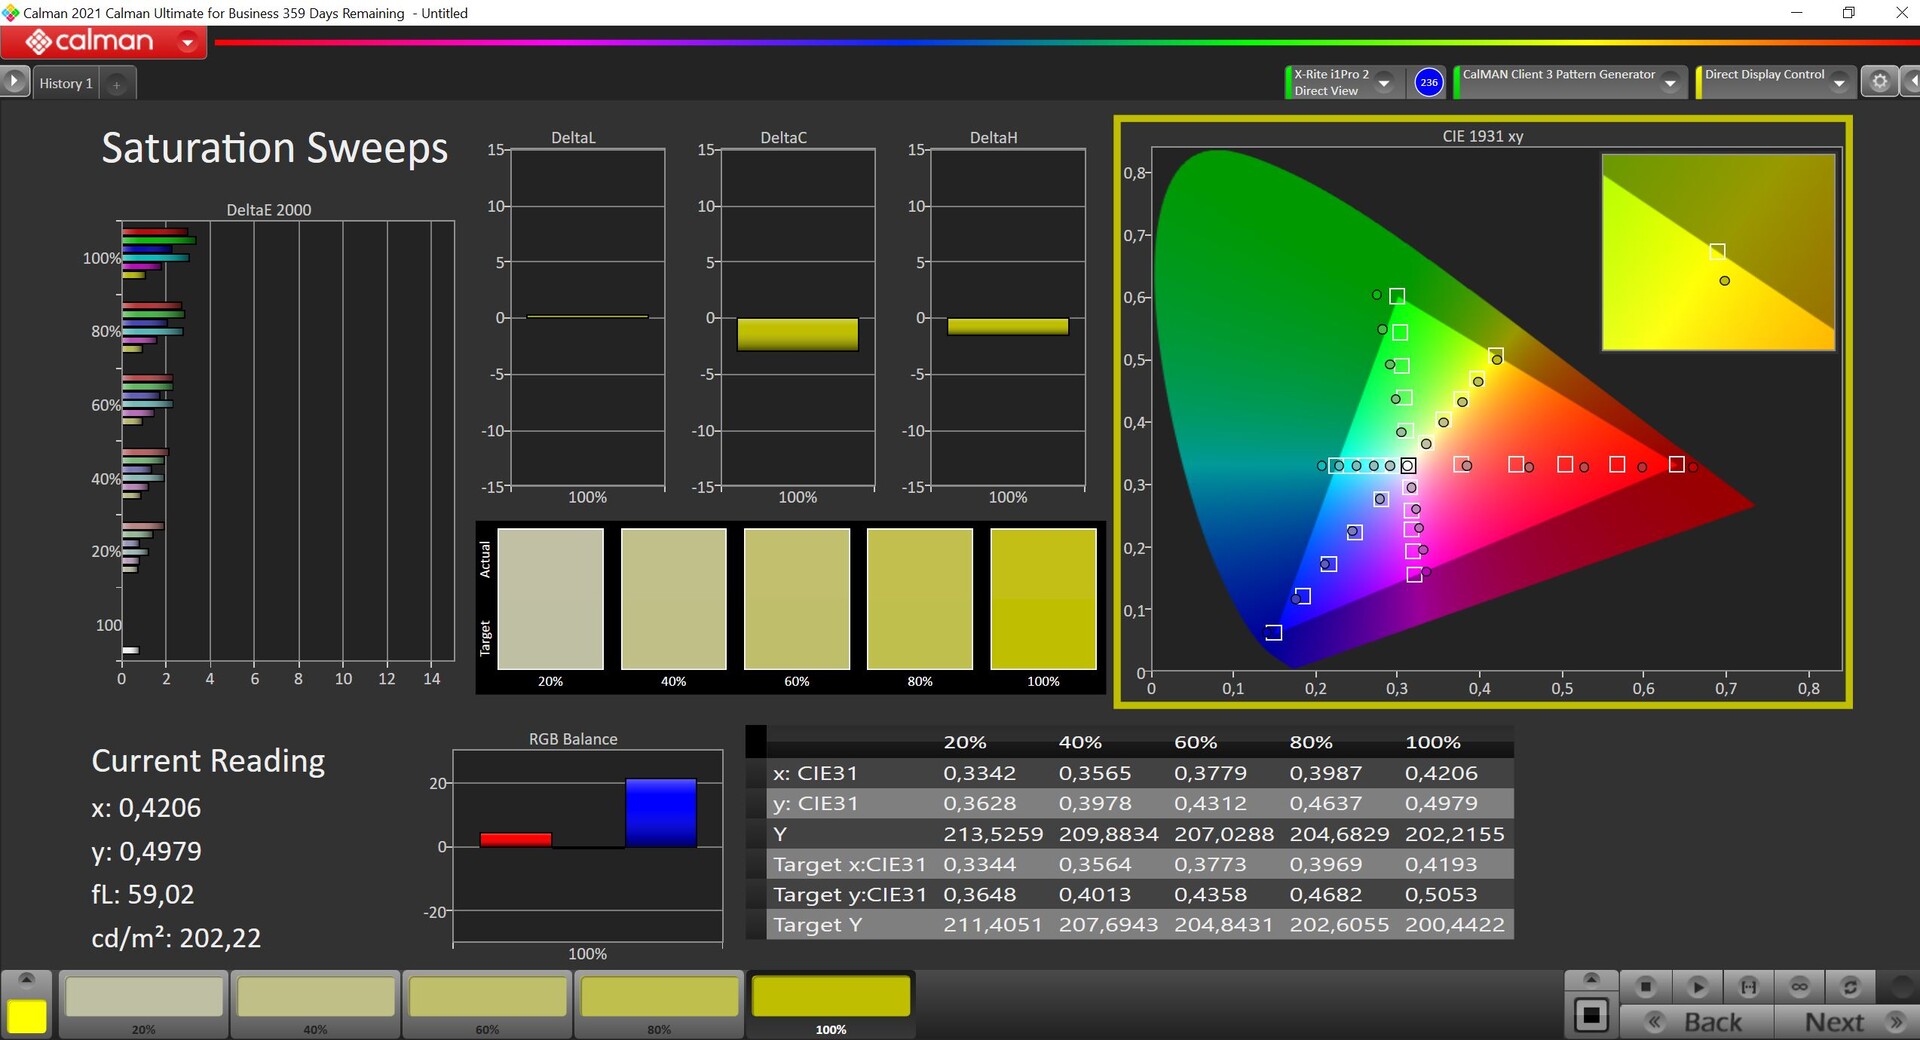
W przypadku wyświetlacza nie ma wiele do powiedzenia, ponieważ producent wciąż stawia na ten sam, matowy panel 3K (16:10, 2880 x 1800 pikseli). Jakość wyświetlania jest doskonała, a jasne obszary nie wyglądają na ziarniste pomimo matowej warstwy. W naszej profesjonalnej analizie oprogramowania CalMAN, panel również wypada dobrze. Osiąga on średnią jasność ~415 nitów i dobry współczynnik kontrastu 1500:1. W fabryce występuje delikatne zabarwienie, ale udało nam się to naprawić dzięki naszej kalibracji. Dzięki pełnemu pokryciu sRGB, możliwa jest również edycja zdjęć. Panel nie opiera się na PWM.
| |||||||||||||||||||||||||
rozświetlenie: 89 %
na akumulatorze: 424 cd/m²
kontrast: 1504:1 (czerń: 0.28 cd/m²)
ΔE ColorChecker Calman: 3.2 | ∀{0.5-29.43 Ø4.72}
calibrated: 2
ΔE Greyscale Calman: 4.4 | ∀{0.09-98 Ø4.97}
75.3% AdobeRGB 1998 (Argyll 3D)
97.4% sRGB (Argyll 3D)
74.1% Display P3 (Argyll 3D)
Gamma: 2.22
CCT: 6384 K
| Schenker Vision 14 2022 RTX 3050 Ti MNE007ZA1-1, IPS, 2880x1800, 14" | Schenker Vision 14 MNE007ZA1, IPS, 2880x1800, 14" | Huawei MateBook X Pro 2022 TMX1422, IPS, 3120x2080, 14.2" | Lenovo Yoga 9i 14 2022 i7-1260P LEN140WQUXGA, OLED, 3840x2400, 14" | Dell Inspiron 14 Plus 7420 InfoVision 140NWHE, IPS, 2240x1400, 14" | Asus Vivobook Pro 14 M3401QC-KM007T SAMSUNG: SDC4171, OLED, 2880x1800, 14" | Apple MacBook Pro 14 2021 M1 Pro Entry Mini-LED, 3024x1964, 14.2" | |
|---|---|---|---|---|---|---|---|
| Display | 0% | 15% | 22% | -4% | 21% | 34% | |
| Display P3 Coverage (%) | 74.1 | 74.3 0% | 94.6 28% | 98.7 33% | 68.8 -7% | 99.41 34% | 99.3 34% |
| sRGB Coverage (%) | 97.4 | 97.6 0% | 99.5 2% | 99.8 2% | 99.3 2% | 99.94 3% | |
| AdobeRGB 1998 Coverage (%) | 75.3 | 75.7 1% | 86.5 15% | 98.5 31% | 69.5 -8% | 94.79 26% | |
| Response Times | -28% | 1% | 86% | -31% | 85% | -132% | |
| Response Time Grey 50% / Grey 80% * (ms) | 31.5 ? | 40.4 ? -28% | 25.4 ? 19% | 2.8 ? 91% | 32.8 ? -4% | 3 ? 90% | 58.4 ? -85% |
| Response Time Black / White * (ms) | 14.5 ? | 18.4 ? -27% | 17.1 ? -18% | 2.8 ? 81% | 22.8 ? -57% | 3 ? 79% | 40.4 ? -179% |
| PWM Frequency (Hz) | 239.2 ? | 360 | 14880 | ||||
| Screen | 11% | 31% | 3006% | 5% | 53% | 439% | |
| Brightness middle (cd/m²) | 421 | 407 -3% | 603 43% | 361 -14% | 331.1 -21% | 384 -9% | 489 16% |
| Brightness (cd/m²) | 416 | 407 -2% | 586 41% | 362 -13% | 326 -22% | 385 -7% | 479 15% |
| Brightness Distribution (%) | 89 | 94 6% | 91 2% | 98 10% | 85 -4% | 98 10% | 94 6% |
| Black Level * (cd/m²) | 0.28 | 0.25 11% | 0.39 -39% | 0.001 100% | 0.29 -4% | 0.07 75% | 0.01 96% |
| Contrast (:1) | 1504 | 1628 8% | 1546 3% | 361000 23903% | 1142 -24% | 5486 265% | 48900 3151% |
| Colorchecker dE 2000 * | 3.2 | 2.6 19% | 1.1 66% | 2.8 13% | 2.23 30% | 1.75 45% | 0.8 75% |
| Colorchecker dE 2000 max. * | 5.5 | 4.4 20% | 2.2 60% | 5.8 -5% | 5.44 1% | 3.41 38% | 1.3 76% |
| Colorchecker dE 2000 calibrated * | 2 | 2 -0% | 1.2 40% | 0.63 68% | 2.32 -16% | ||
| Greyscale dE 2000 * | 4.4 | 2.7 39% | 1.5 66% | 1.9 57% | 3.6 18% | 1.06 76% | 1.1 75% |
| Gamma | 2.22 99% | 2.18 101% | 2.17 101% | 2.16 102% | 2.21 100% | 2.39 92% | 2.24 98% |
| CCT | 6384 102% | 6316 103% | 6549 99% | 6181 105% | 6022 108% | 6440 101% | |
| Całkowita średnia (program / ustawienia) | -6% /
3% | 16% /
23% | 1038% /
1868% | -10% /
-2% | 53% /
51% | 114% /
298% |
* ... im mniej tym lepiej

Wyświetl czasy reakcji
| ↔ Czas reakcji od czerni do bieli | ||
|---|---|---|
| 14.5 ms ... wzrost ↗ i spadek ↘ łącznie | ↗ 4.7 ms wzrost | 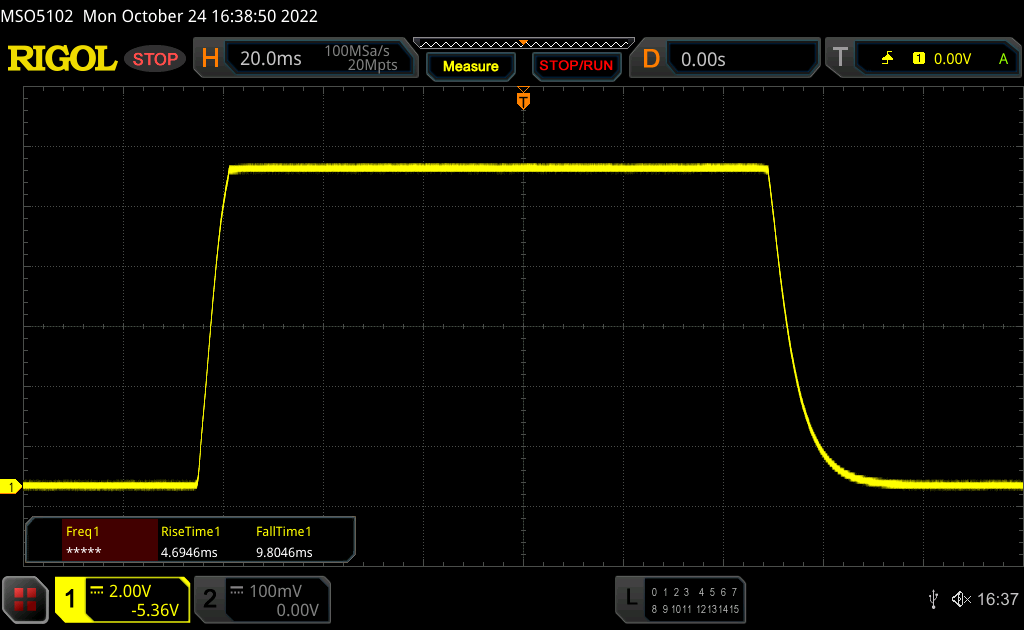 |
| ↘ 9.8 ms upadek | ||
| W naszych testach ekran wykazuje dobry współczynnik reakcji, ale może być zbyt wolny dla graczy rywalizujących ze sobą. Dla porównania, wszystkie testowane urządzenia wahają się od 0.1 (minimum) do 240 (maksimum) ms. » 35 % wszystkich urządzeń jest lepszych. Oznacza to, że zmierzony czas reakcji jest lepszy od średniej wszystkich testowanych urządzeń (19.9 ms). | ||
| ↔ Czas reakcji 50% szarości do 80% szarości | ||
| 31.5 ms ... wzrost ↗ i spadek ↘ łącznie | ↗ 14 ms wzrost | 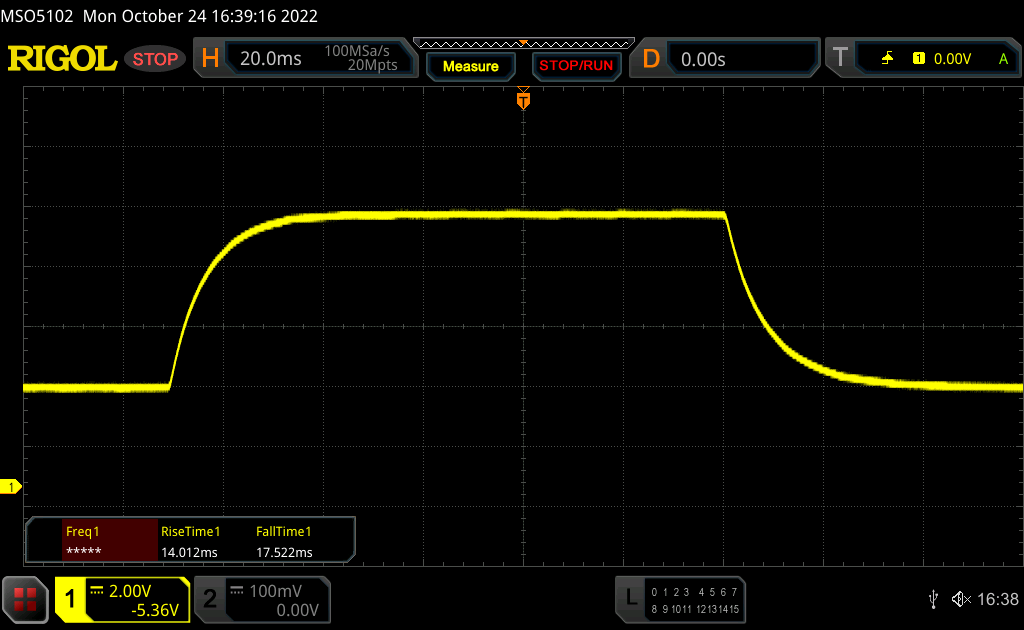 |
| ↘ 17.5 ms upadek | ||
| W naszych testach ekran wykazuje powolne tempo reakcji, co będzie niezadowalające dla graczy. Dla porównania, wszystkie testowane urządzenia wahają się od 0.165 (minimum) do 636 (maksimum) ms. » 43 % wszystkich urządzeń jest lepszych. Oznacza to, że zmierzony czas reakcji jest zbliżony do średniej wszystkich testowanych urządzeń (31.1 ms). | ||
Migotanie ekranu / PWM (modulacja szerokości impulsu)
| Migotanie ekranu/nie wykryto PWM | 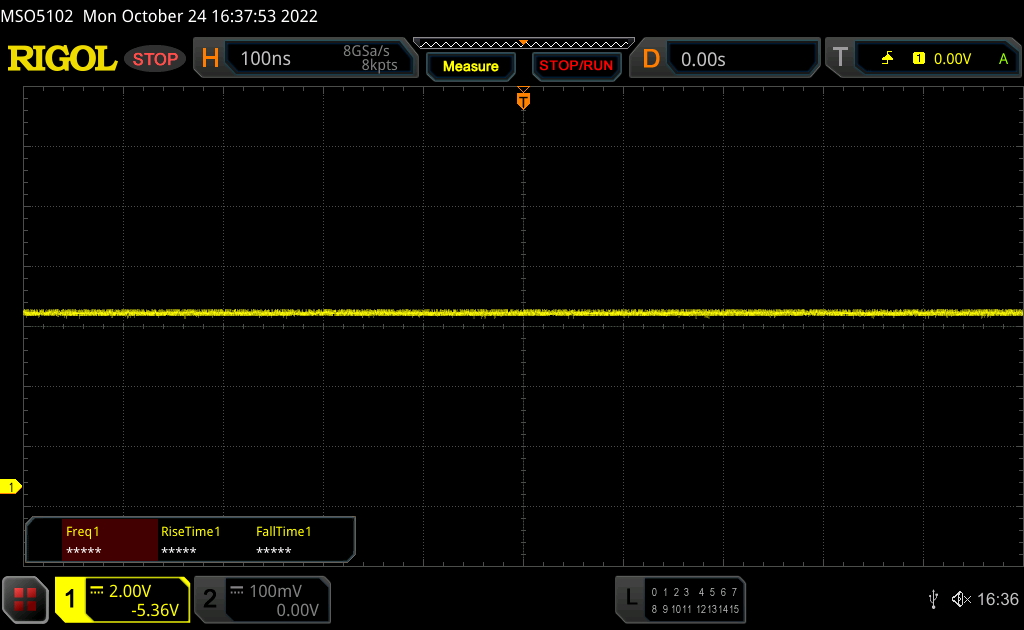 | ||
Dla porównania: 52 % wszystkich testowanych urządzeń nie używa PWM do przyciemniania wyświetlacza. Jeśli wykryto PWM, zmierzono średnio 7784 (minimum: 5 - maksimum: 343500) Hz. | |||
Wydajność - Alder Lake-H & GeForce RTX 3050 Ti
Warunki badania
Do dyspozycji mamy ponownie dwa profile bazowe z trzema podprofilami, każdy, dostępnymi na preinstalowanym oprogramowaniu Control Center (quiet & performance). Wygodnie, profile bazowe można przełączać za pomocą klawisza F3. Poniższa tabela zawiera dane dotyczące wydajności dla różnych profili mocy.
| Profil | CPU Stress | GPU Stress | Combined CPU+GPU Stress | Maks. hałas wentylatora |
|---|---|---|---|---|
| Cichy 20 dB | 10 watów | 20 watów | CPU: 10 watówGPU : 20 watów |
32,5 dB(A) |
| Quiet 30 dB | 13 watów | 25 watów | CPU: 13 watówGPU : 25 watów |
40 dB(A) |
| Quiet 40 dB | 15 watów | 35 watów | CPU: 15 watówGPU : 35 watów |
45,8 dB(A) |
| Performance Balanced | 60 -> 20 watów | 45 watów | CPU: 20 watówGPU : 40 watów |
45,8 dB(A) |
| Performance Enthusiast | 60 -> 40 watów | 45 watów | CPU: 25 watówGPU : 35 watów |
48,8 dB(A) |
| Performance Overboost | 60 -> 45 watów | 45 watów | CPU: 25 watówGPU : 35 watów |
51,1 dB(A) |
Istnieją dwie zauważalne różnice pomiędzy naszym testowym urządzeniem a starszym modelem. Podczas gdy starszy Tiger Lake Core i7-11370H był ograniczony do 46 W, nowszy Core i7-12700H ma dostęp do nawet 60 W. W międzyczasie RTX 3050 Ti musi się teraz zadowolić 45 W (35 W TGP + 10 W Dynamic Boost), podczas gdy w starszym modelu GPU miało do dyspozycji nawet 50 W.
Ponieważ profil Performance Enthusiast oferuje ogólnie najlepsze kompromisy, wybraliśmy go do naszych testów. W niektórych kolejnych sekcjach (a w szczególności w sekcji poświęconej hałasowi systemowemu) przyjrzymy się bliżej także innym profilom, choć użytkownicy mogą chcieć wybrać jeden ze słabszych profili, aby skorzystać z cichszego szumu wentylatora w niezbyt wymagającej codziennej scenerii.
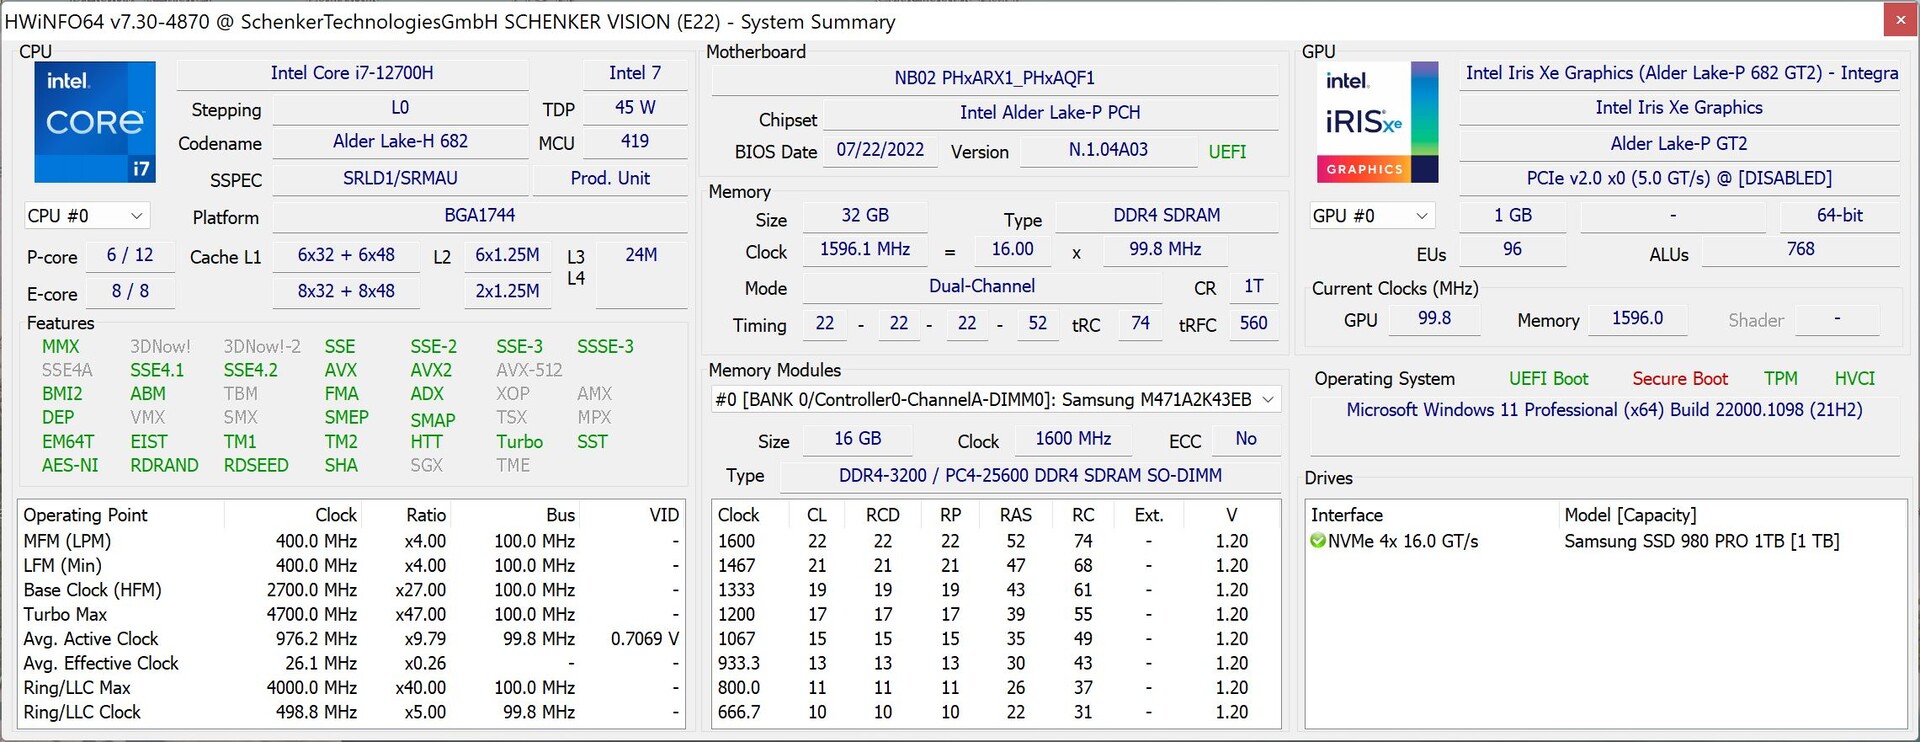
Procesor - Intel Core i7-12700H
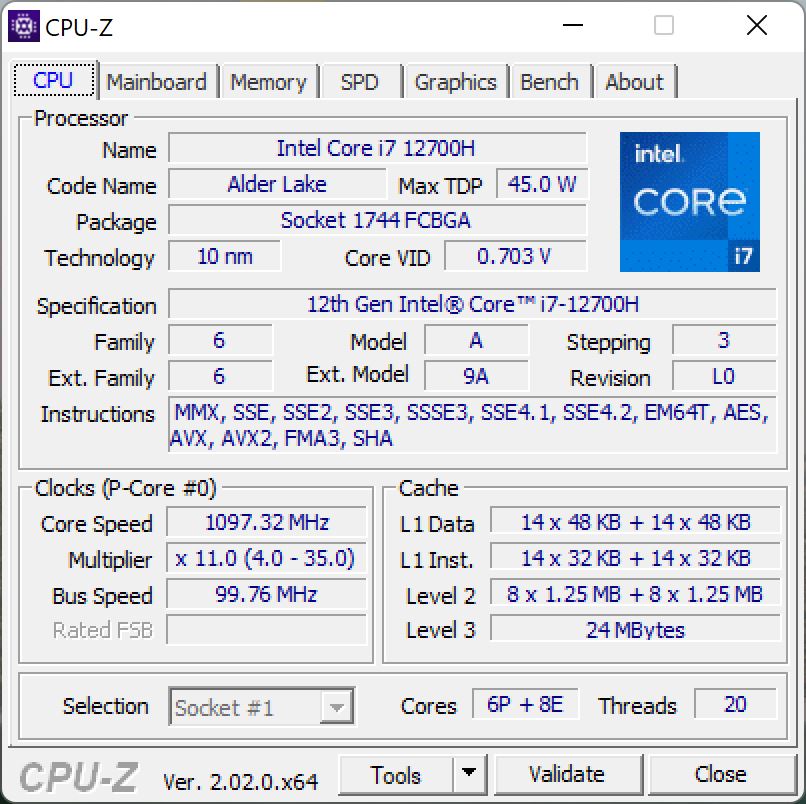
Na stronie Core i7-12700H to 45-watowy procesor wyposażony w 6 rdzeni wydajnościowych i 8 wydajnościowych, co pozwala mu na jednoczesne przetwarzanie do 20 wątków. Limity TDP (60/40 W) są trzymane mocno, a wydajność jest ogólnie znakomita. Starszy Core i7-11370H nie tylko zostaje znacznie w tyle w testach wielowątkowych (nowszy model jest tu w zasadzie dwukrotnie szybszy), ale także w testach jednowątkowych dzięki nowym rdzeniom wydajnościowym.
Cinebench R15 Multi Loop
Teraz na pytanie czy Core i7-12700H ma większy sens przy tych wartościach TDP niż procesor Alder Lake-P np Core i7-1260P (z 4 rdzeniami wydajnościowymi). Odpowiedź jest jednoznacznie twierdząca, gdyż to właśnie liczba rdzeni wydajnościowych ma ostatecznie znaczenie. Jak wiemy, rdzenie wydajnościowe stają się coraz mniej wydajne przy wyższych taktowaniach. Co prawda rozdzielenie dostępnego TDP pomiędzy większą liczbę rdzeni wydajnościowych skutkuje nieco niższymi taktowaniami, ale za to niższymi temperaturami, które z kolei wpływają korzystnie na wydajność. Dodatkowo, dwa dodatkowe rdzenie z nawiązką rekompensują nieco niższe prędkości zegara. Chociaż tak samo byłoby w przypadku Core i7-1280P (taka sama konfiguracja rdzeni jak w przypadku i7-12700H), ale OEM nie oferuje układów Alder Lake-P dla wersji barebone modelu Vision 14 z podwójnymi ciepłowodami.
Przewaga Core i7-12700H staje się bardzo widoczna w porównaniu z m.in Lenovo Yoga 9i 14, w którym pracuje Core i7-1260P przy bardzo zbliżonym TDP wynoszącym 64/38 W. Niezależnie od tego, Core i7-12700H przewyższa go dramatycznie w testach wielowątkowych (~18% w naszej pętli multi CB R15). To powiedziawszy, należy zauważyć, że Core i7-12700H nie jest w stanie uwolnić tutaj swojego pełnego potencjału, który wymagałby ponad 120 watów dla maksymalnych prędkości zegara wszystkich rdzeni. Wydajność procesora w wersji z iGPU w Vision 14 jest identyczna.
W trybie akumulatorowym procesor jest ograniczony do 45, a następnie 40 W, co oznacza, że poziom wydajności pozostaje dość wysoki. Spadek wydajności staje się bardziej znaczący przy poziomie baterii poniżej 20%. Więcej benchmarków procesora można znaleźć w naszym dziale technicznym.
Cinebench R23: Multi Core | Single Core
Cinebench R20: CPU (Multi Core) | CPU (Single Core)
Cinebench R15: CPU Multi 64Bit | CPU Single 64Bit
Blender: v2.79 BMW27 CPU
7-Zip 18.03: 7z b 4 | 7z b 4 -mmt1
Geekbench 5.5: Multi-Core | Single-Core
HWBOT x265 Benchmark v2.2: 4k Preset
LibreOffice : 20 Documents To PDF
R Benchmark 2.5: Overall mean
| CPU Performance rating | |
| Przeciętny Intel Core i7-12700H | |
| Dell Inspiron 14 Plus 7420 | |
| Schenker Vision 14 2022 RTX 3050 Ti | |
| Apple MacBook Pro 14 2021 M1 Pro Entry -8! | |
| Średnia w klasie Subnotebook | |
| Lenovo Yoga 9i 14 2022 i7-1260P | |
| Huawei MateBook X Pro 2022 | |
| Asus Vivobook Pro 14 M3401QC-KM007T | |
| Schenker Vision 14 | |
| Cinebench R23 / Multi Core | |
| Przeciętny Intel Core i7-12700H (4032 - 19330, n=64) | |
| Schenker Vision 14 2022 RTX 3050 Ti | |
| Dell Inspiron 14 Plus 7420 | |
| Średnia w klasie Subnotebook (1555 - 21812, n=59, ostatnie 2 lata) | |
| Lenovo Yoga 9i 14 2022 i7-1260P | |
| Apple MacBook Pro 14 2021 M1 Pro Entry | |
| Huawei MateBook X Pro 2022 | |
| Asus Vivobook Pro 14 M3401QC-KM007T | |
| Schenker Vision 14 | |
| Cinebench R23 / Single Core | |
| Lenovo Yoga 9i 14 2022 i7-1260P | |
| Dell Inspiron 14 Plus 7420 | |
| Przeciętny Intel Core i7-12700H (778 - 1826, n=63) | |
| Średnia w klasie Subnotebook (358 - 2213, n=60, ostatnie 2 lata) | |
| Schenker Vision 14 2022 RTX 3050 Ti | |
| Huawei MateBook X Pro 2022 | |
| Apple MacBook Pro 14 2021 M1 Pro Entry | |
| Schenker Vision 14 | |
| Asus Vivobook Pro 14 M3401QC-KM007T | |
| Cinebench R20 / CPU (Multi Core) | |
| Przeciętny Intel Core i7-12700H (1576 - 7407, n=64) | |
| Schenker Vision 14 2022 RTX 3050 Ti | |
| Dell Inspiron 14 Plus 7420 | |
| Średnia w klasie Subnotebook (579 - 8541, n=56, ostatnie 2 lata) | |
| Lenovo Yoga 9i 14 2022 i7-1260P | |
| Huawei MateBook X Pro 2022 | |
| Asus Vivobook Pro 14 M3401QC-KM007T | |
| Schenker Vision 14 | |
| Cinebench R20 / CPU (Single Core) | |
| Schenker Vision 14 2022 RTX 3050 Ti | |
| Dell Inspiron 14 Plus 7420 | |
| Przeciętny Intel Core i7-12700H (300 - 704, n=64) | |
| Huawei MateBook X Pro 2022 | |
| Lenovo Yoga 9i 14 2022 i7-1260P | |
| Średnia w klasie Subnotebook (128 - 832, n=56, ostatnie 2 lata) | |
| Schenker Vision 14 | |
| Asus Vivobook Pro 14 M3401QC-KM007T | |
| Cinebench R15 / CPU Multi 64Bit | |
| Przeciętny Intel Core i7-12700H (1379 - 2916, n=70) | |
| Dell Inspiron 14 Plus 7420 | |
| Schenker Vision 14 2022 RTX 3050 Ti | |
| Średnia w klasie Subnotebook (327 - 3345, n=56, ostatnie 2 lata) | |
| Huawei MateBook X Pro 2022 | |
| Huawei MateBook X Pro 2022 | |
| Lenovo Yoga 9i 14 2022 i7-1260P | |
| Asus Vivobook Pro 14 M3401QC-KM007T | |
| Apple MacBook Pro 14 2021 M1 Pro Entry | |
| Schenker Vision 14 | |
| Schenker Vision 14 | |
| Cinebench R15 / CPU Single 64Bit | |
| Schenker Vision 14 2022 RTX 3050 Ti | |
| Średnia w klasie Subnotebook (72.4 - 322, n=56, ostatnie 2 lata) | |
| Dell Inspiron 14 Plus 7420 | |
| Przeciętny Intel Core i7-12700H (113 - 263, n=65) | |
| Huawei MateBook X Pro 2022 | |
| Lenovo Yoga 9i 14 2022 i7-1260P | |
| Schenker Vision 14 | |
| Asus Vivobook Pro 14 M3401QC-KM007T | |
| Apple MacBook Pro 14 2021 M1 Pro Entry | |
| Blender / v2.79 BMW27 CPU | |
| Schenker Vision 14 | |
| Średnia w klasie Subnotebook (159 - 2271, n=57, ostatnie 2 lata) | |
| Asus Vivobook Pro 14 M3401QC-KM007T | |
| Huawei MateBook X Pro 2022 | |
| Lenovo Yoga 9i 14 2022 i7-1260P | |
| Schenker Vision 14 2022 RTX 3050 Ti | |
| Dell Inspiron 14 Plus 7420 | |
| Przeciętny Intel Core i7-12700H (168 - 732, n=63) | |
| 7-Zip 18.03 / 7z b 4 | |
| Przeciętny Intel Core i7-12700H (22844 - 73067, n=63) | |
| Dell Inspiron 14 Plus 7420 | |
| Schenker Vision 14 2022 RTX 3050 Ti | |
| Lenovo Yoga 9i 14 2022 i7-1260P | |
| Średnia w klasie Subnotebook (11668 - 77867, n=56, ostatnie 2 lata) | |
| Huawei MateBook X Pro 2022 | |
| Asus Vivobook Pro 14 M3401QC-KM007T | |
| Schenker Vision 14 | |
| 7-Zip 18.03 / 7z b 4 -mmt1 | |
| Schenker Vision 14 2022 RTX 3050 Ti | |
| Przeciętny Intel Core i7-12700H (2743 - 5972, n=63) | |
| Dell Inspiron 14 Plus 7420 | |
| Schenker Vision 14 | |
| Średnia w klasie Subnotebook (2643 - 6699, n=58, ostatnie 2 lata) | |
| Huawei MateBook X Pro 2022 | |
| Asus Vivobook Pro 14 M3401QC-KM007T | |
| Lenovo Yoga 9i 14 2022 i7-1260P | |
| Geekbench 5.5 / Multi-Core | |
| Dell Inspiron 14 Plus 7420 | |
| Przeciętny Intel Core i7-12700H (5144 - 13745, n=64) | |
| Schenker Vision 14 2022 RTX 3050 Ti | |
| Średnia w klasie Subnotebook (2557 - 17218, n=48, ostatnie 2 lata) | |
| Lenovo Yoga 9i 14 2022 i7-1260P | |
| Huawei MateBook X Pro 2022 | |
| Apple MacBook Pro 14 2021 M1 Pro Entry | |
| Asus Vivobook Pro 14 M3401QC-KM007T | |
| Schenker Vision 14 | |
| Geekbench 5.5 / Single-Core | |
| Średnia w klasie Subnotebook (726 - 2224, n=48, ostatnie 2 lata) | |
| Schenker Vision 14 2022 RTX 3050 Ti | |
| Apple MacBook Pro 14 2021 M1 Pro Entry | |
| Lenovo Yoga 9i 14 2022 i7-1260P | |
| Huawei MateBook X Pro 2022 | |
| Przeciętny Intel Core i7-12700H (803 - 1851, n=64) | |
| Dell Inspiron 14 Plus 7420 | |
| Schenker Vision 14 | |
| Asus Vivobook Pro 14 M3401QC-KM007T | |
| HWBOT x265 Benchmark v2.2 / 4k Preset | |
| Przeciętny Intel Core i7-12700H (4.67 - 21.8, n=64) | |
| Dell Inspiron 14 Plus 7420 | |
| Schenker Vision 14 2022 RTX 3050 Ti | |
| Średnia w klasie Subnotebook (0.97 - 25.1, n=56, ostatnie 2 lata) | |
| Lenovo Yoga 9i 14 2022 i7-1260P | |
| Huawei MateBook X Pro 2022 | |
| Asus Vivobook Pro 14 M3401QC-KM007T | |
| Schenker Vision 14 | |
| LibreOffice / 20 Documents To PDF | |
| Asus Vivobook Pro 14 M3401QC-KM007T | |
| Średnia w klasie Subnotebook (39.9 - 220, n=55, ostatnie 2 lata) | |
| Dell Inspiron 14 Plus 7420 | |
| Schenker Vision 14 | |
| Lenovo Yoga 9i 14 2022 i7-1260P | |
| Przeciętny Intel Core i7-12700H (34.2 - 95.3, n=63) | |
| Schenker Vision 14 2022 RTX 3050 Ti | |
| Huawei MateBook X Pro 2022 | |
| R Benchmark 2.5 / Overall mean | |
| Asus Vivobook Pro 14 M3401QC-KM007T | |
| Schenker Vision 14 | |
| Średnia w klasie Subnotebook (0.4024 - 1.456, n=57, ostatnie 2 lata) | |
| Lenovo Yoga 9i 14 2022 i7-1260P | |
| Huawei MateBook X Pro 2022 | |
| Dell Inspiron 14 Plus 7420 | |
| Przeciętny Intel Core i7-12700H (0.4441 - 1.052, n=63) | |
| Schenker Vision 14 2022 RTX 3050 Ti | |
* ... im mniej tym lepiej
AIDA64: FP32 Ray-Trace | FPU Julia | CPU SHA3 | CPU Queen | FPU SinJulia | FPU Mandel | CPU AES | CPU ZLib | FP64 Ray-Trace | CPU PhotoWorxx
| Performance rating | |
| Przeciętny Intel Core i7-12700H | |
| Schenker Vision 14 2022 RTX 3050 Ti | |
| Dell Inspiron 14 Plus 7420 | |
| Średnia w klasie Subnotebook | |
| Asus Vivobook Pro 14 M3401QC-KM007T | |
| Huawei MateBook X Pro 2022 | |
| Lenovo Yoga 9i 14 2022 i7-1260P | |
| AIDA64 / FP32 Ray-Trace | |
| Średnia w klasie Subnotebook (1135 - 32888, n=57, ostatnie 2 lata) | |
| Schenker Vision 14 2022 RTX 3050 Ti | |
| Dell Inspiron 14 Plus 7420 | |
| Przeciętny Intel Core i7-12700H (2585 - 17957, n=64) | |
| Asus Vivobook Pro 14 M3401QC-KM007T | |
| Lenovo Yoga 9i 14 2022 i7-1260P | |
| Huawei MateBook X Pro 2022 | |
| AIDA64 / FPU Julia | |
| Asus Vivobook Pro 14 M3401QC-KM007T | |
| Średnia w klasie Subnotebook (5218 - 123315, n=57, ostatnie 2 lata) | |
| Schenker Vision 14 2022 RTX 3050 Ti | |
| Dell Inspiron 14 Plus 7420 | |
| Przeciętny Intel Core i7-12700H (12439 - 90760, n=64) | |
| Huawei MateBook X Pro 2022 | |
| Lenovo Yoga 9i 14 2022 i7-1260P | |
| AIDA64 / CPU SHA3 | |
| Średnia w klasie Subnotebook (444 - 5287, n=57, ostatnie 2 lata) | |
| Przeciętny Intel Core i7-12700H (833 - 4242, n=64) | |
| Schenker Vision 14 2022 RTX 3050 Ti | |
| Dell Inspiron 14 Plus 7420 | |
| Asus Vivobook Pro 14 M3401QC-KM007T | |
| Lenovo Yoga 9i 14 2022 i7-1260P | |
| Huawei MateBook X Pro 2022 | |
| AIDA64 / CPU Queen | |
| Przeciętny Intel Core i7-12700H (57923 - 103202, n=63) | |
| Dell Inspiron 14 Plus 7420 | |
| Schenker Vision 14 2022 RTX 3050 Ti | |
| Huawei MateBook X Pro 2022 | |
| Asus Vivobook Pro 14 M3401QC-KM007T | |
| Średnia w klasie Subnotebook (10579 - 95002, n=50, ostatnie 2 lata) | |
| Lenovo Yoga 9i 14 2022 i7-1260P | |
| AIDA64 / FPU SinJulia | |
| Przeciętny Intel Core i7-12700H (3249 - 9939, n=64) | |
| Asus Vivobook Pro 14 M3401QC-KM007T | |
| Schenker Vision 14 2022 RTX 3050 Ti | |
| Dell Inspiron 14 Plus 7420 | |
| Średnia w klasie Subnotebook (744 - 18418, n=57, ostatnie 2 lata) | |
| Huawei MateBook X Pro 2022 | |
| Lenovo Yoga 9i 14 2022 i7-1260P | |
| AIDA64 / FPU Mandel | |
| Asus Vivobook Pro 14 M3401QC-KM007T | |
| Średnia w klasie Subnotebook (3341 - 65433, n=57, ostatnie 2 lata) | |
| Dell Inspiron 14 Plus 7420 | |
| Schenker Vision 14 2022 RTX 3050 Ti | |
| Przeciętny Intel Core i7-12700H (7135 - 44760, n=64) | |
| Huawei MateBook X Pro 2022 | |
| Lenovo Yoga 9i 14 2022 i7-1260P | |
| AIDA64 / CPU AES | |
| Asus Vivobook Pro 14 M3401QC-KM007T | |
| Przeciętny Intel Core i7-12700H (31839 - 144360, n=64) | |
| Schenker Vision 14 2022 RTX 3050 Ti | |
| Dell Inspiron 14 Plus 7420 | |
| Huawei MateBook X Pro 2022 | |
| Średnia w klasie Subnotebook (638 - 96917, n=57, ostatnie 2 lata) | |
| Lenovo Yoga 9i 14 2022 i7-1260P | |
| AIDA64 / CPU ZLib | |
| Przeciętny Intel Core i7-12700H (305 - 1171, n=64) | |
| Schenker Vision 14 2022 RTX 3050 Ti | |
| Dell Inspiron 14 Plus 7420 | |
| Średnia w klasie Subnotebook (164.9 - 1379, n=57, ostatnie 2 lata) | |
| Lenovo Yoga 9i 14 2022 i7-1260P | |
| Huawei MateBook X Pro 2022 | |
| Asus Vivobook Pro 14 M3401QC-KM007T | |
| AIDA64 / FP64 Ray-Trace | |
| Średnia w klasie Subnotebook (610 - 17495, n=57, ostatnie 2 lata) | |
| Schenker Vision 14 2022 RTX 3050 Ti | |
| Dell Inspiron 14 Plus 7420 | |
| Przeciętny Intel Core i7-12700H (1437 - 9692, n=64) | |
| Asus Vivobook Pro 14 M3401QC-KM007T | |
| Lenovo Yoga 9i 14 2022 i7-1260P | |
| Huawei MateBook X Pro 2022 | |
| AIDA64 / CPU PhotoWorxx | |
| Średnia w klasie Subnotebook (6569 - 85600, n=57, ostatnie 2 lata) | |
| Huawei MateBook X Pro 2022 | |
| Dell Inspiron 14 Plus 7420 | |
| Przeciętny Intel Core i7-12700H (12863 - 52207, n=64) | |
| Schenker Vision 14 2022 RTX 3050 Ti | |
| Lenovo Yoga 9i 14 2022 i7-1260P | |
| Asus Vivobook Pro 14 M3401QC-KM007T | |
Wydajność systemu
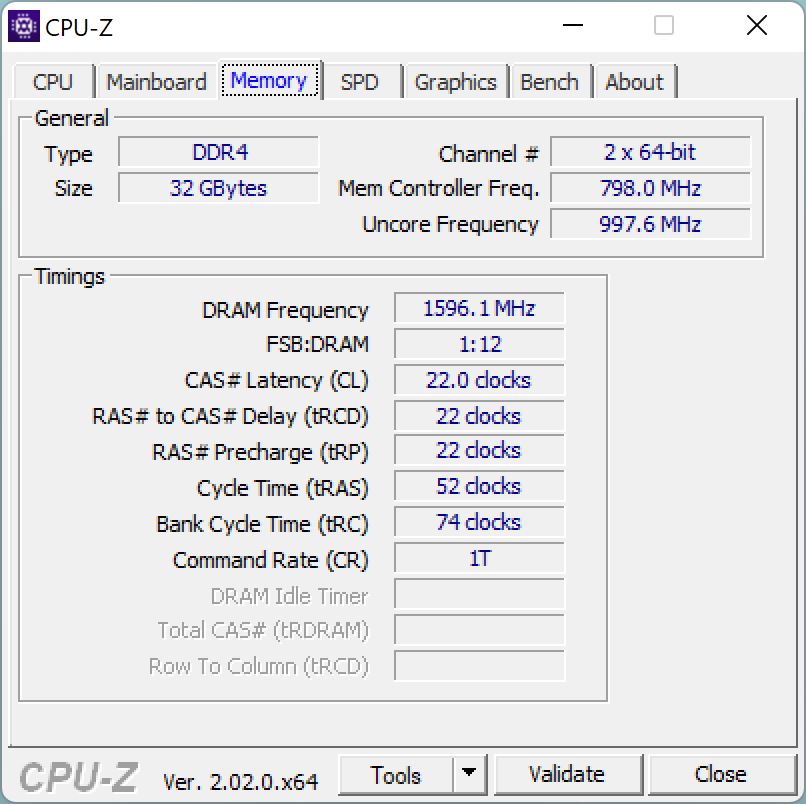
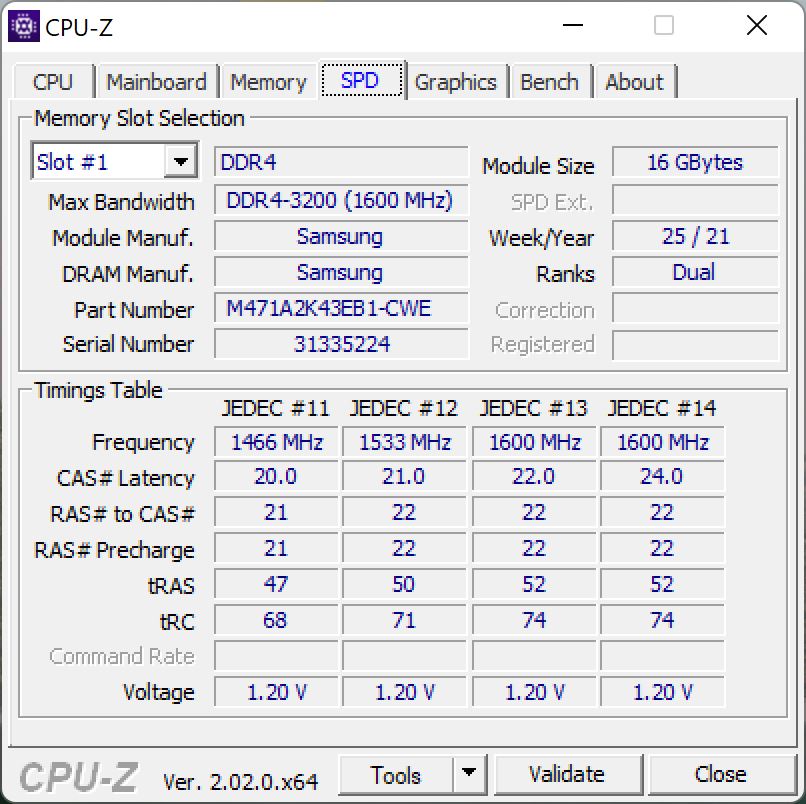
Bardzo responsywne subiektywne wrażenie Vision 14 znajduje potwierdzenie w naszych syntetycznych benchmarkach. Podczas naszych testów nie napotkaliśmy żadnych problemów. Decyzja Schenkera o niestosowaniu pamięci RAM DDR5 (ze względu na koszty, jak podaje producent), nie wpływa na codzienne użytkowanie.
CrossMark: Overall | Productivity | Creativity | Responsiveness
| PCMark 10 / Score | |
| Średnia w klasie Subnotebook (4920 - 9939, n=44, ostatnie 2 lata) | |
| Przeciętny Intel Core i7-12700H, NVIDIA GeForce RTX 3050 Ti Laptop GPU (6623 - 7075, n=5) | |
| Dell Inspiron 14 Plus 7420 | |
| Schenker Vision 14 2022 RTX 3050 Ti | |
| Huawei MateBook X Pro 2022 | |
| Schenker Vision 14 | |
| Asus Vivobook Pro 14 M3401QC-KM007T | |
| Lenovo Yoga 9i 14 2022 i7-1260P | |
| PCMark 10 / Essentials | |
| Lenovo Yoga 9i 14 2022 i7-1260P | |
| Huawei MateBook X Pro 2022 | |
| Schenker Vision 14 2022 RTX 3050 Ti | |
| Średnia w klasie Subnotebook (8552 - 11646, n=44, ostatnie 2 lata) | |
| Przeciętny Intel Core i7-12700H, NVIDIA GeForce RTX 3050 Ti Laptop GPU (9540 - 10970, n=5) | |
| Dell Inspiron 14 Plus 7420 | |
| Asus Vivobook Pro 14 M3401QC-KM007T | |
| Schenker Vision 14 | |
| PCMark 10 / Productivity | |
| Średnia w klasie Subnotebook (5435 - 16606, n=44, ostatnie 2 lata) | |
| Przeciętny Intel Core i7-12700H, NVIDIA GeForce RTX 3050 Ti Laptop GPU (8530 - 9555, n=5) | |
| Dell Inspiron 14 Plus 7420 | |
| Schenker Vision 14 | |
| Huawei MateBook X Pro 2022 | |
| Schenker Vision 14 2022 RTX 3050 Ti | |
| Asus Vivobook Pro 14 M3401QC-KM007T | |
| Lenovo Yoga 9i 14 2022 i7-1260P | |
| PCMark 10 / Digital Content Creation | |
| Średnia w klasie Subnotebook (5722 - 13779, n=44, ostatnie 2 lata) | |
| Przeciętny Intel Core i7-12700H, NVIDIA GeForce RTX 3050 Ti Laptop GPU (8855 - 9542, n=5) | |
| Schenker Vision 14 2022 RTX 3050 Ti | |
| Dell Inspiron 14 Plus 7420 | |
| Asus Vivobook Pro 14 M3401QC-KM007T | |
| Lenovo Yoga 9i 14 2022 i7-1260P | |
| Schenker Vision 14 | |
| Huawei MateBook X Pro 2022 | |
| CrossMark / Overall | |
| Huawei MateBook X Pro 2022 | |
| Przeciętny Intel Core i7-12700H, NVIDIA GeForce RTX 3050 Ti Laptop GPU (1654 - 1872, n=5) | |
| Dell Inspiron 14 Plus 7420 | |
| Lenovo Yoga 9i 14 2022 i7-1260P | |
| Schenker Vision 14 2022 RTX 3050 Ti | |
| Średnia w klasie Subnotebook (365 - 2356, n=59, ostatnie 2 lata) | |
| Schenker Vision 14 | |
| Apple MacBook Pro 14 2021 M1 Pro Entry | |
| Asus Vivobook Pro 14 M3401QC-KM007T | |
| CrossMark / Productivity | |
| Huawei MateBook X Pro 2022 | |
| Przeciętny Intel Core i7-12700H, NVIDIA GeForce RTX 3050 Ti Laptop GPU (1595 - 1792, n=5) | |
| Schenker Vision 14 2022 RTX 3050 Ti | |
| Dell Inspiron 14 Plus 7420 | |
| Lenovo Yoga 9i 14 2022 i7-1260P | |
| Średnia w klasie Subnotebook (364 - 2277, n=59, ostatnie 2 lata) | |
| Schenker Vision 14 | |
| Asus Vivobook Pro 14 M3401QC-KM007T | |
| Apple MacBook Pro 14 2021 M1 Pro Entry | |
| CrossMark / Creativity | |
| Apple MacBook Pro 14 2021 M1 Pro Entry | |
| Dell Inspiron 14 Plus 7420 | |
| Huawei MateBook X Pro 2022 | |
| Średnia w klasie Subnotebook (372 - 2743, n=59, ostatnie 2 lata) | |
| Przeciętny Intel Core i7-12700H, NVIDIA GeForce RTX 3050 Ti Laptop GPU (1699 - 1993, n=5) | |
| Lenovo Yoga 9i 14 2022 i7-1260P | |
| Schenker Vision 14 2022 RTX 3050 Ti | |
| Schenker Vision 14 | |
| Asus Vivobook Pro 14 M3401QC-KM007T | |
| CrossMark / Responsiveness | |
| Huawei MateBook X Pro 2022 | |
| Przeciętny Intel Core i7-12700H, NVIDIA GeForce RTX 3050 Ti Laptop GPU (1383 - 1768, n=5) | |
| Lenovo Yoga 9i 14 2022 i7-1260P | |
| Schenker Vision 14 2022 RTX 3050 Ti | |
| Schenker Vision 14 | |
| Dell Inspiron 14 Plus 7420 | |
| Średnia w klasie Subnotebook (312 - 1854, n=59, ostatnie 2 lata) | |
| Asus Vivobook Pro 14 M3401QC-KM007T | |
| Apple MacBook Pro 14 2021 M1 Pro Entry | |
| PCMark 10 Score | 6623 pkt. | |
Pomoc | ||
| AIDA64 / Memory Copy | |
| Średnia w klasie Subnotebook (14554 - 131023, n=57, ostatnie 2 lata) | |
| Huawei MateBook X Pro 2022 | |
| Dell Inspiron 14 Plus 7420 | |
| Przeciętny Intel Core i7-12700H (25615 - 80511, n=64) | |
| Schenker Vision 14 2022 RTX 3050 Ti | |
| Asus Vivobook Pro 14 M3401QC-KM007T | |
| AIDA64 / Memory Read | |
| Średnia w klasie Subnotebook (15948 - 127174, n=57, ostatnie 2 lata) | |
| Huawei MateBook X Pro 2022 | |
| Dell Inspiron 14 Plus 7420 | |
| Przeciętny Intel Core i7-12700H (25586 - 79442, n=64) | |
| Asus Vivobook Pro 14 M3401QC-KM007T | |
| Schenker Vision 14 2022 RTX 3050 Ti | |
| AIDA64 / Memory Write | |
| Średnia w klasie Subnotebook (15709 - 135141, n=57, ostatnie 2 lata) | |
| Huawei MateBook X Pro 2022 | |
| Dell Inspiron 14 Plus 7420 | |
| Przeciętny Intel Core i7-12700H (23679 - 88660, n=64) | |
| Schenker Vision 14 2022 RTX 3050 Ti | |
| Asus Vivobook Pro 14 M3401QC-KM007T | |
| AIDA64 / Memory Latency | |
| Dell Inspiron 14 Plus 7420 | |
| Huawei MateBook X Pro 2022 | |
| Średnia w klasie Subnotebook (6.1 - 159.9, n=55, ostatnie 2 lata) | |
| Schenker Vision 14 2022 RTX 3050 Ti | |
| Asus Vivobook Pro 14 M3401QC-KM007T | |
| Przeciętny Intel Core i7-12700H (76.2 - 133.9, n=62) | |
* ... im mniej tym lepiej
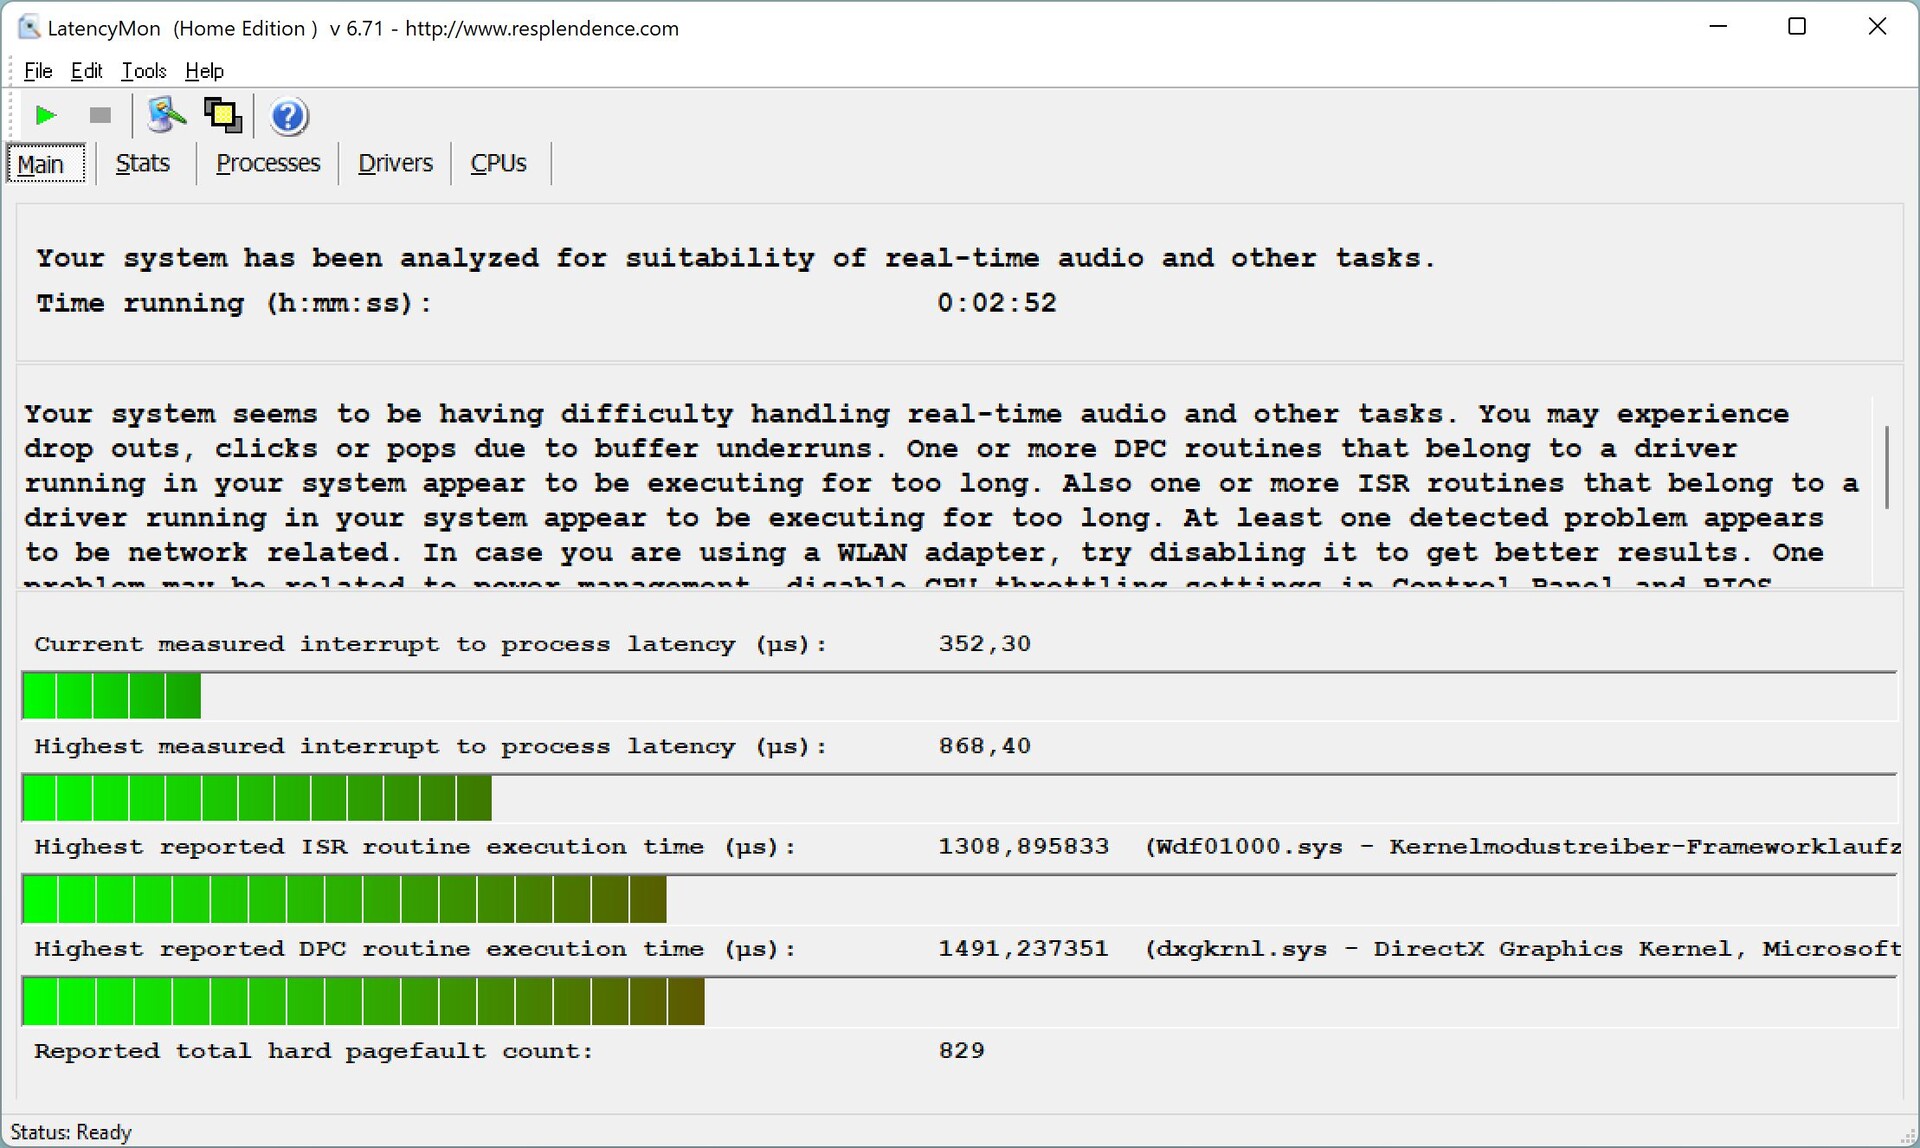
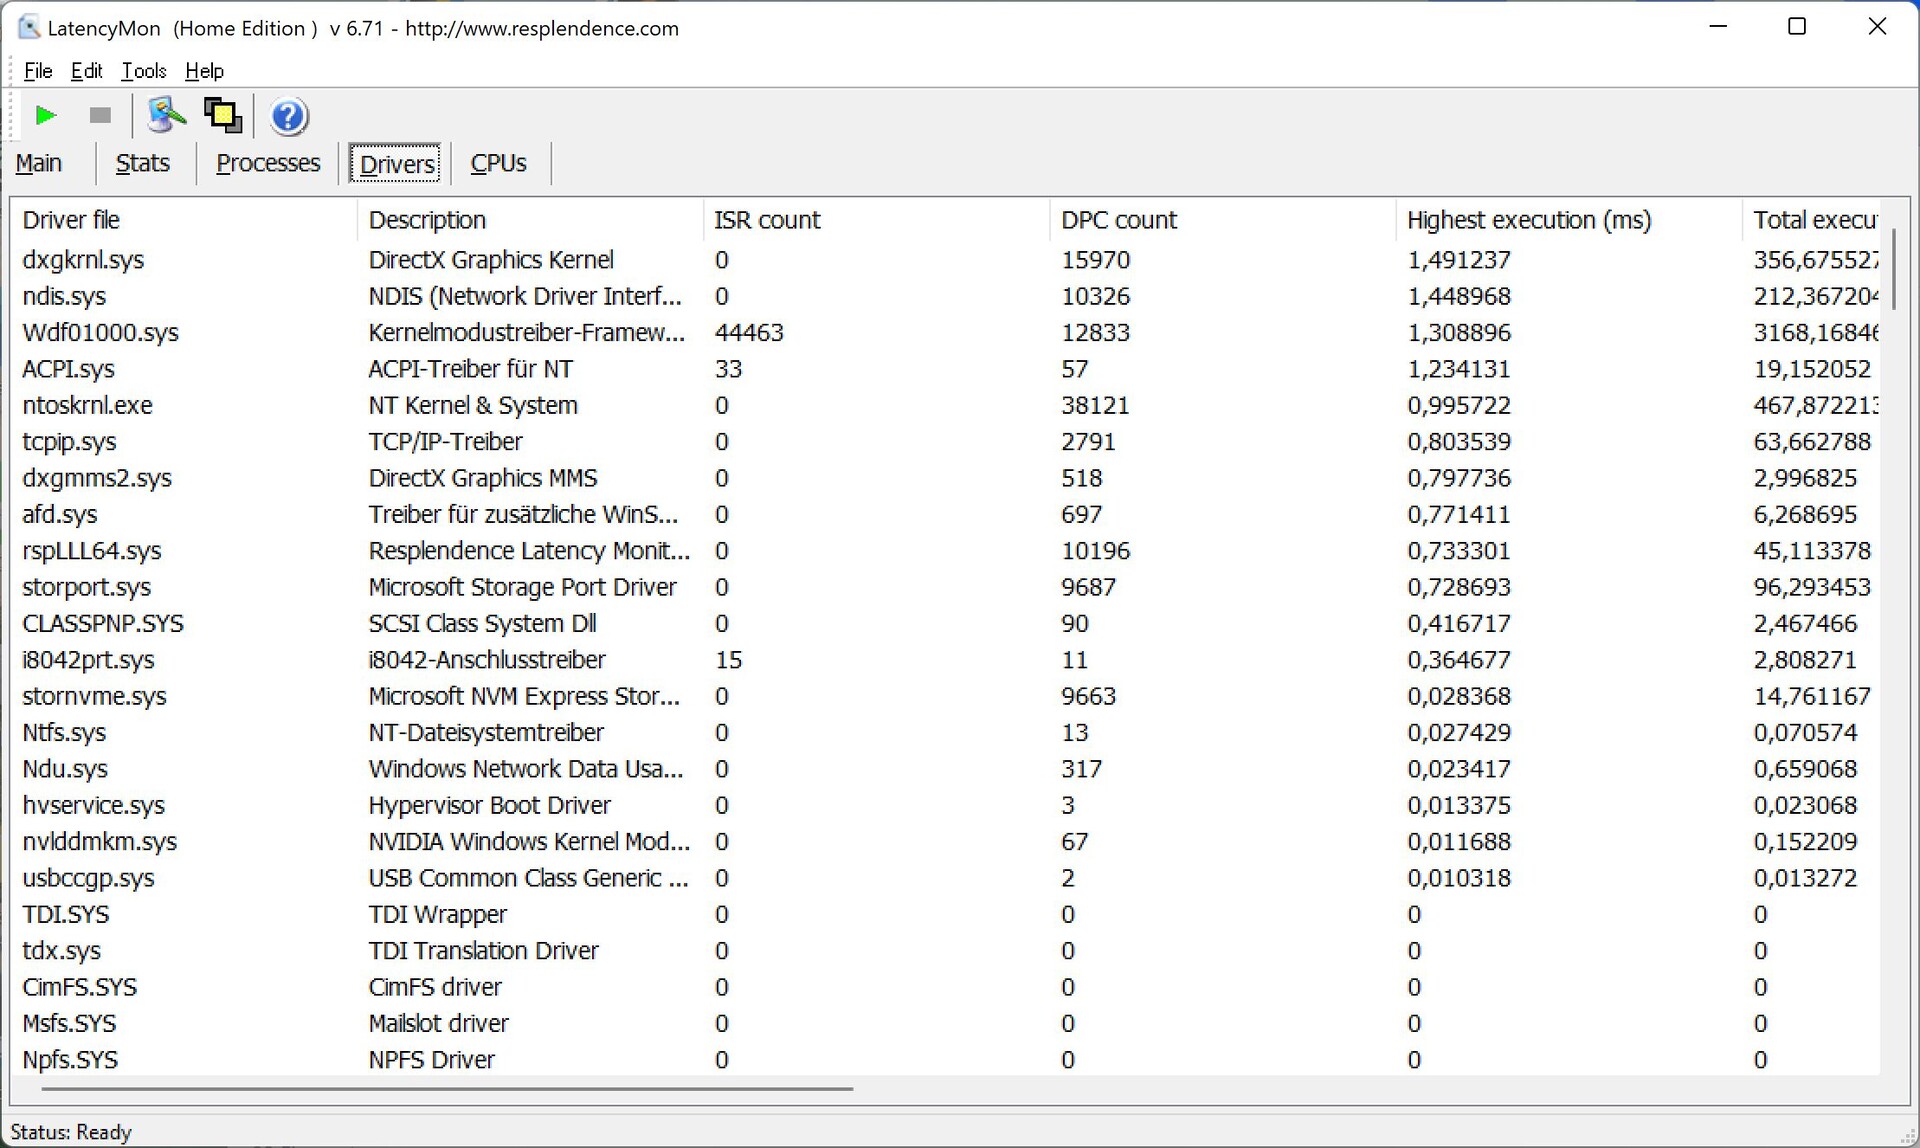
Opóźnienie DPC
Vision 14 wykazuje nieco zwiększone opóźnienia w naszym standardowym teście opóźnień na obecnej wersji BIOS-u, co czyni go nieoptymalnym wyborem dla aplikacji działających w czasie rzeczywistym. Podczas odtwarzania filmów 4K na YouTube nie spadły żadne klatki.
| DPC Latencies / LatencyMon - interrupt to process latency (max), Web, Youtube, Prime95 | |
| Asus Vivobook Pro 14 M3401QC-KM007T | |
| Lenovo Yoga 9i 14 2022 i7-1260P | |
| Huawei MateBook X Pro 2022 | |
| Schenker Vision 14 2022 RTX 3050 Ti | |
| Dell Inspiron 14 Plus 7420 | |
* ... im mniej tym lepiej
Rozwiązanie w zakresie przechowywania
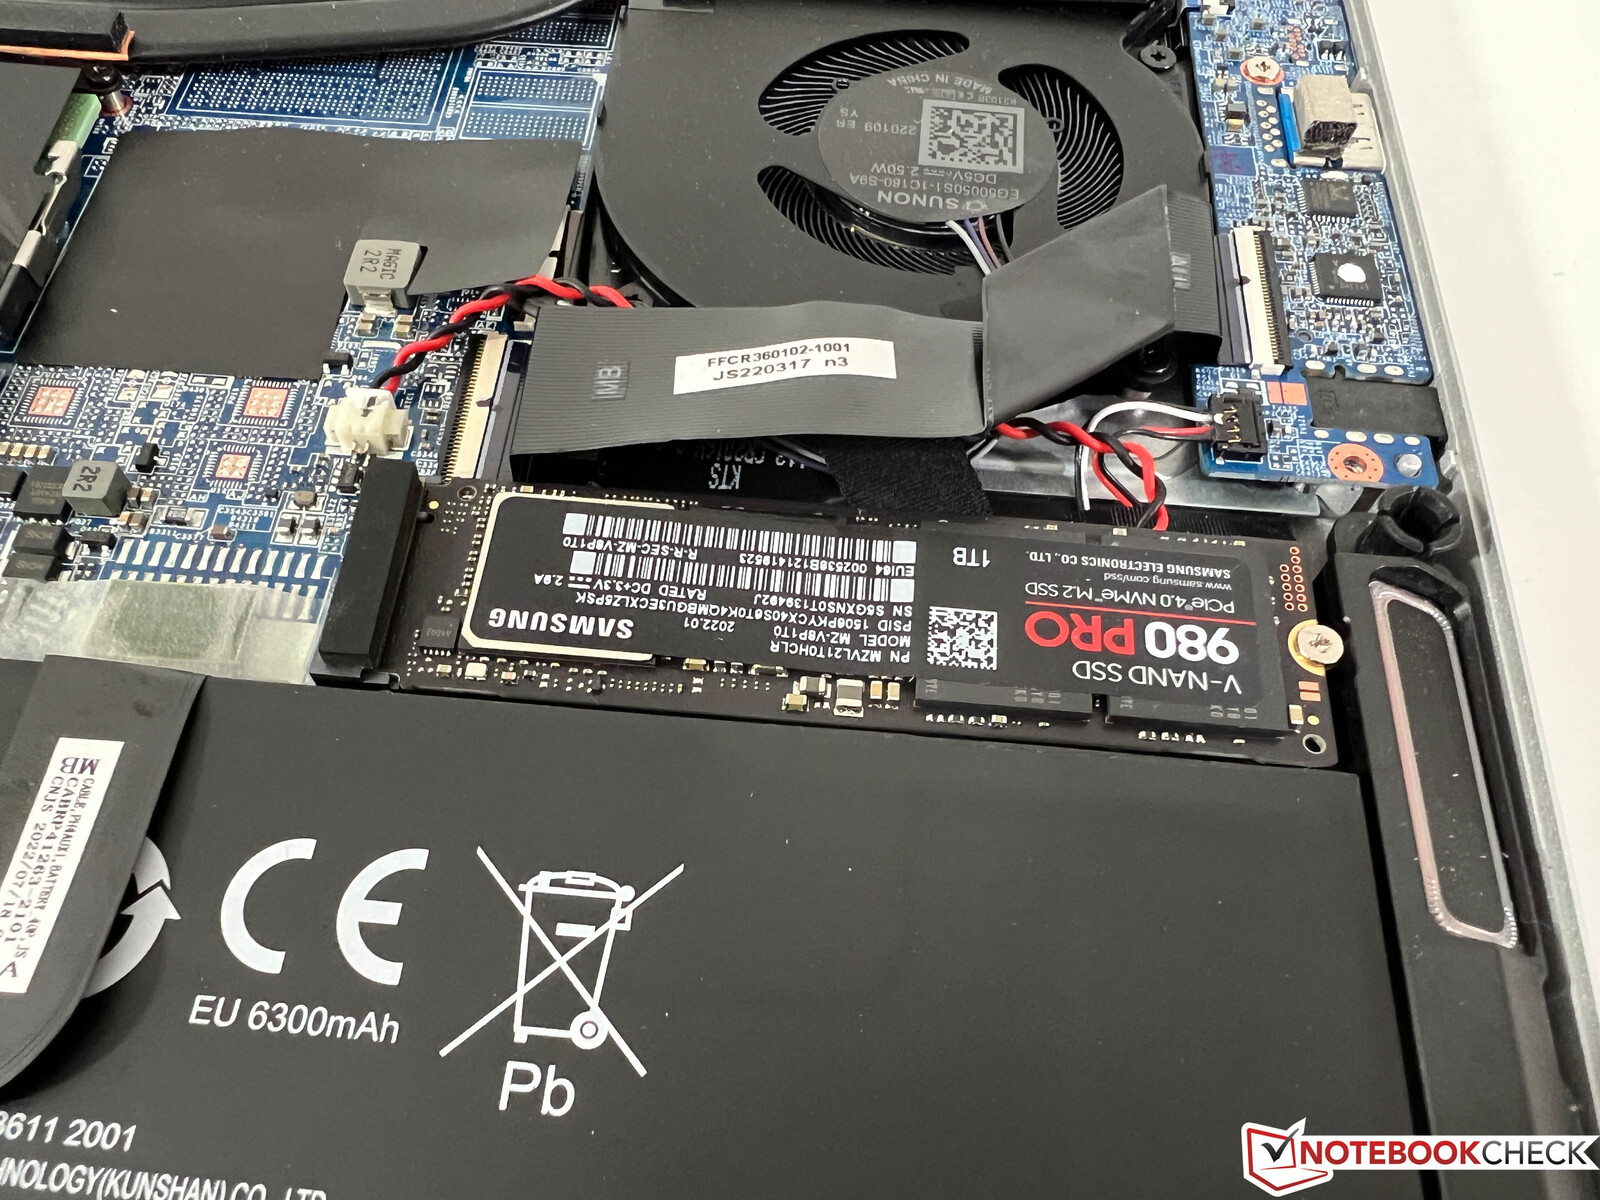
Jak już wcześniej wspomniano, wybór większej baterii o pojemności 99 Wh oznacza brak drugiego gniazda M.2-2280. Nasze urządzenie testowe wyposażone jest w dysk Samsung Pro 1 TB, który osiąga prędkość transferu do 7 GB/s, co czyni go jednym z najszybszych dostępnych obecnie dysków. Nie ma też żadnych problemów termicznych, a wydajność pozostaje całkowicie spójna nawet pod ciągłym obciążeniem. Więcej benchmarków SSD można znaleźć tutaj.

| Drive Performance rating - Percent | |
| Schenker Vision 14 2022 RTX 3050 Ti | |
| Lenovo Yoga 9i 14 2022 i7-1260P | |
| Przeciętny Samsung SSD 980 Pro 1TB MZ-V8P1T0BW | |
| Huawei MateBook X Pro 2022 | |
| Średnia w klasie Subnotebook | |
| Dell Inspiron 14 Plus 7420 | |
| Asus Vivobook Pro 14 M3401QC-KM007T | |
* ... im mniej tym lepiej
Disk Throttling: DiskSpd Read Loop, Queue Depth 8
Wydajność GPU
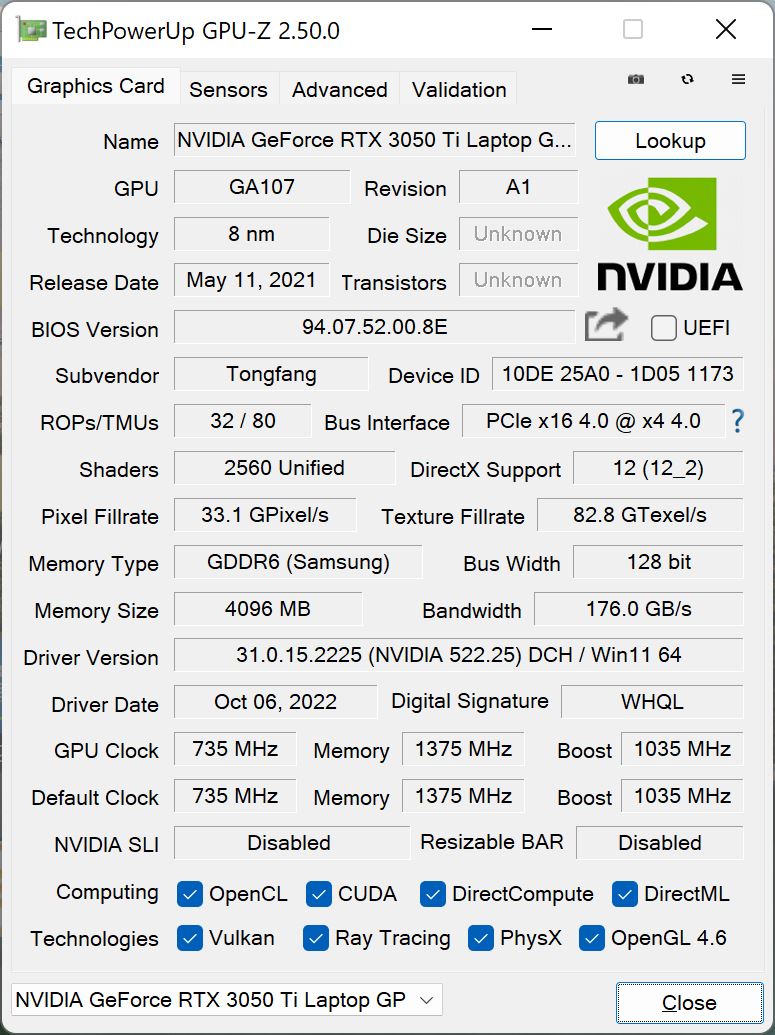
Vision 14 nadal wykorzystuje popularny układ Nvidia GeForce RTX 3050 Ti z TGP na poziomie 35 W (i dodatkowym 10-watowym Dynamic Boost od procesora). Nvidia RTX 3050 Ti jest oceniana na TGP w zakresie 35-80 W, co oznacza, że nasz model testowy wykorzystuje słabszą wersję tego układu. Benchmark Vision 14 odzwierciedla to wynikami, które są nieco gorsze dla tego GPU.
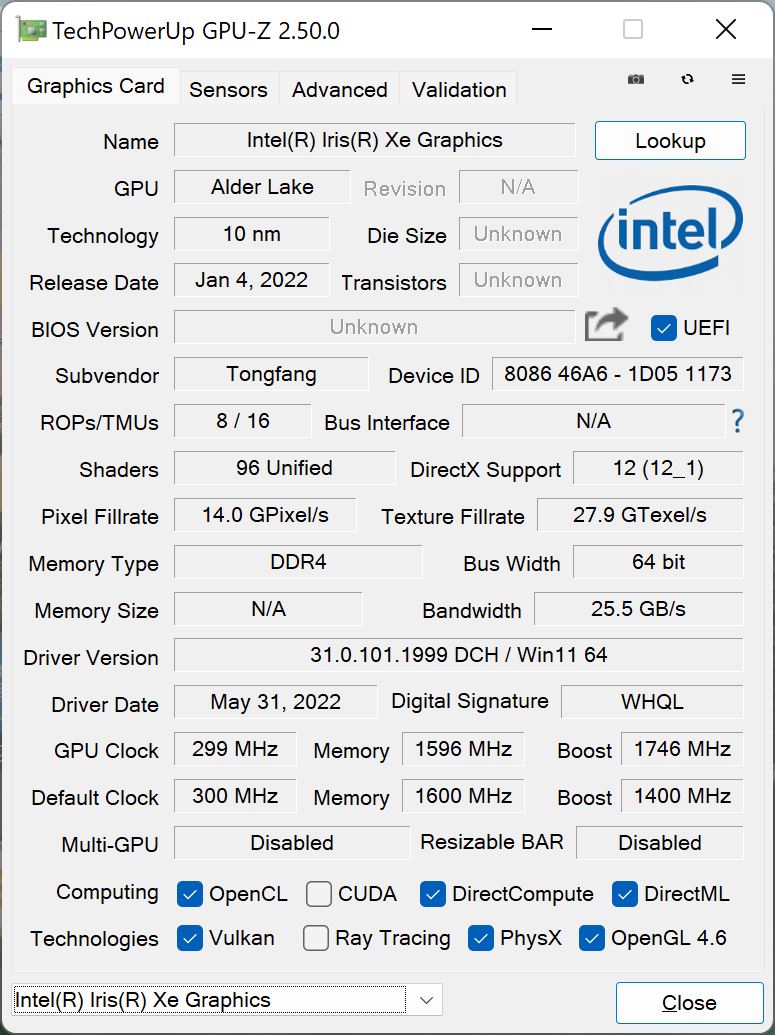
W porównaniu do poprzednika z RTX 3050 Tinajnowszy Vision 14 jest w stanie zapewnić sobie niewielką przewagę i ląduje na równi z M1 Pro GPU w podstawowym modelu Apple MacBook Pro 14. W przypadku wyboru wersji iGPU z Vision 14, Intel Iris Xe Graphics G7 z 96 jednostkami EU jest wykorzystywany zamiast niego, co skutkuje znacznie wolniejszą wydajnością GPU, co potwierdzają konkurenci Lenovo Yoga 9i 14 oraz Huawei MateBook X Pro.
Wydajność GPU pozostaje stała nawet przy ciągłym obciążeniu, choć w trybie bateryjnym (~ 75%) dość mocno cierpi. Więcej benchmarków GPU można znaleźć tutaj.
| 3DMark 11 - 1280x720 Performance GPU | |
| Przeciętny NVIDIA GeForce RTX 3050 Ti Laptop GPU (7952 - 20905, n=27) | |
| Schenker Vision 14 2022 RTX 3050 Ti | |
| Schenker Vision 14 | |
| Dell Inspiron 14 Plus 7420 | |
| Asus Vivobook Pro 14 M3401QC-KM007T | |
| Średnia w klasie Subnotebook (995 - 18489, n=54, ostatnie 2 lata) | |
| Lenovo Yoga 9i 14 2022 i7-1260P | |
| Huawei MateBook X Pro 2022 | |
| 3DMark | |
| 1920x1080 Fire Strike Graphics | |
| Przeciętny NVIDIA GeForce RTX 3050 Ti Laptop GPU (7917 - 15611, n=26) | |
| Schenker Vision 14 2022 RTX 3050 Ti | |
| Dell Inspiron 14 Plus 7420 | |
| Asus Vivobook Pro 14 M3401QC-KM007T | |
| Schenker Vision 14 | |
| Średnia w klasie Subnotebook (832 - 16347, n=55, ostatnie 2 lata) | |
| Lenovo Yoga 9i 14 2022 i7-1260P | |
| Huawei MateBook X Pro 2022 | |
| 2560x1440 Time Spy Graphics | |
| Przeciętny NVIDIA GeForce RTX 3050 Ti Laptop GPU (3744 - 6122, n=27) | |
| Schenker Vision 14 2022 RTX 3050 Ti | |
| Schenker Vision 14 | |
| Dell Inspiron 14 Plus 7420 | |
| Asus Vivobook Pro 14 M3401QC-KM007T | |
| Średnia w klasie Subnotebook (804 - 6288, n=54, ostatnie 2 lata) | |
| Lenovo Yoga 9i 14 2022 i7-1260P | |
| Huawei MateBook X Pro 2022 | |
| Wild Life Extreme Unlimited | |
| Przeciętny NVIDIA GeForce RTX 3050 Ti Laptop GPU (9340 - 9565, n=2) | |
| Schenker Vision 14 2022 RTX 3050 Ti | |
| Apple MacBook Pro 14 2021 M1 Pro Entry | |
| Średnia w klasie Subnotebook (3225 - 9092, n=14, ostatnie 2 lata) | |
| Huawei MateBook X Pro 2022 | |
| 3DMark 11 Performance | 16439 pkt. | |
| 3DMark Fire Strike Score | 11233 pkt. | |
| 3DMark Time Spy Score | 5098 pkt. | |
Pomoc | ||
| Blender / v3.3 Classroom OPTIX/RTX | |
| Dell Inspiron 14 Plus 7420 | |
| Asus VivoBook Pro 16X OLED N7600PC-L2026X | |
| Schenker Vision 14 2022 RTX 3050 Ti | |
| Przeciętny NVIDIA GeForce RTX 3050 Ti Laptop GPU (48 - 60, n=7) | |
| Dell Precision 7670 | |
| Lenovo ThinkBook 16p G3 ARH | |
| Blender / v3.3 Classroom CUDA | |
| Asus VivoBook Pro 16X OLED N7600PC-L2026X | |
| Dell Inspiron 14 Plus 7420 | |
| Schenker Vision 14 2022 RTX 3050 Ti | |
| Przeciętny NVIDIA GeForce RTX 3050 Ti Laptop GPU (83 - 104, n=7) | |
| Dell Precision 7670 | |
| Lenovo ThinkBook 16p G3 ARH | |
| Blender / v3.3 Classroom CPU | |
| Asus VivoBook Pro 16X OLED N7600PC-L2026X | |
| Huawei MateBook X Pro 2022 | |
| Lenovo ThinkPad T14 G3-21CF004NGE | |
| Średnia w klasie Subnotebook (241 - 861, n=59, ostatnie 2 lata) | |
| Dell Inspiron 14 Plus 7420 | |
| Schenker Vision 14 2022 RTX 3050 Ti | |
| Przeciętny NVIDIA GeForce RTX 3050 Ti Laptop GPU (379 - 557, n=7) | |
| Lenovo ThinkBook 16p G3 ARH | |
| Dell Precision 7670 | |
* ... im mniej tym lepiej
Wydajność w grach
Ponieważ wydajność w grach wciąż jest definiowana przede wszystkim przez GeForce RTX 3050 Ti, nawet jeśli niektóre wyniki benchmarków pokazują zalety szybszego procesora, różnice między nowym a starszym Vision 14 zwłaszcza przy bardzo wysokich ustawieniach jakości. Wiele nowoczesnych tytułów działa płynnie nawet na wysokich lub maksymalnych detalach, chociaż ustawienia graficzne będą musiały zostać zmniejszone w bardzo wymagających tytułach, takich jak Cyberpunk 2077 lub F1 2022, aby uzyskać płynną liczbę klatek.
| The Witcher 3 | |
| 1920x1080 High Graphics & Postprocessing (Nvidia HairWorks Off) | |
| Schenker Vision 14 2022 RTX 3050 Ti | |
| Przeciętny NVIDIA GeForce RTX 3050 Ti Laptop GPU (30 - 110, n=26) | |
| Dell Inspiron 14 Plus 7420 | |
| Schenker Vision 14 | |
| Asus Vivobook Pro 14 M3401QC-KM007T | |
| Średnia w klasie Subnotebook (25.6 - 64, n=13, ostatnie 2 lata) | |
| Lenovo Yoga 9i 14 2022 i7-1260P | |
| Huawei MateBook X Pro 2022 | |
| 1920x1080 Ultra Graphics & Postprocessing (HBAO+) | |
| Asus Vivobook Pro 14 M3401QC-KM007T | |
| Przeciętny NVIDIA GeForce RTX 3050 Ti Laptop GPU (19 - 58.5, n=29) | |
| Dell Inspiron 14 Plus 7420 | |
| Schenker Vision 14 2022 RTX 3050 Ti | |
| Schenker Vision 14 | |
| Średnia w klasie Subnotebook (13.9 - 34.6, n=13, ostatnie 2 lata) | |
| Huawei MateBook X Pro 2022 | |
| Lenovo Yoga 9i 14 2022 i7-1260P | |
| GTA V | |
| 1920x1080 High/On (Advanced Graphics Off) AA:2xMSAA + FX AF:8x | |
| Schenker Vision 14 2022 RTX 3050 Ti | |
| Przeciętny NVIDIA GeForce RTX 3050 Ti Laptop GPU (53.8 - 149, n=25) | |
| Asus Vivobook Pro 14 M3401QC-KM007T | |
| Dell Inspiron 14 Plus 7420 | |
| Schenker Vision 14 | |
| Średnia w klasie Subnotebook (25.8 - 99.6, n=54, ostatnie 2 lata) | |
| Lenovo Yoga 9i 14 2022 i7-1260P | |
| Huawei MateBook X Pro 2022 | |
| 1920x1080 Highest AA:4xMSAA + FX AF:16x | |
| Schenker Vision 14 2022 RTX 3050 Ti | |
| Przeciętny NVIDIA GeForce RTX 3050 Ti Laptop GPU (27.8 - 75.6, n=26) | |
| Dell Inspiron 14 Plus 7420 | |
| Asus Vivobook Pro 14 M3401QC-KM007T | |
| Schenker Vision 14 | |
| Średnia w klasie Subnotebook (10.7 - 43.7, n=55, ostatnie 2 lata) | |
| Lenovo Yoga 9i 14 2022 i7-1260P | |
| Huawei MateBook X Pro 2022 | |
| Cyberpunk 2077 1.6 | |
| 1920x1080 High Preset | |
| Przeciętny NVIDIA GeForce RTX 3050 Ti Laptop GPU (39 - 51.5, n=9) | |
| Dell Inspiron 14 Plus 7420 | |
| Schenker Vision 14 2022 RTX 3050 Ti | |
| 1920x1080 Ultra Preset | |
| Przeciętny NVIDIA GeForce RTX 3050 Ti Laptop GPU (31 - 50.5, n=9) | |
| Dell Inspiron 14 Plus 7420 | |
| Schenker Vision 14 2022 RTX 3050 Ti | |
| Dota 2 Reborn | |
| 1920x1080 high (2/3) | |
| Dell Inspiron 14 Plus 7420 | |
| Przeciętny NVIDIA GeForce RTX 3050 Ti Laptop GPU (74.8 - 154, n=27) | |
| Schenker Vision 14 | |
| Schenker Vision 14 2022 RTX 3050 Ti | |
| Asus Vivobook Pro 14 M3401QC-KM007T | |
| Średnia w klasie Subnotebook (14.8 - 101.2, n=60, ostatnie 2 lata) | |
| Lenovo Yoga 9i 14 2022 i7-1260P | |
| Huawei MateBook X Pro 2022 | |
| 1920x1080 ultra (3/3) best looking | |
| Dell Inspiron 14 Plus 7420 | |
| Schenker Vision 14 | |
| Przeciętny NVIDIA GeForce RTX 3050 Ti Laptop GPU (67.3 - 145, n=27) | |
| Schenker Vision 14 2022 RTX 3050 Ti | |
| Asus Vivobook Pro 14 M3401QC-KM007T | |
| Średnia w klasie Subnotebook (13 - 97, n=60, ostatnie 2 lata) | |
| Lenovo Yoga 9i 14 2022 i7-1260P | |
| Huawei MateBook X Pro 2022 | |
| Far Cry 5 | |
| 1920x1080 High Preset AA:T | |
| Schenker Vision 14 2022 RTX 3050 Ti | |
| Przeciętny NVIDIA GeForce RTX 3050 Ti Laptop GPU (36 - 94, n=14) | |
| Schenker Vision 14 | |
| Asus Vivobook Pro 14 M3401QC-KM007T | |
| Średnia w klasie Subnotebook (19 - 54, n=24, ostatnie 2 lata) | |
| Lenovo Yoga 9i 14 2022 i7-1260P | |
| Huawei MateBook X Pro 2022 | |
| 1920x1080 Ultra Preset AA:T | |
| Schenker Vision 14 2022 RTX 3050 Ti | |
| Przeciętny NVIDIA GeForce RTX 3050 Ti Laptop GPU (30 - 89, n=14) | |
| Asus Vivobook Pro 14 M3401QC-KM007T | |
| Schenker Vision 14 | |
| Średnia w klasie Subnotebook (18 - 51, n=24, ostatnie 2 lata) | |
| Lenovo Yoga 9i 14 2022 i7-1260P | |
| Huawei MateBook X Pro 2022 | |
| F1 2021 | |
| 1920x1080 High Preset AA:T AF:16x | |
| Schenker Vision 14 2022 RTX 3050 Ti | |
| Asus Vivobook Pro 14 M3401QC-KM007T | |
| Przeciętny NVIDIA GeForce RTX 3050 Ti Laptop GPU (68 - 131, n=11) | |
| Schenker Vision 14 | |
| Lenovo Yoga 9i 14 2022 i7-1260P | |
| Huawei MateBook X Pro 2022 | |
| 1920x1080 Ultra High Preset + Raytracing AA:T AF:16x | |
| Schenker Vision 14 2022 RTX 3050 Ti | |
| Przeciętny NVIDIA GeForce RTX 3050 Ti Laptop GPU (44.4 - 69, n=11) | |
| Asus Vivobook Pro 14 M3401QC-KM007T | |
| Schenker Vision 14 | |
| Lenovo Yoga 9i 14 2022 i7-1260P | |
| Huawei MateBook X Pro 2022 | |
| Final Fantasy XV Benchmark | |
| 1920x1080 High Quality | |
| Przeciętny NVIDIA GeForce RTX 3050 Ti Laptop GPU (23.5 - 106, n=24) | |
| Schenker Vision 14 2022 RTX 3050 Ti | |
| Dell Inspiron 14 Plus 7420 | |
| Schenker Vision 14 | |
| Średnia w klasie Subnotebook (11.6 - 54.5, n=53, ostatnie 2 lata) | |
| Lenovo Yoga 9i 14 2022 i7-1260P | |
| Huawei MateBook X Pro 2022 | |
| 1920x1080 Standard Quality | |
| Schenker Vision 14 2022 RTX 3050 Ti | |
| Przeciętny NVIDIA GeForce RTX 3050 Ti Laptop GPU (33.4 - 106, n=24) | |
| Dell Inspiron 14 Plus 7420 | |
| Schenker Vision 14 | |
| Średnia w klasie Subnotebook (15.1 - 75.2, n=53, ostatnie 2 lata) | |
| Lenovo Yoga 9i 14 2022 i7-1260P | |
| Huawei MateBook X Pro 2022 | |
| Strange Brigade | |
| 1920x1080 high AA:high AF:8 | |
| Przeciętny NVIDIA GeForce RTX 3050 Ti Laptop GPU (79.2 - 117.3, n=23) | |
| Schenker Vision 14 2022 RTX 3050 Ti | |
| Dell Inspiron 14 Plus 7420 | |
| Asus Vivobook Pro 14 M3401QC-KM007T | |
| Schenker Vision 14 | |
| Średnia w klasie Subnotebook (22.8 - 114.9, n=49, ostatnie 2 lata) | |
| Lenovo Yoga 9i 14 2022 i7-1260P | |
| Huawei MateBook X Pro 2022 | |
| 1920x1080 ultra AA:ultra AF:16 | |
| Przeciętny NVIDIA GeForce RTX 3050 Ti Laptop GPU (34.8 - 101.3, n=25) | |
| Schenker Vision 14 2022 RTX 3050 Ti | |
| Dell Inspiron 14 Plus 7420 | |
| Asus Vivobook Pro 14 M3401QC-KM007T | |
| Schenker Vision 14 | |
| Średnia w klasie Subnotebook (19 - 101.3, n=49, ostatnie 2 lata) | |
| Lenovo Yoga 9i 14 2022 i7-1260P | |
| Huawei MateBook X Pro 2022 | |
Witcher 3 FPS Graph
Wydajność w grach pozostaje stała w ciągłym stresie, jak pokazuje nasza Witcher 3 pętla pokazuje. Jednak sprawdzenie, czy cichsze profile zasilania mogą zapewnić wystarczającą wydajność w grach, może być warte uwagi w zależności od gry. W trybie bateryjnym wydajność w grach jest znacznie obniżona, a detale muszą być drastycznie zredukowane, by gry pozostały grywalne.
| low | med. | high | ultra | QHD | |
|---|---|---|---|---|---|
| GTA V (2015) | 170.6 | 163.3 | 121 | 67.5 | 48.4 |
| The Witcher 3 (2015) | 249 | 264 | 92 | 44.2 | |
| Dota 2 Reborn (2015) | 148.1 | 121.9 | 114.4 | 109.1 | |
| Final Fantasy XV Benchmark (2018) | 130.6 | 71 | 50.1 | 36.2 | |
| X-Plane 11.11 (2018) | 112.4 | 99.6 | 82.3 | ||
| Far Cry 5 (2018) | 121 | 87 | 79 | 75 | 53 |
| Strange Brigade (2018) | 259 | 126.9 | 100.8 | 86 | 63 |
| F1 2021 (2021) | 223 | 148 | 120.8 | 59.2 | 41 |
| Cyberpunk 2077 1.6 (2022) | 56 | 49 | 40 | 31 | 20 |
| F1 22 (2022) | 136.1 | 124.8 | 93 | 28 | 16.1 |
Emisja - Vision 14 Gets Too Loud
Szum systemu
W porównaniu z poprzednim modelem nic się nie zmieniło w kwestii rozwiązania chłodzenia. Vision 14 nadal korzysta z dwóch wentylatorów i dwóch heatpipów. Co prawda niektóre wyniki uległy lekkiemu przesunięciu, ale w zasadzie pokrywają się z tymi, które osiągał m.in starszego modelu. Nasze wyniki z różnych scenariuszy znajdują się w poniższej tabeli. Nie zauważyliśmy żadnych elektronicznych szumów.
| Profile | Cinebench R23 Multi | Witcher 3 Ultra | Stress test |
|---|---|---|---|
| Quiet 20 dB | 26 dB(A) | 32,5 dB(A) | 32,5 dB(A) |
| Quiet 30 dB | 26 dB(A) | 40 dB(A) | 40 dB(A) |
| Quiet 40 dB | 27.8 dB(A) | 45.8 dB(A) | 45.8 dB(A) |
| Performance Balanced | 29.2 dB(A) | 45.8 dB(A) | 45.8 dB(A) |
| Performance Enthusiast | 46 dB(A) | 48,2dB(A) | 48,8 dB(A) |
| Performance Overboost | 48,2 dB(A) | 51,1 dB(A) | 51,1 dB(A) |
Hałas
| luz |
| 24.4 / 24.4 / 27.8 dB |
| obciążenie |
| 43.3 / 48.8 dB |
 | ||
30 dB cichy 40 dB(A) słyszalny 50 dB(A) irytujący |
||
min: | ||
| Schenker Vision 14 2022 RTX 3050 Ti GeForce RTX 3050 Ti Laptop GPU, i7-12700H, Samsung SSD 980 Pro 1TB MZ-V8P1T0BW | Huawei MateBook X Pro 2022 Iris Xe G7 96EUs, i7-1260P, Silicon Motion PCIe-8 SSD 1TB | Lenovo Yoga 9i 14 2022 i7-1260P Iris Xe G7 96EUs, i7-1260P, Samsung PM9A1 MZVL21T0HCLR | Dell Inspiron 14 Plus 7420 GeForce RTX 3050 4GB Laptop GPU, i7-12700H, SK Hynix BC711 512GB HFM512GD3GX013N | Asus Vivobook Pro 14 M3401QC-KM007T GeForce RTX 3050 4GB Laptop GPU, R5 5600H, Intel SSD 670p SSDPEKNU512GZ | Apple MacBook Pro 14 2021 M1 Pro Entry M1 Pro 14-Core GPU, M1 Pro 8-Core, Apple SSD AP0512 | Schenker Vision 14 GeForce RTX 3050 Ti Laptop GPU, i7-11370H, Samsung SSD 980 Pro 1TB MZ-V8P1T0BW | |
|---|---|---|---|---|---|---|---|
| Noise | 12% | 6% | 1% | -11% | 12% | 2% | |
| wyłączone / środowisko * (dB) | 24.4 | 23.5 4% | 24.1 1% | 23.2 5% | 25.4 -4% | 24.8 -2% | 24.3 -0% |
| Idle Minimum * (dB) | 24.4 | 23.5 4% | 24.1 1% | 23.2 5% | 25.4 -4% | 24.8 -2% | 24.3 -0% |
| Idle Average * (dB) | 24.4 | 23.5 4% | 24.1 1% | 23.2 5% | 25.4 -4% | 24.8 -2% | 24.3 -0% |
| Idle Maximum * (dB) | 27.8 | 25.9 7% | 30 -8% | 23.2 17% | 30.9 -11% | 24.8 11% | 25.9 7% |
| Load Average * (dB) | 43.3 | 33.8 22% | 39.4 9% | 47.5 -10% | 56 -29% | 27.8 36% | 43.3 -0% |
| Witcher 3 ultra * (dB) | 48.2 | 35.4 27% | 39.4 18% | 51.7 -7% | 27.8 42% | 44.6 7% | |
| Load Maximum * (dB) | 48.8 | 40.6 17% | 39.4 19% | 51.7 -6% | 56 -15% | 49.5 -1% | 49.5 -1% |
* ... im mniej tym lepiej
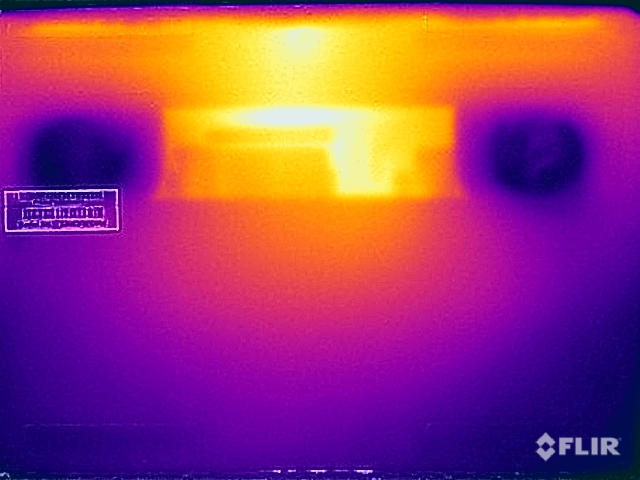
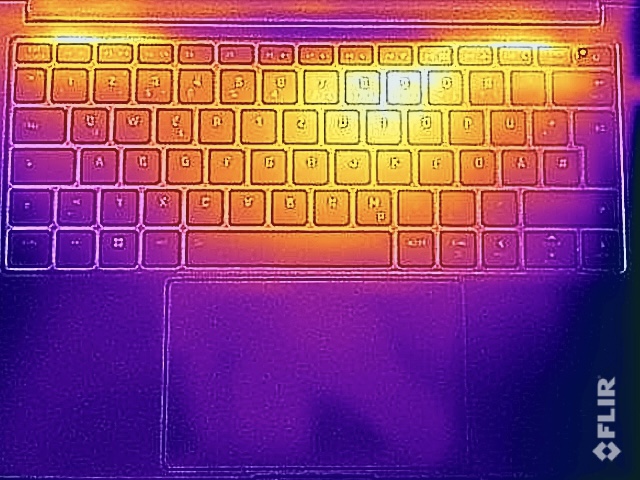
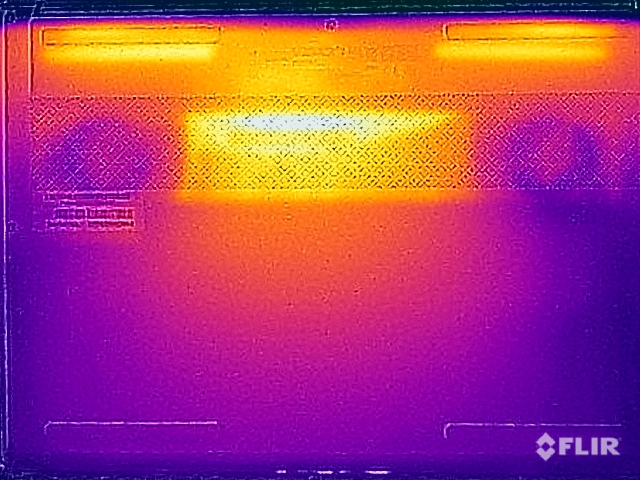
Temperatura
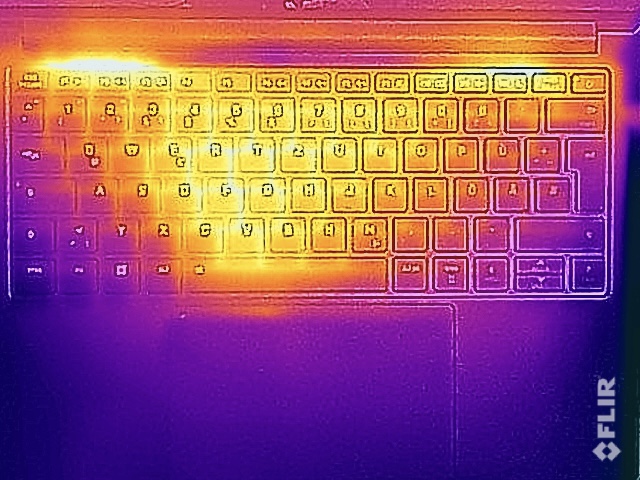
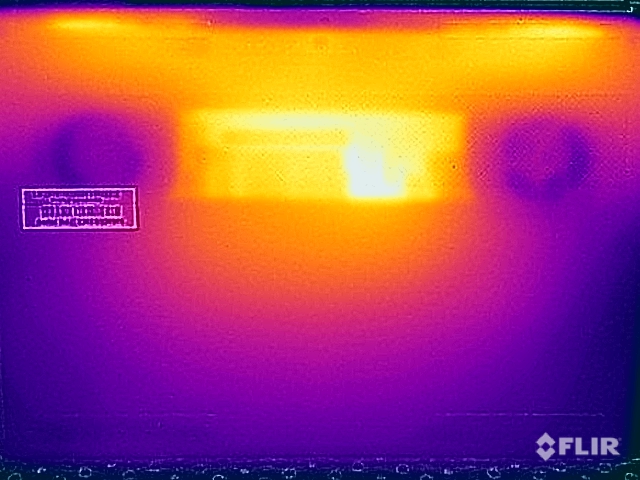
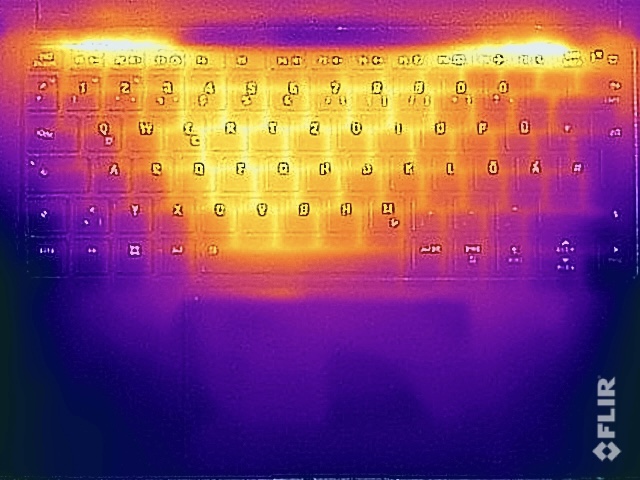
Widać też uderzające podobieństwa do poprzednika jeśli chodzi o temperatury powierzchni. W stanie bezczynności i podczas wykonywania niewymagających zadań temperatury pozostają niskie, natomiast środkowy obszar nad klawiaturą i środkowy obszar na spodzie mogą osiągnąć odpowiednio blisko bardzo gorące 50°C (122°F) i powyżej 50°C. W takich scenariuszach odradzamy używanie laptopa na kolanach. Przy obciążeniu tylko do 45 °C (113 °F) wersja z iGPU pozostaje znacznie chłodniejsza.
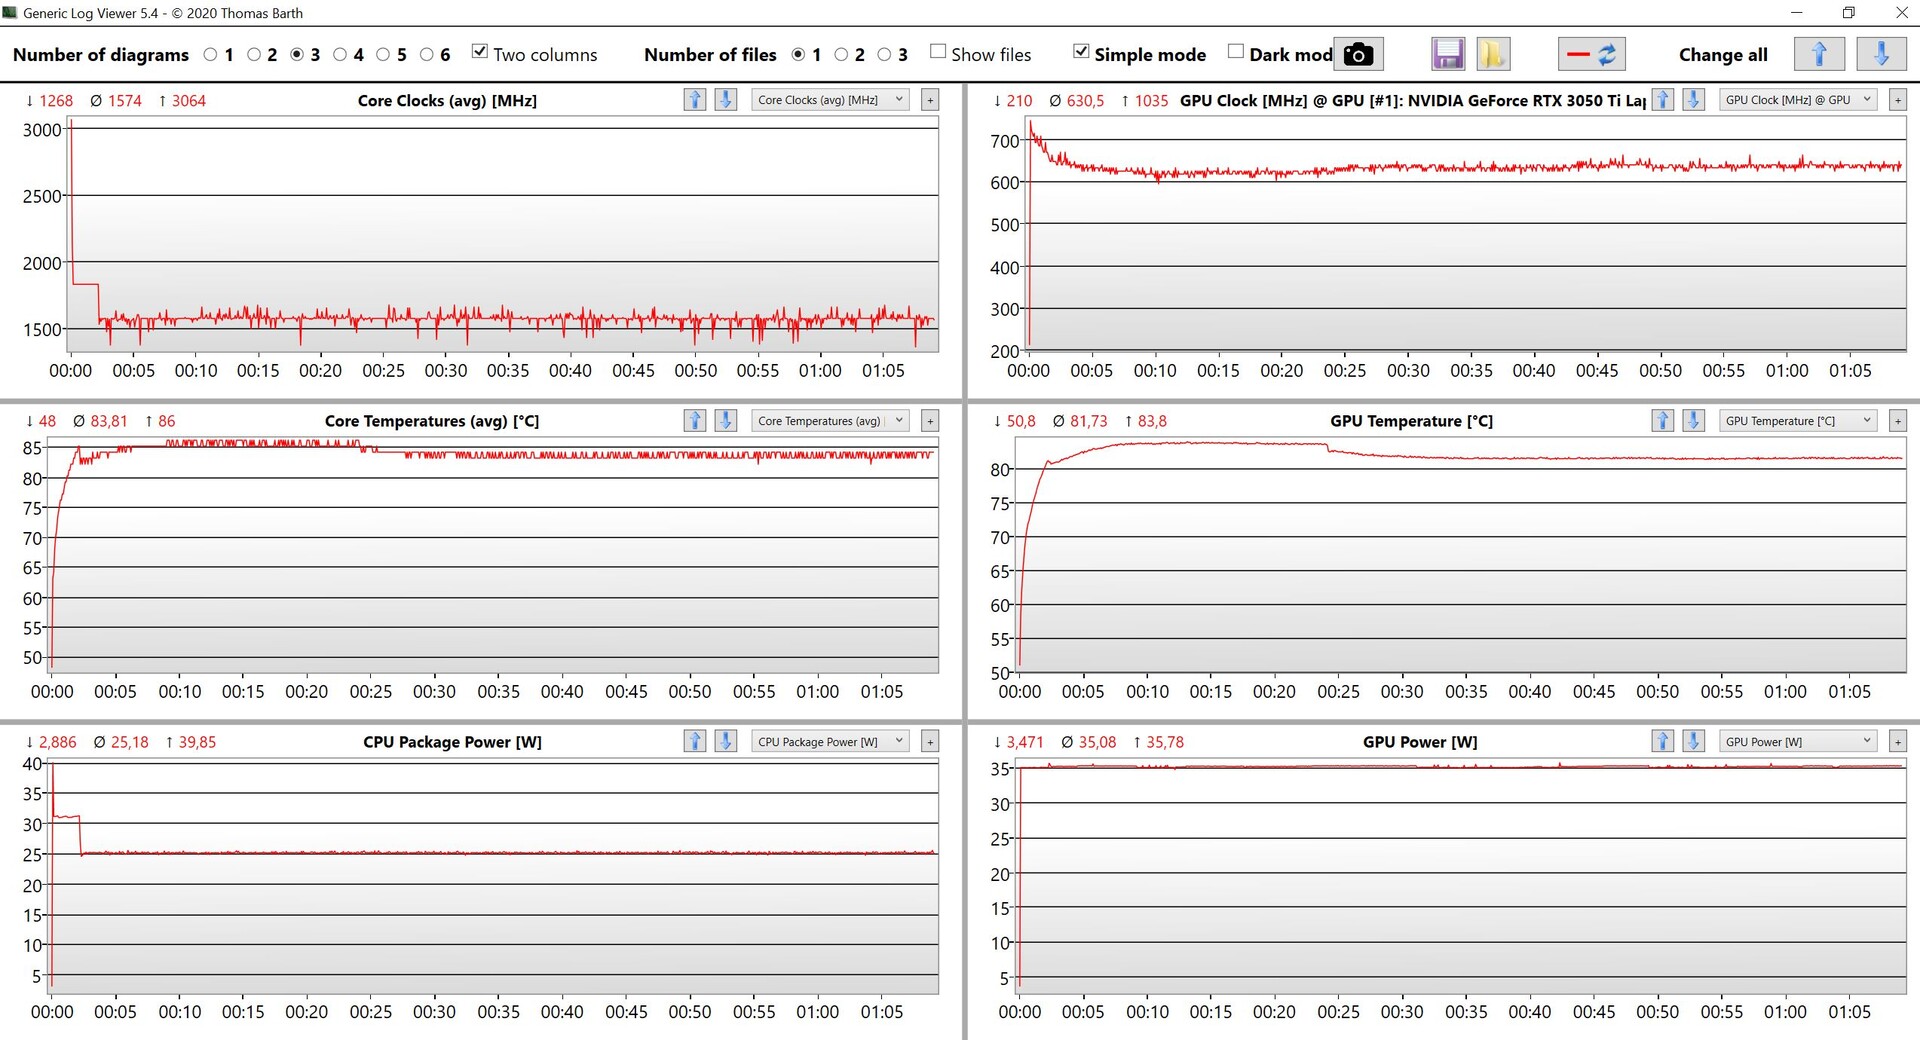
Podczas naszego testu obciążeniowego karta graficzna utrzymuje się stale na poziomie 35 W, podczas gdy procesor początkowo zużywa około 31 W, by po kilku minutach ustabilizować się na poziomie 25 W. Pełna wydajność jest nadal dostępna bezpośrednio po teście warunków skrajnych.
(-) Maksymalna temperatura w górnej części wynosi 48.4 °C / 119 F, w porównaniu do średniej 35.9 °C / 97 F , począwszy od 21.4 do 59 °C dla klasy Subnotebook.
(-) Dno nagrzewa się maksymalnie do 57.1 °C / 135 F, w porównaniu do średniej 39.2 °C / 103 F
(+) W stanie bezczynności średnia temperatura górnej części wynosi 26.6 °C / 80 F, w porównaniu ze średnią temperaturą urządzenia wynoszącą 30.8 °C / ### class_avg_f### F.
(-) Podczas gry w Wiedźmina 3 średnia temperatura górnej części wynosi 40.8 °C / 105 F, w porównaniu do średniej temperatury urządzenia wynoszącej 30.8 °C / ## #class_avg_f### F.
(+) Podpórki pod nadgarstki i touchpad są chłodniejsze niż temperatura skóry i maksymalnie 28.5 °C / 83.3 F i dlatego są chłodne w dotyku.
(±) Średnia temperatura obszaru podparcia dłoni w podobnych urządzeniach wynosiła 28.2 °C / 82.8 F (-0.3 °C / -0.5 F).
| Schenker Vision 14 2022 RTX 3050 Ti Intel Core i7-12700H, NVIDIA GeForce RTX 3050 Ti Laptop GPU | Huawei MateBook X Pro 2022 Intel Core i7-1260P, Intel Iris Xe Graphics G7 96EUs | Lenovo Yoga 9i 14 2022 i7-1260P Intel Core i7-1260P, Intel Iris Xe Graphics G7 96EUs | Dell Inspiron 14 Plus 7420 Intel Core i7-12700H, NVIDIA GeForce RTX 3050 4GB Laptop GPU | Asus Vivobook Pro 14 M3401QC-KM007T AMD Ryzen 5 5600H, NVIDIA GeForce RTX 3050 4GB Laptop GPU | Apple MacBook Pro 14 2021 M1 Pro Entry Apple M1 Pro 8-Core, Apple M1 Pro 14-Core GPU | Schenker Vision 14 Intel Core i7-11370H, NVIDIA GeForce RTX 3050 Ti Laptop GPU | |
|---|---|---|---|---|---|---|---|
| Heat | 8% | 4% | 14% | -7% | 16% | -2% | |
| Maximum Upper Side * (°C) | 48.4 | 43.1 11% | 47.5 2% | 40 17% | 42.3 13% | 46.8 3% | 49.7 -3% |
| Maximum Bottom * (°C) | 57.1 | 42 26% | 52.2 9% | 36.4 36% | 49.6 13% | 40.9 28% | 56 2% |
| Idle Upper Side * (°C) | 28.1 | 29.4 -5% | 27.1 4% | 27 4% | 34.2 -22% | 24.2 14% | 28.8 -2% |
| Idle Bottom * (°C) | 29 | 29.4 -1% | 28.5 2% | 29.2 -1% | 37.9 -31% | 24.2 17% | 30.6 -6% |
* ... im mniej tym lepiej
Mówcy
Ze względu na duży akumulator trzeba było zastosować dwa nowe moduły głośnikowe. Nie ma jednak odczuwalnej różnicy i jakość dźwięku pozostaje jedną ze słabych stron Vision 14. Głośniki brzmią bardzo cienko i nie mogą konkurować z tymi z innych laptopów multimedialnych.
Schenker Vision 14 2022 RTX 3050 Ti analiza dźwięku
(±) | głośność głośnika jest średnia, ale dobra (81.9 dB)
Bas 100 - 315 Hz
(-) | prawie brak basu - średnio 20.6% niższa od mediany
(±) | liniowość basu jest średnia (9% delta do poprzedniej częstotliwości)
Średnie 400 - 2000 Hz
(±) | wyższe średnie - średnio 6.7% wyższe niż mediana
(+) | średnie są liniowe (5.8% delta do poprzedniej częstotliwości)
Wysokie 2–16 kHz
(+) | zrównoważone maksima - tylko 4.3% od mediany
(+) | wzloty są liniowe (4.9% delta do poprzedniej częstotliwości)
Ogólnie 100 - 16.000 Hz
(±) | liniowość ogólnego dźwięku jest średnia (20.4% różnicy w stosunku do mediany)
W porównaniu do tej samej klasy
» 65% wszystkich testowanych urządzeń w tej klasie było lepszych, 8% podobnych, 27% gorszych
» Najlepszy miał deltę 5%, średnia wynosiła ###średnia###%, najgorsza wynosiła 53%
W porównaniu do wszystkich testowanych urządzeń
» 53% wszystkich testowanych urządzeń było lepszych, 8% podobnych, 39% gorszych
» Najlepszy miał deltę 4%, średnia wynosiła ###średnia###%, najgorsza wynosiła 134%
Apple MacBook Pro 14 2021 M1 Pro Entry analiza dźwięku
(+) | głośniki mogą odtwarzać stosunkowo głośno (84.9 dB)
Bas 100 - 315 Hz
(+) | dobry bas - tylko 4.3% od mediany
(+) | bas jest liniowy (5.9% delta do poprzedniej częstotliwości)
Średnie 400 - 2000 Hz
(+) | zbalansowane środki średnie - tylko 1.1% od mediany
(+) | średnie są liniowe (1.9% delta do poprzedniej częstotliwości)
Wysokie 2–16 kHz
(+) | zrównoważone maksima - tylko 2.9% od mediany
(+) | wzloty są liniowe (3% delta do poprzedniej częstotliwości)
Ogólnie 100 - 16.000 Hz
(+) | ogólny dźwięk jest liniowy (5.6% różnicy w stosunku do mediany)
W porównaniu do tej samej klasy
» 2% wszystkich testowanych urządzeń w tej klasie było lepszych, 1% podobnych, 97% gorszych
» Najlepszy miał deltę 5%, średnia wynosiła ###średnia###%, najgorsza wynosiła 45%
W porównaniu do wszystkich testowanych urządzeń
» 0% wszystkich testowanych urządzeń było lepszych, 0% podobnych, 100% gorszych
» Najlepszy miał deltę 4%, średnia wynosiła ###średnia###%, najgorsza wynosiła 134%
Zarządzanie energią - dłuższy czas pracy dzięki baterii o pojemności 99 Wh
Zużycie energii
Chociaż zużycie energii zostało nieznacznie poprawione w porównaniu z starszym modelem, zużycie Vision 14 na poziomie ponad 11 watów nadal nie czyni go bardzo wydajnym urządzeniem, co jest konsekwencją zastosowania panelu 3K. Zmierzyliśmy maksymalne zużycie 110 watów (które spada i stabilizuje się na poziomie ~93 watów po kilku minutach). Ponieważ pojemność baterii nie zmieniła się w trakcie testu, wydaje się, że dołączony do zestawu 90-watowy zasilacz AC ma jakieś ukryte rezerwy. Ładowanie i zasilanie urządzenia ładowarką USB-C (minimum 65-watową) jest generalnie możliwe, modele 90-watowe prawdopodobnie nie będą wtedy w stanie osiągnąć pełnego potencjału wydajnościowego Vision 14 lub będą zmuszone uciec się do dostępu do baterii pod pełnym obciążeniem.
| wyłączony / stan wstrzymania | |
| luz | |
| obciążenie |
|
Legenda:
min: | |
| Schenker Vision 14 2022 RTX 3050 Ti i7-12700H, GeForce RTX 3050 Ti Laptop GPU, Samsung SSD 980 Pro 1TB MZ-V8P1T0BW, IPS, 2880x1800, 14" | Huawei MateBook X Pro 2022 i7-1260P, Iris Xe G7 96EUs, Silicon Motion PCIe-8 SSD 1TB, IPS, 3120x2080, 14.2" | Lenovo Yoga 9i 14 2022 i7-1260P i7-1260P, Iris Xe G7 96EUs, Samsung PM9A1 MZVL21T0HCLR, OLED, 3840x2400, 14" | Dell Inspiron 14 Plus 7420 i7-12700H, GeForce RTX 3050 4GB Laptop GPU, SK Hynix BC711 512GB HFM512GD3GX013N, IPS, 2240x1400, 14" | Asus Vivobook Pro 14 M3401QC-KM007T R5 5600H, GeForce RTX 3050 4GB Laptop GPU, Intel SSD 670p SSDPEKNU512GZ, OLED, 2880x1800, 14" | Apple MacBook Pro 14 2021 M1 Pro Entry M1 Pro 8-Core, M1 Pro 14-Core GPU, Apple SSD AP0512, Mini-LED, 3024x1964, 14.2" | Schenker Vision 14 i7-11370H, GeForce RTX 3050 Ti Laptop GPU, Samsung SSD 980 Pro 1TB MZ-V8P1T0BW, IPS, 2880x1800, 14" | Przeciętny NVIDIA GeForce RTX 3050 Ti Laptop GPU | Średnia w klasie Subnotebook | |
|---|---|---|---|---|---|---|---|---|---|
| Power Consumption | 6% | 16% | -19% | 13% | 27% | -7% | -23% | 41% | |
| Idle Minimum * (Watt) | 7.5 | 6.5 13% | 7.1 5% | 6.3 16% | 6.6 12% | 2.9 61% | 6.7 11% | 8.2 ? -9% | 3.86 ? 49% |
| Idle Average * (Watt) | 10.4 | 13.7 -32% | 10 4% | 10.3 1% | 9.6 8% | 11.6 -12% | 12.6 -21% | 12.6 ? -21% | 6.61 ? 36% |
| Idle Maximum * (Watt) | 11.4 | 14.4 -26% | 10.8 5% | 20 -75% | 7.3 36% | 11.9 -4% | 15.4 -35% | 17.2 ? -51% | 8 ? 30% |
| Load Average * (Watt) | 83.3 | 64.6 22% | 64 23% | 106.2 -27% | 73 12% | 49.5 41% | 85.7 -3% | 92 ? -10% | 42.2 ? 49% |
| Witcher 3 ultra * (Watt) | 92.7 | 57.2 38% | 47.7 49% | 96.1 -4% | 74.4 20% | 58.2 37% | 83 10% | ||
| Load Maximum * (Watt) | 110.3 | 90.9 18% | 97 12% | 136.5 -24% | 119 -8% | 68.5 38% | 110.9 -1% | 139.1 ? -26% | 64.5 ? 42% |
* ... im mniej tym lepiej
Power Consumption Witcher 3 / Stress Test
Power Consumption external Monitor
Czas pracy na baterii
Dzięki 99 Wh nowy akumulator oferuje prawie dwukrotnie większą pojemność, co bez zaskoczenia skutkuje znacznie lepszym czasem pracy na baterii. Podczas gdy poprzednik był w stanie wytrzymać tylko 4,5-5,5 godziny w naszym teście Wi-Fi w zależności od ustawienia jasności, nowy model osiąga 8-10 godzin i 11 godzin odtwarzania wideo przy jasności 150 nitów (około 36% maksymalnej jasności w przypadku naszego urządzenia testowego). Choć wyniki te są dobre, to pokazują również, że panel 3K jest po prostu mało wydajny. Urządzenie z tak dużą pojemnością baterii mogłoby w innym przypadku osiągnąć jeszcze lepsze czasy pracy.
Po włączeniu urządzenia proces ładowania trwa 105 minut; 50 % baterii jest już dostępne po 36 minutach. Model iGPU w Vision 14 osiąga zasadniczo te same wyniki z odchyleniem w granicach kilku minut.
| Schenker Vision 14 2022 RTX 3050 Ti i7-12700H, GeForce RTX 3050 Ti Laptop GPU, 99.8 Wh | Huawei MateBook X Pro 2022 i7-1260P, Iris Xe G7 96EUs, 60 Wh | Lenovo Yoga 9i 14 2022 i7-1260P i7-1260P, Iris Xe G7 96EUs, 75 Wh | Dell Inspiron 14 Plus 7420 i7-12700H, GeForce RTX 3050 4GB Laptop GPU, 64 Wh | Asus Vivobook Pro 14 M3401QC-KM007T R5 5600H, GeForce RTX 3050 4GB Laptop GPU, 63 Wh | Apple MacBook Pro 14 2021 M1 Pro Entry M1 Pro 8-Core, M1 Pro 14-Core GPU, 69.9 Wh | Schenker Vision 14 i7-11370H, GeForce RTX 3050 Ti Laptop GPU, 53 Wh | Średnia w klasie Subnotebook | |
|---|---|---|---|---|---|---|---|---|
| Czasy pracy | -26% | -8% | -43% | -8% | 9% | -39% | 24% | |
| H.264 (h) | 11.1 | 7.6 -32% | 12.6 14% | 15 35% | 6.8 -39% | 15.4 ? 39% | ||
| WiFi v1.3 (h) | 10.1 | 7.5 -26% | 8.6 -15% | 7.2 -29% | 9.5 -6% | 13.6 35% | 5.5 -46% | 14 ? 39% |
| Load (h) | 2.1 | 1.7 -19% | 1.6 -24% | 0.9 -57% | 1.9 -10% | 1.2 -43% | 1.4 -33% | 1.969 ? -6% |
| Reader / Idle (h) | 11.9 | 11.5 | 28.6 ? |
Za
Przeciw
Werdykt - Wizja 14 ze znacznymi ulepszeniami
W najnowszej wersji Vision 14 Schenker rozwiązuje oba nasze główne zarzuty wobec poprzednika. Nowy procesor Alder Lake-H45 oferuje dużo większą wydajność niż starszy układ Tiger Lake, dzięki czemu Vision 14 jest jednym z najszybszych modeli w swojej klasie urządzeń. Podobnie jest w przypadku RTX 3050 Ti radzi sobie przyzwoicie, choć rozwój w tej dziedzinie jest od pewnego czasu niewielki, co sprawia, że jesteśmy jeszcze bardziej podekscytowani nadchodzącymi procesorami graficznymi RTX 4000.
Dzięki nowemu akumulatorowi o pojemności 99-Wh, czas pracy na baterii również drastycznie wzrasta, choć odbywa się to kosztem około 0,44 lbs większej wagi, grubości zwiększonej o 1 mm (~0,04 in) i drugiego gniazda M.2-2280 SSD. Podczas gdy lżejsza wersja z mniejszą baterią 53-Wh jest nadal dostępna, musi być skonfigurowana z dedykowanym GPU GeForce. Dla użytkowników, którzy nie potrzebują długich czasów pracy, bardziej lekki model jest nadal łatwą rekomendacją.
Dzięki Core i7-12700H i baterii o pojemności 99-Wh nowy Vision 14 nie jest już tak ograniczony pod względem wydajności procesora czy czasu pracy na baterii. Choć 14-calowa obudowa jest nieco cięższa i marginalnie grubsza, połączenie dobrej wydajności, szerokiej gamy portów, dobrych opcji konserwacji i pięknego wyświetlacza 3K o częstotliwości odświeżania 90 Hz sprawia, że Vision 14 jest niezwykle ekscytującym i doskonałym 14-calowym laptopem.
Vision 14 zachowuje bardzo małe wymiary, wystarczające opcje portów, gniazda pamięci RAM i wymienny moduł Wi-Fi pomimo nieco grubszej i cięższej obudowy. Wprawdzie niekompatybilność z nowoczesnymi sieciami 6-GHz (Wi-Fi 6E) jest wadą, ale użytkownicy prawdopodobnie nie będą tym ograniczeni przez jakiś czas. Ponadto zawiasy pokrywy nie są tak szczelne w porównaniu z konkurentami, co powoduje dość znaczne tetrowanie. Choć 90-watowy zasilacz sieciowy jest nominalnie zbyt słaby, wydaje się wystarczający przy szczytowym poborze mocy 110 W. Co więcej, użytkownicy nadal będą musieli zmagać się z wysokimi temperaturami powierzchni i głośnymi wentylatorami pod dużym obciążeniem lub podczas gry. Jest to po prostu efekt zastosowania bardzo wydajnych komponentów w kompaktowej obudowie.
Konkurenci o podobnej charakterystyce wydajności i dedykowanych GPU są znacznie ciężsi od Vision 14 i jest to w zasadzie maksymalna wydajność dostępna obecnie w tak małej obudowie. Vision 14 z RTX 3050 Ti nie jest jednak do końca okazyjny - jego cena jest podobna do ceny obecnego MacBook Pro 14 (aczkolwiek z mniejszą ilością pamięci RAM i pamięci masowej). Ten ostatni jest prawdopodobnie lepszym wyborem dla użytkowników, którzy nie są zależni od systemu Windows, ze względu na panel mini LED, wydajny układ M1 Pro i doskonałą konfigurację głośników. Tymczasem Dell Inspiron 14 Plus 7420 - choć jest zauważalnie cięższy i grubszy - jest znacznie tańszą alternatywą.
Cena i dostępność
Schenker Vision 14 może być skonfigurowany na Bestware.com zaczynając od 1659 euro (~1659 USD).https://bestware.com/de/schenker-vision-14-e22.html
Schenker Vision 14 2022 RTX 3050 Ti
- 25/10/2022 v7 (old)
Andreas Osthoff
Price comparison

