Recenzja laptopa MSI Creator Z17: Co dostają twórcy i gracze za około 4 tys. euro?
Nowy Creator Z17 idzie w ślady m.in Creator 17 (2020), ale jego design został całkowicie zmieniony. Mieliśmy już okazję zapoznać się z nowym projektem podczas recenzując Creator Z16P, który jest 16-calowym wariantem tej drogiej stacji roboczej skierowanej do twórców.
Wyposażona w Core i9-12900H oraz RTX 3070 Ti, Creator Z17 z pewnością przypadnie do gustu również graczom. Jednak wysoka cena, cienka metalowa obudowa, refleksyjny ekran dotykowy 2,2K i, nie wspominając o karcie graficznej, która nie jest w stanie pracować z pełną mocą, oznaczają, że urządzenie jest bardziej skierowane do osób wykonujących pracę twórczą.
W naszej opinii Z17 konkuruje z multimedialnymi lub gamingowymi laptopami o podobnym sprzęcie, takimi jak Razer Blade 17. Oprócz Razera w naszym zestawieniu musieliśmy uwzględnić także Aorus 17X XES oraz Dell XPS 17 (niestety dostępny tylko z RTX 3060). A ponieważ 16-calowy model od MSI jest dla nas dostępny, również będzie częścią porównania. Na koniec przyjrzymy się dwuletniemu poprzednikowi, aby zobaczyć co się zmieniło.
Potentiella konkurrenter i jämförelse
Ocena | Data | Model | Waga | Wysokość | Rozmiar | Rezolucja | Cena |
|---|---|---|---|---|---|---|---|
| 83.8 % v7 (old) | 09/2022 | MSI Creator Z17 A12UGST-054 i9-12900H, GeForce RTX 3070 Ti Laptop GPU | 2.5 kg | 19 mm | 17.00" | 2560x1600 | |
| 82.5 % v7 (old) | MSI Creator 17 A10SGS i7-10875H, GeForce RTX 2080 Super Max-Q | 2.4 kg | 20 mm | 17.30" | 3840x2160 | ||
| 83.7 % v7 (old) | MSI Creator Z16P B12UHST i9-12900H, GeForce RTX 3080 Ti Laptop GPU | 2.4 kg | 20.4 mm | 16.00" | 2560x1600 | ||
| 90.1 % v7 (old) | Razer Blade 17 (i7-12800H, RTX 3070 Ti) i7-12800H, GeForce RTX 3070 Ti Laptop GPU | 2.8 kg | 19.9 mm | 17.30" | 2560x1440 | ||
| 83.7 % v7 (old) | Aorus 17X XES i9-12900HX, GeForce RTX 3070 Ti Laptop GPU | 2.7 kg | 30 mm | 17.30" | 1920x1080 | ||
| 88.8 % v7 (old) | 02/2023 | Dell XPS 17 9720 RTX 3060 i7-12700H, GeForce RTX 3060 Laptop GPU | 2.5 kg | 19.5 mm | 17.00" | 3840x2400 |
Obudowa - Ultra cienka, wytrzymała i wykonana z metalu
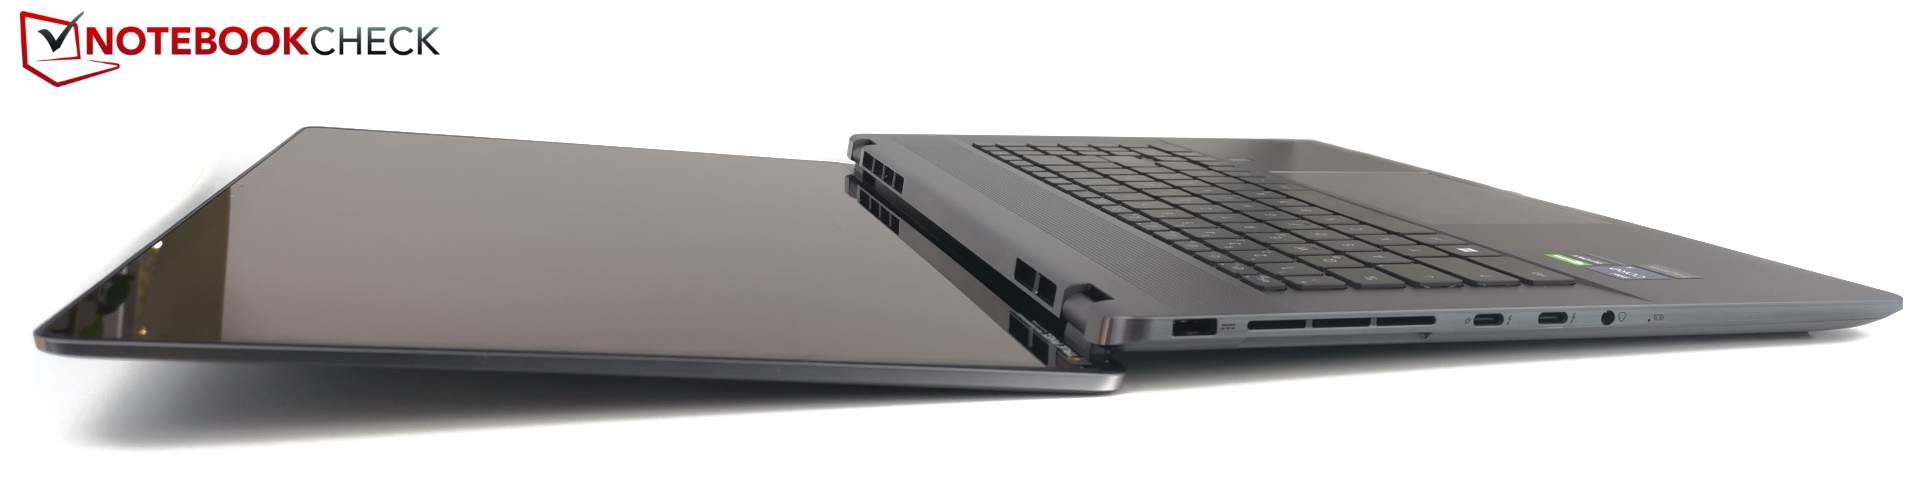
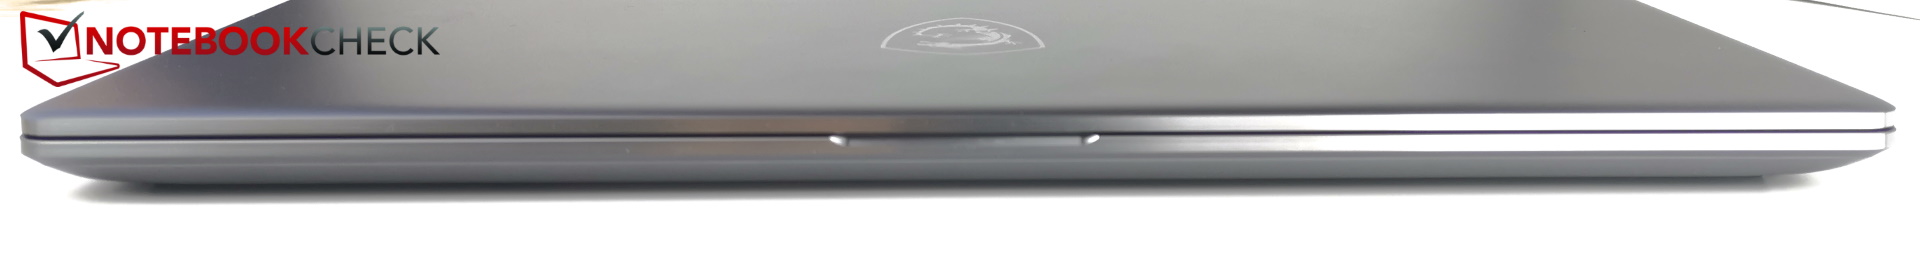
Obudowa ma zaledwie 19 mm (0,75") grubości i wydaje się być niemal w całości wykonana z metalu. Dzięki temu urządzenie jest niezwykle solidne. W rezultacie nie wykazuje ono prawie żadnych wygięć podczas skręcania i wydaje jedynie bardzo drobne odgłosy skrzypienia, szczególnie w okolicach portów po prawej stronie. Nawet pokrywa wyświetlacza, którą można otworzyć do 180 stopni, jest przyjemnie odporna na skręcanie.
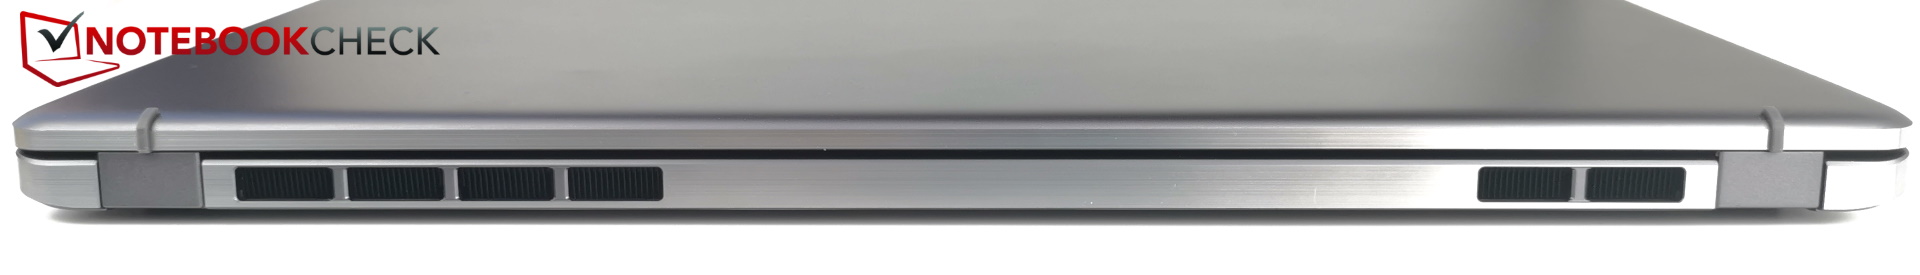
Ciemnoszara metalowa konstrukcja jest czysta i stylowa. Prawie wszystkie krawędzie i narożniki są zaokrąglone. Wszędzie są otwory wentylacyjne, ale te po bokach są tak małe, że dość niepozorne.
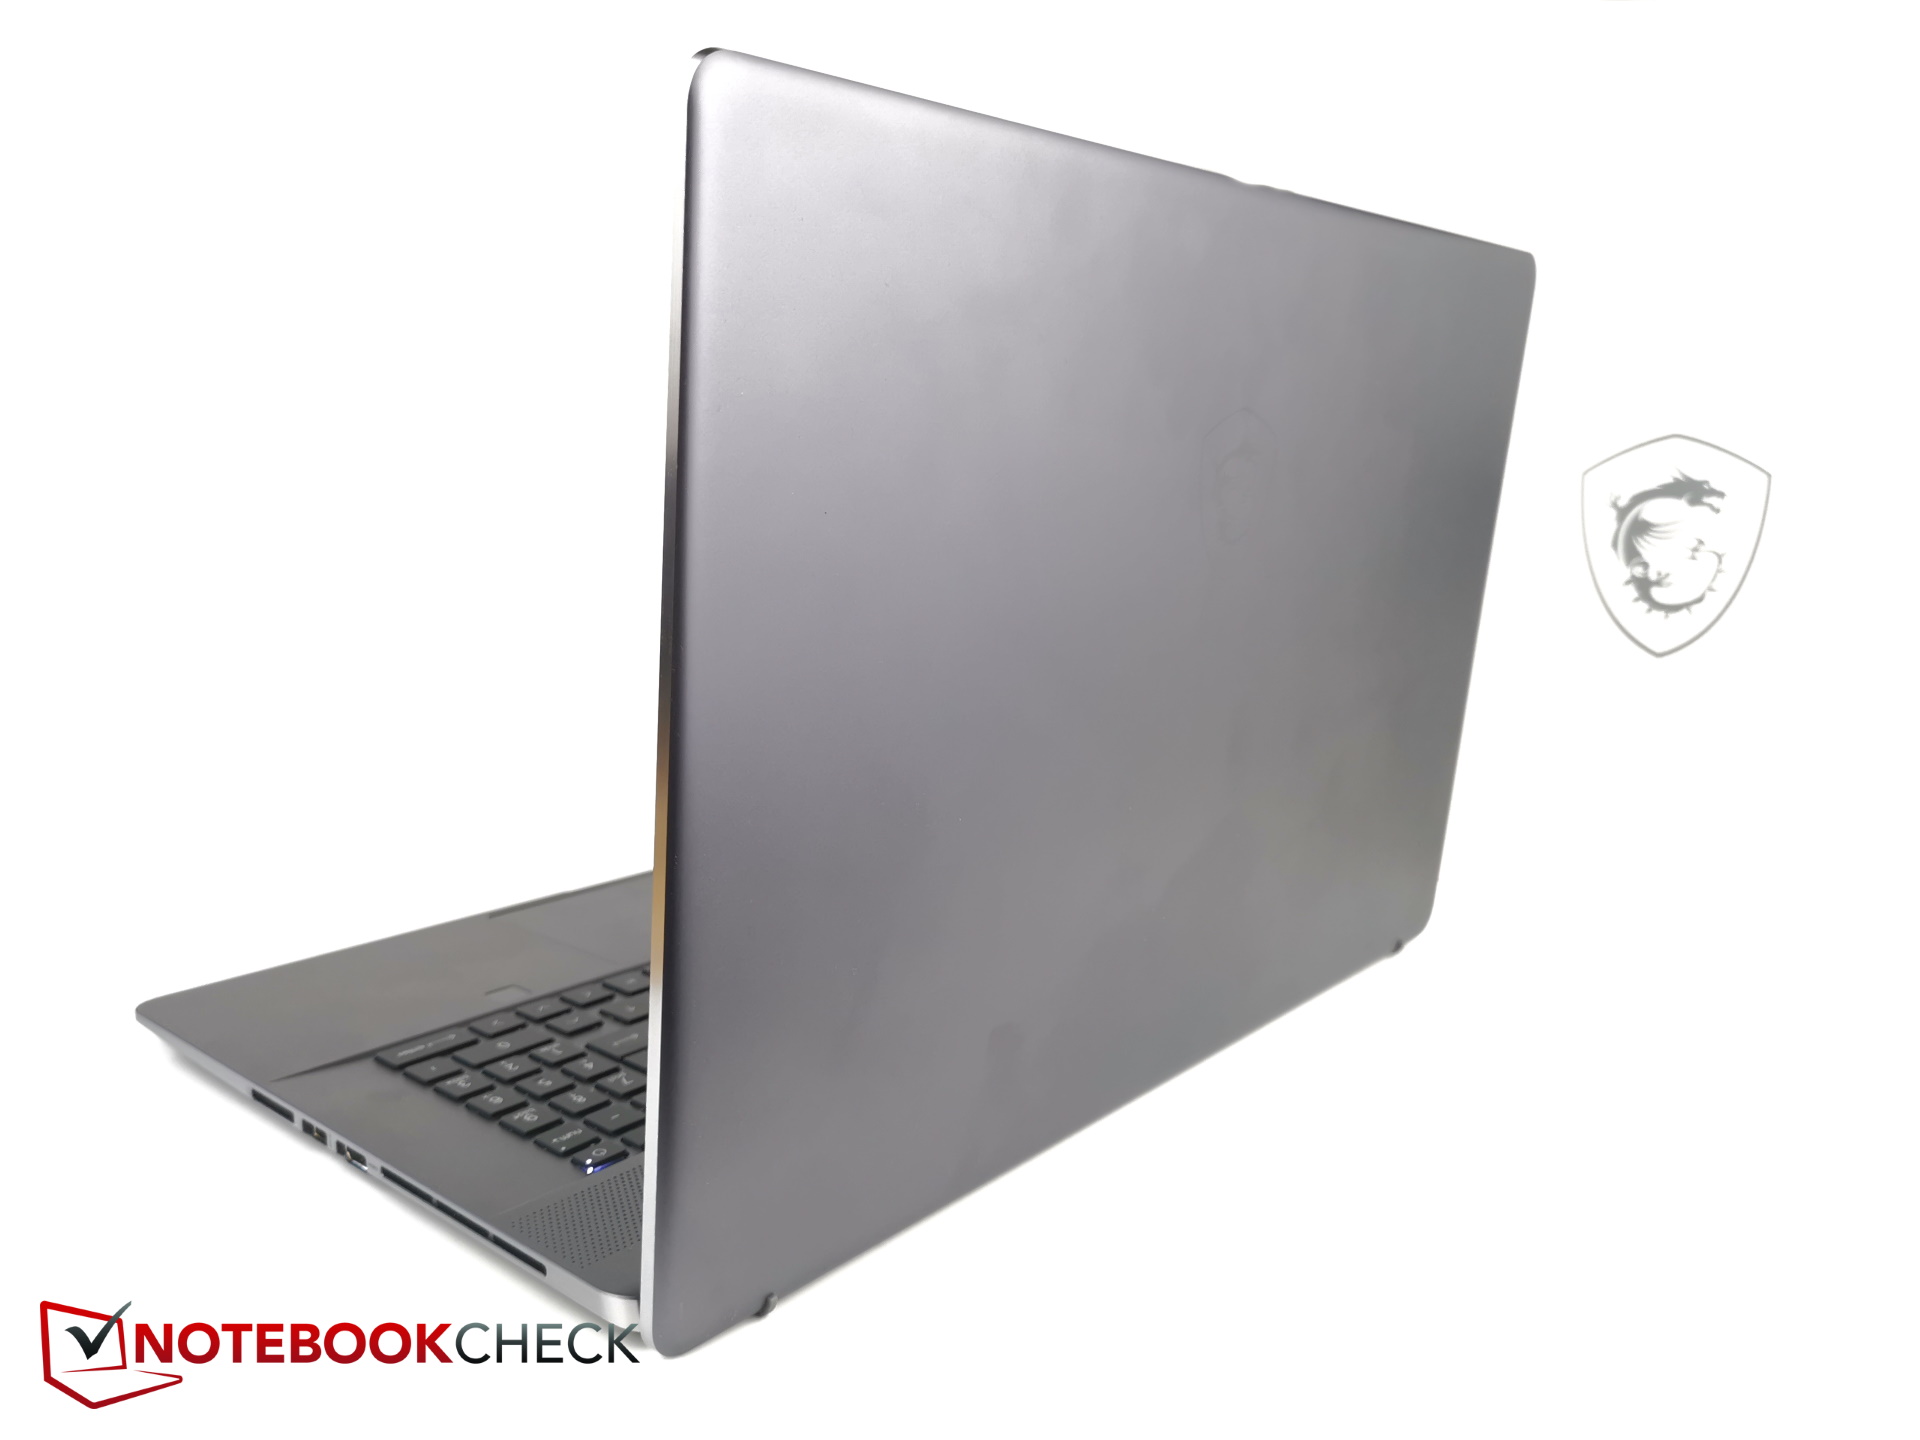
Z17 jest nieco bardziej kompaktowy od swojego poprzednika, szczególnie na szerokość. Jego grubość wynosi zaledwie 19 mm (0,75"). Nawet bardzo cienki Razer Blade jest grubszy o około 1 mm (0,04") i nie może się równać z tym, jak smukły jest Creator
Ważąc około 2,5 kg (5,5 lb), Creator Z17 jest również o około 300 g (0,66 lb) lżejszy niż Blade 17. Ogólnie rzecz biorąc, urządzenie jest najcieńsze w naszym porównaniu, a także jednym z najmniejszych 17-calowych laptopów.
Cechy - Smukła stacja robocza MSI
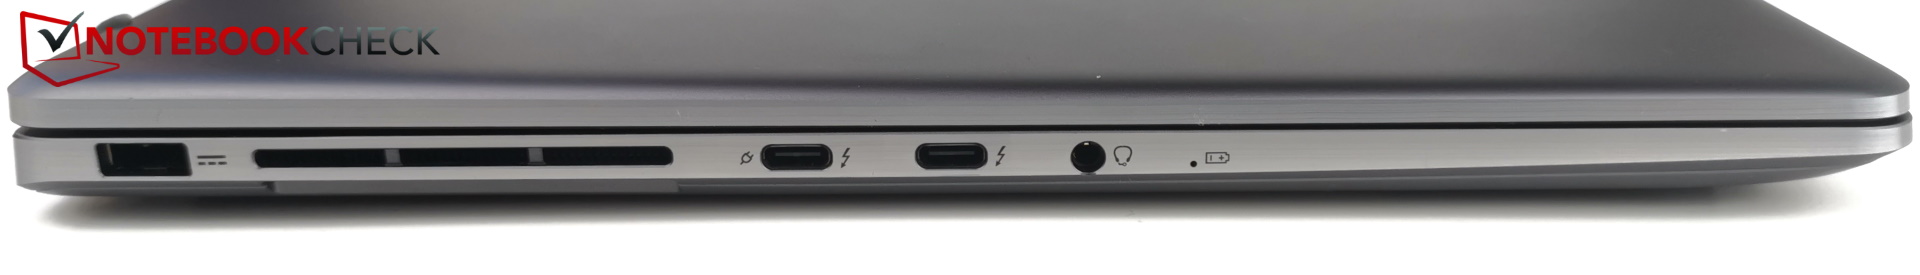
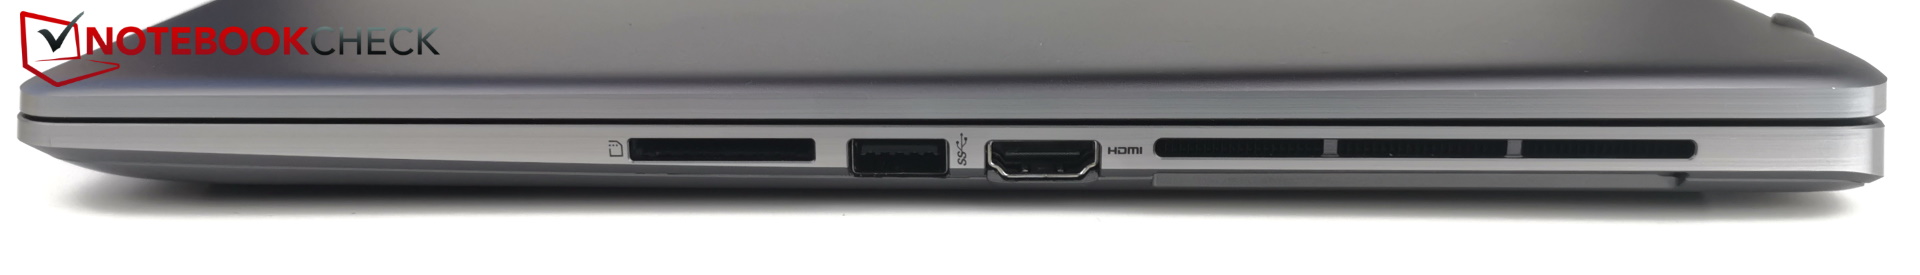
Wybór portów jest raczej szczupły jak na 17-calowe urządzenie. Są tu w sumie trzy porty USB, jedno gniazdo słuchawkowe, wyjście HDMI i czytnik kart SD. Z17 nie posiada nawet portu Ethernet ani gniazda blokady Kensington. Aby uzyskać łączność Ethernet, trzeba będzie kupić opcjonalny adapter USB.
Pozytywnym akcentem jest to, że dwa porty USB-C obsługują Thunderbolt 4. Niestety oznacza to również, że w urządzeniu dostępny jest tylko jeden port USB-A. Dla twórców niemal niezbędne jest więc użycie huba do pracy.
Mimo niewielkiego wyboru portów, sposób ich rozmieszczenia jest mniej niż optymalny - przynajmniej po prawej stronie. Wyjście HDMI i port USB-A, ze wszystkich rzeczy, są umieszczone bardzo blisko siebie i prawie na pewno będą ze sobą kolidować.
Czytnik kart SD
Po włożeniu karty SD do czytnika, nie blokuje się ona na miejscu, ale raczej siedzi tam z wystającą połową. Transfery osiągnięte przy użyciu naszej referencyjnej karty SD (AV PRO microSD 128 GB V60) były raczej skromne. Od laptopa w tej cenie powinno się oczekiwać więcej. Na przykład Razer Blade jest dwukrotnie szybszy, a XPS 17 jest w tym dziale jeszcze szybszy.
| SD Card Reader | |
| average JPG Copy Test (av. of 3 runs) | |
| Dell XPS 17 9720 RTX 3060 (Toshiba Exceria Pro SDXC 64 GB UHS-II) | |
| Razer Blade 17 (i7-12800H, RTX 3070 Ti) | |
| Średnia w klasie Multimedia (23 - 531, n=44, ostatnie 2 lata) | |
| MSI Creator Z17 A12UGST-054 (AV Pro SD microSD 128 GB V60) | |
| MSI Creator Z16P B12UHST (AV PRO microSD 128 GB V60) | |
| maximum AS SSD Seq Read Test (1GB) | |
| Dell XPS 17 9720 RTX 3060 (Toshiba Exceria Pro SDXC 64 GB UHS-II) | |
| Średnia w klasie Multimedia (27.9 - 1455, n=43, ostatnie 2 lata) | |
| Razer Blade 17 (i7-12800H, RTX 3070 Ti) | |
| MSI Creator Z17 A12UGST-054 (AV Pro SD microSD 128 GB V60) | |
Łączność
Jak już wcześniej wspomniano, w Z17 brakuje portu Ethernet. Bez adaptera użytkownik jest ograniczony do korzystania z połączeń bezprzewodowych nawet w domu. Ale MSI przynajmniej dołączyło moduł bezprzewodowy Killer, który obsługuje Wi-Fi 6E
Transfer jest ładny i szybki, zwłaszcza gdy korzysta się z pasma 6 GHz. W dwóch testach w każdym z nich wystąpił niewielki spadek prędkości transferu.
| Networking | |
| iperf3 receive AXE11000 6GHz | |
| Aorus 17X XES | |
| MSI Creator Z17 A12UGST-054 | |
| Średnia w klasie Multimedia (1212 - 2361, n=25, ostatnie 2 lata) | |
| Przeciętny Killer Wi-Fi 6E AX1675i 160MHz Wireless Network Adapter (1327 - 1788, n=20) | |
| Razer Blade 17 (i7-12800H, RTX 3070 Ti) | |
| iperf3 transmit AXE11000 6GHz | |
| Aorus 17X XES | |
| Razer Blade 17 (i7-12800H, RTX 3070 Ti) | |
| Przeciętny Killer Wi-Fi 6E AX1675i 160MHz Wireless Network Adapter (1229 - 1693, n=19) | |
| Średnia w klasie Multimedia (869 - 2373, n=25, ostatnie 2 lata) | |
| MSI Creator Z17 A12UGST-054 | |
Kamera internetowa
MSI dołączyło kamerkę internetową Full HD z czujnikiem IR i funkcją rozpoznawania twarzy. Jakość obrazu jest przyzwoita, ale odchylenia kolorów mają tendencję do lekkiego zaczerwienienia.


Bezpieczeństwo
Creator Z17 posiada czujnik linii papilarnych. Ponadto jego aparat jest wyposażony w czujnik IR i obsługuje logowanie za pomocą rozpoznawania twarzy.
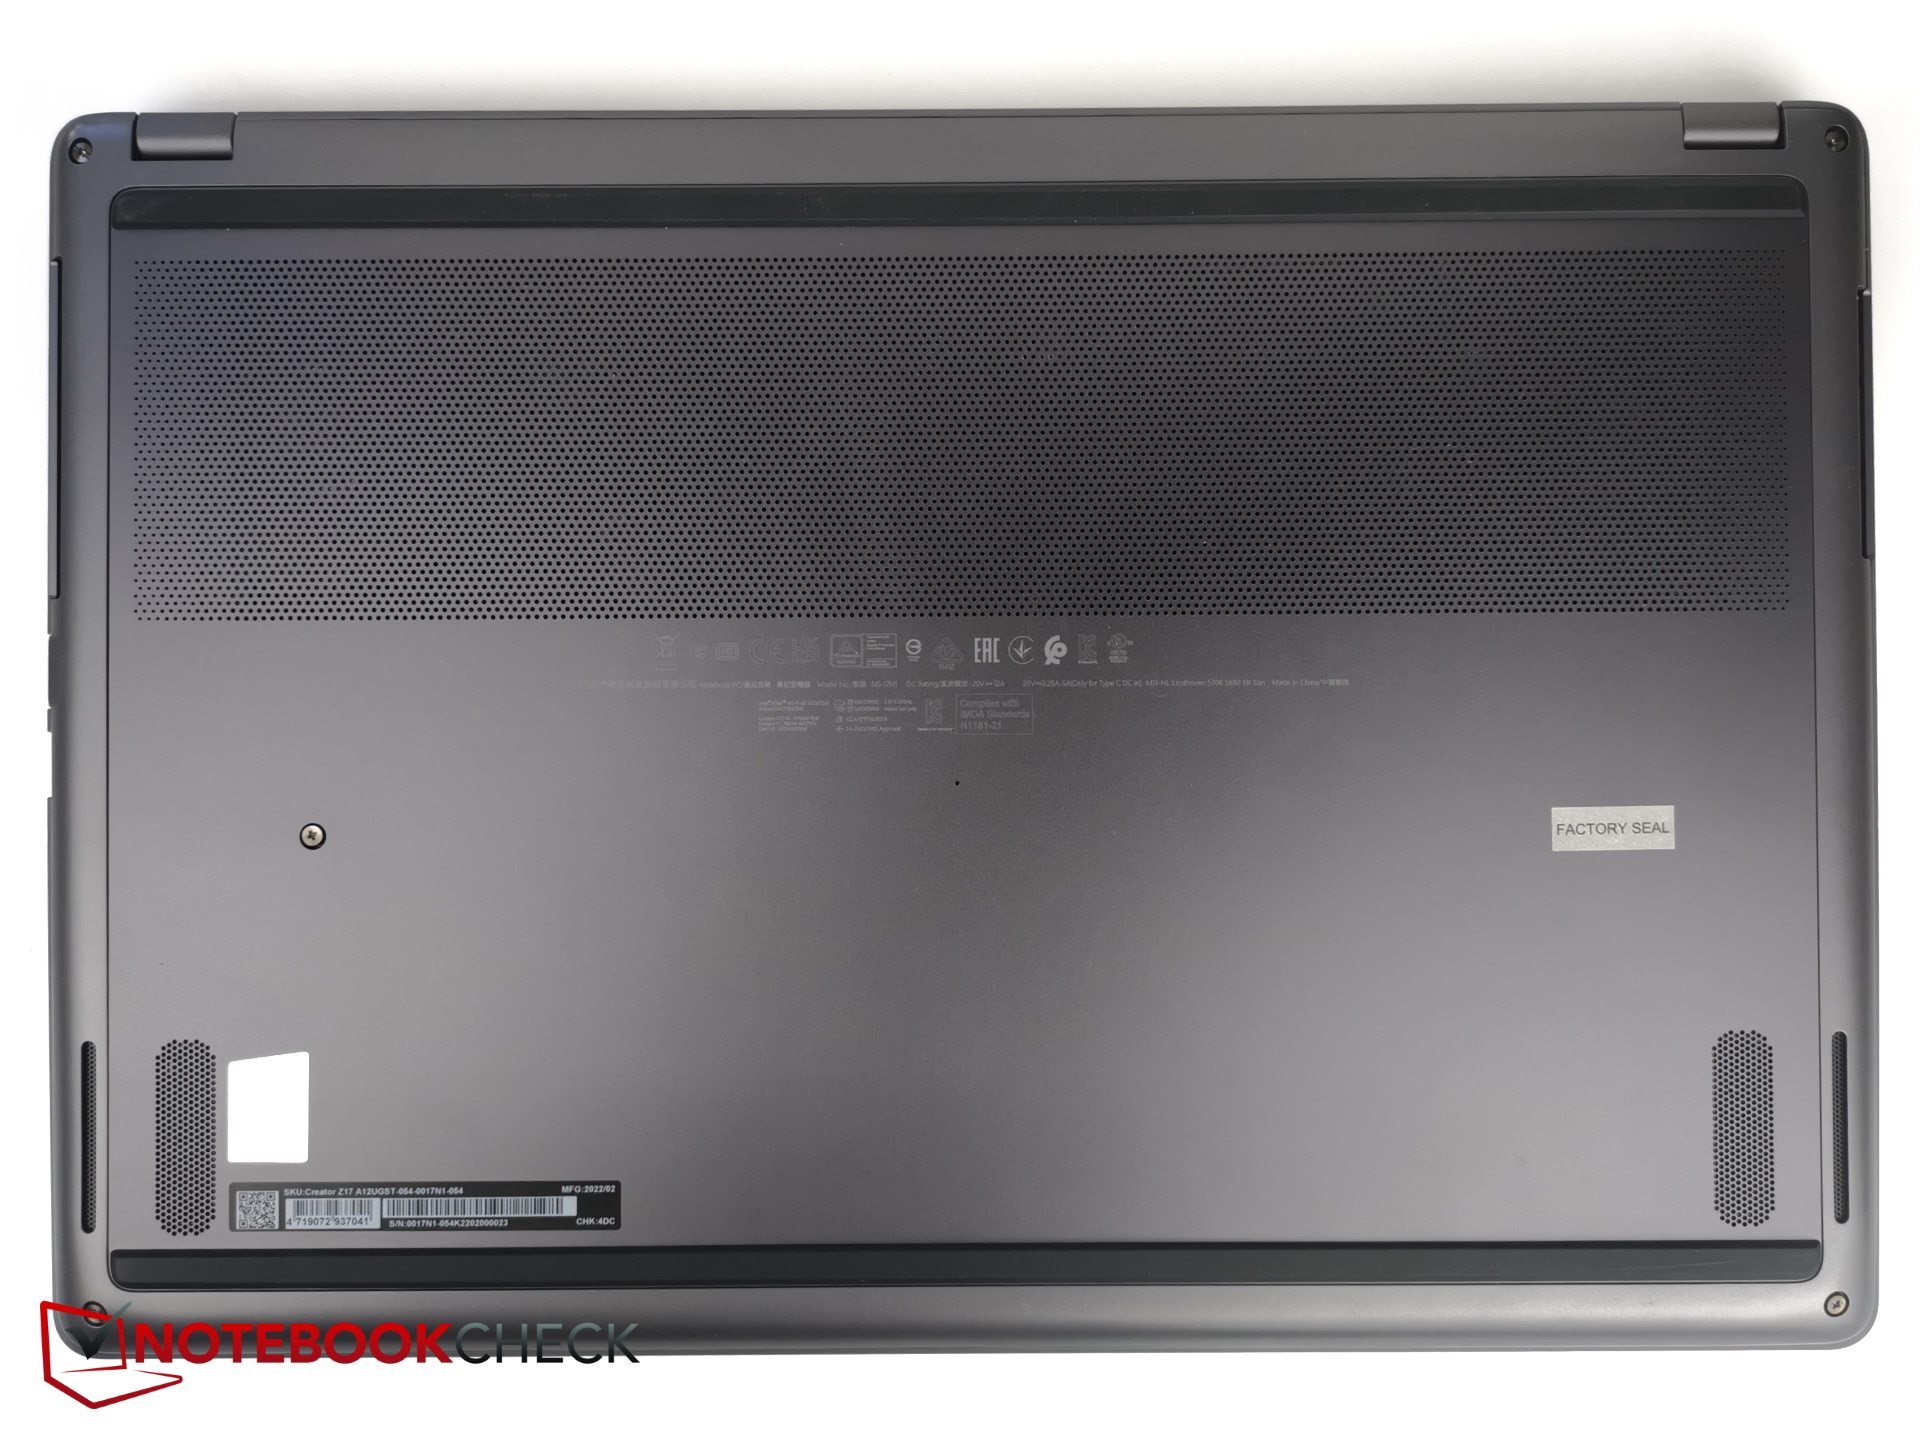
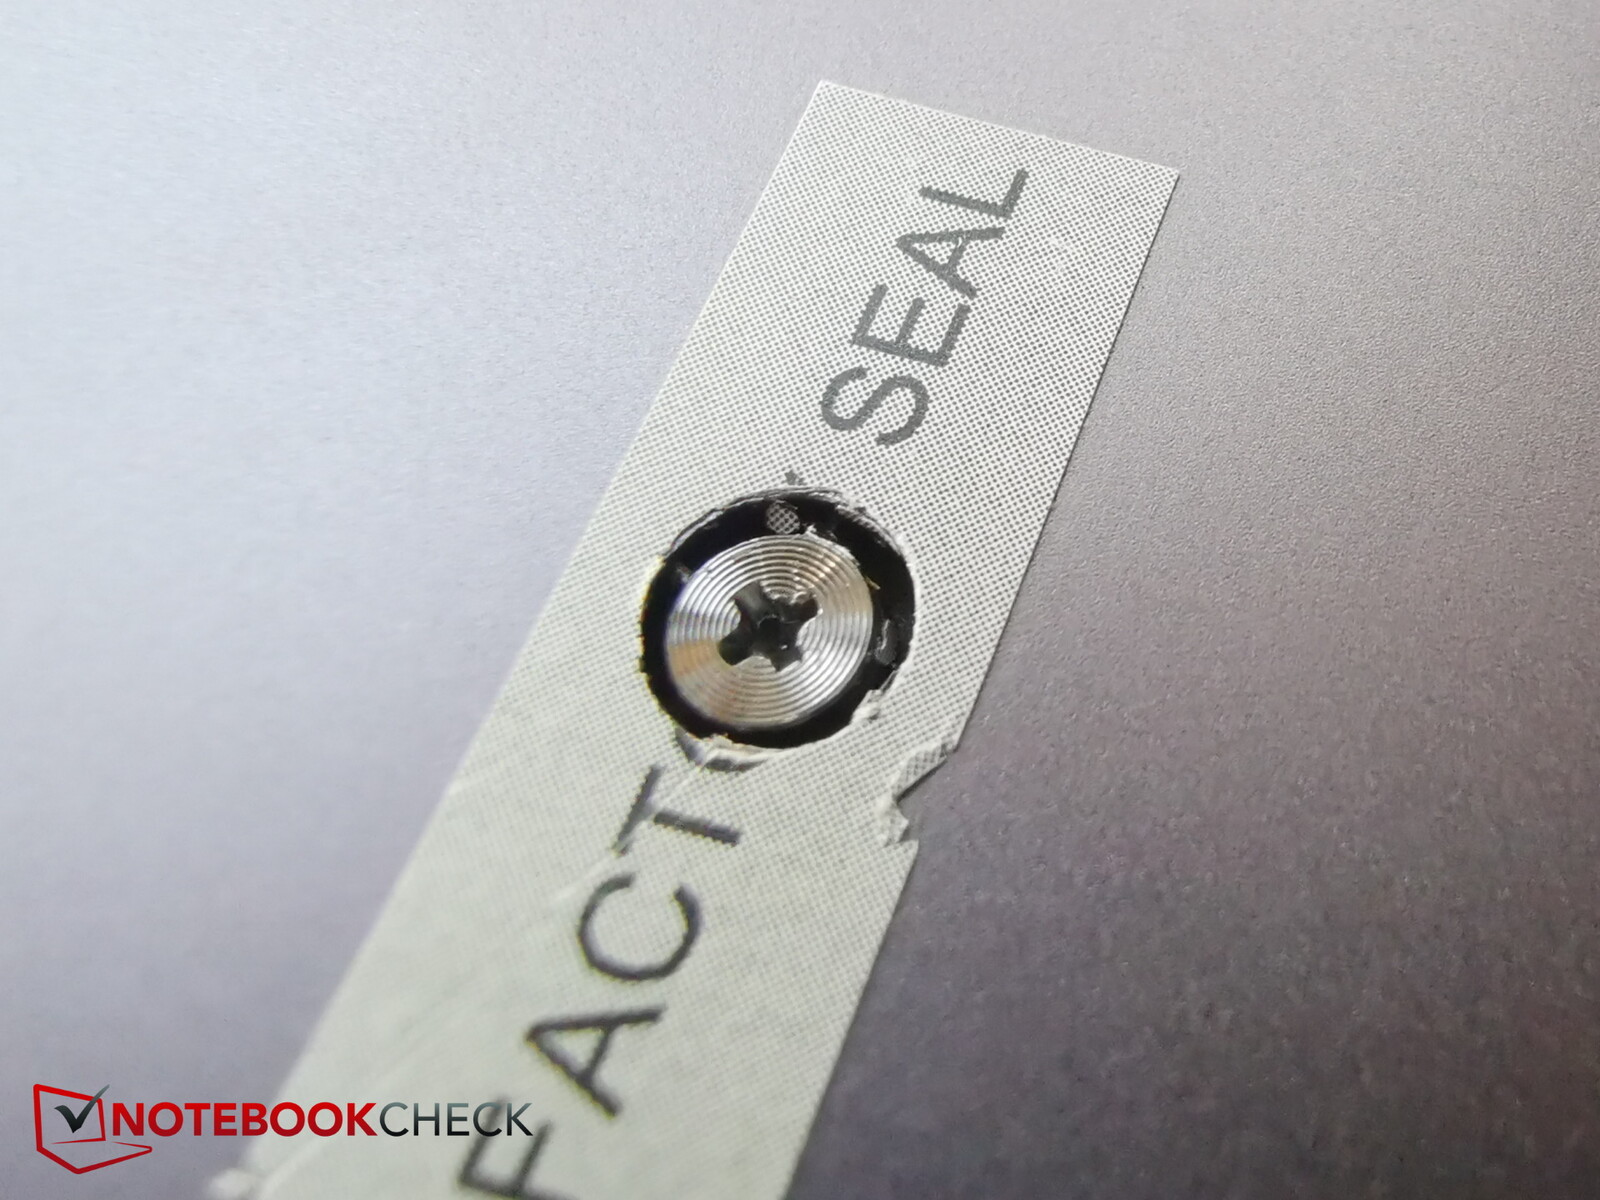
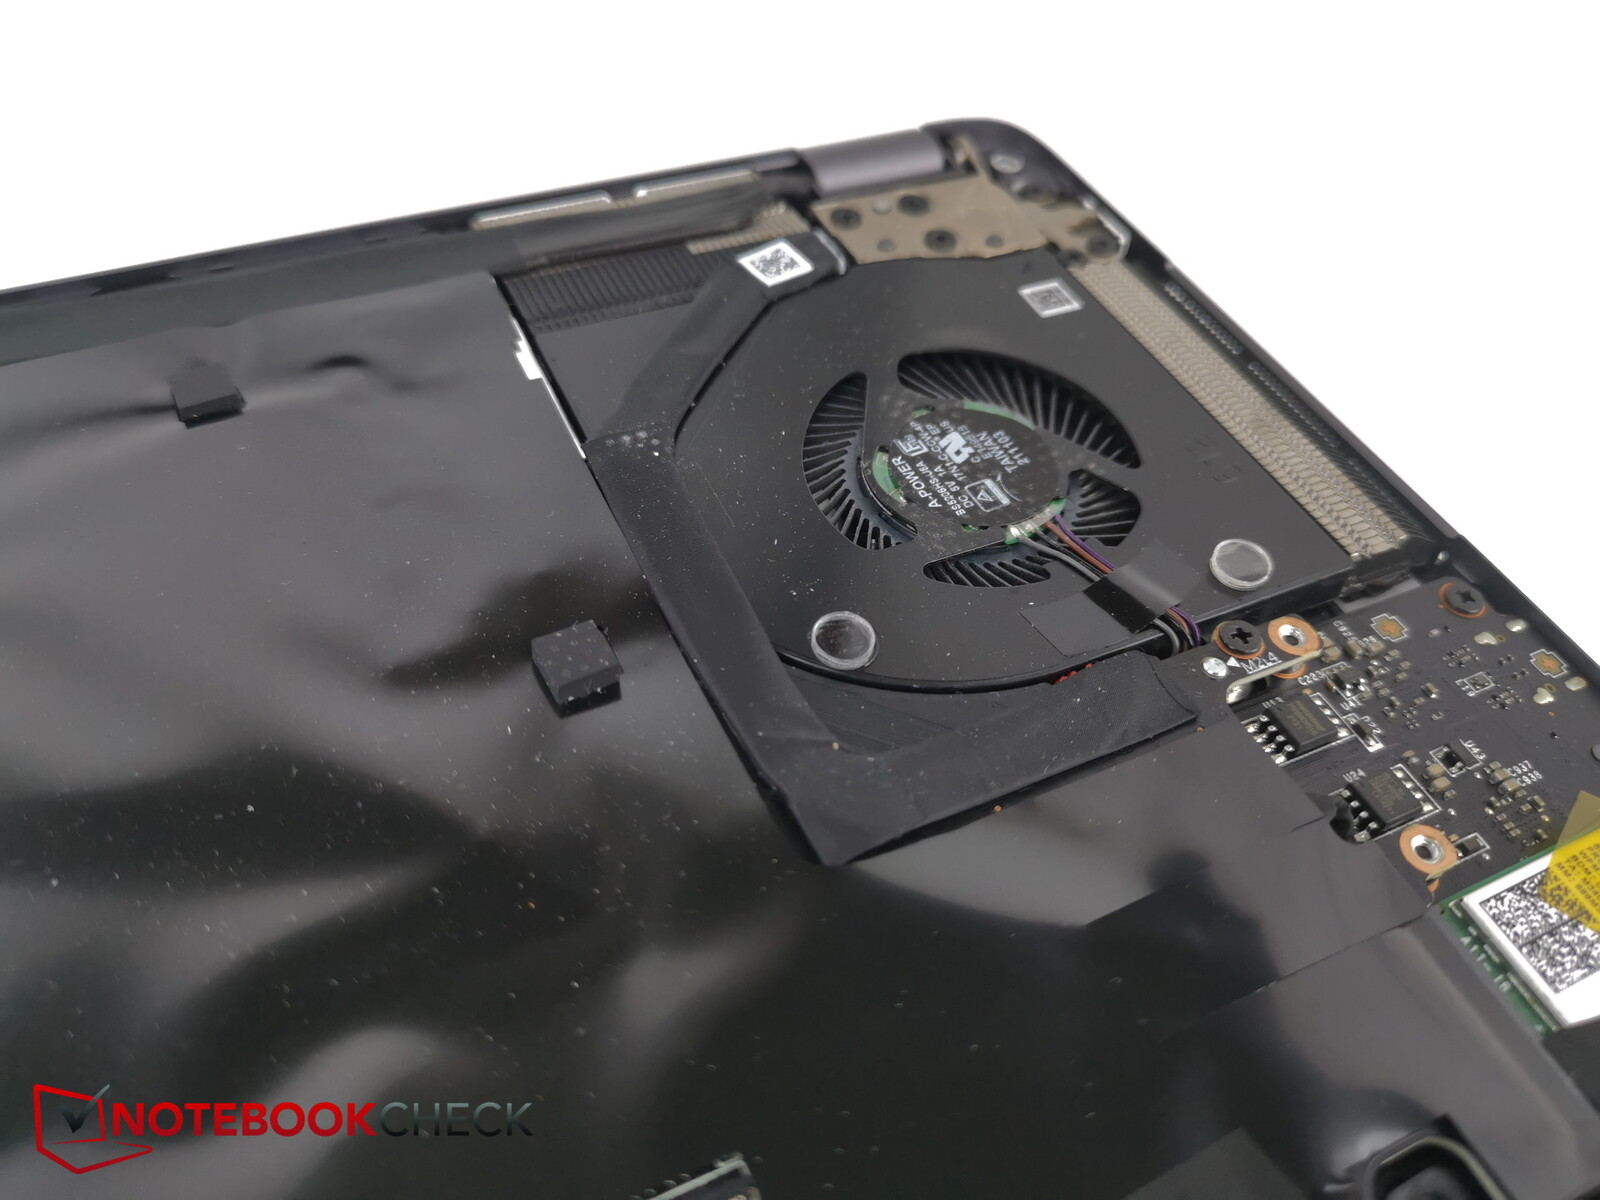
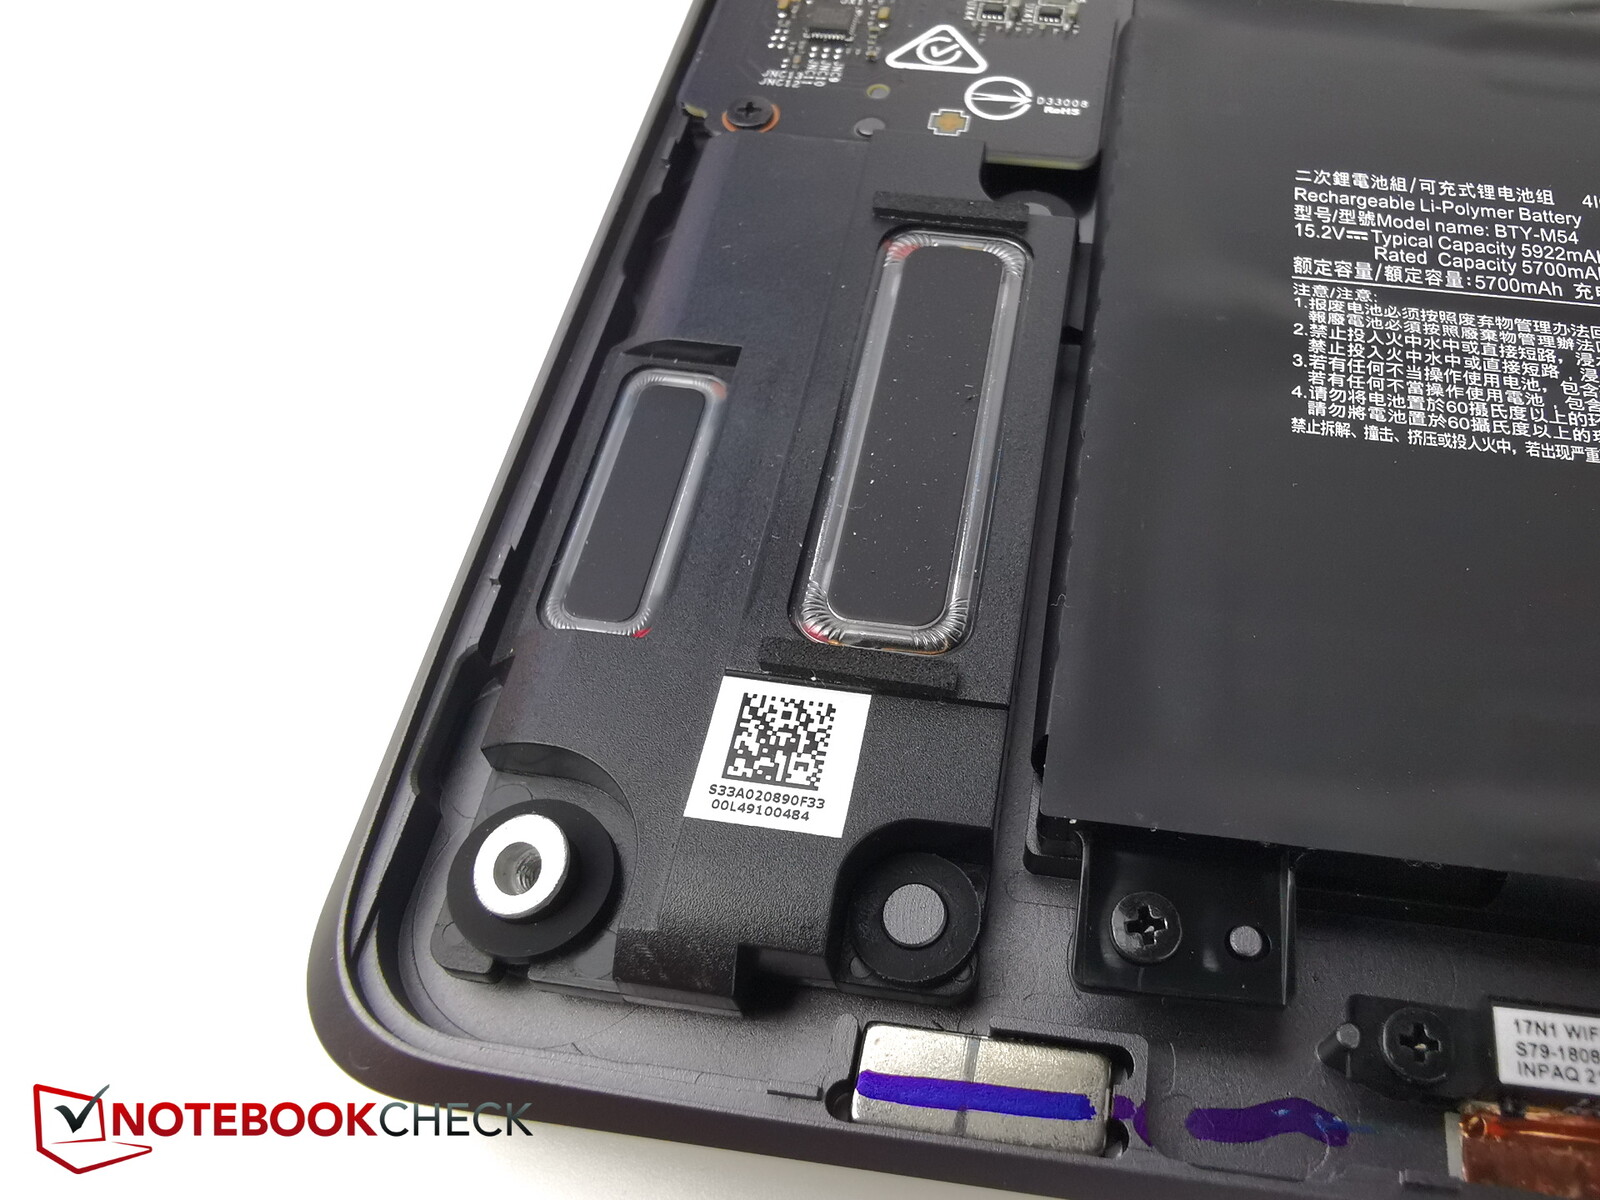
Konserwacja
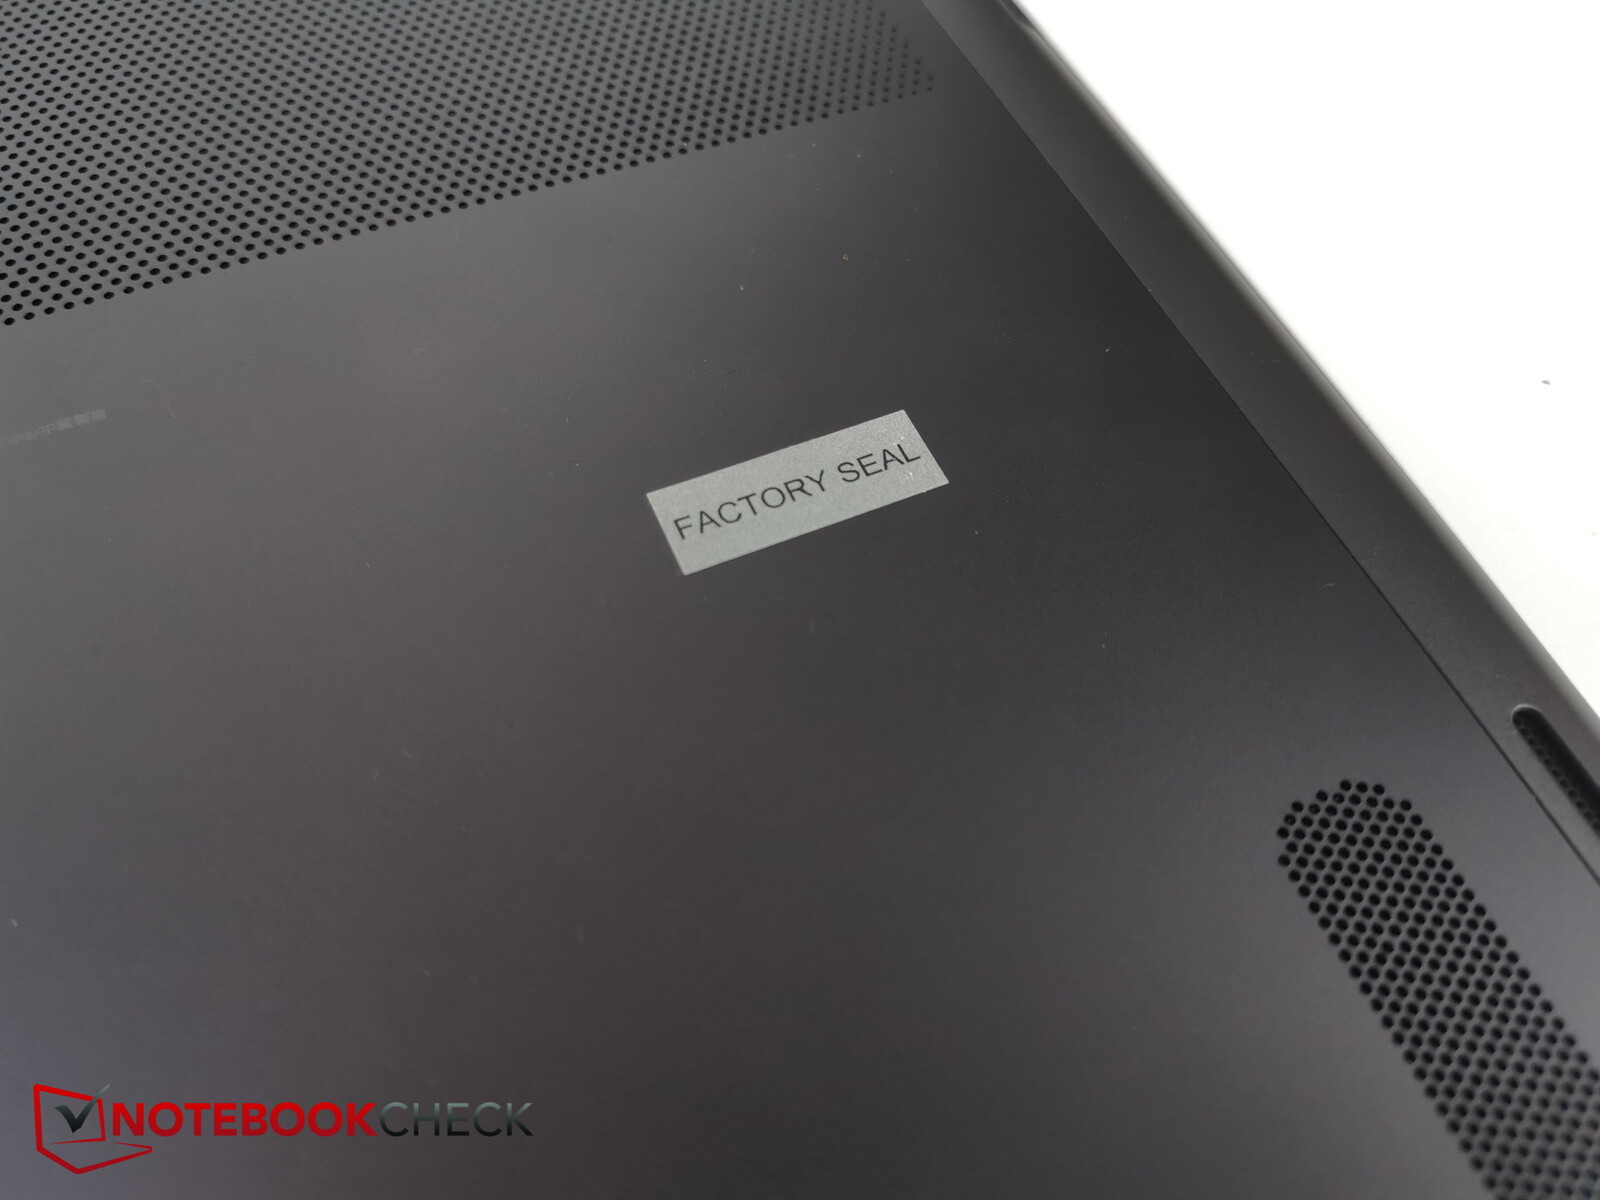
Dolna płyta jest mocowana na miejscu za pomocą zaledwie sześciu śrubek Phillips. Niestety, na jednej z nich znajduje się fabryczna naklejka plombowa. Uszkodzenie naklejki może wpłynąć na ważność ewentualnych przyszłych roszczeń gwarancyjnych. W pierwszej kolejności potrzebne będzie narzędzie do odkręcenia panelu. Następnie można szybko i bez wysiłku zdjąć panel.
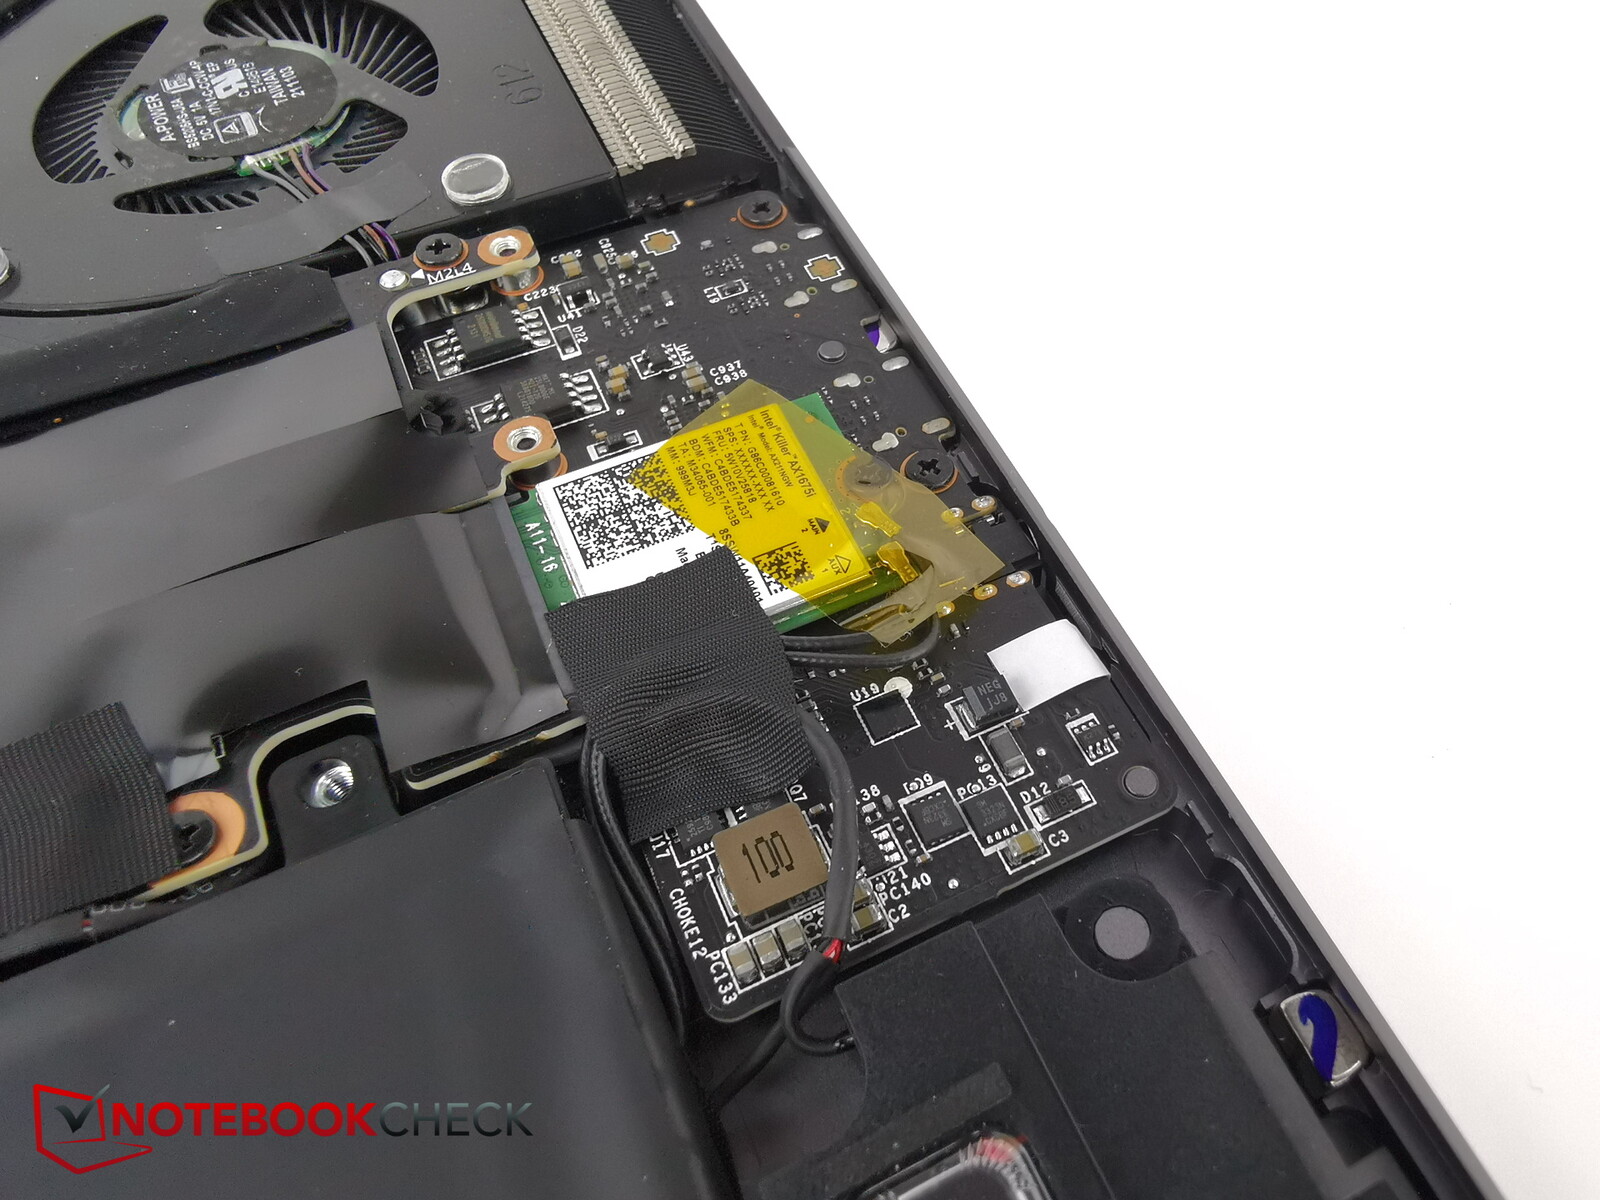
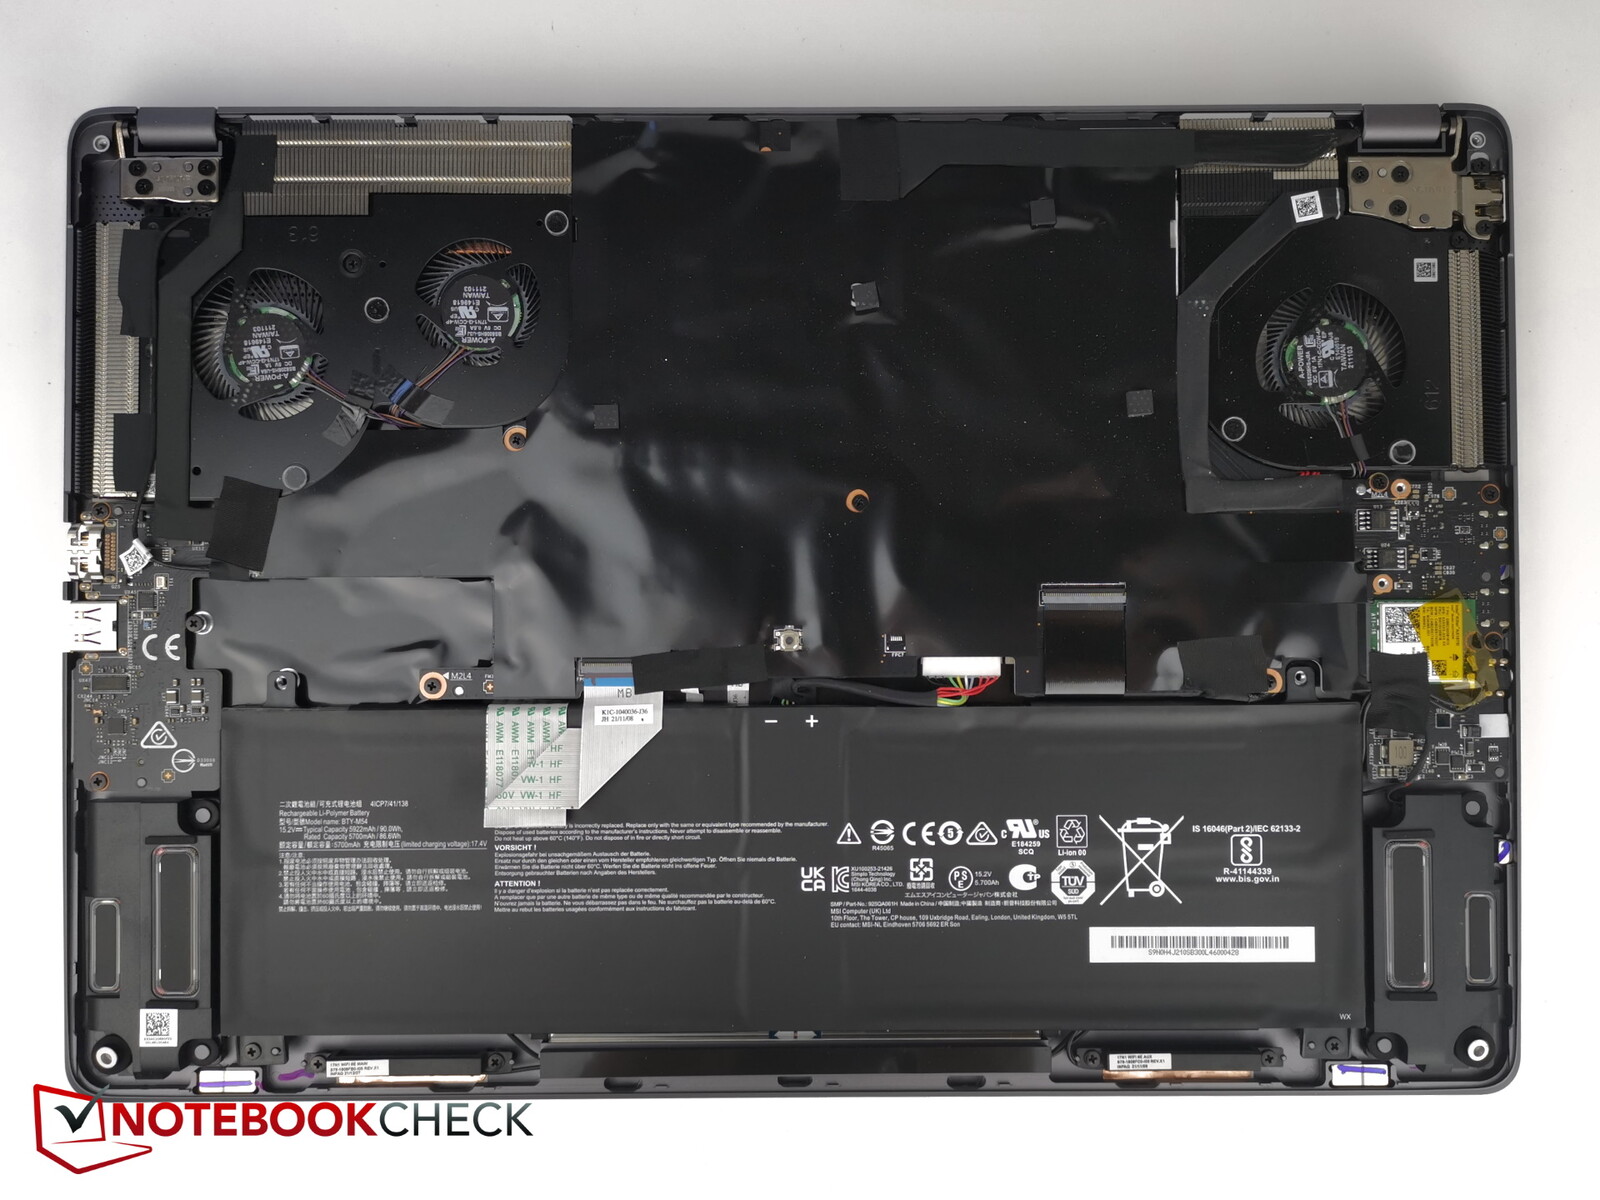
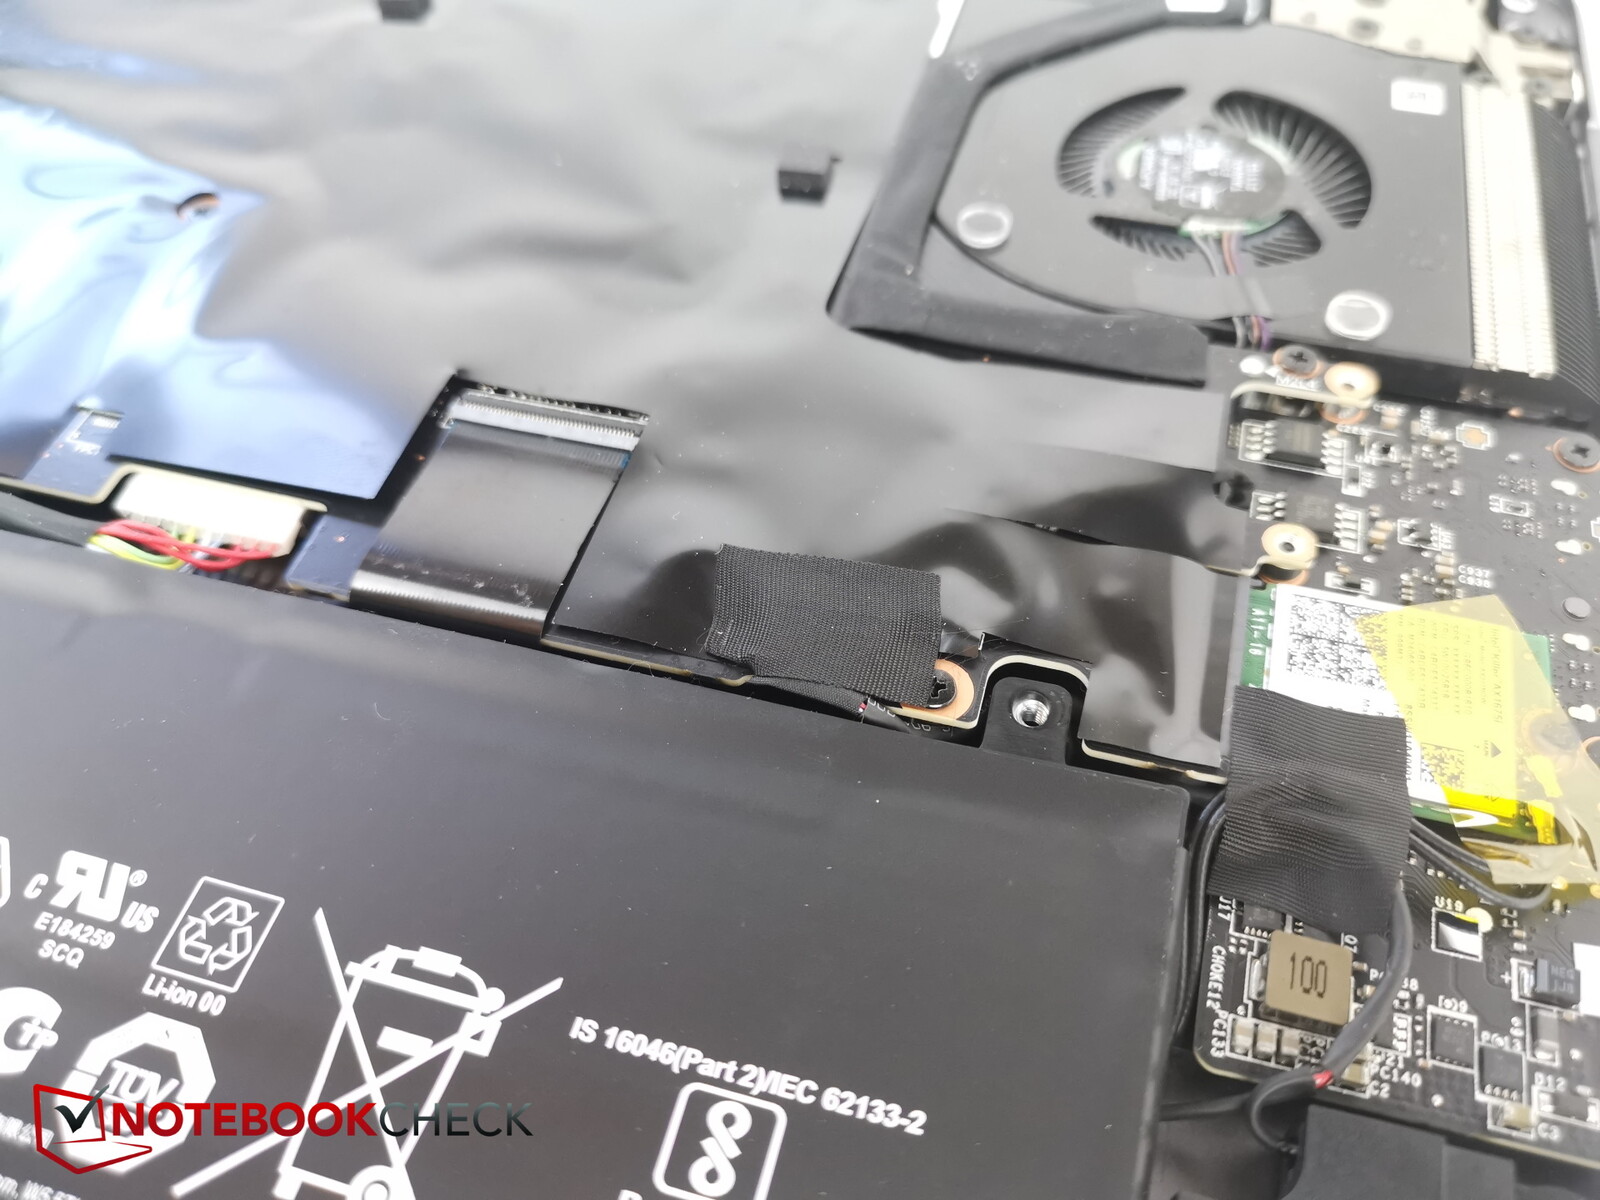
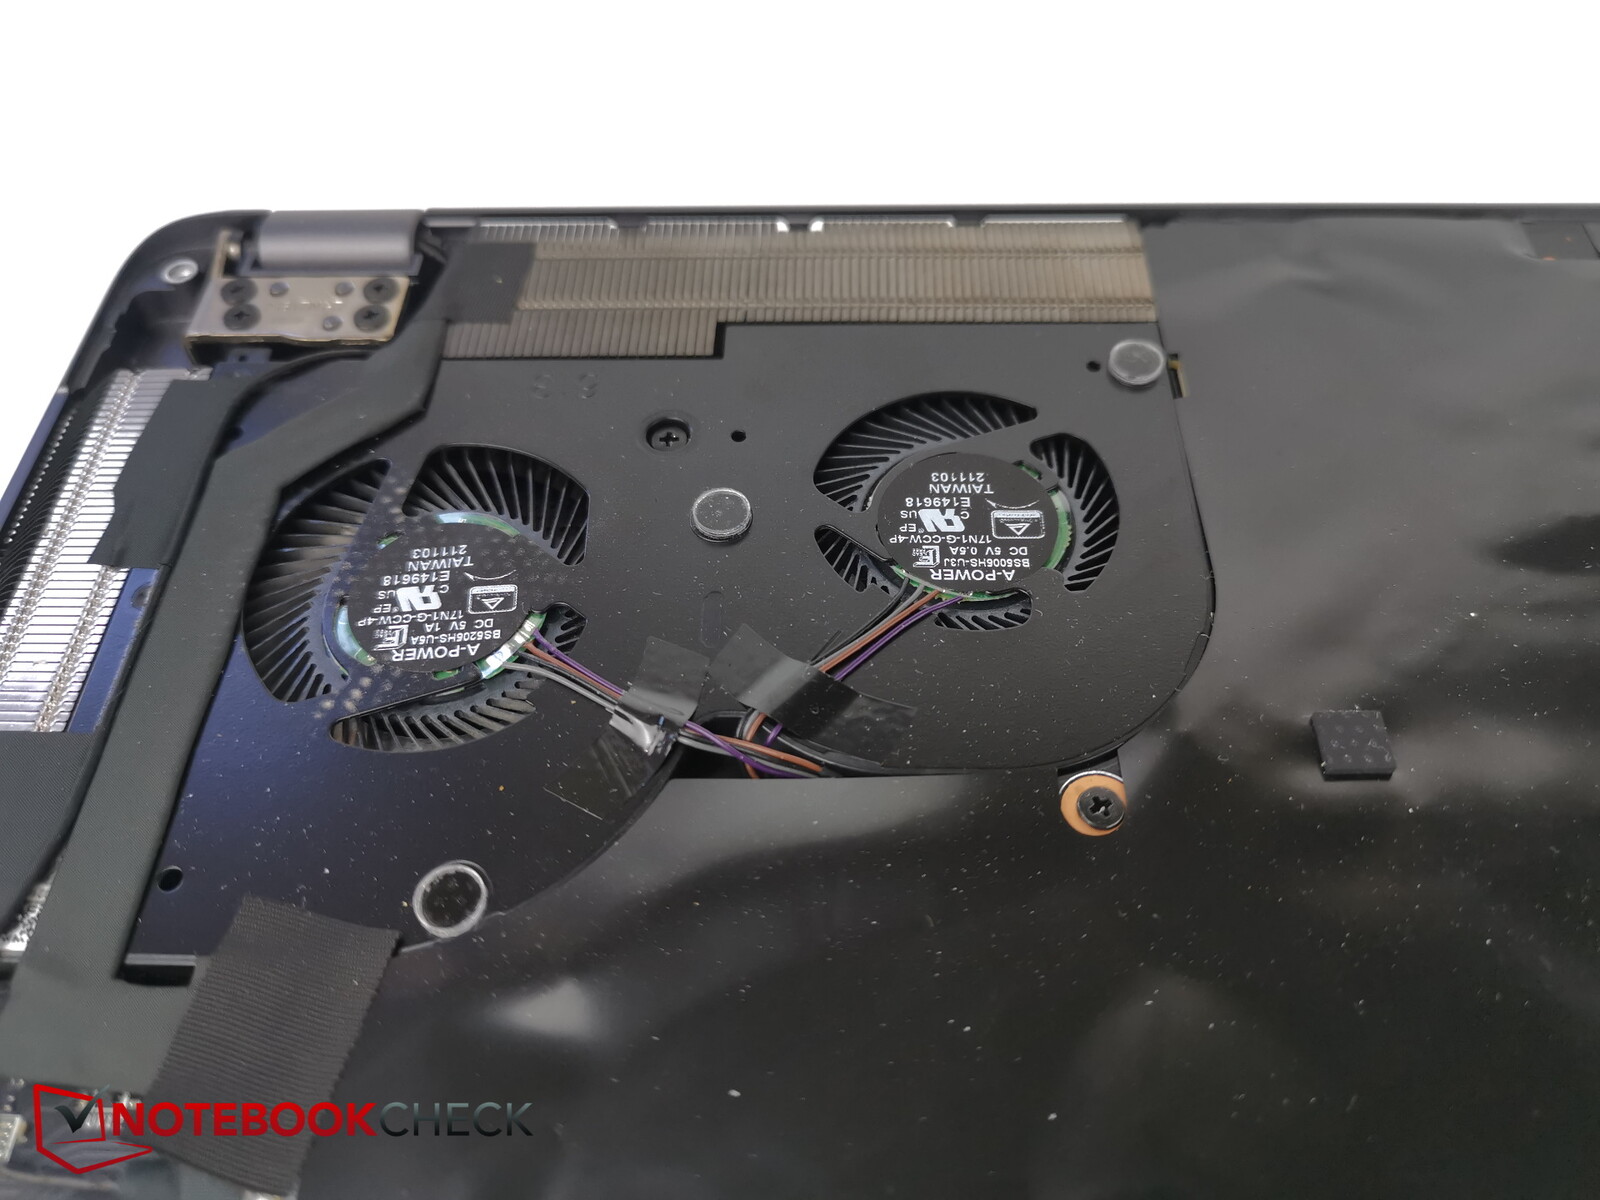
Wnętrze Z17 jest dość trudne do serwisowania i modernizacji, gdyż prawie wszystkie komponenty są przykryte dużym arkuszem czarnej folii. Jedynie moduł Wi-Fi i wentylatory są dostępne od razu. Nawet po zajrzeniu pod rogi folii nie byliśmy w stanie znaleźć miejsca, gdzie znajduje się pamięć RAM i dysk SSD. Arkusz został przyklejony w taki sposób, że nie da się go usunąć bez uszkodzenia czegokolwiek.
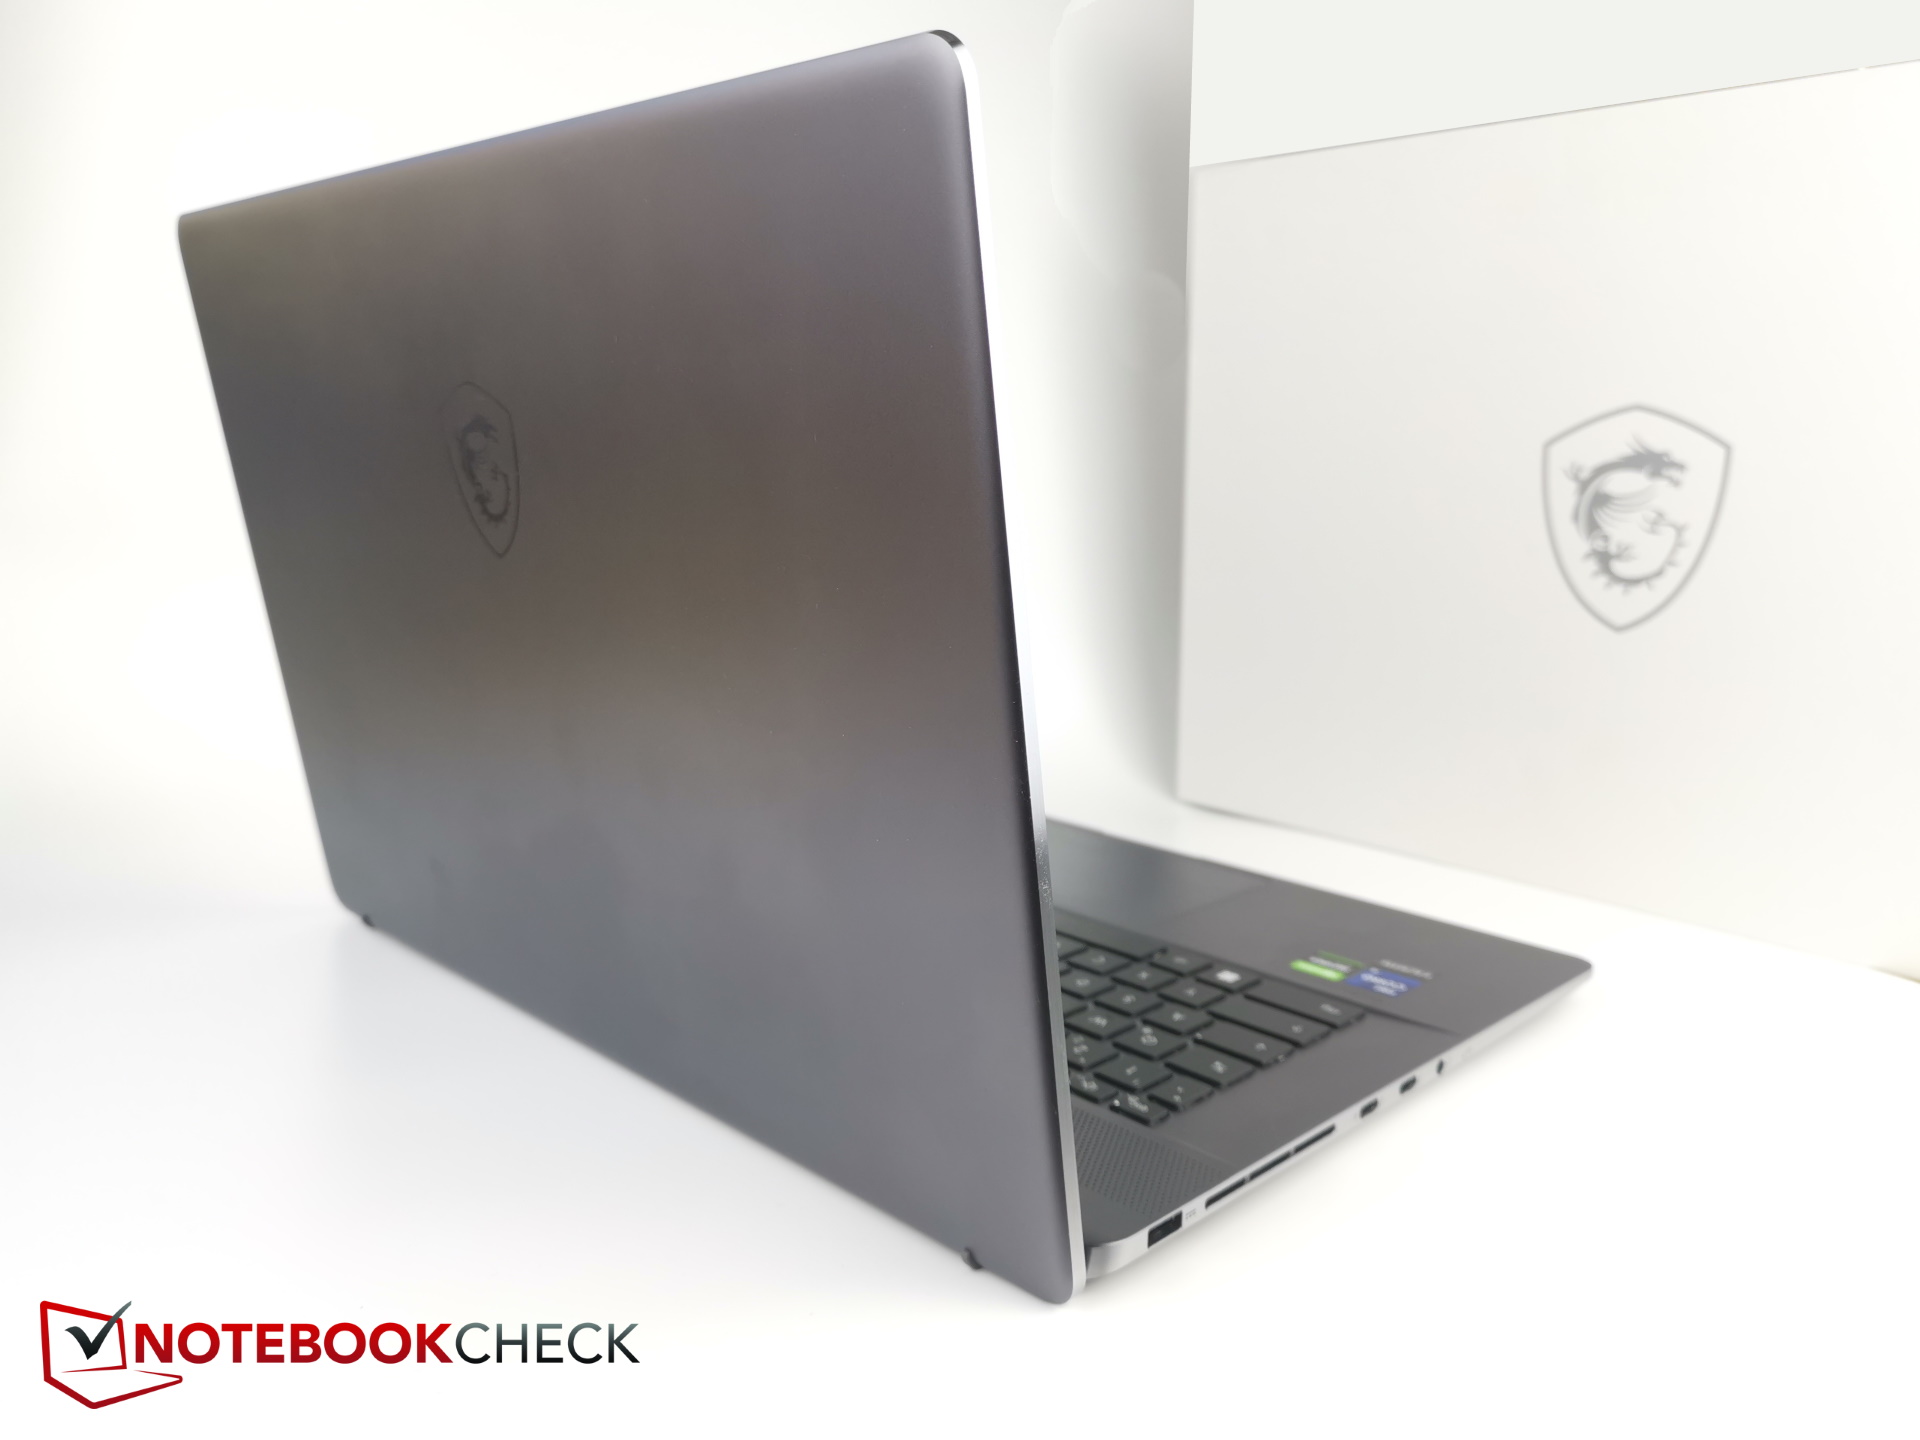
Akcesoria i gwarancja
Pomimo wysokiej ceny urządzenia, w pudełku nie znajdziemy żadnych akcesoriów. Przydałaby się przynajmniej przejściówka z USB na Ethernet.
W Niemczech MSI zapewnia dwuletnią gwarancję na laptopa, w tym usługę pick-up & return. W USA okres gwarancyjny wynosi jeden rok.
Input devices - Solid options for creators
Klawiatura
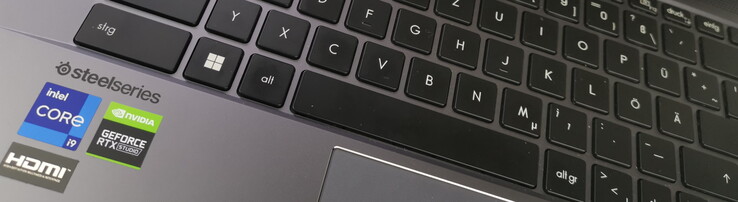
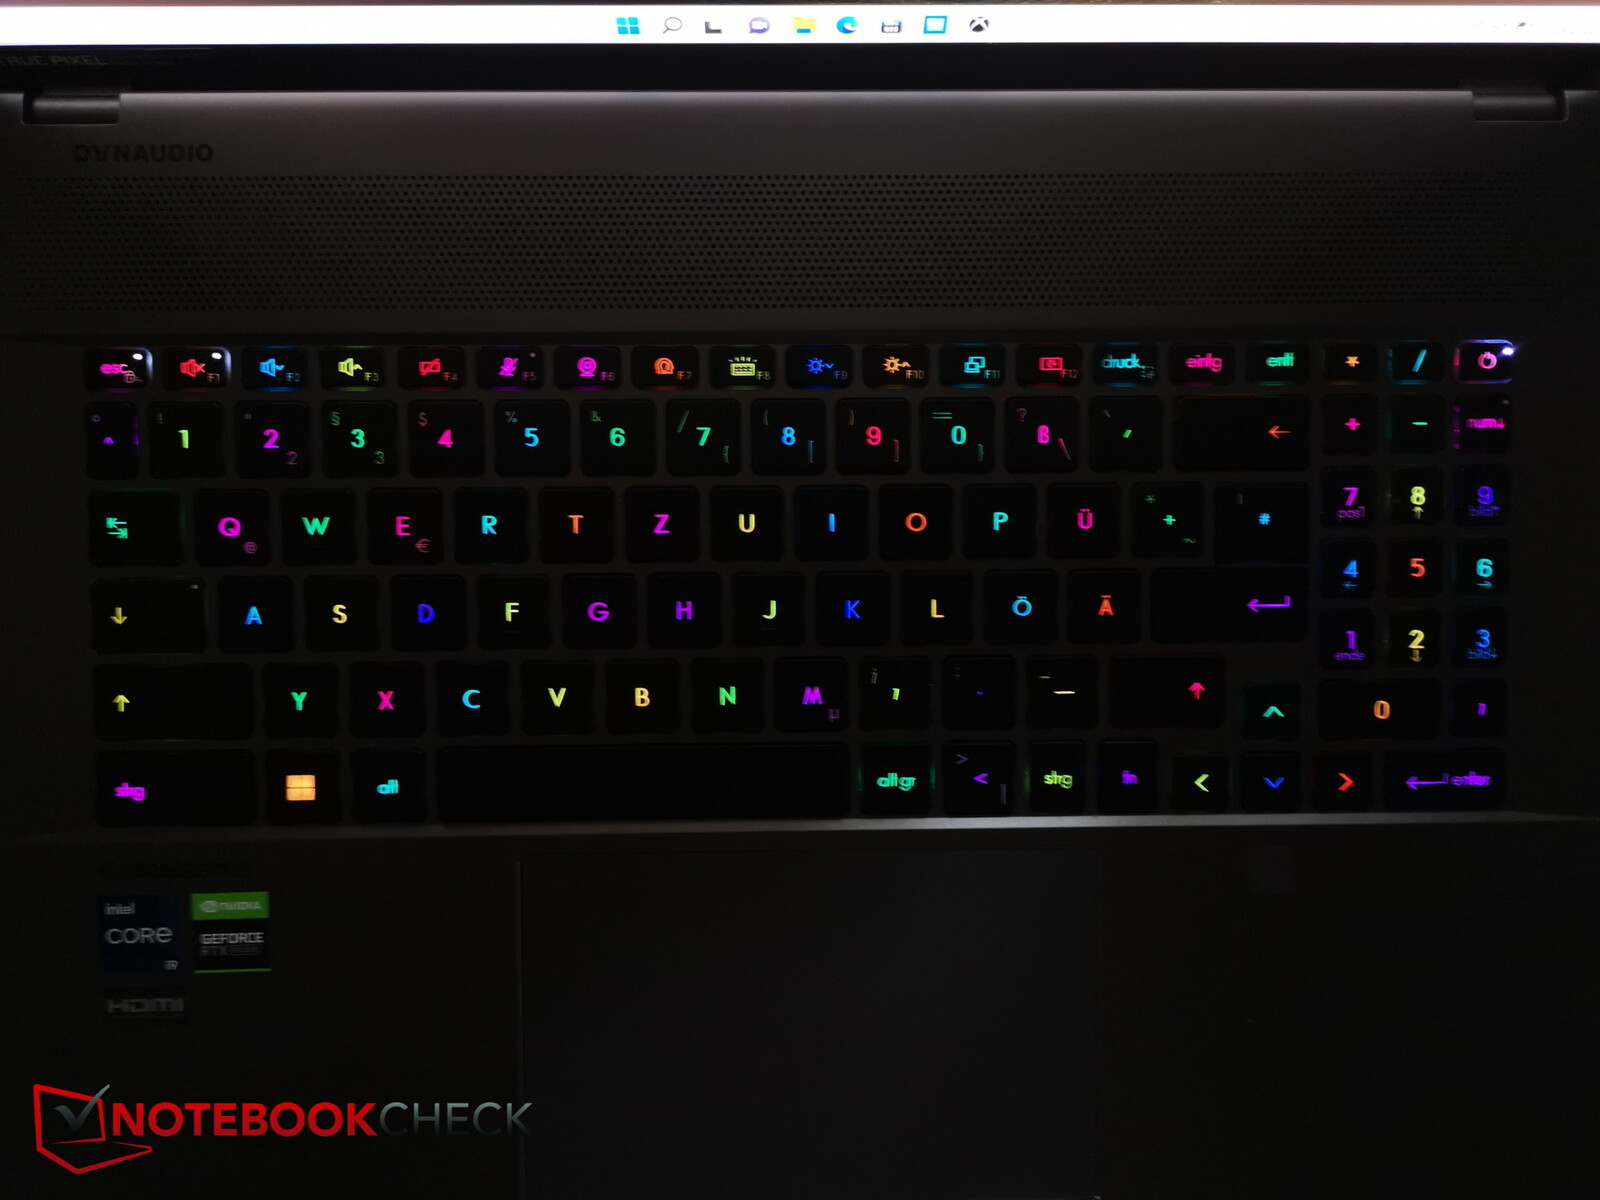
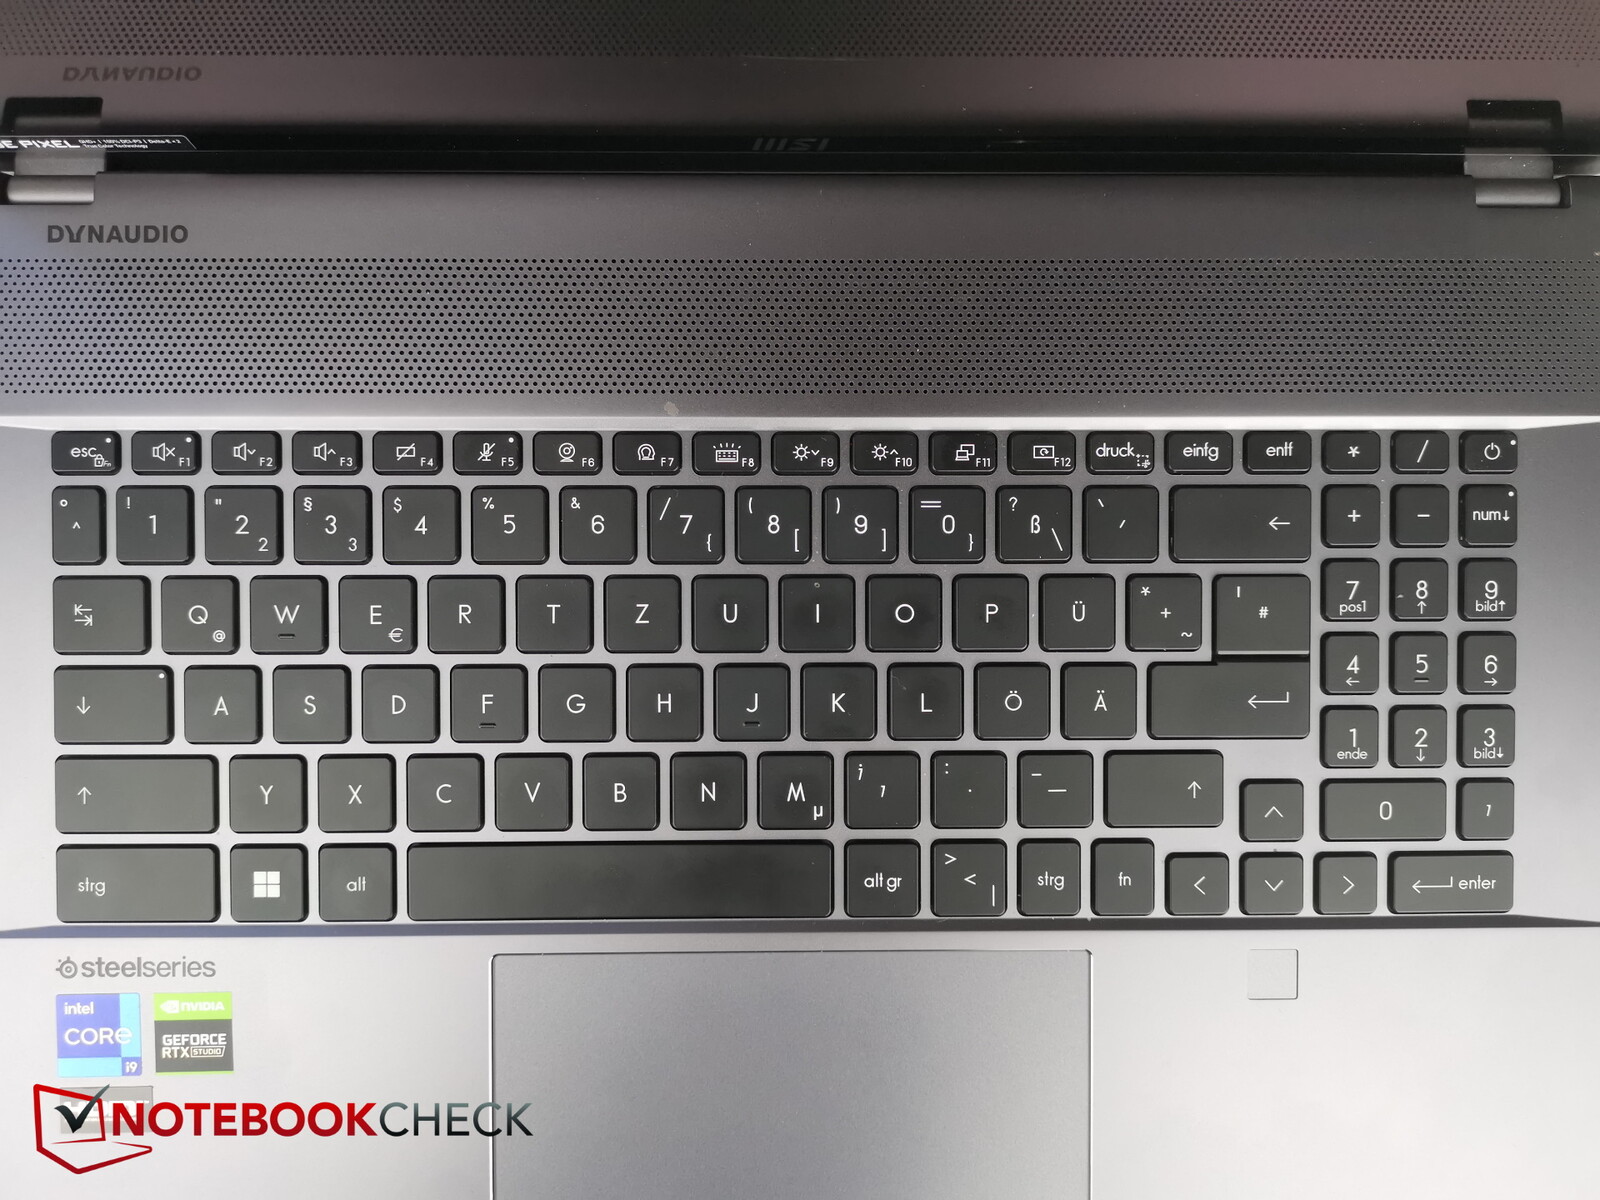
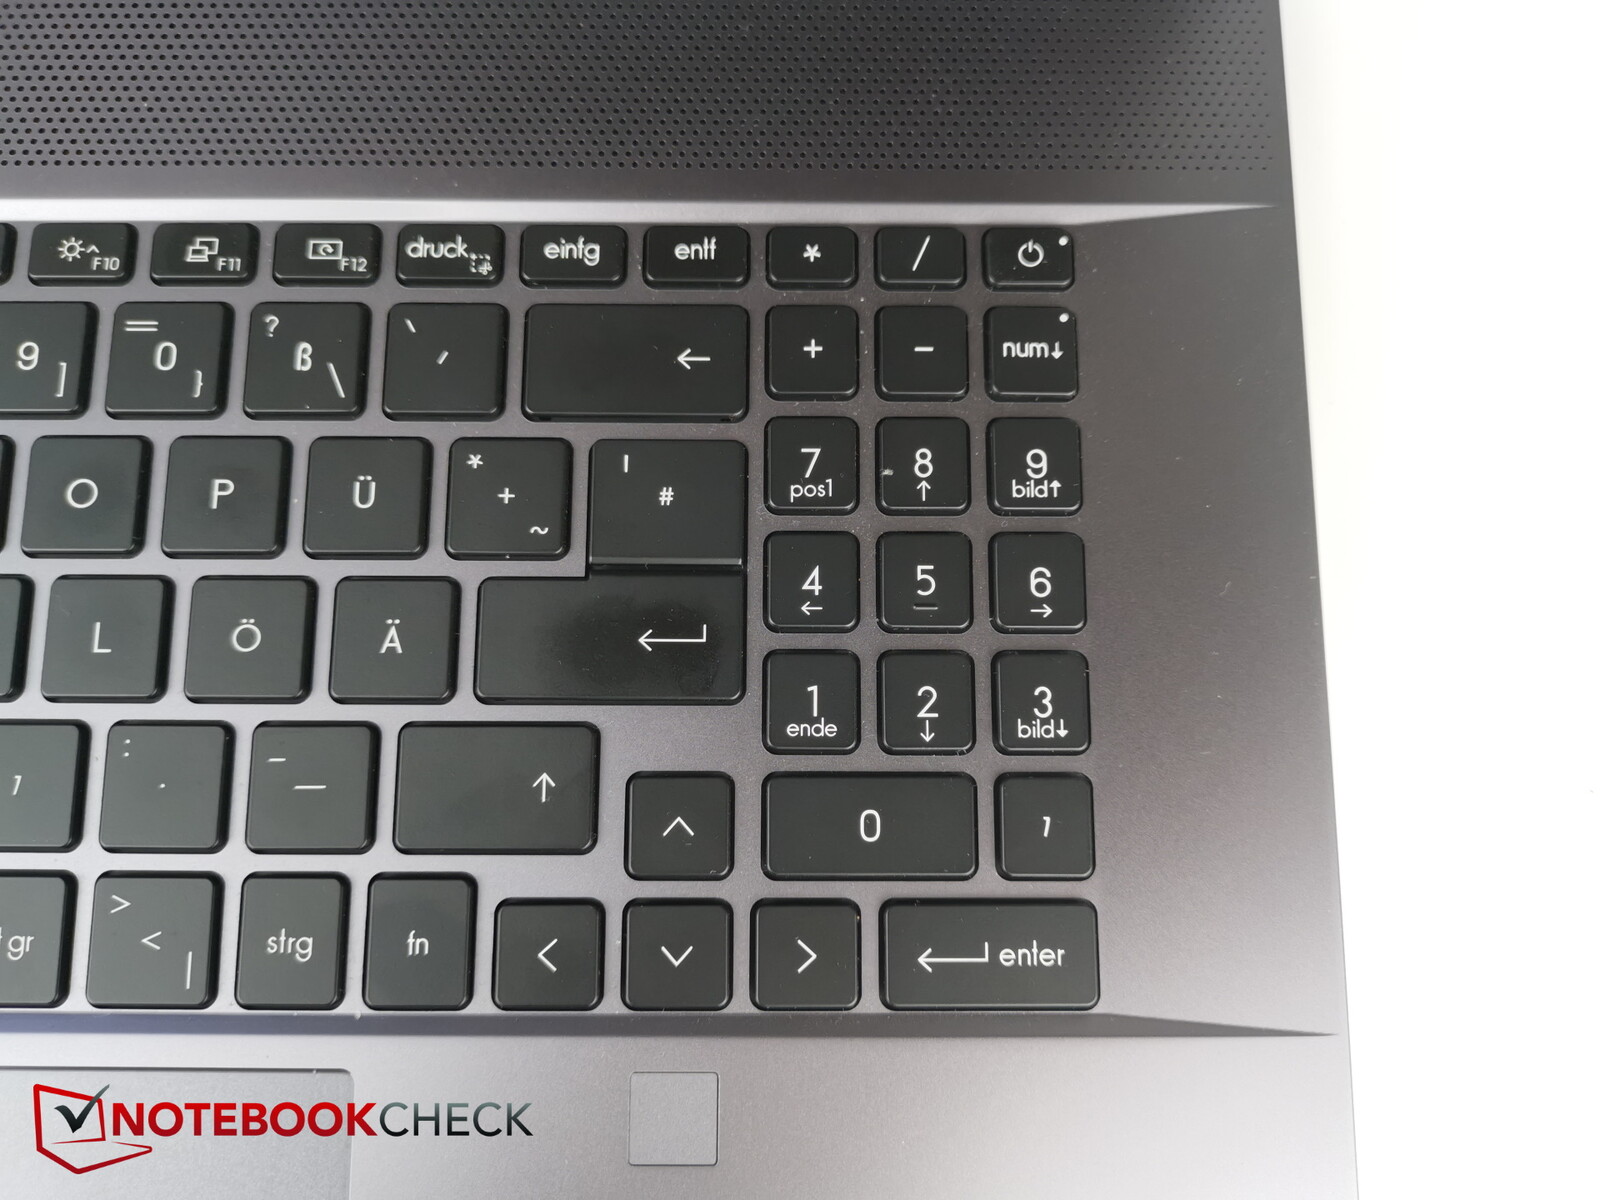
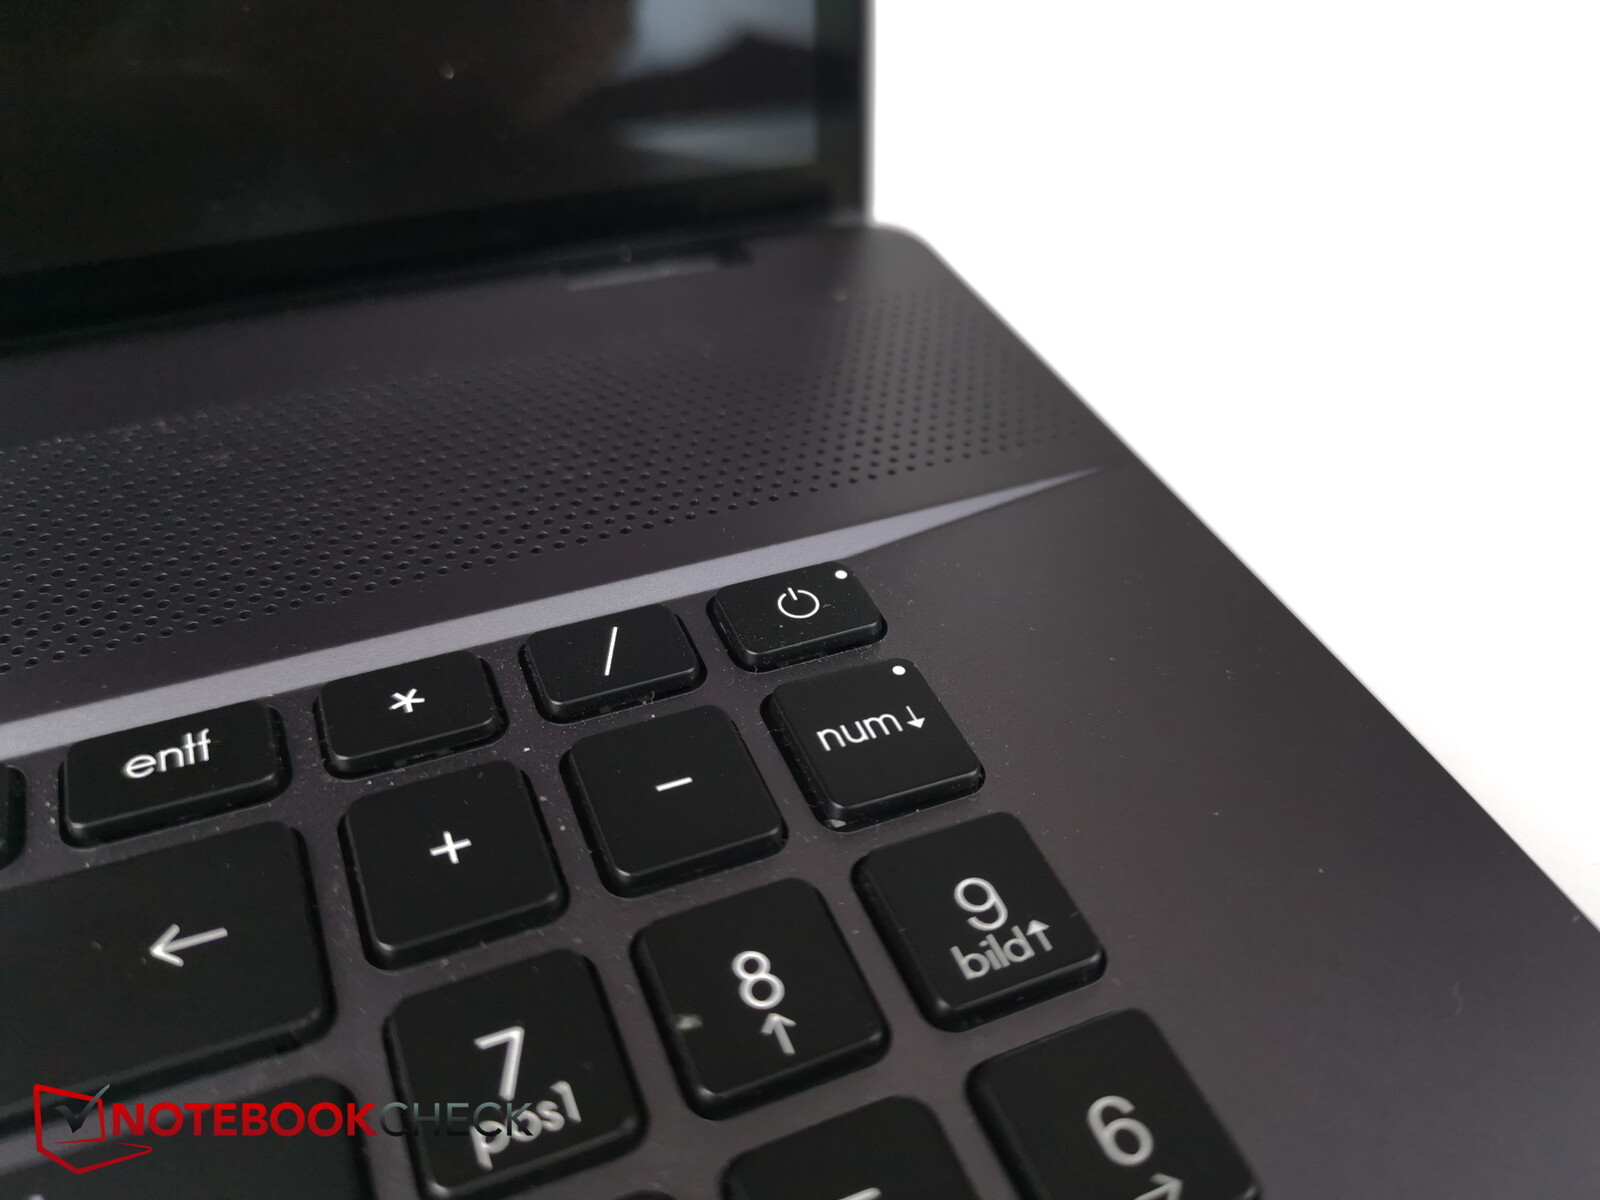
Choć jest to laptop 17-calowy, nie wykorzystuje on całej swojej szerokości na potrzeby klawiatury. Podczas gdy normalne klawisze są wystarczająco duże i dobrze rozstawione, klawiatura numeryczna po prawej stronie wygląda na zbyt małą i zgniecioną. Czcionka na klawiszach jest jednak dobrze widoczna i czytelna na całej długości.
Podobnie bardzo małe są klawisze strzałek. To samo dotyczy prawego klawisza Ctrl oraz wąskiego klawisza Fn (który w przeciwieństwie do większości klawiatur znajduje się tylko po prawej stronie).
Same klawisze mają dość krótki skok, ale oferują wyraźną informację zwrotną, co pozwala na szybkie pisanie. Środek klawiatury nie ma żadnego zauważalnego ugięcia podczas pisania - wszystko sprawia wrażenie sztywnego.
Klawiatura posiada indywidualne podświetlenie RGB do użytku w słabo oświetlonych miejscach. Do wyboru są cztery poziomy jasności, a podświetlenie można oczywiście wyłączyć.
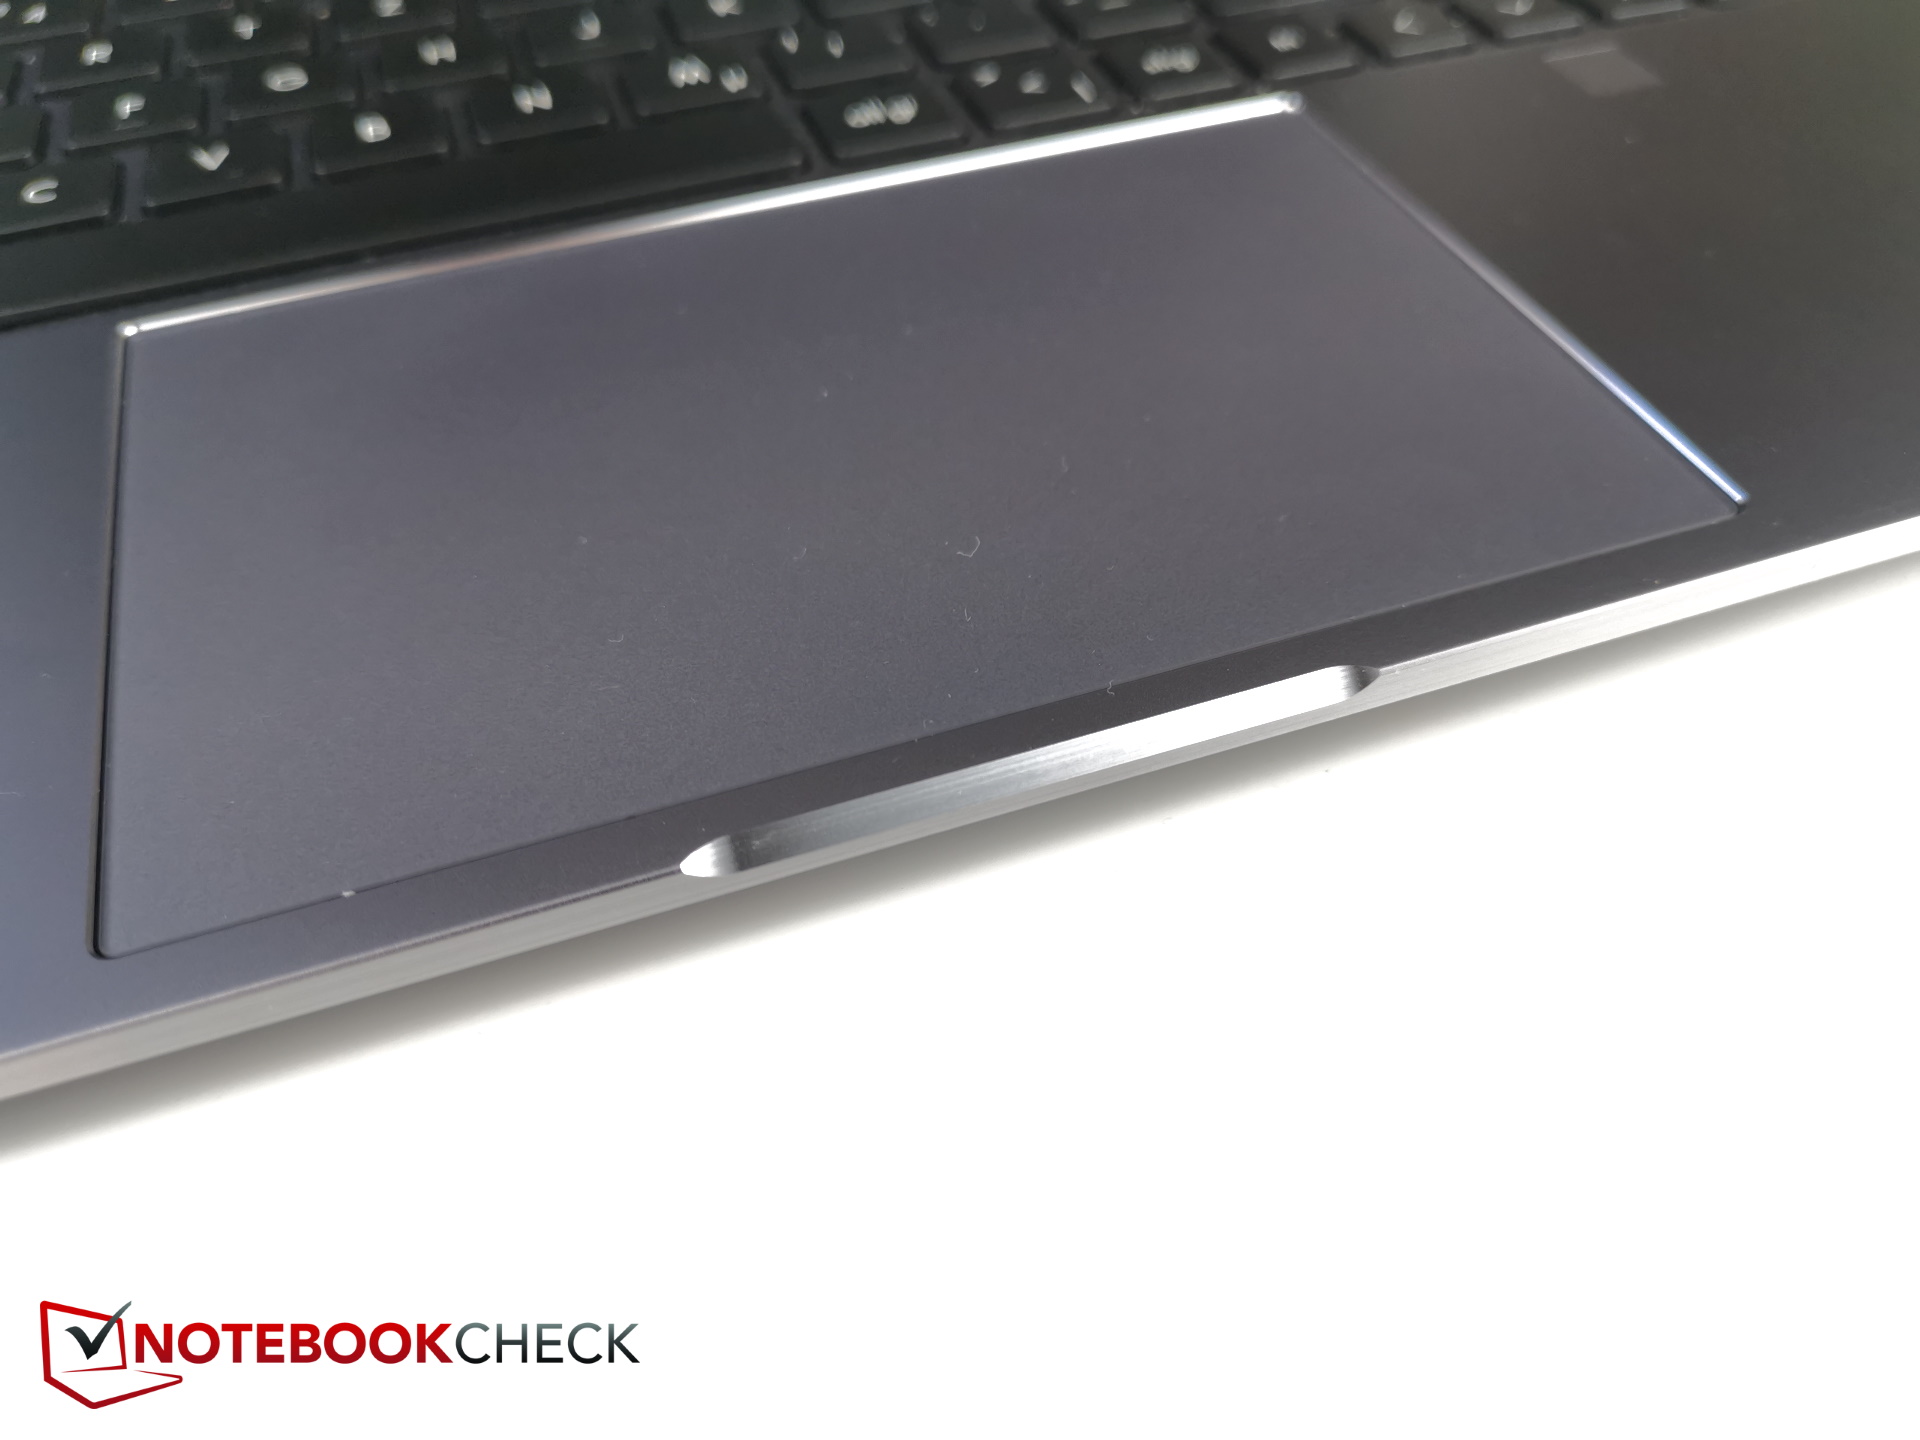
Touchpad
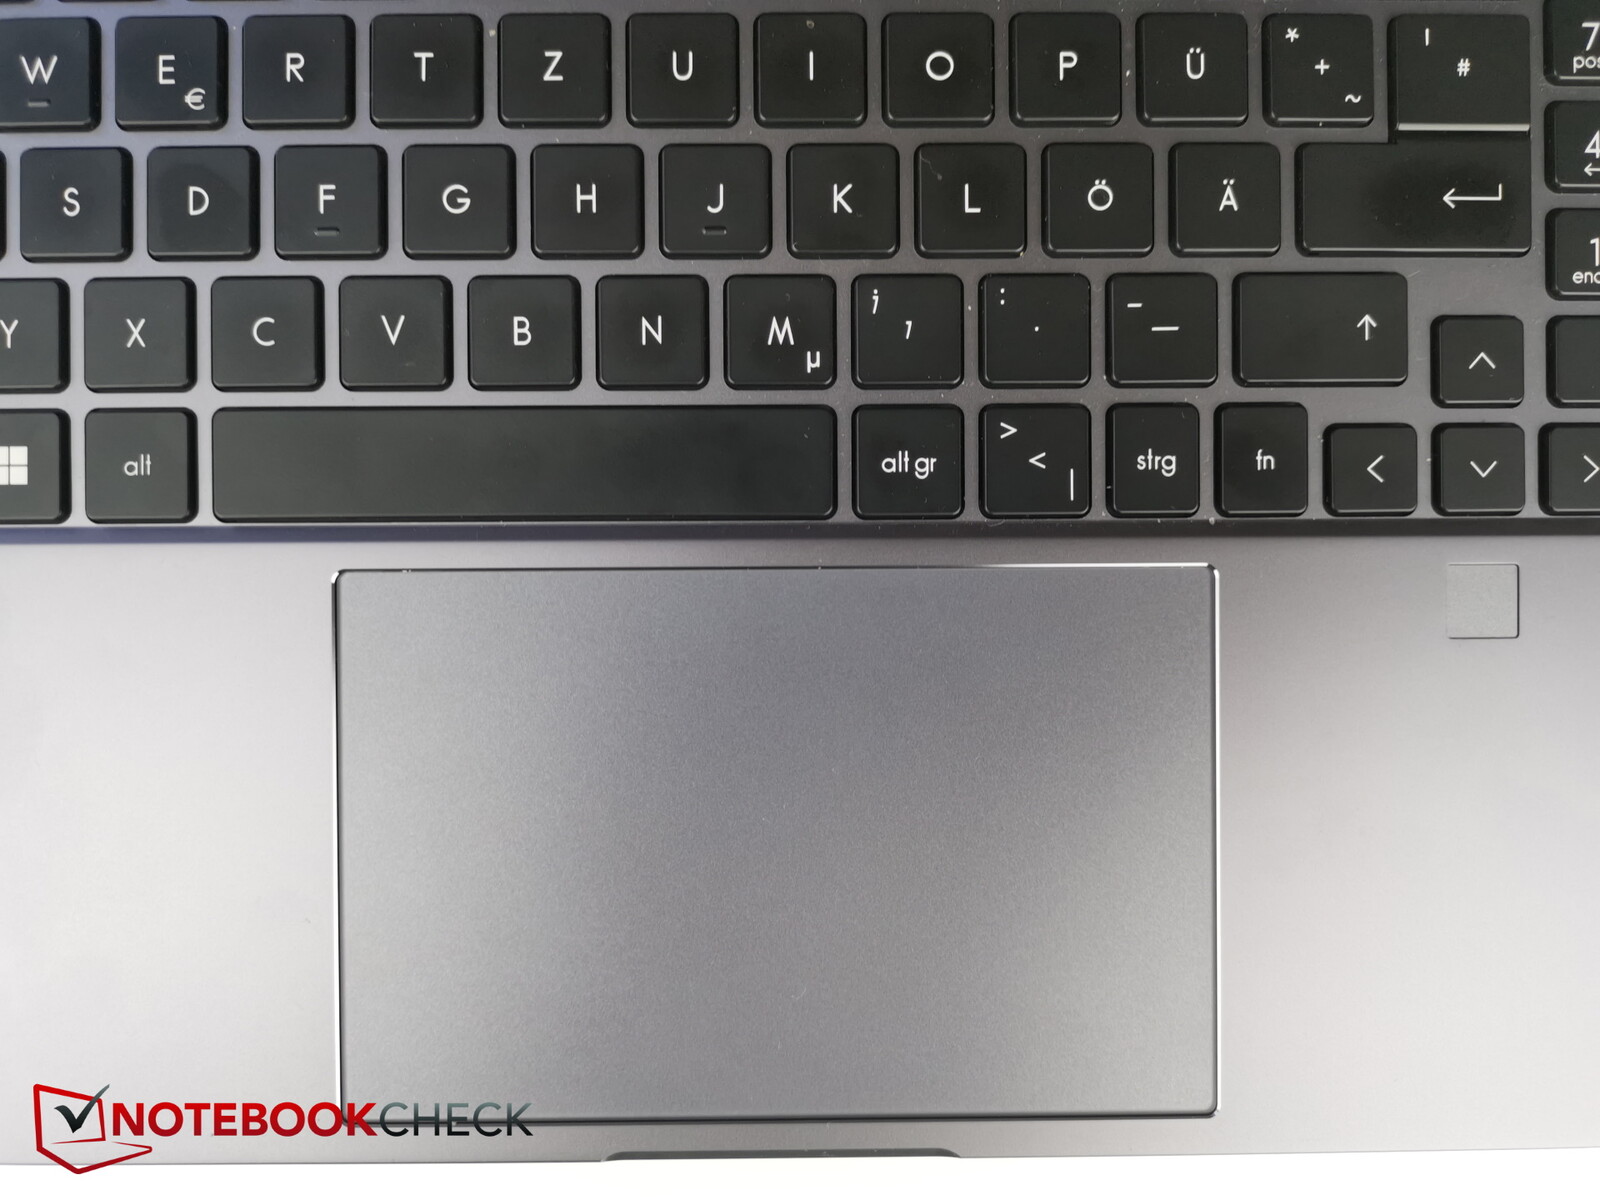
Pierwszą rzeczą, jaką zauważysz na touchpadzie, jest jego wielkość (około 13,1 x 8,2 cm, czyli 5,16 x 3,23"). Powierzchnia jest znakomicie gładka i w ogóle nie czuć na niej chropowatości, nawet gdy przesuwa się po niej palce bardzo powoli.
Zintegrowane przyciski mają wyraźny punkt nacisku. Siła wymagana do naciśnięcia przycisków jest w sam raz, a może nawet nieco większa, niż jest to konieczne. Odgłos klikania z touchpada jest bardzo rozsądny.
Ekran dotykowy
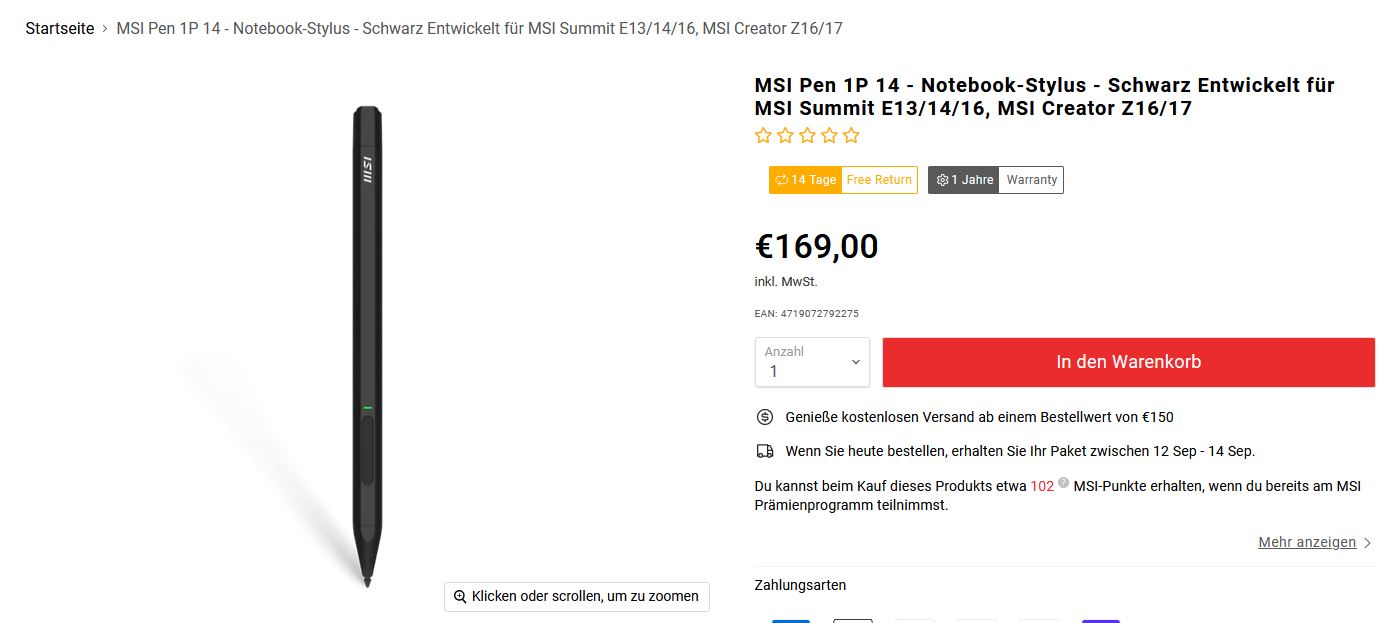
Wejścia dotykowe są rejestrowane bez żadnych zauważalnych opóźnień, co skutkuje tym, że ekran dotykowy jest naprawdę łatwy w użyciu. MSI Creator Z17 obsługuje również wprowadzanie danych za pomocą pióra, ale rysik niestety nie jest dołączony do zestawu, pomimo wysokiej ceny produktu. Sam rysik MSI Pen kosztuje aż 169 euro (99 dolarów na Amazon.com). Korzystanie z ekranu dotykowego za pomocą palców ma tendencję do pozostawiania nieestetycznych śladów.
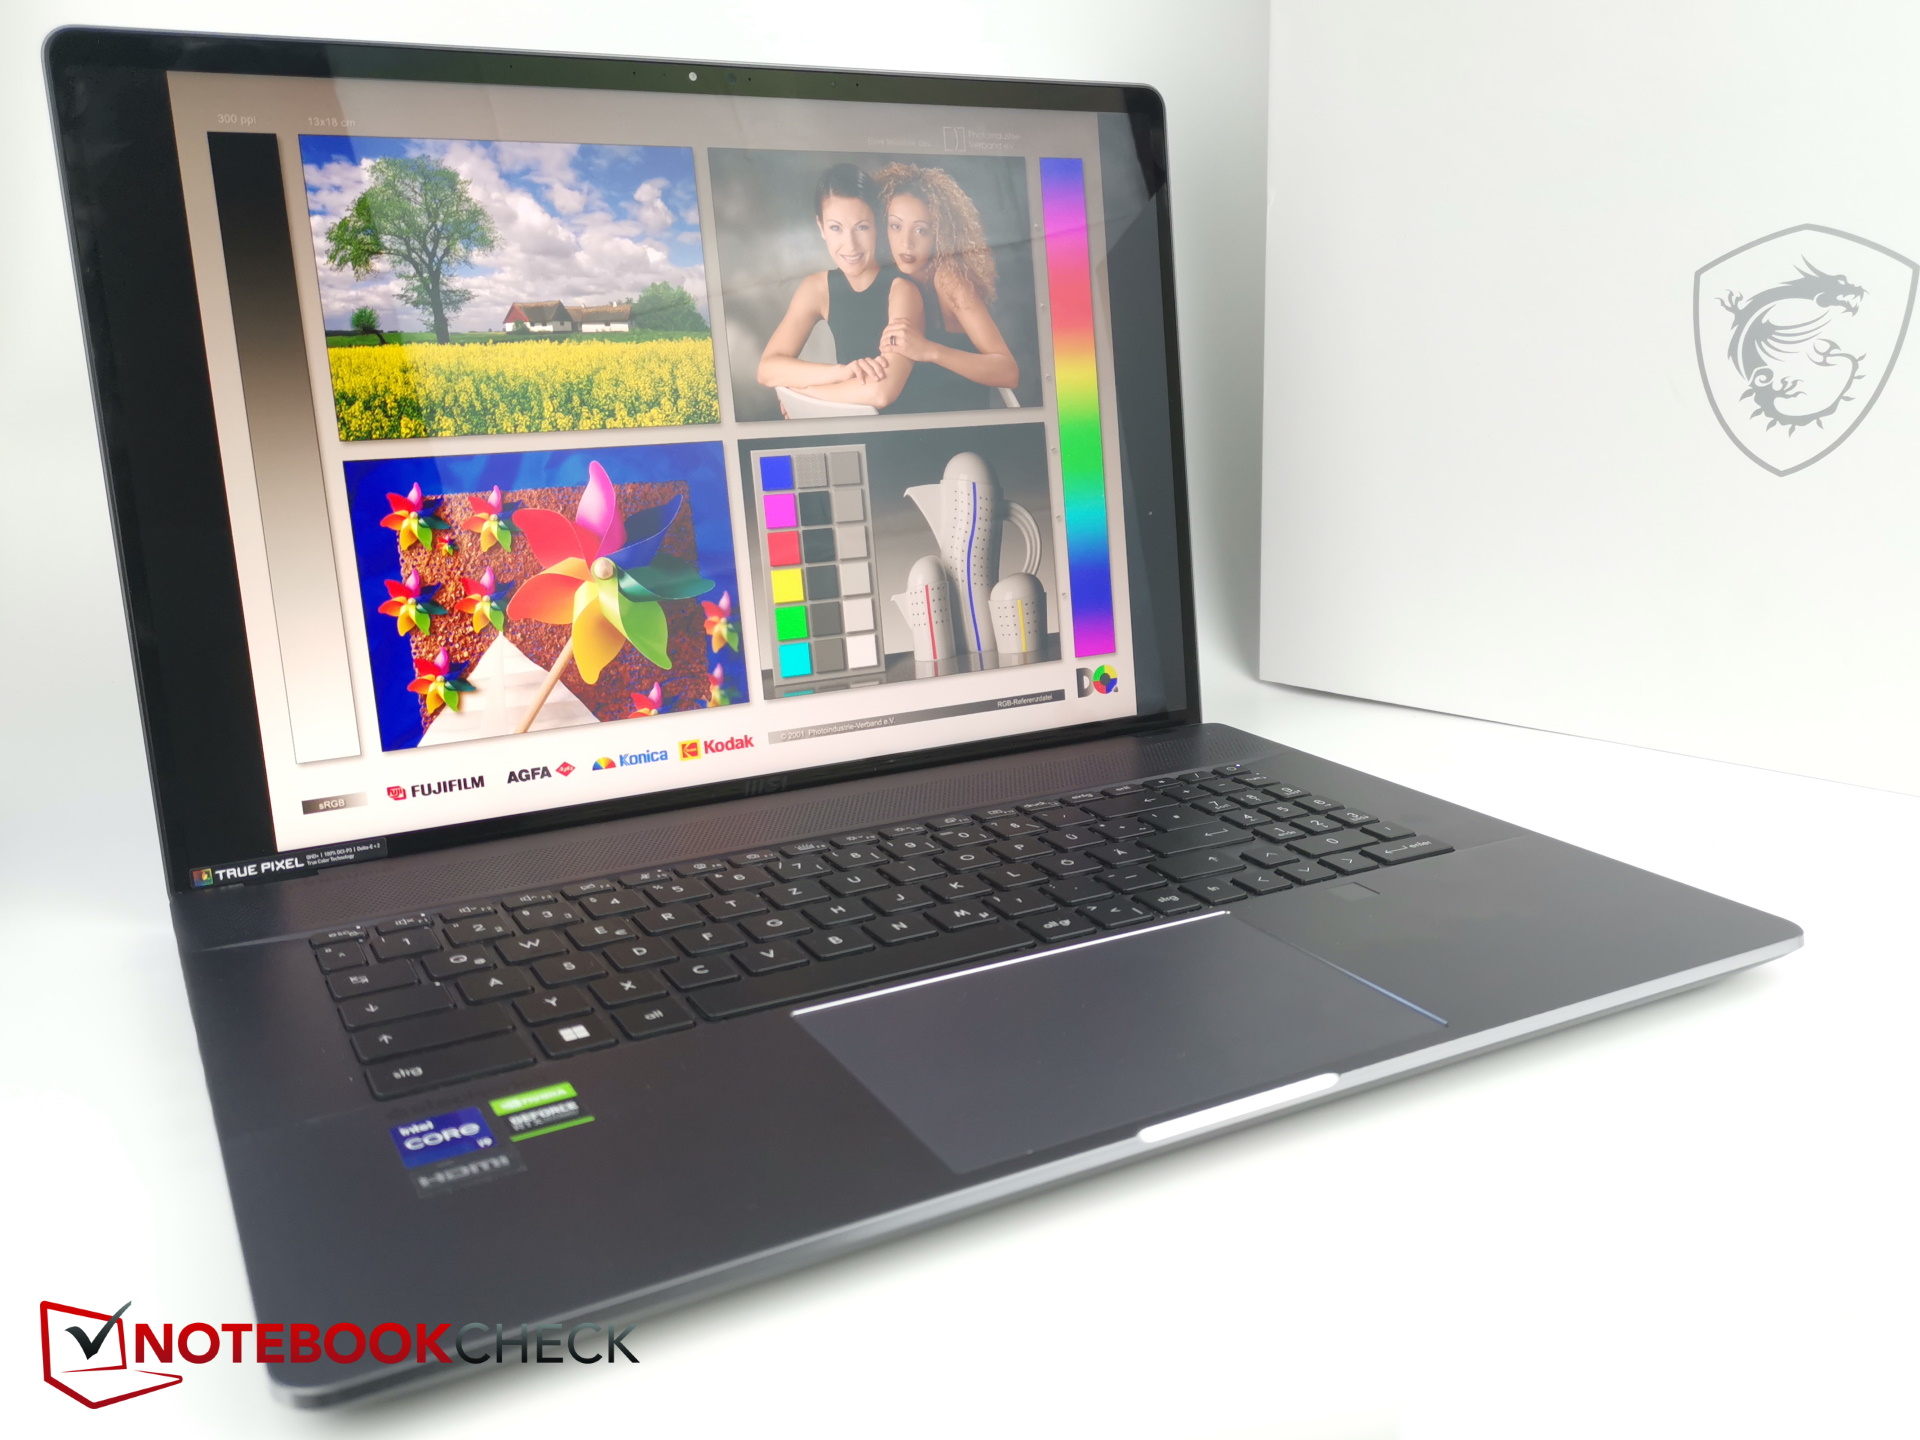
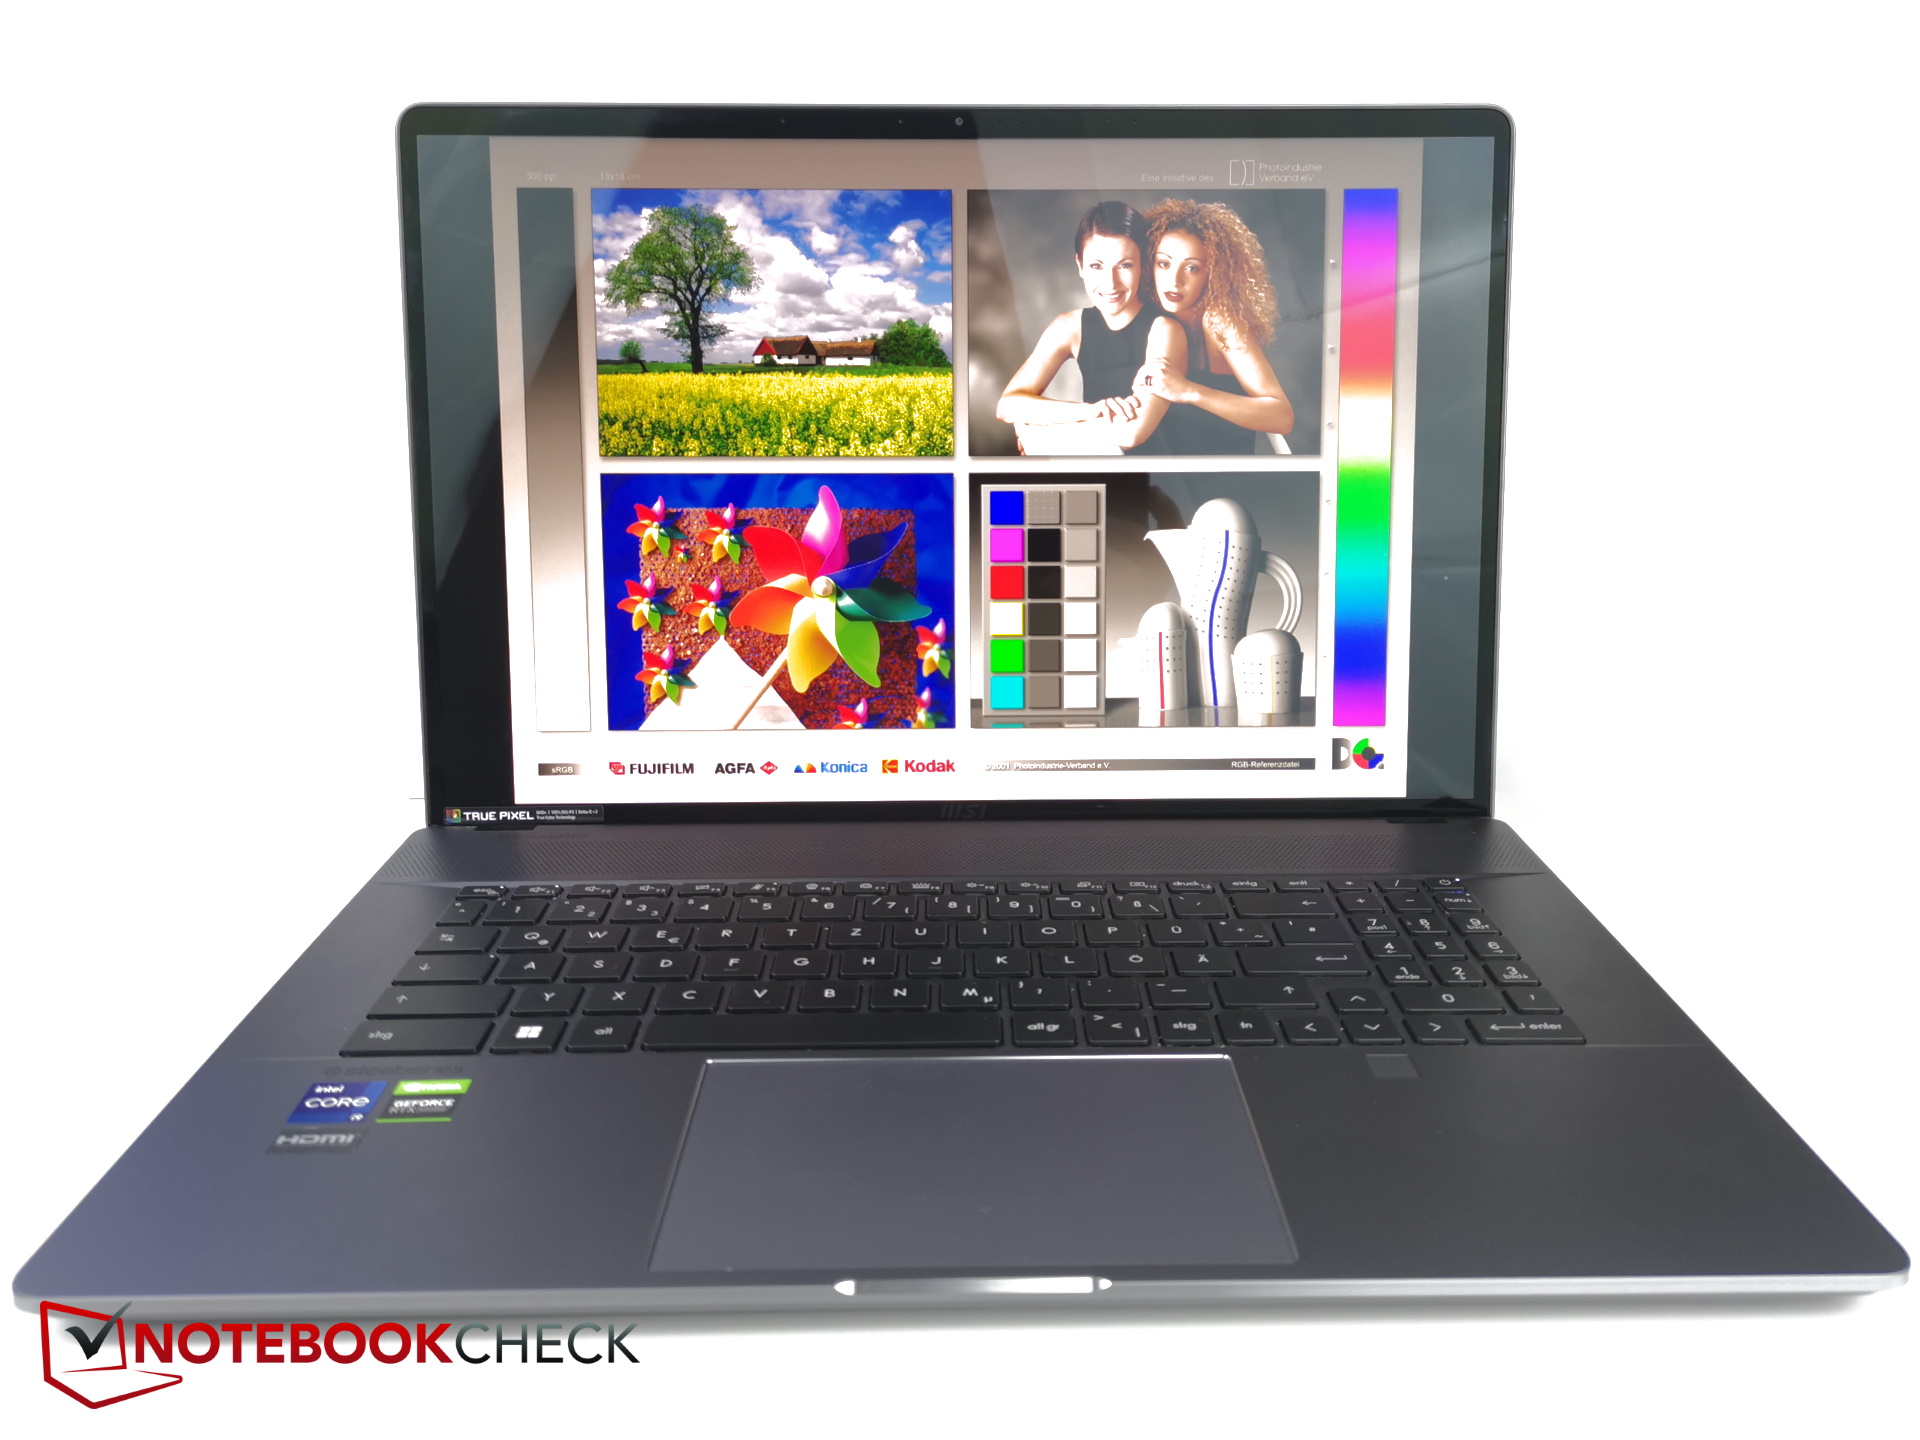
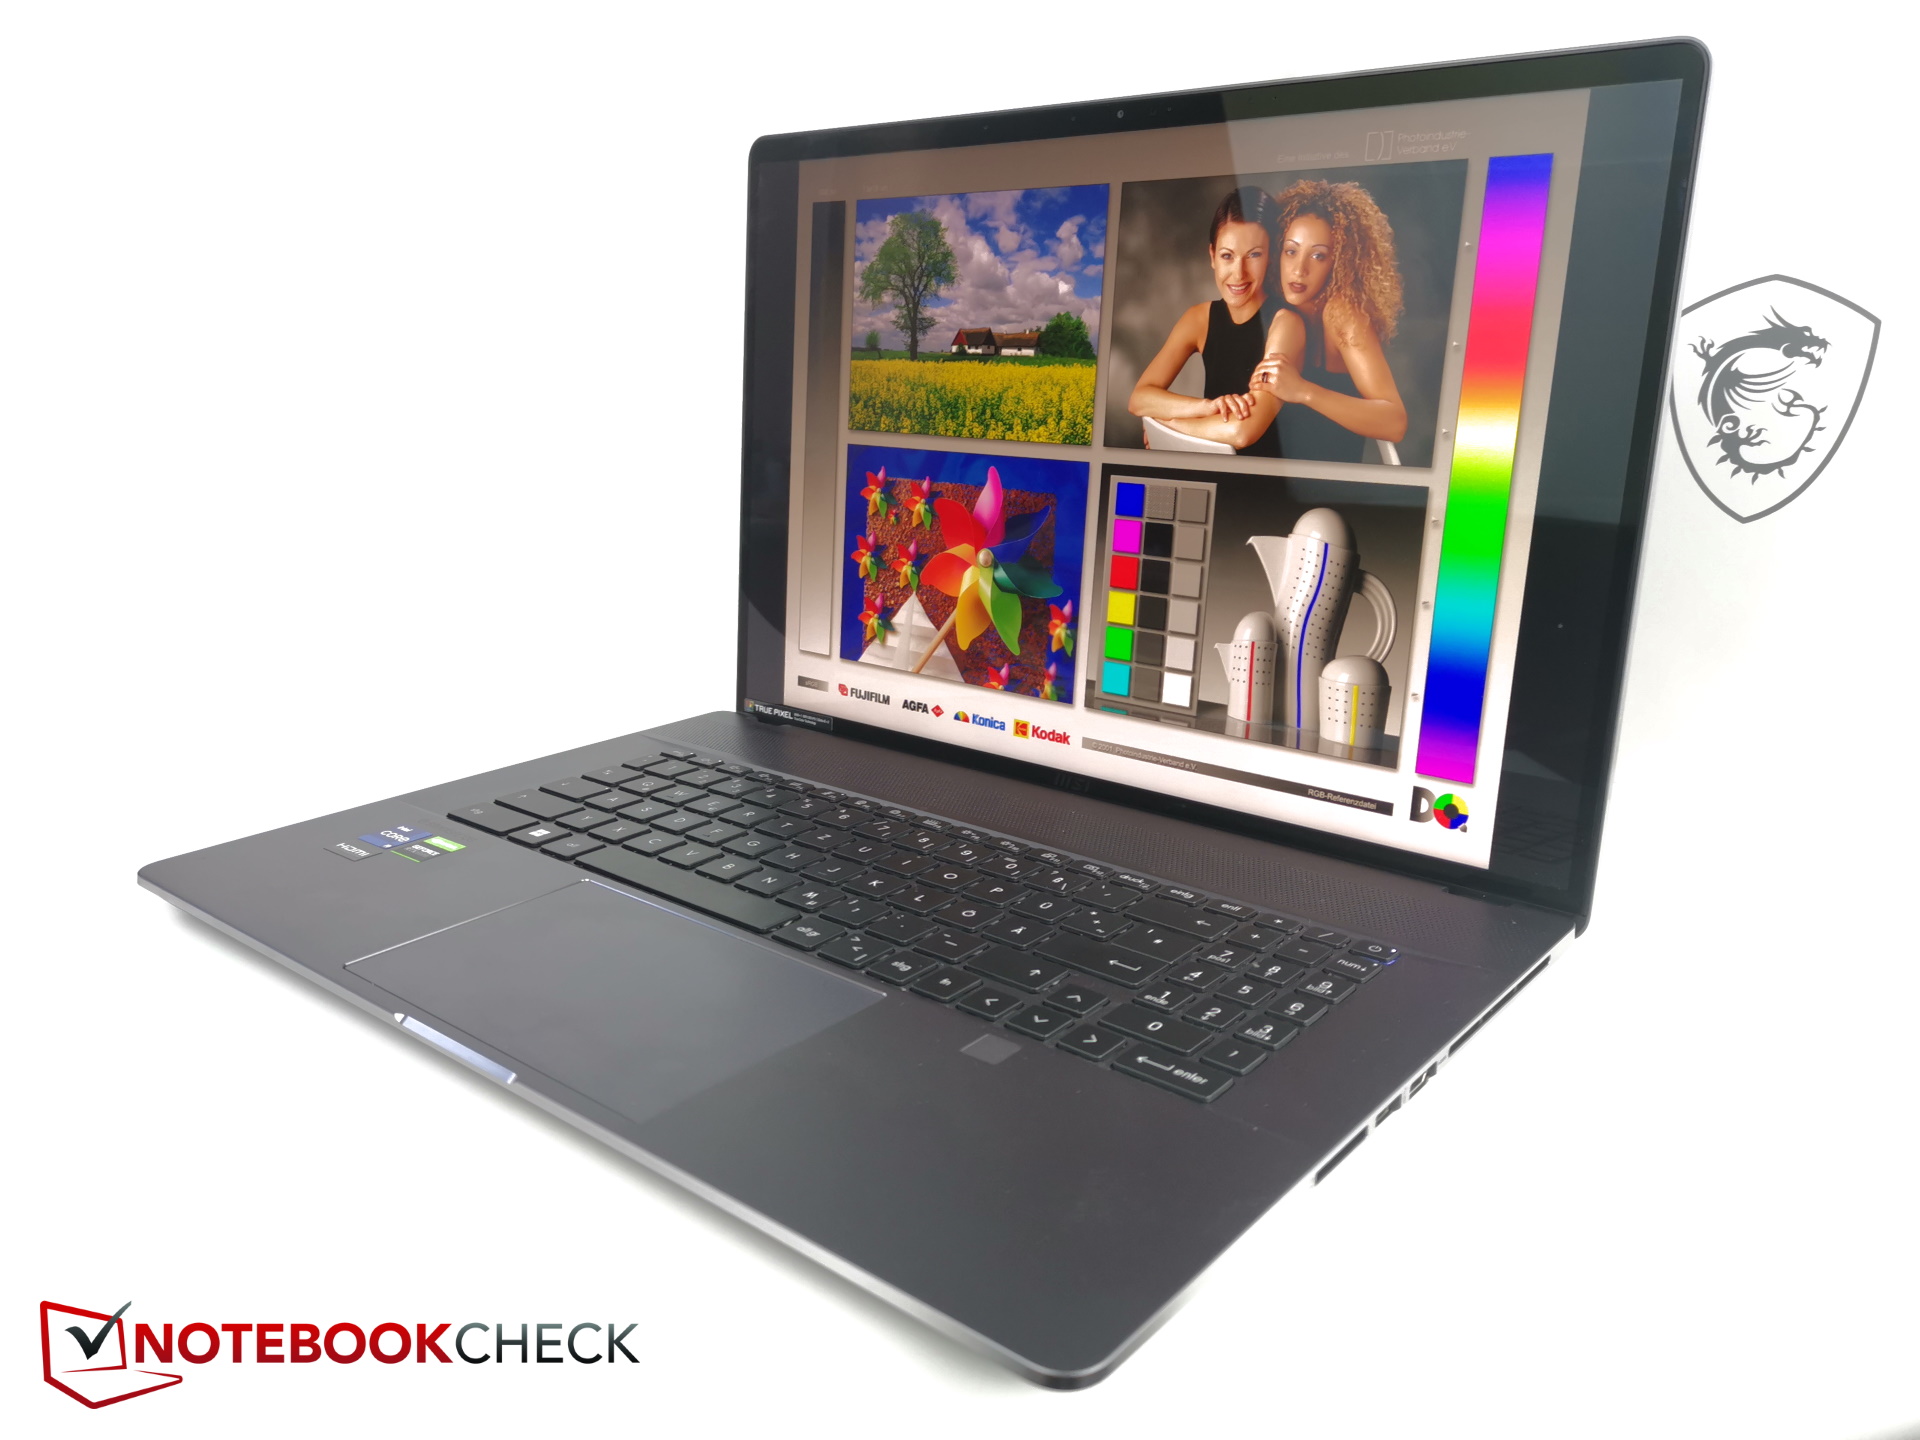
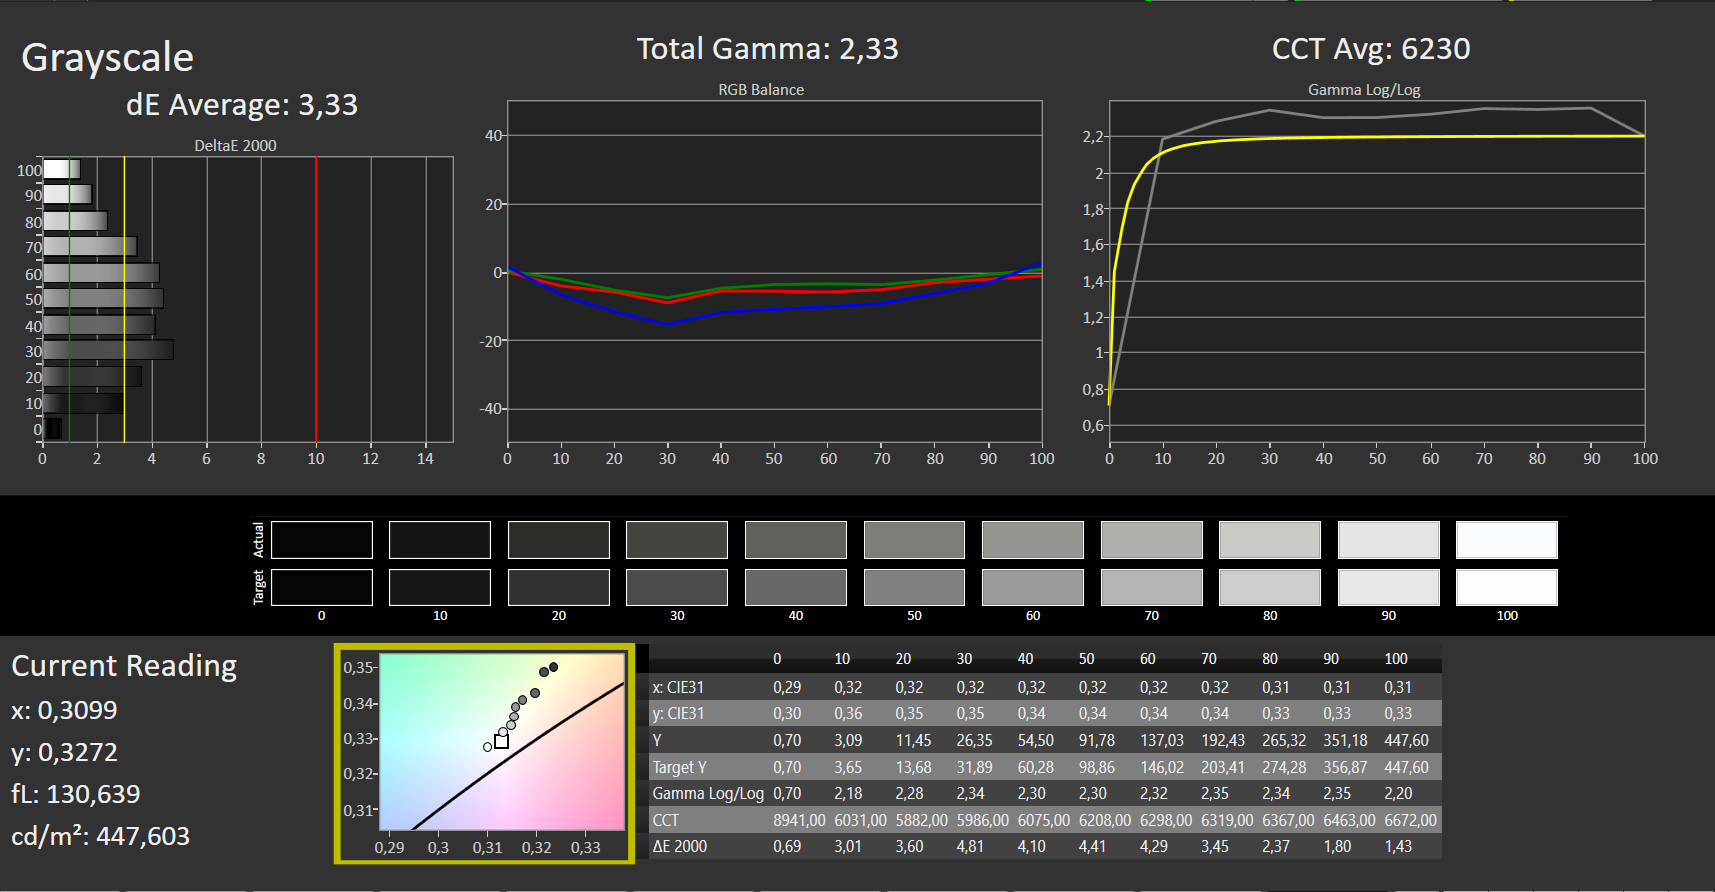
Wyświetlacz - błyszczący ekran dotykowy z pełnym wyświetlaczem P3

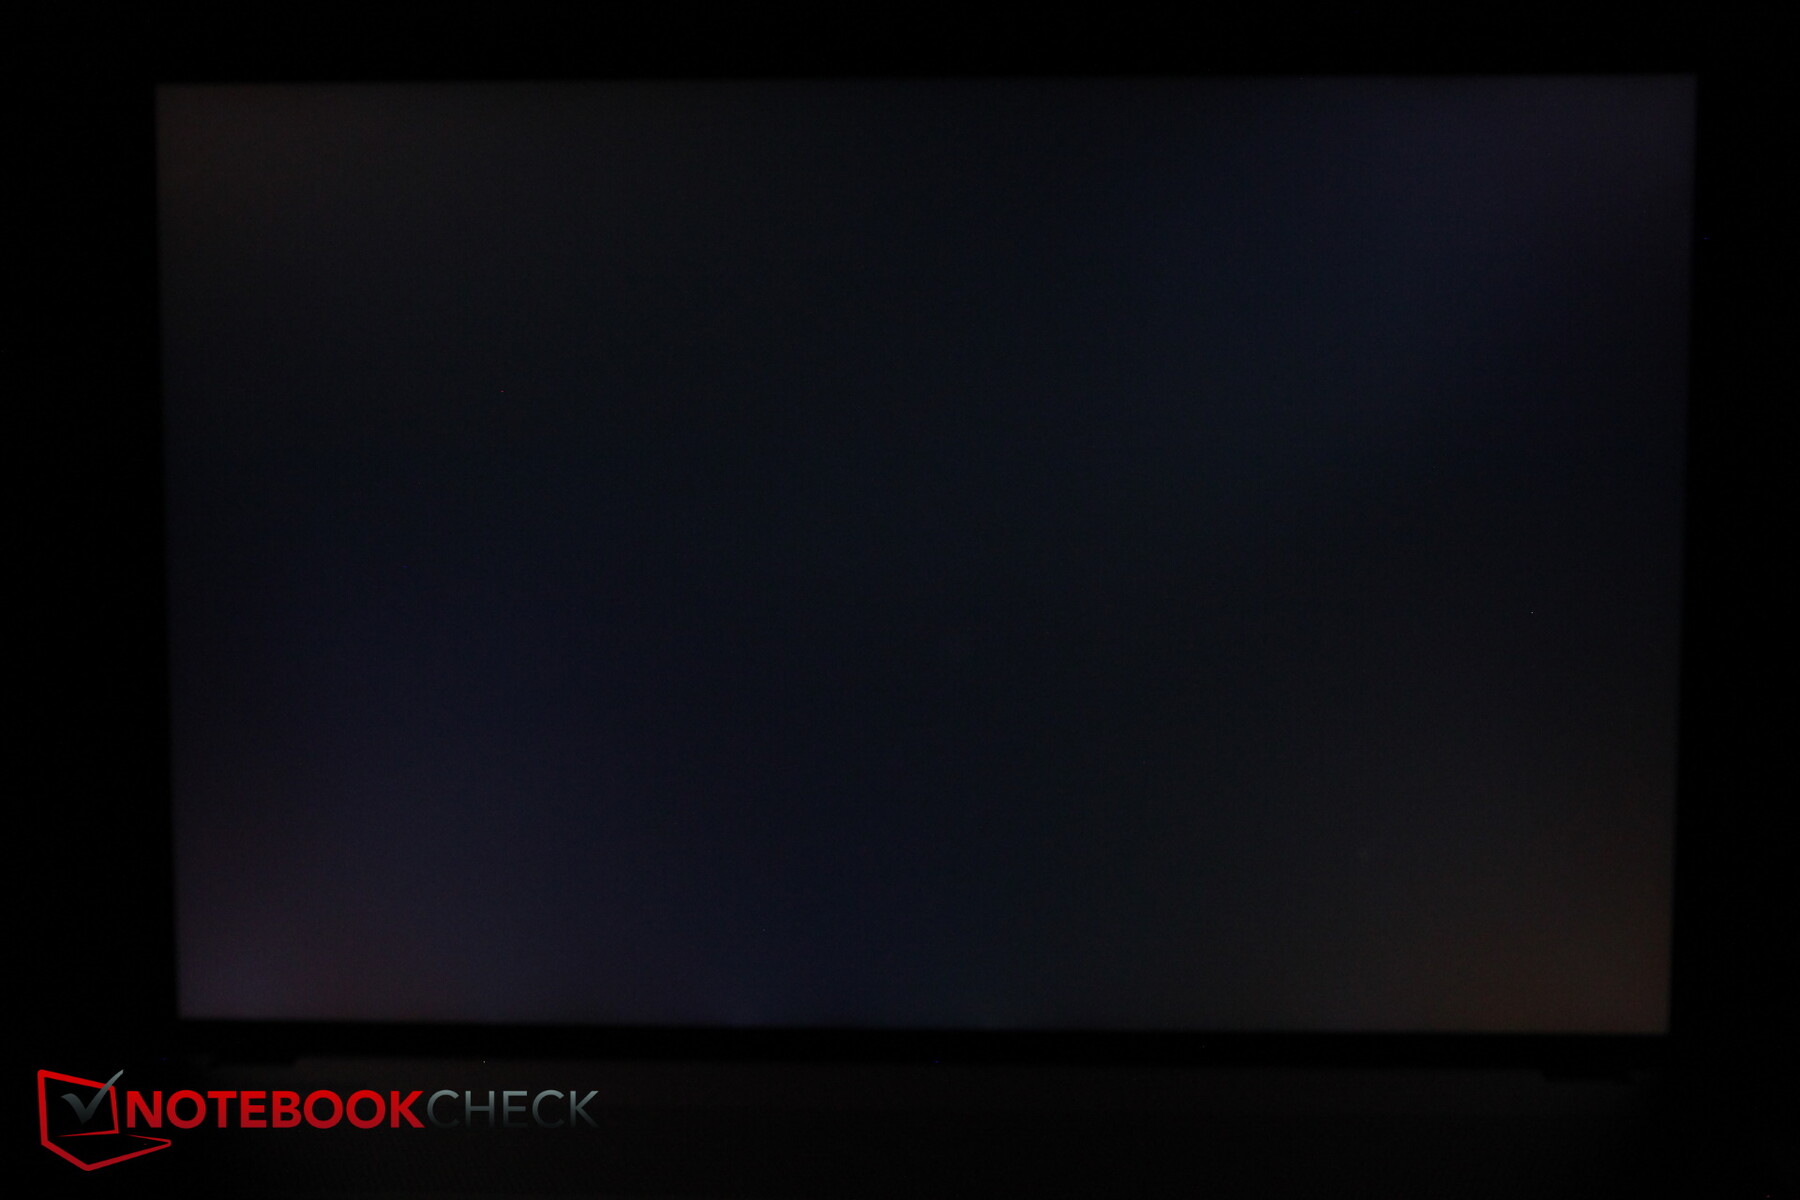
MSI poszło w przypadku laptopa z błyszczącym 17-calowym ekranem dotykowym. Jest to panel IPS o częstotliwości 165 Hz i rozdzielczości 2 560 x 1 600 (czyli o proporcjach 16:10).
Wyświetlacz jest w stanie zapewnić dość wysoką jasność szczytową na poziomie 400 nitów. I jest też uważany za dość równomiernie podświetlony z rozkładem jasności na poziomie 88 procent. Poziom czerni i kontrast są nieco rozczarowujące w odniesieniu do zmierzonych przez nas wartości. W oparciu o nasze subiektywne wrażenia, kolory wydają się jednak bardzo żywe dzięki błyszczącej powierzchni.
Gracze będą również zadowoleni z niezwykle szybkich czasów reakcji. W bardzo ciemnym otoczeniu krwawienie ekranu jest tylko minimalnie widoczne wzdłuż dolnej krawędzi ekranu.
| |||||||||||||||||||||||||
rozświetlenie: 88 %
na akumulatorze: 444 cd/m²
kontrast: 634:1 (czerń: 0.7 cd/m²)
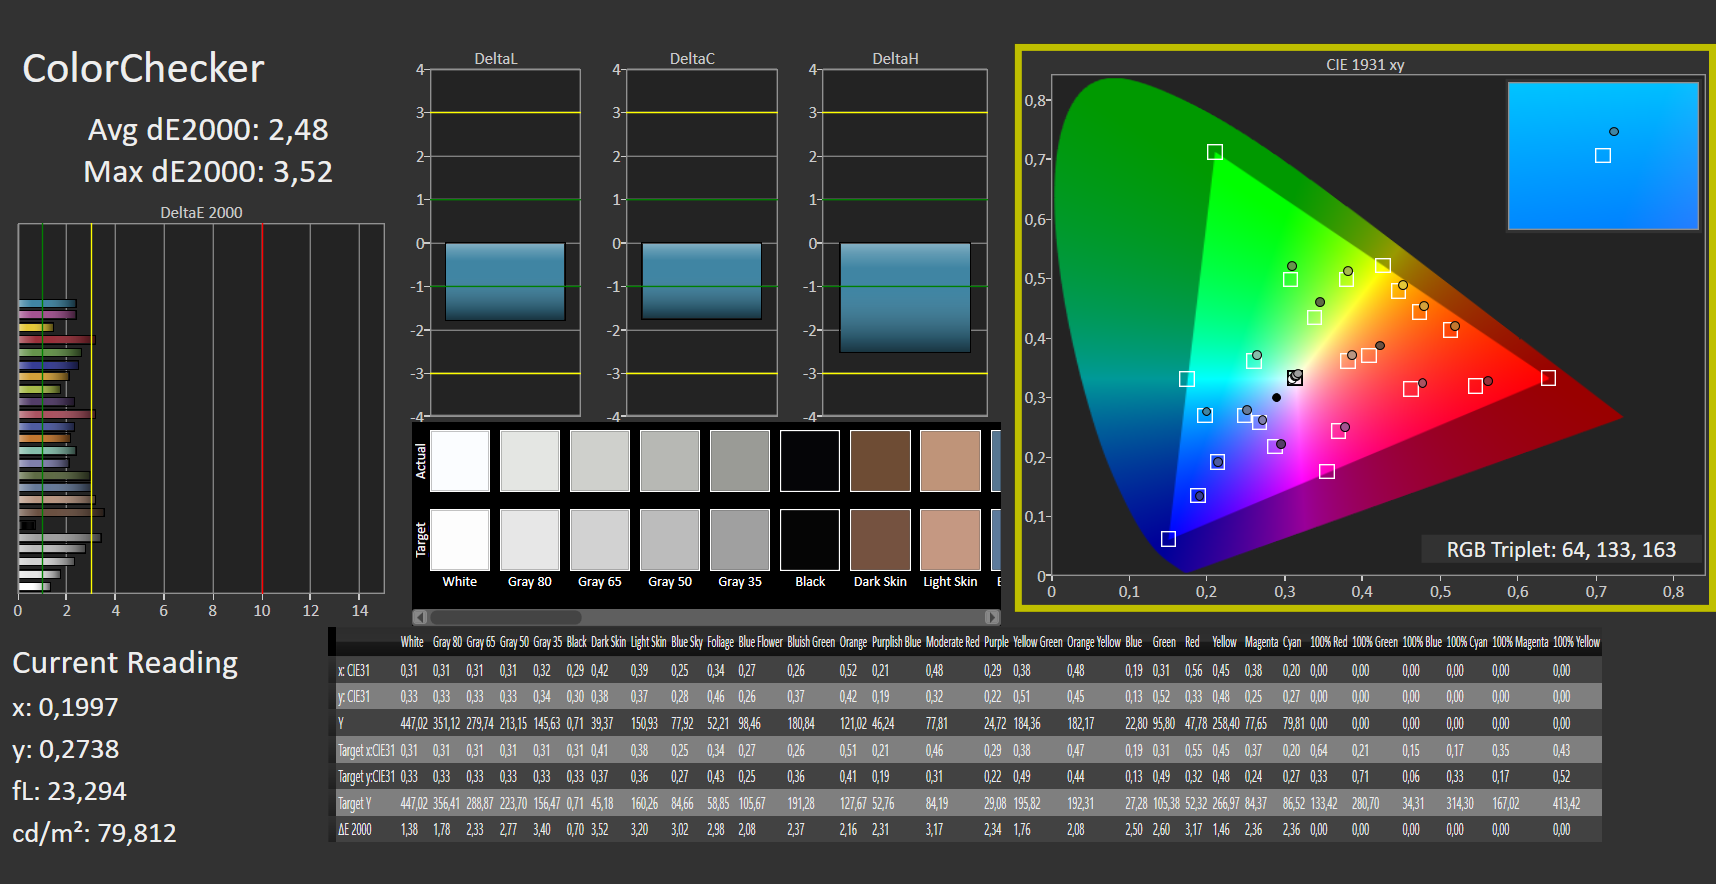
ΔE ColorChecker Calman: 2.48 | ∀{0.5-29.43 Ø4.72}
calibrated: 2.91
ΔE Greyscale Calman: 3.33 | ∀{0.09-98 Ø4.97}
86.4% AdobeRGB 1998 (Argyll 3D)
99.9% sRGB (Argyll 3D)
98.9% Display P3 (Argyll 3D)
Gamma: 2.33
CCT: 6230 K
| MSI Creator Z17 A12UGST-054 AUO3C9B (B170QAN01.0), IPS, 2560x1600, 17" | MSI Creator 17 A10SGS B173ZAN05.0 (AUO278E), Mini-LED IPS-Level, 3840x2160, 17.3" | MSI Creator Z16P B12UHST AUOD298, IPS True Pixel (~100% DCI-P3), 2560x1600, 16" | Razer Blade 17 (i7-12800H, RTX 3070 Ti) BOE CQ NE173QHM-NZ1 (BOE09F9), IPS, 2560x1440, 17.3" | Aorus 17X XES Sharp SHP1563, IPS, 1920x1080, 17.3" | Dell XPS 17 9720 RTX 3060 Sharp LQ170R1, IPS, 3840x2400, 17" | |
|---|---|---|---|---|---|---|
| Display | -7% | -0% | -1% | -15% | -2% | |
| Display P3 Coverage (%) | 98.9 | 82 -17% | 97.6 -1% | 97.9 -1% | 70.1 -29% | 92.9 -6% |
| sRGB Coverage (%) | 99.9 | 97.5 -2% | 99.9 0% | 99.9 0% | 99.9 0% | 100 0% |
| AdobeRGB 1998 Coverage (%) | 86.4 | 84 -3% | 86.8 0% | 85.5 -1% | 71.9 -17% | 85.3 -1% |
| Response Times | -76% | -23% | -81% | 27% | -485% | |
| Response Time Grey 50% / Grey 80% * (ms) | 11 ? | 12.9 ? -17% | 15.2 ? -38% | 3.4 ? 69% | 51.2 ? -365% | |
| Response Time Black / White * (ms) | 5 ? | 8.8 ? -76% | 6.4 ? -28% | 11.2 ? -124% | 5.8 ? -16% | 35.2 ? -604% |
| PWM Frequency (Hz) | 26600 ? | |||||
| Screen | 26% | 16% | -28% | -28% | -34% | |
| Brightness middle (cd/m²) | 444 | 996 124% | 428 -4% | 341 -23% | 278 -37% | 512.7 15% |
| Brightness (cd/m²) | 415 | 952 129% | 394 -5% | 308 -26% | 273 -34% | 463 12% |
| Brightness Distribution (%) | 88 | 93 6% | 86 -2% | 82 -7% | 79 -10% | 85 -3% |
| Black Level * (cd/m²) | 0.7 | 0.68 3% | 0.42 40% | 0.45 36% | 0.26 63% | 0.32 54% |
| Contrast (:1) | 634 | 1465 131% | 1019 61% | 758 20% | 1069 69% | 1602 153% |
| Colorchecker dE 2000 * | 2.48 | 4.21 -70% | 1.67 33% | 4.16 -68% | 3.96 -60% | 5.98 -141% |
| Colorchecker dE 2000 max. * | 3.52 | 6.79 -93% | 5.71 -62% | 8.14 -131% | 10.78 -206% | 12.09 -243% |
| Colorchecker dE 2000 calibrated * | 2.91 | 2.03 30% | 0.71 76% | 3 -3% | 1.07 63% | |
| Greyscale dE 2000 * | 3.33 | 4.1 -23% | 3.1 7% | 5.09 -53% | 6.8 -104% | 7.2 -116% |
| Gamma | 2.33 94% | 2.207 100% | 2.195 100% | 2.48 89% | 2.224 99% | 2.54 87% |
| CCT | 6230 104% | 7491 87% | 6498 100% | 6884 94% | 7651 85% | 6914 94% |
| Color Space (Percent of AdobeRGB 1998) (%) | 84 | |||||
| Color Space (Percent of sRGB) (%) | 97 | |||||
| Całkowita średnia (program / ustawienia) | -19% /
11% | -2% /
7% | -37% /
-30% | -5% /
-18% | -174% /
-96% |
* ... im mniej tym lepiej
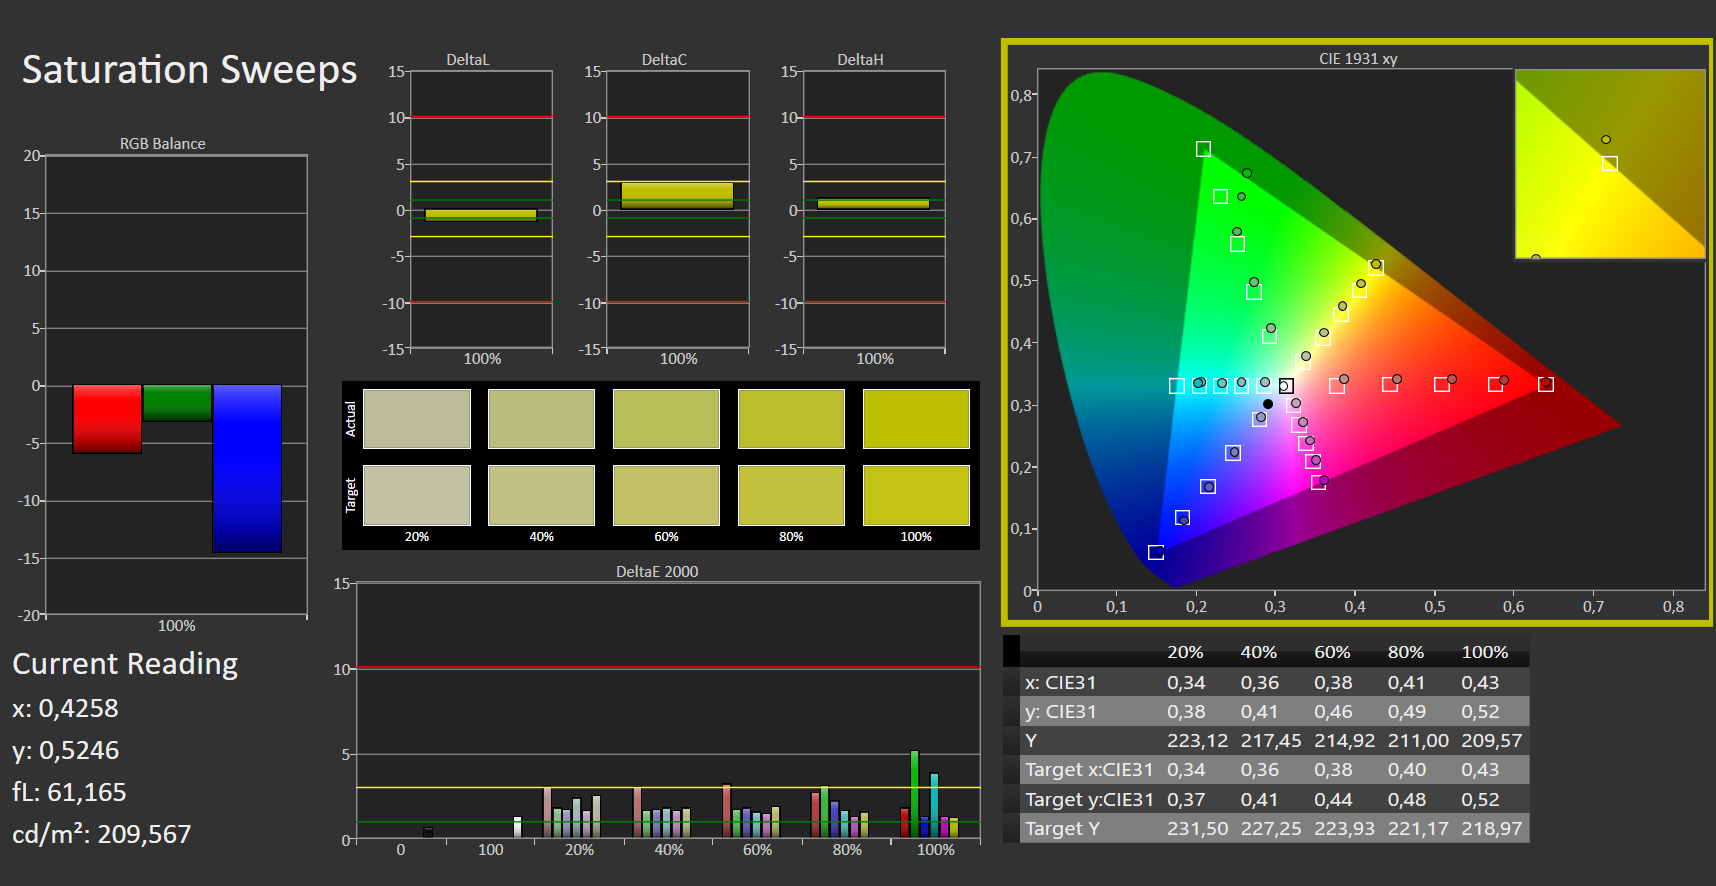
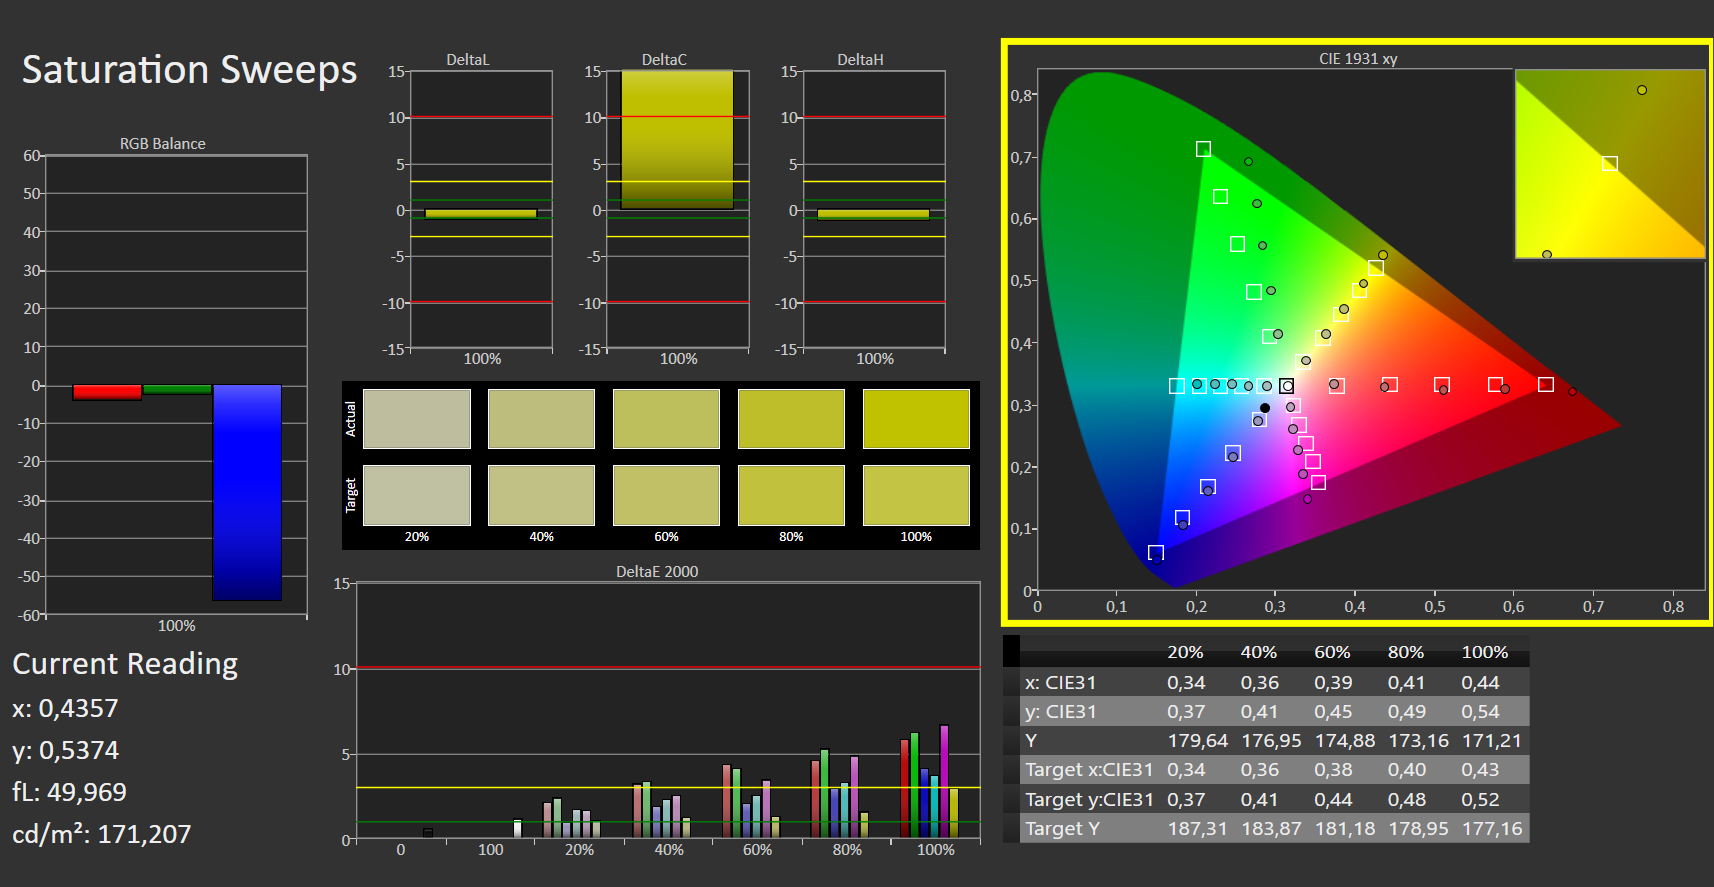
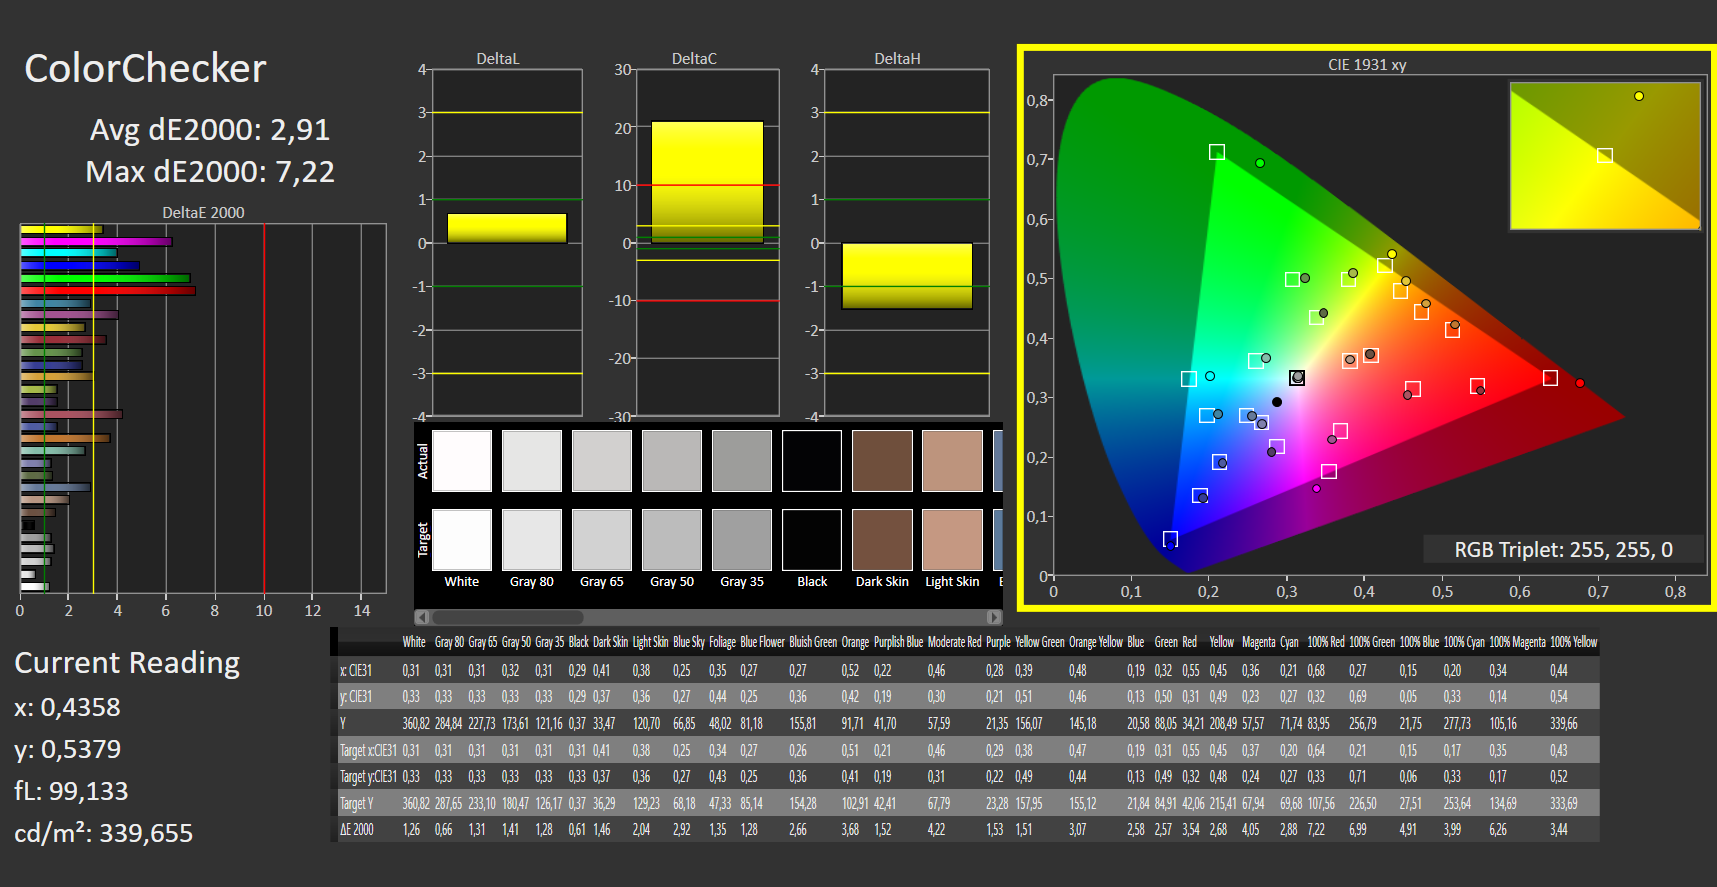
Dobra wiadomość dla twórców: wyświetlacz ma pełne pokrycie Display P3 i sRGB, a nawet jest w stanie pokryć do 86 procent przestrzeni kolorów AdobeRGB.
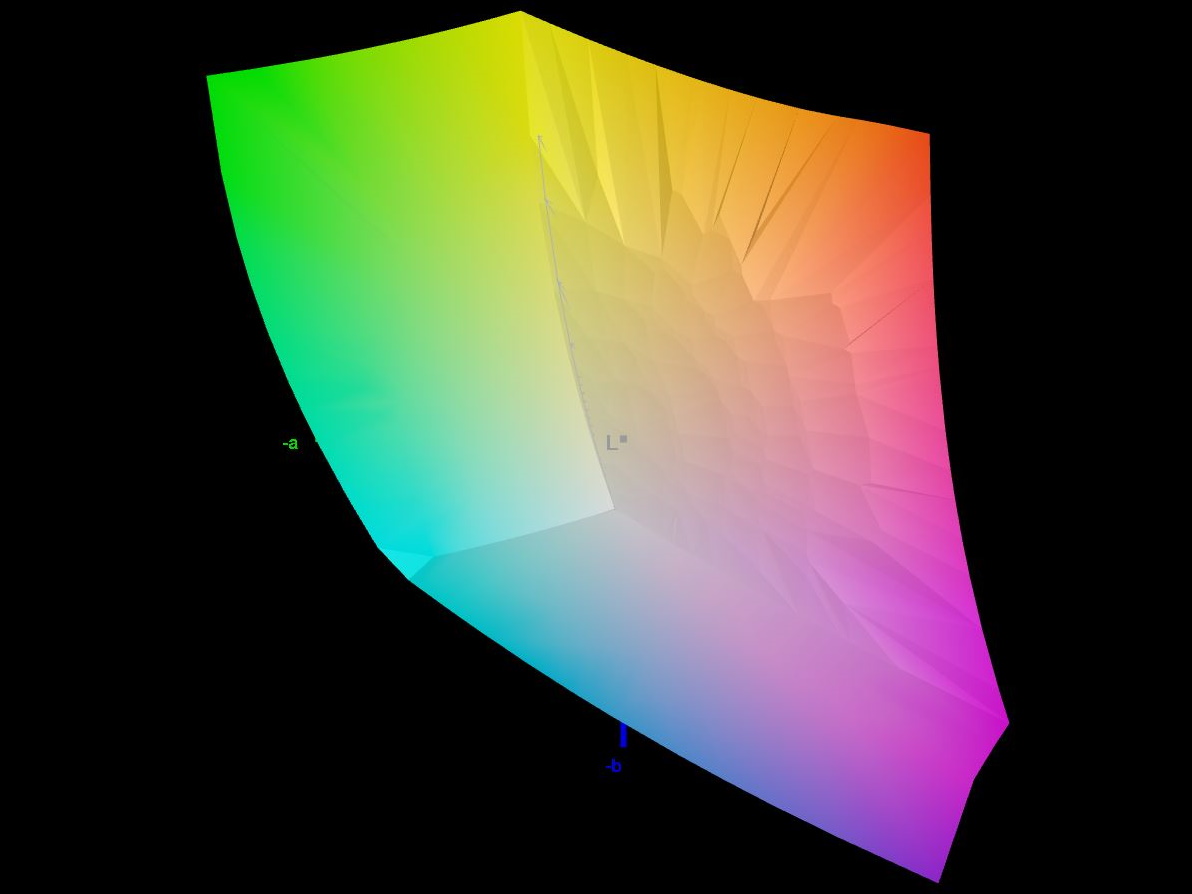
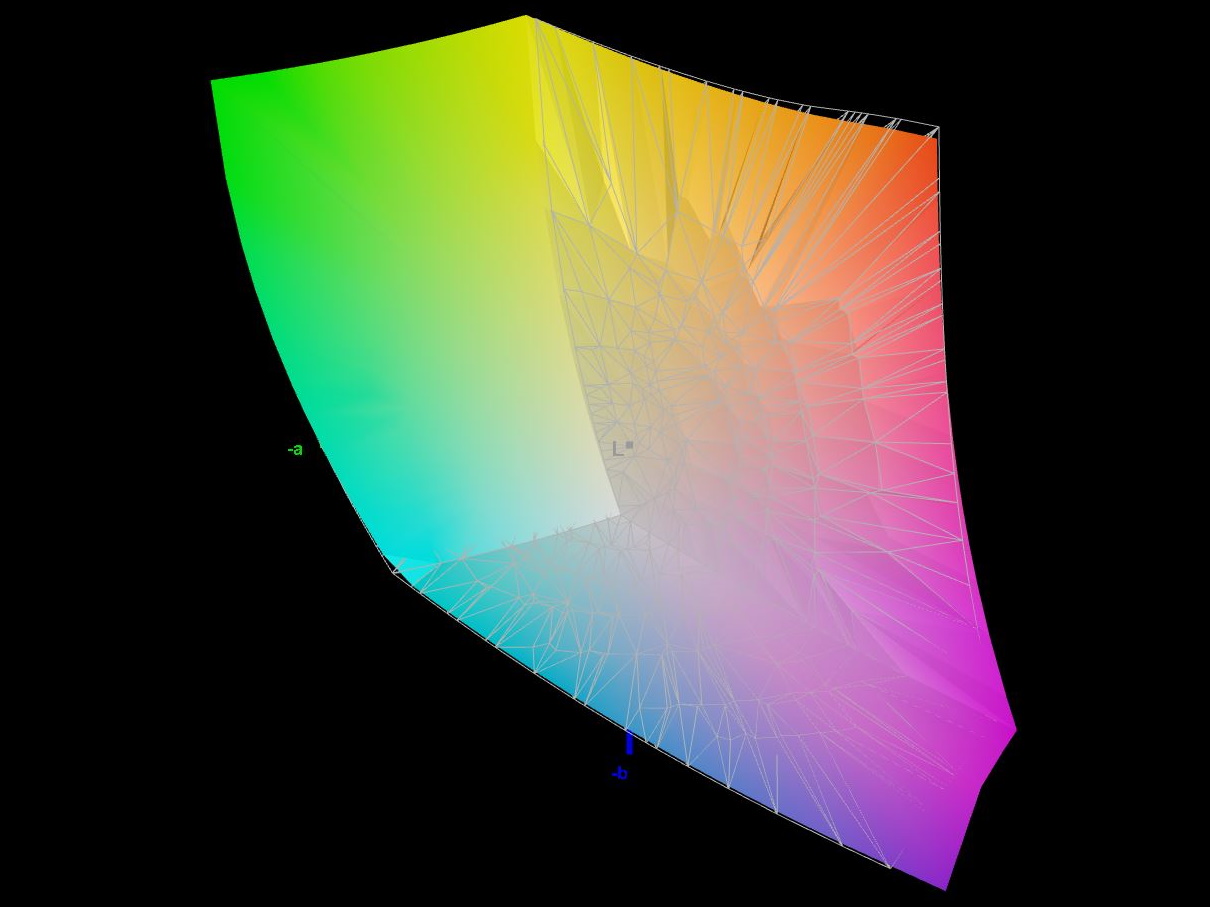
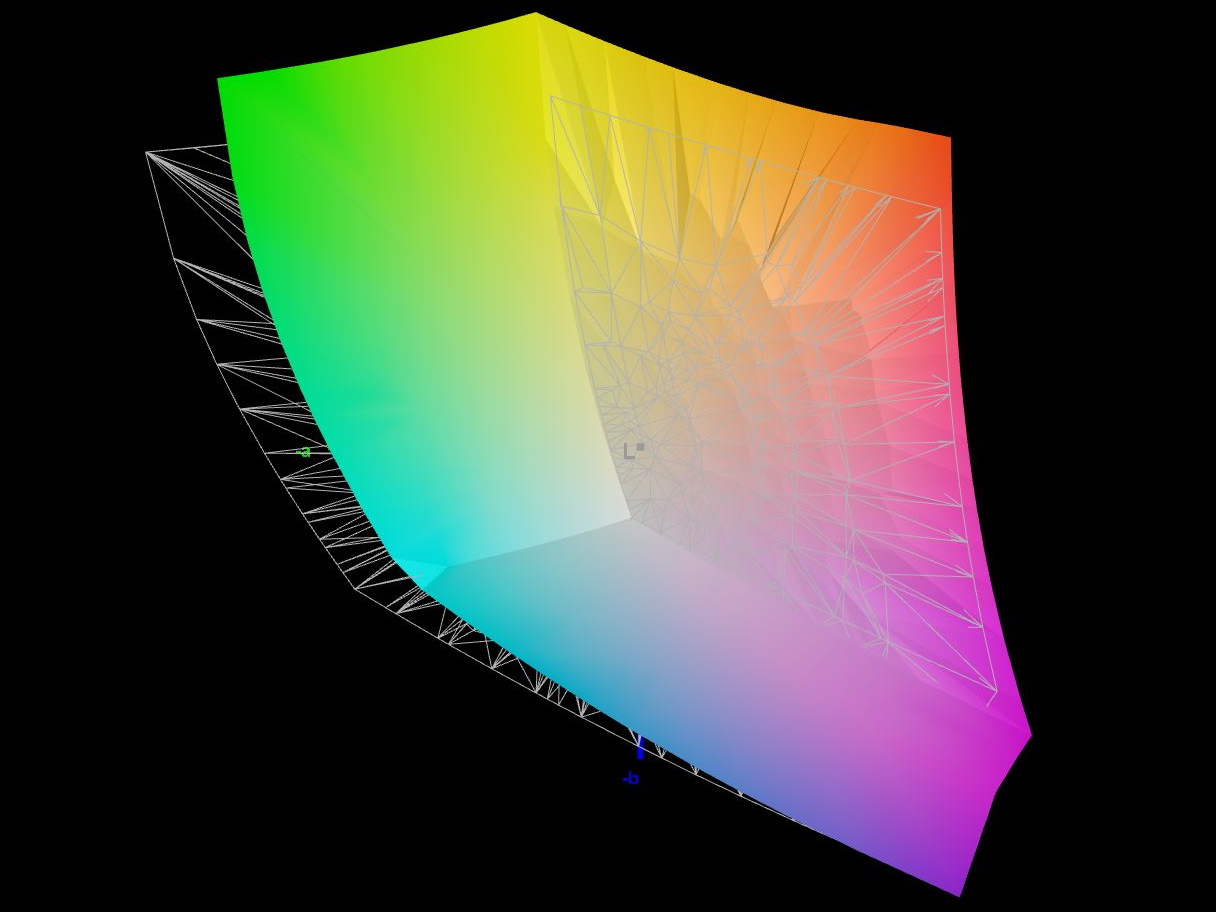
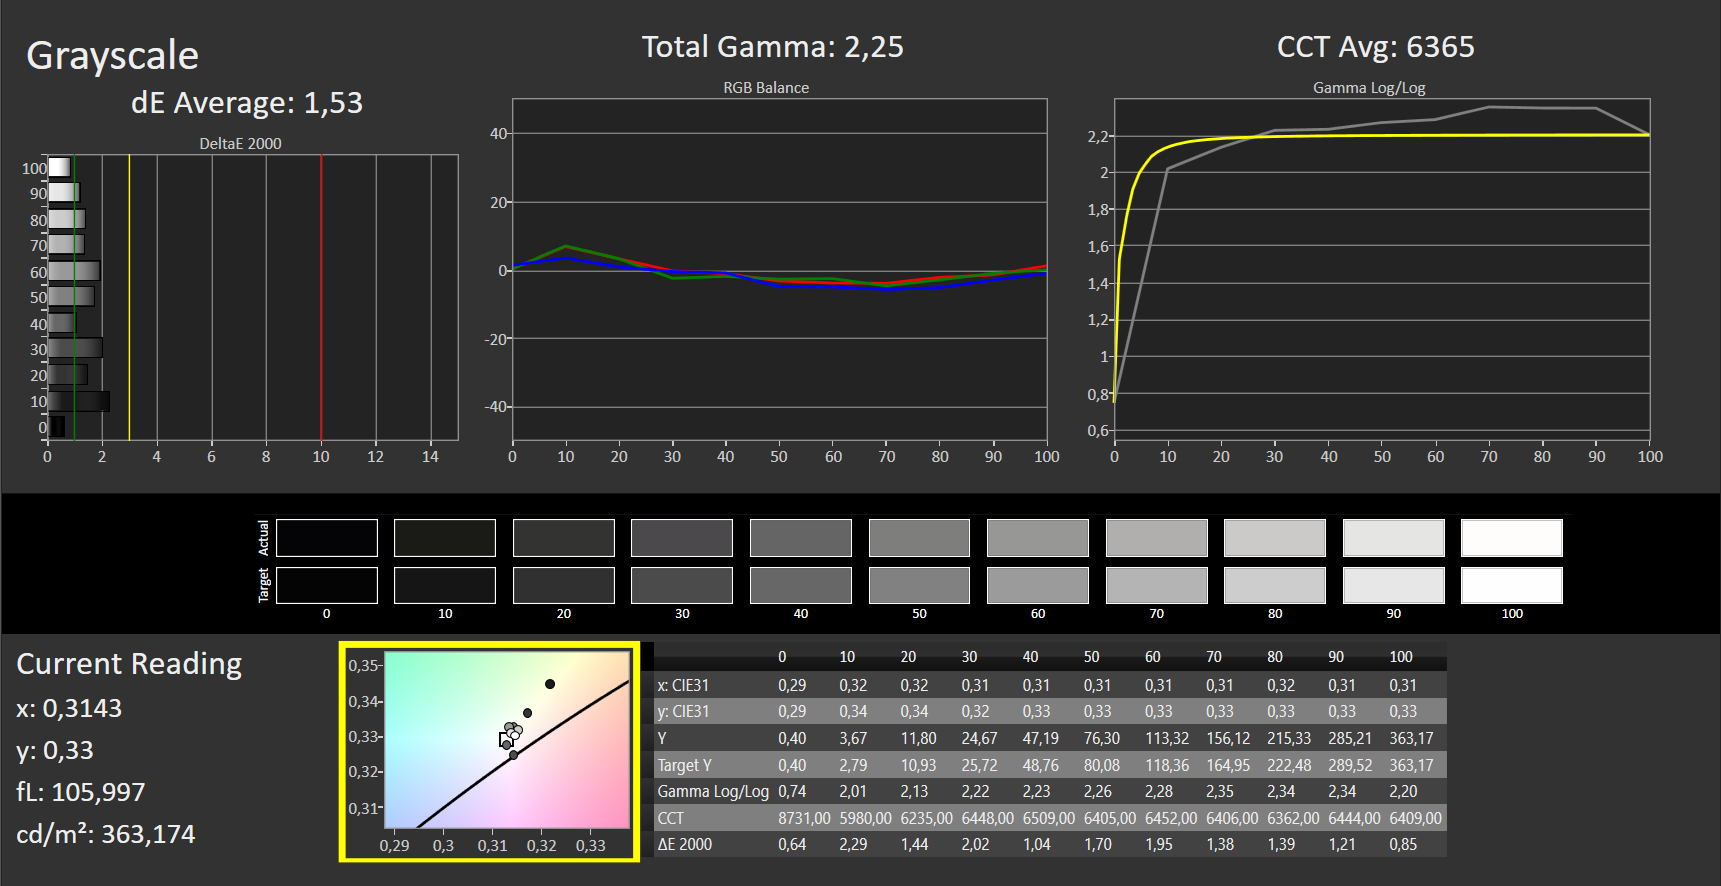
Wyświetlacz jest już dobrze skalibrowany zaraz po wyjęciu z pudełka. Wartości Delta E wahają się między 2 a 3 dla kolorów i odcieni szarości. Ręczna kalibracja nie poprawiła już wyników.
Wyświetl czasy reakcji
| ↔ Czas reakcji od czerni do bieli | ||
|---|---|---|
| 5 ms ... wzrost ↗ i spadek ↘ łącznie | ↗ 2 ms wzrost |  |
| ↘ 3 ms upadek | ||
| W naszych testach ekran wykazuje bardzo szybką reakcję i powinien bardzo dobrze nadawać się do szybkich gier. Dla porównania, wszystkie testowane urządzenia wahają się od 0.1 (minimum) do 240 (maksimum) ms. » 17 % wszystkich urządzeń jest lepszych. Oznacza to, że zmierzony czas reakcji jest lepszy od średniej wszystkich testowanych urządzeń (19.8 ms). | ||
| ↔ Czas reakcji 50% szarości do 80% szarości | ||
| 11 ms ... wzrost ↗ i spadek ↘ łącznie | ↗ 5 ms wzrost |  |
| ↘ 6 ms upadek | ||
| W naszych testach ekran wykazuje dobry współczynnik reakcji, ale może być zbyt wolny dla graczy rywalizujących ze sobą. Dla porównania, wszystkie testowane urządzenia wahają się od 0.165 (minimum) do 636 (maksimum) ms. » 25 % wszystkich urządzeń jest lepszych. Oznacza to, że zmierzony czas reakcji jest lepszy od średniej wszystkich testowanych urządzeń (31 ms). | ||
Migotanie ekranu / PWM (modulacja szerokości impulsu)
| Migotanie ekranu/nie wykryto PWM |    | ||
Dla porównania: 52 % wszystkich testowanych urządzeń nie używa PWM do przyciemniania wyświetlacza. Jeśli wykryto PWM, zmierzono średnio 7769 (minimum: 5 - maksimum: 343500) Hz. | |||
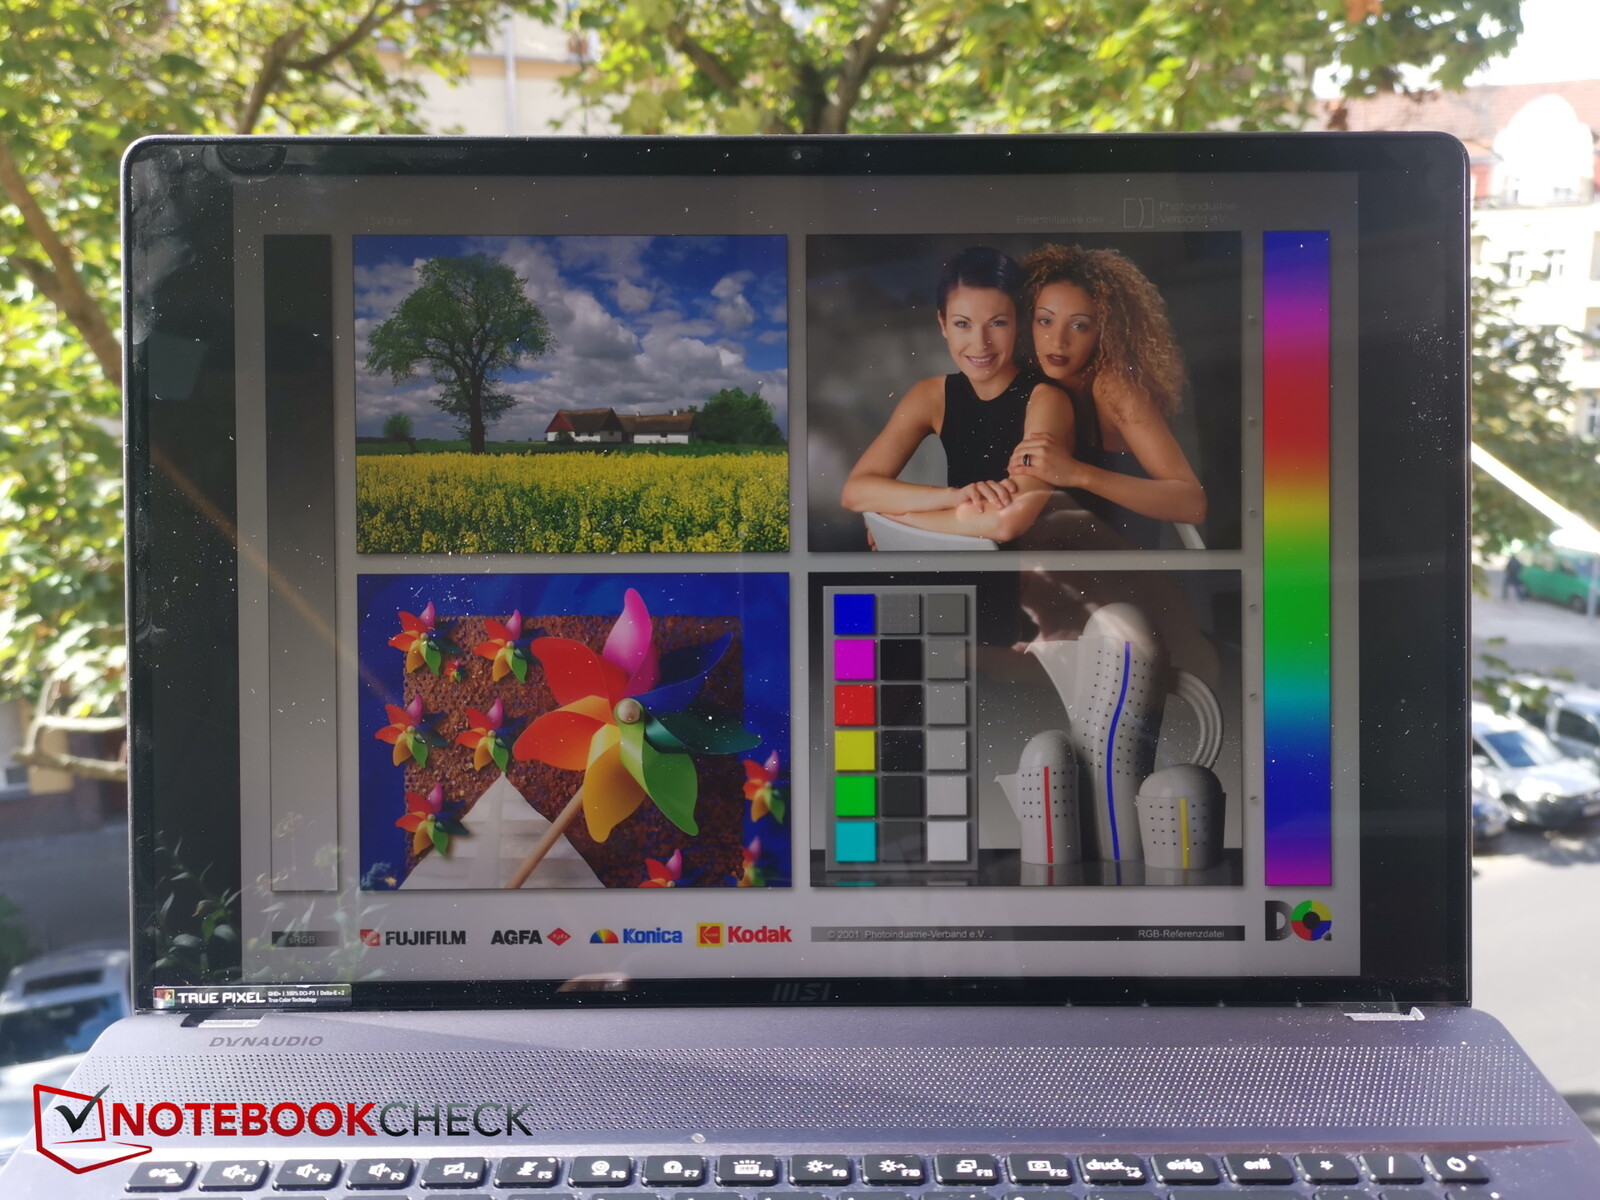
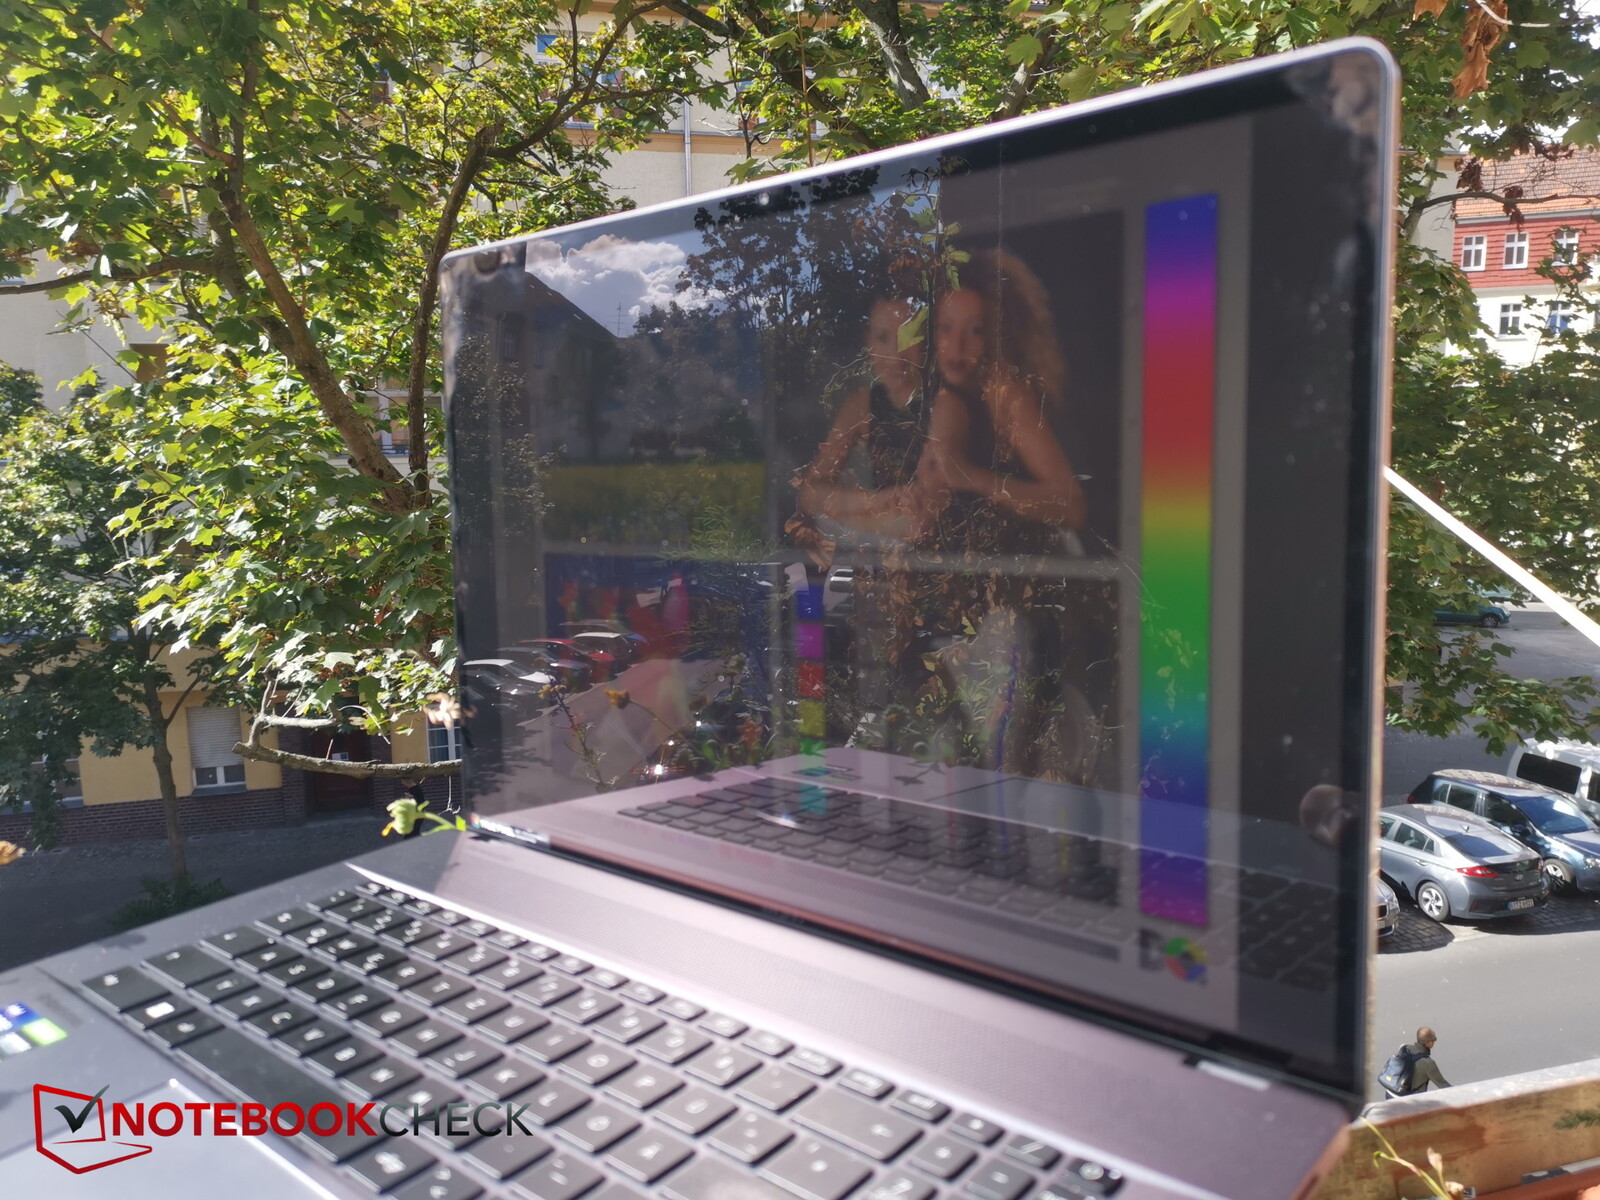
Błyszcząca powierzchnia znacznie utrudnia korzystanie z laptopa na dworze. Jej wady tylko częściowo łagodzi dość wysoka jasność ekranu. Jeśli zamierzasz pracować na dworze, powinieneś chyba poszukać zacienionego miejsca.
Wyświetlacz ma dość szerokie kąty widzenia. Jasność i kontrast zaczynają spadać dopiero przy oglądaniu ekranu pod skrajnymi kątami.

Wydajność - smukła obudowa kosztuje Z17 swoją wydajność
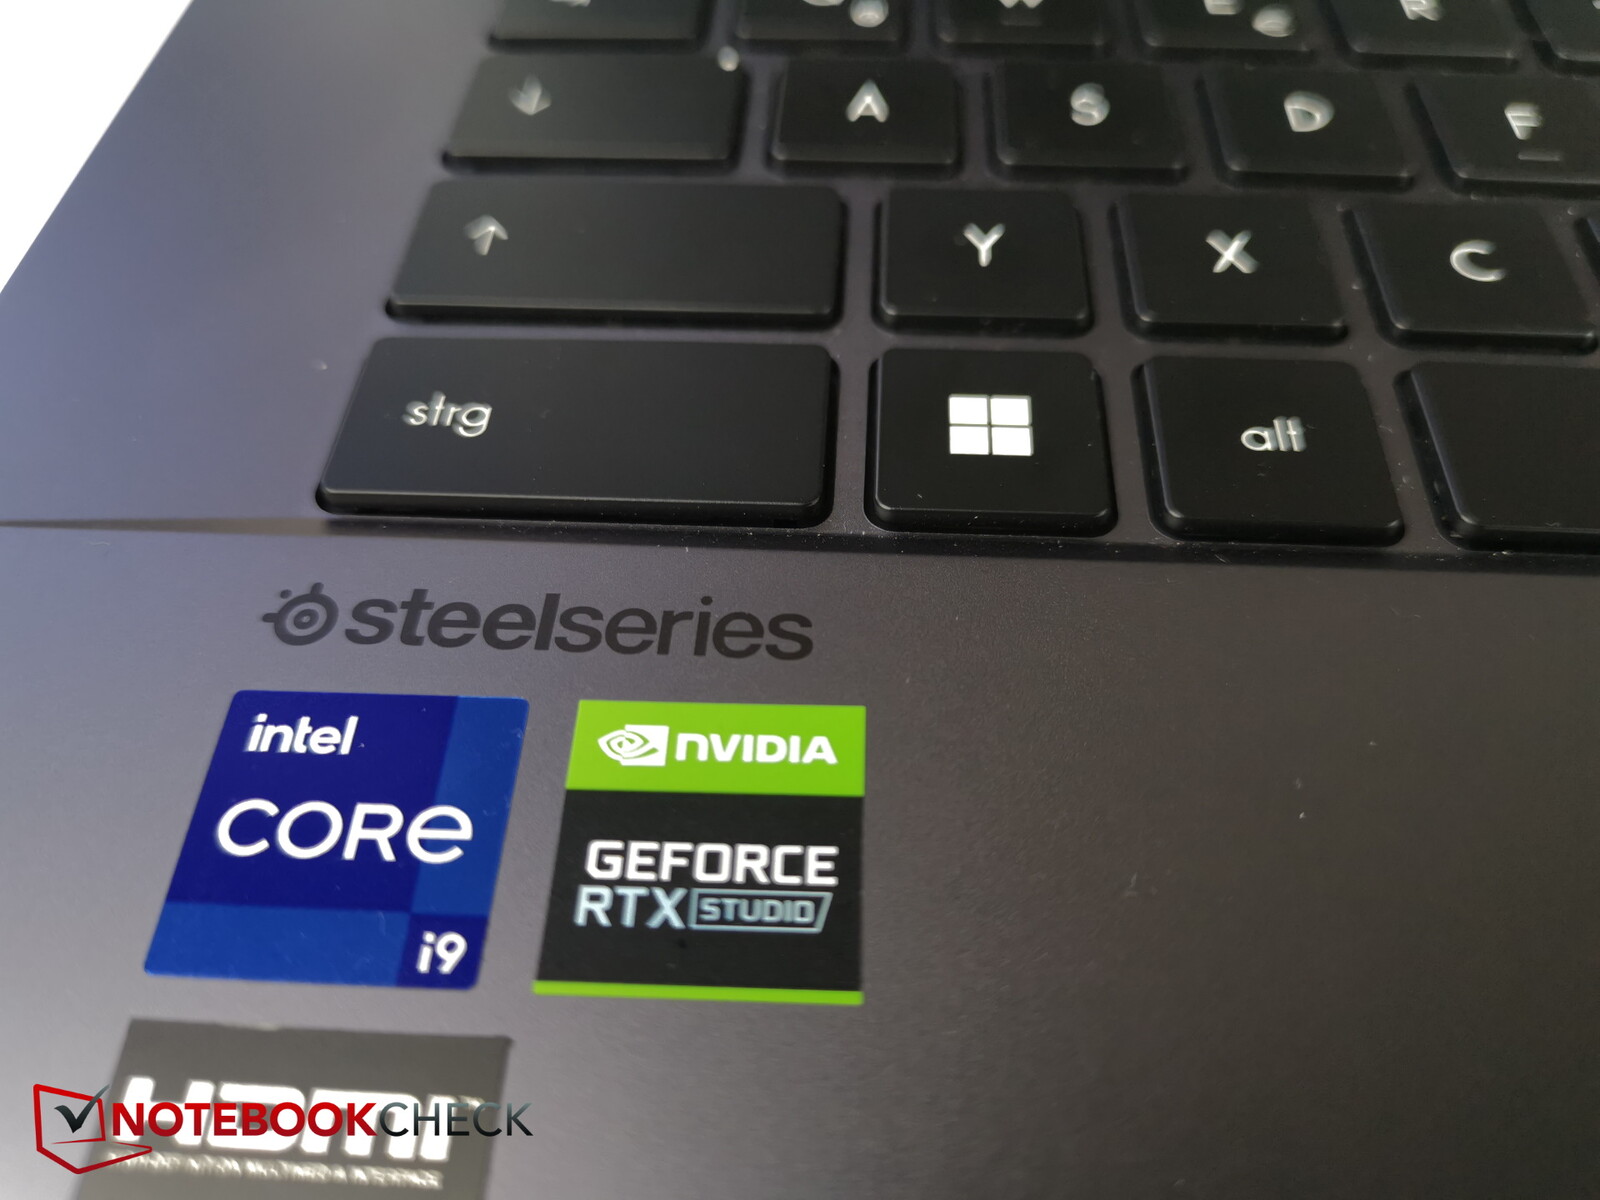
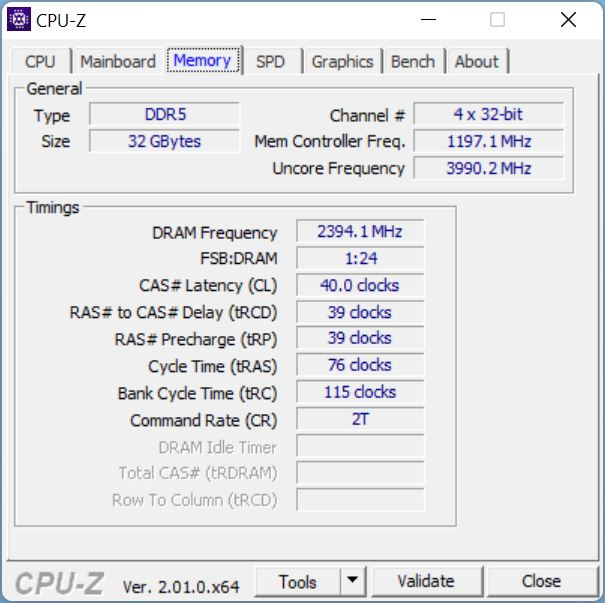
Połączenie potężnego Core i9-12900H i RTX 3070 Tipowinno wprawić w ekscytację zarówno graczy, jak i twórców treści. W szczególności świetny ekran dotykowy jest czymś, co przyciągnie twórców treści. Laptop ma również hojne 32 GB pamięci RAM, co jest akurat odpowiednią ilością dla kreatywnych projektów.
Z17 jest dostępny w trzech konfiguracjach. Oprócz konfiguracji recenzenckiej, jest też jedna zRTX 3080 i 2 TB pamięci masowej SSD, a także model o najwyższej specyfikacji, który jest wyposażony w RTX 3080 Ti, 64 GB pamięci RAM i 2 TB pamięci masowej SSD. Wszystkie trzy modele wykorzystują ten sam procesor i wyświetlacz.

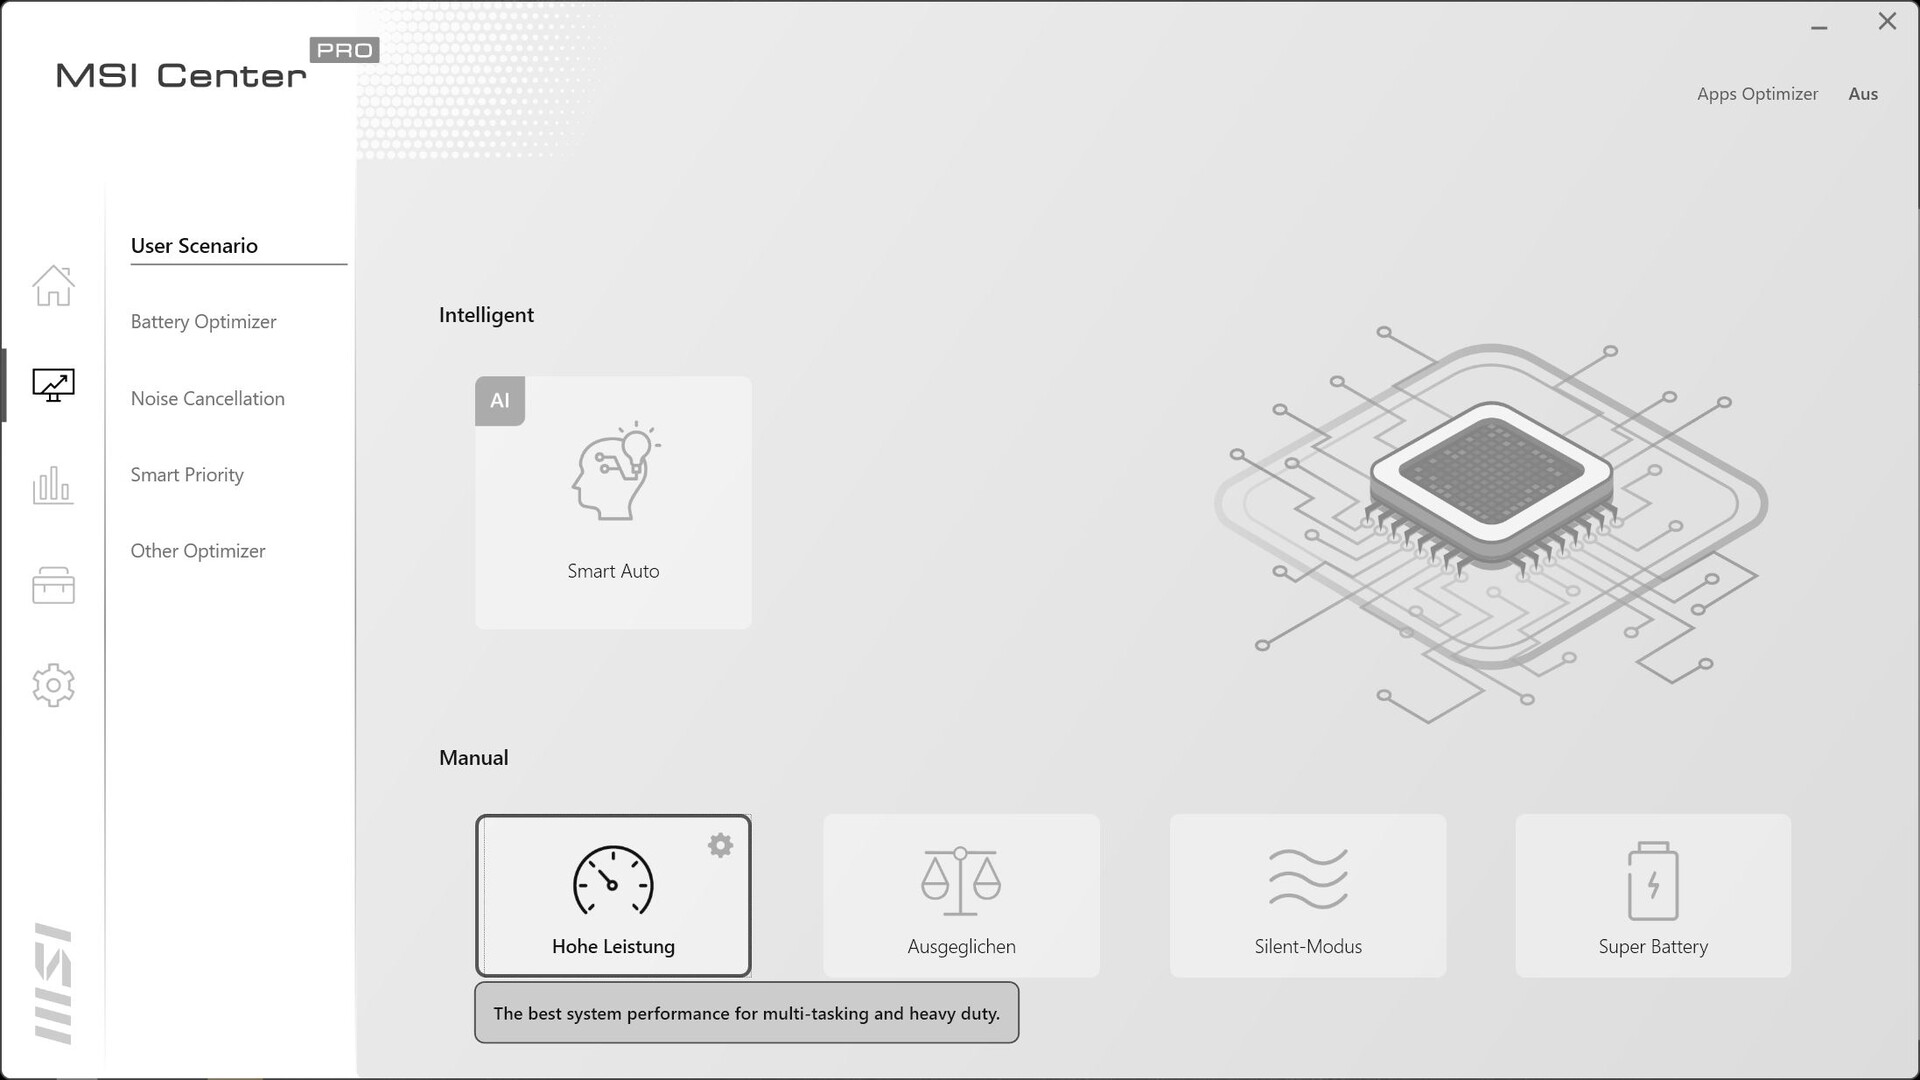
Warunki badania
Do laptopa dołączone jest MSI Center Pro - autorskie oprogramowanie producenta, które pozwala na dostosowanie różnych ustawień systemowych. Poza testem baterii wszystkie pozostałe benchmarki zostały przeprowadzone z laptopem w trybie wysokiej wydajności, by uzyskać jak najlepsze wyniki. Uruchomienie oprogramowania po uruchomieniu laptopa zajmuje chwilę.
Procesor
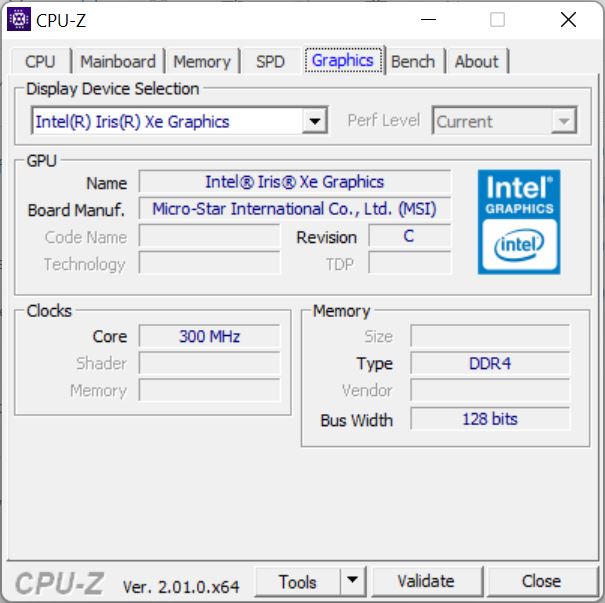
Z Intel Core i9-12900H, MSI umieściło w Z17 jeden z najszybszych procesorów obecnej generacji Alder Lake. Jest to raczej nietypowe dla urządzenia o tak smukłej obudowie. W sumie jest 14 rdzeni (20 wątków; 6 rdzeni P & 8 rdzeni E) o taktowaniu od 1,8 do 5 GHz. Procesor obsługuje pełny zestaw funkcji "Enterprise" vPro (funkcje zarządzania). Wszystkie 96 EU są aktywne na zintegrowanym układzie graficznym Xe Graphics.
W teście pętli Cinebench konkurenci zostali całkowicie zdeklasowani przez Z17, przynajmniej pod względem trwałej wydajności CPU. Niemniej jednak te laptopy również nie są wyposażone w procesor z najwyższej półki. Na stronie Core i7-12800H w Blade 17 był w stanie przewyższyć i9-12900H z Z17 na początku. Z17 ma jednak wciąż lepszą wydajność trwałą.
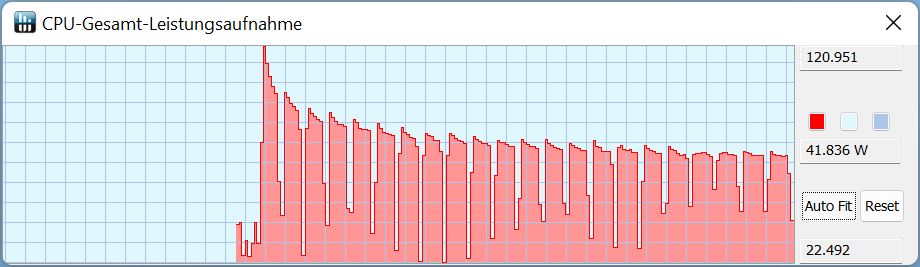
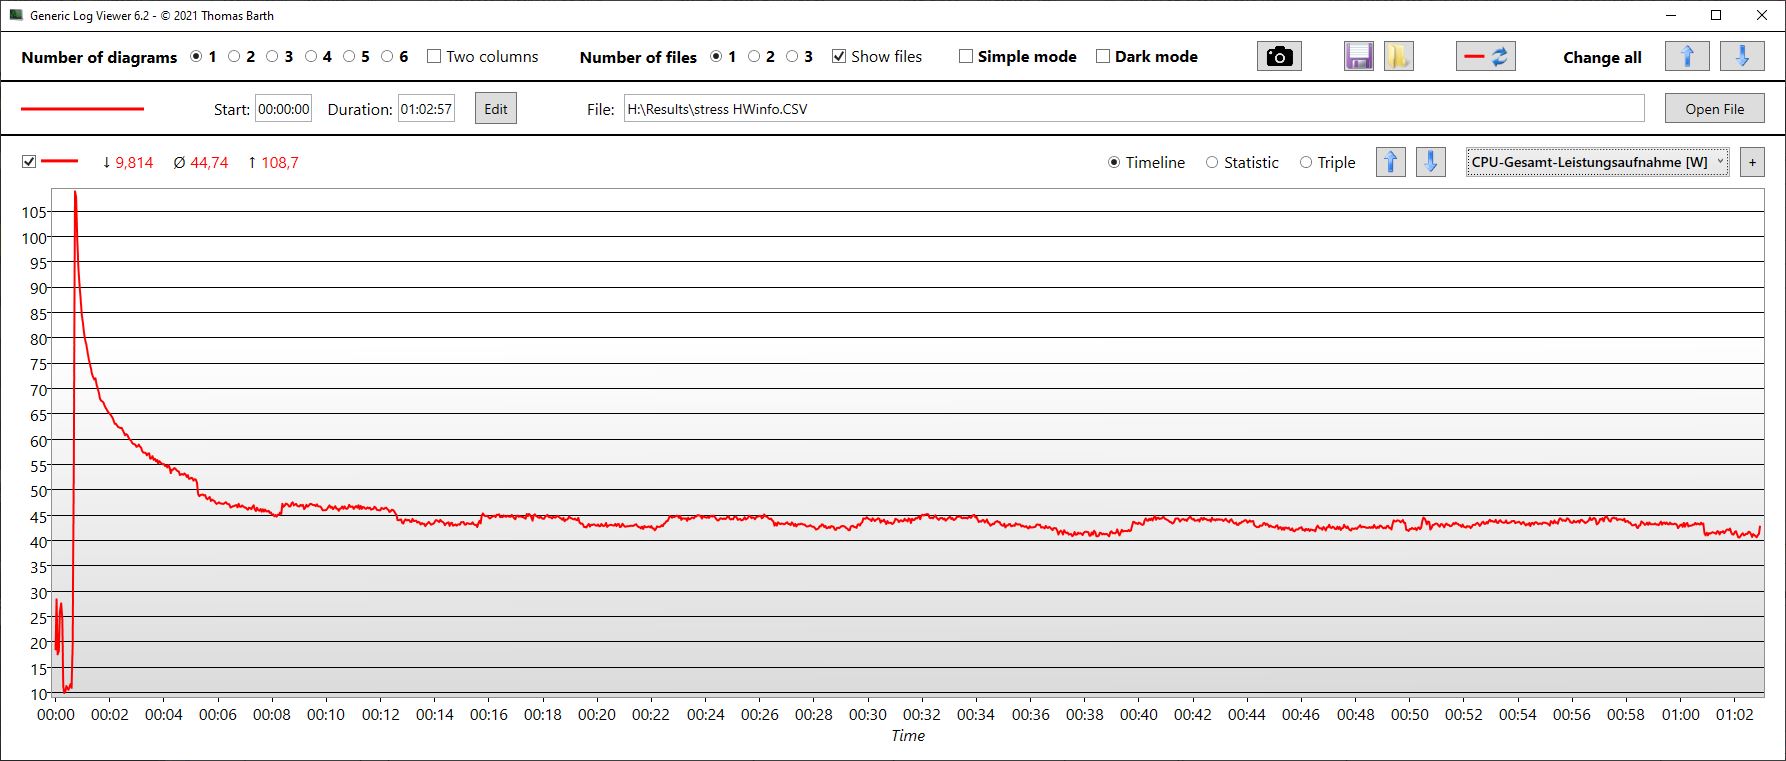
Jak zachowuje się procesor, można stwierdzić na zrzucie ekranu po prawej stronie. TDP wyniosło 120 W tylko podczas pierwszego uruchomienia; następnie pobór mocy zaczął stopniowo spadać w miarę upływu czasu. TDP zmniejszało się też nieznacznie w każdym przebiegu.
Ogólnie rzecz biorąc, Z17 wykazał wyraźnie mniejszy spadek wydajności niż Razer Blade z procesorem i7 po kilku pierwszych uruchomieniach. Co ciekawe, ten sam procesor i9 w Z16P jest stale o około 10-15% szybszy pomimo mniejszej obudowy tego laptopa. Oznacza to, że i9 w Z17 wcale nie pracuje z pełnym potencjałem. Bardzo minimalny wzrost wydajności w stosunku do konkurentów nie uzasadnia więc zastosowania głodnego mocy procesora Core i9. Wydajność jednowątkowa jest nieco poniżej tego, czego oczekuje się od i9-12900H.
Podczas pracy na akumulatorze laptop stracił około 25% wydajności procesora, co zostało zmierzone przy użyciu Cinebench R15. Procesor zdołał osiągnąć tylko TDP na poziomie 50 W.
Cinebench R15 Multi Sustained Load
Cinebench R23: Multi Core | Single Core
Cinebench R20: CPU (Multi Core) | CPU (Single Core)
Cinebench R15: CPU Multi 64Bit | CPU Single 64Bit
Blender: v2.79 BMW27 CPU
7-Zip 18.03: 7z b 4 | 7z b 4 -mmt1
Geekbench 5.5: Multi-Core | Single-Core
HWBOT x265 Benchmark v2.2: 4k Preset
LibreOffice : 20 Documents To PDF
R Benchmark 2.5: Overall mean
| CPU Performance rating | |
| Aorus 17X XES | |
| MSI Creator Z16P B12UHST | |
| MSI Creator Z17 A12UGST-054 | |
| Średnia w klasie Multimedia | |
| Dell XPS 17 9720 RTX 3060 | |
| Razer Blade 17 (i7-12800H, RTX 3070 Ti) | |
| Przeciętny Intel Core i9-12900H | |
| MSI Creator 17 A10SGS -2! | |
| Cinebench R23 / Multi Core | |
| MSI Creator Z16P B12UHST | |
| Aorus 17X XES | |
| Dell XPS 17 9720 RTX 3060 | |
| Średnia w klasie Multimedia (4861 - 33362, n=81, ostatnie 2 lata) | |
| MSI Creator Z17 A12UGST-054 | |
| Razer Blade 17 (i7-12800H, RTX 3070 Ti) | |
| Przeciętny Intel Core i9-12900H (7359 - 19648, n=28) | |
| Cinebench R23 / Single Core | |
| Aorus 17X XES | |
| Średnia w klasie Multimedia (1128 - 2459, n=73, ostatnie 2 lata) | |
| MSI Creator Z16P B12UHST | |
| MSI Creator Z17 A12UGST-054 | |
| Przeciętny Intel Core i9-12900H (1634 - 1930, n=28) | |
| Razer Blade 17 (i7-12800H, RTX 3070 Ti) | |
| Dell XPS 17 9720 RTX 3060 | |
| Cinebench R20 / CPU (Multi Core) | |
| Aorus 17X XES | |
| MSI Creator Z16P B12UHST | |
| Dell XPS 17 9720 RTX 3060 | |
| Średnia w klasie Multimedia (1887 - 12912, n=64, ostatnie 2 lata) | |
| MSI Creator Z17 A12UGST-054 | |
| Przeciętny Intel Core i9-12900H (2681 - 7471, n=28) | |
| Razer Blade 17 (i7-12800H, RTX 3070 Ti) | |
| MSI Creator 17 A10SGS | |
| Cinebench R20 / CPU (Single Core) | |
| Aorus 17X XES | |
| MSI Creator Z16P B12UHST | |
| Średnia w klasie Multimedia (425 - 853, n=64, ostatnie 2 lata) | |
| MSI Creator Z17 A12UGST-054 | |
| Razer Blade 17 (i7-12800H, RTX 3070 Ti) | |
| Przeciętny Intel Core i9-12900H (624 - 738, n=28) | |
| Dell XPS 17 9720 RTX 3060 | |
| MSI Creator 17 A10SGS | |
| Cinebench R15 / CPU Multi 64Bit | |
| MSI Creator Z16P B12UHST | |
| Aorus 17X XES | |
| Razer Blade 17 (i7-12800H, RTX 3070 Ti) | |
| MSI Creator Z17 A12UGST-054 | |
| Średnia w klasie Multimedia (856 - 5224, n=68, ostatnie 2 lata) | |
| Przeciętny Intel Core i9-12900H (1395 - 3077, n=28) | |
| Dell XPS 17 9720 RTX 3060 | |
| MSI Creator 17 A10SGS | |
| Cinebench R15 / CPU Single 64Bit | |
| Średnia w klasie Multimedia (184.8 - 326, n=66, ostatnie 2 lata) | |
| Aorus 17X XES | |
| MSI Creator Z16P B12UHST | |
| Razer Blade 17 (i7-12800H, RTX 3070 Ti) | |
| Przeciętny Intel Core i9-12900H (235 - 277, n=29) | |
| MSI Creator Z17 A12UGST-054 | |
| Dell XPS 17 9720 RTX 3060 | |
| MSI Creator 17 A10SGS | |
| Blender / v2.79 BMW27 CPU | |
| MSI Creator 17 A10SGS | |
| Średnia w klasie Multimedia (100 - 557, n=65, ostatnie 2 lata) | |
| Przeciętny Intel Core i9-12900H (160 - 451, n=28) | |
| Razer Blade 17 (i7-12800H, RTX 3070 Ti) | |
| Dell XPS 17 9720 RTX 3060 | |
| MSI Creator Z17 A12UGST-054 | |
| Aorus 17X XES | |
| MSI Creator Z16P B12UHST | |
| 7-Zip 18.03 / 7z b 4 | |
| MSI Creator Z16P B12UHST | |
| Dell XPS 17 9720 RTX 3060 | |
| Aorus 17X XES | |
| MSI Creator Z17 A12UGST-054 | |
| Razer Blade 17 (i7-12800H, RTX 3070 Ti) | |
| Przeciętny Intel Core i9-12900H (34684 - 76677, n=28) | |
| Średnia w klasie Multimedia (26062 - 130368, n=62, ostatnie 2 lata) | |
| MSI Creator 17 A10SGS | |
| 7-Zip 18.03 / 7z b 4 -mmt1 | |
| Aorus 17X XES | |
| MSI Creator Z16P B12UHST | |
| Średnia w klasie Multimedia (3666 - 7545, n=63, ostatnie 2 lata) | |
| MSI Creator Z17 A12UGST-054 | |
| Przeciętny Intel Core i9-12900H (5302 - 6289, n=28) | |
| Razer Blade 17 (i7-12800H, RTX 3070 Ti) | |
| Dell XPS 17 9720 RTX 3060 | |
| MSI Creator 17 A10SGS | |
| Geekbench 5.5 / Multi-Core | |
| Aorus 17X XES | |
| MSI Creator Z16P B12UHST | |
| MSI Creator Z17 A12UGST-054 | |
| Średnia w klasie Multimedia (4652 - 20422, n=62, ostatnie 2 lata) | |
| Razer Blade 17 (i7-12800H, RTX 3070 Ti) | |
| Dell XPS 17 9720 RTX 3060 | |
| Przeciętny Intel Core i9-12900H (8519 - 14376, n=31) | |
| MSI Creator 17 A10SGS | |
| Geekbench 5.5 / Single-Core | |
| Średnia w klasie Multimedia (805 - 2974, n=62, ostatnie 2 lata) | |
| Aorus 17X XES | |
| MSI Creator Z16P B12UHST | |
| MSI Creator Z17 A12UGST-054 | |
| Przeciętny Intel Core i9-12900H (1631 - 1897, n=31) | |
| Razer Blade 17 (i7-12800H, RTX 3070 Ti) | |
| Dell XPS 17 9720 RTX 3060 | |
| MSI Creator 17 A10SGS | |
| HWBOT x265 Benchmark v2.2 / 4k Preset | |
| Aorus 17X XES | |
| MSI Creator Z16P B12UHST | |
| Średnia w klasie Multimedia (5.26 - 36.1, n=63, ostatnie 2 lata) | |
| MSI Creator Z17 A12UGST-054 | |
| Przeciętny Intel Core i9-12900H (8.05 - 22.5, n=28) | |
| Razer Blade 17 (i7-12800H, RTX 3070 Ti) | |
| Dell XPS 17 9720 RTX 3060 | |
| MSI Creator 17 A10SGS | |
| LibreOffice / 20 Documents To PDF | |
| MSI Creator 17 A10SGS | |
| Średnia w klasie Multimedia (23.9 - 146.7, n=64, ostatnie 2 lata) | |
| Przeciętny Intel Core i9-12900H (36.8 - 59.8, n=28) | |
| Dell XPS 17 9720 RTX 3060 | |
| Razer Blade 17 (i7-12800H, RTX 3070 Ti) | |
| MSI Creator Z17 A12UGST-054 | |
| MSI Creator Z16P B12UHST | |
| Aorus 17X XES | |
| R Benchmark 2.5 / Overall mean | |
| MSI Creator 17 A10SGS | |
| Średnia w klasie Multimedia (0.3604 - 0.947, n=63, ostatnie 2 lata) | |
| Dell XPS 17 9720 RTX 3060 | |
| Razer Blade 17 (i7-12800H, RTX 3070 Ti) | |
| Przeciętny Intel Core i9-12900H (0.4218 - 0.506, n=28) | |
| MSI Creator Z17 A12UGST-054 | |
| MSI Creator Z16P B12UHST | |
| Aorus 17X XES | |
* ... im mniej tym lepiej
AIDA64: FP32 Ray-Trace | FPU Julia | CPU SHA3 | CPU Queen | FPU SinJulia | FPU Mandel | CPU AES | CPU ZLib | FP64 Ray-Trace | CPU PhotoWorxx
| Performance rating | |
| Aorus 17X XES | |
| Średnia w klasie Multimedia | |
| MSI Creator Z16P B12UHST | |
| Przeciętny Intel Core i9-12900H | |
| MSI Creator Z17 A12UGST-054 | |
| Dell XPS 17 9720 RTX 3060 | |
| Razer Blade 17 (i7-12800H, RTX 3070 Ti) | |
| MSI Creator 17 A10SGS | |
| AIDA64 / FP32 Ray-Trace | |
| Średnia w klasie Multimedia (2214 - 50388, n=60, ostatnie 2 lata) | |
| Aorus 17X XES | |
| Przeciętny Intel Core i9-12900H (4074 - 18289, n=29) | |
| MSI Creator 17 A10SGS | |
| MSI Creator Z16P B12UHST | |
| MSI Creator Z17 A12UGST-054 | |
| Razer Blade 17 (i7-12800H, RTX 3070 Ti) | |
| Dell XPS 17 9720 RTX 3060 | |
| AIDA64 / FPU Julia | |
| Średnia w klasie Multimedia (12867 - 201874, n=61, ostatnie 2 lata) | |
| Aorus 17X XES | |
| Przeciętny Intel Core i9-12900H (22307 - 93236, n=29) | |
| MSI Creator 17 A10SGS | |
| MSI Creator Z16P B12UHST | |
| MSI Creator Z17 A12UGST-054 | |
| Razer Blade 17 (i7-12800H, RTX 3070 Ti) | |
| Dell XPS 17 9720 RTX 3060 | |
| AIDA64 / CPU SHA3 | |
| Średnia w klasie Multimedia (626 - 8623, n=61, ostatnie 2 lata) | |
| Aorus 17X XES | |
| Przeciętny Intel Core i9-12900H (1378 - 4215, n=29) | |
| MSI Creator Z16P B12UHST | |
| MSI Creator Z17 A12UGST-054 | |
| Razer Blade 17 (i7-12800H, RTX 3070 Ti) | |
| Dell XPS 17 9720 RTX 3060 | |
| MSI Creator 17 A10SGS | |
| AIDA64 / CPU Queen | |
| MSI Creator Z16P B12UHST | |
| MSI Creator Z17 A12UGST-054 | |
| Aorus 17X XES | |
| Przeciętny Intel Core i9-12900H (78172 - 111241, n=28) | |
| Dell XPS 17 9720 RTX 3060 | |
| Razer Blade 17 (i7-12800H, RTX 3070 Ti) | |
| MSI Creator 17 A10SGS | |
| Średnia w klasie Multimedia (13483 - 181505, n=48, ostatnie 2 lata) | |
| AIDA64 / FPU SinJulia | |
| Aorus 17X XES | |
| MSI Creator Z16P B12UHST | |
| Razer Blade 17 (i7-12800H, RTX 3070 Ti) | |
| MSI Creator Z17 A12UGST-054 | |
| Przeciętny Intel Core i9-12900H (5709 - 10410, n=29) | |
| Średnia w klasie Multimedia (886 - 28794, n=61, ostatnie 2 lata) | |
| Dell XPS 17 9720 RTX 3060 | |
| MSI Creator 17 A10SGS | |
| AIDA64 / FPU Mandel | |
| Średnia w klasie Multimedia (6395 - 105740, n=60, ostatnie 2 lata) | |
| Aorus 17X XES | |
| Przeciętny Intel Core i9-12900H (11257 - 45581, n=29) | |
| MSI Creator 17 A10SGS | |
| MSI Creator Z16P B12UHST | |
| MSI Creator Z17 A12UGST-054 | |
| Razer Blade 17 (i7-12800H, RTX 3070 Ti) | |
| Dell XPS 17 9720 RTX 3060 | |
| AIDA64 / CPU AES | |
| Aorus 17X XES | |
| MSI Creator Z16P B12UHST | |
| MSI Creator Z17 A12UGST-054 | |
| Przeciętny Intel Core i9-12900H (31935 - 151546, n=29) | |
| Dell XPS 17 9720 RTX 3060 | |
| Średnia w klasie Multimedia (8171 - 126790, n=61, ostatnie 2 lata) | |
| Razer Blade 17 (i7-12800H, RTX 3070 Ti) | |
| MSI Creator 17 A10SGS | |
| AIDA64 / CPU ZLib | |
| MSI Creator Z16P B12UHST | |
| Razer Blade 17 (i7-12800H, RTX 3070 Ti) | |
| Aorus 17X XES | |
| Średnia w klasie Multimedia (143.8 - 2022, n=61, ostatnie 2 lata) | |
| MSI Creator Z17 A12UGST-054 | |
| Przeciętny Intel Core i9-12900H (449 - 1193, n=29) | |
| Dell XPS 17 9720 RTX 3060 | |
| MSI Creator 17 A10SGS | |
| AIDA64 / FP64 Ray-Trace | |
| Średnia w klasie Multimedia (1014 - 26875, n=61, ostatnie 2 lata) | |
| Aorus 17X XES | |
| Przeciętny Intel Core i9-12900H (2235 - 10511, n=29) | |
| MSI Creator Z16P B12UHST | |
| MSI Creator 17 A10SGS | |
| MSI Creator Z17 A12UGST-054 | |
| Dell XPS 17 9720 RTX 3060 | |
| Razer Blade 17 (i7-12800H, RTX 3070 Ti) | |
| AIDA64 / CPU PhotoWorxx | |
| Średnia w klasie Multimedia (8187 - 88154, n=61, ostatnie 2 lata) | |
| Dell XPS 17 9720 RTX 3060 | |
| Aorus 17X XES | |
| MSI Creator Z16P B12UHST | |
| MSI Creator Z17 A12UGST-054 | |
| Przeciętny Intel Core i9-12900H (20960 - 48269, n=30) | |
| Razer Blade 17 (i7-12800H, RTX 3070 Ti) | |
| MSI Creator 17 A10SGS | |
Wydajność systemu
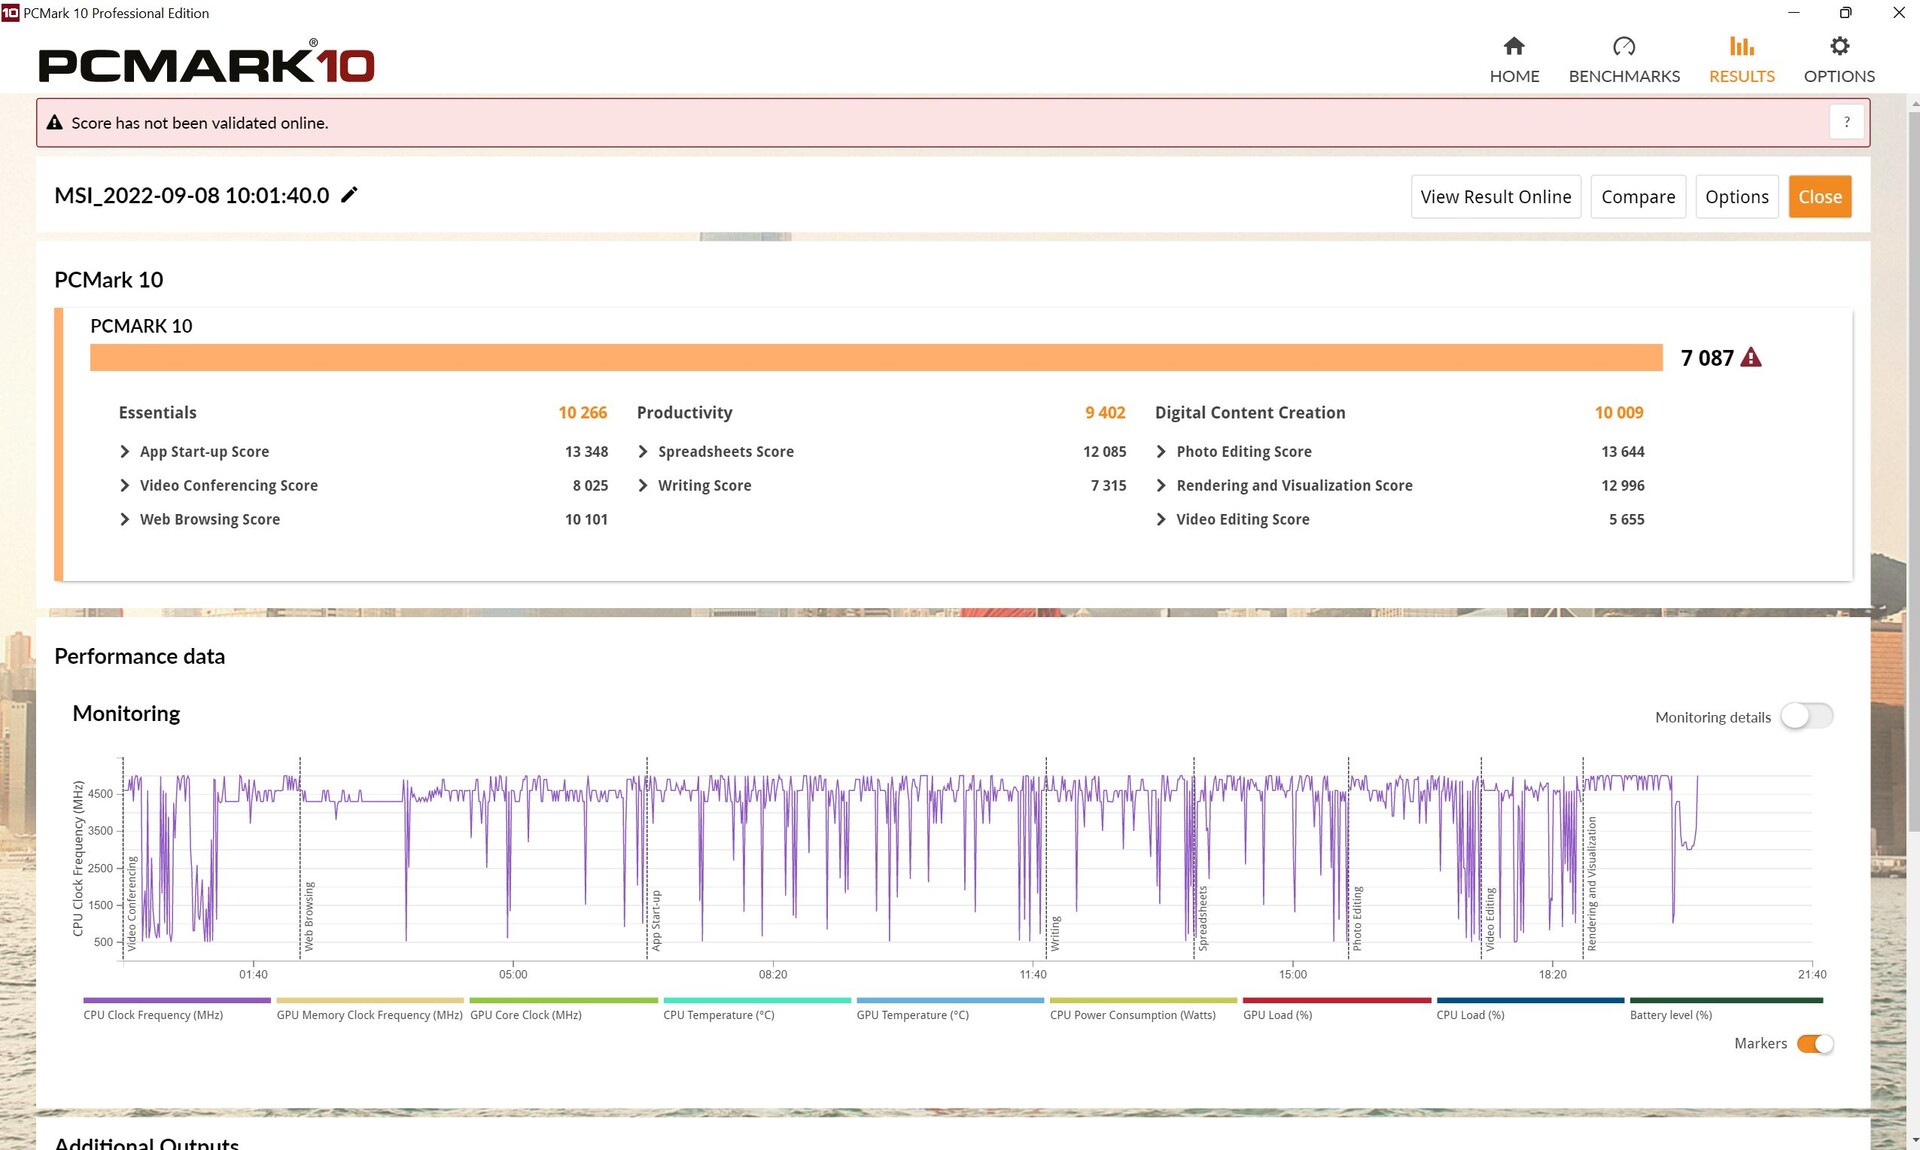
Co zaskakujące, Z17 dostarczył nieco poniżej średniej wydajności w PCMarku 10. Powtórzenie testu nie przyniosło poprawy wyników. Inne laptopy z tym samym zestawem CPU/GPU wypadły średnio o 8 procent lepiej.
Z naszych doświadczeń z Z17 wynika jednak, że podczas codziennej pracy działa on płynnie i bez problemów.
CrossMark: Overall | Productivity | Creativity | Responsiveness
| PCMark 10 / Score | |
| MSI Creator Z16P B12UHST | |
| Aorus 17X XES | |
| Przeciętny Intel Core i9-12900H, NVIDIA GeForce RTX 3070 Ti Laptop GPU (7087 - 8072, n=6) | |
| Średnia w klasie Multimedia (4325 - 10386, n=58, ostatnie 2 lata) | |
| Dell XPS 17 9720 RTX 3060 | |
| Razer Blade 17 (i7-12800H, RTX 3070 Ti) | |
| MSI Creator Z17 A12UGST-054 | |
| MSI Creator 17 A10SGS | |
| PCMark 10 / Essentials | |
| MSI Creator Z16P B12UHST | |
| Przeciętny Intel Core i9-12900H, NVIDIA GeForce RTX 3070 Ti Laptop GPU (10266 - 11663, n=6) | |
| Dell XPS 17 9720 RTX 3060 | |
| Aorus 17X XES | |
| Średnia w klasie Multimedia (8025 - 11664, n=57, ostatnie 2 lata) | |
| MSI Creator Z17 A12UGST-054 | |
| Razer Blade 17 (i7-12800H, RTX 3070 Ti) | |
| MSI Creator 17 A10SGS | |
| PCMark 10 / Productivity | |
| Średnia w klasie Multimedia (7323 - 18233, n=57, ostatnie 2 lata) | |
| MSI Creator Z16P B12UHST | |
| Aorus 17X XES | |
| Przeciętny Intel Core i9-12900H, NVIDIA GeForce RTX 3070 Ti Laptop GPU (9402 - 10742, n=6) | |
| MSI Creator Z17 A12UGST-054 | |
| Dell XPS 17 9720 RTX 3060 | |
| Razer Blade 17 (i7-12800H, RTX 3070 Ti) | |
| MSI Creator 17 A10SGS | |
| PCMark 10 / Digital Content Creation | |
| Aorus 17X XES | |
| MSI Creator Z16P B12UHST | |
| Przeciętny Intel Core i9-12900H, NVIDIA GeForce RTX 3070 Ti Laptop GPU (10009 - 12541, n=6) | |
| Razer Blade 17 (i7-12800H, RTX 3070 Ti) | |
| Dell XPS 17 9720 RTX 3060 | |
| Średnia w klasie Multimedia (3651 - 16240, n=57, ostatnie 2 lata) | |
| MSI Creator Z17 A12UGST-054 | |
| MSI Creator 17 A10SGS | |
| CrossMark / Overall | |
| Aorus 17X XES | |
| MSI Creator Z17 A12UGST-054 | |
| Dell XPS 17 9720 RTX 3060 | |
| Przeciętny Intel Core i9-12900H, NVIDIA GeForce RTX 3070 Ti Laptop GPU (1664 - 2044, n=6) | |
| Średnia w klasie Multimedia (866 - 2728, n=67, ostatnie 2 lata) | |
| Razer Blade 17 (i7-12800H, RTX 3070 Ti) | |
| CrossMark / Productivity | |
| Aorus 17X XES | |
| MSI Creator Z17 A12UGST-054 | |
| Przeciętny Intel Core i9-12900H, NVIDIA GeForce RTX 3070 Ti Laptop GPU (1591 - 1968, n=6) | |
| Dell XPS 17 9720 RTX 3060 | |
| Średnia w klasie Multimedia (931 - 2489, n=67, ostatnie 2 lata) | |
| Razer Blade 17 (i7-12800H, RTX 3070 Ti) | |
| CrossMark / Creativity | |
| Aorus 17X XES | |
| MSI Creator Z17 A12UGST-054 | |
| Średnia w klasie Multimedia (907 - 3465, n=67, ostatnie 2 lata) | |
| Dell XPS 17 9720 RTX 3060 | |
| Przeciętny Intel Core i9-12900H, NVIDIA GeForce RTX 3070 Ti Laptop GPU (1797 - 2148, n=6) | |
| Razer Blade 17 (i7-12800H, RTX 3070 Ti) | |
| CrossMark / Responsiveness | |
| Aorus 17X XES | |
| MSI Creator Z17 A12UGST-054 | |
| Przeciętny Intel Core i9-12900H, NVIDIA GeForce RTX 3070 Ti Laptop GPU (1514 - 2069, n=6) | |
| Dell XPS 17 9720 RTX 3060 | |
| Razer Blade 17 (i7-12800H, RTX 3070 Ti) | |
| Średnia w klasie Multimedia (605 - 2024, n=67, ostatnie 2 lata) | |
| PCMark 10 Score | 7087 pkt. | |
Pomoc | ||
| AIDA64 / Memory Copy | |
| Średnia w klasie Multimedia (11299 - 132135, n=61, ostatnie 2 lata) | |
| MSI Creator Z16P B12UHST | |
| Dell XPS 17 9720 RTX 3060 | |
| Aorus 17X XES | |
| MSI Creator Z17 A12UGST-054 | |
| Przeciętny Intel Core i9-12900H (34438 - 74264, n=29) | |
| Razer Blade 17 (i7-12800H, RTX 3070 Ti) | |
| MSI Creator 17 A10SGS | |
| AIDA64 / Memory Read | |
| Średnia w klasie Multimedia (11624 - 174586, n=61, ostatnie 2 lata) | |
| Aorus 17X XES | |
| Dell XPS 17 9720 RTX 3060 | |
| MSI Creator Z16P B12UHST | |
| MSI Creator Z17 A12UGST-054 | |
| Przeciętny Intel Core i9-12900H (36365 - 74642, n=29) | |
| Razer Blade 17 (i7-12800H, RTX 3070 Ti) | |
| MSI Creator 17 A10SGS | |
| AIDA64 / Memory Write | |
| Średnia w klasie Multimedia (11755 - 134998, n=61, ostatnie 2 lata) | |
| MSI Creator Z16P B12UHST | |
| MSI Creator Z17 A12UGST-054 | |
| Dell XPS 17 9720 RTX 3060 | |
| Aorus 17X XES | |
| Przeciętny Intel Core i9-12900H (32276 - 67858, n=29) | |
| Razer Blade 17 (i7-12800H, RTX 3070 Ti) | |
| MSI Creator 17 A10SGS | |
| AIDA64 / Memory Latency | |
| Średnia w klasie Multimedia (7 - 535, n=60, ostatnie 2 lata) | |
| MSI Creator Z16P B12UHST | |
| MSI Creator Z17 A12UGST-054 | |
| Dell XPS 17 9720 RTX 3060 | |
| Aorus 17X XES | |
| Przeciętny Intel Core i9-12900H (74.7 - 118.1, n=28) | |
| MSI Creator 17 A10SGS | |
| Razer Blade 17 (i7-12800H, RTX 3070 Ti) | |
* ... im mniej tym lepiej
Opóźnienie DPC
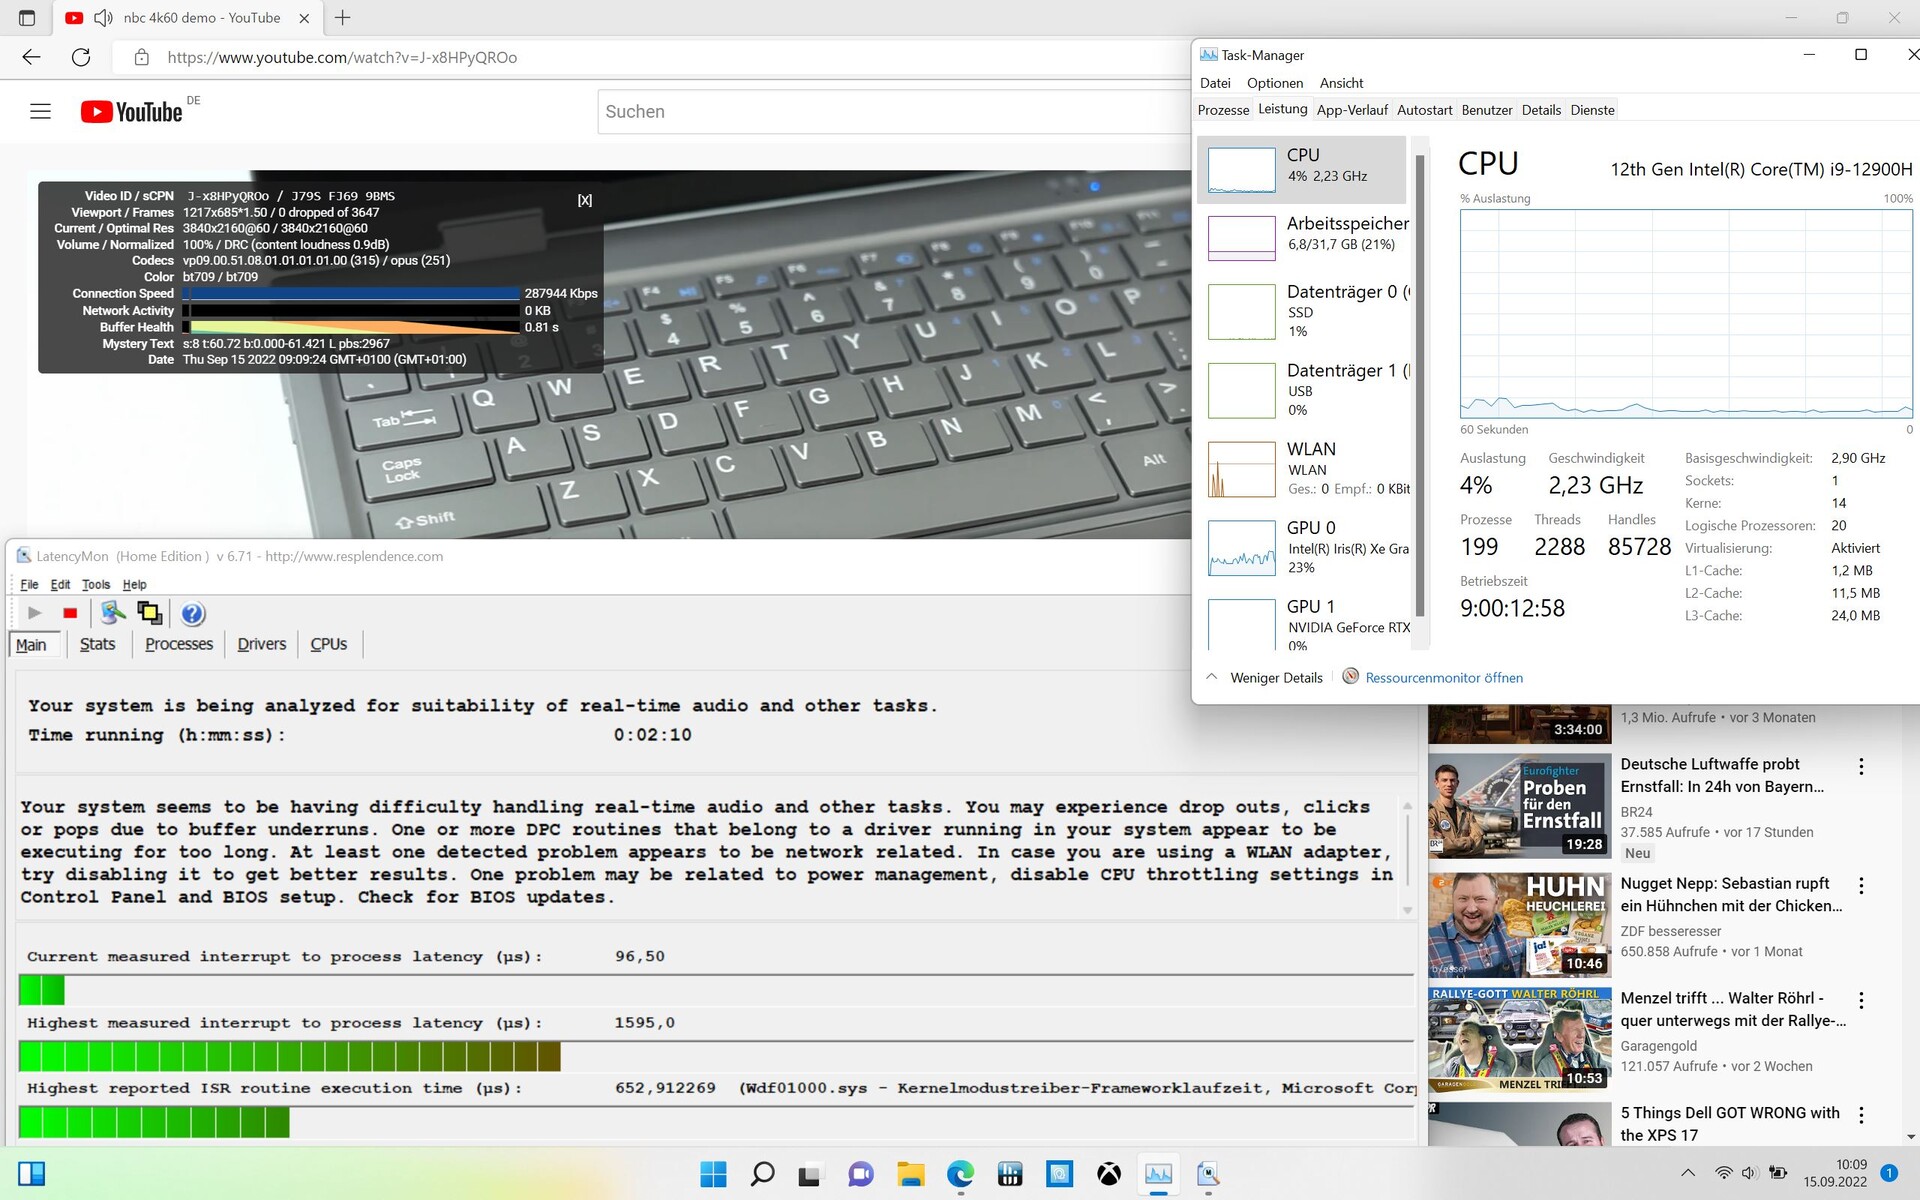
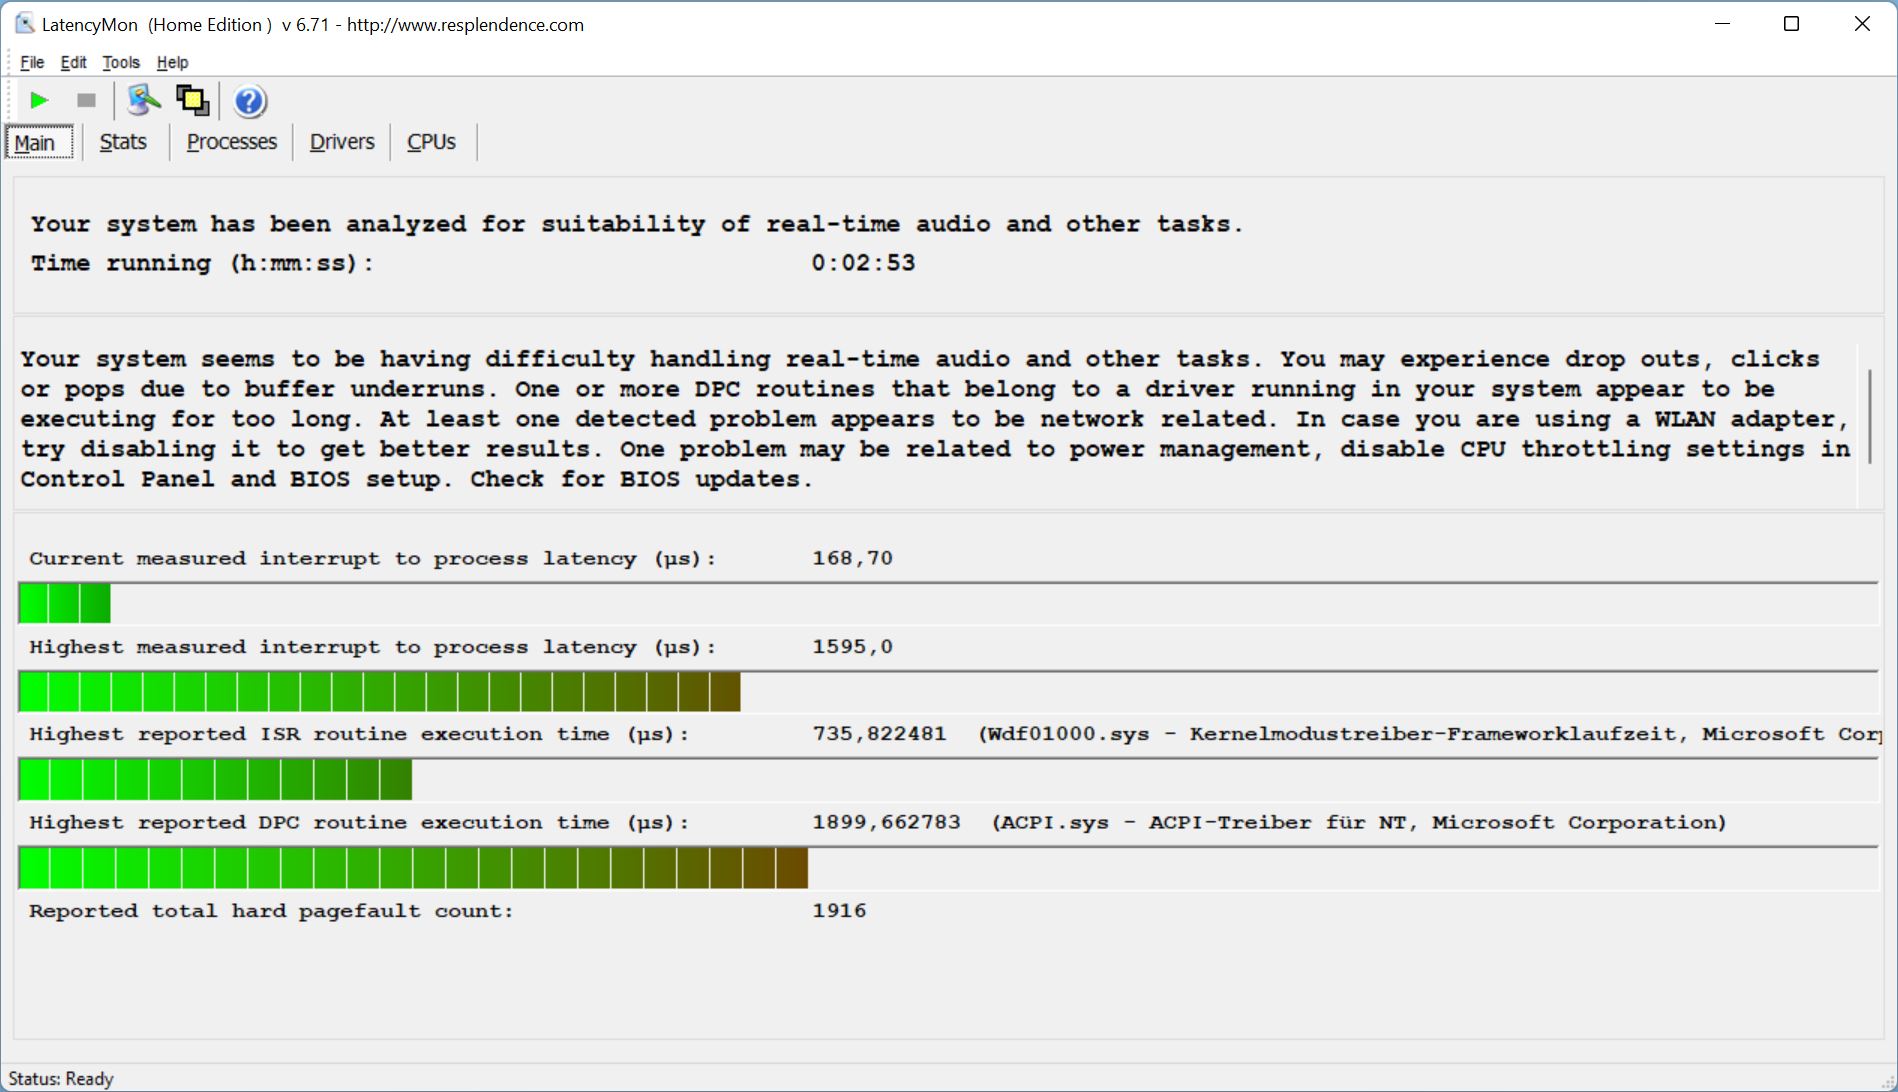
LatencyMon nie wykrył żadnych problemów przy otwarciu przeglądarki. Nie było tak jednak w przypadku otwarcia kilku zakładek jednocześnie, by wyświetlić naszą stronę główną. Latencja jest rozczarowująco wysoka jak na laptopa twórcę.
Mimo to odtwarzanie naszych filmów w YouTube w rozdzielczości 4K 60FPS było płynne i nie skutkowało spadkiem klatek
W trakcie naszej recenzji raz, zaraz po uruchomieniu laptopa, pojawił się błąd niebieskiego ekranu. Miejmy nadzieję, że producent szybko naprawi te problemy poprzez aktualizację BIOS-u.

| DPC Latencies / LatencyMon - interrupt to process latency (max), Web, Youtube, Prime95 | |
| MSI Creator Z17 A12UGST-054 | |
| Aorus 17X XES | |
| MSI Creator 17 A10SGS | |
| Razer Blade 17 (i7-12800H, RTX 3070 Ti) | |
| MSI Creator Z16P B12UHST | |
| Dell XPS 17 9720 RTX 3060 | |
* ... im mniej tym lepiej
Pamięć masowa
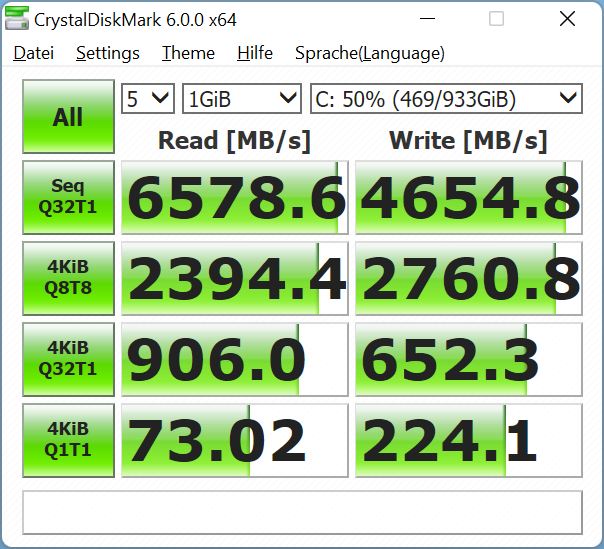
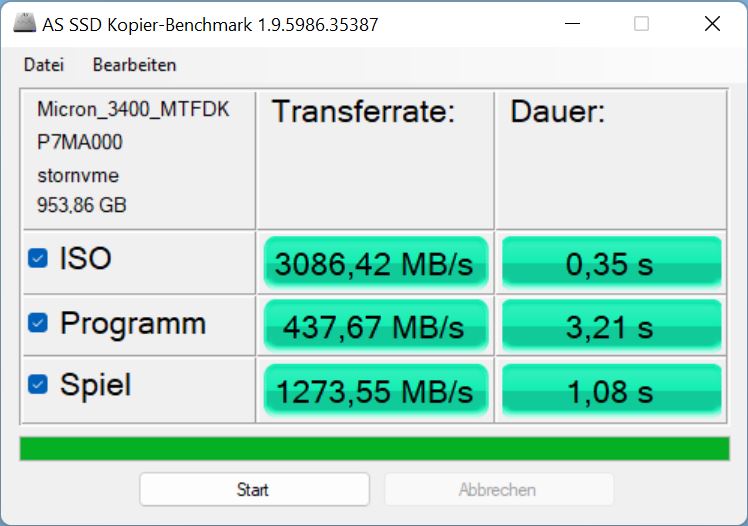
W naszym modelu MSI zainstalowało dysk SSD Micron 3400 o pojemności 1 TB. Dysk PCIe 4 zajmuje 63. miejsce w naszej tabeli porównawczej dysków SSD https://www.notebookcheck.net/Laptop-harddisks-HDD-SSD-benchmarks.22089.0.html. Producent twierdzi, że jego maksymalna prędkość odczytu wynosi 6 600 MB/s - co nasze pomiary mogą zdecydowanie potwierdzić. Dysk charakteryzuje się również bardzo stabilną trwałą wydajnością.
Niemniej jednak, dyski Samsung PM9A1 w Razer Blade 17 i MSI Z16P są nieco szybsze, podobnie jak dysk SSD Gigabyte'a w Aorusie. Ale ta niewielka różnica raczej nie może odpowiadać za dość słabą wydajność systemową Z17.


| Drive Performance rating - Percent | |
| MSI Creator Z16P B12UHST | |
| Aorus 17X XES | |
| Razer Blade 17 (i7-12800H, RTX 3070 Ti) | |
| MSI Creator Z17 A12UGST-054 | |
| Dell XPS 17 9720 RTX 3060 | |
| Przeciętny Micron 3400 1TB MTFDKBA1T0TFH | |
| Średnia w klasie Multimedia | |
| MSI Creator 17 A10SGS | |
* ... im mniej tym lepiej
Sustained Read Performance: DiskSpd Read Loop, Queue Depth 8
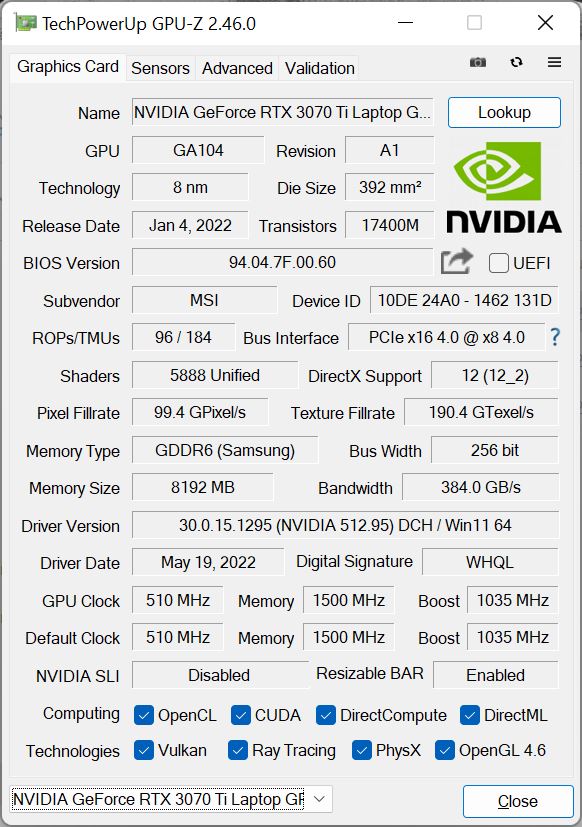
Karta graficzna
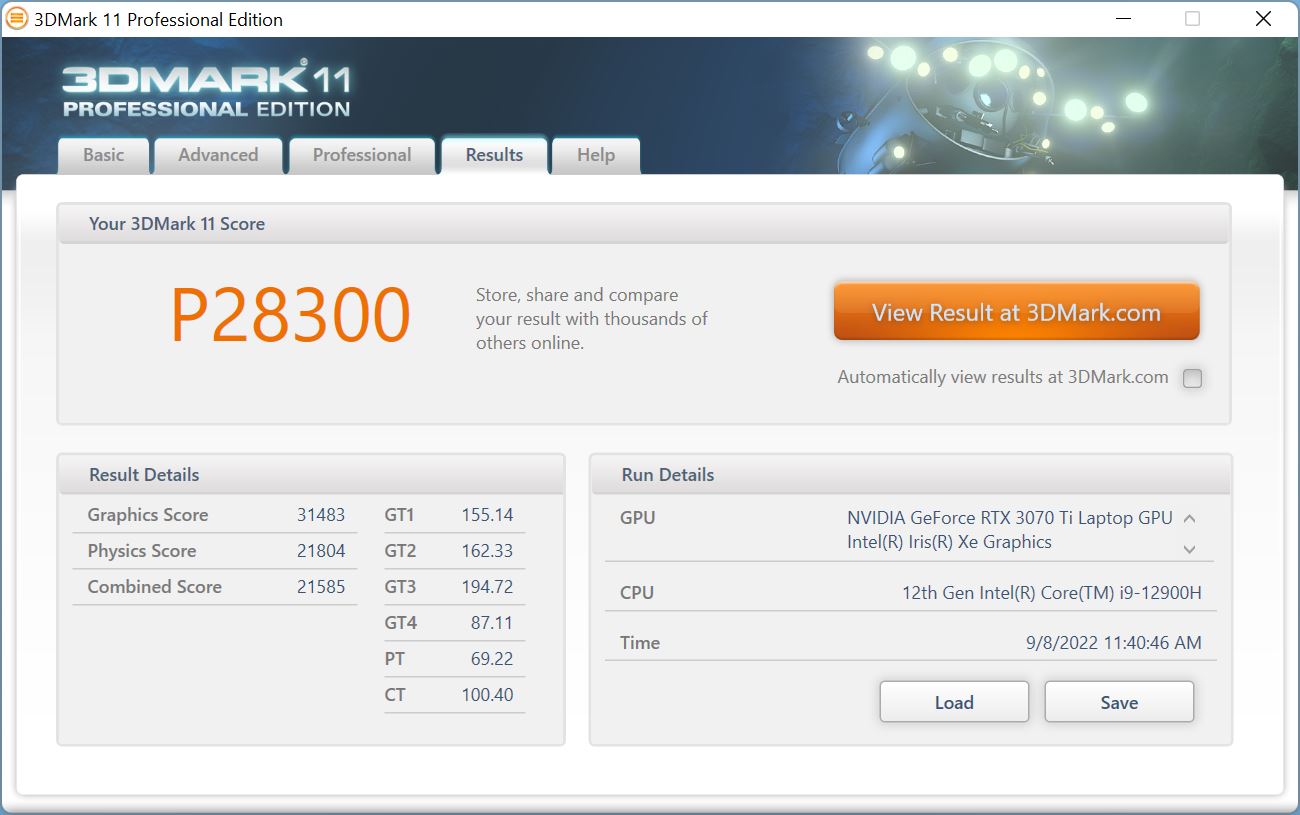
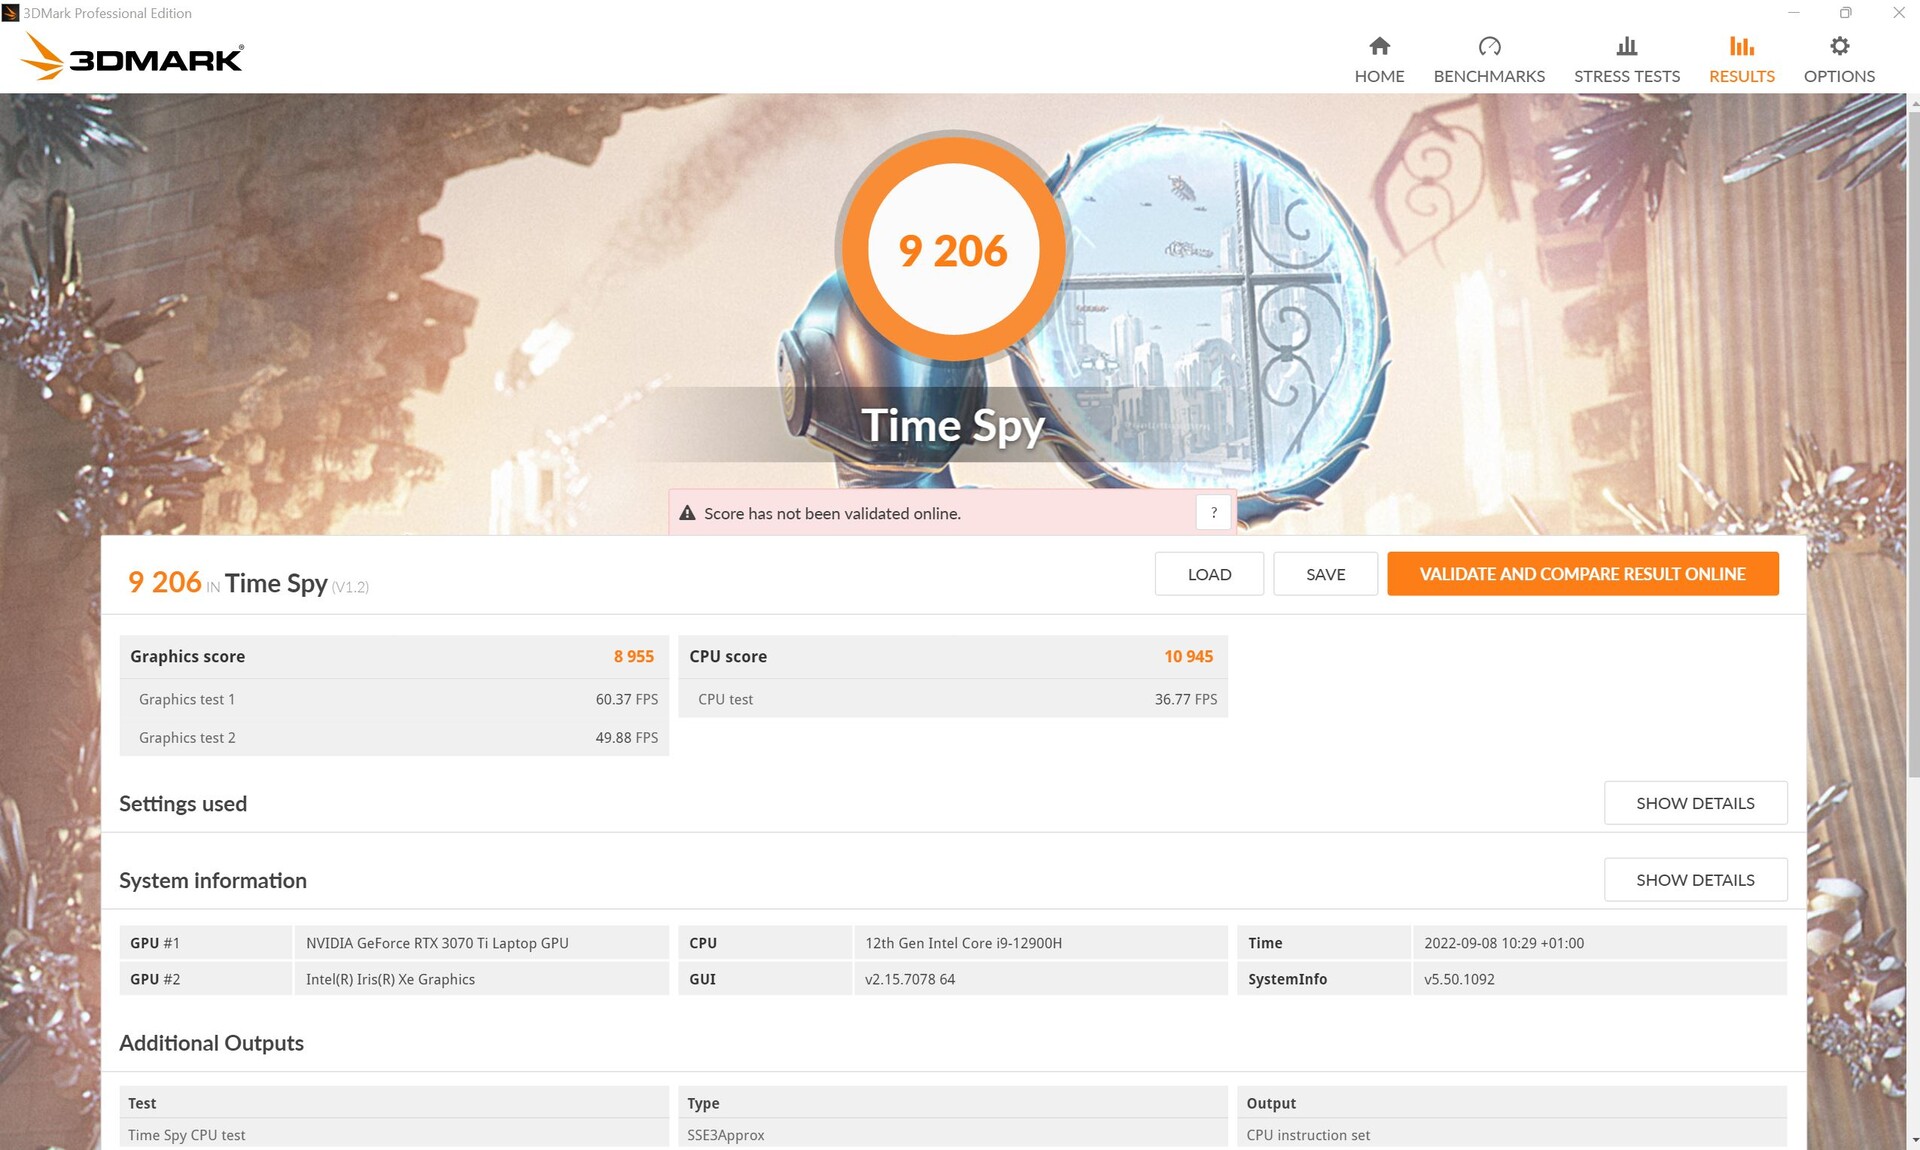
Z17 posiada układ GeForce RTX 3070 Ti z 8 GB pamięci wideo. Teoretycznie jest to bardzo wydajna karta grafiki, ale w cienkim Z17 ma ona dostęp tylko do 90 W mocy (w tym Dynamic Boost). Dla porównania, GPU w np Blade 17 ma do dyspozycji 150 W.
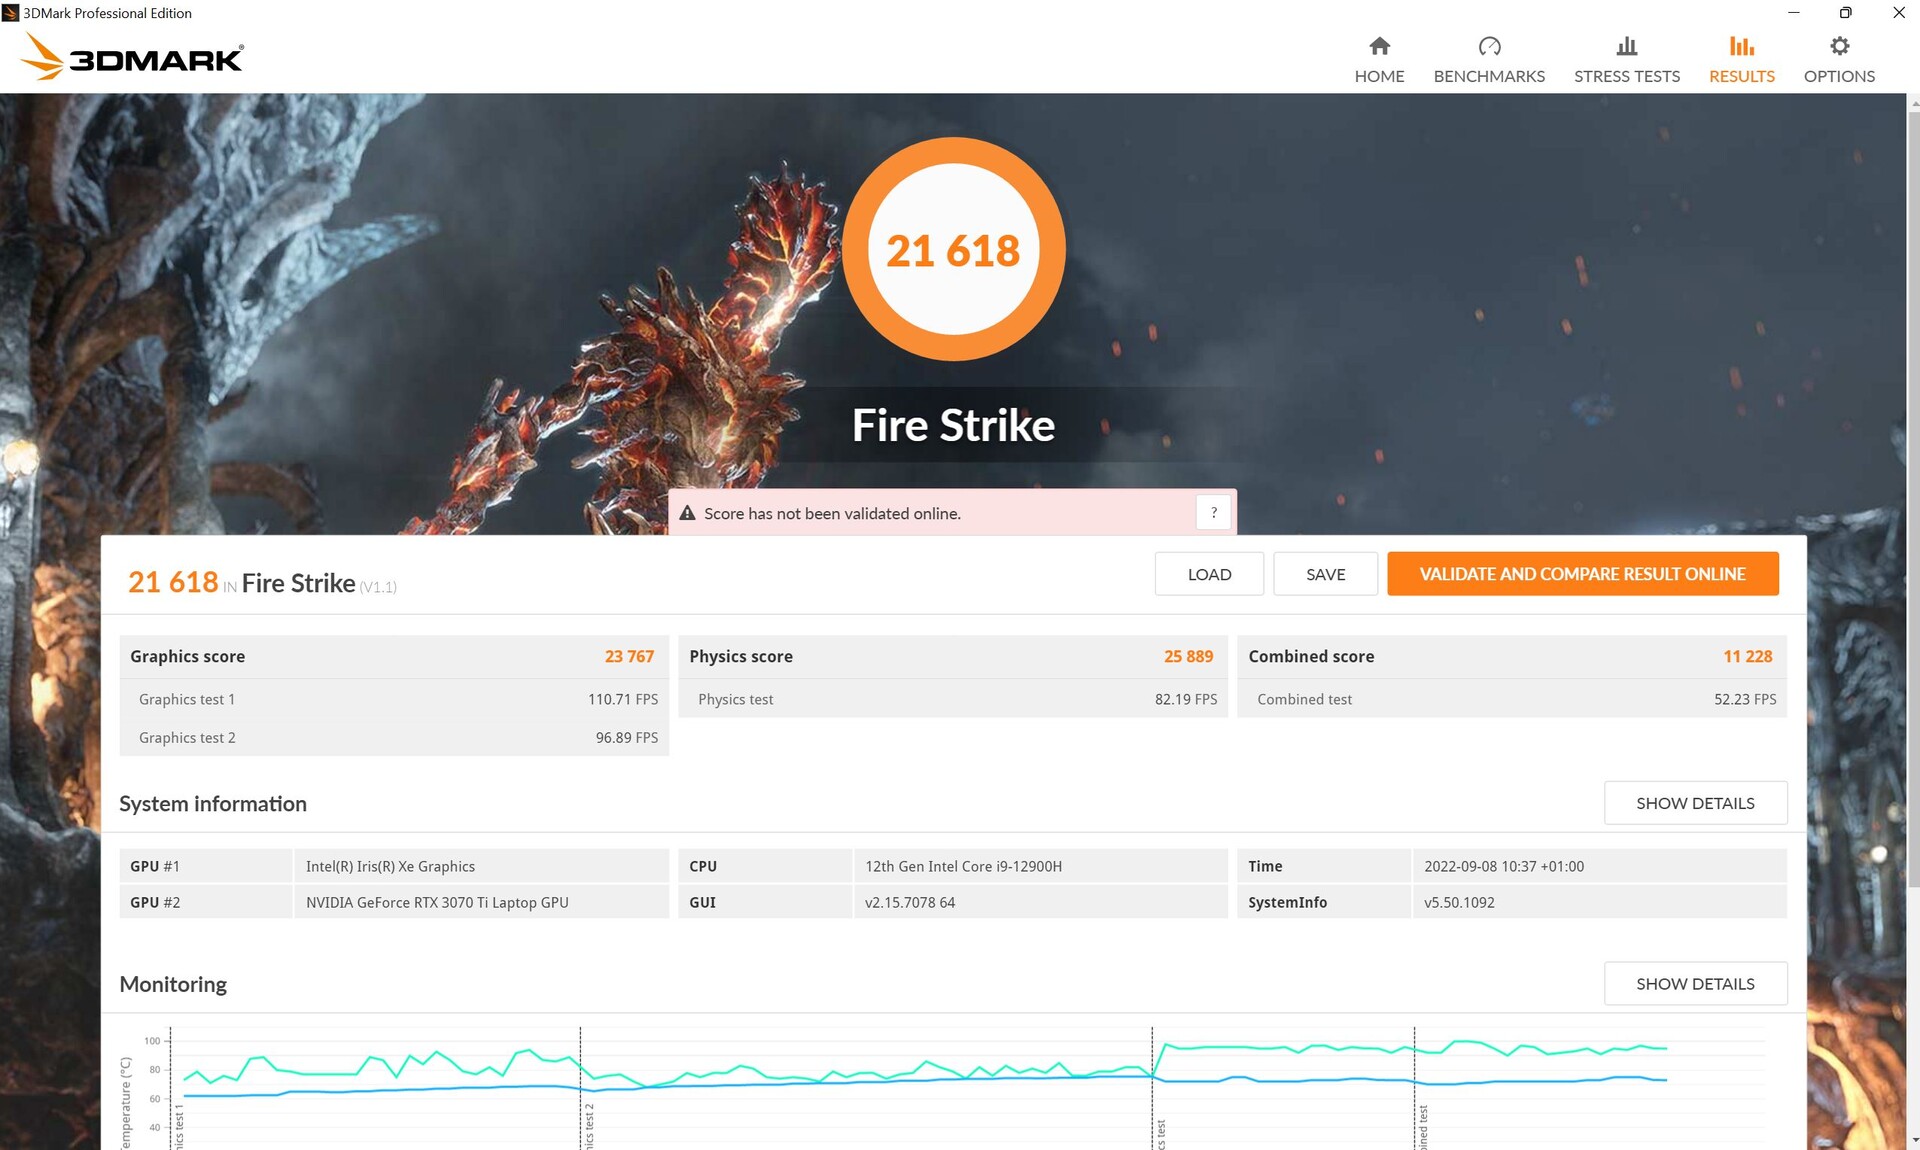
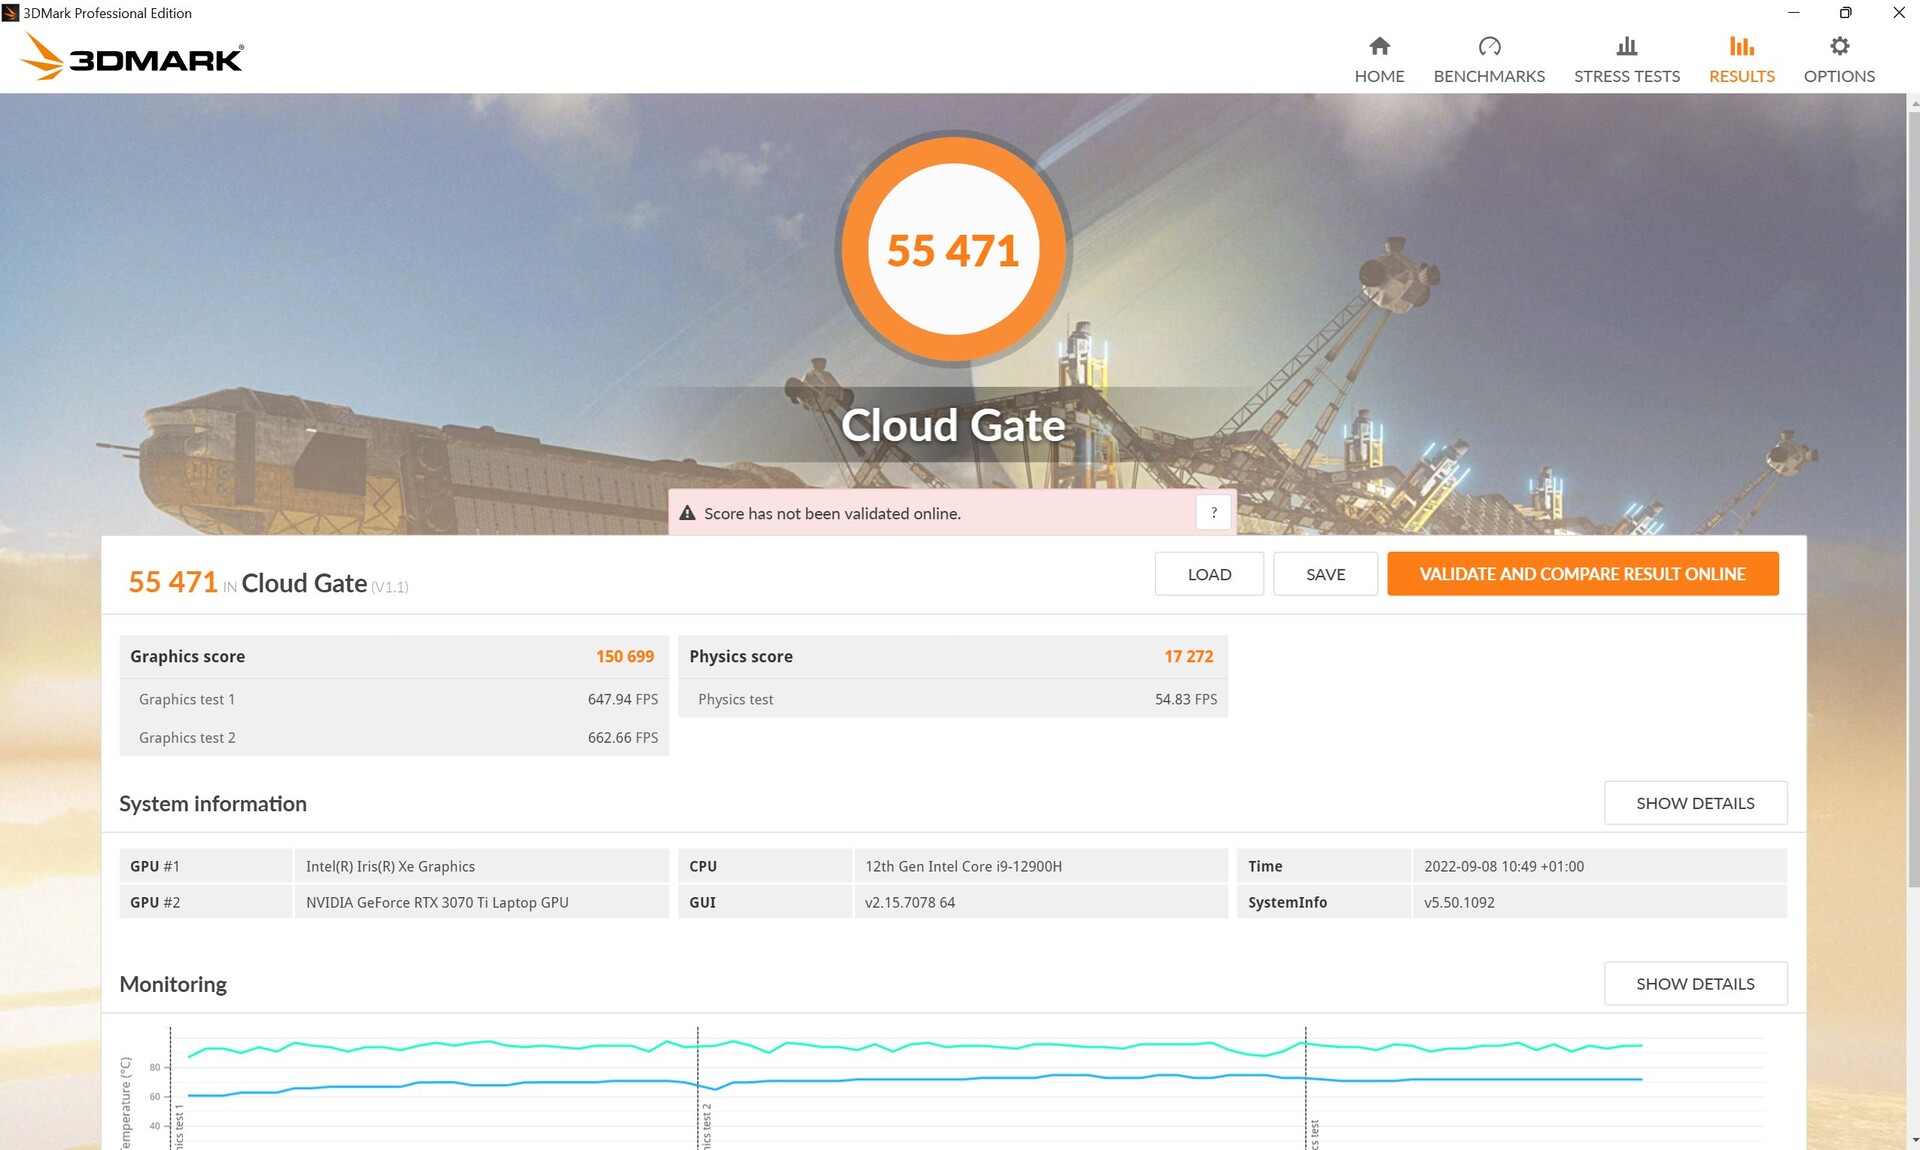
W rezultacie wyniki Creatora Z17 w syntetycznych benchmarkach 3DMark są przynajmniej o 5 procent niższe od średniej dla wszystkich laptopów z tym samym GPU.
Podczas pracy na akumulatorze laptop ten stracił około 45 procent wydajności GPU w 3DMarku 11.
| 3DMark Performance rating - Percent | |
| Razer Blade 17 (i7-12800H, RTX 3070 Ti) | |
| Przeciętny NVIDIA GeForce RTX 3070 Ti Laptop GPU | |
| Aorus 17X XES | |
| MSI Creator Z17 A12UGST-054 | |
| MSI Creator Z16P B12UHST | |
| MSI Creator 17 A10SGS -1! | |
| Dell XPS 17 9720 RTX 3060 | |
| Średnia w klasie Multimedia | |
| 3DMark 11 - 1280x720 Performance GPU | |
| Razer Blade 17 (i7-12800H, RTX 3070 Ti) | |
| Przeciętny NVIDIA GeForce RTX 3070 Ti Laptop GPU (13799 - 42569, n=36) | |
| Aorus 17X XES | |
| MSI Creator Z17 A12UGST-054 | |
| MSI Creator 17 A10SGS | |
| Dell XPS 17 9720 RTX 3060 | |
| Średnia w klasie Multimedia (3749 - 60002, n=62, ostatnie 2 lata) | |
| MSI Creator Z16P B12UHST | |
| 3DMark | |
| 1280x720 Cloud Gate Standard Graphics | |
| Aorus 17X XES | |
| MSI Creator Z17 A12UGST-054 | |
| MSI Creator Z16P B12UHST | |
| Przeciętny NVIDIA GeForce RTX 3070 Ti Laptop GPU (33126 - 181005, n=25) | |
| Razer Blade 17 (i7-12800H, RTX 3070 Ti) | |
| Dell XPS 17 9720 RTX 3060 | |
| Średnia w klasie Multimedia (16765 - 143501, n=35, ostatnie 2 lata) | |
| 1920x1080 Fire Strike Graphics | |
| Razer Blade 17 (i7-12800H, RTX 3070 Ti) | |
| Przeciętny NVIDIA GeForce RTX 3070 Ti Laptop GPU (22612 - 32550, n=37) | |
| MSI Creator Z16P B12UHST | |
| Aorus 17X XES | |
| MSI Creator Z17 A12UGST-054 | |
| MSI Creator 17 A10SGS | |
| Dell XPS 17 9720 RTX 3060 | |
| Średnia w klasie Multimedia (2328 - 48907, n=66, ostatnie 2 lata) | |
| 2560x1440 Time Spy Graphics | |
| Razer Blade 17 (i7-12800H, RTX 3070 Ti) | |
| Przeciętny NVIDIA GeForce RTX 3070 Ti Laptop GPU (8142 - 12324, n=37) | |
| MSI Creator Z16P B12UHST | |
| Aorus 17X XES | |
| MSI Creator Z17 A12UGST-054 | |
| MSI Creator 17 A10SGS | |
| Dell XPS 17 9720 RTX 3060 | |
| Średnia w klasie Multimedia (696 - 19403, n=67, ostatnie 2 lata) | |
| 3DMark 11 Performance | 28300 pkt. | |
| 3DMark Cloud Gate Standard Score | 55471 pkt. | |
| 3DMark Fire Strike Score | 21618 pkt. | |
| 3DMark Time Spy Score | 9206 pkt. | |
Pomoc | ||
| Blender | |
| v3.3 Classroom OPTIX/RTX | |
| Średnia w klasie Multimedia (12 - 105, n=24, ostatnie 2 lata) | |
| Aorus 17X XES | |
| v3.3 Classroom CUDA | |
| Średnia w klasie Multimedia (20 - 186, n=24, ostatnie 2 lata) | |
| Aorus 17X XES | |
| v3.3 Classroom CPU | |
| Średnia w klasie Multimedia (134.5 - 1042, n=67, ostatnie 2 lata) | |
| Aorus 17X XES | |
* ... im mniej tym lepiej
Wydajność w grach
Świetny pokaz w Far Cry 5 wydaje się być mniej więcej wyjątkiem. Ogólnie rzecz biorąc, przy 90 watach RTX 3070 Ti wypadł co najmniej 5 do 10 procent poniżej średniej. W porównaniu z Blade 17, różnice w wydajności mogą wynosić nawet 20 procent, w zależności od gry i zastosowanych ustawień. To powiedziawszy, różnica jest znacznie mniej dramatyczna w większości gier.
| The Witcher 3 | |
| 1920x1080 High Graphics & Postprocessing (Nvidia HairWorks Off) | |
| Przeciętny NVIDIA GeForce RTX 3070 Ti Laptop GPU (139.7 - 226, n=27) | |
| Razer Blade 17 (i7-12800H, RTX 3070 Ti) | |
| MSI Creator Z17 A12UGST-054 | |
| Aorus 17X XES | |
| MSI Creator Z16P B12UHST | |
| MSI Creator 17 A10SGS | |
| Dell XPS 17 9720 RTX 3060 | |
| Średnia w klasie Multimedia (22 - 224, n=13, ostatnie 2 lata) | |
| 1920x1080 Ultra Graphics & Postprocessing (HBAO+) | |
| Razer Blade 17 (i7-12800H, RTX 3070 Ti) | |
| Przeciętny NVIDIA GeForce RTX 3070 Ti Laptop GPU (76.8 - 124.1, n=39) | |
| Aorus 17X XES | |
| MSI Creator Z17 A12UGST-054 | |
| MSI Creator 17 A10SGS | |
| MSI Creator Z16P B12UHST | |
| Dell XPS 17 9720 RTX 3060 | |
| Średnia w klasie Multimedia (11 - 121, n=13, ostatnie 2 lata) | |
| Far Cry 5 | |
| 1920x1080 Ultra Preset AA:T | |
| Aorus 17X XES | |
| MSI Creator Z17 A12UGST-054 | |
| MSI Creator Z16P B12UHST | |
| Przeciętny NVIDIA GeForce RTX 3070 Ti Laptop GPU (91 - 138, n=25) | |
| Razer Blade 17 (i7-12800H, RTX 3070 Ti) | |
| Średnia w klasie Multimedia (17 - 145, n=23, ostatnie 2 lata) | |
| 2560x1440 Ultra Preset AA:T | |
| Razer Blade 17 (i7-12800H, RTX 3070 Ti) | |
| MSI Creator Z16P B12UHST | |
| Przeciętny NVIDIA GeForce RTX 3070 Ti Laptop GPU (77 - 111, n=15) | |
| MSI Creator Z17 A12UGST-054 | |
| Średnia w klasie Multimedia (45 - 106, n=4, ostatnie 2 lata) | |
| GTA V | |
| 1920x1080 Highest AA:4xMSAA + FX AF:16x | |
| MSI Creator Z17 A12UGST-054 | |
| Aorus 17X XES | |
| Przeciętny NVIDIA GeForce RTX 3070 Ti Laptop GPU (44 - 123.9, n=36) | |
| Razer Blade 17 (i7-12800H, RTX 3070 Ti) | |
| MSI Creator Z16P B12UHST | |
| MSI Creator 17 A10SGS | |
| Dell XPS 17 9720 RTX 3060 | |
| Średnia w klasie Multimedia (7.92 - 141.6, n=63, ostatnie 2 lata) | |
| 2560x1440 Highest AA:4xMSAA + FX AF:16x | |
| Przeciętny NVIDIA GeForce RTX 3070 Ti Laptop GPU (72.7 - 108.7, n=22) | |
| MSI Creator Z17 A12UGST-054 | |
| Średnia w klasie Multimedia (28 - 119.8, n=21, ostatnie 2 lata) | |
| MSI Creator Z16P B12UHST | |
| Dell XPS 17 9720 RTX 3060 | |
| Final Fantasy XV Benchmark | |
| 1920x1080 High Quality | |
| Razer Blade 17 (i7-12800H, RTX 3070 Ti) | |
| Przeciętny NVIDIA GeForce RTX 3070 Ti Laptop GPU (49.5 - 122.4, n=35) | |
| Aorus 17X XES | |
| MSI Creator Z16P B12UHST | |
| MSI Creator Z17 A12UGST-054 | |
| Dell XPS 17 9720 RTX 3060 | |
| Średnia w klasie Multimedia (7.61 - 144.4, n=66, ostatnie 2 lata) | |
| 2560x1440 High Quality | |
| Razer Blade 17 (i7-12800H, RTX 3070 Ti) | |
| Przeciętny NVIDIA GeForce RTX 3070 Ti Laptop GPU (57.9 - 93, n=24) | |
| Średnia w klasie Multimedia (18.4 - 129.9, n=25, ostatnie 2 lata) | |
| MSI Creator Z16P B12UHST | |
| MSI Creator Z17 A12UGST-054 | |
| Dell XPS 17 9720 RTX 3060 | |
| Strange Brigade | |
| 1920x1080 ultra AA:ultra AF:16 | |
| Razer Blade 17 (i7-12800H, RTX 3070 Ti) | |
| Przeciętny NVIDIA GeForce RTX 3070 Ti Laptop GPU (109 - 221, n=37) | |
| Aorus 17X XES | |
| MSI Creator Z17 A12UGST-054 | |
| MSI Creator Z16P B12UHST | |
| Dell XPS 17 9720 RTX 3060 | |
| Średnia w klasie Multimedia (13.3 - 303, n=66, ostatnie 2 lata) | |
| 2560x1440 ultra AA:ultra AF:16 | |
| Przeciętny NVIDIA GeForce RTX 3070 Ti Laptop GPU (110.7 - 160.5, n=21) | |
| Średnia w klasie Multimedia (41.3 - 266, n=21, ostatnie 2 lata) | |
| MSI Creator Z17 A12UGST-054 | |
| MSI Creator Z16P B12UHST | |
| Dell XPS 17 9720 RTX 3060 | |
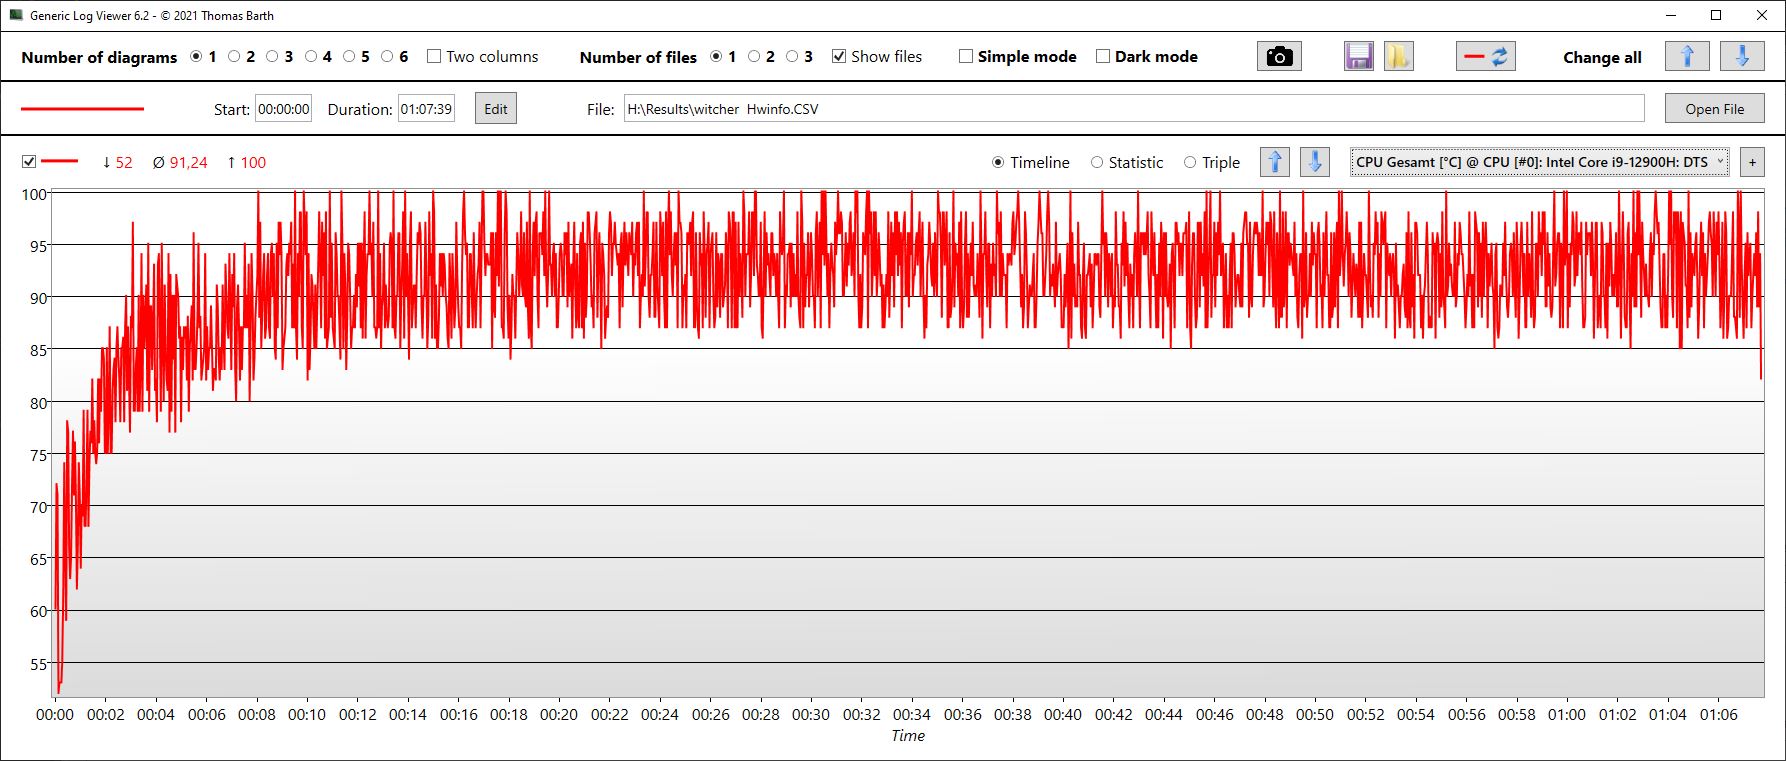
Podczas testu w pętli Witcher 3 wydajność spadała w ciągu godziny. Między początkiem a końcem liczba klatek na sekundę spadła o całe 18 procent, czyli całkiem sporo. Może to być spowodowane wysokimi temperaturami, które uniemożliwiały Z17 ciągłe osiąganie szczytowej wydajności.
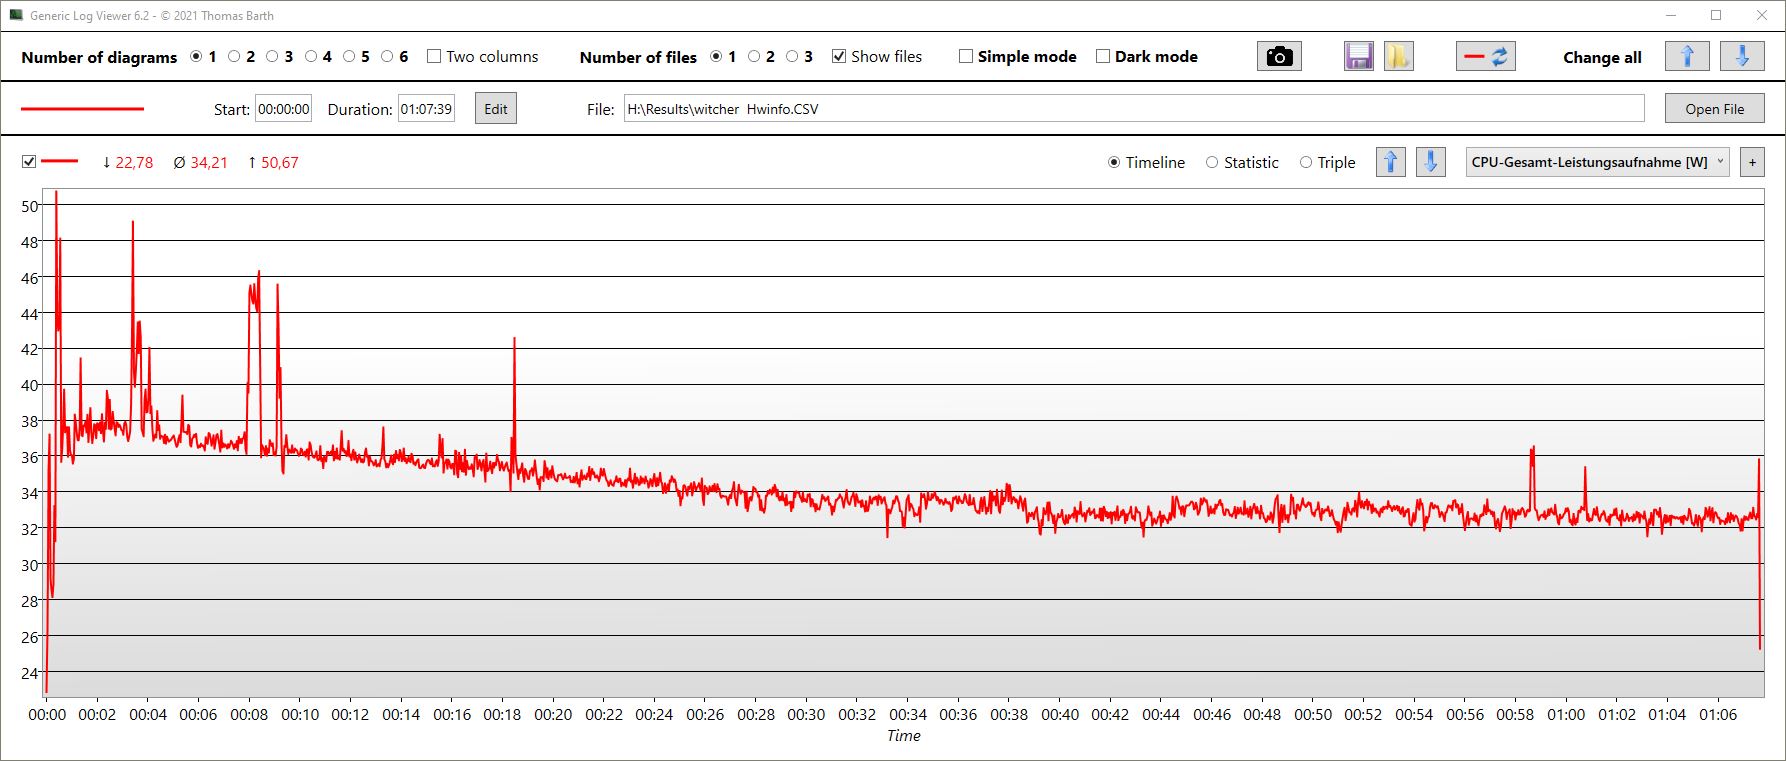
Prędkość taktowania procesora wahała się między 2,5 a 3,3 GHz (w zależności od rdzenia), a temperatury CPU wynosiły średnio 91°C (196°F). W czasie trwania testu całkowite zużycie energii spadło z 50 do 34 W.
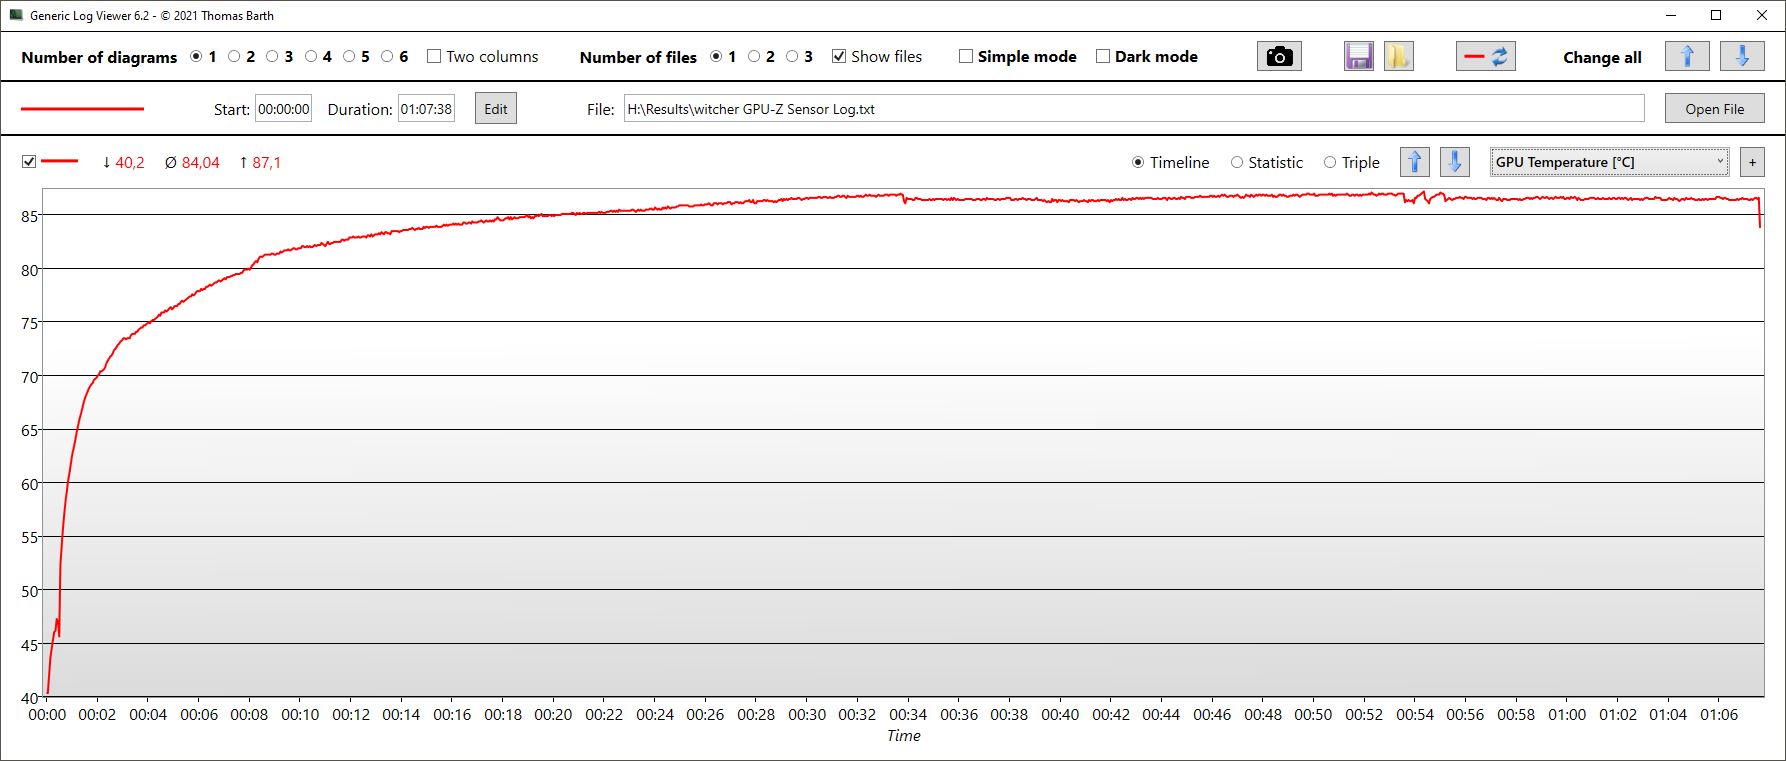
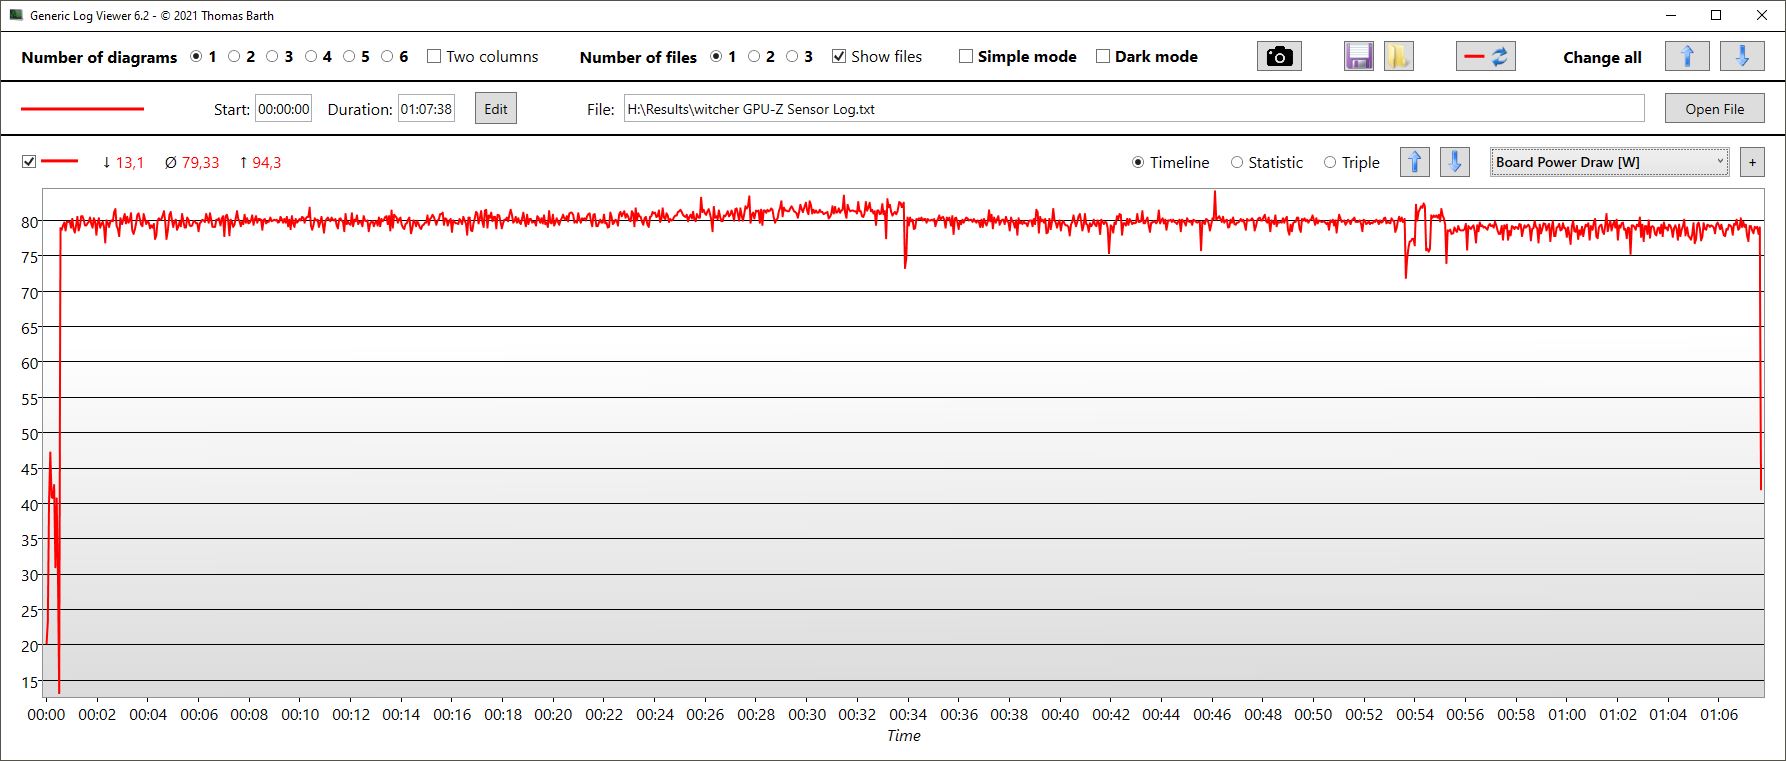
W tym samym czasie taktowanie GPU osiągnęło na krótko 1,6 GHz, po czym spadło do zaledwie 1,1 GHz. Prędkość zegara pamięci pozostała niezmienna. Temperatura GPU wynosiła około 84°C (183°F), ale w niektórych miejscach osiągała 99°C (210°F). Procesor graficzny pobierał łącznie około 79 W mocy.
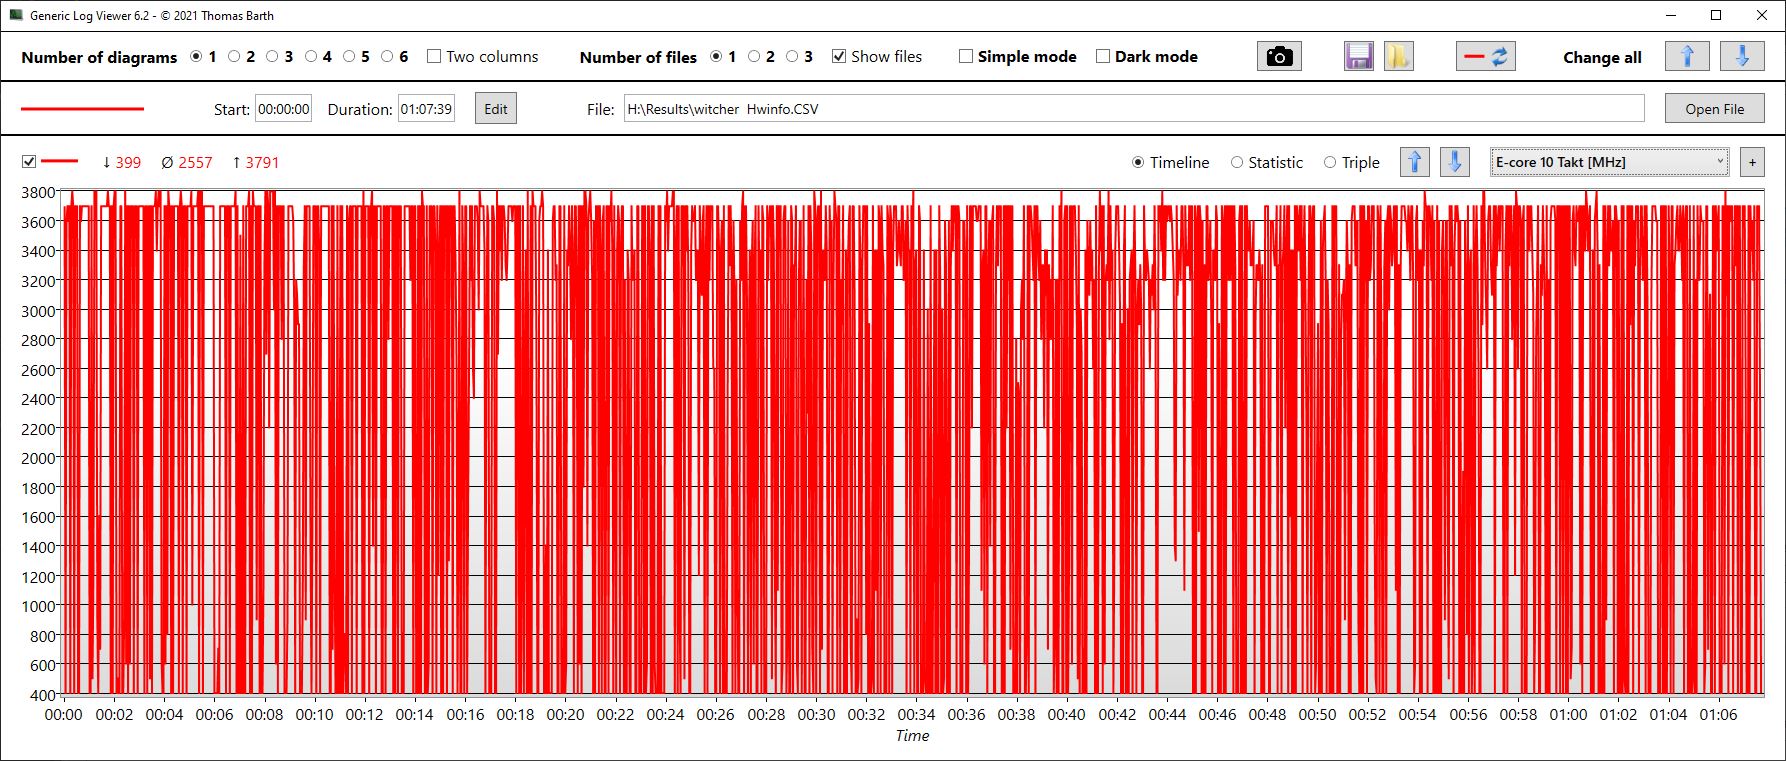
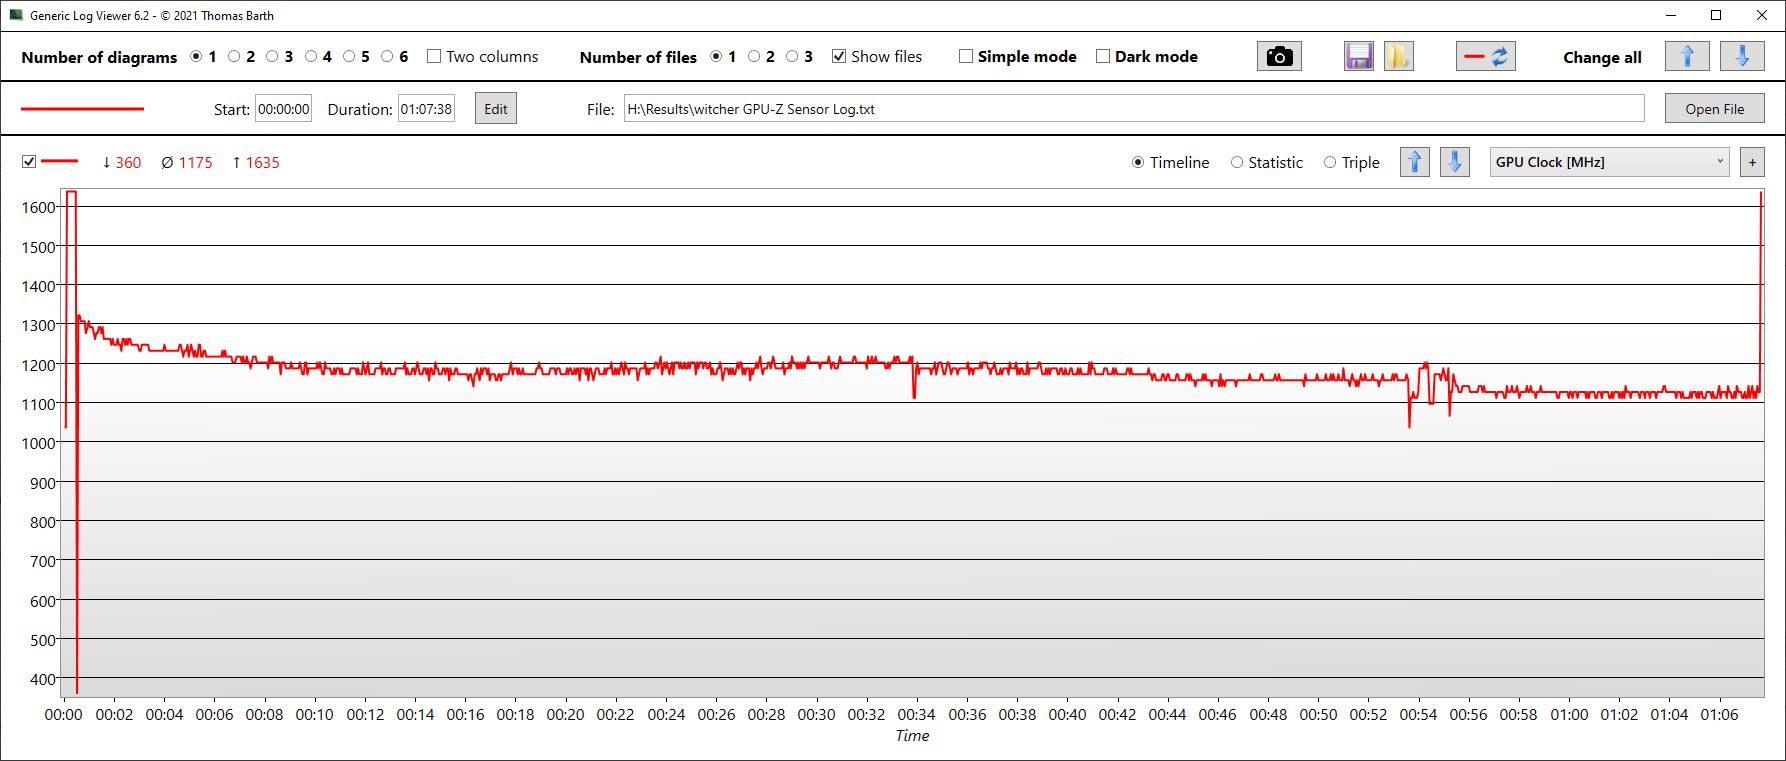
Witcher 3, FPS graph
| low | med. | high | ultra | QHD | |
|---|---|---|---|---|---|
| GTA V (2015) | 118.7 | 90.7 | |||
| The Witcher 3 (2015) | 307 | 289.4 | 165.6 | 90.5 | |
| Dota 2 Reborn (2015) | 191.9 | 177.5 | 168.3 | 158.5 | |
| Final Fantasy XV Benchmark (2018) | 186.6 | 117.9 | 85.4 | 62.5 | |
| X-Plane 11.11 (2018) | 152.5 | 135.3 | 107.6 | ||
| Far Cry 5 (2018) | 187 | 145 | 137 | 124 | 93 |
| Strange Brigade (2018) | 160.6 | 119.8 | |||
| Dying Light 2 (2022) | 100 | 81 | 67.2 | 46.7 |
Emisje - Creator Z17 jest gorący i głośny
Emisja hałasu
Wentylatory w Z17 prawie nigdy nie przestają działać, przez co ten smukły laptop jest głośniejszy od konkurentów nawet w stanie bezczynności. Tryb "Silent" w MSI Center Pro to niemalże żart. Po jego aktywacji najprawdopodobniej będziesz na próżno czekać, aż w pewnym momencie wentylatory przestaną się kręcić.
Niestety, sytuacja z hałasem utrzymuje się, gdy urządzenie jest pod obciążeniem. Jedynie grubszy i znacznie wydajniejszy Aorus jest minimalnie głośniejszy w stresie. Aby jeszcze bardziej zilustrować ten problem, na przykładzie Razer Blade 17, który jest co najmniej tak samo szybki, jest pod obciążeniem od 10 do 30 procent cichszy od Z17.
Hałas
| luz |
| 31.8 / 31.8 / 31.8 dB |
| obciążenie |
| 53.9 / 54.9 dB |
 | ||
30 dB cichy 40 dB(A) słyszalny 50 dB(A) irytujący |
||
min: | ||
| MSI Creator Z17 A12UGST-054 GeForce RTX 3070 Ti Laptop GPU, i9-12900H, Micron 3400 1TB MTFDKBA1T0TFH | MSI Creator 17 A10SGS GeForce RTX 2080 Super Max-Q, i7-10875H, Samsung SSD PM981 MZVLB2T0HMLB | MSI Creator Z16P B12UHST GeForce RTX 3080 Ti Laptop GPU, i9-12900H, Samsung PM9A1 MZVL22T0HBLB | Razer Blade 17 (i7-12800H, RTX 3070 Ti) GeForce RTX 3070 Ti Laptop GPU, i7-12800H, Samsung PM9A1 MZVL21T0HCLR | Aorus 17X XES GeForce RTX 3070 Ti Laptop GPU, i9-12900HX, Gigabyte AG470S1TB-SI B10 | Dell XPS 17 9720 RTX 3060 GeForce RTX 3060 Laptop GPU, i7-12700H, Samsung PM9A1 MZVL21T0HCLR | |
|---|---|---|---|---|---|---|
| Noise | -1% | 12% | 21% | -1% | 18% | |
| wyłączone / środowisko * (dB) | 26 | 30 -15% | 26 -0% | 23 12% | 26 -0% | 23.8 8% |
| Idle Minimum * (dB) | 31.8 | 32 -1% | 27 15% | 23 28% | 28 12% | 24.1 24% |
| Idle Average * (dB) | 31.8 | 33 -4% | 29 9% | 23 28% | 32 -1% | 24.1 24% |
| Idle Maximum * (dB) | 31.8 | 40 -26% | 31 3% | 23 28% | 38 -19% | 24.1 24% |
| Load Average * (dB) | 53.9 | 47 13% | 43 20% | 36.92 32% | 53 2% | 43.2 20% |
| Witcher 3 ultra * (dB) | 53.9 | 46 15% | 43 20% | 50 7% | 54 -0% | 48 11% |
| Load Maximum * (dB) | 54.9 | 48 13% | 46 16% | 50 9% | 55 -0% | 48 13% |
* ... im mniej tym lepiej
Temperatura
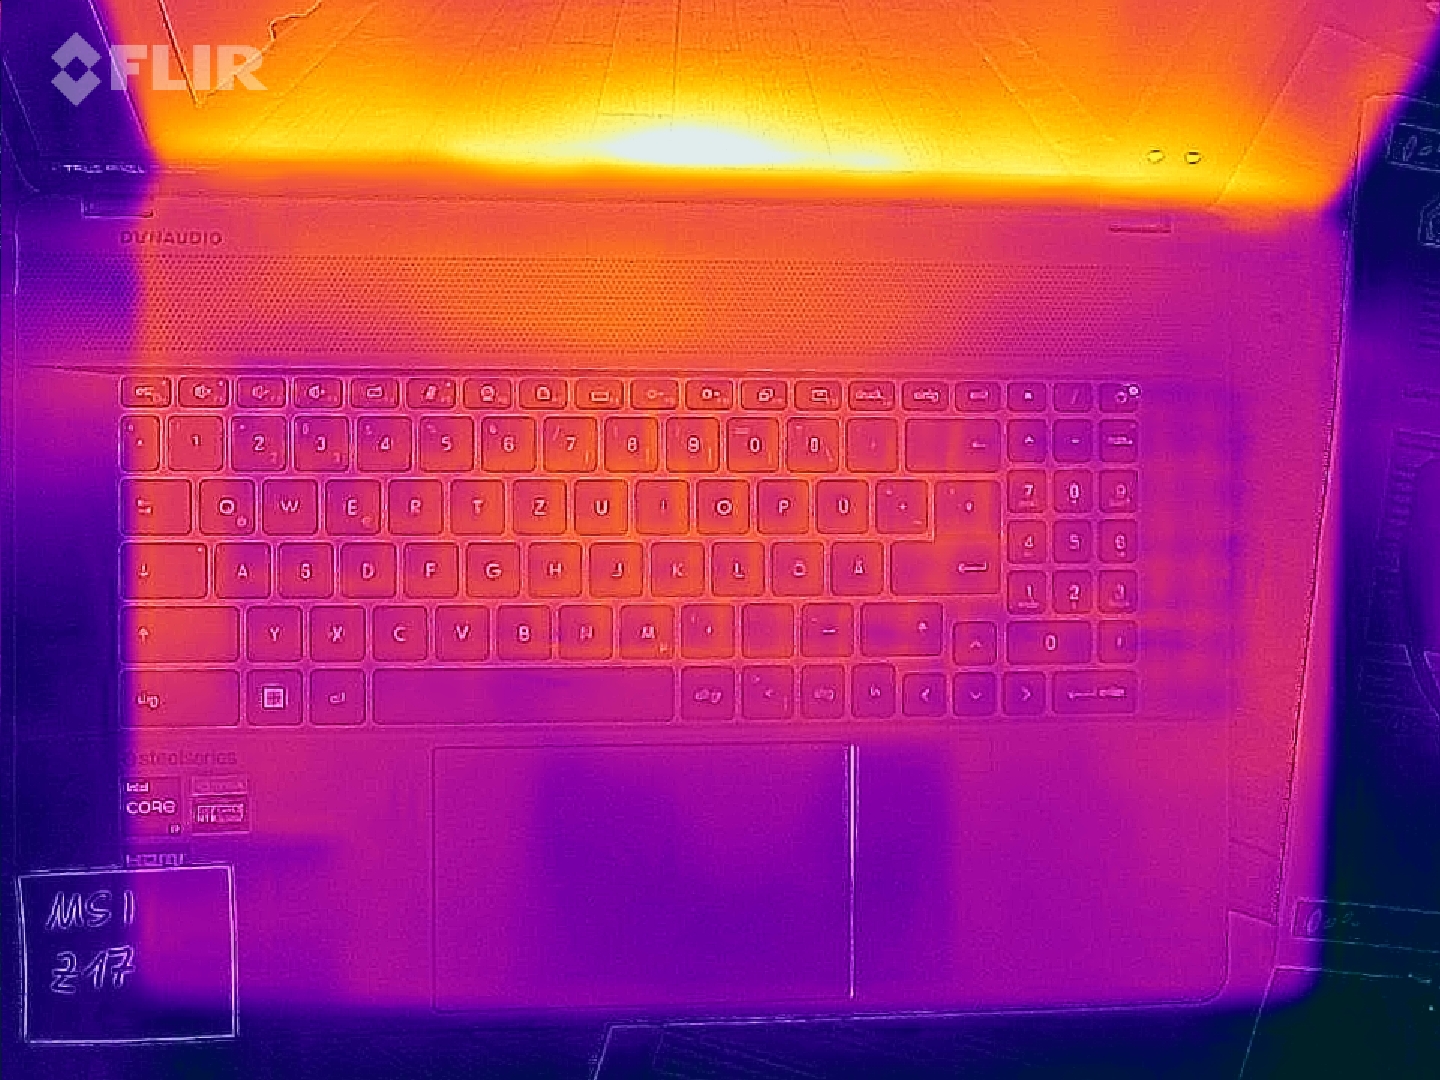
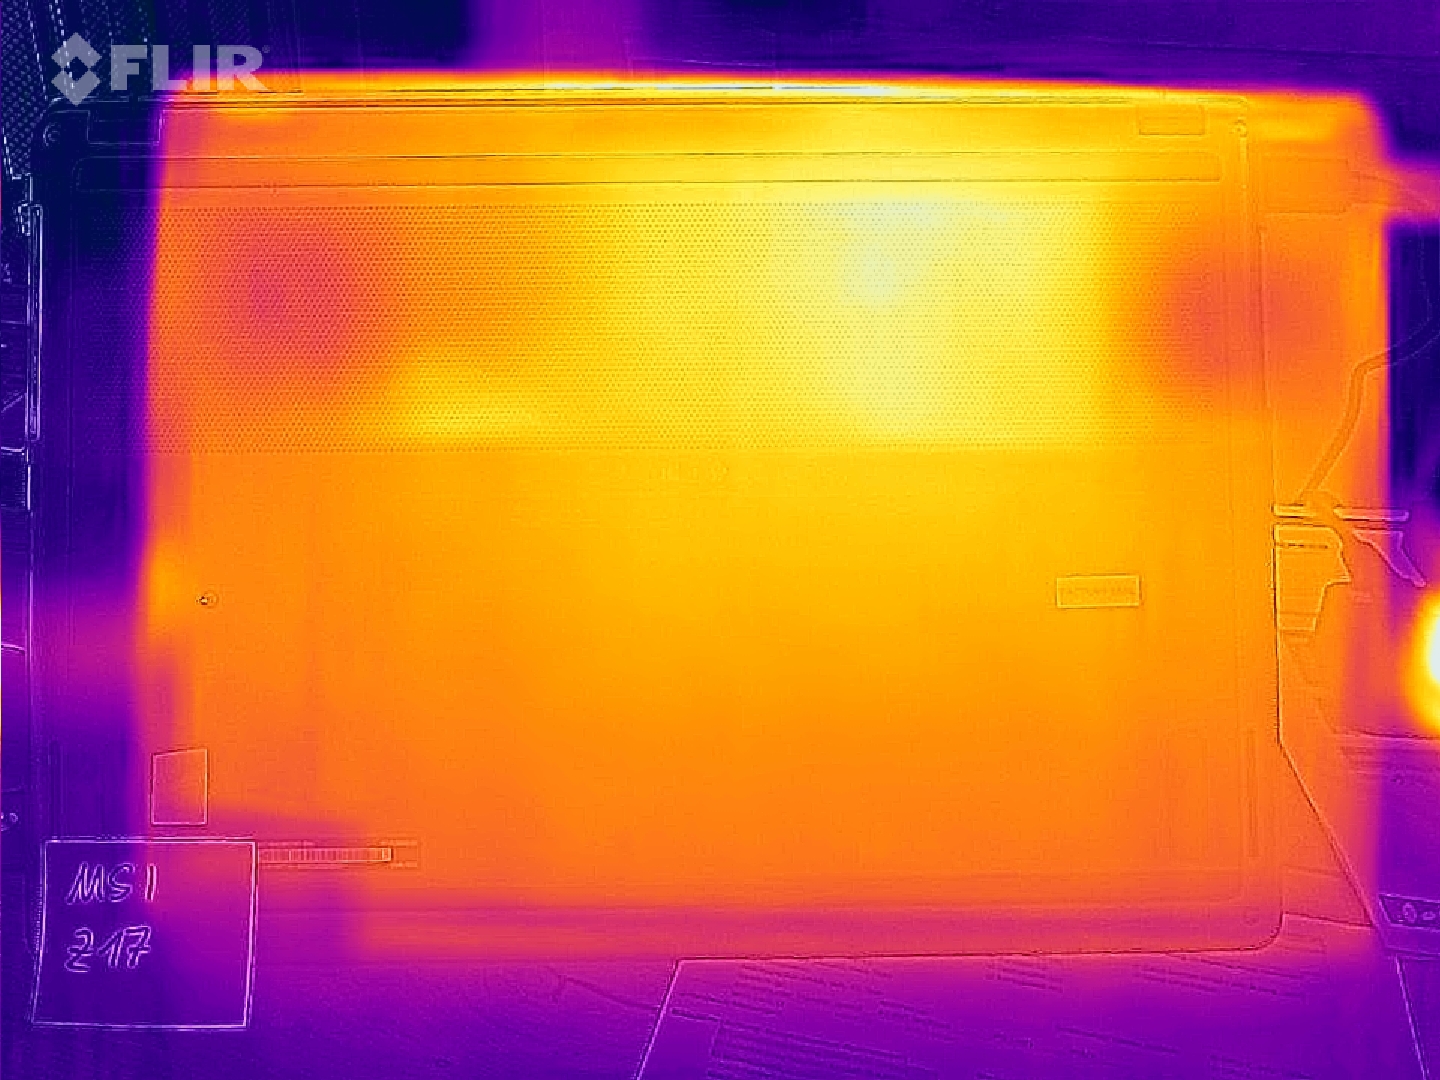
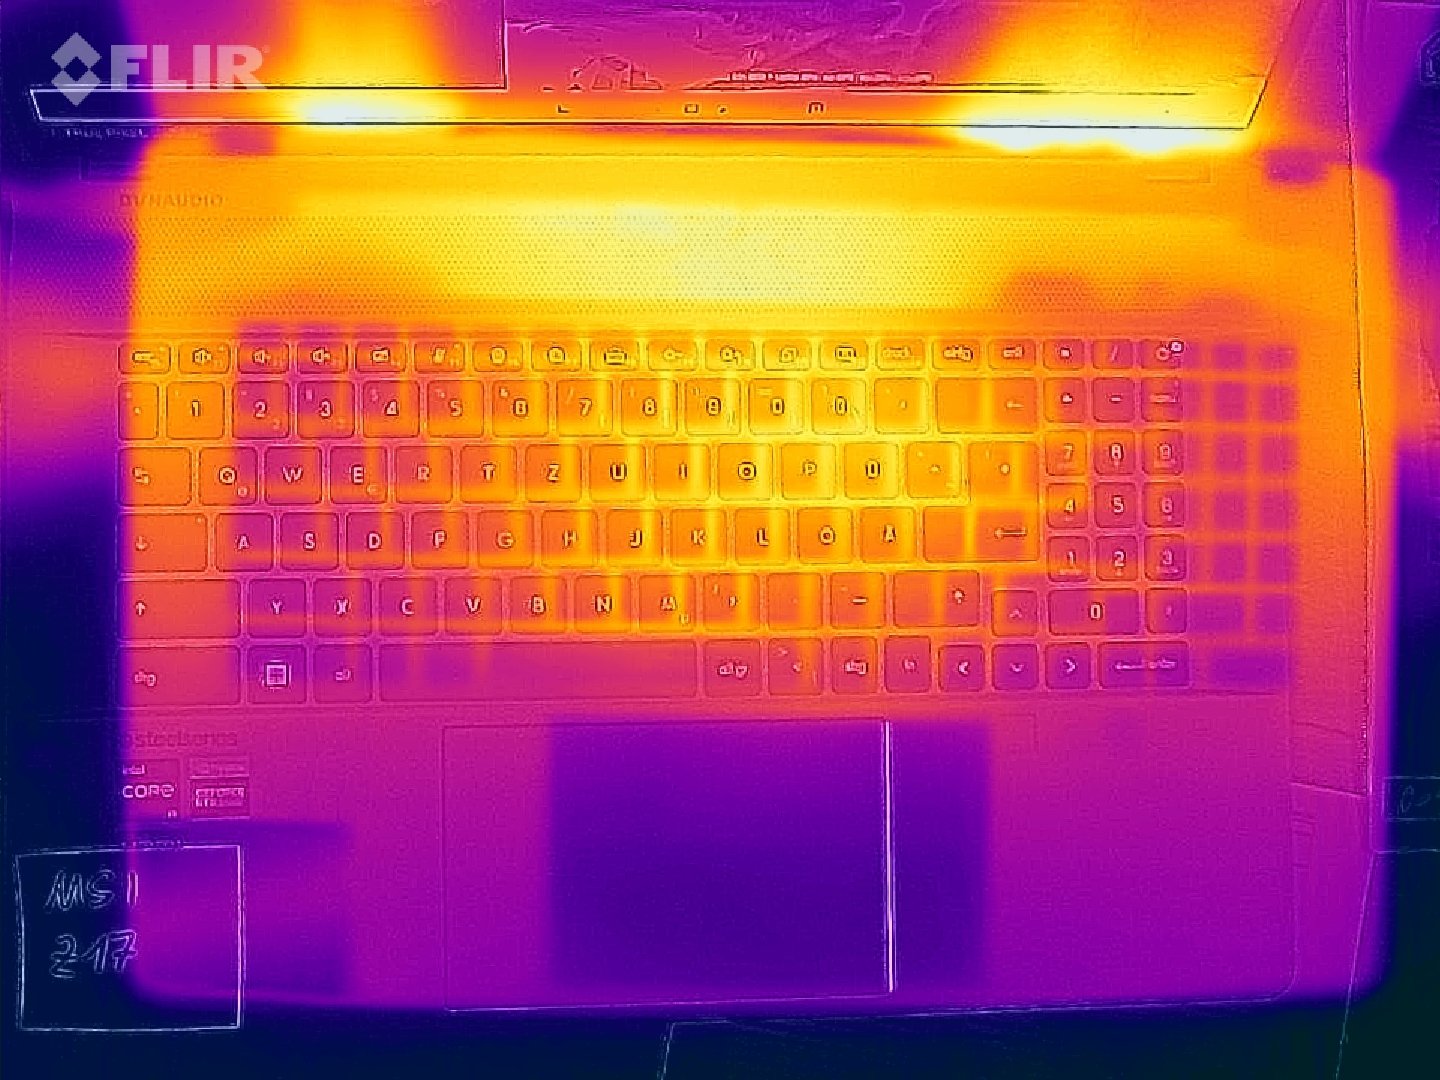
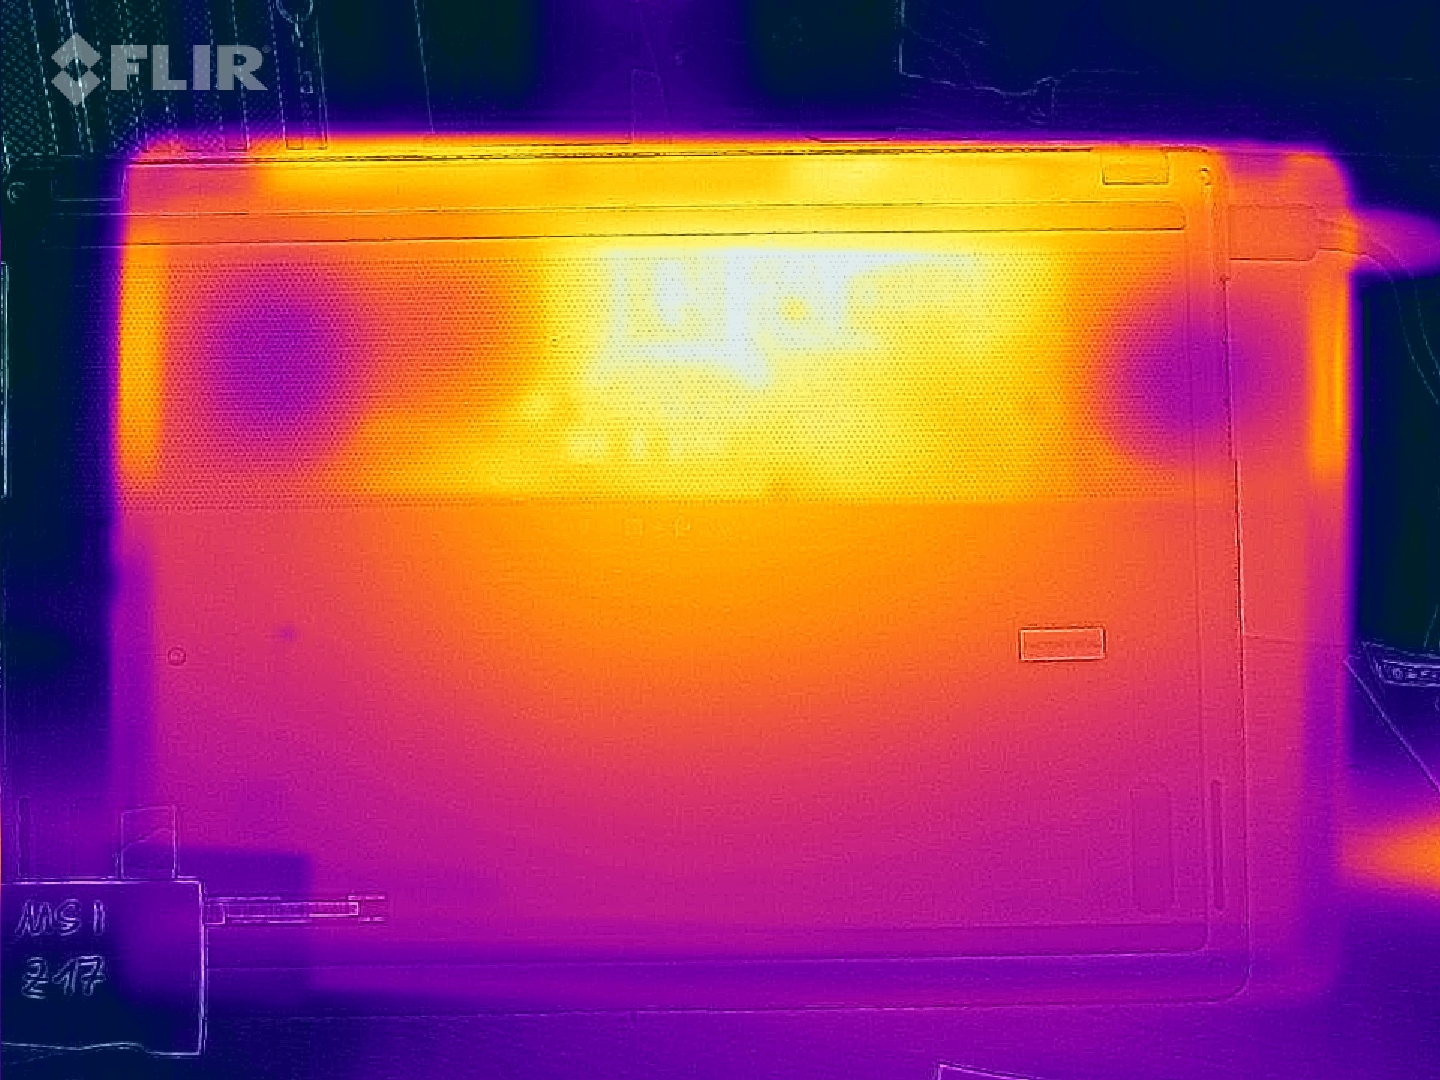
Można by się pomylić, sądząc, że głośne wentylatory przynajmniej utrzymają obudowę w chłodzie. Pod obciążeniem (stress test) na środku dolnego panelu (w pobliżu wyświetlacza) występowały gorące punkty o temperaturze nawet 68°C (154°F). Konkurencyjne produkty innych firm są o co najmniej 10°C (50°F) chłodniejsze zarówno pod obciążeniem, jak i podczas grania.
Nawet oparcia dłoni miały w teście obciążeniowym blisko 40°C (104°F), a podczas pracy laptopa na stronie Witcher 3 osiągnęły 36°C (97°F). Są to również najwyższe wartości w grupie porównawczej.
(-) Maksymalna temperatura w górnej części wynosi 63.9 °C / 147 F, w porównaniu do średniej 36.8 °C / 98 F , począwszy od 21 do 71 °C dla klasy Multimedia.
(-) Dno nagrzewa się maksymalnie do 68 °C / 154 F, w porównaniu do średniej 39.1 °C / 102 F
(+) W stanie bezczynności średnia temperatura górnej części wynosi 27 °C / 81 F, w porównaniu ze średnią temperaturą urządzenia wynoszącą 31.3 °C / ### class_avg_f### F.
(-) Podczas gry w Wiedźmina 3 średnia temperatura górnej części wynosi 44.6 °C / 112 F, w porównaniu do średniej temperatury urządzenia wynoszącej 31.3 °C / ## #class_avg_f### F.
(-) Podpórki pod nadgarstki i touchpad mogą się bardzo nagrzać w dotyku, maksymalnie do 40 °C / 104 F.
(-) Średnia temperatura obszaru podparcia dłoni w podobnych urządzeniach wynosiła 28.7 °C / 83.7 F (-11.3 °C / -20.3 F).
| MSI Creator Z17 A12UGST-054 Intel Core i9-12900H, NVIDIA GeForce RTX 3070 Ti Laptop GPU | MSI Creator 17 A10SGS Intel Core i7-10875H, NVIDIA GeForce RTX 2080 Super Max-Q | MSI Creator Z16P B12UHST Intel Core i9-12900H, NVIDIA GeForce RTX 3080 Ti Laptop GPU | Razer Blade 17 (i7-12800H, RTX 3070 Ti) Intel Core i7-12800H, NVIDIA GeForce RTX 3070 Ti Laptop GPU | Aorus 17X XES Intel Core i9-12900HX, NVIDIA GeForce RTX 3070 Ti Laptop GPU | Dell XPS 17 9720 RTX 3060 Intel Core i7-12700H, NVIDIA GeForce RTX 3060 Laptop GPU | |
|---|---|---|---|---|---|---|
| Heat | 1% | -1% | 11% | -8% | 5% | |
| Maximum Upper Side * (°C) | 63.9 | 52 19% | 67 -5% | 43 33% | 54 15% | 51.8 19% |
| Maximum Bottom * (°C) | 68 | 59 13% | 69 -1% | 44 35% | 58 15% | 44.2 35% |
| Idle Upper Side * (°C) | 28.3 | 34 -20% | 29 -2% | 32 -13% | 37 -31% | 34.8 -23% |
| Idle Bottom * (°C) | 30.2 | 33 -9% | 29 4% | 34 -13% | 39 -29% | 33.2 -10% |
* ... im mniej tym lepiej
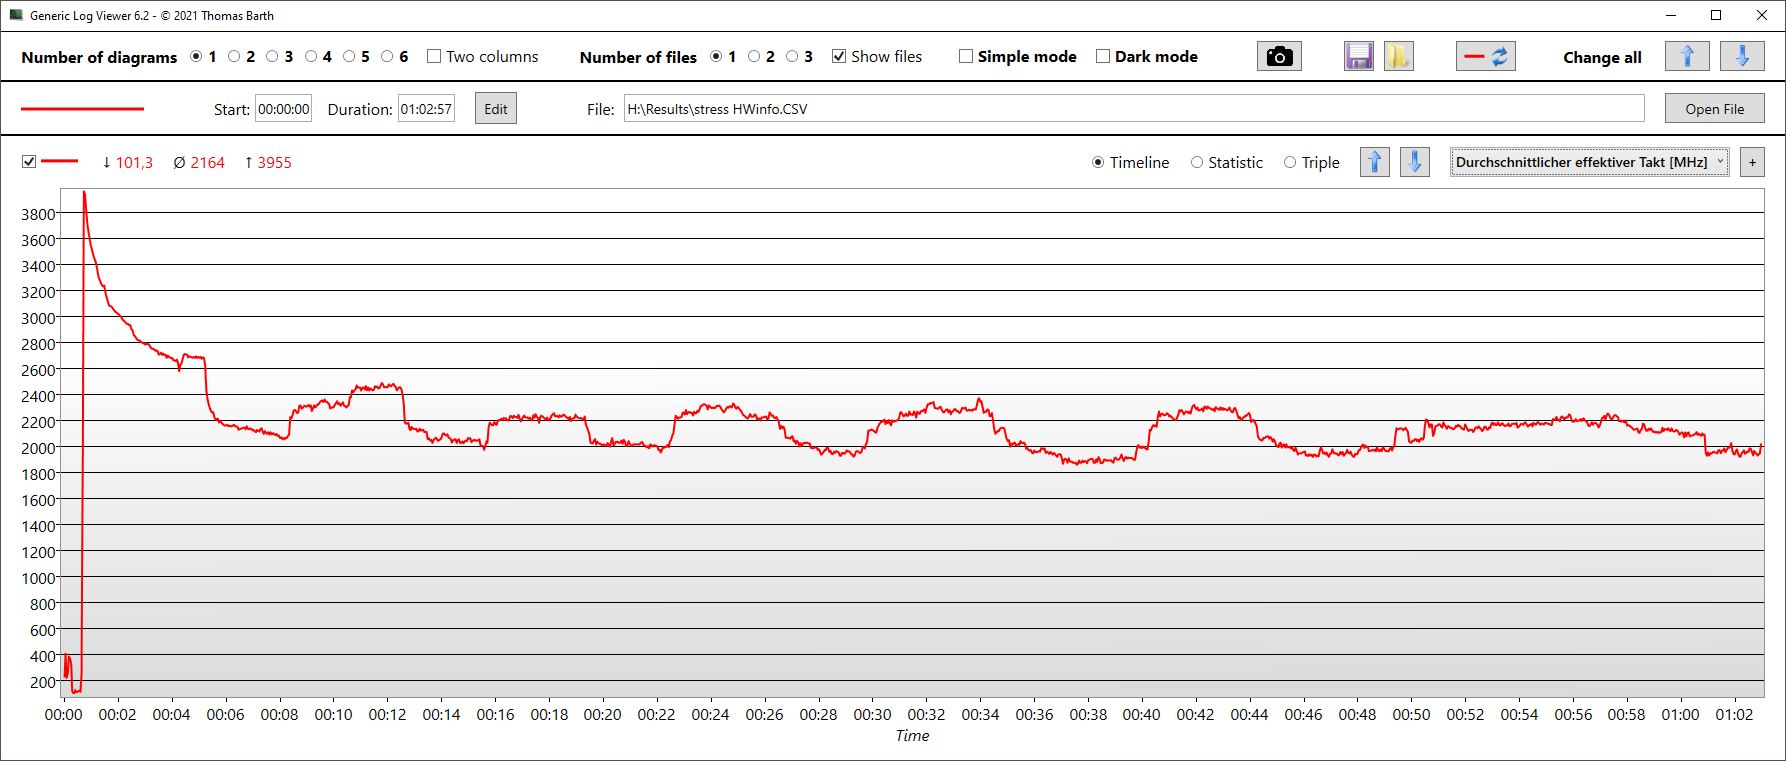
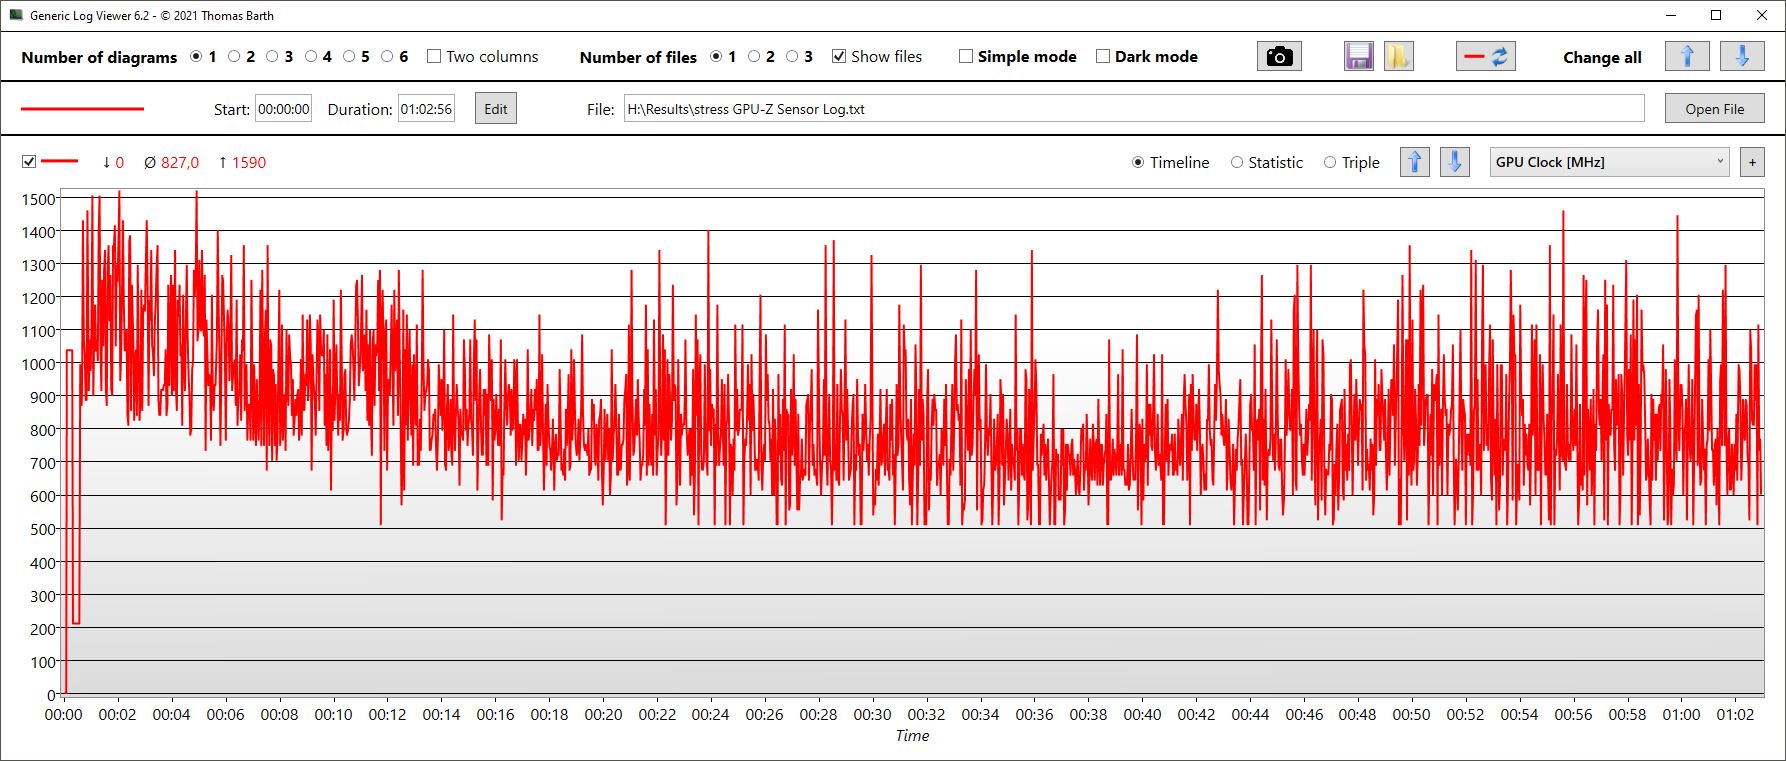
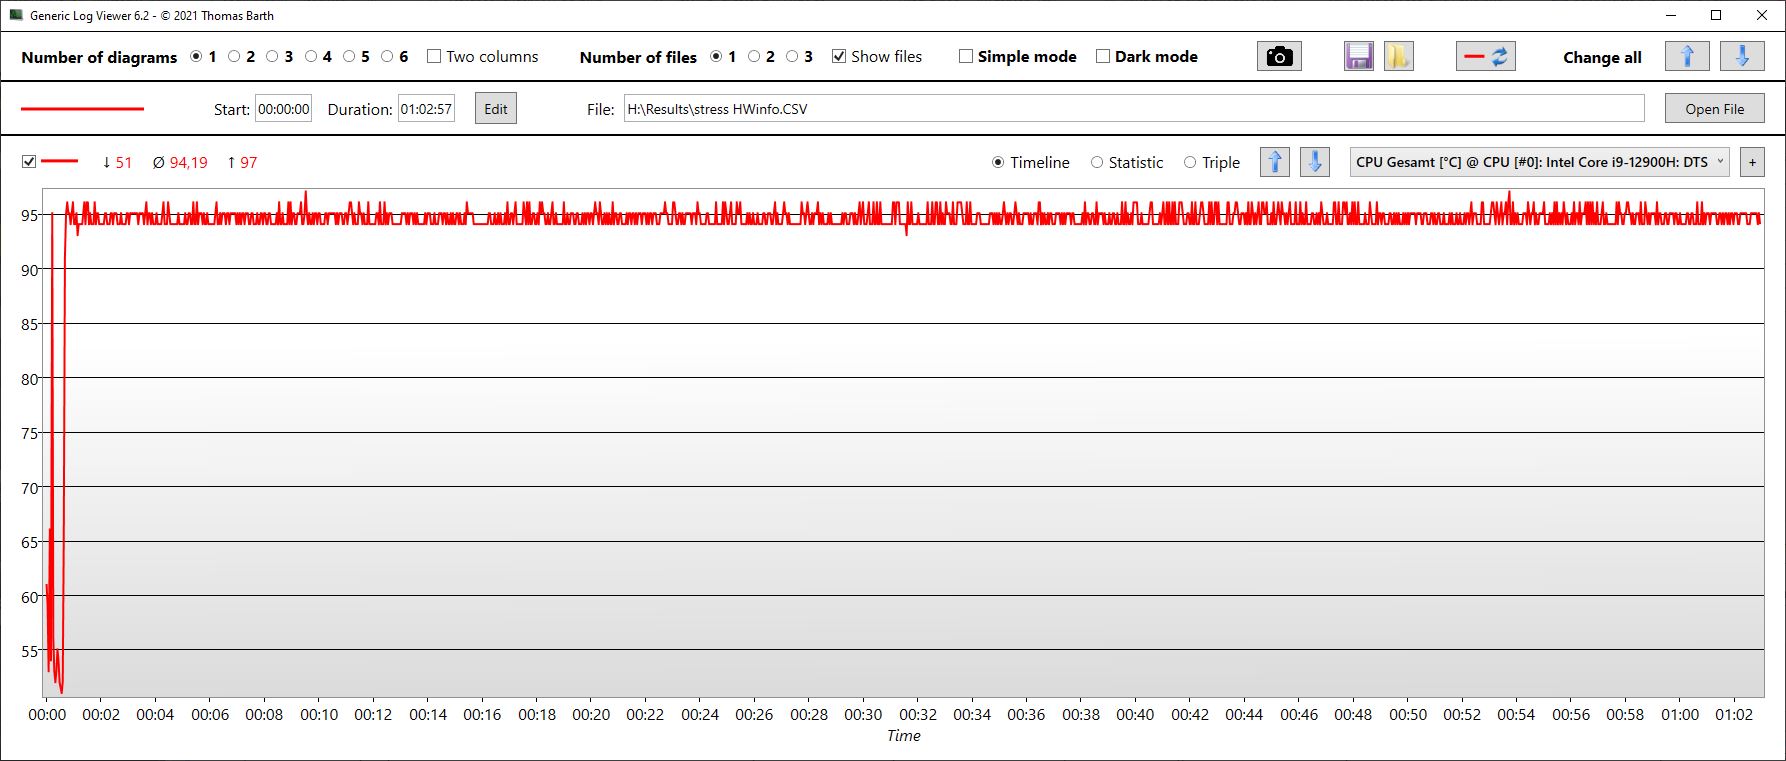
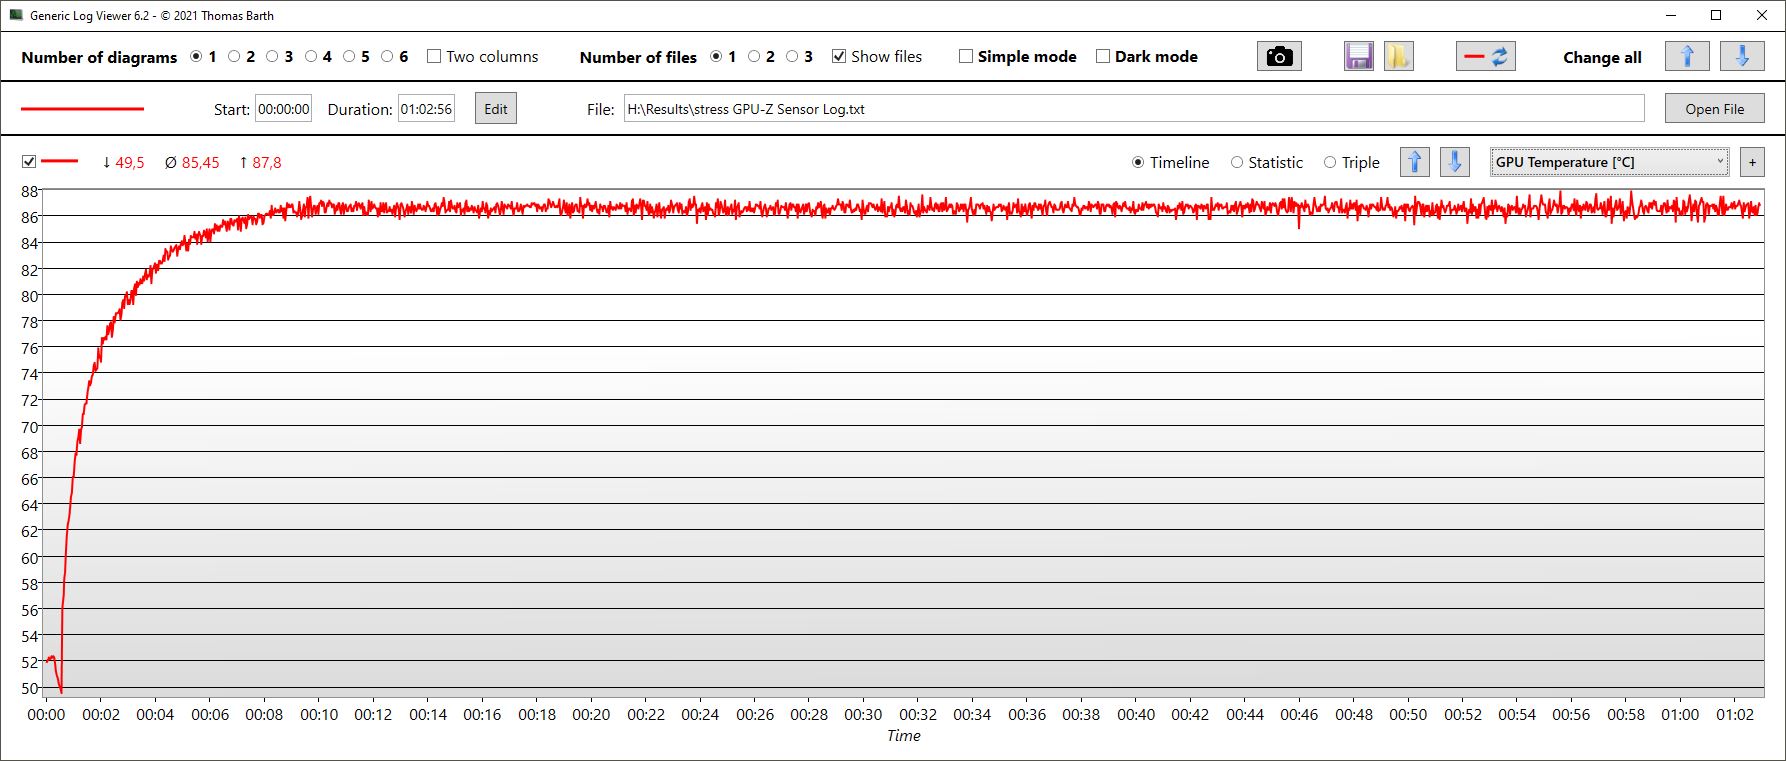
Test na stres
Na początku naszego godzinnego testu obciążeniowego taktowanie CPU bardzo krótko zbliżało się do 4 GHz. Następnie szybko spadło z powodu wysokich temperatur, po czym ustabilizowało się na poziomie około 2,1 do 2,2 GHz. Rdzenie trafiały na swój limit temperatury i pracowały średnio w temperaturze 94°C (201°C).
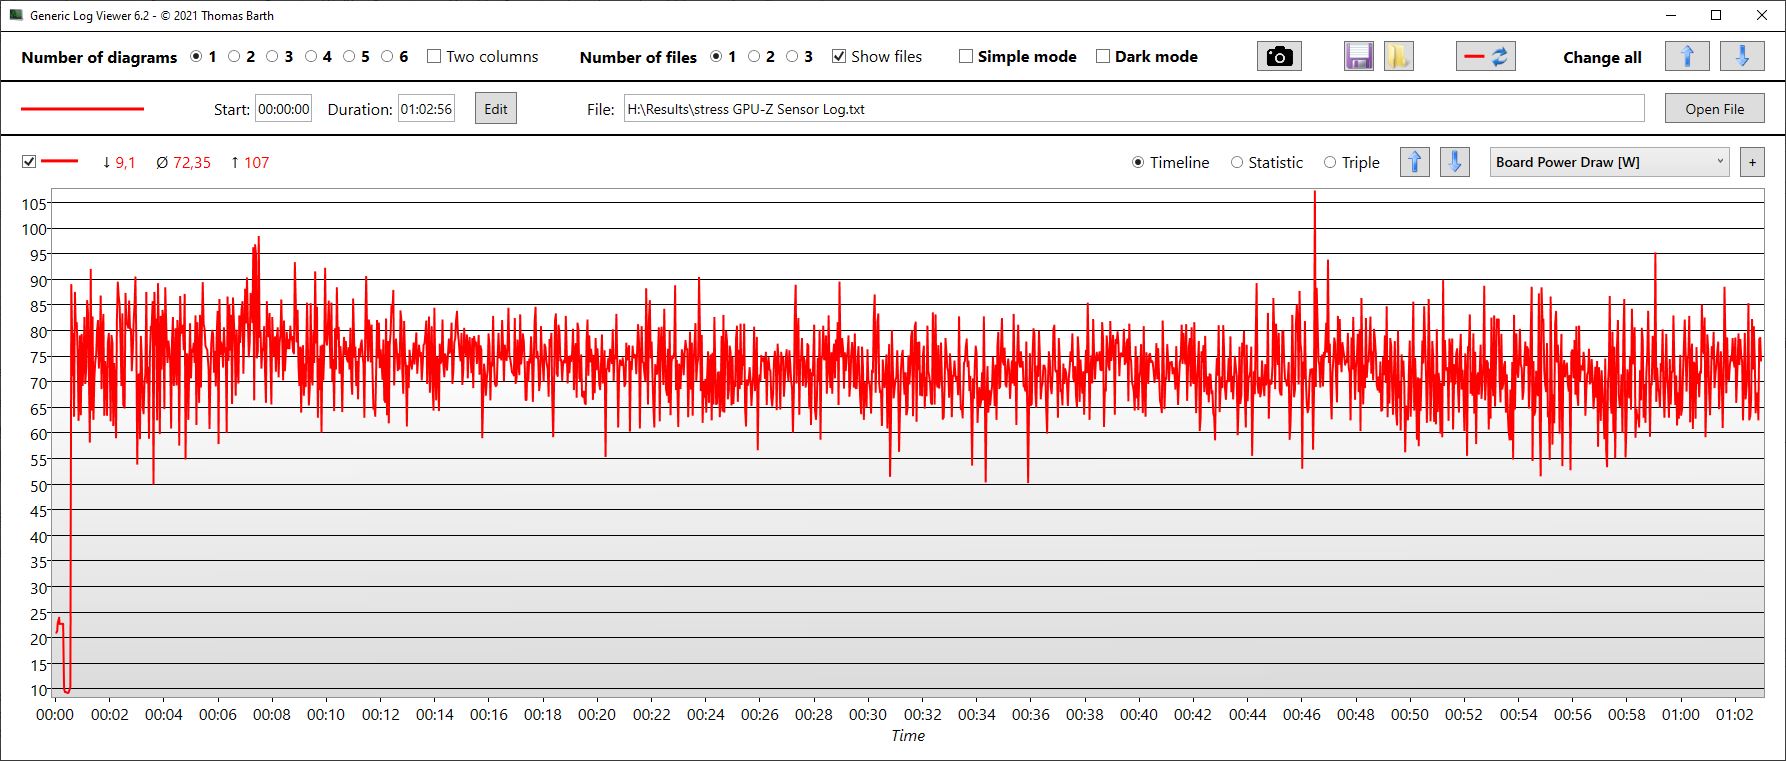
W tym samym czasie taktowanie GPU wahało się drastycznie między 500 MHz a 1,4 GHz, osiągając średnio dość niskie 827 MHz. Temperatura GPU utrzymywała się na stałym poziomie 85°C (185°F) i pobierał on około 72 W mocy.
Mówcy
Mimo, że dwudrożne głośniki stereo potrafią być głośne, nie mają prawie żadnego basu, o którym można by mówić. Spodziewaliśmy się więcej po głośnikach stereo. Dostępne jest tylko gniazdo słuchawkowe do podłączenia analogowych urządzeń odtwarzających.
MSI Creator Z17 A12UGST-054 analiza dźwięku
(+) | głośniki mogą odtwarzać stosunkowo głośno (84.8 dB)
Bas 100 - 315 Hz
(-) | prawie brak basu - średnio 29.6% niższa od mediany
(±) | liniowość basu jest średnia (12.8% delta do poprzedniej częstotliwości)
Średnie 400 - 2000 Hz
(+) | zbalansowane środki średnie - tylko 2.4% od mediany
(±) | liniowość środka jest średnia (8.9% delta do poprzedniej częstotliwości)
Wysokie 2–16 kHz
(±) | wyższe maksima - średnio 6.8% wyższe od mediany
(+) | wzloty są liniowe (6.5% delta do poprzedniej częstotliwości)
Ogólnie 100 - 16.000 Hz
(±) | liniowość ogólnego dźwięku jest średnia (20.9% różnicy w stosunku do mediany)
W porównaniu do tej samej klasy
» 71% wszystkich testowanych urządzeń w tej klasie było lepszych, 8% podobnych, 21% gorszych
» Najlepszy miał deltę 5%, średnia wynosiła ###średnia###%, najgorsza wynosiła 45%
W porównaniu do wszystkich testowanych urządzeń
» 57% wszystkich testowanych urządzeń było lepszych, 8% podobnych, 36% gorszych
» Najlepszy miał deltę 4%, średnia wynosiła ###średnia###%, najgorsza wynosiła 134%
Apple MacBook Pro 16 2021 M1 Pro analiza dźwięku
(+) | głośniki mogą odtwarzać stosunkowo głośno (84.7 dB)
Bas 100 - 315 Hz
(+) | dobry bas - tylko 3.8% od mediany
(+) | bas jest liniowy (5.2% delta do poprzedniej częstotliwości)
Średnie 400 - 2000 Hz
(+) | zbalansowane środki średnie - tylko 1.3% od mediany
(+) | średnie są liniowe (2.1% delta do poprzedniej częstotliwości)
Wysokie 2–16 kHz
(+) | zrównoważone maksima - tylko 1.9% od mediany
(+) | wzloty są liniowe (2.7% delta do poprzedniej częstotliwości)
Ogólnie 100 - 16.000 Hz
(+) | ogólny dźwięk jest liniowy (4.6% różnicy w stosunku do mediany)
W porównaniu do tej samej klasy
» 0% wszystkich testowanych urządzeń w tej klasie było lepszych, 0% podobnych, 100% gorszych
» Najlepszy miał deltę 5%, średnia wynosiła ###średnia###%, najgorsza wynosiła 45%
W porównaniu do wszystkich testowanych urządzeń
» 0% wszystkich testowanych urządzeń było lepszych, 0% podobnych, 100% gorszych
» Najlepszy miał deltę 4%, średnia wynosiła ###średnia###%, najgorsza wynosiła 134%
Zarządzanie energią - stacja robocza zgodna z oczekiwaniami
Pobór mocy
Podobnie jak wydajność, zużycie energii jest rozsądne pod obciążeniem. Dla porównania Razer Blade 17 zużywa znacznie więcej energii podczas gry lub przy maksymalnym obciążeniu. To samo dotyczy również Aorusów.
Natomiast zużycie energii przez Z17 jest dość nietypowe - jest dwukrotnie wyższe niż u konkurencji. Ponieważ Creator Z16P zużywa w stanie bezczynności tylko o połowę mniej energii niż Z17, mimo że posiada mocniejszy układ graficzny, uważamy, że jakiś proces powoduje aktywację GPU RTX.
Zmierzyliśmy szczytowe zużycie energii na poziomie 220 watów. Ładowarka o mocy 240 W (ok. 16,4 x 7,5 x 2,5 cm, czyli 6,5 x 3,0 x 1,0") nie powinna mieć problemów z takim poziomem zużycia energii.
| wyłączony / stan wstrzymania | |
| luz | |
| obciążenie |
|
Legenda:
min: | |
| MSI Creator Z17 A12UGST-054 i9-12900H, GeForce RTX 3070 Ti Laptop GPU, Micron 3400 1TB MTFDKBA1T0TFH, IPS, 2560x1600, 17" | MSI Creator 17 A10SGS i7-10875H, GeForce RTX 2080 Super Max-Q, Samsung SSD PM981 MZVLB2T0HMLB, Mini-LED IPS-Level, 3840x2160, 17.3" | MSI Creator Z16P B12UHST i9-12900H, GeForce RTX 3080 Ti Laptop GPU, Samsung PM9A1 MZVL22T0HBLB, IPS True Pixel (~100% DCI-P3), 2560x1600, 16" | Razer Blade 17 (i7-12800H, RTX 3070 Ti) i7-12800H, GeForce RTX 3070 Ti Laptop GPU, Samsung PM9A1 MZVL21T0HCLR, IPS, 2560x1440, 17.3" | Aorus 17X XES i9-12900HX, GeForce RTX 3070 Ti Laptop GPU, Gigabyte AG470S1TB-SI B10, IPS, 1920x1080, 17.3" | Dell XPS 17 9720 RTX 3060 i7-12700H, GeForce RTX 3060 Laptop GPU, Samsung PM9A1 MZVL21T0HCLR, IPS, 3840x2400, 17" | Przeciętny NVIDIA GeForce RTX 3070 Ti Laptop GPU | Średnia w klasie Multimedia | |
|---|---|---|---|---|---|---|---|---|
| Power Consumption | 18% | 33% | 21% | 3% | 45% | 31% | 68% | |
| Idle Minimum * (Watt) | 34.6 | 15 57% | 11 68% | 14.4 58% | 18 48% | 5.9 83% | 14.2 ? 59% | 5.64 ? 84% |
| Idle Average * (Watt) | 43 | 20 53% | 17 60% | 20 53% | 28 35% | 15.8 63% | 19.9 ? 54% | 10 ? 77% |
| Idle Maximum * (Watt) | 44.9 | 42 6% | 26 42% | 21.5 52% | 36 20% | 26.7 41% | 26.2 ? 42% | 12.2 ? 73% |
| Load Average * (Watt) | 145 | 150 -3% | 124 14% | 119 18% | 153 -6% | 117.4 19% | 125.8 ? 13% | 64.8 ? 55% |
| Witcher 3 ultra * (Watt) | 152.4 | 170 -12% | 133.5 12% | 218 -43% | 221 -45% | 114.8 25% | ||
| Load Maximum * (Watt) | 220 | 210 5% | 212 4% | 248 -13% | 290 -32% | 136.6 38% | 248 ? -13% | 111.7 ? 49% |
* ... im mniej tym lepiej
Power consumption Witcher 3 / stress test
Power consumption with external monitor
Żywotność baterii
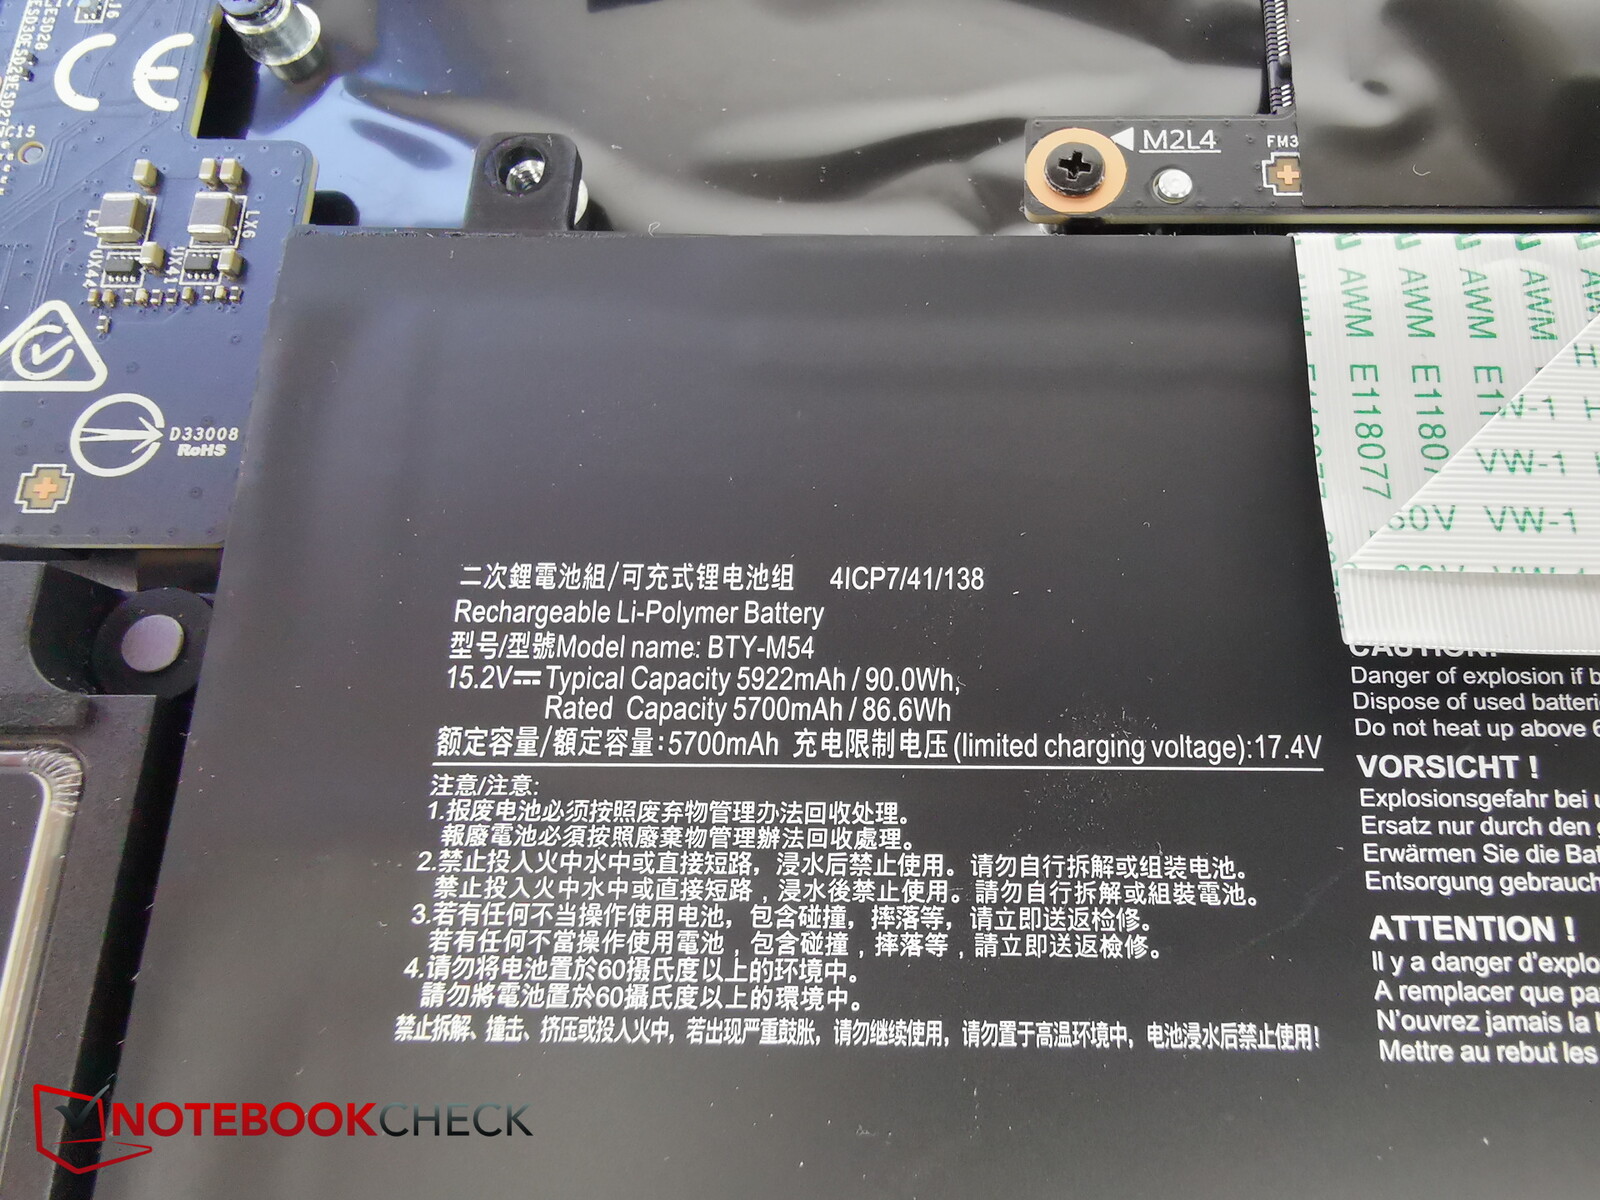
Creator Z17 jest zasilany przez akumulator o pojemności 90 Wh, kiedy jest odłączony od zasilania, co nie odbiega od innych laptopów w tym porównaniu. Uzyskany czas pracy na akumulatorze znajduje się raczej w górnej części wśród urządzeń z porównania. Pomimo posiadania marginalnie mniejszego akumulatora, tj Razer Blade 17 jest w stanie wytrzymać prawie tak długo na jednym ładowaniu. By maksymalnie wykorzystać akumulator laptopa, kluczowe jest zmniejszenie częstotliwości odświeżania wyświetlacza do 60 Hz. W Z17 dzieje się to dość automatycznie, gdy urządzenie jest odłączone od zasilania.
Podczas przeglądania stron internetowych Z17 wytrzyma od 4,5 do 5,5 godziny (w zależności od jasności ekranu). Czas pracy na baterii mieści się w tym samym zakresie przy odtwarzaniu wideo.
| MSI Creator Z17 A12UGST-054 i9-12900H, GeForce RTX 3070 Ti Laptop GPU, 90 Wh | MSI Creator 17 A10SGS i7-10875H, GeForce RTX 2080 Super Max-Q, 82 Wh | MSI Creator Z16P B12UHST i9-12900H, GeForce RTX 3080 Ti Laptop GPU, 90 Wh | Razer Blade 17 (i7-12800H, RTX 3070 Ti) i7-12800H, GeForce RTX 3070 Ti Laptop GPU, 82 Wh | Aorus 17X XES i9-12900HX, GeForce RTX 3070 Ti Laptop GPU, 99 Wh | Dell XPS 17 9720 RTX 3060 i7-12700H, GeForce RTX 3060 Laptop GPU, 97 Wh | Średnia w klasie Multimedia | |
|---|---|---|---|---|---|---|---|
| Czasy pracy | -35% | -18% | -7% | -29% | 2% | 97% | |
| H.264 (h) | 5.5 | 5.8 5% | 4.9 -11% | 3.8 -31% | 16.4 ? 198% | ||
| WiFi v1.3 (h) | 5.5 | 4.4 -20% | 5.2 -5% | 5.9 7% | 4.4 -20% | 8.7 58% | 12 ? 118% |
| Load (h) | 2.2 | 1.1 -50% | 1 -55% | 1.8 -18% | 1.4 -36% | 1 -55% | 1.675 ? -24% |
| Reader / Idle (h) | 7.2 | 25.2 ? |
Za
Przeciw
Werdykt - 4,000 Euro za stację roboczą MSI
Na pierwszy rzut oka MSI Creator Z17 wydaje się być świetnym laptopem do pracy dla kreatywnych. Jego wysoka cena wynika nie tylko z potężnego sprzętu, ale także z solidnej metalowej obudowy, wyjątkowo cienkiej formy, świetnego ekranu dotykowego i tak dalej.
Trzeba przyznać, że postawiliśmy poprzeczkę stosunkowo wysoko dla Z17, ale i tak rozczarował nas jako całość. Wynika to głównie z faktu, że urządzenie generuje dużo ciepła i hałasu: pomimo posiadania trzech wentylatorów, system chłodzenia nie jest optymalny dla cienkiej obudowy. Oznacza to, że Z17 jest gorętszy i głośniejszy od swoich konkurentów, a nawet gorzej radzi sobie w aplikacjach 3D, ponieważ RTX 3070 Ti ma do dyspozycji tylko 90 W mocy. Zwiększenie mocy nie jest możliwe, biorąc pod uwagę już wysokie temperatury.
Moglibyśmy przeoczyć nieco poniżej przeciętnej wydajności w laptopie do pracy, gdyby działał on ciszej i chłodniej niż konkurencja. W przypadku Z17 jest jednak zupełnie odwrotnie.
Creator Z17 ma fantastyczne rozmiary, świetny ekran dotykowy oraz dobre spasowanie i wykończenie, ale jego wadą jest fakt, że rozwiązanie chłodzące wydaje się być nieco przytłoczone i powodujące spadek wydajności z czasem
Doskonały Razer Blade 17 jest świetną alternatywą dla Z17. Jest tak samo cienki i premium, ale jest cichszy, chłodniejszy, a nawet jest w stanie zapewnić bardziej spójną wydajność. Własny MSI Creator Z16Prównież robi niektóre rzeczy nieco lepiej niż Z17, jak na przykład poziom hałasu.
Cena i dostępność
Z17 miał kosztować ponad 4.000 euro (3.875 dolarów), co naszym zdaniem jest zbyt wysoką ceną, biorąc pod uwagę dostępne alternatywy. Jednak model o podobnej specyfikacji jest już dostępny na stronie Amazon.com za 3,049 USD.
MSI Creator Z17 A12UGST-054
- 20/09/2022 v7 (old)
Christian Hintze
Price comparison

